Notes
Article history
The research reported in this issue of the journal was funded by the EME programme as project number 11/20/03. The contractual start date was in October 2012. The final report began editorial review in June 2017 and was accepted for publication in January 2018. The authors have been wholly responsible for all data collection, analysis and interpretation, and for writing up their work. The EME editors and production house have tried to ensure the accuracy of the authors’ report and would like to thank the reviewers for their constructive comments on the final report document. However, they do not accept liability for damages or losses arising from material published in this report.
Declared competing interests of authors
David Newby reports that a patent (US 9275432 B2) held by the University of Edinburgh has been filed relating to the registration of medical images that were generated as part of this study.
Permissions
Copyright statement
© Queen’s Printer and Controller of HMSO 2018. This work was produced by Forsythe et al. under the terms of a commissioning contract issued by the Secretary of State for Health and Social Care. This issue may be freely reproduced for the purposes of private research and study and extracts (or indeed, the full report) may be included in professional journals provided that suitable acknowledgement is made and the reproduction is not associated with any form of advertising. Applications for commercial reproduction should be addressed to: NIHR Journals Library, National Institute for Health Research, Evaluation, Trials and Studies Coordinating Centre, Alpha House, University of Southampton Science Park, Southampton SO16 7NS, UK.
2018 Queen’s Printer and Controller of HMSO
Chapter 1 Introduction
Aortic aneurysms frequently occur in patients with atherosclerosis, and the two disease processes share several common risk factors. However, there are distinct differences. Atherosclerotic lesions are predominantly located in the intima, whereas it is the media and adventitia that are primarily involved in aneurysms. Aneurysm disease is also much more closely associated with smoking and hypertension, and has a particular predilection for the abdominal aorta.
The formation, growth and rupture of aneurysms are now recognised to be the result of a complex interplay between biological and mechanical factors. Aneurysm tissue is characterised by excessive medial neovascularisation, infiltration of inflammatory cells (principally macrophages) and irreversible remodelling of the extracellular matrix. These pathological processes do not affect the aorta uniformly but are focal in nature. Shear wall stress varies spatially within the aneurysm1 and tensile strength varies in different parts of the aneurysm sac. 2 Focal neovascularisation occurs at the site of rupture and its presence corresponds to the degree of inflammation. These biological ‘hotspots’ represent sites of potential rupture and are putative targets for novel imaging strategies aiming to predict aneurysm expansion and assess the risk of rupture. In addition, tissue and wall stresses vary spatially within the aneurysm, and tensile strength varies in different parts of the aneurysm sac. Synergy between these biological ‘hotspots’ and areas of intense biomechanical stress may be the focal point precipitating aneurysm rupture. Indeed, there is strong evidence that aneurysm ruptures are seen in those patients with more rapid aneurysm expansion rates. 3,4
Magnetic resonance imaging
Magnetic resonance imaging (MRI) is emerging as a useful investigative tool for cardiovascular disease that can distinguish the different atherosclerotic plaque components, such as the lipid-rich core and areas of calcification. 5 Standard gadolinium-based MRI identifies areas of thrombus formation and fibrosis in abdominal aortic aneurysms (AAAs). 6 Newer contrast agents containing superparamagnetic particles of iron oxide have been developed that provide additional biological and functional information through the detection of cellular inflammation within tissues. Ultrasmall superparamagnetic particles of iron oxide (USPIO), with particle sizes in the range of 10–30 nm, escape immediate recognition by the reticuloendothelial system and persist for longer in the bloodstream, allowing them to be used to assess the accumulation of macrophages within vascular and lymphatic tissues. 7–11 Current preparations are biodegradable and safe for clinical administration. 12–14
The USPIO accumulate in the aortae of hypercholesterolaemic rabbits15 and in murine models of AAAs. 16 In humans, USPIO accumulate in ruptured or rupture-prone carotid plaques rather than stable plaques,9,10 and treatment with atorvastatin reduces both inflammation and USPIO uptake in carotid plaques. 11 Moreover, it has been shown that USPIO accumulation can describe the cellular myocardial inflammatory response following acute myocardial infarction. 17–19 Indeed, we have described the early time course of macrophage-mediated inflammation that occurs in the first 2 weeks following an acute myocardial infarction. 18 For this reason, USPIO-enhanced MRI can be used to temporally track tissue inflammation and describe the natural history of disease progression. Indeed, USPIO-enhanced MRI has been used to explore a range of cardiovascular diseases associated with cellular inflammation in humans. 20
Ultrasmall superparamagnetic particles of iron oxide-enhanced magnetic resonance imaging in abdominal aortic aneurysms
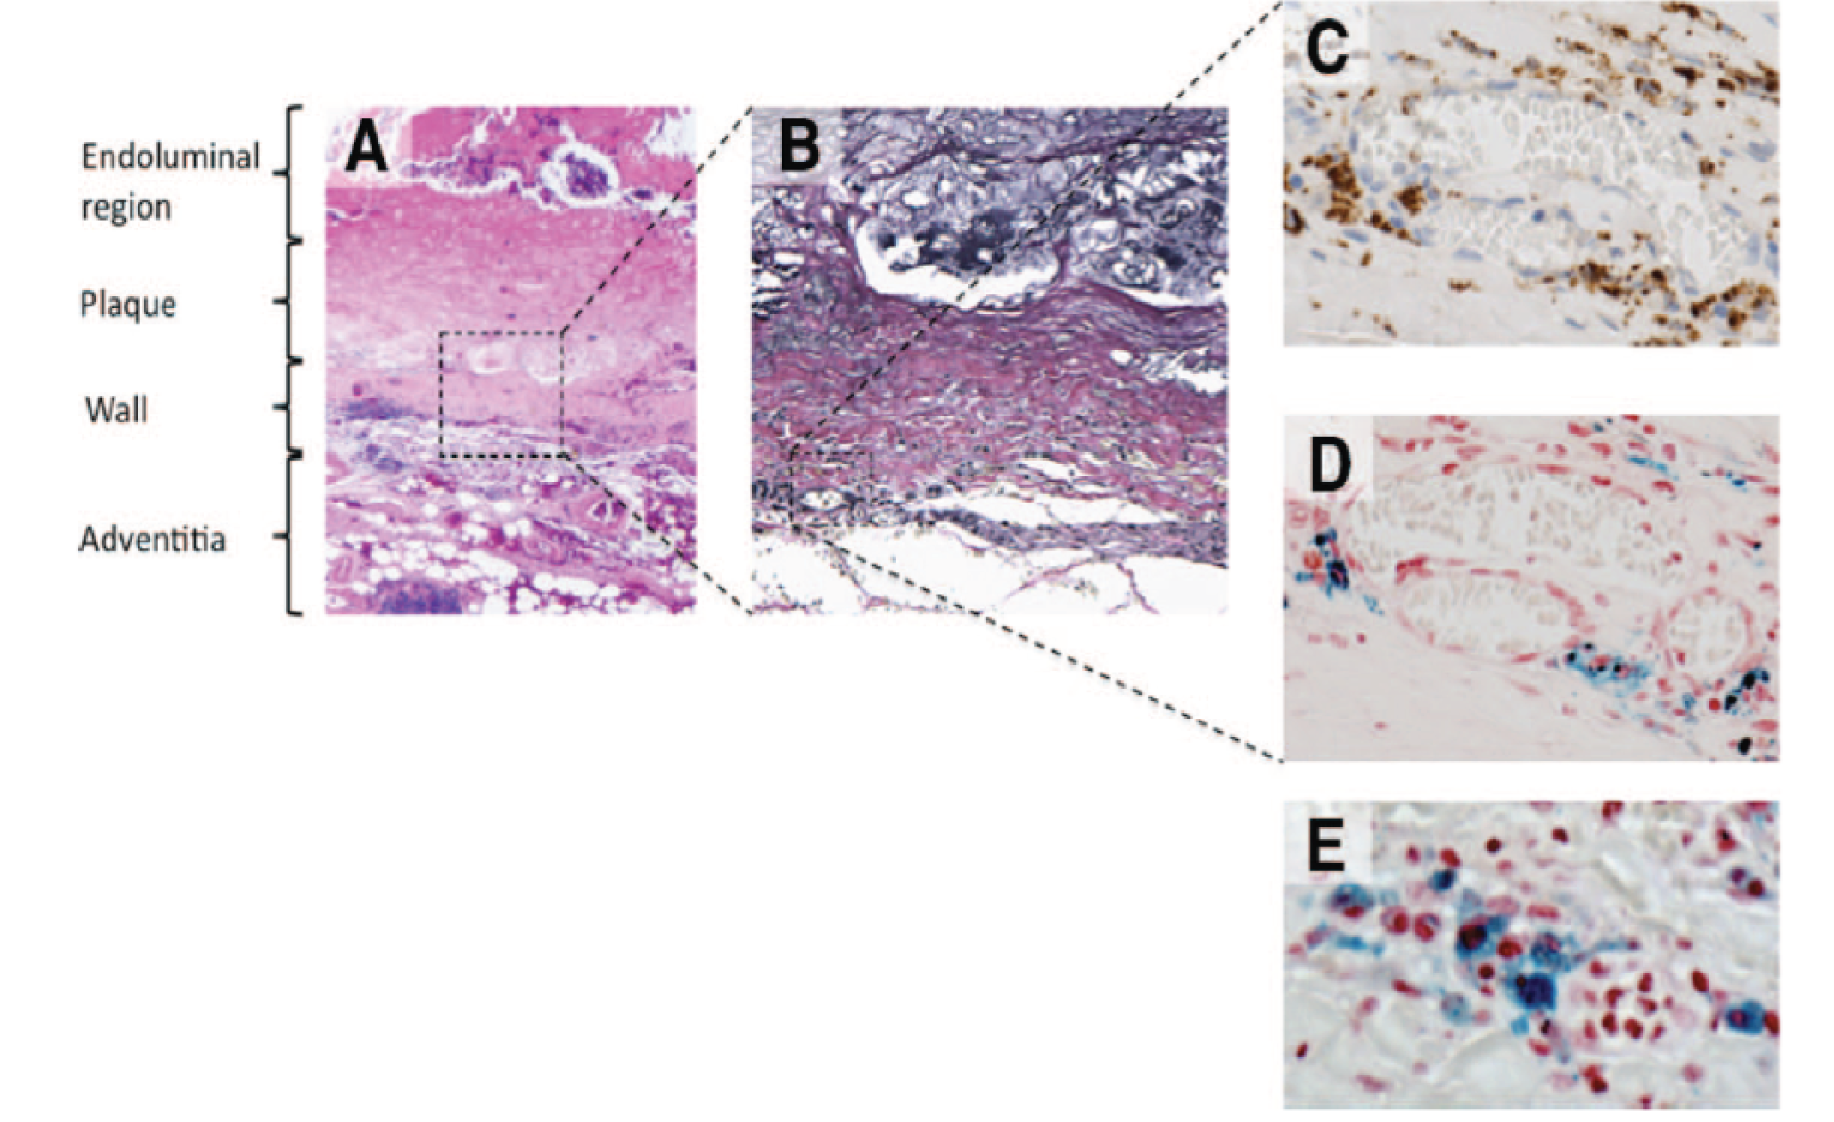
To date, there have been very few studies using USPIO-enhanced MRI in patients with AAAs. 21 We have previously conducted a series of MRI studies of patients with AAAs and shown that uptake of USPIO in the aortic wall correlates with macrophage activity and identifies cellular inflammation. 22 Using a 3-T magnetic resonance scanner, patients with asymptomatic AAAs (n = 29; aneurysm diameter of 40–66 mm) attending our surveillance programme were imaged before and 24–36 hours after intravenous administration of USPIO. Histological examination of aneurysm tissue confirmed co-localisation and uptake of USPIO in areas of macrophage infiltration (Figure 1). 22
FIGURE 1.
Representative histological sections of the aortic wall. (a) Haematoxoylin and eosin (× 20) of the full thickness of the aortic wall including atherosclerotic plaque, adherent thrombus and periadventitial fatty tissue; (b) Verhoeff’s stain (× 100) of the aortic wall showing complete destruction of the normal wall structure, including fibrosis (collagen = pink) of the media and adventitia and virtual absence of intact medial elastic fibres (black); (c) Prussian blue staining for iron demonstrating co-localisation of CD68-positive macrophages (× 400; brown); with (d) USPIO (× 400; blue); and (e) high-power (× 1000) Prussian blue staining shows intracytoplasmic accumulation of USPIO within macrophages.
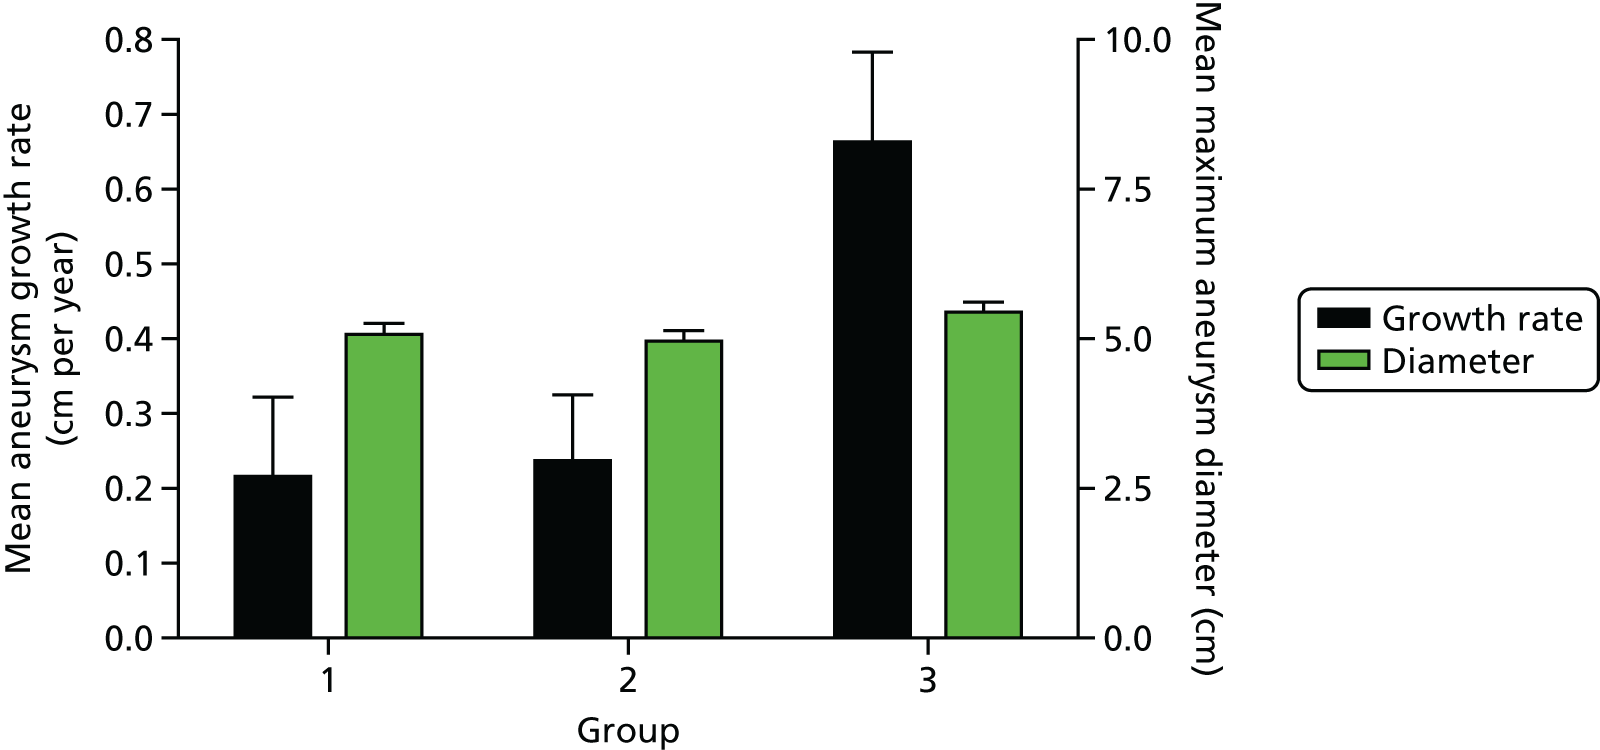
Furthermore, AAAs with mural USPIO uptake had a threefold higher expansion rate when compared with AAAs with no or non-specific USPIO uptake despite similar baseline anteroposterior diameters (Figure 2). 22 Indeed, one patient with substantial mural USPIO uptake died suddenly 2 months after scanning from presumed aneurysm rupture. We have therefore shown that this technique holds major promise as a new method of risk-stratification of patients with an AAA that extends beyond simple anatomical measurements of aneurysm diameter.
FIGURE 2.
Uptake of USPIO in the aortic wall (group 3; 45% of total population) predicted a threefold increase in aneurysm expansion rate despite similar aortic diameters.
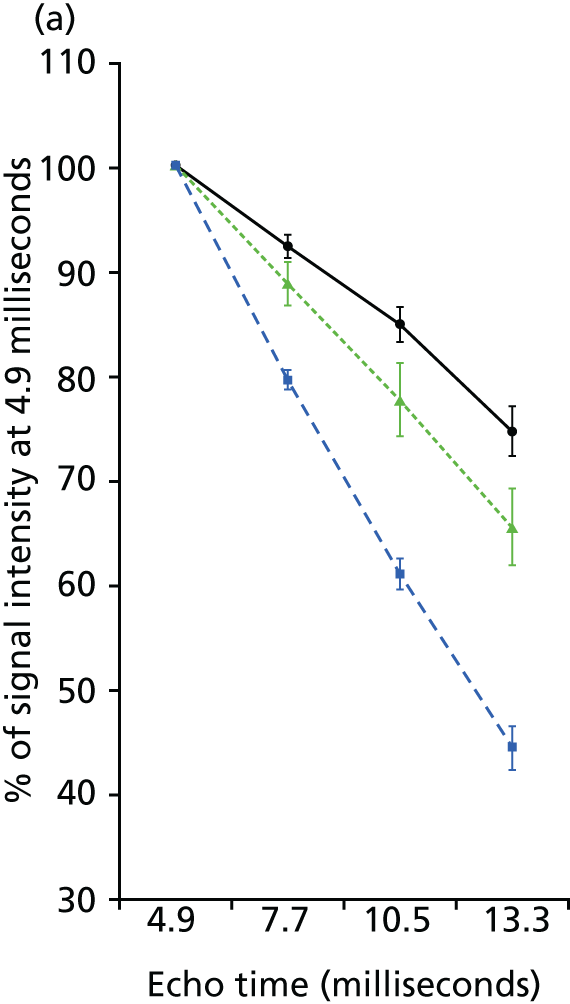
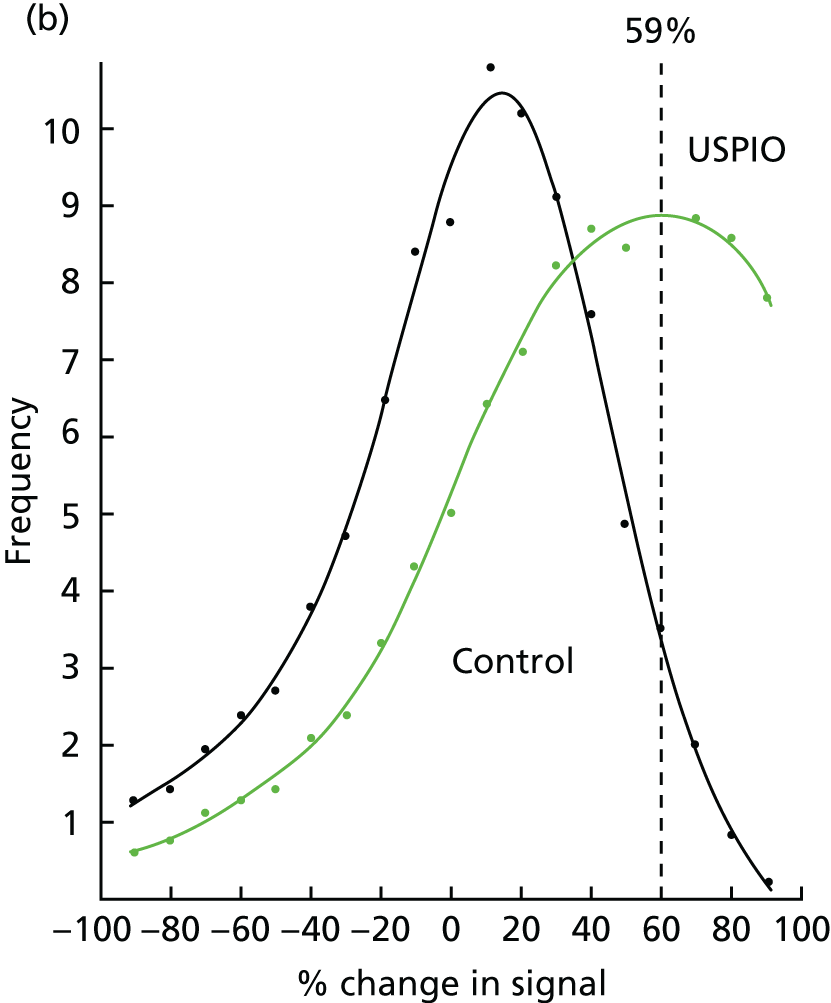
To date, the assessment of USPIO uptake has been qualitative or based on relative changes in signal intensity within regions of interest defined by vessel quadrants. 10,11 However, this change in signal intensity can be caused by other factors including imaging artefacts. During the process of our studies, we have developed a more robust semiquantitative image acquisition methodology for the detection of iron nanoparticle accumulation in humans using 3-T MRI scans. 22 Here we apply a multiecho gradient sequence to define the T2* value of the tissue. Images before and after USPIO administration are then co-registered and the difference in T2* value quantified. Following repeatability measurements in patients with AAAs, we have identified a threshold of change in signal intensity (59%) that defines USPIO accumulation in tissues (Figure 3). 22
FIGURE 3.
Effect of USPIO on rate and decay and change in signal intensity. (a) Signal intensity as percentage of first echo time (4.9 ms) within the multiecho sequence of precontrast and postcontrast images in areas of no (black circles), low (green triangles) and high (blue squares) USPIO uptake; and (b) frequency of voxels with per cent change in T2* for patients who did (green) or did not (black) receive USPIO. The upper 95% threshold of per cent change in T2* in the absence of USPIO was 59%.
Biomechanical stress
Another potential predictive marker of aneurysm rupture is wall tissue stress. Information on aneurysm geometry is provided by computed tomography (CT) and MRI, and these can be combined with finite element (FE) analysis to enable prediction of tissue stresses within the aneurysm wall. 1,23 Peak wall tissue stress is higher in patients with symptomatic aneurysms24 and co-localises with regions of inflammation identified by 18F-fluorodeoxyglucose positron emission tomography. 25 This suggests that combining stress analysis with imaging of inflammation may provide added predictive value in the assessment of aneurysm expansion and potential rupture.
Rationale for the study
Ruptured AAAs are the 13th commonest cause of death in the UK and account for 6800 deaths each year in England and Wales. Population screening halves the mortality associated with AAAs and has led to the establishment of national screening and surveillance programmes. However, AAA surveillance is complex because of the non-linearity and unpredictability of expansion rates. Although the best predictor of aneurysm expansion is the aneurysm diameter, up to one-fifth of ruptured AAAs are < 55 mm in diameter, and many patients present with diameters considerably larger than 55 mm in size without prior symptoms or rupture. There is therefore a major unmet clinical need to predict aneurysm growth and rupture more accurately so that surgeons can better target preventative, potentially life-saving, surgery. We have developed a novel MRI method that is based on the known biological processes underlying aneurysm expansion and rupture. For the first time, this study proposes to assess this novel approach to identify aneurysms that are likely to expand more rapidly and potentially rupture. This technique would provide potentially important additional information to the current simplistic gold standard of ultrasonographic measurement of aneurysm diameter.
Study objectives
Primary objective
To determine whether or not mural uptake of USPIO provides incremental risk prediction in addition to standard risk markers, such as aneurysm diameter, smoking and blood pressure.
Secondary objectives
In patients under surveillance for AAAs, to determine whether or not mural uptake of USPIO:
-
correlates with the rate of aneurysm expansion
-
occurs more commonly in patients who progress to surgery or whose aneurysm subsequently ruptures
-
co-localises with, or relates to, areas of biomechanical stress
-
occurs in a reproducible manner.
In addition, we explored the added value of biomechanical stress modelling, as we suspected that co-localisation of both USPIO uptake and areas of high mechanical stress could act synergistically and cause more marked aneurysm growth. We also examined correlates with other blood biomarkers, including regulators of extracellular matrix turnover (such as matrix metalloproteinases and tissue inhibitors of metalloproteinases) and vascular inflammation (such as C-reactive protein and interleukin 6).
End points
Primary end point
The primary end point of the study was the composite of aneurysm rupture or AAA repair.
Secondary end points
Secondary end points included:
-
the rate of aneurysm rupture
-
the rate of surgical repair of the aneurysm
-
the aneurysm growth rate
-
all-cause and aneurysm-related mortality.
We also conducted exploratory analyses examining the interactions between mural USPIO uptake, biomechanical stress, clinical risk factors and serum biomarkers of extracellular matrix turnover and inflammation.
Clinicians who were directly involved with patient surveillance and care were blinded to the MRI findings of mural USPIO uptake.
Reproducibility and natural history substudies
The natural history of mural inflammation in AAA disease over time, and any subsequent effect on expansion rate, is unknown. We first assessed the immediate reproducibility of our USPIO MRI technique and rescanned a subgroup of patients at 1 month following the baseline scan. We also assessed whether or not patients’ USPIO-enhanced MRI classification changed over time and whether or not this influenced AAA growth rates by completing two natural history substudies at 1 and 2 years.
Chapter 2 Methods
Trial design
This was a prospective observational cohort study of patients participating in AAA surveillance programmes with blinded assessments of USPIO uptake.
Participants
Participants were identified from the clinical surveillance programme from three centres: Royal Infirmary of Edinburgh, Western Infirmary in Glasgow and Forth Valley Royal Hospital in Larbert. Potential participants were given a patient information leaflet describing the study and eligibility was confirmed before taking consent. Eligible participants who were interested in the study attended a baseline visit and written informed consent was obtained by a suitably qualified member of the research team.
Eligible participants recruited from Edinburgh consented to some limited additional study procedures. Additional written informed consent was obtained for these procedures.
Inclusion and exclusion criteria
The following inclusion and exclusion criteria were used.
Inclusion criteria
-
Abdominal aortic aneurysms measuring ≥ 40 mm in anteroposterior diameter on ultrasonography.
-
Aged ≥ 40 years. Patients < 40 years of age with AAAs may have a connective tissue disorder and a different aetiology to their disease.
Exclusion criteria
-
Patients expecting to recieve, or who have already received, imminent elective or emergency surgical or endovascular repair.
-
Contraindication to MRI scanning identified from MRI safety questionnaire.
-
Patients refusing or unable to give informed consent.
-
Women with childbearing potential, who were breastfeeding, who have experienced menarche, who are premenopausal, who have not been sterilised or who are currently pregnant.
-
Intercurrent illness, including patients with a systemic inflammatory disorder or underlying malignancy (life expectancy of < 2 years).
-
Renal dysfunction (estimated glomerular filtration rate of ≤ 30 ml/minute/1.73 m2).
-
Polycythaemia.
-
Contraindication to ferumoxytol (evidence of known iron overload, haemochromatosis, known hypersensitivity to ferumoxytol or its components or anaemia not caused by iron deficiency).
-
Contraindication to iodine.
-
Patients with any known history of drug allergy (including hypersensitivity) to other parenteral iron products.
Ineligible and non-recruited participants
An anonymised log was kept for patients who were screened for the study and subsequently found to be ineligible or not recruited.
Premature withdrawal
Participants could be withdrawn by the investigator or could withdraw themselves from the study at any time.
Participants withdrawn before the administration of ferumoxytol were replaced by another participant. Participants withdrawn after the administration of ferumoxytol continued to be followed up in the research clinic or through record linkage if continued consent was in place.
All withdrawals were recorded on the study database and the reason for withdrawal was documented on the participant’s case report form (CRF).
Study assessments
A summary of study assessments is shown in Table 1. Participants recruited from Edinburgh and Forth Valley were seen in clinic every 6 months and had some additional assessments performed. Participants recruited from Glasgow were followed up remotely (via medical records) at 6-month intervals and seen in clinic for their final follow-up at 2 years.
| Assessments | Visits | ||||||
|---|---|---|---|---|---|---|---|
| Surveillance clinic | Baseline | 6 months | 12 months | 18 months | 24 months | ||
| (a) | (b) | ||||||
| Screening/eligibility | ✓ | ||||||
| Medical history/demographics and concomitant medications | ✓ | ||||||
| Consent | ✓ | ||||||
| Ultrasonography of AAA | ✓ | ✓ | ✓ | ✓ | ✓ | ||
| Clinical assessment | ✓ | ✓ | ✓ | ✓ | ✓ | ||
| Pulse wave analysis and velocity | ✓ | ✓a | ✓a | ✓a | ✓ | ||
| Blood sampling | ✓ | ✓a | ✓a | ✓a | ✓ | ||
| CT scan of AAAb | ✓ | ✓ | |||||
| MRI of AAA (pre ferumoxytol) | ✓ | ||||||
| i.v. administration of ferumoxytol | ✓ | ||||||
| Post-ferumoxytol MRI scan of AAA | ✓ | ||||||
| AE/SAE reporting | ↔ | ||||||
Six-month follow-up visits, 24-month visits and reproducibility scans were performed within ± 8 weeks of the due date.
Clinical assessment
All participants had a full formal and standardised clinical assessment at baseline that included medical history, examination, documentation of cardiovascular risk factor profile (smoking status, family history, hypertension, hyperlipidaemia, diabetes mellitus) and concomitant medications (antihypertensive medication, preventative therapies, etc.). Concomitant medications were recorded at baseline and at the end of the trial.
Brachial artery systolic and diastolic blood pressure, pulse pressure and mean arterial pressure were measured after a 30-minute supine rest period using an automated oscillometric sphygmomanometer (model 711; Omron Healthcare GmbH, Hamburg, Germany). The mean of three recordings was taken.
Blood sampling
Blood samples (20 ml at each visit) were collected at baseline and at 24 months for routine biochemistry and haematology (including full blood count, urea and electrolytes, liver function tests, total cholesterol and glucose).
For patients recruited from Edinburgh and Forth Valley, a blood sample was processed (plasma and serum) and stored at –80 °C for later analysis of potential extracellular matrix and inflammatory biomarkers. This was performed at baseline and 6, 12, 18 and 24 months.
Ultrasonography of abdominal aorta
Patients had 6-month ultrasonography as part of standard care for the surveillance programme to measure the maximal anteroposterior diameter of the aneurysm (ultrasound scans should be every 6 ± 2 months from the last ultrasound scan). A linear array transducer was used to provide standard real-time longitudinal B-scan images of the AAA at the point of maximum diameter. Maximum anteroposterior AAA diameter and distensibility (pressure strain elastic modulus and stiffness) were assessed. Scans were undertaken by accredited clinical vascular scientists with interobserver coefficient of variation of aortic diameter measurements of 3.5% in our laboratory. 26
Computed tomography of the abdominal aorta
Contrast-enhanced images of the abdominal aorta were obtained using a 320-multidetector CT scanner (Aquilion ONE; Toshiba, Tokyo, Japan) or a 64-slice multidetector CT detector (Brilliance 64; Philips, Amsterdam, the Netherlands) at baseline and 2 years at either the Clinical Research Imaging Centre in Edinburgh or at the Western Infirmary in Glasgow. The data were reconstructed into three dimensions using volumetric matrices to enable a more comprehensive assessment of the aneurysm geometry and growth than that provided by the ultrasonographic assessment of the unidimensional aortic anteroposterior diameter. In cases when study participants had an emergency repair of a ruptured AAA then a CT scan may not have been performed. In the event of patients not receiving the CT scan at baseline (because of a CT scanner or other clinical issue), the CT scan was performed within 1 month of the baseline visit.
Magnetic resonance imaging of the abdominal aorta
Magnetic resonance imaging was conducted using a 3-T Siemens Magnetom Verio scanner (Siemens, Erlangen, Germany) before and 24–36 hours after administration of the ferumoxytol (Rienso, Takeda UK Ltd) in the Edinburgh or Glasgow imaging centres. Patients were given intravenous Buscopan® (Boehringer IngelheimPharma GmbH and Co. KG, Ingelheim am Rhein, Germany; hyoscine butylbromide) prior to imaging to minimise bowel motion artefacts. Routine clinical coronal and sagittal breath-held T2-weighted multislice HASTE (Half-fourier Acquisition Single-shot Turbo spin-Echo) sequences were used to identify the position and extent of the aneurysm, following which a respiratory-gated, electrocardiographically-triggered T2-weighted turbo-spin echo sequence was used to acquire detailed anatomical data [TR (repetition time)/TE (echo time) 2 R–R intervals/72 milliseconds; flip angle 180°; matrix 192 × 256; field of view 400 × 400 mm; slice width of 5 mm]. A multiecho, gradient-echo T2*-weighted sequence (TE 4.9, 7.7, 10.5, 13.3 milliseconds; TR 133 milliseconds; flip angle 15°; matrix 192 × 256; field of view 400 × 400 mm; slice width of 5 mm) was used to acquire contiguous axial images of the entire aneurysm (from the neck of the aneurysm down to the iliac bifurcation) with slice positions corresponding to those of the T2-weighted images.
Dosing regime
Takeda, the marketing authorisation holders of Rienso, updated their recommendations for dosing during the recruitment phase of the study. As a result, ferumoxytol was administered differently to MA3RS participants depending on when they were recruited. Participants who had consented to the trial before 8 August 2014 received a single dose by injection and participants who had consented after 13 September 2014 were given a single dose by intravenous infusion over 15–30 minutes.
The single dose was given 24–36 hours before the MRI scan and all participants received the same dose (4 mg/kg). The study investigator was responsible for dose calculations and administration of the infusion, and to ensure that this was documented on the participant’s CRF.
Reproducibility and natural history substudies
Participants recruited from Edinburgh and Forth Valley under active follow-up were approached for inclusion in the reproducibility and natural history substudies, at one of three time points: (1) 1 month after baseline, (2) 1 year after baseline or (3) 2 years after baseline. Patients who had undergone interim AAA repair were excluded from this substudy. Other exclusion criteria included patients who had undergone interim medical procedures requiring insertion of a MRI-incompatible device (such as a pacemaker), those who were diagnosed with intercurrent illness or had a life expectancy of < 1 year, patients whose renal function had deteriorated (estimated glomerular filtration rate of < 30 ml/minute/1.73 m2) or were unable to tolerate repeated MRI scanning. At the baseline visit, verbal reconfirmation of consent to participate in this substudy was obtained from each participant.
Twenty patients initially underwent repeated scanning at 1 month as part of the reproducibility substudy. However, three of these scans were unable to be analysed in the early phase of the study because of processing errors. We therefore recruited a further three patients into the 1-month reproducibility study. After a review of the data and the addition of the 1- and 2-year natural history studies to the protocol, the Trial Steering Committee advised that the reproducibility study could be completed after 20 successfully scanned patients, in order to focus on recruitment into the natural history substudies. However, by the time of final analysis, we were able to reprocess the three scans that were initially corrupted using a revised iteration of our image analysis software. We therefore included a final total of 23 patients in our 1-month reproducibility study. A further 58 patients underwent repeated scanning at 1 year and 20 patients underwent repeated scanning at 2 years. An identical scanning protocol, USPIO administration and classification system was used at all time points. A summary of study assessments is given in Table 2.
| Assessments | Visit | |||||||||
|---|---|---|---|---|---|---|---|---|---|---|
| Surveillance clinic | Baseline | Reproducibility | ||||||||
| (a) | (b) | (a) 1 month | (b) 1 month | 6 months | (a) 12 months | (b) 12 months | 18 months | 24 months | ||
| Screening/eligibility | ✓ | |||||||||
| Medical history/demographics and concomitant medications | ✓ | |||||||||
| Consent | ✓ | |||||||||
| Ultrasonography of AAA (standard clinical care) | ✓ | ✓ | ||||||||
| Clinical assessment | ✓ | ✓ | ✓ | ✓ | ✓ | ✓ | ✓ | ✓ | ||
| Pulse wave analysis and velocity | ✓ | ✓ | ✓ | ✓ | ||||||
| Blood sampling | ✓ | ✓ | ✓ | ✓ | ✓ | ✓ | ✓ | ✓ | ||
| CT scan of AAA | ✓ | ✓ | ||||||||
| MRI scan of AAA (pre ferumoxytol) | ✓ | ✓ | ✓ | ✓ | ✓ | |||||
| Administration of i.v. ferumoxytol | ✓ | ✓ | ✓ | |||||||
| Post-ferumoxytol MRI scan of AAA | ✓ | ✓ | ✓ | |||||||
| AE/SAE reporting | ↔ | |||||||||
After repeated imaging in the natural history studies (1- and 2-year scans), aneurysms were classified into the following USPIO classification groups:
-
negative negative (– –) = USPIO negative at baseline and repeated scan
-
positive negative (+ –) = USPIO positive at baseline, USPIO negative at repeated scan
-
negative positive (– +) = USPIO negative at baseline, USPIO positive at repeated scan
-
positive positive (+ +) = USPIO positive at baseline and repeated scan.
Follow-up of participants
All participants were followed up every 6 months for 2 years. Participants recruited from Edinburgh and Forth Valley were invited back for follow-up visits at the Edinburgh Clinical Research Facility. The 6-month visits were intentionally timed to co-ordinate with their scheduled ultrasonography appointments, which are part of normal clinical care for patients with AAAs. Patients recruited in Edinburgh also had pulse wave analysis and pulse wave velocity measurements taken and they also had blood samples taken. At the final follow-up appointment (at 2 years), patients had a full clinical assessment and a CT scan. If a patient did not attend their scheduled follow-up appointment, their medical records were reviewed for any relevant safety data and the AAA ultrasound scan result was recorded. Participants who did not attend were invited back to the next scheduled follow-up appointment.
Patients recruited in Glasgow were followed up remotely every 6 months via their medical records. All participants were invited back at 2 years for a full medical assessment by a research nurse or research fellow and a CT scan.
If a participant had an open or endovascular repair of their AAA, they did not return routinely for an ultrasound scan examination, pulse wave analysis or pulse wave velocity every 6 months but were invited to return every 6 months for blood tests (Edinburgh patients only) and at 2 years for a CT scan.
If a patient was considered not fit for elective surgery then they would normally be have been discharged from the care of the vascular surgeons. However, participants were invited to attend for the standard study assessments as described here, when possible.
Clinical end-point adjudication
Clinical data from clinic visits, research databases, electronic health records, primary care contacts and the General Register Office were reviewed and clinical end points adjudicated by an independent Clinical End Point Committee. The committee members were blinded to the MRI findings. All end points were agreed by consensus and, when there was disagreement, decided by the chairperson. Follow-up was censored at 21 November 2016 or at the time of event.
Additional assessments
Patients who had elective repair of their aneurysms during the course of their follow-up had a repeat CT scan prior to surgery (when possible).
Patients recruited in Edinburgh and Forth Valley who had elective surgery had their AAA wall tissue collected and stored for the assessment of tissue-resident macrophages and matrix metalloproteinases. Samples were not collected for patients undergoing endovascular aneurysm repair or from elective surgeries in which unexpected complications can arise.
Biomechanical modelling of abdominal aortic aneurysms
Co-localisation of ultrasmall superparamagnetic particles of iron oxide uptake with biomechanical stress
The study includes 50 patients from the MA3RS study cohort who underwent USPIO-enhanced MRI and CT angiography between November 2012 and December 2014.
A patient-specific modelling workflow was created that took CT imaging data as input and produced output data of wall stress within the AAA. Details of the workflow are:
-
Imaging. CT imaging data provided high-quality imaging data.
-
Segmentation. Segmentation of the AAA geometry was undertaken using a commercial software specifically dedicated to AAAs (VASCOPS GmbH, Stockholm, Sweden). This package employs a specialist algorithm to calculate a physiological aneurysm wall thickness distribution, which varies between 1.5 mm and 1.13 mm at the thrombus-free and covered sites, respectively.
-
Meshing. FE meshes were then created from the three-dimensional aneurysm geometry using the A4 clinical research software (VASCOPS). After suitable refinement, each AAA volume mesh typically consisted of > 160,000 (C3D8H) elements.
-
Finite element analysis modelling. Meshes were exported to Abaqus 6.10-1 (SIMULIA™, Dassault Systèmes®, Providence, RI, USA) for analysis. Both the aortic wall and thrombus regions were modelled as hyperelastic, homogeneous, incompressible and isotropic materials, using well-established constitutive models1 with material constants based on population data. Loading representative of peak systolic blood pressure was applied as an outward-facing uniformly distributed pressure load acting on the luminal surface of the aneurysm. To remove any variability caused by loading, and to allow for comparison across patient cases, a peak systolic blood pressure of 120 mmHg (0.016 MPa) was chosen, as is common practice in the field.
A custom script was developed in Python (Python Language Reference, version 2.7; Python Software Foundation, Beaverton, OR, USA) to automate the definition of the model parameters and batch process all 50 patients. All simulations were computed on a Dell Precision T7600 workstation (Round Rock, TX, USA) with 16 cores and 64 GB of RAM (random-access memory). Contour plots of von Mises stress were output for all aneurysms.
Two-dimensional comparison of ultrasmall superparamagnetic particles of iron oxide and finite element analysis data
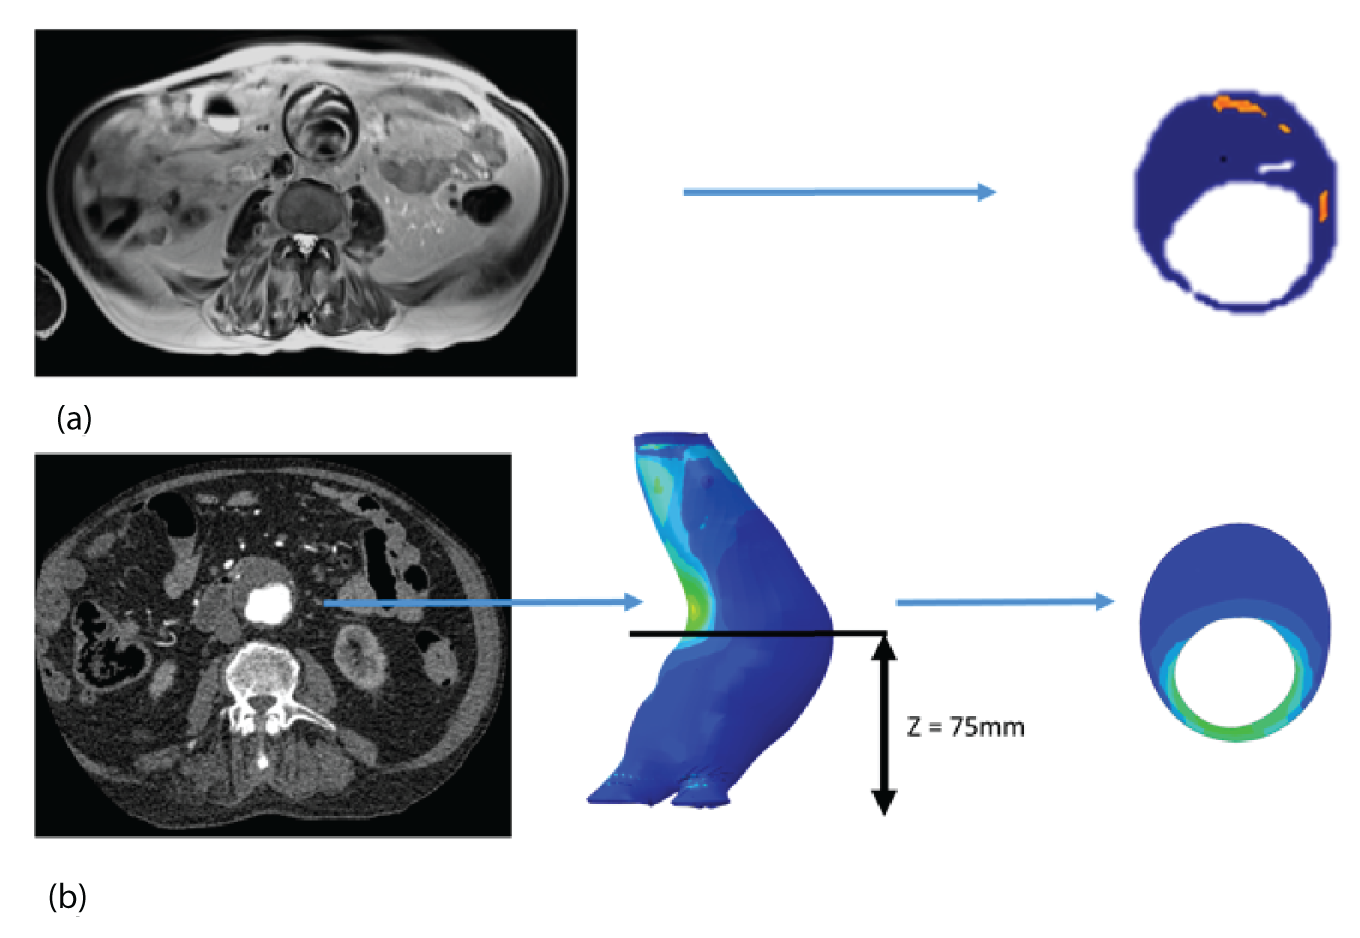
The two-dimensional contour maps of von Mises stress were manually co-aligned with the USPIO colour maps. The MRI slice with the largest area of USPIO uptake (i.e. most diseased segment) was chosen for analysis, ensuring that the corresponding cross-sectional slice was analysed from the two-dimensional contour map (Figure 4). Co-location of elevated peak wall stress and areas of mural USPIO enhancement was examined for visual overlap on the chosen slice.
FIGURE 4.
Two-dimensional comparison of USPIO and FE analysis data. (a) The slice with the largest mural USPIO enhancement (≥ 10 contiguous voxels exceeding the threshold of ≥ 71% ΔT2*) is selected from the MRI scan. This represents the ‘most diseased segment’; and (b) based on its position in three-dimensional space, the corresponding slice is then extracted from the CT scan. Because the FE models are CT based, the same slice can then be extracted from the FE model using information on the location of this slice relative to a relevant anatomical landmark, for example, Z-distance from the iliac bifurcation. The two two-dimensional contours are then visually compared in order to determine the relationship between inflammation and stress.
Whole abdominal aortic aneurysm comparison of ultrasmall superparamagnetic particles of iron oxide and finite element analysis data
Global comparisons between peak wall stress predicted for each patient and maximum and peak USPIO uptake (%ΔT2*) per patient were also investigated, using values derived from the entire aneurysm. Maximum AAA diameter was also included in the analysis, as this is the most widely used predictor of aneurysm rupture.
To examine the trends with respect to the focal mural inflammation observed in USPIO-positive aneurysms, the correlation of diameter and whole-vessel peak wall stress with mural USPIO uptake values (mean and peak USPIO values identified on the most diseased segment) was investigated. Non-focal areas of USPIO uptake (those that did not meet the definition of mural USPIO enhancement) were removed prior to this analysis.
Influence of wall thickness on predicted clinical outcomes
In FE analysis of AAAs, a number of methodological decisions need to be made concerning the modelling strategy, such as the choice of constitutive model, whether or not to undertake pre-stressing, and what assumptions will be made concerning wall thickness (noting that wall thickness cannot be measured from CT). The choices described in Biomechanical modelling of abdominal aortic aneurysm concerning factors, such as wall thickness, represent a pragmatic approach that enabled us to make best use of the available data. This study investigated the effect of wall thickness on the estimated wall stress and on rupture risk index.
At present, it is not possible to determine the wall–thrombus interface explicitly from CT. As a consequence, virtually all early computational studies of AAAs have assumed a uniform wall thickness of 1.9 mm. 1 However, from previous studies,1,27,28 it is known that aortic wall thicknesses vary considerably from region to region within the same patient, and across different patients. Therefore, the assumption of a uniform wall may not be adequate when attempting to characterise the response of the aneurysm.
This substudy aimed to assess the importance of patient-specific wall thickness, derived directly from high-resolution CT scans, in a small population of aneurysms that lacked thrombus, while also testing the validity of the widely applied uniform wall assumption and its impact on predicted clinical outcomes.
Of those included in this substudy, 10 patients were identified in whom there was no thrombus within the AAA. The 10 CT data sets, one for each patient, were used for biomechanical modelling.
The main workflow is the same as described in Co-localisation of ultrasmall superparamagnetic particles of iron oxide uptake with biomechanical stress. The main difference concerns wall thickness estimation. In this case, two models were created and each was processed:
-
Model 1. The vessel wall was segmented from the CT data set. The luminal region was segmented automatically using a thresholding approach, and the outer wall was segmented in a semi-automatic manner using a three-dimensional live wires approach with manual correction of the wall contours on certain slices in which the outer boundary was ambiguous (e.g. close to the duodenum). Given that there was physically no thrombus in the selected patient, a true patient-specific wall thickness (PWStrue) was then obtained as the difference between the contrast-enhanced lumen and the outer wall.
-
Model 2. A uniform wall thickness version of each AAA was also reconstructed. This approach involved merely offsetting the luminal surface outward in the radial direction by a fixed distance, 1.9 mm,1 thereby creating an aneurysm with a constant uniform wall thickness. The corresponding peak wall stress is referred to as ‘PWSuniform’.
Rupture risk analysis
Failure occurs when the stress in a system exceeds its strength at any given point. Calculating the risk of failure requires knowledge of the stresses in the system and the precise strength of the material it is constructed from. In this study, wall strength for each individual AAA was estimated using an empirically determined relationship;29 risk of rupture was then assessed using the rupture potential index (RPI)30 that is defined as the local wall stress divided by the local wall strength. The returned index then indicates the potential likelihood of rupture occurring, when values close to 0 indicate a relatively low risk and values approaching 1 indicate a very high risk of rupture.
Structural and mechanical changes after 24 months
Understanding how aneurysms change over time and what influence these structural changes exert on the potential markers for rupture risk are of key importance in correctly identifying the patients most in need of intervention. For this reason, this study aimed to assess a small population of patients at 24 months after the initial examination, with the goal of quantifying in three-dimensions the overall structural and mechanical changes to each aneurysm caused by disease progression.
A subset of 50 patients (men, n = 43; women, n = 7)31 were selected for analysis. Wall stresses for both the baseline and 24-month time points were calculated using a processing chain with CT as the input data. Three-dimensional reconstruction and meshing were performed using commercial software (VASCOPS GmbH), and FE analysis using Abaqus 6.10-1.
Comparison of aneurysm geometry and mechanical changes at baseline and 24 months
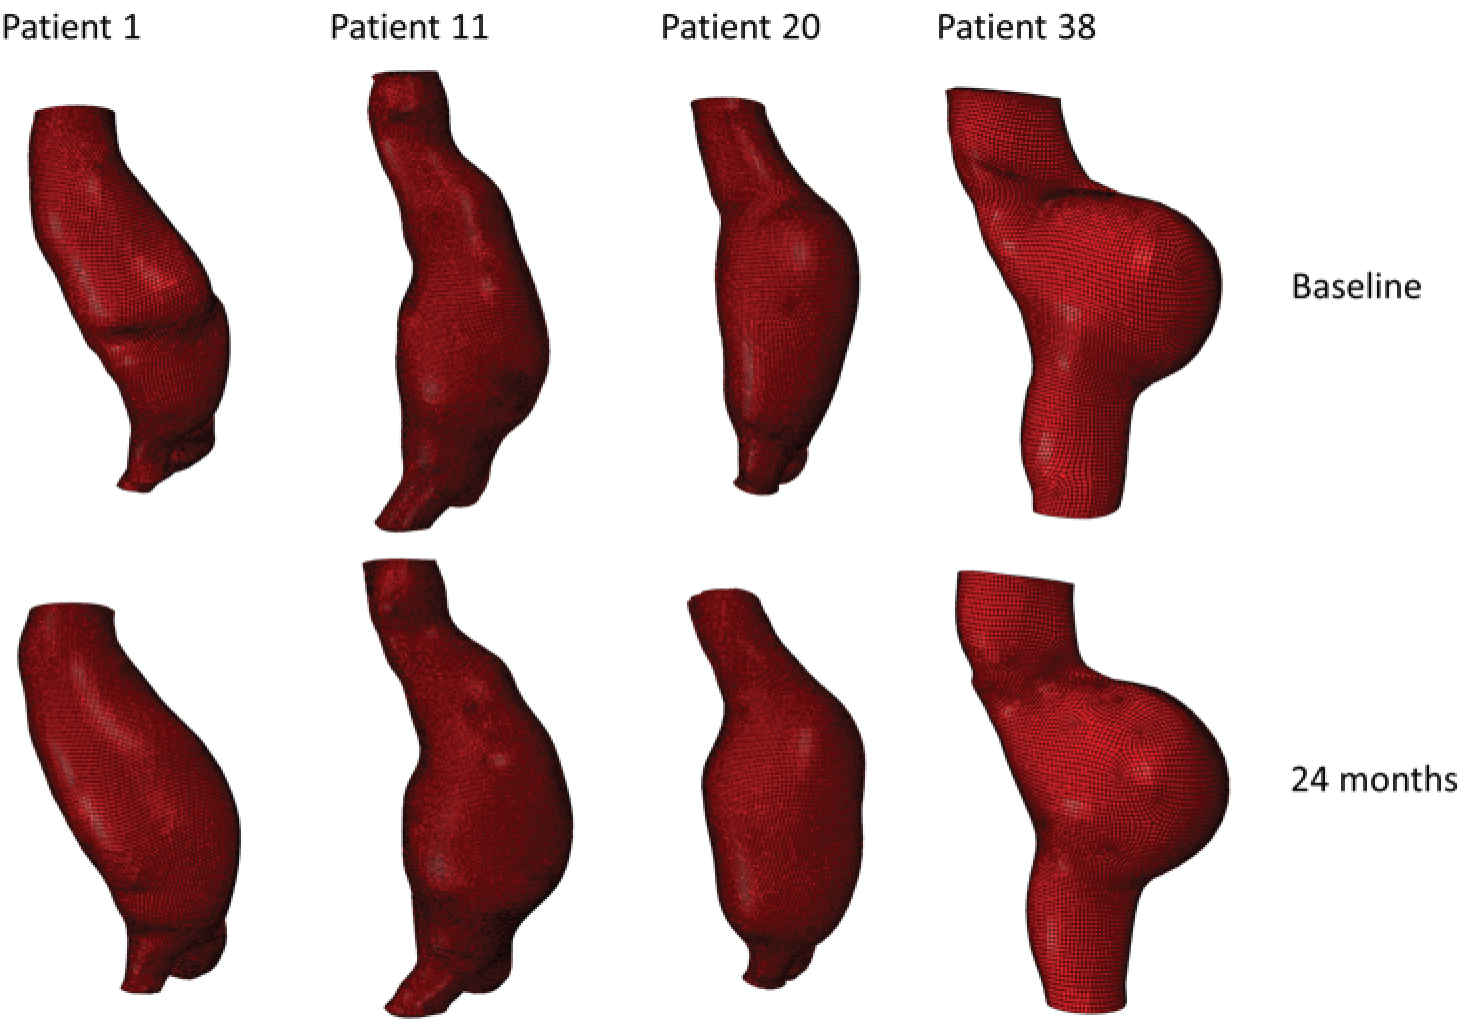
Each three-dimensional patient-specific aneurysm model constructed from the 24-month follow-up CT scan was clipped to the same approximate region of interest as the initial baseline model. This allowed all key geometrical parameters to be compared, such as change in maximum AAA diameter and AAA total volume. Changes to the mechanical environment of each aneurysm were also assessed by comparing the change in peak wall stress, as well as rupture risk indices between the two time points. Figure 5 highlights examples of four different aneurysm geometries at baseline and 24 months later. The first three show an increase in volume over time, whereas the fourth exhibits a decrease in total volume.
FIGURE 5.
A sample of four patient-specific reconstructions at baseline and 24 months. The first three aneurysms exhibit an obvious increase in volume at the 24-month time point, whereas the last AAA shows a slight decrease in volume (particularly noticeable on the posterior aspect of the sac and in the vessel just distal to the sac).
Aneurysm rupture prediction using a three-dimensional analysis of geometrical features
Several studies have found a good correlation between rupture risk and peak stress32–34 and have shown that risk categorisations based on wall stress are at least as good as those derived from the maximum diameter criterion. 32,35 However, patient-specific wall stress analyses have not yet been adopted clinically, owing in part to the time-consuming nature of reconstructing and analysing patient-specific aneurysms and the requirement of having a specially trained analyst to conduct this work.
The aim of this study was to introduce a novel method for the evaluation of rupture risk based solely on three-dimensional geometry data extracted from the medical images. The obtained surface characterisation quantities using this method are then compared with wall stress values obtained from patient-specific FE models and their relationship quantified.
A subset of 10 patient-specific models generated as part of the study described in Co-localisation of ultrasmall superparamagnetic particles of iron oxide uptake with biomechanical stress was selected for analysis in this study. The exclusion criterion for this study was aneurysms with a heavily skewed geometry.
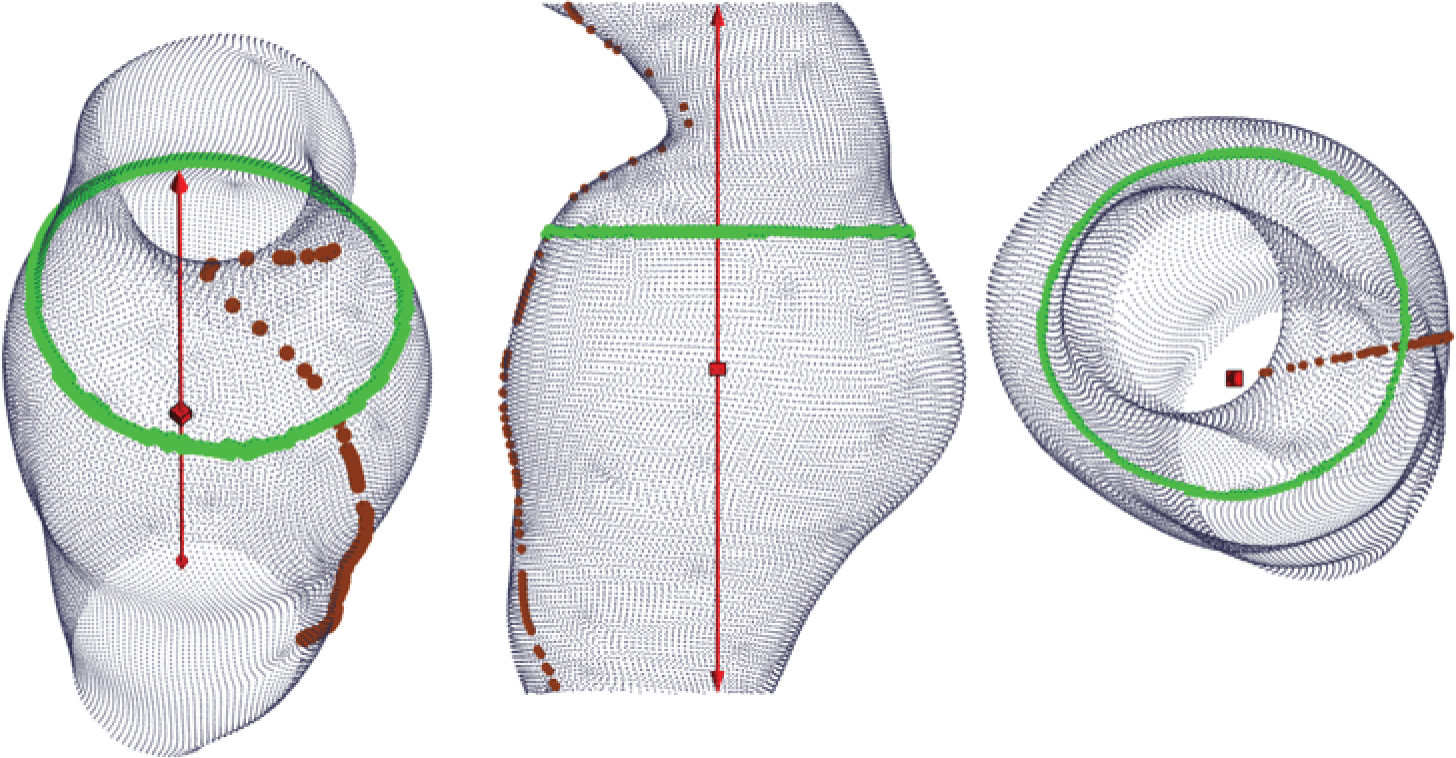
The aneurysm geometry was interpolated and differentiated based on three spatial co-ordinates, x, y and z, exported from Abaqus CAE analysis files. Microsoft Excel® (version 15.32; Microsoft Corporation, Redmond, WA, USA) was subsequently used to prepare the exported co-ordinate data for import into Mathematica (version 9.0.1.0; Wolfram Research, Inc., Champaign, IL, USA). A key requirement for the algorithm as proposed here is a central co-ordinate axis running inside the vessel at all times (Figure 6). Thus, initial data processing, such as translation, deletion and rotation, was carried out to ensure the correct alignment of the geometry. Using Mathematica, the vessel geometry was split into angular slices of 0.9° width, sufficiently narrow to be interpreted as effectively in plane. Thus, approximately planar sequences of points were defined longitudinally on the vessel wall. These linear sequences were interpolated using piecewise polynomials (splines) and pointwise differentiated. The recorded point derivatives were subsequently compared with von Mises stress values as carried over from Abaqus.
FIGURE 6.
Sample aneurysm with exemplary longitudinal and circumferential slices highlighted. Note the requirement of a central axis passing through the model unobstructed.
Similarly, circumferential slices were taken and used to compute the maximum transverse diameter in each slice. These diameter values were then related to the point von Mises stress values.
Data management
Trial data were collected onto CRFs by the research nurses and the clinical research fellows. Completed CRFs were sent securely to the Edinburgh Clinical Trials Unit and entered into the trial database by the data entry clerk. The database was hosted on a secure network at the University of Edinburgh with inbuilt validation and an audit trail allowing changes to be traced by date and user. Any queries with the data were checked with the research nurse or fellow using a paper query form and the relevant fields of the database were updated if necessary.
Statistical methods
A statistical analysis plan was in place at the beginning of the trial. This was agreed and reviewed by the Trial Steering Committee. The analysis was conducted by the study statistician, Catriona Graham (Senior Statistician, Wellcome Trust Clinical Research Facility), under the supervision of Gordon Murray (Professor of Medical Statistics, University of Edinburgh).
Sample size
The sample size was determined by the numbers required to build robust prognostic models for rupture and/or surgical repair, and in particular to measure the additional prognostic value of mural USPIO uptake when added to such a prognostic model based only on conventional clinical risk factors. There is a widely accepted ‘rule of thumb’ that one needs at least 10, ideally 20, outcome events per covariate to be included in a prognostic model. 36 As described in more detail shortly, we used the net reclassification index (NRI) as the primary measure of the clinical relevance of the added prognostic value of mural USPIO uptake. 37,38 Based on two recent papers using the NRI39,40 and also taking account of the Harrell ‘rule of thumb’,36 we estimated that we would need to observe 130 events (i.e. the composite of rupture or surgical repair) to have adequate sensitivity to answer the primary question. With our estimated event rate of 41% over the mean duration of follow-up of 2 years,41 this equates to 317 patients.
We expected a very modest loss to follow-up for the primary analysis, because all study recruits were already enrolled on a surveillance programme. Moreover, we sought consent at the time of recruitment to flag the patients, so that if any patients were lost to follow-up they could be traced to identify any hospital admissions or to identify if they had died. In addition, some patients dropped out because of claustrophobia or because of a technical failure, such as poor image quality. We therefore conservatively accounted for a 10% dropout rate and had a recruitment target of 350 patients.
Summary of statistical analysis
The baseline assessment included the baseline aneurysm diameter, sex, smoking habit and blood pressure. Using these covariates, a prognostic model predicting the time to the composite outcome event of rupture or surgical repair was developed using Cox proportional hazards regression models. The added prognostic value of adding mural USPIO uptake to this model was assessed using the increase in the area under the receiver operator characteristic (ROC) curve, the NRI. 37,38 The NRI is a direct measure of the clinical relevance of adding a covariate to a prognostic model. It is an overall measure of how many patients increase or decrease predicted risk when the covariate is added. For the primary analysis, the USPIO was taken as a binary covariate (as in Richards et al. 22).
A secondary analysis followed a similar analytical strategy, but using prognostic models to predict aneurysm growth rate. This analysis was far more complex, with there being serial measures of aneurysm diameter, and with these measurements being censored on rupture or on surgical repair.
Reproducibility of the technique was assessed in a subgroup of study participants who had repeat magnetic resonance scanning and USPIO administration at 1 month (n = 23). Participants were categorised with respect to the presence or absence of USPIO uptake to define the proportionate agreement, with 95% confidence intervals (CIs).
Natural history of inflammation was assessed in two subgroups of patients who had repeated USPIO MRI scans at 1 year (n = 58) or 2 years (n = 20).
Data presentation
In general terms, categorical data were presented using counts and percentages, whereas continuous variables were presented using the mean, median, standard deviation (SD), minimum, maximum, interquartile points at 25% and 75% (quartile 1 and quartile 3), and the number of patients with an observation (n).
All applicable statistical tests were two-sided and performed using a 5% significance level, leading to 95% (two-sided) CIs unless otherwise specified.
Distributional assumptions underlying the statistical analyses were assessed by visual inspection of residual plots. Normality was examined by normal probability plots. If the distributional assumptions for the parametric approach were not satisfied, further data transformation (for achieving normality) or other suitable methods were considered. This was documented in the statistical results report together with the reasoning supporting the action taken, if applicable.
Handling of missing data
There was no imputation for the data with regard to missing values or withdrawals for the statistical summaries and statistical analysis unless justified and fully specified in the analysis report.
Quality control of summary tables and statistical analysis
Isolated data errors detected in the database as a result of the quality control checks that were deemed significant were submitted for enquiry to the trial manager or designee.
There were no systematic data errors in the data reporting but if any had been found these would have been investigated further; the data would be corrected if necessary, and the appropriate table then rechecked.
A random selection of unique analysis and summary tables was quality controlled using manual methods (such as comparison of results in the table with results calculated by a calculator, spreadsheet, database output or any alternative summarisation tool).
Study populations
Primary analysis population
The primary analysis used all recruited participants and was based on events observed by 21 November 2016, when all patients had a minimum of 2 years’ follow-up.
Recruitment and retention
A Consolidated Standards of Reporting Trials (CONSORT)-like flow chart was provided. The statistical report tabulates the number of patients that were approached, eligible, consented and recruited. The number of patients discontinued early from the study is summarised by reason for withdrawal.
-
Descriptive statistics: demographics, baseline/clinical characteristics, event rates.
-
Baseline demographic and clinical characteristics as recorded in the study database will be presented descriptively.
The number of events (aneurysm ruptures, surgical repairs, all-cause deaths, aneurysm-related deaths) were reported and the corresponding rates displayed using Kaplan–Meier plots. Follow-up was censored as described in more detail below.
Reproducibility and natural history substudies
No formal statistical testing was performed for the reproducibility study (1 month). Participants were categorised with respect to the presence or absence of USPIO uptake and a 2 × 2 table was presented showing the cross-tabulation of the original classification with the repeat classification. The proportion of repeat assessments in which there was agreement in the classifications was reported along with the corresponding 95% CI.
For the natural history substudies (1 year and 2 years), demographic data were compared between groups using two-sided chi-squared or Fisher’s exact test comparison of proportions for categorical data, and analysis of variance or Student’s t-test (or Kruskal–Wallis test if non-parametric data) to determine the difference in means between categories for continuous data. For the clinical outcomes survival analysis (AAA events and death), Kaplan–Meier survival curves were generated and the log-rank statistic was presented. The proportion of aneurysms that were reclassified at the repeated time points were presented as n (%) and the effect on growth rate between time intervals was compared between groups, using the difference in growth rate between baseline and repeated scan versus repeated scan and end of follow-up [i.e. for the 1-year substudy, difference = (growth rate from 1 year to 2 years) – (growth rate from baseline to 1 year)]. Expansion rates were highly skewed and were therefore transformed (log2) for the analysis.
Primary outcome
The primary end point of the study was the composite of aneurysm rupture or AAA repair. The baseline assessment included the baseline aneurysm diameter, sex, smoking habit and blood pressure. Using these covariates, a prognostic model predicting the time to the composite outcome event was developed using Cox proportional hazards regression models. The primary analysis was based on all available follow-up, with follow-up censored at 21 November 2016, or at the time of the first composite event or death, if the death was not related to aneurysm rupture or to surgical repair.
The added prognostic value of adding mural USPIO uptake to this model was assessed using the increase in the area under the ROC curve, the NRI. 37,38 The NRI is a direct measure of the clinical relevance of adding a covariate to a prognostic model. It is an overall measure of how many patients increase or decrease predicted risk when the covariate is added. For the primary analysis, the USPIO will be taken as a binary covariate (as in Richards et al. 22).
Secondary outcomes
Aneurysm rupture
An analysis using the analytical approach set out earlier was performed using the end point of aneurysm rupture rather than the primary composite end point. Follow-up was censored at 21 November 2016 or at the time of aneurysm rupture or death, if death was unrelated to aneurysm rupture.
Surgical repair
An analysis using the analytical approach set out earlier was performed using the end point of surgical repair rather than the primary composite end point. Follow-up was censored at 21 November 2016 or at the time of surgical repair or death, if death was unrelated to surgical repair.
Aneurysm growth rate
An analysis was performed to evaluate the ‘added value’ of USPIO uptake to predicting aneurysm growth rate, using a hierarchical model that assumes a linear rate of growth per individual, based on all available measurements of aneurysm size per individual.
All-cause mortality
An analysis using the analytical approach set out above was performed using the end point of all-cause mortality rather than the primary composite end point. Follow-up was censored at 21 November 2016 or at the time of death.
Aneurysm-related mortality
An analysis using the analytical approach set out earlier was performed using the end point of aneurysm-related mortality rather than the primary composite end point. Follow-up was censored at 21 November 2016 or at the time of aneurysm-related mortality or death, if death was unrelated to the aneurysm.
Exploratory analyses were conducted to examine the interactions between mural USPIO uptake, biomechanical stress, clinical risk factors and serum biomarkers of extracellular matrix turnover and inflammation.
Study oversight
A Trial Steering Committee was established and the committee met every 6 months until recruitment was finished. Day-to-day management of the trial was overseen by a Trial Management Group consisting of the chief investigator, research fellow and trial manager.
The sponsor carried out routine monitoring visits to the Edinburgh and Glasgow sites. In addition, Edinburgh Clinical Trials Unit performed regular quality control checks on the trial data to ensure data quality and accuracy.
Ethics and regulatory approval
Ethics approval for the trial was given by the East of Scotland Research Ethics Service Research Ethics Committee (REC) 2 on 14 August 2012 (12/ES/0068). Local NHS management approval and appropriate site-specific assessments were obtained at each participating site. The trial was registered with the International Standard Randomised Controlled Trial Register under reference number ISRCTN76413758 and the European Clinical Trials Database under reference number 2012-002488-25.
Related studies
The Edinburgh cardiology team utilised the MA3RS participant group and data set in two other AAA studies: the Sodium Fluoride Imaging of Abdominal Aortic Aneurysms (SoFIA3) study42 (REC approval 14/SS0080) and the DESmosine as a prognostic Marker in Aortic Aneurysm (DES-MA3RS) study.
Sodium Fluoride Imaging of Abdominal Aortic Aneurysms study
The SoFIA3 study was a prospective observational cohort study to evaluate the ability of 18F-sodium fluoride to identify regions of necrotic inflammation in AAAs and predict AAA expansion, and to explore the added value in assessing the identification of macrophage activity using MRI scans. Potential recruits were identified from the MA3RS trial database and eligibility and consent was managed by the research fellow. Consented participants had positron emission tomography (PET)-CT after administration of 18F-sodium fluoride, 12 months after the MA3RS baseline visit. Participants were followed up as per the MA3RS protocol.
DESmosine as a prognostic Marker in Aortic Aneurysm study
The DES-MA3RS study aims to determine whether or not desmosine, a substance released in blood from breakdown of the aorta, can be used to monitor aortic enlargement and assess the risk of rupture in patients with AAAs. Plasma samples from the MA3RS participants are being analysed at baseline, 6 months and 12 months. Plasma desmosine concentrations will be correlated with disease severity, disease progression and clinical outcomes. The MA3RS follow-up data and outcome events will be utilised to assess this novel circulating biomarker, providing evidence to underpin further validation studies.
Chapter 3 Results
Recruitment
The original agreed start date for recruitment was 1 April 2013; however, the trial protocol and required approvals were in place ahead of schedule and recruitment actually commenced on 8 November 2012. The final participant was recruited on 5 December 2014.
There was a temporary halt on recruitment in August and September 2014 in all sites to allow for the relevant regulatory approvals for the revised dosing instructions for Rienso. The temporary halt had a minimal impact on the overall project timelines, with recruitment being completed within 10 weeks of reopening all sites.
Study population
A CONSORT flow diagram for recruitment is provided in Figure 7. During the recruitment phase, 1942 patients attending outpatient vascular clinics were screened for inclusion in the trial. The clinical research fellow was responsible for identifying potential participants and determining eligibility. Of the 741 potentially eligible patients who were identified, ultimately 361 (48.7%) were recruited into the study. Nineteen patients were subsequently withdrawn, predominantly because they were unable to undergo repeated MRI scans because of claustrophobia.
FIGURE 7.
The CONSORT flow diagram.
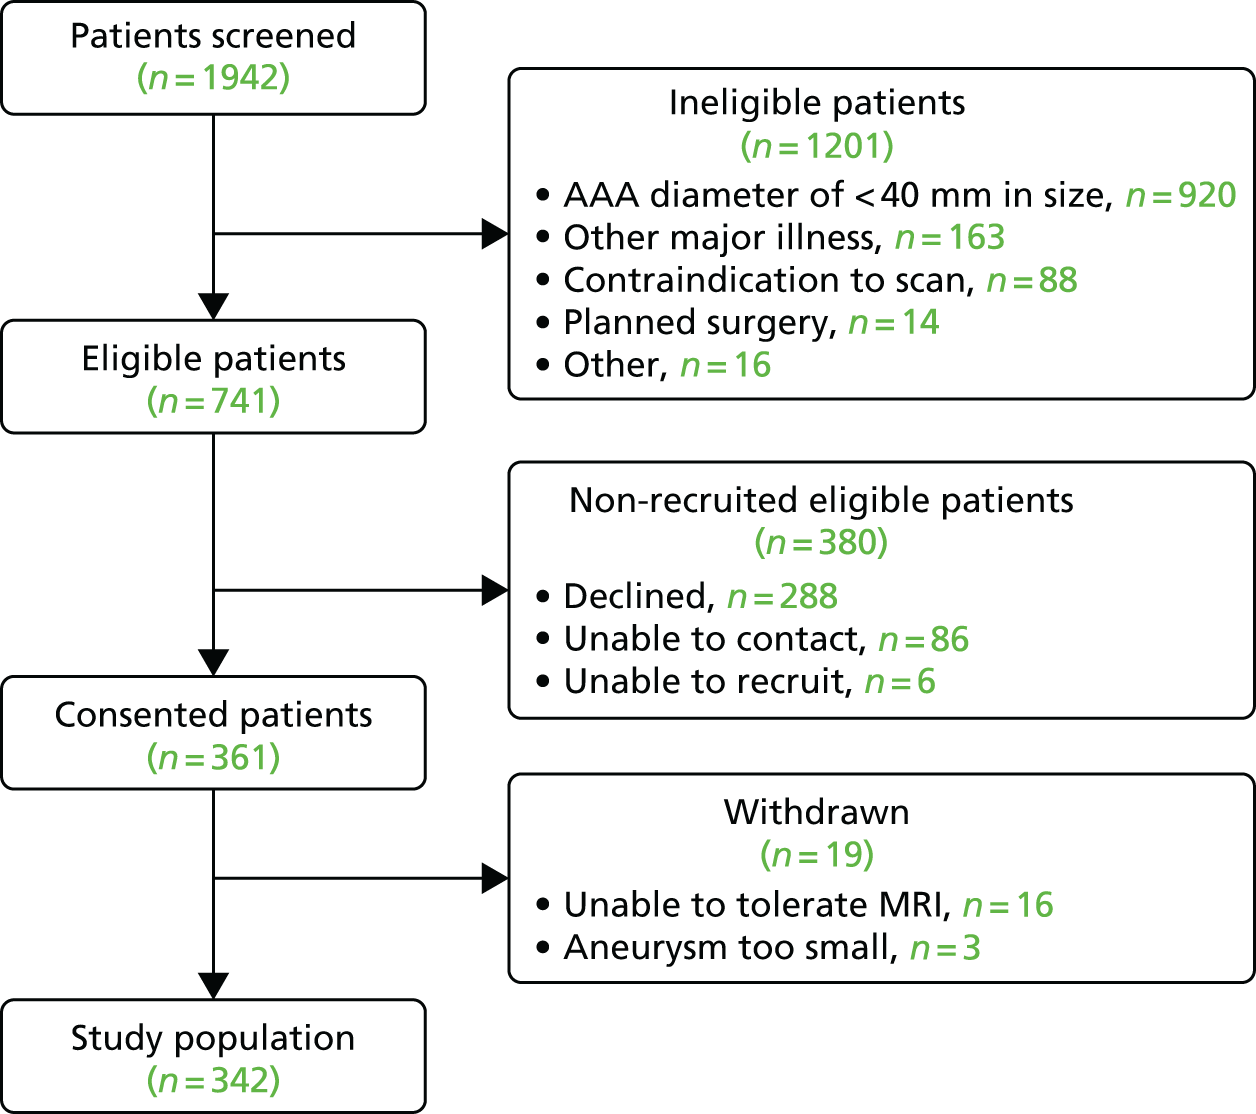
Table 3 summarises the final study population, which comprised 342 participants who were predominantly elderly male current or ex-smokers with hypercholesterolaemia and hypertension.
| Characteristic | All participants (N = 342) | Enhancement | Difference (95% CI) | p-value | ||
|---|---|---|---|---|---|---|
| Indeterminant USPIO (N = 5) | No USPIO (N = 191) | USPIO (N = 146) | ||||
| Age (years), mean (SD) | 73.1 (7.2) | 75.0 (7.0) | 73.4 (7.5) | 72.8 (6.8) | –0.6 (–2.2 to 0.9) | 0.4330 |
| Male, n (%) | 292 (85.4) | 5 (100) | 166 (86.9) | 121 (82.9) | –4.0 (–11.8 to 3.7) | 0.3019 |
| Blood pressure, mean (SD) | ||||||
| Systolic (mmHg) | 139.6 (21.2) | 151.6 (5.3) | 140.3 (21.3) | 138.2 (21.3) | –2.1 (–6.8 to 2.5) | 0.3610 |
| Diastolic (mmHg) | 81.4 (10.8) | 87.0 (10.7) | 80.5 (10.3) | 82.3 (11.3) | 1.9 (–0.4 to 4.2) | 0.1101 |
| Heart rate (b.p.m.), mean (SD) | 70.7 (10.1) | 71.6 (12.1) | 70.0 (10.1) | 71.5 (10.0) | 1.5 (–0.7 to 3.7) | 0.1779 |
| Body mass index (kg/m2), mean (SD) | 27.6 (4.2) | 25.0 (3.1) | 28.0 (4.2) | 27.2 (4.2) | –0.8 (–1.7 to 0.1) | 0.0729 |
| Creatinine (µmol/l), mean (SD) | 89.9 (23.4) | 76.2 (9.7) | 90.0 (21.1) | 90.3 (26.5) | 0.4 (–4.9 to 5.7) | 0.8912 |
| Cholesterol (mmol/l), mean (SD) | 4.5 (1.0) | 5.0 (1.9) | 4.5 (1.0) | 4.5 (1.0) | 0.0 (–0.2 to 0.3) | 0.7732 |
| Smoking, n (%) | ||||||
| Current smoker | 101 (29.5) | 4 (80) | 40 (20.9) | 57 (39.0) | 18.1 (8.3 to 27.9)a | 0.0003a |
| Ex-smoker | 195 (57.0) | 1 (20) | 120 (62.8) | 74 (50.7) | ||
| Never smoker | 46 (13.5) | 0 (0) | 31 (16.2) | 15 (10.3) | ||
| Aneurysm | ||||||
| AAA diameter (mm), mean (SD) | 49.6 (7.7) | 54.4 (12.3) | 48.2 (6.6) | 51.4 (8.4) | 3.2 (1.5 to 4.8) | 0.0002 |
| Concurrent iliac artery aneurysm, n (%) | 66 (19.3) | 1 (20) | 29 (15.2) | 36 (24.7) | 9.5 (0.8 to 18.1) | 0.0289 |
| Past medical history, n (%) | ||||||
| Hypertension | 246 (71.9) | 3 (60) | 143 (74.9) | 100 (68.5) | –6.4 (–16.1 to 3.4) | 0.1959 |
| Hypercholesterolaemia | 257 (75.1) | 2 (40) | 146 (76.4) | 109 (74.7) | –1.8 (–11.1 to 7.5) | 0.7056 |
| Diabetes mellitus | 47 (13.7) | 0 (0) | 31 (16.2) | 16 (11.0) | –5.3 (–12.6 to 2.0) | 0.1663 |
| Family history of AAAs | 61 (17.8) | 0 (0) | 32 (16.8) | 29 (19.9) | 3.1 (–5.3 to 11.5) | 0.4626 |
| Ischaemic heart disease | 125 (36.5) | 1 (20) | 69 (36.1) | 55 (37.7) | 1.6 (–8.9 to 12.0) | 0.7706 |
| Peripheral vascular disease | 66 (19.3) | 1 (20) | 34 (17.8) | 31 (21.2) | 3.4 (–5.1 to 12.0) | 0.4288 |
| Cerebrovascular disease | 46 (13.5) | 0 (0) | 22 (11.5) | 24 (16.4) | 4.9 (–2.6 to 12.5) | 0.1924 |
| Baseline medication, n (%) | ||||||
| Antiplatelet therapy | 224 (65.5) | 2 (40) | 127 (66.5) | 95 (65.1) | –1.4 (–11.7 to 8.8) | 0.7847 |
| Statin therapy | 270 (78.9) | 4 (80) | 151 (79.1) | 115 (78.8) | –0.3 (–9.1 to 8.5) | 0.9483 |
| Anticoagulant therapy | 25 (7.3) | 0 (0) | 16 (8.4) | 9 (6.2) | –2.2 (–7.8 to 3.3) | 0.4425 |
| Beta blocker therapy | 120 (35.1) | 1 (20) | 72 (37.7) | 47 (32.2) | –5.5 (–15.7 to 4.7) | 0.2948 |
| ACE inhibitor therapy | 123 (36.0) | 2 (40) | 68 (35.6) | 53 (36.3) | 0.7 (–9.6 to 11.0) | 0.8945 |
Duration of follow-up
The overall duration of follow-up has been derived as the time in days between consent and the last event verification prior to database lock and analysis (21 November 2016) or if the participant died, the duration between consent and date of death. A summary of missing data is shown in Table 4.
| Group | n | n missing | Mean | SD | Minimum | Lower quartile | Median | Upper quartile | Maximum |
|---|---|---|---|---|---|---|---|---|---|
| Missing | 5 | 0 | 1027 | 270.4 | 749.0 | 909.0 | 979.0 | 1026 | 1473 |
| Negative | 191 | 0 | 1017 | 241.0 | 168.0 | 895.0 | 1021 | 1182 | 1474 |
| Positive | 146 | 0 | 988.6 | 324.9 | 27.0 | 830.0 | 1017 | 1265 | 1462 |
| All | 342 | 0 | 1005 | 279.8 | 27.0 | 865.0 | 1017 | 1210 | 1474 |
Adverse reactions
There were no serious adverse reactions to intravenous ferumoxytol administration; it was generally well tolerated by all participants. There was one potential adverse reaction: mild asymptomatic hypotension that was possibly related to ferumoxytol in one participant who required no medical intervention.
Image analysis
Image analysis development: image registration
Excellent registration was achieved for all patients using the automated registration software. The in-house registration tool developed for the study was evaluated by comparing the automatic transformation produced by the software and the manual correction performed by the clinician. The mean translational and rotational errors in the x, y, z and mean Euclidean error are shown in Table 5. The overall mean translational error for both data sets was 2.56 mm, with 59.6% of T2-weighted to T2*-weighted image registrations and 54.5% of pre-contrast T2*-weighted to post-contrast T2*-weighted image registrations achieving subvoxel accuracy (Dr Chengjia Wang, University of Edinburgh, 2015, personal communication). A summary of mean registration errors is also given in Table 5.
| Dimension | T2-weighted – T2*-weighted | pre-contrast T2*-weighted – post-contrast T2*-weighted | ||
|---|---|---|---|---|
| Translation | Rotation | Translation | Rotation | |
| x | 0.9 | 0 | 1.06 | 0.7 |
| y | 1.3 | 0 | 1.13 | 0.24 |
| z | 0.49 | 0.03 | 1.8 | 0.56 |
| Overall | 1.55 | 0.04 | 1.76 | 0.81 |
Generation of threshold level for T2* value
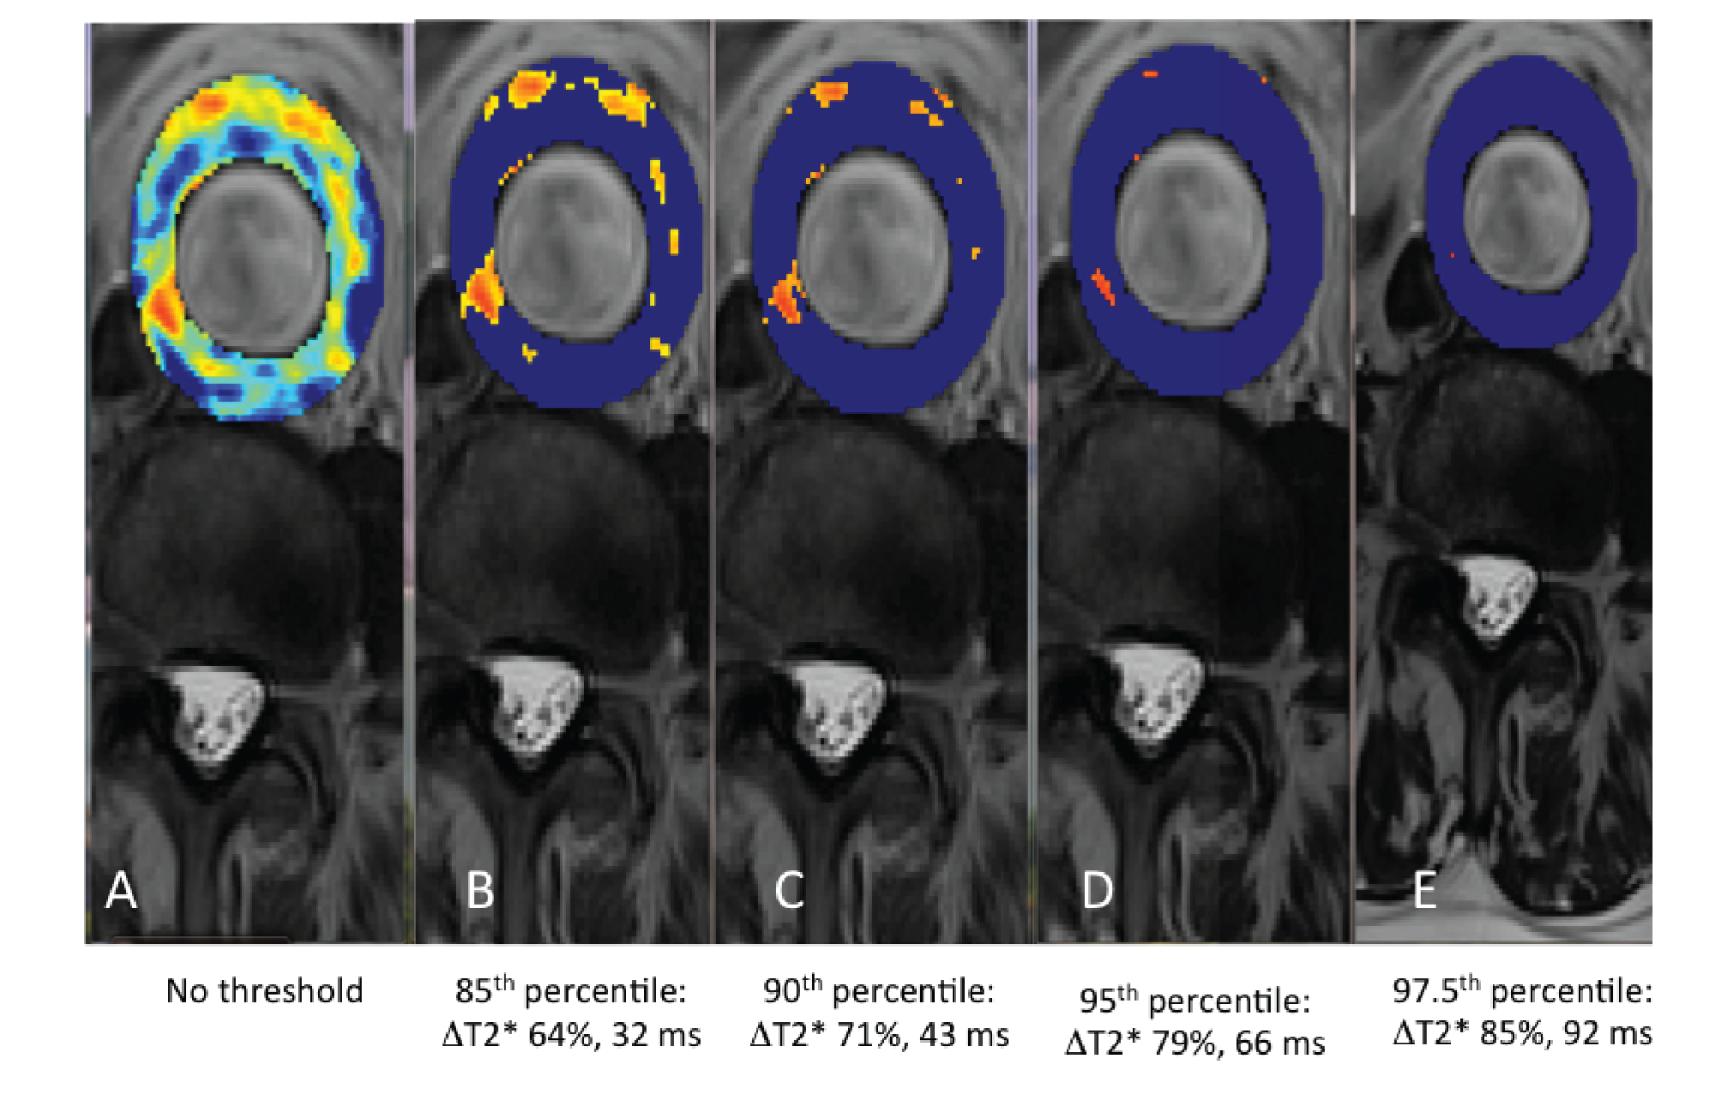
The threshold represents a level above which a ΔT2* can be attributed to USPIO accumulation. To generate this, the interscan variability in T2* in the absence of USPIO was assessed using the baseline pre-USPIO scan and the pre-USPIO scan from the short-term reproducibility substudy. For each voxel, both the absolute and per cent ΔT2* values between these two scans were calculated. This provided the variability in T2* values resulting from both registration and the measurement itself. Varying percentiles (85th, 90th, 95th and 97.5th) for the absolute and per cent ΔT2* were calculated for individual patients and averaged for all patients. These were then modelled by applying the different thresholds to the colour maps (Figure 8). The 90th percentile value was selected as this facilitated accurate data interpretation.
FIGURE 8.
Varying thresholds applied to colour maps representing the ΔT2* value between pre- and post-contrast scans. (a) No threshold; (b) 85th percentile (%ΔT2*: 64%, absolute ΔT2*: 32 milliseconds); (c) 90th percentile (%ΔT2*: 71%, absolute ΔT2*: 43 milliseconds); (d) 95th percentile (%ΔT2*: 79%, absolute ΔT2*: 66 milliseconds); and (e) 97.5th percentile (%ΔT2*: 85%, absolute ΔT2*: 92 milliseconds).
Absolute versus per cent change T2*
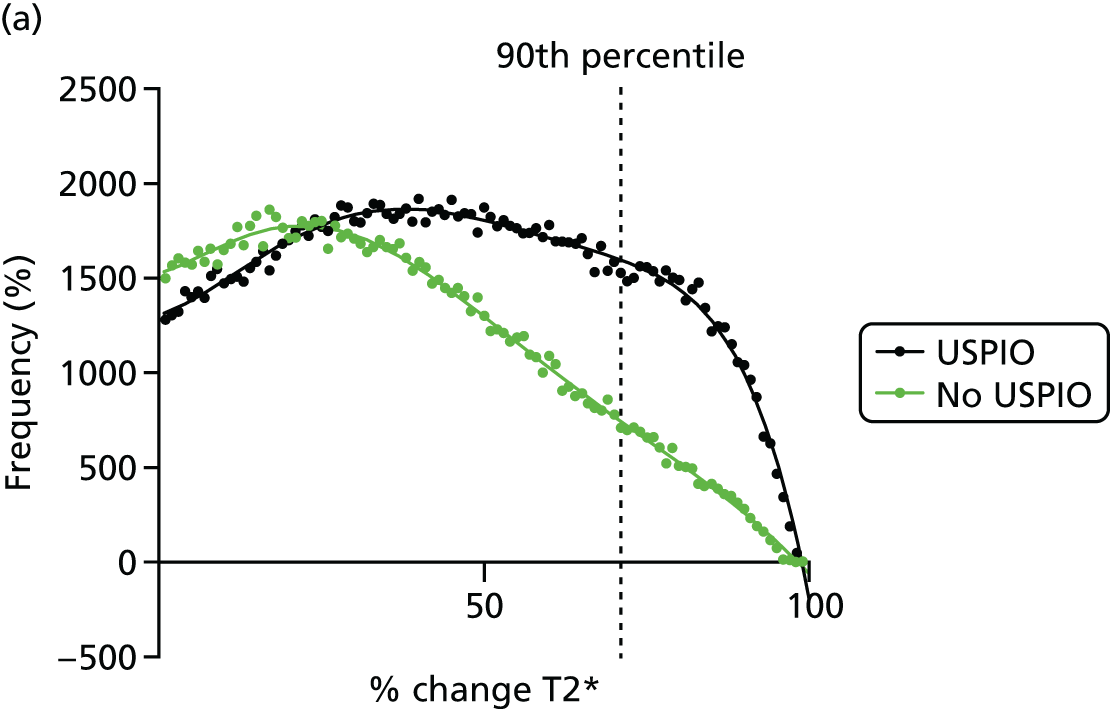
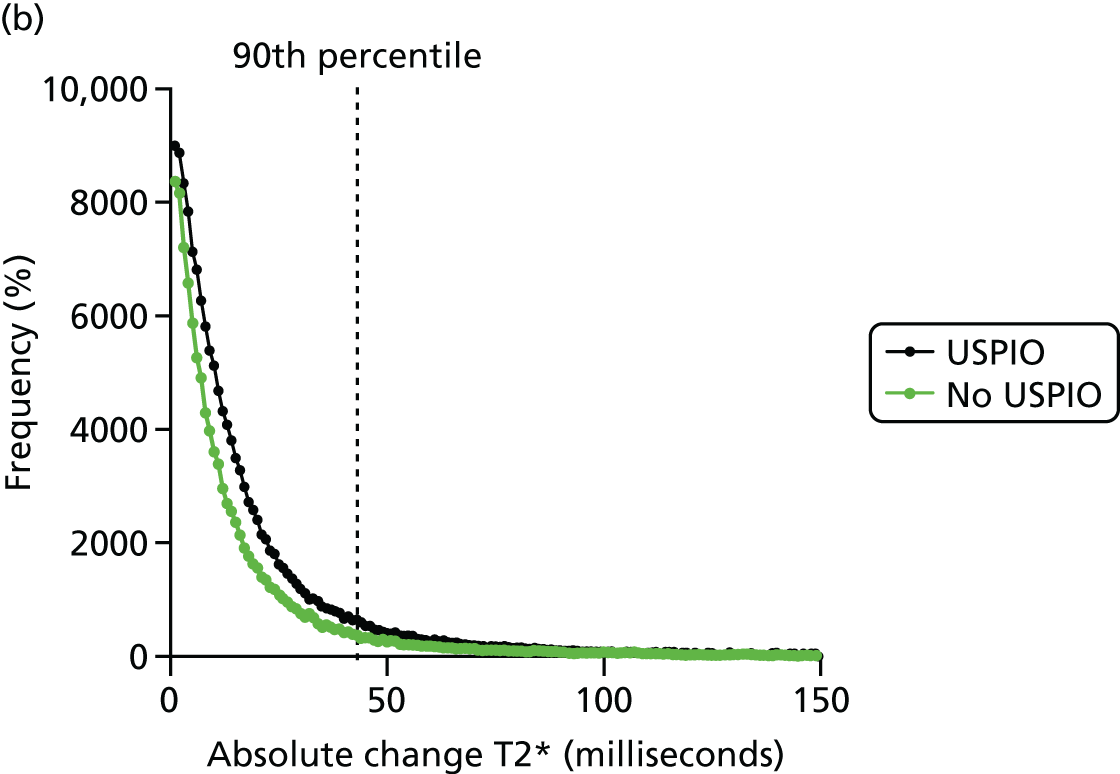
Per cent ΔT2* value from baseline was selected to represent the accumulation of USPIO, rather than absolute ΔT2* value. The reason for this is clearly demonstrated in the frequency histograms in Figure 9. The frequency distribution for the absolute ΔT2* was very similar when comparing the ΔT2* for USPIO (baseline pre- and post-USPIO scans) and no USPIO (baseline and short-term reproducibility pre-USPIO scans). In contrast, a marked right shift in frequency distribution is seen when per cent ΔT2* value is plotted (see Figure 9a).
FIGURE 9.
Effect of USPIO on percentage and absolute change in signal intensity. Frequency of voxels with (a) per cent; and (b) absolute ΔT2* value between baseline pre- and post-contrast scans (USPIO = black line) and baseline pre-contrast and short-term reproducibility pre-contrast scan (no USPIO = green line). The 90th percentile of ΔT2* in the absence of USPIO is marked by the dashed line at (a) 71% or (b) 43 milliseconds.
Repeatability of T2* value
To determine the repeatability of the measurement of the T2* value, data from the baseline pre-USPIO scan and the pre-USPIO scan at short-term reproducibility were compared. A voxel-by-voxel analysis was undertaken, with a total of 188,905 data points. The Bland–Altman method was used to compare the data, resulting in a mean bias of 2.07 milliseconds and a SD of the difference of 24.0 milliseconds.
Reproducibility
Reproducibility of the technique was assessed using quantitative and semiquantitative measures. A comparison was first made between the absolute ΔT2* value at baseline and at approximately 1 month, on a voxel-by-voxel basis (117,870 data points), using the Bland–Altman method. This demonstrated a mean bias of –2.01 milliseconds and a SD of the difference of 24.0 milliseconds.
At baseline and 1 month, participants were assessed for the presence or absence of mural USPIO uptake and categorised as ultrasmall superparamagnetic particles of iron oxide positive (USPIO+ve) or ultrasmall superparamagnetic particles of iron oxide negative (USPIO–ve). Table 6 shows a cross-tabulation of classifications at baseline and 1 month. The proportional agreement was 20/23 = 0.87 [95% CI 0.66 to 0.97; Kappa Kappa, 0.74 (95% CI 0.47 to 1.00); p < 0.001; McNemar’s test p = 1.00].
| Baseline grouping | 1-month grouping | Total | |
|---|---|---|---|
| USPIO–ve | USPIO+ve | ||
| USPIO–ve | 10 | 1 | 11 |
| USPIO+ve | 2 | 10 | 12 |
| Total | 12 | 11 | 23 |
Observer agreement
Twenty-three scans were also assessed for intraobserver and interobserver agreement.
Proportional intraobserver agreement for the reclassification of baseline scans by the first observer was 0.91, with a kappa value of 0.82 (McNemar’s test 0.50). When both observers independently classified the baseline scans, the proportional interobserver agreement was 0.83, with a kappa of 0.66 and a McNemar’s test of 0.125 (Table 7).
| Baseline grouping | Agreement | |||
|---|---|---|---|---|
| Intraobserver | Interobserver | |||
| USPIO–ve | USPIO+ve | USPIO–ve | USPIO+ve | |
| USPIO–ve | 9 | 2 | 11 | 0 |
| USPIO+ve | 0 | 12 | 4 | 8 |
| Total | 9 | 14 | 15 | 8 |
Natural history of ultrasmall superparamagnetic particles of iron oxide uptake
For the 1-year substudy, 58 patients attended for repeat USPIO MRI scans at a mean of 358 days (SD 21 days) after the baseline visit. They were predominantly male (95%), with a mean AAA diameter of 47.0 mm (SD 7.3 mm) on baseline ultrasonography (Table 8). Baseline diameter was largest in the + + group [47.44 (SD 4.90) vs. 45.37 (SD 4.07), 44.67 (SD 4.62), 44.50 (SD 5.29); p = 0.098]. During a mean follow-up of 1034 days (SD 278 days) after the baseline scan, there were 18 AAA events (31.0%) (17 repairs and 1 rupture) and 5 deaths (8.6%). The median AAA expansion rate was 2.45 (SD 3.50) mm/year at 1 year and 2.11 (SD 2.38) mm/year at 2 years (see Table 8).
| Parameter | All patients | USPIO classification | ||||
|---|---|---|---|---|---|---|
| – – | + – | – + | + + | p-value for difference | ||
| N | 58 | 25 | 7 | 10 | 16 | |
| Male, n (%) | 55 (94.8) | 25 (100.0) | 7 (100.0) | 9 (90.0) | 14 (87.5) | 0.230 |
| Age (year), mean (SD) | 72.38 (6.93) | 73.15 (6.89) | 74.01 (8.19) | 71.04 (6.93) | 71.30 (6.61) | 0.704 |
| Aortic diameter on USS (mm), mean (SD) | 47.02 (7.27) | 45.37 (4.07) | 44.67 (4.62) | 44.50 (5.29) | 47.44 (4.90) | 0.098 |
| Blood pressure (mmHg), mean (SD) | ||||||
| Systolic | 136.78 (16.13) | 138.16 (17.75) | 145.33 (4.04) | 128.88 (18.44) | 136.11 (13.44) | 0.148 |
| Diastolic | 81.97 (80.00) | 81.58 (11.81) | 85.33 (5.51) | 77.63 (10.73) | 84.11 (13.16) | 0.110 |
| Heart rate (b.p.m.), mean (SD) | 70.19 (10.85) | 67.16 (7.52) | 71.00 (16.46) | 76.75 (12.70) | 71.22 (11.38) | 0.266 |
| BMI (kg/m2), mean (SD) | 27.53 (3.70) | 28.83 (3.92) | 28.64 (1.25) | 26.52 (1.77) | 26.64 (3.39) | 0.161 |
| Serum creatinine (mmol/l), mean (SD) | 85.83 (16.98) | 88.52 (14.87) | 94.29 (22.11) | 80.90 (13.02) | 81.00 (18.92) | 0.214 |
| Family history of AAA, n (%) | 10 (17.2) | 3 (12.0) | 2 (28.57) | 2 (20.0) | 3 (18.75) | 0.662 |
| Current smoker, n (%) | 18 (31.0) | 5 (20.0) | 2 (28.57) | 2 (20.0) | 9 (56.25) | 0.090 |
| Comorbidities, n (%) | ||||||
| Hypertension | 39 (67.2) | 19 (76.0) | 4 (57.14) | 8 (80.0) | 8 (50.0) | 0.283 |
| Hypercholesterolaemia | 51 (87.9) | 22 (88.0) | 7 (100.0) | 9 (90.0) | 13 (81.25) | 0.838 |
| Ischaemic heart disease | 21 (36.2) | 7 (28.0) | 3 (42.86) | 6 (60.0) | 5 (31.25) | 0.341 |
| Cerebrovascular disease | 4 (6.9) | 3 (12.0) | 0 (0.0) | 0 (0.0) | 1 (6.25) | 0.997 |
| Peripheral artery disease | 10 (17.2) | 5 (20.0) | 1 (14.29) | 1 (10.0) | 3 (18.75) | 0.957 |
| Diabetes mellitus | 12 (20.7) | 6 (24.0) | 1 (14.29) | 4 (40.0) | 1 (6.25) | 0.181 |
For the 2-year substudy, 20 patients (75% male) attended for repeat USPIO MRI at 725 days (SD 35 days) from the baseline visit. The mean AAA diameter at baseline was 46.5 mm (SD 4.8 mm) on ultrasonography (Table 9). During a mean follow-up of 1169 days (SD 206 days) after the baseline scan, there were seven AAA events (35%) (six repairs and one rupture) and one death (5%). The median AAA expansion rate was 0.95 (SD 3.14) mm/year at 1 year, 1.85 (SD 2.89) mm/year at 2 years and 1.90 (SD 3.22) mm/year at the most recent follow-up point (mean of 1152 days (SD 186 days) from baseline; see Table 9).
| Parameter | All patients | USPIO classification | ||||
|---|---|---|---|---|---|---|
| – – | + – | – + | + + | p-value for difference | ||
| N | 20 | 4 | 8 | 5 | 3 | |
| Male, n (%) | 15 (75.00) | 3 (75.00) | 7 (87.5) | 3 (60.00) | 2 (66.67) | 0.747 |
| Age (years), mean (SD) | 73.42 (7.49) | 73.70 (10.53) | 73.83 (4.69) | 72.29 (7.46) | 73.84 (13.18) | 0.988 |
| Aortic diameter on USS (mm), mean (SD) | 46.45 (4.77) | 43.25 (2.75) | 49.00 (4.90) | 44.80 (4.21) | 46.67 (5.86) | 0.202 |
| Blood pressure (mmHg), mean (SD) | ||||||
| Systolic | 126.70 (15.23) | 121.25 (16.5) | 128.88 (19.60) | 127.00 (15.23) | 127.67 (13.56) | 0.894 |
| Diastolic | 77.35 (7.65) | 69.75 (2.22) | 79.50 (8.28) | 79.00 (7.97) | 79.00 (6.08) | 0.174 |
| Heart rate (b.p.m.), mean (SD) | 66.55 (7.10) | 68.25 (11.24) | 65.63 (7.65) | 66.60 (3.78) | 66.67 (6.08) | 0.956 |
| BMI (kg/m2), mean (SD) | 26.78 (2.40) | 26.2 (1.95) | 27.50 (3.12) | 26.78 (2.40) | 26.10 (1.56) | 0.770 |
| Family history of AAA, n (%) | 2 (10.00) | 0 (0.00) | 0 (0.00) | 1 (20.00) | 1 (33.33) | 0.242 |
| Current smoker, n (%) | 5 (25.00) | 1 (25.0) | 2 (25.00) | 0 (0.00) | 2 (66.67) | 0.253 |
| Comorbidities, n (%) | ||||||
| Hypertension | 18 (90.00) | 4 (100.00) | 8 (100.00) | 3 (60.00) | 3 (100.00) | 0.100 |
| Hypercholesterolaemia | 18 (90.00) | 4 (100.00) | 8 (100.00) | 3 (60.00) | 3 (100.00) | 0.100 |
| Ischaemic heart disease | 12 (60.00) | 1 (25.00) | 6 (75.00) | 3 (60.00) | 2 (66.67) | 0.510 |
| Cerebrovascular disease | 6 (30.00) | 1 (25.00) | 2 (25.00) | 2 (40.00) | 1 (33.33) | 1.000 |
| Peripheral artery disease | 2 (10.00) | 0 (0.00) | 1 (12.50) | 1 (20.00) | 0 (0.00) | 1.000 |
| Diabetes mellitus | 2 (10.00) | 0 (0.00) | 0 (0.00) | 2 (40.00) | 0 (0.00) | 0.100 |
In both substudy cohorts, participants had a range of cardiovascular comorbidities, as expected (see Tables 8 and 9). There were no differences in any of the baseline characteristics between groups or categories in either the 1-year or 2-year substudy cohorts. However, current smokers were most likely to remain USPIO+ve over time, with a trend towards significance (p = 0.090).
Approximately one-third of patients (n = 17; 29.3%) were reclassified into a different group after repeated scanning at 1 year and two-thirds (n = 13; 65%) were reclassified after repeat scanning at 2 years (Table 10).
| Baseline classification | Repeat scan classification | |||||
|---|---|---|---|---|---|---|
| 1 year | 2 years | |||||
| Negative | Positive | Total | Negative | Positive | Total | |
| Negative | 25 (43.1) | 10 (17.2) | 35 | 4 (20) | 5 (25) | 9 |
| Positive | 7 (12.1) | 16 (27.6) | 23 | 8 (40) | 3 (15) | 11 |
| Total | 58 | 20 | ||||
Clinical outcomes in the natural history substudies
Natural history cohort
Although patients who were classified as + + had the highest growth rates at all time points, the growth rates between all four USPIO classification groups were not statistically different (baseline to 1 year, p = 0.226; 1 year to 2 years, p = 0.688; baseline to 2 years, p = 0.562).
Patients whose aneurysm changed from positive to negative at repeated scanning appeared to experience a decrease in median growth rate of > 1 mm/year after the repeat scan [2.11 (SD 2.08) mm/year vs. 1.15 (SD 1.10) mm/year] and patients whose aneurysm changed from negative to positive appeared to experience an increase in median growth rate of almost 1 mm/year [1.00 (SD 3.65) mm/year vs. 2.13 (SD 4.01) mm/year] after a repeat scan. However, neither of these comparisons were statistically different.
The median growth rate of aneurysms that did not change USPIO category remained relatively constant over time [+ +, 3.00 (SD 2.77) mm/year vs. 2.71 (SD 2.72) mm/year; – –, 1.75 (SD 3.77) mm/year vs. 1.90 (SD 2.87) mm/year].
There was no significant difference in the proportion of patients who experienced an AAA event between USPIO classification groups (log-rank p = 0.649). There was also no difference in the proportion of deaths between USPIO classification groups. A summary of clinical outcomes for the 1-year natural history substudy cohort is shown in Table 11.
| Outcome | All patients (N = 58) | USPIO classification | p-value for difference | |||
|---|---|---|---|---|---|---|
| – – (N = 25) | + – (N = 7) | – + (N = 10) | + + (N = 16) | |||
| Interim AAA growth (baseline to 1 year) (mm/year), mean (SD) | 2.45 (3.50) | 1.75 (3.77) | 2.11 (2.08) | 1.00 (3.65) | 3.00 (2.77) | 0.226 |
| Interim AAA growth (1 year to 2 years) (mm/year), mean (SD) | 2.02 (2.62) | 1.90 (2.87) | 1.15 (1.10) | 2.13 (4.01) | 2.71 (2.72) | 0.688 |
| Overall AAA growth (baseline to 2 year) (mm/year), mean (SD) | 2.11 (2.38) | 2.10 (2.51) | 1.96 (0.0) | 2.08 (2.22) | 3.87 (2.76) | 0.562 |
| AAA repair or rupture, n (%) | 18 (31.0) | 6 (24.0) | 3 (42.86) | 3 (30.00) | 6 (37.5) | 0.649 |
| AAA repair, n (%) | 17 (29.3) | 6 (24.0) | 3 (42.86) | 3 (30.00) | 5 (31.25) | 0.753 |
| AAA rupture, n (%) | 1 (1.70) | 0 (0.00) | 0 (0.00) | 0 (0.00) | 1 (6.25) | N/A |
| Death, n (%) | 5 (8.62) | 1 (4.00) | 0 (0.00) | 1 (10.00) | 3 (18.75) | 0.280 |
Serum biomarkers
There were no significant correlations between any of the serum biomarker concentrations and the rate of aneurysm expansion at any interval. In patients who experienced an AAA event, the mean concentration of IL-10 was lower than in those who did not experience an event [2.12 (SD 0.06) vs. 2.66 (SD 0.50); difference –0.55, 95% CI –0.92 to –0.16; p = 0.011] (see Table 13). There were no other significant associations between serum biomarker levels and clinical outcomes. Serum biomarker measurements and aneurysm growth and clinical outcome are shown in Tables 12 and 13.
| Growth rate | Values | Serum biomarker | ||||
|---|---|---|---|---|---|---|
| IL-6 | IL-10 | MMP-2 | MMP-9 | TIMP-1 | ||
| To 1 year | r | –0.136 | –0.3563 | 0.117 | 0.012 | 0.112 |
| p | 0.428 | 0.246 | 0.390 | 0.938 | 0.410 | |
| To 2 years | r | –0.203 | –0.351 | 0.219 | –0.078 | 0.017 |
| p | 0.352 | 0.354 | 0.175 | 0.677 | 0.919 | |
| Overall growth rate | r | –0.101 | –0.419 | 0.217 | –0.091 | 0.053 |
| p | 0.583 | 0.228 | 0.127 | 0.577 | 0.711 | |
| Serum biomarker | AAA event | Mean (SD) | Mean difference | 95% CI of the difference | p-value for difference |
|---|---|---|---|---|---|
| IL-6 | Yes | 1.70 (0.36) | –0.09 | –0.36 to 0.18 | 0.521 |
| No | 1.79 (0.34) | ||||
| IL-10 | Yes | 2.12 (0.06) | –0.55 | –0.92 to –016 | 0.011 |
| No | 2.66 (0.50) | ||||
| MMP-2 | Yes | 2.69 (0.22) | –0.05 | –0.18 to 0.08 | 0.406 |
| No | 2.74 (0.22) | ||||
| MMP-9 | Yes | 1.59 (0.50) | 0.71 | –0.09 to 1.51 | 0.079 |
| No | 0.88 (1.49) | ||||
| TIMP-1 | Yes | 0.67 (0.19) | 0.00001 | –0.12 to 0.12 | 1.000 |
| No | 0.67 (0.67) |
Two-year natural history cohort
There was no difference or trend in expansion rates at any interval when comparing USPIO classification groups (all with p-values of > 0.05). The clinical outcomes for patients in the 2-year natural history substudy cohort is shown in Table 14.
| Clinical outcome | All patients (N = 20) | USPIO classification | p-value for difference | |||
|---|---|---|---|---|---|---|
| – – (N = 4) | + – (N = 8) | – + (N = 5) | + + (N = 3) | |||
| Interim AAA growth (baseline to 1 year) (mm/year), mean (SD) | 0.95 (3.14) | 0.90 (5.88) | 3.35 (6.30) | 0.00 (2.32) | 0.00 (N/A) | 0.158 |
| Interim growth (baseline to 2 years) (mm/year), mean (SD) | 1.85 (2.89) | 1.17 (3.49) | 3.62 (3.37) | 2.15 (3.59) | 1.04 (N/A) | 0.276 |
| Interim AAA growth (1 year to 2 years) (mm/year), mean (SD) | 1.97 (1.91) | 0.92 (2.26) | 2.26 (4.08) | 2.38 (6.00) | 1.79 (N/A) | 0.091 |
| Interim AAA growth (2 years to most recent) (mm/year), mean (SD) | 1.96 (2.53) | 0.97 (N/A) | 2.93 (5.33) | 2.88 (4.91) | 0.84 (N/A) | 0.316 |
| Overall AAA growth (baseline to most recent) (mm/year), mean (SD) | 1.90 (3.22) | 0.00 (N/A) | 2.48 (2.33) | 3.71 (3.24) | 0.67 (N/A) | 0.316 |
| AAA repair or rupture, n (%) | 7 (35.00) | 1 (25.00) | 4 (50.00) | 1 (20.00) | 1 (33.33) | 0.716 |
| AAA repair, n (%) | 6 (30.00) | 0 (0.00) | 4 (50.00) | 1 (20.00) | 1 (33.33) | 0.428 |
| AAA rupture, n (%) | 1 (5.00) | 1 (25.00) | 0 (0.00) | 0 (0.00) | 0 (0.00) | 0.350 |
| Death, n (%) | 1 (5.00) | 1 (25.00) | 0 (0.00) | 0 (0.00) | 0 (0.00) | 0.350 |
Principal results of the total study population
Ultrasmall superparamagnetic particles of iron oxide enhancement
Ultrasmall superparamagnetic particles of iron oxide enhancement of the AAA wall was identified in 146 participants (42.7%), was absent in 191 participants (55.8%) and was indeterminate in 5 participants (1.5%). USPIO enhancement was strongly associated with current smoking status as well as baseline AAA diameter and the presence of a common iliac aneurysm (see Appendix 5, Tables 32 and 33).
Abdominal aortic aneurysm expansion
Computed tomography scans
When possible, CT scans were conducted at baseline and again at 2 years, irrespective of whether or not a repair had been conducted within that time frame. When a repair has been carried out, a CT scan may also have been conducted immediately prior to the repair. Of the 342 participants, 334 (97.7%) had a baseline CT scan and 206 (60.2%) had a scan at 2 years (see Appendix 5, Table 34).
In order to determine growth rate, we need a minimum of two CT values that have come from scans conducted prior to any rupture or repair. To determine the growth rate over the study, we have calculated the following:
-
Change in aneurysm size (mm). Size (mm) on the most recent scan prior to any repair – size on baseline scan (mm).
-
Time gap between scans (days). Date of most recent scan prior to any repair – date of baseline scan.
-
Change per year (mm/year). (Change in AAA size/time gap) × 365.25.
We are able to calculate these values in 194 of our participants; however, the values from two participants have been excluded: both had an AAA repair (see Appendix 5, Tables 35 and 36).
Using a two-sample t-test, there is no evidence of a difference in the mean rate of growth between USPIO+ve and USPIO–ve participants: difference in means of 0.5 mm/year with 95% CI for the difference of –0.6 to 1.6 mm/year; p = 0.3488.
A linear regression has been generated accounting for the baseline variables: sex (male, female), smoking status (current smoker, non-current smoker), systolic blood pressure (mm/Hg, continuous variable) and baseline AAA size as measured on ultrasonography (mm, continuous variable). A second model has been generated using with the addition of USPIO uptake group (+−) (see Appendix 5, Table 37).
Ultrasound scans
Ultrasound scans were conducted at baseline and every 6 months up to 2 years unless a participant had undergone AAA repair and no further ultrasonography results were captured after the repair. As AAA size determined by ultrasonography at baseline was a criterion for inclusion into the trial, all participants had a baseline scan. In 63 participants we have a single ultrasonographic measurement only: 53 were repaired, seven died, one withdrew and for two we were unsure of the reason.
In a similar way to the CT measurements, we have determined the growth rate in a simple way throughout the study by calculating the following:
-
Change in aneurysm size (mm). Size (mm) on the most recent scan prior to any repair – size on baseline scan (mm).
-
Time gap between scans (days). Date of most recent scan prior to any repair – date of baseline scan.
-
Change per year (mm/year). (Change in size/time gap) × 365.25
However, this method only makes use of two ultrasonographic measurements per participant. In order to utilise all measurements available, the size over time has been plotted and a regression line fitted. From this, we can then use the slope of the regression line fitted to each participant as a measure of growth. To illustrate this, Figure 10 shows ultrasonographic measurements for the first participant (11001) over time. In this instance, time has been shown in years so that the resulting slope of the line is expressed in the units mm/year.
FIGURE 10.
Example regression slope using serial ultrasonographic measures of aneurysm diameter. DF, degrees of freedom.
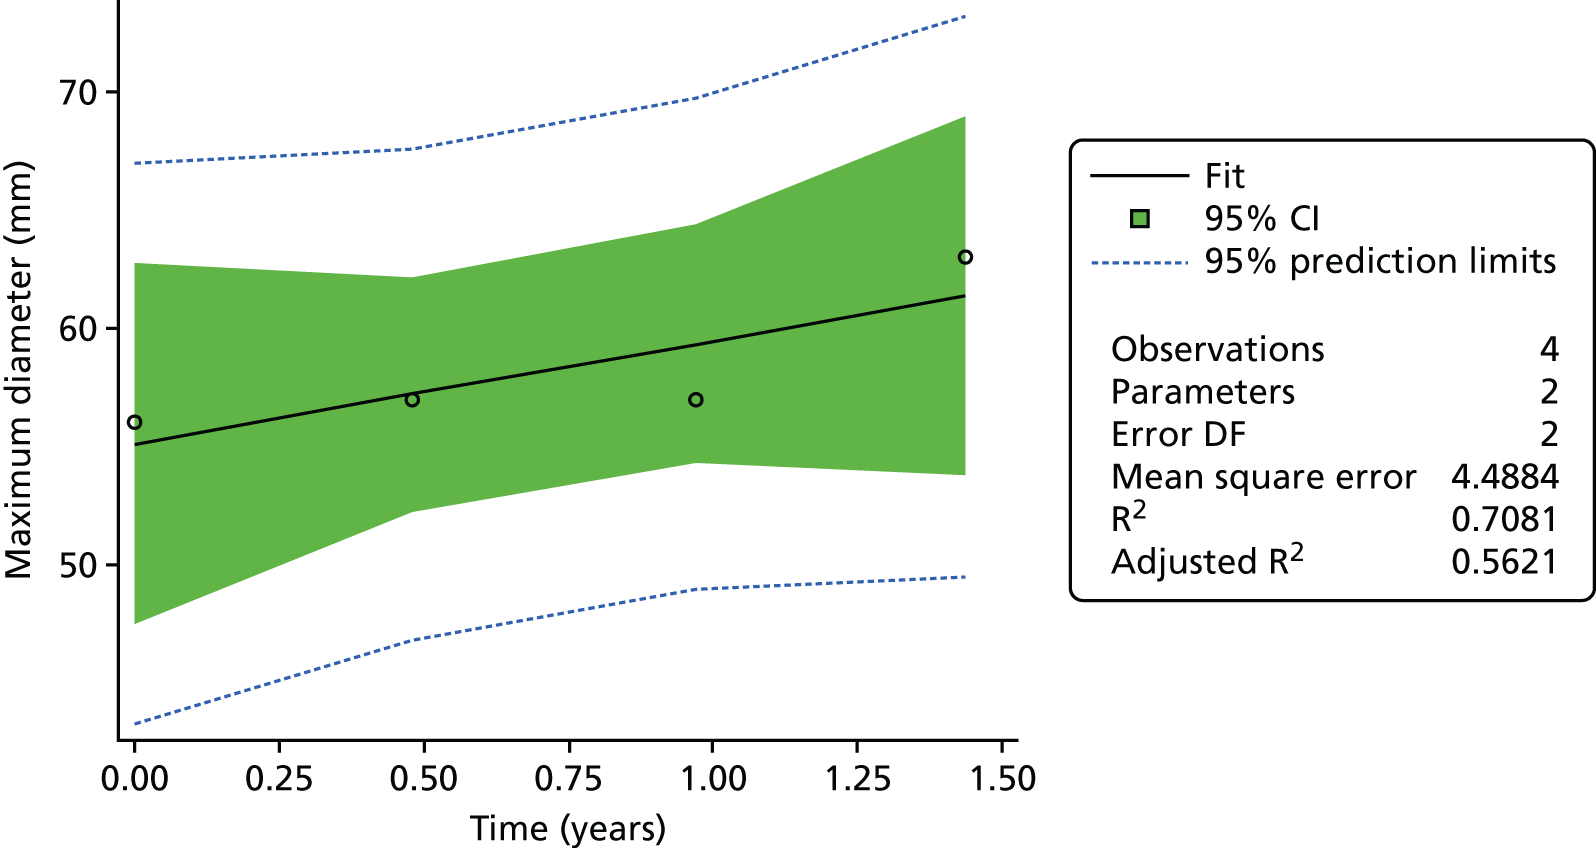
From this we obtain the following regression with a slope of 4.34 mm/year compared with a rate of 4.87 mm/year if we use the simple method taking into account only the first and last measurements (see Appendix 5, Tables 38 and 39).
Table 15 shows the descriptive statistics for ultrasonography change and ultrasonography growth rate both calculated using the first and last observations only, and also the ultrasonography growth rate determined from the slope of the regression.
| Variable | Group | n | n missing | Mean | SD | Minimum | Lower quartile | Median | Upper quartile | Maximum |
|---|---|---|---|---|---|---|---|---|---|---|
| US change, first to last (mm) | Missing | 3 | 2 | 6.3 | 2.1 | 4.0 | 4.0 | 7.0 | 8.0 | 8.0 |
| US change, first to last (mm) | Negative | 161 | 30 | 4.1 | 3.8 | –3.0 | 1.0 | 4.0 | 6.0 | 24.0 |
| US change, first to last (mm) | Positive | 115 | 31 | 4.7 | 3.6 | –3.0 | 2.0 | 4.0 | 7.0 | 16.0 |
| US rate, first to last (mm/year) | Missing | 3 | 2 | 4.4 | 2.9 | 2.3 | 2.3 | 3.2 | 7.7 | 7.7 |
| US rate, first to last (mm/year) | Negative | 161 | 30 | 2.6 | 2.5 | –1.8 | 0.9 | 2.3 | 3.7 | 12.4 |
| US rate, first to last (mm/year) | Positive | 115 | 31 | 3.2 | 2.5 | –1.7 | 1.4 | 2.9 | 4.6 | 11.6 |
| US rate, slope of regression (mm/year) | Missing | 3 | 2 | 4.3 | 3.0 | 2.5 | 2.5 | 2.7 | 7.8 | 7.8 |
| US rate, slope of regression (mm/year) | Negative | 161 | 30 | 2.5 | 2.4 | –1.8 | 1.0 | 2.1 | 3.3 | 12.4 |
| US rate, slope of regression (mm/year) | Positive | 115 | 31 | 3.1 | 2.5 | –1.5 | 1.4 | 3.0 | 4.3 | 11.6 |
Using a two-sample t-test, there is evidence of a difference in the mean growth rate between USPIO+ve and USPIO–ve participants when examining the simple rate [first to last scan; labelled ‘US rate, first to last (mm/year)’ in Table 15]: difference in means of 0.6 mm with 95% CI for the difference of 0.03 to 1.20 mm (p = 0.0394).
However, looking at the absolute change [first to last scan; labelled ‘US change, first to last (mm)’ in Table 15], the difference between positive and negative uptake is not statistically significant: difference in means of 0.6 mm with 95% CI for difference of –0.3 to 1.5 mm (p = 0.1727).
If we were to use the annual rate as determined by the linear regression [labelled ‘US rate, slope of regression (mm/year)’ in Table 15], the difference between positive and negative uptake is very similar to the simple method using only the first and last reading: difference in means 0.6 mm/year with 95% CI for difference of 0.02 to 1.20 mm/year (p = 0.0424).
The pattern of change in ultrasonographic measurements over time are shown in two plots (see Appendix 6, Figures 20 and 21). Figure 20 shows the results for those participants in the USPIO–ve group and Figure 21 shows the results for those in the USPIO+ve group. In both plots each line represents a different participant.
Using the slope of the individual participant regressions, a linear regression has been generated accounting for the baseline variables: sex (male, female), smoking status (current smoker, non-current smoker), systolic blood pressure (mm/Hg, continuous variable) and baseline AAA size as measured on ultrasonography (mm, continuous variable). Table 16 shows a second model generated with the addition of USPIO uptake group (positive, negative).
| Parameter | Estimate | Standard error | t-value | p-value |
|---|---|---|---|---|
| Model 1: sex, smoking status, AAA ultrasound diameter and systolic BP | ||||
| Intercept | 0.3821393859 | 1.47846306 | 0.26 | 0.7962 |
| Ultrasound maximum diameter (mm) | 0.0385174610 | 0.02311211 | 1.67 | 0.0968 |
| Sex | ||||
| Female | 0.3213353188 | 0.39224802 | 0.82 | 0.4134 |
| Male | 0.0000000000 | – | – | – |
| Smoking status | ||||
| Current | 0.7820228323 | 0.32178331 | 2.43 | 0.0157 |
| Not-current | 0.0000000000 | – | – | – |
| Baseline systolic BP | 0.0019579385 | 0.00703613 | 0.28 | 0.7810 |
| Model 2: sex, smoking status, AAA ultrasound diameter, systolic BP and USPIO uptake | ||||
| Intercept | 0.8673807873 | 1.52407611 | 0.57 | 0.5697 |
| Ultrasound maximum diameter (mm) | 0.0314975091 | 0.02372021 | 1.33 | 0.1853 |
| Sex | ||||
| Female | 0.2931745854 | 0.39238537 | 0.75 | 0.4556 |
| Male | 0.0000000000 | – | – | – |
| Smoking status | ||||
| Current | 0.7095265868 | 0.32629643 | 2.17 | 0.0305 |
| Not-current | 0.0000000000 | – | – | – |
| Baseline systolic BP | 0.0027264626 | 0.00705297 | 0.39 | 0.6994 |
| USPIO–ve | 0.3952221270 | 0.30716943 | –1.29 | 0.1993 |
| USPIO+ve | 0.0000000000 | – | – | – |
Clinical events
Table 17 shows the breakdown of events by USPIO uptake. It contains the summary events by USPIO uptake and includes differences, 95% CI for differences and p-values.
| Clinical event | All participants (N = 342), n (%) | USPIO, n (%) | Difference (95% CI for difference) | p-value | ||
|---|---|---|---|---|---|---|
| Unknown (n = 5) | Negative (n = 191) | Positive (n = 146) | ||||
| AAA | ||||||
| Rupture/repair | 140 (40.9) | 3 (60) | 68 (35.6) | 69 (47.3) | 11.7 (1.1 to 22.2) | 0.0308 |
| Rupture | 17 (5.0) | 0 (0) | 7 (3.7) | 10 (6.8) | 3.2 (–1.7 to 8.1) | 0.1857 |
| Repair | 126 (36.8) | 3 (60) | 62 (32.5) | 61 (41.8) | 9.3 (–1.1 to 19.7) | 0.0782 |
| Type of repair | ||||||
| EVAR | 53 (15.5) | 1 (20) | 29 (15.2) | 23 (15.8) | ||
| Open | 73 (21.3) | 2 (40) | 33 (17.3) | 38 (26.0) | ||
| Type of surgery | ||||||
| Elective | 120 (35.1) | 3 (60) | 58 (30.4) | 59 (40.4) | ||
| Emergency | 6 (1.8) | 0 (0) | 4 (2.1) | 2 (1.4) | ||
| Death | ||||||
| All-cause | 48 (14.0) | 1 (20) | 21 (11.0) | 26 (17.8) | 6.8 (–0.8 to 14.4) | 0.0736 |
| Cardiovascular: AAA related | 17 (5.0) | 0 (0) | 6 (3.1) | 11 (7.5) | 4.4 (–0.6 to 9.3) | 0.0679 |
| Cardiovascular: non-AAA related | 12 (3.5) | 0 (0) | 8 (4.2) | 4 (2.7) | ||
| CVA | 2 (0.6) | 0 (0) | 2 (1.0) | 0 (0) | ||
| IHD | 8 (2.3) | 0 (0) | 4 (2.1) | 4 (2.7) | ||
| Other cardiovascular | 2 (0.6) | 0 (0) | 2 (1.0) | 0 (0) | ||
| Non cardiovascular | 19 (5.6) | 1 (20) | 7 (3.7) | 11 (7.5) | ||
| Malignancy | 12 (3.5) | 1 (20) | 4 (2.1) | 7 (4.8) | ||
| Other | 7 (2.0) | 0 (0) | 3 (1.6) | 4 (2.7) | ||
Abdominal aortic aneurysm rupture or repair
Time to event has been determined by the number of days between consent and rupture or repair (Figure 11); when no rupture or repair has occurred, participants have been censored at 21 November 2016 or at date of death. Table 18 shows the descriptive statistics for time to event/censor broken down by event.
FIGURE 11.
The Kaplan–Meier survival curve for AAA rupture or repair stratified by USPIO uptake group. Product-limit survival estimates with number of participants at risk.
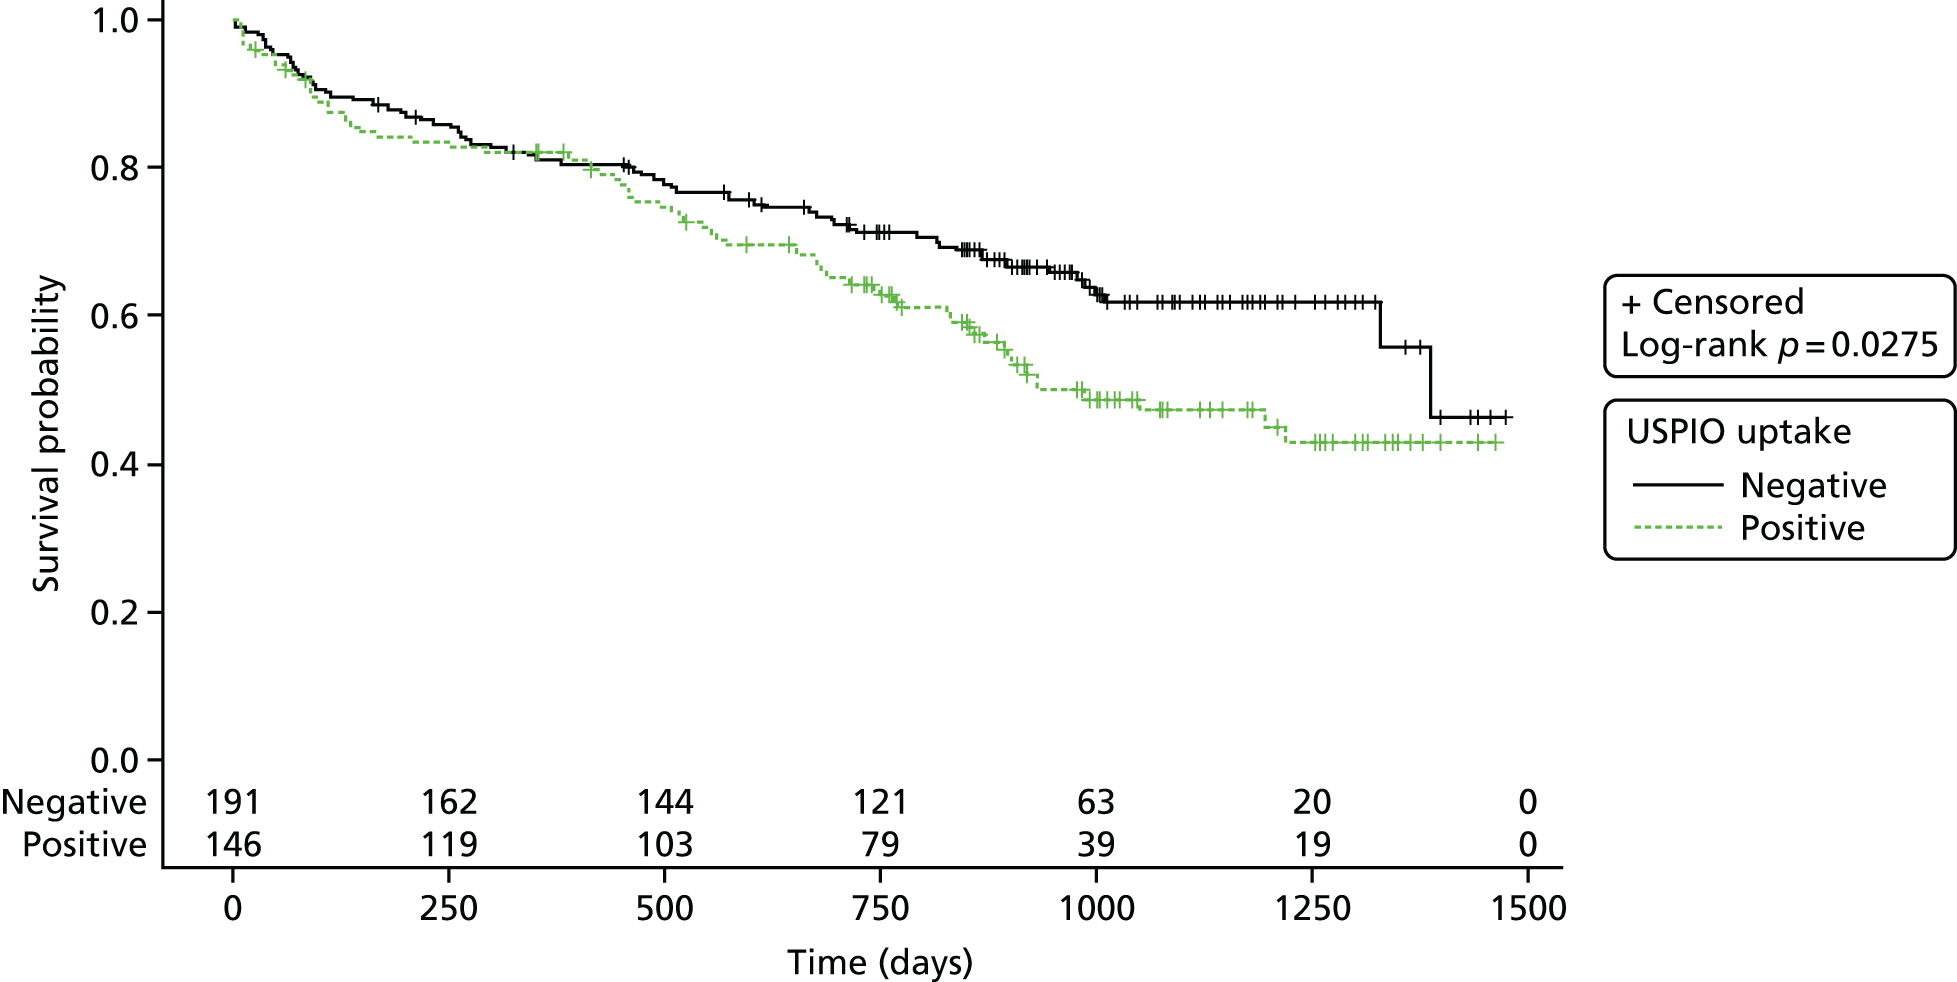
| Rupture or repair | n | Mean | SD | Minimum | Lower quartile | Median | Upper quartile | Maximum |
|---|---|---|---|---|---|---|---|---|
| No | 202 | 975.7 | 274.3 | 27.0 | 851.0 | 987.5 | 1175 | 1474 |
| Yes | 140 | 447.5 | 350.3 | 2.0 | 97.0 | 446.5 | 718.5 | 1387 |
A Cox proportional hazards model has been generated using ‘time to the composite end point of rupture/repair’, accounting for the baseline variables: sex (male, female), smoking status (current smoker, non-current smoker), systolic blood pressure (mm/Hg, continuous variable) and baseline AAA size as measured on ultrasonography (mm, continuous variable). Table 19 shows a second model generated using ‘with the addition of USPIO uptake group’ (positive, negative).
| Parameter | DF | Parameter estimate | Standard error | χ2 | p-value | Hazard ratio | 95% hazard ratio CI | Label |
|---|---|---|---|---|---|---|---|---|
| Model 1: sex, smoking status, AAA ultrasound diameter and systolic BP – analysis of maximum likelihood estimates | ||||||||
| Ultrasound maximum diameter (mm) | 1 | 0.07427 | 0.00777 | 91.2646 | <.0001 | 1.077 | 1.061 to 1.094 | AAA diameter: US (mm) |
| Sex: female | 1 | –0.04939 | 0.24491 | 0.0407 | 0.8402 | 0.952 | 0.589 to 1.538 | Sex: female |
| Smoking habit: current | 1 | 0.38142 | 0.18872 | 4.0849 | 0.0433 | 1.464 | 1.012 to 2.120 | Smoking status: current |
| Baseline systolic BP | 1 | –0.00329 | 0.00433 | 0.5759 | 0.4479 | 0.997 | 0.988 to 1.005 | BP: systolic |
| Model 2: sex, smoking status, AAA ultrasound diameter, systolic BP and USPIO uptake – analysis of maximum likelihood estimates | ||||||||
| Ultrasound maximum diameter (mm) | 1 | 0.07433 | 0.00824 | 81.2851 | < 0.0001 | 1.077 | 1.060 to 1.095 | AAA diameter: US (mm) |
| Sex: female | 1 | –0.04912 | 0.24533 | 0.0401 | 0.8413 | 0.952 | 0.589 to 1.540 | Sex: female |
| Smoking habit: current | 1 | 0.38217 | 0.19284 | 3.9275 | 0.0475 | 1.465 | 1.004 to 2.139 | Smoking status: current |
| Baseline systolic BP | 1 | –0.00329 | 0.00435 | 0.5727 | 0.4492 | 0.997 | 0.988 to 1.005 | BP: systolic |
| USPIO uptake: negative | 1 | 0.00349 | 0.18380 | 0.0004 | 0.9849 | 1.003 | 0.700 to 1.439 | Group: negative |
Appendix 6, Figure 22, shows the predicted probability of a rupture/repair by 2 years calculated using each of the given models. A diagonal line has been inserted for reference and illustrates where the points would lie if there was no difference in the models and the symbols/colours are used to illustrate presence or absence of rupture/repair at any point during the study [rupture/repair (green crosses) or no rupture or repair (blue circles)].
Tables 20 and 21 show the reclassification statistics, respectively.
| Model | Number of pairs | C-statistic | 95% CI | ||
|---|---|---|---|---|---|
| Usable | Concordant | Discordant | |||
| 1 (without USPIO) | 46,032 | 36,476 | 9556 | 0.79241 | 0.63918 to 0.91457 |
| 2 (with USPIO) | 46,032 | 36,486 | 9546 | 0.79262 | 0.63944 to 0.91473 |
| Events | All | Reclassified | |
|---|---|---|---|
| Up | Down | ||
| Estimated event rate | 0.316 | 0.291 | 0.351 |
| Estimated number of event participants | 106.6 | 55.85 | 50.84 |
| Estimated number of non-event participants | 230.4 | 136.2 | 94.16 |
| Net reclassification (%) | |||
| Among event participants | 4.7 | ||
| Among non-event participants | –18.2 | ||
| Overall (95% CI) | –13.5 (–36.4 to 9.3) | ||
Abdominal aortic aneurysm rupture
Time to event has been determined by the number of days between consent and rupture (Figure 12); when no rupture has occurred, participants have been censored at 21 November 2016 or at date of death. Table 22 shows the descriptive statistics for time to event/censor broken down by event.
| Rupture | n | Mean | SD | Minimum | Lower quartile | Median | Upper quartile | Maximum |
|---|---|---|---|---|---|---|---|---|
| No | 325 | 1030 | 257.2 | 27.0 | 888.0 | 1035 | 1218 | 1474 |
| Yes | 17 | 514.0 | 258.3 | 69.0 | 269.0 | 522.0 | 715.0 | 977.0 |
FIGURE 12.
The Kaplan–Meier survival curve for AAA rupture stratified by USPIO uptake group. Product-limit survival estimates with number of participants at risk.
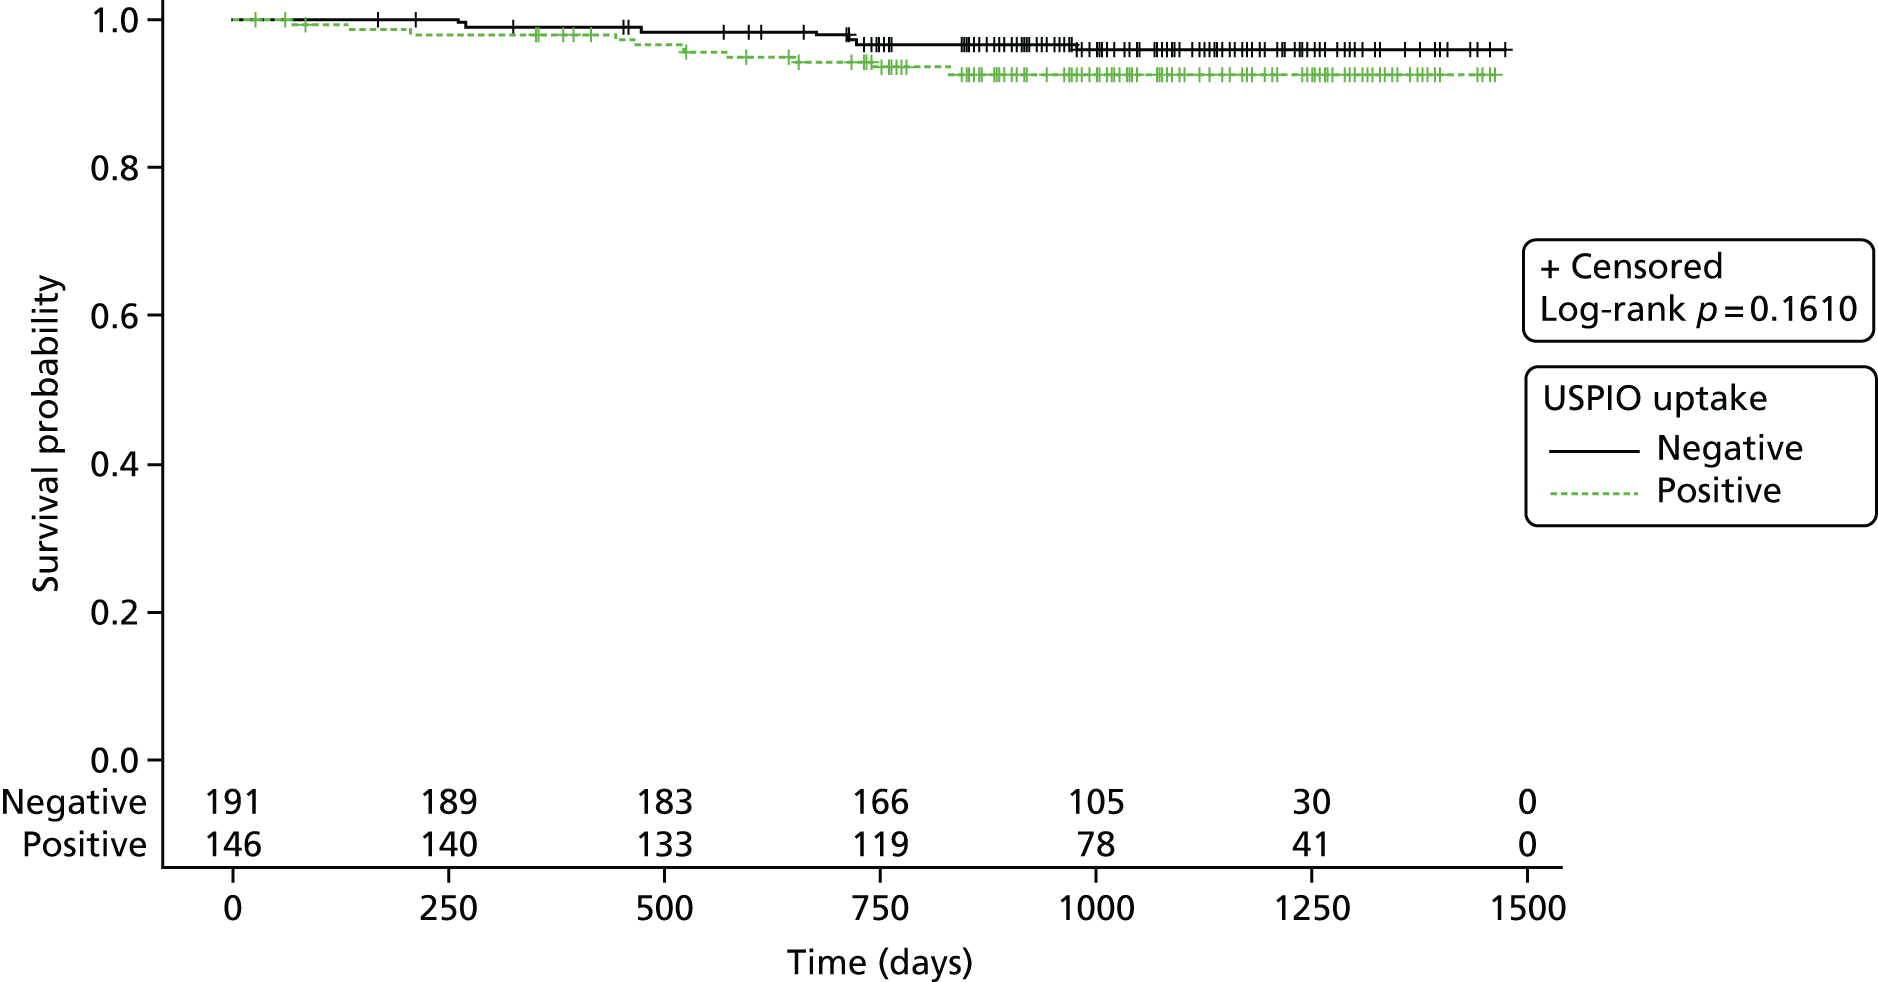
A Cox proportional hazards model has been generated using ‘time to the end point of rupture’, accounting for the baseline variables: sex (male, female), smoking status (current smoker, non-current smoker), systolic blood pressure (mm/Hg, continuous variable) and baseline AAA size as measured on ultrasonography (mm, continuous variable). Tables 23 and 24 shows a second model generated using ‘with the addition of USPIO uptake group’ (positive, negative).
| Parameter | DF | Parameter estimate | Standard error | χ2 | p-value | Hazard ratio | 95% hazard ratio CI | Label |
|---|---|---|---|---|---|---|---|---|
| Model 1: sex, smoking status, AAA ultrasound diameter and systolic BP – analysis of maximum likelihood estimates | ||||||||
| Ultrasound maximum diameter | 1 | 0.06889 | 0.02255 | 9.3303 | 0.0023 | 1.071 | 1.025 to 1.120 | AAA diameter: US (mm) |
| Sex: female | 1 | 0.70185 | 0.58794 | 1.4250 | 0.2326 | 2.017 | 0.637 to 6.386 | Sex: female |
| Smoking habit: current | 1 | 0.65818 | 0.50088 | 1.7267 | 0.1888 | 1.931 | 0.724 to 5.155 | Smoking status: current |
| Baseline systolic BP | 1 | 0.00653 | 0.01091 | 0.3576 | 0.5499 | 1.007 | 0.985 to 1.028 | BP: systolic |
| Model 2: sex, smoking status, AAA ultrasound diameter, systolic BP and USPIO uptake – analysis of maximum likelihood estimates | ||||||||
| Ultrasound maximum diameter | 1 | 0.06481 | 0.02347 | 7.6261 | 0.0058 | 1.067 | 1.019 to 1.117 | AAA diameter: US (mm) |
| Sex: female | 1 | 0.67374 | 0.58908 | 1.3081 | 0.2527 | 1.962 | 0.618 to 6.223 | Sex: female |
| Smoking habit: current | 1 | 0.59066 | 0.51447 | 1.3181 | 0.2509 | 1.805 | 0.659 to 4.948 | Smoking status: current |
| Baseline systolic BP | 1 | 0.00657 | 0.01083 | 0.3677 | 0.5443 | 1.007 | 0.985 to 1.028 | BP: systolic |
| USPIO uptake: negative | 1 | –0.29961 | 0.52479 | 0.3259 | 0.5681 | 0.741 | 0.265 to 2.073 | Group: negative |
| Model | Number of pairs | C-statistic | 95% CI | ||
|---|---|---|---|---|---|
| Usable | Concordant | Discordant | |||
| 1 (without USPIO) | 5712 | 3608 | 2104 | 0.63165 | 0.12679 to 1.05455 |
| 2 (with USPIO) | 5712 | 3601 | 2111 | 0.63043 | 0.12573 to 1.05393 |
Appendix 6, Figure 23, shows the predicted probability of a rupture by 2 years calculated using each of the given models. A diagonal line has been inserted for reference and illustrates where the points would lie if there was no difference in the models, and the symbols/colours are used to illustrate presence or absence of rupture at any point during the study [rupture (green crosses) or no rupture (blue circles)].
Table 25 shows the reclassification statistics.
| Events | All | Reclassified | |
|---|---|---|---|
| Up | Down | ||
| Estimated event rate | 0.043 | 0.058 | 0.032 |
| Estimated number of event participants | 14.52 | 8.36 | 6.22 |
| Estimated number of non-event participants | 322.5 | 136.6 | 185.8 |
| Net reclassification (%) | |||
| Among event participants | 14.7 | ||
| Among non-event participants | 15.2 | ||
| Overall (95% CI) | 29.9 (–22.0 to 81.9) | ||
Abdominal aortic aneurysm repair
There are 126 participants who underwent a repair procedure during the trial.
Time to event has been determined by the number of days between consent and repair; when no repair has occurred, participants have been censored at 21 November 2016 or at date of death. Table 26 shows the descriptive statistics for time to event/censor broken down by event.
| Repair | n | Mean | SD | Minimum | Lower quartile | Median | Upper quartile | Maximum |
|---|---|---|---|---|---|---|---|---|
| No | 216 | 945.8 | 295.5 | 27.0 | 776.0 | 970.0 | 1147 | 1474 |
| Yes | 126 | 440.2 | 359.4 | 2.0 | 92.0 | 412.0 | 744.0 | 1387 |
Figure 13 shows the Kaplan–Meier survival curve for AAA repair and has been stratified by USPIO uptake group.
FIGURE 13.
The Kaplan–Meier survival curve for AAA repair stratified by USPIO uptake group. Product-limit survival estimates with number of participants at risk.
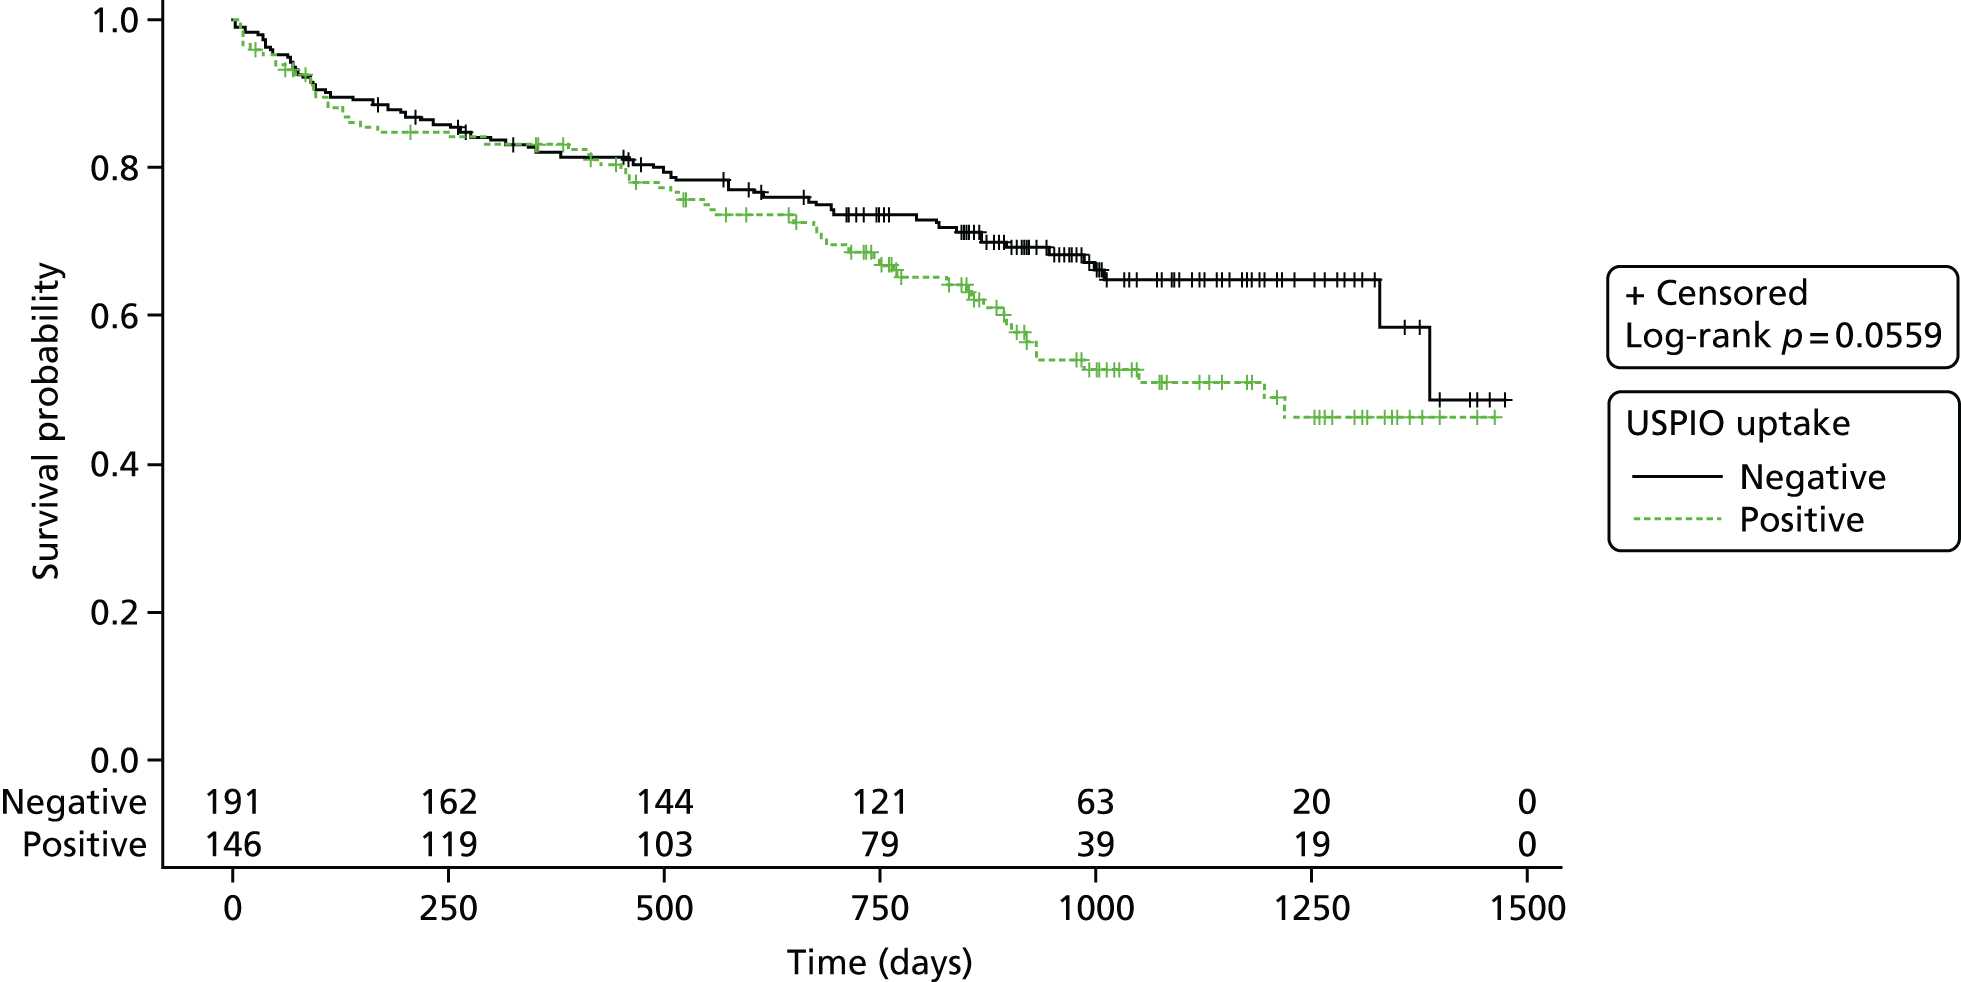
A Cox proportional hazards model has been generated using ‘time to the end point of repair’, accounting for the baseline variables: sex (male, female), smoking status (current smoker, non-current smoker), systolic blood pressure (mm/Hg, continuous variable) and baseline AAA size as measured on ultrasonography (mm, continuous variable). Tables 27 and 28 show a second model generated using ‘with the addition of USPIO uptake group’ (positive, negative).
| Parameter | DF | Parameter estimate | Standard error | χ2 | p-value | Hazard ratio | 95% hazard ratio CI | Label |
|---|---|---|---|---|---|---|---|---|
| Model 1: sex, smoking status, AAA ultrasound diameter and systolic BP – analysis of maximum likelihood estimates | ||||||||
| Ultrasound maximum diameter | 1 | 0.07251 | 0.00824 | 77.5089 | < 0.0001 | 1.075 | 1.058 to 1.093 | AAA diameter: US (mm) |
| Sex: female | 1 | –0.17540 | 0.27091 | 0.4192 | 0.5173 | 0.839 | 0.493 to 1.427 | Sex: female |
| Smoking habit: current | 1 | 0.32595 | 0.20081 | 2.6347 | 0.1046 | 1.385 | 0.935 to 2.053 | Smoking status: current |
| Baseline systolic BP | 1 | –0.00410 | 0.00459 | 0.7959 | 0.3723 | 0.996 | 0.987 to 1.005 | BP: systolic |
| Model 2: sex, smoking status, AAA ultrasound diameter, systolic BP and USPIO uptake – analysis of maximum likelihood estimates | ||||||||
| Ultrasound maximum diameter | 1 | 0.07277 | 0.00873 | 69.5514 | < 0.0001 | 1.075 | 1.057 to 1.094 | AAA diameter: US (mm) |
| Sex: female | 1 | –0.17410 | 0.27132 | 0.4117 | 0.5211 | 0.840 | 0.494 to 1.430 | Sex: female |
| Smoking habit: current | 1 | 0.32968 | 0.20516 | 2.5823 | 0.1081 | 1.391 | 0.930 to 2.079 | Smoking status: current |
| Baseline systolic BP | 1 | –0.00414 | 0.00462 | 0.8034 | 0.3701 | 0.996 | 0.987 to 1.005 | BP: systolic |
| USPIO uptake: negative | 1 | 0.01717 | 0.19379 | 0.0079 | 0.9294 | 1.017 | 0.696 to 1.487 | Group: negative |
| Model | Number of pairs | C-statistic | 95% CI | ||
|---|---|---|---|---|---|
| Usable | Concordant | Discordant | |||
| 1 (without USPIO) | 41,328 | 33,062 | 8266 | 0.79999 | 0.63865 to 0.92606 |
| 2 (with USPIO) | 41,328 | 33,044 | 8284 | 0.79955 | 0.63813 to 0.92575 |
Appendix 6, Figure 24, shows the predicted probability of a repair by 2 years calculated using each of the previous models. A diagonal line has been inserted for reference and illustrates where the points would lie if there was no difference in the models, and the symbols/colours are used to illustrate presence or absence of repair at any point during the study [repair (green crosses) or no repair (blue circles)].
Table 29 shows the reclassification statistics.
| Event | All | Reclassified | |
|---|---|---|---|
| Up | Down | ||
| Estimated event rate | 0.283 | 0.266 | 0.307 |
| Estimated number of event participants | 95.36 | 51.00 | 44.45 |
| Estimated number of non-event participants | 241.6 | 141.0 | 100.5 |
| Net reclassification (%) | |||
| Among event participants | 6.9 | ||
| Among non-event participants | –16.7 | ||
| Overall (95% CI) | –9.9 (–33.4 to 13.7) | ||
All-cause death
Time to event has been determined by the number of days between consent and all-cause death; when no death has occurred, participants have been censored at 21 November 2016. Table 30 shows the descriptive statistics for time to event/censor broken down by event.
| Death: all-cause | n | Mean | SD | Minimum | Lower quartile | Median | Upper quartile | Maximum |
|---|---|---|---|---|---|---|---|---|
| No | 294 | 1080 | 197.3 | 711.0 | 916.0 | 1077 | 1245 | 1474 |
| Yes | 48 | 548.1 | 277.9 | 27.0 | 351.5 | 571.0 | 748.5 | 1034 |
Figure 14 shows the Kaplan–Meier curve for all-cause death and has been stratified by USPIO uptake group.
FIGURE 14.
The Kaplan–Meier survival curve for all-cause death stratified by USPIO uptake group. Product-limit survival estimates with number of participants at risk.
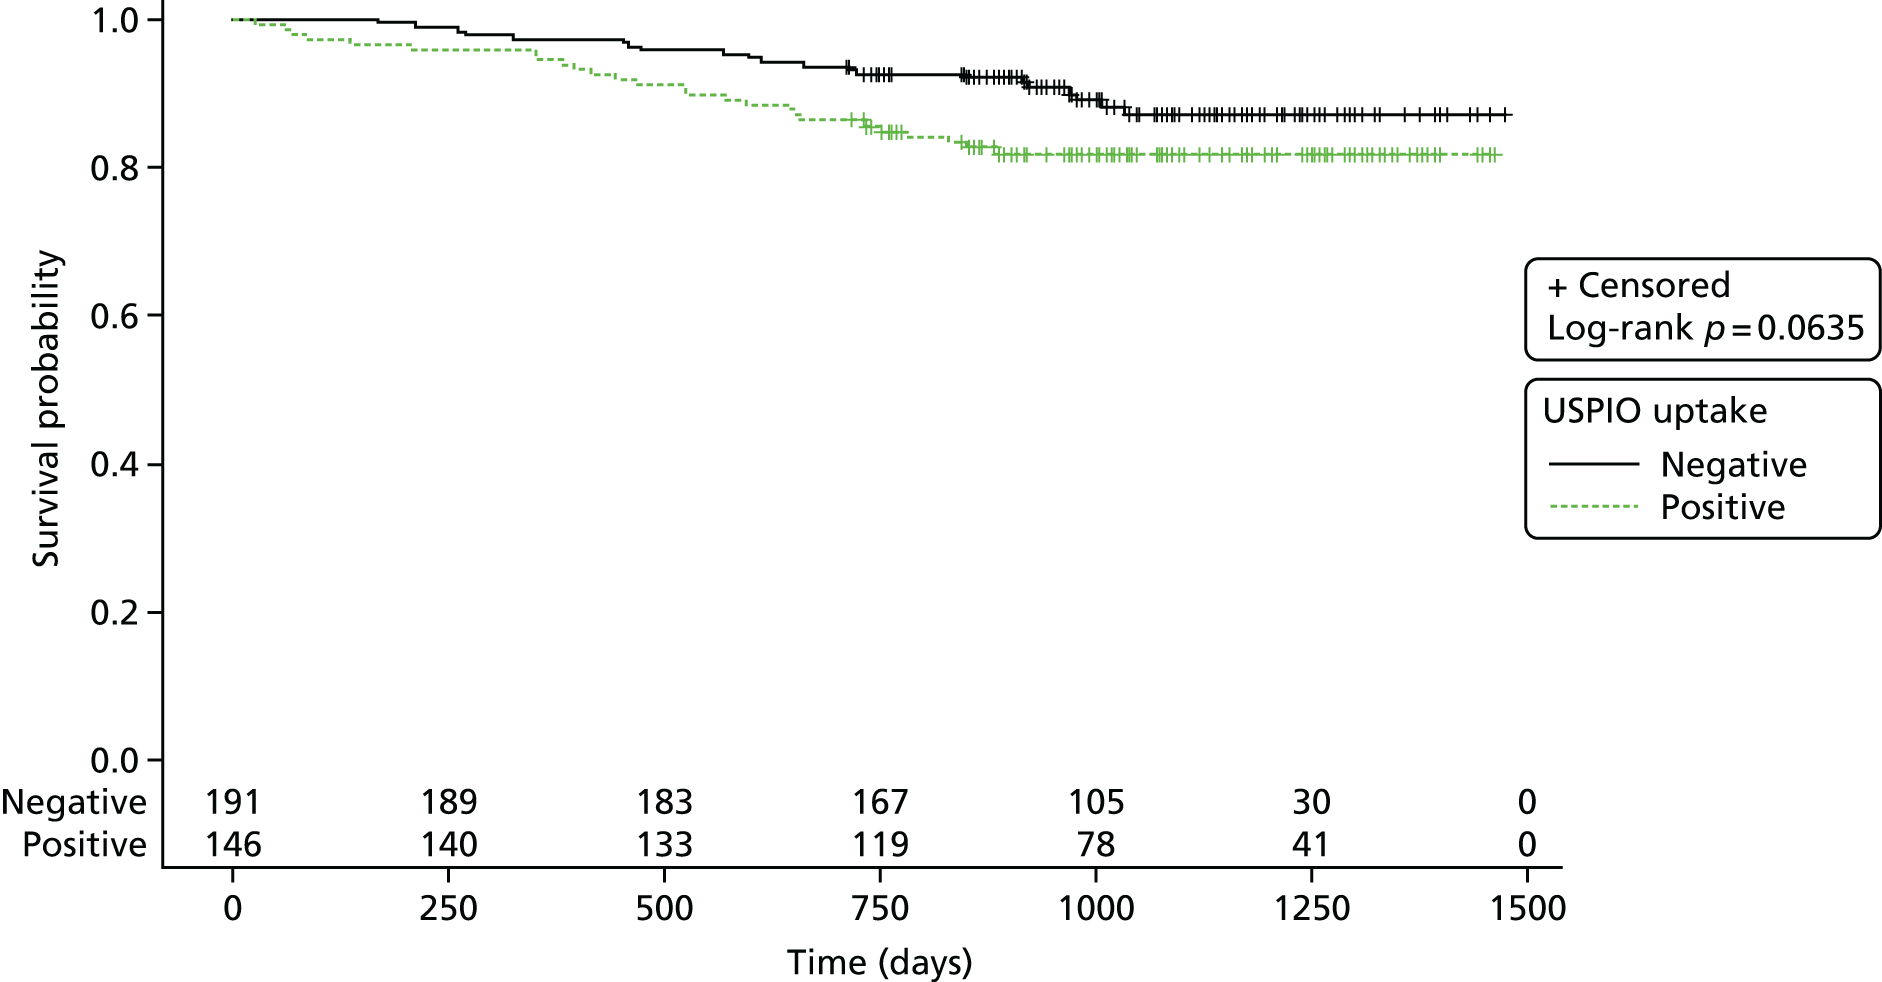
A Cox proportional hazards model has been generated using ‘time to the end point of all-cause death’, accounting for the baseline variables: sex (male, female), smoking status (current smoker, non-current smoker), systolic blood pressure (mm/Hg, continuous variable) and baseline AAA size as measured on ultrasonography (mm, continuous variable). A second model has been generated using ‘with the addition of USPIO uptake group’ (positive, negative) (see Appendix 5, Tables 40–42).
Appendix 6, Figure 25, shows the predicted probability of a death (all-cause) by 2 years, calculated using each of the previous models. A diagonal line has been inserted for reference and illustrates where the points would lie if there was no difference in the models, and the symbols/colours are used to illustrate presence or absence of repair at any point during the study [alive (green crosses) or dead (blue circles)].
Abdominal aortic aneurysm-related death
Time to event has been determined by the number of days between consent and AAA-related death; when no AAA-related death has occurred, participants have been censored at 21 November 2016 or at the date of non-AAA death (see Appendix 5, Table 43).
Figure 15 shows the Kaplan–Meier survival curve for AAA-related death and has been stratified by USPIO uptake group.
FIGURE 15.
The Kaplan–Meier survival curve for AAA-related death stratified by USPIO uptake group. Product-limit survival estimates with number of participants at risk.
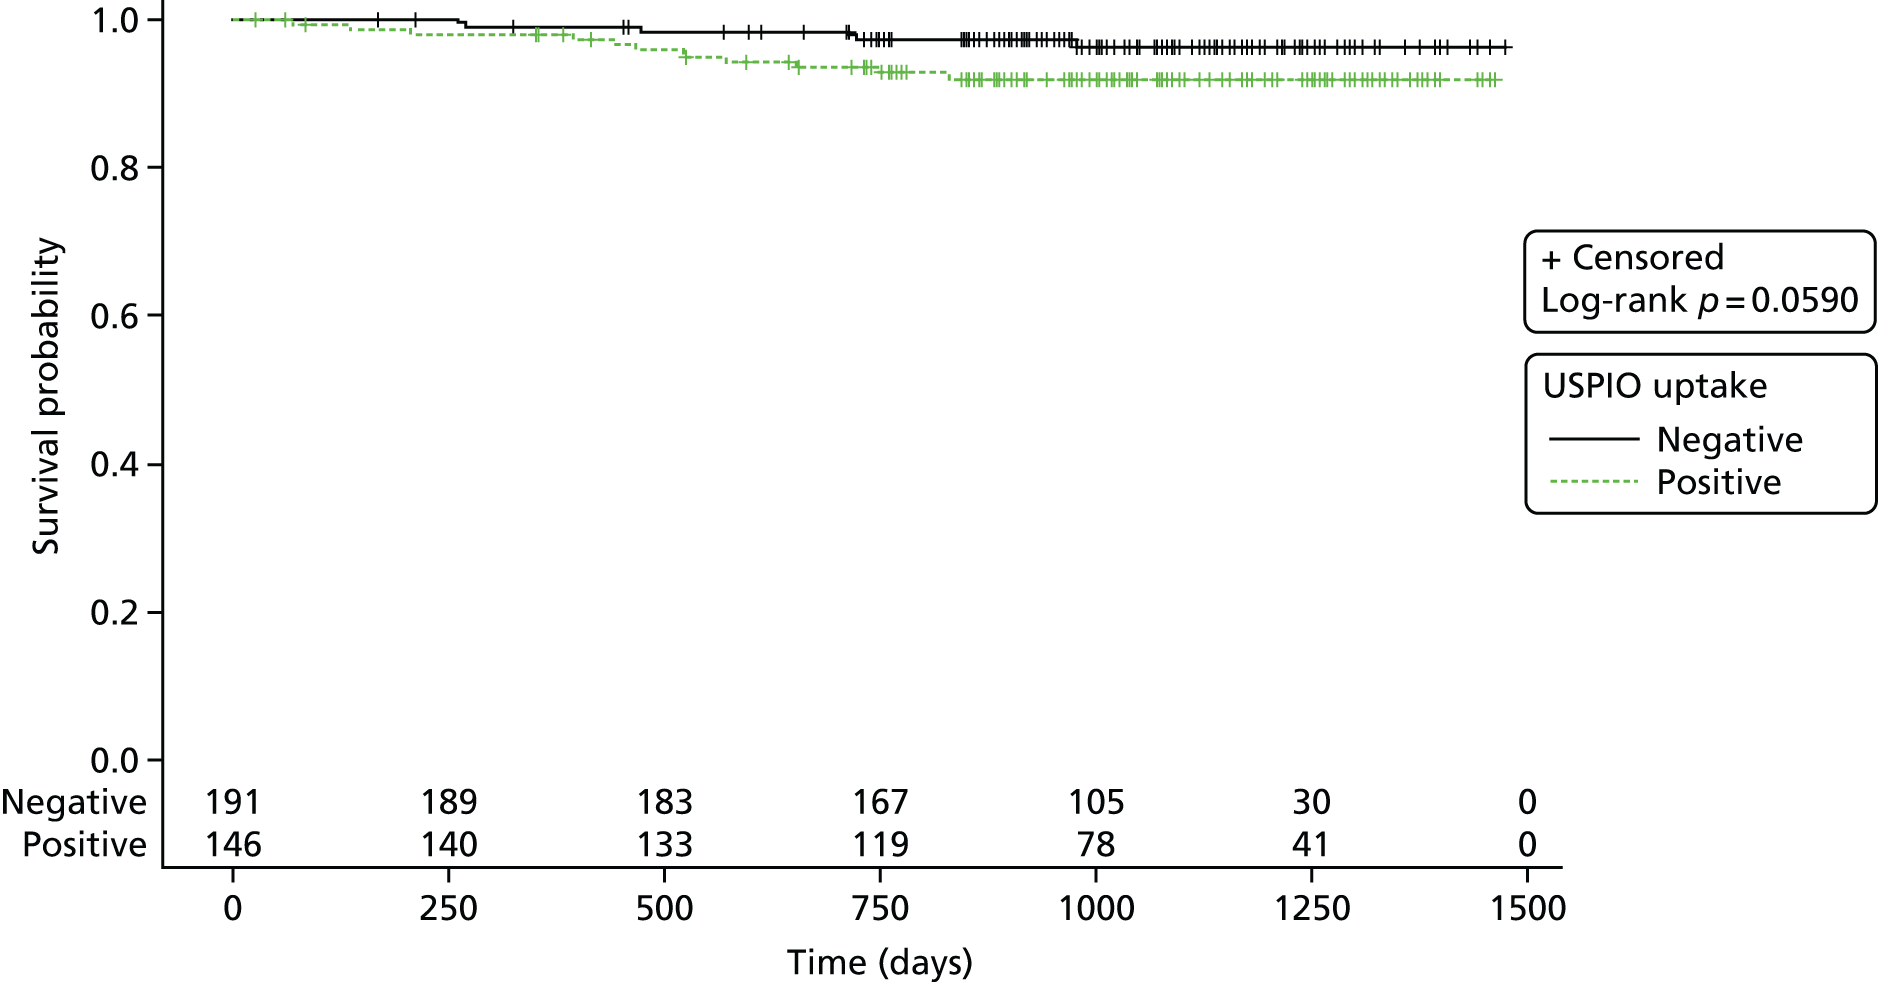
A Cox proportional hazards model has been generated using ‘time to the end point of AAA-related death’, accounting for the baseline variables: sex (male, female), smoking status (current smoker, non-current smoker), systolic blood pressure (mm/Hg, continuous variable) and baseline AAA size as measured on ultrasonography (mm, continuous variable). A second model has been generated using ‘with the addition of USPIO uptake group’ (positive, negative) (see Appendix 5, Tables 44–46).
Appendix 6, Figure 22 shows the predicted probability of an AAA-related death by 2 years, calculated using each of the previous models. A diagonal line has been inserted for reference and illustrates where the points would lie if there was no difference in the models, and the symbols/colours are used to illustrate presence or absence of repair at any point during the study [AAA-related death (green crosses) or no AAA-related death (blue circles)] (see Appendix 6, Figure 26).
Clinical outcome by abdominal aortic aneurysm size
In post hoc analysis, we explored whether or not USPIO enhancement varied in accordance with aneurysm size. We dichotomised the population at the mean diameter into smaller (diameter of 40–49 mm; n = 187) and larger (diameter of ≥ 50 mm; n = 155) aneurysms. The rate of USPIO enhancement was lower in patients with smaller aneurysms: n = 65 (35.1%) versus n = 81 (53.3%) in those with larger aneurysms, difference 18.2% (95% CI 7.7% to 28.9%; p = 0.0008). However, in patients with smaller aneurysms, USPIO enhancement was associated with a doubling in the rate of repair or rupture without an effect on mortality (see Appendix 5, Table 46), whereas it was the reverse in those with larger aneurysms, with a more than doubling of mortality but no effect on the primary end point (see Appendix 5, Tables 47 and 48).
Biomechanical modelling of abdominal aortic aneurysms
Co-localisation of ultrasmall superparamagnetic particles of iron oxide uptake with biomechanical stress
Two-dimensional comparison
When analysing the most diseased segment, 40 aneurysms (80%) demonstrated some degree of visual overlap between regions of elevated stress and USPIO enhancement somewhere in the vessel (e.g. adjacent to lumen and/or wall), and in the remaining 10 cases no visual overlap was observed. Of the 40 aneurysms that did exhibit overlap, only 19 (38%) demonstrated spatial co-location of increased stress and USPIO enhancement adjacent to the aneurysm wall; the remaining aneurysms exhibited overlap of elevated stress at areas of periluminal USPIO uptake when classification is challenging. Overall, only eight aneurysms (16%) demonstrated co-location of elevated stress with an area meeting the definition of mural USPIO enhancement. Examples of the two-dimensional comparison can be seen in Figure 16.
FIGURE 16.
Visual overlap and co-location of %ΔT2* USPIO uptake with elevated stress. (a) Aneurysms with no co-location of elevated stress and USPIO uptake; (b) aneurysms with areas of visual overlap of elevated stress and USPIO uptake at the periluminal area, which does not represent inflammation; and (c) aneurysms demonstrating true co-location of elevated stress with significant mural USPIO enhancement. Black arrows point to approximate regions of co-location.
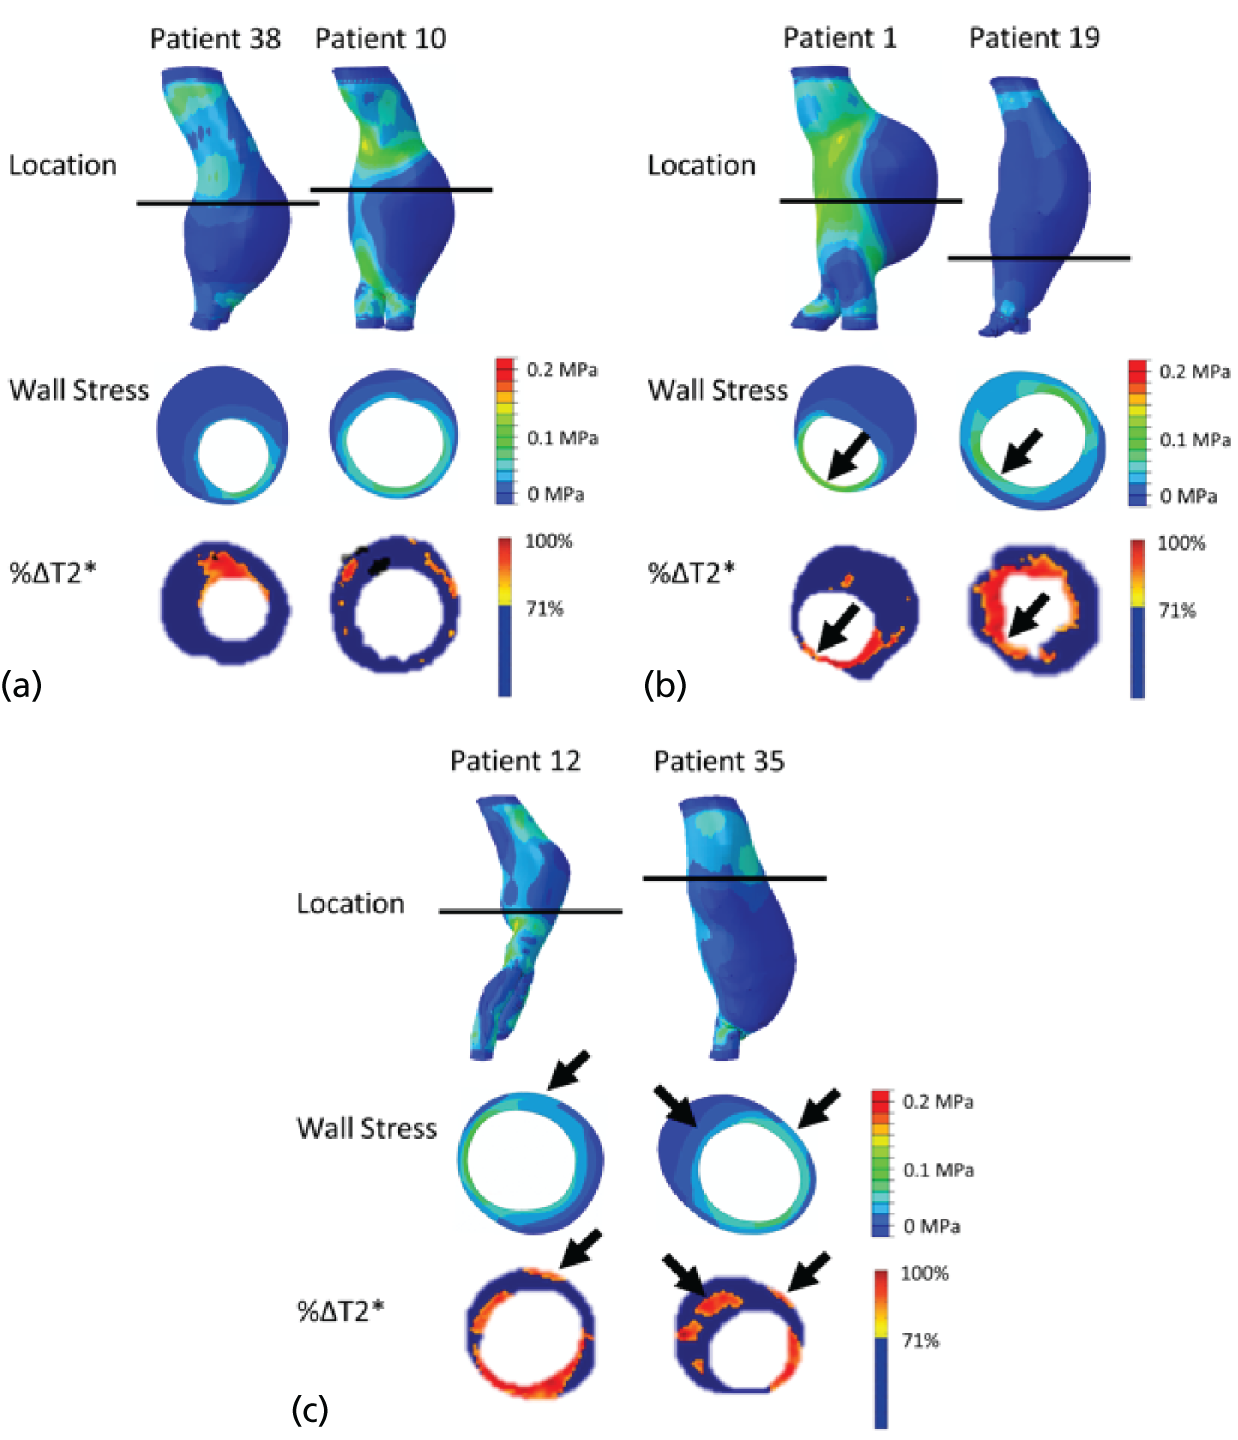
Whole abdominal aortic aneurysm comparison
The average peak wall stress for all aneurysms was 0.1980 MPa. There was no difference (p = 0.83) between the average peak wall stress for USPIO–ve aneurysms [0.1999 MPa (SD 0.1326 MPa)] and USPIO+ve aneurysms [0.1955 MPa (SD 0.1495 MPa)].
Maximum diameter was not associated with peak wall stress (r = 0.13; p = 0.36) or maximum USPIO uptake (r = 0.05; p = 0.74). There was no correlation between peak wall stress and maximum USPIO enhancement over the entire aneurysm (r = 0.17; p = 0.23).
When comparing between groups, diameter was not correlated with peak wall stress in either group (USPIO–ve, r = 0.17, p = 0.39; USPIO+ve, r = 0.13, p = 0.61), nor was diameter and peak USPIO uptake (USPIO–ve, r = 0.04, p = 0.85; USPIO+ve, r = –0.15, p = 0.52). There was no difference in correlation between peak wall stress and mural USPIO enhancement between groups (r = 0.23 vs. r = 0.09; p = 0.22).
Mural ultrasmall superparamagnetic particles of iron oxide and finite element analysis comparison
Mean or peak USPIO uptake within the individual areas of mural USPIO enhancement on the most-diseased segment did not correlate with diameter (r = –0.05, p = 0.61; r = –0.45, p = 0.04, respectively). There were no associations between peak wall stress and mean or peak USPIO uptake within the identified regions of mural USPIO enhancement (r = 0.37, p = 0.10; r = 0.32, p = 0.16).
Influence of wall thickness on predicted clinical outcomes
Figure 17 gives an example of the variation in wall stress for each wall thickness strategy employed. The difference in peak wall stress (PWSuniform – PWStrue) varied from –54.6% to 39.7% with a mean difference of –12.3% to 35.3%, indicating that, overall, the uniform wall model leads to an underestimation of peak wall stress by 12%.
FIGURE 17.
Contour plots showing the magnitude and distribution of wall stress (von Mises) for both uniform (left) and patient-specific (right) wall thickness cases.
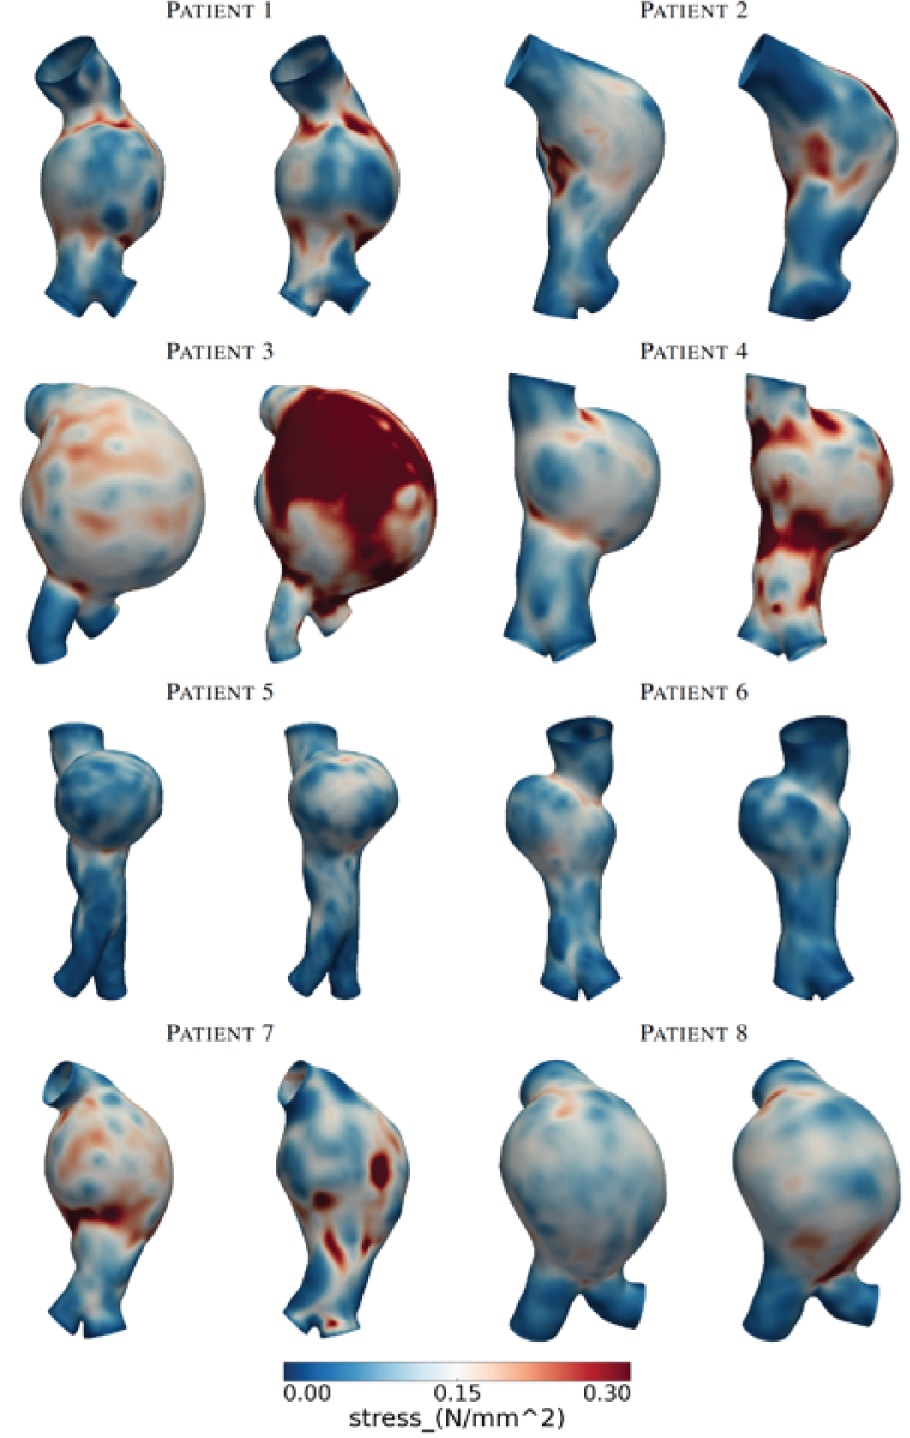
Figure 18 shows the calculated maximum rupture risk index for both wall types, using the RPI method,30 for all patients investigated. The dashed black line represents the point after which risk of rupture increases significantly. There is an increase of rupture risk for every patient, and in four patients the rupture risk index moved into the ‘significant risk’ zone.
FIGURE 18.
Graph showing calculated maximum rupture risk index for both wall types using the RPI method, for all patients investigated. The dashed black line represents the point after which risk of rupture increases significantly.
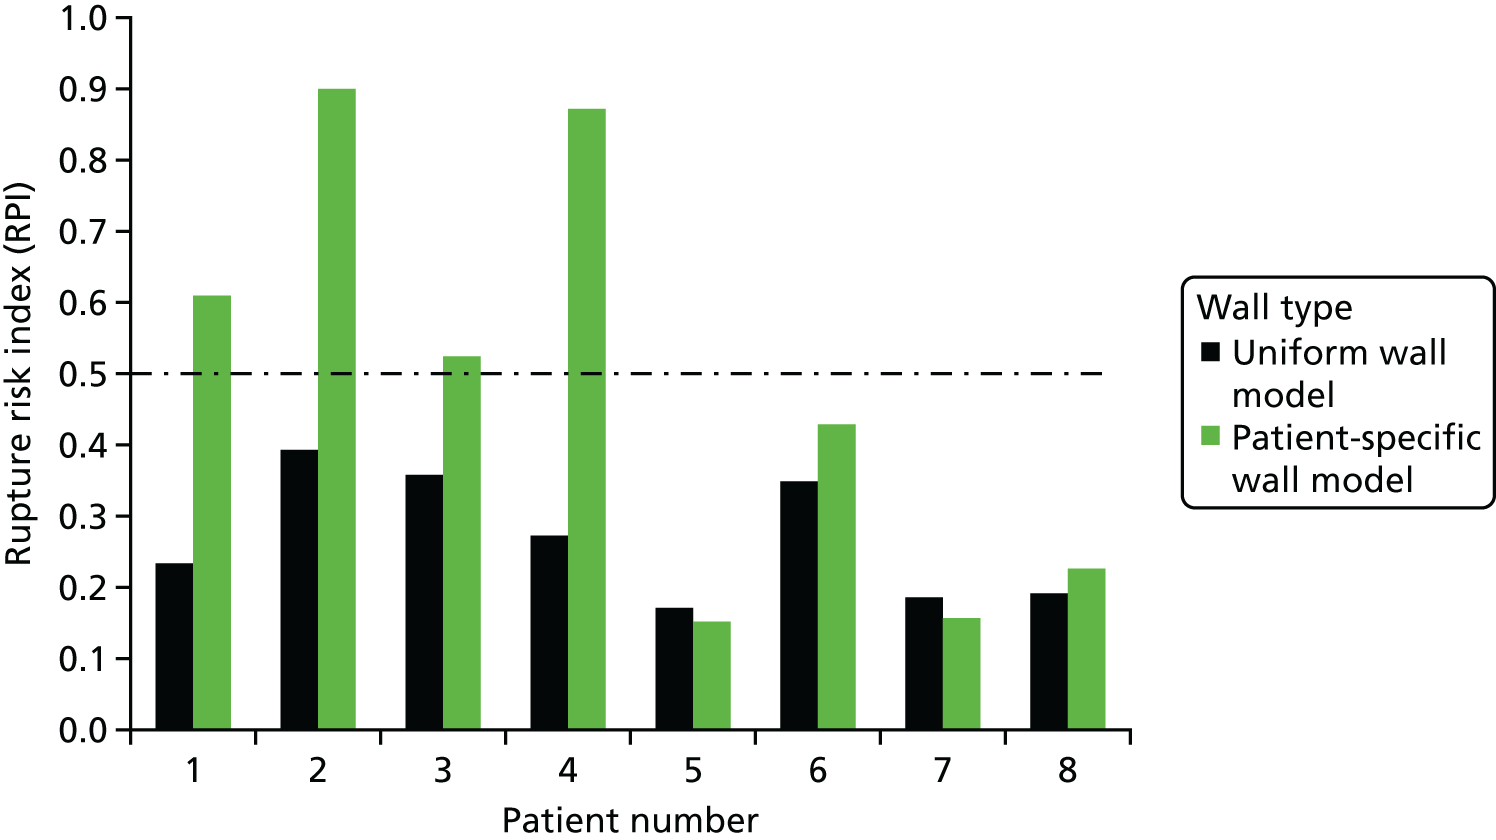
Structural and mechanical changes after 24 months
At baseline, the average maximum AAA diameter was 52 mm (SD 6 mm), mean peak wall stress was 0.194 MPa (SD 0.405 MPa), mean rupture risk was 0.44362 (SD 0.121) and mean total AAA volume was 143.4 cm3 (SD 56.96 cm3). At follow-up, maximum diameter had increase on average by 8%, peak wall stress by 9%, rupture risk by 10% and total volume by up to 22%. Interestingly, not all individual aneurysms increased in dimensions over the course of the study, with some in fact showing a decrease in diameter (2 out of 50) and volume (3 out of 50) by up to 20% and 17%, respectively, at the 24-month time point (see Appendix 6, Figure 27).
Interestingly, if changes to the luminal volume were accounted for then decreases in volume of up to 28% were observed in 13 out of 50 patients (see Appendix 6, Figure 28).
Aneurysm rupture prediction using a three-dimensional analysis of geometrical features
The key parameter computed in this analysis was the longitudinal derivative of the length. As a piecewise interpolation using splines was used, a derivative was continuously defined for each point along each line. The derivative parameter clearly discerns regions of high rates of change in the surface. Qualitative comparison yields some apparent similarity to the FE analysis stress maps in some cases, although the rate of change in longitudinal direction does not replicate the stress patterns.
A key motivation for this project was to relate statistically analytical results derived from the topography of the surface with stress results calculated using FE analysis. The map in Appendix 6, Figure 28, exhibits colour-coded Spearman’s ρ correlation factors between the longitudinal surface derivative and the von Mises stress for 5° radial slices, incorporating several differentiated planar sequences. In addition, the radial location of the maximum occurring stress is marked on the map. The correspondence is high on very few sections of some aneurysms, but very low for most sections. Maximum stresses occur solely in sections with low correlation. Similarly, Spearman’s ρ correlation values between local diameter values and von Mises stress are presented in Appendix 6, Figure 28. Sections of high correlation are frequently seen for this parameter, although predominantly low correlation values were found. Notably, the maximum stress is in radial sectors of high correlation in four cases.
The results presented in Appendix 6, Figures 28 and 29, emphasise that wall stress as determined through FE analysis and parameters derived from the geometry do not highly correlate. However, results regarding data independence suggest that these two geometric parameters are very unlikely to be independent of von Mises wall stress.
Chapter 4 Discussion
This is the largest prospective multicentre clinical study of MRI in patients with AAAs, and is the first report of an imaging technique that not only identifies cellular inflammation, but also predicts disease progression and outcome. This suggests a central role of cellular inflammation in the pathophysiology, progression and outcome of AAA disease. However, on multivariate analysis incorporating known and standard clinical risk factors, USPIO-enhanced MRI scans did not provide independent predictions of aneurysm expansion or clinical outcomes. This suggests that although it informs the pathophysiological progression of AAA disease, the immediate and widespread clinical applications of this technique are more limited.
In a pilot study of 29 patients with AAAs, we previously described an association between aneurysm expansion and mural USPIO-enhanced MRI. 22 This pilot study suggested that rates of expansion were markedly enhanced and that this was independent of aneurysm diameter. We concluded that this was a potentially exciting and important imaging approach that needed further prospective validation in a large multicentre trial. This was the basis of the MA3RS study. We have here presented our findings in 342 patients with AAAs followed up over a median of nearly 3 years. Although we confirmed that mural USPIO enhancement was associated with more rapid rates of aneurysm expansion, the effect size was more modest and it was not independent of known risk factors, especially current smoking habit and baseline aneurysm diameter. Thus, we were unable to confirm either the magnitude or the independent predictive power of mural USPIO enhancement on the rate of aneurysm expansion.
Why did we fail to demonstrate our previous striking observations? There are a number of potential explanations. First, the chance of a type I error in a small pilot study is relatively high. Second, it is hard to show that risk factors interact with the imaging findings when there is such a small sample size. Third, effect sizes are often attenuated and more conservative when studies are undertaken across multiple sites with the inevitable variation in clinical approaches to patients and scanning. This is part of the rationale for undertaking multicentre studies, to determine generalisability of initial findings. Fourth, we previously used a different USPIO preparation (ferumoxtran; Sinerem, Guerbet, France) and we cannot be sure that its behaviour is identical. Finally, and perhaps most importantly, mural USPIO enhancement is likely to be indicative of aneurysm inflammation induced by smoking and leading to aneurysm diameter expansion detected by ultrasonography. Thus, to demonstrate added predictive power is challenging, especially when the clinical end points are primary driven by elective repair triggered by crossing the ultrasonography-determined threshold of aneurysm diameter.
Reproducibility and natural history of mural ultrasmall superparamagnetic particles of iron oxide enhancement
In a subgroup of patients, we explored both the reproducibility and the natural history of mural USPIO enhancement. We determined reproducibility by assessing categorisation of patients with mural USPIO enhancement, both between trained observers with repeated image analysis, and with repeated MRI scans and ferumoxytol administration performed within 1 month of each other. We were able to demonstrate very good reproducibility of the image analysis approach with excellent agreement within and between observers. With repeated scanning, patients were again reliably categorised in accordance with mural USPIO enhancement. This established that the technique was sufficiently robust to be potentially used in clinical practice.
We next explored the natural history of mural USPIO enhancement to determine whether or not there are significant temporal changes in USPIO uptake. We undertook repeated MRI and USPIO administration at 1- and 2-year intervals. We observed an apparent time-dependent change in mural USPIO enhancement. Most AAAs with initial mural USPIO enhancement demonstrated a loss of enhancement with time, and, conversely, fewer aneurysms developing mural USPIO enhancement having been previously quiescent. This was more marked at the 2-year rather than the 1-year time point. This is perhaps not unsurprising, as the extent of inflammation within AAAs is likely to vary with time, after which some aneurysms will heal whereas others will become more inflamed. Moreover, this changing biology did appear to track with variations in aneurysm expansion rates. This temporal variability will perhaps make this technique less attractive for clinical application unless it is undertaken at regular, perhaps yearly, intervals. This does not necessarily present major hurdles as ultrasonography is undertaken at 6- to 12-month intervals, but this would substantially add to the cost of implementing such a technique for long-term clinical surveillance.
Mural ultrasmall superparamagnetic particles of iron oxide enhancement and inflammation
Abdominal aortic aneurysm expansion is driven by several potential pathogenetic mechanisms that are associated with inflammation and tissue degradation. 43,44 Macrophages are central to many of these processes45 and their depletion appears to prevent aneurysm formation or progression in preclinical models of AAAs. 46 Non-invasive in vivo imaging of tissue-resident macrophages would therefore seem an intuitive and promising approach in patients with an AAA, but until now it has not been prospectively tested in large clinical cohorts. 44,47,48 This was the rationale for the MA3RS study, the first study in a large clinical cohort to image tissue-resident macrophages with USPIO-enhanced MRI. We demonstrated that USPIO enhancement is associated with more rapid AAA growth rates and adverse clinical outcomes. This provides strong support for the concept that imaging the biology of an AAA may be a promising new approach to risk stratify and manage patients with this disease. 44
Although we demonstrated associations with cellular inflammation, we failed to identify consistent associations with humoral inflammatory markers. Although there were no associations between interleukin 6 and either aneurysm expansion or clinical events, there was a modest association with interleukin 10, which appeared to be protective against clinical events without affecting the rate of aneurysm growth. The explanation for this is unclear, although interleukin 10 is known to have anti-inflammatory actions in AAAs, which may explain the association. 49,50 In contrast, there were uniformally no associations between serum concentrations of matrix metalloproteinases or their tissue resident inhibitors and AAA expansion rates or clinical events. This does not preclude a local effect of these potential mediators within the AAA itself but this is certainly not reflected in their circulating levels quantified in serum, suggesting the absence of a systemic effect.
Current smoking habit and mural ultrasmall superparamagnetic particles of iron oxide enhancement
The rate of AAA growth has previously been shown to be predicted by smoking status, aneurysm size and the presence of common iliac aneurysms. 51,52 Indeed, smoking habit is the principal modifiable risk factor for AAA progression and rupture and is the main focus of lifestyle modification in these patients. We have demonstrated that USPIO-enhanced MRI is associated with all of these three risk factors. In particular, current smoking was an independent risk factor for AAA growth and, intriguingly, USPIO enhancement was twice as frequent in current smokers. We know that smoking promotes inflammation, macrophage-mediated injury and vascular dysfunction. 53–55 This suggests a potential mechanistic link between smoking and macrophage-driven AAA inflammation. Indeed, components of cigarette smoke, such as 3,4-benzopyrene, promote macrophage infiltration of AAAs, leading to increased matrix metalloproteinase expression and vascular smooth muscle apoptosis. 56 Using adoptive transfer experiments, Jin et al. 57 have further shown that in vivo exposure of leucocytes to smoke can accelerate the progression of aneurysm disease in smoke-free animals. In this context, the USPIO data suggest that macrophage-mediated inflammation may be the mechanistic link to explain the association between smoking and disease progression in patients with an AAA.
Abdominal ultrasonography and mural ultrasmall superparamagnetic particles of iron oxide enhancement
The primary end point of the study was the rate of AAA rupture or repair, and, although this was higher in patients with USPIO-enhanced MRI, it was not independent of known predictors of outcome, including baseline AAA diameter and smoking habit. Indeed, incorporation of USPIO-enhanced MRI did not improve the discrimination of a model incorporating these known clinical risk factors. This probably reflects the mutual interdependence and potential causal association of these factors, namely that USPIO enhancement highlights areas of smoking-induced cellular inflammation within the aneurysm, which causes more rapid expansion and increase in the aneurysm diameter leading to aneurysm rupture or triggering of the threshold for repair.
Ultrasonography measurements of AAA diameter are the mainstay of clinical management and the principal determinant of the timing of elective surgical repair. Their dominant effect on the primary end point is therefore perhaps not surprising, especially as most events were caused by elective surgical repair. Given that the clinicians were blind to the results of the USPIO-enhanced MRI, it would be challenging to demonstrate that it could lead to any changes in the rate of elective surgical repair. We therefore explored other measures of outcome that were independent of elective surgical repair. We found that USPIO enhancement appeared to be greater in those with emergent AAA-related events, including AAA rupture and AAA-related mortality, although the absolute number of events was small and fell just short of achieving statistical significance. Given the small number of emergent events, our study did not have sufficient power to determine whether or not USPIO enhancement could provide clinically useful information that could independently predict emergent events. However, post hoc analyses did suggest that USPIO-enhanced MRI did predict overall mortality in patients with larger aneurysms.
Clinical application of mural ultrasmall superparamagnetic particles of iron oxide enhancement
Although USPIO-enhanced MRI was not an independent predictor of outcome across the whole study population, it did identify aneurysm disease activity, correlate with rates of aneurysm expansion and appear to predict clinical outcomes including rupture and death. If future studies confirm the utility of USPIO-enhanced MRI, how would it be applied in a clinic? For some patients, treatment decisions are not straightforward. For example, abdominal pain in a patient with an AAA may be caused by other abdominal pathology and not the aneurysm itself. Urgent repair may be unhelpful and associated with considerable risk in such circumstances. Furthermore, decisions to undertake surgical repair can be challenging in those with high-risk or morphologically atypical aneurysms of < 55 mm in size those with borderline aneurysm sizes of 50–55 mm (especially in women), or those with larger aneurysms in which the balance of risk and benefit is uncertain. Additional information regarding disease activity that is tied to disease progression and adverse clinical outcome may be helpful in guiding such decisions. The value of USPIO-enhanced MRI may also differ in accordance with aneurysm size, with the prediction of future aneurysm repair greater in patients with smaller aneurysms and the future mortality risk being more marked in those with larger aneurysms. Although not directly tested here, USPIO-enhanced MRI may assist the clinician in making these difficult management decisions that are associated with significant potential benefits and hazards. This requires further investigation.
There are no definitive medical treatments that can have an impact on disease progression in this serious and potentially fatal condition. Novel anti-inflammatory or other disease-modifying therapies are potential interventions that could address this unmet clinical need. USPIO-enhanced MRI would provide a very useful surrogate biomarker of efficacy in such early proof-of-concept clinical trials. Reduction in USPIO enhancement would be predicted to correlate with reduced cellular inflammation within the aneurysm and consequently reduced rates of expansion. This merits further investigation.
Biomechanical modelling
Despite there being general visual overlap between stress and USPIO uptake, only 16% of all aneurysms in our study demonstrated co-location of elevated stress with mural USPIO enhancement. Although there was co-location between luminal USPIO uptake and peak stress, it is thought that the luminal USPIO uptake does not represent true inflammation; rather, it represents luminal trapping of USPIO. The overall lack of co-location between USPIO uptake and wall stress suggests that inflammation and stress are distinct processes in terms of the growth of aneurysms.
In a parallel study, we recently examined vascular inflammation in a small population of patients with AAAs (n = 15) and found some, but not a close, correlation between 18F-fluorodeoxyglucose uptake on combined PET and CT, and USPIO uptake on MRI. 31 This may reflect the different elements of macrophage activity that these imaging techniques detect: glycolysis and phagocytosis, respectively.
Some studies have attempted to quantify the interaction between inflammation and peak stress using a combined mechanical and biological approach to assess the overall stability of individual AAAs. In a pilot study (n = 5), Xu et al. 25 reported a tentative link between 18F-fluorodeoxyglucose metabolic activity and high wall stress. Later work by Maier et al. 58 confirmed that wall stress predicted by FE analysis and 18F-fluorodeoxyglucose uptake evaluated by combined PET and CT correlated both quantitatively and spatially in the cases examined (n = 18). Interestingly, our study has observed that high stress often occurs in regions of high curvature or inflection points, such as the aneurysm shoulder and posterior luminal surface, which have been reported to have high 18F-fluorodeoxyglucose uptake. 25,31,58,59 However, more recent work by Nchimi et al. 59 on a larger sample size (n = 53) concluded that the relationship between 18F-fluorodeoxyglucose uptake and peak stress was not directly correlated, instead pointing to a complex multifactorial relationship between increased 18F-fluorodeoxyglucose uptake and patient-specific factors, such as aneurysm location (thoracic or abdominal), wall stress, family history and patient lifestyle. The present study also suggests that the relationship between inflammation and peak stress is complex and potentially independent. However, it remains a possibility that although peak wall stress and mural USPIO enhancement are independent processes, their co-localisation could be a trigger for aneurysm rupture. To address this hypothesis requires long-term follow-up of clinical cohorts.
The results from geometrical analyses show that, although diameter and stress both increase with time, a more representative measure of risk may be total AAA volume. This measure accounts for the full structural growth in three dimensions rather than merely an assessment of how the AAA has changed in one plane at the location of its maximum diameter. Interestingly, in a handful of cases, diameter, peak wall stress, rupture risk and total AAA volume were observed to decrease. As AAAs are not treated medically, this may potentially reflect active remodelling of the vessel following treatment for coexisting conditions, such as hypertension, or in response to medically advised lifestyle changes such as smoking cessation. This finding is of great interest as it points to the dynamic nature of the aneurysm wall and that treatment for coexisting conditions can greatly influence disease progression.
In this study, a novel surface characterisation method to assess rupture risk was introduced. Fully automated, the algorithm can be run and completed on a simple three-dimensional model constituted by a set of x, y and z co-ordinates in a matter of minutes, compared with several hours for a patient-specific model derived from the same imaging data. Furthermore, this method does not involve the same level of technical complexity or assumptions with regard to material properties as is required in patient-specific-FE analyses. All of these last factors have traditionally been barriers to the adoption of this approach in clinical use. The results presented are a significant refinement of earlier methodologies, as suggested, for example, by Georgakarakos et al. 60 or Doyle et al. ,61 and demonstrate significant prospects for a clinical contribution of additional parameters for the rupture risk assessment of AAAs.
Study limitations
Our study had a number of strengths and limitations. It was a multicentre prospective observational cohort study that ensured blinding of the USPIO-enhanced MRI findings from the patients, vascular technicians and attending clinicians, and was therefore independent of clinical decision-making. It was an adequately sized Phase II proof-of-concept trial that was ≈10-fold larger than previous studies in this area. 21,22 The study also achieved its predicted event rates and met its primary end point, although not independent of known clinical predictors. However, the inclusion of elective surgical repair in the primary end point generates some challenges in interpretation because of the ultrasonography and diameter-guided decision-making for elective surgical repair. The prediction of emergent events appears promising but will require a much larger study with greater power to confirm these findings. We would also highlight that although we observed no marked sex differences, our study population had a strong male bias (typical of this disease population) and we cannot be certain that our findings are truly representative for both men and women. Finally, USPIO-enhanced MRI is resource intensive and was not possible in a small number of patients because of contraindications or claustrophobia. However, it was a feasible, safe and deliverable clinical technique that was well tolerated in the vast majority of patients, with no serious adverse effects from the MRI or contrast medium. Moreover, we have demonstrated its applicability across multiple sites, and have developed robust computer algorithms and image analysis techniques than enable automated reporting of USPIO enhancement, lending itself to immediate clinical application. However, we would accept that the cost-effectiveness of a relatively expensive imaging approach is questionable given the limited additional benefit observed here.
Summary
In a multicentre prospective observational cohort study, it has been demonstrated that USPIO-enhanced MRI predicts the rate of aneurysm expansion, and the risk of AAA rupture and repair. Although it does not provide independent prediction of aneurysm expansion or clinical outcomes in a model incorporating known clinical risk factors, this is the first demonstration of a cellular imaging technique that can predict clinical events in patients with an AAA. Whether or not clinical outcomes can be improved by treatment decisions based on this novel imaging approach remains to be established.
Chapter 5 Conclusions
Reproducibility of mural ultrasmall superparamagnetic particles of iron oxide enhancement
Image analysis can detect mural USPIO enhancement in AAAs with very good reproducibility and excellent agreement within and between observers. With repeated scanning, patients can again be reliably categorised in accordance with mural USPIO enhancement. We conclude that USPIO-enhanced MRI is sufficiently robust to be used in clinical practice.
Natural history of mural ultrasmall superparamagnetic particles of iron oxide enhancement
Mural USPIO enhancement in AAAs is time sensitive with changing patterns of uptake over periods of years, such that by 2 years, the majority of aneurysms have undergone some change in USPIO enhancement. This is in keeping with the known changes in aneurysm biology and activity over time. We conclude that this temporal variability may require repeated MRI scans, perhaps at yearly intervals.
Mural ultrasmall superparamagnetic particles of iron oxide enhancement and inflammation
Some have debated the role of inflammation in AAA expansion and disease progression. Although there is little evidence of an association with systemic humoral inflammation, USPIO enhancement is associated with more rapid AAA growth rates and adverse clinical outcomes, and this provides strong support for this concept. We conclude that imaging the biology of an AAA may be a promising new approach to risk stratify and manage patients with this disease.
Current smoking habit and mural ultrasmall superparamagnetic particles of iron oxide enhancement
Smoking habit is the principal modifiable risk factor for AAA progression and rupture, and is the main focus of lifestyle modification in these patients. We have demonstrated that USPIO enhancement was twice as frequent in current smokers. We conclude that macrophage-mediated inflammation is potentially the mechanistic link to explain the association between smoking and disease progression in patients with an AAA.
Clinical risk factors and mural ultrasmall superparamagnetic particles of iron oxide enhancement
The primary end point of the study was the rate of AAA rupture or repair, and although this was higher in patients with USPIO enhancement on MRI, it was not independent of known predictors of outcome including baseline AAA diameter and smoking habit. Indeed, incorporation of USPIO-enhanced MRI did not improve the discrimination of a model incorporating these known clinical risk factors. We conclude that there are two principal explanations for this finding. First, there is a mutual interdependence and causal association between these factors. USPIO-enhancement highlights areas of smoking-induced cellular inflammation within the aneurysm, which causes more rapid expansion and increase in the aneurysm diameter leading to aneurysm rupture or triggering of the threshold for repair. Second, ultrasonographic measurements of AAA diameter are the mainstay of clinical management and are used to determine the timing of elective surgical repair. Given that the clinicians were blind to the results of the USPIO-enhanced MRI, it would be challenging to demonstrate that it could lead to any changes in the rate of elective surgical repair. However, this is the mainstay of current clinical practice and ultrasonography is both more readily applicable and cost-effective. Therefore, we conclude that USPIO-enhanced MRI is unlikely to displace current routine standards of care.
Emergent events and mural ultrasmall superparamagnetic particles of iron oxide enhancement
We explored other measures of outcome that were independent of elective surgical repair. We found that USPIO enhancement appeared to be greater in those with emergent AAA-related events including AAA rupture and AAA-related mortality. Given the small number of emergent events, our study did not have sufficient power to determine whether or not USPIO enhancement could provide clinically useful information that could independently predict emergent events. However, post hoc analyses did suggest that USPIO-enhanced MRI did predict overall mortality in patients with larger aneurysms. We conclude that USPIO-enhanced MRI continues to hold some promise in guiding the management of patients with advanced disease.
Clinical application of mural ultrasmall superparamagnetic particles of iron oxide enhancement
Although multivariate analysis demonstrated that USPIO-enhanced MRI does not appear to improve risk stratification beyond current predictors of clinical outcome, this technique may be a useful adjunctive imaging approach in those patients in whom clinical decision-making is unclear. For example, we suggest that it may assist in patients with high-risk aneurysms of < 55 mm in size, those with borderline aneurysm sizes of 50–55 mm and those with larger aneurysms in which the balance of risk and benefit is uncertain.
Chapter 6 Recommendations for future research
Ultrasmall superparamagnetic particles of iron oxide-enhanced magnetic resonance imaging to predict rupture events
We have demonstrated that USPIO-enhanced MRI did not provide additive predictive value to standard clinical risk factors including ultrasound scanning. However, the sample size was modest and we cannot exclude a moderate effect on outcomes. In particular, the prediction of emergent events in larger aneurysms suggests that it may provide additive predictive power, which could assist in decision-making for patients at increased operative risk of reparative surgery. This would require a further clinical trial in which clinical decisions were informed by the result of the USPIO-enhanced MRI.
Non-invasive imaging of abdominal aortic aneurysm disease
The MA3RS study did demonstrate the predictive strengths of USPIO-enhanced MRI, albeit not independent of known clinical risk factors. This does not undermine the principle that understanding AAA disease may have added benefit beyond current risk factors but does suggest that targeting cellular inflammation may not be the best approach.
We propose using other novel imaging targets that may provide additive predictive information. We have recently demonstrated that the positron emitting radiotracer, 18F-sodium fluoride, can identify areas of early microcalcification that occur in response to necrotic inflammation in ruptured or high-risk human carotid and coronary atherosclerotic plaques. 62–64 This tracer has not been assessed in patients with an AAA. We hypothesised that 18F-sodium fluoride uptake on PET would highlight areas of microcalcification and AAA disease activity, representing regions prone to expansion and rupture. We therefore propose a study to determine whether or not 18F-sodium fluoride uptake on combined PET and CT is increased in AAAs, and whether or not this is associated with aneurysm growth and the subsequent rates of AAA repair or rupture. This was the rationale for the SOFIA3 study.
Blood biomarkers of abdominal aortic aneurysm disease
At present, there are no available specific laboratory markers for screening, monitoring disease progression or determining the results of intervention in patients with an AAA. Desmosine is an amino acid cross-link that is specifically a product found in mature elastin within vessel walls and can only be found in blood and urine when there is damage to the structures containing elastin, such as blood vessels. 65 Desmosine offers potential as a plasma biomarker for aortopathies that are characterised by vessel wall damage. This has, to date, not been explored in patients with an AAA. We propose to use plasma obtained during the MA3RS study to explore whether or not this simple measure is increased in an AAA, and whether or not this is associated with aneurysm growth and the subsequent rates of AAA repair or rupture. This was the rationale for the DES-MA3RS study.
Acknowledgements
David Newby is supported by the British Heart Foundation (CH/09/002, RE/13/3/30183, RM/13/2/30158) and is the recipient of a Wellcome Trust Senior Investigator Award (WT103782AIA). Olivia McBride is supported by the Academic Department of Military Surgery and Trauma. The Edinburgh Clinical Research Facility and Edinburgh Imaging Facility are supported by NHS Research Scotland. We would like to acknowledge the support of Karen Gallagher, Janice Taylor and David Brian during the conduct of this study.
We would like to thank all the participants who took part in the trial. We gratefully acknowledge the help of the people listed below.
Trial Steering Committee
Julie Brittenden (Chairperson), Graeme Houston, Robert Lambie, John Norrie (member of the NIHR Health Technology Assessment Editorial Board), Olivia McBride, Rachael Forsythe, David Newby, Graham McKillop, Scott Semple, Paul Burns, Colin Berry, Gordon Murray and Fiona Wee.
Clinical End Point Committee
Jakub Kacqynski, Anoop Shah and Andrew Tambyraja.
The Magnetic resonance imaging for Abdominal Aortic Aneurysms to predict Rupture or Surgery study investigators
Chief investigator
David Newby.
Trial research fellows
Rachael Forsythe, Olivia McBride, Jennifer Robson and Alex Vesey.
Trial sites
Royal Infirmary of Edinburgh
Roderick Chalmers, Paul Burns, O James Garden, David Newby, Rachael Forsythe, Olivia McBride, Jennifer Robson, Scott Semple, Marc Dweck, Calum Grey, Tom MacGillivray, Chengjia Wang, Yolanda Georgia Koutraki, Neil Mitchard, Annette Cooper, Edwin van Beek, Graham McKillop, Weiyang Ho, Liz Fraser, Hayley Cuthbert, Peter Hoskins, Barry Doyle and Noel Conlisk.
Western Infirmary, Glasgow
Wesley Stuart, Colin Berry, Alex Vesey, Giles Roditi and Laura Murdoch.
Forth Valley Royal Hospital
Richard Holdsworth and Emma Scott.
Edinburgh Clinical Trials Unit
Lynsey Milne, Fiona Strachan, Fiona Wee, Katherine Oatey, Catriona Graham, Gordon Murray, Garry Milne, Marise Bucukoglu and Kirsteen Goodman.
Contributions of authors
Dr Rachael Forsythe (Speciality Registrar in Vascular Surgery, Scotland Programme and Clinical Research Fellow, University of Edinburgh) was a research fellow. She was responsible for the later conduct of the research and was a member of the Trial Steering Committee and Trial Management Group. She was also involved in the refinement and amendment of the protocol and the interpretation and reporting of trial results.
Dr Olivia McBride (Speciality Registrar in Vascular Surgery, Scotland Programme and Clinical Research Fellow, University of Edinburgh) was a research fellow. She was responsible for the early conduct of the research and was a member of the Trial Steering Committee and Trial Management Group. She was also involved in the refinement and amendment of the protocol and the interpretation and reporting of trial results.
Dr Jennifer Robson (Clinical Lecturer in Vascular Surgery, University of Edinburgh) conducted the pilot work, was involved in the design of the research and was a member of the Trial Management Group.
Ms Catriona Graham (Senior Statistician, Edinburgh Clinical Research Facility) was the trial statistician and was responsible for the interpreting and reporting of results, and drafting and revising of the manuscript.
Dr Noel Conlisk (Visiting Researcher, Institute for Bioengineering, University of Edinburgh) was involved in the design, conduct and reporting and interpretation of results from the biomechanical stress modelling of AAA studies.
Professor Peter Hoskins (Personal Chairperson of Medical Physics and Biomechanics, University of Edinburgh) was responsible for the design, conduct and reporting and interpretation of results from the biomechanical stress modelling of AAA studies.
Ms Fiona Wee (Trial Manager, Edinburgh Clinical Trials Unit, University of Edinburgh) was involved in the day-to-day running of the trial and was a member of the Trial Management Group.
Professor David Newby (British Heart Foundation John Wheatley Professor of Cardiology) was the chief investigator. He devised the study, was involved in the design and conduct of the research and was a member of the Trial Steering Committee and Trial Management Group. He was also responsible for the refinement and amendment of the protocol and the interpretation and reporting of trial results.
The involvement of the MA3RS investigators is detailed previously. The MA3RS investigators were invited to review and comment on this report.
Publications
The Magnetic resonance imaging using ultrasmall superparamagnetic particles of iron oxide in patients under surveillance for Abdominal Aortic Aneurysm to predict Rupture or Surgical repair (MA3RS) Study Investigators. Aortic wall inflammation predicts abdominal aortic aneurysm expansion, rupture and need for surgical repair. Circulation 2017;136:787–97.
Forsythe RO, Dweck MR, McBride OMB, Vesey AT, Semple SI, Shah ASV, et al. 18F-Sodium fluoride uptake in abdominal aortic aneurysms. J Am Coll Cardiol 2018;71:513–523.
Data-sharing statement
All data requests should be submitted to the corresponding author for consideration. Access to available anonymised data may be granted following review.
Patient data
This work uses data provided by patients and collected by the NHS as part of their care and support. Using patient data is vital to improve health and care for everyone. There is huge potential to make better use of information from people’s patient records, to understand more about disease, develop new treatments, monitor safety, and plan NHS services. Patient data should be kept safe and secure, to protect everyone’s privacy, and it’s important that there are safeguards to make sure that it is stored and used responsibly. Everyone should be able to find out about how patient data are used. #datasaveslives You can find out more about the background to this citation here: https://understandingpatientdata.org.uk/data-citation.
Disclaimers
This report presents independent research. The views and opinions expressed by authors in this publication are those of the authors and do not necessarily reflect those of the NHS, the NIHR, the MRC, NETSCC, the EME programme or the Department of Health and Social Care. If there are verbatim quotations included in this publication the views and opinions expressed by the interviewees are those of the interviewees and do not necessarily reflect those of the authors, those of the NHS, the NIHR, NETSCC, the EME programme or the Department of Health and Social Care.
References
- Raghavan ML, Vorp DA. Toward a biomechanical tool to evaluate rupture potential of abdominal aortic aneurysm: identification of a finite strain constitutive model and evaluation of its applicability. J Biomech 2000;33:475-82. https://doi.org/10.1016/S0021-9290(99)00201-8.
- Vallabhaneni SR, Gilling-Smith GL, How TV, Carter SD, Brennan JA, Harris PL. Heterogeneity of tensile strength and matrix metalloproteinase activity in the wall of abdominal aortic aneurysms. J Endovasc Ther 2004;11:494-502. https://doi.org/10.1583/04-1239.1.
- Brown PM, Zelt DT, Sobolev B. The risk of rupture in untreated aneurysms: the impact of size, gender, and expansion rate. J Vasc Surg 2003;37:280-4. https://doi.org/10.1067/mva.2003.119.
- Thompson AR, Cooper JA, Ashton HA, Hafez H. Growth rates of small abdominal aortic aneurysms correlate with clinical events. Br J Surg 2010;97:37-44. https://doi.org/10.1002/bjs.6779.
- Cai J, Hatsukami TS, Ferguson MS, Kerwin WS, Saam T, Chu B, et al. In vivo quantitative measurement of intact fibrous cap and lipid-rich necrotic core size in atherosclerotic carotid plaque: comparison of high-resolution, contrast-enhanced magnetic resonance imaging and histology. Circulation 2005;112:3437-44. https://doi.org/10.1161/CIRCULATIONAHA.104.528174.
- Kramer CM, Cerilli LA, Hagspiel K, DiMaria JM, Epstein FH, Kern JA. Magnetic resonance imaging identifies the fibrous cap in atherosclerotic abdominal aortic aneurysm. Circulation 2004;109:1016-21. https://doi.org/10.1161/01.CIR.0000116767.95046.C2.
- Harisinghani MG, Barentsz J, Hahn PF, Deserno WM, Tabatabaei S, van de Kaa CH, et al. Noninvasive detection of clinically occult lymph-node metastases in prostate cancer. N Engl J Med 2003;348:2491-9. https://doi.org/10.1056/NEJMoa022749.
- Heesakkers RA, Hövels AM, Jager GJ, van den Bosch HC, Witjes JA, Raat HP, et al. MRI with a lymph-node-specific contrast agent as an alternative to CT scan and lymph-node dissection in patients with prostate cancer: a prospective multicohort study. Lancet Oncol 2008;9:850-6. https://doi.org/10.1016/S1470-2045(08)70203-1.
- Kooi ME, Cappendijk VC, Cleutjens KB, Kessels AG, Kitslaar PJ, Borgers M, et al. Accumulation of ultrasmall superparamagnetic particles of iron oxide in human atherosclerotic plaques can be detected by in vivo magnetic resonance imaging. Circulation 2003;107:2453-8. https://doi.org/10.1161/01.CIR.0000068315.98705.CC.
- Trivedi RA, Mallawarachi C, U-King-Im JM, Graves MJ, Horsley J, Goddard MJ, et al. Identifying inflamed carotid plaques using in vivo USPIO-enhanced MR imaging to label plaque macrophages. Arterioscler Thromb Vasc Biol 2006;26:1601-6. https://doi.org/10.1161/01.ATV.0000222920.59760.df.
- Tang TY, Howarth SP, Miller SR, Graves MJ, Patterson AJ, U-King-Im JM, et al. The ATHEROMA (Atorvastatin Therapy: Effects on Reduction of Macrophage Activity) Study. Evaluation using ultrasmall superparamagnetic iron oxide-enhanced magnetic resonance imaging in carotid disease. J Am Coll Cardiol 2009;53:2039-50. https://doi.org/10.1016/j.jacc.2009.03.018.
- Bernd H, De Kerviler E, Gaillard S, Bonnemain B. Safety and tolerability of ultrasmall superparamagnetic iron oxide contrast agent: comprehensive analysis of a clinical development program. Invest Radiol 2009;44:336-42. https://doi.org/10.1097/RLI.0b013e3181a0068b.
- Bourrinet P, Bengele HH, Bonnemain B, Dencausse A, Idee JM, Jacobs PM, et al. Preclinical safety and pharmacokinetic profile of ferumoxtran-10, an ultrasmall superparamagnetic iron oxide magnetic resonance contrast agent. Invest Radiol 2006;41:313-24. https://doi.org/10.1097/01.rli.0000197669.80475.dd.
- Müller K, Skepper JN, Posfai M, Trivedi R, Howarth S, Corot C, et al. Effect of ultrasmall superparamagnetic iron oxide nanoparticles (Ferumoxtran-10) on human monocyte-macrophages in vitro. Biomaterials 2007;28:1629-42. https://doi.org/10.1016/j.biomaterials.2006.12.003.
- Ruehm SG, Corot C, Vogt P, Kolb S, Debatin JF. Magnetic resonance imaging of atherosclerotic plaque with ultrasmall superparamagnetic particles of iron oxide in hyperlipidemic rabbits. Circulation 2001;103:415-22. https://doi.org/10.1161/01.CIR.103.3.415.
- Turner GH, Olzinski AR, Bernard RE, Aravindhan K, Boyle RJ, Newman MJ, et al. Assessment of macrophage infiltration in a murine model of abdominal aortic aneurysm. J Magn Reson Imaging 2009;30:455-60. https://doi.org/10.1002/jmri.21843.
- Alam SR, Shah AS, Richards J, Lang NN, Barnes G, Joshi N, et al. Ultrasmall superparamagnetic particles of iron oxide in patients with acute myocardial infarction: early clinical experience. Circ Cardiovasc Imaging 2012;5:559-65. https://doi.org/10.1161/CIRCIMAGING.112.974907.
- Stirrat CG, Alam SR, MacGillivray TJ, Gray CD, Dweck MR, Raftis J, et al. Ferumoxytol-enhanced magnetic resonance imaging assessing inflammation after myocardial infarction. Heart 2017;103:1528-35. https://doi.org/10.1136/heartjnl-2016-311018.
- Yilmaz A, Dengler MA, van der Kuip H, Yildiz H, Rösch S, Klumpp S, et al. Imaging of myocardial infarction using ultrasmall superparamagnetic iron oxide nanoparticles: a human study using a multi-parametric cardiovascular magnetic resonance imaging approach. Eur Heart J 2013;34:462-75. https://doi.org/10.1093/eurheartj/ehs366.
- Alam SR, Stirrat C, Richards J, Mirsadraee S, Semple SI, Tse G, et al. Vascular and plaque imaging with ultrasmall superparamagnetic particles of iron oxide. J Cardiovasc Magn Reson 2015;17. https://doi.org/10.1186/s12968-015-0183-4.
- Jalalzadeh H, Indrakusuma R, Planken RN, Legemate DA, Koelemay MJ, Balm R. Inflammation as a predictor of abdominal aortic aneurysm growth and rupture: a systematic review of imaging biomarkers. Eur J Vasc Endovasc Surg 2016;52:333-42. https://doi.org/10.1016/j.ejvs.2016.05.002.
- Richards JM, Semple SI, MacGillivray TJ, Gray C, Langrish JP, Williams M, et al. Abdominal aortic aneurysm growth predicted by uptake of ultrasmall superparamagnetic particles of iron oxide: a pilot study. Circ Cardiovasc Imaging 2011;4:274-81. https://doi.org/10.1161/CIRCIMAGING.110.959866.
- Doyle BJ, Corbett TJ, Callanan A, Walsh MT, Vorp DA, McGloughlin TM. An experimental and numerical comparison of the rupture locations of an abdominal aortic aneurysm. J Endovasc Ther 2009;16:322-35. https://doi.org/10.1583/09-2697.1.
- Fillinger MF, Raghavan ML, Marra SP, Cronenwett JL, Kennedy FE. In vivo analysis of mechanical wall stress and abdominal aortic aneurysm rupture risk. J Vasc Surg 2002;36:589-97. https://doi.org/10.1067/mva.2002.125478.
- Xu XY, Borghi A, Nchimi A, Leung J, Gomez P, Cheng Z, et al. High levels of 18F-FDG uptake in aortic aneurysm wall are associated with high wall stress. Eur J Vasc Endovasc Surg 2010;39:295-301. https://doi.org/10.1016/j.ejvs.2009.10.016.
- Wilson KA, Hoskins PR, Lee AJ, Fowkes FG, Ruckley CV, Bradbury AW. Ultrasonic measurement of abdominal aortic aneurysm wall compliance: a reproducibility study. J Vasc Surg 2000;31:507-13. https://doi.org/10.1067/mva.2000.102131.
- Sumner DS, Hokanson DE, Strandness DE. Stress-strain characteristics and collagen-elastin content of abdominal aortic aneurysms. Surg Gynecol Obstet 1970;130:459-66.
- Kazi M, Thyberg J, Religa P, Roy J, Eriksson P, Hedin U, et al. Influence of intraluminal thrombus on structural and cellular composition of abdominal aortic aneurysm wall. J Vasc Surg 2003;38:1283-92. https://doi.org/10.1016/S0741-5214(03)00791-2.
- Vande Geest JP, Wang DH, Wisniewski SR, Makaroun MS, Vorp DA. Towards a noninvasive method for determination of patient-specific wall strength distribution in abdominal aortic aneurysms. Ann Biomed Eng 2006;34:1098-106. https://doi.org/10.1007/s10439-006-9132-6.
- Vande Geest JP, Di Martino ES, Bohra A, Makaroun MS, Vorp DA. A biomechanics-based rupture potential index for abdominal aortic aneurysm risk assessment: demonstrative application. Ann N Y Acad Sci 2006;1085:11-2. https://doi.org/10.1196/annals.1383.046.
- McBride OM, Joshi NV, Robson JM, MacGillivray TJ, Gray CD, Fletcher AM, et al. Positron emission tomography and magnetic resonance imaging of cellular inflammation in patients with abdominal aortic aneurysms. Eur J Vasc Endovasc Surg 2016;51:518-26. https://doi.org/10.1016/j.ejvs.2015.12.018.
- Fillinger MF, Marra SP, Raghavan ML, Kennedy FE. Prediction of rupture risk in abdominal aortic aneurysm during observation: wall stress versus diameter. J Vasc Surg 2003;37:724-32. https://doi.org/10.1067/mva.2003.213.
- Malkawi AH, Hinchliffe RJ, Xu Y, Holt PJ, Loftus IM, Thompson MM. Patient-specific biomechanical profiling in abdominal aortic aneurysm development and rupture. J Vasc Surg 2010;52:480-8. https://doi.org/10.1016/j.jvs.2010.01.029.
- Conlisk N, Geers AJ, McBride OM, Newby DE, Hoskins PR. Patient-specific modelling of abdominal aortic aneurysms: the influence of wall thickness on predicted clinical outcomes. Med Eng Phys 2016;38:526-37. https://doi.org/10.1016/j.medengphy.2016.03.003.
- Kleinstreuer C, Li Z. Analysis and computer program for rupture-risk prediction of abdominal aortic aneurysms. Biomed Eng Online 2006;5. https://doi.org/10.1186/1475-925X-5-19.
- Harrell FE, Lee KL, Califf RM, Pryor DB, Rosati RA. Regression modelling strategies for improved prognostic prediction. Stat Med 1984;3:143-52. https://doi.org/10.1002/sim.4780030207.
- Pencina MJ, D’Agostino RB, D’Agostino RB, Vasan RS. Evaluating the added predictive ability of a new marker: from area under the ROC curve to reclassification and beyond. Stat Med 2008;27:157-72. https://doi.org/10.1002/sim.2929.
- Pencina MJ, D’Agostino RB, Steyerberg EW. Extensions of net reclassification improvement calculations to measure usefulness of new biomarkers. Stat Med 2011;30:11-2. https://doi.org/10.1002/sim.4085.
- Fellahi JL, Le Manach Y, Daccache G, Riou B, Gérard JL, Hanouz JL. Combination of EuroSCORE and cardiac troponin 1 improves the prediction of adverse outcome after cardiac surgery. Anesthesiology 2011;114:330-9. https://doi.org/10.1097/ALN.0b013e318201662f.
- Polak JF, Pencina MJ, Pencina KM, O’Donnell CJ, Wolf PA, D’Agostino RB. Carotid-wall intima-media thickness and cardiovascular events. N Engl J Med 2011;365:213-21. https://doi.org/10.1056/NEJMoa1012592.
- Wilson KA, Lee AJ, Lee AJ, Hoskins PR, Fowkes FG, Ruckley CV, et al. The relationship between aortic wall distensibility and rupture of infrarenal abdominal aortic aneurysm. J Vasc Surg 2003;37:112-17. https://doi.org/10.1067/mva.2003.40.
- Forsythe RO, Dweck MR, McBride OMB, Vesey AT, Semple SI, Shah ASV, et al. 18F-Sodium fluoride uptake in abdominal aortic aneurysms. J Am Coll Cardiol 2018;71:513-2. https://doi.org/10.1016/j.jacc.2017.11.053.
- Kent KC. Clinical practice. Abdominal aortic aneurysms. N Engl J Med 2014;371:2101-8. https://doi.org/10.1056/NEJMcp1401430.
- Forsythe RO, Newby DE, Robson JM. Monitoring the biological activity of abdominal aortic aneurysms Beyond Ultrasound. Heart 2016;102:817-24. https://doi.org/10.1136/heartjnl-2015-308779.
- Mallat Z. Macrophages. Arterioscler Thromb Vasc Biol 2014;34:2509-19. https://doi.org/10.1161/ATVBAHA.114.304794.
- Wang Y, Ait-Oufella H, Herbin O, Bonnin P, Ramkhelawon B, Taleb S, et al. TGF-beta activity protects against inflammatory aortic aneurysm progression and complications in angiotensin II-infused mice. J Clin Invest 2010;120:422-32. https://doi.org/10.1172/JCI38136.
- Wanhainen A, Mani K, Golledge J. Surrogate markers of abdominal aortic aneurysm progression. Arterioscler Thromb Vasc Biol 2016;36:236-44. https://doi.org/10.1161/ATVBAHA.115.306538.
- Buijs RV, Willems TP, Tio RA, Boersma HH, Tielliu IF, Slart RH, et al. Current state of experimental imaging modalities for risk assessment of abdominal aortic aneurysm. J Vasc Surg 2013;57:851-9. https://doi.org/10.1016/j.jvs.2012.10.097.
- Ciavarella C, Alviano F, Gallitto E, Ricci F, Buzzi M, Velati C, et al. Human vascular wall mesenchymal stromal cells contribute to abdominal aortic aneurysm pathogenesis through an impaired immunomodulatory activity and increased levels of matrix metalloproteinase-9. Circ J 2015;79:1460-9. https://doi.org/10.1253/circj.CJ-14-0857.
- Vucevic D, Maravic-Stojkovic V, Vasilijic S, Borovic-Labudovic M, Majstorovic I, Radak D, et al. Inverse production of IL-6 and IL-10 by abdominal aortic aneurysm explant tissues in culture. Cardiovasc Pathol 2012;21:482-9. https://doi.org/10.1016/j.carpath.2012.02.006.
- Brady AR, Thompson SG, Fowkes FG, Greenhalgh RM, Powell JT. UK Small Aneurysm Trial Participants . Abdominal aortic aneurysm expansion: risk factors and time intervals for surveillance. Circulation 2004;110:16-21. https://doi.org/10.1161/01.CIR.0000133279.07468.9F.
- Sweeting MJ, Thompson SG, Brown LC, Powell JT. RESCAN collaborators . Meta-analysis of individual patient data to examine factors affecting growth and rupture of small abdominal aortic aneurysms. Br J Surg 2012;99:655-65. https://doi.org/10.1002/bjs.8707.
- Messner B, Bernhard D. Smoking and cardiovascular disease: mechanisms of endothelial dysfunction and early atherogenesis. Arterioscler Thromb Vasc Biol 2014;34:509-15. https://doi.org/10.1161/ATVBAHA.113.300156.
- Newby DE, McLeod AL, Uren NG, Flint L, Ludlam CA, Webb DJ, et al. Impaired coronary tissue plasminogen activator release is associated with coronary atherosclerosis and cigarette smoking: direct link between endothelial dysfunction and atherothrombosis. Circulation 2001;103:1936-41. https://doi.org/10.1161/01.CIR.103.15.1936.
- Harding SA, Sarma J, Josephs DH, Cruden NL, Din JN, Twomey PJ, et al. Upregulation of the CD40/CD40 ligand dyad and platelet-monocyte aggregation in cigarette smokers. Circulation 2004;109:1926-9. https://doi.org/10.1161/01.CIR.0000127128.52679.E4.
- Ji K, Zhang Y, Jiang F, Qian L, Guo H, Hu J, et al. Exploration of the mechanisms by which 3,4-benzopyrene promotes angiotensin II-induced abdominal aortic aneurysm formation in mice. J Vasc Surg 2014;59:492-9. https://doi.org/10.1016/j.jvs.2013.03.022.
- Jin J, Arif B, Garcia-Fernandez F, Ennis TL, Davis EC, Thompson RW, et al. Novel mechanism of aortic aneurysm development in mice associated with smoking and leukocytes. Arterioscler Thromb Vasc Biol 2012;32:2901-9. https://doi.org/10.1161/ATVBAHA.112.300208.
- Maier A, Essler M, Gee MW, Eckstein HH, Wall WA, Reeps C. Correlation of biomechanics to tissue reaction in aortic aneurysms assessed by finite elements and [18F]-fluorodeoxyglucose-PET/CT. Int J Numer Method Biomed Eng 2012;28:456-71. https://doi.org/10.1002/cnm.1477.
- Nchimi A, Cheramy-Bien JP, Gasser TC, Namur G, Gomez P, Seidel L, et al. Multifactorial relationship between 18F-fluoro-deoxy-glucose positron emission tomography signaling and biomechanical properties in unruptured aortic aneurysms. Circ Cardiovasc Imaging 2014;7:82-91. https://doi.org/10.1161/CIRCIMAGING.112.000415.
- Georgakarakos E, Ioannou CV, Kamarianakis Y, Papaharilaou Y, Kostas T, Manousaki E, et al. The role of geometric parameters in the prediction of abdominal aortic aneurysm wall stress. Eur J Vasc Endovasc Surg 2010;39:42-8. https://doi.org/10.1016/j.ejvs.2009.09.026.
- Doyle BJ, Callanan A, Burke PE, Grace PA, Walsh MT, Vorp DA, et al. Vessel asymmetry as an additional diagnostic tool in the assessment of abdominal aortic aneurysms. J Vasc Surg 2009;49:443-54. https://doi.org/10.1016/j.jvs.2008.08.064.
- Irkle A, Vesey AT, Lewis DY, Skepper JN, Bird JLE, Dweck MR, et al. Identifying active vascular micro-calcification by (18)F-sodium fluoride positron emission tomography. Nat Commun 2015;6. https://doi.org/10.1038/ncomms8495.
- Vesey AT, Jenkins WS, Irkle A, Moss A, Sng G, Forsythe RO, et al. 18F-fluoride and 18F-fluorodeoxyglucose positron emission tomography after transient ischemic attack or minor ischemic stroke: case–control study. Circ Cardiovasc Imaging 2017;10. https://doi.org/10.1161/CIRCIMAGING.116.004976.
- Joshi NV, Vesey AT, Williams MC, Shah AS, Calvert PA, Craighead FH, et al. 18F-fluoride positron emission tomography for identification of ruptured and high-risk coronary atherosclerotic plaques: a prospective clinical trial. Lancet 2014;383:705-13. https://doi.org/10.1016/S0140-6736(13)61754-7.
- Huang JT, Chaudhuri R, Albarbarawi O, Barton A, Grierson C, Rauchhaus P, et al. Clinical validity of plasma and urinary desmosine as biomarkers for chronic obstructive pulmonary disease. Thorax 2012;67:502-8. https://doi.org/10.1136/thoraxjnl-2011-200279.
Appendix 1 Summary of protocol amendments
| Protocol number | Date | Summary of changes |
|---|---|---|
| 8 | 18 March 2015 | Current version |
| 7 | 15 August 2014 |
|
| 6 | 27 May 2014 |
|
| 5 | 26 June 2013 |
|
| 4 | 24 January 2013 |
|
| 3 | 25 September 2012 | (Amendments requested by MHRA during the initial review)
|
| 2 | 15 August 2012 | (Amendments requested by REC during the initial review)
|
| 1 | 19 July 2012 | Original protocol |
Appendix 2 Recruitment graph
FIGURE 19.
Plot of predicted vs. actual recruitment. Original predicted (black), revised predicted (green) and actual (blue) recruitment.
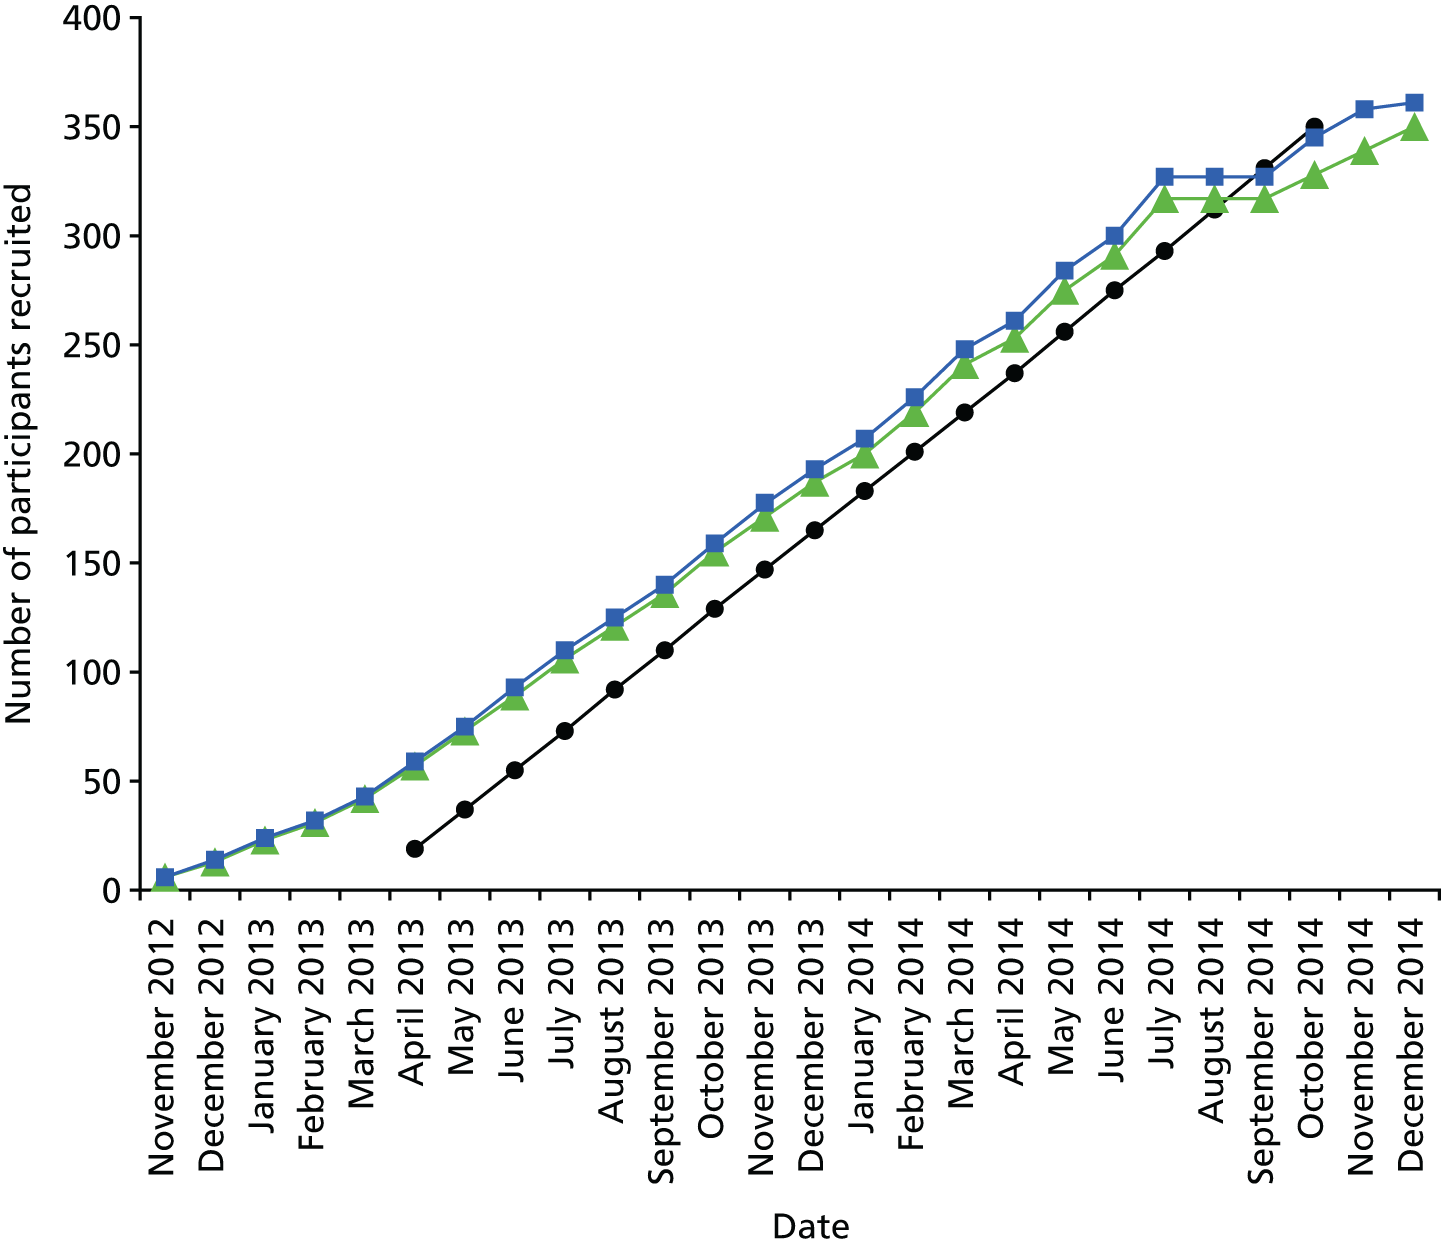
| Date | Number of participants | ||
|---|---|---|---|
| Original predicted | Revised predicted | Actual | |
| November 2012 | 6 | 6 | |
| December 2012 | 13 | 14 | |
| January 2013 | 23 | 24 | |
| February 2013 | 31 | 32 | |
| March 2013 | 42 | 43 | |
| April 2013 | 19 | 57 | 59 |
| May 2013 | 37 | 73 | 75 |
| June 2013 | 55 | 89 | 93 |
| July 2013 | 73 | 106 | 110 |
| August 2013 | 92 | 121 | 125 |
| September 2013 | 110 | 136 | 140 |
| October 2013 | 129 | 155 | 159 |
| November 2013 | 147 | 171 | 177 |
| December 2013 | 165 | 187 | 193 |
| January 2014 | 183 | 200 | 207 |
| February 2014 | 201 | 219 | 226 |
| March 2014 | 219 | 241 | 248 |
| April 2014 | 237 | 253 | 261 |
| May 2014 | 256 | 275 | 284 |
| June 2014 | 275 | 291 | 300 |
| July 2014 | 293 | 317 | 327 |
| August 2014 | 312 | 317 | 327 |
| September 2014 | 331 | 317 | 327 |
| October 2014 | 350 | 328 | 345 |
| November 2014 | 339 | 358 | |
| December 2014 | 350 | 361 | |
Appendix 3 Summary of intellectual property
Throughout the progression of the study, the business development team for the College of Medicine and Veterinary Medicine at the University of Edinburgh were updated on results that were of potential commercial interest and suitable for protection via patenting. Indeed, a patent was filed relating to the registration of medical images that were generated as part of this study (US 927 5432 B2). The results presented in this report confirm the existence and benefits of a cellular-imaging technique that can predict clinical events in patients with an AAA. The use of ferumoxytol as a contributor to clinical outcomes and treatment decisions for patients with an AAA is unclear and requires further investigation to support its use. The evidence presented is inconclusive to suggest an alternative contrast agent extension of use for ferumoxytol and this has not been taken further at this stage.
Appendix 4 Clinical end-point adjudication
There are no consensus guidelines to direct investigators when adjudicating end points relating to death in patients with known AAAs who have no definitive proof of causality (such as post-mortem examination). Most of the recently proposed classification systems relating to AAA events require radiological or operative evidence to classify AAA events. In the event that no such confirmation was available, the end points were assessed and determined by each member of the Clinical End Point Committee and any disagreement settled by consensus, with oversight from the chairperson. ‘Cold pursuit’ of relevant data included obtaining information from primary care or hospital records as to the likely cause of death, cause of death listed on the death certificate obtained from the public registry, and data from the Information and Statistics Division of NHS Scotland. The following guidelines and classification system were used as part of the assessment for adjudication of cause of death.
Abdominal aortic aneurysm-related events
-
Abdominal aortic aneurysm-related death, confirmed:
-
death occurs in hospital following confirmed AAA rupture on CT or intraoperative findings
-
death occurs following treatment for AAA during same admission (elective or emergency)
-
death arising from complications relating to AAA treatment
-
death occurs out of hospital, confirmed AAA rupture on post-mortem
-
death occurs out of hospital, confirmed AAA treatment-related complication on post-mortem.
-
-
Abdominal aortic aneurysm-related death, probable:
-
death occurs in circumstances with high probability of AAA rupture (e.g. patient admitted to hospital following collapse, known AAA, hypotension, no other obvious cause of symptoms, death shortly after presentation)
-
death occurs in circumstances with high probability of complications relating to AAA treatment (e.g. known endoleak, suspected rupture post endovascular aortic repair)
-
death occurs out of hospital, no post-mortem performed but highly likely as no other obvious cause of death (e.g. witnessed collapse at home, known AAA, sudden death, no other obvious cause)
-
sudden unexplained death in a patient with known AAA of ≥ 7 cm, with no other cause of death identified.
-
-
Abdominal aortic aneurysm-related death, possible:
-
death occurs in hospital, no post-mortem performed and cannot be judged as highly likely to be AAA-related, but no other circumstances to suggest other definitive cause
-
death occurs out of hospital, no post-mortem performed and cannot be judged as highly likely to be AAA-related, but no other circumstances to suggest other definitive cause.
-
Non-abdominal aortic aneurysm-related events
-
Cardiovascular death (non-AAA):
-
death resulting from an acute myocardial infarction, sudden cardiac death, heart failure, stroke, cardiovascular procedures or other cardiovascular causes (excluding AAA-related deaths).
-
-
Non-cardiovascular death
-
death resulting from all other causes, excluding cardiovascular or AAA-related deaths.
-
Appendix 5 Additional tables
| Variable | n | n missing | Mean | SD | Minimum | Lower quartile | Median | Upper quartile | Maximum |
|---|---|---|---|---|---|---|---|---|---|
| Age at consent (years) | 342 | 0 | 73.1 | 7.2 | 53.0 | 67.0 | 74.0 | 78.0 | 91.0 |
| BMI (kg/m2) | 342 | 0 | 27.6 | 4.2 | 18.9 | 24.7 | 27.1 | 30.2 | 41.9 |
| BP (mmHg) | |||||||||
| Diastolic | 342 | 0 | 81.4 | 10.8 | 55.0 | 75.0 | 81.0 | 88.0 | 118.0 |
| Systolic | 342 | 0 | 139.6 | 21.2 | 92.0 | 124.0 | 136.0 | 152.0 | 245.0 |
| Heart rate (b.p.m.) | 338 | 4 | 70.7 | 10.1 | 47.0 | 62.0 | 70.0 | 79.0 | 103.0 |
| AAA diameter: CT (mm) | 334 | 8 | 52.2 | 8.3 | 34.0 | 46.0 | 51.7 | 57.0 | 87.0 |
| Cholesterol (mmol/l) | 331 | 11 | 4.5 | 1.0 | 2.0 | 3.8 | 4.4 | 5.1 | 8.8 |
| Creatinine (µmol/l) | 338 | 4 | 89.9 | 23.4 | 52.0 | 73.0 | 85.0 | 101.0 | 190.0 |
| Height (cm) | 342 | 0 | 171.4 | 8.2 | 137.0 | 166.0 | 172.0 | 177.0 | 191.0 |
| CIA diameter (mm) | |||||||||
| Left | 45 | 297 | 22.2 | 5.3 | 14.0 | 20.0 | 21.0 | 24.0 | 43.0 |
| Right | 56 | 286 | 23.6 | 7.1 | 15.0 | 18.5 | 22.0 | 25.5 | 43.0 |
| AAA diameter: US (mm) | 342 | 0 | 49.6 | 7.7 | 38.0 | 44.0 | 49.0 | 53.0 | 87.0 |
| Weight (kg) | 342 | 0 | 81.4 | 14.7 | 46.4 | 70.4 | 80.0 | 90.5 | 127.0 |
| Variable | n | n missing | Mean | SD | Minimum | Lower quartile | Median | Upper quartile | Maximum |
|---|---|---|---|---|---|---|---|---|---|
| Age at consent (years) | |||||||||
| Missing | 5 | 0 | 75.0 | 7.0 | 66.0 | 71.0 | 75.0 | 79.0 | 84.0 |
| Negative | 191 | 0 | 73.4 | 7.5 | 54.0 | 67.0 | 74.0 | 79.0 | 91.0 |
| Positive | 146 | 0 | 72.8 | 6.8 | 53.0 | 68.0 | 73.5 | 78.0 | 90.0 |
| BMI (kg/m2) | |||||||||
| Missing | 5 | 0 | 25.0 | 3.1 | 21.2 | 23.5 | 24.1 | 27.7 | 28.6 |
| Negative | 191 | 0 | 28.0 | 4.2 | 18.9 | 25.5 | 27.5 | 30.3 | 41.9 |
| Positive | 146 | 0 | 27.2 | 4.2 | 19.0 | 24.2 | 26.5 | 30.0 | 41.4 |
| BP: diastolic (mmHg) | |||||||||
| Missing | 5 | 0 | 87.0 | 10.7 | 80.0 | 80.0 | 81.0 | 89.0 | 105.0 |
| Negative | 191 | 0 | 80.5 | 10.3 | 58.0 | 73.0 | 80.0 | 87.0 | 118.0 |
| Positive | 146 | 0 | 82.3 | 11.3 | 55.0 | 76.0 | 82.0 | 88.0 | 112.0 |
| BP: systolic (mmHg) | |||||||||
| Missing | 5 | 0 | 151.6 | 5.3 | 143.0 | 150.0 | 154.0 | 155.0 | 156.0 |
| Negative | 191 | 0 | 140.3 | 21.3 | 96.0 | 124.0 | 136.0 | 155.0 | 215.0 |
| Positive | 146 | 0 | 138.2 | 21.3 | 92.0 | 124.0 | 135.5 | 148.0 | 245.0 |
| Heart rate (b.p.m.) | |||||||||
| Missing | 5 | 0 | 71.6 | 12.1 | 52.0 | 70.0 | 73.0 | 80.0 | 83.0 |
| Negative | 191 | 0 | 70.0 | 10.1 | 49.0 | 61.0 | 70.0 | 78.0 | 103.0 |
| Positive | 142 | 4 | 71.5 | 10.0 | 47.0 | 63.0 | 71.0 | 80.0 | 93.0 |
| AAA diameter: CT (mm) | |||||||||
| Missing | 5 | 0 | 58.4 | 11.6 | 45.0 | 53.0 | 56.0 | 62.0 | 76.0 |
| Negative | 186 | 5 | 50.5 | 7.4 | 34.0 | 45.0 | 49.0 | 55.0 | 77.0 |
| Positive | 143 | 3 | 54.2 | 8.8 | 39.0 | 49.0 | 54.0 | 59.0 | 87.0 |
| Cholesterol (mmol/l) | |||||||||
| Missing | 5 | 0 | 5.0 | 1.9 | 3.3 | 3.9 | 4.0 | 5.9 | 7.8 |
| Negative | 186 | 5 | 4.5 | 1.0 | 2.0 | 3.8 | 4.3 | 5.1 | 8.8 |
| Positive | 140 | 6 | 4.5 | 1.0 | 2.2 | 3.8 | 4.5 | 5.0 | 8.0 |
| Creatinine (µmol/l) | |||||||||
| Missing | 5 | 0 | 76.2 | 9.7 | 64.0 | 74.0 | 76.0 | 76.0 | 91.0 |
| Negative | 190 | 1 | 90.0 | 21.1 | 61.0 | 74.0 | 87.5 | 99.0 | 175.0 |
| Positive | 143 | 3 | 90.3 | 26.5 | 52.0 | 71.0 | 84.0 | 103.0 | 190.0 |
| CIA diameter: left (mm) | |||||||||
| Missing | 0 | 5 | |||||||
| Negative | 19 | 172 | 22.3 | 4.6 | 14.0 | 20.0 | 22.0 | 26.0 | 32.0 |
| Positive | 26 | 120 | 22.1 | 5.9 | 16.0 | 19.0 | 20.5 | 24.0 | 43.0 |
| CIA diameter: right (mm) | |||||||||
| Missing | 1 | 4 | 26.0 | . | 26.0 | 26.0 | 26.0 | 26.0 | 26.0 |
| Negative | 26 | 165 | 23.4 | 6.9 | 15.0 | 19.0 | 22.0 | 24.0 | 42.0 |
| Positive | 29 | 117 | 23.7 | 7.5 | 15.0 | 18.0 | 22.0 | 26.0 | 43.0 |
| AAA diameter: US (mm) | |||||||||
| Missing | 5 | 0 | 54.4 | 12.3 | 43.0 | 49.0 | 50.0 | 55.0 | 75.0 |
| Negative | 191 | 0 | 48.2 | 6.6 | 39.0 | 43.0 | 47.0 | 52.0 | 73.0 |
| Positive | 146 | 0 | 51.4 | 8.4 | 38.0 | 46.0 | 50.0 | 55.0 | 87.0 |
| CT scan size present | Group, n (%) | All | |||
|---|---|---|---|---|---|
| Baseline | 2 years | Missing | Negative | Positive | |
| No | No | 0 (0.0) | 1 (0.5) | 2 (1.4) | 3 (0.9) |
| Yes | 0 (0.0) | 4 (2.1) | 1 (0.7) | 5 (1.5) | |
| Yes | No | 1 (20.0) | 71 (37.2) | 61 (41.8) | 133 (38.9) |
| Yes | 4 (80.0) | 115 (60.2) | 82 (56.2) | 201 (58.8) | |
| Total | 5 (100.0) | 191 (100.0) | 146 (100.0) | 342 (100.0) | |
| Variable | n | n missing | Mean | SD | Minimum | Lower quartile | Median | Upper quartile | Maximum |
|---|---|---|---|---|---|---|---|---|---|
| CT change, first to last (mm) | 192 | 150 | 4.1 | 3.8 | –5.0 | 1.0 | 3.0 | 6.0 | 21.0 |
| CT rate, first to last (mm/year) | 192 | 150 | 2.3 | 3.3 | –7.6 | 0.8 | 2.0 | 3.4 | 37.1 |
| Variable | n | n missing | Mean | SD | Minimum | Lower quartile | Median | Upper quartile | Maximum |
|---|---|---|---|---|---|---|---|---|---|
| CT change, first to last (mm) | |||||||||
| Missing | 2 | 3 | 5.0 | 2.8 | 3.0 | 3.0 | 5.0 | 7.0 | 7.0 |
| Negative | 109 | 82 | 4.1 | 4.0 | –5.0 | 1.0 | 3.0 | 6.0 | 21.0 |
| Positive | 81 | 65 | 4.1 | 3.6 | –2.0 | 1.0 | 3.0 | 6.0 | 16.0 |
| CT rate, first to last (mm/year) | |||||||||
| Missing | 2 | 3 | 2.6 | 1.8 | 1.3 | 1.3 | 2.6 | 3.8 | 3.8 |
| Negative | 109 | 82 | 2.1 | 2.3 | –7.6 | 0.5 | 2.0 | 3.4 | 10.7 |
| Positive | 81 | 65 | 2.6 | 4.3 | –1.1 | 0.9 | 2.1 | 3.4 | 37.1 |
| Parameter | Estimate | Standard error | t-value | p-value |
|---|---|---|---|---|
| Model 1: sex, smoking status, AAA ultrasound diameter and systolic BP | ||||
| Intercept | –3.232904276 | 2.41630486 | –1.34 | 0.1826 |
| Ultrasound maximum diameter | 0.093661841 | 0.03666913 | 2.55 | 0.0114 |
| Sex | ||||
| Female | 1.070747559 | 0.63134087 | 1.70 | 0.0916 |
| Male | 0.000000000 | |||
| Smoker | ||||
| Current | 0.556810976 | 0.54756935 | 1.02 | 0.3105 |
| Not current | 0.000000000 | |||
| Baseline systolic BP | 0.005430430 | 0.01139750 | 0.48 | 0.6343 |
| Model 2: sex, smoking status, AAA ultrasound diameter, systolic BP and USPIO uptake | ||||
| Intercept | –3.014466440 | 2.50568158 | –1.20 | 0.2305 |
| Ultrasound maximum diameter | 0.090771082 | 0.03772552 | 2.41 | 0.0171 |
| Sex | ||||
| Female | 1.067236682 | 0.63293901 | 1.69 | 0.0935 |
| Male | 0.000000000 | |||
| Smoker | ||||
| Current | 0.525584180 | 0.55649721 | 0.94 | 0.3462 |
| Not-current | 0.000000000 | |||
| Baseline systolic BP | 0.005618942 | 0.01143825 | 0.49 | 0.6238 |
| USPIO | ||||
| Negative | –0.170623606 | 0.50129481 | –0.34 | 0.7340 |
| Positive | 0.000000000 | |||
| Variable | Label | DF | Parameter estimate | Standard error | t-value | p-value |
|---|---|---|---|---|---|---|
| Intercept | Intercept | 1 | 55.11407 | 1.77464 | 31.06 | 0.0010 |
| Rate of progression per year by ultrasonography | 1 | 4.34274 | 1.97174 | 2.20 | 0.1585 |
| Variable | n | n missing | Mean | SD | Minimum | Lower quartile | Median | Upper quartile | Maximum |
|---|---|---|---|---|---|---|---|---|---|
| US change, first to last (mm) | 279 | 63 | 4.4 | 3.7 | –3.0 | 2.0 | 4.0 | 6.0 | 24.0 |
| US rate (mm/year) | |||||||||
| First to last | 279 | 63 | 2.8 | 2.5 | –1.8 | 1.0 | 2.5 | 4.0 | 12.4 |
| Slope of regression | 279 | 63 | 2.8 | 2.4 | –1.8 | 1.0 | 2.5 | 3.9 | 12.4 |
| Parameter | DF | Parameter estimate | Standard error | χ2 | p-value | Hazard ratio | 95% hazard ratio CI | Label |
|---|---|---|---|---|---|---|---|---|
| Model 1: sex, smoking status, AAA ultrasound diameter and systolic BP – analysis of maximum likelihood estimates | ||||||||
| Ultrasound maximum diameter | 1 | 0.04173 | 0.01519 | 7.5430 | 0.0060 | 1.043 | 1.012 to 1.074 | AAA diameter: US (mm) |
| Sex: female | 1 | 0.06269 | 0.41448 | 0.0229 | 0.8798 | 1.065 | 0.473 to 2.399 | Sex: female |
| Smoking habit: current | 1 | 0.34301 | 0.31083 | 1.2178 | 0.2698 | 1.409 | 0.766 to 2.591 | Smoking status: current |
| Baseline systolic BP | 1 | 0.0009953 | 0.00679 | 0.0215 | 0.8835 | 1.001 | 0.988 to 1.014 | BP: systolic |
| Model 2: sex, smoking status, AAA ultrasound diameter, systolic BP and USPIO uptake – analysis of maximum likelihood estimates | ||||||||
| Ultrasound maximum diameter | 1 | 0.03720 | 0.01558 | 5.6984 | 0.0170 | 1.038 | 1.007 to 1.070 | AAA diameter: US (mm) |
| Sex: female | 1 | 0.03824 | 0.41464 | 0.0085 | 0.9265 | 1.039 | 0.461 to 2.342 | Sex: female |
| Smoking habit: current | 1 | 0.25839 | 0.31883 | 0.6568 | 0.4177 | 1.295 | 0.693 to 2.419 | Smoking status: current |
| Baseline systolic BP | 1 | 0.00118 | 0.00673 | 0.0307 | 0.8610 | 1.001 | 0.988 to 1.014 | BP: systolic |
| USPIO uptake: negative | 1 | –0.36657 | 0.30825 | 1.4142 | 0.2344 | 0.693 | 0.379 to 1.268 | Group: negative |
| Model | Number of pairs | C-statistic | 95% CI | ||
|---|---|---|---|---|---|
| Usable | Concordant | Discordant | |||
| 1 (without USPIO) | 15,792 | 12,897 | 2895 | 0.81668 | 0.54076 to 1.00360 |
| 2 (with USPIO) | 15,792 | 12,469 | 3323 | 0.78958 | 0.50770 to 0.99008 |
| Events | All | Reclassified | |
|---|---|---|---|
| Up | Down | ||
| Estimated event rate | 0.101 | 0.131 | 0.078 |
| Estimated number of event participants | 33.97 | 18.93 | 14.98 |
| Estimated number of non-event participants | 303.0 | 126.1 | 177.0 |
| Net reclassification (%) | |||
| Among event participants | 11.6 | ||
| Among non-event participants | 16.8 | ||
| Overall (95% CI) | 28.4 (–6.8 to 63.6) | ||
| AAA death | n | Mean | SD | Minimum | Lower quartile | Median | Upper quartile | Maximum |
|---|---|---|---|---|---|---|---|---|
| No | 325 | 1032 | 254.9 | 27.0 | 888.0 | 1035 | 1218 | 1474 |
| Yes | 17 | 497.9 | 256.4 | 69.0 | 269.0 | 473.0 | 715.0 | 977.0 |
| Parameter | DF | Parameter estimate | Standard error | χ2 | p-value | Hazard ratio | 95% hazard ratio CI | Label |
|---|---|---|---|---|---|---|---|---|
| Model 1: sex, smoking status, AAA ultrasound diameter and systolic BP – analysis of maximum likelihood estimates | ||||||||
| Ultrasound maximum diameter | 1 | 0.06845 | 0.02214 | 9.5607 | 0.0020 | 1.071 | 1.025 to 1.118 | AAA diameter: US (mm) |
| Sex: female | 1 | 0.73441 | 0.58884 | 1.5555 | 0.2123 | 2.084 | 0.657 to 6.610 | Sex: female |
| Smoking habit: current | 1 | 0.39398 | 0.51471 | 0.5859 | 0.4440 | 1.483 | 0.541 to 4.067 | Smoking status: current |
| Baseline systolic BP | 1 | 0.00379 | 0.01110 | 0.1168 | 0.7326 | 1.004 | 0.982 to 1.026 | BP: systolic |
| Model 2: sex, smoking status, AAA ultrasound diameter, systolic BP and USPIO uptake – analysis of maximum likelihood estimates | ||||||||
| Ultrasound maximum diameter | 1 | 0.06035 | 0.02286 | 6.9719 | 0.0083 | 1.062 | 1.016 to 1.111 | AAA diameter: US (mm) |
| Sex: female | 1 | 0.67970 | 0.58895 | 1.3319 | 0.2485 | 1.973 | 0.622 to 6.259 | Sex: female |
| Smoking habit: current | 1 | 0.25727 | 0.52712 | 0.2382 | 0.6255 | 1.293 | 0.460 to 3.634 | Smoking status: current |
| Baseline systolic BP | 1 | 0.00388 | 0.01098 | 0.1248 | 0.7239 | 1.004 | 0.983 to 1.026 | BP: systolic |
| USPIO uptake: negative | 1 | –0.62425 | 0.53625 | 1.3551 | 0.2444 | 0.536 | 0.187 to 1.532 | Group: negative |
| Model | Number of pairs | C-statistic | 95% CI | ||
|---|---|---|---|---|---|
| Usable | Concordant | Discordant | |||
| 1 (without USPIO) | 5712 | 3751 | 1961 | 0.65669 | 0.14890 to 1.06693 |
| 2 (with USPIO) | 5712 | 3607 | 2105 | 0.63148 | 0.12664 to 1.05446 |
| Event | All | Reclassified | |
|---|---|---|---|
| Up | Down | ||
| Estimated event rate | 0.043 | 0.065 | 0.027 |
| Estimated number of event participants | 14.45 | 9.36 | 5.17 |
| Estimated number of non-event participants | 322.5 | 135.6 | 186.8 |
| Net reclassification (%) | |||
| Among event participants | 29.0 | ||
| Among non-event participants | 15.9 | ||
| Overall (95% CI) | 44.8 (–5.6 to 95.3) | ||
| Clinical outcome | All participants (N = 187), n (%) | USPIO enhancement, n (%) | Difference (95% CI) | p-value | ||
|---|---|---|---|---|---|---|
| Indeterminant (n = 2) | No (n = 120) | Yes (n = 65) | ||||
| AAA event | ||||||
| Rupture/repair | 42 (22.5) | 0 (0) | 20 (16.7) | 22 (33.8) | 17.2 (3.9 to 30.5) | 0.0077 |
| Rupture | 4 (2.1) | 0 (0) | 2 (1.7) | 2 (3.1) | 1.4 (–3.4 to 6.2) | 0.6136a |
| Repair | 38 (20.3) | 0 (0) | 18 (15.0) | 20 (30.8) | 15.8 (2.9 to 28.7) | 0.0113 |
| Type of repair | ||||||
| EVAR | 19 (10.2) | 0 (0) | 9 (7.5) | 10 (15.4) | ||
| Open | 19 (10.2) | 0 (0) | 9 (7.5) | 10 (15.4) | ||
| Type of surgery | ||||||
| Elective | 36 (19.3) | 0 (0) | 16 (13.3) | 20 (30.8) | ||
| Emergency | 2 (1.1) | 0 (0) | 2 (1.7) | 0 (0) | ||
| Death | ||||||
| All-cause | 20 (10.7) | 1 (50) | 14 (11.7) | 5 (7.7) | –4.0 (–12.6 to 4.7) | 0.3953 |
| Cardiovascular: AAA related | 4 (2.1) | 0 (0) | 2 (1.7) | 2 (3.1) | 1.4 (–3.4 to 6.2) | 0.6136a |
| Cardiovascular: non-AAA related | 8 (4.3) | 0 (0) | 7 (5.8) | 1 (1.5) | ||
| Stroke | 1 (0.5) | 0 (0) | 1 (0.8) | 0 (0) | ||
| Myocardial infarction | 5 (2.7) | 0 (0) | 4 (3.3) | 1 (1.5) | ||
| Other cardiovascular | 2 (1.1) | 0 (0) | 2 (1.7) | 0 (0) | ||
| Non-cardiovascular | 8 (4.3) | 1 (50) | 5 (4.2) | 2 (3.1) | ||
| Malignancy | 4 (2.1) | 1 (50) | 3 (2.5) | 0 (0) | ||
| Other | 4 (2.1) | 0 (0) | 2 (1.7) | 0 (0) | ||
| Clinical outcome | All participants (n = 155), n (%) | USPIO enhancement, n (%) | Difference(95% CI) | p-value | ||
|---|---|---|---|---|---|---|
| Indeterminant USPIO (n = 3) | No (n = 71) | Yes (n = 81) | ||||
| AAA event | ||||||
| Rupture/repair | 111 (71.6) | 3 (100) | 53 (74.6) | 55 (67.9) | ||
| Rupture | 98 (63.2) | 3 (100) | 48 (67.6) | 47 (58.0) | –9.6 (–24.9 to 5.7) | 0.2235 |
| Repair | 13 (8.4) | 0 (0) | 5 (7.0) | 8 (9.9) | 2.8 (–6.0 to 11.7) | 0.5330 |
| Type of repair | ||||||
| EVAR | 88 (56.8) | 3 (100) | 44 (62.0) | 41 (50.6) | –11.4 (–27.0 to 4.3) | 0.1595 |
| Open | 34 (21.9) | 1 (33) | 20 (28.2) | 13 (16.0) | ||
| Type of surgery | ||||||
| Elective | 54 (34.8) | 2 (67) | 24 (33.8) | 28 (34.6) | ||
| Emergency | 84 (54.2) | 3 (100) | 42 (59.2) | 39 (48.1) | ||
| Death | ||||||
| All-cause | 4 (2.6) | 0 (0) | 2 (2.8) | 2 (2.5) | ||
| Cardiovascular: AAA related | 28 (18.1) | 0 (0) | 7 (9.9) | 21 (25.9) | 16.1 (4.3 to 27.9) | 0.0108 |
| Cardiovascular: non-AAA related | 13 (8.4) | 0 (0) | 4 (5.6) | 9 (11.1) | 5.5 (–3.2 to 14.2) | 0.2283 |
| Stroke | 4 (2.6) | 0 (0) | 1 (1.4) | 3 (3.7) | ||
| Myocardial infarction | 1 (0.6) | 0 (0) | 1 (1.4) | 0 (0) | ||
| Other cardiovascular | 3 (1.9) | 0 (0) | 0 (0) | 3 (3.7) | ||
| Non-cardiovascular | 0 (0) | 0 (0) | 0 (0) | 0 (0) | ||
| Malignancy | 11 (7.1) | 0 (0) | 2 (2.8) | 9 (11.1) | ||
| Other | 8 (5.2) | 0 (0) | 1 (1.4) | 7 (8.6) | ||
Appendix 6 Additional figures
FIGURE 20.
Serial ultrasonographic measurements of aneurysm diameter in patients without USPIO enhancement.
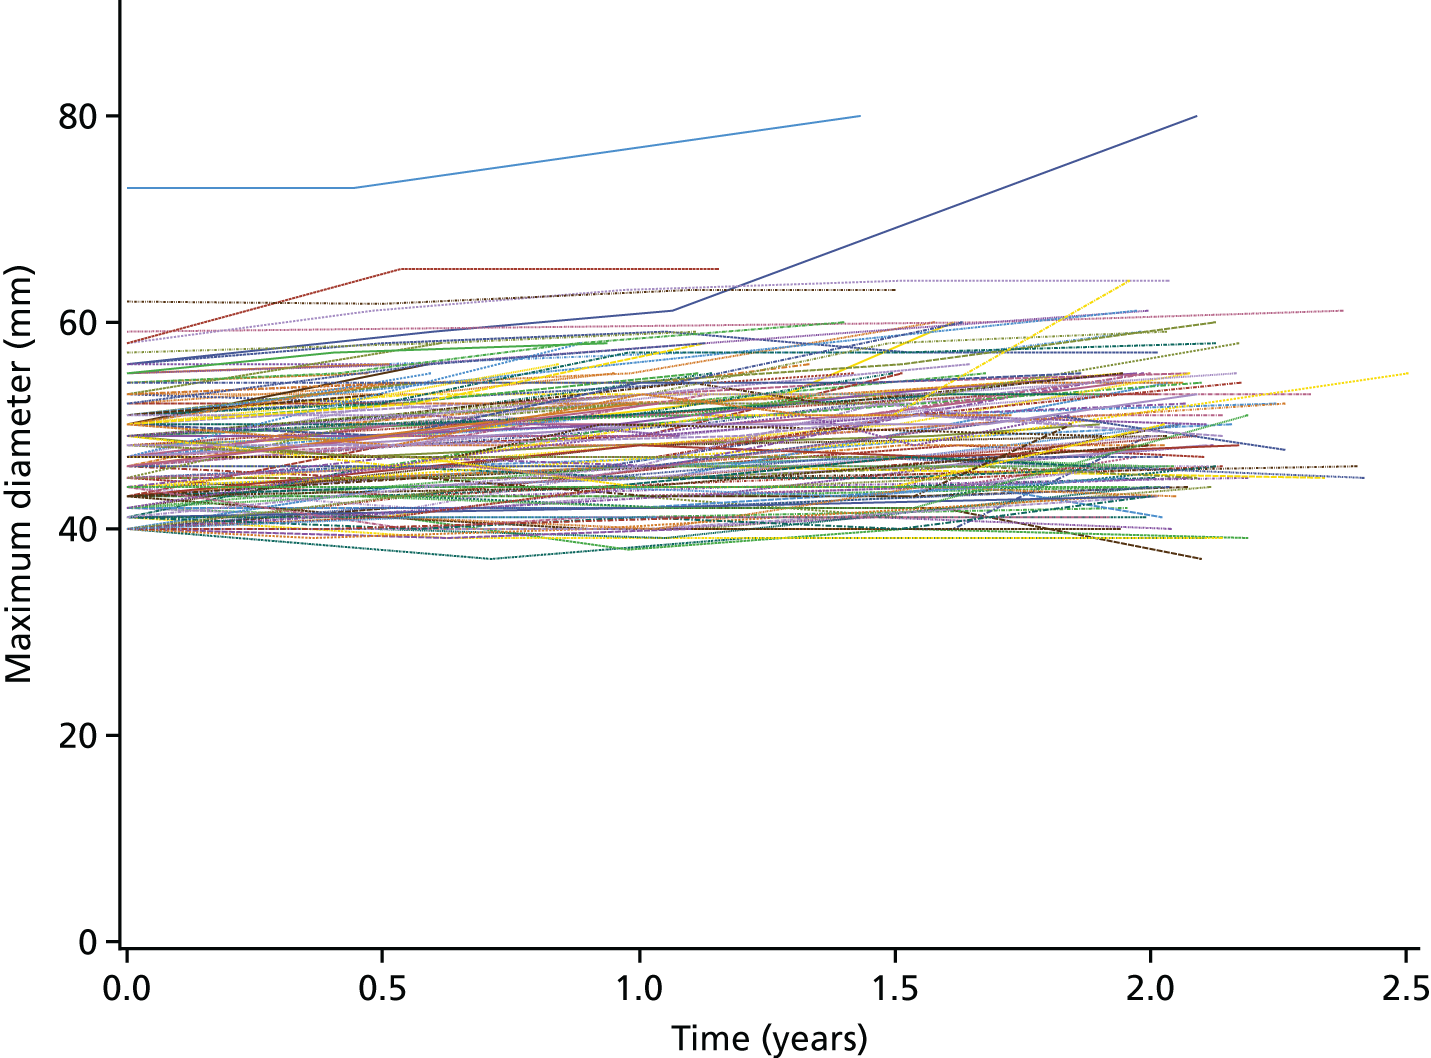
FIGURE 21.
Serial ultrasonographic measurements of aneurysm diameter in patients with USPIO enhancement.
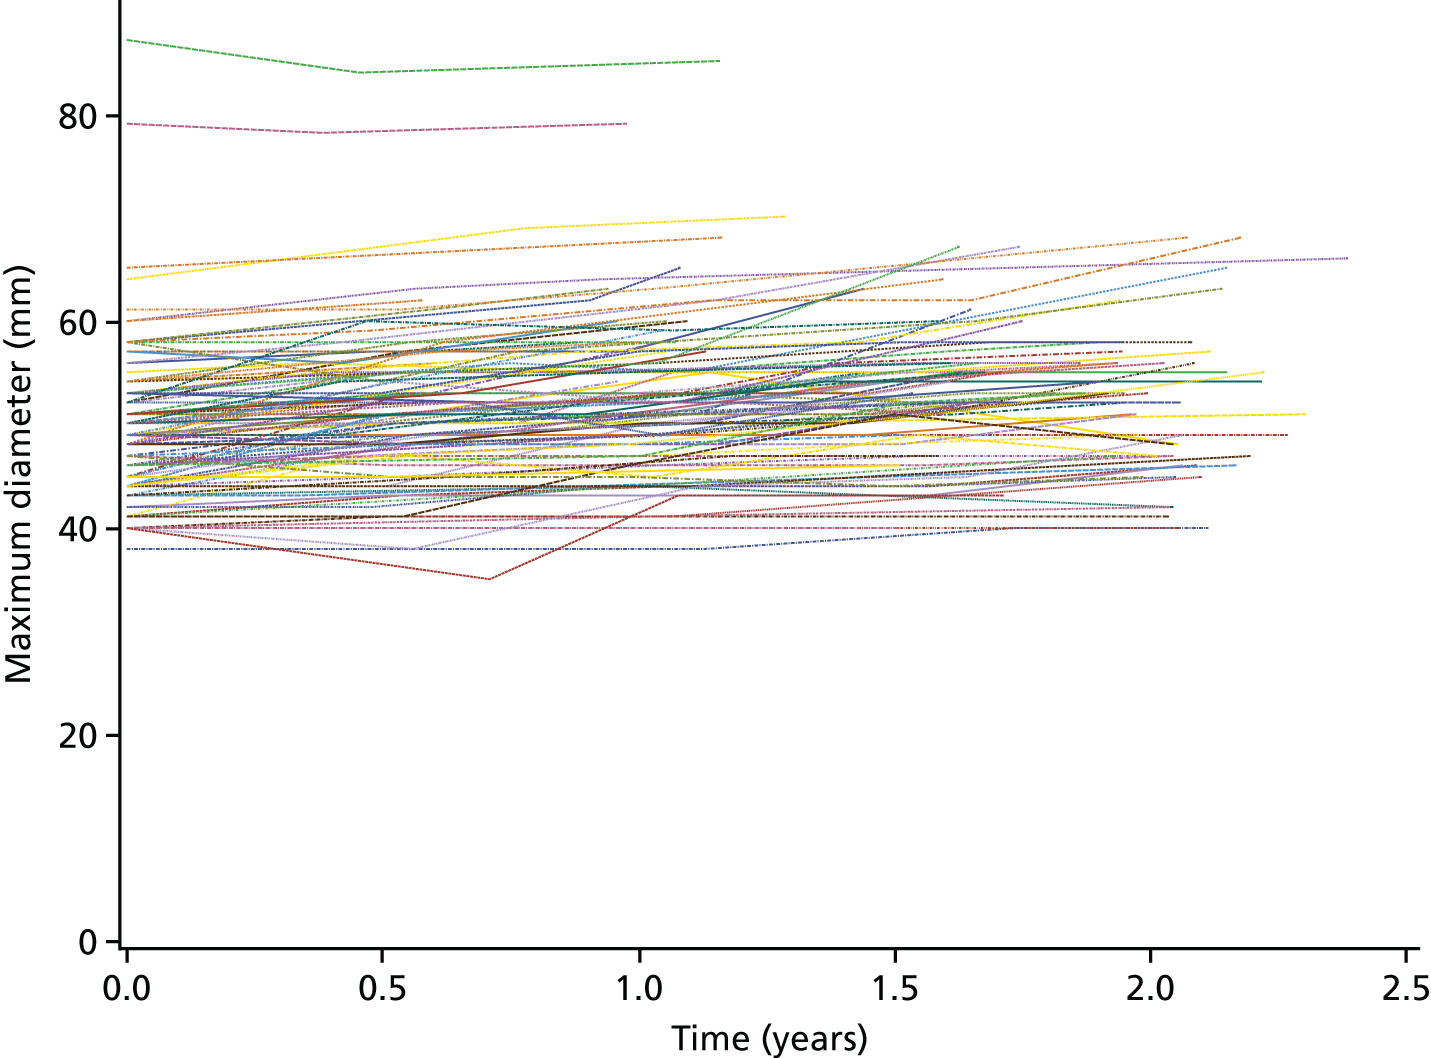
FIGURE 22.
Probability plots of models 1 and 2 for AAA rupture or repair.
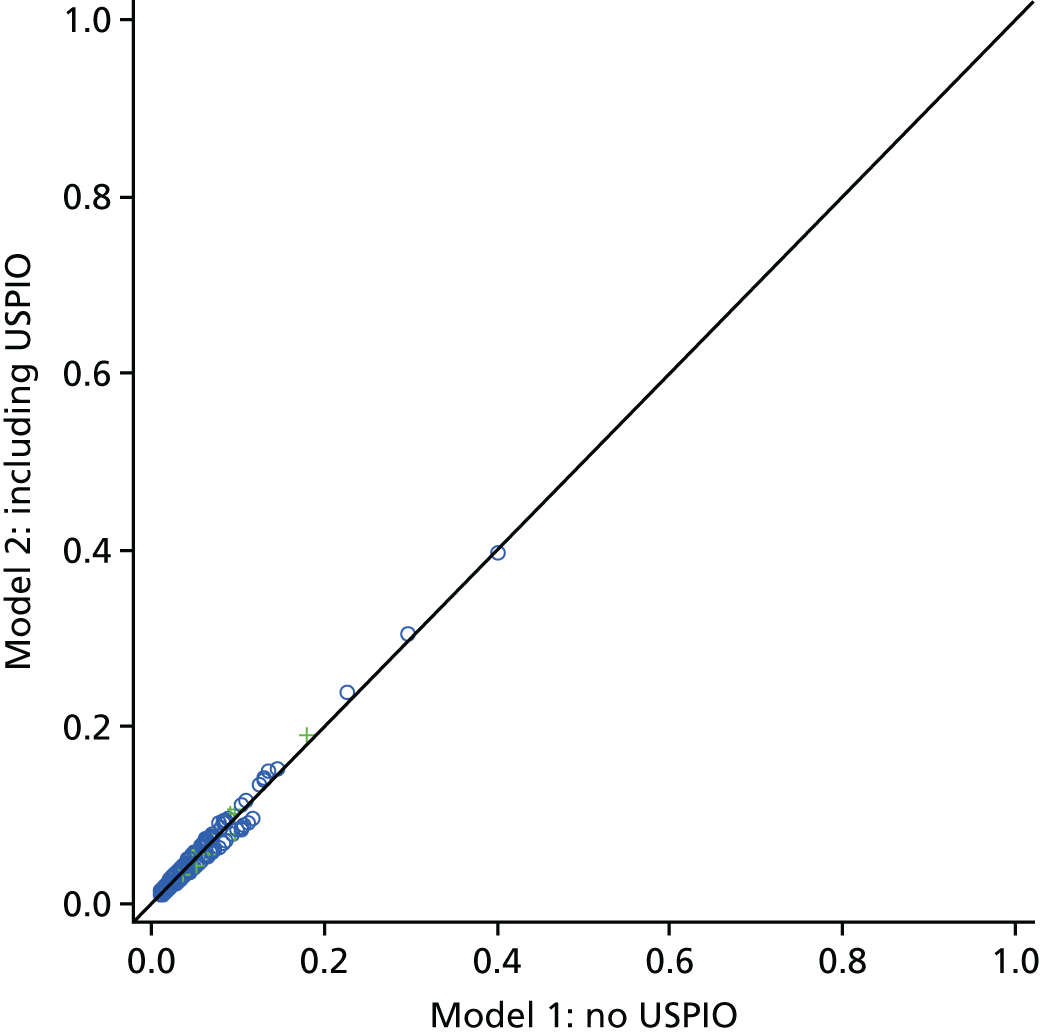
FIGURE 23.
Probability plots of models 1 and 2 for the prediction of AAA rupture.
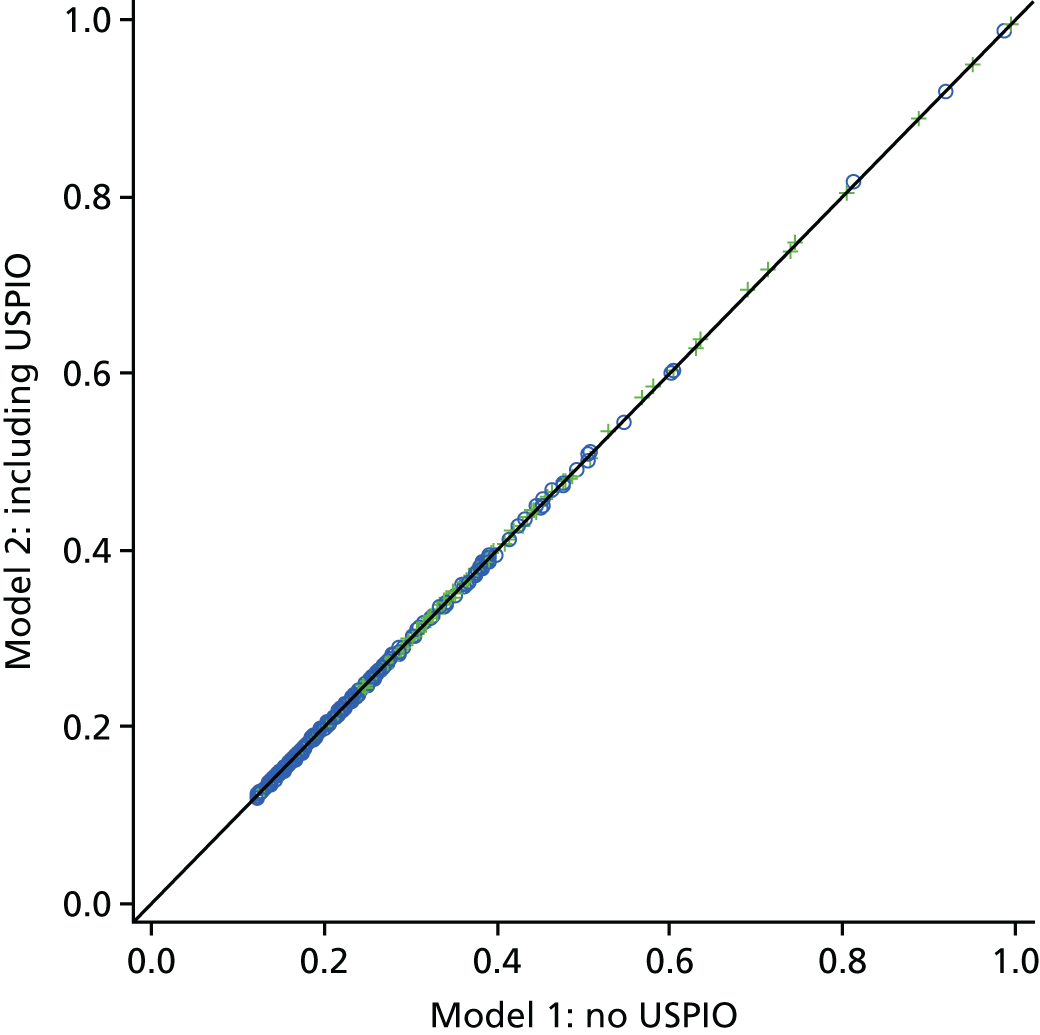
FIGURE 24.
Probability plots of models 1 and 2 for AAA repair with and without USPIO uptake.
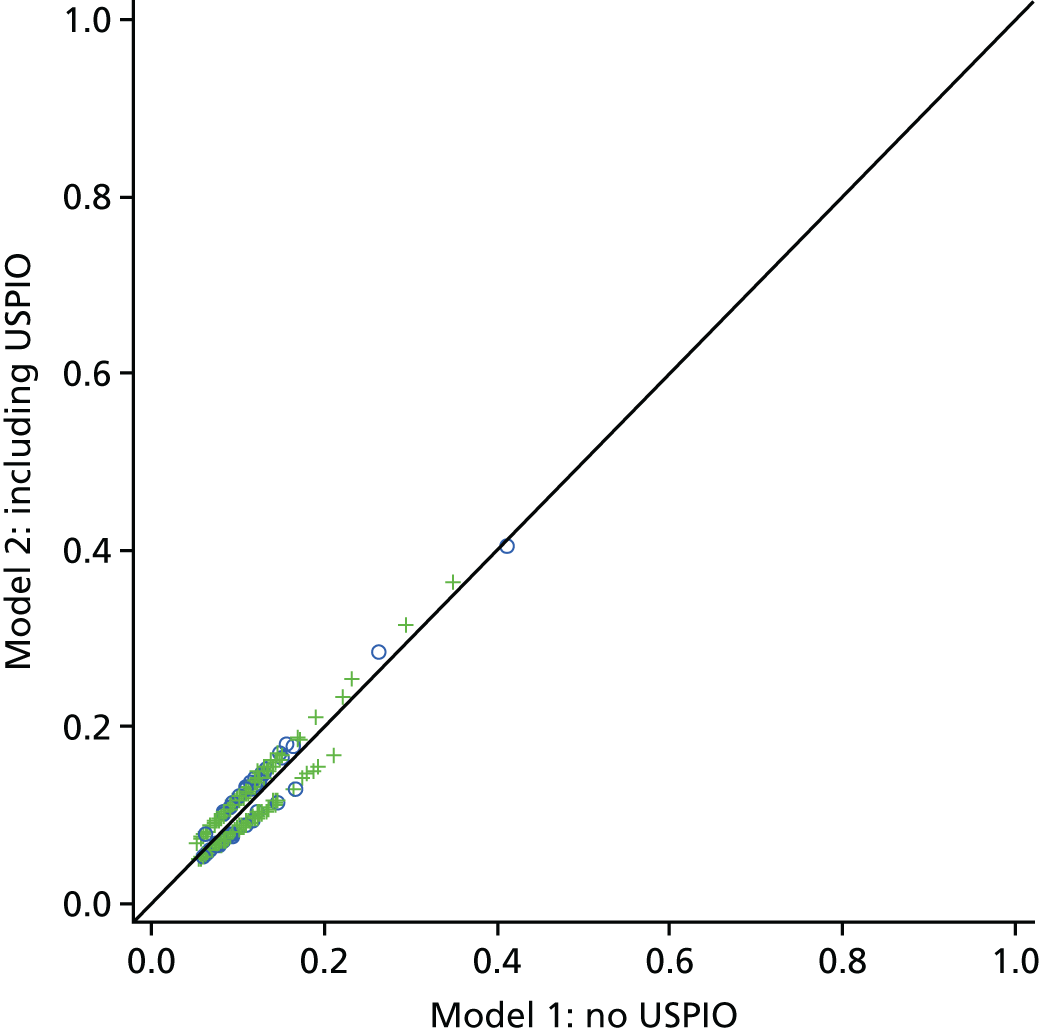
FIGURE 25.
Probability plots of models 1 and 2 for all-cause death with and without USPIO uptake.
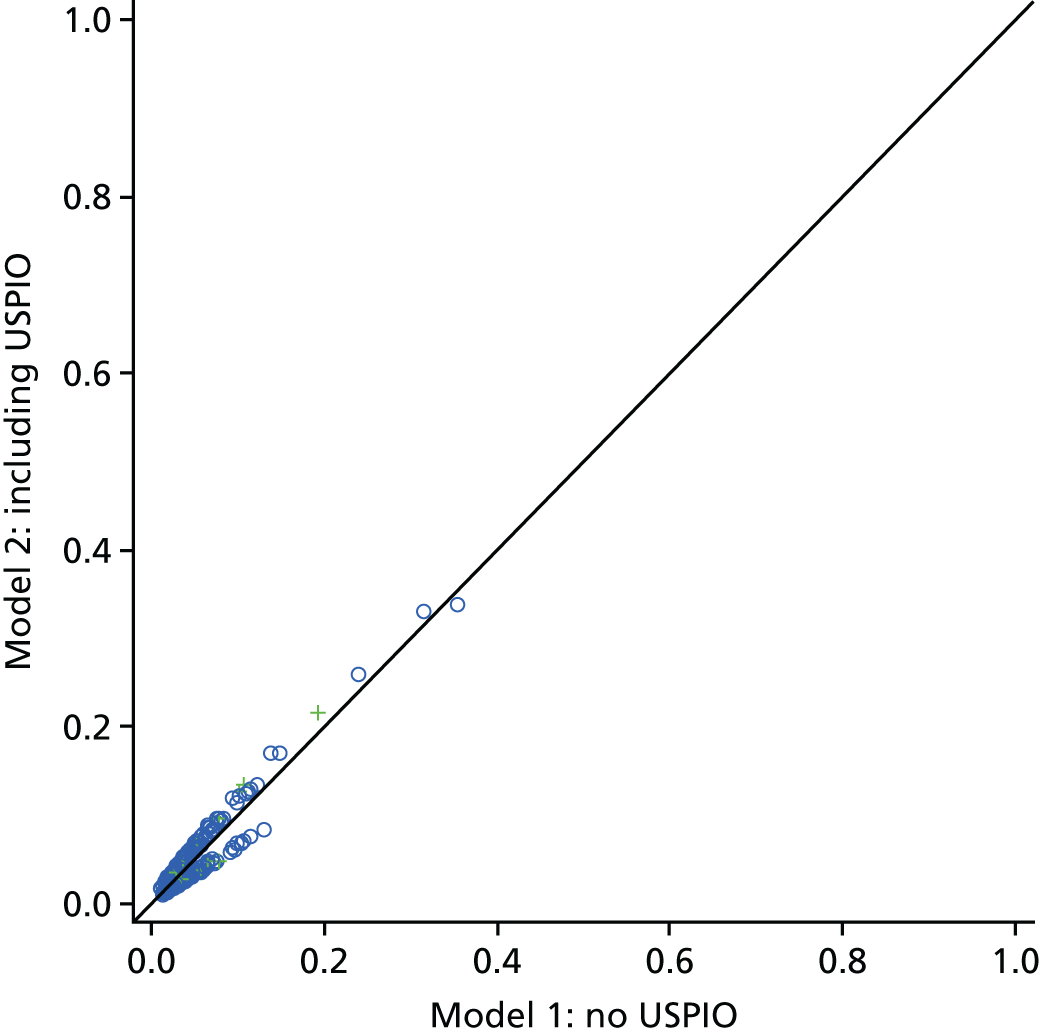
FIGURE 26.
Graphs showing the percentage increase in (a) maximum diameter and (b) total AAA volume from baseline values after a 24-month period.
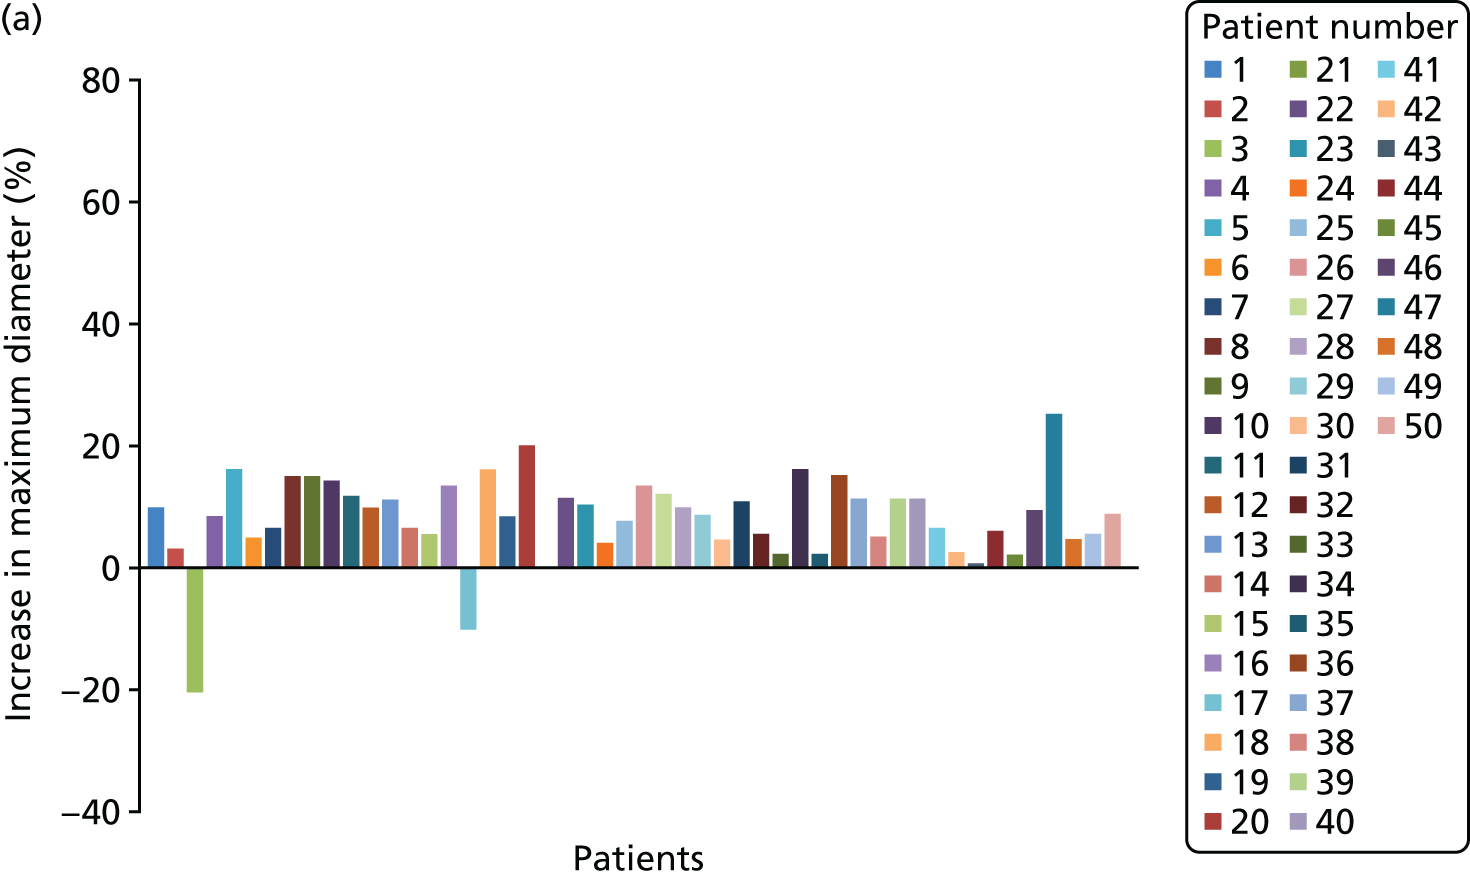
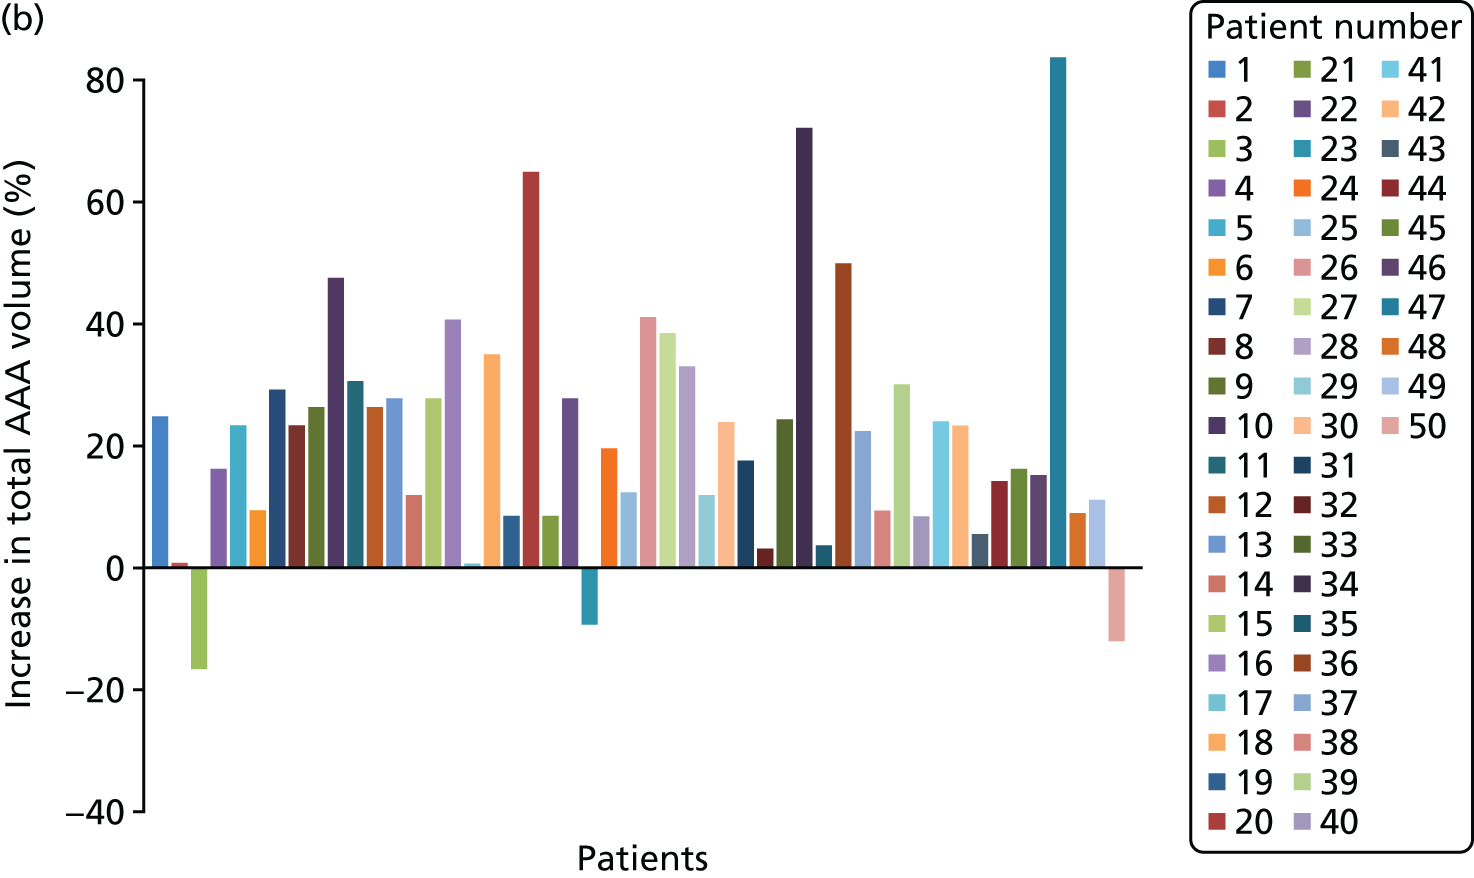
FIGURE 27.
Graph showing the percentage change in AAA volume once artefacts caused by blood pressure changes (e.g. change in luminal volume) were taken into account.
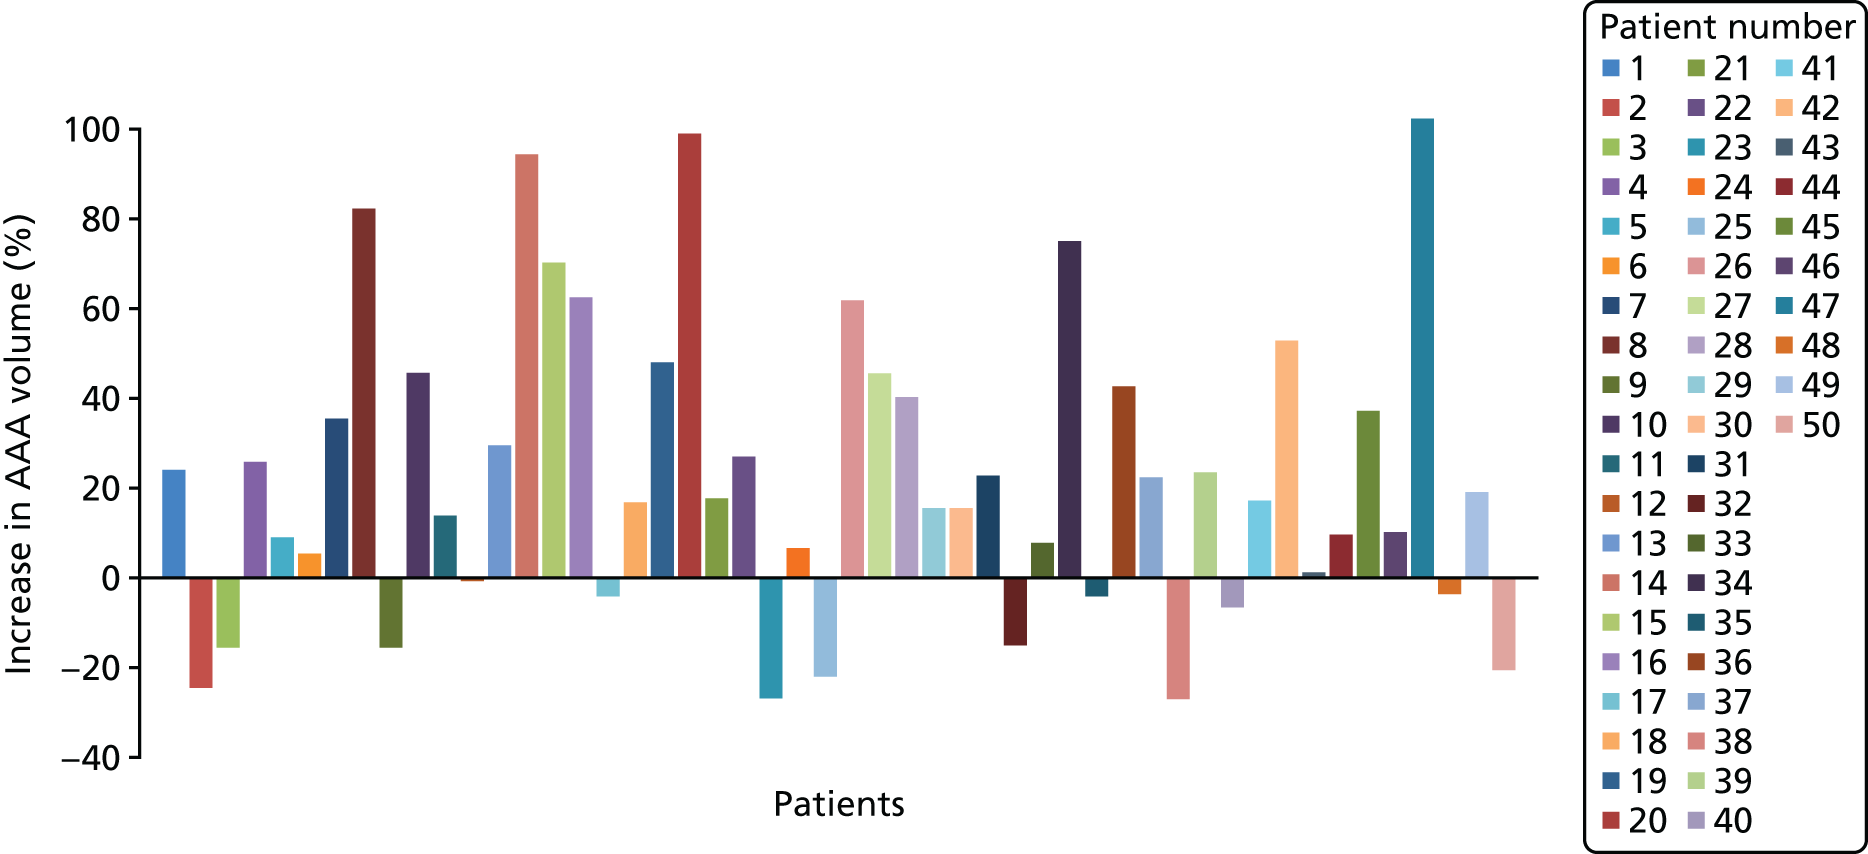
FIGURE 28.
Correlation values mapped for each 5° slice and all 10 aneurysms. Each individual coloured bar represents the correlation between all data points of the longitudinal surface derivative (dr) and stress (σ) for a given increment of Θ (°).
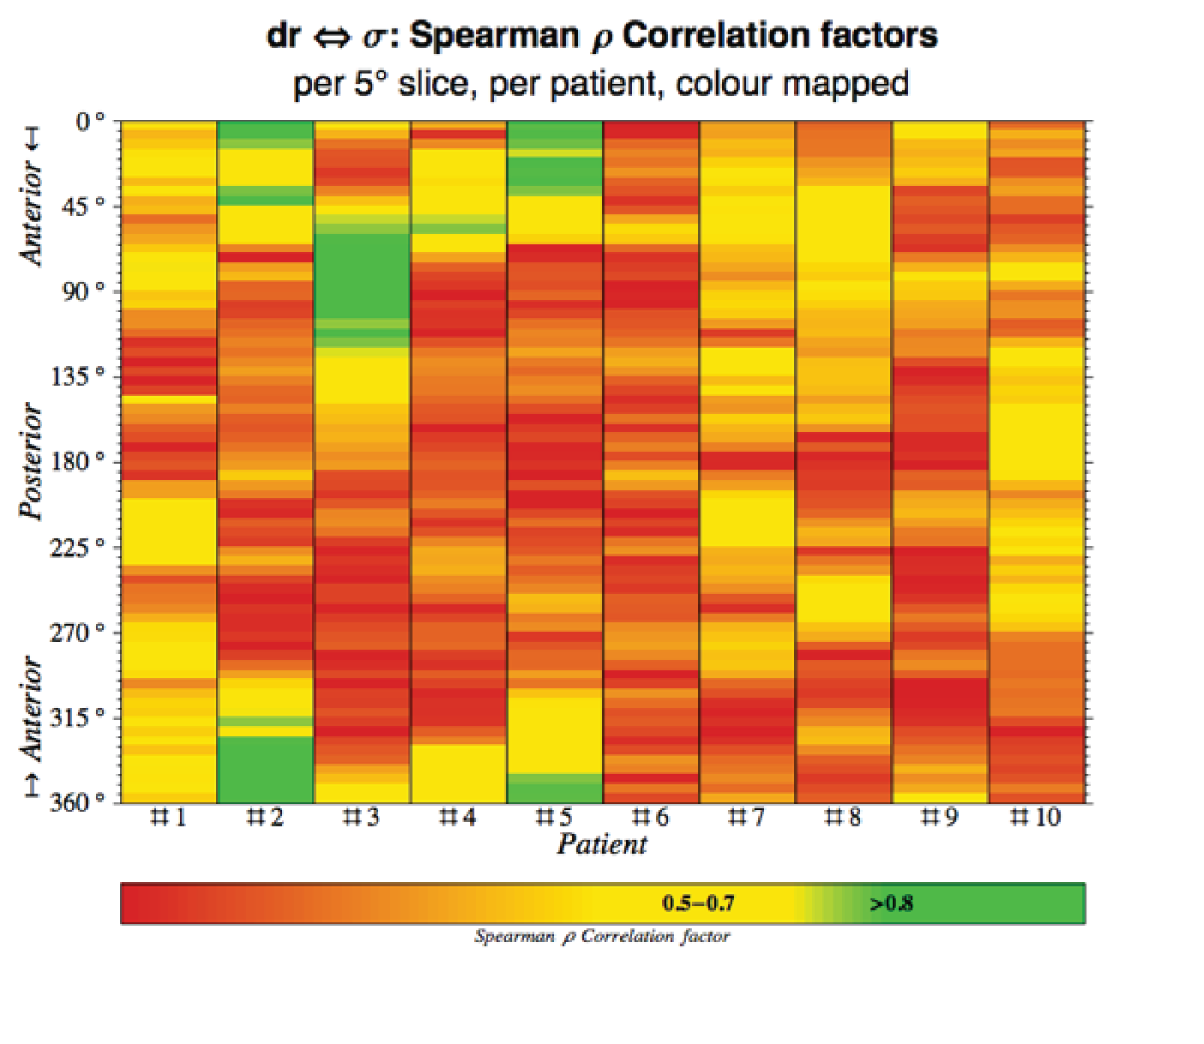
FIGURE 29.
Correlation values mapped for each 5° slice and all 10 aneurysms. Each individual coloured bar represents the correlation between all data points of diameter (D) and stress (σ) for a given increment of Θ.
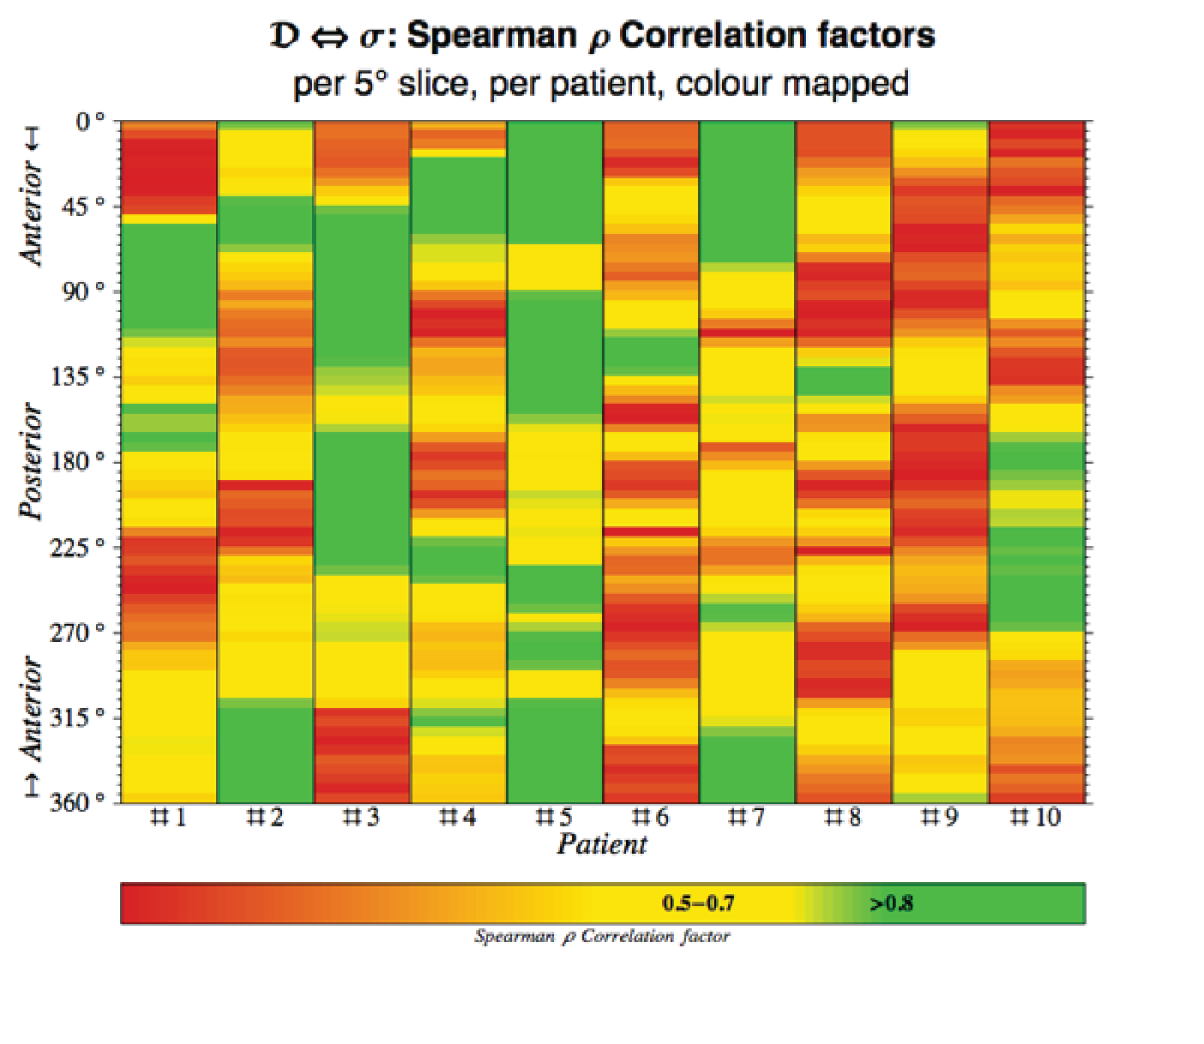
List of abbreviations
- AAA
- abdominal aortic aneurysm
- CI
- confidence interval
- CONSORT
- Consolidated Standards of Reporting Trials
- CRF
- case report form
- CT
- computed tomography
- DES-MA3R
- DESmosine as a prognostic Marker in Aortic Aneurysm
- FE
- finite element
- MA3RS
- Magnetic resonance imaging for Abdominal Aortic Aneurysms to predict Rupture or Surgery
- MRC
- Medical Research Council
- MRI
- magnetic resonance imaging
- NIHR
- National Institute for Health Research
- NRI
- net reclassification index
- PET
- positron emission tomography
- REC
- Research Ethics Committee
- ROC
- receiver operator characteristic
- RPI
- rupture potential index
- SD
- standard deviation
- SoFIA3
- Sodium Fluoride Imaging of Abdominal Aortic Aneurysms
- TE
- echo time
- TR
- repetition time
- USPIO
- ultrasmall superparamagnetic particles of iron oxide
- USPIO–ve
- ultrasmall superparamagnetic particles of iron oxide negative
- USPIO+ve
- ultrasmall superparamagnetic particles of iron oxide positive
