Notes
Article history
The research reported in this issue of the journal was funded by the EME programme as project number 14/01/02. The contractual start date was in February 2016. The final report began editorial review in September 2018 and was accepted for publication in June 2020. The authors have been wholly responsible for all data collection, analysis and interpretation, and for writing up their work. The EME editors and production house have tried to ensure the accuracy of the authors’ report and would like to thank the reviewers for their constructive comments on the final report document. However, they do not accept liability for damages or losses arising from material published in this report.
Permissions
Copyright statement
© Queen’s Printer and Controller of HMSO 2020. This work was produced by Poon et al. under the terms of a commissioning contract issued by the Secretary of State for Health and Social Care. This issue may be freely reproduced for the purposes of private research and study and extracts (or indeed, the full report) may be included in professional journals provided that suitable acknowledgement is made and the reproduction is not associated with any form of advertising. Applications for commercial reproduction should be addressed to: NIHR Journals Library, National Institute for Health Research, Evaluation, Trials and Studies Coordinating Centre, Alpha House, University of Southampton Science Park, Southampton SO16 7NS, UK.
2020 Queen’s Printer and Controller of HMSO
Chapter 1 Introduction
Background
Pre-eclampsia, which affects 2–3% of pregnancies, is a major cause of maternal and perinatal morbidity and mortality. 1–4 Pre-eclampsia can be subdivided into preterm pre-eclampsia, requiring delivery before 37 weeks’ gestation, and term-pre-eclampsia, with delivery at ≥ 37 weeks’ gestation. Preterm pre-eclampsia is associated with a higher incidence of adverse outcome. 5 Globally, 76,000 women and 500,000 babies die each year from pre-eclampsia.
Obstetricians managing women with preterm pre-eclampsia are faced with the challenge of balancing the need for achieving fetal maturation in utero with the risks to the mother and fetus from continuing the pregnancy longer. These risks include progression to eclampsia, development of placental abruption and haemolysis, elevated liver enzymes, low platelets (HELLP) syndrome. On the other hand, preterm delivery is associated with higher infant mortality rates and increased morbidity resulting from babies born small for gestational age (SGA), thrombocytopenia, bronchopulmonary dysplasia, cerebral palsy and an increased risk of various chronic diseases in adult life. Women who have experienced pre-eclampsia may also face additional health problems in later life, as the condition is associated with an increased risk of death from future cardiovascular disease, hypertension, stroke, renal impairment, metabolic syndrome and diabetes.
Low-dose aspirin for the prevention of pre-eclampsia
Several trials have been carried out in the last 30 years that have investigated the potential benefit of prophylactic use of low-dose aspirin in the prevention of pre-eclampsia. 6 These studies were heterogeneous in selection criteria, gestational age at onset, dose of aspirin and outcome measures. A meta-analysis of these trials concluded that low-dose aspirin in high-risk women for development of pre-eclampsia reduces the risk by about 10%. 6
Recent evidence suggests that the risk of preterm pre-eclampsia can be substantially reduced by the prophylactic use of aspirin. The multicentre Aspirin for Evidence-Based Preeclampsia Prevention (ASPRE) trial carried out by the same research team (i.e. LCP, DW and KHN) reported that in women with singleton pregnancies at high risk for pre-eclampsia, aspirin (150 mg/day) compared with placebo from 11–14 to 36 weeks’ gestation was associated with a 62% [95% confidence interval (CI) 26% to 80%] reduction in the incidence of preterm pre-eclampsia, but had no significant effect on the incidence of term pre-eclampsia. 7 A systematic review and meta-analysis of 16 trials in a combined total of 18,907 participants, including the ASPRE trial,7 reported that aspirin reduces the risk of preterm pre-eclampsia by 67% (95% CI 43% to 81%) provided that the daily dose was ≥ 100 mg and onset of therapy was < 16 weeks. Aspirin had no significant effect on incidence of term pre-eclampsia. 1
Current NICE recommendation
In the UK, the high-risk group who are advised to take aspirin is determined according to the guidelines8 of the National Institute for Health and Care Excellence (NICE). 9 At the booking visit, pregnant women are considered to be at high risk of developing pre-eclampsia if they have any one major factor (i.e. history of hypertensive disease in a previous pregnancy, chronic kidney disease, autoimmune disease, diabetes or chronic hypertension) or any two moderate factors (i.e. first pregnancy, aged ≥ 40 years, interpregnancy interval of > 10 years, body mass index at first visit of ≥ 35 kg/m2 or a family history of pre-eclampsia). 8
Logistic regression
Methods for identifying women at high risk of pre-eclampsia using probability incorporating biomarkers as well as maternal risk factors have been the subject of much research over the last 20 years. Most of these methods use binary logistic regression models and treat pre-eclampsia as a binary outcome. An extensive review of these methods and the development of new models have recently been undertaken by the International Prediction of Pregnancy Complication Network. 10
Competing risk model
The method that we have developed represents pre-eclampsia as an event in time and uses a survival model for the gestational age at delivery with pre-eclampsia. In this approach, deliveries for reasons other than pre-eclampsia are treated as censored observations. Given her maternal characteristics (Mat-CHs) and biomarker measurements, each woman has a personalised distribution of gestational age at delivery with pre-eclampsia. The risk of delivery with pre-eclampsia before any particular gestational age can be determined from this personalised distribution. This method therefore allows early, preterm and all pre-eclampsia to be incorporated in the same model.
Using a similar approach to that taken in risk assessment for aneuploidies,11 the model is specified in terms of a prior distribution from Mat-CHs and likelihood functions from biomarker measurements. 12–16 Data from biomarker measurements are used to update the prior distribution using Bayes’ theorem to produce a posterior distribution. By chaining Bayes’ theorem, the posterior distribution can be updated as new information becomes available at different stages in pregnancy. This way of specifying the model therefore provides a framework for dynamic prediction. It also allows the different marker combinations to be used within the same underling model and new markers to be included without the need for a completely new model.
Objectives of the SPREE study
The objectives of the screening programme for pre-eclampsia (SPREE) study set out in our original application were as follows.
Prediction algorithm
We aimed to finalise the competing risk model for prediction of pre-eclampsia from Mat-CHs together with combinations of the following four biomarkers:
-
mean arterial pressure (MAP)
-
uterine artery pulsatility index (UTA-PI)
-
maternal serum placental growth factor (PLGF)
-
pregnancy-associated plasma protein-A (PAPP-A).
Comparisons with NICE
We aimed to make the following prespecified comparisons of predictive performance of the competing risk model with that of the NICE method:
-
Primary – for the same screen-positive rate (SPR) determined by the NICE method, comparison of the detection rate (DR) for pre-eclampsia with delivery at any gestational age:
-
NICE compared with a mini-combined test (i.e. Mat-CHs, MAP and PAPP-A).
-
-
Secondary – for the same SPR determined by NICE, comparison of DRs of preterm pre-eclampsia:
-
NICE compared with Mat-CHs, MAP and PLGF
-
NICE compared with Mat-CHs, MAP, PLGF and UTA-PI
-
NICE compared with Mat-CHs, MAP and PAPP-A.
-
Predictive performance
We aimed to assess the predictive performance of the competing risk model for prediction of pre-eclampsia at < 34 weeks’ gestation, pre-eclampsia at < 37 weeks’ gestation, pre-eclampsia at ≥ 37 weeks’ gestation and pre-eclampsia with delivery at any gestational age.
Screening in two stages
We aimed to demonstrate the process of first-stage screening using a subset of markers and then applying the complete test to a subpopulation selected from first-stage risks.
Evaluation and inclusion of additional biomarkers
We aimed to explore the potential value of another biomarker, inhibin A, in predicting pre-eclampsia.
Prediction of small for gestational age neonates
We aimed to assess of the performance of the competing risk model in the prediction of SGA neonates.
In addition, we included a meta-analysis of screening performance that combines data from the SPREE study with two other data sets. One data set has a population of 35,948 women and is used in a model development referred to as the American Journal of Obstetricians and Gynecology (AJOG) data. 17 The other data set has a population of 8775 women and is used in the quality study phase of the ASPRE trial, referred to as the ASPRE Screening Quality Study (SQS) data. Predictive performance is also included for the AJOG data and for the SPREE study.
The rest of the report is organised as follows. Chapter 2 explains the competing risk model and is accompanied by a technical specification (see Appendix 1). Details of the SPREE study cohort study and the methodology used for comparisons of the competing risk model with NICE guidelines are described in Chapter 3. Results from the SPREE study and comparisons with the NICE method are given in Chapter 4 and discussed in Chapter 5. Assessment of performance of risk calibration is presented in Chapter 6. Decision analysis curves are presented in Chapter 7. Chapter 8 presents the meta-analysis of the results from the SPREE study, along with those from AJOG and ASPRE SQS data sets. Chapter 9 presents the application of two-stage screening. Chapter 10 shows, using inhibin A, how an additional marker can be added to the model. Chapter 11 examines the performance of the competing risk model in the prediction of SGA.
Chapter 2 The competing risk model
The objective of this chapter is to provide a non-technical description of the competing risk model for assessing the risk of pre-eclampsia that would provide a conceptual understanding of the approach that is accessible to non-statisticians. Sections of this chapter have been reprinted from Am J Obstet Gynecol, 214/1, O’Gorman N, Wright D, Syngelaki A, Akolekar R, Wright A, Poon LC, Nicolaides KH, Competing risks model in screening for preeclampsia by maternal factors and biomarkers at 11–13 weeks’ gestation, 103.e1–103.e12, 2016, with permission from Elsevier. 17
Description of the competing risk model
The competing risk model11 assumes that if the pregnancy was to continue indefinitely then all women would develop pre-eclampsia and whether or not they do so before a specified gestational age depends on competition between delivery before or after development of pre-eclampsia. 18,19
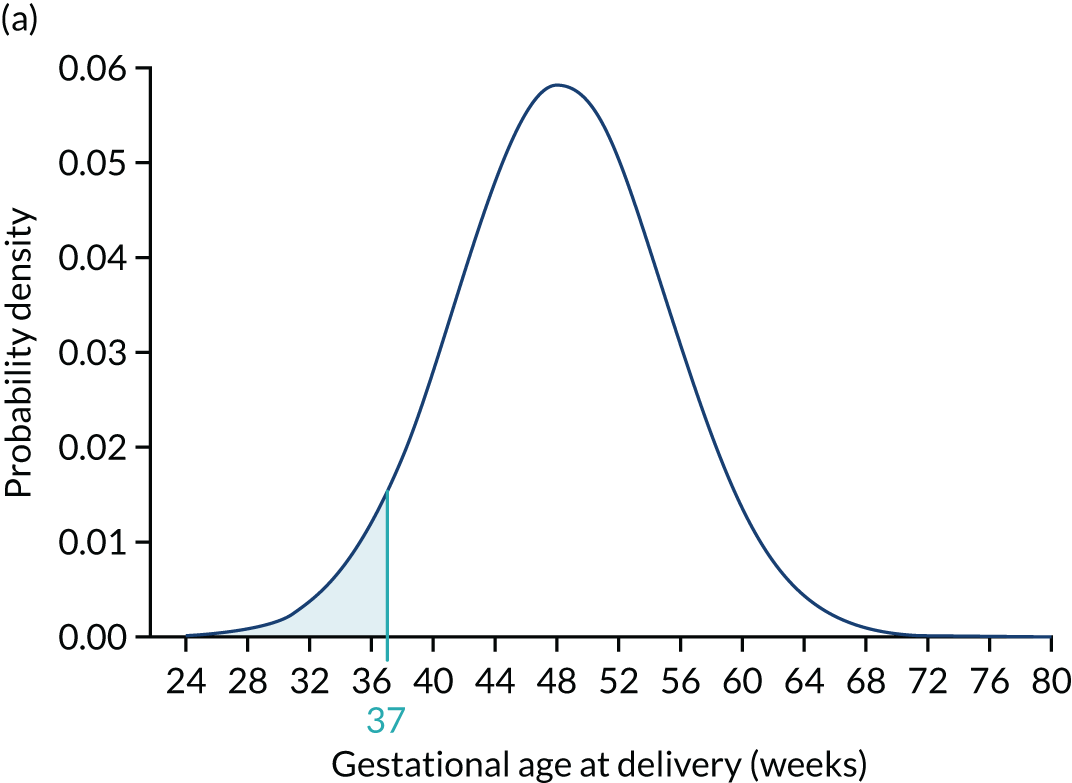
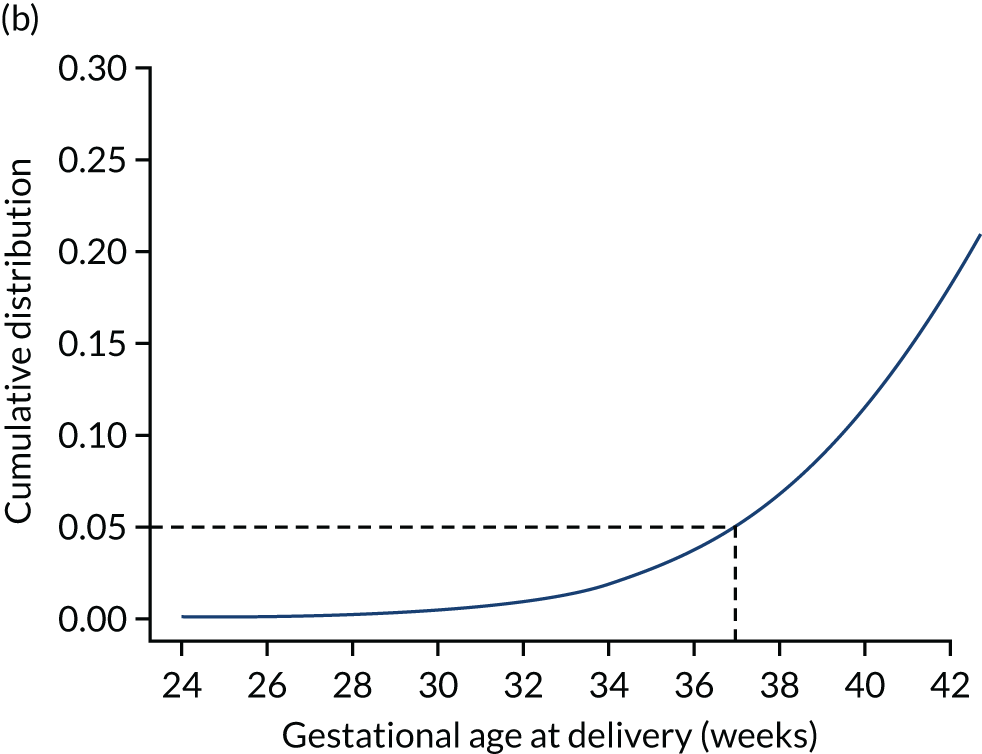
Each woman has a personalised distribution of gestational age at delivery with pre-eclampsia, as illustrated in Figure 1. The risks obtained from this distribution are probabilities of delivery with pre-eclampsia, assuming no other-cause delivery. These are given by the area under the probability density curve, as illustrated in Figure 1a, or the height of the cumulative distribution curve, as illustrated in Figure 1b. The cumulative distribution curve on Figure 1b is the graph of the areas on Figure 1a as functions of gestational age at delivery.
FIGURE 1.
Personalised distribution of gestational age at delivery with pre-eclampsia. Risk of delivery with pre-eclampsia before 37 weeks’ gestation is shown in the shaded area under the probability density (a) and the height of the cumulative distribution (b). The area shaded blue is 0.05 or 1 in 20 and this is the risk of pre-eclampsia with delivery before 37 weeks’ gestation.
There are many approaches that can be taken to fitting models to obtain personalised distribution. Our approach uses Bayes’ theorem to combine a prior distribution determined from maternal and pregnancy characteristics that are available at the first trimester of pregnancy with likelihoods from biomarkers measured during pregnancy. The benefit of this approach for risk assessment is that biomarkers can be added at different times and the posterior distribution can be updated with further information as the pregnancy progresses. If no biomarker information is available, then risks can be obtained from the prior model. From the model development perspective, new biomarkers can be incorporated by augmenting the likelihood model without the need for a completely new model. This facilitates extension of the model through the addition of new biomarkers. This report concerns biomarkers measured in the first trimester. The full model includes biomarkers measured in the second and third trimesters of pregnancy.
Prior model based on maternal factors
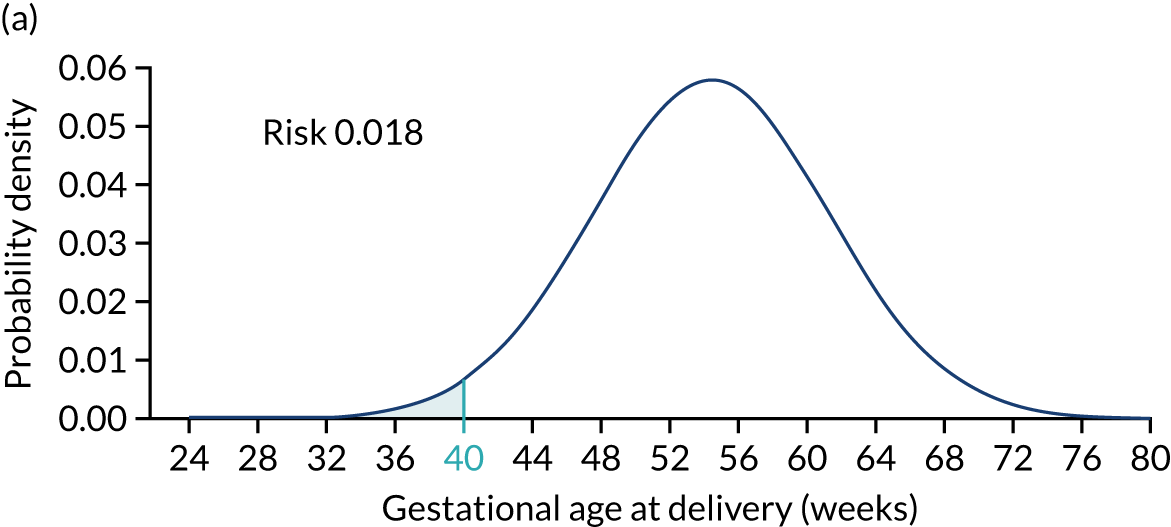
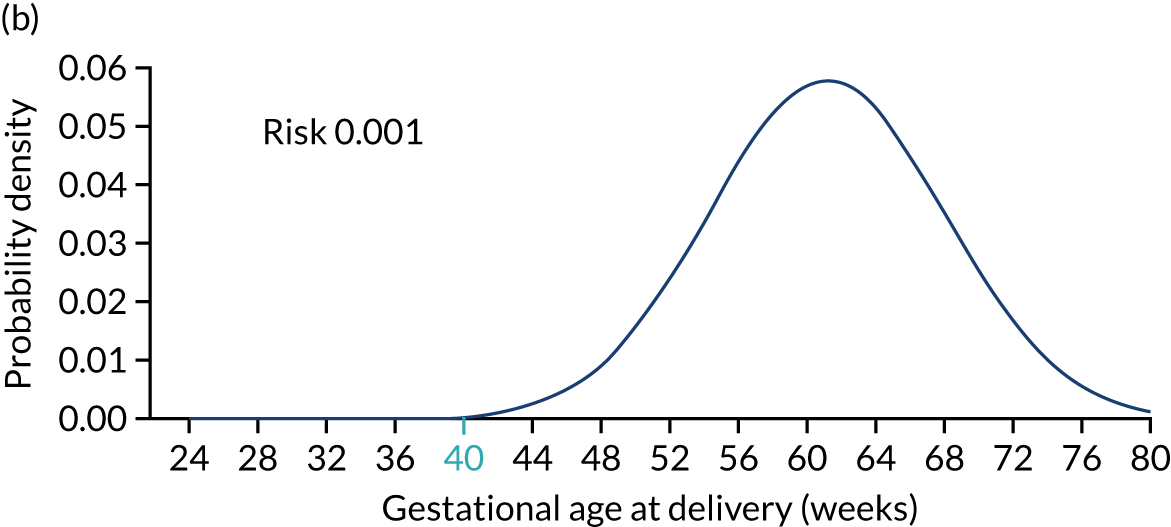
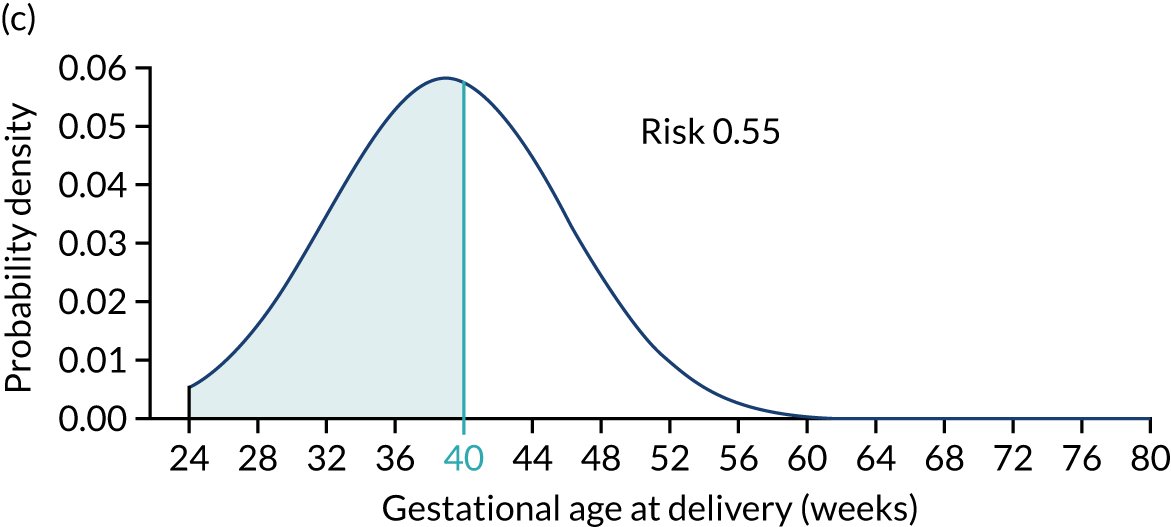
Figure 2 illustrates the prior distribution of gestational age at delivery with pre-eclampsia for three different scenarios. Figure 2a shows the reference distribution that applies to a white, nulliparous woman with no family history of pre-eclampsia, aged ≤ 35 years and with a weight of 69 kg and a height of 164 cm. Figure 2b shows the distribution for a woman with low-risk factors, resulting in a shift of the mean to the right by 6.7 weeks and, therefore, a reduction in risk of delivery with pre-eclampsia at < 40 weeks’ gestation. Figure 2c shows the distribution for a woman with high-risk factors, resulting in a shift of the mean to the left by 15.3 weeks and, therefore, an increase in risk of delivery with pre-eclampsia at < 40 weeks’ gestation. 11
FIGURE 2.
Prior distributions for three scenarios. The shaded areas show the risks of pre-eclampsia with delivery before 40 weeks’ gestation assuming no other cause for delivery. (a) Scenario 1 (age: 25 years, height: 164 cm, weight: 69 kg, race: white, family history of pre-eclampsia: no, parity: nulliparous, conception: spontaneous, medical conditions: none); (b) scenario 2 (age: 34 years, height: 170 cm, weight: 50 kg, race: white, family history of pre-eclampsia: no, parity: parous without pre-eclampsia, previous gestation at delivery: 40 weeks’ gestation, pregnancy interval: 2 years, conception: spontaneous, medical conditions: none); and (c) scenario 3 (age: 40 years, height: 140 cm, weight: 120 kg, race: black, family history of pre-eclampsia: yes mother, parity: parous with pre-eclampsia, previous gestational age at delivery: 37 weeks’ gestation, pregnancy interval: 1 year, conception: spontaneous, medical conditions: none).
Multiples of the median of biomarkers
The use of multiple of the median (MoM) values as standardised biomarker measures has a long history in screening that goes back over 40 years to early work on screening for anencephaly and spina bifida. 20 It is the established approach for standardisation incorporated in many software systems.
The purpose of this standardisation is to remove the effects of characteristics (e.g. gestational age, weight and ethnicity) associated with the individual being measured and characteristics associated with the measurement instrument. If y denotes the measurement of the biomarker of a particular individual and m the median value given the characteristics of this individual, then the MoM value is given by MoM = y/m. MoM values are generally obtained from regression models of log-transformed biomarker values. They are the antilogarithm of the errors or residuals from the regression model.
An important property of MoM values for our purposes is that, given the gestation of delivery with pre-eclampsia, MoM values can be assumed to be conditionally independent of the covariates included in the prior model. This is achieved by ensuring that MoM values are standardised for the covariates used to determine the prior model.
Likelihood functions for biomarker measurements
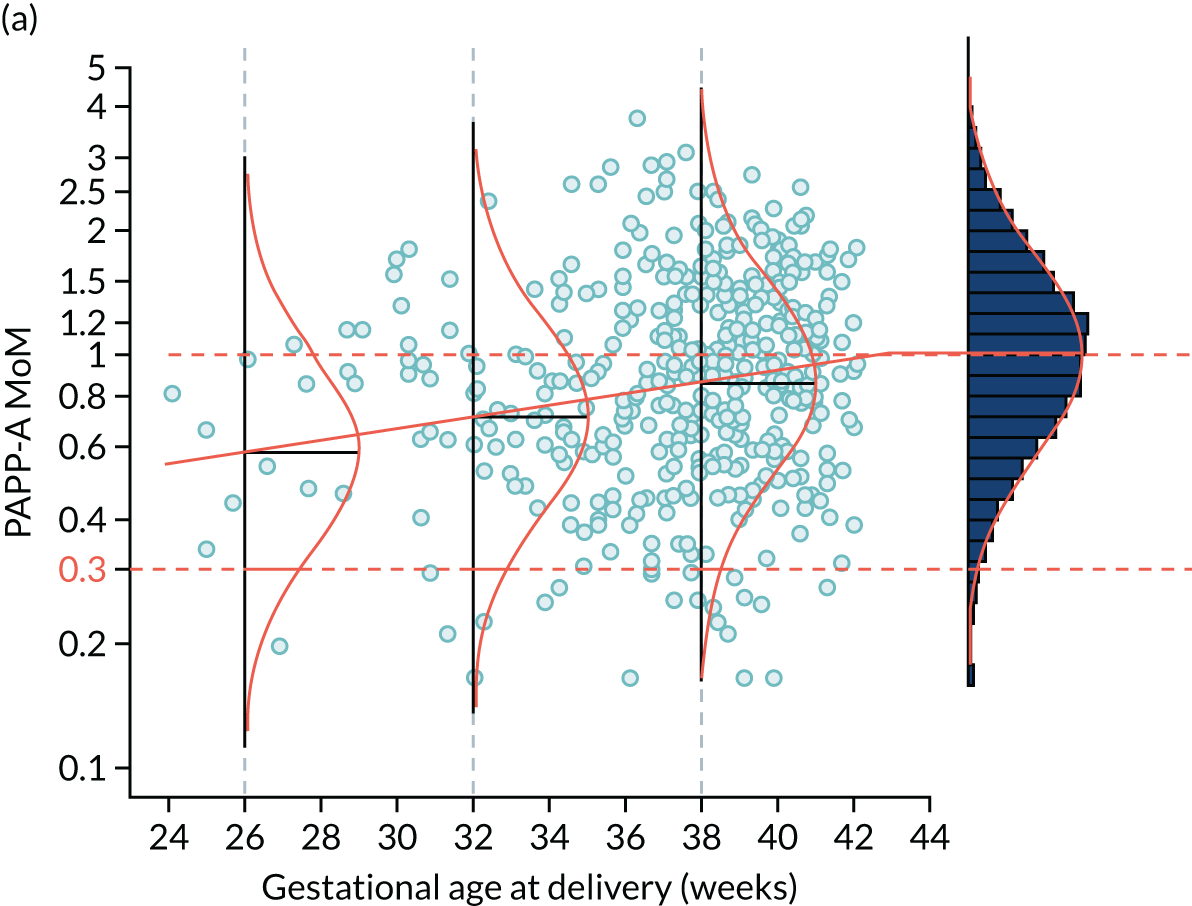
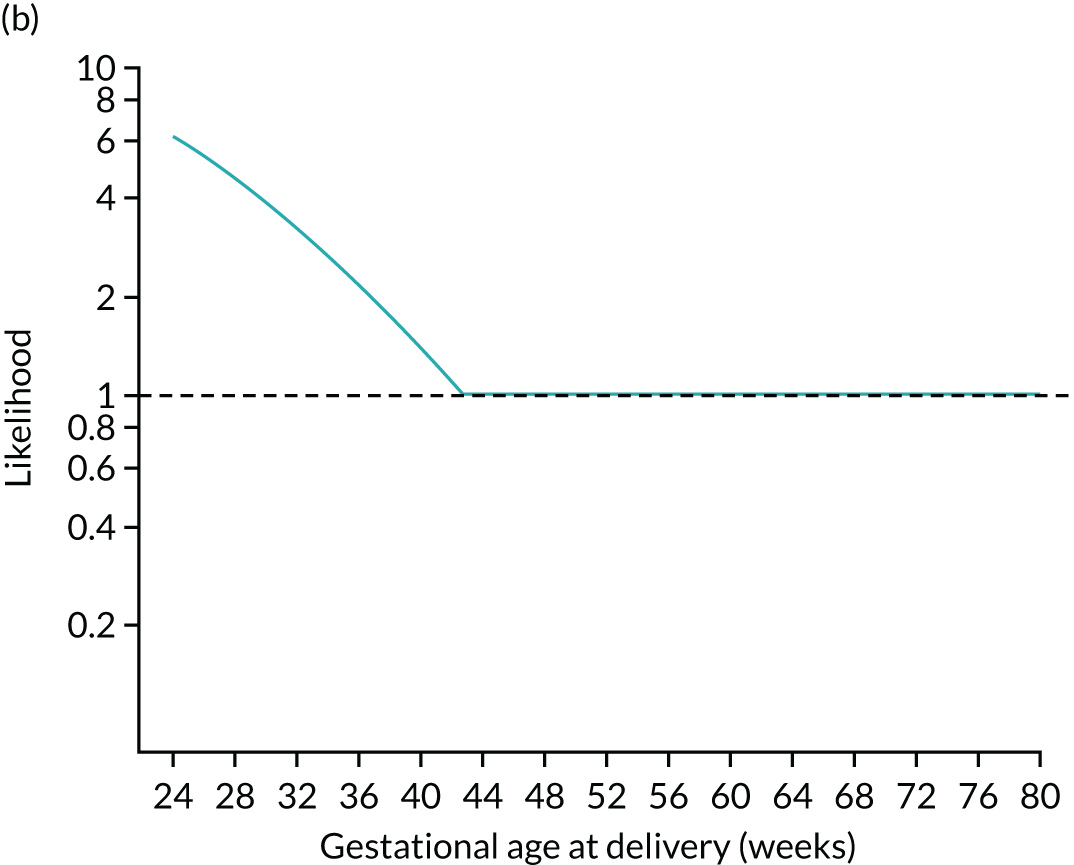
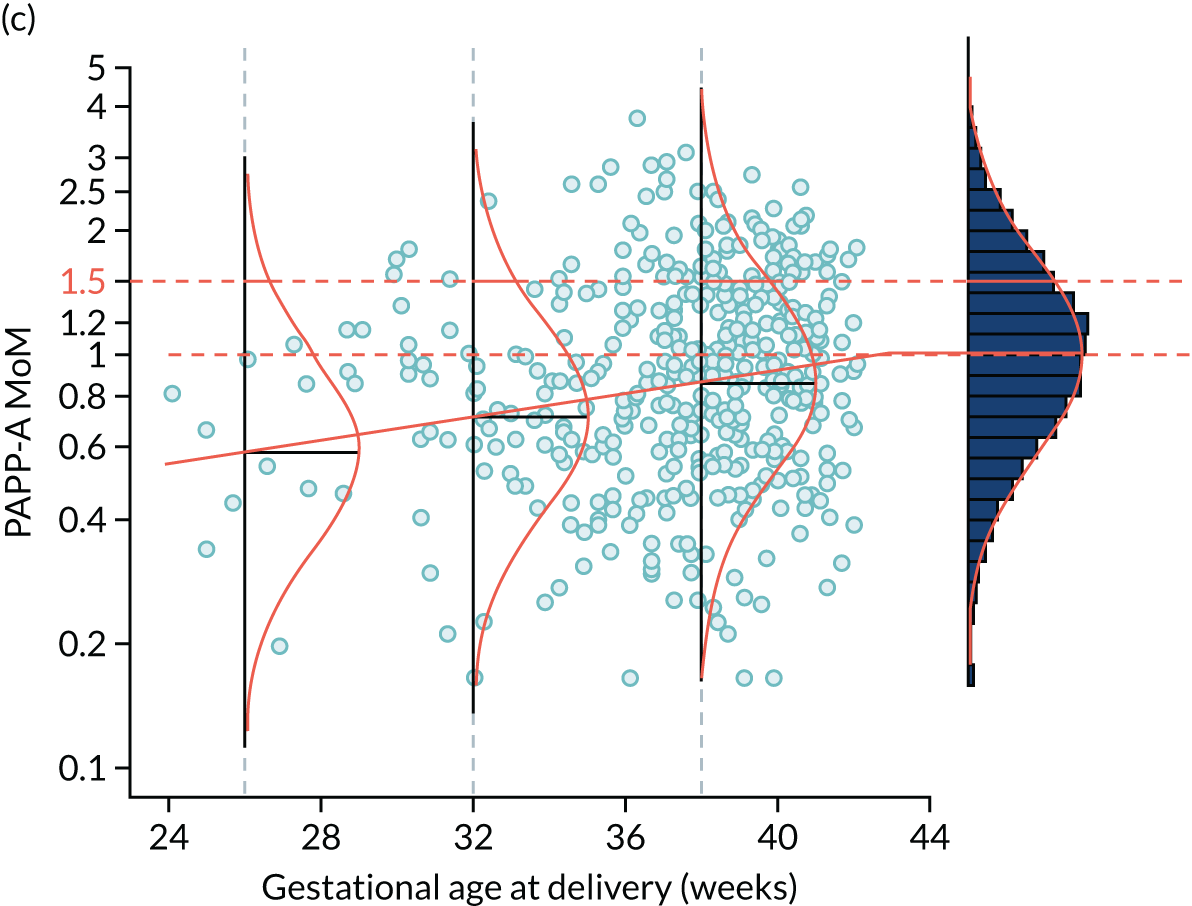
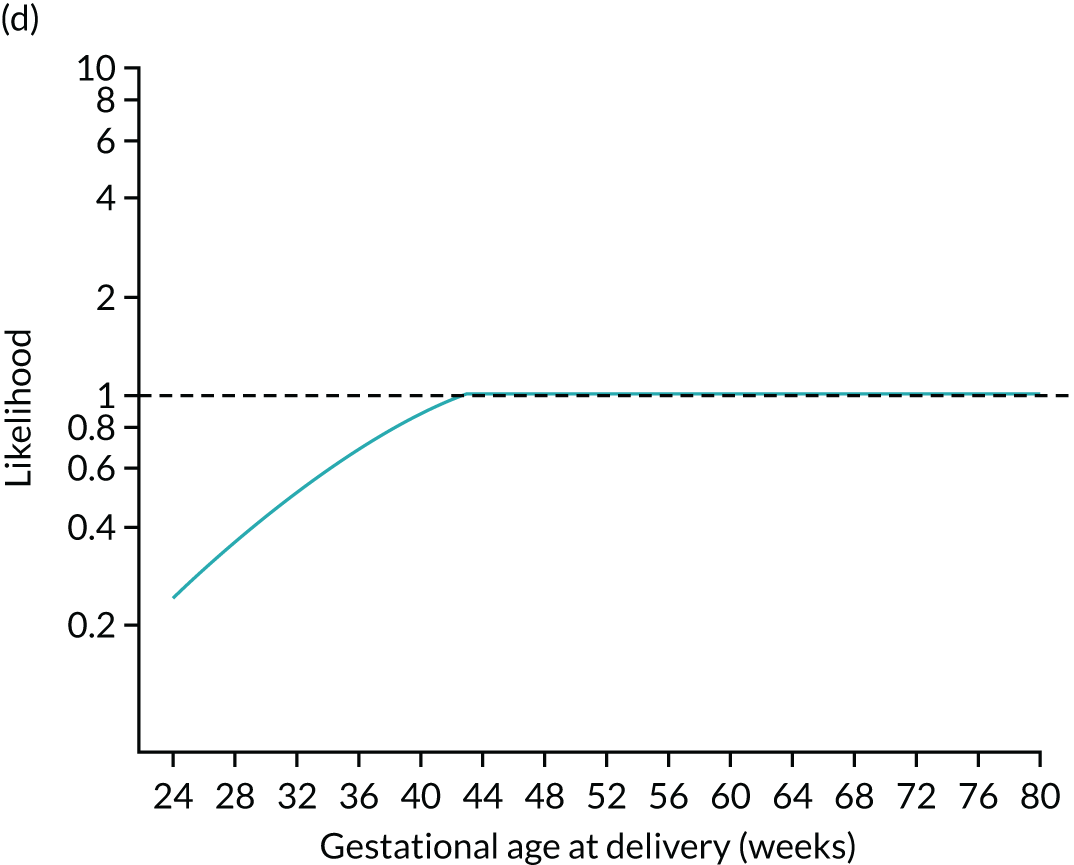
The likelihood is specified in terms of the distribution of log10 transformed MoM values. Figure 3 shows the fitted model for the biomarker PAPP-A. For a given value of PAPP-A MoM, the likelihood of a particular value of gestational age at delivery with pre-eclampsia is given by the height of the Gaussian curve. This is illustrated for cases where PAPP-A MoM is 0.3 and 1.5 in Figure 4.
FIGURE 3.
Distribution of PAPP-A by gestational age at delivery with pre-eclampsia. The points are observations of gestational age at delivery with pre-eclampsia. The solid orange line is the broken stick model for mean log-MoM value of PAPP-A. The histogram on the right shows log-MoM values for pregnancies where birth occurred without pre-eclampsia. The Gaussian curves show the distribution of log-MoM PAPP-A conditionally on gestational age at delivery with pre-eclampsia at 26, 32 and 38 weeks’ gestation, and for those beyond 42.8 weeks’ gestation for which the mean log-MoM is zero. The data shown as points and in the histogram are from the SPREE study. The broken stick model is used to capture the increasing effect on markers with increasing disease severity and the fact that gestations of delivery with pre-eclampsia beyond term represent normality so therefore have a median of 1.0 as shown in the histogram on the right-hand side.
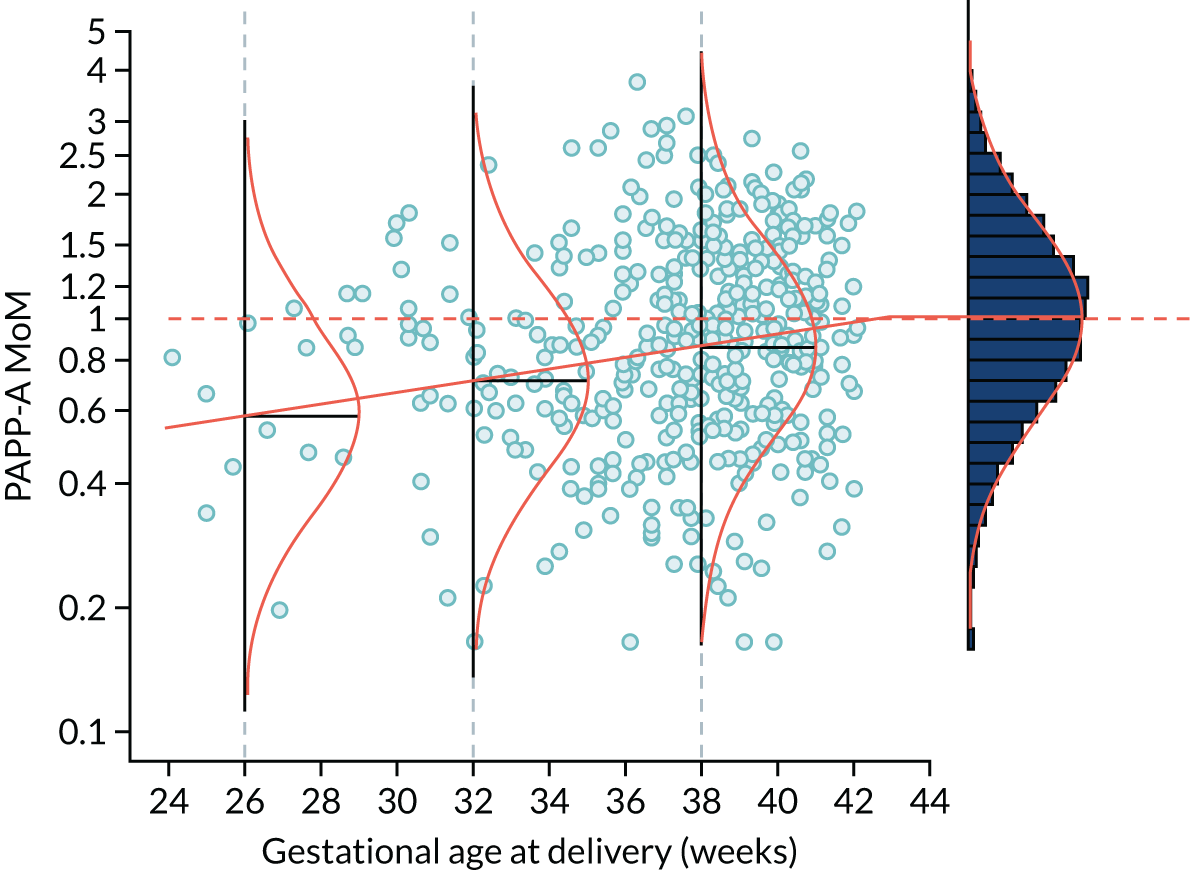
FIGURE 4.
Illustration of likelihood functions PAPP-A MoM values of 0.3 and 1.5. The heights shown in orange in parts (a) and (c) are the values of the likelihood function for deliveries with pre-eclampsia at 26, 32, 38 and beyond 41.2 weeks’ gestation. The likelihood function is shown in parts (b) and (d).
Application of Bayes’ theorem
The posterior distribution of gestational age at delivery with pre-eclampsia is obtained using Bayes’ theorem to combine the prior distribution from maternal and pregnancy characteristics with the likelihood function from biomarker MoM values.
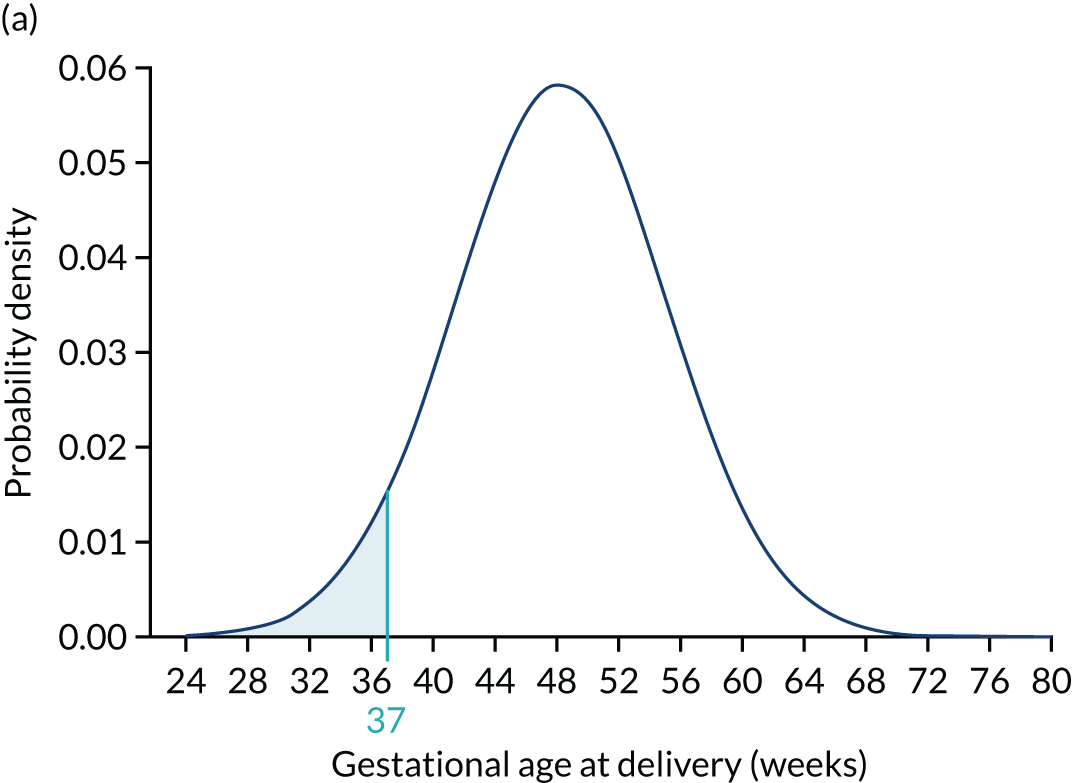
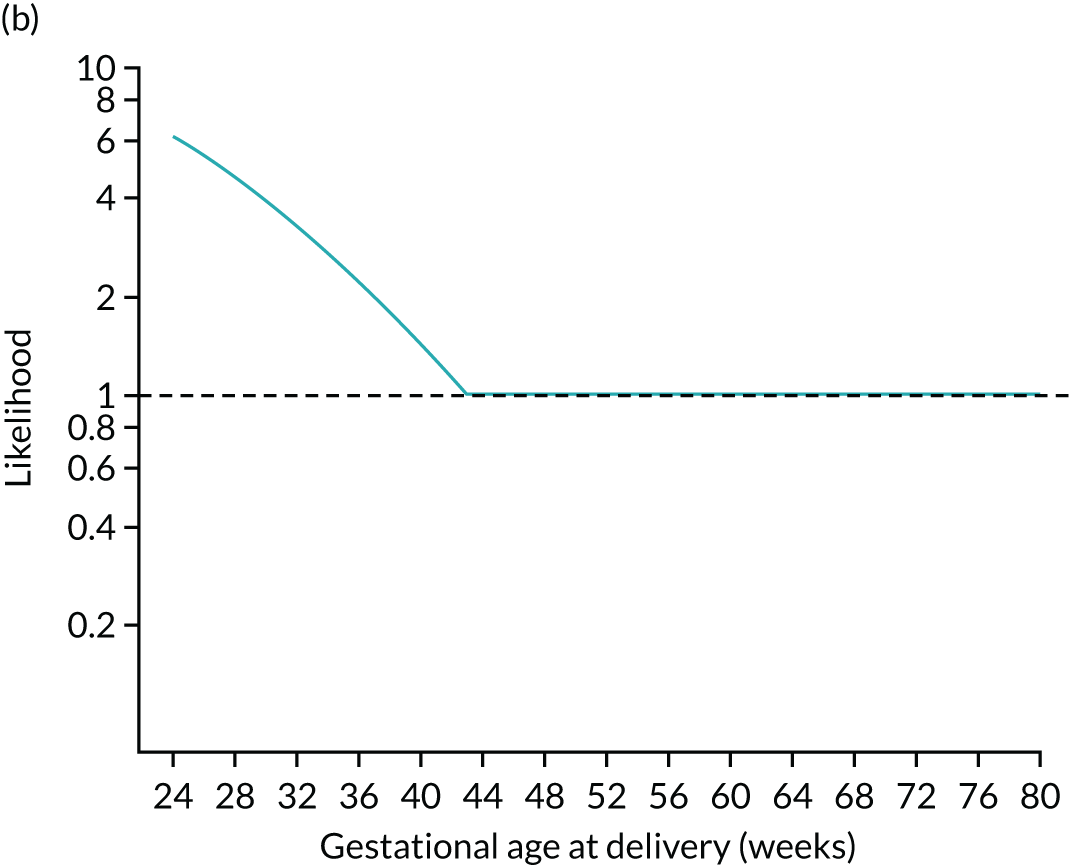
The posterior distribution is obtained by multiplying the prior probability density by the likelihood function (Figure 5). Figures 5a–c show how the prior is modified by the likelihood for a MoM value of PAPP-A of 0.3. At each gestation, the prior density shown in Figures 5a and d is multiplied by the likelihood. For example, at 24 weeks’ gestation the prior probability is multiplied by about 6. In this case, densities at lower gestations are increased relative to those at higher gestations.
FIGURE 5.
Application of Bayes’ theorem in a case with PAPP-A MoM = 0.3 (a–c) and one with PAPP-A MoM = 1.5 (d–f). The prior distribution is the same in both cases with a prior risk of pre-eclampsia before 37 weeks’ gestation of 0.05 or 1 in 20. With a PAPP-A MoM of 0.3, the posterior risk is 0.122. With a PAPP-A MoM of 1.5, the posterior risk is 0.033.
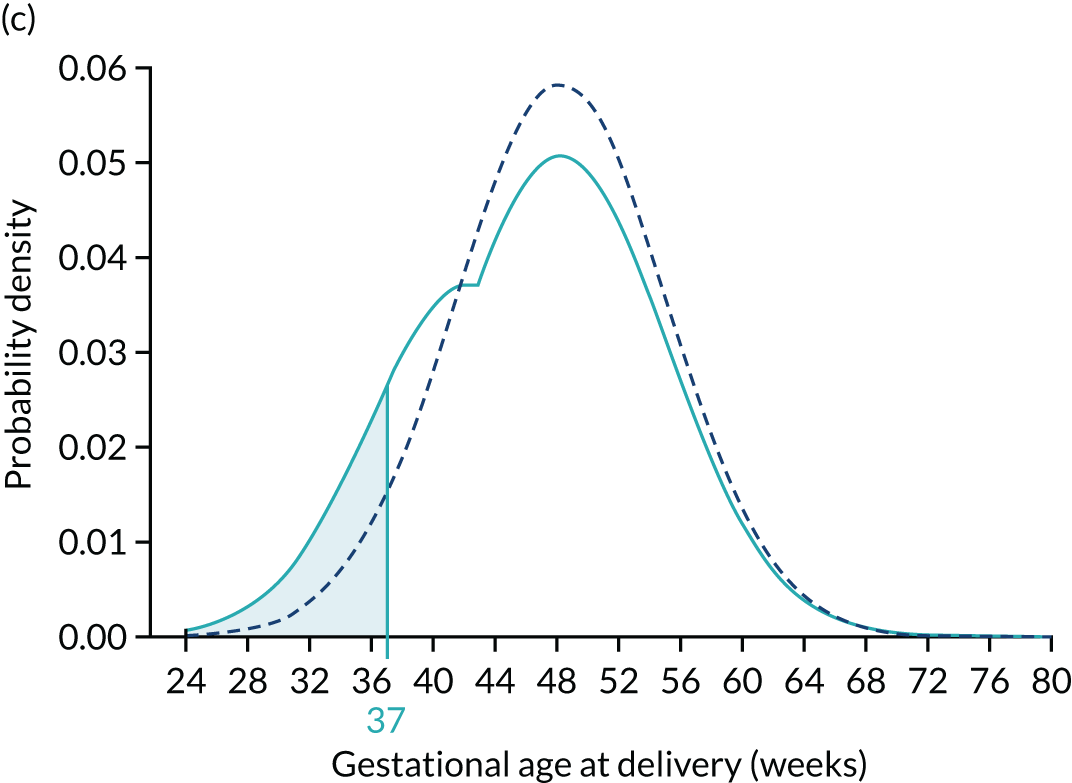
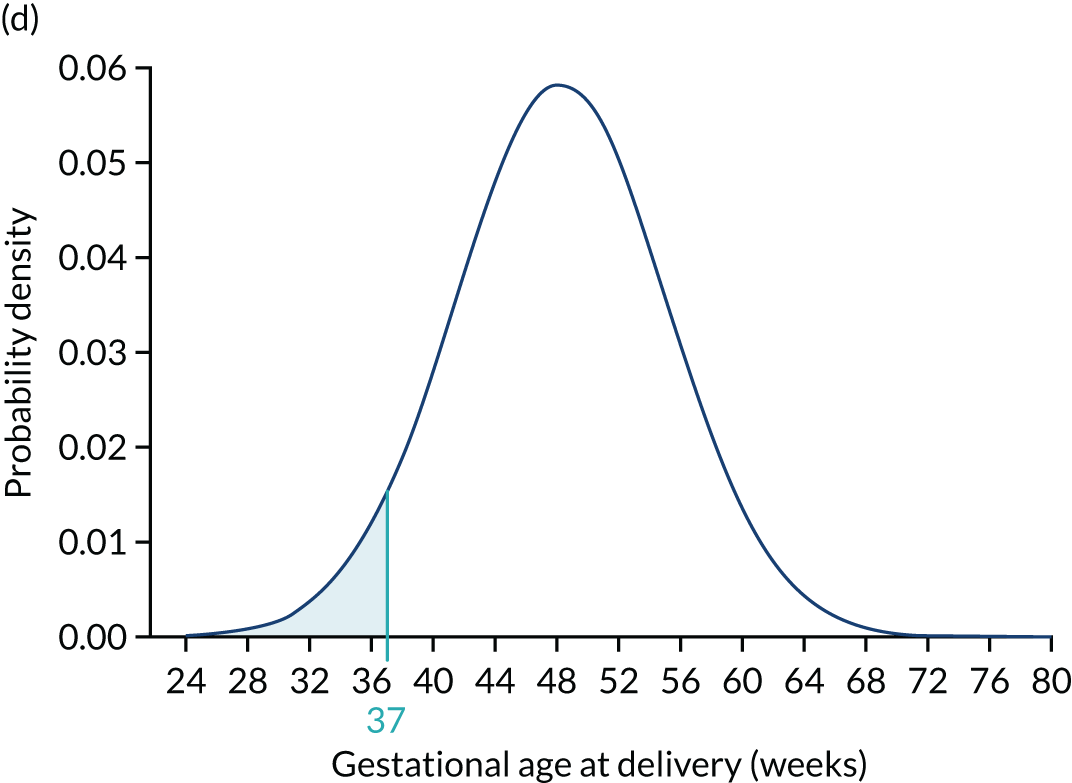
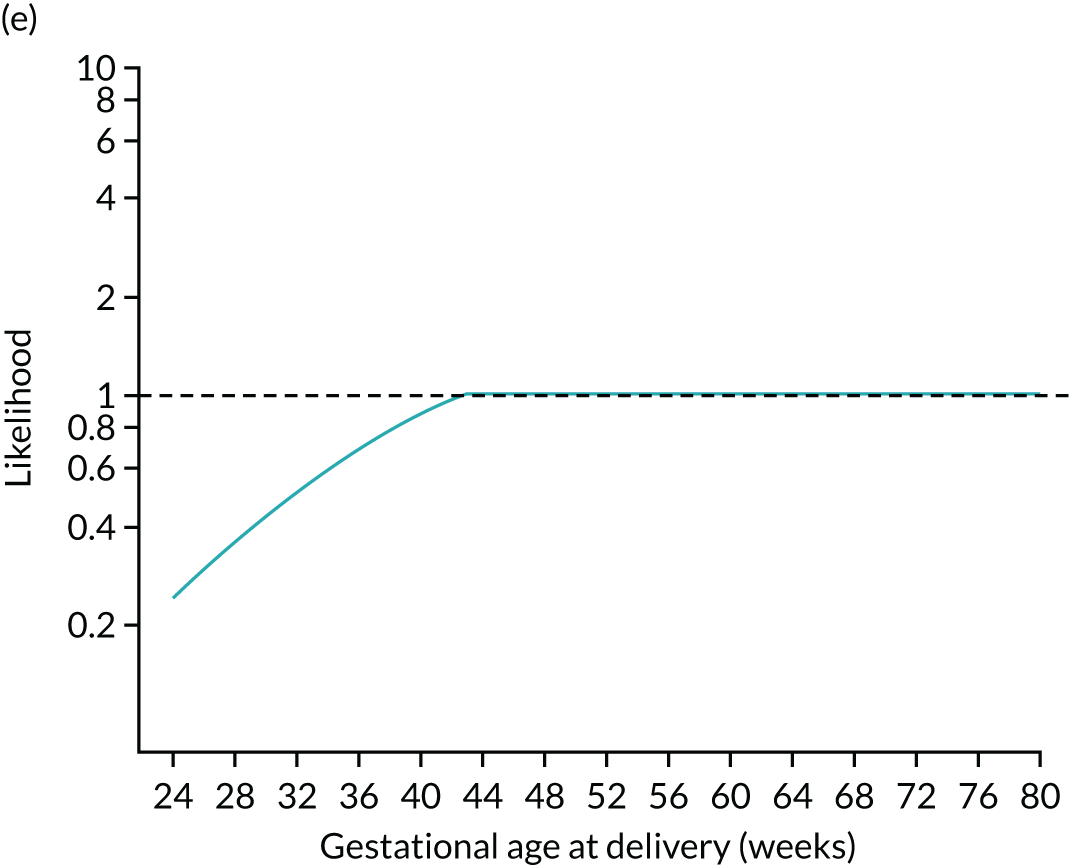
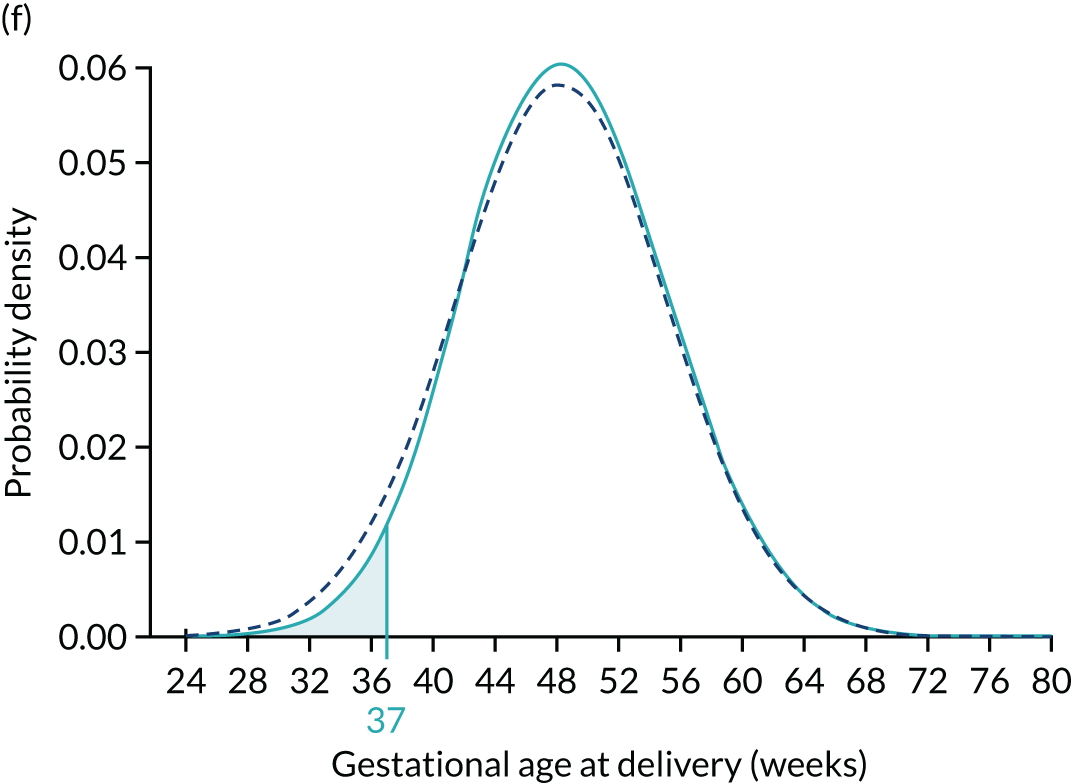
To complete the posterior density, the area under the curve is made 1.0 by multiplying by a normalising constant to produce the posterior shown in Figures 5c and f. Figures 5d–f show how the prior is modified by the likelihood for a MoM value of PAPP-A of 1.5. In this case, densities at lower gestations are decreased relative to those at higher gestations.
The area defining the risk can be computed for other gestations to produce a cumulative distribution of risks that can be used as in individualised risk profile. This is illustrated in Figure 6, which shows the cumulative distribution for the prior for the posterior with PAPP-A MoM equal to 0.3 and for the posterior with PAPP-A MoM equal to 1.5.
FIGURE 6.
Prior (dark blue) and posterior risk profiles for PAPP-A MoM = 0.3 (solid light blue) and 1.5 (dashed light blue).
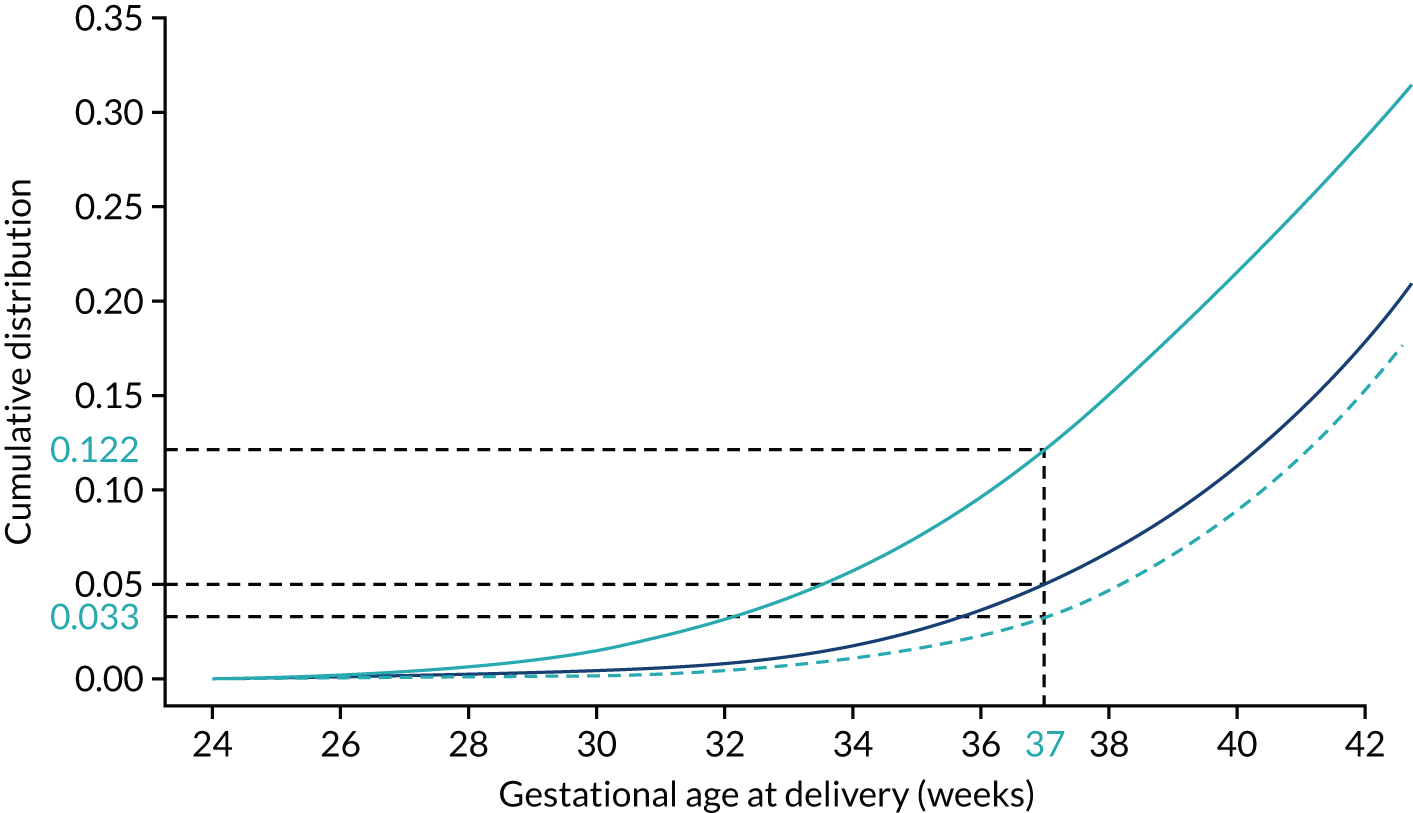
The examples shown in Figures 5 and 6 illustrate the elements of our model using univariate examples. The log-transformed biomarkers are assumed to follow a Gaussian distribution with a mean dependent on the gestational age at delivery with pre-eclampsia according to a broken stick model. In general, a multivariate Gaussian distribution is used and the association between biomarkers captured in the correlations between markers. Technical details and parameter estimates of the algorithm for risk calculation are given in Appendix 1.
Face validity
The notion that if there were no deliveries from other causes then all pregnancies would deliver with pre-eclampsia and that the distribution of gestations at deliveries with pre-eclampsia can occur at unrealistically long gestational ages has raised questions. Some eminent workers in the field take the view that these features are clinically plausible. Others argue that the model lacks face validity. With this in mind, we remark that it is possible to formulate the model with a mixture of a continuous distribution, up to say 44 weeks’ gestation, and a probability mass, at 44 weeks’ gestation. This formulation, which gives the same risks, avoids unrealistically long gestations. From a pragmatic perspective, the model provides a framework for risk calculation that has advantages over alternative approaches in terms of flexibility and performance.
Comparison with other approaches
A simple method of identifying a high-risk group for pre-eclampsia is to use a classification based on the presence of risk factors from maternal demographic characteristics and medical history. The current NICE8 and American College of Obstetricians and Gynecologists21,22 guidelines adopt this method. These have benefits in terms of simplicity; however, they do not give estimates of risk for counselling and decision-making. The inclusion of extra information in terms of biomarker measurements is problematic and predictive performance is limited.
Probability models can overcome these difficulties and there are numerous publications that use logistic regression models for risk assessment. An extensive review of these logistic regression models and the development of new models has recently been undertaken by the International Prediction of Pregnancy Complication Network. 10 These logistic regression models assume binary outcomes, and separate models are needed for early-onset pre-eclampsia, for all pre-eclampsia and for late-onset pre-eclampsia. 12,14,15,23–29
Our approach, within the framework of competing risks, is based on a continuous model for the gestational age at delivery with pre-eclampsia, treating births from causes other than pre-eclampsia as censored observations using survival analyses. 18,19 The same model covers pre-eclampsia at different gestational ages of delivery and captures the way in which biomarkers show increasingly large effects depending on the severity of pre-eclampsia. Implementing this model using Bayes’ theorem provides a natural framework for dynamic prediction in which risk assessment is updated as new information becomes available during pregnancy. Incorporation of biomarker information using likelihoods means that new markers can be added by extending an existing model rather than developing a completely new model.
Implementation
For the last three decades, commercial suppliers of equipment for ultrasound and laboratory measurements have provided software systems for assessment of risk of aneuploidies. Computation of MoM values are needed in these applications and calculations involving the combination of prior risks from Mat-CHs and likelihoods from multivariate Gaussian distributions using Bayes’ theorem are involved. 11 These systems are used routinely for prenatal screening worldwide. The implementation of the competing risk model is very similar to that involved in risk assessment for aneuploidies, including the computation of MoM values, application of Bayes’ theorem and the need for effective quality assurance. The algorithm used for risk calculations in the SPREE study has been implemented in many commercial software systems.
Chapter 3 The SPREE study methods
The study was conducted according to protocol version 3.1 (14 November 2016). 30
Study design and population
This was a prospective multicentre cohort study carried out in seven NHS maternity hospitals in England, between 12 April 2016 and 15 December 2016.
The participating hospitals were King’s College Hospital, London; University Hospital Lewisham, London; Medway Maritime Hospital, Gillingham; Homerton University Hospital, London; North Middlesex University Hospital, London; Southend University Hospital, Essex; and The Royal London Hospital, London.
Inclusion and exclusion criteria
Women aged > 18 years with a singleton pregnancy and a live fetus at the 11- to 13-week scan were included in the study. Women who were unconscious or severely ill at the time of recruitment, those with learning difficulties or serious mental illness and those with major fetal abnormality identified at the 11- to 13-week scan were excluded from the study.
Research ethics approval
Approval for the study was obtained from the London–Surrey Borders Research Ethics Committee. The study is registered with the ISRCTN registry, number 83611527.
Quality control of screening
Quality control of screening and verification of adherence to protocol were performed by the University College London Comprehensive Clinical Trials Unit (UCL-CCTU).
Procedures
All eligible women with singleton pregnancies attending their routine hospital visit at 11+0 to 13+6 weeks’ gestation were given written information about the study and those who agreed to participate provided written informed consent.
Gestational age was determined from the measurement of the fetal crown–rump length. 31 Mat-CHs, medical, obstetric and drug history were recorded, and maternal weight and height measured. The MAP and UTA-PI were measured in accordance with standardised protocols;12,32 the measurements of MAP were carried out by health-care assistants or research sonographers and measurements of UTA-PI were performed by research sonographers. Maternal serum concentrations of PAPP-A and PLGF were measured by one of two automated devices (DELFIA® Xpress analyser, PerkinElmer Life and Analytical Sciences Ltd, Waltham, MA, USA, or BRAHMS KRYPTOR™ analyser, Thermo Fisher Scientific, Hennigsdorf, Germany). Quality control was applied to achieve consistency of measurement of biomarkers across different hospitals throughout the duration of the study.
Risks calculated using the competing risks model (see Chapter 2)17,33 were not made available to the participants or their clinicians. The decision concerning administration of aspirin was made by the attending clinicians in accordance with routine standard of care at each site and the information was recorded in the research database both at the time of screening at 11–13 weeks’ gestation and during collection of data on pregnancy outcome.
All data on participant characteristics, biomarker values and outcome from each site were reported to UCL-CCTU. The data, blinded to outcome, were then provided to the study statistician who:
-
defined the screen-positive group in accordance with NICE criteria
-
computed risks for all pre-eclampsia and preterm pre-eclampsia for the prespecified combinations of biomarkers using the competing risks model17,33
-
identified the group that was treated with aspirin (≥ 75 mg/day, starting at < 14 weeks’ gestation and ending at ≥ 36 weeks’ gestation or at the time of earlier birth)
-
examined associations between treatment using aspirin and baseline covariates, including the components of the NICE method and biomarkers.
Details of the imputation methodology for dealing with the effects of aspirin and summaries of Mat-CHs and treatment with aspirin were added to the statistical analysis plan. After the signed statistical analysis plan and the data file containing data fields (a)–(c) were received and approved by the UCL-CCTU research team, they provided data on pregnancy outcomes to the study statistician for linking for the unblinded analysis.
Diagnosis of pre-eclampsia
Data on pregnancy outcome were collected from the hospital maternity records or the women’s general medical practitioners. The obstetric records of all women with pre-existing or pregnancy-associated hypertension were examined to determine the diagnosis of pre-eclampsia. This was based on the finding of hypertension (i.e. systolic blood pressure of ≥ 140 mmHg or diastolic blood pressure of ≥ 90 mmHg on at least two occasions, 4 hours apart, developing after 20 weeks’ gestation in previously normotensive women) and at least one of the following: proteinuria (i.e. ≥ 300 mg/24 hours or protein-to-creatinine ratio of ≥ 30 mg/mmol or ≥ 2+ on dipstick testing), renal insufficiency (i.e. serum creatinine > 1.1 mg/dl or twofold increase in serum creatinine in the absence of underlying renal disease), liver involvement (i.e. blood concentration of transaminases to twice the normal level), neurological complications (e.g. cerebral or visual symptoms), thrombocytopenia (i.e. platelet count < 100,000/µl) or pulmonary oedema. 21,34
Outcome measures
The primary comparison was DR of risk assessment recommended by the NICE guidelines compared with screening by a mini-combined test (i.e. Mat-CHs, MAP and PAPP-A) in the prediction of pre-eclampsia occurring at any gestational age (i.e. all pre-eclampsia) after adjustment for the effect of aspirin, for the same SPR determined by the NICE method. This combination of biomarkers was selected because the test can be introduced without additional cost, as all NHS maternity hospitals in England offer first-trimester combined screening for trisomies, which includes measurement of PAPP-A.
Key secondary comparisons were DR for preterm pre-eclampsia using NICE guidelines compared with the competing risk model with the following marker combinations:
-
Mat-CHs, MAP and PAPP-A
-
Mat-CHs, MAP and PLGF
-
Mat-CHs, MAP, UTA-PI and PLGF.
The combination of Mat-CHs and PLGF was selected because PLGF can be measured in the same sample on the same machines used in screening for trisomies. In addition, in previous studies this was found to be more effective than PAPP-A in the prediction of pre-eclampsia. 35 The combination of Mat-CHs, MAP, UTA-PI and PLGF was selected because in previous studies it was found to be the most effective method of screening.
Statistical analysis
We proposed to recruit 16,850 women. On the assumptions of an incidence of pre-eclampsia of 2.6% and a loss to follow-up rate of 5% there would be 16,000 women for evaluation. On the extreme assumption that 90% of NICE screen-positive patients and 10% of NICE screen-negative patients would be treated with aspirin and that aspirin reduces the incidence of all pre-eclampsia by 50%, the power to detect a 10% difference in DR between the NICE method and the mini-combined test in the prediction of all pre-eclampsia at the one-sided 2.5% level would be > 80%.
We used McNemar’s test to compare the DR of the NICE method with that of the Bayes’ theorem-based method. However, as some of the women who were screen positive according to NICE guidelines were prescribed aspirin, which could have reduced the risk of pre-eclampsia, some of the patients in the screen-positive group would have effectively been converted to false positives. Consequently, treating NICE screen-positive women with aspirin would reduce the DR and bias the McNemar’s test against the NICE method. Our approach to dealing with this was to apply multiple imputation of data on the incidence of pre-eclampsia that would have occurred had it not been for the effect of treatment. Markov chain Monte Carlo was used to impute incidence data and generate 10 complete data sets for analysis. 36 Estimates of DR were then pooled across data. The incidence of pre-eclampsia that would have occurred had it not been for the effect of treatment was determined from a logistic regression model dependent on NICE and centre, and that aspirin reduced the incidence with a prespecified probability of 0.3 for all pre-eclampsia and 0.6 for preterm pre-eclampsia. 7 Although these probabilities were based on the results of the ASPRE trial, in which the daily dose of aspirin was 150 mg rather than 75 mg (as recommended by NICE),8 we wanted to avoid any potential criticism of bias against the NICE method by assuming that the effect of 75 mg was similar to that of higher doses of the drug. The method of imputation and the choice of treatment effects were prespecified and documented prior to receipt of the outcome data.
Additional evaluation of performance of the Bayes’ theorem-based method involved estimation of DRs of pre-eclampsia at a fixed SPR of 10% for all 16 combinations of biomarkers. McNemar’s test was applied to the effect of adding markers. No adjustments were made for the effects of aspirin in this additional evaluation.
Markov chain Monte Carlo was implemented using the WinBUGS 1.4.3 software (MRC Biostatistics Unit, Cambridge, UK). The WinBUGS model and a description of the methodology are given in Appendix 2. The statistical software package R (The R Foundation for Statistical Computing, Vienna, Austria) was used for data analyses with the MICE package, pooling estimates across the 10 complete data sets using the function pool.scalar. Results were reported according to standards for the reporting of diagnostic accuracy studies guidelines. 37
Public and patient involvement
Public and patient involvement input into this study was particularly important to (1) identify possible barriers to recruitment, (2) evaluate acceptability of early screening, (3) understand the implications of classifying somebody as screen positive and (4) ensure that findings are disseminated and implemented appropriately.
Melissa Green, Chief Executive Officer of Bliss, and Jane Fisher, Director of Antenatal Results and Choices, were fully involved with our study and were full, independent members of the Study Steering Group. They contributed to the development of the research question, to the application and provided input into the study from funding through to reporting of the findings.
Chapter 4 The SPREE study results
Study participants
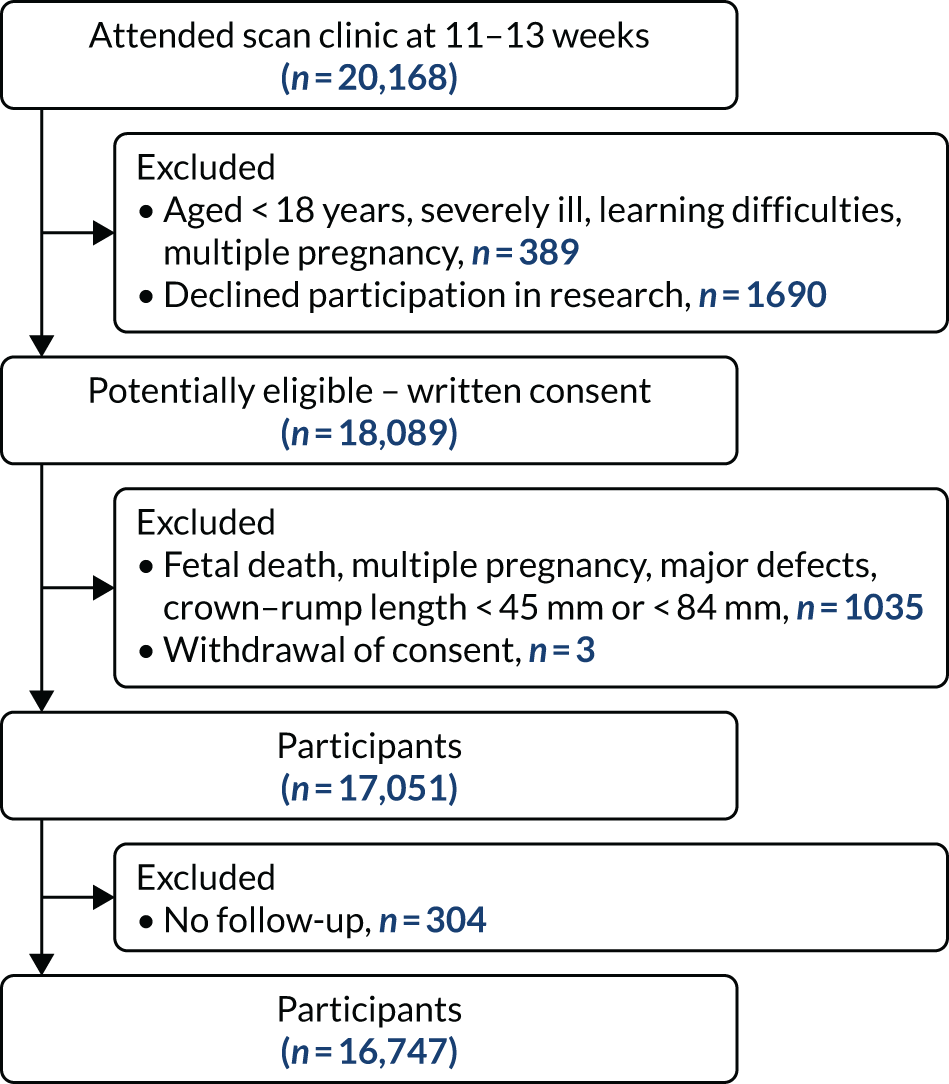
During the study period, a total of 20,168 pregnant women attended one of the participating hospitals for assessment at 11–13 weeks’ gestation. Of the 18,089 women who provided written informed consent, 17,051 were eligible to participate in the study and were screened for pre-eclampsia. Outcome data were obtained from 16,747 women (Figure 7). The baseline characteristics of the participants are given in Table 1. Pre-eclampsia developed in 473 (2.8%) pregnancies; in 142 (0.8%) cases, this was preterm pre-eclampsia. 37
FIGURE 7.
Screening and follow-up.
| Characteristic | Total (N = 16,747) |
|---|---|
| Gestational age at screening (weeks), median (IQR) | 12.8 (12.4–13.2) |
| Age (years), median (IQR) | 31.5 (27.4–35.1) |
| Body mass index (kg/m2), median (IQR) | 24.7 (22.0–28.7) |
| Racial origin, n (%) | |
| White | 12,112 (72.3) |
| Black | 2404 (14.4) |
| South Asian | 1384 (8.3) |
| East Asian | 414 (2.5) |
| Mixed | 433 (2.6) |
| Conception, n (%) | |
| Natural | 16,046 (95.8) |
| Assisted by use of ovulation drugs | 126 (0.8) |
| In vitro fertilisation | 575 (3.4) |
| Cigarette smoker, n (%) | 1132 (6.8) |
| Mother had pre-eclampsia, n (%) | 543 (3.2) |
| Medical history, n (%) | |
| Chronic hypertension | 143 (0.85) |
| Systemic lupus erythematosus/antiphospholipid syndrome | 40 (0.24) |
| Diabetes | 119 (0.71) |
| Renal disease | 29 (0.17) |
| Obstetrical history, n (%) | |
| Nulliparous | 7714 (46.1) |
| Multiparous without pre-eclampsia | 8641 (51.6) |
| Multiparous with pre-eclampsia | 392 (2.3) |
| Interval from last pregnancy (years), median (IQR) | 2.7 (1.5–4.7) |
| Screen-positive by NICE guidelines, n (%) | 1727 (10.3) |
| Aspirin intake during pregnancy, n (%) | 749 (4.5) |
| NICE screen-positive group | 400 (23.2) |
| NICE screen-negative group | 349 (2.3) |
Intake of aspirin
Aspirin from < 14 weeks’ gestation to delivery or 36 weeks’ gestation was taken by 749 (4.5%) of 16,747 women in the study population. The daily dose was 75 mg in 730 (97.5%) women and 150 mg in 19 (2.5%) women. Aspirin was taken by 400 (23.2%) women in the NICE screen-positive group and 349 (2.3%) women in the NICE screen-negative group. The reported reasons for treatment in the latter group were previous history of miscarriage (n = 153), stillbirth (n = 26), fetal growth restriction (n = 25), placental abruption (n = 8), thrombophilia (n = 18), cardiovascular surgery (n = 3), family history of pre-eclampsia (n = 6), current pregnancy conceived by in vitro fertilisation (n = 34), high body mass index (n = 21), low serum PAPP-A found at screening for fetal trisomies (n = 47), one episode of high blood pressure in the first trimester of pregnancy (n = 6), medical history of Lynch syndrome (n = 1) and Raynaud’s disease (n = 1).
Primary comparison
Classification into screen positive and screen negative by the NICE method and the mini-combined test stratified by outcome and aspirin treatment is shown in Table 2. With regard to Table 2, it is notable that when using a fixed overall SPR and the results are stratified by aspirin, there is a substantial imbalance between the SPRs obtained using the NICE method and those using the mini-combined test in the aspirin and no-aspirin groups. If the risk cut-off point is chosen so that the SPRs for the NICE method and the mini-combined test are the same, then the contingency results given in Table 3 are obtained. For the aspirin group, this shows a significant benefit for the mini-combined test over the NICE method (p = 0.003 without imputation for aspirin and p = 0.034 with imputation, assuming RRR = 0.3). For the no-aspirin group the mini-combined test is superior to the NICE method (p < 0.001). 38
| Screening outcome | Mini-combined test | ||||||||||||
|---|---|---|---|---|---|---|---|---|---|---|---|---|---|
| All outcomes | Pre-eclampsia | No pre-eclampsia | |||||||||||
| Positive (n) | Negative (n) | Total (n) | Per cent | Positive (n) | Negative (n) | Total (n) | Per cent | Positive (n) | Negative (n) | Total (n) | Per cent | ||
| All pregnancies | |||||||||||||
| NICE | Positive (n) | 824 | 903 | 1727 | 10.3 | 119 | 25 | 144 | 30.4 | 705 | 878 | 1583 | 9.7 |
| Negative (n) | 903 | 14,117 | 15,020 | 89.7 | 83 | 246 | 329 | 69.6 | 820 | 13,871 | 14,691 | 90.3 | |
| Total (n) | 1727 | 15,020 | 16,747 | 202 | 271 | 473 | 1525 | 14,749 | 16,274 | ||||
| Per cent | 10.3 | 89.7 | 42.7 | 57.3 | 9.4 | 90.6 | |||||||
| Aspirin | |||||||||||||
| NICE | Positive (n) | 256 | 144 | 400 | 53.4 | 45 | 8 | 53 | 73.6 | 211 | 136 | 347 | 51.3 |
| Negative (n) | 48 | 301 | 349 | 46.6 | 10 | 9 | 19 | 26.4 | 38 | 292 | 330 | 48.7 | |
| Total (n) | 304 | 445 | 749 | 55 | 17 | 72 | 249 | 428 | 677 | ||||
| Per cent | 40.6 | 59.4 | 76.4 | 23.6 | 36.8 | 63.2 | |||||||
| No aspirin | |||||||||||||
| NICE | Positive (n) | 568 | 759 | 1327 | 8.3 | 74 | 17 | 91 | 22.7 | 494 | 742 | 1236 | 7.9 |
| Negative (n) | 855 | 13,816 | 14,671 | 91.7 | 73 | 237 | 310 | 77.3 | 782 | 13,579 | 14,361 | 92.1 | |
| Total (n) | 1423 | 14,575 | 15,998 | 147 | 254 | 401 | 1276 | 14,321 | 15,597 | ||||
| Per cent | 8.9 | 91.1 | 36.7 | 63.3 | 8.2 | 91.8 | |||||||
| Screening outcome | Mini-combined test | ||||||||||||
|---|---|---|---|---|---|---|---|---|---|---|---|---|---|
| All outcomes | Pre-eclampsia | No pre-eclampsia | |||||||||||
| Positive (n) | Negative (n) | Total (n) | Per cent | Positive (n) | Negative (n) | Total (n) | Per cent | Positive (n) | Negative (n) | Total (n) | Per cent | ||
| Aspirin | |||||||||||||
| NICE | Positive (n) | 319 | 81 | 400 | 53.4 | 52 | 1 | 53 | 73.6 | 267 | 80 | 347 | 49.9 |
| Negative (n) | 81 | 286 | 349 | 46.6 | 12 | 7 | 19 | 26.4 | 69 | 279 | 348 | 50.1 | |
| Total (n) | 400 | 367 | 749 | 64 | 8 | 72 | 336 | 359 | 695 | ||||
| Per cent | 53.4 | 49.0 | 88.9 | 11.1 | 48.3 | 51.7 | |||||||
| No aspirin | |||||||||||||
| NICE | Positive (n) | 544 | 783 | 1327 | 8.3 | 74 | 17 | 91 | 22.7 | 470 | 766 | 1236 | 7.9 |
| Negative (n) | 783 | 13,888 | 14671 | 91.7 | 65 | 245 | 310 | 77.3 | 718 | 13,643 | 14,361 | 92.1 | |
| Total (n) | 1327 | 14,671 | 15998 | 139 | 262 | 401 | 1188 | 14,409 | 15,597 | ||||
| Per cent | 8.3 | 91.7 | 34.7 | 65.3 | 7.6 | 92.4 | |||||||
Without imputation
Table 4 summarises the results with and without multiple imputation of adjust for the effect of aspirin. Without imputation, the SPR using the NICE method was 10.3% (1727/16,747) and the DR for all pre-eclampsia was 30.4% (95% CI 26.3% to 34.6%). In screening by the mini-combined test using a combination of Mat-CHs, MAP and PAPP-A, the DR of all pre-eclampsia was 42.7% (95% CI 38.2% to 47.2%) and the difference in DR between the two methods was 12.3% (95% CI 8.1% to 16.5%). The difference was overwhelmingly significant (p < 0.001). The false-positive rate (FPR) for the NICE method was 9.7% (95% CI 9.3% to 10.2%) compared with 9.4% (95% CI 8.9% to 9.8%) for the mini-combined test. For both the aspirin and no-aspirin subgroups shown in Table 4, the performance for the mini-combined test is superior to that of the NICE method (p = 0.0028 for the aspirin group and p < 0.0001 for the no aspirin group).
| No adjustment for aspirin | Adjusted for aspirin | |||
|---|---|---|---|---|
| DR, % (95% CI) | Difference from NICE, % (95% CI) | DR, % (95% CI) | Difference from NICE, % (95% CI) | |
| All pregnancies (SPR = 10.3%) | ||||
| All pre-eclampsia (n = 473) | ||||
| NICE guidelines | 30.4 (26.3 to 34.6) | 31.6 (27.3 to 35.9) | ||
| Mat-CHs + MAP + PAPP-A | 42.7 (38.2 to 47.2) | 12.3 (8.1 to 16.4) | 42.8 (38.4 to 47.3) | 11.2 (6.9 to 15.6) |
| Preterm pre-eclampsia (n = 142) | ||||
| NICE guidelines | 40.8 (32.8 to 48.9) | 44.1 (35.7 to 52.6) | ||
| Mat-CHs + MAP + PAPP-A | 53.5 (45.3 to 61.7) | 12.7 (4.7 to 20.7) | 53.5 (45.5 to 61.6) | 9.4 (0.1 to 18.2) |
| Mat-CHs + MAP + PLGF | 69.0 (61.4 to 76.6) | 28.2 (19.4 to 37.0) | 67.3 (59.7 to 75.0) | 23.2 (13.2 to 33.3) |
| Mat-CHs + MAP + UTA-PI + PLGF | 82.4 (76.1 to 88.7) | 41.6 (33.2 to 49.9) | 79.6 (72.7 to 86.5) | 35.5 (25.2 to 45.8) |
| Nulliparous (SPR = 12.7%) | ||||
| All pre-eclampsia (n = 284) | ||||
| NICE guidelines | 21.5 (16.7 to 26.3) | 22.3 (17.4 to 27.2) | ||
| Mat-CHs + MAP + PAPP-A | 35.9 (30.3 to 41.5) | 14.4 (9.0 to 19.8) | 36.1 (30.6 to 41.7) | 13.8 (8.4 to 19.3) |
| Preterm pre-eclampsia (n = 75) | ||||
| NICE guidelines | 29.3 (19.0 to 39.6) | 31.6 (21.1 to 42.2) | ||
| Mat-CHs + MAP + PAPP-A | 48.0 (36.7 to 59.3) | 18.7 (6.0 to 31.3) | 48.6 (37.3 to 60.0) | 17.0 (4.2 to 29.8) |
| Mat-CHs + MAP + PLGF | 65.3 (54.6 to 76.1) | 36.0 (23.4 to 48.6) | 64.5 (53.5 to 75.5) | 32.8 (19.3 to 46.4) |
| Mat-CHs + MAP + UTA-PI + PLGF | 77.3 (67.9 to 86.8) | 48.0 (36.1 to 59.9) | 75.7 (65.7 to 85.7) | 44.0 (30.9 to 57.2) |
| Parous (SPR = 8.3%) | ||||
| All pre-eclampsia (n = 189) | ||||
| NICE guidelines | 43.9 (36.8 to 51.0) | 45.2 (37.9 to 52.6) | ||
| Mat-CHs + MAP + PAPP-A | 51.9 (44.7 to 59.0) | 7.9 (1.7 to 14.2) | 51.7 (44.6 to 58.7) | 6.4 (–0.3 to 13.1) |
| Preterm pre-eclampsia (n = 67) | ||||
| NICE guidelines | 53.7 (41.8 to 65.7) | 57.1 (44.9 to 69.3) | ||
| Mat-CHs + MAP + PAPP-A | 61.2 (49.5 to 72.9) | 7.5 (–2.1 to 17.0) | 60.3 (48.9 to 71.6) | 3.2 (–8.5 to 14.9) |
| Mat-CHs + MAP + PLGF | 80.6 (71.1 to 90.1) | 26.9 (16.3 to 37.5) | 77.4 (67.3 to 87.4) | 20.2 (6.9 to 33.5) |
| Mat-CHs + MAP + UTA-PI + PLGF | 85.1 (76.5 to 93.6) | 31.3 (20.2 to 42.5) | 81.0 (71.3 to 90.6) | 23.8 (9.6 to 38.1) |
Imputation
The impact of aspirin treatment on McNemar’s test is to prevent pre-eclampsia and, therefore, transfer events counts for aspirin in Table 2 from the pre-eclampsia to no pre-eclampsia. The data imputation methodology reverses this process and, for those treated with aspirin, some observations are transferred from the no pre-eclampsia to the pre-eclampsia data. The discordant cells positive with the mini-combined test and negative with the NICE method (n = 38) and negative with the mini-combined test and positive with the NICE method (n = 136) is the no pre-eclampsia data that have an impact on McNemar’s test. Owing to the larger number in the negative mini-combined test and positive NICE method cells, the effect of the imputation is to correct a negative bias against the NICE method. Imputation was undertaken using the Markov chain Monte Carlo method, as described in Appendix 2.
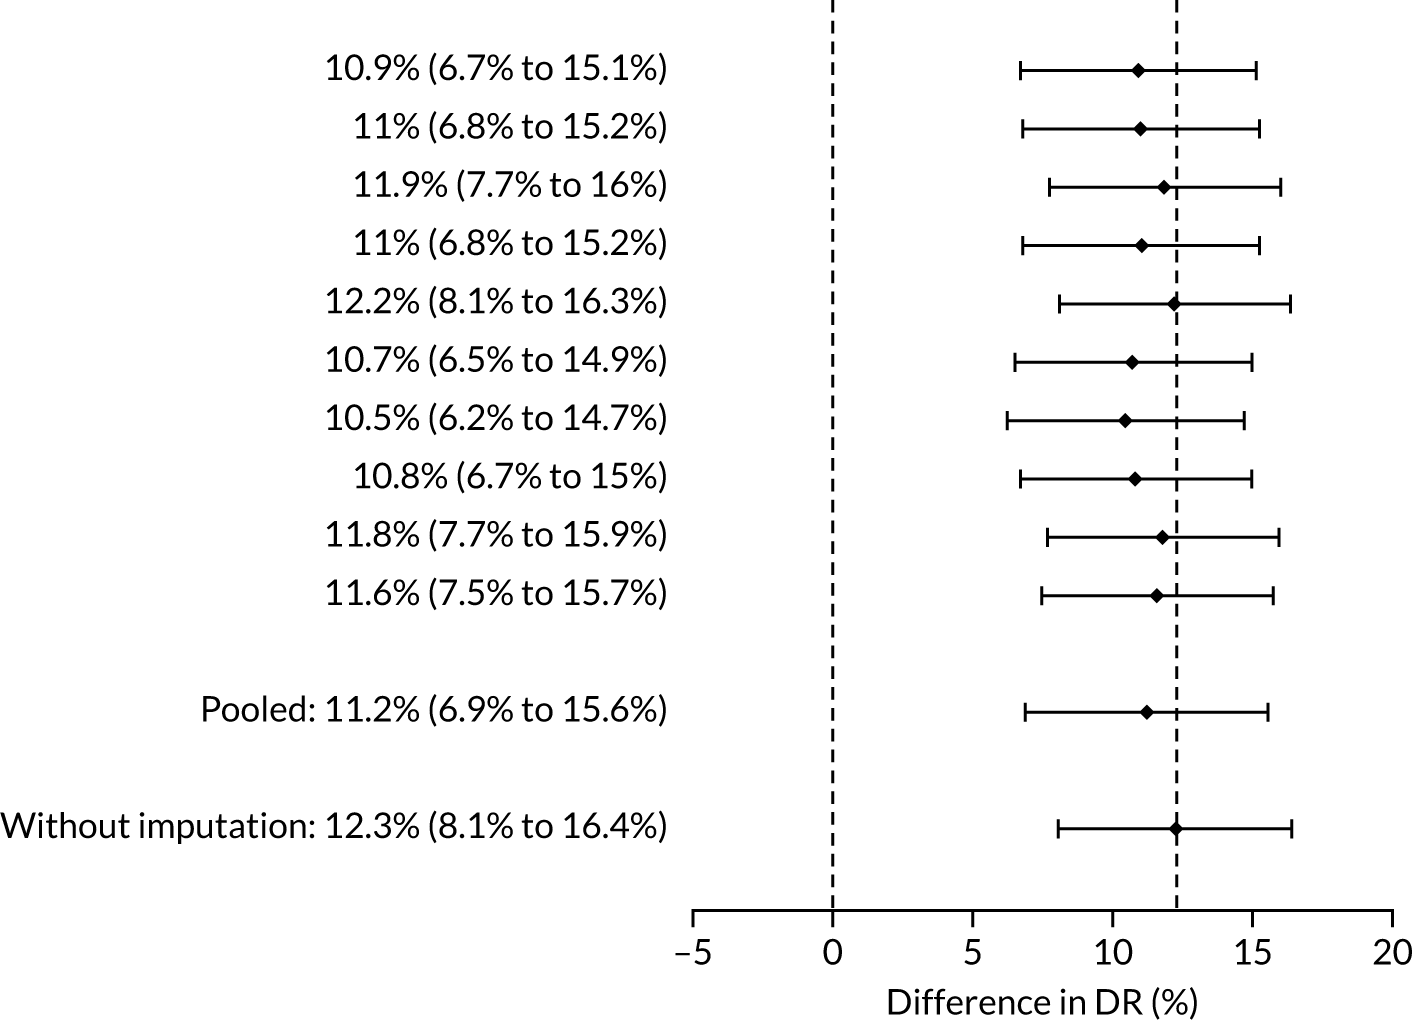
The results of multiple imputation of data on the incidence of all pre-eclampsia that would have occurred had it not been for the effect of treatment with aspirin are shown in Figure 8. After adjustment for the effect of aspirin (i.e. a 30% reduction in the rate of all pre-eclampsia) in those receiving this drug the DR of the NICE method was 31.6% (95% CI 27.3% to 35.9%) and that of the Bayes’ theorem-based method was 42.8% (95% CI 38.4% to 47.3%). The difference between the two methods was 11.2% (95% CI 6.9% to 15.6%) (see Table 4).
FIGURE 8.
Difference in DRs for pre-eclampsia with delivery at any gestational age [mini-combined test (i.e. Mat-CHs, MAP and PAPP-A) vs. NICE method] with relative risk reduction from aspirin of 30%. The first 10 rows give the results for 10 imputed samples.
Sensitivity analysis for assumptions regarding the effect of aspirin is given in Appendix 3, Figure 20. This shows that our conclusions are robust to the effect of aspirin and even in the most extreme case when aspirin is assumed to be 100% effective in preventing pre-eclampsia there is a substantial and overwhelmingly significant (p < 0.0001) improvement in DR using the mini-combined test (vs. the NICE method).
Key secondary comparisons
The three prespecified secondary comparisons were the NICE method compared with the competing risk model using maternal factors and the following biomarker combinations for the prediction of preterm pre-eclampsia (i.e. pre-eclampsia with delivery before 37 weeks’ gestation):
-
Mat-CHs, MAP and PAPP-A
-
Mat-CHs, MAP and PLGF
-
Mat-CHs, MAP, UTA-PI and PLGF.
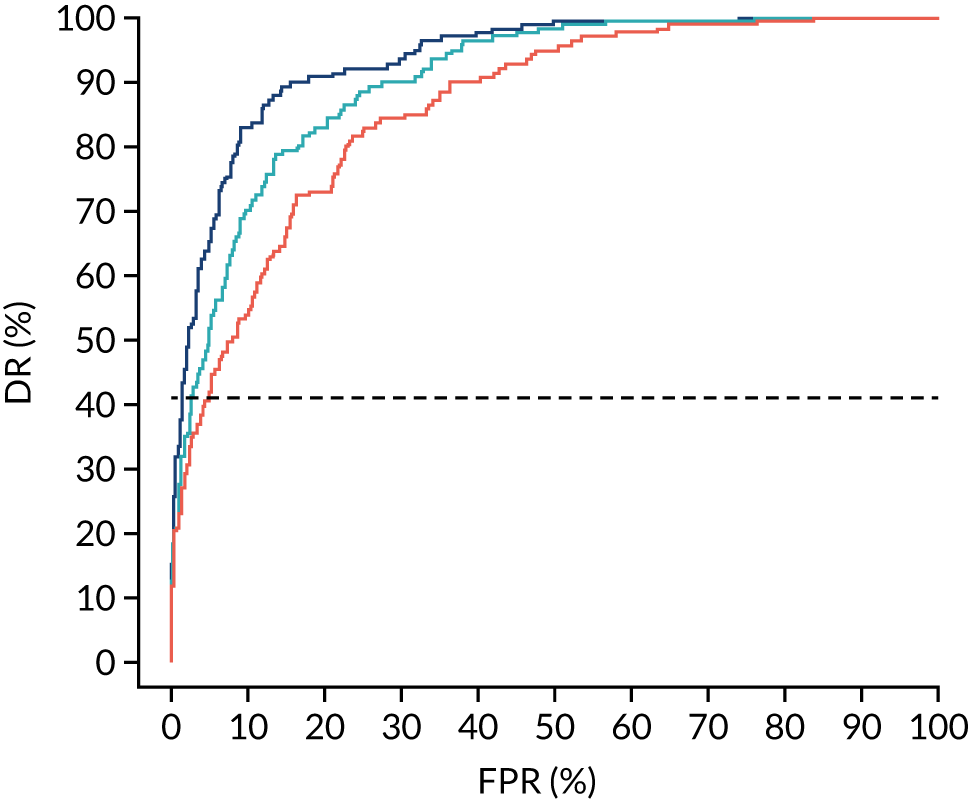
There were 142 women who delivered with preterm pre-eclampsia. Screening performance of the competing risk model and the NICE method is summarised in Table 4 and shown in Figure 9. After adjusting for the effect of aspirin, the DR of the NICE method for preterm pre-eclampsia was 44.1% (95% CI 35.7% to 52.6%), which was lower than that of the Bayes’ theorem-based method using Mat-CHs, MAP and PAPP-A (53.5%, 95% CI 45.5% to 61.6%), Mat-CHs, MAP and PLGF (67.3%, 95% CI 59.6% to 75.0%), and Mat-CHs, MAP, PLGF and UTA-PI (79.6%, 95% CI 72.7% to 86.5%). The difference in DRs (i.e. competing risk model – NICE method) was 9.4% (95% CI 0.1% to 18.2%) using the mini-combined test, 23.2% (95% CI 13.2% to 33.3%) using Mat-CHs together with MAP and PLGF, and 35.5% (95% CI 25.2% to 45.8%) using Mat-CHs with MAP, UTA-PI and PLGF.
FIGURE 9.
Receiver operating characteristic curves for prediction of preterm pre-eclampsia by the competing risk model. The patient-specific risk is derived by a combination of Mat-CHs with the measurements of MAP and PAPP-A (orange curve), MAP and PLGF (light blue curve) and MAP, PLGF and UTA-PI (dark blue curve). Performance of risk assessment using NICE guidelines is shown as a horizontal interrupted black line.
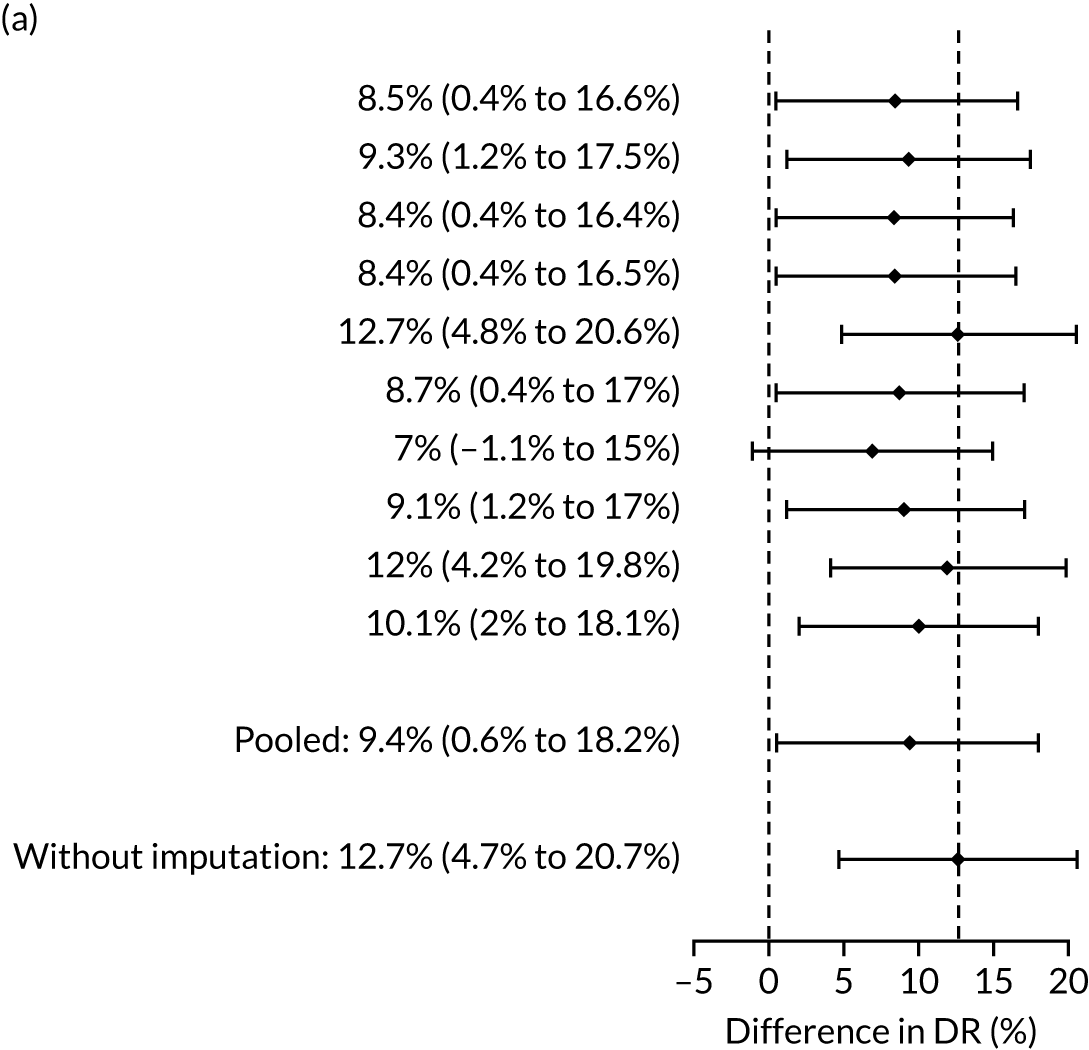
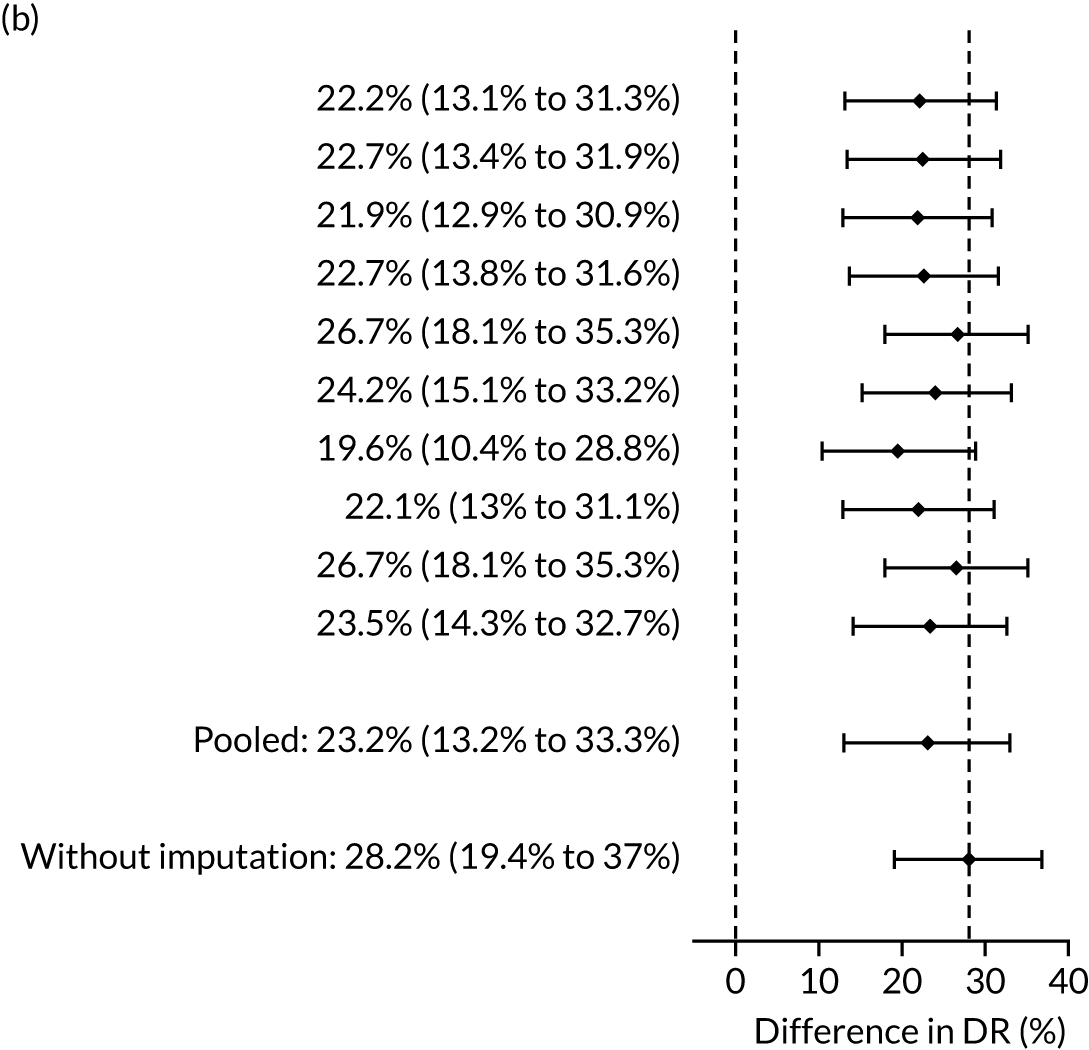
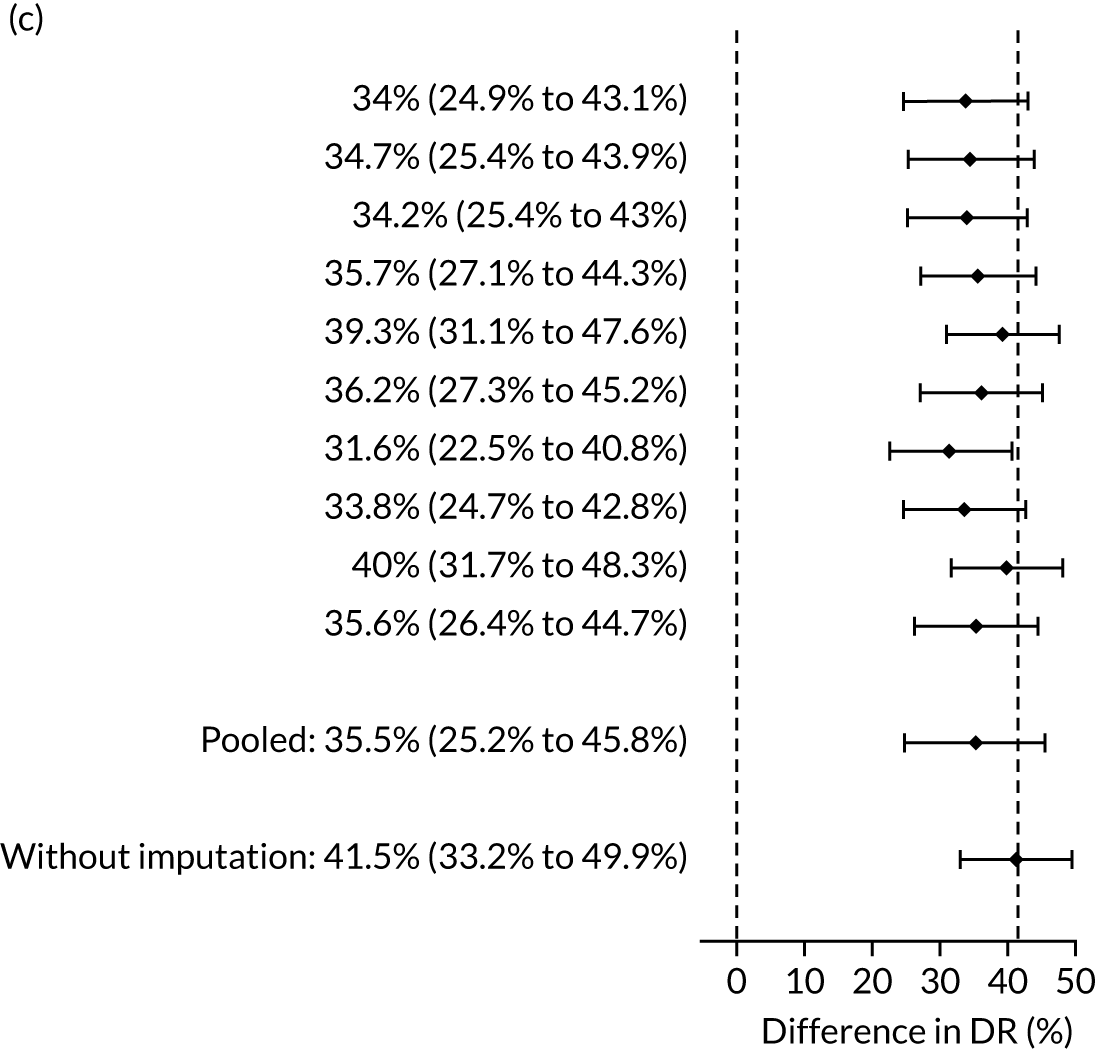
The results of multiple imputation of data on the incidence of preterm pre-eclampsia that would have occurred had it not been for the effect of treatment with aspirin are shown in Figure 10. After adjustment for the effect of aspirin (i.e. a 60% reduction in rate of preterm pre-eclampsia) in those receiving this drug, the difference in DR of the three Bayes’ theorem-based methods from the NICE method was 10.5% (95% CI 2.3% to 18.8%), 24.0% (95% CI 14.3% to 33.7%) and 35.1% (95% CI 25.1% to 45.0%), respectively.
FIGURE 10.
Results of multiple imputation of data on the incidence of preterm pre-eclampsia that would have occurred had it not been for the effect of treatment with aspirin. The DR of risk assessment by the NICE guidelines is compared with that of screening by a combination of Mat-CHs with the measurements of (a) MAP and PAPP-A; (b) MAP and PLGF; and (c) MAP, PLGF and UTA-PI.
Additional data on performance of the competing risk model
Table 5 provides data on the DR of early, preterm and term pre-eclampsia at a fixed SPR of 10% in screening by various combinations of biomarkers. Table 6 presents an analysis of the incremental benefit in DR of individual biomarkers when added to a specific combination of markers. In all cases apart from the addition of PAPP-A, the addition of a biomarker improved the DR.
| Method of screening | Pre-eclampsia at < 34 weeks | Pre-eclampsia at < 37 weeks | Pre-eclampsia at ≥ 37 weeks | |||
|---|---|---|---|---|---|---|
| n/N | % (95% CI) | n/N | % (95% CI) | n/N | % (95% CI) | |
| Mat-CHs | 29/60 | 48.3 (35.2 to 61.6) | 59/142 | 41.5 (33.3 to 50.1) | 100/331 | 30.2 (25.3 to 35.5) |
| Mat-CHs + MAP | 39/60 | 65.0 (51.6 to 76.9) | 70/142 | 49.3 (40.8 to 57.8) | 128/331 | 38.7 (33.4 to 44.2) |
| Mat-CHs + UTA-PI | 44/60 | 73.3 (60.3 to 83.9) | 88/142 | 62.0 (53.5 to 70.0) | 105/331 | 31.7 (26.7 to 37.0) |
| Mat-CHs + PAPP-A | 33/60 | 55.0 (41.6 to 67.9) | 64/142 | 45.1 (36.7 to 53.6) | 100/331 | 30.2 (25.3 to 35.5) |
| Mat-CHs + PLGF | 40/60 | 66.7 (53.3 to 78.3) | 84/142 | 59.2 (50.6 to 67.3) | 113/331 | 34.1 (29.0 to 39.5) |
| Mat-CHs + MAP + UTA-PI | 53/60 | 88.3 (77.4 to 95.2) | 105/142 | 73.9 (65.9 to 80.9) | 144/331 | 43.5 (38.1 to 49.0) |
| Mat-CHs + MAP + PAPP-A | 39/60 | 65.0 (51.6 to 76.9) | 75/142 | 52.8 (44.3 to 61.2) | 125/331 | 37.8 (32.5 to 43.2) |
| Mat-CHs + MAP + PLGF | 44/60 | 73.3 (60.3 to 83.9) | 97/142 | 68.3 (60.0 to 75.9) | 131/331 | 39.6 (34.3 to 45.1) |
| Mat-CHs + UTA-PI + PAPP-A | 44/60 | 73.3 (60.3 to 83.9) | 90/142 | 63.4 (54.9 to 71.3) | 107/331 | 32.3 (27.3 to 37.7) |
| Mat-CHs + UTA-PI + PLGF | 45/60 | 75.0 (62.1 to 85.3) | 100/142 | 70.4 (62.2 to 77.8) | 126/331 | 38.1 (32.8 to 43.5) |
| Mat-CHs + PAPP-A + PLGF | 41/60 | 68.3 (55.0 to 79.7) | 87/142 | 61.3 (52.7 to 69.3) | 113/331 | 34.1 (29.0 to 39.5) |
| Mat-CHs + MAP + UTA-PI + PAPP-A | 52/60 | 86.7 (75.4 to 94.1) | 108/142 | 76.1 (68.2 to 82.8) | 141/331 | 42.6 (37.2 to 48.1) |
| Mat-CHs + MAP + UTA-PI + PLGF | 54/60 | 90.0 (79.5 to 96.2) | 116/142 | 81.7 (74.3 to 87.7) | 141/331 | 42.6 (37.2 to 48.1) |
| Mat-CHs + MAP + PAPP-A + PLGF | 46/60 | 76.7 (64.0 to 86.6) | 96/142 | 67.6 (59.2 to 75.2) | 130/331 | 39.3 (34.0 to 44.8) |
| Mat-CHs + UTA-PI + PAPP-A + PLGF | 47/60 | 78.3 (65.8 to 87.9) | 102/142 | 71.8 (63.7 to 79.1) | 119/331 | 36.0 (30.8 to 41.4) |
| Mat-CHs + MAP + UTA-PI + PAPP-A + PLGF | 54/60 | 90.0 (79.5 to 96.2) | 115/142 | 81.0 (73.6 to 87.1) | 144/331 | 43.5 (38.1 to 49.0) |
| Comparison of methods of screening | DR (%) | p-value | ||
|---|---|---|---|---|
| Before | After | Difference (95% CI) | ||
| Mat-CHs vs. addition of MAP | 41.55 | 49.30 | 7.75 (1.6 to 14.6) | 0.0291 |
| Mat-CHs vs. addition of UTA-PI | 41.55 | 61.97 | 20.42 (12.9 to 28.5) | < 0.0001 |
| Mat-CHs vs. addition of PLGF | 41.55 | 59.15 | 17.61 (10.1 to 25.7) | < 0.0001 |
| Mat-CHs vs. addition of PAPP-A | 41.55 | 45.07 | 3.52 (–1.7 to 9.2) | 0.2673 |
| Mat-CHs and MAP vs. addition of PLGF | 49.30 | 68.31 | 19.01 (11.7 to 27.0) | < 0.0001 |
| Mat-CHs and MAP vs. addition of UTA-PI | 49.30 | 73.94 | 24.65 (16.7 to 33.0) | < 0.0001 |
| Mat-CHs, MAP and UTA-PI vs. addition of PLGF | 73.94 | 81.69 | 7.75 (2.3 to 14.1) | 0.0153 |
| Mat-CHs, MAP and PLGF vs. addition of UTA-PI | 68.31 | 81.69 | 13.38 (8.0 to 20.2) | < 0.0001 |
| Mat-CHs, UTA-PI and PLGF vs. addition of MAP | 70.42 | 81.69 | 11.27 (5.3 to 18.2) | 0.0014 |
Additional figures of receiver operating characteristic curves for prediction of pre-eclampsia by the competing risk model are provided in Appendix 4.
Chapter 5 The SPREE study discussion
Principal findings of this study
The SPREE study has demonstrated that risk assessment for pre-eclampsia as currently recommended by NICE guidelines8 identifies approximately 30% of women who would develop pre-eclampsia and about 40% of those that will develop severe pre-eclampsia leading to preterm birth, at a SPR of 10%.
Compliance with the NICE recommendation that women at high-risk for pre-eclampsia should be treated with aspirin from the first trimester to the end of pregnancy was only 23%. Such low compliance may, at least in part, be attributed to the generally held belief, based on the results of a meta-analysis in 2007,6 that aspirin reduces the risk of pre-eclampsia by only about 10%.
The performance of screening by competing risks model, which combines maternal factors with biomarkers,17,33 was superior to that of risk assessment by NICE guidelines. At the same SPR as for the NICE method, the DR for all pre-eclampsia in screening by Mat-CHs, MAP and serum PAPP-A was 42.5% and the DR for preterm pre-eclampsia by a combination of Mat-CHs, MAP, UTA-PI and PLGF was 82.4%, which is significantly higher than that of the NICE guidelines.
Strengths and limitations of this study
The strengths of the study include prospective examination of a large number of pregnant women in several maternity units covering a wide spectrum of demographic and racial characteristics. The results are therefore likely to be generalisable across the UK. More than 90% of patients attending for routine care agreed to participate in the study. Measurement of all biomarkers was recorded in all cases and complete follow-up was obtained from > 98% of participants. Consistency in data collection was maintained throughout the study period by ensuring adequate training for all investigators based on standardised protocols, regular UCL-CCTU monitoring, and external validation and quality assurance of biomarker measurements.
A potential limitation of the study is lack of formal health economic assessment concerning the implementation of combined screening for pre-eclampsia. Such assessment was beyond the scope of this study, but it is currently being carried out.
Comparison with results of previous studies
The performance of screening for preterm pre-eclampsia by the competing risks model, utilising Mat-CHs, MAP, UTA-PI and PLGF, observed in this study is comparable to that reported in several previous studies of singleton pregnancies at 11–13 weeks’ gestation. 17,19,39,40 The algorithm was originally developed from a study19 of 58,884 pregnancies. The DR of preterm pre-eclampsia was 77% at a FPR of 10%. 19 Subsequently, we used data from prospective screening in 35,948 pregnancies to update the original algorithm. The DR of preterm pre-eclampsia was 75% at a FPR of 10%. 17 The diagnostic accuracy of this algorithm was examined in a prospective multicentre study39 of 8775 pregnancies. The DR of preterm pre-eclampsia was 75% at a FPR of 10%. 39 In the screened population in the ASPRE trial,40 involving 25,797 pregnancies from 13 maternity hospitals in six countries, the DR of preterm pre-eclampsia after adjustment for the effect of aspirin was 77% at a FPR of 9.2%. 40 None of these studies found evidence that PAPP-A improved screening achieved by MAP, UTA-PI and PLGF.
Other first-trimester combined prediction models have been developed in different populations. Specifically, two Spanish cohort studies27,29 have developed models with the use of Mat-CHs, UTA-PI, MAP and biochemical markers that have demonstrated similar predictive performance in comparison with the Bayes’ theorem-based model. In contrast, three combined prediction algorithms, established from cohort studies in the USA, demonstrate lower predictive performance than the Bayes’ theorem-based model. 25,28,41
A recent systematic review has compared the performance of simple risk models (i.e. Mat-CHs only) with that of specialised models that include specialised tests (e.g. measurements of MAP, UTA-PI and/or biochemical markers) for the prediction of pre-eclampsia. 42 Seventy models from 29 studies were identified (17 models to predict pre-eclampsia of any gestation, 31 models to predict early-onset pre-eclampsia and 22 models to predict late-onset pre-eclampsia). Among them, 22 were simple risk models, whereas 48 were classified as specialised models. Comparing simple and specialised models, the latter performed better than the simple models in predicting both early- and late-onset pre-eclampsia. 42 The specialised models have been shown to increase the DR of pre-eclampsia by 18% (95% CI 0% to 56%) at a fixed FPR of 5% or 10%. 42 Such results further confirm that our approach to screening using a combination of various tests rather than a single test is better for the prediction of pre-eclampsia.
Implications on clinical practice
Recent evidence suggests that first-trimester risk assessment should focus on prediction of pre-eclampsia leading to preterm birth primarily with the aim of preventing preterm birth through treatment with aspirin from 11–13 weeks’ gestation. Aspirin is considerably more effective than previously thought in reducing the risk of preterm pre-eclampsia, provided the daily dose of the drug is ≥ 100 mg and the gestational age at onset of therapy is < 16 weeks. 1 In the ASPRE trial,7,43 use of aspirin (150 mg/day) starting from 11–14 weeks’ gestation reduced the risk of preterm pre-eclampsia by 62% and a secondary analysis of the trial reported that the reduction was even greater (75%) if the compliance was ≥ 90%. Against this background, there are ongoing debates about prediction and prevention of preterm pre-eclampsia centred on two questions: (1) whether or not aspirin should be recommended for all women or to a subpopulation of those women predicted to be at increased risk of developing pre-eclampsia and (2) if a strategy of prediction and prevention is to be used, what method should be used for prediction.
The arguments in favour of recommending aspirin to all women are that it avoids the need for prediction and the whole population benefits from the prophylactic treatment with aspirin. Arguments against this are that (1) compliance is likely to be worse when aspirin is applied to the whole population than when recommended to a subpopulation selected, and counselled, based on risk and (2) there is a need to balance the benefit from aspirin in prevention of preterm pre-eclampsia with potential harm from aspirin due to haemorrhagic and other adverse effects. Assuming that the entire population took aspirin, an incidence of 0.8% and a relative reduction in risk of preterm pre-eclampsia of 60%, 208 women would be exposed to aspirin treatment for every case of preterm pre-eclampsia prevented. Using risk stratification with Mat-CHs, MAP, UTA-PI and PLGF with the same SPR as NICE, 16 women would need to be exposed to aspirin to prevent one case compared with 30 women using the NICE guidelines.
Regarding the method of prediction, the debate centres around screening performance, costs and practical issues of implementation.
The main focus of this report has been on the DR achieved by using the competing risk model compared with that of the NICE method. For the same SPR as NICE, the DR for preterm pre-eclampsia achieved by combining Mat-CHs with MAP, UTA-PI and PLGF is 79.6% (95% CI 72.7% to 86.5%) compared with 44.1% (95% CI 35.7% to 52.6%) when using the NICE method. Using these estimates and with an incidence of preterm pre-eclampsia of 0.8% the positive predictive values are 1 in 16 compared with 1 in 29 for the competing risk model and NICE method, respectively. Among women who screen negative, the proportions with preterm pre-eclampsia (i.e. 1 – negative predictive value) are 1 in 550 compared with 1 in 200 for the competing risk model and NICE method, respectively.
The main argument against the use of risk algorithms, such as the competing risk model, is that they are too complex to use in practice. Simple methods, such as the NICE criteria or cut-off points applied to biomarker measurements or their ratios, should be preferred because they are easy to implement in practice. In fact, the essential features of our approach of using Bayes’ theorem to update likelihoods from biomarker MoM values to update a prior based on maternal factors have been used for many decades in screening for aneuploidies. These algorithms have been built into commercial software used extensively in practice. The commercial software suppliers have implemented the competing risk algorithm for pre-eclampsia screening into their software systems.
Regarding the approaches based on application of cut-off points to individual markers or ratios of different markers, the following points need to be considered. First, they do not provide individualised risks for decision-making. Second, their performance is inferior to approaches based on probability theory to make optimal use of the available information. Last, because biomarkers are affected by covariates such as ethnicity, they are likely to be inequitable in the way they perform across different groups within the population.
In the clinical implementation of the first-trimester combined test for preterm pre-eclampsia, recording Mat-CHs and medical history, measurement of blood pressure and hospital attendance at 11–13 weeks’ gestation for an ultrasound scan are an integral part of routine antenatal care. Measurement of UTA-PI can be carried out by the same sonographers and ultrasound machines used for the routine scan at 11–13 weeks’ gestation; however, the sonographers will require training to carry out this test and the measurement would add 2–3 minutes to the current 20–30 minutes used for the scan. Serum PLGF can be measured in the same blood sample and by the same automated platforms that are currently used for measurement of serum PAPP-A as part of routine clinical practice in screening for fetal trisomies in all maternity hospitals in England; however, there is an additional cost for the reagents. Extensive research has established reference ranges for MAP, PLGF and UTA-PI, has described the Mat-CHs that affect the measurements and has developed the infrastructure for auditing of results. 44–46
One decade ago, effective first-trimester screening for fetal trisomies was implemented in all maternity hospitals in the UK within a few months of the appropriate decision being taken by the UK National Screening Committee and NICE. 47 The same infrastructure can now be used to expand the aims of first-trimester screening to include identification of women at high risk of developing preterm pre-eclampsia and substantially reducing such risk through the prophylactic use of the appropriate dose of aspirin. 48
Conclusion
The SPREE study has demonstrated that the performance of first trimester screening for pre-eclampsia by a combination of maternal factors and biomarkers is superior to that achieved by the risk assessment method recommended by the current NICE guidelines.
Chapter 6 The SPREE study calibration
Calibration refers to how well the predictions from the model agree with the observed outcomes. For a well-calibrated model, among those women with a risk of 1 in n the incidence should be 1 in n. This property should also hold for subgroups defined in terms of previous pregnancy history and maternal factors and biomarkers.
The objective of this chapter is to provide the predictive performance of the competing risk model17,33 for (1) all pre-eclampsia using Mat-CHs, MAP and PAPP-A (which was the prespecified primary outcome in the SPREE study);38 (2) pre-eclampsia with delivery at < 34 weeks’ gestation (i.e. early pre-eclampsia), pre-eclampsia with delivery at < 37 weeks’ gestation (i.e. preterm pre-eclampsia) and all pre-eclampsia for various combinations of the biomarkers MAP, UTA-PI and PLGF in the SPREE study;38 and (3) the data set from another validation study of the competing risks model (i.e. ASPRE SQS). 39
Methods
Calibration was assessed visually through a series of figures showing the estimated incidence against that predicted from risk for pre-eclampsia at < 34 weeks’ gestation, < 37 weeks’ gestation and any pre-eclampsia for screening by maternal factors and various combinations of biomarkers. The plots were obtained by grouping the data into bins according to risk. The estimated incidence in each group was then plotted against the incidence predicted from the risks within each group (i.e. the mean risk). 35
Calibration, in the large, is a measure of whether the risks are generally too high or too low. This is quantified by the estimated intercept from a logistic regression of incidence on the logit of risk with the slope fixed at 1. The intercept is a measure of the deviation of the observed incidence from the predicted. For perfectly calibrated risks, the intercept should be zero. If there is a general tendency for underestimation, so that the observed incidence is larger than that predicted, the intercept will be positive. Conversely, for overestimation the intercept will be negative.
The calibration slope assesses the calibration across the range of risks and is the slope of the regression line of the logistic regression of incidence on the logit of risk. If the risk is well calibrated then the slope should be 1.0. A slope < 1 means that the relationship between risk and incidence is flatter than it should be. A calibration slope > 1 means that the relationship is steeper than it should be.
The risks produced from our competing risks model17,33 are for delivery with pre-eclampsia before a specific gestation, assuming no other cause for delivery. As other-cause deliveries are effectively censored observations, the actual incidence of pre-eclampsia would be expected to be lower than predicted. For early gestations, when there are few other-cause deliveries, the effects would be small. At later gestations, with many other-cause deliveries, the effect of censoring may be substantial. Consequently, we applied survival analysis and used a Kaplan–Meier49 estimate of incidence of delivery with pre-eclampsia treating deliveries from other causes as censored observations. The incidence counts were adjusted for the effect of censoring by multiplying the estimated incidence by the number of observations in each bin. The analysis was undertaken using the R statistical software with the survival package for Kaplan–Meier estimates of survival probabilities.
Results
Calibration of risks for the mini-combined test: Mat-CHs, MAP and PAPP-A in the SPREE study
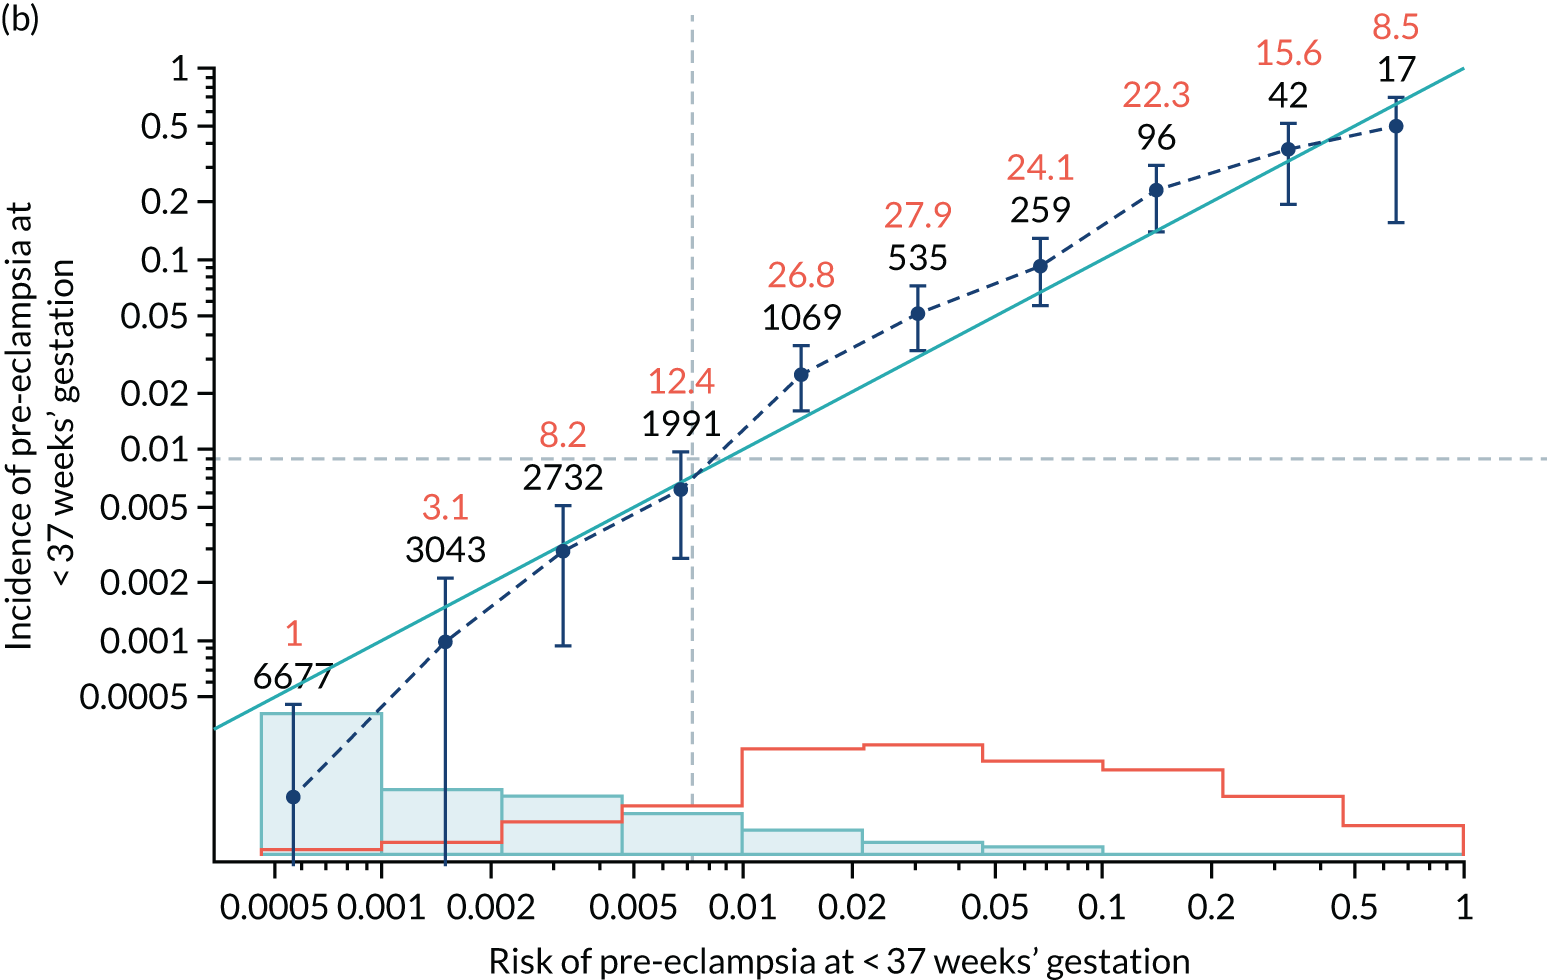
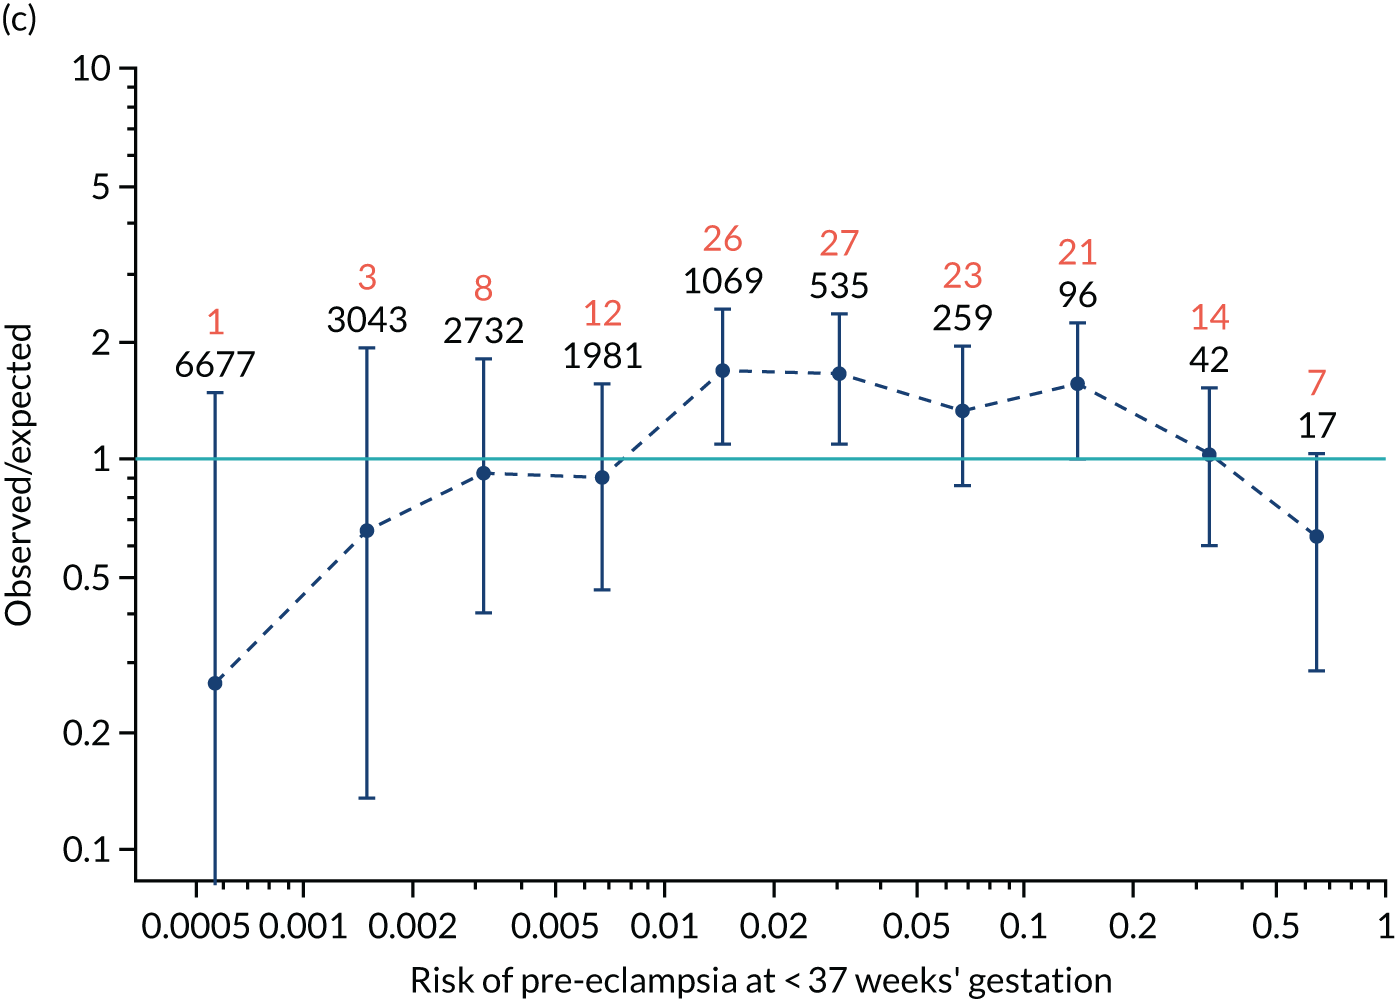
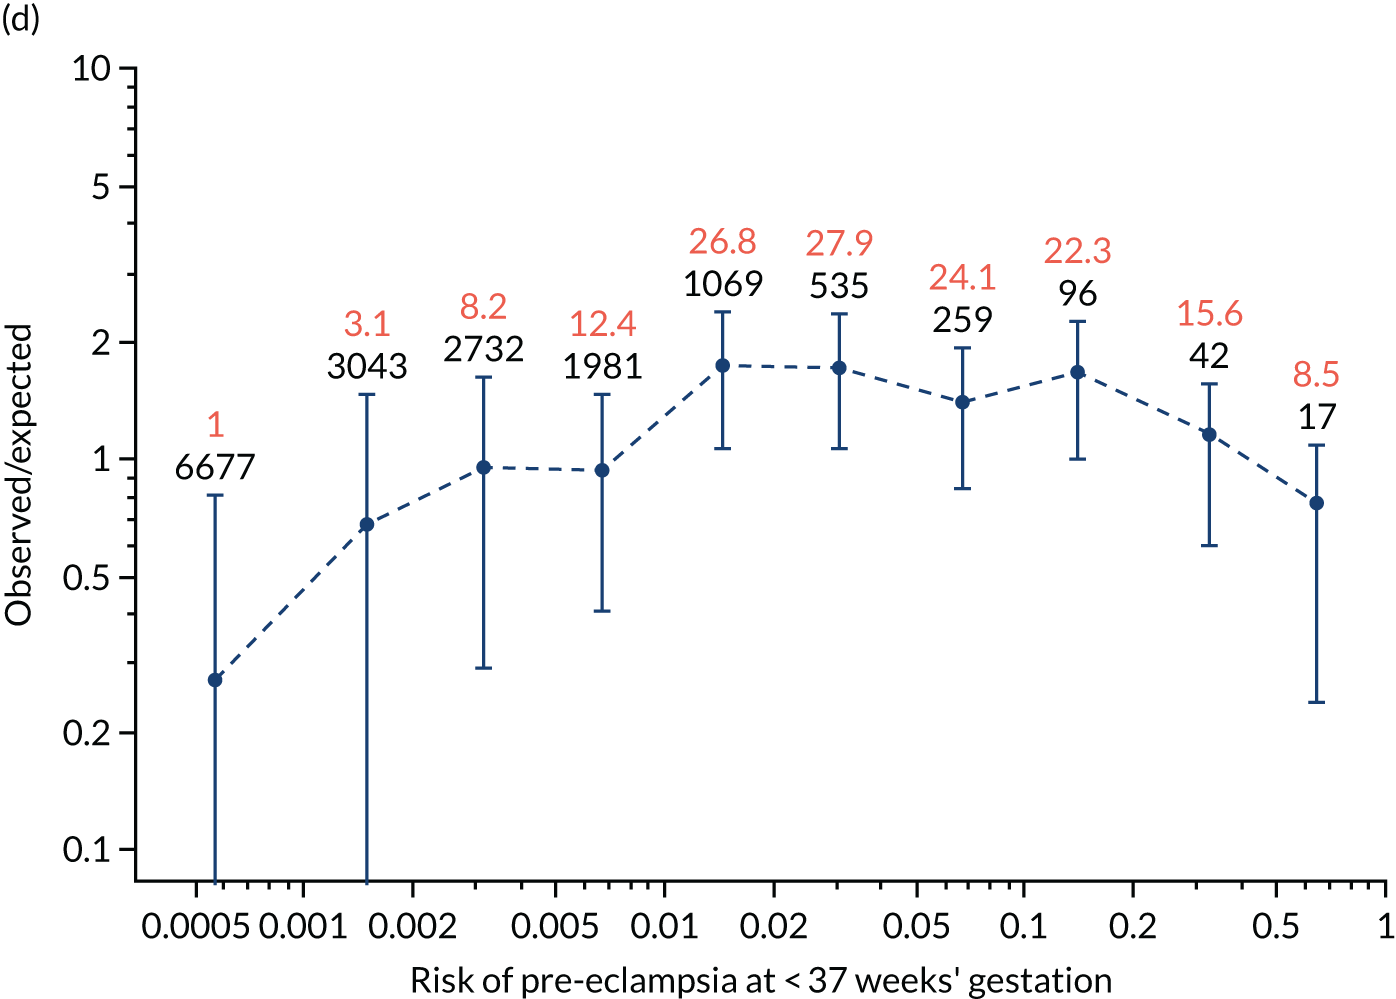
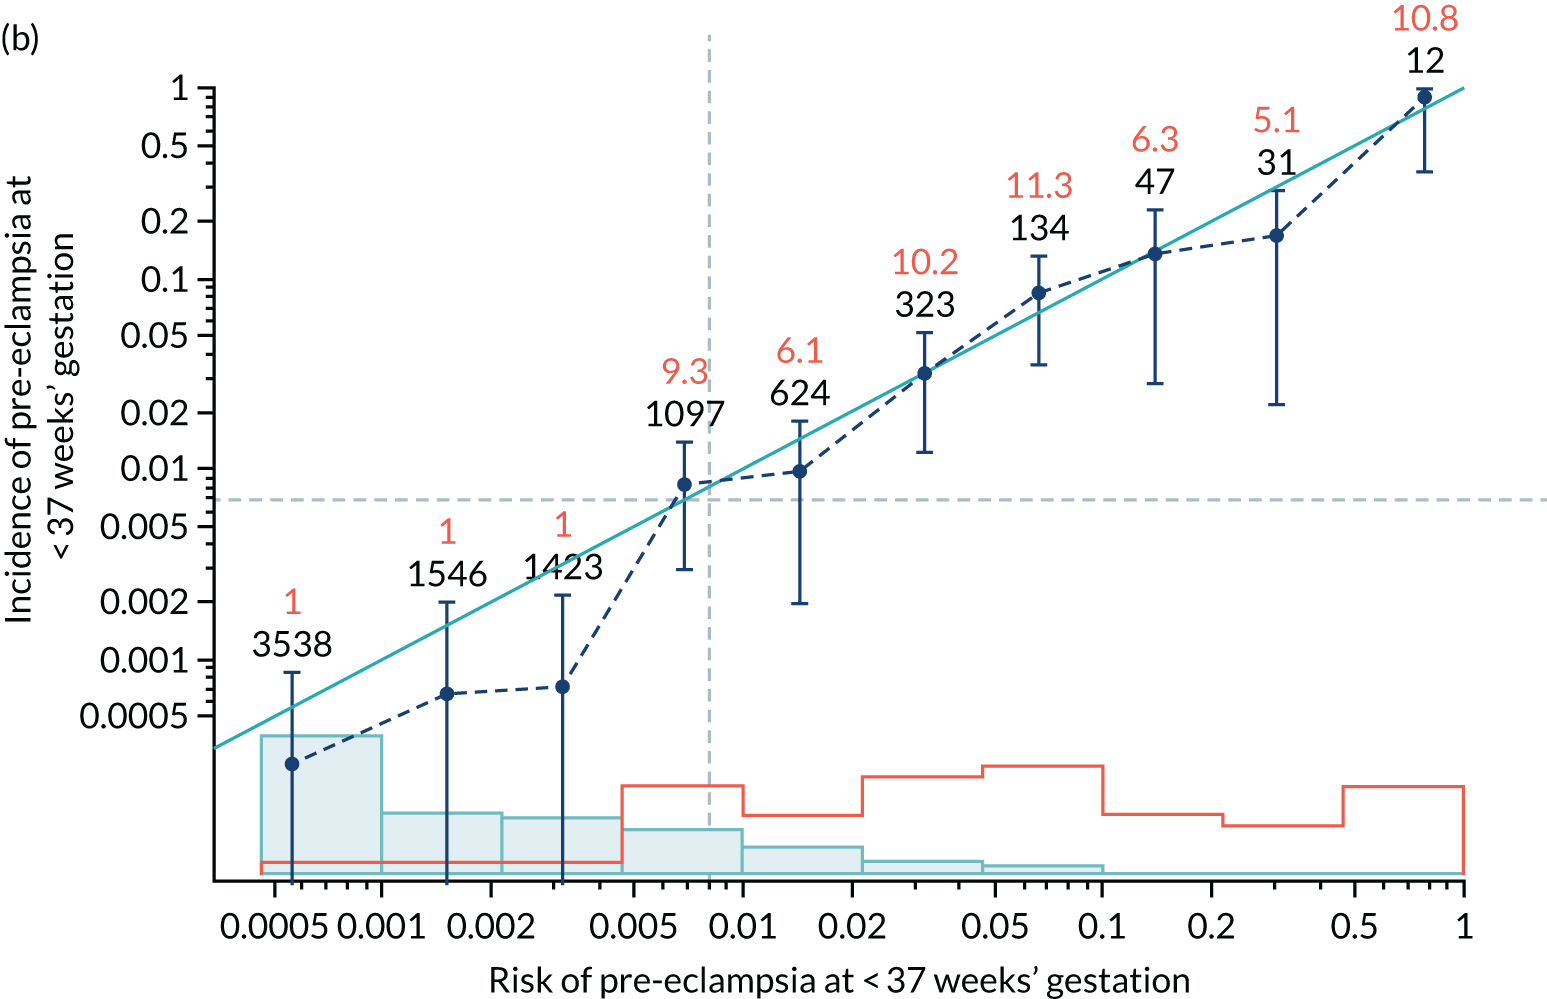
Calibration plots of the predictive performance of the competing risk model for all pre-eclampsia using Mat-CHs, MAP and PAPP-A in the SPREE study are shown in Figure 11. Figures 11a and c show the incidence with no correction for censoring. Figures 11b and d show the Kaplan–Meier estimates of incidence obtained from a survival analysis treating births due to other causes as censored observations. The error bars are 95% CIs. The numbers in black shown above each interval are the number of pregnancies in each bin. Those in orange are the incidence counts in each of the bins. Statistics for the calibration-in-the-large intercept and the calibration slope are shown superimposed on Figure 11. The light blue line shows where the risks are perfect predictors of incidence. The vertical dashed line is the mean overall risk and the horizontal dashed line is the overall incidence. The histograms show the distribution of risks for pregnancies with pre-eclampsia (orange) and without pre-eclampsia (light blue). The figure at the bottom of each graph shows the estimated incidence/mean risk within each bin.
FIGURE 11.
Calibration plots for screening using the competing risk model for prediction of all pre-eclampsia by Mat-CHs, MAP and PAPP-A. (a) Estimated incidence with no adjustment for censoring for Mat-CHs, MAP and PAPP-A (all pre-eclampsia); (b) estimated incidence with adjustment for censoring for Mat-CHs, MAP and PAPP-A (all pre-eclampsia); (c) observed/expected incidence with no adjustment for censoring for Mat-CHs, MAP and PAPP-A (all pre-eclampsia); and (d) observed/expected incidence with adjustment for censoring for Mat-CHs, MAP and PAPP-A (all pre-eclampsia).
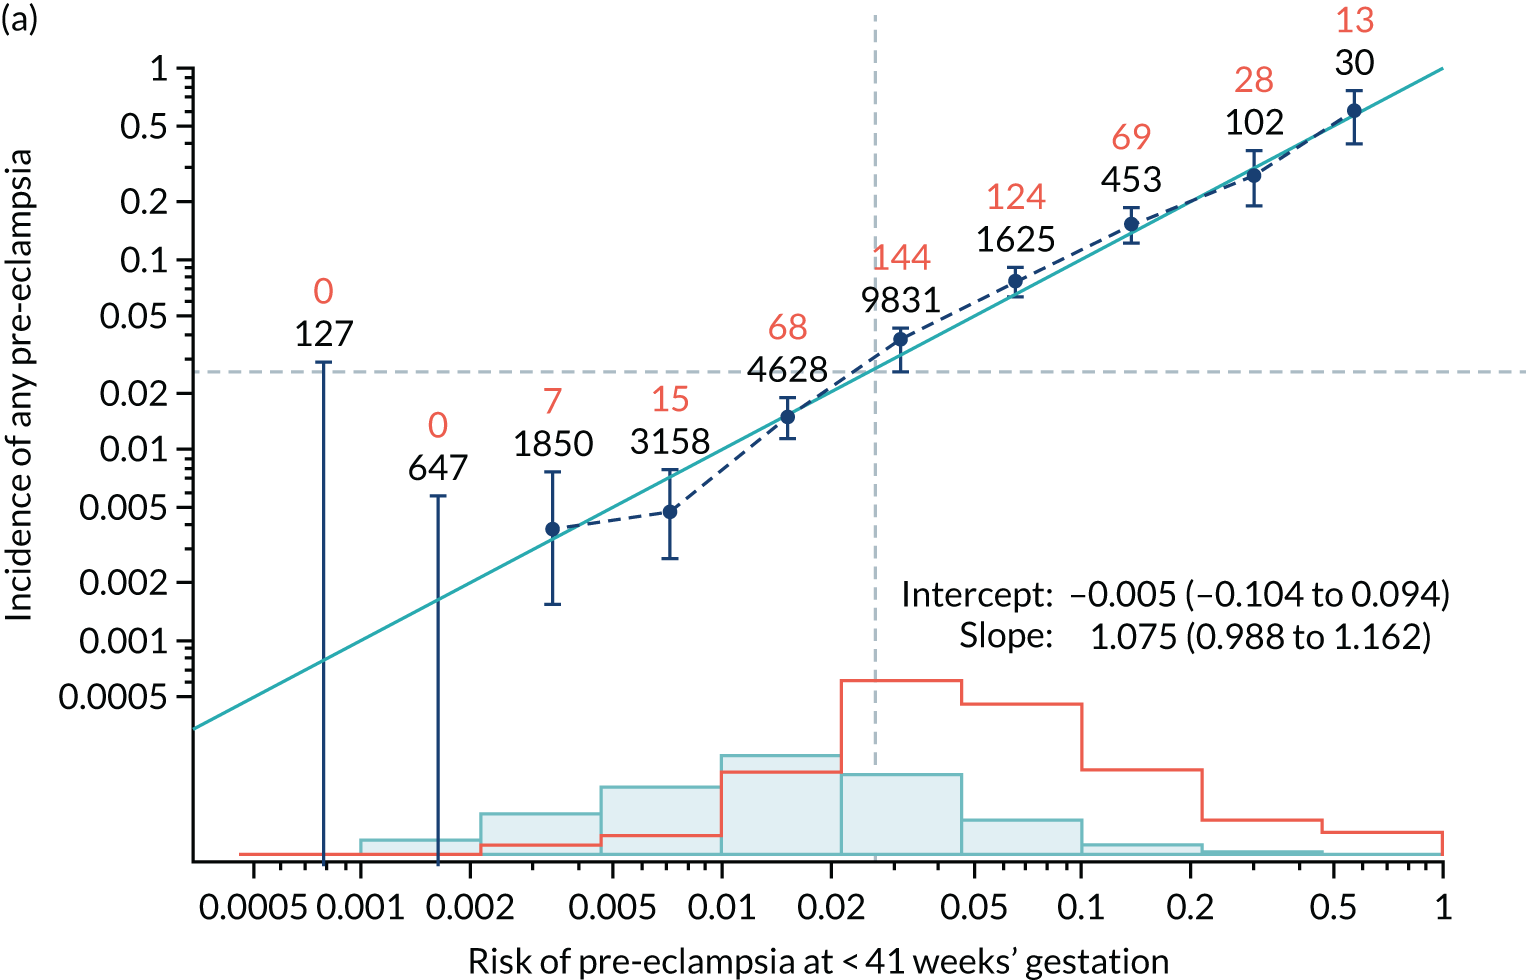
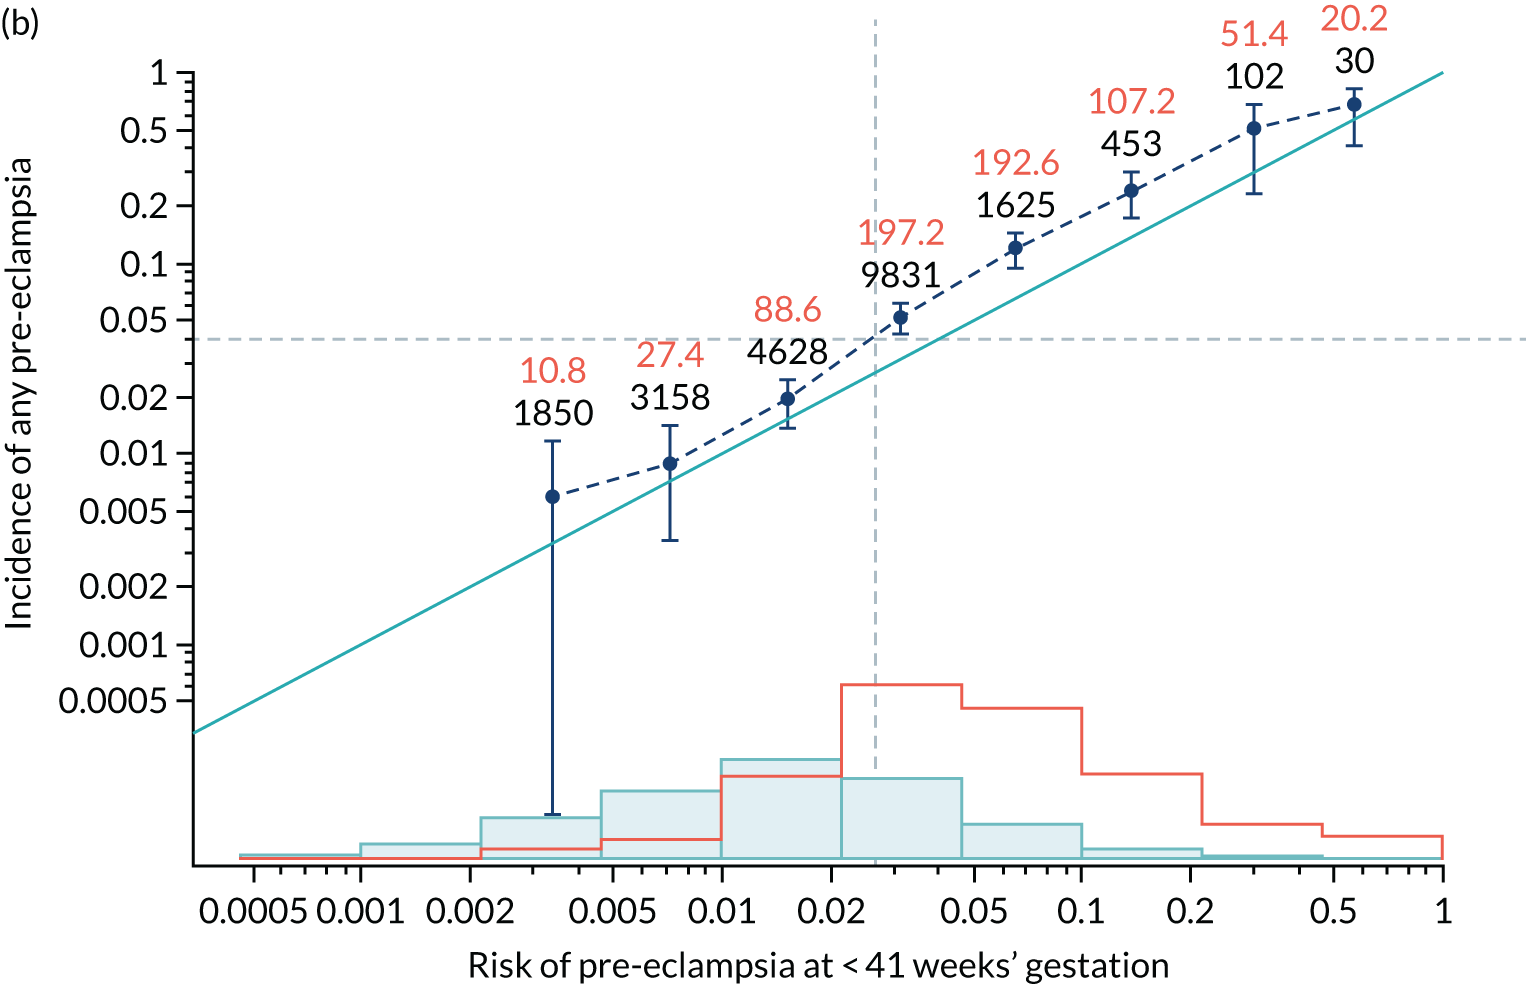
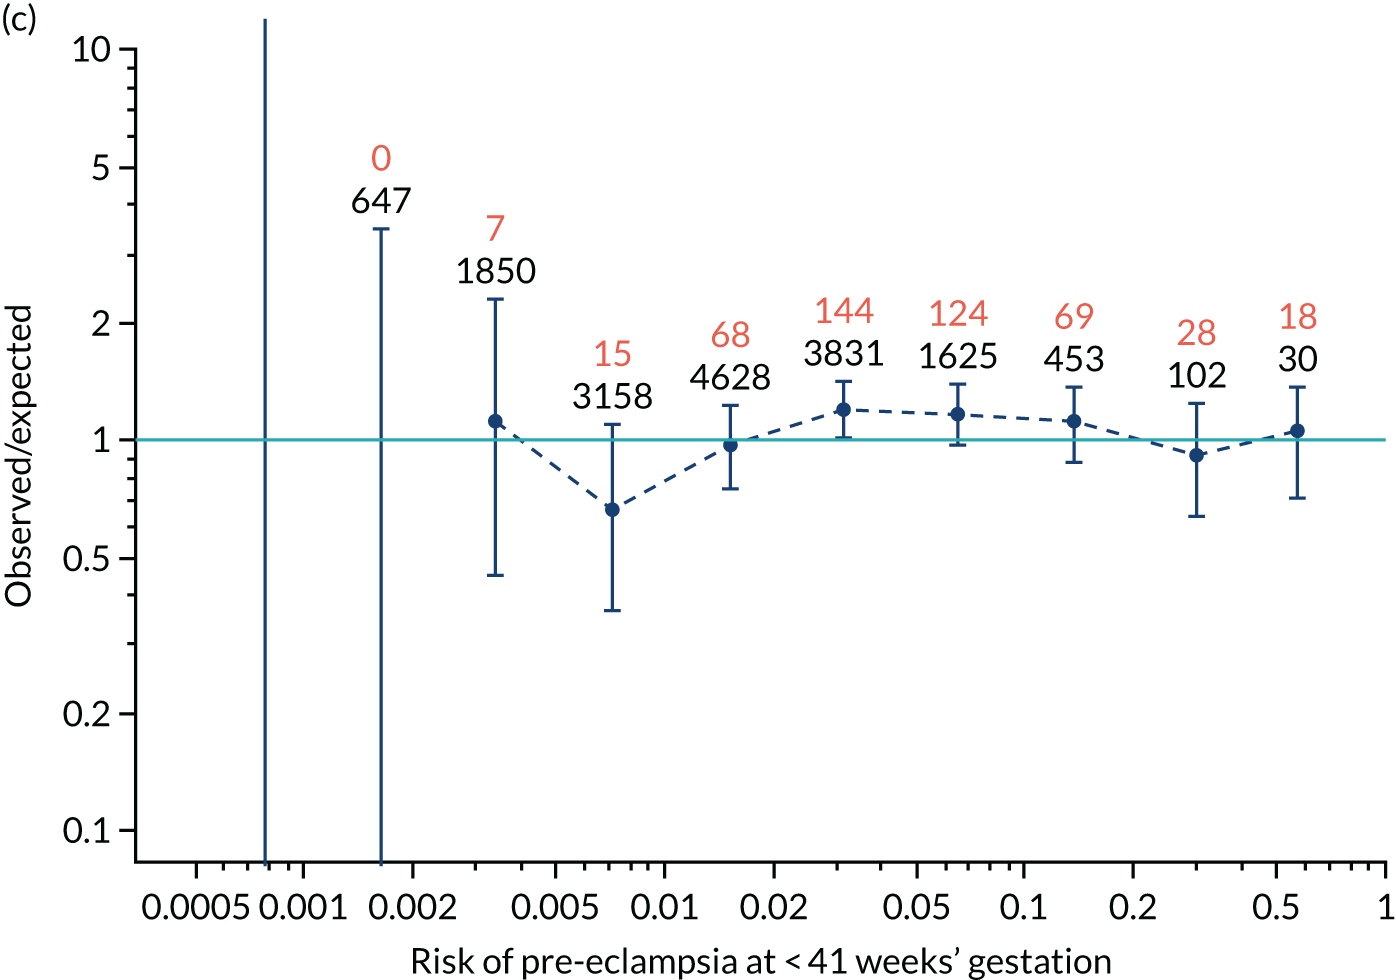
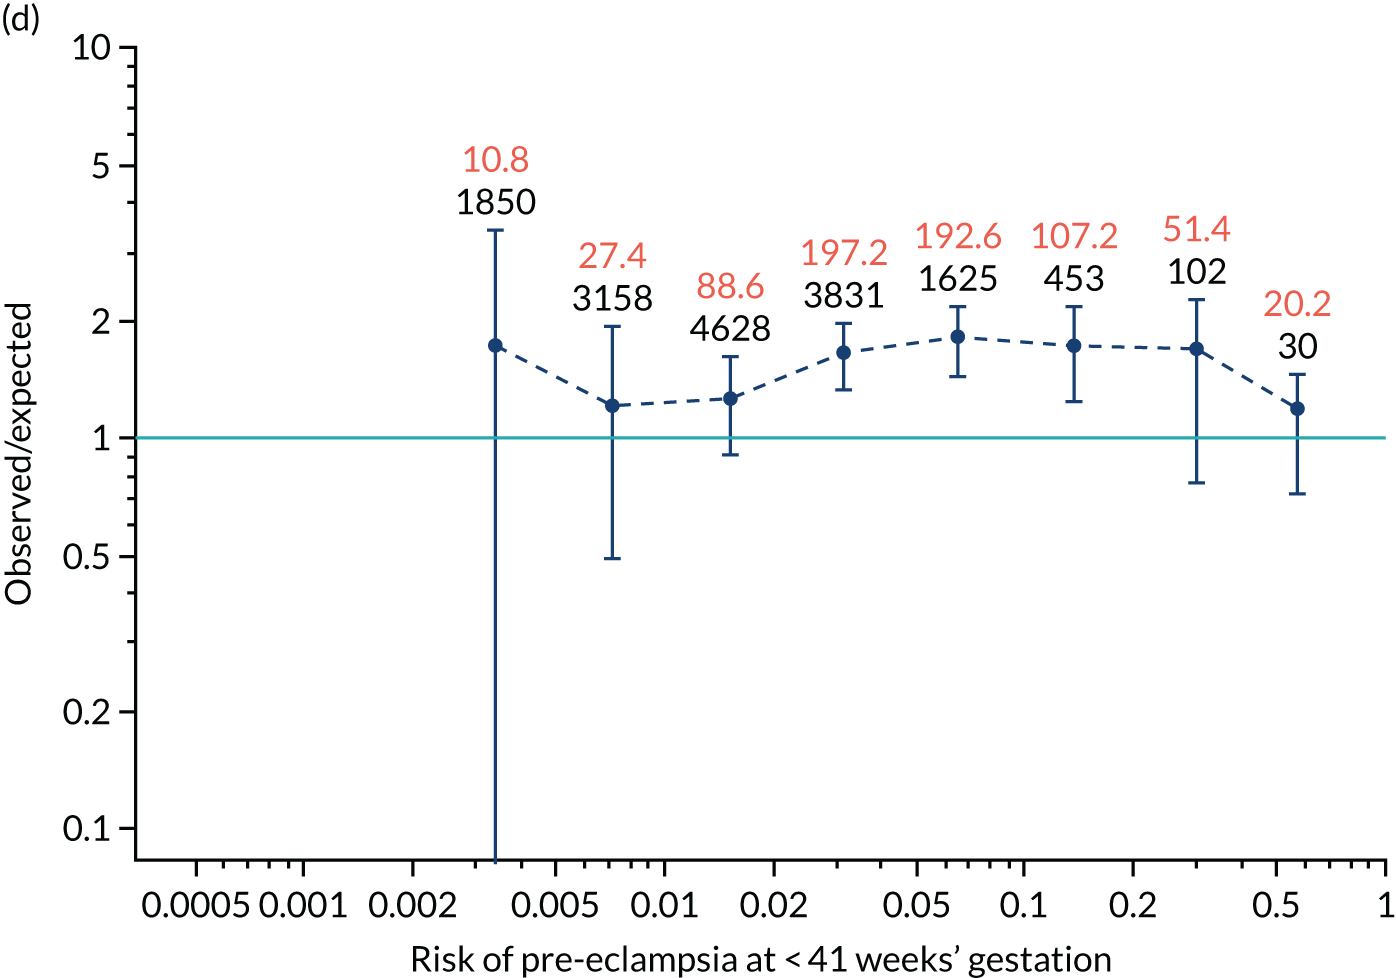
With no adjustment for censoring, risks were well calibrated and with adjustment for censoring the risks underestimated the incidence.
Calibration of risks for the preterm pre-eclampsia using Mat-CHs, MAP, UTA-PI and PLGF in the SPREE study
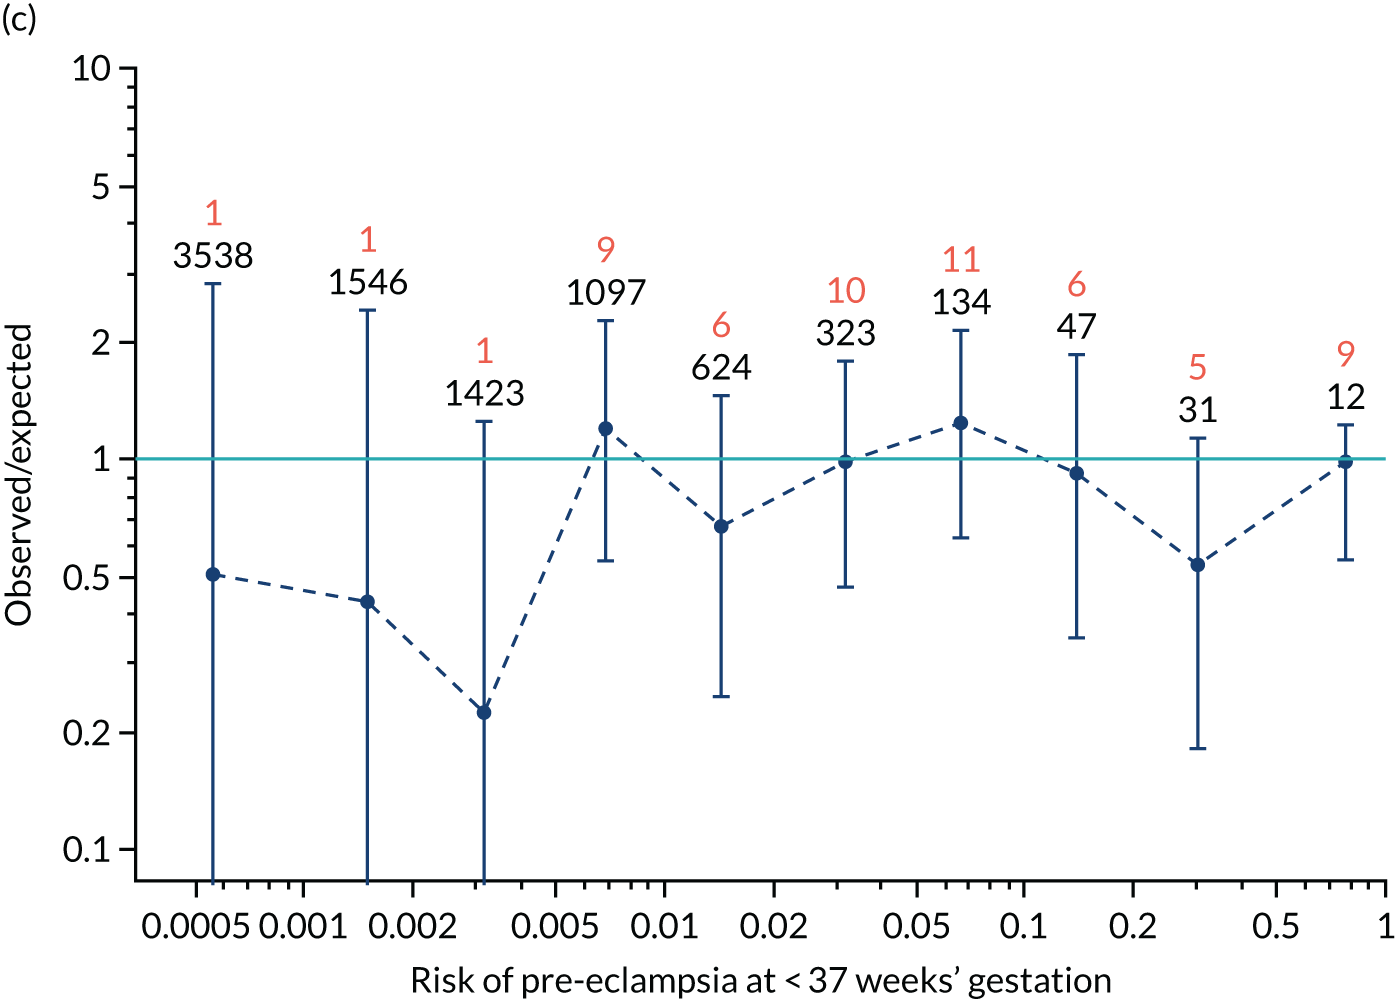
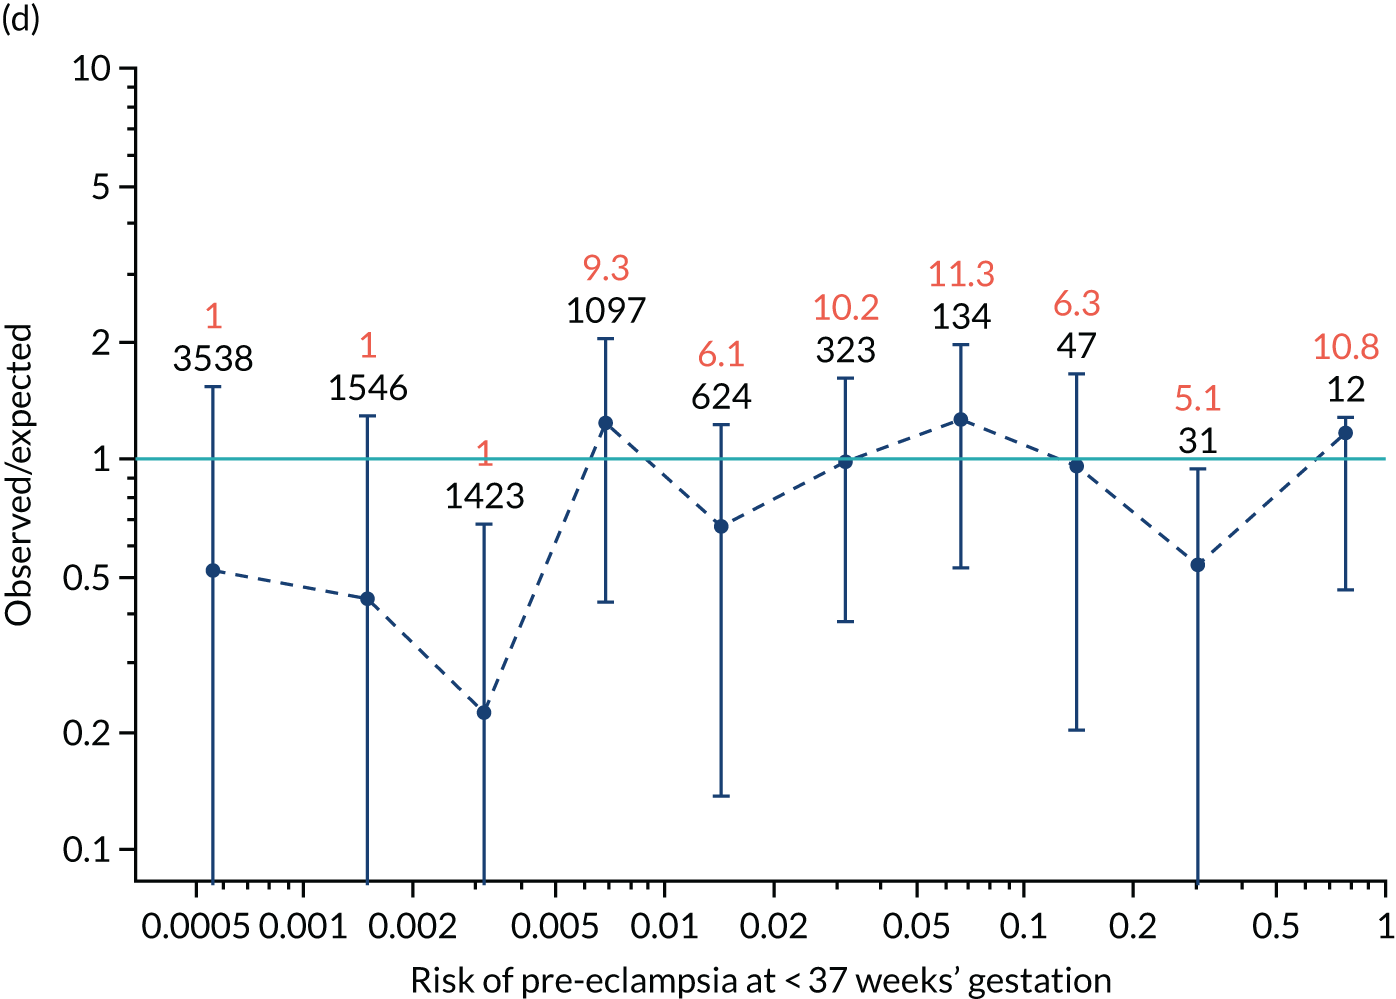
Calibration plots of the predictive performance of the competing risk model for preterm pre-eclampsia using Mat-CHs, MAP, UTA-PI and PLGF in the SPREE study are shown in Figure 12. Calibration of risks for the uncorrected and corrected incidence was good and the calibration slope was very close to 1.0. However, there was a tendency for the risks to underestimate the incidence of pre-eclampsia.
FIGURE 12.
Calibration plots for screening using the competing risk model for prediction of preterm pre-eclampsia by Mat-CHs, MAP, UTA-PI and PLGF. (a) Estimated incidence with no adjustment for censoring for Mat-CHs, MAP, UTA-PI and PLGF (pre-eclampsia before 37 weeks’ gestation); (b) estimated incidence with adjustment for censoring for Mat-CHs, MAP, UTA-PI and PLGF (pre-eclampsia before 37 weeks’ gestation); (c) observed/expected incidence with no adjustment for censoring for Mat-CHs, MAP, UTA-PI and PLGF (pre-eclampsia before 37 weeks’ gestation); and (d) observed/expected incidence with adjustment for censoring for Mat-CHs, MAP, UTA-PI and PLGF (pre-eclampsia before 37 weeks’ gestation). The histograms show the distribution of risks in pregnancies with pre-eclampsia before 37 weeks’ gestation (orange) and those without delivery with pre-eclampsia before 37 weeks’ gestation (light blue).
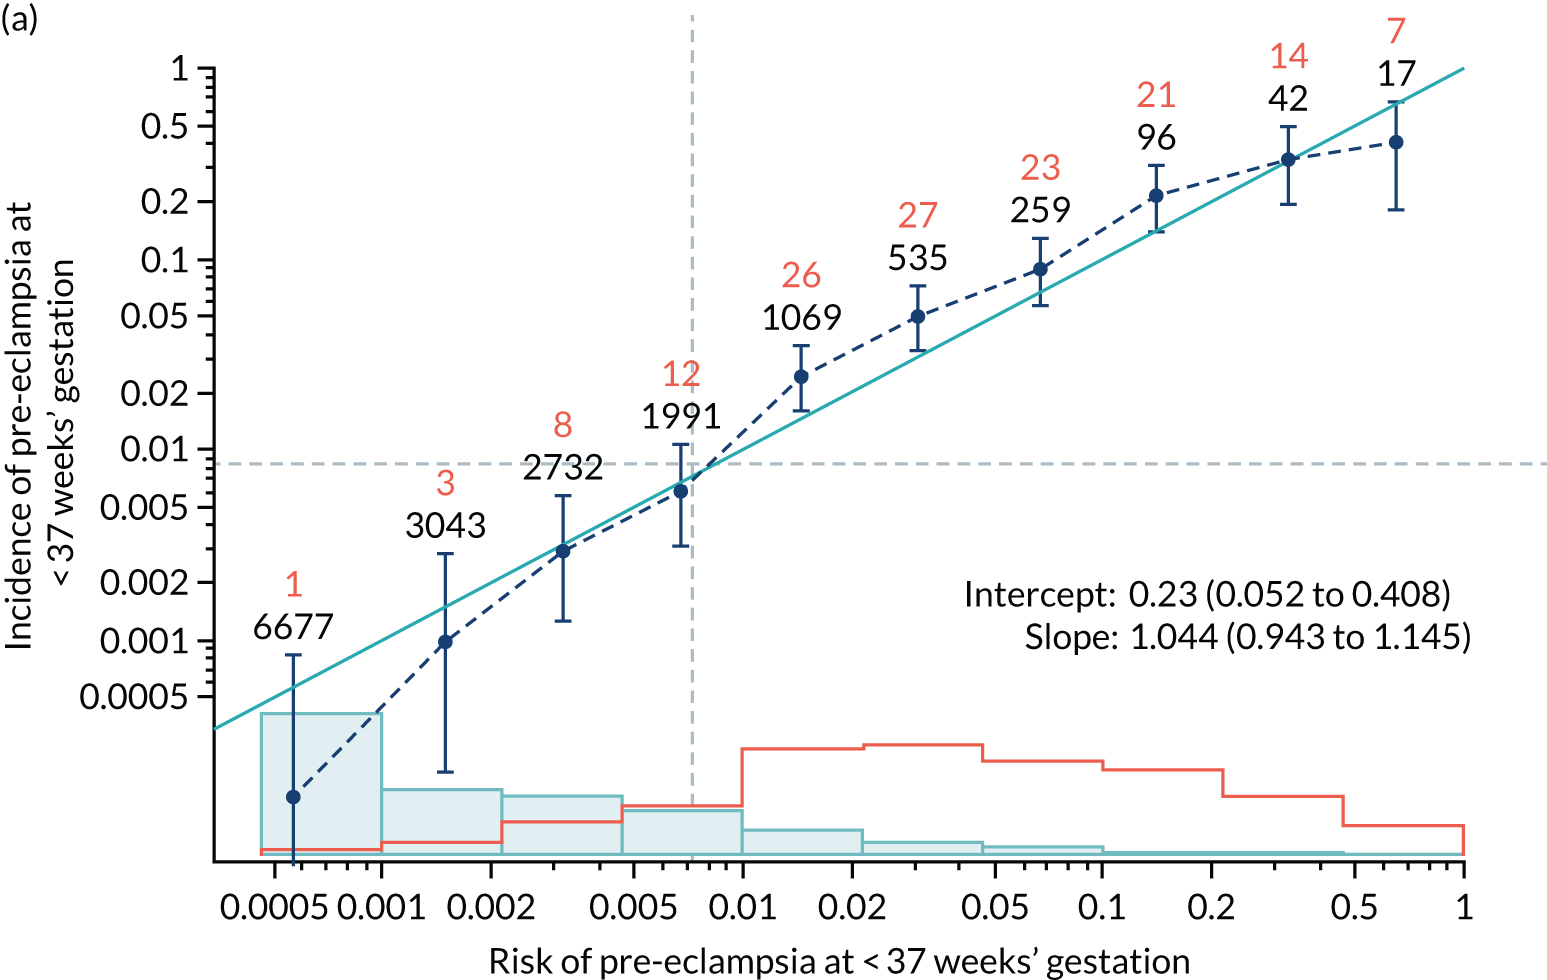
Additional plots for other combinations of biomarkers are provided in Appendix 5.
Calibration of risks for delivery with pre-eclampsia by combinations of biomarkers in the SPREE study
Quantitative assessment of calibration in the prediction of pre-eclampsia with delivery at < 34 weeks’ gestation, pre-eclampsia with delivery at < 37 weeks’ gestation and all pre-eclampsia is reported in Tables 7–9.
| Method of screening | Slope (95% CI) | Intercept (95% CI) |
|---|---|---|
| Mat-CHs | 0.891 (0.737 to 1.045) | 0.401 (0.142 to 0.66) |
| Mat-CHs + MAP | 0.974 (0.825 to 1.124) | 0.549 (0.289 to 0.808) |
| Mat-CHs + UTA-PI | 1.083 (0.934 to 1.231) | 0.477 (0.214 to 0.739) |
| Mat-CHs + PLGF | 0.781 (0.664 to 0.899) | 0.362 (0.092 to 0.632) |
| Mat-CHs + PAPP-A | 0.879 (0.735 to 1.023) | 0.364 (0.103 to 0.624) |
| Mat-CHs + MAP + UTA-PI | 1.188 (1.03 to 1.346) | 0.64 (0.377 to 0.903) |
| Mat-CHs + MAP + PAPP-A | 0.938 (0.799 to 1.077) | 0.497 (0.235 to 0.759) |
| Mat-CHs + MAP + PLGF | 0.815 (0.699 to 0.93) | 0.473 (0.199 to 0.747) |
| Mat-CHs + MAP + PLGF + UTA-PI | 0.921 (0.8 to 1.042) | 0.486 (0.209 to 0.763) |
| Method of screening | Slope (95% CI) | Intercept (95% CI) |
|---|---|---|
| Mat-CHs | 0.96 (0.837 to 1.083) | 0.136 (–0.033 to 0.305) |
| Mat-CHs + MAP | 1.032 (0.914 to 1.151) | 0.252 (0.083 to 0.422) |
| Mat-CHs + UTA-PI | 1.162 (1.042 to 1.283) | 0.177 (0.007 to 0.348) |
| Mat-CHs + PLGF | 0.904 (0.806 to 1.003) | 0.127 (–0.048 to 0.301) |
| Mat-CHs + PAPP-A | 0.943 (0.827 to 1.059) | 0.111 (–0.059 to 0.281) |
| Mat-CHs + MAP + UTA-PI | 1.248 (1.124 to 1.371) | 0.303 (0.131 to 0.474) |
| Mat-CHs + MAP + PAPP-A | 0.997 (0.886 to 1.108) | 0.22 (0.05 to 0.391) |
| Mat-CHs + MAP + PLGF | 0.937 (0.84 to 1.035) | 0.224 (0.048 to 0.4) |
| Mat-CHs + MAP + PLGF + UTA-PI | 1.044 (0.943 to 1.145) | 0.23 (0.052 to 0.408) |
| Method of screening | Slope (95% CI) | Intercept (95% CI) |
|---|---|---|
| Mat-CHs | 1.024 (0.928 to 1.121) | –0.212 (–0.309 to –0.114) |
| Mat-CHs + MAP | 1.111 (1.02 to 1.201) | 0.01 (–0.089 to 0.108) |
| Mat-CHs + UTA-PI | 1.115 (1.022 to 1.209) | –0.057 (–0.155 to 0.041) |
| Mat-CHs + PLGF | 0.96 (0.879 to 1.042) | –0.072 (–0.172 to 0.028) |
| Mat-CHs + PAPP-A | 0.983 (0.892 to 1.073) | –0.086 (–0.184 to 0.012) |
| Mat-CHs + MAP + UTA-PI | 1.225 (1.133 to 1.317) | 0.029 (–0.07 to 0.128) |
| Mat-CHs + MAP + PAPP-A | 1.075 (0.988 to 1.162) | –0.005 (–0.104 to 0.094) |
| Mat-CHs + MAP + PLGF | 1.034 (0.954 to 1.115) | 0.003 (–0.097 to 0.103) |
| Mat-CHs + MAP + PLGF + UTA-PI | 1.096 (1.015 to 1.177) | 0.007 (–0.094 to 0.107) |
Calibration of risks in the ASPRE SQS
The data for the ASPRE SQS were derived from prospective screening for pre-eclampsia in 8775 women between February and September 2015 in 12 maternity hospitals in England, Spain, Belgium, Italy and Greece. 39 This study was carried out before the ASPRE trial7 and was primarily designed to examine the feasibility of multicentre screening and establish methods for quality assurance of the biomarkers. The algorithm used for screening was the same as in the SPREE study. 17,33 The diagnosis of pre-eclampsia was based on the previous criteria of the International Society for the Study of Hypertension in Pregnancy,34 whereas the new wider definition was used in the SPREE study. 21,34
Calibration plots of the predictive performance of the competing risk model for all pre-eclampsia using Mat-CHs, MAP and PAPP-A in the ASPRE SQS are shown in Figure 13, and calibration plots of the predictive performance of the model for preterm pre-eclampsia using Mat-CHs, MAP, UTA-PI and PLGF in the ASPRE SQS are shown in Figure 14.
FIGURE 13.
Calibration plots for screening using the competing risk model for prediction of all pre-eclampsia by Mat-CHs, MAP and PAPP-A for the ASPRE SQS. (a) Estimated incidence with no adjustment for censoring for Mat-CHs, MAP and PAPP-A (all pre-eclampsia); (b) estimated incidence with adjustment for censoring for Mat-CHs, MAP and PAPP-A (all pre-eclampsia); (c) observed/expected incidence with no adjustment for censoring for Mat-CHs, MAP + PAPP-A (all pre-eclampsia); and (d) observed/expected incidence with adjustment for censoring for Mat-CHs, MAP and PAPP-A (all pre-eclampsia).
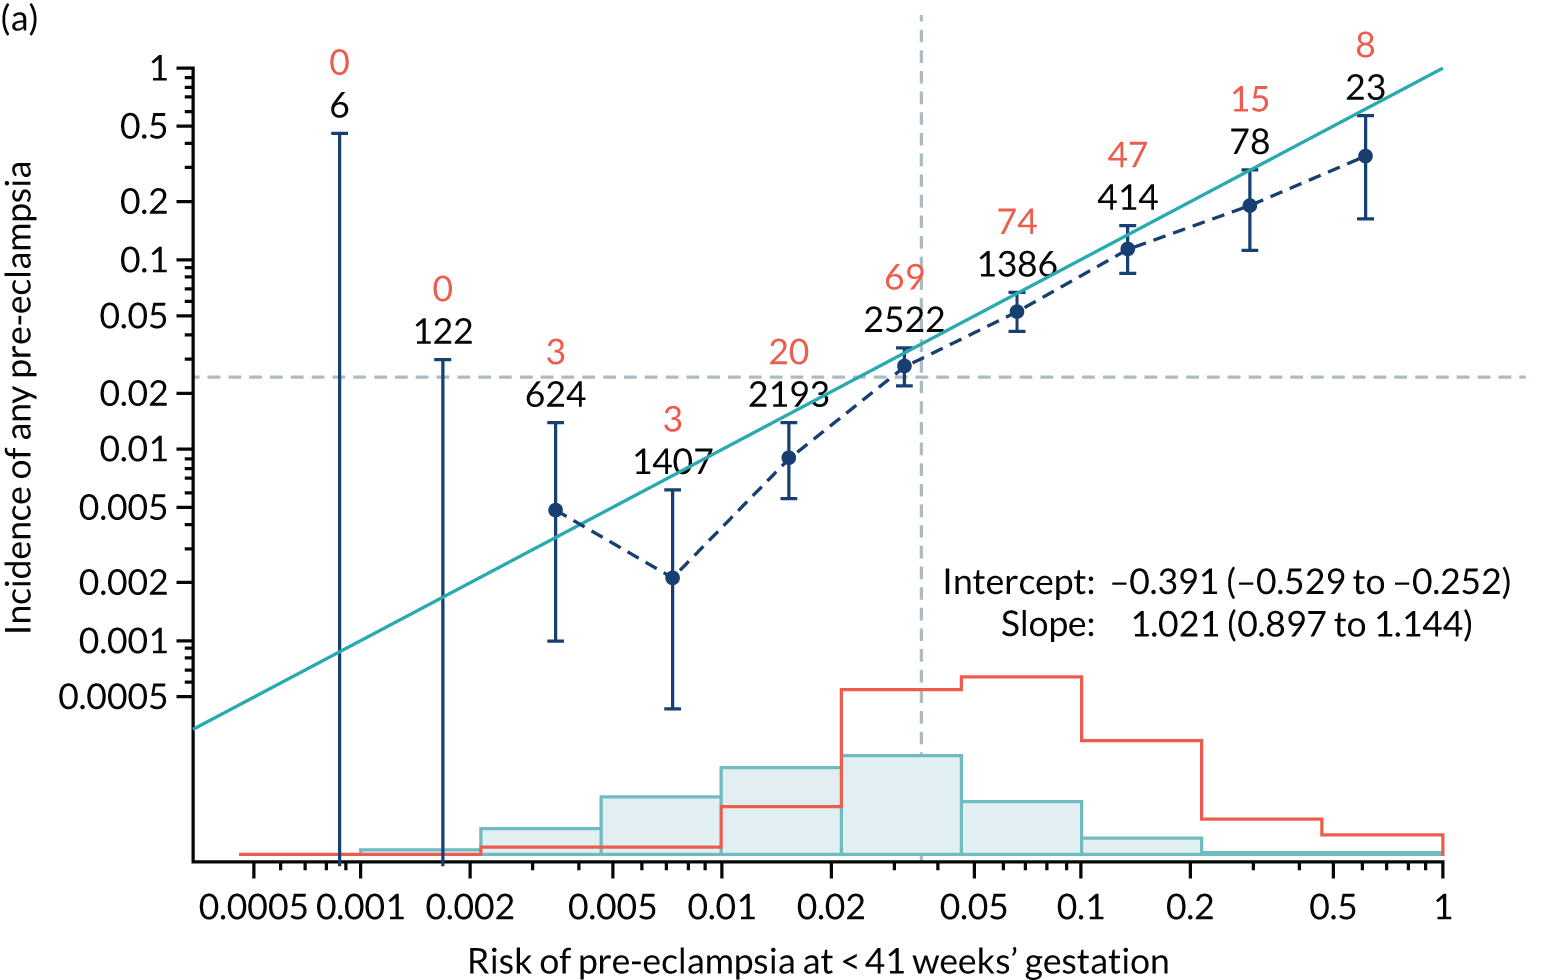
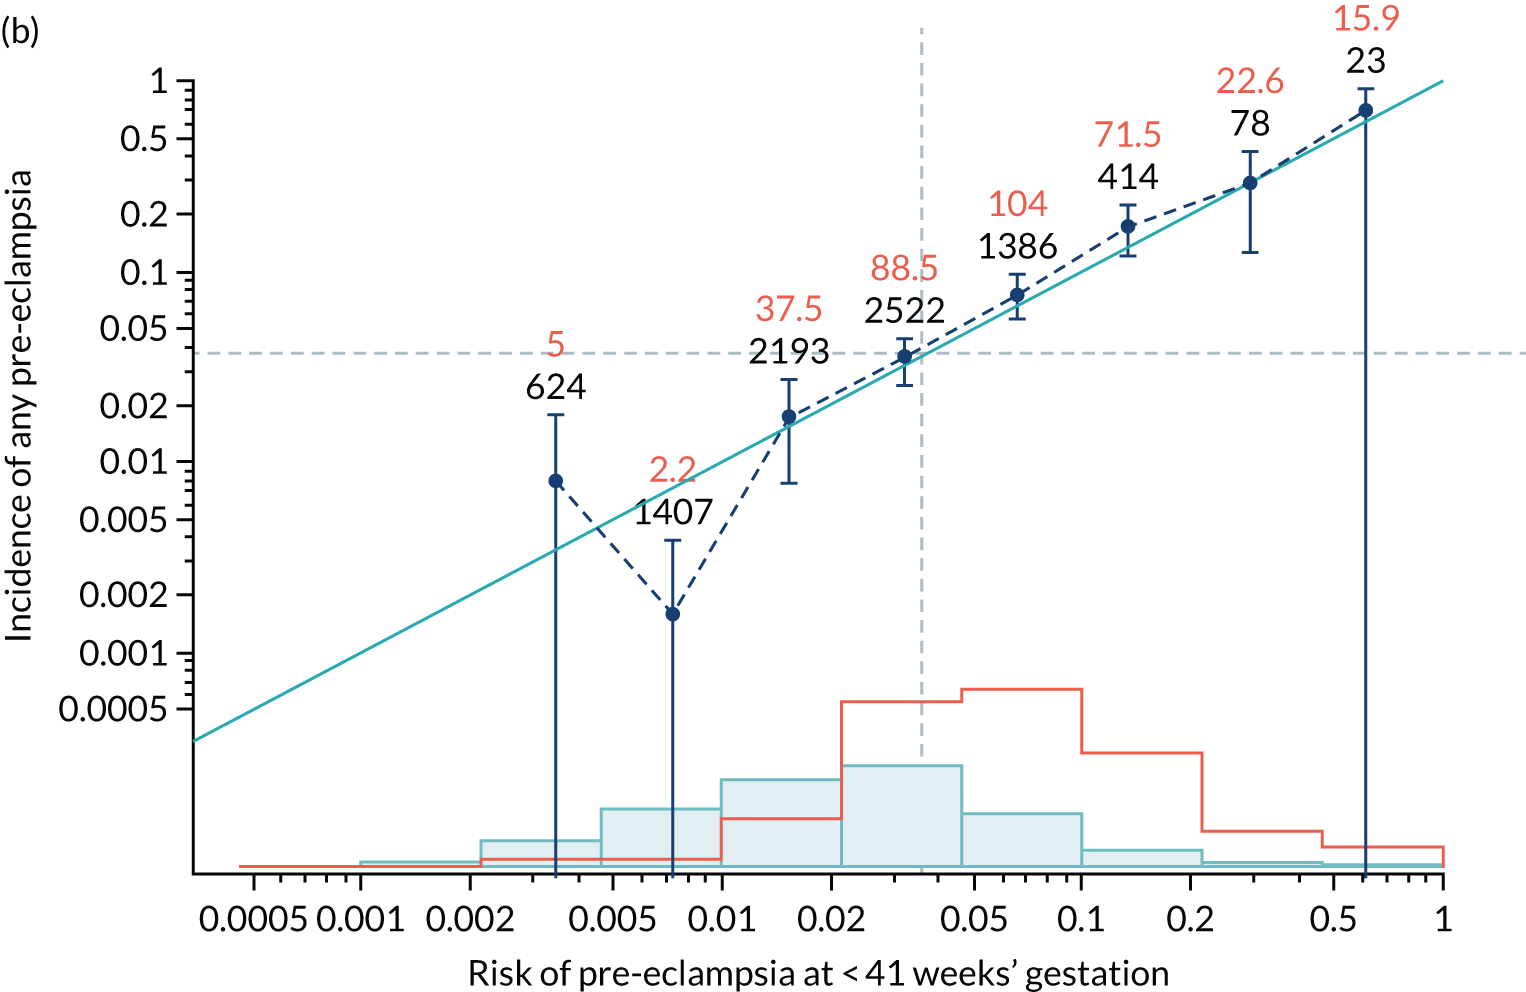
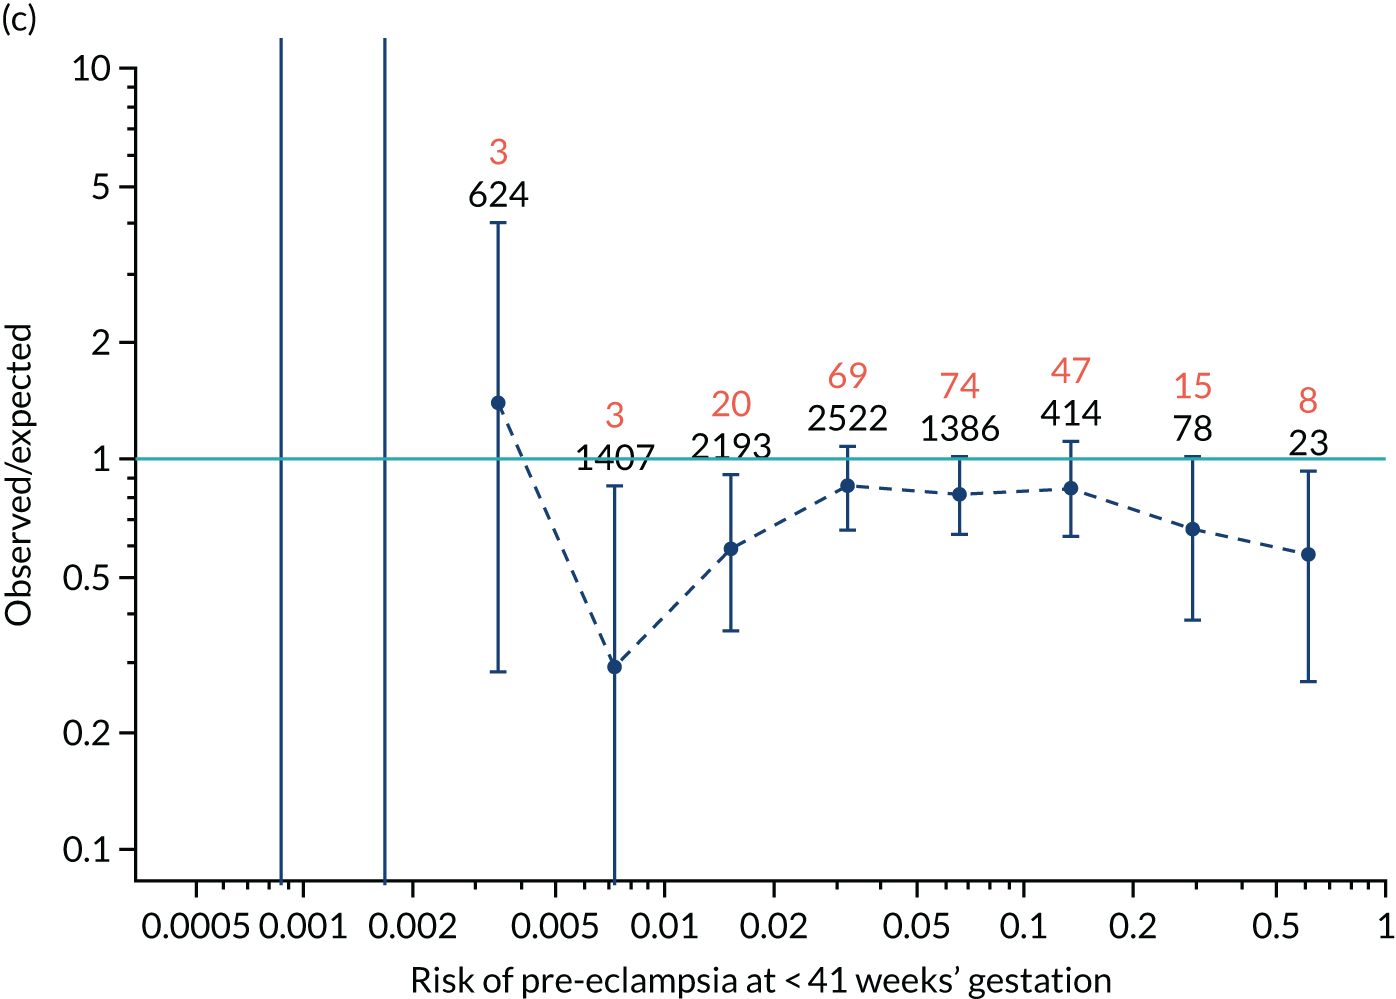
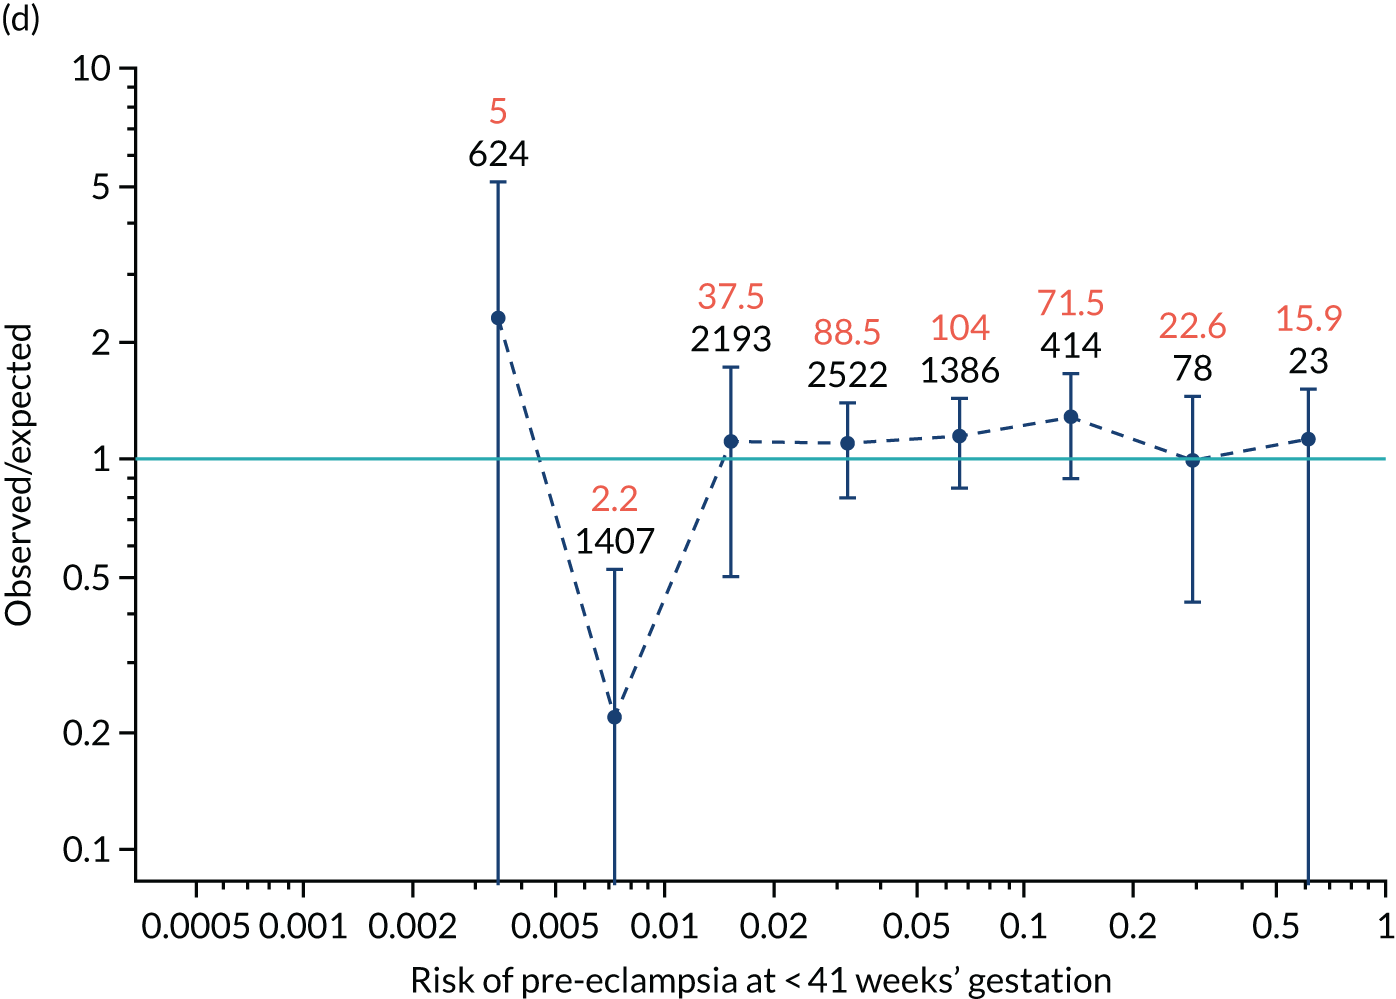
FIGURE 14.
Calibration plots for screening using the competing risk model for prediction of preterm pre-eclampsia by Mat-CHs, MAP and PAPP-A for the ASPRE SQS. (a) Estimated incidence with no adjustment for censoring for Mat-CHs, MAP and PAPP-A (pre-eclampsia before 37 weeks); (b) estimated incidence with adjustment for censoring for Mat-CHs, MAP and PAPP-A (pre-eclampsia before 37 weeks); (c) observed/expected incidence with no adjustment for censoring for Mat-CHs, MAP and PAPP-A (pre-eclampsia before 37 weeks); and (d) observed/expected incidence with adjustment for censoring for Mat-CHs, MAP and PAPP-A (pre-eclampsia before 37 weeks’ gestation).
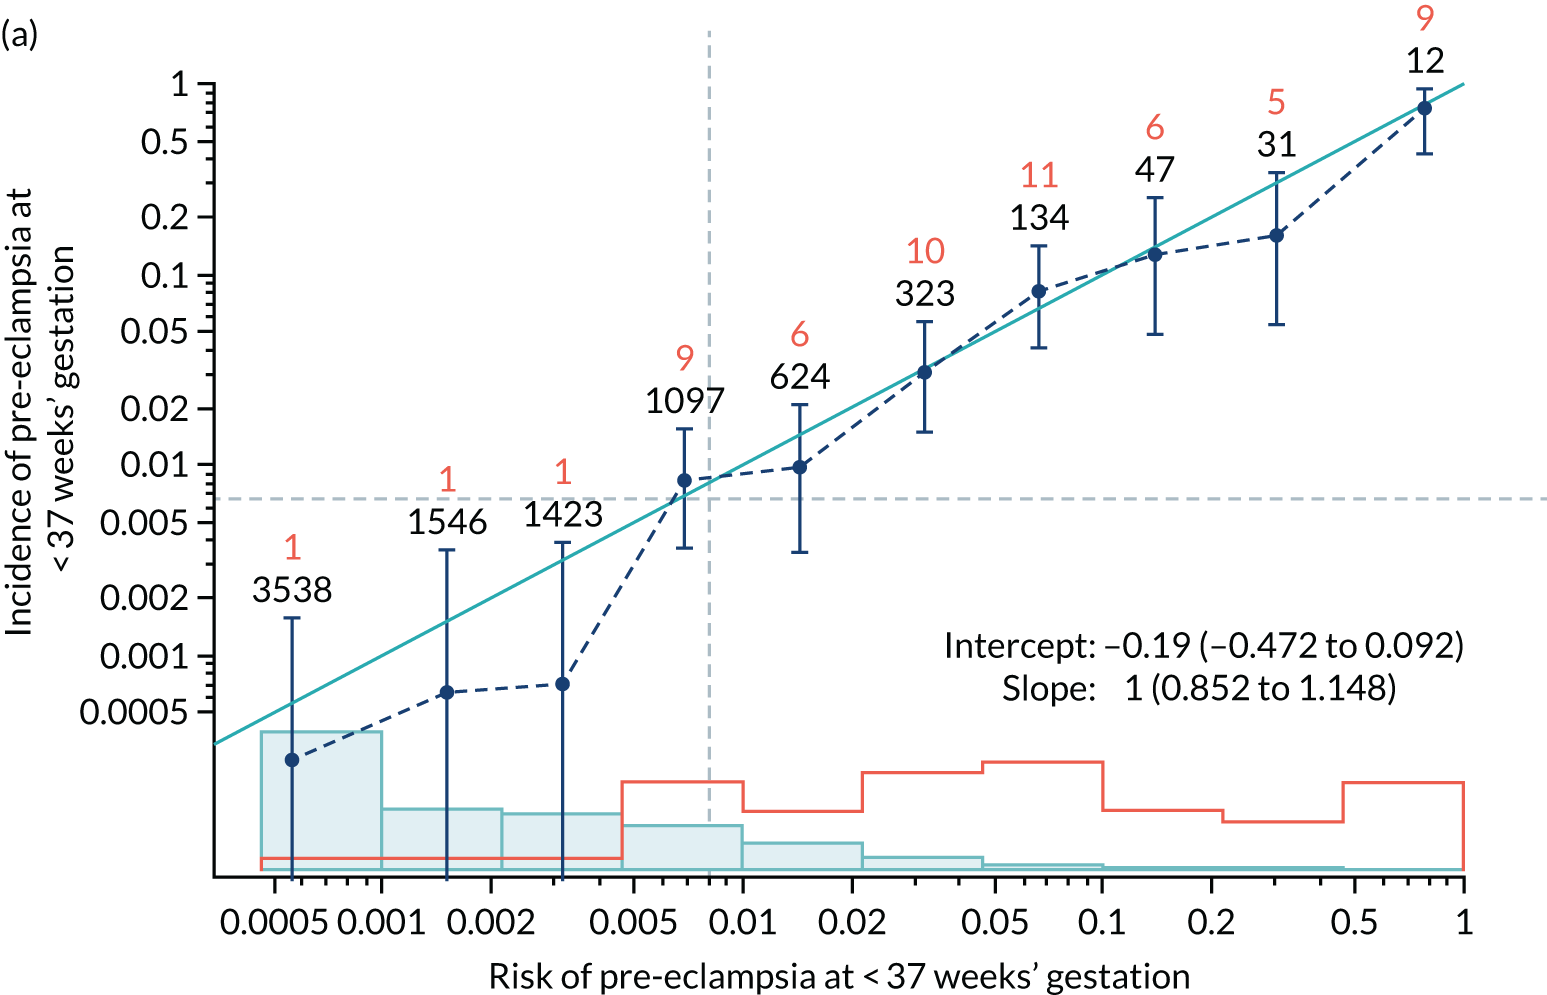
In screening by the mini-combined test, the risks overestimate the unadjusted incidence and are relatively well calibrated for the adjusted incidence. In the case of screening by Mat-CHs, MAP, UTA-PI and PLGF for preterm pre-eclampsia, adjustment for censoring makes very little difference and calibration is generally good.
Discussion
This study has examined the predictive performance of the competing risk model17,33 in two prospective screening studies (i.e. the SPREE study and the ASPRE SQS). The results demonstrate that in both the SPREE study and the ASPRE SQS calibration of risks for pre-eclampsia was generally good, with the calibration slope very close to 1.0. However, in the case of the SPREE study there was a tendency for the risks to underestimate the incidence of pre-eclampsia. This was made worse when adjustments were made for censoring. With the ASPRE SQS, calibration was improved with adjustment for censoring, with no underestimation of risks.
Calibration refers to how well the predictions from the model agree with the observed outcomes. Deviations between the predicted and observed outcome not only reflect on the accuracy of a given model but could also be the consequence of differences between the studies used for development of the model and the studies used for validation in terms of the below:
-
methodology and accuracy of recording Mat-CHs and medical history, and the measurement of biomarkers
-
ascertainment and definition of the outcome measure.
Possible explanations for the differences in findings between the SPREE study and the ASPRE SQS are that in the SPREE study we used the new criteria for defining pre-eclampsia, which results in a higher incidence. In addition, the ascertainment was higher because the study was specifically designed for this purpose. The ASPRE SQS focused on quality assurance of biomarkers in preparation for the ASPRE trial.
The strengths of this study include that (1) it is a large prospective evaluation of the calibration of risks from a prespecified algorithm, (2) the assessment of calibration allowed for the effect of censoring due to births from causes other than pre-eclampsia and (3) it is a multicentre study with a diverse population, making the results generalisable.
Chapter 7 The SPREE study decision curve analysis
Previous chapters focus on the predictive performance of the model. This chapter examines the clinical utility of the model using decision curve analysis.
Methods
Decision curves are graphical displays of net benefit as a function of threshold probabilities. Each threshold represents a risk at which a true positive is equivalent to avoiding a false positive. At one extreme, a threshold of zero represents the position where true positive outweighs any number of false positives. At the other extreme, a threshold of 1 represents the point at which avoidance of a false positive outweighs any number of true positives. A threshold of 0.5 means that the avoidance of a false positive equates to a true positive, so that the probability threshold that determines the decision is 0.5. For a given threshold probability, pt, the net benefit is given by:
where n is the number of participants in the study.
The higher the net benefit the better. The maximum net benefit occurs when the DR for a given test is 100%, the FPR is zero and the net benefit is the same as the incidence.
If there is no screening test and all individuals are considered as negative then the net benefit is zero. If there is no screening test and all individuals are considered as positive then the net benefit is given by:
In prediction and prevention of preterm pre-eclampsia this would represent the policy of treating everyone with aspirin.
Net benefits were computed and plotted using the R statistical software. A log-scale was used for the probability threshold so that the lower values of most interest occupied a greater proportion of the scale.
The decision curves shown in dark blue in Figure 15 are for prediction of pre-eclampsia before 34 weeks’ gestation, before 37 weeks’ gestation and at any gestational age using the competing risk with different combinations of markers. Screening for pre-eclampsia with delivery before 34 and 37 weeks’ gestation was chosen for the purposes of examining policies of treatment with aspirin.
Results
Decision curves for pre-eclampsia with delivery before 34 and 37 weeks’ gestation for the SPREE study data using the competing risk model with the following combinations of markers are shown in Figure 15:
-
Mat-CHs and MAP
-
Mat-CHs, MAP and PLGF
-
Mat-CHs MAP and UTA-PI
-
Mat-CHs, MAP, UTA-PI and PLGF.
FIGURE 15.
Decision curves for screening for pre-eclampsia with delivery before (a) 34 weeks’ gestation; and (b) 37 weeks’ gestation. The light blue curve is the decision curve for the policy of screening everyone positive. The pink line is the decision curve for screening everyone negative.
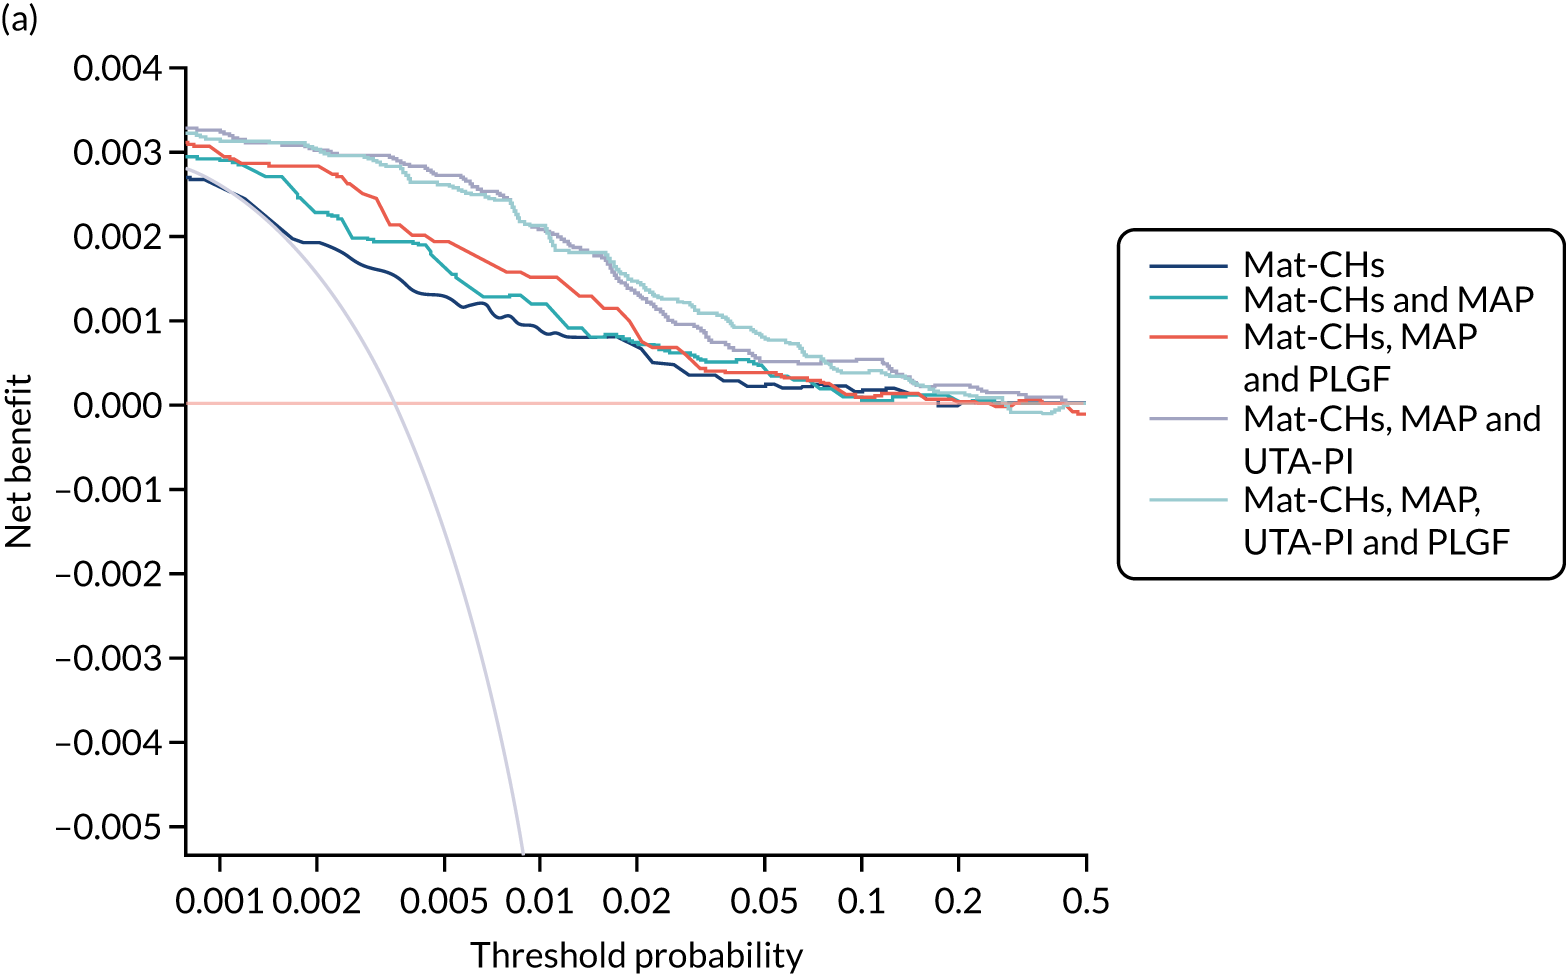
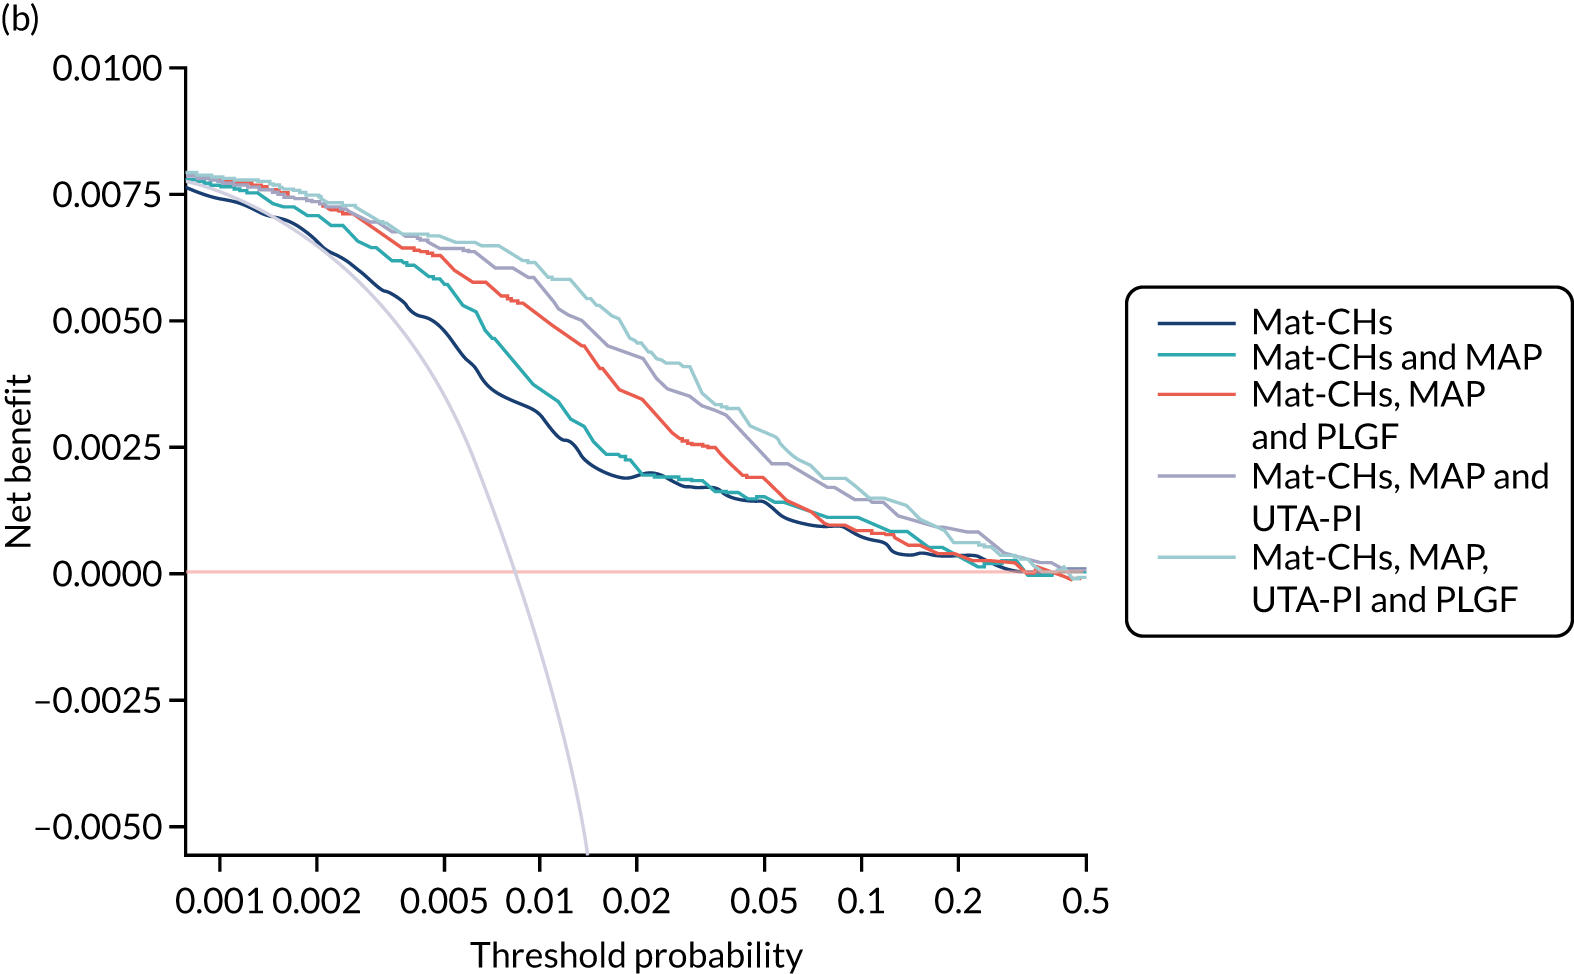
Decision curves for other marker combinations and for pre-eclampsia with delivery at any gestational age are given in Appendix 5, Figure 87.
Discussion
In general, the decision curves for the combined test are superior to the policies of screening everyone positive or screening everyone negative for the range of threshold probabilities that would seem reasonable. The best performance is provided by the competing risk model incorporating Mat-CHs and the triple test. It is notable that the net benefit of screening all positive is lower than that of screening using the competing risk model for probability thresholds as low as 0.001.
Chapter 8 Meta-analysis of performance
In this chapter we compare the performance of screening for pre-eclampsia in the SPREE study with two other data sets: (1) a population used for development of the algorithm, referred to as AJOG,17 and (2) a population like that of the SPREE study that was used for validation of the algorithm, referred to as the ASPRE SQS. 39 Details of these populations can be found in the original publications and are summarised below. 17,39
Methods
In all three populations there was prospective screening for pre-eclampsia in singleton pregnancies at 11+0 to 13+6 weeks’ gestation. Women aged > 18 years with a singleton pregnancy and a live fetus at the 11- to 13-week scan were included in the study. Women who were unconscious or severely ill at the time of recruitment, those with learning difficulties or serious mental illness and those with major fetal abnormality identified at the 11- to 13-week scan were excluded from the study.
The visit at 11–13 weeks’ gestation included (1) recording of Mat-CHs and obstetric and medical history,33 (2) measurement of maternal weight and height, (3) measurement of MAP by validated automated devices and standardised protocol,32 (4) measurement of the left and right UTA-PI by transabdominal colour Doppler ultrasound and calculation of the mean pulsatility index,12 and (5) measurement of serum concentration of PLGF and PAPP-A (using a DELFIA Xpress analyser or BRAHMS KRYPTOR analyser). Gestational age was determined from the fetal crown–rump length. 31 The women gave written informed consent to participate in the studies, which were approved by the relevant research ethics committee in each participating centre.
In this study and from each of the three data sets (i.e. the SPREE study, the ASPRE SQS and AJOG) we included only pregnancies delivering a phenotypically normal live birth or stillbirth at ≥ 24 weeks’ gestation, and we excluded pregnancies with aneuploidies and major fetal abnormalities and those ending in termination, miscarriage or fetal death before 24 weeks.
Population in AJOG
The data for this study were derived from prospective screening for adverse obstetric outcomes in 35,948 women attending for their routine first hospital visit in pregnancy at King’s College Hospital or Medway Maritime Hospital. 17 The diagnosis of pre-eclampsia was based on the previous criteria of the International Society for the Study of Hypertension in Pregnancy. 34 These include the finding of hypertension (i.e. systolic blood pressure of ≥ 140 mmHg or diastolic blood pressure of ≥ 90 mmHg on at least two occasions, 4 hours apart, developing after 20 weeks’ gestation in previously normotensive women) and proteinuria (i.e. ≥ 300 mg/24 hours or protein-to-creatinine ratio of ≥ 30 mg/mmol or ≥ 2+ on dipstick testing).
Population in the ASPRE SQS
The data for this study were derived from prospective screening for pre-eclampsia in 8775 women and involved pregnancies in 12 maternity hospitals in England, Spain, Belgium, Italy and Greece. 39 The women were screened between February and September 2015. This study was carried out before the ASPRE trial7 and was primarily designed to examine the feasibility of multicentre screening and establish methods for quality assurance of the biomarkers. The algorithm used for screening was the one established in AJOG. 17 The diagnosis of pre-eclampsia was based on the previous criteria of the International Society for the Study of Hypertension in Pregnancy. 34
Population in the SPREE study
This was a prospective multicentre cohort study carried out in seven NHS maternity hospitals in England, between April and December 2016. 38 This study was specifically designed to examine the performance of screening by the algorithm established in AJOG17 in comparison with that of the method advocated by NICE. 8 The diagnosis of pre-eclampsia was based on updated criteria of the International Society for the Study of Hypertension in Pregnancy. 21,34 This includes the finding of hypertension (i.e. systolic blood pressure of ≥ 140 mmHg or diastolic blood pressure of ≥ 90 mmHg on at least two occasions, 4 hours apart, developing after 20 weeks’ gestation in previously normotensive women) and at least one of the following: proteinuria (i.e. ≥ 300 mg/24 hours or protein-to-creatinine ratio ≥ 30 mg/mmol or ≥ 2 + on dipstick testing), renal insufficiency (i.e. serum creatinine > 1.1 mg/dl or a twofold increase in serum creatinine in the absence of underlying renal disease), liver involvement (i.e. blood concentration of transaminases to twice the normal level), neurological complications (e.g. cerebral or visual symptoms), thrombocytopenia (i.e. platelet count < 100,000/µl) or pulmonary oedema.
Statistical analysis
Patient-specific risks of delivery with pre-eclampsia at < 32, < 37 and ≥ 37 weeks’ gestation and all pre-eclampsia were calculated using the competing risks model17,33 to combine the prior distribution of the gestational age at delivery with pre-eclampsia, obtained from Mat-CHs and medical history, with MoM values of MAP, UTA-PI, PLGF and PAPP-A. The performance of screening in each of the three data sets and in the combined total population was assessed. Heterogeneity was assessed using Q- and I2-statistics.
Results
Maternal and pregnancy characteristics in AJOG, the ASPRE SQS and the SPREE study populations are provided and compared in Table 10. The population in AJOG appears to be at higher risk of pre-eclampsia than in the other two data sets. There were also significantly more black women and fewer white women in the AJOG data set, as well as more women with chronic hypertension, diabetes or a family history of pre-eclampsia and more nulliparous women and parous women with a previous history of pre-eclampsia. Despite this increased risk in the AJOG data set, the observed incidence of pre-eclampsia was decreased, raising the possibility of underascertainment.
| Variable | AJOG (N = 35,948) | ASPRE SQS (N = 8775) | SPREE study (N = 16,451) |
|---|---|---|---|
| Maternal age (years), median (IQR) | 31.3 (26.8–35.0) | 31.5 (27.3–35.0)a | 31.5 (27.4–35.1)a |
| Maternal weight (kg), median (IQR) | 66.7 (59.0–77.2) | 66.5 (59.0–77.0)b | 67.0 (59.2–78.0)a |
| Maternal height (cm), median (IQR) | 164.5 (160.0–169.0) | 164.5 (160.0–169.0)b | 165.0 (160.0–169.0)a |
| Body mass index (kg/m2), median (IQR) | 24.5 (22.0–28.4) | 24.5 (21.9–28.4)b | 24.7 (22.0–28.7)a |
| Gestational age (weeks), median (IQR) | 12.7 (12.3–13.1) | 12.7 (12.3–13.1)a,b | 12.9 (12.4–13.3)a |
| Racial origin, n (%) | a,b | a | |
| White | 25,879 (71.99) | 6883 (78.44) | 11,922 (72.47) |
| Black | 6681 (18.59) | 1090 (12.42) | 2337 (14.21) |
| South Asian | 1623 (4.51) | 462 (5.26) | 1361 (8.27) |
| East Asian | 846 (2.35) | 154 (1.75) | 407 (2.47) |
| Mixed | 919 (2.56) | 186 (2.12) | 424 (2.58) |
| Conception, n (%) | a,b | a | |
| Natural | 34,743 (96.65) | 8483 (96.67) | 15,765 (95.83) |
| Assisted by use of ovulation drugs | 349 (0.97) | 64 (0.73) | 125 (0.76) |
| In vitro fertilisation | 856 (2.38) | 227 (2.59) | 561 (3.41) |
| Medical history, n (%) | |||
| Chronic hypertension | 561 (1.56) | 100 (1.14)b | 137 (0.83)a |
| Diabetes type 1 | 137 (0.38) | 31 (0.35)b | 46 (0.28)a |
| Diabetes type 2 | 188 (0.52) | 37 (0.42)b | 71 (0.43)a |
| SLE/APS | 53 (0.15) | 19 (0.22) | 39 (0.24)a |
| Cigarette smokers, n (%) | 3263 (9.08) | 732 (8.34)b | 1105 (6.72)a |
| Family history of pre-eclampsia, n (%) | 1518 (4.22) | 339 (3.86)a | 535 (3.25)a |
| Parity, n (%) | a,b | a | |
| Nulliparous | 17,361 (48.29) | 4127 (47.03) | 7587 (46.12) |
| Parous with no previous pre-eclampsia | 17,311 (48.16) | 4459 (50.81) | 8483 (51.57) |
| Parous with previous pre-eclampsia | 1276 (3.55) | 189 (2.15) | 381 (2.32) |
| Pre-eclampsia, n (%) | |||
| Total | 1058 (2.94) | 239 (2.72)a,b | 473 (2.88) |
| Delivery < 37 weeks’ gestation | 292 (0.81) | 59 (0.67)a,b | 142 (0.86) |
| Delivery < 32 weeks’ gestation | 66 (0.18) | 17 (0.19)b | 33 (0.20) |
The DR for preterm pre-eclampsia at a fixed SPR of 10% in the three data sets is summarised in Figure 16. The DR for pre-eclampsia at < 32, < 37 and ≥ 37 weeks’ gestation and all pre-eclampsia at a fixed SPR of 10% by various combinations of biomarkers is given in Tables 11–14.
FIGURE 16.
Detection rate for preterm pre-eclampsia at a fixed SPR of 10% in the three databases.
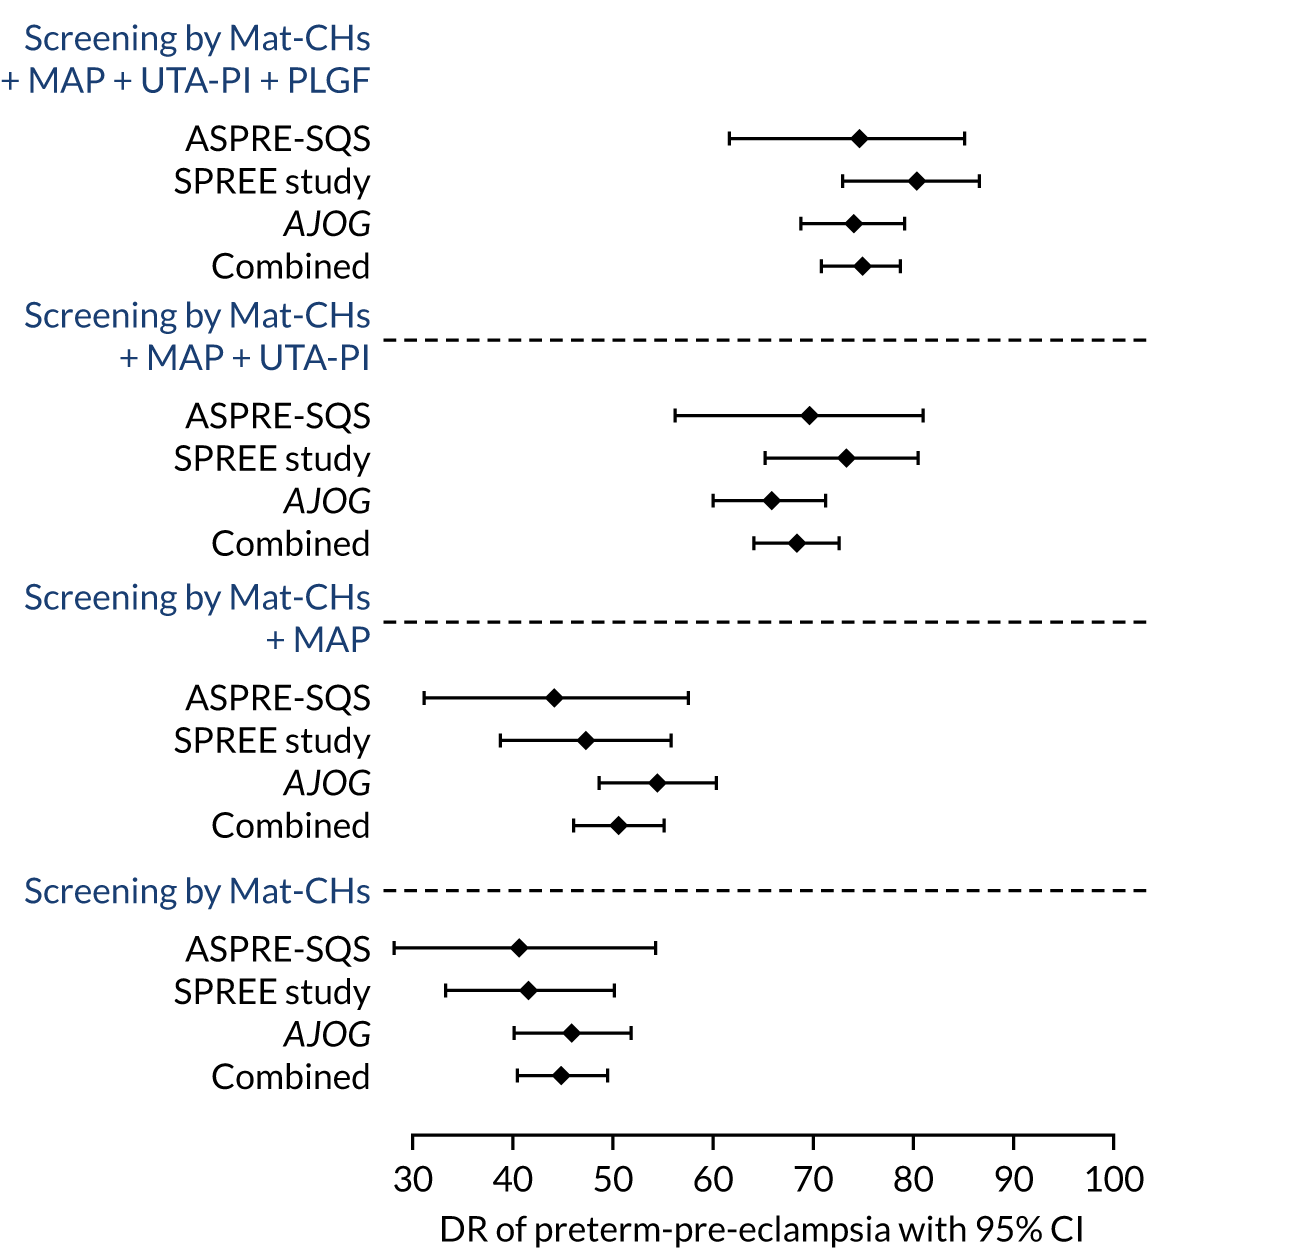
| Method of screening | AJOG, DR (95% CI) | ASPRE SQS, DR (95% CI) | SPREE study, DR (95% CI) | Combined, DR (95% CI) |
|---|---|---|---|---|
| Mat-CHs | 50.00 (37.43 to 62.57) | 52.94 (27.81 to 77.02) | 51.52 (33.54 to 69.20) | 52.59 (43.11 to 61.93) |
| MAP | 60.61 (47.81 to 72.42) | 70.59 (44.04 to 89.69) | 69.70 (51.29 to 84.41) | 61.21 (51.72 to 70.11) |
| UTA-PI | 63.64 (50.87 to 75.13) | 76.47 (50.10 to 93.19) | 78.79 (61.09 to 91.02) | 69.83 (60.61 to 78.00) |
| PLGF | 77.27 (65.30 to 86.69) | 70.59 (44.04 to 89.69) | 63.64 (45.12 to 79.60) | 72.41 (63.34 to 80.30) |
| PAPP-A | 48.48 (35.99 to 61.12) | 52.94 (27.81 to 77.02) | 57.58 (39.22 to 74.52) | 55.17 (45.66 to 64.41) |
| MAP, UTA-PI | 75.76 (63.64 to 85.46) | 88.24 (63.56 to 98.54) | 87.88 (71.80 to 96.60) | 82.76 (74.64 to 89.14) |
| MAP, PAPP-A | 62.12 (49.34 to 73.78) | 70.59 (44.04 to 89.69) | 69.70 (51.29 to 84.41) | 65.52 (56.12 to 74.10) |
| MAP, PLGF | 81.82 (70.39 to 90.24) | 82.35 (56.57 to 96.20) | 75.76 (57.74 to 88.91) | 79.31 (70.80 to 86.27) |
| UTA-PI, PAPP-A | 65.15 (52.42 to 76.47) | 76.47 (50.10 to 93.19) | 75.76 (57.74 to 88.91) | 69.83 (60.61 to 78.00) |
| UTA-PI, PLGF | 83.33 (72.13 to 91.38) | 88.24 (63.56 to 98.54) | 78.79 (61.09 to 91.02) | 81.03 (72.71 to 87.72) |
| PLGF, PAPP-A | 74.24 (61.99 to 84.22) | 76.47 (50.10 to 93.19) | 66.67 (48.17 to 82.04) | 74.14 (65.18 to 81.82) |
| MAP, UTA-PI, PAPP-A | 77.27 (65.30 to 86.69) | 88.24 (63.56 to 98.54) | 87.88 (71.80 to 96.60) | 82.76 (74.64 to 89.14) |
| MAP, PAPP-A, PLGF | 84.85 (73.90 to 92.49) | 88.24 (63.56 to 98.54) | 78.79 (61.09 to 91.02) | 81.03 (72.71 to 87.72) |
| MAP, UTA-PI, PLGF | 87.88 (77.51 to 94.62) | 94.12 (71.31 to 99.85) | 90.91 (75.67 to 98.08) | 89.66 (82.63 to 94.54) |
| UTA-PI, PAPP-A, PLGF | 84.85 (73.90 to 92.49) | 88.24 (63.56 to 98.54) | 78.79 (61.09 to 91.02) | 81.03 (72.71 to 87.72) |
| MAP, UTA-PI, PAPP-A, PLGF | 87.88 (77.51 to 94.62) | 94.12 (71.31 to 99.85) | 90.91 (75.67 to 98.08) | 89.66 (82.63 to 94.54) |
| Method of screening | AJOG, DR (95% CI) | ASPRE SQS, DR (95% CI) | SPREE study, DR (95% CI) | Combined, DR (95% CI) |
|---|---|---|---|---|
| Mat-CHs | 45.89 (40.07 to 51.79) | 40.68 (28.07 to 54.25) | 41.55 (33.35 to 50.11) | 44.83 (40.38 to 49.34) |
| MAP | 54.45 (48.55 to 60.26) | 44.07 (31.16 to 57.60) | 47.18 (38.76 to 55.73) | 50.51 (46.00 to 55.01) |
| UTA-PI | 56.51 (50.61 to 62.27) | 61.02 (47.44 to 73.45) | 61.97 (53.45 to 69.98) | 58.42 (53.93 to 62.81) |
| PLGF | 60.62 (54.76 to 66.26) | 61.02 (47.44 to 73.45) | 60.56 (52.02 to 68.65) | 60.65 (56.18 to 64.99) |
| PAPP-A | 47.60 (41.75 to 53.50) | 45.76 (32.72 to 59.25) | 45.77 (37.39 to 54.33) | 48.48 (43.99 to 52.99) |
| MAP, UTA-PI | 65.75 (60.00 to 71.18) | 69.49 (56.13 to 80.81) | 73.24 (65.17 to 80.32) | 68.36 (64.05 to 72.44) |
| MAP, PAPP-A | 57.53 (51.64 to 63.27) | 49.15 (35.89 to 62.50) | 53.52 (44.97 to 61.93) | 55.78 (51.27 to 60.22) |
| MAP, PLGF | 70.21 (64.60 to 75.39) | 66.10 (52.61 to 77.92) | 64.79 (56.34 to 72.61) | 66.13 (61.76 to 70.30) |
| UTA-PI, PAPP-A | 56.85 (50.95 to 62.61) | 62.71 (49.15 to 74.96) | 63.38 (54.89 to 71.30) | 59.23 (54.75 to 63.60) |
| UTA-PI, PLGF | 67.47 (61.76 to 72.81) | 71.19 (57.92 to 82.24) | 71.13 (62.93 to 78.42) | 66.94 (62.59 to 71.08) |
| PLGF, PAPP-A | 62.67 (56.85 to 68.24) | 62.71 (49.15 to 74.96) | 60.56 (52.02 to 68.65) | 63.49 (59.07 to 67.75) |
| MAP, UTA-PI, PAPP-A | 65.07 (59.30 to 70.53) | 67.80 (54.36 to 79.38) | 75.35 (67.42 to 82.19) | 68.15 (63.84 to 72.25) |
| MAP, PAPP-A, PLGF | 70.89 (65.31 to 76.04) | 67.80 (54.36 to 79.38) | 64.79 (56.34 to 72.61) | 67.34 (63.01 to 71.47) |
| MAP, UTA-PI, PLGF | 73.97 (68.54 to 78.91) | 74.58 (61.56 to 85.02) | 80.28 (72.78 to 86.48) | 74.85 (70.77 to 78.62) |
| UTA-PI, PAPP-A, PLGF | 68.15 (62.47 to 73.46) | 71.19 (57.92 to 82.24) | 69.01 (60.72 to 76.50) | 68.15 (63.84 to 72.25) |
| MAP, UTA-PI, PAPP-A, PLGF | 73.29 (67.82 to 78.27) | 76.27 (63.41 to 86.38) | 79.58 (72.00 to 85.88) | 74.85 (70.77 to 78.62) |
| Method of screening | AJOG, DR (95% CI) | ASPRE-SQS, DR (95% CI) | SPREE, DR (95% CI) | Combined, DR (95% CI) |
|---|---|---|---|---|
| Maternal factors | 34.46 (31.10 to 37.95) | 35.00 (28.05 to 42.45) | 30.21 (25.31 to 35.47) | 33.52 (30.93 to 36.18) |
| MAP | 39.82 (36.33 to 43.38) | 36.67 (29.62 to 44.16) | 37.76 (32.52 to 43.23) | 38.29 (35.62 to 41.02) |
| UtA-PI | 37.47 (34.03 to 41.00) | 33.33 (26.50 to 40.73) | 32.02 (27.03 to 37.35) | 35.16 (32.54 to 37.85) |
| PLGF | 38.77 (35.31 to 42.33) | 31.67 (24.95 to 39.00) | 32.02 (27.03 to 37.35) | 34.53 (31.93 to 37.21) |
| PAPP-A | 37.60 (34.16 to 41.14) | 35.00 (28.05 to 42.45) | 30.21 (25.31 to 35.47) | 35.24 (32.62 to 37.93) |
| MAP, UtA-PI | 42.04 (38.51 to 45.62) | 40.56 (33.31 to 48.11) | 42.60 (37.21 to 48.12) | 41.43 (38.71 to 44.18) |
| MAP, PAPP-A | 40.21 (36.71 to 43.78) | 40.00 (32.78 to 47.55) | 37.46 (32.23 to 42.92) | 39.08 (36.39 to 41.81) |
| MAP, PLGF | 41.91 (38.38 to 45.49) | 38.33 (31.20 to 45.86) | 38.07 (32.81 to 43.54) | 39.31 (36.62 to 42.05) |
| UtA-PI, PAPP-A | 38.12 (34.67 to 41.67) | 36.11 (29.10 to 43.59) | 32.33 (27.31 to 37.66) | 36.34 (33.69 to 39.04) |
| UtA-PI, PLGF | 38.51 (35.05 to 42.06) | 37.22 (30.15 to 44.73) | 35.95 (30.78 to 41.38) | 36.88 (34.23 to 39.60) |
| PLGF, PAPP-A | 39.03 (35.56 to 42.59) | 32.22 (25.46 to 39.58) | 30.21 (25.31 to 35.47) | 35.71 (33.08 to 38.41) |
| MAP, UtA-PI, PAPP-A | 41.91 (38.38 to 45.49) | 40.56 (33.31 to 48.11) | 41.39 (36.03 to 46.90) | 40.56 (37.86 to 43.32) |
| MAP, PAPP-A, PLGF | 41.91 (38.38 to 45.49) | 37.22 (30.15 to 44.73) | 36.25 (31.07 to 41.69) | 39.31 (36.62 to 42.05) |
| MAP, UtA-PI, PLGF | 42.17 (38.64 to 45.75) | 40.56 (33.31 to 48.11) | 42.90 (37.50 to 48.43) | 40.96 (38.24 to 43.71) |
| UtA-PI, PAPP-A, PLGF | 38.77 (35.31 to 42.33) | 35.56 (28.58 to 43.02) | 35.05 (29.91 to 40.45) | 36.88 (34.23 to 39.60) |
| MAP, UtA-PI, PAPP-A, PLGF | 41.64 (38.13 to 45.23) | 39.44 (32.25 to 46.99) | 42.90 (37.50 to 48.43) | 41.35 (38.63 to 44.1) |
| Method of screening | AJOG, DR (95% CI) | ASPRE SQS, DR (95% CI) | SPREE study, DR (95% CI) | Combined, DR (95% CI) |
|---|---|---|---|---|
| Mat-CHs | 37.62 (34.69 to 40.62) | 36.40 (30.30 to 42.85) | 33.62 (29.37 to 38.07) | 36.67 (34.42 to 38.96) |
| MAP | 43.86 (40.84 to 46.91) | 38.49 (32.29 to 44.98) | 40.59 (36.13 to 45.17) | 41.69 (39.39 to 44.03) |
| UTA-PI | 42.72 (39.72 to 45.77) | 40.17 (33.90 to 46.68) | 41.01 (36.54 to 45.60) | 41.64 (39.33 to 43.98) |
| PLGF | 44.80 (41.78 to 47.86) | 38.91 (32.69 to 45.41) | 40.59 (36.13 to 45.17) | 41.81 (39.50 to 44.15) |
| PAPP-A | 40.36 (37.39 to 43.39) | 37.66 (31.49 to 44.13) | 34.88 (30.59 to 39.37) | 38.93 (36.65 to 41.24) |
| MAP, UTA-PI | 48.58 (45.53 to 51.64) | 47.70 (41.22 to 54.23) | 51.80 (47.19 to 56.38) | 48.93 (46.57 to 51.28) |
| MAP, PAPP-A | 44.99 (41.96 to 48.05) | 42.26 (35.92 to 48.79) | 42.28 (37.79 to 46.88) | 43.73 (41.40 to 46.08) |
| MAP, PLGF | 49.72 (46.66 to 52.77) | 45.19 (38.76 to 51.73) | 46.09 (41.53 to 50.70) | 46.78 (44.43 to 49.14) |
| UTA-PI, PAPP-A | 43.29 (40.28 to 46.34) | 42.68 (36.32 to 49.22) | 41.65 (37.17 to 46.24) | 42.71 (40.39 to 45.06) |
| UTA-PI, PLGF | 46.50 (43.46 to 49.56) | 45.61 (39.17 to 52.15) | 46.51 (41.94 to 51.12) | 45.25 (42.92 to 47.61) |
| PLGF, PAPP-A | 45.56 (42.53 to 48.61) | 39.75 (33.50 to 46.26) | 39.32 (34.89 to 43.89) | 43.45 (41.12 to 45.79) |
| MAP, UTA-PI, PAPP-A | 48.30 (45.25 to 51.36) | 47.28 (40.81 to 53.82) | 51.59 (46.98 to 56.17) | 48.25 (45.90 to 50.61) |
| MAP, PAPP-A, PLGF | 49.91 (46.85 to 52.96) | 44.77 (38.36 to 51.31) | 44.82 (40.28 to 49.43) | 47.12 (44.77 to 49.48) |
| MAP, UTA-PI, PLGF | 50.95 (47.89 to 54.00) | 48.95 (42.45 to 55.48) | 54.12 (49.51 to 58.68) | 50.40 (48.04 to 52.75) |
| UTA-PI, PAPP-A, PLGF | 46.88 (43.84 to 49.94) | 44.35 (37.95 to 50.90) | 45.24 (40.69 to 49.85) | 45.59 (43.25 to 47.95) |
| MAP, UTA-PI, PAPP-A, PLGF | 50.38 (47.32 to 53.43) | 48.54 (42.04 to 55.06) | 53.91 (49.30 to 58.47) | 50.68 (48.32 to 53.03) |
Receiver operating characteristics curves for the performance of screening for preterm pre-eclampsia are given in Appendix 7.
Discussion
Differences in screening performance between studies, reflecting differences in study populations, study design and measurement quality, are inevitable. However, the results of this analysis on performance of screening show that there is little evidence of substantive differences in DRs across the three data sets at a SPR of 10% (equivalent to that of NICE guidelines).
The combined results demonstrate that (1) the performance of screening is substantially better for early pre-eclampsia and preterm pre-eclampsia than for term pre-eclampsia (DR by the triple test at a 10% SPR of 90% and 75% vs. 41%, respectively); (2) in preterm pre-eclampsia screening by Mat-CHs is sequentially improved by the addition of one, two and three biomarkers; and (3) addition of PAPP-A to any combination of biomarkers that includes PLGF has little benefit.
Our analysis uses two independent test data sets for assessment of screening performance: the ASPRE SQS and the SPREE study. The AJOG data were used as a training data and their inclusion in the analysis is questionable. However, this is a very large data set relative to the number of parameters involved in model fitting. Moreover, the results from AJOG are very similar to those from the ASPRE SQS and the SPREE study. For this reason, and to provide evidence based on large number of cases, we decided to include the AJOG data.
Chapter 9 Competing risk model: two-stage screening
Sections of this chapter have been reprinted from Am J Obstet Gynecol, 220/2, Wright A, Wright D, Syngelaki A, Georgantis A, Nicolaides KH, Two-stage screening for preterm preeclampsia at 11–13 weeks’ gestation, 197.e1–197.e11, 2019, with permission from Elsevier50 and Am J Obstet Gynecol, 220/2, Wright D, Tan MY, O’Gorman N, Poon LC, Syngelaki A, Wright A, Nicolaides KH, Predictive performance of the competing risk model in screening for preeclampsia, 199.e1–199.e13, 2019, with permission from Elsevier. 35
This chapter shows an application of competing risk model in which risks are updated as new information becomes available. 50 In this application, a first-stage assessment using Mat-CHs alone or a combination of Mat-CHs with a subset of the biomarkers (i.e. MAP, UTA-PI and PLGF) is applied to the whole population. Based on the risks from this first-stage assessment, the population is stratified into subpopulations. One with risks below a predetermined level who are classified as screen negative and those with risks above that level for measurements of the remaining markers. After this second stage of measurement, the risks are updated and then the subpopulation is stratified into high- and low-risk strata (Figure 17).
FIGURE 17.
Two-stage screening for preterm pre-eclampsia.
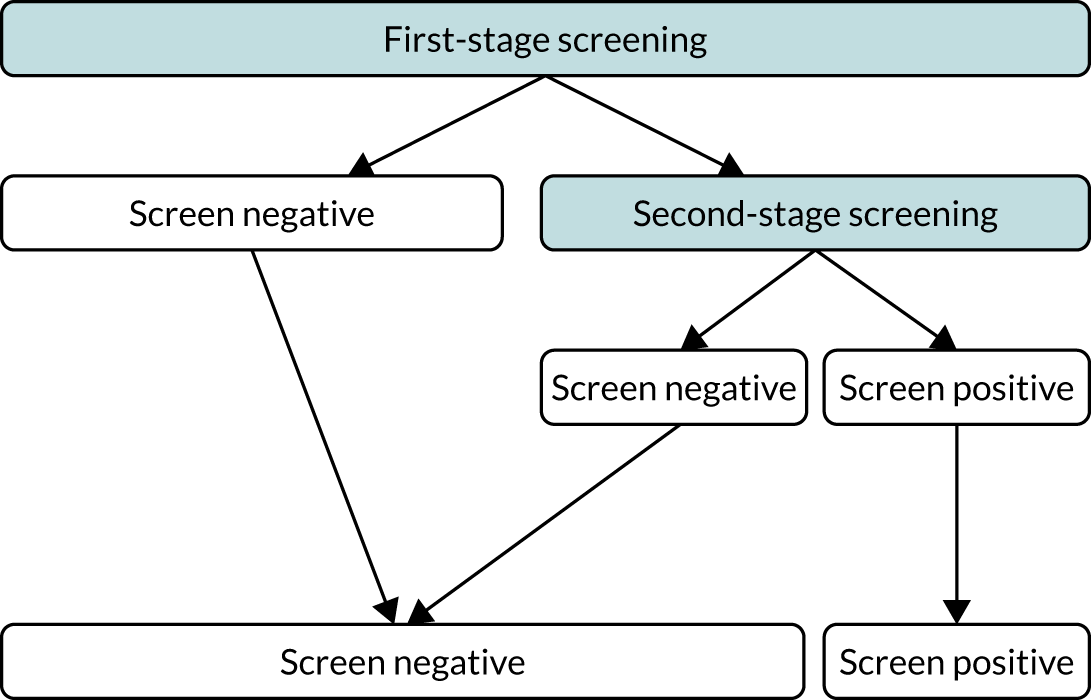
The rationale for this two-stage stratification process is to achieve performance close to that of the full test with all three markers, but restricting the need for measurement of some of the markers to a subset of the population. Depending on the setting, the choice of markers measured at each stage and the risk cut-off points can be chosen to achieve a good compromise between performance and measurement requirements.
Methods
Study population
We used the data from AJOG, ASPRE SQS and the SPREE study on a combined total of 61,174 singleton pregnancies with screening for pre-eclampsia with measurements of MAP, UTA-PI and PLGF at 11+0 to 13+6 weeks’ gestation.
Women with a singleton pregnancy who were undergoing first-trimester combined screening for pre-eclampsia and who subsequently delivered a morphologically normal live or stillborn infant at ≥ 24 weeks’ gestation were included. We excluded pregnancies with aneuploidies and major fetal abnormalities and those ending in termination, miscarriage or fetal death at < 24 weeks’ gestation.
Statistical analysis
Patient-specific risks of delivery with pre-eclampsia at < 32 and < 37 weeks’ gestation were calculated using the competing risks model to combine the prior distribution of the gestational age at delivery with pre-eclampsia, obtained from Mat-CHs and medical history, with various combinations of MoM values of MAP, UTA-PI and PLGF.
We estimated the DR of preterm pre-eclampsia and early pre-eclampsia at an overall SPR of 10% and 20% from a policy in which first-stage screening of the whole population is carried out by some of the components of the triple test and second-stage screening by the full triple test on women selected on the basis of results from first-stage screening.
The risk of development of pre-eclampsia is higher in women of black or South Asian racial origin than in white women. 33 Consequently, in screening a population of mixed racial origins for a given risk cut-off point the DR and SPR would be higher in black and South Asian women than in white women and the overall performance would be dependent on the proportion of the various racial groups within that population. The majority of our patients were white (44,684/61,174) and, therefore, we decided to develop a model based on white women and then observe the performance of screening at fixed-risk cut-off points in different racial groups. The following steps were used to develop the model. First, Mat-CHs and medical history from the 44,684 records were sampled with replacement 1,000,000 times. For each record, the prior distribution of time to delivery was obtained from the competing risk model. 33 Second, the MoM values of MAP, UTA-PI and PLGF were simulated from the fitted multivariate Gaussian distribution for log-transformed MoM values. 17 Third, posterior distributions of times to delivery with pre-eclampsia were obtained by combining the prior distribution of gestational age at delivery with pre-eclampsia33 and the likelihoods of the biomarkers using Bayes’ theorem. Risks of pre-eclampsia were obtained by calculating the area under the posterior distribution.
The performance of screening for pre-eclampsia was assessed via a two-stage strategy (see Figure 16). On the basis of the results of first-stage screening, the population was divided into a low-risk screen-negative group and a higher-risk group in need of further testing. After such testing, the patients were again classified as screen negative or screen positive. The performance of three first-stage strategies was examined: screening of the whole population by Mat-CHs alone; Mat-CHs, MAP and UTA-PI; and Mat-CHs, MAP and PLGF. The second-stage test was the triple test. The proportion of women continuing to the second stage and the overall SPR and DR for preterm pre-eclampsia and early pre-eclampsia were defined by various stage 1 and 2 risk cut-off points. Risk cut-off points were selected so that the DR of preterm pre-eclampsia was within 1% of that achieved by screening the whole population with the triple test.
Results
Model-based performance of two-stage screening
The model-based DR of preterm pre-eclampsia and early pre-eclampsia in women of white racial origin at a SPR of 10% and 20% is shown in Tables 15 and 16. When screening the whole population by the triple test at a SPR of 10%, the DR of preterm pre-eclampsia was 67% and of early pre-eclampsia was 85%. The corresponding values at a SPR of 20% were 81% and 93%, respectively.
| Method of first-stage screening | Racial group | Need for second-stage screening (%) | SPR, % (95% CI) | DR for pre-eclampsia | |
|---|---|---|---|---|---|
| < 37 weeks’ gestation | < 32 weeks’ gestation | ||||
| AJOG | |||||
| Mat-CHs | White (n = 25,879) | 72.3 | 12.3 (11.9 to 12.7) | 66.9 (58.4 to 74.6) | 81.0 (58.1 to 94.6) |
| Black (n = 6681) | 99 | 36.6 (35.5 to 37.8) | 92.7 (86.6 to 96.6) | 100.0 (90.5 to 100.0) | |
| South Asian (n = 1623) | 88.7 | 21.3 (19.3 to 23.4) | 95.0 (75.1 to 99.9) | 100.0 (54.1 to 100.0) | |
| Mat-CHs + MAP + UTA-PI | White (n = 25,879) | 36.7 | 12.2 (11.8 to 12.6) | 67.6 (59.2 to 75.3) | 81.0 (58.1 to 94.6) |
| Black (n = 6681) | 70.5 | 36.2 (35.0 to 37.3) | 92.7 (86.6 to 96.6) | 100.0 (90.5 to 100.0) | |
| South Asian (n = 1623) | 50.6 | 20.8 (18.9 to 22.9) | 95.0 (75.1 to 99.9) | 100.0 (54.1 to 100.0) | |
| Mat-CHs + MAP + PLGF | White (n = 25,879) | 25.2 | 12.2 (11.8 to 12.6) | 67.6 (59.2 to 75.3) | 85.7 (63.7 to 97.0) |
| Black (n = 6681) | 56.8 | 36.4 (35.2 to 37.6) | 92.7 (86.6 to 96.6) | 100.0 (90.5 to 100.0) | |
| South Asian (n = 1623) | 36.8 | 21.0 (19.1 to 23.1) | 95 (75.1 to 99.9) | 100.0 (54.1 to 100.0) | |
| ASPRE SQS | |||||
| Mat-CHs | White (n = 6883) | 70.6 | 7.7 (7.1 to 8.4) | 65.8 (48.6 to 80.4) | 100.0 (63.1 to 100.0) |
| Black (n = 1090) | 98.1 | 28.6 (26 to 31.4) | 92.9 (66.1 to 99.8) | 100.0 (63.1 to 100.0) | |
| South Asian (n = 462) | 86.8 | 10.8 (8.1 to 14) | 100.0 (29.2 to 100.0) | ||
| Mat-CHs + MAP + UTA-PI | White (n = 6883) | 33 | 7.7 (7.0 to 8.3) | 65.8 (48.6 to 80.4) | 100.0 (63.1 to 100.0) |
| Black (n = 1090) | 67.9 | 28.6 (26 to 31.4) | 92.9 (66.1 to 99.8) | 100.0 (63.1 to 100.0) | |
| South Asian (n = 462) | 42.9 | 10.8 (8.1 to 14) | 100.0 (29.2 to 100.0) | ||
| Mat-CHs + MAP + PLGF | White (n = 6883) | 17.2 | 7.7 (7.1 to 8.4) | 63.2 (46 to 78.2) | 87.5 (47.3 to 99.7) |
| Black (n = 1090) | 49.3 | 28.6 (26.0 to 31.4) | 92.9 (66.1 to 99.8) | 100.0 (63.1 to 100.0) | |
| South Asian (n = 462) | 23.6 | 10.6 (7.9 to 13.8) | 100.0 (29.2 to 100.0) | ||
| SPREE study | |||||
| Mat-CHs | White (n = 11,922) | 69.8 | 7.0 (6.6 to 7.5) | 69.6 (58.2 to 79.5) | 78.9 (54.4 to 93.9) |
| Black (n = 2337) | 98.6 | 28.8 (26.9 to 30.6) | 91.3 (79.2 to 97.6) | 100.0 (71.5 to 100.0) | |
| South Asian (n = 1361) | 87.6 | 12.8 (11.1 to 14.7) | 100.0 (78.2 to 100.0) | 100.0 (29.2 to 100.0) | |
| Mat-CHs + MAP + UTA-PI | White (n = 11,922) | 31.5 | 7.0 (6.5 to 7.4) | 72.2 (60.9 to 81.7) | 84.2 (60.4 to 96.6) |
| Black (n = 2337) | 64.4 | 28.3 (26.5 to 30.2) | 91.3 (79.2 to 97.6) | 100.0 (71.5 to 100.0) | |
| South Asian (n = 1361) | 45.5 | 12.5 (10.8 to 14.4) | 100.0 (78.2 to 100.0) | 100.0 (29.2 to 100.0) | |
| Mat-CHs + MAP + PLGF | White (n = 11,922) | 16.2 | 6.9 (6.5 to 7.4) | 68.4 (56.9 to 78.4) | 84.2 (60.4 to 96.6) |
| Black (n = 2337) | 49.8 | 28.5 (26.7 to 30.4) | 89.1 (76.4 to 96.4) | 100.0 (71.5 to 100.0) | |
| South Asian (n = 1361) | 24.8 | 12.6 (10.8 to 14.4) | 100.0 (78.2 to 100.0) | 100.0 (29.2 to 100.0) | |
| Method of first-stage screening | Racial group | Need for second-stage screening (%) | SPR, % (95% CI) | DR for pre-eclampsia | |
|---|---|---|---|---|---|
| < 37 weeks’ gestation | < 32 weeks’ gestation | ||||
| AJOG | |||||
| Mat-CHs | White (n = 25,879) | 72.3 | 22.6 (22.0 to 23.1) | 79.9 (72.2 to 86.2) | 90.5 (69.6 to 98.8) |
| Black (n = 6681) | 99.0 | 53.2 (52.0 to 54.4) | 98.4 (94.2 to 99.8) | 100.0 (90.5 to 100.0) | |
| South Asian (n = 1623) | 88.7 | 34.7 (32.4 to 37.1) | 95.0 (75.1 to 99.9) | 100.0 (54.1 to 100.0) | |
| Mat-CHs + MAP + UTA-PI | White (n = 25,879) | 44.6 | 22.4 (21.9 to 22.9) | 81.3 (73.8 to 87.4) | 95.2 (76.2 to 99.9) |
| Black (n = 6681) | 77.2 | 52.3 (51.1 to 53.5) | 97.6 (93.0 to 99.5) | 100.0 (90.5 to 100.0) | |
| South Asian (n = 1623) | 57.9 | 33.9 (31.6 to 36.2) | 95.0 (75.1 to 99.9) | 100.0 (54.1 to 100.0) | |
| Mat-CHs + MAP + PLGF | White (n = 25,879) | 34.7 | 22.3 (21.7 to 22.8) | 79.9 (72.2 to 86.2) | 90.5 (69.6 to 98.8) |
| Black (n = 6681) | 67.0 | 52.3 (51.1 to 53.5) | 97.6 (93 to 99.5) | 100.0 (90.5 to 100.0) | |
| South Asian (n = 1623) | 46.6 | 33.6 (31.3 to 36) | 95 (75.1 to 99.9) | 100.0 (54.1 to 100.0) | |
| ASPRE SQS | |||||
| Mat-CHs | White (n = 6883) | 70.6 | 16.1 (15.3 to 17) | 78.9 (62.7 to 90.4) | 100.0 (63.1 to 100.0) |
| Black (n = 1090) | 98.1 | 45 (42.1 to 48.1) | 100.0 (76.8 to 100.0) | 100.0 (63.1 to 100.0) | |
| South Asian (n = 462) | 86.8 | 22.1 (18.4 to 26.1) | 100.0 (29.2 to 100.0) | ||
| Mat-CHs + MAP + UTA-PI | White (n = 6883) | 40.6 | 16.2 (15.4 to 17.1) | 84.2 (68.7 to 94) | 100.0 (63.1 to 100.0) |
| Black (n = 1090) | 74.7 | 44.5 (41.5 to 47.5) | 100.0 (76.8 to 100.0) | 100.0 (63.1 to 100.0) | |
| South Asian (n = 462) | 52.2 | 22.3 (18.6 to 26.4) | 100.0 (29.2 to 100.0) | ||
| Mat-CHs + MAP + PLGF | White (n = 6883) | 25.5 | 15.8 (15 to 16.7) | 81.6 (65.7 to 92.3) | 100.0 (63.1 to 100.0) |
| Black (n = 1090) | 57.7 | 44.6 (41.6 to 47.6) | 100.0 (76.8 to 100.0) | 100.0 (63.1 to 100.0) | |
| South Asian (n = 462) | 35.3 | 21.4 (17.8 to 25.5) | 100.0 (29.2 to 100.0) | ||
| SPREE study | |||||
| Mat-CHs | White (n = 11,922) | 69.8 | 14.9 (14.3 to 15.6) | 82.3 (72.1 to 90.0) | 84.2 (60.4 to 96.6) |
| Black (n = 2337) | 98.6 | 44.6 (42.6 to 46.7) | 97.8 (88.5 to 99.9) | 100.0 (71.5 to 100.0) | |
| South Asian (n = 1361) | 87.6 | 23.6 (21.4 to 25.9) | 100.0 (78.2 to 100.0) | 100.0 (29.2 to 100.0) | |
| Mat-CHs + MAP + UTA-PI | White (n = 11,922) | 38.4 | 14.7 (14.1 to 15.4) | 84.8 (75.0 to 91.9) | 89.5 (66.9 to 98.7) |
| Black (n = 2337) | 72.5 | 43.9 (41.8 to 45.9) | 97.8 (88.5 to 99.9) | 100.0 (71.5 to 100.0) | |
| South Asian (n = 1361) | 55.8 | 23.6 (21.4 to 25.9) | 100.0 (78.2 to 100.0) | 100.0 (29.2 to 100.0) | |
| Mat-CHs + MAP + PLGF | White (n = 11,922) | 23.8 | 14.4 (13.8 to 15) | 83.5 (73.5 to 90.9) | 84.2 (60.4 to 96.6) |
| Black (n = 2337) | 60.2 | 43.9 (41.9 to 46) | 95.7 (85.2 to 99.5) | 100.0 (71.5 to 100.0) | |
| South Asian (n = 1361) | 34.8 | 22.9 (20.7 to 25.3) | 100.0 (78.2 to 100.0) | 100.0 (29.2 to 100.0) | |
In two-stage screening with Mat-CHs as the method of screening in the first stage and reserving measurements of MAP, UTA-PI and PLGF for the second stage to only 70% of the population, a similar DR was achieved as when screening the whole population by the triple test, irrespective of whether the SPR was 10% or 20% (Figure 18). In the case of first-stage screening by Mat-CHs, MAP and UTA-PI, the DR was similar to that achieved by screening the whole population with the triple test by limiting measurement of PLGF in the second stage to approximately 30% of the population for an overall SPR of 10% and 40% for a SPR of 20%. In the case of first-stage screening by Mat-CHs, MAP and PLGF, a similar DR was achieved as in screening the whole population with the triple test by limiting measurement of UTA-PI in the second stage to approximately 20% of the population for an overall SPR of 10% and 30% for SPR of 20%.
FIGURE 18.
Relationship between model-based DR of pre-eclampsia with delivery at < 37 weeks’ gestation (dark blue curve) and < 32 weeks’ gestation (light blue curve) and percentage of the population requiring second-stage screening at a fixed overall SPR of 20% in women of white racial origin. Screening at first stage (a) Mat-CHs; (b) Mat-CHs, MAP and UTA-PI; and (c) Mat-CHs, MAP and PLGF.
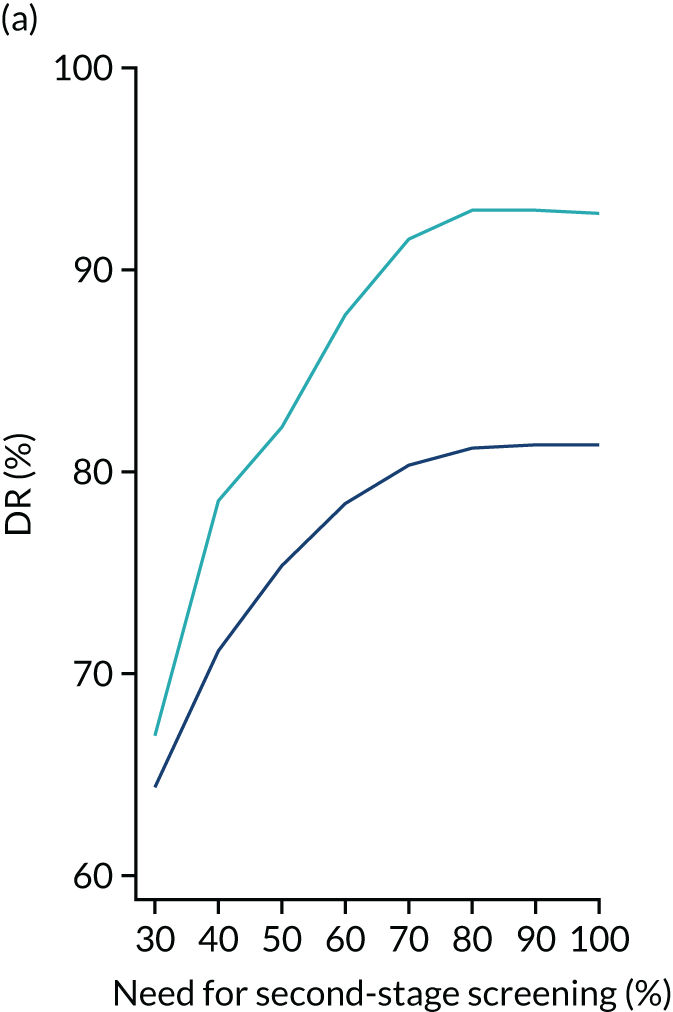
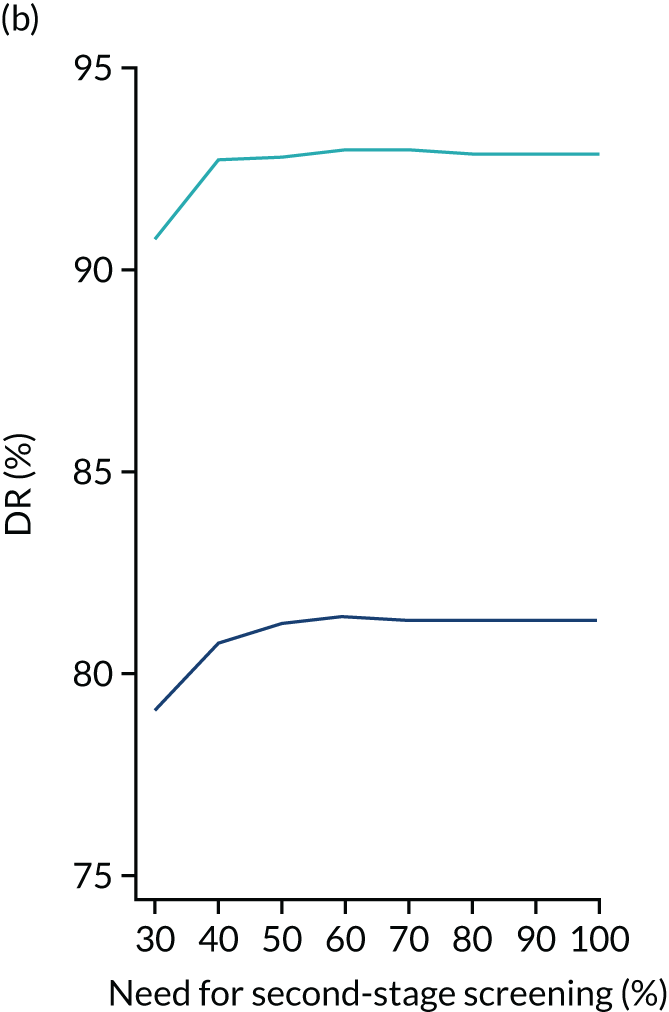
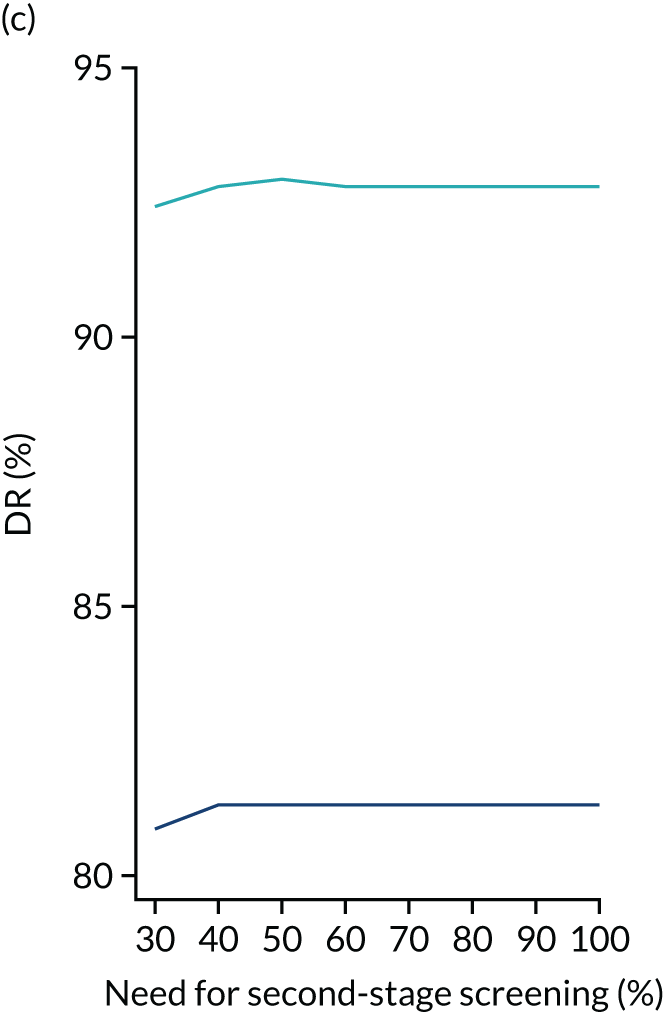
Selection of risk cut-off points for first- and second-stage screening
On the basis of the model-based results we selected the following risk cut-off points for preterm pre-eclampsia to assess the empirical performance of screening at an overall SPR of 10%. For the first stage, the risk cut-off points for selecting the group in need of second-stage screening was 1 in 600 when screening was with Mat-CHs, 1 in 300 when screening using a combination of Mat-CHs, MAP and UTA-PI, and 1 in 200 when screening or Mat-CHs, MAP and PLGF. The risk cut-off point for selecting the screen-positive group after second-stage screening was 1 in 100.
On the basis of the model-based results we selected the following risk cut-off points for preterm pre-eclampsia to assess the empirical performance of screening at an overall SPR of 20%. For the first stage, the risk cut-off points for selecting the group in need of second-stage screening was 1 in 600 when screening was with Mat-CHs, 1 in 400 in screening using a combination of Mat-CHs, MAP and UTA-PI, and 1 in 300 when screening or Mat-CHs, MAP and PLGF. The risk cut-off point for selecting the screen-positive group after second-stage screening was 1 in 200.
Empirical performance of two-stage screening
Empirical performance of two-stage screening for white women in AJOG, ASPRE SQS and the SPREE study at a fixed overall SPR of 10% and a fixed SPR of 20% is shown in Tables 15 and 16, respectively.
The results of the ASPRE SQS and the SPREE study are similar (with values within the 95% CIs) in terms of the proportion of the population requiring second-stage screening, overall SPR and DR of pre-eclampsia. In AJOG, the proportions of the population requiring second-stage screening and overall SPR were higher than in the other two data sets. The likely explanation for this is that the prior risk was higher in the AJOG data set than in the other two data sets.
In all three data sets, at the same risk cut-off points for first- and second-stage screening, among women of black racial origin and women of South Asian racial origin both the proportion requiring second-stage screening and the overall SPR and DR were considerably higher than among white women.
Discussion
The findings of this study demonstrate that a similar SPR and DR can be achieved with a two-stage strategy of screening at substantially lower costs than with carrying out screening with all biomarkers in the whole population. If the method of first-stage screening is Mat-CHs, then measurement of biomarkers can be reserved for only 70% of the population and if some of the biomarkers are included in first-stage screening then the need for the complete triple test can be reduced to 30–40% of the population.
Screening by the triple test in a population of white women resulted in a DR of preterm pre-eclampsia of 67% at a SPR of 10%, and this increased to 81% at a SPR of 20%. Randomised trials on the use of aspirin have reported that the drug is not associated with increased risk of adverse events, and in the case of antepartum haemorrhage the risk may actually be reduced. 51 In this respect, it may be acceptable that in screening for pre-eclampsia the SPR could be about 20% so as to maximise the DR.
The inevitable consequence of fixing a risk cut-off point aiming to achieve a given SPR in a white population is that the rate would be considerably higher for women of black or South Asian racial origin. An alternative strategy in screening is to fix the SPR to be the same for all racial groups and to use different risk cut-off points for each group. However, in a multiracial society such strategy would not be easy to implement, and in any case it would be wrong because it would merely mask the increased risk for pre-eclampsia in certain racial groups. Inevitably, the overall performance of screening in a racially mixed population will depend on the proportion of the various racial groups. This is analogous to screening for Down syndrome, for which the maternal age-derived prior risk is combined with the measurement of first- and/or second-trimester biomarkers to derive the posterior risk. At a fixed-risk cut-off point both the SPR and the DR increase with maternal age and, therefore, the overall performance of screening depends of the maternal age distribution of a given study population.
The strengths of this screening study are the (1) large number of patients examined; (2) accurate recording of maternal factors and biomarkers; (3) use of Bayes’ theorem to combine the prior distribution of gestational age at delivery with pre-eclampsia from maternal factors with biomarkers to estimate patient-specific risks and the performance of screening for pre-eclampsia delivering at different stages of pregnancy; and (4) comparison of model-based results and empirical results on performance of screening.
The observed performance of two-stage screening applies to our study population and comparison between studies requires the appropriate adjustments for the characteristics of the population under investigation. In the application of screening in different countries it is likely that adjustments would be necessary for the calculation of MoM values for the biomarkers and establishment of a system for quality assurance of the measurements.
Chapter 10 Competing risks model: incorporating a new biomarker
Our approach to screening for pre-eclampsia is to use Bayes’ theorem to combine the prior distribution of the gestational age at delivery with pre-eclampsia, obtained from Mat-CHs and medical history, with the results of various combinations of biophysical and biochemical measurements. 17,33 A major advantage of this approach is that the model can easily be updated with new biomarkers.
The three biomarkers found to be useful in first-trimester screening for pre-eclampsia are MAP, UTA-PI and PLGF. 17 This chapter explores the potential value of another biomarker, inhibin A. Inhibin A is a glycoprotein hormone that is mainly produced by the placenta. 52 In patients with established pre-eclampsia there is an up to 10-fold increase in the maternal circulating levels of inhibin A and there is also evidence that increased levels precede the clinical onset of pre-eclampsia and may be evident from the first trimester of pregnancy. 53–56
Methods
Case–control study
We conducted a case–control study drawn from a large prospective screening study for adverse obstetric outcomes in women attending for their routine visit at 11+0 to 13+6 weeks’ gestation, which included recording of maternal demographic characteristics and medical history, and measurement of MAP, UTA-PI and PLGF. Inhibin A concentration was measured by a fully automated biochemical analyser in stored serum samples from 98 women who subsequently developed pre-eclampsia and 200 women (controls) who did not develop any hypertensive disorder of pregnancy. Each case of pre-eclampsia was matched with two women (controls) who had blood collected on the same day.
The MoM values for inhibin A were calculated from a linear regression model fitted to log10 inhibin A concentrations, with various Mat-CHs and previous medical and pregnancy history as predictors. Backwards elimination was used for variable selection. To determine whether or not inhibin A would be useful in predicting pre-eclampsia, terms for pre-eclampsia and the gestational age at delivery with pre-eclampsia were included in the model. The partial residuals after excluding the contribution of pre-eclampsia comprised the log10 MoM values. Plots of log10 inhibin A MoM compared with log10 MAP, UTA-PI and PLGF MoM values were produced to explore correlations between markers and the behaviour between marker profiles in pre-eclampsia pregnancies. The standard deviations of log10 inhibin A MoM values were also estimated. The competing risks model was used to calculate risks for various combinations of biomarkers so that the performance of screening could be assessed based on the inclusion of inhibin A.
Model-based estimates of screening performance were obtained via multiple imputation. The data for our previous study on prospective non-intervention screening for pre-eclampsia by a combination of Mat-CHs, MAP, UTA-PI and PLGF at 11+0 to 13+6 weeks’ gestation in 61,174 singleton pregnancies, including 1770 (2.9%) women who developed pre-eclampsia,57 were sampled, with replacement, to create a new data set consisting of 100,000 records. Based on parameters obtained from the case–control study, as outlined above, inhibin A MoM values were simulated for these 100,000 records. Risks were calculated for various combinations of the four biomarkers and screening performance was assessed in terms of DR and FPR. This process was repeated 10 times and DRs and FPRs were summarised.
Screening study
Serum inhibin A was measured in all 5245 stored samples from patients who participated in the SPREE study at King’s College Hospital. These included 140 patients who developed pre-eclampsia. The competing risk model was used to calculate risks for various combinations of biomarkers so that the performance of screening could be assessed based on the inclusion of inhibin A.
Results
Case–control study
In women who developed pre-eclampsia, compared with those without pre-eclampsia, the MoM values of inhibin A (Figure 19), UTA-PI and MAP were increased and PLGF was decreased, and the deviation from normal was greater for early pre-eclampsia than for late pre-eclampsia for all four biomarkers.
FIGURE 19.
Scatter diagram and regression line for the relationship between inhibin A MoM values and gestational age at delivery in pregnancies with pre-eclampsia.
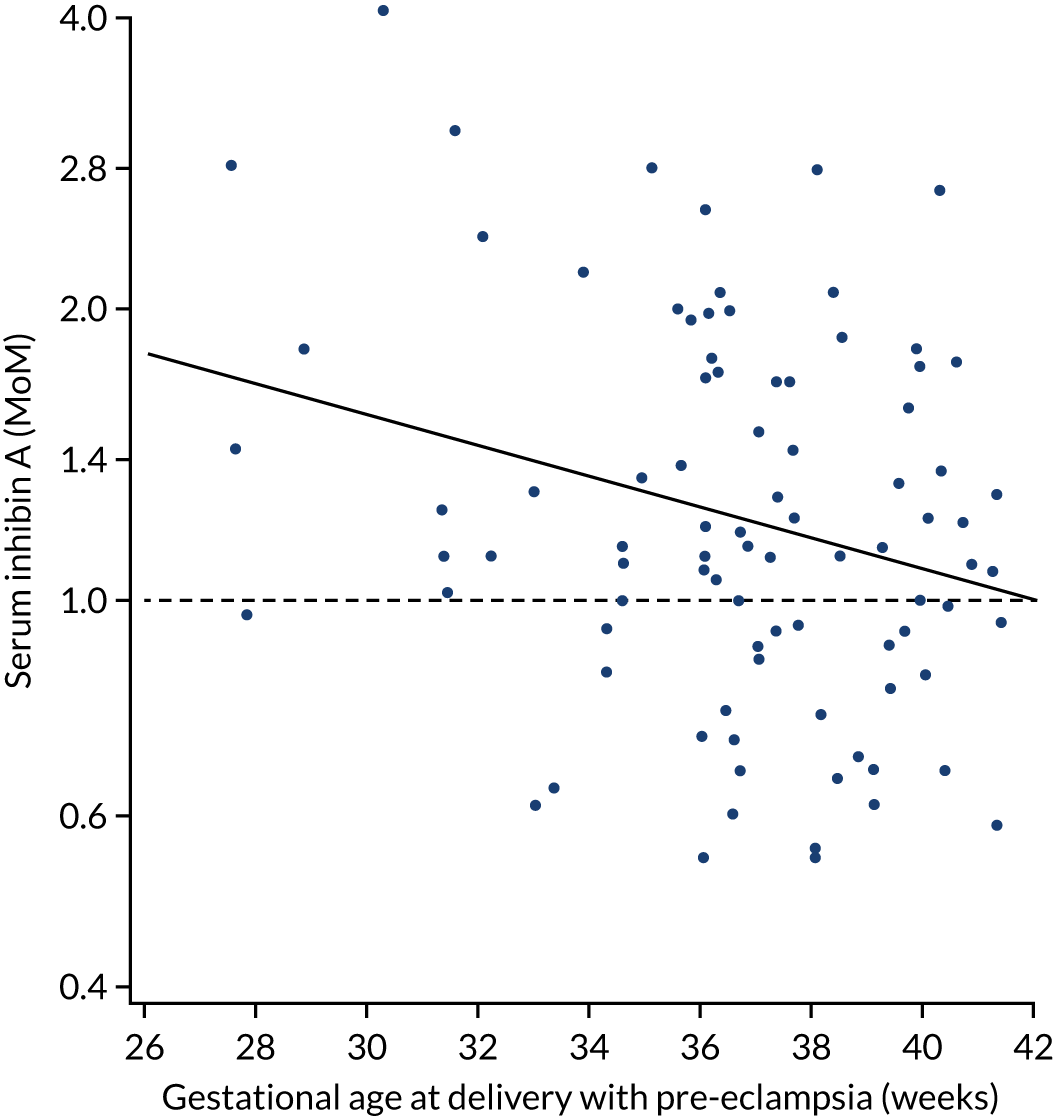
The empirical and model-based performance of screening for pre-eclampsia by maternal factors with combinations of biomarkers is shown in Table 17. Addition of inhibin A was associated with a non-significant improvement in the performance of screening by (1) Mat-CHs and PLGF, (2) Mat-CHs, MAP and PLGF and (3) Mat-CHs, MAP, UTA-PI and PLGF. The empirical results were comparable to the model-based results. However, in view of the small number of cases examined and the wide CIs, there is considerable uncertainty concerning the additional value of inhibin A in improving the performance of screening achieved by the other biomarkers.
| Method of screening | Pre-eclampsia with delivery at < 37 weeks’ gestation | Pre-eclampsia with delivery at < 32 weeks’ gestation | ||
|---|---|---|---|---|
| Empirical (95% CI) | Modelled | Empirical (95% CI) | Modelled | |
| Mat-CHs | 38.3 (24.5 to 53.6) | 46.6 | 33.3 (7.5 to 70.1) | 52.6 |
| Mat-CHs + PLGF | 46.8 (32.1 to 61.9) | 64.2 | 66.7 (29.9 to 92.5) | 74.1 |
| Mat-CHs + inhibin A | 46.8 (32.1 to 61.9) | 52.1 | 66.7 (29.9 to 92.5) | 64.1 |
| Mat-CHs + PLGF + inhibin A | 55.3 (40.1 to 69.8) | 67.1 | 77.8 (40.0 to 97.2) | 80.9 |
| Mat-CHs + MAP | 46.8 (32.1 to 61.9) | 53.4 | 66.7 (29.9 to 92.5) | 65.5 |
| Mat-CHs + MAP + UTA-PI | 70.2 (55.1 to 82.7) | 69.6 | 88.9 (51.8 to 99.7) | 83.6 |
| Mat-CHs + MAP + PLGF | 59.6 (44.3 to 73.6) | 68.8 | 66.7 (29.9 to 92.5) | 81.9 |
| Mat-CHs + MAP + inhibin A | 55.3 (40.1 to 69.8) | 59.2 | 77.8 (40.0 to 97.2) | 74.1 |
| Mat-CHs + MAP + PLGF + inhibin A | 68.1 (52.9 to 80.9) | 72.1 | 77.8 (40.0 to 97.2) | 85.8 |
| Mat-CHs + MAP UTA-PI + PLGF | 74.5 (59.7 to 86.1) | 76.7 | 88.9 (51.8 to 99.7) | 90.5 |
| Mat-CHs + MAP + UTA-PI + PLGF + inhibin A | 72.3 (57.4 to 84.4) | 77.8 | 88.9 (51.8 to 99.7) | 92.8 |
It was concluded that inclusion of serum inhibin A could potentially improve the performance of first-trimester screening for pre-eclampsia, but this needs to be investigated further by prospective screening studies.
Screening study
The DR of all pre-eclampsia and pre-eclampsia with delivery at < 37 and < 32 weeks’ gestation is shown in Table 18. Although inhibin A improved the prediction provided by maternal factors alone, it did not improve the prediction provided by biomarkers that included PLGF. The findings suggest that although inhibin A is a biomarker of pre-eclampsia, it is unlikely to improve the prediction provided by a combination of MAP and PLGF or MAP, UTA-PI and PLGF.
| Method of screening | DR (95% CI) | ||
|---|---|---|---|
| All pre-eclampsia | Pre-eclampsia with delivery at < 37 weeks’ gestation | Pre-eclampsia with delivery at < 32 weeks’ gestation | |
| Mat-CHs | 37 (29 to 46) | 49 (34 to 64) | 60 (26 to 88) |
| Mat-CHs + inhibin A | 41 (32 to 49) | 60 (44 to 74) | 80 (44 to 97) |
| Mat-CHs + PLGF | 48 (39 to 56) | 60 (44 to 74) | 80 (44 to 97) |
| Mat-CHs + PLGF + inhibin A | 48 (39 to 56) | 64 (49 to 78) | 80 (44 to 97) |
| Mat-CHs + MAP + PLGF | 54 (45 to 62) | 67 (51 to 80) | 80 (44 to 97) |
| Mat-CHs + MAP + PLGF + inhibin A | 51 (42 to 59) | 67 (51 to 80) | 70 (35 to 93) |
| Mat-CHs + MAP + UTA-PI + PLGF | 61 (52 to 69) | 80 (65 to 90) | 100 (69 to 100) |
| Mat-CHs + MAP + UTA-PI+ PLGF + inhibin A | 61 (52 to 69) | 80 (65 to 90) | 100 (69 to 100) |
Discussion
This study has demonstrated the feasibility of utilising the competing risk model to investigate the potential value of new biomarkers of pre-eclampsia.
The findings of the case–control study demonstrated that in women who developed pre-eclampsia, inhibin A is increased and the deviation from normal is greater for early pre-eclampsia than late pre-eclampsia. On the basis of modelling, it was suggested that addition of inhibin A may improve the performance of screening by Mat-CHs and combinations of MAP, UTA-PI and PLGF. Although the empirical results were compatible with the model-based results, there was considerable uncertainty concerning the additional value of inhibin A in improving the performance of screening achieved by the other biomarkers. The results of the screening demonstrated that inhibin A is unlikely to be a useful first trimester biomarker of pre-eclampsia.
Chapter 11 Competing risks model: prediction of small for gestational age neonates
Small for gestational age neonates can be constitutionally small or growth can be restricted because of impaired placentation, fetal abnormalities or congenital infection. In pre-eclampsia, especially early and preterm pre-eclampsia, many fetuses are SGA. 58 Additionally, preterm SGA in the absence of pre-eclampsia is associated with similar maternal factors and biomarker profile as in preterm pre-eclampsia. 59 It could therefore be anticipated that first-trimester combined screening for preterm pre-eclampsia would also identify a high proportion of SGA neonates in both the presence and the absence of pre-eclampsia.
In this chapter we use the data from the SPREE study38 to examine the effect of first-trimester screening for pre-eclampsia on the prediction of SGA neonates. 60
Methods
The data for this study were derived from the SPREE study. 38 We investigated the performance of screening for SGA by a combination of Mat-CHs and biomarkers at 11–13 weeks’ gestation. In the ASPRE trial, women with singleton pregnancies identified by combined screening as being at high risk for preterm pre-eclampsia (> 1 in 100) participated in a trial of aspirin (150 mg/day from 11 to 14 weeks’ gestation until 36 weeks’ gestation) compared with placebo. 40 We used the data from the SPREE study to estimate the proportion of SGA neonates born at ≥ 37, < 37 and < 32 weeks’ gestation, with first-trimester combined risk for preterm pre-eclampsia (calculated by the competing risk model through a combination of Mat-CHs, MAP, UTA-PI and PLGF) of > 1 in 100. 17,33
Data on pregnancy outcome were collected from the hospital maternity records or the women’s general medical practitioners. The diagnosis of SGA < 10th, < 5th or < 3rd percentile was based on a reference range of birthweight with gestational age in our population. 61 The pregnancies with SGA fetuses were subdivided according to the presence or absence of pre-eclampsia. 21,34
Results
First-trimester screening was carried out in 17,051 pregnancies, but 304 were lost to follow-up and 296 resulted in miscarriage or pregnancy termination at < 24 weeks’ gestation. Therefore, the study population comprised 16,451 pregnancies. 60
Pre-eclampsia developed in 473 (2.9%) pregnancies, including 33 with early pre-eclampsia, 142 with preterm pre-eclampsia and 331 with term pre-eclampsia (Table 19). In the early pre-eclampsia group, 84.8%, 84.8% and 81.8% of babies were SGA < 10th, < 5th and < 3rd percentile, respectively. In the preterm pre-eclampsia group, 70.4%, 60.6% and 54.9% of babies were SGA < 10th, < 5th and < 3rd percentile, respectively. In the term pre-eclampsia group, 19.3%, 13.9% and 11.5% of babies were SGA < 10th, < 5th and < 3rd percentile, respectively. 60
| Gestation at which pre-eclampsia developed | n | SGA, n (%) | ||
|---|---|---|---|---|
| < 10th percentile | < 5th percentile | < 3rd percentile | ||
| < 32 weeks’ gestation | 33 | 28 (84.8) | 28 (84.8) | 27 (81.8) |
| < 37 weeks’ gestation | 142 | 100 (70.4% | 86 (60.6) | 78 (54.9) |
| ≥ 37 weeks’ gestation | 331 | 64 (19.3) | 46 (13.9) | 38 (11.5) |
Birth at < 32, < 37 and ≥ 37 weeks’ gestation occurred in 172 (1.0%), 950 (5.8%) and 15,501 (94.2%) pregnancies, respectively. The proportion of babies who were SGA and the contribution of pre-eclampsia to the incidence of SGA are shown in Table 20. Essentially, 41.3% of babies born at < 32 weeks were SGA < 10th percentile and in 39.4% of such pregnancies there was pre-eclampsia. Similarly, a high proportion of babies born at < 37 weeks were SGA < 10th percentile (36.1%) and in 29.2% of such pregnancies there was pre-eclampsia. In contrast, the incidence of SGA < 10th in babies born at term was 11.4%, and only 3.6% of these babies were from pregnancies with pre-eclampsia. 60
| Definition of SGA | Total births, n | SGA, n (%) | |
|---|---|---|---|
| Total | Pre-eclampsia | ||
| < 10th percentile | |||
| ≥ 37 weeks’ gestation | 15,501 | 1761 (11.4) | 64 (3.6) |
| < 37 weeks’ gestation | 950 | 343 (36.1) | 100 (29.2) |
| < 32 weeks’ gestation | 172 | 71 (41.3) | 28 (39.4) |
| < 5th percentile | |||
| ≥ 37 weeks’ gestation | 15,501 | 988 (6.4) | 46 (4.7) |
| < 37 weeks’ gestation | 950 | 266 (28.0) | 86 (32.3) |
| < 32 weeks’ gestation | 172 | 66 (38.4) | 28 (42.4) |
| < 3rd percentile | |||
| ≥ 37 weeks’ gestation | 15,501 | 684 (4.4) | 38 (5.6) |
| < 37 weeks’ gestation | 950 | 226 (23.8) | 78 (34.5) |
| < 32 weeks’ gestation | 172 | 57 (33.1) | 27 (47.4) |
In screening by a combination of Mat-CHs, MAP, UTA-PI and PLGF and a risk cut-off point for preterm pre-eclampsia of 1 in 100, the SPR was 12.2% (2014/16,451) and the high-risk group included 30 (90.9%) of early pre-eclampsia, 118 (83.1%) of preterm pre-eclampsia and 162 (48.9%) of term pre-eclampsia. The proportion of SGA neonates from all pregnancies and those with and without pre-eclampsia with a first-trimester combined risk for preterm pre-eclampsia of > 1 in 100 is shown in Table 21. 60
| Birth weight | SGA all pregnancies | SGA with pre-eclampsia | SGA no pre-eclampsia | |||
|---|---|---|---|---|---|---|
| All, n | Pre-eclampsia risk > 1 in 100, n (%) | All, n | Pre-eclampsia risk > 1 in 100, n (%) | All, n | Pre-eclampsia risk > 1 in 100, n (%) | |
| < 10th percentile | ||||||
| ≥ 37 weeks’ gestation | 1761 | 365 (20.7) | 64 | 38 (59.4) | 1697 | 327 (19.3) |
| < 37 weeks’ gestation | 343 | 157 (45.8) | 100 | 81 (81.0) | 243 | 76 (31.3) |
| < 32 weeks’ gestation | 71 | 40 (56.3) | 28 | 25 (89.3) | 43 | 15 (34.9) |
| < 5th percentile | ||||||
| ≥ 37 weeks’ gestation | 988 | 249 (25.2) | 46 | 31 (67.4) | 942 | 218 (23.1) |
| < 37 weeks’ gestation | 266 | 130 (48.9) | 86 | 68 (79.1) | 180 | 62 (34.4) |
| < 32 weeks’ gestation | 65 | 39 (60.0) | 28 | 25 (89.3) | 37 | 14 (37.8) |
| < 3rd percentile | ||||||
| ≥ 37 weeks’ gestation | 684 | 178 (26.0) | 38 | 27 (71.1) | 646 | 151 (23.4) |
| < 37 weeks’ gestation | 226 | 117 (51.8) | 78 | 61 (78.2) | 148 | 56 (37.8) |
| < 32 weeks’ gestation | 57 | 36 (63.2) | 27 | 24 (88.9) | 30 | 12 (40.0) |
In the high-risk group, the proportions of neonates born at ≥ 37 weeks' gestation who were below the 10th, 5th and 3rd weight percentile were 20.7%, 25.2% and 26.0%, respectively. The corresponding percentages for those born at < 37 weeks’ gestation were 45.8%, 48.9% and 51.8% and for those born at < 32 weeks’ gestation were 56.3%, 60.0% and 63.2%. In the group of SGA < 10th percentile neonates from pregnancies with pre-eclampsia, the high-risk group included about 81% of those born at < 37 weeks’ gestation and 89% of those born at < 32 weeks’ gestation. The corresponding values from pregnancies without pre-eclampsia were approximately 31% and 35%. In the group of SGA < 5th percentile neonates from pregnancies with pre-eclampsia, the high-risk group included about 79% of those born at < 37 weeks’ gestation and 89% of those born at < 32 weeks’ gestation. The corresponding values from pregnancies without pre-eclampsia were approximately 34% and 38%. In the group of SGA < 3rd percentile neonates from pregnancies with pre-eclampsia, the high-risk group included about 78% of those born at < 37 weeks’ gestation and 89% of those born at < 32 weeks’ gestation. The corresponding values from pregnancies without pre-eclampsia were approximately 38% and 40%. 60
Discussion
The findings of this study demonstrate that (1) neonates are SGA < 10th percentile in 70% of pregnancies with preterm pre-eclampsia and in 85% of those with early pre-eclampsia; (2) in women who deliver preterm and early SGA neonates there is pre-eclampsia in 29% and 39% of cases, respectively; and (3) screening for preterm pre-eclampsia by a combination of Mat-CHs, MAP, UTA-PI and PLGF at 11–13 weeks’ gestation identifies a high-risk group that contains about 46% of cases of preterm SGA and 56% of cases of early SGA.
Analysis of data from the SPREE study and the ASPRE trial showed that in pregnancies identified by first-trimester combined screening as being at high-risk for preterm pre-eclampsia, use of aspirin reduces the incidence of preterm SGA by about 40% and that of early SGA by 73%. 60 The aspirin-related decrease in incidence of SGA was mainly due to a decrease in the pregnancies with pre-eclampsia, the decrease being approximately 70% in babies born at < 37 weeks’ gestation and approximately 90% in babies born at < 32 weeks’ gestation. In the pregnancies without pre-eclampsia use of aspirin was not associated with a significant reduction in incidence of SGA. On the basis of these results, it was estimated that first-trimester screening for preterm pre-eclampsia and use of aspirin in the high-risk group would potentially reduce the incidence of preterm and early SGA by about 20% and 40%, respectively. 60
Preterm pre-eclampsia is, to a great extent, predictable by first-trimester combined screening and preventable by use of aspirin (i.e. 150 mg/day from the first to the third trimester). 7,17,33 A beneficial consequence of such strategy is the prevention of a high proportion of cases of preterm SGA, because (1) preterm pre-eclampsia is commonly associated with SGA and (2) a high proportion of cases of preterm SGA are associated with pre-eclampsia.
The ASPRE trial demonstrated that, in women identified by means of first-trimester screening as being at high risk for pre-eclampsia, use of aspirin reduces the incidence of preterm pre-eclampsia and early pre-eclampsia by approximately 60% and 90%, respectively. 7 A secondary analysis of the trial demonstrated that use of aspirin reduces the length of stay in the neonatal intensive care unit by approximately 70%. 62 More than 80% of the length of stay was contributed from babies born at < 32 weeks’ gestation and the aspirin-related reduction in length of stay could essentially be attributed to prevention of early pre-eclampsia. The consequence of reduction in length of stay in the neonatal intensive care unit is a substantial saving in health-care cost, which is well in excess of the cost of population screening and treatment of the high-risk group with aspirin. Reduction in the risk of birth at < 32 weeks’ gestation is also likely to be associated with reduction in risk of infant death, cerebral palsy and long-term use of specialised health-care resources. 63–65
In conclusion, first-trimester screening for pre-eclampsia by the combined test identifies a high proportion of cases of preterm SGA that can potentially be prevented by the prophylactic use of aspirin. Most cases of SGA, particularly those delivering at term, are neither predictable in the first trimester nor preventable by prophylactic use of aspirin.
Acknowledgements
Contributions of authors
Liona C Poon (https://orcid.org/0000-0002-3944-4130) (Professor, Maternal Fetal Medicine Specialist) conceptualised the study and designed the research, performed the research and approved the report.
David Wright (https://orcid.org/0000-0003-4800-3190) (Professor, Biostatistician) conceptualised the study and designed the research, analysed and interpreted data, and approved the report.
Steve Thornton (https://orcid.org/0000-0001-7613-0408) (Professor, Obstetrics Specialist) conceptualised the study and designed the research, and approved the report.
Ranjit Akolekar (https://orcid.org/0000-0001-7265-5442) (Professor, Maternal Fetal Medicine Specialist) performed the research and approved the report.
Peter Brocklehurst (https://orcid.org/0000-0002-9950-6751) (Professor, Epidemiologist) managed the study and approved the report.
Kypros H Nicolaides (https://orcid.org/0000-0003-3515-7684) (Professor, Fetal Medicine specialist) conceptualised the study and designed the research, performed the research and approved the report.
Publications
Tan MY, Poon LC, Rolnik DL, Syngelaki A, de Paco Matallana C, Akolekar R, et al. Prediction and prevention of small-for-gestational-age neonates: evidence from SPREE and ASPRE. Ultrasound Obstet Gynecol 2018;52:52–9.
Tan MY, Syngelaki A, Poon LC, Rolnik DL, O’Gorman N, Delgado JL, et al. Screening for pre-eclampsia by maternal factors and biomarkers at 11–13 weeks’ gestation. Ultrasound Obstet Gynecol 2018;52:186–95.
Tan MY, Wright D, Syngelaki A, Akolekar R, Cicero S, Janga D, et al. Comparison of diagnostic accuracy of early screening for pre-eclampsia by NICE guidelines and a method combining maternal factors and biomarkers: results of SPREE. Ultrasound Obstet Gynecol 2018;51:743–50.
Data-sharing statement
We shall make data available to the scientific community with as few restrictions as feasible, while retaining exclusive use until the publication of major outputs. Anonymised data will be deposited here at URL: www.fetalmedicine.org to encourage wider use.
Patient data
This work uses data provided by patients and collected by the NHS as part of their care and support. Using patient data is vital to improve health and care for everyone. There is huge potential to make better use of information from people’s patient records, to understand more about disease, develop new treatments, monitor safety, and plan NHS services. Patient data should be kept safe and secure, to protect everyone’s privacy, and it’s important that there are safeguards to make sure that it is stored and used responsibly. Everyone should be able to find out about how patient data are used. #datasaveslives You can find out more about the background to this citation here: https://understandingpatientdata.org.uk/data-citation.
Disclaimers
This report presents independent research. The views and opinions expressed by authors in this publication are those of the authors and do not necessarily reflect those of the NHS, the NIHR, the MRC, NETSCC, the EME programme or the Department of Health and Social Care. If there are verbatim quotations included in this publication the views and opinions expressed by the interviewees are those of the interviewees and do not necessarily reflect those of the authors, those of the NHS, the NIHR, NETSCC, the EME programme or the Department of Health and Social Care.
References
- Steegers EA, von Dadelszen P, Duvekot JJ, Pijnenborg R. Pre-eclampsia. Lancet 2010;376:631-44. https://doi.org/10.1016/S0140-6736(10)60279-6.
- Irgens HU, Reisaeter L, Irgens LM, Lie RT. Long term mortality of mothers and fathers after pre-eclampsia: population based cohort study. BMJ 2001;323:1213-17. https://doi.org/10.1136/bmj.323.7323.1213.
- Souza JP, Gülmezoglu AM, Vogel J, Carroli G, Lumbiganon P, Qureshi Z, et al. Moving beyond essential interventions for reduction of maternal mortality (the WHO Multicountry Survey on Maternal and Newborn Health): a cross-sectional study. Lancet 2013;381:1747-55. https://doi.org/10.1016/S0140-6736(13)60686-8.
- Saleem S, McClure EM, Goudar SS, Patel A, Esamai F, Garces A, et al. A prospective study of maternal, fetal and neonatal deaths in low- and middle-income countries. Bull World Health Organ 2014;92:605-12. https://doi.org/10.2471/BLT.13.127464.
- Lisonkova S, Joseph KS. Incidence of preeclampsia: risk factors and outcomes associated with early- versus late-onset disease. Am J Obstet Gynecol 2013;209:544-544.e12. https://doi.org/10.1016/j.ajog.2013.08.019.
- Askie LM, Duley L, Henderson-Smart DJ, Stewart LA. PARIS Collaborative Group . Antiplatelet agents for prevention of pre-eclampsia: a meta-analysis of individual patient data. Lancet 2007;369:1791-8. https://doi.org/10.1016/S0140-6736(07)60712-0.
- Rolnik DL, Wright D, Poon LC, O’Gorman N, Syngelaki A, de Paco Matallana C, et al. Aspirin versus placebo in pregnancies at high risk for preterm preeclampsia. N Engl J Med 2017;377:613-22. https://doi.org/10.1056/NEJMoa1704559.
- National Collaborating Centre for Women’s and Children’s Health (UK) . Hypertension in Pregnancy: The Management of Hypertensive Disorders During Pregnancy 2010.
- NICE . Hypertension in Pregnancy: Diagnosis and Management. NICE Guideline [NG133] 2019. www.nice.org.uk/guidance/ng133 (accessed October 2020).
- Allotey J, Snell KIE, Chan C, Hooper R, Dodds J, Rogozinska E, et al. External validation, update and development of prediction models for pre-eclampsia using an individual participant data (IPD) meta-analysis: the International Prediction of Pregnancy Complication Network (IPPIC pre-eclampsia) protocol. Diagn Progn Res 2017;1. https://doi.org/10.1186/s41512-017-0016-z.
- Royston P, Thompson SG. Model-based screening by risk with application to Down’s syndrome. Stat Med 1992;11:257-68. https://doi.org/10.1002/sim.4780110211.
- Plasencia W, Maiz N, Bonino S, Kaihura C, Nicolaides KH. Uterine artery Doppler at 11 + 0 to 13 + 6 weeks in the prediction of pre-eclampsia. Ultrasound Obstet Gynecol 2007;30:742-9. https://doi.org/10.1002/uog.5157.
- Akolekar R, Zaragoza E, Poon LC, Pepes S, Nicolaides KH. Maternal serum placental growth factor at 11 + 0 to 13 + 6 weeks of gestation in the prediction of pre-eclampsia. Ultrasound Obstet Gynecol 2008;32:732-9. https://doi.org/10.1002/uog.6244.
- Poon LC, Kametas NA, Pandeva I, Valencia C, Nicolaides KH. Mean arterial pressure at 11(+ 0) to 13(+ 6) weeks in the prediction of preeclampsia. Hypertension 2008;51:1027-33. https://doi.org/10.1161/HYPERTENSIONAHA.107.104646.
- Poon LC, Maiz N, Valencia C, Plasencia W, Nicolaides KH. First-trimester maternal serum pregnancy-associated plasma protein-A and pre-eclampsia. Ultrasound Obstet Gynecol 2009;33:23-3. https://doi.org/10.1002/uog.6280.
- Poon LC, Kametas NA, Valencia C, Chelemen T, Nicolaides KH. Hypertensive disorders in pregnancy: screening by systolic diastolic and mean arterial pressure at 11–13 weeks. Hypertens Pregnancy 2011;30:93-107. https://doi.org/10.3109/10641955.2010.484086.
- O’Gorman N, Wright D, Syngelaki A, Akolekar R, Wright A, Poon LC, et al. Competing risks model in screening for preeclampsia by maternal factors and biomarkers at 11–13 weeks gestation. Am J Obstet Gynecol 2016;214:103-103.e12. https://doi.org/10.1016/j.ajog.2015.08.034.
- Wright D, Akolekar R, Syngelaki A, Poon LC, Nicolaides KH. A competing risks model in early screening for preeclampsia. Fetal Diagn Ther 2012;32:171-8. https://doi.org/10.1159/000338470.
- Akolekar R, Syngelaki A, Poon L, Wright D, Nicolaides KH. Competing risks model in early screening for preeclampsia by biophysical and biochemical markers. Fetal Diagn Ther 2013;33:8-15. https://doi.org/10.1159/000341264.
- Wald NJ, Cuckle H, Brock JH, Peto R, Polani PE, Woodford FP. Maternal serum-alpha-fetoprotein measurement in antenatal screening for anencephaly and spina bifida in early pregnancy. Report of U.K. collaborative study on alpha-fetoprotein in relation to neural-tube defects. Lancet 1977;1:1323-32. https://doi.org/10.1016/S0140-6736(77)92549-1.
- American College of Obstetricians and Gynecologists, Task Force on Hypertension in Pregnancy . Hypertension in pregnancy. Report of the American College of Obstetricians and Gynecologists’ Task Force on Hypertension in Pregnancy. Obstet Gynecol 2013;122:1122-31. https://doi.org/10.1097/01.AOG.0000437382.03963.88.
- American College of Obstetricians and Gynecologists Committee opinion no . 743: low-dose aspirin use during pregnancy. Obstet Gynecol 2018;132:e44-e52. https://doi.org/10.1097/AOG.0000000000002708.
- Goetzinger KR, Singla A, Gerkowicz S, Dicke JM, Gray DL, Odibo AO. Predicting the risk of pre-eclampsia between 11 and 13 weeks’ gestation by combining maternal characteristics and serum analytes, PAPP-A and free β-hCG. Prenat Diagn 2010;30:1138-42. https://doi.org/10.1002/pd.2627.
- Poon LC, Kametas NA, Chelemen T, Leal A, Nicolaides KH. Maternal risk factors for hypertensive disorders in pregnancy: a multivariate approach. J Hum Hypertens 2010;24:104-10. https://doi.org/10.1038/jhh.2009.45.
- Odibo AO, Zhong Y, Goetzinger KR, Odibo L, Bick JL, Bower CR, et al. First-trimester placental protein 13, PAPP-A, uterine artery Doppler and maternal characteristics in the prediction of pre-eclampsia. Placenta 2011;32:598-602. https://doi.org/10.1016/j.placenta.2011.05.006.
- Kuc S, Koster MP, Franx A, Schielen PC, Visser GH. Maternal characteristics, mean arterial pressure and serum markers in early prediction of preeclampsia. PLOS ONE 2013;8. https://doi.org/10.1371/journal.pone.0063546.
- Scazzocchio E, Figueras F, Crispi F, Meler E, Masoller N, Mula R, et al. Performance of a first-trimester screening of preeclampsia in a routine care low-risk setting. Am J Obstet Gynecol 2013;208:203-203.e10. https://doi.org/10.1016/j.ajog.2012.12.016.
- Baschat AA, Magder LS, Doyle LE, Atlas RO, Jenkins CB, Blitzer MG. Prediction of preeclampsia utilizing the first trimester screening examination. Am J Obstet Gynecol 2014;211:514-7. https://doi.org/10.1016/j.ajog.2014.04.018.
- Crovetto F, Figueras F, Triunfo S, Crispi F, Rodriguez-Sureda V, Dominguez C, et al. First trimester screening for early and late preeclampsia based on maternal characteristics, biophysical parameters, and angiogenic factors. Prenat Diagn 2015;35:183-91. https://doi.org/10.1002/pd.4519.
- Tan MY, Koutoulas L, Wright D, Nicolaides KH, Poon LCY. Protocol for the prospective validation study: ‘screening programme for pre-eclampsia’ (SPREE). Ultrasound Obstet Gynecol 2017;50:175-9. https://doi.org/10.1002/uog.17467.
- Robinson HP, Fleming JE. A critical evaluation of sonar ‘crown-rump length’ measurements. Br J Obstet Gynaecol 1975;82:702-10.
- Poon LC, Zymeri NA, Zamprakou A, Syngelaki A, Nicolaides KH. Protocol for measurement of mean arterial pressure at 11–13 weeks’ gestation. Fetal Diagn Ther 2012;31:42-8. https://doi.org/10.1159/000335366.
- Wright D, Syngelaki A, Akolekar R, Poon LC, Nicolaides KH. Competing risks model in screening for preeclampsia by maternal characteristics and medical history. Am J Obstet Gynecol 2015;213:62-62.e10. https://doi.org/10.1016/j.ajog.2015.02.018.
- Brown MA, Lindheimer MD, de Swiet M, Van Assche A, Moutquin JM. The classification and diagnosis of the hypertensive disorders of pregnancy: statement from the International Society for the Study of Hypertension in Pregnancy (ISSHP). Hypertens Pregnancy 2001;20:IX-XIV. https://doi.org/10.1081/PRG-100104165.
- Wright D, Tan MY, O’Gorman N, Poon LC, Syngelaki A, Wright A, et al. Predictive performance of the competing risk model in screening for preeclampsia. Am J Obstet Gynecol 2019;220:199-199.e13. https://doi.org/10.1016/j.ajog.2018.11.1087.
- Gilk W, Richardson S, Spiegelhalter D. Markov Chain Monte Carlo in Practice. Boca Raton, FL: Chapman & Hall; 1998.
- Bossuyt PM, Reitsma JB, Bruns DE, Gatsonis CA, Glasziou PP, Irwig L, et al. STARD 2015: an updated list of essential items for reporting diagnostic accuracy studies. BMJ 2015;351. https://doi.org/10.1136/bmj.h5527.
- Tan MY, Wright D, Syngelaki A, Akolekar R, Cicero S, Janga D, et al. Comparison of diagnostic accuracy of early screening for pre-eclampsia by NICE guidelines and a method combining maternal factors and biomarkers: results of SPREE. Ultrasound Obstet Gynecol 2018;51:743-50. https://doi.org/10.1002/uog.19039.
- O’Gorman N, Wright D, Poon LC, Rolnik DL, Syngelaki A, Wright A, et al. Accuracy of competing-risks model in screening for pre-eclampsia by maternal factors and biomarkers at 11–13 weeks’ gestation. Ultrasound Obstet Gynecol 2017;49:751-5. https://doi.org/10.1002/uog.17399.
- Rolnik DL, Wright D, Poon LCY, Syngelaki A, O’Gorman N, de Paco Matallana C, et al. ASPRE trial: performance of screening for preterm pre-eclampsia. Ultrasound Obstet Gynecol 2017;50:492-5. https://doi.org/10.1002/uog.18816.
- Oliveira N, Magder LS, Blitzer MG, Baschat AA. First-trimester prediction of pre-eclampsia: external validity of algorithms in a prospectively enrolled cohort. Ultrasound Obstet Gynecol 2014;44:279-85. https://doi.org/10.1002/uog.13435.
- Al-Rubaie Z, Askie LM, Ray JG, Hudson HM, Lord SJ. The performance of risk prediction models for pre-eclampsia using routinely collected maternal characteristics and comparison with models that include specialised tests and with clinical guideline decision rules: a systematic review. BJOG 2016;123:1441-52. https://doi.org/10.1111/1471-0528.14029.
- Wright D, Poon LC, Rolnik DL, Syngelaki A, Delgado JL, Vojtassakova D, et al. Aspirin for Evidence-Based Preeclampsia Prevention trial: influence of compliance on beneficial effect of aspirin in prevention of preterm preeclampsia. Am J Obstet Gynecol 2017;217:685-685.e5. https://doi.org/10.1016/j.ajog.2017.08.110.
- Tayyar A, Guerra L, Wright A, Wright D, Nicolaides KH. Uterine artery pulsatility index in the three trimesters of pregnancy: effects of maternal characteristics and medical history. Ultrasound Obstet Gynecol 2015;45:689-97. https://doi.org/10.1002/uog.14789.
- Tsiakkas A, Duvdevani N, Wright A, Wright D, Nicolaides KH. Serum placental growth factor in the three trimesters of pregnancy: effects of maternal characteristics and medical history. Ultrasound Obstet Gynecol 2015;45:591-8. https://doi.org/10.1002/uog.14811.
- Wright A, Wright D, Ispas CA, Poon LC, Nicolaides KH. Mean arterial pressure in the three trimesters of pregnancy: effects of maternal characteristics and medical history. Ultrasound Obstet Gynecol 2015;45:698-706. https://doi.org/10.1002/uog.14783.
- UK National Screening Committee . Fetal Anomaly Screening Programme – Screening for Down’s Syndrome: UK NSC Policy Recommendations 2007–10: Model of Best Practice 2008.
- Nicolaides KH. Turning the pyramid of prenatal care. Fetal Diagn Ther 2011;29:183-96. https://doi.org/10.1159/000324320.
- Therneau TM, Grambsch PM. Modeling Survival Data: Extending the Cox Model. New York, NY: Springer-Verlag; 2000.
- Wright A, Wright D, Syngelaki A, Georgantis A, Nicolaides KH. Two-stage screening for preterm preeclampsia at 11–13 weeks’ gestation. Am J Obstet Gynecol 2019;220:197-197.e11. https://doi.org/10.1016/j.ajog.2018.10.092.
- Roberge S, Bujold E, Nicolaides KH. Meta-analysis on the effect of aspirin use for prevention of preeclampsia on placental abruption and antepartum hemorrhage. Am J Obstet Gynecol 2018;218:483-9. https://doi.org/10.1016/j.ajog.2017.12.238.
- Muttukrishna S, Child TJ, Groome NP, Ledger WL. Source of circulating levels of inhibin A, pro alpha C-containing inhibins and activin A in early pregnancy. Hum Reprod 1997;12:1089-93. https://doi.org/10.1093/humrep/12.5.1089.
- Muttukrishna S, Knight PG, Groome NP, Redman CW, Ledger WL. Activin A and inhibin A as possible endocrine markers for pre-eclampsia. Lancet 1997;349:1285-8. https://doi.org/10.1016/S0140-6736(96)09264-1.
- Sebire NJ, Roberts L, Noble P, Wallace E, Nicolaides KH. Raised maternal serum inhibin A concentration at 10 to 14 weeks of gestation is associated with pre-eclampsia. BJOG 2000;107:795-7. https://doi.org/10.1111/j.1471-0528.2000.tb13343.x.
- Spencer K, Cowans NJ, Nicolaides KH. Maternal serum inhibin-A and activin-A levels in the first trimester of pregnancies developing pre-eclampsia. Ultrasound Obstet Gynecol 2008;32:622-6. https://doi.org/10.1002/uog.6212.
- Akolekar R, Minekawa R, Veduta A, Romero XC, Nicolaides KH. Maternal plasma inhibin A at 11–13 weeks of gestation in hypertensive disorders of pregnancy. Prenat Diagn 2009;29:753-60. https://doi.org/10.1002/pd.2279.
- Tan MY, Syngelaki A, Poon LC, Rolnik DL, O’Gorman N, Delgado JL, et al. Screening for pre-eclampsia by maternal factors and biomarkers at 11–13 weeks’ gestation. Ultrasound Obstet Gynecol 2018;52:186-95. https://doi.org/10.1002/uog.19112.
- Yu CK, Khouri O, Onwudiwe N, Spiliopoulos Y, Nicolaides KH. Fetal Medicine Foundation Second-Trimester Screening Group . Prediction of pre-eclampsia by uterine artery Doppler imaging: relationship to gestational age at delivery and small-for-gestational age. Ultrasound Obstet Gynecol 2008;31:310-13. https://doi.org/10.1002/uog.5252.
- Karagiannis G, Akolekar R, Sarquis R, Wright D, Nicolaides KH. Prediction of small-for-gestation neonates from biophysical and biochemical markers at 11–13 weeks. Fetal Diagn Ther 2011;29:148-54. https://doi.org/10.1159/000321694.
- Tan MY, Poon LC, Rolnik DL, Syngelaki A, de Paco Matallana C, Akolekar R, et al. Prediction and prevention of small-for-gestational-age neonates: evidence from SPREE and ASPRE. Ultrasound Obstet Gynecol 2018;52:52-9. https://doi.org/10.1002/uog.19077.
- Nicolaides KH, Wright D, Syngelaki A, Wright A, Akolekar R. Fetal Medicine Foundation fetal and neonatal population weight charts. Ultrasound Obstet Gynecol 2018;52:44-51. https://doi.org/10.1002/uog.19073.
- Wright D, Rolnik DL, Syngelaki A, de Paco Matallana C, Machuca M, de Alvarado M, et al. Aspirin for Evidence-Based Preeclampsia Prevention trial: effect of aspirin on length of stay in the neonatal intensive care unit. Am J Obstet Gynecol 2018;218:612-612.e6. https://doi.org/10.1016/j.ajog.2018.02.014.
- Larroque B, Ancel PY, Marret S, Marchand L, André M, Arnaud C, et al. Neurodevelopmental disabilities and special care of 5-year-old children born before 33 weeks of gestation (the EPIPAGE study): a longitudinal cohort study. Lancet 2008;371:813-20. https://doi.org/10.1016/S0140-6736(08)60380-3.
- Moster D, Lie RT, Markestad T. Long-term medical and social consequences of preterm birth. N Engl J Med 2008;359:262-73. https://doi.org/10.1056/NEJMoa0706475.
- Pierrat V, Marchand-Martin L, Arnaud C, Kaminski M, Resche-Rigon M, Lebeaux C, et al. Neurodevelopmental outcome at 2 years for preterm children born at 22 to 34 weeks’ gestation in France in 2011: EPIPAGE-2 cohort study. BMJ 2017;358. https://doi.org/10.1136/bmj.j3448.
- Rubin DB. Multiple Imputation for Nonresponse in Surveys. New York, NY: John Wiley & Sons; 1987.
Appendix 1 The competing risk model
The competing risks model18,33 for pre-eclampsia is a model for the distribution of gestational age, g (weeks), at delivery with pre-eclampsia, assuming no other-cause delivery. This distribution is obtained using Bayes’ theorem to combine a prior distribution of g, given Mat-CHs, with a likelihood function for g from biomarker MoM values. For a given posterior distribution, risks of pre-eclampsia occurring in a particular gestational age interval are obtained by integrating the posterior distribution over the interval. The model used in this appendix is from N Engl J Med, Rolnik DL, Wright D, Poon LC, O’Gorman N, Syngelaki A, de Paco Matallana C, et al. , Aspirin versus placebo in pregnancies at high risk for preterm preeclampsia, 377, 613–22. Copyright © 2017 Massachusetts Medical Society. Reprinted with permission from Massachusetts Medical Society. 7
The prior model
The prior model assumes that g has a Gaussian distribution with mean µg and standard deviation σg. The mean µg is obtained from the regression model with the parameters given in Table 22.
| Term | Coefficient |
|---|---|
| Constant | 54.3637 |
| Age (years) (–35 if age > 35; 0 if age < 35) | –0.206886 |
| Height (cm): 164 | 0.11711 |
| Afro-Caribbean racial origin | –2.6786 |
| South Asian racial origin | –1.129 |
| Chronic hypertension | –7.2897 |
| Systemic lupus erythematosus or antiphospolipid syndrome | –3.0519 |
| Conception by in vitro fertilisation | –1.6327 |
| Parous with previous pre-eclampsia | –8.1667 |
| Parous with previous pre-eclampsia: [previous GA (week)–24]2 | 0.0271988 |
| Parous with no previous pre-eclampsia: intercept | –4.335 |
| Parous with no previous pre-eclampsia: interval (years)–1 | –4.15137651 |
| Parous with no previous pre-eclampsia: interval (years)–0.5 | 9.21473572 |
| Parous with no previous pre-eclampsia: [previous GA (week)–24]2 | 0.01549673 |
| (Weight in kg – 69) × (not CH) | –0.0694096 |
| (Family history of pre-eclampsia) × (not CH) | –1.7154 |
| [Diabetes mellitus (type 1 or 2)] × (not CH) | –3.3899 |
| Scale | 6.8833 |
| Age lower limit | 12 |
| Age upper limit | 55 |
| Weight lower limit | 34 |
| Weight upper limit | 190 |
| Height lower limit | 127 |
| Height upper limit | 198 |
| Interval lower limit | 0.25 |
| Interval upper limit | 15 |
| Previous GA lower limit | 24 |
| Previous GA upper limit | 42 |
Likelihood
The likelihood is a multivariate Gaussian density for the distribution of biomarker log10 MoM values conditional on g. The elements of the mean vector (µx) of this distribution are given by the broken stick model:
0 else.
The estimated regression parameters and biomarker likelihood covariance matrix are given in Tables 23 and 24, respectively.
| Term | Intercept | Slope |
|---|---|---|
| m1 | 0.08900 | 0.0016711 |
| u1 | 0.58610 | –0.014233 |
| plgf1 | –0.92352 | 0.021584 |
| p1 | –0.59273 | 0.013836 |
| Term | m1 | u1 | plgf1 | p1 |
|---|---|---|---|---|
| m1 | 0.001413964 | –0.000272567 | –0.000190680 | –0.000030300 |
| u1 | –0.000272567 | 0.016309062 | –0.003453917 | –0.004901669 |
| plgf1 | –0.00019068 | –0.003453917 | 0.031472254 | 0.013331676 |
| p1 | –0.000030300 | –0.004901669 | 0.013331676 | 0.056500355 |
Posterior probability density
The posterior probability density p(g), up to a normalising constant, is calculated by multiplying the likelihood by the prior:
In Equation 4, dmvnorm is the multivariate Gaussian density for x, with mean µx and covariance matrix Σx. dnorm is the univariate Gaussian density for g, with mean µg and standard deviation σg according to the history model.
Posterior risks
The risk of pre-eclampsia requiring delivery before gestation G (weeks), assuming no other-cause delivery is given by:
where g* = max(24, Current gestation).
Appendix 2 WinBUGS model for data imputation
Data
-
n: 16,747.
-
n.centre: 7.
-
centre: vector of 16,747 centre labels.
-
event: vector of 16,747 observed pre-eclampsia events (0 = no event; 1 = pre-eclampsia).
-
aspirin: vector of 16,747 aspirin indicators (0 = no aspirin; 1 = aspirin).
-
nice: vector of 16,747 indicators (0 = NICE negative, 1 = NICE positive).
-
risk: vector of 16,747 indicators (0 = risk negative, 1 = risk positive).
5000 Markov chain Monte Carlo iterations were carried out to ensure convergence and checked visually using parameter trace plots.
A further 1000 iterations were carried out and values of the counts s1, s2, s3 and s4 were recorded for observation 100, 200, . . . , 1000, providing 10 imputed data sets. The observed event counts and imputed counts, assuming a relative risk reduction with aspirin of 0.3, allowing for the effects of aspirin are shown in Table 25. It is notable that the number of events imputed in the NICE positive and risk negative cell exceeds that in the NICE negative and risk positive group. The reflects the different numbers treated by aspirin in the two groups. This reduces the effect size (see Figures 8 and 9).
| Data set | NICE, risk | |||
|---|---|---|---|---|
| Positive, positive | Positive, negative | Negative, positive | Negative, negative | |
| Observed events | 119 | 25 | 83 | 119 |
| Imputation 5100 | 125 | 30 | 83 | 125 |
| Imputation 5200 | 123 | 30 | 83 | 123 |
| Imputation 5300 | 124 | 26 | 83 | 124 |
| Imputation 5400 | 121 | 30 | 83 | 121 |
| Imputation 5500 | 122 | 26 | 85 | 122 |
| Imputation 5600 | 124 | 31 | 83 | 124 |
| Imputation 5700 | 127 | 32 | 83 | 127 |
| Imputation 5800 | 125 | 30 | 83 | 125 |
| Imputation 5900 | 124 | 27 | 84 | 124 |
| Imputation 6000 | 126 | 27 | 83 | 126 |
Estimates and their standard errors of the difference in DRs were computed for each of the imputed data sets. These were then pooled using the formula (3.1.2) of Rubin. 66
Appendix 3 Sensitivity analysis for the effect of aspirin
All pre-eclampsia
Difference in DRs (i.e. mini-combined test – NICE method) of pre-eclampsia at any gestational age for a fixed SPR of 10.3% defined by NICE (Figure 20).
FIGURE 20.
Difference in DRs for pre-eclampsia with delivery at any gestational age [mini-combined test (i.e. Mat-CHs, MAP + PAPP-A) vs. the NICE method] with a relative risk reduction from aspirin of (a) 30%; (b) 50%; and (c) 100%.
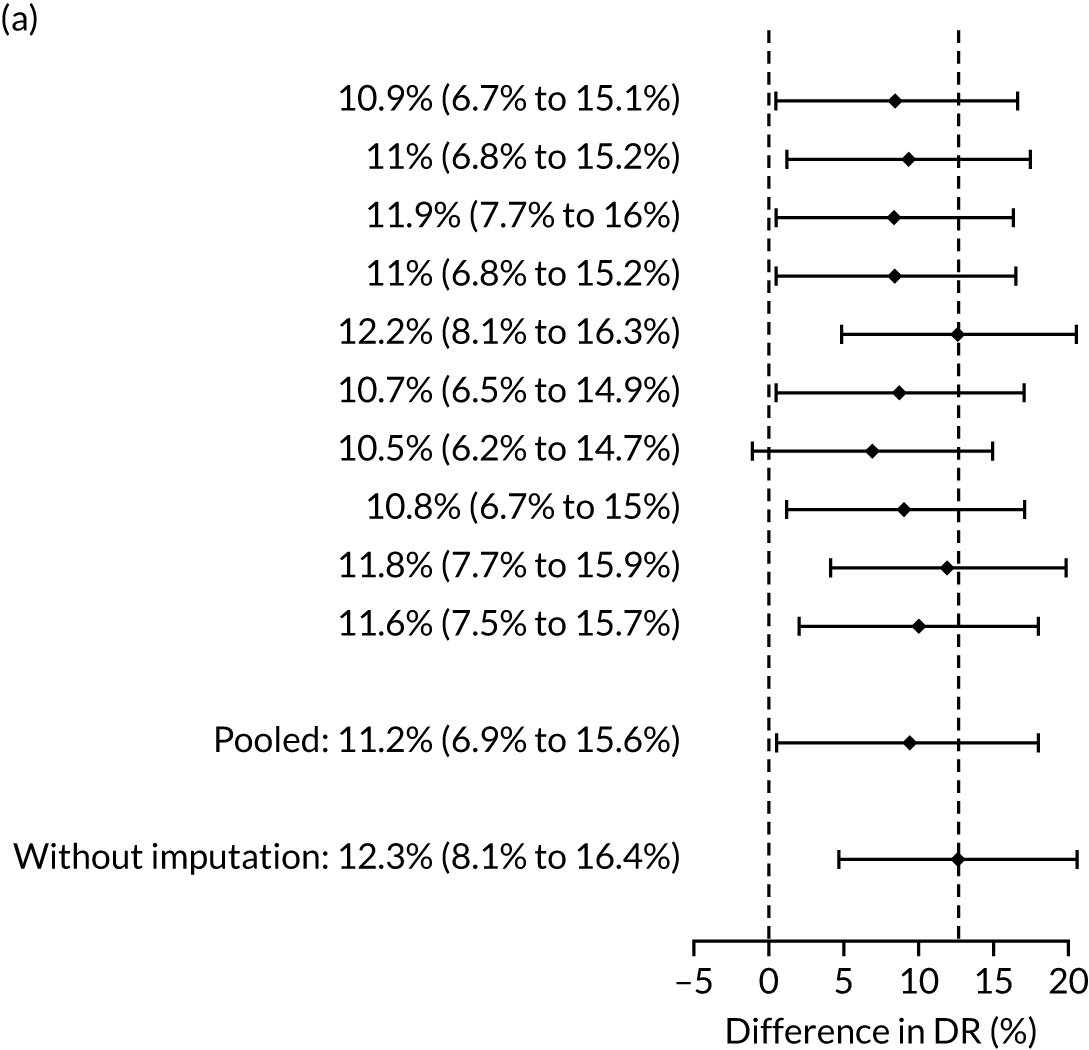
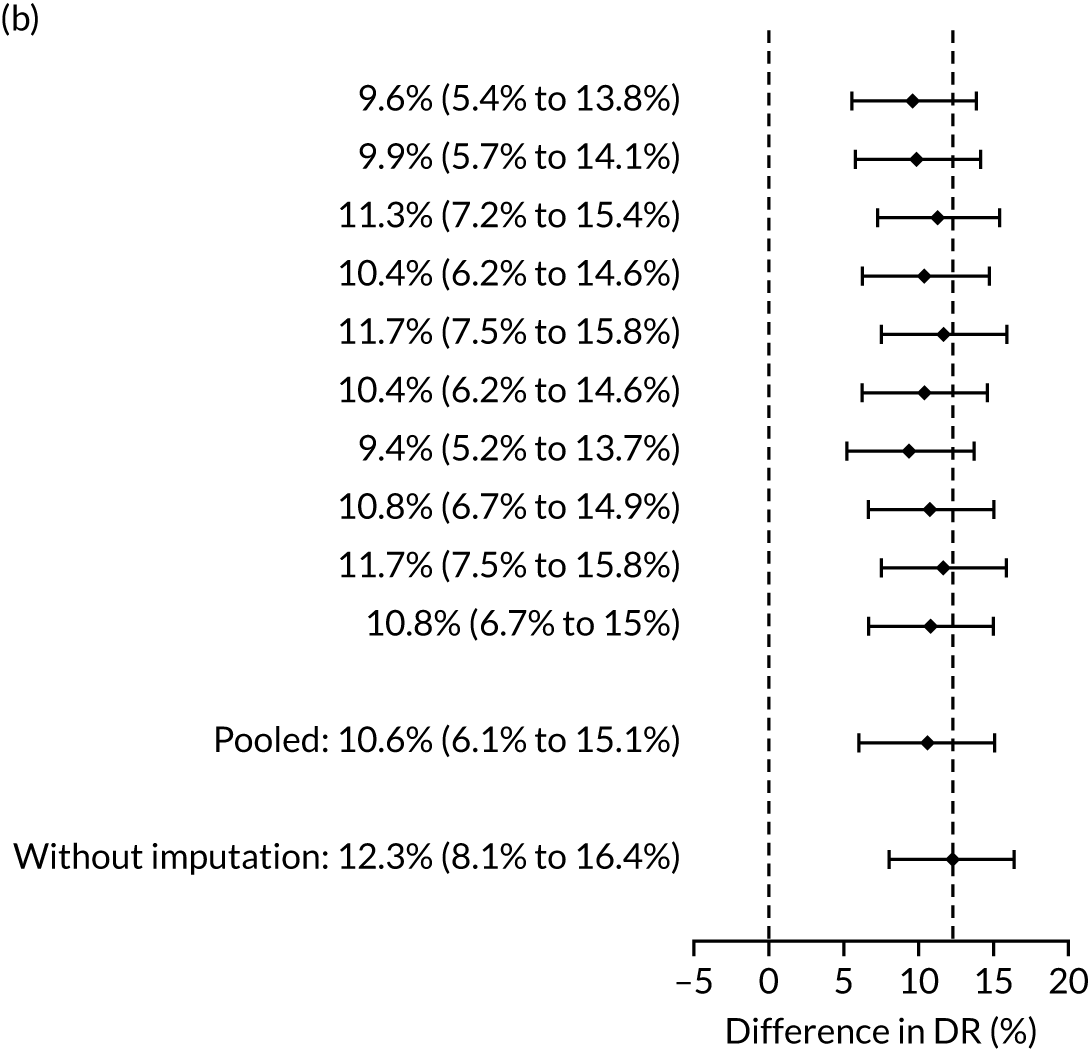
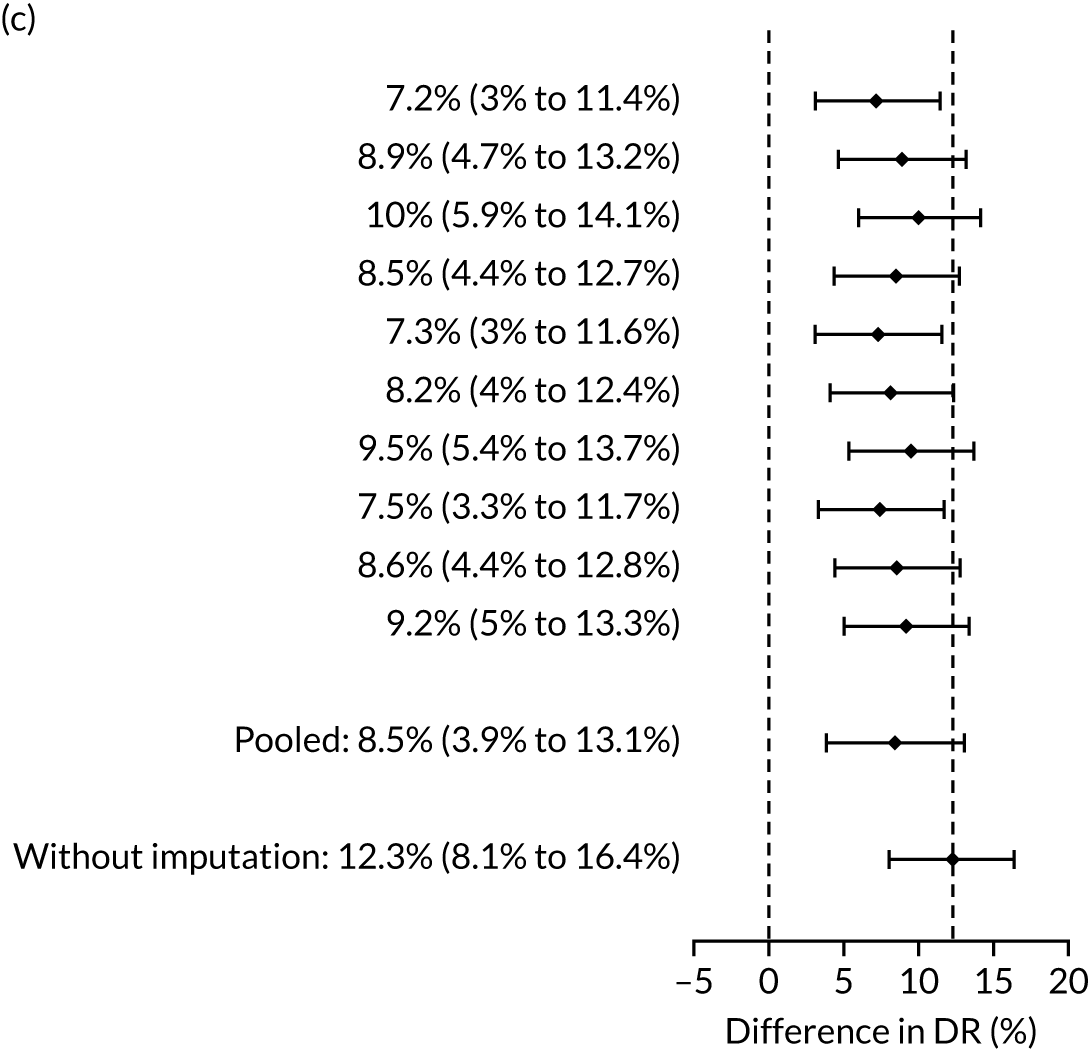
Pre-eclampsia with delivery before 37 weeks
Difference in DRs (i.e. mini-combined test vs. NICE method) of preterm pre-eclampsia (< 37 weeks’ gestation) for a fixed SPR of 10.3% defined by NICE (Figure 21).
FIGURE 21.
Difference in DRs (Mat-CHs + MAP + PAPP-A vs. the NICE method) with a relative risk reduction from aspirin of (a) 60%; (b) 80%; and (c) 100%.
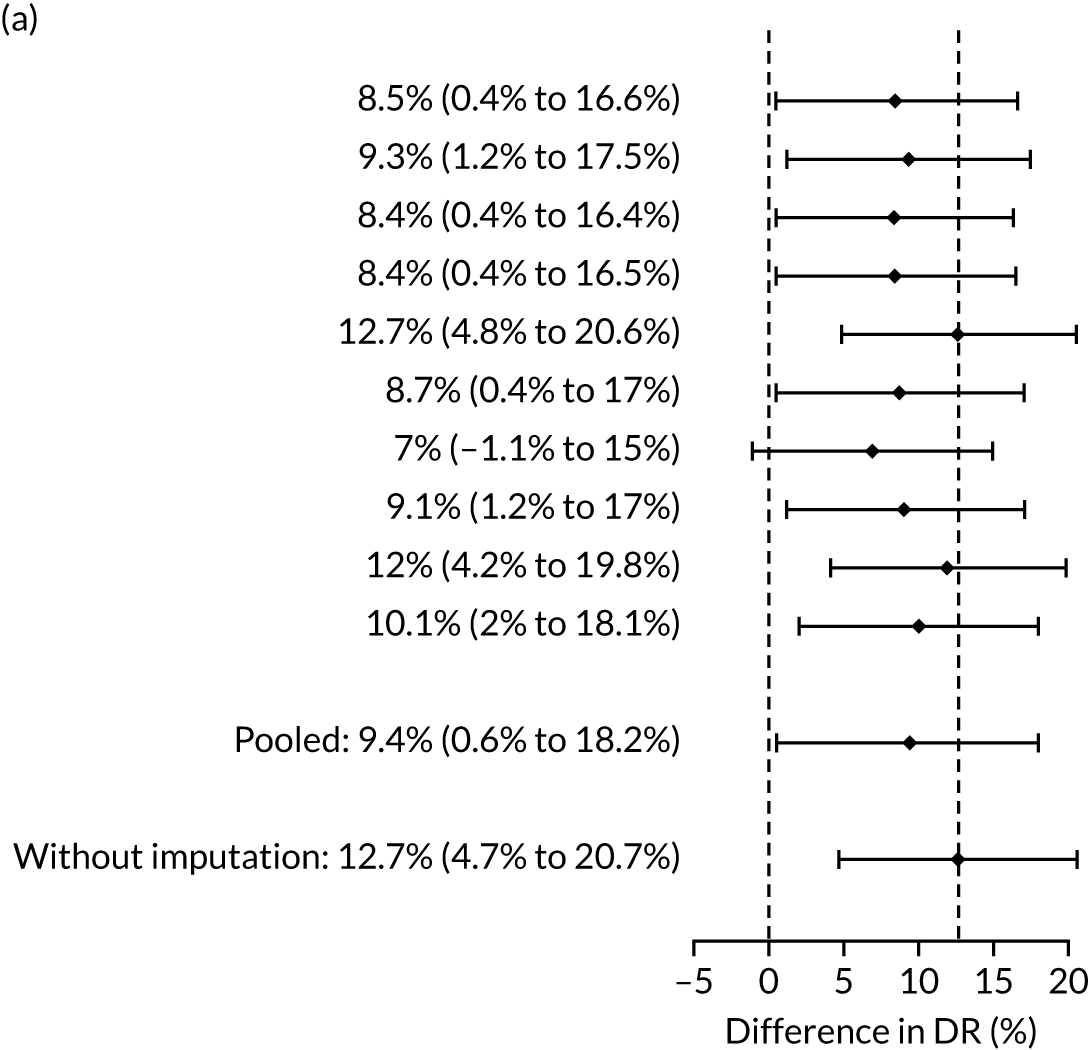
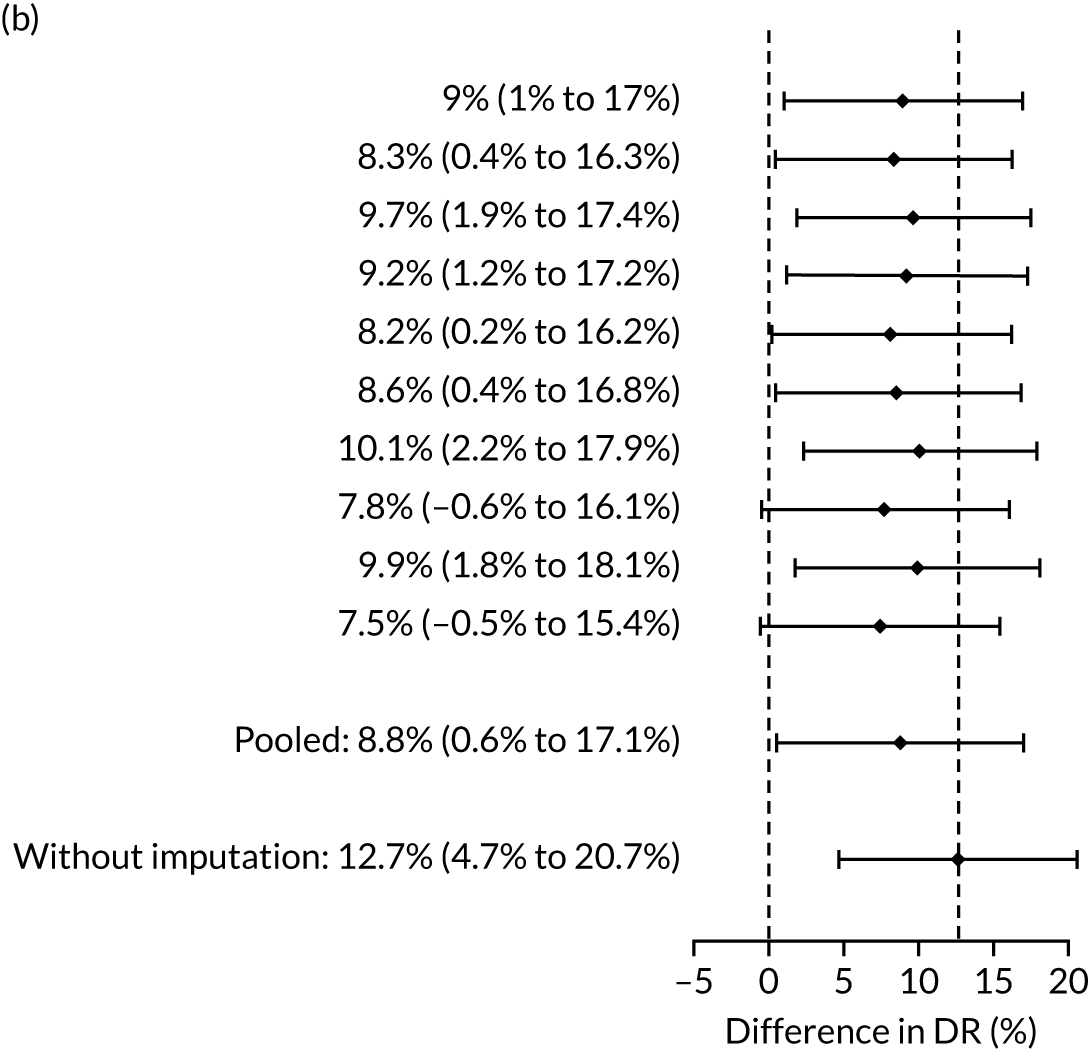
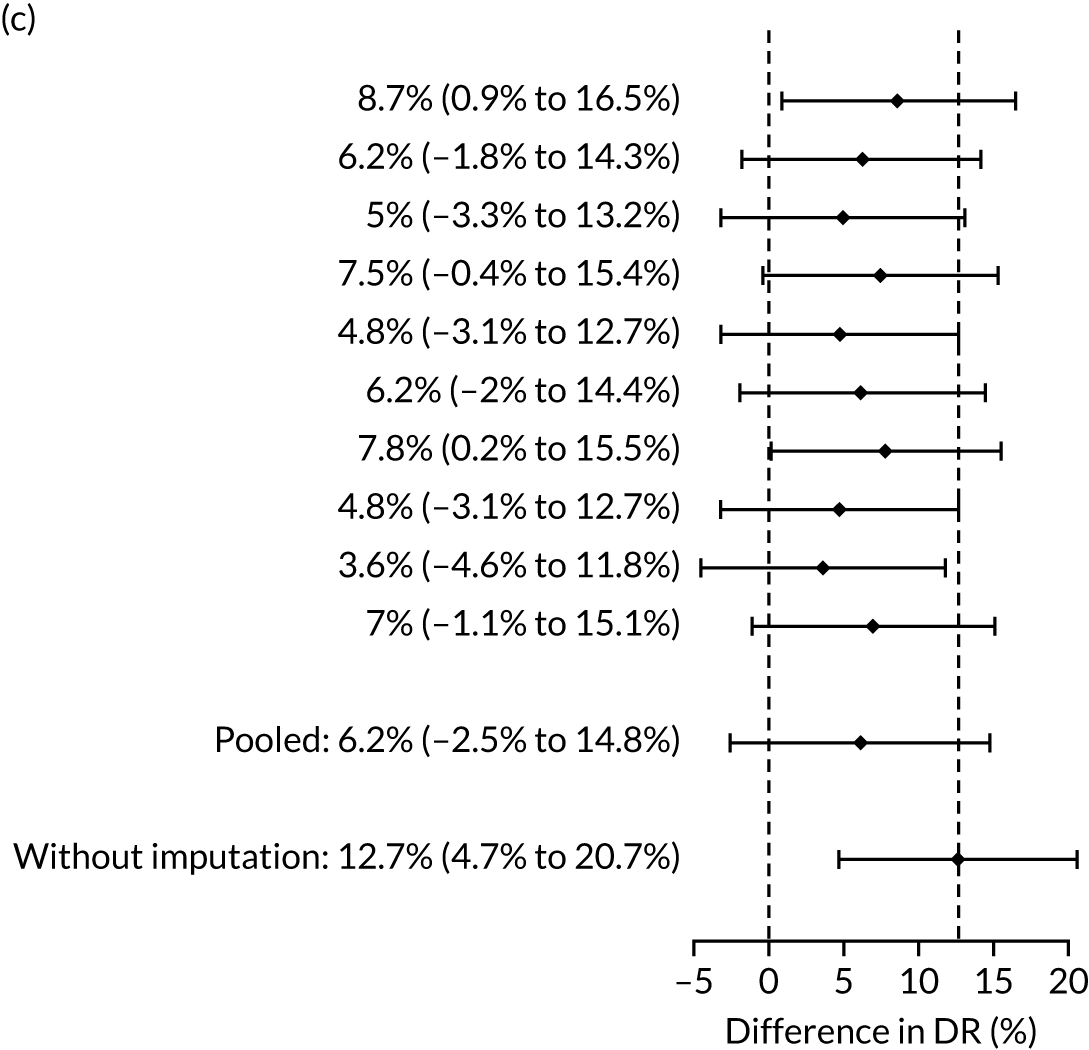
Pre-eclampsia with delivery before 37 weeks
Difference in DRs (i.e. Mat-CHs, MAP and PLGF vs. the NICE method) of preterm pre-eclampsia (< 37 weeks’ gestation) for a fixed SPR of 10.3% defined by NICE (Figure 22).
FIGURE 22.
Difference in DRs (Mat-CHs + MAP + PLGF vs. the NICE method) with a relative risk reduction from aspirin of (a) 60%; (b) 80%; and (c) 100%.
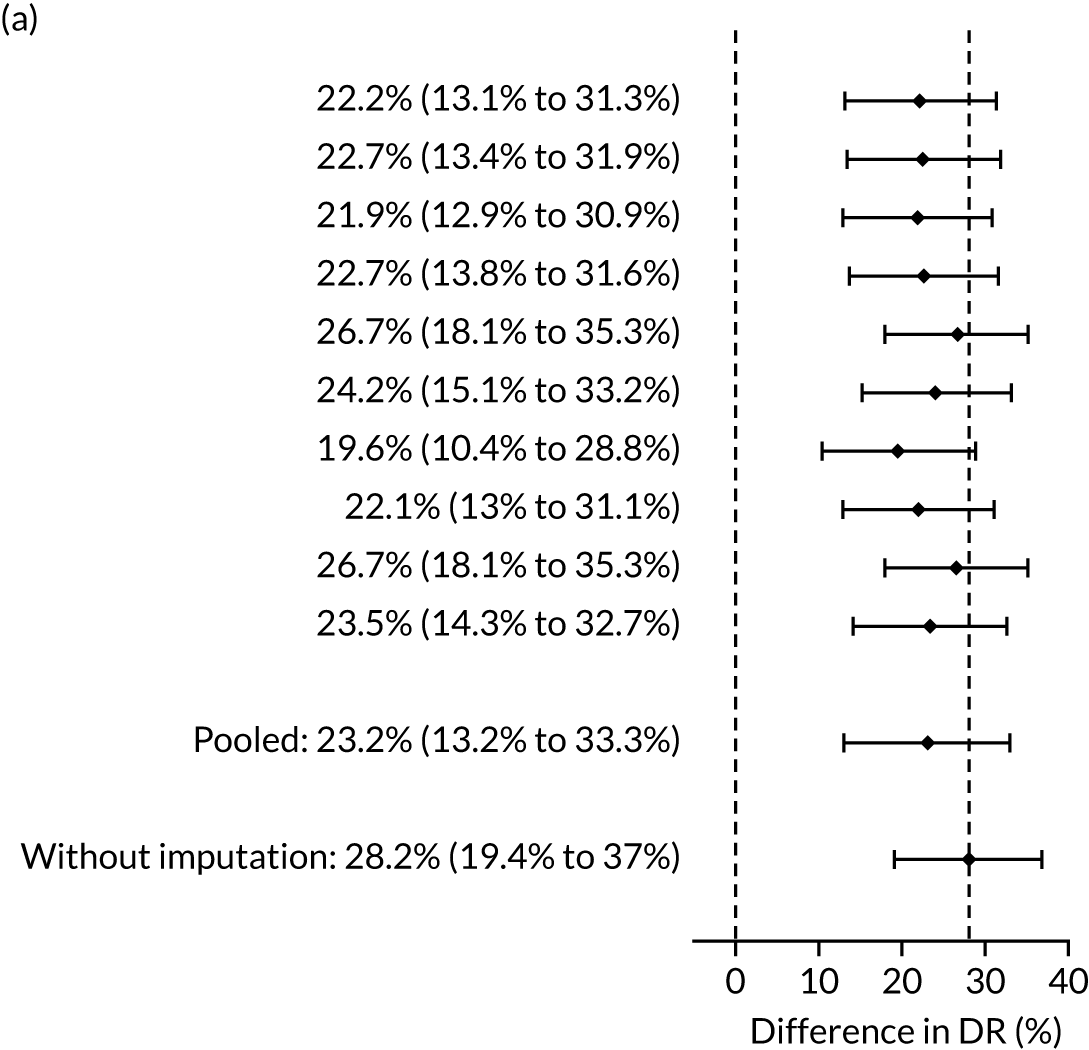
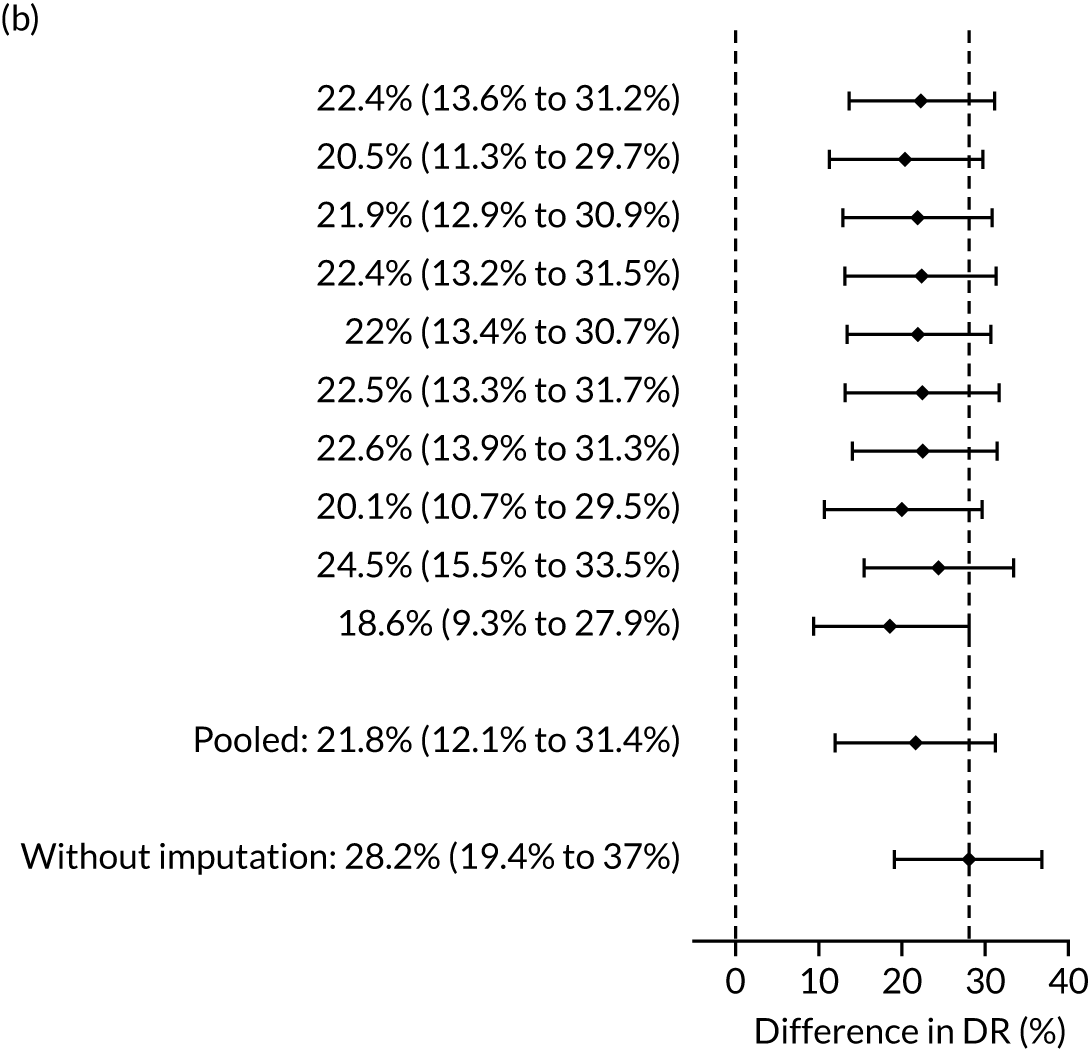
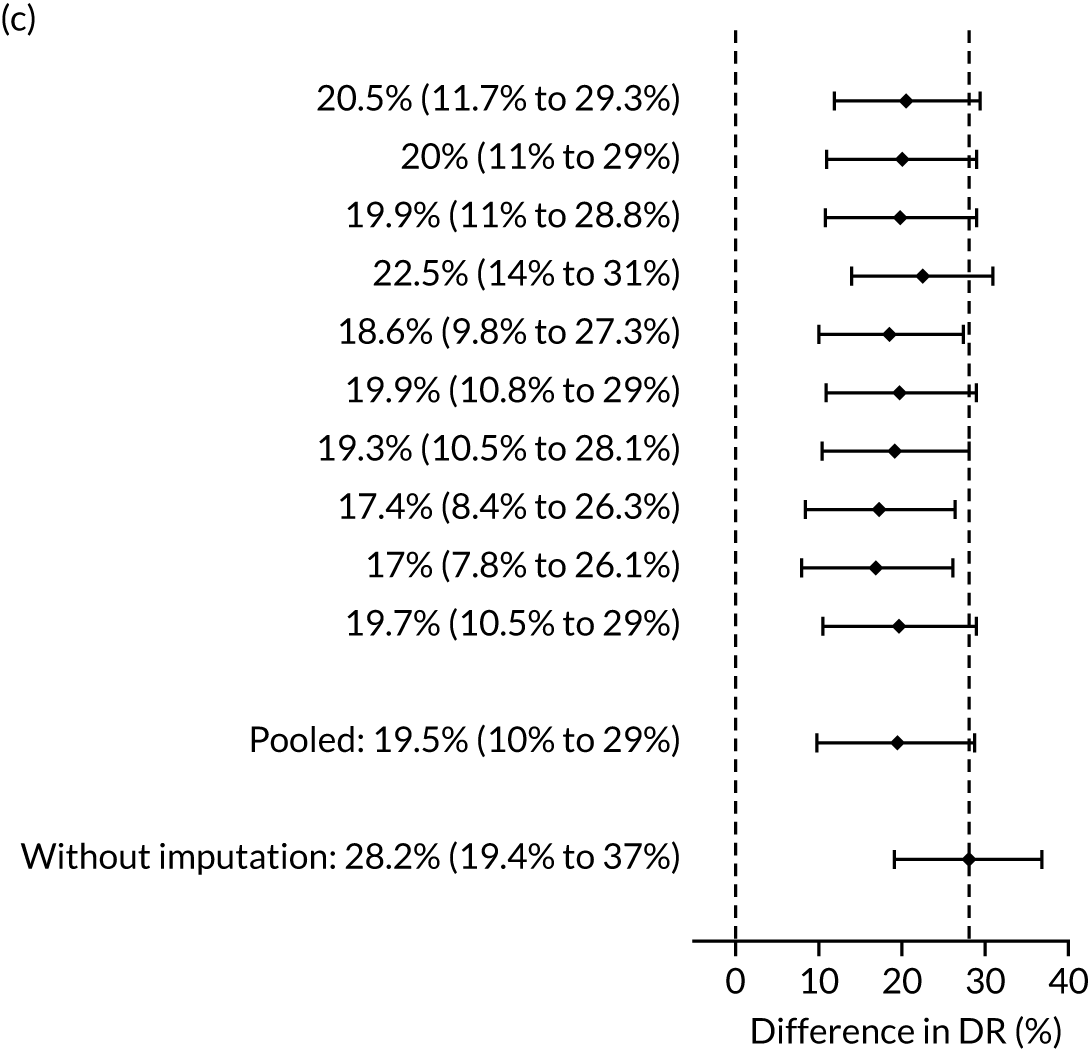
Pre-eclampsia with delivery before 37 weeks
Difference in DRs (i.e. Mat-CHs, MAP, UTA-PI and PLGF vs. the NICE method) of preterm pre-eclampsia (< 37 weeks’ gestation) for a fixed SPR of 10.3% defined by NICE (Figure 23).
FIGURE 23.
Difference in DRs (Mat-CHs + MAP + PLGF vs. the NICE method) with a relative risk reduction from aspirin of (a) 60%; (b) 80%; and (c) 100%.
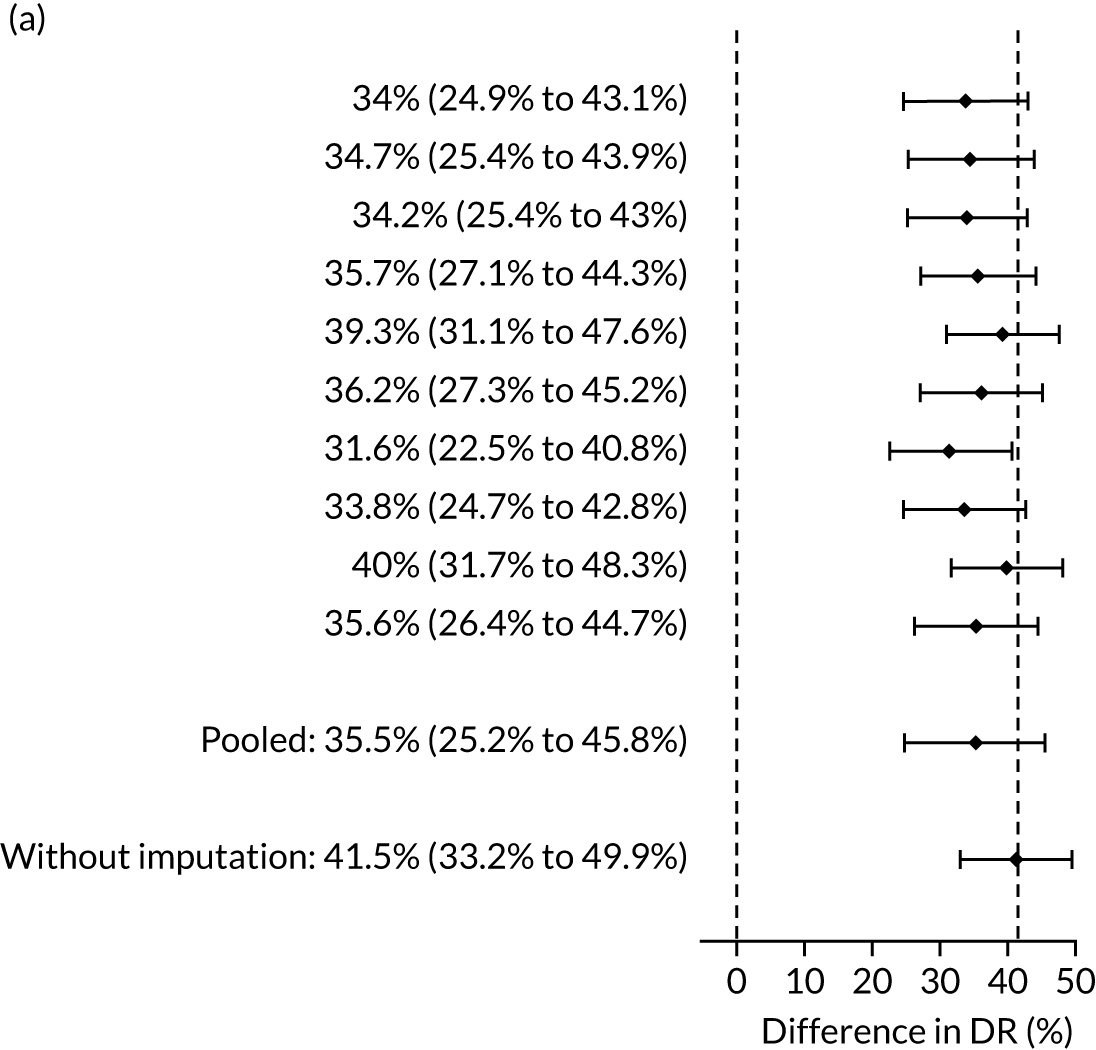
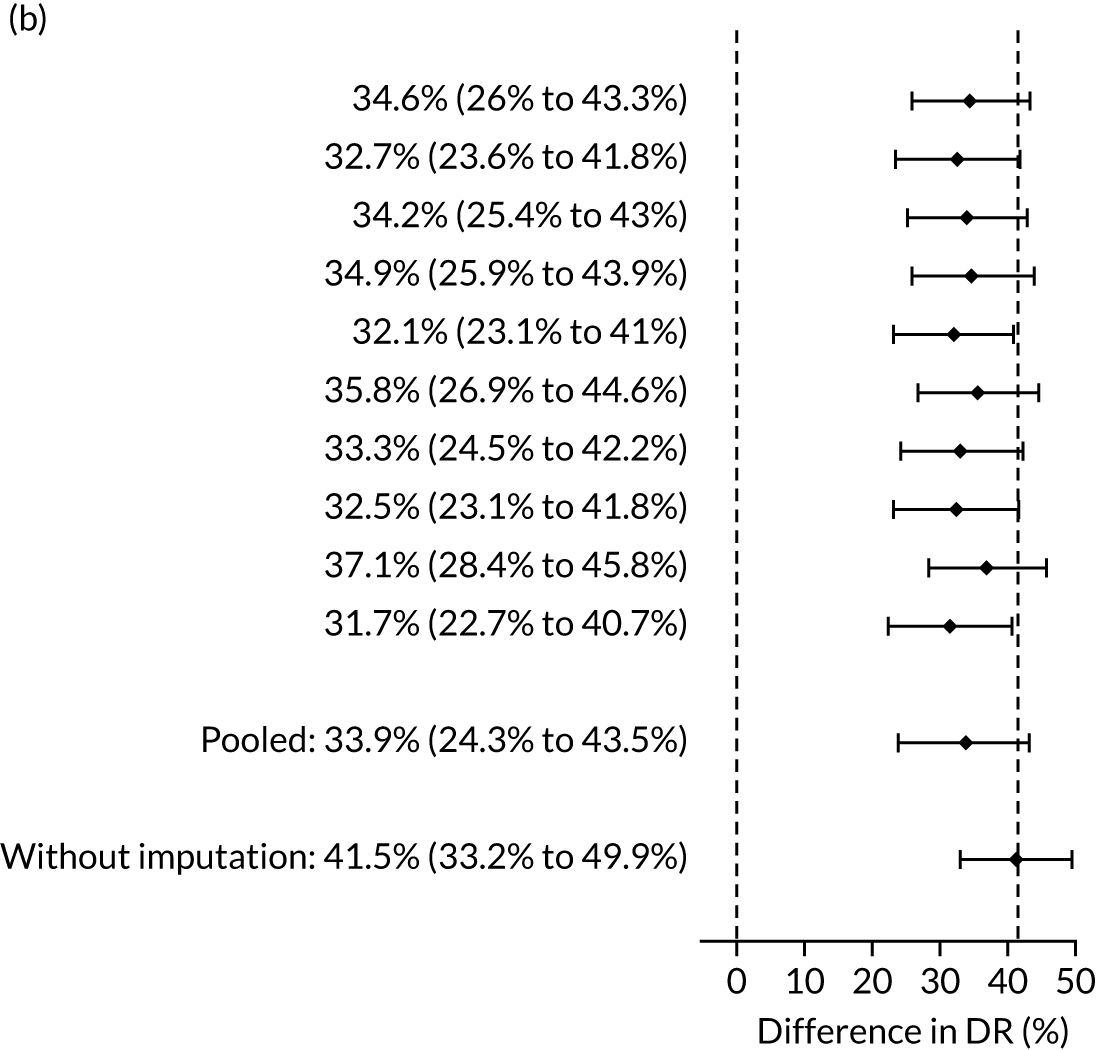
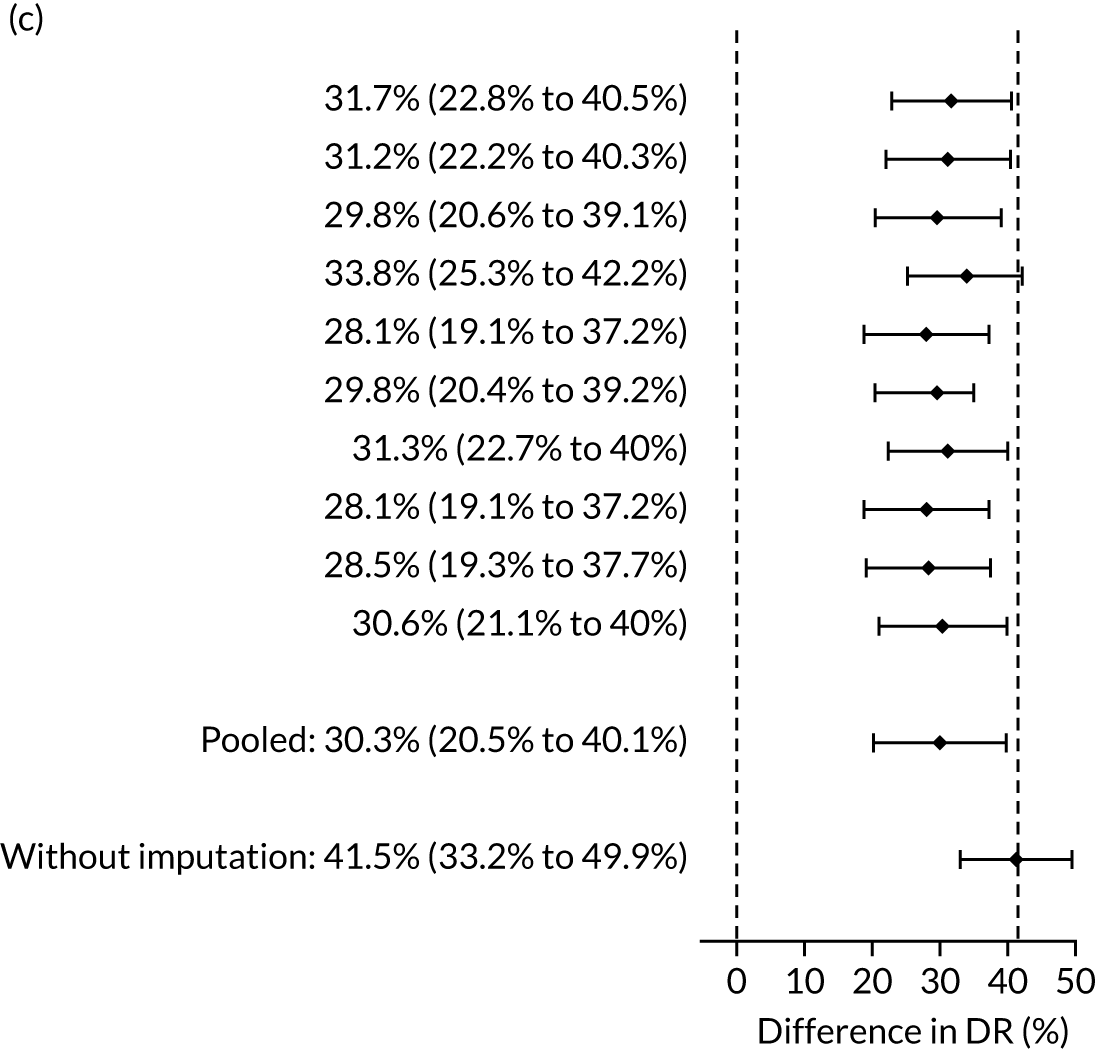
Appendix 4 Performance of screening for pre-eclampsia by the competing risk model
In the receiver operating characteristic plots (Figures 24–32) the dark blue line is for prediction of pre-eclampsia at < 32 weeks’ gestation, the light blue line for pre-eclampsia at < 37 weeks’ gestation, the grey line for pre-eclampsia at ≥ 37 weeks’ gestation and the orange line for all pre-eclampsia. The circles indicate the DR and FPR achieved by the NICE guidelines.
FIGURE 24.
Performance of screening for pre-eclampsia with Mat-CHs.
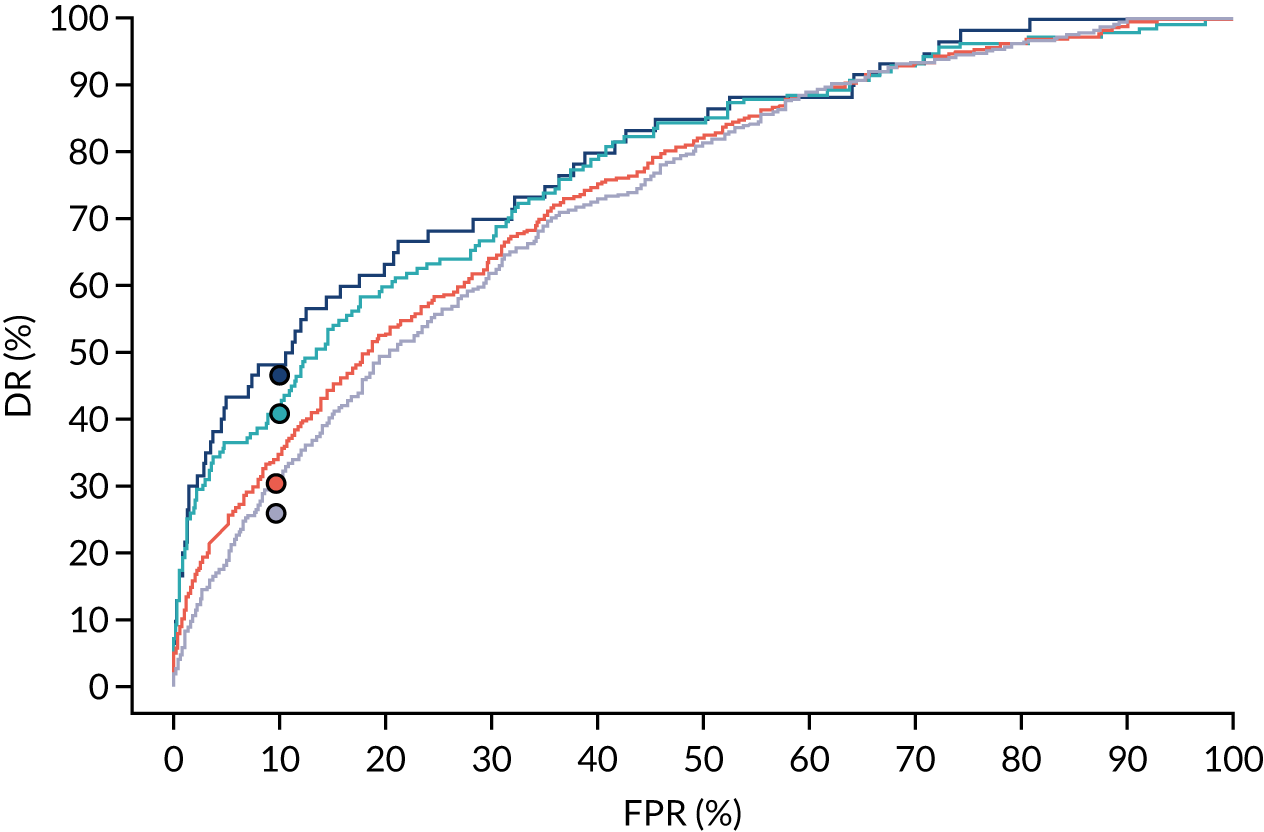
FIGURE 25.
Performance of screening for pre-eclampsia with Mat-CHs and MAP.
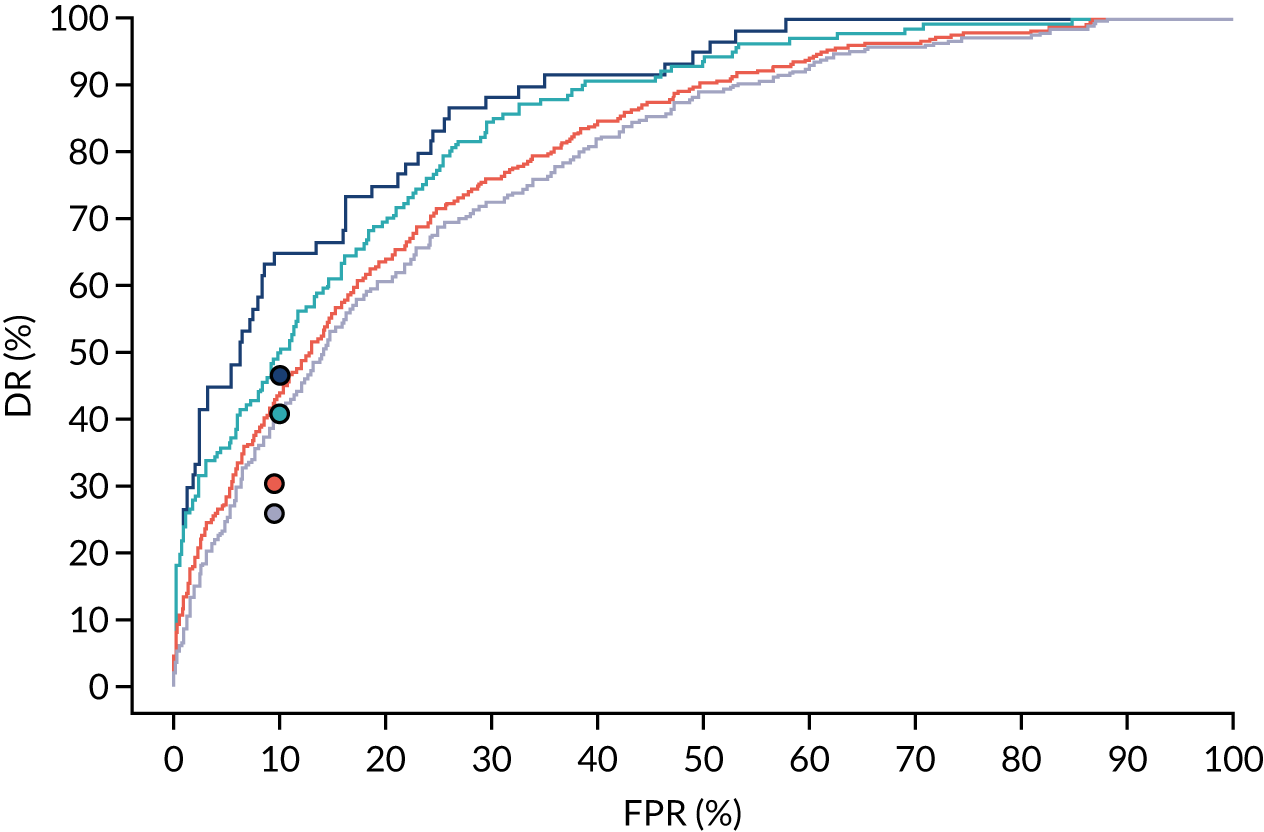
FIGURE 26.
Performance of screening for pre-eclampsia with Mat-CHs and UTA-PI.
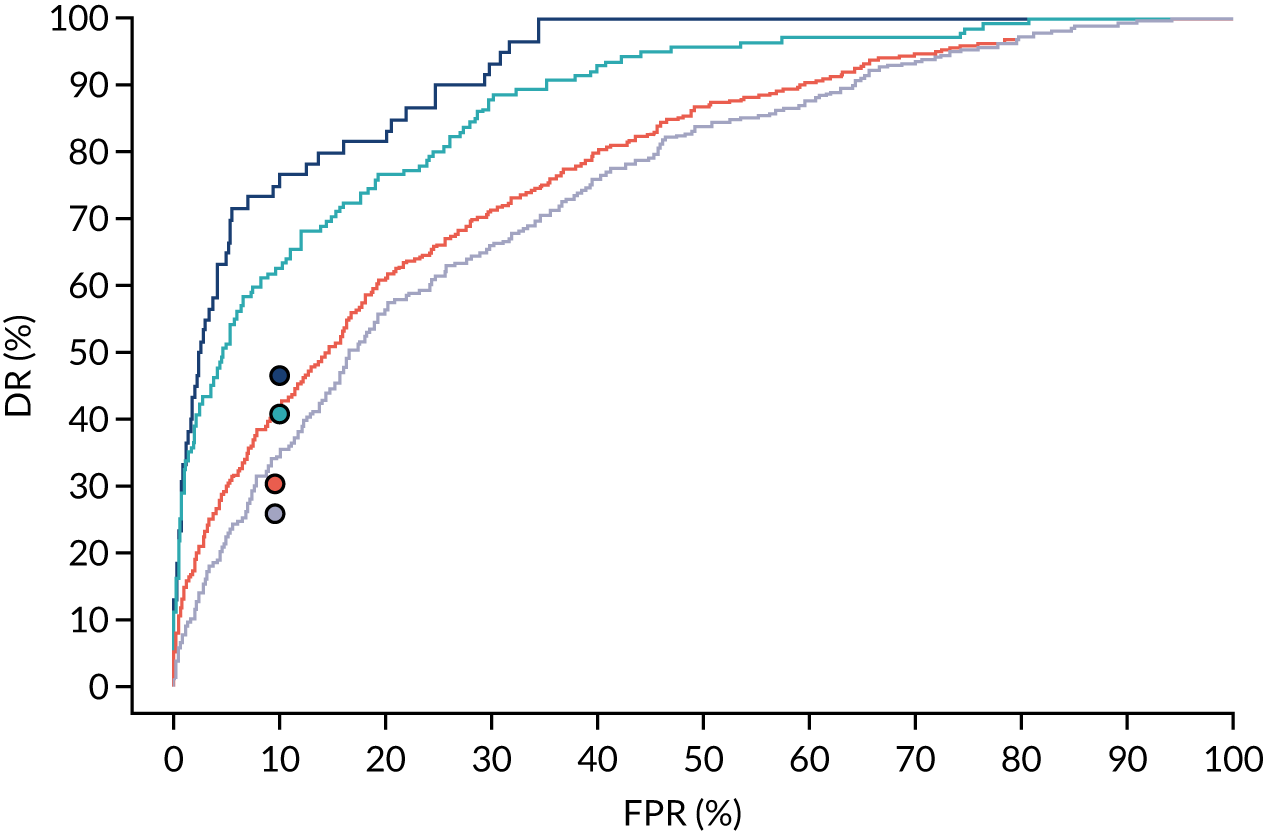
FIGURE 27.
Performance of screening for pre-eclampsia with Mat-CHs and PLGF.
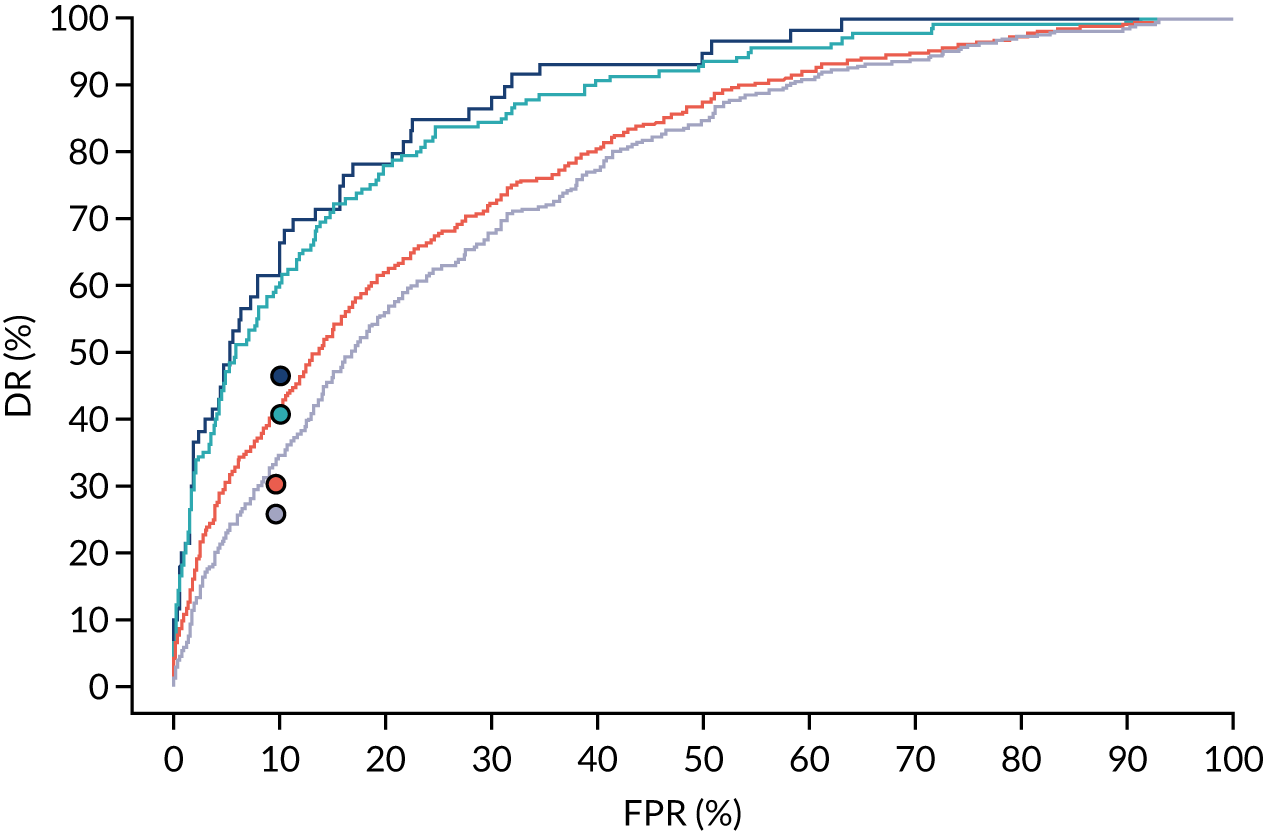
FIGURE 28.
Performance of screening for pre-eclampsia with Mat-CHs and PAPP-A.
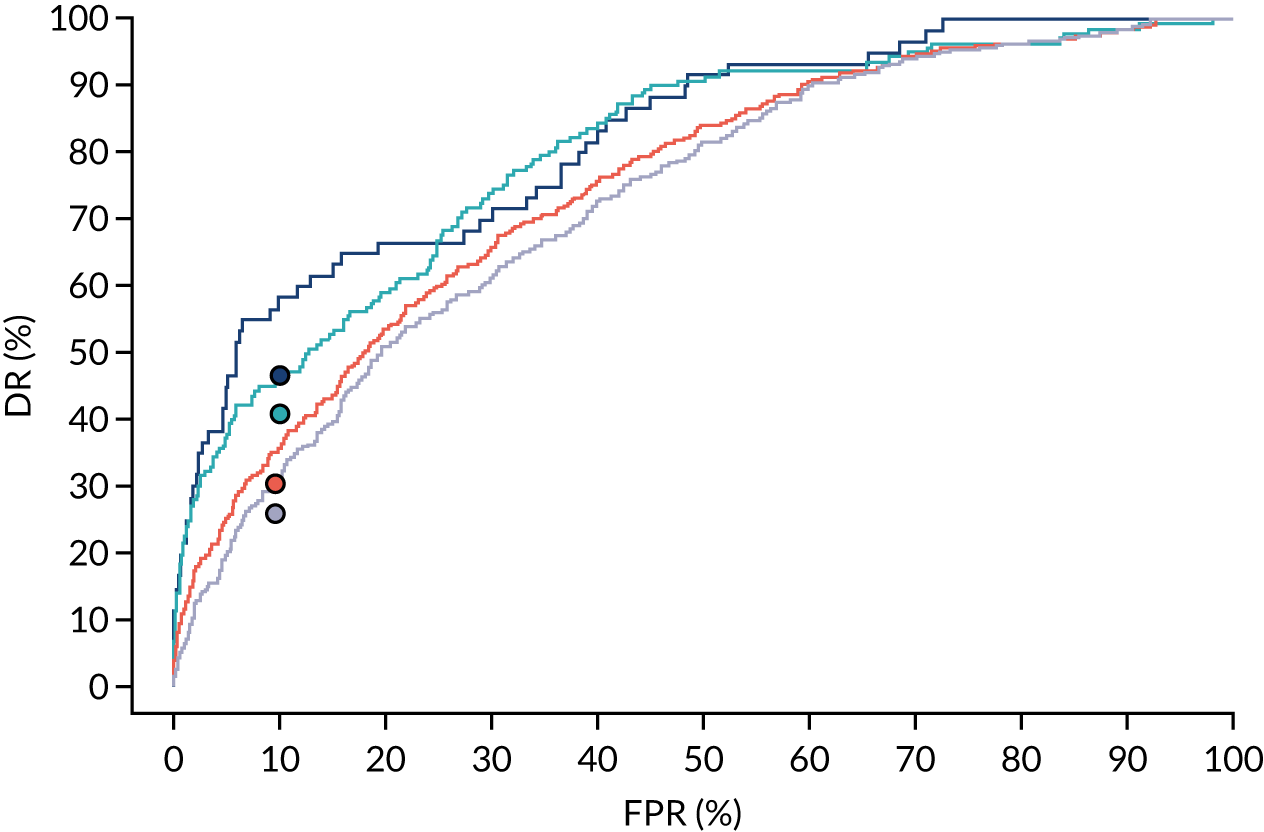
FIGURE 29.
Performance of screening for pre-eclampsia with Mat-CHs, MAP and UTA-PI.
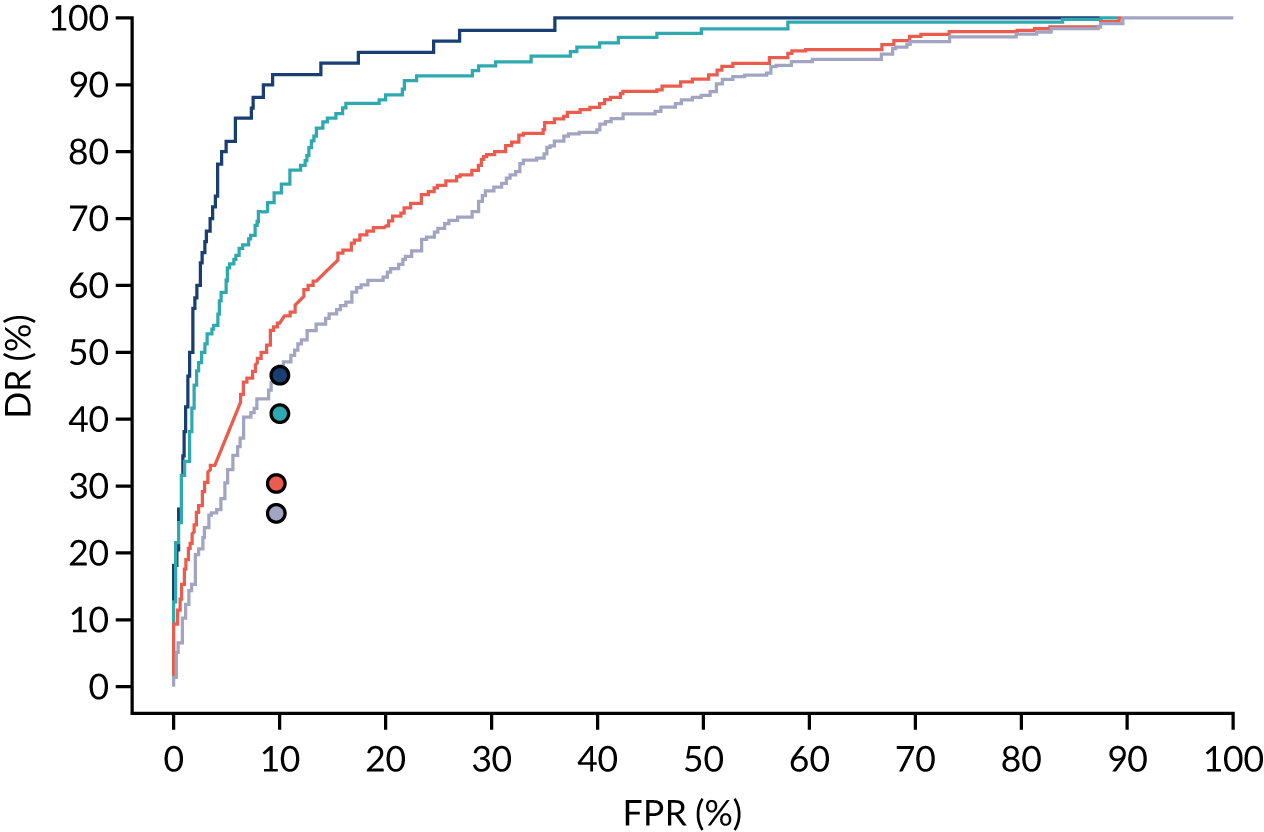
FIGURE 30.
Performance of screening for pre-eclampsia with Mat-CHs, MAP and PAPP-A.
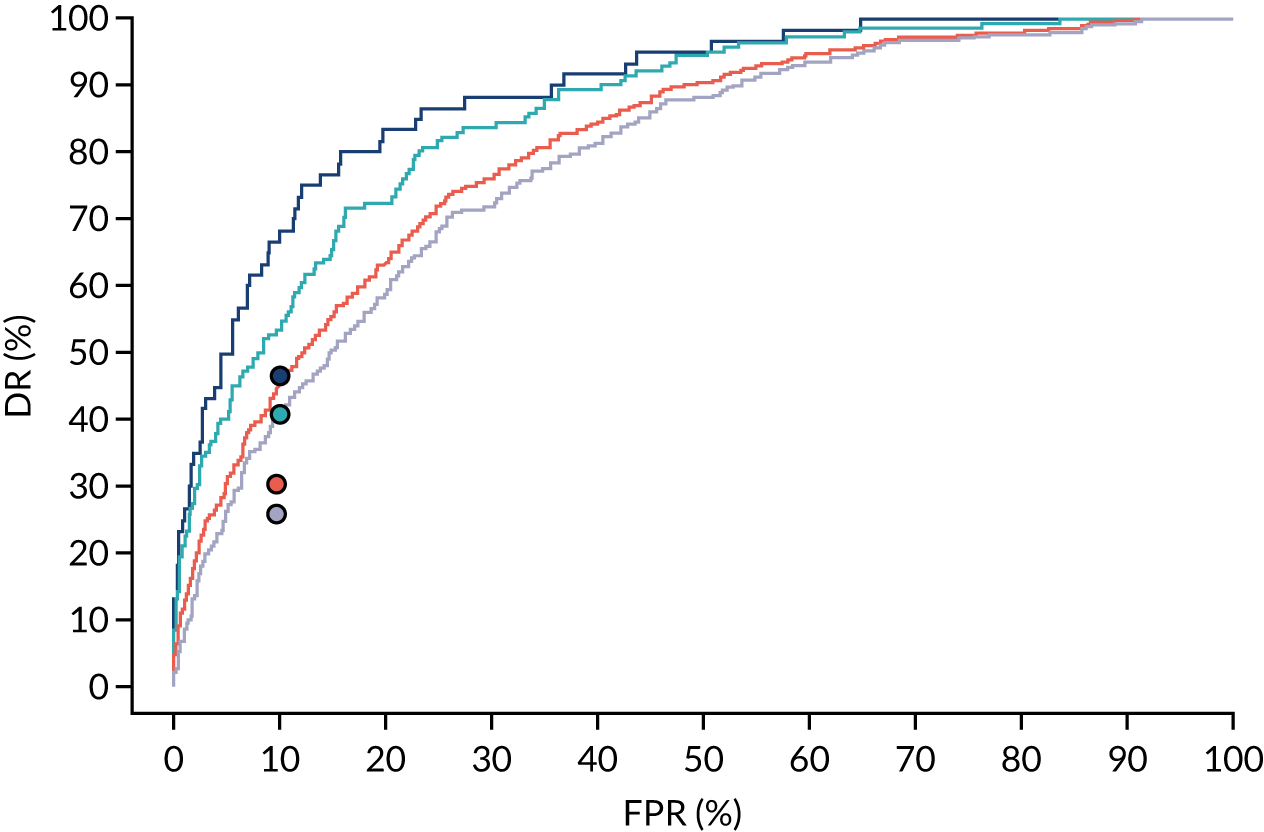
FIGURE 31.
Performance of screening for pre-eclampsia with Mat-CHs, MAP and PLGF.
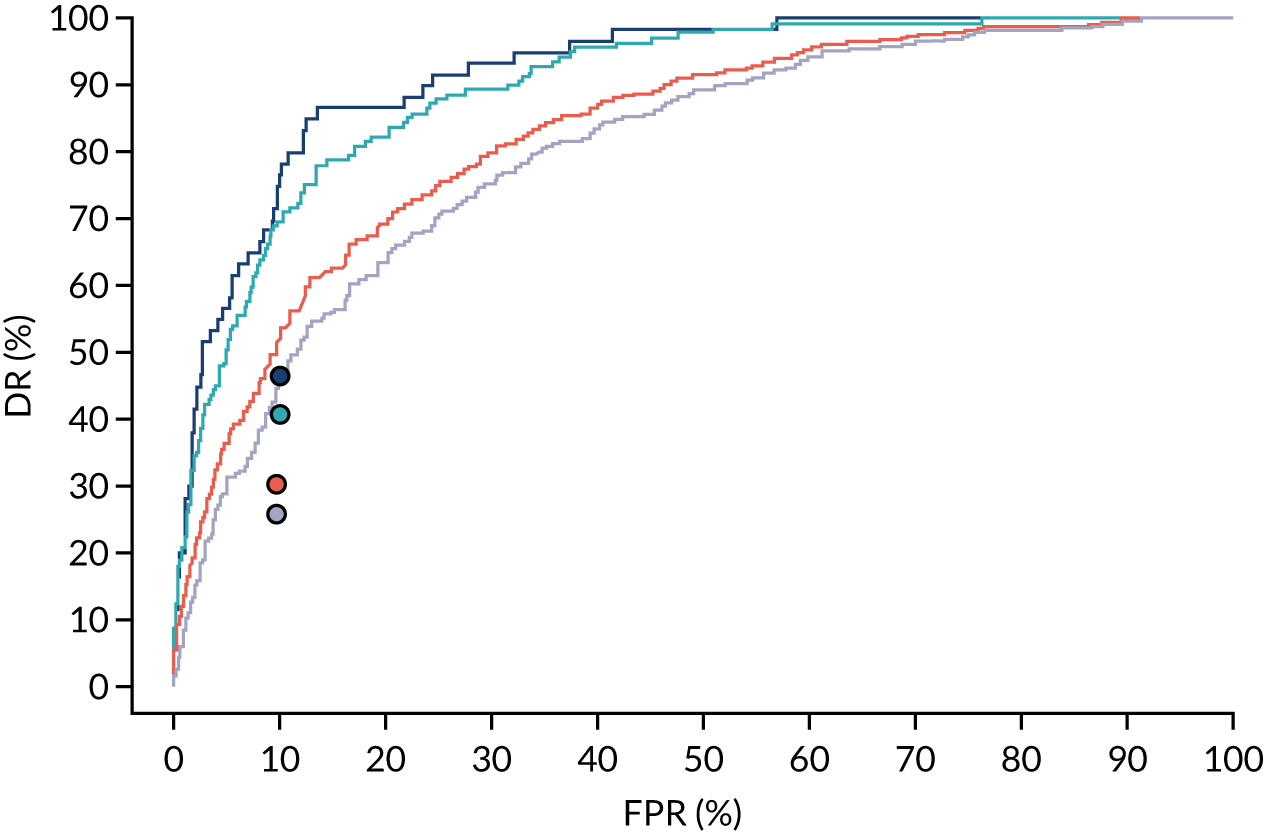
FIGURE 32.
Performance of screening for pre-eclampsia with Mat-CHs, MAP, PLGF and UTA-PI.
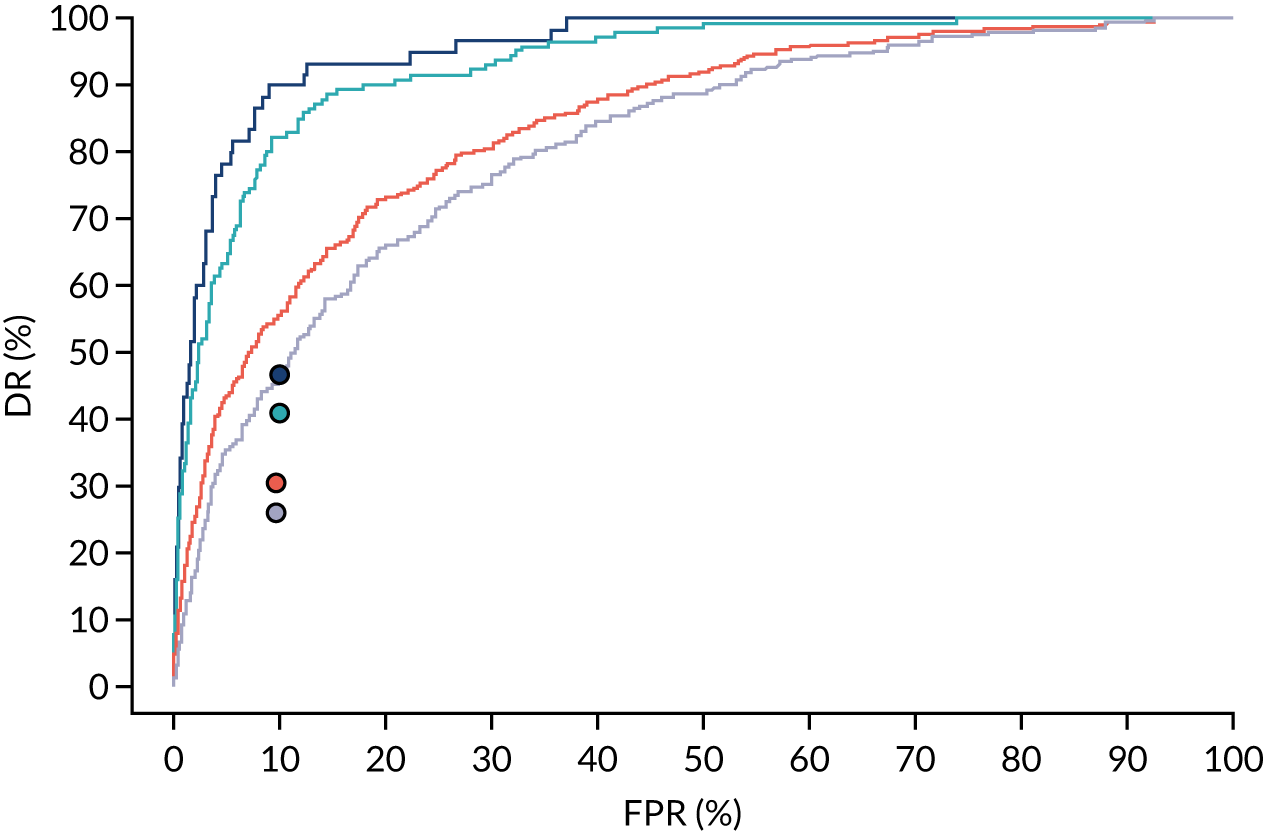
Appendix 5 The SPREE study calibration
Figures 33–86 show the estimated incidence against risk of pre-eclampsia in bins defined according to risk. Estimates and 95% CIs are shown for the incidence within each bin. The diagonal light blue line is the line of perfect agreement. The overall mean risk is shown by the vertical dashed line and the overall incidence by the horizontal dashed line. The histograms show risks grouped by risk in those with pre-eclampsia before the specified gestation (orange) and those without pre-eclampsia before the specified gestation (light blue).
FIGURE 33.
Calibration plot for Mat-CHs in predicting pre-eclampsia at < 34 weeks’ gestation.
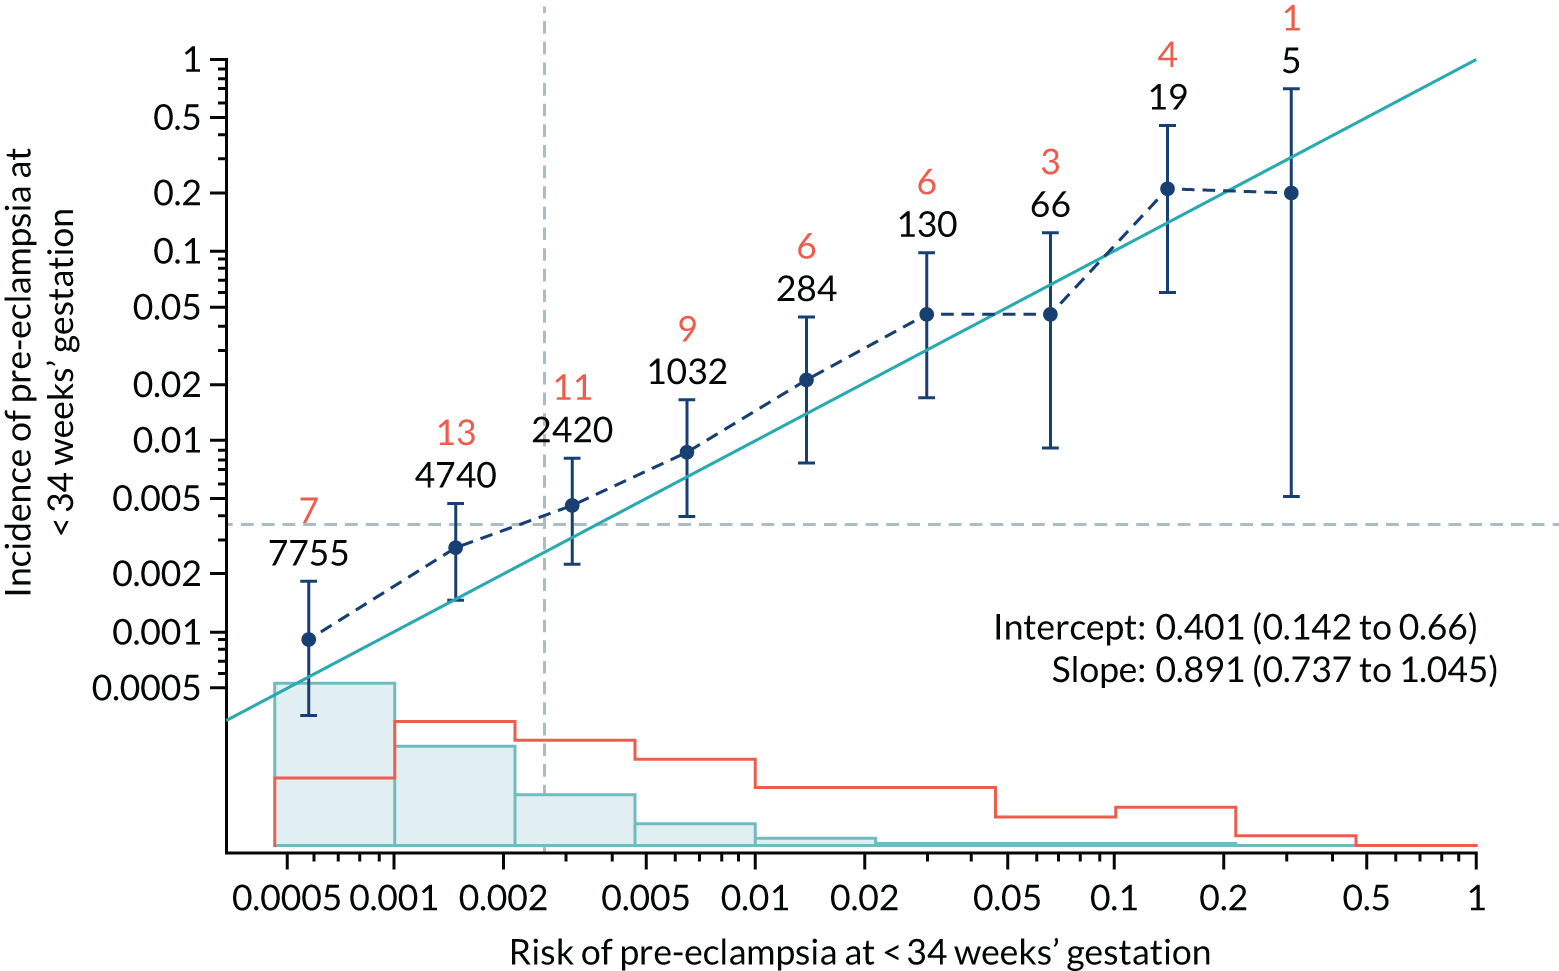
FIGURE 34.
Adjusted calibration plot for Mat-CHs in predicting pre-eclampsia at < 34 weeks’ gestation.
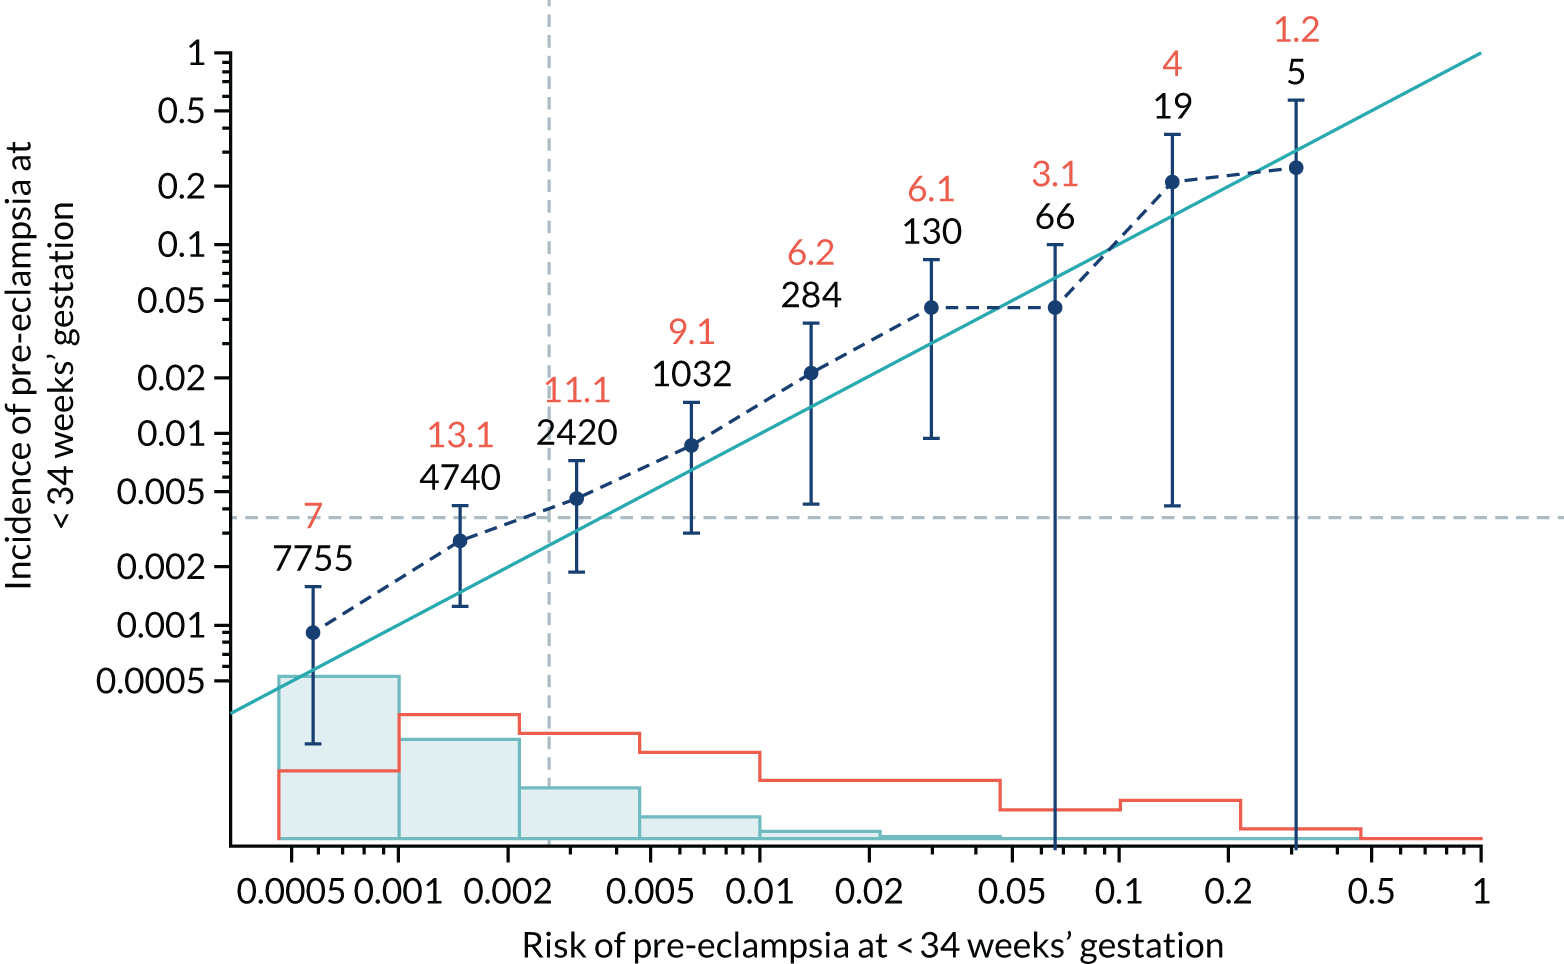
FIGURE 35.
Calibration plot for Mat-CHs in predicting pre-eclampsia at < 37 weeks’ gestation.
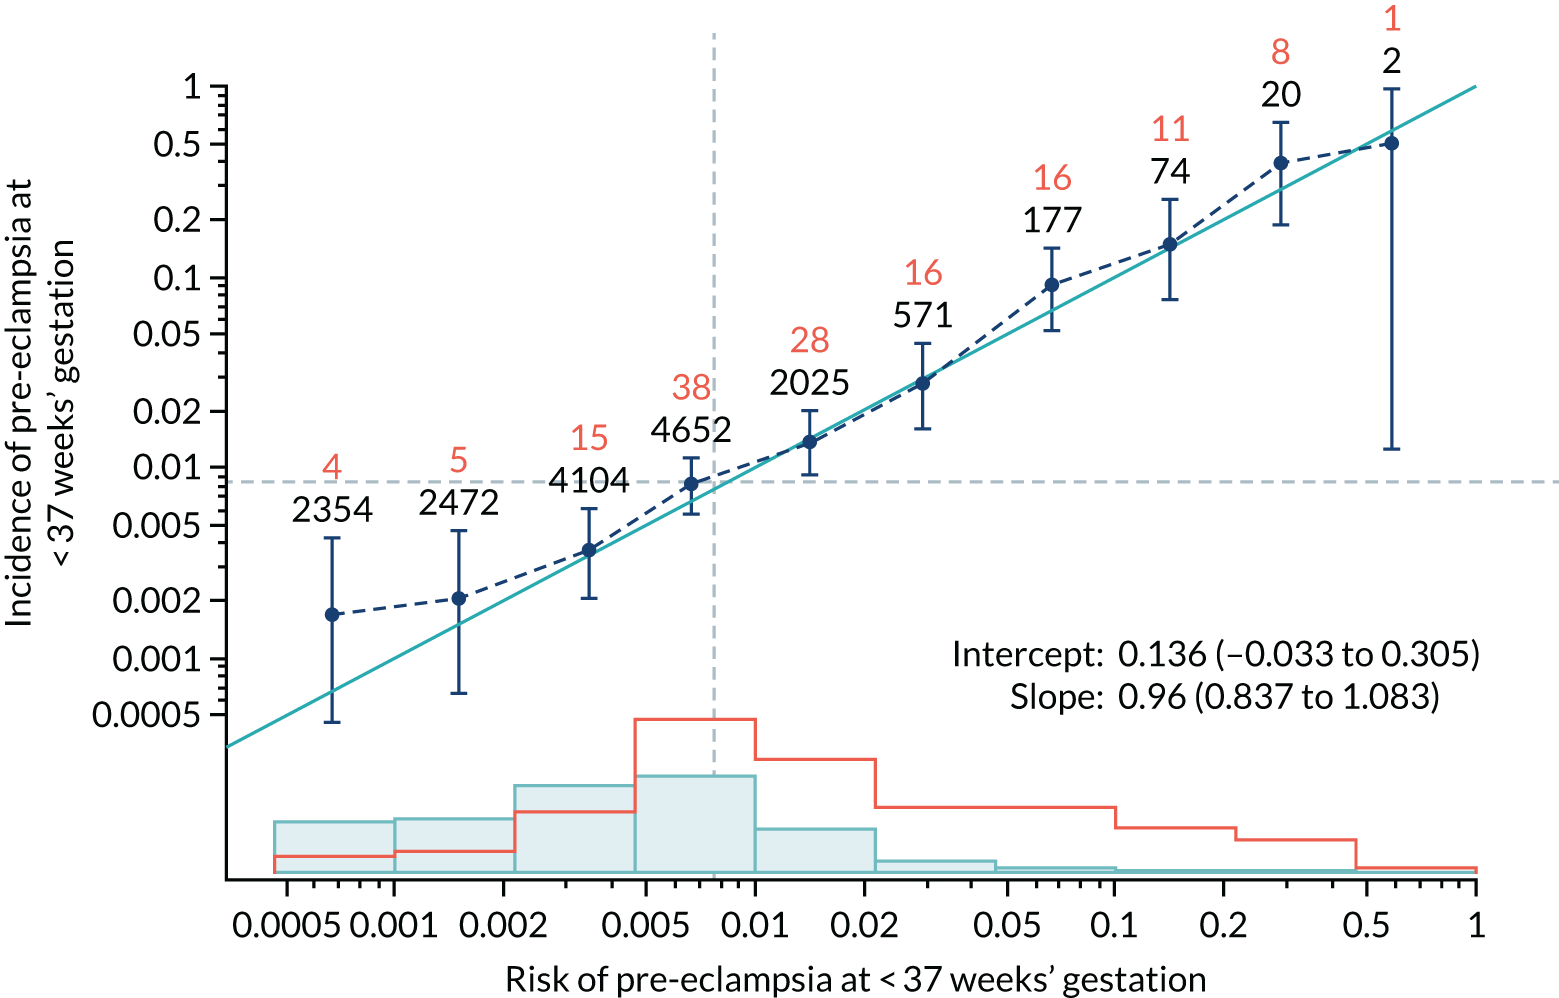
FIGURE 36.
Adjusted calibration plot for Mat-CHs in predicting pre-eclampsia at < 37 weeks’ gestation.
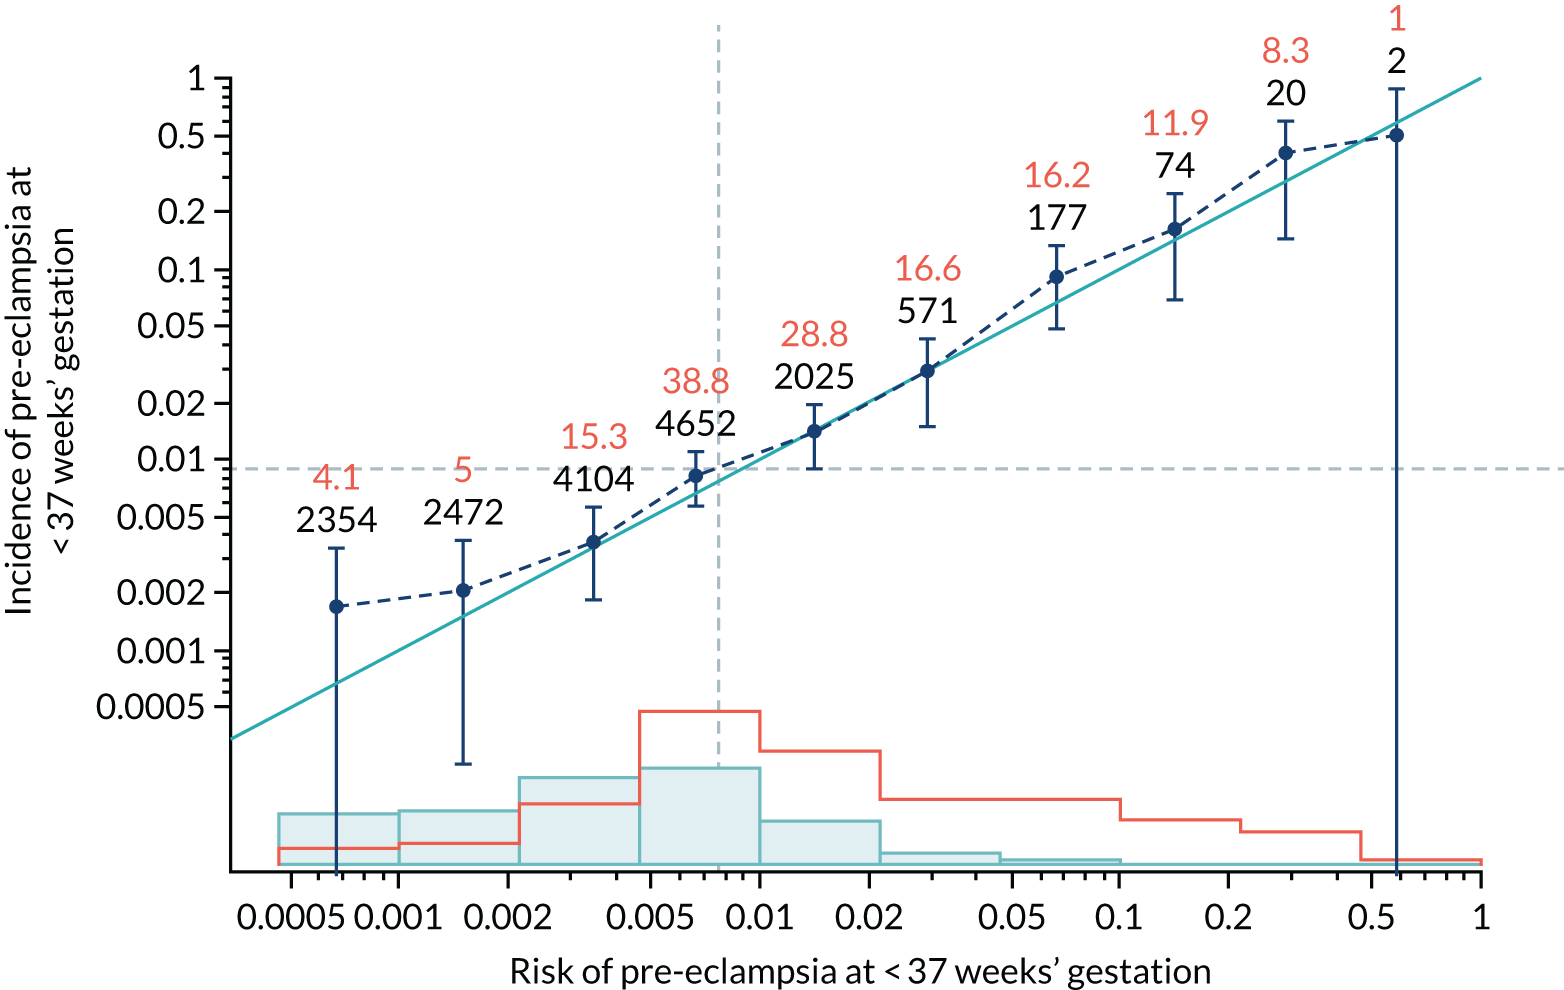
FIGURE 37.
Calibration plot for Mat-CHs in predicting all pre-eclampsia.
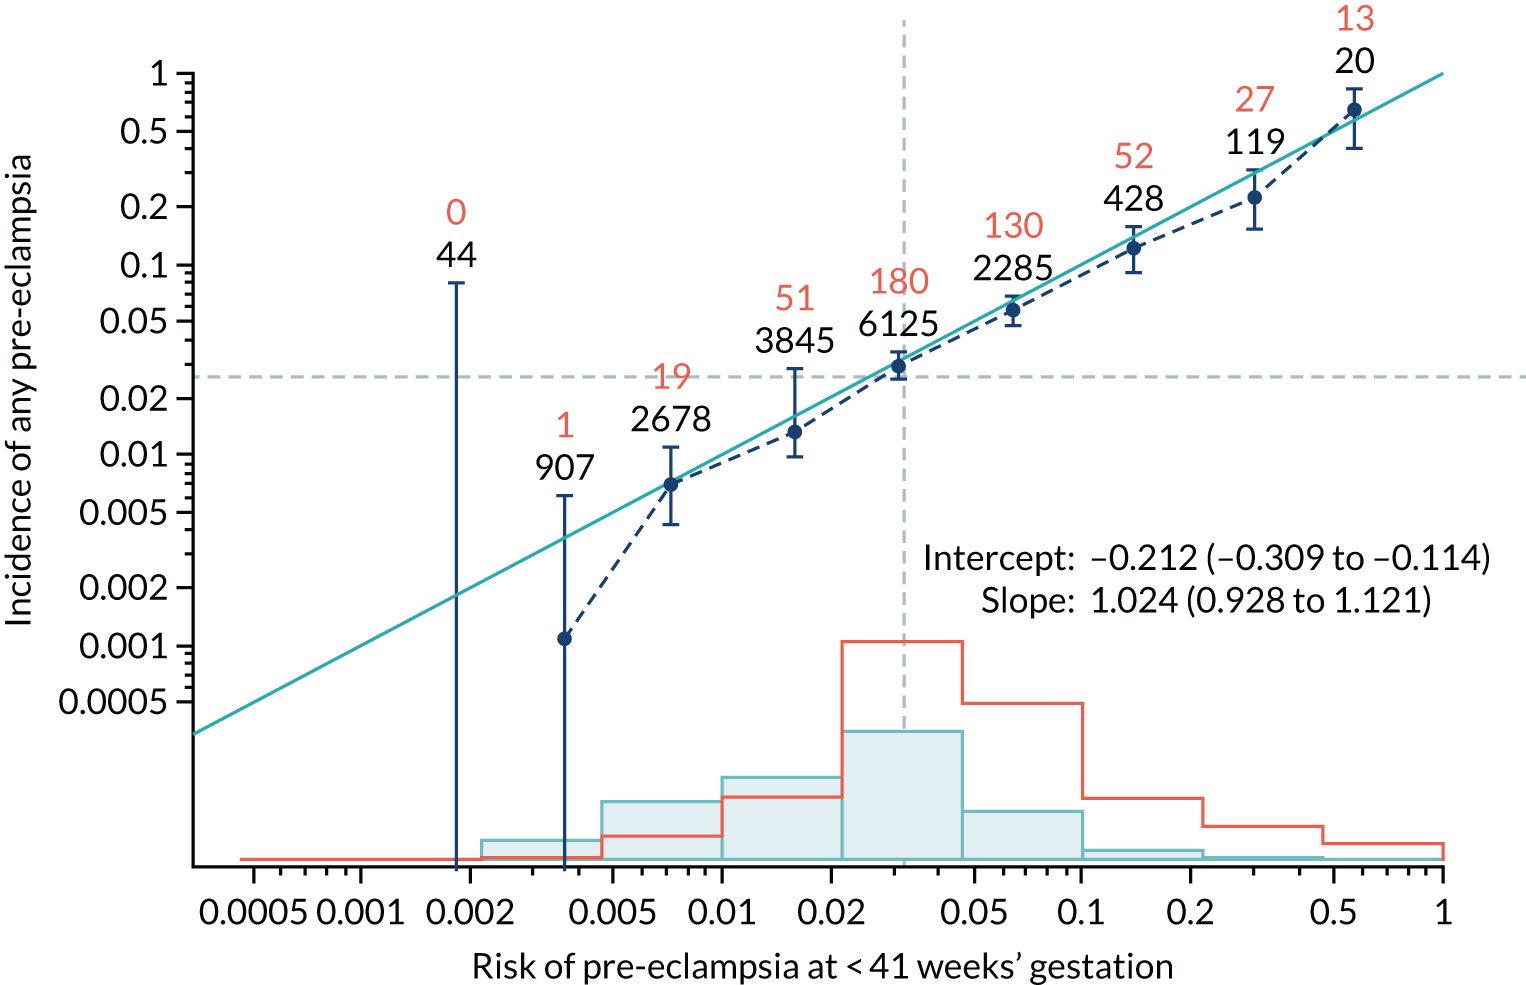
FIGURE 38.
Adjusted calibration plot for Mat-CHs in predicting all pre-eclampsia.
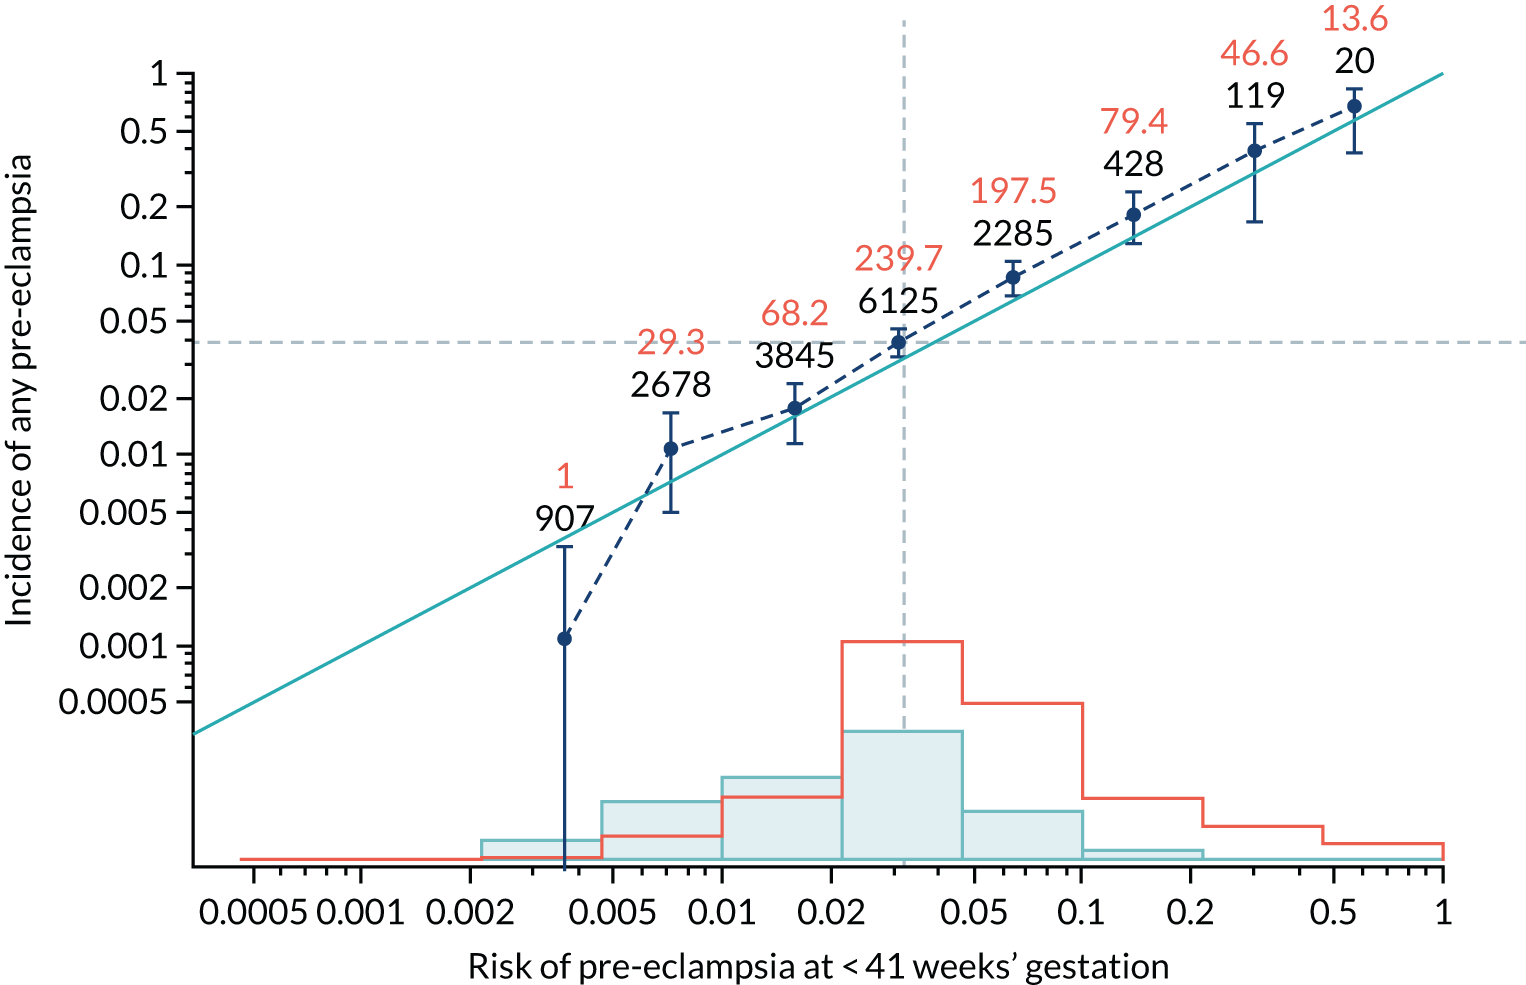
FIGURE 39.
Calibration plot for Mat-CHs and MAP in predicting pre-eclampsia at < 34 weeks’ gestation.
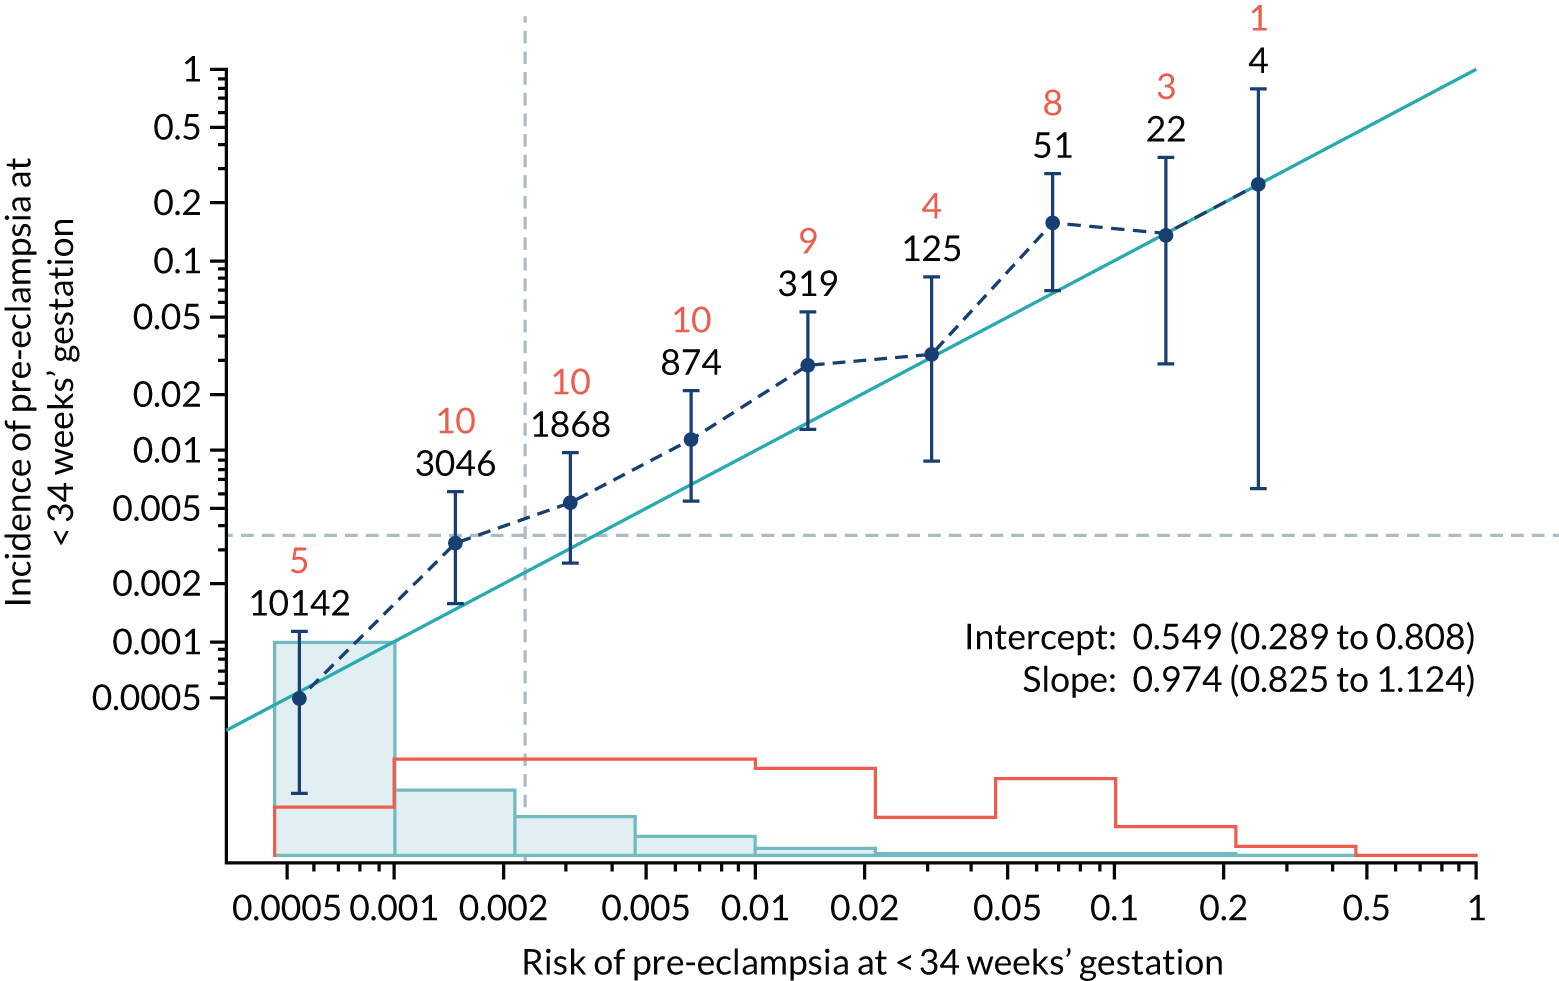
FIGURE 40.
Adjusted calibration plot for Mat-CHs and MAP in predicting pre-eclampsia at < 34 weeks’ gestation.
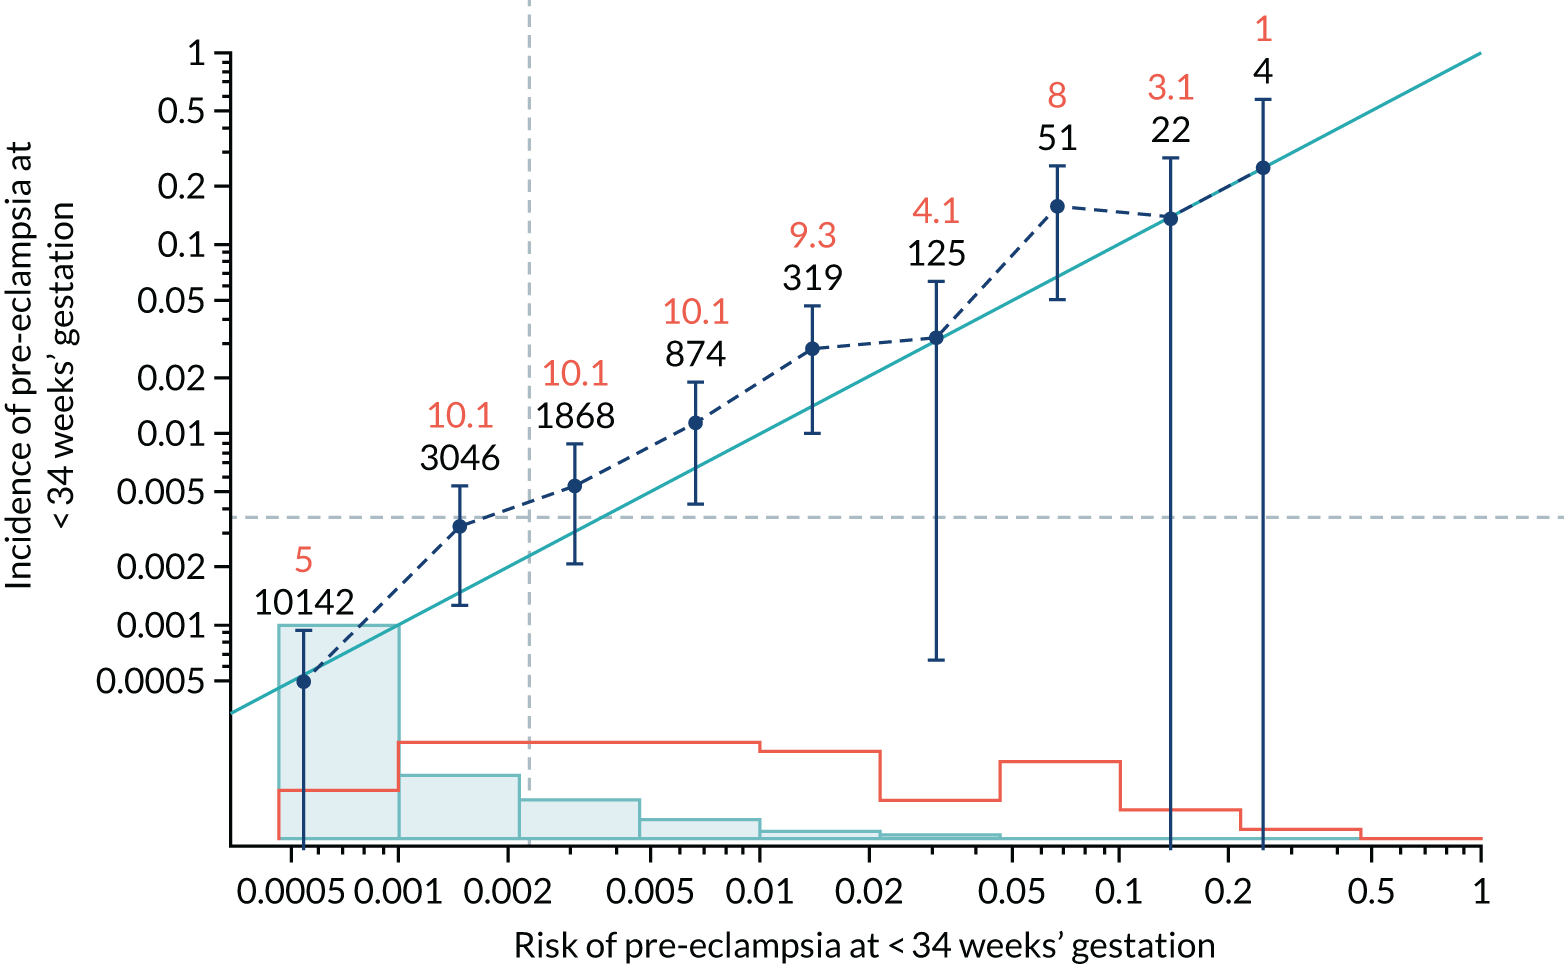
FIGURE 41.
Calibration plot for Mat-CHs and MAP in predicting pre-eclampsia at < 37 weeks’ gestation.
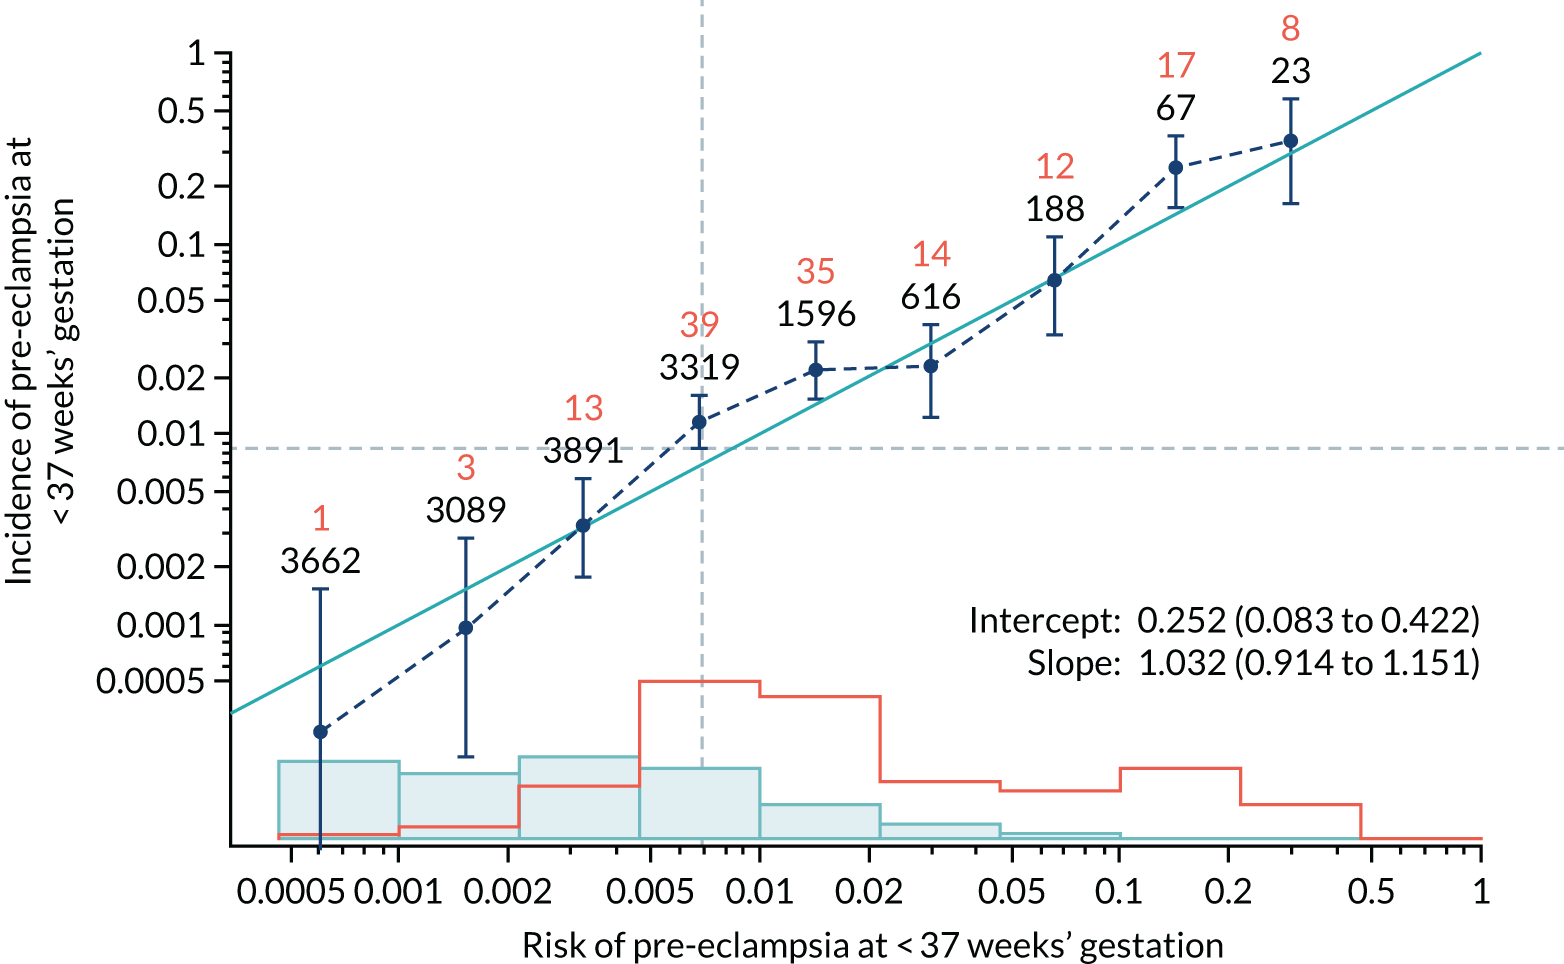
FIGURE 42.
Adjusted calibration plot for Mat-CHs and MAP in predicting pre-eclampsia at < 37 weeks’ gestation.
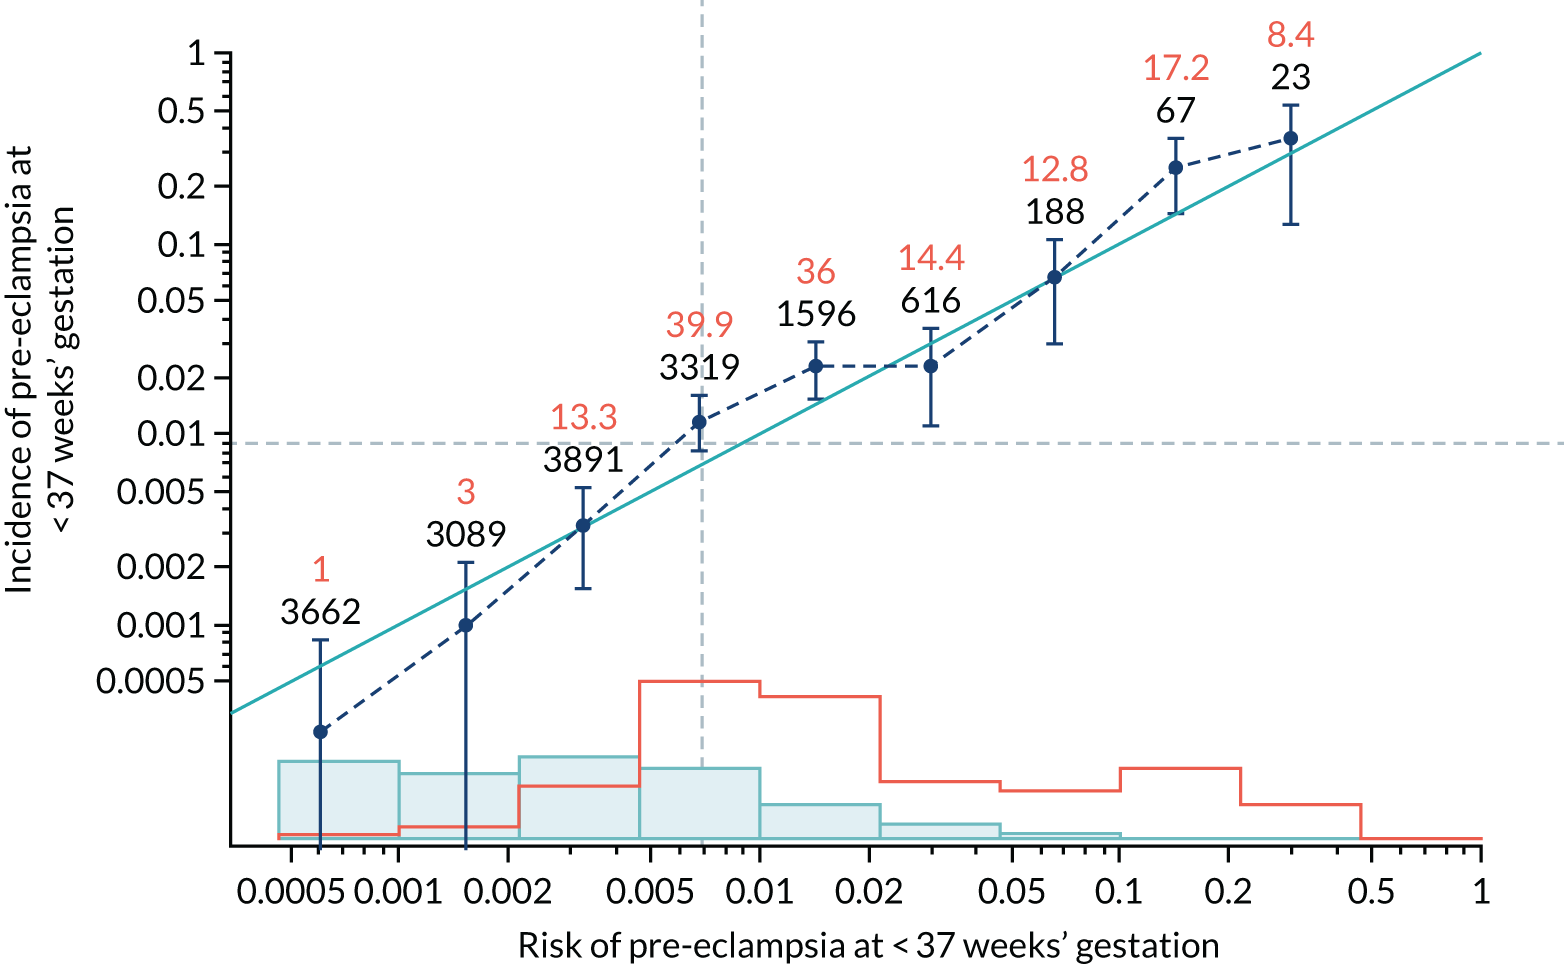
FIGURE 43.
Calibration plot for Mat-CHs and MAP in predicting all pre-eclampsia.
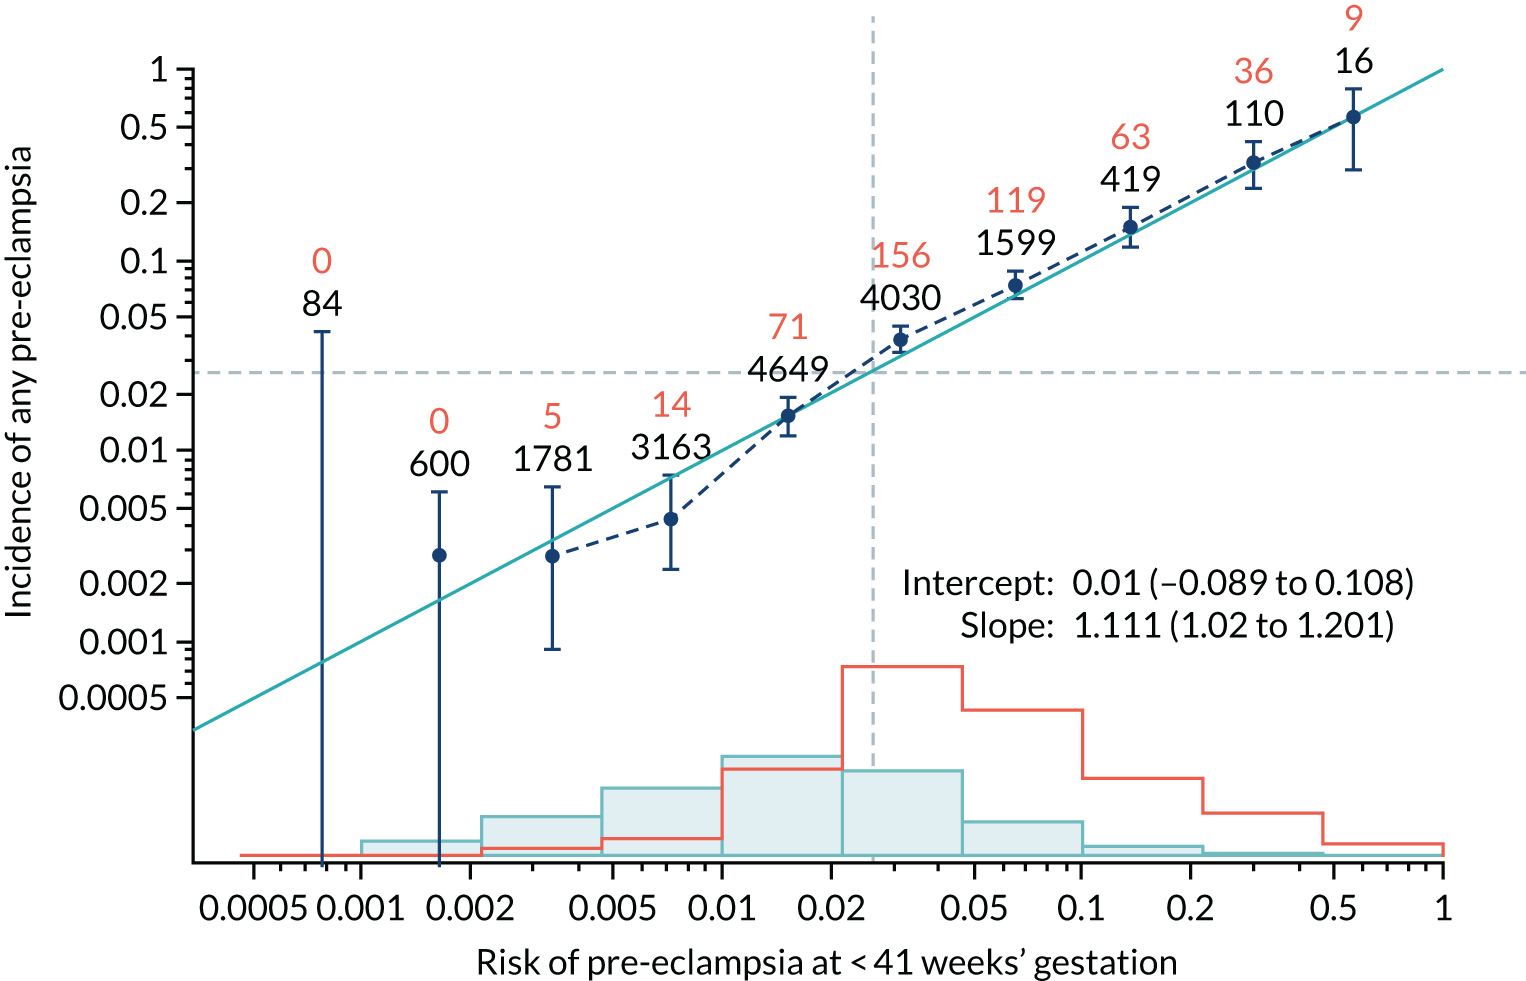
FIGURE 44.
Adjusted calibration plot for Mat-CHs and MAP in predicting all pre-eclampsia.
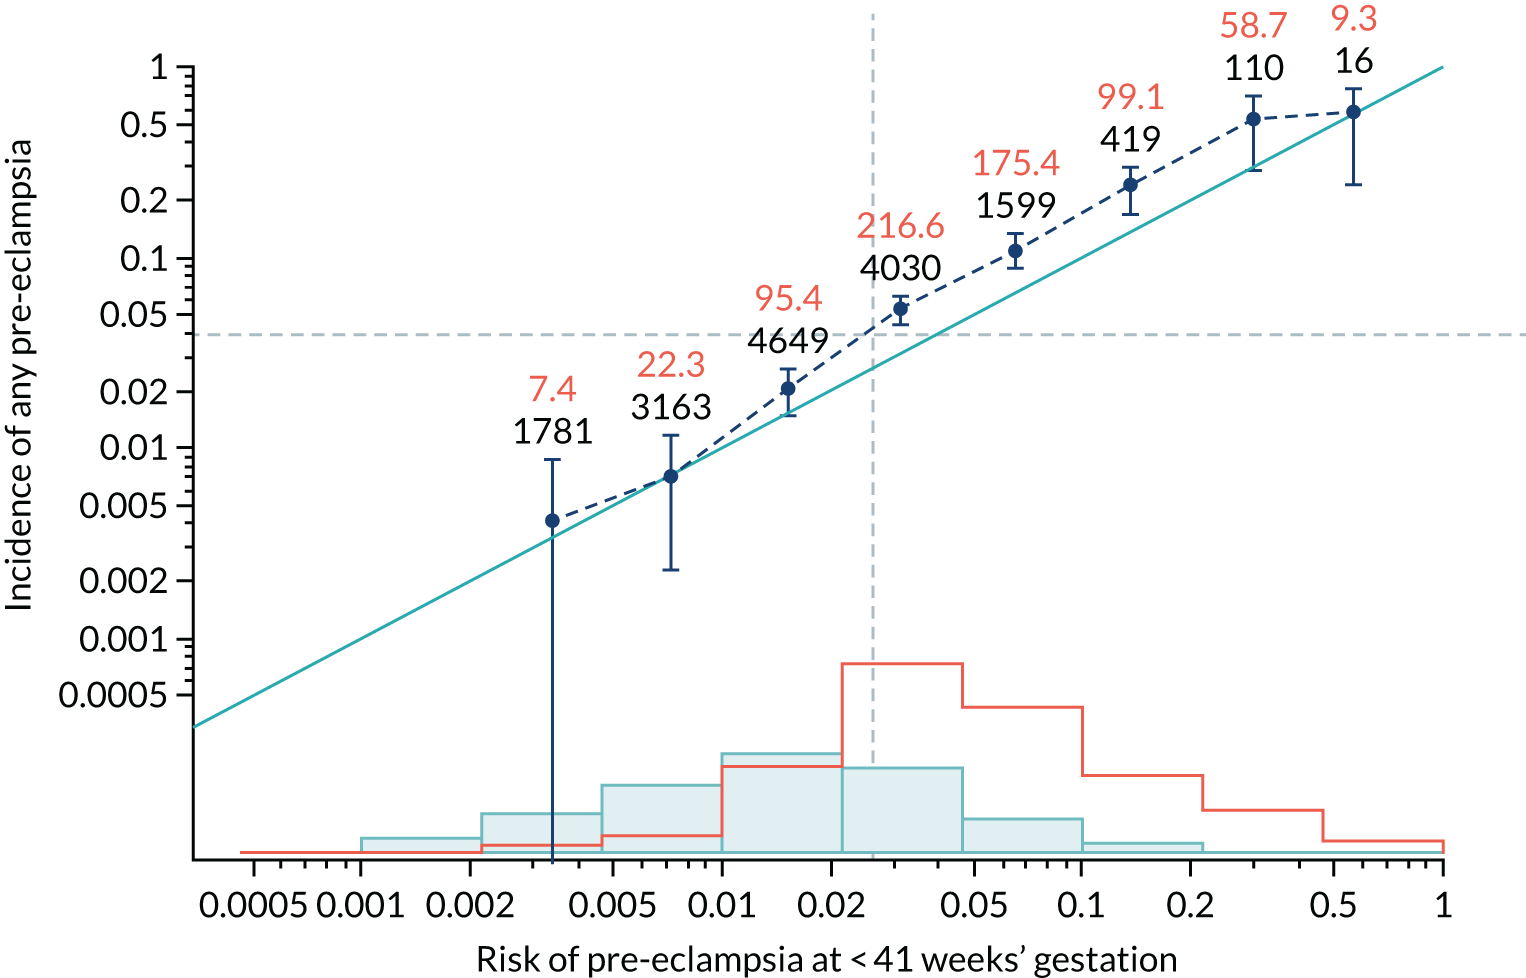
FIGURE 45.
Calibration plot for Mat-CHs and UTA-PI in predicting pre-eclampsia at < 34 weeks’ gestation.
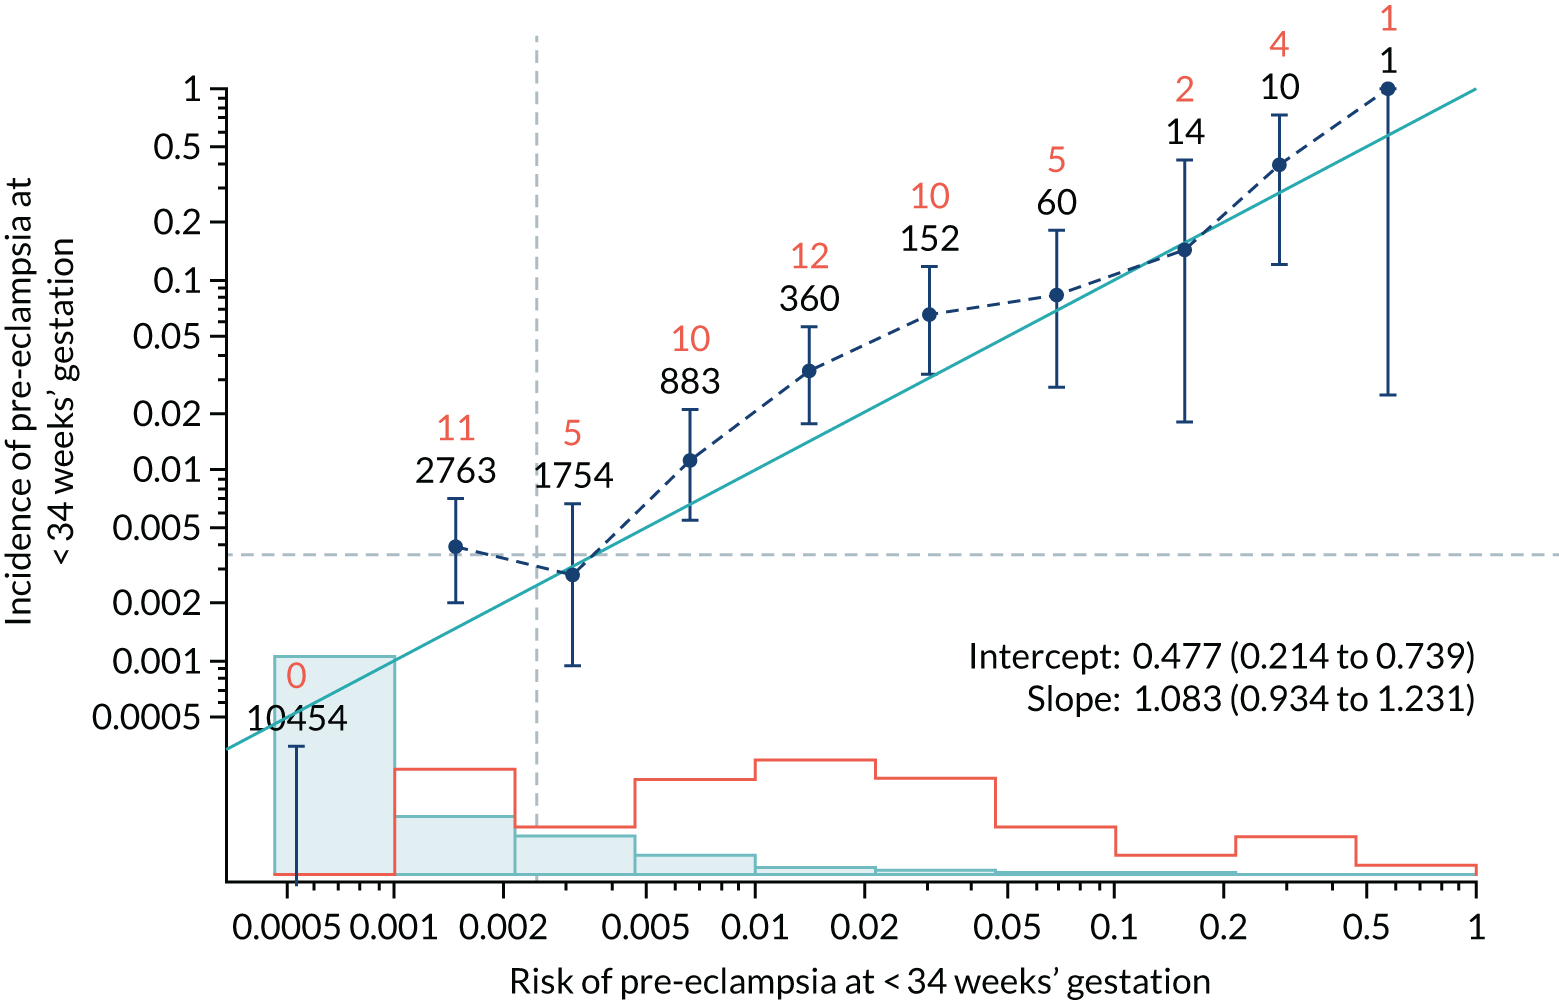
FIGURE 46.
Adjusted calibration plot for Mat-CHs and UTA-PI in predicting pre-eclampsia at < 34 weeks’ gestation.
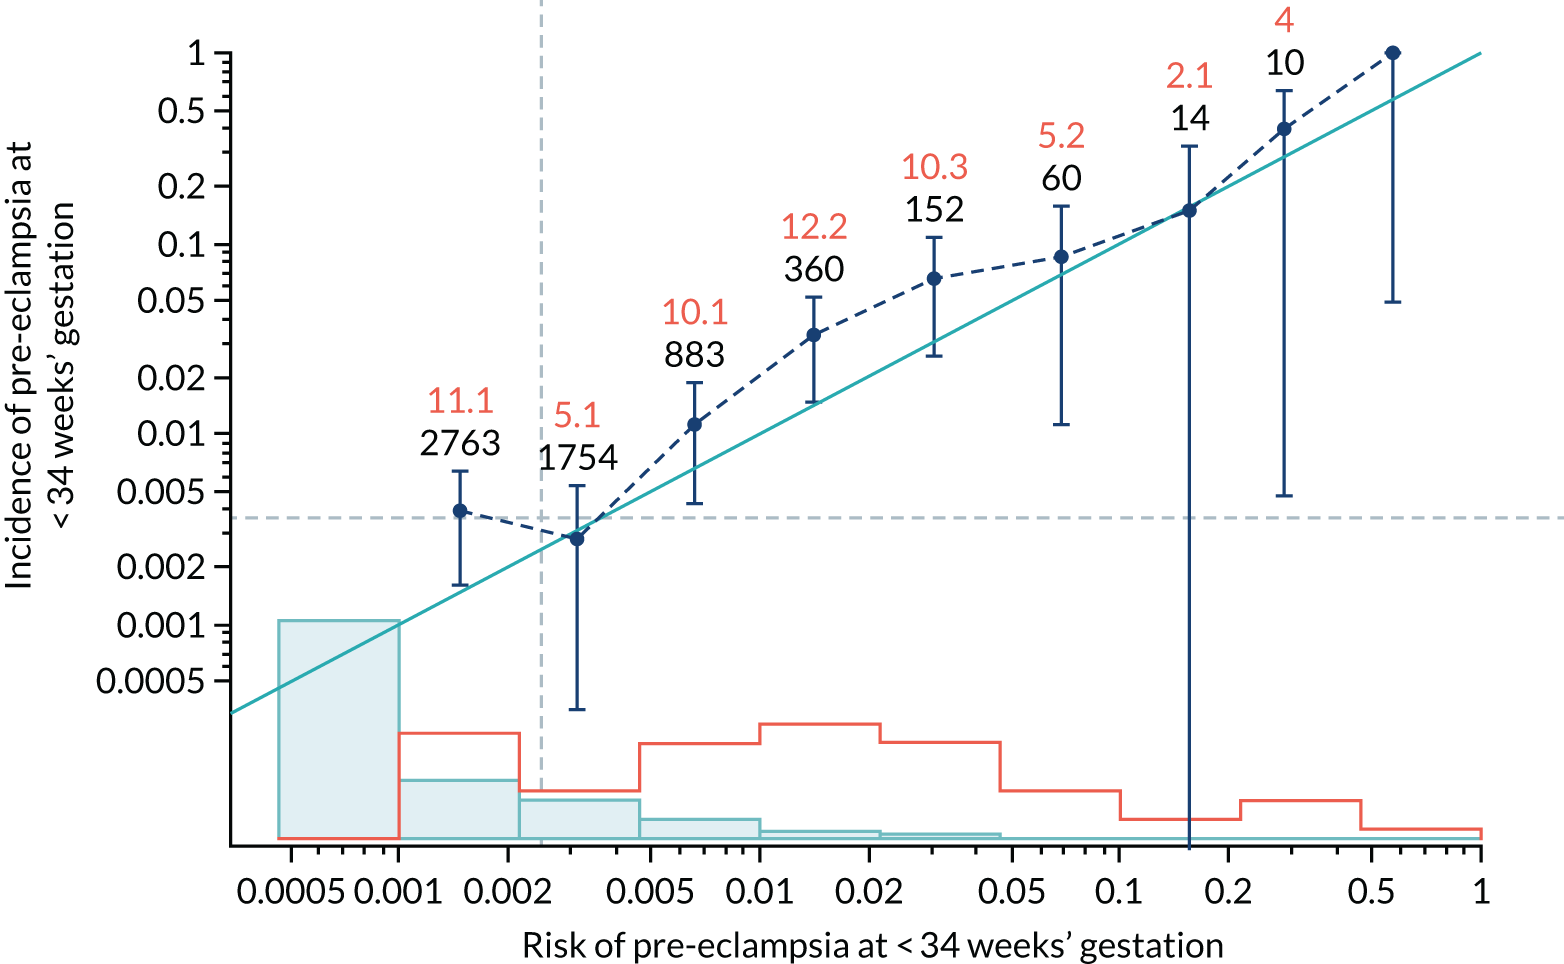
FIGURE 47.
Calibration plot for Mat-CHs and UTA-PI in predicting pre-eclampsia at < 37 weeks’ gestation.
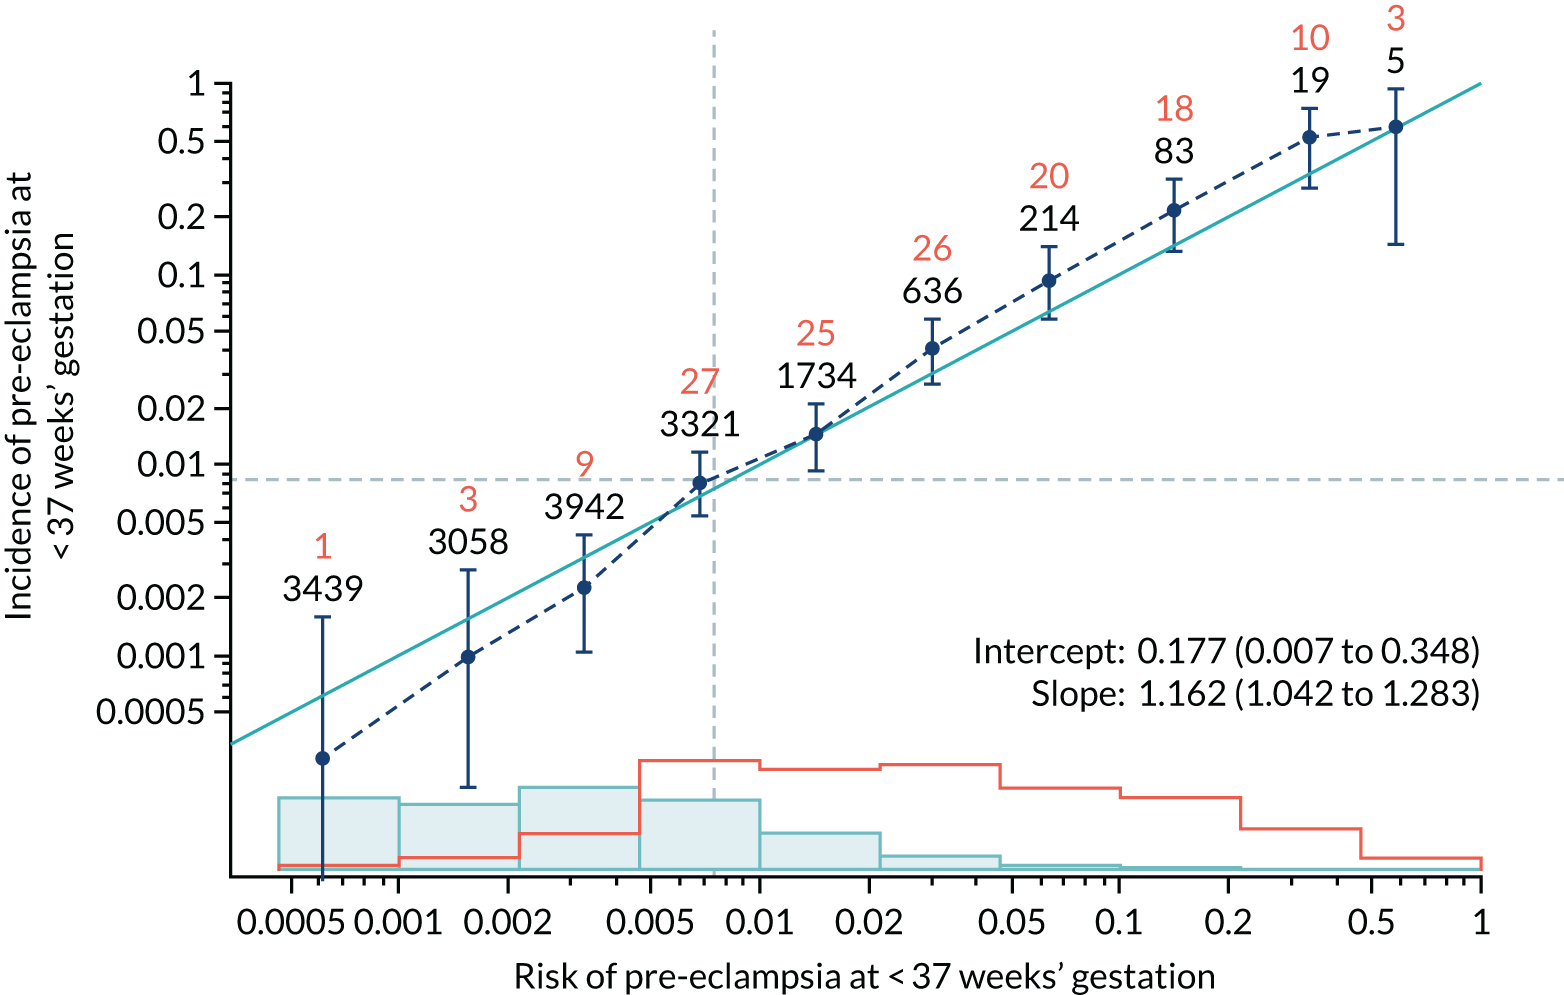
FIGURE 48.
Adjusted calibration plot for Mat-CHs and UTA-PI in predicting pre-eclampsia at < 37 weeks’ gestation.
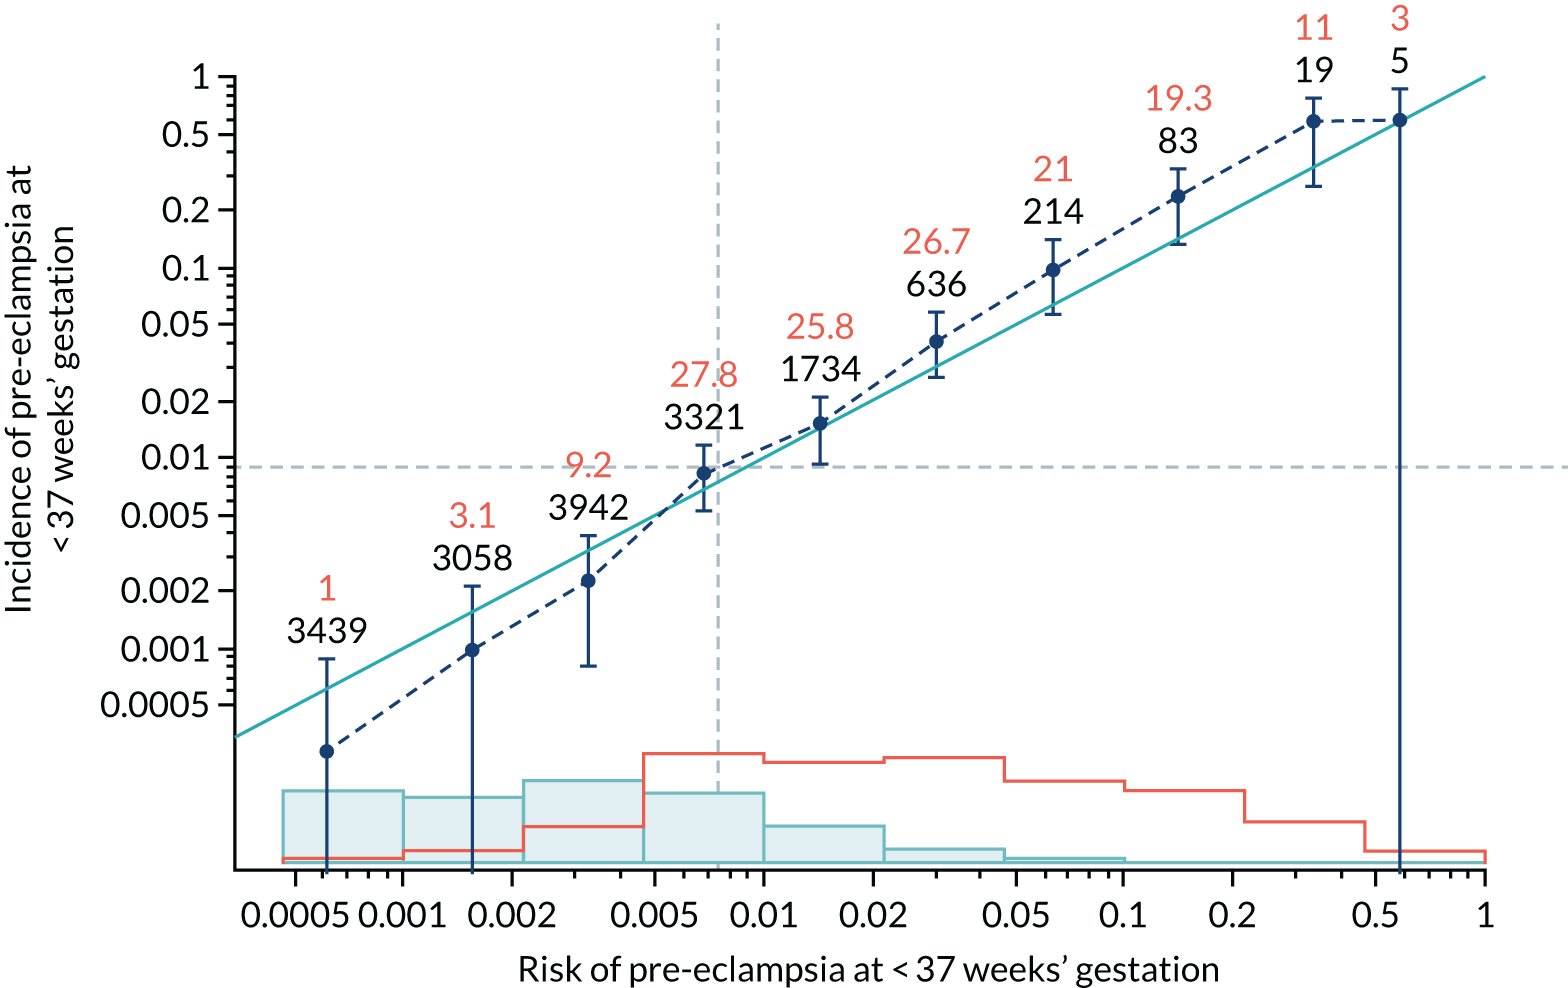
FIGURE 49.
Calibration plot for Mat-CHs and UTA-PI in predicting all pre-eclampsia.
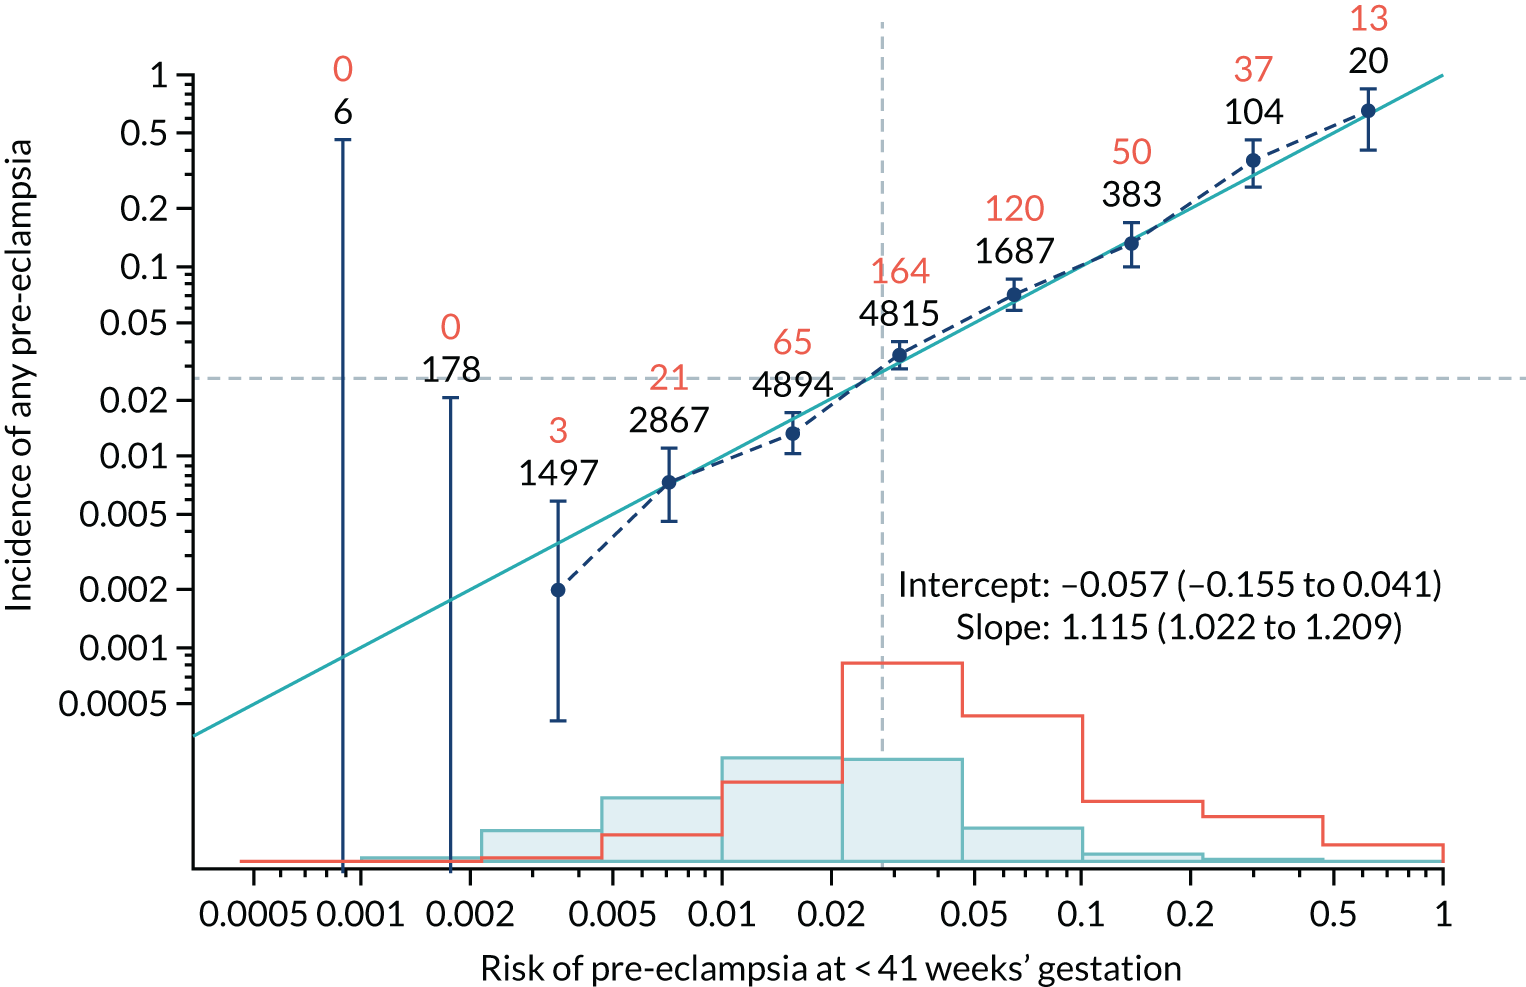
FIGURE 50.
Adjusted calibration plot for Mat-CHs and UTA-PI in predicting all pre-eclampsia.
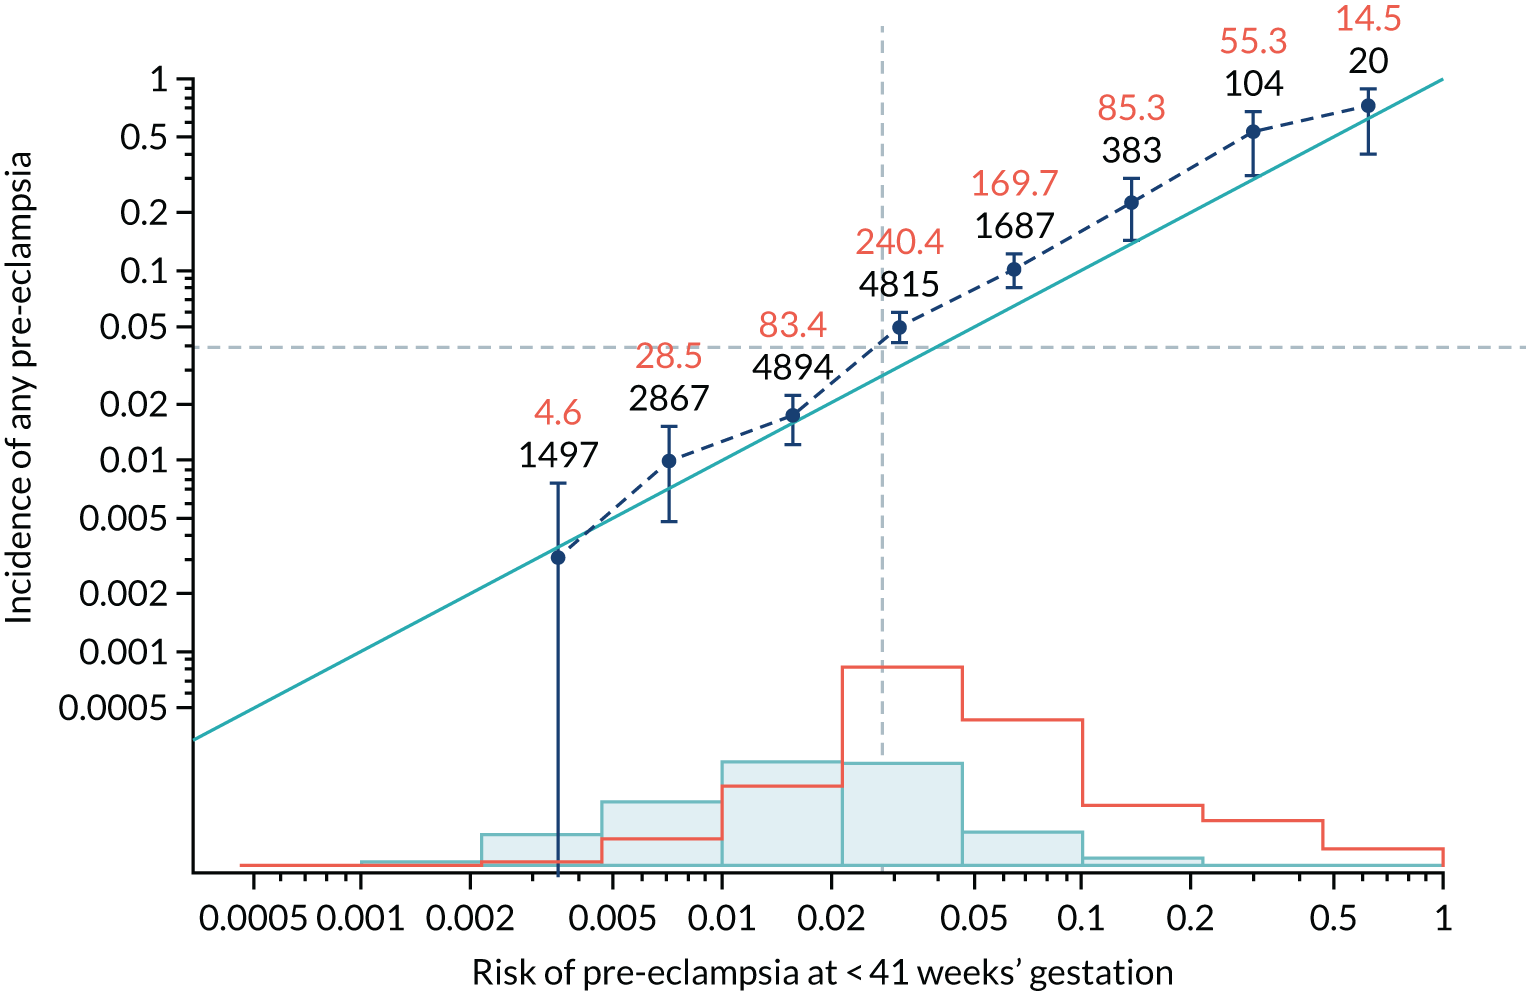
FIGURE 51.
Calibration plot for Mat-CHs and PLGF in predicting pre-eclampsia at < 34 weeks’ gestation.
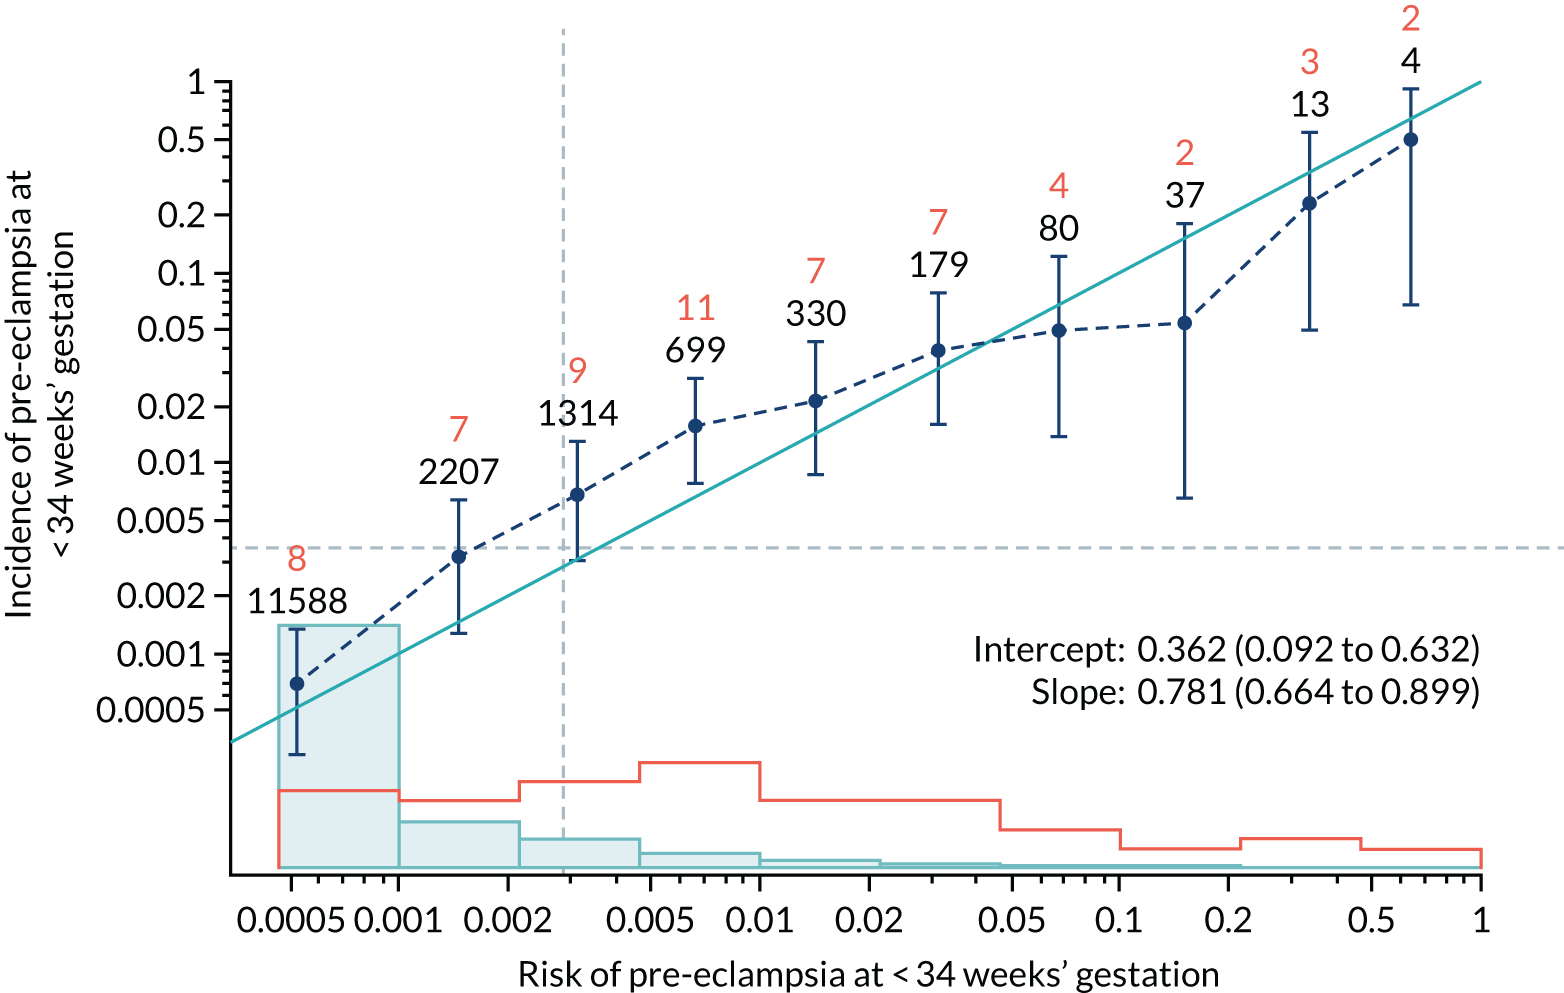
FIGURE 52.
Adjusted calibration plot for Mat-CHs and PLGF in predicting pre-eclampsia at < 34 weeks’ gestation.
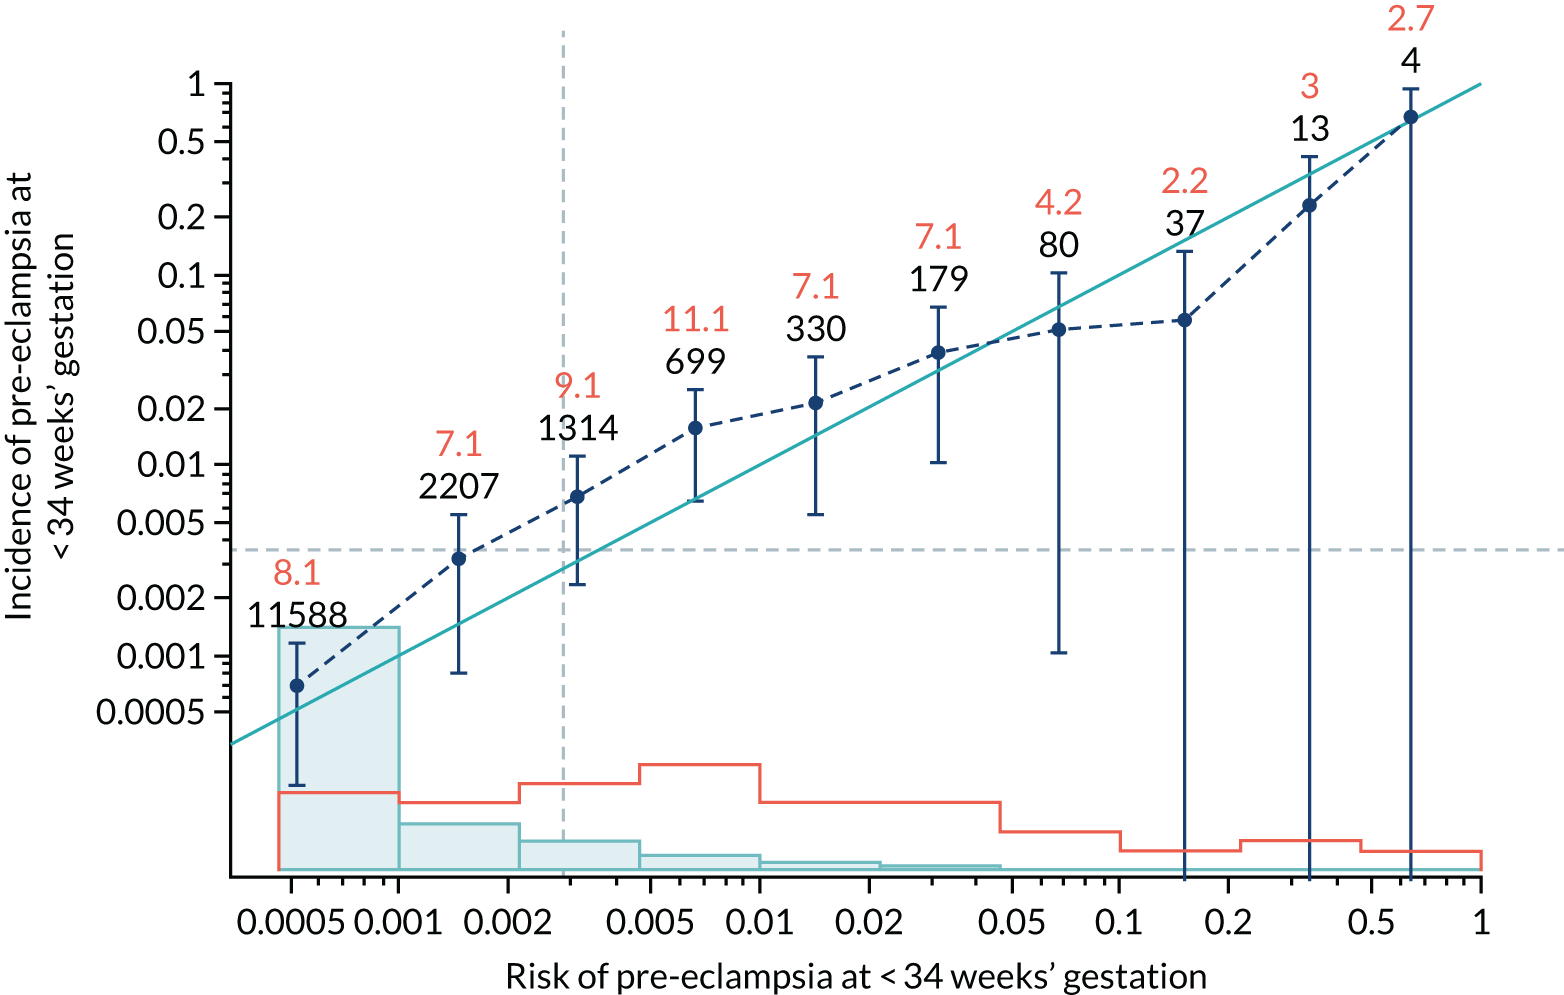
FIGURE 53.
Calibration plot for Mat-CHs and PLGF in predicting pre-eclampsia at < 37 weeks’ gestation.
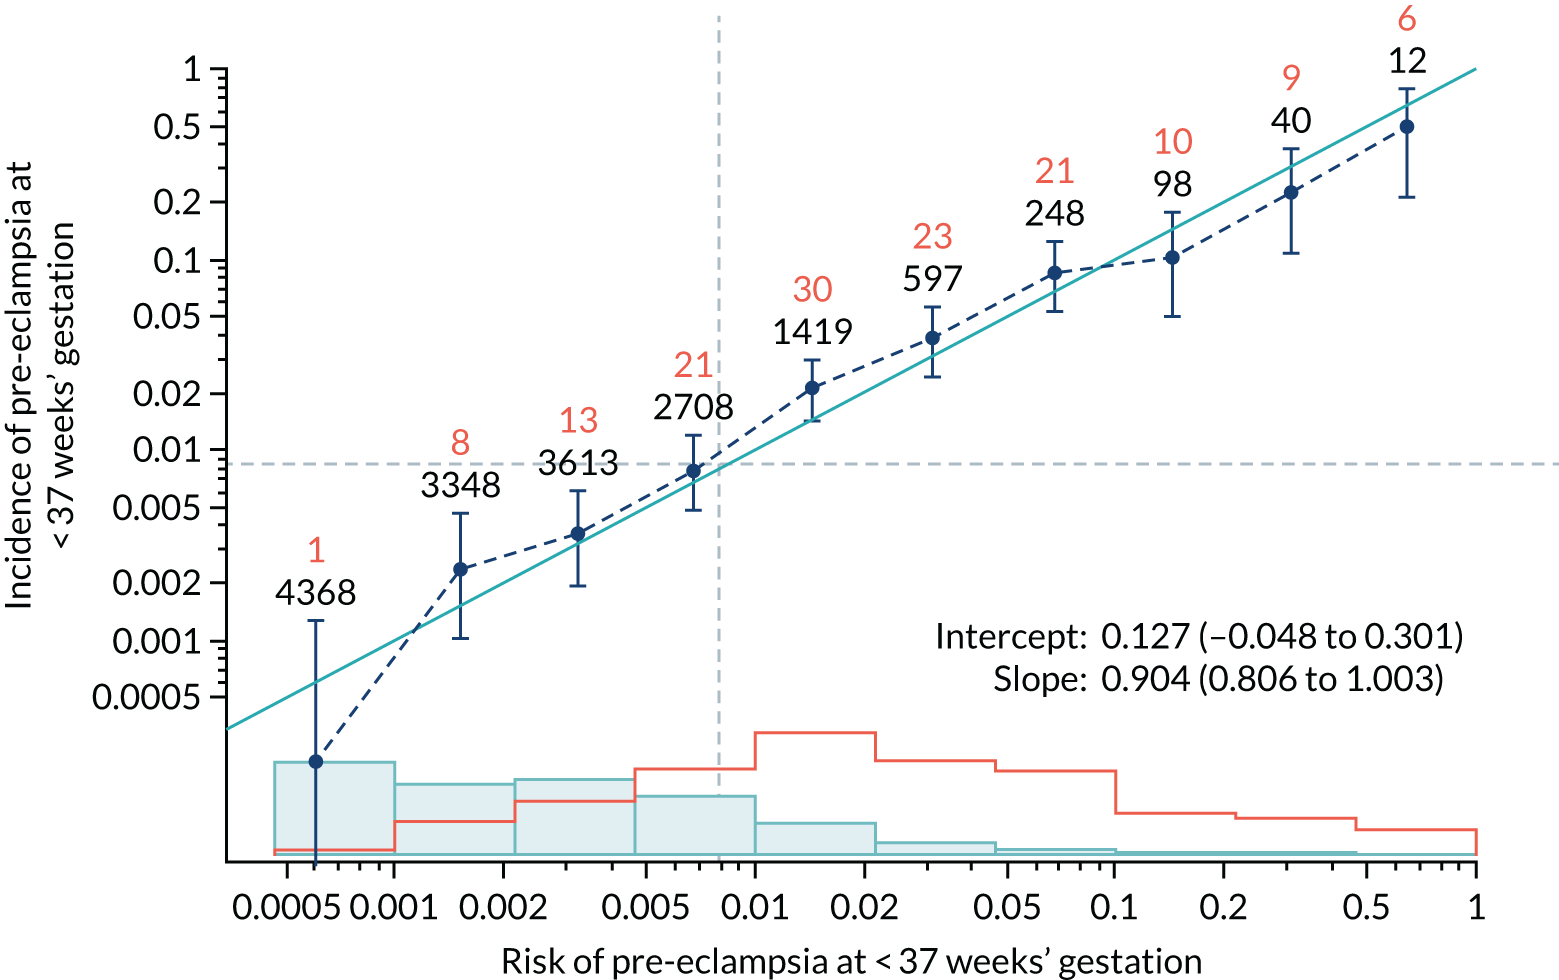
FIGURE 54.
Adjusted calibration plot for Mat-CHs and PLGF in predicting pre-eclampsia at < 37 weeks’ gestation.
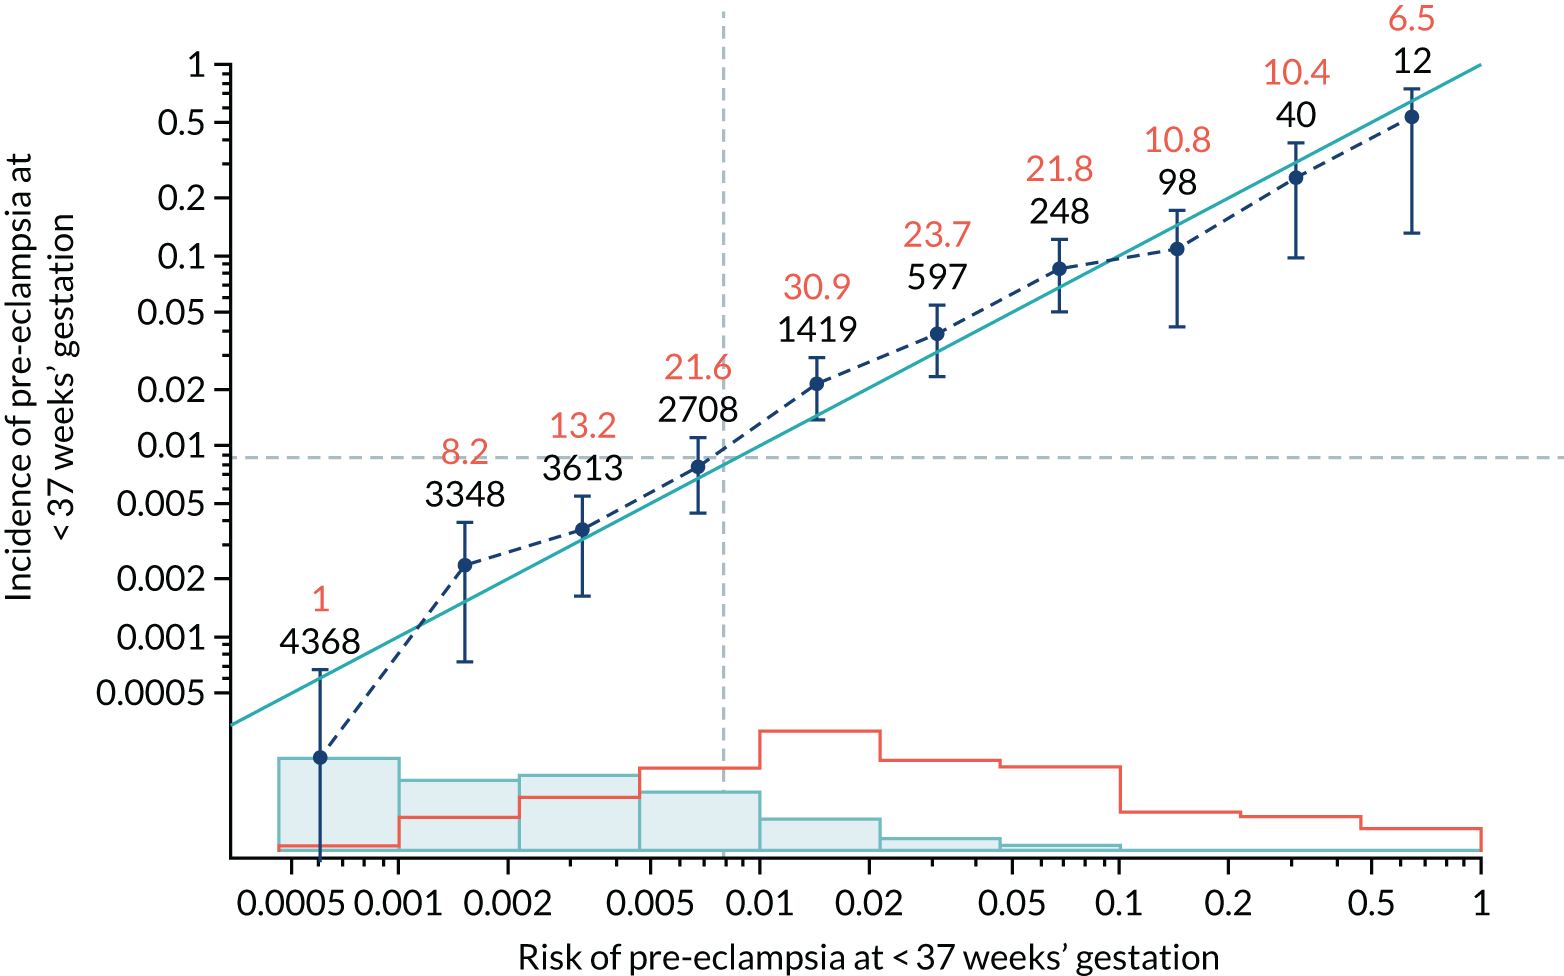
FIGURE 55.
Calibration plot for Mat-CHs and PLGF in predicting all pre-eclampsia.
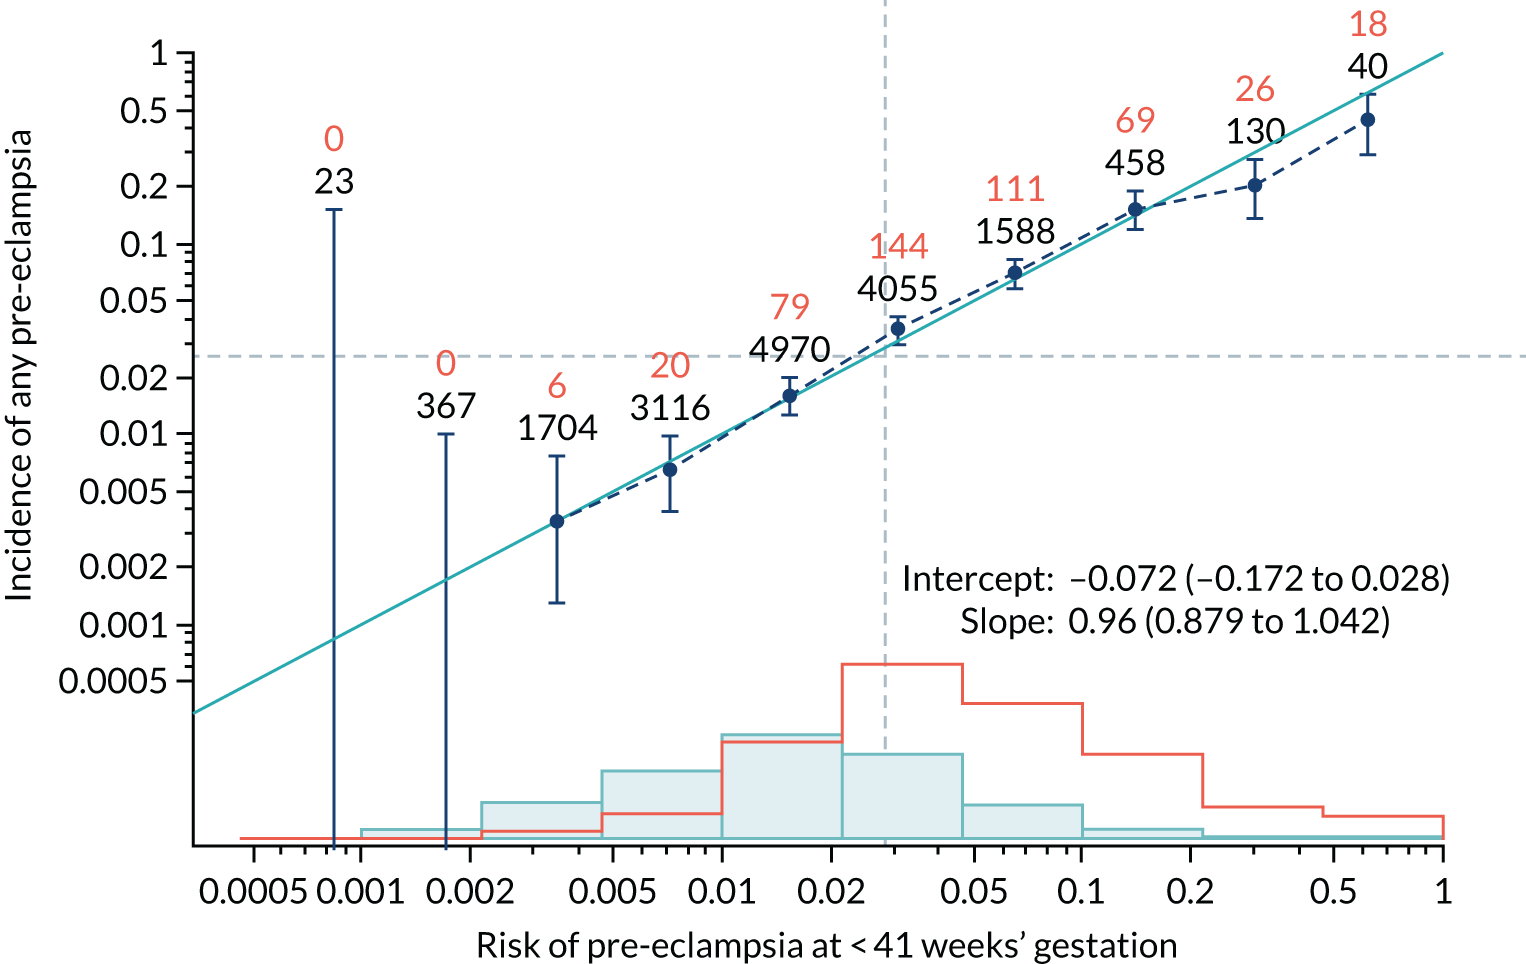
FIGURE 56.
Adjusted calibration plot for Mat-CHs and PLGF in predicting all pre-eclampsia.
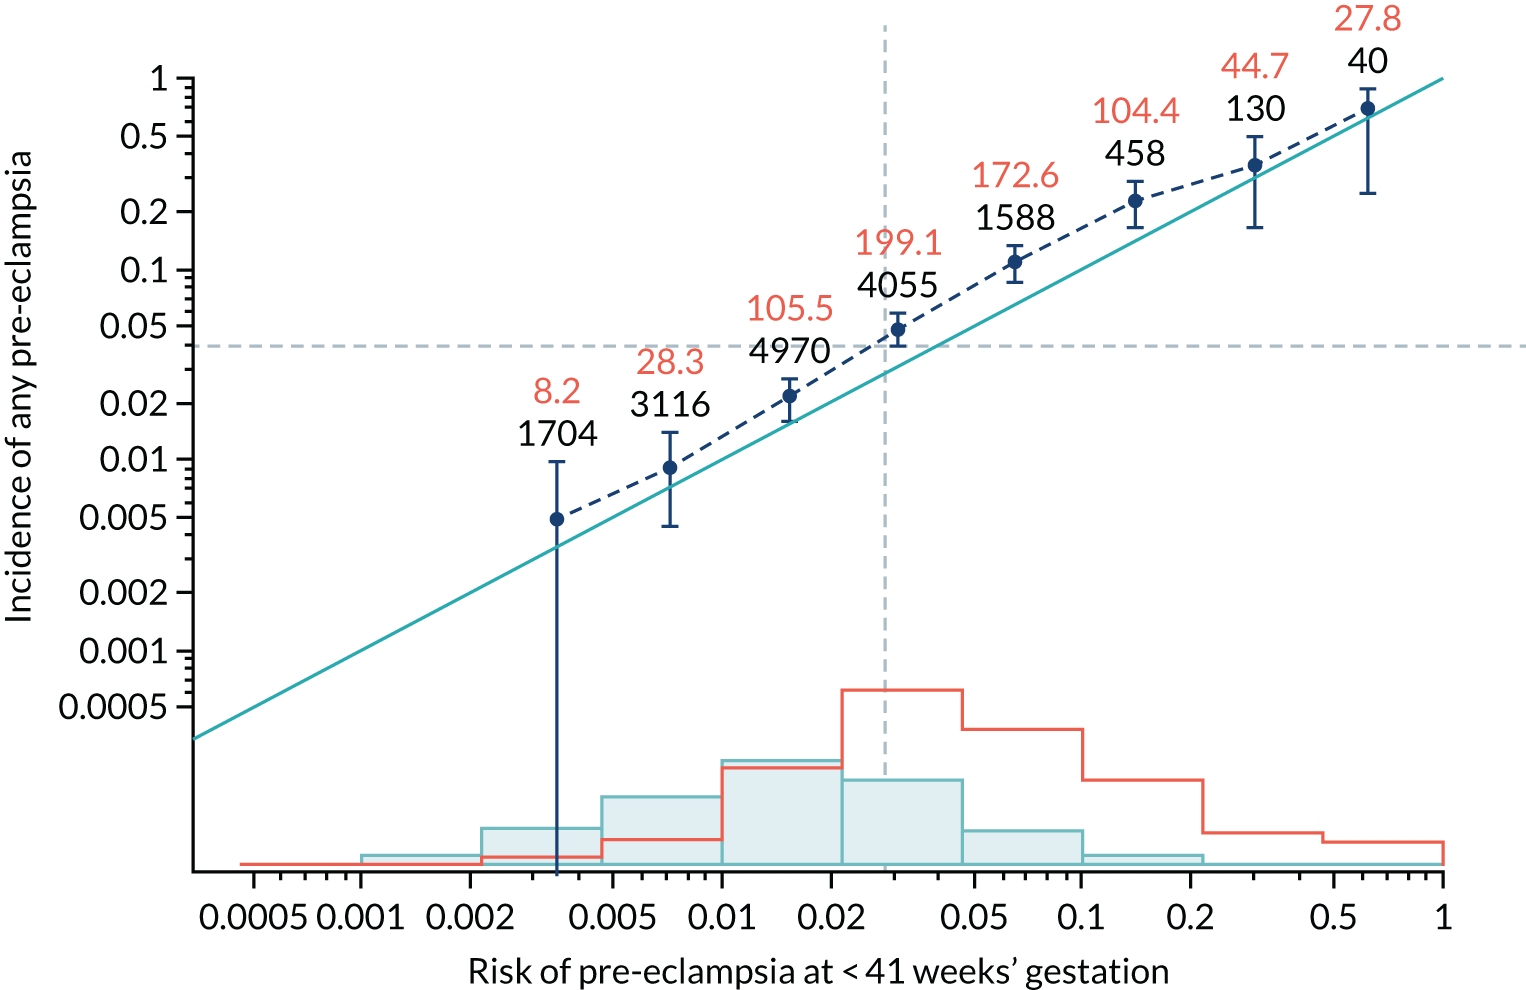
FIGURE 57.
Calibration plot for Mat-CHs and PAPP-A in predicting pre-eclampsia at < 34 weeks’ gestation.
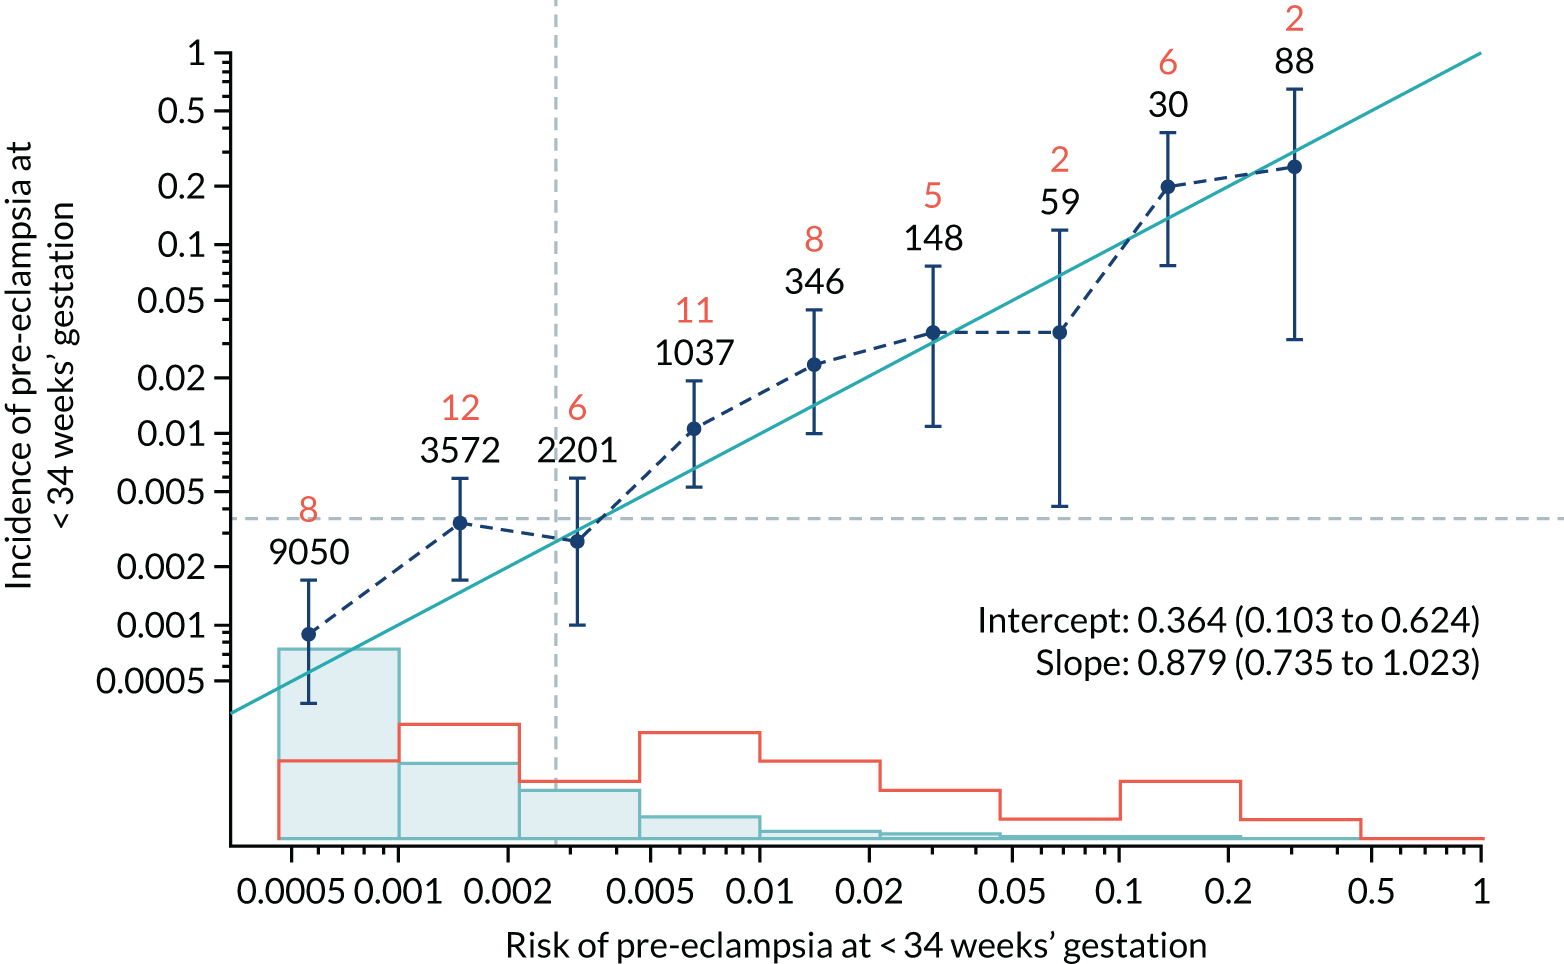
FIGURE 58.
Adjusted calibration plot for Mat-CHs and PAPP-A in predicting pre-eclampsia at < 34 weeks’ gestation.
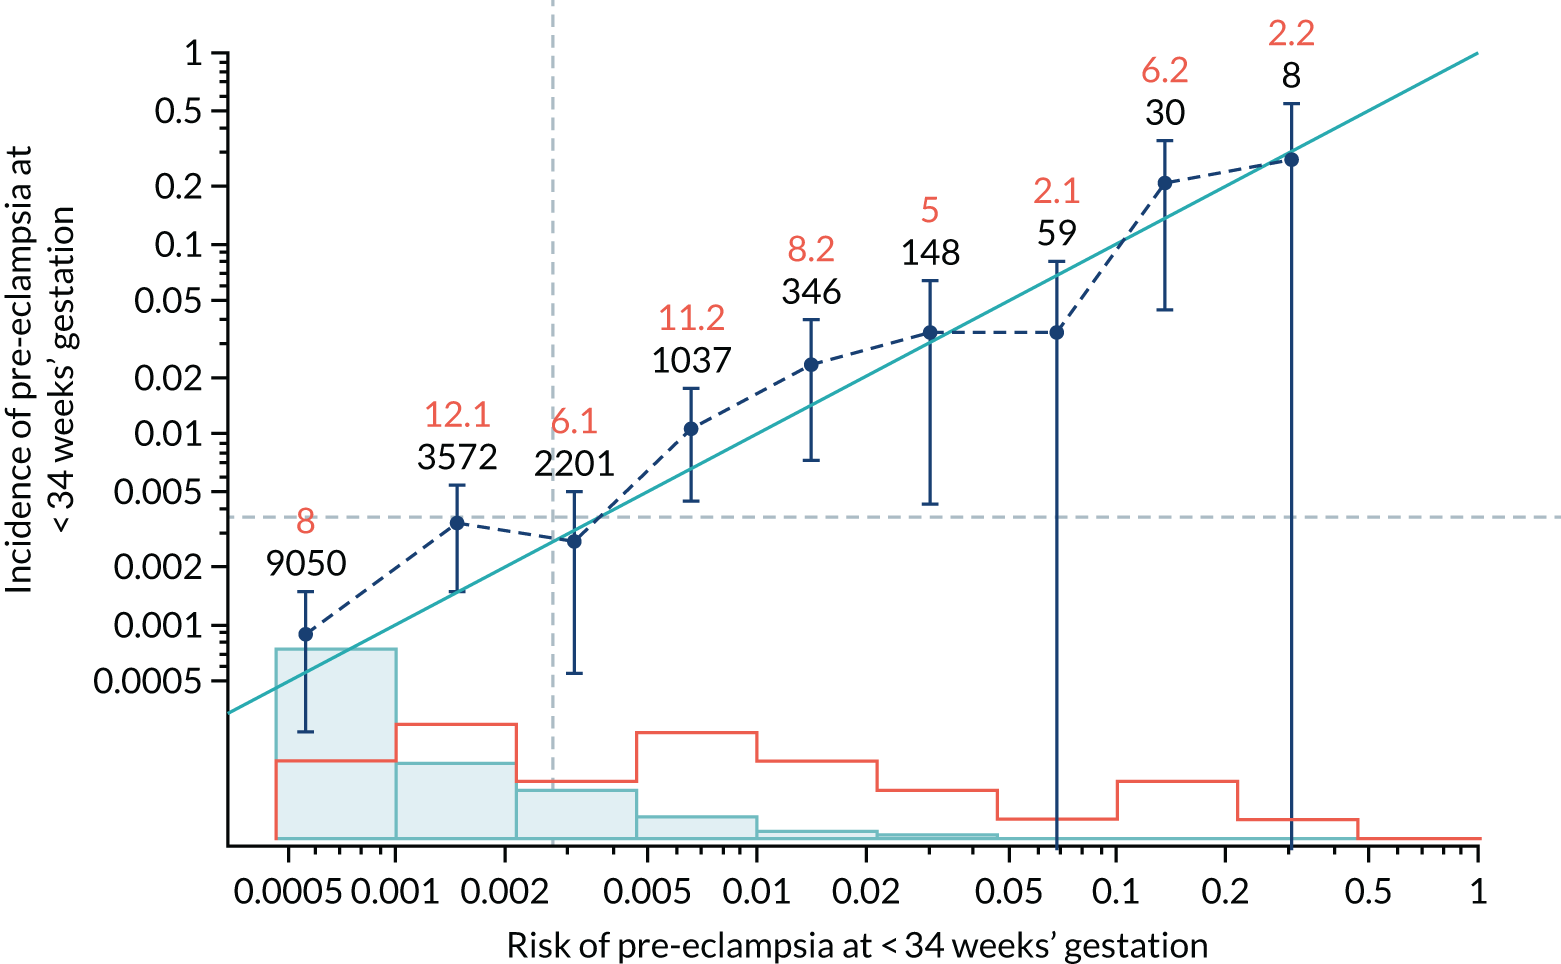
FIGURE 59.
Calibration plot for Mat-CHs and PAPP-A in predicting pre-eclampsia at < 37 weeks’ gestation.
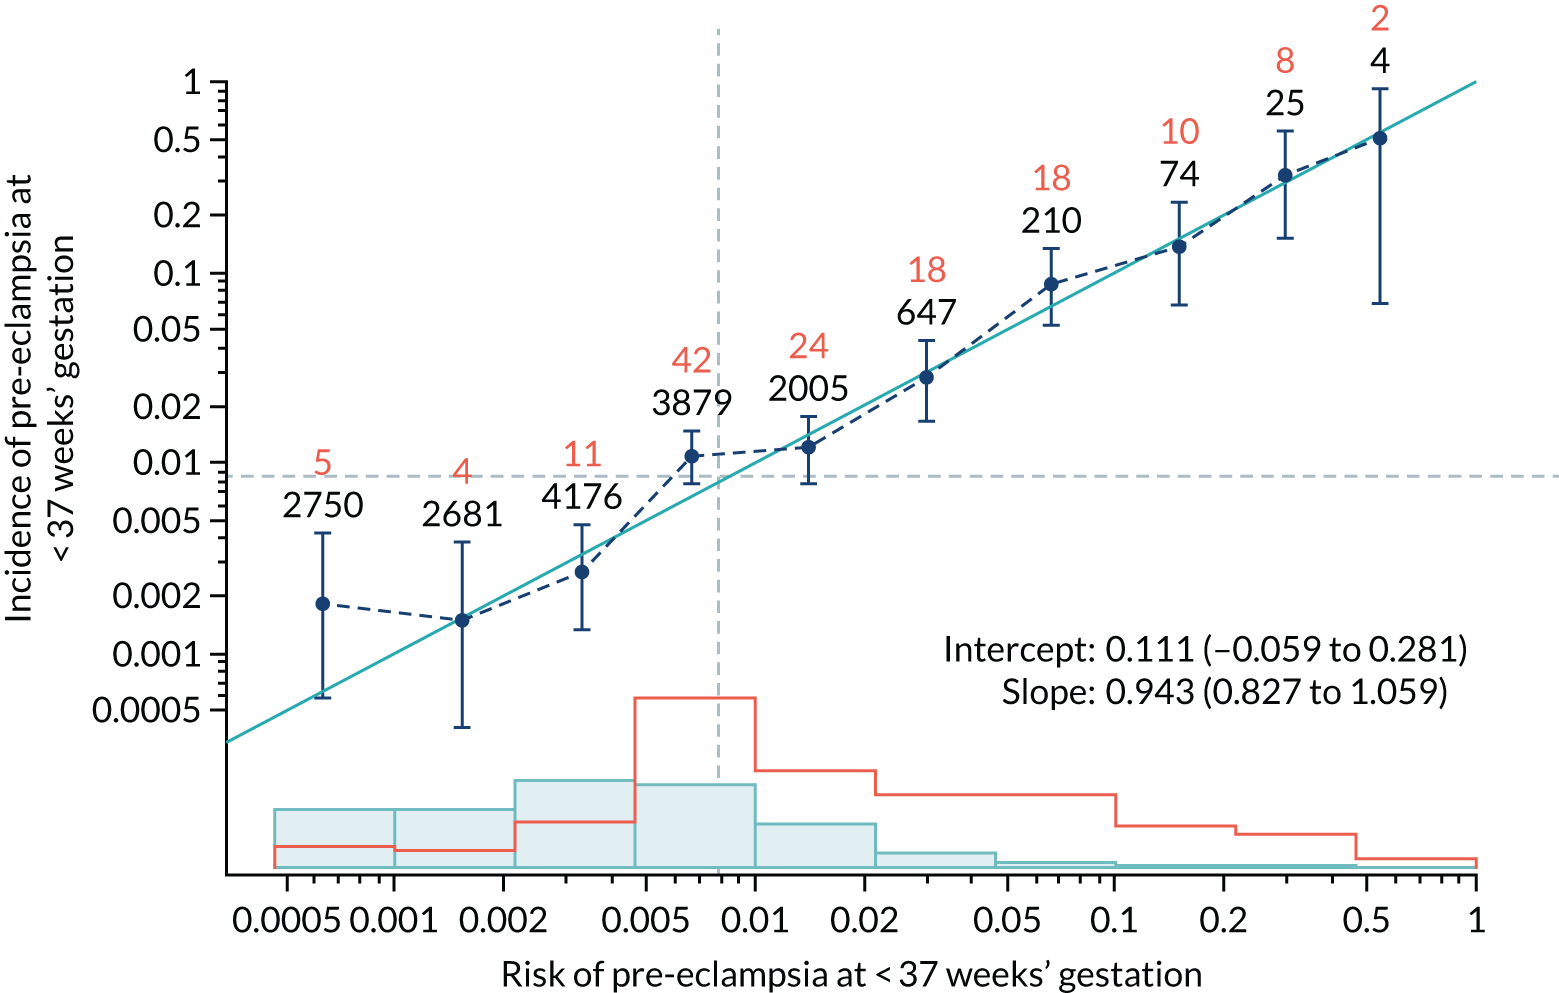
FIGURE 60.
Adjusted calibration plot for Mat-CHs and PAPP-A in predicting pre-eclampsia at < 37 weeks’ gestation.
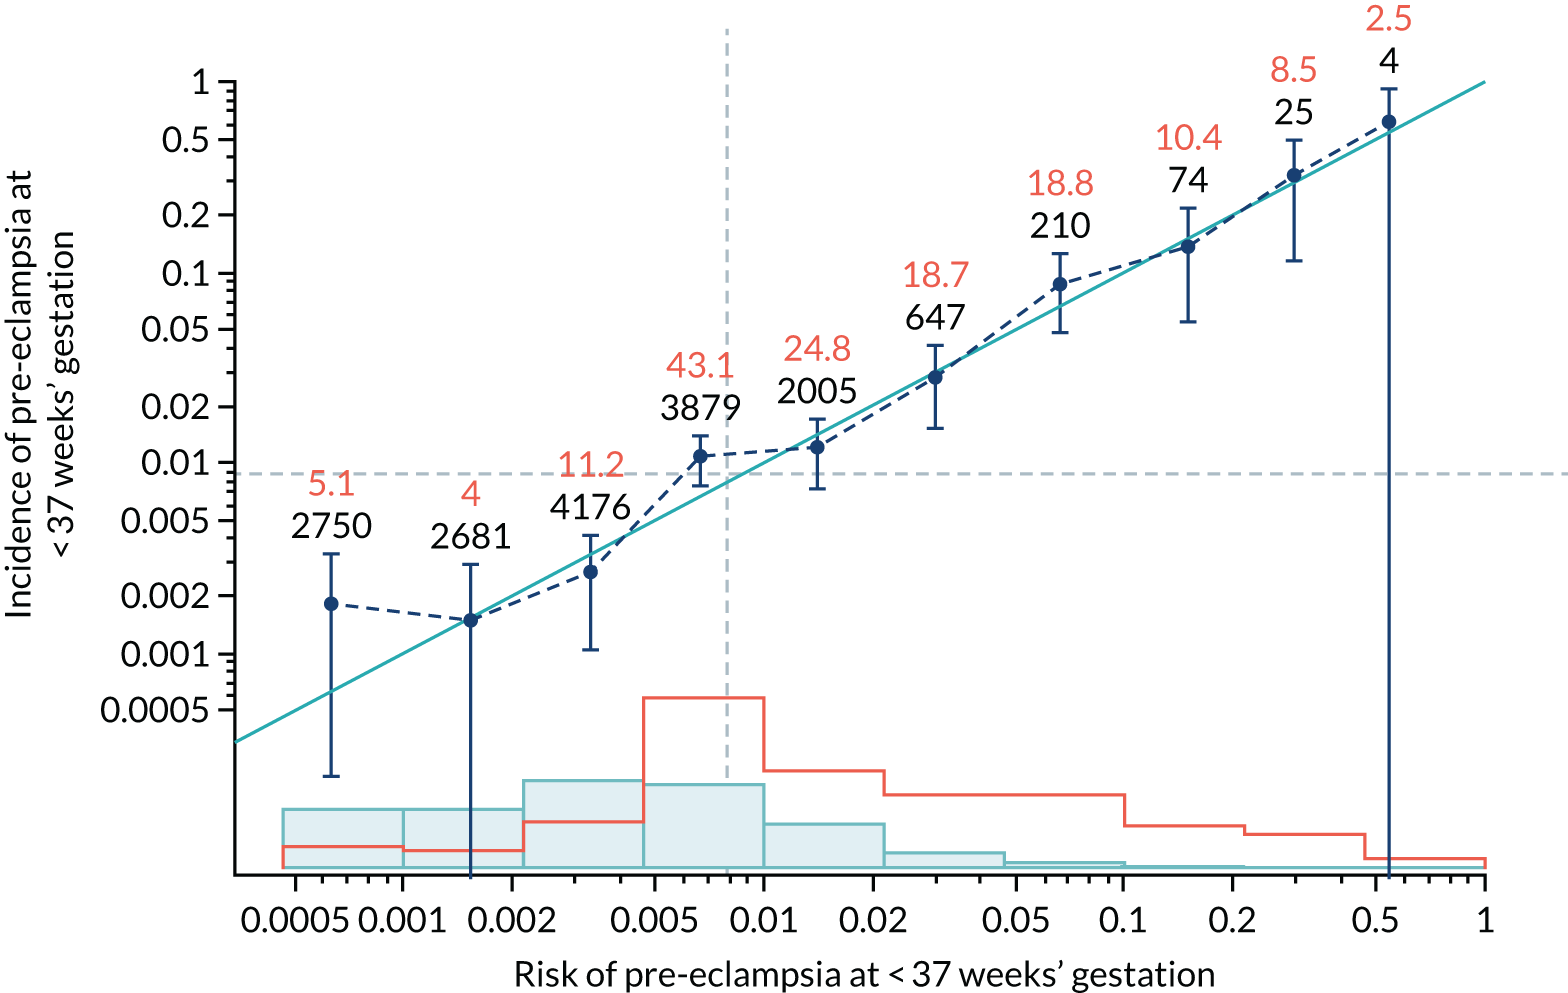
FIGURE 61.
Calibration plot for Mat-CHs and PAPP-A in predicting all pre-eclampsia.
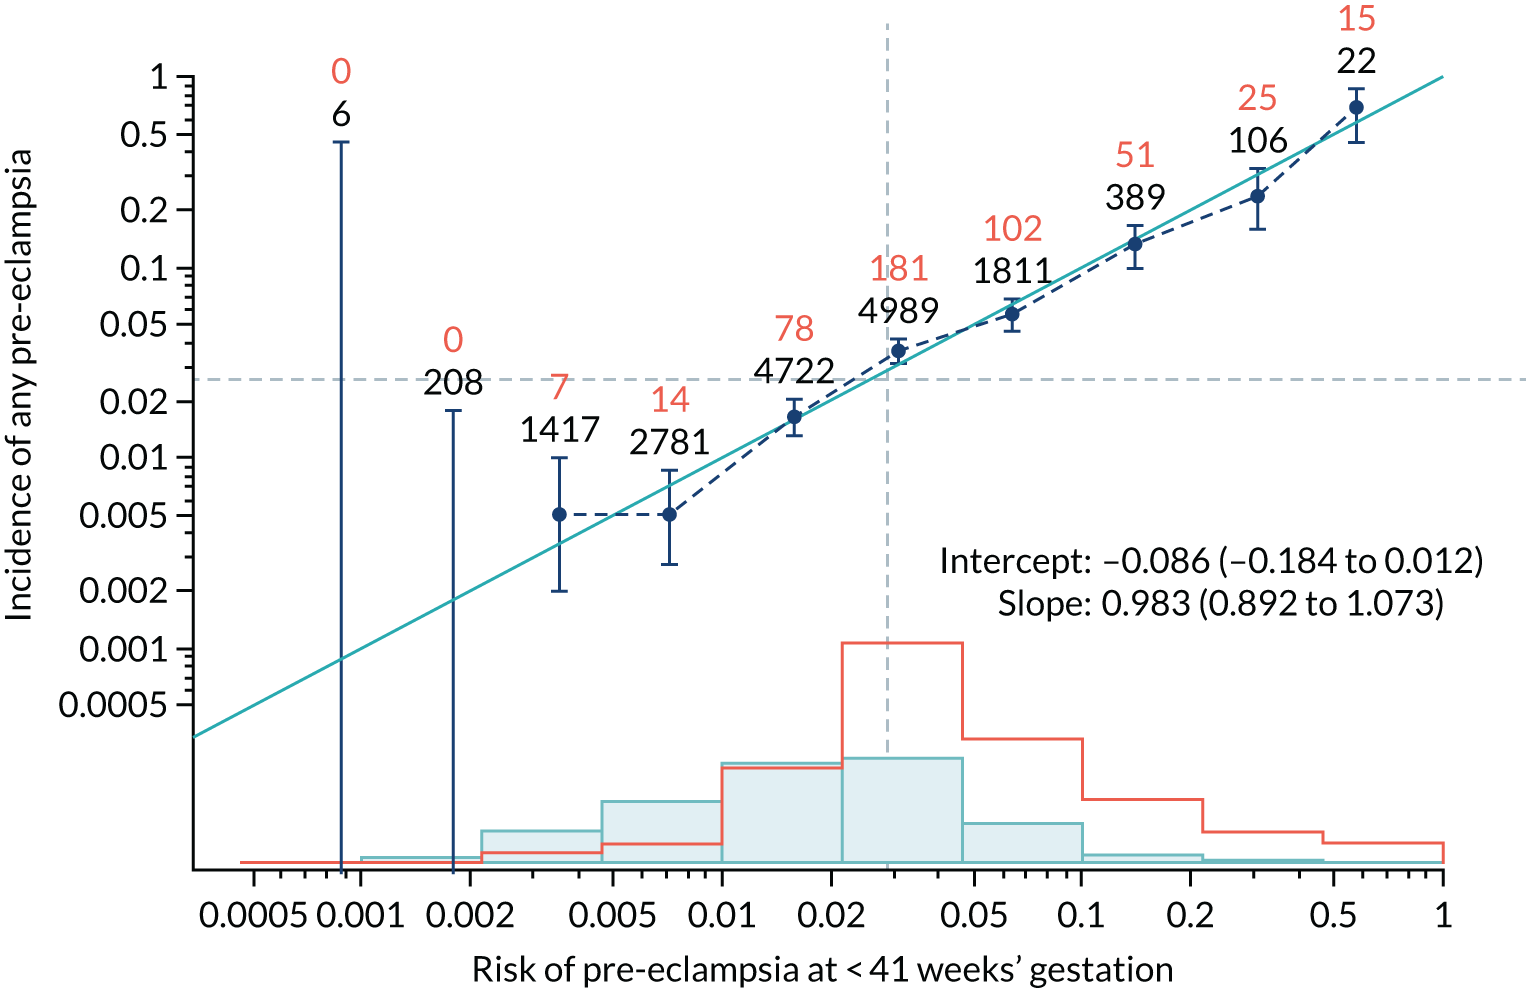
FIGURE 62.
Adjusted calibration plot for Mat-CHs and PAPP-A in predicting all pre-eclampsia.
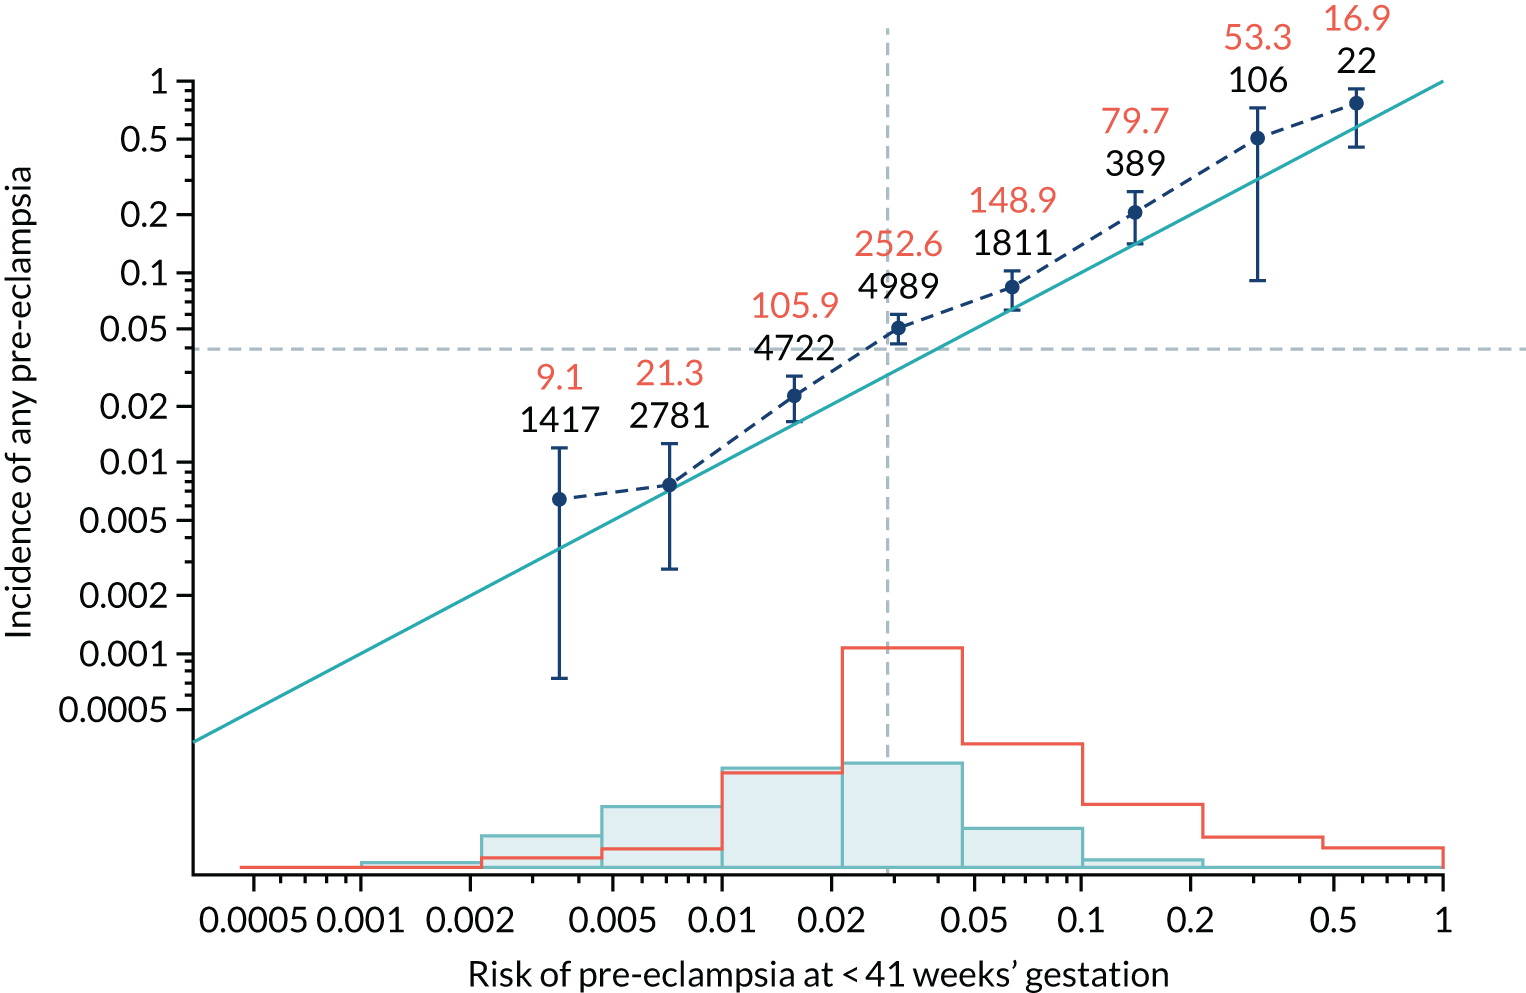
FIGURE 63.
Calibration plot for Mat-CHs, MAP and UTA-PI in predicting pre-eclampsia at < 34 weeks’ gestation.
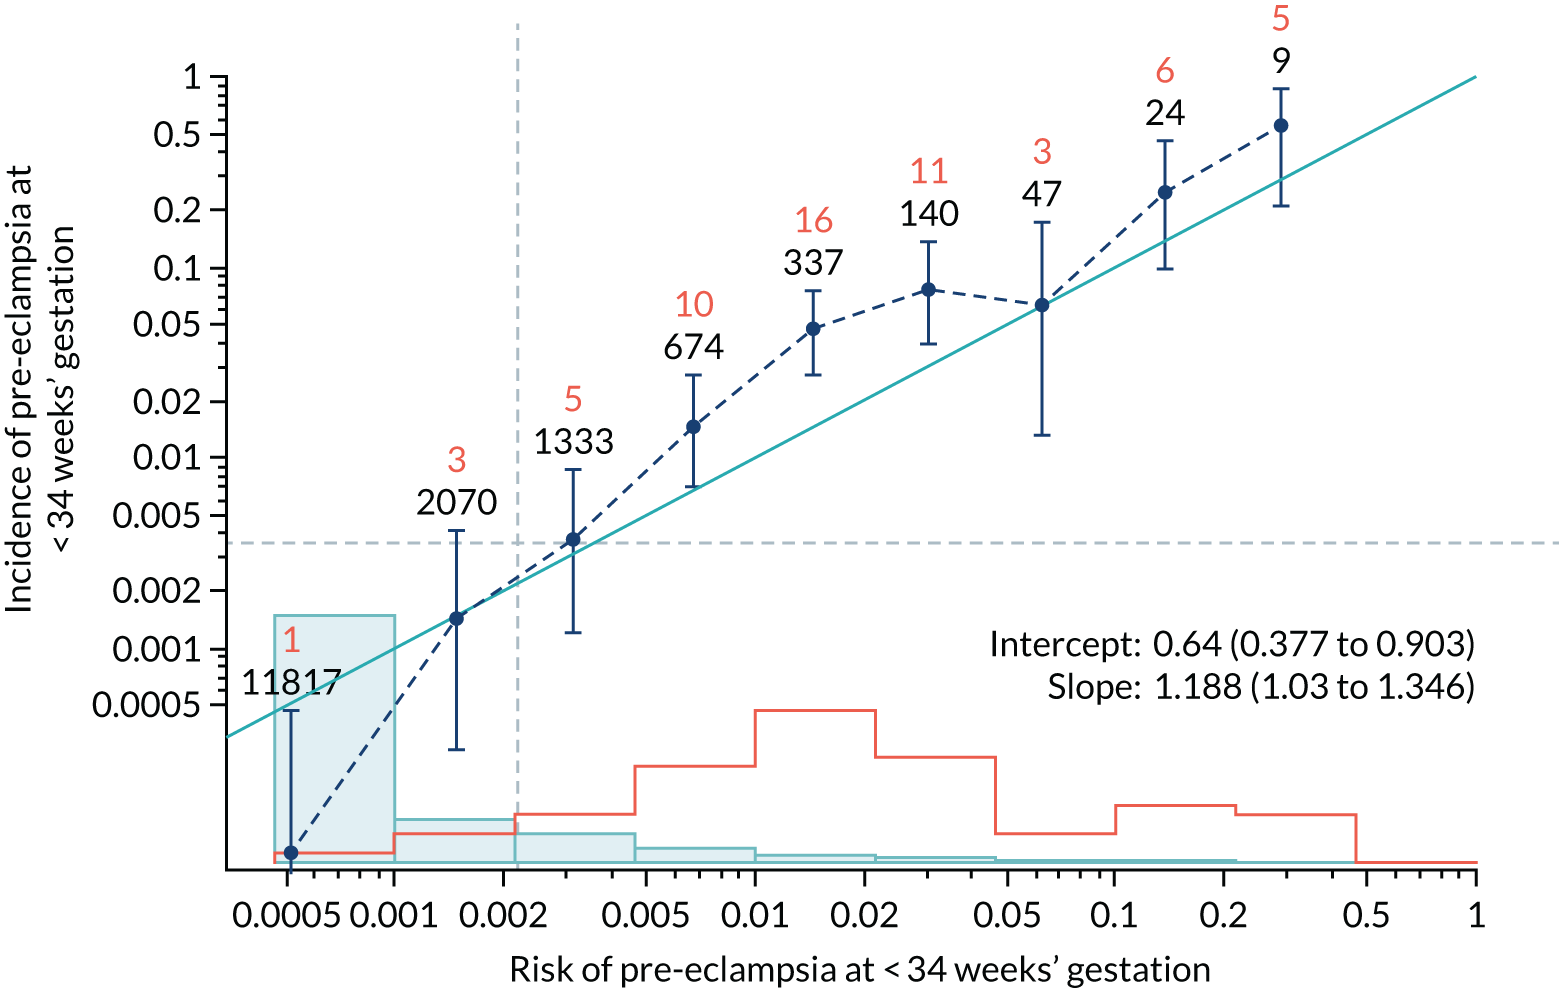
FIGURE 64.
Adjusted calibration plot for Mat-CHs, MAP and UTA-PI in predicting pre-eclampsia at < 34 weeks’ gestation.
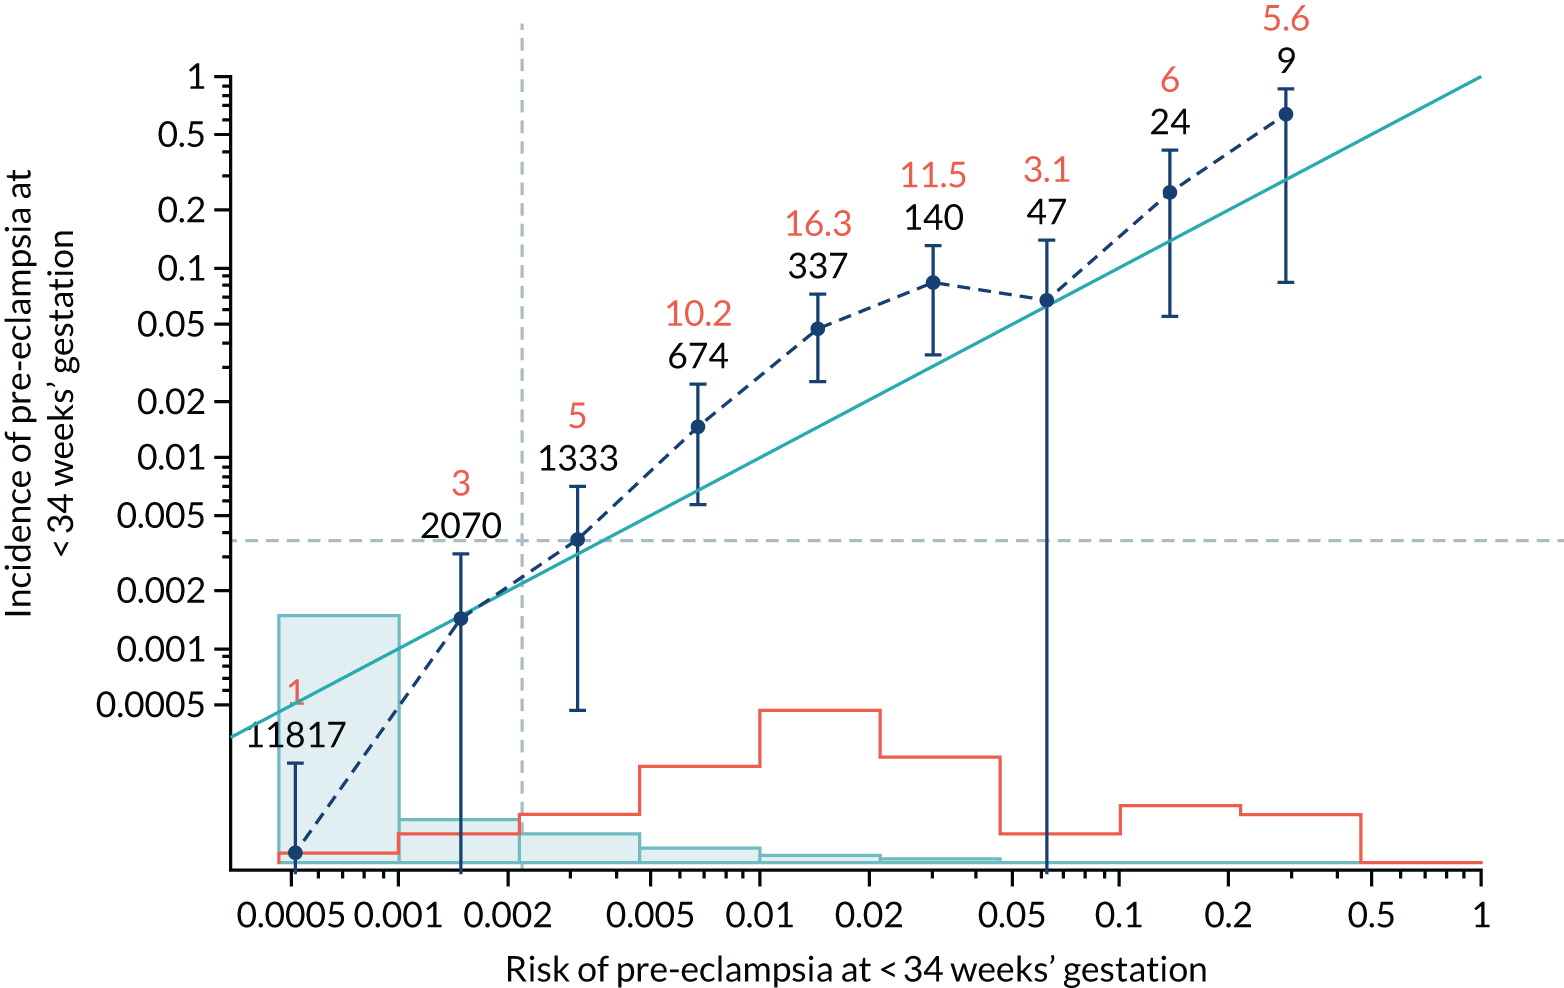
FIGURE 65.
Calibration plot for Mat-CHs, MAP and UTA-PI in predicting pre-eclampsia at < 37 weeks’ gestation.
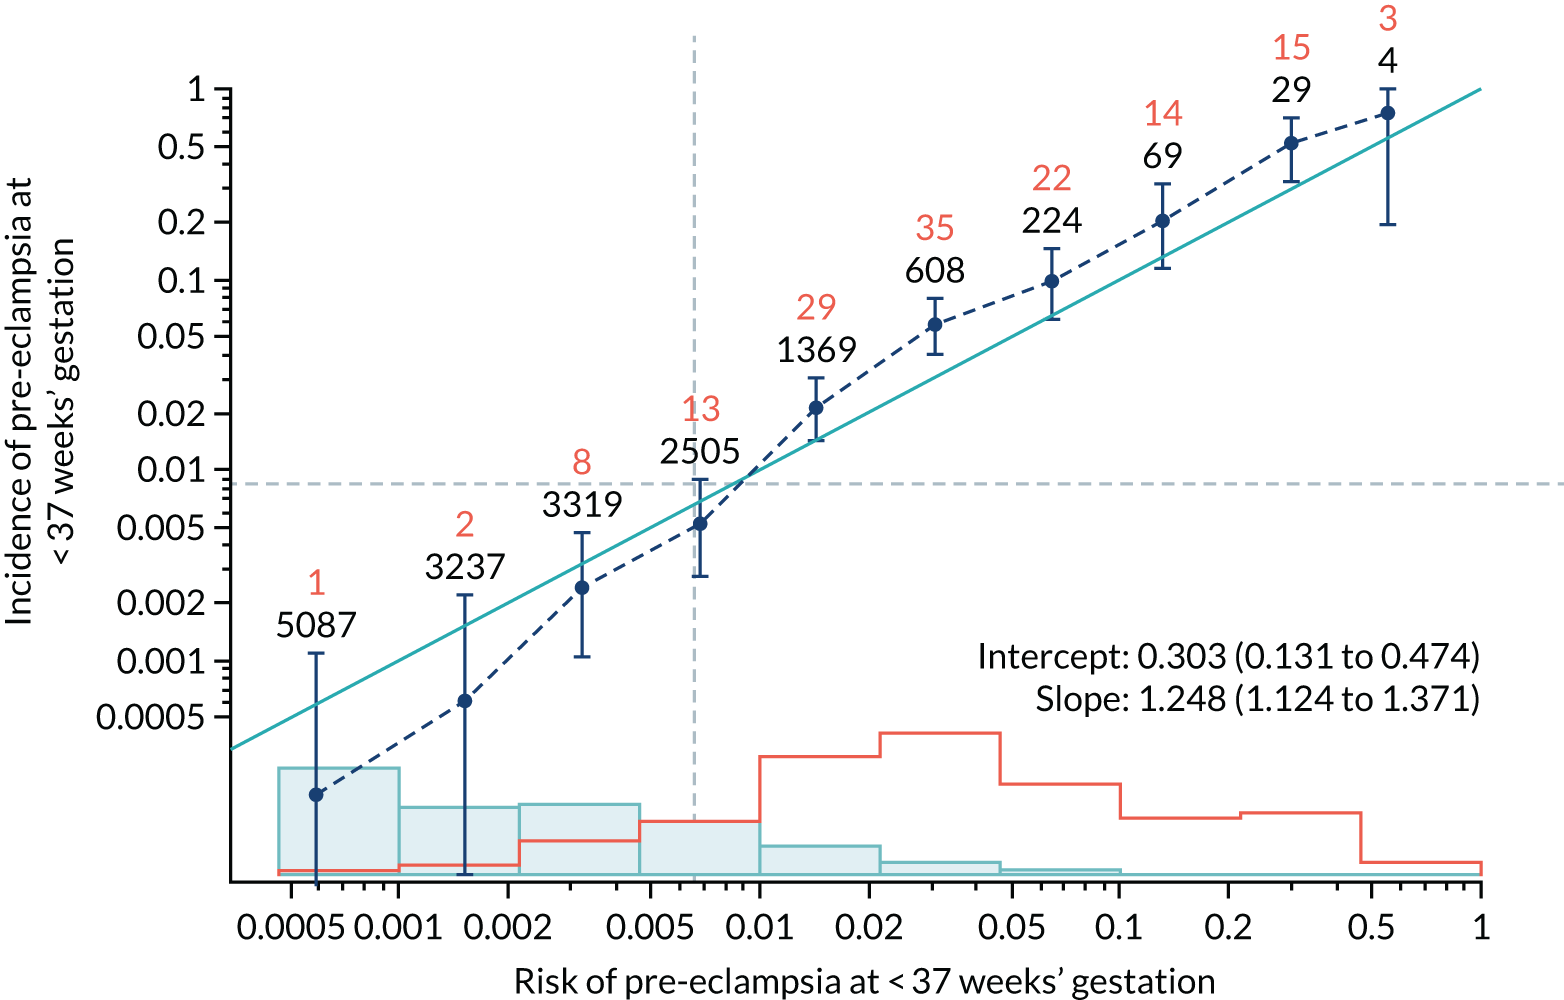
FIGURE 66.
Adjusted calibration plot for Mat-CHs, MAP and UTA-PI in predicting pre-eclampsia at < 37 weeks’ gestation.
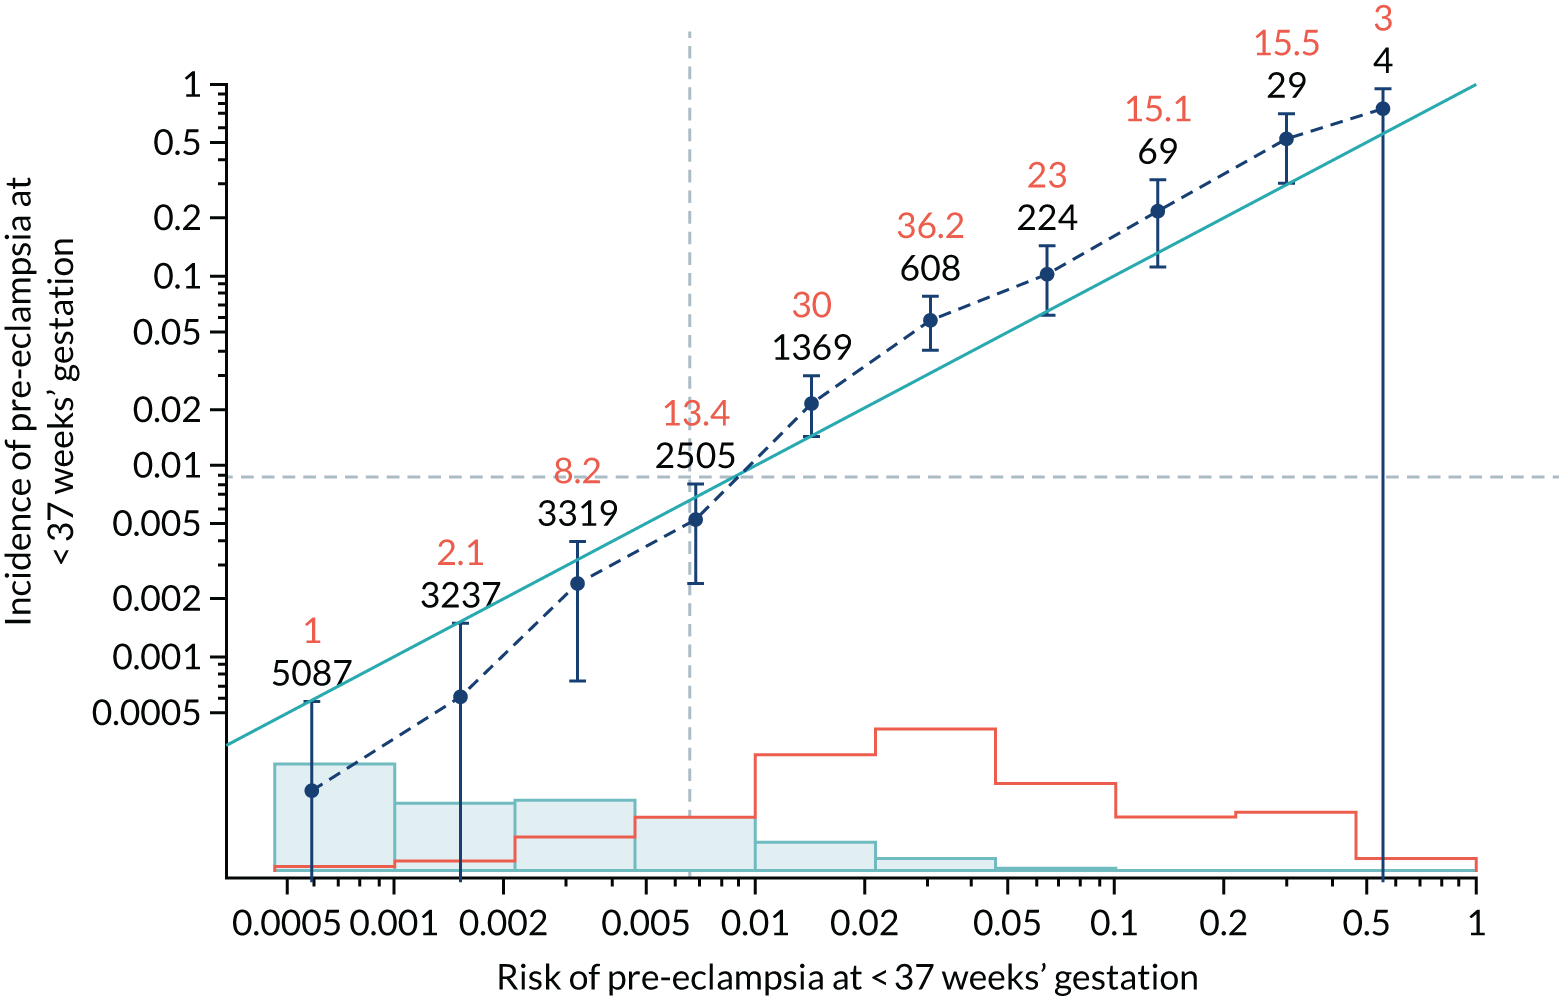
FIGURE 67.
Calibration plot for Mat-CHs, MAP and UTA-PI in predicting all pre-eclampsia.
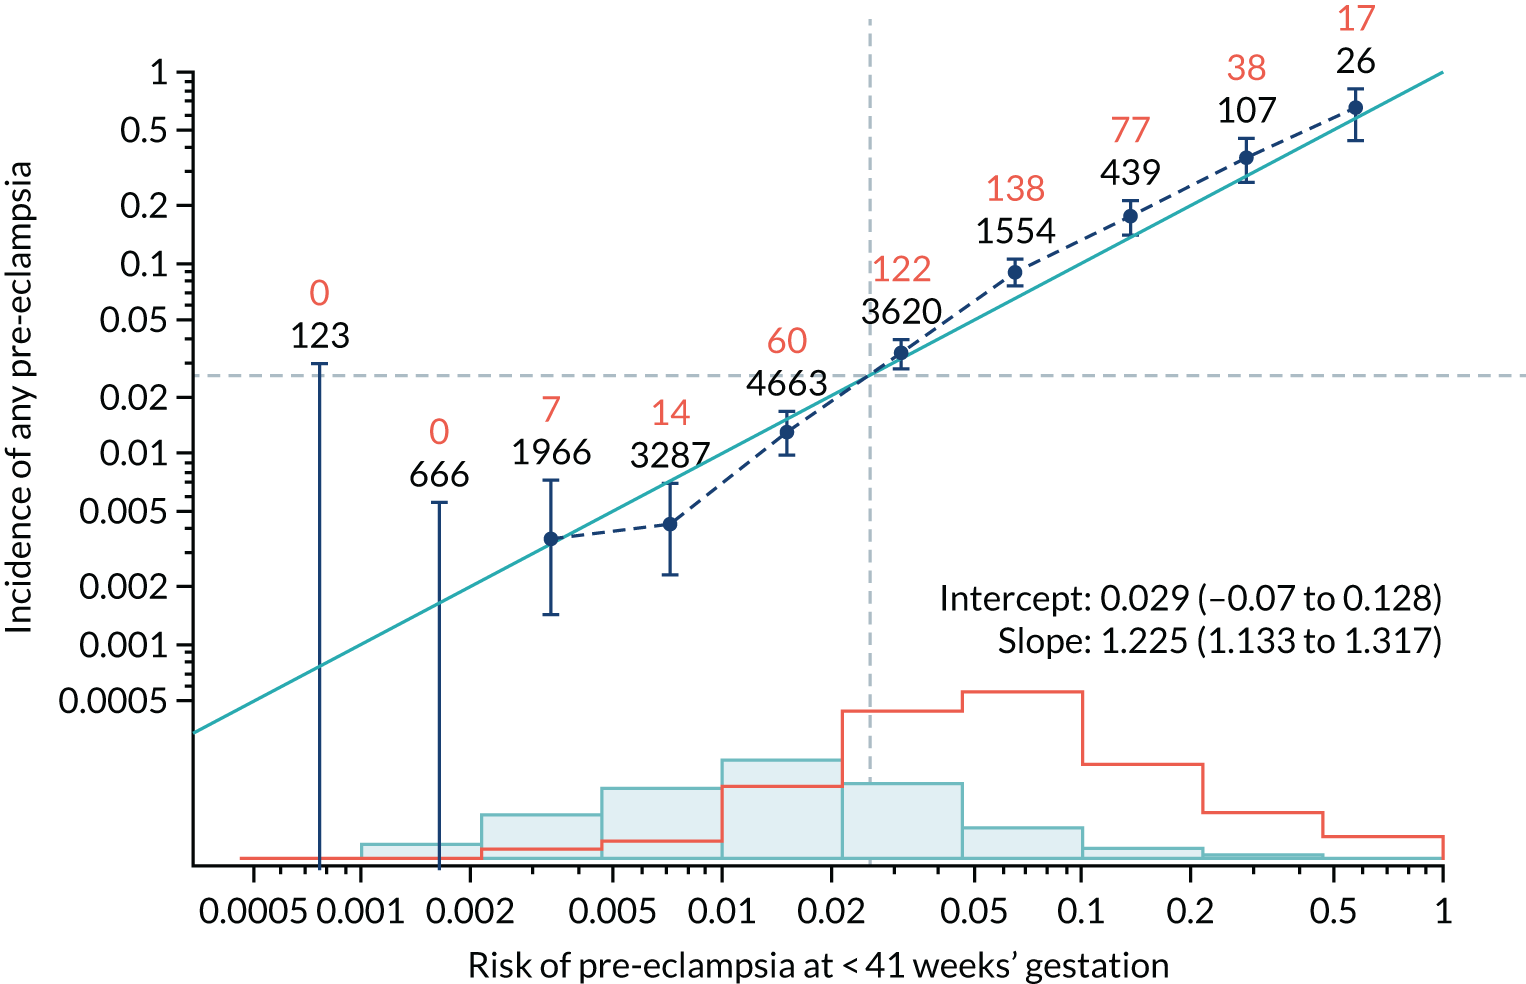
FIGURE 68.
Adjusted calibration plot for Mat-CHs, MAP and UTA-PI in predicting all pre-eclampsia.
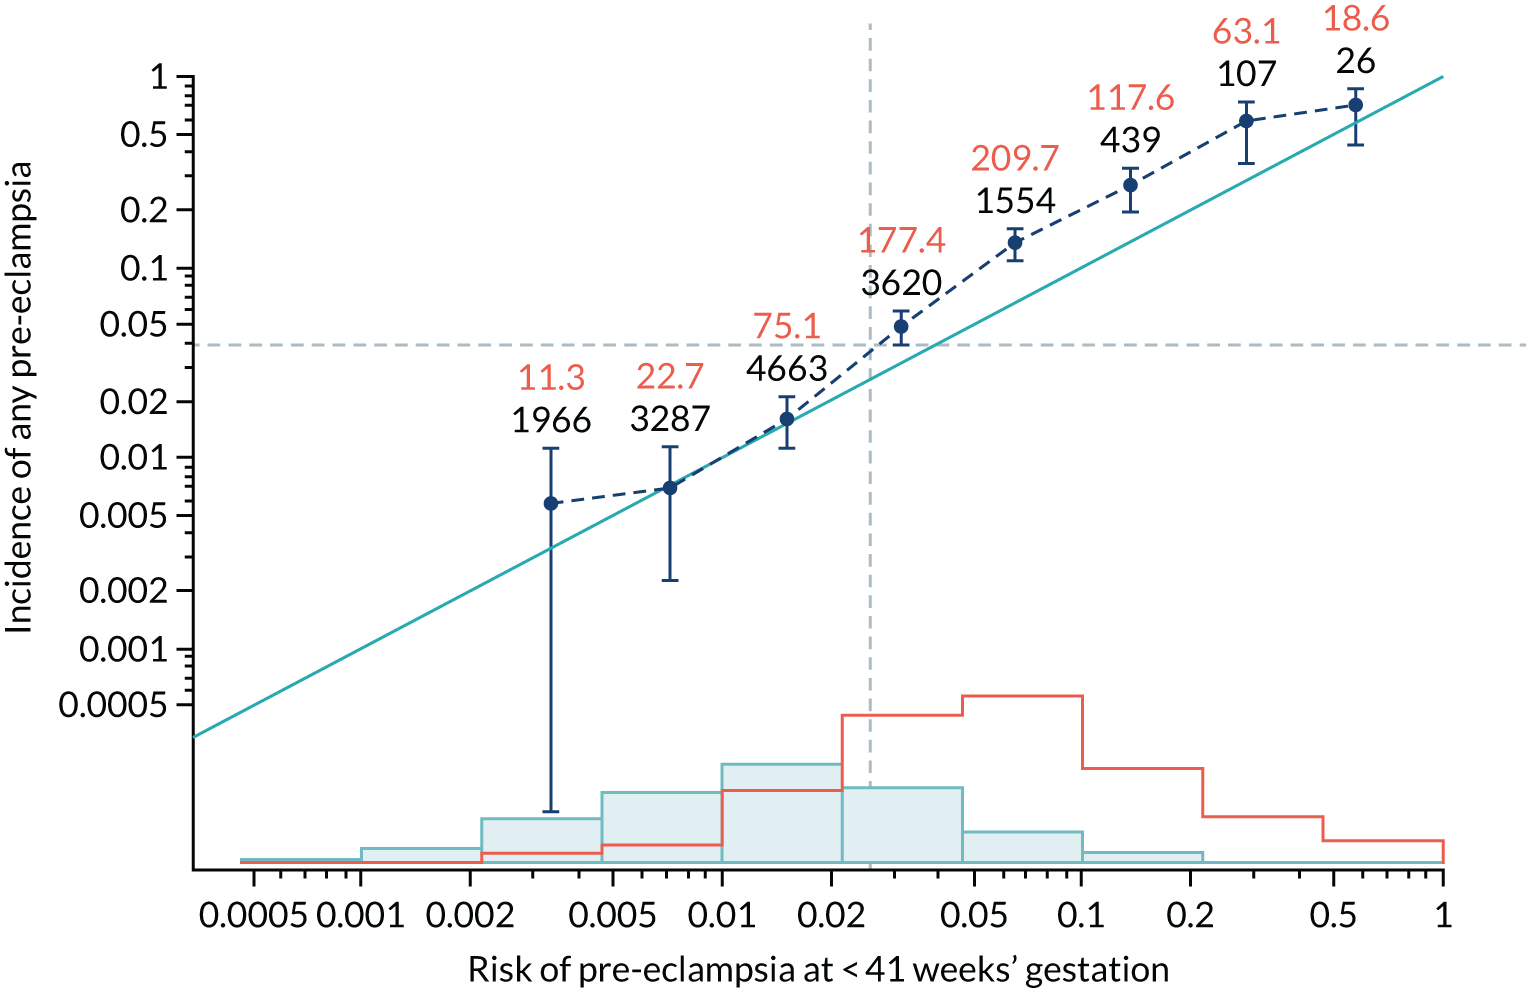
FIGURE 69.
Calibration plot for Mat-CHs, MAP and PAPP-A in predicting pre-eclampsia at < 34 weeks’ gestation.
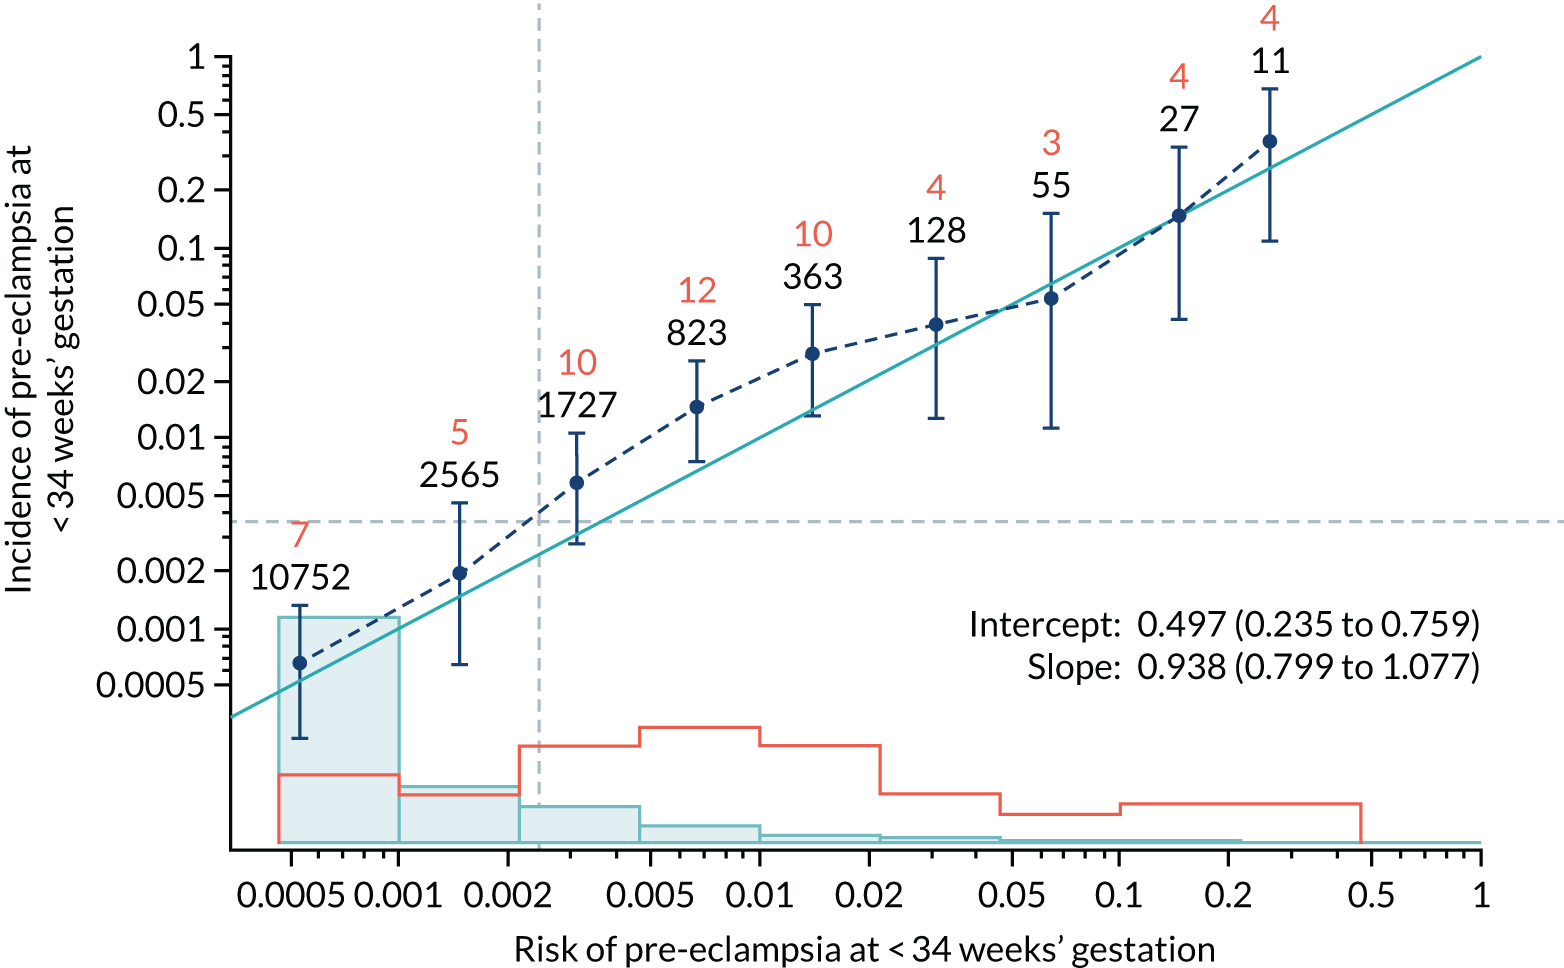
FIGURE 70.
Adjusted calibration plot for Mat-CHs, MAP and PAPP-A in predicting pre-eclampsia at < 34 weeks’ gestation.
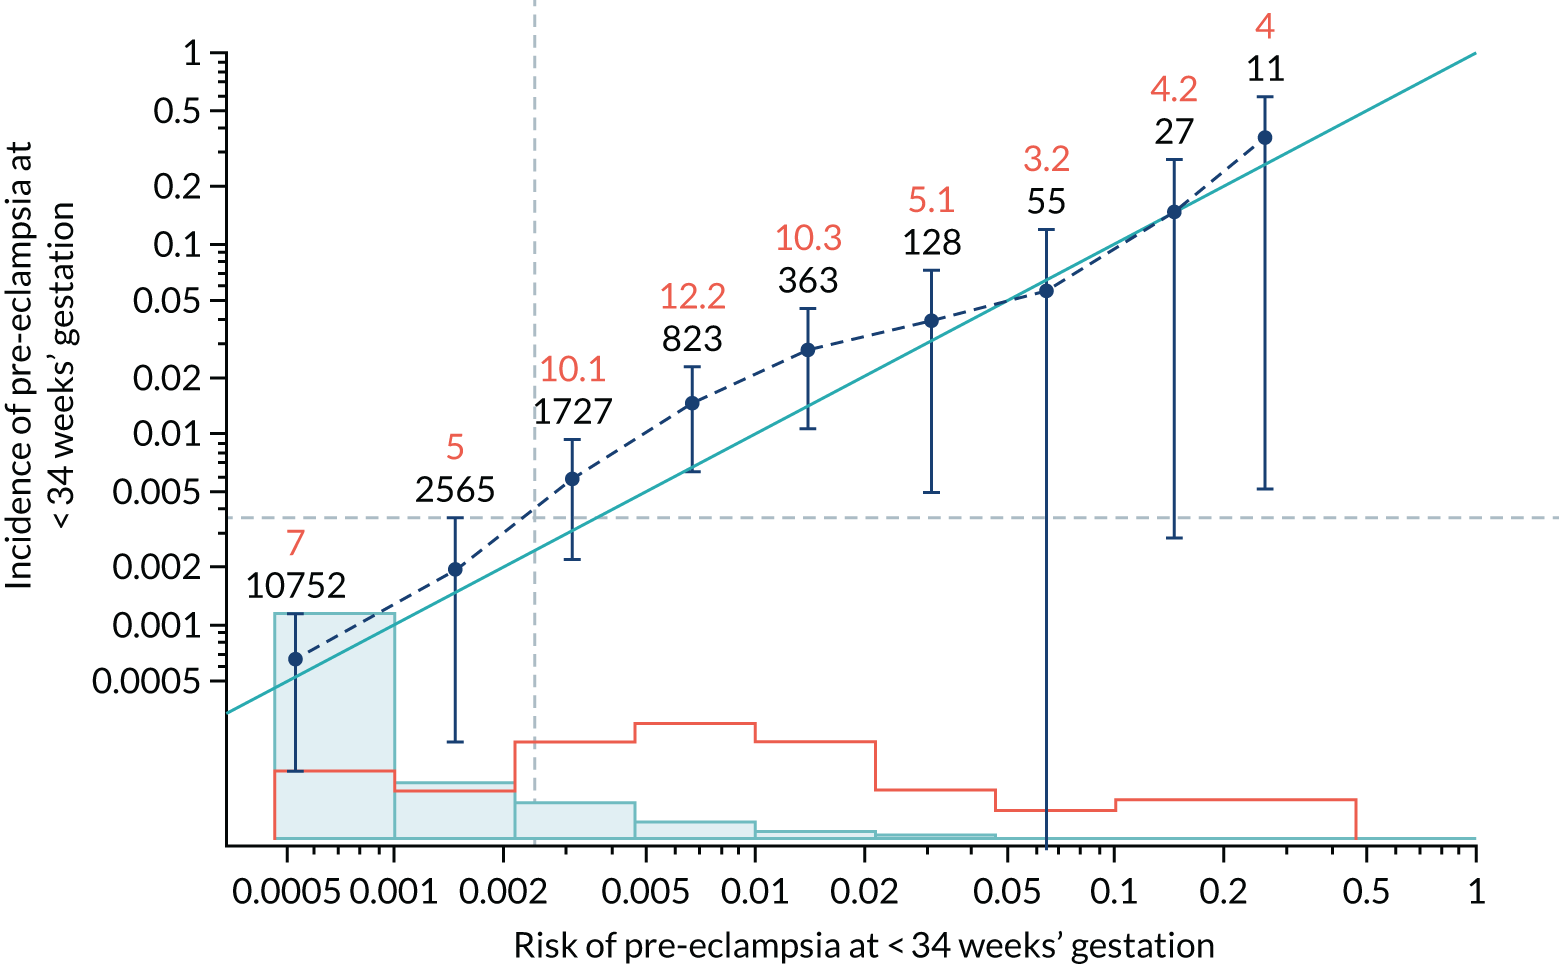
FIGURE 71.
Calibration plot for Mat-CHs, MAP and PAPP-A in predicting pre-eclampsia at < 37 weeks’ gestation.
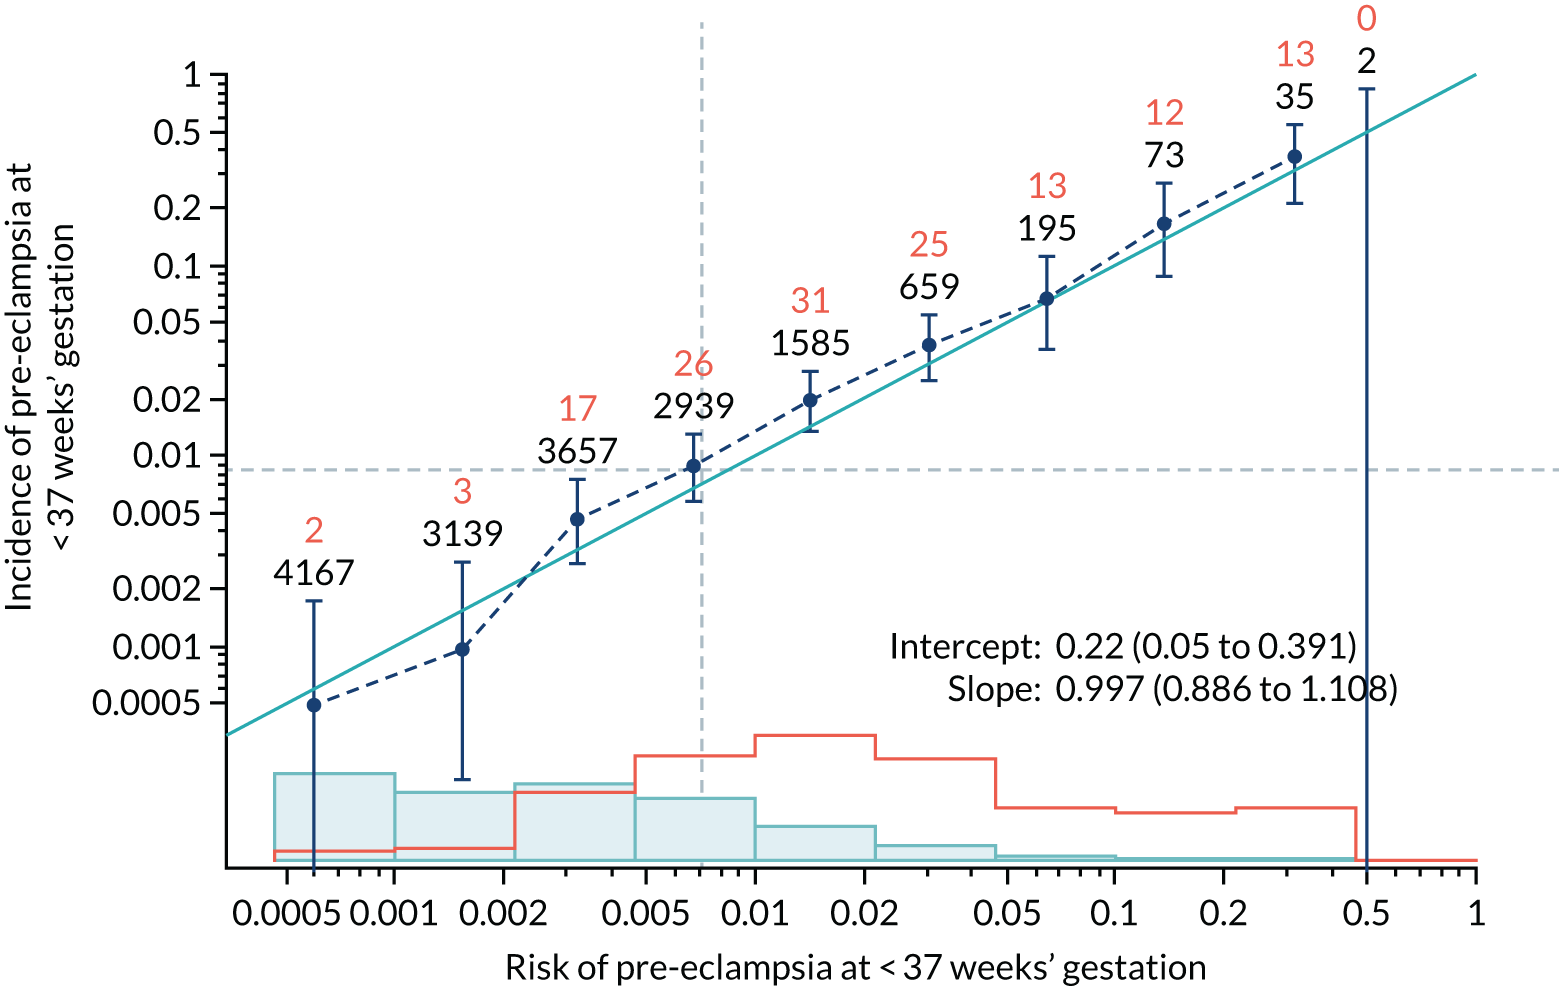
FIGURE 72.
Adjusted calibration plot for Mat-CHs, MAP and PAPP-A in predicting pre-eclampsia at < 37 weeks’ gestation.
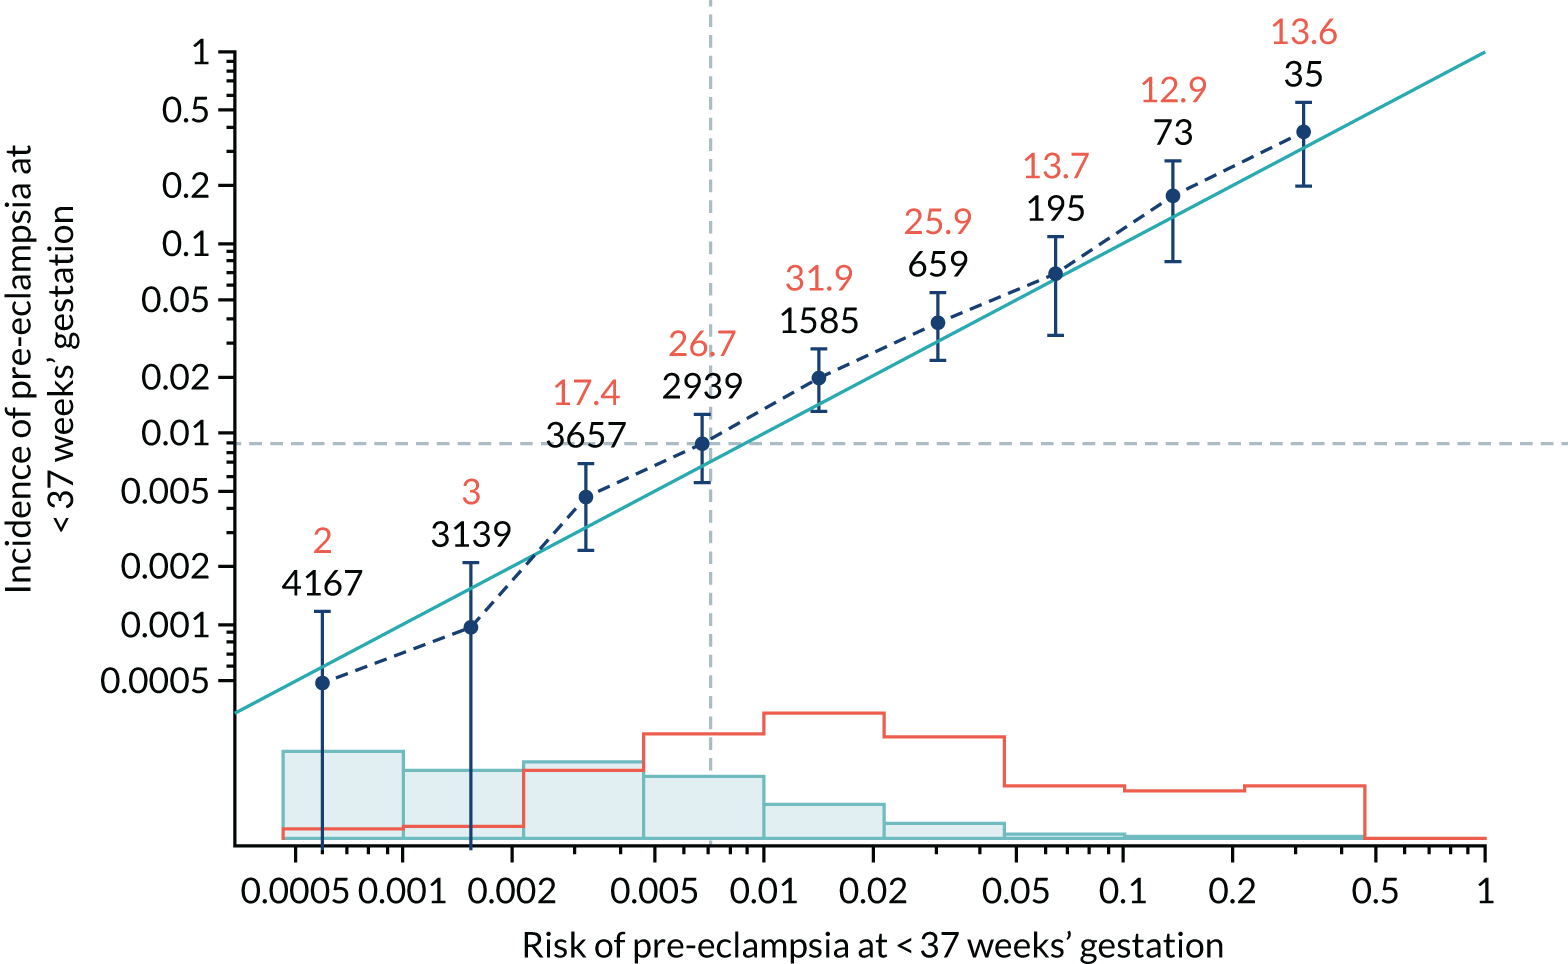
FIGURE 73.
Calibration plot for Mat-CHs, MAP and PAPP-A in predicting all pre-eclampsia.
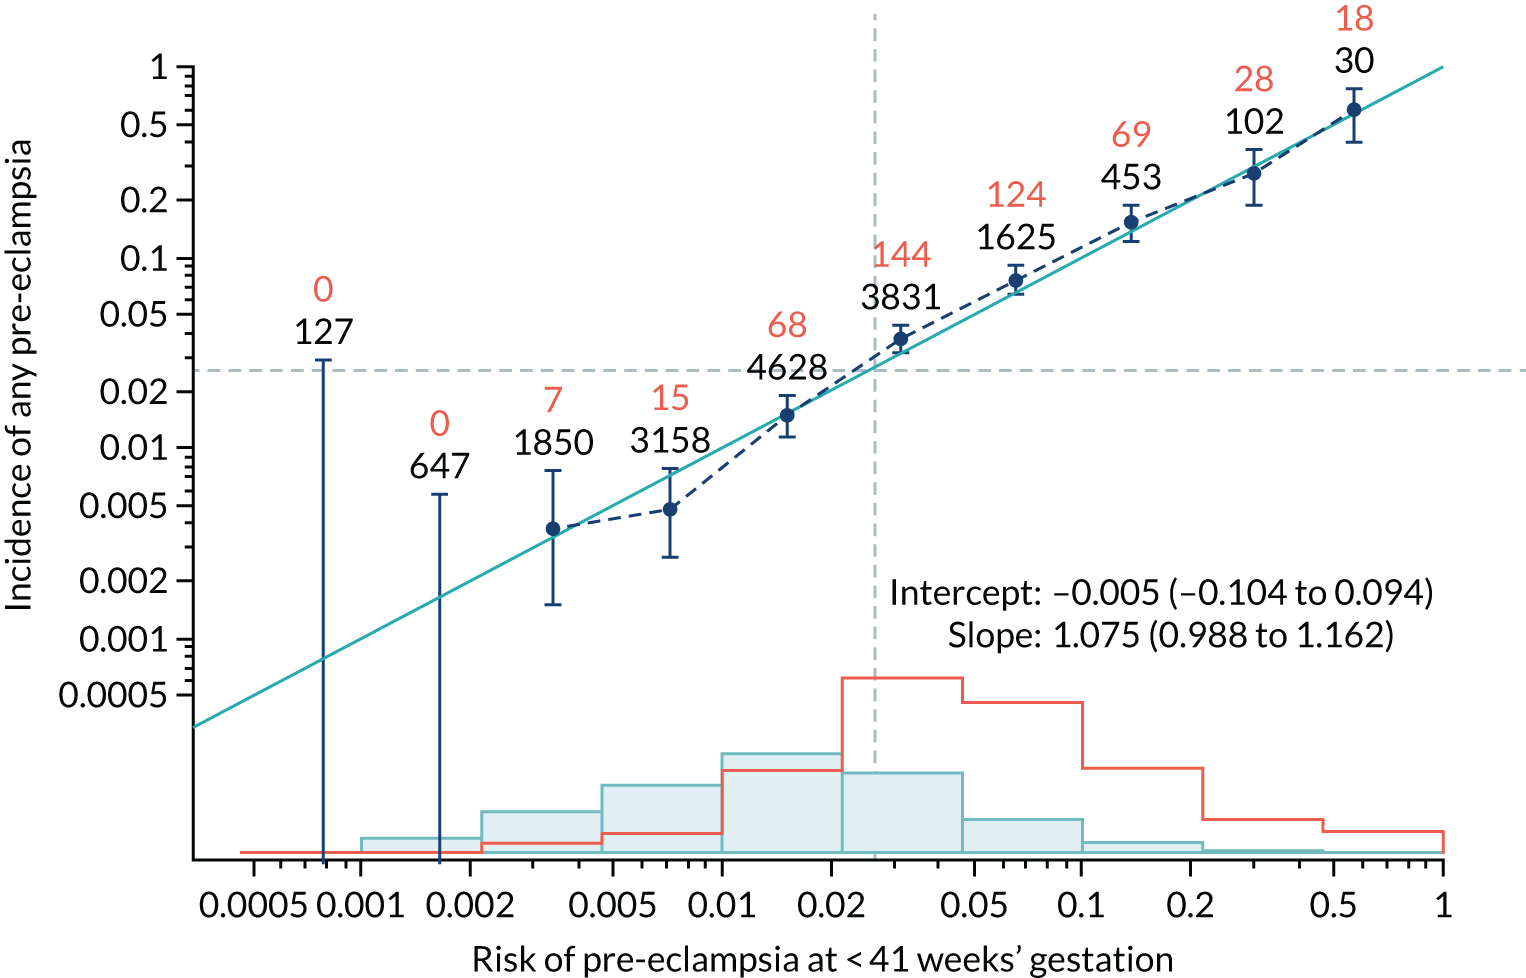
FIGURE 74.
Adjusted calibration plot for Mat-CHs, MAP and PAPP-A in predicting all pre-eclampsia.
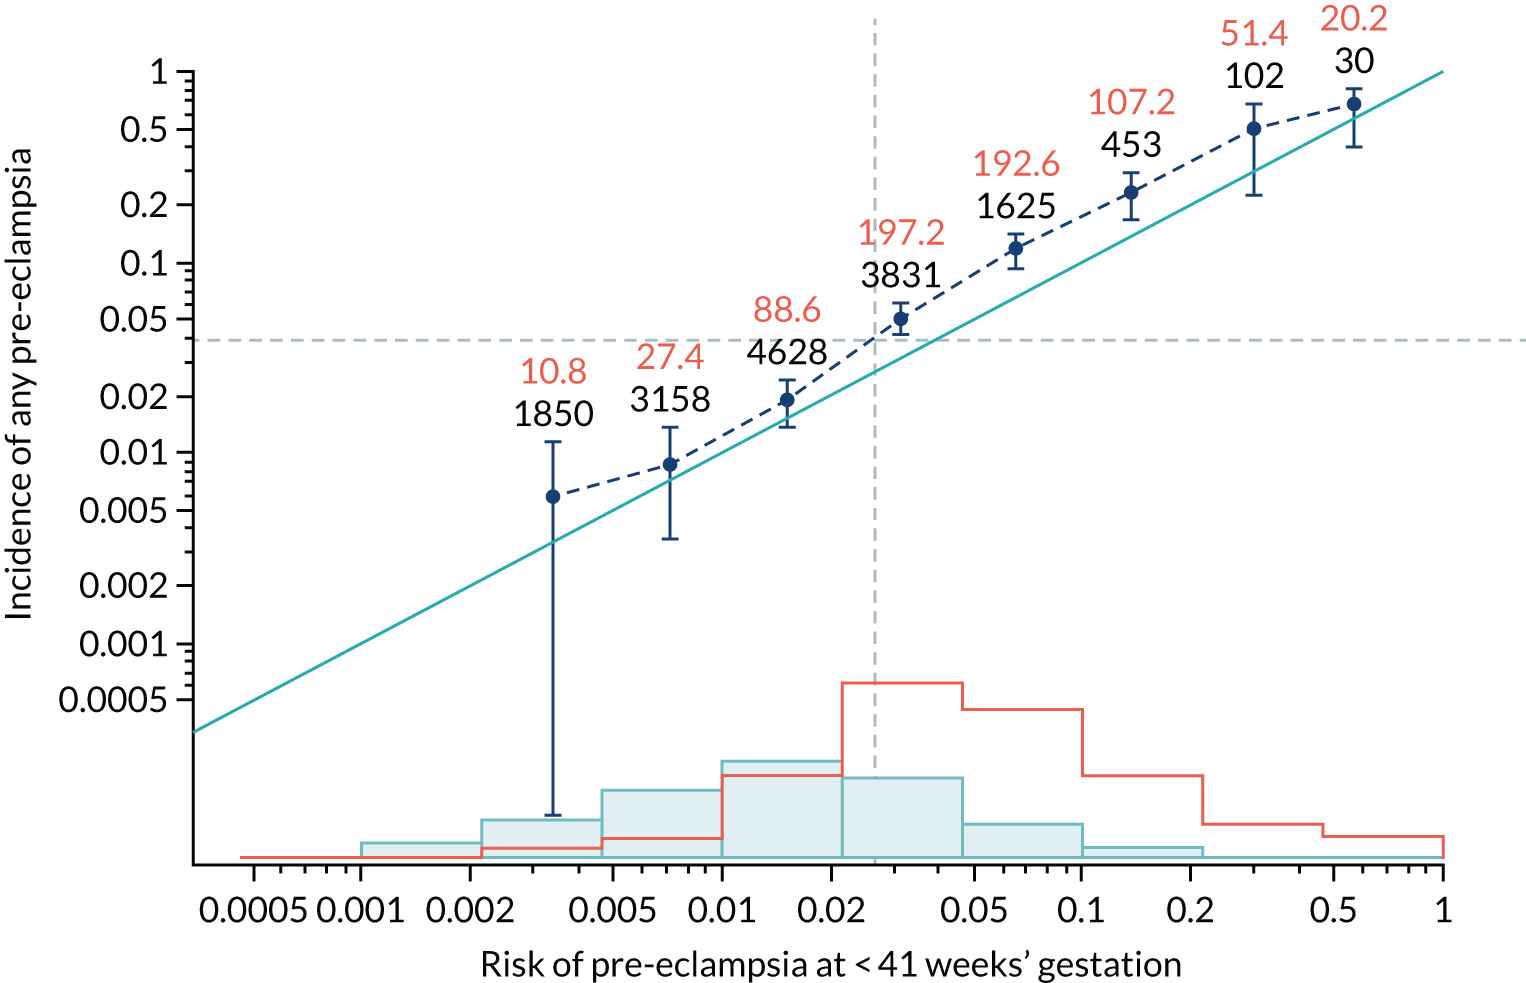
FIGURE 75.
Calibration plot for Mat-CHs, MAP and PLGF in predicting pre-eclampsia at < 34 weeks’ gestation.
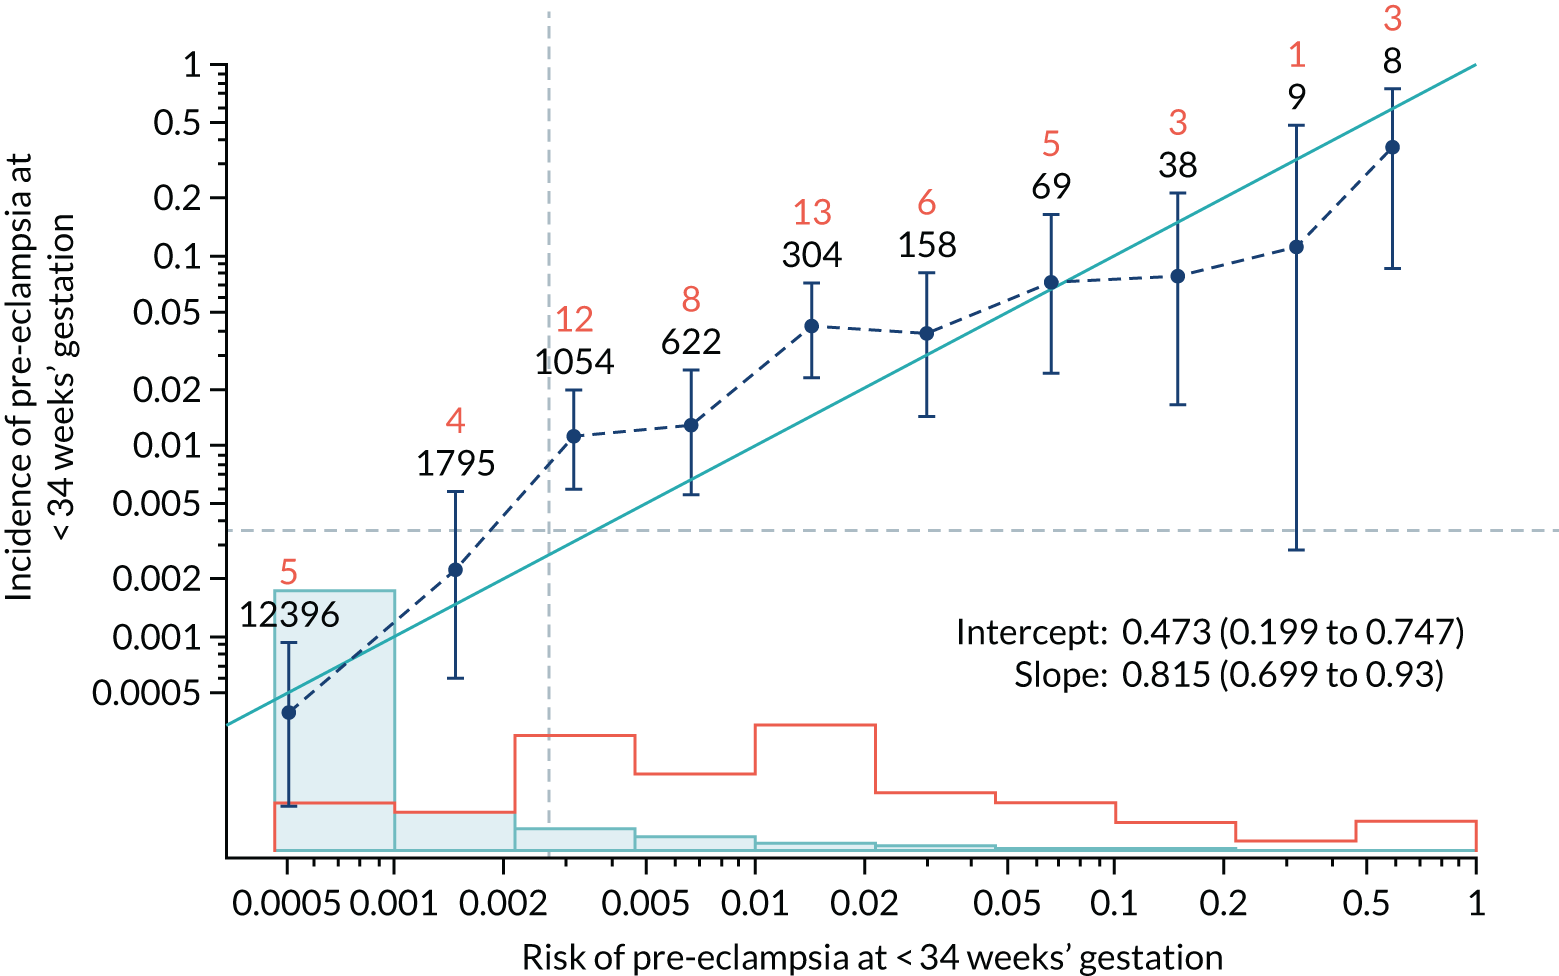
FIGURE 76.
Adjusted calibration plot for Mat-CHs, MAP and PLGF in predicting pre-eclampsia at < 34 weeks’ gestation.
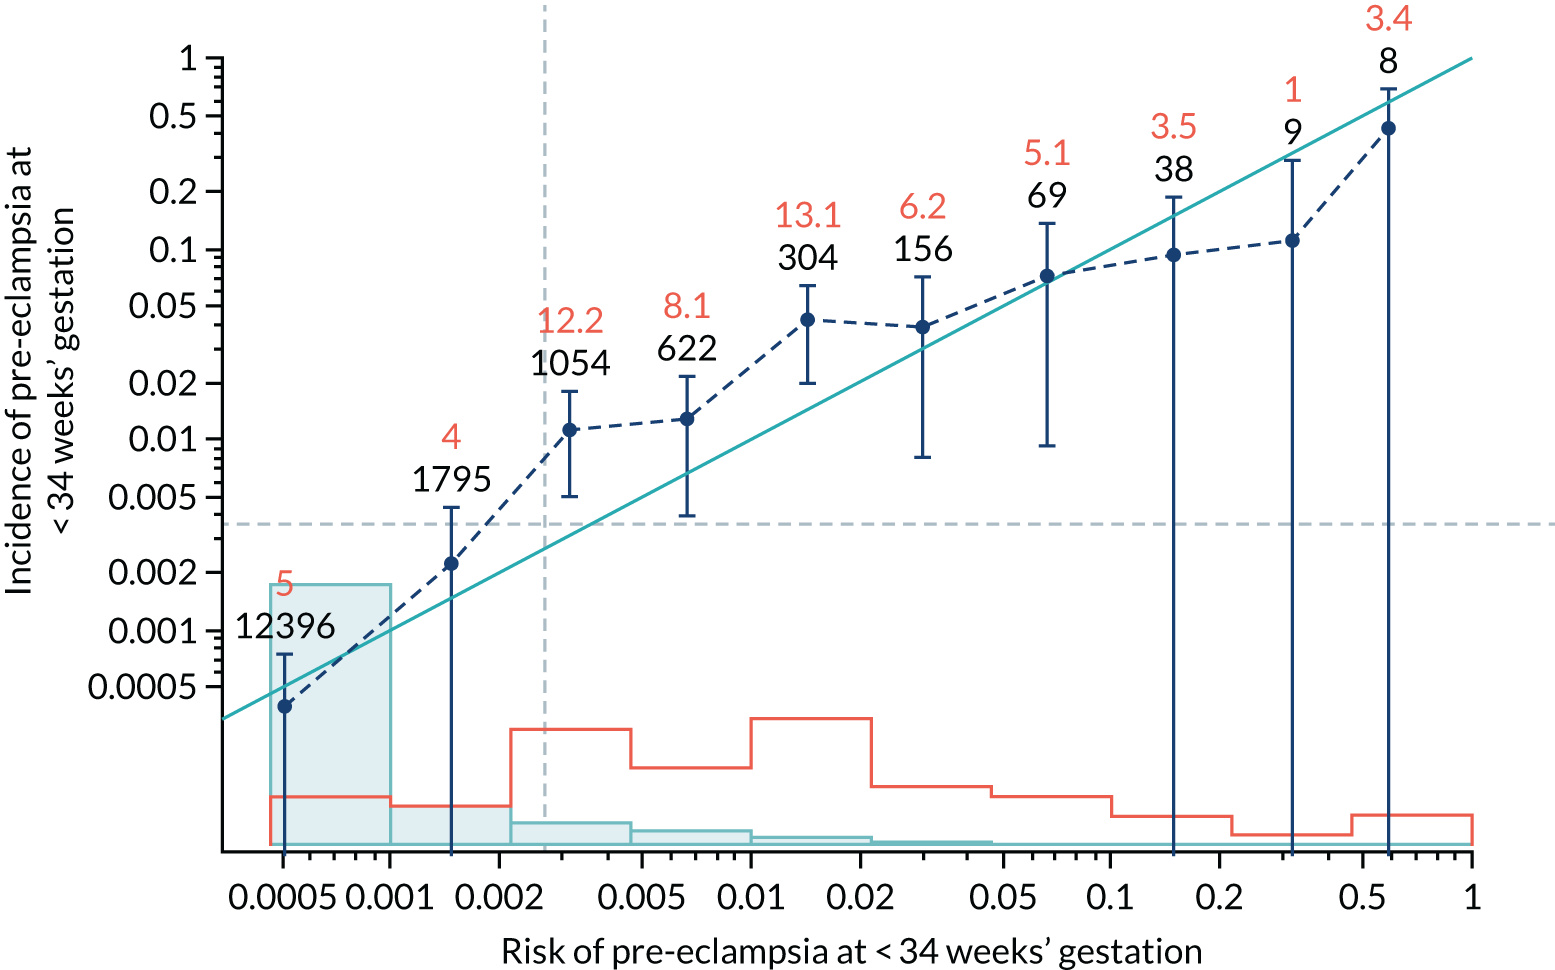
FIGURE 77.
Calibration plot for Mat-CHs, MAP and PLGF in predicting pre-eclampsia at < 37 weeks’ gestation.
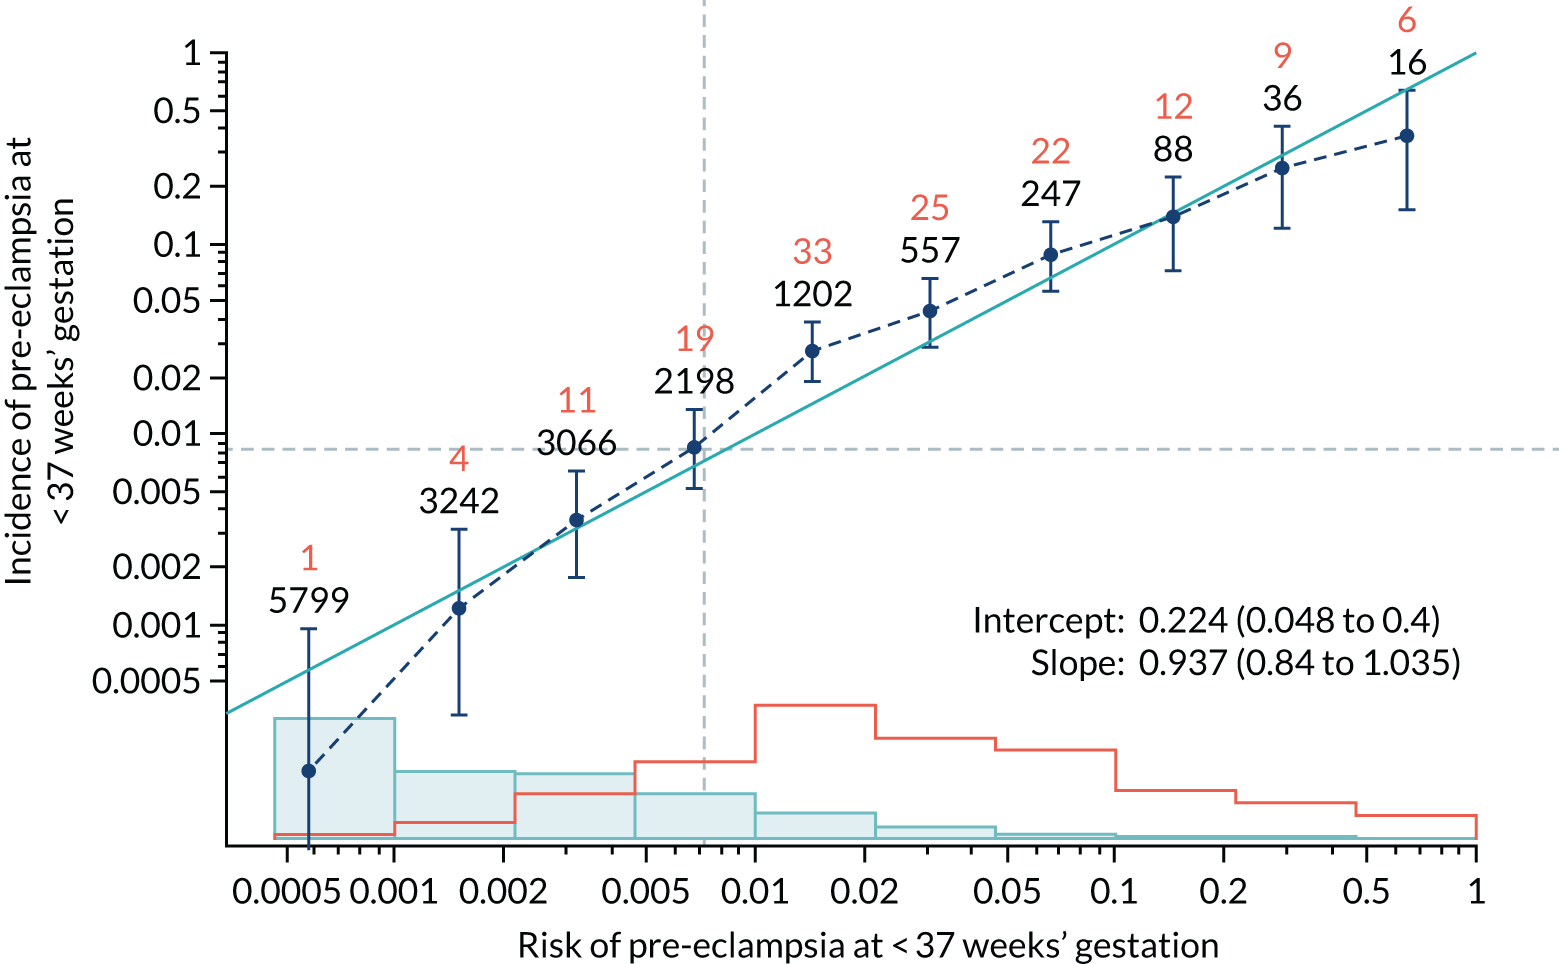
FIGURE 78.
Adjusted calibration plot for Mat-CHs, MAP and PLGF in predicting pre-eclampsia at < 37 weeks’ gestation.
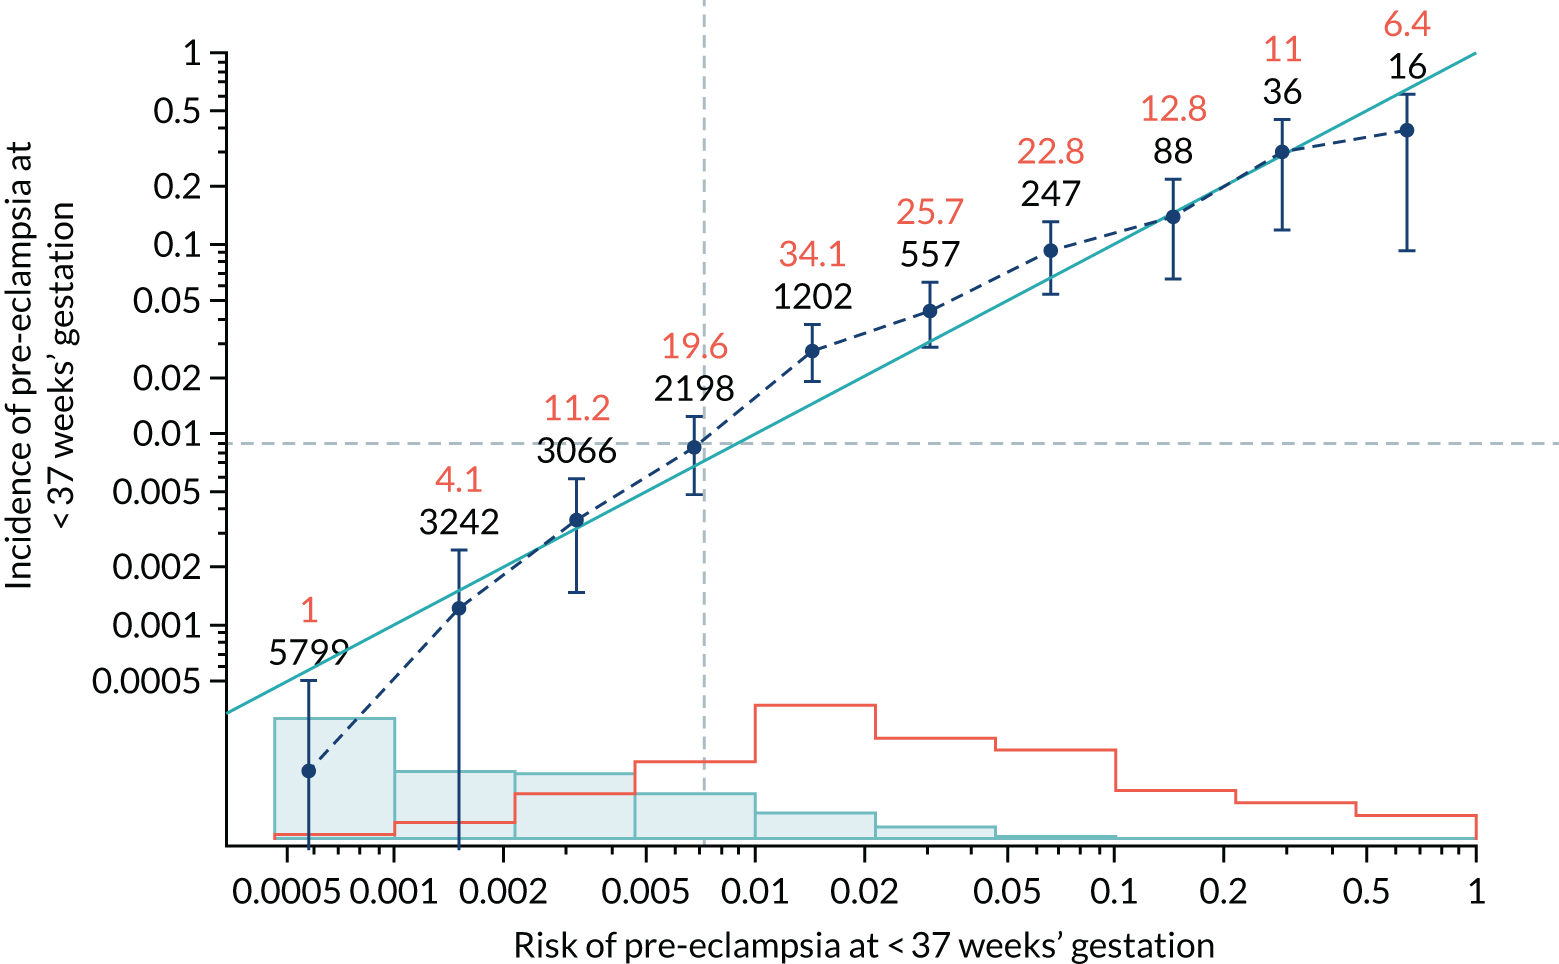
FIGURE 79.
Calibration plot for Mat-CHs, MAP and PLGF in predicting all pre-eclampsia.
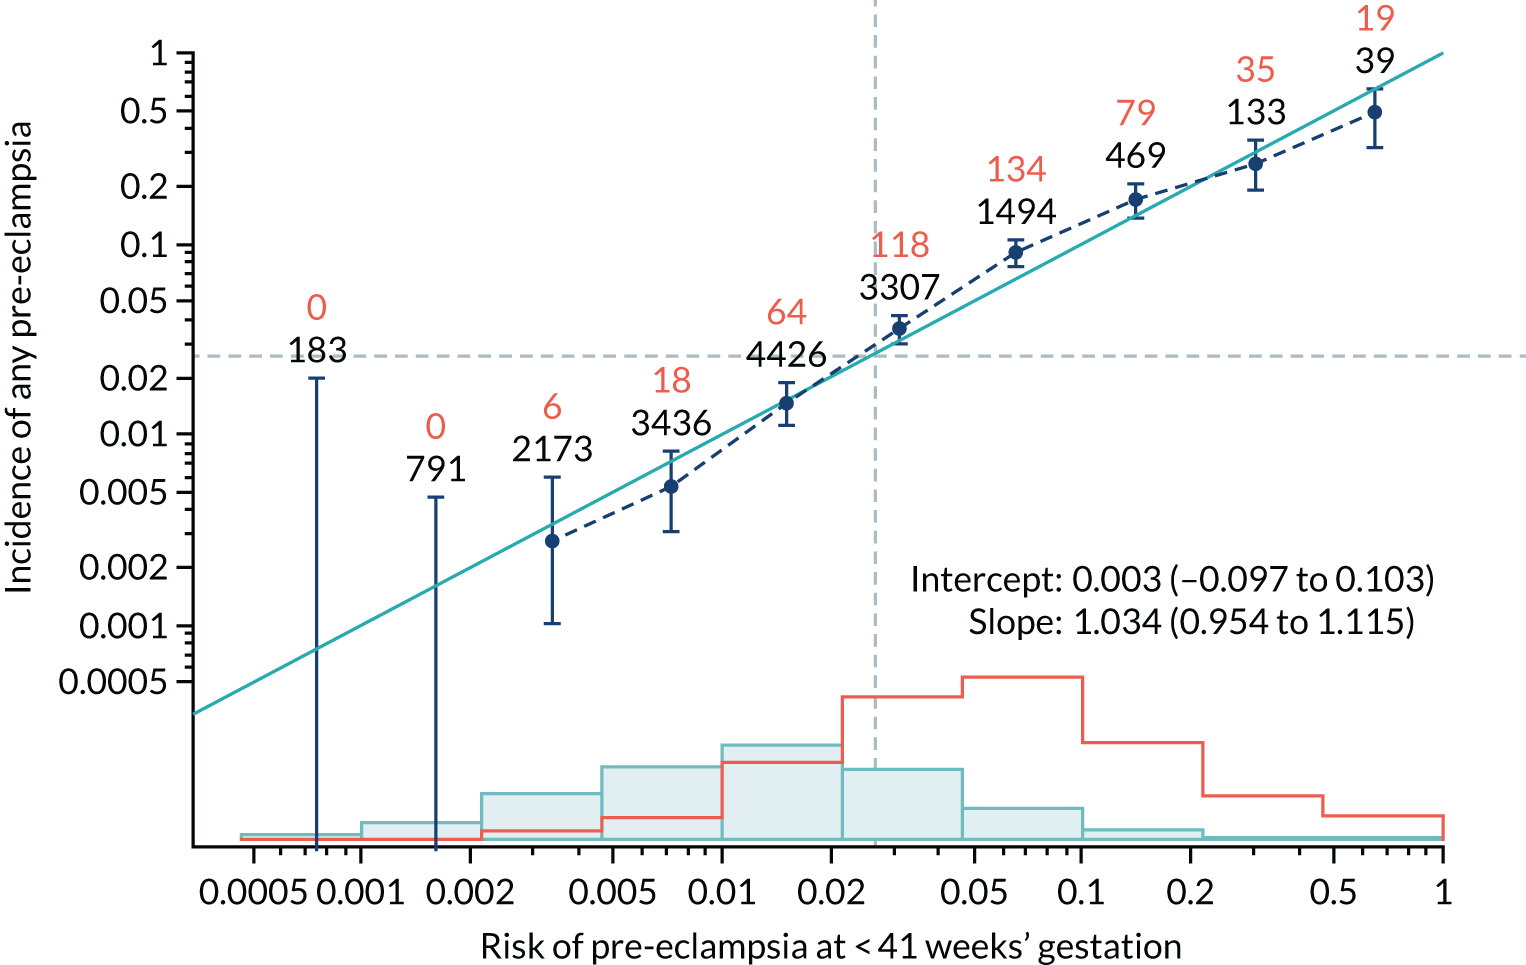
FIGURE 80.
Adjusted calibration plot for Mat-CHs, MAP and PLGF in predicting all pre-eclampsia.
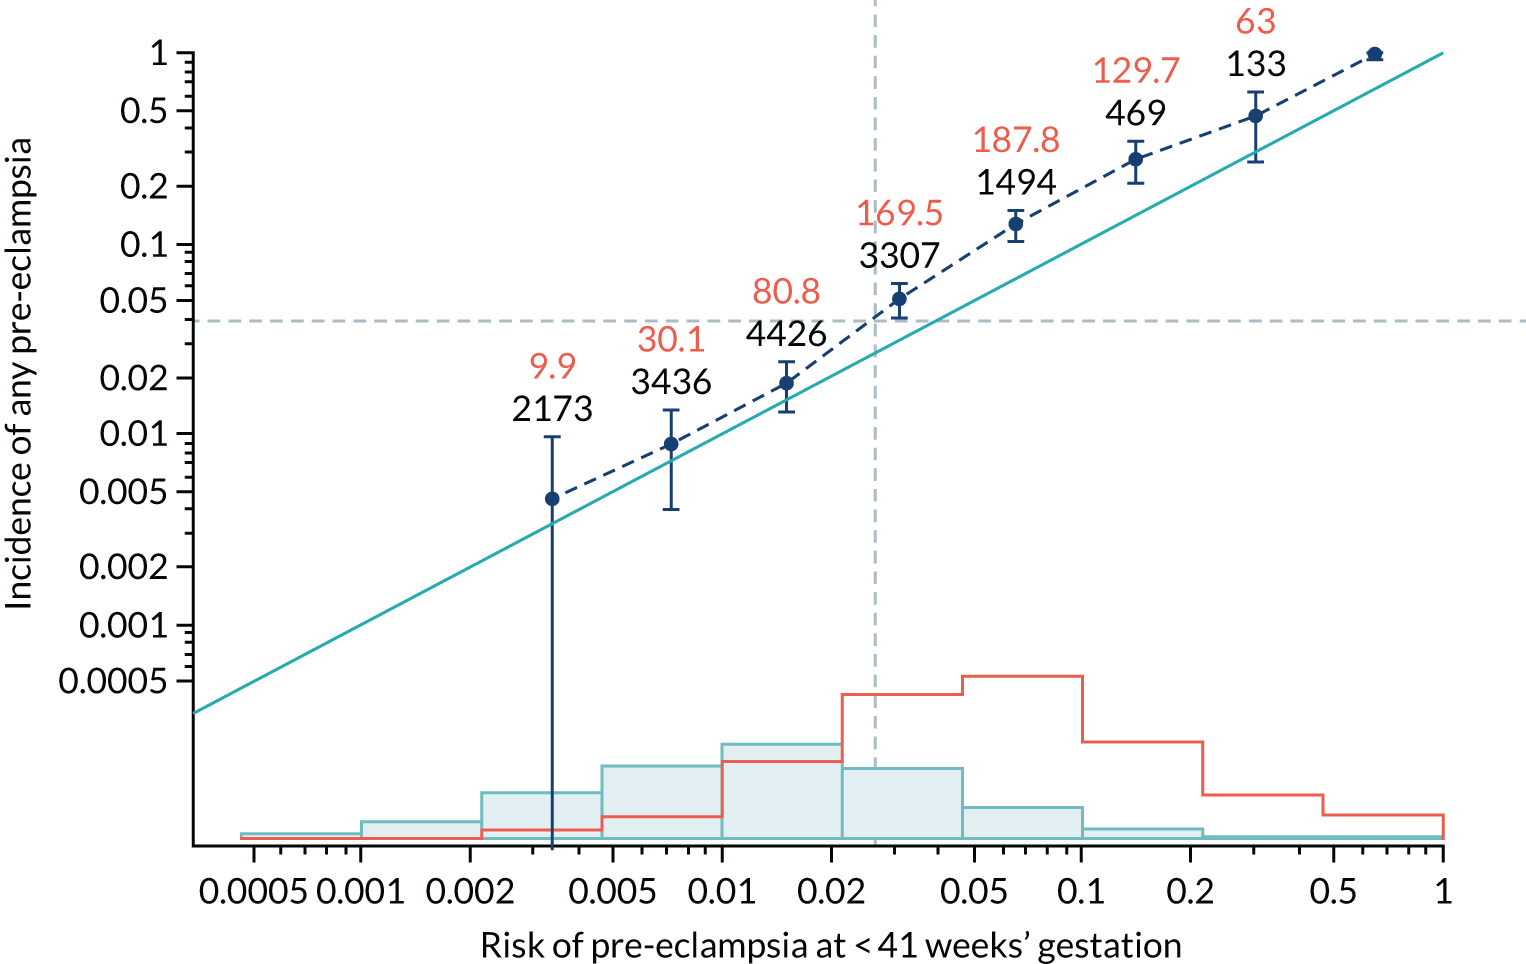
FIGURE 81.
Calibration plot for Mat-CHs, MAP, PLGF and UTA-PI in predicting pre-eclampsia at < 34 weeks’ gestation.
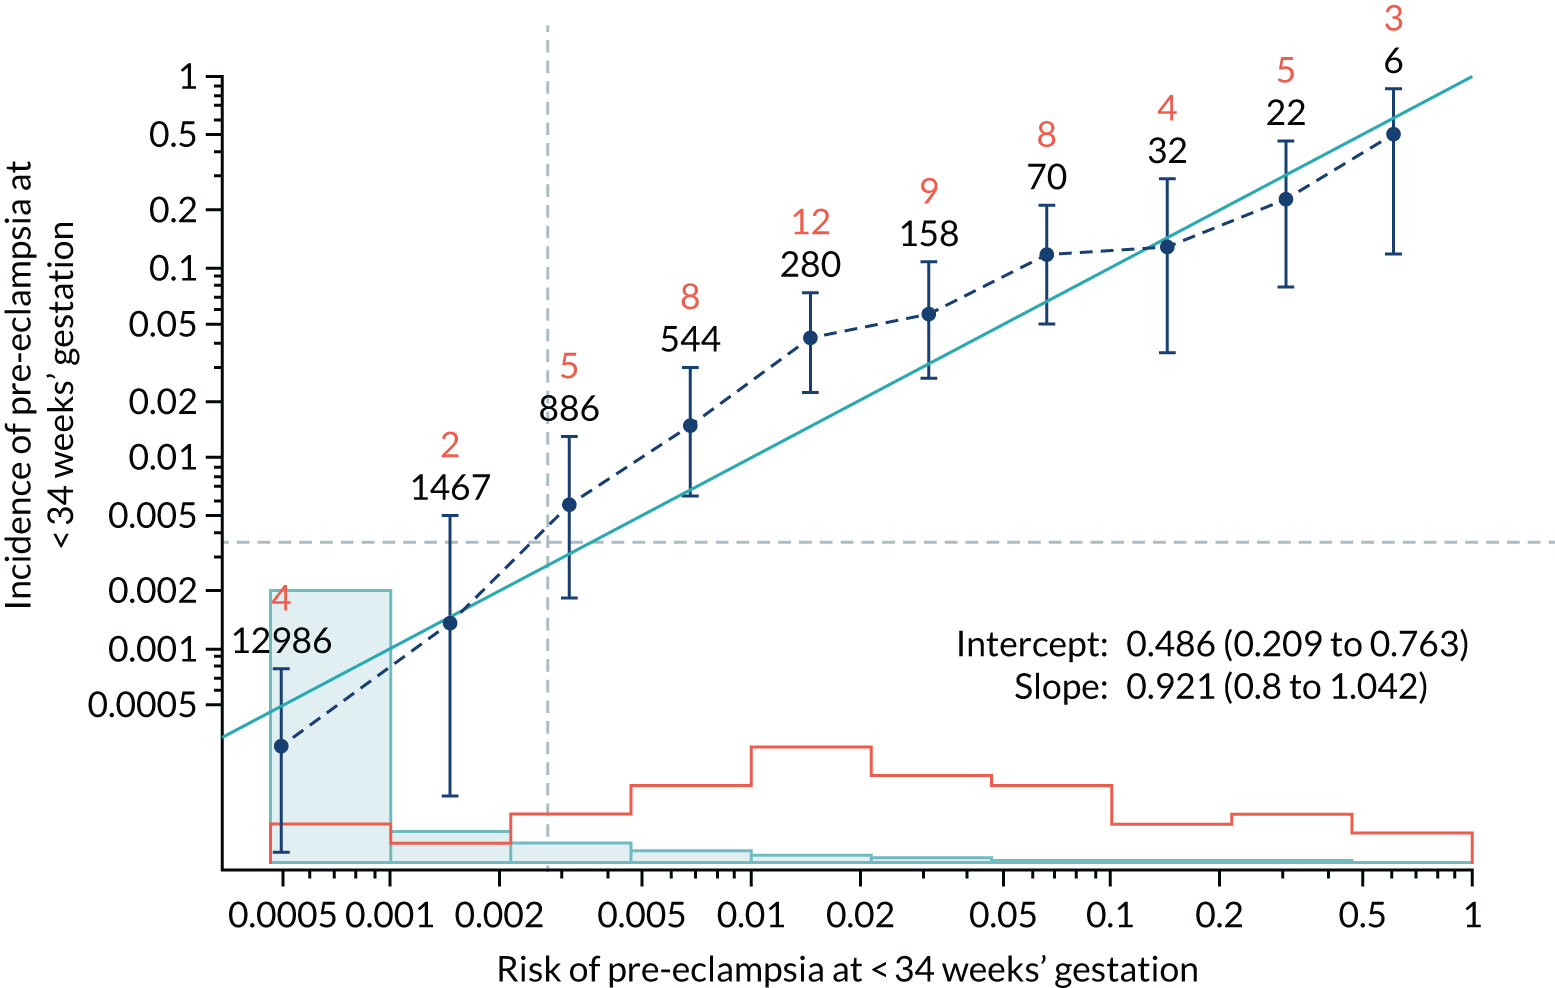
FIGURE 82.
Adjusted calibration plot for Mat-CHs, MAP, PLGF and UTA-PI in predicting pre-eclampsia at < 34 weeks’ gestation.
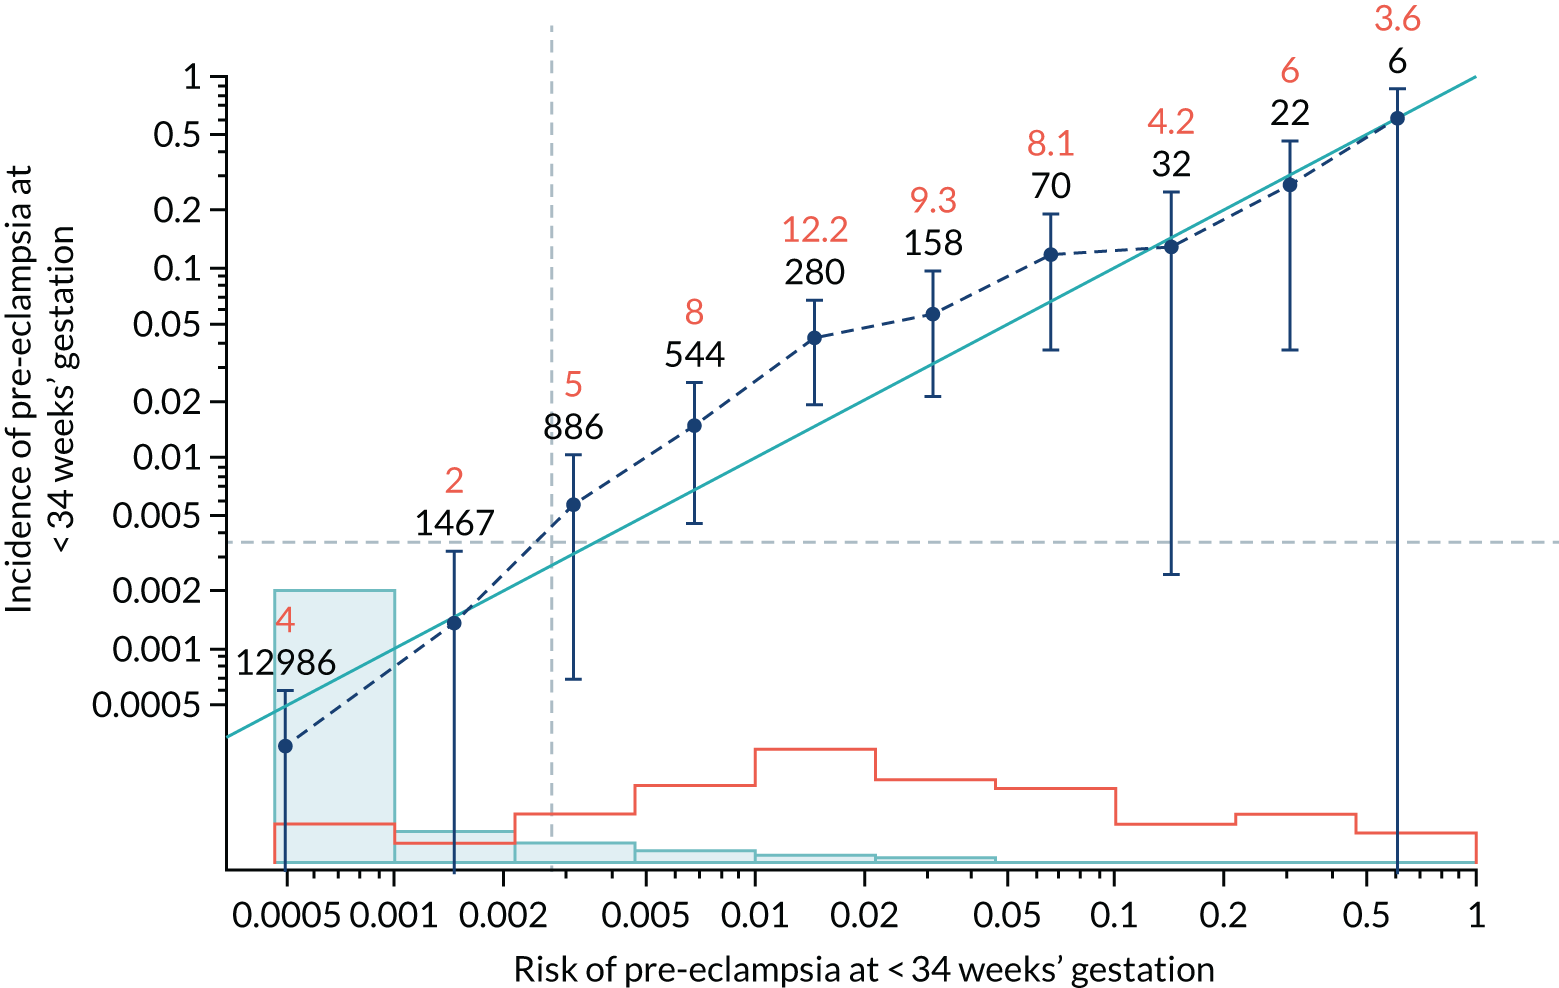
FIGURE 83.
Calibration plot for Mat-CHs, MAP, PLGF and UTA-PI in predicting pre-eclampsia at < 37 weeks’ gestation.
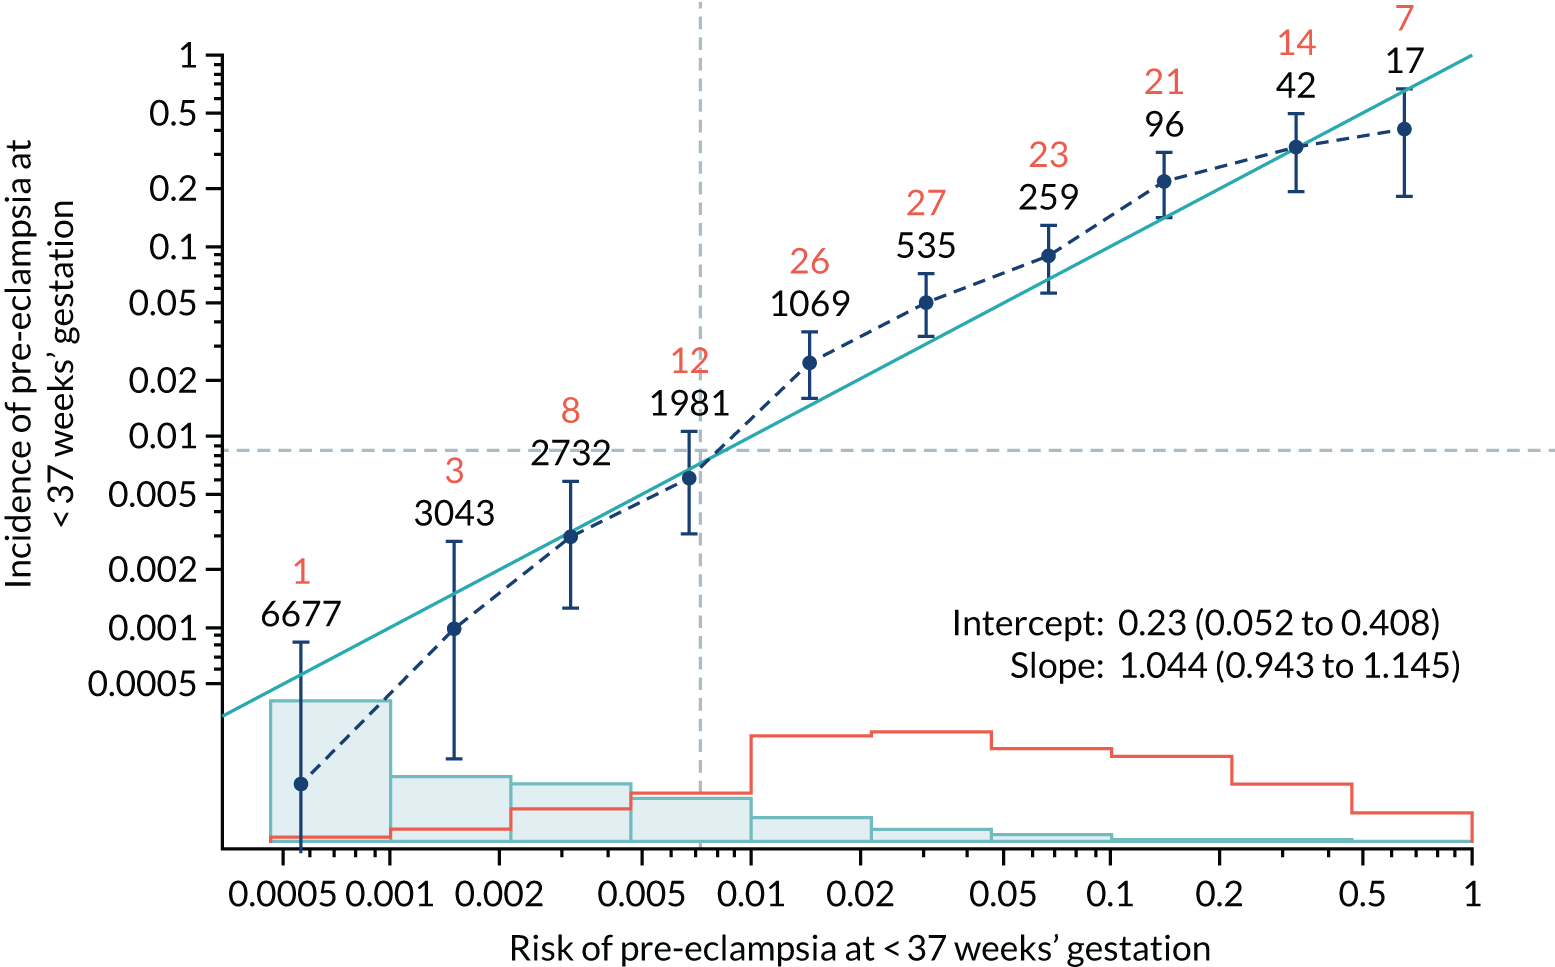
FIGURE 84.
Adjusted calibration plot for Mat-CHs, MAP, PLGF and UTA-PI in predicting pre-eclampsia at < 37 weeks’ gestation.
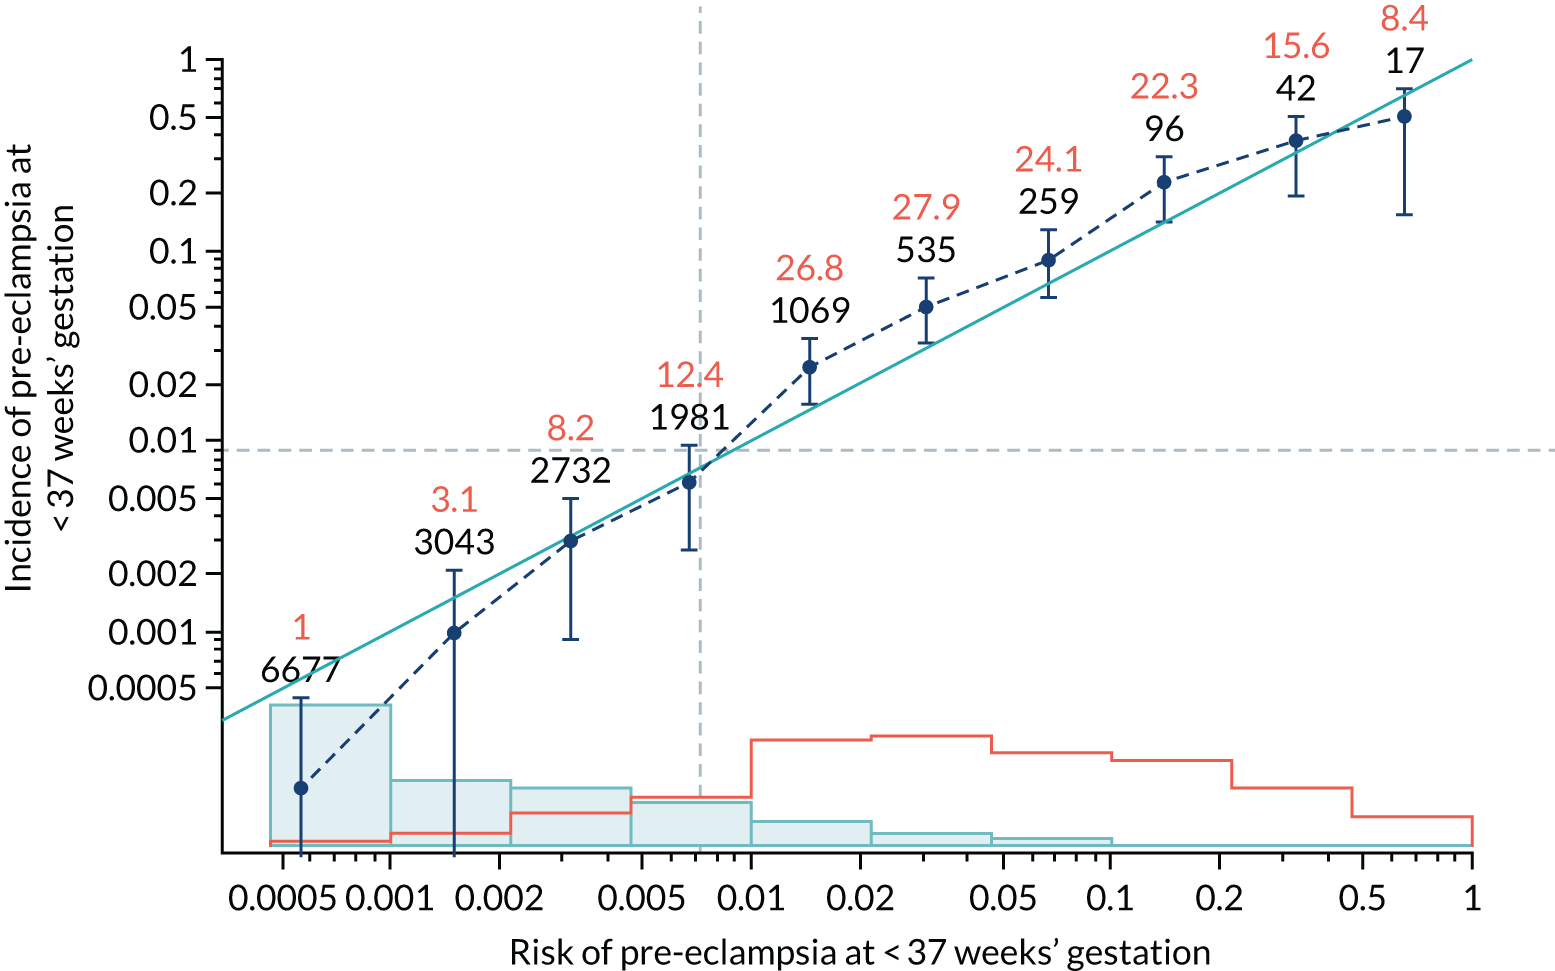
FIGURE 85.
Calibration plot for Mat-CHs, MAP, PLGF and UTA-PI in predicting all pre-eclampsia.
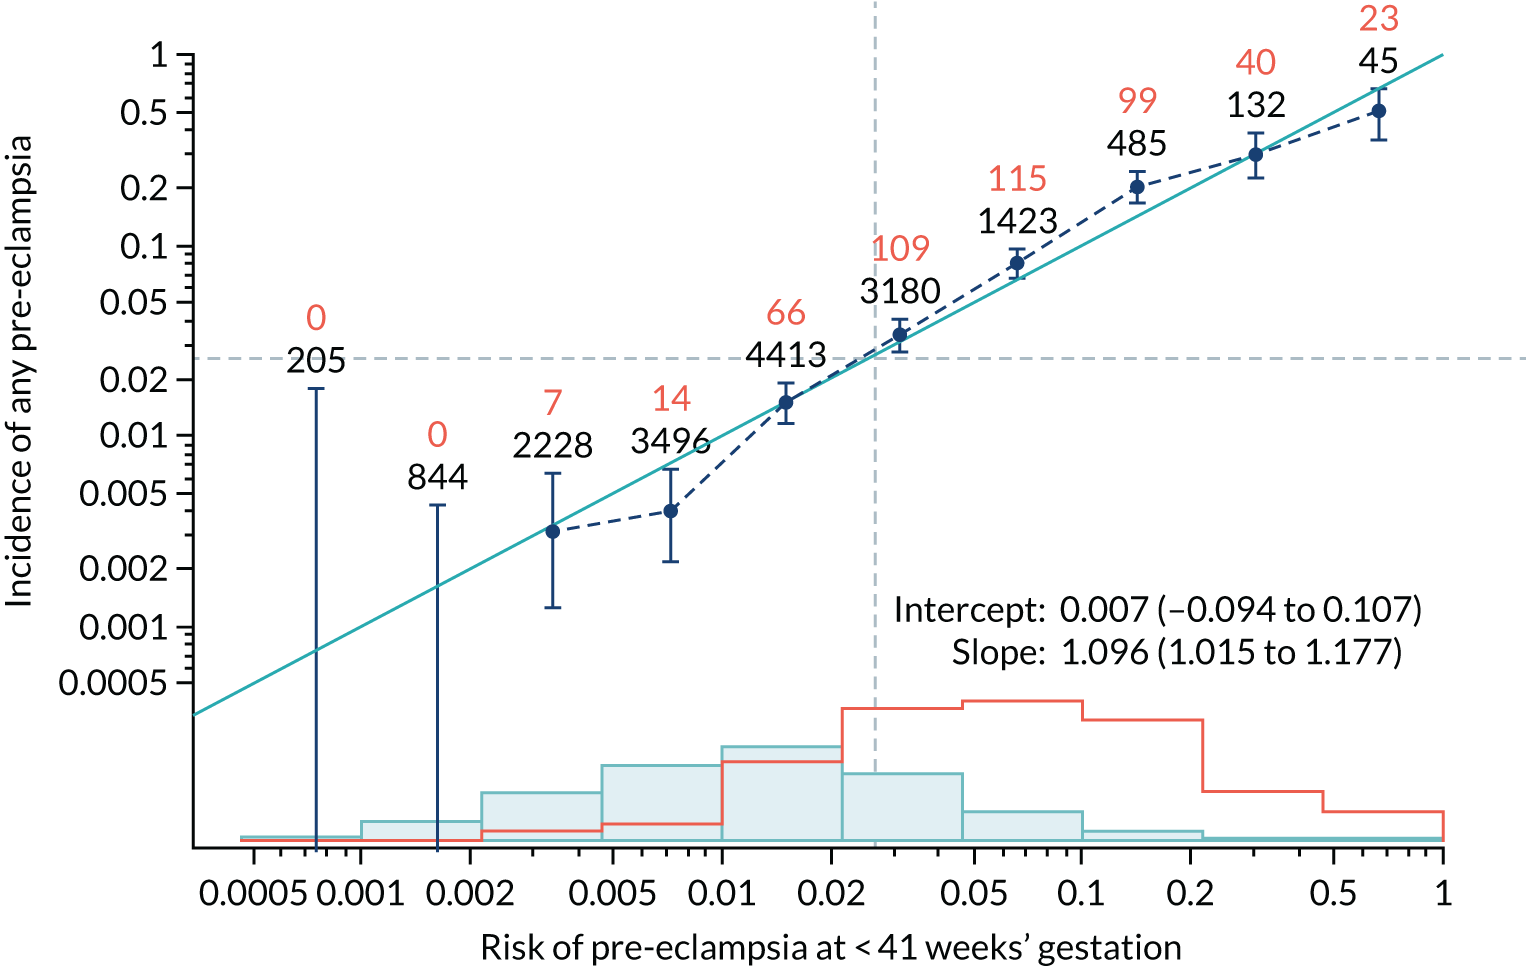
FIGURE 86.
Adjusted calibration plot for Mat-CHs, MAP, PLGF and UTA-PI in predicting all pre-eclampsia.
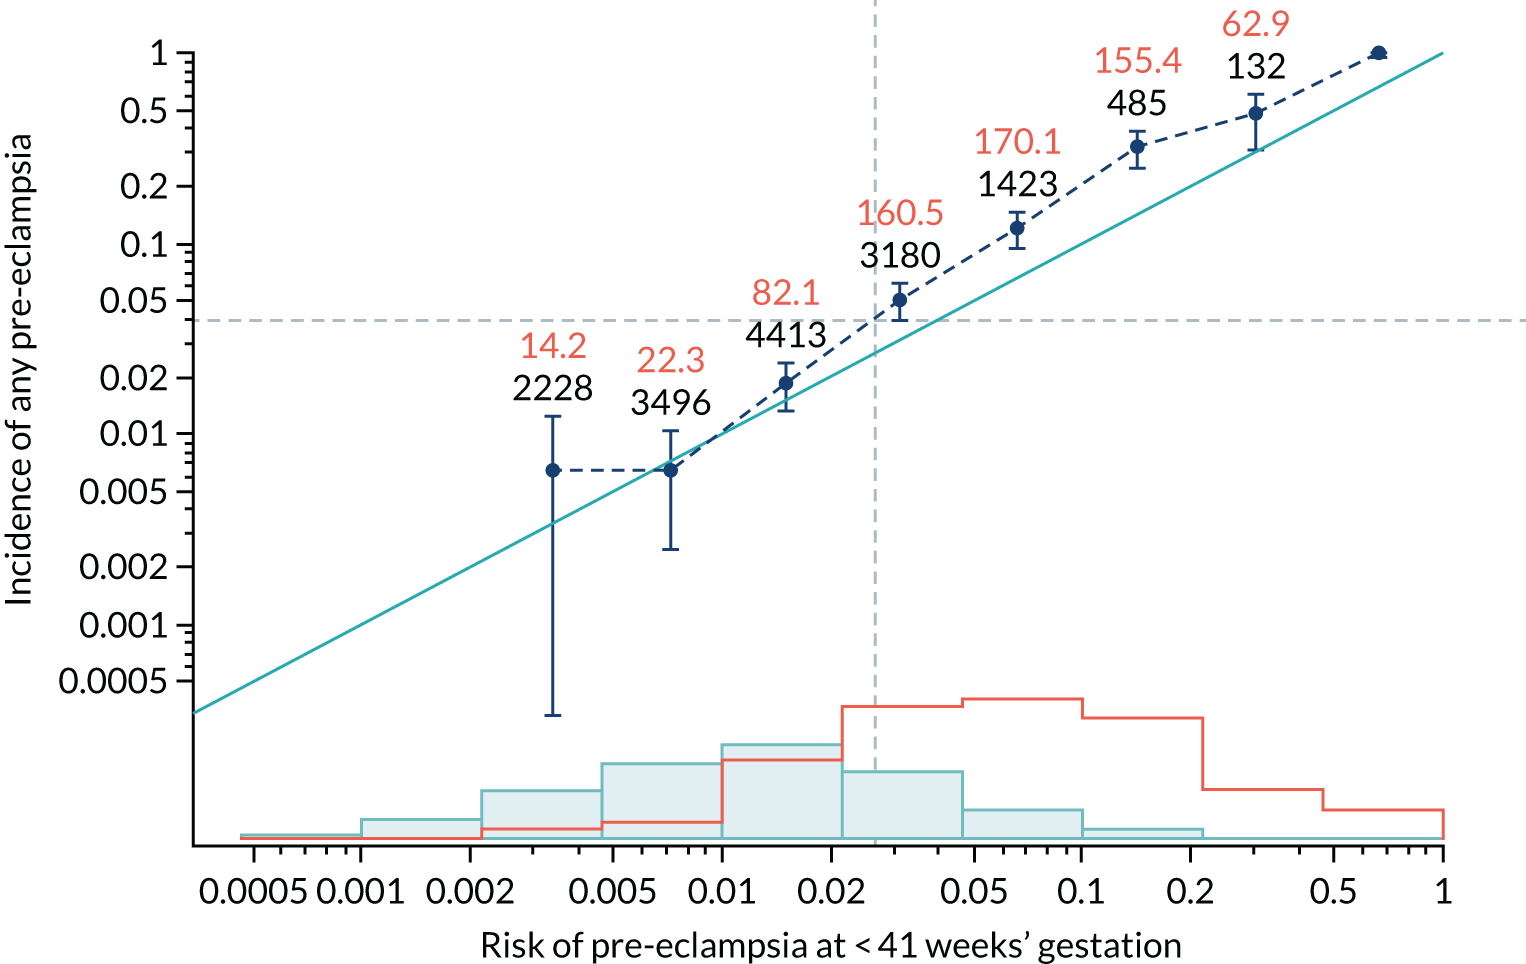
Figures 87–140 show the estimated incidence/mean risk within each bin.
FIGURE 87.
The estimated incidence/mean risk within each bin for Mat-CHs in predicting pre-eclampsia at < 34 weeks’ gestation.
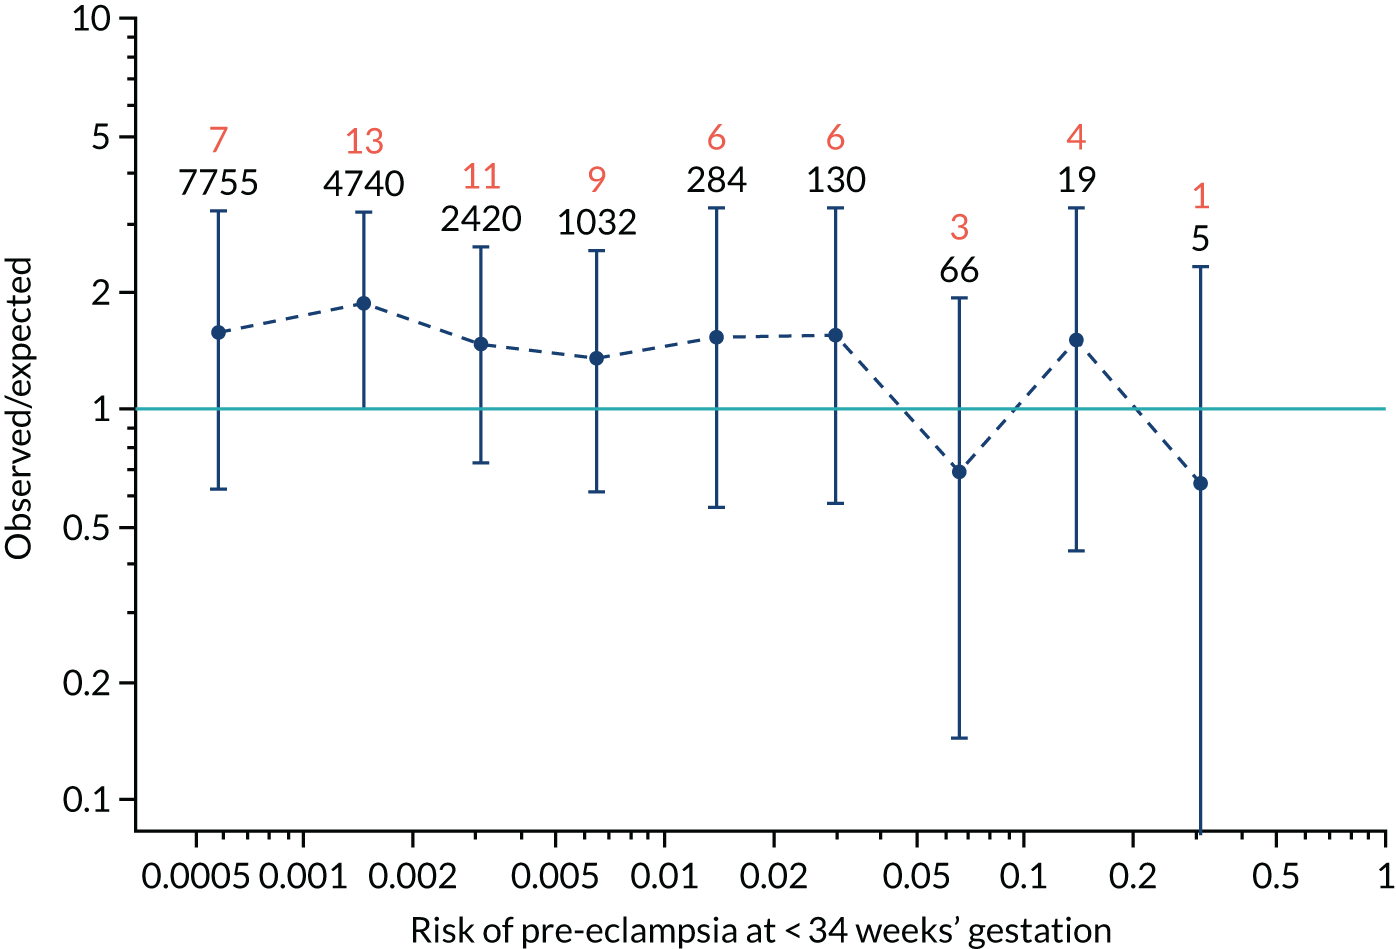
FIGURE 88.
The estimated incidence/mean risk within each bin for Mat-CHs in predicting pre-eclampsia at < 34 weeks’ gestation.
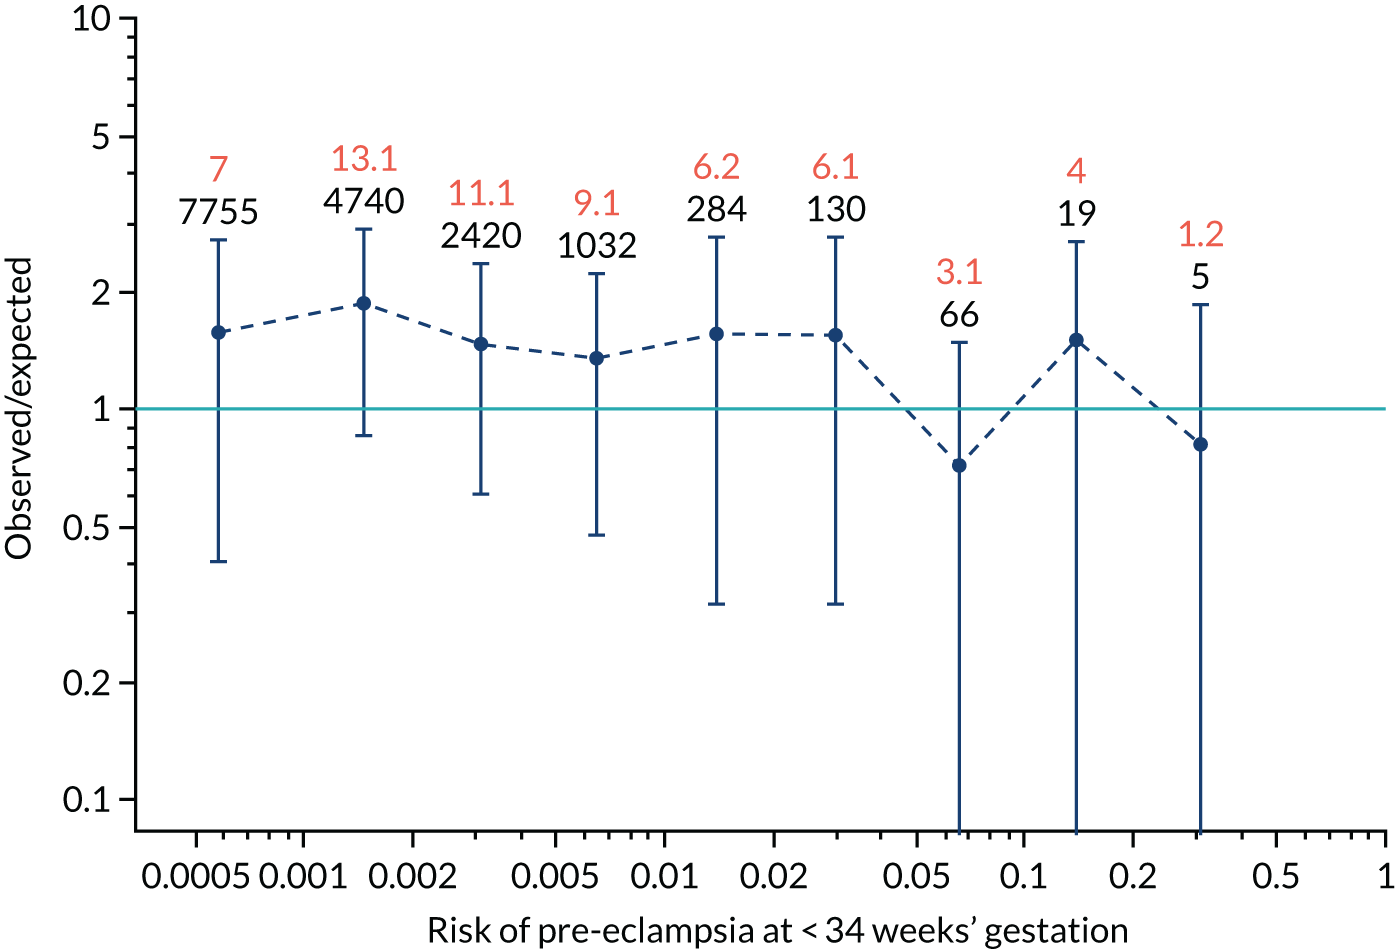
FIGURE 89.
The estimated incidence/mean risk within each bin for Mat-CHs in predicting pre-eclampsia at < 37 weeks’ gestation.
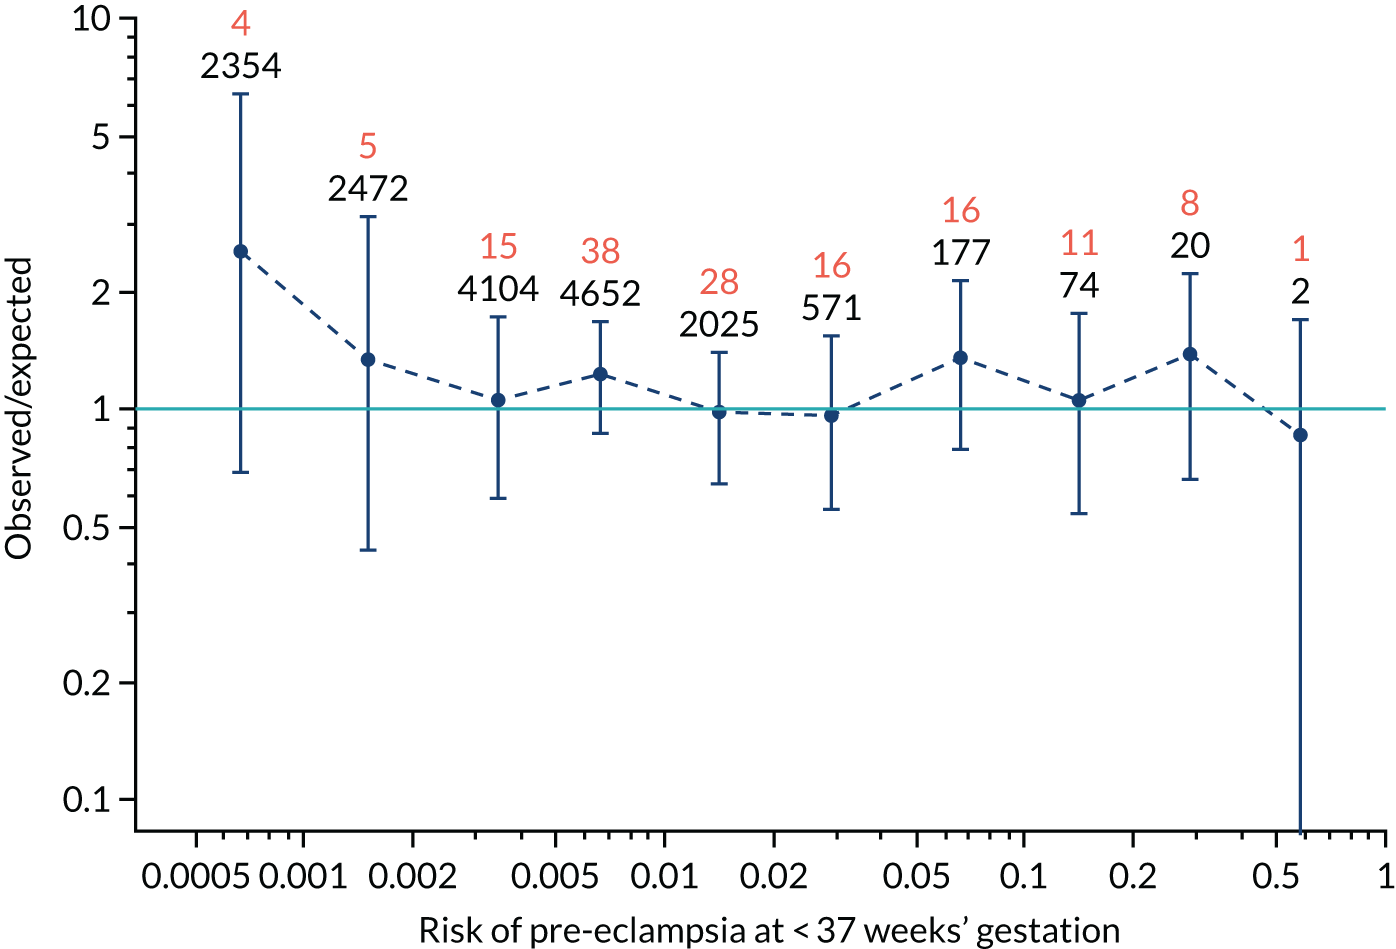
FIGURE 90.
The estimated incidence/mean risk within each bin for Mat-CHs in predicting pre-eclampsia at < 37 weeks’ gestation.
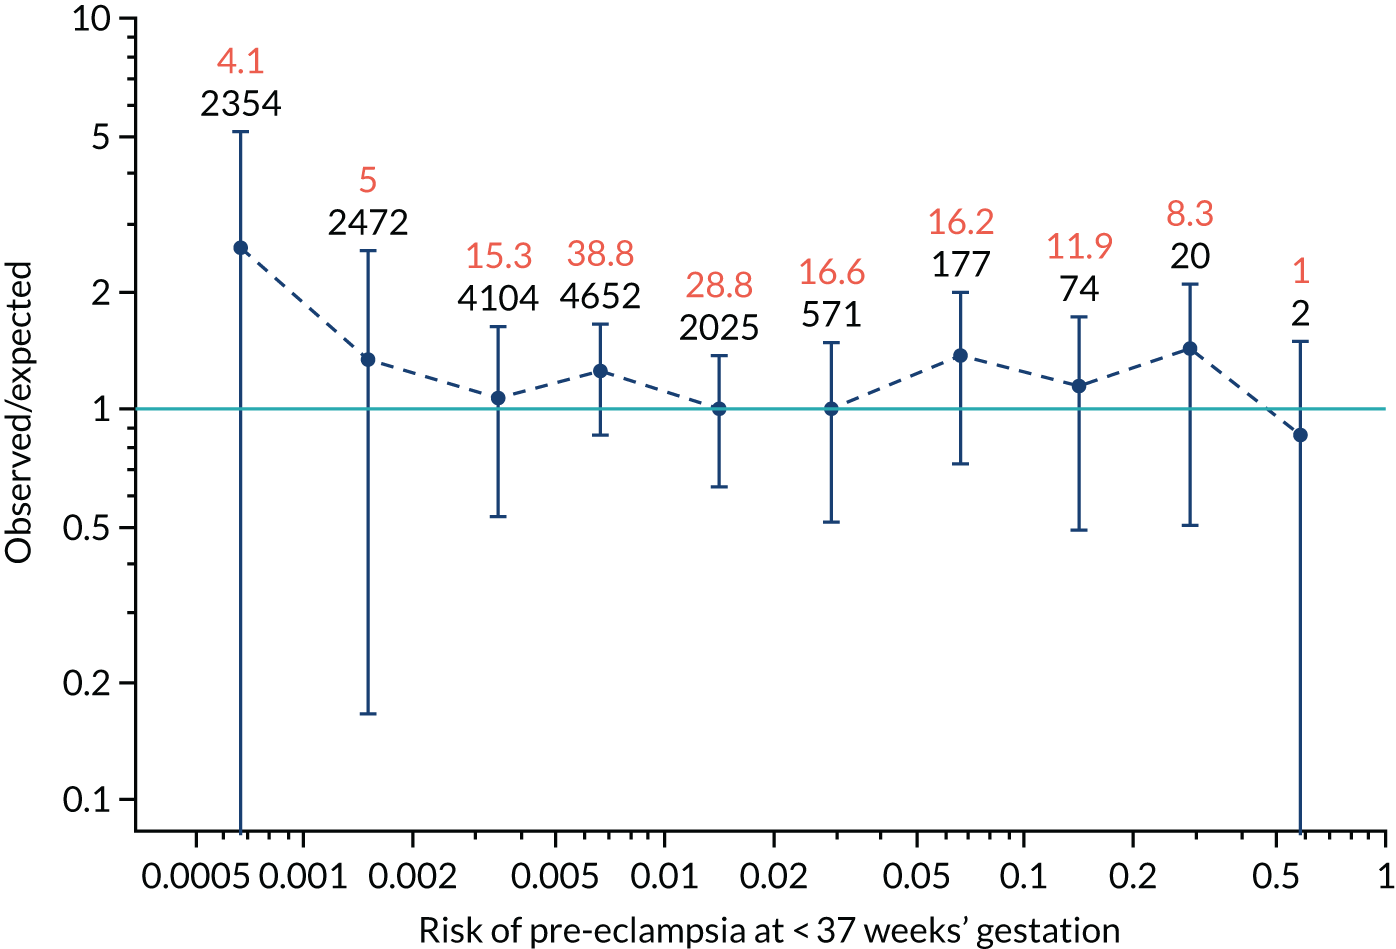
FIGURE 91.
The estimated incidence/mean risk within each bin for Mat-CHs in predicting all pre-eclampsia.
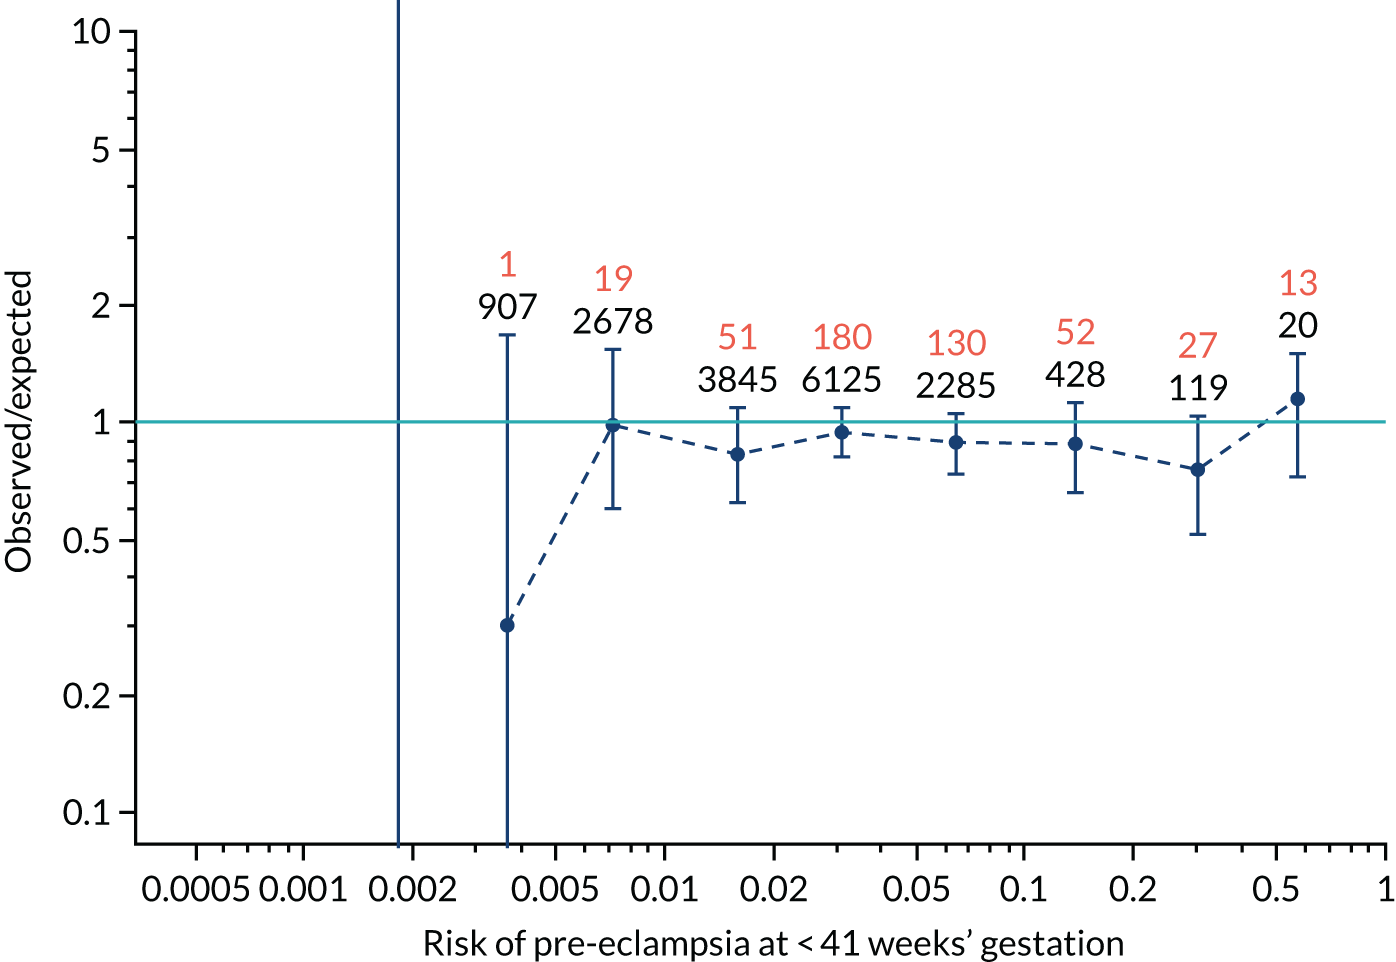
FIGURE 92.
The estimated incidence/mean risk within each bin for Mat-CHs in predicting all pre-eclampsia.
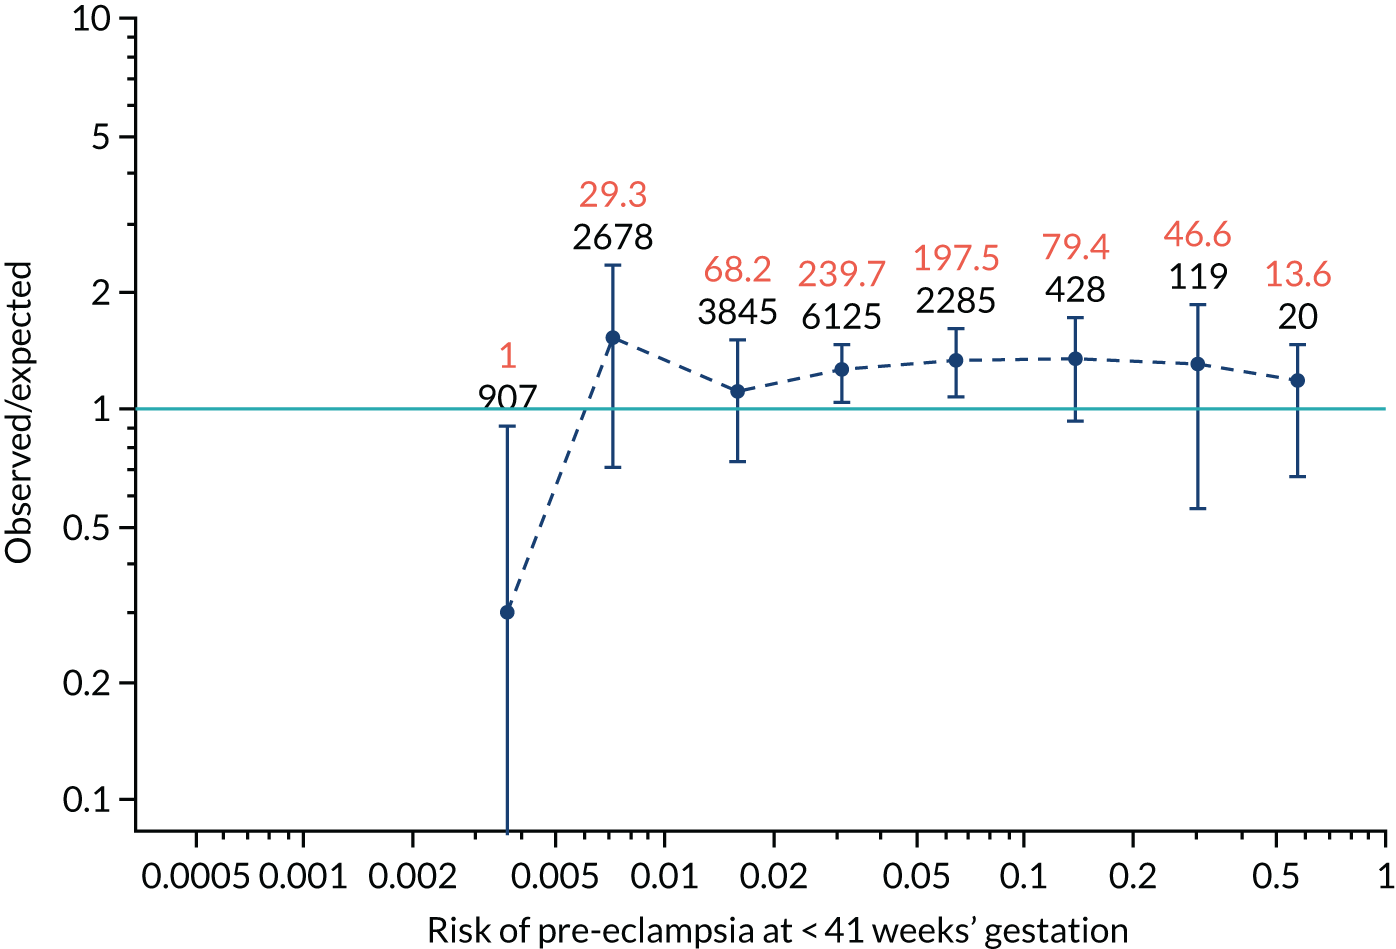
FIGURE 93.
The estimated incidence/mean risk within each bin for Mat-CHs and MAP in predicting pre-eclampsia at < 34 weeks’ gestation.
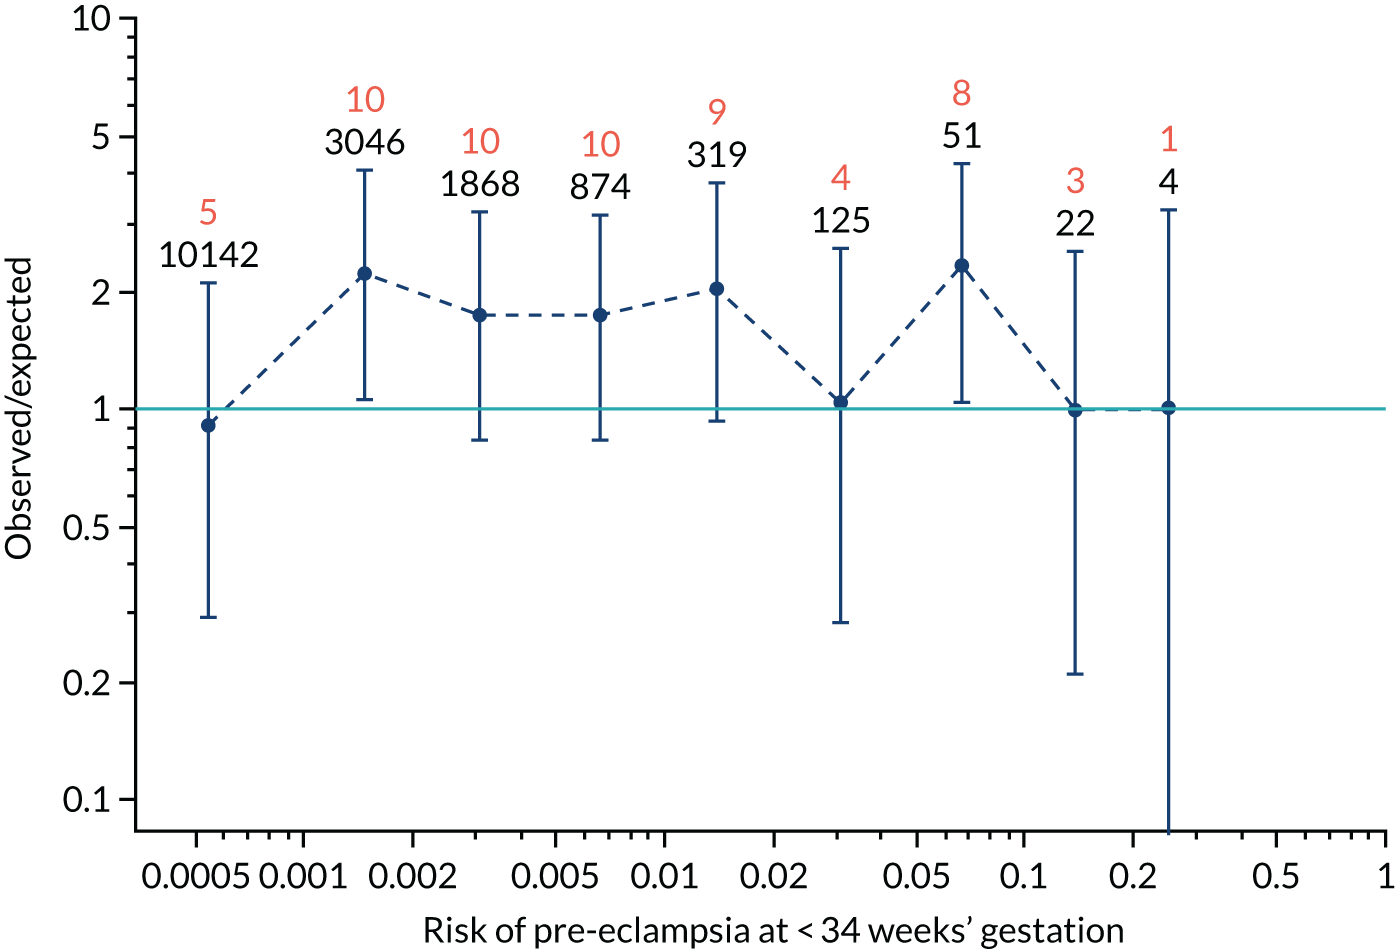
FIGURE 94.
The estimated incidence/mean risk within each bin for Mat-CHs and MAP in predicting pre-eclampsia at < 34 weeks’ gestation.
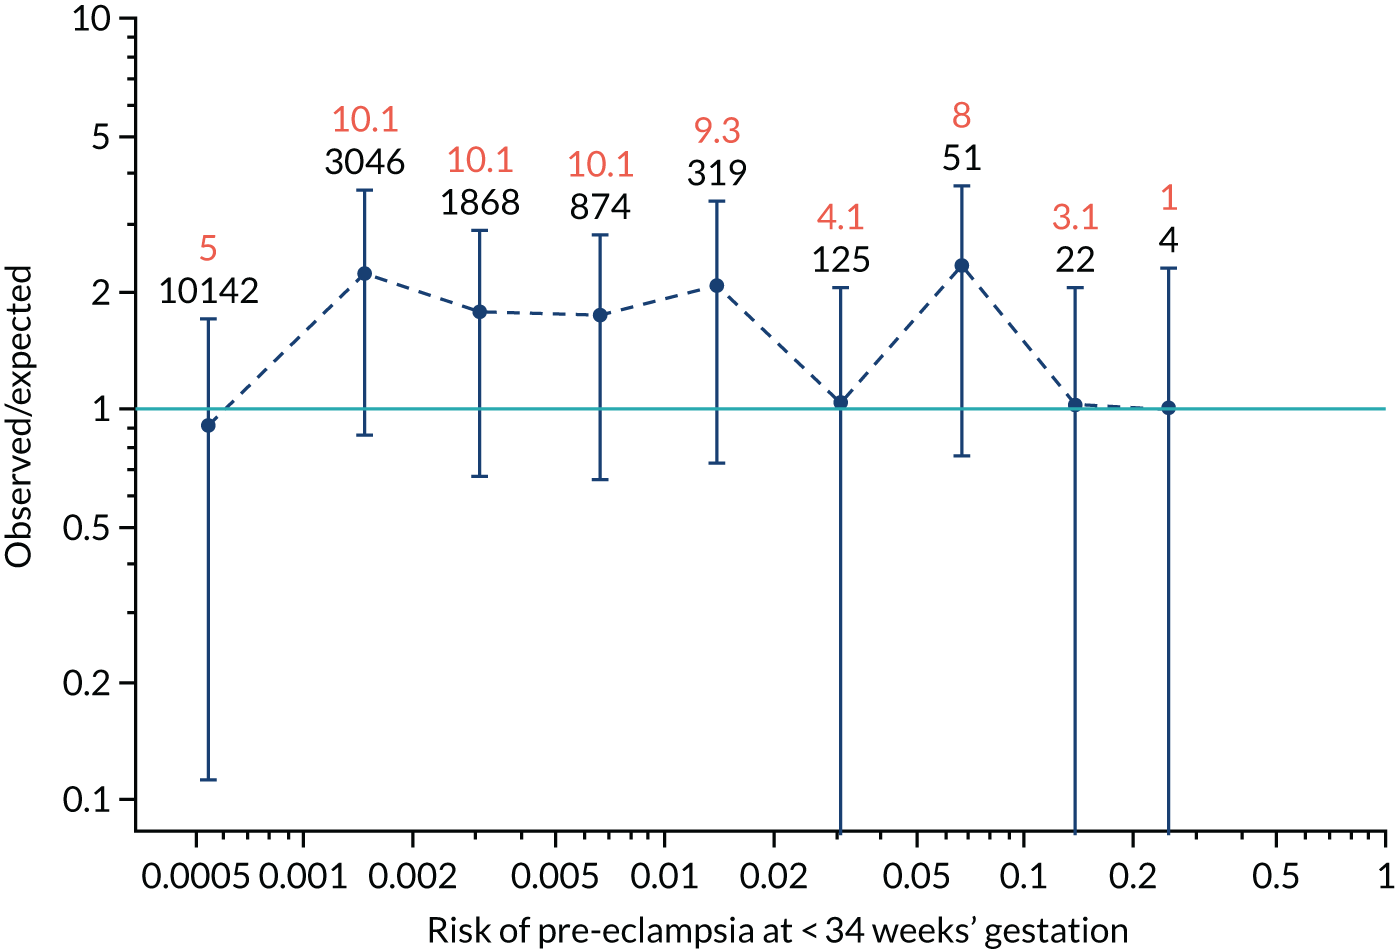
FIGURE 95.
The estimated incidence/mean risk within each bin for Mat-CHs and MAP in predicting pre-eclampsia at < 37 weeks’ gestation.
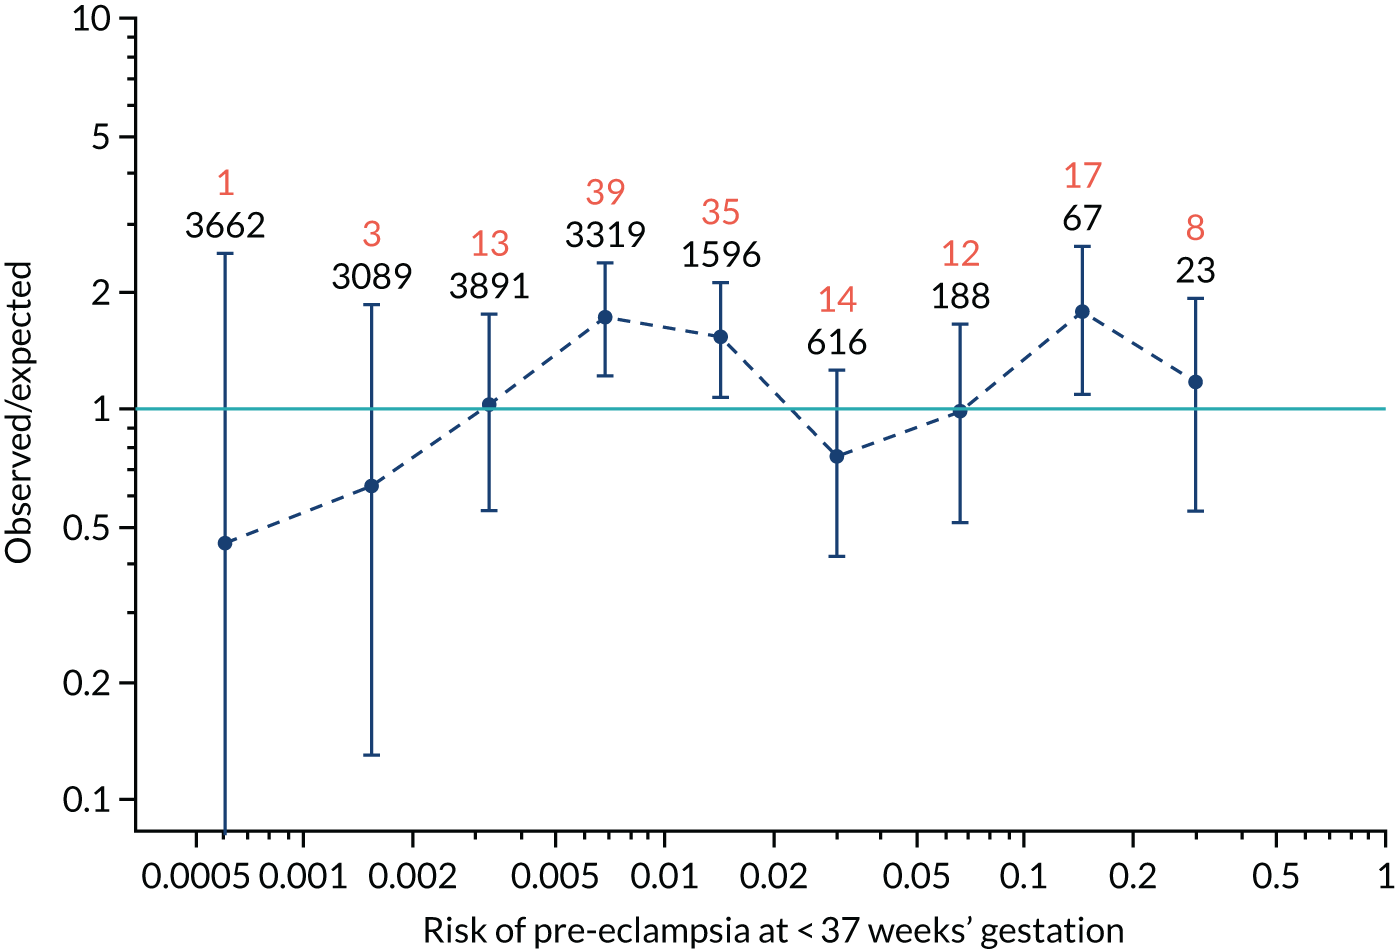
FIGURE 96.
The estimated incidence/mean risk within each bin for Mat-CHs and MAP in predicting pre-eclampsia at < 37 weeks’ gestation.
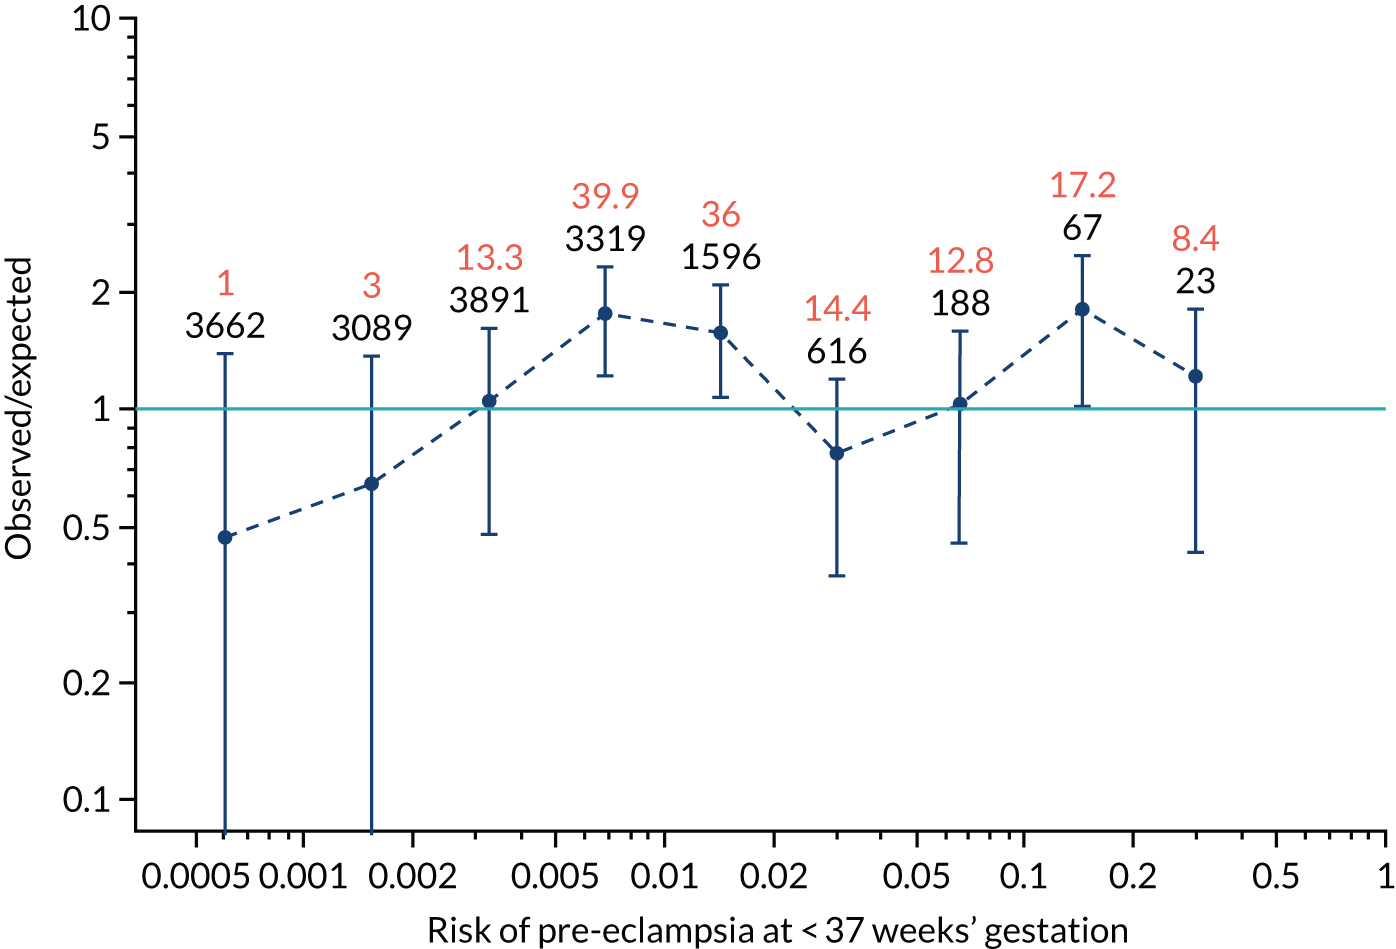
FIGURE 97.
The estimated incidence/mean risk within each bin for Mat-CHs and MAP in predicting all pre-eclampsia.
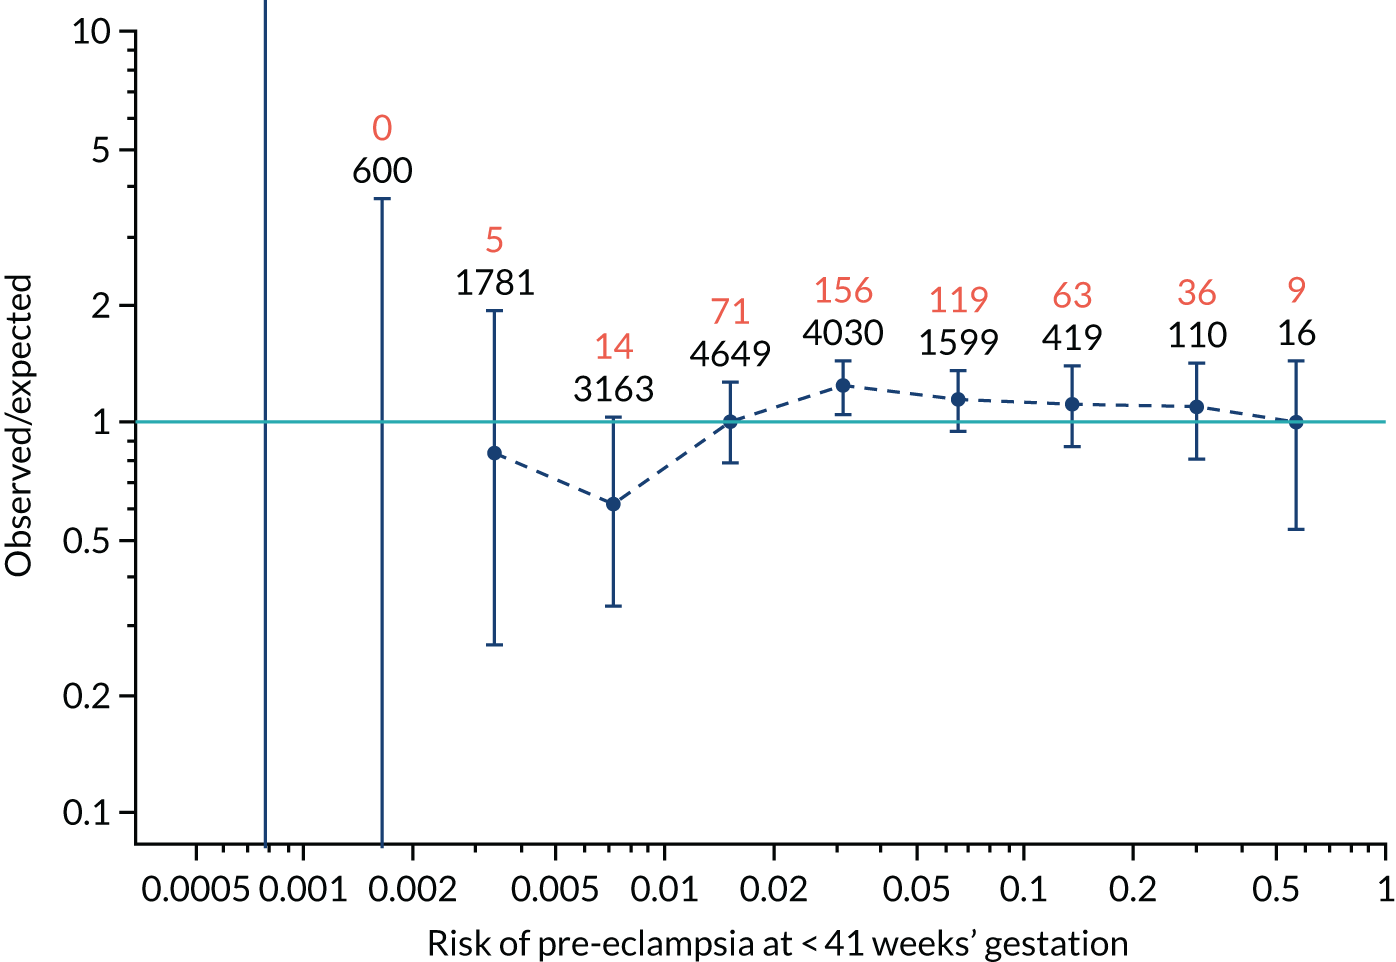
FIGURE 98.
The estimated incidence/mean risk within each bin for Mat-CHs and MAP in predicting all pre-eclampsia.
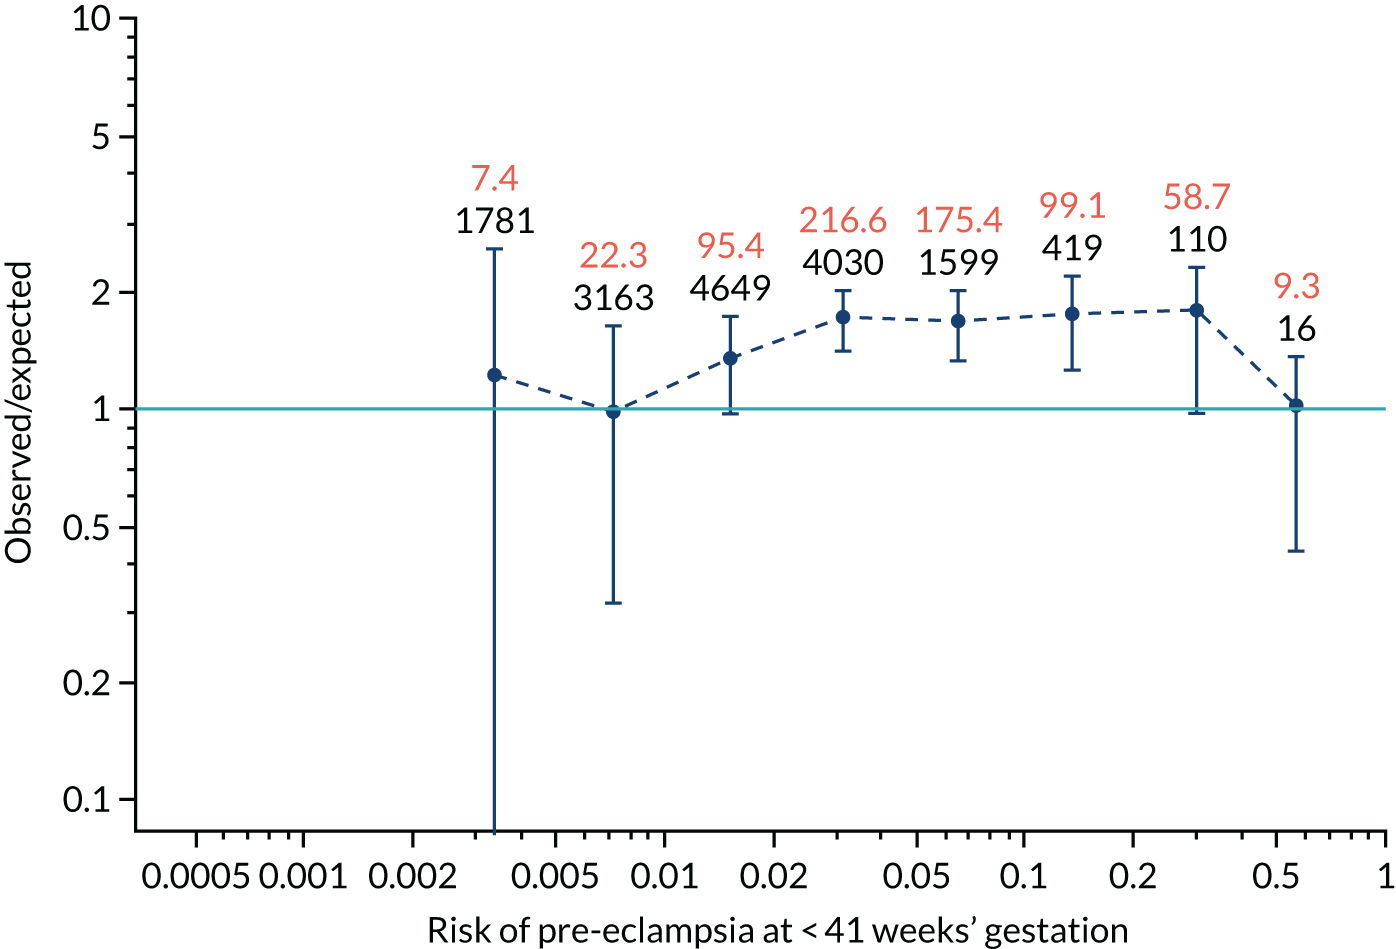
FIGURE 99.
The estimated incidence/mean risk within each bin for Mat-CHs and UTA-PI in predicting pre-eclampsia at < 34 weeks’ gestation.
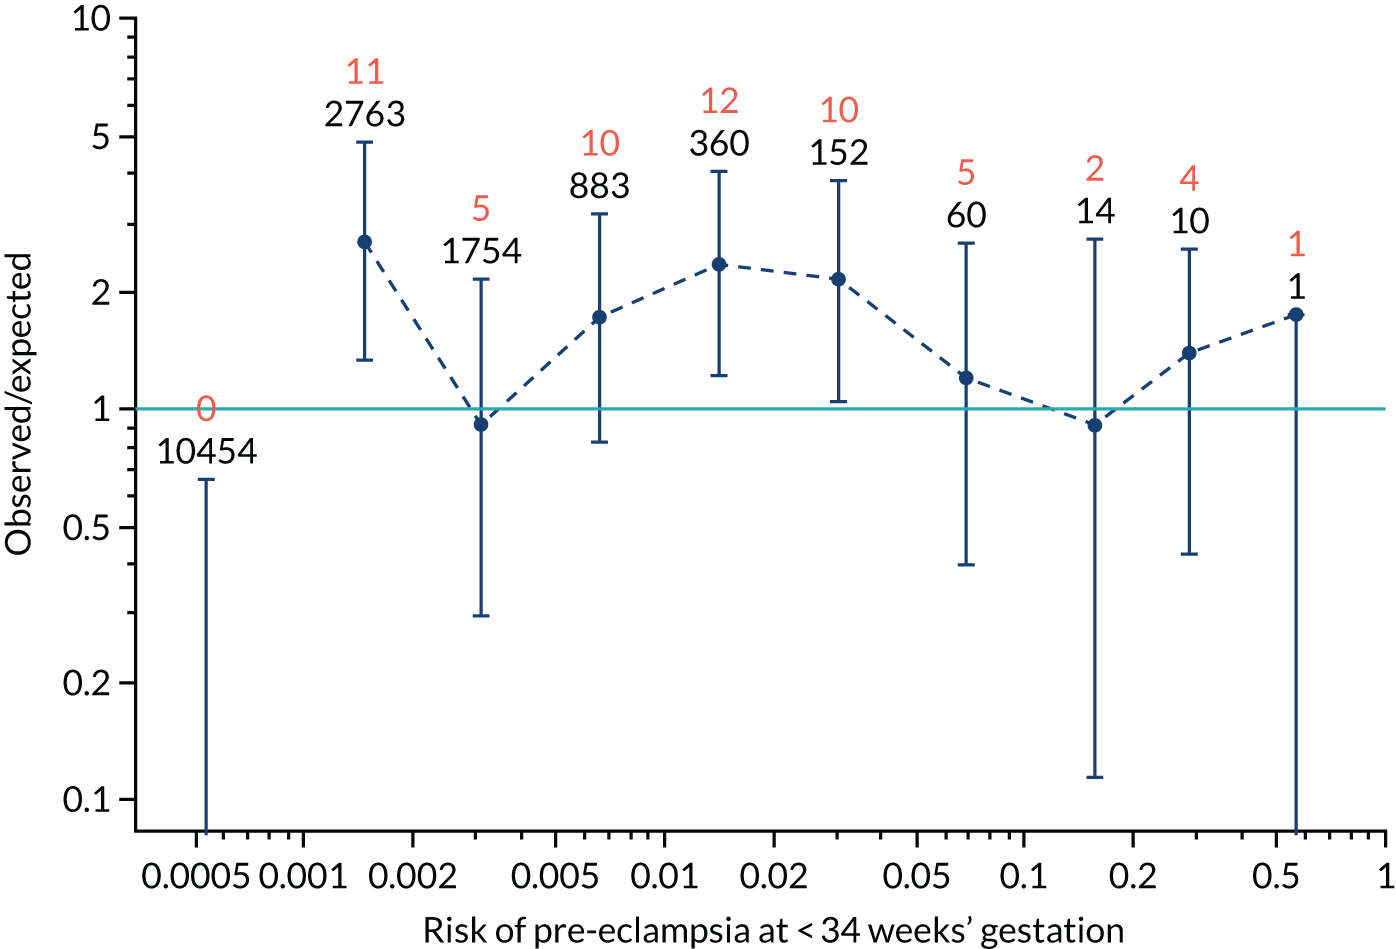
FIGURE 100.
The estimated incidence/mean risk within each bin for Mat-CHs and UTA-PI in predicting pre-eclampsia at < 34 weeks’ gestation.
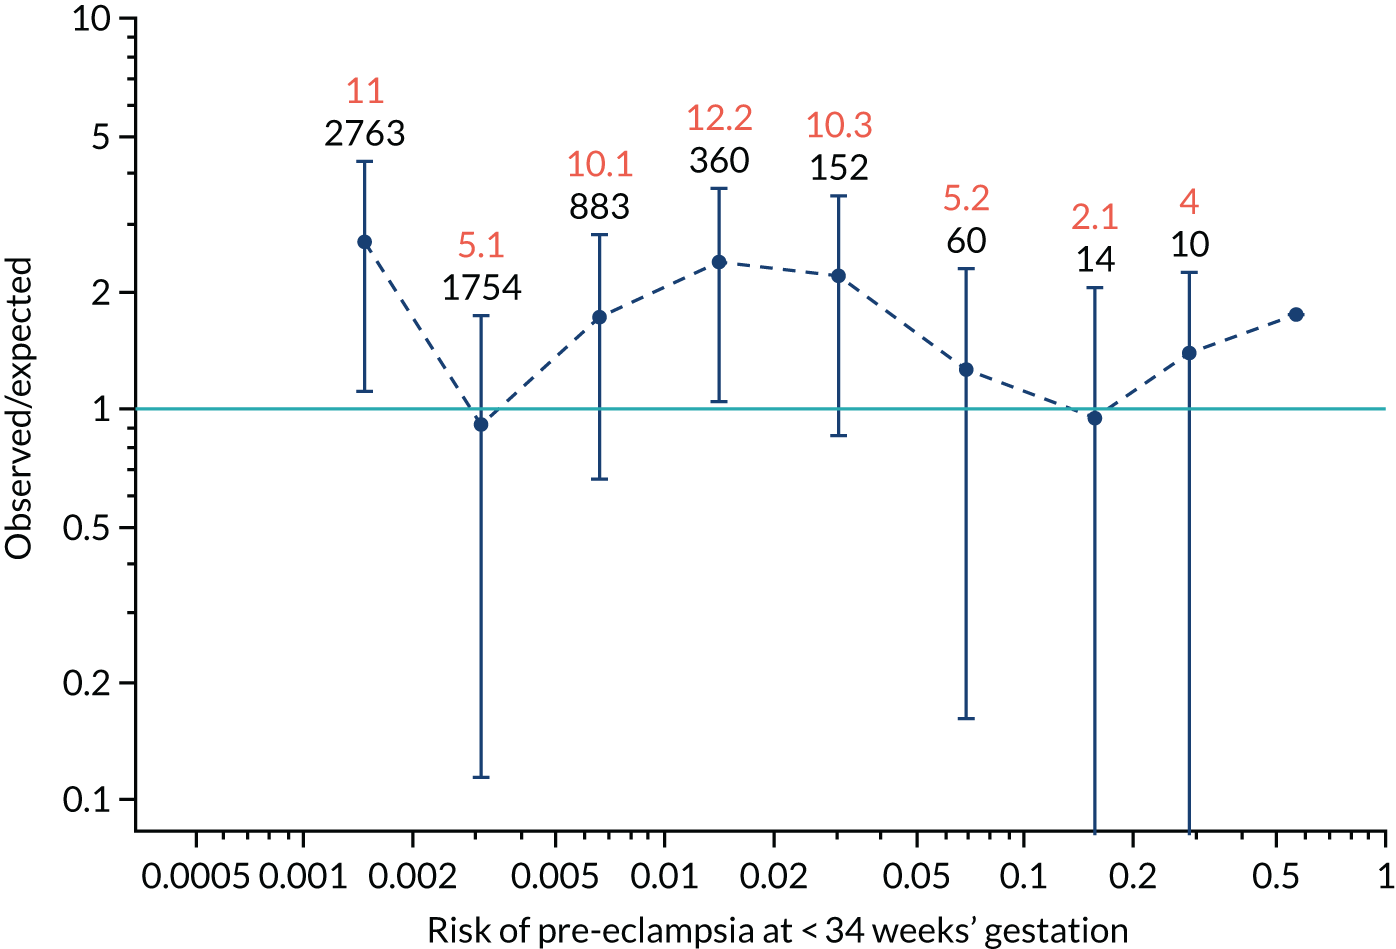
FIGURE 101.
The estimated incidence/mean risk within each bin for Mat-CHs and UTA-PI in predicting pre-eclampsia at < 37 weeks’ gestation.
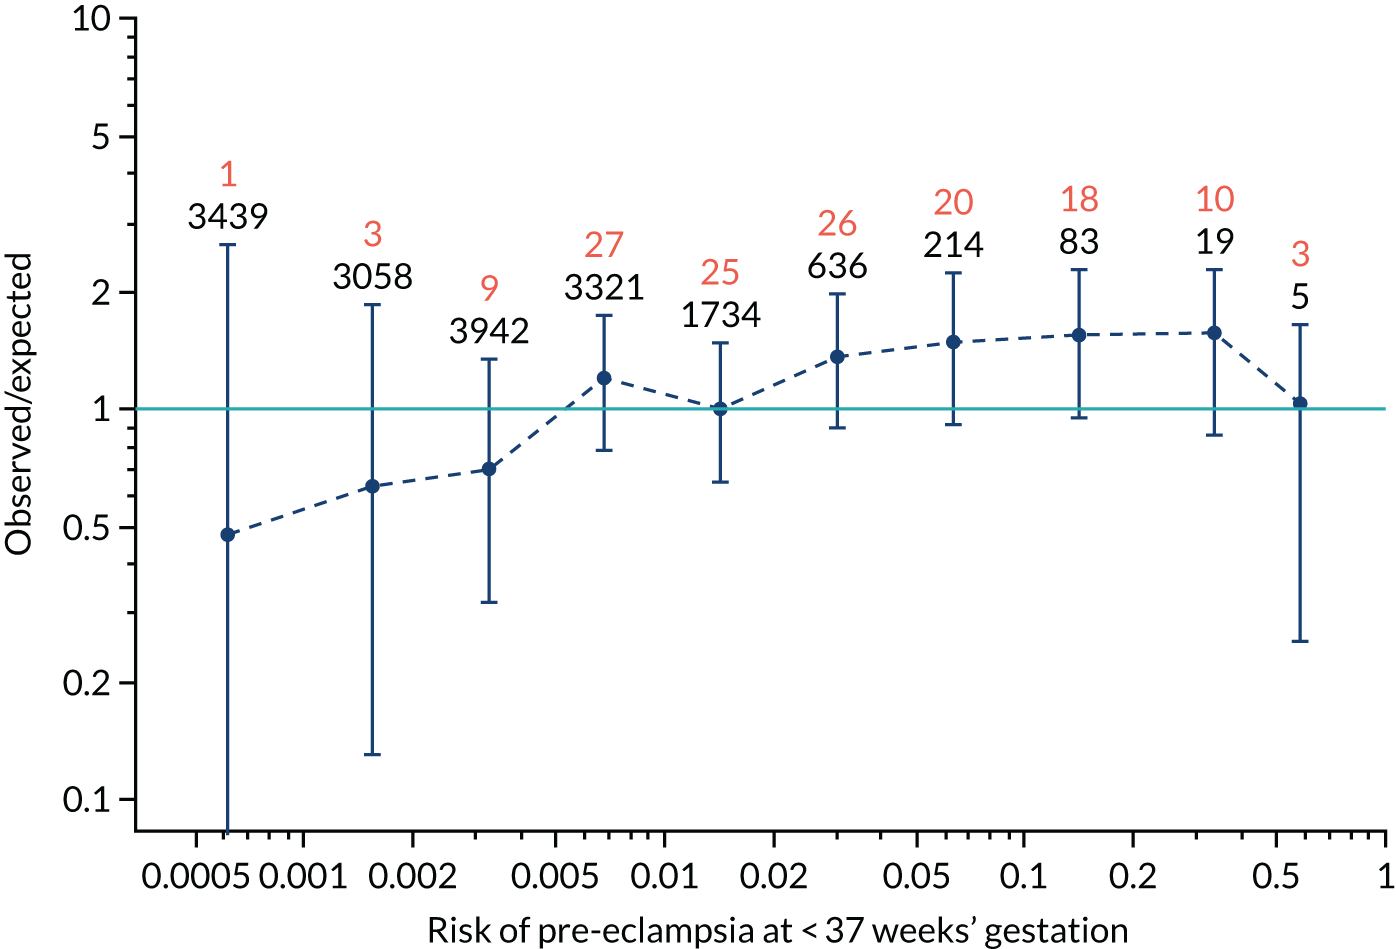
FIGURE 102.
The estimated incidence/mean risk within each bin for Mat-CHs and UTA-PI in predicting pre-eclampsia at < 37 weeks’ gestation.
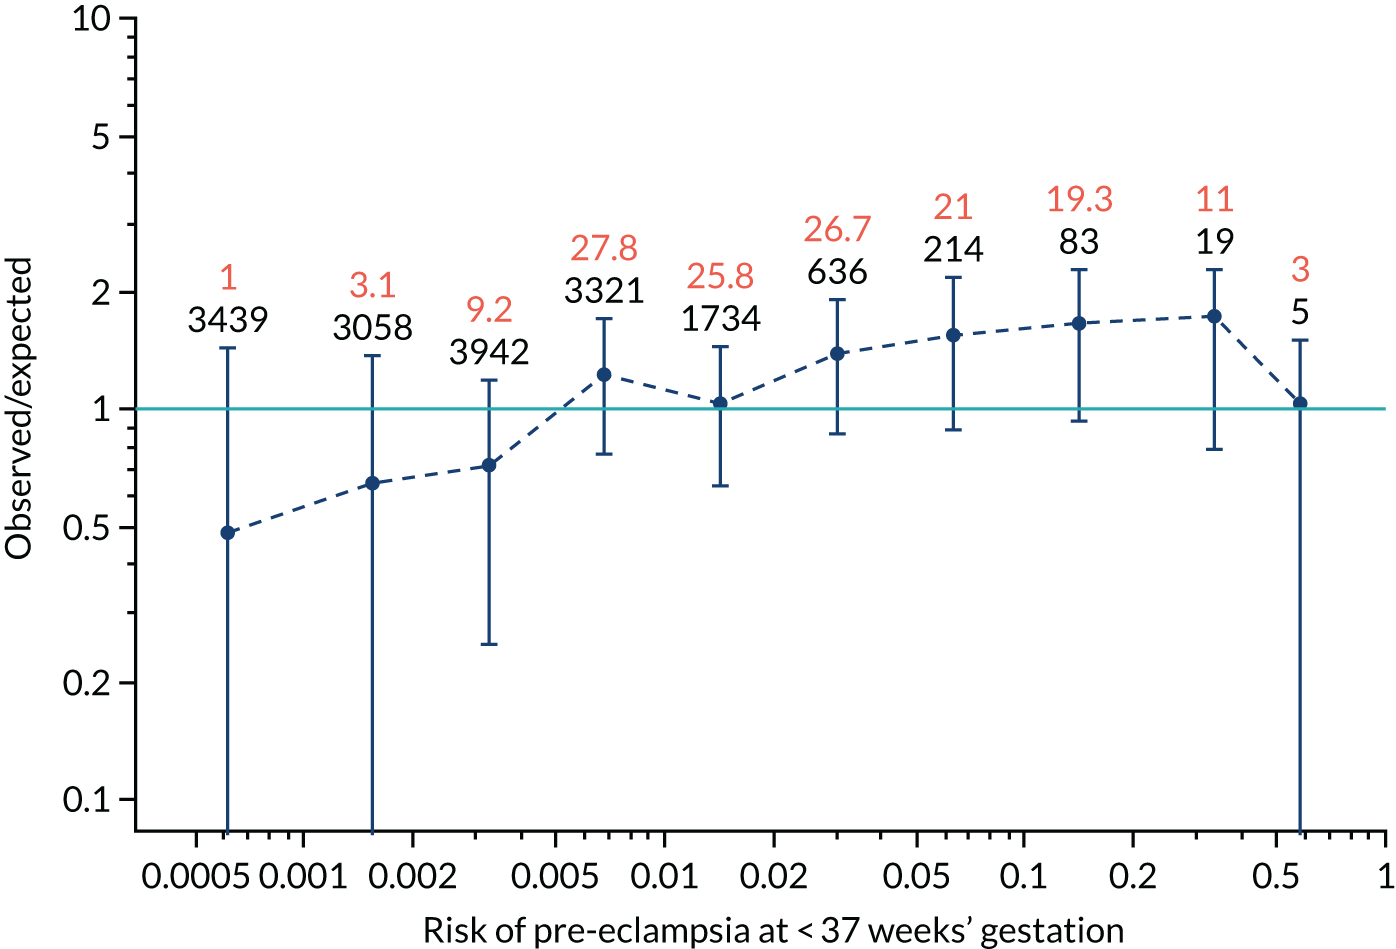
FIGURE 103.
The estimated incidence/mean risk within each bin for Mat-CHs and UTA-PI in predicting all pre-eclampsia.
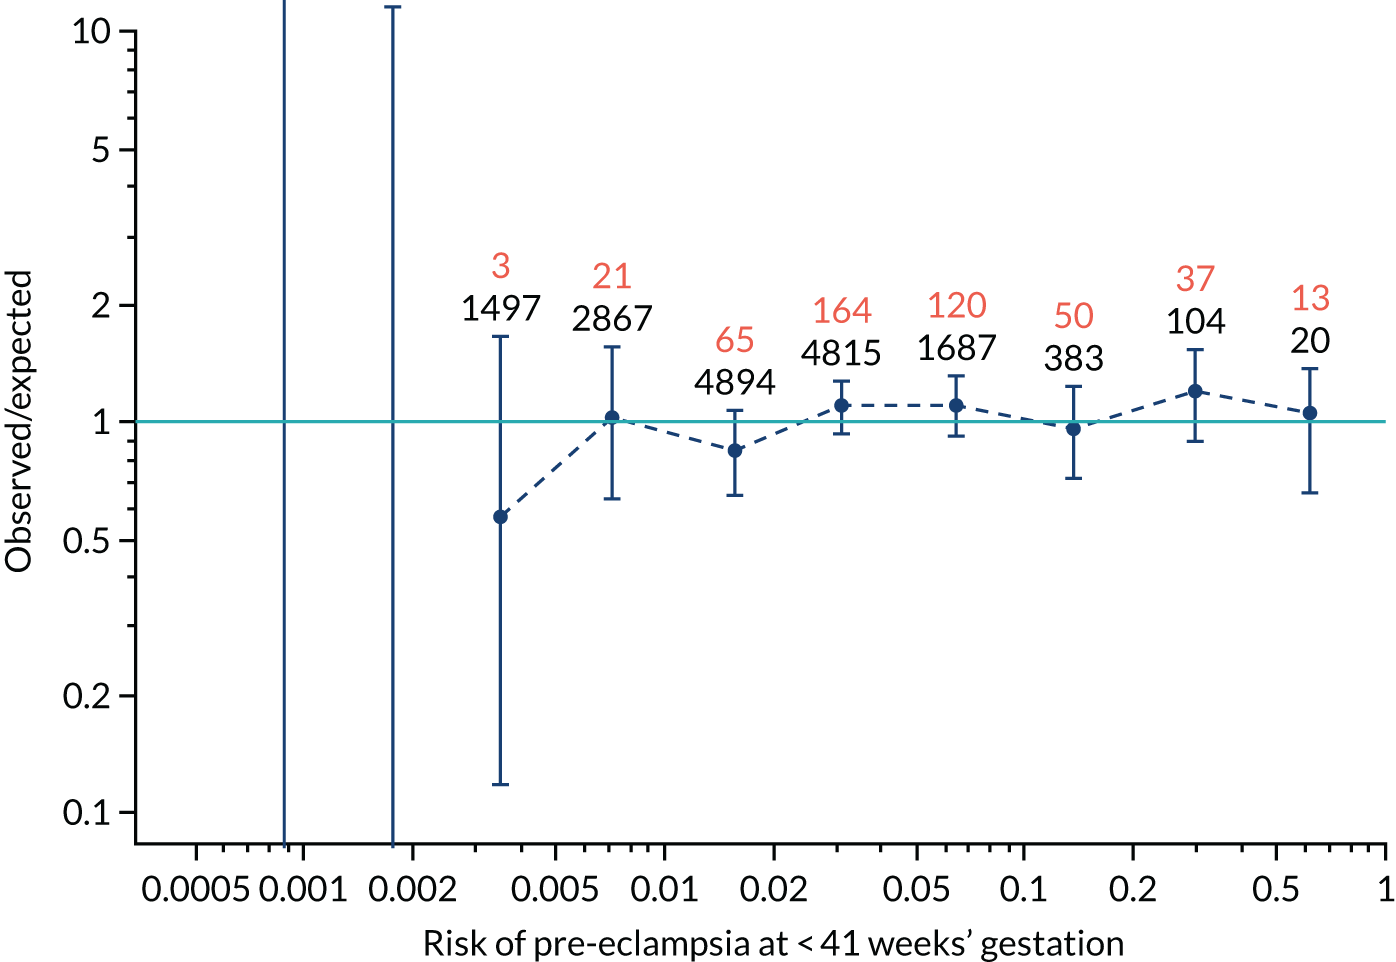
FIGURE 104.
The estimated incidence/mean risk within each bin for Mat-CHs and UTA-PI in predicting all pre-eclampsia.
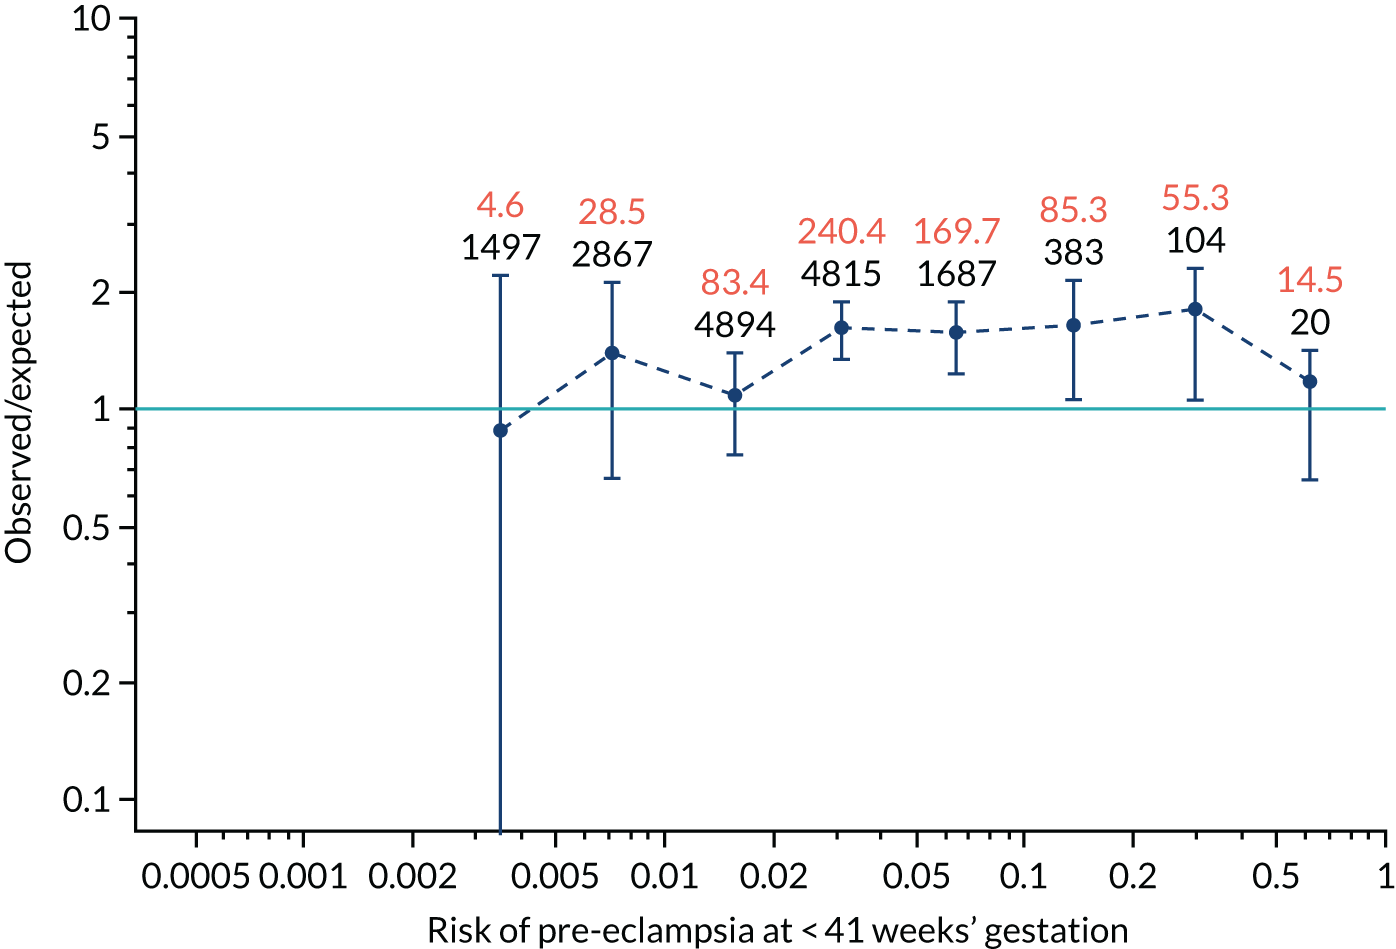
FIGURE 105.
The estimated incidence/mean risk within each bin for Mat-CHs and PLGF in predicting pre-eclampsia at < 34 weeks’ gestation.
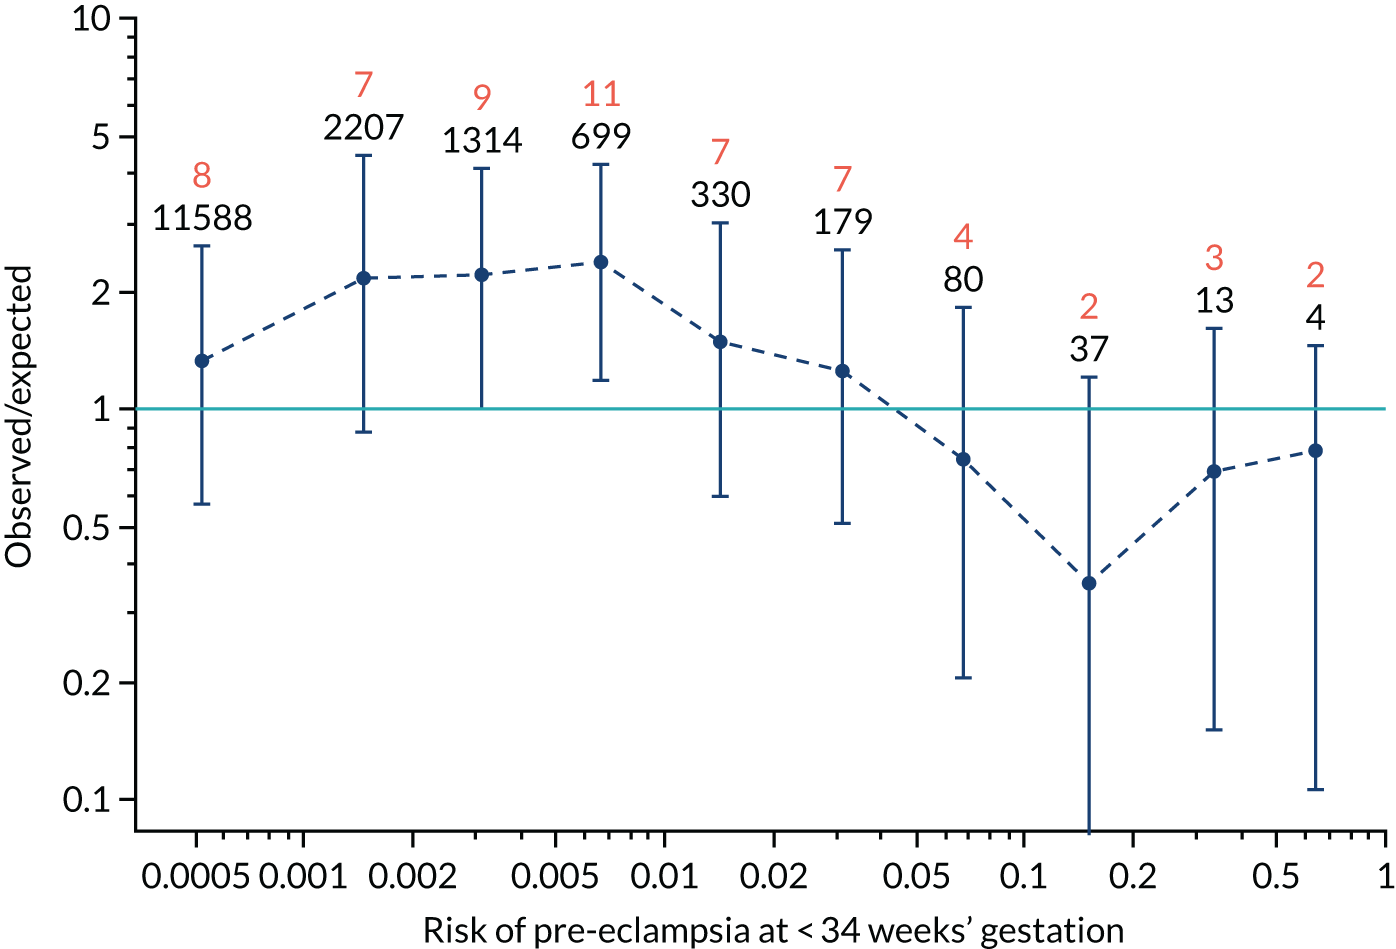
FIGURE 106.
The estimated incidence/mean risk within each bin for Mat-CHs and PLGF in predicting pre-eclampsia at < 34 weeks’ gestation.
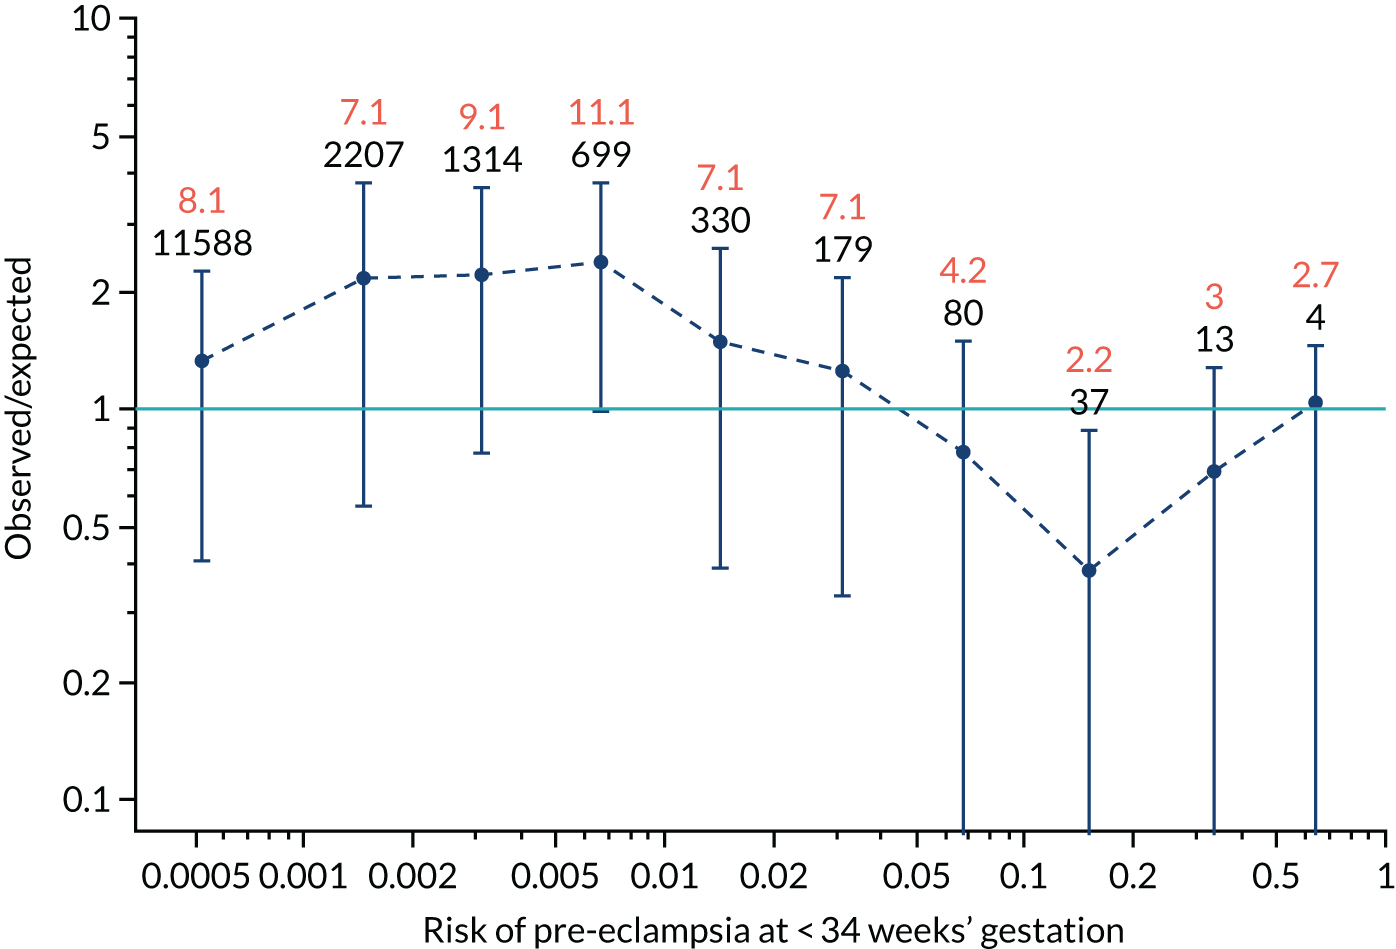
FIGURE 107.
The estimated incidence/mean risk within each bin for Mat-CHs and PLGF in predicting pre-eclampsia at < 37 weeks’ gestation.
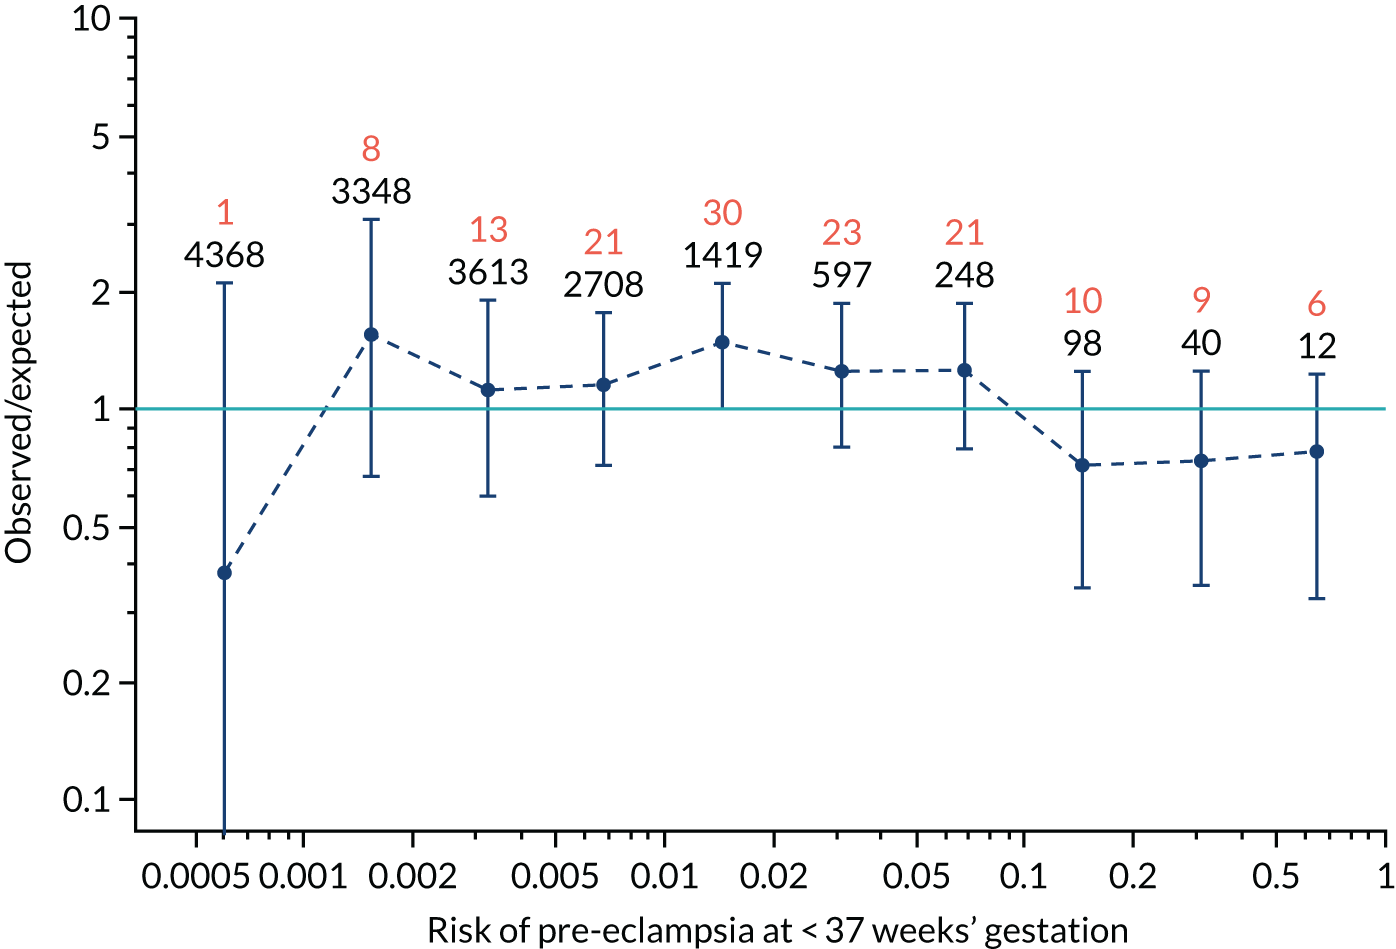
FIGURE 108.
The estimated incidence/mean risk within each bin for Mat-CHs and PLGF in predicting pre-eclampsia at < 37 weeks’ gestation.
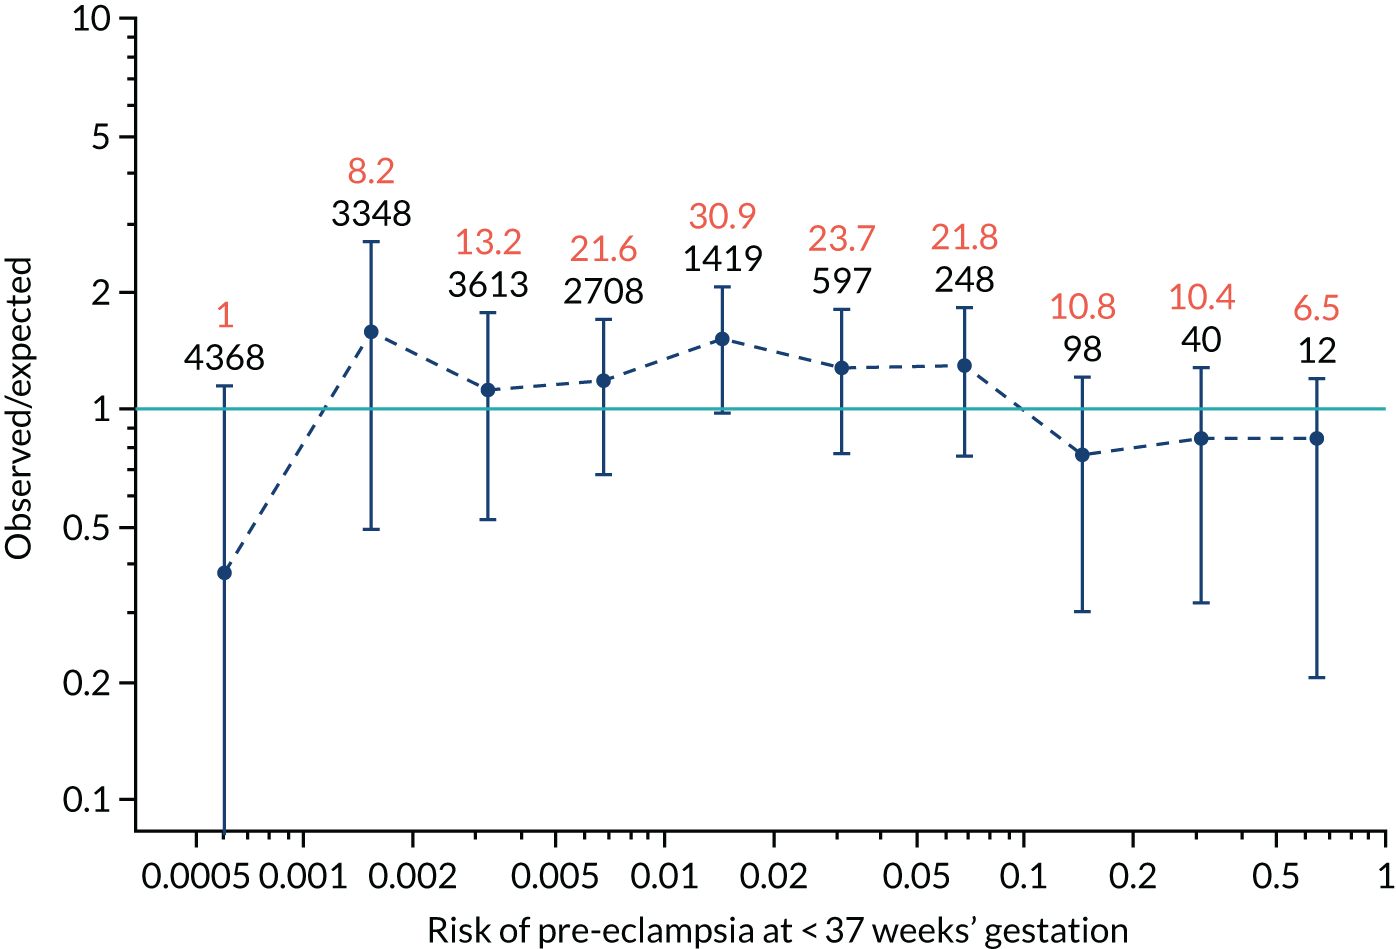
FIGURE 109.
The estimated incidence/mean risk within each bin for Mat-CHs and PLGF in predicting all pre-eclampsia.
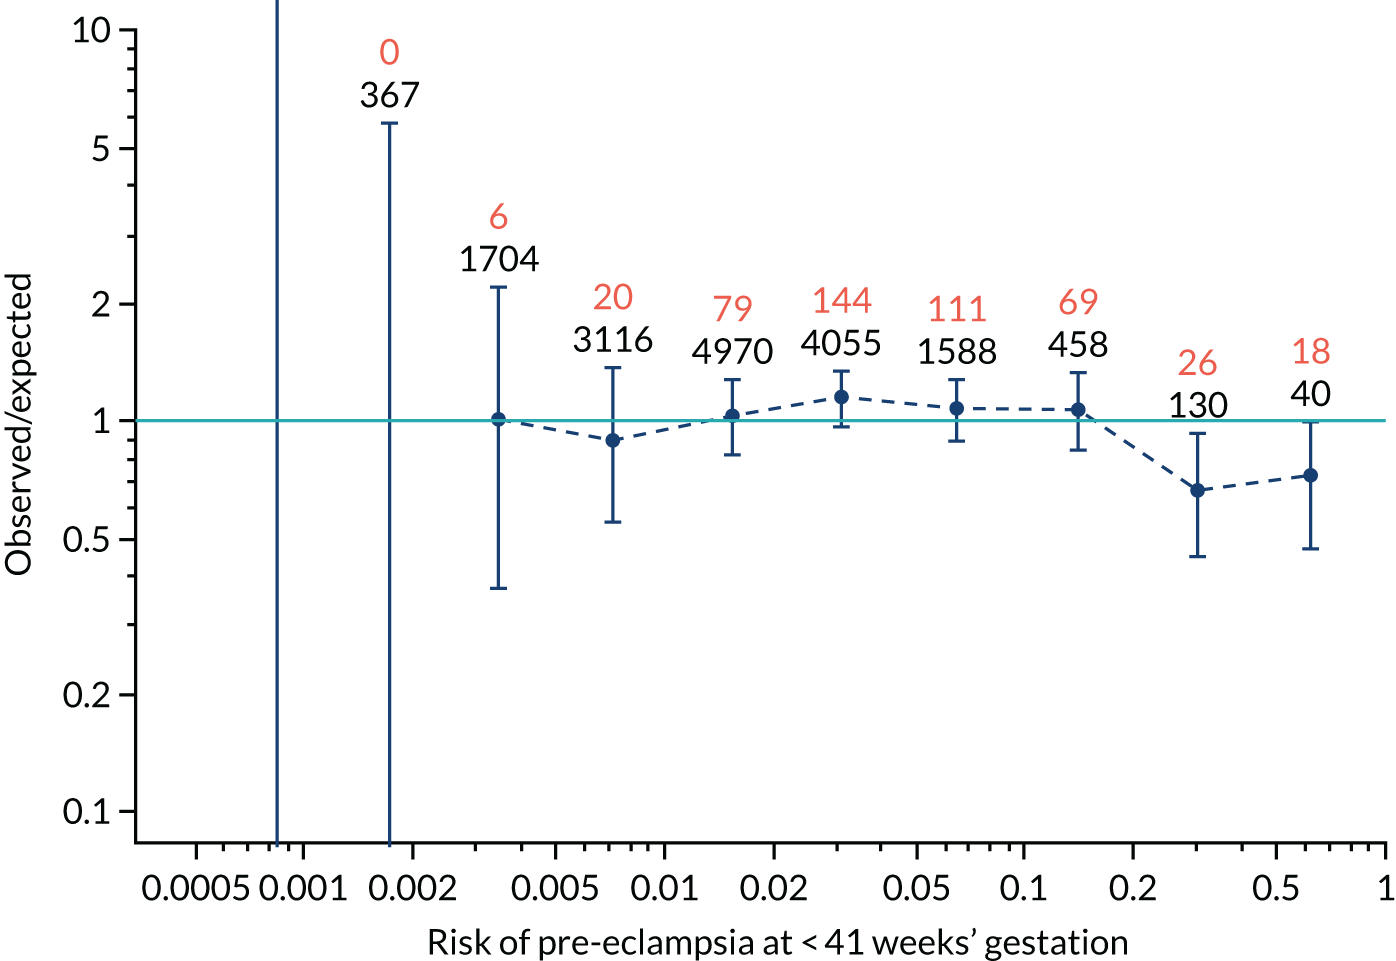
FIGURE 110.
The estimated incidence/mean risk within each bin for Mat-CHs and PLGF in predicting all pre-eclampsia.
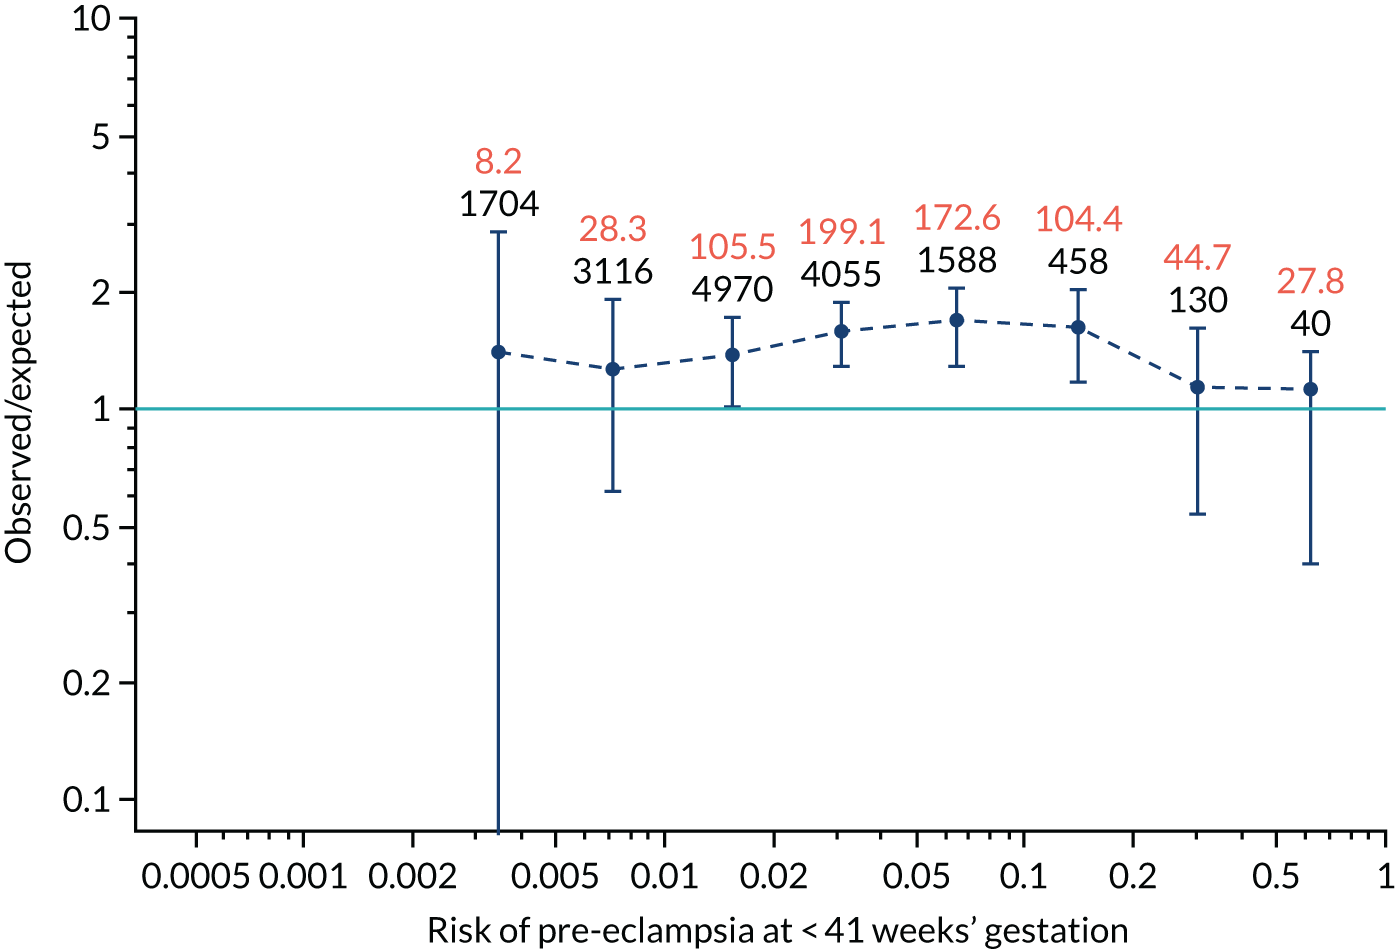
FIGURE 111.
The estimated incidence/mean risk within each bin for Mat-CHs and PAPP-A in predicting pre-eclampsia at < 34 weeks’ gestation.
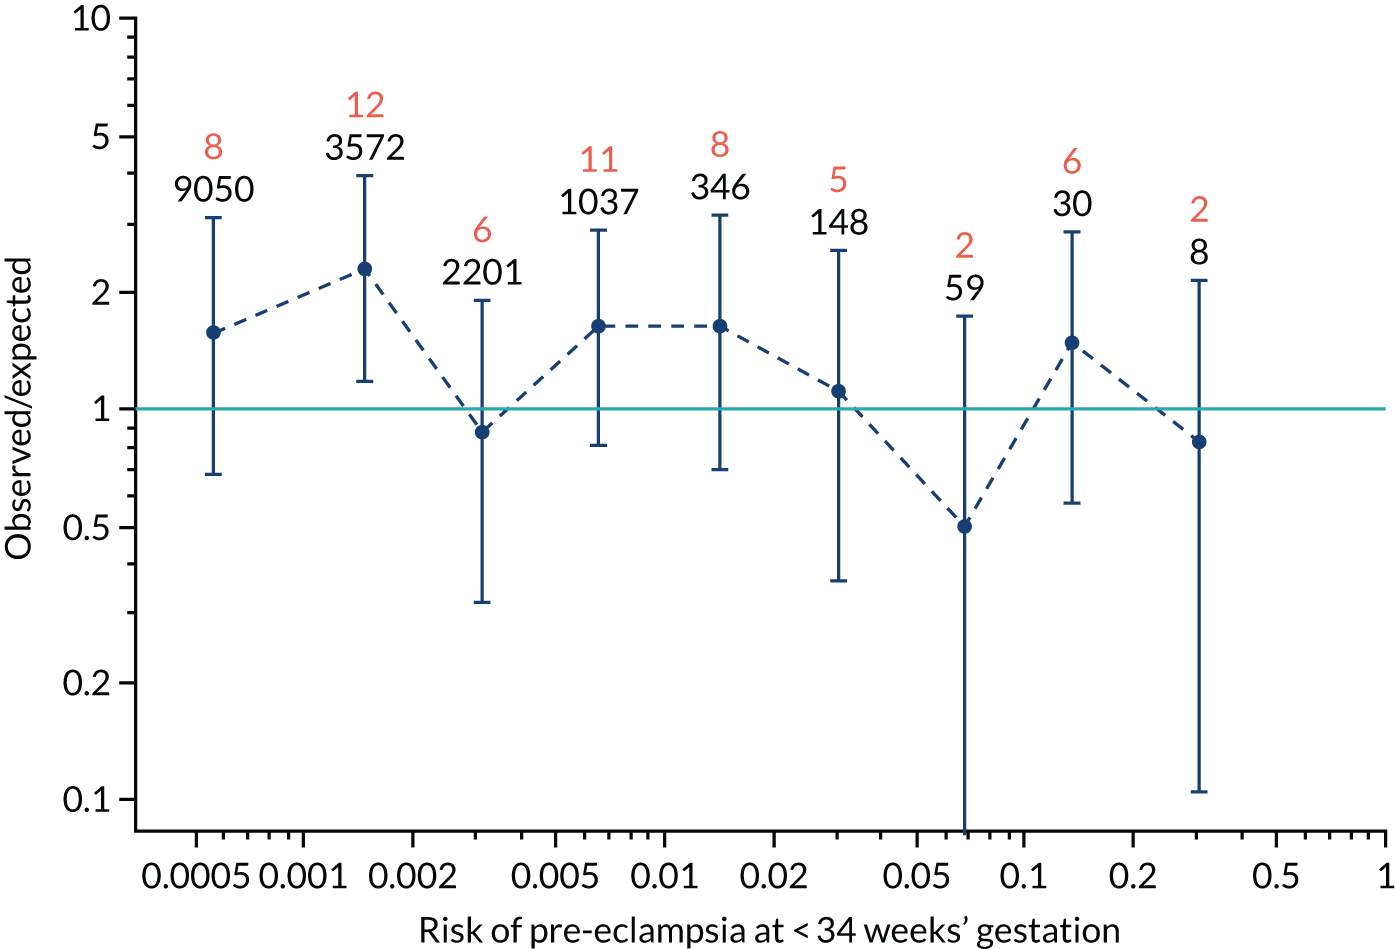
FIGURE 112.
The estimated incidence/mean risk within each bin for Mat-CHs and PAPP-A in predicting pre-eclampsia at < 34 weeks’ gestation.
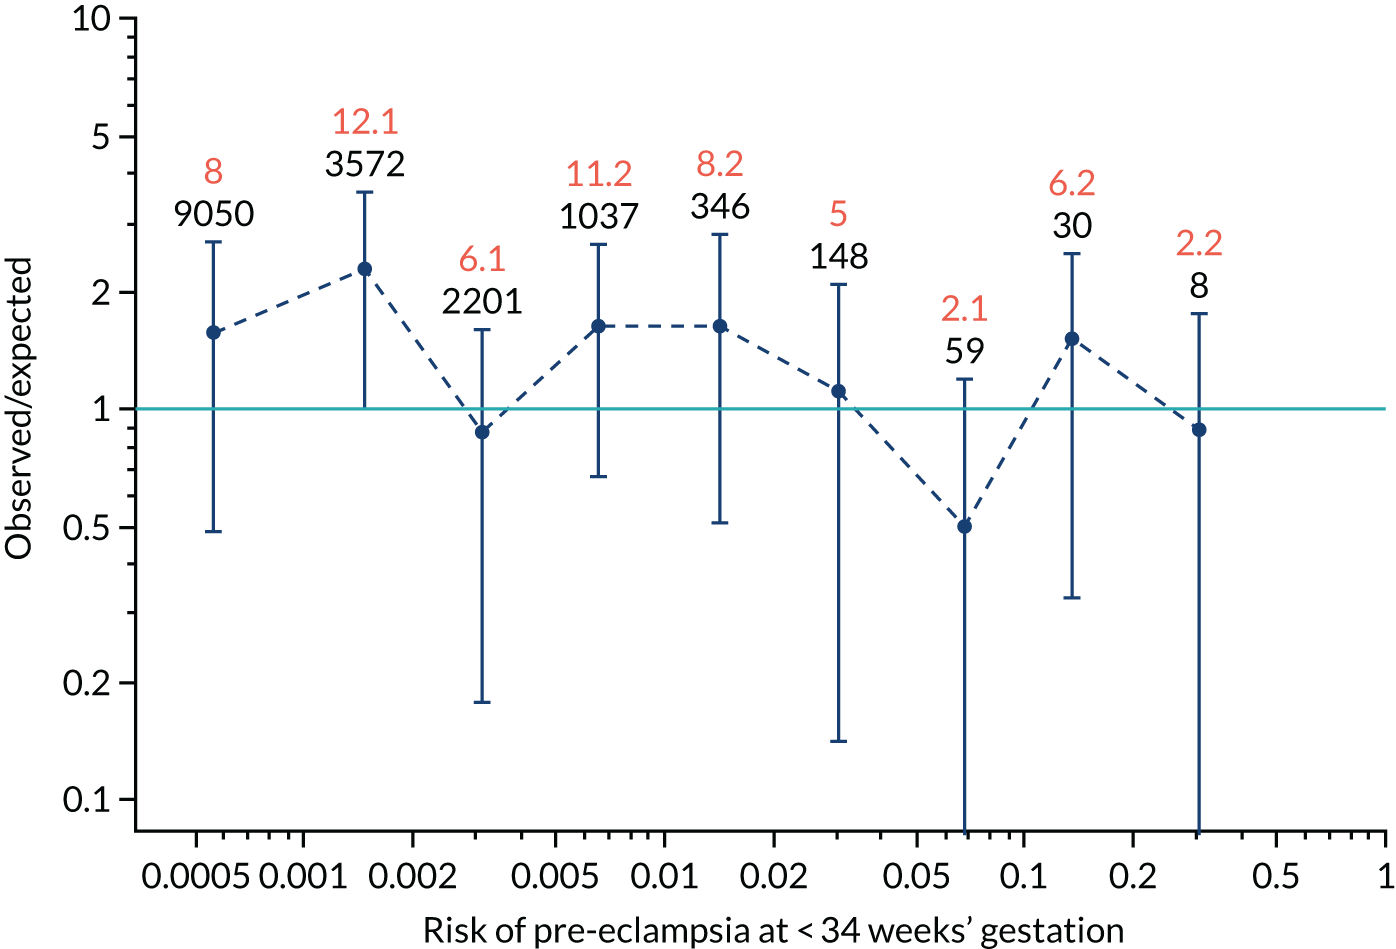
FIGURE 113.
The estimated incidence/mean risk within each bin for Mat-CHs and PAPP-A in predicting pre-eclampsia at < 37 weeks’ gestation.
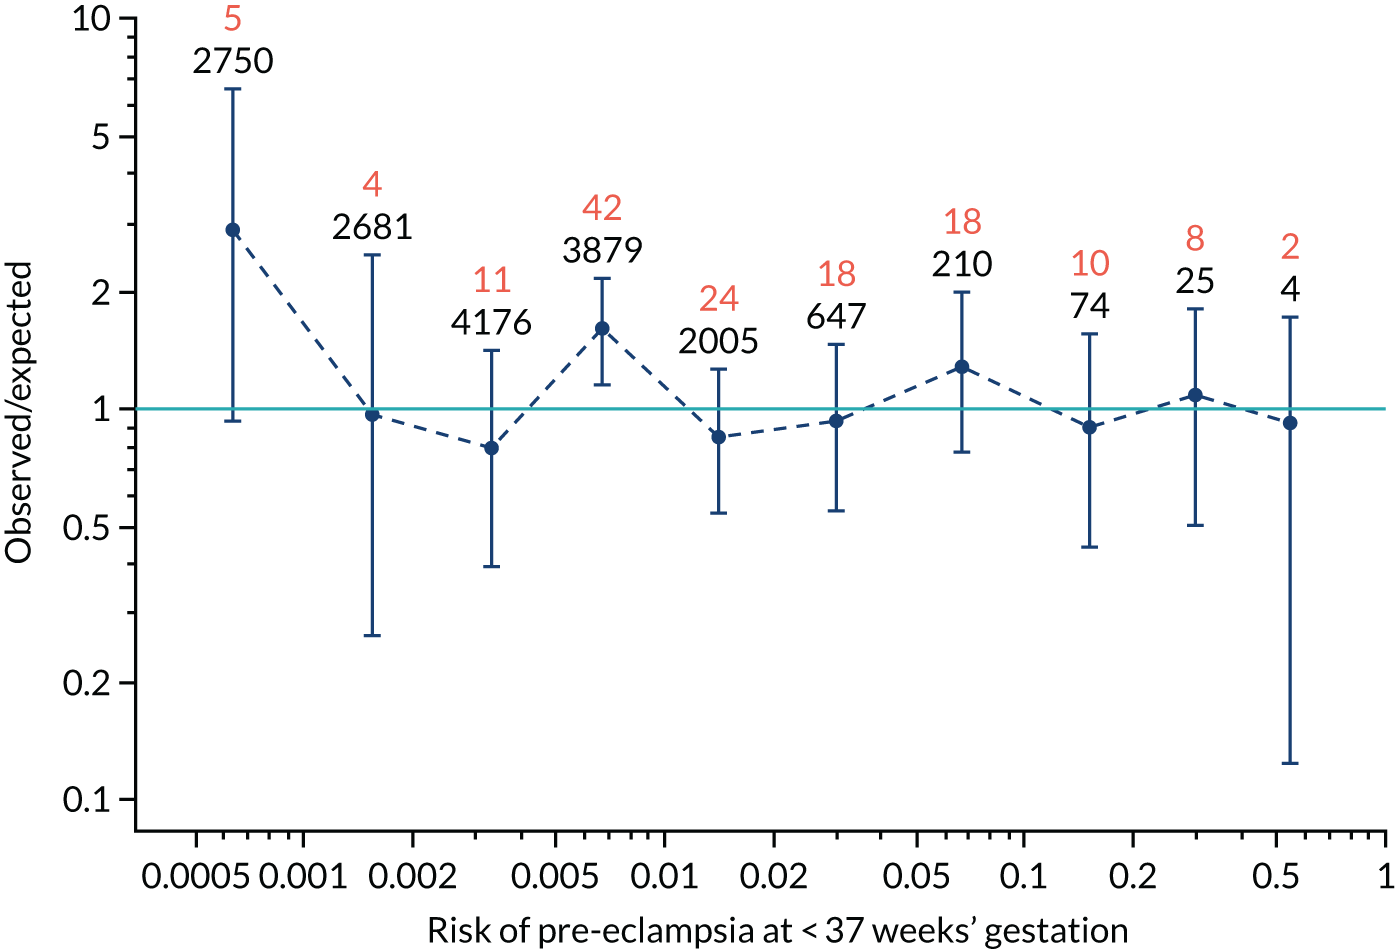
FIGURE 114.
The estimated incidence/mean risk within each bin for Mat-CHs and PAPP-A in predicting pre-eclampsia at < 37 weeks’ gestation.
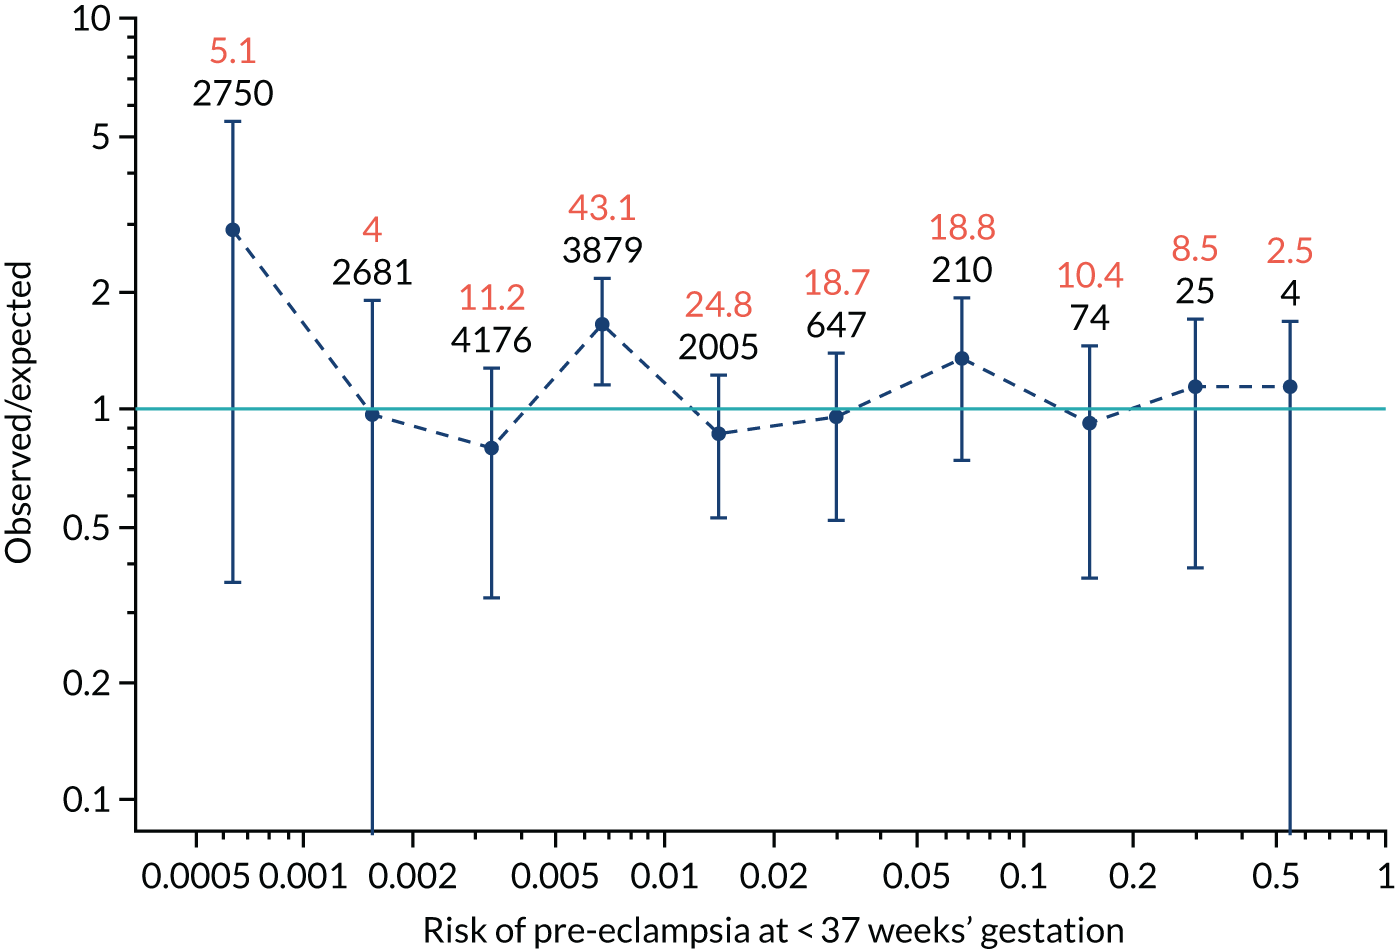
FIGURE 115.
The estimated incidence/mean risk within each bin for Mat-CHs and PAPP-A in predicting all pre-eclampsia.
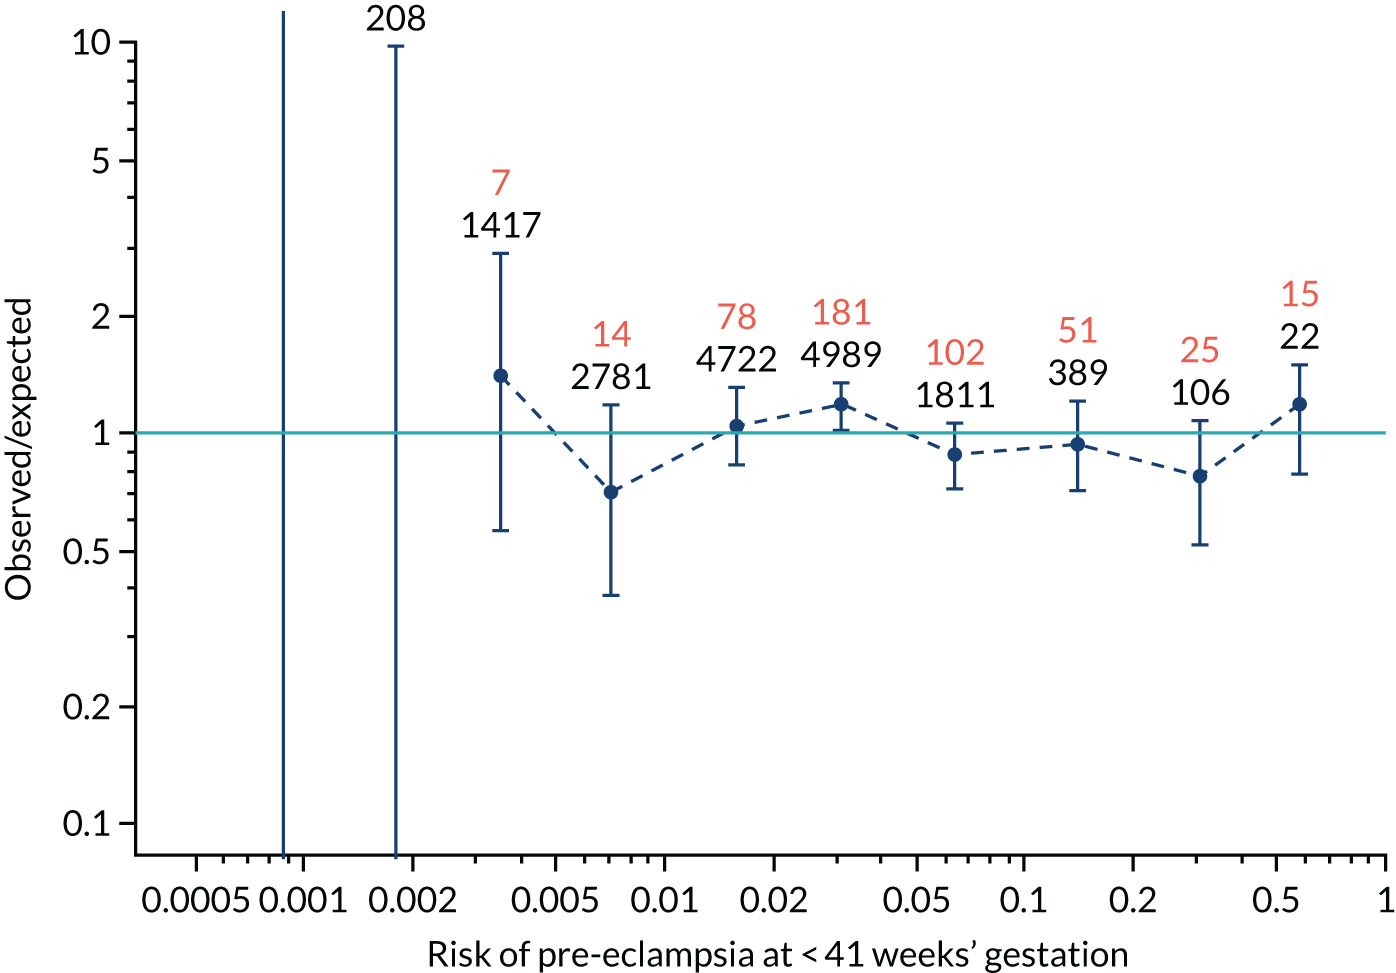
FIGURE 116.
The estimated incidence/mean risk within each bin for Mat-CHs and PAPP-A in predicting all pre-eclampsia.
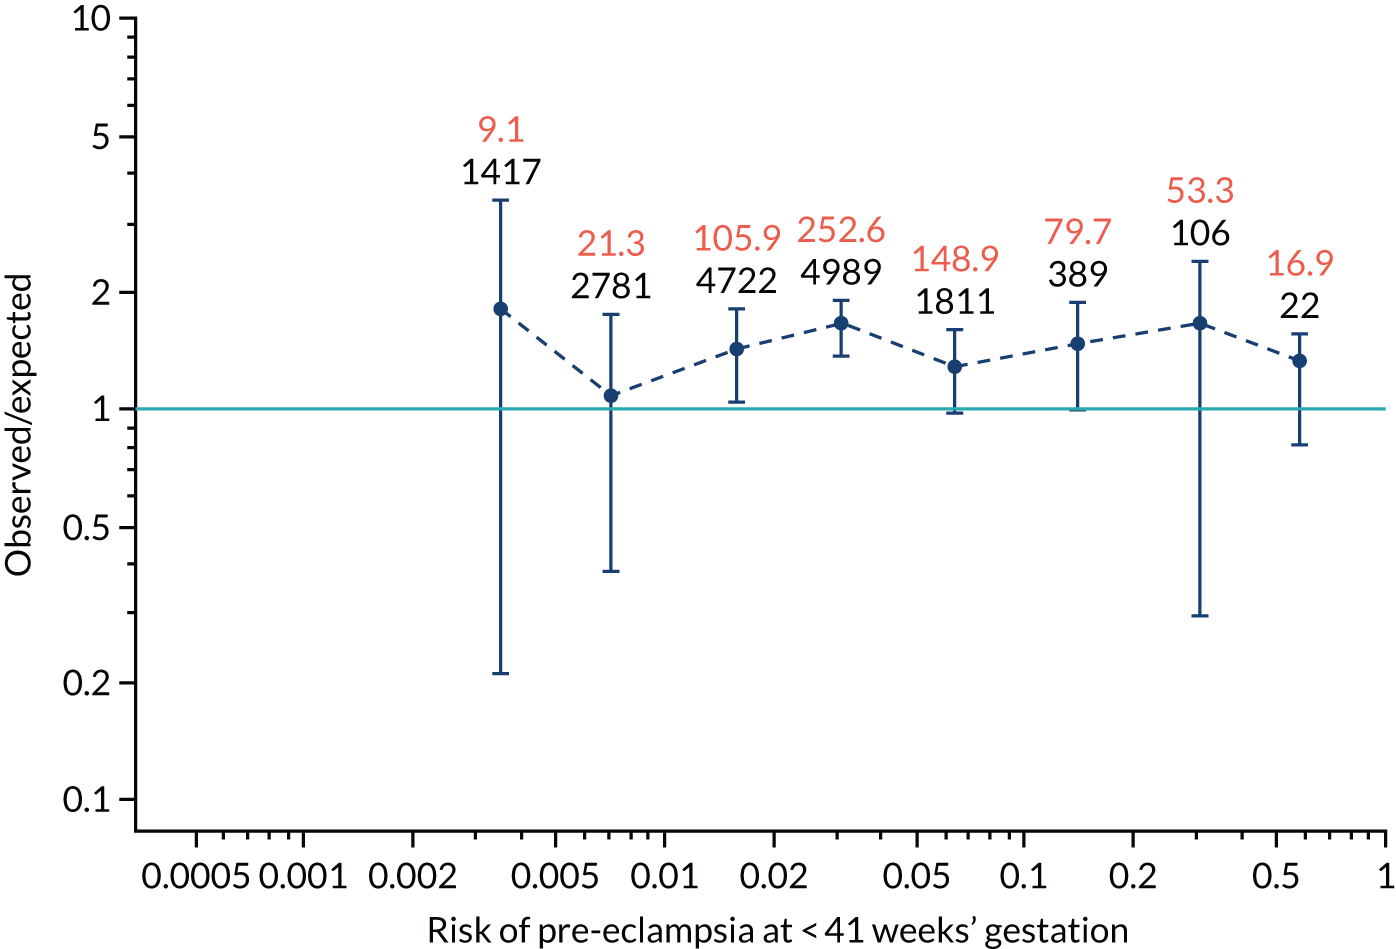
FIGURE 117.
The estimated incidence/mean risk within each bin for Mat-CHs, MAP and UTA-PI in predicting pre-eclampsia at < 34 weeks’ gestation.
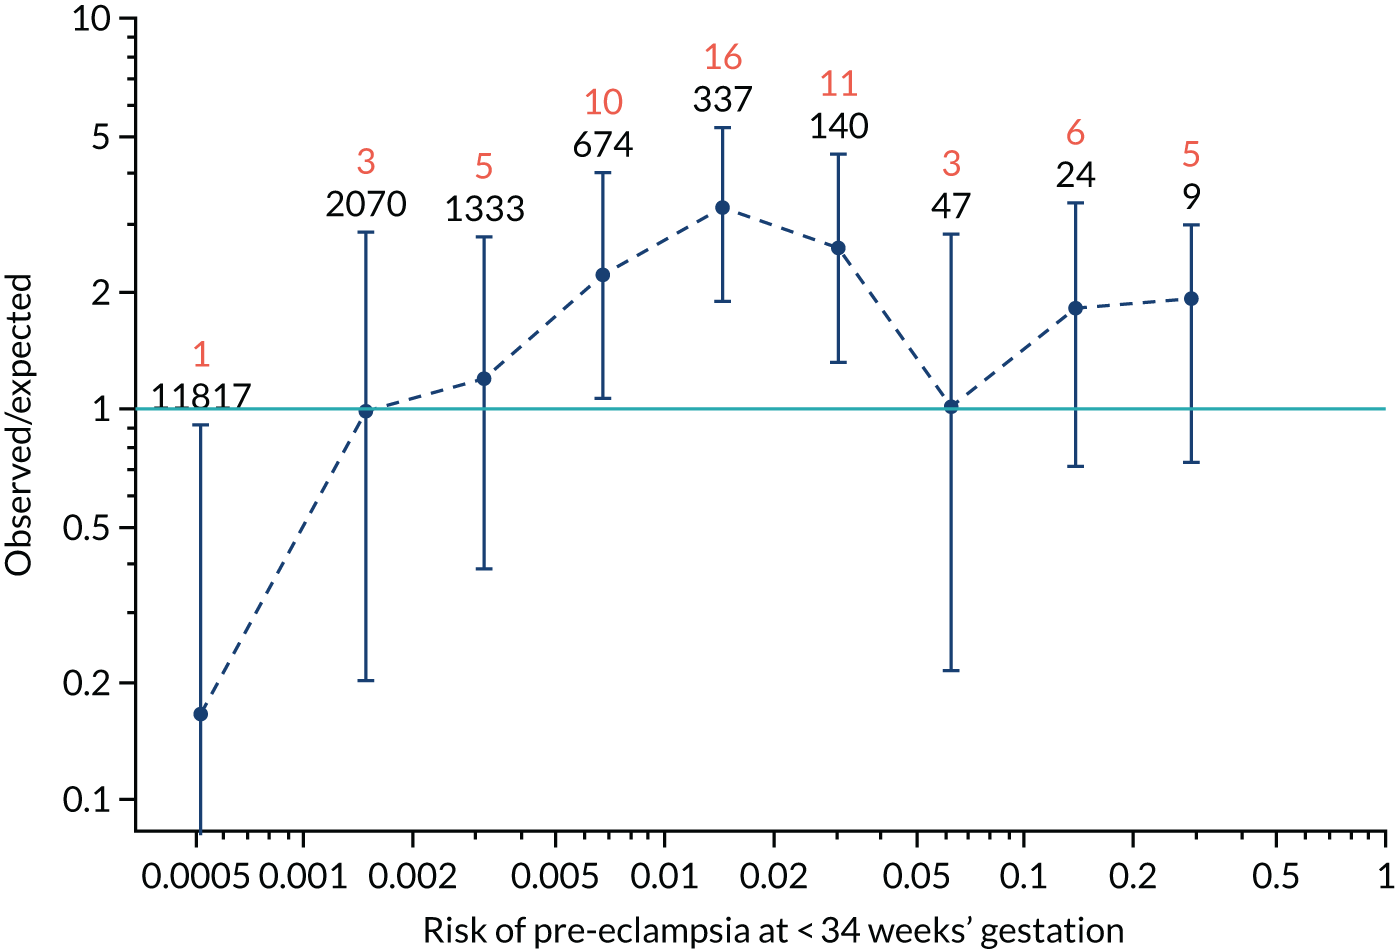
FIGURE 118.
The estimated incidence/mean risk within each bin for Mat-CHs, MAP and UTA-PI in predicting pre-eclampsia at < 34 weeks’ gestation.
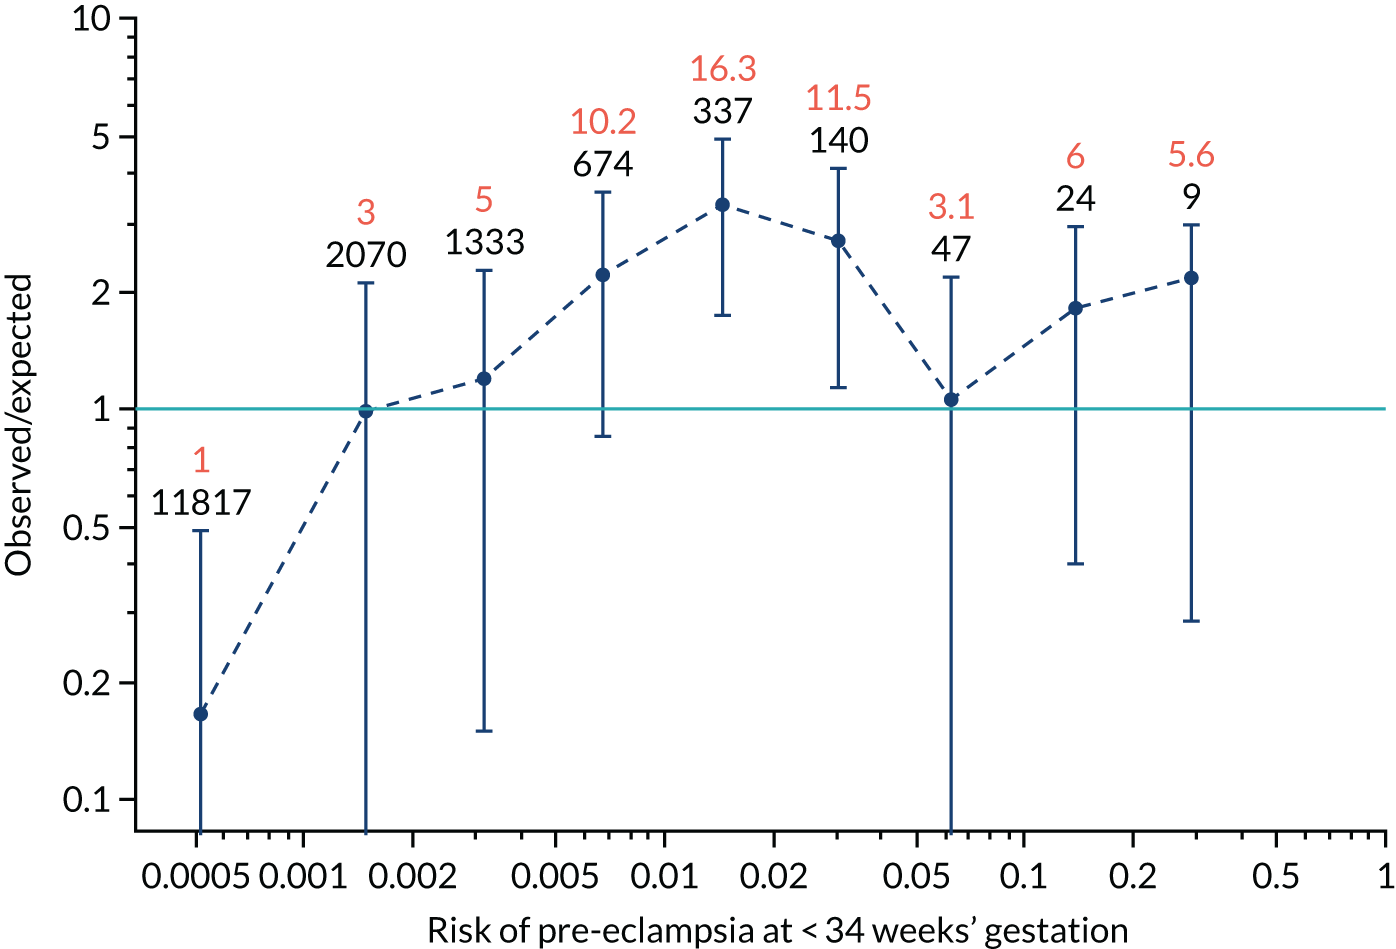
FIGURE 119.
The estimated incidence/mean risk within each bin for Mat-CHs, MAP and UTA-PI in predicting pre-eclampsia at < 37 weeks’ gestation.
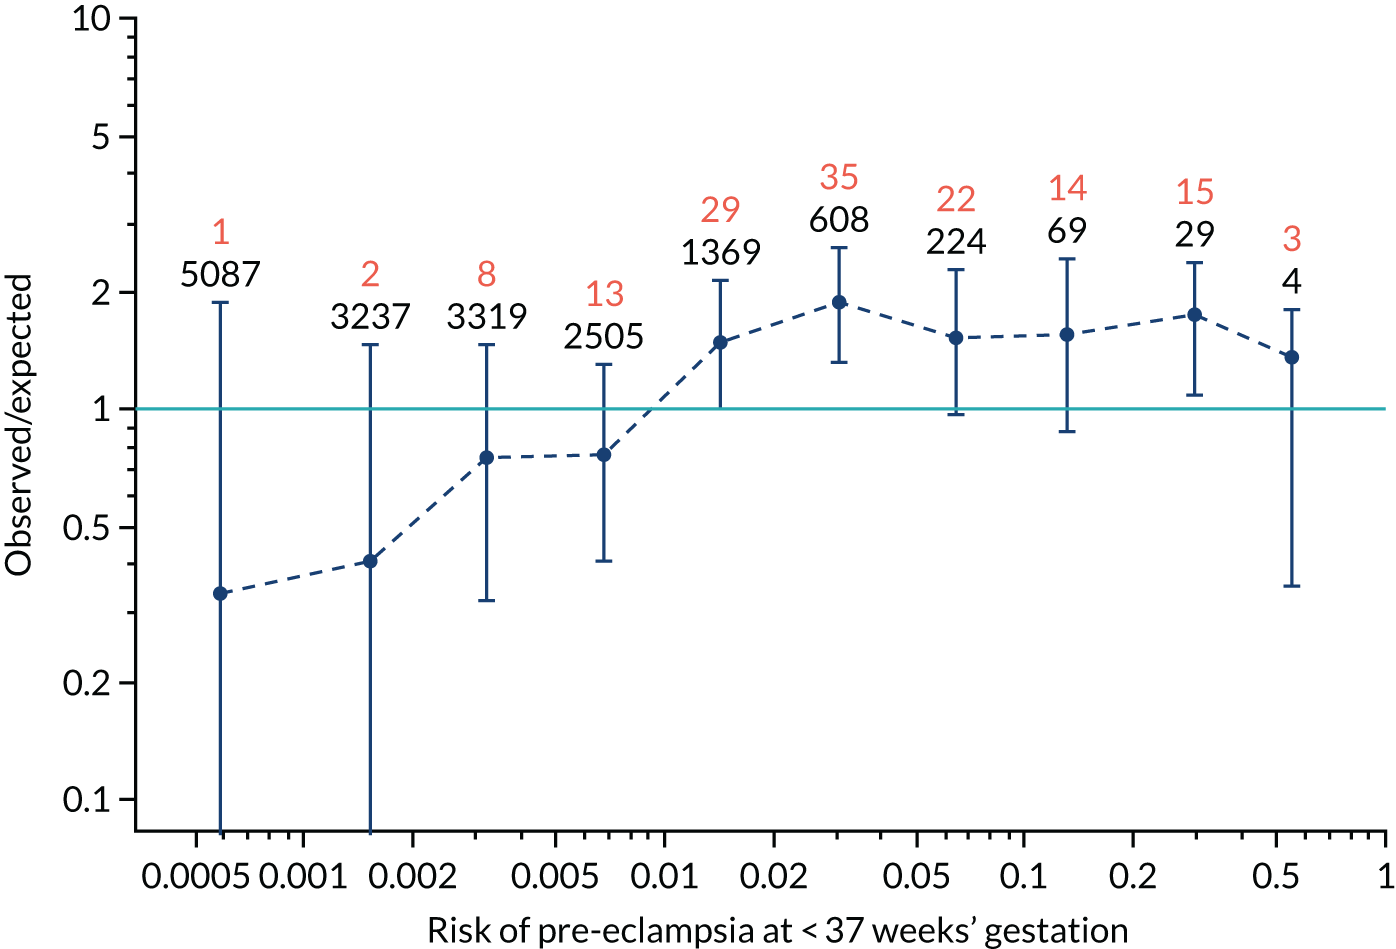
FIGURE 120.
The estimated incidence/mean risk within each bin for Mat-CHs, MAP and UTA-PI in predicting pre-eclampsia at < 37 weeks’ gestation.
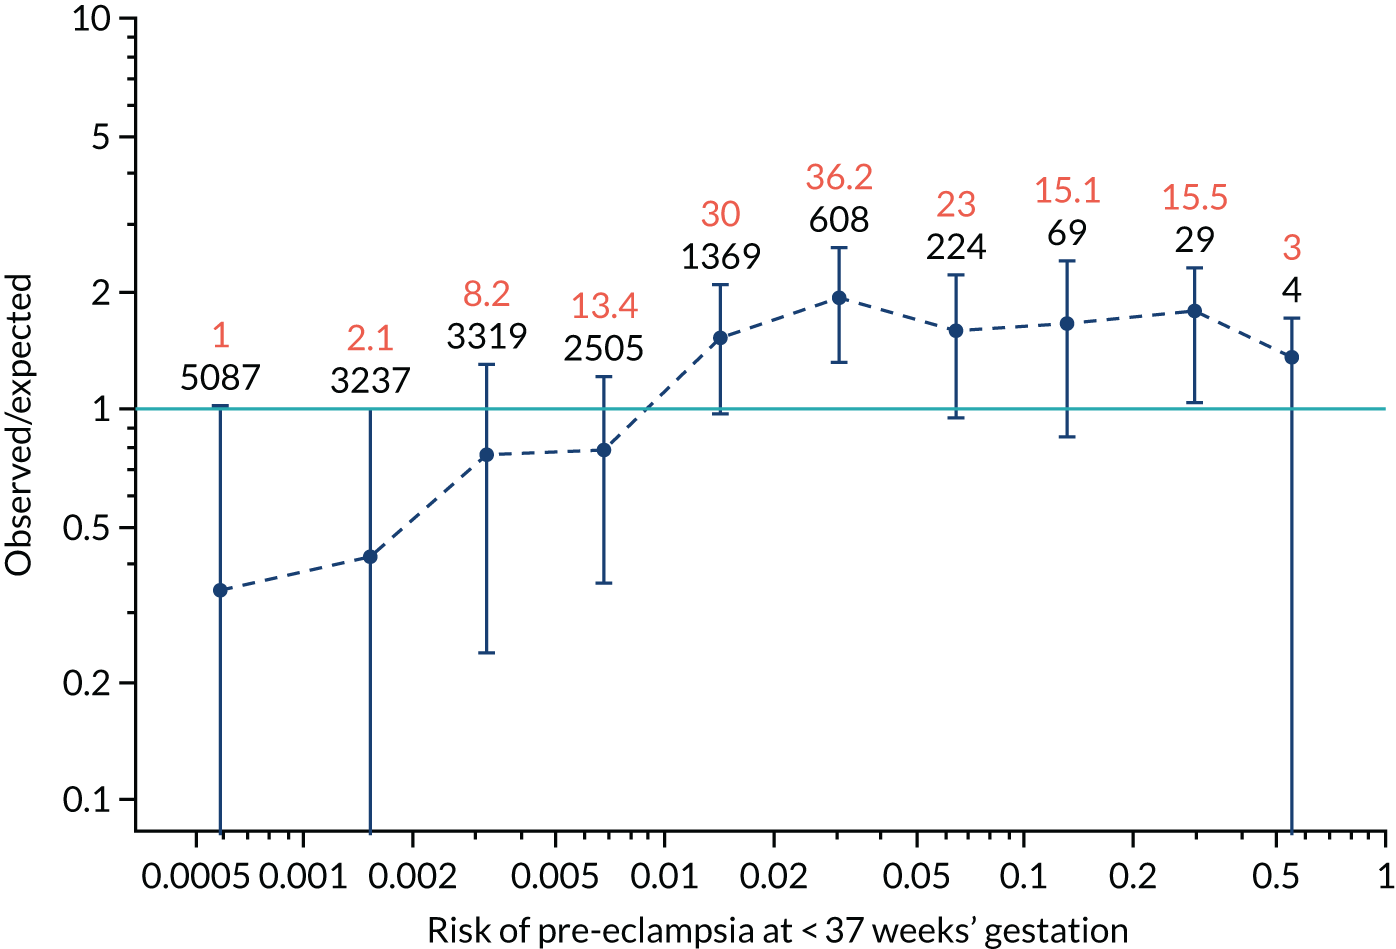
FIGURE 121.
The estimated incidence/mean risk within each bin for Mat-CHs, MAP and UTA-PI in predicting all pre-eclampsia.
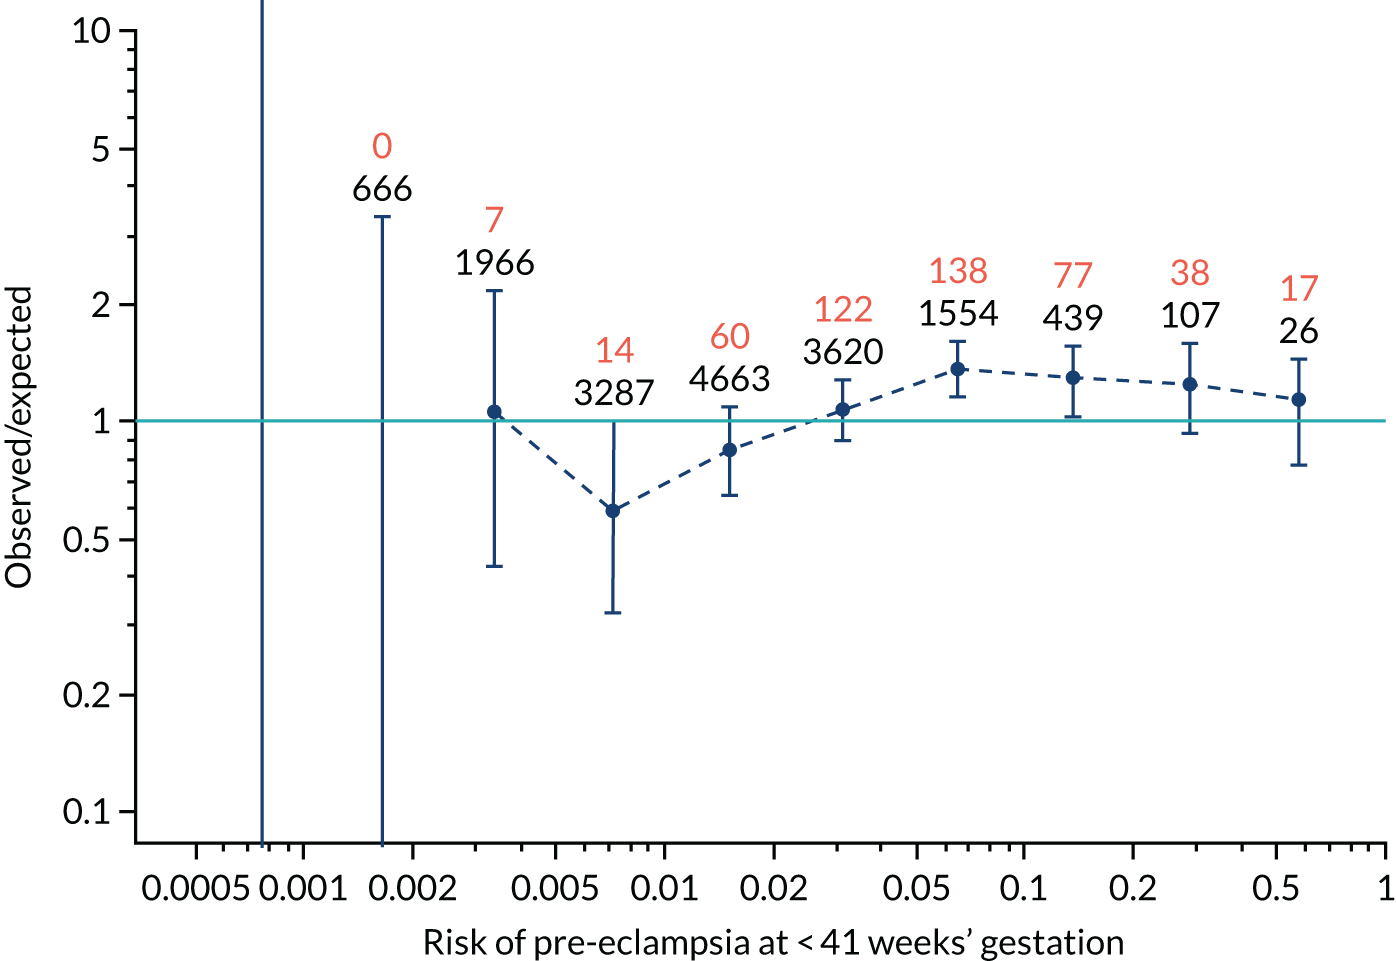
FIGURE 122.
The estimated incidence/mean risk within each bin for Mat-CHs, MAP and UTA-PI in predicting all pre-eclampsia.
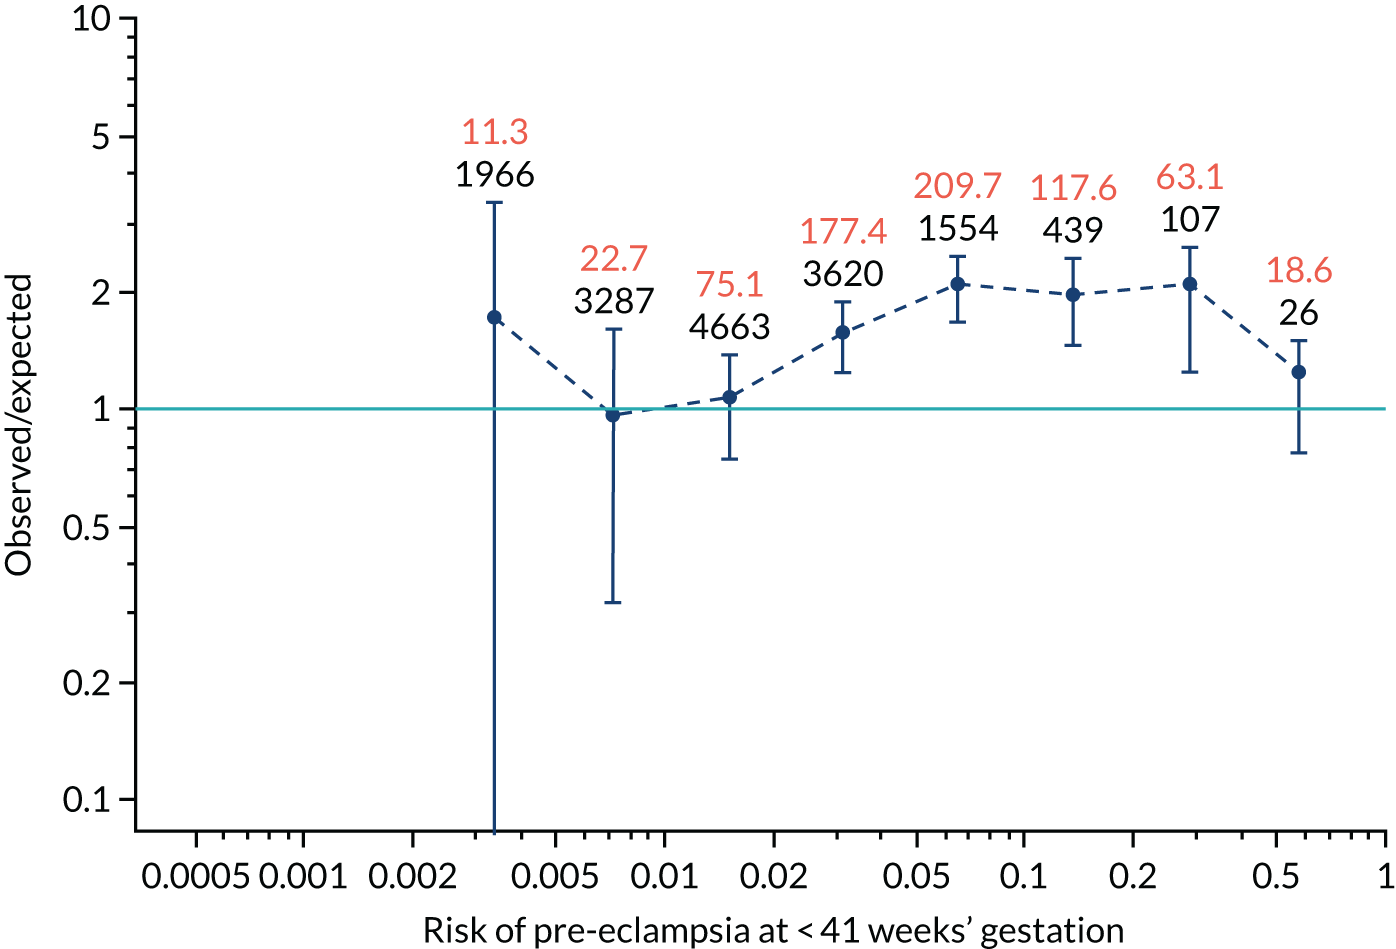
FIGURE 123.
The estimated incidence/mean risk within each bin for Mat-CHs, MAP and PAPP-A in predicting pre-eclampsia at < 34 weeks’ gestation.
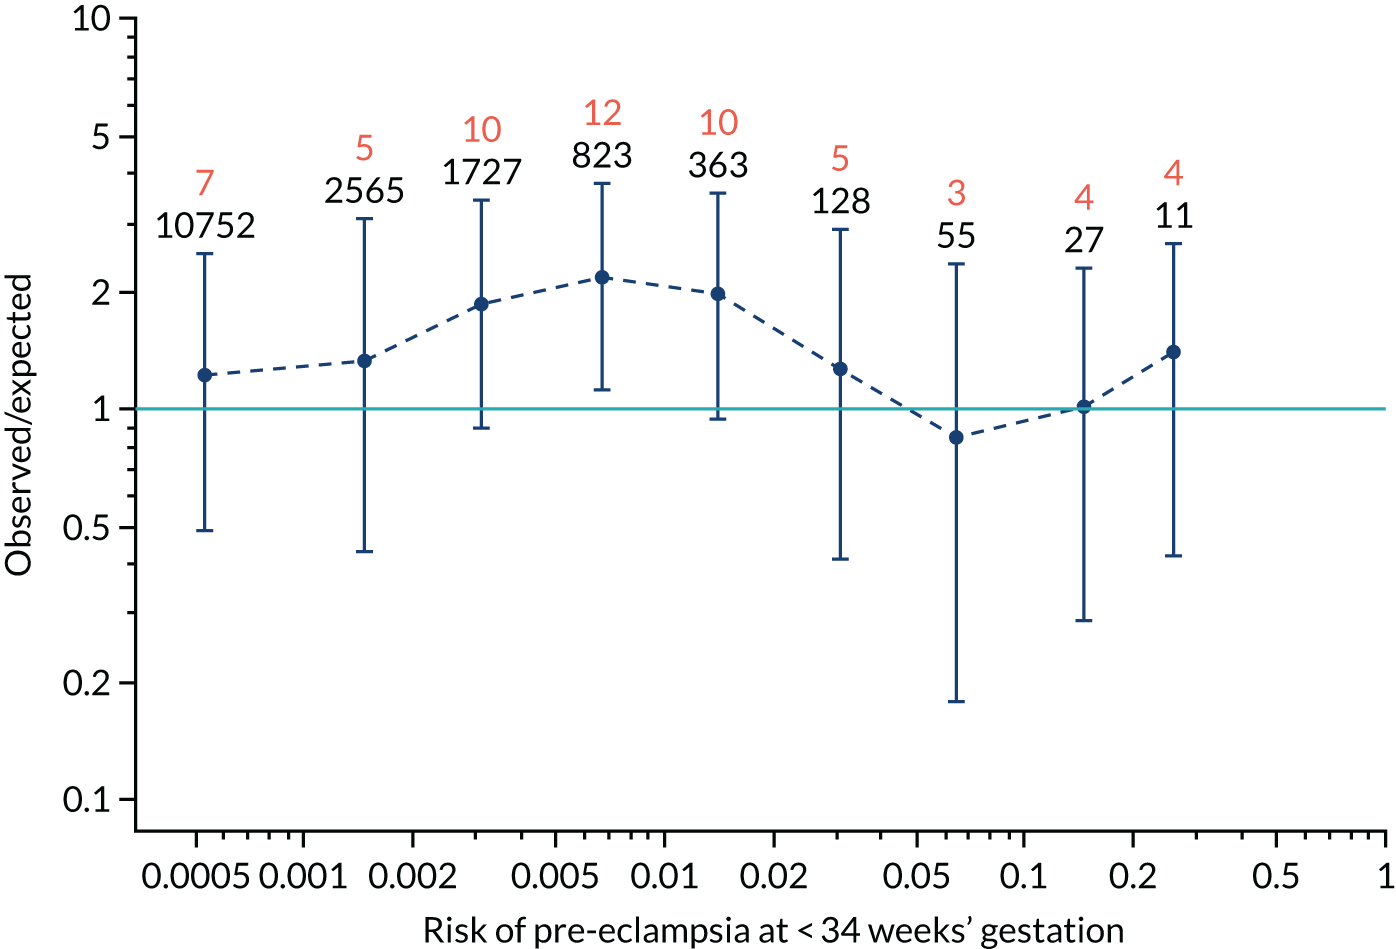
FIGURE 124.
The estimated incidence/mean risk within each bin for Mat-CHs, MAP and PAPP-A in predicting pre-eclampsia at < 34 weeks’ gestation.
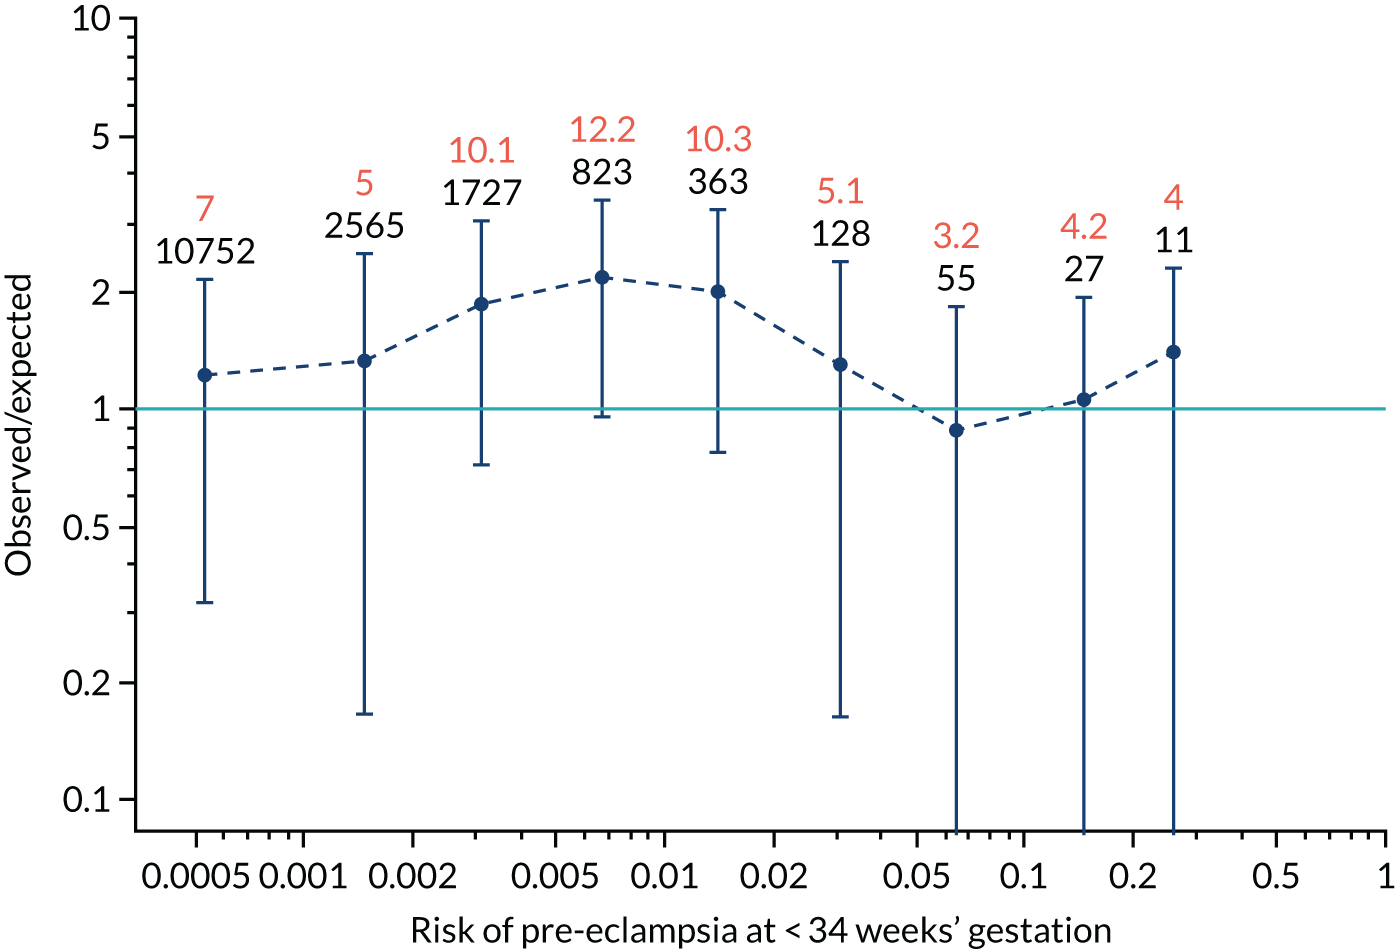
FIGURE 125.
The estimated incidence/mean risk within each bin for Mat-CHs, MAP and PAPP-A in predicting pre-eclampsia at < 37 weeks’ gestation.
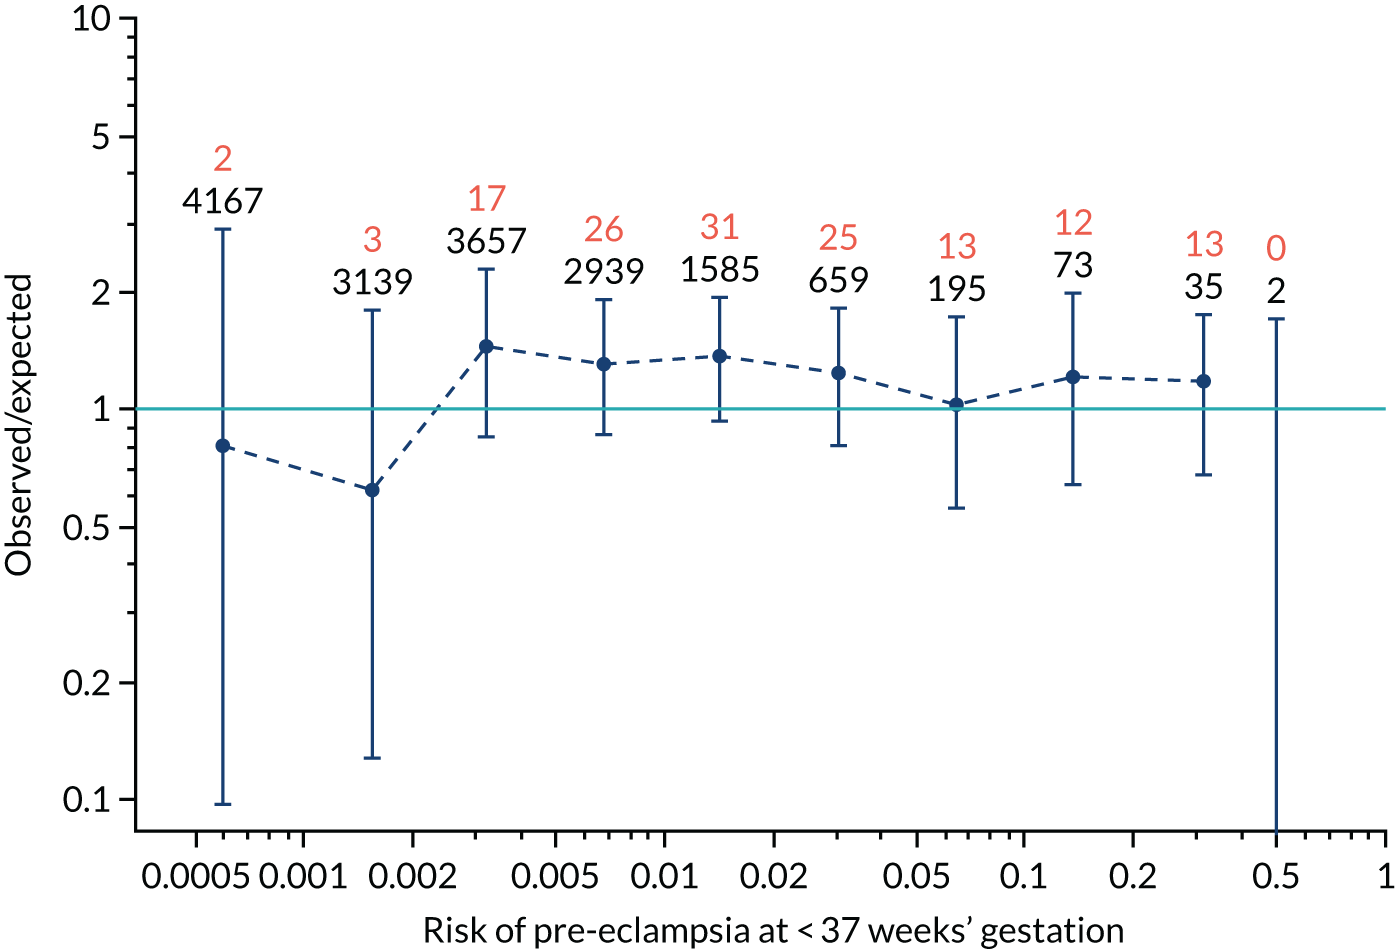
FIGURE 126.
The estimated incidence/mean risk within each bin for Mat-CHs, MAP and PAPP-A in predicting pre-eclampsia at < 37 weeks’ gestation.
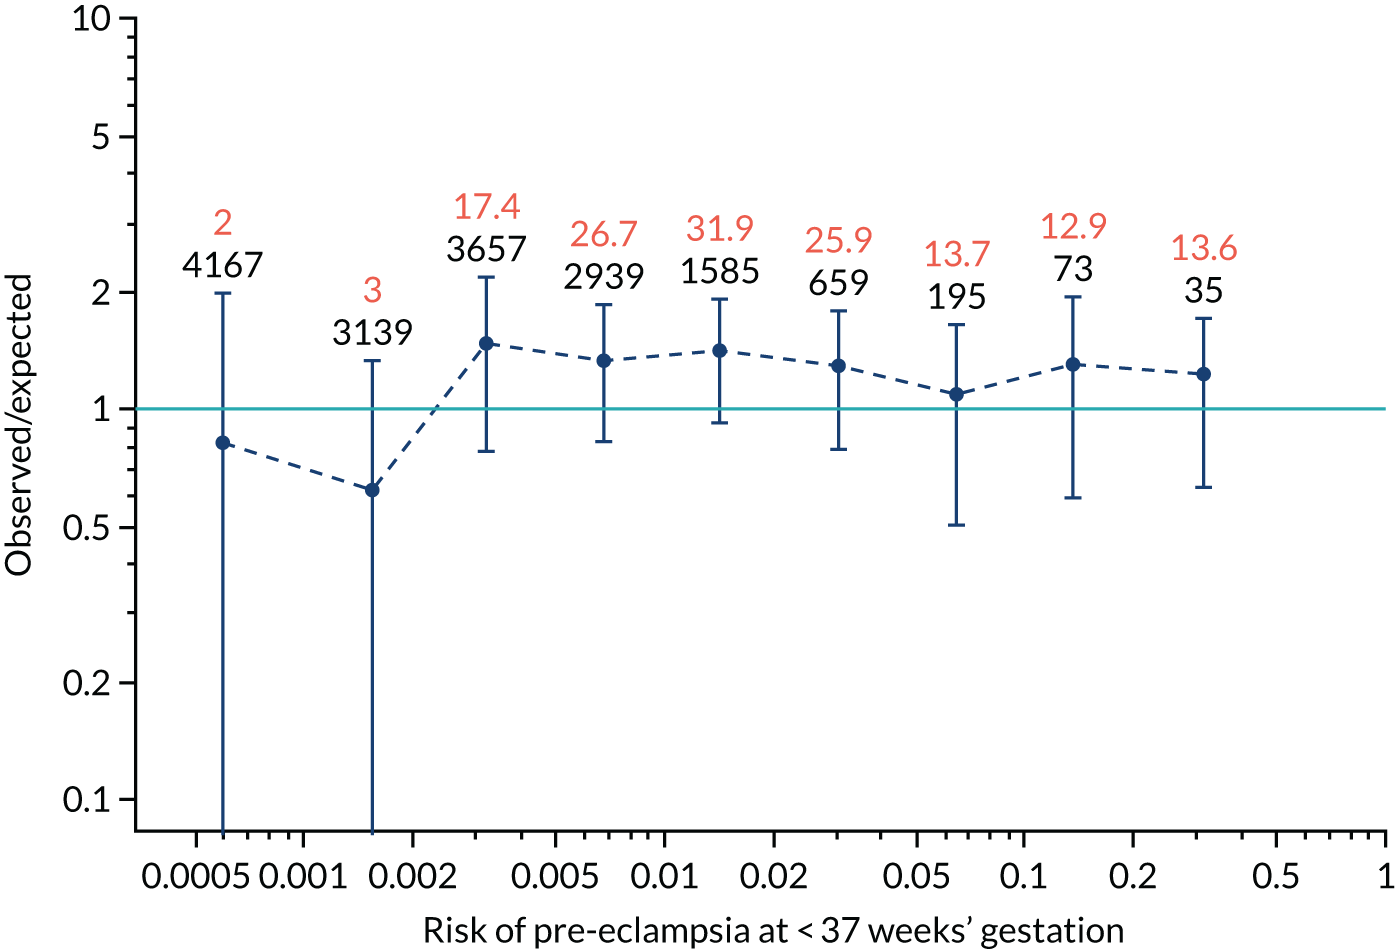
FIGURE 127.
The estimated incidence/mean risk within each bin for Mat-CHs, MAP and PAPP-A in predicting all pre-eclampsia.
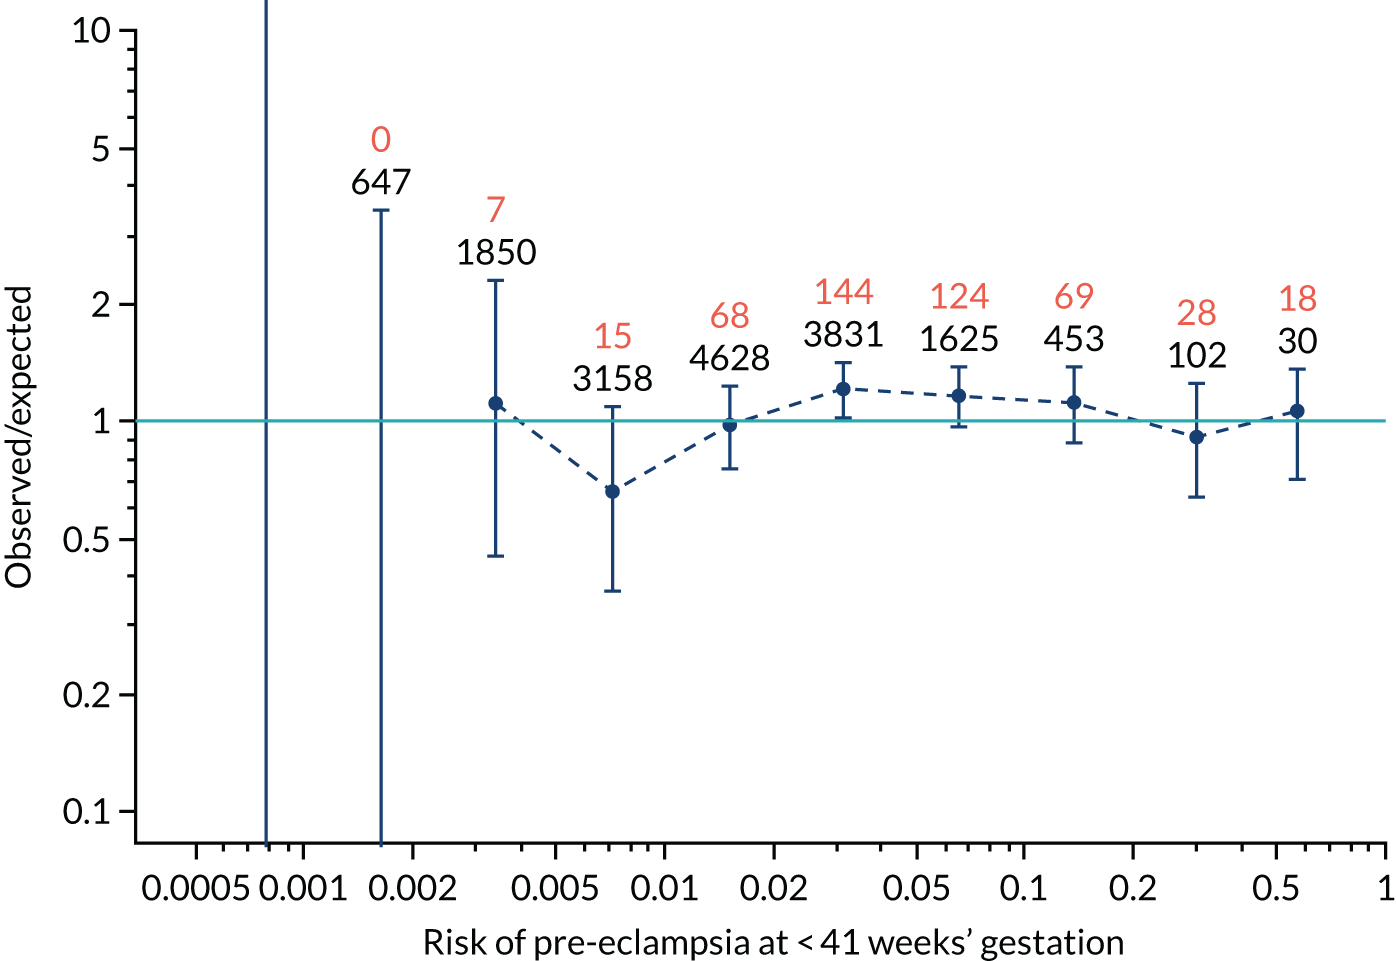
FIGURE 128.
The estimated incidence/mean risk within each bin for Mat-CHs, MAP and PAPP-A in predicting all pre-eclampsia.
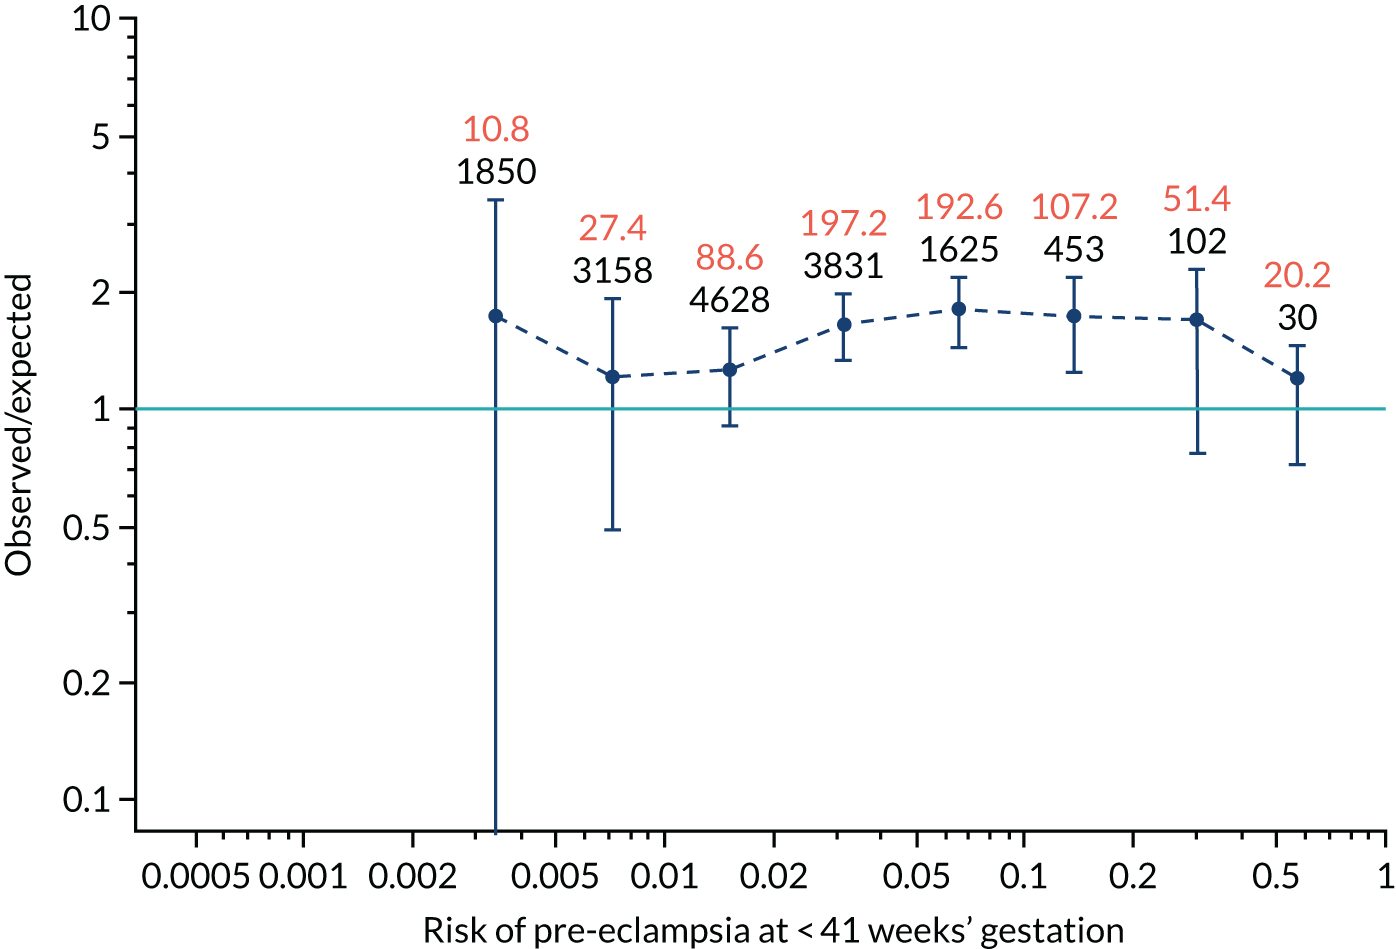
FIGURE 129.
The estimated incidence/mean risk within each bin for Mat-CHs, MAP and PLGF in predicting pre-eclampsia at < 34 weeks’ gestation.
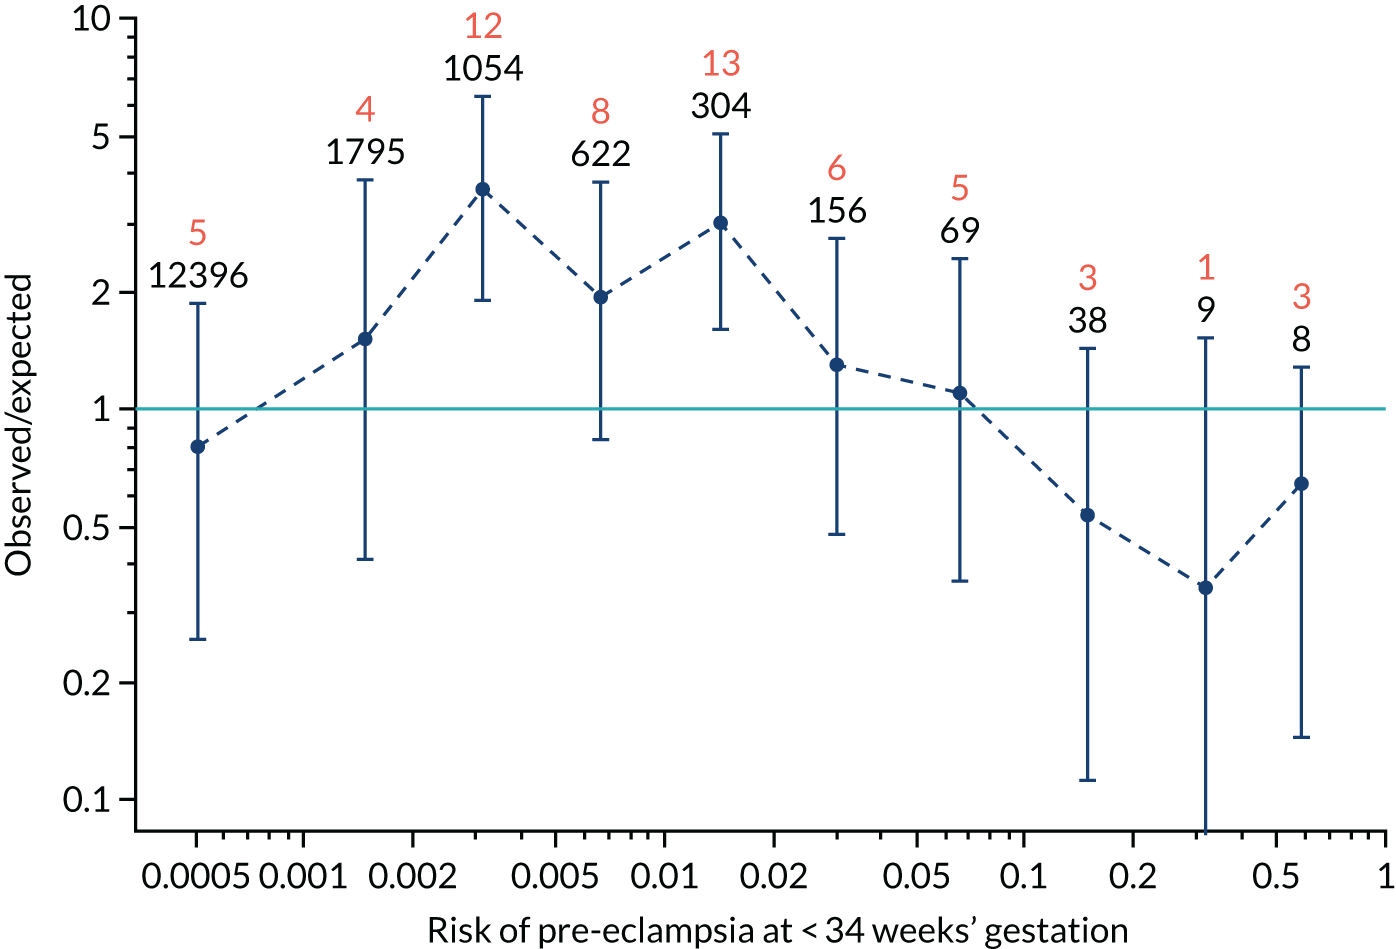
FIGURE 130.
The estimated incidence/mean risk within each bin for Mat-CHs, MAP and PLGF in predicting pre-eclampsia at < 34 weeks’ gestation.
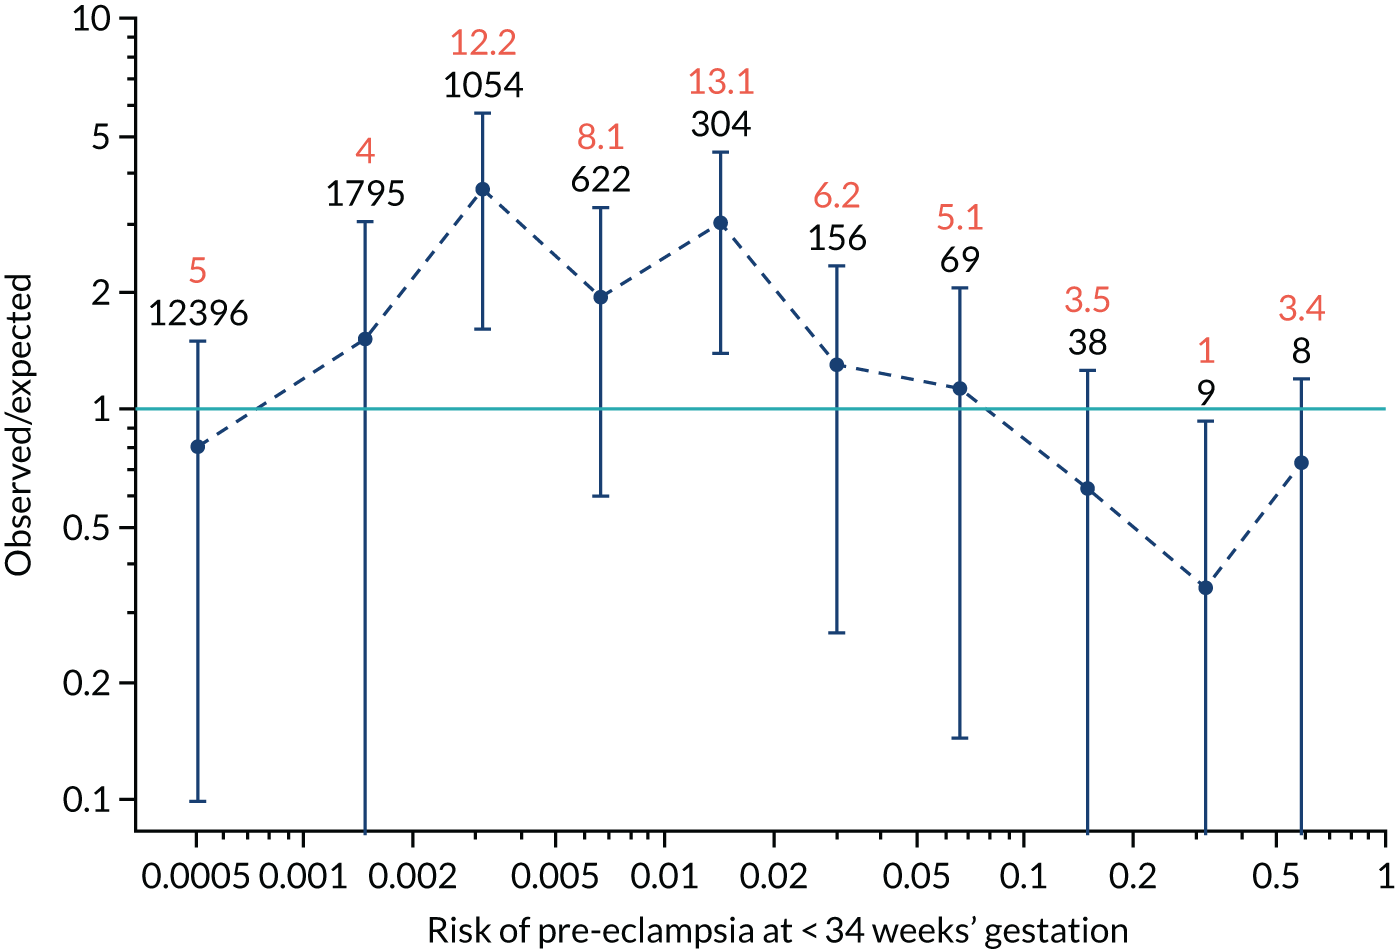
FIGURE 131.
The estimated incidence/mean risk within each bin for Mat-CHs, MAP and PLGF in predicting pre-eclampsia at < 37 weeks’ gestation.
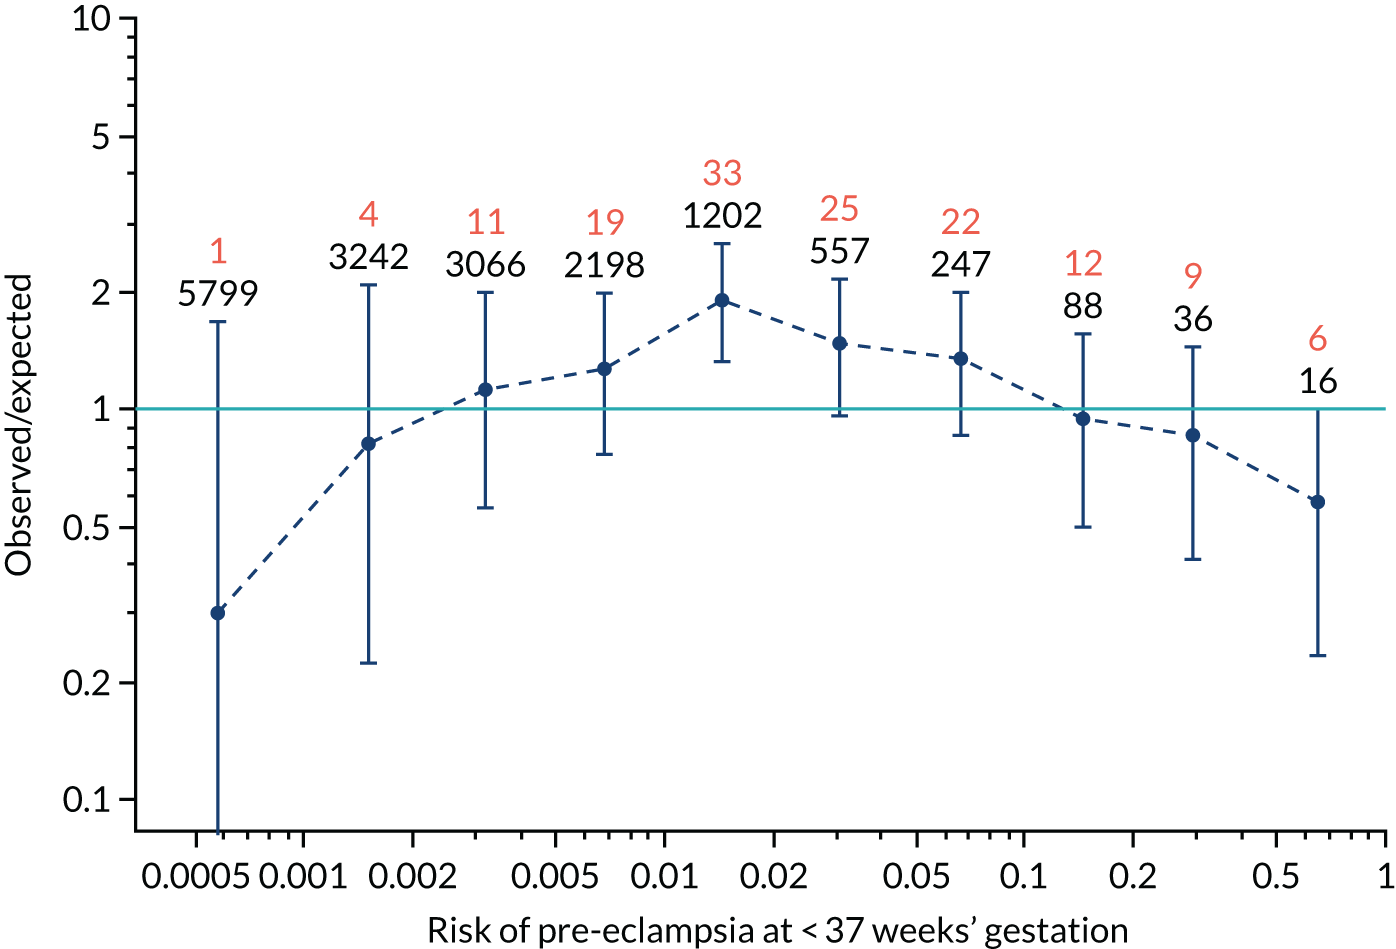
FIGURE 132.
The estimated incidence/mean risk within each bin for Mat-CHs, MAP and PLGF in predicting pre-eclampsia at < 37 weeks’ gestation.
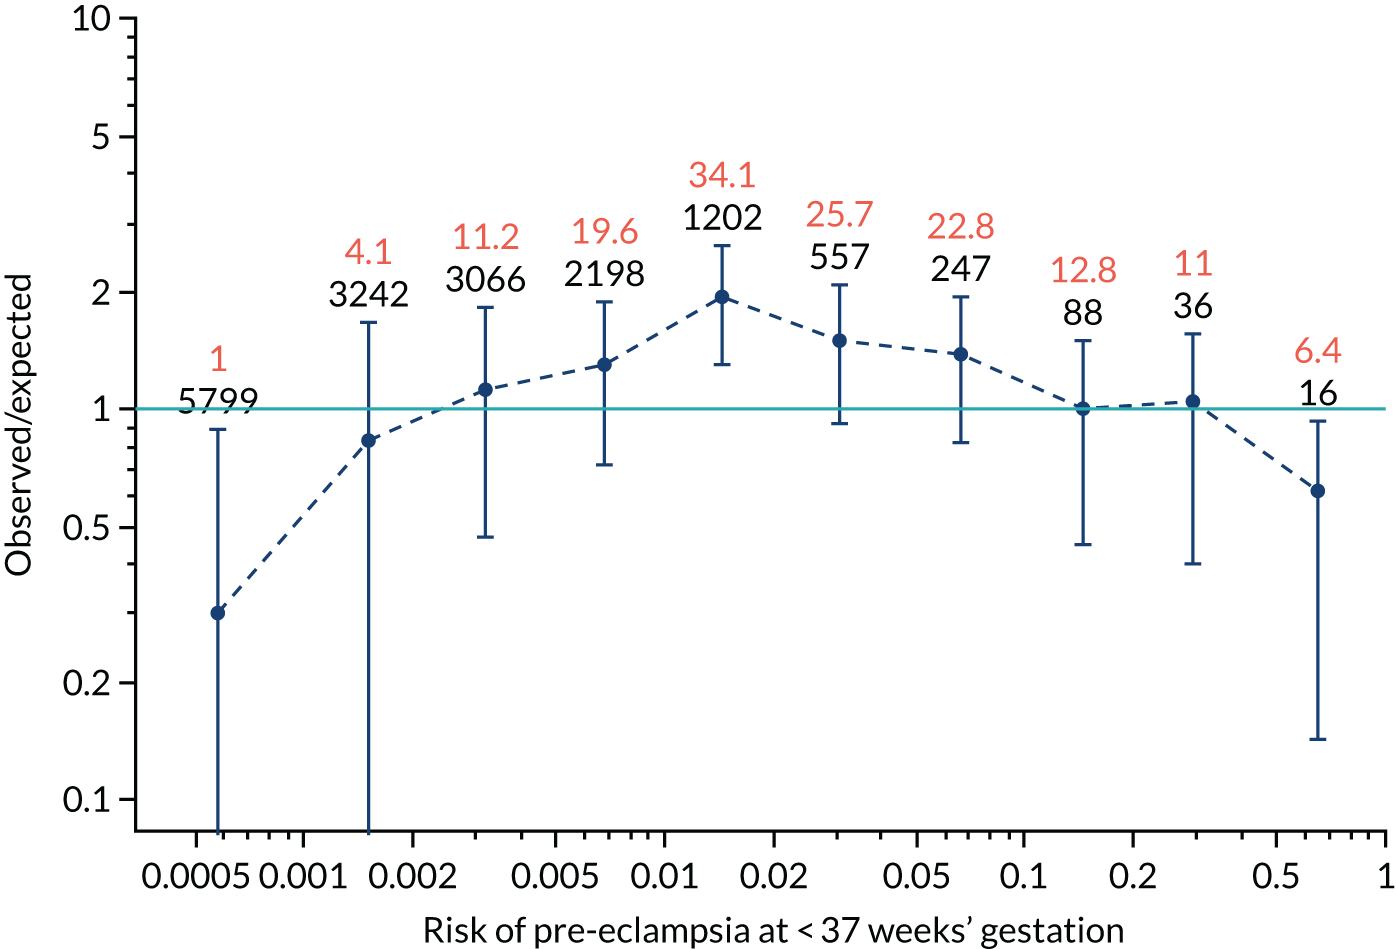
FIGURE 133.
The estimated incidence/mean risk within each bin for Mat-CHs, MAP and PLGF in predicting all pre-eclampsia.
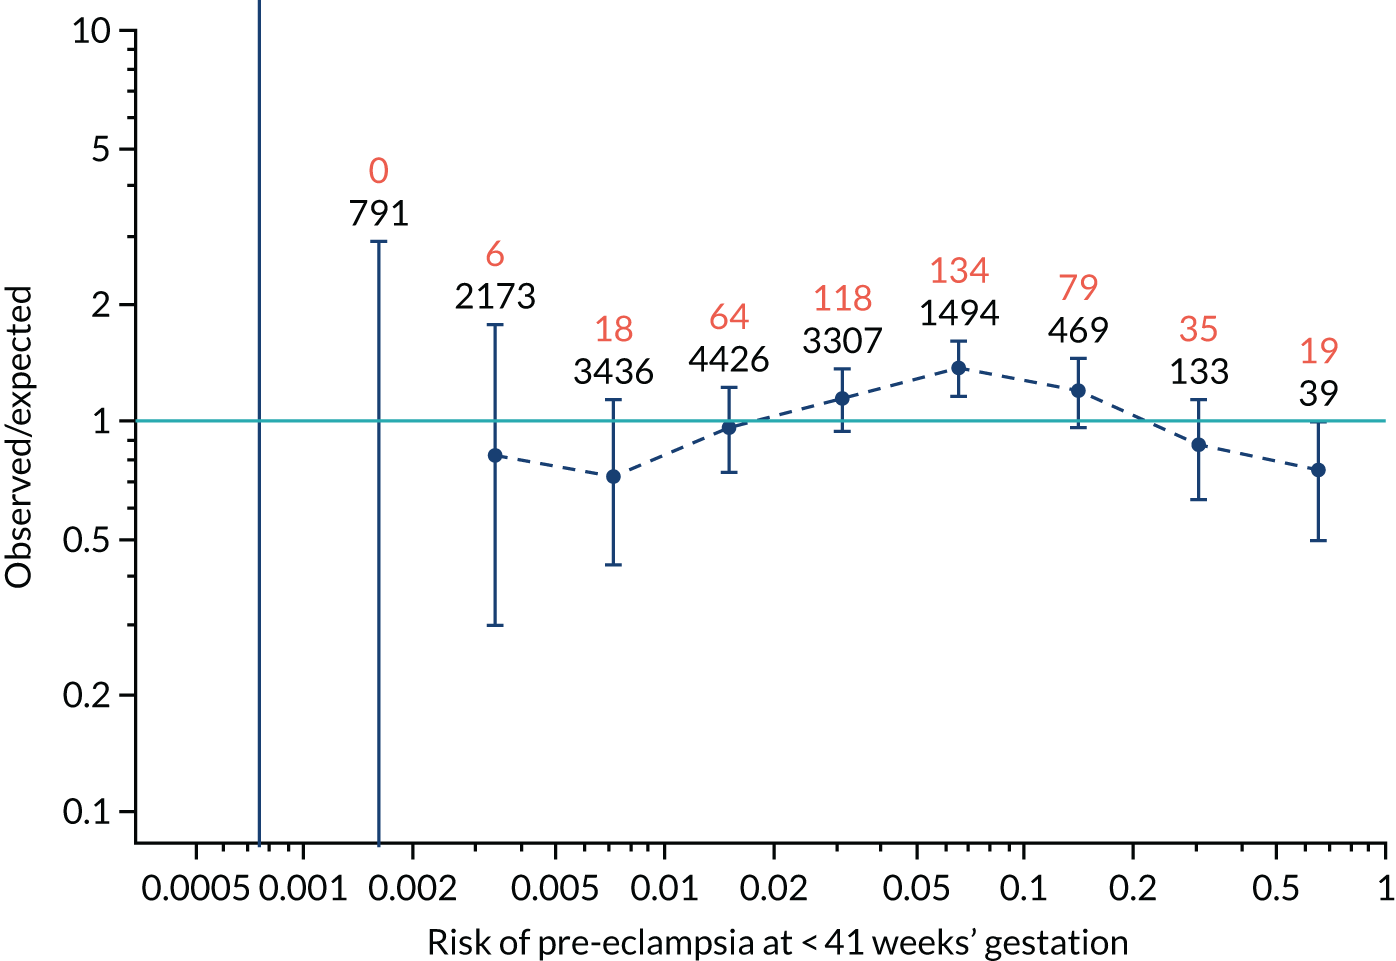
FIGURE 134.
The estimated incidence/mean risk within each bin for Mat-CHs, MAP and PLGF in predicting all pre-eclampsia.
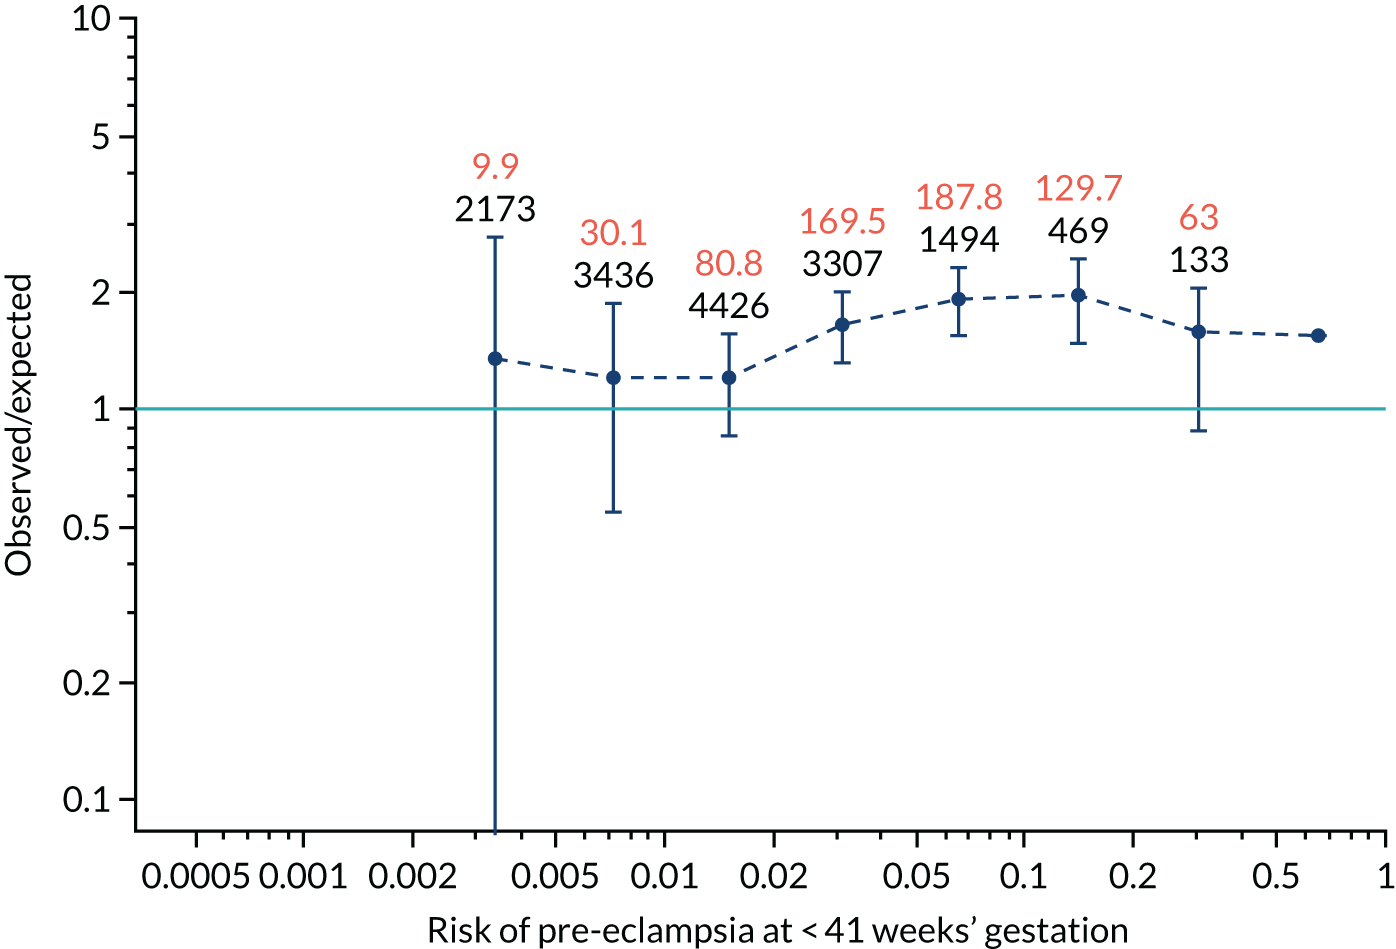
FIGURE 135.
The estimated incidence/mean risk within each bin for Mat-CHs, MAP, PLGF and UTA-PI in predicting pre-eclampsia at < 34 weeks’ gestation.
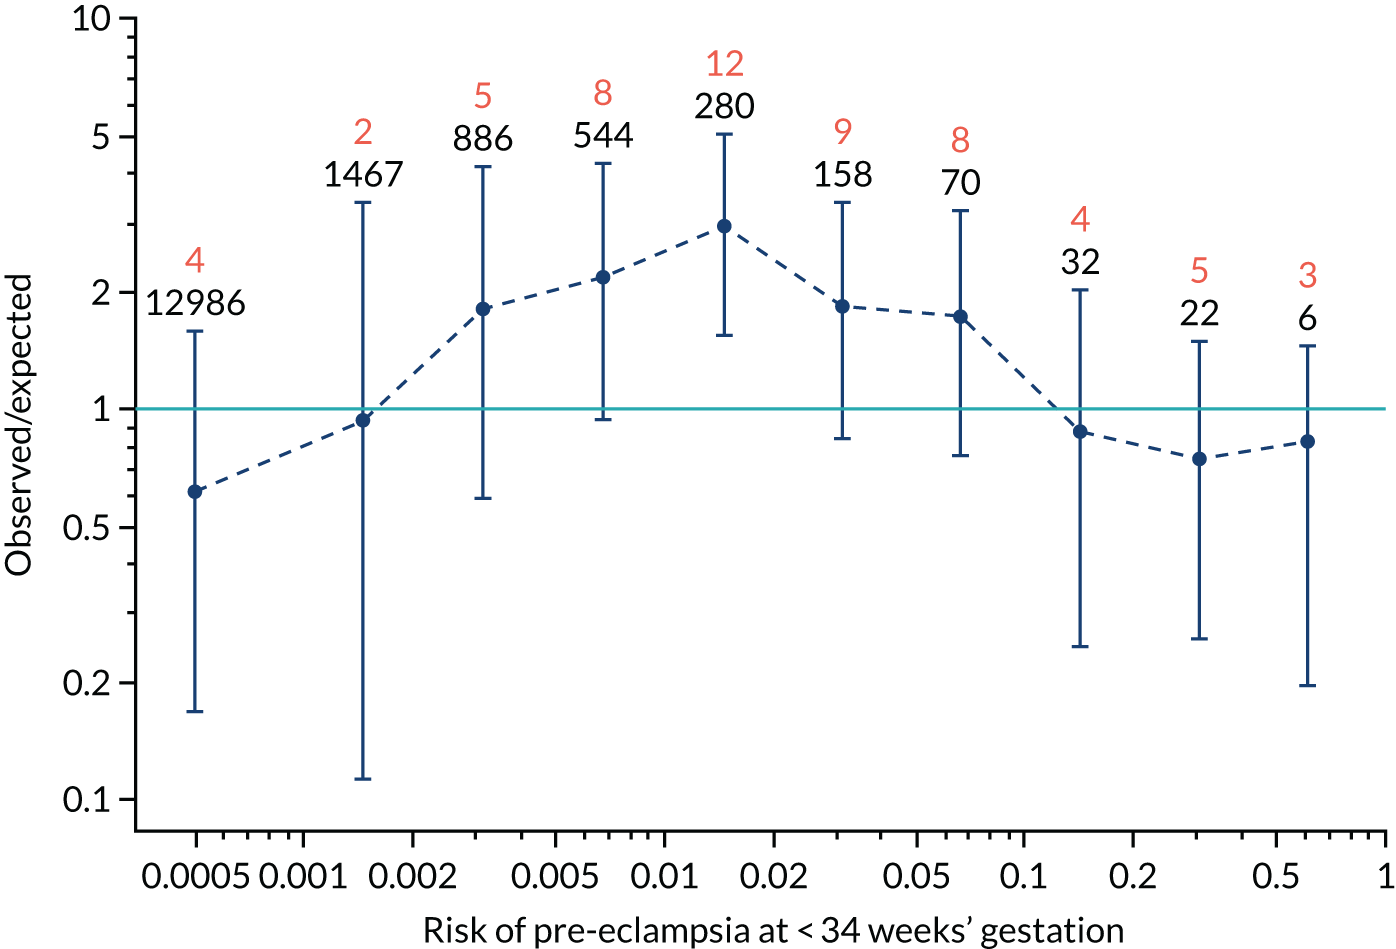
FIGURE 136.
The estimated incidence/mean risk within each bin for Mat-CHs, MAP, PLGF and UTA-PI in predicting pre-eclampsia at < 34 weeks’ gestation.
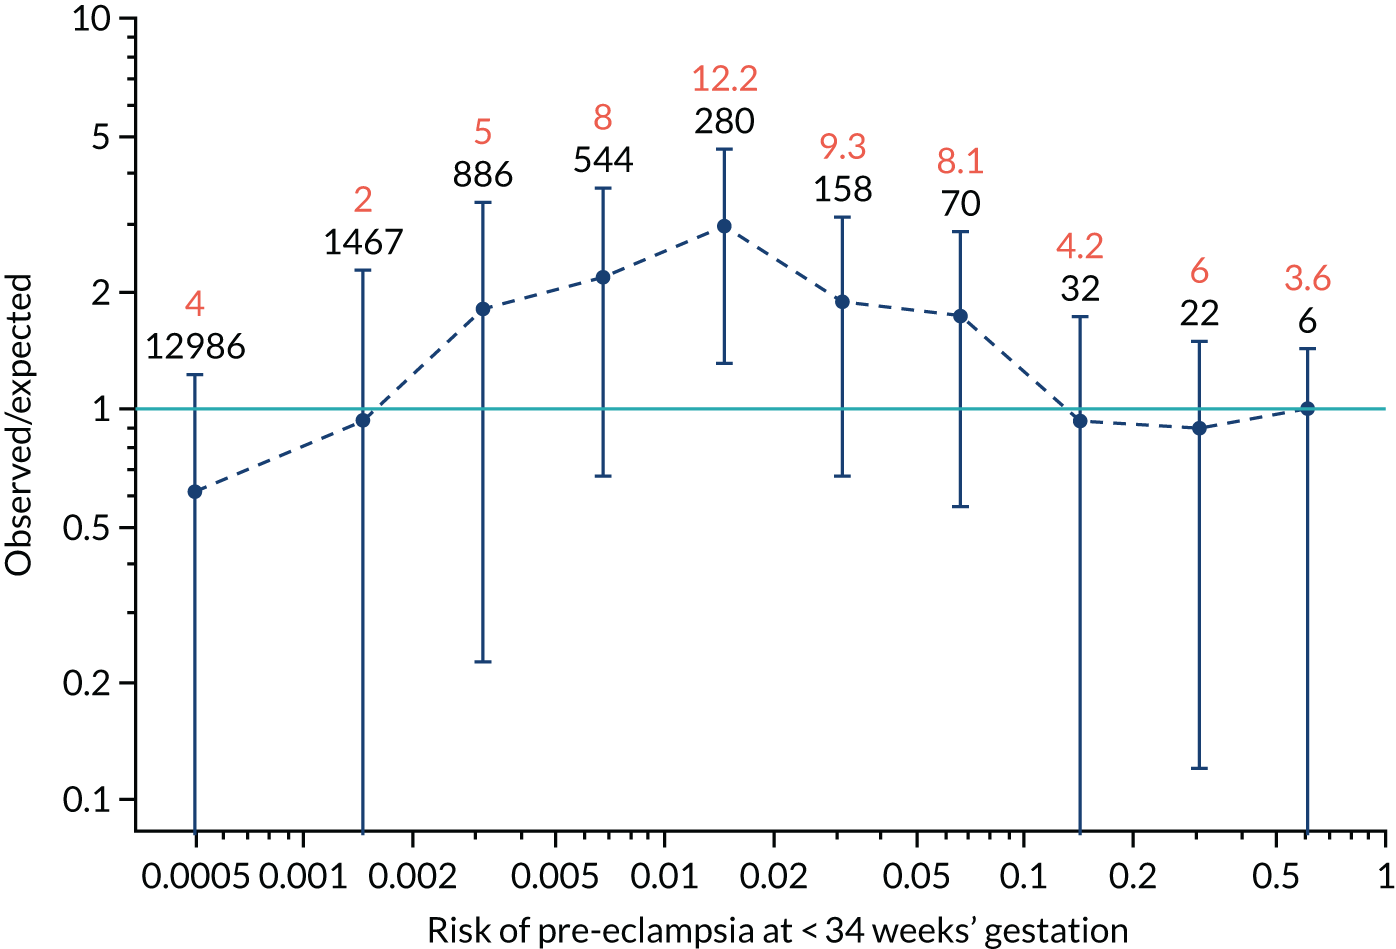
FIGURE 137.
The estimated incidence/mean risk within each bin for Mat-CHs, MAP, PLGF and UTA-PI in predicting pre-eclampsia at < 37 weeks’ gestation.
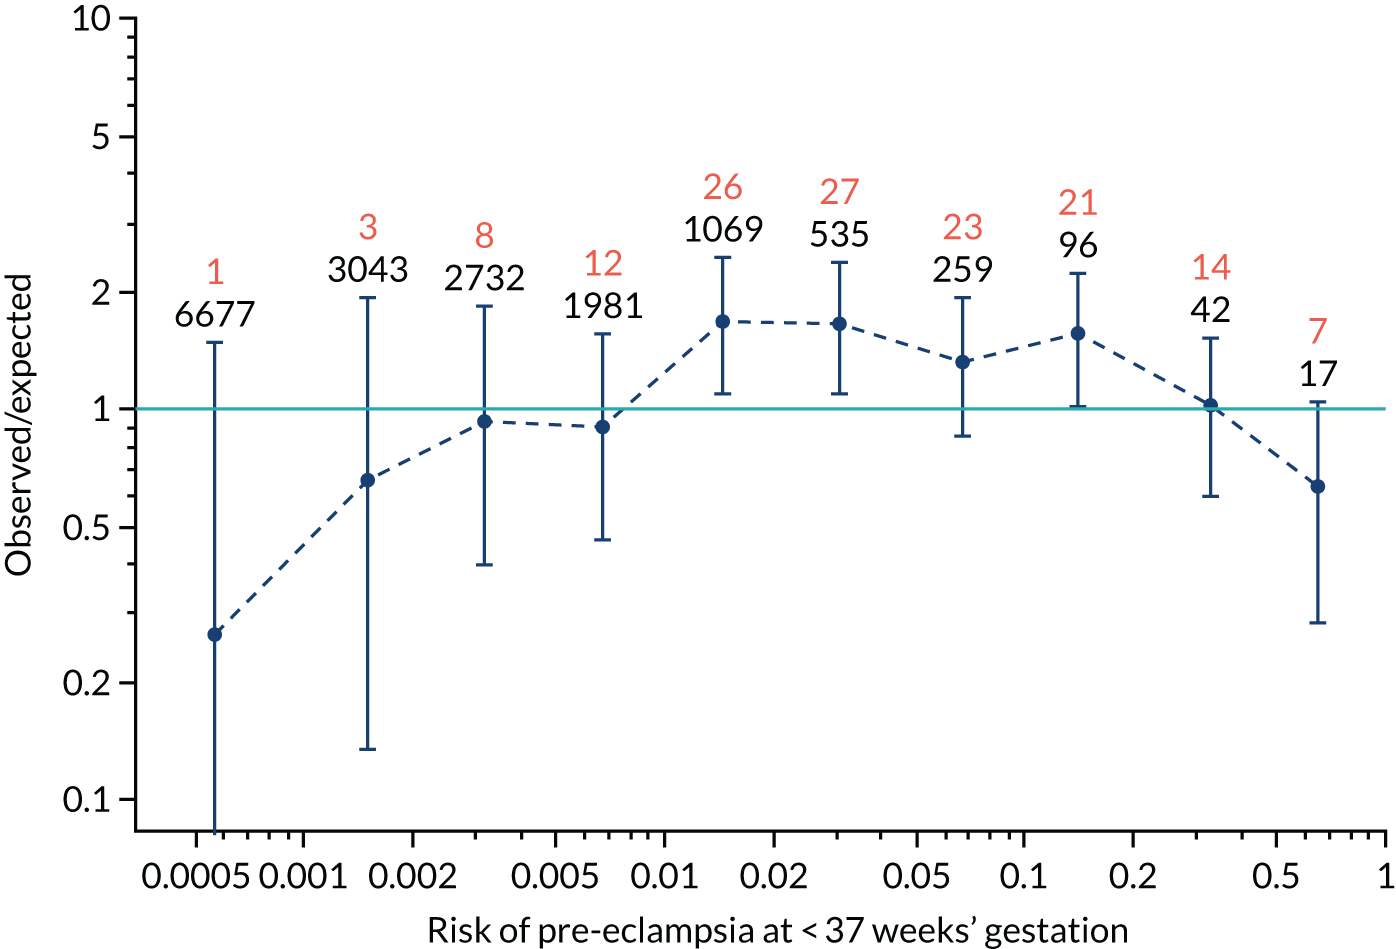
FIGURE 138.
The estimated incidence/mean risk within each bin for Mat-CHs, MAP, PLGF and UTA-PI in predicting pre-eclampsia at < 37 weeks’ gestation.
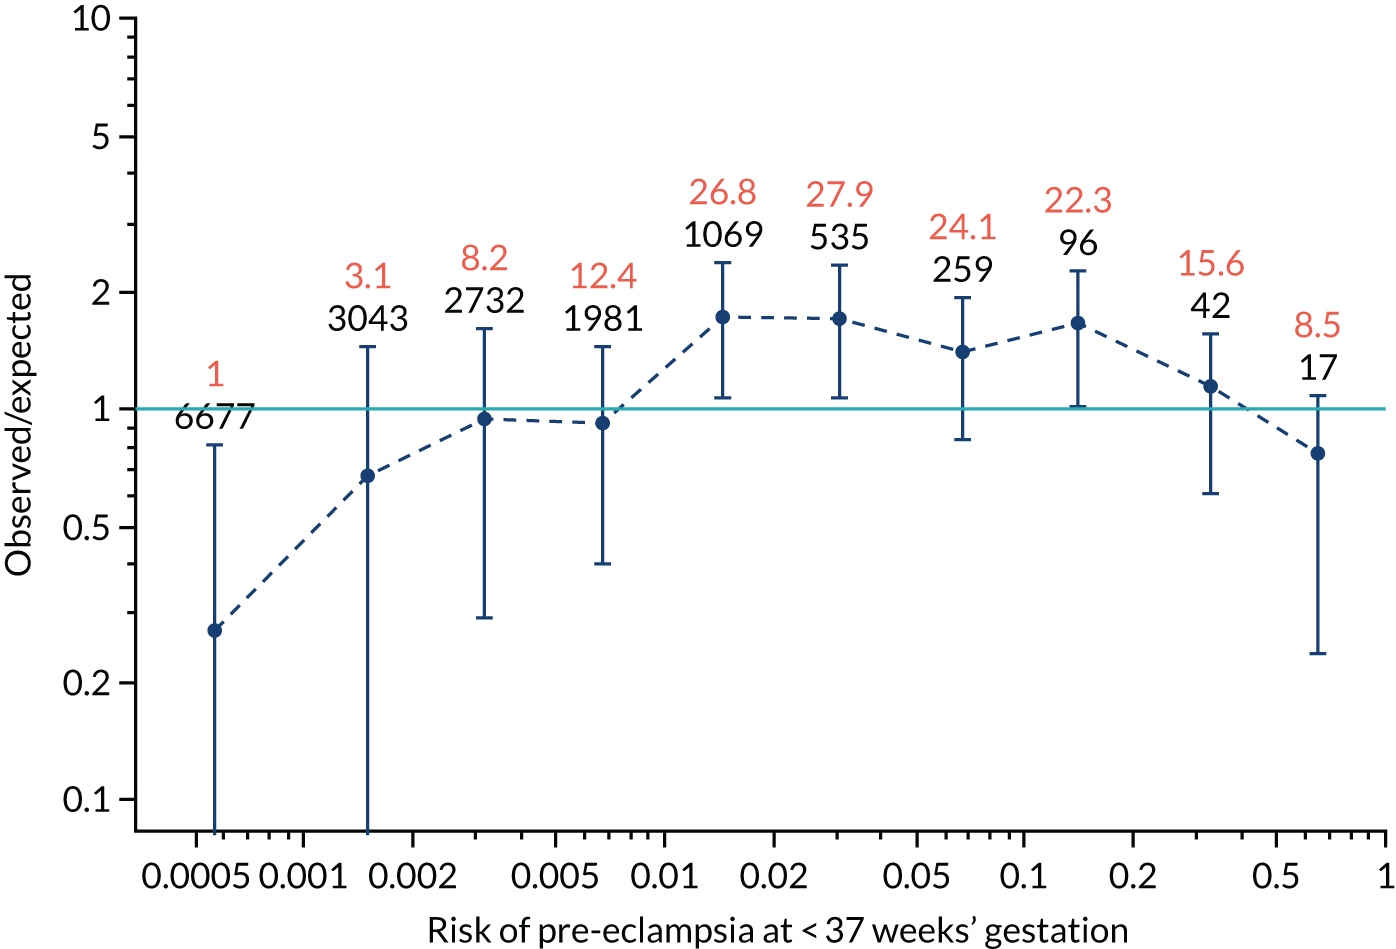
FIGURE 139.
The estimated incidence/mean risk within each bin for Mat-CHs, MAP, PLGF and UTA-PI in predicting all pre-eclampsia.
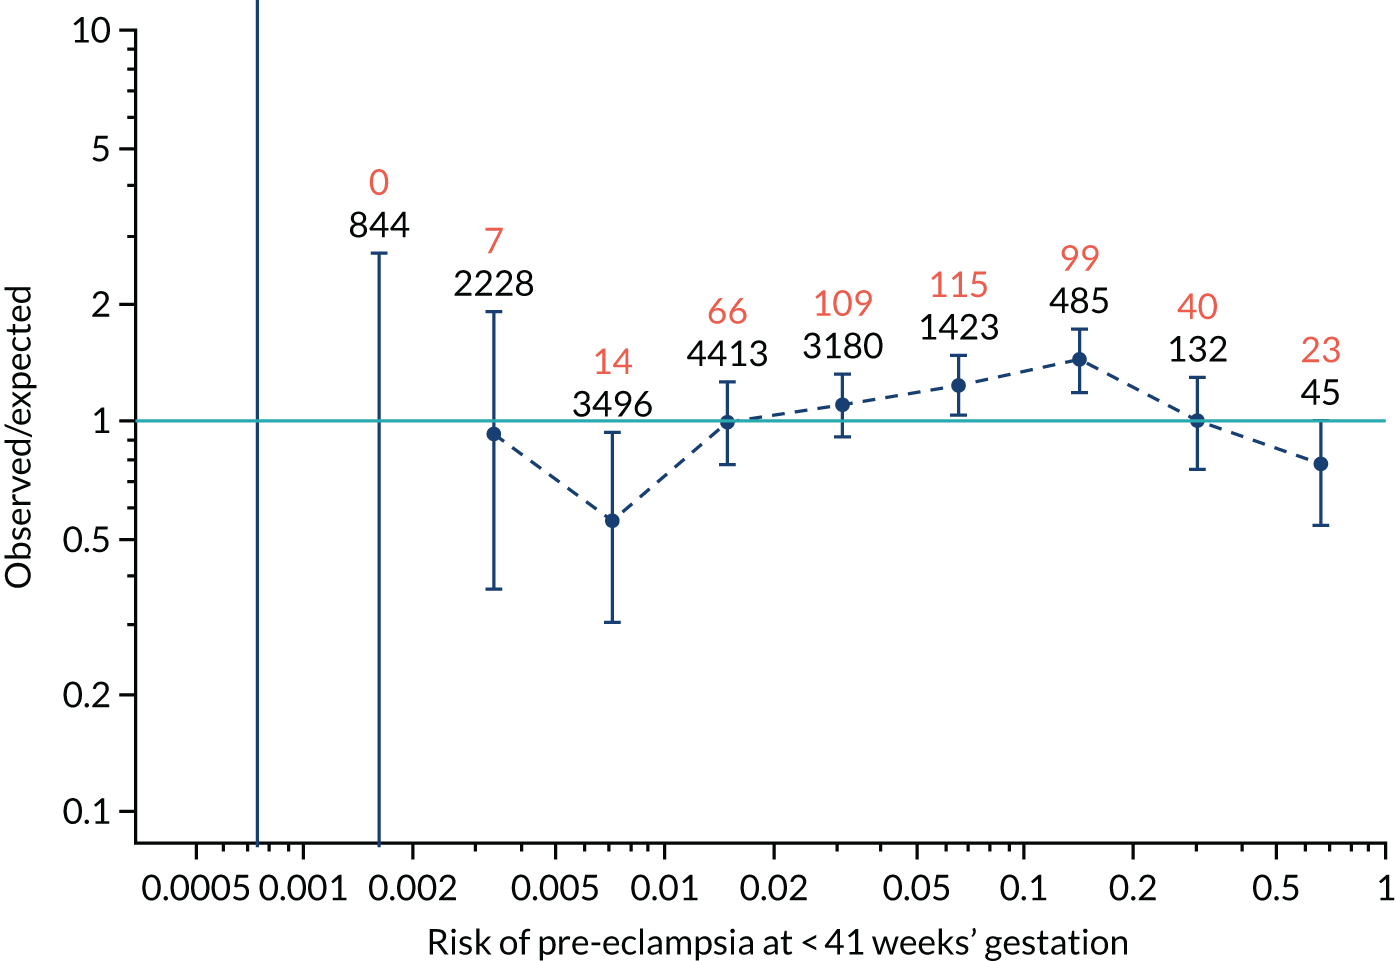
FIGURE 140.
The estimated incidence/mean risk within each bin for Mat-CHs, MAP, PLGF and UTA-PI in predicting all pre-eclampsia.
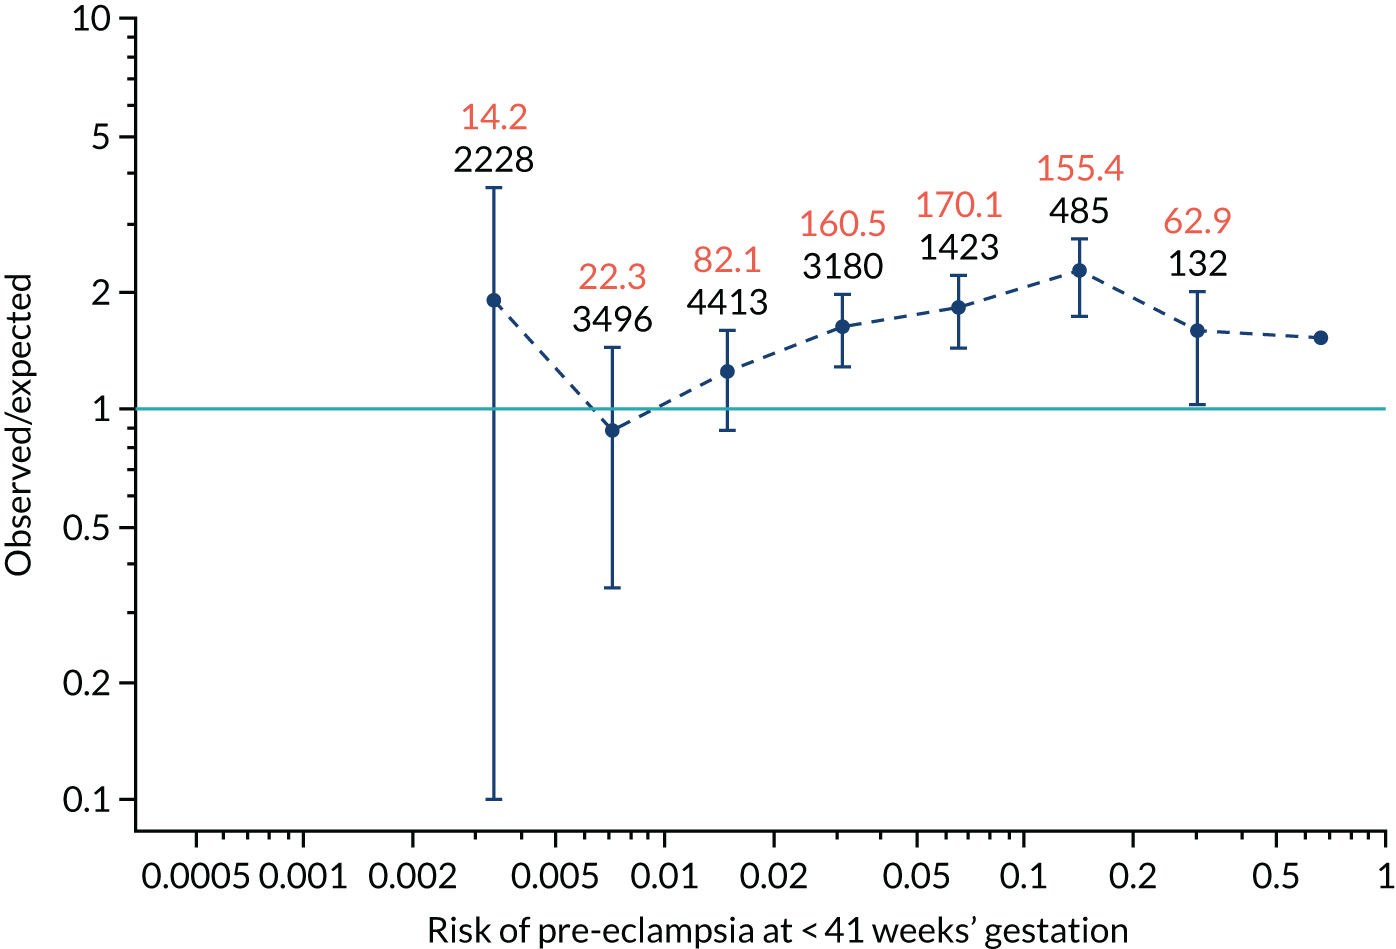
Calibration plots are shown for incidence without and with adjustment for censoring. For the plots without censoring, the calibration-in-the-large intercept and slope are shown with 95% CIs.
Appendix 6 The SPREE study decision curves
In Figures 141–152, the dark blue lines are for prediction of pre-eclampsia before 34 weeks’ gestation, before 37 weeks’ gestation and at any gestational age using the competing risk with different combinations of markers. The light blue curve is the decision curve for the policy of screening everyone positive. The orange line is the decision curve for screening everyone negative. In general, the decision curves for the combined test are superior to the policies of screening everyone positive or screening everyone negative for the range of threshold probabilities that would seem reasonable.
FIGURE 141.
Decision curve for Mat-CHs in predicting pre-eclampsia at < 34 weeks’ gestation.
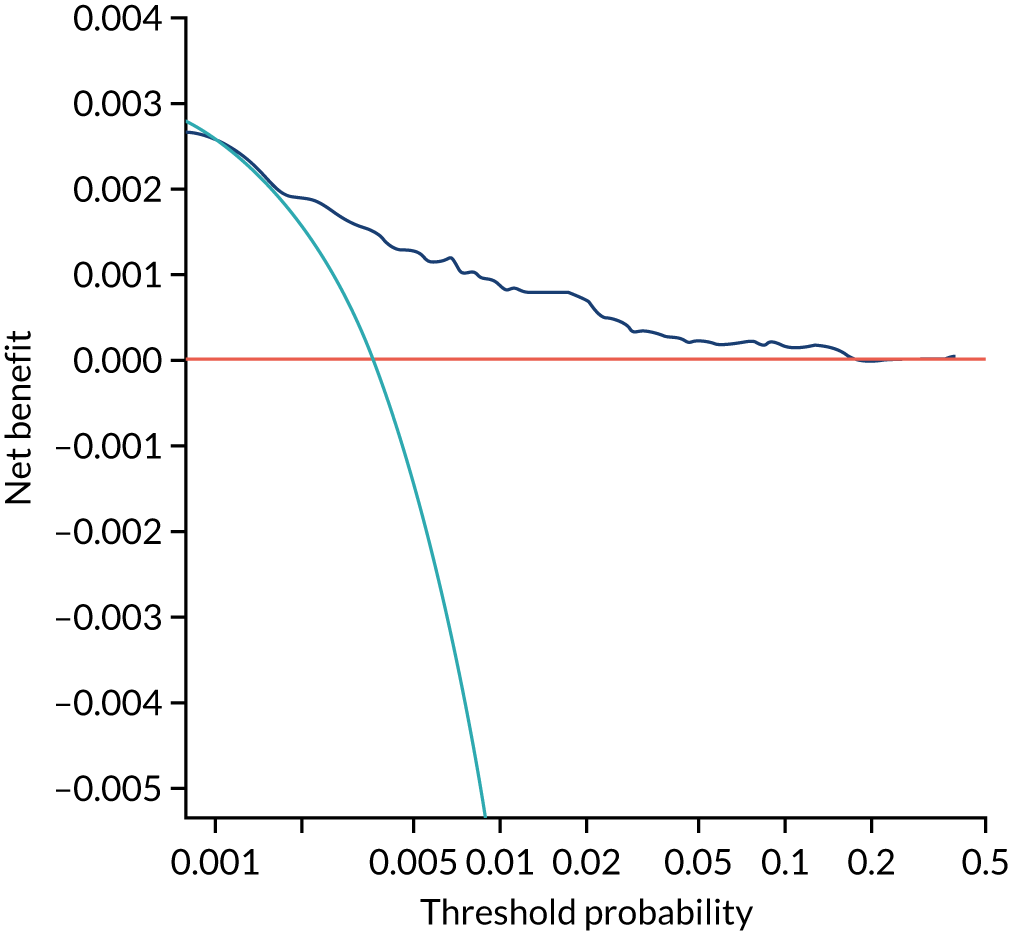
FIGURE 142.
Decision curve for Mat-CHs in predicting pre-eclampsia at < 37 weeks’ gestation.
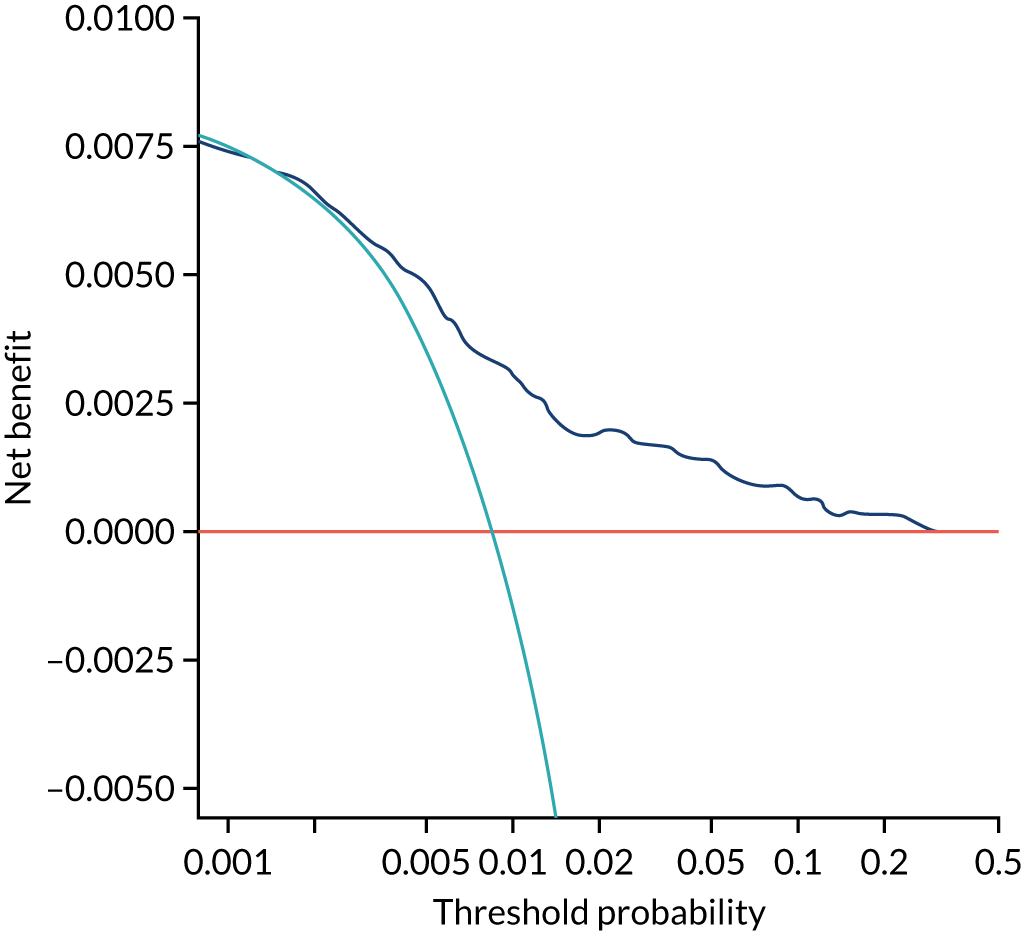
FIGURE 143.
Decision curve for Mat-CHs in predicting all pre-eclampsia.
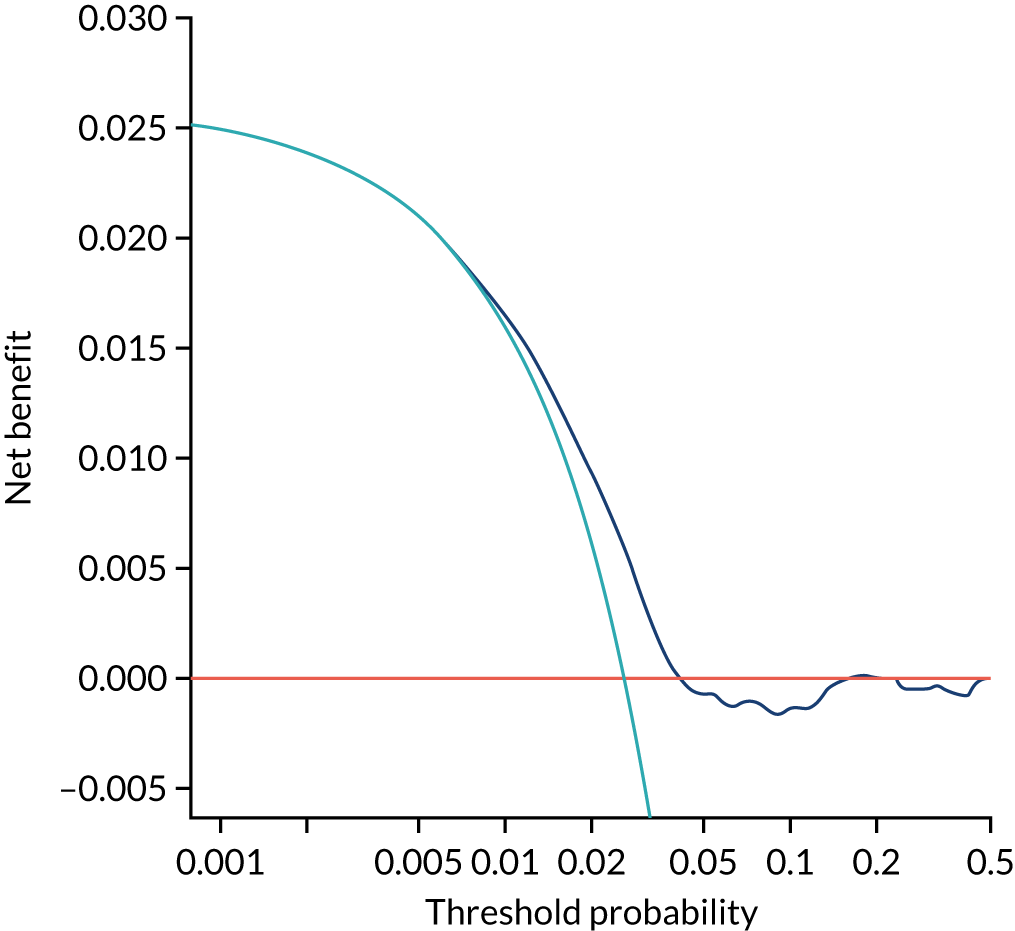
FIGURE 144.
Decision curve for Mat-CHs and MAP in predicting pre-eclampsia at < 34 weeks’ gestation.
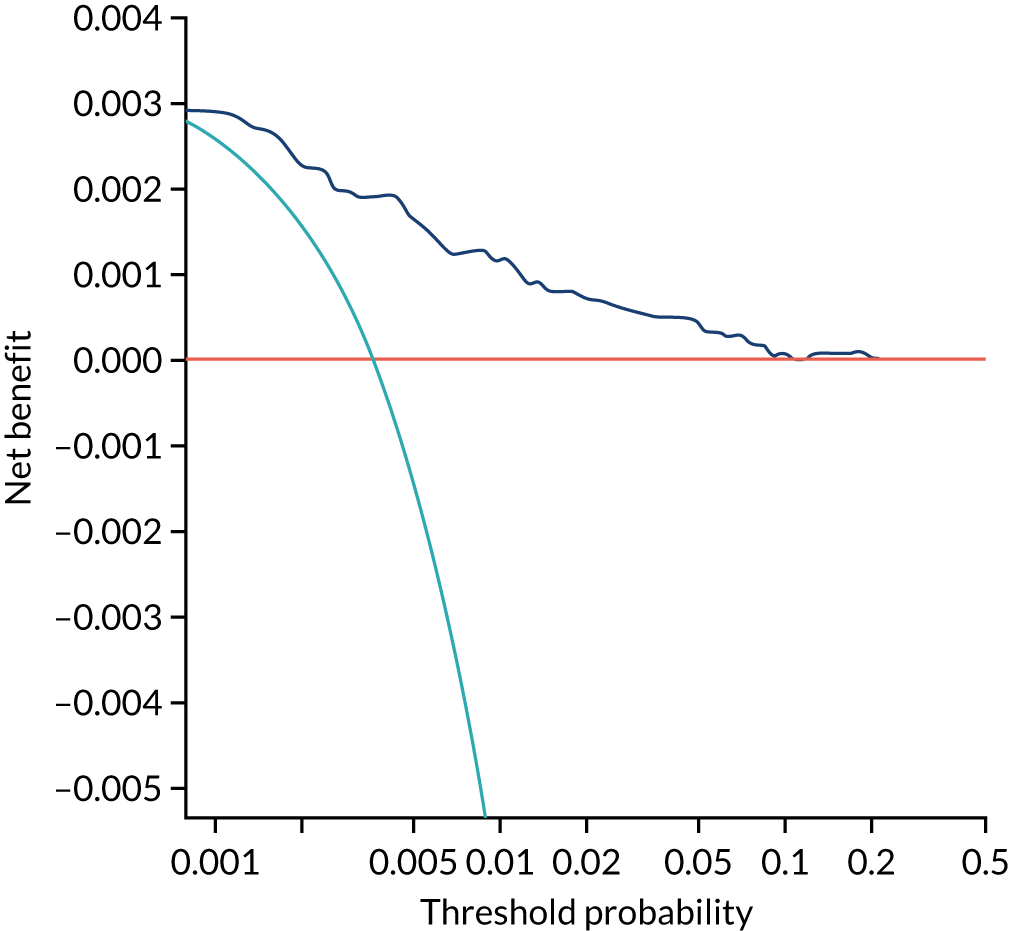
FIGURE 145.
Decision curve for Mat-CHs and MAP in predicting pre-eclampsia at < 37 weeks’ gestation.
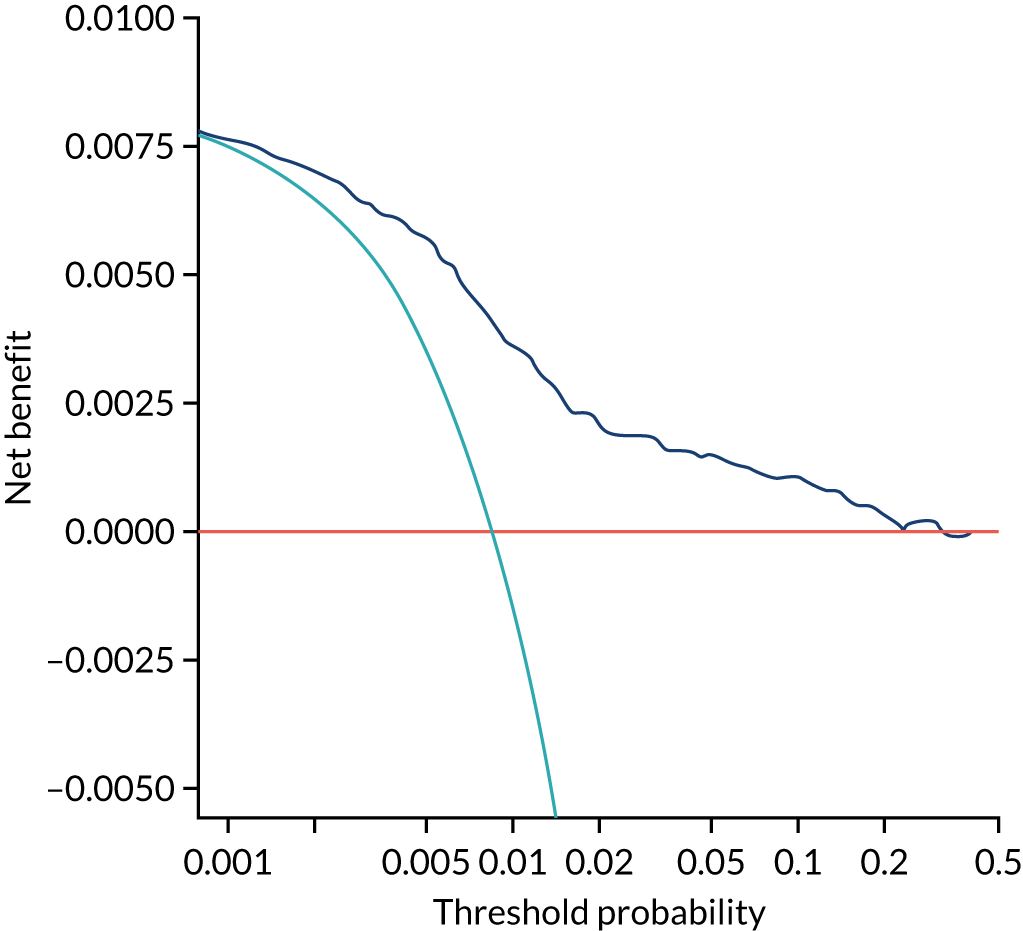
FIGURE 146.
Decision curve for Mat-CHs and MAP in predicting all pre-eclampsia.
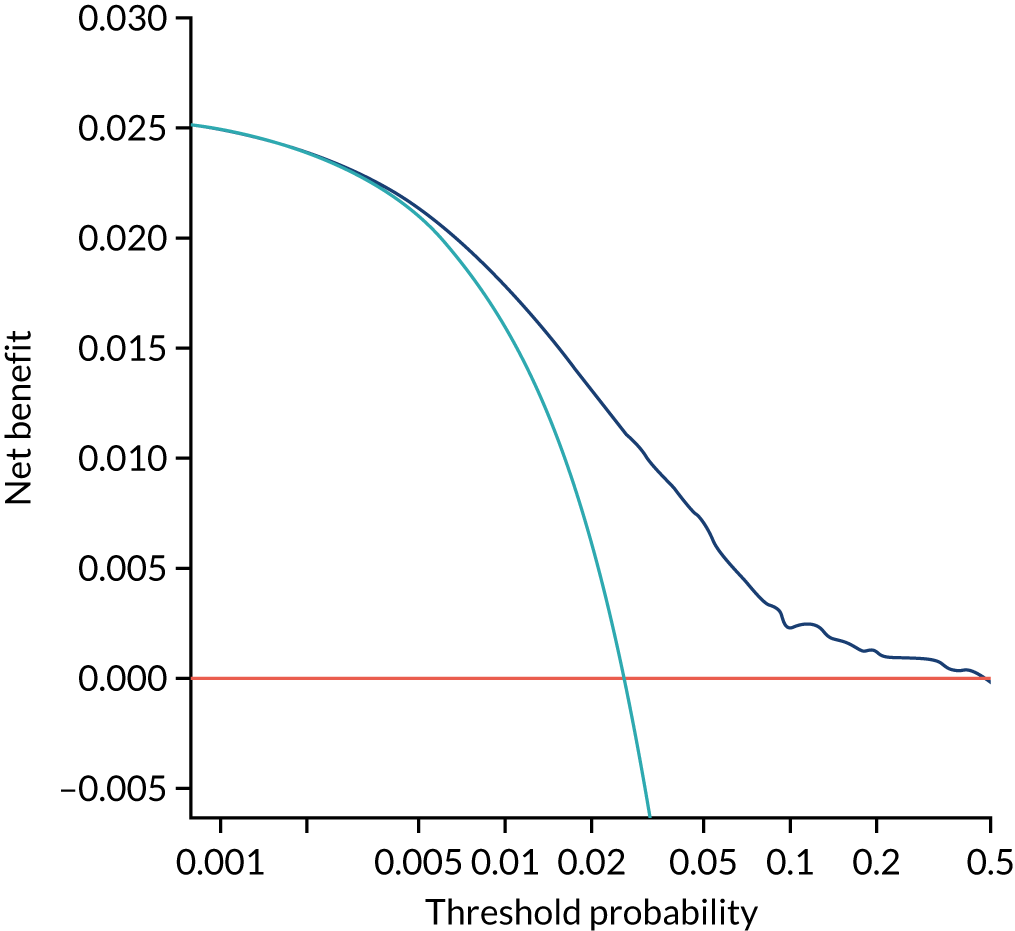
FIGURE 147.
Decision curve for Mat-CHs and UTA-PI in predicting pre-eclampsia at < 34 weeks’ gestation.
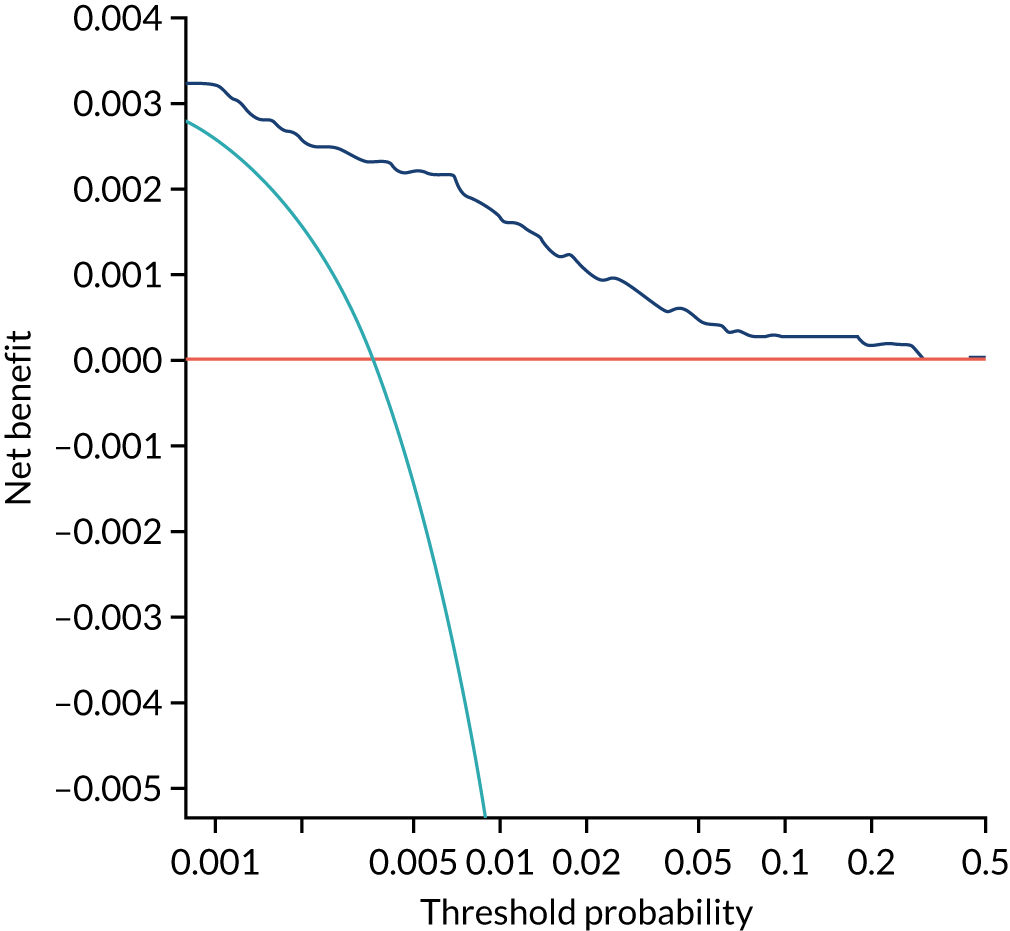
FIGURE 148.
Decision curve for Mat-CHs and UTA-PI in predicting pre-eclampsia at < 37 weeks’ gestation.
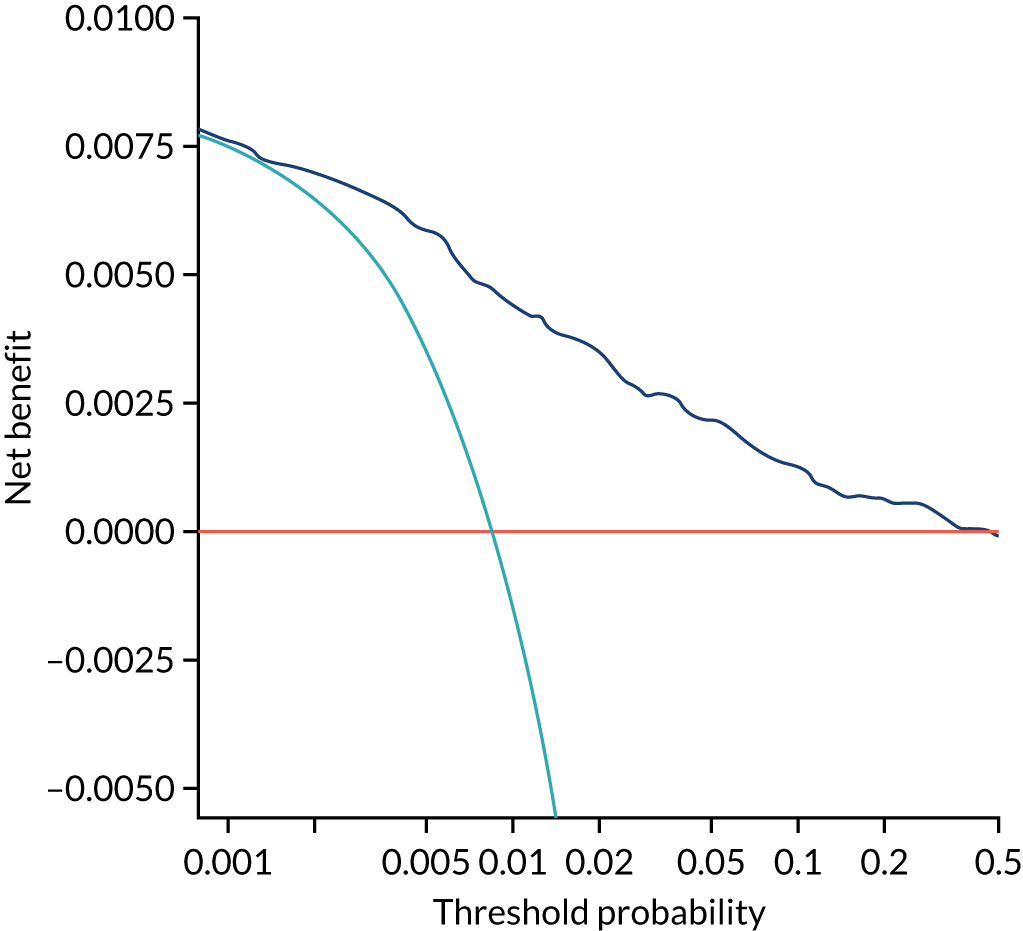
FIGURE 149.
Decision curve for Mat-CHs and UTA-PI in predicting all pre-eclampsia.
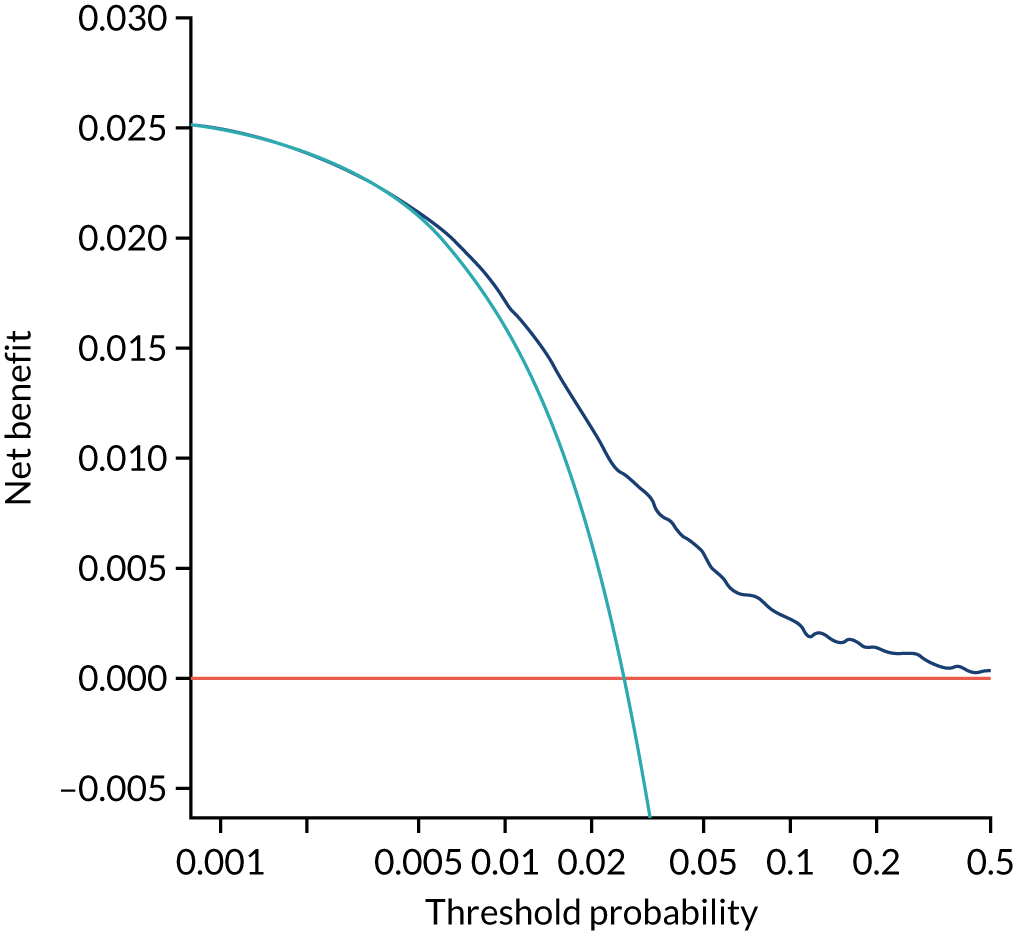
FIGURE 150.
Decision curve for Mat-CHs, MAP, PLGF and UTA-PI in predicting pre-eclampsia at < 34 weeks’ gestation.
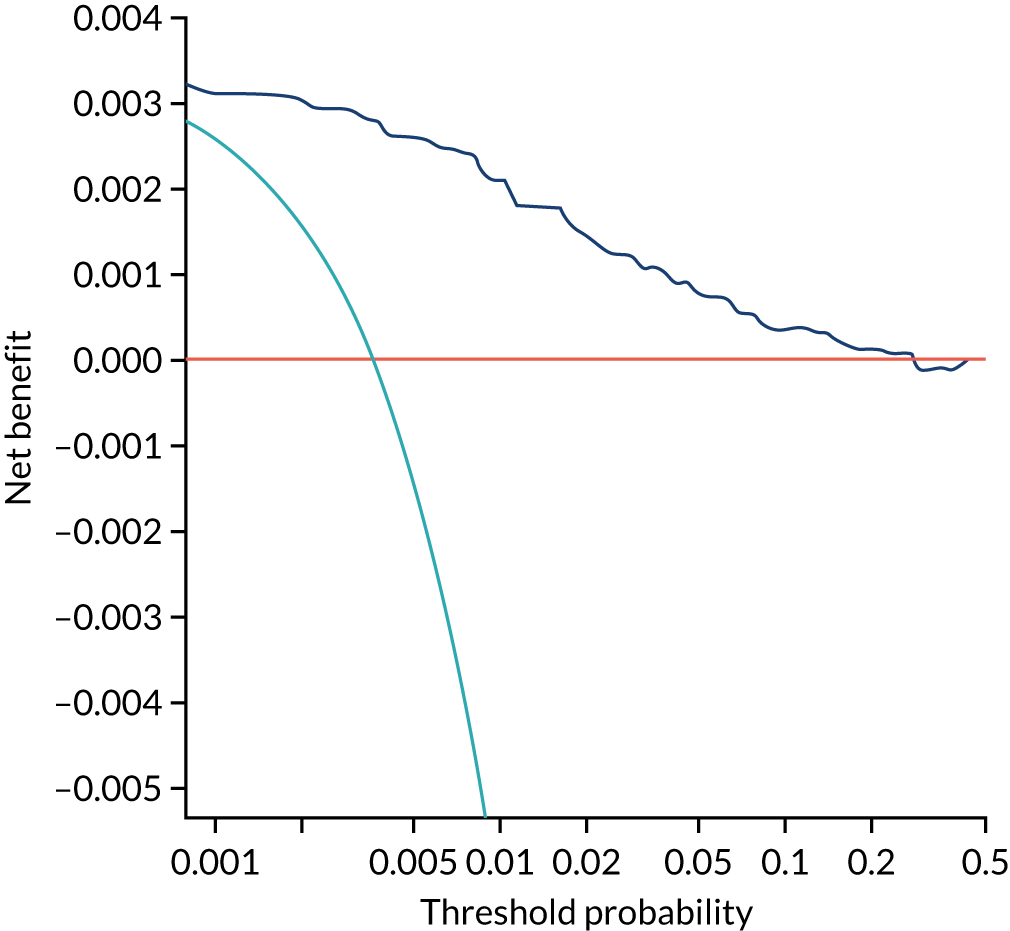
FIGURE 151.
Decision curve for Mat-CHs, MAP, PLGF and UTA-PI in predicting pre-eclampsia at < 37 weeks’ gestation.
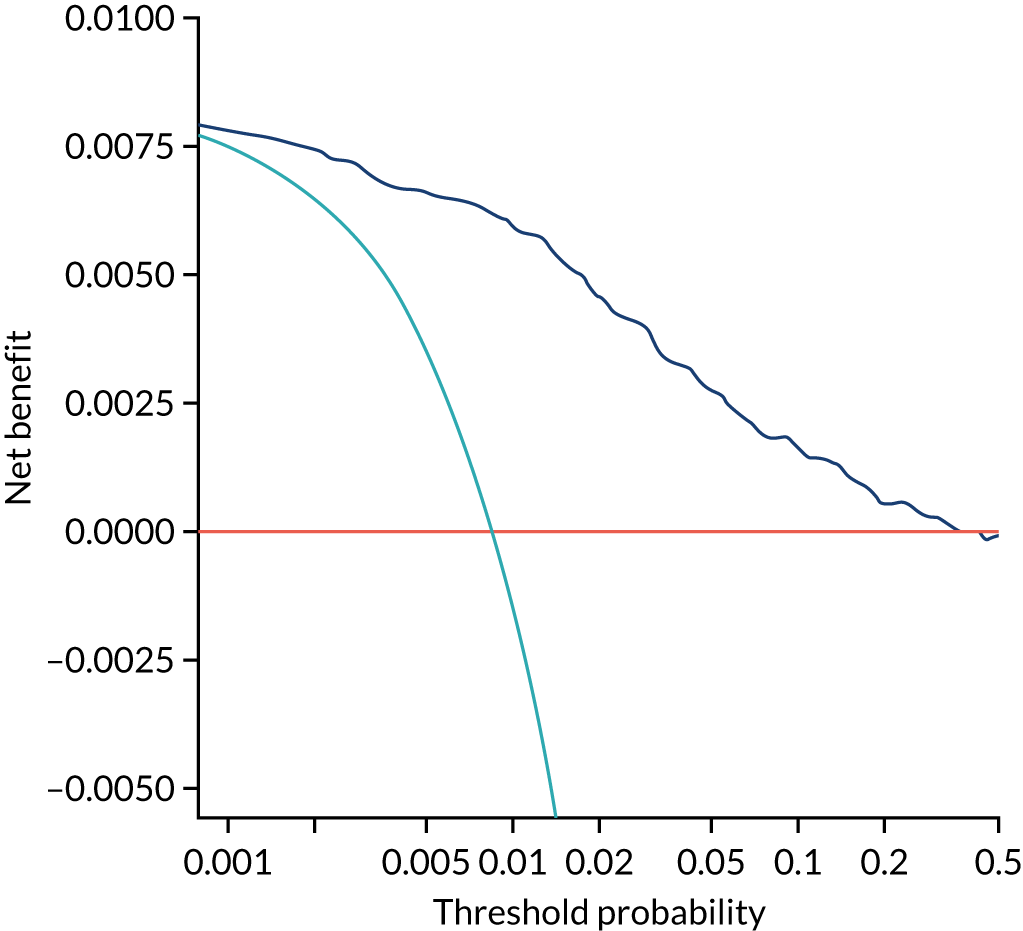
FIGURE 152.
Decision curve for Mat-CHs, MAP, PLGF and UTA-PI in predicting all pre-eclampsia.
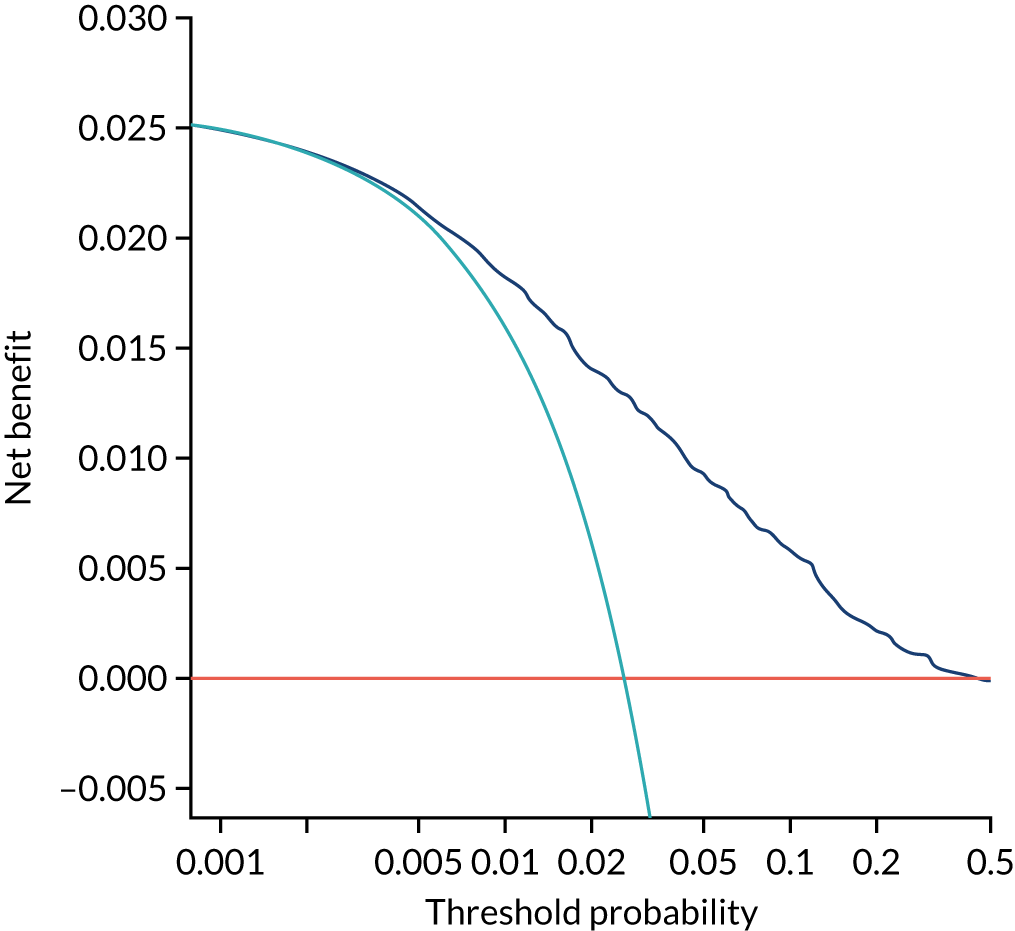
Appendix 7 Performance of screening for preterm pre-eclampsia by the competing risk model in three data sets
In Figures 153–161, the orange line is for the population used for development of the algorithm (AJOG),19 the dark blue line is for the SPREE study,50 the light blue line is for ASPRE SQS47 and the grey line is for the combined data from the three data sets.
FIGURE 153.
Performance of screening for preterm pre-eclampsia by Mat-CHs.
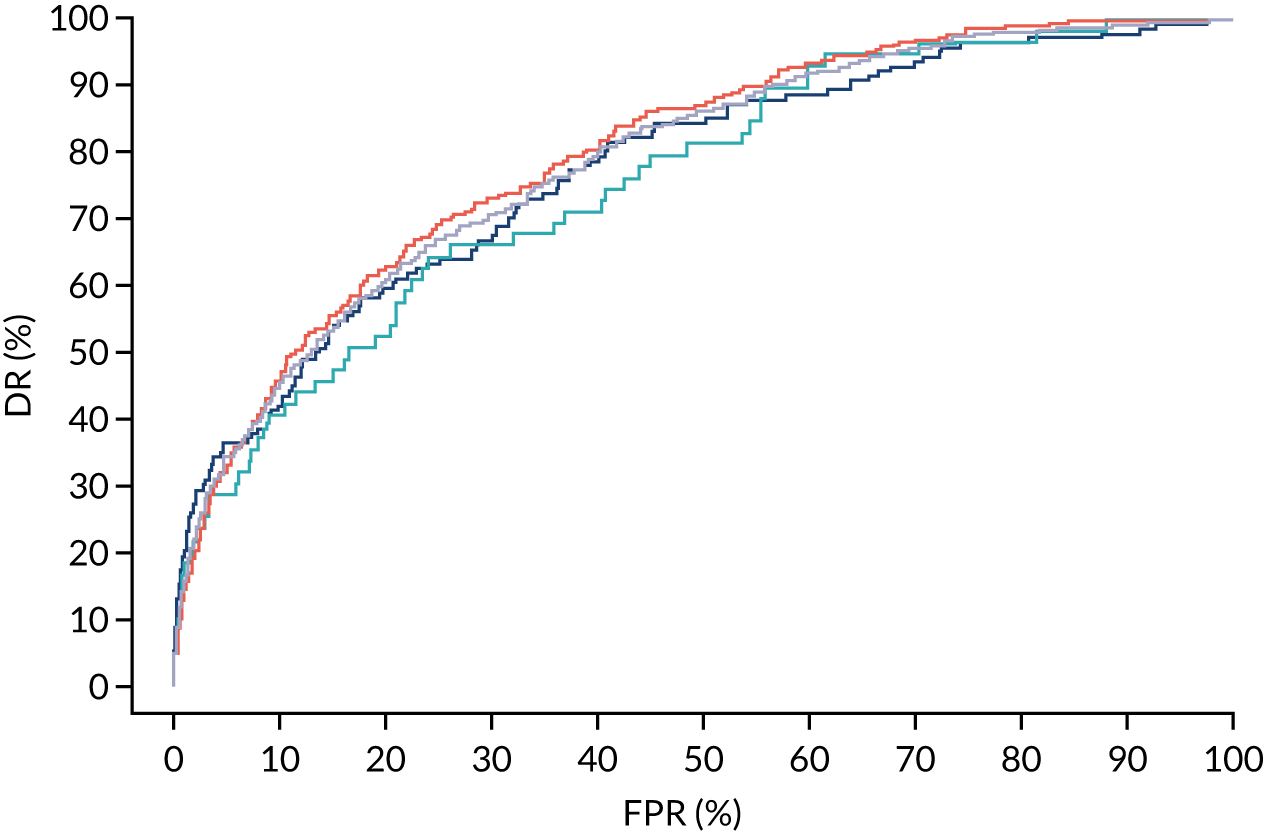
FIGURE 154.
Performance of screening for preterm pre-eclampsia by Mat-CHs and MAP.
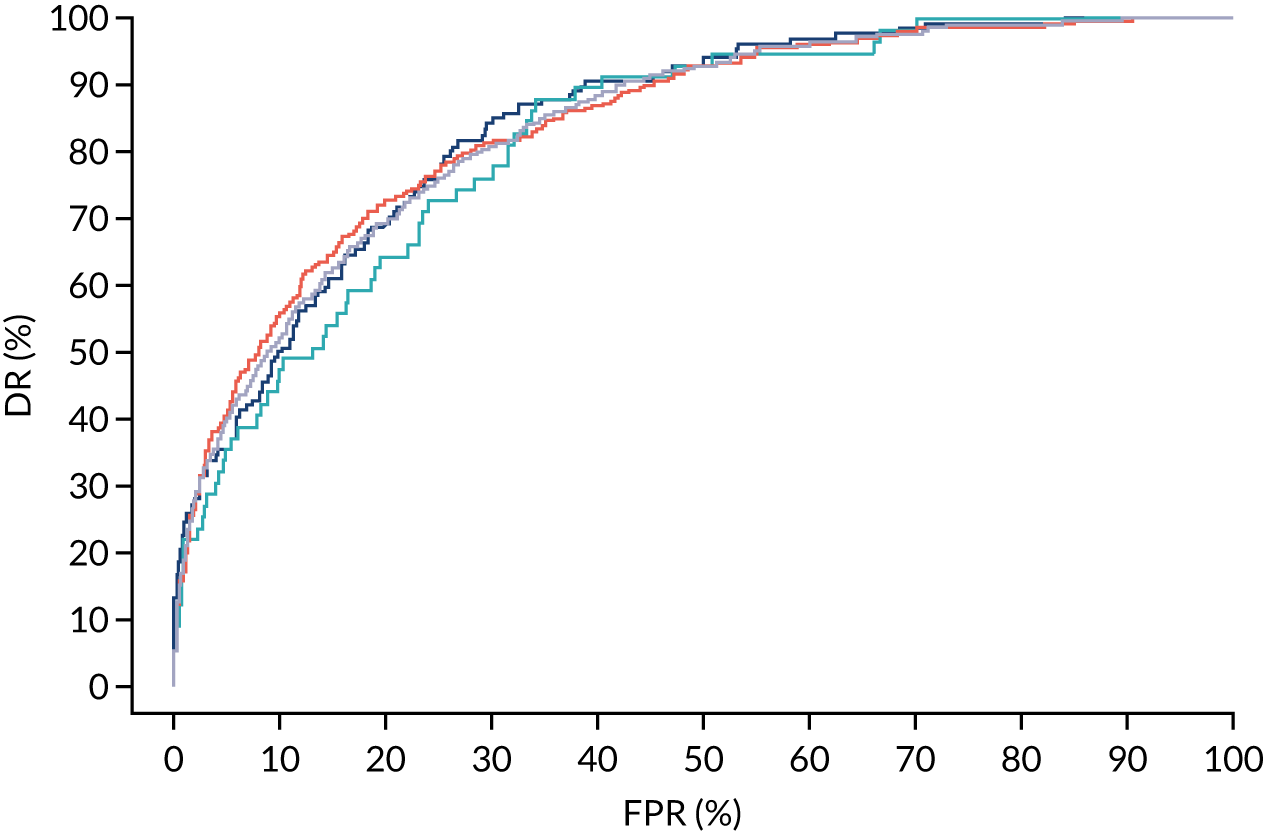
FIGURE 155.
Performance of screening for preterm pre-eclampsia by Mat-CHs and UTA-PI.
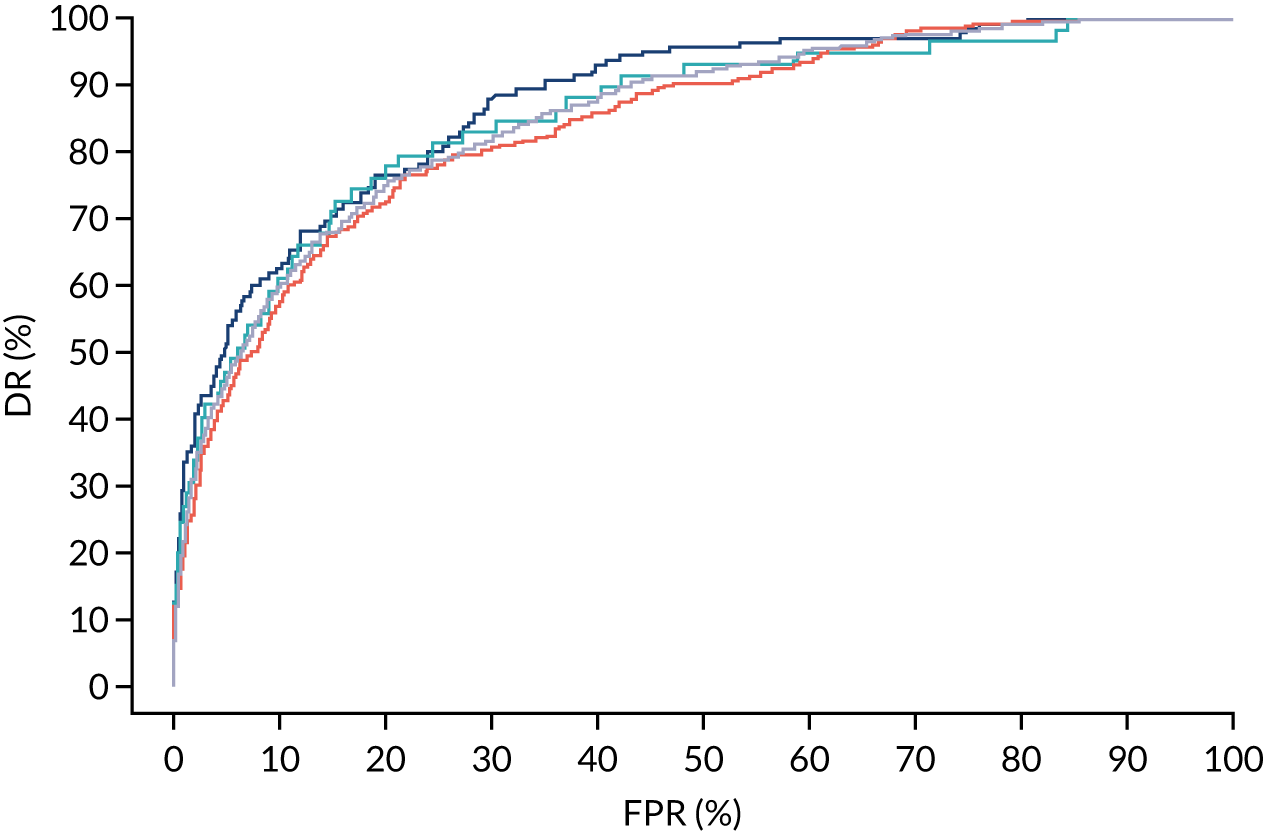
FIGURE 156.
Performance of screening for preterm pre-eclampsia by Mat-CHs and PLGF.
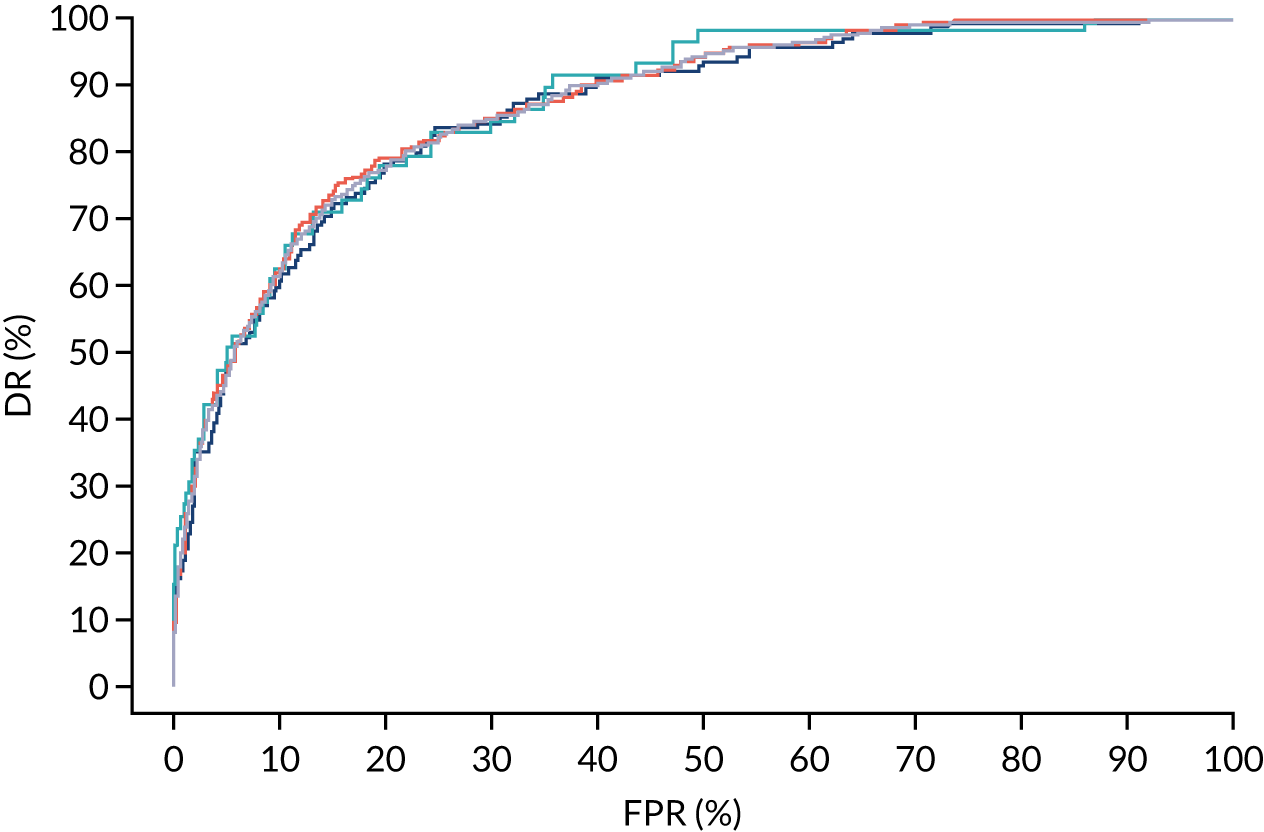
FIGURE 157.
Performance of screening for preterm pre-eclampsia by Mat-CHs and PAPP-A.
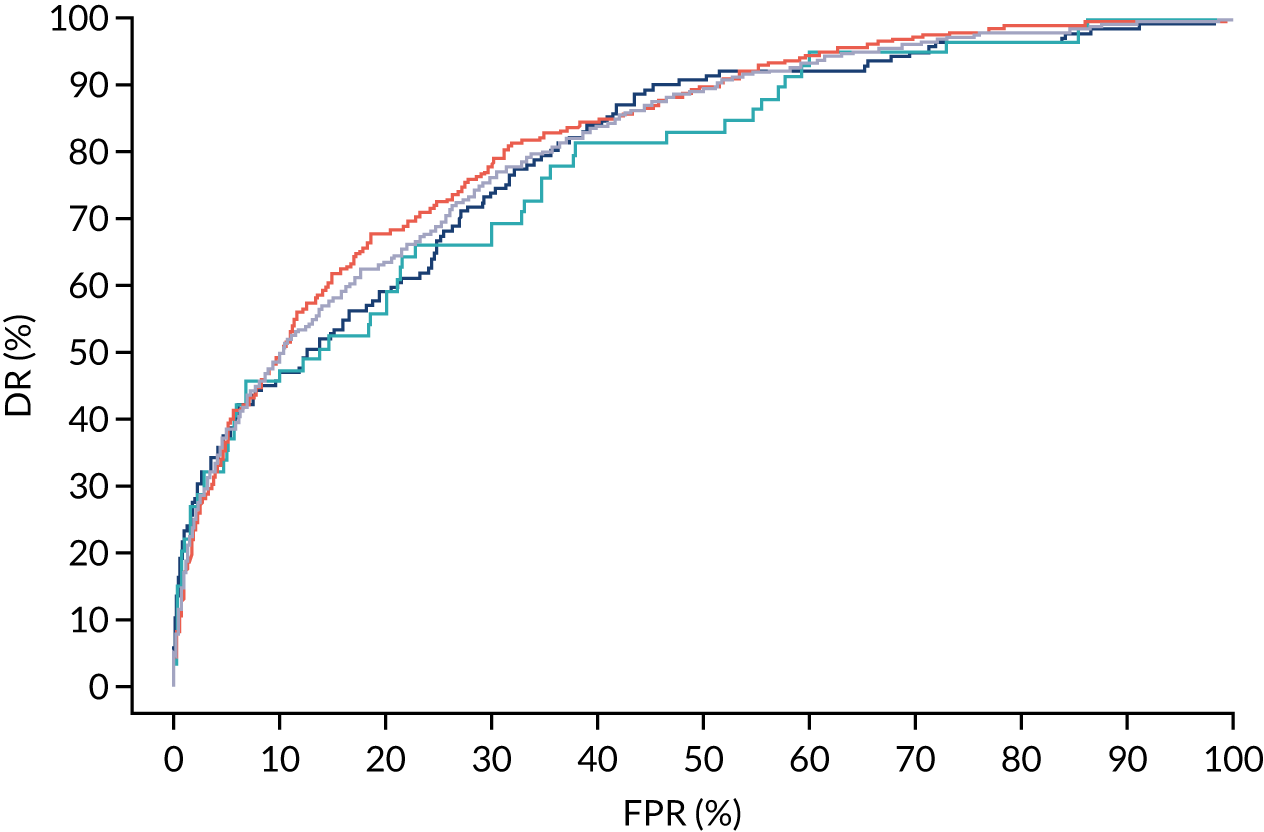
FIGURE 158.
Performance of screening for preterm pre-eclampsia by Mat-CHs, MAP and UTA-PI.
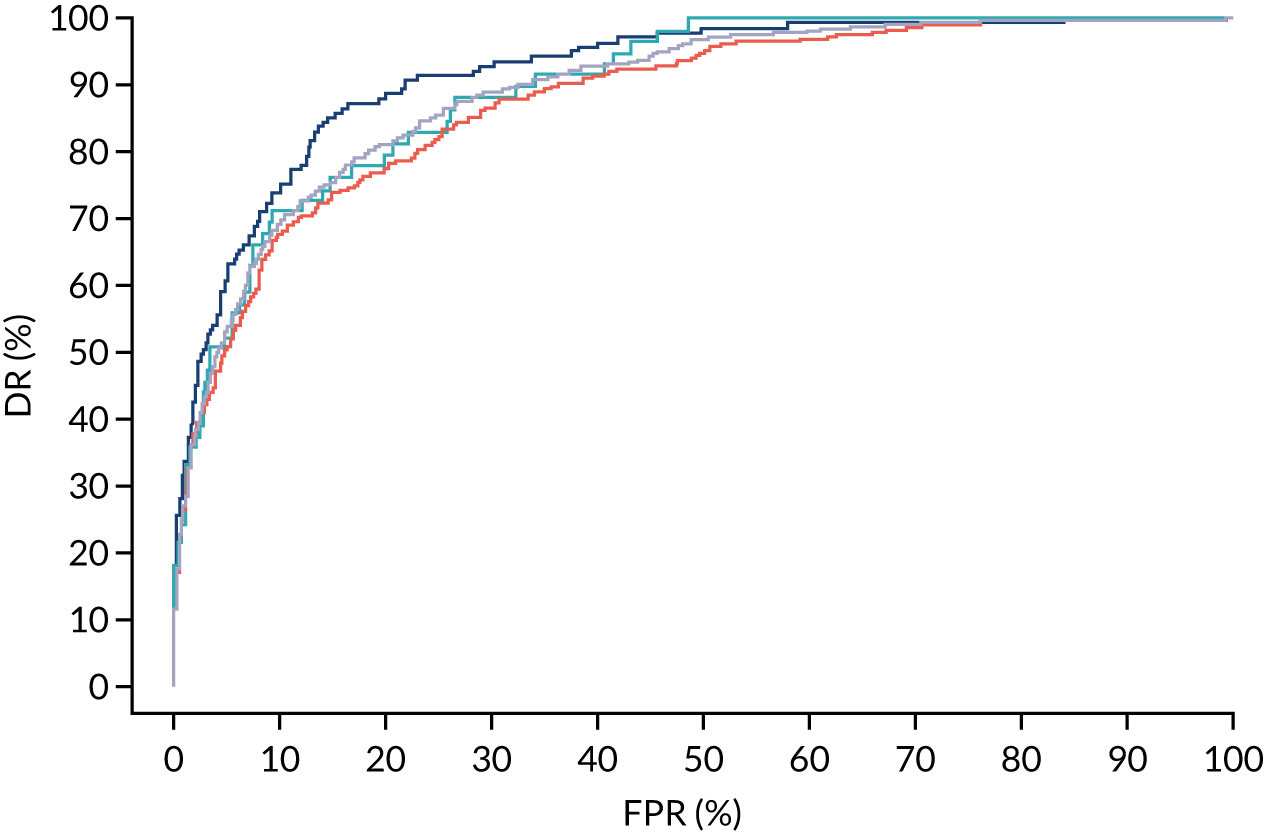
FIGURE 159.
Performance of screening for preterm pre-eclampsia by Mat-CHs, MAP and PAPP-A.
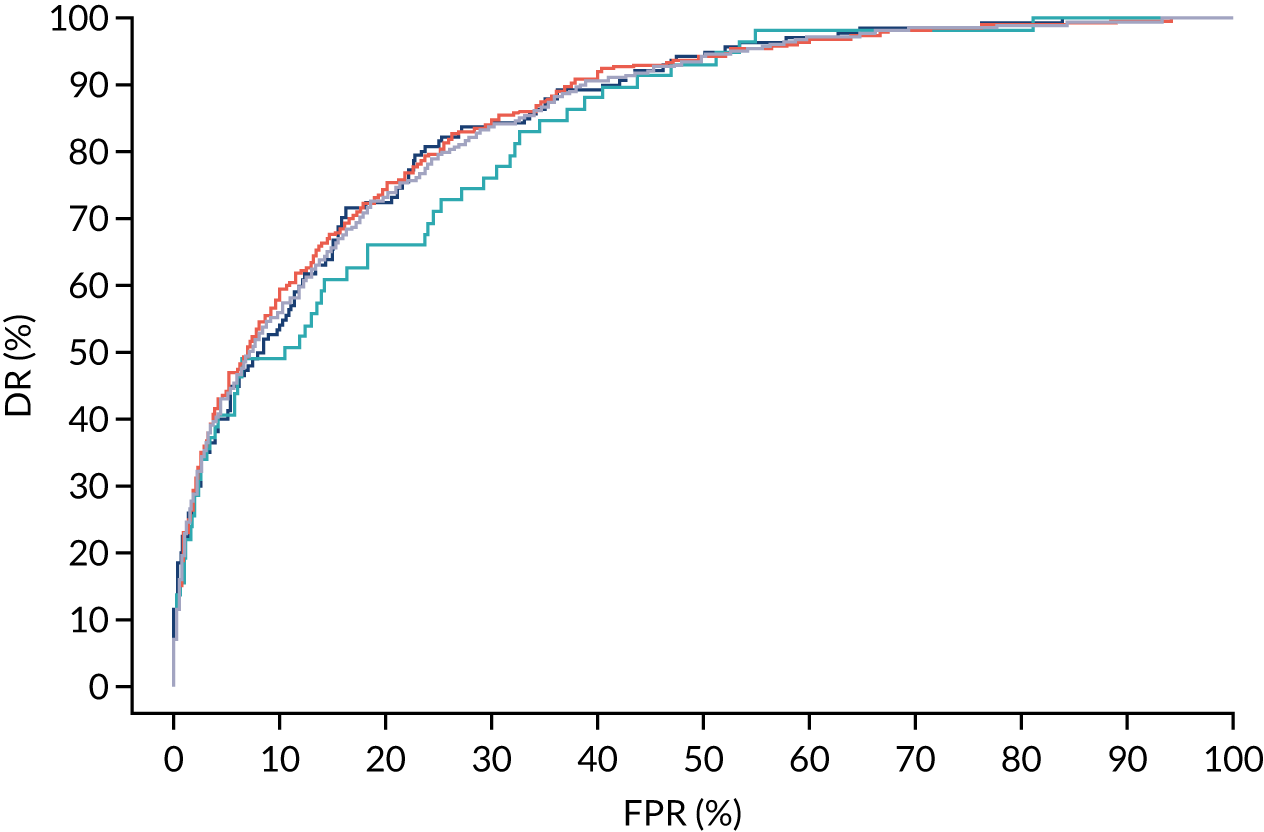
FIGURE 160.
Performance of screening for preterm pre-eclampsia by Mat-CHs, MAP and PLGF.
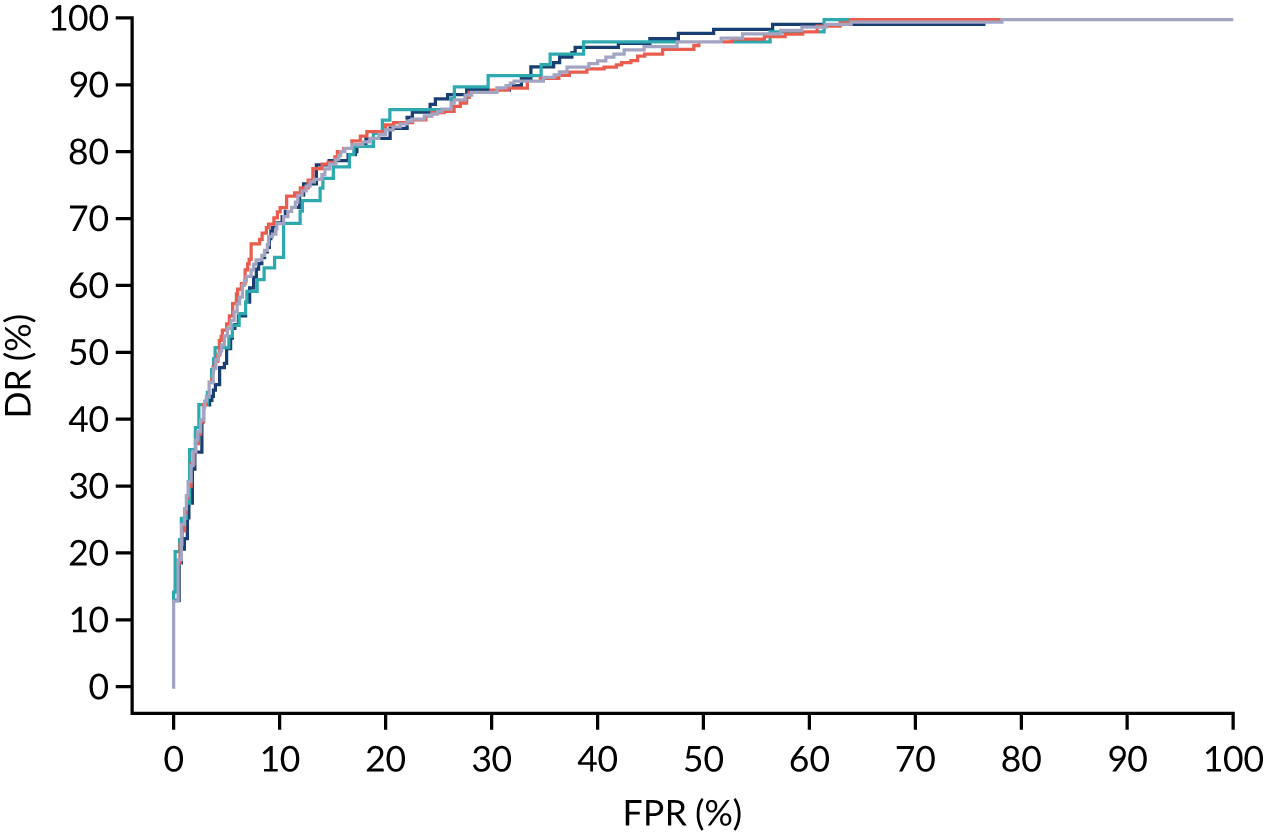
FIGURE 161.
Performance of screening for preterm pre-eclampsia by Mat-CHs, MAP, PLGF and UTA-PI.
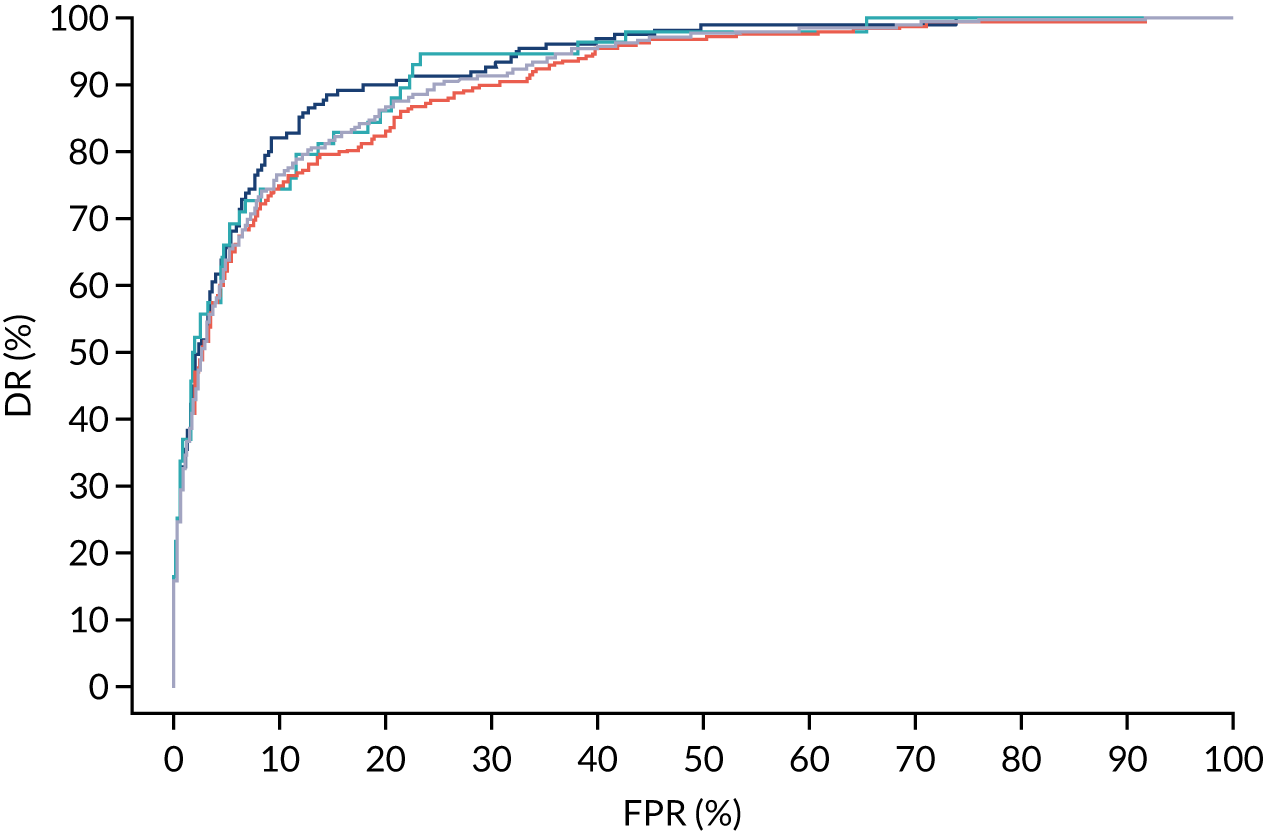
List of abbreviations
- AJOG
- American Journal of Obstetricians and Gynecology
- ASPRE
- Aspirin for Evidence-Based Preeclampsia Prevention
- CI
- confidence interval
- DR
- detection rate
- FPR
- false-positive rate
- MAP
- mean arterial pressure
- Mat-CH
- maternal characteristic
- MoM
- multiple of the median
- NICE
- National Institute for Health and Care Excellence
- PAPP-A
- pregnancy-associated plasma protein-A
- PLGF
- placental growth factor
- SGA
- small for gestational age
- SPR
- screen-positive rate
- SPREE
- screening programme for pre-eclampsia
- SQS
- Screening Quality Study
- UCL-CCTU
- University College London Comprehensive Clinical Trials Unit
- UTA-PI
- uterine artery pulsatility index
