Notes
Article history
The research reported in this issue of the journal was funded by the EME programme as project number 14/24/04. The contractual start date was in February 2017. The final report began editorial review in March 2019 and was accepted for publication in October 2019. The authors have been wholly responsible for all data collection, analysis and interpretation, and for writing up their work. The EME editors and production house have tried to ensure the accuracy of the authors’ report and would like to thank the reviewers for their constructive comments on the final report document. However, they do not accept liability for damages or losses arising from material published in this report.
Permissions
Copyright statement
© Queen’s Printer and Controller of HMSO 2020. This work was produced by Chicca et al. under the terms of a commissioning contract issued by the Secretary of State for Health and Social Care. This issue may be freely reproduced for the purposes of private research and study and extracts (or indeed, the full report) may be included in professional journals provided that suitable acknowledgement is made and the reproduction is not associated with any form of advertising. Applications for commercial reproduction should be addressed to: NIHR Journals Library, National Institute for Health Research, Evaluation, Trials and Studies Coordinating Centre, Alpha House, University of Southampton Science Park, Southampton SO16 7NS, UK.
2020 Queen’s Printer and Controller of HMSO
Chapter 1 Introduction
Multiple myeloma (MM) is a cancer of bone marrow plasma cells that causes anaemia, skeletal fractures, renal failure and profound immunodeficiency. 1 MM is one of the top 20 most common cancers in the UK, diagnosed in 5500 patients each year. MM is an incurable disease that requires long-term monitoring and predominantly affects individuals aged ≥ 60 years, with a median age at presentation of 70 years. The majority of cases present de novo, but it is now recognised that MM is preceded by an asymptomatic monoclonal gammopathy of undetermined significance phase in virtually all patients. 2 The incidence of MM has increased by over 11% in the last decade and is likely to further increase in the next decade as a result of an ageing population alongside increased prevalence, attributable to improving long-term survival from MM.
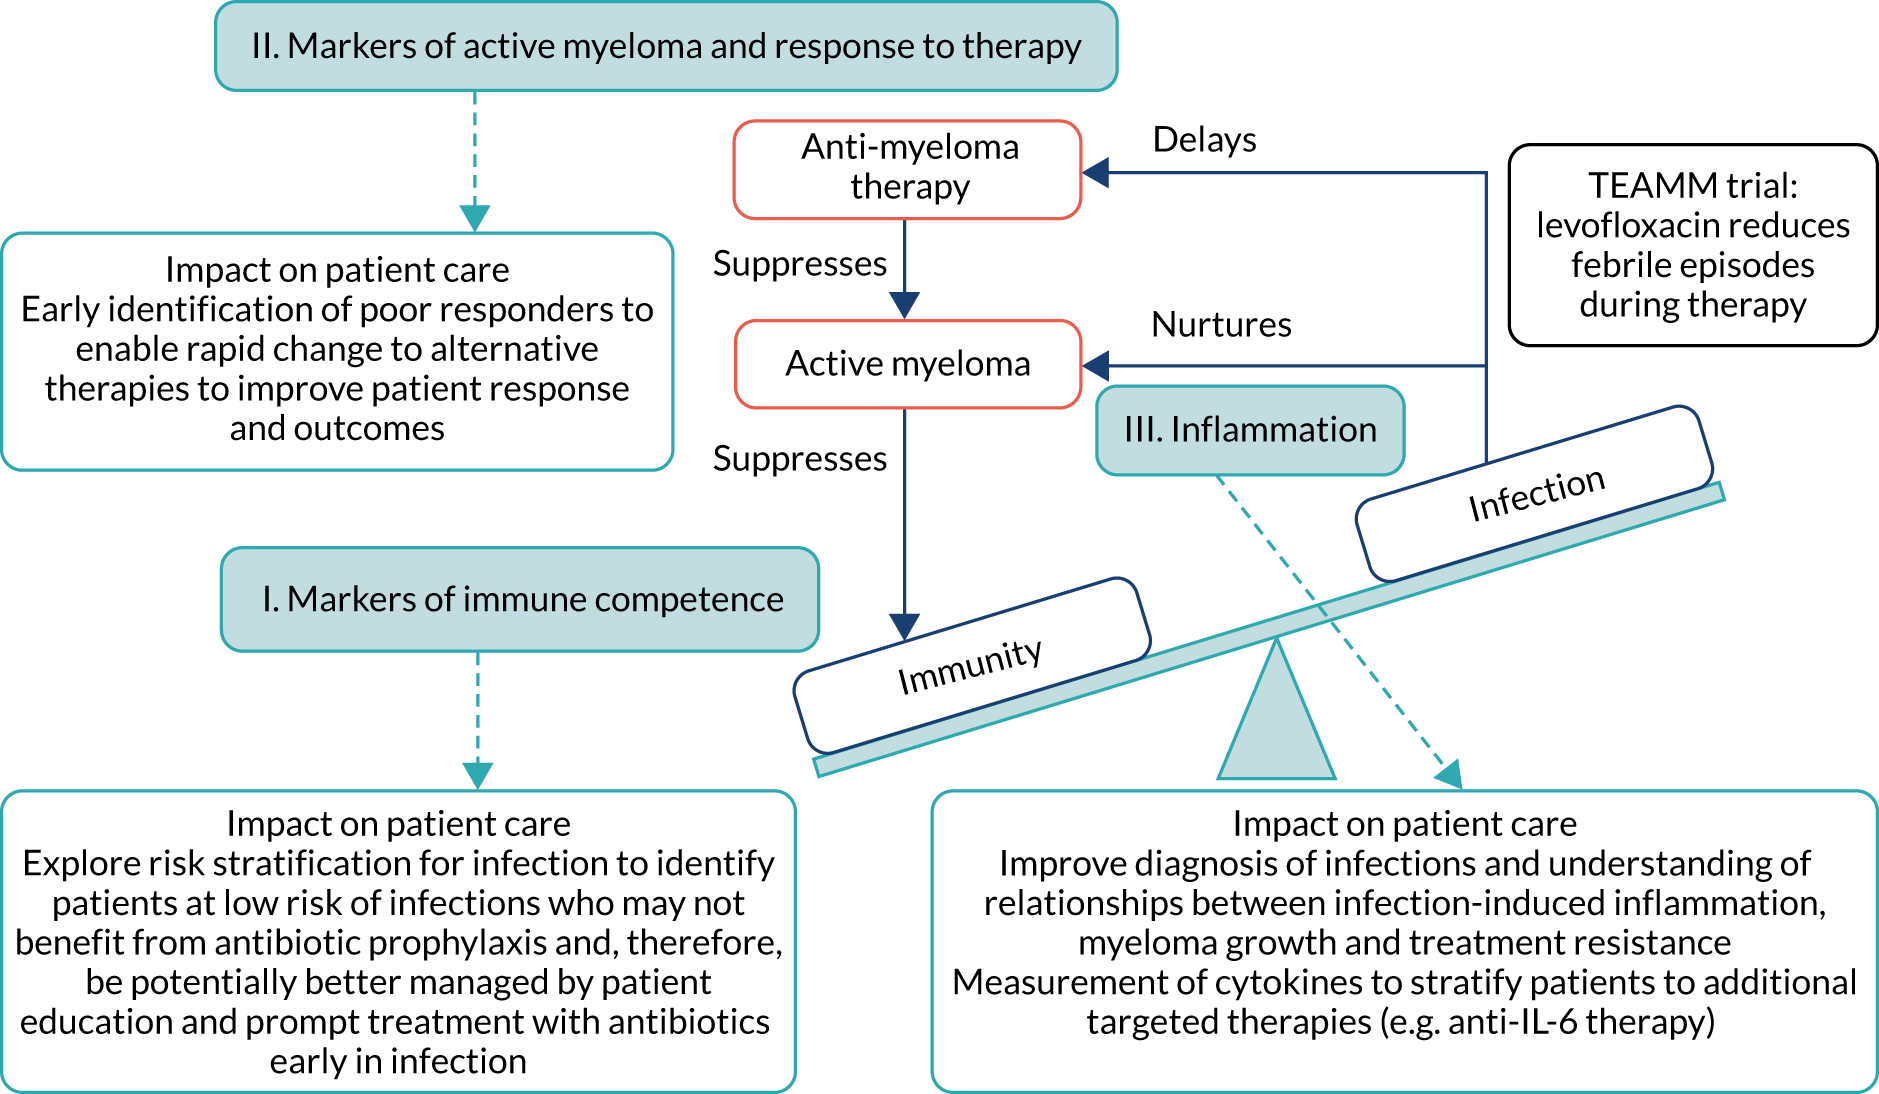
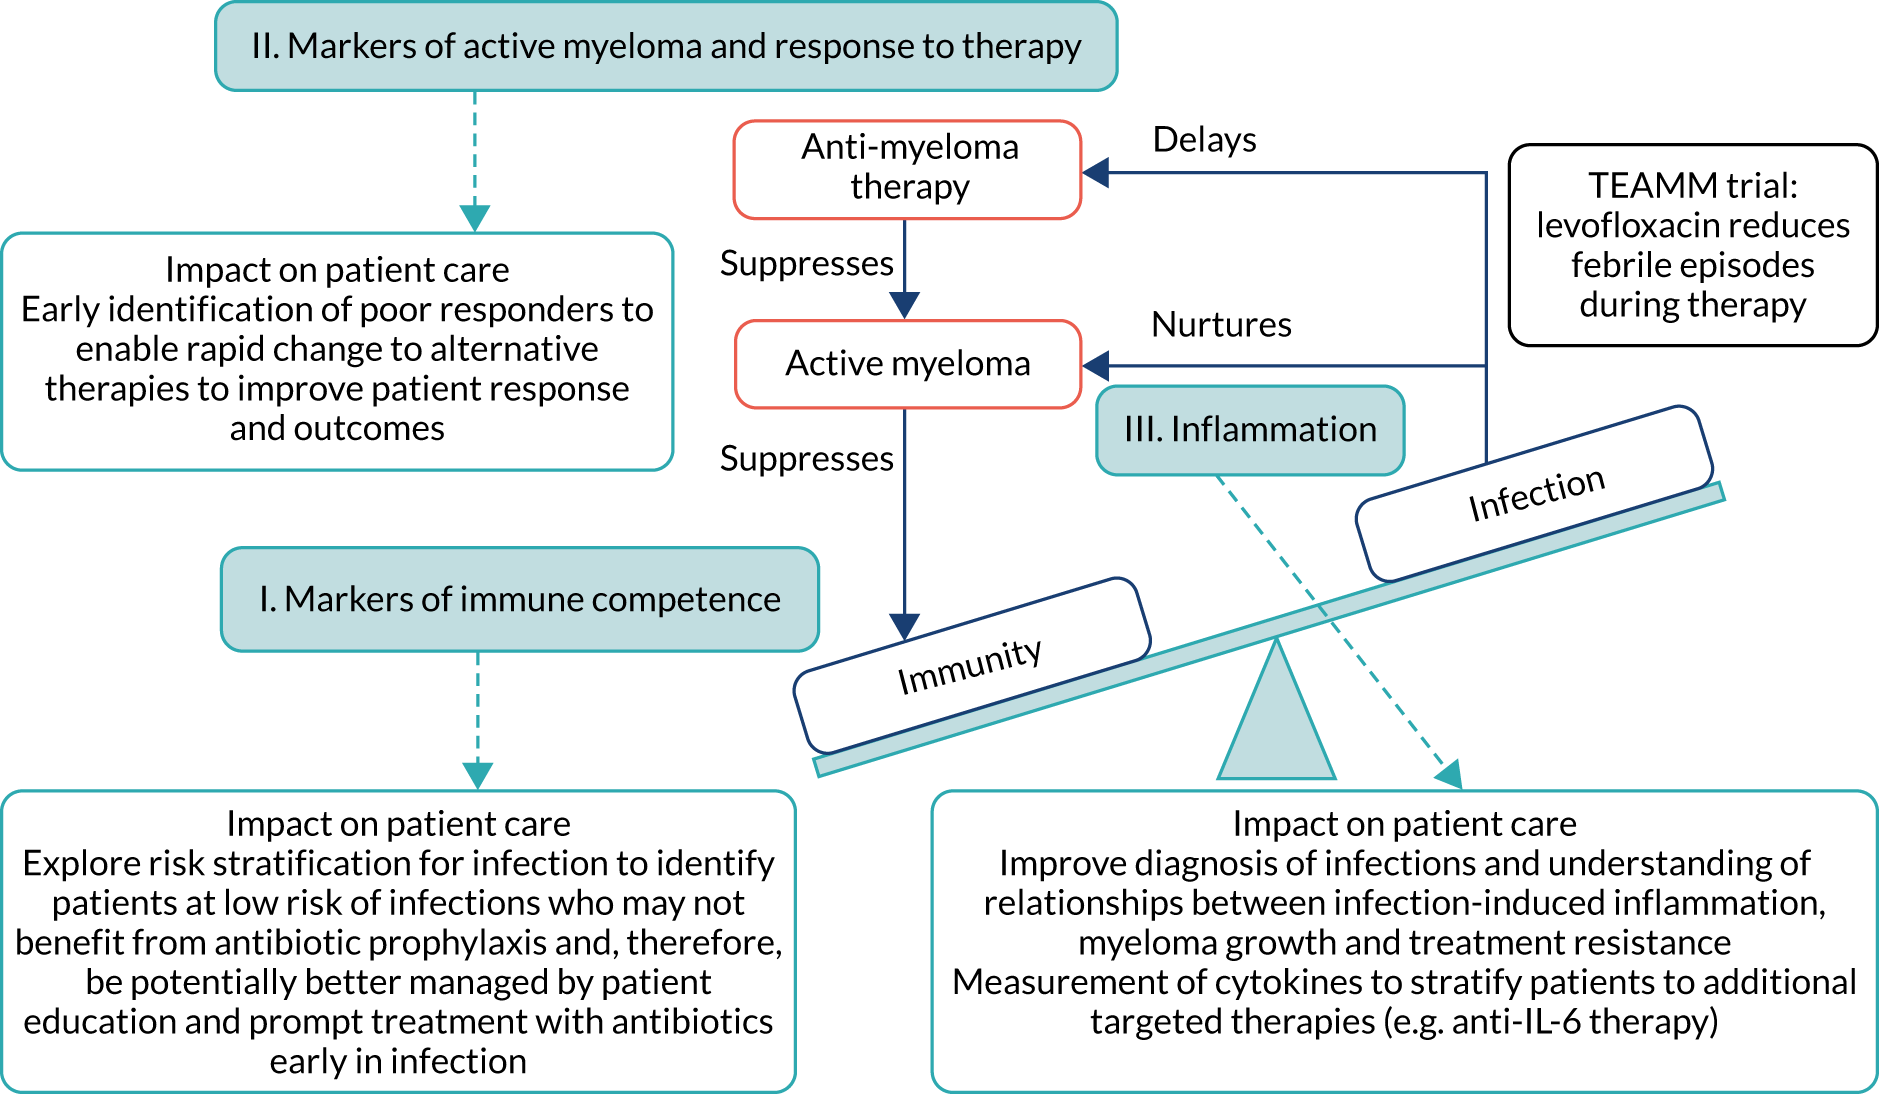
Infection is a major cause of morbidity and mortality in patients with active MM,1,3 particularly in the first 12 weeks from diagnosis as anti-MM therapy gradually brings the disease under control. An analysis of all patients registered onto UK-based Medical Research Council trials (from 1980 to 2002) showed that 10% of patients died within 60 days of trial entry, and almost half of these deaths were attributable to bacterial infection. 4 Although survival has greatly improved with modern anti-MM therapies, this high early death rate remains unchanged. Figure 1 shows that interactions between the triad of myeloma disease activity, immunity and infection are central to the Tackling Early Morbidity and Mortality in Myeloma (TEAMM) trial. Active MM suppresses immunity, resulting in a high incidence of infections following diagnosis. Interaction between MM tumour cells and the immune system via cytokines promotes tumour cell survival and drug resistance. 3,5 Evidence from in vitro studies suggests that infection may exacerbate this damaging relationship, causing inflammation and the release of cytokines that further stimulates the growth and survival of MM cells and resistance to anti-MM therapy. 6,7 This cyclical relationship contributes to the early mortality observed in MM. However, the mechanisms driving these interactions have yet to be explored. Factors that suppress immunity, promote active MM and are implicated in infection-induced inflammation have been separately identified, although these factors have yet to be examined together to understand their role in the cycle of active disease and treatment response following diagnosis. Uncovering disease-related mechanisms following diagnosis and during induction therapy can facilitate stratification and intervention to improve responses early in the disease and long-term prognosis.
FIGURE 1.
The cycle of immunity–infection–active disease in multiple myeloma. Active myeloma and anti-myeloma therapy suppress immunity. Infections delay administration of anti-myeloma therapy, and inflammation associated with infection is thought to nurture myeloma activity and resistance to anti-myeloma therapy. These interactions are central to the TEAMM trial, which aims to prevent infections during anti-myeloma therapy and help break the immunity–infection–myeloma activity cycle that fosters the maintenance of active myeloma. The TEAMM trial measured three core aspects relating to this cycle (shown in the light blue boxes), with identifiable routes to patient impact. The objective was to understand the mechanisms underlying these interactions, and to provide further routes and refinement of interventions through stratification and identification strategies. IL-6, interleukin 6.
Currently, other than the decision to assign patients to high- or low-dose therapy, patient stratification is not part of routine myeloma care provision. However new models are being developed and randomised trials set up to start addressing these issues. 8 The TEAMM trial provided new information about the benefits and risks of prophylactic antibiotics, but not about the mechanisms linking antibiotics and patient outcomes. 9 Given the current challenges surrounding antibiotic resistance and the possibility of health-care-associated infections (HCAIs), antibiotic prophylaxis may not be appropriate for all patients. As such, there is a need to stratify risk of infection at diagnosis. Presently, it is known that MM patients are at greater risk of infections, and it is known that this negatively affects patient outcomes. However, there are no tools to predict which patients are most susceptible to infection and, thus, most likely to benefit from levofloxacin treatment.
The TEAMM trial
This Efficacy and Mechanism Evaluation (EME) programme-funded project is mostly related to the National Institute for Health Research Health Technology Assessment (HTA) programme-funded project entitled ‘Tackling Early Morbidity and Mortality in Myeloma: assessing the benefit of randomised, double-blind, placebo-controlled multicentre phase 3 trial’ (reference number 08/116/69). The trial assessed the risks, benefits and cost-effectiveness of a prophylactic antibiotic for 12 weeks in patients with newly diagnosed symptomatic multiple myeloma. The trial identified that prophylactic levofloxacin incorporated to active myeloma treatment reduced the number of febrile episodes and deaths in newly diagnosed myeloma patients without a significant increase in HCAIs. The study population of the TEAMM trial was newly diagnosed symptomatic MM patients [median age 68 years, interquartile range (IQR) 60–75 years], within 2 weeks of starting anti-myeloma therapy. Patients were allocated to receive either 500 mg of levofloxacin or placebo orally once daily for 12 weeks. At trial entry, and at 4, 8, 12 and 16 weeks, samples were taken for central laboratory analysis of stools, nasal swabs for microbiology and of blood and urine for myeloma response and immune function. The primary outcome was death and number of febrile episodes in the first 12 weeks from randomisation, the latter defined as a single oral temperature ≥ 38 °C and that the patient was then given anti-infectives. The secondary outcome measures included:
-
days on anti-infective therapy for treatment of infection
-
carriage and invasive infections with Staphylococcus aureus, Clostridium difficile and extended-spectrum beta-lactamase (ESBL) coliforms
-
number of days in hospital from baseline to 12 weeks
-
response to anti-MM therapy and its relationship to infection.
The full TEAMM trial protocol can be found here: www2.warwick.ac.uk/fac/med/research/ctu/trials/cancer/teamm/. The trial was registered with the International Standard Randomised Controlled Trial Number (ISRCTN) registry as ISRCTN51731976.
The TEAMM started in November 2011. Recruitment of 977 patients was achieved by April 2016, with all study samples being collected by March 2017.
Infection-related biomarkers of interest
Polyclonal immunoglobulins
Levels of polyclonal immunoglobulins (Igs; i.e. normal antibodies), produced from healthy plasma cells to protect against infection, are reduced in MM and this reduction, known as immunoparesis, is typically linked with bacterial respiratory tract infections, especially Streptococcus pneumoniae, which is one of the most frequent infections that occur in these patients. 1 Total levels of polyclonal Igs may provide an indication of susceptibility to infection. However, levels of antibody against a range of pertinent bacterial antigenic targets will provide more specific information regarding protection against bacterial infections, such as S. pneumoniae, but antibody levels against these bacterial targets have yet to be measured in a randomised control trial (RCT) assessing infections. In addition, anti-viral Igs against influenza and also latent viruses represent an important biomarker of immune competence, but anti-viral Ig relationships with other aspects of immune function and patient outcomes in a RCT, such as the TEAMM trial, have yet to be explored.
Neutrophil biomarkers
Neutrophils, the first cells to arrive at the site of inflammation, are the main defence against bacteria. Neutrophils kill bacteria by phagocytosis and intracellular killing, casting extracellular traps [i.e. neutrophil extracellular traps (NETs)] to entrap and kill bacteria, and degranulation (including neutrophil elastase release). Neutrophil elastase is found in azurophilic (primary) granules that release their contents into phagocytic vesicles with little discharge outside the cell except for release from disintegrating neutrophils. Lactoferrin is found in specific (secondary) granules that both release their contents into phagocytic vesicles and the extracellular medium. Matrix metalloproteinase 9 (MMP9) is found in gelatinase (tertiary) granules that more readily release their contents into the extracellular medium than the other granules. Calprotectin is found in the cytoplasm of neutrophils and makes up one-third of neutrophilic cytosolic protein. Calprotectin is released into the extracellular medium as neutrophils disintegrate, and provides anti-bacterial and anti-fungal functions. 10 Neutrophil function reduces with ageing11,12 and is implicated in the high incidence of bacterial infections in older adults. 13 At diagnosis, < 10% of MM patients have neutropenia, but all MM patients have a bacterial infection profile (i.e. organism and site) akin to patients with neutropenia. The median age of MM patients is 70 years, and poor neutrophil function, further blunted by MM and its treatment, may be a major cause of infection. Interleukin 10 (IL-10) is regarded as an anti-inflammatory cytokine that downregulates innate immune function, including those of neutrophils. 14,15 Furthermore, the level of IL-10 has been shown to be elevated in MM patients, and correlates significantly with disease progression. 16 Therefore, IL-10 may be implicated in both susceptibility to infection and active MM and be a therapeutic target. These biomarkers of immune competence have not been studied in the context of antibiotic prophylaxis and infection in myeloma. This study aimed to use these biomarkers to characterise infection risk and guide treatment stratification.
Soluble CD138
Clinical laboratories monitor MM disease activity through measurement of monoclonal Igs by densitometry on electrophoretic strips and total protein quantitation. In addition to myeloma protein changes to monitor myeloma response, levels of soluble CD138 (solCD138; also known as syndecan-1) can be measured. CD138 is a proteoglycan that is shed from myeloma cells that has effects on tumour cell growth, survival, adhesion and invasion, and on bone cell differentiation. 17,18 Elevated levels of serum solCD138 correlate with increased tumour mass and decreased patient survival. 17,19 A large cohort study demonstrated that the level of solCD138 at presentation and its reduction with treatment were powerful prognostic indicators for overall survival in MM. 20 Measurement of levels of solCD138 in the TEAMM trial at presentation and during therapy induction will enable sensitive measurement of speed and depth of response, and help establish how levofloxacin may be associated with improved response and survival.
Cytokines
Levels of interleukin 6 (IL-6) increase in the bloodstream during bacterial and viral infection. IL-6 is also a proinflammatory cytokine and a range of studies have confirmed this cytokine promotes MM cell growth, survival and drug resistance. 5,21 Classic IL-6 signalling occurs when IL-6 binds to membrane-bound proteins IL-6 receptor (IL-6R) and glycoprotein 130 (gp130). An alternative IL-6 signalling pathway termed IL-6 trans-signalling occurs when IL-6 binds to soluble IL-6R. In the IL-6 trans-signalling pathway, IL-6R is shed from the surface of host cells during MM resulting in elevated soluble IL-6R levels, followed by the formation of soluble IL-6–IL-6R complexes that bind membrane-bound gp130 expressed on tumour cells, resulting in tumour growth;22,23 the increased levels of soluble IL-6R have been associated with a poor response to chemotherapy. 24
Interleukin 8 (IL-8), a proinflammatory chemokine, is a known inducer of angiogenesis in myeloma and has been implicated in the pathophysiology of the disease. 25,26 Levels of this chemokine correlate with MM disease activity27 and IL-8 has also been shown to contribute to bone marrow-induced NF-κB (nuclear factor κ light chain enhancer of activated B cells) activity; this activity is associated with treatment resistance to bortezomib. 28 During inflammation and infection, IL-8 plays a role in the recruitment and activation of neutrophils. 29 These cytokines (i.e. IL-6 and IL-8) have been separately acknowledged in their role in infection and MM disease activity; however, their potential simultaneous roles in infection-induced inflammation, active MM and treatment resistance have yet to be investigated. Investigating these biomarkers in the TEAMM trial would uncover their importance for these interactions, and thereby help identify patients who may be at risk of poor treatment response, who may be most susceptible to infection, and those patients who may most benefit from levofloxacin and/or additional treatment pathways during induction therapy.
Procalcitonin
Procalcitonin (PCT) is a peptide precursor of the hormone calcitonin and levels become elevated in response to proinflammatory stimuli of bacterial origin, which is of key interest in newly diagnosed MM patients and for the TEAMM trial. It is considered the most sensitive biomarker of bacterial infection, correlating well with degree of sepsis, and can be used to differentiate between viral and bacterial infections in 91% of cases. 30 Levels of PCT have been shown to be able to discriminate between underlying MM disease and bacterial infection in patients where IL-6 and C-reactive protein (CRP) are linked to active MM. 31 The TEAMM trial already assesses serum CRP level as a biomarker of inflammation. A recent systematic review of RCTs has shown that measurement of PCT to confirm bacterial infection is generally associated with reduced antibiotic use, without an increase in mortality or treatment failure. 32 The use of PCT in differential diagnosis of febrile states in MM has been documented in case studies,33 but the use of PCT to confirm bacterial infection in a study as large as the TEAMM trial has not taken place.
The objective of the TEAMM trial was to tackle the early mortality rate in MM through infection prevention via antibiotic prophylaxis. This EME project built on the body of existing research by investigating the links between the triad of MM disease activity, immune competence and infection, to better understand the relationship between the intervention and patient outcomes in the TEAMM trial. Examining sensitive biomarkers of MM activity, response to therapy and bacterial infection supported this objective and provided additional benefits for patient monitoring and stratification.
Aims and objectives
The aim of the study was to investigate the interaction between myeloma disease activity, immune competence and occurrence of infections in order to identify patients most at risk of infections and, therefore, help inform future guidance for the use of antibiotics for myeloma patients which, in turn, could improve their responses to anti-myeloma therapy and survival. The study had three distinct objectives measuring biomarkers of:
-
immune competence to develop risk stratification of patients for infection so that the decision to prescribe antibiotic prophylaxis can be personalised
-
myeloma activity to sensitively measure speed and depth of myeloma response
-
inflammation to identify patients who may be at risk of poor treatment responses and patients who may benefit from additional targeted therapies.
Objective 1 outcome measures
Objective 1 was to measure biomarkers of immune competence to develop risk stratification of patients for infection so that the decision to prescribe antibiotic prophylaxis can be personalised.
The objective 1 outcome measures were:
-
levels of serum immunoglobulins (specifically serum polyclonal IgG) against –
-
bacterial antigens (such as pneumococcus, meningococcus, Haemophilus influenza type b, and tetanus and diphtheria toxoids)
-
viral antigens (such as influenza strain B, H1N1 and H3N2)
-
-
serum biomarkers of neutrophil activity (such as neutrophil elastase, MMP9, calprotectin, lactoferrin and NETs)
-
levels of the serum anti-inflammatory cytokine IL-10.
Objective 2 outcome measures
Objective 2 was to measure biomarkers of myeloma activity to sensitively measure the speed and the depth of the myeloma response.
The objective 2 outcome measures were serum biomarkers:
-
for measurement of malignant and uninvolved immunoglobulins
-
of myeloma disease activity solCD138.
Objective 3 outcome measures
Objective 3 was to measure biomarkers of inflammation to identify patients who may be at risk of poor treatment responses and patients who may benefit from additional targeted therapies.
The objective 3 outcome measures were:
-
levels of the serum proinflammatory cytokines IL-6 and IL-8
-
levels of the serum biomarker of bacterial infections PCT.
Chapter 2 Methods
The TEAMM trial patients and sample collection
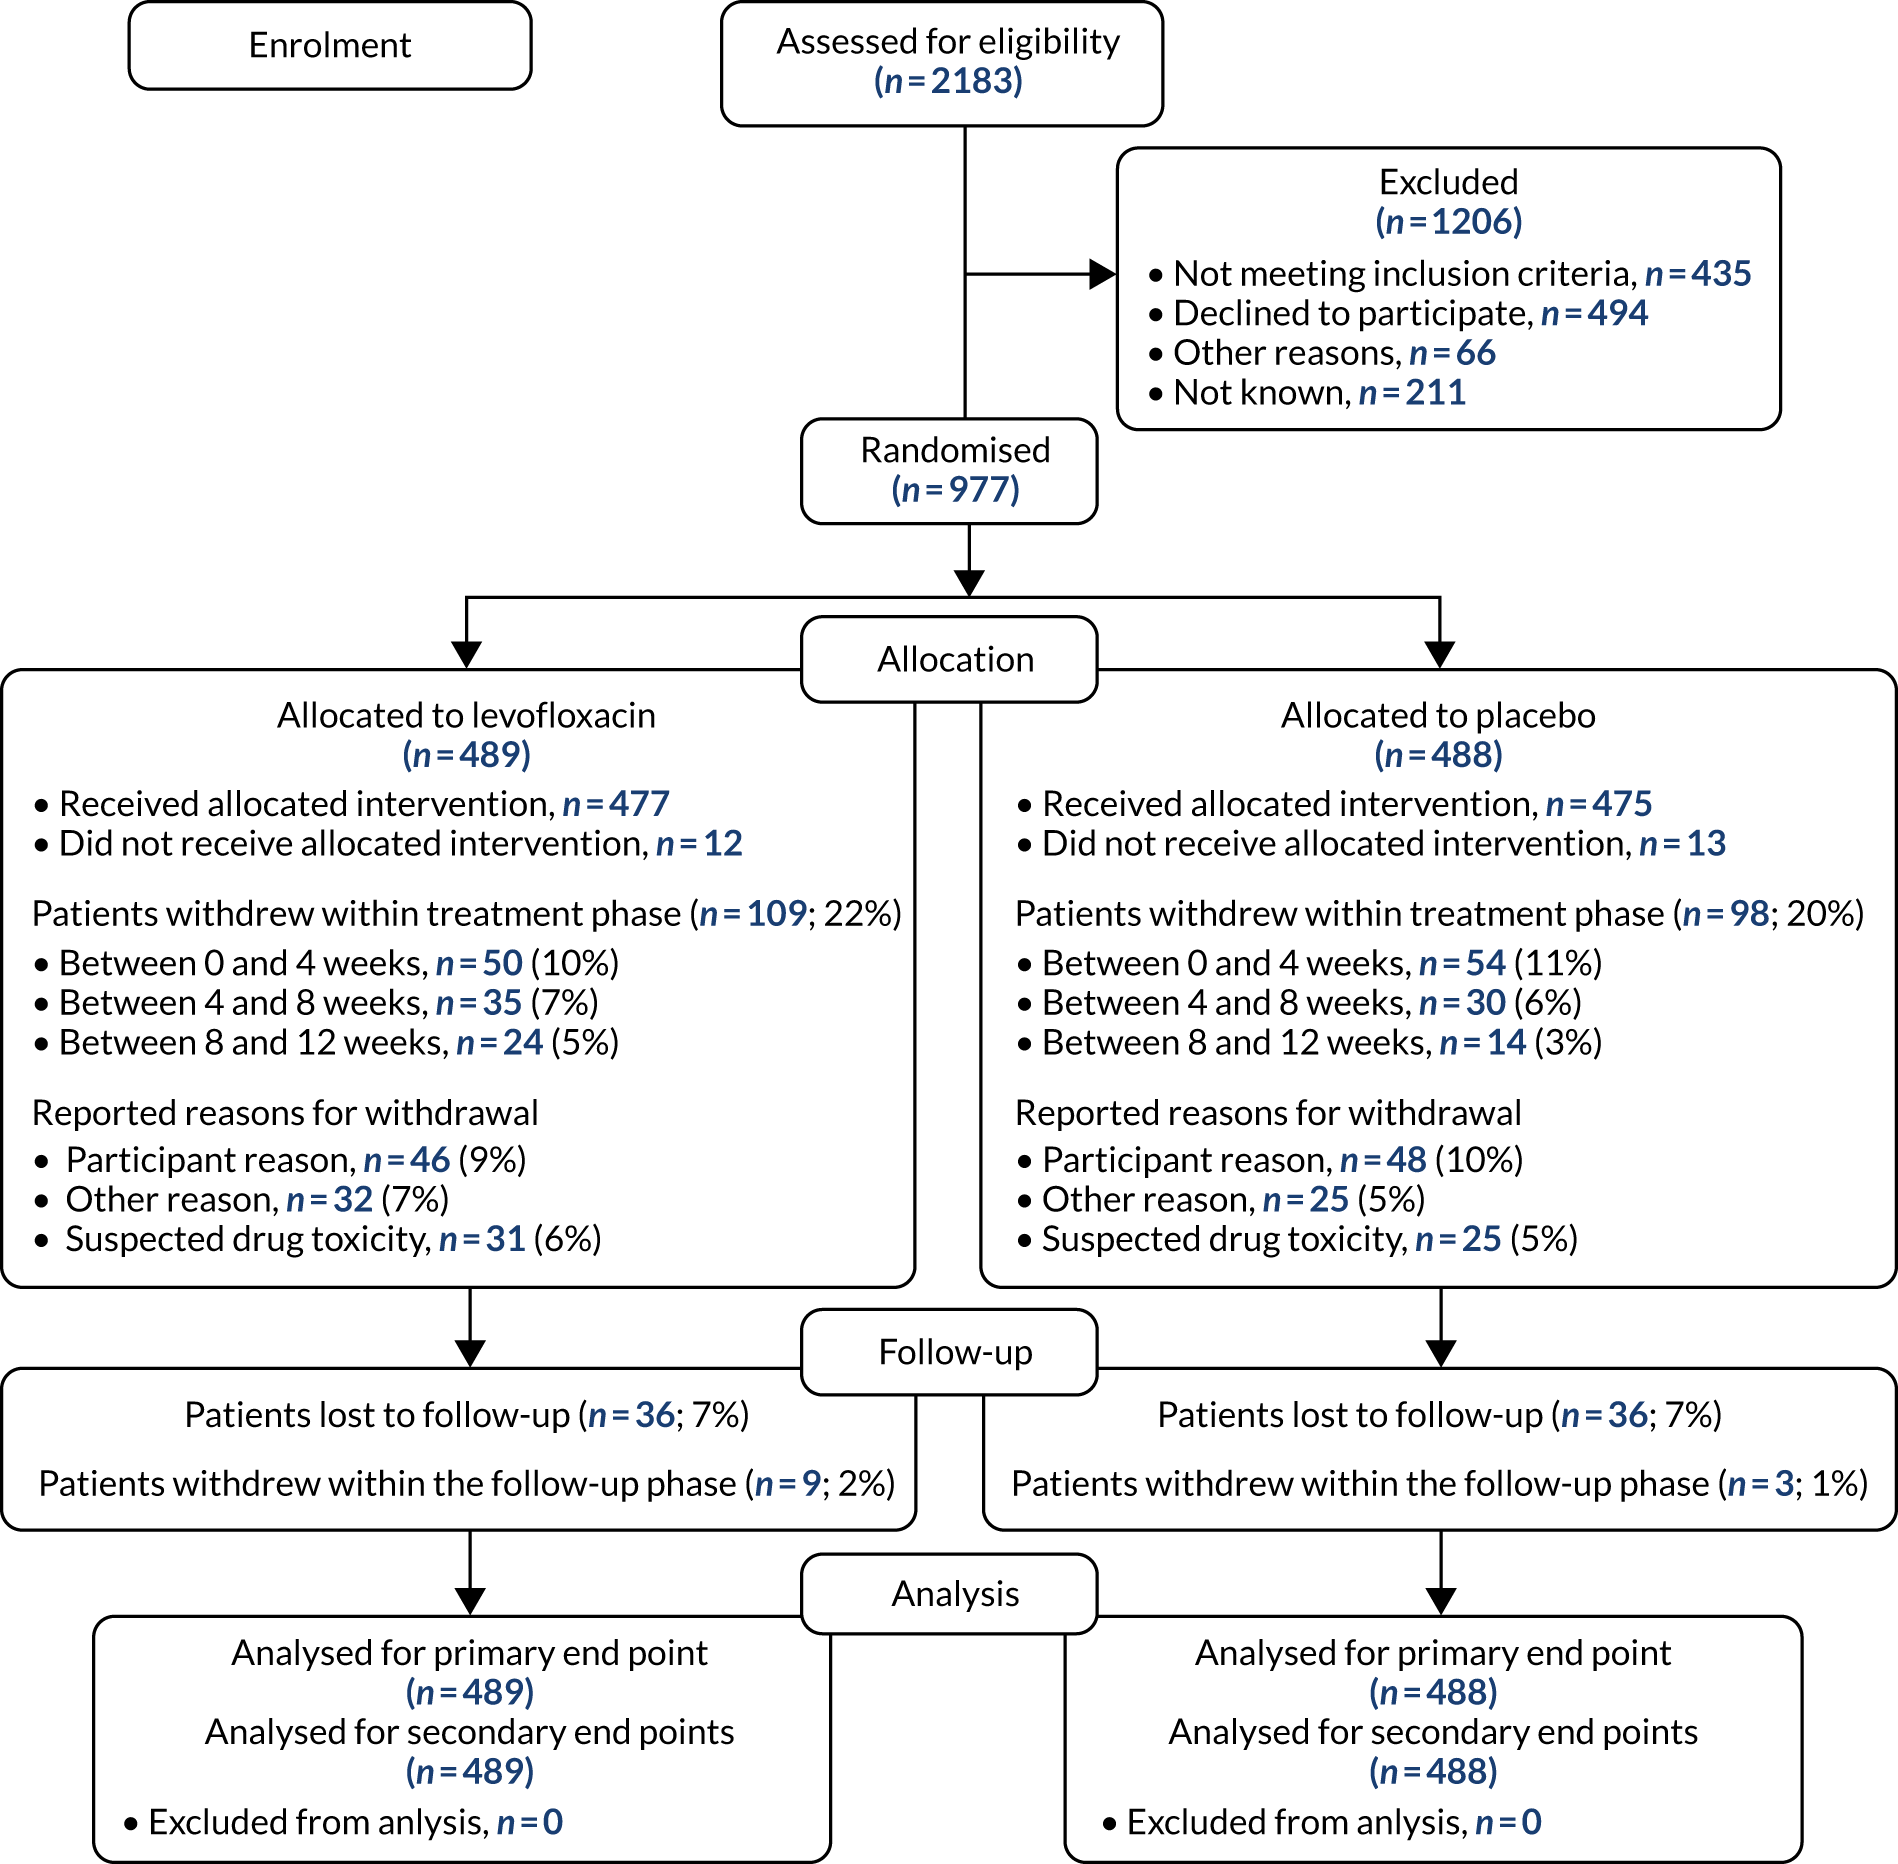
The project analysed samples obtained from the TEAMM trial patients. The Consolidated Standards of Reporting Trials (CONSORT) flow diagram of the TEAMM trial is presented in Figure 2. Patient characteristics are presented in Table 1. The TEAMM trial recruited 977 patients aged ≥ 21 years with newly diagnosed symptomatic myeloma, and within 14 days of starting active myeloma treatment. The trial had ethics approval from the UK Coventry & Warwickshire Research Ethics Committee (Research Ethics Committee reference number 11/WM/0220) and all patients provided written informed consent. Blood samples from patients were collected at randomisation, then every 4 weeks for 16 weeks and, again, at 1 year after randomisation. Blood samples were received and processed, then serum was appropriately labelled and stored in the Clinical Immunology Service biobank (located at the Medical School of the University of Birmingham, Birmingham, UK) until analysis.
FIGURE 2.
The CONSORT flow diagram of the TEAMM trial. Diagram of patient recruitment, allocation and withdrawal during the TEAMM trial.
| Factors | Treatment arm | Total (N = 977) | ||||
|---|---|---|---|---|---|---|
| Levofloxacin (N = 489) | Placebo (N = 488) | |||||
| n | % | n | % | n | % | |
| eGFR | ||||||
| > 50 ml/minute | 369 | 75 | 369 | 76 | 738 | 76 |
| 20–50 ml/minute | 95 | 19 | 93 | 19 | 188 | 19 |
| < 20 ml/minute | 25 | 5 | 26 | 5 | 51 | 5 |
| High-dose CT with planned auto-SCT | ||||||
| No | 223 | 46 | 222 | 46 | 445 | 46 |
| Yes | 266 | 54 | 266 | 54 | 532 | 54 |
| Sex | ||||||
| Male | 316 | 65 | 295 | 60 | 611 | 63 |
| Female | 173 | 35 | 193 | 40 | 366 | 37 |
| Age (years) | ||||||
| Median (IQR) | 67 (59–75) | 67 (61–75) | 67 (60–75) | |||
| ECOG performance status at randomisation | ||||||
| 0 | 164 | 34 | 173 | 35 | 337 | 34 |
| 1 | 209 | 43 | 188 | 39 | 397 | 41 |
| 2 | 80 | 16 | 76 | 16 | 156 | 16 |
| 3 | 24 | 5 | 36 | 7 | 60 | 6 |
| 4 | 2 | < 1 | 5 | 1 | 7 | 1 |
| Missing | 10 | 2 | 10 | 2 | 20 | 2 |
| ISS | ||||||
| Stage I | 100 | 20 | 116 | 24 | 216 | 22 |
| Stage II | 188 | 38 | 165 | 34 | 353 | 36 |
| Stage III | 121 | 25 | 130 | 27 | 251 | 26 |
| Missing | 80 | 16 | 77 | 16 | 157 | 16 |
| Ethnicity | ||||||
| White | 452 | 92 | 437 | 90 | 889 | 91 |
| Mixed | 1 | < 1 | 2 | < 1 | 3 | < 1 |
| Asian or British Asian | 10 | 2 | 17 | 4 | 27 | 3 |
| Black or black British | 26 | 5 | 28 | 6 | 54 | 6 |
| Chinese or other | 0 | 0 | 1 | < 1 | 1 | < 1 |
| Missing | 0 | 0 | 3 | 1 | 3 | < 1 |
| Prior infection | ||||||
| C. difficile | 2 | < 1 | 1 | < 1 | 3 | < 1 |
| MRSA | 6 | 1 | 7 | 1 | 13 | 1 |
| ESBL coliforms | 3 | 1 | 5 | 1 | 8 | 1 |
| Anti-infectives in month prior | ||||||
| No | 332 | 68 | 331 | 68 | 663 | 68 |
| Yes | 75 | 15 | 76 | 16 | 151 | 15 |
| Missing | 82 | 17 | 81 | 17 | 163 | 17 |
| Steroids 14 days prior to randomisation | ||||||
| Yes | 248 | 51 | 246 | 51 | 494 | 51 |
| Corticosteroids | ||||||
| Prednisolone | 24 | 5 | 18 | 4 | 42 | 4 |
| Dexamethasone | 226 | 46 | 229 | 47 | 455 | 47 |
| Other | – | – | 2 | < 1 | 2 | < 1 |
| Planned anti-myeloma treatment | ||||||
| Thalidomide based | 208 | 43 | 216 | 44 | 424 | 43 |
| VELCADE® (Takeda Pharmaceutical Company Limited, Tokyo, Japan) based | 152 | 31 | 150 | 31 | 302 | 31 |
| Lenalidomide based | 72 | 15 | 69 | 14 | 141 | 14 |
| Lenalidomide and carfilzomib based | 50 | 10 | 43 | 9 | 93 | 10 |
| Other | 7 | 1 | 10 | 2 | 17 | 2 |
| Bisphosphonate status | ||||||
| At randomisation | ||||||
| Not given | 68 | 14 | 60 | 12 | 128 | 13 |
| Given/will be given | 419 | 86 | 419 | 87 | 838 | 86 |
| Missing | 2 | < 1 | 9 | 2 | 11 | 1 |
| Bisphosphonate | ||||||
| Zolendronate | 284 | 68 | 280 | 67 | 564 | 67 |
| Pamidronate | 111 | 26 | 105 | 25 | 216 | 26 |
| Clodronate | 14 | 3 | 23 | 5 | 37 | 4 |
| Other | 3 | 1 | 7 | 2 | 10 | 1 |
| Missing | 7 | 2 | 4 | 1 | 11 | 1 |
| Prophylactic anti-viral/-fungal | ||||||
| No | 170 | 35 | 166 | 34 | 336 | 34 |
| Yes | 237 | 48 | 240 | 49 | 477 | 49 |
| Missing | 82 | 17 | 82 | 17 | 164 | 17 |
Study design
The TEAMM trial was a two-arm, double-blinded, multicentre, placebo-controlled randomised clinical trial. Patients were randomised centrally using a minimisation algorithm that generated a trial number and drug pack for each patient and allocated treatments in a one-to-one ratio. Allocation was balanced by centre, estimated glomerular filtration rate and intention to proceed to autologous stem cell transplant. All investigators, patients and trial co-ordination staff were blinded to the treatment allocation. Tablets were manufactured specifically for the trial and packaged in identical blister packs. Patients were given 500 mg of levofloxacin (2 × 250-mg tablets), once daily, for 12 weeks, or placebo tablets, with dose reduction in patients with renal impairment. Other prophylactic antibiotics were prohibited, except for the use of low-dose co-trimoxazole to prevent pneumocystis pneumonia according to local practice.
The TEAMM trial outcomes
The TEAMM trial randomised 977 patients from 93 UK NHS hospitals between August 2012 and April 2016 (see Figure 1). Patients were randomised to receive levofloxacin prophylaxis (489 patients) or placebo (488 patients). There were 207 withdrawals during the trial treatment period (see Figure 1) and, since recruitment was faster than expected, the target was extended to 1000 patients. Patient characteristics were well balanced across treatment groups, in terms of stratification variables, prognostic factors and anti-myeloma therapy; 98% of patients received immunomodulatory imide drugs or proteasome inhibitors and > 99% of patients received steroids (see Table 1).
The outcomes of the TEAMM trial were used in this study to evaluate the association of biomarkers with infection episodes (febrile episodes and/or non-febrile episodes), febrile episodes, non-febrile episodes (other infections) and deaths.
The primary outcome in the TEAMM trial was time to first febrile episode or death from all causes within the first 12 weeks of trial treatment. A febrile episode was defined as a single oral temperature of ≥ 38 °C causing the patient to be given anti-infectives. A single febrile episode was defined as the initial febrile event and any subsequent fevers until that course of anti-infectives was stopped. The capture of febrile episodes was via hospital records or patient diary cards, as patients were asked to self-report temperature on a daily basis or when they felt unwell. All hospitalisations were cross-referenced and notes checked for any additional information.
Secondary outcomes assessed from start of trial treatment to 12 weeks included the number of deaths and infection-related deaths, number of days in hospital, number of days in hospital on anti-infectives, carriage of meticillin-resistant S. aureus (MRSA), C. difficile and ESBL-Gram-negative card and invasive infections. Non-febrile infections were clinically suspected infections without a temperature of ≥ 38 °C and for which anti-infectives were prescribed.
Healthy controls
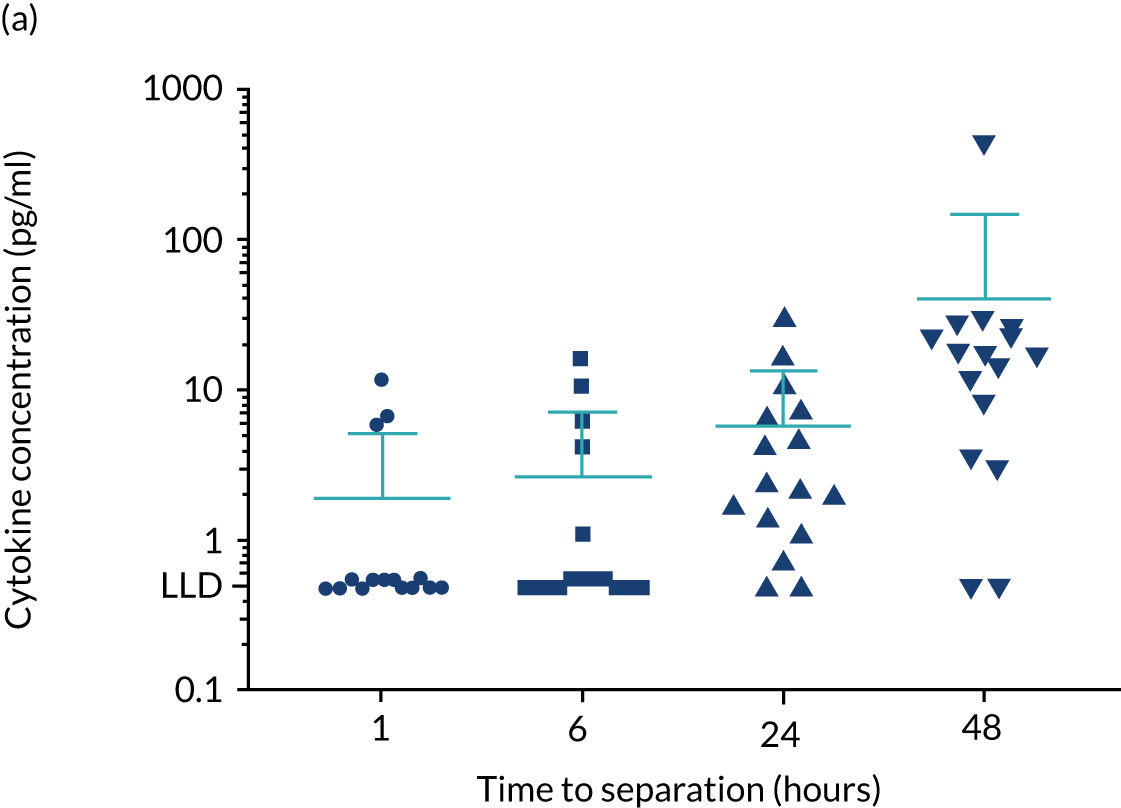
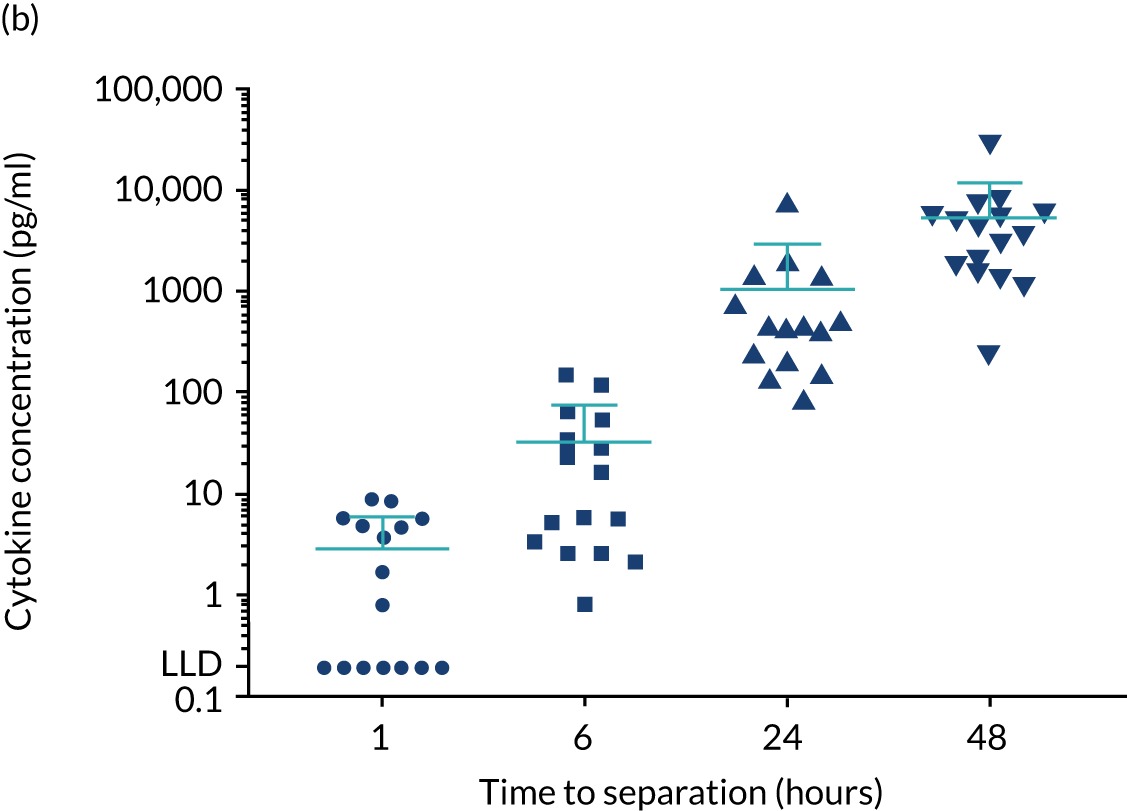
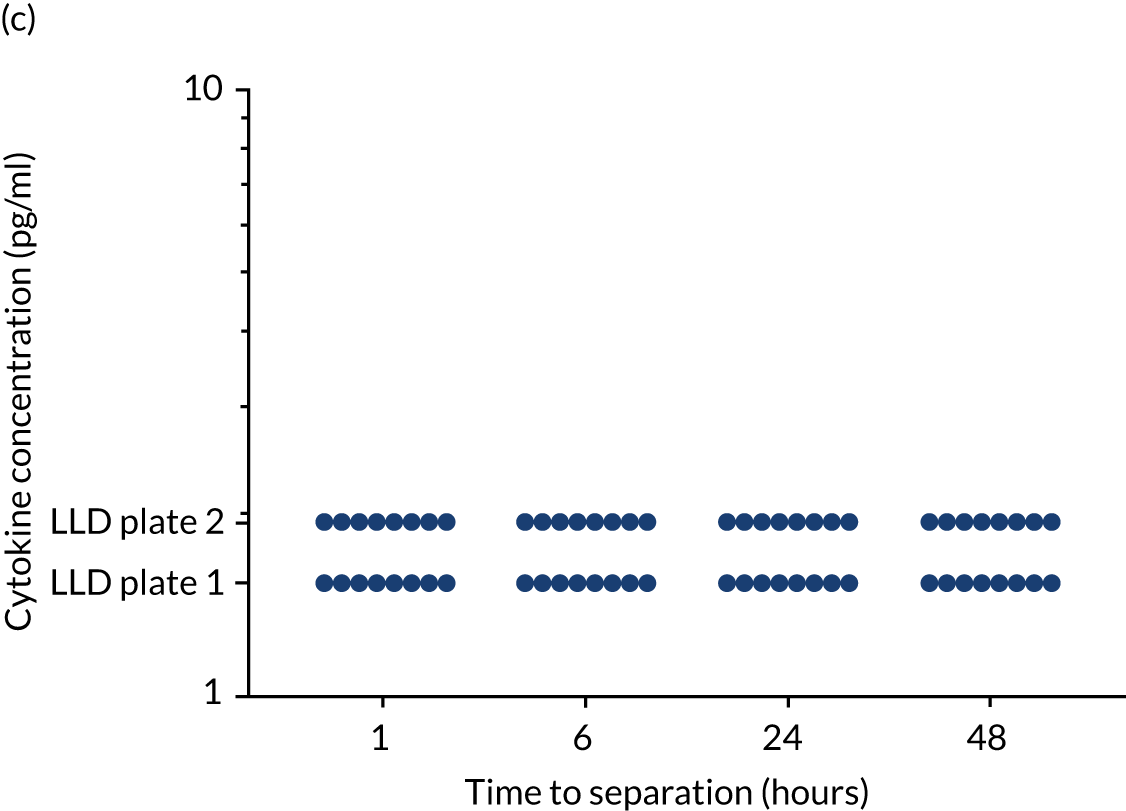
For the purpose of the EME project, two cohorts of healthy volunteers were used in the assays to identify normal ranges of biomarkers to be investigated. Recruitment of healthy controls had ethics approval from the University of Birmingham Science, Technology, Engineering and Mathematics Ethical Review Committee (reference numbers ERN 17-0213 and ERN_17-0213A) and all patients provided written informed consent. Serum samples from 193 adult donors, aged 17–65 years [from the NHS Blood and Transplant (NHSBT), Birmingham, UK], were used for the determination of normal ranges for anti-bacterial antibodies, polyclonal immunoglobulins and CD138. The sera were all obtained within 72 hours of venesection. A second cohort of healthy volunteers was used to enable fresh blood collection for the determination of normal ranges for cytokines and neutrophil biomarkers. Blood samples were obtained from 16 healthy donors from the University of Birmingham (seven males and nine females; age range 25–65 years). To enable a comparison with how the TEAMM trial patient samples had been processed, the sera from the health donors were separated from whole blood 1, 6, 24 or 48 hours after venesection. Levels of cytokines IL-6 and IL-8 increased in serum separated after ≥ 6 hours of venesection. Levels of cytokine IL-10 in healthy controls was below the assay’s lower limit of detection (Figure 3). Levels quantified in serum separated after 24 hours of venesection were used for comparison with patients in the analysis.
FIGURE 3.
Levels of cytokines IL-6, IL-8 and IL-10 in the serum of healthy controls up to 48 hours after venesection. Distribution and median levels of cytokines in (a) IL-6 serum, (b) IL-8 serum and (c) IL-10 serum of 16 healthy volunteers separated after 1 hour, 6 hours, 24 hours or 48 hours of venesection. The medians and standard deviations are shown in light blue. LLD, lower limit of detection.
Experimental methods
Multibeads Luminex assays for anti-bacterial antibodies and cytokine measures
Serum anti-bacterial antibodies were measured using an in-house multibeads Luminex® (R&D Systems, Minneapolis, MN, USA) assay currently used in the laboratory for routine clinical assessments of immune competence and vaccination response. The assay measured immunoglobulins against 19 antigens (Table 2). Assay development, methodology and validation has been published previously. 34 For IgG the following protective thresholds were applied: 0.35 µg/ml for pneumococcal antibody serotypes,35 2 µg/ml for meningococcal antibody serotypes,36 1.0 µg/ml for H. influenza type b antibody37 and 0.1 International Unit (IU)/ml (long term) for tetanus and diphtheria antibodies. 38
| Antigen | Serotype | Type of antigen | Protective levels of IgG |
|---|---|---|---|
| S. pneumoniae | Pneumococcal 1 (Pn1) | Capsular polysaccharide | ≥ 0.35 µg/ml |
| S. pneumoniae | Pneumococcal 3 (Pn3) | Capsular polysaccharide | ≥ 0.35 µg/ml |
| S. pneumoniae | Pneumococcal 4 (Pn4) | Capsular polysaccharide | ≥ 0.35 µg/ml |
| S. pneumoniae | Pneumococcal 5 (Pn5) | Capsular polysaccharide | ≥ 0.35 µg/ml |
| S. pneumoniae | Pneumococcal 6B (Pn6B) | Capsular polysaccharide | ≥ 0.35 µg/ml |
| S. pneumoniae | Pneumococcal 7F (Pn7F) | Capsular polysaccharide | ≥ 0.35 µg/ml |
| S. pneumoniae | Pneumococcal 9V (Pn9V) | Capsular polysaccharide | ≥ 0.35 µg/ml |
| S. pneumoniae | Pneumococcal 14 (Pn14) | Capsular polysaccharide | ≥ 0.35 µg/ml |
| S. pneumoniae | Pneumococcal 18C (Pn18C) | Capsular polysaccharide | ≥ 0.35 µg/ml |
| S. pneumoniae | Pneumococcal 19A (Pn19A) | Capsular polysaccharide | ≥ 0.35 µg/ml |
| S. pneumoniae | Pneumococcal 19F (Pn19F) | Capsular polysaccharide | ≥ 0.35 µg/ml |
| S. pneumoniae | Pneumococcal 23F (Pn23F) | Capsular polysaccharide | ≥ 0.35 µg/ml |
| Neisseria meningitidis | Meningococcal A (Men A) | Capsular polysaccharide | ≥ 2 µg/ml |
| Neisseria meningitidis | Meningococcal C (Men C) | Capsular polysaccharide | ≥ 2 µg/ml |
| Neisseria meningitidis | Meningococcal W-135 (Men W-135) | Capsular polysaccharide | ≥ 2 µg/ml |
| Neisseria meningitidis | Meningococcal Y (Men Y) | Capsular polysaccharide | ≥ 2 µg/ml |
| H. influenza | Influenza type b (HiB) | Capsular polysaccharide | ≥ 1 µg/ml |
| Tetanus | Toxoid | ≥ 0.1 IU/ml | |
| Diphtheria | Toxoid | ≥ 0.1 IU/ml |
Polysaccharide antigens were pre-conjugated to poly-L-lysine (PLL) and purified. PLL-conjugated antigens and toxoids were conjugated to carboxylated microspheres, each corresponding to a different bead region for the reading on a Luminex instrument. Antigen concentrations were based on previously published information and conjugated bead count was performed using a haemocytometer. The analysis of serum samples for the 19 antigens (19-plex) on multibeads was performed in a 96-well filter plate. A 12-point standard curve was obtained following a 12-fold 1 : 2 dilution of standard serum 007 in 1% phosphate-buffered saline (PBS), 0.05% bovine serum albumin (BSA) and TWEEN® 20 (Sigma-Aldrich, St Louis, MO, USA) containing 5 µg/ml pneumococcal cell wall polysaccharide. Serum samples were diluted 1 : 100 using 1% PBS, 0.05% BSA, and TWEEN 20 containing 5 µg/ml pneumococcal cell wall polysaccharide and 5 µg/ml pneumococcal serotype 22F to prevent unspecific binding. Human serum, pooled serum and serum deprived of IgGs were used as controls.
For cytokine analysis a commercially available kit was purchased from Bio-Rad Laboratories, Inc. (Hercules, CA, USA) and assays were performed following the manufacturer’s instructions. Pre-made bead-conjugated anti-IL-6, -IL-8 and -IL-10 antibodies and standards for each cytokine were included in the kit. Pooled sera from eight healthy donors were used as controls.
Beads were pre-adsorbed on the filter plate and then incubated (at room temperature) in the dark on an orbital shaker [at 500 revolutions per minute (r.p.m.)] with standards, controls or samples. Anti-human IgG antibody and a reporting system (i.e. phycoerythrin) were then added to the samples and further incubated (at room temperature) in the dark on an orbital shaker (at 500 r.p.m.). Reading and data analysis were performed on a Luminex instrument running the Bio-Plex Manager™ software (version 6.1; Bio-Rad Laboratories, Inc., Hercules, CA, USA). Coefficients of inter-plate variation are shown in Table 3.
| Assay | Coefficients of variation (%) | |
|---|---|---|
| Inter assay | Intra assay | |
| Anti-bacterial antibodies | 21.8 | 6.9 |
| Cytokines | 41.5 | 5.2 |
| CD138 | 16.2 | 3.8 |
| Neutrophil elastase | 14.2 | 10.0 |
| MMP9 | 30.8 | 16.0 |
| Lactoferrin | 17.2 | 31.0 |
| NETs | 28.9 | 17.0 |
| Calprotectin | 32.1 | 7.0 |
Enzyme-linked immunosorbent assays for the detection of neutrophil biomarkers, CD138 and procalcitonin
Detection and measurement of serum levels of neutrophil biomarkers, solCD138 and procalcitonin in the TEAMM trial patients were performed by sandwich enzyme-linked immunosorbent assays (ELISAs). Kits for the analysis of neutrophil elastase, MMP9, lactoferrin, solCD138 and procalcitonin were purchased from Abcam (Cambridge, UK). Assays were performed following manufacturers’ instructions and guidance.
A modified capture ELISA for the quantification of NETs was performed following the protocol published by Caudriller et al. 39 The capture ELISA is based on the association of myeloperoxidase (MPO) with the deoxyribonucleic acid (DNA) of NETs. Briefly, the anti-MPO capture antibody was coated on a 96-well plate overnight at 4 °C and, after washing, serum samples were added. A peroxidase-labelled anti-DNA antibody was added as a secondary antibody; the peroxidase substrate was included as the reporting system.
Calculated coefficients of inter- and intra-plate variation for all assays are shown in Table 3.
Haemagglutination assay for anti-viral antibody measures
Anti-viral antibodies were measured in the serial samples of 19 TEAMM trial patients who received flu vaccines during the trial period. Antibodies against influenza B, influenza A strains H1N1 and H3N2 were measured before and after the TEAMM trial patients had received their flu vaccine.
Haemagglutination assays (HAIs) were performed by the Division of Virology at the National Institute for Biological Standards and Control (NIBSC; Potters Bar, UK). The units of measurement of anti-viral antibodies are HAI titres, in which a HAI titre of ≥ 40 is correlated with protection against influenza infection. 40
Statistical analysis
The main analysis, to determine any associations between outcome measures and biomarkers using prespecified cut-off points were explored using, where appropriate, chi-squared tests for categorical variables using Fisher’s exact test. Mann–Whitney U-test, Friedman and Dunn’s modified test were used to compare categorical data between groups. Correlations between biomarkers and outcomes measures were investigated using Spearman’s rank test.
The analysis of time to first infection within 12 weeks was carried out using a log-rank comparison, starting from the date the patient started trial treatment to the date of first infection, or to a censor date for those patients with no infections. All randomised patients were included in an intention-to-treat analysis and assessed using Kaplan–Meier curves and the log-rank test. 41 Overall survival was calculated from date of starting trial treatment to the date of death or censor, as appropriate. Cox proportional hazards models were utilised to compare factors after adjustment for age and treatment pathway. 42 Statistical analyses were performed using IBM® SPSS Statistics (version 21; IBM, Portsmouth, UK), Prism (version 8; GraphPad, GraphPad Software Inc., San Diego, CA, USA) and SAS® (version 9.3; SAS Institute Inc., Cary, NC, USA) software.
Chapter 3 Results
Objective 1: measuring biomarkers of immune competence to develop risk stratification of patients for infection so that the decision to prescribe antibiotic prophylaxis can be personalised
Total levels of polyclonal IgG, IgA and IgM
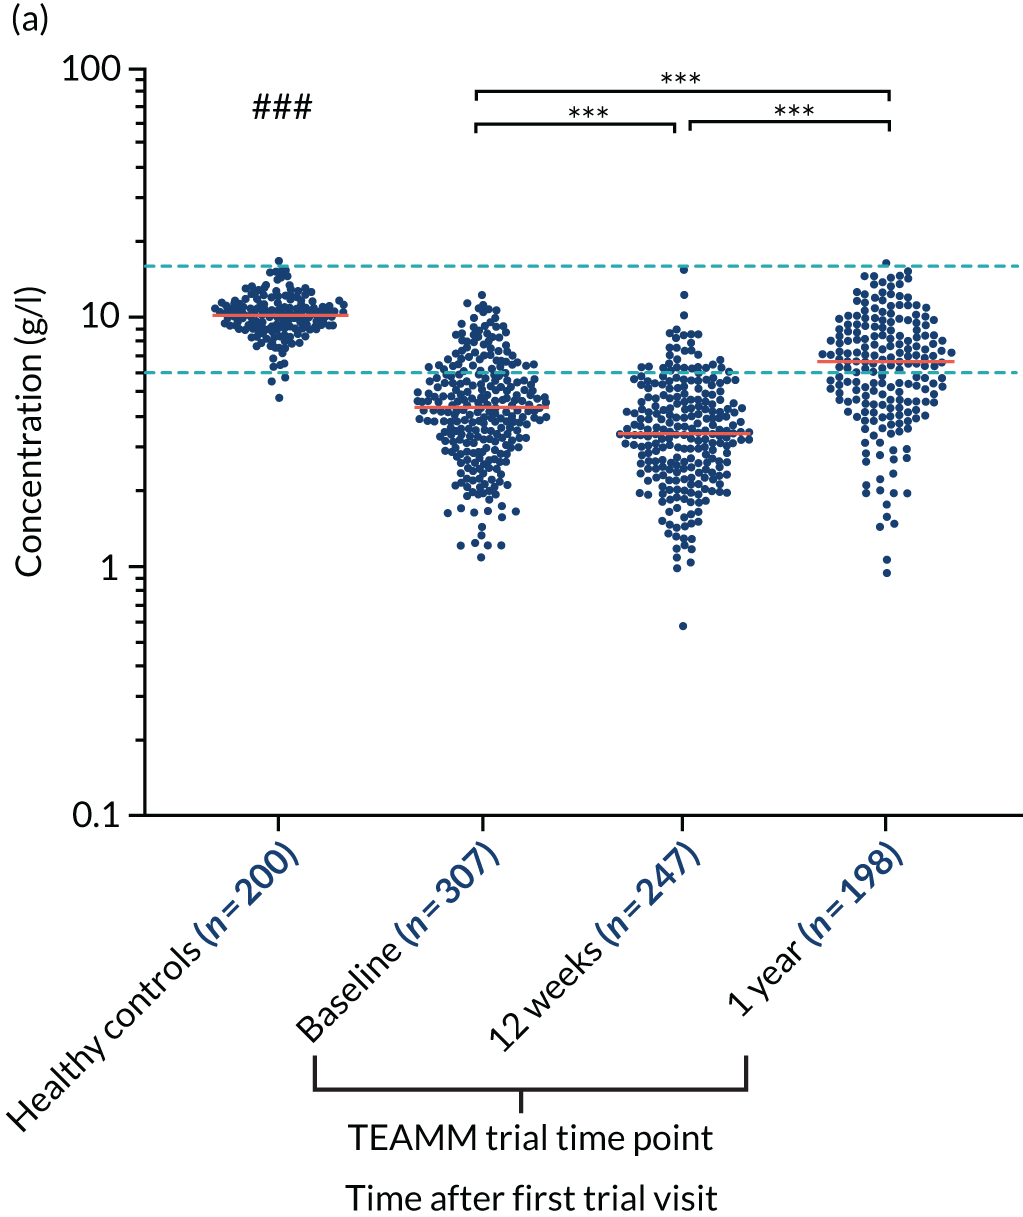
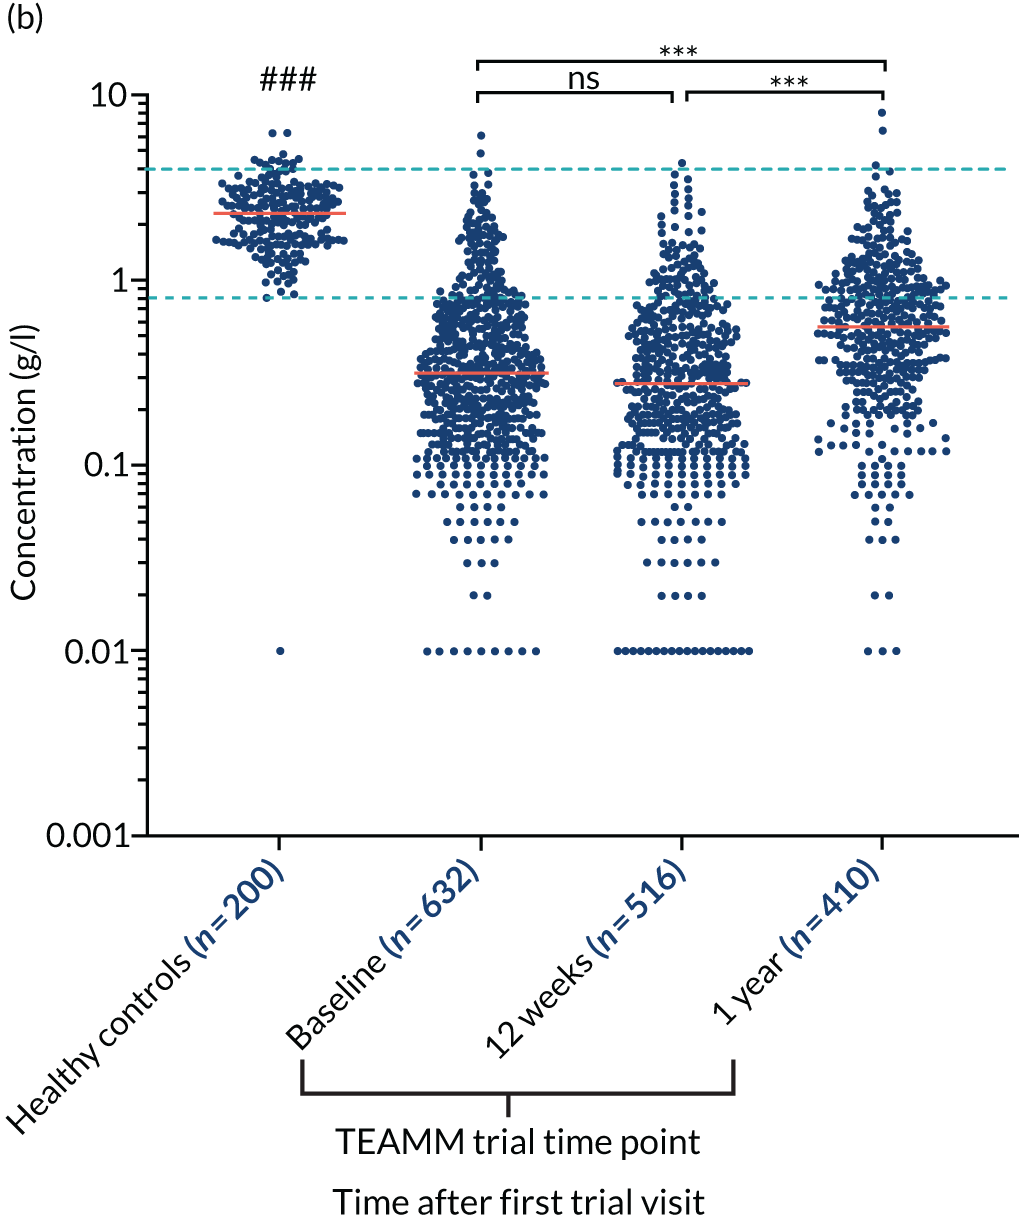
Suppression of polyclonal immunoglobulin levels (immunoparesis) is a hallmark of myeloma. More than 80% of myeloma patients are expected to have levels of polyclonal immunoglobulins below the normal range,43 which contributes to the increased susceptibility to infections identified in patients. Levels of polyclonal IgG, IgA and IgM were measured in TEAMM trial participants without an IgG, IgA and IgM myeloma monoclonal protein (m-protein), respectively:
-
polyclonal IgG levels –
-
in healthy controls: 10.17 g/l
-
TEAMM trial participants at baseline: 4.40 g/l
-
TEAMM trial participants at 12 weeks: 3.44 g/l
-
TEAMM trial participants at 1 year: 6.65 g/l
-
-
polyclonal IgA levels –
-
in healthy controls: 2.28 g/l
-
TEAMM trial participants at baseline: 0.32 g/l
-
TEAMM trial participants at 12 weeks: 0.28 g/l
-
TEAMM trial participants at 1 year: 0.55 g/l
-
-
polyclonal IgM levels –
-
in healthy controls: 0.90 g/l
-
TEAMM trial participants at baseline: 0.17 g/l
-
TEAMM trial participants at 12 weeks: 0.18 g/l
-
TEAMM trial participants at 1 year: 0.28 g/l.
-
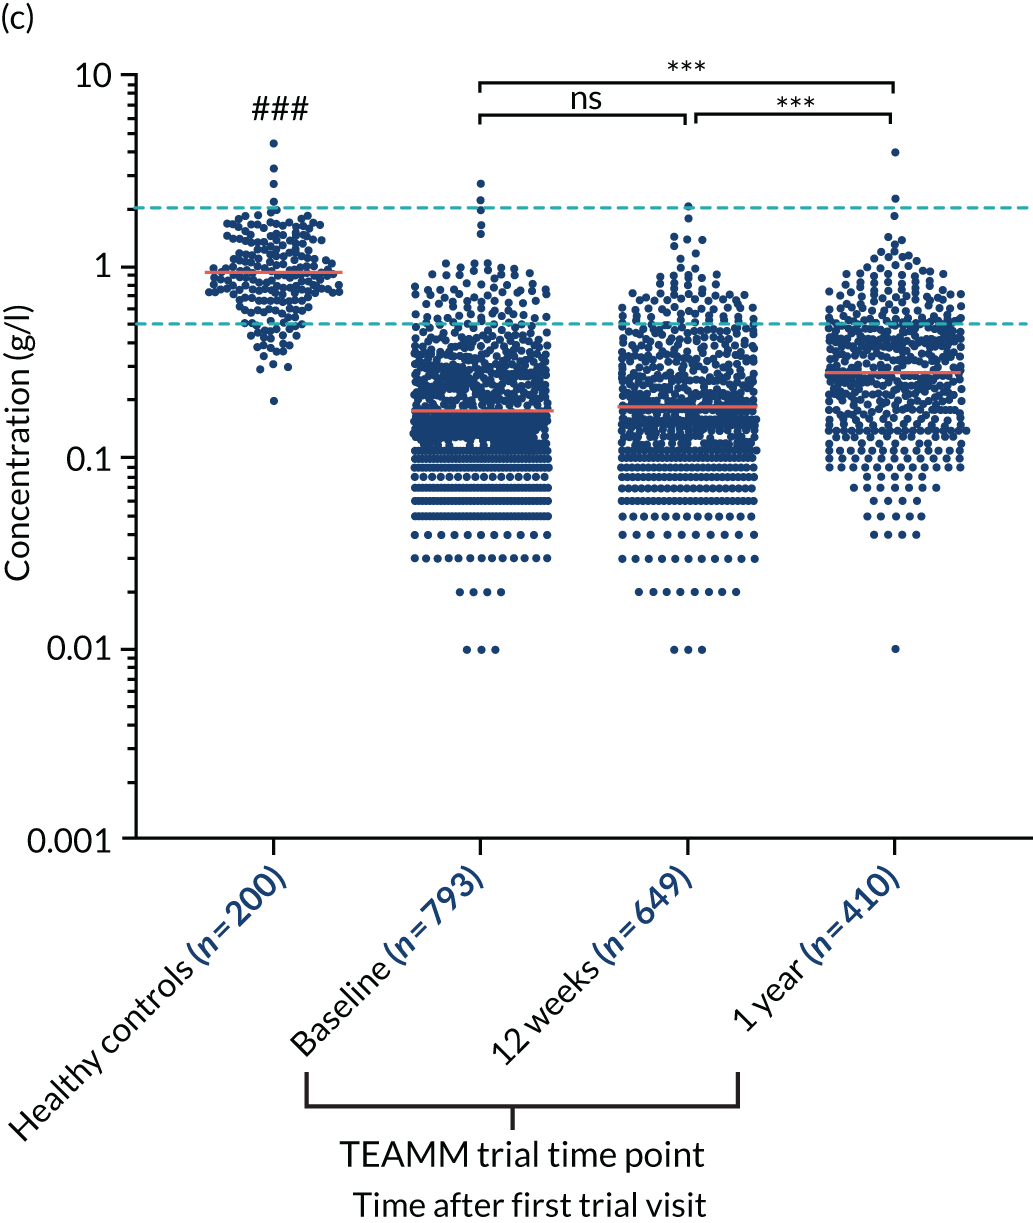
At baseline, the majority of TEAMM trial patients had levels of polyclonal IgG (76%), IgA (83%) and IgM (90%) below the normal range (Figure 4). Median levels of polyclonal IgG were further decreased after 12 weeks of therapy, whereas polyclonal IgA and IgM levels remained unaltered compared with baseline. After 1 year, polyclonal levels for all three types of immunoglobulins had increased compared with baseline. The median levels of polyclonal IgG were within the normal range, recovering above levels at diagnosis. However, despite levels increasing above baseline, median levels of IgA and IgM remained below the normal range at 1 year. For all three types of polyclonal immunoglobulins median levels in the TEAMM trial patients at all time points were significantly lower than median levels identified in the healthy cohort.
FIGURE 4.
Levels of polyclonal immunoglobulins in the TEAMM trial and the healthy controls. (a) Polyclonal IgG levels; (b) polyclonal IgA levels; and (c) polyclonal IgM levels. The distribution and median levels (red lines) of polyclonal immunoglobulins IgG, IgA and IgM in a healthy cohort and in TEAMM trial patients at baseline, after 12 weeks of therapy and at 1 year. For TEAMM trial patients, IgG levels are from those patients who do not have an IgG m-protein; IgA levels are from those patients who do not have an IgA m-protein; and IgM levels are from those patients who do not have an IgM m-protein. The fifth and 95th percentile of normal ranges identified in healthy conditions are shown as light blue dotted lines. Statistical significant differences between TEAMM trial patients’ median values and healthy controls’ median values is represented with # (i.e. a p-value of < 0.001 = ###), whereas statistical significance between TEAMM trial time points are indicated with * (not significant = ns; a p-value of < 0.001 = ***).
Serum IgG antibody levels against bacterial antigens commonly associated with infections (i.e. pneumococcus, meningococcus, Haemophilus influenza type b, tetanus and diphtheria toxoid)
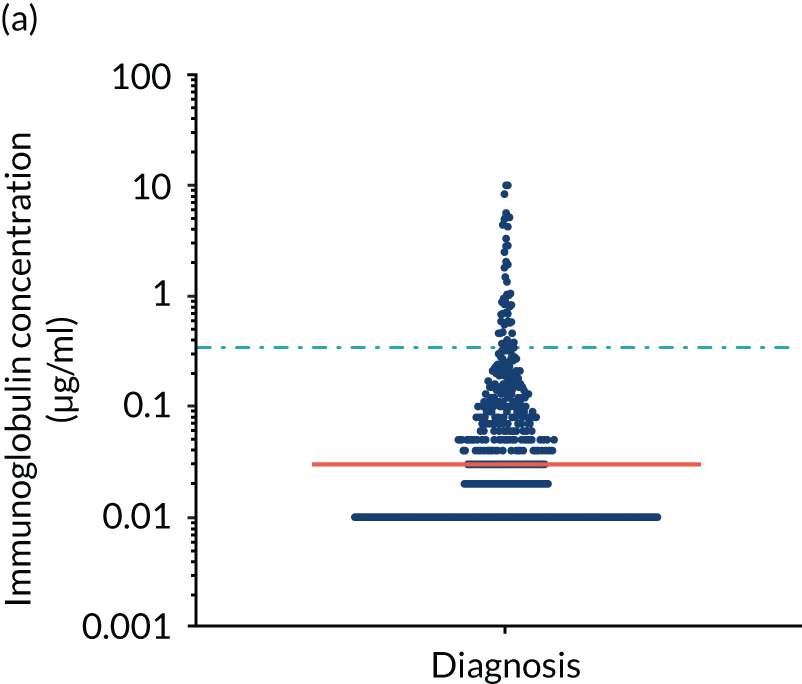
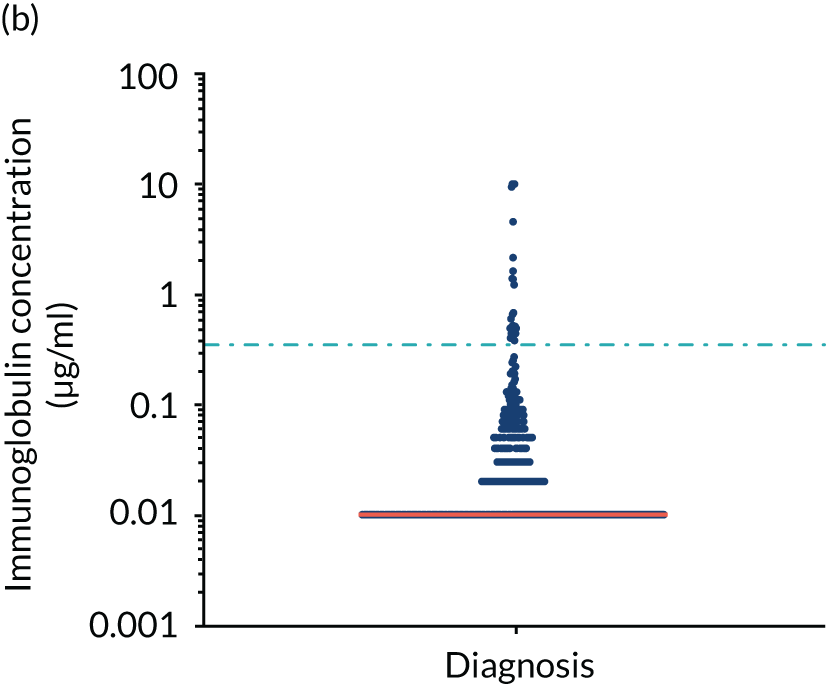
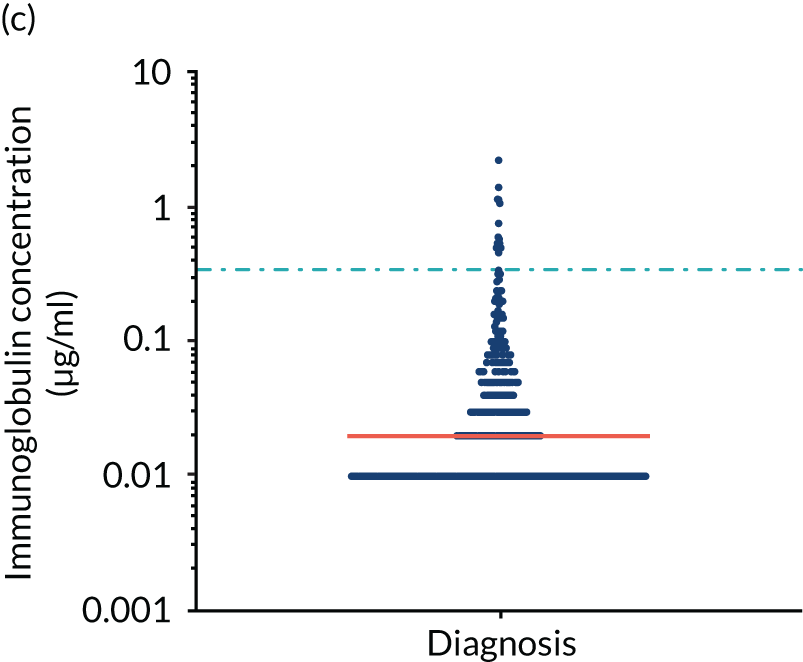
Anti-bacterial antibody levels against commonly encountered bacterial antigens have been quantified at baseline for 841 of the TEAMM trial patients. This analysis is the largest of its kind in a cohort of myeloma patients and provided novel information regarding immune competence in myeloma and the severity of impaired antibody defence that patients have against bacterial infections. The World Health Organization (WHO) provides guidelines regarding the levels of anti-bacterial antibodies expected in individuals for protection against infections. The distribution of anti-bacterial antibodies in the TEAMM trial is shown in Figure 5 along with the WHO’s protective threshold level as discontinuous lines. The median antibody levels of TEAMM trial patients were below the recommended protection levels for 18 of the 19 bacterial antigens tested. The only exception was identified for the bacterial pneumococcal serotype 14, against which the median level of antibodies in TEAMM trial patients was comparable to the WHO’s protective level; however, this still left 40% of patients without protection.
FIGURE 5.
Levels of anti-bacterial antibodies in TEAMM trial patients at disease presentation compared with thresholds of protection against bacterial infections. A scatterplot showing the distribution of anti-bacterial immunoglobulins in 841 TEAMM trial patients at disease presentation and their cumulative median level (in red) along with the WHO’s protective threshold level as discontinuous lines. At baseline, myeloma patients are immunocompromised and present levels of anti-bacterial immunoglobulins below the WHO-recommended threshold. (a) Pn1 IgG; (b) Pn3 IgG; (c) Pn4 IgG; (d) Pn5 IgG; (e) Pn6B IgG; (f) Pn7F IgG; (g) Pn9V IgG; (h) Pn14 IgG; (i) Pn18C IgG; (j) Pn19A IgG; (k) Pn19F IgG; (l) Pn23F IgG; (m) HiB IgG; (n) tetanus IgG; (o) diphtheria IgG; (p) Men A IgG; (q) Men C IgG; (r) Men W-135 IgG; and (s) Men Y IgG. HiB, H. influenza type b; men, meningococcal; Pn, pneumococcal.
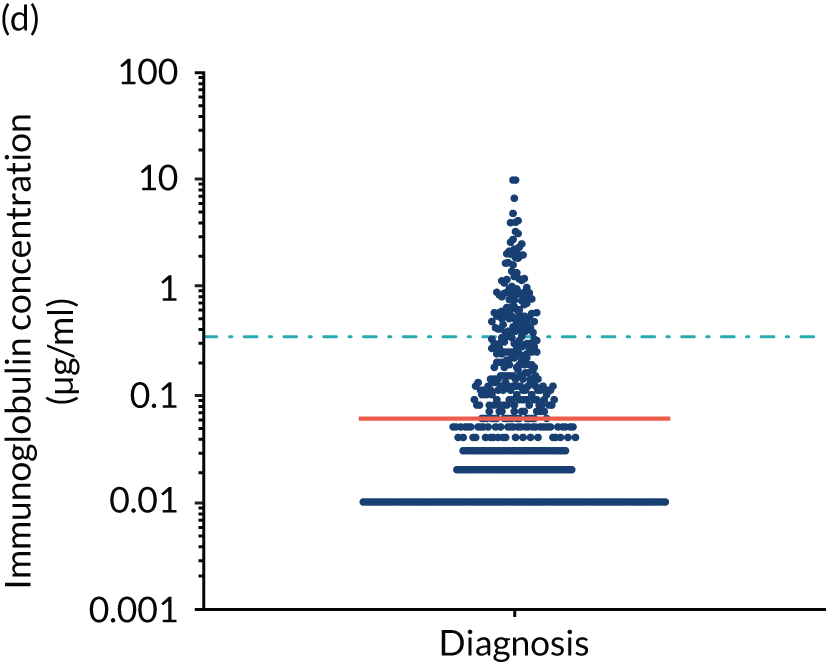
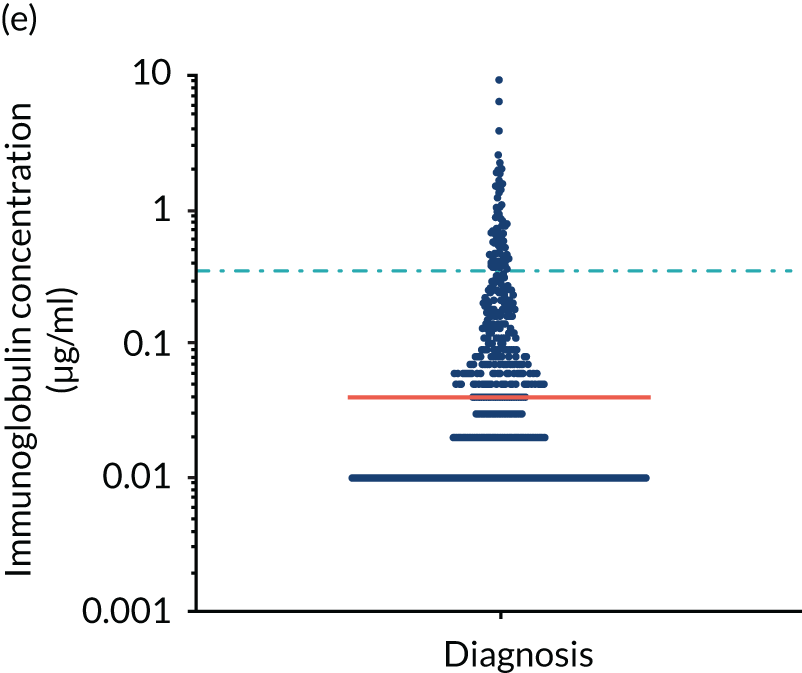
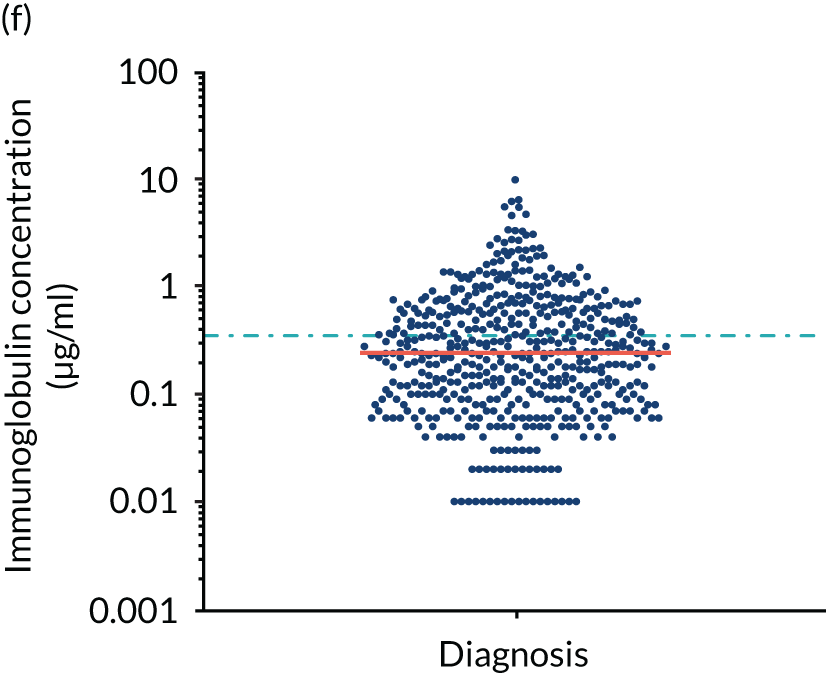
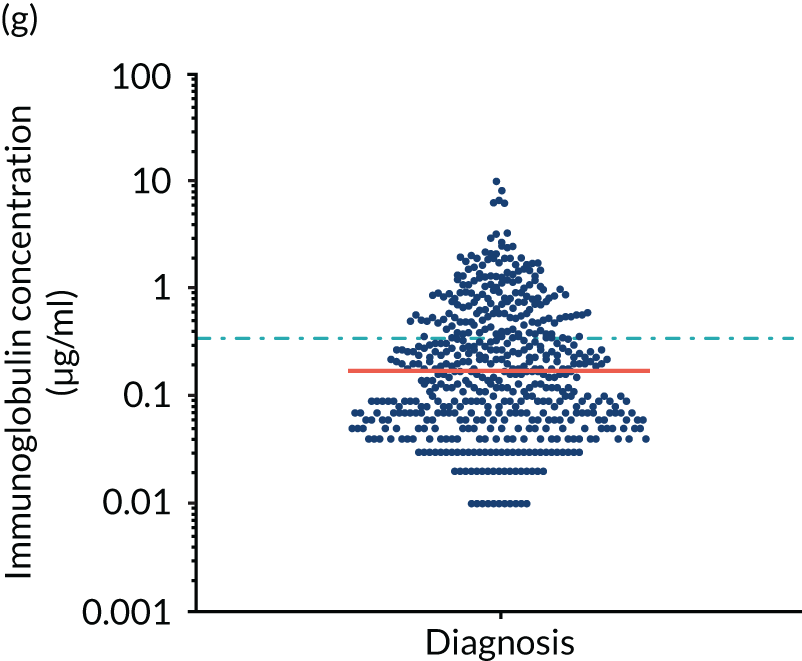
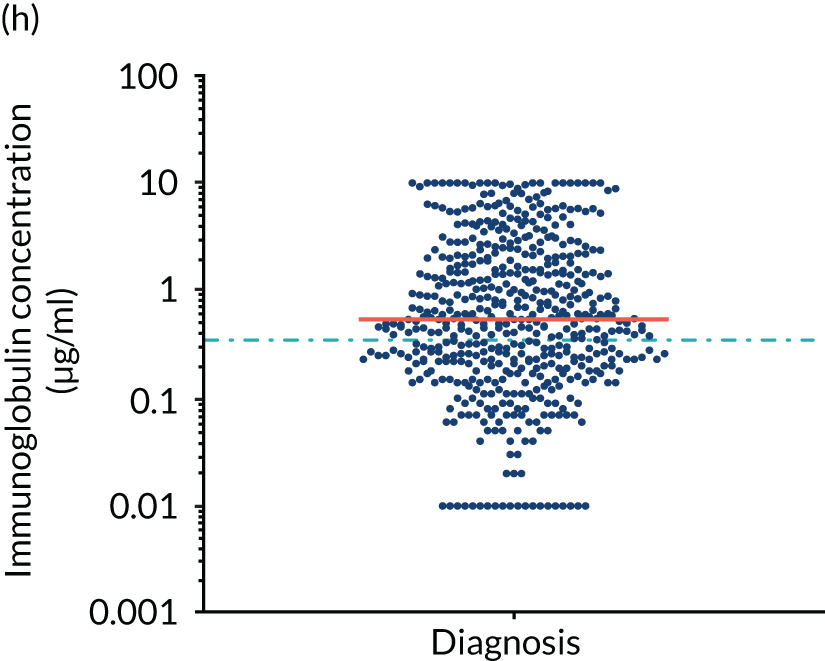
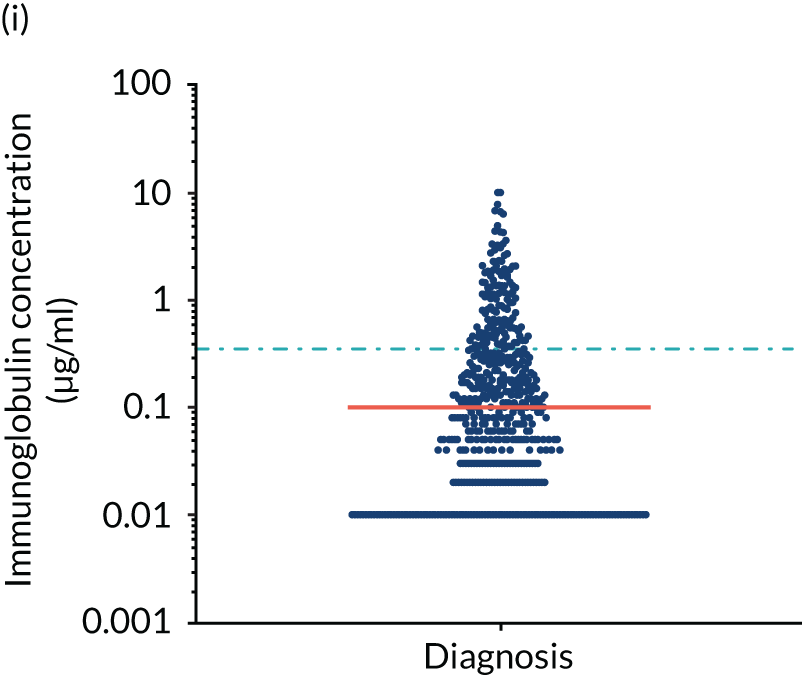
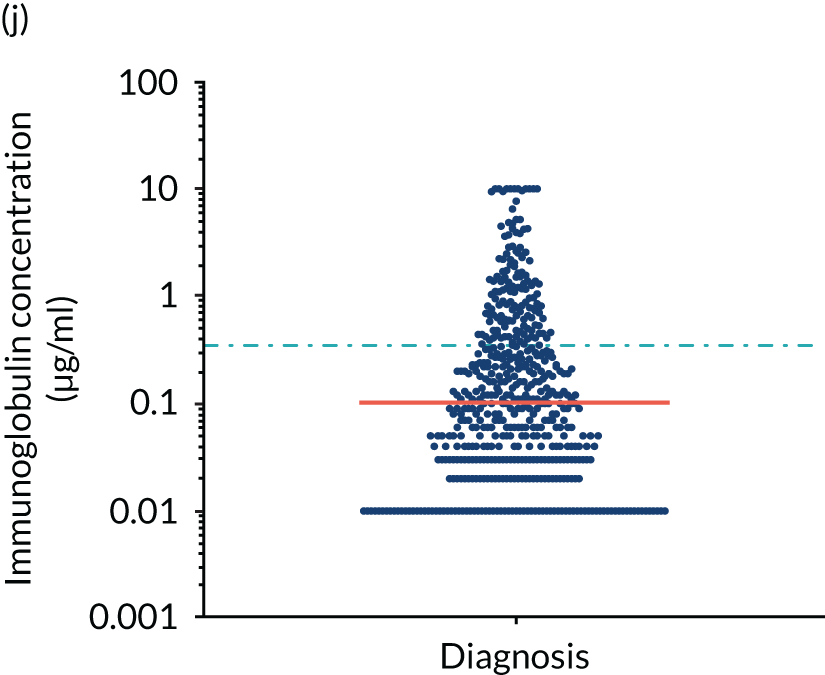
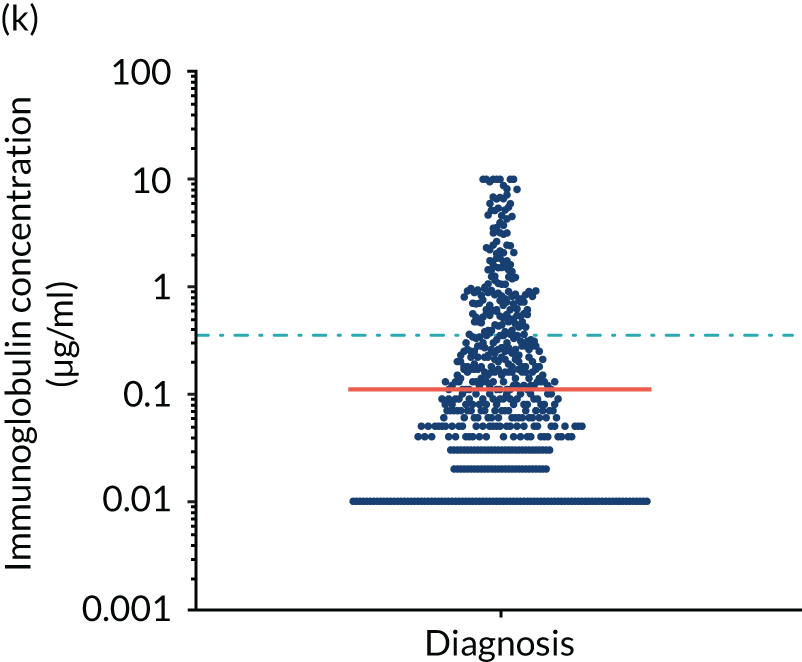
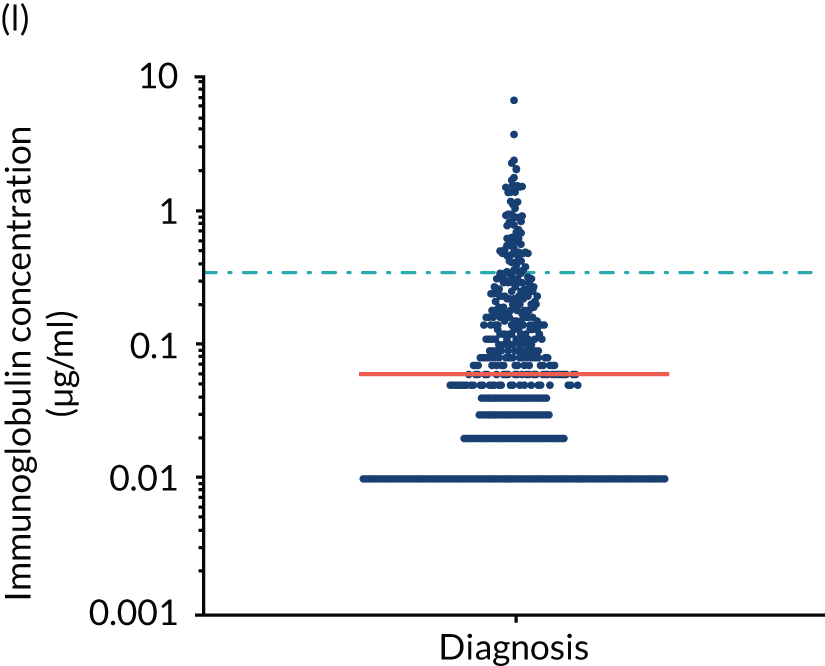
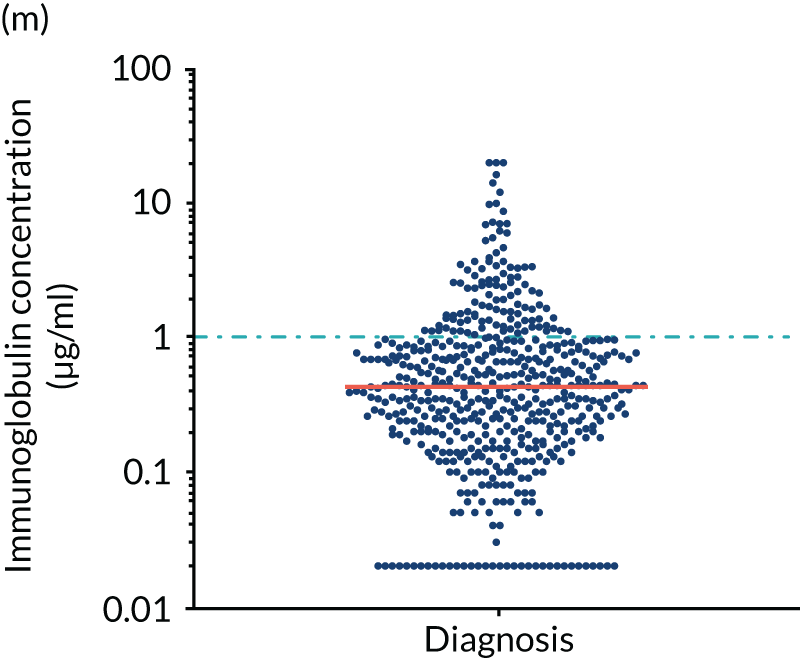
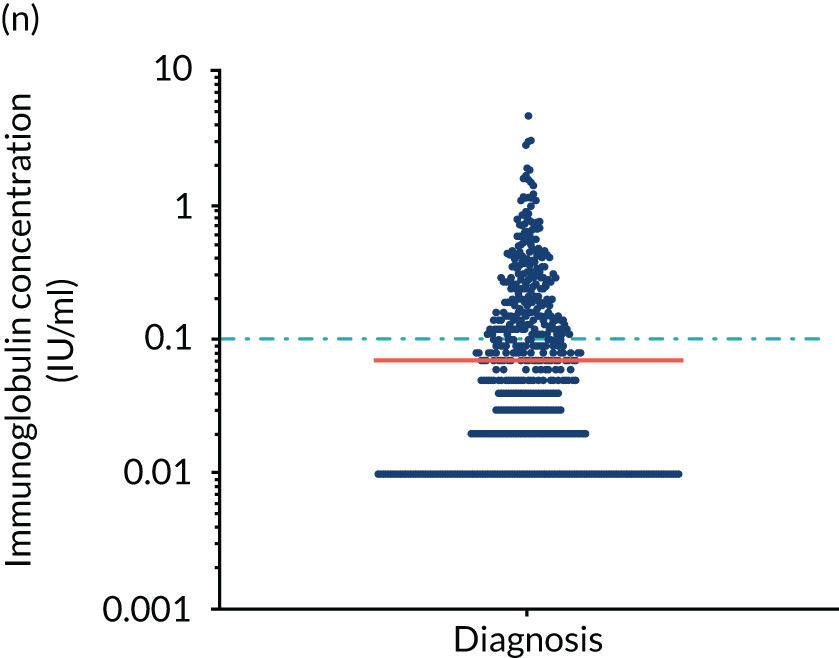
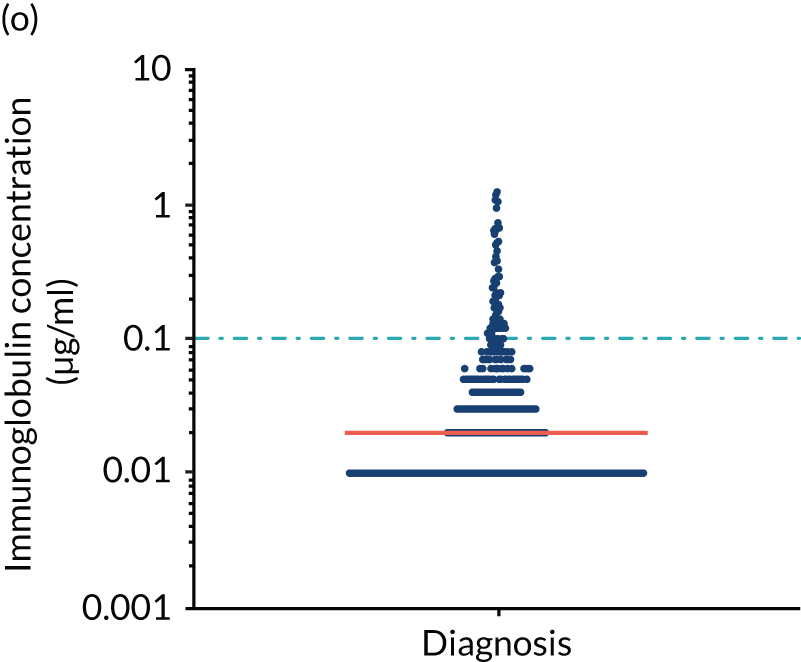
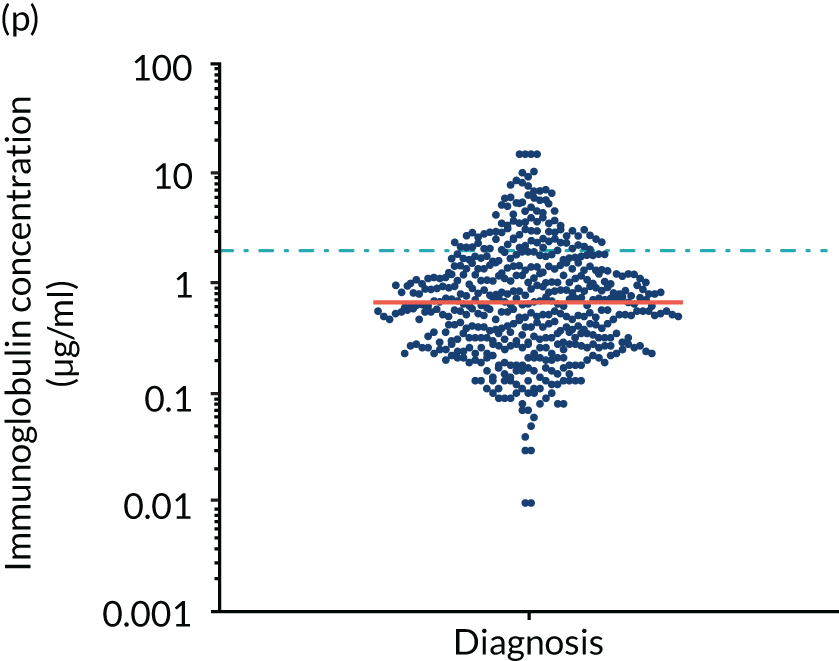
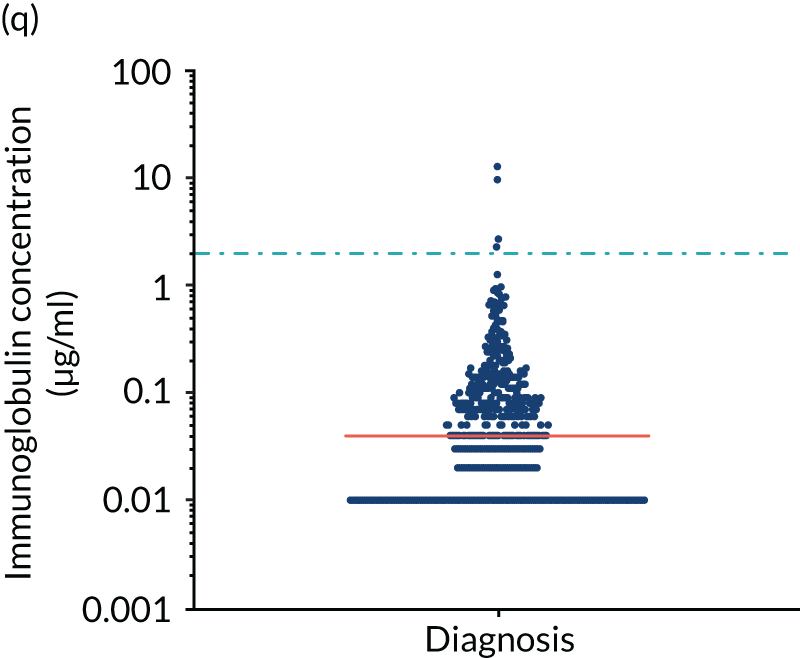
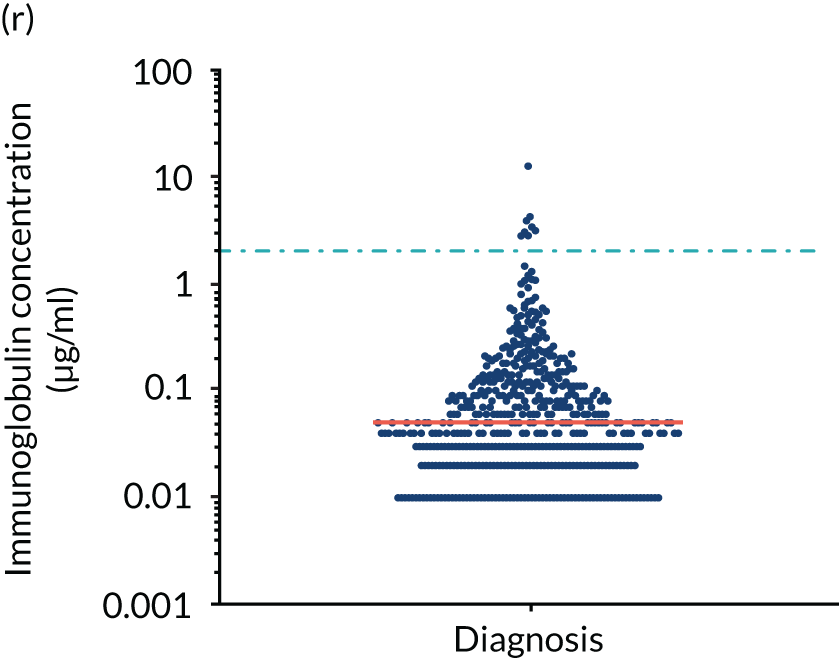
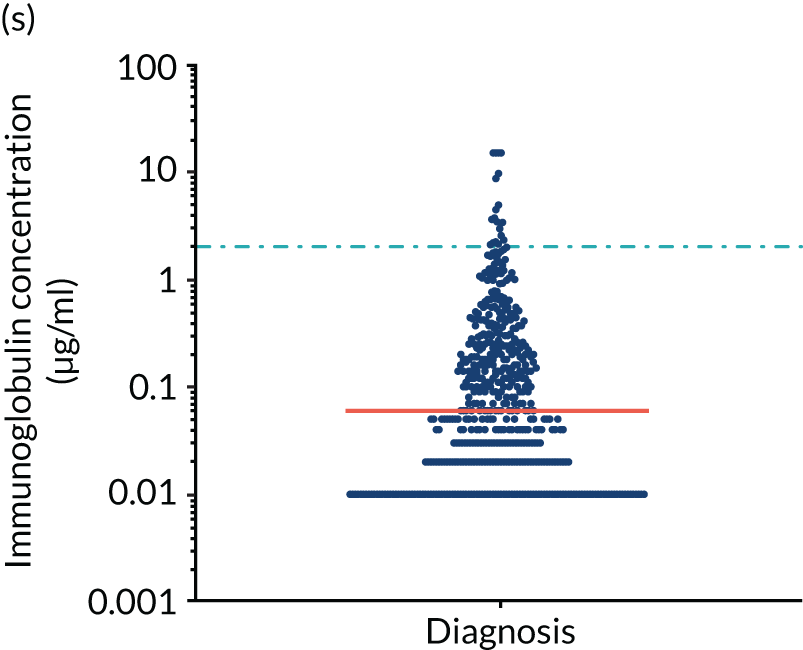
Antibody protection was previously characterised against these infective agents in a cohort of 193 healthy volunteers. 34 Compared with this healthy cohort (Table 4), a significantly lower percentage of TEAMM trial patients demonstrated protective levels for all bacterial antigens. Typically, > 55% of healthy donors exhibited protective levels against any of the bacterial targets compared with < 20% of myeloma patients. Pneumococcal (Pn) serotypes Pn1, Pn3 and Pn4 had strikingly low protection rates with < 10% of myeloma patients having the minimum level required for protection.
| Antigens (protective threshold) | Cohort | Chi-squared p-value | Significance | |||
|---|---|---|---|---|---|---|
| TEAMM trial (n = 84) | Healthy (n = 193) | |||||
| Median (% of healthy median values)a | % with a protective concentrationb | Median | % with a protective concentrationb | |||
| S. pneumoniae (≥ 0.35 µg/ml) | ||||||
| Pn1 | 0.03 (14) | 9 | 0.22 | 40 | < 0.0001 | *** |
| Pn3 | 0.01 (2) | 5 | 0.56 | 59 | < 0.0001 | *** |
| Pn4 | 0.02 (7) | 2 | 0.30 | 45 | < 0.0001 | *** |
| Pn5 | 0.06 (13) | 19 | 0.47 | 58 | < 0.0001 | *** |
| Pn6B | 0.04 (5) | 11 | 0.87 | 69 | < 0.0001 | *** |
| Pn7F | 0.24 (28) | 40 | 0.87 | 76 | < 0.0001 | *** |
| Pn9V | 0.16 (27) | 30 | 0.60 | 61 | < 0.0001 | *** |
| Pn14 | 0.55 (28) | 61 | 1.93 | 81 | < 0.0001 | *** |
| Pn18C | 0.11 (10) | 26 | 1.11 | 76 | < 0.0001 | *** |
| Pn19A | 0.10 (5) | 26 | 2.20 | 89 | < 0.0001 | *** |
| Pn19F | 0.11 (10) | 28 | 1.07 | 75 | < 0.0001 | *** |
| Pn23F | 0.06 (9) | 15 | 0.66 | 65 | < 0.0001 | *** |
| H. influenza (≥ 1 µg/ml) | ||||||
| HiB | 0.42 (58) | 21 | 0.73 | 41 | < 0.0001 | *** |
| Tetanus (≥ 0.1 IU/ml) | 0.07 (4) | 41 | 1.77 | 95 | < 0.0001 | *** |
| Diphtheria (≥ 0.1 IU/ml) | 0.02 (33) | 13 | 0.06 | 34 | < 0.0001 | *** |
| N. meningitidis (≥ 2 µg/ml) | ||||||
| Men A | 0.64 (24) | 17 | 2.63 | 56 | < 0.0001 | *** |
| Men C | 0.04 (33) | 1 | 0.12 | 10 | < 0.0001 | *** |
| Men W-135 | 0.05 (31) | 1 | 0.16 | 4 | 0.008 | ** |
| Men Y | 0.07 (30) | 4 | 0.23 | 18 | < 0.0001 | *** |
| Polyclonal immunoglobulins (g/l) | ||||||
| IgG | 4.4 (43) | 10.17 | ||||
| IgA | 0.32 (14) | 2.28 | ||||
| IgM | 0.17 (19) | 0.90 | ||||
In clinical assessment of response to pneumococcal vaccines containing multiple serotypes (typically 13–23) in healthy individuals a response is considered normal when inducing protective levels against two-thirds of serotypes (8/12). The healthy controls in this study were UK blood donors under the age of 65 years and thus unlikely to have ever been vaccinated against pneumococcus. Therefore, these blood donors’ antibody levels against pneumococcal serotypes are the result of natural exposure. By contrast, TEAMM trial patients over the age of 65 years were likely to have received the 23-valent polysaccharide pneumococcal vaccine PPV23 (PNEUMOVAX® 23; Merck, Sharp & Dohme, Kenilworth, NJ, USA) as part of the UK NHS vaccine schedule administered in primary care to all individuals in the autumn in their 66th year. Notably, only 6% of myeloma patients had protective levels for two-thirds of pneumococcal serotypes compared with 55% of healthy blood donors. Indeed, only 15% and 33% of patients had protective levels for half and one-third of serotypes, respectively. The highest level of protection for the healthy donors was found for tetanus, in which 95% of individuals displayed protective levels in contrast to 41% of myeloma patients. Even for the tetanus toxoid, the levels of toxoid-specific IgG were lower than total IgG levels (i.e. 4% vs. 43% of normal median levels). For 18 out of 19 bacterial antigen targets, levels of specific IgG were substantially lower than the levels of total polyclonal IgG.
Adaptive immunity wanes as age increases above 50 years and in people over 65 years of age antibody response to vaccination is substantially less than in younger individuals. Antibody protection against bacterial antigens was found to differ between patients < 65 and patients ≥ 65 years of age (Table 5). As expected, proportionately more young patients had protective levels against meningococcal serotypes, H. influenza type b, and tetanus and diphtheria toxoids. However, a higher proportion of older individuals showed protective levels against pneumococcal serotypes than of younger patients. These differences between antigens based on age reflect the UK’s PPV23 vaccination programme for individuals aged ≥ 65 years. Although these findings provide some support for the efficacy of the current vaccination programme in this age/patient population, significant differences were found for only three pneumococcal serotypes. Furthermore, the majority of older patients still failed to meet protective levels and only 6% of patients demonstrated protective levels for 8 out of 12 serotypes, which is a normal adult response to PPV23 vaccination.
| Antigens (protective threshold) | Age (years) of TEAMM trial participant, % with protective concentrationa | Chi-squared p-value | Significance | |
|---|---|---|---|---|
| Under 65 years (n = 339) | Over 65 years (n = 503) | |||
| S. pneumoniae (≥ 0.35 µg/ml) | ||||
| Pn1 | 5 | 12 | < 0.0001 | *** |
| Pn3 | 5 | 4 | 0.7286 | ns |
| Pn4 | 1 | 3 | 0.0878 | ns |
| Pn5 | 14 | 22 | 0.0009 | *** |
| Pn6B | 10 | 12 | 0.396 | ns |
| Pn7F | 38 | 41 | 0.4714 | ns |
| Pn9V | 28 | 31 | 0.2048 | ns |
| Pn14 | 59 | 62 | 0.2829 | ns |
| Pn18C | 17 | 32 | < 0.0001 | *** |
| Pn19A | 23 | 28 | 0.0772 | ns |
| Pn19F | 25 | 29 | 0.1177 | ns |
| Pn23F | 13 | 16 | 0.2446 | ns |
| 8 out of 12 Pn serotypes | 5 | 6 | 0.2261 | ns |
| H. influenza (≥ 1 µg/ml) | ||||
| HiB | 22 | 21 | 0.7235 | ns |
| Tetanus (≥ 0.1 IU/ml) | 46 | 37 | 0.0064 | ** |
| Diphtheria (≥ 0.1 IU/ml) | 13 | 13 | 0.7629 | ns |
| N. meningitidis (≥ 2 µg/ml) | ||||
| Men A | 18 | 16 | 0.7578 | ns |
| Men C | 1 | 0 | 0.0272 | * |
| Men W-135 | 2 | 1 | 0.4499 | ns |
| Men Y | 5 | 4 | 0.6828 | ns |
Correlation of functional antibody levels with infections, febrile episodes and deaths
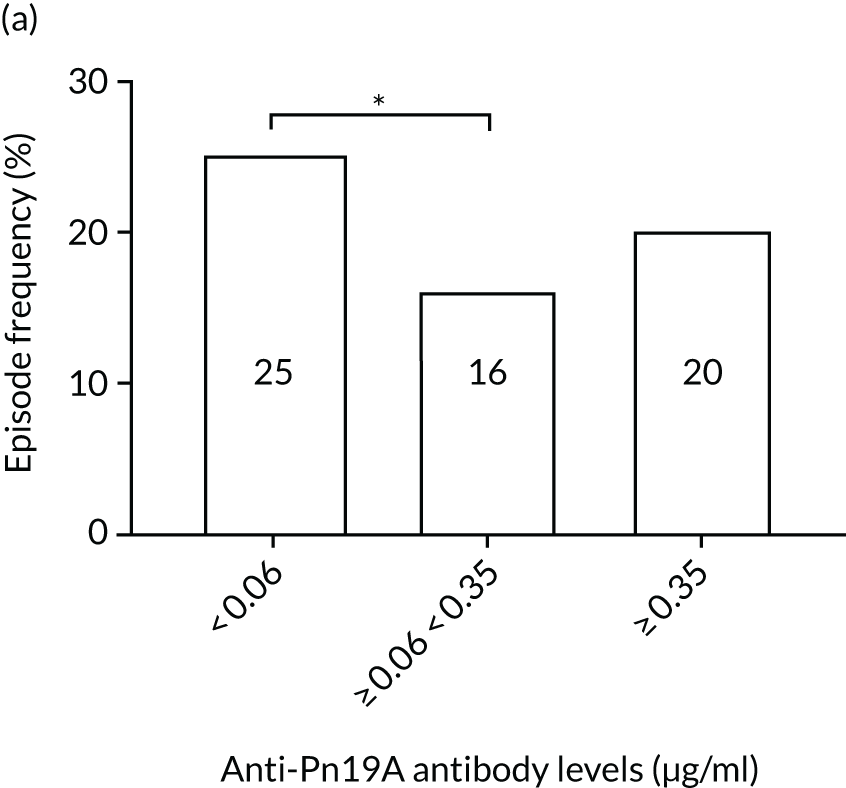
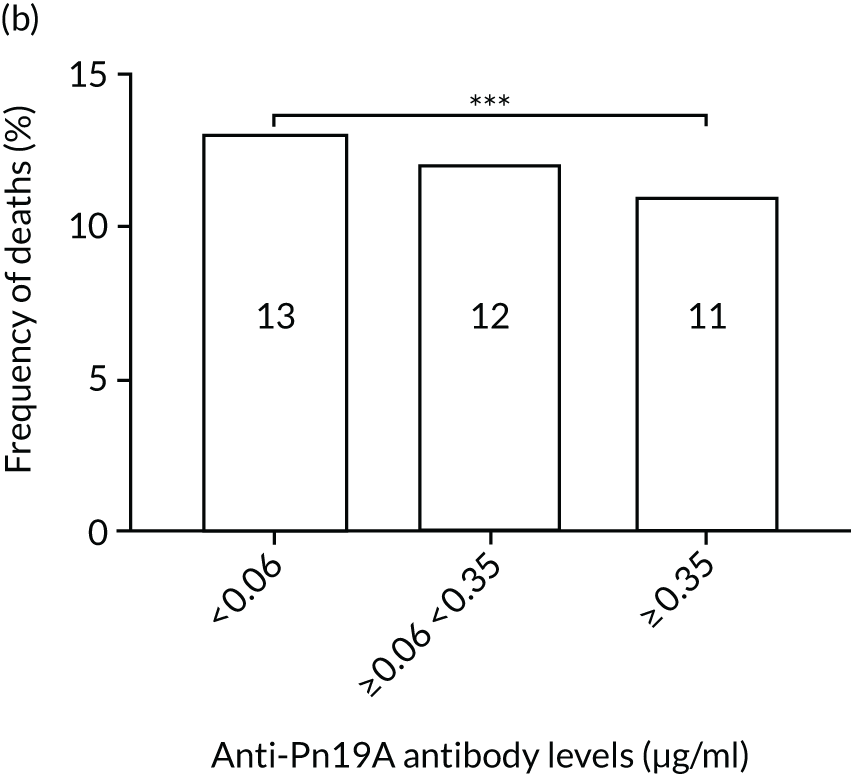
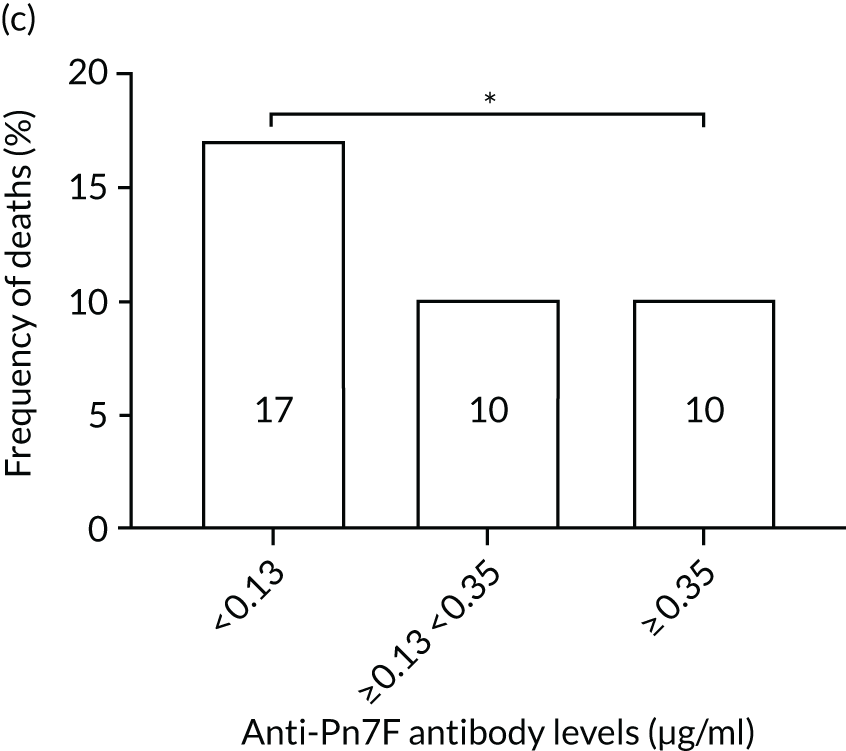
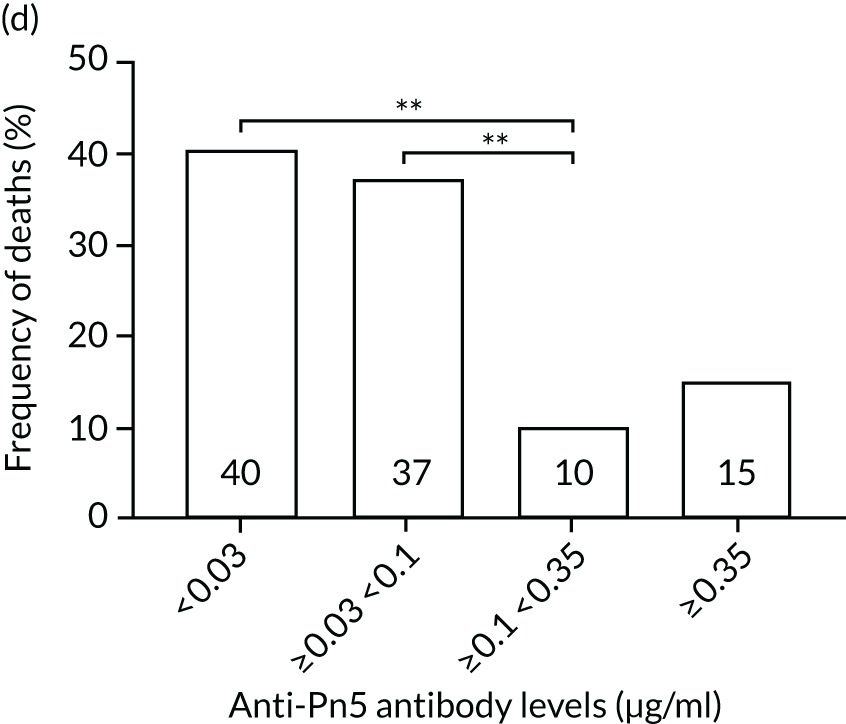
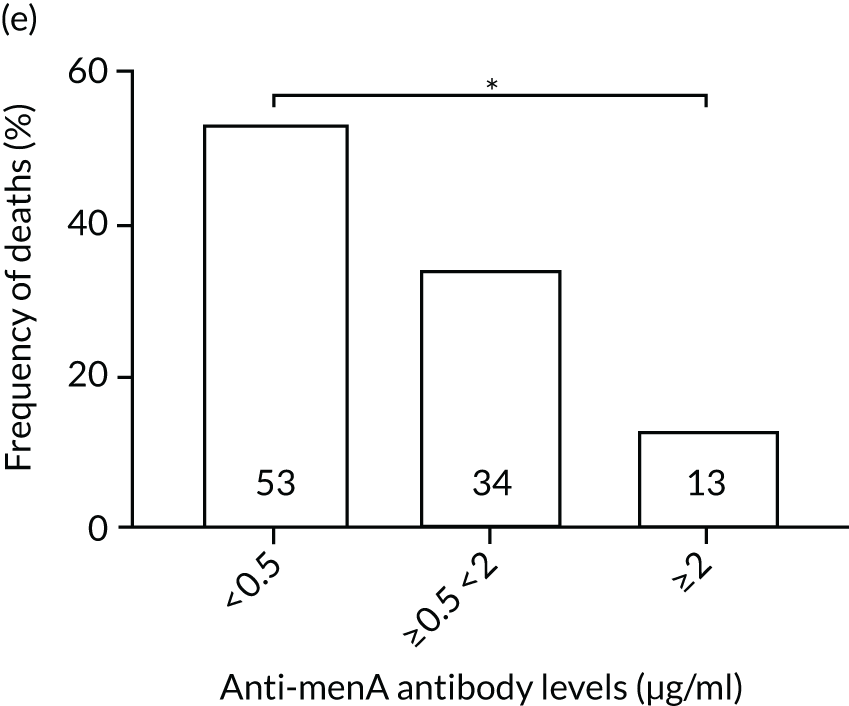
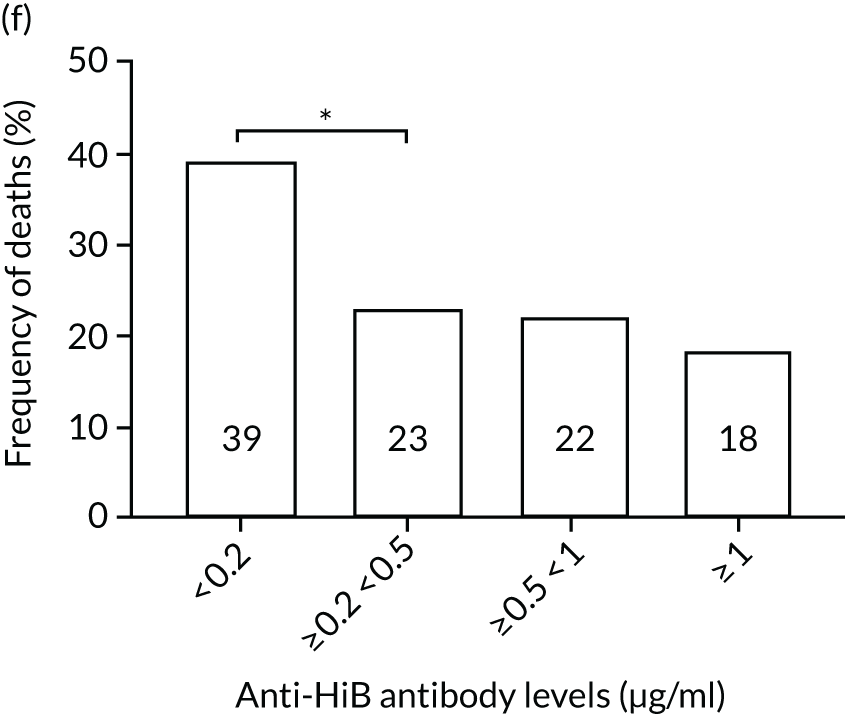
The association among antibody levels, prevalence of infections, febrile episodes and deaths in the TEAMM trial was investigated. The TEAMM patients were divided into tertiles or quartiles based on their levels of anti-bacterial antibodies to explore if those patients with the lowest levels had a higher incidence of febrile episodes and/or were more likely to die within the year following diagnosis. Frequencies of febrile episodes and deaths in these groups of patients are shown in Figure 6. Levels of anti-pneumococcal serotype 19A < 0.06µg/ml in TEAMM trial patients were associated with an increased incidence of febrile episodes and deaths (25% and 13%, respectively) up to 12 weeks after the beginning of treatment, compared with patients with levels above 0.06 µg/ml (16% and 12%, respectively) and with patients with levels above the WHO-recommended threshold of 0.35 µg/ml (20% and 11%, respectively). Other associations were found between low levels of antibodies against pneumococcal serotypes and occurrence of deaths. Levels of anti-pneumococcal serotype 5 < 0.1 µg/ml were associated with an increased incidence of deaths, > 37% compared with < 15% in patients with levels ≥ 0.1 µg/ml. Similarly, deaths were more frequent in patients with levels of anti-pneumococcal serotype 7F < 0.13 µg/ml (i.e. in 17% of patients) than in patients with levels ≥ 0.13 µg/ml (i.e. in 10% of patients). Low levels of antibodies against other bacterial antigens not part of the pneumococcal family were also found to be associated with an increased numbers of deaths in the TEAMM trial at 1 year. Deaths were more frequent in patients with antibody levels against H. influenza type b < 0.2 µg/ml (i.e. 39% of patients) than in patients with levels of antibodies above this threshold (≤ 23%). Similarly, lower levels of antibodies against meningococcal serotype A were found to be associated with the occurrence of death (53% vs. ≤ 34%) in the TEAMM trial.
FIGURE 6.
Frequencies of febrile episodes and deaths in TEAMM trial patients stratified into groups based on their levels of anti-bacterial antibodies. Frequencies of (a) febrile episodes and (b) deaths in TEAMM trial patients with levels of anti-Pn19A antibodies < 0.06 µg/ml, between 0.06 µg/ml and 0.35 µg/ml, and ≥ 0.35 µg/ml; (c) frequency of deaths in TEAMM trial patients with levels of anti-Pn7F antibodies < 0.13 g/ml, between 0.13 g/ml and 0.35 µg/ml, and ≥ 0.35 µg/ml; (d) frequency of deaths in TEAMM trial patients with levels of anti-Pn5 antibodies < 0.03 µg/ml, between 0.03 µg/ml and 0.1 µg/ml, between 0.1 µg/ml and 0.35 µg/ml, and ≥ 0.35 µg/ml; (e) frequency of deaths in TEAMM trial patients with levels of anti-Men A antibodies < 0.5 µg/ml, between 0.5 µg/ml and 2 µg/ml, and ≥ 2 µg/ml; and (f) frequency of deaths in TEAMM trial patients with levels of anti-HiB antibodies < 0.2 µg/ml, between 0.2 µg/ml and 0.5 µg/ml, between 0.5 µg/ml and 1 µg/ml, and ≥ 1µg/ml. Statistical significance was calculated with Fisher’s exact test (*p < 0.05; **p < 0.01; ***p < 0.001). HiB, H. influenza type b; men, meningococcal.
Anti-viral antibodies
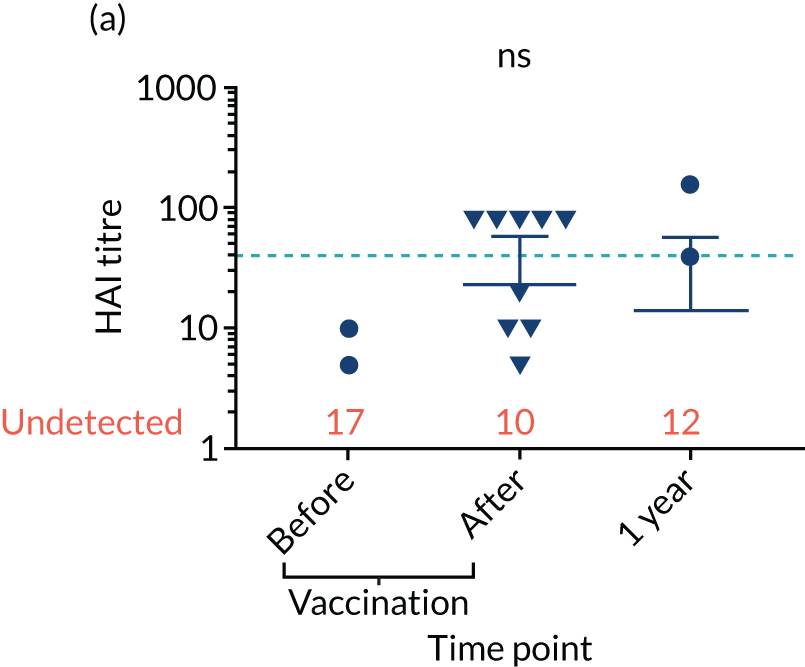
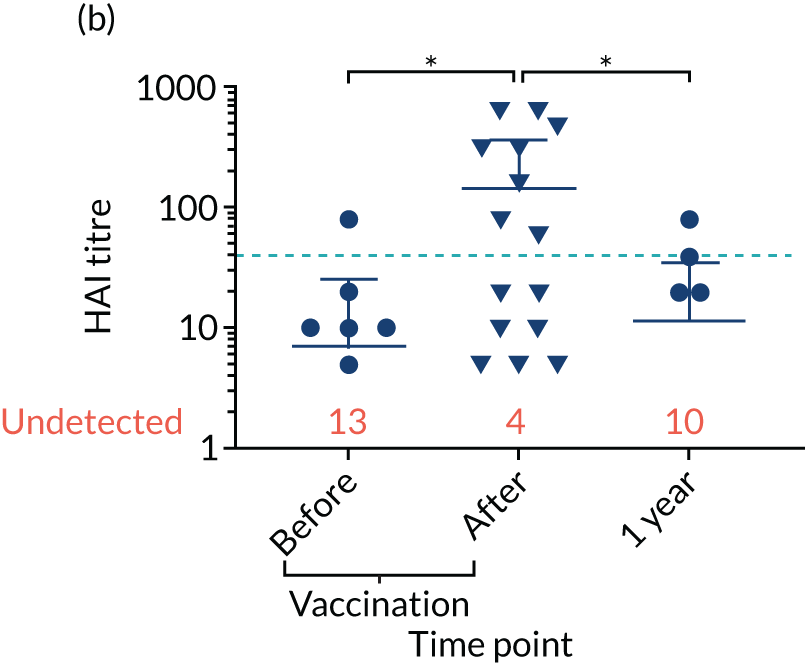
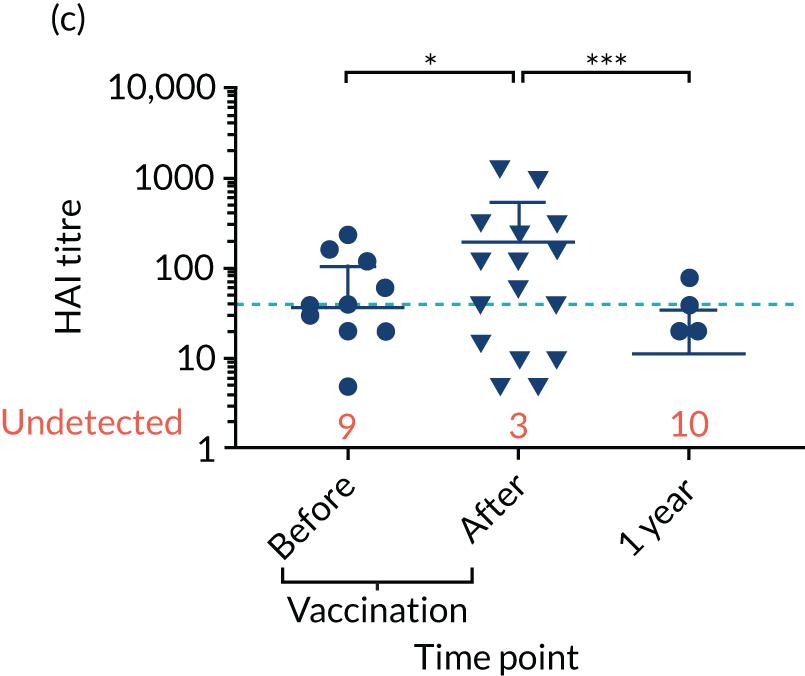
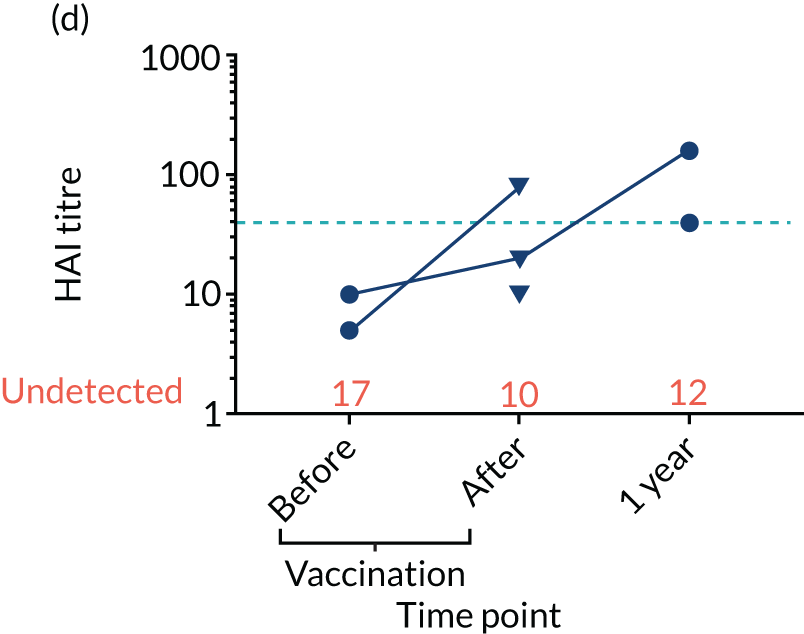
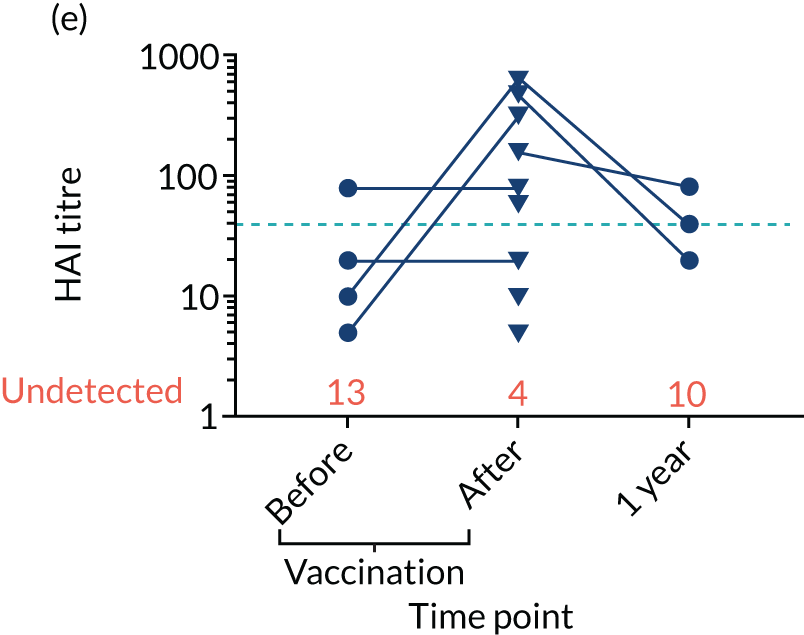
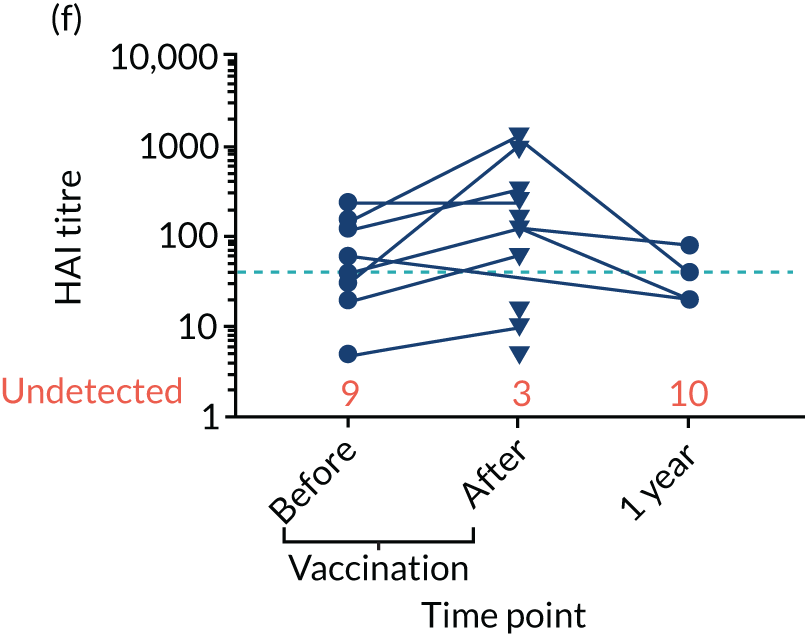
Levels of anti-viral antibodies were measured in the samples of a sub-cohort of 19 of TEAMM trial patients who received flu vaccines during the trial period. Antibodies against influenza B, influenza A strain H1N1 and influenza A strain H3N2 were measured in 19 patients before and after they received flu vaccine and, again, at 1 year (range 9–15 months) after vaccination. A threshold HAI titre ≥ 40 was used to indicate protection against flu strains (i.e. discontinuous line in Figure 7). Before vaccination, the median antibody level for the 19 TEAMM trial patients was below the recommended threshold for protection. In fact, the percentages of patients protected against these viral strains were 0% for influenza B, 5% for H1N1 and 32% for H3N2. After receiving vaccination, antibody titres increased in a proportion of patients, the increase was statistically significant for strains H1N1 and H3N2, and the percentage protected increased to 26%, 42% and 58% for flu strains influenza B, H1N1 and H3N2 (see Figure 7 and Table 6), respectively. The study was also able to measure anti-viral antibodies in 14 of the initial 19 patients at 1 year after beginning the trial and receiving flu vaccination. The median level of antibody titre had significantly decreased by 1 year. The percentage of protection against all three viral strains decreased to 14%, indicating that only two patients for each strain were protected against flu virus infections. Interestingly, the two patients showed protection against both strains H1N1 and H3N2 at 1 year, although the patients showed a HAI titre of anti-influenza B antibodies equal to zero.
FIGURE 7.
Distribution of anti-viral antibodies in vaccinated TEAMM trial patients before and after vaccination and at 1 year after the first trial visit. Levels of antibodies against influenza B, H1N1 and H3N2 strains in 19 TEAMM trial patients who received flu vaccination during the trial. The number of patients with undetected levels of antibodies (i.e. with a HAI titre = 0) is shown in red and the HAI titre threshold recommended for protection against viral strains (i.e. a HAI titre = 40) is represented as a discontinuous line. (a) Distribution, average and standard deviation of levels of antibodies before vaccination, after vaccination and at 1 year post disease presentation for influenza B; (b) distribution, average and standard deviation of levels of antibodies before vaccination, after vaccination and at 1 year post disease presentation for H1N1; (c) distribution, average and standard deviation of levels of antibodies before vaccination, after vaccination and at 1 year post disease presentation for H3N2; (d) before-and-after vaccination graphs representing levels of antibodies for each vaccinated TEAMM trial patient for influenza B; (e) before-and-after vaccination graphs representing levels of antibodies for each vaccinated TEAMM trial patient for H1N1; and (f) before-and-after vaccination graphs representing levels of antibodies for each vaccinated TEAMM trial patient for H3N2. Statistical significance was calculated with Dunn’s test (*p < 0.05; ***p < 0.001). ns, not significant.
| Viral antigen | Time point, % protection | ||
|---|---|---|---|
| Vaccination (n = 19) | 1 year (n = 14) | ||
| Before | After | ||
| Influenza B | 0 | 26 | 14 |
| H1N1 | 5 | 42 | 14 |
| H3N2 | 32 | 58 | 14 |
In order to identify possible correlations between viral and bacterial protection, anti-flu antibodies were analysed in association with anti-bacterial antibodies data identified in the TEAMM trial patients post vaccination. Correlation values and statistical significance for each pair of antigens are summarised in Table 7. A strong correlation was identified between levels of antibody against influenza type b and Pn19A (highlighted in purple in Table 7). Moderate associations (highlighted in light blue in Table 7) were also identified between anti-viral influenza B and anti-Pn18C and -Pn19F; and between anti-H1N1 and anti-Pn18C, -Pn19F, -influenza B and diphtheria. Based on these data, antibody protection against bacterial pathogens was evaluated on flu-vaccinated TEAMM trial patients before and after their vaccination (Table 8). Although for most of the bacterial serotypes the level of protection remained unchanged or lower, protection against two serotypes increased in flu-vaccinated TEAMM trial patients, and these are Pn4 and tetanus (as highlighted in purple in Table 8).
| Antigen pairs | rho | p-value | Significance |
|---|---|---|---|
| Influenza B vs. Pn | |||
| Influenza B vs. Pn5 | 0.4 | 0.157 | ns |
| Influenza B vs. Pn9V | 0.5 | 0.117 | ns |
| Influenza B vs. Pn18C | 0.7 | 0.015 | * |
| Influenza B vs. Pn19A | 0.8 | 0.005 | ** |
| Influenza B vs. Pn19F | 0.6 | 0.039 | * |
| Influenza B vs. HiB | 0.4 | 0.171 | ns |
| Influenza B vs. diphtheria | 0.5 | 0.058 | ns |
| H1N1 vs. Pn | |||
| H1N1 vs. Pn7F | 0.4 | 0.177 | ns |
| H1N1 vs. Pn9V | 0.6 | 0.062 | ns |
| H1N1 vs. Pn14 | 0.5 | 0.111 | ns |
| H1N1 vs. Pn18C | 0.7 | 0.008 | ** |
| H1N1 vs. Pn19A | 0.8 | 0.002 | ** |
| H1N1 vs. Pn19F | 0.6 | 0.041 | * |
| H1N1 vs. Pn23F | 0.5 | 0.094 | ns |
| H1N1 vs. HiB | 0.7 | 0.008 | ** |
| H1N1 vs. diphtheria | 0.6 | 0.046 | * |
| H1N1 vs. Men A | 0.6 | 0.062 | ns |
| H1N1 vs. Men Y | 0.5 | 0.132 | ns |
| H2N3 vs. Pn | |||
| H2N3 vs. Pn5 | 0.4 | 0.182 | ns |
| H3N2 vs. Pn18C | 0.5 | 0.133 | ns |
| H3N2 vs. Pn19A | 0.5 | 0.115 | ns |
| H3N2 vs. Pn19F | 0.5 | 0.109 | ns |
| Antigen | Time point, percentage protected (n = 19) | Level of protection | |
|---|---|---|---|
| Before vaccination | After vaccination | ||
| S. pneumoniae | |||
| Pn1 | 0 | 0 | = |
| Pn3 | 0 | 0 | = |
| Pn4 | 0 | 8 | ↑ |
| Pn5 | 17 | 17 | = |
| Pn6B | 17 | 17 | = |
| Pn7F | 50 | 42 | ↓ |
| Pn9V | 50 | 25 | ↓ |
| Pn14 | 83 | 58 | ↓ |
| Pn18C | 33 | 25 | ↓ |
| Pn19A | 33 | 8 | ↓ |
| Pn19F | 33 | 25 | ↓ |
| Pn23F | 25 | 17 | ↓ |
| HiB | 25 | 17 | ↓ |
| Tetanus | 33 | 42 | ↑ |
| Diphtheria | 17 | 8 | ↓ |
| N. meningitidis | |||
| Men A | 17 | 17 | = |
| Men C | 0 | 0 | = |
| Men W-135 | 8 | 8 | = |
| Men Y | 8 | 8 | = |
| 8 out of 12 Pn serotypes | 0 | 0 | = |
Neutrophils
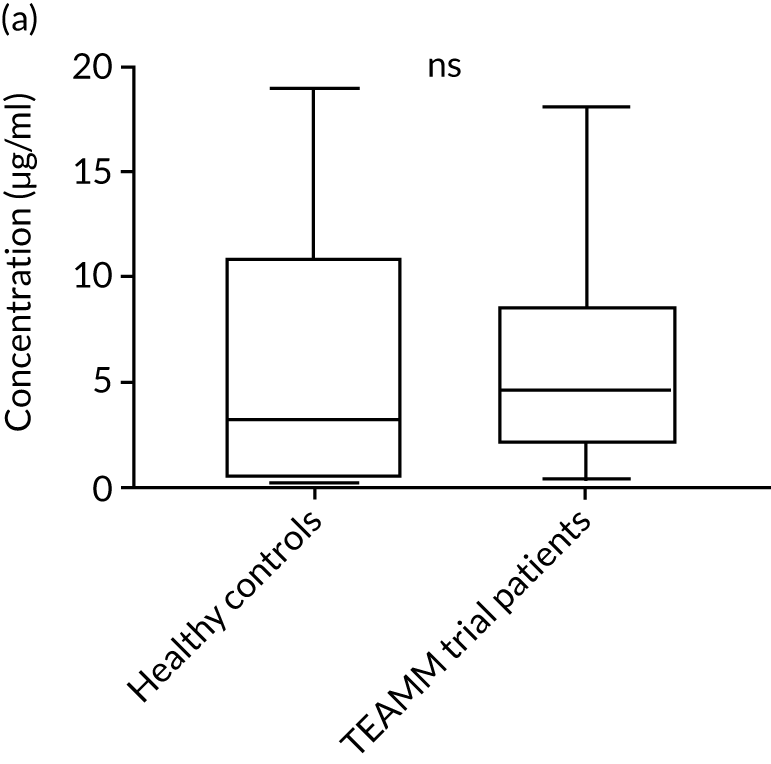
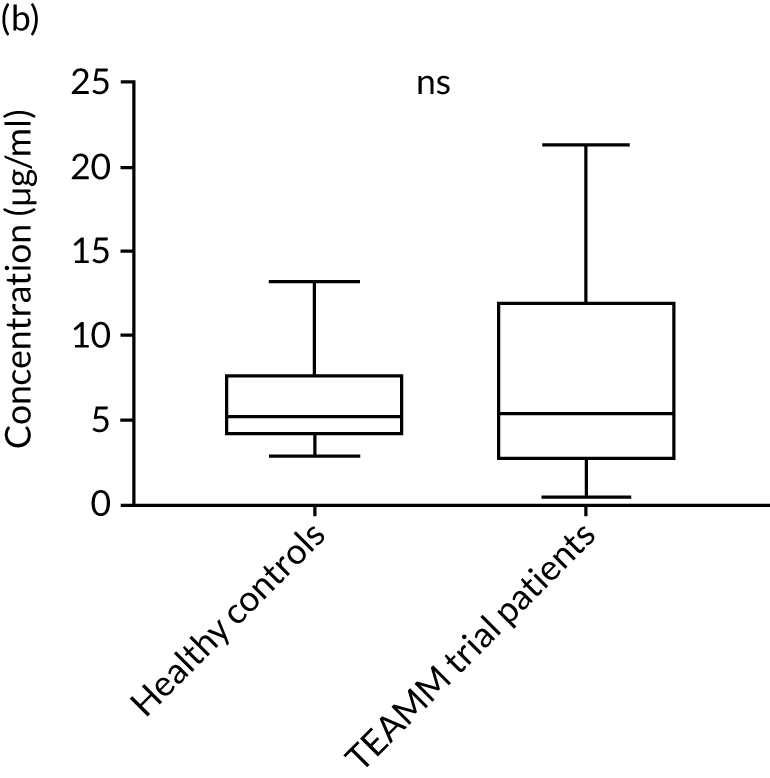
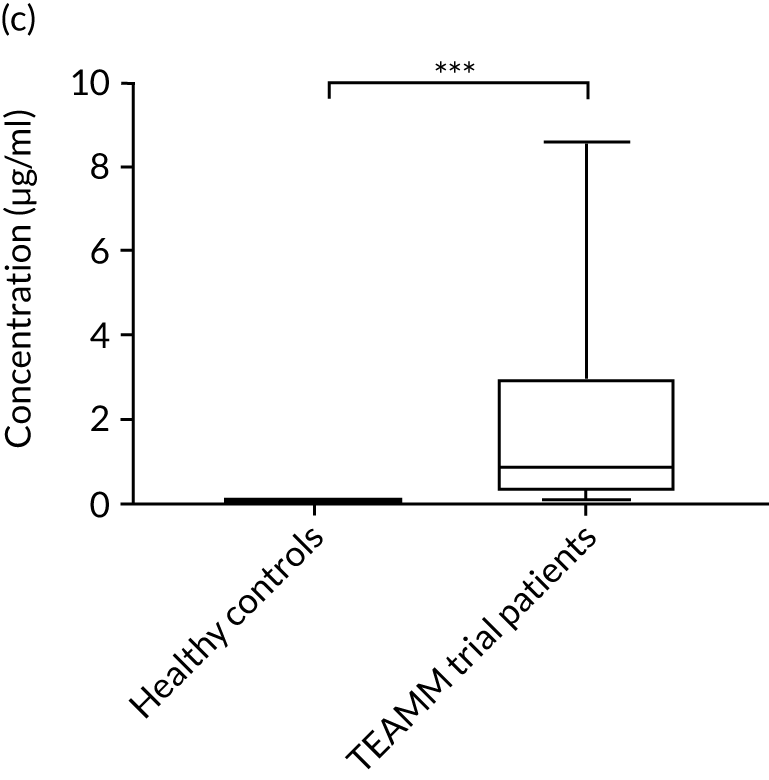
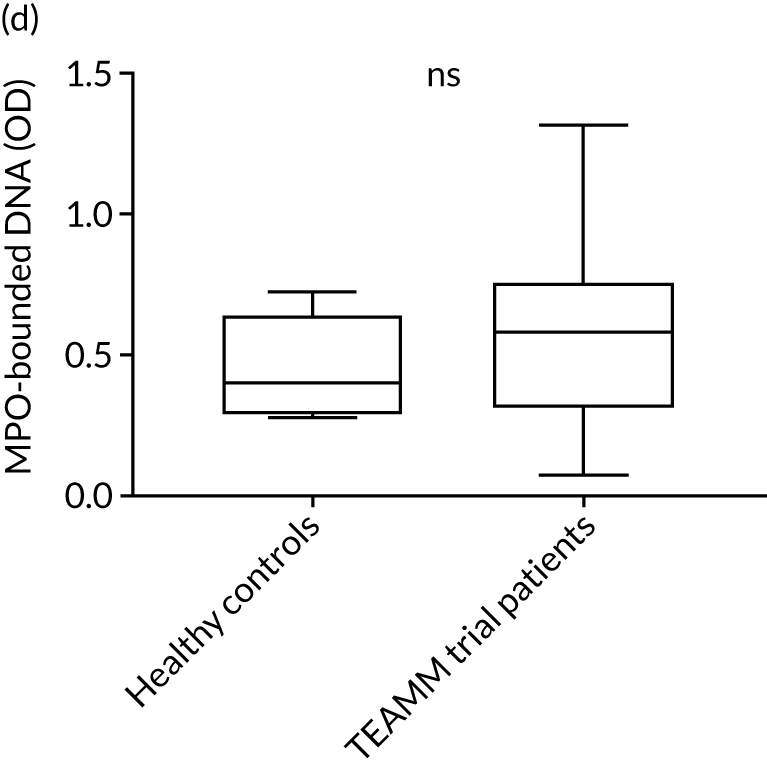
To assess the competence of innate immunity in the context of myeloma, biomarkers of neutrophil functions were investigated in the serum of ≈200 TEAMM trial patients at baseline. Although neutrophils are not present in the serum, biomarkers of their activity, such as proteins released during degranulation and NET components, can be found and measured in these serum samples. For the identification of reference ranges in health, these biomarkers were also measured in the serum of a cohort of 10 healthy volunteers of a similar age to the myeloma cohort (i.e. age range 25–65 years). Degranulation activity was analysed by measuring levels of neutrophil elastase, lactoferrin, MMP9 and calprotectin released into the serum of these patients. Interestingly, at baseline, most biomarkers of neutrophil activity were elevated in myeloma patients compared with healthy controls (Figure 8). This elevation was found to be significant for neutrophil elastase and calprotectin (p < 0.005), which were low or undetectable in all healthy controls. Of all the neutrophil biomarkers, only MMP9 in TEAMM trial patients presented median levels comparable with those of healthy control samples. The values observed in the two cohorts are summarised in Table 9. For neutrophil elastase and calprotectin, the majority of TEAMM trial patients (i.e. 97% and 84%, respectively) were found to have levels above the median level of the healthy cohort. This distribution was also observed for the other biomarkers where 74%, 68% and 61% of TEAMM trial patients had levels above the median of the healthy cohort for lactoferrin, MMP9 and NETs, respectively.
FIGURE 8.
Levels of neutrophil biomarkers in TEAMM trial patients at baseline and in healthy volunteers. (a) Lactoferrin; (b) MMP9; (c) neutrophil elastase; (d) NETs; and (e) calprotectin. Box-and-whiskers plots representing medians, 25–75th percentiles, and minimum and maximum values of neutrophil biomarkers lactoferrin, MMP9, neutrophil elastase, NETs and calprotectin in 10 healthy volunteers and in, respectively, 140, 208, 196, 172 and 117 TEAMM trial patients. Statistical significance was calculated with the Mann–Whitney U-test (not significant = ns; p-value < 0.001 = ***).
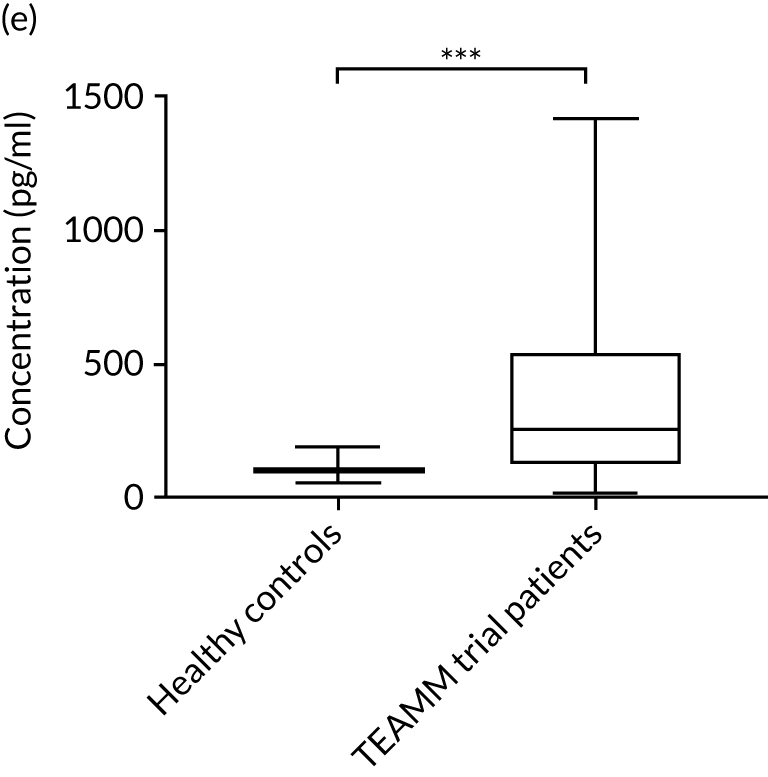
| Cohort | Biomarker | ||||
|---|---|---|---|---|---|
| Lactoferrin (µg/ml) | MMP9 (µg/ml) | Elastase (µg/ml) | NETs (ELISA OD) | Calprotectin (pg/ml) | |
| Healthy controls | |||||
| Minimum value | 0.18 | 2.84 | < 0.16 | 0.27 | 56.37 |
| Maximum value | 18.92 | 13.22 | < 0.16 | 0.72 | 194.54 |
| Median value | 3.24 | 5.20 | < 0.16 | 0.40 | 106.53 |
| TEAMM patients | |||||
| Minimum value | 0.06 | 0.02 | 0.01 | –0.01 | 20.16 |
| Maximum value | 26.93 | 24.79 | 13.27 | 1.56 | 1419.06 |
| Median value | 7.65 | 8.07 | 2.83 | 0.53 | 258.62 |
| % of TEAMM trial patients above the median level identified in the healthy cohort | 73 | 68 | 97 | 61 | 84 |
| % of TEAMM trial patients above the max level identified in the healthy cohort | 6 | 29 | 97 | 35 | 62 |
Analysis of correlation between levels of neutrophil biomarkers and CRP, a biomarker of inflammation and active infection, showed no correlation (rho < 0.5), but the analysis highlighted the strong correlation between levels of neutrophil elastase and calprotectin (rho 0.08). To assess if neutrophil biomarkers at disease presentation were associated with infection and/or deaths, these data were analysed in association with prevalence of non-febrile infection episodes, febrile episodes and deaths in the TEAMM trial patients. However, no association was identified between these biomarkers and infection and survival outcomes.
Cytokine interleukin 10 levels
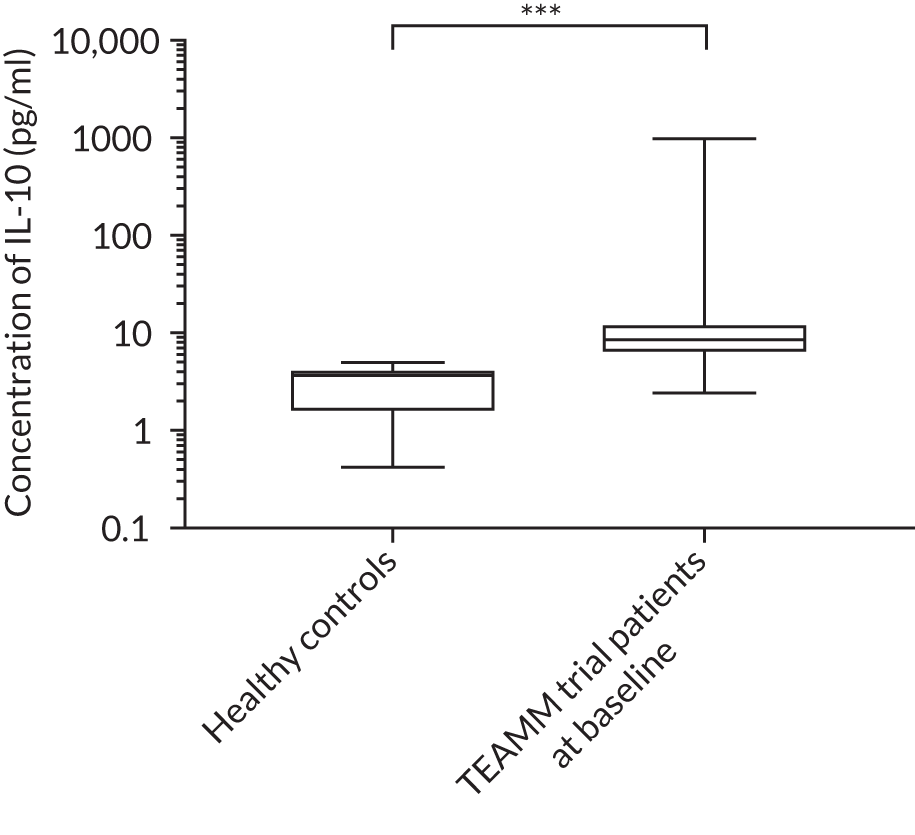
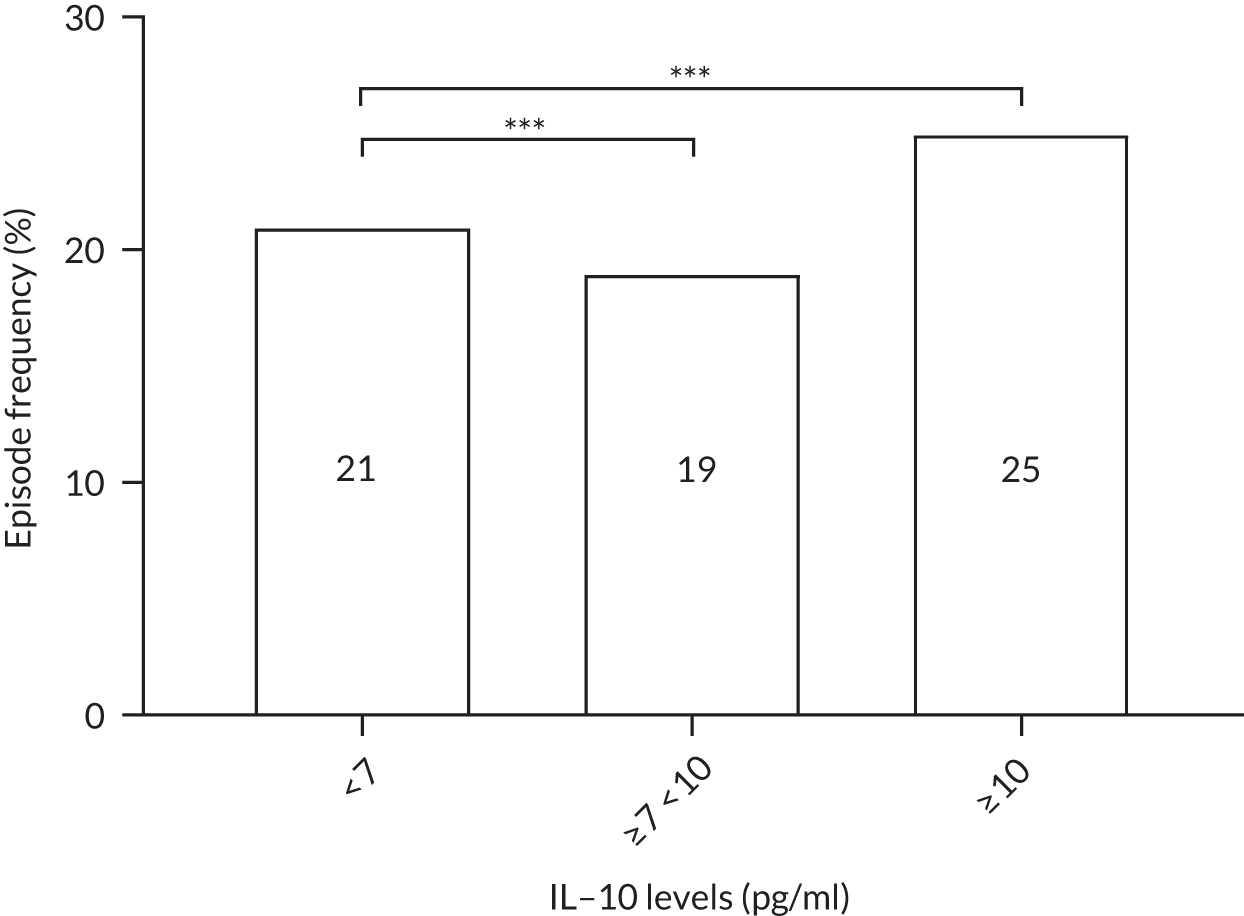
The cytokine IL-10 is known to be elevated in myeloma and is associated with worse survival. 44,45 Levels of IL-10 were measured in the sera in a cohort of 16 healthy individuals and in 321 TEAMM trial patients at diagnosis. The concentration of IL-10 in the serum of TEAMM trial patients has been found to exceed the level identified in healthy individuals, which was below the limit of detection of the assay (Figure 9). In fact, at baseline, 95% of sera analysed of TEAMM trial patients had IL-10 levels above the level identified in healthy controls (1.74 pg/ml). Analysis was performed in order to verify whether high levels of IL-10 in myeloma patients was associated with a higher prevalence of non-febrile infections and/or febrile episodes. The results summarised in Table 10 show that one-third of the cohort of patients with high levels of IL-10 (i.e. ≥ 10 pg/ml) had a greater frequency of infections (57%) and febrile episodes (25%) than the proportion of TEAMM trial patients with lower levels of IL-10 (i.e. < 10 pg/ml) who showed a lower incidence of episodes [i.e. < 40% and 21%, respectively, for infection episodes (febrile episodes and/or non-febrile episodes) and febrile episodes only]. The association between levels of IL-10 ≥ 10 pg/ml and incidence of febrile episode, in respect to patients with a IL-10 level of < 7, ≥ 7 and < 10 pg/ml, was also confirmed by Fisher’s exact test. The results (Figure 10) showed statistical significance at a p-value < 0.0001. The association between IL-10 levels in TEAMM trial patients at baseline and response to therapy, in terms of percentage change of free light chains (FLCs) between trial visits, was evaluated. No correlation was found between IL-10 levels and response to therapy at any trial visits up to 1 year (rho < 0.25).
FIGURE 9.
Baseline levels of cytokine IL-10 in TEAMM trial patients compared with levels identified in the healthy cohort. Box-and-whisker plots representing medians, 25–75th percentiles, and minimum and maximum values of IL-10 levels in 16 healthy volunteers and in 321 TEAMM trial patients. Statistical significance was calculated with the Mann–Whitney U-test (p-value < 0.001 = ***).
| Outcome | IL-10 concentration | ||
|---|---|---|---|
| < 7 pg/ml (n = 56) | ≥ 7 to < 10 pg/ml (n = 54) | ≥ 10 pg/ml (n = 53) | |
| Infection | 39% | 39% | 57% |
| Febrile episode | 21% | 19% | 25% |
| OI episode | 27% | 22% | 40% |
| Death | 11% | 19% | 19% |
FIGURE 10.
Frequencies of febrile episodes in TEAMM trial patients divided in to groups based on their levels of IL-10. Frequencies of febrile episodes in TEAMM trial patients with IL-10 levels < 7 pg/ml, between 7 pg/ml and 10 pg/ml, and ≥ 10 pg/ml. Statistical significance was calculated with Fisher’s exact test (p-value < 0.001 = ***).
Analysis of risk of infection and survival in TEAMM trial patients based on immune competence biomarkers at baseline
Based on the analysis previously shown (see Correlation of functional antibody levels with infections, febrile episodes and deaths and Cytokine interleukin 10 levels), biomarkers anti-Pn5, -Pn7F, -Pn19A, -meningococcal (Men) A antibodies and IL-10 along with polyclonal immunoglobulins were selected as possible predictors of febrile/non-febrile episodes and survival among TEAMM trial patients. TEAMM trial patients were divided into tertiles or quartiles based on their levels of biomarker to explore if those patients with the lowest levels had a higher risk of febrile/non-febrile episodes and/or if they were more likely to die within the year following diagnosis.
Time to first infection
An association was observed in time to first infection within 12 weeks of starting trial treatment in TEAMM trial patients with lower levels of IL-10, higher levels of polyclonal IgM in non-IgM m-protein patients, higher levels of polyclonal IgA in non-IgA m-protein patients and higher polyclonal IgG in non-IgG m-protein patients (p = 0.01, p = 0.05, p = 0.08 and p = 0.04, respectively; Table 11). These differences were retained when adjusting for age and treatment pathway (Tables 12 and 13).
| Biomarker | Biomarker level | Patients | Log-rank chi-squared p-value, significance | |
|---|---|---|---|---|
| n | Percentage infection free | |||
| Pn5 | < 0.03 µg/ml | 259 | 57 | 1.72, ns |
| 0.03–0.1 µg/ml | 229 | 54 | ||
| 0.1–0.35 µg/ml | 178 | 56 | ||
| > 0.35 µg/ml | 161 | 59 | ||
| Pn7F | < 0.13 µg/ml | 245 | 57 | 2.53, ns |
| 0.13–0.35 µg/ml | 227 | 60 | ||
| > 0.35 µg/ml | 314 | 53 | ||
| Pn19A | < 0.06 µg/ml | 312 | 55 | 1.07, ns |
| 0.6–0.35 µg/ml | 296 | 59 | ||
| > 0.35 µg/ml | 219 | 56 | ||
| Men A | < 0.5 µg/ml | 319 | 61 | 3.10, ns |
| 0.5–2 µg/ml | 352 | 54 | ||
| > 2 µg/ml | 142 | 54 | ||
| IL-10 | < 7 pg/ml | 56 | 61 | 8.49, * |
| 7–10 pg/ml | 54 | 57 | ||
| > 10 pg/ml | 54 | 38 | ||
| IgM for non-IgM myeloma | < 0.12 g/l | 248 | 52 | 6.04, ns |
| 0.12–0.24 g/l | 258 | 55 | ||
| > 0.24 g/l | 284 | 63 | ||
| IgA for non-IgA myeloma | < 0.2 g/l | 187 | 51 | 5.13, ns |
| 0.2–0.4 g/l | 186 | 55 | ||
| 0.4 g/l | 255 | 62 | ||
| IgG for non-IgG myeloma | < 4 g/l | 117 | 45 | 6.48, * |
| 4–6 g/l | 119 | 59 | ||
| > 6 g/l | 121 | 63 | ||
| Biomarker | Biomarker level | Age (years) group of patient | Log-rank chi-squared p-value, significance | |||
|---|---|---|---|---|---|---|
| Aged ≤ 65 | Aged > 65 | |||||
| n | Percentage infection free | n | Percentage infection free | |||
| Pn5 | < 0.03 µg/ml | 126 | 61 | 133 | 54 | 0.18, ns |
| 0.03–0.1 µg/ml | 100 | 53 | 129 | 56 | ||
| 0.1–0.35 µg/ml | 73 | 51 | 105 | 60 | ||
| > 0.35 µg/ml | 52 | 63 | 109 | 57 | ||
| Pn7F | < 0.13 µg/ml | 108 | 61 | 137 | 55 | 1.74, ns |
| 0.13 – 0.35 µg/ml | 106 | 64 | 121 | 56 | ||
| > 0.35 µg/ml | 123 | 46 | 191 | 58 | ||
| Pn19A | < 0.06 µg/ml | 139 | 55 | 173 | 54 | 0.03, ns |
| 0.6–0.35 µg/ml | 130 | 62 | 166 | 57 | ||
| > 0.35 µg/ml | 79 | 50 | 140 | 58 | ||
| Men A | < 0.5 µg/ml | 152 | 60 | 167 | 61 | 2.97, ns |
| 0.5–2 µg/ml | 135 | 59 | 217 | 52 | ||
| > 2 µg/ml | 60 | 45 | 82 | 61 | ||
| IL-10 | < 7 pg/ml | 25 | 67 | 31 | 57 | 7.62, ** |
| 7–10 pg/ml | 26 | 67 | 28 | 48 | ||
| > 10 pg/ml | 25 | 36 | 29 | 39 | ||
| IgM for non-IgM myeloma | < 0.12 g/l | 105 | 51 | 143 | 53 | 5.08, * |
| 0.12–0.24 g/l | 113 | 59 | 145 | 52 | ||
| > 0.24 g/l | 122 | 62 | 162 | 64 | ||
| IgA for non-IgA myeloma | < 0.2 g/l | 85 | 47 | 102 | 55 | 4.52, * |
| 0.2–0.4 g/l | 76 | 51 | 110 | 58 | ||
| 0.4 g/l | 107 | 70 | 148 | 56 | ||
| IgG for non-IgG myeloma | < 4 g/l | 53 | 34 | 64 | 55 | 3.98, ns |
| 4–6 g/l | 43 | 60 | 76 | 59 | ||
| > 6 g/l | 49 | 67 | 72 | 59 | ||
| Biomarker | Biomarker level | Treatment pathway | Log-rank chi-squared p-value, significance | |||
|---|---|---|---|---|---|---|
| Non-intensive | Intensive | |||||
| n | Percentage infection free | n | Percentage infection free | |||
| Pn5 | < 0.03 µg/ml | 118 | 58 | 141 | 57 | 0.10, ns |
| 0.03–0.1 µg/ml | 100 | 56 | 129 | 53 | ||
| 0.1–0.35 µg/ml | 77 | 64 | 101 | 50 | ||
| > 0.35 µg/ml | 81 | 59 | 80 | 60 | ||
| Pn7F | < 0.13 µg/ml | 115 | 55 | 130 | 59 | 1.84, ns |
| 0.13–0.35 µg/ml | 91 | 59 | 136 | 61 | ||
| > 0.35 µg/ml | 148 | 62 | 166 | 46 | ||
| Pn19A | < 0.06 µg/ml | 138 | 55 | 174 | 54 | 0.03, ns |
| 0.6–0.35 µg/ml | 126 | 61 | 170 | 58 | ||
| > 0.35 µg/ml | 112 | 61 | 107 | 51 | ||
| Men A | < 0.5 µg/ml | 139 | 59 | 180 | 62 | 3.32, ns |
| 0.5–2 µg/ml | 166 | 58 | 186 | 51 | ||
| > 2 µg/ml | 62 | 61 | 80 | 49 | ||
| IL-10 | < 7 pg/ml | 29 | 53 | 27 | 70 | 7.96, ** |
| 7–10 pg/ml | 25 | 50 | 29 | 64 | ||
| > 10 pg/ml | 23 | 39 | 31 | 37 | ||
| IgM for non-IgM myeloma | < 0.12 g/l | 110 | 53 | 138 | 51 | 5.00, * |
| 0.12–0.24 g/l | 120 | 54 | 138 | 56 | ||
| > 0.24 g/l | 120 | 69 | 164 | 58 | ||
| IgA for non-IgA myeloma | < 0.2 g/l | 82 | 53 | 105 | 51 | 4.44, * |
| 0.2–0.4 g/l | 85 | 59 | 101 | 52 | ||
| 0.4 g/l | 109 | 63 | 146 | 61 | ||
| IgG for non-IgG myeloma | < 4 g/l | 52 | 49 | 65 | 42 | 3.93, * |
| 4–6 g/l | 60 | 58 | 59 | 60 | ||
| > 6 g/l | 49 | 66 | 72 | 60 | ||
Cox regression analysis showed that level of IL-10 was an important factor and retained its significance in the presence of age, treatment pathway and other biomarkers (Table 14). However, as a result of missing data, several models were considered, with and without IL-10, to assess the importance of these factors. The univariate analysis demonstrated that levels of IL-10 and polyclonal immunoglobulins were individual predictors of time to first infection. Repeating the Cox model without IL-10 indicated that polyclonal IgG for non-IgG myeloma was a significant predictor of infection in the presence of age and treatment pathway.
| Factor | Biomarker level | Coefficient | p-value | HR (95% CI) |
|---|---|---|---|---|
| 1. Biomarkers (n = 150) | ||||
| 70 events, adjusting for age and treatment pathway | ||||
| Pn5 | < 0.03 µg/ml | –0.18 | 0.17 | 0.83 (0.64 to 1.08) |
| 0.03–0.1 µg/ml | ||||
| 0.1–0.35 µg/ml | ||||
| > 0.35 µg/ml | ||||
| Pn7F | < 0.13 µg/ml | –0.01 | 0.96 | 0.99 (0.66 to 1.49) |
| 0.13–0.35 µg/ml | ||||
| > 0.35 µg/ml | ||||
| Pn19A | < 0.06 µg/ml | 0.08 | 0.67 | 1.08 (0.75 to 1.56) |
| 0.6–0.35 µg/ml | ||||
| > 0.35 µg/ml | ||||
| Men A | < 0.5 µg/ml | 0.30 | 0.21 | 1.35 (0.85 to 2.14) |
| 0.5–2 µg/ml | ||||
| > 2 µg/ml | ||||
| IL-10 | < 7 pg/ml | 0.40 | 0.01 | 1.49 (1.10 to 2.02) |
| 7–10 pg/ml | ||||
| > 10 pg/ml | ||||
| Age | ≤ 65 years | 0.16 | 0.65 | 1.17 (0.59 to 2.31) |
| > 65 years | ||||
| Treatment pathway | Non-intensive | –0.33 | 0.34 | 0.72 (0.36 to 1.42) |
| Intensive | ||||
| 2. Biomarkers (n = 752) | ||||
| 319 events without IL-10, adjusting for age and treatment pathway | ||||
| Pn5 | < 0.03 µg/ml | –0.07 | 0.28 | 0.94 (0.83 to 1.05) |
| 0.03–0.1 µg/ml | ||||
| 0.1–0.35 µg/ml | ||||
| > 0.35 µg/ml | ||||
| Pn7F | < 0.13 µg/ml | 0.07 | 0.40 | 1.07 (0.91 to 1.26) |
| 0.13–0.35 µg/ml | ||||
| > 0.35 µg/ml | ||||
| Pn19A | < 0.06 µg/ml | –0.05 | 0.55 | 0.95 (0.81 to 1.12) |
| 0.6–0.35 µg/ml | ||||
| > 0.35 µg/ml | ||||
| Men A | < 0.5 µg/ml | 0.13 | 0.17 | 1.14 (0.95 to 1.38) |
| 0.5–2 µg/ml | ||||
| > 2 µg/ml | ||||
| Age | ≤ 65 years | 0.12 | 0.38 | 1.13 (0.86 to 1.49) |
| > 65 years | ||||
| Treatment pathway | Non-intensive | 0.20 | 0.15 | 1.22 (0.93 to 1.61) |
| Intensive | ||||
| 3. Polyclonal immunoglobulins (n = 357) | ||||
| 153 events | ||||
| IgM for non-IgM myeloma | < 0.12 g/l | 0.96 | 0.06 | 2.61 (0.96 to 7.12) |
| 0.12–0.24 g/l | ||||
| > 0.24 g/l | ||||
| IgA for non-IgA myeloma | < 0.2 g/l | –0.11 | 0.41 | 0.90 (0.70 to 1.16) |
| 0.2–0.4 g/l | ||||
| 0.4 g/l | ||||
| IgG for non-IgG myeloma | < 4 g/l | –1.11 | 0.03 | 0.33 (0.12 to 0.91) |
| 4–6 g/l | ||||
| > 6 g/l | ||||
| Age | ≤ 65 years | –0.10 | 0.61 | 0.90 (0.61 to 1.34) |
| > 65 years | ||||
| Treatment pathway | Non-intensive | 0.02 | 0.90 | 1.02 (0.69 to 1.52) |
| Intensive | ||||
| 4. Polyclonal immunoglobulins (n = 357) | ||||
| 153 events adjusting for age | ||||
| IgG for non-IgG myeloma | < 4 g/l | –1.28 | 0.03 | 0.32 (0.12 to 0.89) |
| 4–6 g/l | ||||
| > 6 g/l | ||||
| IgM for non-IgM myeloma | < 0.12 g/l | 0.90 | 0.07 | 2.47 (0.91 to 6.66) |
| 0.12–0.24 g/l | ||||
| > 0.24 g/l | ||||
| Age | ≤ 65 years | –0.11 | 0.49 | 0.89 (0.65 to 1.23) |
| > 65 years | ||||
| 5. Polyclonal immunoglobulins (n = 357) | ||||
| 153 events, adjusting for treatment pathway | ||||
| IgG for non-IgG myeloma | < 4 g/l | –1.14 | 0.03 | 0.32 (0.12 to 0.87) |
| 4–6 g/l | ||||
| > 6 g/l | ||||
| IgM for non-IgM myeloma | < 0.12 g/l | 0.92 | 0.07 | 2.50 (0.93 to 6.75) |
| 0.12–0.24 g/l | ||||
| > 0.24 g/l | ||||
| Treatment pathway | Non-intensive | 0.08 | 0.61 | 1.09 (0.79 to 1.50) |
| Intensive | ||||
| 6. Individual factors | ||||
| Univariate | ||||
| Pn5 (n = 827, events = 346) | < 0.03 µg/ml | –0.02 | 0.72 | 0.98 (0.89 to 1.08) |
| 0.03–0.1 µg/ml | ||||
| 0.1–0.35 µg/ml | ||||
| > 0.35 µg/ml | ||||
| Pn7F (n = 786, events = 330) | < 0.13 µg/ml | 0.08 | 0.24 | 1.08 (0.95 to 1.23) |
| 0.13–0.35 µg/ml | ||||
| > 0.35 µg/ml | ||||
| Pn19A (n = 827, events = 347) | < 0.06 µg/ml | –0.001 | 0.98 | 0.99 (0.87 to 1.14) |
| 0.6–0.35 µg/ml | ||||
| > 0.35 µg/ml | ||||
| Men A (n = 813, events = 339) | < 0.5 µg/ml | 0.12 | 0.10 | 1.13 (0.98 to 1.31) |
| 0.5–2 µg/ml | ||||
| > 2 µg/ml | ||||
| IL-10 (n = 164, events = 75) | < 7 pg/ml | 0.39 | 0.008 | 1.47 (1.11 to 1.95) |
| 7–10 pg/ml | ||||
| > 10 pg/ml | ||||
| IgM for non-IgM myeloma | < 0.12 g/l | –0.16 | 0.02 | 0.85 (0.75 to 0.97) |
| 0.12–0.24 g/l | ||||
| > 0.24 g/l | ||||
| IgA for non-IgA myeloma | < 0.2 g/l | –0.16 | 0.03 | 0.86 (0.74 to 0.99) |
| 0.2–0.4 g/l | ||||
| 0.4 g/l | ||||
| IgG for non-IgG myeloma | < 4 g/l | –0.23 | 0.02 | 0.79 (0.65 to 0.97) |
| 4–6 g/l | ||||
| > 6 g/l | ||||
Overall survival at 12 months
There was an overall survival benefit detected up to 12 months for TEAMM trial patients with higher levels of Pn7F (p = 0.03; Table 15). When adjusting for age (Table 16), levels of Pn7F were no longer significant but TEAMM trial patients with higher Pn5 levels experienced better survival at 12 months than those patients with lower levels of Pn5 (p = 0.03). This reflects the borderline significances of these factors and the potential multicollinearity of Pn7 and Pn5 with age.
| Biomarker | Biomarker level | Patients | Log-rank chi-squared p-value, significance | |
|---|---|---|---|---|
| n | Percentage surviving at 1 year | |||
| Pn5 | < 0.03 µg/ml | 260 | 89 | 6.66, ns |
| 0.03–0.1 µg/ml | 231 | 89 | ||
| 0.1–0.35 µg/ml | 178 | 96 | ||
| > 0.35 µg/ml | 161 | 91 | ||
| Pn7F | < 0.13 µg/ml | 246 | 87 | 7.34, * |
| 0.13–0.35 µg/ml | 228 | 95 | ||
| > 0.35 µg/ml | 314 | 91 | ||
| Pn19A | < 0.06 µg/ml | 314 | 89 | 2.40, ns |
| 0.6–0.35 µg/ml | 297 | 91 | ||
| > 0.35 µg/ml | 219 | 93 | ||
| Men A | < 0.5 µg/ml | 322 | 89 | 2.37, ns |
| 0.5–2 µg/ml | 352 | 93 | ||
| > 2 µg/ml | 142 | 92 | ||
| IL-10 | < 7 pg/ml | 56 | 90 | 1.22, ns |
| 7–10 pg/ml | 54 | 84 | ||
| > 10 pg/ml | 54 | 86 | ||
| IgM for non-IgM myeloma | < 0.12 g/l | 248 | 89 | 3.67, ns |
| 0.12–0.24 g/l | 259 | 92 | ||
| > 0.24 g/l | 286 | 93 | ||
| IgA for non-IgA myeloma | < 0.2 g/l | 188 | 92 | 0.45, ns |
| 0.2–0.4 g/l | 188 | 91 | ||
| 0.4 g/l | 255 | 92 | ||
| IgG for non-IgG myeloma | < 4 g/l | 117 | 88 | 3.92, ns |
| 4–6 g/l | 119 | 91 | ||
| > 6 g/l | 122 | 95 | ||
| Biomarker | Biomarker level | Age (years) group of patient | Log-rank chi-squared p-value, significance | |||
|---|---|---|---|---|---|---|
| Aged ≤ 65 | Aged > 65 | |||||
| n | Percentage surviving 1 year | n | Percentage surviving 1 year | |||
| Pn5 | < 0.03 µg/ml | 127 | 97 | 133 | 81 | 4.68, * |
| 0.03–0.1 µg/ml | 101 | 95 | 130 | 84 | ||
| 0.1–0.35 µg/ml | 73 | 97 | 105 | 96 | ||
| > 0.35 µg/ml | 52 | 100 | 109 | 87 | ||
| Pn7F | < 0.13 µg/ml | 108 | 95 | 138 | 81 | 1.88, ns |
| 0.13 – 0.35 µg/ml | 107 | 98 | 121 | 92 | ||
| > 0.35 µg/ml | 123 | 98 | 191 | 86 | ||
| Pn19A | < 0.06 µg/ml | 140 | 96 | 174 | 83 | 3.40, ns |
| 0.6–0.35 µg/ml | 131 | 97 | 166 | 86 | ||
| > 0.35 µg/ml | 79 | 99 | 140 | 90 | ||
| Men A | < 0.5 µg/ml | 154 | 96 | 168 | 83 | 2.65, ns |
| 0.5–2 µg/ml | 135 | 98 | 217 | 89 | ||
| > 2 µg/ml | 60 | 100 | 82 | 86 | ||
| IL-10 | < 7 pg/ml | 25 | 100 | 31 | 83 | 1.35, ns |
| 7–10 pg/ml | 26 | 96 | 28 | 72 | ||
| > 10 pg/ml | 25 | 96 | 29 | 78 | ||
| IgM for non-IgM myeloma | < 0.12 g/l | 105 | 97 | 143 | 82 | 3.46, ns |
| 0.12–0.24 g/l | 113 | 96 | 146 | 89 | ||
| > 0.24 g/l | 124 | 96 | 162 | 91 | ||
| IgA for non-IgA myeloma | < 0.2 g/l | 86 | 98 | 102 | 88 | 0.07, ns |
| 0.2–0.4 g/l | 77 | 97 | 111 | 86 | ||
| 0.4 g/l | 107 | 96 | 148 | 88 | ||
| IgG for non-IgG myeloma | < 4 g/l | 53 | 94 | 64 | 83 | 4.43, * |
| 4–6 g/l | 43 | 98 | 76 | 87 | ||
| > 6 g/l | 50 | 98 | 72 | 93 | ||
In addition, in age-adjusted analyses, higher levels of polyclonal IgG (p = 0.04) were associated with better survival at 12 months in both age groups (i.e. ≤ 65 and > 65 years). The same relationship was found for polyclonal IgM, although with borderline significance (p = 0.06). When examining survival adjusting for treatment pathways (Table 17), a borderline difference was observed for IgG (p = 0.06), in which higher baseline levels of polyclonal IgG were associated with better survival.
| Biomarker | Biomarker level | Treatment pathway | Log-rank chi-squared p-value, significance | |||
|---|---|---|---|---|---|---|
| Non-intensive | Intensive | |||||
| n | Percentage surviving 1 year | n | Percentage surviving 1 year | |||
| Pn5 | < 0.03 µg/ml | 118 | 81 | 142 | 96 | 2.97, ns |
| 0.03–0.1 µg/ml | 102 | 83 | 129 | 93 | ||
| 0.1–0.35 µg/ml | 77 | 94 | 101 | 98 | ||
| > 0.35 µg/ml | 81 | 86 | 80 | 97 | ||
| Pn7F | < 0.13 µg/ml | 116 | 78 | 130 | 95 | 1.48, ns |
| 0.13–0.35 µg/ml | 92 | 91 | 136 | 98 | ||
| >> 0.35 µg/ml | 148 | 85 | 166 | 96 | ||
| Pn19A | < 0.06 µg/ml | 139 | 82 | 175 | 95 | 3.15, ns |
| 0.6–0.35 µg/ml | 127 | 85 | 170 | 95 | ||
| > 0.35 µg/ml | 112 | 89 | 107 | 98 | ||
| Men A | < 0.5 µg/ml | 141 | 81 | 181 | 95 | 1.90, ns |
| 0.5–2 µg/ml | 166 | 89 | 186 | 96 | ||
| > 2 µg/ml | 62 | 84 | 80 | 98 | ||
| IL-10 | < 7 pg/ml | 29 | 82 | 27 | 100 | 1.74, ns |
| 7–10 pg/ml | 25 | 70 | 29 | 96 | ||
| > 10 pg/ml | 23 | 81 | 31 | 90 | ||
| IgM for non-IgM myeloma | < 0.12 g/l | 110 | 79 | 138 | 96 | 3.40, ns |
| 0.12–0.24 g/l | 121 | 88 | 138 | 95 | ||
| > 0.24 g/l | 121 | 91 | 165 | 95 | ||
| IgA for non-IgA myeloma | < 0.2 g/l | 82 | 87 | 106 | 97 | 0.20, ns |
| 0.2–0.4 g/l | 87 | 85 | 101 | 96 | ||
| 0.4 g/l | 109 | 88 | 146 | 95 | ||
| IgG for non-IgG myeloma | < 4 g/l | 52 | 78 | 65 | 95 | 3.61, ns |
| 4–6 g/l | 60 | 86 | 59 | 96 | ||
| > 6 g/l | 49 | 98 | 73 | 94 | ||
Cox regression analysis showed that Pn5 was an important factor and retained its significance in the presence of age and treatment pathway only when tested independently. Age remained a significant predictor of 12-month survival (p = 0.03), indicating that these two variables have independent effects (Table 18).
| Factor | Biomarker level | Coefficient | p-value | HR (95% CI) |
|---|---|---|---|---|
| 1. Biomarkers (n = 150) | ||||
| 19 events adjusting for age and treatment pathway | ||||
| Pn5 | < 0.03 µg/ml | –0.17 | 0.47 | 0.85 (0.54 to 1.33) |
| 0.03–0.1 µg/ml | ||||
| 0.1–0.35 µg/ml | ||||
| > 0.35 µg/ml | ||||
| Pn7F | < 0.13 µg/ml | –0.39 | 0.32 | 0.67 (0.31 to 1.46) |
| 0.13–0.35 µg/ml | ||||
| > 0.35 µg/ml | ||||
| Pn19A | < 0.06 µg/ml | 0.29 | 0.36 | 1.34 (0.72 to 2.49) |
| 0.6–0.35 µg/ml | ||||
| > 0.35 µg/ml | ||||
| Men A | < 0.5 µg/ml | 0.32 | 0.48 | 1.38 (0.57 to 3.34) |
| 0.5–2 µg/ml | ||||
| > 2 µg/ml | ||||
| IL-10 | < 7 pg/ml | 0.32 | 0.28 | 1.37 (0.78 to 2.44) |
| 7–10 pg/ml | ||||
| > 10 pg/ml | ||||
| Age | ≤ 65 years | 1.21 | 0.22 | 3.36 (0.49 to 23.33) |
| > 65 years | ||||
| Treatment pathway | Non-intensive | –1.13 | 0.18 | 0.32 (0.06 to 1.66) |
| Intensive | ||||
| 2. Biomarkers (n = 754) | ||||
| 63 events without IL-10, adjusting for age and treatment pathway | ||||
| Pn5 | < 0.03 µg/ml | –0.18 | 0.19 | 0.83 (0.64 to 1.09) |
| 0.03–0.1 µg/ml | ||||
| 0.1–0.35 µg/ml | ||||
| > 0.35 µg/ml | ||||
| Pn7F | < 0.13 µg/ml | 0.03 | 0.88 | 1.03 (0.71 to 1.49) |
| 0.13–0.35 µg/ml | ||||
| > 0.35 µg/ml | ||||
| Pn19A | < 0.06 µg/ml | –0.12 | 0.49 | 0.88 (0.62 to 1.25) |
| 0.6–0.35 µg/ml | ||||
| > 0.35 µg/ml | ||||
| Men A | < 0.5 µg/ml | –0.13 | 0.57 | 0.88 (0.55 to 1.39) |
| 0.5–2 µg/ml | ||||
| > 2 µg/ml | ||||
| Age | ≤ 65 years | 1.21 | 0.01 | 3.36 (1.41 to 8.00) |
| > 65 years | ||||
| Treatment pathway | Non-intensive | –0.91 | 0.01 | 0.40 (0.20 to 0.81) |
| Intensive | ||||
| 3. Biomarkers (n = 830) | ||||
| 68 events, adjusted for age | ||||
| Pn5 | < 0.03 µg/ml | 1.60 | < 0.0001 | 4.94 (2.52 to 9.69) |
| 0.03–0.1 µg/ml | ||||
| 0.1–0.35 µg/ml | ||||
| > 0.35 µg/ml | ||||
| Age | ≤ 65 years | –0.25 | 0.03 | 0.78 (0.62 to 0.98) |
| > 65 years | ||||
| 4. Biomarkers (n = 830) | ||||
| 68 events, adjusted for treatment pathway | ||||
| Pn5 | < 0.03 µg/ml | –1.36 | < 0.0001 | 0.26 (0.15 to 0.45) |
| 0.03–0.1 µg/ml | ||||
| 0.1–0.35 µg/ml | ||||
| > 0.35 µg/ml | ||||
| Treatment pathway | Non-intensive | –0.20 | 0.08 | 0.82 (0.66 to 1.03) |
| Intensive | ||||
| 5. Polyclonal paraproteins (n = 358) | ||||
| 28 events, adjusted for age and treatment pathway | ||||
| IgM for non-IgM myeloma | < 0.12 g/l | 0.05 | 0.96 | 1.05 (0.14 to 8.09) |
| 0.12–0.24 g/l | ||||
| > 0.24 g/l | ||||
| IgA for non-IgA myeloma | < 0.2 g/l | 0.35 | 0.25 | 1.42 (0.78 to 2.59) |
| 0.2–0.4 g/l | ||||
| 0.4 g/l | ||||
| IgG for non-IgG myeloma | < 4 g/l | –0.79 | 0.44 | 0.45 (0.06 to 3.44) |
| 4–6 g/l | ||||
| > 6 g/l | ||||
| Age | ≤ 65 years | 0.91 | 0.11 | 2.48 (0.80 to 7.64) |
| > 65 years | ||||
| Treatment pathway | Non-intensive | –0.55 | 0.24 | 0.58 (0.23 to 1.45) |
| Intensive | ||||
| 6. Polyclonal paraproteins (n = 358) | ||||
| 28 events, adjusting for age | ||||
| IgG for non-IgG myeloma | < 4 | 1.24 | 0.01 | 3.45 (1.31 to 9.09) |
| 4–6 | ||||
| > 6 | ||||
| Age | ≤ 65 years | –0.51 | 0.04 | 0.60 (0.37 to 0.97) |
| > 65 years | ||||
| 7. Polyclonal paraproteins (n = 358) | ||||
| 28 events, adjusting for treatment pathway | ||||
| IgG for non-IgG myeloma | < 4 | –0.47 | 0.06 | 0.63 (0.39 to 1.01) |
| 4–6 | ||||
| > 6 | ||||
| Treatment pathway | Non-intensive | –1.00 | 0.01 | 0.37 (0.17 to 0.81) |
| Intensive | ||||
| 8. Individual factors | ||||
| Univariate | ||||
| Pn5 (n = 830, events = 68) | < 0.03 µg/ml | –0.18 | 0.12 | 0.84 (0.67 to 1.05) |
| 0.03–0.1 µg/ml | ||||
| 0.1–0.35 µg/ml | ||||
| > 0.35 µg/ml | ||||
| Pn7F (n = 788, events = 65) | < 0.13 µg/ml | –0.18 | 0.21 | 0.83 (0.62 to 1.11) |
| 0.13–0.35 µg/ml | ||||
| > 0.35 µg/ml | ||||
| Pn19A (n = 830, events = 68) | < 0.06 µg/ml | –0.24 | 0.12 | 0.78 (0.58 to 1.07) |
| 0.6–0.35 µg/ml | ||||
| > 0.35 µg/ml | ||||
| Men A (n = 816, events = 66) | < 0.5 µg/ml | –0.22 | 0.22 | 0.80 (0.57 to 1.14) |
| 0.5–2 µg/ml | ||||
| > 2 µg/ml | ||||
| IL-10 (n = 164, events = 20) | < 7 pg/ml | 0.21 | 0.45 | 1.23 (0.72 to 2.09) |
| 7–10 pg/ml | ||||
| > 10 pg/ml | ||||
| IgM for non-IgM myeloma | < 0.12 g/l | –0.29 | 0.06 | 0.75 (0.55 to 1.02) |
| 0.12–0.24 g/l | ||||
| > 0.24 g/l | ||||
| IgA for non-IgA myeloma | < 0.2 g/l | 0.05 | 0.77 | 1.05 (0.75 to 1.48) |
| 0.2–0.4 g/l | ||||
| 0.4 g/l | ||||
| IgG for non-IgG myeloma | < 4 g/l | –0.47 | 0.05 | 0.63 (0.39 to 1.01) |
| 4–6 g/l | ||||
| > 6 g/l | ||||
Objective 2: measuring biomarkers of myeloma activity to sensitively measure speed and depth of the myeloma response
Levels of soluble CD138
The analysis of serum levels of solCD138 was performed for a cohort of 327 TEAMM trial patients at all trial time points and compared with levels measured in 50 healthy donors (age range 17–65 years). As expected, median levels of solCD138 were elevated in TEAMM trial patients, compared with the healthy cohort (TEAMM trial: 120.4 IU/ml, range 1.41–256 IU/ml; healthy cohort: 36.6 IU/ml, range 18.49–57.42 IU/ml), confirming its validity as a biomarker of active disease (Figure 11). In total, 28% of TEAMM trial patients presented with solCD138 levels within the normal range, whereas 72% of patients had a solCD138 level higher than the highest value in the 50 healthy controls (Table 19). At diagnosis, in the 234 patients with solCD138 levels above the normal range, parallel to m-protein and FLC levels, the solCD138 levels decreased thereafter in association with the anti-myeloma induction therapy. However, average levels of solCD138 in TEAMM trial patients remained elevated compared with the normal range at all trial time points to 1 year of follow-up (Figure 12). During induction therapy, levels of solCD138 decreased by 25% during the first 4 weeks of treatment, 25% between 4 and 8 weeks, 12% between 8 and 12 weeks, 7% between 12 and 16 weeks and 17% between 16 and 52 weeks (Table 20). By 1 year, most patients were in remission.
FIGURE 11.
Levels of solCD138 in TEAMM trial patients at presentation compared with levels in a healthy cohort. Box-and-whisker plots representing medians, 25–75th percentiles, and minimum and maximum values of levels of solCD138 in 45 healthy volunteers and 327 TEAMM trial patients. Statistical significance was calculated with the Mann–Whitney U-test (p-value < 0.001 = ***).
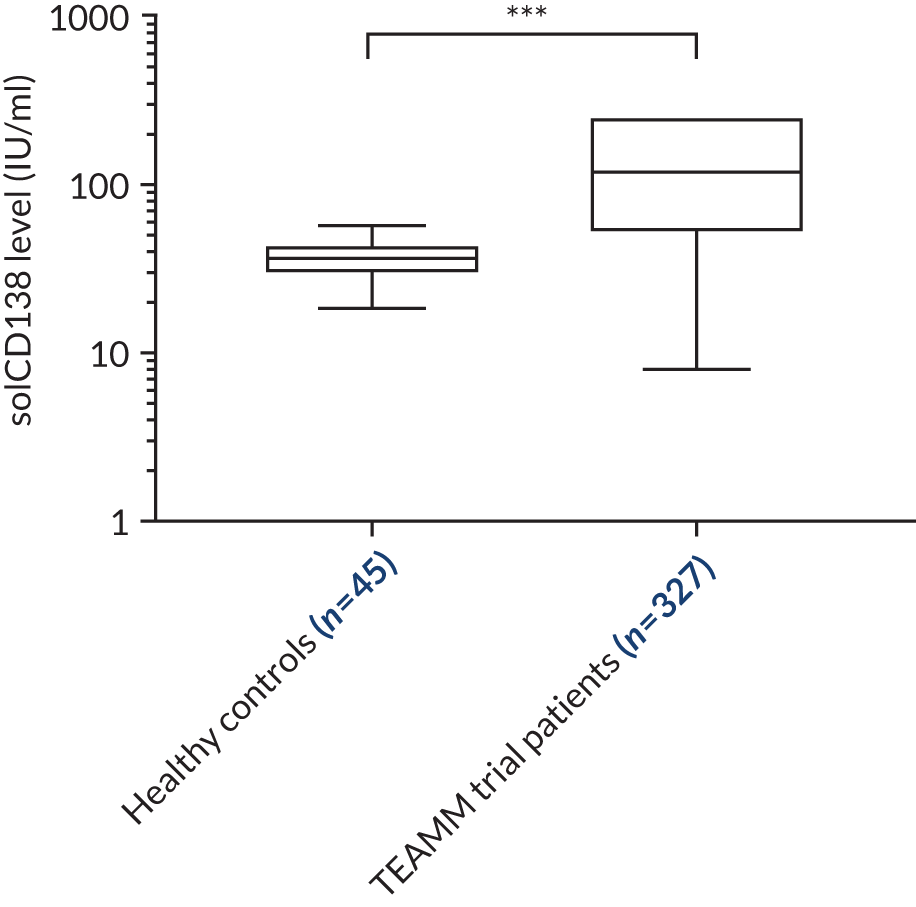
| Patients | Number | Percentage of 327 patients |
|---|---|---|
| Analysed | 327 | |
| Within normal range | 93 | 28 |
| Above normal range | 234 | 72 |
FIGURE 12.
Levels of solCD138 in TEAMM trial patients at each trial visit up to 1 year from presentation. Average levels and standard deviations of solCD138 in TEAMM trial patients at disease presentation, 4 weeks, 8 weeks, 12 weeks, 16 weeks and 1 year after presentation. Levels of solCD138 identified in 45 healthy controls are the normal range shown in green: median level (solid line), 5th and 95th percentile (discontinued lines).
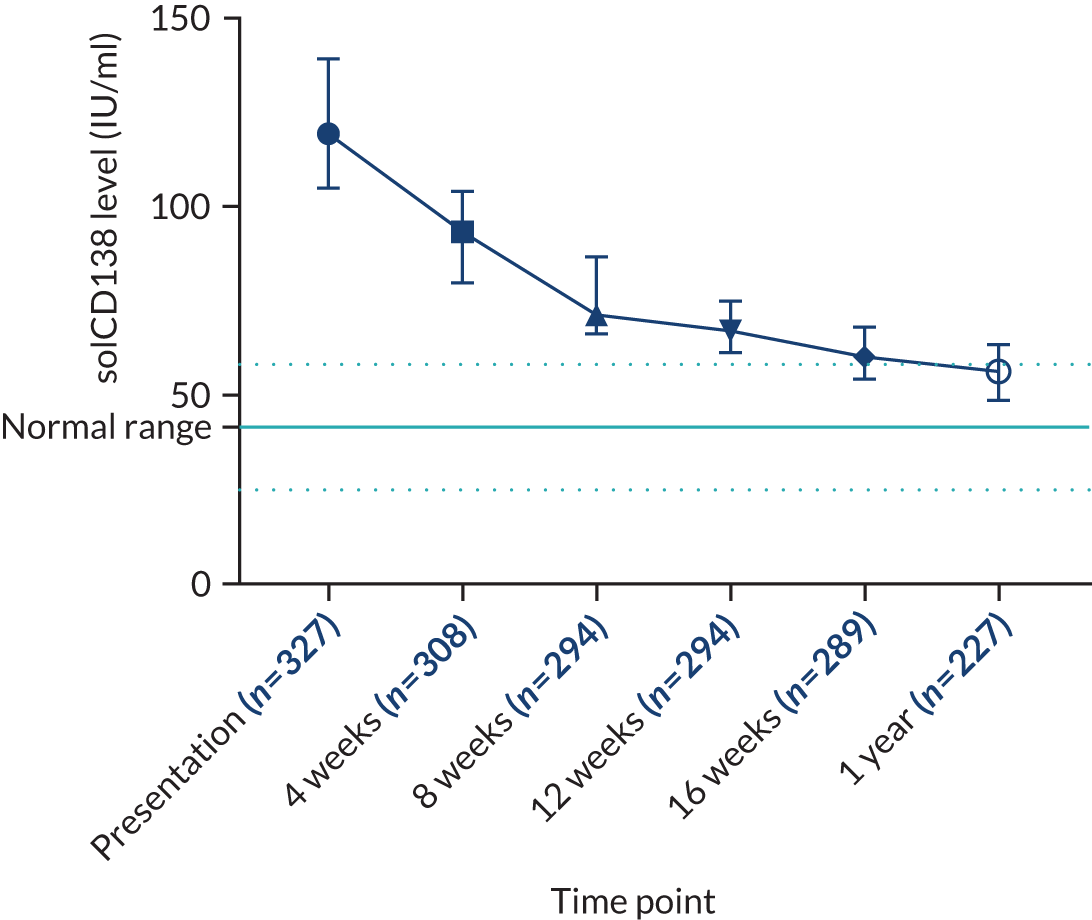
| Time point | Percentage change in solCD138 level | |
|---|---|---|
| Reduction compared with baseline | Reduction between visits | |
| 4 weeks | 31 | 25 |
| 8 weeks | 47 | 25 |
| 12 weeks | 49 | 12 |
| 16 weeks | 58 | 7 |
| 1 year | 62 | 17 |
Comparison of changes in serum levels of solCD138, m-protein and monoclonal free light chains
The percentage change in solCD138 levels between trial visits was compared with the percentage change in m-protein and FLC levels during the same periods. As shown in Figure 13, after 4 weeks of therapy the reduction is greater for FLCs than m-proteins; this is as expected because of different serum half-lives. IgG has a long half-life of 21 days because of recycling by the FcRn receptor, whereas IgA has a typical serum protein half-life of 5 days. FLCs have a half-life of just 5 hours because their low molecular weight results in clearance by glomerular filtration. A reduction in serum FLC levels reflects decreased myeloma disease activity, whereas a reduction in levels of whole m-protein reflects a combination of decreased myeloma disease activity and protein half-life. A reduction in solCD138 levels follows a different pattern to the reduction observed in m-protein and FLC levels, with a smaller reduction in the first 4 weeks but the rate of reduction is sustained in the second 4-week period. Most patients completed induction therapy plus or minus high-dose melphalan and autologous stem cell rescue by 6–8 months. In the period 16–52 weeks there is a further mean reduction in m-protein and FLC levels and a greater mean reduction in solCD138 levels.
FIGURE 13.
Average percentage reduction in levels of solCD138 (dark blue line), m-protein (light blue line) and FLCs (orange line) between consecutive trial visits and up to 1 year (i.e. 52 weeks) in TEAMM trial patients. Each data point represents the percentage reduction between two consecutive trial visits. Elevated values (e.g. at 4 weeks) indicate greater reductions in the levels of solCD138, m-protein and FLCs, whereas low values (e.g. at 16 weeks) indicate smaller reductions in the levels of solCD138, m-protein and FLCs. The percentage reduction decreased up to 16 weeks for all three biomarkers and increased at 1 year for solCD138.
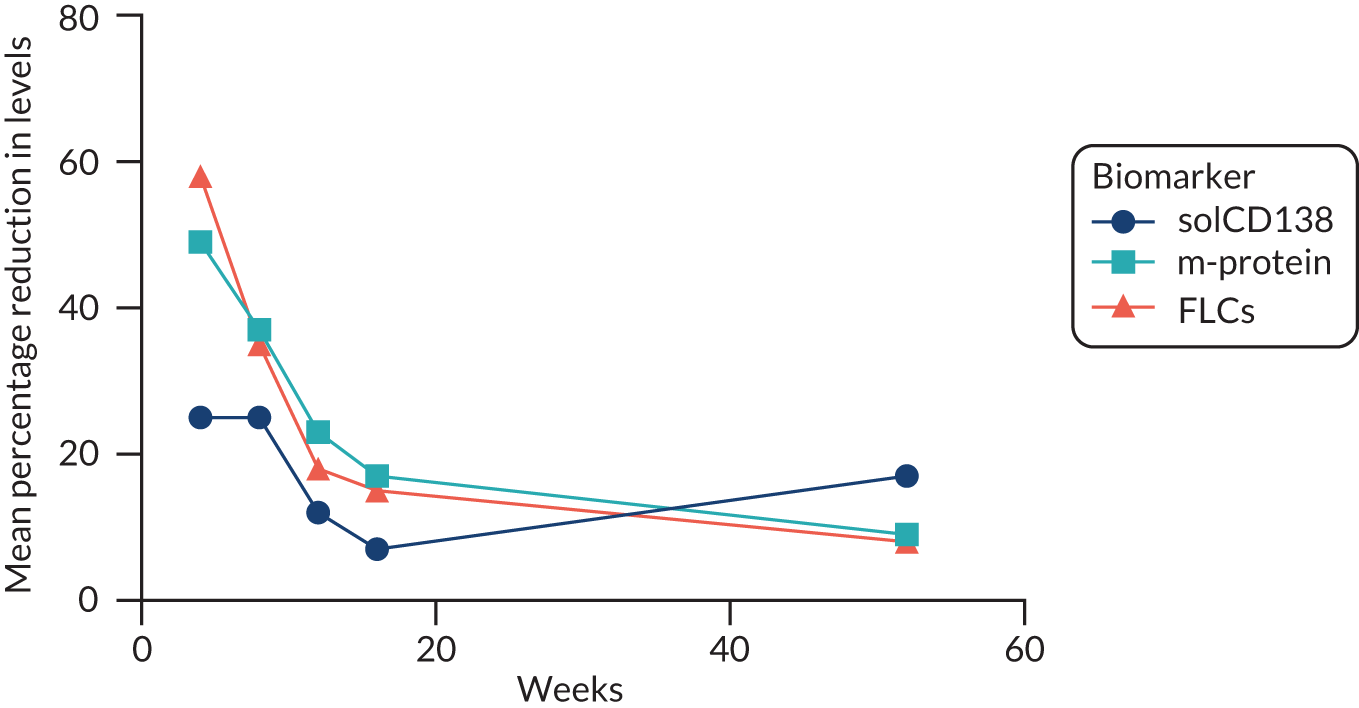
Changes in levels of m-protein, FLCs and solCD138 can also be compared by analysing achievement of the different response categories at the different trial time points. A complete response (CR) to therapy is considered a 100% reduction in biomarker levels. For m-proteins, a CR is defined as the disappearance of the m-protein, as defined by no m-protein being detectable by immunofixation. For FLCs, a CR is defined by normalisation of the difference in kappa lambda levels (< 20 mg/l) and the serum FLC kappa lambda ratio. For solCD138, a CR is the return of serum levels to within the normal range (i.e. 18.49–57.42 IU/ml). Responses in levels are categorised as follows:
-
a ≥ 90% but < 100% reduction – very good partial response (VGPR)
-
a ≥ 50% but < 90% reduction – partial response (PR)
-
a ≥ 25% but < 50% reduction – minimal response (MR)
-
a < 25% reduction and ≤ 25% increase – stable disease (SD)
-
a > 25% increase – progressive disease (PD).
Figure 14 presents the percentage of patients for each category of response based on the reduction in levels of solCD138, m-proteins and FLCs after 4, 16 and 52 weeks of anti-myeloma therapy.
FIGURE 14.
The percentage of TEAMM trial patients within response categories based on the percentage change of levels of solCD138, m-protein and FLC at (a) 4 weeks, (b) 16 weeks and (c) 1 year from baseline.
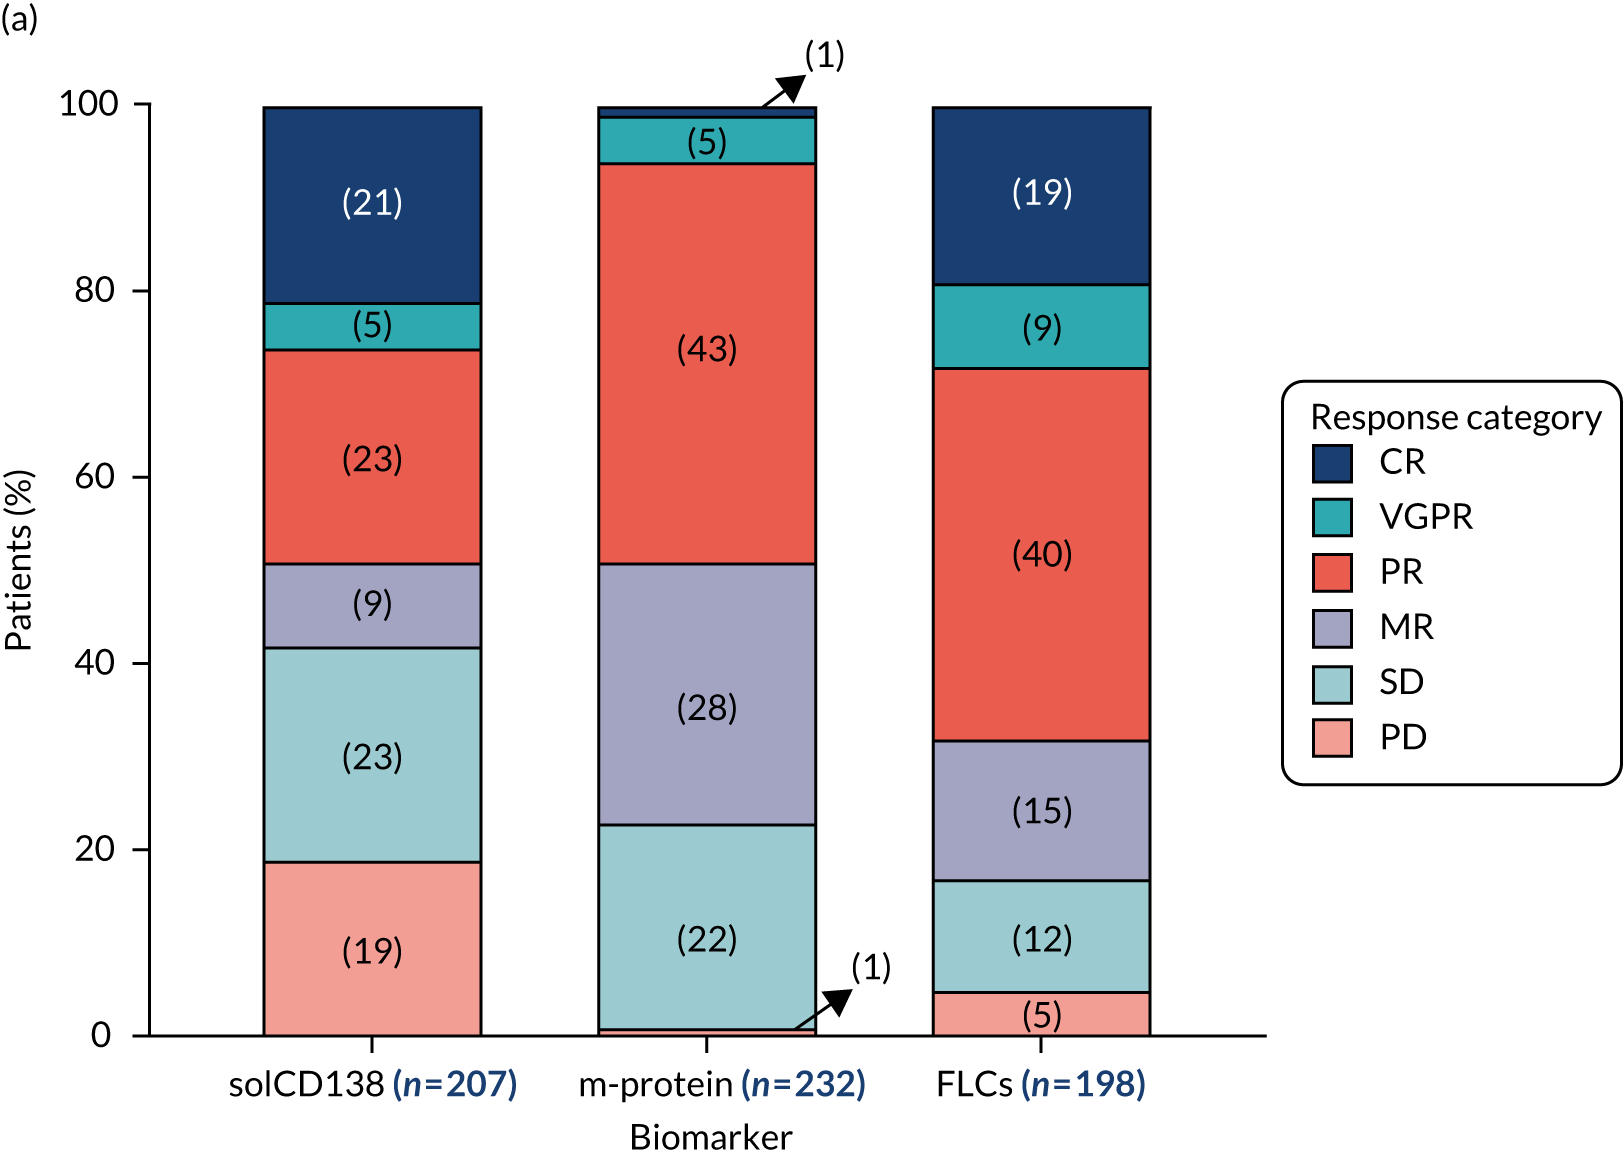
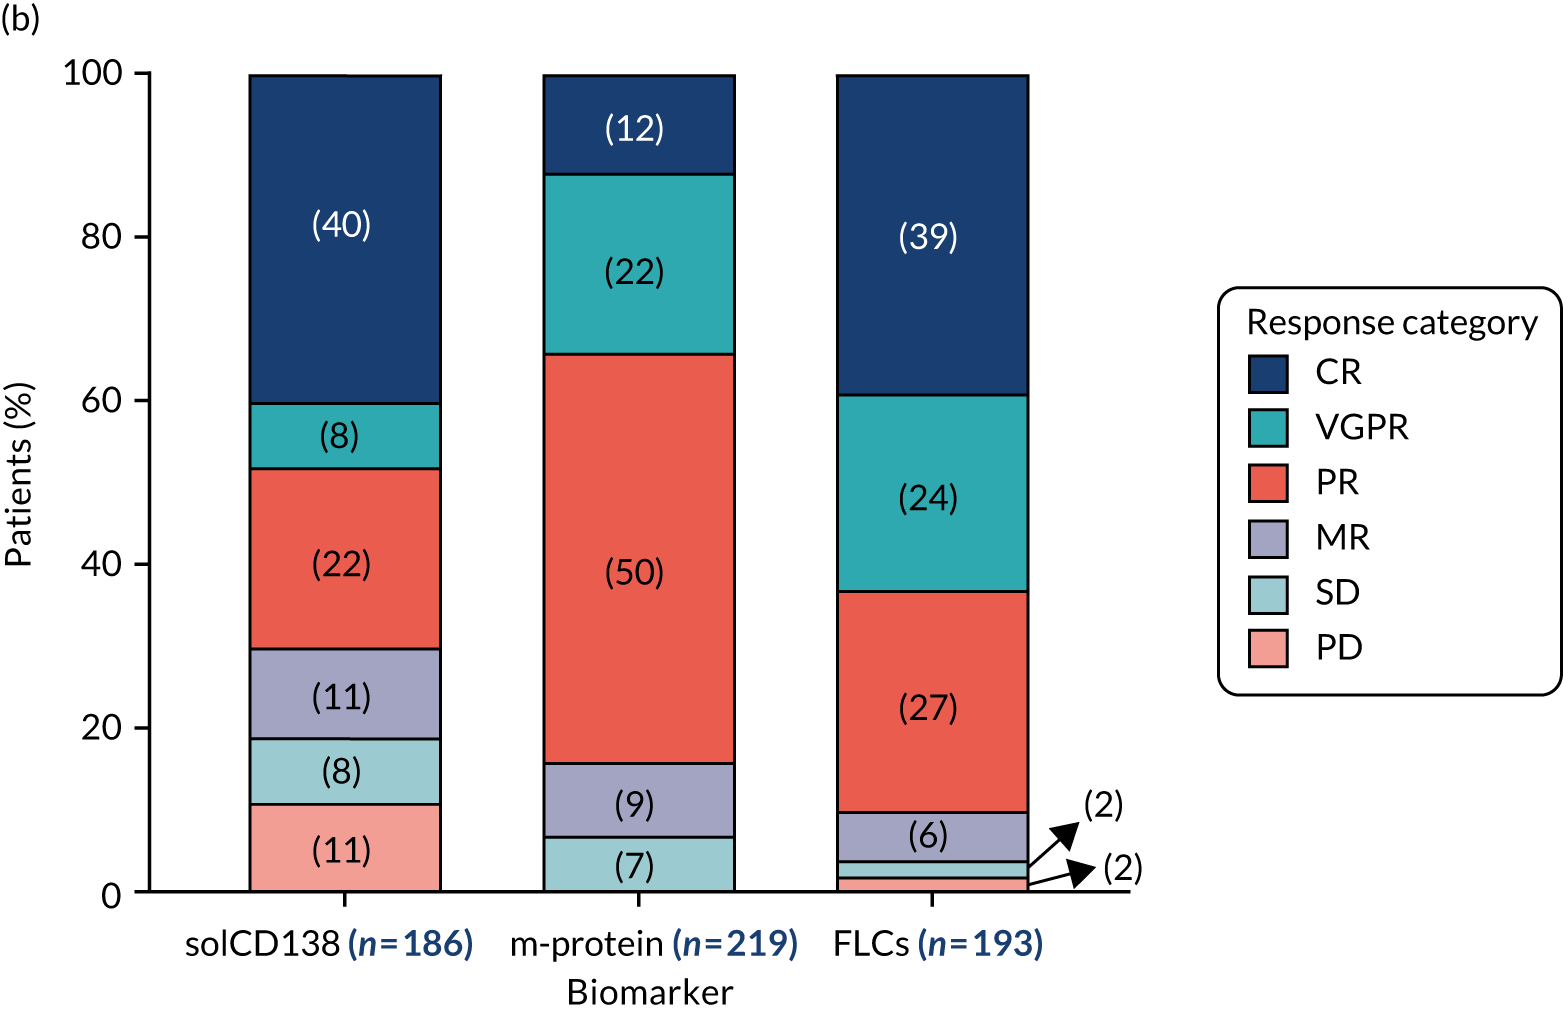
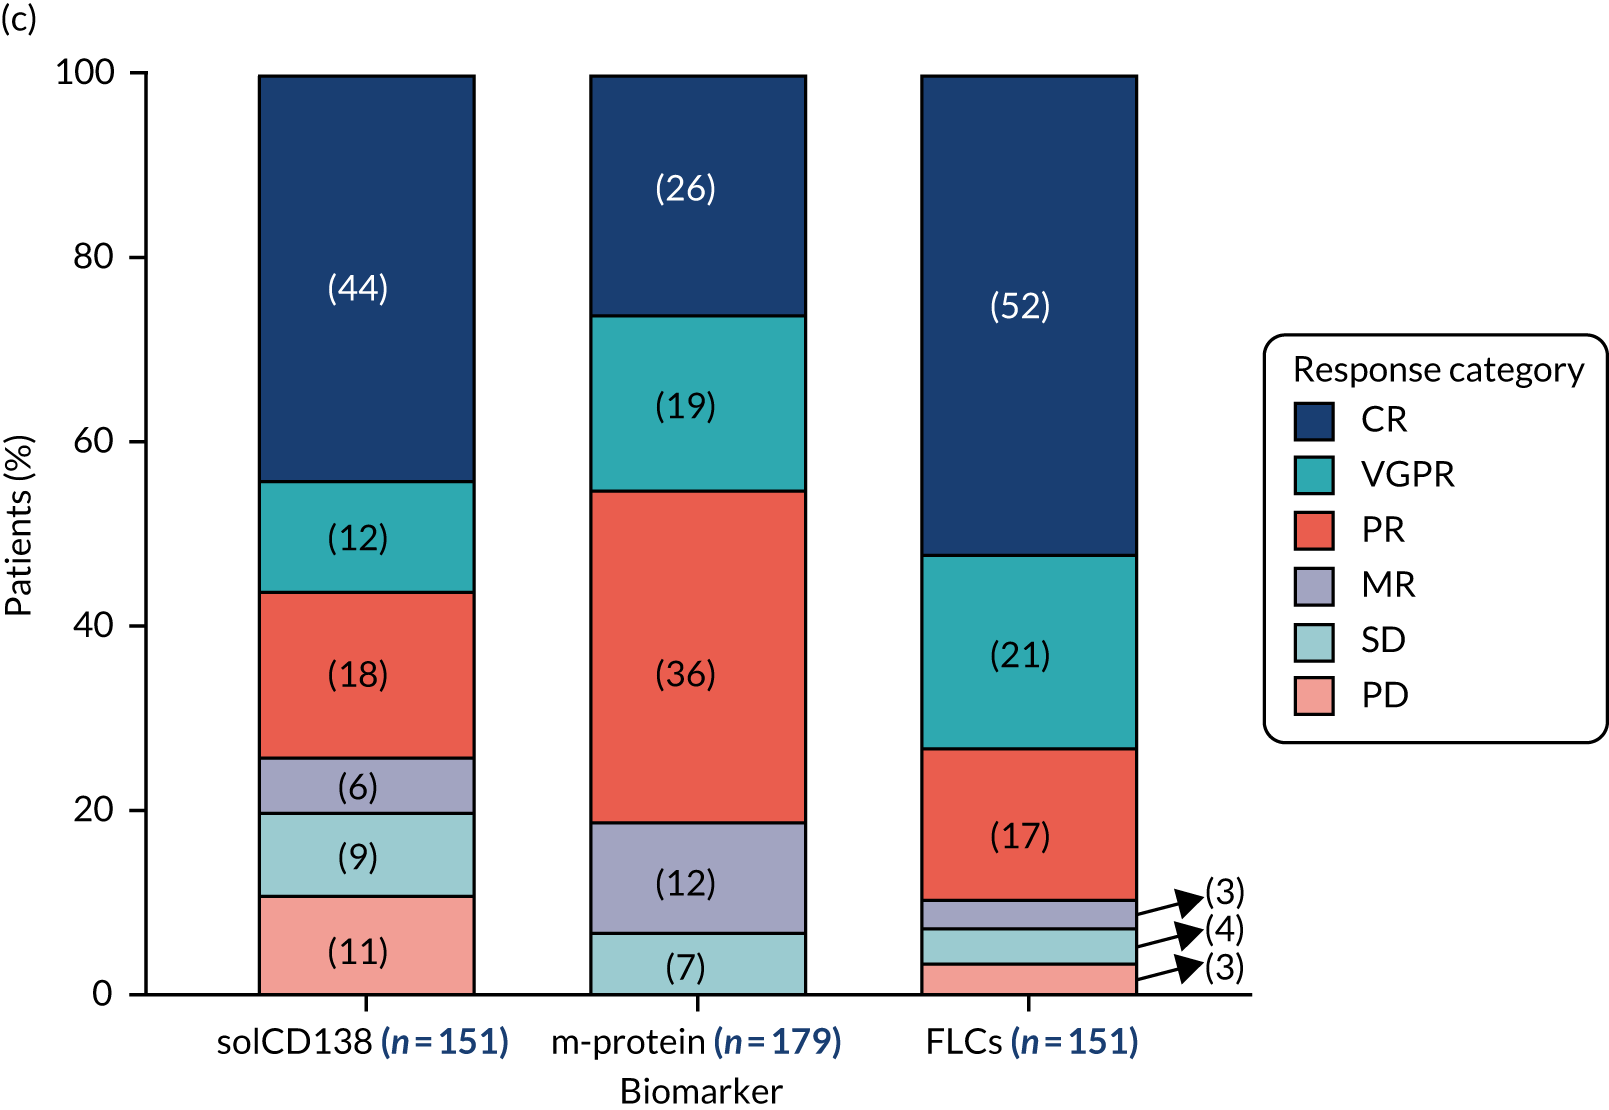
By 4 weeks, the depth of response was greater for FLCs (i.e. 28% ≥ VGPR) than for m-proteins (i.e. 6% ≥ VGPR), which is consistent with the short half-life of FLCs. Similar to FLC responses, 26% of patients had achieved a VGPR or CR for levels of solCD138. However, the solCD138 responses were < 50% in 51% of patients compared with 32% of patients for FLC responses. By 16 weeks, responses in the levels of FLCs, m-proteins and solCD138 had all deepened while retaining the differences between them. By 1 year, all of the biomarker responses had further deepened and the differences between them were still maintained.
The m-protein response correlates closely with the FLC response, being either the same or one response category below (see the light blue-shaded boxes in Table 21). In contrast, the solCD138 response correlates poorly with the FLC response being in the most part in different categories than solCD138 (below and above purple-shaded boxes in Table 21). Of the 76 patients achieving a CR at 16 weeks for FLCs, only 30% had a CR for solCD138. At baseline, 30% of patients had a solCD138 level within normal range, 9% achieved a VGPR, 16% a PR and 11% showed a reduction in levels of solCD138 < 50% (MR, SD and PD). Similar differences can be observed for other response categories, more than ≈ 30% of patients achieving a VGPR and > 20% achieving a PR for FLCs showed a CR in terms of solCD138 percentage decrease. One-quarter of the 11 patients in the MR category showed ≥ 90% solCD138 percentage decrease (i.e. VGPR and CR). Last, the outcomes in terms of solCD138 reduction fluctuated for the few patients SD and PD based on FLC percentage change.
| FLC response | Biomarker response compared with the FLC response | |||||||||||
|---|---|---|---|---|---|---|---|---|---|---|---|---|
| m-protein | solCD138 | m-protein | solCD138 | m-protein | solCD138 | m-protein | solCD138 | m-protein | solCD138 | m-protein | solCD138 | |
| CR (N = 76) | 3% | 30% | 2% | 28% | 2% | 23% | 0% | 18% | 0% | 25% | 0% | 33% |
| VGPR (N = 47) | 47% | 9% | 15% | 4% | 8% | 6% | 0% | 9% | 0% | 0% | 0% | 0% |
| PR (N = 52) | 26% | 16% | 49% | 13% | 58% | 15% | 18% | 18% | 25% | 25% | 0% | 0% |
| MR (N = 11) | 0% | 5% | 9% | 11% | 8% | 8% | 27% | 9% | 25% | 0% | 33% | 0% |
| SD (N = 4) | 0% | 3% | 0% | 2% | 0% | 10% | 36% | 0% | 50% | 25% | 33% | 0% |
| PD (N = 3) | 0% | 3% | 0% | 2% | 0% | 8% | 0% | 9% | 0% | 25% | 33% | 67% |
| Sample with solCD138 within normal range at baseline | – | 32% | – | 32% | – | 25% | – | 36% | – | 0% | – | 0% |
| Sample unavailable for analysis | 24% | 3% | 26% | 9% | 25% | 6% | 18% | 0% | 0% | 0% | 0% | 0% |
Objective 3: measuring biomarkers of inflammation to identify patients who may be at risk of poor treatment responses and patients who may benefit from additional targeted therapies
Procalcitonin
Procalcitonin levels were measured in samples of a proportion of TEAMM trial patients collected at all four time points of the TEAMM trial. The study’s results indicated an average of 6.4% of investigated TEAMM trial patients presented elevated PCT levels at each time point, whereas the remaining patients had undetectable levels. The study selected patients who had samples collected 1 day before or up to 3 days after the occurrence of a febrile or non-febrile episode. Levels of PCT were analysed in a total of 97 patients, of whom 33% had at least one febrile episode during the trial and 67% had other types of non-febrile episodes. The concentration used as threshold for inflammation/infection was a PCT level ≥ 0.15 ng/ml. The study’s results indicate that PCT levels were elevated in only 50% of the cases for both febrile and other infection episodes.
C-reactive protein
Levels of CRP were also measured in all TEAMM trial patients, at all time points, as a biomarker of inflammation and bacterial infection. Levels of CRP were above the threshold for inflammation/infection (i.e. ≥ 10 mg/l) in 60% of patients, specifically CRP levels were elevated in 60% of patients who had febrile episodes and 57% of patients who had non-febrile episodes. Analysis of PCT levels in association with CRP levels showed no correlation between the two parameters.
Cytokines interleukins 6 and 8
The analysis of serum proinflammatory cytokines IL-6 and IL-8, as biomarkers of infection-induced inflammation, was performed for ≈300 TEAMM trial patients and compared with levels identified in the sera of a cohort of 16 healthy controls, in which blood samples were separated 24 hours after venesection. Surprisingly, the analysis indicated that levels of IL-6 and IL-8 in TEAMM trial patients at presentation were below those measured in the healthy cohort and the concentration measured at 12 weeks and at 1 year post treatment showed no statistically significant difference compared with levels identified before treatment (Figure 15). Although a moderate association was found between levels of IL-6 and IL-8 at all the study time points (rho = 0.6), no correlation was identified for these cytokines with the biomarker of infection, that is, CRP, at baseline (rho < 0.25). Furthermore, data analysis was performed in order to verify whether the distribution of IL-6 and IL-8 at baseline was different in TEAMM trial patients who had febrile and/or non-febrile episodes or none during the trial (Figure 16). Results indicated that levels of IL-6 and IL-8 were comparable between patients having febrile and/or non-febrile episodes and patients who had no episodes during the trial. Statistically significant differences were identified in only IL-6 levels between patients who had non-febrile episodes only and patients who had fevers and non-febrile episodes during the trial, suggesting that patients more prone to either type of episodes might have lower levels of IL-6. However, no statistically significant difference was observed compared with patients who had no episodes during the trial.
FIGURE 15.
Median levels of (a) IL-6 and (b) IL-8 in TEAMM patients at disease presentation, 12 weeks and 1 year after presentation. Levels of IL-6 and IL-8 in 16 healthy controls are shown as normal range in light blue: median level, maximum and minimal values (discontinued lines). Statistical significance was calculated with Dunn’s unmodified test for multiple comparison (a p-value of < 0.05 = *; not significant = ns).
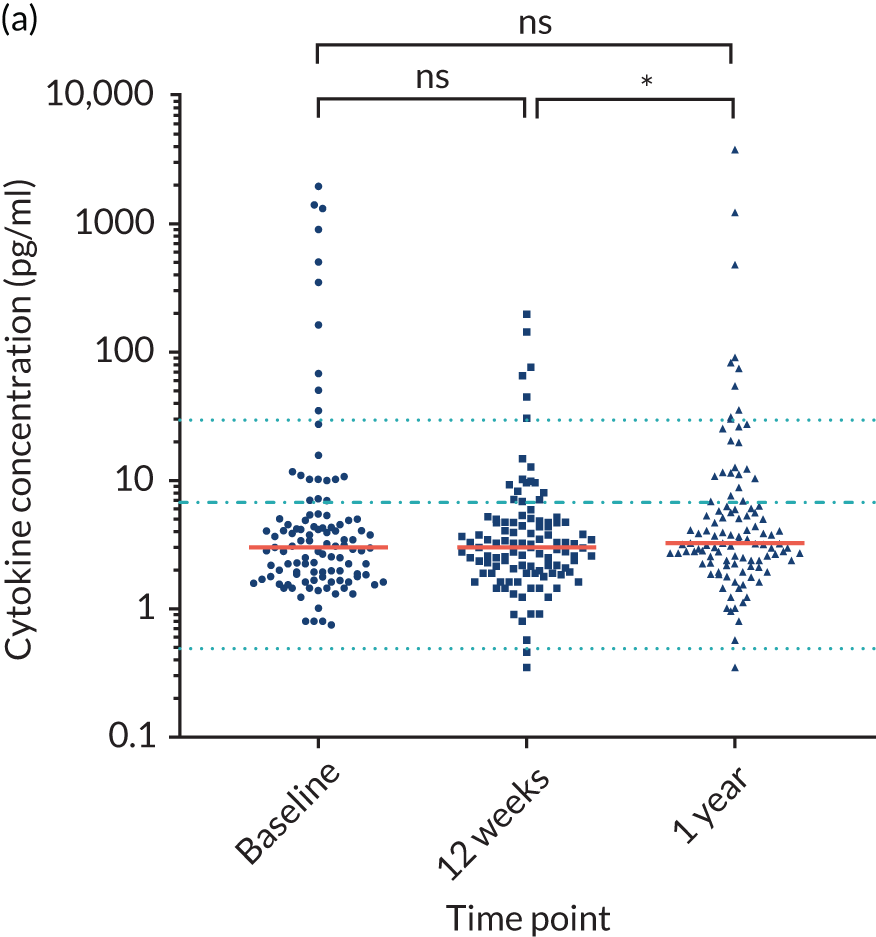
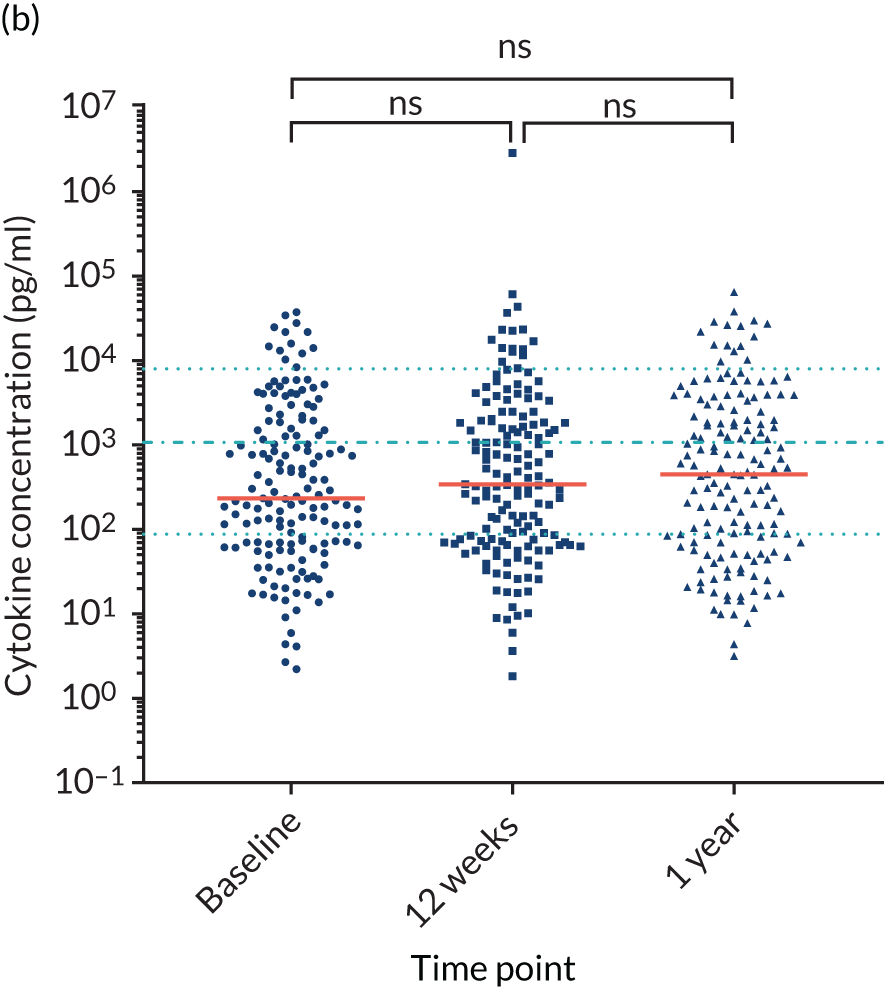
FIGURE 16.
Levels of cytokines (a) IL-6 and (b) IL-8 at presentation in TEAMM trial patients with different infection profiles during the trial. Box-and-whisker plots representing median, 25th–75th percentiles, and minimum and maximum values of IL-6 and IL-8 concentrations in TEAMM trial patients with different infection profiles. Statistical significance was calculated with Dunn’s unmodified test for multiple comparison (a p-value of < 0.05 = *; not significant = ns).
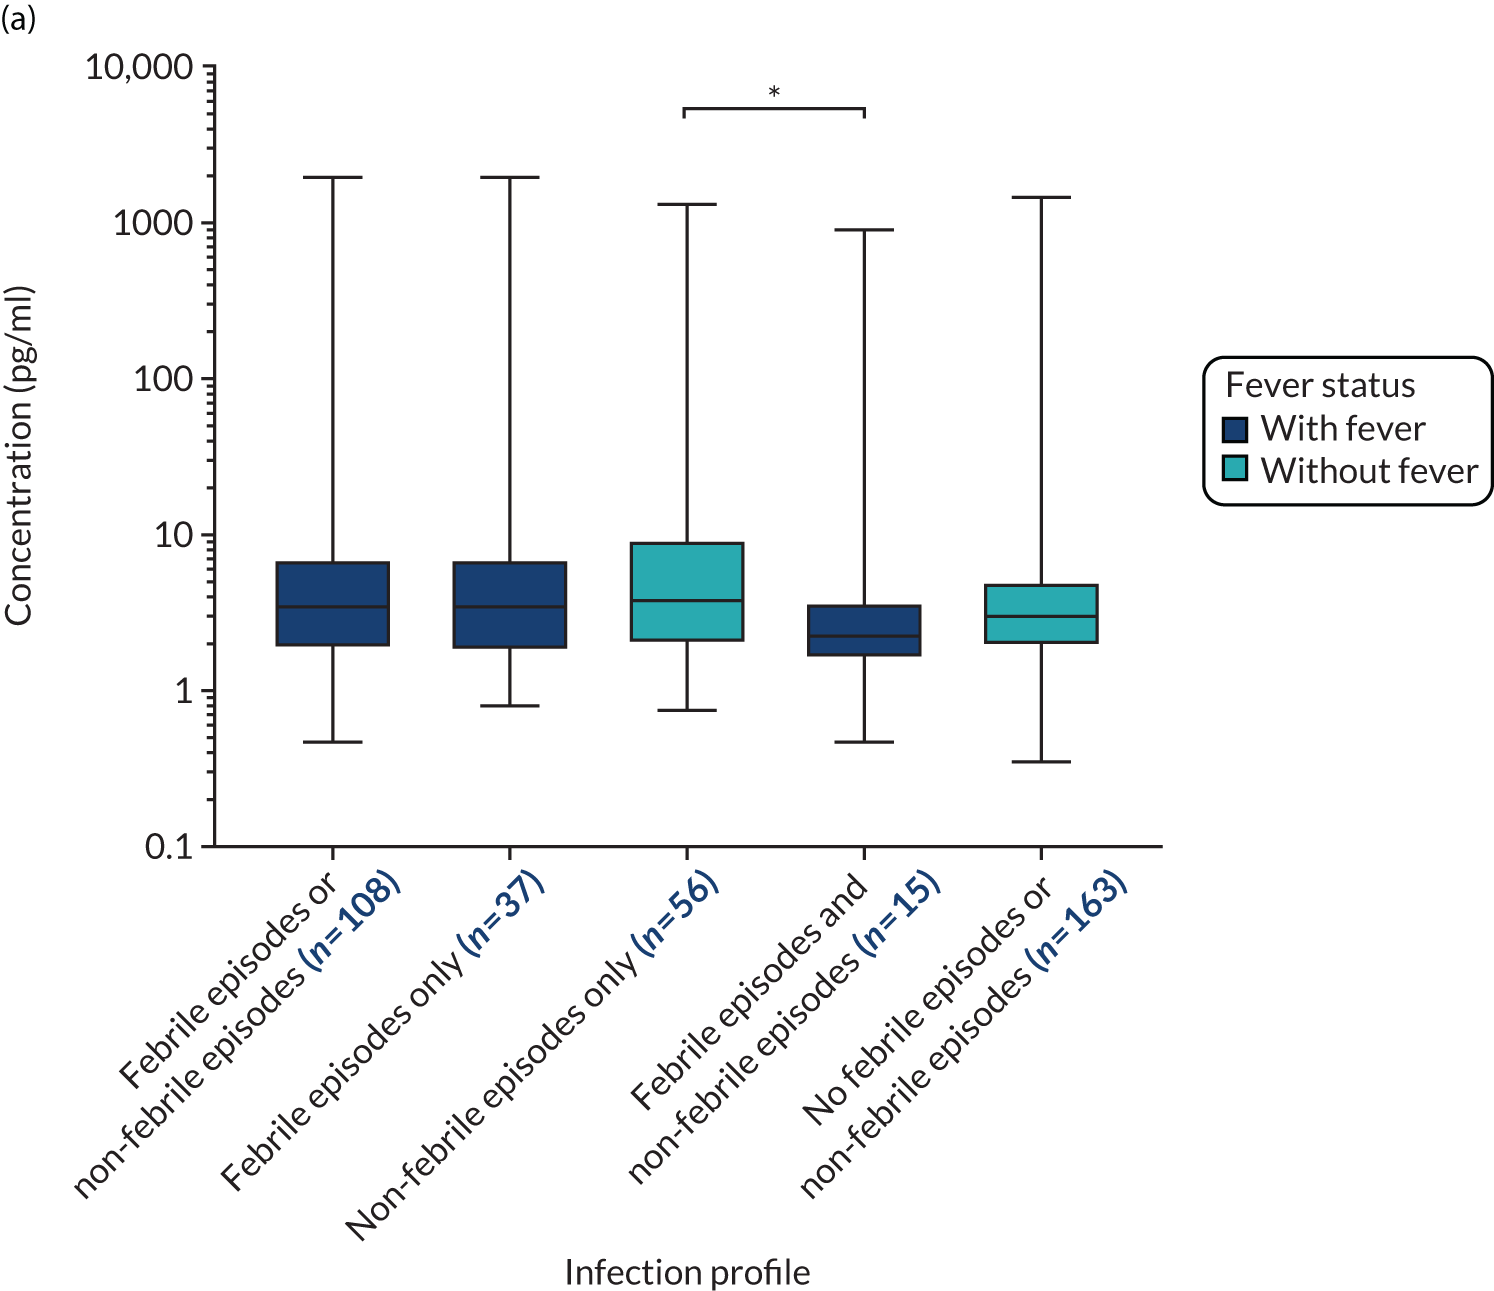
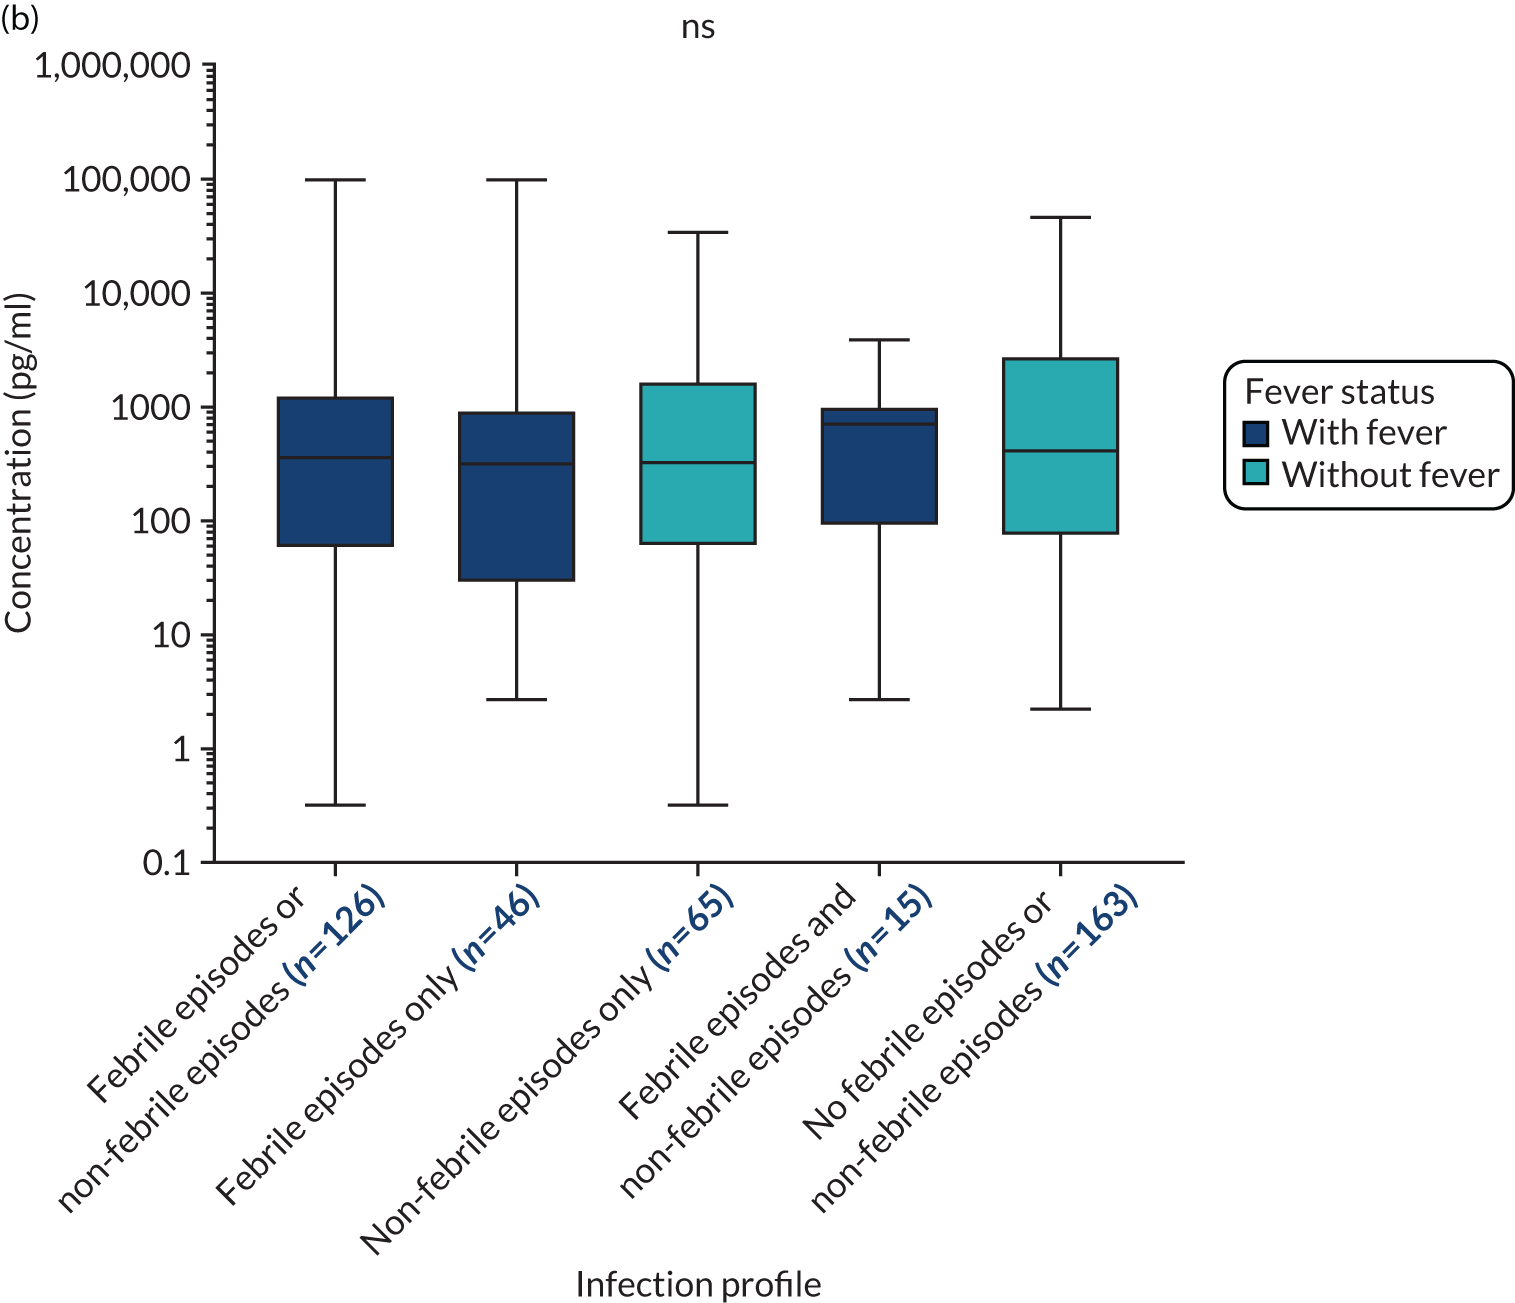
The levels of IL-6 and IL-8 before and after therapy, and at 1 year in TEAMM trial patients was also compared between good myeloma responders and poor responders (Figure 17). The TEAMM trial patients were categorised as good responders if showing ≥ 90% reduction in FLCs at 16 weeks, whereas poor responders were patients with < 90% reduction in FLCs at 16 weeks. Both groups of patients had levels of IL-6 and IL-8 below the normal range at all trial visits. Interestingly, patients achieving a poor response to therapy at 16 weeks also showed lower levels of IL-6 at baseline than good responders; however, this difference was lost by 12 weeks and at 1 year. Statistically significant differences were not found between levels of IL-8 in the two response groups; however, the median level in poor responders at 12 weeks was notably lower than baseline levels in the same group of response and also compared with levels post therapy in good responders.
FIGURE 17.
Distribution and median levels of cytokines (a) IL-6 and (b) IL-8 at baseline, 12 weeks after therapy and at 1 year in TEAMM trial patients divided by their response to therapy. In dark blue good responders and in grey poor responders are shown. Levels of IL-6 and IL-8 in 16 healthy controls are shown as normal range in light blue: median level, maximum and minimal values (discontinued lines). Statistical significance between trial time points was calculated with Dunn’s unmodified test for multiple comparison (no significance found), whereas statistical significance between response groups at each time point was calculated with the Mann–Whitney U-test (a p-value of < 0.05 = *; not significant = ns).
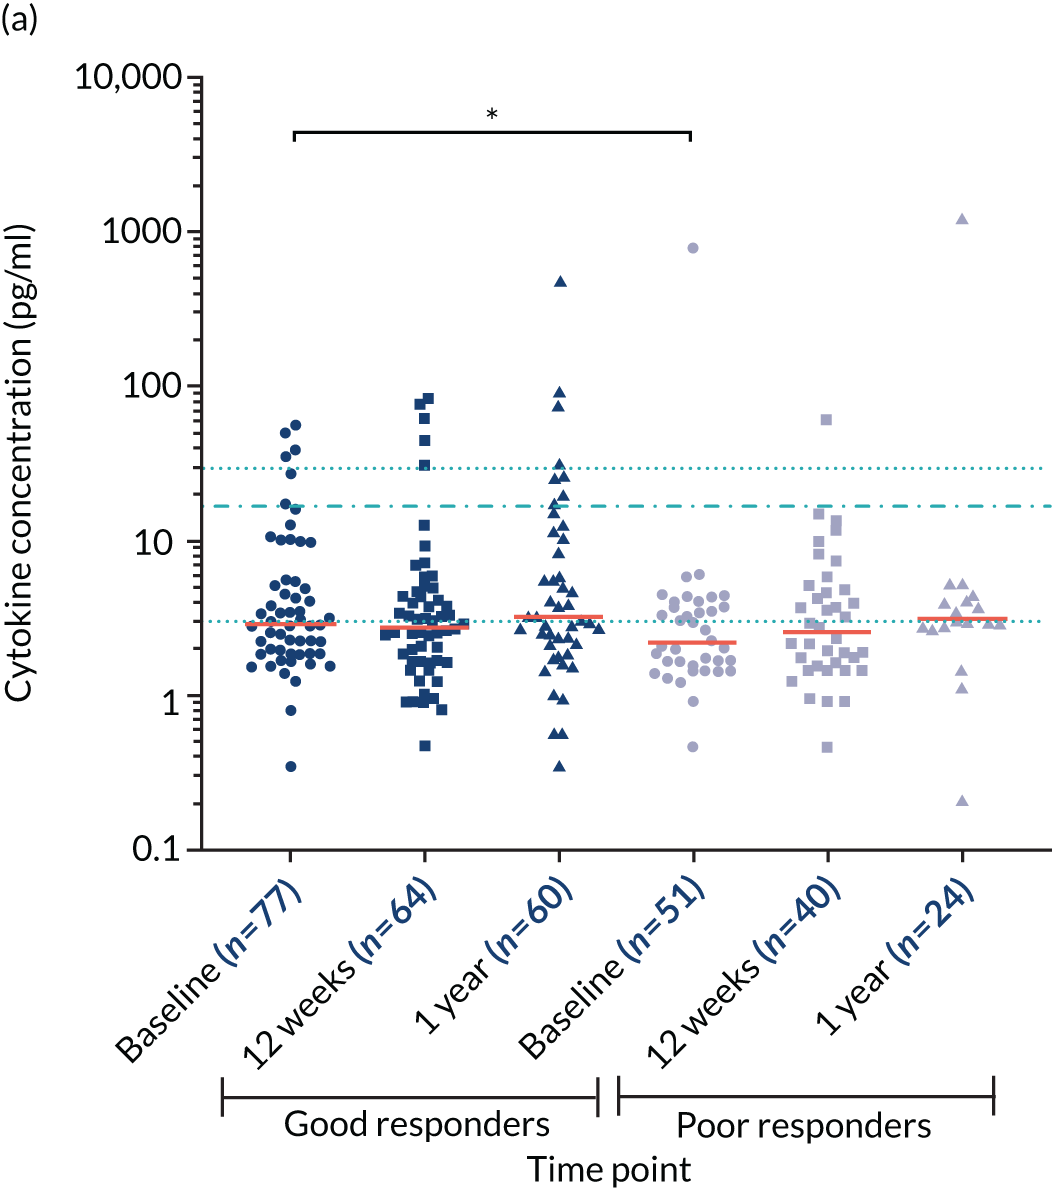
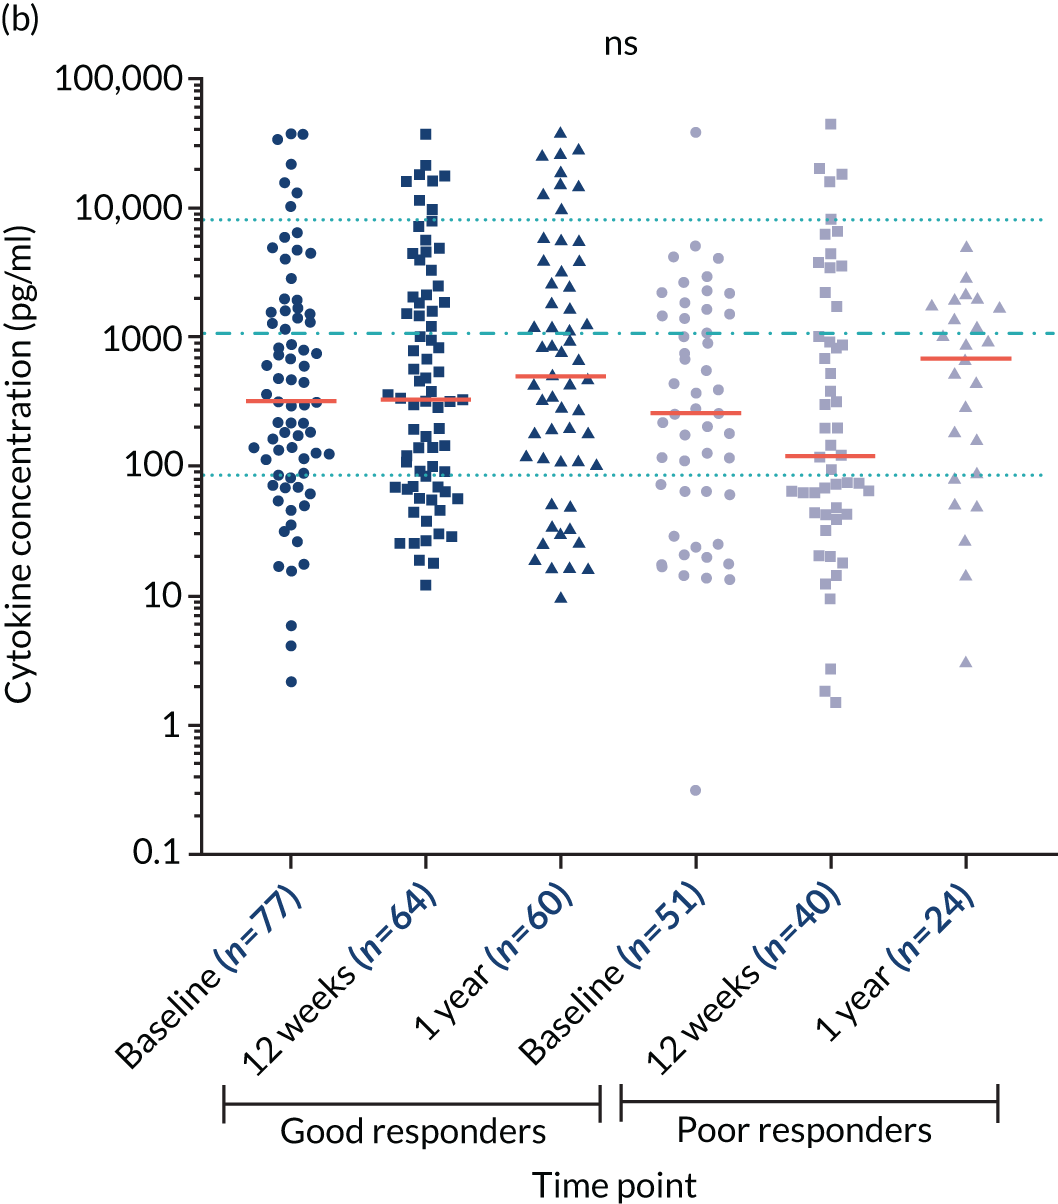
Objective 1 key findings
-
Levels of polyclonal immunoglobulins were below the normal range at baseline. Levels of polyclonal IgGs were further decreased after therapy, but recovered at 1 year.
-
Levels of anti-bacterial antibodies were profoundly suppressed at diagnosis compared with healthy donors. The majority of patients’ antibody levels were below the concentration required for protection against infection.
-
A higher proportion of older individuals showed protective levels against pneumococcal serotypes compared with the younger patients, reflecting the PPV23 immunisation programme for individuals aged > 65 years. However, the majority of older patients still failed to meet protective levels of antibodies against Pn serotypes.
-
Patients in the bottom tertile for Pn19A had a higher incidence of infections and being in the bottom tertile for Pn5, Pn7F, Hib and Men A was associated with death at 1 year.
-
In a subcohort of patients who received influenza vaccine after diagnosis, anti-flu antibodies increased in response to vaccination in some but not all patients; at 1 year from diagnosis levels of anti-flu antibodies had diminished. Anti-flu antibodies post-vaccination were correlated with some but not all anti-bacterial antibodies and vaccination boosted levels of tetanus and Pn4 antibodies.
-
Levels of biomarkers of neutrophil activity were higher in myeloma patients compared with healthy controls: the majority of patients (i.e. 61–97%) had biomarker levels above the median level of healthy controls. A strong relationship was observed between two of the biomarkers: neutrophil elastase and calprotectin.
-
No associations were found between neutrophil biomarkers and CRP, nor prevalence of infection episodes, febrile episodes and deaths.
-
Myeloma patients had significantly higher levels of IL-10 than healthy controls: 95% of TEAMM trial patients at diagnosis had IL-10 levels above the median concentration of healthy controls.
-
IL-10 levels at diagnosis were related to infection during the TEAMM trial: patients with high levels of IL-10 (i.e. ≥ 10 pg/ml) had more infections and febrile episodes than patients with lower levels of IL-10 (i.e. < 10 pg/ml). No associations were found between IL-10 levels and response to therapy during the TEAMM trial or up to 1 year of follow-up.
-
A significant benefit was observed in time to first infection within 12 weeks of starting trial treatment in patients with lower levels of IL-10 and higher levels of polyclonal immunoglobulins. IL-10 and polyclonal IgG were good predictors for infections.
-
High levels of Pn7F were associated with better survival at 12 months. When adjusted for age Pn7F was not significant, but higher levels of Pn5 and polyclonal IgG become significant. Pn5 was found to be a good predictor for survival at 12 months.
Objective 2 key findings
-
Levels of solCD138 were elevated in TEAMM trial patients compared with the healthy cohort, confirming solCD138’s utility as a biomarker of active disease.
-
solCD138 levels followed a similar pattern to conventional measures of disease, that is, levels of m-protein and/or FLCs, in which levels were highly elevated at diagnosis and significantly reduced following induction therapy.
-
More patients had a CR at 4 weeks and 16 weeks when measured by levels of solCD138 and FLCs, compared with m-protein. This suggests that the speed and depth of responses to anti-myeloma therapy can be measured shortly after therapy by evaluating levels of solCD138 and FLCs, compared with whole m-proteins because of the long half-life of immunoglobulins.
-
The m-protein response correlates closely with the FLC response, whereas the solCD138 response correlates poorly with the FLC response.
Objective 3 key findings
-
Levels of PCT were analysed in patients 1 day before or up to 3 days after experiencing febrile or non-febrile episodes. Levels of PCT were elevated in only 50% of cases suggesting that PCT was not a sensitive biomarker of infection in TEAMM trial patients.
-
Levels of IL-6 and IL-8 were decreased in TEAMM trial patients compared with the healthy cohort, suggesting a relative incompetence of leucocytes in myeloma patients.
-
Levels of IL-6 and IL-8 in TEAMM trial patients did not change post treatment at 12 weeks and 1 year, compared with disease presentation.
-
Levels of IL-6 were lower in TEAMM trial patients who had febrile and non-febrile episodes during the trial compared with patients who had only non-febrile episodes. No other differences were found for IL-6 and IL-8 cytokines on the basis of infection profile during the trial.
-
Levels of IL-6 were lower at baseline in poor responders than in good responders, and the difference was lost after therapy.
Chapter 4 Discussion
The TEAMM trial identified that use of levofloxacin as a prophylactic antibiotic reduced febrile episodes and deaths during the 12 weeks of the study. Therefore, the overall evidence emerging from the TEAMM trial supported the use of levofloxacin as prophylaxis for myeloma patients undergoing anti-myeloma treatment. The retrospective study of stored serum samples (associated with the TEAMM trial) has provided valuable information on immunological competence of myeloma patients, on potential novel biomarkers for infection predisposition and for monitoring disease activity that can contribute to improving risk stratification criteria for patients. The purpose of creating infection risk stratification criteria at disease presentation is to target the use of prophylactic antibiotics. These criteria should ensure that patients at high risk of infection receive prophylactic antibiotics to prevent infection-related morbidity and mortality and improve response to anti-myeloma therapy. By identifying patients who are unlikely to benefit from prophylactic antibiotics there will be reduced use of antibiotics and their associated risk of HCAIs.
It is well-established that myeloma patients have reduced levels of polyclonal immunoglobulins compared with healthy references ranges. 46 However, this study provides new evidence revealing antibodies specific for bacterial and viral targets are even more severely compromised in a large cohort of myeloma patients at disease presentation. This depth of anti-bacterial immunoparesis, and failure to meet recommended cut-off points required for protection, is likely to be a key contributing factor to infections in the first few months following diagnosis. The study’s data provide evidence that low levels of antibodies against some particular bacterial targets are associated with an increased incidence of febrile episodes and deaths. At 1 year most patients are in remission from myeloma and have increased levels of polyclonal IgG, IgA and IgM compared with at the time of diagnosis. The greatest increase was observed in IgG levels, in which the median level had reached the reference range for healthy individuals, although this was significantly below the median level for that healthy cohort. In stark contrast, levels of IgG against specific bacterial targets were even lower than they had been at diagnosis, indicating the need for a vaccination schedule for patients in remission.
A high proportion of the 193 healthy volunteers (all aged under 65 years) have protective levels of antibodies against most of the bacterial target antigens tested. This reflects vaccination schedules for tetanus and diphtheria toxins and for the other bacterial targets. This also reflects the high levels of natural exposure since these bacteria, as well as being potential lower respiratory tract pathogens, are also common nasopharyngeal commensals. As immunosenescence develops, it is recommended to boost these naturally acquired antibody levels by vaccination; therefore, PPV23 is recommended for people aged ≥ 65 years and flu vaccines annually from the age of 65 years, with the shingles vaccine recommended for people aged ≥ 70 years.
Previous studies have shown reduced levels of antibody production in response to PNEUMOVAX 23 vaccination in MM patients. 1,47 In this study, investigations based on age (i.e. for patients aged ≥/< 65 years) have revealed valuable insights into the efficacy of the current UK PNEUMOVAX 23 vaccination programme. At disease presentation, myeloma patients aged ≥ 65 years (who would have been eligible for routine PNEUMOVAX 23 vaccination in the community, preceding myeloma presentation) have higher anti-bacterial antibodies than patients < 65 years old. However, significant differences were found for only three pneumococcal serotypes (i.e. Pn1, Pn5 and Pn18C). Furthermore, the majority of older patients still failed to meet protective levels and only 6% of patients demonstrated protective levels for 8 out of 12 serotypes, which is a normal adult response to PPV23 vaccination (i.e. laboratory reference range). The low levels of antibody at diagnosis and even lower levels in remission render these patients at great risk of bacterial respiratory tract infections. This highlights the need for vaccination strategies following completion of therapy and provides further evidence on the importance of protecting patients during therapy (i.e. prophylactic antibiotics). As for other groups of patients with antibody deficiency, including primary causes like common variable immune deficiency, bacterial chest infections are the most common problem. Nevertheless, the risk of rarer infections, such as meningitis and tetanus, is also greatly increased and needs to be considered in antibiotic prophylaxis and vaccination schedules. The study’s analysis demonstrated no correlation between low levels of some functional antibodies and the occurrence of febrile and non-febrile episodes. Conversely, correlations were found between low levels of some functional antibodies and the occurrence of deaths, in particular for anti-Pn5 antibodies and total polyclonal IgG. These results were confirmed in the study’s model that indicated anti-Pn5 antibody levels are a good predictor for survival at 12 months.
With a targeted analysis, the study was able to look at the response to flu vaccination in 19 myeloma patients undergoing anti-myeloma therapy. The analysis showed that TEAMM trial patients had poor levels of anti-viral antibodies at presentation and a successful response to vaccination could be achieved in only half of the patients, leaving them exposed and more susceptible to flu virus infections. Alarmingly, most of the patients achieving a response after vaccination lost the protective antibodies by 1 year, which may reflect a negative effect of anti-myeloma therapy on the duration as well as the immediate antibody response to vaccination. The association found between anti-viral antibodies boosted after vaccination and anti-bacterial antibodies at 12 weeks of therapy could represent the evidence of an overall immunological boost triggered by the flu vaccination. However, these patients remain severely immunocompromised as protective levels against most bacterial strains were identified in only a small percentage of patients at baseline and levels of antibodies were mostly reduced after 12 weeks of therapy.
Neutrophils are produced in the bone marrow and, as fundamental cells of the innate immune system, act as the first line of defence in cases of bacterial infections. Anti-microbial strategies employed by neutrophils include phagocytosis, the production of reactive oxygen species, degranulation and release of NETs. 10 Multiple myeloma patients are not often neutropenic; however, the infection profile of these patients is similar to those of neutropenic individuals thus raising the possibility that neutrophils of myeloma patients often function poorly. This study investigated neutrophil function-related biomarkers, found in serum, in TEAMM trial patients and compared their levels with those identified in a healthy cohort of volunteers. The study’s results indicate that the levels of neutrophil elastase and calprotectin were elevated compared with a healthy population, but no correlation was identified with CRP or with the occurrence of infections in TEAMM trial patients. Overall, these results suggest that the neutrophil functions investigated in serum, that is, degranulation and NET formation, were only relatively affected in TEAMM trial patients and do not provide additional information on their immune competence and on the occurrence of infection in this cohort. However, the remarkable difference between levels of serum neutrophil elastase and calprotectin in TEAMM trial patients compared with the healthy cohort requires further analysis. The difference in levels could reflect poor neutrophil capacity to survive and thus earlier release of these biomarkers from disintegrating neutrophils in vitro. Conversely, the study’s regression analysis of the anti-inflammatory cytokine IL-10 indicated that the biomarker is an important factor for prediction of febrile episodes. The study’s models also suggest that levels of anti-inflammatory cytokine IL-10 and polyclonal immunoglobulins are associated with risk of infection in the first 3 months following diagnosis. Previous studies have shown that IL-10 is overexpressed by plasmacytosis and that high levels of IL-10 are associated with poor prognosis in MM patients. 44,45 The study’s results suggest that IL-10 may be implicated in the downregulation of the immune system and it has a role in the increased susceptibility to infections of myeloma patients. Therefore, monitoring levels of IL-10 might have implications for the management of infections in MM patients.
The purpose of investigating myeloma response markers, such as solCD138 and FLCs, is to provide more precise profiling of disease response that would in turn facilitate the rapid identification of patients who do not respond adequately to therapies, thus informing change to alternative therapies. Levels of solCD138 was found elevated in TEAMM trial patients, compared with levels identified in a healthy population. Furthermore, levels of solCD138 decreased in response to therapy. Although levels of solCD138 decreased in response to therapy, the changes in levels of this biomarker correlate poorly with changes in levels of FLC and m-protein, suggesting that solCD138 is independent and might provide additional information on therapy efficacy, as proposed in the study hypotheses.
The purpose of assessing biomarkers of inflammation, such as IL-6, IL-8 and PCT, was to confirm bacterial infection, to identify patients who may be at risk of poor treatment response, patients who may be most susceptible to infection, and those patients who may most benefit from levofloxacin and/or additional treatment during induction therapy. The measurement of PCT 1 day before or 3 days after infection episodes does not provide useful information on infection occurring in TEAMM trial patients; therefore, PCT is unlikely to have utility as a sensitive biomarker of infection in myeloma patients over and above the cheaper CRP test. The study’s results indicate that levels of IL-6 and IL-8 do not provide additional information on the interaction between myeloma disease activity and the occurrence of infections in TEAMM trial patients. However, results in the TEAMM trial might have been affected by the poor stability of IL-6 and IL-8 hours after venepuncture.
Chapter 5 Conclusions
Multiple myeloma is in the top 20 most common cancers in the UK, accounts for 10% of all blood cancers and predominantly occurs in individuals aged ≥ 65 years. Incidence rates for MM have increased by over 11% in the last decade as a result of the ageing population, and improved survival with the use of modern anti-myeloma therapies has increased the prevalence of myeloma. However, infection is still the main cause of death in one-quarter of MM patients and so it is vital that the most effective and efficient supportive health care in this area of the disease is provided. The objectives of this study were aligned with this need, that is, aiming to stratify patients in relation to clinical management and therapeutic strategies not only to improve patient care but to offer improved economy in the NHS in terms of patient care.
The study’s investigation has shown that levels of IL-10 and polyclonal immunoglobulins have the potential to be used as biomarkers to stratify MM patients for risk of infections in the first 3 months following diagnosis. Furthermore, anti-bacterial Pn5 antibodies levels together with levels of polyclonal immunoglobulins IgG and IgM could be used to stratify patients for survival at 1 year.
The outcomes of the study have highlighted new strategies for monitoring disease activity and the immune competence of myeloma patients. Overall, these data demonstrate the need to protect patients against infections both following diagnosis and after anti-myeloma therapy. Based on these findings, vaccination programmes should be implemented when MM patients are in remission. However, prior to remission, other strategies for protection, including prophylactic antibiotics and patient education, should be considered during active disease or when patients are undergoing therapy.
Risk-stratifying patients for infection based on their immune competence and their levels of IL-10 could introduce targeted prescription of antibiotics and channel patients who may not benefit from antibiotic treatment towards alternative treatment approaches. Rather than routine prescription, this stratification could enable responsible and evidence-based recommendation of prophylactic antibiotic treatment and, as such, help balance the risk of infection from disease with risk of HCAI. Understanding the relationship between infection, inflammation and active myeloma could expose opportunities for intervention and highlight patients who may benefit from additional targeted therapies to augment responses to anti-myeloma therapy and avoid early mortality. Identifying non-responders early, through the use of measuring levels of FLCs and solCD138, could allow patients to be directed to alternative therapies to gain control over active disease and reduce their risk of infection. It could prevent pursuing treatment that may not have long-term benefits and avoid adverse events associated with ineffective therapies; early poor responders are unlikely to have adequate responses to a full schedule of anti-myeloma therapy and have poor outcomes with resistant disease and early relapse. Furthermore, early control of FLC secretions by successful anti-myeloma therapy prevents further renal damage and allows renal function recovery. Moreover, the biomarkers and concepts used in this study are transferable to other medical specialties, not just for cancer but for predicting risk in other high infection risk situations, including critical care and surgery. Ultimately, risk stratification and patient identification strategies enable clinical practice to be responsive to individual patient needs and, ultimately, increase the patient’s chance of a successful response to therapy and chance of survival.
Chapter 6 Recommendation for future research
This retrospective analysis of samples collected during the TEAMM trial has provided evidence that potentially supports new recommendations for MM patient management and monitoring during therapy and up to 1 year after treatment. The study gives an evidence base for use of biomarkers to contribute to stratification of patients for risk of infections and poor responders to therapy up to 12 weeks following diagnosis. Although the first 3 months are the most critical for risk of infections for MM patients, the analysis of biomarkers and the stratification can be extended to a longer period of time, thus providing insights on the risk of infection after induction therapy and during remission. In fact, the TEAMM 2 trial (in preparation) will explore the benefit of prophylactic antibiotics extended to 12 months following diagnosis and will provide the basis for a prolonged analysis. In addition, the TEAMM trial ended in only 2016 and data on long-term survival and progression-free survival are not available for TEAMM trial patients. The study team will apply some of the key findings to the investigation of these biomarkers in samples from other UK myeloma trials where long-term outcome data are available. However, the stability of biomarkers in blood and serum should be taken into consideration and an appropriate healthy range should be established for clinical purposes. The analysis of biomarkers for immunity, infection and disease activity in association with survival data might provide information that could help stratify MM patients for risk of disease relapse and/or death, even years after their first treatment.
As this study addressed infection risk and chemotherapy-related immunosuppression, these findings are potentially significant to other cancer patients and older adults in whom immunosenescence renders them inherently at greater risk of infection.
Chapter 7 Public and patient involvement
The progress of the EME-funded study was reported back to the main TEAMM Trial Management Group, which includes Eric Low (patient advocate, lead representative for Myeloma UK). The study aim was to disseminate some results via the journal Myeloma Matters and Myeloma UK’s web site. Some of the results are contributing to the design of a further trial of antibiotic prophylaxis in myeloma and myelodysplasia, in which patient advocates are involved in the design and application to the NIHR Health Technology Assessment programme for funding.
Acknowledgements
Contributions of authors
Ilaria J Chicca (https://orcid.org/0000-0002-3191-8645), Jennifer LJ Heaney and Mark T Drayson were responsible for the central laboratory analysis and the interpretation of the results.
Jennifer LJ Heaney (https://orcid.org/0000-0002-2928-9712) and Mark T Drayson (https://orcid.org/0000-0002-1528-7564) were responsible for identifying the research questions and the conception of the study.
Gulnaz Iqbal (https://orcid.org/0000-0002-1391-6021) (Trial Statistician) and Janet A Dunn (https://orcid.org/0000-0001-7313-4446) (Warwick Clinical Trials Unit Lead) carried out the statistical analysis and interpreted the results.
Gulnaz Iqbal, Janet A Dunn, Stella Bowcock (https://orcid.org/0000-0002-8195-8960), Tim Planche (https://orcid.org/0000-0002-0263-0888), Guy Pratt (https://orcid.org/0000-0002-6937-2852), Kwee Yong (https://orcid.org/0000-0002-6487-276X) and Mark T Drayson were responsible for the conception of the TEAMM trial.
Eric Low (https://orcid.org/0000-0001-8600-3357) reviewed the EME proposal and provided feedback.
Jill Wood (https://orcid.org/0000-0002-0262-4285), Kerry Raynes (https://orcid.org/0000-0002-8493-3144) and Helen Higgins (https://orcid.org/0000-0002-7095-4542) managed the co-ordination and administration of the TEAMM trial.
All authors provided comments on the report and approved the final version of the report.
Data-sharing statement
All data requests should be submitted to the corresponding author for consideration. Please note that exclusive use will be retained until the publication of major outputs. Access to anonymised data may be granted following review.
Publication
Chicca IJ, Heaney JLJ, Iqbal G, Dunn JA, Bowcock S, Pratt G, et al. Anti-bacterial antibodies in multiple myeloma patients at disease presentation, in response to therapy and in remission: implications for patient management. Blood Cancer J 2020;10:114.
Patient data
This work uses data provided by patients and collected by the NHS as part of their care and support. Using patient data is vital to improve health and care for everyone. There is huge potential to make better use of information from people’s patient records, to understand more about disease, develop new treatments, monitor safety, and plan NHS services. Patient data should be kept safe and secure, to protect everyone’s privacy, and it’s important that there are safeguards to make sure that it is stored and used responsibly. Everyone should be able to find out about how patient data are used. #datasaveslives You can find out more about the background to this citation here: https://understandingpatientdata.org.uk/data-citation.
Disclaimers
This report presents independent research. The views and opinions expressed by authors in this publication are those of the authors and do not necessarily reflect those of the NHS, the NIHR, the MRC, NETSCC, the EME programme or the Department of Health and Social Care. If there are verbatim quotations included in this publication the views and opinions expressed by the interviewees are those of the interviewees and do not necessarily reflect those of the authors, those of the NHS, the NIHR, NETSCC, the EME programme or the Department of Health and Social Care.
References
- Nucci M, Anaissie E. Infections in patients with multiple myeloma in the era of high-dose therapy and novel agents. Clin Infect Dis 2009;49:1211-25. https://doi.org/10.1086/605664.
- Landgren O, Kyle RA, Pfeiffer RM, Katzmann JA, Caporaso NE, Hayes RB, et al. Monoclonal gammopathy of undetermined significance (MGUS) consistently precedes multiple myeloma: a prospective study. Blood 2009;113:5412-17. https://doi.org/10.1182/blood-2008-12-194241.
- Pratt G, Goodyear O, Moss P. Immunodeficiency and immunotherapy in multiple myeloma. Br J Haematol 2007;138:563-79. https://doi.org/10.1111/j.1365-2141.2007.06705.x.
- Augustson BM, Begum G, Dunn JA, Barth NJ, Davies F, Morgan G, et al. Early mortality after diagnosis of multiple myeloma: analysis of patients entered onto the United Kingdom Medical Research Council trials between 1980 and 2002 – Medical Research Council Adult Leukaemia Working Party. J Clin Oncol 2005;23:9219-26. https://doi.org/10.1200/JCO.2005.03.2086.
- Mahindra A, Hideshima T, Anderson KC. Multiple myeloma: biology of the disease. Blood Rev 2010;24:5-11. https://doi.org/10.1016/S0268-960X(10)70003-5.
- Bohnhorst J, Rasmussen T, Moen SH, Fløttum M, Knudsen L, Børset M, et al. Toll-like receptors mediate proliferation and survival of multiple myeloma cells. Leukemia 2006;20:1138-44. https://doi.org/10.1038/sj.leu.2404225.
- Jego G, Bataille R, Geffroy-Luseau A, Descamps G, Pellat-Deceunynck C. Pathogen-associated molecular patterns are growth and survival factors for human myeloma cells through Toll-like receptors. Leukemia 2006;20:1130-7. https://doi.org/10.1038/sj.leu.2404226.
- Cook G, Royle KL, Pawlyn C, Hockaday A, Shah V, Kaiser MF, et al. A clinical prediction model for outcome and therapy delivery in transplant-ineligible patients with myeloma (UK Myeloma Research Alliance Risk Profile): a development and validation study. Lancet Haematol 2019;6:e154-e166. https://doi.org/10.1016/S2352-3026(18)30220-5.
- Drayson MT, Bowcock S, Planche T, Iqbal G, Pratt G, Yong K, et al. Levofloxacin prophylaxis in newly diagnosed myeloma patients. Lancet 2019;20:1760-72. https://doi.org/10.1016/S1470-2045(19)30506-6.
- Borregaard N. Neutrophils, from marrow to microbes. Immunity 2010;33:657-70. https://doi.org/10.1016/j.immuni.2010.11.011.
- Lord JM, Butcher S, Killampali V, Lascelles D, Salmon M. Neutrophil ageing and immunosenescence. Mech Ageing Dev 2001;122:1521-35. https://doi.org/10.1016/S0047-6374(01)00285-8.
- Hazeldine J, Harris P, Chapple IL, Grant M, Greenwood H, Livesey A, et al. Impaired neutrophil extracellular trap formation: a novel defect in the innate immune system of aged individuals. Aging Cell 2014;13:690-8. https://doi.org/10.1111/acel.12222.
- Sapey E, Greenwood H, Walton G, Mann E, Love A, Aaronson N, et al. Phosphoinositide 3-kinase inhibition restores neutrophil accuracy in the elderly: toward targeted treatments for immunosenescence. Blood 2014;123:239-48. https://doi.org/10.1182/blood-2013-08-519520.
- Capsoni F, Minonzio F, Ongari AM, Carbonelli V, Galli A, Zanussi C. Interleukin-10 down-regulates oxidative metabolism and antibody-dependent cellular cytotoxicity of human neutrophils. Scand J Immunol 1997;45:269-75. https://doi.org/10.1046/j.1365-3083.1997.d01-393.x.
- Laichalk LL, Danforth JM, Standiford TJ. Interleukin-10 inhibits neutrophil phagocytic and bactericidal activity. FEMS Immunol Med Microbiol 1996;15:181-7. https://doi.org/10.1111/j.1574-695X.1996.tb00084.x.
- Ameglio F, Alvino S, Trento E, Marcucci M, Pimpinelli F, Tong A, et al. Serum interleukin-10 levels in patients affected with multiple myeloma – correlation with the monoclonal component and disease progression. Int J Oncol 1995;6:1189-92. https://doi.org/10.3892/ijo.6.6.1189.
- Dhodapkar MV, Kelly T, Theus A, Athota AB, Barlogie B, Sanderson RD. Elevated levels of shed syndecan-1 correlate with tumour mass and decreased matrix metalloproteinase-9 activity in the serum of patients with multiple myeloma. Br J Haematol 1997;99:368-71. https://doi.org/10.1046/j.1365-2141.1997.3893203.x.
- Sanderson RD, Børset M. Syndecan-1 in B lymphoid malignancies. Ann Hematol 2002;81:125-35. https://doi.org/10.1007/s00277-002-0437-8.
- Seidel C, Sundan A, Hjorth M, Turesson I, Dahl IM, Abildgaard N, et al. Serum syndecan-1: a new independent prognostic marker in multiple myeloma. Blood 2000;95:388-92. https://doi.org/10.1182/blood.V95.2.388.
- Lovell R, Dunn JA, Begum G, Barth NJ, Plant T, Moss PA, et al. Soluble syndecan-1 level at diagnosis is an independent prognostic factor in multiple myeloma and the extent of fall from diagnosis to plateau predicts for overall survival. Br J Haematol 2005;130:542-8. https://doi.org/10.1111/j.1365-2141.2005.05647.x.
- Gadó K, Domján G, Hegyesi H, Falus A. Role of interleukin-6 in the pathogenesis of multiple myeloma. Cell Biol Int 2000;24:195-209. https://doi.org/10.1006/cbir.2000.0497.
- Gaillard JP, Bataille R, Brailly H, Zuber C, Yasukawa K, Attal M, et al. Increased and highly stable levels of functional soluble interleukin-6 receptor in sera of patients with monoclonal gammopathy. Eur J Immunol 1993;23:820-4. https://doi.org/10.1002/eji.1830230408.
- Hargreaves PG, Wang F, Antcliff J, Murphy G, Lawry J, Russell RG, et al. Human myeloma cells shed the interleukin-6 receptor: inhibition by tissue inhibitor of metalloproteinase-3 and a hydroxamate-based metalloproteinase inhibitor. Br J Haematol 1998;101:694-702. https://doi.org/10.1046/j.1365-2141.1998.00754.x.
- Lauta VM. A review of the cytokine network in multiple myeloma: diagnostic, prognostic, and therapeutic implications. Cancer 2003;97:2440-52. https://doi.org/10.1002/cncr.11072.
- Pappa CA, Tsirakis G, Boula A, Sfiridaki A, Psarakis FE, Alexandrakis MG, et al. The significance of non correlation between interleukin-8 serum levels with bone marrow microvascular density in patients with myeloma multiple. Pathol Oncol Res 2013;19:539-43. https://doi.org/10.1007/s12253-013-9614-4.
- Giuliani N, Storti P, Bolzoni M, Palma BD, Bonomini S. Angiogenesis and multiple myeloma. Cancer Microenviron 2011;4:325-37. https://doi.org/10.1007/s12307-011-0072-9.
- Kline M, Donovan K, Wellik L, Lust C, Jin W, Moon-Tasson L, et al. Cytokine and chemokine profiles in multiple myeloma; significance of stromal interaction and correlation of IL-8 production with disease progression. Leuk Res 2007;31:591-8. https://doi.org/10.1016/j.leukres.2006.06.012.
- Markovina S, Callander NS, O’Connor SL, Xu G, Shi Y, Leith CP, et al. Bone marrow stromal cells from multiple myeloma patients uniquely induce bortezomib resistant NF-kappaB activity in myeloma cells. Mol Cancer 2010;9. https://doi.org/10.1186/1476-4598-9-176.
- Hammond ME, Lapointe GR, Feucht PH, Hilt S, Gallegos CA, Gordon CA, et al. IL-8 induces neutrophil chemotaxis predominantly via type I IL-8 receptors. J Immunol 1995;155:1428-33.
- Schuetz P, Christ-Crain M, Müller B. Procalcitonin and other biomarkers to improve assessment and antibiotic stewardship in infections – hope for hype?. Swiss Med Wkly 2009;139:318-26. https://doi.org/smw-12584.
- Eberhard OK, Haubitz M, Brunkhorst FM, Kliem V, Koch KM, Brunkhorst R. Usefulness of procalcitonin for differentiation between activity of systemic autoimmune disease (systemic lupus erythematosus/systemic antineutrophil cytoplasmic antibody-associated vasculitis) and invasive bacterial infection. Arthritis Rheum 1997;40:1250-6.
- Schuetz P, Müller B, Christ-Crain M, Stolz D, Tamm M, Bouadma L, et al. Procalcitonin to initiate or discontinue antibiotics in acute respiratory tract infections. Evid Based Child Health 2013;8:1297-371. https://doi.org/10.1002/ebch.1927.
- Machálková K, Maisnar V. [The role of procalcitonin in the differential diagnosis of fever in patients with multiple myeloma.]. Klin Onkol 2011;24:298-301.
- Whitelegg AM, Birtwistle J, Richter A, Campbell JP, Turner JE, Ahmed TM, et al. Measurement of antibodies to pneumococcal, meningococcal and haemophilus polysaccharides, and tetanus and diphtheria toxoids using a 19-plexed assay. J Immunol Methods 2012;377:37-46. https://doi.org/10.1016/j.jim.2012.01.007.
- World Health Organization . WHO Workshop on Standardization of Pneumococcal Opsonophagocytic Assay 2008. www.who.int/biologicals/publications/meetings/areas/vaccines/pneumococcal/Pneumo_Meeting_Report_FINAL_IK_24_Dec_08.pdf?ua=1 (accessed 2 November 2017).
- Peltola H, Mákelá H, Káyhty H, Jousimies H, Herva E, Hállström K, et al. Clinical efficacy of meningococcus group A capsular polysaccharide vaccine in children three months to five years of age. N Engl J Med 1977;297:686-91. https://doi.org/10.1056/NEJM197709292971302.
- Käyhty H, Peltola H, Karanko V, Mäkelä PH. The protective level of serum antibodies to the capsular polysaccharide of Haemophilus influenzae type b. J Infect Dis 1983;147. https://doi.org/10.1093/infdis/147.6.1100.
- Plotkin SA. Immunologic correlates of protection induced by vaccination. Pediatr Infect Dis J 2001;20:63-75. https://doi.org/10.1097/00006454-200101000-00013.
- Caudrillier A, Kessenbrock K, Gilliss BM, Nguyen JX, Marques MB, Monestier M, et al. Platelets induce neutrophil extracellular traps in transfusion-related acute lung injury. J Clin Invest 2012;122:2661-71. https://doi.org/10.1172/JCI61303.
- Hobson D, Curry RL, Beare AS, Ward-Gardner A. The role of serum haemagglutination-inhibiting antibody in protection against challenge infection with influenza A2 and B viruses. J Hyg 1972;70:767-77. https://doi.org/10.1017/S0022172400022610.
- Kaplan EL, Meier P. Nonparametric estimation from incomplete samples. J ASA 1958;73:457-81. https://doi.org/10.1080/01621459.1958.10501452.
- Cox DR. Regression models and life-tables. J R Stat Soc Ser B 1972;34:187-220. https://doi.org/10.1111/j.2517-6161.1972.tb00899.x.
- Heaney JLJ, Campbell JP, Iqbal G, Cairns D, Richter A, Child JA, et al. Characterisation of immunoparesis in newly diagnosed myeloma and its impact on progression-free and overall survival in both old and recent myeloma trials. Leukemia 2018;32:1727-38. https://doi.org/10.1038/s41375-018-0163-4.
- Alexandrakis MG, Goulidaki N, Pappa CA, Boula A, Psarakis F, Neonakis I, et al. Interleukin-10 induces both plasma cell proliferation and angiogenesis in multiple myeloma. Pathol Oncol Res 2015;21:929-34. https://doi.org/10.1007/s12253-015-9921-z.
- Wang H, Wang L, Chi PD, Wang WD, Chen XQ, Geng QR, et al. High level of interleukin-10 in serum predicts poor prognosis in multiple myeloma. Br J Cancer 2016;114:463-8. https://doi.org/10.1038/bjc.2016.11.
- Pruzanski W, Gidon MS, Roy A. Suppression of polyclonal immunoglobulins in multiple myeloma: relationship to the staging and other manifestations at diagnosis. Clin Immunol Immunopathol 1980;17:280-6. https://doi.org/10.1016/0090-1229(80)90097-5.
- Karlsson J, Andréasson B, Kondori N, Erman E, Riesbeck K, Hogevik H, et al. Comparative study of immune status to infectious agents in elderly patients with multiple myeloma, Waldenstrom’s macroglobulinemia, and monoclonal gammopathy of undetermined significance. Clin Vaccine Immunol 2011;18:969-77. https://doi.org/10.1128/CVI.00021-11.
List of abbreviations
- BSA
- bovine serum albumin
- CONSORT
- Consolidated Standards of Reporting Trials
- CR
- complete response
- CRP
- C-reactive protein
- DNA
- deoxyribonucleic acid
- ELISA
- enzyme-linked immunosorbent assay
- EME
- Efficacy and Mechanism Evaluation
- ESBL
- extended-spectrum beta-lactamase
- FLC
- free light chain
- gp130
- glycoprotein 130
- HAI
- haemagglutination assay
- HCAI
- health-care-associated infection
- Ig
- immunoglobulin
- IgA
- immunoglobulin type A
- IgG
- immunoglobulin type G
- IgM
- immunoglobulin type M
- IL-6
- interleukin 6
- IL-6R
- interleukin 6 receptor
- IL-8
- interleukin 8
- IL-10
- interleukin 10
- IU
- International Unit
- m-protein
- myeloma monoclonal protein
- Men
- meningococcal
- MM
- multiple myeloma
- MMP9
- matrix metallopeptidase 9
- MPO
- myeloperoxidase
- MR
- minimal response
- NET
- neutrophil extracellular trap
- NIHR
- National Institute for Health Research
- PBS
- phosphate-buffered saline
- PCT
- procalcitonin
- PD
- progressive disease
- PLL
- poly-L-lysine
- Pn
- pneumococcal
- PPV23
- 23-valent polysaccharide pneumococcal vaccination
- PR
- partial response
- RCT
- randomised control trial
- r.p.m.
- revolutions per minute
- SD
- stable disease
- solCD138
- soluble CD138
- TEAMM
- Tackling Early Morbidity and Mortality in Myeloma
- VGPR
- very good partial response
- WHO
- World Health Organization

