Notes
Article history
The research reported in this issue of the journal was funded by the EME programme as project number 11/100/29. The contractual start date was in February 2013. The final report began editorial review in September 2018 and was accepted for publication in May 2019. The authors have been wholly responsible for all data collection, analysis and interpretation, and for writing up their work. The EME editors and production house have tried to ensure the accuracy of the authors’ report and would like to thank the reviewers for their constructive comments on the final report document. However, they do not accept liability for damages or losses arising from material published in this report.
Permissions
Copyright statement
© Queen’s Printer and Controller of HMSO 2021. This work was produced by Awasthi et al. under the terms of a commissioning contract issued by the Secretary of State for Health and Social Care. This issue may be freely reproduced for the purposes of private research and study and extracts (or indeed, the full report) may be included in professional journals provided that suitable acknowledgement is made and the reproduction is not associated with any form of advertising. Applications for commercial reproduction should be addressed to: NIHR Journals Library, National Institute for Health Research, Evaluation, Trials and Studies Coordinating Centre, Alpha House, University of Southampton Science Park, Southampton SO16 7NS, UK.
2021 Queen’s Printer and Controller of HMSO
Chapter 1 Project introduction
Over 30,000 patients in the UK are affected by chronic ulcerative colitis (UC), which is an inflammatory condition associated with a pro-neoplastic drive. The longer and more extensive the inflammation, the higher the risk of colorectal cancer for individuals with UC. 1 The risk of cancer is greatest in those who have been diagnosed young and in those with extensive colonic inflammation,2 reaching 18% after 30 years. This results in > 1000 colectomies being performed each year in the UK for colorectal cancer or for cancer prevention in those for whom (precancerous) dysplastic lesions have been identified. Nevertheless, despite intensive colonoscopic surveillance with random sampling (> 10 biopsies) taken throughout the length of the affected bowel, most early tumours are missed. As many as 50% of cases progress to invasive cancer before neoplasia is detected. 3,4 The presence of advanced malignancy can prevent safe restoration of bowel continuity, require adjuvant chemotherapy and result in incurable disease and death which occurs in more than 40% of patients with colitis-associated large bowel cancer. 5
Currently, patients with colitis are stratified into three categories:
-
low risk – quiescent or left-sided inflammation
-
intermediate risk – mild inflammation or with a family member who developed colorectal cancer aged ≥ 50 years
-
high risk – extensive moderate or severe active inflammation, primary sclerosing cholangitis (PSC), a history of dysplasia/colonic stricture, or with a first-degree relative who developed colorectal cancer aged < 50 years.
Surveillance in these groups is performed by colonoscopy at 5-, 3- or 1-yearly intervals respectively, enabling identification and biopsy of suspected neoplasia. 6 Standard colonoscopic surveillance involves 24-hour bowel preparation preceded by 36 hours of liquid diet, and is performed under intravenous sedation or nitrous oxide. The colonoscope is advanced to the small bowel junction and then withdrawn slowly. Biopsy protocols vary: most endoscopists perform a series of random biopsies that are formalin-fixed for histological analysis. The 2002 British Society of Gastroenterology guidelines7 suggest that two to four biopsies be taken every 10 cm. More recently,8 it has been recommended that the colonic mucosa should be dye-sprayed with targeted biopsy of any abnormalities and such enhanced ‘chromoendoscopy’ is now recommended in some guidelines6 as standard practice for colonic cancer surveillance in UC. However, a recent study suggests that benefits from techniques such as ‘dye spray’, may, at best, provide limited benefit. 9 There is considerable evidence of endoscopic practice varying across the UK10 and elsewhere. There is also likely to be variation in biopsy practice. Well-circumscribed dysplastic adenomas may be amenable to local endoscopic resection, but in the event of there being dysplastic change in flat mucosa or adenomatous change in a background of abnormal mucosa, the patient is generally offered prophylactic total colectomy. 9
Nevertheless, there is a pressing need to enhance the effectiveness of surveillance and early selection for prophylactic resection in order to increase clinician and patient confidence in the surveillance process. This was highlighted in the 2011 National Institute for Health and Care Excellence (NICE) guidelines,6 which recommend the identification of epigenetic and genetic biomarkers to aid more accurate patient identification. An ideal test would complement colonoscopy and biopsy by providing enhanced detection of pre-cancerous lesions (dysplasia), thereby delivering better patient selection for prophylactic resection.
Tumour development requires loss of tumour suppressor gene function and/or gain of oncogenic drivers. Historically, the role of chromosomal loss and genetic mutation of tumour suppressor genes has been well documented, but more recent data demonstrate the importance of epigenetic silencing, particularly in early tumourigenesis. Gene expression is modulated by ‘key’ methylation sites usually in the promoter region of the gene. Increased methylation, particularly in these promoter regions, will prevent the binding of transcription factors, which prevents transcription of ribonucleic acid and, thus, causes (epigenetic) silencing of the gene. Deoxyribonucleic acid (DNA) hypermethylation in gene promoter regions leads to this epigenetic silencing (of tumour suppressor genes). This phenomenon represents an attractive and identifiable diagnostic target (of early tumour development) as it reflects functional change, is stable in the DNA obtained from biological samples and can be detected reliably in DNA extracted from formalin-fixed, paraffin-embedded (FFPE) biopsies.
A number of retrospective cohort studies over the past decade have shown frequent epigenetic silencing of tumour suppressor genes associated with promoter hypermethylation in the development of colitis-associated neoplasia. 11–16 Colitis-associated neoplasia is an especially suitable target for epigenetic change as, unlike sporadic colon cancer, the chronic inflammation creates a field change effect, resulting in multifocal disease. A molecular marker such as methylation change may, therefore, increase sensitivity of colonoscopy by detecting changes in methylation in mucosa where neoplastic change is not visible, or masked by chronic inflammation.
Studies of sporadic and genetic colorectal cancer have shown that hypermethylation and epigenetic silencing of secreted Wnt antagonists such as secreted frizzled-related protein (SFRP) 1 occurs early in tumour development17–19 and suggest that this methylation and silencing could be a ‘gatekeeper’ event, essential for large bowel neoplastic change. Wnt antagonist silencing, therefore, has the potential to provide a marker for detecting the development of neoplasia at the earliest stages. Moreover, the potential to identify changes that are present away from the site of neoplasia could significantly increase the sensitivity of the test.
Dhir et al. 20 carried out an analysis of methylation of Wnt signalling pathway genes [adenomatous polyposis coli (APC)1A, APC2, SFRP1, SFRP2, SFRP4, SFRP5, Dickkopf-related (DKK) 1 gene, DKK3, WNT inhibitory factor 1 (WIF1) and liver kinase B1 (LKB1)] in the development of UC-associated neoplasia, finding that methylation of SFRP1/2 and APC1A/2 were associated with the progression to invasive disease. Guo et al. 21 demonstrated that SOX7, an independent checkpoint for beta-catenin function, can be hypermethylated in colorectal cancer and may play a role in UC-associated neoplasia.
Genetic variation in RUNX3 has been demonstrated as a risk factor for the development of UC22 and Garritty-Park et al. 23 demonstrated that hypermethylation of RUNX3 and MINT1 could be detected in the non-neoplastic mucosa from patients with colitis-associated neoplasia. Pilot data on UC mucosal biopsies indicated this in promoter region methylation of Wnt antagonists and, more recently, in an analysis utilising the Illumina Methylation450 platform (Illumina Incorporated; San Diego, CA, USA), in promoter hypomethylation of TUBB6 in non-neoplastic colonic mucosa from patients with UC-associated neoplasia. 24,25
Taken together, these data indicate that it should be possible to perform molecular identification of neoplastic change by analysis of background bowel mucosa, even if the neoplastic lesion(s) was missed at colonoscopy. This should complement surveillance colonoscopy by improved early tumour identification, enabling early treatment for these patients.
This developing information concerning the effect of chronic colonic inflammation on DNA methylation potentially modifying epithelial neoplastic pathways opens the possibility of developing a diagnostic test to identify inflammatory bowel disease (IBD) patients at a high risk for the development of colon cancer based on the methylation of an array of relevant genes, which was the aim of the ENDCaP-C (Enhanced Neoplasia Detection and Cancer Prevention in Chronic Colitis) study. The development of the test starts with the extraction of DNA from FFPE biopsies lodged in histology archives of samples taken during colonoscopic surveillance programmes. Pyrosequencing to detect differential promoter methylation of dysplastic tissue compared with non-dysplastic control tissues then allows a panel of biomarkers to be developed, which is prospectively tested in a real-life setting.
In recent years, with the advent of high-throughput genetic sequencing technology coupled with the capability of bioinformatics computing, the importance of the gut microbiome in both the pathogenesis of IBD and the development of colon cancer has been proposed. There has been sparse investigation of the effect of microbiome dysbiosis on epigenetic changes in colonic epithelium. A prospective study such as the ENDCaP-C study also provides an opportunity to collect a series of stool samples for such future studies.
The aims of the ENDCaP-C programme are therefore to:
-
establish and optimise a multimarker methylation panel for the detection of colitis-associated neoplasia
-
measure the accuracy of this panel in a prospective multicentre cohort of patients with colitis.
Ancillary exploratory objectives were to evaluate the utility of next-generation sequencing (NGS) as an alternative to pyrosequencing and to assess the feasibility of detecting markers of dysplasia-associated epigenetic methylation in serum and faecal samples collected from patients undergoing colonic surveillance as part of this programme. Hence, faecal samples were collected to characterise the faecal microbiome in this cohort of patients at a higher risk of colonic neoplasia, although the analysis of these samples does not form part of this report.
The overarching ambition of this multicentre project was to enhance future colon cancer surveillance for patients with chronic UC using novel biomarkers to stratify risk, improve early detection of cancer and rationalise colonoscopic programmes.
Chapter 2 Module 1: development of a multimarker methylation panel for the detection of colitis-associated neoplasia
Module 1: introduction
Chronic inflammation caused by UC causes a pro-neoplastic drive in the inflamed colon, leading to a markedly greater risk of invasive malignancy than that of the general population. 1 Although rates of UC-associated neoplasia seem to be decreasing,26 due in part to improved medical control of inflammation, there remains an elevated risk of developing colorectal cancer over the background risk in the unaffected population. The risk is particularly pronounced in patients with extensive colitis and an IBD diagnosis before 30 years of age. 2
Despite national and international colonoscopic surveillance protocols,27 50% of cases are reported to have developed invasive cancer before neoplasia is detected. The disease is frequently multifocal, which is presumed to be caused by the diffuse sensitisation of the large bowel mucosa by the chronic inflammatory process. Mutational events, such as KRAS and TP53 mutation,28 have been observed as part of this field cancerisation effect in UC, but no consistent pattern has been demonstrated.
Endoscopic therapy can provide local control of early dysplastic lesions, but enhanced detection strategies are required to aid early detection and ensure that progressive dysplasia is not missed during surveillance. 29–31
Chronic inflammation has been demonstrated to promote aberrant DNA methylation in conditions such as UC. 13 This may be as a result of a direct chemical effect causing cytosine methylation in the inflamed colon, shutting down genetic activity to protect the bowel wall. Use of abnormal DNA methylation as a biomarker for UC-associated neoplasia has considerable theoretical advantages: first, methylation tends to be gene-centric,32 centred around CpG islands and, second, it is usually homogenously distributed within the CpG island, having a functional effect on transcription factor binding and, thus, gene expression. This homogeneity facilitates simpler detection of abnormal methylation patterns. Another advantageous property of assaying methylation is that it tends to occur as part of a ‘field cancerisation’ effect whereby associated changes in methylation extend out past the dysplastic lesion in the colon and can therefore be detected in apparently normal mucosa some distance from the lesion. 33–35
The ENDCaP-C study sets out to establish whether or not an optimised methylation marker panel of suitable specificity could improve detection of early neoplastic lesions at colonoscopic surveillance diagnostic accuracy. The initial phase (module 1) aims to measure the accuracy of an optimised panel of markers on a multicentre, retrospective cohort of patients with UC before assessing their utility in a prospective multicentre test accuracy study (module 3).
Module 1: aims
-
Establish and optimise a multimarker methylation panel for the detection of colitis-associated neoplasia.
-
Measure the accuracy of this panel in a retrospective multicentre cohort of patients with colitis-associated neoplasia.
Module 1: methods
Patient recruitment
Patients were identified from archived histology biopsy samples in six hospitals across the West Midlands area. Patients were identified through tracing endoscopy records and correlation with histology reports. Searches were restricted to endoscopies after January 1996 because of changes to formalin fixation at that time, and to before January 2014 to minimise missed neoplasia through identification during the follow-up period. Mucosal biopsies were classified as one of:
-
neoplasia – defined as any of adenocarcinoma, high-grade or low-grade dysplasia
-
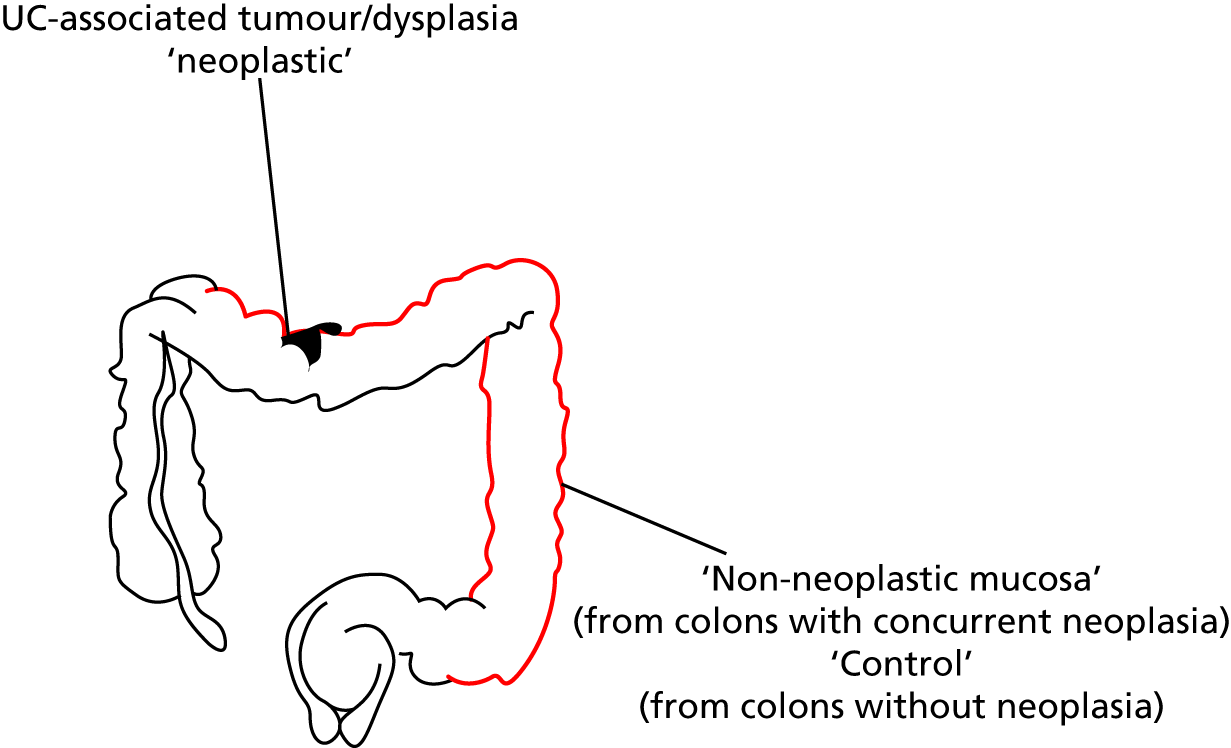
matched non-neoplastic – defined as non-neoplastic chronically inflamed colonic mucosal biopsies taken distant from areas of neoplasia (Figure 1)
-
control – defined as colonic mucosa, sampled from patients with chronic UC of duration of > 8 years and extending at least to the splenic flexure or patients with a diagnosis of both UC and PSC who had been screened for neoplasia without it being found.
FIGURE 1.
Diagram of colonoscopic sampling from patients for the ENDCaP-C study.
Ethics approval was from South Birmingham Research Ethics Committee (reference 08/H1207/104).
Sample processing
Biopsy samples from identified patients were retrieved from the histopathology archives at the six collaborating hospitals. For those patients with neoplasia in the large bowel, separate biopsies from different colonic segments were selected alongside the neoplastic biopsy. All blocks were reviewed centrally by the lead ENDCaP-C histopathologist, with representative sections undergoing DNA extraction. Histological diagnosis of dysplasia (the gold standard) was defined as an altered nuclear/cytoplasmic ratio, increased cell size and/or an increase in mitotic figures. DNA extraction of neoplasia was performed by needle macrodissection to enrich for tumour material; macrodissected material was extracted using the FFPE protocol of the Qiagen DNEasy FFPE kit (Qiagen, Hilden, Germany). Extracted DNA was quantified by both NanoDrop spectrophotometry (Nanodrop ND 8000 spectrophotometer; Thermo Fisher Scientific, Waltham, MA, USA) and Qubit fluorimetry (Qubit 2.0 Fluorometer; Invitrogen, Life technologies, Carlsbad, CA, USA).
Neoplasia, matched non-neoplastic and control samples were included in mixed batches to ensure that test performance could be analysed at sequential analyses across the study duration. Each sample was labelled with only a study sample identification number and assays undertaken blinded to neoplasia status.
Deoxyribonucleic acid methylation analysis
A total of 500 ng of extracted DNA was bisulphite converted using a Zymo EZ-DNA methylation bisulphite conversion kit (Zymo Research, Irvine, CA, USA) according to the manufacturer’s protocol. Two microliters of eluted bisulphite converted DNA was utilised in a pyrosequencing polymerase chain reaction (PCR) using the Qiagen PyroMark PCR kit (Qiagen, Hilden, Germany) according to the manufacturer’s protocol in a 25-µl reaction volume. PCR products were run on a 2% agarose gel with a DNA size ladder and successful amplification was defined as the presence of a band at the appropriate size for the marker run. PCR products were cleaned using streptavidin beads, washed and mixed with the requisite pyrosequencing primers. These were then sequenced on a Qiagen PyroMark Q96 instrument (Qiagen, Hilden, Germany). All reactions were run with 100% methylated and unmethylated DNA positive and negative controls, as well as a water reaction. Methylated DNA was generated by incubating 1 µg of blood-derived control DNA with CpG methyltransferase (M.SssI) (New England Biolabs, Ipswich, MA, USA). Unmethylated DNA was generated by whole-genome amplification of 10 ng of blood-derived control DNA using the Qiagen Repli-G Mini kit (Qiagen, Hilden, Germany).
The marker panel chosen for this experiment was based on previous reported findings and consisted of the following markers: SFRP1, SFRP2, SFRP4, SFRP5, WIF1, TUBB6, SOX7, APC1A, APC2, MINT1 and RUNX3. Primer sequences, chromosomal positions and reaction conditions are shown in Appendix 1, Table 17. After each run, sample data were examined using Qiagen PyroMark Q96 software (Qiagen, Hilden, Germany). Samples that had failed Qiagen quality metrics were marked as failed on the sample sheet.
Sample size
The original planned sample size of 160 neoplastic and 320 control samples was determined to provide adequate events to develop a robust model (with > 10 events per marker) and provide estimates of sensitivity and specificity with adequate precision [with 95% confidence interval (CI) width < 16% for sensitivity and < 12% for specificity]. The 2 : 1 sampling ratio is determined based on access to sample banks.
Statistical analysis
Where a biomarker was examined at multiple CpG sites, the mean CpG value across sites was computed and used in all analyses. This was undertaken for consistency and was considered appropriate, as methylation within small regions tends to be distributed homogenously. 32 Statistical analysis was then undertaken in three stages.
In stage 1, biomarkers that were futile with respect to their ability to discriminate between neoplastic samples and control samples were identified and testing was terminated early. The sample size required 320 control samples and 160 neoplastic samples (480 in total). To evaluate the performance of each biomarker as the samples were being processed in batches of 30 (20 control samples and 10 neoplastic samples), we planned to undertake 16 interim analyses for each biomarker (420 total samples divided by 30 batches of samples). To account for multiple testing, the results for each batch of samples for each biomarker were evaluated in a group sequential analysis following the O’Brien and Fleming method36 to assess whether further testing of each biomarker was justified or considered futile. Sequential boundaries were constructed according to the O’Brien and Fleming method,36 the t-statistic from the t-test computed for each biomarker at each analysis step, and the comparison made to the predefined boundary values to test for statistical significance or futility (see Appendix 1, Figure 18). The boundary values were computed using the SAS® statistics software (SAS Institute Inc., Cary, NC, USA) and the SAS code is given under Appendix 1, Figure 18. (SAS and all other SAS Institute Inc. product or service names are registered trademarks or trademarks of SAS Institute Inc. in the USA and other countries. ® indicates USA registration.)
In this first stage, the distributions of the biomarker values were unknown and data were analysed without transformation. Once all data were accumulated, visual inspection of histograms demonstrated a positive skew (see Appendix 1, Figure 19) and the mean biomarker values for each sample were log-transformed prior to further analysis.
In stage 2, markers with responses suitable for inclusion in the predictive models were selected. Biomarkers that showed significant (p < 0.05) discrimination and attained amplification rates of > 85% were selected for inclusion. The ability of each marker to discriminate was described by computing the ratio of geometric means (with 95% CI) and statistical significance was assessed by two-sample t-tests undertaken on the log-transformed scale. Comparisons were made between (1) neoplasia samples and control samples and (2) matched non-neoplastic samples and control samples.
In stage 3, predictive models were fitted using logistic regression with outcome (1 = sample or 0 = control) and the mean log-CpG value for each patient for the biomarkers selected from stage 2. Only samples that had complete data for the selected biomarkers were initially included in these analyses. Three separate models were constructed: (1) differentiating neoplasia samples from control samples, (2) differentiating dysplasia samples from control samples and (3) differentiating matched non-neoplastic samples from control samples. Model 2 used the same patients and biomarker selection as model 1, but excluded any samples that were classed as adenocarcinomas.
Estimation of the adjustments for shrinkage and optimism in the model fit were computed using standard bootstrap internal validation techniques as recommended by Steyerberg. 37 The final models were produced including all samples, using multiple imputation using chained equations to impute missing biomarker data. Multiple imputation models used 50 iterations with pathology categorisation, sample type and measurements of all other biomarkers as predictors. The model coefficients were corrected for optimism by application of the shrinkage factor. To facilitate application of the model when individual or pairs of biomarkers are unavailable, reduced models were computed omitting each biomarker and possible pair of biomarkers from the multiple imputation model. Discriminatory performance for each model was measured by the area under the receiver operating characteristic curve (AUC).
One biomarker (TUBB6) was not selected for inclusion in models 1 and 2 in the stage 1 O’Brien and Fleming method36 analysis on untransformed data, but did show significant differences in stage 2 once log-transformations had been applied. Models 1 and 2 were fitted with and without this biomarker.
The clinical team considered that a positive test result should have a positive predictive value of at least 20% to be of clinical value. Given an assumed background incidence of 4% this corresponds to the point on the receiver operating characteristic (ROC) curve with a positive likelihood ratio [sensitivity/(1 – specificity)] of 6. The threshold at this point was identified from the ROC tabulation of each predictive equation, and estimates of sensitivity and specificity were obtained. We also identified thresholds for each model that corresponds with 90% of cases being detected.
Module 1: results
In total, 838 blocks from 575 patients were collected from six participating hospitals. Of these, 269 blocks were not used in the study because they were duplicates from the same patient, or deemed not useable after histological review. This left 569 blocks from 456 patients undergoing surveillance, consisting of 113 neoplastic, 113 matched non-neoplastic and 343 control blocks (Table 1). Of the neoplastic biopsy samples, 35 out of 113 contained adenocarcinoma and the remaining 78 out of 113 harboured dysplasia only. Baseline data for participants providing these blocks are shown in Table 2. These show that the control population was comparable with the test population in terms of risk factors associated with colitis-associated neoplasia and was a high-risk population.
| Histopathological type | Patients with neoplasia (N = 113) | Patients without neoplasia (control) (N = 343), n (%) | ||
|---|---|---|---|---|
| Neoplastic samples, n (%) | Matched non-neoplastic samples, n (%) | |||
| Neoplasia | ||||
| Cancer | Adenocarcinoma | 35 (31) | – | – |
| Dysplasia | High-grade dysplasia | 4 (4) | – | – |
| Low-grade dysplasia | 74 (65) | – | – | |
| Non-neoplasia | Normal mucosa | – | 113 (100) | – |
| Control (without neoplasia) | Normal mucosa | – | – | 343 (100) |
| Baseline characteristics | Patients with neoplasia (N = 113), n (%) | Patients without neoplasia (control) (N = 343), n (%) | Total (N = 456), n (%) |
|---|---|---|---|
| Montreal classification | |||
| Distal (recto-sigmoid) | 23 (20) | 56 (16) | 79 (17) |
| Left sided (to splenic flexure) | 17 (15) | 61 (18) | 78 (17) |
| Extensive (beyond splenic flexure) | 67 (59) | 203 (59) | 270 (59) |
| Unknown/missing | 6 (5) | 23 (7) | 29 (6) |
| Smoker | |||
| No | 75 (66) | 197 (57) | 272 (60) |
| Yes | 7 (6) | 9 (2) | 16 (4) |
| Unknown/missing | 22 (19) | 125 (36) | 147 (32) |
| Ex-smoker | 9 (8) | 12 (3) | 21 (5) |
| PSC | |||
| No | 100 (88) | 293 (85) | 393 (86) |
| Yes | 8 (7) | 46 (13) | 54 (12) |
| Unknown/missing | 5 (4) | 4 (1) | 9 (2) |
| Family history of IBD | |||
| No | 85 (75) | 249 (73) | 334 (73) |
| Yes | 4 (4) | 20 (6) | 24 (5) |
| Unknown/missing | 24 (21) | 74 (22) | 98 (21) |
| Family history of colorectal cancer | |||
| No | 83 (73) | 257 (75) | 340 (75) |
| Yes | 6 (5) | 6 (2) | 12 (3) |
| Unknown/missing | 24 (21) | 80 (24) | 104 (23) |
Selection of biomarkers
Eight out of the 11 methylation markers had an amplification success rate of > 85% (Table 3 and see Appendix 1, Table 18). The three remaining primer sets were within the promoter regions of SFRP1, MINT1 and RUNX3. Because of the reduced reliability, these three primer sets were not taken forward for further analysis.
| Biomarker | Geometric mean (95% CI) | Ratio of geometric means (95% CI); p-valuea | |||
|---|---|---|---|---|---|
| Neoplastic (n = 113) | Matched non-neoplastic (n = 113) | Control (n = 343) | Neoplastic vs. control | Non-neoplastic vs. control | |
| SFRP2 | 22.1 (19.7 to 24.9) | 14.0 (12.8 to 15.4) | 14.1 (13.4 to 14.9) | 1.57 (1.40 to 1.76) | 0.99 (0.89 to 1.11) |
| (n = 105) | (n = 106) | (n = 303) | p < 0.0001 | p = 0.92 | |
| SFRP4 | 44.7 (42.1 to 47.5) | 34.4 (31.8 to 37.2) | 32.0 (31.0 to 33.1) | 1.40 (1.31 to 1.49) | 1.07 (1.00 to 1.15) |
| (n = 108) | (n = 109) | (n = 312) | p < 0.0001 | p = 0.057 | |
| WIF1 | 21.6 (18.6 to 25.2) | 12.8 (11.1 to 14.8) | 13.9 (12.8 to 15.0) | 1.56 (1.33 to 1.83) | 0.93 (0.79 to 1.08) |
| (n = 104) | (n = 105) | (n = 292) | p < 0.0001 | p = 0.33 | |
| APC1A | 2.92 (2.37 to 3.60) | 2.54 (2.16 to 3.00) | 1.99 (1.83 to 2.17) | 1.47 (1.22 to 1.77) | 1.28 (1.07 to 1.52) |
| (n = 102) | (n = 102) | (n = 297) | p = 0.0001 | p = 0.006 | |
| APC2 | 35.4 (32.1 to 39.0) | 22.3 (20.4 to 24.4) | 20.2 (18.9 to 21.5) | 1.76 (1.55 to 1.99) | 1.11 (0.98 to 1.26) |
| (n = 111) | (n = 106) | (n = 322) | p < 0.0001 | p = 0.12 | |
| SFRP1 | 35.7 (30.5 to 41.9) | 24.1 (21.7 to 26.7) | 25.1 (23.2 to 27.1) | 1.42 (1.21 to 1.67) | 0.96 (0.82 to 1.13) |
| (n = 39) | (n = 29) | (n = 118) | p < 0.0001 | p = 0.62 | |
| SFRP5 | 7.14 (5.75 to 8.87) | 4.90 (4.08 to 5.90) | 6.40 (5.64 to 7.27) | 1.12 (0.87 to 1.43) | 0.77 (0.60 to 0.98) |
| (n = 102) | (n = 95) | (n = 275) | p = 0.38 | p = 0.03 | |
| MINT1 | 4.14 (3.32 to 5.16) | 3.40 (2.87 to 4.04) | 3.13 (2.82 to 3.48) | 1.32 (1.06 to 1.64) | 1.09 (0.89 to 1.33) |
| (n = 73) | (n = 70) | (n = 200) | p = 0.012 | p = 0.42 | |
| RUNX3 | 8.73 (7.15 to 10.7) | 7.58 (6.37 to 9.02) | 7.44 (6.68 to 8.29) | 1.17 (0.94 to 1.46) | 1.02 (0.83 to 1.25) |
| (n = 87) | (n = 97) | (n = 248) | p = 0.15 | p = 0.86 | |
| SOX7 | 5.70 (4.60 to 7.06) | 3.92 (3.41 to 4.51) | 5.41 (4.88 to 5.99) | 1.05 (0.85 to 1.30) | 0.73 (0.60 to 0.87) |
| (n = 100) | (n = 106) | (n = 280) | p = 0.63 | p = 0.001 | |
| TUBB6 | 12.2 (10.5 to 14.2) | 8.04 (6.93 to 9.34) | 9.34 (8.52 to 10.23) | 1.31 (1.10 to 1.56) | 0.86 (0.72 to 1.03) |
| (n = 108) | (n = 95) | (n = 292) | p = 0.003 | p = 0.11 | |
In the stage 2 analysis, five markers accurately discriminated between neoplasia and control samples with a p-value of < 0.0001: SFRP2, SFRP4, WIF1, APC1A and APC2 (see Table 3) (with between 40% and 76% increases in geometric mean values). TUBB6 showed a smaller (31%) increase, but this was also strongly significant (p = 0.003).
Comparing methylation in the samples of background mucosa (from patients with colitis-associated neoplasia) with control patients (with chronic UC only) showed some discrimination in four out of the eight promoter regions: SFRP4, APC1A, SFRP5 and SOX7 (see Table 3). Two of these markers (i.e. SFRP4 and APC1A) showed increases of in geometric mean values of 7% and 28%, respectively; the other two (i.e. SFRP5 and SOX7) showed decreases of 23% and 27%, respectively.
Performance of predictive models
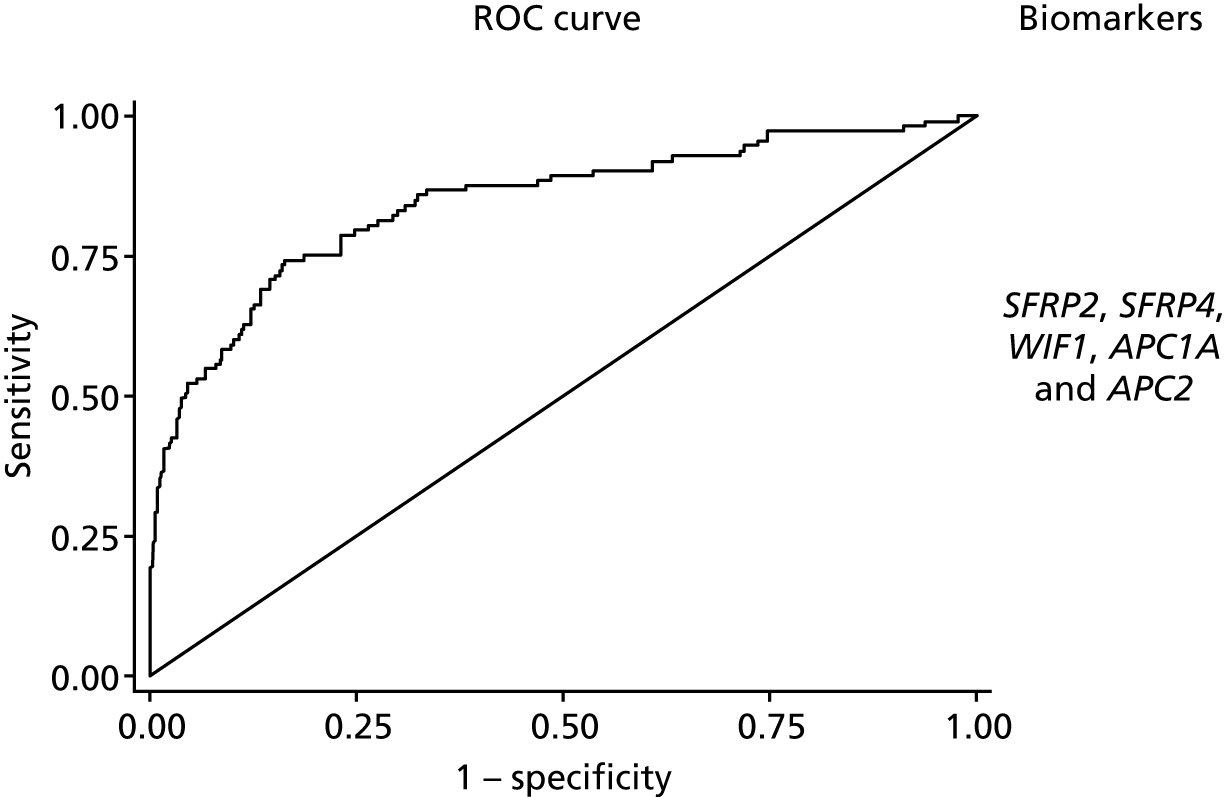
Predictive models to discriminate neoplasia samples from controls had good discrimination (Table 4). The optimism-adjusted AUC for model 1 detecting all neoplasia was 0.86 (95% CI 0.81 to 0.91) for the complete-case analysis (with a shrinkage factor of 0.93) but lower at 0.83 (95% CI 0.79 to 0.88) for the model using multiple imputation (see Table 4 and Figure 2). The addition of TUBB6 increased the AUC by only 0.001. When considered together in the panel, all markers other than WIF1 showed significant independent predictive value.
| Modela | Optimismb | Shrinkageb | Complete case AUC (95% CI) | Complete-case adjusted for optimism AUC (95% CI) | Multiple imputation AUC (95% CI) | Multiple imputation adjusted for optimism AUC (95% CI) |
|---|---|---|---|---|---|---|
| Model 1 | 0.012 | 0.93 | 0.871 (0.822 to 0.919) | 0.859 (0.810 to 0.907) | 0.845 (0.799 to 0.891) | 0.833 (0.787 to 0.879) |
| With TUBB6 | 0.015 | 0.91 | 0.875 (0.826 to 0.923) | 0.860 (0.811 to 0.908) | 0.848 (0.802 to 0.894) | 0.833 (0.787 to 0.879) |
| Model 2 | 0.012 | 0.91 | 0.930 (0.892 to 0.967) | 0.918 (0.880 to 0.955) | 0.892 (0.849 to 0.934) | 0.880 (0.837 to 0.922) |
| With TUBB6 | 0.015 | 0.88 | 0.932 (0.894 to 0.970) | 0.917 (0.879 to 0.955) | 0.894 (0.852 to 0.937) | 0.879 (0.837 to 0.922) |
| Model 3 | 0.021 | 0.90 | 0.682 (0.614 to 0.750) | 0.661 (0.593 to 0.729) | 0.696 (0.640 to 0.751) | 0.675 (0.619 to 0.730) |
FIGURE 2.
The ROC curves for final fitted predictive models (after multiple imputation) for model 1 neoplasia vs. control, with the biomarkers used within this model.
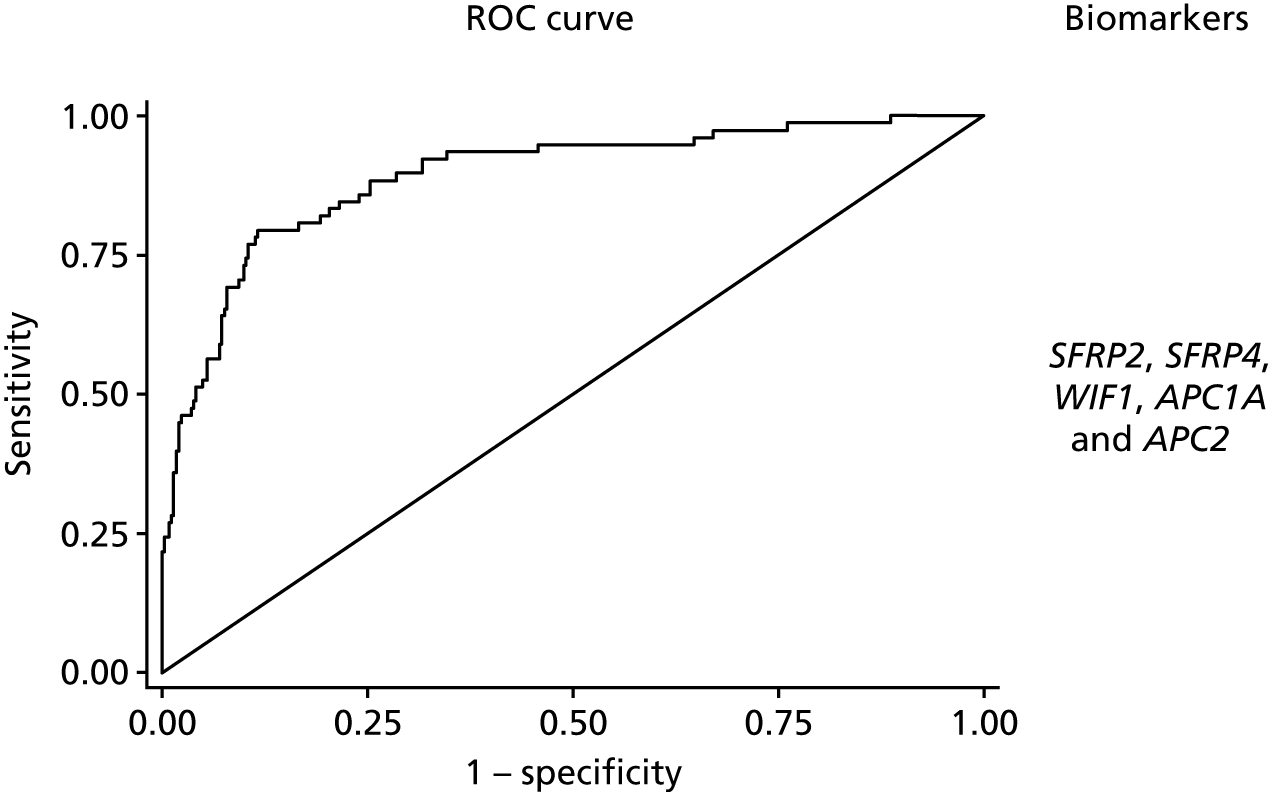
The discrimination of model 2, predicting only dysplasia (excluding adenocarcinoma cases), was higher with an optimism corrected AUC of 0.92 (95% CI 0.88 to 0.96) for the analysis of complete cases (with a shrinkage factor of 0.91) and 0.88 (95% CI 0.84 to 0.92) for the model using multiple imputation (see Table 4 and Figure 3). Again, adding TUBB6 made little difference, decreasing the AUC by 0.001. The coefficients for model 1 based on the multiple imputation data set are reported in Appendix 1, Table 19, and for model 2 in Appendix 1, Table 20. When considered together in the panel, all markers other than WIF1 showed significant independent predictive value.
FIGURE 3.
The ROC curves for final fitted predictive models (after multiple imputation) for model 2 dysplasia vs. control, with the biomarkers used within this model.
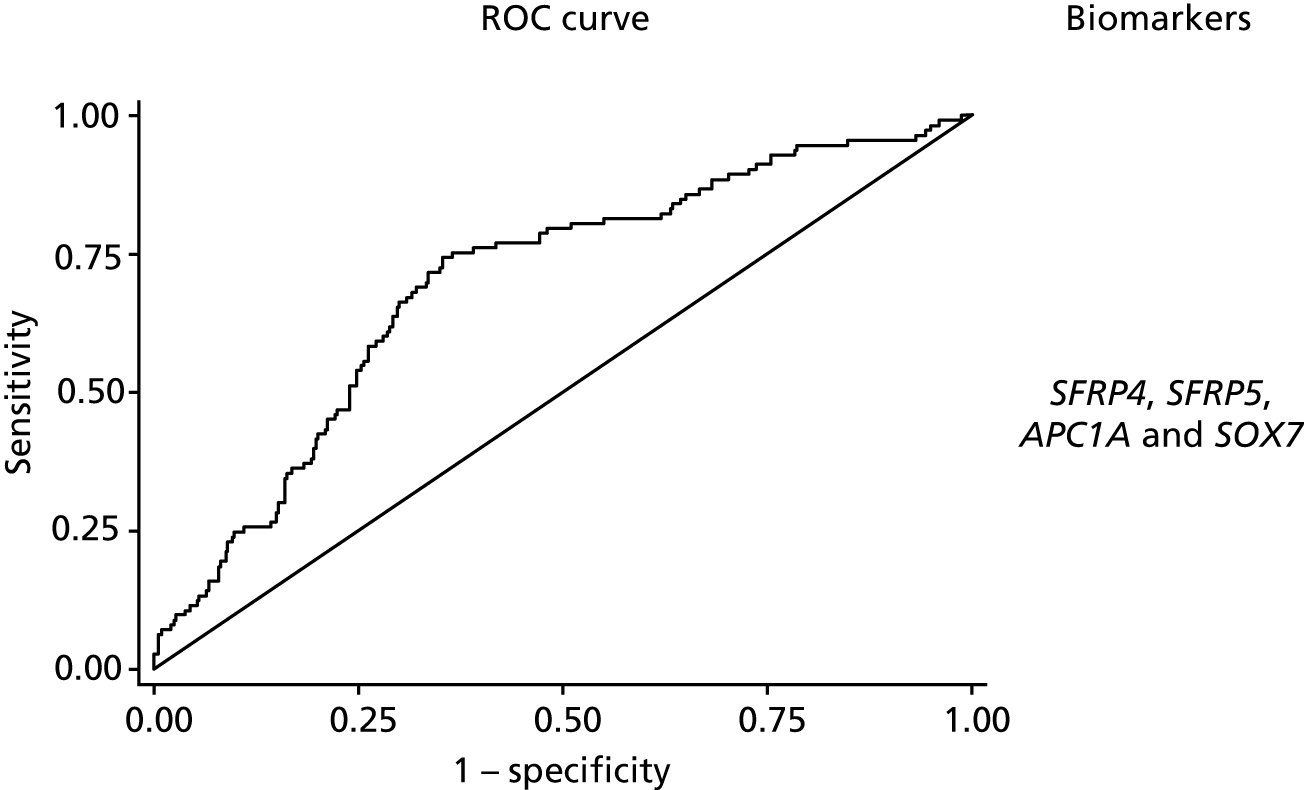
The predictive model to discriminate samples where there is methylation in the background mucosa (the matched non-neoplastic samples, model 3) from controls had poorer discrimination, with an optimism-adjusted AUC of 0.66 (95% CI 0.59 to 0.73) for the complete-case model (shrinkage factor 0.91) and 0.68 (95% CI 0.62 to 0.73) for the model using multiple imputation (Figure 4). We report coefficients for model 3 based on the multiple imputation data set in Appendix 1, Table 21. For SFRP5 and SOX7, lower levels of methylation were associated with neoplastic change in background mucosa. When considered together, only AP1CA and SOX7 showed significant independent predictive value.
FIGURE 4.
The ROC curves for final fitted predictive models (after multiple imputation) for model 3 matched non-neoplastic vs. control, with the biomarkers used within this model.
The calibration plot for model 1 after multiple imputation suggested that our final model for neoplasia detection after multiple imputation was reasonably well calibrated, with slight overestimation of probability at lower risk and overestimation at higher risk (see Appendix 1, Figures 19 and 32).
Identification of a diagnostic threshold
We identified the value of the predictive model corresponding to a likelihood ratio of at least 6, to identify thresholds that would have a positive predictive value of at least 20% when incidence of neoplastic disease was 4%. This corresponded to a threshold of 0.40 for model 1, 0.28 for model 2 and 0.50 for model 3. Sensitivity and specificity (with 95% CIs) at this threshold were 58.4% (48.8% to 67.6%) and 90.38% (86.8% to 93.3%) for model 1, 79.5% (71.0% to 86.6%) and 86.9% (82.8% to 90.3%) for model 2, and 7.1% (3.1% to 13.5%) and 98.8% (97.0% to 99.7%) for model 3.
To achieve a sensitivity of at least 90%, model 1 would use a threshold of 0.11 with a specificity of 46.4% (95% CI 41.1% to 51.8%), positive predictive value of 6.6% (95% CI 5.9% to 7.3%) and diagnostic odds ratio of 8.0 (95% CI 4.1 to 17.1); model 2 would use a threshold of 0.11 with a specificity of 68.2% (95% CI 63.0% to 73.1%), positive predictive value of 10.7% (95% CI 9.11% to 12.3%) and diagnostic odds ratio of 18.8 (95% CI 8.6 to 46.5); and model 3 would use a threshold of 0.19 with a specificity of 27.1% (95% CIs 22.5% to 32.1%), positive predictive value of 4.9% (95% CI 4.5% to 5.3%) and diagnostic odds ratio of 3.4 (95% CI 1.7 to 7.4).
Models for missing data
For model 1, to provide models for scenarios where data on fewer than five of the chosen biomarkers amplify, separate models accounting for all possible scenarios, where at least three out of the five biomarkers amplified, were created through re-analysis of the multiple imputation model with reduced sets of predictor variables. This created an additional 15 models (see Appendix 1, Table 22).
Module 1: discussion
In this study we have demonstrated that a five-marker methylation marker panel accurately predicts UC-associated dysplasia and invasive neoplasia from formalin-fixed mucosal biopsies taken at endoscopy. Recruitment of a diverse population (diagnosed in different hospitals and from different genetic pools) increases the likely generalisability of these findings. The study has also identified a second marker panel found in the background mucosa that is (more weakly) associated with neoplastic change. Our panels utilise epigenetic biomarkers, which are emerging as a reproducible method of quantifying disease risk in a population,38 and suggest that these markers may add value to endoscopic detection of colitis-associated neoplasia.
Specific patterns of methylation change have been observed in colorectal cancer39 as well as specific changes observed in the transition from dysplastic colorectal adenoma to malignant adenocarcinoma24 suggesting that methylation has good sensitivity as a biomarker of disease. To our knowledge, this is the first multiplex methylation biomarker panel in colorectal cancer.
Other cancer types have demonstrated potential utility of methylation analysis in screening for invasive disease. The UroMark study38 investigated the utility of multiplex bisulphite PCR amplicon NGS in the detection of muscle invasive bladder cancer in voided urine. Using a 150-marker panel based on differentially methylated CpG loci in a discovery study, they tested their marker panel in a cohort of 274 patients with muscle invasive bladder cancer, reporting an overall AUC of 0.97. Although the analysis may have been overfitted, a significant advantage was the ability to develop a marker panel based on an epigenome-wide association study, an approach that might be appropriate in UC-associated dysplasia, which has a heterogeneous genetic profile.
Generally it is accepted that an AUC of > 0.80 represents a ‘good’ biomarker panel for the detection of disease and multiple marker panels using several different technologies have been developed across multiple disease types that have reached this target. 40–42 The AUC for detection of colitis-associated neoplasia suggests this is an accurate test for neoplasia. However, we are seeking to enhance detection, not replace colonoscopy for which it is necessary for the test to also identify neoplasia missed on colonoscopy. Ultimately it is the early detection of occult disease that will determine the clinical value of this assay, and that requires prospective evaluation, which is undertaken in module 3 of the ENDCaP-C study.
It is likely with more extensive epigenetic analysis of this retrospective cohort we could enhance discrimination. The study has established that a reliable and robust assay can be developed for these patients. Although we under-recruited tumour blocks (113 rather than the planned 160), this still provided > 20 events per variable for generating our five-marker models but will have increased the maximum 95% CI width for sensitivity by 3%. The study was carried out on a genetically and geographically diverse population, supporting the generalisability of our findings.
This study has also developed a novel marker set for predicting the presence of co-existing neoplasia from analysis of the background mucosa. Unsurprisingly, the AUC value for this is significantly lower and the test is, therefore, less discriminating. But the true impact of these markers can be determined only in a prospective longitudinal analysis. These methylation changes are present in a subset of the UC population, without associated neoplasia. Follow-up of these patients will be required to determine whether or not this represents a high-risk population for whom therapeutic cancer prevention strategies can be developed.
Three biomarkers (i.e. SFRP1, MINT1 and RUNX3) were not taken forward because of poor amplification rates during PCR, which we hypothesised was because of the high GC (guanosine triphosphate cytidine triphosphate) content of these regions making primer design difficult for FFPE-derived DNA. In addition, WIF1 methylation was found not to contribute to the disease model, presumably because its methylation levels were similar to other genes that were analysed within this study that are all modulators of the Wnt signalling pathway. It was also noticed that the direction of methylation (towards hypomethylation) differed for the markers in model 3. It was hypothesised that this was because of the previously demonstrated ‘wave’ of hypomethylation43 that occurs as a precursor to invasive malignancy and, therefore, should occur in the disease-associated non-dysplastic mucosa that we sampled here.
In conclusion, we have successfully developed a multiplex methylation marker panel for the detection of UC-associated dysplasia and neoplasia that was validated in a retrospective cohort. Module 3 describes the validation of these markers in a prospective clinical study.
Chapter 3 Module 2: evaluation of next generation sequencing as an alternative to pyrosequencing
Module 2: introduction
The aim of the ENDCaP-C study module 2 was to evaluate the utility of NGS as an alternative to pyrosequencing – the technology routinely used to determine the methylation status of specific targets in FFPE extracted DNA. It was considered that pyrosequencing was not an appropriate platform to deliver a high-throughput strategy for introduction into routine clinical practice. Although pyrosequencing is already widely used in the clinical diagnostic setting, it does not offer the high-throughput level required for widespread use in UC patients. Moreover, both laboratory work and results analysis offer little space for automation, which has an impact on the turnaround time and standardisation.
A number of potential technical approaches were considered, but it was decided to evaluate an amplicon-based target enrichment strategy using the Fluidigm 48.48 Access Array (Fluidigm Corporation; San Francisco, CA, USA) system with subsequent sequencing analysis performed on the Illumina MiSeq platform (Illumina Incorporated; San Diego, CA, USA). The advantages of this system included speed, single nucleotide resolution, high coverage of each locus, low cost of simultaneously assaying multiple CpG loci and high-throughput capability. This approach has been proved successful in a number of studies. 44–46
Module 2: methods
Bisulphite DNA conversion
Bisulphite DNA conversions were performed using the EZ-96 DNA Methylation Gold MagPrep Kit (Zymo Research; Irvine, CA, USA) according to the manufacturer’s instructions. The amount of input DNA was variable, dependent on the sample source, ranging between 1 ng and 30 ng.
Target enrichment using the Fluidigm Access Array system
Multiplex PCR amplification was carried out on a 48.48 Fluidigm Access Array (Fluidigm Corporation, South San Francisco, CA, USA) following the methods of Lange et al. 44 using a Roche High Fidelity Fast Start Kit (Roche Holding AG, Basel, Switzerland). The target specific primer sequences are given in Table 5.
| CS1 and CS2 Fluidigm tag (5′–3′) | Target sequence (5′–3′) | Primer name |
|---|---|---|
| ACACTGACGACATGGTTCTACA | GGGTGTTTTTGTTTAATAAGAATTGT | CS1-SFRP1-14-for |
| ACACTGACGACATGGTTCTACA | GTTGTGGTTGTATATTTTTATGAGGG | CS1-SFRP4-15-for |
| ACACTGACGACATGGTTCTACA | GTTTTAGTAGGTTGGGT | CS1-SFRP5-16-for |
| ACACTGACGACATGGTTCTACA | GGGGTTAGGGTTAGGTAGG | CS1-APC1A-17-for |
| ACACTGACGACATGGTTCTACA | AGTTTGTAGTGGGAGAGT | CS1-APC2-18-for |
| ACACTGACGACATGGTTCTACA | GTTTTTATGGTTTGGGTTAAGG | CS1-SOX7-19-for |
| ACACTGACGACATGGTTCTACA | AGGAGTAGGTTGTATAGAT | CS1-TUBB6-20-for |
| ACACTGACGACATGGTTCTACA | AATAGTTTTGGTTGAGGGAGTTGTA | CS1-WIF1-10-for |
| ACACTGACGACATGGTTCTACA | GTGTTGAGAGAGTTTGAAAGAAATATTAT | CS1-MINT1-3-for |
| ACACTGACGACATGGTTCTACA | GAGGAGGTTTTAGTGTTATAGTTTAGGG | CS1-RUNX3-4-for |
| ACACTGACGACATGGTTCTACA | GTTGTTGGGGTATAGTTAGAGTTTTT | CS1-SFRP2-6-for |
| TACGGTAGCAGAGACTTGGTCT | ACTTAAACATCTCCAACCAATAAAAACC | CS2-SFRP1-14-rev |
| TACGGTAGCAGAGACTTGGTCT | CCCATTTACACCCTAAAATTCCTA | CS2-SFRP4-15-rev |
| TACGGTAGCAGAGACTTGGTCT | CAATACCTTAACATCCCTAC | CS2-SFRP5-16-rev |
| TACGGTAGCAGAGACTTGGTCT | TCCAACCAATTACACAACTACTTCTCTCT | CS2-APC1A-17-rev |
| TACGGTAGCAGAGACTTGGTCT | CTACCTACCTCCAACTCAAATAACAAC | CS2-APC2-18-rev |
| TACGGTAGCAGAGACTTGGTCT | ACCCAACATCTTACTAAACTC | CS2-SOX7-19-rev |
| TACGGTAGCAGAGACTTGGTCT | TCTCCCAAAATACAAAAACCATTCCTCT | CS2-TUBB6-20-rev |
| TACGGTAGCAGAGACTTGGTCT | CCCAAAAAATTTTTACTAAATAAAAAC | CS2-MINT1-3-rev |
| TACGGTAGCAGAGACTTGGTCT | AAATTACAAAAATCACAAACCC | CS2-RUNX3-4-rev |
| TACGGTAGCAGAGACTTGGTCT | CAACCAAAATTCCCTTCCAA | CS2-SFRP2-6-rev |
| TACGGTAGCAGAGACTTGGTCT | ACCAACAAACACAAAAAAATACTCC | CS2-WIF1-10-rev |
Sequencing adaptor and barcode primer incorporation
A bidirectional sequencing protocol was adopted as provided by Fluidigm (Access Array™ Barcode Bidirectional Library for Illumina Sequencers – 100–3771; Fluidigm Corporation, San Francisco, CA, USA) to facilitate simultaneous sequencing of the forward and reverse directions, which is important to provide sufficient base diversity content during subsequent MiSeq Illumina sequencing (Figure 5).
FIGURE 5.
Schematic representation of the bidirectional sequencing strategy adopted to overcome the low diversity issues.
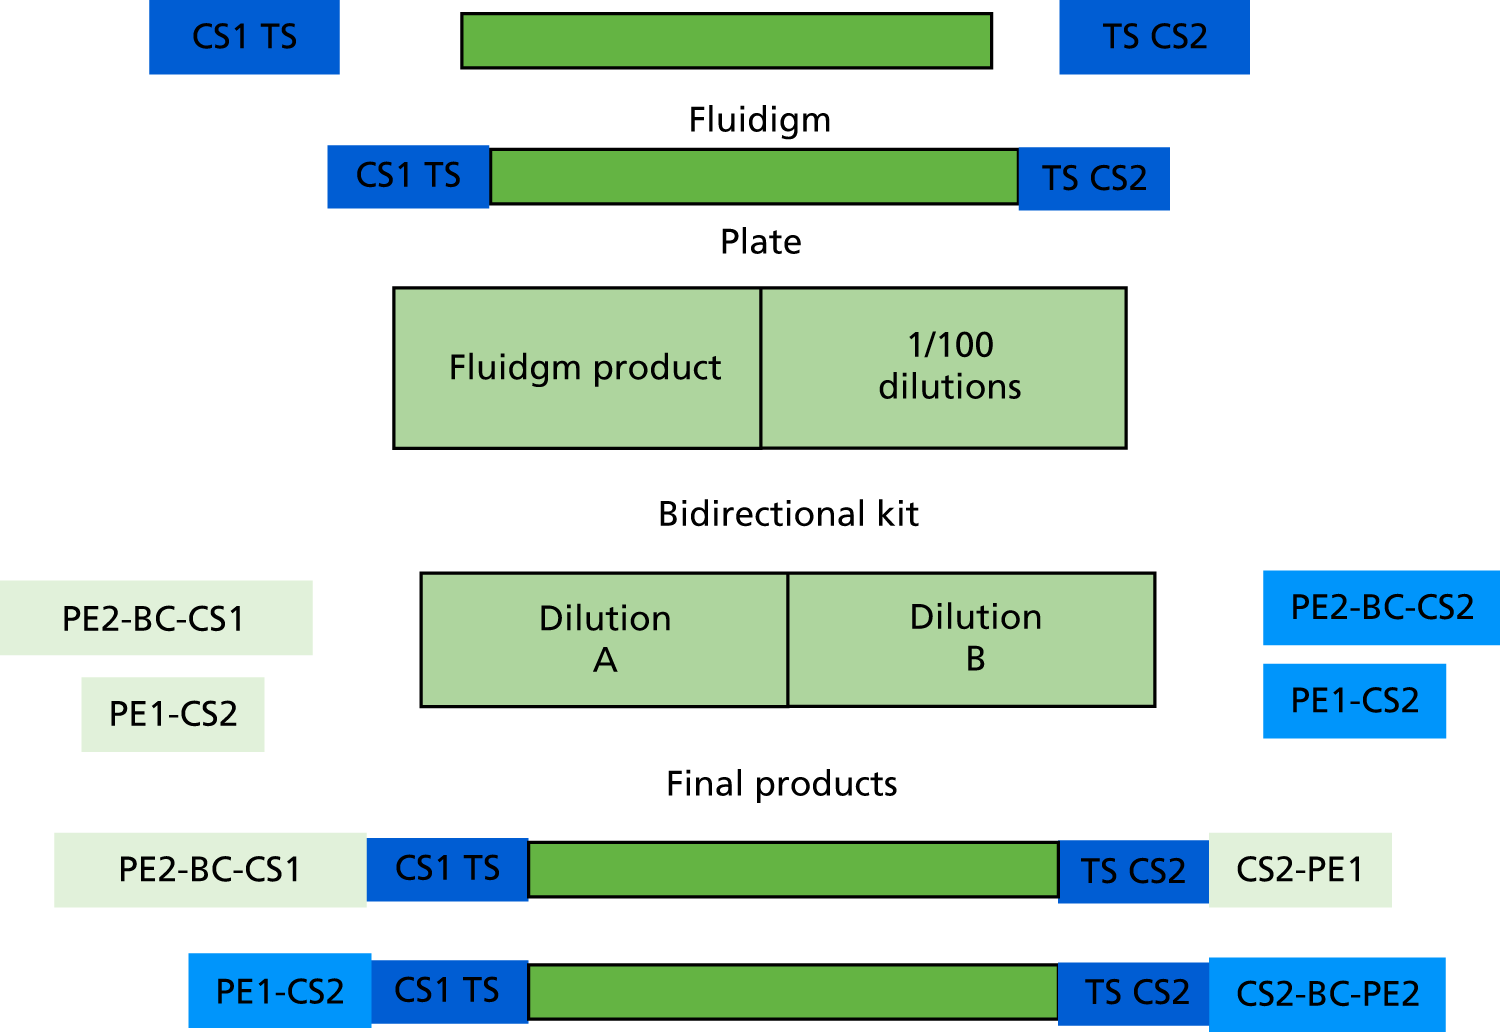
For each sample, 1 µl of the 50-fold diluted PCR products was added to each of two PCR plates containing 15 µl of pre-sample mastermix containing 0.05 U/µl of FastStart™ High Fidelity Enzyme blend (Roche Holding AG, Basel, Switzerland), 1 × FastStart High Fidelity Enzyme Buffer (Roche Holding AG, Basel, Switzerland), 200 µM each of dNTPs, 4.5 mM MgCl2 and 5% dimethyl sulphoxide. In the first plate, 4 µl of one pair of primers containing an individual 10-base barcode (BC) sequence, and sequence tags for reading in one direction (PE2-BC-CS1+PE1-CS) were added to each well. In the second plate, 4 μl of primers containing PE2-BC-CS2/PEI-CS2 were added to each well. Reaction products in plates were amplified for 15 cycles: 95 °C for 10 minutes, 15 cycles of 95 °C for 15 seconds, 60 °C for 30 seconds and 72 °C for 4 minutes, 1 cycle of 95 °C for 3 minutes.
Quantification and clean-up of deoxyribonucleic acid sequencing library
The barcoded products were pooled together and purified using AMPure XP beads (Beckman Coulter Life Sciences, Brea, CA, USA) using a bead to amplicon ratio of 1 : 1. The library was analysed and quantified using microfluidic electrophoresis on Agilent 2200 TapeStation (D1000 DNA screen tape) (Agilent Technologies Incorporated, Santa Clara, CA, USA) to ensure that the expected size was obtained (a main peak of 330 bp). A 2-nM library dilution was prepared, checked on the Agilent 2200 TapeStation (high-sensitivity tape) and sequenced on MiSeq sequencing platform according to the Illumina standard protocol.
Bioinformatic pipeline
An in-house bioinformatics pipeline was used to automate the cytosine methylation state detection ‘Bismark’ software (Babraham Bioinformatics; Cambridge, UK). 47 Briefly, CS (consensus sequences) were removed using cutadapt (v1.4.1) and target-specific sequences were analysed using Bismark package (version v0.10.0). Bismark utilised bowtie (v1.1.1) to align the trimmed reads allowing only one mismatch per 50 (high quality, Q > 28) bases. Methylation data were extracted using the bismark_methylation_extracter tool to generate a table of methylation counts. Methylation count data were mapped and converted to genomic locations using a custom Python script.
Raw data obtained from the MiSeq was quality assessed and filtered against a minimum Phred score of 30, using a sliding four-base window across each read. Reads were trimmed to remove the primer sequences using the cutadapt v1.4.1 tool.
Reads were processed using Bismark v0.10.1, which simultaneously aligned against in silico converted DNA and unmodified DNA reference sequences (the 11 amplicon sequences as defined by the target specific primers, hg19 genome assembly).
After alignment the ‘bismark_methylation_extractor’ script computed the number of counts corresponding to methylated and unmethylated bases to give the percentage of methylated reads. The ‘local’ alignment co-ordinates were then converted into genomic co-ordinates using a custom Python script to create a bed file for viewing methylation data on the Integrative Genomics Viewer 2.3 (The Eli and Edythe L Broad Institute of MIT and Harvard; Cambridge, MA, USA).
Module 2: results
Primer design and validation
Primers used in module 1 for the 11 chosen targets (i.e. SFRP1, SFRP2, SFRP4, SFRP5, WIF1, RUNX3, MINT1, SOX7, APC1A, APC2 and TUBB6) were single nucleotide polymorphisms checked to exclude common population variants with a frequency of > 1%. Primers included CS tags, which were required for the Fluidigm protocol.
Amplification performance of the primers was tested on anonymised normal control genomic DNA samples (using the Fluidigm 48.48 Access Array system) as described in the above methods. Products of the expected size were seen for all targets.
Alternative primers were designed for three poorly performing targets (RUNX3, MINT1 and SOX7). Sequence complexity prohibited the redesign of alternative primers for the APC2 locus. Primers were designed using the MethPrimer online tool (UroGene S.A., Genopole, France). 48 The new primers were tested in triplicate using normal FFPE tissue and resulted in a marked improvement in test performance.
Amplification metrics
A total of 729 samples were processed through the ENDCaP-C NGS workflow in duplicate. Samples for which there was insufficient DNA remaining for duplicate analysis were excluded. Targets for which < 100 reads were obtained have been excluded from the analysis (a marker of poor quality).
The average methylation percentage at each CpG site between replicates was calculated and this output was forwarded to the Birmingham Clinical Trials Unit (BCTU) for statistical analysis.
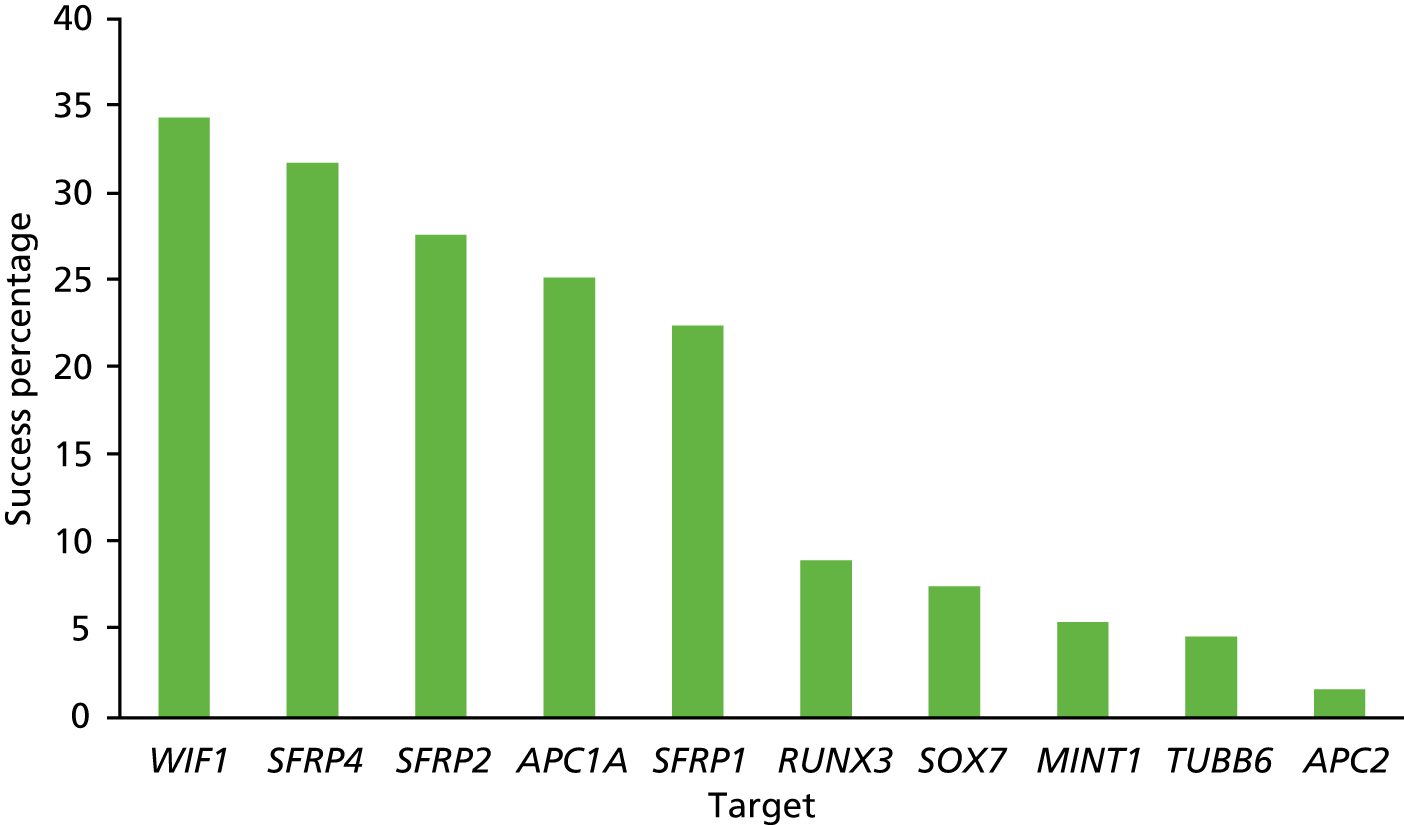
The DNA amplification performance (a necessary first step for successful NGS) for each of the 11 targets is illustrated in Figure 6. On average, the success rate fell below 35% for each target. This low amplification rate is anticipated as small formalin-fixed biopsy samples will yield only small amounts of DNA strands of sufficient length for the amplification process. The variation between the different targets (from 34% to < 5%) reflects the variation in length of the amplicons and also the reduced sequence complexity (i.e. enrichment for adenine-thymine base pairs) during DNA bisulphite conversion, which affects the binding of the primers.
FIGURE 6.
Amplification success at each of the 11 targets for the 729 samples processed (in duplicate).
The reasons for poor amplification performance are multifactorial, including low DNA integrity, low concentration (below the minimum threshold required for the Fluidigm Access Array workflow) and the amplicon length. The relationship between DNA quality and performance of the NGS test is shown by comparing Figures 7 and 8. The relationship between amplicon length performance of the NGS test is shown by comparing Figures 9–11.
FIGURE 7.
Q-ratio of the ENDCaP-C input samples.
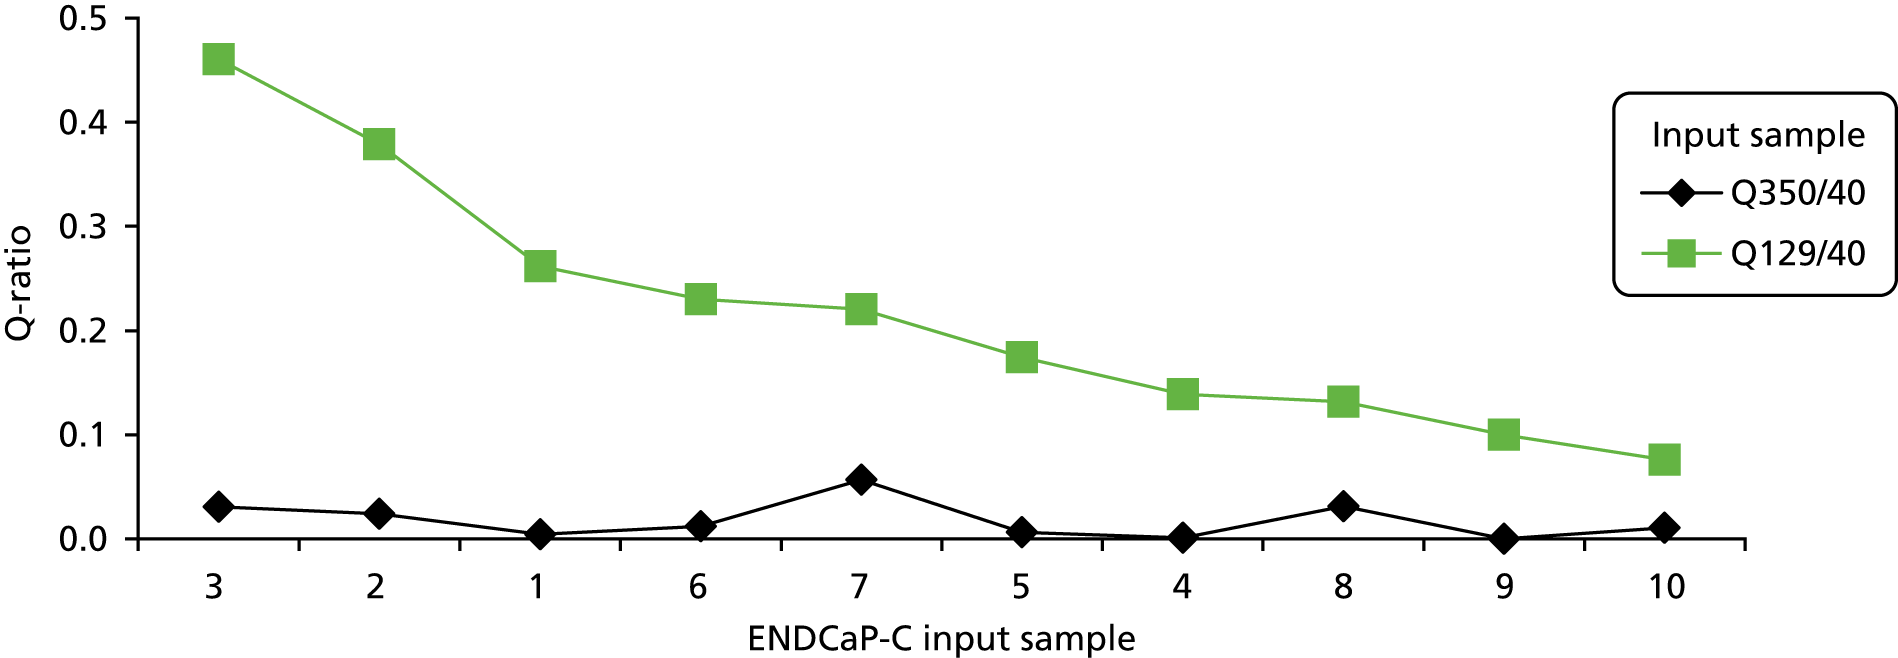
FIGURE 8.
The ENDCaP-C input samples performance of the NGS test. Green shading means pass, blue shading means fail and pale green shading means a result from only one duplicate.
| Sample 3 | Sample 2 | Sample 1 | Sample 6 | Sample 7 | Sample 5 | Sample 4 | Sample 8 | Sample 9 | Sample 10 |
|---|---|---|---|---|---|---|---|---|---|
| SFRP2 | WIF1 | WIF1 | RUNX3 | RUNX3 | SFRP1 | WIF1 | RUNX3 | WIF1 | SFRP4 |
| WIF1 | RUNX3 | SOX7 | SFRP5 | WIF1 | SFRP4 | SFRP2 | WIF1 | RUNX3 | SFRP2 |
| SFRP5 | SFRP2 | SFRP1 | WIF1 | APC1A | RUNX3 | SFRP4 | APC1A | SFRP1 | WIF1 |
| APC1A | SFRP4 | RUNX3 | APC1A | MINT1 | SFRP2 | RUNX3 | MINT1 | SOX7 | RUNX3 |
| RUNX3 | APC1A | SFRP4 | MINT1 | SFRP4 | WIF1 | SFRP1 | SFRP2 | APC1A | APC1A |
| SFRP4 | SFRP1 | SFRP2 | SFRP2 | SFRP1 | APC1A | SOX7 | SFRP4 | APC2 | MINT1 |
| SOX7 | SOX7 | APC1A | SFRP4 | SOX7 | MINT1 | APC1A | SFRP1 | SFRP2 | SFRP1 |
| SFRP1 | TUBB6 | MINT1 | SFRP1 | TUBB6 | SOX7 | APC2 | SOX7 | SFRP4 | SOX7 |
| TUBB6 | SFRP5 | SFRP5 | TUBB6 | SFRP2 | SFRP5 | SFRP5 | SFRP5 | SFRP5 | SFRP5 |
| MINT1 | MINT1 | APC2 | APC2 | SFRP5 | TUBB6 | TUBB6 | TUBB6 | TUBB6 | TUBB6 |
| APC2 | APC2 | TUBB6 | SOX7 | APC2 | APC2 | MINT1 | APC2 | MINT1 | APC2 |
FIGURE 9.
Concentration (ng/µl) of the different fragment sizes (40, 129 and 350 bp) within the ENDCaP-C input samples as measured by qPCR using the KAPA hgDNA Quantification and QC Kit.
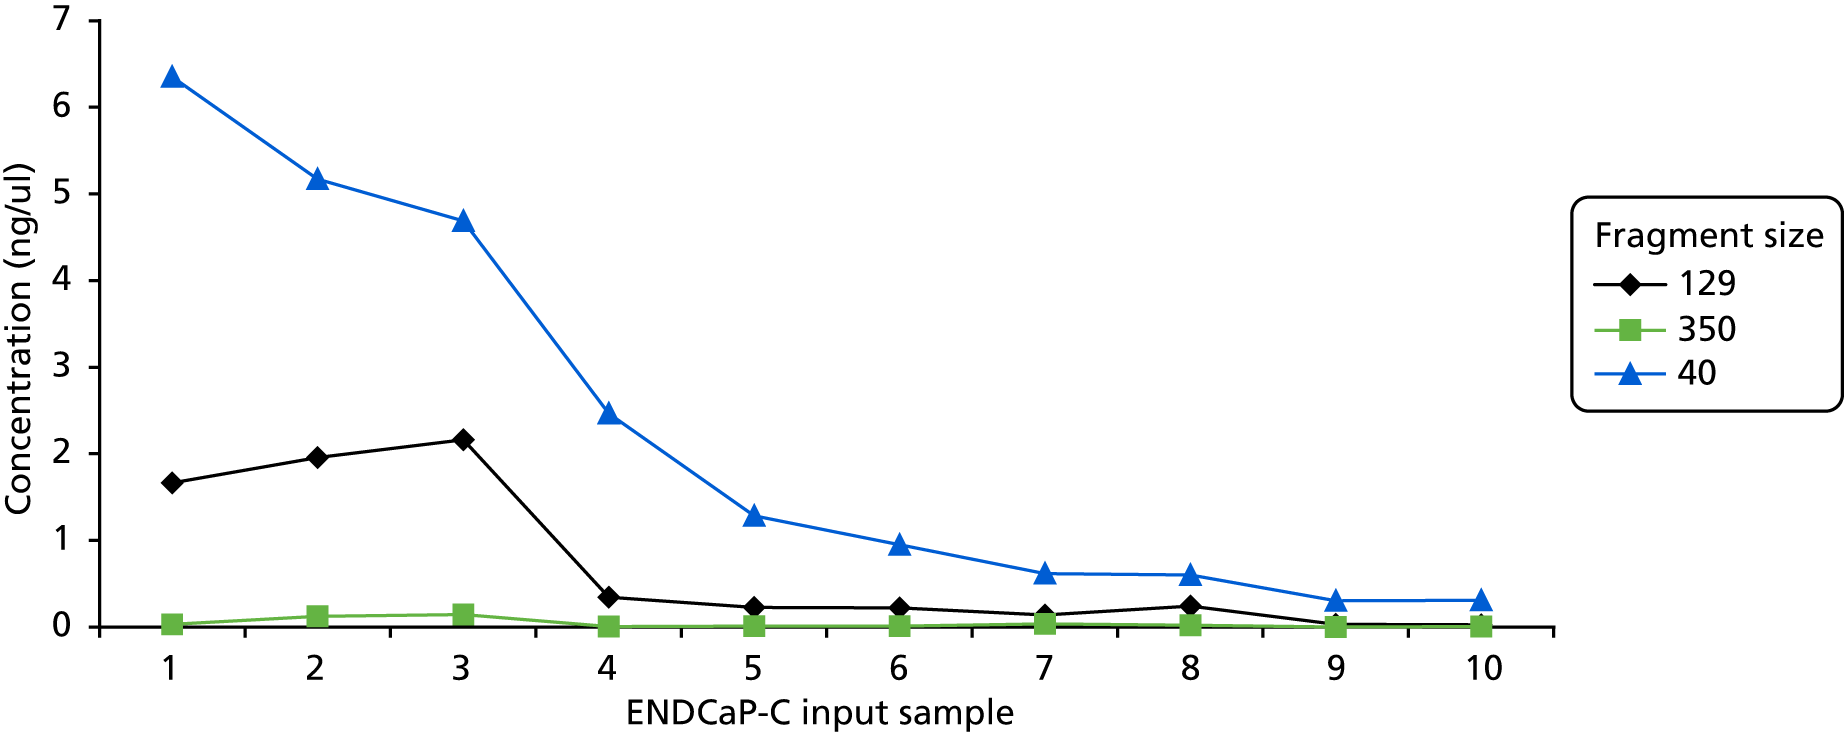
FIGURE 10.
The ENDCaP-C input samples performance of the NGS test. Green shading means pass, blue shading means fail and pale green shading means result from only one duplicate.
| Sample 1 | Sample 2 | Sample 3 | Sample 4 | Sample 5 | Sample 6 | Sample 7 | Sample 8 | Sample 9 | Sample 10 |
|---|---|---|---|---|---|---|---|---|---|
| WIF1 | WIF1 | SFRP2 | WIF1 | SFRP1 | RUNX3 | RUNX3 | RUNX3 | WIF1 | SFRP4 |
| SOX7 | RUNX3 | WIF1 | SFRP2 | SFRP4 | SFRP1 | WIF1 | WIF1 | RUNX3 | SFRP2 |
| SFRP1 | SFRP2 | SFRP5 | SFRP4 | RUNX3 | WIF1 | APC1A | APC1A | SFRP1 | WIF1 |
| RUNX3 | SFRP4 | APC1A | RUNX3 | SFRP2 | APC1A | MINT1 | MINT1 | SOX7 | RUNX3 |
| SFRP4 | APC1A | RUNX3 | SFRP1 | WIF1 | MINT1 | SFRP4 | SFRP2 | APC1A | APC1A |
| SFRP2 | SFRP1 | SFRP4 | SOX7 | APC1A | SFRP2 | SFRP1 | SFRP4 | APC2 | MINT1 |
| APC1A | SOX7 | SOX7 | APC1A | MINT1 | SFRP4 | SOX7 | SFRP1 | SFRP2 | SFRP1 |
| MINT1 | TUBB6 | SFRP1 | APC2 | SOX7 | SFRP1 | TUBB6 | SOX7 | SFRP4 | SOX7 |
| SFRP5 | SFRP5 | TUBB6 | SFRP5 | SFRP5 | TUBB6 | SFRP2 | SFRP5 | SFRP5 | SFRP5 |
| APC2 | MINT1 | MINT1 | TUBB6 | TUBB6 | APC2 | SFRP5 | TUBB6 | TUBB6 | TUBB6 |
| TUBB6 | APC2 | APC2 | MINT1 | APC2 | SOX7 | APC2 | APC2 | MINT1 | APC2 |
FIGURE 11.
Amplicon length of the targets.

Assessment of deoxyribonucleic acid quantity and quality
To better understand the reasons behind the high failure rate in the NGS platform, an analysis of the input DNA was carried out on a small number of representative samples, with a wide range of different DNA concentrations.
The concentration and quality of 10 DNA samples was assessed by:
-
quantitative polymerase chain reaction (qPCR) analysis to quantify the percentage of amplifiable DNA in the samples, performed using the KAPA hgDNA Quantification and QC Kit (Roche Holding AG)
-
NanoDrop (spectrophotometric analysis to assess purity; Thermo Fisher Scientific, Waltham, MA, USA)
-
fluorometric quantitation (Qubit platform; Thermo Fisher Scientific).
The qPCR assay determines the relative copies of three amplicons of different lengths (i.e. 350 bp, 129 bp and 40 bp) to assess DNA integrity and assign a Q-ratio. High-quality DNA has a 350 : 40 ratio and a 129 : 40 ratio close to 1 (Q-ratio), whereas for damaged DNA the ratio would be much lower.
Table 6 gives a summary of the three methods used to assess quantity and quality of DNA.
| Sample | NanoDrop | Qubit | qPCR (40 bp) | qPCR (129 bp) | qPCR (350 bp) | Q-ratio (129 : 40) | Q-ratio (350 : 40) | Success rate (%) |
|---|---|---|---|---|---|---|---|---|
| 1 | 48 | 14.50 | 6.349485 | 1.660897 | 0.027171 | 0.261580 | 0.004279 | 63.0 |
| 2 | 47 | 15.00 | 5.169203 | 1.958042 | 0.123428 | 0.378790 | 0.023878 | 58.5 |
| 3 | 15 | 3.10 | 4.688881 | 2.158972 | 0.144207 | 0.460445 | 0.030755 | 67.5 |
| 4 | 27 | 6.48 | 2.463435 | 0.342568 | 0.002739 | 0.139061 | 0.001112 | 13.5 |
| 5 | 45 | 13.00 | 1.283114 | 0.223549 | 0.008016 | 0.174224 | 0.006247 | 22.5 |
| 6 | 76 | 28.40 | 0.950962 | 0.218799 | 0.011400 | 0.230082 | 0.011988 | 49.5 |
| 7 | 24 | 4.37 | 0.616272 | 0.135763 | 0.034894 | 0.220297 | 0.056621 | 54.0 |
| 8 | 13 | 1.75 | 0.599380 | 0.240766 | 0.018792 | 0.131692 | 0.031352 | 22.5 |
| 9 | 3 | 0.30 | 0.299616 | 0.029897 | 0.000000 | 0.099783 | 0.000000 | 4.5 |
| 10 | 15 | 0.72 | 0.306560 | 0.023222 | 0.003233 | 0.075751 | 0.010546 | 13.5 |
Qubit quantification showed that for the majority of samples the amount of input DNA fell below that recommended for both the bisulphite conversion stage (> 200 ng) and the Fluidigm amplification (> 50 ng).
The Q-ratio scores for both the 129-bp and the 350-bp fragments are below 1 in all 10 samples assessed, indicating significant sample degradation. The Q-ratio scores have been compared directly with the NGS analysis performance (see Figure 5). This comparison shows a clear correlation between the Q-score and NGS success. For example, sample 3 has the highest 129-bp Q-score and also the best NGS performance (6 out of 11 fragments passed), whereas sample 10 has the lowest 129-bp Q-score and a very poor NGS performance (no fragments passed). It is important to note that the Q-score for the 350-bp fragment is at least 10-fold less than that of the 129-bp Q-score for each test sample, indicating low amplification potential for fragments of this size. This is significant because the NGS assay includes fragments up to 350 bp in size.
The concentration of input DNA was also shown to correlate closely with NGS performance, as illustrated in Figure 6 comparing the concentration of each fragment (40 bp, 129 bp and 350 bp) within the 10 representative input samples. For example, sample 1 gave the highest concentration of the 40-bp and 129-bp fragments (see Figure 9) as well as the best NGS performance (see Figure 10). As described above, the length of each NGS target fragment correlated well with overall performance (see Figure 11).
Assessment of predictive value of next-generation sequencing
Data produced from the module 2 NGS assay were analysed using the methods established in module 1 (see Chapter 2, Statistical analysis) to compare amplification performance with predictive ability.
Data analysis included an assessment of amplification performance for each target, comparing directly the NGS and pyrosequencing technologies. The statistical model derived from module 1 was then applied to the model 2 data set to assess whether or not the data obtained where amplification was successful maintained the same predictive ability as data from pyrosequencing used in module 1.
Overall, the NGS assay showed a significantly lower amplification success than the pyrosequencing method used in module 1 (Figure 12 and Table 7).
FIGURE 12.
Percentage amplification of target biomarkers (total biopsies) using pyrosequencing (module 1) and NGS (module 2).
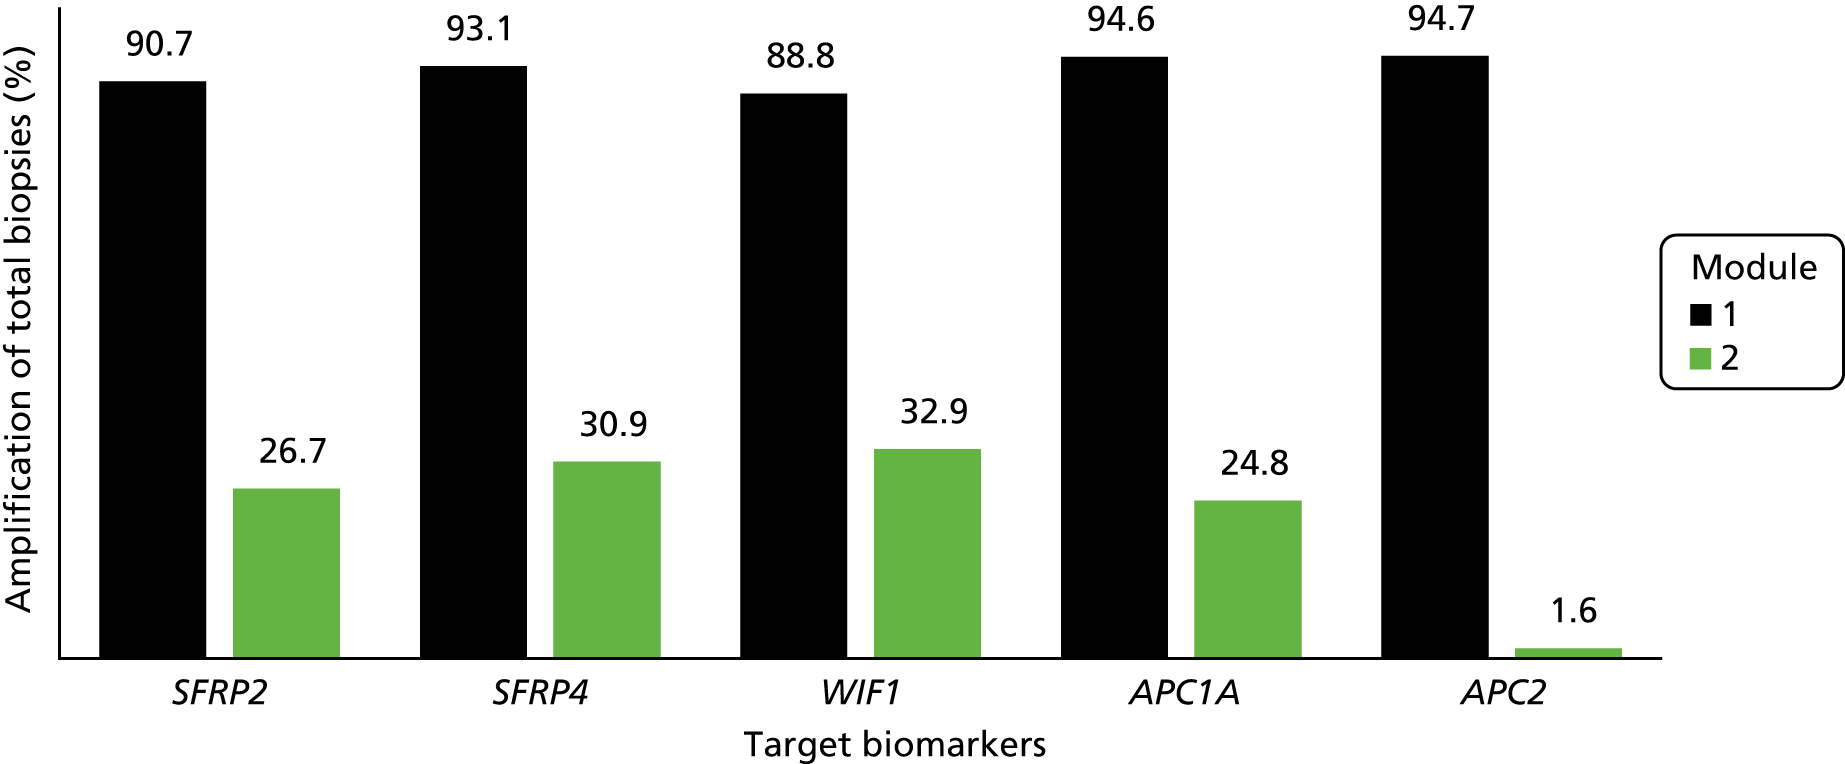
| Biomarker | Amplification status | Sample biopsies, n (%) | Total (N = 569), n (%) | ||
|---|---|---|---|---|---|
| Neoplastic (N = 113) | Non-neoplastic (N = 113) | All controls (N = 343) | |||
| SFRP2 | Not amplified | 63 (55.8) | 81 (71.7) | 254 (74.1) | 398 (69.9) |
| Amplified | 49 (43.4) | 30 (26.5) | 73 (21.3) | 152 (26.7) | |
| Not done | 1 (0.9) | 2 (1.8) | 16 (4.7) | 19 (3.3) | |
| SFRP4 | Not amplified | 58 (51.3) | 78 (69) | 238 (69.4) | 374 (65.7) |
| Amplified | 54 (47.8) | 33 (29.2) | 89 (25.9) | 176 (30.9) | |
| Not done | 1 (0.9) | 2 (1.8) | 16 (4.7) | 19 (3.3) | |
| WIF1 | Not amplified | 59 (52.2) | 75 (66.4) | 229 (66.8) | 363 (63.8) |
| Amplified | 53 (46.9) | 36 (31.9) | 98 (28.6) | 187 (32.9) | |
| Not done | 1 (0.9) | 2 (1.8) | 16 (4.7) | 19 (3.3) | |
| APC1A | Not amplified | 69 (61.1) | 79 (69.9) | 261 (76.1) | 409 (71.9) |
| Amplified | 43 (38.1) | 32 (28.3) | 66 (19.2) | 141 (24.8) | |
| Not done | 1 (0.9) | 2 (1.8) | 16 (4.7) | 19 (3.3) | |
| APC2 | Not amplified | 54 (47.8) | 60 (53.1) | 182 (53.1) | 296 (52) |
| Amplified | 4 (3.5) | 4 (3.5) | 1 (0.3) | 9 (1.6) | |
| Not done | 55 (48.7) | 49 (43.4) | 160 (46.6) | 264 (46.4) | |
We fitted the model on data from the 60 participants for whom biomarker data were available for SFRP2, SFRP4, WIF1 and APC1A. Owing to very low levels of amplification for biomarker APC2 in module 2, this marker was not included in the model. The results are shown in Table 8 and Figure 13.
| Outcome (sample/control) | Coefficienta | p-value | 95% CI |
|---|---|---|---|
| Log – SFRP2 mean CpG | 0.829 | 0.004 | 0.27 to 1.39 |
| Log – SFRP4 mean CpG | 1.294 | 0.006 | 0.38 to 2.21 |
| Log – WIF1 mean CpG | 0.660 | 0.034 | 0.05 to 1.27 |
| Log – APC1A mean CpG | –0.273 | 0.503 | –1.07 to 0.53 |
| Constant term | –6.728 | 0.001 | –10.88 to 2.58 |
FIGURE 13.
The ROC curve of the fitted final logistic regression model for module 2.
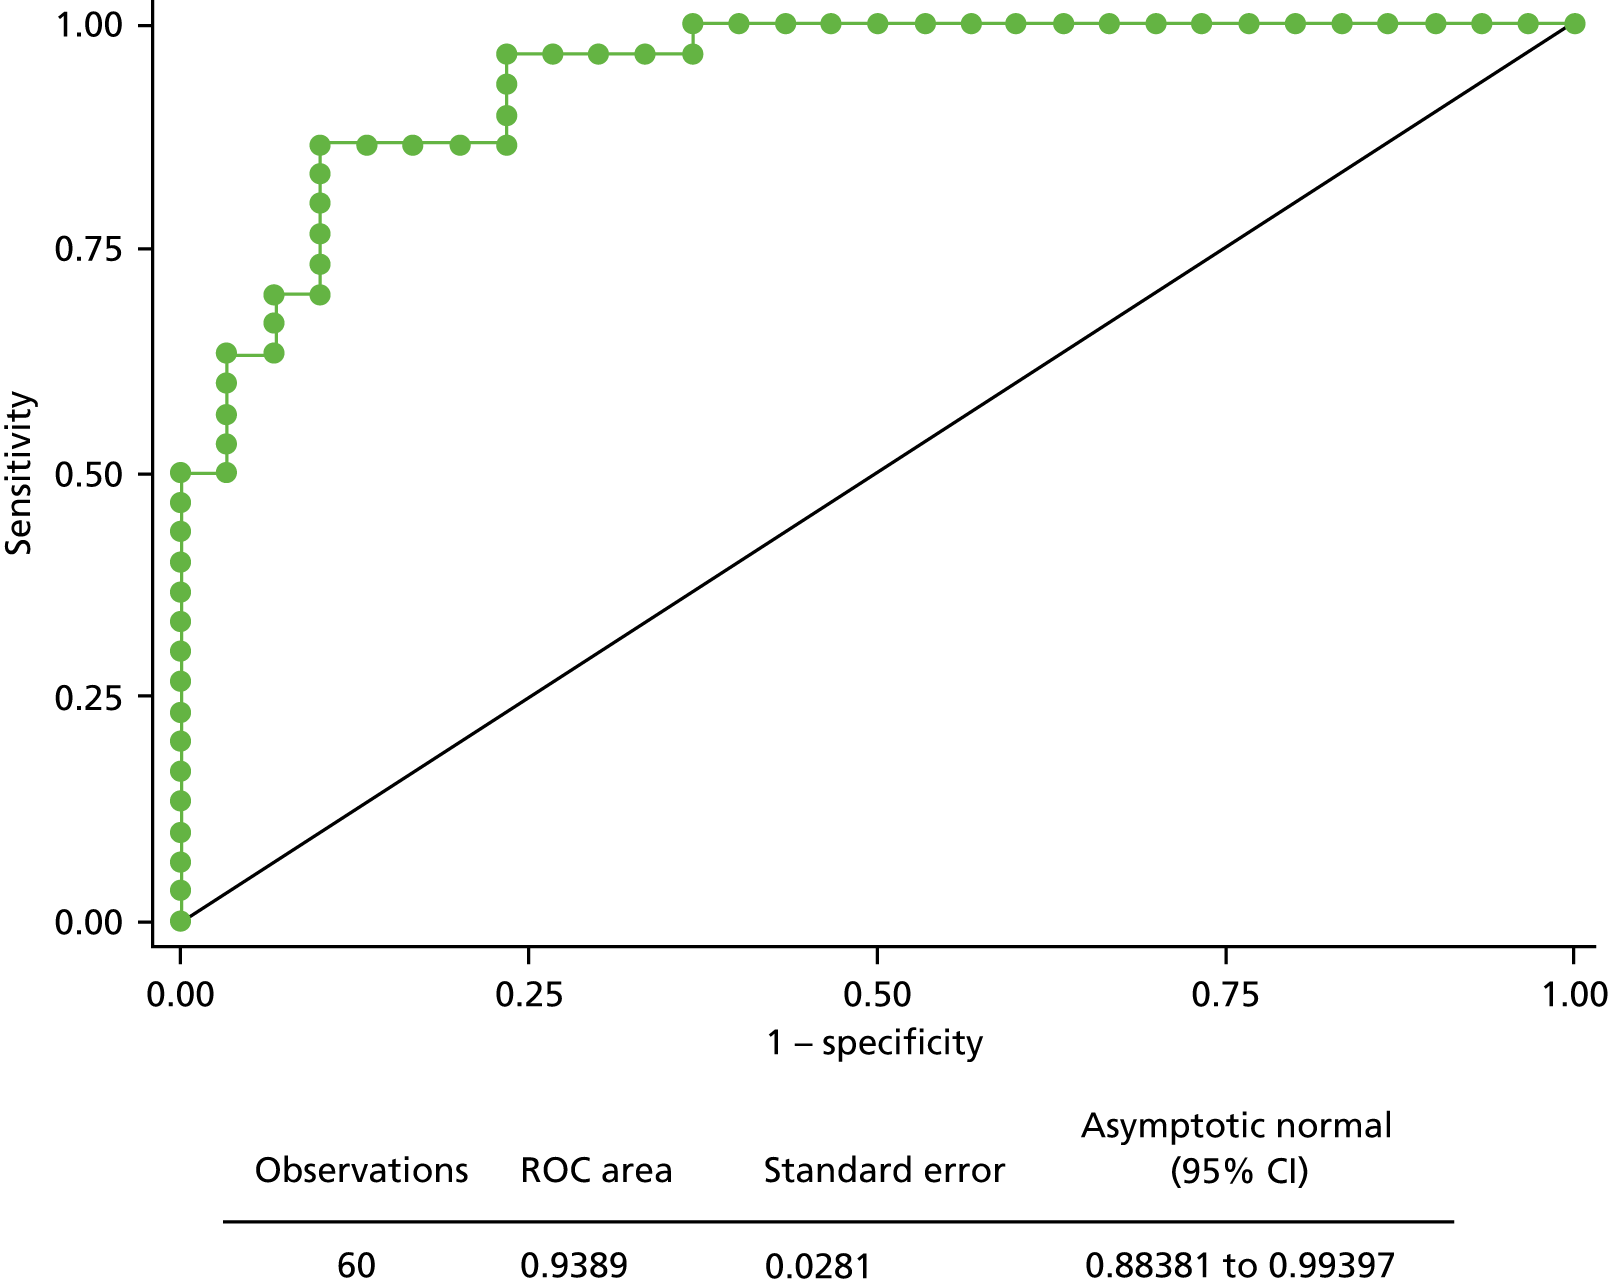
This fitted model suggests that, despite the poor amplification success obtained in module 2, the data from the NGS platform have predictive ability as in module 1 (pyrosequencing), although the values of estimated coefficients differ (see Appendix 3, Tables 23–25).
Model 2: discussion
The aim of the ENDCaP-C study module 2 was to evaluate the utility of NGS as an alternative to pyrosequencing, which is the technology routinely used to determine the methylation status of specific targets in FFPE extracted DNA.
Results have shown that the Fluidigm approach is less robust than pyrosequencing, producing a relatively poor amplification performance, with the low DNA concentrations and DNA degradation leading to higher failure rates. In addition, the intrinsic lack of sequence complexity as a consequence of bisulphite-treated DNA creates several challenges to the sequencing platform, from library generation to data interpretation.
At present, there is not a gold standard NGS method for bisulphite-treated DNA. 49 Indeed, further work is needed to optimise the NGS workflow for its use on FFPE-derived DNA. A multiplex PCR strategy could be used to overcome the restrictions resulting from using a Fluidigm platform,50 but was not used in this study.
The DNA quality from FFPE tissue is a major challenge for any NGS platform. The treatment of tissue with formalin inevitably leads to damage of the nucleic acids but its use is at the base of several clinical diagnostic services as it preserves tissue morphology and represents a convenient and affordable way to store specimens.
One solution to DNA fragmentation from FFPE samples could be shortening the target regions needed for the NGS test used in module 2. Although modifying the amplicon length can be done when dealing with unmodified DNA, this proves quite unsuccessful when the DNA has been bisulphite converted. This procedure is key to identify methylated dinucleotides but inevitably determinates a reduction in base diversity content, therefore increasing the similarity of DNA sequences. As a result, when designing PCR primers for the test, finding unique stretches of bases becomes difficult and it is therefore often not possible to reduce the length of the amplicons.
A more suitable material for NGS testing is fresh-frozen tissue, which would be a better material as it provides high-quality nucleic acids; however, its collection requires changes in the clinical pathway that would require time to be implemented. 51
The Fluidigm system, although offering high-throughput and low-cost capabilities, has been shown to be less useful for the analysis of methylated FFPE DNA and is therefore not recommended to be used in to module 3.
Chapter 4 Module 3: prospective validation of a multimarker methylation panel
Module 3: introduction
Rationale for study
The clinical effectiveness of colonoscopy surveillance for colitis-associated neoplasia has been under scrutiny for some time. 6 Unlike colonoscopic examination for sporadic neoplasia, the inflamed or distorted background mucosa associated with chronic UC can compromise the detection of neoplastic change. The recognised ‘miss rate’ for neoplasia has reduced patient and clinician confidence in the procedure. Although some recent advances in optical technology hold promise of improvement, there is a need for an adjunctive test that can primarily increase the sensitivity of colonoscopy to detect neoplasia and secondarily to provide some stratification of future risk to enable colonoscopy to be better targeted at the highest risk population. In module 3, we prospectively assess whether or not the methylation marker panels generated in module 1 can detect neoplasia in this setting.
Selection of patients
The purpose of the study was to assess if there might be added value from methylation testing above that of colonoscopy. Study subjects were therefore selected from patients within surveillance programmes. One concern was that there would be insufficient cases of neoplasia (not recognised and missed at the index examination) to address the question. No similar study had been carried out on which to base the assessment. We therefore set out to select a high-risk population (see Chapter 4, Inclusion criteria). We also recognised that the surveillance population is heterogeneous and, therefore, to overcome centre bias we would seek to recruit from multiple hospitals across the country.
Introduction into routine practice
To demonstrate clinical value, we set up the DNA testing within a recognised NHS laboratory, rather than a research institute. This would help demonstrate the clinical applicability of the test as well as its generalisability.
Module 3: methods
Study-related information including the protocol and case report forms (CRFs) are available at: www.birmingham.ac.uk/ENDCaP-C (accessed 18 June 2018).
Objectives
The primary objective in module 3 was to prospectively evaluate the ability of the methylation assay to detect pre-cancerous lesions (dysplasia) missed by histology within a surveillance programme for colitis-associated neoplasia.
A secondary objective was to estimate the incremental accuracy of methylation testing in addition to colonoscopy and histology assessment within the existing colitis-associated neoplasia surveillance programme, and thereby gain experience of its applicability in the clinical setting.
Trial design
Module 3 of the ENDCaP-C study was a multicentre cohort test accuracy study for enhanced neoplasia detection and cancer prevention in patients with chronic colitis. In the first stage of the study (Figure 14) all participants underwent baseline colonoscopy, which assessed baseline histology and baseline methylation status. Baseline histology results were made available to patients and clinicians and were used to inform their immediate health care. Methylation test results were not released. This baseline methylation test is the index test under evaluation in the study. Those found to be histology negative at baseline were considered to be at risk of having dysplasia missed by colonoscopy and formed the key group of interest in the study to assess whether or not the methylation test can identify cases missed by colonoscopy. To assess this, this subgroup of participants progressed to the second stage (Figure 15).
FIGURE 14.
Study schema: baseline colonoscopies. PIS, patient information sheet. −ve, negative; +ve, positive.
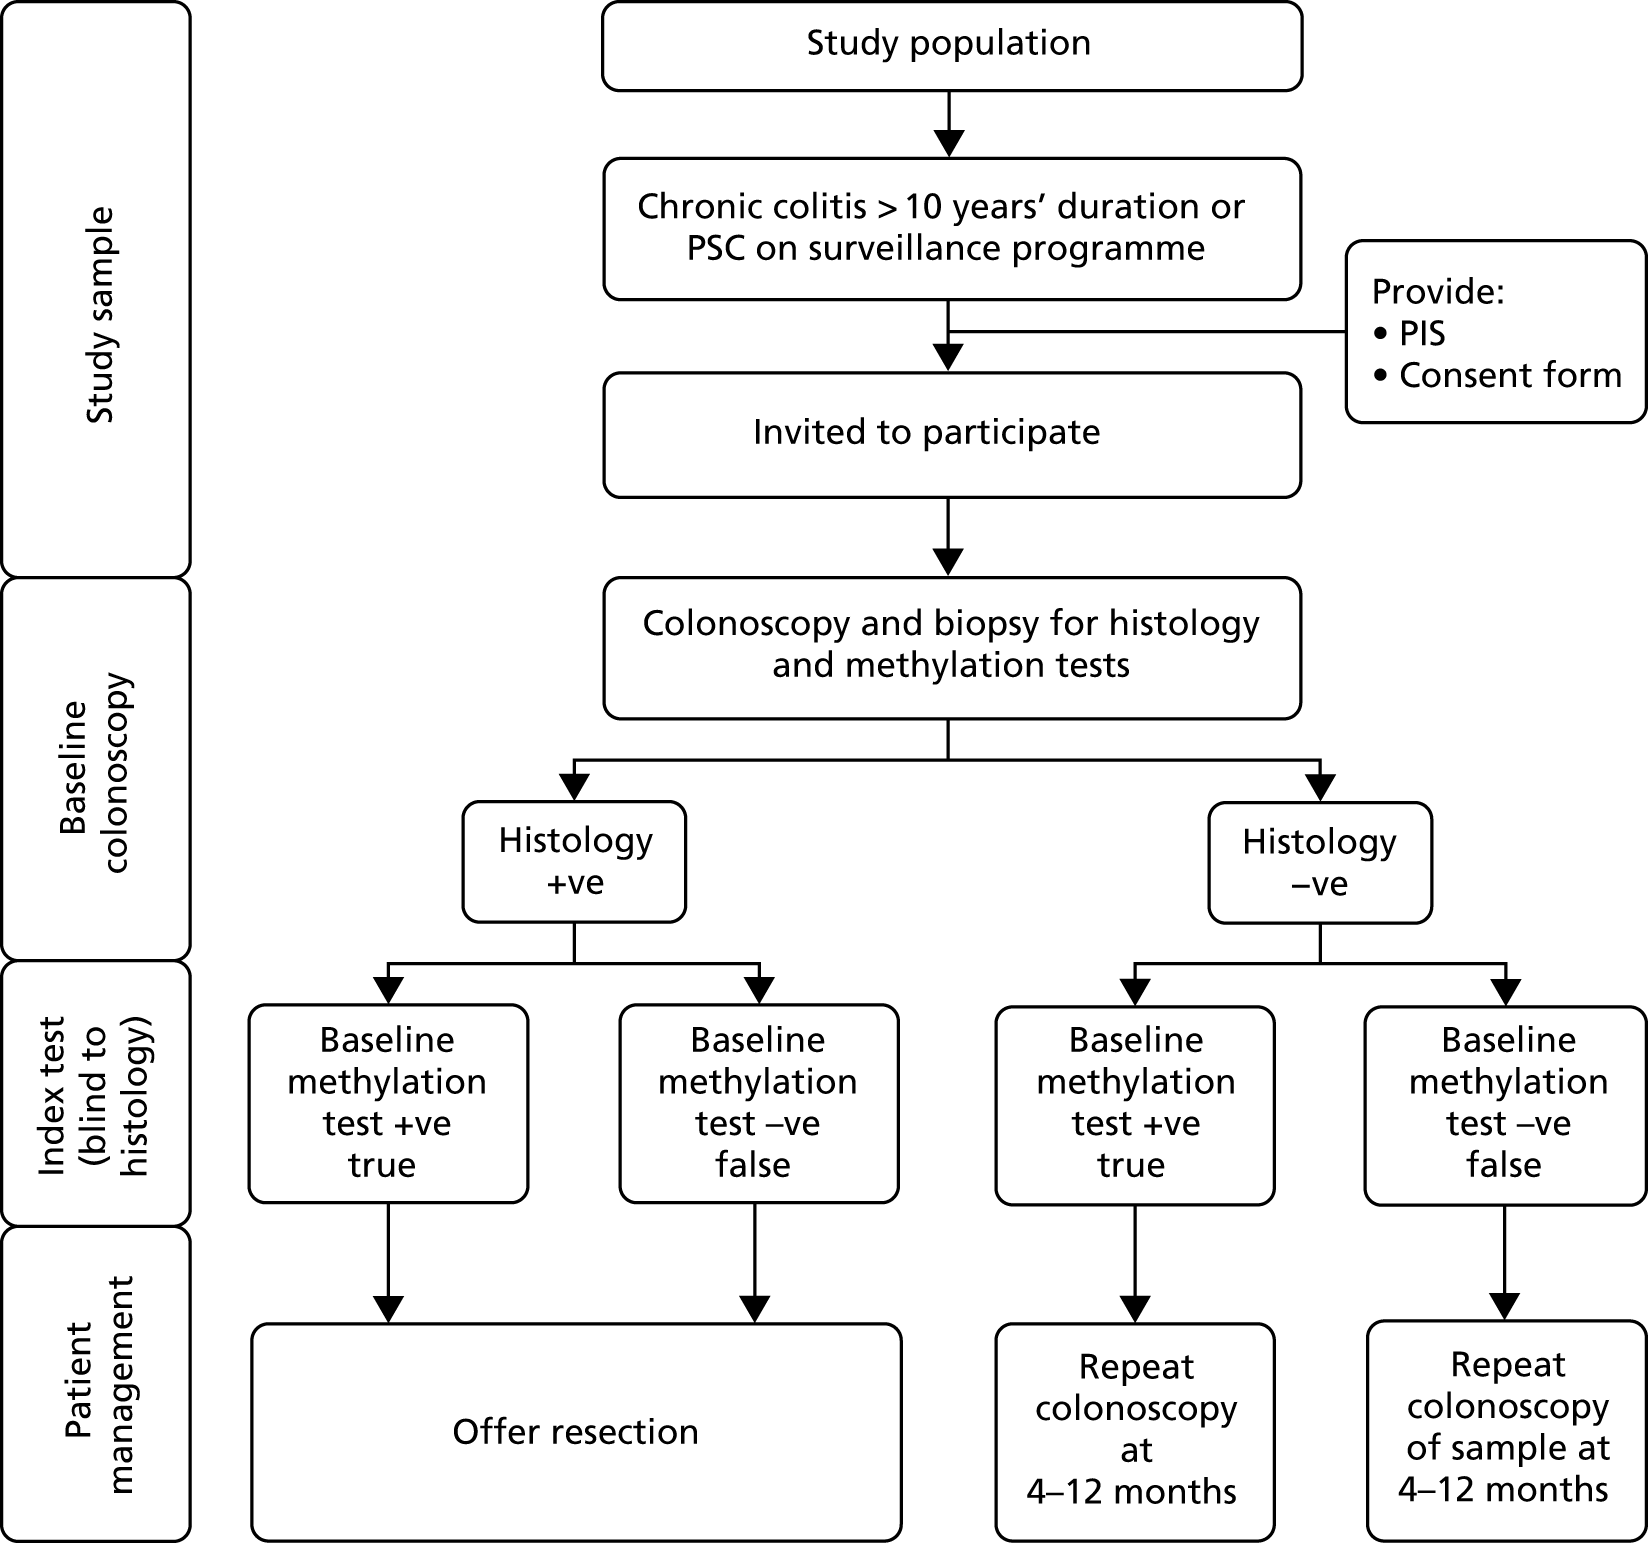
FIGURE 15.
Study schema: repeat colonoscopies. −ve, negative; +ve, positive.
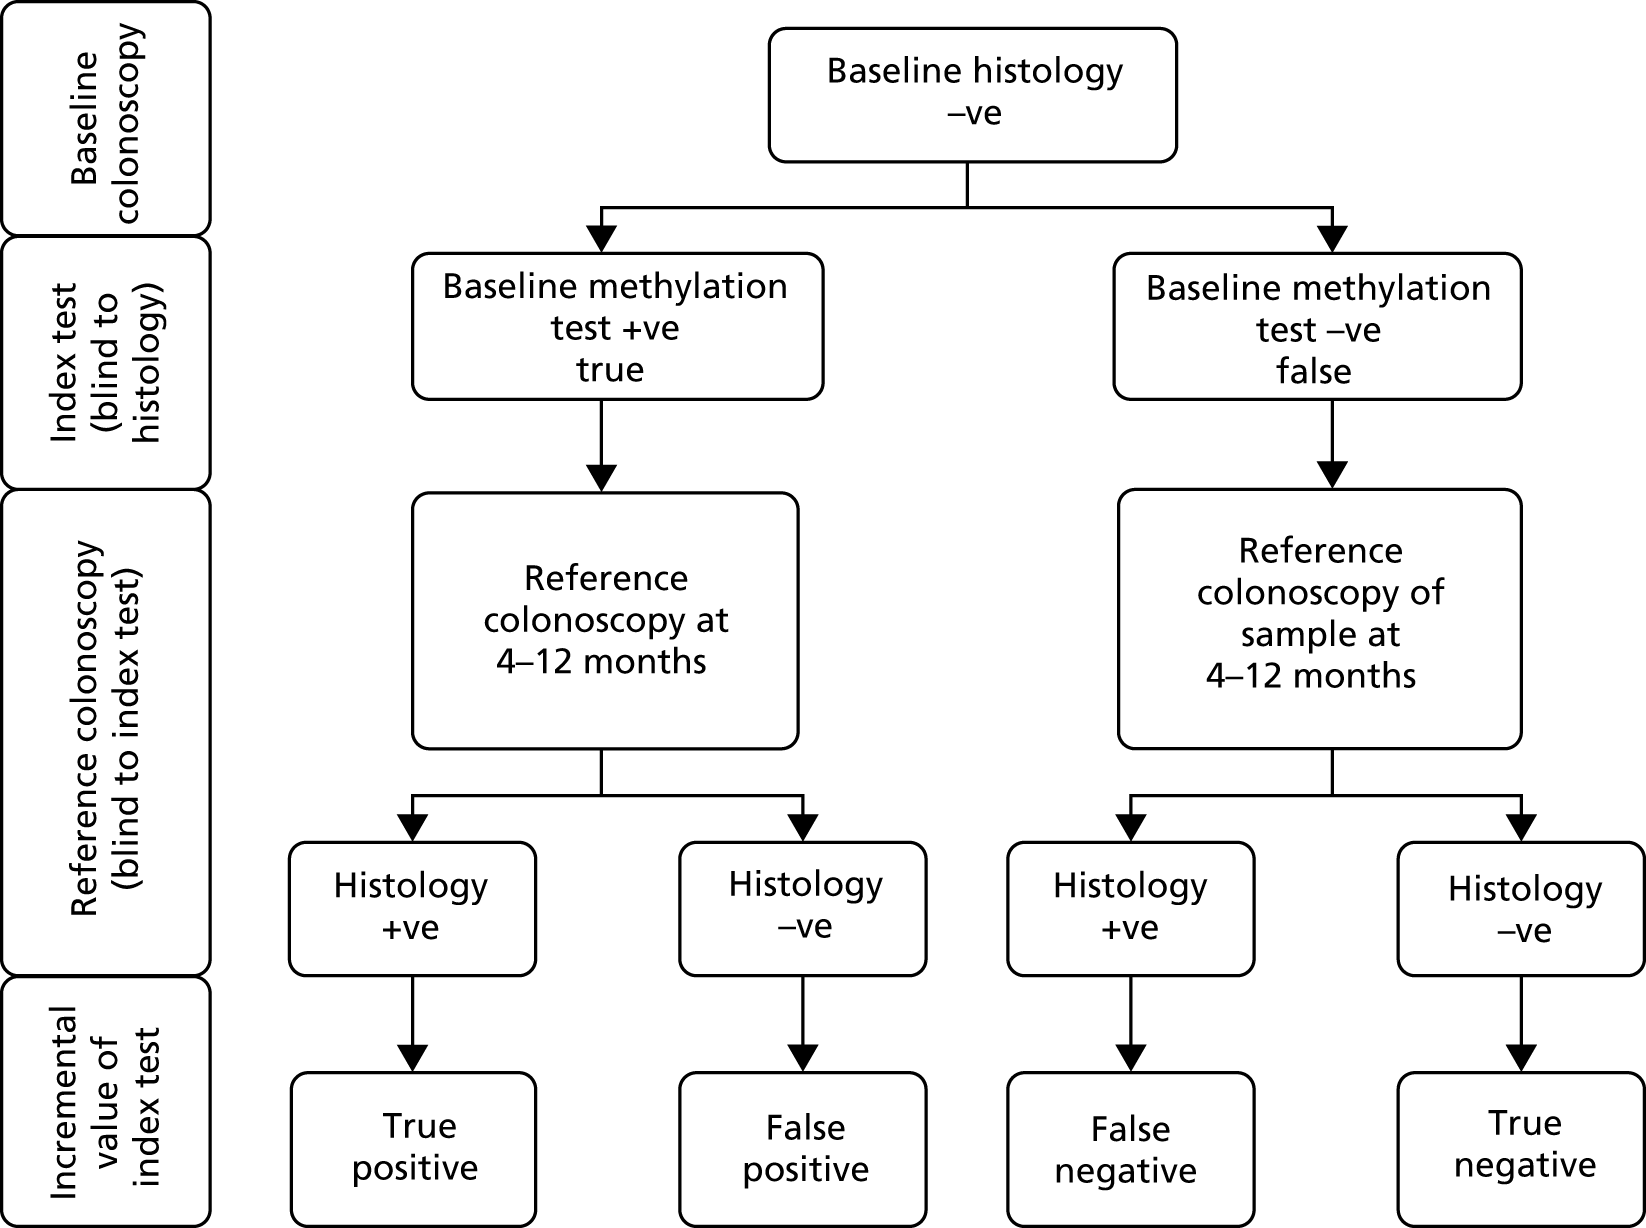
In the second stage, a reference colonoscopy was undertaken 4–12 months after the baseline colonoscopy to identify dysplasia missed at baseline. The histological assessments made from the biopsy samples taken at the second colonoscopy form the reference standard in the study, with which the baseline methylation results were compared. The methylation tests were also repeated in these patients. Participants were selected for invitation to the second stage according to their baseline methylation results – all patients with positive baseline methylation status were invited as well as a random sample of methylation-negative patients (see Sample size for the justification for this design). The second stage reference colonoscopies, histology and methylation tests were undertaken blinded to information from the baseline methylation tests (it was known that the baseline histology was negative in all these cases).
Three additional comparisons were made within the study and are reported:
-
Accuracy of the methylation index test at baseline compared with baseline histology. This comparison assesses the accuracy of methylation testing compared with a reference standard obtained from the histological assessments made at the contemporaneous baseline colonoscopy, and provides a ‘proof of principle’ assessment as to whether or not methylation tests identify clinically evident neoplasia.
-
Agreement of methylation testing at the baseline and reference assessments to assess the stability of methylation assessments.
-
Accuracy of a combined baseline plus follow-up methylation assessment compared with a reference colonoscopy. This comparison redefines the index test according the combination of repeated assessments across two time points.
Participants
Module 3 of the ENDCaP-C study aimed to recruit 1000 patients with chronic colitis. The inclusion and exclusion criteria were as follows.
Inclusion criteria
-
Diagnosis of either:
-
Chronic UC with symptoms for > 10 years’ duration, or
-
PSC.
-
The above criteria ensured that a subset of patients at a higher risk of neoplasia were entered into the study:
-
were on the surveillance programme and undergoing a routine colonoscopy during the study period
-
were willing to accept the possibility of an additional colonoscopy between 4 and 12 months after registration
-
had no history of colorectal cancer
-
were aged ≥ 18 years
-
were able and willing to provide written informed consent for the study.
Exclusion criteria
-
Patients with bowel obstruction.
-
Patients in whom it was not possible to undertake complete colonoscopies.
-
Patients with proctitis only.
-
Patients unable to give written informed consent.
-
Patients aged < 18 years.
-
For UC only patients, excluded patients with –
-
Fulminant colitis.
-
Crohn’s colitis.
-
Unclassified IBD.
-
Microscopic colitis.
-
Consent and registration
Recruitment
There were 32 UK hospital trusts open to recruitment into the ENDCaP-C study, all undertaking protocol driven surveillance based on national guidelines. Training on participant identification, selection and enrolment was provided via site initiation meetings that were conducted in person or by teleconference. Regular investigator and research nurse teleconferences were held to provide additional guidance on support in recruiting participants.
Eligible participants were identified by review of local IBD databases, in clinic or from endoscopy lists (varied from hospital to hospital). Those meeting the eligibility criteria were provided with study information, usually with their endoscopy appointment letter and an invitation to participate, in the form of the patient information sheet (PIS). At the pre-assessment or colonoscopy appointment, the patients met with a consultant gastroenterologist or surgeon to discuss the study. A participant’s eligibility was confirmed by a medically qualified doctor with access to and a full understanding of the potential participant’s medical history prior to registration.
Informed consent
Written informed consent to participate in the study was obtained before registration and after a full explanation of the study was given, with adequate opportunity for the participant to ask questions. Written informed consent could be obtained by a trained member of the research team (with clinical training, good clinical practice training, knowledge of the study protocol and delegated authority from the local principal investigator). Within the ENDCaP-C study, consent was usually obtained by a research nurse, gastroenterologist or surgeon at the site. Owing to the nature of the study, there was no minimum time between the patient being approached and being given the PIS before consent could be obtained.
Once written informed consent was obtained, the original copy was to be kept in the ENDCaP-C investigator site file and copies were to be given to the patient, kept in the patient’s notes and sent to the ENDCaP-C study office. Patients gave their explicit consent for the movement of their consent form, giving permission for the ENDCaP-C study office to be sent a copy. This was used to perform in-house monitoring of the consent process.
Informed consent was required before any study-related procedures were undertaken.
Registration
Once eligibility was confirmed and after written informed consent had been obtained, patients were registered into the study by a telephone call to the BCTU. Registration could take place before or (shortly) after the completion of the colonoscopy.
Tests and procedures
Baseline colonoscopy
All patients underwent baseline colonoscopy by a named colonoscopist as per usual NHS care. In the majority of cases this was part of the surveillance for colon cancer prevention but some were for other indications where the patient was in the surveillance programme.
During this procedure, routine biopsy samples were taken as per usual practice. The minimum study requirements were two biopsies from the left side of the colon, two from the right side of the colon and one from the rectum. If preferred by a site, the biopsies for use in the ENDCaP-C study were taken in addition to those for routine use. Each biopsy was to consist of two ‘bites’ from the mucosa using spiked endoscopy forceps, as is current standard practice. Endoscopists were permitted to take random biopsies or targeted biopsies, as per their routine practice. Only biopsies that had shown no dysplasia on histology were put forward for methylation testing.
Baseline histological assessment
Biopsy samples were fixed in formalin, embedded in paraffin and processed, and the sections were assessed as per local practice. The only study instruction was to embed biopsies from different sites (left, right and rectum) into separate blocks, one per site, to facilitate tracking. If this was not possible, guidance on how to identify the appropriate biopsies was required. Analysis of FFPE sections from biopsy material was co-ordinated by a named lead pathologist at each site. The histological assessments were provided on the histology CRF by the lead or the other delegated pathologist or, in a small number of instances, the principal investigator.
If dysplasia was detected in any of the biopsies, patients were offered endoscopic or surgical resection as decided by their multidisciplinary team. Details of the type (endoscopy, laparotomy and laparoscopy) and extent of resection was recorded on the surgery CRF along with updated pathological findings.
Methylation index test
The index test was the DNA methylation panel of markers; the combination of genes and loci that result in a classification of hypermethylation as defined in module 1. This was tested on the biopsies taken at the baseline colonoscopy.
After local histological analysis, FFPE blocks were sent to the ENDCaP-C study office before transfer to the pathology department at the Queen Elizabeth Hospital Birmingham. All blocks underwent central review by a specialist histopathologist (Dr Phillipe Taniere) before proceeding to DNA extraction. Samples were screened to ensure that no samples with (histological) neoplasia were sent for DNA analysis.
The DNA was extracted and transferred to the West Midlands Regional Genomics Laboratory at Birmingham Women’s Hospital for methylation analysis (bisulphite treatment and pyrosequencing). The data generated were sent to the BCTU, where the methylation positive/negative status was obtained by the study statistician by utilising model 1 from module 1. To ensure that the reference standard colonoscopy was undertaken blinded to the methylation status, only the study statistician was aware of the positive/negative methylation status. Methylation status was not released to patients in the trial, clinicians or any other members of the ENDCaP-C study team during the study period.
Reference colonoscopy
The reference standard was the histological analysis of biopsies obtained from a repeat colonoscopy (4–12 months post trial entry). Patients who were histologically negative at baseline with positive methylation status at the standard surveillance colonoscopy (test positives) were identified and invited to undergo this repeat colonoscopy. A proportion of histologically negative patients who had negative methylation status were also selected randomly (test negatives) by the ENDCaP-C study office and were invited to undergo repeat colonoscopy. Initially, the selection was completely at random but it became necessary to adapt the strategy to balance requests for repeat colonoscopies across centres and to ensure that the distribution of times between baseline and repeat colonoscopies was similar in test positives and test negatives. Matching by date reduced the chance of an important difference in the time between the initial and repeat colonoscopies for the test negatives compared with the test positives, which could introduce bias. When a test positive was found, we identified all test negatives who had a similar baseline test date (± 1 month), and then randomly chose matching patients weighting to achieve equal chance of recall across the centres. Lists of patients containing both test positives and test negatives (but without any indication of this status) were generated by the study statistician and provided to the ENDCaP-C study team to initiate patient recall.
This reference assessment was standardised using dye spray and targeted biopsy to maximise dysplasia detection and performed by nominated, experienced colonoscopists at each site. During this procedure, biopsy samples were taken. The minimum study requirements for number and location, histological assessment and methylation analysis were the same as for the baseline colonoscopy.
Blood and stool samples
Blood and stool samples were collected from patients attending the reference colonoscopy who consented to sample collection. Patients were provided with stool collection kits (30-ml universal container and spoon containing 11 ml of ethanol) with instructions to collect the sample before commencing bowel preparations and to bring the sample to the hospital on the day of their colonoscopy. Prior to colonoscopy, a 10-ml venous blood sample was collected using a cell-free DNA blood collection tube (Streck, Omaha, NE, USA).
The samples were sent to the surgical research laboratory at the University of Birmingham to be used in ENDCaP-C module 4 to test for Wnt antagonist methylation in the stool and serum (see Chapter 5).
Serious adverse events
Any adverse events (AEs) meeting the definition of a serious adverse event (SAE) were recorded on a standardised SAE form and faxed to the BCTU within 24 hours of the local principal investigator or member of their research team becoming aware of the event. The principal investigator was responsible for assigning causality to the SAE.
For the purposes of ENDCaP-C module 3, SAEs included (but were not limited to):
-
bowel injury/perforation
-
post-colonoscopy bleed requiring admission to hospital
-
inpatient admission for exacerbation of chronic colitis.
The following are SAEs that could be reasonably expected for this group of patients during the course of the study and did not require reporting on a SAE form:
-
hospitalisations for routine treatment or monitoring of the studied indication, not associated with any deterioration in condition
-
hospitalisations for treatment, which was elective or pre-planned, for a pre-existing condition that is unrelated to the indication under study, and did not worsen
-
admission to a hospital or other institution for general care, not associated with any deterioration in condition
-
treatment on an emergency, outpatient basis for an event not fulfilling any of the definitions of serious given above and not resulting in hospital admission
-
hospitalisations for planned surgery following non-response to UC treatment.
Disease-related morbidity and routine treatment or monitoring of a pre-existing condition that has not worsened were not considered as SAEs and were not reported.
The SAEs occurring within 1 week from the date of the colonoscopy (baseline or repeat colonoscopy) and not listed as ‘expected’ as defined above were always reportable. SAEs outside this time frame could also be reported if it was felt by the principal investigator that there was a possible causal relationship to an aspect of the study.
Assessments of relatedness and expectedness were undertaken by the module 3 chief investigator (or delegated clinical co-ordinator).
Data collection
Data were collected via paper CRFs (see www.journalslibrary.nihr.ac.uk/programmes/eme/1110029/#/documentation; accessed September 2019) completed, signed/dated and returned to the ENDCaP-C study office by the investigator (or an authorised member of the site research team). Data were input centrally into a bespoke database with built-in validation so that range, date and logic checks could be performed at the point of data entry. Data reported on each CRF were to be consistent with the source data or the discrepancies had to be accounted for. If information was not known, this was to be clearly indicated on the CRF. All missing and ambiguous data were queried. It was requisite to complete all sections on the CRFs.
Decision tool for a positive methylation
Module 1 of the ENDCaP-C study identified five predictive biomarkers. These biomarkers were variable in their amplification success and, therefore, the pragmatic decision was made by the Trial Management Group (TMG) that at least three out of the five must successfully amplify for the methylation status of a sample to be determined. To enable this, a further set of models were created across all possible combinations of three or more biomarkers were produced from the module 1 data. Cut-off values defined in module 1 were used to define methylation positive/negative status for each equation. Altogether, 16 different models were constructed to be used as a decision tool for a positive methylation (see Appendix 3, Tables 23–25).
The primary analysis was undertaken using the module 1 model for diagnosis of neoplasia or dysplasia compared with control samples (referred to as model 1 in the module 1 analysis). The performance of the model 2 from module 1 utilising the same biomarkers but comparing only dysplasia with control samples was also fitted. Data are currently not available to assess the predictive value of the third model. This model was derived by comparing matched non-neoplastic samples (from patients with neoplasia) to control samples using additional markers in module 1 (referred to as model 3 in the module 1 analysis).
Patients had biopsies taken from three separate sites and the methylation status of these samples was determined individually (samples were not pooled). A patient was classified as methylation (test) positive if any of the three samples attained the cut-off point required by the decision tool (see Appendix 2).
Statistical considerations
Sample size
Computation of the sample size was based on (1) records indicating that dysplasia was detected by histology in 4% of patients from a high-risk cohort, (2) an assumption that a further 4% are missed (assuming a detection rate of 50% for routine colonoscopy) of which (3) 50% will be detected by methylation testing (i.e. sensitivity = 50%), which will (4) give false-positive results in 5% free of dysplasia (i.e. specificity = 95%). The sensitivity and specificity of methylation testing have been estimated to be 90% and 100% in retrospective samples, thus these figures were considered conservative. These figures correspond to a diagnostic odds ratio of 19.
The study was designed to have adequate power to show that the test was discriminatory (measured by having an odds ratio different from 1) and that the positive predictive value was high enough to be useful for identification of the high-risk patients, being at least 15%. The clinical consequence of a positive test result would be a further colonoscopy, and we consider that detecting neoplasia in one in seven selected for further investigation would be regarded a clinically useful yield. It was not feasible to power the study to show that the negative predictive value is low enough to identify a low-risk group.
In the cohort of 1000, it was estimated that there would be 80 with underlying dysplasia: 40 of these would be detected by histology from the initial biopsies, and 20 of the remaining 40 would be identified by the methylation test. Following the assumptions about test performance, the methylation test would thus give 46 false-positive results (5% of the 920 without dysplasia) giving an expected positive predictive value of 30% (20 out of 66). With the assumed test performance, a sample size of 66 test positives would have 87% power to show (in a one sample test) a positive predictive value of over 15% with a p-value of < 0.05.
Additionally, the status of 132 (double) test negatives were to be verified to obtain estimates of the sensitivity and specificity of the test (computed adjusting for the sampling fraction of test negatives). It was expect that these would include three found positive for dysplasia and 129 without dysplasia, which provides > 90% power to show the diagnostic odds ratio is significantly (p < 0.05) different from one. A specificity of 95% would be estimated with a CI of < 4% points.
Statistical analysis for test accuracy
As the ENDCaP-C study is an early stage study aiming to evaluate methylation testing, the primary analyses were based on patients who complied with the study protocol. Secondary analyses, including additional patients who failed to comply with the protocol, were undertaken to test the robustness of the results. This was stated in the statistical analysis plan and was agreed by the Data Monitoring and Ethics Committee (DMEC) and the chief investigator(s) prior to final analysis being released.
Compliance
Patients were required to adhere to the following pathway in order to be compliant with the protocol:
-
use of dye spray for the repeat colonoscopy
-
use of the correct endoscopic technique
-
repeat colonoscopy within the time frame stated in the protocol (4–12 months after initial colonoscopy at trial entry).
However, because of the nature of the study, the pressures on NHS endoscopy services and the way in which the patient pathway was defined (see Appendix 4), it was often not possible to conduct the repeat colonoscopy within the time frame specified. The timing of the repeat colonoscopy was dependent on various factors and a delay at any point could have an impact on the time to repeat colonoscopy. Delaying the repeat colonoscopy to > 12 months was unlikely to adversely affect cancer detection, with only a small risk of inclusion of interval cases.
A small number of patients in this study had their repeat colonoscopy performed using the next-generation colonoscopes. The enhanced visualisation technology has changed the interpretation of the mucosal appearance, promoting more and better targeted biopsies. This makes the findings difficult to interpret in the context of the trial, as the selection criteria for a biopsy and the identification of mucosal abnormalities are performed against a different baseline. In practice, this was a small group of patients and they are detailed in the analysis section.
Hence, the final analysis was conducted in the following ways:
-
sensitivity analysis – all patients who had the reference colonoscopy using dye spray and standard colonoscopy equipment, irrespective of time to repeat colonoscopy
-
per-protocol set – all patients who had the reference colonoscopy using dye spray and standard colonoscopy equipment, within 4–12 months after the initial colonoscopy
-
intention-to-treat analysis – all patients regardless of dye spray use, the equipment used and the time to repeat after the initial colonoscopy.
Analysis methods
The analysis for the primary outcome estimates the positive and negative predictive values of methylation as a proportion of those methylation positive at the initial colonoscopy that were detected with colitis-associated neoplasia at the reference colonoscopy, and the proportion of methylation negative that were free of colitis-associated neoplasia at the reference colonoscopy, respectively. The overall discriminatory ability of the methylation test was described using an odds ratio (with 95% CI) with statistical significance assessed by computing Fisher’s exact test comparing follow-up histology rates with baseline methylation status. Values for prevalence (at baseline and reference colonoscopy), sensitivity and specificity were estimated correcting for the sampling proportions of those methylation test positive and methylation test negative using the svy complex survey commands in Stata® V15.0 (StataCorp LP, College Station, TX, USA).
Cohen’s kappa was used to assess the agreement between the methylation decision rule at baseline and repeat colonoscopy.
Patient and public involvement
Independent patient representatives were members of the TMG (Jane French) and Trial Steering Committee (TSC) (Heather Beard).
Representatives contributed to the design of the patient pathway and the PIS. Patient representatives attended management meetings before and during the trial. They will also be involved in the development of a lay report for participants.
Ethics approval, regulation and trial registration
Ethics approval for the work that constituted module 1 was granted by South Birmingham Research Ethic Committee (reference 08/H1207/104). Ethics approval for module 3 was granted by South East Coast – Surrey Research Ethics Committees (reference 14/LO/1842).
The trial was conducted in accordance with the recommendations guiding physicians in biomedical research involving human subjects, adopted by the 18th World Medical Association General Assembly, Helsinki, Finland, June 1964 (and its subsequent amendments),52 the Research Governance Framework for Health and Social Care,53 and the applicable UK Statutory Instruments including the Data Protection Act 199854 and the International Conference on Harmonisation Guidelines for Good Clinical Practice. 55
Module 3: results
Screening
A total of 4827 patients were assessed for eligibility. Of these patients, 3433 did not meet the eligibility criteria, 522 were eligible but were not recruited and 53 had been identified as potential participants but their eligibility was not established (Table 9).
| Reason for not being included | Number of patients | ||
|---|---|---|---|
| Eligible | Declined (n = 251) | Unwilling to accept the possibility of an additional colonoscopy after 6 months | 61 |
| No response to invitation to participate | 29 | ||
| Too much going on | 9 | ||
| Does not wish to take part in research | 7 | ||
| Other health issues | 5 | ||
| Lives abroad so unable to commit to an additional colonoscopy | 2 | ||
| Choosing to discontinue surveillance | 2 | ||
| PIS not received | 2 | ||
| No reason provided | 134 | ||
| Competing study | 61 | ||
| Missed | 56 | ||
| DNA | 37 | ||
| Other (eligible) | 51 | ||
| Eligible but not registered (reason not known) | 66 | ||
| Excluded | Non-UC | 532 | |
| Disease not beyond splenic flexure | 440 | ||
| Patient in whom it is not possible to do complete colonoscopies | 302 | ||
| Diagnosis of UC for < 10 years | 275 | ||
| Crohn’s colitis patient | 255 | ||
| Not scheduled for surveillance colonoscopy during the study period | 156 | ||
| Disease extent unknown | 77 | ||
| History of colorectal cancer | 51 | ||
| Patient with unclassified IBD | 19 | ||
| Patient with proctitis only | 16 | ||
| Unable to give written informed consent | 4 | ||
| Deceased | 4 | ||
| Less than 18 years of age | 1 | ||
| Patient with microscopic colitis | 1 | ||
| Other (ineligible) | 14 | ||
| Ineligible (reason not known) | 1286 | ||
| Not registered – reason unknown | 54 | ||
| Total | 4009 | ||
Reasons for ineligibility were available for 2147 out of the 3433 (62.5%) ineligible patients (see Figure 17). The largest subgroup of these 2147 excluded patients were patients undergoing endoscopic procedures for reasons other than as part of surveillance for cancer prevention (n = 532, 24.8%).
Recruitment
Recruitment commenced in November 2014 and formally ended on 31 March 2017, with a small number of pre-identified patients being entered in April 2017, finishing with 818 recruited patients. There were 32 centres opened to recruitment, of which 31 recruited at least one patient (see Appendix 5, Figure 33 and Table 26). June 2016 was the best recruiting month with 59 patients registered.
Participant flow
The flow of all participants from screening to completion of the baseline colonoscopy is shown in Figure 16. The flow of the participants identified to undergo a repeat colonoscopy is shown in Figure 17.
FIGURE 16.
The Standards for Reporting of Diagnostic Accuracy (STARD) flow diagram; baseline colonoscopy. a, i.e. not enough biomarkers amplified to give meaningful result.
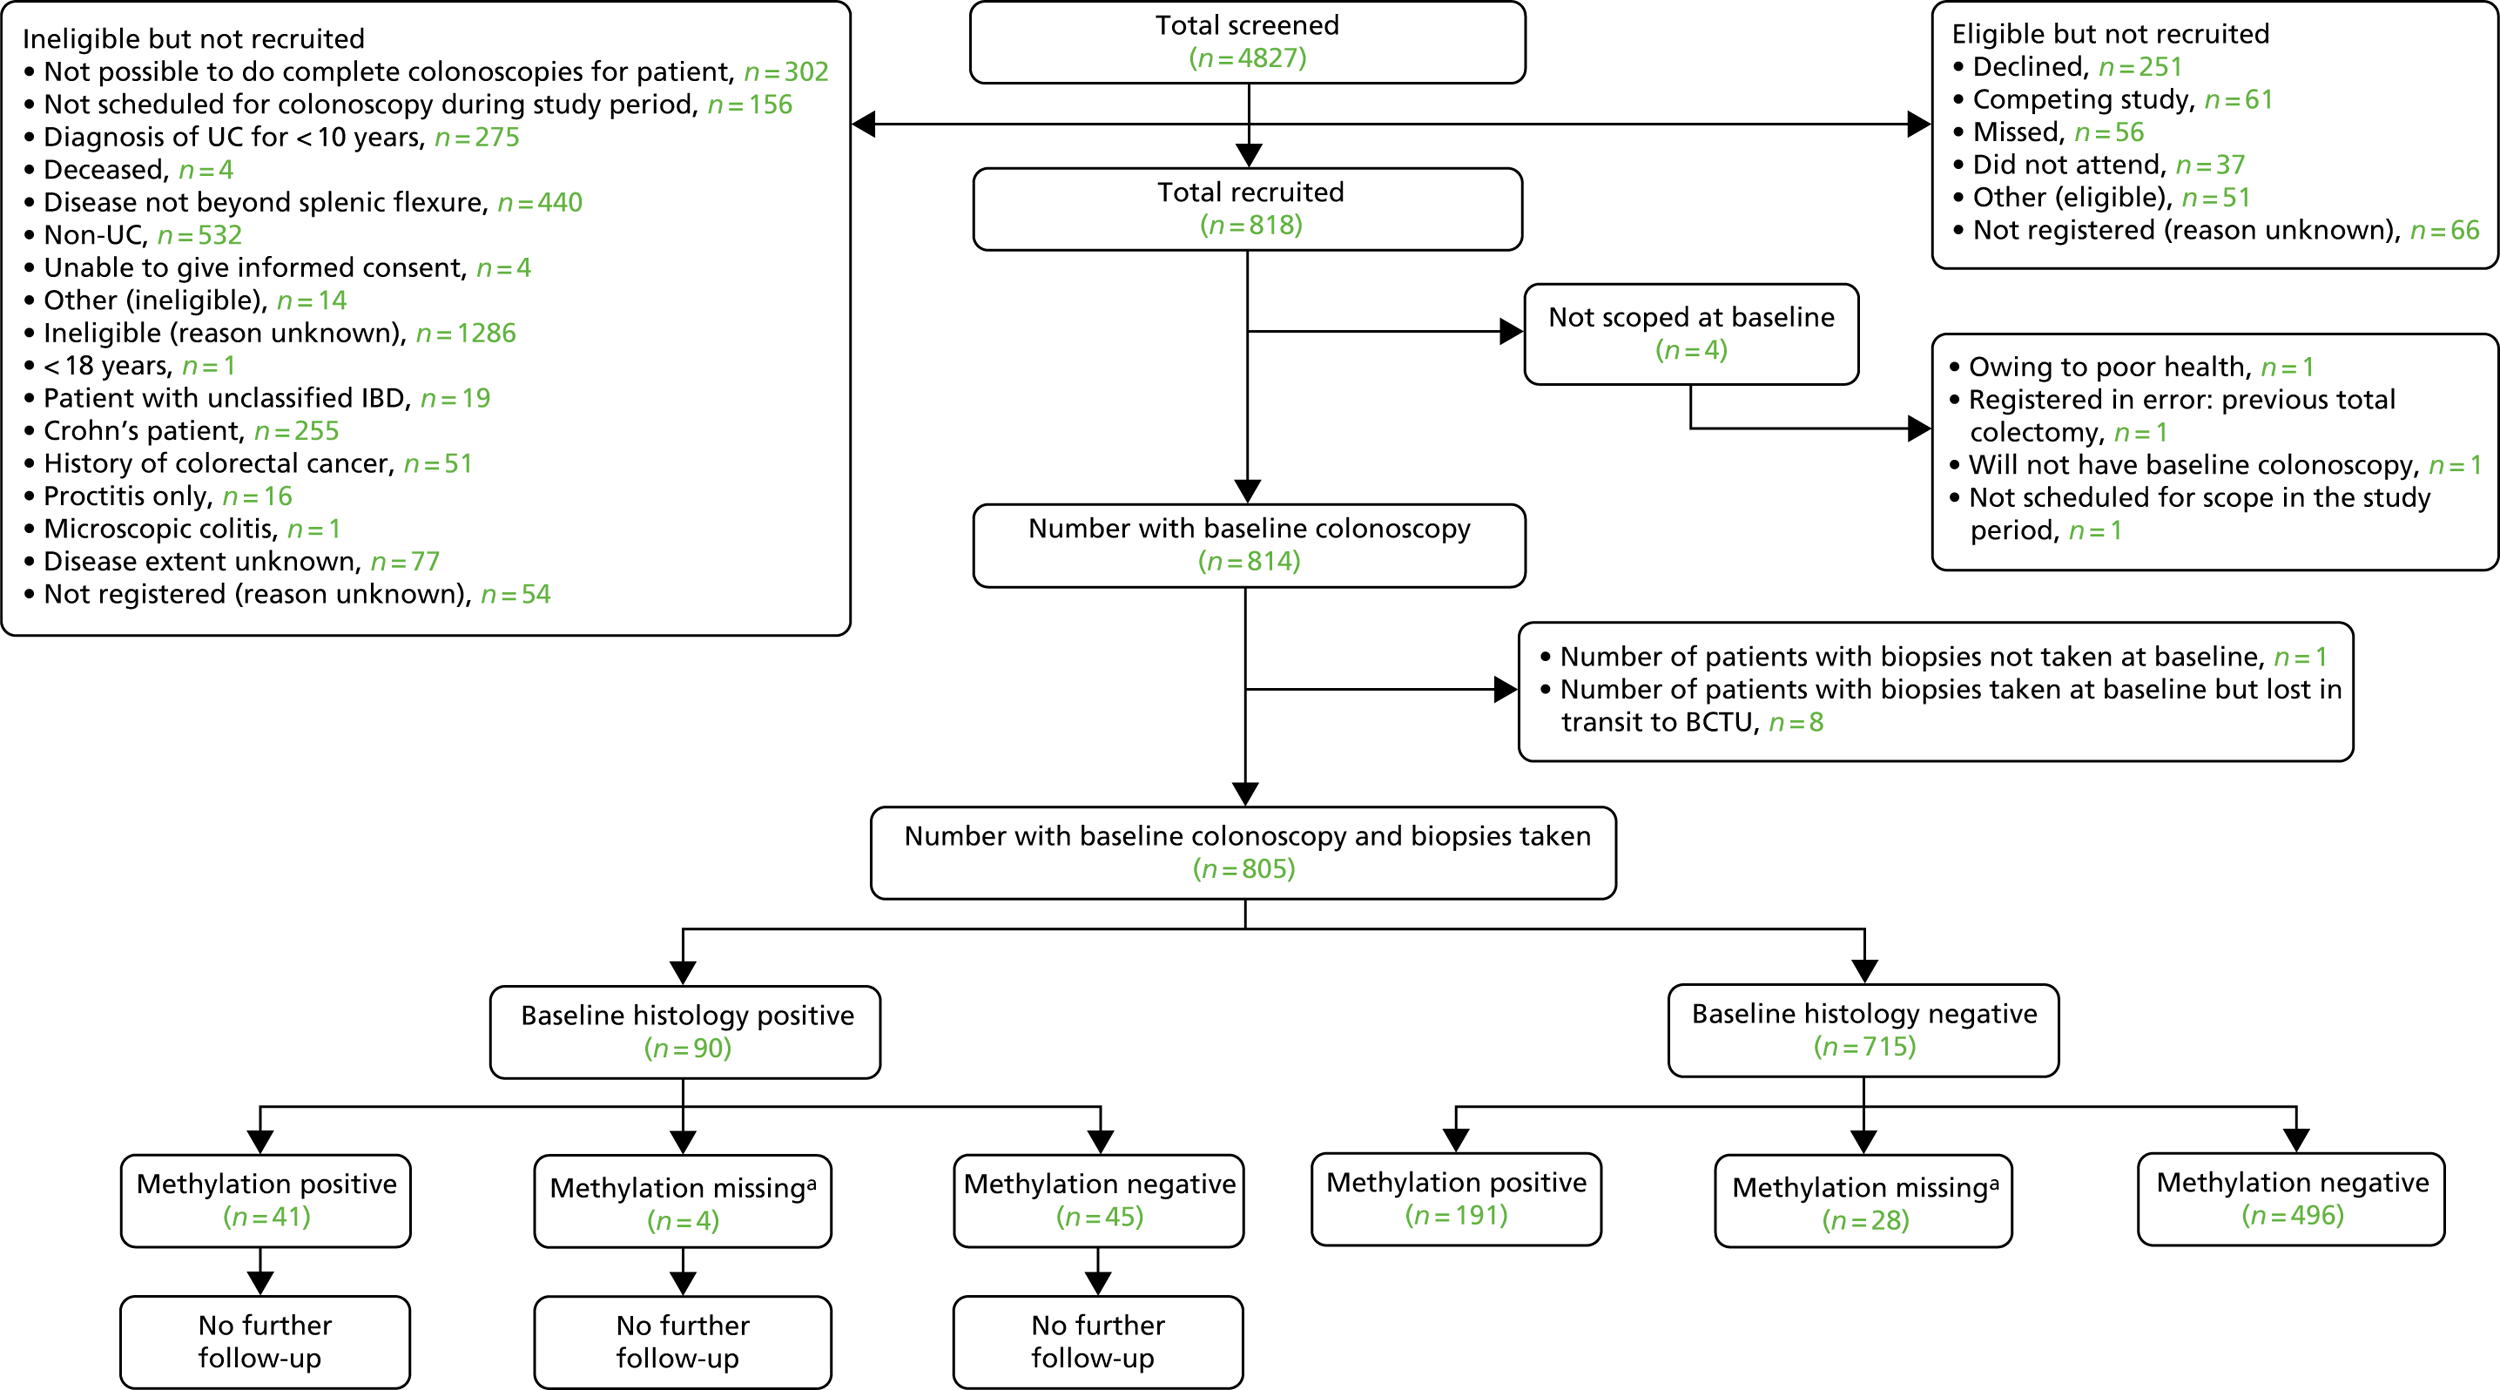
FIGURE 17.
The STARD flow diagram; repeat colonoscopy. a, i.e. not enough biomarkers amplified to give meaningful result.
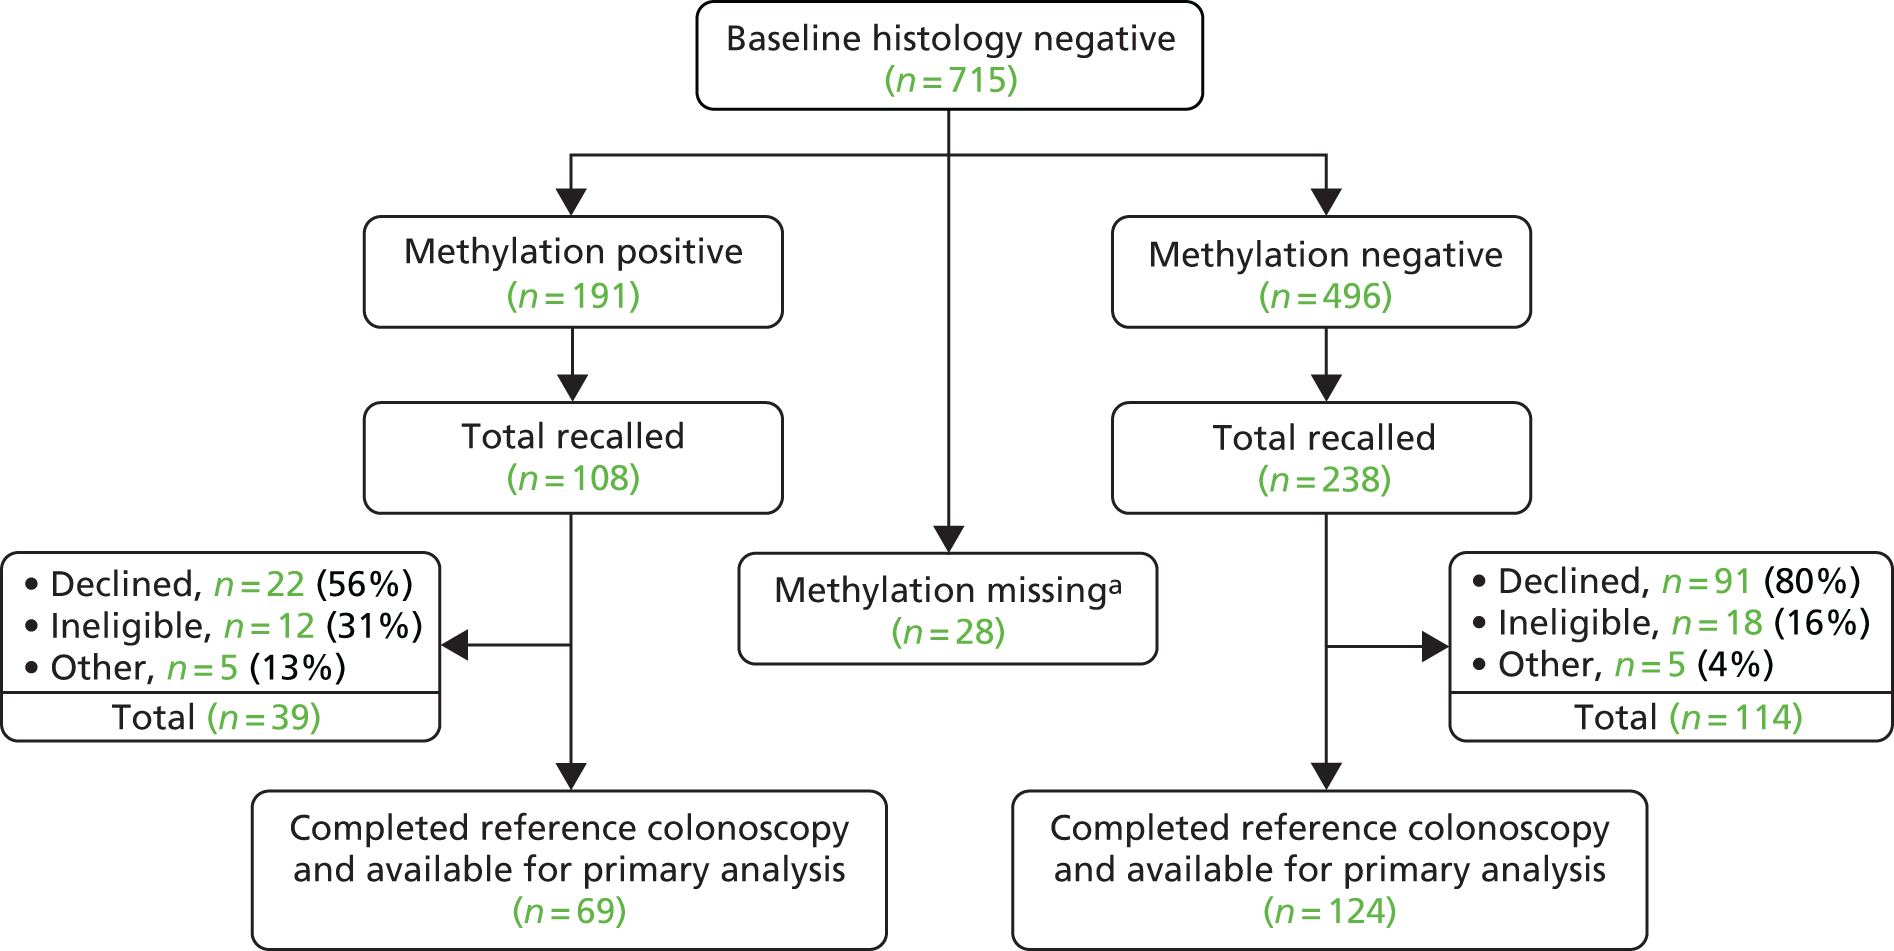
Figure 17 shows that out of the 191 methylation positives identified, 108 were recalled. In addition, out of the 496 methylation negatives identified, 238 were recalled. The reason for not recalling all of the methylation positives was because, as per the sample size calculation for module 3, we needed 66 methylation positives to be recalled and twice as many methylation negatives to be recalled. However, once a patient was requested to return for a repeat colonoscopy it was not possible to know with certainty how many of the recalled patients will actually attend their repeat colonoscopy, as quite a large proportion of recalled patients declined. Hence, patient recalls were sent until the target of at least 66 methylation-positive patients having had their repeat colonoscopy was reached. We also tried to get as close as possible for the number of repeat colonoscopies for methylation negatives to be twice as many as the methylation positives by the time the study had closed.
Data completeness
The return rates for the CRF, FFPE blocks and pathology reports separated by time point are shown in Appendix 6, Table 27.
Baseline data
The baseline data for module 3 participants are shown in Table 10.
| Baseline data | Module 3 participants | Total (N = 805) | |
|---|---|---|---|
| UC only (N = 607) | UC and PSC (N = 198) | ||
| Diagnosis age | |||
| Mean (SD) | 55.1 (14) | 46.1 (17.2) | 52.9 (15.4) |
| Min.–max. | 18–88 | 16–78 | 16–88 |
| Sex,a n (%) | |||
| Female | 239 (39.4) | 66 (33.3) | 305 (37.9) |
| Male | 368 (60.6) | 132 (66.7) | 500 (62.1) |
| Smoker, n (%) | |||
| No | 569 (93.7) | 190 (96) | 759 (94.3) |
| Yes | 36 (5.9) | 8 (4) | 44 (5.5) |
| Missing | 2 (0.3) | 0 (0) | 2 (0.2) |
| Cigarettes per day | |||
| Mean (SD) | 9.8 (8) | 10.1 (5.5) | 9.9 (7.6) |
| Median (IQR) | 8 (5–15) | 10 (10–10) | 10 (5–15) |
| Min.–max. | 1–30 | 1–20 | 1–30 |
| Family history of IBD, n (%) | |||
| No | 493 (81.2) | 160 (80.8) | 653 (81.1) |
| Yes | 111 (18.3) | 35 (17.7) | 146 (18.1) |
| Missing | 3 (0.5) | 3 (1.5) | 6 (0.7) |
| Number of colonoscopies prior to first ENDCaP-C colonoscopy,b n (%) | |||
| 1 | 100 (16.5) | 31 (15.7) | 131 (16.3) |
| 2–5 | 242 (39.9) | 73 (36.9) | 315 (39.1) |
| 6–10 | 71 (11.7) | 46 (23.2) | 117 (14.5) |
| > 10 | 32 (5.3) | 14 (7.1) | 46 (5.7) |
| Other | 33 (5.4) | 17 (8.6) | 50 (6.2) |
| Unknown | 6 (1) | 1 (0.5) | 7 (0.9) |
| Missing | 2 (0.3) | 0 (0) | 2 (0.2) |
| Routine surveillance schedule at time of first ENDCaP-C colonoscopy,b n (%) | |||
| 1 yearly | 66 (10.9) | 144 (72.7) | 210 (26.1) |
| 2 yearly | 8 (1.3) | 1 (0.5) | 9 (1.1) |
| 3 yearly | 170 (28) | 5 (2.5) | 175 (21.7) |
| 4 yearly | 2 (0.3) | 1 (0.5) | 3 (0.4) |
| 5 yearly | 105 (17.3) | 4 (2) | 109 (13.5) |
| Other | 39 (6.4) | 18 (9.1) | 57 (7.1) |
| Unknown | 58 (9.6) | 5 (2.5) | 63 (7.8) |
| Missing | 38 (6.3) | 4 (2) | 42 (5.2) |
| Number of outpatient visits within the last 12 months,b n (%) | |||
| 0–3 | 412 (67.9) | 138 (69.7) | 550 (68.3) |
| 4–6 | 70 (11.5) | 31 (15.7) | 101 (12.5) |
| ≥ 7 | 3 (0.5) | 12 (6.1) | 15 (1.9) |
| Unknown | 1 (0.2) | 0 (0) | 1 (0.1) |
| Missing | 0 (0) | 1 (0.5) | 1 (0.1) |
| Number of inpatient visits within the last 12 months,b n (%) | |||
| 0 | 412 (67.9) | 138 (69.7) | 550 (68.3) |
| 1–2 | 70 (11.5) | 31 (15.7) | 101 (12.5) |
| ≥ 3 | 3 (0.5) | 12 (6.1) | 15 (1.9) |
| Unknown | 1 (0.2) | 0 (0) | 1 (0.1) |
| Missing | 0 (0) | 1 (0.5) | 1 (0.1) |
| Length of time of baseline colonoscopy (minutes), n (%) | |||
| Mean (SD) | 38.1 (14.9) | 40.2 (13.3) | 38.6 (14.6) |
| Median (IQR) | 36 (30–45) | 40 (30–47) | 38 (30–45) |
| Min.–max. | 8–210 | 15–80 | 8–210 |
| Missing | 25 (4.1) | 12 (6.1) | 37 (4.6) |
| Montreal class, n (%) | |||
| Distal (recto-sigmoid) | 70 (11.5) | 10 (5.1) | 80 (9.9) |
| Left sided (to splenic flexure) | 74 (12.2) | 10 (5.1) | 84 (10.4) |
| Extensive (beyond splenic flexure) | 364 (60) | 141 (71.2) | 505 (62.7) |
| PSC patient (N/A) | 0 (0) | 11 (5.6) | 11 (1.4) |
| Otherc | 99 (16.3) | 26 (13.1) | 125 (15.5) |
| Missing | 0 (0) | 0 (0) | 0 (0) |
| Number of patients taking the following medications in the 12 months prior to their baseline colonoscopy, n (%) | |||
| Steroid medicationb | |||
| No | 419 (69) | 152 (76.8) | 571 (70.9) |
| Yes | 57 (9.4) | 24 (12.1) | 81 (10.1) |
| Unknown | 10 (1.6) | 5 (2.5) | 15 (1.9) |
| Missing | 0 (0) | 1 (0.5) | 1 (0.1) |
| Regular aspirinb | |||
| No | 311 (51.2) | 113 (57.1) | 424 (52.7) |
| Yes | 20 (3.3) | 14 (7.1) | 34 (4.2) |
| Unknown | 155 (25.5) | 54 (27.3) | 209 (26) |
| Missing | 0 (0) | 1 (0.5) | 1 (0.1) |
| Statinsb | |||
| No | 296 (48.8) | 118 (59.6) | 414 (51.4) |
| Yes | 46 (7.6) | 8 (4) | 54 (6.7) |
| Unknown | 144 (23.7) | 55 (27.8) | 199 (24.7) |
| Missing | 0 (0) | 1 (0.5) | 1 (0.1) |
| Dysplasia and/or adenoma at baseline colonoscopy, n (%) | |||
| Negative | 536 (88.3) | 179 (90.4) | 715 (88.8) |
| Positive | 71 (11.7) | 19 (9.6) | 90 (11.2) |
The study population in module 3 represents a group of patients with UC at a higher risk of colorectal neoplasia at the time of baseline colonoscopy. Coexisting risk factors included 24.5% of the population additionally suffering from PSC; the median age was > 50 years (owing to longer duration of disease); and the disease extended beyond the splenic flexure in 62.7% (n = 505) of patients. The proportion of patients on steroids was 10.1%, perhaps reflecting the selected patients representing chronic rather than active disease.
There was an attempt to select for a high-risk population for the purposes of powering the study. The proportion of patients with PSC, a family history of colorectal cancer and their median age were all higher than in the general population of patients with UC. The incidence of dysplasia (11.2%) was almost three times that predicted from historical published data.
Compliance
Of the 193 patients who underwent the reference standard, 12 (6.2%) did not use dye spray and 9 (4.7%) did not follow the standard endoscopic technique (Table 11). Thus, 21 patients were excluded from the sensitivity analysis, which was based on 172 (89.1%) of the patients scoped.
| Compliance at repeat colonoscopy | Methylation test | Total (N = 193) | |
|---|---|---|---|
| Positive (N = 69) | Negative (N = 124) | ||
| Dye spray used, n (%) | |||
| No | 2 (2.9) | 10 (8.1) | 12 (6.2) |
| Yes | 67 (97.1) | 114 (91.9) | 181 (93.8) |
| Repeats done using standard technique, n (%) | |||
| No | 2 (2.9) | 7 (5.6) | 9 (4.7) |
| Yes | 67 (97.1) | 117 (94.4) | 184 (95.3) |
| Time to re-scope (months) | |||
| Mean (SD) | 11.4 (4.0) | 11.9 (3.0) | 11.7 (3.4) |
| Median (IQR) | 10.1 (8.5–13.1) | 11.5 (9.9–14.1) | 11.3 (9.2–13.9) |
| Min.–max. | 5.3 – 26.9 | 6.0 – 21.3 | 5.3 – 26.9 |
| Repeats done within 4–12 months, n (%) | |||
| No | 26 (37.7) | 51 (41.1) | 77 (39.9) |
| Yes | 43 (62.3) | 73 (58.9) | 116 (60.1) |
| Complied according to sensitivity analysis, n (%) | |||
| No | 4 (5.8) | 17 (13.7) | 21 (10.9) |
| Yes | 65 (94.2) | 107 (86.3) | 172 (89.1) |
| Complied according to per-protocol set, n (%) | |||
| No | 27 (39.1) | 62 (50.0) | 89 (46.1) |
| Yes | 42 (60.9) | 62 (50.0) | 104 (53.9) |
Seventy-seven (39.9%) of the reference colonoscopies were undertaken after 12 months, with a maximum delay of 26.9 months. Twelve of these were also undertaken without dye spray or not using the standard technique. Hence, the per-protocol analysis was based on 104 (53.9%) of the patients scoped.
A final intention-to-treat analysis was undertaken, which included all 193 patients regardless of compliance with the reference standard protocol.
Serious adverse events
There was a single SAE reported in one participant. The event was related to the trial procedure, the colonoscopy, and consisted of a bowel perforation during the reference procedure. The rate is comparable to the 0.1% reported in the PIS: 1 out of 1007 colonoscopies.
There were complications reported for 18 colonoscopies with six pertaining to AEs: bleeding (n = 4), hypotension (n = 1) and stricture (n = 1).
Outcomes
Adjustment for sampling fractions used in study design
The design of the study involved using different sampling fractions in the methylation positive and negative groups based on model 1 (Table 12). The study design requires adjustment for these fractions in order to obtain unbiased estimates of test sensitivity, specificity and prevalence by using the sampling fractions as sampling weights.
| Methylation test results after baseline colonoscopy | Gold-standard repeat colonoscopy | Total recalled | Total available to select for recall | Sampling fraction | Weight (1/sampling fraction) | |
|---|---|---|---|---|---|---|
| Re-scoped | Not re-scoped | |||||
| Methylation –ve | 124 | 114 | 238 | 496 | 124/496 = 0.25 | 4 |
| Methylation +ve | 69 | 39 | 108 | 191 | 69/191 = 0.36 | 2.78 |
Primary analysis: detection of dysplasia missed at baseline colonoscopy
The accuracy of the methylation test to detect missed cancer (the primary objective of the study) was assessed by comparing the baseline methylation results with the results of the histology analysis of biopsy samples taken at the reference colonoscopies in participants who were histology negative at baseline. A total of 193 participants had data available for these analyses, with 172 eligible for the sensitivity analysis, 104 for the per-protocol analysis and all 193 for the intention-to-treat analysis.
Table 13 reports the performance of the methylation test for both models 1 and 2 (defined in module 1) for the three analyses.
| Model | Methylation results at baseline colonoscopy | Colonoscopy results at repeat colonoscopy | Total | PPV (95% CI) | NPV (95% CI) | Sensitivity (95% CI) | Specificity (95% CI) | DOR (95% CI); p-value | Prevalence (95% CI) | |
|---|---|---|---|---|---|---|---|---|---|---|
| Histology +ve | Histology –ve | |||||||||
| Sensitivity analysis: excluding no dye spray and non-standard endoscopic technique | ||||||||||
| 1 | Methylation +ve | 8 | 57 | 65 | 12.3% (5.5% to 22.8%) | 93.5% (87.0% to 97.3%) | 44.2% (20.1% to 71.5%) | 71.6% (64.5% to 77.8%) | 2.01 (0.60 to 6.84); p = 0.27 | 8.3% (5.0% to 13.4%) |
| Methylation –ve | 7 | 100 | 107 | |||||||
| Total | 15 | 157 | 172 | |||||||
| 2 | Methylation +ve | 9 | 65 | 74 | 12.2% (5.7% to 21.8%) | 93.9% (87.1% to 97.7% | 52.2% (25.2% to 77.9%) | 65.9% (58.3% to 72.8%) | 2.12 (0.64 to 7.59); p = 0.18 | 8.3% (5.0% to 13.4%) |
| Methylation –ve | 6 | 92 | 98 | |||||||
| Total | 15 | 157 | 172 | |||||||
| Per-protocol analysis: excluding no dye spray and non-standard endoscopic technique – additionally excluding follow-up > 12 months | ||||||||||
| 1 | Methylation +ve | 7 | 35 | 42 | 16.7% (7.0% to 31.4%) | 95.2% (86.5% to 99.0%) | 61.8% (23.8% to 89.4%) | 70.8% (61.3% to 78.8%) | 3.93 (0.82 to 24.8); p = 0.09 | 8.6% (4.6% to 15.6%) |
| Methylation –ve | 3 | 59 | 62 | |||||||
| Total | 10 | 94 | 104 | |||||||
| 2 | Methylation +ve | 7 | 37 | 44 | 15.9% (6.6% to 30.1%) | 95.0% (86.1% to 99.0%) | 61.8% (23.8% to 89.4%) | 68.4% (58.7% to 76.8%) | 3.59 (0.75 to 22.6); p = 0.09 | 8.6% (4.6% to 15.6%) |
| Methylation –ve | 3 | 57 | 60 | |||||||
| Total | 10 | 94 | 104 | |||||||
| Intention-to-treat analysis – including all patients | ||||||||||
| 1 | Methylation +ve | 8 | 61 | 69 | 11.6% (5.1% to 21.6%) | 91.9% (85.7% to 96.1%) | 35.7% (16.6% to 60.9%) | 72.9% (66.3% to 78.7%) | 1.50 (0.48 to 4.45); p = 0.45 | 9.0% (5.7% to 14.1%) |
| Methylation –ve | 10 | 114 | 124 | |||||||
| Total | 18 | 175 | 193 | |||||||
| 2 | Methylation +ve | 9 | 71 | 80 | 11.3% (5.3% to 20.3%) | 92.0% (85.4% to 96.3%) | 42.1% (20.7% to 67.1%) | 66.5% (59.4% to 73.0%) | 1.46 (0.49 to 4.38); p = 0.46 | 9.0% (5.7% to 14.1%) |
| Methylation –ve | 9 | 104 | 113 | |||||||
| Total | 18 | 175 | 193 | |||||||
Sensitivity analysis: excluding no dye spray and non-standard endoscopic technique
This analysis standardised the colonoscopy procedure across the participating centres. This was an attempt to quality assure the procedure. In this analysis, the association between methylation status (for both models 1 and 2) and histology findings was in the direction of positive methylation, indicating an increased risk of neoplasia; however, this did not reach conventional levels of statistical significance (p = 0.27 and p = 0.18 for models 1 and 2, respectively). The diagnostic odds ratio measuring the ability of the methylation panels to discriminate was of low magnitude (with diagnostic odds ratios of around 2).
Fifteen of the 172 patients in this analysis were histology positive on the reference colonoscopy (prevalence of 8.3%). The model 1 methylation test identified eight of these patients (sensitivity of 44%, 95% CI 20% to 72%), whereas model 2 identified nine patients (sensitivity of 52%, 95% CI 25% to 78%). Of the 157 patients who were histology negative, 57 were given false-positive results by model 1 methylation (specificity 72%, 95% CI 65% to 78%), whereas 65 were false-positive results by model 2 (specificity 66%, 95% CI 58% to 73%).
A positive model 1 methylation test result increased the probability of being histology positive from the prevalence of 8–12%; being methylation negative very slightly increased the probability of being histology negative from a prevalence of 92–94%. Changes for model 2 were the same.
Per-protocol analysis: additionally excluding follow-up > 12 months
The per-protocol analysis additionally excluded 68 patients who did not receive their reference colonoscopy within 12 months of the baseline colonoscopy; this reported increases in sensitivity and diagnostic odds ratios. This reduces the potential for de novo dysplasia being identified at the reference examination (stringency test). Diagnostic odds ratios increased to around 4 but still did not reach levels of conventional statistical significance (p = 0.09 for both models 1 and 2).
Only 10 histology-positive patients were included in this analysis (prevalence of 8.6%). Both models 1 and 2 methylation tests identified seven of these patients (sensitivity 62%, 95% CI 24% to 89%). These values are higher than the sensitivity analysis as four out of the five histology-positive cases deleted in this analysis were false negatives in the sensitivity analysis.
Of the 94 histology-negative patients, 35 were given false-positive results by model 1 (specificity 71%, 95% CI 61% to 79%) and 37 were given false-positive results by model 2 (specificity 68%, 95% CI 59% to 77%).
A positive methylation test result increased the probability of being histology positive from the prevalence of 9% to 17%; being methylation negative increased the probability of being histology negative from a prevalence of 91% to 95%. Changes for model 2 were very similar (from 9% to 16%, and from 91% to 95%, respectively).
Intention-to-treat analysis: including all patients
The intention-to-treat analysis, including all patients, found weaker discrimination with diagnostic odds ratios of around 1.5 (with p-values of 0.45 and 0.46 for models 1 and 2, respectively).
Eighteen patients were histology positive (prevalence of 9.0%), with the model 1 methylation test identifying eight of these patients (sensitivity 36%, 95% CI 17% to 61%) and the model 2 test identifying nine (sensitivity of 42%, 95% CI 21% to 67%). Of the 175 patients who were histology negative, 61 were given false-positive results by model 1 (specificity 73%, 95% CI 33% to 79%) and 71 by model 2 (specificity 67%, 95% CI 59% to 73%).
A positive methylation test result slightly increased the probability of being histology positive from the prevalence of 9% to 12%; being methylation negative very slightly increased the probability of being histology negative from a prevalence of 91–92%. Changes for model 2 were very similar.
Additional comparisons
Accuracy of methylation index test at baseline compared with baseline histology
This comparison was made as a ‘proof of principle’ assessment, as to whether or not methylation tests identify neoplasia evident at the baseline colonoscopy.
Table 14 reports the performance of the methylation test (based on the background mucosal biopsy) at identifying patients who have dysplasia/neoplasia in the baseline colonoscopy. The patient is defined as histology positive if any one of the biopsy samples taken is positive for dysplasia and/or adenoma.
| Model | Methylation results at baseline colonoscopy | Colonoscopy results at baseline colonoscopy | Total | PPV (95% CI) | NPV (95% CI) | Sensitivity (95% CI) | Specificity (95% CI) | DOR (95% CI); p-value$ | Prevalence (95% CI) | |
|---|---|---|---|---|---|---|---|---|---|---|
| Histology +ve | Histology –ve | |||||||||
| 1 | Methylation +ve | 41 | 191 | 232 | 17.7% (13.0% to 23.2%) | 91.7% (89.0% to 93.9%) | 47.7% (36.8% to 58.7%) | 72.2% (68.7% to 75.5%) | 2.37 (1.46 to 3.82); p < 0.001 | 11.1% (9.0% to 13.6%) |
| Methylation –ve | 45 | 496 | 541 | |||||||
| Total | 86 | 687 | 773 | |||||||
| 2 | Methylation +ve | 46 | 246 | 292 | 15.8% (11.8% to 20.4%) | 91.7% (88.8% to 94.0%) | 53.5% (42.4% to 64.3%) | 64.2% (60.5% to 67.8%) | 2.06 (1.28 to 3.33); p = 0.001 | 11.1% (9.0% to 13.6%) |
| Methylation –ve | 40 | 441 | 481 | |||||||
| Total | 86 | 687 | 773 | |||||||
The results show a higher baseline prevalence of dysplasia than predicted in the sample size calculation: 11% compared with 4%. There was a statistically significant but small association between methylation test results and histology results (diagnostic odds ratio of 2.4, 95% CI 1.5 to 3.8; p < 0.001) for model 1 and 2.1 (95% CI 1.3 to 3.3; p = 0.001) for model 2. This indicates that the test has a relationship with observed neoplasia.
There were 86 histology-positive patients out of the 773 tested – model 1 correctly identified 41 of these (sensitivity 48%, 95% CI 37% to 59%), whereas model 2 identified 46 (sensitivity 54%, 95% CI 42% to 64%). Model 1 made fewer false-positive diagnoses (191 out of 687) than model 2 (246 out of 687), yielding estimates of specificity of 72% (95% CI 69% to 76%) and 64% (95% CI 61% to 68%), respectively.
Agreement of methylation testing at the baseline and reference assessments
Methylation results from biopsy samples taken at baseline and reference colonoscopies were compared to assess the stability of methylation assessments over time. Methylation results (for biopsies taken at reference colonoscopy) were available for 162 out of the 193 participants undergoing reference colonoscopy. Separate tabulations were made for categorisations based on models 1 and 2 (Table 15).
| Methylation test results after | Methylation test results after baseline colonoscopy | Total | |
|---|---|---|---|
| Reference colonoscopy | Model 1 baseline methylation +ve | Model 1 baseline methylation –ve | |
| Model 1 methylation +ve | 18 | 11 | 29 |
| Model 1 methylation –ve | 35 | 98 | 133 |
| Total | 53 | 109 | 162 |
| Observed agreement: 72%, 95% CI 64% to 78%; chance-corrected agreement (kappa): 0.27, 95% CI 0.13 to 0.41 | |||
| Repeat colonoscopy | Model 2 methylation +ve | Model 2 methylation –ve | Total |
| Model 2 methylation +ve | 24 | 12 | 36 |
| Model 2 methylation –ve | 38 | 88 | 126 |
| Total | 62 | 100 | 162 |
| Observed agreement: 69%, 95% CI 61% to 76%; chance-corrected agreement (kappa): 0.29, 95% CI 0.15 to 0.43 | |||
Although 72% of results for model 1 and 69% for model 2 were in agreement between baseline and reference colonoscopy, adjustment for agreement expected by chance yielded kappa coefficients of 0.27 and 0.29, which are standardly interpreted as showing only fair agreement.
Accuracy of a combined baseline plus follow-up methylation assessment compared with reference colonoscopy
This comparison redefines the index test according the combination of repeated assessments across two time points. Utilising the methylation results available at both baseline and from the reference colonoscopy we defined new tests combining the two results (Table 16). We considered methylation positive being defined using an OR rule as positive either at baseline or at the repeat (which increases the percentage methylation test positive for model 1 to 64 out of 162: 40%); or using an AND rule if positive at both baseline and follow-up (which decreases the percentage methylation test positive for model 1 to 18 out of 162; 11%). Combining tests using the OR rule increases sensitivity at the cost of decreased specificity, using the AND rule decreases sensitivity at the benefit of increased specificity. Neither combination greatly increased diagnostic accuracy as measured by the diagnostic odds ratio – values were between 2 and 3 for both models, and did not reach formal criteria for statistical significance (p-values of 0.07 and 0.12 for model 1 OR and AND rules, respectively, p-values of 0.08 and 0.15 for model 2 OR and AND rules, respectively).
| Methylation results at baseline and repeat |
Colonoscopy results at Reference colonoscopy |
Total | PPV (95% CI) | NPV (95% CI) | Sensitivity (95% CI) | Specificity (95% CI) | DOR (95% CI) p-value | Prevalence (95% CI) | ||
|---|---|---|---|---|---|---|---|---|---|---|
| Histology +ve | Histology –ve | |||||||||
| Model 1 | Either +ve | 11 | 53 | 64 | 17.2% (8.9% to 28.7%) | 92.9% (85.8% to 97.1%) | 55.0% (29.8% to 77.8%) | 69.9% (62.1% to 76.6%) | 2.70 (0.89 to 8.68) p = 0.07 | 10.7% (6.7% to 16.5%) |
| Both –ve | 7 | 91 | 98 | |||||||
| Total | 18 | 144 | 162 | |||||||
| Model 1 | Both +ve | 4 | 14 | 18 | 22.2% (6.4% to 47.6%) | 90.3% (84.2% to 94.6%) | 17.9% (6.0% to 42.7%) | 92.5% (87.6% to 95.6%) | 2.65 (0.56 to 10.06) p = 0.12 | 10.7% (6.7% to 16.5%) |
| Either –ve | 14 | 130 | 144 | |||||||
| Total | 18 | 144 | 162 | |||||||
| Model 2 | Either +ve | 12 | 62 | 62 | 16.2% (8.7% to 26.6%) | 93.2% (85.7% to 97.5%) | 61.4% (34.8% to 82.6%) | 63.0% (54.8% to 70.4%) | 2.65 (0.86 to 9.03) p = 0.08 | 10.7% (6.7% to 16.5%) |
| Both –ve | 6 | 82 | 82 | |||||||
| Total | 18 | 144 | 162 | |||||||
| Model 2 | Both +ve | 5 | 19 | 24 | 20.8% (7.1% to 42.2%) | 90.6% (84.4% to 94.9%) | 22.3% (8.4% to 47.5%) | 89.4% (83.8% to 93.2%) | 2.53 (0.63 to 8.65) p = 0.15 | 10.7% (6.7% to 16.5%) |
| Either –ve | 13 | 125 | 138 | |||||||
| Total | 18 | 144 | 162 | |||||||
For model 1, the combined test identified 11 out of the 18 participants with neoplasia detected at follow-up (sensitivity 55%, 95% CI 30% to 78%) using the OR rule but only 4 out of the 18 participants with neoplasia using the AND rule (sensitivity 18%, 95% CI 6% to 43%). False-positive numbers were greatly reduced using the AND rule with only 14 out of 144 (specificity 93%, 95% CI 88% to 96%) false positives compared with 53 out of 144 (specificity 70%, 95% CI 62% to 77%) using the AND rule. Results for model 2 were similar.
Observing two repeated methylation-positive findings increased the probability of neoplasia from a baseline of 11% to 22%, but the 95% CI on this post-test probability is wide as it is based only on data from 18 patients in which this double positive occurred, and ranges from a decrease of 6% to an increase of 48%. Observing two repeated methylation-negative findings decreased the probability of not having neoplasia from a baseline of 90% to 93%.
Module 3: discussion
In module 3, a prospective two-stage study was undertaken in a clinically relevant population of 814 participants to evaluate two biomarker panels of methylation markers developed from retrospective analyses in module 1. The accuracy of the methylation markers was estimated by comparison with results of a second reference colonoscopy. To minimise patient burden and increase efficiency, the study design used stratified sampling according to the results of the baseline methylation test to enrich the sample undergoing verification for neoplasia. The analysis adjusted for the stratified design to provide statistically unbiased estimates of test accuracy.
Key findings from the study are that:
-
It is feasible to successfully deliver a cohort study of 800 participants in this clinical setting with acceptable recruitment and follow-up rates, with over half (56%) of those asked willing to undergo a repeat reference colonoscopy.
-
The prevalence of neoplasia at baseline colonoscopy was higher than expected (11% observed vs. 4% expected).
-
The incidence of neoplasia at the reference colonoscopy was also higher than expected (9% observed vs. 2% expected).
-
The methylation markers at baseline showed a significant relationship with baseline histology (p < 0.0001).
-
Relationships of the methylation markers with neoplasia detected at the reference colonoscopy were in the same direction, but weaker and statistically non-significant.
-
Some patients lost the methylation signal when repeat testing was performed. Repeated methylation positives at baseline and reference colonoscopies identified a higher risk strata (predicted risk of 22%), and a single positive result identified an intermediate risk strata. The numbers in these subgroup strata were low, but suggested that methylation testing would aid risk stratification (above colonoscopy alone).
Successful delivery
Module 3 was embedded within the existing surveillance programme for UC within the NHS. We demonstrated that the additional test was acceptable to patients and clinicians and could be incorporated within existing care pathways. One challenging aspect was the collection and secure transfer of samples for centralised processing. This was successfully carried out within/across NHS histopathology and DNA laboratories.
A variety of colonoscopic techniques are currently used across the UK for surveillance of patients with UC. To standardise the late reference examination (carried out in 193 patients), the protocol stipulated the use of dye spray as well as obtaining untargeted biopsies. This protocol was followed in > 90% of reference examinations, providing additional quality assurance to the study.
The protocol stipulated the reference examination was performed between 4 and 12 months after the baseline examination. This was completed in 60% of all reference colonoscopies (n = 116). The delay largely reflected the pressure on NHS endoscopic services. An emerging risk of bias from potential differences in the length of follow-up was identified when difficulties were noted in obtaining reference colonoscopies within the 12-month time-frame stated in the protocol. To overcome this, a matching process was introduced to select and invite methylation-negative reference colonoscopies that matched methylation-positive reference colonoscopies in terms of time from index colonoscopy. The median time to reference standard colonoscopy was slightly longer in the methylation-negative group of the study (median 11.5 vs. 10.1 months). These factors would tend to increase the number of ‘new’ dysplastic lesions occurring in the methylation-negative group, but the impact would be anticipated to be negligible.
Prevalence higher than expected at baseline: neoplasia/dysplasia risk
The study population in module 3 was selected to be at high risk of neoplasia as defined by the associated risk factors seen in the study population. The proportion of patients with identified dysplasia (11.2%) at the baseline colonoscopy was considerably higher than predicted. The high prevalence was not explained by inclusion of PSC patients as their observed risk was lower (9.6%), although their age-matched colorectal cancer risk is substantially higher. This lower dysplasia rate may reflect the younger median age of PSC patients in the study.
Some changes to the eligibility criteria were made during the study. These relaxed the criteria, specifically around the duration of disease and the extent of disease as this was often not recorded in patient records prior to colonoscopy. The high proportion of patients with dysplasia would indicate that this had little impact on the selection of a high-risk population.
Incidence higher than expected at reference colonoscopy
The reference colonoscopy population excluded patients who had neoplasia diagnosed by histological examination of biopsies (at baseline colonoscopy). The rate of dysplasia in the reference colonoscopy population was substantially higher than we anticipated. This may be reasonably predicted within those with a methylation-positive result, as they had been shown to have a significant association with neoplasia at baseline (DOR = 2.4; p < 0.0001). The high incidence of dysplasia in the methylation-negative reference group is more difficult to explain, as it approaches that found at baseline (9% vs. 11.2%). The reason for this is not obvious. It is not explained by de novo lesions as the time frame is too short.
If the reference colonoscopy neoplasia rate correctly reflects the background neoplasia rate in the study population, it suggests that colonoscopy was missing as many patients with dysplasia as were being identified. Given the high rate of identified dysplasia at baseline, this seems unlikely, and the use of central review of histology provided quality assurance to this diagnosis. Alternatively, the rate of progression to neoplasia may be higher than previously recognised. However, as cancer risk in this population does not rise significantly until after 10 years, such an increase would be expected to take place over a much longer time frame.
Acceptance rates for the repeat colonoscopy averaged 56% but were higher in those methylation positive (64%) than those methylation negative (52%), which is a slightly larger difference than could be explained by chance (p = 0.04). Only the study statistician was aware of the methylation result, thus there should not have been any selection bias by methylation status. However, patients and clinicians were aware of the clinical and histological findings of the baseline colonoscopy, and one explanation for the difference in acceptance rates is that the clinician/patient interaction around the baseline colonoscopy may have ‘subliminally’ caused reference colonoscopies to be declined where the index examination was deemed ‘normal’ or accepted otherwise. This may have resulted in a subgroup of higher-risk patients being selected into the methylation-negative group. As it is impossible to blind the clinician and the patient to the findings at the initial examination, it is difficult to see how to avoid this potential source of bias.
Methylation marker relationships
The association between background mucosal methylation changes and associated distant neoplasia in patients with UC was established for the first time in a prospective multicentre study (DOR = 2.4; p < 0.0001). This is a proof of principle for methylation testing as an adjunct to colonoscopy for these patients in increasing the sensitivity of colonoscopic surveillance. In fact, methylation changes were seen in only 50% of patients harbouring neoplastic changes (at baseline). It may be that testing a wider range of methylation sites would increase the sensitivity of the test. It is also possible that there is a subset of patients without field change. If this is the case, these patients would be more suitable for local treatment of dysplasia and so avoid radical surgery (total colectomy). We would plan to investigate the remaining biopsy samples by genome-wide testing to investigate this further. Longitudinal follow-up of this patient population would also go some way to addressing the residual neoplasia risk in the study population.
We investigated the impact of adherence to the protocol for reference colonoscopy in per-protocol analyses restricted to those who complied with the required colonoscopic technique and with compliance to timing, and in an analysis of all patients. It was notable that the discriminatory performance of the methylation panel was highest in analyses that were restricted to the most compliant patient group and lowest when all patients were included, suggesting that the suitability of the reference standard did depend on how and when the follow-up investigation was completed.
Repeat methylation results
At reference colonoscopy, we were able to assess the impact of repeat methylation testing. The numbers were necessarily small, but did show evidence of additional risk stratification, with repeated positive methylation tests being associated with a rising risk of neoplastic change distant to the biopsy site. As surveillance for UC is undertaken over decades for most patients, the ability to better risk stratify patients would be of real clinical value. It would not only select patients more accurately for intensive surveillance, but also select a high-risk population for evaluation of chemopreventative therapy. It was also seen in a subset of patients who methylation changes could be ‘lost’. Whether this reflects a limitation of sampling or perhaps a subgroup of lesser risk patients without true field change is not possible to discern from this study.
This prospective multicentre study has shown for the first time, to our knowledge, a clear association between methylation changes in the background mucosa and distant neoplasia. Additional reference colonoscopy demonstrated that this positive association was sustained, although failed to reach clinical significance. These background mucosa changes were seen in only 50% of patients with neoplasia, but the clinical significance of this remains unclear. Secondary analyses also showed that repeat testing could help refine stratification for surveillance and the true added value of this will be investigated through longitudinal follow-up of this cohort. The assay, as tested, would not yet be recommended for routine clinical use, but this finding may be modified as follow-up data become available.
Outcomes
We have summarised discrimination using the DOR, which combines both sensitivity and specificity into a single number. Values of the DOR for accurate diagnostic tests can be high numbers, for example, when both sensitivity and specificity are 90% the DOR is 81, when they are both 95% it is 361, and when they are both 99% it is 9801. Although such values of diagnostic accuracy were not anticipated, nor are necessary for a test to be a useful stratification tool, the methylation panels were found to have poorer discriminatory performance with observed DOR values of between 1.5 and 4 than hypothesised or observed in module 1 (where observed values were DOR = 8 for model 1, DOR = 19 for model 2 and DOR = 3 for model 3). In most analyses, observed DORs were not shown to be significantly different from an uninformative test (DOR = 1). The sample size for the second stage of the study was based on preliminary data, which predicted that the DOR would be around 19, and thus the study was underpowered to detect less discriminatory tests.
However, the comparison of baseline methylation with the findings of baseline colonoscopy was based on the larger cohort of 773 participants and, thus, was powered to detect less discriminatory tests. This analysis conclusively demonstrated that the relationships between methylation and neoplasia is not explicable by the play of chance, even if it is weaker than hypothesised. The diagnostic odds ratio of 2.37 indicates that a positive methylation test (of a biopsy taken distant from the neoplastic lesion and showing no histological evidence of neoplasia, in a blinded central analysis by Philippe Taniere) was able to select for a population at higher risk of associated concurrent dysplasia. Although the sensitivity of the test, 47.7% (41/86), appears low, it must be emphasised that the methylation test was seeking to compliment, not substitute for, a colonoscopic examination (we were seeking to investigate the ‘added value’ of methylation testing above that observed by colonoscopy alone).
When planning the study, we considered that we expected the methylation test to detect around 50% of missed cases (i.e. with a sensitivity of 50%) and that it would only give false-positive results in the 5% of non-neoplastic cases. Although we observed sensitivities in the range stated, false-positive rates were much higher, with up to 35% of patients without evidence neoplasia being classified as methylation positive. Although this could be reduced by increasing the test positive threshold and increasing the positive predictive value, it would also reduce the proportion of cases detected as positive (as is seen in the baseline plus follow-up combined methylation test).
In technical comparisons in the laboratory, the methylation test was found to be robust and reproducible under stringent testing of > 800 patients. However, methylation status varied between baseline and reference colonoscopies, which may explain why the observed accuracy was lower than expected. The source of this variation is unclear – whether it is a result of within-patient variation in methylation status between sample sites or over time, or undetected laboratory issues. Samples were collected from 31 different hospitals across the country and processed centrally. Despite challenges around transferred samples, and the small size of the biopsies taken, interpretable methylation results were available for over 95% of patients in the study.
The positive methylation rate (191/773, 24.7%) was above our projected positive rate of 20%, based on data from module 1. This may be because of the analysis of multiple biopsies in module 3. The module 1 analysis was performed on single blocks.
Ultimately, the study was underpowered. However, the unprecedented high rate of dysplasia in the methylation-negative group had a considerable impact on this. The high reference dysplasia rate demonstrates the real clinical need for an adjunctive test to colonoscopy for these patients. It also implies that there was some occult clinical bias in the selection of the methylation-negative population.
Further studies
Further analysis using markers that were specific to the background mucosa identified in model 3 is planned. In models 1 and 2, the markers were selected by their occurrence within neoplastic lesions. This is rational if you are seeking to detect neoplasia at its earliest stage of development. However, it is possible to hypothesise that the optimal markers in background mucosa may not be present in the neoplastic tissue. In practice, these markers that seemed to select for neoplasia but were not represented in neoplastic tissue overlapped with those identified in module 1, but included two additional methylation markers.
In addition to the model 3 analysis, we are also planning an exploratory analysis of stool and blood samples, to see if the methylation markers can be identified through non-invasive testing (i.e. without the need for a colonoscopy). Such a test may prove of value to patients deemed at low risk of neoplasia and for whom a colonoscopy may be avoided. The low sensitivity of this current marker panel would suggest that a different marker panel may need to be developed, particularly if we seek to define a low-risk subpopulation.
The most exciting question raised by this study is whether or not methylation changes may precede neoplastic change. The ENDCaP-C study established a unique cohort of patients with a characterised methylation profile. By follow-up of this cohort, it would be possible to determine whether or not methylation changes may be identifying a high-risk population. A longitudinal study is now proposed to follow these patients for the next 5 years. If such a predictive value can be assigned to methylation markers, this will open the opportunity to instigate chemopreventative strategies that might prevent the onset of neoplasia and perhaps reverse these early methylation changes.
Chapter 5 Module 4: feasibility of applying a multimarker methylation panel to other sample types
The aim of this module was to evaluate the feasibility of testing for hypermethylation of secreted Wnt antagonists in serum and faecal samples and, if feasible, to assess their accuracy.
A total of 117 stool samples and 133 blood samples from patients undergoing a reference colonoscopy have been collected and stored (see Chapter 4, Blood and stool samples). We are now seeking to undertake evaluation of the methylation markers in this sample set, but this will not form part of this report.
Project overview and limitations
Project overview
A unique multidisciplinary team of research scientists, NHS laboratory scientists and clinicians were brought together across over 30 hospitals to undertake this study. This has enabled the first ever multicentre prospective evaluation of predictive molecular biomarkers for patients at risk of UC-associated dysplasia, to our knowledge. The collaboration enabled a large set of historical samples to be collected to evaluate all existing methylation markers in the published literature. It enabled the development of a high-throughput, clinically applicable testing platform to be developed within the NHS. It then enabled this to be tested prospectively across a population of > 800 high-risk patients for the first time.
This work will enable a longitudinal follow-up study to be undertaken and determine the predictive value of these markers. The sample set will also allow some limited testing of new improved markers that might emerge to be rapidly evaluated and incorporated into clinical practice if appropriate, potentially without a further prospective study.
Project limitations
The project was limited to the available technology at the time. If carried out now, more advanced methylation assessment would be possible and assessment of the whole methylome would have been undertaken in module 1. There have also been advances in NGS that might enable more efficient platform testing to be developed.
Performing a repeat endoscopy within the already stretched resources of the NHS has proven to be challenging for the service, the clinicians and the patients. We are extremely grateful for all of their efforts.
The main limitation of the study design would appear to be the potential bias in the selection of the methylation-negative reference population. Unfortunately, it is difficult to see how this might be overcome (even in hindsight). The endoscopist and the patient would expect to discuss the findings at their endoscopy. This will inevitably inform judgement of the undertaking of a further reference examination. Patients and clinicians will inevitably be less enthusiastic to undertake a further examination in the knowledge that the initial examination appeared low risk. This limitation may, however, be mitigated to some extent if we can successfully follow-up the patients to determine whether or not future risk of neoplasia is increased by the initial presence of methylation abnormalities. Funding for follow-up is being sought as an extension to this project.
Implications for health care
At present we cannot recommend the routine use of these methylation tests for patients with UC. However the emergence of the longitudinal follow-up data may change this recommendation.
In undertaking the reference colonoscopy we have demonstrated that a substantial cohort of patients with chronic UC will have dysplastic mucosa within 12 months of a colonoscopy, indicating the limitations of this examination in the presence of UC and the real need for better risk stratification of this population of patients to determine surveillance strategies. It would also appear that the incidence of dysplasia in this selected high-risk population is higher than historical data would suggest. This is likely to reflect improving quality of imaging over the last decade.
Implications for research
The study has shown, for the first time to our knowledge, that methylation testing of bowel mucosa can identify a subgroup of patients with UC at enhanced (more than twofold) risk of synchronous neoplasia through the analysis of background mucosa. There is clearly a case for seeking improved markers and this work is being undertaken by our own group and by others. Better risk stratification of the population would enable the introduction and evaluation of chemoprevention measures for colorectal cancer, ultimately reducing the need for radical surgery. Further follow-up of this prospectively evaluated population will increase our understanding of the methylation changes and their implication for the development of neoplasia.
Acknowledgements
Independent Oversight Committees
We are grateful to all members of the TSC and the DMEC for their support and guidance.
Independent TSC members:
-
Dr Brian Cooper (chairperson), Honorary Consultant Physician (retired), Sandwell and West Birmingham Hospitals NHS Trust.
-
Professor Andrew Silver, Professor of Cancer Genetics, Barts and The London School of Medicine & Dentistry.
-
Professor Gary Collins, Deputy Director of Centre for Statistics in Medicine and the Head of Prognosis Methodology, University of Oxford.
-
Dr Heather Beard, patient representative.
Independent DMEC members:
-
Professor Barney Reeves (chairperson), Professorial Research Fellow in Health Services Research, University of Bristol.
-
Dr Michael Hall, Consultant Physician & Gastroenterologist (retired), Wye Valley NHS Trust.
-
Professor Charles Knowles, Clinical Professor of Surgical Research, Queen Mary University of London.
Birmingham Clinical Trials Unit
The authors would like to thank the staff of BCTU past and present for their support of the ENDCaP-C study:
-
Peter Antonio, Data Manager (December 2012–July 2014)
-
James Brown, Trial Manger (June 2016–May 2018)
-
Annika Feilbach, Programmer (December 2014–May 2018)
-
Rebecca Howard, Trial Manger (July 2014–September 2014)
-
Steve Johnson, Senior Trial Manger (July 2014–March 2015)
-
Laura Magill, Team Leader (February 2013–May 2018)
-
Michala Pettitt, Data Manager (August 2016–April 2018)
-
Nicholas Sheward, Data Manager (August 2014–April 2016)
-
Chakanaka Sidile, Programmer (June 2013–September 2014)
-
Alexandra Vince, Senior Trial Manager (August 2013–July 2014 and June 2015–May 2016).
Affiliated laboratories
Thanks go to the laboratory staff at University Hospitals Birmingham NHS Foundation Trust, West Midlands Regional Genetics Service at Birmingham Women’s and Children’s NHS Foundation Trust and Surgical Research Laboratory at the University of Birmingham for their help, particularly for their involvement in the management and processing of samples:
-
Zarqa Shoaib
-
Amina Mulla
-
Amalia Goula
-
Elizabeth Marshall
-
Brendan O’Sullivan
-
Louise Tee
-
Celina Whalley.
Recruiting centres
The ENDCaP-C study has been a collaborative effort and its success is a result of the enormous enthusiasm and support from the participating centres. We would, therefore, like to acknowledge the members of staff at recruitment sites who facilitated recruitment, sample collection and follow-up of trial participants (the principal investigator at each centre is indicated with an asterisk):
Bart’s Health NHS Trust
Konstantinos Giaslakiotis, Ceri Guarnieri, Syed Samiul Hoque,* Bianca Petri and Attia Rehman.
Basildon and Thurrock University Hospitals NHS Foundation Trust
Nazar Alsanjari, Wilson Alvares, Georgina Butt, Natasha Christmas, Mark Jarvis,* Denis Lindo, Zia Mazhar, Pushpakaran Munuswamy, Javaid Subhani and Gavin Wright.
Blackpool Teaching Hospitals NHS Foundation Trust
Senthil Murugesan,* Greta Van Duyvenvoorde, Suboda Weerasinghe and Rachael Wheeldon.
Cambridge University Hospitals NHS Foundation Trust
James Yiu Hon Chan, Miles Parkes,* Konstantina Strongili and Merry Jay Jimenez-Smith.
County Durham and Darlington NHS Foundation Trust
Sarah Clark, Anjan Dhar,* Gillian Horner and Sree Mussunoor.
Gateshead Health NHS Foundation Trust
Jamie Barbour,* Sophie Gelder, James A Henry, Paul O’Loughlin, Jitendra Singh and Ann Wilson.
Hampshire Hospitals NHS Foundation Trust
Matthew Brown,* Susan Farmer, Asmat Mustajab, Caroline Palmer and John Ramage.
Heart of England NHS Foundation Trust
Safia Begum, Gerald Langman and Naveen Sharma.*
Hull and East Yorkshire Hospitals NHS Trust
Sarah Ford, Laszlo Karsai, Sally Myers and Shaji Sebastian.*
Imperial College Healthcare NHS Trust
Robert Goldin, Bridget Hradsky, Christwishes Makahamadze, Mike Osborn, Simon Peake and Julian Teare.*
Isle of Wight NHS Trust
Leonie Grellier,* Kamarul Jamil, Andres Kulla, Norman Mounter, Chris Sheen and Joy Wilkins.
Kettering General Hospital NHS Foundation Trust
Laura Aitken and Ajay Verma.*
Leeds Teaching Hospitals NHS Trust
Suzie Colquhoun, Ruth Fazakerley, Olorunda Rotimi, Venkat Subramanian* and Charlotte Wilson.
London North West Healthcare NHS Trust
Ibrahim Al-Bakir, Naila Arebi, Pooja Datt, Ailsa Hart,* Dennis Lim, Ravi Misra, Morgan Moorghen and Lawrence Penez.
Northumbria Healthcare NHS Foundation Trust
Shoba Abraham, Helen Bailey, Sonya Beaty, Jane Dickson, Anthoor Jayaprakash* and Linda Patterson.
Oxford University Hospitals NHS Trust
Nathan Atkinson, Amirah Bouraba, James East, Satish Keshav,* Conor Lahiff, Mary Lucas, Simon Travis, Lai Mun Wang, Kate Williamson and Jean Wilson.
Portsmouth Hospitals NHS Trust
Michelle Baker-Moffatt, Pradeep Bhandari,* Jennifer Hale, Maria Hayes, Kesavan Kandiah, Lisa Murray, David Poller, Sharmila Subramaniam, Sreedhari Thayalasekaran and Prokopios Vogiatzis.
Royal Liverpool and Broadgreen University Hospitals NHS Trust
Tim Andrews, Fiona Campbell, Martyn Dibb, Tracey Forshaw, Alvyda Gureviciute, Hayley Hamlett, Chris Probert,* Sreedhar Subramanian and Clare Shaw.
Royal United Hospital Bath NHS Foundation Trust
Leigh Biddlestone, Dawne Chandler, Ben Colleypriest* and Lucy Howie, Joyce Katebe.
Salford Royal NHS Foundation Trust
Gordon Armstrong, Abby Conlin* and Melanie Taylor.
Sandwell and West Birmingham Hospitals NHS Trust
Ala Ali, Julie Colley, Edward Fogden,* Ann Francis, Anne Hayes, Samia Hussain, Imtiyaz Mohammed, Suhail Muzaffar, Nithin Nair, Mirza Sharjil Baig and Nigel Trudgill.
Sherwood Forest Hospitals NHS Foundation Trust
Stephen Foley,* Cheryl Heeley, Samiya Ibrahim and Wayne Lovegrove.
South Tees Hospitals NHS Foundation Trust
Andrea Boyce, Wendy Jackson, David Oliver, Kolanu Prasad, Arvind Ramadas* and Julie Tregonning.
The Dudley Group NHS Foundation Trust
Clare Allcock, Shanika de Silva,* Sarah Fullwood, Shahkee Garai, Sauid Ishaq, Rizwan Mahmood, Ali Sherif, Veena Shinde and Claire Whitcombe.
The Princess Alexandra Hospital NHS Trust
Deb Ghosh,* Hazel Guth, Nikki Staines and Vasi Sundaresan.
The Royal Bournemouth and Christchurch Hospitals NHS Foundation Trust
Nina Barratt, Emma Gunter, Joan McCutcheon and Simon McLaughlin.*
The Royal Wolverhampton NHS Trust
Matthew Brookes,* Jill Brown, Dragana Cvijan, Marie Green, Shingankutti A M Mangalika, Jayne Rankin, Karen Sedgewick, Asit Shah and Monika Widlak.
University Hospitals Birmingham NHS Foundation Trust
Olufunso Adedeji, Claire Arthur, Lillie Bennett, Neeraj Bhala, Louise Bowlas, Ralph Boulton, Ruth Buckingham, Tamar Cameron, Rachel Cooney, Sheldon Cooper, Christopher Dobson, Jason Goh, Tariq Iqbal,* Kate Kane, Shrikanth Pathmakanthan, Zarqa Shoaib, Jessica Simmons, Nigel Suggett, Philippe Taniere, Tanya Van der Westhuizen and Robert Walt.
University Hospitals of Leicester NHS Trust
John de Caestecker,* Angus McGregor, Alison Moore and Sarah Nicholson.
Walsall Healthcare NHS Trust
Katherine Johanna Arndtz, Ashish Awasthi,* Kiran Desai, Victoria Foster, Rachael Howe, Rangarajan Kasturi and Jasbir Nahal.
West Middlesex University Hospital NHS Trust
Shaila Desai, Joel Mawdsley,* Kevin Monahan,* Metod Oblak, Krishna Sundaram and Anne Thorpe.
Participants
Finally, and most importantly, we would like to thank all of the patients who agreed to participate in the study.
Contributions of authors
Dr Ashish Awasthi (https://orcid.org/0000-0003-0990-3815) contributed to the conduct of the study, recruitment, data acquisition, the interpretation of the results and review of the report.
Dr Jamie Barbour (https://orcid.org/0000-0001-7536-0498) contributed to recruitment, data acquisition, the conduct of the study and review of the report.
Mr Andrew Beggs (https://orcid.org/0000-0003-0784-2967) contributed to the design of the project, the conduct of the study, the interpretation of the results and the writing and editing of the report.
Professor Pradeep Bhandari (https://orcid.org/0000-0002-1241-2083) contributed to recruitment, data acquisition, the conduct of the study and review of the report.
Mr Daniel Blakeway (https://orcid.org/0000-0001-9501-7451) contributed to the conduct of the study, data acquisition, the conduct of the study and review of the report.
Professor Matthew Brookes (https://orcid.org/0000-0002-8782-0292) contributed to recruitment, data acquisition, the conduct of the study and review of the report.
Mr James Brown (https://orcid.org/0000-0003-4513-1509) contributed to the conduct and co-ordination of the study, collation of the data and interpretation of the results, and the writing and editing of the report.
Dr Matthew Brown (https://orcid.org/0000-0002-1467-241X) contributed to recruitment, data acquisition, the conduct of the study and review of the report.
Dr Germaine Caldwell (https://orcid.org/0000-0002-7521-1983) contributed to the conduct of the study, data acquisition, the conduct of the study and review of the report.
Dr Samuel Clokie (https://orcid.org/0000-0002-0025-3652) contributed to the conduct of the study, data acquisition, the conduct of the study and review of the report.
Dr Ben Colleypriest (https://orcid.org/0000-0002-4332-465X) contributed to recruitment, data acquisition, the conduct of the study and review of the report.
Dr Abby Conlin (https://orcid.org/0000-0003-4216-8971) contributed to recruitment, data acquisition, the conduct of the study and review of the report.
Dr Shanika de Silva (https://orcid.org/0000-0002-7362-4661) contributed to recruitment, data acquisition, the conduct of the study and review of the report.
Dr John de Caestecker (https://orcid.org/0000-0001-5526-8176) contributed to recruitment, data acquisition, the conduct of the study and review of the report.
Professor Jonathan Deeks (https://orcid.org/0000-0002-8850-1971) contributed to the conception and design of the project, the conduct of the study, the interpretation of the results and the writing and editing of the report.
Dr Anjan Dhar (https://orcid.org/0000-0001-8964-2031) contributed to recruitment, data acquisition, the conduct of the study and review of the report.
Mr Mark Dilworth (https://orcid.org/0000-0002-2650-355X) contributed to the conduct of the study, data acquisition, the conduct of the study and review of the report.
Dr Edward Fogden (https://orcid.org/0000-0002-2210-5036) contributed to recruitment, data acquisition, the conduct of the study and review of the report.
Dr Stephen Foley (https://orcid.org/0000-0003-0286-0031) contributed to recruitment, data acquisition, the conduct of the study and review of the report.
Dr Deb Ghosh (https://orcid.org/0000-0001-7601-4044) contributed to recruitment, data acquisition, the conduct of the study and review of the report.
Dr Leonie Grellier (https://orcid.org/0000-0002-0529-3530) contributed to recruitment, data acquisition, the conduct of the study and review of the report.
Dr Ailsa Hart (https://orcid.org/0000-0002-7141-6076) contributed to recruitment, data acquisition, the conduct of the study and review of the report.
Dr Syed Samiul Hoque (https://orcid.org/0000-0002-1139-6528) contributed to recruitment, data acquisition, the conduct of the study and review of the report.
Dr Marietta Iacucci (https://orcid.org/0000-0003-2440-2592) contributed to the conduct of the study, recruitment, data acquisition, the interpretation of the results and review of the report.
Professor Tariq Iqbal (https://orcid.org/0000-0002-6681-9882) contributed to the conception and design of the project, the conduct and oversight of the study, recruitment, data acquisition the interpretation of the results and the writing and editing of the report.
Dr Jonathan James (https://orcid.org/0000-0003-3116-8781) contributed to the conduct of the study, data acquisition, the conduct of the study and review of the report.
Dr Mark Jarvis (https://orcid.org/0000-0002-9180-5570) contributed to the conduct of the study, recruitment, data acquisition, the interpretation of the results and review of the report.
Dr Anthoor Jayaprakash (https://orcid.org/0000-0001-6541-048X) contributed to recruitment, data acquisition, the conduct of the study and review of the report.
Dr Satish Keshav (https://orcid.org/0000-0003-0508-8665) contributed to recruitment, data acquisition, the conduct of the study and review of the report.
Dr Laura Magill (https://orcid.org/0000-0003-2498-8407) contributed to the conception and design of the project, the conduct of the study, the interpretation of the results and the editing of the report.
Dr Glenn Matthews (https://orcid.org/0000-0001-6948-6641) contributed to the conception and design of the project, the conduct and oversight of the study, and review of the report.
Dr Joel Mawdsley (https://orcid.org/0000-0002-1637-1952) contributed to recruitment, data acquisition, the conduct of the study and review of the report.
Dr Simon McLaughlin (https://orcid.org/0000-0003-4390-1485) contributed to recruitment, data acquisition, the conduct of the study and review of the report.
Mr Samir Mehta (https://orcid.org/0000-0001-7096-513X) contributed to the design of the study, supervised the statistical analyses and the interpretation of the results and contributed to the writing and editing of the report.
Dr Kevin Monahan (https://orcid.org/0000-0002-7918-4003) contributed to recruitment, data acquisition, the conduct of the study and review of the report.
Professor Dion Morton (https://orcid.org/0000-0001-6784-1689) contributed to the conception and design of the project, the conduct and oversight of the study, the interpretation of the results and the writing and editing of the report.
Dr Senthil Murugesan (https://orcid.org/0000-0001-6816-9097) contributed to recruitment, data acquisition, the conduct of the study and review of the report.
Dr Miles Parkes (https://orcid.org/0000-0002-6467-0631) contributed to recruitment, data acquisition, the conduct of the study and review of the report.
Dr Valerie Pestinger (https://orcid.org/0000-0002-6203-3073) contributed to the conduct of the study, data acquisition, the conduct of the study and review of the report.
Professor Chris Probert (https://orcid.org/0000-0003-4550-0239) contributed to recruitment, data acquisition, the conduct of the study and review of the report.
Dr Arvind Ramadas (https://orcid.org/0000-0001-7353-2516) contributed to recruitment, data acquisition, the conduct of the study and review of the report.
Dr Alessandro Rettino (https://orcid.org/0000-0002-8679-1936) contributed to the conduct of the project, data acquisition, the interpretation of the results and the writing and editing of the report.
Dr Shaji Sebastian (https://orcid.org/0000-0002-3670-6545) contributed to the conduct of the study, recruitment, data acquisition, the interpretation of the results and review of the report.
Dr Naveen Sharma (https://orcid.org/0000-0002-2298-654X) contributed to the design of the project, the conduct of the study, recruitment, data acquisition, the interpretation of the results and review of the report.
Professor Michael Griffiths (https://orcid.org/0000-0001-5112-2882) contributed to the conception and design of the project, the conduct of the study and review of the report.
Dr Joanne Stockton (https://orcid.org/0000-0002-5797-8275) contributed to the conduct of the study, data acquisition, the conduct of the study and review of the report.
Dr Venkat Subramanian (https://orcid.org/0000-0003-3603-0861) contributed to recruitment, data acquisition, the conduct of the study and review of the report.
Mr Nigel Suggett (https://orcid.org/0000-0002-9542-3465) contributed to the conception and design of the project, the conduct of the study, recruitment, data acquisition, the interpretation of the results and review of the report.
Dr Philippe Taniere (https://orcid.org/0000-0002-4638-4551) contributed to the conception and design of the project, the conduct of the study, data acquisition, the interpretation of the results and the editing of the report.
Professor Julian Teare (https://orcid.org/0000-0003-3551-9139) contributed to recruitment, data acquisition, the conduct of the study and review of the report.
Dr Ajay M Verma (https://orcid.org/0000-0002-6432-3357) contributed to recruitment, data acquisition, the conduct of the study and review of the report.
Dr Yvonne Wallis (https://orcid.org/0000-0002-5079-967X) contributed to the conception and design of the project, the conduct of the study, the interpretation of the results and the editing of the report.
Data-sharing statement
All data requests should be submitted to the corresponding author for consideration. Access to available anonymised data may be granted following review.
Patient data
This work uses data provided by patients and collected by the NHS as part of their care and support. Using patient data is vital to improve health and care for everyone. There is huge potential to make better use of information from people’s patient records, to understand more about disease, develop new treatments, monitor safety, and plan NHS services. Patient data should be kept safe and secure, to protect everyone’s privacy, and it’s important that there are safeguards to make sure that it is stored and used responsibly. Everyone should be able to find out about how patient data are used. #datasaveslives You can find out more about the background to this citation here: https://understandingpatientdata.org.uk/data-citation.
Disclaimers
This report presents independent research. The views and opinions expressed by authors in this publication are those of the authors and do not necessarily reflect those of the NHS, the NIHR, the MRC, NETSCC, the EME programme or the Department of Health and Social Care. If there are verbatim quotations included in this publication the views and opinions expressed by the interviewees are those of the interviewees and do not necessarily reflect those of the authors, those of the NHS, the NIHR, NETSCC, the EME programme or the Department of Health and Social Care.
References
- Romano M, DE Francesco F, Zarantonello L, Ruffolo C, Ferraro GA, Zanus G, et al. From inflammation to cancer in inflammatory bowel disease: molecular perspectives. Anticancer Res 2016;36:1447-60.
- Triantafillidis JK, Nasioulas G, Kosmidis PA. Colorectal cancer and inflammatory bowel disease: epidemiology, risk factors, mechanisms of carcinogenesis and prevention strategies. Anticancer Res 2009;29:2727-37.
- Shu X, Ji J, Sundquist J, Sundquist K, Hemminki K. Survival in cancer patients hospitalised for inflammatory bowel disease in Sweden. Inflamm Bowel Dis 2011;17:816-22. https://doi.org/10.1002/ibd.21380.
- Lukas M. Inflammatory bowel disease as a risk factor for colorectal cancer. Dig Dis 2010;28:619-24. https://doi.org/10.1159/000320276.
- Zhen Y, Luo C, Zhang H. Early detection of ulcerative colitis-associated colorectal cancer. Gastroenterol Rep 2018;6:83-92. https://doi.org/10.1093/gastro/goy010.
- National Institute for Health and Care Excellence (NICE) . Colorectal Cancer Prevention: Colonoscopic Surveillance in Adults With Ulcerative Colitis, Crohn’s Disease or Adenomas 2011.
- Cairns S, Scholefield JH. Guidelines for colorectal cancer screening in high risk groups. Gut 2002;51:V1-2. https://doi.org/10.1136/gut.51.suppl_5.v1.
- Cairns SR, Scholefield JH, Steele RJ, Dunlop MG, Thomas HJ, Evans GD, et al. Guidelines for colorectal cancer screening and surveillance in moderate and high risk groups (update from 2002). Gut 2010;59:666-89. https://doi.org/10.1136/gut.2009.179804.
- Iacucci M, Kaplan GG, Panaccione R, Akinola O, Lethebe BC, Lowerison M, et al. A randomised trial comparing high definition colonoscopy alone with high definition dye spraying and electronic virtual chromoendoscopy for detection of colonic neoplastic lesions during IBD surveillance colonoscopy. Am J Gastroenterol 2018;113:225-34. https://doi.org/10.1038/ajg.2017.417.
- Desai D, Desai N. Colorectal cancer surveillance in inflammatory bowel disease: a critical analysis. World J Gastrointest Endosc 2014;6:541-8. https://doi.org/10.4253/wjge.v6.i11.541.
- Azarschab P, Stembalska A, Loncar MB, Pfister M, Sasiadek MM, Blin N. Epigenetic control of E-cadherin (CDH1) by CpG methylation in metastasising laryngeal cancer. Oncol Rep 2003;10:501-3. https://doi.org/10.3892/or.10.2.501.
- Sato F, Shibata D, Harpaz N, Xu Y, Yin J, Mori Y, et al. Aberrant methylation of the HPP1 gene in ulcerative colitis-associated colorectal carcinoma. Cancer Res 2002;62:6820-2.
- Tominaga K, Fujii S, Mukawa K, Fujita M, Ichikawa K, Tomita S, et al. Prediction of colorectal neoplasia by quantitative methylation analysis of estrogen receptor gene in nonneoplastic epithelium from patients with ulcerative colitis. Clin Cancer Res 2005;11:8880-5. https://doi.org/10.1158/1078-0432.CCR-05-1309.
- Osborn NK, Zou H, Molina JR, Lesche R, Lewin J, Lofton-Day C, et al. Aberrant methylation of the eyes absent 4 gene in ulcerative colitis-associated dysplasia. Clin Gastroenterol Hepatol 2006;4:212-18. https://doi.org/10.1016/j.cgh.2005.11.009.
- Moriyama T, Matsumoto T, Nakamura S, Jo Y, Mibu R, Yao T, et al. Hypermethylation of p14 (ARF) may be predictive of colitic cancer in patients with ulcerative colitis. Dis Colon Rectum 2007;50:1384-92. https://doi.org/10.1007/10350-007-0302-x.
- Kukitsu T, Takayama T, Miyanishi K, Nobuoka A, Katsuki S, Sato Y, et al. Aberrant crypt foci as precursors of the dysplasia-carcinoma sequence in patients with ulcerative colitis. Clin Cancer Res 2008;14:48-54. https://doi.org/10.1158/1078-0432.CCR-07-1835.
- Caldwell GM, Jones CE, Ashley AM, Wei W, Hejmadi RK, Morton DG, et al. Wnt signalling in adenomas of familial adenomatous polyposis patients. Br J Cancer 2010;103:910-17. https://doi.org/10.1038/sj.bjc.6605790.
- Caldwell GM, Jones C, Gensberg K, Jan S, Hardy RG, Byrd P, et al. The Wnt antagonist sFRP1 in colorectal tumorigenesis. Cancer Res 2004;64:883-8. https://doi.org/10.1158/0008-5472.CAN-03-1346.
- Caldwell GM, Jones CE, Taniere P, Warrack R, Soon Y, Matthews GM, et al. The Wnt antagonist sFRP1 is downregulated in premalignant large bowel adenomas. Br J Cancer 2006;94:922-7. https://doi.org/10.1038/sj.bjc.6602967.
- Dhir M, Montgomery EA, Glöckner SC, Schuebel KE, Hooker CM, Herman JG, et al. Epigenetic regulation of WNT signaling pathway genes in inflammatory bowel disease (IBD) associated neoplasia. J Gastrointest Surg 2008;12:1745-53. https://doi.org/10.1007/s11605-008-0633-5.
- Guo L, Zhong D, Lau S, Liu X, Dong XY, Sun X, et al. Sox7 Is an independent checkpoint for beta-catenin function in prostate and colon epithelial cells. Mol Cancer Res 2008;6:1421-30. https://doi.org/10.1158/1541-7786.MCR-07-2175.
- Weersma RK, Zhou L, Nolte IM, van der Steege G, van Dullemen HM, Oosterom E, et al. Runt-related transcription factor 3 is associated with ulcerative colitis and shows epistasis with solute carrier family 22, members 4 and 5. Inflamm Bowel Dis 2008;14:1615-22. https://doi.org/10.1002/ibd.20610.
- Garrity-Park MM, Loftus EV, Sandborn WJ, Bryant SC, Smyrk TC. Methylation status of genes in non-neoplastic mucosa from patients with ulcerative colitis-associated colorectal cancer. Am J Gastroenterol 2010;105:1610-19. https://doi.org/10.1038/ajg.2010.22.
- Beggs AD, Jones A, El-Bahrawy M, El-Bahwary M, Abulafi M, Hodgson SV, et al. Whole-genome methylation analysis of benign and malignant colorectal tumours. J Pathol 2013;229:697-704. https://doi.org/10.1002/path.4132.
- Beggs AD, James J, Caldwell G, Prout T, Dilworth MP, Taniere P, et al. Discovery and validation of methylation biomarkers for ulcerative colitis associated neoplasia. Inflamm Bowel Dis 2018;24:1503-9. https://doi.org/10.1093/ibd/izy119.
- Lutgens MW, van Oijen MG, van der Heijden GJ, Vleggaar FP, Siersema PD, Oldenburg B. Declining risk of colorectal cancer in inflammatory bowel disease: an updated meta-analysis of population-based cohort studies. Inflamm Bowel Dis 2013;19:789-99. https://doi.org/10.1097/MIB.0b013e31828029c0.
- Eaden JA, Mayberry JF. British Society for Gastroenterology . Guidelines for screening and surveillance of asymptomatic colorectal cancer in patients with inflammatory bowel disease. Gut 2002;51:V10-2. https://doi.org/10.1136/gut.51.suppl_5.v10.
- Leedham SJ, Graham TA, Oukrif D, McDonald SA, Rodriguez-Justo M, Harrison RF, et al. Clonality, founder mutations, and field cancerization in human ulcerative colitis-associated neoplasia. Gastroenterology 2009;136:542-50.e6. https://doi.org/10.1053/j.gastro.2008.10.086.
- Laine L, Kaltenbach T, Barkun A, McQuaid KR, Subramanian V, Soetikno R. SCENIC Guideline Development Panel . SCENIC international consensus statement on surveillance and management of dysplasia in inflammatory bowel disease. Gastrointest Endosc 2015;81:489-501.e26. https://doi.org/10.1016/j.gie.2014.12.009.
- Neumann H, Vieth M, Langner C, Neurath MF, Mudter J. Cancer risk in IBD: how to diagnose and how to manage DALM and ALM. World J Gastroenterol 2011;17:3184-91. https://doi.org/10.3748/wjg.v17.i27.3184.
- Naymagon S, Ullman TA. Chromoendoscopy and dysplasia surveillance in inflammatory bowel disease: past, present, and future. Gastroenterol Hepatol 2015;11:304-11.
- Bird A. DNA methylation patterns and epigenetic memory. Genes Dev 2002;16:6-21. https://doi.org/10.1101/gad.947102.
- Shen L, Kondo Y, Rosner GL, Xiao L, Hernandez NS, Vilaythong J, et al. MGMT promoter methylation and field defect in sporadic colorectal cancer. J Natl Cancer Inst 2005;97:1330-8. https://doi.org/10.1093/jnci/dji275.
- Beggs AD, Domingo E, Abulafi M, Hodgson SV, Tomlinson IP. A study of genomic instability in early preneoplastic colonic lesions. Oncogene 2013;32:5333-7. https://doi.org/10.1038/onc.2012.584.
- Luo Y, Yu M, Grady WM. Field cancerization in the colon: a role for aberrant DNA methylation? Gastroenterol Rep (Oxf) 2014;2:16-20. https://doi.org/10.1093/gastro/got039.
- O’Brien PC, Fleming TR. A multiple testing procedure for clinical trials. Biometrics 1979;35:549-56. https://doi.org/10.2307/2530245.
- Steyerberg EW. Clinical Prediction Models: A Practical Approach to Development, Validation, and Updating. New York, NY: Springer-Verlag New York; 2009.
- Feber A, Dhami P, Dong L, de Winter P, Tan WS, Martínez-Fernández M, et al. UroMark-a urinary biomarker assay for the detection of bladder cancer. Clin Epigenetics 2017;9. https://doi.org/10.1186/s13148-016-0303-5.
- Cancer Genome Atlas Network . Comprehensive molecular characterisation of human colon and rectal cancer. Nature 2012;487:330-7. https://doi.org/10.1038/nature11252.
- Brand RE, Nolen BM, Zeh HJ, Allen PJ, Eloubeidi MA, Goldberg M, et al. Serum biomarker panels for the detection of pancreatic cancer. Clin Cancer Res 2011;17:805-16. https://doi.org/10.1158/1078-0432.CCR-10-0248.
- Goodison S, Ogawa O, Matsui Y, Kobayashi T, Miyake M, Ohnishi S, et al. A multiplex urinary immunoassay for bladder cancer detection: analysis of a Japanese cohort. J Transl Med 2016;14. https://doi.org/10.1186/s12967-016-1043-1.
- Jia J, Wang W, Meng W, Ding M, Ma S, Wang X. Development of a multiplex autoantibody test for detection of lung cancer. PLOS ONE 2014;9. https://doi.org/10.1371/journal.pone.0095444.
- Ehrlich M. DNA hypomethylation in cancer cells. Epigenomics 2009;1:239-59. https://doi.org/10.2217/epi.09.33.
- Lange V, Böhme I, Hofmann J, Lang K, Sauter J, Schöne B, et al. Cost-efficient high-throughput HLA typing by MiSeq amplicon sequencing. BMC Genomics 2014;15. https://doi.org/10.1186/1471-2164-15-63.
- Li Z, Guo X, Wu Y, Li S, Yan J, Peng L, et al. Methylation profiling of 48 candidate genes in tumor and matched normal tissues from breast cancer patients. Breast Cancer Res Treat 2015;149:767-79. https://doi.org/10.1007/s10549-015-3276-8.
- Shen J, LeFave C, Sirosh I, Siegel AB, Tycko B, Santella RM. Integrative epigenomic and genomic filtering for methylation markers in hepatocellular carcinomas. BMC Med Genomics 2015;8. https://doi.org/10.1186/s12920-015-0105-1.
- Krueger F, Andrews SR. Bismark: a flexible aligner and methylation caller for Bisulfite-Seq applications. Bioinformatics 2011;27:1571-2. https://doi.org/10.1093/bioinformatics/btr167.
- Li LC, Dahiya R. MethPrimer: designing primers for methylation PCRs. Bioinformatics 2002;18:1427-31. https://doi.org/10.1093/bioinformatics/18.11.1427.
- Redshaw N, Huggett JF, Taylor MS, Foy CA, Devonshire AS. Quantification of epigenetic biomarkers: an evaluation of established and emerging methods for DNA methylation analysis. BMC Genomics 2014;15. https://doi.org/10.1186/1471-2164-15-1174.
- Korbie D, Lin E, Wall D, Nair SS, Stirzaker C, Clark SJ, et al. Multiplex bisulfite PCR resequencing of clinical FFPE DNA. Clin Epigenetics 2015;7. https://doi.org/10.1186/s13148-015-0067-3.
- Robbe P, Popitsch N, Knight SJL, Antoniou P, Becq J, He M, et al. Clinical whole-genome sequencing from routine formalin-fixed, paraffin-embedded specimens: pilot study for the 100,000 Genomes Project. Genet Med 2018;20:1196-205. https://doi.org/10.1038/gim.2017.241.
- World Medical Association . Declaration of Helsinki: ethical principles for medical research involving human subjects. J. American Med Assoc 2013;310:2191-4. https://doi.org/10.1001/jama.2013.281053.
- Department of Health and Social Care . Research Governance Framework for Health and Social Care. 2005. https://assets.publishing.service.gov.uk/government/uploads/system/uploads/attachment_data/file/139565/dh_4122427.pdf (accessed September 2019).
- UK Act of Parliament . An Act to Make New Provision for the Regulation of the Processing of Information Relating to Individuals, Including the Obtaining, Holding, Use or Disclosure of Such Information 1998. www.legislation.gov.uk/ukpga/1998/29 (accessed September 2019).
- Dixon . International conference on harmonisation guidelines for good clinical practice. Qual Assur 1998;6:65-74. https://doi.org/10.1080/105294199277860.
Appendix 1 Module 1: figures and tables
| Biomarker | Chromosomal position | Forward primer (5′–3′) | Reverse primer (5′–3′) | Sequencing primer (5′–3′) | Annealing temperature (°C) |
|---|---|---|---|---|---|
| SFRP1 | Chr12: 65,444,407–65,515,116 | GGGTGTTTTTGTTTAATAAGAATTGT | ACTTAAACATCTCCAACCAATAAAAACC | GTTGAGGGAGTTGTAG | 56 |
| SFRP2 | Chr4: BP 1547103XX–1547103XX | Qiagen assay ID PM00018809 | 56 | ||
| SFRP4 | Chr7: BP 379558XX–379558XX | Qiagen assay ID PM00029834 | 56 | ||
| SFRP5 | Chr10: BP 995313XX–995314XX | Qiagen assay ID PM00147182 | 56 | ||
| WIF1 | Chr12: 65,444,407–65,515,116 | GTTTTGGTTGAGGGAGTTG | CCAACAAACACAAAAAAATACTCCA | GTTGAGGGAGTTGTAG | 56 |
| TUBB6 | Chr18: 12307624–12307734 | AGGAGTAGGTTGTATAGAT | Btn-TCTCCCAAAATACAAAAACCATTCCTCT | ATTAGGAGTAGGAGGTGTTTATT | 48 |
| SOX7 | Qiagen assay ID PM00138229 | 56 | |||
| APC1A | Chr5: 112072610–112073685 | GGGGTTAGGGTTAGGTAGG | TCCAACCAATTACACAACTACTTCTCTCT | AGGGTTAGGTAGGTT | 56 |
| APC2 | Chr19: 1449557–1450887 | AGTTTGTAGTGGGAGAGT | CTACCTACCTCCAACTCAAATAACAAC | GTTTGTAGTGGGAGAGTTA | 56 |
| MINT1 | Chr5: 75378746–75381277 | GTGTTGAGAGAGTTTGAAAGAAATATTAT | CCCAAAAAATTTTTACTAAATAAAAAC | GAATTTTTAAATTTTTTTATATATA | 56 |
| RUNX3 | Chr1: 25254900–25258752 | GGGAGTTAGGGGTAAATGTTAGAAAT | CCCCCAACCCCAAATTACAAAAATCACA | GGTAAATGTTAGAAATTTGTTTAGA | 56 |
| Biomarker | Amplification status | Sample, n (%) | Total (N = 569), n (%) | ||
|---|---|---|---|---|---|
| Neoplastic (N = 113) | Non-neoplastic (N = 113) | All controls (N = 343) | |||
| SFRP1 | Not amplified | 72 (63.7) | 84 (74.3) | 223 (65) | 379 (66.6) |
| Amplified | 39 (34.5) | 29 (25.7) | 119 (34.7) | 187 (32.9) | |
| Not done | 2 (1.8) | 0 (0) | 1 (0.3) | 3 (0.5) | |
| SFRP2 | Not amplified | 8 (7.1) | 7 (6.2) | 38 (11.1) | 53 (9.3) |
| Amplified | 105 (92.9) | 106 (93.8) | 305 (88.9) | 516 (90.7) | |
| Not done | 0 (0) | 0 (0) | 0 (0) | 0 (0) | |
| SFRP4 | Not amplified | 5 (4.4) | 4 (3.5) | 30 (8.7) | 39 (6.9) |
| Amplified | 108 (95.6) | 109 (96.5) | 313 (91.3) | 530 (93.1) | |
| Not done | 0 (0) | 0 (0) | 0 (0) | 0 (0) | |
| SFRP5 | Not amplified | 3 (2.7) | 1 (0.9) | 16 (4.7) | 20 (3.5) |
| Amplified | 110 (97.3) | 112 (99.1) | 323 (94.2) | 545 (95.8) | |
| Not done | 0 (0) | 0 (0) | 4 (1.2) | 4 (0.7) | |
| WIF1 | Not amplified | 7 (6.2) | 8 (7.1) | 45 (13.1) | 60 (10.5) |
| Amplified | 106 (93.8) | 105 (92.9) | 294 (85.7) | 505 (88.8) | |
| Not done | 0 (0) | 0 (0) | 4 (1.2) | 4 (0.7) | |
| TUBB6 | Not amplified | 3 (2.7) | 9 (8) | 23 (6.7) | 35 (6.2) |
| Amplified | 110 (97.3) | 104 (92) | 316 (92.1) | 530 (93.1) | |
| Not done | 0 (0) | 0 (0) | 4 (1.2) | 4 (0.7) | |
| SOX7 | Not amplified | 9 (8) | 1 (0.9) | 47 (13.7) | 57 (10) |
| Amplified | 104 (92) | 112 (99.1) | 292 (85.1) | 508 (89.3) | |
| Not done | 0 (0) | 0 (0) | 4 (1.2) | 4 (0.7) | |
| APC1A | Not amplified | 2 (1.8) | 5 (4.4) | 20 (5.8) | 27 (4.7) |
| Amplified | 111 (98.2) | 108 (95.6) | 319 (93) | 538 (94.6) | |
| Not done | 0 (0) | 0 (0) | 4 (1.2) | 4 (0.7) | |
| APC2 | Not amplified | 2 (1.8) | 7 (6.2) | 17 (5) | 26 (4.6) |
| Amplified | 111 (98.2) | 106 (93.8) | 322 (93.9) | 539 (94.7) | |
| Not done | 0 (0) | 0 (0) | 4 (1.2) | 4 (0.7) | |
| MINT1 | Not amplified | 33 (29.2) | 26 (23) | 102 (29.7) | 161 (28.3) |
| Amplified | 80 (70.8) | 87 (77) | 238 (69.4) | 405 (71.2) | |
| Not done | 0 (0) | 0 (0) | 3 (0.9) | 3 (0.5) | |
| RUNX3 | Not amplified | 23 (20.4) | 12 (10.6) | 80 (23.3) | 115 (20.2) |
| Amplified | 90 (79.6) | 101 (89.4) | 259 (75.5) | 450 (79.1) | |
| Not done | 0 (0) | 0 (0) | 4 (1.2) | 4 (0.7) | |
| Methylation marker (sample/control) | Number of values imputed | Coefficienta | 95% CI | p-value |
|---|---|---|---|---|
| Log-SFRP2 | 48 | 0.790 | 0.21 to 1.37 | 0.008 |
| Log-SFRP4 | 36 | 2.690 | 1.63 to 3.75 | < 0.0005 |
| Log-WIF1 | 60 | 0.169 | –0.27 to 0.61 | 0.452 |
| Log-APC1A | 57 | 0.427 | 0.09 to 0.76 | 0.013 |
| Log-APC2 | 23 | 1.157 | 0.55 to 1.76 | < 0.0005 |
| Constant term | – | –17.742 | –21.73 to –13.75 | < 0.0005 |
| Methylation marker (sample/control) | Number of values imputed | Coefficienta | 95% CI | p-value |
|---|---|---|---|---|
| Log-SFRP2 | 48 | 1.008 | 0.26 to 1.76 | 0.009 |
| Log-SFRP4 | 36 | 4.094 | 2.62 to 5.57 | < 0.001 |
| Log-WIF1 | 57 | 0.116 | –0.41 to 0.64 | 0.667 |
| Log-APC1A | 57 | 0.793 | 0.32 to 1.27 | 0.001 |
| Log-APC2 | 23 | 0.796 | 0.12 to 1.4 | 0.021 |
| Constant term | – | –22.988 | –28.79 to –17.19 | < 0.001 |
| Methylation marker (sample/control) | Number of values imputed | Coefficienta | 95% CI | p-value |
|---|---|---|---|---|
| Log-SFRP4 | 35 | 0.607 | –0.17 to 1.39 | 0.127 |
| Log-APC1A | 57 | 0.464 | 0.15 to 0.78 | 0.004 |
| Log-SFRP5 | 86 | –0.142 | –0.40 to 0.11 | 0.270 |
| Log-SOX7 | 70 | –0.539 | –0.84 to –0.24 | < 0.001 |
| Constant term | – | –2.540 | –5.30 to 0.22 | 0.071 |
| Model | Log-SFRP2 | Log-SFRP4 | Log-WIF1 | Log-APC1A | Log-APC2 | Constant | Cut-off point |
|---|---|---|---|---|---|---|---|
| Full model | |||||||
| 1 | 0.790341 | 2.68987 | 0.168881 | 0.426967 | 1.15658 | –17.7416 | 0.40 |
| Models missing one biomarker | |||||||
| 2 | 0.9269516 | 3.202865 | 0.4268864 | 0.4359665 | –16.95697 | 0.39 | |
| 3 | 0.7636128 | 2.746595 | 0.1808004 | 1.170222 | –17.57503 | 0.41 | |
| 4 | 0.8433857 | 2.710108 | 0.4288462 | 1.225026 | –17.71891 | 0.38 | |
| 5 | 1.033815 | 0.1984314 | 0.4600073 | 1.537024 | –10.08218 | 0.44 | |
| 6 | 2.926569 | 0.3321497 | 0.400415 | 1.25723 | –17.14115 | 0.42 | |
| Models missing two biomarkers | |||||||
| 7 | 0.9056502 | 3.251479 | 0.4481147 | –16.74635 | 0.36 | ||
| 8 | 1.093859 | 3.344528 | 0.4462922 | –16.76433 | 0.36 | ||
| 9 | 0.8201064 | 2.772632 | 1.244751 | –17.56854 | 0.41 | ||
| 10 | 1.291991 | 0.5715801 | 0.4782231 | –6.844074 | 0.38 | ||
| 11 | 1.019545 | 0.227554 | 1.561684 | –9.816336 | 0.44 | ||
| 12 | 1.094246 | 0.4661336 | 1.626908 | –9.997097 | 0.44 | ||
| 13 | 3.560993 | 0.6468267 | 0.4075435 | –16.23202 | 0.40 | ||
| 14 | 2.988017 | 0.3418931 | 1.268989 | –17.0741 | 0.42 | ||
| 15 | 3.000233 | 0.4011913 | 1.41747 | –17.00814 | 0.41 | ||
| 16 | 0.4182801 | 0.4323438 | 1.736938 | –8.405532 | 0.49 | ||
FIGURE 18.
The O’Brien and Fleming method36 boundary values. The x-axis represents the 16 different interim analysis stages and at each stage the batch are increased by 30 samples in a cumulative way and the 2 : 1 sampling ratio for control samples and neoplastic samples is maintained. At each interim analysis stage, methylation data for each biomarker is analysed using a t-test and the t-statistic computed is compared against the prespecified boundary values in the Figure 1.
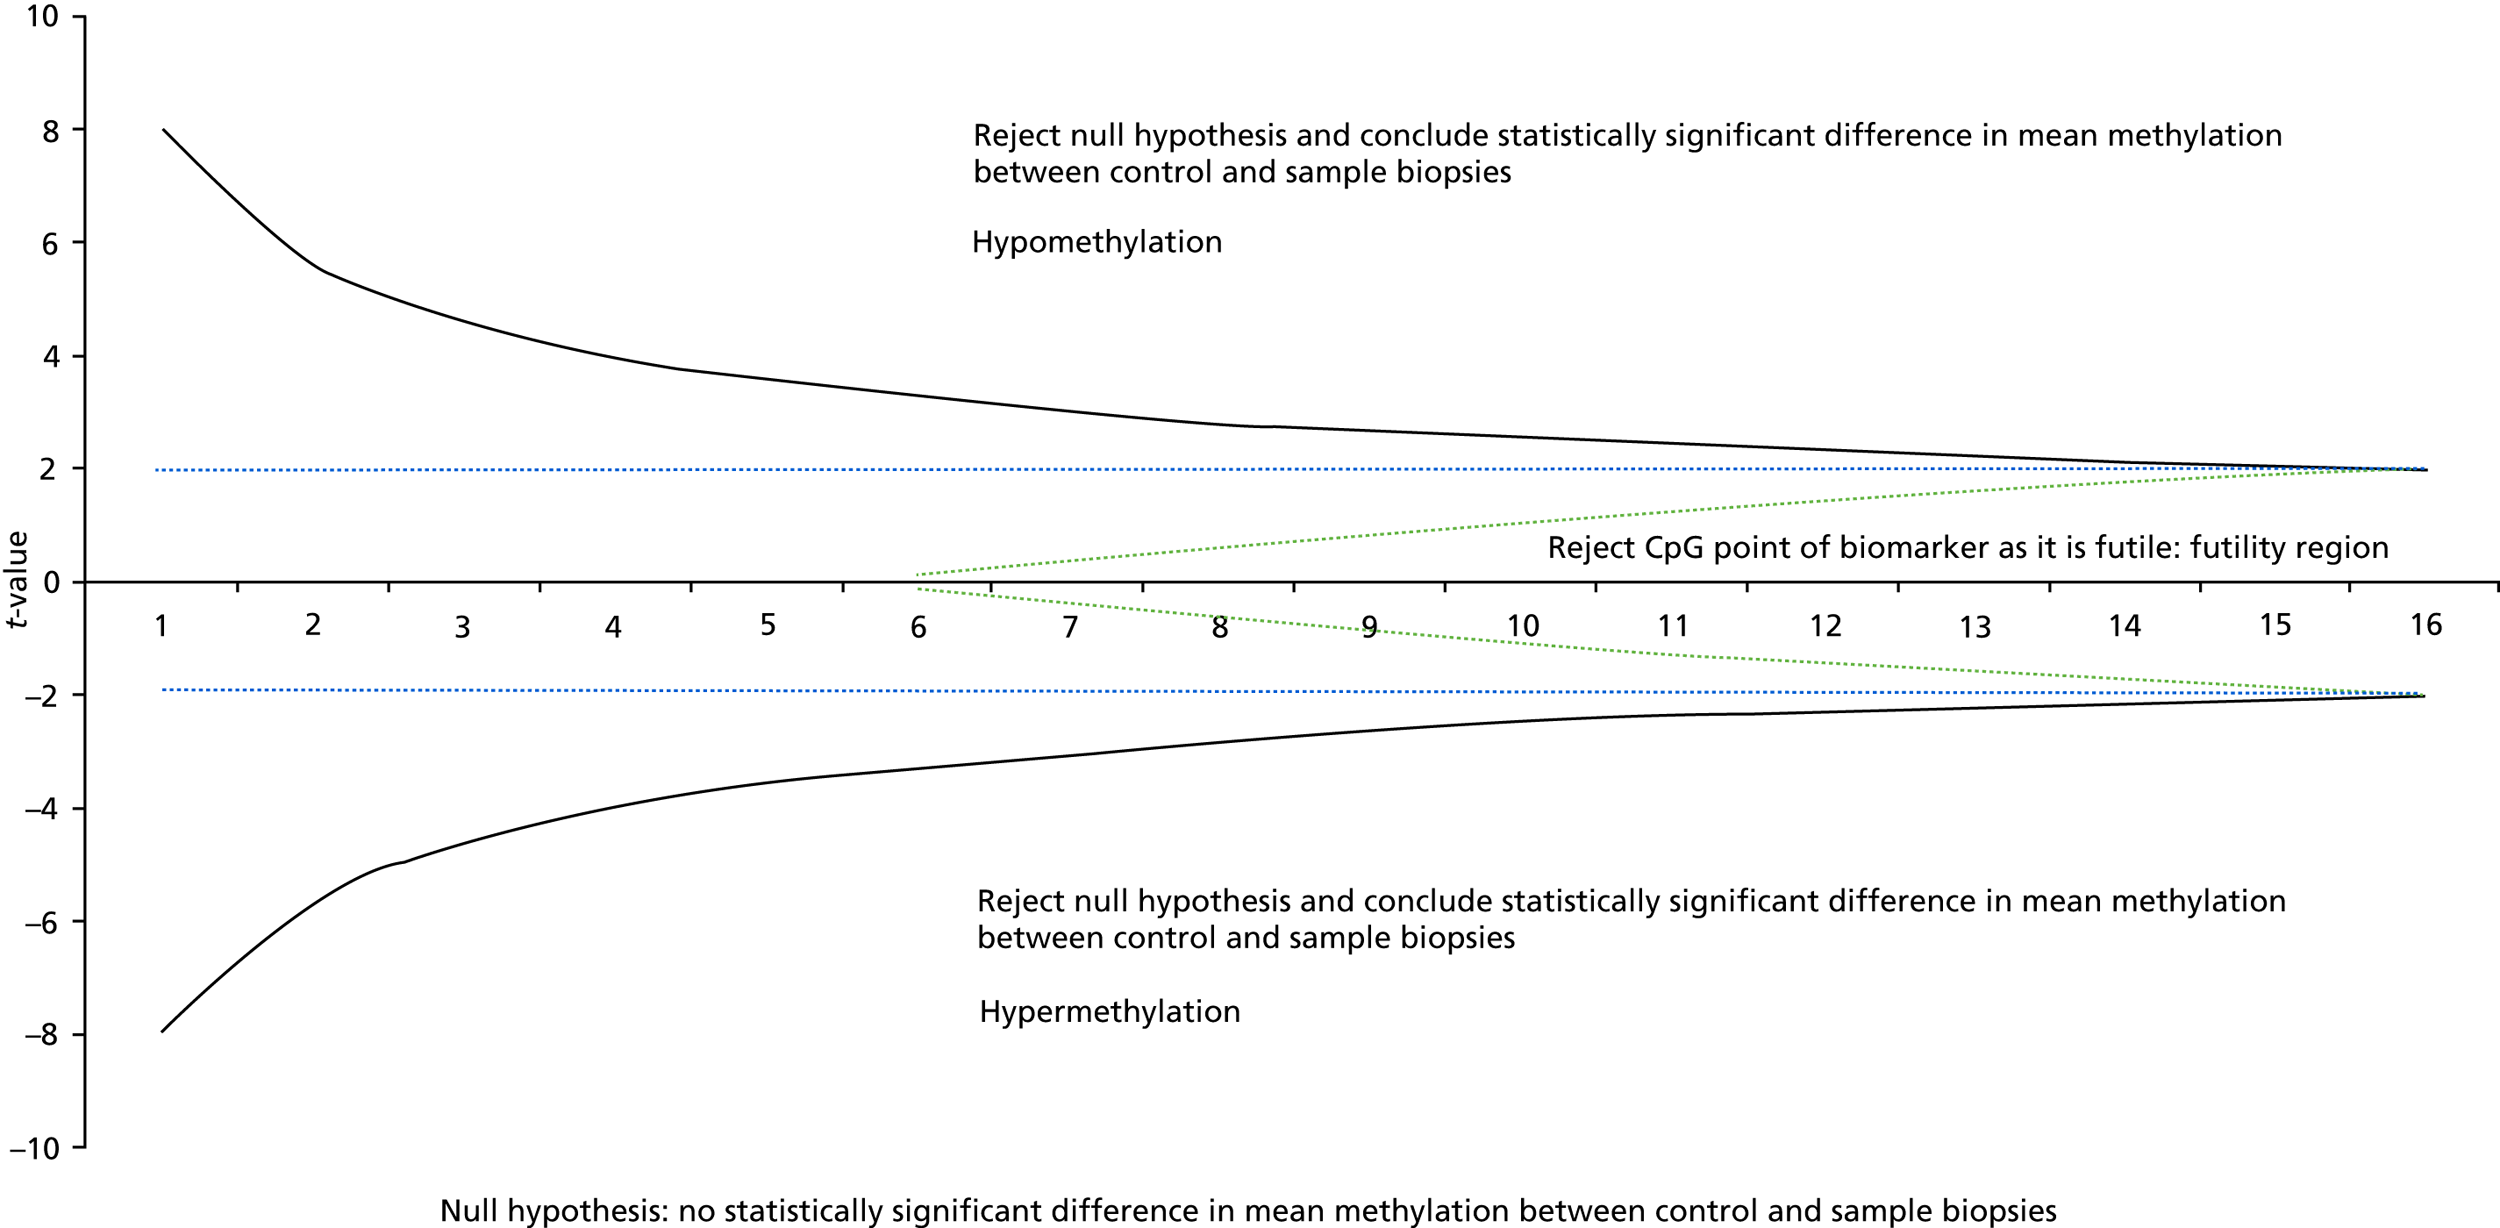
SAS code for the O’Brien-Fleming method boundary values
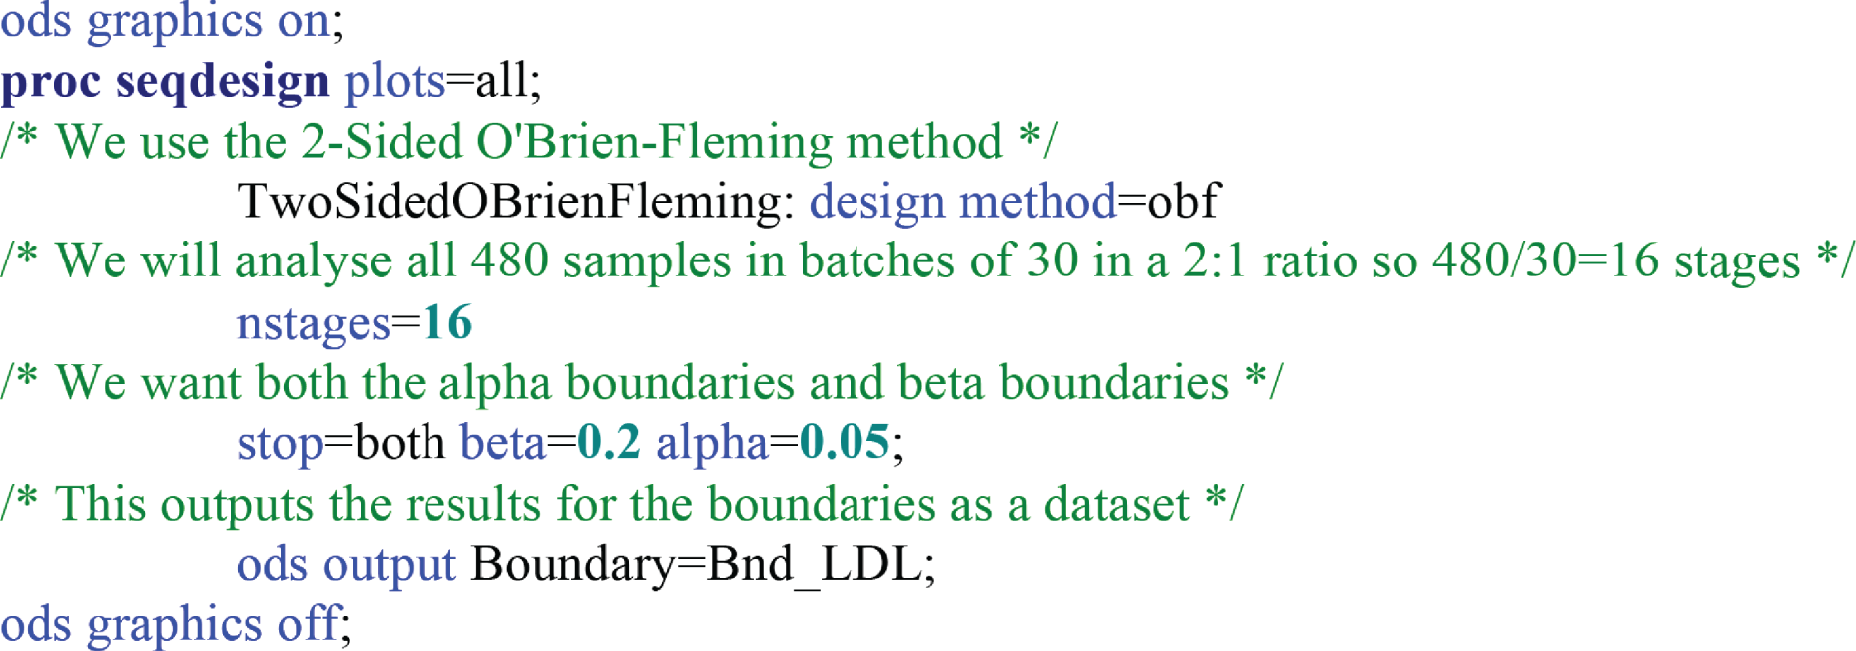
FIGURE 19.
Box plots of methylation value of SFRP2 for neoplastic, control and matched non-neoplastic mucosa.
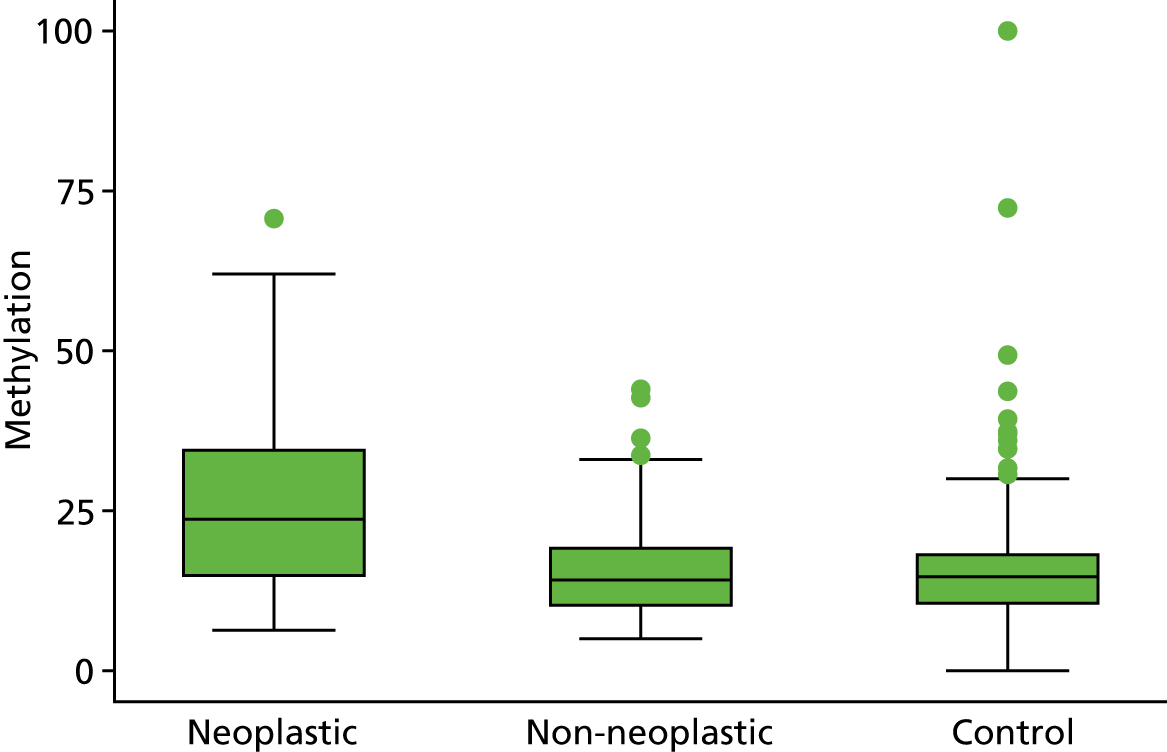
FIGURE 20.
Box plots of methylation value of SFRP4 for neoplastic, control and matched non-neoplastic mucosa.
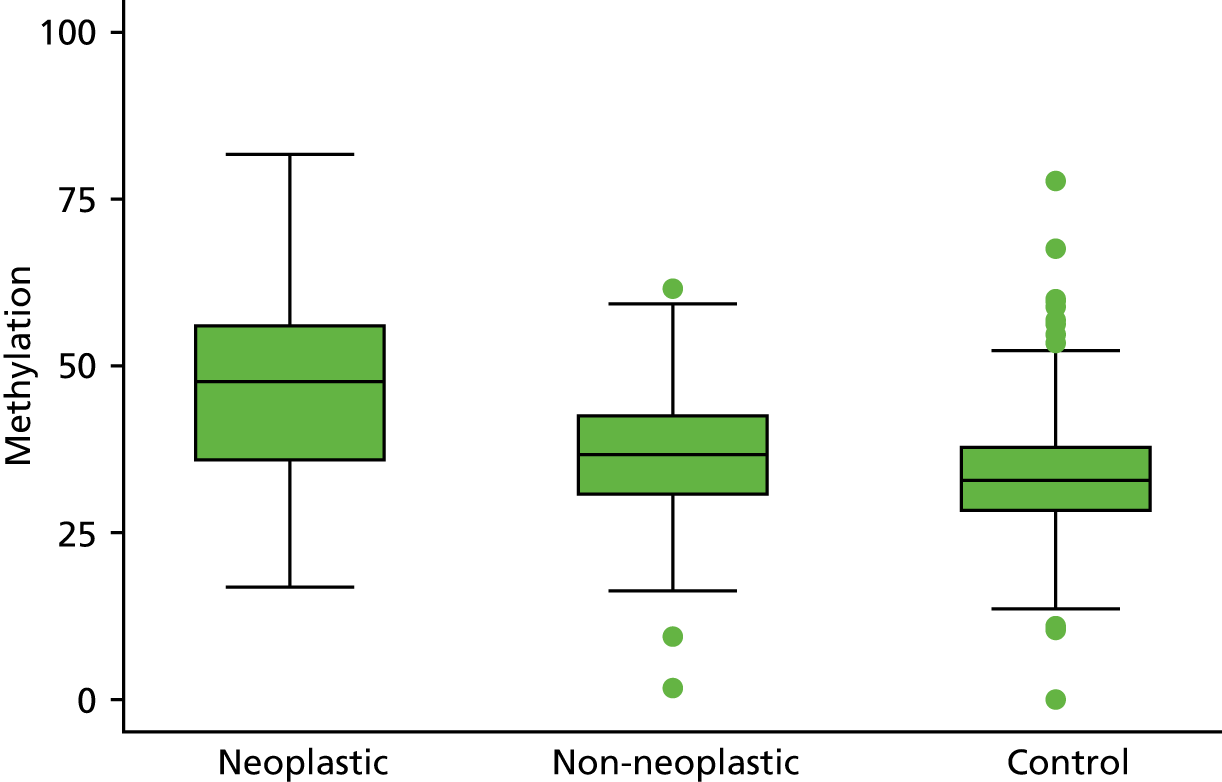
FIGURE 21.
Box plots of methylation value of WIF1 for neoplastic, control and matched non-neoplastic mucosa.
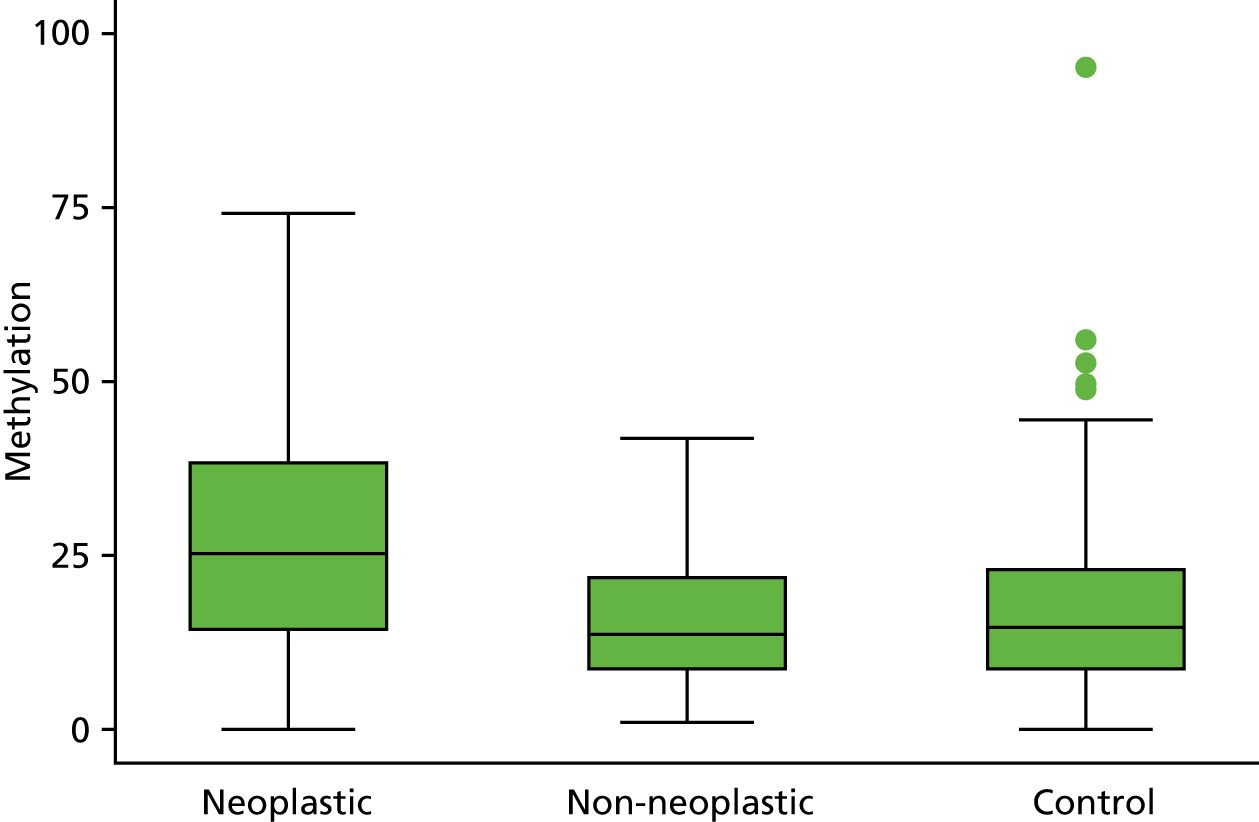
FIGURE 22.
Box plots of methylation value of APC1A for neoplastic, control and matched non-neoplastic mucosa.
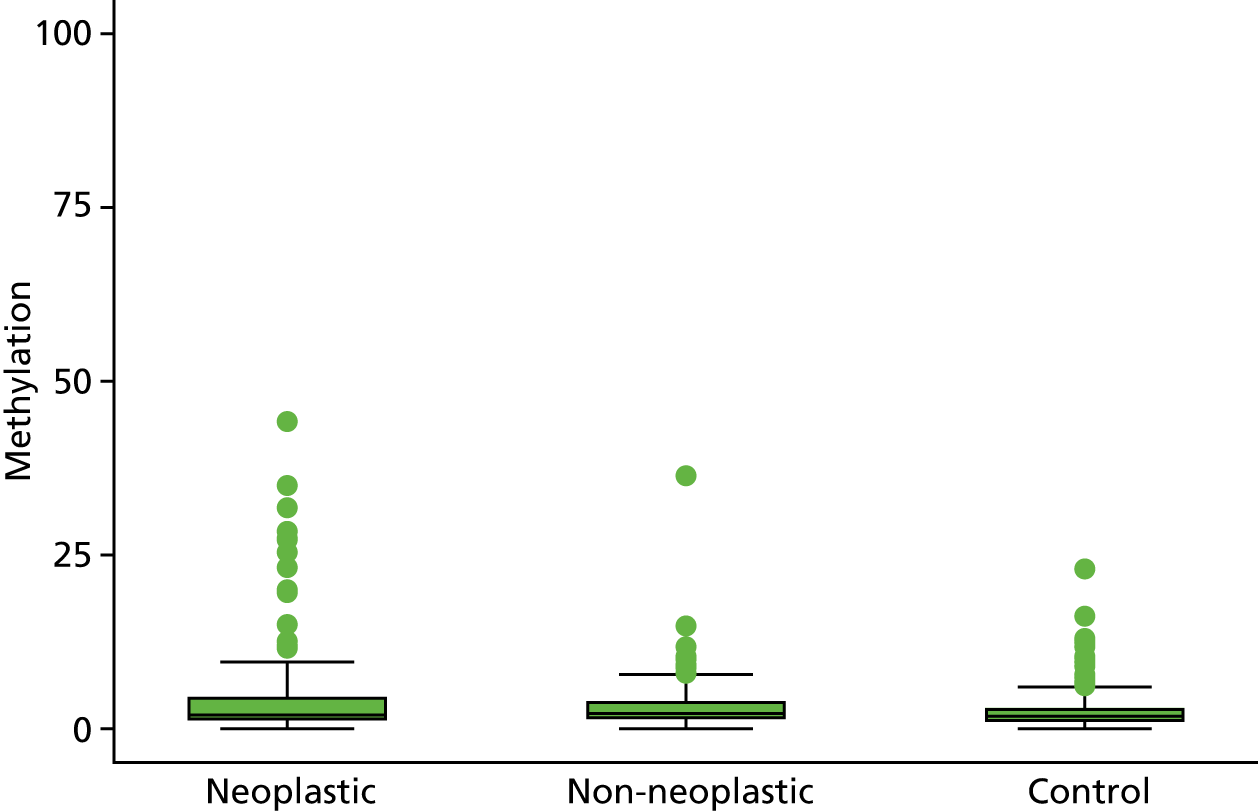
FIGURE 23.
Box plots of methylation value of APC2 for neoplastic, control and matched non-neoplastic mucosa.
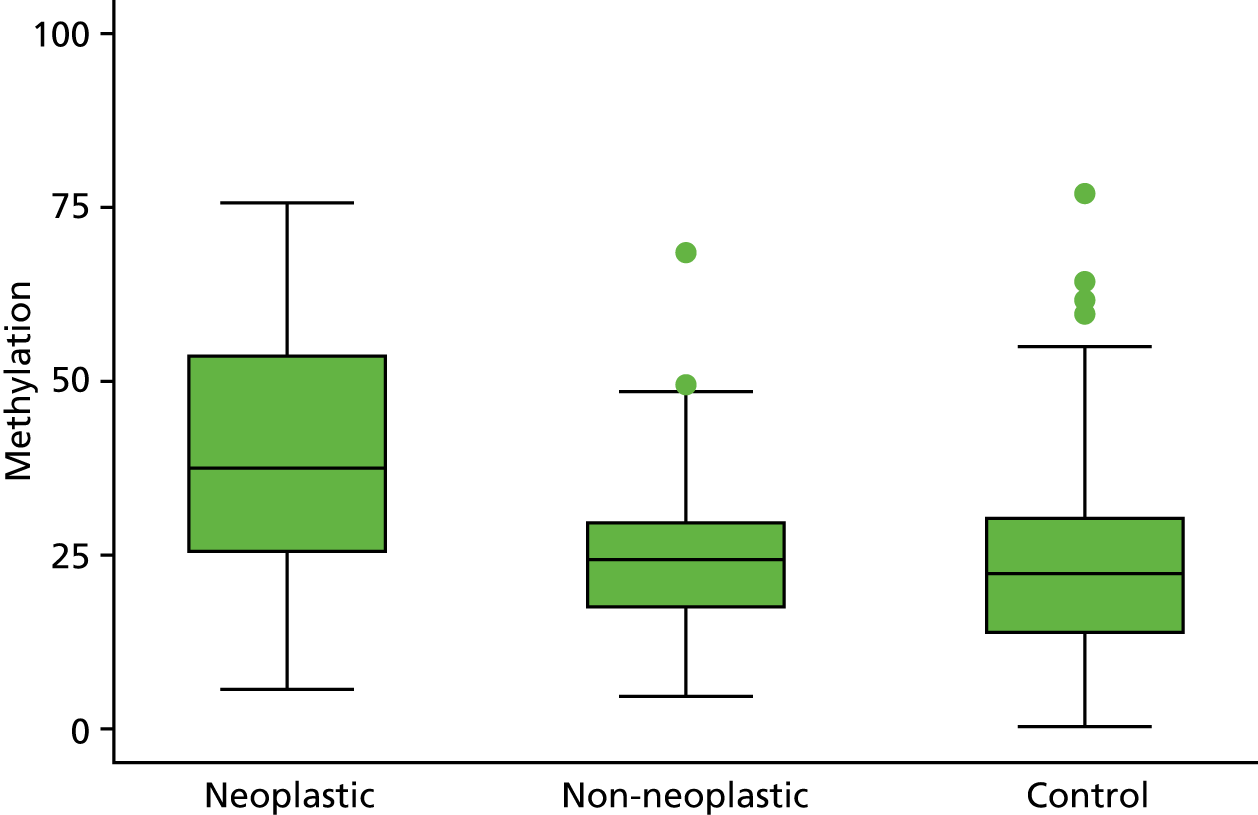
FIGURE 24.
Box plots of methylation value of SFRP1 for neoplastic, control and matched non-neoplastic mucosa.
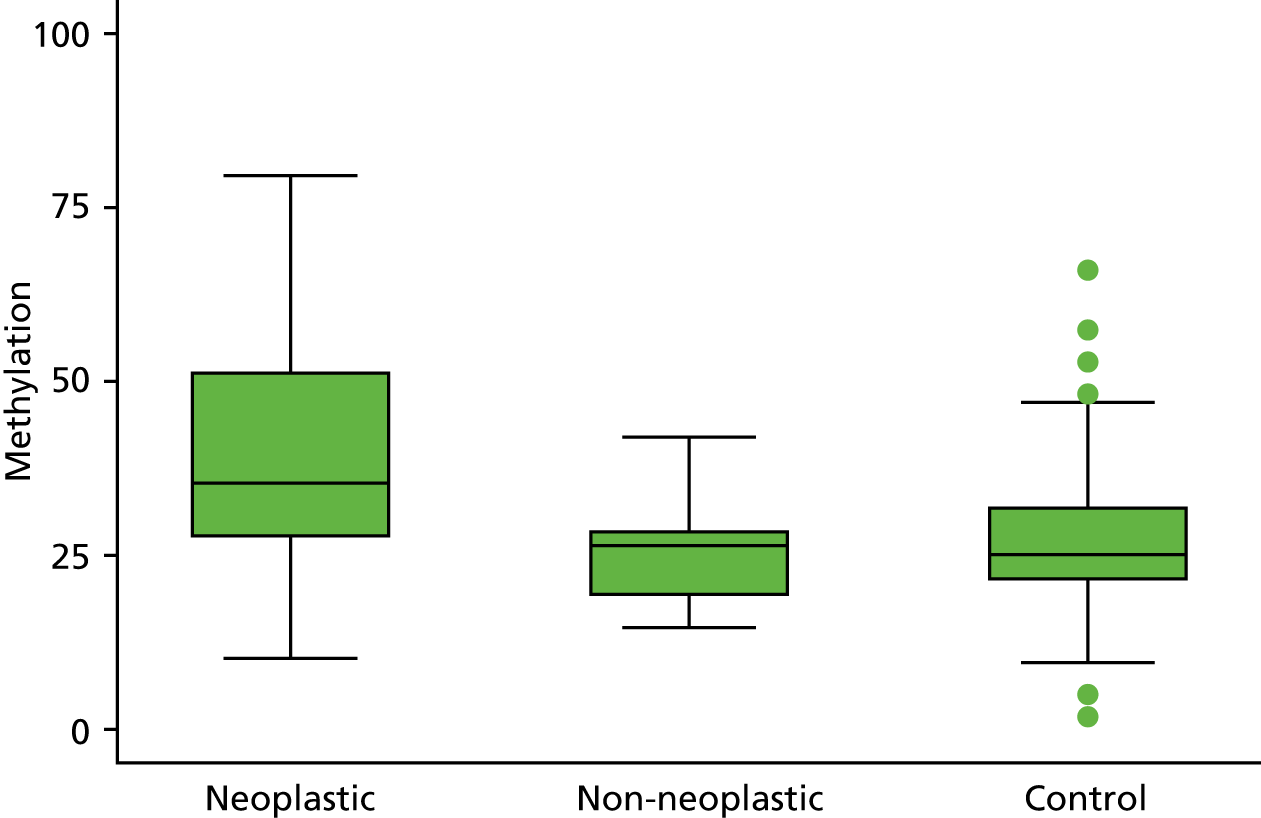
FIGURE 25.
Box plots of methylation value of SFRP5 for neoplastic, control and matched non-neoplastic mucosa.
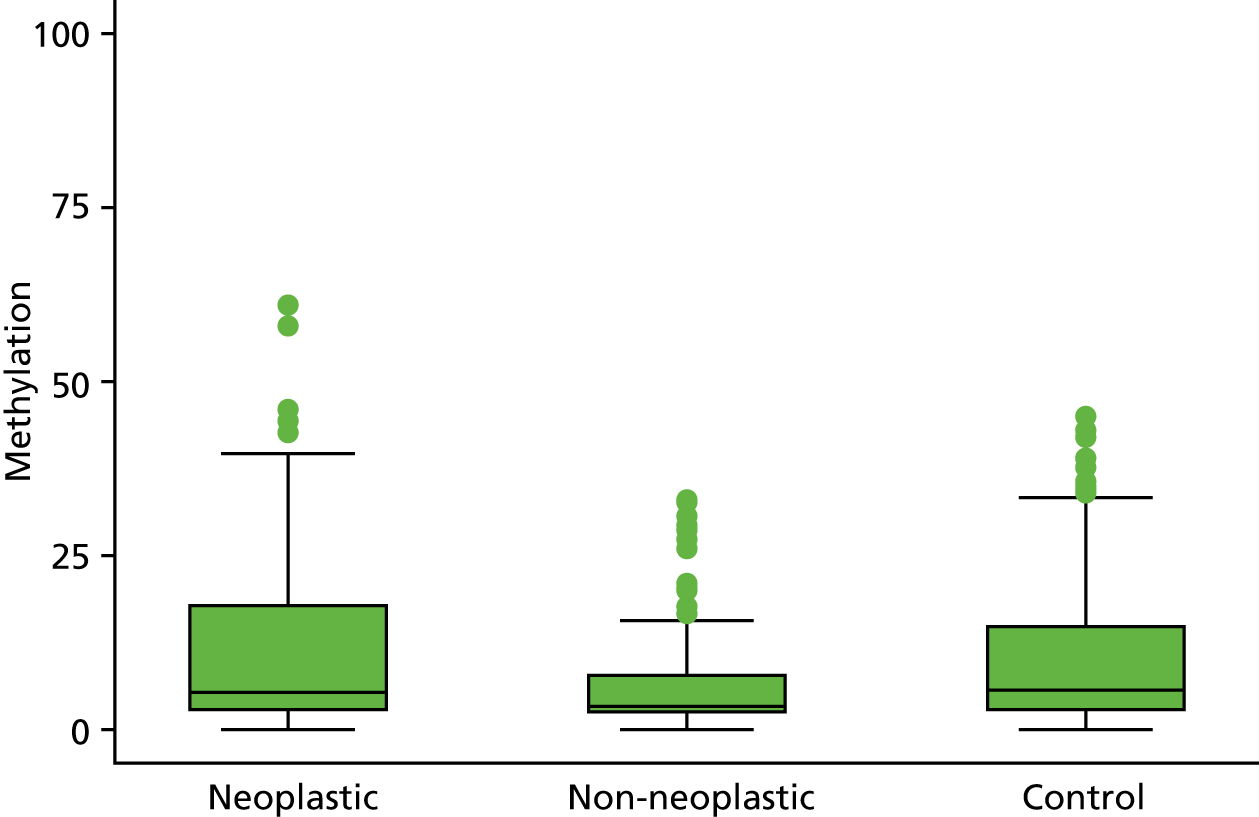
FIGURE 26.
Box plots of methylation value of MINT1 for neoplastic, control and matched non-neoplastic mucosa.
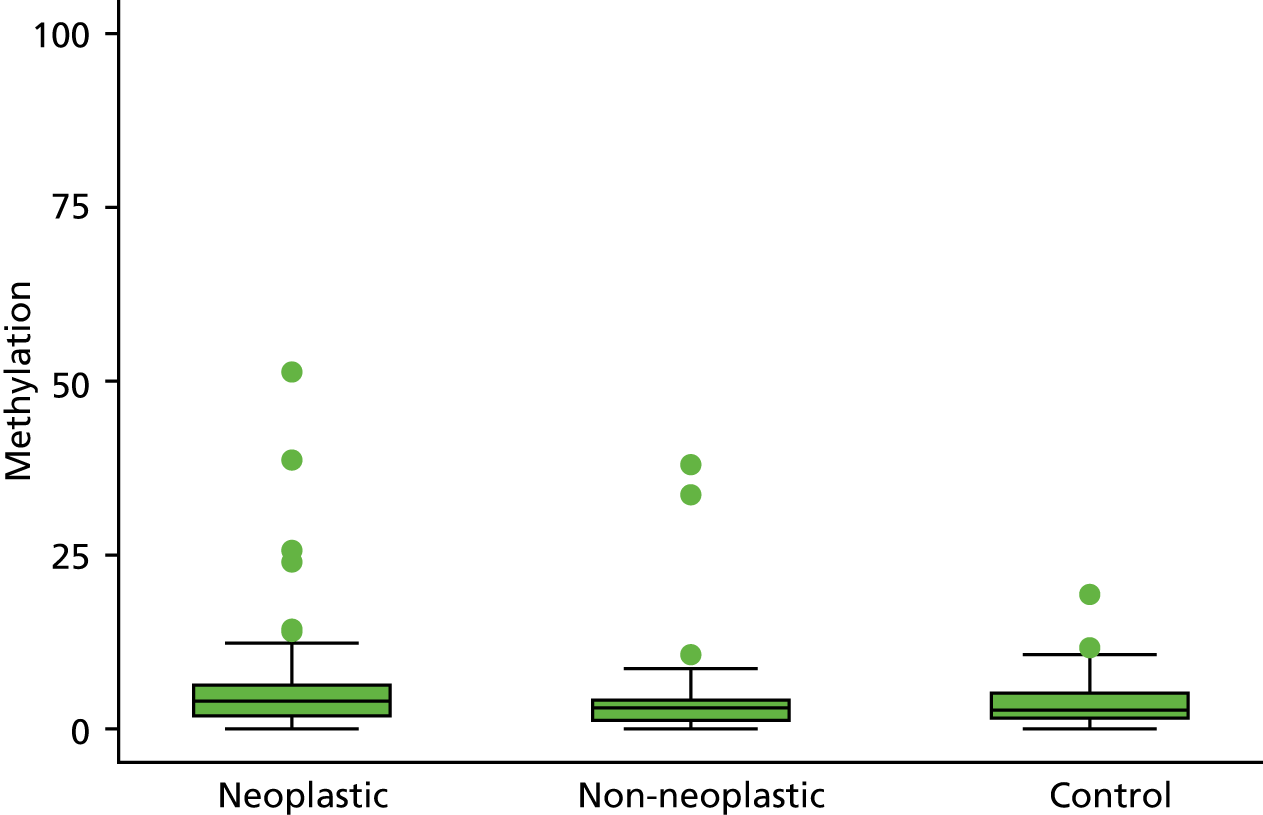
FIGURE 27.
Box plots of methylation value of RUNX for neoplastic, control and matched non-neoplastic mucosa.
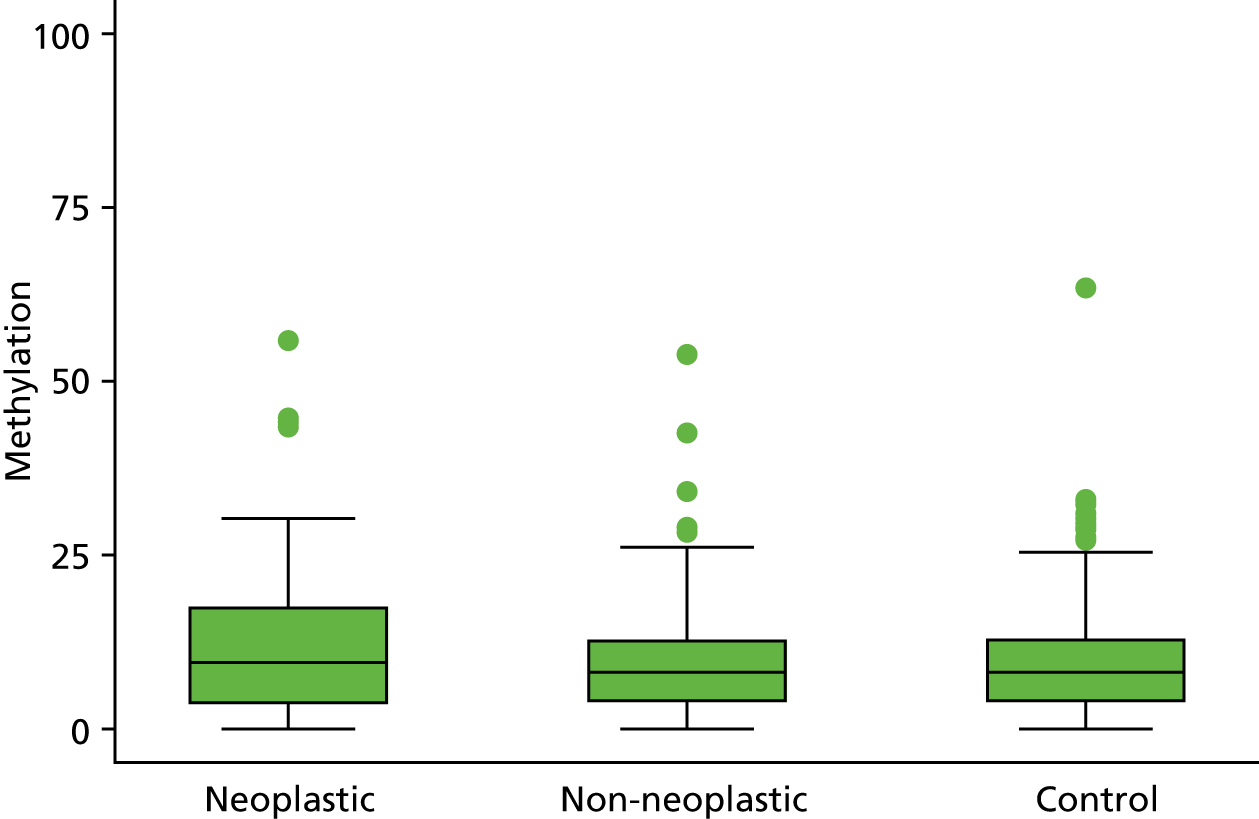
FIGURE 28.
Box plots of methylation value of SOX7 for neoplastic, control and matched non-neoplastic mucosa.
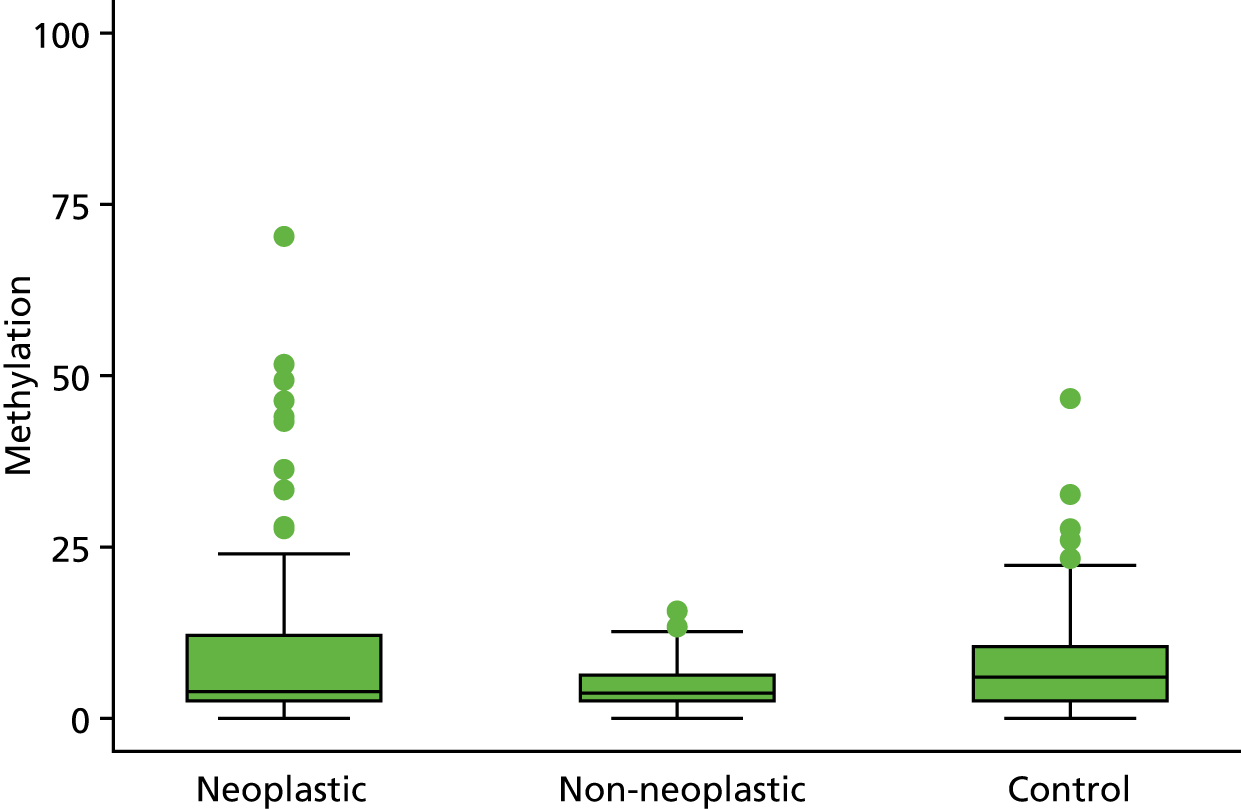
FIGURE 29.
Box plots of methylation value of TUBB6 for neoplastic, control and matched non-neoplastic mucosa.
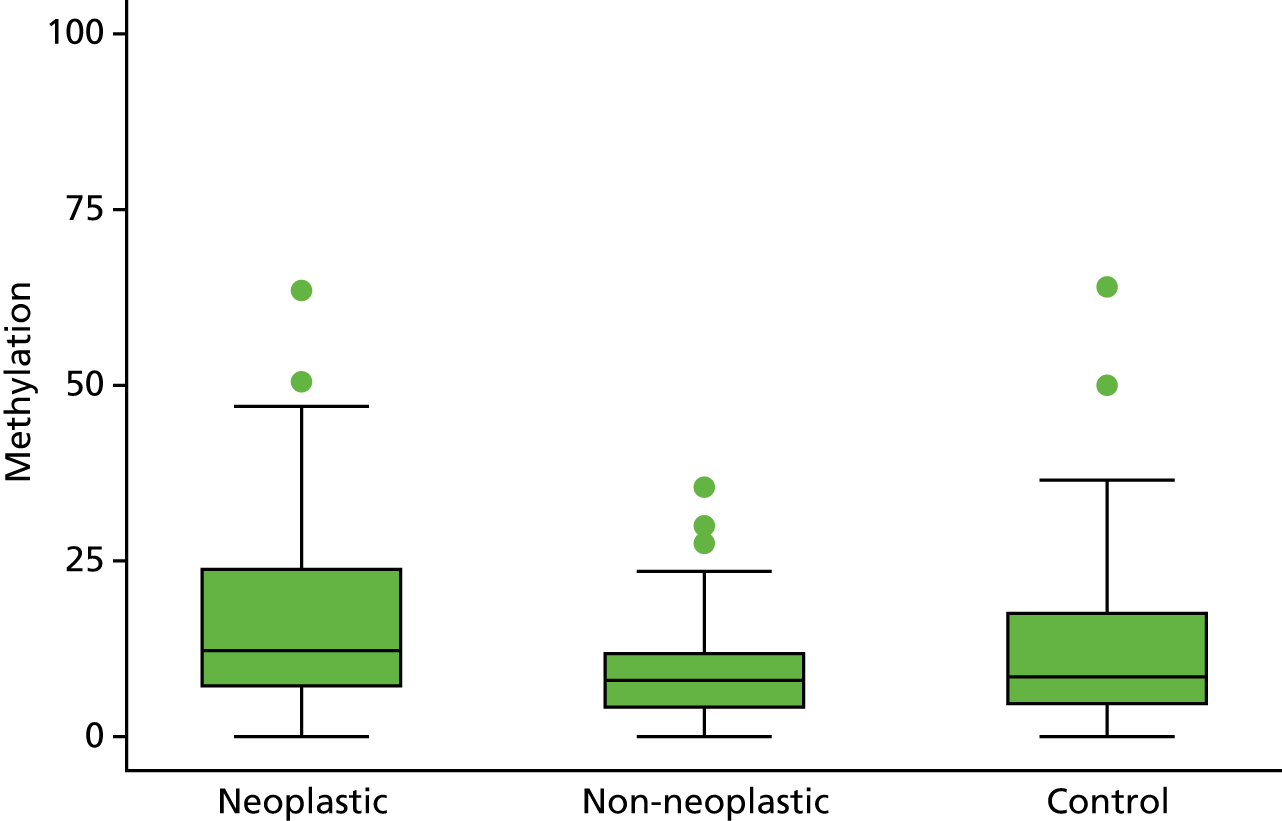
FIGURE 30.
Calibration plot for model 1 neoplasia vs. control (after multiple imputation).
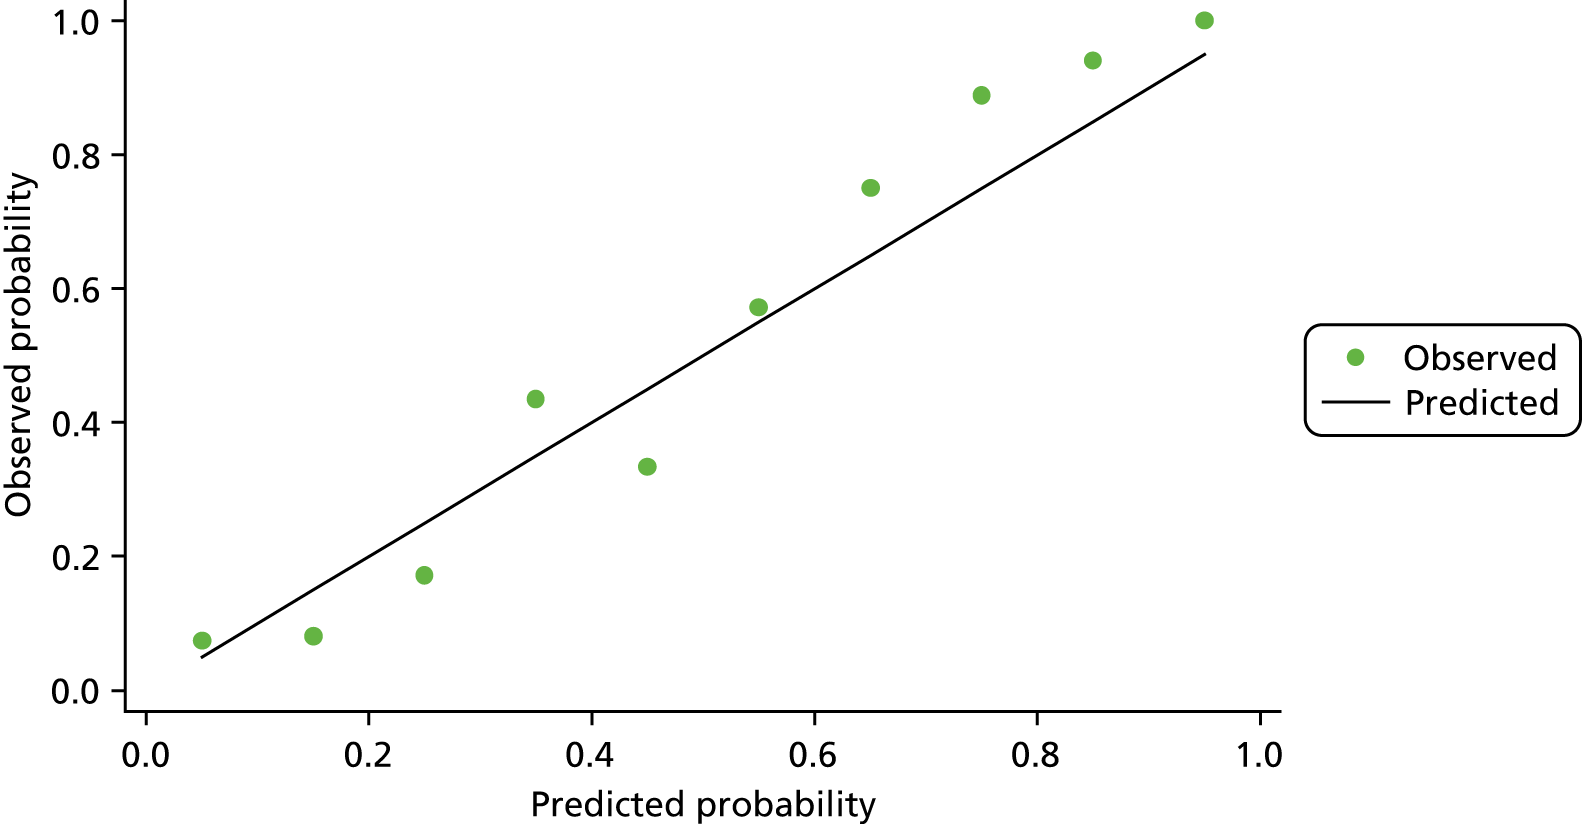
FIGURE 31.
Calibration plot for model 2 dysplasia vs. control.
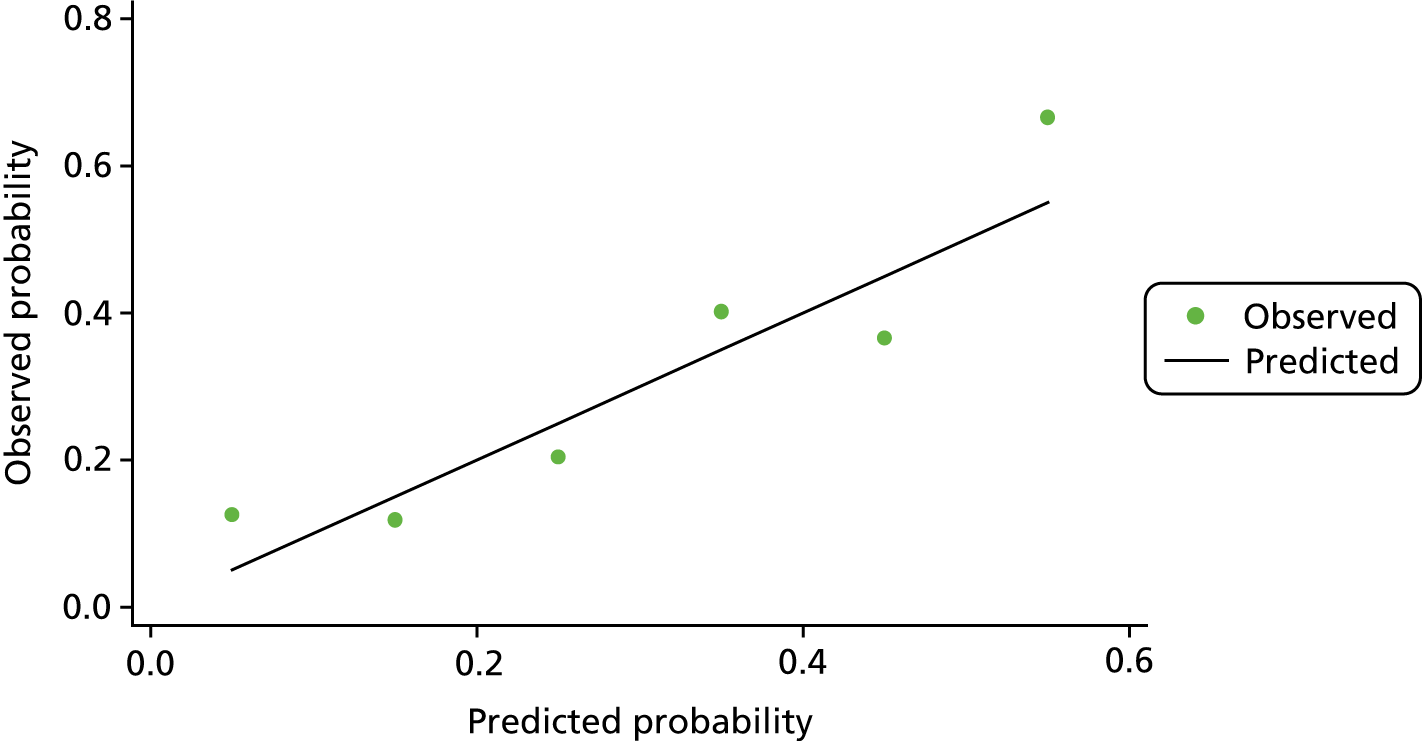
FIGURE 32.
Calibration plot for matched non-neoplastic vs. control.
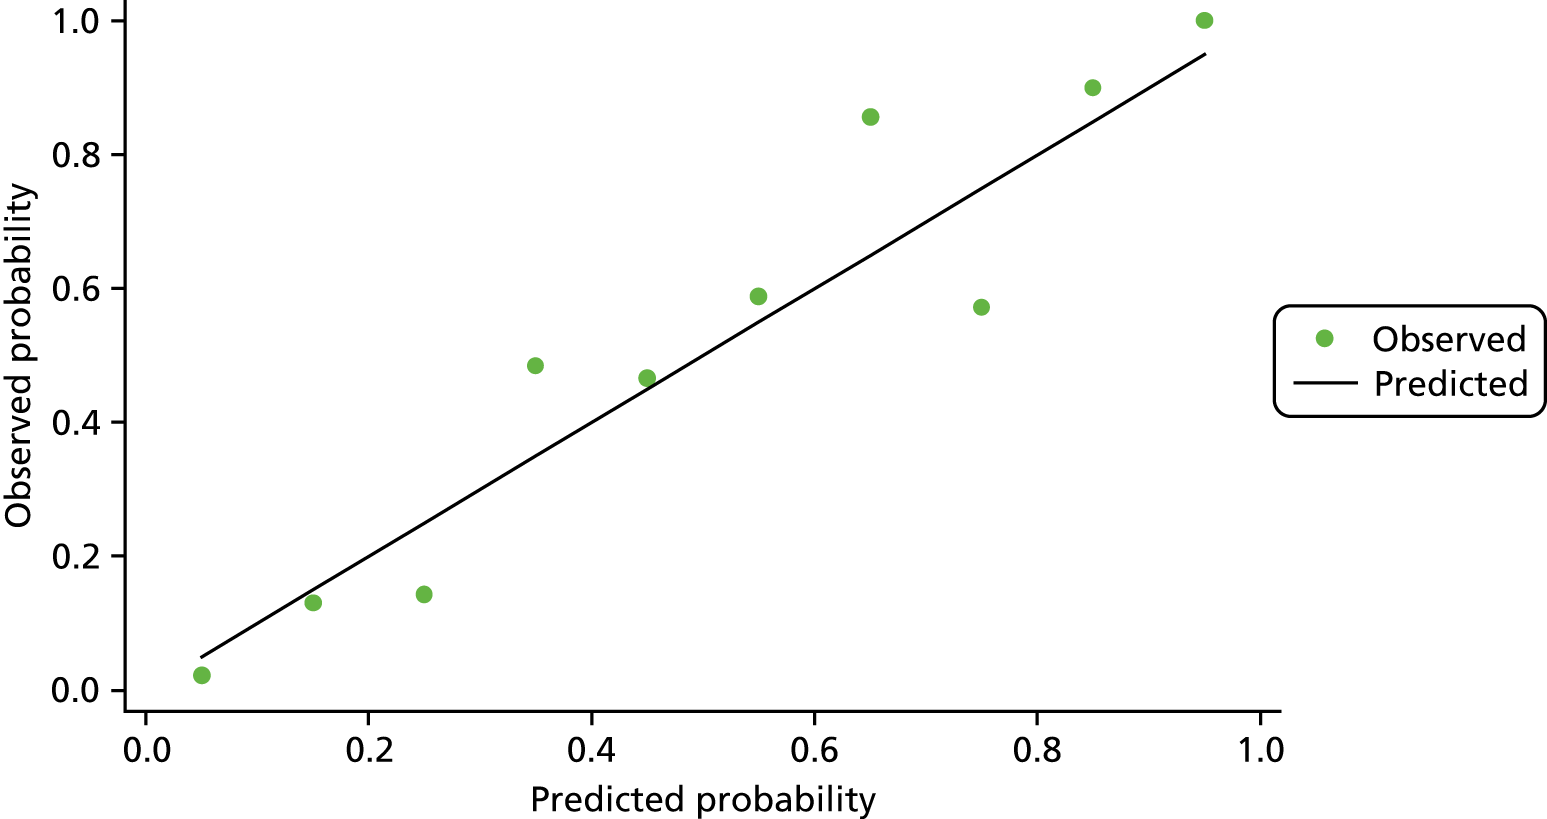
Appendix 2 Module 3: decision rule
Decision rule
If the p-value is less than the chosen cut-off value, then the biomarker is considered methylation negative.
If the p-value is equal to or greater than the chosen cut-off value, then the biomarker is considered methylation positive.
We need to estimate the predicted probability of each patient using the following equation estimated from ENDCaP module 1 analysis:
hence:
in which α is constant term and β1, β2,. . . are coefficients from the models developed in module 1. x1, x2, . . . are the actual log-transformed methylation data values from module 3.
One of the issues with the module 1 data set was amplification failure for some of the five biomarkers in some patients; therefore, a complete methylation data set was not available. This would be problematic if this situation were to occur for final model prediction in module 3, as we can use this model only if amplification for all the five chosen biomarkers is complete.
This issue was discussed it was decided that to accurately estimate the probability of dysplasia for patients in module 3 of the study, at least three of the five chosen biomarkers would need to be amplified and have data available. However, as the main model is built with estimated coefficients for the full model, we needed to develop separate models accounting for all possible combinations of at least three biomarkers need to be fitted from the subset of the main chosen model.
Consequently, an additional 15 models (16 in total) that account for all possible combinations of at least three biomarkers being amplified were generated. Final coefficients for models 1 and 2 after multiple imputation are shown in Appendix 3, Tables 23 and 24. Again, the final coefficients of all the 16 models need to be multiply by shrinkage factor.
Similarly, model 3 was developed and these results are also presented in Appendix 3, Table 25.
Appendix 3 Module 3: model coefficients and cut-off values for the three models from module 1
| Model | Biomarker | Constant term | Cut-off point | ||||
|---|---|---|---|---|---|---|---|
| SFRP2 | SFRP4 | WIF1 | APC1A | APC2 | |||
| 1 (Full model) | 0.790341 | 2.68987 | 0.168881 | 0.426967 | 1.15658 | –17.7416 | 0.40 |
| 2 | 0.9269516 | 3.202865 | 0.4268864 | 0.4359665 | –16.95697 | 0.39 | |
| 3 | 0.7636128 | 2.746595 | 0.1808004 | 1.170222 | –17.57503 | 0.41 | |
| 4 | 0.8433857 | 2.710108 | 0.4288462 | 1.225026 | –17.71891 | 0.38 | |
| 5 | 1.033815 | 0.1984314 | 0.4600073 | 1.537024 | –10.08218 | 0.44 | |
| 6 | 2.926569 | 0.3321497 | 0.400415 | 1.25723 | –17.14115 | 0.42 | |
| 7 | 0.9056502 | 3.251479 | 0.4481147 | –16.74635 | 0.36 | ||
| 8 | 1.093859 | 3.344528 | 0.4462922 | –16.76433 | 0.36 | ||
| 9 | 0.8201064 | 2.772632 | 1.244751 | –17.56854 | 0.41 | ||
| 10 | 1.291991 | 0.5715801 | 0.4782231 | –6.844074 | 0.38 | ||
| 11 | 1.019545 | 0.227554 | 1.561684 | –9.816336 | 0.44 | ||
| 12 | 1.094246 | 0.4661336 | 1.626908 | –9.997097 | 0.44 | ||
| 13 | 3.560993 | 0.6468267 | 0.4075435 | –16.23202 | 0.40 | ||
| 14 | 2.988017 | 0.3418931 | 1.268989 | –17.0741 | 0.42 | ||
| 15 | 3.000233 | 0.4011913 | 1.41747 | –17.00814 | 0.41 | ||
| 16 | 0.4182801 | 0.4323438 | 1.736938 | –8.405532 | 0.49 | ||
| Model | Biomarker | Constant term | Cut-off point | ||||
|---|---|---|---|---|---|---|---|
| SFRP2 | SFRP4 | WIF1 | APC1A | APC2 | |||
| 1 (Full model) | 1.007859 | 4.094435 | 0.115937 | 0.793109 | 0.796012 | –22.9882 | 0.27 |
| 2 | 1.11233 | 4.495571 | 0.294416 | 0.820524 | –22.7044 | 0.26 | |
| 3 | 0.835842 | 4.008315 | 0.160146 | 0.865081 | –21.7549 | 0.30 | |
| 4 | 1.041748 | 4.094877 | 0.795679 | 0.8399 | –22.9093 | 0.27 | |
| 5 | 1.322719 | 0.112145 | 0.775275 | 1.328834 | –10.6523 | 0.36 | |
| 6 | 4.403568 | 0.296998 | 0.702239 | 0.930208 | –22.1374 | 0.33 | |
| 7 | 0.952287 | 4.428606 | 0.362928 | –21.3864 | 0.27 | ||
| 8 | 1.223555 | 4.559514 | 0.836779 | –22.4581 | 0.25 | ||
| 9 | 0.879651 | 4.022217 | 0.92927 | –21.6948 | 0.31 | ||
| 10 | 1.561194 | 0.424315 | 0.817744 | –7.91299 | 0.32 | ||
| 11 | 1.17386 | 0.189786 | 1.406414 | –9.98965 | 0.37 | ||
| 12 | 1.351722 | 0.780752 | 1.37627 | –10.5821 | 0.35 | ||
| 13 | 4.948412 | 0.528044 | 0.724206 | –21.7848 | 0.31 | ||
| 14 | 4.291101 | 0.309121 | 0.980183 | –21.2266 | 0.31 | ||
| 15 | 4.441385 | 0.700204 | 1.068782 | –21.9053 | 0.33 | ||
| 16 | 0.352211 | 0.652091 | 1.588809 | –8.29386 | 0.38 | ||
| Model | Biomarker | Constant term | Cut-off point | |||
|---|---|---|---|---|---|---|
| SFRP4 | APC1A | SFRP5 | SOX7 | |||
| 1 (Full model) | 0.607489 | 0.464081 | –0.14209 | –0.53888 | –2.53903 | 0.50 |
| 2 | 0.596561 | 0.375996 | –0.2337 | –3.10659 | 0.46 | |
| 3 | 0.601794 | 0.471136 | –0.57308 | –2.71236 | 0.51 | |
| 4 | 0.80032 | –0.15475 | –0.46798 | –2.92711 | 0.47 | |
| 5 | 0.499641 | –0.14001 | –0.53845 | –0.44288 | 0.49 | |
Appendix 4 Module 3: patient pathway
The pathway for the patient after their initial baseline scope was as follows:
-
Biopsies were taken during the initial scope and FFPE as per the site local practice.
-
DNA from the blocks were then extracted and bisulphite treated.
-
The extracted DNA was then processed via pyrosequencing and methylation data were generated.
-
Methylation data were then sent to the ENDCaP-C statistician for analysis and at this point, based on the results, it was determined whether the patient was positive or negative for dysplasia.
-
From the patients who were histology negative at baseline colonoscopy, all patients who are test positive and random sample of test-negative patients were selected (up until the planned sample size was reached) according to centre and matching time period of follow-up. Recruiting centres were then contacted and informed of the patients to be recalled for a repeat colonoscopy.
-
The recruiting site then contacted the patient to arrange a date for their repeat colonoscopy; at this point the patient could either agree or decline the repeat colonoscopy.
-
For those that agreed to the repeat colonoscopy the date was confirmed. However, in some instances, further date changes were subsequently made for repeat colonoscopy because of patient, clinician and hospital factors.
It was not, therefore, always possible to ensure that all patients had their repeat colonoscopy within 4–12 months from their initial colonoscopy.
Appendix 5 Module 3: recruitment
FIGURE 33.
Recruitment by month.
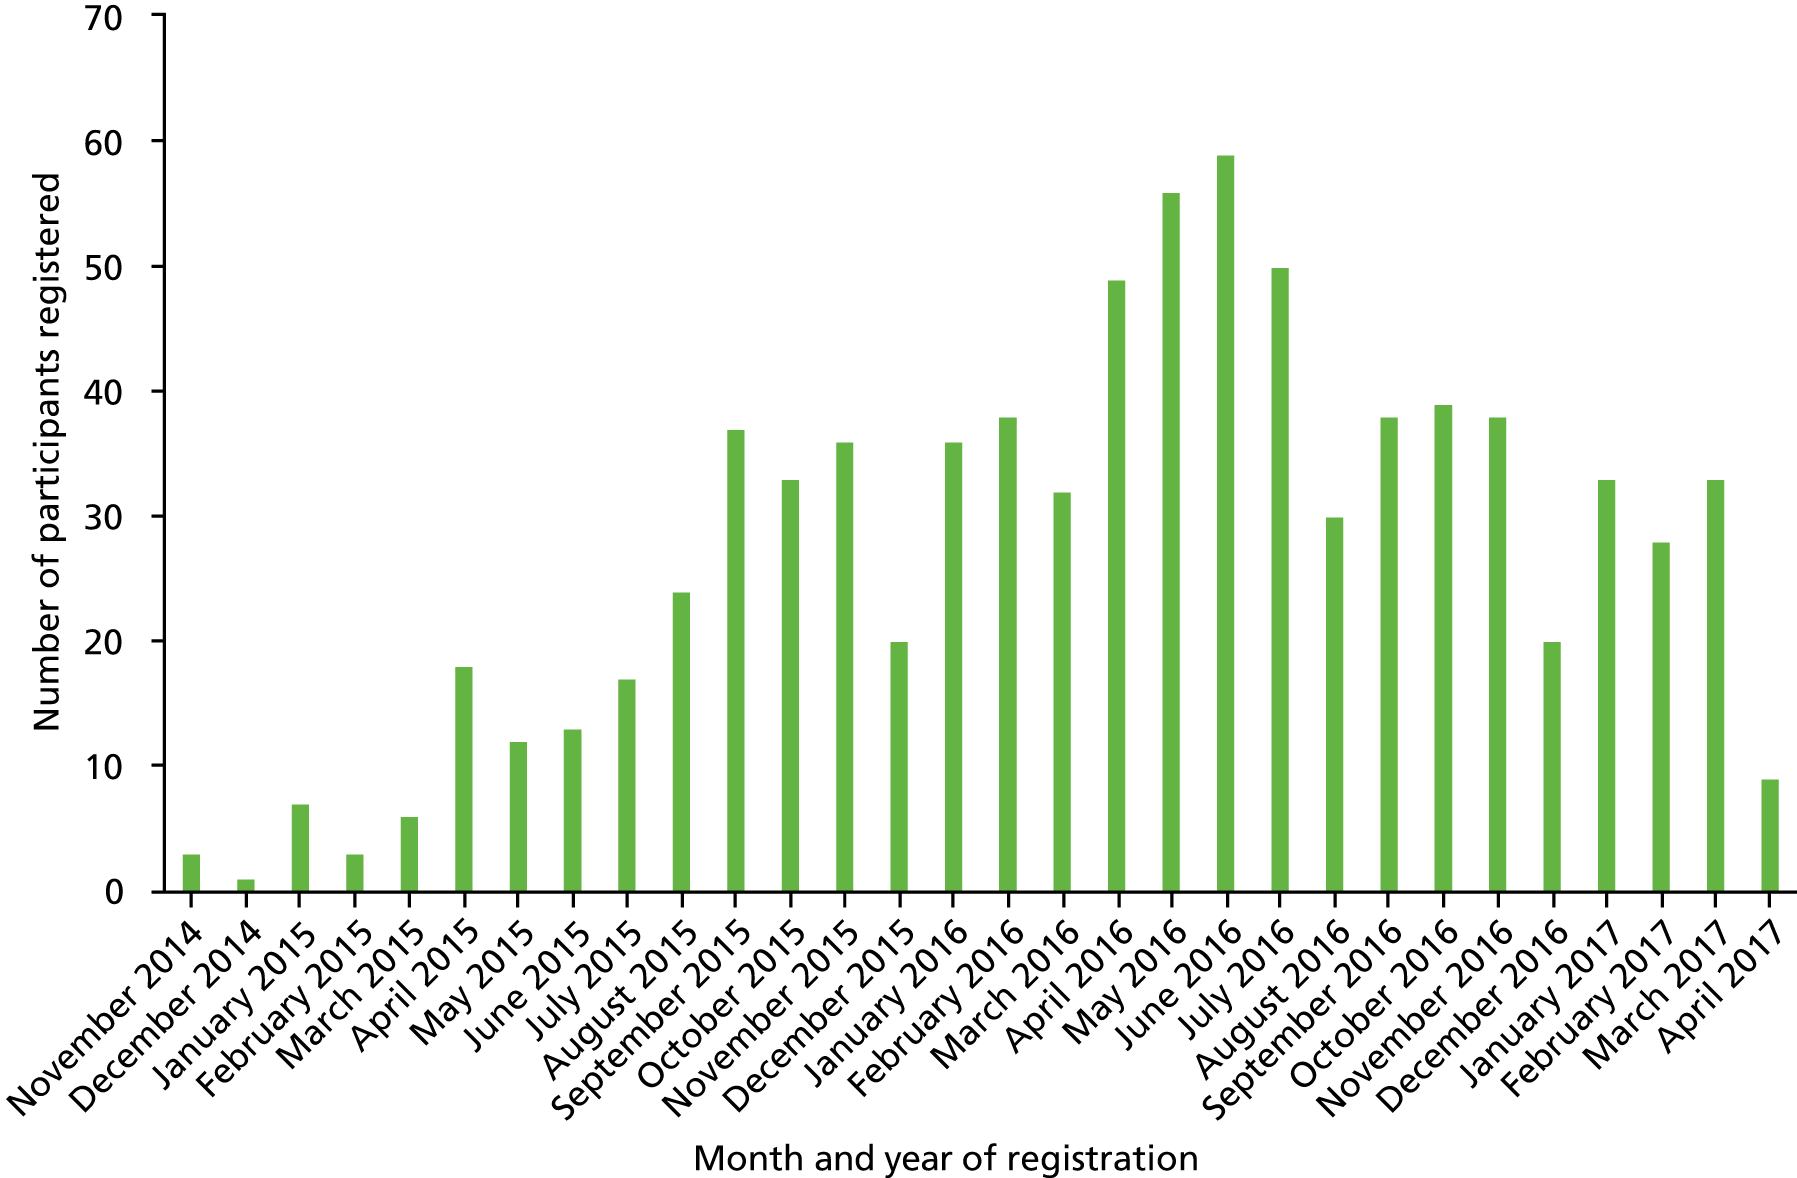
| Centre | Date site opened | Date first participant randomised | Date last participant randomised | Number of participants registered |
|---|---|---|---|---|
| Queen Elizabeth Hospital (University Hospitals Birmingham NHS Foundation Trust) | 13 November 14 | 13 November 14 | 29 March 17 | 140 |
| Basildon and Thurrock University Hospital (Basildon and Thurrock University Hospitals NHS Foundation Trust) | 12 August 15 | 14 August 15 | 12 April 17 | 61 |
| Hull Royal Infirmary (Hull and East Yorkshire Hospitals NHS Trust) | 18 November 15 | 14 December 15 | 22 March 17 | 54 |
| Russells Hall Hospital (The Dudley Group NHS Foundation Trust) | 5 February 15 | 22 April 15 | 29 March 17 | 47 |
| Walsall Manor Hospital (Walsall Healthcare NHS Trust) | 11 February 15 | 11 February 15 | 15 December 16 | 47 |
| Birmingham Heartlands Hospital (formerly Heart of England NHS Foundation Trust, now University Hospitals Birmingham NHS Foundation Trust) | 8 January 15 | 28 January 15 | 15 March 17 | 45 |
| St Marks Hospital (London North West Healthcare NHS Trust) | 27 April 15 | 25 November 15 | 1 September 16 | 42 |
| John Radcliffe Hospital (Oxford University Hospitals NHS Trust) | 3 July 15 | 22 July 15 | 20 April 17 | 37 |
| Royal Liverpool University Hospital (The Royal Liverpool and Broadgreen University Hospitals NHS Trust) | 16 September 15 | 6 October 15 | 28 March 17 | 34 |
| New Cross Hospital (The Royal Wolverhampton NHS Trust) | 16 January 15 | 21 January 15 | 27 March 17 | 32 |
| St James’s University Hospital (The Leeds Teaching Hospital NHS Foundation Trust) | 4 June 15 | 29 June 15 | 3 August 16 | 32 |
| Basingstoke and North Hampshire Hospital (Hampshire Hospitals NHS Foundation Trust) | 4 August 15 | 16 September 15 | 10 January 17 | 31 |
| Royal United Hospital, Bath (Royal United Hospital Bath NHS Trust) | 26 October 15 | 4 February 16 | 28 February 17 | 23 |
| Leicester Royal Infirmary (University Hospitals of Leicester NHS Trust) | 14 April 15 | 14 April 15 | 17 March 17 | 22 |
| Whipps Cross University Hospital (Bart’s Health NHS Trust) | 10 September 15 | 23 September 15 | 14 October 16 | 22 |
| Queen Alexandra Hospital (Portsmouth Hospitals NHS Trust) | 29 October 15 | 6 November 15 | 29 July 16 | 17 |
| St Marys Hospital, Isle of Wight (Isle of Wight NHS Trust) | 13 October 15 | 5 November 15 | 8 February 17 | 17 |
| Darlington Memorial Hospital (County Durham and Darlington NHS Foundation Trust) | 24 February 16 | 20 April 16 | 8 March 17 | 15 |
| West Middlesex University Hospital (Formerly West Middlesex University Hospital NHS Trust, now Chelsea and Westminster NHS Foundation Trust) | 9 July 15 | 31 July 15 | 13 March 17 | 15 |
| City Hospital (Sandwell and West Birmingham NHS Foundation Trust) | 12 May 15 | 13 July 15 | 21 March 17 | 12 |
| Addenbrooke’s Hospital (Cambridge University Hospitals NHS Foundation Trust) | 20 April 16 | 21 April 16 | 24 March 17 | 11 |
| Kettering General Hospital (Kettering General Hospital NHS Foundation Trust) | 31 March 16 | 30 June 16 | 27 April 17 | 11 |
| James Cook University Hospital (South Tees Hospitals NHS Foundation Trust) | 14 October 15 | 15 January 16 | 14 March 17 | 10 |
| North Tyneside General Hospital (Northumbria Healthcare NHS Foundation Trust) | 11 February 16 | 11 February 16 | 28 February 17 | 9 |
| Salford Royal Hospital (Salford Royal NHS Foundation Trust) | 30 September 15 | 23 November 15 | 8 February 17 | 7 |
| Blackpool Victoria Hospital (Blackpool Teaching Hospital NHS Foundation Trust) | 14 October 15 | 3 December 15 | 10 November 16 | 6 |
| St Mary’s Hospital (Imperial College NHS Trust) | 30 June 16 | 9 September 16 | 13 December 16 | 5 |
| Princess Alexandra Hospital (The Princess Alexandra Hospital NHS Trust) | 3 February 16 | 4 February 16 | 5 January 17 | 4 |
| Queen Elizabeth Hospital (Gateshead Health NHS Foundation Trust) | 14 July 16 | 27 July 16 | 10 October 16 | 4 |
| Kings Mill Hospital (Sherwood Forest Hospitals NHS Foundation Trust) | 28 April 16 | 25 May 16 | 3 April 17 | 3 |
| Royal Bournemouth Hospital (The Royal Bournemouth and Christchurch Hospitals NHS Foundation Trust) | 20 May 15 | 21 March 16 | 30 August 16 | 3 |
| Luton and Dunstable Hospital (Luton and Dunstable University Hospital NHS Foundation Trust) | 25 May 16 | N/A | N/A | 0 |
Appendix 6 Module 3: data completeness
| CRF | Baseline | Repeat | ||||
|---|---|---|---|---|---|---|
| Expected | Received | % received | Expected | Received | % received | |
| Registration form | 818 | 818 | 100.0 | N/A | N/A | N/A |
| Consent forms | 818 | 818 | 100.0 | N/A | N/A | N/A |
| Colonoscopy form | 814 | 814 | 100.0 | 193 | 193 | 100.0 |
| Medication form | 691 | 691 | 100.0 | 193 | 193 | 100.0 |
| Histology form | 813 | 812 | 99.9 | 193 | 193 | 100.0 |
| Histology report | 813 | 812 | 99.9 | 193 | 193 | 100.0 |
| Histology blocks | 813 | 805 | 99.0 | 193 | 193 | 100.0 |
| Surgery form | 92 | 91 | 98.9 | 17 | 16 | 94.1 |
| Additional data form | 815 | 678 | 83.2 | N/A | N/A | N/A |
| EQ-5Da | 214 | 207 | 96.7 | N/A | N/A | N/A |
List of abbreviations
- AE
- adverse event
- APC
- adenomatous polyposis coli
- AUC
- area under the receiver operating characteristic curve
- BC
- base barcode
- BCTU
- Birmingham Clinical Trials Unit
- CI
- confidence interval
- CRF
- case report form
- DKK
- Dickkopf related
- DMEC
- Data Monitoring and Ethics Committee
- DNA
- deoxyribonucleic acid
- ENDCaP-C
- Enhanced Neoplasia Detection and Cancer Prevention in Chronic Colitis
- FFPE
- formalin fixed, paraffin embedded
- IBD
- inflammatory bowel disease
- LKB1
- liver kinase B1
- NGS
- next-generation sequencing
- NICE
- National Institute for Health and Care Excellence
- NIHR
- National Institute for Health Research
- PCR
- polymerase chain reaction
- PIS
- patient information sheet
- PSC
- primary sclerosing cholangitis
- qPCR
- quantitative polymerase chain reaction
- ROC
- receiver operating characteristic
- SAE
- serious adverse event
- SFRP
- secreted frizzled-related protein
- STARD
- Standards for Reporting of Diagnostic Accuracy
- TMG
- Trial Management Group
- TSC
- Trial Steering Committee
- UC
- ulcerative colitis
- WIF1
- WNT inhibitory factor 1
