Notes
Article history
The research reported in this issue of the journal was funded by the EME programme as project number 12/65/27. The contractual start date was in March 2014. The final report began editorial review in April 2018 and was accepted for publication in December 2018. The authors have been wholly responsible for all data collection, analysis and interpretation, and for writing up their work. The EME editors and production house have tried to ensure the accuracy of the authors’ report and would like to thank the reviewers for their constructive comments on the final report document. However, they do not accept liability for damages or losses arising from material published in this report.
Permissions
Copyright statement
© Queen’s Printer and Controller of HMSO 2021. This work was produced by Halliday et al. under the terms of a commissioning contract issued by the Secretary of State for Health and Social Care. This issue may be freely reproduced for the purposes of private research and study and extracts (or indeed, the full report) may be included in professional journals provided that suitable acknowledgement is made and the reproduction is not associated with any form of advertising. Applications for commercial reproduction should be addressed to: NIHR Journals Library, National Institute for Health Research, Evaluation, Trials and Studies Coordinating Centre, Alpha House, University of Southampton Science Park, Southampton SO16 7NS, UK.
2021 Queen’s Printer and Controller of HMSO
Chapter 1 Introduction
Background: tuberculosis
Tuberculosis (TB) is a devastating disease, with approximately 10 million cases worldwide each year. 1 Globally, it is one of the top 10 causes of death and is the leading cause of death from a single infectious agent, ahead of human immunodeficiency virus (HIV)/acquired immunodeficiency syndrome (AIDS). 1 Important characteristics of the current global epidemic are the interaction with the HIV/AIDS epidemic (with HIV/TB co-infection driving increased mortality) and the increasing rates of multidrug-resistant TB cases. The areas with the greatest TB burden are in south-east Asia, Africa and the Western Pacific World Health Organization (WHO) regions. England has among the highest rates of TB in Western Europe, with 5664 notifications and a rate of 10.2 cases per 100,000 people in 2016. 2 The majority of TB cases in Europe occur in large cities (especially London, Birmingham and Leicester in England), and the disease disproportionately affects immigrants and socially marginalised and socioeconomically disadvantaged groups.
Tuberculosis is caused by the bacterium Mycobacterium tuberculosis (Mtb), and is transmitted from person to person via the aerosol route by droplet particles that are produced when an individual with the pulmonary form of TB coughs. On exposure to an uninfected individual, a number of eventualities can occur. Approximately 50% of exposed individuals resist the infection; the remainder become infected, as identified by the detection of peripheral cellular immune responses to Mtb antigens. The majority of infected individuals will develop prolonged but controlled latent infection of Mtb [i.e. latent tuberculosis infection (LTBI)]. It is estimated that between one-quarter and one-third of the world’s population has LTBI. 3 In a small proportion of infected individuals, the immune response can lose control of Mtb replication, and in such cases TB disease will develop. In most cases this development to active TB occurs within the first 6 months after initial infection,4 although progression from LTBI to active TB (also known as reactivation) can occur at any time during an individual’s lifetime. Active TB can manifest in many forms and can infect any organ of the body. Owing to the mode of transmission, pulmonary tuberculosis (PTB) is the typical form of TB; however, extrapulmonary tuberculosis (EPTB) is becoming increasingly common, particularly in cases of reactivation from LTBI.
Reduction of TB cases and working towards elimination of TB as a public health issue are nationally and internationally agreed as public health priorities at the level of the UK, European Union and WHO. 1,5 Although global TB incidence is declining by around 2% per year, improved reduction rates are required to progress towards elimination. Internationally agreed targets for improved global TB control, such as in the sustainable development goals or the WHO’s End TB Strategy,6 require that TB incidence rates fall by up to 5% per year, which is not achievable with existing tools. New innovative methods for TB prevention, diagnosis and treatment are urgently needed, and the WHO’s global plan calls for researchers and industry to deliver an improved, fit-for-purpose anti-TB toolkit, with major emphasis on the need for new diagnostic tests. 7 Prompt and accurate diagnosis and treatment of TB are essential to improve individual patient outcomes, as well as to prevent onward transmission in the community with its attendant health and social care costs. However, the currently available diagnostic toolkit lacks the ability to provide results with clinically acceptable speed and diagnostic accuracy.
Current diagnostic tests for tuberculosis
Currently available tests recommended by the National Institute for Health and Care Excellence (NICE) for diagnosis of active TB in the UK comprise smear microscopy, Mtb culture, radiography and nucleic acid amplification tests. 8 Smear microscopy is rapid but has low sensitivity, whereas radiography has low specificity. Mtb culture is the current microbiological gold standard, but is limited by its lack of speed (requiring 2–6 weeks to generate a result), and it is only moderately sensitive. Importantly, both smear microscopy and Mtb culture suffer from reduced sensitivity in a number of key ‘hard-to-diagnose’ patient populations, including those with EPTB or HIV co-infection.
Nucleic acid amplification tests have been a major advancement in TB diagnostics, and the Xpert® MTB/RIF test (Cepheid Inc., Sunnyvale, CA, USA) now performs with higher sensitivity than smear microscopy and provides a result on the same day. The Xpert MTB/RIF test is a substantial improvement on conventional microbiological tests, especially now that the improved Xpert MTB/RIF Ultra has shown greater sensitivity in the smear-negative culture-positive population of TB cases (64% compared with 46% with conventional Xpert). 9 However, culture-negative TB cases (another key ‘hard-to-diagnose’ patient subgroup) are mostly falsely negative when tested by Xpert. As with microscopy and culture, sensitivity of the Xpert (and Ultra) is also lower in people with EPTB and HIV co-infection. Furthermore, the Xpert is expensive and its cost-effectiveness within routine NHS practice is unknown. Thus, within the UK setting, culture remains the gold standard.
The tuberculin skin test (TST) and interferon gamma release assays (IGRAs) are immunological tests recommended by NICE for the diagnosis of LTBI. 8,10 Although these tests can be used to detect Mtb infection, none is able to discriminate between LTBI and active TB disease, and all lack sufficient diagnostic sensitivity to exclude a suspected diagnosis of TB. 11,12 IGRAs have improved specificity for Mtb infection over the TST, which is compromised by poor specificity owing to cross-reactive responses to the test in bacillus Calmette–Guérin (BCG)-vaccinated or non-Mtb-exposed individuals. 13 There are two main types of IGRA: the QuantiFERON® GOLD In-Tube (QFT-GIT) (QIAGEN, Hilden, Germany) and the T-SPOT. TB test. 12,14 Therefore, although the IGRA and TST tests are recommended for detection of LTBI, the utility of IGRAs in the diagnostic work-up of active TB is not currently recommended. However, should there be an upgrade to these immunological tests whereby the sensitivity for all active TB was increased to > 95%, then they would have the potential to be used as triage tests to rule out active TB. The IGRA in the Diagnostic Evaluation of Active TB (IDEA) study,12,14 which provided the cohort and biobank samples for the Validation of New Technologies for the Diagnostic Evaluation of active Tuberculosis (VANTDET) study, was an observational prospective cohort study that sought to define the role of commercially available IGRAs, as well as a second-generation IGRA, in the diagnosis of active TB. The IDEA study found that, although the T-SPOT. TB had significantly greater sensitivity for active TB than QFT-GIT (81.4% and 67.3%, respectively), neither test had sufficient sensitivity to rule out a diagnosis of active TB. However, the second-generation IGRA had a sensitivity of 94% for culture-confirmed TB and 89% for all TB, providing the first proof of principle that an immune-based test has the potential to practically serve as a rule-out test. 12,14 Such a test would significantly reduce the time to diagnosis of patients for whom TB is a suspected condition on initial assessment, but are diagnosed with another disease by the end of diagnostic work-up.
Interferon gamma release assays and the TST are widely used to detect LTBI in those at high risk of having the infection, such as those who have recently been exposed to an active case of PTB. A recent large prospective cohort study investigating the predictive power of the IGRA and TSTs for detecting progression to active TB disease (among new-entrant migrants and recent close contacts of TB cases) in the UK found that these tests provide high negative predictive power but very low positive predictive power for identifying those who will progress to active TB. 15 Despite culture being the gold standard microbiological test for active TB in the UK and elsewhere, it is standard practice to commence treatment for clinically suspected TB cases before a positive culture result has confirmed TB. Globally, although a large proportion of cases of TB are diagnosed based on a positive sputum smear microscopy test, the sensitivity of smear for all TB cases (especially in EPTB, childhood TB and with HIV co-infection) is low and, therefore, a large proportion of patients are diagnosed clinically and treated without a definitive diagnosis. The unique epidemiology of TB in the UK (i.e. high rate of culture-negative TB cases and high proportion of active cases with EPTB)2 means that a large proportion of patients’ treatment is initiated despite the lack of microbiological confirmation and, as such, the need for tests to detect these hard-to-diagnose groups of patients is greater.
Clinical unmet needs
Globally, there is a need for improved diagnostic tests for both active TB and LTBI. As identified by the New Diagnostic Working Group (WHO and Stop TB Partnership), there is a need for a rapid non-sputum-based biomarker test for detecting active TB. 16 A fast, highly sensitive test for all types of active TB, with improved sensitivity over the current microbiological tests (which provide high specificity but low sensitivity), would improve triage of TB suspects and increase the speed at which patients start appropriate treatment.
In high-income, low-incidence settings, such as in the UK, a high proportion of new cases of active TB are a result of reactivation from LTBI. For this reason, a major priority for TB control programmes in these settings is to identify individuals with LTBI and to offer prophylactic treatment to those at highest risk of progression to active TB. 17 Although IGRAs and TST provide high sensitivity for these individuals, an independent or follow-on test with improved specificity would enable us to reduce the number needed to treat to prevent subsequent cases of progression to active TB.
Therefore, the major clinical unmet needs for improved TB diagnostics in the UK are as follows:
-
a triage rule-out test for active TB
-
a rapid, accurate test for identifying ‘highly probable’ TB, where a clinical diagnosis cannot be confirmed by culture
-
a sensitive test to predict those at increased risk of progressing to active TB from exposure and/or positive test for LTBI.
Rationale for the VANTDET study
Blood-based tests: the rationale and technological approaches
The low sensitivity of microbiological diagnostic tools for TB reflects the low bacterial load in a high proportion of clinical samples from TB cases. Therefore, host-derived biomarkers, such as molecular transcriptomic or proteomic signatures, have been proposed as an approach that may have improved sensitivity for TB diagnosis. 18–20 The pursuit of TB biomarkers has been reinvigorated by the developments in high-throughput transcriptomic, proteomic and cellular immune technology platforms, and parallel advances in computational analytical methodologies. The past 18 or so years have seen a wealth of publications in this field, particularly in the development of transcriptomic biomarkers for active TB,18,20 in which promising test accuracy has been demonstrated in large, multisite international cohorts of TB cases and controls. In addition, serum proteomic profiling has led to blood-based biomarkers of TB with promising test accuracies. 19,21
Currently available immune-based tests have shown promise of greater sensitivity for detecting active TB when compared with microbiological tests, leading to speculation that development of newer, more sophisticated, immunological assays might lead to more accurate immune-based tests for TB. Several strategies for improving either sensitivity or specificity for TB have been proposed, including using different/additional antigens for stimulation,22 measurement of additional/alternative analytes [to interferon gamma (IFNγ)],23,24 and/or measurement of cellular phenotype. 25 Measurement of additional or alternative analytes has been shown to improve both sensitivity and specificity for active TB in case–control studies. The measurement of phenotype and function, so far using only flow cytometric technology, has been shown in multiple studies to improve specificity by discriminating between active TB and LTBI. 24,25
Technologies
In the light of the above developments in the field of blood-based diagnostic tests for TB, we sought to validate the following approaches for the diagnostic evaluation of active TB: transcriptomics, proteomics, flow cytometry and chemokine quantitative reverse transcription-polymerase chain reaction (qRT-PCR) (Table 1).
| Blood sample type | Field | Technology to be tested in VANTDET |
|---|---|---|
| RNA (whole blood) | Transcriptomics | Illumina microarray |
| Serum | Proteomics | SELDI-TOF |
| PBMC | Cellular immunology |
Flow cytometry Improved immune-based tests for rule-out of active TB |
The need for a real-life clinical cohort of active tuberculosis suspects
A large proportion of reported cases of TB are diagnosed without confirmation from standard tests. Furthermore, most studies of new diagnostic approaches fail to include individuals who lack culture confirmation (or those negative with other microbiological tests, such as Xpert, smear microscopy), despite the fact that those with a negative culture results are the very population in whom a new diagnostic test would be most beneficial. This is why, when validating new diagnostics for active TB, we require a representative spectrum of patients, including those with a culture-negative status. We have therefore used the samples collected as part of the IDEA study, a National Institute for Health Research (NIHR) Health Technology Assessment-funded, prospective, multicentre UK cohort study of > 1000 adults presenting with suspected active TB at NHS outpatient or inpatient services at 13 participating NHS hospitals in London, Birmingham and Leicester. 12 Patients with suspected TB were prospectively recruited into the IDEA study at the point of initial diagnostic work-up in secondary care in routine clinical practice, before a diagnosis was confirmed. The new diagnostic tests for ruling in active TB were evaluated against the composite reference standard to allow for the inclusion of clinically diagnosed TB patients in the TB disease group. Within the VANTDET study, we also evaluated two candidate approaches for a triage rule-out test, which aim to improve on the sensitivity of the current IGRA tests.
Study scope
The scope of the VANTDET study is specifically to address the needs for new diagnostic tests for active TB in individuals for whom there is a clinical suspicion of the condition (i.e. a triage rule-out test for active TB and a rapid, accurate test for identifying ‘highly probable’ TB, where a clinical diagnosis cannot be confirmed by culture). Although a triage test for active TB may potentially have a use in other settings, such as in contact clinics or for screening new patients from high-incidence areas, this is beyond the scope of this study.
Aim
To validate promising new technologies (namely whole-blood transcriptomics, proteomics, flow cytometry and a chemokine qRT-PCR), and existing signatures for detection of active TB in samples obtained from individuals suspected of having active TB.
Research objectives
Primary objectives
-
To define the role of previously identified whole-blood gene expression signatures in the diagnostic evaluation of active TB using host transcriptomic microarray.
-
To define the role of previously identified serum proteomic signatures in the diagnostic evaluation of active TB using mass spectrometry and surface-enhanced laser desorption ionisation time-of-flight mass spectrometry (SELDI-TOF).
-
To define the role of previously established cellular immunological signatures in the diagnostic evaluation of active TB using flow cytometry.
-
To validate our candidate-stimulated whole-blood chemokine-based qRT-PCR assay for rapid patient triage by excluding the diagnosis of active TB.
Secondary objectives
-
To evaluate the use of the previously identified tests in the diagnosis of key subpopulations of active TB, namely human immunodeficiency virus-positive (HIV+) patients/human immunodeficiency virus-negative (HIV–) patients, patients with culture-confirmed TB/highly probable TB and patients with PTB/EPTB.
-
To define optimal diagnostic algorithms that delineate the role of these new tests in the routine diagnostic assessment of patients with suspected active TB in the NHS.
-
To assess the cost-effectiveness of the best-performing novel tests validated in this study for the diagnostic work-up of TB patients in routine NHS practice.
-
To identify novel signatures of active TB (using the same technologies described in the Primary objectives), selected to provide optimal diagnostic performance (i.e. beyond those previously proposed).
Chapter 2 Study overview, management and general methodology
This study consists of four substudies each addressing the main technologies to be assessed in primary objectives 1–4. The substudies are outlined in detail in Chapters 3–6; the secondary objectives (5–8) are addressed within these same chapters, in the context of each of the technologies being assessed. The health economic assessment is presented in Chapter 7 for all of the best-performing tests. The reporting of each of the subprojects adheres to the standards for the reporting of diagnostic accuracy studies (STARD) guideline.
The biobank of blood samples that were collected and stored as part of the IDEA study12 were used for the four subprojects. However, the criteria for cohort selection, sample processing, technical methodology and analytical approach differed between these subprojects. Detailed methodology and rationale can be found in the chapter corresponding to each subproject. This chapter summarises the main features of the overall study cohort (i.e. the IDEA study cohort), as well as the overarching methodology and approach for study management.
Study management structure
Overview of study design
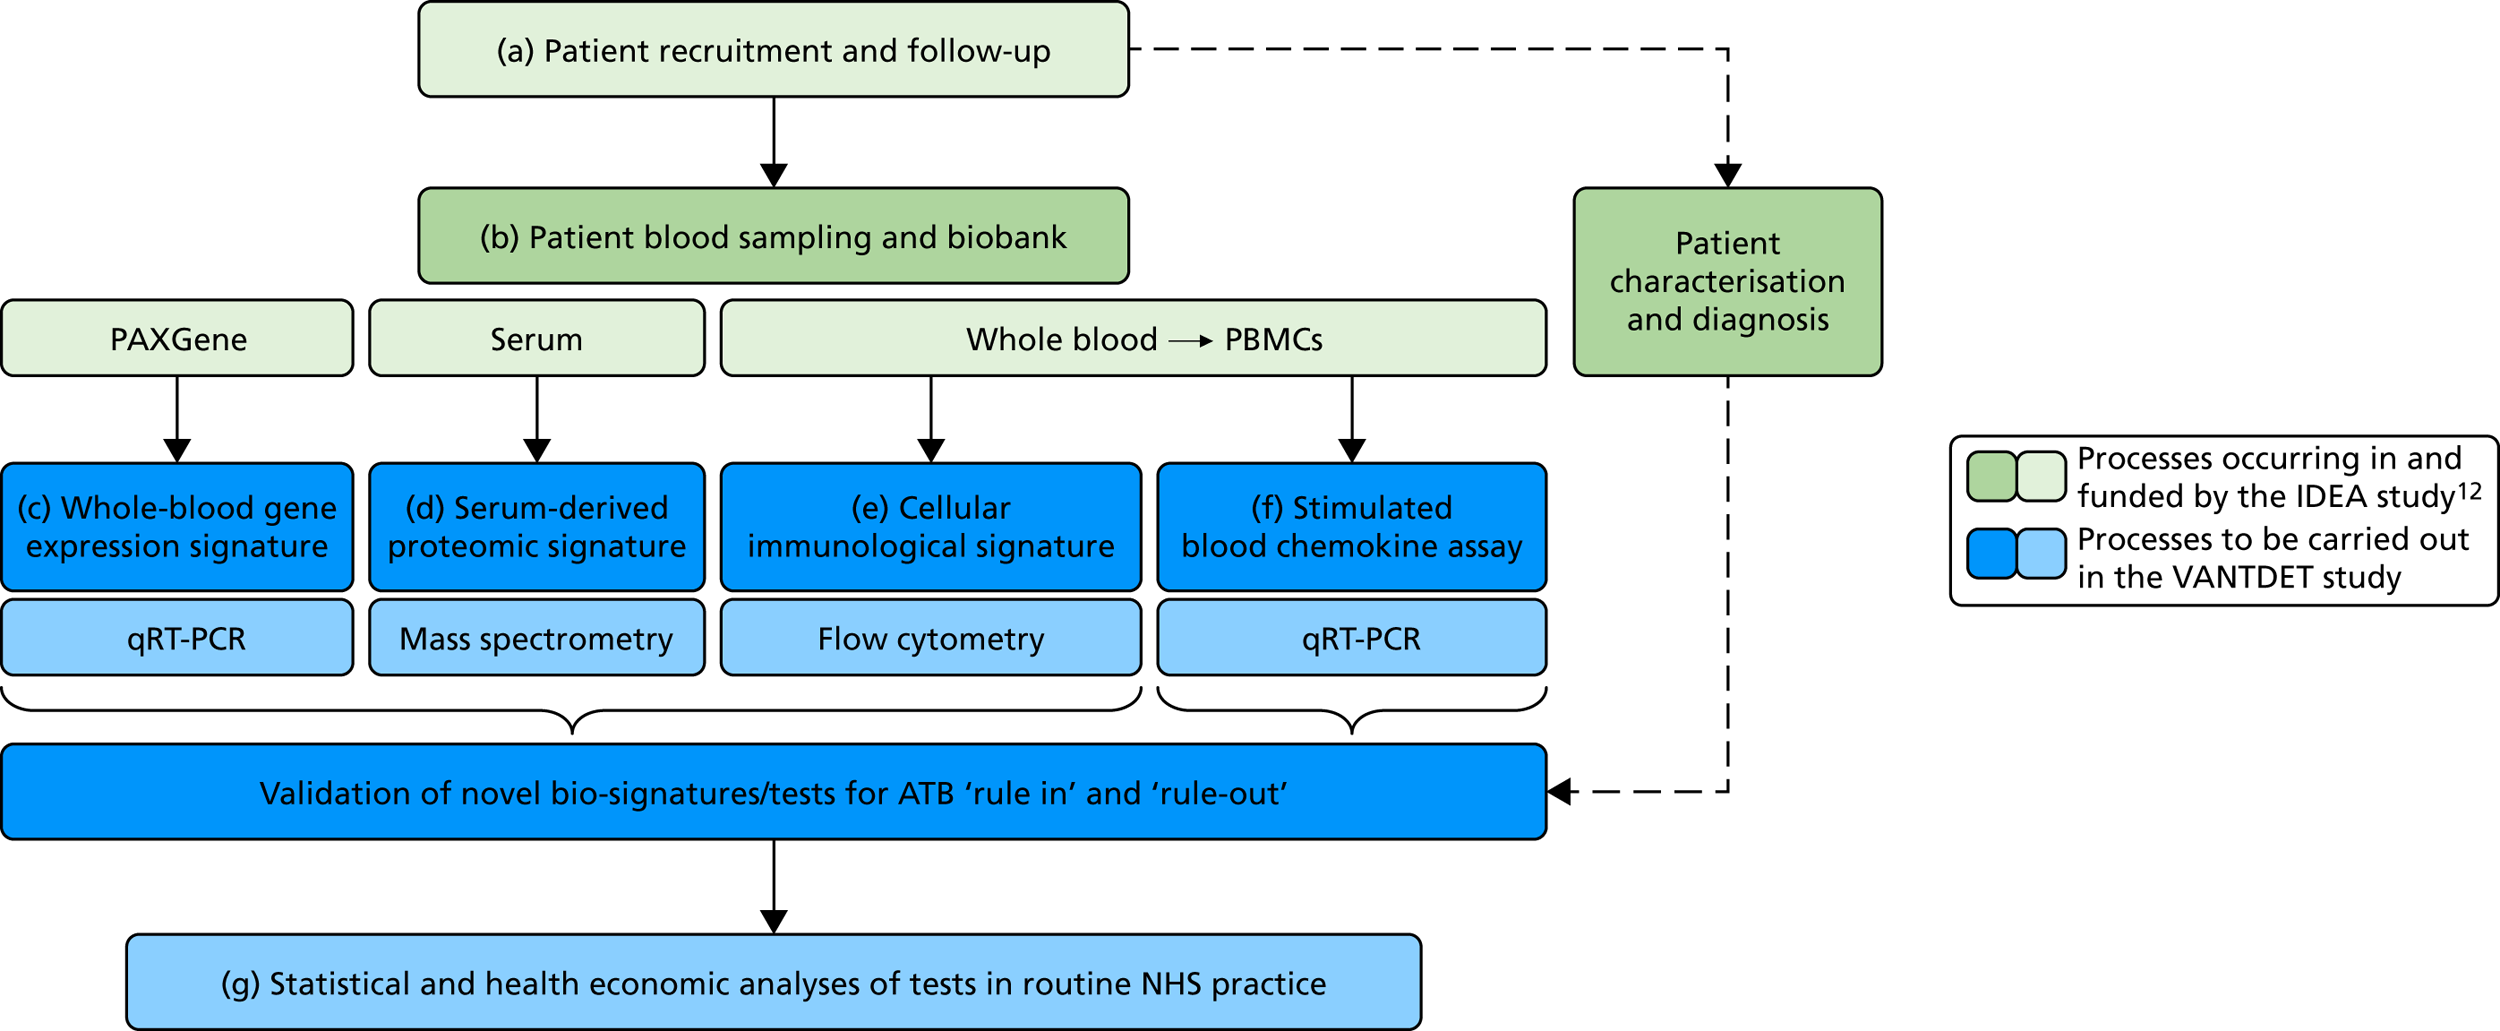
The original protocol specified the link between the IDEA study and the VANTDET study, as well as the processes and samples for each VANTDET substudy (Figure 1). In the IDEA study, additional blood was taken to allow for long-term storage of PAXGene® (Beckton, Dickinson Biosciences, NJ, USA), serum and peripheral blood mononuclear cell (PBMC) samples. These samples, coupled with clinical data, provided the biobank for the VANTDET study.
FIGURE 1.
Proposed VANTDET study design and link with the IDEA study. ATB, active tuberculosis.
General management and task allocation
The VANTDET study required a relatively simple management structure and a less rigorous monitoring process because there was no patient recruitment. The chief investigator (AL) and interim chief investigator (PB led the project from May 2015 to May 2016) provided general oversight of the study. Each of the four subprojects was managed by a laboratory scientist [three research associates (AH, LH and RP) and a laboratory technician (MTW)], who all worked within the TB research centre laboratory at St Mary’s Campus, Imperial College London. Data processing and analysis support was provided by a bioinformatician (PJ), and laboratory and analytical support was provided by a research MSc student/technician (TM) and other TB research group members (AB, VM and AF). These individuals constituted the main research team. The SELDI-TOF proteomic validation work was performed by a research associate (SH) and was overseen by a co-investigator (ML) and the chief investigator (AL). A research associate (NG) and co-investigator (PW) in the Department of Infection Disease Epidemiology (also based at the St Mary’s Campus in Imperial College London) were responsible for the health economic analysis that was done at the end of the project and involved discussion with the main research team. Medical statisticians (YT and JD) provided advice on study design, cohort selection, analytical protocols and presentation of data.
Management and oversight meetings
Study Management Group
The Study Management Group (SMG) included the chief investigators, post-doctoral research associates and technicians. The SMG met regularly (at least fortnightly in laboratory meetings), to report on progress, share/discuss results, discuss methodology, etc.
Wider Study Management Group
The wider SMG consisted of members of the SMG and statisticians from the University of Birmingham: Dr Yemisi Takwoingi and Dr Jon Deeks. The group met three times (22 September 2015, 3 February 2016 and 18 May 2016) to discuss the statistical approaches taken for each of the objectives/substudies and established the need for an Independent Scientific Advisory Board (ISAB).
Independent Scientific Advisory Board
The ISAB consisted of three independent members: Professor Sanjeev Krishna, Dr Mahdad Noursadeghi and Dr David Connell. The ISAB and SMG met once (15 July 2016) to discuss overall study design and research plans for each objective.
Issues and problems
The SELDI-TOF arrays required to validate the SELDI-TOF signatures were discontinued by the manufacturer. Initially, an alternative supplier was sought, but unfortunately was not found. Hence, this platform will not be available for future diagnostic tests. We are performing an analysis using the remaining stock from the manufacture (n = 90) and are performing liquid chromatography–mass spectrometry (LC–MS) to identify serum biomarkers and will develop enzyme-linked immunosorbent assay (ELISA) tests.
Changes to study protocol and management plan
The study protocol and management plan documents were changed once, in October 2016. The comments below are taken from the progress report that followed the updates in March 2017.
Protocol
The changes included updated methods for the validation of cellular immunological signatures and candidate rule-out tests for active TB, based on new literature and results from the IDEA study. Furthermore, there were changes in the sample size for both the cellular immune signature validation and the proteomic signature validation.
Cellular immune signature validation
Additional cellular immune signatures identified since conception of the VANTDET study and protocol also show promise in their ability to discriminate between active TB and LTBI. These new signatures were tested in-house in preliminary experiments, before the laboratory was protocol updated, and optimised so that these additional signatures could be identified within the flow cytometry panel we used on the cohort. These signatures included those which measure the proportion of Mtb-specific cluster of differentiation 4 (CD4)+ IFNγ+ cells with an activation phenotype26 or the levels of cluster of differentiation 27 (CD27) as a ratio or in combination with CD45RA expression. 27,28
Candidate ‘rule-out’ tests
In a draft final report, the IDEA study identified that the use of four antigens [6-kDa early secretory antigenic target (ESAT-6), culture filtrate antigen (CFP-10), Rv3615c and Rv3879c (ECRR)] combined in the T-SPOT. TB assay provided the highest sensitivity for active TB. 12 Use of all four of these antigens was therefore included in the assay for validation of a rule-out test for TB.
Study population and sample sizes
Proteomic signature
For the proteomics experiments, samples were chosen at random from the IDEA study cohort (HIV–) and the first 90 were analysed using both SELDI-TOF and LC–MS, techniques, with the sensitivity and specificity of signatures compared with the landmark studies. The Hamilton and Levin unpublished SELDI-TOF signature (Hamilton MS and Levin M, Imperial College London, London, UK, 2016–18) is currently being adapted into an ELISA-based test; should the SELDI-TOF signature be validated in the IDEA study cohort (n = 90, sensitivity > 85%), we planned to validate the ELISA test on the entire IDEA (HIV–/+) study cohort to provide confidence intervals (CIs) < 5% for active TB compared with other disease (OD). For LC–MS, a total of 200 samples (HIV–/+) were analysed and this data set was used to explore the diagnostic performance of both previously identified and novel protein markers.
Cellular immunological signature
Using a nested case–control approach, 82 active TB patients were randomly selected (but enriched for those with HIV infection), to add to the approximately 82 LTBI patients, to provide a final cohort of 164 individuals. Although smaller than the ideal sample size, this will still be more than sufficient to provide enough power to demonstrate 95% sensitivity and specificity.
Molecular rule-out test
In order for the molecular test to be used to rule out TB, it must have extremely high sensitivity and, therefore, must provide a positive result for those individuals who are infected with Mtb but who fail to test positive in the most sensitive of the currently available tests for Mtb infection (the T-SPOT. TB). We therefore selected an initial cohort of 100 individuals recruited into the IDEA study, selected at random, but conforming to the following criteria: 25 individuals with active TB and a positive T-SPOT. TB result; 25 individuals with active TB and a negative T-SPOT. TB result; 25 individuals with ODs with a positive T-SPOT. TB result; and 25 individuals with a negative T-SPOT. TB result. The new protocol stipulated that, once this initial cohort was tested using the molecular rule-out test, the results would be analysed to test the performance of the assay in ruling out active TB. If the results were promising (i.e. > 95% sensitivity is demonstrated), we would continue to assay the rest of the available PBMC samples from the IDEA study cohort, in order to maximise the confidence of our findings. However, in the event of obtaining less promising results, the full cohort of PBMCs would not be analysed.
Management plan
An updated management plan that reflected the changes in timelines, sample sizes, protocols and experimental approaches was submitted to the NIHR Efficacy and Mechanism Evaluation board in October 2016. The new end-of-study date of 31 December 2017 was agreed. No further changes to the management plan were made during the course of the project.
Study cohorts
Although the focus of this study project was to evaluate all four novel technologies in the diagnostic evaluation of all TB, each required a slightly different approach to selecting a final study cohort from the full IDEA study cohort. The details of the inclusion criteria are presented in each substudy chapter. The inclusion criteria, as well as the sample size calculations, were agreed by the study oversight groups and the ISAB.
The IDEA study cohort and biobank
The IDEA study cohort is described in detail in the IDEA Health Technology Assessment report12 and recent manuscript. 14 In summary, 1060 adults (aged ≥ 16 years) with suspected active TB were prospectively recruited to 12 NHS hospital sites in London, Slough, Oxford, Leicester and Birmingham. Because the proportion of HIV+ patients recruited within the main study cohort of active TB suspects was low, an extended study was performed to increase the number of HIV+ patients. The HIV infection rate in the full cohort was 22.9%, but in the main study it was 16%.
In the main cohort, 845 individuals were included in the final analysis. Of these, 363 (43%) had active TB, of which 261 cases (72%) were confirmed by culture. This represents the rate of TB in the full cohort of TB suspects recruited in the IDEA study, a population that is reflective of all TB suspects in areas with high TB rates in England. TB was excluded in 52% of patients and the remaining 5.1% were clinically indeterminate. For a more detailed description of the full IDEA study cohort, including demographic and clinical characteristics, please refer to the publications and reports from this study. 12
Reference standard
For the validation of signatures for the detection of active TB, a composite reference standard was used, the Dosanjh categorisation,11 by which patients are divided into four possible groups: definite TB, highly probable TB, clinically indeterminate and non-TB (Table 2). Importantly, this allows for inclusion of the full spectrum of TB cases, including those lacking microbiological conformation (Dosanjh category 2).
| Diagnostic category | Criteria |
|---|---|
| 1: Culture-confirmed TB | Microbiological culture of Mtb AND suggestive clinical and radiological findings |
| 2: Highly probable TB | Clinical and radiological features highly suggestive of TB unlikely to be caused by OD AND a decision to treat made by a clinician AND appropriate response to therapy AND histological support if available |
| 3: Clinically indeterminate | Final diagnosis of TB neither highly probable nor reliably excluded |
| 4: Active TB excluded: subclassification | |
| 4A: inactive TB | History of prior episode OR stable CXR changes AND TST positivea (if done) AND bacteriologically negative (if done) AND no clinical evidence of active disease |
| 4B: one or more risk factors for TB exposure,b TST positivea | TST positivea AND bacteriologically negative (if done) AND no clinical evidence of active disease |
| 4C: one or more risk factors for TB exposure,b TST negativea | History of TB exposure AND TST negative (if done) |
| 4D: no risk factors for TB exposure,b TST negative | No history of TB exposure AND TST negative (if done) |
Categorisation of patients was performed by a clinical panel of four respiratory medicine and infectious disease clinicians specialising in TB. These clinicians had access to anonymised diagnostic and follow-up (up to 12 months post recruitment) clinical details for each patient, including response to treatment, while remaining blind to final IGRA results, as outlined in the IDEA study protocol. It should be noted that not all individuals in Dosanjh category 2 were culture negative; some individuals did not have a culture test done or the test failed. This group should therefore be considered as ‘culture unconfirmed’ rather than ‘culture negative’, given that, for active TB to be excluded, a definitive diagnosis of another condition is required. Therefore, in this report, we refer to the ‘active TB excluded’ group (i.e. Dosanjh category 4) as OD.
Patient groups used for main and subgroup analyses
The primary analysis for determining test accuracies and other diagnostic accuracy parameters of previously described tests/signatures was to assess their performance in detecting all TB (i.e. Dosanjh categories 1 and 2 combined), against all OD within each cohort. Given the uncertainty over the correct final diagnosis of those who were categorised as ‘clinically indeterminate’ (Dosanjh category 3) by the clinical panel in the IDEA study, these patients have been excluded from each of the VANTDET substudies (as was the case with the IDEA study).
In each substudy (with the exception of the candidate rule-out tests), subgroup analyses were also performed, which included determining diagnostic performance for detecting either culture-confirmed (Dosanjh category 1) or highly probable (Dosanjh category 2) TB, as well as for either PTB or EPTB. In these cases, the PTB group included individuals who had pulmonary involvement as well as those who had pulmonary and extrapulmonary involvement. Those with extrapulmonary involvement only were classified as EPTB.
Prevalence data
Within this report, we have calculated prevalence values for active TB groups in various parent populations using the data from the final IDEA study [both the ‘main study’ and the ‘HIV cohort’,12 without exclusion of the ‘clinically indeterminate’ population (Dosanjh category 3)]. The prevalence values are given in Appendices 1 and 2 (see Table 23).
Patient and public engagement and involvement
The TB research centre where the laboratory team of the VANTDET study is based is associated with the Health Protection Research Unit (HPRU) in Respiratory Infections, and both are led by the VANTDET study’s chief investigator, Professor Ajit Lalvani. The HRPU conducts an extensive patient and public involvement (PPI) and engagement programme, which has been recognised within the Imperial College London as an exemplar of good practice (see our case studies in the Imperial Patient Experience Research Centre30,31). The TB research centre team, including the VANTDET study researchers AH, MTW, LH, TM and RP, are frequently requested to run public engagement events.
For the IDEA study, Ms Nisha Karnani (a lay member) was appointed as the patient representative for the duration of the study. She was consulted at key points during the study and was invited to Study Steering Committee meetings and the IDEA study presentation at the end of the study.
The HPRU conducts quarterly symposium series, in which the VANTDET study team has disseminated and discussed project findings to a wide audience, including the HPRU in Respiratory Infections, the ISAB, patient representatives, collaborators and colleagues. Members of the management board have an excellent track record in active engagement with patients and public:
-
Professor Ajit Lalvani was a key member on the panel at the Engagement to End TB event at the University of East London. This was part of the Voices for London Festival, which was attended by community members of East London.
-
The VANTDET study team has participated in several public engagement events to showcase the TB research we are involved in. We also, along with other TB research centre members, received specific public engagement funding to develop and evaluate an animation film and LTBI diagnostics and treatment. This film was evaluated with screening and focus groups events for community groups, members of the public and other institutions involved in public engagement. These included the Imperial Festival (May 2017), Bromley by Bow Unity Festival (East London, July 2017), screening of the LTBI film at the Midaye Somali Women’s Group (White City, December 2017) and Let’s Talk about Tuberculosis (White City, December 2017).
The team has also published their research work in various online articles for a wider public audience:
-
Tuberculosis in England: How Research at Imperial is Supporting the National Strategy. 32
-
Increasing Awareness About Latent Tuberculosis Infection. 33
-
Multilingual White City Residents Help Imperial Raise Awareness of TB Research. 34
-
Case Study #6: Evaluating a TB Awareness Animation. 35
The HPRU in Respiratory Infections and TB research centre have established their first patient and public panel that comprises seven members of the public directly or indirectly affected by, or interested in, our research areas and both with and without previous experience of PPI. The role of the panel is to support the delivery of effective PPI and engagement approaches and activities within the HPRU. The panel advises on different PPI avenues available for disseminating our findings (e.g. charity/voluntary organisation websites and blogs), and also help to distribute findings within their informal networks.
Statistical analysis and presentation of data
For statistical analyses, R software (version 3.4.2; The R Foundation for Statistical Computing, Vienna, Austria) or Prism (version 7.04; GraphPad Software Inc., CA, USA) was used as indicated in the Methods sections of Chapters 3–6. For all technologies and data sets, the outcome of signature performance was presented in a dot plot, box-and-whisker plot and/or a receiver operating characteristic (ROC) curve, all generated using Prism software. ROC curve analysis was used to estimate diagnostic accuracy.
Blinding
All individuals carrying out experiments and determining index test results were blind to clinical data, reference standard results and all other patient-specific information. Only study ID was known.
Defining the cut-off points
In each substudy, multiple methods for defining test cut-off points were used, depending on the proposed use of the test. For those tests being assessed as rule-in tests, specificity was set at > 90%. For those being assessed as rule-out tests, sensitivity was set at > 95%. For a balanced approach, either the cut-off point with the optimal Youden value was given (for transcriptomic and proteomic tests) or, for the cellular immune signatures, the cut-off point in which sensitivity was equal to specificity was used (in line with standard practice in the respective field of study).
Chapter 3 Transcriptomics
Introduction
Several studies have demonstrated that whole-blood gene expression profiles have the potential to be used for diagnostic tests for active TB, in adults and children. In 2010, Berry et al. 18 demonstrated that differential transcriptional patterns in peripheral blood can be harnessed to differentiate TB from other conditions and a whole-blood 86-transcript signature distinguished active TB from other inflammatory and infectious diseases. A major milestone was reached by a study that showed that a 44-blood transcript signature was able to differentiate active TB from ODs using a cohort from a high-burden setting. 20 Anderson et al. 36 used a similar approach to identify a 51-gene signature that could distinguish TB from ODs in a cohort of children, all of whom had suspected TB at recruitment. This study has particular strengths in the approach to study design, as highly probable TB cases were also included and the OD group included a wide variety of differential diagnoses that present in a real-life clinical setting. Such a study in adults has yet to be used for validation of transcriptomic signatures for TB diagnosis. Maertzdorf et al. 37 identified a four-gene signature (guanylate-binding protein 1, inhibitor of DNA binding 3, interferon-induced transmembrane protein 3 and purinergic receptor, P2RY14) that distinguished subjects with active TB from healthy controls (HCs) and those with LTBIs with high accuracy. Similarly, a combination of four genes [cluster of differentiation 177 (CD177), Charcot–Leyden crystal galectin, haptoglobin (HP) and immunoglobulin J chain] was identified using support vector machine learning (SVML) and was shown to accurately classify active TB (including EPTB) from non-TB febrile patients. 38
Most recently, Sweeney et al. 39 used a meta-analysis approach to derive a TB risk score from three genes (dual-specificity phosphatase 3, guanylate-binding protein 5 and Krüppel-like factor 2), which was able to distinguish active TB from ODs with high accuracy. The important characteristics and diagnostic classification of TB are summarised in Table 29 for the five studies and the meta-analysis.
The aim of this substudy is to define the role of previously identified whole-blood gene-expression signatures in the diagnostic evaluation of active TB using host transcriptomic microarray.
Methods
Inclusion criteria
The inclusion criteria were definite diagnosis of either active TB (Dosanjh categories 1 or 2) or OD (Dosanjh category 4); consent given for genetic analysis; and PAXGene sample available. Those with a clinically indeterminate diagnosis (Dosanjh category 3) were excluded. Among HIV+ participants in the IDEA study, all active TB cases were selected and a similar number of participants with ODs were randomly selected for the microarray assay analysis.
Ribonucleic acid extraction and quality control
For whole-blood ribonucleic acid (RNA), 2.5 ml of blood was collected into PAXGene tubes and was frozen at –80 °C as part of the IDEA study protocol. 12 RNA was extracted from PAXGene tube samples using the PAXGene Blood RNA Kit (PreAnalytiX, Hombrechtikon, Switzerland), in accordance with the manufacturer’s instructions. RNA quality control (QC) was performed using both the NanoDrop 8000 (Thermo Fisher Scientific, Waltham, MA, USA) and the Agilent 2100 Bioanalyzer (Agilent, CA, USA) instruments.
Whole genome-wide microarray
Illumina gene expression microarray platforms were used in this study (Illumina, San Diego, CA, USA). The detailed protocol has been published. 40 Briefly, a total of 100 ng of RNA in 11 µl of ribonuclease (RNase)-free water was used for synthesising first-strand complementary deoxyribonucleic acid (cDNA), using a master mix containing 1 µl of T7 oligo(dT) primer, 2 µl of 10× first-strand buffer, 4 µl of deoxyribonucleotide triphosphate mix, 1 µl of RNase inhibitor and 1 µl of ArrayScript. Next, a second-strand cDNA was synthesised using 80 µl of master mix (i.e. 63 µl of nuclease-free water, 10 µl of 10× second-strand buffer, 4 µl of deoxyribonucleotide triphosphate mix, 2 µl of DNA polymerase and 1 µl of RNase H). After purification, 17.5 µl of cDNA was in vitro transcribed to synthesise antisense RNA using an in vitro transcription master mix (i.e. 2.5 µl of T7 10 × reaction buffer, 2.5 µl of T7 enzyme mix and 2.5 µl of biotin-NTP mix). Next, a total of 750 ng of complementary RNA was used for array hybridisation to the Illumina Human HT12-v4 beadchips (Illumina, San Diego, CA, USA), in accordance with the manufacturer’s protocol. Finally, the beadchip was scanned on the Illumina BeadArray Reader (Illumina, San Diego, CA, USA). The gene expression data were extracted from images collected from Illumina BeadArray Reader.
Microarray quality control and normalisation
A raw probe intensity signal for approximately 47,000 transcripts was acquired from the arrays using Beadstudio software (Illumina, San Diego, CA, USA) and normalised using the Lumi R package (Bioconductor, WA, USA). 41 First, the raw data were log2-transformed using lumi.T function, and robust spline normalisation was applied using lumi.N. 42 Next, transcripts that were not expressed in any samples (Illumina detection p-value > 0.01) were removed from further analysis. Finally, principal component analysis was used to remove outliers.
Statistical analysis
Calculation of signatures scores
Those published signatures for which the gene expression levels of selected target genes were combined to give a score were calculated as previously described. 20,36,39
Linear discriminant analysis
Linear discriminant analysis (LDA) is a supervised classification approach. It was used to model the linear combination of candidate transcripts from previously reported signatures as a function of sample type (i.e. TB or OD). LDA is based on the assumptions of multivariate normal distribution of the explanatory variables (candidate transcripts) and these variables have the same covariance matrix for classification categories (sample types) considered.
Testing trained models
For the Roe et al. 38 signature, the original trained support vector machine model was available. Therefore, classification performance of this model was assessed, in addition to the leave-one-out LDA model on the full cohort, and performance was reported. Support vector machine is a machine-learning algorithm that used preselected variables to perform a binary classification of input samples; in our case two classes were active, TB and OD.
Receiver operating characteristic curve analysis and defining cut-off points
Test values (i.e. score, probability or otherwise) for the different signatures in diagnostic evaluation of the key patient groups were assessed for discriminatory ability using ROC analysis, performed using either Prism or R software. Three alternative approaches were used for selecting the cut-off point. To prioritise sensitivity, the cut-off point providing > 95% was given and, to prioritise specificity, the cut-off point providing > 90% specificity was given. To optimise both sensitivity and specificity, the maximum Youden index (i.e. sensitivity + specificity – 1) was used to select the cut-off point. 43
Calculation of predictive values
To determine the predictive value of tests in given populations in which TB prevalence is known (or assumed), we calculated the positive predictive value (PPV) and negative predictive value (NPV).
Results
Final cohort
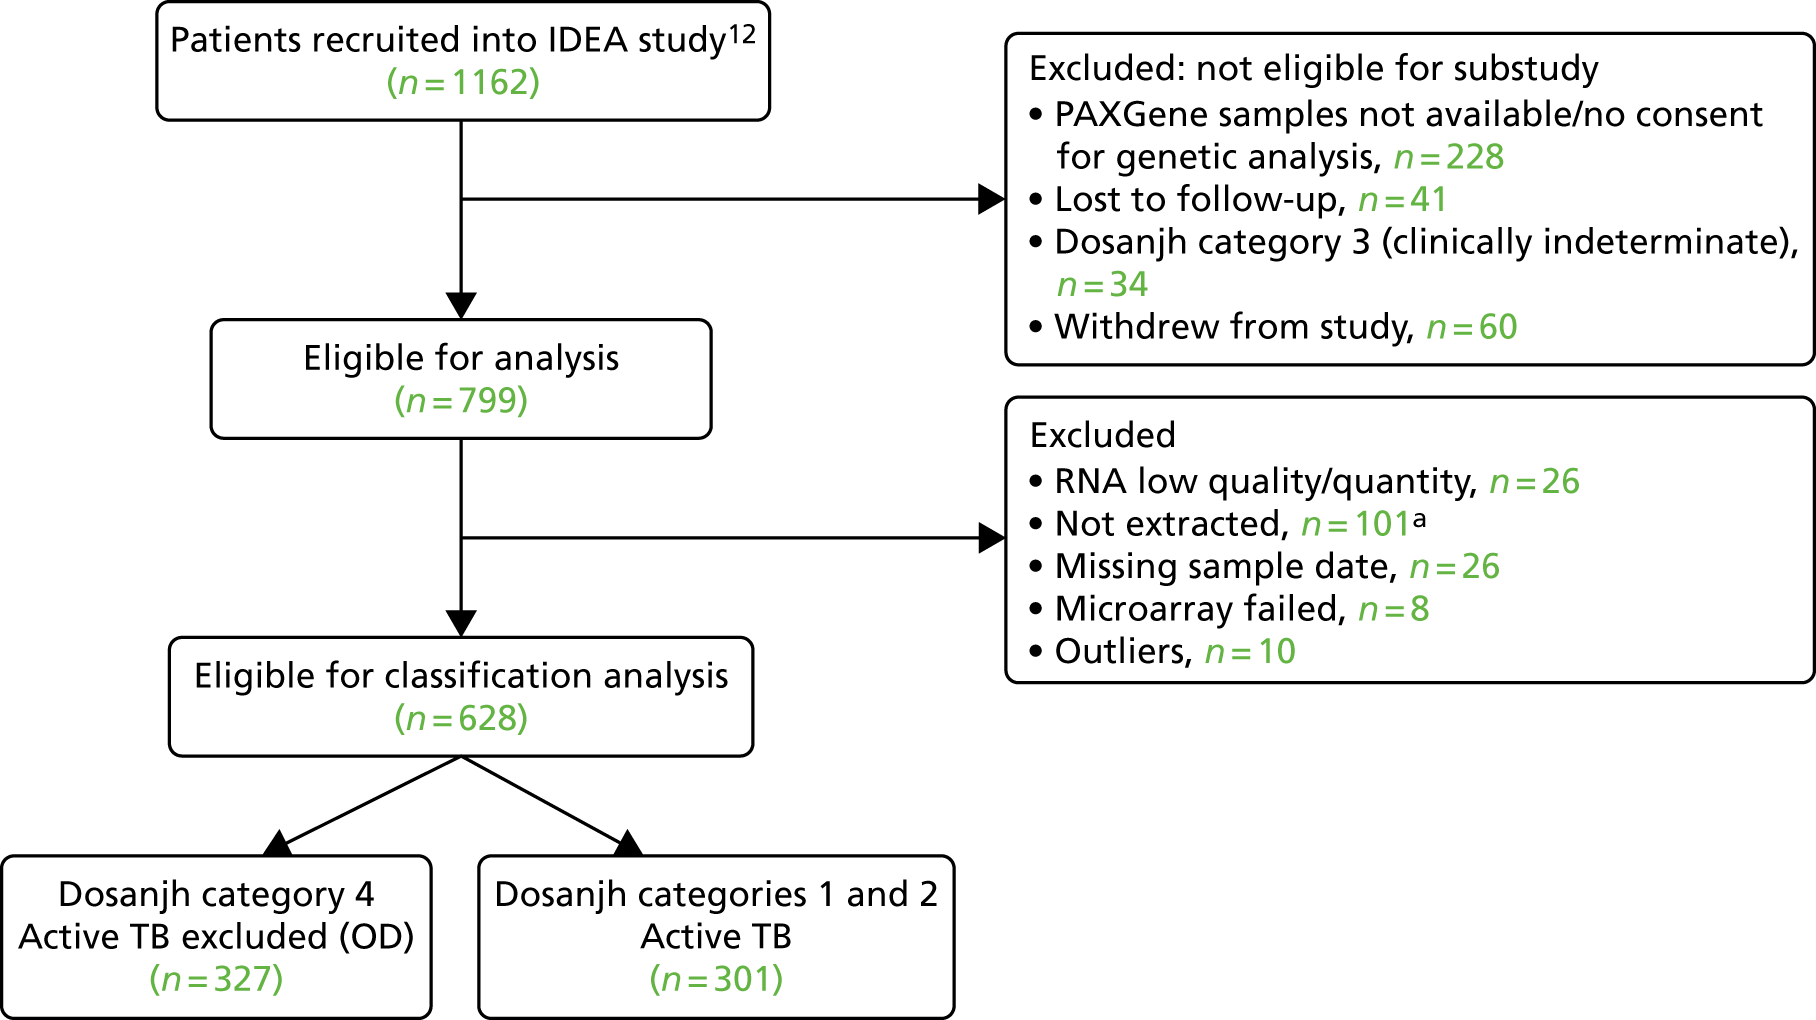
The study flow chart in Figure 2 shows the final cohort selected from the total IDEA study cohort. In the IDEA study, 288 patients did not give consent for a PAXGene sample to be taken or for genetic analysis. Of the 799 patients who were eligible for the transcriptomic substudy, 628 patients were selected for RNA extraction, had sufficient RNA, were used in microarray analysis and had passed the RNA and micorarray QC checks.
FIGURE 2.
Study flow chart for validation of transcriptomics signatures. a, 101 samples from OD patients who were HIV+ were excluded. From the full cohort of 1162 patients recruited into the IDEA study, 628 were selected for RNA extraction. Of note, the rate of active TB among the HIV+ cohort of patients in IDEA study was low (≈ 14%). Therefore, all of the eligible HIV+ active TB cases (n = 20) were selected for cohort inclusion, with a similar number of HIV+ OD participants (n = 25) randomly selected from the 146 HIV+ participants available.
The main demographic characteristics of the transcriptomics validation cohort are presented in Table 3. Of all TB cases included, 29.6% were culture unconfirmed (highly probable TB/Dosanjh category 2), which reflects the proportion of this group in the full IDEA study cohort of TB patients (in which 28.1% of TB cases were highly probable). As in the overall IDEA study cohort, significant differences were observed between patients groups, with TB patients being younger, weighing less and having lower body mass index (BMI), and more likely to be of Indian subcontinent ethnicity (includes Indian, Bangladeshi, Pakistani and Sri Lankan).
| Demographic characteristic | Culture-confirmed TB (Dosanjh category 1) (N = 212) | Highly probable TB (Dosanjh category 2) (N = 89) | OD (Dosanjh category 4) (N = 327) | p-value overalla |
|---|---|---|---|---|
| Age (years), median (range) | 32.0 (16.0–81.0) | 36.0 (18.0–76.0) | 43.0 (17.0–87.0) | < 0.001 |
| Male, n (%) | 149 (70.3) | 45 (50.6) | 189 (57.8) | 0.001 |
| Ethnic origin, n (%) | < 0.001 | |||
| Asian | 12 (5.66) | 3 (3.37) | 12 (3.67) | |
| Black | 36 (17.00) | 17 (19.10) | 62 (19.00) | |
| Hispanic | 1 (0.47) | 0 (0.00) | 1 (0.31) | |
| Indian subcontinent | 139 (65.60) | 61 (68.50) | 150 (45.90) | |
| Middle Eastern | 3 (1.42) | 0 (0.00) | 11 (3.36) | |
| Mixed | 2 (0.94) | 0 (0.00) | 7 (2.14) | |
| Unable/unwilling to respond | 0 (0.00) | 0 (0.00) | 1 (0.31) | |
| White | 19 (8.96) | 8 (8.99) | 83 (25.4) | |
| Height (m), median (range) | 1.69 (1.37–1.96) | 1.67 (1.47–1.98) | 1.70 (1.32–1.96) | 0.305 |
| Height missing, n (%) | 94 (44.3) | 33 (37.1) | 106 (32.4) | |
| Weight (kg), median (range) | 63.1 (34.7–1270) | 63.0 (40.4–1160) | 68.7 (41.4–1400) | < 0.001 |
| Weight missing, n (%) | 6 (2.8) | 4 (4.5) | 24 (7.3) | |
| BMI (kg/m2), median (range) | 22.6 (15.7–48.5) | 22.5 (15.6–42.2) | 24.4 (14.8–47.2) | 0.005 |
| BMI missing, n (%) | 96 (45.3) | 36 (40.4) | 114 (34.9) |
The main clinical features of the transcriptomic signatures validation cohort are presented in Table 4. There was a higher proportion of HIV+ individuals in the highly probable TB group than in the culture-confirmed TB and OD groups. Because the number of HIV+ OD cases was higher in the overall IDEA study cohort, the HIV+ rate we reported within this subcohort does not reflect the parent population. However, all HIV+ TB patients were included. The higher proportion of HIV-infected individuals in the highly probable TB group than in the culture-confirmed TB group reflects the comparatively paucibacillary nature of active TB and HIV co-infected cases.
| Clinical characteristic | Culture-confirmed TB (Dosanjh category 1) (N = 212) | Highly probable TB (Dosanjh category 2) (N = 89) | OD (Dosanjh category 4) (N = 327) | p-value overalla |
|---|---|---|---|---|
| Clinical setting, n (%) | 0.74 | |||
| Unknown | 1 (0.47) | 1 (1.12) | 1 (0.31) | |
| Inpatient | 68 (32.1) | 31 (34.8) | 103 (31.5) | |
| Outpatient | 143 (67.5) | 57 (64.0) | 223 (68.2) | |
| BCG vaccinated yes, n (%) | 126 (59.4) | 46 (51.7) | 191 (58.4) | 0.439 |
| BCG scar visible, n (%) | 0.632 | |||
| Missing | 49 (23.1) | 19 (21.3) | 75 (22.9) | |
| No | 13 (6.13) | 4 (4.49) | 16 (4.89) | |
| Unsure | 10 (4.72) | 8 (8.99) | 30 (9.17) | |
| Yes | 140 (66.0) | 58 (65.2) | 206 (63.0) | |
| HIV+, n (%) | 9 (4.2) | 11 (12.4) | 25 (7.6) | 0.04 |
| TB contact no, n (%) | 160 (75.5) | 72 (80.9) | 257 (78.6) | 0.527 |
The distribution of type and severity of TB, and distribution of alternative diagnoses in the OD group, are presented in Appendix 1.
Diagnostic accuracy analysis
There were no missing data for any of the genes for the validation of published signatures.
Performance of ‘score’-based signatures in diagnosing active tuberculosis
Three of the published signatures presented a score [referred to in the publications as either disease risk score (DRS) or tuberculosis score (TBS), as previously described20,36,39], which is calculated using the expression levels of signature genes. We were able to apply the same score-based approach to testing these gene signatures within the signatures in our cohort. Cross-tabulation of the score value distributions against diagnostic categories according to the reference standard (Dosanjh criteria) is shown in Table 26 in Appendix 3.
Analysis of performance of score-based signatures in the full cohort
The distribution of score values in TB and OD cases in the overall cohort, as well as within either the HIV+ or HIV– cohort, is shown in Figure 16 in Appendix 3 (the ROC curves showing diagnostic performance are also shown).
The TB group had significantly higher score values than the OD group for all three signatures when assessed within the full transcriptomic cohort, with the difference being lowest for the Anderson et al. 36 DRS. The Kaforou et al. 20 44-gene signature and the Sweeney et al. 39 three-gene signature performed comparably, and both performed better than the Anderson et al. 36 signature in the overall and HIV+ cohorts, with area under the curve (AUC) values between 0.82 (95% CI 0.78 to 0.85) and 0.84 (95% CI 0.80 to 0.86).
Interestingly, although the scores were all significantly higher in the TB groups than in the OD group within the HIV– population, there were no significant differences between scores in these groups within the HIV+ population (Table 5 and Figure 16c in Appendix 3). This was reflected in a poor diagnostic performance (AUC = 0.50–0.69) for all three signatures in the HIV+ population, and the observation that, when the HIV+ population was excluded from the overall cohort, the AUC for each signature improved slightly (see Table 5).
| Signature (reference) | HIV | TB (n) | OD (n) | AUC, %(95% CI) | Cut-off point | Sensitivity, % (95% CI) | Specificity, % (95% CI) | PPV | NPV |
|---|---|---|---|---|---|---|---|---|---|
| DRS (Anderson et al.36) | – | 281 | 302 | 0.70 (0.66 to 0.75) | > 86.0a | 95.0 (91.8 to 97.3) | 23.8 (19.2 to 29.1) | 0.48 | 0.86 |
| > 100.6b | 30.3 (24.9 to 36.0) | 90.0 (86.1 to 93.2) | 0.70 | 0.63 | |||||
| > 91.4c | 75.4 (70.0 to 80.4) | 53.6 (47.8 to 59.4) | 0.55 | 0.74 | |||||
| + | 20 | 25 | 0.50 (0.33 to 0.68) | < 105.6a | 95.0 (75.1 to 99.9) | 8.0 (0.98 to 26.0) | 0.44 | 0.68 | |
| < 84.2b | 5.0 (0.13 to 24.9) | 92.0 (74.0 to 99.0) | 0.32 | 0.56 | |||||
| > 97.9c | 70.0 (45.7 to 88.1) | 44.0 (24.4 to 65.0) | 0.49 | 0.66 | |||||
| –/+ | 301 | 327 | 0.68 (0.64 to 0.72) | > 86.0a | 95.0 (91.9 to 97.2) | 22.9 (18.5 to 27.9) | 0.48 | 0.86 | |
| > 100.8b | 28.2 (23.2 to 33.7) | 90.2 (86.5 to 93.2) | 0.68 | 0.62 | |||||
| > 91.4c | 75.4 (70.2 to 80.2) | 52.0 (46.4 to 57.5) | 0.54 | 0.74 | |||||
| DRS (Kaforou et al.20) | – | 281 | 302 | 0.83 (0.79 to 0.86) | > 101.1a | 95.0 (91.8 to 97.3) | 32.8 (27.5 to 38.3) | 0.52 | 0.90 |
| > 113.4b | 57.0 (51.0 to 62.8) | 90.4 (86.5 to 93.5) | 0.82 | 0.74 | |||||
| > 108.6c | 74.7 (69.2 to 79.7) | 78.8 (73.8 to 83.3) | 0.73 | 0.81 | |||||
| + | 20 | 25 | 0.69 (0.53 to 0.85) | > 104.3a | 95.0 (75.1 to 99.9) | 36.0 (18 to 57.5) | 0.53 | 0.91 | |
| > 124.2b | 35.0 (15.4 to 59.2) | 92.0 (74.0 to 99.0) | 0.77 | 0.65 | |||||
| > 120.2d | 45.0 (23.0 to 68.5) | 88.0 (68.8 to 97.5) | 0.74 | 0.68 | |||||
| > 113.2d | 65.0 (40.8 to 84.6) | 68.0 (46.5 to 85.05) | 0.61 | 0.72 | |||||
| –/+ | 301 | 327 | 0.82 (0.78 to 0.85) | > 101.1a | 95.0 (91.9 to 97.2) | 31.8 (26.8 to 37.2) | 0.51 | 0.89 | |
| > 114.7b | 53.2 (47.4 to 58.9) | 90.2 (86.5 to 93.2) | 0.80 | 0.72 | |||||
| > 108.6c | 74.4 (69.1 to 79.3) | 76.8 (71.8 to 81.2) | 0.71 | 0.80 | |||||
| TBS (Sweeney et al.39) | – | 281 | 302 | 0.84 (0.81 to 0.87) | > –4.05a | 95.0 (91.8 to 97.3) | 34.4 (29.1 to 40.1) | 0.52 | 0.90 |
| > –2.60b | 56.2 (50.2 to 62.1) | 90.0 (86.1 to 93.2) | 0.81 | 0.7 | |||||
| > –3.2c | 79.4 (74.2 to 83.9) | 76.8 (71.7 to 81.5) | 0.72 | 0.83 | |||||
| + | 20 | 25 | 0.64 (0.47 to 0.81) | > –4.51a | 95.0 (75.1 to 99.9) | 0.0 (0.0 to 13.7) | 0.42 | 0 | |
| > –1.69b | 15.0 (3.2 to 37.9) | 92.0 (74.0 to 99.0) | 0.59 | 0.59 | |||||
| > –2.49c | 55.0 (31.5 to 76.9) | 80.0 (59.3 to 93.1) | 0.67 | 0.70 | |||||
| –/+ | 301 | 327 | 0.83 (0.80 to 0.86) | > –4.1a | 95.0 (91.9 to 97.2) | 29.4 (24.5 to 34.6) | 0.50 | 0.89 | |
| > –2.5b | 55.2 (49.3 to 60.9) | 90.2 (86.5 to 93.2) | 0.81 | 0.73 | |||||
| > –3.2c | 78.4 (73.3 to 82.9) | 75.5 (70.5 to 80.1) | 0.71 | 0.83 |
The full diagnostic performance of the ‘score’-based signatures in full, HIV+ and HIV– populations is also presented in Table 5, including a range of sensitivity and specificity values selected by varying the cut-off values for each score-based test based on predefined criteria. The PPVs and NPVs are also given.
The poor performance of these signatures within the HIV+ population suggests that these signatures are unable to detect TB in this population. However, the variability in the diagnostic accuracy scores demonstrates uncertainty in the estimates and reflects the small numbers of patients.
The performance of score signatures by Dosanjh classification
By comparing the ‘score’ signature results between Dosanjh categories, we can ascertain the effect of culture status within the TB group, and the likelihood of LTBI within the OD group (Figure 3).
FIGURE 3.
The performance of previously published score signatures, stratified by Dosanjh category. (a) Anderson et al. ;36 (b) Kaforou et al. ;20 and (c) Sweeney et al. 39 Statistical differences between score values between groups were determined using the Kruskal–Wallis with Dunn’s post hoc test for multiple comparisons. *p < 0.05; **p < 0.005; ***p < 0.0005; ****p < 0.0001.
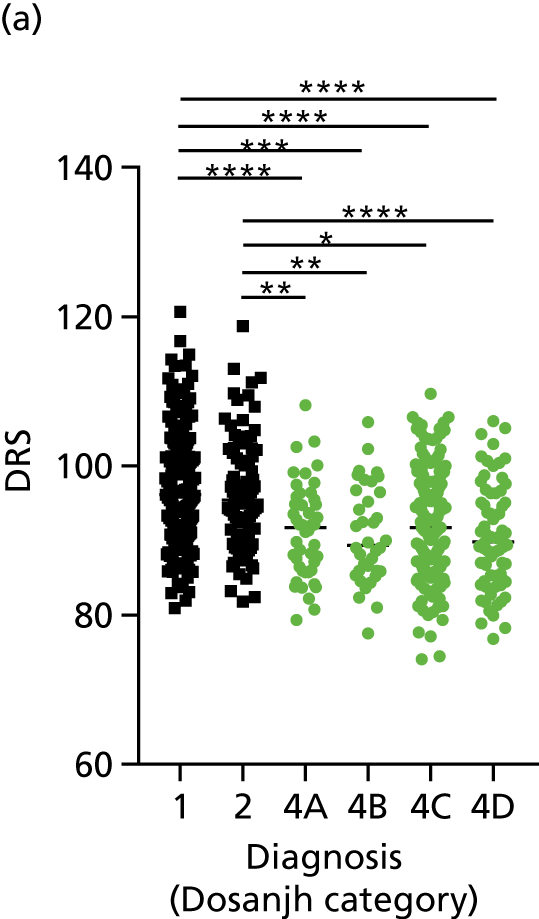
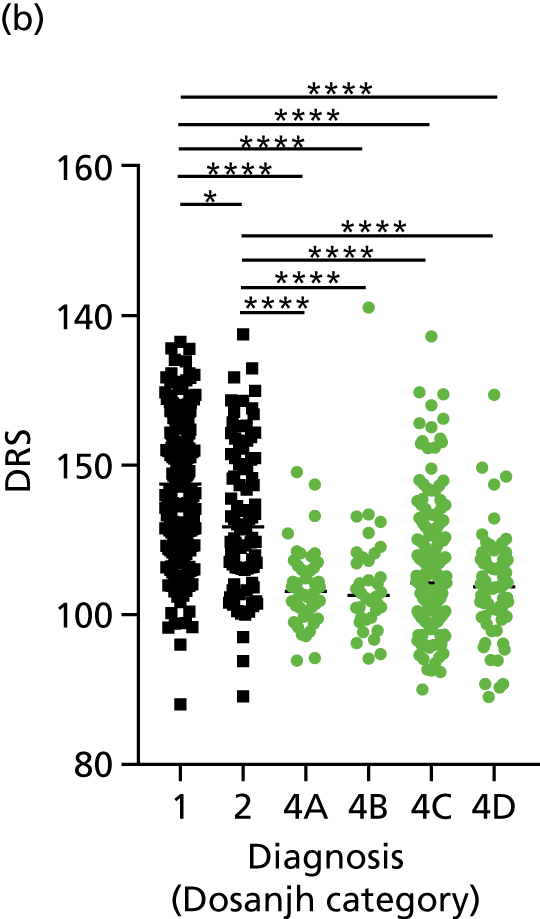
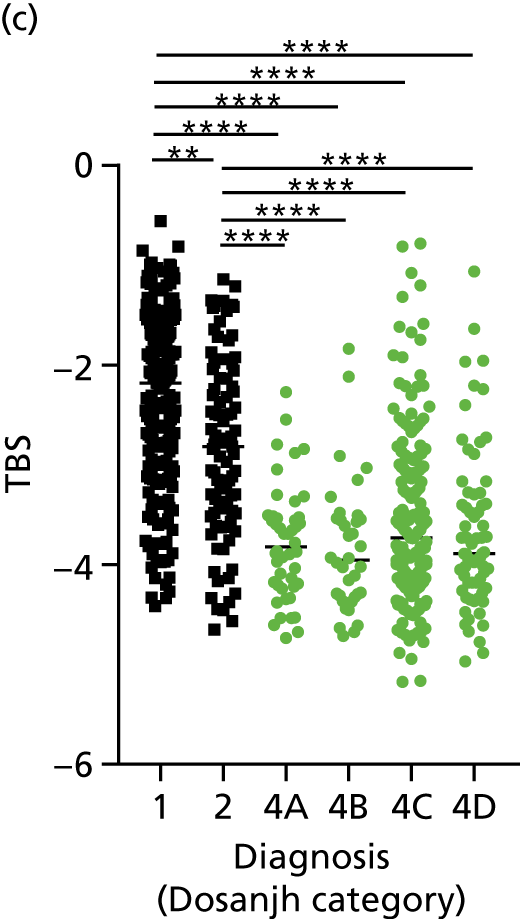
In all cases, the score signatures were higher (significantly so in the case of the Kaforou et al. 20 and Sweeney et al. 39 signatures) in the culture-confirmed TB cases (Dosanjh category 1) than the highly probable TB cases (Dosanjh category 2) and, as a result, the diagnostic accuracy (AUC values) for culture-confirmed TB was slightly better than for highly probable TB for all score signatures (see Appendix 4). The maximum AUC for the detection of culture-confirmed TB was 0.86 (95% CI 0.83 to 0.89) using the Sweeney et al. 39 TBS, [the Kaforou et al. 20 DRS gave similar performance AUC of 0.85 (95% CI 0.81 to 0.88)] (see Table 27). For distinguishing highly probable TB from OD, the highest AUC achieved was 0.75 (95% CI 0.70 to 0.81), again with the Sweeney et al. 39 TBS.
No differences were observed in score signatures between the subgroups of OD patients in Dosanjh category 4, suggesting that neither previous history of TB or inactive TB (not to be confused with diagnosed LTBI) nor stratified risk of LTBI within the OD population affected the outcome of these score signatures. In fact, the highest AUCs were reported when the 4A and 4B groups (highest risk of having LTBI) were classified from all TB cases (see Figure 17b), the opposite of what was expected. The full diagnostic accuracy data are shown in Table 27 in Appendix 3, including additional analyses with the HIV+ patients excluded from the cohort. As expected, given the poor diagnostic performance within the HIV+ population, removing this group of patients resulted in slightly improved diagnostic performance (see Figure 17).
The performance of score signatures in detecting pulmonary or extrapulmonary tuberculosis
The clinical presentation, management and outcome of PTB and EPTB are different, and the latter is typically harder to diagnose as a result of several factors (e.g. difficulty of obtaining biopsy samples). Therefore, we wished to compare the score values in these groups and determine the diagnostic performance in either of these subclassifications of TB. As with the previous analyses, the Kaforou et al. 20 and Sweeney et al. 39 score signatures performed similarly when classifying either PTB or EPTB, whereas the Anderson et al. 36 signature had lower AUC values (see Figure 18 in Appendix 3). The optimal performance for diagnosing either PTB or EPTB was comparable, with highest AUCs being 0.85 (95% CI 0.81 to 0.89; achieved by both the Kaforou et al. 20 DRS and the Sweeney et al. 39 TBS) and 0.84 (95% CI 0.80 to 0.87; achieved by the Sweeney et al. 39 TBS), respectively.
In addition, we stratified the OD group by the most prevalent disease types, so that we could identify any differences within this heterogeneous population of TB suspects with a wide array of ODs. Interestingly, sarcoidosis was the only condition within the OD group that consistently did not differ significantly from either type of TB (PTB or EPTB) across all three signatures (see Figure 18b and 18c), suggesting that this specific differential diagnosis is a major confounding factor for the optimal performance of these score-based signatures in a real-life clinical setting.
Performance of score signatures in detecting tuberculosis in smear-negative tuberculosis suspects
Among those in the IDEA study population tested for acid-fast bacilli (76% of IDEA study cohort), using smear microscopy, the test provided high specificity (96.7%) and poor sensitivity (23%) for all TB. Therefore, smear microscopy functions as a reliable cheap and fast rule-in test for (mostly) PTB in the UK setting, and a positive result indicates high bacterial burden. This allows clinicians to start treatment for this important infectious subgroup of TB patients very quickly. However, there is currently no rapid and reliable rule-in or rule-out test with which to identify TB in the ≈77% of smear-negative (paucibacillary) TB suspects who present in secondary care, as culture confirmation can take several weeks. We therefore assessed the performance of the score signatures within this smear-negative population of TB suspects and, using the prevalence data from the IDEA study as the pre-test probability, calculated the PPVs and NPVs for these tests. In Table 6 we present the performance of these scores in the smear-negative population of TB suspects.
| Performance characteristic | Signature | ||
|---|---|---|---|
| Anderson et al.36 | Kaforou et al.20 | Sweeney et al.39 | |
|
Performance in smear-negative TB (Dosanjh categories 1 and 2) (n = 198 TB vs. n = 244 OD) Prevalence of TB in all smear-negative TB suspects = 46% (from overall IDEA study population) |
|||
| AUC, % (95% CI) | 0.67 (0.61 to 0.71) | 0.79 (0.75 to 0.83) | 0.80 (0.76 to 0.84) |
| Cut-off point (Youden index)a | > 91.78 | > 107.5 | > –3.241 |
| Sensitivity, % (95% CI) | 72.2 (65.43 to 78.34) | 77.3 (70.8 to 82.9) | 78.3 (71.9 to 83.8) |
| Specificity, % (95% CI) | 50.8 (44.4 to 57.3) | 71.3 (65.2 to 76.0) | 74.2 (68.2 to 79.55) |
| PPV/NPV | 0.56/0.68 | 0.69/0.79 | 0.72/0.80 |
|
Performance in smear-negative culture-confirmed (Dosanjh category 1) TB (n = 139 TB vs. n = 244 OD) Prevalence of culture-confirmed TB = 33% |
|||
| AUC, % (95% CI) | 0.66 (0.61 to 0.72) | 0.81 (0.77 to 0.86) | 0.82 (0.78 to 0.87) |
| Cut-off point (Youden index)a | > 91.78 | > 107.5 | > –3.233 |
| Sensitivity, % (95% CI) | 72.7 (64.5 to 79.9) | 82.0 (74.6 to 88.0) | 82.7 (75.4 to 88.6) |
| Specificity, % (95% CI) | 50.8 (44.4 to 57.3) | 71.3 (65.2 to 76.9) | 74.2 (68.2 to 79.6) |
| PPV/NPV | 0.42/0.79 | 0.58/0.89 | 0.61/0.90 |
|
Performance in detecting smear-negative and culture-negative (Dosanjh category 2) TB (n = 59 TB vs. n = 244 OD) Prevalence of culture-unconfirmed TB in smear-negative TB suspects = 13% |
|||
| AUC, % (95% CI) | 0.65 (0.58 to 0.73) | 0.74 (0.67 to 0.81) | 0.75 (0.68 to 0.82) |
| Cut-off point (Youden index)a | > 92.41 | > 109.5 | > –3.467 |
| Sensitivity, % (95% CI) | 71.2 (57.9 to 82.2) | 62.7 (49.2 to 75.0) | 74.6 (61.7 to 85.0) |
| Specificity, % (95% CI) | 52.9 (46.4 to 59.3) | 76.2 (70.4 to 81.4) | 68.9 (62.6 to 74.6) |
| PPV/NPV | 0.18/0.92 | 0.28/0.93 | 0.26/0.95 |
These results demonstrate that the performance of the Sweeney et al. 39 and Kaforou et al. 20 transcriptomic signatures in the smear-negative population of TB suspects is sufficient to provide a high NPV (89–90%) for culture-positive TB in a UK-like setting, in which the prevalence of culture-positive TB in smear-negative TB suspects was 33%.
Analysis of Roe et al. signatures using published method
We obtained the SVML model from Roe et al. 38 and validated the signature using the approach proposed in their publication. The performance of this model for discriminating TB cases from patients with ODs in our cohort was very poor with an AUC of 0.59 (95% CI 0.54 to 0.63). Although sensitivity for TB was high using this model [296 of 301 cases correctly classified, sensitivity of 98.3% (95% CI 96.2% to 99.3%)], specificity was very low [10/327 cases correctly classified as fever; specificity of 3.1% (95% CI 1.7% to 5.5%)].
Analysis of all previously reported signatures using linear discriminant analysis
To allow for a fair and comparable validation of all six transcriptomic signatures in our cohort (i.e. including those in which the published method of diagnostic assessment was not reproducible),18,37 we applied a LDA approach to assess the accuracy of each signature to each of the predefined comparisons we selected for validation analyses. Furthermore, this approach determined the optimal performance of each gene set from the selected signatures within our cohort, without the introduction of learning bias. Thus, the findings using this approach should be reproducible in a new, similarly designed cohort.
Assessment in the full cohort
For the distribution of these signatures by probability as calculated by LDA in the full cohort, and diagnostic performance for detecting all TB cases (including stratification by HIV infection status), see Figure 19 in Appendix 5.
Interestingly, in contrast to the score values, where the Anderson et al. 36 DRS underperformed compared with the Kaforou et al. 20 and Sweeney et al. 39 signatures (although no formal statistical comparison was made), the six signatures performed with similar accuracy when assessed using the LDA approach, with AUCs between 0.81 and 0.84 for detecting all TB cases in the full cohort. The accuracy marginally increased to AUC = 0.85 when HIV+ cases were excluded. The performance in the HIV+ population could be assessed only for these signatures using this method,37–39 as the other signatures used a larger set of genes and, in all cases, the performance was poor and highly variable, with no significant differences between probability scores.
Performance in detecting culture-confirmed or highly probable tuberculosis
The performance of all six signatures at detecting either culture-confirmed (Dosanjh category 1) or highly probable (Dosanjh category 2) TB was assessed using the LDA approach (see Table 30 in Appendix 5). For detecting culture-confirmed TB, the performance of all six signatures was comparable, with AUCs between 0.84 and 0.87. However, for detecting highly probable TB, there was a wide range in performance, with the Sweeney et al. 39 signature providing the highest test accuracy (AUC = 0.80).
Performance in detecting either pulmonary tuberculosis or extrapulmonary tuberculosis
When the six signatures were compared using LDA for the detection of either PTB or EPTB, comparable test accuracies were found for all signatures, with detection of PTB being marginally more accurate (maximum AUC = 0.86) than detection of EPTB (maximum AUC = 0.85) (see Table 32 in Appendix 5).
Derivation of novel signatures
To address our secondary objective to derive novel transcriptomic signatures for the detection of TB, we plan to split the validation cohort into a training set and a test set (80% : 20% split), and to use a variable selection method to identify our candidate genes within the training set, train them and finally test their performance on the remaining 20%. We are in the process of carrying out this analysis, but it did not fit within the scope of this report and will therefore be published elsewhere.
Discussion
In this study, we have shown that none of the previously identified transcriptomic signatures for detecting active TB is sufficiently accurate for the detection of all TB in this clinically relevant cohort. Indeed, the signatures are not sufficiently accurate to detect any of the major subgroups of TB, even when considering the culture-confirmed TB cases alone, which are typically the most straightforward to identify. Their performance was much lower than previously reported, which probably reflects differences in study cohorts, as most of the previous studies did not include the full spectrum of TB types and their differential diagnoses.
Assessment of the previously proposed signatures in an unbiased and reproducible way by using summary scores20,36,39 or a SVML model as previously reported,38 or by applying a LDA approach, allowed us to assess performance in key patient groups in our validation cohort. Although diagnostic performance among culture-confirmed TB cases was greater than for highly probable TB cases, neither group could be accurately distinguished from the OD group. For highly probable TB, the Sweeney et al. 39 signature performed better than other published signatures, although only marginally so, and no statistical comparison was made. It is of note that the Anderson et al. 36 TBS underperformed when compared with the Kaforou et al. 20 DRS, whereas when the signatures were both assessed with LDA their performance was comparable. This probably reflects the nature of the derivation cohorts on which the score values were derived, with Anderson et al. 36 deriving the signature from a paediatric cohort. 36
However, as there is currently no test for rapidly ruling in the highly probable TB group, it is still possible that a whole-blood transcriptomic signature test may be useful for assessment of TB in those cases where a negative microbiological test result is obtained. The prevalence of highly probable TB within the culture-unconfirmed cohort from the IDEA study was found to be 17.5%. Thus, we are able to assess the predictive performance of transcriptomic tests for highly probable TB in those with a negative culture test for TB.
The best-performing, previously identified signature was the Sweeney et al. 39 signature, which gave an AUC of 0.80 (95% CI 0.74 to 0.85) for detecting highly probable TB cases when assessed using LDA on the full cohort, with a sensitivity of 82.1% and specificity of 73.8% when a balanced cut-off point was selected. The scenario in which such a test would be useful is in a TB suspect for whom the culture (or other microbiological test, e.g. Xpert® MTB/RIF Ultra) is negative or not available. The prevalence of highly probable TB in the culture-unconfirmed TB suspects recruited into the IDEA study was 17.5%. Using this prevalence value, the Sweeney et al. 39 gene signature for highly probable TB would provide a poor PPV of 0.4, but a very high NPV of 0.95. Therefore, it could be that such a transcriptomic signature, if developed into a simple and cheap rapid blood test and validated in new cohorts, could provide a sufficiently high NPV to be considered as a useful rule-out test in the microbiologically unconfirmed population. Furthermore, in settings with higher prevalence rates of highly probable TB, the PPV of these tests would be higher.
A rapid test with high diagnostic accuracy would be particularly helpful in the context of patients who are smear negative on initial assessment for TB, as culture takes a long time to give a definitive result. We present data on the performance of the score signatures20,36,39 in this subcohort of patients; both the Sweeney et al. 39 and the Kaforou et al. 20 signatures provided reasonably high NPV (89–90%). If this result is validated in other studies, this may provide clinicians with sufficient reason to withhold treatment (or at least delay it until culture results are available) in smear-negative TB patients who test negative with these signatures.
The performance of all signatures was very poor within the HIV+ population in this cohort. This suggests that HIV co-infection masks the transcriptomic signal that differentiates TB from OD in the wider population. However, as the number of HIV+ participants in our cohort was small, this study was likely to be underpowered to validate performance within this population. Nevertheless, it is intriguing that others have shown that their identified signatures can perform with comparable test accuracy for detecting TB from OD in HIV+ and HIV– populations. 20,39
Our data suggest that the performance of signatures for distinguishing TB from OD was compromised by sarcoidosis, as well as by HIV co-infection. If sarcoidosis could be excluded early in the diagnostic work-up of active TB, then the performance of transcriptomic signatures would improve and may potentially be of use in specific patient subgroups.
Our transcriptomic validation substudy has some limitations. We used microarray to determine the transcriptional profile of the whole-blood samples used in this cohort, and this technology has now more or less been replaced by RNA sequencing. Nevertheless, as the previously published signatures were all generated by microarray, this was the appropriate platform to use. It is generally accepted that clinical diagnostic scores overdiagnose TB in children, but to what extent this occurs in adult TB is unknown. 44 It is possible that the presence of patients without TB in the highly probable group negatively affects the transcriptomic signatures’ performance. Thus, these signatures could still be clinically useful for paucibacillary (i.e. smear negative and Xpert negative) if these cases are removed from the analysis. In future studies, we aim to use this novel data set to derive and test new signatures, with a particular focus on identifying signatures with high diagnostic performance for smear-negative, culture-negative and EPTB cases of TB.
The suboptimal performance of the published signatures and the newly derived signatures highlights the unmet need in TB diagnosis, which is a rapid, accurate and generalisable test of the full spectrum of TB, including culture-negative TB. Although a similar cohort has been used to derive signatures of paediatric TB,36 our study is the first one to address it in a large clinical adult TB cohort.
Chapter 4 Proteomics
Introduction
Serum protein biomarkers have the potential to be rapid, cheap and easy-to-use tests to rule in or rule out active TB disease. The ‘proteomic signatures’ measure the changes in individual proteins found in the serum as a result of the host’s response to disease. Many of the changes observed are not unique to one condition, as they reflect overlapping strategies to combat or adapt to disease processes. However, certain proteins, when used in combination, can provide a high level of diagnostic accuracy when applied in the correct clinical situation. Therefore, the cohort used for selection and testing of proteomic signatures needs to be appropriate to the clinical question and condition for which it is being developed.
Proteomic biomarkers: current methodologies
Proteins in sera are present in a dynamic range that spans at least four orders of magnitude, and the accurate detection of all proteins and their isoforms has not yet been achieved by any technology. In order to overcome this limitation, many proteomic signatures have been generated after immune depletion of the most abundant proteins. This assumes that depleted proteins are not useful biomarkers and serum albumin and immunoglobulin G, which account for > 90% of the total protein mass, will often be removed. Depletion allows accurate quantification of less abundant proteins, but it can alter the abundance of proteins that interact with the proteins being depleted. SELDI-TOF provides a quick, reproducible and cheap profiling technology for intact proteins, but is limited by dynamic range and does not provide identification of the protein signatures. LC–MS is a newer technology and provides both accurate quantification and protein identification, but is slow and costly compared with SELDI-TOF and ELISA. ELISA is fast and cheap, and highly suitable for the development of a point-of-care test for TB. It is, however, limited to the quantification of only a few proteins, in which distinct antibody pairs have been developed and tested. In ELISA, the identity of the signature is required prior to beginning the investigation and, thus, it requires the identification of any signature developed by another technology to be known.
To investigate the utility of the serum proteomic signatures to diagnose TB, we reviewed the most important and relevant studies carried out previously.
Previously published signatures
We selected 12 published studies reporting a proteomic signature for the detection of TB cases and summarised the key study characteristics (Table 7).
| Study | Cohort (in validation if done) | Classification accuracy | Technology | Suitable for validation, why |
|---|---|---|---|---|
| Agranoff et al. 200645 | TB, n = 179; 86–87% smear positive; OD, n = 170 | AUC = 0.96 | SELDI-TOF | No, failed validation |
| Ratzinger et al. 201246 | N/A | AUC = 54% | SELDI-TOF | No, low performance |
| Liu et al. 201047 | ATB, n = 87; HC, n = 55; OD, n = 13 | Accuracy = 88.09–93.55% | SELDI-TOF | No, HCs |
| Zhang et al. 201248 | TB, n = 129; HC, n = 60; OD, n = 69 | Sensitivity of 96.9% and a specificity of 97.8% | SELDI-TOF | No, HCs |
| Sandhu et al. 201249 | TB, n = 151; OD, n = 110 | Sensitivity of 84%, specificity of 90% and AUC = 0.93 | SELDI-TOF | Yes, no validation done |
| Hamilton and Levin (unpublished) | TB, n = 300; OD, n = 300 | AUC = 84.7, 95% CI 0.7 to 0.9 or AUC = 81.9a | SELDI-TOF/ELISA | Yes, no validation done, ELISA signature available |
| Liu et al. 201350 | TB, n = 180; HC, n = 90; OD, n = 121 | Accuracy of 80.1% (75.0% sensitivity, 83.5% specificity) | SELDI-TOF | No, low performance and HCs in the control group |
| Song et al. 201451 | TB, n = 26; OD, n = 31 | AUC = 0.947 (95% CI 0.8 to 1) | LC–MS/ELISA (AUC) | Yes |
| Xu et al. 201552 | PTB, n = 40, pneumonia, n = 40; lung cancer, n = 40; HC, n = 40 | TB vs. pneumonia AUC = 0.955 vs. lung cancer AUC = 0.954 | LC–MS/ELISA (AUC) | Yes |
| Li et al. 201553 | TB, n = 125; pneumonia, n = 15; HC, n = 32 | AUC = 0.904 | LC–MS/ELISA (AUC) | No, HCs in validation |
| Achkar et al. 201521 | TB, n = 28; OD, n = 45 | HIV– AUC 0.96; HIV+ AUC 0.95 | LC–MS (AUC) | Yes |
| Chegou et al. 201654 | TB, n = 214; OD, n = 487 | Sensitivity of 81.3% (95% CI 69.2% to 89.5%) and specificity of 79.5% (95% CI 71.8% to 85.5%) | ELISA | No |
| De Groote et al. 201719 | TB, n = 92; OD, n = 123 | AUC = 0.87 (95% CI 0.81 to 0.91) | SOMAscan® (Somalogic Inc., Boulder, CO, USA) | No, technology not available |
In 2014, when the VANDET study proposal was funded, the majority of signatures generated were based on SELDI-TOF analysis. Of note, a large prospective cohort study by Agranoff et al. 45 in 2006 identified a signature with a sensitivity of 93.5% and a specificity of 94.9% (AUC of 0.96). This signature was validated in a cohort of mainly PTB patients and gave a reduced sensitivity of 88.9% and specificity of 77.2%. Ratzinger et al. 46 also validated this signature externally in a UK cohort that was diverse in the presentation of the site of TB disease, including more EPTB. In this report the accuracy reduced to 54% (95% CI 47% to 61%). Although the latter reported that the accuracy of the protein markers could be improved using additional clinical data, the poor performance of the protein signature as a test meant that it will not be considered an important test to assess within the VANTDET study.
Recently, two published SELDI-TOF profiles were identified for active TB compared with healthy or mainly HC cohorts, making them not useful for clinical validation. 48,50 Sandhu et al. 49 published a novel 54 mass-to-charge ratio (m/z) cluster using SELDI-TOF that performed with high accuracy (84% sensitivity, 90% specificity, AUC = 0.93). This signature remains unvalidated, but it was generated using a prospective cohort of mainly patients with PTB and other non-TB diseases and, therefore, warrants assessment within the VANTDET study.
In a larger cohort (n = 600), our collaborators (SH, LC and ML) have identified a four-peak protein signature with excellent performance in paediatric TB (AUC = 84.7, CI 0.7 to 0.9 or AUC = 81.9), depending on whether or not the data were analysed using a DRS forward selection method. Hamilton and Levin (unpublished) have also successfully identified all four proteins in the cohort and are currently developing and validating this as an ELISA for point-of-care testing.
Liquid chromatography–mass spectrometry has become the method of choice for biomarker discovery, and we identified four studies each identifying a signature for active TB using this method. Song et al. 51 identified serpin family A member 1 (SERPINA1), also known as alpha-1-antitrypsin, as a single and highly accurate marker of TB (AUC = 0.947, 95% CI 0.8 to 1.0). The authors performed no validation and their choice of disease controls, diseased patients who do not exhibit symptoms of active TB, is highly suspect.
More promisingly, Xu et al. 52 pooled immunodepleted serum and used LC–MS to detect a three-protein signature [calcium-binding protein A9 (S100A9), superoxide dismutase 3 (SOD3) and matrix metalloproteinase 9 (MMP9)] that could discriminate active TB from controls. They validated these proteins using ELISA in the case–control cohort but included diseases that often confound diagnosis of active TB (PTB, n = 40; pneumonia, n = 40; lung cancer, n = 40; and HC, n = 40). This signature could resolve PTB and pneumonia (AUC = 0.955) and discriminate between PTB and lung cancer (AUC = 0.954) with high accuracy. However, it was limited in terms of the spectrum of disease subtypes included in the active TB group (all culture-confirmed PTB) and other non-TB disease (limited to two disease types).
The findings from the IDEA study demonstrate that the differential diagnoses for active TB are numerous and varied (> 200 final diagnoses were reported in the OD group), reflecting the heterogeneous nature of different types of TB disease and the various clinical presentations that are associated with them. 12 Achkar et al. 21 took LC–MS a step closer to a real-life road test when they recruited patients from four different hospitals, including both culture-negative and HIV+ patients, and a verification cohort of TB cases and patients with ODs with TB-like symptoms. The signature differed depending on HIV infection status and gave excellent classification of active TB from other non-TB-like diseases (HIV– AUC = 0.96 and HIV+ AUC = 0.95). The progression shown by this work demonstrates the potential of a proteomic signature detected by LC–MS in active TB diagnosis.
In the last year a new technology has been utilised to generate a signature for active TB: SOMAscan. This technology relies on aptamers and combines the benefits of both LC–MS and ELISA into one assay that is potentially customisable into a point-of-care test. 19 However, the commercial availability is limited and not available to be investigated in the VANTDET study. De Groote et al. 19 discovered a novel six-protein signature [SYWC (WARS), kallistatin (SERPINA4), C9 (C9), gelsolin (GSN), testican-2 (SPOCK2) and aldolase C (ALDOC)] that provides a high classification accuracy (AUC = 0.87, 95% CI 0.81 to 0.91) in culture-confirmed TB. 19 The cohort tested did not include culture-negative TB but did include TB and other related diseases with similar symptoms and HIV co-infection.
Aim
Our aim was to assess the clinical utility of proteomic signatures for the diagnosis of active TB. We chose five signatures for validation: two identified by SELDI-TOF [i.e. Sandhu et al. 49 and Hamilton et al. (unpublished)] and three by LC–MS (i.e. Song et al. ,51 Xu et al. 52 and Achkar et al. 21). All five were chosen because the signatures were developed in a cohort of prospectively recruited patients with ODs.
Objectives
-
Assess the utility of the SELDI-TOF four-protein signature in the IDEA study cohort.
-
Bridge signatures derived by SELDI-TOF with LC–MS technology.
-
Assess the utility of all signatures using LC–MS.
Methods
Cohort selection
A cohort of 171 samples was selected randomly from the HIV– patients of eligible individuals within the full IDEA study cohort. The sera were processed in blocks of nine patients and a pooled serum sample was created by mixing equal volumes of patient sera. The internal control was included in each batch processed by LC–MS. SELDI-TOF mass spectrometry was performed in one batch on a total of 90 serum samples, as this was the maximum number achievable given the limited number of chips available (see Chapter 2, Issues and problems). The 90 patients used were a direct subset of the 171 individuals eligible for analysis, allowing for a bridging assessment between technologies. During experimentation and analysis, samples were excluded if consent was withdrawn, if the patient was found to have not been followed up by clinical assessment, or if errors occurred in experimental processing. The final cohorts consisted of 86 individuals in the SELDI-TOF arm and 166 individuals in the LC–MS arm.
Serum samples
In the IDEA study, blood for serum collection was collected into a BD serum tube (Becton, Dickinson and Company, Franklin Lakes, NJ, USA) and allowed to clot for 60 minutes before centrifuging at 1000 g for 10 minutes at room temperature to remove cell debris and clots. Serum supernatant was aliquoted into sterile 2-ml tubes and kept at –80 °C until use.
SELDI-TOF
Protein profiling of serum by SELDI-TOF mass spectrometry was achieved by placing serum samples on anionic (Q10), cationic (CM10) and immobilised metal affinity chromatography (IMAC) ProteinChip arrays (Bio-Rad Laboratories, CA, USA). The arrays were primed twice with binding buffers for Q10 (50 mM Tris, 0.1% Triton X-100, pH 7.5 and 9.5), CM10 (50 mM ammonium acetate, 0.01% Triton X-100, pH 4.0 and 6.0) and IMAC Cu2+ (0.1 mM sodium phosphate, 0.5 mM sodium chloride, pH 7.0), and incubated at room temperature with shaking for 5 minutes. A 1 : 10 dilution of serum in binding buffer was then applied to the Q10 and CM10 arrays and a 1 : 5 dilution of serum in binding buffer was applied to the IMAC Cu2+ array and incubated at room temperature with shaking for 1 hour. The arrays were washed twice with binding buffer and deionised water and dried at room temperature for 15 minutes. Saturated sinapinic acid (0.7 µl) was applied twice to each spot on the CM10 and IMAC arrays and 50% saturated sinapinic acid was applied to the Q10 array, allowing the matrix to air dry between each application. Time-of-flight spectra were generated using a PCS-4000 mass spectrometer (Bio-Rad Laboratories, CA, USA). Low-range spectra (m/z 0–20,000) were obtained at a laser energy of 2800–3400 nJ with a focus mass of 6000 nJ and the matrix attenuated to 1000 nJ. High-range spectra (m/z 0–200,000) were obtained at a laser energy of 3800–4200 nJ with a focus mass of 30,000 nJ and the matrix attenuated to 10,000 nJ. Ten shots were obtained per position and mass accuracy was calibrated externally using All-in-One Peptide or protein molecular mass standards (Bio-Rad Laboratories, CA, USA).
Liquid chromatography–mass spectrometry
An internal standard was made by pooling equal amounts of serum from the first 100 patients. For each batch an equal amount of serum from nine patients and the internal standard were solubilised in 1% sodium deoxycholate, and 100 mM ammonium bicarbonate. Ten µg of protein was reduced with 10 mM dithiothreitol for 15 minutes at 60 °C, followed by alkylation with 20 mM lodoacetamide for 15 minutes at room temperature in the dark. Trypsin (Promega, Madison, WI, USA) was added at a 1 : 50 (enzyme–protein) ratio and digestion was carried out at 37 °C overnight. Peptide digests were purified using the C18 STop And Go Extraction (STAGE) tips and eluted peptides were dried and labelled with nine labels from the TMT10plex Mass Tag Labelling Kit (Thermo Fisher Scientific, Waltham, MA, USA), as described in the instructions with minor modifications. 55 Peptides were dissolved in 25 µl of 100 mM triethylammonium bicarbonate (TEAB) and 10 µl of each label in acetonitrile, and incubated for 60 minutes at room temperature before it was quenched with 2.5 µl of 50% [volume/volume (v/v)] TEAB and combined. Samples were diluted to a final acetonitrile concentration of 3% (v/v) acetonitrile, acidified to 0.1% (v/v) trifluoroacetic acid and purified, again, by the C18 STAGE tips. Each fraction was dried completely and dissolved in 2% (weight/volume) acetonitrile–0.1% (v/v) formic acid prior to LC–MS.
Mass spectrometry analysis was performed as described in Reuschl et al. ,56 except that the resolution of MS2 scans was 35 K, MS2 charge targets were limited to 1E5 and isolation window set to 1.5 m/z.
Data processing
Surface-enhanced laser desorption ionisation time-of-flight spectra were analysed using ProteinChip data manager (version 4.1.0, Bio-Rad Laboratories, CA, USA) and normalised using total ion current. Peak clusters were auto-detected using a peak threshold of 20% and a mass window of 0.3% and the raw data converted for subsequent analysis using R software.
Raw LC–MS spectra were identified and quantified using MaxQuant 1.5.15 (Max Planck Institute of Biochemistry, Planegg, Germany), using a 1% peptide and protein false discovery rate (FDR) as described by Cox and Mann and using the UniProt SwissProt database (UniProt, European Bioinformatics Institute, Cambridgeshire, UK), downloaded on 5 June 2014, with additional common contaminant proteins and TMT-10 plex quantitation mode enabled. Reporter ion intensities for tandem mass spectrometry scans were filtered to ensure < 75% precursor isolation purity, summed and assigned to proteins based on unique matches and parsimony as described previously. For every patient, each protein was quantitated using the sum of all peptide intensities. This number was divided by the same measure for the pooled internal control to give a block normalised ratio (accounting for batch processing). This value was pre-processed by log2 transformation and checked for normality and batch effects.
Statistical analysis
To assess the performance of the four-protein signature evaluated using the SELDI-TOF platform, the four proteins were identified using their mass values. The DRS method20,57 was used to calculate a score from the abundance data of the four proteins, as described previously.
To identify differentially expressed proteins, analysis of variance and Welch’s t-test were calculated between all disease groups, and p-values were adjusted for the effect of multiple hypothesis testing using the FDR (< 0.1) method.
The performance of published signatures using the depleted LC–MS data set was assessed using abundance data (for the Song et al. 51 signature containing one protein) or LDA, for signatures incorporating multiple proteins, on the full cohort.
To assess for diagnostic performance, the abundance, DRS or probability values generated for each signature (depending on whether a raw abundance, DRS or LDA approach was taken for analysis, respectively) were used to generate ROC curves and determine diagnostic accuracy data (sensitivity, specificity, etc.).
Results
A cohort of 171 samples was selected randomly from the eligible HIV individuals within the full IDEA study cohort. SELDI-TOF mass spectrometry was performed on a total of 90 serum samples. This was the maximum number achievable given the limited number of SELDI-TOF chips available (see Chapter 2, Issues and problems). LC–MS analysis was performed on the full cohort of 171 samples; the 90 samples used in SELDI-TOF were a direct subset of the 171 individuals eligible for analysis, allowing for a bridging assessment between the two technologies (Figure 4). During experimentation and analysis, samples were excluded if consent was withdrawn, if the patient was found to have not been followed up by clinical assessment, or if errors occurred in experimental processing. The final cohorts with complete SELDI-TOF and LC–MS data were n = 86 for SELDI-TOF, and n = 86 and n = 166 for LC–MS (see Figure 4).
FIGURE 4.
Flow diagram for the proteomics validation substudy.
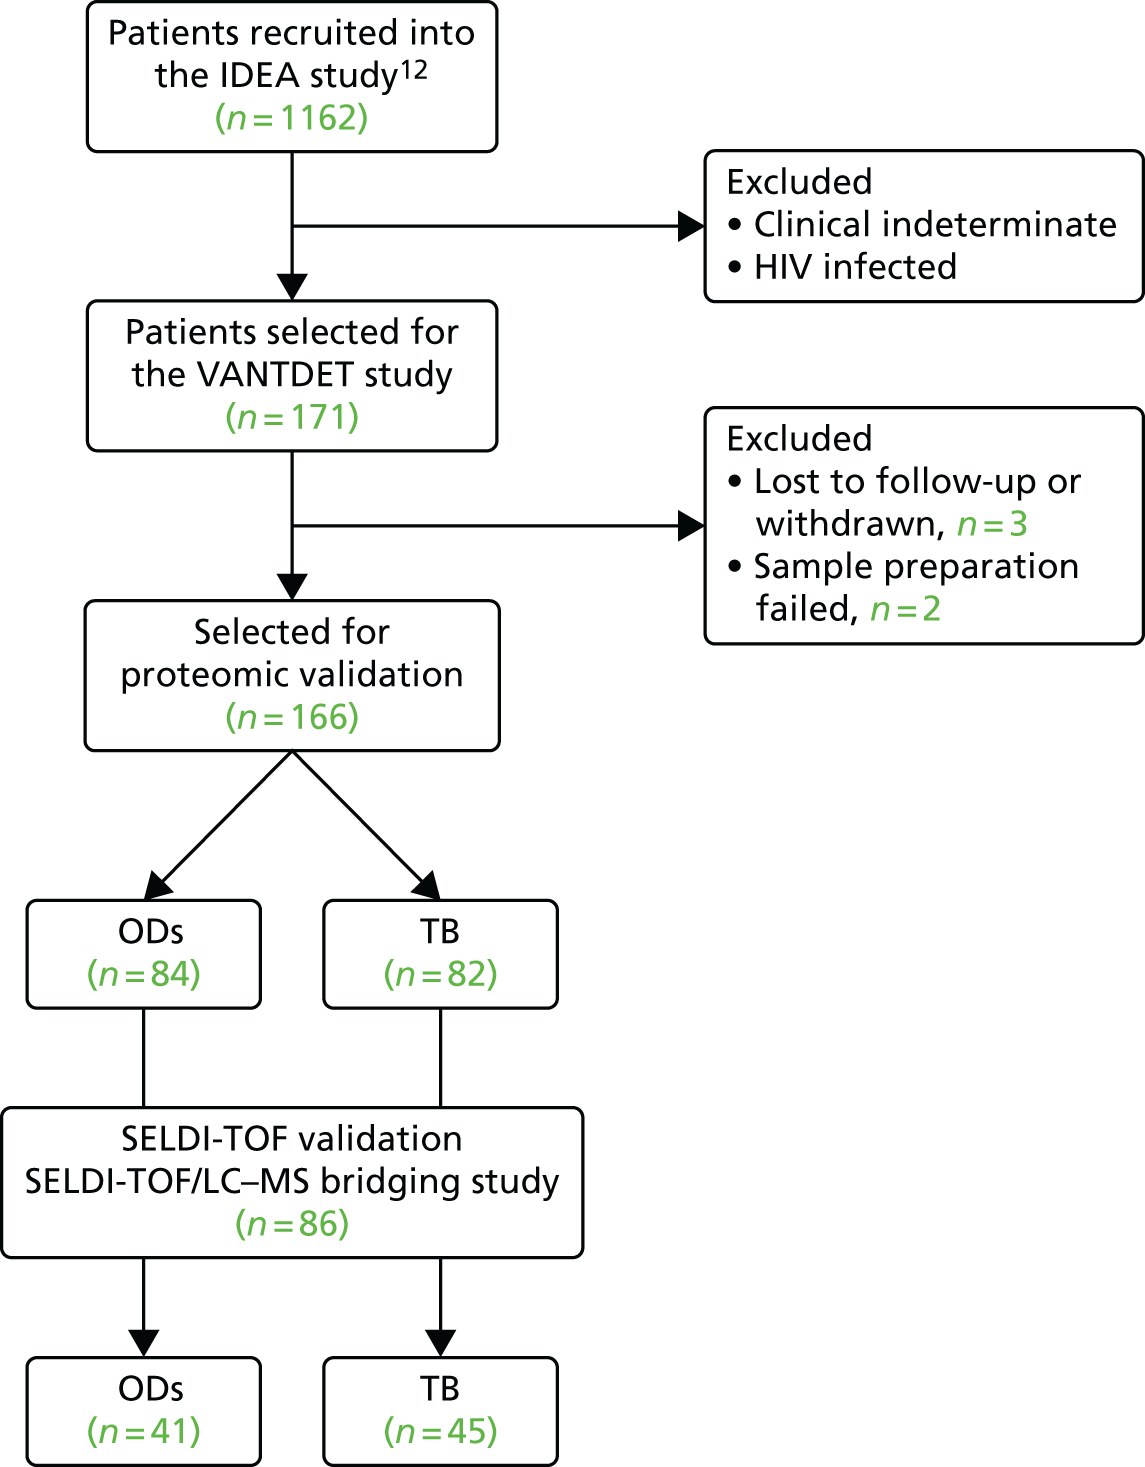
We also performed an additional LC–MS experiment on a larger number of samples (n = 279) using crude sera, which included samples from HIV+ patients. This experiment was sent to an external contractor (FingerPrints Proteomics, URL: http://proteomics.lifesci.dundee.ac.uk/). This data set was restricted to 218 proteins and we were unable to consistently identify and quantitate the protein signatures found in the studies reviewed (see Table 36 in Appendix 6), apart from SERPINA1. This data set was therefore not utilised in biomarker validation results presented below.
Cohort characteristics
The demographic characteristics of the proteomic validation cohorts are given in Tables 8 and 9 (for LC–MS and SELDI-TOF, respectively). Statistical analysis of the patient demographics in the LC–MS cohort (n = 166) identified differences (p < 0.05) between the two major diagnostic groups under investigation, with patient age, weight and BMI all lower in patients with a final diagnosis of active TB (Dosanjh categories 1 and 2) than in those classified as having ODs (Dosanjh category 4). A similar trend was observed for these characteristics in the SELDI-TOF subset, with a statically significant difference in age and weight (see Table 9).
| Demographic and clinical characteristic | Culture-confirmed TB (Dosanjh category 1) (N = 60) | Highly probable TB (Dosanjh category 2) (N = 22) | ODs (Dosanjh category 4) (N = 84) | p-value overalla |
|---|---|---|---|---|
| Clinical setting, n (%) | 0.59 | |||
| Inpatient | 22 (36.7) | 7 (31.8) | 24 (28.6) | |
| Outpatient | 38 (63.3) | 15 (68.2) | 60 (71.4) | |
| Age (years), median (range) | 30.5 (17.0–72.0) | 31.0 (18.0–54.0) | 47.0 (21.0–85.0) | < 0.001 |
| Male, n (%) | 37 (61.7) | 10 (45.5) | 47 (56.0) | 0.416 |
| Ethnic origin, n (%) | 0.598 | |||
| Asian | 3 (5.00) | 0 (0.00) | 4 (4.76) | |
| Black | 9 (15.0) | 3 (13.6) | 15 (17.9) | |
| Indian subcontinent | 41 (68.3) | 17 (77.3) | 43 (51.2) | |
| Middle Eastern | 1 (1.67) | 0 (0.00) | 1 (1.19) | |
| Mixed | 1 (1.67) | 0 (0.00) | 3 (3.57) | |
| Unable/unwilling to respond | 0 (0.00) | 0 (0.00) | 1 (1.19) | |
| White | 5 (8.33) | 2 (9.09) | 17 (20.20) | |
| Height (m), median (range) | 1.69 (1.50–1.88) | 1.63 (1.48–1.85) | 1.70 (1.51–1.93) | 0.475 |
| Height missing, n (%) | 26 (43.3) | 7 (31.8) | 31 (36.9) | 0.578 |
| Weight (kg), median (range) | 60.0 (38.5–127.0) | 61.4 (44.6–77.0) | 68.2 (41.5–124.0) | 0.001 |
| Weight missing, n (%) | 2 (3.33) | 2 (9.09) | 5 (5.95) | 0.508 |
| BMI (kg/m2), median (range) | 21.6 (15.7–40.1) | 21.0 (16.0–34.6) | 24.5 (17.3–36.7) | 0.039 |
| BMI missing, n (%) | 26 (43.3) | 9 (40.9) | 33 (39.3) | 0.888 |
| BCG vaccinated yes, n (%) | 39 (65.0) | 9 (40.9) | 54 (64.3) | 0.104 |
| BCG scar visible, n (%) | 0.125 | |||
| Missing | 15 (25.0) | 2 (9.09) | 11 (13.1) | |
| No | 2 (3.33) | 1 (4.55) | 5 (5.95) | |
| Unsure | 3 (5.0) | 4 (18.2) | 15 (17.9) | |
| Yes | 40 (66.7) | 15 (68.2) | 53 (63.1) | |
| HIV+, n (%) | 0 (0) | 0 (0) | 0 (0) | |
| TB contact no, n (%) | 45 (75.0) | 19 (86.4) | 68 (81.0) | 0.491 |
| Demographic and clinical characteristic | Culture-confirmed TB (Dosanjh category 1) (n = 33) | Highly probable TB (Dosanjh category 2) (n = 12) | ODs (Dosanjh category 4) (n = 41) | p-value overalla |
|---|---|---|---|---|
| Clinical setting, n (%) | 0.454 | |||
| Inpatient | 14 (42.4) | 5 (41.7) | 12 (29.3) | |
| Outpatient | 19 (57.6) | 7 (58.3) | 29 (70.7) | |
| Age (years), median (range) | 29.0 (17.0–72.0) | 29.5 (18.0–54.0) | 46.0 (22.0–85.0) | < 0.001 |
| Male, n (%) | 20 (60.6) | 6 (50.0) | 21 (51.2) | 0.68 |
| Ethnic origin, n (%) | 0.389 | |||
| Asian | 3 (9.09) | 0 (0.00) | 2 (4.88) | |
| Black | 6 (18.20) | 1 (8.33) | 9 (22.00) | |
| Indian subcontinent | 21 (63.6) | 10 (83.3) | 18 (43.9) | |
| Mixed | 0 (0.00) | 0 (0.00) | 1 (2.44) | |
| Unable/unwilling to respond | 0 (0.00) | 0 (0.00) | 1 (2.44) | |
| White | 3 (9.09) | 1 (8.33) | 10 (24.40) | |
| Height (m), median (range) | 1.70 (1.50–1.88) | 1.63 (1.48–1.85) | 1.68 (1.52–1.85) | 0.806 |
| Height missing, n (%) | 12 (36.4) | 5 (41.7) | 16 (39.0) | 0.955 |
| Weight (kg), median (range) | 62.0 (38.5–127.0) | 58.0 (44.6–77.0) | 69.5 (41.5–96.0) | 0.04 |
| Weight missing, n (%) | 2 (6.06) | 0 (0.00) | 3 (7.32) | 1 |
| BMI (kg/m2), median (range) | 21.4 (15.7–40.1) | 20.8 (16.0–34.6) | 24.6 (17.3–32.6) | 0.147 |
| BM missing, n (%) | 12 (36.4) | 5 (41.7) | 17 (41.5) | 0.912 |
| BCG vaccinated yes, n (%) | 19 (57.6) | 5 (41.7) | 22 (53.7) | 0.639 |
| BCG scar visible, n (%) | 0.322 | |||
| Missing | 10 (30.3) | 0 (0.0) | 8 (19.5) | |
| No | 1 (3.03) | 1 (8.33) | 2 (4.88) | |
| Unsure | 2 (6.06) | 1 (8.33) | 5 (12.20) | |
| Yes | 20 (60.6) | 10 (83.3) | 26 (63.4) | |
| HIV+, n (%) | 33 (100) | 12 (100) | 41 (100) | . |
| TB contact no, n (%) | 24 (72.7) | 10 (83.3) | 34 (82.9) | 0.55 |
No HIV-infected individuals were included, because at the time of the initial experimentation there was not a validated procedure for ensuring that samples were not infectious for steps required for proteomic sample processing. It was considered that the validity of a test could be adequately assessed in a HIV– cohort.
Performance of previously published signatures using SELDI-TOF
We selected two SELDI-TOF signatures for validation using this technology in the SELDI-TOF VANTDET study cohort: those described by Sandhu et al. 49 and Hamilton and Levin (unpublished) (see Table 33 in Appendix 6). To allow interstudy comparisons to be made, all SELDI-TOF profiles were acquired for the surfaces utilised in these studies.
The Sandhu et al. 49 signature consisted of two sets of m/z SELDI-TOF peaks, one set (n = 98) derived from crude sera on the CM10 and the second set from 54 m/z peaks from fractionated sera. We acquired SELDI-TOF data on the CM10 surface at pH 4.0 and pH 6.0 in line with these signatures; however, we found that only 2 out of 54 and 2 out of 98 peaks matched between the profiles of Sandhu et al. 49 and our spectra. Based on this, we were unable to validate the Sandhu et al. 49 signatures for diagnosis of TB in our cohort.
The signature proposed by Hamilton and Levin (unpublished) is based on the signature of four to six m/z peaks, corresponding to four unique proteins, and working closely with Hamilton and Levin (unpublished) we could detect the same peaks in our SELDI-TOF profiles (see Table 33). With these data we assessed the classification accuracy in the VANTDET study cohort (n = 86) using the DRS methodology they propose (see Methods). This resulted in an AUC = 0.66 (95% CI 0.54 to 0.77) in the full cohort when comparing all TB (Dosanjh categories 1 and 2, n = 45) to OD (Dosanjh category 4, n = 41). The AUC improved if only culture-confirmed TB (Dosanjh category 1, n = 33) was included in the TB disease group, providing an AUC = 0.74 (95% CI 0.63 to 0.86), whereas no classification was observed for detection of highly probable TB (Dosanjh category 2, n = 12) from OD patients (AUC = 0.58, 95% CI 0.4 to 0.76) (Figure 5).
FIGURE 5.
Performance of the four-protein signature (Hamilton and Levin, unpublished) on SELDI-TOF, for the classification of TB in the VANTDET SELDI-TOF substudy cohort (n = 86). The DRS for the four target proteins was calculated and assessed to diagnostic performance using ROC curve analysis. The performance for classifying all TB (Dosanjh categories 1 and 2 combined, n = 45, black line), culture-confirmed TB (Dosanjh category 1, n = 33, green line) and highly probable TB (Dosanjh category 2, n = 12, blue line) against all OD patients (n = 41) is displayed.
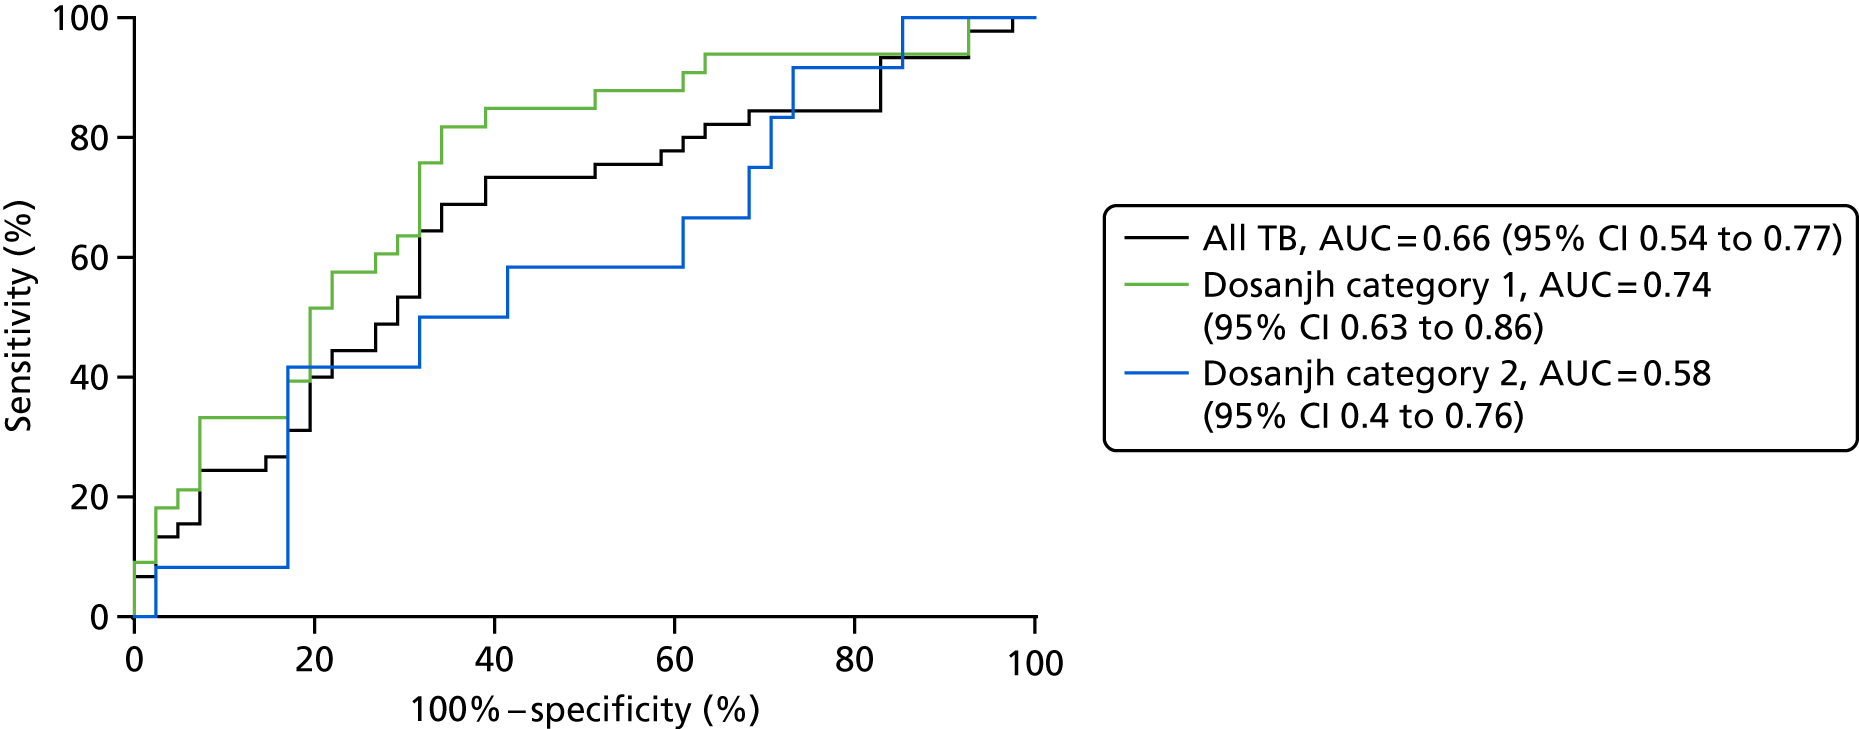
Bridging study
Our study was designed to bridge the two technologies, LC–MS and SELDI-TOF, by analysing the same 86 samples. This aimed to answer the question ‘can signatures identified in SELDI-TOF be reproduced by LC–MS?’ in the affirmative enabling the transfer of signature testing to LC–MS for larger cohorts, which is limited in SELDI-TOF owing to the discontinuation of consumables. To do this we took three out of the four protein identifications provided from the Hamilton and Levin (unpublished) SELDI-TOF signature (patent pending), extracted the quantitative data for these proteins in the LC–MS data set and analysed them using correlation (see Table 34). Correlation between the methods was low; only protein 1 achieved statistical significance (p < 0.05) (see Figure 20a). We also compared the proteins for significant difference between the different categories in diagnosis of active TB and found no proteins significant in the SELDI-TOF data and one protein (protein 2) significant when measured by LC–MS.
Performance of previously published signatures using liquid chromatography–mass spectrometry
Next, we asked if any of the key published and unpublished signatures [i.e. the signatures identified by Hamilton and Levin (unpublished), Song et al. ,51 Xu et al. ,52 Achkar et al. 21 and De Groote et al. 19] could provide accurate disease classification for active TB using the LC–MS platform. To do this, we utilised the quantitative LC–MS data set generated on immunodepleted sera from 166 individuals, extracting specific quantitative data for the protein signatures within each signature. The data set consisted of spectra collected from immunodepleted sera digested with trypsin and labelled by TMT-10 plex labelling (see Methods). Samples were fractionated by strong anion exchange chromatography into six fractions and each fraction was analysed by LC–MS.
Using the software MaxQuant we identified 8773 peptide identifications mapping to 720 proteins, each with a quantitative value in at least one patient, and 380 proteins with a quantitative value for all patients. Imputation was required for 18% of the proteins used for the discovery of novel signatures (42/228). Overall, the imputation rate for OD samples (n = 84) was 0.3% of all of the reported protein abundances. Similarly, for TB samples (n = 82) the proportion of imputed values was 0.1%.
Detection of key proteins from published signatures
All proteins from the four key publications [Hamilton and Levin (unpublished), Song et al. ,51 Xu et al. ,52 Achkar et al. 21] were detected in our depleted LC–MS data set and could therefore be validated within our cohort of 166 patients. Unfortunately, we could not validate the De Groote et al. 19 signature within this data set, as only four of the six proteins could be detected, and two of these had > 50% missing values. For those signatures we could validate, we first assessed the abundance of the proteins in the key patient groups. The average of the relative abundance (log2 ratio) and statistical analysis of the proteins is shown in Table 35 in Appendix 6 for the key patient groups. When comparing all TB cases with ODs, the majority of proteins (10/18) were found to be significantly different between these groups, this number fell to 5 out of 18 if only highly probable TB (Dosanjh category 2) cases were considered [P08294 from the Xu et al. 52 signature, Levin 1 and Levin 2 from the Hamilton and Levin (unpublished) signature, and P02654 and P49908 from the Achkar et al. 21 signature] (see Table 35).
Validation of diagnostic performance of serum protein signatures using liquid chromatography–mass spectrometry
To assess whether or not these protein signatures could be used to classify all TB cases from OD, we used LDA (Figure 6) to test the performance of the signatures in separate diagnostic groups, with the exception of the Song et al. 51 signature, for which only one protein (P01009 or SERPINA1) is used51 and the raw abundance data can be used for validation purposes (see Figure 21).
FIGURE 6.
The diagnostic performance of the Xu et al.,52 Hamilton and Levin (unpublished) and Achkar et al. 21 protein signatures on the LC–MS depleted data set (n = 166) using LDA. The diagnostic performance is presented for discrimination of TB vs. OD, discrimination of Dosanjh category 1 vs. OD (Dosanjh category 4) and discrimination of Dosanjh category 2 vs. OD (Dosanjh category 4).
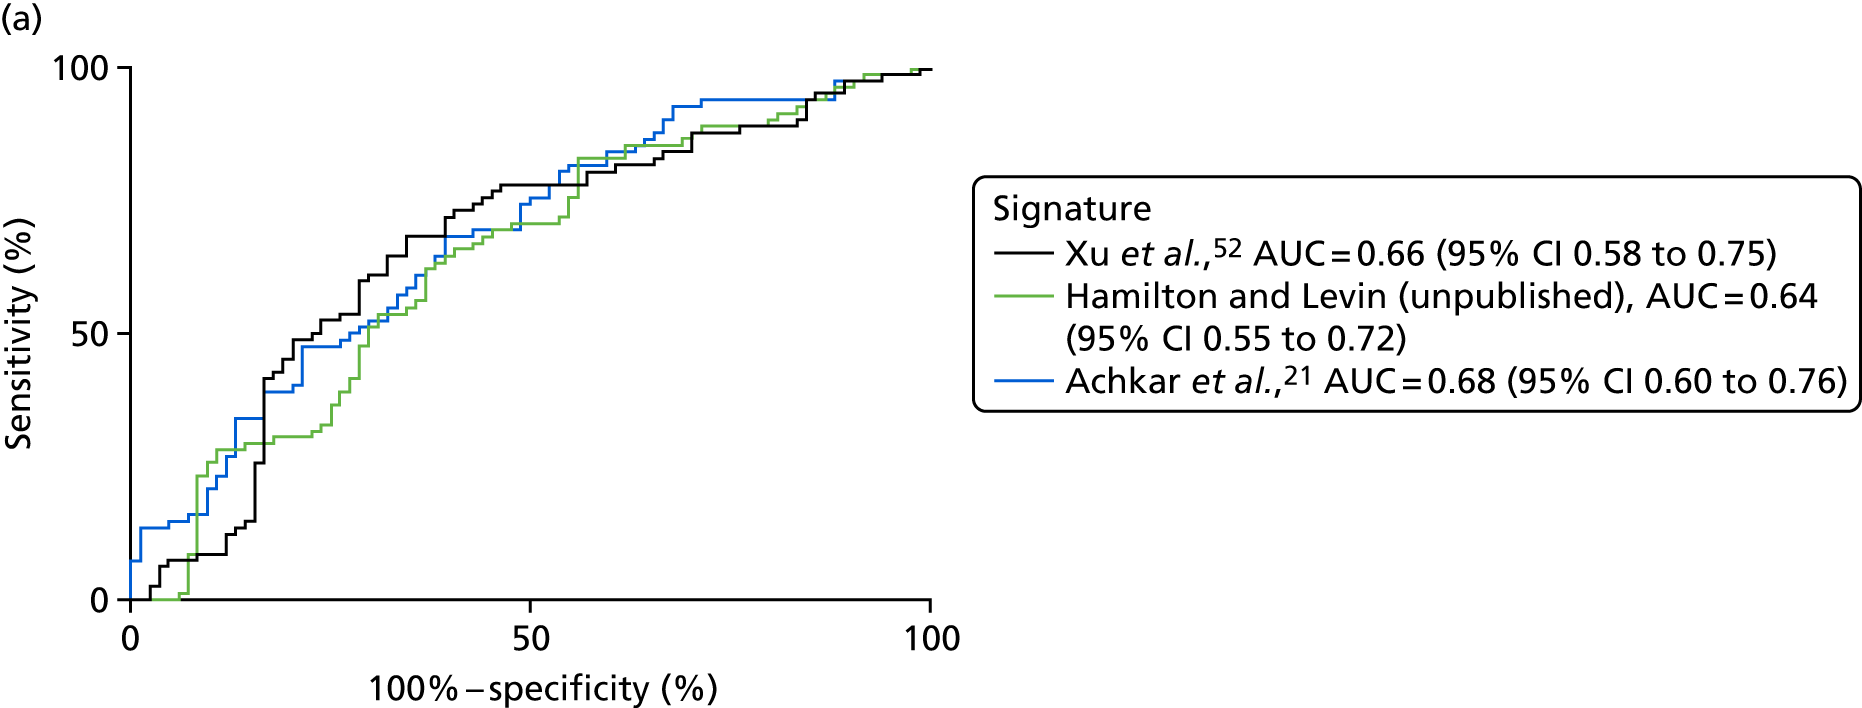
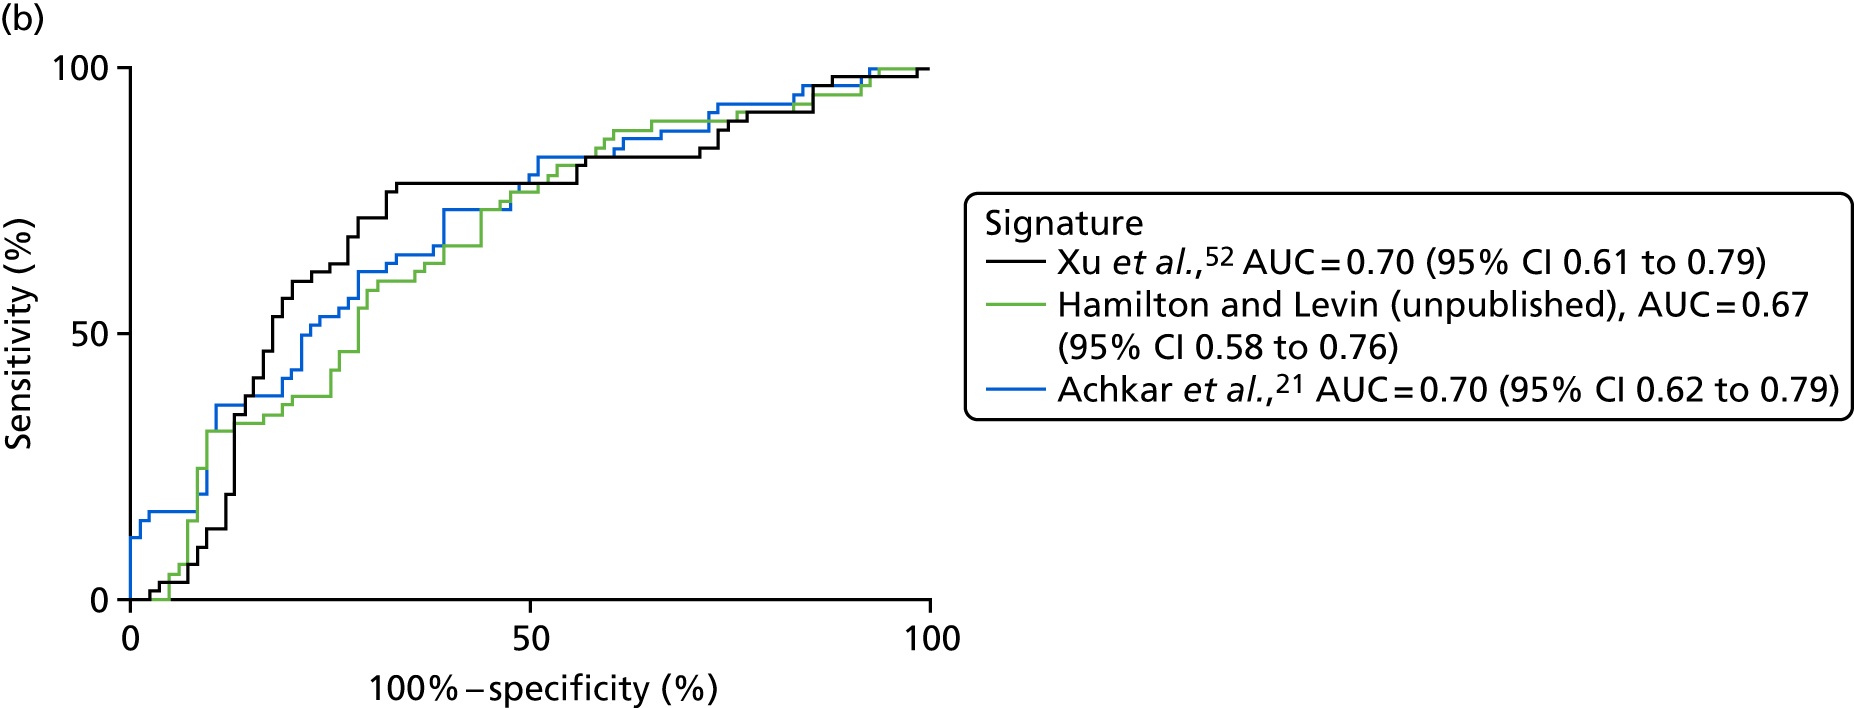
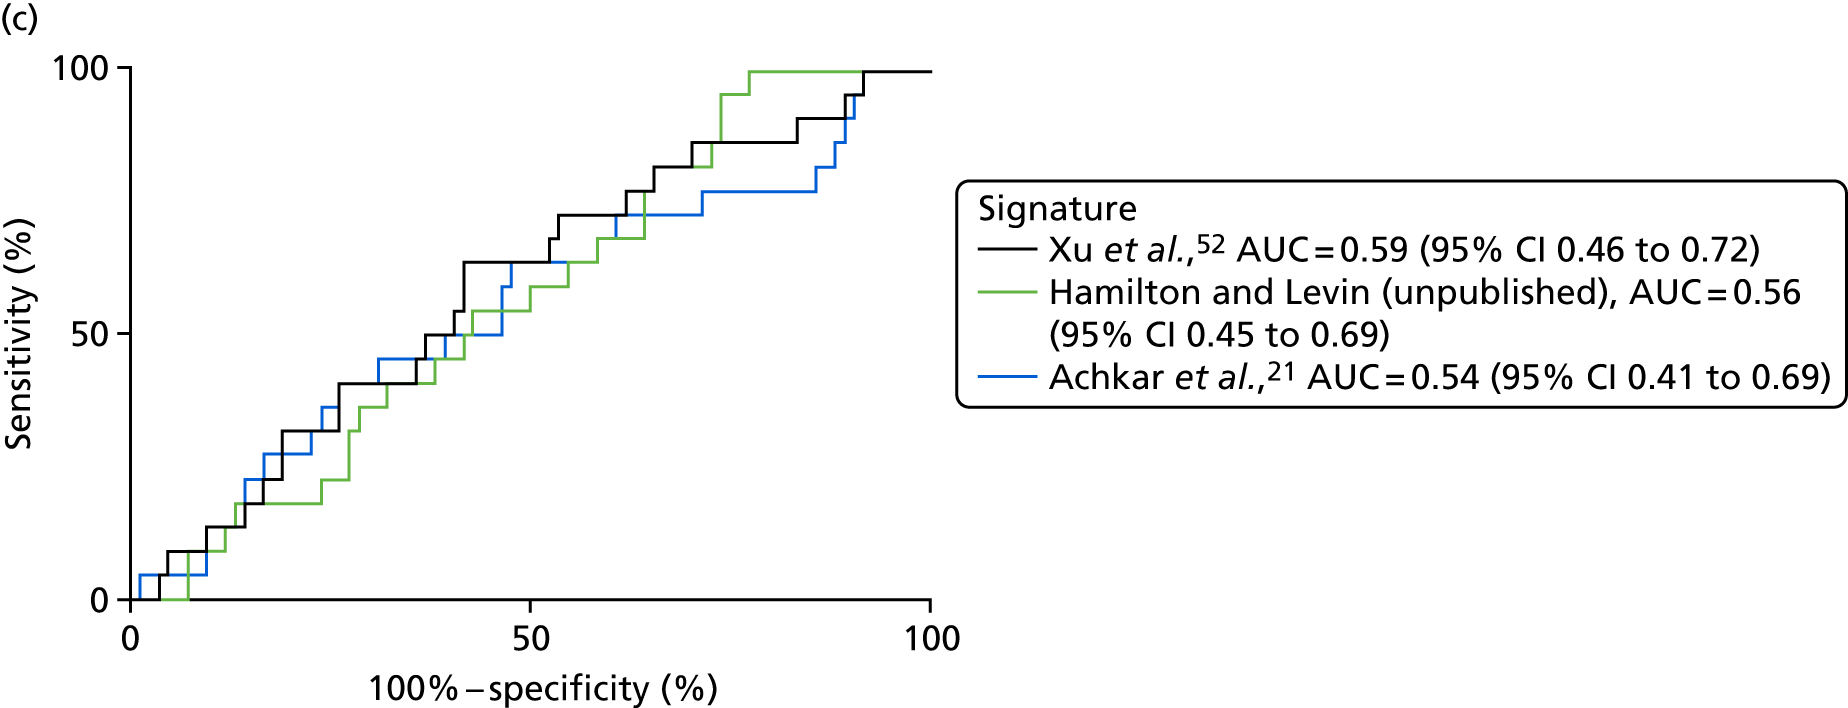
All four signatures performed similarly, providing an AUC = 0.62–0.67 for detection of all TB cases within the cohort. The AUC values, as well as the sensitivity and specificity scores, can be found in Appendix 6 (see Table 37) and Appendix 7 (see Table 38). We further assessed their performance for the classification of either culture-confirmed or highly probable active TB (i.e. Dosanjh categories 1 and 2, respectively) against all OD for culture-confirmed TB; the best classification accuracy was achieved with the Xu et al. 52 and Achkar et al. 21 signatures, providing AUCs = 0.70 (see Table 39). All of the signatures gave a poor performance for detecting highly probable TB, with no significant discriminatory ability (AUC = 0.53–0.59). The performance of all signatures for diagnosing PTB was greater than that for EPTB, for which no discriminatory ability was achieved by any of the published signatures (see Table 37 in Appendix 6 and Table 39 in Appendix 7). Thus, the subgroup in which all signatures performed optimally in VANTDET was the culture-confirmed TB group.
Removal of sarcoidosis from other disease
It is known from our own studies, and those by others, that the serum proteomic profiles of patients with sarcoidosis are very similar to those of patients with active TB. We therefore carried out a LDA on the detection of all TB, as well as stratifying by Dosanjh category, when patients with sarcoidosis were removed from the OD cohort. The results from these analyses are shown in Appendix 8 (see Tables 40 and 41). For the detection of all TB, the performance of all of the published signatures improved slightly. However, when the performance in key subgroups was assessed, the performances of the signatures changed very little, or even reduced in diagnostic accuracy.
Discussion
The focus of this substudy of VANTDET was to test the diagnostic accuracy of previously identified protein signatures that occur in the serum of patients with active TB. To do this we reviewed and tested previously published proteomic signatures using the two major technological platforms, SELDI-TOF and LC–MS.
Our results indicate that diagnosis of TB cases in UK hospitals is not possible using currently identified proteomic signatures in SELDI-TOF or LC–MS technology. We used ROC curve analysis to indicate diagnostic accuracy for the binary classification of TB or OD. Applying this, none of the signatures tested met the GO/NO-GO threshold (AUC > 0.85) outlined in the management plan for this proteomics substudy of the VANTDET study. The best-performing signature was described by Achkar et al. 21 and resulted in an AUC = 0.68 when measured by LC–MS and analysed by LDA. Using SELDI-TOF, the Hamilton and Levin (unpublished) signature performed with an AUC = 0.66 when analysed by calculating the DRS. The classification accuracy was reduced compared with that reported by our collaborators in their cohort of TB and OD patients (AUC = 0.85). The other SELDI-TOF signature developed by Sandhu et al. 49 was not measurable because of poor interlaboratory reproducibility. All signatures improved their classification accuracy if only culture-confirmed active TB cases were considered for diagnosis. Herein, the Hamilton and Levin (unpublished) SELDI-TOF signature gave an AUC = 0.74, which was the optimal diagnostic performance we identified using any proteomic technique; the Xu et al. 52 and Achkar et al. 21 signatures gave a test accuracy performance of AUC = 0.70 using LC–MS as assessed using LDA.
We utilised the Dosanjh categorisation of active TB as our reference standard, in which TB diagnosis is based on both (1) gold standard microbiological culture and (2) clinical diagnosis of culture-negative TB. Approximately 28% of all TB cases recruited were culture negative, and this was driven by the relatively high prevalence of EPTB and other forms of paucibacillary TB cases among the UK cohort. Here, the development of new diagnostics is vital, as standard methods, such as culture or polymerase chain reaction (PCR), perform poorly. Our data show that the host response signatures found in the serum proteome for TB also perform poorly in culture-unconfirmed TB. The markers tested here perform better in culture-conformed (mainly pulmonary) TB potentially as a result of the robust acute-phase response in this type of disease that tracks with increased symptoms and more extensive immunopathology or necrotic disease. A limitation of the previous signatures for TB is their development in cohorts with a high prevalence of pulmonary TB, in which severity of disease at presentation is probably greater. The signature in the Achkar et al. 21 study was the only signature developed from patients in different hospitals, including both culture-negative TB and OD with TB-like symptoms, very similar to the IDEA study cohort utilised in the VANTDET study. The IDEA study12 also recruited prospectively, resulting in a cohort of diverse OD diagnoses (> 100), all classified as one group (Dosanjh category 4). The high diversity among this group, and similarity of symptoms reported by patients from all groups, reflects the real clinical problem, but it hampers any biomarker that is driven by a generalised mechanism in the host response to disease. For example, in diseases consisting of both neutrophil-driven necrotic disease and macrophage recruitment it is likely that the same proteins that are altered will be the same as found in active TB (e.g. S100A8/A9, MMP9). In developing their signatures, both Xu et al. 52 and Song et al. 51 limit selection of control groups to specific diseases, and controls often did not have similar symptoms in the Song et al. 51 study. This artificial selection leads to the development of tests that work well between diseases that are specifically different in the host response orchestrated, but also leads to the selection of markers that reflect only the difference between healthy and sick people. In utilising the IDEA study cohort, the VANTDET study improved on this by creating a design that tested the utility of such markers in a complex environment in which symptomatic people present on a case-by-case basis.
Our study was limited by technological problems in the platforms utilised and the cross-platform compatibility available for protein detection and quantitation. The discontinuation of SELDI-TOF limited the numbers of samples that could be analysed and the poor interlaboratory reproducibility limited us to validating only the four-protein signature developed in-house [developed by Hamilton and Levin (unpublished)]. The transfer of these biomarkers to new methods, LC–MS and ELISA, is troublesome. First, the identification of the proteins was not made until late 2017 and remains unpublished. Second, markers detected by SELDI-TOF do not always correlate accurately to antigenic regions raised during in vivo immune responses, making the development of ELISA difficult. LC–MS detects tryptic peptides for proteins and, therefore, can also not fully recapitulate what is observed in SELDI-TOF, which may be large fragments of proteins. Our goal was to analyse 200 samples from the IDEA study cohort, but this was limited to 90 by SELDI-TOF and 171 by LC–MS, as a result of low levels of consumables left in the UK and limited access to LC–MS equipment internally. Furthermore, the larger data set of crude sera resulted in poor protein coverage and an inability to detect the published signatures. To combat the limited power of our initial investigations, we analysed only HIV– samples. HIV status is known to affect proteomic profile in the serum of people with TB; however, as our cohort consisted of limited numbers of HIV+ (15%) co-infected patients, we decided to test signatures in HIV– patients initially and expand into HIV+ individuals if we achieved an AUC > 0.85. This AUC was never achieved using our approach by LC–MS or SELDI-TOF.
Liquid chromatography–mass spectrometry and SELDI-TOF failed to achieve the minimum requirements set in the VANTDET study for a clinically useful signature. Both technologies are limited by the depth of proteomic coverage and the ease of cross-platform development to a point-of-care test; and this was apparent in our study. Recently, a new technology termed SOMAscan offers an attractive method able to overcome these limitations. De Groote et al. 19 used this technology to discover and test a novel eight-protein signature for TB in the serum of people with PTB compared with other related non-TB diseases. This study was multicentre and prospective, but was limited to culture-confirmed PTB, for which it gave an AUC = 0.87 (95% CI 0.81 to 0.91). Testing of this signature in the VANTDET study using SOMAscan was not possible owing to the limited accessibility to this technology in the public domain at the time of project conception. Furthermore, the proteins comprising this signature were not all detected in either of our LC–MS data sets.
To address our secondary objective of using these proteomic data sets to derive novel signatures that may offer improved accuracy for diagnosing either all TB cases or specific subgroups of TB, we will be applying variable selection methods to identify the proteins providing the best classification accuracy (in both crude and depleted sera samples). We intend to train a prediction model on 60% of the cohort and test the accuracy of the model on the remaining 40% (test set). This work was not within the scope of this report, but will be the logical next step in utilising this novel proteomic data set to derive a clinically useful proteomic signature with potential to be used in the diagnostic work-up of TB.
Our study provided two important conclusions. The previously reported proteomic signatures for detecting TB were not found to be clinically useful in this cohort, probably because of the differences in the complexity of TB/OD patients in the respective cohorts. Therefore, our data from the IDEA study cohort, which does reflect real-life clinical practice, provide a springboard for future studies and an opportunity to derive new signatures that are robust and can pave the way for future validation in similar cohorts.
Chapter 5 Cellular immune signatures
Introduction
The IGRA tests measure the presence of circulating memory T lymphocytes producing IFNγ in response to the Mtb region of difference 1 (RD1) antigens. In addition to being the gold standard test for LTBI, they are able to detect between 55% and 87% of all active TB cases, depending on the population and test used. 12 However, as IGRAs cannot discriminate between these two states of infection, they lack the specificity to be used as a rule-in test for active TB. To improve on the specificity of such an immune-based test, various groups have explored the Mtb-specific T-cell response with greater complexity than simply measuring production of IFNγ, and have found that, by using flow cytometry to measure phenotypic and functional markers of Mtb-specific T cells, cellular immune signatures have the potential to be used as immune-based tests to discriminate between active and LTBI.
The first group to identify a signature that differed between disease states sufficiently to allow discrimination between active TB and LTBI was Harari et al. ,24 who, in 2011, showed that the functionality of CD4-positive T cells could discriminate between active and LTBI. Specifically, the proportion of Mtb-specific T cells with a polyfunctional profile [IFNγ positive, interleukin 2 (IL-2), positive, tumour necrosis factor alpha (TNF-α) positive] was higher in those with LTBI, whereas the proportion secreting TNF-α only (IFNγ negative, IL-2 negative, TNF-α positive) was higher in those with active TB and could discriminate between the two groups with high accuracy in a training and test cohort. 24
Work from our laboratory exploited the potential diagnostic value of TNFα-only-secreting Mtb-specific T cells while simultaneously improving diagnostic accuracy by combining measurement of T-cell memory/differentiation phenotype (based on cell surface markers) in parallel. Indeed, Pollock et al. 25 demonstrated that measurement of the proportion of TNF-α-only-secreting purified protein derivative (PPD)-specific cluster of differentiation 3 (CD3)- and CD4-positive cells that were CD45RA–CCR7–CD127– (i.e. highly differentiated late-effector T cells) was highly discriminatory between active TB and LTBI (see Table 42 in Appendix 9). The signature had 100% sensitivity and 93% specificity in a test cohort of 34 patients (n = 13, active TB; n = 21, LTBI), of whom 50% were HIV+. 25 Since then, additional cellular immune signatures have been identified that also show promise in their ability to discriminate between active TB and LTBI, including one that combined the proportion of TNF-α-only population (among all cytokine responders as in Harari et al. 24) with the presence of a detectable cluster of differentiation 8 (CD8)- and IFNγ-positive T-cell response into a SCORE value. 58
However, in recent years, the research focus has returned to the CD4-positive IFNγ-producing Mtb-specific population, and several groups have reported using the memory marker CD27 to differntatiate TB from LTBI patients. Different approaches to incorporating this marker into a cellular immune signature have been taken (i.e. by measuring the levels of CD27 as a ratio in relation to the parent population27 or measuring the presence/absence of expression in combination with the memory marker CD45RA). 28 The discrimination between groups was high in these studies, with a specificity of > 90% for active TB for the CD27–CD45RA– signature. 28 More recently, the incorporation of activation markers, such as human leucocyte antigen – antigen D related (HLA-DR), in cellular immune signatures has been shown in several studies to provide improved disrimination between these two disease states;26 a finding that has been validated by external groups, including those with/without co-infection with HIV. 59,60 For reference throughout this chapter, the signatures are referred to using either the numerical value or short description, as follows: (1) %TNF-α only,24 (2) % differentiated T effector cells (TEFF),25 (3) SCORE,58 (4) CD27 MFI (median fluorescence intensity) ratio,27 (5) %CD27–/+CD45RA–28 and (6) %HLA-DR. 26
Flow cytometry is already established in many NHS diagnostic laboratories throughout the UK and is suitable for routine diagnostic use. 61 These signatures therefore warrant prospective validation in a large-scale independent cohort in routine practice. As yet, none of the studies have tested the performance of such signatures in key patient groups that reflect those to present in a clinical setting, such as those with ODs and LTBI, and TB patients with hard-to-diagnose forms of the disease (i.e. culture-unconfirmed TB and/or EPTB). Indeed, patients were not recruited as part of routine clinical practice in any of the previous studies that have been conducted.
Aim
By combining the markers required to measure all of the signatures that have shown promise into one panel of antibodies, we sought to validate the performance of these signatures on a cohort of individuals with suspected TB recruited as part of routine clinical practice (i.e. using the IDEA study cohort).
Objectives
-
To validate the performance of the six (see Introduction) previously reported cellular immune signatures in diagnosing active TB.
-
To perform substudy analyses where specific clinical groups are included/excluded in the classification analysis (i.e. culture-confirmed TB/highly probable TB, PTB/EPTB, etc.).
Methods
Cohort selection
As the cellular immune signatures to be validated are dependent on a detectable T-cell response to Mtb antigens, and have thus been proposed as a test to allow for discrimination between active and LTBI, only those with a positive IGRA can be assessed. We therefore identified those individuals eligible for the final IDEA study analysis who had sufficient PBMCs available in the biobank and had a positive IGRA test (with a positive QFT-GIT and/or T-SPOT. TB being sufficient to be classified as IGRA positive). To balance the two groups, we carried out a nested control approach and randomly selected patients from the active TB group to generate our final cohort, with the exception that all eligible HIV-infected samples were included in the final cohort. Using this approach, all of the individuals selected from Dosanjh category 4 had a positive IGRA result and can therefore be classified as having both ODs and LTBI; we therefore refer to this group in the chapter as ‘OD/LTBI’.
Experimental design
Blinding of patient status
The patients were selected for this study by the data manager (AB) and the statistician (YT), using the criteria detailed in Cohort selection. The laboratory researchers (research associates and technicians: AH, MTW and TM) involved in the sampling handling, experiments and analysis, had access to only the patient IDs and locations. The demographic and clinical data related to each patient were not revealed to the researchers until the final analysis was complete and locked (i.e. the cellular immunology data could not be changed).
Batching
Each experiment took place over 2 days. Between five and nine samples were defrosted in each experiment and between one and three vials of PBMCs were required, depending on recovery. The details of viability, cell counting, plate layouts, antibody quantities and timings, etc., were entered on to a standards experimental log sheet. Records of antibody volumes/concentrations used, antigen batches and other details were also taken and stored for each experiment.
Cell culture and antigen stimulations
Thawed PBMCs were initially resuspended in RPMI-1640 (Sigma, St Louis, MO, USA) and supplemented with 10% heat-inactivated fetal bovine serum (referred to as R-10 from here on). The cells were then washed, resuspended in RMPI-1640 and counted using trypan blue and an automated cell counter (Countess II FL Automated Cell Counter, Invitrogen, CA, USA). PBMCs were then resuspended in R-10 to give a final concentration of 15 × 106 cells/ml. The cells were distributed in three to six wells of a 48-well plate (CELLSTAR™, Greiner Bio-One Kremsmünster, Austria) (in a volume of 100–250 µl) and rested for precisely 6 hours [at 37 °C in 5% carbon dioxide (CO2)]. After resting, the cells were stimulated with phorbol 12-myristate 13-acetate (PMA)/ionomycin-positive control (PMA concentration of 5 ng/ml and ionomycin concentration of 500 ng/ml), tuberculin PPD RT50 (AJ Vaccines, Copenhagen, Denmark/Statens Serum Institut, Copenhagen, Denmark) (16.7 µg/ml final concentration) and a combination of four RD1-related peptides shown previously to have a powerful discriminatory power (including ECRR, final concentration of 5 µg/ml per peptide). Unstimulated cells were used as a negative control. After stimulation, the cells were incubated for a further 2 hours and 2 µl of a monensin–brefeldin A mix (BioLegend, San Diego, CA, USA) (both at a 1× concentration according to manufacturer’s instructions) was added and the plate was incubated for a further 16 hours (total stimulation time = 18 hours).
Multicolour staining
Following stimulation, cells were incubated on ice for 10 minutes followed by scraping and washing with phosphate-buffered saline (PBS). Cells were then stained with a dead cell marker (LIVE/DEAD™ Fixable Near-IR, Life Cell Technologies, Auckland, New Zealand) at 1× in PBS for 10 minutes on ice, protected from light. After washing in fluorescence-activated cell sorting (FACS) buffer (PBS containing 2 mM ethylenediaminetetraacetic acid, 0.5% bovine serum albumin), all cells were placed in Block buffer (10% human serum in FACS buffer) containing a mixture of pre-titrated fluorochrome-conjugated antibodies for detection of surface markers (see Table 43). After washing with FACS buffer (PBS, 2 mM ethylenediaminetetraacetic acid, 0.5% bovine serum albumin), the cells were fixed and permeabilised using Cytofix/Cytoperm™ buffer (fixation/permeabilisation kit; Becton Dickinson and Company) for 20 minutes on ice protected from light. The cells were washed with BD Perm/Wash™ buffer (Becton Dickinson and Company) from the same kit and then stained with pre-titrated fluorochrome-conjugated antibodies diluted in Perm/Wash for the detection of intracellular cytokines (see Table 1). The cells were washed twice with FACS buffer before acquiring samples on a BD LSRFortessa™ cell analyser (Becton Dickinson and Company), containing five lasers [ultraviolet (UV) 355 nm, violet 405 nm, blue 488 nm, yellow–green 561 nm and red 633 nm). Antibody concentrations were optimised during titration experiments using the MFI staining index calculation approach.
Interexperimental controls
Various controls were included in each experiment, including the use of 8-Peak Rainbow Beads (BioLegend), which allowed for fine-tuning of the voltage settings to allow for comparable detection of fluorescence peaks across experiments. Single-stained controls for each antibody/viability dye cells or mouse/rat beads (selected to allow to detection of maximum possible brightness for each marker) were used to allow for calculation on the compensation matrix. Finally, PBMCs from a PPD-responsive anonymous leucocyte cone donor were used as a fully stained control in each experiment, as well as for fluorescence minus one control for each target antibody. All the controls ensured the standardisation and calibration of the BD LSRFortessa cell analyser across experiments.
Acquisition on flow cytometer
The samples and controls were acquired straight after the last experimental step using the BD LSRFortessa cell analyser, coupled with a computer and FACS Diva v8.01 software (Becton Dickinson and Company). A maximum of 2 × 10⁶ events (set at live singlet lymphocytes) were collected for each condition of each sample. Flow cytometry standard files were exported later that day to be further analysed using FlowJo version 10.4.2 (Treestar; Becton Dickinson and Company).
Use of purified protein derivative-responsive control
Leucocyte cones obtained from an anonymous donor were purchased from NHS Blood and Transplant. On receipt, cells were washed in RPMI-1640, counted and stored in cryovials containing approximately 20,000,000 live cells per vial. Cells from these samples were screened for responsiveness to PPD using flow cytometry. One PPD cytokine responder was used as an internal responsive control in each experiment.
Analysis and gating
The data were analysed using FlowJo version 10. Before analysis was applied to each experiment, the compensation matrix (derived from the FACS Diva software and compensation controls) was checked and adjusted accordingly so that over/under-compensation did not affect gating. For images showing the gating strategies used for the full analysis of all signatures, see Appendix 9 and Figures 22–24.
Selection of viable T cells
Gates were set on lymphocytes followed by single cells using forward and side scatter properties. Live lymphocytes were selected using LIVE/DEAD Fixable Near-IR versus forward scatter. Samples were checked against time in case an abnormality occurred while acquiring. CD3-postive T cells were selected within the live lymphocytes population gated against the CD4-positive T cells; this gate allowed for detection of highly activated CD3- and CD4-positive T cells on which surface expression of surface CD3 positive can be downregulated. 62 To visualise these gates see Figure 22.
Selection of cytokine-specific T cells
Within the CD3 population, CD4- and CD8-positive T-cell populations were further selected. The IFNγ-positive gate (after removal of artefacts as described in Appendix 9) was selected on either CD4-positive versus IFNγ or CD8 versus IFNγ, depending on the parent T-cell population of interest. IL-2 and TNF-α were plotted against each other and gated on this plot for either CD4 positive or CD8 positive.
Phenotypic gates (i.e. for CD45RA/CCR7, CCR7/CD127, CD127 positive/negative CD27/CD45RA and HLA-DR positive) were first gated on the CD4-positive population and were then transferred to cytokine-specific populations as required for each published signature (see Figures 23 and 24).
Determining the inclusion criteria for antigen responsiveness
For the purpose of this study, we defined a set of inclusion criteria to ensure that only those samples with a definite response to Mtb antigens, and with sufficient cells to allow for accurate calculation of phenotype, were included. Therefore, to identify samples with a sufficient antigen-specific cytokine response (whether CD4 positive–IFNγ positive or CD4 positive–TNF-α only), only those with at least twice the levels of cytokine above background were included (i.e. per cent of cells > 2× unstimulated). In addition, if phenotypic analysis of cytokine-specific cells was required for signature calculation, only those with ≥ 10 analysable events were included. These criteria are similar, although not identical, to those used in the publications where the signatures were first proposed.
Statistical analysis
All statistics were performed using Prism software. Differences in signature measurements between groups was determined using either a Mann–Whitney U-test or a Kruskal–Wallis test (depending on the number of groups). Diagnostic accuracy for discriminating between groups was calculated using ROC curve analysis.
Results
Cohort selection
The nested case–control approach was used to select the final cohort for validation of cellular immune signatures, resulting in a cohort of 184 participants samples being defrosted for the stimulation and flow cytometry staining (Figure 7), with equal numbers of TB and OD/LTBI participants (n = 92).
FIGURE 7.
Study flow chart of patients included in the validation of cellular immune signatures substudy. A nested case–control approach was used to select the patients from the full cohort of IGRA-positive participants who were eligible for analysis in the IDEA study, resulting in a total of 92 patients per group (with the TB patients being randomly selected and all the HIV+ and IGRA-positive patients being selected). Note: this cohort was larger than originally anticipated (i.e. n = 164), as additional IGRA-positive patients were identified since the October 2016 protocol was written. ATB, active tuberculosis.
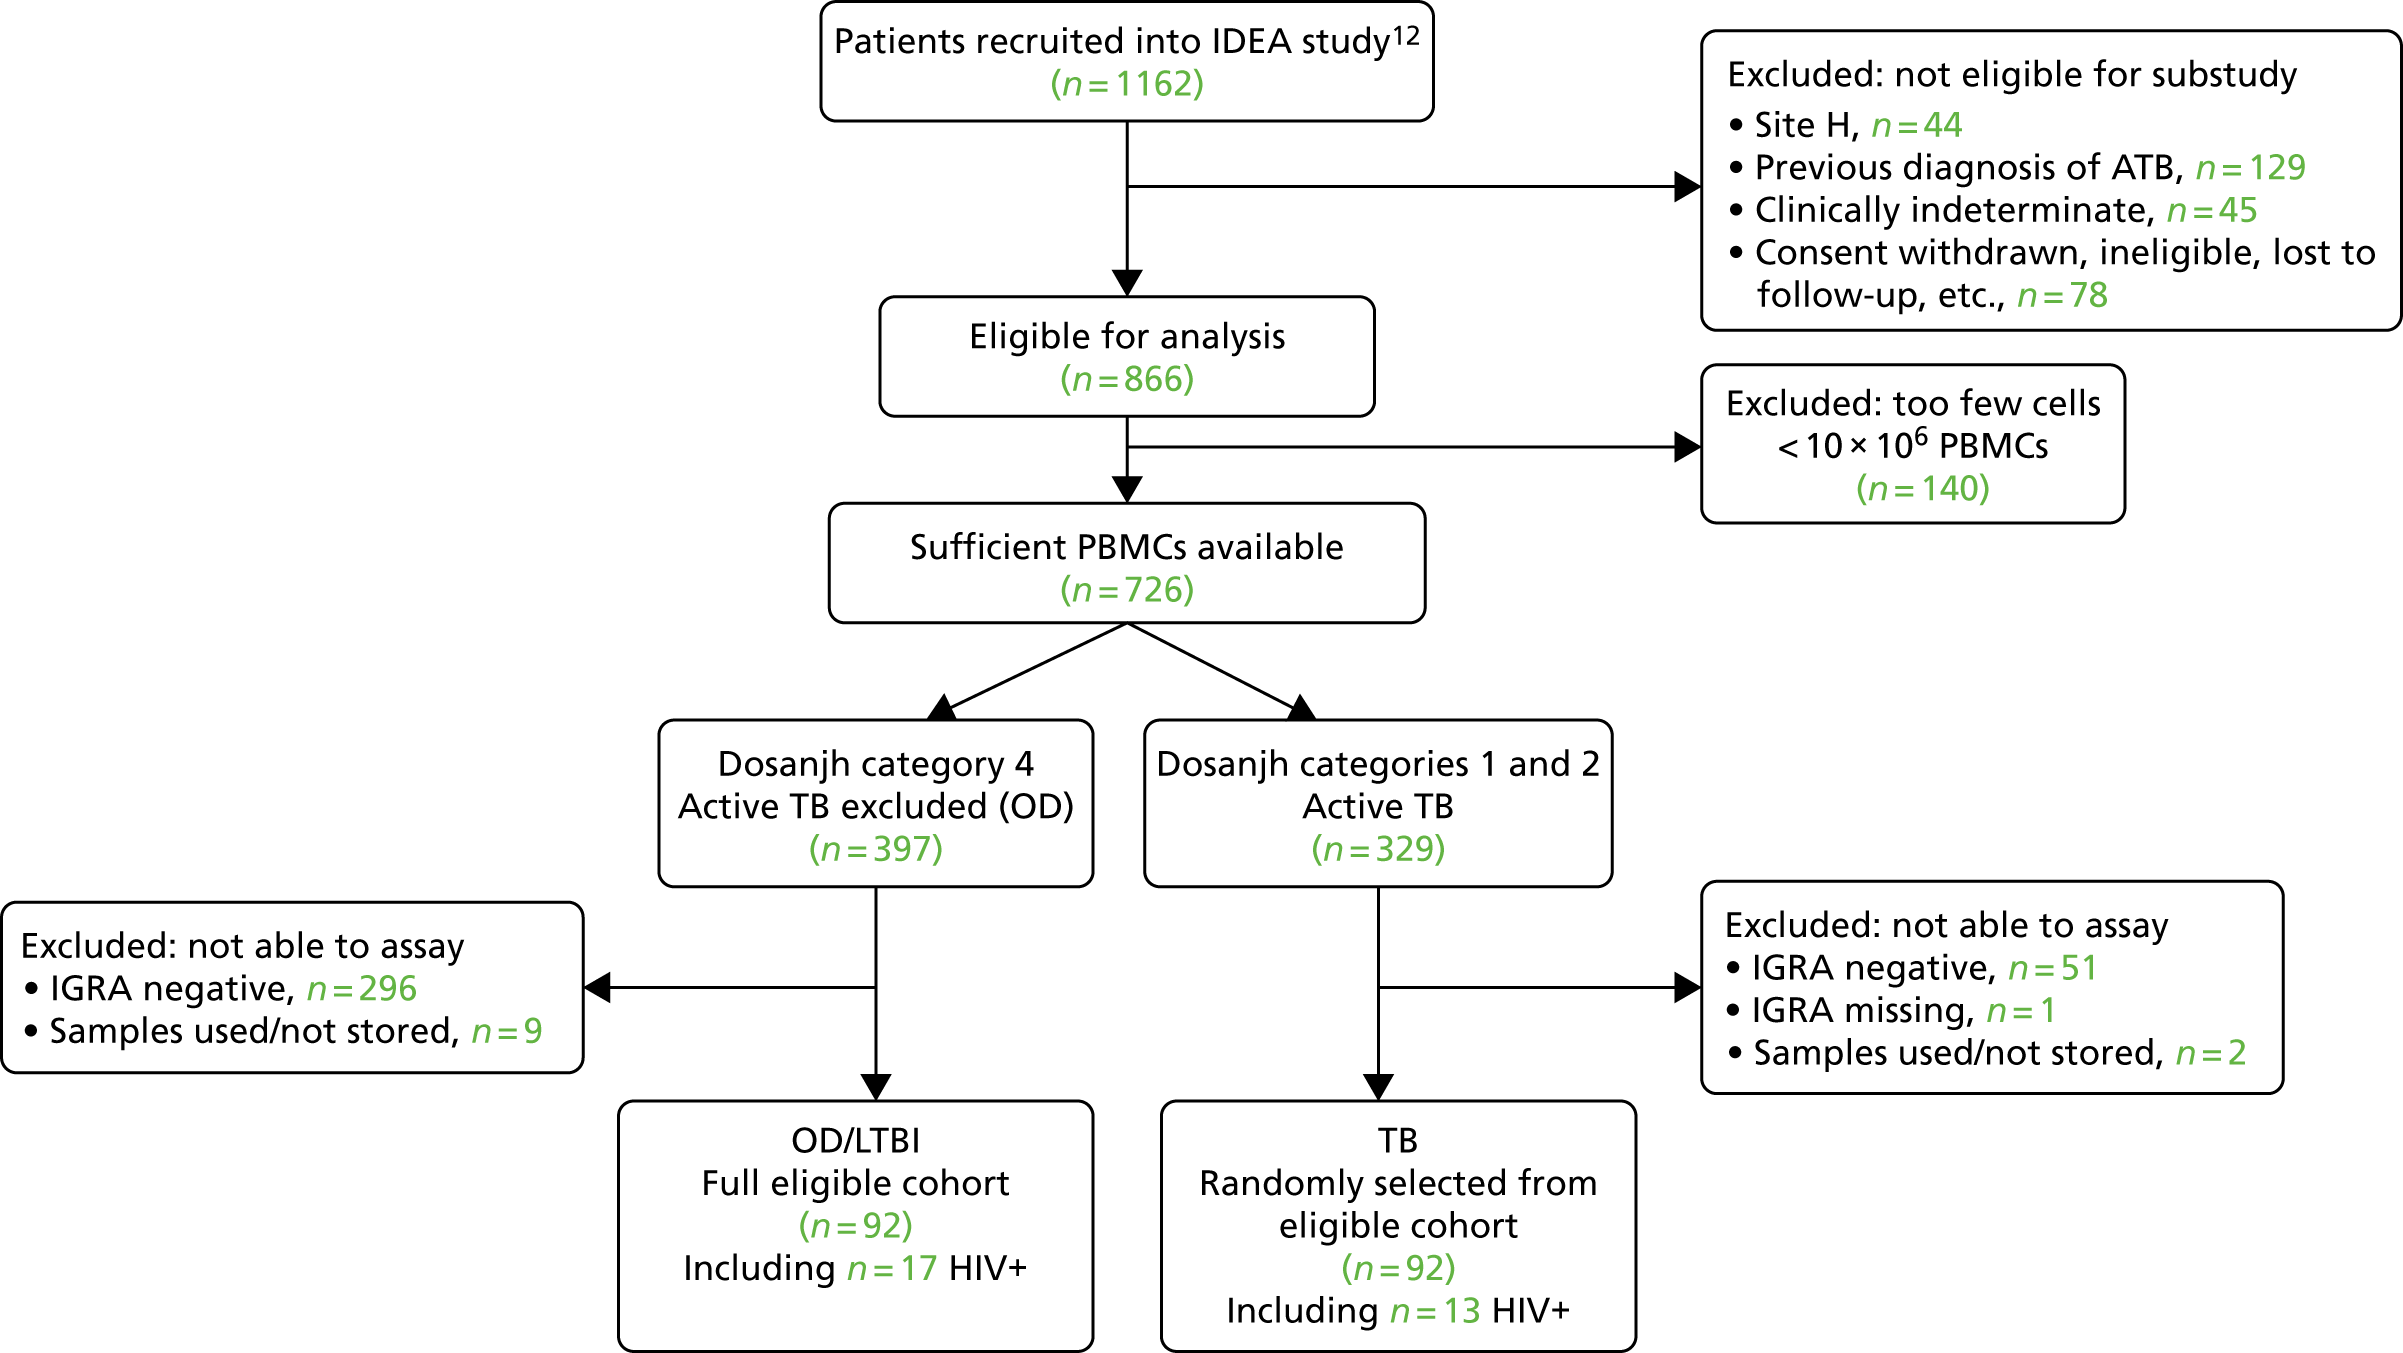
Cohort characteristics
The main demographic characteristics of the final analysed cohort are present in Table 10. As with the other VANTDET substudy and main IDEA study cohorts, there was a significant difference in age between the groups, with the OD group being older than the TB groups. Unlike in the IDEA study and transcriptomic substudy cohort, we do not observe a significant difference in ethnicity in this substudy cohort. This is probably because of the smaller cohort size. There were no significant differences in the key clinical characteristics (Table 11).
| Characteristic | Dosanjh category | p-value | ||
|---|---|---|---|---|
| 1: culture-confirmed TB | 2: highly probable TB | 4: OD/LTBI | ||
| Total, n | 60 | 32 | 92 | |
| Age (years), median (range) | 33 (16–72) | 36.5 (21–76) | 40.5 (17–80) | 0.0027 |
| Female, n (%) | 18 (30.0) | 13 (40.6) | 34 (37.0) | 0.5365 |
| Ethnic origin, n (%) | 0.2136 | |||
| Asian | 3 (5.0) | 3 (9.4) | 7 (7.6) | |
| Black | 18 (30.0) | 6 (18.8) | 29 (31.5) | |
| Hispanic | 1 (1.7) | 1 (3.1) | 1 (1.1) | |
| Indian subcontinent | 32 (53.3) | 20 (62.5) | 34 (37.0) | |
| Middle Eastern | 0 (0.0) | 0 (0.0) | 5 (5.4) | |
| Mixed | 0 (0.0) | 1 (3.1) | 1 (1.1) | |
| White | 6 (10.0) | 1 (3.1) | 14 (15.2) | |
| Unknown | 0 (0.0) | 0 (0.0) | 1 (1.1) | |
| Characteristic | Dosanjh category | p-value | ||
|---|---|---|---|---|
| 1: culture-confirmed TB | 2: highly probable TB | 4: OD/LTBI | ||
| Total, n | 60 | 32 | 92 | |
| Height (m) | ||||
| Median (range) | 1.68 (1.50–1.89) | 1.71 (1.50–1.80) | 1.7 (1.50–1.96) | 0.823 |
| Missing, n (%) | 24 (40.0) | 13 (40.6) | 26 (28.3) | |
| Weight (kg) | ||||
| Median (range) | 60.2 (41.3–97.0) | 64 (44.7–116.0) | 70.5 (42.0–132.0) | |
| Missing, n (%) | 0 (0) | 1 (3.1) | 4 (4.3) | |
| BMI (kg/m2) | ||||
| Median (range) | 21.7 (15.7–32.0) | 23.7 (16.1–42.2) | 24.3 (14.9–47.2) | |
| Missing, n (%) | 24 (40.0) | 14 (43.8) | 27 (29.3) | |
| BCG positive, n (%) | 46 (76.7) | 25 (78.1) | 64 (69.6) | 0.500 |
| HIV+, n (%) | 6 (10.0) | 6 (18.75) | 13 (14.1) | 0.495 |
The distribution of disease in the TB groups is presented in Table 44 and the list of main diagnoses in the OD group is presented in Table 45 (see Appendix 10). Individuals with PTB and EPTB were presented in both the culture-confirmed (Dosanjh category 1) and the highly probable (Dosanjh category 2) TB groups.
Recovery and detection of antigen-specific responses
Of the 184 samples in which PBMCs were defrosted, 181 (98%) were used for the full 2-day experiment (three were not plated or used for the full experiment owing to the recovery of no/too few live cells; two were TB; and one was OD/LTBI). Of the 181 samples that were assayed (i.e. stimulated, stained with full antibody panel and analysed), all were stimulated with PPD, all had a negative control (unstimulated), 179 (99%) were stimulated with PMA/ionomycin and 107 (59%) were stimulated with the RD1 antigens (ECRR). The Mtb antigen condition was included in each assay only when there were sufficient cells to have four conditions (> 7 × 10⁶). The PMA/ionomycin stimulation condition was excluded in two cases as a result of low numbers of cells. For details of the recovery rate of PBMC from storage, viability before plating and at acquisition, viability after stimulation and overall cytokine responses to all antigens, see Appendix 11, Tables 46–49 and Figure 25. In summary, all of those samples stimulated with PMA/ionomycin responded by producing cytokines, whereas responses to PPD and Mtb antigens were less frequent (with 87% and 93% of those stimulated responding with a detectable IFNγ response, respectively). Those individuals who did not meet the criteria for antigen responsiveness were excluded from diagnostic accuracy analysis.
Diagnostic performance of signatures in full cohort
Here we present the diagnostic performance of six previously identified cellular immune signatures for the detection of TB from OD/LTBI in the IGRA-positive population of TB suspects.
Distribution of signature values in tuberculosis and other disease/latent tuberculosis infection groups
The distribution of signature measurements in the TB and OD/LTBI groups after stimulation with PPD is displayed in Figure 8a and the values after RD1 antigen stimulation are displayed in Appendix 12. There was significant and strong correlation in four of the six signature scores between PPD and RD1 stimulations in those individuals who had both stimulations (see Figure 27; shown only for %HLA-DR).
FIGURE 8.
Performance of published signatures in full cohort, stratified by HIV infection status. (a) Dot plots scoring the signature values after PPD stimulation in TB suspects, stratified by diagnosis (TB or OD) and HIV infection status (positive or negative); and (b) ROC curves demonstrating diagnostic performance of signatures in the detection of active TB cases within the combined HIV+/– population, HIV+ alone and HIV– alone.


Performance characteristics
The performance of each of the signatures for discriminating all TB from those with OD/LTBI is presented in Figure 8 and Table 12 for the PPD stimulation, stratified by HIV infection status.
| Signature, reference | HIV | TB, n | OD/LTBI, n | AUC, %(95% CI) | Cut-off point | Sensitivity, % (95% CI) | Specificity, % (95% CI) | PPV | NPV |
|---|---|---|---|---|---|---|---|---|---|
| %TNF-α-only24 | – | 72 | 72 | 0.57 (0.47 to 0.66) | < 29.3a | 54.2 (42 to 66) | 54.2 (42 to 66) | 0.80 | 0.26 |
| < 18.7b | 23.6 (14.4 to 35.1) | 90.3 (81 to 96) | 0.89 | 0.26 | |||||
| + | 9 | 3 | 0.83 (0.59 to 1.07) | < 49.0a | 77.8 (40 to 97.2) | 66.7 (9.4 to 99.2) | 0.64 | 0.80 | |
| < 44.2b | 66.7 (29.9 to 92.5) | 100 (29.4 to 100) | 1.0 | 0.80 | |||||
| –/+ | 81 | 75 | 0.56 (0.47 to 0.65) | < 29.8a | 55.6 (44.1 to 66.6) | 56 (44.1 to 67.5) | 0.81 | 0.28 | |
| < 18.7b | 23.46 (14.8 to 34.2) | 90.7 (81.7 to 96.2) | 0.89 | 0.26 | |||||
| %TEFF25 | – | 72 | 66 | 0.86 (0.79 to 0.92) | > 27.6a | 76.4 (64.9 to 85.6) | 77.3 (65.3 to 86.7) | 0.92 | 0.50 |
| > 37.2b | 56.9 (44.73 to 68.6) | 90.9 (81.3 to 96.6) | 0.95 | 0.39 | |||||
| + | 8 | 3 | 0.58 (0.25 to 0.92) | < 59.3a | 50 (15.7 to 84.3) | 66.7 (9.4 to 99.2) | 0.54 | 0.63 | |
| < 53.7b | 50 (15.7 to 84.3) | 100 (29.4 to 100) | 1.0 | 0.72 | |||||
| –/+ | 80 | 69 | 0.83 (0.76 to 0.90) | > 28.1a | 77.5 (66.8 to 86.1) | 76.8 (65.1 to 86.1) | 0.92 | 0.51 | |
| > 49.4b | 36.3 (25.8 to 47.8) | 91.3 (82.0 to 96.7) | 0.93 | 0.30 | |||||
| SCORE58 | – | 72 | 72 | 0.58 (0.49 to 0.68) | < 3.43a | 52.8 (40.7 to 64.7) | 52.8 (40.7 to 64.7) | 0.79 | 0.25 |
| < 1.7b | 23.6 (14.4 to 35.1) | 90.3 (81 to 96) | 0.89 | 0.26 | |||||
| + | 9 | 3 | 0.91 (0.73 to 1.1) | < 5.2a | 77.8 (40 to 97.2) | 66.7 (9.4 to 99.2) | 0.64 | 0.85 | |
| < 5.0b | 77.8 (40 to 97.2) | 100 (29.2 to 100) | 1.0 | 0.85 | |||||
| –/+ | 81 | 75 | 0.58 (0.49 to 0.67) | < 3.5a | 51.9 (40.5 to 63.1) | 52 (40.2 to 63.7) | 0.78 | 0.25 | |
| < 1.7b | 23.5 (14.8 to 34.2) | 90.7 (81.7 to 96.2) | 0.89 | 0.26 | |||||
| CD27 MFI ratio27 | – | 71 | 69 | 0.78 (0.70 to 0.86) | > 9.5a | 74.7 (62.9 to 84.2) | 75.4 (63.5 to 85) | 0.91 | 0.47 |
| > 25b | 32.4 (21.8 to 44.6) | 91.3 (82 to 96.7) | 0.92 | 0.29 | |||||
| + | 9 | 5 | 0.53 (0.19 to 0.88) | < 7.2a | 55.6 (21.2 to 86.3) | 60 (14.7 to 94.7) | 0.52 | 0.64 | |
| < 4.3b | 44.4 (13.7 to 78.9) | 80 (28.4 to 99.5) | 0.63 | 0.65 | |||||
| –/+ | 80 | 74 | 0.76 (0.68 to 0.84) | > 9.3a | 72.5 (61.4 to 81.9) | 73 (61.4 to 82.7) | 0.90 | 0.45 | |
| > 25.0b | 31.3 (21.4 to 42.6) | 90.5 (81.5 to 96.1) | 0.92 | 0.29 | |||||
| %CD27–CD45RA–28 | – | 71 | 69 | 0.82 (0.75 to 0.89) | > 60.1a | 73.2 (61.4 to 83.1) | 72.5 (60.4 to 82.5) | 0.90 | 0.45 |
| > 76.5b | 39.4 (28 to 51.8) | 91.3 (82 to 96.7) | 0.94 | 0.31 | |||||
| + | 9 | 5 | 0.56 (0.19 to 0.92) | > 69.1a | 44.4 (13.7 to 78.8) | 40 (5.3 to 85.3) | 0.36 | 0.48 | |
| > 86.8b | 11.1 (0.28 to 48.3) | 100 (47.8 to 100) | 1.0 | 0.59 | |||||
| –/+ | 80 | 74 | 0.80 (0.73 to 0.87) | > 60.7a | 72.5 (61.4 to 81.9) | 73 (61.4 to 82.7) | 0.90 | 0.45 | |
| > 76.6b | 38.8 (28.1 to 50.3) | 90.5 (81.5 to 96.1) | 0.93 | 0.31 | |||||
| %HLA-DR26 | – | 71 | 69 | 0.90 (0.84 to 0.95) | > 41.5a | 80.3 (69.1 to 88.8) | 81.2 (70 to 89.6) | 0.93 | 0.56 |
| > 49.6b | 70.4 (58.4 to 80.7) | 91.3 (82 to 96.7) | 0.96 | 0.48 | |||||
| + | 9 | 5 | 0.91 (0.76 to 1.1) | > 75.0a | 77.8 (40 to 97.2) | 80 (28.4 to 99.5) | 0.75 | 0.82 | |
| > 81.3b | 77.8 (40 to 97.2) | 100 (47.8 to 100) | 1.0 | 0.85 | |||||
| –/+ | 80 | 74 | 0.89 (0.84 to 0.94) | > 42.2a | 80.3 (69.9 to 88.3) | 79.2 (68.5 to 87.6) | 0.93 | 0.55 | |
| > 54.3b | 64.2 (52.8 to 74.6) | 90.9 (82.2 to 96.3) | 0.96 | 0.44 |
The diagnostic accuracy of the discriminatory signatures was optimal for the culture-confirmed TB group (with the %HLA-DR signature achieving the highest AUC of 0.92, 95% CI 0.88 to 0.97), although the performance for the culture-unconfirmed group (Dosanjh category 2) was still reasonable for this hard-to diagnose group of patients (Table 13). To evaluate if the Dosanjh category 4 subcategory influences the diagnostic accuracy of the signatures, we evaluated the performance of detecting all TB using only the Dosanjh subcategories 4B or 4C patients in the TB-excluded (OD/LTBI) group. Interestingly, the performance of the cellular immune signatures was comparable, suggesting that likelihood and risk of LTBI in the OD/LTBI group does not influence test accuracy of cellular immune signatures (see Table 52 in Appendix 13).
| Comparison | Signature | TB, n | OD/LTBI, n | AUC, %(95% CI) | Cut-off point | Sensitivity, % (95% CI) | Specificity, % (95% CI) | PPV | NPV |
|---|---|---|---|---|---|---|---|---|---|
| Dosanjh category 1 vs. Dosanjh category 4 | %TNF-α-only24 | 47 | 72 | 0.58 (0.47 to 0.68) | < 28.90a | 55.3 (40.1 to 69.8) | 55.6 (43.4 to 67.3) | 0.62 | 0.48 |
| < 18.70b | 23.4 (12.3 to 38.0) | 90.3 (81.0 to 96.0) | 0.76 | 0.47 | |||||
| %TEFF25 | 48 | 66 | 0.88 (0.82 to 0.94) | > 29.30a | 81.3 (67.4 to 91.1) | 81.8 (70.4 to 90.2) | 0.86 | 0.77 | |
| > 42.20b | 47.9 (33.3 to 62.8) | 90.9 (81.3 to 96.6) | 0.88 | 0.57 | |||||
| SCORE58 | 47 | 72 | 0.58 (0.48 to 0.69) | < 3.46a | 51.1 (36.1 to 65.9) | 51.4 (39.3 to 63.4) | 0.58 | 0.44 | |
| < 1.70b | 23.4 (12.3 to 38.0) | 90.3 (81.0 to 96.0) | 0.76 | 0.47 | |||||
| CD27 MFI ratio27 | 46 | 69 | 0.81 (0.73 to 0.89) | > 10.4a | 73.9 (58.9 to 85.7) | 75.4 (63.5 to 85.0) | 0.80 | 0.68 | |
| > 25.0b | 39.1 (25.1 to 54.6) | 91.3 (82.0 to 96.7) | 0.86 | 0.53 | |||||
| %CD27–CD45RA–28 | 46 | 69 | 0.84 (0.77 to 0.92) | > 61.3a | 78.3 (63.6 to 89.1) | 78.3 (66.7 to 87.3) | 0.83 | 0.73 | |
| > 76.5b | 47.8 (32.9 to 63.1) | 91.3 (82.0 to 96.7) | 0.88 | 0.57 | |||||
| %HLA-DR26 | 46 | 69 | 0.92 (0.88 to 0.97) | > 44.2a | 82.6 (68.6 to 92.2) | 82.6 (71.6 to 90.7) | 0.86 | 0.78 | |
| > 49.6b | 78.3 (63.6 to 89.1) | 91.3 (82.0 to 96.7) | 0.92 | 0.76 | |||||
| Dosanjh category 2 vs. Dosanjh category 4 | %TNF-α-only24 | 25 | 72 | 0.55 (0.41 to 0.69) | < 30.3a | 52.0 (31.3 to 72.2) | 52.8 (40.7 to 64.7) | 0.21 | 0.82 |
| < 18.7b | 24.0 (9.4 to 45.1) | 90.3 (81.0 to 96.0) | 0.38 | 0.83 | |||||
| %TEFF25 | 24 | 66 | 0.81 (0.71 to 0.90) | > 23.0a | 70.8 (48.9 to 87.4) | 72.7 (60.4 to 83.0) | 0.39 | 0.91 | |
| > 37.2b | 45.8 (25.6 to 67.2) | 90.9 (81.3 to 96.6) | 0.55 | 0.87 | |||||
| SCORE58 | 25 | 72 | 0.58 (0.45 to 0.72) | < 3.3a | 56.0 (34.9 to 75.6) | 56.9 (44.7 to 68.6) | 0.24 | 0.84 | |
| < 1.6b | 24.0 (9.4 to 45.1) | 90.3 (81.0 to 96.0) | 0.38 | 0.83 | |||||
| CD27 MFI ratio27 | 25 | 69 | 0.73 (0.62 to 0.84) | > 7.5a | 68.0 (46.5 to 85.1) | 68.1 (55.8 to 78.8) | 0.34 | 0.90 | |
| > 25.1b | 20.0 (6.8 to 40.7) | 91.3 (82.0 to 96.7) | 0.36 | 0.82 | |||||
| %CD27–CD45RA–28 | 25 | 69 | 0.77 (0.67 to 0.87) | > 57.4a | 72.0 (50.6 to 87.9) | 71.0 (58.8 to 81.3) | 0.37 | 0.91 | |
| > 76.5b | 24.0 (9.4 to 45.1) | 91.3 (82.0 to 86.7) | 0.40 | 0.83 | |||||
| %HLA-DR26 | 25 | 69 | 0.84 (0.76 to 0.93) | > 38.1a | 76.0 (54.9 to 90.6) | 76.8 (65.1 to 86.1) | 0.44 | 0.93 | |
| > 49.6b | 56.0 (34.9 to 75.6) | 91.3 (82.0 to 96.7) | 0.61 | 0.89 |
The next best-performing signatures in the HIV– and HIV–/+ combined subgroups were, in order of decreasing accuracy, the %TEFF (of CD4-positive TNF-α-only cells) proposed by Pollock et al. 25 (AUC = 0.86 in HIV–, 95% CI 0.79 to 0.92), %CD27–CD45RA– proposed by Petruccioli et al. 28 (AUC = 0.82 in HIV–, 95% CI 0.75 to 0.89) and CD27 MFI ratio proposed by Portevin et al. 27 (AUC = 0.78, 95% CI 0.70 to 0.86), all of which showed highly significant discrimination between TB and OD/LTBI above the level of AUC = 0.5 (p < 0.0001). However, none of these signatures performed well in the HIV+ population, with AUCs ≤ 0.58 in all cases (see Table 12). No statistical analysis to compare diagnostic accuracy between the signatures was performed.
The two signatures that measured proportions of functional Mtb-specific subsets only, and not phenotype of Mtb-specific cells, were the %TNF-α-only (of CD4-positive and cytokine-positive) signature proposed by Harari et al. 24 and the SCORE signature proposed by Rozot et al. 58 These did not provide significant discrimination between TB groups in the HIV– or HIV+/– populations, with AUCs of ≤ 0.57 that were not significant (p > 0.05). Owing to the small numbers of responders in the HIV– cohort, this population was excluded from subsequent subcohort analyses.
Diagnostic performance in key subgroups of tuberculosis
Next, we sought to evaluate the performance of the cellular immune signatures in detecting important subsets of TB. First, we assessed the diagnostic accuracy for identifying either the culture-confirmed TB cases (Dosanjh category 1) or culture-unconfirmed TB cases (Dosanjh category 2). We were also able to evaluate the influence of the Dosanjh category 4 subcategories (B, C and D, which correspond to decreasing risk/likelihood of having LTBI) on the signature performance. The signature values in each of the Dosanjh categories are presented in Figure 28 in Appendix 13.
As with the full cohort analysis, the signatures measuring functionality only (cytokine responses), that is the TNF-α-only24 signature and the SCORE58 signatures, showed no differences between Dosanjh categories in the HIV– cohort. However, the four signatures measuring phenotype (%TEFF,25 CD27–MFI ratio,27 %CD27–CD45RA–28 and %HLA-DR26) showed significantly higher values in both Dosanjh categories 1 and 2 TB groups than in the OD/LTBI Dosanjh category 4 subcategories. Interestingly, no differences were observed in the signature values between the Dosanjh category 4 subcategories (only 4B and 4C could be used for statistical comparisons as there were too few participants in the 4D group).
The performance of signatures in the smear-negative interferon gamma release assay-positive cohort of tuberculosis suspects
Smear microscopy results are available on the same day that the patient presents to secondary care and IGRA results are usually available by the next day. The flow cytometry signature aims to distinguish active TB from LTBI in those who are IGRA positive, when it unclear whether the Mtb infection is latent or active. In this subanalysis, we therefore assessed the performance of the two best-flow signatures (the %HLA-DR26 and %TEFF25), within the IGRA-positive smear-negative population within this cohort (Table 14).
| Diagnostic performance characteristic | %HLA-DR26 | %TEFF25 |
|---|---|---|
|
Performance in detecting smear-negative TB (Dosanjh categories 1 and 2) Prevalence of TB in all smear-negative T-SPOT. TB-positive TB suspects = 79% (from overall IDEA study population) |
||
| TB/OD (n/n) | 49/45 | 50/43 |
| AUC, % (95% CI) | 0.91 (0.84 to 0.97) | 0.90 (0.83 to 0.96) |
| Cut-off pointa | > 41.2 | > 24.6 |
| Sensitivity, % (95% CI) | 81.6 (68.0 to 91.2) | 80 (66.3 to 90.0) |
| Specificity, % (95% CI) | 80 (65.4 to 90.4) | 81.4 (66.6 to 91.6) |
| PPV/NPV | 0.94/0.54 | 0.94/0.52 |
|
Performance in detecting smear-negative culture-positive (Dosanjh category 1) TB Prevalence of culture-positive TB in all smear-negative T-SPOT. TB-positive TB suspects = 59% |
||
| TB/OD (n/n) | 29/45 | 31/43 |
| AUC, % (95% CI) | 0.91 (0.83 to 0.98) | 0.92 (0.86 to 0.98) |
| Cut-off pointa | > 43.1 | > 28.2 |
| Sensitivity, % (95% CI) | 82.8 (64.2 to 94.2) | 83.9 (66.3 to 94.6) |
| Specificity, % (95% CI) | 82.2 (68.0 to 92) | 86.1 (72.1 to 94.7) |
| PPV/NPV | 0.87/0.73 | 0.90/0.78 |
|
Performance in detecting smear-negative and culture-negative (Dosanjh category 2) TB Prevalence of culture-unconfirmed TB in smear-negative TB suspects = 20% |
||
| TB/OD (n/n) | 20/45 | 19/43 |
| AUC, % (95% CI) | 0.90 (0.82 to 0.98) | 0.86 (0.76 to 0.96) |
| Cut-off pointa | > 39.1 | > 22.5 |
| Sensitivity, % (95% CI) | 80 (56.3 to 94.3) | 79 (54.4 to 94.0) |
| Specificity, % (95% CI) | 77.8 (62.9 to 88.8) | 79.1 (64.0 to 90.0) |
| PPV/NPV | 0.47/0.94 | 0.49/0.94 |
The pre-test probability of a TB suspect having TB after presenting with both a negative smear and a positive IGRA test is 79% (note, 59% and 20% for culture-positive and culture-negative TB subgroups, respectively), which is high, but not high enough to be confident that commencing TB treatment is the correct treatment course. The findings from this subanalysis show that, by using either the %HLA-DR26 or %TEFF25 signature tests, a high PPV for all TB (0.94) and culture-confirmed TB alone (0.87) can be achieved.
The HIV– cohort was further stratified by disease type, with the TB group split into either PTB or EPTB and the OD/LTBI group split into groups based on most frequent final diagnoses (see Figure 29 and Table 53). Again, only the signatures measuring phenotype showed differences between groups. Although no differences between other diagnoses in the OD/LTBI were observed, both PTB and EPTB showed elevated signature levels compared with the OD/LTBI groups.
Diagnostic accuracy was highest for detection of PTB cases from the overall OD/LTBI group (maximum AUC of 0.93, 95% CI 0.87 to 0.98) compared with EPTB in which performance was reduced (maximum AUC of 0.88, 95% CI 0.82 to 0.94), as achieved using the %HLA-DR26 signature that achieved the highest test accuracy. The diagnostic performance characteristics, including AUCs, sensitivity and specificity, for detecting either PTB or EPTB are presented in Table 53.
Discussion
Here we present the first validation of previously identified cellular immune signatures for the detection of active TB cases in a cohort of TB suspects recruited as part of routine clinical practice. The immunological nature of these assays, with the signatures being measurable only when a detectable Mtb-specific CD4-positive response can be characterised, confines the eligible patient population to those who respond to Mtb antigens (i.e. the IGRA-positive individuals) and, therefore, the challenge for these assays is to discriminate between active TB and OD/LTBI. We found that, of the six signatures validated in this cohort, only those that measured incorporated phenotypic markers in the flow cytometry signature (i.e. %TEFF, CD27 expression or %HLA-DR25–27) showed discriminatory ability, whereas the signatures measuring functionality did not differentiate between TB and OD/LTBI.
The best-performing signature was found to be the %HLA-DR signature,26 which has recently been validated in several cohorts and shown to have high test accuracy for differentiating TB from healthy LTBI. 26,59,60 This is the first study to demonstrate its diagnostic performance in a cohort in which the LTBI group also had OD and in which all patients were recruited with suspected TB. The performance we present here (AUC = 0.90) is not as high as previously found (AUCs 0.92–1.0). However, when only culture-confirmed TB among HIV– patients was considered, the diagnostic accuracy of this signature was comparable to that reported by Riou et al. 60 (also AUC = 0.92). Therefore, the overall lower performance we present here for detection of all TB using previously described cellular immune signatures probably reflects the inclusion of paucibacillary and hard-to-diagnose TB patients, particularly those with culture-unconfirmed TB.
The %TEFF25 signature also performed with reasonably high accuracy for detection of all TB, providing an AUC of 0.86 for detecting all TB in the HIV– population. Unlike in the original paper, in which performance was high in a mixed cohort of HIV+ and HIV– patients, in this study the signature could not discriminate between TB and OD/LTBI in the HIV+ population.
Both the %HLA-DR26 and %TEFF25 signatures could be useful in the setting of IGRA-positive TB suspects, as, in this scenario, they are able to provide a high PPV for all TB (0.95 and 0.95, respectively) and for culture-confirmed TB (0.92 and 0.88, respectively). Therefore, on initial screening of an IGRA-positive suspect, a positive result in these tests could provide clinicians with sufficient evidence (i.e. ≈90% probability) to start treatment immediately, without any need to wait for culture confirmation. This is the testing algorithm in which these assays could be useful. In future studies, we wish to determine these signatures in the smear-negative group of TB patients. Importantly, we also assessed the performance of these two signatures in the smear-negative subgroup within the cohort. These signatures were found to provide very high PPVs for all TB and culture-confirmed TB within the T-SPOT. TB-positive smear-negative population of TB suspects. These patients usually require several more investigations to inform treatment decision, or else treatment will be started without confidence in the correct diagnosis having been made. For culture-confirmed TB, the prevalence of which in the smear-negative T-SPOT. TB-positive population was 59%, the PPVs of 0.87 and 0.88 raised the pre-test probability of TB by 28–29% (i.e. from 59% pre-test probability to 87–88% post-test probability). The increase in the pre-test probability for all TB cases in this specific population was 13% (from 79% to a PPV of 94%), demonstrating that a positive test result with either of these assays would provide a rapid rule-in test, facilitating an accelerated decision to treat. A positive result in this setting would thus provide strong support for a diagnosis of TB and a decision to treat.
We found in this study that the signatures measuring polyfunctional profiles (%TNF-α-only24 and SCORE58) do not appear to be able to discriminate between TB and OD/LTBI groups. Several research groups have measured similar profiles, and it appears that these signatures are not reproducible across different studies. Day et al. 63 found that there were differences between LTBI and smear-negative and smear-positive TB, not with TNF-α-only CD4-positive responses, but with IFNγ+TNF-α+IL-2– and IL-2 responses.
Incorporating measurement of CD27 showed reasonable test accuracy in our cohort, but only in the HIV– population, and to a lesser extent than the %HLA-DR26 and%TEFF25 signatures (although statistical analyses to compare tests were not performed).
There are some limitations. Some of the PBMC stimulations did not result in detectable cytokine responses, meaning that they were excluded from the diagnostic performance analysis. Therefore, the performance may not be fully reflected in the analysis we present and, in practice, these tests may result in a number of failed or indeterminate results.
This is the largest validation of cellular immune signatures in a cohort of TB and LTBI patients and the first to test their performance in a cohort of TB suspects. We have demonstrated that cellular immune signatures can provide high test accuracy and may be useful for a rapid blood-based test for TB in the IGRA-positive population.
Chapter 6 Candidate rule-out tests
Introduction
Interferon gamma release assays are the recommended immunological assays to detect Mtb infection. There are two commercially available IGRAs, both of which measure IFNγ production in response to RD1 antigens (the T-SPOT. TB, which uses the T-SPOT. TB platform, and the QFT-GIT, which uses ELISA). IGRAs are unable to discriminate between active disease and LTBI and, as such, are unsuitable as tests to rule in active TB (because of poor specificity). Their sensitivity for detecting active TB cases is reasonably high, leading to the possibility that these tests could be used as a rule-out test for active TB. Ideally, such a test would provide > 95% sensitivity for all TB cases for it to be clinically useful. The IDEA study demonstrated that the T-SPOT. TB tests provided optimal accuracy (as compared with QFT-GIT), but that neither test in their current format provides sufficient sensitivity (between 67.3% and 82.3%) for detecting all TB12 for this important clinical utility. 11,12 In this substudy we explored two candidate approaches to improve on the sensitivity of immunological tests for active TB.
Additional Mycobacterium tuberculosis antigens
A strategy for improving diagnostic sensitivity of immune based tests is to include additional Mtb antigens. Use of Mtb-specific antigens for stimulation ensures that, although different secreted immune mediators are being meaured than in IGRA (i.e. chemokines instead of IFNγ), diagnostic specificity is not compromised. Various studies have taken this approach in an attempt to stratify different types of TB infection and/or improve sensitivity. 22,64 Indeed, the new updated version of the QuantiFERON test (QuantiFERON TB Gold-Plus, QIAGEN, Hilden, Germany) contains an additional antigen tube containing peptides that are proposed to stimulate Mtb CD8-positive T cells and drive improved test sensitivity for TB. However, very few studies have been performed to validate this new test and one recent study found its sensitivity and specificity for active TB were similar to those of the QFT-GIT. 65
The recently completed IDEA study identified that four Mtb RD1-related antigens were able to provide good sensitivity for active TB when used in a next-generation T-SPOT. TB assay: ESAT-6, CFP-10, Rv3615c [Esx-1 substrate protein C (EspC)] and Rv3798c. 12 Use of all four of these antigens in a stimulation assay together is therefore likely to maximise detection of Mtb infection. Indeed, in the next-generation T-SPOT. TB assay, combinations of these four antigens could provide an improved performance, with a sensitivity of 89.9% for all TB and of 94.4% for culture-confirmed TB. 12
Detection of additional or alternative analytes
A further powerful and pragmatic approach to enhance test sensitivity is to include measurement of alternative or additional immune mediators. We and others66–68 have proposed to improve on the sensitivity provided by detection of IFNγ by measuring immune mediators in which secretion is promoted by IFNγ, thereby providing an amplified signal. Two such chemokines are chemokine (C-X-C motif) ligand 9 [CXCL9, also known as MIG (monokine induced by gamma interferon)] and chemokine (C-X-C motif) ligand 10 (CXCL10, also known as interferon gamma-induced protein-10), both of which are produced by monocytes, neutrophils and other cells in response to IFNγ production by antigen-specific T cells and have been found to provide increased sensitivity for TB cases in some studies. 68,69 Others have proposed to detect alternative cytokines, such as IL-2, TNF-α or Th2-type cytokines,68,70 although the evidence for these cytokines providing improved sensitivity for TB (over that of IFNγ) is limited.
Alternative assay platforms
We and others have previously developed a highly sensitive whole-blood molecular test with high potential to reliably rule out the diagnosis of TB based on measurement of IFNγ-dependent chemokine release in response to Mtb-specific antigens. 23 The assay involves overnight stimulation of blood with ESAT-6 and CFP-10, and the subsequent measurement of CXCL9 and CXCL10 expression by qRT-PCR. To further improve sensitivity, we incorporated a third highly immunodominant and Mtb-specific antigen, EspC (Rv3615c), an immunogenic RD1-dependent antigen. 22 In preliminary studies using a case–control approach, the assay was found to be 100% sensitive for active TB (n = 39), when combining pairs of antigens and regardless of the pairing (i.e. any two of ESAT-6, CFP-10 and EspC) (Connell D, Reuschl AK, Lalvani A, et al., Imperial College London, unpublished data, 2012). Specificity was also high (94%), with only 1 of 16 IGRA-negative BCG-vaccinated HCs scoring positive in the assay. These compelling data suggest potential for a stimulated chemokine qRT-PCR test with sufficiently high diagnostic sensitivity to be used to rule out TB infection (and, therefore, active TB disease) at first presentation. The promising results with this assay to date now merit validation in a large-scale prospective cohort study of patients undergoing routine diagnostic work-up for suspected active TB.
As an alternative to the ELISA platform for detecting proteins as used in the current QFT-GIT, we further propose that the detection of target analytes from plasma of stimulated blood could be improved on this platform using Meso Scale Discovery (MSD) technology, which provides a broader dynamic range and greater sensitivity for low-abundance proteins than ELISA (www.mesoscale.com/).
Rationale for candidate rule-out assays
Assay platforms
Given the promising performance of qRT-PCR detection of Mtb antigen-specific CXCL9 and CXCL10 production in stimulated PBMC samples in our unpublished case–control cohort, coupled with data from Kasprowicz et al. 23 showing that performance appeared to be better than that of T-SPOT. TB, we decided to use this assay approach for the detection of our target genes. An additional IFNγ-related gene was selected for inclusion in the candidate molecular rule-out test. Basic leucine zipper atf-like transcription factor 2 (BATF2), which was significantly overexpressed in whole blood collected from TB patients (Long Hoang, National Heart and Lung Institute, Imperial College London, 2017), encodes a transcription factor and is expressed in macrophages stimulated by IFNγ. 71
Additionally, within the IDEA study biobank, we were also able to use the surplus supernatants from the QFT-GIT tests performed to evaluate whether or not the use of selected analytes could improve on the sensitivity compared with measuring IFNγ alone. Analytes were assessed either singly or in combination. Therefore, as an additional substudy, to further test the proof of concept that detection of alternative analytes can improve on test accuracy when compared with IFNγ, we chose to measure target chemokines in the QFT-GIT supernatants using MSD.
Aim
The aim of this substudy was to evaluate the diagnostic accuracy of two candidate immune-based tests to measure previously identified chemokine and cytokines for their use in ruling out active TB cases.
Primary objective
-
To determine whether or not the detection of molecules downstream of IFNγ, namely CXCL9, CXCL10 and BATF2, by qRT-PCR from RD1-stimulated PBMCs, can provide a greater sensitivity for active TB than in currently available tests (i.e. a molecular rule-out test).
Secondary objectives
-
To determine whether or not detection of CXCL10 or IFNγ in the GFT-GIT supernatants by MSD can provide improved diagnostic accuracy for detecting TB cases than in the ELISA platform.
-
To determine the performance of the above tests for discriminating between active TB and OD in the IGRA-positive population of TB suspects.
Methods
Cohort selection
As the existing data on this candidate molecular rule-out test are limited when compared with the other tests, we decided (at the SMG meetings and ISAB meetings) that for this technology we would take a two-stage approach to validation. First, we planned to assess the performance of the test in an artificial cohort, selected from within the IDEA study cohort, to act as a proof of principle that the candidate tests can provide greater sensitivity for active TB than the current immunological tests: the T-SPOT. TB and QFT-GIT. Therefore, we designed a ‘GO/NO-GO’ cohort for the first stage of validation. If high sensitivity for active TB was achieved in the cohort (i.e. greater than T-SPOT. TB), then the test would be rolled out on the full cohort of eligible patients for whom a PBMC sample was available (note that the cellular immune test was prioritised within the VANTDET study, but for most participants more than one PBMC vial was available so inclusion in both substudies was achievable in many cases).
For overall eligibility, the same inclusion criteria were used for assessment of the T-SPOT. TB and QFT-GIT tests within the IDEA study (i.e. diagnosis of either TB or OD, no history/evidence of previous TB), with the exception that individuals from site H were included in this cohort and only those with an available PBMC sample were included. HIV+ individuals were included.
GO/NO-GO cohort
For the GO/NO-GO cohort, 25 individuals with available PBMC samples were picked randomly from each of the four different groups: (1) active TB T-SPOT. TB positive, (2) active TB T-SPOT. TB negative, (3) OD T-SPOT. TB positive and (4) OD T-SPOT. TB negative. Previous studies exploring novel immune tests for active TB lack the active-TB IGRA-negative group, which we have enriched for in this cohort. Should any of the analytes we detect in these candidate assays provide > 95% sensitivity for active TB, with an acceptable level of specificity (> 65%), then the GO/NO-GO criteria from the first study would have been met, and the assays would have been performed on the full IDEA study cohort, in which PBMCs were available. For detection of CXCL10 and IFNγ, by MSD using QFT-GIT supernatants, we used a similar cohort of TB and OD patients.
Full cohort
In the event that 95% sensitivity and > 65% specificity for all active TB cases is achieved (i.e. GO criteria met), the assay will be performed on all available eligible individuals with available PBMCs.
Experimental set-up for molecular rule-out test
All 100 samples were placed into blocks of five or six samples for each experiment, selected randomly.
Stimulation
After thawing the frozen PBMCs and counting them with a Countess II FL Automated Cell Counter, the samples were spun down and resuspended in R10, and plated at 1 × 10⁶ PBMCs per well in a 48-well plate (CELLSTAR); at least three wells were required for each sample. Cells were immediately stimulated with one of the following antigen formulations (200 µl total volume): pooled 15-mer overlapping peptides from the Mtb antigens ECRR in R10 (final peptide concentration of 10 µg/ml); IFNγ (10 µg/ml) in R10, to act as the positive control; and R10 containing dimethyl sulfoxide (final concentration 1.48% to match that of ECRR), to act as a negative control. Stimulated PBMCs were incubated at 37 °C in 5% CO2 for 16 hours.
Ribonucleic acid extraction and quality control
After 16 hours’ stimulation, the cells were lysed with Buffer RLT (QIAGEN, Hilden, Germany) with 1% β-mercaptoethanol. Total RNA from the stimulated cells was extracted using the QIAGEN RNeasy Micro kit as per the manufacturer’s instructions (QIAGEN, Hilden, Germany). Total RNA was eluted in 14 µl of RNase-free water and stored at –80 °C until further used. Quantification of the concentration and quality of the RNA were measured using a NanoDrop 8000 spectrophotometer and an Agilent 2100 Bioanalyzer, respectively.
Two-step quantitative reverse transcription-polymerase chain reaction
Extracted messenger RNA was reverse transcribed to cDNA using First Strand cDNA Synthesis (Thermo Fisher Scientific). PCR was performed using a TC-512 Thermal Cycler (Techne, Staffordshire, UK), with RNase inhibitor (Thermo Fisher Scientific) and random hexamers (Thermo Fisher Scientific). The amplification and detection was performed using Applied Biosciences™ 7500 Fast Real-Time PCR System (Thermo Fisher Scientific), using the default settings suitable for Quantitation-Comparative Ct (threshold cycle) to perform the analysis 2 ΔΔCt. The probes and primers (Life Technologies, CA, USA) assay ID for the internal reference HPRT1 (Hs02800695_m1) and target genes CXCL10 (Hs01124251_g1), CXCL9 (Hs00171065_m1), IFNγ (Hs00989291_m1) and BATF2 (Hs00912737_m1) were used. The relative fold change was calculated as the ratio between the mean Ct values of the target gene and reference gene (GAPDH) in each stimulated sample in relation to the unstimulated sample.
Detection of candidate biomarkers from QuantiFERON supernatants
During the IDEA study, the excess supernatants from the QFT-GIT test were harvested and stored at –80 °C. An additional project was to test the performance of promising candidate immune mediators IFNγ, IL-2, CXCL10, monocyte chemoattractant protein 1 (MCP-1), monocyte chemoattractant protein 3 (MCP-3), macrophage inflammatory protein 1β (MIP-1B) and TNF-α. Using the MSD U-PLEX platform to detect all of these chemokines and cytokines as per manufacturer’s instructions with some variation with longer stimulation time; plates were read using a MESO QuickPlex SQ 120 instrument (Meso Scale Discovery, Rockville, MD, USA). Concentration was calculated by normalising the stimulated supernatant from the nil sample.
Statistical analysis
All statistics were performed using Prism software. Differences between groups (in normalised fold change gene expression or analyte concentration) were determined using a Kruskal–Wallis test with Dunn’s post hoc test for multiple comparisons. Diagnostic accuracy for discriminating between groups was calculated using ROC curve analysis.
Results
Cohort characteristics
The details of the cohort eligible for analysis and the stratification between the full eligible cohort and GO/NO-GO cohort are given in Figure 9.
FIGURE 9.
Study flow diagram for the validation of the candidate rule-out tests. ATB, active tuberculosis.
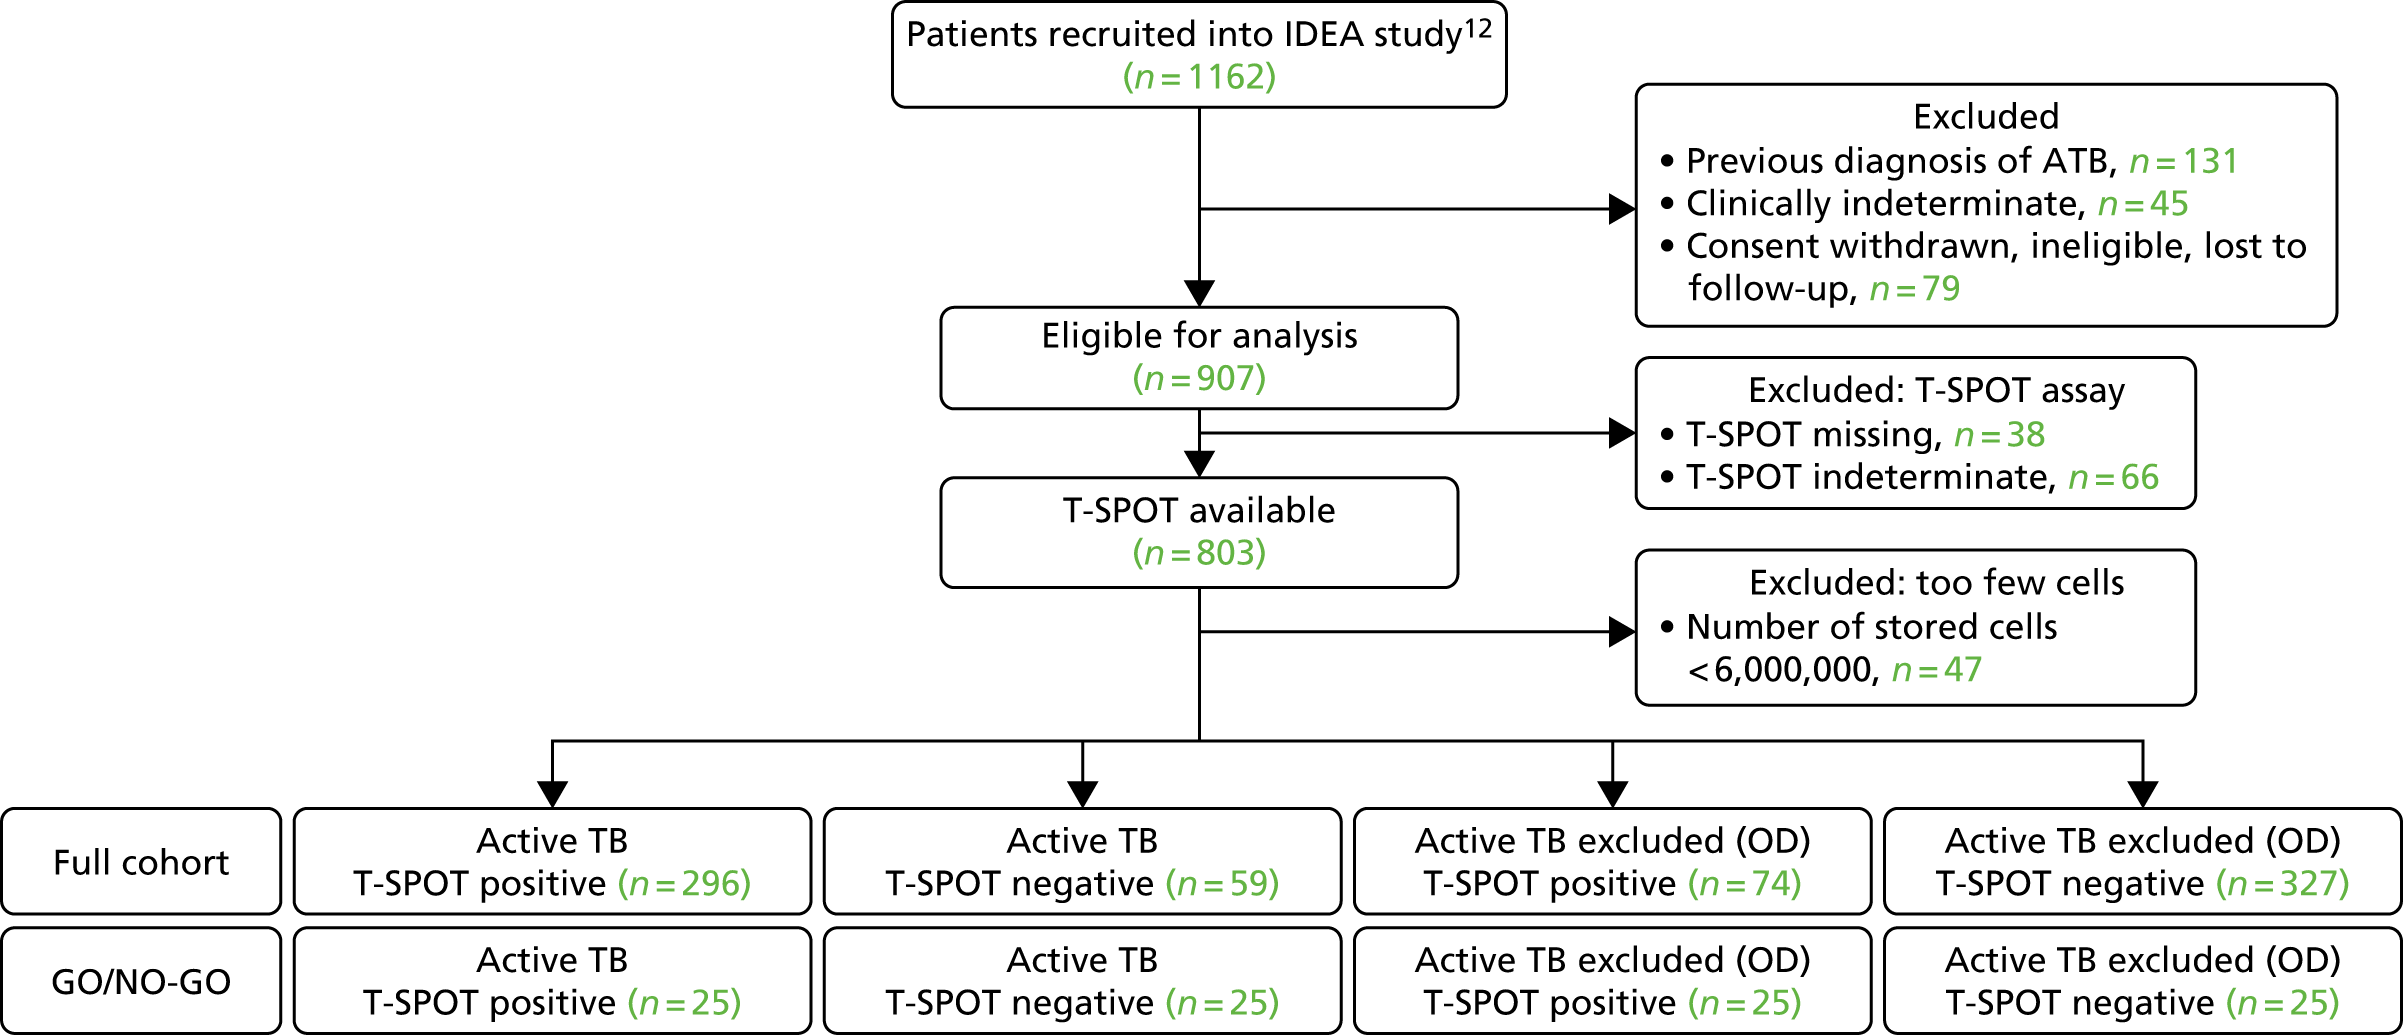
From the 100 individuals selected to be part of the GO/NO-GO cohort, three were not found in the biobank and an additional three samples were found, subsequently, to be ineligible (having a previous history of TB), leaving a total of 94 in the full cohort of assay individuals.
The demographic and clinical characteristics of the final cohort are shown in Table 15. Further details on the severity and type of TB disease, or OD, within the full cohort are given in Appendix 14 (see Tables 54 and 55).
| Demographic/clinical characteristic | Active TB | OD | p-value | ||
|---|---|---|---|---|---|
| T-SPOT.TB positive (N = 24) | T-SPOT.TB negative (N = 22) | T-SPOT.TB positive (N = 22) | T-SPOT.TB negative (N = 26) | ||
| Age (years), median (range) | 33 (19–57) | 48.5 (27–81) | 43.95 (19–74) | 49.19 (21–84) | 0.0011 |
| Female, n (%) | 12 (50) | 7 (31.8) | 8 (36) | 10 (38) | |
| Ethnic origin, n (%) | N/A | ||||
| Asian | 2 (8.3) | 2 (9.1) | 1 (4.5) | 2 (7.7) | |
| Black | 4 (16.6) | 0 (0) | 3 (13.6) | 7 (26.9) | |
| Indian subcontinent | 17 (70.8) | 13 (59.1) | 10 (45.5) | 9 (34.6) | |
| Mixed | 0 (0) | 2 (9.1) | 0 (0) | 0 (0) | |
| White | 1 (4.2) | 5 (22.7) | 8 (36.4) | 8 (30.1) | |
| HIV+, n (%) | 1 (4.2) | 2 (9.1) | 6 (27.3) | 1 (3.8) | 0.032 |
| TST, n (%) | < 0.0001 | ||||
| Positive | 5 (20.8) | 9 (40.9) | 0 (0) | 1 (3.8) | |
| Negative | 0 (0) | 0 (0) | 1 (4.5) | 8 (30.1) | |
| Not tested | 19 (79.2) | 13 (59.1) | 21 (95.5) | 19 (73.1) | |
| BCG, n (%) | |||||
| Yes | 18 (75) | 17 (77.3) | 19 (86.4) | 22 (84.6) | |
| No | 6 (25) | 5 (22.7) | 3 (13.6) | 4 (15.4) | |
| Height (m), median (range) | 1.69 (1.52–1.85) | 1.69 (1.61–1.8) | 1.65 (1.55–1.88) | 1.68 (1.52–1.86) | 0.3981 |
| Height missing, n (%) | 4 | 10 (45.5) | 2 | 7 | |
| Weight (kg), median (range) | 61 (42–123.5) | 61.5 (47.4–96) | 64.5 (45–82.6) | 72.3 (48.3–140) | 0.2815 |
| Weight missing, n (%) | 1 | 0 | 0 | 4 | |
| BMI (kg/m2), median (range) | 23.1 (17.6–36.9) | 22.6 (18.9–31.1) | 22.4 | 24.4 (15.9–43.2) | 0.6108 |
| BMI missing, n (%) | 4 | 10 | 2 | 8 | |
Validation of molecular rule-out tests
To measure gene expression of all analytes (CXCL10, CXCL9, BATF2 and IFNγ) using qRT-PCR, a minimum of 50 ng of total RNA was needed. Of the 94 samples that were assayed, 13 samples yielded low amounts of RNA (around ≈40 ng); therefore, not all analytes could be measured. In these cases, BATF2 expression was not measured.
Gene expression of target analytes in response to the positive control
As all of the target genes (CXCL9, CXCL10 and BATF2) are known to be up-regulated in response to IFNγ, this was used as the positive control in the assay. Previously, phytohaemagglutinin (PHA) was used in our laboratory for these assays (as is used in T-SPOT. TB and QFT-GIT). However, preliminary optimisation experiments in the VANTDET study revealed that the levels of the target genes were not reliably increased using PHA. This is probably a result of the reduced viability of PBMCs following PHA stimulation, which we confirmed by flow cytometry (data not shown). By plotting the normalised relative expression of target genes in response to ECRR or IFNγ, we were able to select a cut-off point for an acceptable response in the positive control condition. The cut-off points selected were as follows: > 100 for CXCL10, > 100 for CXCL9 and > 10 for BATF2 (as shown in Figure 31 in Appendix 15).
Gene expression in response to Mycobacterium tuberculosis antigens
The results of the PCR detection of target genes in response to the antigen conditions (normalised to unstimulated) are shown in Table 16.
| Analyte/measurement | Active TB | OD | ||
|---|---|---|---|---|
| T-SPOT.TB positive (N = 24) | T-SPOT.TB negative (N = 22) | T-SPOT.TB positive (N = 22) | T-SPOT.TB negative (N = 26) | |
| CXCL10 | ||||
| Total for analysis, n (%) | 19 (75) | 19 (87) | 12 (55) | 21 (81) |
| Total failed, n (%) | 5 (25) | 3 (13) | 10 (45) | 5 (19) |
| PCR indeterminate | 0 | 1 | 0 | 1 |
| HPRT1 fail | 3 | 2 | 6 | 5 |
| Low levels in positive control | 2 | 1 | 4 | 0 |
| Fold change ECRR/unstimulated, mean (range) | 23,604.50 (116.68–14,0596.57) | 9362.95 (8.11–46,681.24) | 115,353 (1.45–56,513.26) | 1408.53 (1.5–18,053.68) |
| IFNγ/unstimulated, mean (range) | 50,483.2 (224.9–325,447.0) | 126,019.7 (829.6–432,419.1) | 104,350.1(156.8–384,828.4) | 55,180.4 (361.6–381,780.3) |
| CXCL9 | ||||
| Total for analysis, n (%) | 18 (76) | 18 (83) | 13 (59) | 21 (81) |
| Total failed, n (%) | 6 (24) | 4 (17) | 9 (40.9) | 5 (19) |
| PCR indeterminate | 0 | 1 | 1 | 1 |
| HPRT1 fail | 3 | 2 | 6 | 5 |
| Low levels in positive control | 3 | 2 | 2 | 0 |
| Fold change ECRR/unstimulated, mean (range) | 33,280.75 (350.84–120,140.97) | 15,049.99 (0.99–74,914.48) | 1030.38 (0.19–5146.35) | 788.49 (0.23–7952.44) |
| IFNγ/unstimulated, mean (range) | 97,456.2 (301.1–605,633.7) | 245,973.5 (1025.6–804,235.3) | 171,387.5 (220.2–792,079.3) | 123,803.4 (1033.6–795,414.8) |
| BATF2 | ||||
| Total for analysis, n (%) | 19 (80) | 14 (66.7) | 10 (45.5) | 18 (69.2) |
| Total failed, n (%) | 5 (20) | 8 (33.3) | 12 (54.5) | 8 (30.8) |
| Low RNA concentration | 1 | 4 | 4 | 4 |
| PCR indeterminate | 0 | 1 | 1 | 0 |
| HPRT1 fail | 3 | 2 | 6 | 4 |
| Low levels in positive control | 1 | 1 | 1 | 0 |
| Fold change ECRR/unstimulated, mean (range) | 33,280.75 (350.84–120,140.97) | 15,049.99 (0.99–74,914.48) | 42,919.01 (0.19–545,582.52) | 788.49 (0.23–7952.44) |
| IFNγ/unstimulated, mean (range) | 97,456.2 (301.1–605,633.7) | 245,973.5 (1025.6–804,235.3) | 171,387.5 (220.2–792,079.3) | 123,803.4 (1033.6–795,414.8) |
Of note, a high proportion (15–27%) of the assays resulted in a ‘fail’ result, as a result of a number of factors. The most prevalent reason for assay failure was unreliable detection of the housekeeping gene HPRT1. Individuals with HIV co-infection were responsible for many of the assay failures, particularly for detection of Mtb-specific CXCL10. We also, for comparison, measured the levels of IFNγ in response to the antigens using the same approach. The findings are shown in Table 56 in Appendix 15. The gene expression data for individuals within each group who passed test inclusion criteria for passing the assay are presented in Figure 30 in Appendix 15.
The T-SPOT. TB-positive TB group displayed the highest Mtb-specific expression of all target genes when compared with other groups, with the exception of CXCL10, for which levels were also very high in the T-SPOT. TB-positive OD (i.e. OD/LTBI) group.
Diagnostic performance for detection of active tuberculosis
The diagnostic performance of the target genes for detecting all TB cases compared with all OD is presented in Figure 10. Although obtaining > 95% sensitivity for all active TB is achievable when the cut-off point for fold/change over unstimulated is set at around 10 for CXCL9 and CXCL10, this was coupled with very low specificity (≈ 5%). For BATF2 and IFNγ, the cut-off point corresponding to > 95% sensitivity was < 1, suggesting that it is not achievable to use these analytes to detect this proportion of all TB cases.
FIGURE 10.
Diagnostic performance of candidate qRT-PCR detection of CXCL10, CXCL9, BATF2 or IFNγ in the candidate molecular rule out, as assessed in the GO/NO-GO cohort. The classification of all TB from all OD (either T-SPOT. TB positive/negative for both) using these readouts is shown (n = 2–48 per group depending on the test). The performance of the T-SPOT. TB assay in this cohort is also shown. ATB, active tuberculosis.
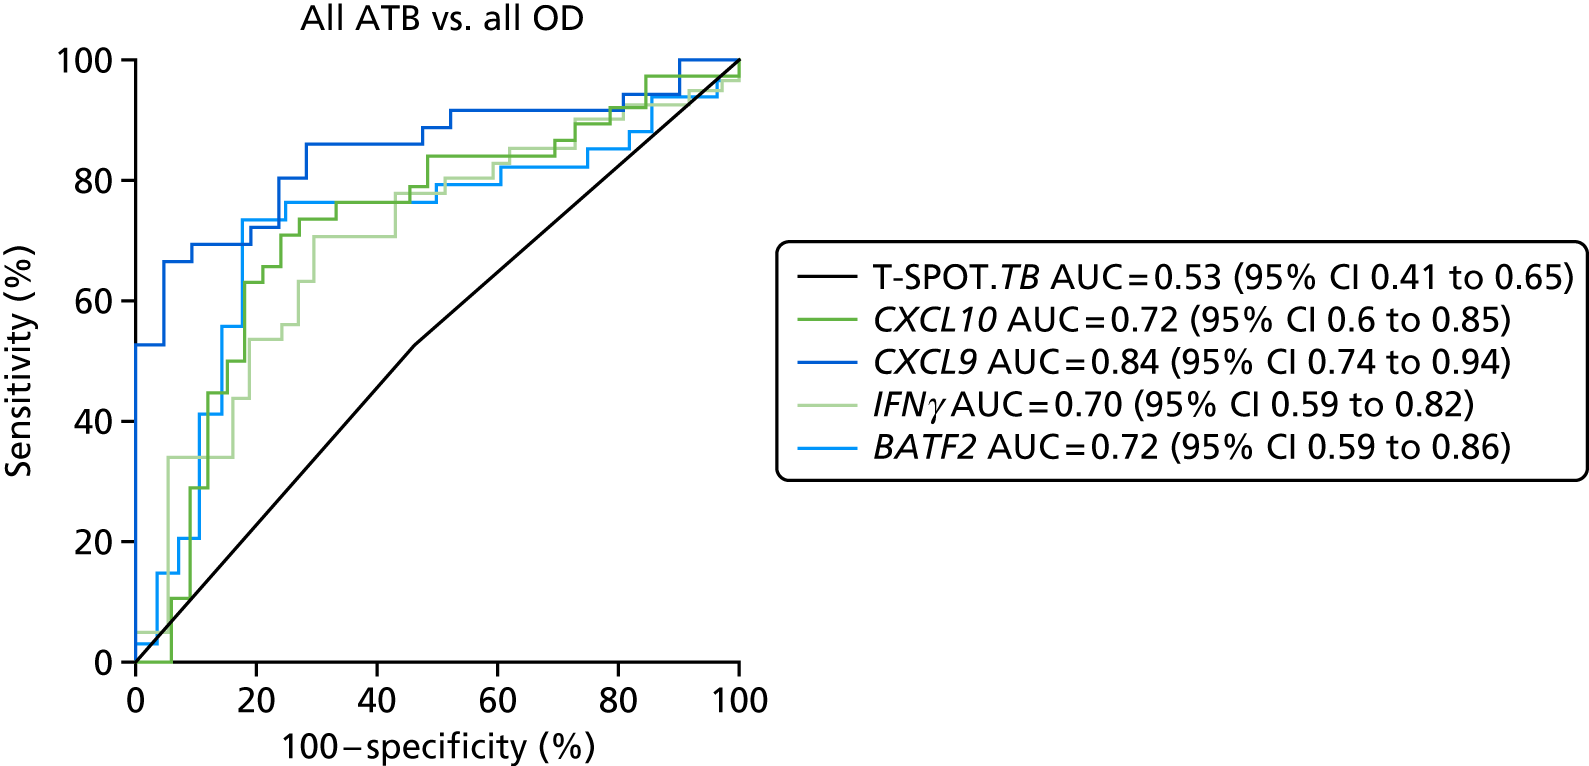
When compared with the T-SPOT. TB test within the same cohort, which showed no diagnostic accuracy in this setting owing to the artificial way the participants were selected (AUC of 0.53), all of the analytes showed improved diagnostic accuracy. This suggests that this method of qRT-PCR measurement of cytokines may provide greater sensitivity than the T-SPOT. TB platform, as even IFNγ detection by qRT-PCR performed better than the T-SPOT. TB in detecting active TB patients. However, these ROC curve analyses do not include those individuals for whom the qRT-PCR assay failed.
The best-performing gene for detection of all active TB was CXCL9, which provided an AUC of 0.84 (95% CI 0.74 to 0.94) for detecting all TB cases in this cohort. However, none of the new assays was able to provide 95% sensitivity with an acceptable corresponding specificity (i.e. > 65%) (see Appendix 15, Table 57). In fact, in all cases, the specificity for either TB group, or indeed LTBI, was unexpectedly low, with a wide range of gene expression values in all groups.
As the proportion of T-SPOT. TB-positive OD patients within this artificial cohort was inflated, the true specificity of these tests is likely to be greater in a cohort that better reflects the levels of T-SPOT. TB positivity in the TB and OD groups. To test this, we compared the diagnostic performance of the tests for detecting all TB cases (T-SPOT. TB positive/negative) with their performance for detecting T-SPOT. TB-negative OD cases only (see Figure 32 in Appendix 15). In this setting, the performance of target genes was more like that seen in the T-SPOT. TB test (AUC = 0.76), with CXCL9 again providing the best test accuracy (AUC = 0.86).
We also compared the performance of target genes when only T-SPOT. TB-positive TB and T-SPOT. TB-negative OD were considered. In this setting, none of the tests provided 100% accuracy and, therefore, performed suboptimally to the T-SPOT. TB (see Figure 33 in Appendix 15). The full performance data for these calculations, including sensitivity and specificity values, are shown in Appendix 15.
Discriminating active tuberculosis from latent tuberculosis infection/other disease
To address our secondary objective of assessing the performance of our target genes in discriminating between active TB and LTBI in our cohort, we assessed their performance using ROC analysis comparing TB (T-SPOT. TB positive) and OD (T-SPOT. TB positive) (see Figure 34). In this setting, the T-SPOT. TB provides no discrimination (as results used are either ‘positive’ or ‘negative’ rather than numerical). All of the target genes, including IFNγ, provided some discrimination between action TB and OD/LTBI in this subcohort of patients, with CXCL9 providing the highest AUC of 0.97 (95% CI 0.91 to 1.0).
Performance of CXCL10 and IFNγ in QuantiFERON® GOLD In-Tube supernatants using Meso Scale Discovery
Of the 95 samples from IDEA study participants selected for QFT-GIT supernatant experiments using the MSD platform, 75 overlapped with samples from the candidate molecular rule-out test cohort, and two of the analytes measured (CXCL10 and IFNγ) could therefore be compared across the two approaches (data shown in Figure 35). The diagnostic performance of both IFNγ and CXCL10 for detecting TB cases was similar using both platforms. The detection of differences between patient groups based on either T-SPOT. TB assay (for qRT-PCR) or QFT-GIT (for MSD assays) was good, but greater discrimination was seen between QFT-GIT-positive/-negative groups in the MSD assay platform, probably reflecting the fact that the analytes were measured from the same stimulated samples (whereas a new stimulation was performed for the molecular rule-out assay).
Discussion
In this substudy we have evaluated two candidate approaches for improving the sensitivity of immune-based tests for active TB: (1) the molecular rule-out test for measuring chemokines from stimulated PBMCs using qRT-PCR; and (2) the measurement of IFNγ and CXCL10 in QFT-GIT supernatants using MSD. Unlike other studies that used a case–control approach and in which patients were often pre-selected for immune assay responsiveness, in this study we have designed a cohort that is deliberately enriched for patients in whom current immune-based tests fail (i.e. those in the TB group who are IGRA negative and those in the OD group who are IGRA positive). This artificial cohort selection approach was used to provide a GO/NO-GO point for the validation of these candidate tests.
We found that CXCL9, CXCL10 and BATF-2 gene expression was upregulated in response to RD1 antigens (ECRR) in TB patients, including in T-SPOT. TB-negative TB patients. We confirmed previous findings23,67 that the levels of CXCL9 and CXCL10 produced by stimulated blood cells are detected at amplified levels compared with those of IFNγ. However, these genes were also upregulated in a large proportion of OD patients in our cohort, which compromised diagnostic performance. This phenomenon was also observed by others, where IGRA-negative controls also displayed production of CXCL10 in response to Mtb antigens,23,67 suggesting potential non-specific production of this chemokine in some tests. Although reasonably high diagnostic accuracy was found (AUC = 0.84 for CXCL9) for all TB in our GO/NO-GO cohort, this did not correspond to a test which could provide > 95% sensitivity and 65% specificity at a given threshold. Therefore, this approach is unlikely to be clinically useful as a rule-out test for all TB. Of all the analytes measured in the molecular rule-out assay approach, CXCL9 provided best diagnostic accuracy for detection of all TB cases from all OD, and for discrimination of TB from OD/LTBI in T-SPOT. TB-positive patients. To our knowledge, this is the first study to test the performance of these chemokines in discriminating between TB and LTBI in a cohort in which the LTBI patients had OD and were suspected of active TB at the point of recruitment. It appears that CXCL9 may be a useful marker for differentiating between these groups. However, it should be noted that statistical analyses to compare diagnostic accuracy (i.e. AUC, sensitivity or specificity values) between analytes were not performed.
We reported a high proportion of assay failures for the candidate molecular rule-out test assay, which were probably a result of poor recovery of some PBMC samples from cryopreservation and into culture. Using either fresh blood or fresh isolated PBMCs for this candidate assay would have been optimal, but we did not have this material available within the VANTDET study. Kasprowicz et al. 23 have already demonstrated that detection of Mtb-specific CXCL9 and CXCL10 using a similar qRT-PCR approach at as little as 50 µl of fresh blood per condition is achievable. Their findings now warrant validation in a cohort of TB suspects, similar to the IDEA study cohort, but using fresh blood samples. We anticipate that fresh samples would result in fewer assays failures and a better performance for detecting all TB cases.
Using supernatants stored from the QFT-GIT tests conducted as part of the IDEA study, we were able to assess the use of the sensitive MSD platform for detection of target analytes and compare the performance of CXCL10 and IFNγ between the two candidate platforms. This way, we could compare the performance (although somewhat indirectly) in detection of these analytes by using either qRT-PCR (for the detection of the transcribed genes) or ELISA (for detection of the proteins). We found comparable performance for detection of the analytes and very similar diagnostic accuracy for detecting TB. However, neither approach was able to provide the required diagnostic accuracy to be used as a rule-out test for all TB and, furthermore, not all IGRA-positive individuals were detected using the new assays. Nevertheless, we were able to demonstrate that MSD is able to detect analytes, such as CXCL10 in plasma, including a wide range of concentrations. Although this is not required for a simple positive/negative immune test, a test for discriminating between disease states, in which differences in quantity of analytes may provide discriminatory power, may benefit from using a MSD platform for quantitation. We plan to investigate this in our future experiments using MSD.
Both of the candidate rule-out test experimental approaches we have evaluated are complex, with multiple steps required (which can introduce significant variability), and requiring technical expertise as well as expensive equipment to perform. This is not in keeping with the WHO’s target product profile for a triage test for TB, which stipulates that such a triage test should take between 5 and 30 minutes to get a result, cost ≈US$1–2 and be achievable using a single device that requires no calibration. 16 However, we propose that in high-income settings, where TB incidence is generally low, an immune-based test providing > 95% sensitivity for all active TB would be clinically useful if available at low cost. Further work is needed to determine the price at which such an assay would be cost-effective.
Chapter 7 Health economic analysis
Introduction
We present methods for assessment of the cost-effectiveness of several novel tests as rule-out and rule-in tests for active TB. That is, in the case of a rule-out test, we consider using novel tests as an initial test, with a negative result indicating that a patient does not have TB, thus accelerating diagnosis of the actual cause of disease in such patients. In the case of a rule-in test, we consider using novel tests as an initial test, with a positive result indicating that a patient does have TB, averting the need for other tests for TB. The use of several tests was compared against current practice, as determined by analysis of patient records. We considered which diagnostic tests were performed, their costs and the time taken between decision points involving each test. The time taken to diagnose, rule in or rule out, TB is a key consideration. Our report adheres to the Consolidated Health Economic Evaluation Reporting Standards (CHEERS) statement. 72
Methods
Decision tree model
We developed a decision tree model to calculate the incremental costs and incremental QALYs of changing from current practice to using a novel test as an initial rule-in or rule-out test. Current practice was determined by analysis of patient records. Adding a rule-out test to the diagnostic pathway introduces additional delays in the diagnosis of active TB in those patients who have the disease, as it introduces an additional step in the pathway. Patients who were not initially diagnosed with active TB have a follow-up consultation after approximately 2 months; those who had a false-negative rule-out test result (i.e. they had TB incorrectly ruled out) can have TB identified at this point. The final diagnostic outcomes were the four categories described in Dosanjh et al.,11 herein referred to as ‘Dosanjh categories’.
The health economic analysis was undertaken from an NHS perspective. No discounting was required as the diagnostic process occurs over a relatively short time period. The time horizon was up to final diagnosis of TB, which was assumed to be < 1 year.
The model contained two levels of uncertainty:
-
individual-level uncertainty – patient records revealed variation in the number and type of tests used for TB diagnosis and time to diagnosis
-
parameter uncertainty – uncertainty in the costs of tests and procedures, and the sensitivity and specificity of the novel tests.
Uncertainty distributions for each are estimated for either uniform or gamma distributions, depending on the form of the data available.
A (balanced) bootstrap sample of TB and non-TB patients was created for each simulation of the decision tree, which retained the TB and non-TB subsample sizes. Individual patient costs and time to diagnosis were jointly sampled to preserve the dependency between them. We sampled across the model parameter distributions to obtain a set of realisations. This was then repeated in a Monte Carlo framework to obtain a sample of 10,000 model runs, which encapsulated the first-order (patient variability) and second-order (parameter) uncertainty in the model outputs. Table 17 summarises the key model parameters.
| Parameter | Symbol | Main model value |
|---|---|---|
| Follow-up time for those not diagnosed with TB (days) | T followup | Direct estimate from clinical data set |
| Cohort ATB prevalence | n+n | Direct estimate from clinical data set, also stratified by HIV status |
| Active TB QALY loss | q | Gamma(5.427,0.0154)73 |
| Hepatotoxicity as a result of treatment QALY loss | q h | Gamma(65.753,7e-5)73 |
| Nausea as a result of treatment QALY loss | q n | Gamma(109.67,3e-6)73 |
| Current time to diagnosis by TB status | t¯+, t¯− | Direct estimate from clinical data set |
| Current combined cost of diagnosis by TB status | c¯+, c¯− | Direct estimate from clinical data set |
The model was implemented in the statistical programming language R. The key model parameters are presented in Table 17.
An example decision tree representation is given in Figure 11. Equivalent figures for alternative scenarios are given in Appendix 16, Figures 36 and 37.
FIGURE 11.
Decision tree comparing current practice (‘no rule-out test’) with a diagnostic pathway incorporating an initial rule-out test (‘rule-out test’). The ‘standard pathway’ branch represents the range of variation observed in the patient cohort. Probabilities are shown below branches following a circular chance node and costs are below branches following a square decision node. FN, false negative; FP, false positive; TN, true negative; TP, true positive.
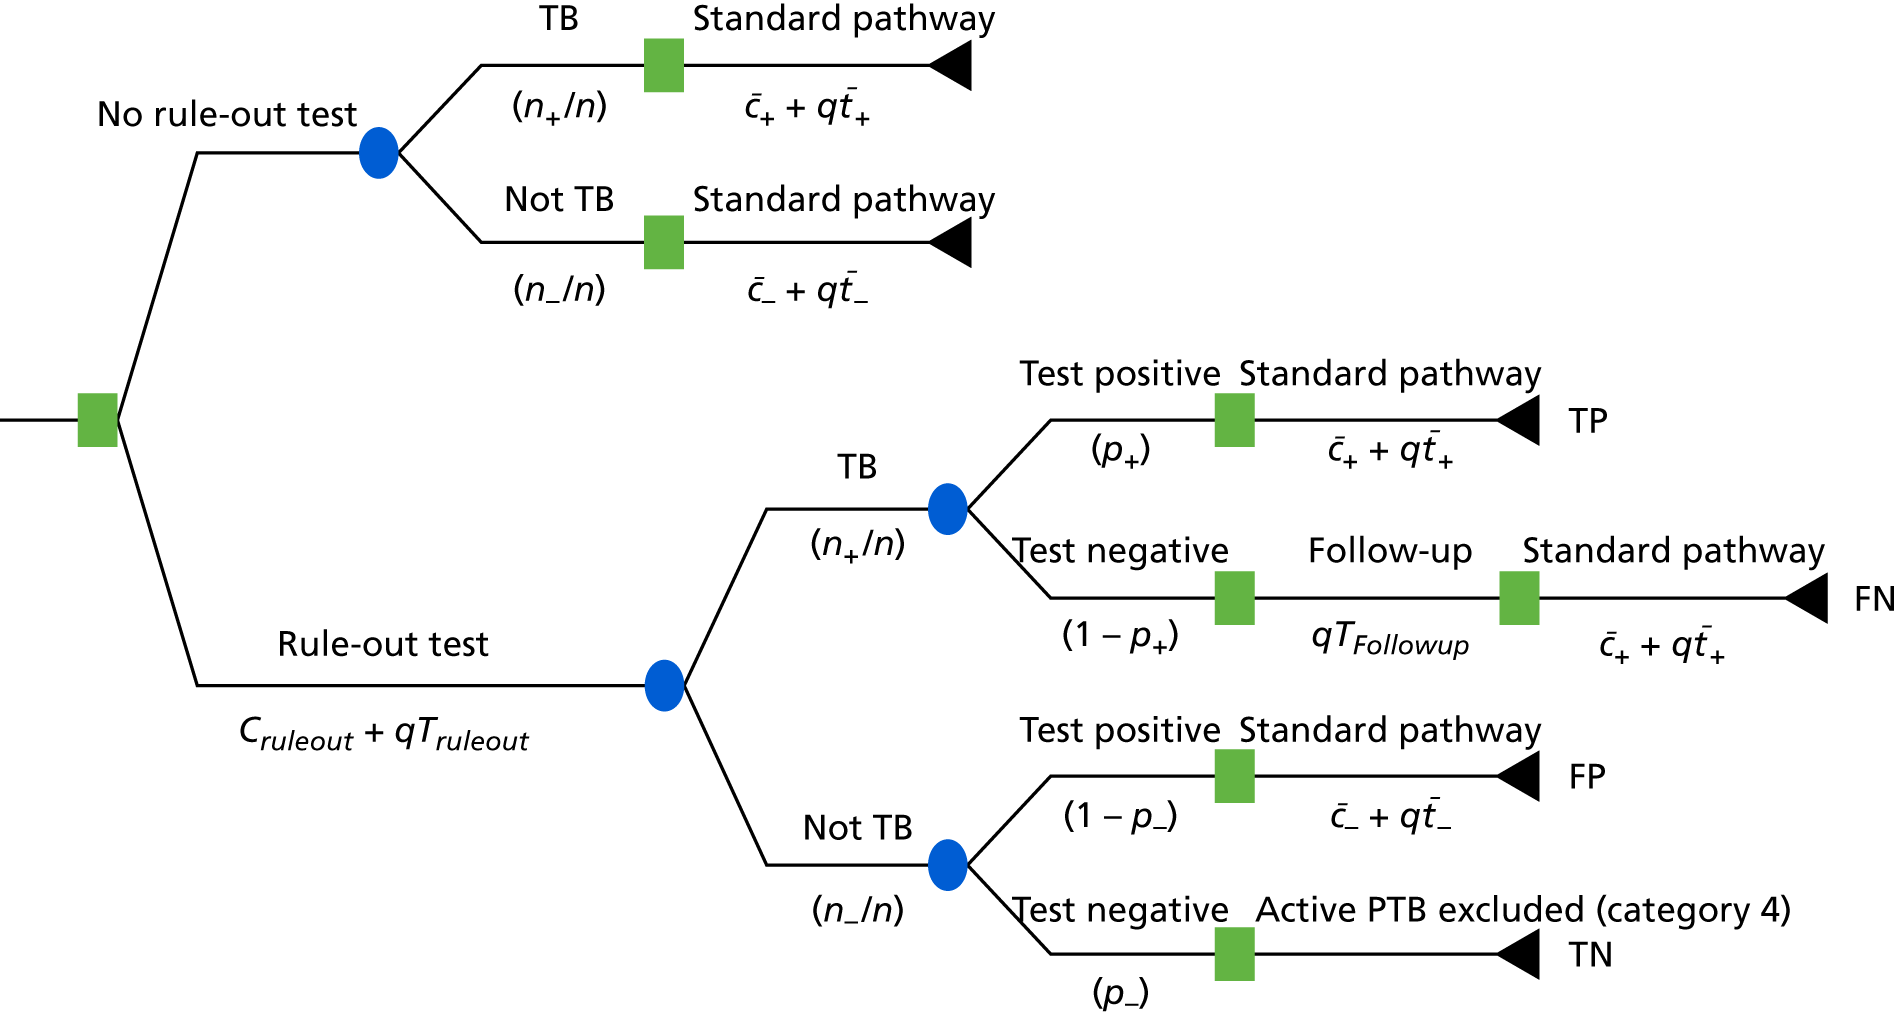
Estimation of costs and health impact used in the model
The costs and distributions used in the probabilistic sensitivity analyses are summarised in Tables 63–65 in Appendix 16, using 2014/15 prices. When necessary, costs were inflated from previous years using the Hospital and Community Health Service pay and price index. 74
If uncertainty bounds were not available in the recent sources used, uncertainty ranges were informed by previous studies. Uniform distributions were used when upper and lower limits were available and gamma distributions were used when the standard error of the average cost was available.
When modifying costs, the uncertainty around the central value was transformed maintaining the proportions from the original value rather than an absolute difference. For example, a lower bound of half and an upper bound of twice the point estimate values were used. 10,17,75 Skewed distributions were represented using a gamma distribution.
As the end point of the diagnosis is diagnosis of TB or ruling out TB, treatment costs after final diagnosis are out of scope. However, when a patient was started on TB treatment and then a lack of response to that treatment informed a decision that the patient did not in fact have TB, the cost of this treatment was included, as it is part of the cost of ruling out TB in those patients.
The treatment costs are given in Table 66. Following the NICE guidelines for active TB management,8 it was assumed that such patients are on treatment until their 2-month follow-up appointment, when they are reassessed for response to treatment. The regimen in this period is daily treatment with rifampicin, isoniazid, pyrazinamide (Rifater, sanofi) and ethambutol. From the NICE British National Formulary,76 adult dosages are fixed except for ethambutol, which is determined by patient weight. The mean weight at time of first presentation, of 67.98 kg, was used in the model.
Selection of tests to evaluate in health economic analysis
In the VANTDET study, we have evaluated several signatures using each new technology, but we wished to evaluate the health economics in only the most promising signatures. As none of the proteomic signatures performed with high enough test accuracy to be clinically useful, these signatures were not used in these analyses. For the transcriptomic signature, the test accuracy data for the Sweeney et al. 39 four-gene signatures, calculated using the TBS method, were used. For the flow cytometry data, the test accuracy for the %HLA-DR signature26 in the HIV– cohort was used. For the molecular rule-out test, the performance of the CXCL9 qRT-PCR in Mtb antigen-stimulated PBMC was used. Table 18 gives the test sensitivity and specificity values used for the probabilistic sensitivity analyses.
| Patient stratum | Test | Rule | |||
|---|---|---|---|---|---|
| In | Out | ||||
| Sensitivity | Specificity | Sensitivity | Specificity | ||
| All | Transcriptomic | Uniform(0.865,0.932) | Uniform(0.493,0.609) | Uniform(0.245,0.346) | Uniform(0.919,0.972) |
| All | Molecular | – | – | Uniform(0.85,1.0) | Uniform(0.057,0.44) |
| HIV– | Cellular immune flow cytometry | Uniform(0.548,0.771) | Uniform(0.836,0.971) | – | – |
The QALY loss as a result of TB treatment is given in Table 17. The sum total was used in the analysis:
Cost-effectiveness outcomes
The current (‘status quo’) cost and QALY loss are the weighted sums of the TB and non-TB pathways observed in the clinical data:
Results
For decision tree diagrams, please see Appendix 16. The results of the cost-effectiveness analysis for the Sweeney et al. 39 transcriptomic signatures used as a rule-out test are given in Figure 12 and Table 19, and the transcriptomic signatures used as a rule-in test are given in Figure 13 and Table 20.
FIGURE 12.
Cost-effectiveness planes for status quo against transcriptomic rule-out test scenario, with contour lines.
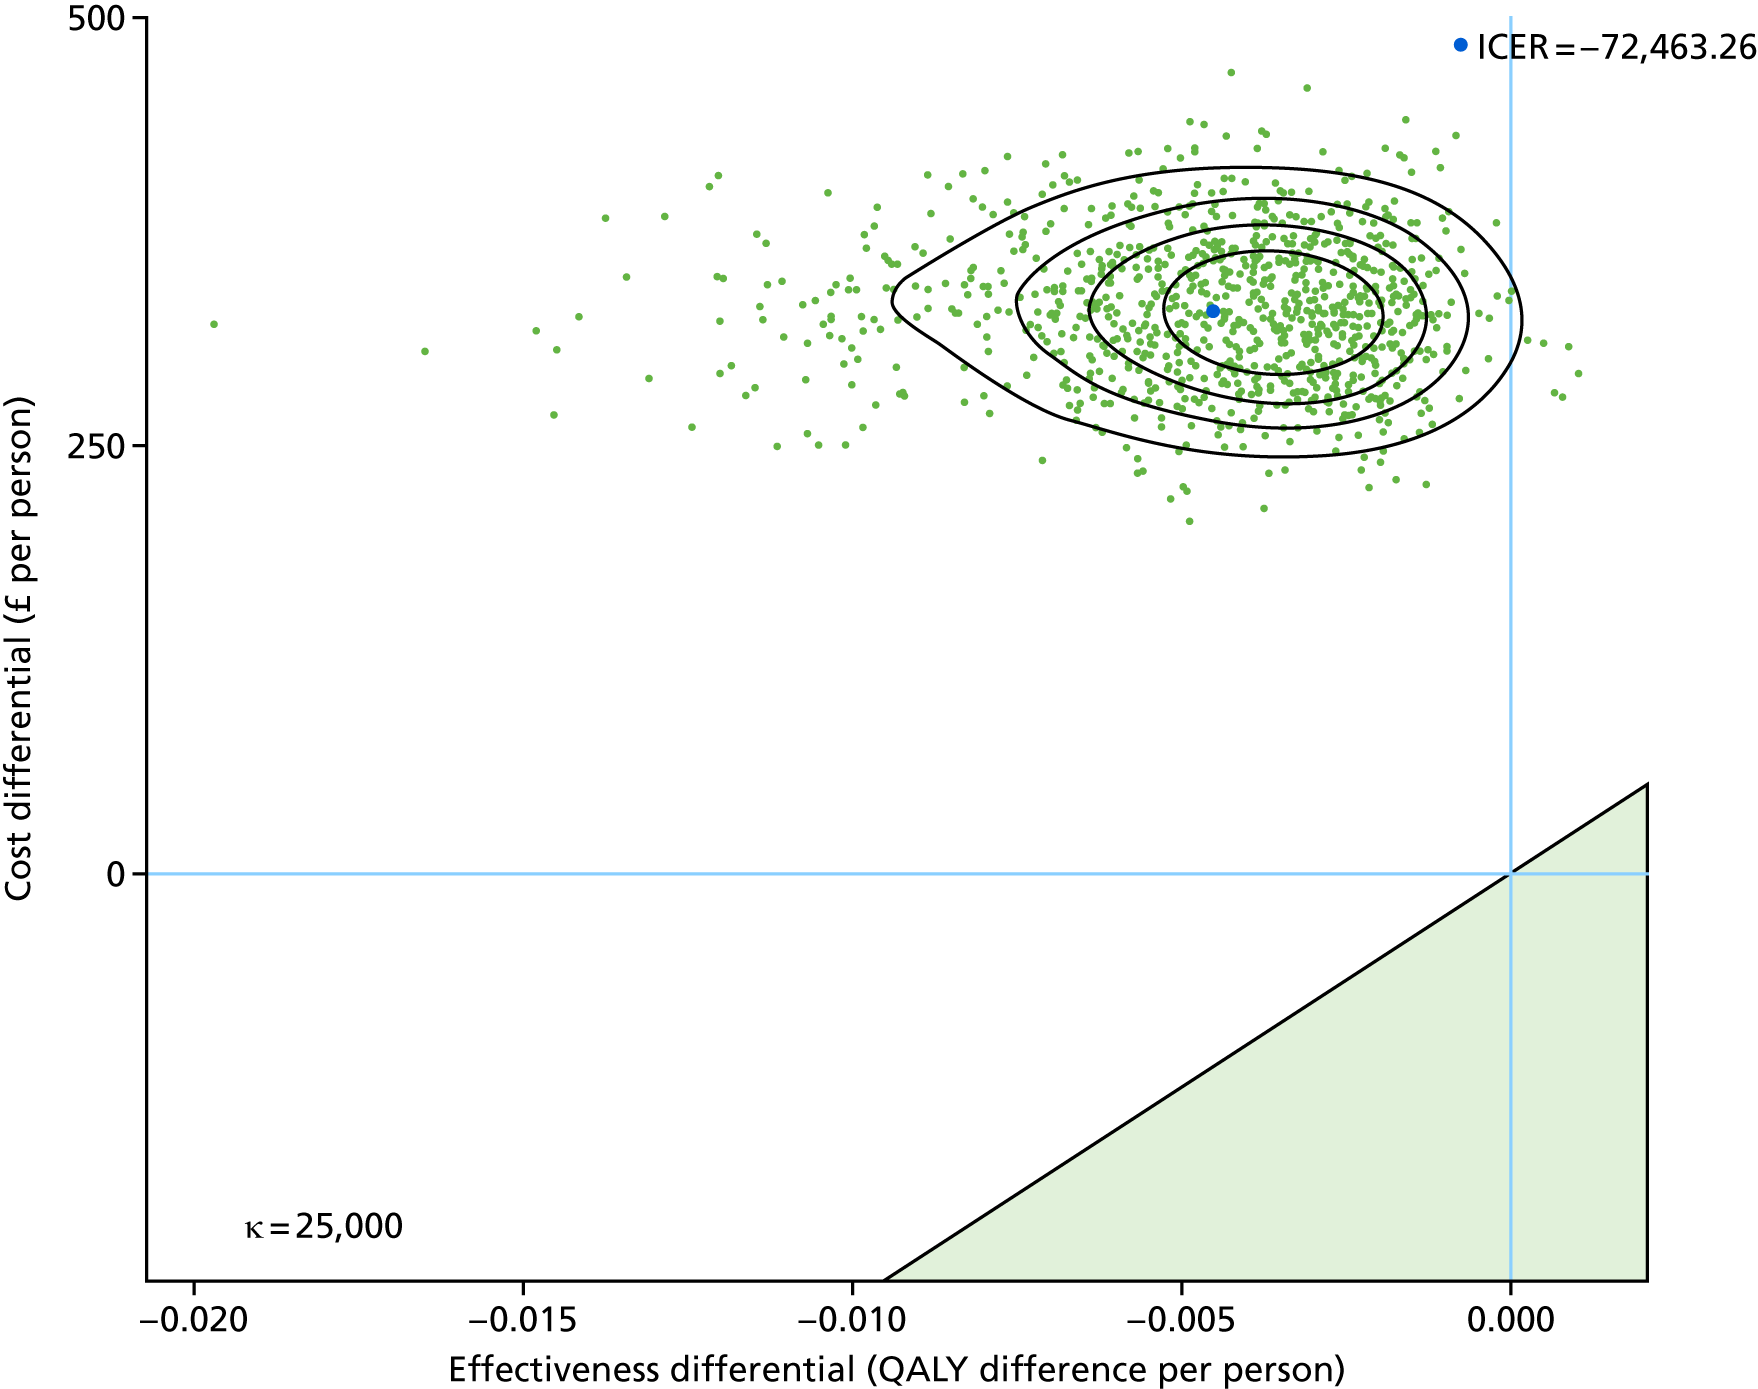
| Scenario | Incremental | Probability cost-effective | ||
|---|---|---|---|---|
| QALY gain | Cost incurred (£) | WTP £20,000/QALY | WTP £30,000/QALY | |
| HIV– | –0.0045 | 329 | 0 | 0 |
FIGURE 13.
Cost-effectiveness planes for status quo against transcriptomic rule-in test scenario, with contour lines.
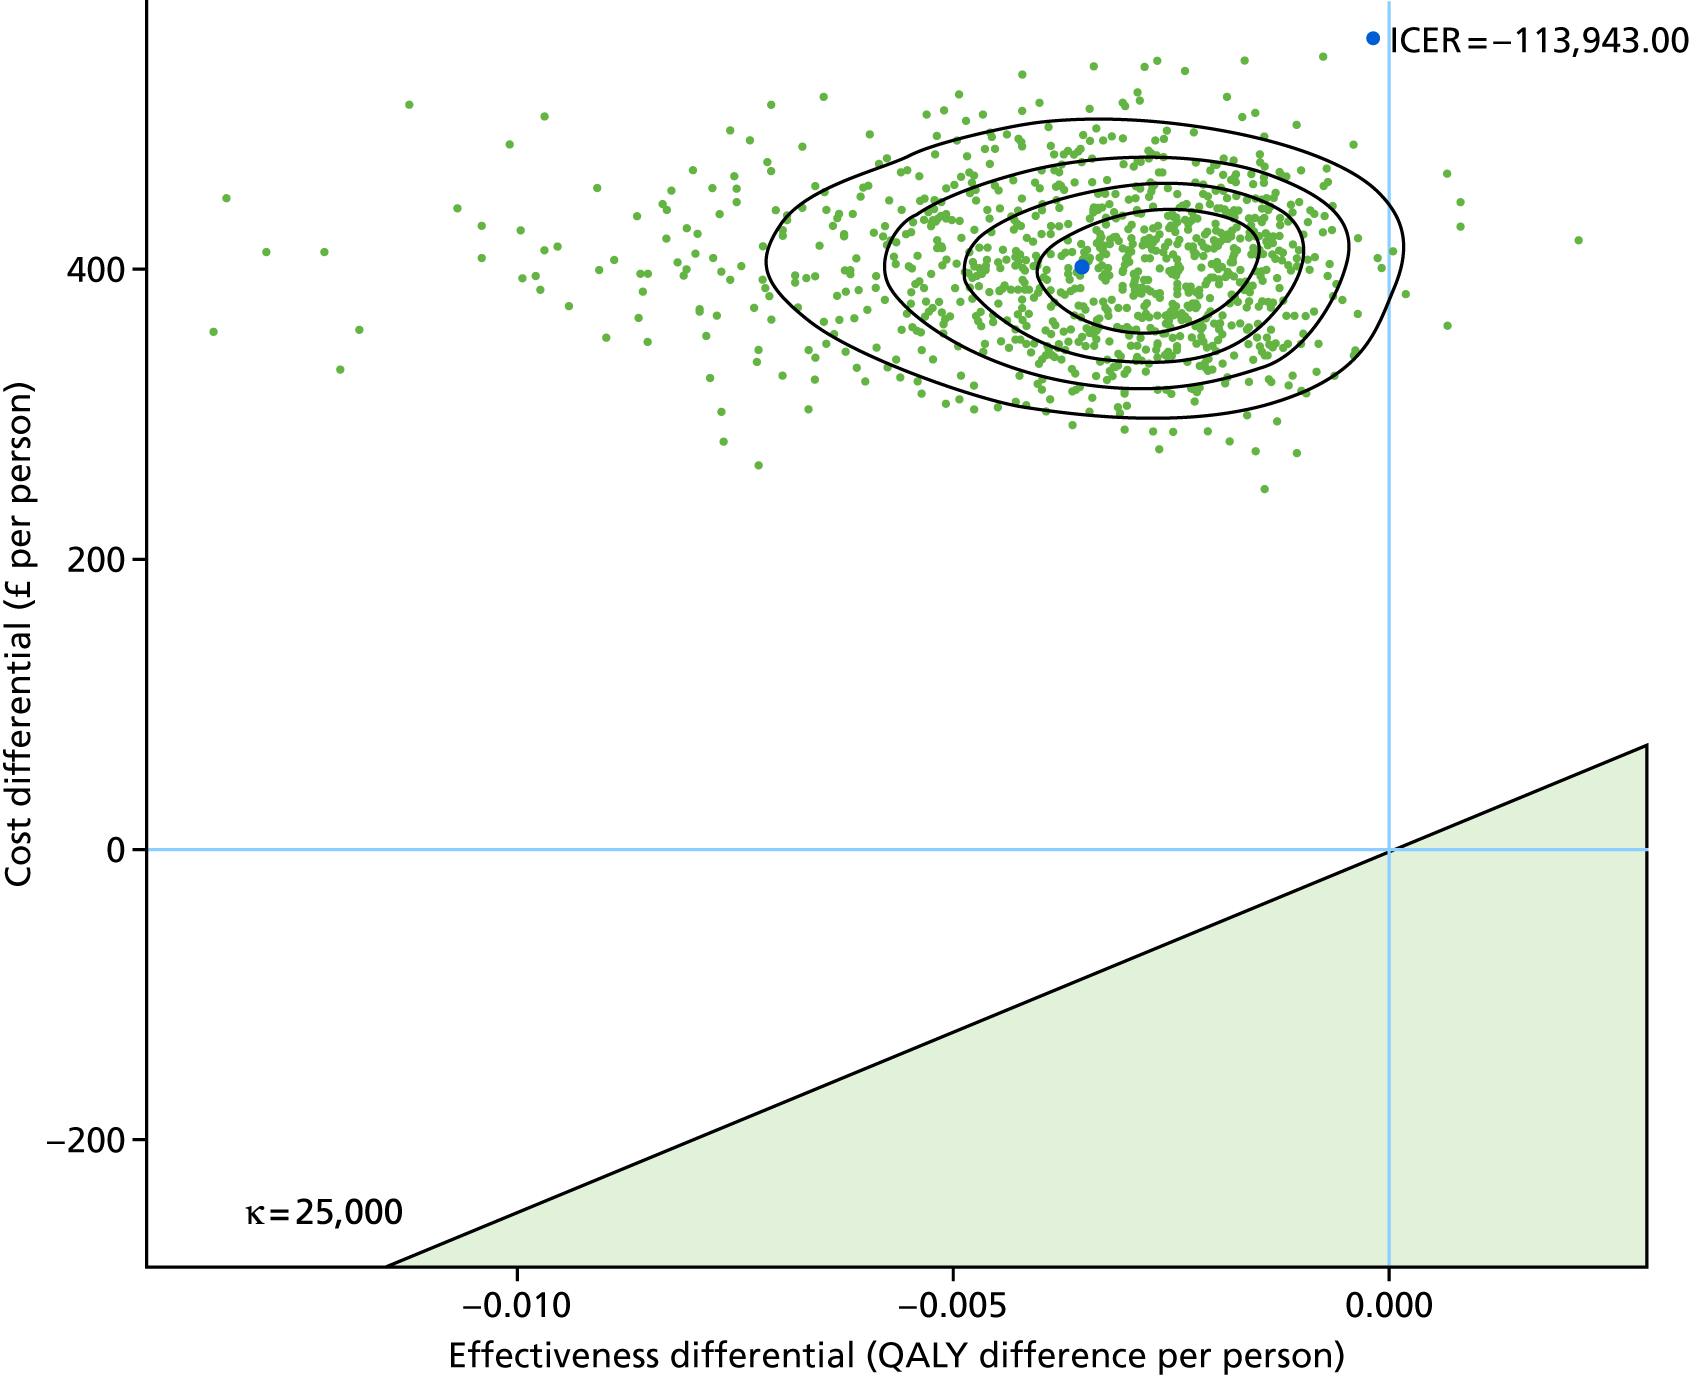
| Scenario | Incremental | Probability cost-effective | ||
|---|---|---|---|---|
| QALY gain | Cost incurred (£) | WTP £20,000/QALY | WTP £30,000/QALY | |
| Total | –0.0035 | 402 | 0 | 0 |
Flow cytometry rule-in test
The results of the cost-effectiveness analysis for the %HLA-DR flow cymometry signatures26 to be used as a rule-in test are presented in Figure 14 and Table 21.
FIGURE 14.
Cost-effectiveness planes for status quo against flow cytometry %HLA-DR rule-in test scenario, with contour lines.
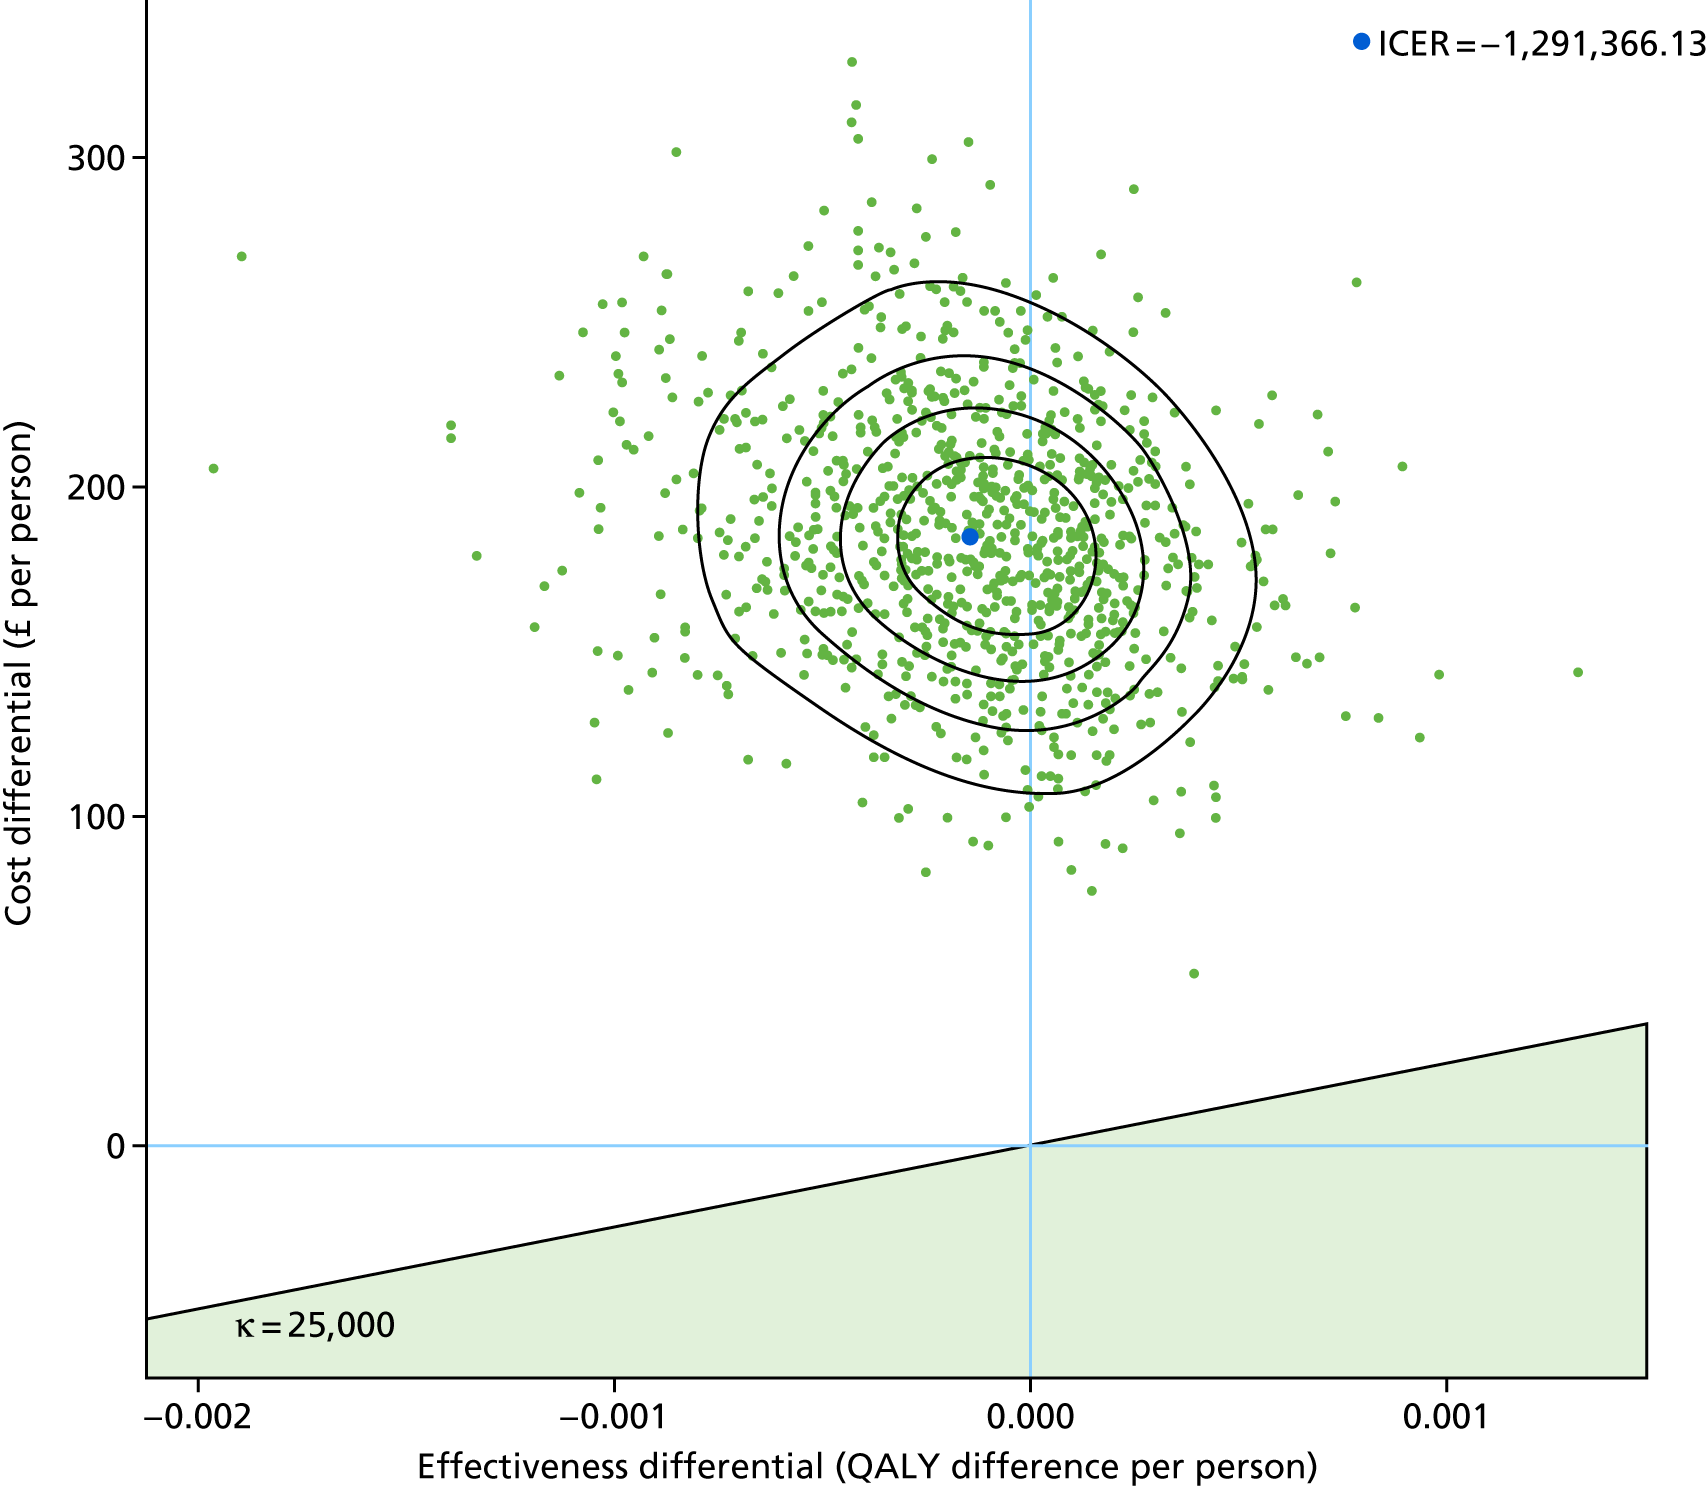
| Scenario | Incremental | Probability cost-effective | ||
|---|---|---|---|---|
| QALY gain | Cost incurred (£) | WTP £20,000/QALY | WTP £30,000/QALY | |
| Total | –0.00014 | 185 | 0 | 0 |
Molecular rule-out test
The results of the cost-effectiveness analysis for the molecular rule-out test are presented in Figure 15 and Table 22.
FIGURE 15.
Cost-effectiveness planes for status quo against molecular rule-out test scenario, with contour lines.
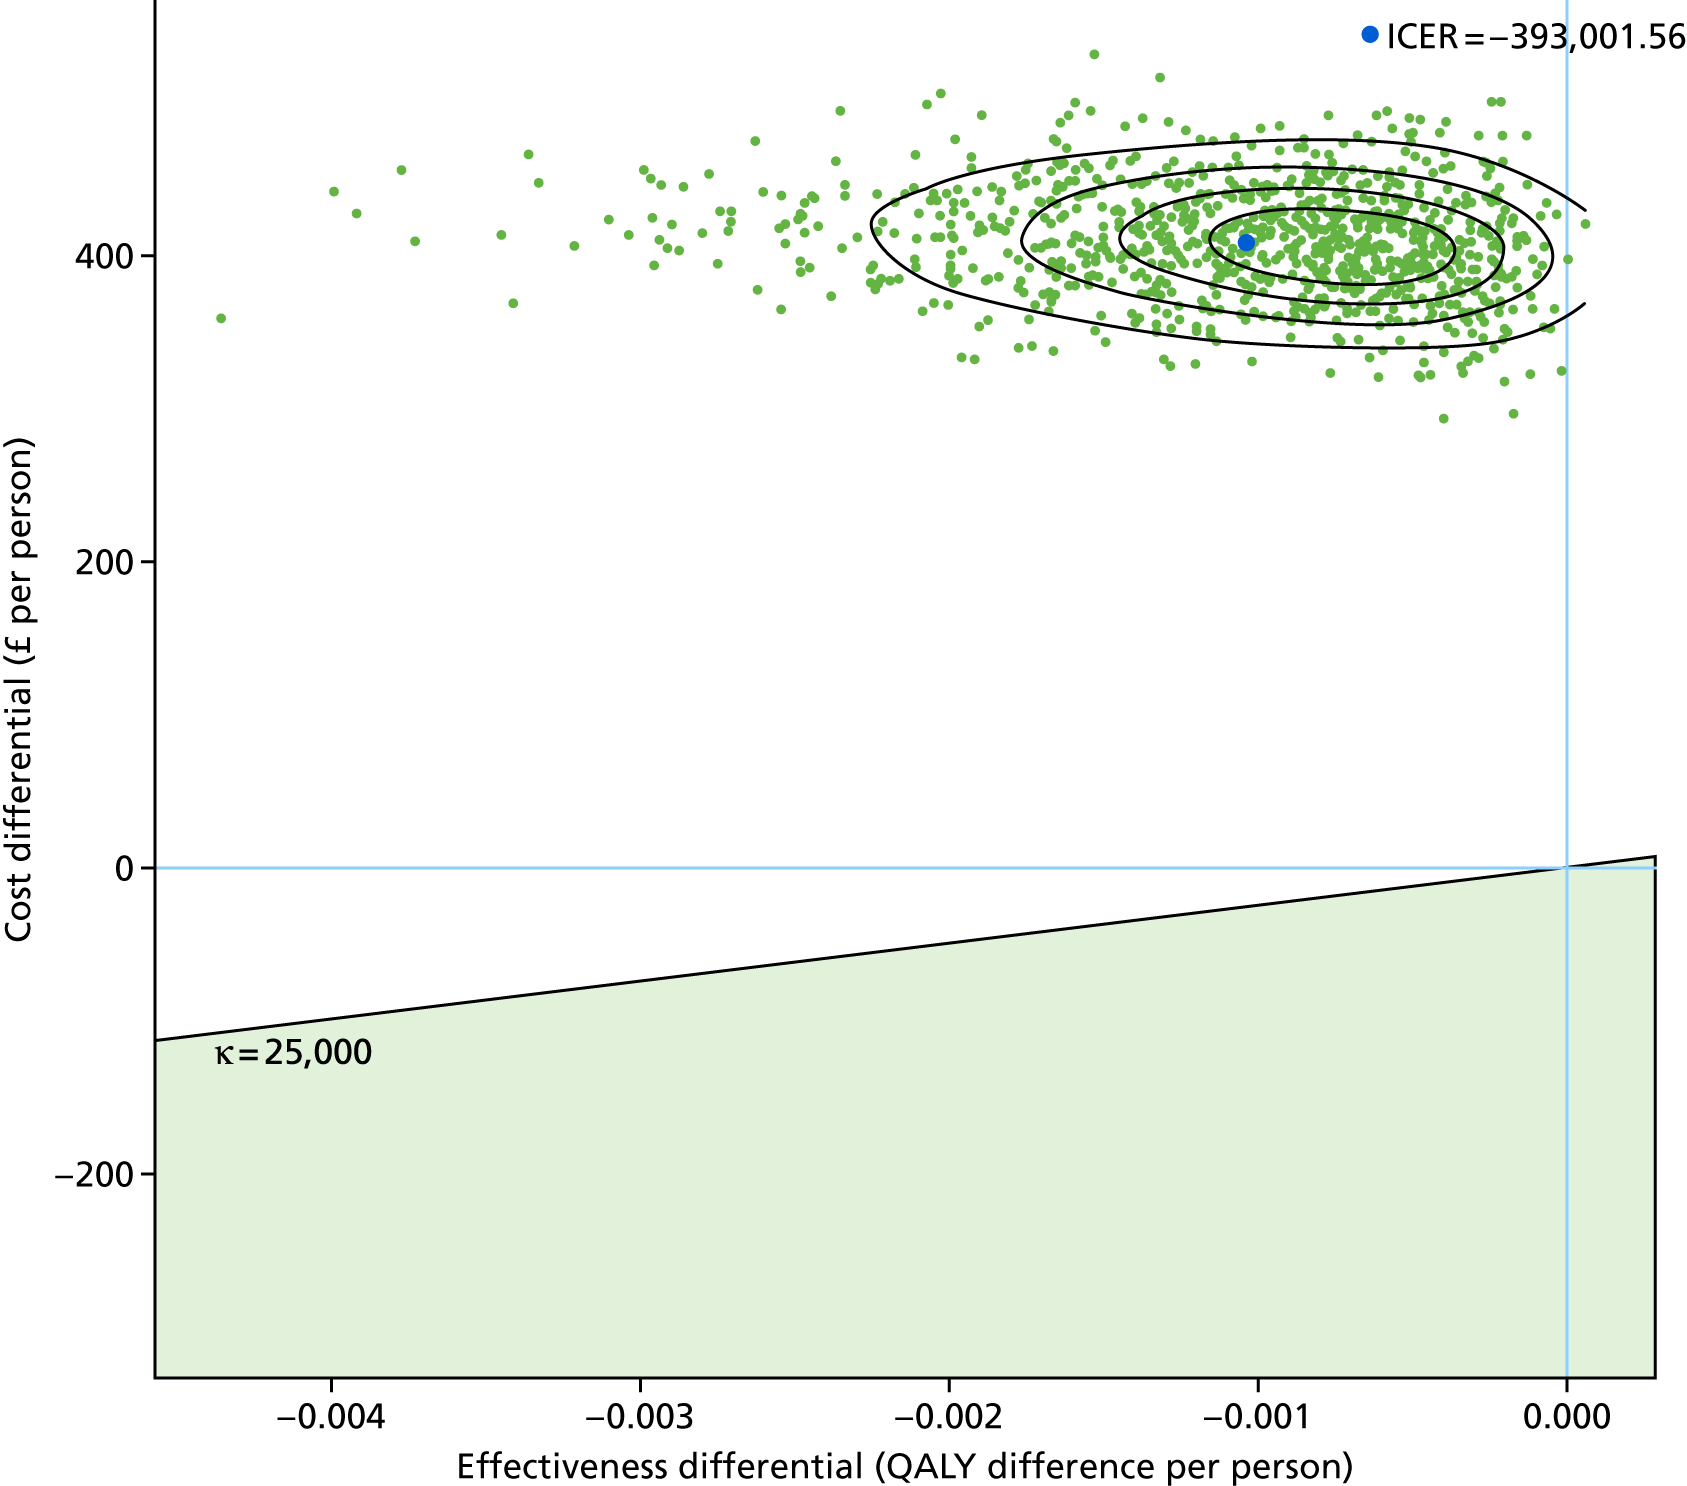
| Scenario | Incremental | Probability cost-effective | ||
|---|---|---|---|---|
| QALY gain | Cost incurred (£) | WTP £20,000/QALY | WTP £30,000/QALY | |
| Total | –0.0010 | 408 | 0 | 0 |
Discussion
This health economic analysis has demonstrated that the use of those tests that performed best in classifying all TB cases in our VANTDET substudies (i.e. the Sweeney et al. 39 four-gene transcriptomic signature, the %HLA-DR cellular immune signature26 and the CXCL9 qRT-PCR test for ruling out active TB) cannot be considered cost-effective, given the assumption of the modelling. This is due in part to the significant cost of these tests, which, in their current proposed format, are very expensive. Furthermore, the sensitivity and specificity provided by these tests were suboptimal, meaning that they did not improve effectiveness when introduced into the current diagnostic pathway. All tests incurred extra costs and there was a minor reduction in QALYs, probably because of the increased delay in diagnosis resulting from the introduction of new tests into the standard pathway. This was the case even when tests were considered as either rule-in or rule-out tests.
It should be noted that, as all of the technologies and signatures are being investigated in research laboratory settings, and have not begun to be commercialised in any way, the cost estimates had a high degree of uncertainty, which affected the cost-effectiveness analysis. The effectiveness for the %HLA-DR cellular immune assay, for which we propose using in the context of IGRA-positive TB suspects only, the cost-effectiveness plane demonstrated reasonable effectiveness, but with a very high cost differential. If the test accuracy of this signature could improve slightly, alongside a significant reduction in cost, it might be that this approach could be cost-effective for diagnosing TB in the IGRA-positive population. It is feasible that the cost of some of these technologies will become more economical in the coming years. Furthermore, it is likely that the costs of a commercial assay using simpler but comparable technologies (i.e. a simple flow cytometry method rather than complex multicolour analysis) would be lower.
This health economic analysis has some limitations. Given the lack of accurate data on novel test costs, we have relied on estimates based on current laboratory research costs and timings, which may not reflect the likely costs of these tests after they have been developed commercially. Therefore, there is a high level of uncertainly in our analyses. The uncertainty about the test sensitivities and specificities is represented as marginal distributions when there is a correlation between the two values that may be represented in a joint distribution if the appropriate information is available. Furthermore, we highlight that one of the main assumptions of the analysis is that we consider a relatively short time frame up to TB diagnosis and, therefore, cannot extend the conclusions beyond this.
Recommendations
In these analyses, we have considered the introduction of new tests into the pathway of a wide range of TB suspects, that is in complex populations with a diverse mix of TB and OD patients, with wide-ranging symptoms, disease severities and clinical suspicion of TB. It is likely that a blood-based test for a specific subset of TB, which could be used to assist in diagnosis against a specific subset of OD patients, would be a more cost-effective approach for these blood-based novel tests. In addition, such a test may have improved performance when used in combination with other tests. We have not yet evaluated such scenarios in this study, but it is a direction for future research on novel tests for diagnosing TB.
For rule-out tests, a test with a combination of high sensitivity and specificity, low cost and rapid speed of result is required to be clinically effective or cost-effective as a screening tool, or as a test to be used at the beginning of a diagnostic pathway for a TB suspect. 16
Future research on the cost-effectiveness of tests would benefit from looking at long-term impacts beyond initial diagnosis and ideally would consider the infectious nature of the condition.
Chapter 8 General discussion
Principal findings
In this large study to validate new technologies for the diagnostic evaluation of active TB, we successfully evaluated four promising approaches for the diagnosis of active TB, all of which used blood samples: transcriptomics, proteomics, flow cytometry and immunological rule-out tests. In each substudy, we were able to evaluate multiple previously identified signatures and assess their diagnostic performance.
For the transcriptomic signature substudy, we report that diagnostic performances range from 0.81 to 0.84 for all previously reported gene expression signatures, for the detection of active TB in the full cohort (using LDA). The performance for all TB and for culture-confirmed TB was not found to be clinically useful. Although performance for either culture-confirmed TB or for PTB was highest, the scenario in which a transcriptomic test is likely to be useful is where current tests fail. For this reason, despite a maximum AUC of 0.80 for identifying highly probable TB, the Sweeney et al. 39 four-gene signature may be a useful clinical test for patients who test negative with microbiological tests. For culture-negative TB, this signature could provide a high NPV (0.95), which may be clinically useful.
None of the previously identified proteomic signatures was able to provide high diagnostic accuracy for detecting active TB cases, with the maximum test accuracy being for the Hamilton and Levin (unpublished) four-protein signature, detected by SELDI-TOF, which provided an AUC of 0.74 for culture-confirmed TB, using the DRS method. We were able to compare this signature across two proteomic technology platforms, SELDI-TOF and LC–MS, and found relatively poor corroboration between the two platforms. We were able to assess the performance of four published signatures19,21,51,52 using LC–MS, none of which performed well for detecting TB (not culture-confirmed or PTB groups).
Of the six previously identified cellular immune signatures for active TB, the %HLA-DR signature26 was found to perform the best, providing an AUC of 0.90 for all TB in the HIV– population. The %HLA-DR and %TEFF tests25,26 provide high PPV for all TB and for culture-confirmed TB in IGRA-positive TB suspects and, therefore, may be clinically useful. Only the signatures that measured the phenotype (either memory/differentiation phenotype, or activation status) provided discriminatory ability. Those signatures measuring function alone did not perform well.
We tested two novel approaches for the development of a rule-out test. We found that the detection of CXCL9 by qRT-PCR of stimulated PBMCs provided a sensitive assay that could detect a high proportion of TB cases. However, the assay has a high failure rate and was also hampered by poor specificity. The use of CXCL9 for discriminating between TB and OD/LTBI in immune assays should be considered.
None of the signatures validated was found to be cost-effective when evaluated for use to rule in or rule out active TB, relative to the current standard diagnostic pathway in the UK. The signature that performed best was the %HLA-DR flow cytometry signature26 for the ruling in of all TB in the IGRA-positive population. However, this signature resulted in significant cost incurred and a slight reduction in QALY.
Strengths and limitations
In the IDEA study, we consecutively recruited a unique, large, multicentre, prospective cohort of individuals who were suspected of having active TB, as part of routine clinical practice. The cohorts we used in these validation studies (with the exception of the rule-out test, for which an artificial cohort was selected) represent the full spectrum of clinical disease reflecting heterogeneity of all clinical phenotypes and other differential diagnoses. The study participants, patients with suspected TB symptoms but unknown diagnosis at point of enrolment, represent the uncertainty faced by clinicians. The high-resource setting provides a high-quality diagnostic facility and reliable and accurate diagnosis for culture-unconfirmed, highly probable TB.
Ultimately, our study provided a real-life road test for the published signatures and evaluated their clinical utility, a crucial test before they enter the next phases of biomarker development. We present the performance of the previously published signatures in our hands. The previously proposed thresholds for each signature were not reported here, as, overall, these thresholds provided suboptimal performance in our cohort. In our experience with diagnostic tests in which the outcome is a continuous, the threshold for optimal diagnostic performance does change between laboratories and cohorts, for a number of reasons, particularly when these tests are yet to be standardised and when the cohorts are so variable. We therefore took several approaches to define optimal thresholds and their associated performance characteristics. Our findings suggest that the performance of all signatures and technologies in detecting TB in the HIV+ population was very poor, much worse than in the HIV– population. This is not in line with other studies, in which performance of signatures in the HIV+ population has either been comparable to that in the HIV– population, or marginally worse. 20,39,60 We were likely under powered to fully assess diagnostic performance in the HIV+ population, owing to the small number of these patients in the parent IDEA study cohort. As such, further validation is required in this population, in particular for the proteomic and cellular immune signature validations. Within the IDEA study cohort, there is a small number of patients who are classified as ‘clinically indeterminate’ (Dosanjh category 3), who were not included within this study, as assessing the performance of new tests within this population would give no known assessment of performance against gold standard/current practice. Nevertheless, they represent a subset of TB suspects who present in real-life clinical practice. We did, however, included this population when all calculations of pre-test probability for TB subsets were made.
In addition to providing detailed statistics on the diagnostic accuracy of the previously published signatures, we herein present complex health economic analyses, in which the most promising signatures were evaluated for cost-effectiveness for either the rule-in or rule-out of active TB. However, we did not present health economic analysis for all subgroups (i.e. culture-confirmed TB alone or PTB alone), and it is likely that effectiveness in these scenarios will improve as the cohort of patients becomes smaller and the clinical question narrower.
We are lacking some analyses. In particular, we do not compare different signatures with each other using a formal statistical comparison. Furthermore, there is a need for further subgroup analyses using these data, for example to perform health economic analysis in particular clinical scenarios (i.e. within the smear-negative groups), as a conclusion of this study is that these new tests are likely to be useful in specific types of TB suspects.
Recommendations for clinical practice
Given the poor performance of each of the new technologies for detecting the full spectrum of active TB cases in this study, and their lack of cost-effectiveness for this purpose, it is unlikely that the findings of this project will immediately have implications for changing current practice when it comes to the diagnostic pathways for TB suspects in the UK. None of the tests evaluated had sufficiently high diagnostic accuracy to provide a clinically useful rule-in or rule-out function over and above the clinical utility of the currently available diagnostic tests. However, diagnostic assessment of certain key groups of patients could potentially be improved by the flow cytometric and the transcriptomic tests. Smear microscopy results are available on the same day that the patient presents to secondary care and IGRA results are usually available by the next day. The role of new tests need to be considered in the context of patients with suspected TB for whom both these test results are known. In patients with suspected TB who are IGRA positive and smear negative, there is commonly a high index of suspicion for TB but a definitive diagnosis is not possible until culture results become available, typically after 2–3 weeks. A test that could rule in or rule out TB in these patients is thus an important unmet clinical need.
The %HLA-DR and %TEFF flow-cytometry tests25,26 gave 94% PPV in the smear-negative IGRA-positive group, providing what is, effectively, a rule-in test and facilitating a decision to start treatment for presumptive TB. The test could thus form part of the diagnostic assessment pathway, forming part of an algorithm alongside smear microscopy and IGRA. Interestingly, two transcriptomic signatures provided high NPVs of 89–90% for culture-positive TB in the smear-negative population (unstratified by IGRA result). These NPVs may thus provide clinicians with sufficient basis for withholding treatment (or at least delaying it until culture results are available) in smear-negative TB suspects who test negative with these signatures.
Recommendations for future research
Smear still remains a quick, cheap and specific method for quickly ruling in TB in cases with high bacterial load. Therefore, a new test is not required for this subpopulation. However, it remains the case that most research into new TB diagnostics includes only individuals with ‘typical’ TB with high bacterial load, who are positive with either culture or smear tests, or both. The clinical need is in fact in the smear-negative patients, for whom there is currently not a quick test available for either rule-in or rule-out of active TB. This is particularly the case in low-prevalence settings, such as in the UK, where a high proportion of those diagnosed with TB are paucibacillary and/or have EPTB.
We have demonstrated that the transcriptomic test is able to provide a reasonably high NPV in those TB suspects who have a negative smear result. These tests are likely to be cheap and rapid if developed commercially and, if found to be reproducible using a rapid qRT-PCR approach, could potentially be developed into near-patient or point-of-care tests. For the reasons already discussed, we propose that future research into the use of these tests focuses on the smear-negative TB suspects and includes those with clinically diagnosed (i.e. culture-negative) TB. The high accuracy for diagnosing TB using the Adekambi et al. 26 and Pollock et al. 25 flow cytometry assays reported in Chapter 5 suggests a clinically useful role for these tests to help rule in a diagnosis of TB in smear-negative IGRA-positive patients, for whom this is currently a clear unmet clinical need. Accordingly, further development, standardisation and simplification of these assays should be prioritised in order to deliver an in vitro diagnostic for routine clinical use. An automated flow cytometry set-up that allows for simple assay preparation and automated gating and analysis would help to make the tests suitable for routine diagnostic laboratories. It is unlikely that these tests would be applicable to low-income high-burden settings, given their complexity and costs. We also propose that the tests are further validated within the specific subpopulations for which they would be useful (i.e. smear-negative TB suspects).
An overall conclusion from this study is that blood-based tests for TB can perform best when specific subtypes of TB are considered and when specific subsets of OD can be excluded. As such, we recommend that future studies exploring these technologies focus on specific subtypes of TB, most usefully those groups where a diagnostic test is most needed (i.e. EPTB, culture/smear-negative TB).
It appears that, although the ‘omic’ technologies are hampered by specific differential diagnoses (e.g. sarcoidosis) for the cellular immune signatures, for which immune cells are stimulated with Mtb antigens before the test is performed, there is no subgroup within the OD population which hampered diagnostic performance. As such, we conclude that immune-based tests are more useful when all TB is considered (with the exception, perhaps, of those infected with HIV).
Conclusion
In conclusion, in this report we presented the validation of new technologies for the diagnostic evaluation of TB and have fully evaluated their use in a real-life clinical setting. Overall, the diagnostic performance of all previously identified ‘signatures’ of TB was lower than previously reported. This probably reflects the nature of the cohort we used, which includes the harder-to-diagnose groups, such as those with culture-unconfirmed TB and EPTB, which were under-represented in previous cohorts.
We have addressed all of our primary objectives. Some analyses are outstanding; importantly, we are yet to fully address our secondary objective of deriving novel signatures for active TB using the data we generated in the substudies. This is an area of ongoing investigation by our group and was beyond the scope of this report. This study provided a real-life road test for these technologies and highlights the need for new diagnostic tests and signatures for TB to be derived and evaluated in cohorts that included the full spectrum of TB cases, and where the hard-to-diagnose subgroups of TB are considered.
Acknowledgements
We would like to thank the following individuals for helpful in providing technical assistance, analytical support and/or advice on the interpretation of data during the project:
Mr Elliot Harper, Dr Yanping Guo, Dr Luis Berrocal Almanza, Dr Ishita Marwah, Mrs Amarjit Badhan, Dr Paul Golby, Dr Hilary Whitworth, Dr Darren Chooneea, Dr Christopher Partlett, Dr Umar Niazi, Dr Lisa Haigh (Chemistry, Imperial College London), the IDEA study team, Miss Gulfer Yackici, Miss Heather Lambie, Miss Helen Piotrowski and Mr Samuel Bremang.
We are grateful to the following centres for providing technical support in terms of conducting experiments:
Lille Transcriptomic Facility (Institut Pasteur de Lille), Dundee Proteomics Facility, Proteomics Facility Imperial College London and St Mary’s Flow Cytometry Facility (Imperial College London).
We thank Mr Dhansuklal Solanki, Mrs Claire Puddephatt and Mrs Tingting Wu for administrative and financial management assistance.
We would also like to thank the patients recruited into the IDEA study, who contributed the samples that were used in this study.
Independent Scientific Advisory Board
Professor Sanjeev Krishna (Chairperson for ISAB meetings), Molecular Parasitology and Medicine, St George’s University of London, London, UK.
Dr Mahdad Noursadeghi (Clinical Senior Lecturer), Infection and Immunity, University College London, London, UK.
Dr David Connell (Respiratory Registrar), The Royal Brompton Hospital, London, UK.
Study Management Group
Professor Ajit Lalvani, Professor Onn Min Kon, Professor Peter Beverly, Dr Alice Halliday, Dr Long Hoang, Dr Pooja Jain, Dr Robert Parker, Mrs Mica Tolosa-Wright and Miss Tereza Masonou.
Wider Study Management Group
Professor Ajit Lalvani, Professor Onn Min Kon, Professor Peter Beverly, Dr Yemisi Takwoingi, Professor Jon Deeks, Dr Alice Halliday, Dr Long Hoang, Dr Robert Parker, Mica Tolosa-Wright and Miss Aime Boakye.
Contributions of authors
Alice Halliday (Research Associate) led the cellular immune signature validation substudy, oversaw the candidate rule-out validation studies, managed the overall VANTDET project co-ordination, co-ordinated the write up of the report and contributed to writing all sections.
Pooja Jain (Bioinformatician) led the statistical analysis for the transcriptomics and proteomics substudies, conducted the main statistical analyses for these two chapters (see Chapters 3 and 4, respectively), and supported the writing of methods, results and discussion sections in these chapters (see Chapters 3 and 4).
Long Hoang (Research Associate) led the validation of transcriptomic signature substudies, oversaw the validation of the molecular rule-out test, conducted statistical analysis and supported the write up of Chapters 3 and 6.
Robert Parker (Research Associate) led the validation of proteomic signatures substudy and led the writing of Chapter 4.
Mica Tolosa-Wright (Research Technician), with the support of Alice Halliday and Long Hoang, led the validation of the molecular rule-out test substudy and led the writing of Chapter 6.
Tereza Masonou (MSc student and Research Technician) supported the validation of cellular immune signature experimental work and analysis and interpretation of the data. She also supported the report write up by writing the methodology section for Chapter 5 and production of results tables.
Nathan Green (Health Economics Statistician) led the health economic analysis for the project and led the write up of the chapter (see Chapter 7).
Aime Boakye (IDEA study administrator) managed and co-ordinated the clinical database for the IDEA study patients and co-ordinated the cohort selection for the separate substudies within the VANTDET study. She ensured that the research staff remained blind to clinical data throughout the study period, until analysis phase. She also supported and led many of the public engagement and involvement activities.
Yemisi Takwoingi (Senior Research Fellow in Biostatistics) provided statistical analysis oversight, support and advice on study design throughout the project.
Shea Hamilton (Research Associate) performed the experimental work for the validation of the four-protein signature by SELDI-TOF technology.
Vinay Mandagere (Medical Student) designed and conducted the QuantiFERON supernatant project in Chapter 6.
Anastasia Fries (Junior Doctor) designed and conducted the QuantiFERON supernatant project in Chapter 6.
Lachlan Coin (Associate Professor) analysed the SELDI-TOF signature validation data.
Jon Deeks (Professor of Biostatistics) was a co-investigator on the project, contributed to the study design and support of statistical analysis approaches.
Peter J White (Reader in Public Health Modelling) was a co-investigator on the project, contributed to the study design and led the statistical analysis of diagnostic pathways and the economic analysis.
Michael Levin (Chairperson in Paediatrics and International Child Health) was a co-investigator on the project and oversaw the SELDI-TOF proteomic signature validation.
Peter Beverley (Emeritus Professor) stood in for Ajit Lalvani during his leave of absence (May 2015–16), oversaw the project, provided clinical expertise, and contributed to the study design and data interpretation.
Onn Min Kon (Professor of Respiratory Medicine) was a co-investigator on the project, provided clinical expertise, and contributed to the study design, data interpretations, execution and the writing of the report.
Ajit Lalvani (Professor and Consultant Physician Imperial College Healthcare) was chief investigator, provided clinical expertise and contributed to the study design, data interpretations, execution and the writing of the report.
Publication
Long TH, Jain P, Pillay TD, Tolosa-Wright M, Niaz U, Takwoingi Y, et al. Transcriptomic signatures for diagnosing tuberculosis in clinical practice Lancet Infect Dis 2021;21:366–75.
Data-sharing statement
All data requests should be submitted to the corresponding author for consideration. Please note exclusive use will be retained until the publication of major outputs. Access to anonymised data may be granted following review.
Patient data
This work uses data provided by patients and collected by the NHS as part of their care and support. Using patient data is vital to improve health and care for everyone. There is huge potential to make better use of information from people’s patient records, to understand more about disease, develop new treatments, monitor safety, and plan NHS services. Patient data should be kept safe and secure, to protect everyone’s privacy, and it’s important that there are safeguards to make sure that it is stored and used responsibly. Everyone should be able to find out about how patient data are used. #datasaveslives You can find out more about the background to this citation here: https://understandingpatientdata.org.uk/data-citation.
Disclaimers
This report presents independent research. The views and opinions expressed by authors in this publication are those of the authors and do not necessarily reflect those of the NHS, the NIHR, the MRC, NETSCC, the EME programme or the Department of Health and Social Care. If there are verbatim quotations included in this publication the views and opinions expressed by the interviewees are those of the interviewees and do not necessarily reflect those of the authors, those of the NHS, the NIHR, NETSCC, the EME programme or the Department of Health and Social Care.
References
- World Health Organization (WHO) . Global Tuberculosis Report 2017 2017.
- Public Health England . Tuberculosis in England 2017 Report 2017.
- Houben RM, Dodd PJ. The global burden of latent tuberculosis infection: a re-estimation using mathematical modelling. PLOS Med 2016;13. https://doi.org/10.1371/journal.pmed.1002152.
- Behr MA, Edelstein PH, Ramakrishnan L. Revisiting the timetable of tuberculosis. BMJ 2018;362. https://doi.org/10.1136/bmj.k2738.
- Uplekar M, Weil D, Lonnroth K, Jaramillo E, Lienhardt C, Dias HM, et al. WHO’s new end TB strategy. Lancet 2015;385:1799-801. https://doi.org/10.1016/S0140-6736(15)60570-0.
- World Health Organization (WHO) . End TB Strategy 2014.
- Department of Health and Social Care (DHSC) . Stopping Tuberculosis in England. An Action Plan from the Chief Medical Officer 2004.
- National Institute for Health and Care Excellence (NICE) . Tuberculosis. NICE Guideline NG33 2016.
- Dorman SE, Schumacher SG, Alland D, Nabeta P, Armstrong DT, King B, et al. Xpert MTB/RIF Ultra for detection of Mycobacterium tuberculosis and rifampicin resistance: a prospective multicentre diagnostic accuracy study. Lancet Infect Dis 2018;18:76-84. https://doi.org/10.1016/S1473-3099(17)30691-6.
- National Institute for Health and Care Excellence (NICE) . Clinical Diagnosis and Management of Tuberculosis, and Measures for Its Prevention and Control. NICE Clinical Guidance (CG117) 2011. www.nice.org.uk/guidance/CG117 (accessed 15 January 2015).
- Dosanjh DP, Hinks TS, Innes JA, Deeks JJ, Pasvol G, Hackforth S, et al. Improved diagnostic evaluation of suspected tuberculosis. Ann Intern Med 2008;148:325-36. https://doi.org/10.7326/0003-4819-148-5-200803040-00003.
- Takwoingi Y, Rees-Roberts M, Badhan A, Partlett C, Green N, Boakye A, et al. Interferon-Gamma Release Assays for Diagnostic Evaluation of Active Tuberculosis (IDEA): Test Accuracy Study and Economic Evaluation 2017. www.journalslibrary.nihr.ac.uk/hta/hta23230/#/abstract (accessed 3 June 2019).
- Thillai M, Pollock K, Pareek M, Lalvani A. Interferon-gamma release assays for tuberculosis: current and future applications. Expert Rev Respir Med 2014;8:67-78. https://doi.org/10.1586/17476348.2014.852471.
- Whitworth HS, Badhan A, Boakye AA, Takwoingi Y, Rees-Roberts M, Partlett C, et al. Clinical utility of existing and second-generation interferon-γ release assays for diagnostic evaluation of tuberculosis: an observational cohort study. Lancet Infect Dis 2019;19:193-202. https://doi.org/10.1016/S1473-3099(18)30613-3.
- Abubakar I, Drobniewski F, Southern J, Sitch AJ, Jackson C, Lipman M, et al. Prognostic value of interferon-γ release assays and tuberculin skin test in predicting the development of active tuberculosis (UK PREDICT TB): a prospective cohort study. Lancet Infect Dis 2018;18:1077-87. https://doi.org/10.1016/S1473-3099(18)30355-4.
- World Health Organization (WHO) . High-Priority Target Product Profiles for New Tuberculosis Diagnostics: Report of a Consensus Meeting 2014.
- Pareek M, Bond M, Shorey J, Seneviratne S, Guy M, White P, et al. Community-based evaluation of immigrant tuberculosis screening using interferon γ release assays and tuberculin skin testing: observational study and economic analysis. Thorax 2013;68:230-9. https://doi.org/10.1136/thoraxjnl-2011-201542.
- Berry MP, Graham CM, McNab FW, Xu Z, Bloch SA, Oni T, et al. An interferon-inducible neutrophil-driven blood transcriptional signature in human tuberculosis. Nature 2010;466:973-7. https://doi.org/10.1038/nature09247.
- De Groote MA, Sterling DG, Hraha T, Russell TM, Green LS, Wall K, et al. Discovery and validation of a six-marker serum protein signature for the diagnosis of active pulmonary tuberculosis. J Clin Microbiol 2017;55:3057-71. https://doi.org/10.1128/JCM.00467-17.
- Kaforou M, Wright VJ, Oni T, French N, Anderson ST, Bangani N, et al. Detection of tuberculosis in HIV-infected and -uninfected African adults using whole blood RNA expression signatures: a case-control study. PLOS Med 2013;10. https://doi.org/10.1371/journal.pmed.1001538.
- Achkar JM, Cortes L, Croteau P, Yanofsky C, Mentinova M, Rajotte I, et al. Host protein biomarkers identify active tuberculosis in HIV uninfected and co-infected individuals. EBioMedicine 2015;2:1160-8. https://doi.org/10.1016/j.ebiom.2015.07.039.
- Millington KA, Fortune SM, Low J, Garces A, Hingley-Wilson SM, Wickremasinghe M, et al. Rv3615c is a highly immunodominant RD1 (Region of Difference 1)-dependent secreted antigen specific for Mycobacterium tuberculosis infection. Proc Natl Acad Sci USA 2011;108:5730-5. https://doi.org/10.1073/pnas.1015153108.
- Kasprowicz VO, Mitchell JE, Chetty S, Govender P, Huang KH, Fletcher HA, et al. A molecular assay for sensitive detection of pathogen-specific T-cells. PLOS ONE 2011;6. https://doi.org/10.1371/journal.pone.0020606.
- Harari A, Rozot V, Bellutti Enders F, Perreau M, Stalder JM, Nicod LP, et al. Dominant TNF-α+ Mycobacterium tuberculosis-specific CD4+ T cell responses discriminate between latent infection and active disease. Nat Med 2011;17:372-6. https://doi.org/10.1038/nm.2299.
- Pollock KM, Whitworth HS, Montamat-Sicotte DJ, Grass L, Cooke GS, Kapembwa MS, et al. T-cell immunophenotyping distinguishes active from latent tuberculosis. J Infect Dis 2013;208:952-68. https://doi.org/10.1093/infdis/jit265.
- Adekambi T, Ibegbu CC, Cagle S, Kalokhe AS, Wang YF, Hu Y, et al. Biomarkers on patient T cells diagnose active tuberculosis and monitor treatment response. J Clin Invest 2015;125:1827-38. https://doi.org/10.1172/JCI77990.
- Portevin D, Moukambi F, Clowes P, Bauer A, Chachage M, Ntinginya NE, et al. Assessment of the novel T-cell activation marker-tuberculosis assay for diagnosis of active tuberculosis in children: a prospective proof-of-concept study. Lancet Infect Dis 2014;14:931-8. https://doi.org/10.1016/S1473-3099(14)70884-9.
- Petruccioli E, Petrone L, Vanini V, Cuzzi G, Navarra A, Gualano G, et al. Assessment of CD27 expression as a tool for active and latent tuberculosis diagnosis. J Infect 2015;71:526-33. https://doi.org/10.1016/j.jinf.2015.07.009.
- Rose AM, Watson JM, Graham C, Nunn AJ, Drobniewski F, Ormerod LP, et al. Tuberculosis at the end of the 20th century in England and Wales: results of a national survey in 1998. Thorax 2001;56:173-9. https://doi.org/10.1136/thorax.56.3.173.
- Moss P. Case Study #5: Establishing a Public Panel in Research. London: Imperial College London; n.d.
- Moss P. Case Study #6: Evaluating a TB Awareness Animation. London: Imperial College London; n.d.
- Berroral-Almanza LC, Halliday A. Tuberculosis in England: How Research at Imperial is Supporting the National Strategy. London: Imperial College London; n.d.
- British Society for Immunology . Increasing Awareness About Latent Tuberculosis Infection n.d. http://bit.ly/2CPk0g9 (accessed 9 April 2019).
- West D. Multilingual White City Residents Help Imperial Raise Awareness of TB Research. London: Imperial College London; n.d.
- Moss P. Case Study #6: Evaluating a TB Awareness Animation. London: Imperial College London; n.d.
- Anderson ST, Kaforou M, Brent AJ, Wright VJ, Banwell CM, Chagaluka G, et al. Diagnosis of childhood tuberculosis and host RNA expression in Africa. N Engl J Med 2014;370:1712-23. https://doi.org/10.1056/NEJMoa1303657.
- Maertzdorf J, McEwen G, Weiner J, Tian S, Lader E, Schriek U, et al. Concise gene signature for point-of-care classification of tuberculosis. EMBO Mol Med 2016;8:86-95. https://doi.org/10.15252/emmm.201505790.
- Roe JK, Thomas N, Gil E, Best K, Tsaliki E, Morris-Jones S, et al. Blood transcriptomic diagnosis of pulmonary and extrapulmonary tuberculosis. JCI Insight 2016;1. https://doi.org/10.1172/jci.insight.87238.
- Sweeney TE, Braviak L, Tato CM, Khatri P. Genome-wide expression for diagnosis of pulmonary tuberculosis: a multicohort analysis. Lancet Respir Med 2016;4:213-24. https://doi.org/10.1016/S2213-2600(16)00048-5.
- Hoang LT, Lynn DJ, Henn M, Birren BW, Lennon NJ, Le PT, et al. The early whole-blood transcriptional signature of dengue virus and features associated with progression to dengue shock syndrome in Vietnamese children and young adults. J Virol 2010;84:12982-94. https://doi.org/10.1128/JVI.01224-10.
- Du P, Kibbe WA, Lin SM. lumi: a pipeline for processing Illumina microarray. Bioinformatics 2008;24:1547-8. https://doi.org/10.1093/bioinformatics/btn224.
- Workman C, Jensen LJ, Jarmer H, Berka R, Gautier L, Nielser HB, et al. A new non-linear normalization method for reducing variability in DNA microarray experiments. Genome Biol 2002;3. https://doi.org/10.1186/gb-2002-3-9-research0048.
- Youden WJ. Index for rating diagnostic tests. Cancer 1950;3:32-5. https://doi.org/10.1002/1097-0142(1950)3:1<32:AID-CNCR2820030106>3.0.CO;2-3.
- Cuevas LE, Browning R, Bossuyt P, Casenghi M, Cotton MF, Cruz AT, et al. Evaluation of tuberculosis diagnostics in children: 2. Methodological issues for conducting and reporting research evaluations of tuberculosis diagnostics for intrathoracic tuberculosis in children. Consensus from an expert panel. J Infect Dis 2012;205:209-15. https://doi.org/10.1093/infdis/jir879.
- Agranoff D, Fernandez-Reyes D, Papadopoulos MC, Rojas SA, Herbster M, Loosemore A, et al. Identification of diagnostic markers for tuberculosis by proteomic fingerprinting of serum. Lancet 2006;368:1012-21. https://doi.org/10.1016/S0140-6736(06)69342-2.
- Ratzinger F, Bruckschwaiger H, Wischenbart M, Parschalk B, Fernandez-Reyes D, Lagler H, et al. Rapid diagnostic algorithms as a screening tool for tuberculosis: an assessor blinded cross-sectional study. PLOS ONE 2012;7. https://doi.org/10.1371/journal.pone.0049658.
- Liu Q, Chen X, Hu C, Zhang R, Yue J, Wu G, et al. Serum protein profiling of smear-positive and smear-negative pulmonary tuberculosis using SELDI-TOF mass spectrometry. Lung 2010;188:15-23. https://doi.org/10.1007/s00408-009-9199-6.
- Zhang J, Wu X, Shi L, Liang Y, Xie Z, Yang Y, et al. Diagnostic serum proteomic analysis in patients with active tuberculosis. Clin Chim Acta 2012;413:883-7. https://doi.org/10.1016/j.cca.2012.01.036.
- Sandhu G, Battaglia F, Ely BK, Athanasakis D, Montoya R, Valencia T, et al. Discriminating active from latent tuberculosis in patients presenting to community clinics. PLOS ONE 2012;7. https://doi.org/10.1371/journal.pone.0038080.
- Liu J, Jiang T, Wei L, Yang X, Wang C, Zhang X, et al. The discovery and identification of a candidate proteomic biomarker of active tuberculosis. BMC Infect Dis 2013;13. https://doi.org/10.1186/1471-2334-13-506.
- Song SH, Han M, Choi YS, Dan KS, Yang MG, Song J, et al. Proteomic profiling of serum from patients with tuberculosis. Ann Lab Med 2014;34:345-53. https://doi.org/10.3343/alm.2014.34.5.345.
- Xu D, Li Y, Li X, Wei LL, Pan Z, Jiang TT, et al. Serum protein S100A9, SOD3, and MMP9 as new diagnostic biomarkers for pulmonary tuberculosis by iTRAQ-coupled two-dimensional LC–MS/MS. Proteomics 2015;15:58-67. https://doi.org/10.1002/pmic.201400366.
- Li C, He X, Li H, Zhou Y, Zang N, Hu S, et al. Discovery and verification of serum differential expression proteins for pulmonary tuberculosis. Tuberculosis 2015;95:547-54. https://doi.org/10.1016/j.tube.2015.06.001.
- Chegou NN, Sutherland JS, Malherbe S, Crampin AC, Corstjens PL, Geluk A, et al. Diagnostic performance of a seven-marker serum protein biosignature for the diagnosis of active TB disease in African primary healthcare clinic attendees with signs and symptoms suggestive of TB. Thorax 2016;71:785-94. https://doi.org/10.1136/thoraxjnl-2015-207999.
- Thermo Fisher Scientific . Instructions TMT10plex Mass Tag Labeling Kits and Reagents n.d. https://assets.thermofisher.com/TFS-Assets/LSG/manuals/MAN0016969_2162457_TMT10plex_UG.pdf (accessed 14 May 2019).
- Reuschl AK, Edwards MR, Parker R, Connell DW, Hoang L, Halliday A, et al. Innate activation of human primary epithelial cells broadens the host response to Mycobacterium tuberculosis in the airways. PLOS Pathog 2017;13. https://doi.org/10.1371/journal.ppat.1006577.
- Herberg JA, Kaforou M, Wright VJ, Shailes H, Eleftherohorinou H, Hoggart CJ, et al. Diagnostic test accuracy of a 2-transcript host RNA signature for discriminating bacterial vs. viral infection in febrile children. JAMA 2016;316:835-45. https://doi.org/10.1001/jama.2016.11236.
- Rozot V, Patrizia A, Vigano S, Mazza-Stalder J, Idrizi E, Day CL, et al. Combined use of Mycobacterium tuberculosis-specific CD4 and CD8 T-cell responses is a powerful diagnostic tool of active tuberculosis. Clin Infect Dis 2015;60:432-7. https://doi.org/10.1093/cid/ciu795.
- Wilkinson KA, Oni T, Gideon HP, Goliath R, Wilkinson RJ, Riou C. Activation profile of Mycobacterium tuberculosis-specific CD4(+) T cells reflects disease activity irrespective of HIV status. Am J Respir Crit Care Med 2016;193:1307-10. https://doi.org/10.1164/rccm.201601-0116LE.
- Riou C, Berkowitz N, Goliath R, Burgers WA, Wilkinson RJ. Analysis of the phenotype of Mycobacterium tuberculosis-specific CD4+ T cells to discriminate latent from active tuberculosis in HIV-uninfected and HIV-infected individuals. Front Immunol 2017;8. https://doi.org/10.3389/fimmu.2017.00968.
- Sester U, Fousse M, Dirks J, Mack U, Prasse A, Singh M, et al. Whole-blood flow-cytometric analysis of antigen-specific CD4 T-cell cytokine profiles distinguishes active tuberculosis from non-active states. PLOS ONE 2011;6. https://doi.org/10.1371/journal.pone.0017813.
- Valitutti S, Müller S, Salio M, Lanzavecchia A. Degradation of T cell receptor (TCR)–CD3-ζ complexes after antigenic stimulation. J Exp. Med 1997;185:1859-64. https://doi.org/10.1084/jem.185.10.1859.
- Day CL, Abrahams DA, Lerumo L, Janse van Rensburg E, Stone L, O’rie T, et al. Functional capacity of Mycobacterium tuberculosis-specific T cell responses in humans is associated with mycobacterial load. J Immunol 2011;187:2222-32. https://doi.org/10.4049/jimmunol.1101122.
- Goletti D, Butera O, Vanini V, Lauria FN, Lange C, Franken KL, et al. Response to Rv2628 latency antigen associates with cured tuberculosis and remote infection. Eur Respir J 2010;36:135-42. https://doi.org/10.1183/09031936.00140009.
- Takasaki J, Manabe T, Morino E, Muto Y, Hashimoto M, Iikura M, et al. Sensitivity and specificity of QuantiFERON-TB Gold Plus compared with QuantiFERON-TB Gold In-Tube and T-SPOT.TB on active tuberculosis in Japan. J Infect Chemother 2018;24:188-92. https://doi.org/10.1016/j.jiac.2017.10.009.
- Lalvani A, Millington KA. T cells and tuberculosis: beyond interferon-gamma. J Infect Dis 2008;197:941-3. https://doi.org/10.1086/529049.
- Blauenfeldt T, Heyckendorf J, Graff Jensen S, Lange C, Drabe C, Hermansen TS, et al. Development of a one-step probe based molecular assay for rapid immunodiagnosis of infection with M. tuberculosis using dried blood spots. PLOS ONE 2014;9. https://doi.org/10.1371/journal.pone.0105628.
- Tebruegge M, Dutta B, Donath S, Ritz N, Forbes B, Camacho-Badilla K, et al. Mycobacteria-specific cytokine responses detect tuberculosis infection and distinguish latent from active tuberculosis. Am J Respir Crit Care Med 2015;192:485-99. https://doi.org/10.1164/rccm.201501-0059OC.
- Wang S, Diao N, Lu C, Wu J, Gao Y, Chen J, et al. Evaluation of the diagnostic potential of IP-10 and IL-2 as biomarkers for the diagnosis of active and latent tuberculosis in a BCG-vaccinated population. PLOS ONE 2012;7. https://doi.org/10.1371/journal.pone.0051338.
- Mihret A, Bekele Y, Bobosha K, Kidd M, Aseffa A, Howe R, et al. Plasma cytokines and chemokines differentiate between active disease and non-active tuberculosis infection. J Infect 2013;66:357-65. https://doi.org/10.1016/j.jinf.2012.11.005.
- Roy S, Guler R, Parihar SP, Schmeier S, Kaczkowski B, Nishimura H, et al. Batf2/Irf1 induces inflammatory responses in classically activated macrophages, lipopolysaccharides, and mycobacterial infection. J Immunol 2015;194:6035-44. https://doi.org/10.4049/jimmunol.1402521.
- Husereau D, Drummond M, Petrou S, Carswell C, Moher D, Greenberg D, et al. Consolidated Health Economic Evaluation Reporting Standards (CHEERS) statement. Value Health 2013;16:e1-5. https://doi.org/10.1016/j.jval.2013.02.010.
- White P, Jit M. Appendix I: Imperial College – LTBI Treatment Report 2015. www.nice.org.uk/guidance/NG33/documents/tuberculosis-update-appendix-i2 (accessed 22 November 2017).
- McAuley C, Knapp M, Beechman J, McCurry N, Sleed M. Young Families Under Stress: Outcomes and Costs of Home Start Support. York: Joseph Rowntree Foundation; 2004.
- National Institute for Health and Care Excellence (NICE) . Cost Effectiveness Analysis of Interferon Gamma Release Assay (IGRA) Testing for Latent Tuberculosis 2010.
- British National Formulary. London: BMJ Group and Pharmaceutical Press; 2015.
- Graves AJ, Padilla MG, Hokey DA. OMIP-022: Comprehensive assessment of antigen-specific human T-cell functionality and memory. Cytometry A 2014;85:576-9. https://doi.org/10.1002/cyto.a.22478.
- Halliday A, Whitworth H, Kottoor SH, Niazi U, Menzies S, Kunst H, et al. Stratification of latent Mycobacterium tuberculosis infection by cellular immune profiling. J Infect Dis 2017;215:1480-7. https://doi.org/10.1093/infdis/jix107.
- Monitor . National Tariff Payment System 2014 15 2014.
- Hughes R, Wonderling D, Li B, Higgins B. The cost effectiveness of nucleic acid amplification techniques for the diagnosis of tuberculosis. Respir Med 2012;106:300-7. https://doi.org/10.1016/j.rmed.2011.10.005.
- Drobniewski F, Cooke M, Jordan J, Casali N, Mugwagwa T, Broda A, et al. Systematic review, meta-analysis and economic modelling of molecular diagnostic tests for antibiotic resistance in tuberculosis. Health Technol Assess 2015;19. https://doi.org/10.3310/hta19340.
- Auguste P, Tsertsvadze A, Pink J, Court R, Seedat F, Gurung T, et al. Accurate diagnosis of latent tuberculosis in children, people who are immunocompromised or at risk from immunosuppression and recent arrivals from countries with a high incidence of tuberculosis: systematic review and economic evaluation. Health Technol Assess 2016;20.
Appendix 1 Prevalence data from the IDEA study
| Target population | n | Parent population | n | Prevalence (%) |
|---|---|---|---|---|
| All TB | 363 | Full cohort | 845 | 43.0 |
| All TB (HIV–) | 338 | Full cohort (HIV–) | 710 | 47.6 |
| All TB (HIV+) | 32 | Full cohort (HIV+) | 201 | 15.9 |
| Culture-confirmed TB | 261 | Full cohort | 845 | 30.9 |
| Highly probable TB | 102 | Full cohort | 845 | 12.1 |
| Culture-confirmed TB (HIV–) | 248 | Full cohort (HIV–) | 710 | 34.9 |
| Highly probable TB (HIV–) | 90 | Full cohort (HIV–) | 710 | 12.7 |
| Highly probable TB | 102 | Culture-negative TB suspects (full) | 584 | 17.5 |
| Highly probable TB (HIV–) | 90 | Culture-negative TB suspects (HIV–) | 462 | 19.5 |
| Highly probable TB (HIV+) | 14 | Culture-negative TB suspects (HIV+) | 183 | 7.7 |
| All TB (T-SPOT.TB positive, full) | 270 | T-SPOT.TB positive (full) | 352 | 76.7 |
| Dosanjh category 1 (T-SPOT.TB positive) | 201 | T-SPOT.TB positive (full) | 352 | 57.1 |
| Dosanjh category 2 (T-SPOT.TB positive/negative) | 69 | T-SPOT.TB positive (full) | 352 | 19.6 |
| All TB (T-SPOT.TB positive and HIV+) | 17 | T-SPOT.TB positive (HIV+) | 39 | 43.6 |
Appendix 2 Distribution of disease types in the transcriptomic validation cohort
| Type of TB disease | TB group, n (%) | Total, n (%) | |
|---|---|---|---|
| Culture-confirmed | Highly probable | ||
| All TB | 212 (70.4) | 89 (29.6) | 301 (100) |
| Culture negative | 0 (0) | 76 (25.2) | 76 (25.2) |
| Smear-positive TB | 48 (22.6) | 2 (2.2) | 50 (16.6) |
| Smear-negative | 139 (65.6) | 59 (66.3) | 198 (65.8) |
| Smear not tested | 25 (8.3) | 28 (9.3) | 53 (17.6) |
| PTB | 85 (40.1) | 16 (18.0) | 101 (33.6) |
| EPTB | 100 (47.2) | 64 (71.9) | 164 (54.5) |
| PTB + EPTB | 27 (12.7) | 9 (10.1) | 36 (12.0) |
| Site of infectiona | |||
| Abdomen | 6 (2.8) | 2 (2.2) | 8 (2.7) |
| Bones | 5 (2.4) | 1 (1.1) | 6 (2.0) |
| Brains | 1 (0.5) | 4 (4.5) | 5 (1.7) |
| Chest | 1 (0.5) | 1 (1.1) | 2 (0.7) |
| Lungs | 112 (52.8) | 24 (27.0) | 136 (45.2) |
| Lymph node | 87 (41.0) | 44 (49.4) | 131 (43.5) |
| Miliary TB (disseminated) | 11 (5.2) | 0 (0) | 11 (3.7) |
| Pericardium | 3 (1.4) | 2 (2.2) | 5 (1.7) |
| Pleura | 13 (6.1) | 10 (11.2) | 23 (7.6) |
| Spine | 10 (4.7) | 6 (6.7) | 16 (5.3) |
| Other | 12 (5.7) | 10 (11.2) | 22 (7.3) |
| Diagnosis | n (%) |
|---|---|
| LRTI | 79 (24.2) |
| Pneumonia | 66 (20.2) |
| Non-pneumonia LRTI | 13 (4.0) |
| Sarcoidosis | 34 (10.4) |
| Cancer | 26 (8.0) |
| Self-resolved illness | 17 (5.2) |
| Chest infection | 11 (3.4) |
| URTI | 10 (3.1) |
| Othera | 169 (51.7) |
Appendix 3 Additional analyses for validation of transcriptomic ‘score’ signatures
| Signature | All TB (n = 301) (Dosanjh categories 1 and 2) | Culture-confirmed TB (n = 212) (Dosanjh category 1) | Highly probable TB (n = 89) (Dosanjh category 2) | OD (n = 327) (Dosanjh category 4) |
|---|---|---|---|---|
| Anderson et al.36 | ||||
| Median (range) | 95.77 (80.95–120.6) | 96.12 (80.95–120.6) | 95.38 (81.83–118.7) | 91.21 (74.06–109.7) |
| Missing, n | 0 | 0 | 0 | 0 |
| Kaforou et al.20 | ||||
| Median (range) | 115.5 (88.01–137.5) | 117.5 (88.01–136.4) | 111.7 (89.07–137.5) | 103.8 (89.02–141.1) |
| Missing, n | 0 | 0 | 0 | 0 |
| Sweeney et al.39 | ||||
| Median (range) | –2.431 (–4.648 to –0.556) | –2.181 (–4.412 to –0.556) | –2.813 (–4.648 to –1.139) | –3.817 (–5.175 to –0.780) |
| Missing, n | 0 | 0 | 0 | 0 |
FIGURE 16.
Performance of published ‘score’-based signatures in the full cohort, stratified by HIV infection status. (a) Dot plot displaying the score values using each signature in the full cohort stratified by OD group (Dosanjh category 4) (n = 327) or the TB groups (Dosanjh categories 1 and 2) (n = 301); (b) groups further stratified by HIV status; and (c) ROC curves displaying diagnostic performance of scores in the full cohort, HIV– or HIV+ cohorts. Statistical differences between score values between groups were determined using either the Mann–Whitney U-test (when only two groups are compared) or Kruskal–Wallis with Dunn’s post hoc test (for multiple comparisons) for three or more groups. *p < 0.05; **p < 0.005; ***p < 0.0005; ****p < 0.0001.
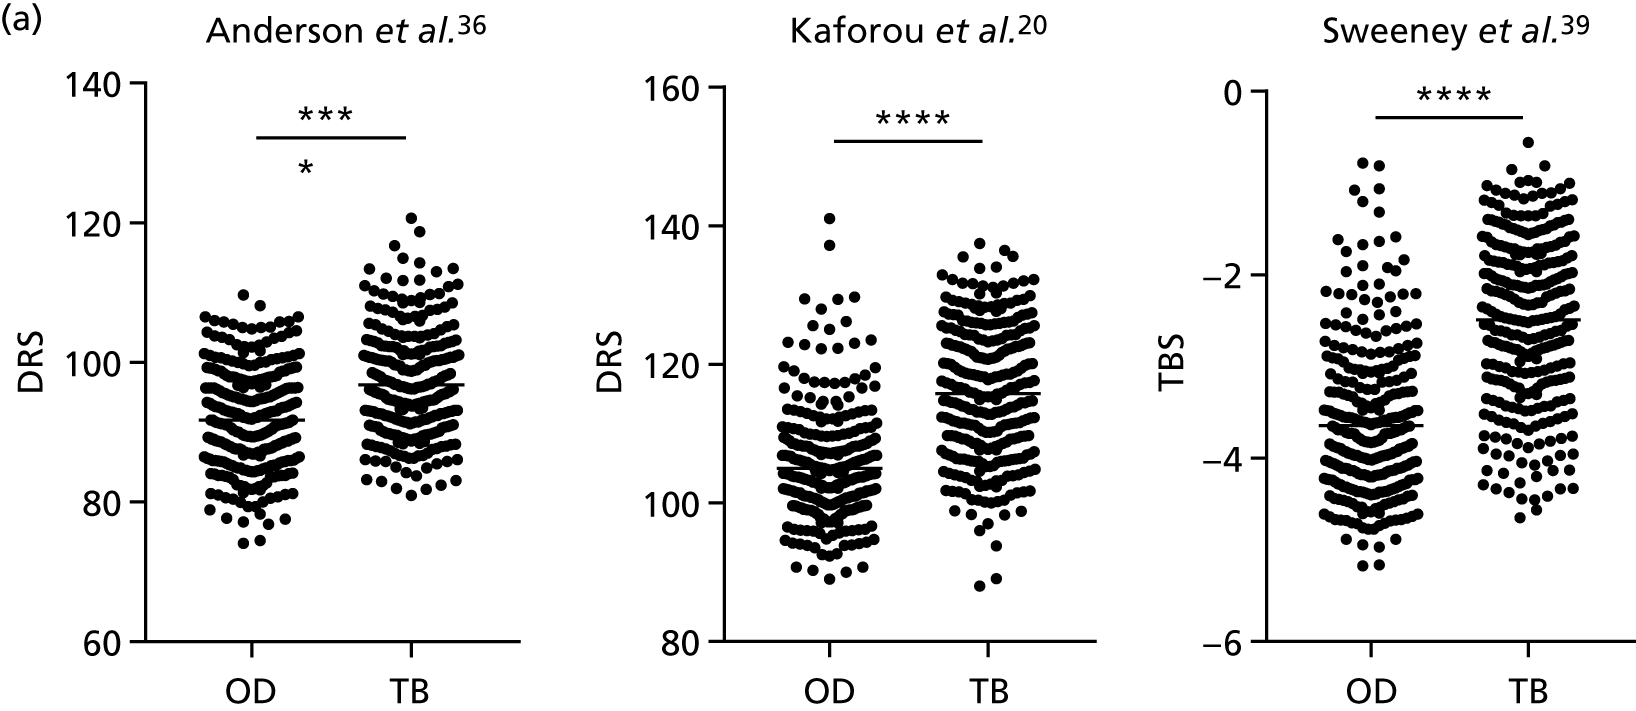
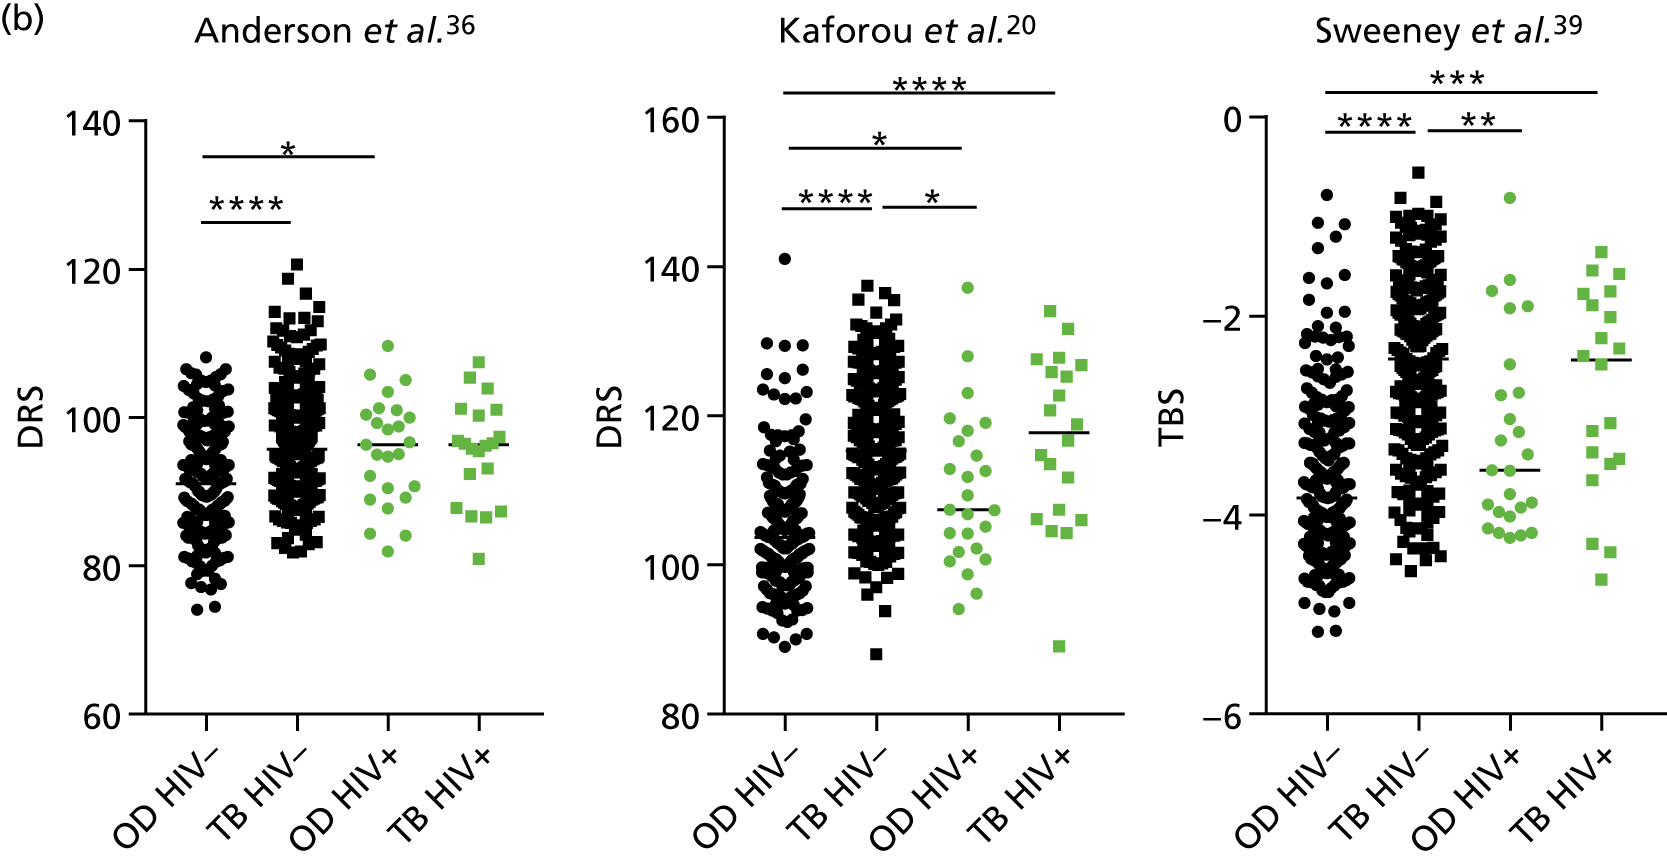

| Comparisona | Signature | Patients, n | Controls, n | AUC, % (95% CI) |
|---|---|---|---|---|
| 1 vs. 4 | Anderson et al.36 | 212 | 327 | 0.69 (0.65 to 0.74) |
| Kaforou et al.20 | 212 | 327 | 0.85 (0.81 to 0.88) | |
| Sweeney et al.39 | 212 | 327 | 0.86 (0.83 to 0.89) | |
| 2 vs. 4 | Anderson et al.36 | 89 | 327 | 0.66 (0.60 to 0.72) |
| Kaforou et al.20 | 89 | 327 | 0.74 (0.68 to 0.80) | |
| Sweeney et al.39 | 89 | 327 | 0.75 (0.70 to 0.81) | |
| 1/2 vs. 4A | Anderson et al.36 | 301 | 46 | 0.71 (0.63 to 0.78) |
| Kaforou et al.20 | 301 | 46 | 0.86 (0.82 to 0.91) | |
| Sweeney et al.39 | 301 | 46 | 0.88 (0.84 to 0.92) | |
| 1/2 vs. 4B | Anderson et al.36 | 301 | 36 | 0.72 (0.63 to 0.81) |
| Kaforou et al.20 | 301 | 36 | 0.85 (0.78 to 0.91) | |
| Sweeney et al.39 | 301 | 36 | 0.88 (0.82 to 0.93) | |
| 1/2 vs. 4C | Anderson et al.36 | 301 | 175 | 0.65 (0.60 to 0.70) |
| Kaforou et al.20 | 301 | 175 | 0.78 (0.74 to 0.83) | |
| Sweeney et al.39 | 301 | 175 | 0.80 (0.76 to 0.84) | |
| 1/2 vs. 4D | Anderson et al.36 | 301 | 70 | 0.73 (0.66 to 0.79) |
| Kaforou et al.20 | 301 | 70 | 0.85 (0.79 to 0.89) | |
| Sweeney et al.39 | 301 | 70 | 0.84 (0.79 to 0.89) |
FIGURE 17.
Performance of published SCORE signatures by Dosanjh category in the HIV– population [1, culture-confirmed TB; 2, highly probable TB; 4A, active TB excluded (inactive TB); 4B, active TB excluded (one or more risk factors for TB exposure, TST positive); 4C, active TB excluded (one or more risk factors for TB exposure, TST negative); 4D, active TB excluded (no risk factors for TB exposure, TST negative)]. (a) Dot plots showing the individual score values within each category; and (b) ROC curves displaying the diagnostic performance of each signature for discriminating between groups. Diagnostic groups were compared using a Kruskal–Wallis test with Dunn’s post hoc test for multiple comparisons.
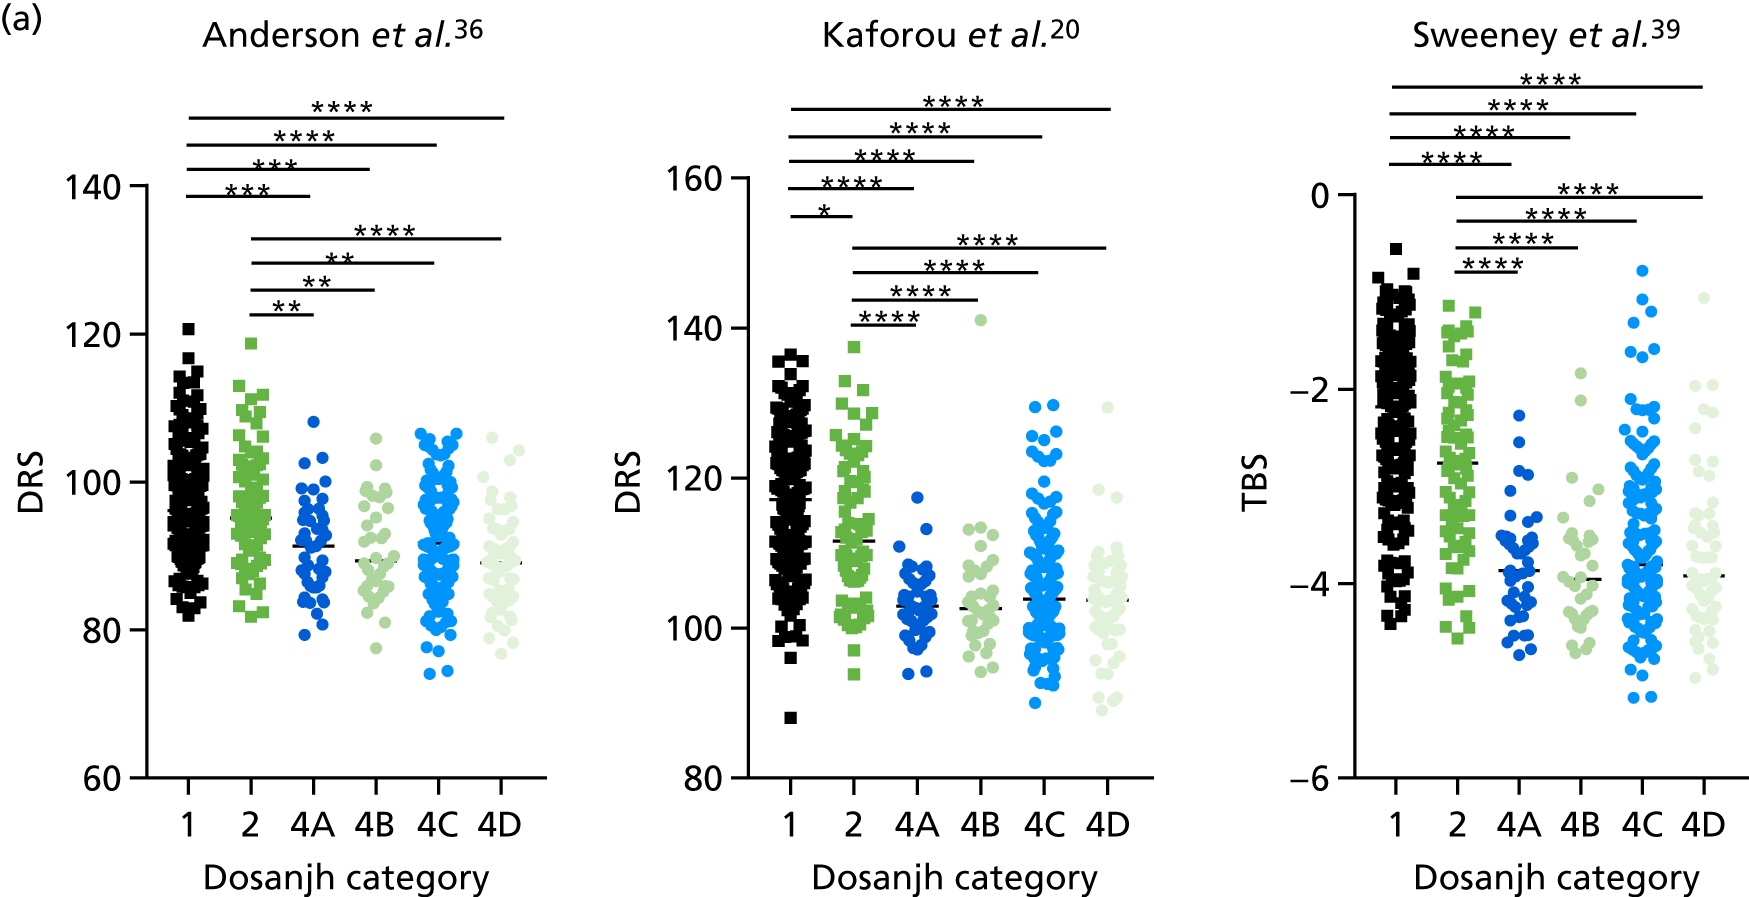
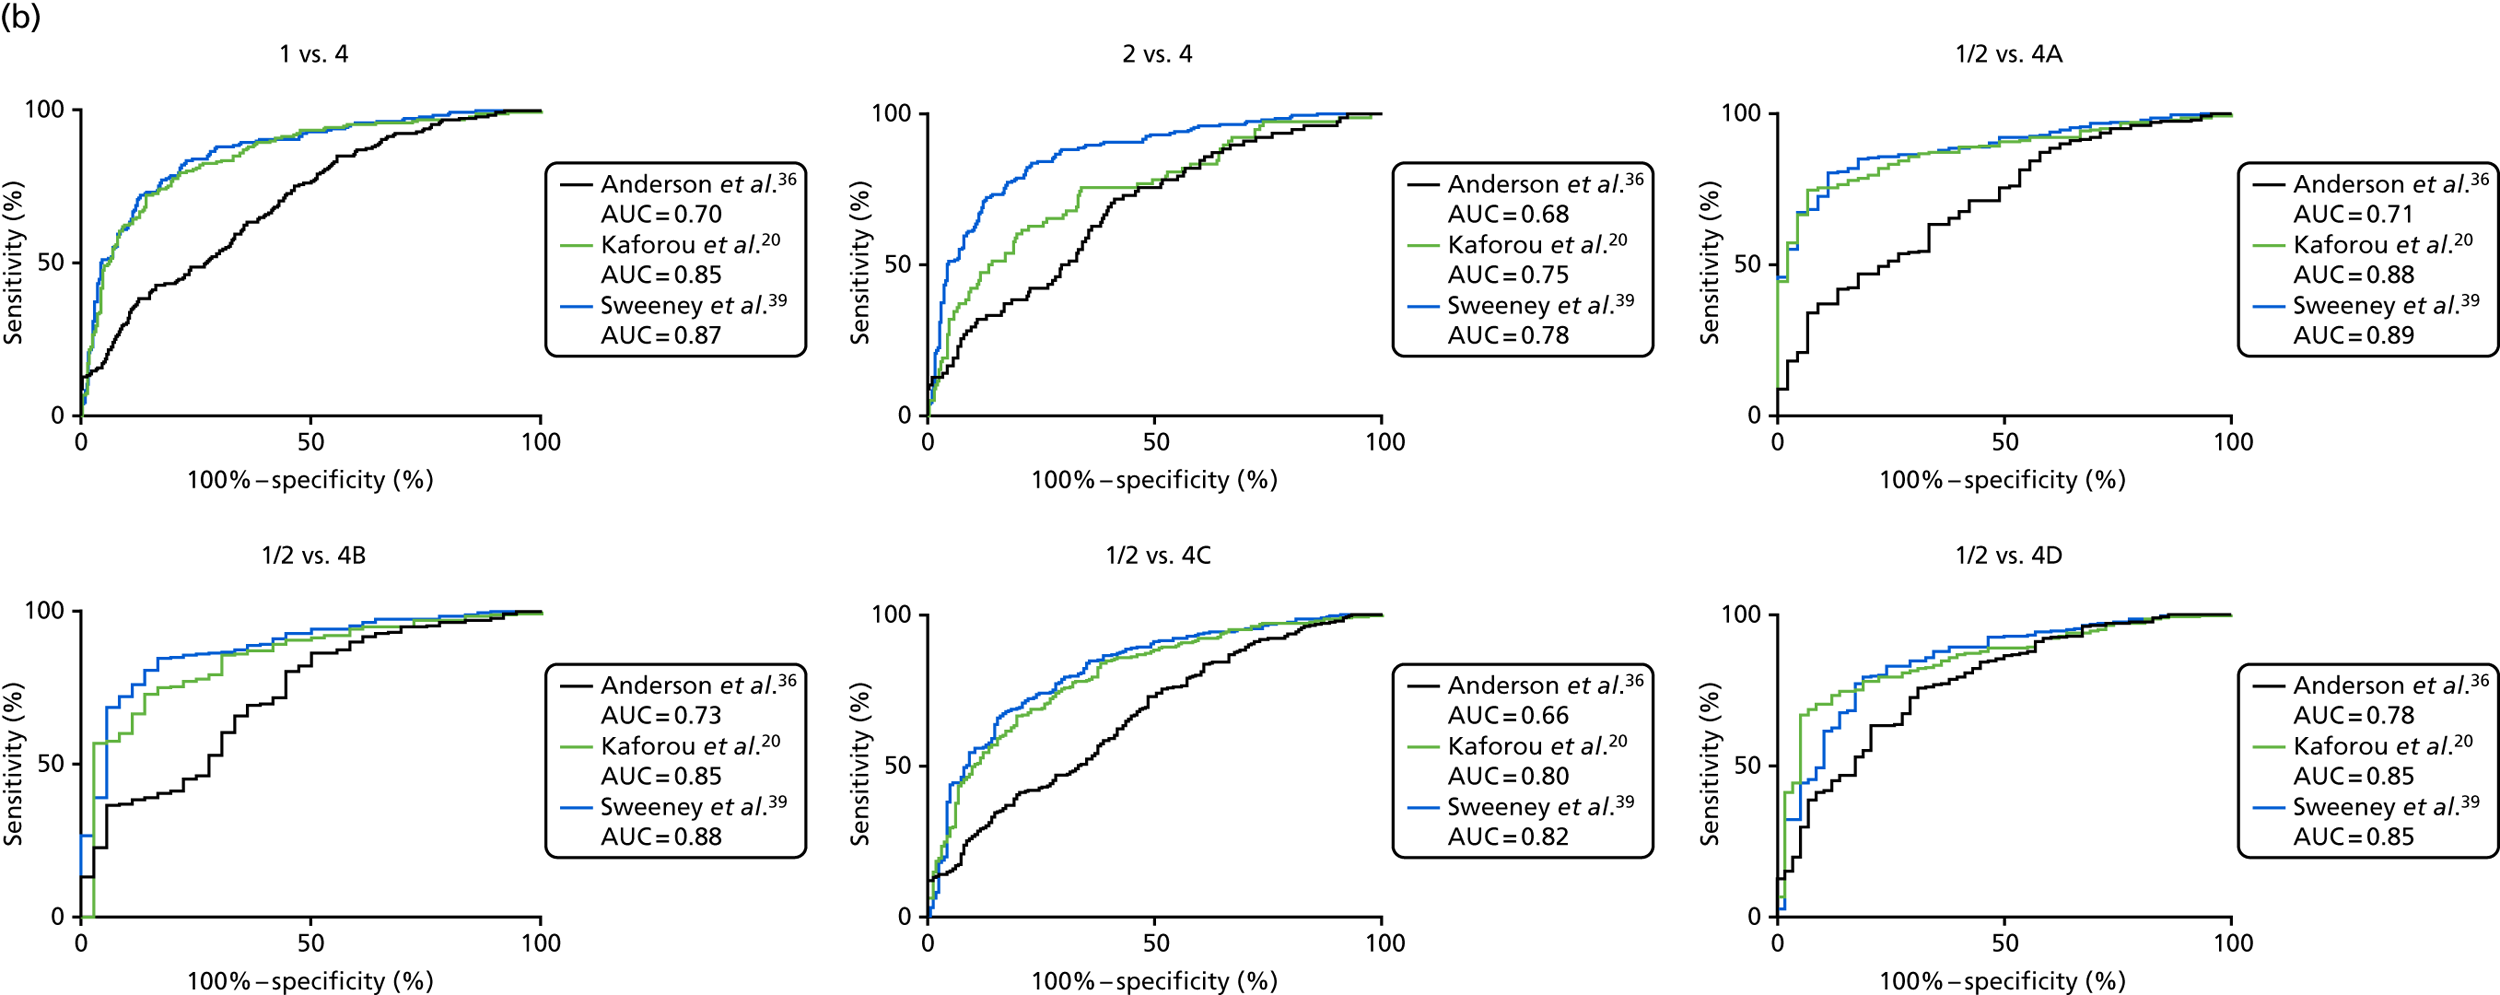
| Comparisona | Signature | Patients (n) | Controls (n) | AUC |
|---|---|---|---|---|
| 1 vs. 4 | Anderson et al.36 | 203 | 302 | 0.70 |
| Kaforou et al.20 | 203 | 275 | 0.85 | |
| Sweeney et al.39 | 203 | 302 | 0.87 | |
| 2 vs. 4 | Anderson et al.36 | 78 | 302 | 0.68 |
| Kaforou et al.20 | 78 | 275 | 0.75 | |
| Sweeney et al.39 | 78 | 302 | 0.78 | |
| 1/2 vs. 4A | Anderson et al.36 | 281 | 45 | 0.71 |
| Kaforou et al.20 | 281 | 45 | 0.88 | |
| Sweeney et al.39 | 281 | 45 | 0.89 | |
| 1/2 vs. 4B | Anderson et al.36 | 281 | 36 | 0.73 |
| Kaforou et al.20 | 281 | 36 | 0.85 | |
| Sweeney et al.39 | 281 | 26 | 0.88 | |
| 1/2 vs. 4C | Anderson et al.36 | 281 | 163 | 0.66 |
| Kaforou et al.20 | 281 | 163 | 0.80 | |
| Sweeney et al.39 | 281 | 163 | 0.82 | |
| 1/2 vs. 4D | Anderson et al.36 | 281 | 58 | 0.78 |
| Kaforou et al.20 | 281 | 58 | 0.85 | |
| Sweeney et al.39 | 281 | 58 | 0.85 |
FIGURE 18.
Performance of score signatures in PTB and EPTB, and in OD stratified by disease types. (a) The diagnostic accuracy for the score signatures for detecting either PTB or EPTB was performed for each signatures; (b) the score values by disease subtype within the TB and OD groups is shown in the dot plots; and (c) scores were compared between groups using a Kruskal–Wallis test and the results of the Dunn’s multiple comparison post hoc tests are shown. Statistical differences between score values between groups were determined using the Kruskal–Wallis test with Dunn’s post hoc test for multiple comparisons. ns, not significant. *p < 0.05; **p < 0.005; ***p < 0.0005; ****p < 0.0001.


Appendix 4 Additional information on transcriptomic signatures used for validation studies
| Characteristic/measure of diagnostic performance | Signature | |||||||
|---|---|---|---|---|---|---|---|---|
| Berry et al.18 | Kaforou et al.20 | Anderson et al.36 | Maertzdorf et al.37 | Roe et al.38 | Sweeney et al.39 | |||
| Study design | Case–control study (training/test and validation) | Case–control study (training/test and validation) | Children with suspected TB (training/test and validation) | Case–control study (training/test and qRT-PCR validation) | Case–control study | Meta-analysis | ||
| Statistical methods | LDA | Elastic net | Elastic net | Random forest | SVML | DerSimonian and Laird, Fisher’s sum of logs | ||
| Location | UK/South Africa | South Africa/Malawi | South Africa/Malawi/Kenya | India/The Gambia/Uganda | UK | Multiple/meta-analysis | ||
| Case type training/test cohort (n) | Training PTB positive (54) | Test PTB positive (33) | Training PTB positive (194) | Test | ATB positive/negative (42/27) | PTB positive (113) | ATB positive (46) | ATB positive/negative (296) |
| Non-TB group training/test cohort (n) | LTBI (69)/healthy (24) | Other inflammatory diseases (172) | LTBI (167) | OD (175) | Discovery cohort: n = 57 LTBI and n = 175 OD; validation cohort: n = 14 LTBI and n = 64 OD | HCs (including latent) (76) | Other: fever (70) | Various cohorts including OD and LTBI |
| Number of genes | 393 | 86 | 27 | 44 | 51 | 4 | 4 | 3 |
| Validated AUC | N/A | 0.83 | 0.98 | 0.95 | 0.89 | 0.98 | 0.95 | 0.84 |
| Sensitivity/specificity | 94.1/96.7 | 90/83 | 95/90 | 93/91 | 82.9/82.8 | 88/75 | 7 | 81/74 |
| Routine clinical practice | No | No | No | No | Yes | No | No | No |
| Immunocompromised included? | No | No | HIV+/– | HIV+/– | HIV+/– | No | No | HIV+/– |
| EPTB included? | No | No | Unknown | No | Yes | No | Yes | Yes |
| Culture negative included? | No | No | No | No | Yes | No | No | Some |
Appendix 5 Additional analyses for validation of transcriptomic signatures using linear discriminant analysis
FIGURE 19.
Validation of published transcriptomic signatures. (a) Using LDA in full cohort; (b) stratified by HIV infection status; and (c) ROC curve analyses in the full cohort, HIV– and HIV+ populations.


| LDA signature, reference | HIV | TB, n | OD, n | AUC, %(95% CI) | Cut-off point | Sensitivity, % (95% CI) | Specificity, % (95% CI) | PPV | NPV |
|---|---|---|---|---|---|---|---|---|---|
| Anderson et al.36 | – | 281 | 302 | 0.85 (0.82 to 0.88) | > 0.09a | 95.0 (91.8 to 97.3) | 39.1 (33.5 to 44.8) | 0.59 | 0.90 |
| > 0.82b | 52.0 (45.9 to 57.9) | 90.0 ( 86.1 to 93.2) | 0.83 | 0.67 | |||||
| > 0.40c | 82.2 (77.2 to 86.5) | 78.2 (73.1 to 82.7) | 0.77 | 0.83 | |||||
| + | N/A | N/A | N/A | N/A | N/A | N/A | N/A | N/A | |
| –/+ | 301 | 327 | 0.83 (0.80 to 0.87) | > 0.09a | 95.0 (91.8 to 97.3) | 33.6 (28.5 to 39.0) | 0.52 | 0.90 | |
| > 0.82b | 47.8 (42.1 to 53.7) | 90.2 (86.5 to 93.2) | 0.79 | 0.70 | |||||
| > 0.36c | 84.4 (79.8 to 88.3) | 73.4 (68.3 to 78.1) | 0.71 | 0.86 | |||||
| Berry et al.18 | – | 281 | 302 | 0.81 (0.78 to 0.85) | > 0.08a | 95.0 (91.8 to 97.3) | 35.4 (30.0 to 41.1) | 0.57 | 0.89 |
| > 0.81b | 47.7 (41.7 to 53.7) | 90.0 (86.1 to 93.2) | 0.81 | 0.65 | |||||
| > 0.37c | 78.3 (73.0 to 83.0) | 71.2 (65.7 to 76.2) | 0.71 | 0.8 | |||||
| + | N/A | N/A | N/A | N/A | N/A | N/A | N/A | N/A | |
| –/+ | 301 | 327 | 0.80 (0.77 to 0.84) | > 0.10a | 95.0 (91.8 to 97.3) | 35.5 (30.3 to 40.9) | 0.52 | 0.90 | |
| > 0.83b | 42.9 (37.2 to 48.6) | 90.2 (86.5 to 93.2) | 0.77 | 0.68 | |||||
| > 0.43c | 73.8 (68.4 to 79.5) | 74.9 (69.9 to 79.5) | 0.69 | 0.79 | |||||
| Kaforou et al.20 | – | 281 | 302 | 0.83 (0.80 to 0.87) | > 0.09a | 95.0 (91.8 to 97.3) | 29.5 (24.4 to 35.0) | 0.55 | 0.87 |
| > 0.80b | 52.3 (46.3 to 58.3) | 90.0 (86.1 to 93.2) | 0.80 | 0.71 | |||||
| > 0.43c | 78.3 (73.0 to 83.0) | 80.0 (64.8 to 84.2) | 0.83 | 0.68 | |||||
| + | N/A | N/A | N/A | N/A | N/A | N/A | N/A | N/A | |
| –/+ | 301 | 327 | 0.82 (0.79 to 0.86) | > 0.11a | 95.0 (91.8 to 97.3) | 30 (25.1 to 35.3) | 0.51 | 0.89 | |
| > 0.87b | 48.8 (43.0 to 54.6) | 90.2 (86.5 to 93.2) | 0.79 | 0.70 | |||||
| > 0.38c | 82.0 (77.3 to 86.2) | 73.0 (67.9 to 77.8) | 0.70 | 0.84 | |||||
| Maertsdorf et al.37 | – | 281 | 302 | 0.84 (0.81 to 0.88) | > 0.18a | 95.0 (91.8 to 97.3) | 46.4 (40.6 to 52.2) | 0.62 | 0.91 |
| > 0.73b | 49.8 (43.8 to 55.8) | 90.0 (86.1 to 93.2) | 0.79 | 0.70 | |||||
| > 0.44c | 79.0 (73.8 to 83.6) | 77.8 (72.7 to 82.3) | 0.82 | 0.66 | |||||
| + | 20 | 25 | 0.63 (0.46 to 0.9) | < 0.50a | 95.0 (75.1 to 99.9) | 32.0 (15.0 to 53.5) | 0.21 | 0.97 | |
| < 0.38b | 25.0 (8.7 to 49.1) | 92.0 (74.0 to 99.0) | 0.37 | 0.87 | |||||
| > 0.52c | 100 (83.2 to 100) | 28.0 (12.1 to 49.4) | 0.21 | 1.0 | |||||
| –/+ | 301 | 327 | 0.82 (0.79 to 0.86) | > 0.18a | 95.0 (91.8 to 97.3) | 37.6 (32.3 to 43.1) | 0.53 | 0.91 | |
| > 0.72b | 46.1 (40.8 to 52.3) | 90.2 (86.5 to 93.2) | 0.78 | 0.69 | |||||
| > 0.46c | 77.1 (71.9 to 81.7) | 78.2 (73.4 to 82.3) | 0.73 | 0.82 | |||||
| Roe et al.38 | – | 281 | 302 | 0.85 (0.82 to 0.88) | > 0.16a | 95.0 (91.8 to 97.3) | 40.4 (34.8 to 46.2) | 0.59 | 0.90 |
| > 0.68b | 55.5 (49.5 to 61.4) | 90.0 (86.1 to 93.2) | 0.84 | 0.69 | |||||
| > 0.31c | 84.0 (79.2 to 88.1) | 73.5 (68.2 to 78.4) | 0.74 | 0.84 | |||||
| + | 20 | 25 | 0.74 (0.60 to 0.89) | < 0.57a | 95.0 (75.1 to 99.9) | 20.0 (6.8 to 40.7) | 0.18 | 0.95 | |
| < 0.40b | 40.0 (19.1 to 64.0) | 92.0 (74.0 to 99.0) | 0.49 | 0.89 | |||||
| > 0.45c | 75.0 (50.9 to 91.3) | 68.0 (46.5 to 85.1) | 0.31 | 0.94 | |||||
| –/+ | 301 | 327 | 0.83 (0.80 to 0.86) | > 0.18a | 95.0 (91.9 to 97.3) | 39.1 (33.8 to 44.7) | 0.54 | 0.91 | |
| > 0.70b | 50.5 (44.7 to 56.3) | 90.2 (86.5 to 93.2) | 0.80 | 0.71 | |||||
| > 0.40c | 76.7 (71.6 to 81.4) | 77.0 (72.1 to 81.5) | 0.72 | 0.81 | |||||
| Sweeney et al.39 | – | 302 | 281 | 0.85 (0.82 to 0.89) | > 0.15a | 95.0 (91.9 to 97.3) | 47.0 (41.3 to 52.8) | 0.62 | 0.91 |
| > 0.78b | 52.7 (46.7 to 58.6) | 90.0 (86.1 to 93.2) | 0.83 | 0.68 | |||||
| > 0.32c | 87.9 (83.5 to 91.5) | 73.8 (68.5 to 78.7) | 0.75 | 0.87 | |||||
| + | 20 | 25 | 0.60 (0.43 to 0.78) | > 0.26a | 95.0 (75.1 to 99.9) | 8.0 (0.99 to 26.0) | 0.16 | 0.89 | |
| > 0.71b | 0.00 (0.0 to 16.8) | 92.0 (74.0 to 99.0) | 0.00 | 0.83 | |||||
| > 0.43c | 70.0 (45.7 to 88.1) | 60.0 (38.7 to 78.9) | 0.25 | 0.92 | |||||
| –/+ | 301 | 327 | 0.84 (0.81 to 0.87) | > 0.15a | 95.0 (91.9 to 97.2) | 43.1 (37.7 to 48.7) | 0.56 | 0.92 | |
| > 0.78b | 50.8 (40.0 to 56.6) | 90.2 (86.5 to 93.2) | 0.80 | 0.71 | |||||
| > 0.33c | 87.4 (83.1 to 90.9) | 72.5 (67.3 to 77.3) | 0.71 | 0.89 |
| Comparison | Signature | Patients, n | Controls, n | AUC, % (95% CI) |
|---|---|---|---|---|
| Dosanjh category 1 vs. Dosanjh category 4 | Anderson et al.36 | 203 | 302 | 0.86 (0.83 to 0.90) |
| Berry et al.18 | 203 | 302 | 0.84 (0.81 to 0.88) | |
| Kaforou et al.20 | 203 | 302 | 0.86 (0.82 to 0.89) | |
| Maertsdorf37 | 203 | 302 | 0.86 (0.83 to 0.89) | |
| Roe et al.38 | 203 | 302 | 0.87 (0.84 to 0.90) | |
| Sweeney et al.39 | 203 | 302 | 0.87 (0.84 to 0.91) | |
| Dosanjh category 2 vs. Dosanjh category 4 | Anderson et al.36 | 78 | 302 | 0.78 (0.73 to 0.84) |
| Berry et al.18 | 78 | 302 | 0.68 (0.61 to 0.75) | |
| Kaforou et al.20 | 78 | 302 | 0.73 (0.66 to 0.80) | |
| Maertsdorf37 | 78 | 302 | 0.79 (0.74 to 0.85) | |
| Roe et al.38 | 78 | 302 | 0.79 (0.74 to 0.85) | |
| Sweeney et al.39 | 78 | 302 | 0.80 (0.74 to 0.85) |
| Comparison | Signature | Patients, n | Controls, n | AUC, % (95% CI) |
|---|---|---|---|---|
| PTB vs. OD | Anderson et al.36 | 128 | 302 | 0.84 (0.80 to 0.89) |
| Berry et al.18 | 128 | 302 | 0.83 (0.79 to 0.87) | |
| Kaforou et al.20 | 128 | 302 | 0.84 (0.80 to 0.89) | |
| Maertsdorf37 | 128 | 302 | 0.85 (0.81 to 0.89) | |
| Roe et al.38 | 128 | 302 | 0.86 (0.82 to 0.90) | |
| Sweeney et al.39 | 128 | 302 | 0.86 (0.82 to 0.90) | |
| EPTB vs. OD | Anderson et al.36 | 153 | 302 | 0.84 (0.80 to 0.87) |
| Berry et al.18 | 153 | 302 | 0.78 (0.73 to 0.82) | |
| Kaforou et al.20 | 153 | 302 | 0.82 (0.78 to 0.86) | |
| Maertsdorf37 | 153 | 302 | 0.83 (0.79 to 0.87) | |
| Roe et al.38 | 153 | 302 | 0.84 (0.80 to 0.87) | |
| Sweeney et al.39 | 153 | 302 | 0.85 (0.81 to 0.89) |
Appendix 6 Supporting data for proteomic signature validation
| Surface | MW (Da) | Protein ID |
|---|---|---|
| Q10 pH 9.5 low | 4357 and 4468 | Patent pending |
| CM10 pH 6.0 low | 8613 | Patent pending |
| IMAC | 5099/5092 | Patent pending |
| CM10 pH 6.0 | 13,762 and 13,801 | Patent pending |
Analysis for bridging study
| Protein | P1 (LC–MS), r (p-value) | P2 (LC–MS), r (p-value) | P3 (LC–MS), r (p-value) |
|---|---|---|---|
| P1 (SELDI-TOF) | 0.17 (0.027) | –0.215 (0.00060) | –0.14 (0.12) |
| P2 (SELDI-TOF) | 0.15 (0.085) | –0.15 (0.16) | 0.02 (0.68) |
| P3 (SELDI-TOF) | 0.12 (0.30) | –0.13 (0.83) | 0.07 (0.17) |
FIGURE 20.
Comparison of three proteins from the Hamilton and Levin (unpublished) signature with LC–MS data. (a) Correlation of protein 1 SELDI-TOF intensity for protein 1 with LC–MS ratio; and (b–d) dot plots for proteins 1–3 in LC–MS and SELDI-TOF data. Abundance was compared between groups using a Mann–Whitney U-test. P1, protein 1; P2, protein 2; P3, protein 3. **p < 0.005.
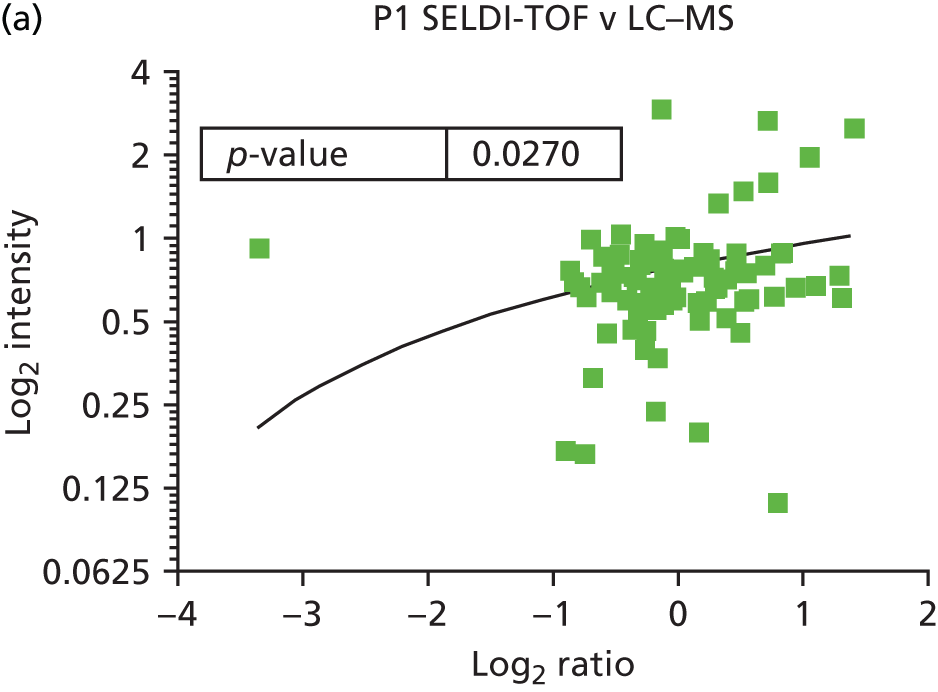
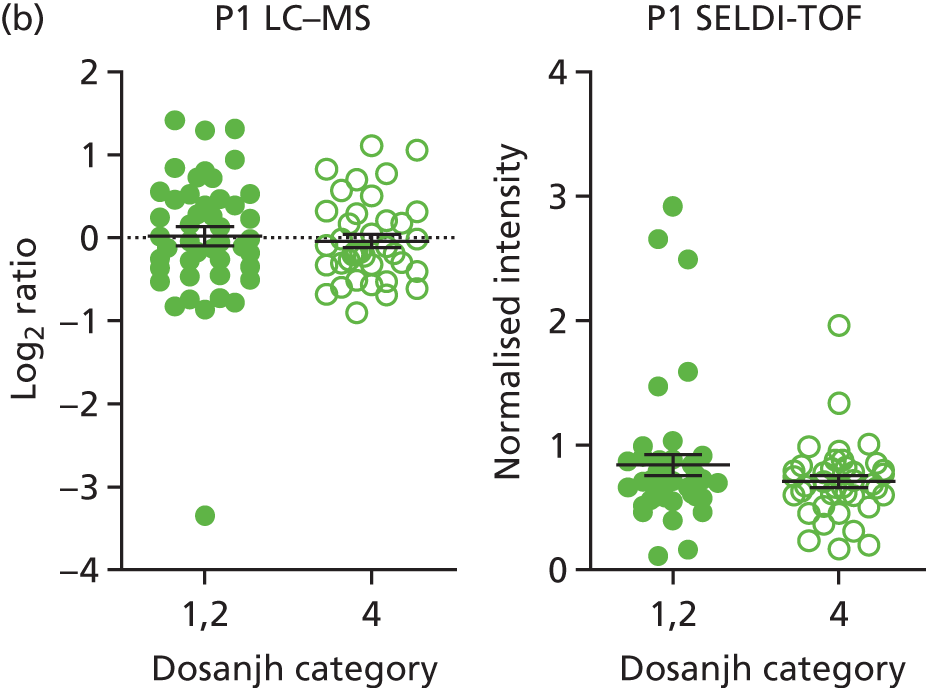
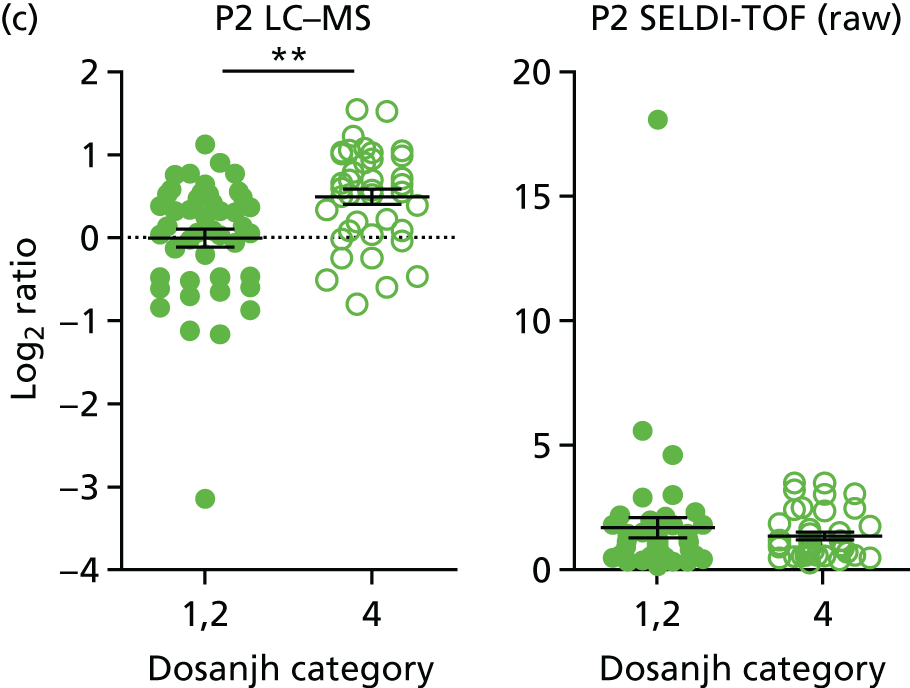
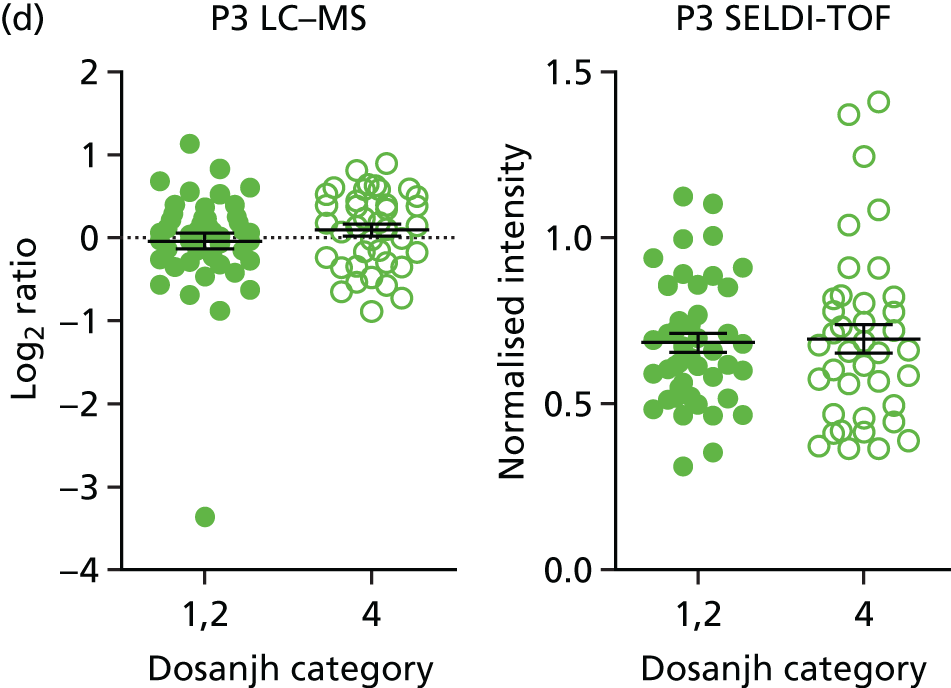
Abundance of signature proteins
| Signature (protein ID) | TB (Dosanjh categories 1 and 2) vs. OD (Dosanjh category 4) (minimum, maximum) | Culture-confirmed TB (Dosanjh category 1) vs. OD (Dosanjh category 4) (minimum, maximum) | Highly probable TB (Dosanjh category 2) vs. OD (Dosanjh category 4) (minimum, maximum) | ||||||
|---|---|---|---|---|---|---|---|---|---|
| ATB (n = 82) | OD (n = 84) | p-value overall | ATB (n = 60) | OD (n = 84) | p-value overall | ATB (n = 22) | OD (n = 84) | p-value overall | |
| Song et al.51 (P01009) | –0.10 (–0.98, 4.63) | –0.27 (–2.08, 4.36) | 0.007 | –0.07 (–0.98, 4.63) | –0.27 (–2.08, 4.36) | 0.001 | –0.24 (–0.58, 0.20) | –0.27 (–2.08, 4.36) | 0.668 |
| Xu et al.52 (P14780_MMP9) | –0.19 (–1.29, 4.10) | –0.20 (–2.97, 4.30) | 0.612 | –0.16 (–1.29, 4.10) | –0.20 (–2.97, 4.30) | 0.335 | –0.20 (–0.56, 0.00) | –0.20 (–2.97, 4.30) | 0.503 |
| Xu et al.52 (P06702_S100A9) | –0.21 (–0.96, 4.21) | –0.30 (–2.40, 3.85) | 0.036 | –0.16 (–0.96, 4.21) | –0.30 (–2.40, 3.85) | 0.008 | –0.27 (–0.58, 0.00) | –0.30 (–2.40, 3.85) | 0.858 |
| Xu et al.52 (P08294_SOD) | –0.28 (–1.53, 4.26) | –0.17 (–0.72, 4.56) | < 0.001 | –0.28 (–1.53, 4.26) | –0.17 (–0.72, 4.56) | < 0.001 | –0.30 (–0.55, 0.49) | –0.17 (–0.72, 4.56) | 0.019 |
| Hamilton and Levin (unpublished) (Levin 1) | –0.23 (–1.06, 4.36) | –0.11 (–2.23, 4.56) | < 0.001 | –0.23 (–1.06, 4.36) | –0.11 (–2.23, 4.56) | < 0.001 | –0.20 (–0.47, –0.05) | –0.11 (–2.23, 4.56) | 0.015 |
| Hamilton and Levin (unpublished) (Levin 2) | –0.20 (–0.94, 4.42) | –0.19 (–2.21, 4.44) | 0.233 | –0.20 (–0.94, 4.42) | –0.19 (–2.21, 4.44) | 0.795 | –0.23 (–0.44, –0.09) | –0.19 (–2.21, 4.44) | 0.018 |
| Hamilton and Levin (unpublished) (Levin 3) | –0.21 (–0.97, 4.51) | –0.23 (–1.89, 4.48) | 0.679 | –0.17 (–0.97, 4.51) | –0.23 (–1.89, 4.48) | 0.206 | –0.26 (–0.46, –0.02) | –0.23 (–1.89, 4.48) | 0.152 |
| Hamilton and Levin (unpublished) (Levin 4) | –0.21 (–1.30, 4.22) | –0.21 (–2.80, 4.63) | 0.475 | –0.20 (–1.30, 4.22) | –0.21 (–2.80, 4.63) | 0.59 | –0.23 (–0.91, 0.34) | –0.21 (–2.80, 4.63) | 0.493 |
| Achkar et al.21 (O00391) | –0.20 (–1.29, 4.31) | –0.17 (–2.89, 4.39) | 0.086 | –0.19 (–1.29, 4.31) | –0.17 (–2.89, 4.39) | 0.12 | –0.21 (–0.43, 0.00) | –0.17 (–2.89, 4.39) | 0.252 |
| Achkar et al.21 (P02654) | –0.23 (–1.08, 4.32) | –0.10 (–2.49, 4.68) | < 0.001 | –0.25 (–1.08, 4.32) | –0.10 (–2.49, 4.68) | < 0.001 | –0.19 (–0.44, 0.01) | –0.10 (–2.49, 4.68) | 0.04 |
| Achkar et al.21 (P07359) | –0.19 (–1.22, 4.34) | –0.18 (–2.48, 4.47) | 0.361 | –0.19 (–1.22, 4.34) | –0.18 (–2.48, 4.47) | 0.404 | –0.18 (–0.45, –0.04) | –0.18 (–2.48, 4.47) | 0.549 |
| Achkar et al.21 (P08571) | –0.19 (–1.31, 4.49) | –0.19 (–2.73, 4.47) | 0.804 | –0.19 (–1.31, 4.49) | –0.19 (–2.73, 4.47) | 0.644 | –0.20 (–0.50, 0.01) | –0.19 (–2.73, 4.47) | 0.773 |
| Achkar et al.21 (P12955) | –0.22 (–1.33, 3.74) | –0.18 (–2.63, 3.99) | < 0.001 | –0.23 (–1.33, 3.74) | –0.18 (–2.63, 3.99) | < 0.001 | –0.22 (–0.41, 0.01) | –0.18 (–2.63, 3.99) | 0.029 |
| Achkar et al.21 (P14151) | –0.18 (–1.14, 4.39) | –0.19 (–2.49, 4.53) | 0.608 | –0.17 (–1.14, 4.39) | –0.19 (–2.49, 4.53) | 0.399 | –0.19 (–0.42, 0.02) | –0.19 (–2.49, 4.53) | 0.703 |
| Achkar et al.21 (P22105) | –0.21 (–1.23, 4.33) | –0.15 (–2.56, 4.52) | 0.023 | –0.22 (–1.23, 4.33) | –0.15 (–2.56, 4.52) | 0.009 | –0.19 (–0.44, 0.01) | –0.15 (–2.56, 4.52) | 0.657 |
| Achkar et al.21 (P49747) | –0.24 (–1.17, 4.31) | –0.12 (–2.56, 4.59) | < 0.001 | –0.24 (–1.17, 4.31) | –0.13 (–2.56, 4.59) | 0.001 | –0.25 (–0.45, –0.03) | –0.15 (–2.56, 4.59) | 0.051 |
| Achkar et al.21 (P49908) | –0.23 (–1.17, 4.40) | –0.14 (–2.54, 4.52) | 0.001 | –0.23 (–1.17, 4.40) | –0.14 (–2.54, 4.52) | 0.002 | –0.22 (–0.45, 0.03) | –0.14 (–2.54, 4.52) | 0.038 |
| Achkar et al.21 (P51884) | –0.24 (–1.07, 4.39) | –0.12 (–2.16, 4.53) | < 0.001 | –0.26 (–1.07, 4.39) | –0.12 (–2.16, 4.53) | < 0.001 | –0.19 (0.49, 0.01) | –0.12 (2.16, 4.53) | –0.074 |
FIGURE 21.
Abundance of SERPINA1 (alpha-1-antitrypsin or P01009). (a) Box plot depicts the median values and distribution of data in Dosanjh categories 1, 2 and 4; (b) ROC curves present the ability of the levels of SERPINA1 protein to discriminate between all TB vs. OD; (c) either culture-confirmed TB (Dosanjh category 1) or highly probable TB (Dosanjh category 2) (1/2) vs. OD (Dosanjh category 4); and (d) PTB vs. OD or EPTB vs. OD. Medians were compared between groups using the Kruskal–Wallis test. **p < 0.005.
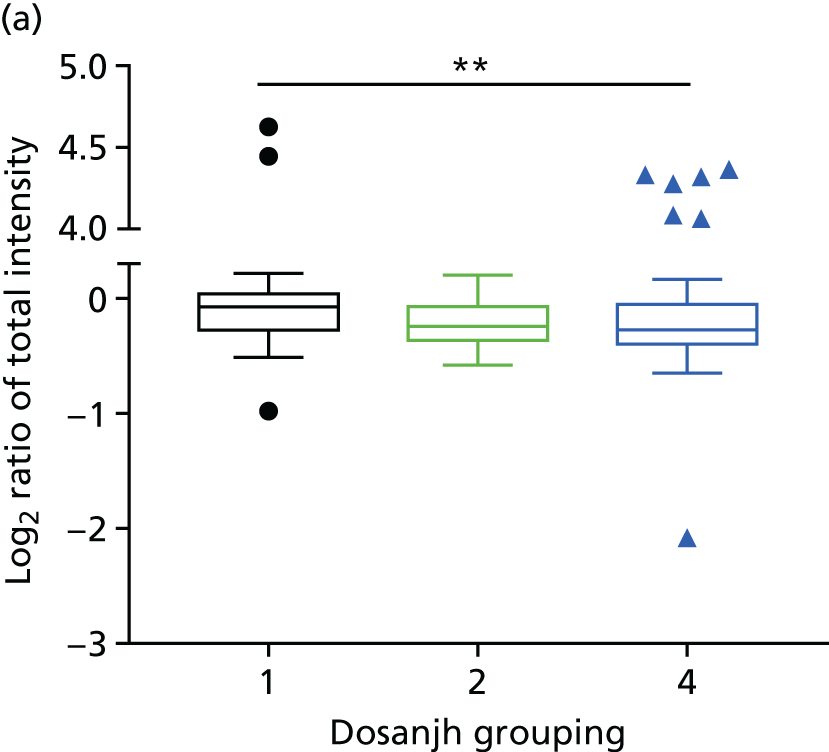
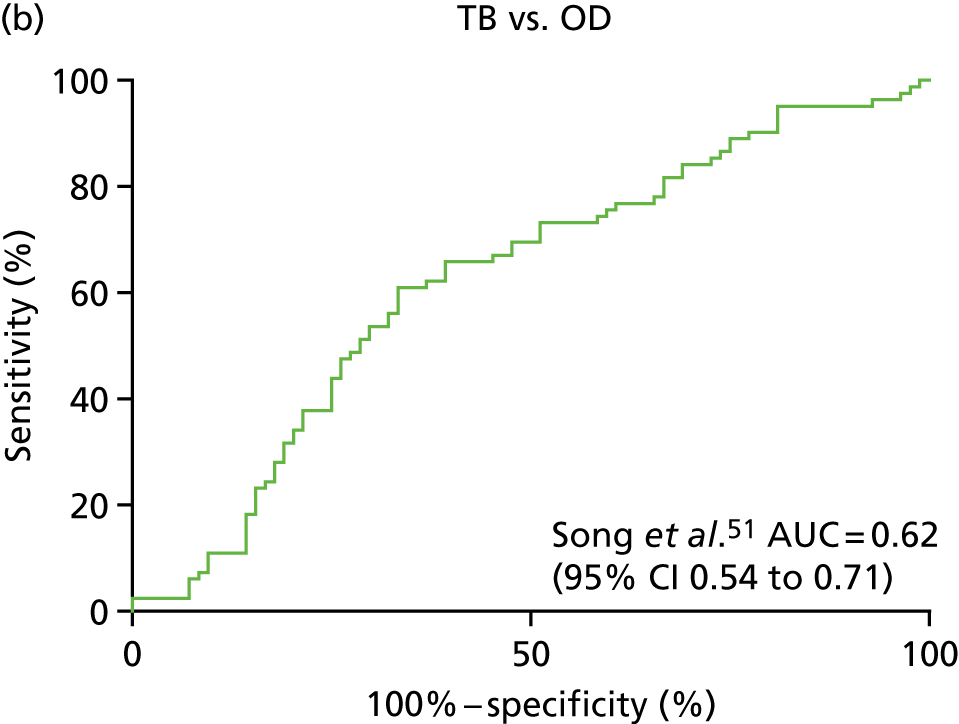
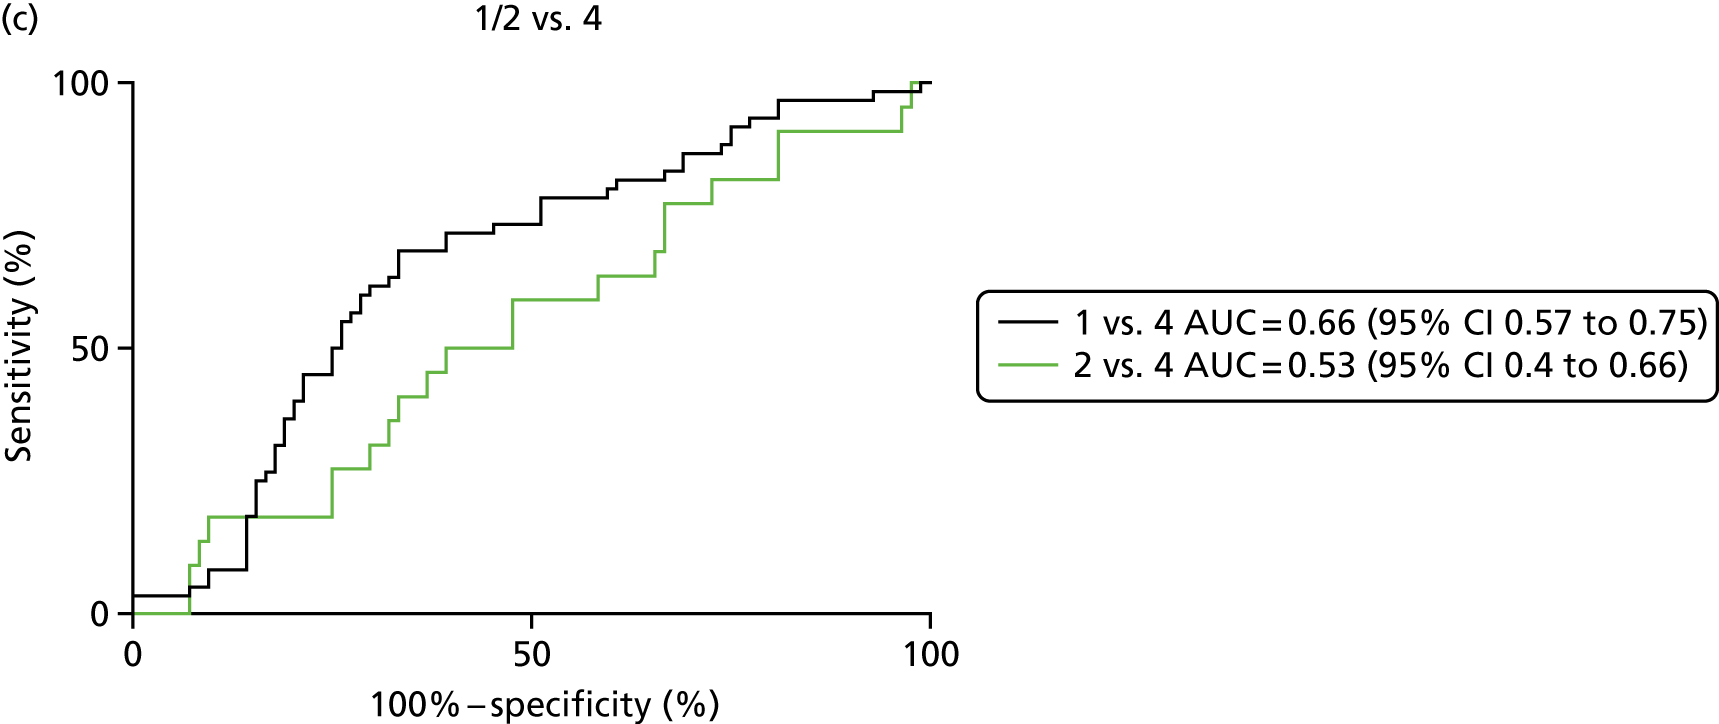
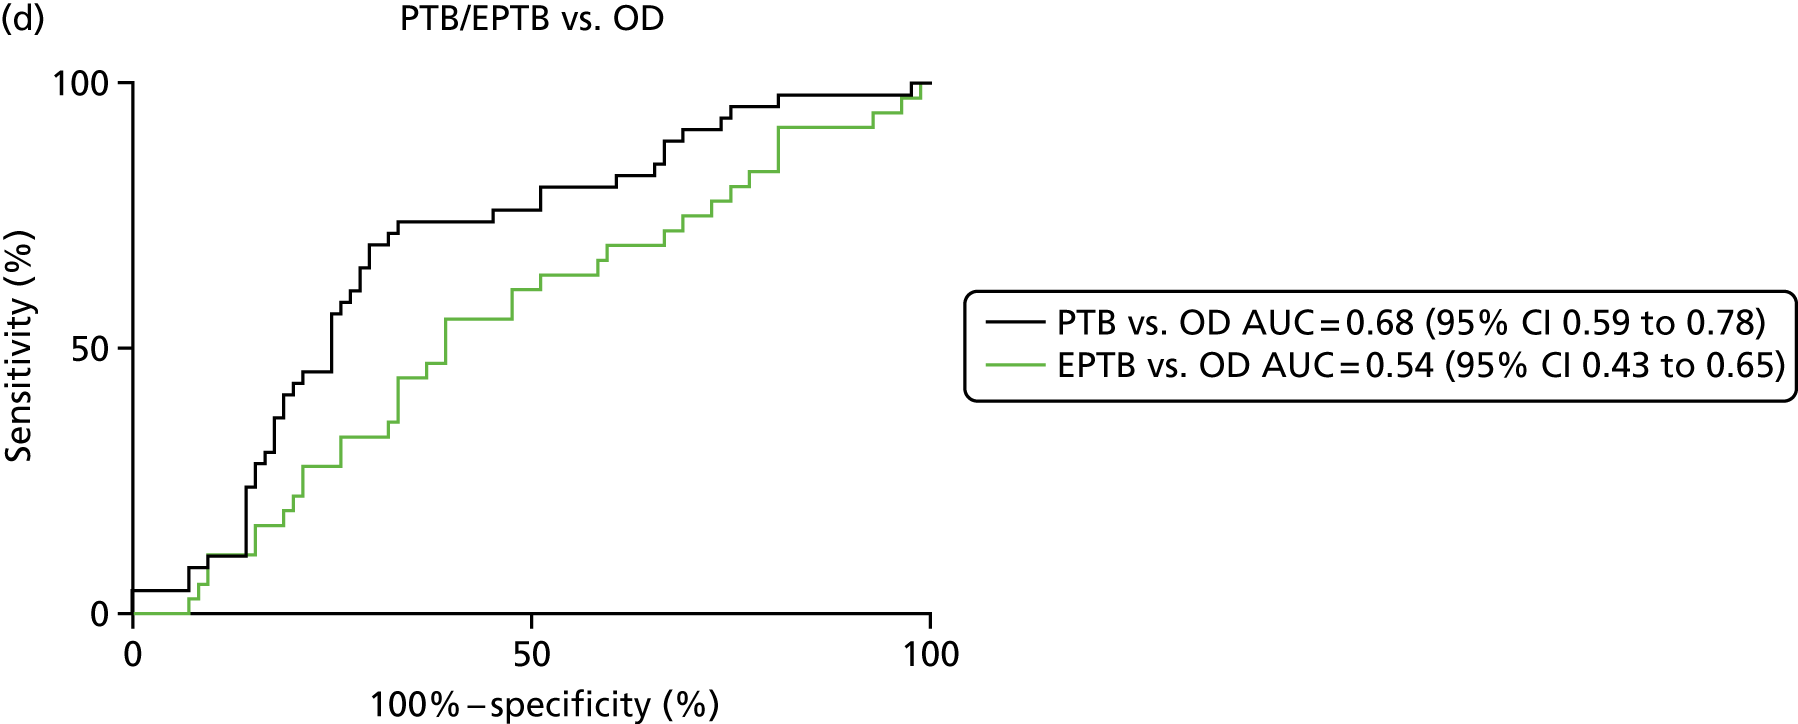
Missing and imputed data
Spreadsheets detailing the missing data for each signature are available on request.
| Study | Published signature | Depleted LC–MS missing values, % | Crude_Dundee LC–MS missing values, % |
|---|---|---|---|
| Song et al.51 | P01009 | 0 | 0 |
| Xu et al.52 | P06702 | 21.43 | 61.65 |
| Xu et al.52 | P08294 | 0.6 | Not Measured |
| Xu et al.52 | P14780 | 10.71 | Not measured |
| Hamilton and Levin (unpublished) | Levin 1 | 0 | 0 |
| Hamilton and Levin (unpublished) | Levin 2 | 0 | 0 |
| Hamilton and Levin (unpublished) | Levin 3 | 0 | 11.11 |
| Hamilton and Levin (unpublished) | Levin 4 | 0 | 65.59 |
| Achkar et al.21 | O00391 | 0 | Not measured |
| Achkar et al.21 | P02654 | 0 | 0 |
| Achkar et al.21 | P07359 | 0 | Not measured |
| Achkar et al.21 | P08571 | 0 | 96.77 |
| Achkar et al.21 | P12955 | 21.43 | Not measured |
| Achkar et al.21 | P14151 | 0 | Not measured |
| Achkar et al.21 | P22105 | 0 | Not measured |
| Achkar et al.21 | P49747 | 0 | Not measured |
| Achkar et al.21 | P49908 | 0 | Not measured |
| Achkar et al.21 | P51884 | 0 | 0 |
| Characteristic | TB vs. OD | 1 vs. 4 | 2 vs. 4 | PTB vs. OD | EPTB vs. OD |
|---|---|---|---|---|---|
| Patients, n | 82 | 60 | 22 | 46 | 36 |
| Control, n | 84 | 84 | 84 | 84 | 84 |
| AUC, % (95% CI) | 0.62 (0.54 to 0.71) | 0.66 (0.57 to 0.75) | 0.53 (0.4 to 0.66) | 0.68 (0.59 to 0.78) | 0.54 (0.43 to 0.65) |
| Cut-off point | –0.44* | –0.42* | –0.53* | –0.4* | –0.53* |
| –0.11$ | –0.11$ | –0.11$ | –0.11$ | –0.11$ | |
| Sensitivity, % (95% CI) | 95 (88 to 99)* | 95 (86 to 99)* | 95 (77 to 100)* | 96 (85 to 99)* | 97 (85 to 100)* |
| 11 (5.1 to 20)$ | 8.3 (2.8 to 18)$ | 18 (5.2 to 40)$ | 11 (3.6 to 24)$ | 11 (3.1 to 26)$ | |
| Specificity, % (95% CI) | 19 (11 to 29)* | 19 (11 to 29)* | 3.6 (0.74 to 10)* | 25 (16 to 36)* | 3.6 (0.74 to 10)* |
| 90 (82 to 96)$ | 90 (82 to 96)$ | 90 (82 to 96)$ | 90 (82 to 96)$ | 90 (82 to 96)$ |
Appendix 7 Additional analyses for diagnostic evaluation of serum protein signatures for detection of active tuberculosis using linear discriminant analysis
| Signature, reference | TB, n | OD/LTBI, n | AUC, % (95% CI) | Cut-off point | Sensitivity, % (95% CI) | Specificity, % (95% CI) |
|---|---|---|---|---|---|---|
| Xu et al.52 | 82 | 84 | 0.66 (0.58 to 0.75) | > 0.29a | 95.1 (88 to 98.7) | 14.3 (7.6 to 23.6) |
| > 0.65b | 8.5 (3.5 to 16.8) | 90.5 (82.1 to 95.8) | ||||
| Hamilton and Levin (unpublished) | 82 | 84 | 0.64 (0.55 to 0.72) | > 0.34a | 95 (88 to 98.6) | 14.1 (7.5 to 23.3) |
| > 0.63b | 25.6 (16.6 to 36.4) | 90.5 (82.1 to 95.8) | ||||
| Achkar et al.21 | 82 | 84 | 0.68 (0.60 to 0.76) | > 0.18a | 95.1 (88 to 98.7) | 11.9 (5.9 to 20.8) |
| > 0.77b | 20.7 (12.6 to 31.1) | 90.5 (82.1 to 95.8) |
| Comparison | Signature | Patients, n | Controls, n | AUC, % (95% CI) |
|---|---|---|---|---|
| 1 vs. 4 | Xu et al.52 | 60 | 84 | 0.70 (0.61 to 0.79) |
| Hamilton and Levin (unpublished) | 60 | 84 | 0.67 (0.58 to 0.76) | |
| Achkar et al.21 | 60 | 84 | 0.70 (0.62 to 0.79) | |
| 2 vs. 4 | Xu et al.52 | 22 | 84 | 0.59 (0.46 to 0.72) |
| Hamilton and Levin (unpublished) | 22 | 84 | 0.57 (0.45 to 0.69) | |
| Achkar et al.21 | 22 | 84 | 0.55 (0.41 to 0.69) | |
| EPTB vs. OD | Xu et al.52 | 36 | 84 | 0.61 (0.50 to 0.71) |
| Hamilton and Levin (unpublished) | 36 | 84 | 0.51 (0.40 to 0.62) | |
| Achkar et al.21 | 36 | 84 | 0.60 (0.49 to 0.70) | |
| PTB vs. OD | Xu et al.52 | 46 | 84 | 0.67 (0.57 to 0.78) |
| Hamilton and Levin (unpublished) | 46 | 84 | 0.69 (0.59 to 0.78) | |
| Achkar et al.21 | 46 | 84 | 0.70 (0.60 to 0.79) |
Appendix 8 Validation of published proteomic signatures using liquid chromatography–mass spectrometry by linear discriminant analysis(with the removal of sarcoidosis)
| Signature, reference | TB, n | OD, n | AUC, % (95% CI) | Cut-off point | Sensitivity, % (95% CI) | Specificity, % (95% CI) |
|---|---|---|---|---|---|---|
| Xu et al.52 | 82 | 79 | 0.68 (0.60 to 0.76) | > 0.30 | 95.1 (88 to 98.7) | 13.9 (7.16 to 23.6) |
| > 0.65 | 11 (5.1 to 19.8) | 91.1 (82.6 to 96.4) | ||||
| Hamilton and Levin (unpublished) | 82 | 79 | 0.65 (0.56 to 0.73) | > 0.35 | 95.1 (88 to 98.7) | 19 (11 to 29.4) |
| > 0.69 | 19.5 (11.6 to 29.7) | 91.1 (82.6 to 96.4) | ||||
| Achkar et al.21 | 82 | 79 | 0.69 (0.60 to 0.76) | > 0.21 | 95.1 (88 to 98.7) | 13.9 (7.2 to 23.6) |
| > 0.76 | 24.4 (15.6 to 35.1) | 91.1 (82.6 to 96.4) |
| Comparison | Signature | TB, n | OD, n | AUC, % (95% CI) |
|---|---|---|---|---|
| 1 vs. 4 | Xu et al.52 | 60 | 79 | 0.72 (0.63 to 0.81) |
| Hamilton and Levin (unpublished) | 60 | 79 | 0.68 (0.59 to 0.77) | |
| Achkar et al.21 | 60 | 79 | 0.71 (0.63 to 0.80) | |
| 2 vs. 4 | Xu et al.52 | 22 | 79 | 0.60 (0.47 to 0.73) |
| Hamilton and Levin (unpublished) | 22 | 79 | 0.55 (0.43 to 0.67) | |
| Achkar et al.21 | 22 | 79 | 0.53 (0.39 to 0.67) | |
| EPTB vs. OD | Xu et al.52 | 36 | 79 | 0.63 (0.53 to 0.74) |
| Hamilton and Levin (unpublished) | 36 | 79 | 0.53 (0.42 to 0.64) | |
| Achkar et al.21 | 36 | 79 | 0.60 (0.49 to 0.70) | |
| PTB vs. OD | Xu et al.52 | 46 | 79 | 0.69 (0.59 to 0.79) |
| Hamilton and Levin (unpublished) | 46 | 79 | 0.70 (0.61 to 0.80) | |
| Achkar et al.21 | 46 | 79 | 0.70 (0.61 to 0.00) |
Appendix 9 Additional information for flow cytometry introduction and methods
The BV421 fluorochrome on the IFNγ-specific antibody invariably showed a false-positive signal in unstimulated samples. This increased background manifested as an aggregate population on the CD3-positive population, an observation that has been noted for the BV421 fluorochrome and specific IFNγ antibodies elsewhere. 77 The false positive could easily be differentiated from a true-positive signal based on the fluorescence in other channels; the ‘streak’ was not positive for AF700 or APC and showed an increasing fluorescence in the BV510 channel. The BV421 aggregate was therefore removed from each file before the final cytokine gates were applied, by selecting the ‘streak’ of artefact staining on the IFNγ-positive TNF-α-positive plot within the CD3-positive population (Tables 42 and 43, Figures 22–24).
| Summary | Harari et al.24 | Pollock et al.25 | Rozot et al.58 | Portevin et al.27 | Petruccioli et al.28 | Adekambi et al.26 |
|---|---|---|---|---|---|---|
| Signature | %TNF-α-only | %TEFF | SCORE (combination of %TNF-α-only and presence of IFNγ response) | CD27 MFI ratio | %CD27–CD45RA | %HLA-DR positive |
| Parent population | CD4 positive, cytokine positive (IFNγ/IL-2/TNF-α) | CD4 positive, TNF-α only | CD4 positive, cytokine positive and CD8 positive | CD4 positive, IFNγ positive | CD4 positive, IFNγ positive | CD4 positive, IFNγ positive |
| TB type, na | Culture-positive PTB/EPTB, 16 | Culture-positive PTB, 13 | C+/– PTB/EPTB, 53 | Children C+/– PTB, 6 | Culture-positive PTB, 13 | Culture-positive PTB, 26 |
| LTBI type, na | Healthy, 77 | Healthy (HIV+/–), 21 | Healthy, 141 | Healthy children, 30 | Healthy, 30 | Healthy, 25 |
| HIV included? | No | Yes | No | No | No | No (in validation) |
| AUCa | 0.99 | 0.99 | 0.89 | – | 0.85 (%CD45RA–CD27–); 0.91 (%CD45RA–CD27+) | 1.0 |
| Sensitivity, %a | 100 | 100 | 81.1 | 83.3 | 69.2 (%CD45RA–CD27–); 76.9 (%CD45RA–CD27+) | 100 |
| Specificity, %a | 96 | 92.9 | 86.5 | 95.6–100 | 87% (%CD45RA–CD27–); 90% (%CD45RA–CD27+) | 96 |
| Internal validation | Yes (AUC 0.82) and includes C+/– and EPTB | No | No | Yes | No | Yes |
| External validation | Wilkinson et al.59 (did not work) | Halliday et al.78 (AUC vs. remote 0.99) | No | Petruccioli et al.28 (AUC) | – | Wilkinson et al.59 HIV+/– (AUC = 0.98); Riou et al.60 HIV+/– (AUC 0.92/0.99) |
| Target | Surface/intracellular | Species, isotype, clone | Fluorochrome | Bandpass Filter Fortessa A | Dilution | Company supplied |
|---|---|---|---|---|---|---|
| CD45RA | Surface | Mouse IgG1, κ, HI3O RUO | BUV395 | 355–450/50 | 1 in 100 | Becton Dickinson and Company |
| CD3 | Surface | Mouse IgG2a, κ, HIT3a | FITC | 488–530/30 | 1 in 30 | BioLegend |
| CD4 | Surface | Mouse IgG2b, κ, OKT4 | BV510 | 405–425/50 | 1 in 30 | BioLegend |
| CD8 | Surface | Mouse (BALB/c) IgG1, κ, SK1 | BV605 | 405–560/520 | 1 in 30 | BioLegend |
| CCR7 | Surface | Rat IgG2a, κ, 3D12 | PE-Cy7 | 561–780/60 | 1 in 15 | Becton Dickinson and Company |
| CD127 | Surface | Mouse IgG1, κ, HIL-7R-M21 | PE | 561–582/15 | 1 in 40 | Becton Dickinson and Company |
| CD27 | Surface | Mouse IgG1, κ, O323 | BV785 | 405–655/8 | 1 in 40 | BioLegend |
| HLA-DR | Surface | Mouse IgG2a, κ, L243 | PerCP-Cy5.5 | 488–710/50 | 1 in 40 | BioLegend |
| IFNγ | IC | Mouse IgG1, κ, 4S.B3 | BV421 | 405–450/50 | 1 in 30 | BioLegend |
| TNF-α | IC | Mouse IgG1, κ, MAb11 | APC | 640–670/14 | 1 in 50 | BioLegend |
| IL-2 | IC | Rat IgG2a, κ, MQ1-17H12 | AF700 | 640–720/40 | 1 in 50 | BioLegend |
FIGURE 22.
Initial basic gating strategies for the cellular immunological signatures as set on FlowJo version 10. Gates were set on the lymphocyte populations, live cells and on single cells, and further gated on the CD3-positive population. FITC, fluorescein isothiocyanate; FSC, forward scatter; SSC, side scatter.
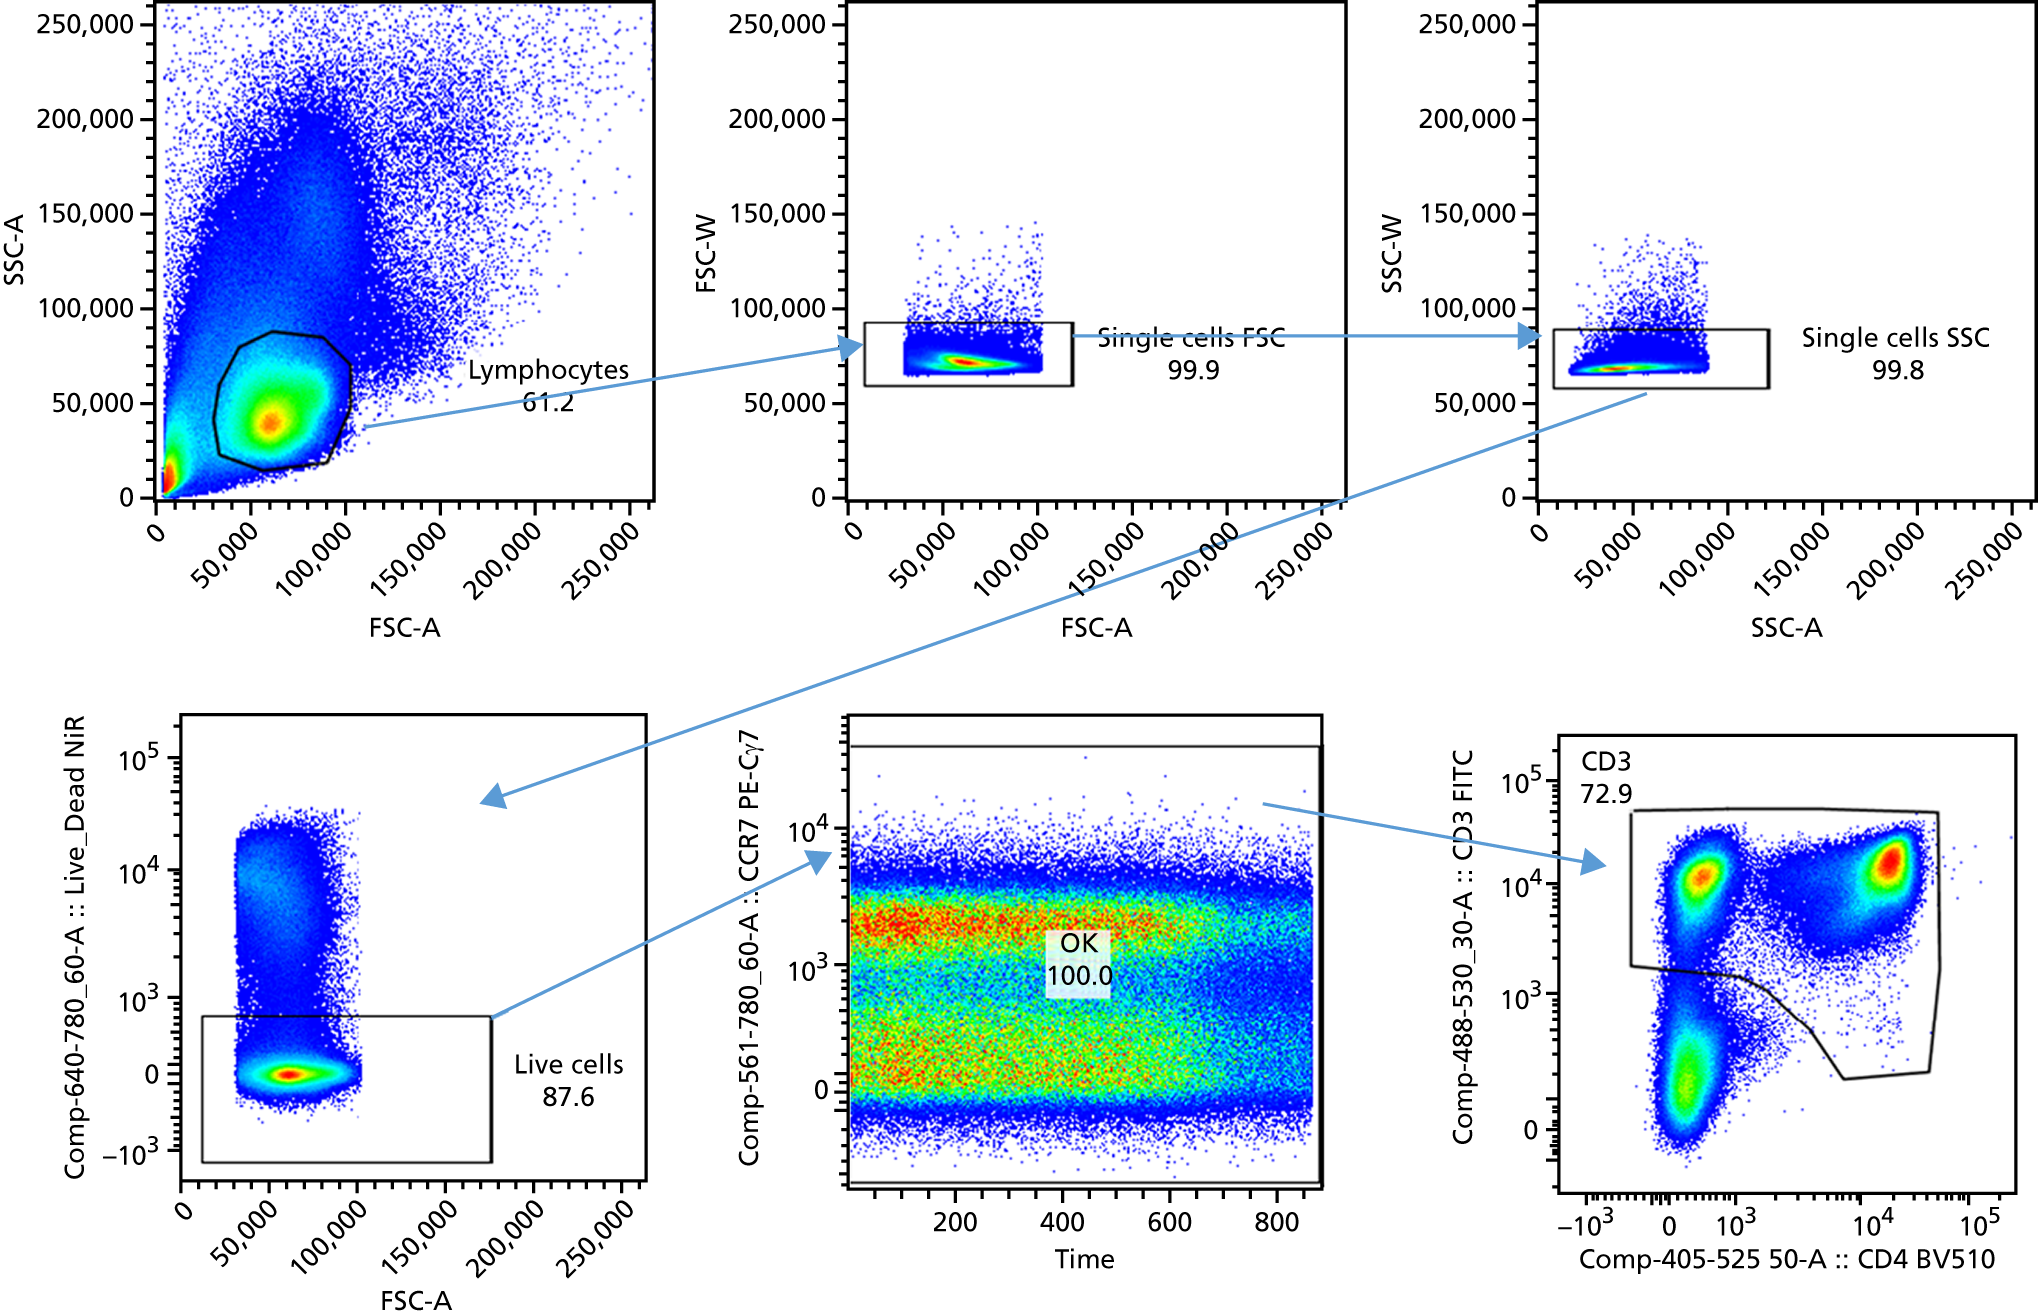
FIGURE 23.
Gating strategies for the validating signatures exploring IFNγ-positive cytokine responses within the CD4-positive population. Petruccioli et al. 28 measures memory cells lost in differentiation, Portevin et al. 27 incorporates a MFI ratio for measuring differentiation and Adekambi et al. 26 measures the %HLA-DR activation marker.
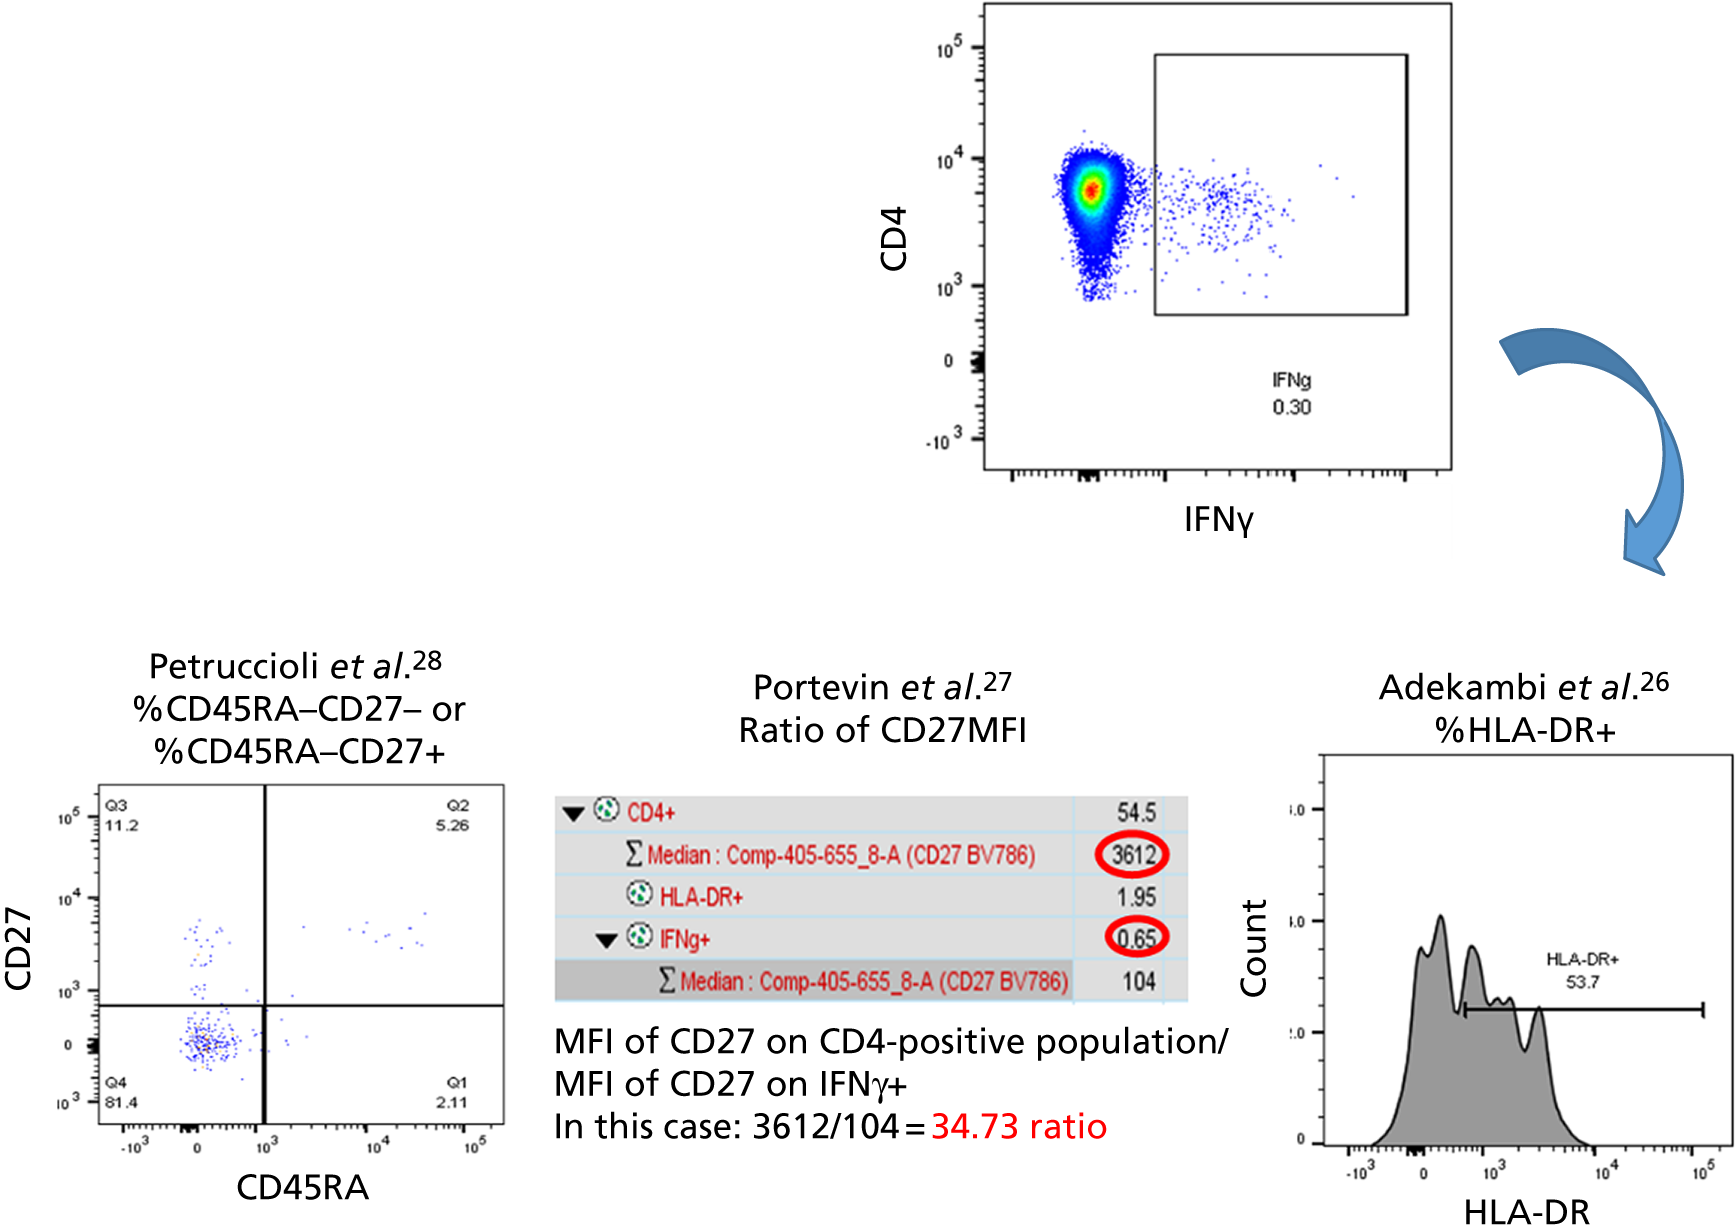
FIGURE 24.
Gating strategy for validating Pollock et al. 25 and Harari et al. 24 signatures. Pollock et al. investigates the effector phenotype within the CD4-positive TNF-α-only population (IFNγ negative, IL-2 negative, TNF-γ positive) and Harari et al. 24 investigates %TNF-α positive within any cytokine producers in the CD4-positive population.
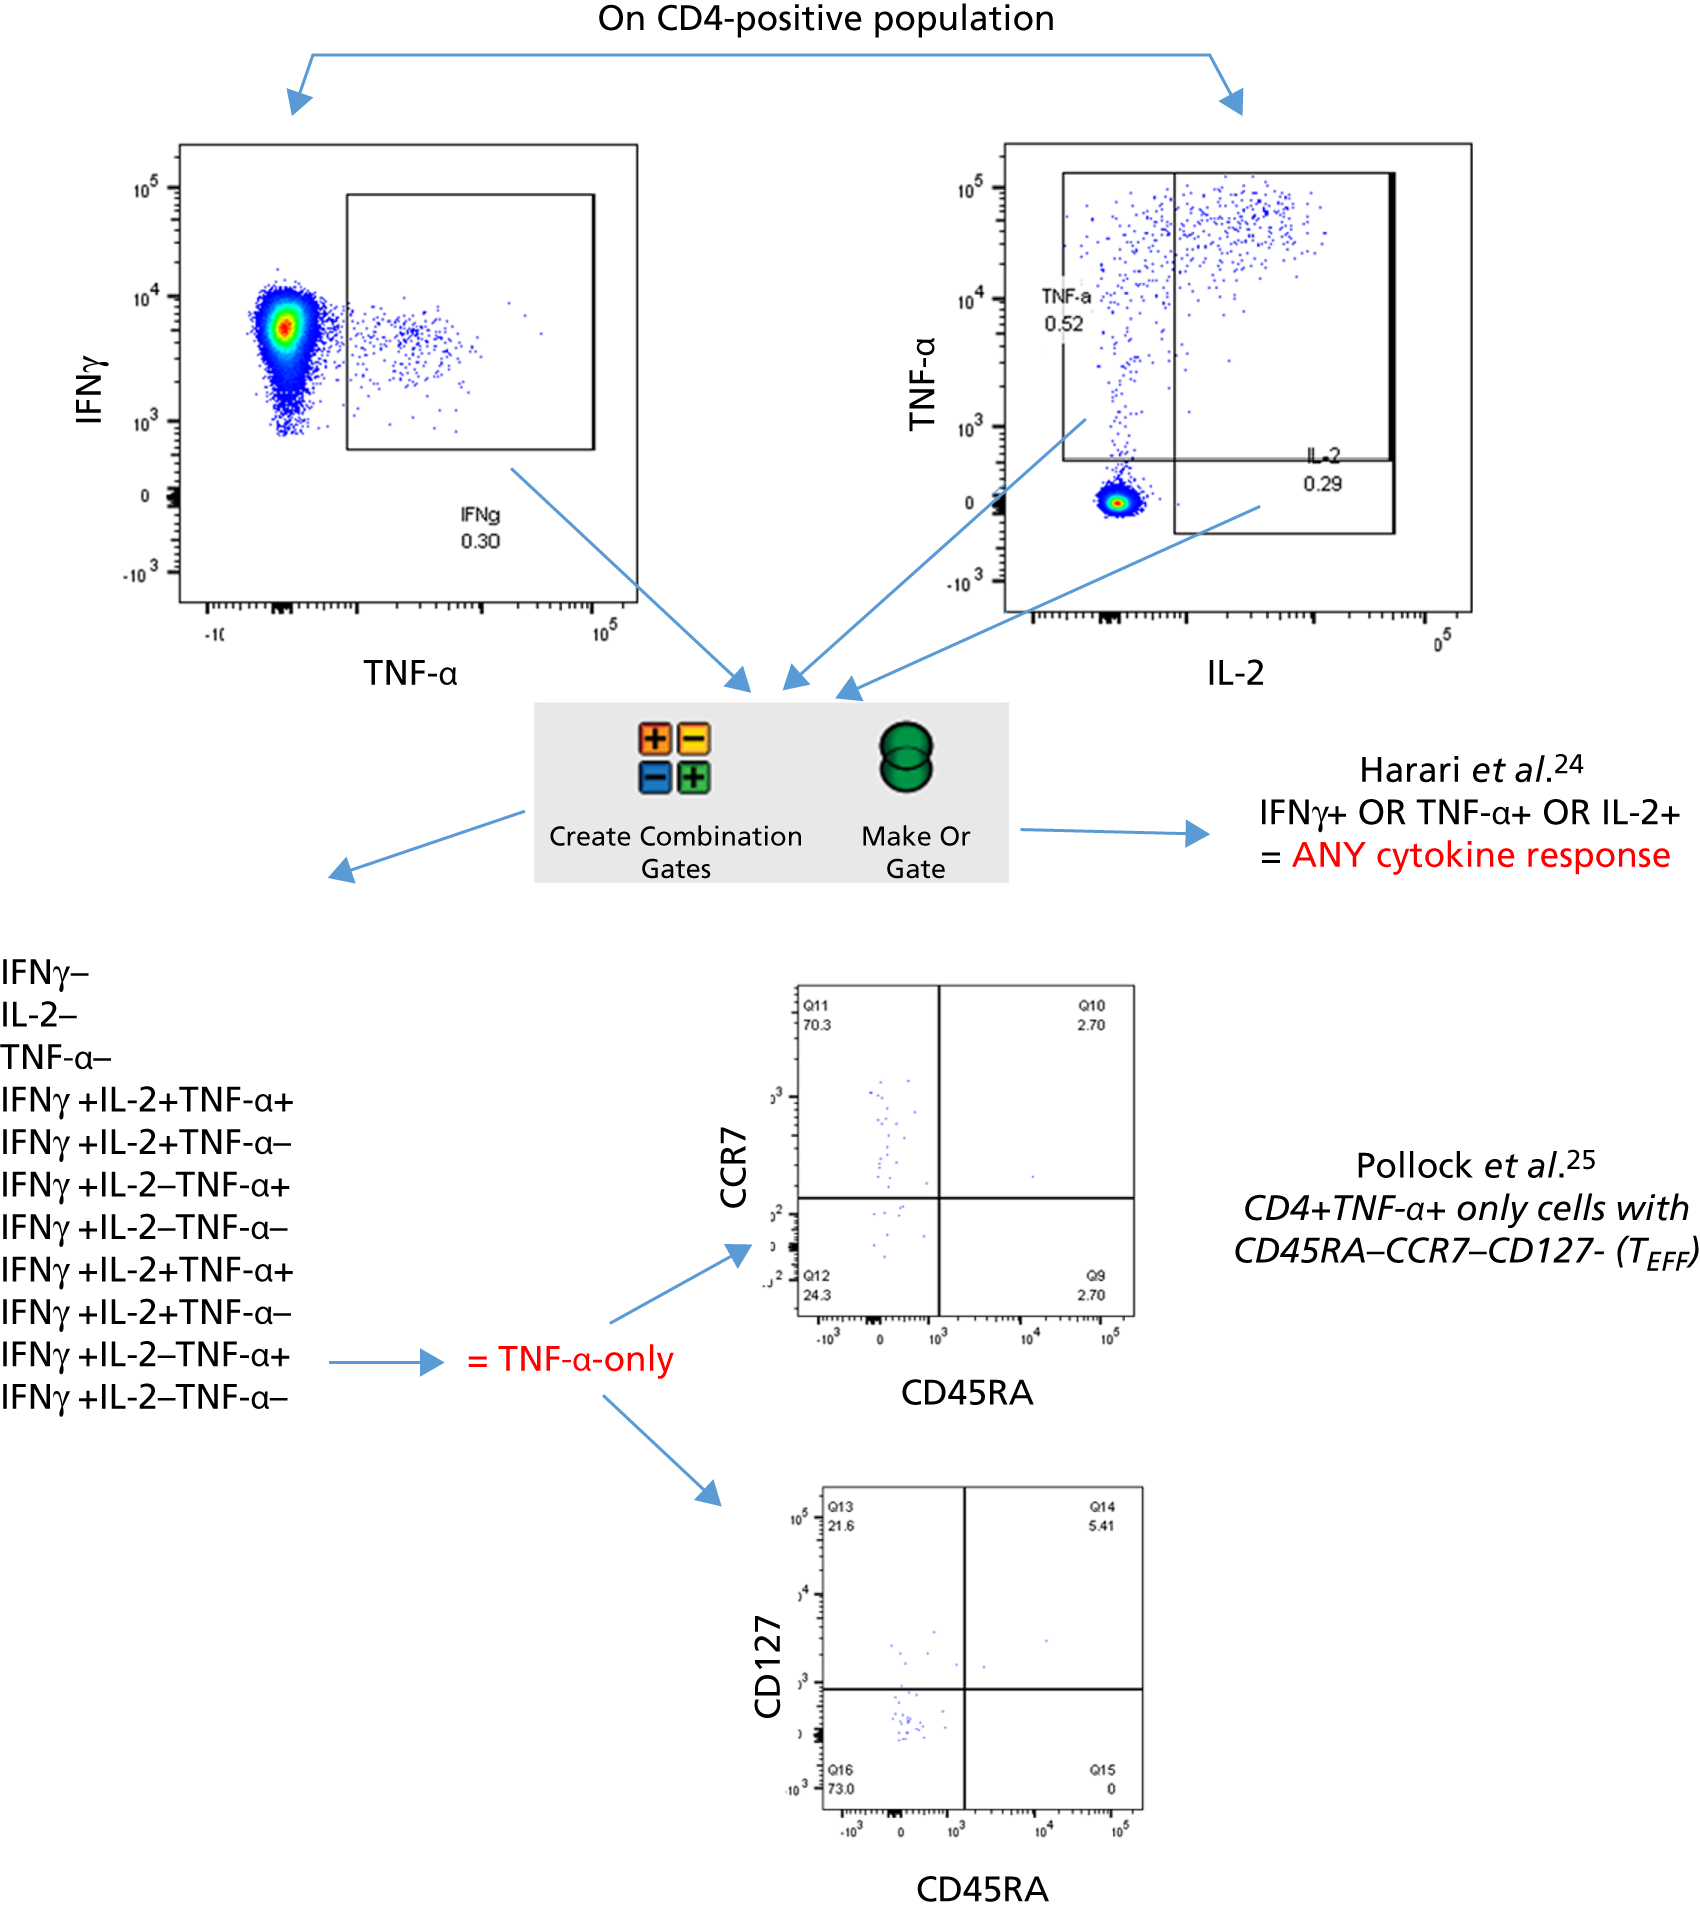
Appendix 10 Additional cohort characteristics of the validation of cellular immune signatures sub-study
| Type of TB | Culture-confirmed TB (Dosanjh category 1) | Highly probable TB (Dosanjh category 2) | All TB (total) |
|---|---|---|---|
| All TB, n | 60 | 32 | 92 |
| Culture, n (%) | |||
| Positive | 60 (100) | 0 (0) | 60 (65.2) |
| Negative | 0 (0) | 27 (84.4) | 27 (29.4) |
| Not tested/failed | 0 (0) | 5 (15.6) | 5 (5.4) |
| Smear, n (%) | |||
| Positive | 18 (30) | 2 (6.3) | 20 (21.8) |
| Negative | 34 (56.7) | 25 (78.1) | 59 (64.1) |
| Not tested/failed | 8 (13.3) | 5 (15.6) | 13 (14.1) |
| PTB, n (%) | 30 (50) | 4 (12.5) | 34 (37) |
| EPTB, n (%) | 19 (31.7) | 27 (84.4) | 46 (50) |
| PTB + EPTB, n (%)a | 11 (18.3) | 1 (3.1) | 12 (13) |
| Site of infection, n (%)b | |||
| Abdomen | 1 (1.7) | 1 (3.1) | 2 (2.2) |
| Brains | 1 (1.7) | 2 (6.2) | 3 (3.3) |
| Chest | 1 (1.7) | 1 (3.1) | 2 (2.2) |
| Lungs | 41 (68.3) | 5 (15.6) | 46 (50) |
| Lymph node | 22 (36.7) | 16 (50) | 38 (41.3) |
| Miliary TB | 3 (5) | 0 (0) | 3 (3.3) |
| Pericardium | 2 (3.3) | 1 (3.1) | 3 (3.3) |
| Pleura | 3 (5) | 2 (6.2) | 5 (5.4) |
| Spine | 2 (3.3) | 2 (6.2) | 4 (4.3) |
| Other (skin, eye, liver, bowel, CNS, intestine, neck, peritoneum) | 3 (5) | 4 (12.5) | 7 (7.6) |
| Diagnosis | n (%) |
|---|---|
| Cancer | 8 (8.7) |
| Pneumonia | 11 (11.9) |
| Sarcoidosis (including sarcoidosis and other) | 3 (3.3) |
| LRTI/chest infection | 9 (9.8) |
| URTI | 4 (4.3) |
| Self-resolving illness | 9 (9.8) |
| Other | 48 (52.2) |
Appendix 11 Viability, cell recovery and cytokine responses to antigens
Recovery and viability
Vials of PBMCs from baseline blood samples of TB suspects were collected into the IDEA study biobank between 2011 and 2013. The vials used in this substudy were kept in cryogenic conditions for a median of 60 months (range 38–70 months), before being defrosted and used in experiments. After defrosting of cells and washing, cells were counted and compared with the total number of stored cells when cryopreservered. The mean recovery of live cells from cryopreserved PBMC vials for the full cohort was 48.1% (range 0–116.7%, median 48.4%), with a mean viability of 81% (range 0–100%, median 85%). The recovery rate from the HIV+ participants was lower than from the HIV– participants (median of 48.96% in HIV– participants vs. 33.33% in HIV+ participants; p = 0.01), when compared using a Mann–Whitney U-test. No differences were observed between TB and OD groups (whether or not HIV status was used to further stratify these groups).
Responses to antigen stimulations
Positive control antigen
Ionomycin/PMA was used as a positive control stimulation to ensure that the assay was successfully able to detect a definite response to stimulation, in the form of cytokine production. All of the samples stimulated with PMA/ionomycin produced the three cytokines to a level that was at least twice above background, displaying wide ranges of responses, from < 1% to > 90% of cells producing cytokines (Table 46).
| Measurement | All TB (N = 90) | Dosanjh category | ||
|---|---|---|---|---|
| 1 (N = 58) | 2 (N = 32) | OD/LTBI: 4 (N = 91) | ||
| Stimulated, n | 90 | 58 | 32 | 88 |
| Cytokine responses, n with response over background (%), % range | ||||
| CD4-positive IFNγ response | 90 (100), 0.28–46.9 | 58 (100), 0.28–46.9 | 32 (100), 1.89–46.2 | 88 (100), 3.7–53.4 |
| CD4-positive IL-2 response | 90 (100), 0.26–55 | 58 (100), 0.26–47.4 | 32 (100), 8.23–55 | 88 (100), 20.9–63.5 |
| CD4-positive TNF-α response | 90 (100), 0.46–81.4 | 58 (100), 0.46–81.4 | 32 (100), 16.5–75.9 | 88 (100) |
| CD4-positive TNF-α-only response | 90 (100), 0.12–30.5 | 58 (100), 0.12–30.5 | 32 (100), 5.79–29.6 | 87 (99) |
| CD4-positive any cytokine response | 90 (100), 0.46–84.6 | 58 (100), 0.46–84.6 | 32 (100), 20.3–79.3 | 87 (99) |
| CD8-positive IFNγ response | 90 (100), 1.82–89.8 | 58 (100), 1.82–89.8 | 32 (100), 11.2–79.2 | 88 (100) |
| CD8-positive IL-2 response | 90 (100), 0.68–54.2 | 58 (100), 0.68–54.2 | 32 (100), 0.94–50.5 | 88 (100) |
| CD8-positive TNF-α-positive response | 90 (100), 5.99–95.3 | 58 (100), 5.99–95.3 | 32 (100), 16.4–91.9 | 88 (100) |
It was noted that the PMA/ionomycin condition reduced the viability of the lymphocyte population compared with the other conditions. Furthermore, this stimulation resulted in a massive reduction in the surface expression of CD4, such that the proportion of CD4-positive cells, as measured by flow cytometry staining, was dramatically reduced (Figure 25).
FIGURE 25.
The effect of PMA/ionomycin on (a) viability of lymphocytes; and (b) CD4-positive surface expression. ****p < 0.0001.
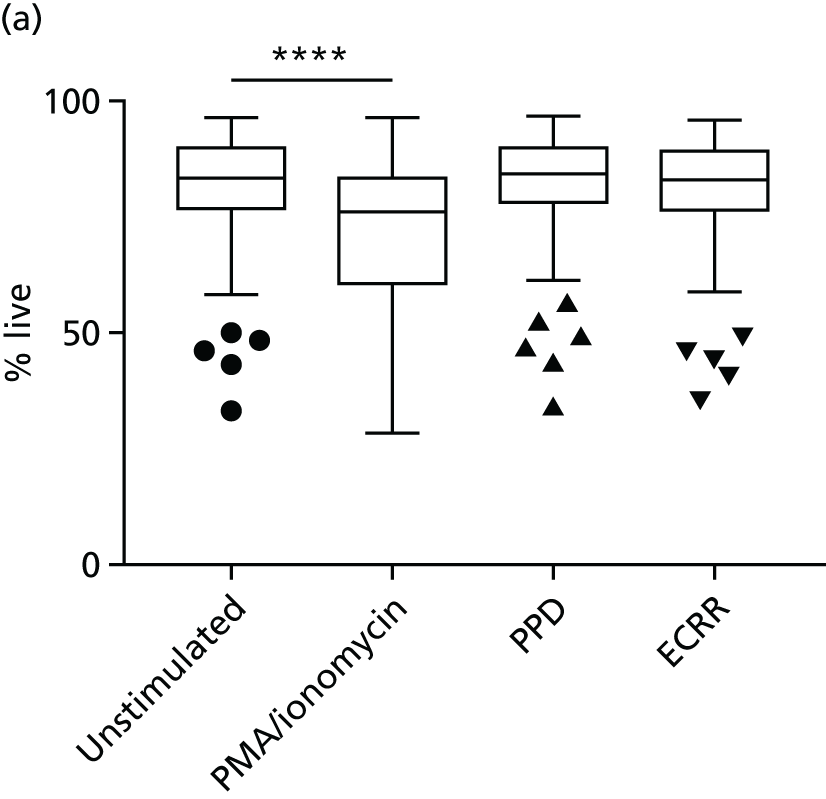
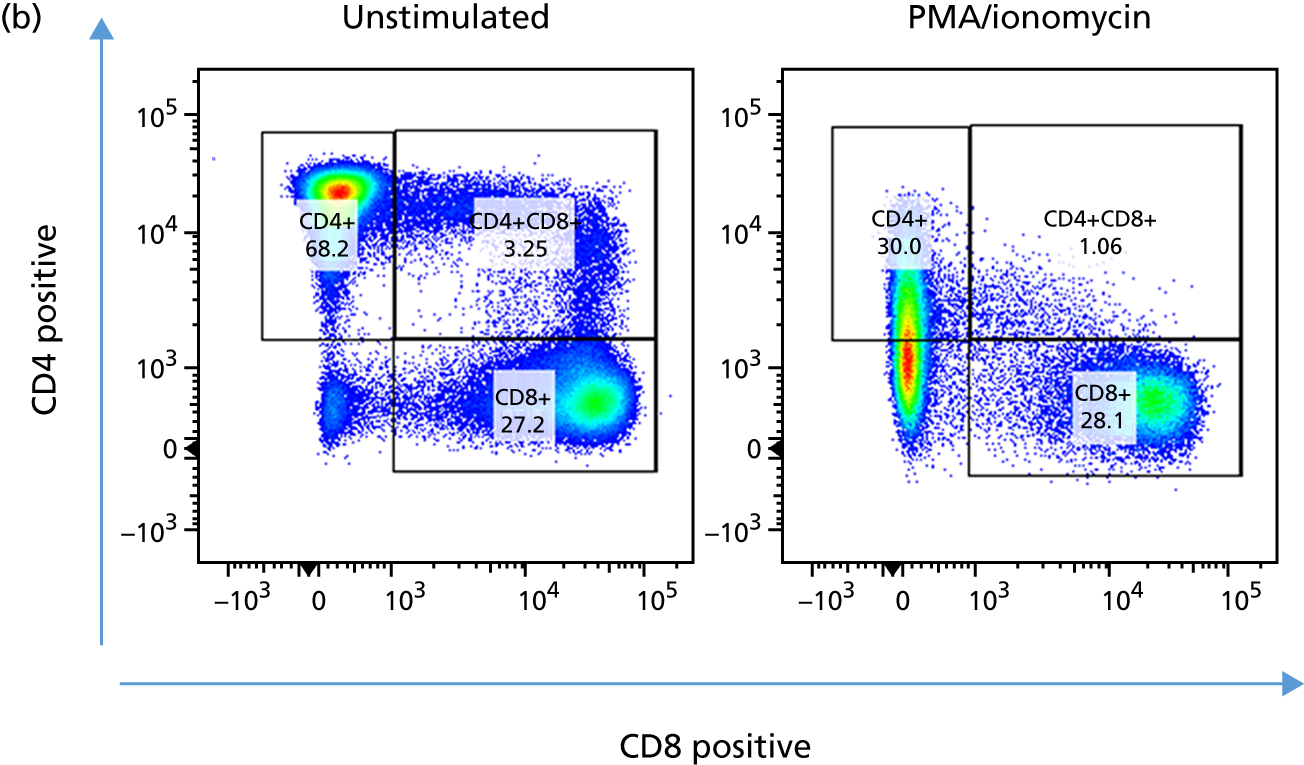
Purified peptide derivative
All of the 181 samples that were plated were stimulated with PPD; the cytokine responses to this antigen are summarised in Tables 47 and 48.
| Measurement | All TB (N = 90) | Dosanjh category | ||
|---|---|---|---|---|
| 1 (N = 58) | 2 (N = 32) | OD/LTBI: 4 (N = 91) | ||
| Stimulated, n | 90 | 58 | 32 | 91 |
| CD4-positive IFNγ response, n (%), % range | 81 (90) | 51 (88) | 30 (94) | 77 (85), 0.005–8.3 |
| CD4-positive IL-2 response, n (%) | 78 (87) | 50 | 28 | 75 |
| CD4-positive TNF-α response, n | 84 | 54 | 30 | 81 |
| CD4-positive TNF-α-only response, n | 85 | 54 | 31 | 79 |
| CD4-positive any cytokine response, n | 82 | 52 | 30 | 78 |
| CD8-positive IFNγ response, n (%) | 33 | 21 (66) | 12 | 42 |
| CD8-positive IL-2 response, n | 36 | 23 | 13 | 40 |
| CD8-positive TNF-α-positive response, n | 43 | 28 | 15 | 41 |
| Measurement | Patient group and HIV infection status, n | |||
|---|---|---|---|---|
| TB HIV– (N = 78) | TB HIV+ (N = 12) | OD/LTBI HIV– (N = 78) | OD/LTBI (N = 13) | |
| CD4-positive IFNγ response | 71 | 10 | 70 | 7 |
| CD4-positive TNF-α-only response | 74 | 11 | 72 | 7 |
| CD4-positive any cytokine response | 72 | 10 | 75 | 5 |
Mycobacterium tuberculosis antigens
Fifty-seven per cent of the samples (n = 107) were also stimulated with a cocktail of RD1-related Mtb antigens. The responses to this stimulation are summarised in Tables 49 and 50.
| Measurement | All TB (N = 56) | Dosanjh category | ||
|---|---|---|---|---|
| 1 (N = 37) | 2 (N = 19) | OD/LTBI: 4 (N = 51) | ||
| Stimulated, n | 56 | 37 | 19 | 51 |
| CD4-positive IFNγ response, n | 54 | 36 | 18 | 45 |
| CD4-positive IL-2 response, n | 53 | 35 | 18 | 36 |
| CD4-positive TNF-α response, n | 55 | 36 | 19 | 38 |
| CD4-positive TNF-α-only response, n | 53 | 36 | 17 | 35 |
| CD4-positive any cytokine response, n | 53 | 35 | 18 | 39 |
| CD8-positive IFNγ response, n (%) | 30 | 21 | 9 | 22 |
| CD8-positive IL-2 response, n | 31 | 23 | 8 | 24 |
| CD8-positive TNF-α-positive response, n | 30 | 19 | 11 | 17 |
| Measurement | Patient group and HIV infection status, n | |||
|---|---|---|---|---|
| TB HIV– (N = 47) | TB HIV+ (N = 9) | OD/LTBI HIV– (N = 31) | OD/LTBI (N = 7) | |
| CD4-positive IFNγ response | 46 | 8 | 26 | 6 |
| CD4-positive TNF-α-only response | 45 | 8 | 21 | 3 |
| CD4-positive any cytokine response | 46 | 7 | 22 | 3 |
Appendix 12 Performance of signatures after Mycobacterium tuberculosis region of difference 1-related antigen stimulation
Performance of cellular immune signatures using Mycobacterium tuberculosis-specific region of difference 1-related antigens
Here we present the performance of the signatures when four Mtb RD1-related antigens were used to stimulate the PBMCs, which was done in a large subset of the overall cohort, where PBMC numbers permitted. The four antigens used were ESAT-6, CFP-10, Rv3615c and Rv3879c (ECRR) (Figure 26).
FIGURE 26.
Performance of published signatures after stimulation with Mtb antigens. (a) Dot plots indicating signature values in individuals in each of the groups; and (b) ROC curves for each signatures, within the HIV– overall population, the HIV+ population and the entire cohort.


Overall, the performance of the signatures using the Mtb RD1-related antigen stimulus was comparable to that using PPD, and, as with PPD, the %HLA-DR signature performed the best. 26 The number of individuals within the HIV+ cohort was small and, therefore, little can be concluded about the performance of the signatures in this important subpopulation of TB suspects.
Correlation between Mycobacterium tuberculosis region of difference 1-related and purified protein derivative antigen responses
In order to check whether or not the PPD and Mtb RD1-related stimuli elicited a comparable response within the same individuals, we did a direct comparison within the individuals in which both stimuli were used (Figure 27).
FIGURE 27.
Correlation of %HLA-DR signature26 using PPD and RD1 (ECRR) antigens. Agreement between %HLA-DR signature using the two conditions was shown, as demonstrated by (a) similar group distributions, averages and variability; (b) high correlation (statistics for Pearson’s correlation shown); and (c) comparable diagnostic accuracy for detection active TB.
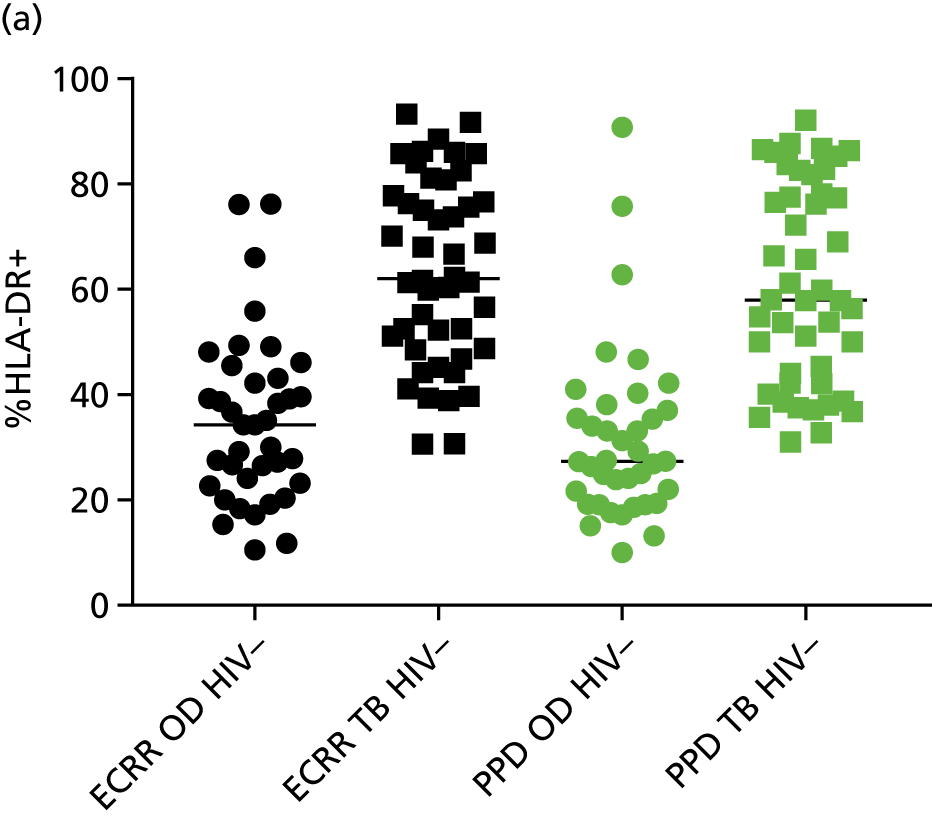
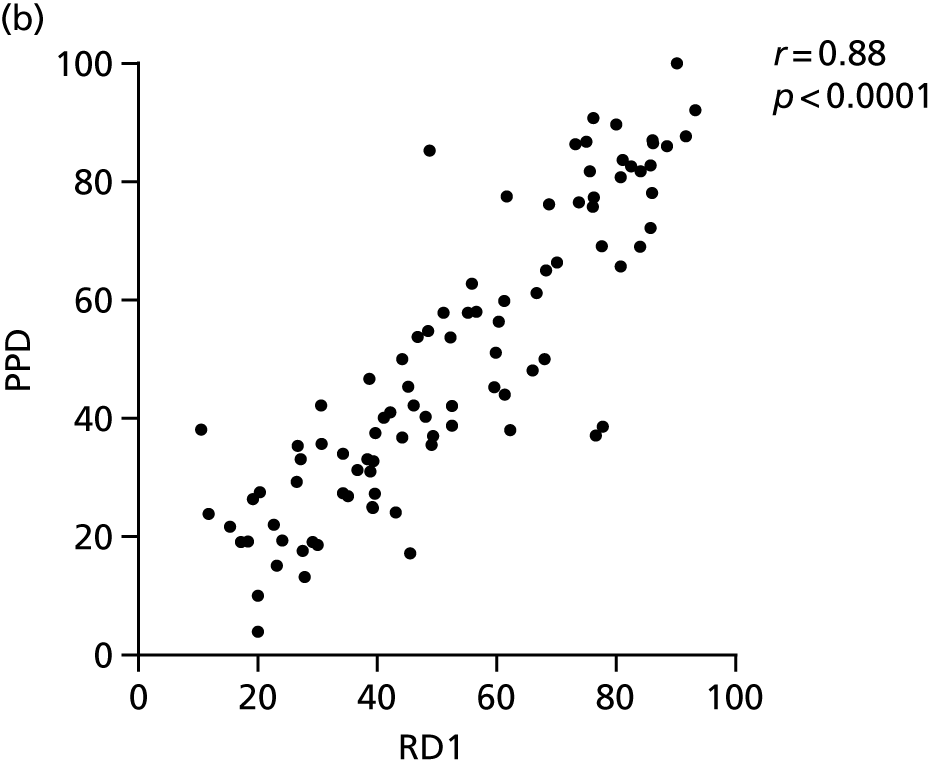
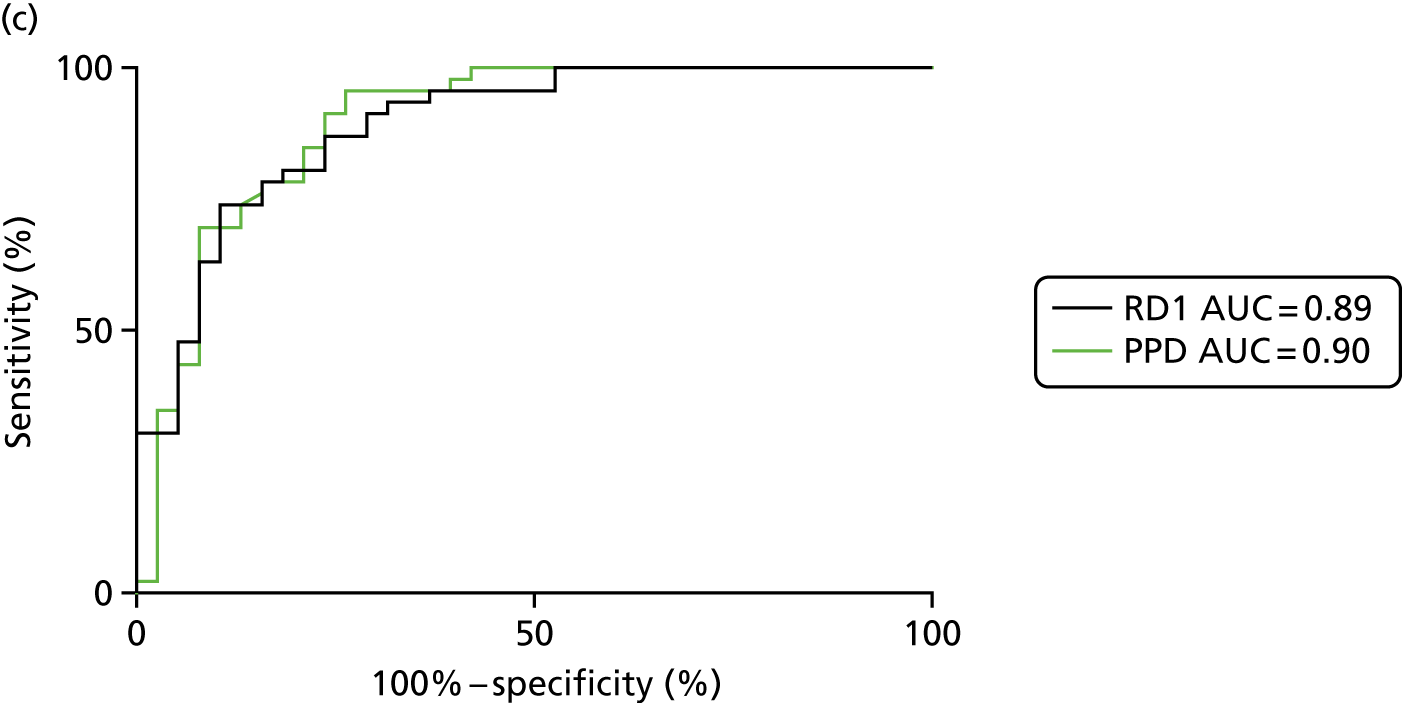
Performance of signatures after ECRR stimulation
The diagnostic performance of the signatures after stimulation with Mtb antigens is summarised in Table 51.
| Signature, reference | HIV | TB, n | OD/LTBI, n | AUC, %(95% CI) | Cut-off point | Sensitivity, % (95% CI) | Specificity, % (95% CI) | PPV | NPV |
|---|---|---|---|---|---|---|---|---|---|
| %TNF-α-only24 | – | 46 | 35 | 0.61 (0.49 to 0.74) | < 20.3a | 60.9 (45.4 to 75.9) | 60.0 (42.1 to 76.2) | 0.83 | 0.32 |
| < 12.7b | 13.0 (4.9 to 26.3) | 94.3 (80.8 to 99.3) | 0.88 | 0.25 | |||||
| + | 7 | 3 | 0.88 (0.65 to 1.11) | > 13.9a | 85.7 (42.1 to 99.6) | 66.7 (9.4 to 99.2) | 0.67 | 0.86 | |
| > 15.5b | 85.7 (42.1 to 99.6) | 100 (29.2 to 100) | 1.0 | 0.90 | |||||
| –/+ | 53 | 38 | 0.54 (0.42 to 0.66) | < 20.3a | 56.6 (42.3 to 70.2) | 55.3 (38.3 to 71.4) | 0.49 | 0.63 | |
| < 12.5b | 13.2 (0.5 to 25.3) | 94.7 (82.3 to 99.4) | 0.89 | 0.25 | |||||
| %TEFF25 | – | 44 | 30 | 0.87 (0.79 to 0.96) | > 17.2a | 81.8 (67.3 to 91.8) | 80.0 (61.4 to 92.3) | 0.93 | 0.57 |
| > 22.6b | 80.0 (64.7 to 90.2) | 90.0 (73.5 to 97.9) | 0.96 | 0.57 | |||||
| + | 5 | 2 | 0.5 (–0.19 to 1.19) | > 43.2a | 60.0 (14.6 to 94.7) | 50.0 (1.3 to 98.7) | 0.48 | 0.62 | |
| > 55.2a | 40.0 (05.3 to 85.3) | 50.0 (01.3 to 98.7) | 0.38 | 0.52 | |||||
| –/+ | 49 | 32 | 0.85 (0.76 to 0.95) | > 21.1a | 81.6 (68.0 to 91.2) | 81.3 (63.6 to 92.8) | 0.93 | 0.57 | |
| > 36.4b | 51.0 (36.3 to 65.6) | 90.6 (75.0 to 98.0) | 0.95 | 0.36 | |||||
| SCORE58 | – | 46 | 35 | 0.54 (0.42 to 0.67) | < 3.5a | 50.0 (34.9 to 65.1) | 51.4 (34.0 to 68.6) | 0.77 | 0.24 |
| < 1.2b | 15.2 (6.3 to 28.9) | 91.4 (76.9 to 98.2) | 0.85 | 0.25 | |||||
| + | 7 | 3 | 0.71 (0.39 to 1.0) | > 2.7a | 71.4 (29.0 to 96.3) | 66.7 (9.4 to 99.2) | 0.62 | 0.75 | |
| > 3.6b | 57.1 (18.4 to 90.1) | 100 (29.2 to 100) | 1.0 | 0.75 | |||||
| –/+ | 53 | 38 | 0.51 (0.39 to 0.64) | < 03.5a | 49.1 (35.1 to 63.2) | 47.4 (31.0 to 64.2) | 0.75 | 0.22 | |
| < 1.18b | 15.1 (6.7 to 27.6) | 92.1 (78.6 to 98.3) | 0.86 | 0.25 | |||||
| CD27 MFI ratio27 | – | 46 | 38 | 0.79 (0.69 to 0.89) | > 08.8a | 78.3 (63.6 to 89.1) | 76.0 (62.7 to 90.5) | 0.92 | 0.52 |
| > 20.1b | 34.8 (21.4 to 50.3) | 92.1 (78.6 to 98.3) | 0.96 | 0.30 | |||||
| + | 6 | 3 | 0.56 (0.17 to 0.94) | > 4.8a | 50.0 (11.8 to 88.2) | 66.7 (9.4 to 99.2) | 0.54 | 0.63 | |
| > 6.1b | 50.0 (11.8 to 88.2) | 100 (29.2 to 100) | 1.0 | 0.72 | |||||
| –/+ | 52 | 41 | 0.78 (0.68 to 0.88) | > 07.1a | 75.0 (61.1 to 86.0) | 75.6 (60.0 to 87.6) | 0.91 | 0.80 | |
| > 19.5b | 32.7 (20.3 to 47.1) | 90.2 (76.9 to 97.3) | 0.92 | 0.29 | |||||
| %CD27–CD45RA–28 | – | 46 | 38 | 0.86 (0.78 to 0.95) | > 58.3a | 80.4 (66.1 to 90.6) | 81.6 (65.7 to 92.3) | 0.93 | 0.56 |
| > 70.7b | 54.4 (39.0 to 69.1) | 92.1 (78.6 to 98.3) | 0.96 | 0.38 | |||||
| + | 6 | 3 | 0.5 (0.01 to 0.99) | > 73.7a | 50.0 (11.8 to 88.2) | 66.7 (9.4 to 99.2) | 0.54 | 0.63 | |
| > 73.7b | 50.0 (11.8 to 88.2) | 66.7 (9.4 to 99.2) | 0.54 | 0.63 | |||||
| –/+ | 52 | 41 | 0.84 (0.75 to 0.93) | > 59.0a | 78.9 (65.3 to 88.9) | 78.1 (62.4 to 89.4) | 0.92 | 0.53 | |
| > 72.9b | 44.2 (30.5 to 58.7) | 90.2 (76.9 to 97.3) | 0.94 | 0.33 | |||||
| %HLA-DR26 | – | 46 | 38 | 0.89 (0.82 to 0.96) | > 46.5a | 80.4 (66.1 to 90.6) | 81.6 (65.7 to 92.3) | 0.93 | 0.56 |
| > 56.3b | 63.0 (47.6 to 76.8) | 92.1 (78.6 to 98.3) | 0.96 | 0.43 | |||||
| + | 6 | 3 | 0.78 (0.45 to 1.1) | > 78.8a | 66.7 (22.3 to 95.7) | 66.7 (09.4 to 99.2) | 0.61 | 0.72 | |
| > 82.5b | 50.0 (11.8 to 88.2) | 100 (29.2 to 100) | 1.0 | 0.72 | |||||
| –/+ | 52 | 41 | 0.88 (0.81 to 0.95) | > 48.3a | 80.8 (67.5 to 90.4) | 80.5 (65.1 to 91.2) | 0.93 | 0.56 | |
| > 66.4b | 51.9 (37.6 to 66) | 90.2 (76.9 to 97.3) | 0.95 | 0.36 |
Appendix 13 Additional analyses for the validation of cellular immune signatures for the diagnostic evaluation of active tuberculosis
FIGURE 28.
Performance of published cellular immune signatures according to Dosanjh classification (HIV– patients only). (a) Harari et al. 24 (%TNF-α only); (b) Pollock et al. 25 (%TEFF); (c) Rozot et al. 58 (SCORE); (d) Portevin et al. 27 (CD27 MFI ratio); (e) Petruccioli et al. 28 (%CD27–CD45RA–); and (f) Adekambi et al. 26 (%HLA-DR). Statistical differences between groups were determined using Kruskal–Wallis with Dunn’s post hoc test for multiple comparisons. *p < 0.05; **p < 0.005; ***p < 0.0005; ****p < 0.0001.
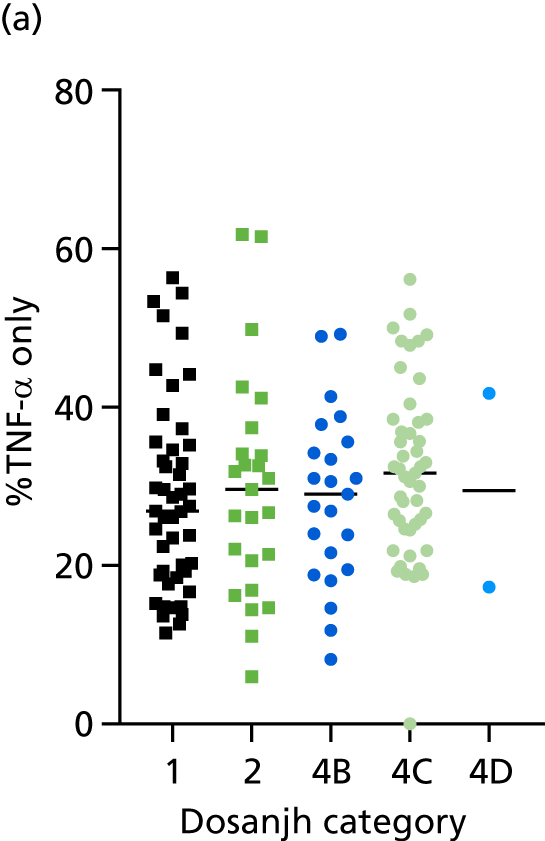
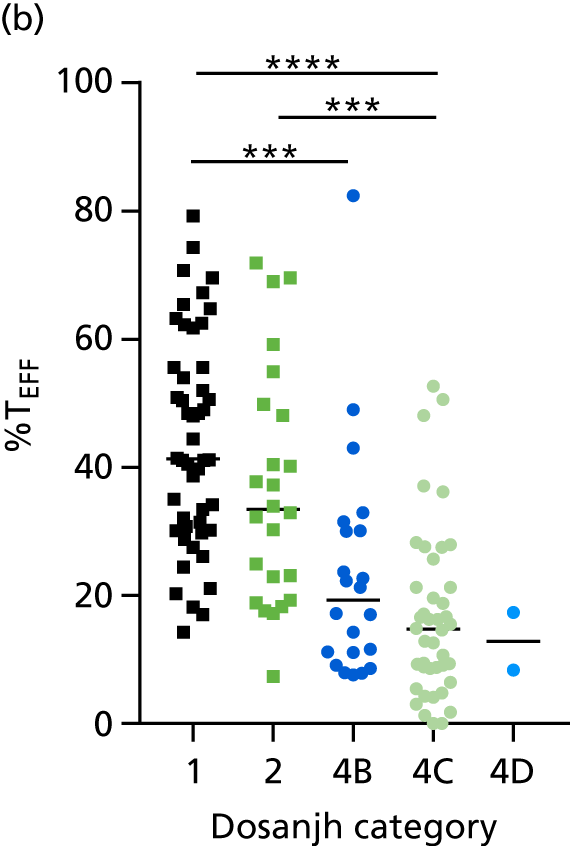
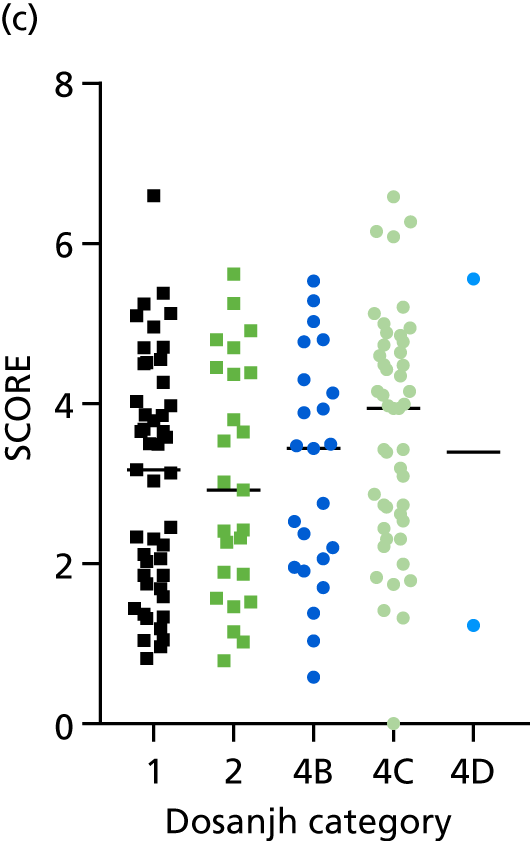
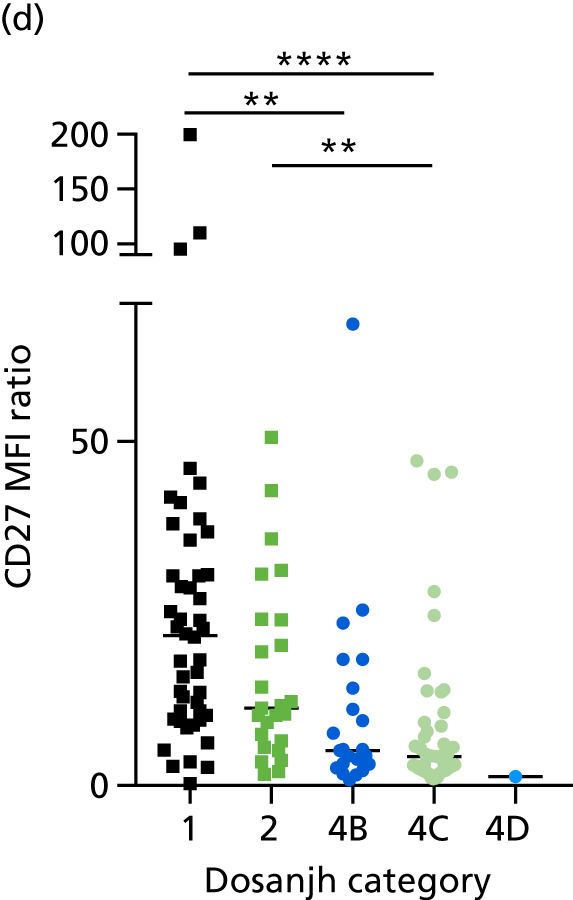
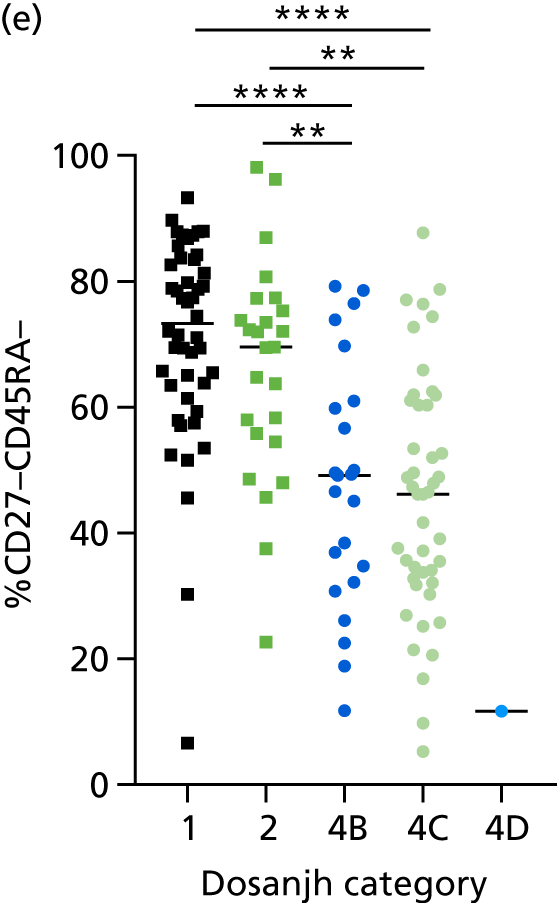
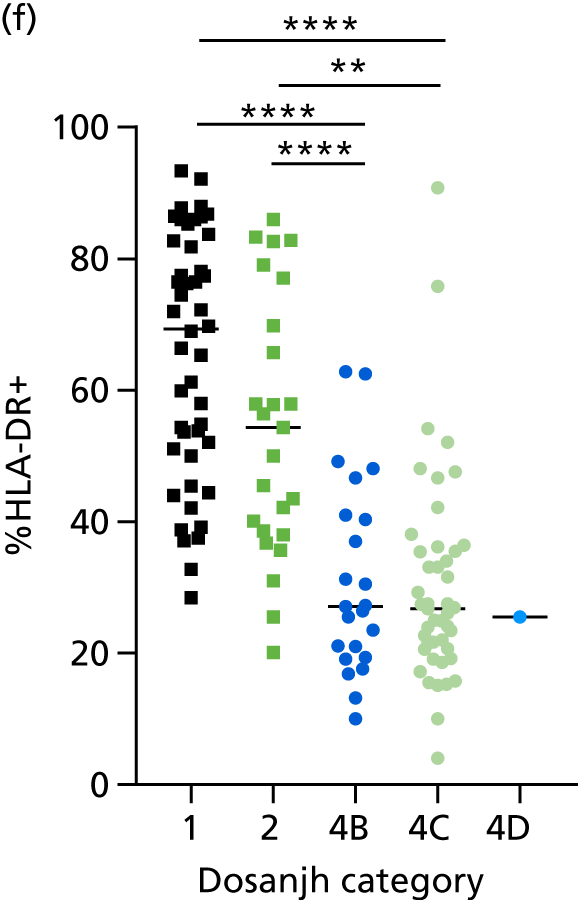
| Comparison (Dosanjh category) | Signature | TB, n | OD/LTBI, n | AUC, % (95% CI) | Cut-off point | Sensitivity, % (95% CI) | Specificity, % (95% CI) | PPV | NPV |
|---|---|---|---|---|---|---|---|---|---|
| 1/2 vs. 4B | Harari et al.24 (%TNF-α only) | 72 | 23 | 0.51 (0.38 to 0.64) | < 28.8a | 52.8 (40.7 to 64.7) | 52.2 (30.6 to 73.2) | 0.50 | 0.55 |
| < 14.5b | 9.7 (4.0 to 19.0) | 91.3 (72.0 to 98.9) | 0.50 | 0.53 | |||||
| Pollock et al.25 (%TEFF) | 72 | 22 | 0.80 (0.69 to 0.92) | > 30.1a | 73.6 (61.9 to 83.3) | 72.7 (49.8 to 89.3) | 0.71 | 0.75 | |
| > 43.7b | 41.7 (30.2 to 53.9) | 90.9 (70.8 to 98.9) | 0.81 | 0.63 | |||||
| Rozot et al.58 (SCORE) | 72 | 23 | 0.52 (0.39 to 0.66) | < 3.3a | 52.8 (40.7 to 64.7) | 52.2 (30.6 to 73.2) | 0.50 | 0.55 | |
| < 1.4b | 15.3 (7.9 to 25.7) | 91.3 (72.0 to 98.9) | 0.61 | 0.54 | |||||
| Portevin et al.27 (CD27 MFI ratio) | 71 | 23 | 0.75 (0.63 to 0.87) | > 10.2a | 69.0 (56.9 to 79.5) | 69.6 (47.1 to 86.8) | 0.67 | 0.71 | |
| > 23.8b | 38.0 (26.8 to 50.3) | 91.3 (72.0 to 98.9) | 0.80 | 0.62 | |||||
| Petruccioli et al.28 (%CD27–CD45RA–) | 71 | 23 | 0.80 (0.69 to 0.90) | > 60.4a | 73.2 (61.4 to 83.1) | 73.9 (51.6 to 89.8) | 0.72 | 0.75 | |
| > 76.6b | 39.4 (28.0 to 51.8) | 91.3 (72.0 to 98.9) | 0.80 | 0.62 | |||||
| Adekambi et al.26 (%HLA-DR) | 71 | 23 | 0.88 (0.81 to 0.96) | > 42.2a | 78.9 (67.6 to 87.7) | 78.3 (56.3 to 92.6) | 0.77 | 0.80 | |
| > 49.6b | 70.4 (58.4 to 80.7) | 91.3 (72.0 to 98.9) | 0.88 | 0.77 | |||||
| 1/2 vs. 4C | Harari et al.24 (%TNF-α only) | 72 | 47 | 0.59 (0.49 to 0.70) | < 29.7a | 56.9 (44.7 to 68.6) | 57.5 (42.2 to 71.7) | 0.55 | 0.60 |
| < 19.1b | 25.0 (15.5 to 36.6) | 91.5 (79.6 to 97.6) | 0.73 | 0.57 | |||||
| Pollock et al.25 (%TEFF) | 72 | 42 | 0.88 (0.82 to 0.95) | > 25.9a | 79.2 (68.0 to 87.8) | 78.6 (63.2 to 89.7) | 0.77 | 0.81 | |
| > 36.7b | 56.9 (44.7 to 68.6) | 90.5 (77.4 to 97.3) | 0.84 | 0.70 | |||||
| Rozot et al.58 (SCORE) | 72 | 47 | 0.62 (0.51 to 0.72) | < 3.5a | 52.8 (40.7 to 64.7) | 53.2 (38.1 to 67.9) | 0.51 | 0.55 | |
| < 1.8b | 25.0 (15.6 to 36.6) | 91.5 (79.6 to 97.6) | 0.73 | 0.57 | |||||
| Portevin et al.27 (CD27 MFI ratio) | 71 | 45 | 0.79 (0.70 to 0.88) | > 9.2a | 77.5 (66.0 to 86.5) | 77.8 (62.9 to 88.8) | 0.76 | 0.79 | |
| > 25.0b | 32.4 (21.8 to 44.6) | 91.1 (78.8 to 97.5) | 0.77 | 0.60 | |||||
| Petruccioli et al.28 (%CD27–CD45RA–) | 71 | 45 | 0.83 (0.75 to 0.90) | > 59.8a | 73.2 (61.4 to 83.1) | 71.1 (55.7 to 83.6) | 0.70 | 0.75 | |
| > 74.5b | 42.3 (30.6 to 54.6) | 91.1 (78.8 to 97.5) | 0.81 | 0.63 | |||||
| Adekambi et al.26 (%HLA-DR) | 71 | 45 | 0.90 (0.84 to 0.96) | > 39.7a | 81.7 (70.7 to 89.9) | 82.2 (68.0 to 92.0) | 0.81 | 0.83 | |
| > 49.1b | 70.4 (58.4 to 80.7) | 91.1 (78.8 to 97.5) | 0.88 | 0.77 |
FIGURE 29.
Performance of cellular immune signatures in different TB and OD/LTBI disease types. (a) Harari et al. 24 (%TNF-α only); (b) Pollock et al. 25 (%TEFF); (c) Rozot et al. 58 (SCORE); (d) Portevin et al. 27 (CD27 MFI ratio); (e) Petruccioli et al. 28 (%CD27–CD45RA–); and (f) Adekambi et al. 26 (%HLA-DR). Statistical differences between groups were determined using Kruskal–Wallis with Dunn’s post hoc test for multiple comparisons. LRTI, lower respiratory tract infection. *p < 0.05; **p < 0.005; ***p < 0.0005; ****p < 0.0001.
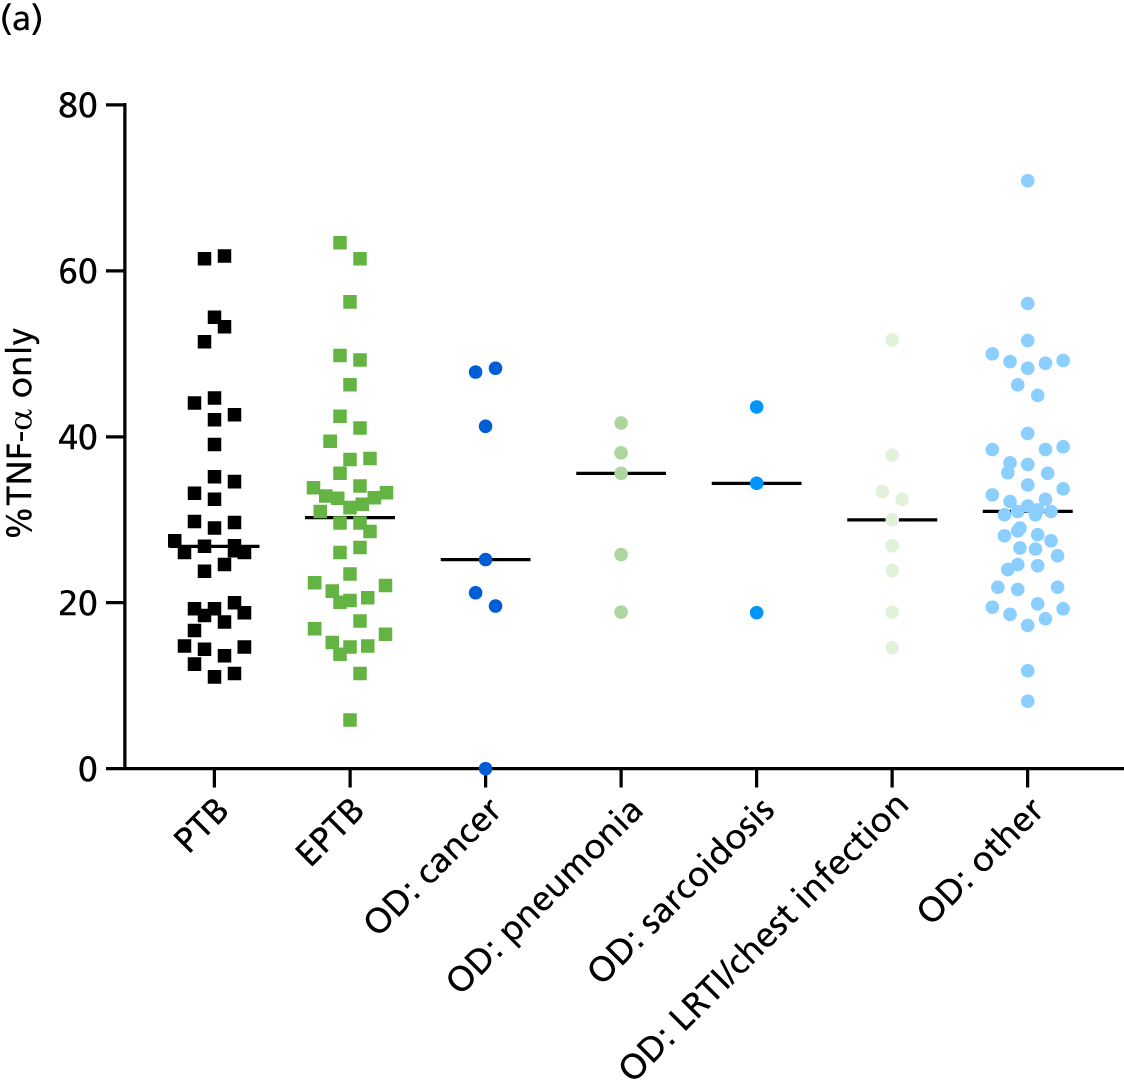
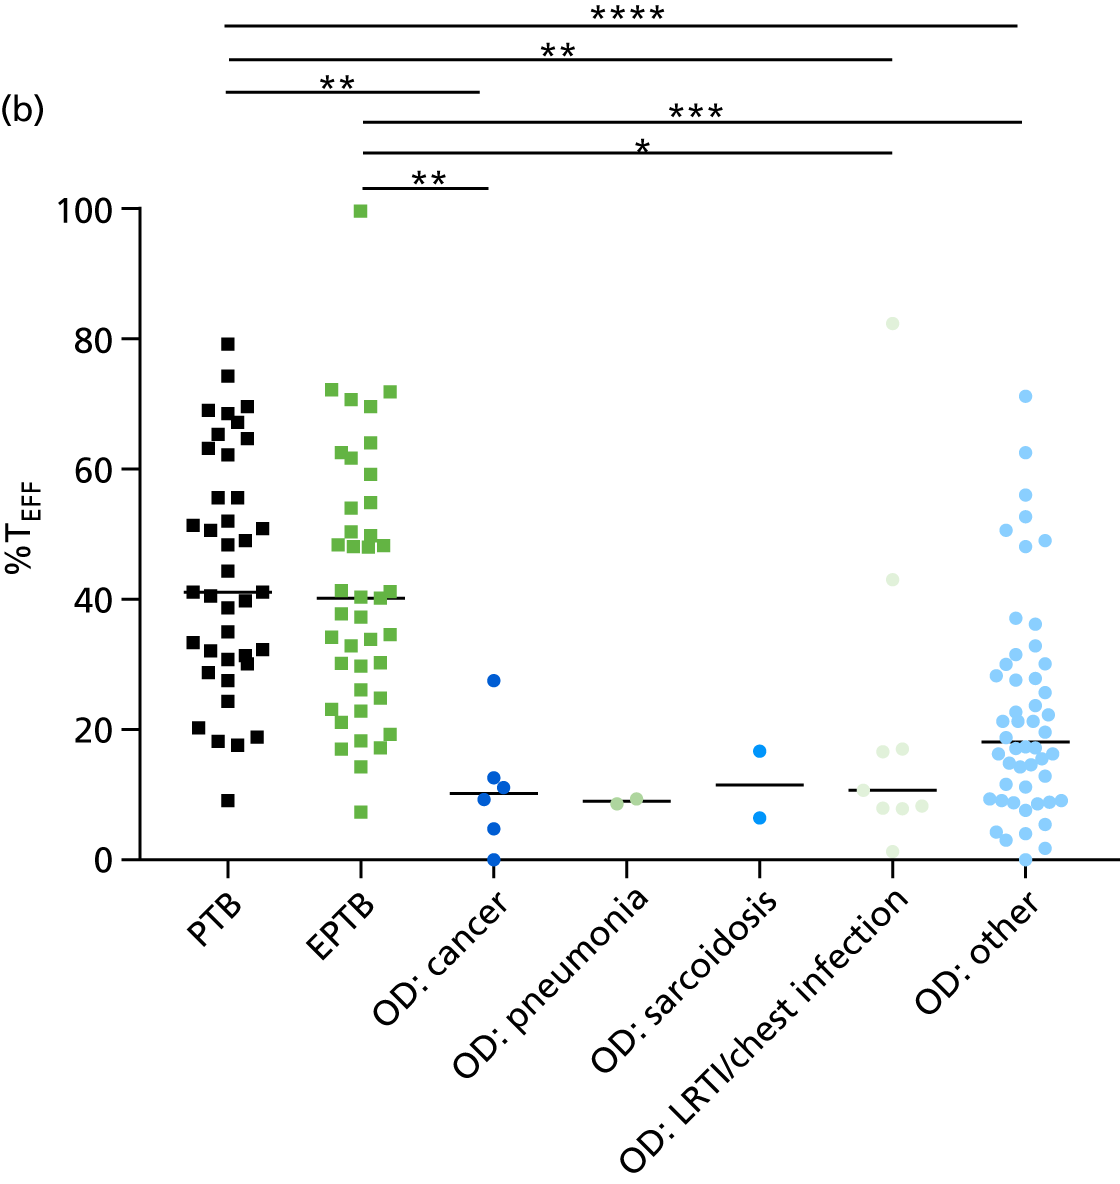
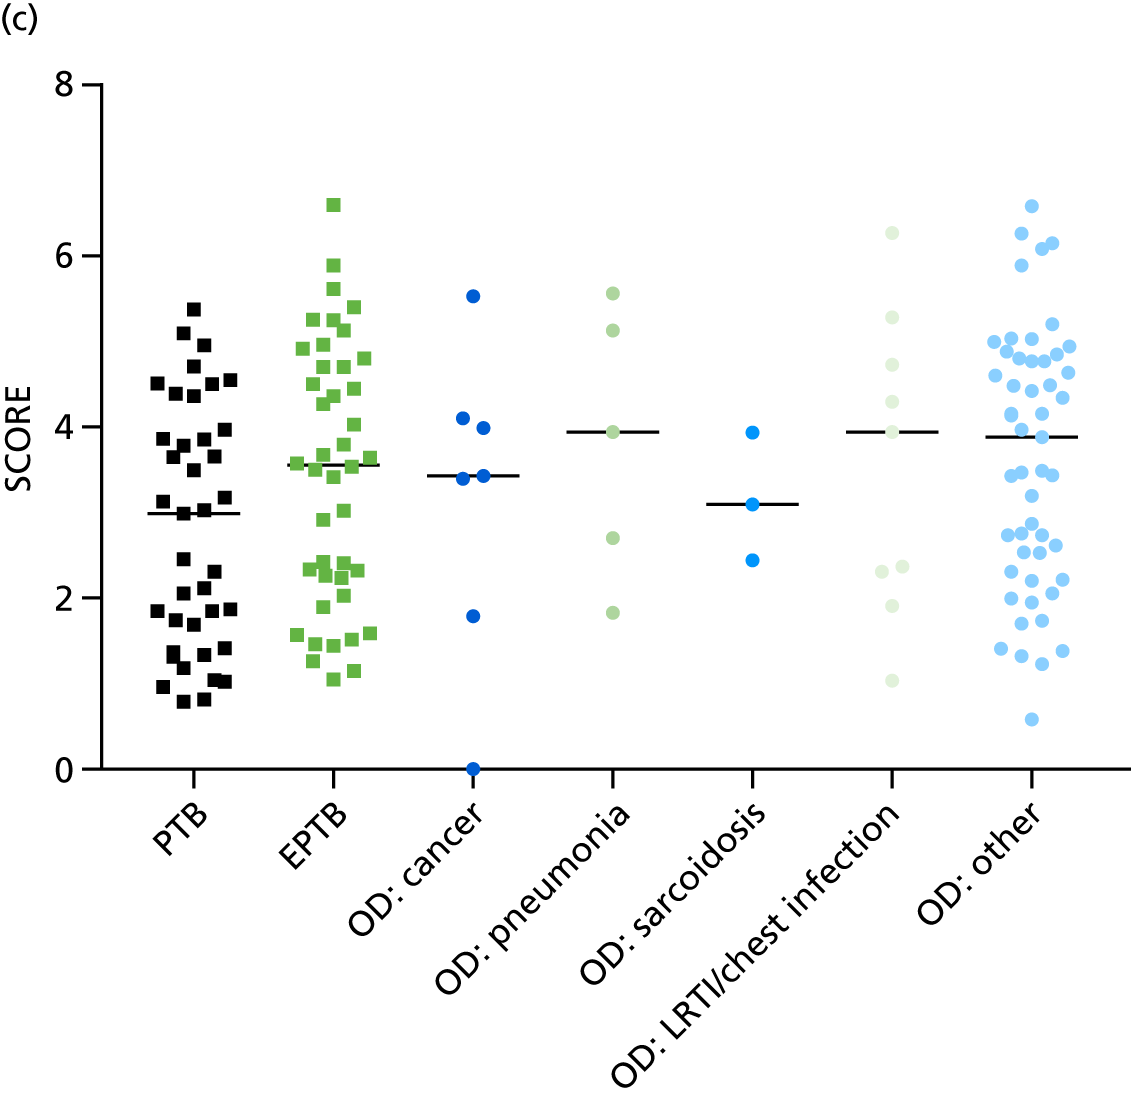
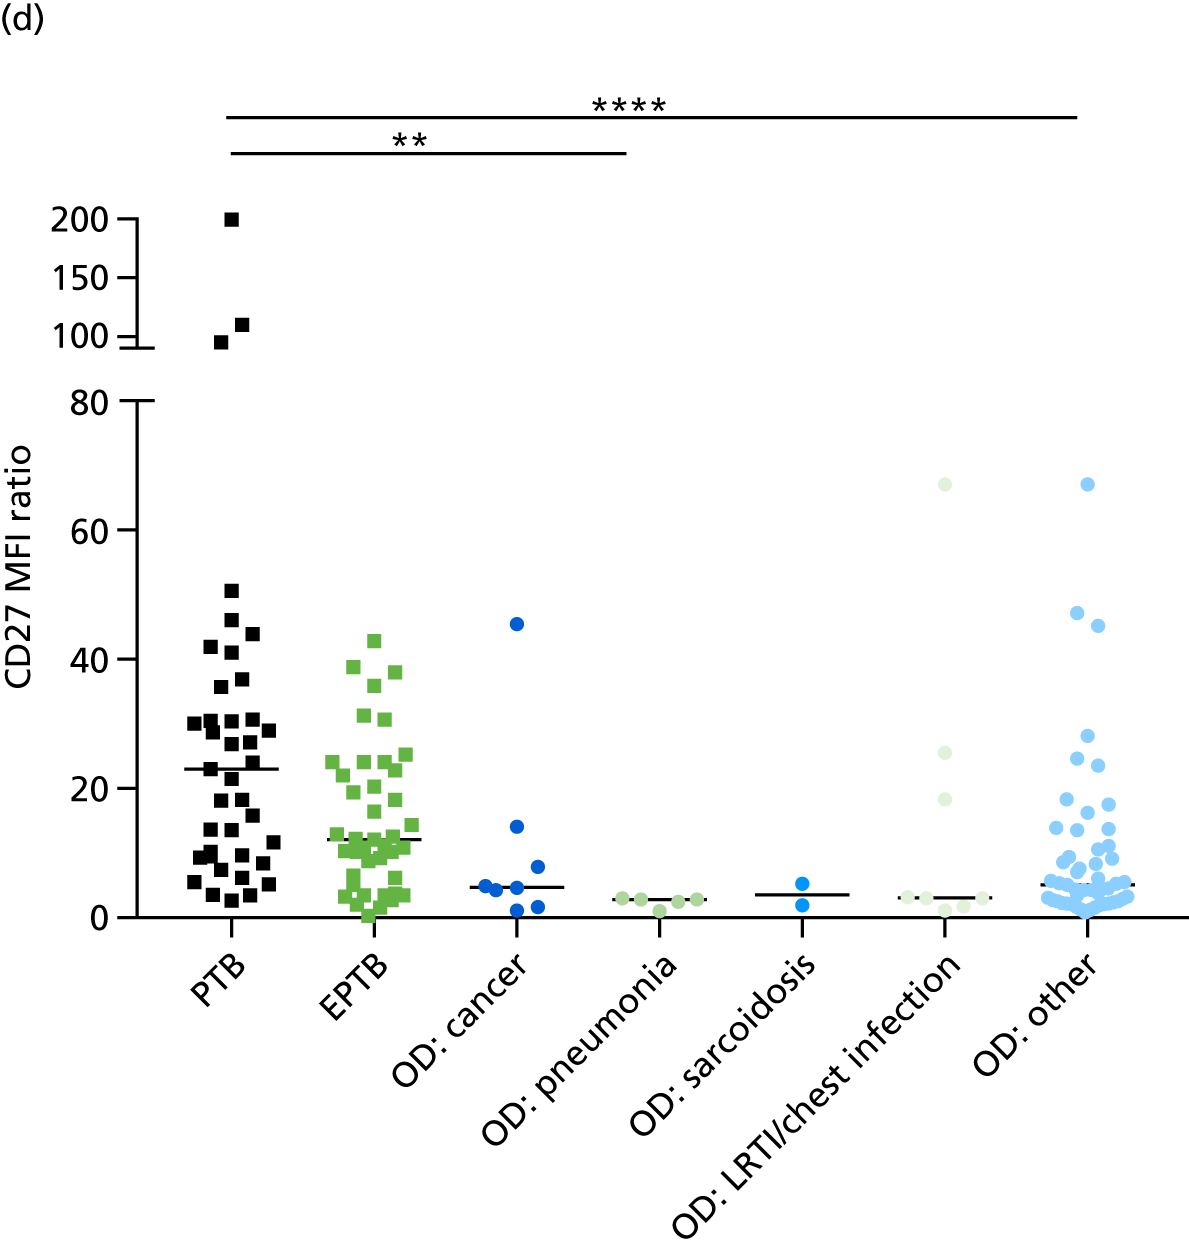
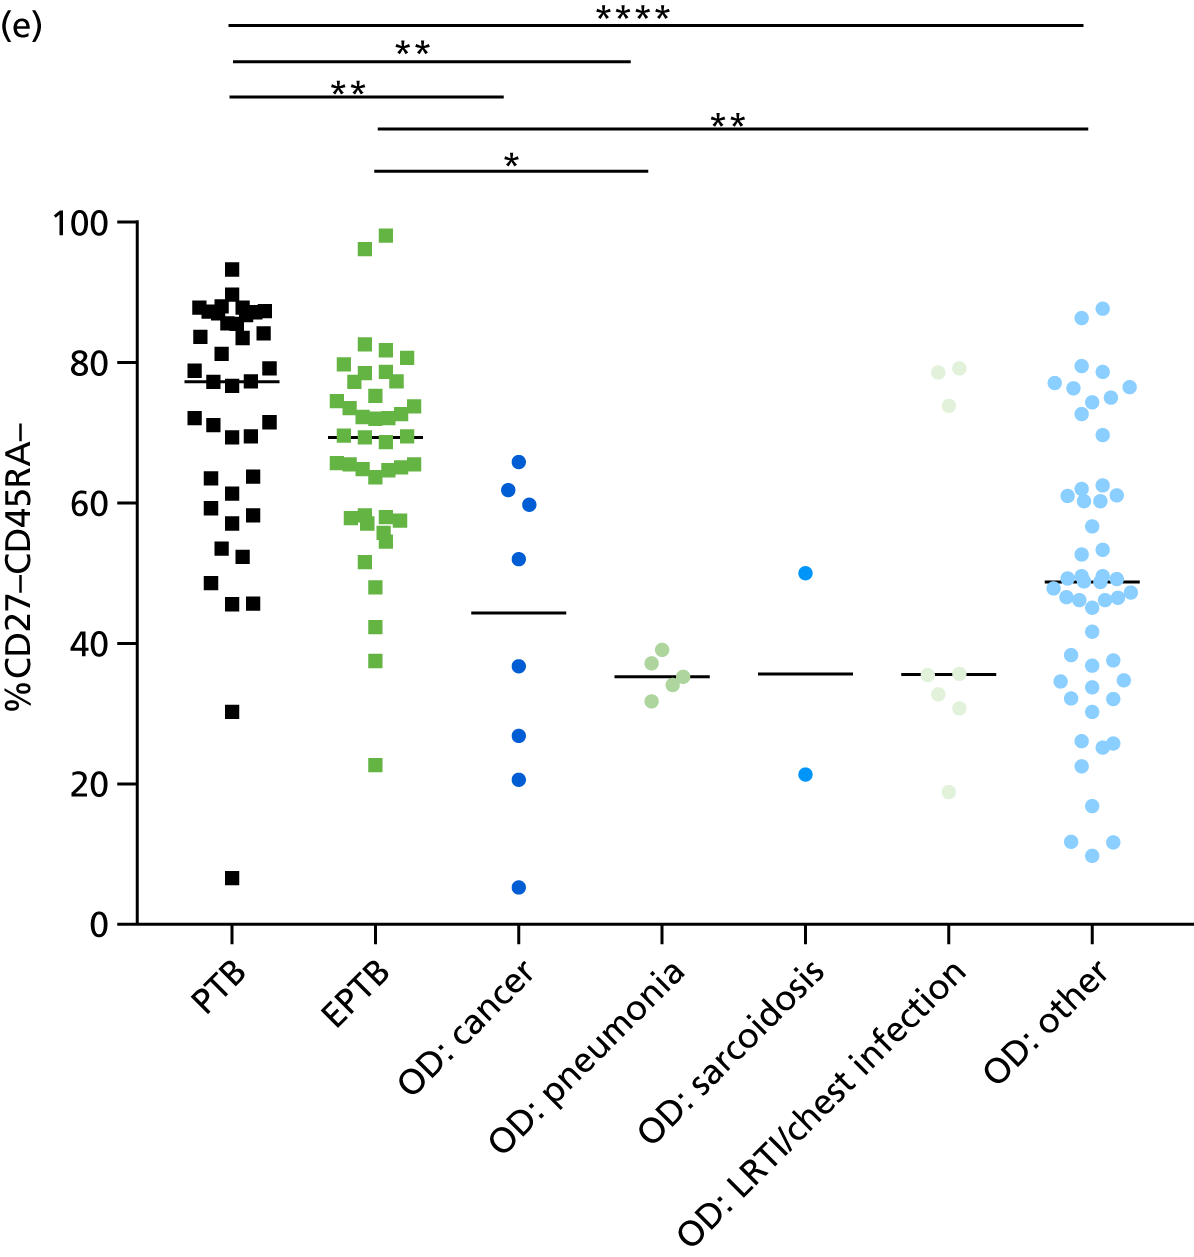
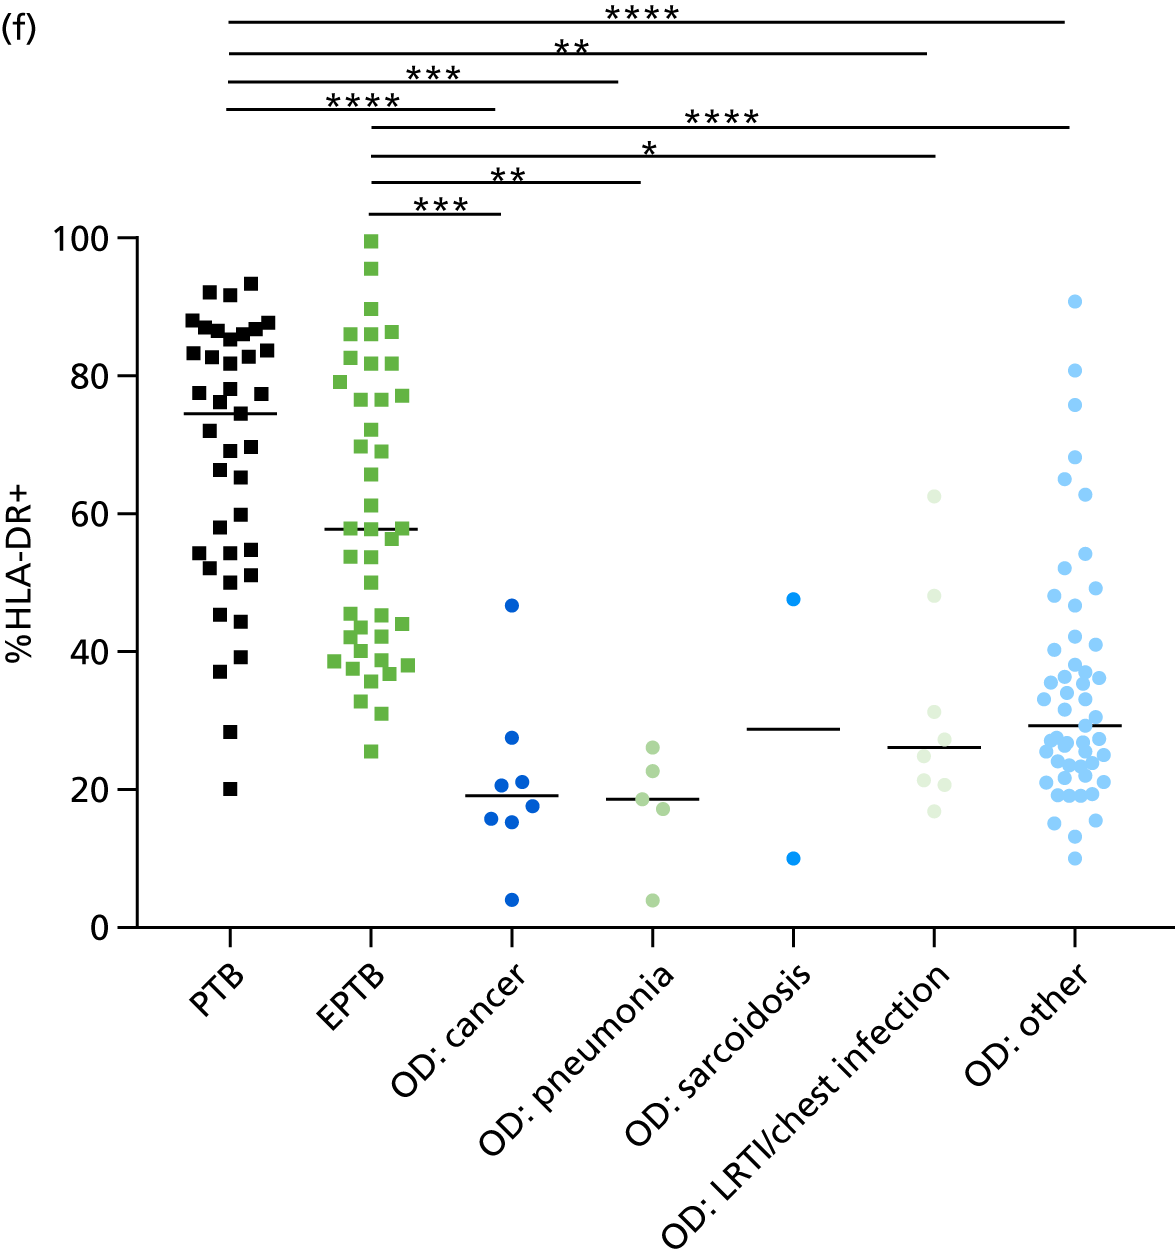
| Comparison | Signature | TB, n | OD/LTBI, n | AUC, %(95% CI) | Cut-off point | Sensitivity, % (95% CI) | Specificity, % (95% CI) |
|---|---|---|---|---|---|---|---|
| PTB vs. OD/LTBI | Harari et al.24 (%TNF-α only) | 39 | 72 | 0.57 (0.45 to 0.69) | < 28.5a | 56.4 (39.6 to 72.2) | 56.9 (44.7 to 68.6) |
| < 18.7b | 25.6 (13.0 to 90.3) | 90.3 (81.0 to 96.0) | |||||
| Pollock et al.25 (%TEFF) | 39 | 66 | 0.88 (0.81 to 0.94) | > 28.55a | 82.05 (66.5 to 92.5) | 81.8 (70.4 to 90.2) | |
| > 37.9b | 61.5 (44.6 to 76.6) | 90.9 (81.3 to 96.6) | |||||
| Rozot et al.58 (SCORE) | 39 | 72 | 0.63 (0.52 to 0.74) | < 3.2a | 59.0 (42.1 to 74.4) | 58.3 (46.1 to 69.9) | |
| < 1.7b | 28.2 (15.0 to 44.9) | 90.3 (91 to 96) | |||||
| Portevin et al.27 (CD27 MFI ratio) | 39 | 69 | 0.83 (0.75 to 0.90) | > 60.7a | 74.4 (57.9 to 87) | 75.4 (63.5 to 85.0) | |
| > 25.1b | 46.2 (30.1 to 62.8) | 91.3 (82.0 to 96.7) | |||||
| Petruccioli et al.28 (%CD27–CD45RA–) | 39 | 69 | 0.83 (0.75 to 0.92) | > 60.7a | 74.4 (57.9 to 87.0) | 75.4 (63.5 to 85.0) | |
| > 76.5b | 53.9 (37.2 to 69.9) | 91.3 (82.0 to 96.7) | |||||
| Adekambi et al.26 (%HLA-DR) | 39 | 69 | 0.93 (0.87 to 0.98) | > 47.2a | 84.6 (69.5 to 94.1) | 85.5 (75.0 to 92.8) | |
| > 49.6b | 84.6 (69.5 to 94.1) | 91.3 (82.0 to 96.7) | |||||
| EPTB vs. OD/LTBI | Harari et al.24 (%TNF-α only) | 25 | 72 | 0.53 (0.42 to 0.64) | < 30.8a | 50.0 (34.2 to 65.8) | 50.0 (78.0 to 62.0) |
| < 18.7b | 21.4 (10.3 to 36.8) | 90.3 (81.0 to 96.0) | |||||
| Pollock et al.25 (%TEFF) | 24 | 66 | 0.84 (0.77 to 0.92) | > 25.9a | 75.6 (59.7 to 87.6) | 75.8 (63.6 to 85.5) | |
| > 37.2b | 56.1 (39.8 to 71.5) | 90.9 (81.3 to 96.6) | |||||
| Rozot et al.58 (SCORE) | 25 | 72 | 0.51 (0.40 to 0.62) | < 03.5a | 47.6 (32.0 to 63.6) | 48.6 (36.7 to 60.7) | |
| < 01.6b | 19.1 (8.6 to 34.1) | 90.3 (81.0 to 96.0) | |||||
| Portevin et al.27 (CD27 MFI ratio) | 25 | 69 | 0.71 (0.61 to 0.81) | > 08.2a | 70.7 (54.5 to 83.9) | 71.0 (58.9 to 81.3) | |
| > 25.0b | 17.1 (07.2 to 32.1) | 91.3 (82.0 to 96.7) | |||||
| Petruccioli et al.28 (%CD27–CD45RA–) | 25 | 69 | 0.80 (0.72 to 0.89) | > 59.1a | 70.7 (54.5 to 83.9) | 71.0 (58.9 to 81.3) | |
| > 76.5b | 24.4 (12.4 to 40.3) | 91.3 (82.0 to 96.7) | |||||
| Adekambi et al.26 (%HLA-DR) | 25 | 69 | 0.88 (0.82 to 0.94) | > 39.5a | 78.1 (62.4 to 89.4) | 78.3 (66.7 to 87.3) | |
| > 49.6b | 61.0 (44.5 to 75.8) | 91.3 (82.0 to 96.7) |
Appendix 14 Additional cohort characteristics for the molecular rule-out test assessment
| Characteristic | Active TB | Total (N = 46) | |
|---|---|---|---|
| T-SPOT.TB positive (N = 24) | T-SPOT.TB negative (N = 22) | ||
| Dosanjh category, n | |||
| Culture-confirmed TB (category 1) | 21 | 16 | 37 |
| Highly probable TB (category 2) | 4 | 6 | 10 |
| Smear positive, n | 3 | 5 | 8 |
| Smear not tested, n | 4 | 3 | 7 |
| PTB, n | 5 | 12 | 17 |
| EPTB, n | 17 | 8 | 25 |
| PTB and EPTB, n | 2 | 2 | 4 |
| Site of infection, n | |||
| Lung only | 5 | 12 | 17 |
| Lymph node only | 14 | 5 | 1 |
| Lung and lymph node | 1 | 1 | 2 |
| Lung and other | 1 | 1 | 2 |
| Lymph node and other | 1 | 1 | 2 |
| Pleura | 1 | 1 | 2 |
| Final diagnosis | OD | Total (N = 48) | |
|---|---|---|---|
| T-SPOT.TB positive (N = 22) | T-SPOT.TB negative (N = 26) | ||
| Cancer | 1 | 3 | 4 |
| Sarcoidosis | 0 | 2 | 2 |
| Chest infection | 1 | 2 | 3 |
| Pneumonia | 6 | 6 | 12 |
| URTI | 1 | 1 | 2 |
| LRTI | 0 | 1 | 1 |
| LTBI | 1 | 2 | |
| Other | 12 | 11 | 23 |
Appendix 15 Additional data for the validation of candidate rule-out tests
FIGURE 30.
Relative abundance of (a) CXCL10, (b) CXCL9, (c) IFNγ and (d) BATF2 in key patient groups within the GO/NO-GO cohort for assessment of the candidate molecular rule-out test. The cut-off points shown are the level of expression required for the test to provide > 95% sensitivity for all active TB cases. HIV+ individuals are shown in green triangles. The gene expression cut-off values for achieving 95% sensitivity for all TB cases are displayed. Statistical differences between groups were determined using Kruskal–Wallis with Dunn’s post hoc test for multiple comparisons. ATB, active tuberculosis; mRNA, messenger ribonucleic acid. *p < 0.05; **p < 0.005; ***p < 0.0005; ****p < 0.0001.
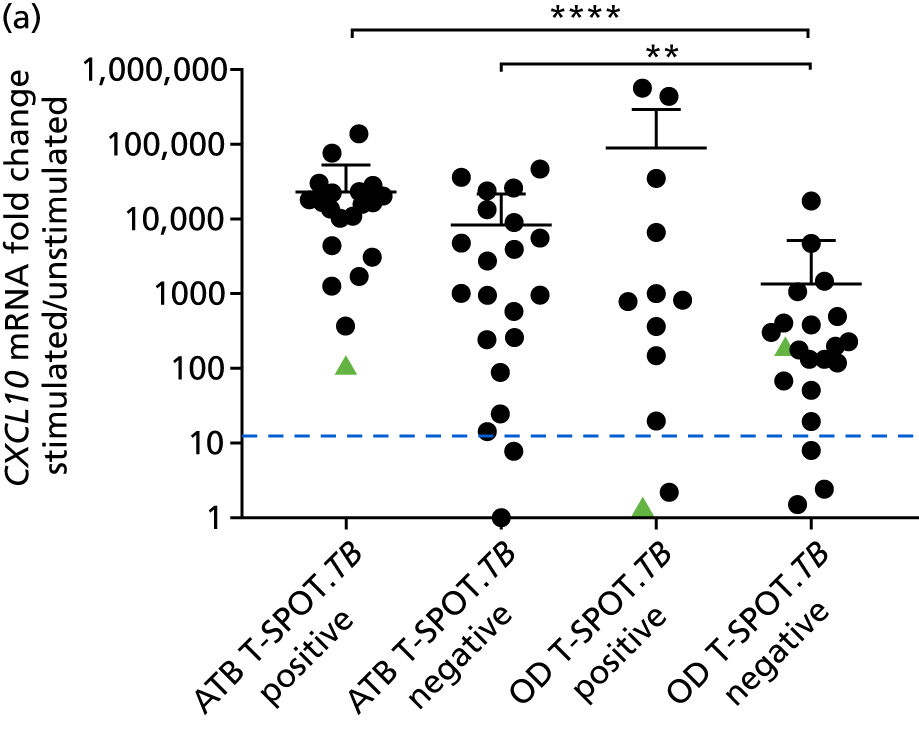
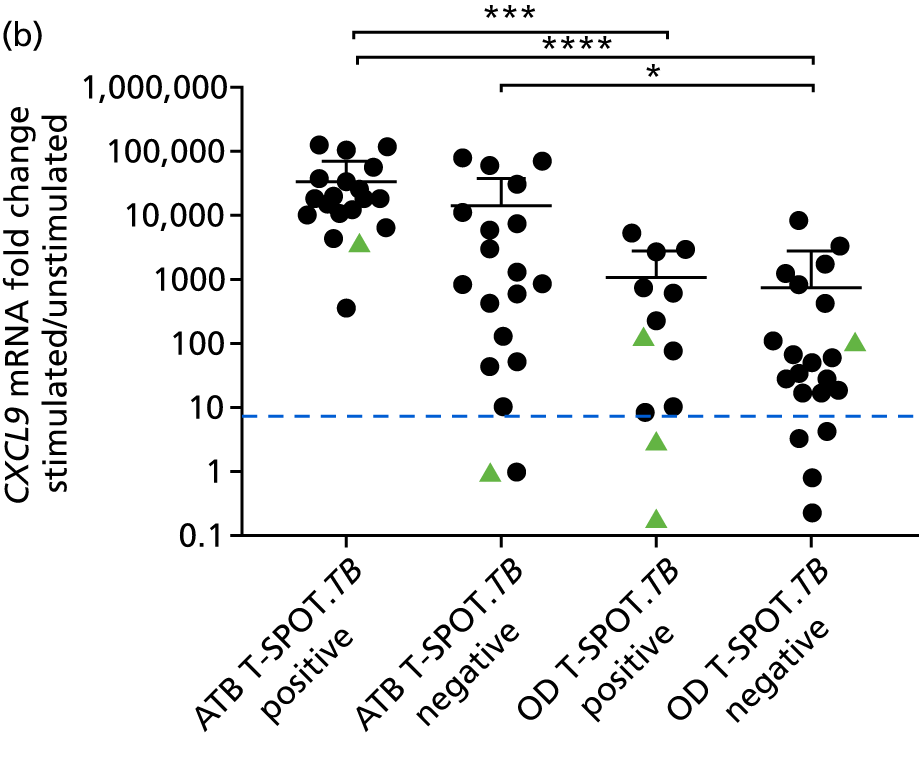
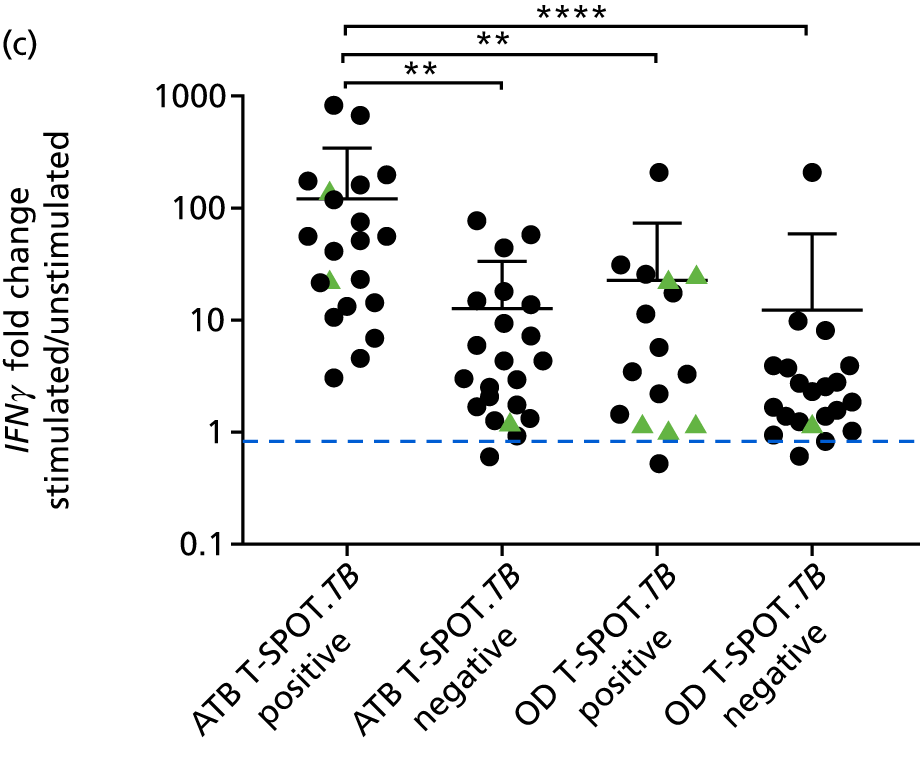
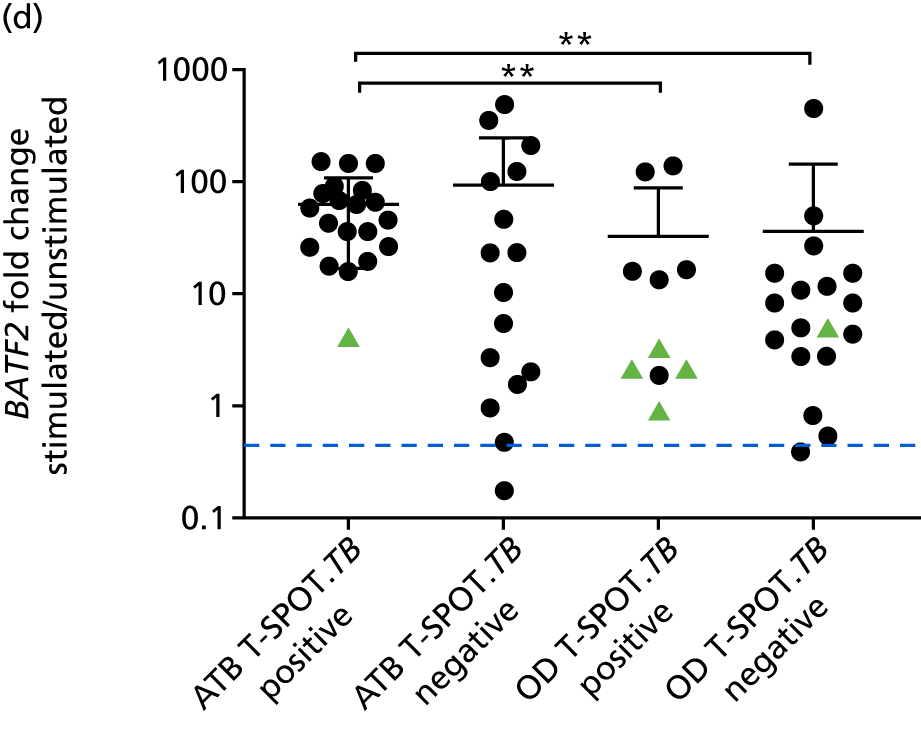
FIGURE 31.
Selection of cut-off point for target genes (a) CXCL10; (b) CXCL9; and (c) BATF2 in response to IFNγ-positive control condition. ATB, active tuberculosis.
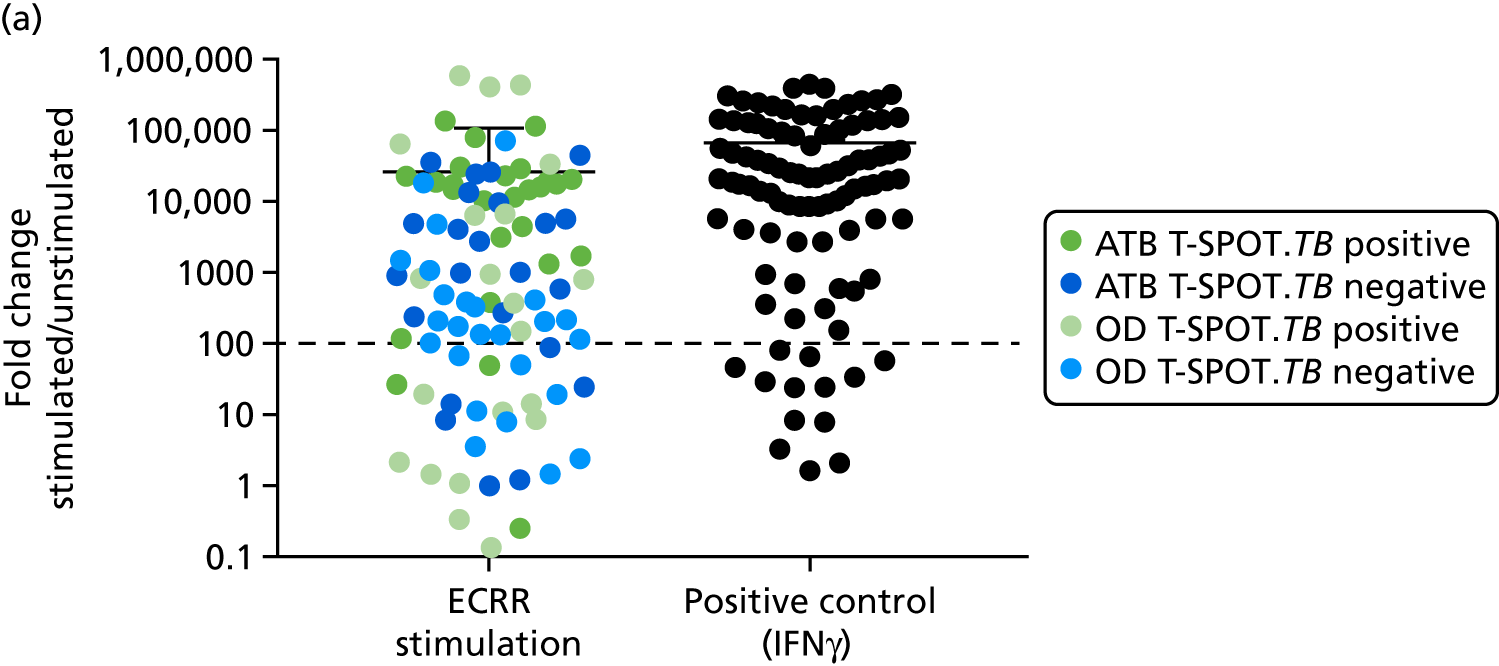
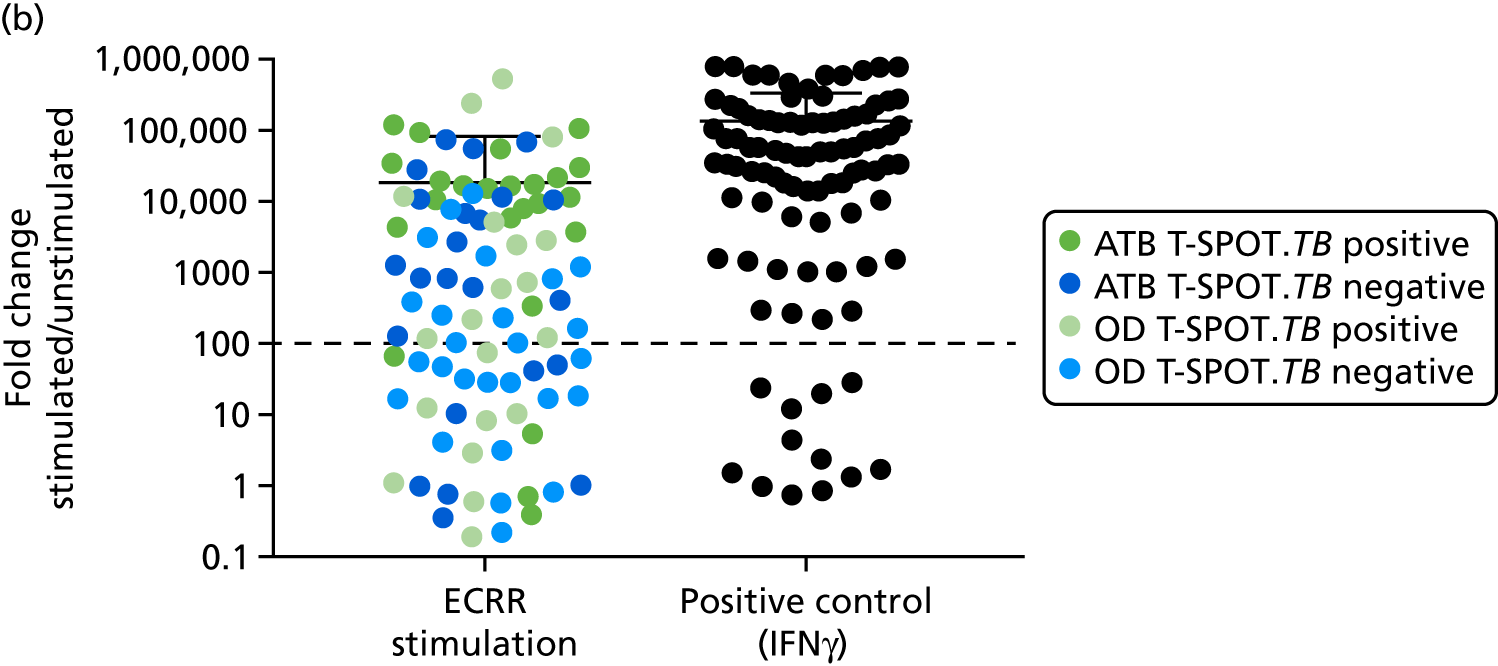
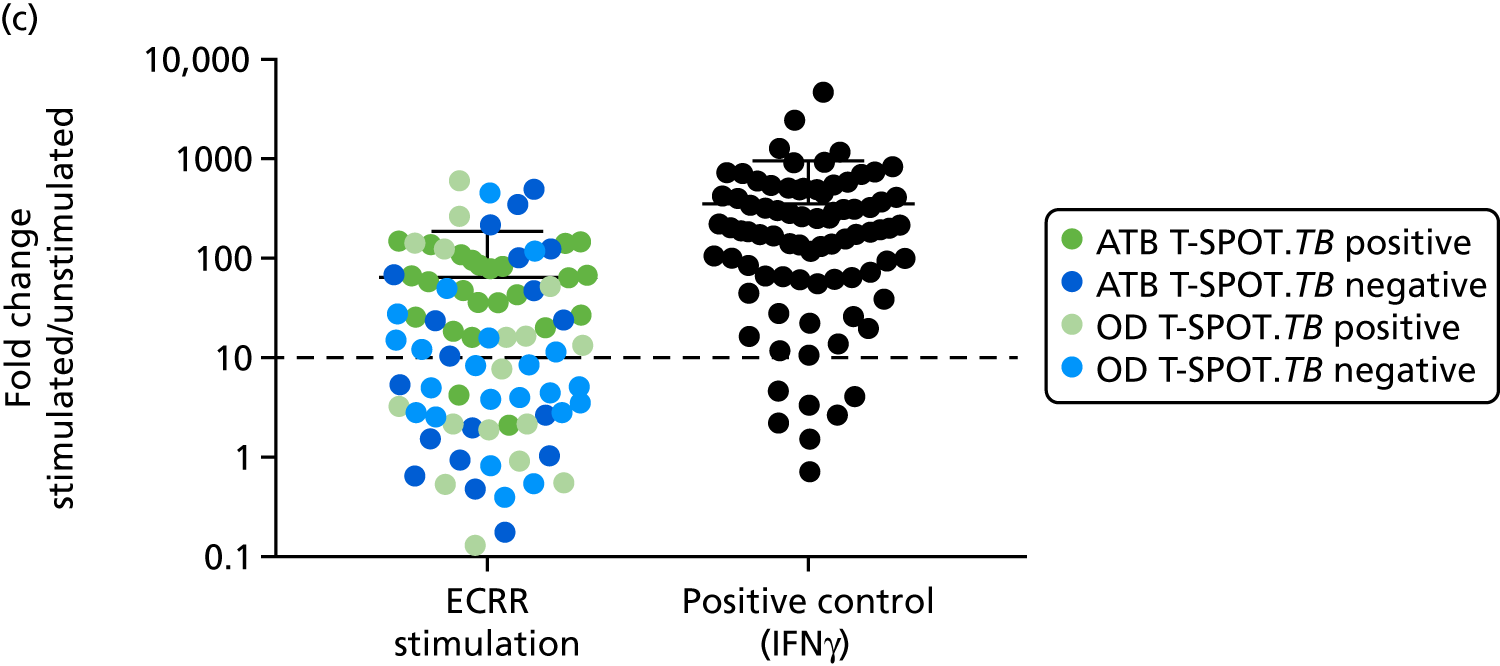
| Measurement | Active TB | OD | ||
|---|---|---|---|---|
| T-SPOT.TB positive | T-SPOT.TB negative | T-SPOT.TB positive | T-SPOT.TB negative | |
| n | 24 | 22 | 22 | 26 |
| Total for analysis, n | 21 | 20 | 16 | 21 |
| QC failed total, n | 3 | 2 | 6 | 5 |
| HPRT1, n | 3 | 2 | 6 | 5 |
| Indeterminate, n | 0 | 0 | 0 | 0 |
| ECRR/unstimulated fold change | 122.09 (0.03 to 787.82) | 12.99 (0.90 to 70.02) | 21.73 (0.51 to 207.58) | 12.01 (0.61 to 200) |
| IFNγ/unstimulated | 21, 72.82 (0.06 to 344.81) | 21, 49.76 (0.60 to 425.01) | 18, 26.79 (0.72 to 179.44) | 21, 25.52 (0.40 to 449.46) |
| Test/analyte | ATB T-SPOT.TB test positive, n | ATB T-SPOT.TB test negative, n | OD T-SPOT.TB test positive, n | OD T-SPOT.TB test negative, n | AUC, % (95% CI) | Cut-off point | Sensitivity, % (95% CI) | Specifity, % (95% CI) |
|---|---|---|---|---|---|---|---|---|
| T-SPOT.TB | 24 | 22 | 22 | 26 | 0.53 (0.41 to 0.65) | 52 (37 to 67) | 54 (39 to 69) | |
| CXCL10 | 19 | 19 | 12 | 21 | 0.72 (0.62 to 0.86) | 11 | 95 (82 to 99) | 15 (5.1 to 32) |
| CXCL9 | 18 | 18 | 12 | 21 | 0.84 (0.74 to 0.94) | 1 | 97 (85 to 99) | 9.1 (1.9 to 24) |
| IFNγ | 21 | 20 | 16 | 21 | 0.70 (0.59 to 0.82) | 0.85 | 95 (83 to 99) | 8.1 (1.7 to 22) |
| BATF2 | 19 | 15 | 10 | 18 | 0.72 (0.59 to 0.80) | 0.44 | 97 (85 to 100) | 3.6 (0.09 to 18) |
FIGURE 32.
Diagnostic performance of CXCL10, CXCL9, IFNγ and BATF2Mtb-specific gene expression in all TB vs. T-SPOT. TB test-negative OD.
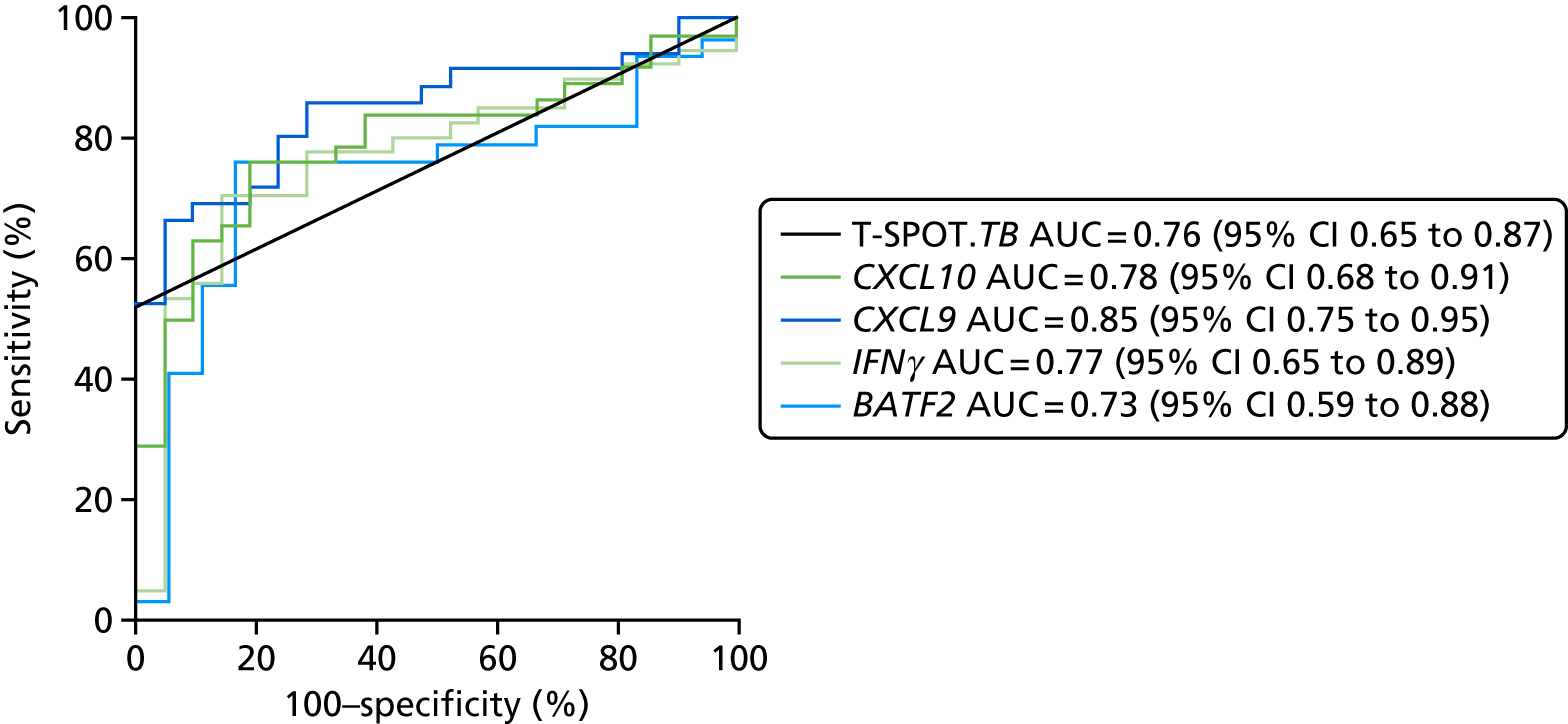
| Test/analyte | ATB T-SPOT.TB test positive, n | ATB T-SPOT.TB test negative, n | OD T-SPOT.TB test negative, n | AUC, % (95% CI) | Cut-off point | Sensitivity, % (95% CI) | Specifity, % (95% CI) |
|---|---|---|---|---|---|---|---|
| T-SPOT.TB | 24 | 22 | 26 | 0.76 (0.65 to 0.87) | 52 (37 to 67) | 100 (87 to 100) | |
| CXCL10 | 19 | 19 | 21 | 0.78 (0.65 to 0.91) | 11 | 95 (82 to 99) | 14 (3 to 36) |
| CXCL9 | 18 | 18 | 21 | 0.85 (0.75 to 0.95) | 1 | 97 (85 to 100) | 9.5 (1.2 to 30) |
| IFNγ | 21 | 20 | 21 | 0.77 (0.65 to 0.89) | 0.85 | 95 (85 to 99) | 9.5 (1.2 to 30) |
| BATF2 | 19 | 14 | 18 | 0.74 (0.59 to 0.88) | 0.44 | 97 (85 to 100) | 5.6 (0.14 to 27) |
| Test/analyte | ATB T-SPOT.TB test positive, n | OD T-SPOT.TB test negative, n | AUC, % (95% CI) | Cut-off point | Sensitivity, % (95% CI) | Specifity, % (95% CI) |
|---|---|---|---|---|---|---|
| T-SPOT.TB | 24 | 26 | 1.0 (1.0 to 1.0) | 100 (86.28 to 100) | 100 (86.77 to 100) | |
| CXCL10 | 19 | 21 | 0.91 (0.81 to 1.0) | 340 | 95 (86.8 to 100) | 67 (43 to 85) |
| CXCL9 | 18 | 21 | 0.98 (0.94 to 1.0) | 229 | 100 (81 to 100) | 71 (48 to 100) |
| IFNγ | 21 | 21 | 0.89 (0.77 to 1.0) | 2.9 | 95 (76 to 100) | 71 (48 to 89) |
| BATF2 | 19 | 18 | 0.88 (0.75 to 1.0) | 16 | 95 (75 to 100) | 83 (59 to 96) |
FIGURE 33.
Diagnostic performance of CXCL10, CXCL9, IFNγ and BATF2Mtb-specific gene expression in T-SPOT. TB test-positive TB vs. T-SPOT. TB test-negative OD.
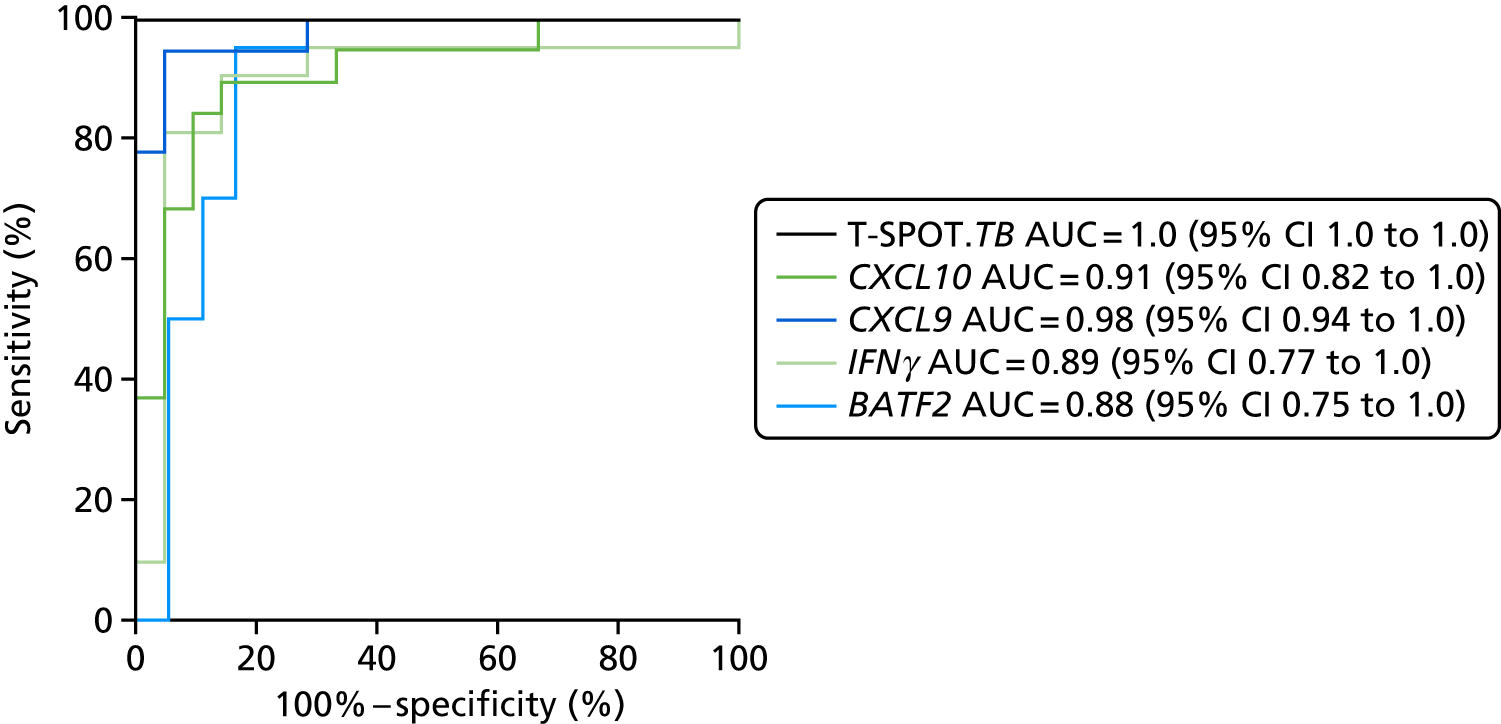
FIGURE 34.
The performance of qRT-PCR detection of CXCL10, CXCL9, IFNγ, BATF2 and T-SPOT for discriminating between T-SPOT. TB-positive TB cases (n = 19–24) and T-SPOT. TB-positive OD/LTBI cases (n = 10–22).
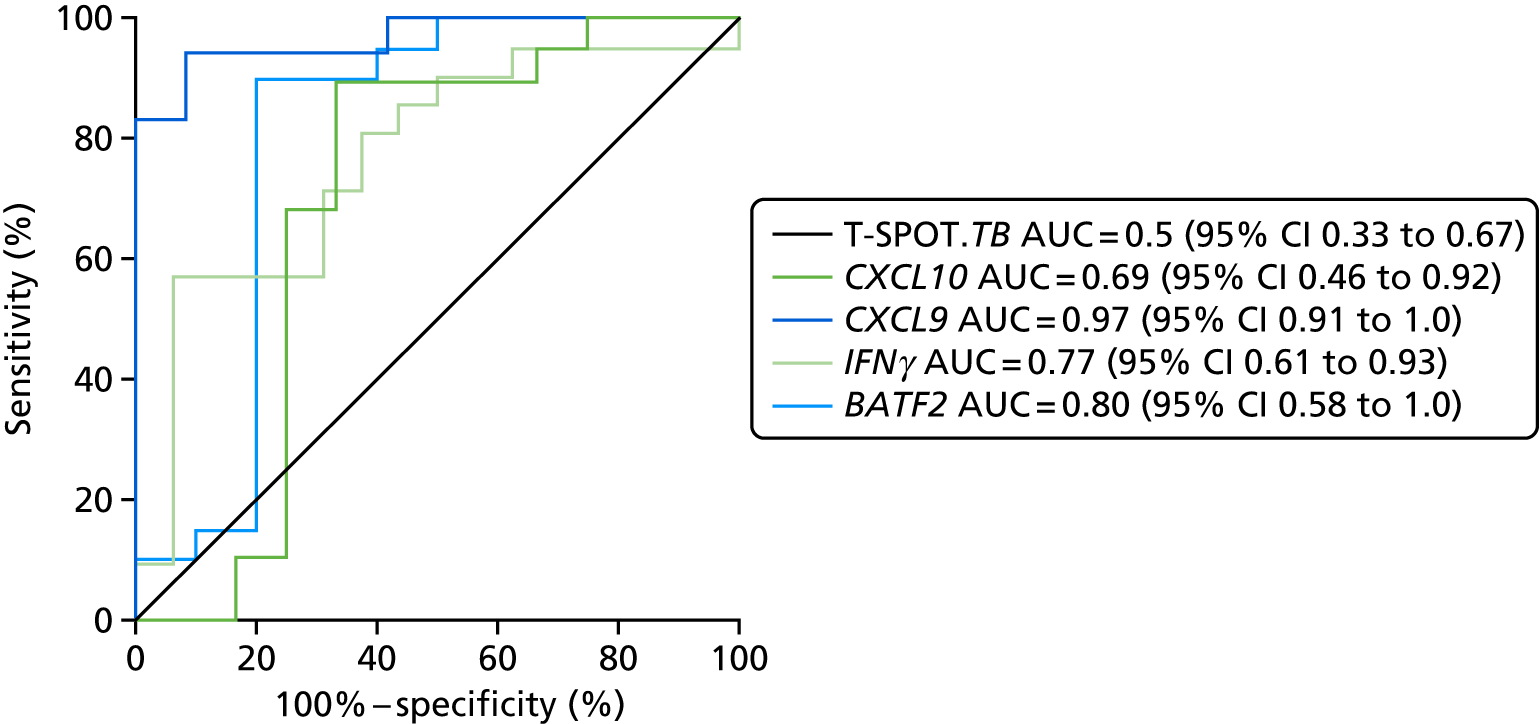
| Test/analyte | ATB T-SPOT.TB test positive, n | OD T-SPOT.TB test positive, n | AUC, % (95% CI) | Cut-off point | Sensitivity, % (95% CI) | Specifity, % (95% CI) |
|---|---|---|---|---|---|---|
| T-SPOT.TB | 24 | 22 | 0.50 (0.35 to 0.67) | 0 (86.28 to 100) | 100 (85 to 100) | |
| CXCL10 | 19 | 12 | 0.69 (0.46 to 0.92) | 260 | 95 (74 to 100) | 33 (9.9 to 65) |
| CXCL9 | 18 | 12 | 0.97 (0.91 to 1.0) | 286 | 100 (81 to 100) | 71 (48 to 89) |
| IFNγ | 21 | 16 | 0.77 (0.61 to 0.93) | 2.9 | 95 (76 to 100) | 71 (48 to 89) |
| BATF2 | 19 | 10 | 0.8 (0.58 to 1.0) | 16 | 95 (75 to 100) | 60 (59 to 96) |
| Test/analyte | ATB QFT-GIT positive, n | ATB QFT-GIT negative, n | OD QFT-GIT positive, n | OD QFT-GIT negative, n | AUC, %(95% CI) | Cut-off point | Sensitivity, % (95% CI) | Specifity, % (95% CI) |
|---|---|---|---|---|---|---|---|---|
| QFT | 20 | 21 | 5 | 23 | 0.7 (0.5 to 0.8) | 49 (33 to 65) | 63 (63 to 94) | |
| CXCL10 | 20 | 21 | 5 | 23 | 0.66 (0.53 to 0.79) | –19 | 95 (83 to 99) | 3.6 (0.09 to 18) |
| IFNγ | 19 | 21 | 5 | 22 | 0.69 (0.57 to 0.82) | –18 | 95 (83 to 99) | 3.7 (0.09 to 19) |
FIGURE 35.
Comparison of detection of IFNγ or CXCL10 in Mtb antigen-stimulated samples. (a) Using either MSD from QFT-GIT supernatants of qRT-PCR from stimulated PBMCs; (b) comparing between patient groups in the overlapping cohort (n = 75), where both tests were performed; and (c) the diagnostic accuracy of using either IFNγ or CXCL10 using either platform, for detection all TB cases, was assessed by ROC curve analysis. Protein levels and fold changes in gene expression were compared between groups using Kruskal–Wallis with Dunn’s post hoc test for multiple comparisons. ATB, active tuberculosis. *p < 0.05; **p < 0.005; ***p < 0.0005; ****p < 0.0001.
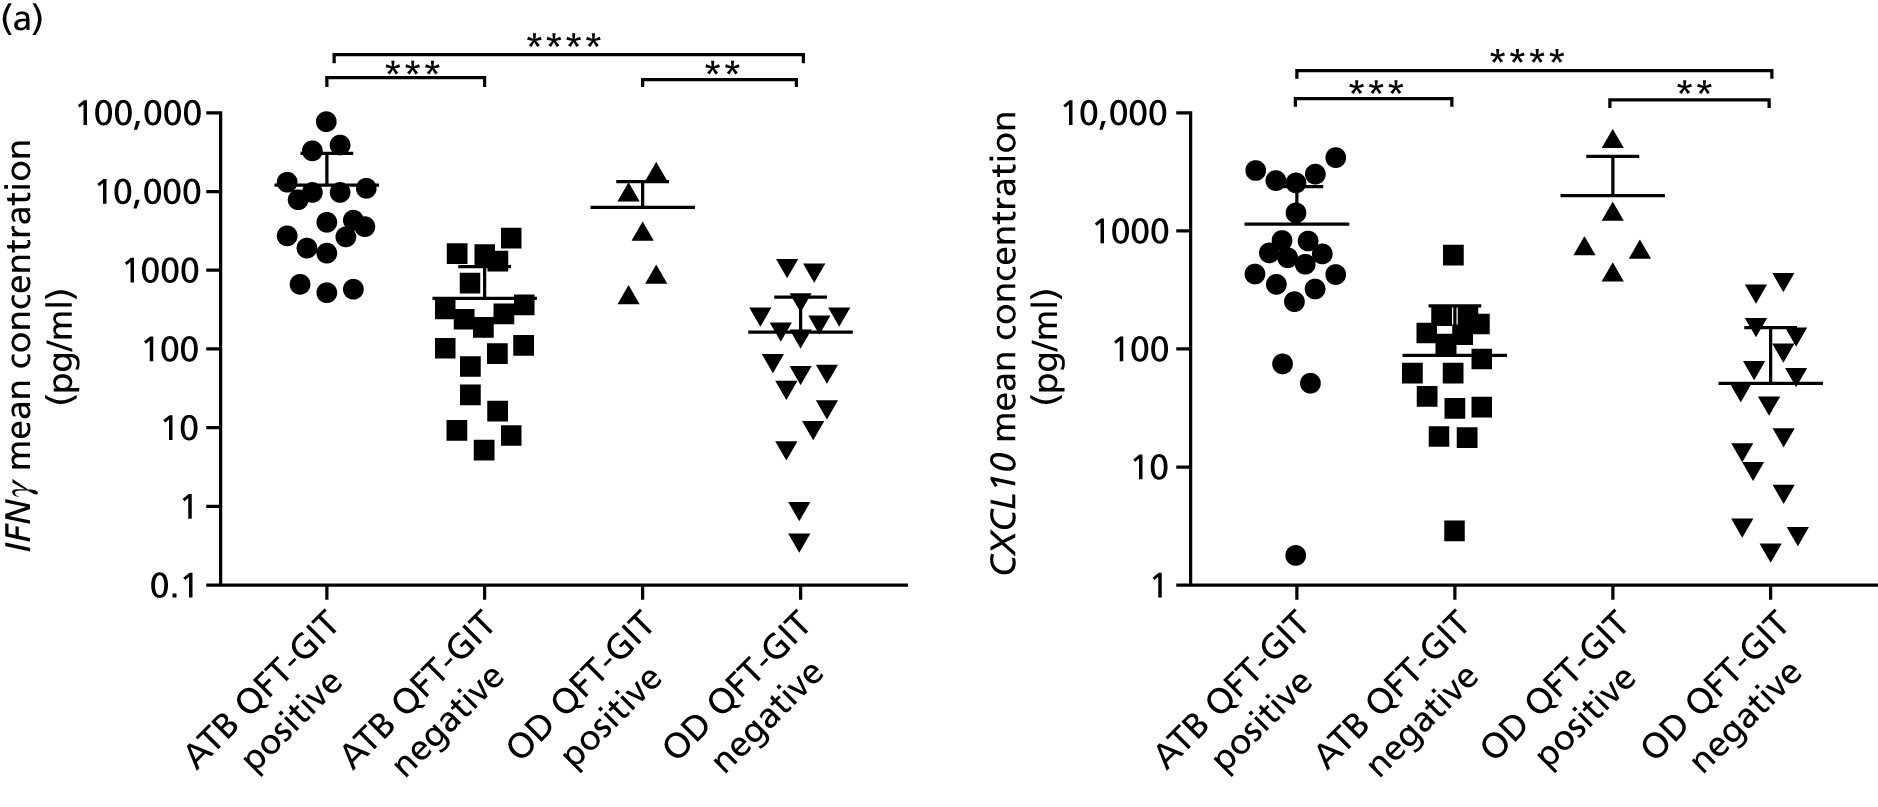
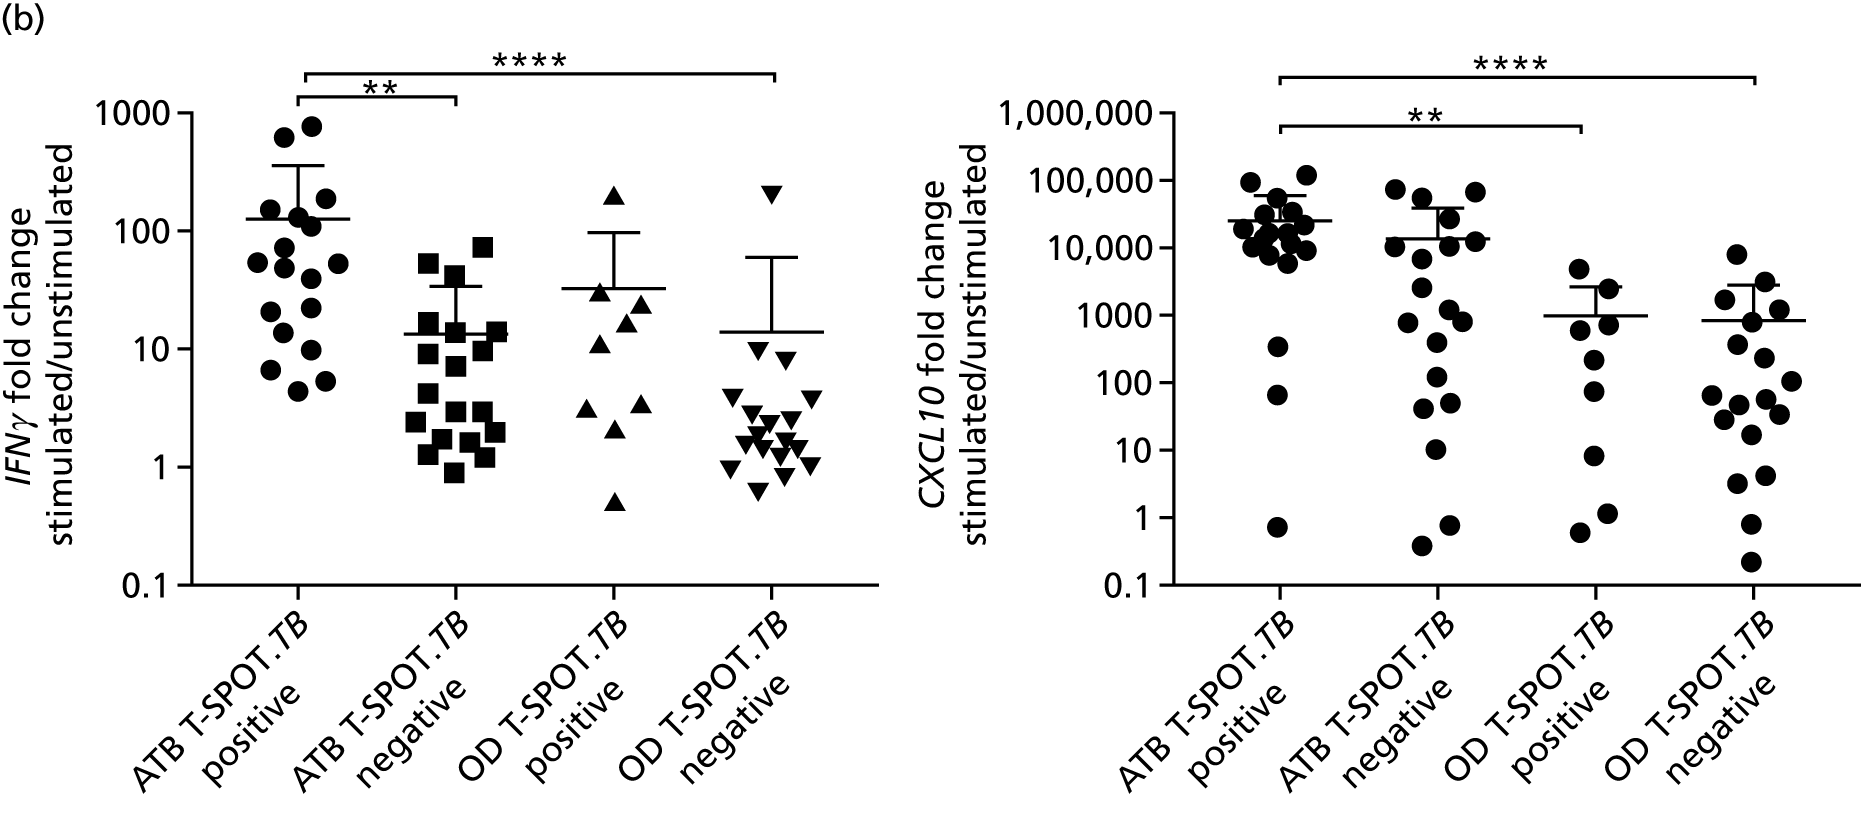

Appendix 16 Additional tables for health economic analysis: methodology
| Adverse event | Symbol | Cost of treatment (£) | QALY loss |
|---|---|---|---|
| Hepatotoxicity | q h | Gamma(6.679,87.889) | Gamma(65.753,7 × 105) |
| Nausea and vomiting | q n | 63 | Gamma(109.67,3 × 106) |
| Test | Cost, £ | Time for a result (days) | |
|---|---|---|---|
| Unit | Total staffa | ||
| Transcriptomic PCR test | 16.5 | Uniform(145.2,193.6) | Uniform(1,1.5) |
| Cellular immune flow cytometry | 150 | Uniform(145.2,193.6) | Uniform(2,7) |
| Molecular rule-out qRT-PCR test | Uniform(27,35) | Uniform(145.2,193.6) | Uniform(2,5) |
| Consultation type | Cost, £ (SE) | Distribution | Source |
|---|---|---|---|
| First visit: respiratory medicine, multiprofessional | 241 | Gamma(53.3,4.52) | National tariff 2014–15, Annex 5A79 |
| 167 (33) | Hughes et al.80 | ||
| Follow-up visit: respiratory medicine, multiprofessional | 143 | Gamma(18.78,7.62) | National tariff 2014–15, Annex 5A79 |
| 167 (33) | Hughes et al.80 |
| Test | Unit cost, £ (SE) (SA range) | Distribution | Sources |
|---|---|---|---|
| Culture | 22.29 (2.23) | Gamma(100,0.22) | Drobniewski et al.81 |
| Sputum smear microscopy | 7 | Gamma(106,0.07) | NICE guidance8 |
| 1.56 (0.68) | Hughes et al.80 | ||
| TST | 17.48 | Auguste et al.82 | |
| 16–8 (32) | Uniform(8,36) | NICE guidance75 | |
| T-SPOT.TB | 59.57 | Auguste et al.82 | |
| 55–45 (99) | Uniform(50,106) | NICE guidance8 | |
| QFT-GIT | 58–29 (87) | Uniform(29,87) | Pareek et al.17 |
| Chest X-ray | 35 | NICE guidance8 | |
| 28–19 (34) | Uniform(23,43) | NICE guidance75 | |
| Bronchoalveolar lavage | 23.24 | N/A | St Mary’s R&D office (St Mary’s Hospital, R&D Office, Imperial College Healthcare NHS Trust, London, 2017, personal communication) |
| –11.62 (46.48) | Uniform(11.62,46.48) | Proportions from NICE clinical guidelines (2006); Pareek et al.;17 NICE guidance10 | |
| Endobronchial ultrasound | 2634 | N/A | St Mary’s R&D office |
| Bronchoscopy procedure | 612 | N/A | St Mary’s R&D office |
| –306 (1224) | Uniform(306,1224) | Proportions from NICE clinical guidelines (2006); Pareek et al.;17 NICE guidance10 | |
| Histology from biopsy | 25 | N/A | St Mary’s R&D office |
| –12.5 (50) | Uniform(12.5,50) | Proportions from NICE clinical guidelines (2006); Pareek et al.;17 NICE guidance10 | |
| Needle aspirate | 90.21 | N/A | St Mary’s R&D office |
| –45.1 (180.42) | Uniform(45.1,180.42) | Proportions from NICE clinical guidelines (2006); Pareek et al.;17 NICE guidance10 | |
| PCR | 202.45 | N/A | St Mary’s R&D office |
| –101.2 (404.9) | Uniform(101.2,404.9) | Proportions from NICE clinical guidelines (2006); Pareek et al.;17 NICE guidance10 |
| Drug | Dosage (mg/day)a | Dosage by patient weight (mg/kg/day)a | Batch costb (£) | Quantity per batch (capsule or tablet)b | Dosage per capsule or tabletb | 60-day total cost (£) |
|---|---|---|---|---|---|---|
| Rifampicin | 600 | – | 48.00 | 100 | 300 | 57.60 |
| Isoniazid | 300 | – | 19.24 | 56 | 50 | 123.69 |
| Pyrazinamide | 2000 | – | 38.34 | 30 | 500 | 306.72 |
| Ethambutol | – | 15 | 42.74 | 56 | 400 | 116.74 |
Distributional formulation of individual level/sample uncertainty
The number of individuals who enter the diagnostic pathway was defined as n. Of these, we defined n+ as active TB cases and the remainder as non-active TB. We defined the probability of a given patient being an active TB case as n+/n (and so the probability of non-active TB is 1 – (n+/n)). This can therefore be considered as a draw from a Bernoulli distribution and so for the total sample, the binomial distribution gives the number of active TB and non-active TB cases in a sample population, denoted with subscript TB and ∼TB, respectively, as:
that is,
By the same principle, patients are then randomly split between those who test positive and those who test negative:
This process results in a final random subdivision of the sample population into one of the four end states.
Use as rule-out test
Each of the terminal nodes (outcomes) of the decision tree has an associated cost and health utility (measured in QALYs). For the patient cohort these were defined as:
Use as rule-in test
Cost-effectiveness outcomes
For the patient cohort the cost and health detriment were defined as:
FIGURE 36.
Decision tree comparing current practice (‘no rule-in test’) with a diagnostic pathway incorporating an initial rule-in test. The ‘standard pathway’ branch represents the range of variation observed in the patient cohort. Probabilities are shown below branches following a circular chance node and costs are below branches following a square decision node.
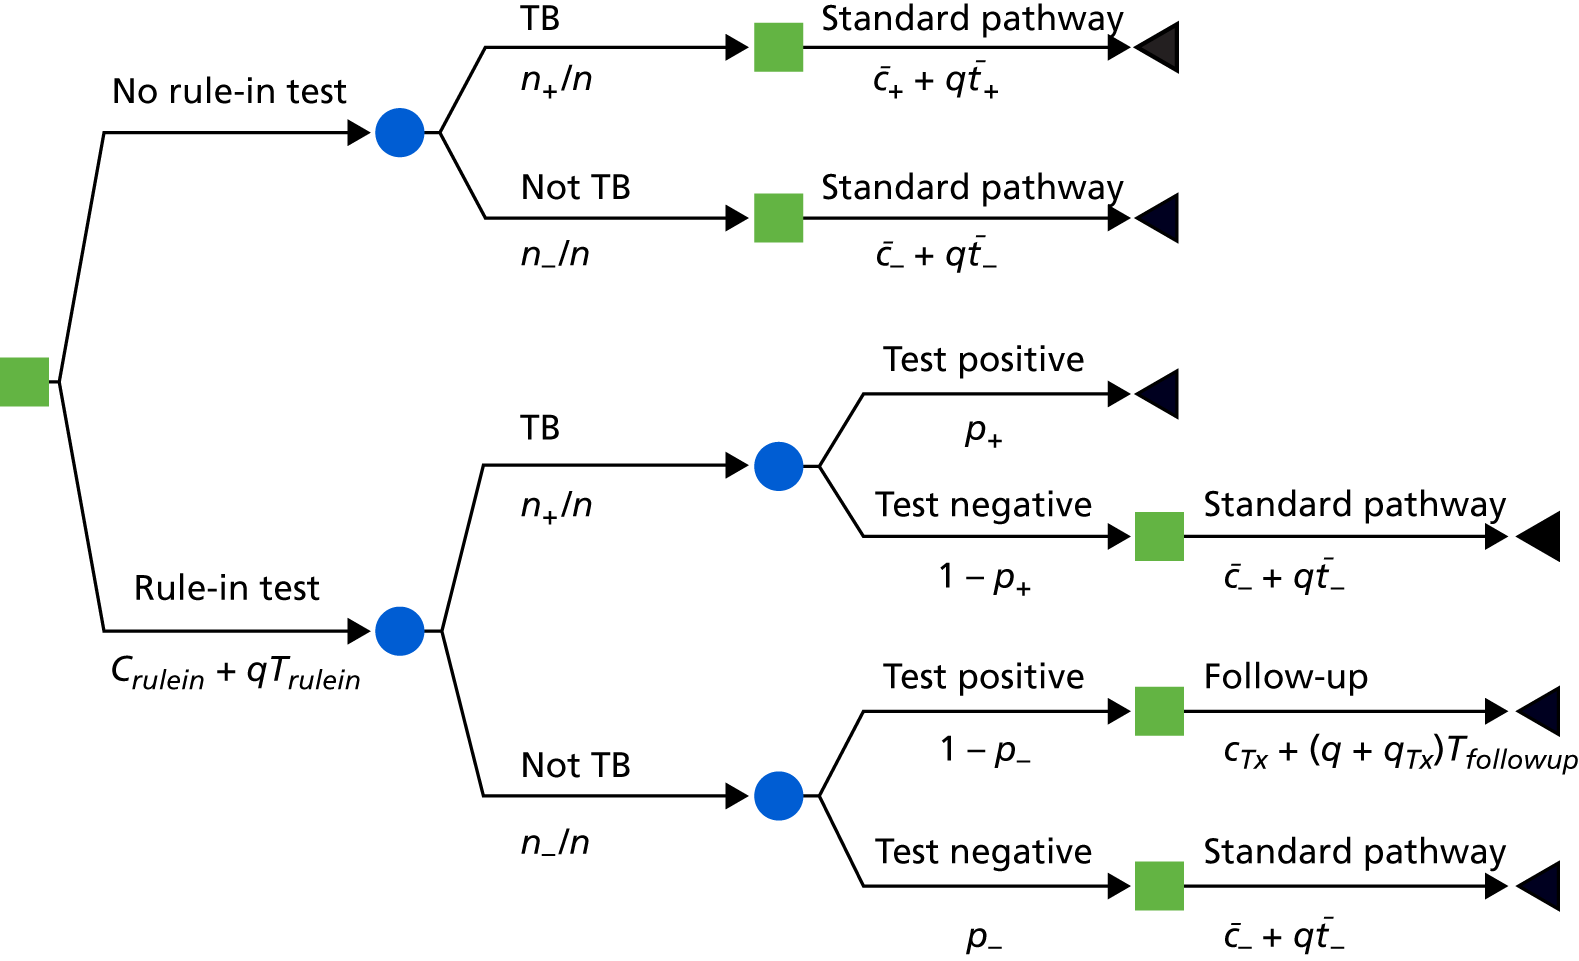
Use of dual testing as rule-in test
Cost-effectiveness outcomes
For the patient cohort the cost and health detriment were defined as:
FIGURE 37.
Decision tree comparing current practice (‘no rule-in test’) with a diagnostic pathway incorporating an initial dual rule-in test. The ‘standard pathway’ branch represents the range of variation observed in the patient cohort. Probabilities are shown below branches following a circular chance node and costs are below branches following a square decision node.
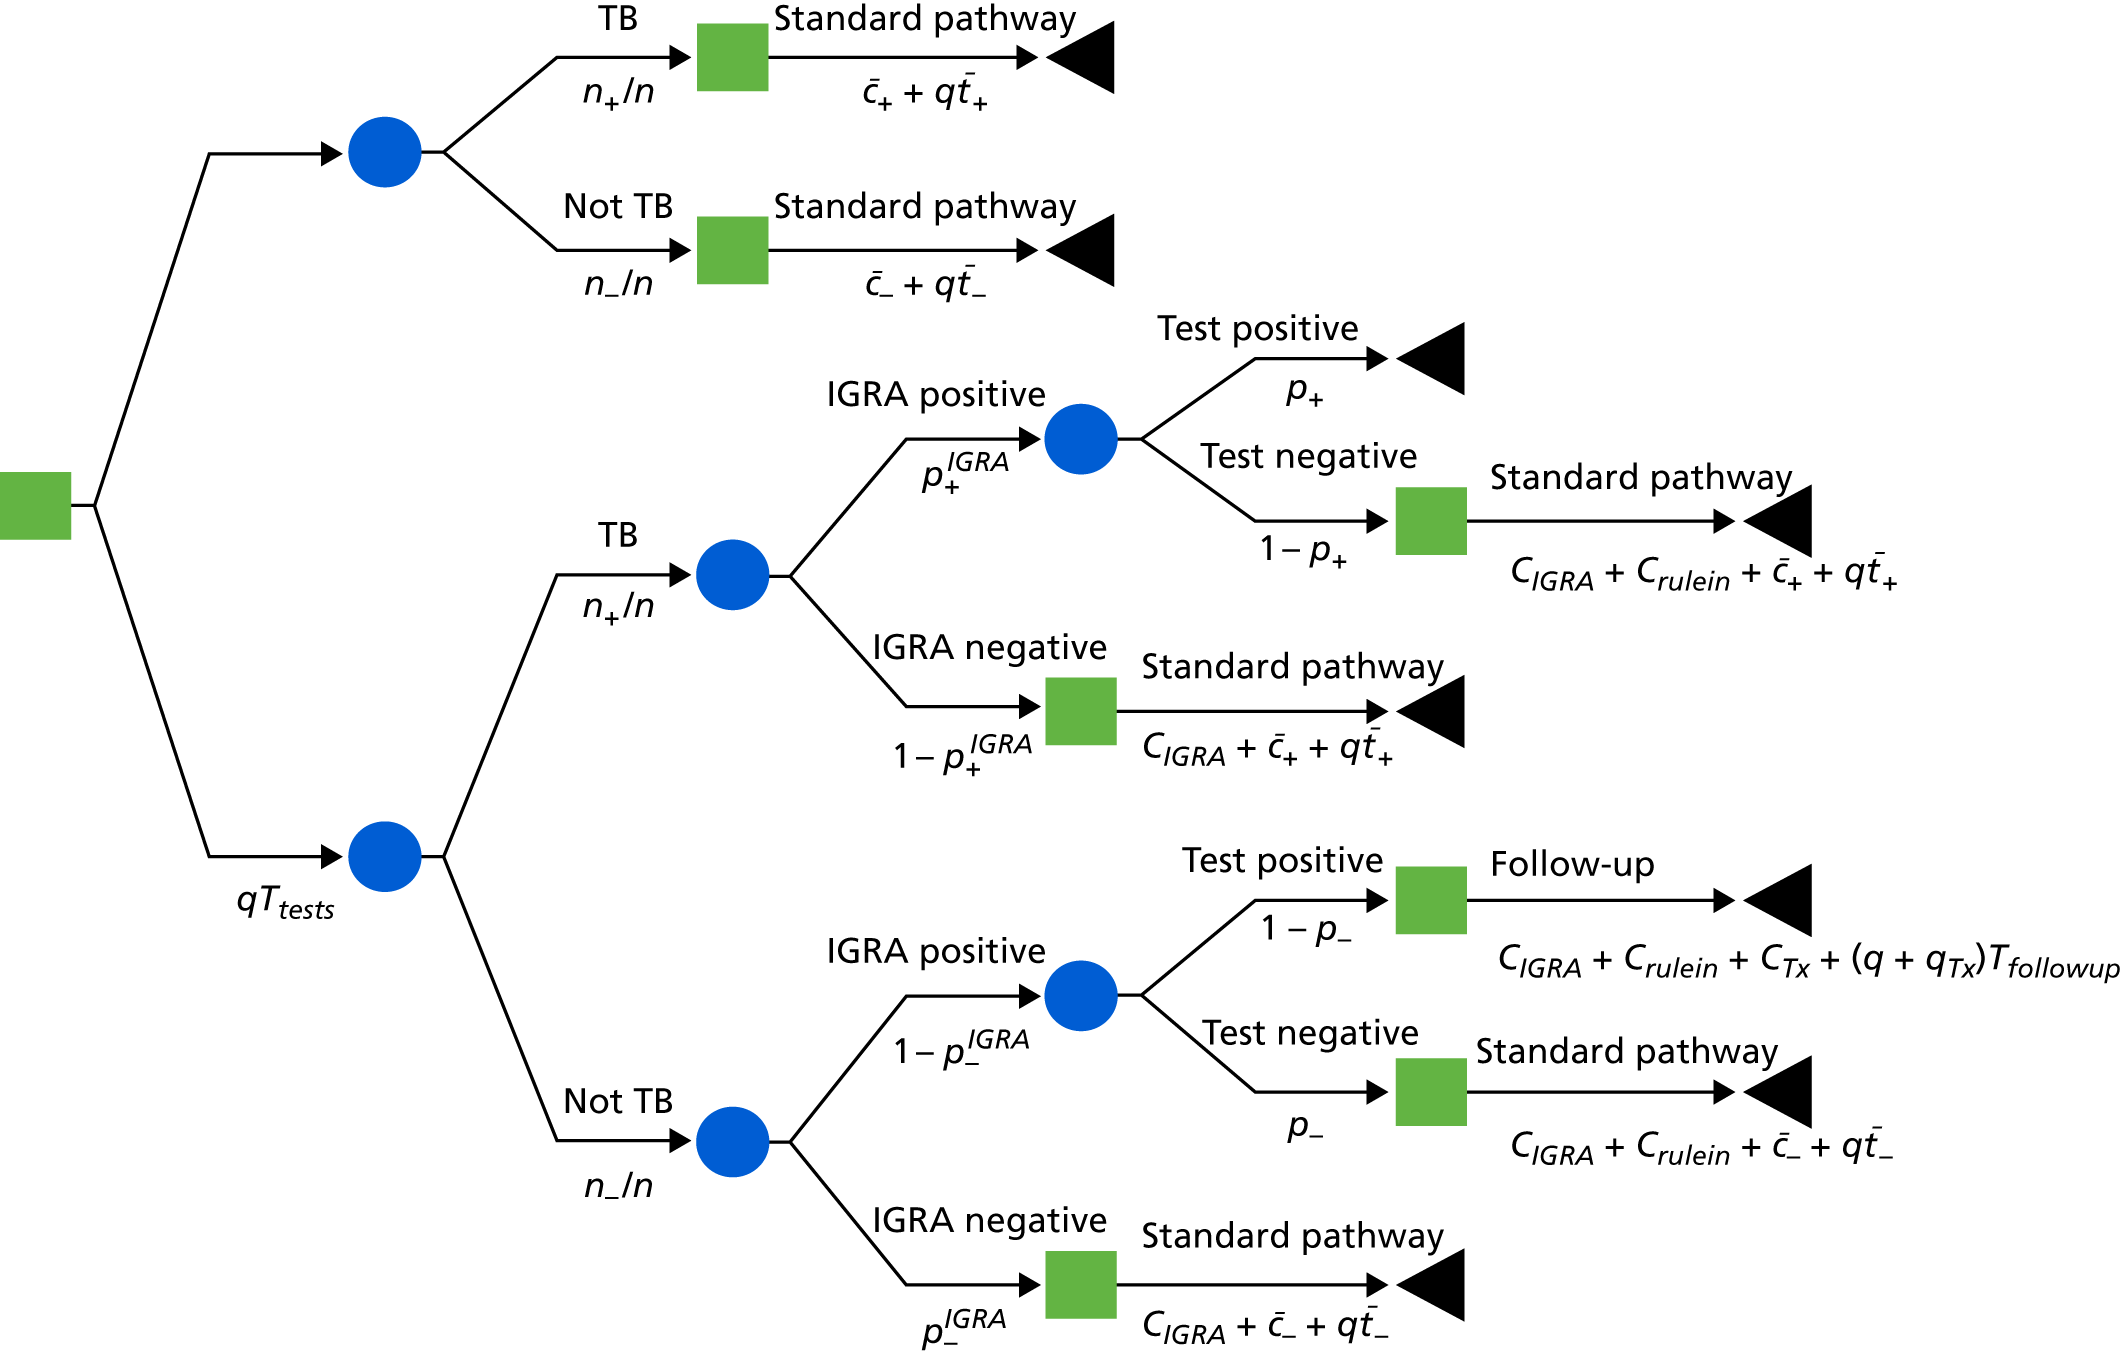
Appendix 17 Inclusion criteria of cellular immune signatures from previous publications
The publications proposing the cellular immune signatures each used different inclusion criteria and/or definitions of ‘responders’ in their studies (Table 67). To ensure a fair comparison of all signatures within this study, we applied universal inclusion criteria for the main analysis. However, we have also validated each signature according to the inclusion criteria reported in each of the reported publications that have shown promising diagnostic performance.
| Parent population | Signature | Study | Inclusion criteria | |||
|---|---|---|---|---|---|---|
| Viability (%) | Frequency of parent (%) | Above background | Number of cells in parent | |||
| CD4 positive, IFNγ/IL-2/TNF-α positive | %TNF-α only | Harari et al.24 | – | > 0.05 | – | > × 2 |
| CD4 positive, TNF-α only | %TEFF | Pollock et al.25 (%TEFF) | – | > 0.001 | > × 2 | > × 2 |
| CD4 positive and CD4 positive, IFNγ positive | CD27 MFI ratio | Portevin et al.27 | – | > 0.05 | > × 2 | ≥ 5 |
| CD4 positive, IFNγ positive | %CD27–CD45RA– | Petruccioli et al.28 | – | > 0.003 | Antigen – unstimulated > 0.003 | ≥ 30 |
| CD4 positive, IFNγ positive | %HLA-DR | Adekambi et al.26 | 75–95 | ≥ 0.05 | – | – |
| All | All phenotype signatures | VANTDET | Any | Any | > × 2 | ≥ 10 |
List of abbreviations
- AIDS
- acquired immunodeficiency syndrome
- AUC
- area under the curve
- BATF2
- basic leucine zipper atf-like transcription factor 2
- BCG
- bacillus Calmette–Guérin
- BMI
- body mass index
- CD3
- cluster of differentiation 3
- CD4
- cluster of differentiation 4
- CD8
- cluster of differentiation 8
- CD27
- cluster of differentiation 27
- cDNA
- complementary deoxyribonucleic acid
- CFP-10
- culture filtrate antigen
- CI
- confidence interval
- CXCL9
- chemokine (C-X-C motif) ligand 9
- CXCL10
- chemokine (C-X-C motif) ligand 10
- DRS
- disease risk score
- ECRR
- ESAT-6, CFP-10, Rv3615c and Rv3879c
- ELISA
- enzyme-linked immunosorbent assay
- EPTB
- extrapulmonary tuberculosis
- ESAT-6
- 6-kDa early secretory antigenic target
- FACS
- fluorescence-activated cell sorting
- FDR
- false discovery rate
- HC
- healthy control
- HIV
- human immunodeficiency virus
- HIV–
- human immunodeficiency virus negative
- HIV+
- human immunodeficiency virus positive
- HLA-DR
- human leucocyte antigen – antigen D related
- HPRU
- Health Protection Research Unit
- IDEA
- IGRA in the Diagnostic Evaluation of Active TB
- IFNγ
- interferon gamma
- IGRA
- interferon gamma release assay
- IL-2
- interleukin 2
- IMAC
- immobilised metal affinity chromatography
- ISAB
- Independent Scientific Advisory Board
- LC–MS
- liquid chromatography–mass spectrometry
- LDA
- linear discriminant analysis
- LTBI
- latent tuberculosis infection
- MFI
- median fluorescence intensity
- MSD
- Meso Scale Discovery
- Mtb
- Mycobacterium tuberculosis
- m/z
- mass-to-charge ratio
- NICE
- National Institute for Health and Care Excellence
- NIHR
- National Institute for Health Research
- NPV
- negative predictive value
- OD
- other disease
- PBMC
- peripheral blood mononuclear cell
- PBS
- phosphate-buffered saline
- PCR
- polymerase chain reaction
- PHA
- phytohaemagglutinin
- PMA
- phorbol 12-myristate 13-acetate
- PPD
- purified protein derivative
- PPI
- patient and public involvement
- PPV
- positive predictive value
- PTB
- pulmonary tuberculosis
- QC
- quality control
- QFT-GIT
- QuantiFERON® GOLD In-Tube
- qRT-PCR
- quantitative reverse transcription-polymerase chain reaction
- RD1
- region of difference 1
- RNA
- ribonucleic acid
- RNase
- ribonuclease
- ROC
- receiver operating characteristic
- SELDI-TOF
- surface-enhanced laser desorption ionisation time-of-flight mass spectrometry
- SERPINA1
- serpin family A member 1
- SMG
- Study Management Group
- SVML
- support vector machine learning
- TB
- tuberculosis
- TBS
- tuberculosis score
- TEAB
- triethylammonium bicarbonate
- TEFF
- differentiation T effector cells
- TNF-α
- tumour necrosis factor alpha
- TST
- tuberculin skin test
- VANTDET
- Validation of New Technologies for the Diagnostic Evaluation of active Tuberculosis
- v/v
- volume/volume
- WHO
- World Health Organization
