Notes
Article history
The research reported in this issue of the journal was funded by the EME programme as project number 16/33/01. The contractual start date was in November 2017. The final report began editorial review in July 2019 and was accepted for publication in May 2020. The authors have been wholly responsible for all data collection, analysis and interpretation, and for writing up their work. The EME editors and production house have tried to ensure the accuracy of the authors’ report and would like to thank the reviewers for their constructive comments on the final report document. However, they do not accept liability for damages or losses arising from material published in this report.
Permissions
Copyright statement
© Queen’s Printer and Controller of HMSO 2021. This work was produced by Shankar-Hari et al. under the terms of a commissioning contract issued by the Secretary of State for Health and Social Care. This issue may be freely reproduced for the purposes of private research and study and extracts (or indeed, the full report) may be included in professional journals provided that suitable acknowledgement is made and the reproduction is not associated with any form of advertising. Applications for commercial reproduction should be addressed to: NIHR Journals Library, National Institute for Health Research, Evaluation, Trials and Studies Coordinating Centre, Alpha House, University of Southampton Science Park, Southampton SO16 7NS, UK.
2021 Queen’s Printer and Controller of HMSO
Chapter 1 Introduction
Sepsis
Sepsis and septic shock were defined in 2016. 1 Sepsis is defined as a life-threatening organ dysfunction caused by a dysregulated host response to infection. The clinical criteria for sepsis are organ dysfunction [defined as an increase in the Sepsis-related Organ Failure Assessment (SOFA) score of ≥ 2 points] in the context of suspected or proven infection as the cause of acute illness. Septic shock is defined as a subset of sepsis, in which particularly profound circulatory, cellular and metabolic abnormalities are associated with a greater risk of mortality than sepsis alone. The clinical criteria for septic shock include vasopressor requirement to maintain a mean arterial pressure of ≥ 65 mmHg and a serum lactate level > 2 mmol/l (> 18 mg/dl) in the absence of hypovolaemia. 1,2
Sepsis is common. The extrapolated population incidence of Sepsis-3 sepsis and Sepsis-3 septic shock in England was 101.8 and 19.3 per 100,000 person-years, respectively, in 2015,3 and global incidence continues to increase every year. 3–5 The mortality rate of patients admitted to critical care with sepsis remains high, at 30–40%. Since the first consensus definition of sepsis in 1992, although there has been a consistent reduction in sepsis mortality, there have been numerous statistically negative trials of potential interventions. 6 Many of the interventions tested in late-phase trials had biological plausibility in preclinical studies and in early-phase trials, and some have even been tested in late-phase trials whose design was based on a priori-defined subgroup differences in the treatment effects observed in earlier Phase III trials. 6 The often-cited reason for these statistically negative trial results is heterogeneity of sepsis cohorts. 7,8 This has led to calls to identify subphenotypes among the overall (crude) sepsis and septic shock phenotype. 8
Acute respiratory distress syndrome
Acute respiratory distress syndrome (ARDS) is a syndrome defined by acute onset of respiratory failure within 7 days of the inciting insult. The clinical criteria include acute onset of hypoxaemia [with three mutually exclusive categories of the ratio of the arterial partial pressure of oxygen (PaO2) to the fraction of inspired oxygen (FiO2), namely mild (200–300 mmHg), moderate (100–200 mmHg) and severe (≤ 100 mmHg)], bilateral chest radiographic opacities not fully explained by effusions, lobar/lung collapse or nodules, and exclusion of cardiac failure or fluid overload as the sole cause of the syndrome. 9
Acute respiratory distress syndrome is a common and frequently fatal cause of respiratory failure among critically ill patients, with an incidence of nearly 200,000 cases per year in the USA alone, an estimated prevalence of 10% among all critically ill patients worldwide and a mortality rate of 30–40%. 10,11 Since the first consensus definition of ARDS in 1988, experts have debated if patients should be subdivided on the basis of natural history, clinical features, biology or some combination thereof. 12 During the ensuing three decades, positive trials of several supportive care interventions, including most notably lung-protective ventilation, have led to decreases in ARDS mortality. However, over the same time period, dozens of pharmacotherapies that seemed to show great promise in preclinical studies have failed in clinical studies. One of the often-cited reasons for this discouraging failure rate has been the considerable clinical and biological heterogeneity within ARDS; however, objective data have been lacking to guide a more precision approach to clinical trials.
Hypothesis
We hypothesised that negative sepsis and ARDS randomised controlled trials (RCTs) are due to between- and within-patient differences in susceptibility, illness manifestation (phenotype), illness biology, response to treatment and risk of outcomes (heterogeneity). 13,14 A negative trial is one in which differences between the intervention and control arms are statistically non-significant.
To test our hypothesis we use data from three recent RCTs: (1) the Vasopressin vs Noradrenaline as Initial Therapy in Septic Shock (VANISH) trial,15 (2) the Levosimendan for the Prevention of Acute oRgan Dysfunction in Sepsis (LeoPARDS) trial16 and (3) the Hydroxymethylglutaryl-CoA reductase inhibition with simvastatin in Acute lung injury to Reduce Pulmonary dysfunction (HARP-2) trial. 17
This hypothesis could be tested by assessing if:
-
the treatment effect varies according to patients’ risk of outcome prior to randomisation [referred to as heterogeneity of treatment effect (HTE)]
-
distinct patient subgroups (subphenotypes) in whom treatment effect differs can be identified in trial populations using clinical and biomarker data.
Aims and objectives
-
What is the variation in baseline risk of death in the VANISH,15 LeoPARDS16 and HARP-217 trials?
-
Does the treatment effect of vasopressin (Pressyn AR®; Ferring Pharmaceuticals, Saint-Prex, Switzerland) and hydrocortisone sodium phosphate (hereafter referred to as hydrocortisone) (EfcortesolTM; Amdipharm plc, St Helier, Jersey) in the VANISH trial,15 of levosimenden in the LeoPARDS trial16 and of simvastatin in the HARP-2 trial17 vary according to baseline risk of death?
-
Can subphenotypes of participants in the VANISH,15 LeoPARDS16 and HARP-2 trials17 be identified?
-
What are the key discriminant variables that differentiate these subphenotypes?
-
Heterogeneity of treatment effect
Non-random variation in the treatment effect of an intervention due to differences in the baseline risk of death between patients in a population represents one form of HTE. 18,19 In critical care settings, sepsis1 and ARDS9 are acute illnesses with significant clinical and biological heterogeneity. 20–23 Therefore, it is expected that RCTs that are enrolling patients who meet generic sepsis or ARDS eligibility criteria would generate heterogeneous trial populations. This heterogeneity occurs both within a trial and between trials. 13 The resulting variation in risk of outcomes and response to treatments may result in clinically important HTE in such trial populations. This heterogeneity is one possible explanation for RCT results. 13,24
Recently, Iwashyna and colleagues24 simulated RCTs using observational cohort data and reported that the magnitude of HTE may be such that the average benefit (or harm) from the tested treatment in critical care RCTs may not be valid for all individual patients meeting the trial eligibility criteria. Therefore, exploring HTE with data from completed RCTs, aside from explaining the RCT results, could also inform future trial design and trial efficiency by targeting a trial population with a higher risk of the outcome and/or a specific baseline measure associated with either the highest treatment benefit or the greatest treatment response (enrichment). 8,13,25
In this context, we explored the presence of HTE for vasopressin and hydrocortisone in the VANISH trial,15 for levosimenden in the LeoPARDS trial16 and for simvastatin in the HARP-217 trial, using multivariable risk-based models with individual patient data. The VANISH trial15 is a 2 × 2 factorial, double-blind RCT in adult patients with sepsis who required vasopressors carried out in 18 general adult intensive care units (ICUs) in the UK. The LeoPARDS trial16 is a two-arm, parallel-group, double-blind, placebo-controlled RCT in adult patients with sepsis who required vasopressors carried out in 34 ICUs in the UK. The HARP-2 trial17 is a two-arm, parallel-group, double-blind, placebo-controlled RCT in adult patients (within 48 hours after the onset of ARDS) carried out in 40 ICUs in the UK and Ireland. We hypothesised that within these RCTs an individual patient’s baseline risk of death modifies the direction and magnitude of the treatment effects of vasopressin,15 hydrocortisone,15 levosimenden16 and simvastatin. 17 Several recent studies support our hypothesis. In a previous RCT, it was found that the treatment effect of vasopressin differed with severity of septic shock. 26 The treatment effect of hydrocortisone differs between trials,27 with potential benefit seen in trials with higher control group mortality. 28–30 The treatment effect of simvastatin differs between ARDS subphenotypes31 and potentially with illness severity in critically ill patients. 32
Conceptual approach for heterogeneity of treatment effect
Our aim was to assess whether or not an individual patient’s baseline risk of death modifies the treatment effect of an intervention (HTE). The Acute Physiology And Chronic Health Evaluation II (APACHE II) model has been proposed as a potential model for HTE evaluation. 24,33,34 We assessed HTE using the APACHE II score34 as the primary measure of baseline risk. In addition, we assessed three secondary measures based on the APACHE II model: (1) the APACHE II physiology score (APS-APII), (2) the APACHE II-calculated risk of death (Rcalc. ), as originally proposed by Knaus and colleagues,34 and (3) a modified APACHE II risk of death model recalibrated (Rrecal. ) using data from the VANISH trial15 and the LeoPARDS trial. 16 The rationale for using the APS-APII was that the total APACHE II score determines a non-modifiable risk of death based on age and severe comorbidity, but the physiological derangement most likely mediates the relationship between treatment effect and outcome. 35 We also investigated whether or not any HTE could be driven by adverse events: if low-risk patients have similar exposure to treatment-related harms as high-risk patients, but do not have the same exposure to benefits, this would result in a net harm signal. 24 Furthermore, irrespective of whether the treatment effects of interventions varied or remained constant over the range of baseline risk, HTE may manifest because of differences in treatment-related adverse events over the range of baseline risk.
Latent class analysis to identify sepsis phenotypes
Identifying subphenotypes in critically ill patients could be achieved using latent class analytic approaches or clustering approaches, as shown in ARDS cohorts36 and sepsis cohorts. 37–39 Calfee and colleagues23 applied latent class analysis (LCA) data from patients enrolled into National Institutes of Health/National Heart, Lung, and Blood Institute ARDS Network randomised controlled trials, and reported two distinct and consistent subphenotypes of ARDS in five trials. In all trials, a hyperinflammatory subphenotype accounting for roughly 30% of the ARDS population was associated with higher levels of inflammatory biomarkers, more profound shock, worse acidosis, significantly worse clinical outcomes and potentially different treatment response to randomly assigned positive end-expiratory pressure and fluid management strategy than a hypoinflammatory subphenotype. 23,31,40–42 In contrast, LCA on data from the PROtein C Worldwide Evaluation in Severe Sepsis (PROWESS) Shock study identified six different sepsis phenotypes and found no treatment effect differences between classes. 39 Furthermore, LCA on sepsis cohorts identified using electronic health records reported four different sepsis phenotypes,37,38 which appear different from sepsis phenotypes identified using PROWESS Shock study-level data. It is important to note that, unlike Calfee and colleagues’ ARDS analyses,23 none of the sepsis subphenotype studies use cytokines, markers of endothelial or end organ injury.
In this context, we conducted an a priori-defined secondary analysis of the VANISH trial15 and the LeoPARDS trial16 using clinical and biomarker data to identify sepsis subphenotypes. Based on the available evidence from ARDS studies, we hypothesised a priori that LCA of the VANISH trial15 and LeoPARDS trial16 cohorts would identify at least two distinct subphenotypes of sepsis, and that patients with these subphenotypes might respond differently to corticosteroids, vasopressin and levosimendan (Simdax®; Orion Pharma, Espoo, Finland).
Latent class analysis to identify acute respiratory distress syndrome phenotypes
Latent class analysis is a well-validated statistical approach that seeks to use objective criteria to identify subgroups within a broader population. We have previously applied LCA in independent analyses of three cohorts of patients derived from three National Institutes of Health/National Heart, Lung, and Blood Institute ARDS Network RCTs. In all three cohorts, summing to over 2000 patients, we observed strong evidence for two distinct and consistent subphenotypes of ARDS. 23,42 In all three cohorts, one subphenotype, representing roughly 30% of ARDS patients, was consistently characterised by higher levels of inflammatory biomarkers, more profound shock and acidosis, and significantly worse clinical outcomes. Of particular interest, we found that this hyperinflammatory subphenotype was associated with a significantly different response to randomly assigned positive end-expiratory pressure and randomly assigned fluid management strategy than the hypoinflammatory subphenotype. 23,42 Therefore, identifying subphenotypes may be critical to future success in ARDS clinical trials. 43 It remains unknown, however, whether or not these ARDS subphenotypes are generalisable to non-US populations, whether or not they can be identified using less extensive data sets and, most importantly, whether or not they may respond differently to pharmacotherapies.
To test these questions we designed a secondary analysis of a Phase IIB RCT of simvastatin for ARDS (i.e. the HARP-2 trial). 17 Based on our prior research, we hypothesised a priori that LCA of the HARP-2 trial cohort would identify two distinct subphenotypes of ARDS, with the hyperinflammatory subphenotype and showing better treatment response to simvastatin.
Chapter 2 Methods
Study approvals and randomised controlled trials data sets
We obtained ethics approval for this study (reference 18/LO/1079). No patients were directly recruited into this study. Data from the VANISH,15 LeoPARDS16 and HARP-217 trials were used in this study. All trials were randomised and double blind. Further details can be found in the original study protocols.
The VANISH trial
The VANISH trial15 is a 2 × 2 factorial, double-blind RCT in adult patients with sepsis who required vasopressors and was carried out in 18 general adult ICUs in the UK. In the VANISH trial, patients were randomly allocated to vasopressin and hydrocortisone (n = 101), vasopressin and placebo (n = 104), noradrenaline and hydrocortisone (n = 101) or noradrenaline and placebo (n = 103). Patients received the second study drug (i.e. hydrocortisone/placebo) only if the maximum infusion of the first study drug (i.e. vasopressin/noradrenaline) had been reached. The 28-day mortality was 63 of 204 (30.9%) patients in the vasopressin group and 56 of 204 (27.5%) patients in the noradrenaline group [a difference of 3.4%, 95% confidence interval (CI) –5.4% to 12.3%].
The LeoPARDS trial
The LeoPARDS trial16 is a two-arm, parallel-group, double-blind, placebo-controlled RCT in adult patients with sepsis who required vasopressors, carried out in 34 ICUs in the UK. In the LeoPARDS trial, patients were randomised to receive either levosimendan (n = 258) or placebo (n = 257) over 24 hours, in addition to standard care. The 28-day mortality was 89 of 258 (34.5%) patients in the levosimendan group and 79 of 256 (30.9%) patients in the placebo group (a difference of 3.6%, 95% CI −4.5% to 11.7%).
The HARP-2 trial
The HARP-2 trial17 is a two-arm, parallel-group, double-blind, placebo-controlled RCT in adult patients (within 48 hours after the onset of ARDS), carried out in 40 ICUs in the UK and Ireland. In the HARP-2 trial, patients were randomised to receive either once-daily simvastatin or identical placebo tablets enterally for up to 28 days. The 28-day mortality was 57 of 259 (22.0%) patients in the simvastatin group and 75 of 280 (26.8%) patients in the placebo group [risk ratio (RR) 0.8, 95% CI 0.6 to 1.1].
Groups for comparison
Treatment effects were assessed primarily on an intention-to-treat basis, except for hydrocortisone compared with placebo (i.e. the second comparison in the VANISH trial15). Patients were eligible to receive hydrocortisone/placebo only if they had reached the maximum infusion of the first study drug, which occurred for around three-quarters of patients. This eligibility criterion was applied post randomisation, but before the administration of the second (blinded) study drug. As there was no interaction between the study drugs, and given the limited power of the analysis, only patients eligible to receive the second drug were included in this comparison (hydrocortisone, n = 148; placebo, n = 148). A sensitivity analysis on the per-protocol population was conducted for the other drug comparisons. Each trial was analysed separately.
Heterogeneity of treatment effect
This chapter includes text reproduced from Santhakumaran and colleagues44 [this article is distributed under the terms of the Creative Commons Attribution 4.0 International License (http://creativecommons.org/licenses/by/4.0/), which permits unrestricted use, distribution, and reproduction in any medium, provided you give appropriate credit to the original author(s) and the source, provide a link to the Creative Commons license, and indicate if changes were made. The Creative Commons Public Domain Dedication waiver (http://creativecommons.org/publicdomain/zero/1.0/) applies to the data made available in this article, unless otherwise stated. The text below includes minor additions and formatting changes to the original text]. Parts of this section, which presents data on ARDS subphenotypes from the HARP-2 trial,17 includes information based on our previous publication by Calfee and colleagues. 31
Outcomes
The primary outcome is mortality at 28 days after randomisation. The secondary outcome is hospital mortality during the initial hospital stay (i.e. ignoring readmissions). The rationale for this is that patients in these trials who left hospital alive were either well enough to be discharged or still sick but transferred elsewhere (e.g. social care). Therefore, hospital mortality is not a true binary outcome, as those alive at discharge are not a consistent group; hence landmark mortality at 28 days was preferred.
Measures of baseline risk
The primary analysis examined HTE for 28-day mortality, with the APACHE II34 as the measure of baseline risk, comparing treatment effect in patients with an APACHE II score above (high) or below (low) the overall median score of 25 points. This score has already been suggested a measure over which HTE could be evaluated. 24,33 The APACHE II score is the sum of the points from three elements: (1) acute physiology, (2) age and (3) chronic health. The calculation of APACHE II score is given in Table 1.
| Element | Low abnormal range | Normal | High abnormal range | ||||||
|---|---|---|---|---|---|---|---|---|---|
| 4 | 3 | 2 | 1 | 0 | 1 | 2 | 3 | 4 | |
| Acute physiology | |||||||||
| Temperature (°C) | ≤ 29.9 | 30.0–31.9 | 32.0–33.9 | 34.0–35.9 | 36.0–38.4 | 38.5–38.9 | 39.0–40.9 | ≥ 41.0 | |
| Mean arterial pressure (mmHg) | ≤ 49 | 50–69 | 70–109 | 110–129 | 130–159 | ≥ 160 | |||
| Heart rate (beats/minute) | ≤ 39 | 40–54 | 55–69 | 70–109 | 110–139 | 140–179 | ≥ 180 | ||
| Respiratory rate (breaths/minute) | ≤ 5 | 6–9 | 10–11 | 12–24 | 25–34 | 35–49 | ≥ 50 | ||
| Oxygenation (kPa) | |||||||||
| FiO2 ≥ 0.5: A–a gradient | < 26.7 | 26.7–46.6 | 46.7–66.6 | > 66.6 | |||||
| FiO2 < 0.5: PaO2 | < 7.33 | 7.33–7.99 | 8.00–9.32 | ≥ 9.33 | |||||
| Arterial pH | < 7.15 | 7.15–7.24 | 7.25–7.32 | 7.33–7.49 | 7.50–7.59 | 7.60–7.69 | ≥ 7.70 | ||
| Serum sodium concentration (mmol/l) | ≤ 110 | 111–119 | 120–129 | 130–149 | 150–154 | 155–159 | 160–179 | ≥ 180 | |
| Serum potassium concentration (mmol/l) | < 2.5 | 2.5–2.9 | 3.0–3.4 | 3.5–5.4 | 5.5–5.9 | 6.0–6.9 | ≥ 7.0 | ||
| Serum creatinine concentration (µmol/l) | < 53 | 53–133 | 134–176 | 177–308 | ≥ 309 | ||||
| Haematocrit (g/dl) | < 6.7 | 6.7–9.9 | 10.0–15.3 | 15.4–16.6 | 16.7–19.9 | ≥ 20.0 | |||
| White blood cell count (× 103/mm3) | < 1.0 | 1.0–2.9 | 3.0–14.9 | 15.0–19.9 | 20.0–39.9 | ≥ 40.0 | |||
| Points assigned | |||||||||
| Glasgow Coma Scale score | 15 | ||||||||
| Age (years) | |||||||||
| ≤ 44 | 0 | ||||||||
| 45–54 | 2 | ||||||||
| 55–64 | 3 | ||||||||
| 65–74 | 5 | ||||||||
| ≥ 75 | 6 | ||||||||
| Chronic health | |||||||||
| History of severe organ system insufficiency or immunocompromised (including NYHA IV, severe COPD and cirrhosis) | 2 points if elective postoperative and 5 points if non-operative or emergency postoperative | ||||||||
As secondary analyses we examined three other baseline risk measures. The first is the acute physiology element of the APACHE II score, which we denote APS-APII. The rationale for using the APS-APII was that the total APACHE II score includes non-modifiable risk of death attributable to age and comorbidity, but the physiological components are more likely mediators of the effect of treatment on outcome. 35 The second additional baseline risk measure we considered was the risk of death in hospital (i.e. Rcalc. ), calculated based on APACHE II score using a formula originally proposed by Knaus and colleagues34 as follows:
Post-emergency surgery is a binary indicator, and diagnostic category weights relate to the principal reason for admission for a patient. The third baseline risk measure was Rrecal. , given by recalibrating R (risk) to the study population to see whether or not an improved prediction yielded a different estimate of HTE. Methods for developing Rrecal. are given in Recalibrating APACHE II.
Recalibrating APACHE II
The following logistic regression models were estimated, with each subsequent model recalibrating with finer detail:
where AP is acute physiology and AP1, . . . , 12 is temperature, mean arterial pressure, heart rate, respiratory rate, oxygenation, arterial pH, serum sodium concentration, serum potassium concentration, serum creatinine concentration, haematocrit, white blood cell count and Glasgow Coma Scale score, respectively, and CH is chronic health. These elements were entered into the model on the points scale described in Table 1, as were age and chronic health. Mortality at 28 days was used as the outcome, as this was the outcome of interest, although predictive performance for hospital mortality was also assessed. Three additional models were estimated by adding the number of organ dysfunctions at baseline (respiratory, renal, hepatic, coagulation and cardiovascular), based on a SOFA score of ≥ 2 points. 7 The number of organ dysfunctions was treated as a continuous variable. The coefficients for the diagnostic categories were kept in proportion to the existing weights, rather than re-estimating the weights for each category because of sparse data.
The discriminatory performance of the models for the whole cohort was compared using the area under receiver operating characteristic (AUROC) curve and the discrimination slope (DS), which is the mean difference in prediction comparing those with the event and those without. 45 We did not use Cox recalibration [i.e. the prediction resulting from a logistic regression of the outcome of interest against the logit (R)], as this would not change the discrimination of the model. If the patients were ordered with respect to their score after Cox recalibration then their rank would remain the same and therefore the HTE pattern would also be the same.
The AUROC curve was calculated for both hospital and 28-day mortality. As some of the data on which performance is assessed were also used to build the model, bootstrapping was used to correct the AUROC curve for overoptimism. 46 For this method, a bootstrap sample is taken and the model is estimated on the sample to obtain new coefficients. In addition, the AUROC curve (for example) is calculated (AUROCboot. ).
Next, the same model and coefficients are applied to the original data set and the AUROC curve calculated (AUROCorig. ). Then, AUROCboot. – AUROCorig. gives an estimate of the optimism and this is repeated for many bootstrap samples and the average optimism taken. The averaged optimism is subtracted from the optimistic AUROC to give a corrected AUROC. This process was modified because the model was estimated on only a sample of the data. A bootstrap sample of the whole data set was taken, stratifying on treatment (control vs. active, taking any active treatment for the VANISH trial15) to ensure that the proportion of placebos is the same in the bootstrap sample. AUROCboot. is calculated by estimating the model on the placebo groups and applying it to the whole bootstrap sample and AUROCorig. is calculated by applying the same model to the original data set. The same approach was applied to the DS. The model with the best corrected discriminatory performance was used as an additional measure of baseline risk.
Models were estimated using the control groups from the VANISH15 (noradrenaline + placebo, n = 103) and LeoPARDS16 trials (placebo, n = 257) to avoid using post-randomisation outcomes to calculate baseline risk. However, in a simulation study, Burke and colleagues47 found that using the whole cohort slightly reduced bias, overfitting and risk of a false-positive finding for HTE, and so in addition the recalibration was performed using the whole cohort.
Descriptive analysis
Distributions of the baseline risk measures in the trial populations were described with histograms, including by treatment group, to check whether or not the distribution was balanced. APACHE II score was grouped in increments of 5 points, with those scoring ≥ 35 points in one category (this is the same categories used by Knaus and colleagues34) and risk of death was grouped into 10% increments. The relationship between risk measures and mortality in the trial cohorts was described using bar charts showing the proportion of patients who died in each category. The discriminatory performance was assessed using the AUROC curve. We estimated the extreme quartile odds ratio (EQuOR) (i.e. the ratio of the odds of death in the highest vs. lowest quartile for risk) as an estimate of how the risk of death varies between patients in the same trial. 48
Statistical methods for heterogeneity of treatment effect
This chapter includes text reproduced from Santhakumaran and colleagues44 [this article is distributed under the terms of the Creative Commons Attribution 4.0 International License (http://creativecommons.org/licenses/by/4.0/), which permits unrestricted use, distribution, and reproduction in any medium, provided you give appropriate credit to the original author(s) and the source, provide a link to the Creative Commons license, and indicate if changes were made. The Creative Commons Public Domain Dedication waiver (http://creativecommons.org/publicdomain/zero/1.0/) applies to the data made available in this article, unless otherwise stated. The text below includes minor additions and formatting changes to the original text.].
Heterogeneity of treatment effect was examined by comparing the treatment effect in those with high and low baseline risk, splitting the population at the median. Forest plots illustrated the absolute risk difference (RD) and RR for 28-day mortality by treatment group, comparing high- and low-APACHE II groups. HTE was quantified on both the absolute and relative scales via additive and multiplicative interactions, respectively. The difference in the RD and associated 95% CI was estimated assuming a linear model for the probability of death, with treatment, a binary indicator for APACHE II subgroup and the interaction between them as covariates, using robust standard errors (SEs). The ratio of the RR and 95% CI was estimated assuming a log-binomial model with the same covariates. For the HARP-2 trial,17 only the primary baseline risk measure of the total APACHE II score was available.
Iwashyna and colleagues24 argued, using simulated data, that low-risk patients may have similar exposure to treatment-related harms as the high-risk patients, but not to the benefits, resulting in a net harm for these patients. We therefore investigated heterogeneity of harms using forest plots by APACHE II subgroup similar to the primary analysis. Interactions were not estimated for heterogeneity of harms because of low number of events.
Regression modelling
We also considered heterogeneity over the range of APACHE II as a continuous variable. A logistic regression model was constructed with 28-day mortality as the outcome, and treatment, APACHE II score and an interaction between the two as covariates to test whether or not treatment effect varies over baseline risk. Logistic regression was chosen over Cox regression as the outcome is short term (i.e. 28 days) and there was no censoring. The model is given by:
where p is the predicted probability of death before 28 days, risk is the mean-centred APACHE II and trt is the binary treatment indicator. The effect of a unit increase in baseline risk on mortality in the placebo group is given by βR and the treatment effect for someone with mean baseline risk is given by βT. HTE is described by the interaction term (i.e. the additional treatment effect for each unit increase in baseline risk) denoted by γ [i.e. all effects are log-odds ratios (ORs)]. Relative HTE was quantified by the interaction between APACHE II score and treatment, expressed as a ratio of ORs. Additive HTE was illustrated by plotting the estimated absolute difference in mortality between treatment groups across the range of APACHE II.
In the first instance, APACHE II was treated linearly, with residual plots used to determine if any transformations or non-linear terms were necessary. This would occur if, for example, the high-risk patients are too sick to benefit from the treatment, resulting in a n-shaped pattern of treatment effect. The non-linearity of the effects of baseline risk and of the interaction was investigated by grouping risk measures into quartiles and comparing nested models with linear and categorical associations using likelihood ratio tests.
Sensitivity analyses
Two sensitivity analyses for the main baseline risk measure (APACHE II score) were performed. First, we used hospital mortality as the outcome instead of mortality at 28 days, as the APACHE II score was originally devised as a prediction tool for hospital mortality. Second, we investigated the potential impact of missing data on the results. There were 47 patients in the VANISH trial15 for whom at least one element of the acute physiology score was missing (and 61 patients in the LeoPARDS trial16). In the main analysis, normal scores were assumed for these elements, as for the main trial. Total APACHE II scores were missing for 66 patients in the HARP-2 trial,17 and these patients were omitted from the main analysis, but are included in the forest plot. Missingness occurred pre randomisation and hence is independent of treatment effect; however, it may affect the precision of the results. In the sensitivity analysis we assumed that patients with missing data were (1) equally likely to be in the high-risk group as those with complete data, (2) 10% more likely or (3) 10% less likely. The APACHE II category was imputed 20 times under these assumptions, and the difference in RD and ratio of RR was computed as for the main analysis, combining results across imputations using Rubin’s rules. 49
Determining sepsis subphenotypes using latent class analysis
Latent class analysis is used to estimate a latent (i.e. unobserved) categorical variable that assigns individuals to groups (i.e. classes) when we have a set of observed data (i.e. indicators) that we believe is distributed differently for each class. LCA is a type of finite mixture model that jointly estimates a model for each of the indicators, with each indicator distribution being a mixture of class-specific distributions. Simultaneously, a multinomial logistic model for probabilities of class membership is estimated. The number of classes is specified in the model, but models with different numbers of classes can be compared. We used LCA to identify latent subphenotypes in adults with sepsis based on observed biomarker data.
Biomarker measurements
We measured three groups of markers to help delineate specific biological effects and illness characteristics. First, a limited cytokine profile was carried out to assess the balance between pro- and anti-inflammatory states using interleukins [i.e. interleukin 1 beta (IL-1β), IL-6, IL-8, IL-10, IL-17 and IL-18], soluble tumour necrosis factor receptor 1 (sTNFR1) and C–C motif chemokine ligand 2 (CCL2). The state of neutrophil and endothelial injury was assessed using myeloperoxidase (MPO), soluble intracellular adhesion molecule and angiotensin II (ANG II). For organ dysfunction, in addition to the SOFA variables,50 which were collected as part of trial data, we measured troponin and N-terminal pro-B-type natriuretic peptide (NT-proBNP) for cardiac dysfunction. These measurements used enzyme-linked immunosorbent assay-based methods. We had laboratory-specific standard operating procedures for these measurements prior to starting any measurements.
Exploratory analysis
Histograms and pairwise correlations were used to assess distributions, outliers and skewness (highly likely for the cytokine data). For assay data, the number and percentage of values below or above the limits of detection were recorded. Normal distributions were used for the continuous indicators, applying natural log transformations as necessary. Observations above or below the limits of detection were included in the analysis but treated as censored and all variables were standardised to have a mean of 0 and standard deviation (SD) of 1, with parameters taken from the data within the limits of detection. The number and proportion of missing observations were described for all biomarkers, clinical variables and demographic characteristics. If a patient has any missing individual indicators then LCA still allows the rest of the complete data to be included, implicitly assuming that the data are missing at random (i.e. the probability of missingness depends on only the observed data and not any missing data). This is reasonable for the biomarker data, as missing individual indicators are likely to be due to a technical issue.
Latent class modelling
Analysis was carried out separately for the LeoPARDS trial16 and VANISH trial15 cohorts. All measured biomarkers [i.e. PaO2/FiO2 ratio, creatinine, platelets, bilirubin, IL-1β, IL-6, IL-8, IL-10, IL-17, IL-18, MPO, soluble intercellular adhesion molecule (sICAM), ANG II, troponin, NT-proBNP, sTNFR1, lactate and CCL2] were included as indicator variables characterising the latent classes. Other baseline clinical and demographic variables {i.e. age, ethnicity, body mass index (BMI), comorbidities [any of New York Heart Association class IV (NYHA IV), severe chronic obstructive pulmonary disease (COPD), chronic renal failure, cirrhosis, immunodeficiency], site of infection (i.e. lung, abdomen, urine, other), SOFA score, APS-APII and post-surgical admission} that may be predictive of subphenotype were included in the model as class predictors. We also included APS-APII as a covariate in the submodel for each indicator based on a priori expectation of associations within classes. Only pre-randomisation data were used to develop the latent class model. All biomarkers were log-transformed and standardised because of skewness. Observations outside the limits of detection were included but treated as censored.
Latent class analysis models were fitted in three stages. First, conditional independence was assumed (i.e. all covariances constrained to zero) and no covariates predicting class membership were included. Second, prespecified clinical and demographic variables measured at baseline were included as covariates predicting class membership. Third, variance assumptions concerning indicators were relaxed to allow (1) non-constant residual variance across classes, (2) non-zero covariances and (3) both of these. It was not possible within the software used to model covariances between censored variables. For each stage we first fitted a one-class model, and then increased the number of classes by 1 until convergence could not be achieved. A number of strategies were used to achieve convergence, namely (1) for a k-class model, using starting values from a k – 1 class model; (2) using alternative integration methods; (3) reducing the number of censored indicators by treating values outside the limits as having values equal to the limit, for indicators with fewer than five such values; and (4) reducing the number of class predictors, selecting covariates that improved model fit based on likelihood ratio tests. Models were fitted using the gsem package in Stata® 15 (StataCorp LP, College Station, TX, USA).
The class means were estimated for each LCA model and differences across classes compared to determine which indicators showed the most separation across classes. For each model and each participant, the probability of an individual being in each class is predicted, with the probabilities for a participant summing to 1 across the classes. Each participant can then be assigned to the class for which they have the highest class probability. The Bayesian information criterion (BIC) was the primary measure of model selection,1 with smaller values indicating better fit. We also considered the Akaike information criterion (AIC), log-likelihood, entropy (i.e. a measure of class separation between 0 and 1), class sizes (with very small classes being indicative of overfitting) and the mean probability of class assignment, averaged over participants in the class. 51 We also assessed the class means and sized to see if the substantive interpretation of the classes differed across models. Additionally, plots of the change in fit statistics with the number of classes were used to determine where additional classes gave limited improvement in fit. 52 If models of different complexity gave a similar fit, then the simplest model was favoured.
Non-technical description of latent class analysis methods
Latent class analysis of the baseline variables aimed to replicate the previous publications using data from published ARDS trials. 23,42 We used data variables from subjects in all trial arms, without the influence of arm. The baseline variables consisted of clinical data, cytokine, and epithelial and endothelial injury marker profiles. For ARDS, the resulting subphenotypes were compared with the two subphenotypes derived independently in three trials previously. 23,42
The inclusion of variables, and any adaptation to their form, will depend on their robustness for their multivariate purpose, which was assessed by screening the univariate and bivariate data distributions for influential outliers, marked skewness and multicollinearity, for categorical variables with extreme prevalence and for variables contributing to the accumulation of missing data. This led to establishing the principal data set for the LCA of each trial, where the variables are further standardised to the z-scale to have mean of zero and unit variance, accounting for their differing units of measurement.
The latent class modelling stage involved the estimation of linear combinations of the standardised variables to identify a number of underlying classes. The number of classes will be determined formally by using the BIC and other model selection criteria, and by assessing the clinical interpretability of the classes as subphenotypes. With high probabilities of class membership, participants were assigned to their most likely phenotype. Regression methods with likelihood ratio tests were used to assess the association of classes with clinical outcomes, with randomisation kept intact and extended to compare response among randomised treatments. Given the factorial nature of the VANISH trial,15 this will involve a sequence of interactions tests respecting the design.
Description of subphenotypes
Once the most suitable model was selected, the estimated class means of each standardised indicator and their relative importance in class separation were shown by plotting the means, ordered by the magnitude of the largest difference between classes. Trial participants were assigned to the class for which they had the highest posterior probability of class membership for subsequent analysis. The median and interquartile range (IQR) of the observed biomarker values by class were tabulated, along with baseline clinical characteristics.
Clinical outcomes
For this study the primary clinical outcome was survival at 3 months in the LeoPARDS trial16 cohort, as this is the time point at which treatment differences stabilise. 53 Mean total SOFA score over 28 days (or ICU stay, whichever is shorter), which was the primary outcome in the LeoPARDS trial,16 and survival to 28 days were examined as secondary outcomes. For the VANISH trial15 we examined survival to 28 days (as survival to 3 months was not available), survival free of renal failure to 28 days among patients not in renal failure at baseline, and days alive and free of renal failure up to 28 days for all other patients (i.e. those who died or experienced some renal failure by day 28).
All outcomes were first compared between classes, irrespective of treatment, then treatment differences were compared between classes. For binary outcomes we presented the proportion of patients having the event in each class and performed a chi-squared test for the difference across classes. Treatment effects were expressed as a RD and the difference in treatment effects across classes as the a difference in RD. Ninety-five per cent CIs for the RD and difference in RD were calculated using linear regression with robust SEs. 54 For mean total SOFA score we presented the mean and SD, with differences between classes or treatment arms expressed as a difference in means. As mean total SOFA score is skewed, 95% CIs were calculated with bootstrapping, as was done in the main trial analysis. The median and IQR was presented for days alive and free of renal failure, again with bootstrap CIs. For continuous variables permutation tests were used to calculate p-values for the treatment–class interaction. Treatment effects by class were displayed using forest plots.
For the LeoPARDS trial,16 the first trial we analysed for identifying subphenotypes, we constructed a model to predict latent class, using a reduced set of indicators. A series of multinomial logit models were estimated, with latent class as the outcome and an increasing number of biomarkers as predictors, added in the order of greatest separation between classes. The probability of being in each class was predicted for each patient and patients were assigned to the class with the highest probability (similarly to the LCA). The class-specific sensitivity, specificity and c-statistics for each model were calculated by comparing the ‘gold-standard’ class of the latent class model with the ‘test’ class of the multinomial model. The final number of markers was chosen as the model for which the addition of further variables would bring negligible increases in accuracy measures.
Sensitivity analysis
In the main analysis we drew a distinction between class-defining and class-predicting variables. As a sensitivity analysis, we compared the class groupings when including all variables as indicators in the latent class model, following earlier work by Calfee and colleagues. 23,31
Determining acute respiratory distress syndrome subphenotypes using latent class analysis
Parts of this section, which presents data on ARDS subphenotypes from the HARP-2 trial,17 includes information based on our previous publication by Calfee and colleagues. 31
To estimate the optimal number of classes in the data, latent class models were fitted in Mplus v8 (Muthén & Muthén, Los Angeles, CA, USA), using baseline demographic characteristics, available clinical data, and IL-6 and sTNFR1 as class-defining variables. Outcome variables were not included in the modelling. Models ranging from one to four classes were estimated to identify the optimal number of classes in the studied sample. From the four models, best fit was evaluated using BIC, the Vuong–Lo–Mendell–Rubin likelihood ratio test (which compares fit of model k-classes to k – 1 classes), class size and entropy. 55,56 Variables were examined for their distribution prior to beginning this modelling and continuous variables with significantly skewed distributions were log-transformed. To estimate the model parameters, continuous variables were placed on a z-scale with a mean of zero and SD of 1, as in our prior work. 23,42 LCA is a form of finite mixture modelling. The basic idea is that the observed distribution of variables is due to a mixture of subgroups that are unknown (i.e. latent). To test this, a series of models are fitted to the data to see if a model with k-classes fits the observed distribution better than a distribution without any subgroups. Although the idea is conceptually the same as cluster analysis, it differs in one key aspect. LCA is model based, which means one can estimate the model fit. Clustering is based on simplifying joining points based on their distance from each other. Model fit is estimated via several metrics, including AIC, BIC and the test of whether or not a model with k-classes fits better than one with k – 1 classes. Other considerations include the size of the smallest class in a given model, the average probabilities of class membership and whether or not the resulting profiles of the classes have some substantive meaning.
Once the optimal number of classes was determined, study participants were assigned to their most likely class and their baseline characteristics were compared using t-tests, Pearson’s chi-squared or Wilcoxon rank-sum test, depending on the nature of the variable. Associations between class assignment and clinical outcomes (i.e. 28- and 90-day mortality, and ventilator-free days) were tested using logistic regression for mortality and zero-inflated Poisson regression for ventilator-free days. We compared time-to-event Kaplan–Meier curves using Cox proportional hazard tests to test for a differential response to treatment by class for survival. For modelling time to unassisted breathing a competing risks model was estimated with death before day 28 as the competing risk. 57 All analyses other than LCA were carried out using SAS® version 9.4 (SAS Institute Inc., Cary, NC, USA). Some of these results have been previously reported in the form of an abstract. 58
Chapter 3 Results
Heterogeneity of treatment effect
This chapter includes text reproduced from Santhakumaran and colleagues44 [this article is distributed under the terms of the Creative Commons Attribution 4.0 International License (http://creativecommons.org/licenses/by/4.0/), which permits unrestricted use, distribution, and reproduction in any medium, provided you give appropriate credit to the original author(s) and the source, provide a link to the Creative Commons license, and indicate if changes were made. The Creative Commons Public Domain Dedication waiver (http://creativecommons.org/publicdomain/zero/1.0/) applies to the data made available in this article, unless otherwise stated. The text below includes minor additions and formatting changes to the original text.].
Descriptive analysis
In the VANISH,15 LeoPARDS16 and HARP-217 trials, 28-day mortality was not significantly different between the intervention and control arms (see Table 1). The illness severity (using the total APACHE II score) was lower in the HARP-2 trial17 than in the VANISH15 and LeoPARDS16 trials (see Table 1). The EQuOR highlighted significant heterogeneity of risk of death in all three RCTs for all three risk measures. Trial-level summary characteristics are shown in Table 2.
| Characteristic | VANISH trial15 | LeoPARDS trial16 | HARP-2 trial17 | |||||
|---|---|---|---|---|---|---|---|---|
| Vasopressin | Noradrenaline | Hydrocortisone | Placebo | Levosimendan | Placebo | Simvastatin | Placebo | |
| 28-day mortality, n/N (%) | 63/204 (31) | 56/204 (27) | 52/147 (35) | 47/148 (32) | 89/258 (35) | 79/256 (31) | 57/259 (22) | 75/279 (27) |
| Related AE, n/N (%) | 23/205 (11) | 16/204 (8) | 18/148 (12) | 18/148 (12) | 41/258 (16) | 16/257 (6) | 36/259 (14) | 25/279 (9) |
| Related SAE, n/N (%) | 13/205 (6) | 10/204 (5) | 11/148 (7) | 12/148 (8) | 13/258 (5) | 2/257 (1) | 3/259 (1) | 4/279 (1) |
| APACHE II score (points), median (IQR) | 24 (19–29) | 24 (19–30) | 25 (19–32) | 25 (20–30) | 25 (21–31) | 25 (21–30) | 18 (14–24) | 18 (14–23) |
| APS-APII, median (IQR) | 20 (14–24) | 20 (15–25) | 21 (15–26) | 20 (16–25) | 20 (16–26) | 21 (16–24) | ||
| Rcalc., median (IQR) | 0.41 (0.24–0.63) | 0.42 (0.25–0.66) | 0.48 (0.25–0.69) | 0.44 (0.28–0.67) | 0.56 (0.36–0.72) | 0.53 (0.39–0.70) | ||
| EQuOR APACHE II, OR (95% CI) | 4.85 (2.49 to 9.46) | 7.35 (4.09 to 13.20) | 5.92 (2.99 to 11.73) | |||||
| EQuOR APS-APII, OR (95% CI) | 3.58 (1.88 to 6.83) | 5.39 (3.06 to 9.51) | ||||||
| EQuOR Rcalc., OR (95% CI) | 5.66 (2.83 to 11.31) | 4.64 (2.63 to 8.17) | ||||||
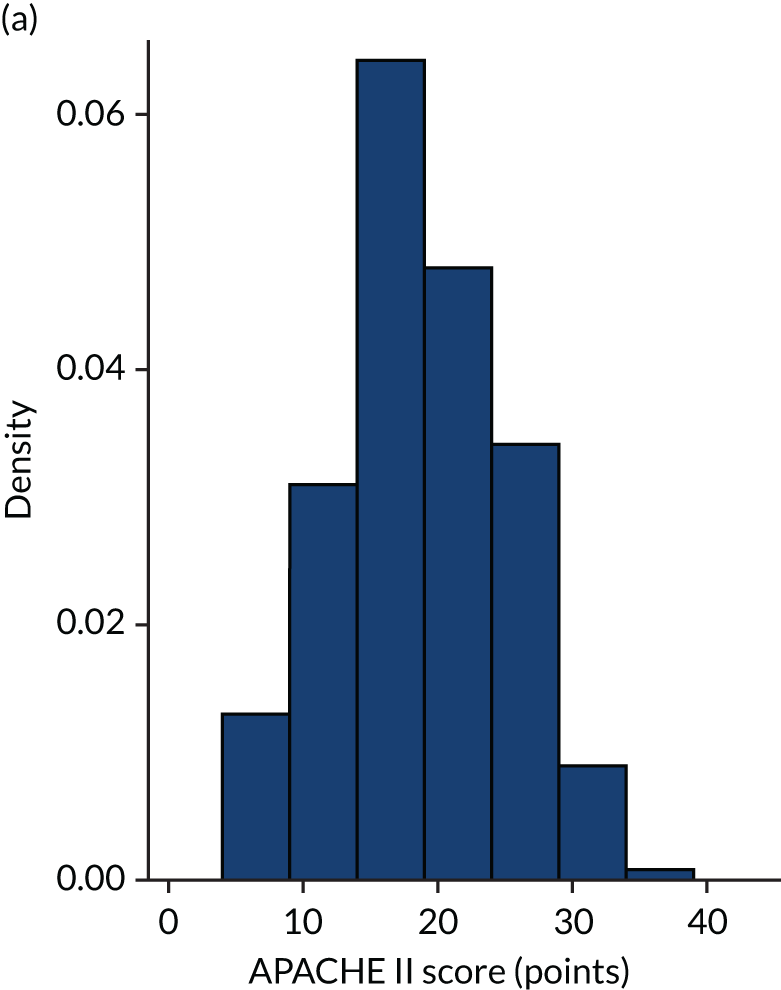
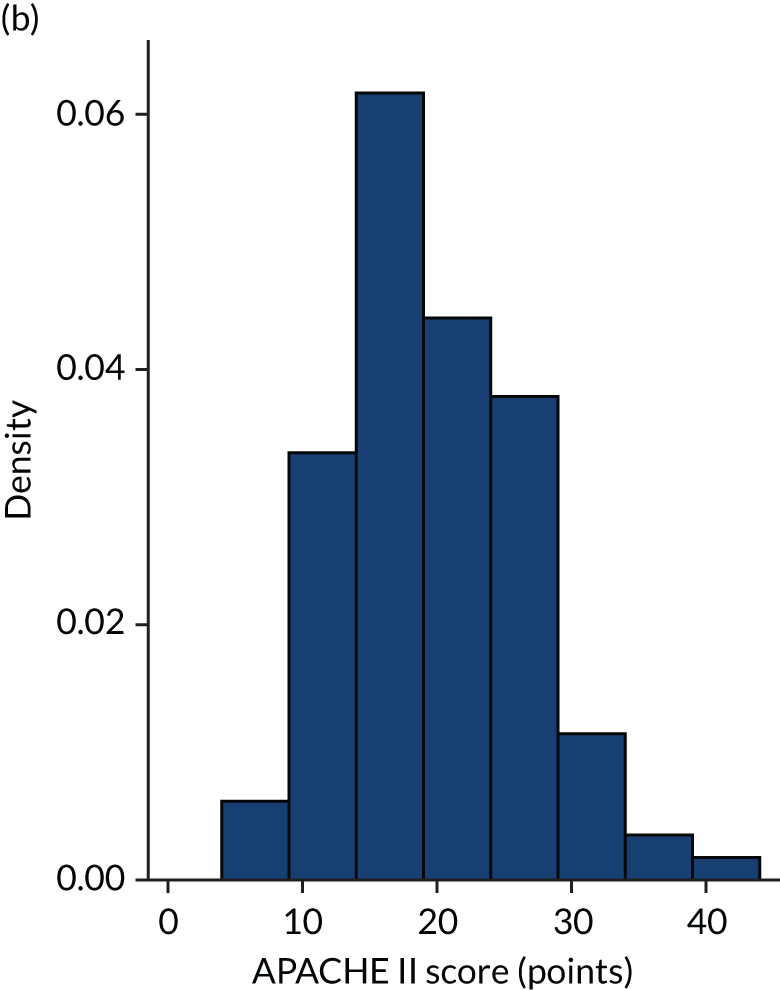
Figures 1–4 show the distribution of APACHE II and R by treatment arm in the VANISH trial15 (vasopressin vs. noradrenaline and hydrocortisone vs. placebo, shown separately). Figures 5 and 6 show the distribution of APACHE II and R, respectively, by treatment arm in the LeoPARDS trial16 cohort. The distribution of APACHE II in the HARP-2 trial17 cohort is shown in Figure 7.
FIGURE 1.
Distribution of APACHE II score by study drug 1: the VANISH trial15 cohort. (a) Noradrenaline; and (b) vasopressin.
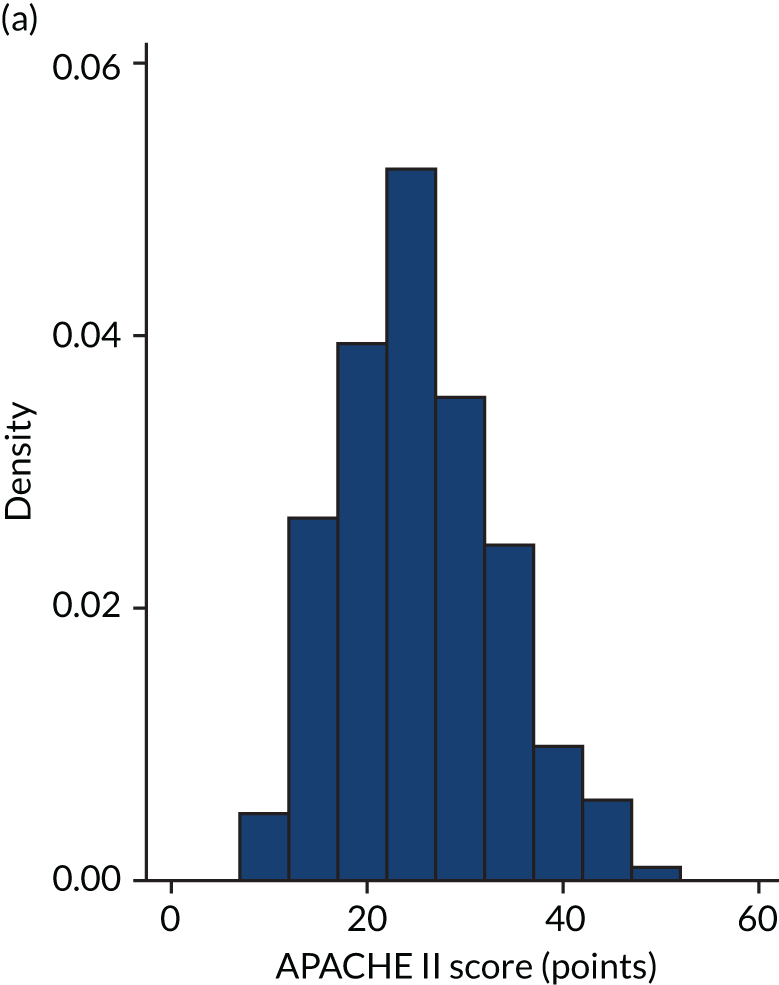
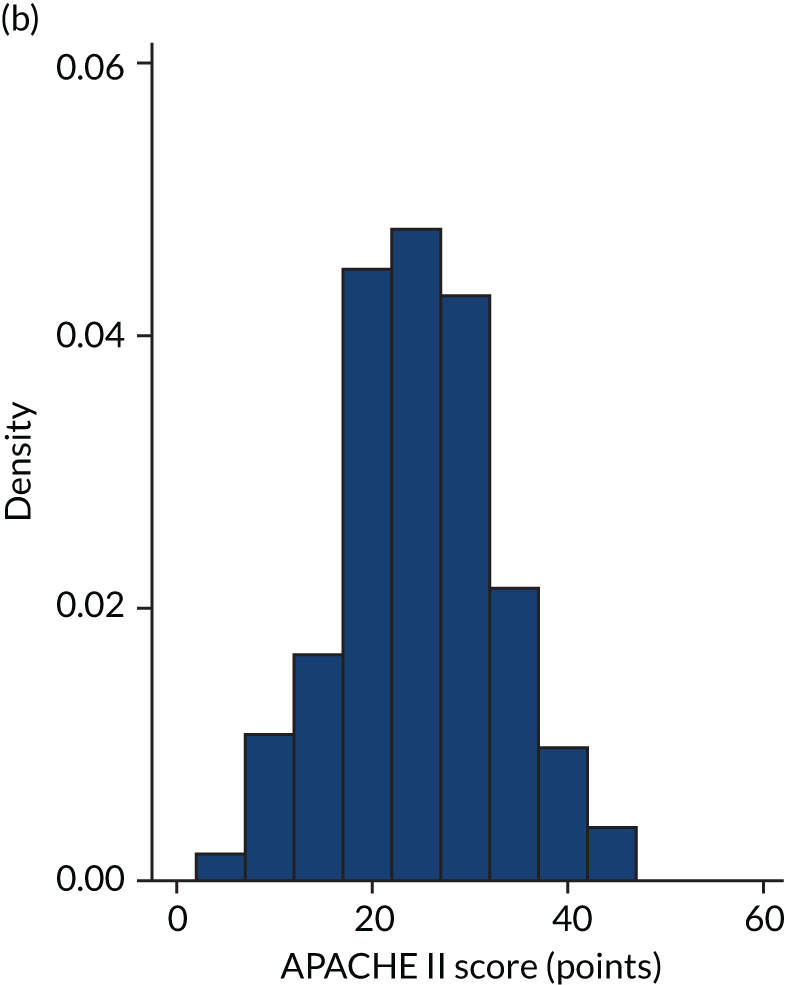
FIGURE 2.
Distribution of APACHE II score by study drug 2: the VANISH trial15 cohort. (a) Placebo; and (b) hydrocortisone.
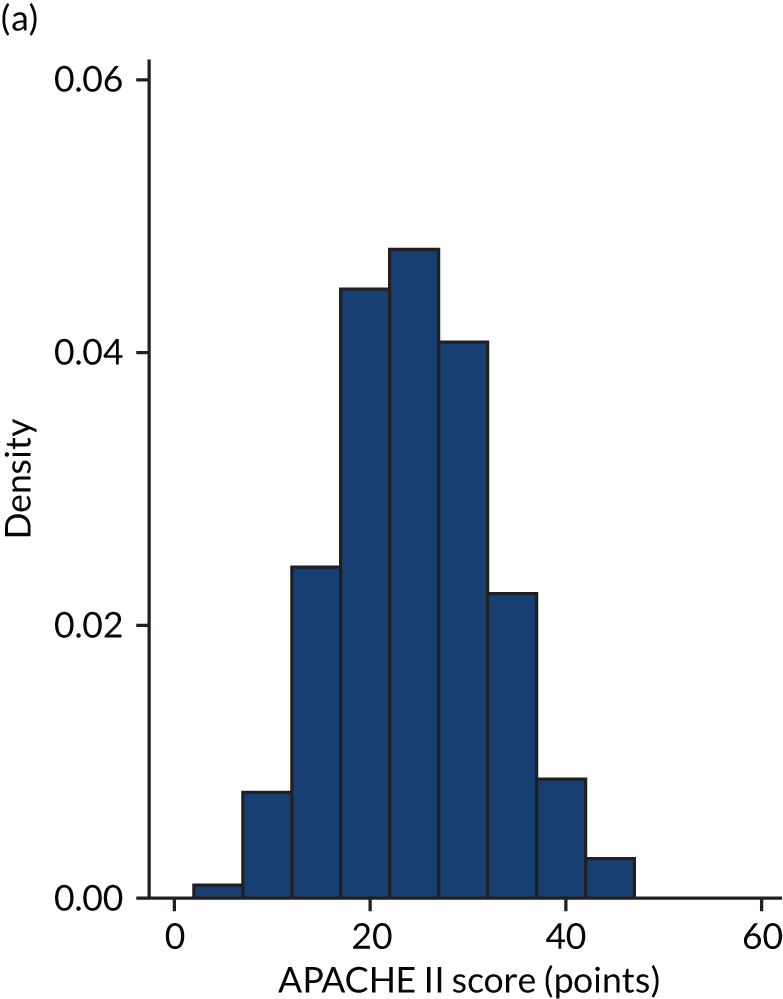
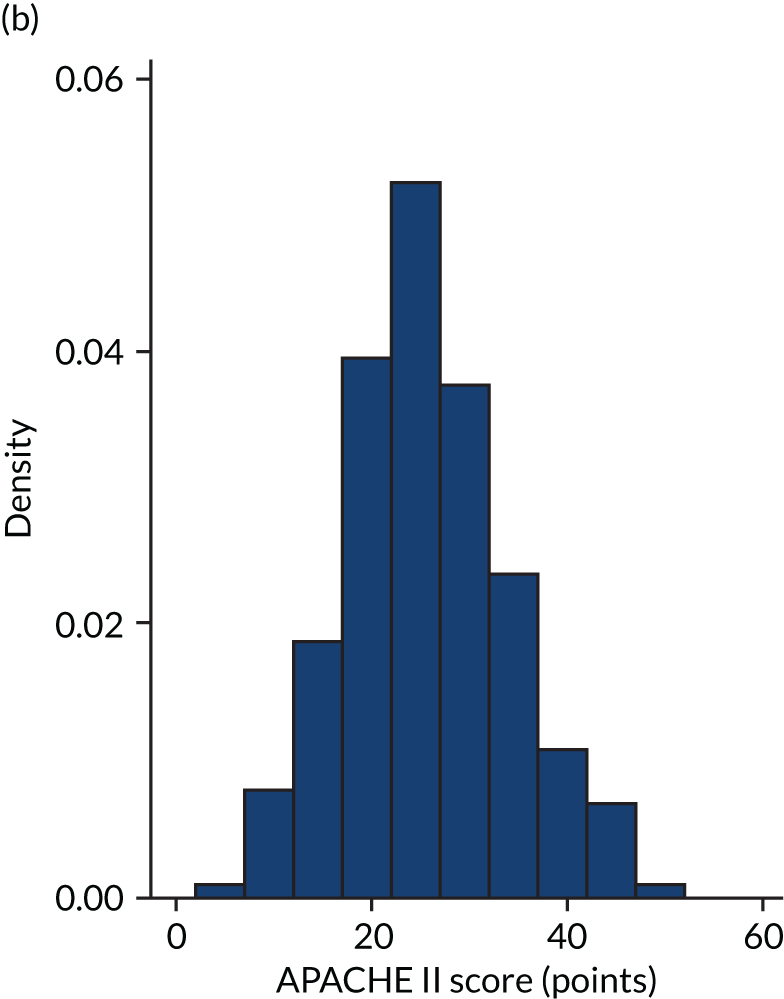
FIGURE 3.
Distribution of Rcalc. by study drug 1: the VANISH trial15 cohort. (a) Noradrenaline; and (b) vasopressin.
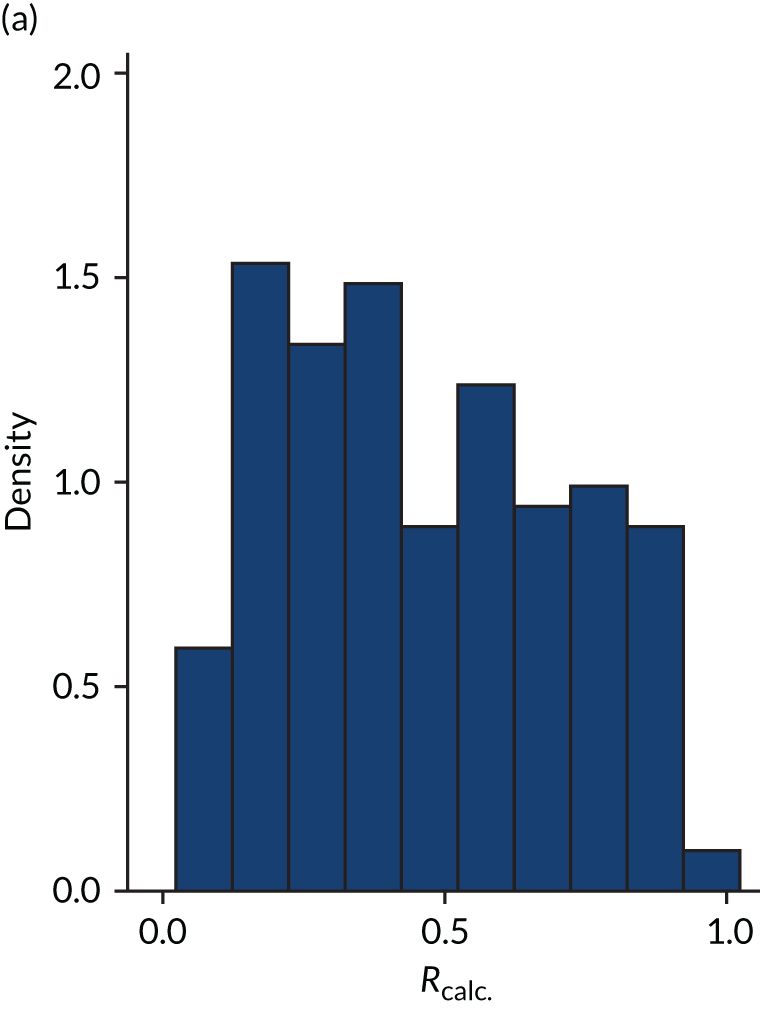
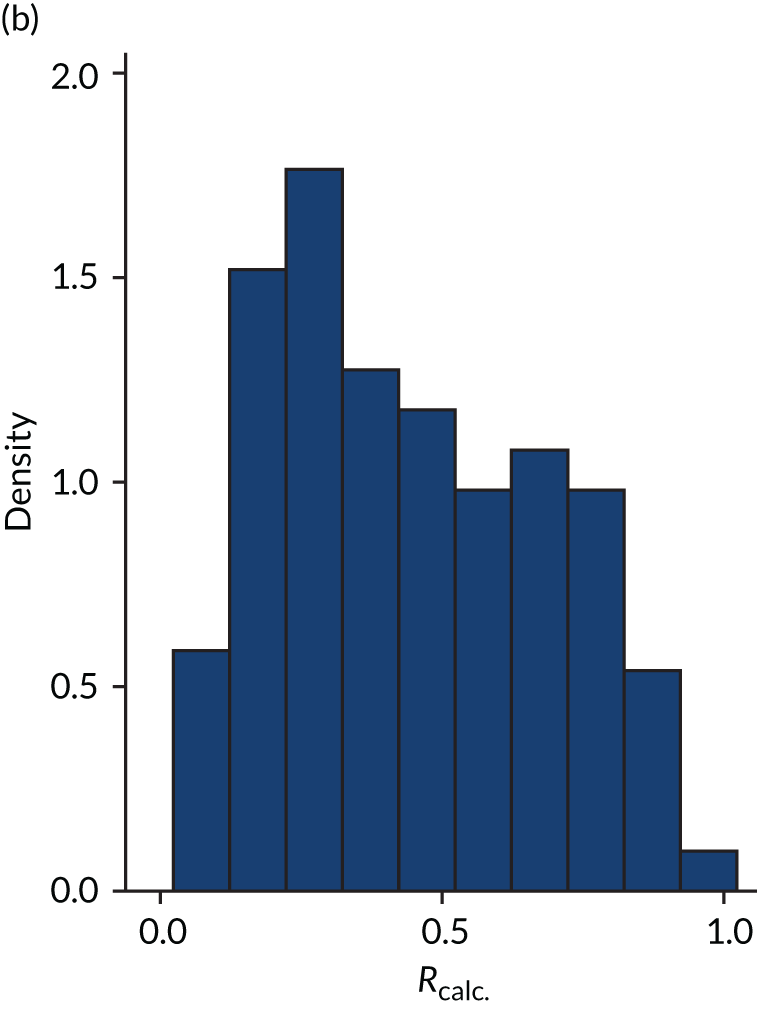
FIGURE 4.
Distribution of Rcalc. by study drug 2: the VANISH trial15 cohort. (a) Placebo; and (b) hydrocortisone.
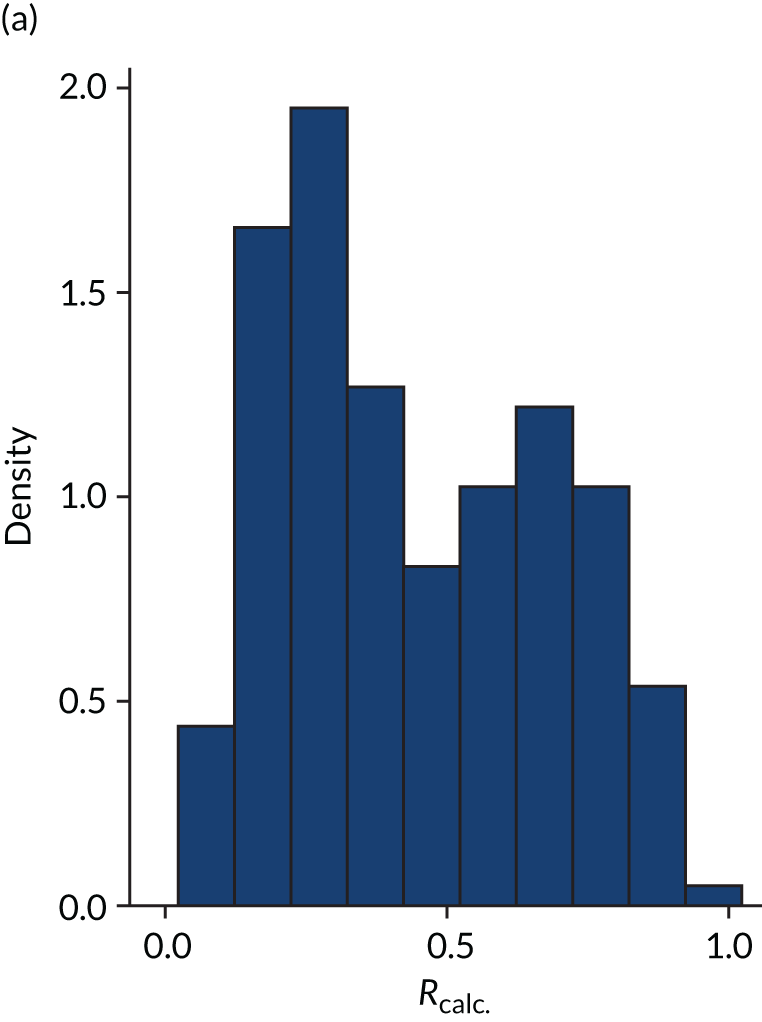
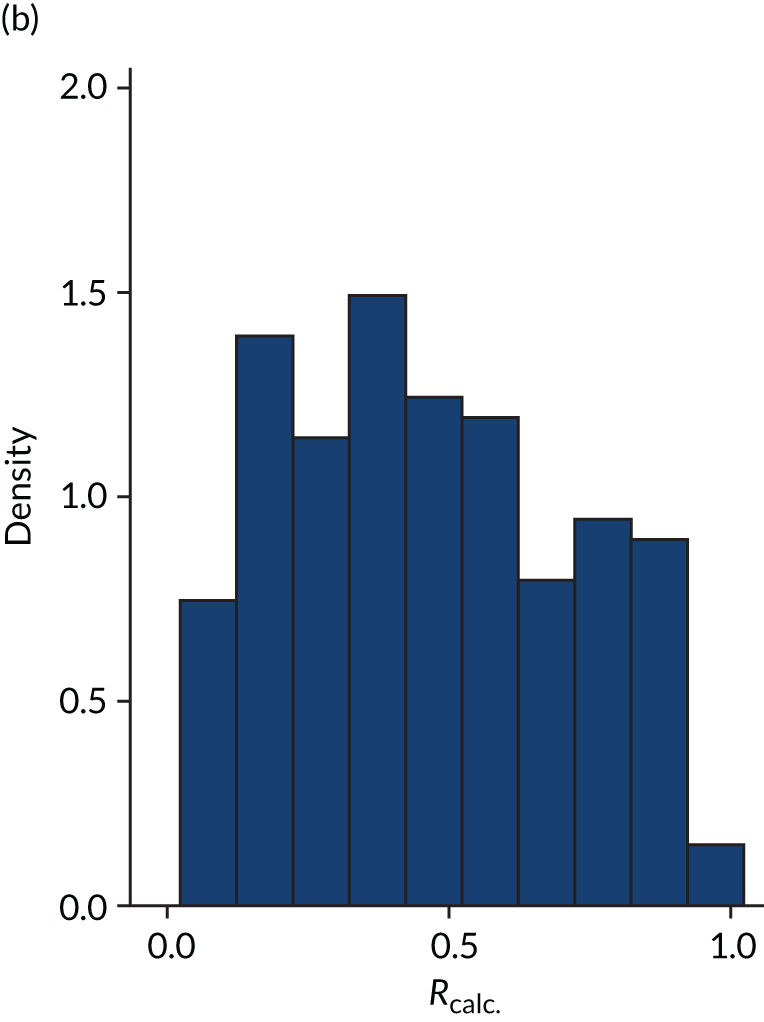
FIGURE 5.
Distribution of APACHE II score by treatment: the LeoPARDS trial16 cohort. (a) Placebo; and (b) levosimendan.
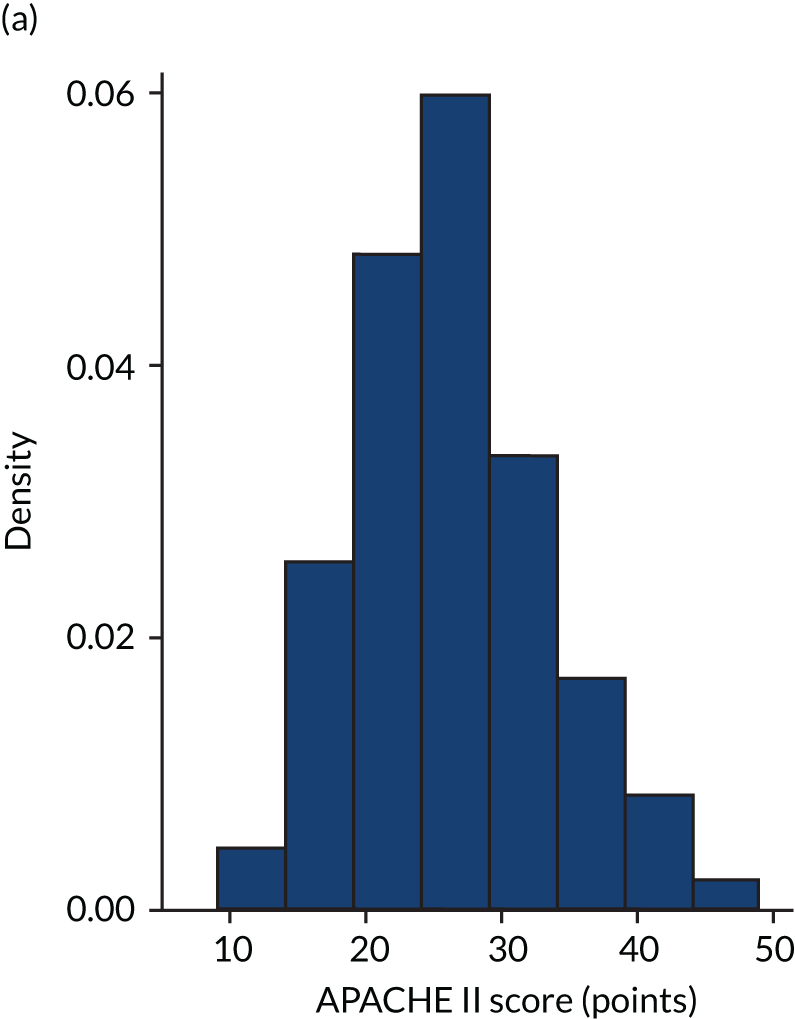
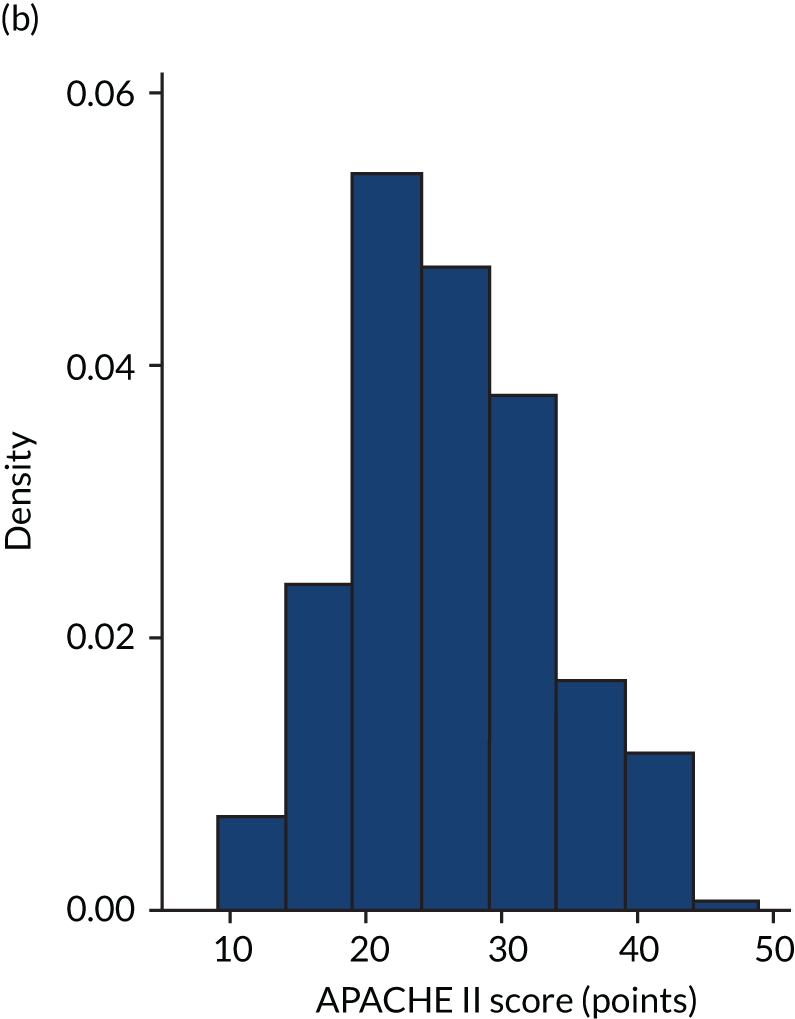
FIGURE 6.
Distribution of Rcalc. by treatment: the LeoPARDS trial16 cohort. (a) Placebo; and (b) levosimendan.
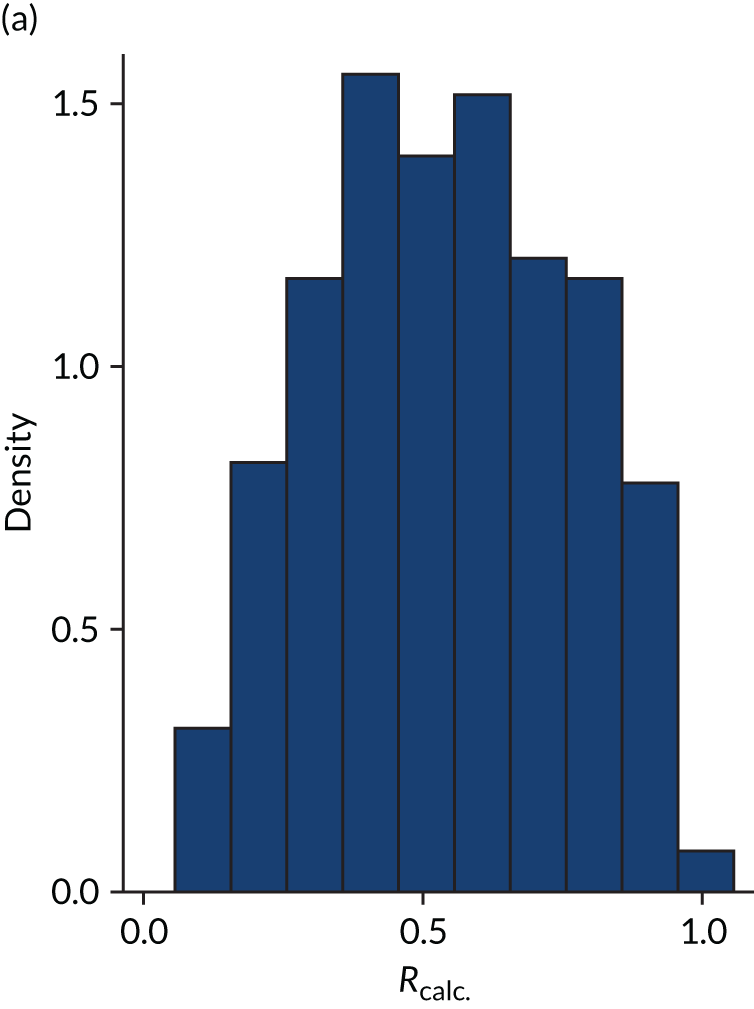
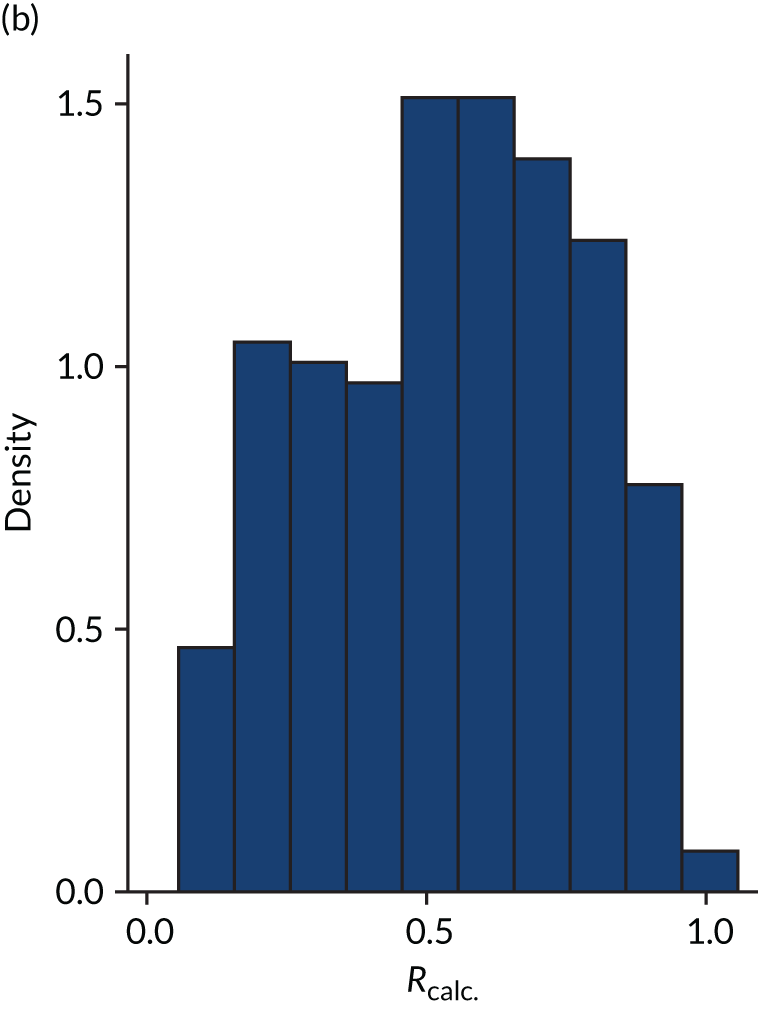
FIGURE 7.
Distribution of APACHE II score by treatment: the HARP-2 trial17 cohort. (a) Placebo; and (b) simvastatin.
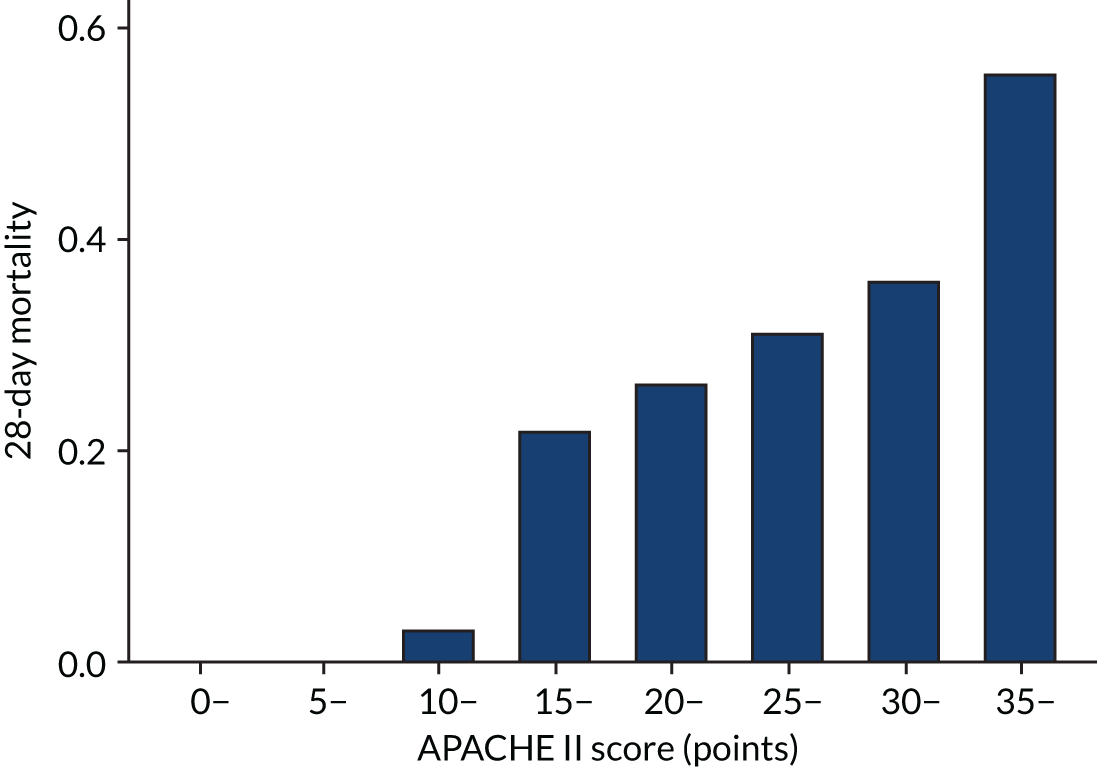
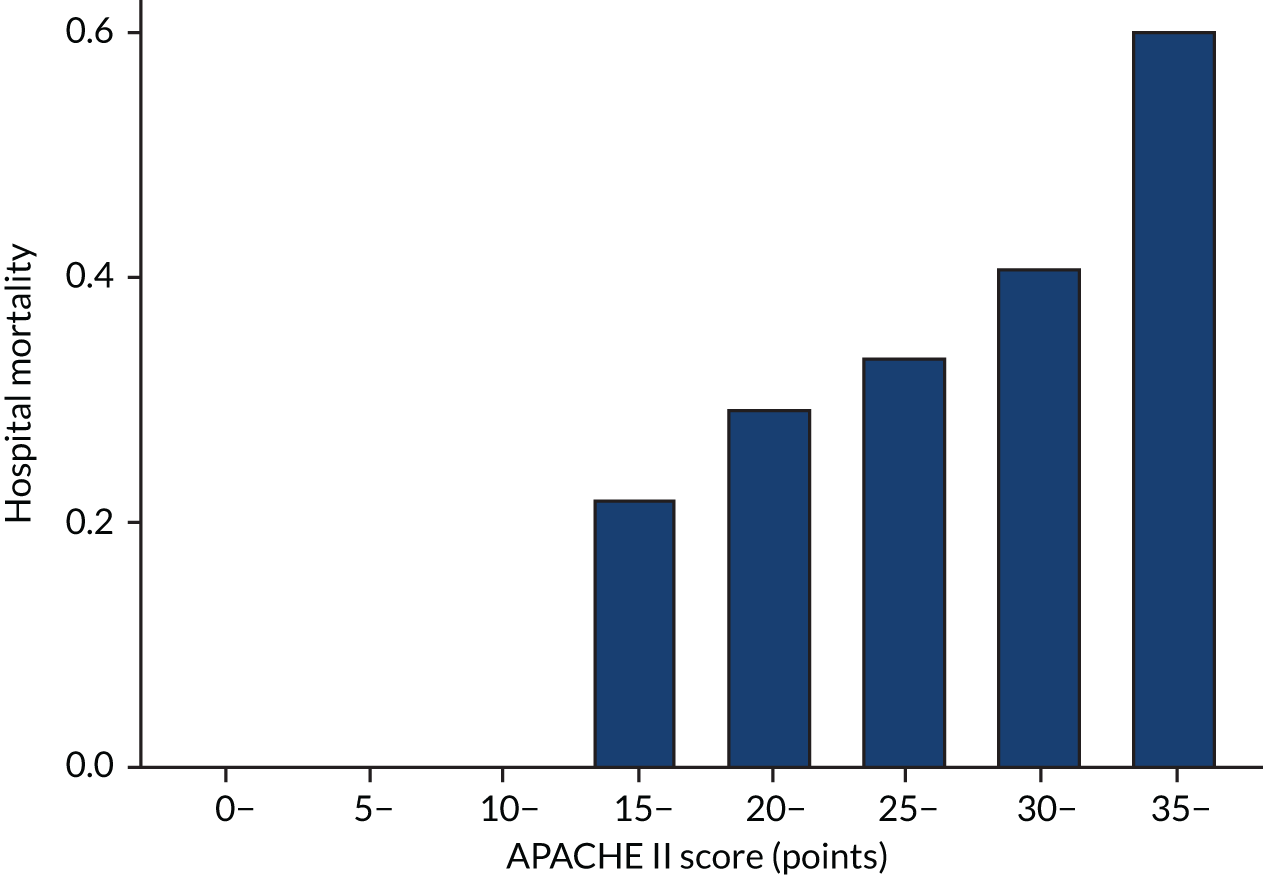
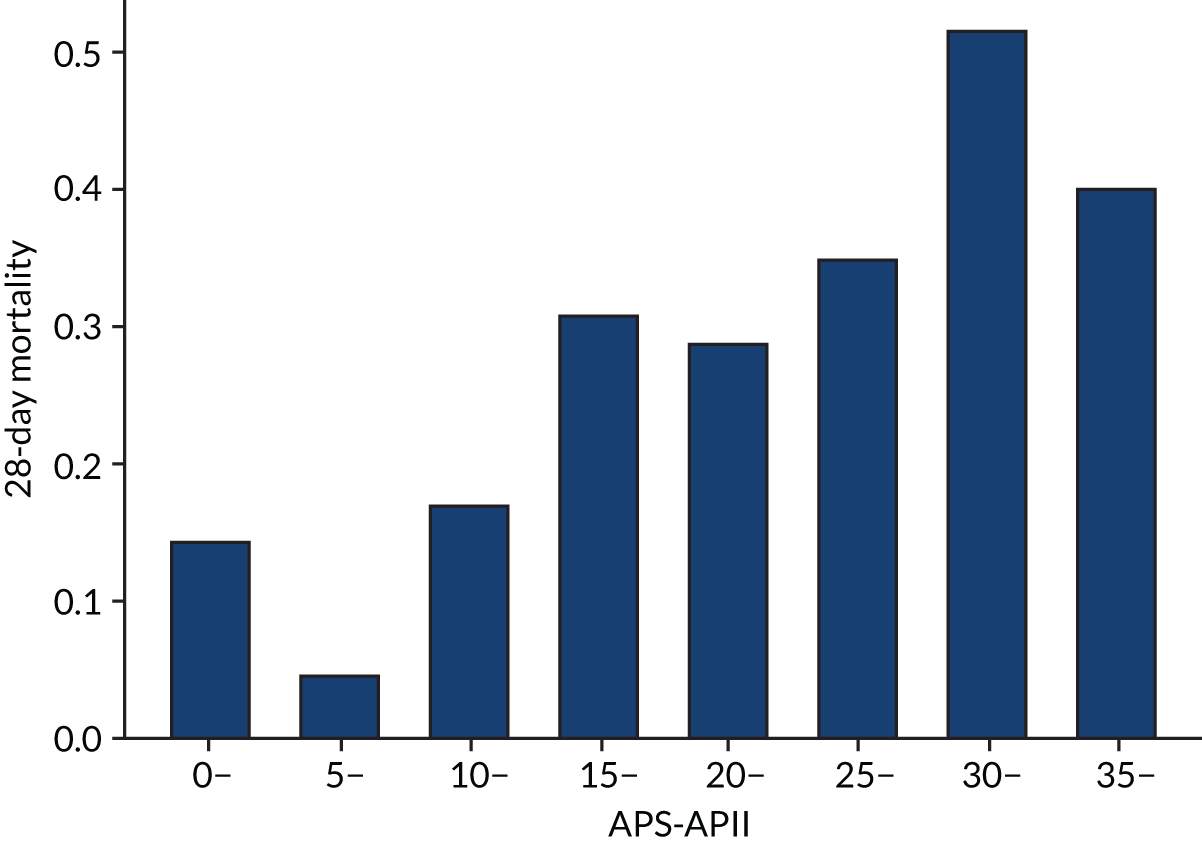
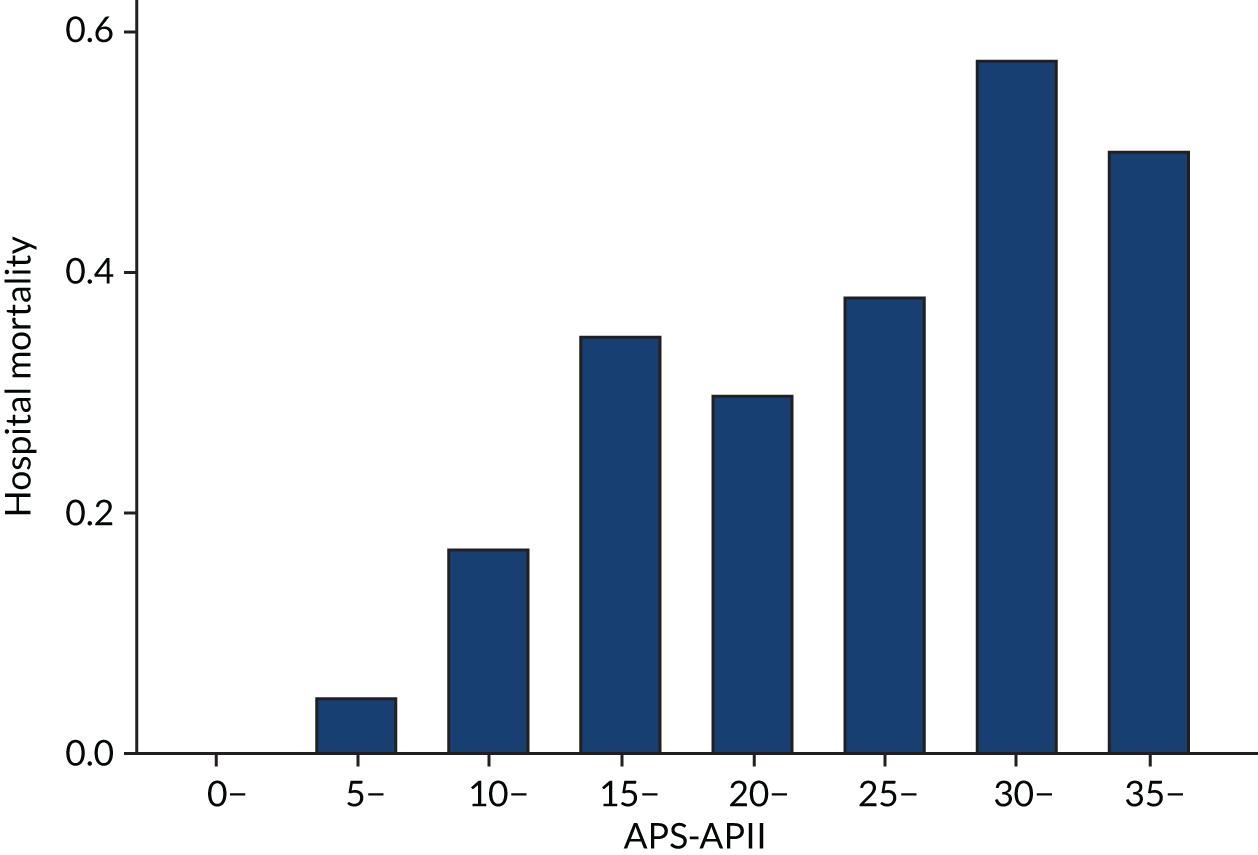
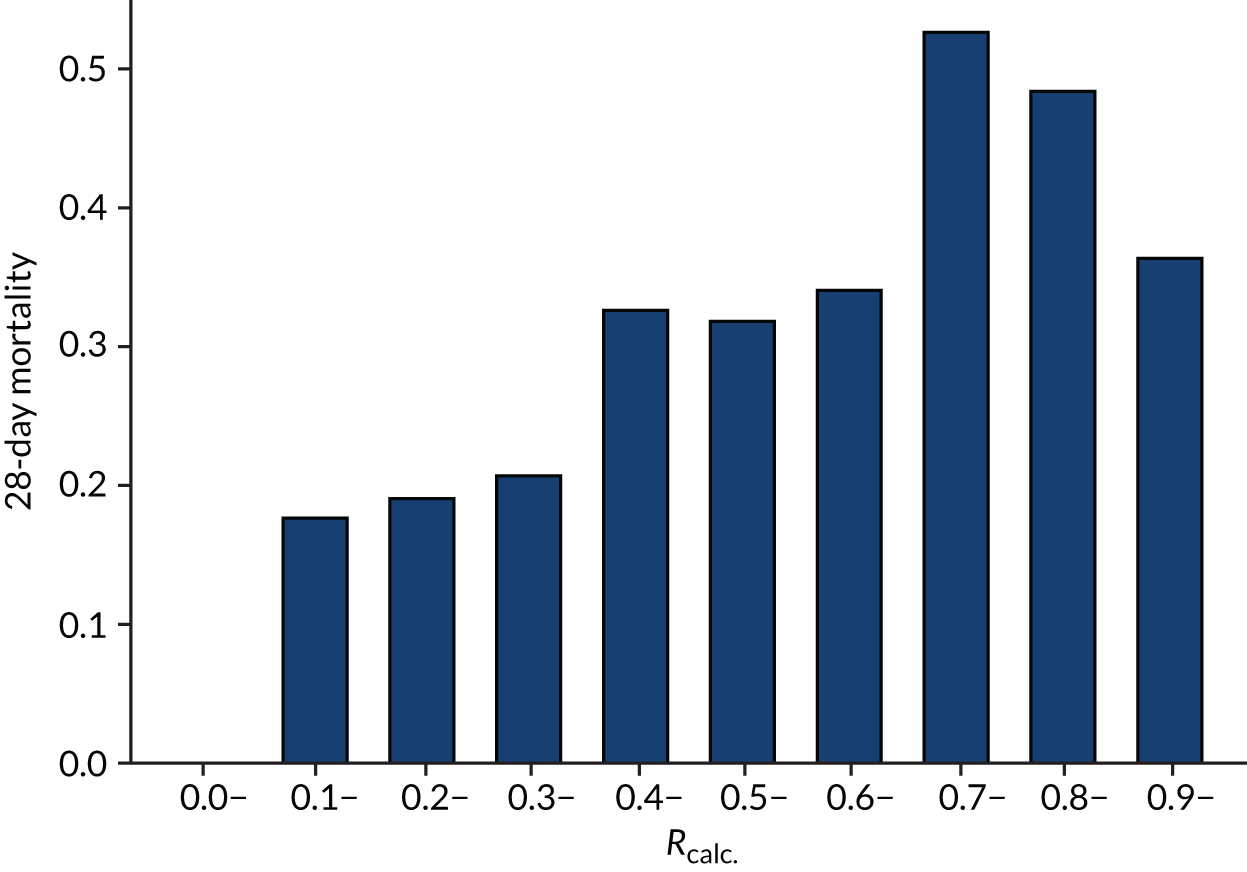
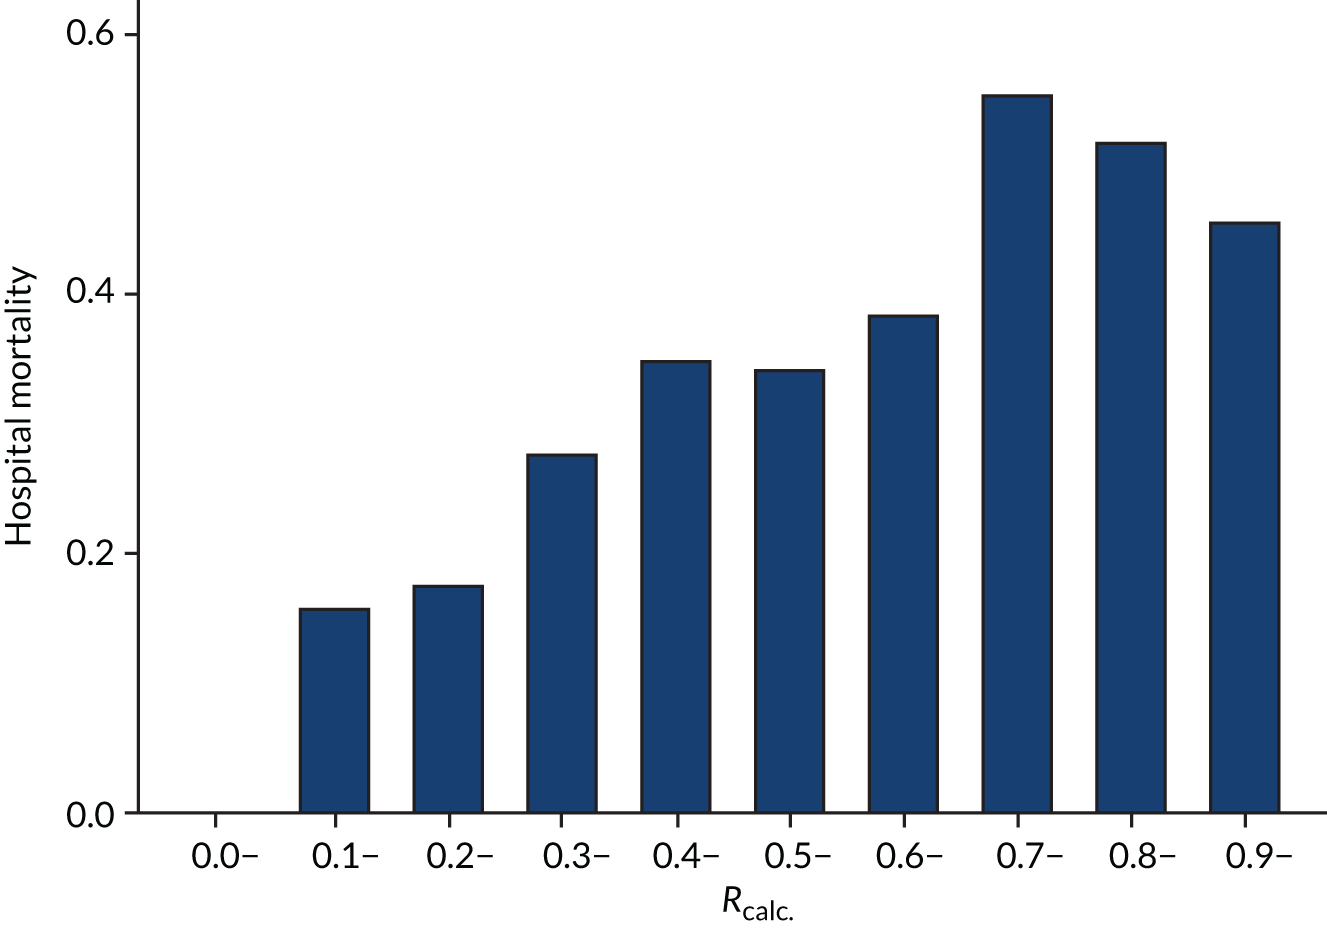
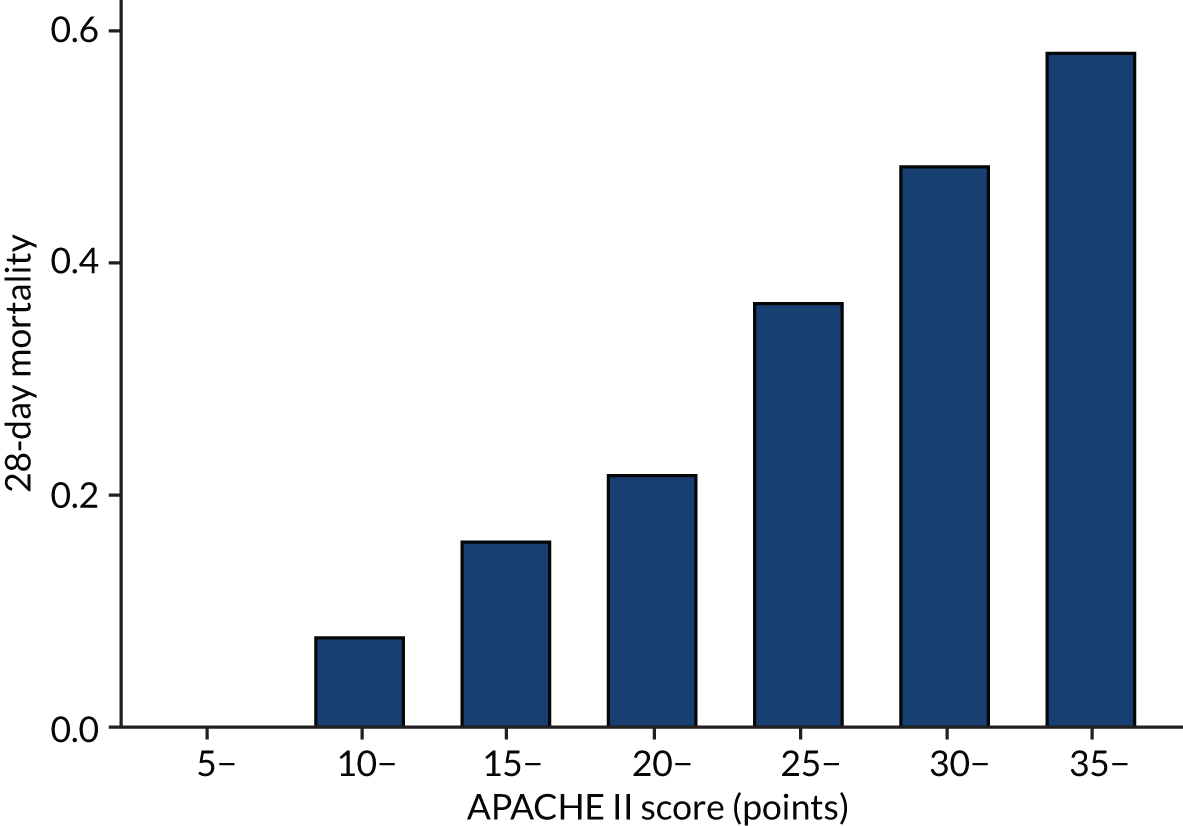
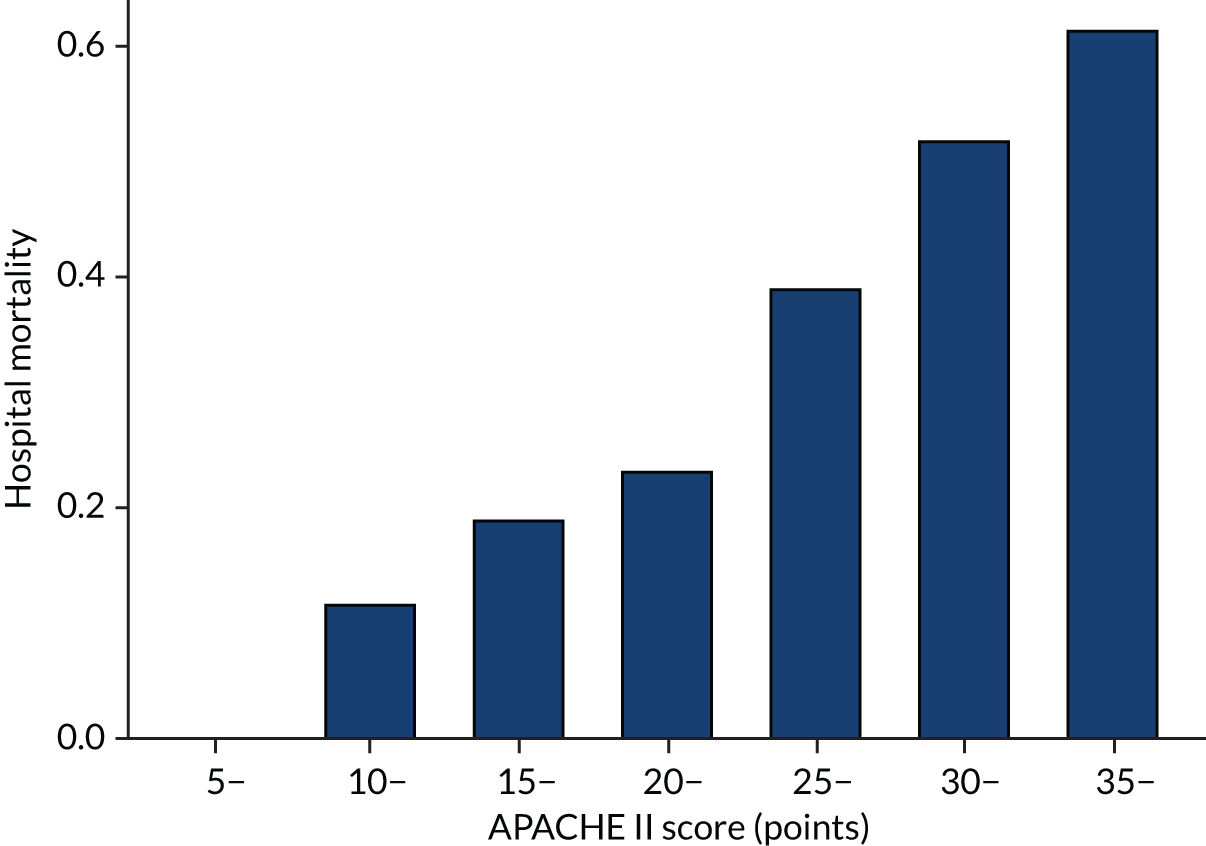
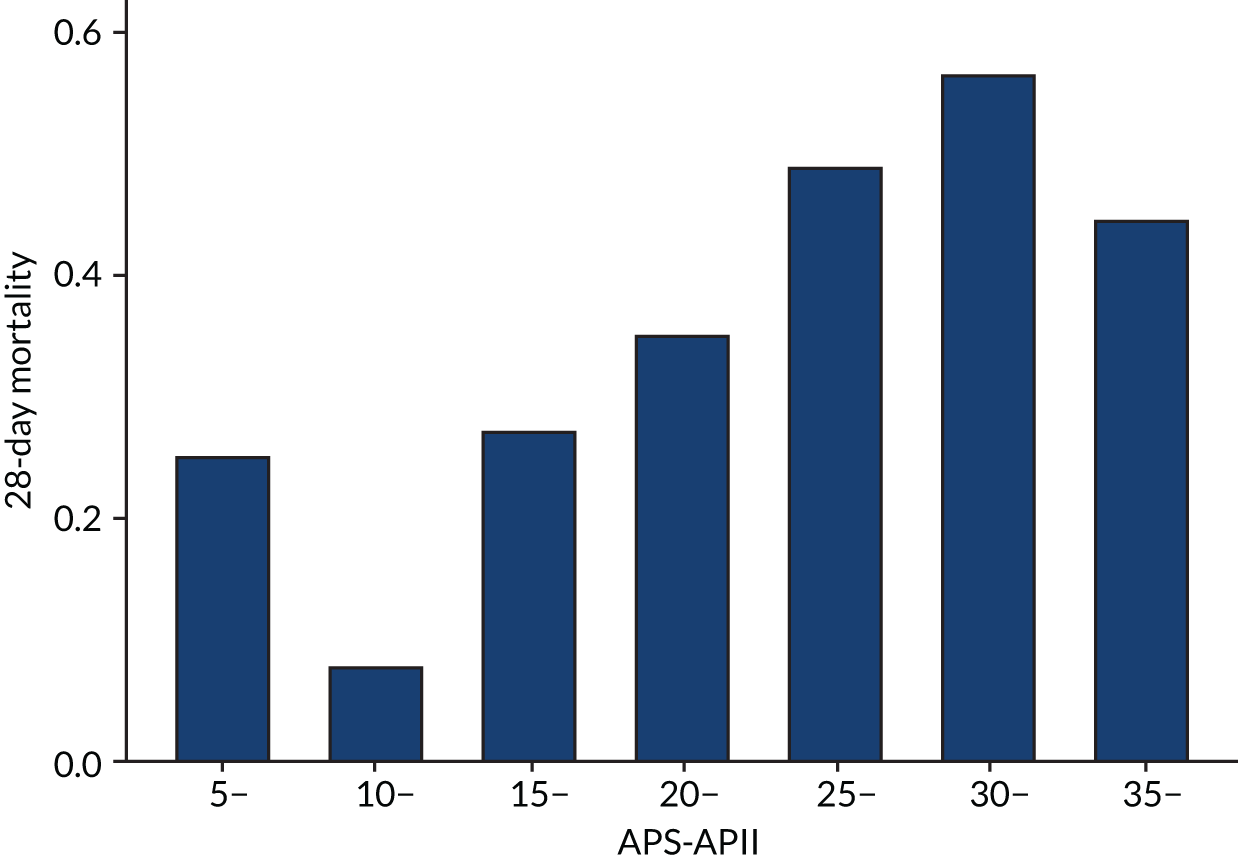
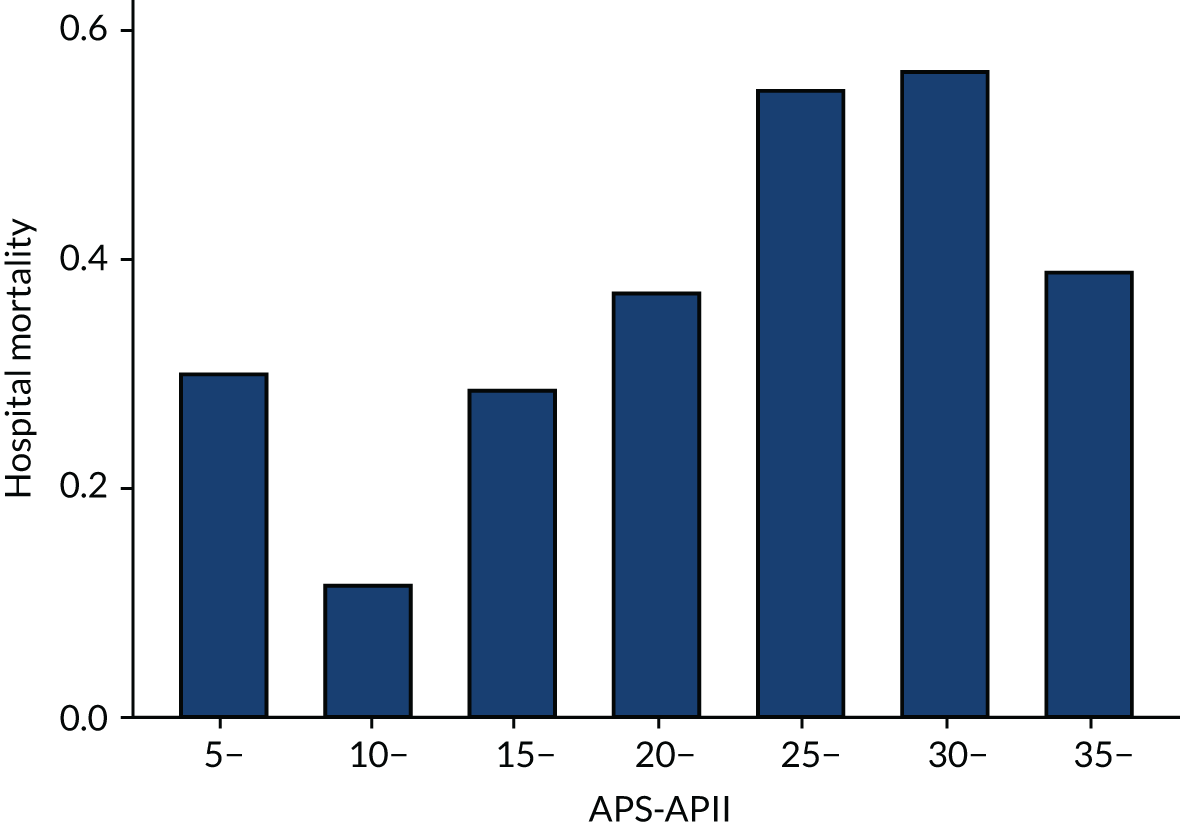
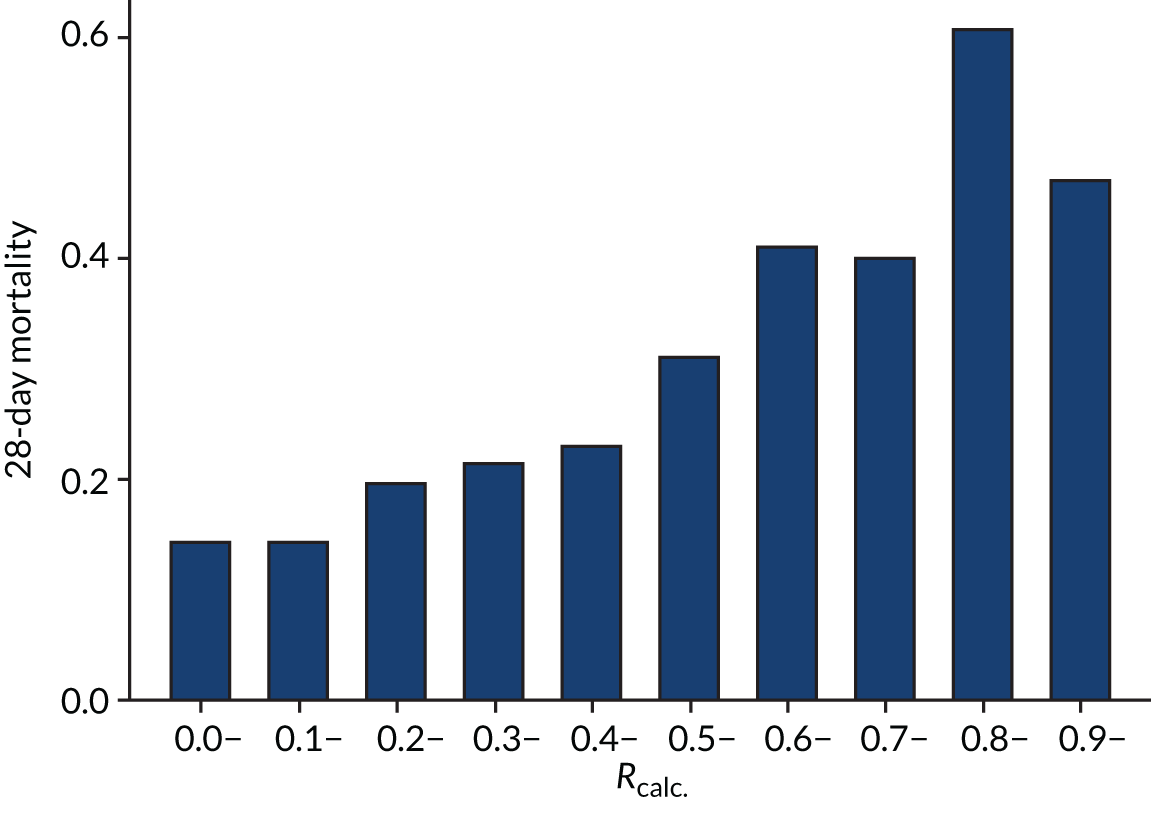
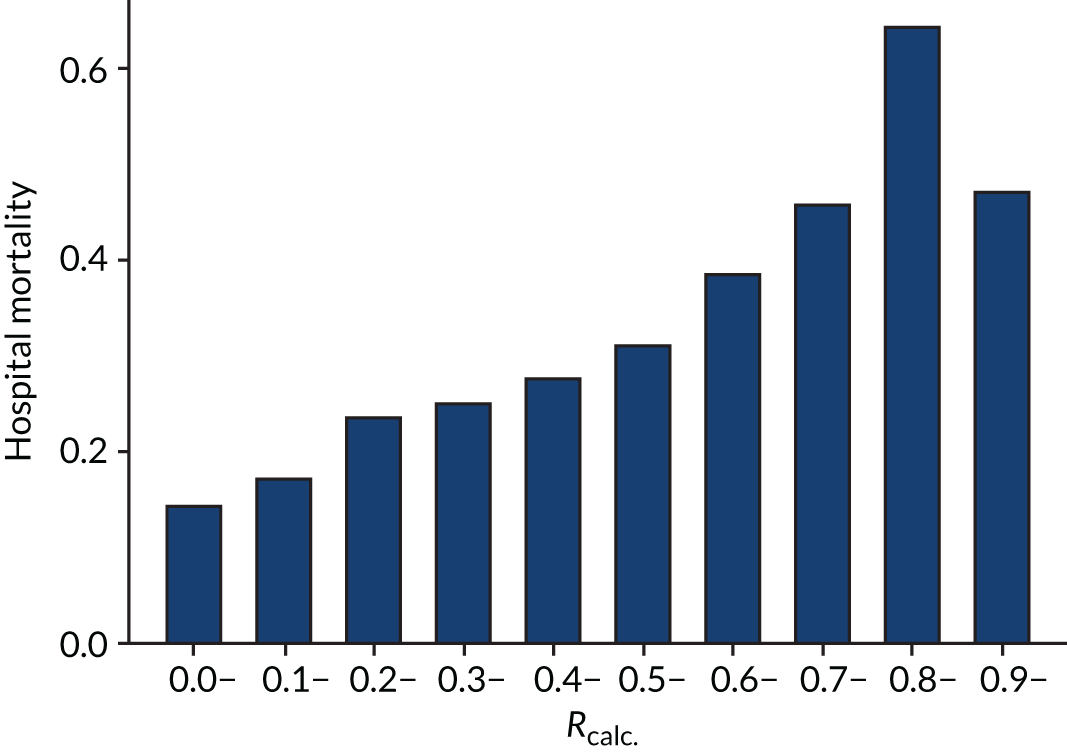
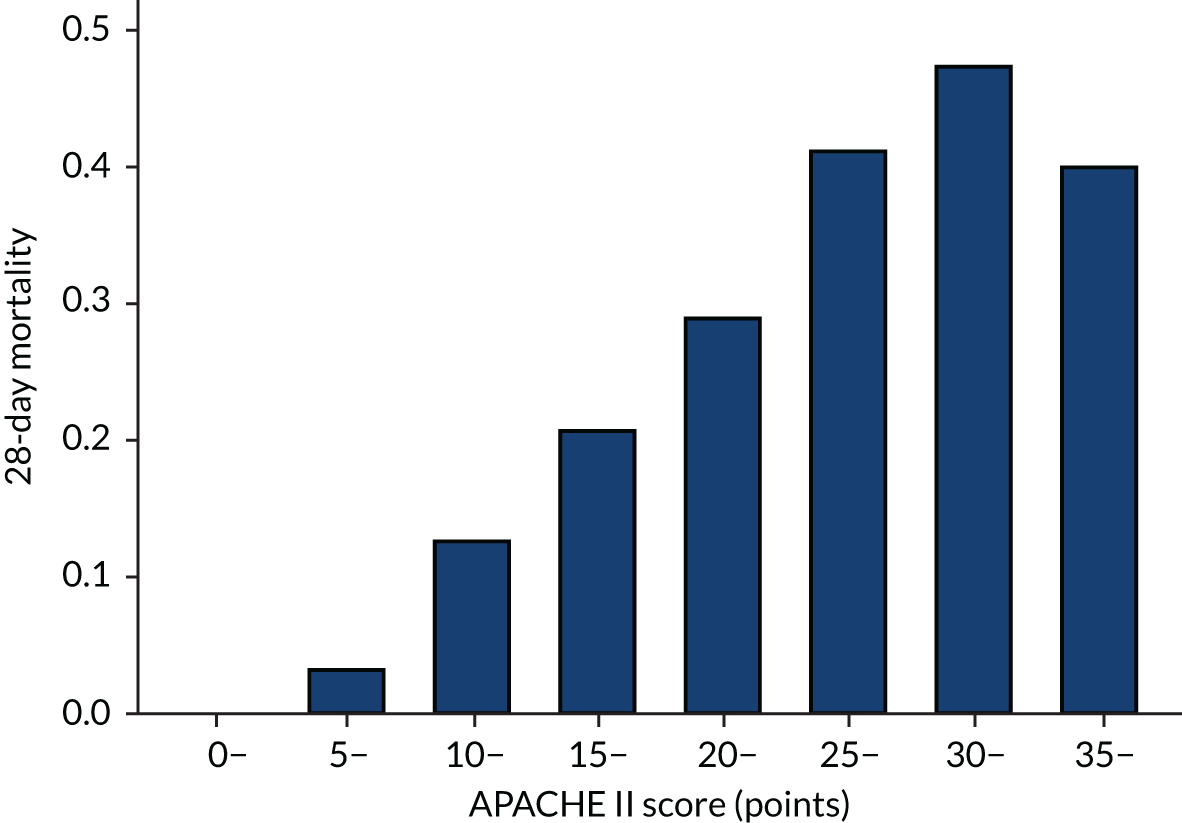
As expected, mortality, in general, increased with increasing baseline risk measures for all trials. Figures 8–13 show the relationship between mortality and baseline risk measures in the VANISH trial,15 both for 28-day and for hospital mortality. Figures 14–19 show the same associations in the LeoPARDS trial16 and Figure 20 shows these associations for the HARP-2 trial. 17
Modified APACHE II risk of death model recalibrated
The predictive performance of APACHE II and R are shown in Table 3. After correction for overoptimism, model M3 without including the number of organ dysfunctions yielded the highest AUROC and DS (Table 4). The estimated parameters from the model are given in Table 5. In the original equation for R, a unit increase in the APACHE II score was associated with a 16% increase in the odds of hospital mortality, with scores from each variable having the same contribution to the prediction. In comparison, in model M3, the effect of unit increases in the APACHE II score on the odds of mortality ranged from a 17% decrease (temperature) to a 76% increase (pH). The baseline odds (i.e. the odds of mortality for a patient with an APACHE II score of zero and diagnostic category weight who was not admitted following emergency surgery) was lower for model M3 than in the original model for R (0.008 vs. 0.03). Therefore, the same OR would produce a much smaller absolute difference in model M3 than in the original model for R.
| Performance | VANISH trial15 | LeoPARDS trial16 | aHARP-2 trial17 |
|---|---|---|---|
| AUROC APACHE II, mean (95% CI) | |||
| 28-day mortality | 0.67 (0.62 to 0.73) | 0.71 (0.66 to 0.75) | 0.68 (0.62 to 0.73) |
| Hospital mortality | 0.69 (0.64 to 0.75) | 0.70 (0.66 to 0.75) | |
| AUROC APS-APII, mean (95% CI) | |||
| 28-day mortality | 0.62 (0.57 to 0.68) | 0.67 (0.62 to 0.72) | |
| Hospital mortality | 0.64 (0.58 to 0.70) | 0.66 (0.61 to 0.71) | |
| AUROC R, mean (95% CI) | |||
| 28-day mortality | 0.67 (0.61 to 0.73) | 0.67 (0.62 to 0.72) | |
| Hospital mortality | 0.69 (0.63 to 0.74) | 0.66 (0.61 to 0.71) | |
| Predicted mortality (%) | 45.6 | 53.7 | |
| Model | 28-day mortality | Hospital mortality | ||||||
|---|---|---|---|---|---|---|---|---|
| AUROC | DS | AUROC | DS | |||||
| Apparent | Corrected | Apparent | Corrected | Apparent | Corrected | Apparent | Corrected | |
| M1 | 0.673 | 0.669 | 0.094 | 0.081 | 0.684 | 0.680 | 0.100 | 0.088 |
| M1 + number of organ dysfunctions | 0.687 | 0.680 | 0.115 | 0.091 | 0.693 | 0.687 | 0.118 | 0.095 |
| M2 | 0.696 | 0.691 | 0.123 | 0.106 | 0.715 | 0.710 | 0.134 | 0.118 |
| M2 + number of organ dysfunctions | 0.715 | 0.698 | 0.151 | 0.088 | 0.728 | 0.713 | 0.160 | 0.103 |
| M3 | 0.718 | 0.712 | 0.168 | 0.144 | 0.742 | 0.737 | 0.185 | 0.163 |
| M3 + number of organ dysfunctions | 0.728 | 0.712 | 0.189 | 0.133 | 0.748 | 0.734 | 0.207 | 0.156 |
| Covariate | Coefficienta | SE | OR | 95% CI |
|---|---|---|---|---|
| Temperature | –0.189 | 0.149 | 0.828 | 0.619 to 1.108 |
| MAP | –0.0567 | 0.141 | 0.945 | 0.716 to 1.247 |
| Heart rate | –0.192 | 0.139 | 0.826 | 0.629 to 1.084 |
| Respiratory rate | 0.239 | 0.113 | 1.271 | 1.018 to 1.586 |
| Oxygenation | 0.120 | 0.101 | 1.127 | 0.925 to 1.374 |
| pH | 0.567 | 0.124 | 1.763 | 1.382 to 2.248 |
| Sodium | 0.124 | 0.145 | 1.132 | 0.852 to 1.505 |
| Potassium | –0.162 | 0.128 | 0.851 | 0.662 to 1.094 |
| Creatinine | 0.119 | 0.0479 | 1.127 | 1.026 to 1.238 |
| Haemoglobin | 0.280 | 0.122 | 1.323 | 1.041 to 1.681 |
| WBCC | 0.0979 | 0.114 | 1.103 | 0.883 to 1.378 |
| GCS | 0.0545 | 0.0331 | 1.056 | 0.990 to 1.127 |
| Age | 0.338 | 0.0794 | 1.402 | 1.200 to 1.639 |
| Chronic health | 0.192 | 0.0707 | 1.211 | 1.054 to 1.391 |
| Emergency surgery (yes/no) | –0.141 | 0.323 | 0.868 | 0.461 to 1.634 |
| Diagnostic category weightb | –0.560 | 0.272 | 0.571 | 0.335 to 0.975 |
The VANISH trial heterogeneity of treatment effect assessment
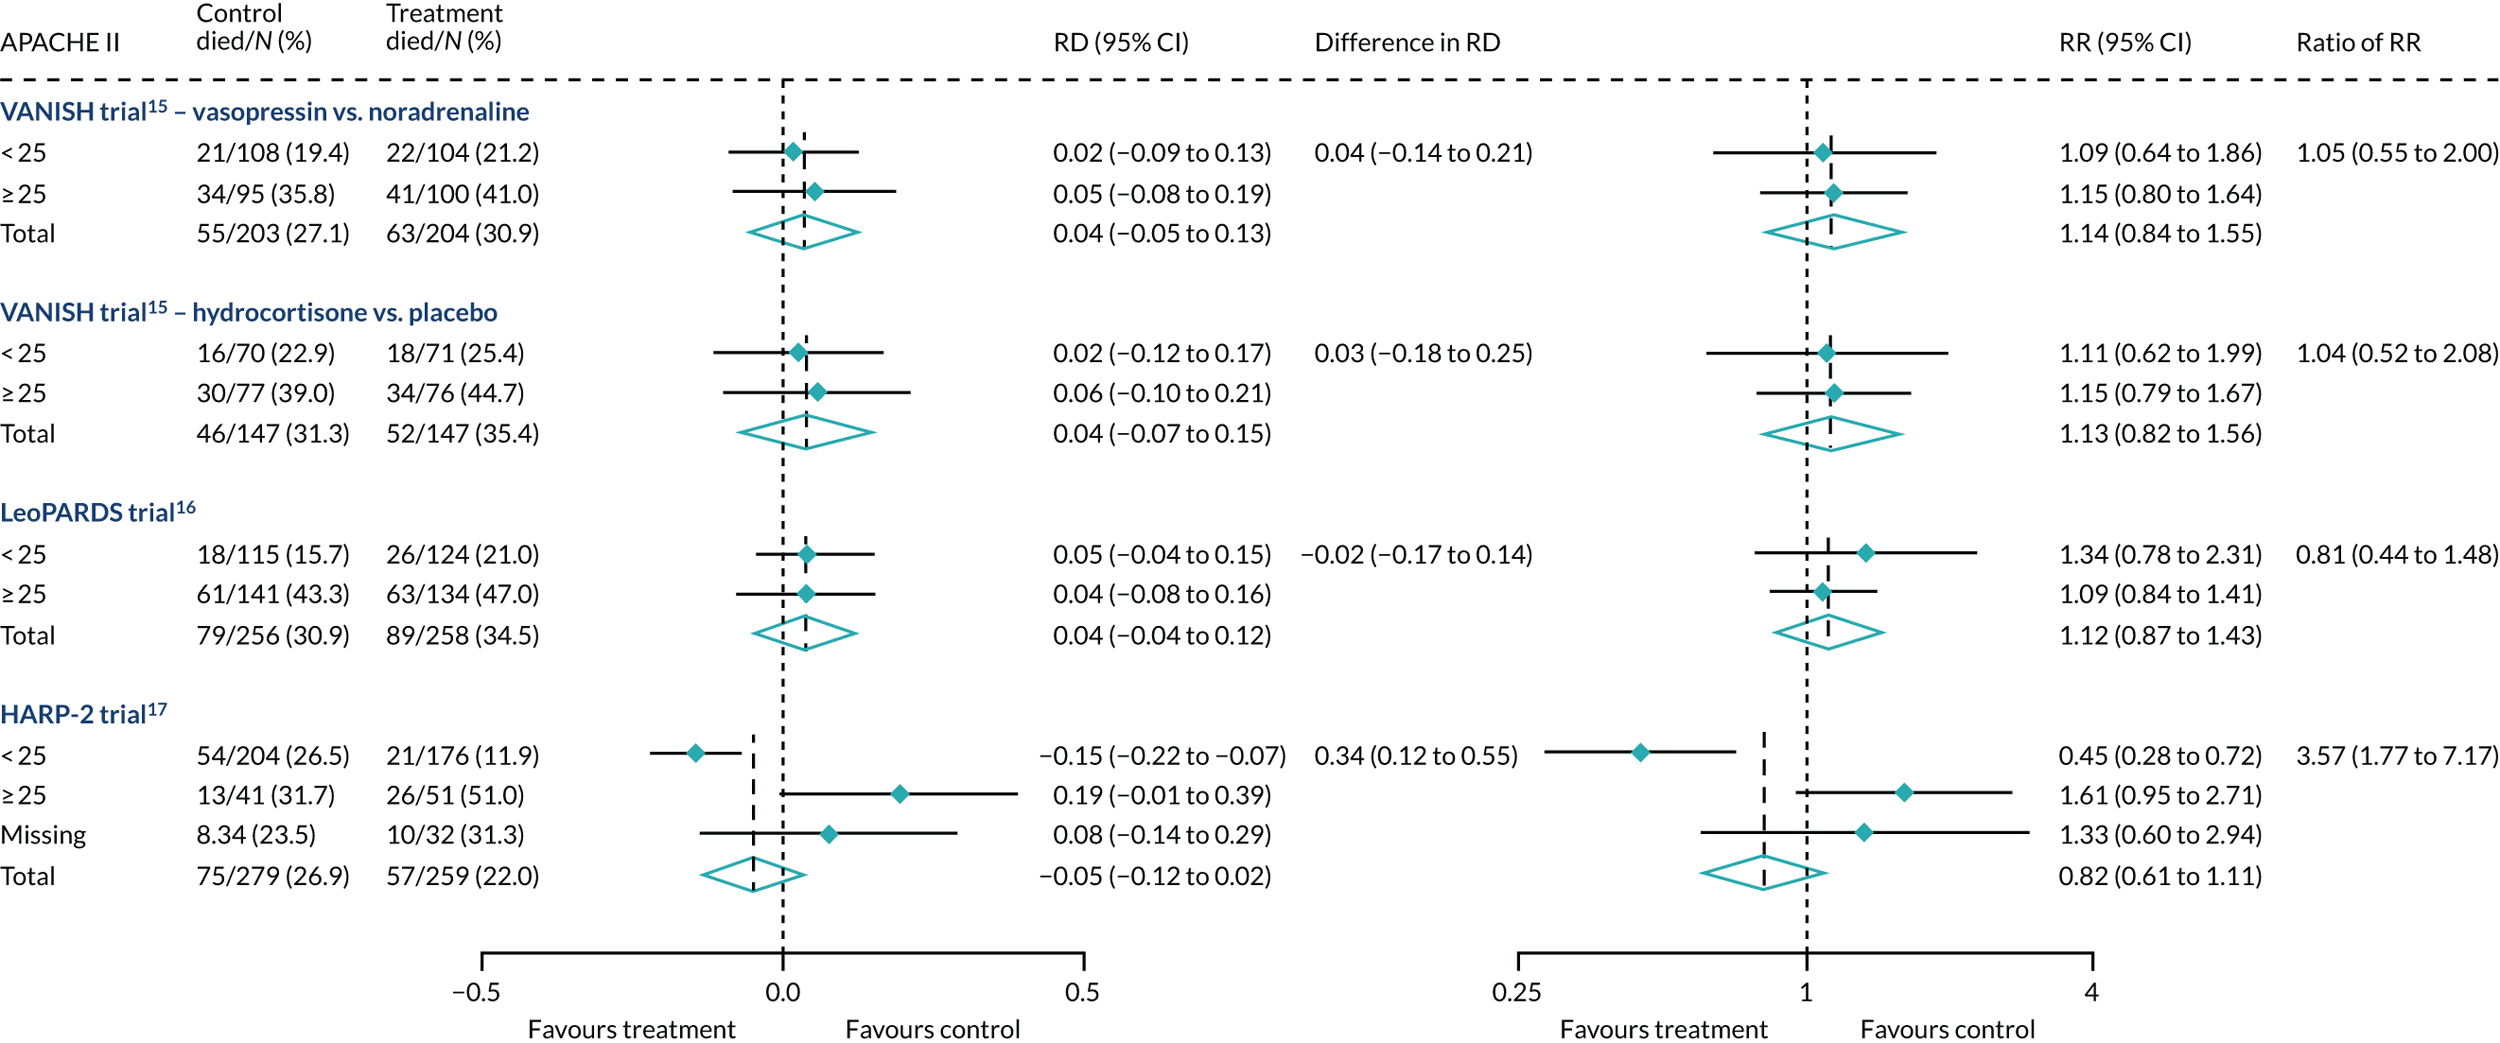
In the primary analysis with APACHE II score as baseline risk of death measure, there was no evidence of HTE for vasopressin in either absolute terms [low-APACHE II group, RD 0.02 (95% CI –0.09 to 0.13); high-APACHE II group, RD 0.05 (95% CI –0.08 to 0.19); difference in RD 0.04 (95% CI –0.14 to 0.21)] or relative terms [low-APACHE II group, RR 1.09 (95% CI 0.64 to 1.86); high-APACHE II, group RR 1.15 (95% CI 0.80 to 1.64); ratio of RR 1.05 (95% CI 0.55 to 2.00)] (Figure 21). In the case of the secondary risk measures, the estimates of HTE for vasopressin were larger with wider CI for APS-APII (Figure 22) and smaller in magnitude for R (Figure 23).
FIGURE 21.
Forest plots for the RD and RR comparing 28-day mortality in treatment and control, by trial and APACHE II score subgroup. Reproduced from Santhakumaran and colleagues. 44 This article is distributed under the terms of the Creative Commons Attribution 4.0 International License (http://creativecommons.org/licenses/by/4.0/), which permits unrestricted use, distribution, and reproduction in any medium, provided you give appropriate credit to the original author(s) and the source, provide a link to the Creative Commons license, and indicate if changes were made. The Creative Commons Public Domain Dedication waiver (http://creativecommons.org/publicdomain/zero/1.0/) applies to the data made available in this article, unless otherwise stated. The figure includes minor additions and formatting changes to the original figure.
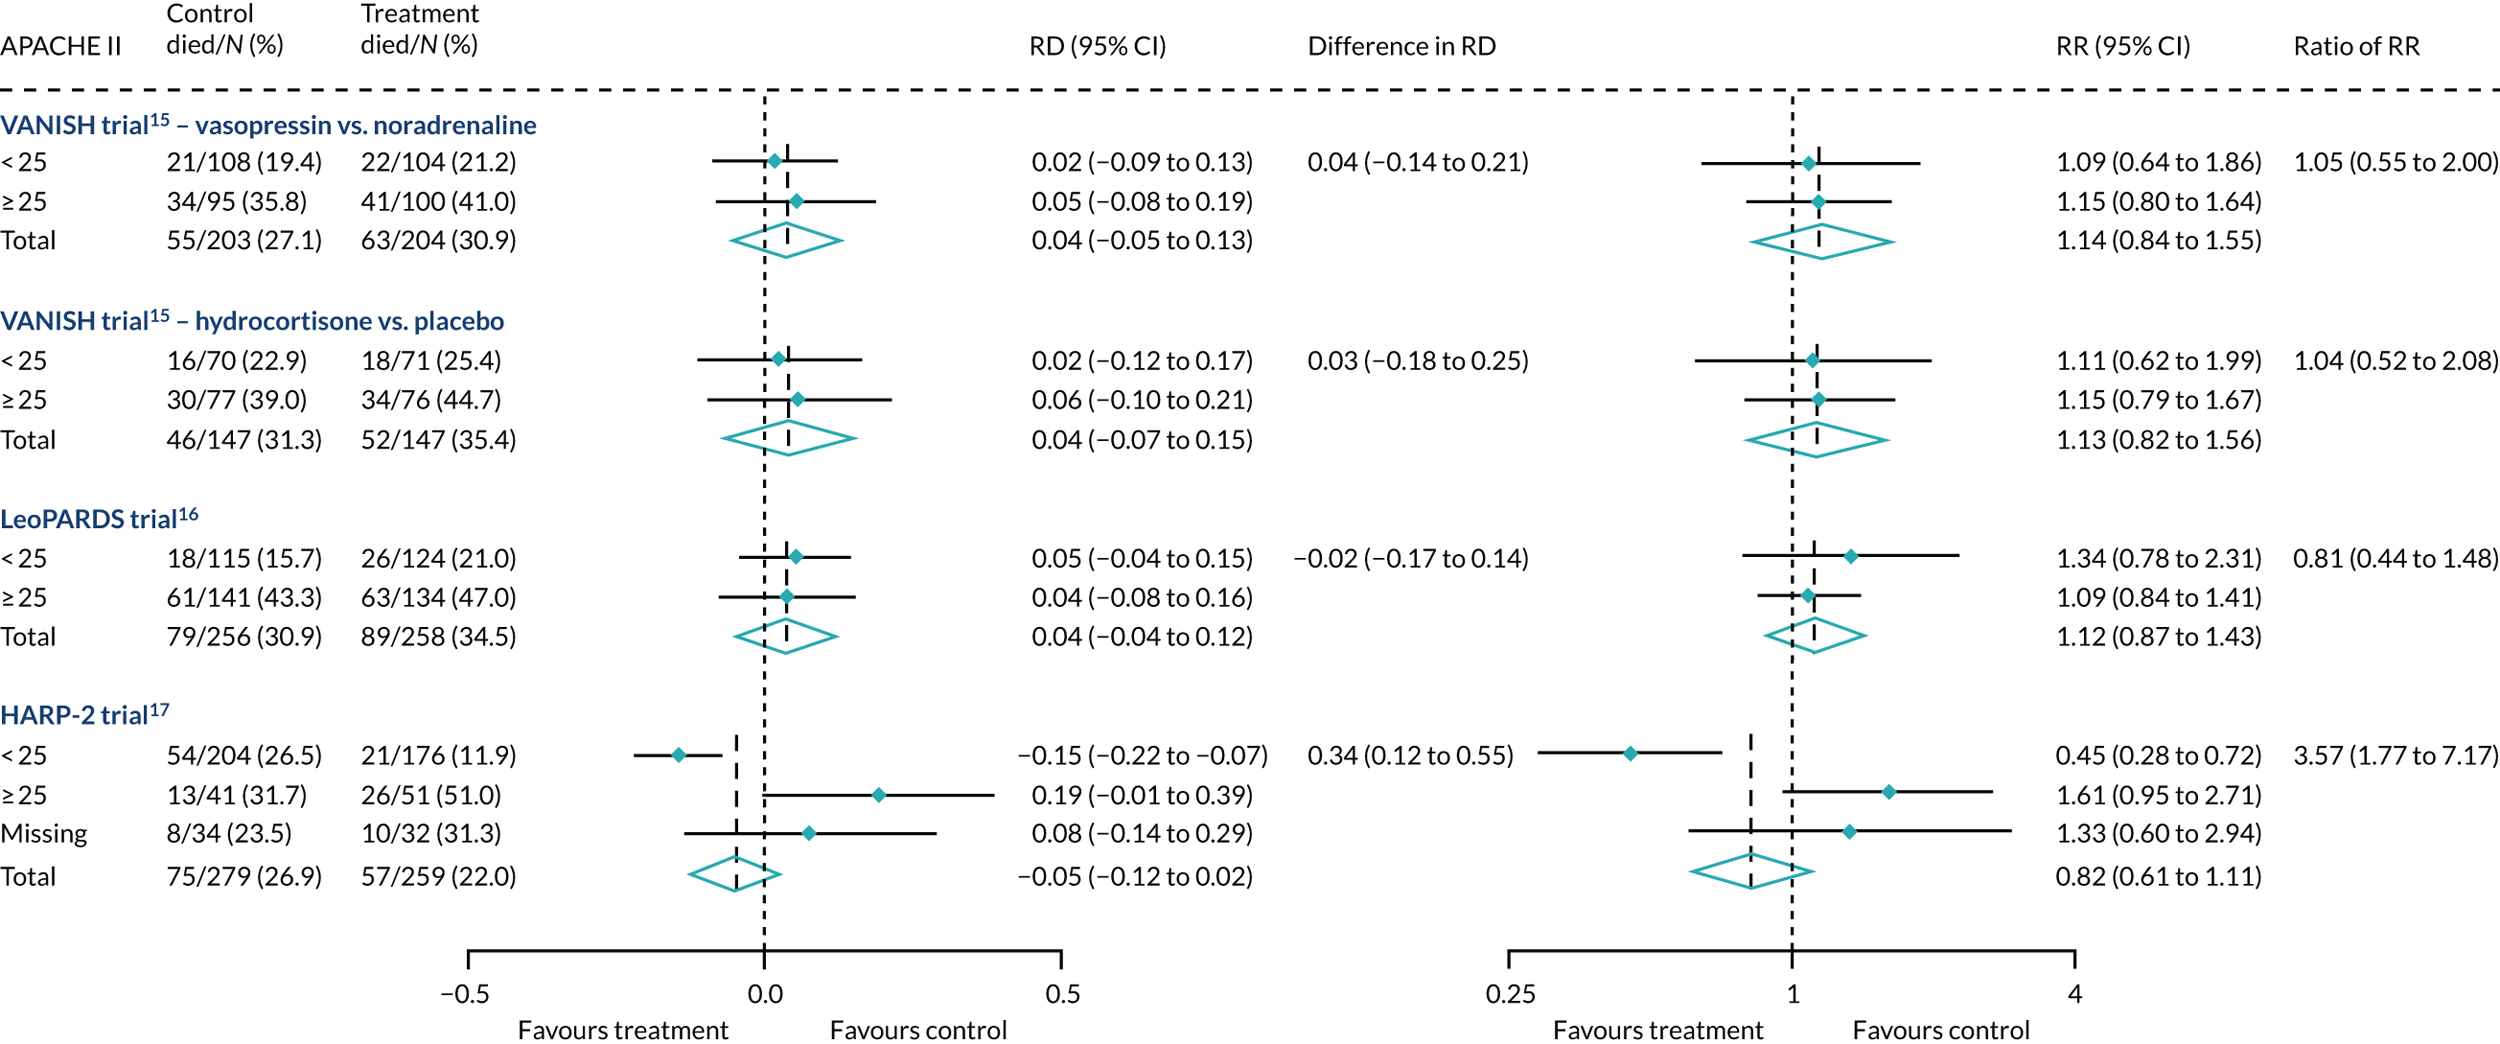
FIGURE 22.
Forest plots for the RD and RR comparing 28-day mortality in treatment and control, by trial and APS-APII subgroup. Reproduced from Santhakumaran and colleagues. 44 This article is distributed under the terms of the Creative Commons Attribution 4.0 International License (http://creativecommons.org/licenses/by/4.0/), which permits unrestricted use, distribution, and reproduction in any medium, provided you give appropriate credit to the original author(s) and the source, provide a link to the Creative Commons license, and indicate if changes were made. The Creative Commons Public Domain Dedication waiver (http://creativecommons.org/publicdomain/zero/1.0/) applies to the data made available in this article, unless otherwise stated. The figure includes minor additions and formatting changes to the original figure.

FIGURE 23.
Forest plots for the RD and RR comparing 28-day mortality in treatment and control, by trial and R subgroup. Reproduced from Santhakumaran and colleagues. 44 This article is distributed under the terms of the Creative Commons Attribution 4.0 International License (http://creativecommons.org/licenses/by/4.0/), which permits unrestricted use, distribution, and reproduction in any medium, provided you give appropriate credit to the original author(s) and the source, provide a link to the Creative Commons license, and indicate if changes were made. The Creative Commons Public Domain Dedication waiver (http://creativecommons.org/publicdomain/zero/1.0/) applies to the data made available in this article, unless otherwise stated. The figure includes minor additions and formatting changes to the original figure.

In the primary analysis with APACHE II score as baseline risk of death measure, there was no evidence of HTE for hydrocortisone in either absolute terms [low-APACHE II group, RD 0.02 (95% CI –0.12 to 0.17); high-APACHE II group, RD 0.06 (95% CI –0.10 to 0.21); difference in RD 0.03 (95% CI –0.18 to 0.25)] or in relative terms [low-APACHE II group, RR 1.11 (95% CI 0.62 to 1.99); high-APACHE II group RR 1.15 (95% CI 0.79 to 1.67); ratio of RR 1.04 (95% CI 0.52 to 2.08)]. In the case of the secondary risk measures, the estimates of HTE for hydrocortisone was similar for APS-APII (see Figure 22) and larger in magnitude for R (see Figure 23). Figures 21–23 were previously published by the authors in the paper by Santhakumaran and colleagues. 44
Heterogeneity of treatment effect was not observed when R was recalibrated either with controls only (Figure 24) or with the whole cohort (Figure 25), although subgroup differences were in the opposite direction for hydrocortisone.
FIGURE 24.
Forest plots for the RD and RR comparing 28-day mortality in treatment and control, by trial and Rrecal. (recalibration model with only controls) subgroup.

FIGURE 25.
Forest plots for the RD and RR comparing 28-day mortality in treatment and control, by trial and Rrecal. (recalibration model with whole cohort) subgroup.

The LeoPARDS trial heterogeneity of treatment effect assessment
For the primary analysis with APACHE II score as baseline risk of death measure there was no evidence of HTE for levosimenden in either absolute terms [low-APACHE II group, RD 0.05 (95% CI –0.04 to 0.15); high-APACHE II group, RD 0.04 (95% CI –0.08 to 0.16); difference in RD –0.02 (95% CI –0.17 to 0.14)] or in relative terms [low-APACHE II group, RR 1.34 (95% CI 0.78 to 2.31); high-APACHE II group, RR 1.09 (95% CI 0.84 to 1.41); ratio of RR 0.81 (95% CI 0.44 to 1.48)] (see Figure 21). For the secondary risk measures, the estimates of HTE for levosimenden were larger for APS-APII (see Figure 22) and in the opposite direction for R (see Figure 23).
Heterogeneity of treatment effect was not observed when R was recalibrated either with controls only (see Figure 24) or with the whole cohort (see Figure 25), although subgroup differences were in the opposite direction.
The HARP-2 trial heterogeneity of treatment effect assessment
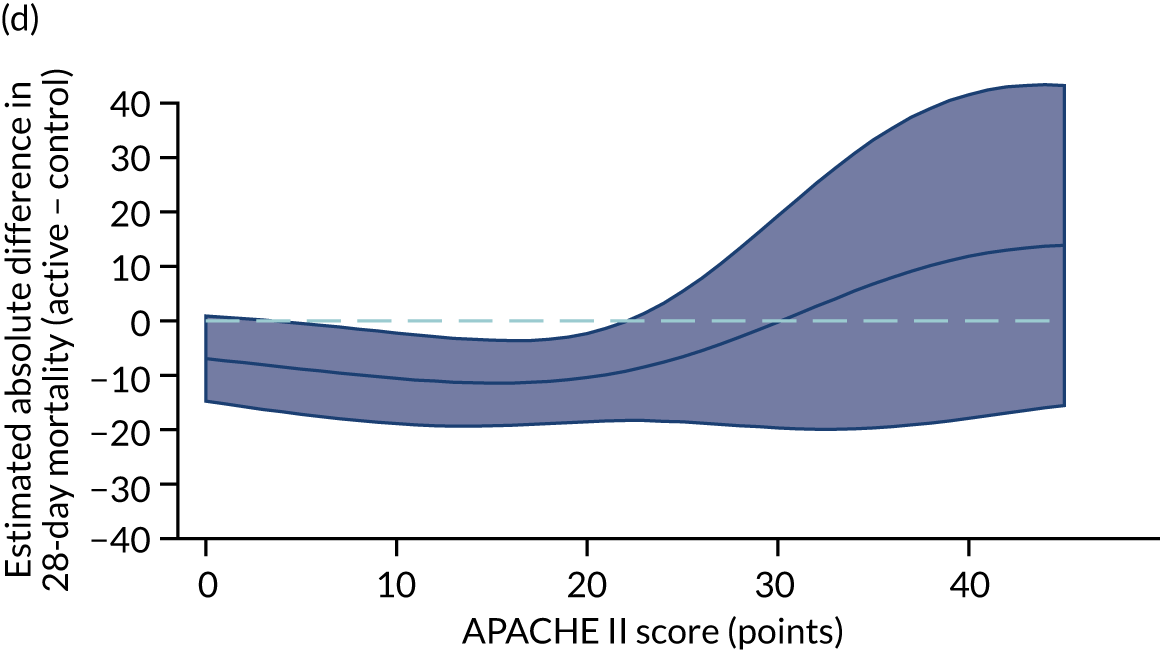
For the primary analysis with APACHE II score as baseline risk of death measure, we observed HTE for simvastatin in absolute terms [low-APACHE II group, RD –0.15 (95% CI –0.22 to –0.07); high-APACHE II group, RD 0.19 (95% CI –0.01 to 0.39); difference in RD 0.34 (95% CI 0.12 to 0.55) (p = 0.02)] and in relative terms [low-APACHE II group, RR 0.45 (95% CI 0.28 to 0.72); high-APACHE II group, RR 1.61 (95% CI 0.95 to 2.71), ratio of RR 3.57 (95% CI 1.77 to 7.17)]. Simvastatin reduced mortality in the low-APACHE II group and increased mortality in the high-APACHE II group (see Figure 21). As raw data APACHE II score data were not available, we have not reported any secondary risk measures for the HARP-2 trial. 17
Serious adverse events and baseline risk
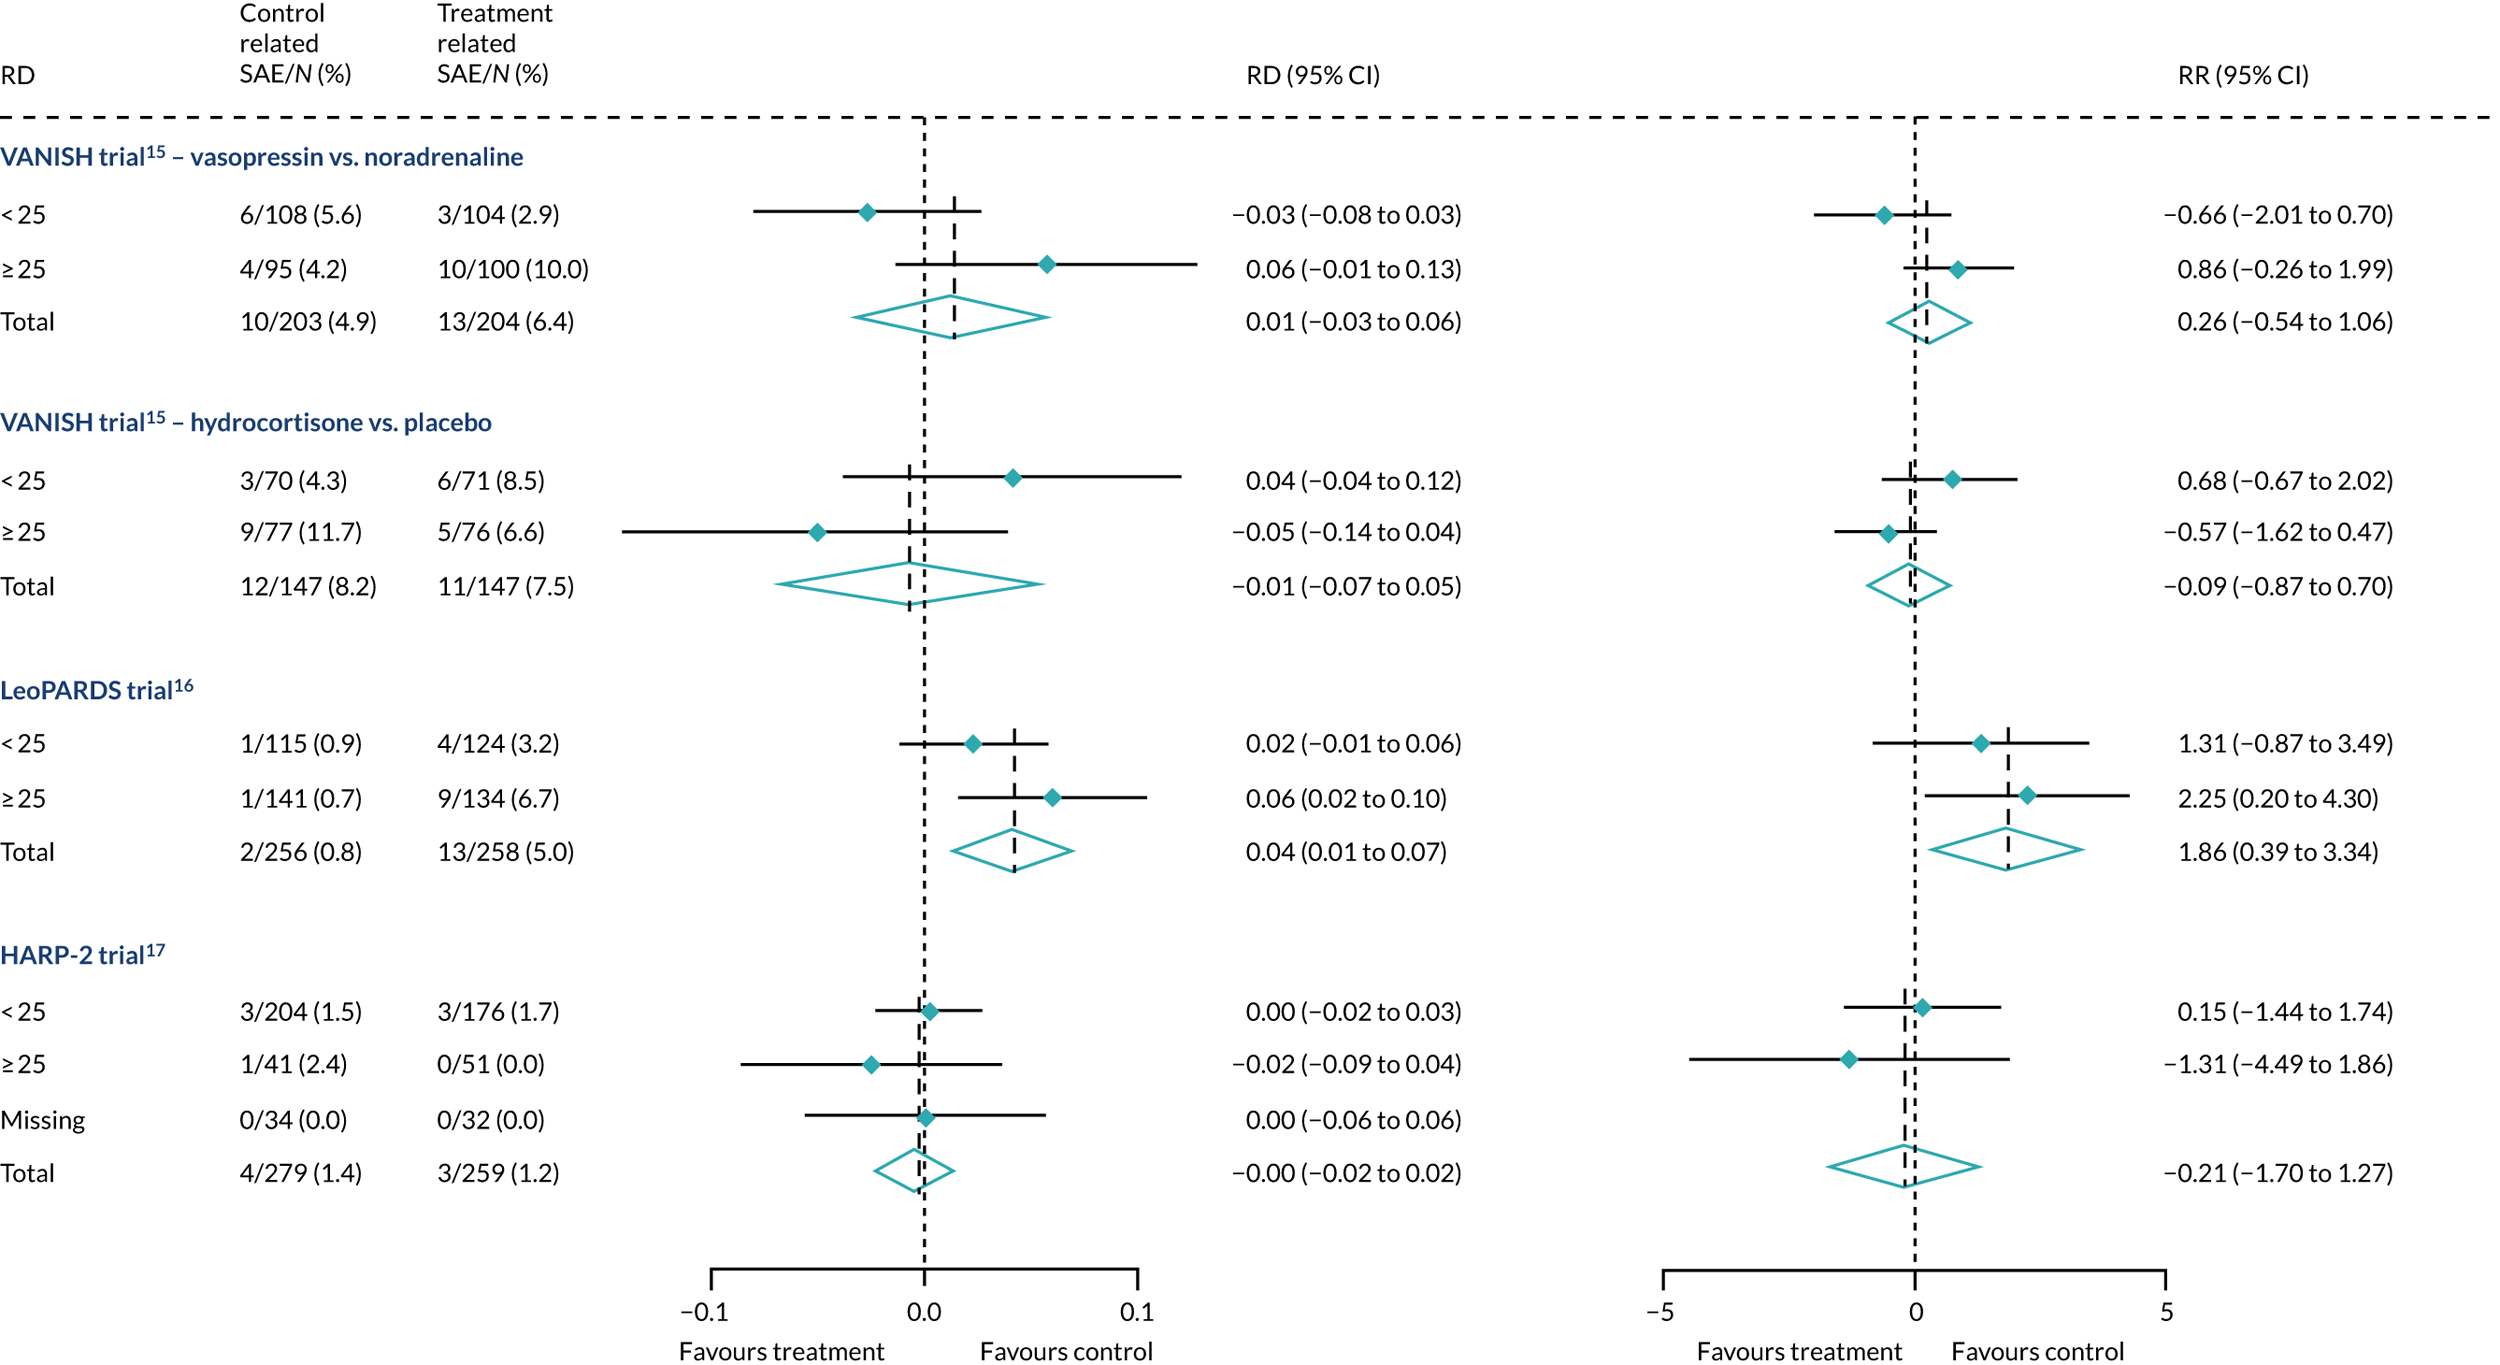
We plotted the proportions of serious adverse events in the low- and high-APACHE II groups in each trial to explore whether or not the pattern of adverse event distribution could explain any HTE in mortality. In all three RCTs, both in the intervention and controls trial arms, there was no pattern in serious adverse events that could explain HTE in mortality (Figure 26).
FIGURE 26.
Forest plots for the RD and RR comparing related serious adverse events in treatment and control, by trial and APACHE II score subgroup.
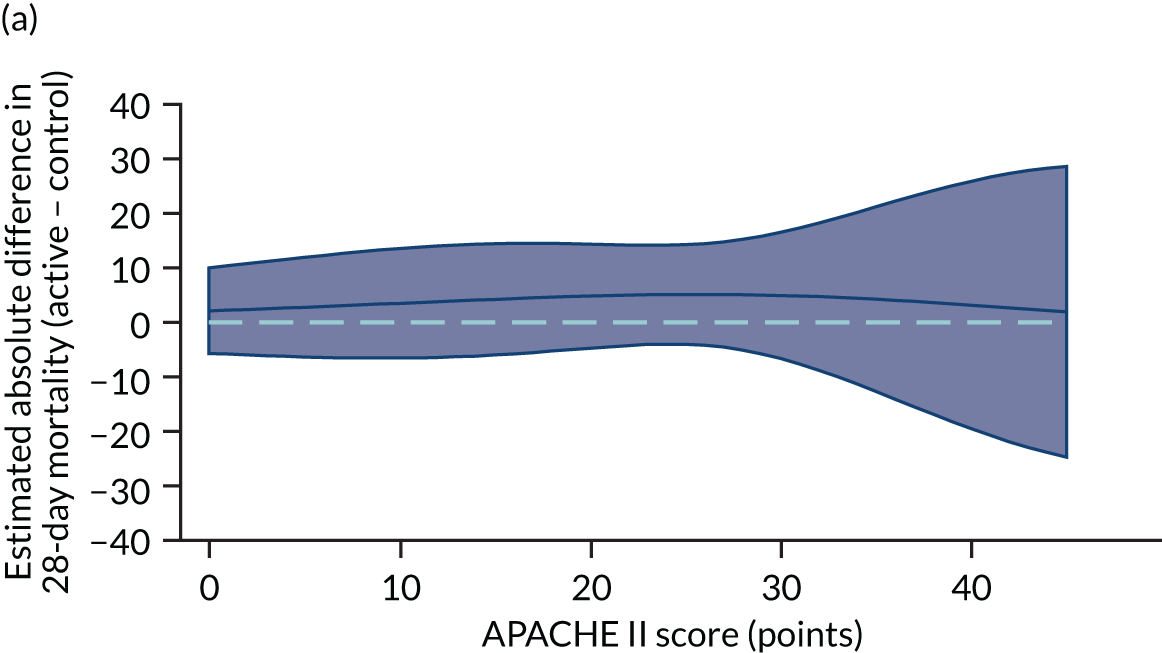
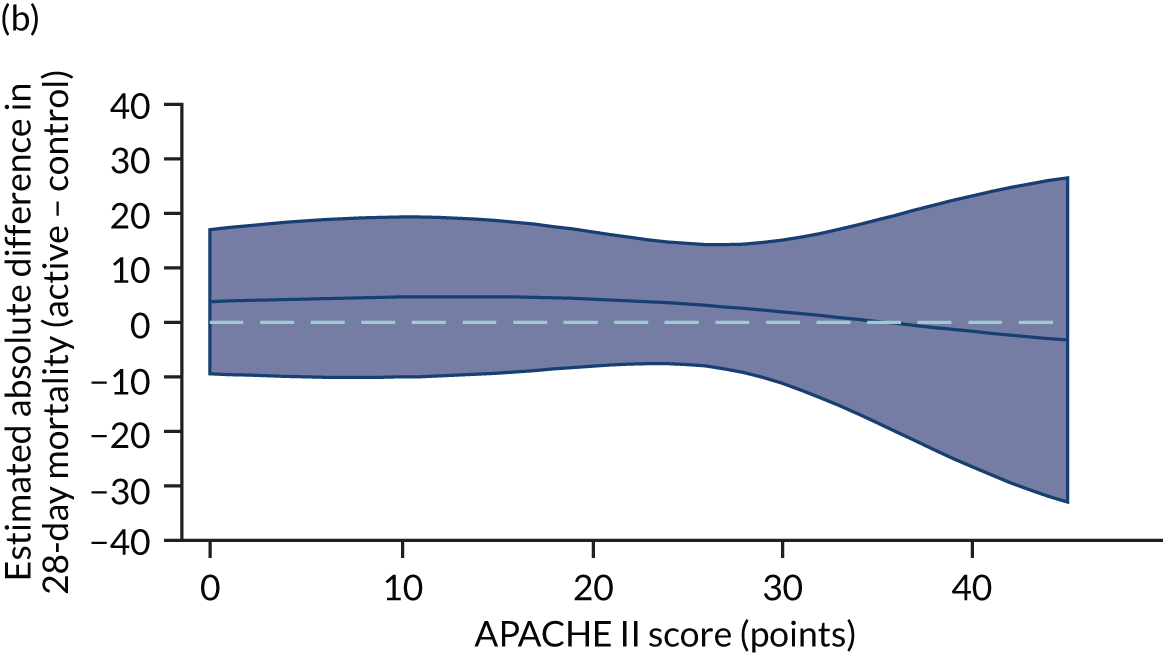
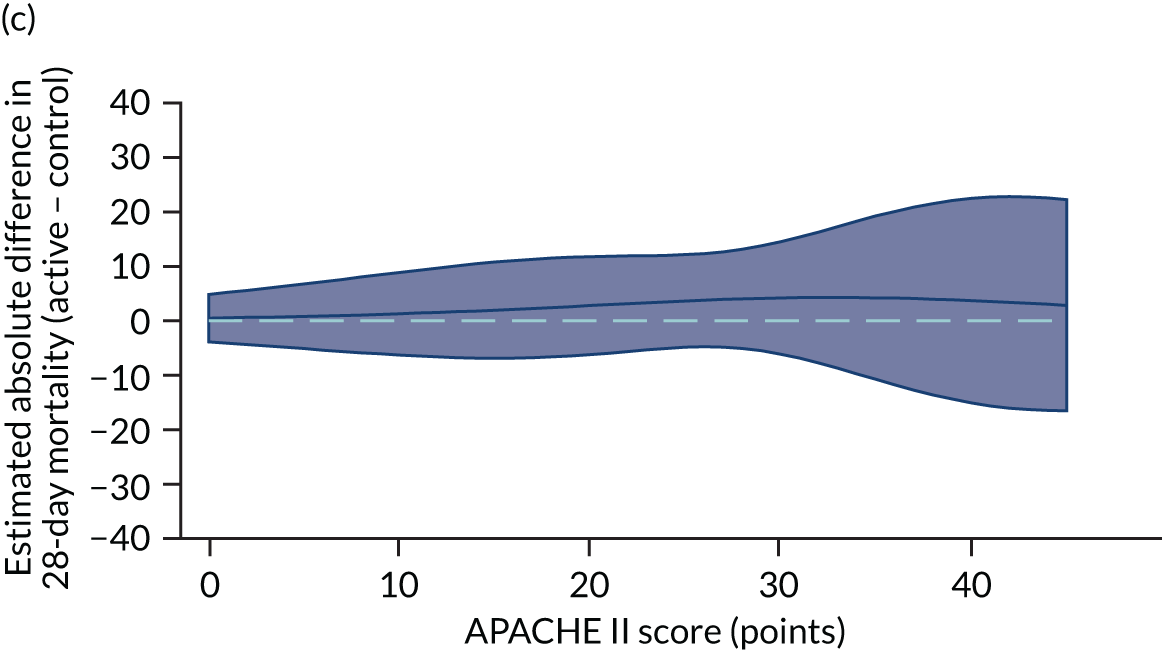
Heterogeneity of treatment effect assessment on continuous scale using regression
Differences were also smaller when HTE was assessed across the continuous range of APACHE II score [ratio of OR for 5-point increase in APACHE II 1.33 (95% CI 0.93 to 1.90)] (Table 6 and Figure 27).
| Trial | Ratio of OR for a 5-point increase in APACHE II score | 95% CI |
|---|---|---|
| VANISH15 (vasopressin vs. noradrenaline) | 0.96 | 0.71 to 1.29 |
| VANISH15 (hydrocortisone vs. placebo) | 0.93 | 0.67 to 1.29 |
| LeoPARDS16 | 1.00 | 0.74 to 1.34 |
| HARP-217 | 1.33 | 0.93 to 1.90 |
FIGURE 27.
Heterogeneity of treatment effect assessment for APACHE II score as a continuous variable. Figures shows the estimated treatment effect with 95% CI bands from regression models for 28-day mortality including a treatment × APACHE II score interaction with (a) the VANISH trial15 (vasopressin); (b) the VANISH trial15 (hydrocortisone); (c) the LeoPARDS trial;16 and (d) the HARP-2 trial. 17
Sensitivity analyses
The results from sensitivity analyses were consistent with those from the main analyses for the VANISH trial15 and the LeoPARDS trial16 (see Table 6 and Figure 28). HTE was attenuated in the sensitivity analyses for the HARP-2 trial17 under different assumptions for the missing data [e.g. ratio of RR was 2.86 (95% CI 1.47 to 5.57) when we assumed that patients with missing APACHE II data were more likely to be high risk; all other results were less attenuated] (Table 7). Differences were also smaller when hospital mortality was used as the outcome [difference in RD 0.25 (95% CI 0.03 to 0.48), ratio of RR 2.34 (95% CI 1.31 to 4.18)] (see Figure 28).
| Assumption for missing APACHE II score | APACHE II score ≥ 25 points (%) | Difference in RD (95% CI) | Ratio of RR (95% CI) |
|---|---|---|---|
| VANISH trial15 (vasopressin vs. noradrenaline) | |||
| Same as complete data | 50 | 0.03 (–0.16 to 0.21) | 1.02 (0.51 to 2.04) |
| 10% higher | 60 | 0.03 (–0.16 to 0.21) | 1.03 (0.51 to 2.07) |
| 10% lower | 40 | 0.01 (–0.17 to 0.20) | 0.96 (0.49 to 1.90) |
| VANISH trial15 (hydrocortisone vs. placebo) | |||
| Same as complete data | 50 | 0.03 (–0.19 to 0.25) | 1.02 (0.49 to 2.14) |
| 10% higher | 60 | 0.03 (–0.20 to 0.25) | 1.03 (0.48 to 2.19) |
| 10% lower | 40 | 0.02 (–0.21 to 0.25) | 0.99 (0.47 to 2.09) |
| LeoPARDS trial16 | |||
| Same as complete data | 56 | –0.01 (–0.17 to 0.17) | 0.89 (0.47 to 1.69) |
| 10% higher | 66 | –0.01 (–0.17 to 0.16) | 0.86 (0.45 to 1.67) |
| 10% lower | 46 | –0.02 (–0.17 to 0.17) | 0.89 (0.47 to 1.69) |
| HARP-2 trial17 | |||
| Same as complete data | 19 | 0.31 (0.10 to 0.52) | 2.99 (1.51 to 5.90) |
| 10% higher | 29 | 0.30 (0.08 to 0.52) | 2.96 (1.43 to 6.10) |
| 10% lower | 18 | 0.30 (0.09 to 0.51) | 2.86 (1.47 to 5.57) |
FIGURE 28.
Forest plots for the RD and RR comparing hospital mortality in treatment and control, by trial and APACHE II score subgroup.
Determining subphenotypes using latent class analysis
Exploratory analysis
Biomarker data (at least one biomarker at baseline) were available for 176 of 409 patients in the VANISH trial15 and 493 of 516 patients in the LeoPARDS trial. 16 Clinical characteristics at baseline are shown in Table 8. A summary of the biomarker data for both trials is shown in Table 9 (the VANISH trial15) and Table 10 (the LeoPARDS trial16), including details of values outside the limits of detection. As the limits varied by assay run, the mean limits for each biomarker are given.
| Characteristic | VANISH trial15 (N = 176) | LeoPARDS trial16 (N = 493) | ||
|---|---|---|---|---|
| Median (IQR) or n (%) | Missing (n) | Median (IQR) or n (%) | Missing (n) | |
| Age (years) | 65 (53.5–77) | 0 | 68 (58–76) | 0 |
| Male | 112 (63%) | 0 | 274 (56%) | 0 |
| Ethnicity | 0 | 0 | ||
| White | 146 (83%) | 461 (94%) | ||
| Black | 14 (8%) | 10 (2%) | ||
| Asian | 13 (7%) | 19 (4%) | ||
| Other | 3 (2%) | 3 (1%) | ||
| BMI (kg/m2) | 26.1 (22.5–31.3) | 6 | 27.1 (23.4–31.0) | 9 |
| Comorbidities | 0 | 0 | ||
| NYHA class IV | 0 (0%) | 5 (1%) | ||
| Severe COPD | 10 (6%) | 23 (5%) | ||
| Chronic renal failure | 8 (5%) | 35 (7%) | ||
| Cirrhosis | 11 (6%) | 9 (2%) | ||
| Immunocompromised | 11 (6%) | 45 (9%) | ||
| Site of infection | 3 | 1 | ||
| Lung | 74 (43%) | 192 (39%) | ||
| Abdomen | 35 (20%) | 181 (37%) | ||
| Urine | 28 (16%) | 29 (6%) | ||
| Primary bacteraemia | 3 (2%) | 10 (2%) | ||
| Neurological | 4 (2%) | 5 (1%) | ||
| Soft tissue or line | 6 (3%) | 26 (5%) | ||
| Other | 23 (13%) | 49 (10%) | ||
| SOFA score (points) | 7 (5–9) | 22 | 8 (6–9) | 16 |
| APACHE II score (points) | 24 (19–30) | 1 | 25 (21–31) | 0 |
| Post-surgical admission | 26 (15%) | 0 | 180 (37%) | 0 |
| Biomarkers | n a | Median (IQR) of values within limits | Lower limit | Upper limit | Missing (n) | ||
|---|---|---|---|---|---|---|---|
| n (%b) below | Mean | n (%b) above | Mean | ||||
| Organ dysfunction | |||||||
| PaO2/FiO2 ratio (kPa) | 169 | 26 (17.3–41.3) | 0 (0) | NA | 0 (0) | NA | 7 |
| Creatinine (µmol/l) | 176 | 120 (78–198) | 0 (0) | NA | 0 (0) | NA | 0 |
| Platelets (× 109/l) | 171 | 186 (118–287) | 0 (0) | NA | 0 (0) | NA | 5 |
| Bilirubin (µmol/l) | 156 | 14.5 (9–28.5) | 0 (0) | NA | 0 (0) | NA | 20 |
| Inflammation (pg/ml) | |||||||
| IL-1β | 162 | 9.5 (5.7–15.6) | 109 (67) | 3.2 | 0 (0) | NA | 14 |
| IL-6 | 162 | 1419 (322–6385) | 0 (0) | NA | 15 (9.3) | 59,149 | 14 |
| IL-8 | 162 | 206 (55–1311) | 16 (9.9) | 10.2 | 0 (0) | NA | 14 |
| IL-10 | 162 | 47.1 (14.4–180.5) | 16 (9.9) | 3.0 | 0 (0) | NA | 14 |
| IL-17 | 162 | 16.7 (8.9–24.9) | 108 (67) | 5.3 | 0 (0) | NA | 14 |
| IL-18 | 162 | 475 (239–803) | 3 (1.9) | 2.2 | 0 (0) | NA | 14 |
| Leucocytes (pg/ml) | |||||||
| Myeloperoxidase | 168 | 433,826 (185,139–860,389) | 1 (0.6) | 31,250 | 2 (1.2) | 5,600,000 | 8 |
| sICAM | 168 | 288,081 (183,124–466,634) | 6 (3.6) | 32,000 | 0 (0) | NA | 8 |
| Endothelial injury (pg/ml) | |||||||
| ANG II | 168 | 4658 (1983–8264) | 2 (1.2) | 375 | 1 (0.6) | 48,000 | 8 |
| Cardiovascular | |||||||
| Troponin (ng/l) | 95 | 49 (12–428) | 0 (0) | NA | 0 (0) | NA | 81 |
| NT-proBNP (pg/ml) | 168 | 5120 (2302–10,547) | 3 (1.8) | 480 | 0 (0) | NA | 8 |
| Other markers | |||||||
| sTNFR1 (pg/ml) | 168 | 5585 (3399–9254) | 0 (0) | NA | 2 (1.2) | 40,000 | 8 |
| Lactate (mmol/l) | 172 | 2.4 (1.5–3.9) | 0 (0) | NA | 0 (0) | NA | 4 |
| Biomarkers | n a | Median (IQR) of values within limits | Lower limit | Upper limit | Missing (n) | ||
|---|---|---|---|---|---|---|---|
| n (%b) below | Mean | n (%b) above | Mean | ||||
| Organ dysfunction | |||||||
| PaO2/FiO2 ratio (kPa) | 491 | 28.8 (20.2–39.3) | 0 (0) | NA | 0 (0) | NA | 2 |
| Creatinine (µmol/l) | 491 | 138 (91–213) | 0 (0) | NA | 0 (0) | NA | 2 |
| Platelets (× 109/l) | 490 | 215 (141–307) | 0 (0) | NA | 0 (0) | NA | 3 |
| Bilirubin (µmol/l) | 483 | 15 (8–26) | 0 (0) | NA | 0 (0) | NA | 10 |
| Inflammation (pg/ml) | |||||||
| IL-1β | 486 | 1.41 (0.84–2.97) | 43 (8.8) | 0.42 | 0 (0) | NA | 7 |
| IL-6 | 490 | 676 (222–2881) | 0 (0) | NA | 34 (6.9) | 40,000 | 3 |
| IL-8 | 490 | 166 (60–437) | 0 (0) | NA | 4 (0.8) | 24,000 | 3 |
| IL-10 | 490 | 79 (31–193) | 0 (0) | NA | 1 (0.2) | 80,000 | 3 |
| IL-17 | 486 | 8.4 (5.6–17.5) | 9 (1.9) | 1.64 | 0 (0) | NA | 7 |
| IL-18 | 486 | 732 (463–1176) | 4 (0.8) | 93.6 | 12 (2.5) | 6000 | 7 |
| Leucocytes (pg/ml) | |||||||
| Myeloperoxidase | 486 | 424,478 (251,550–786,731) | 35 (7.2) | 87,500 | 12 (2.5) | 5,600,000 | 7 |
| sICAM | 486 | 310,426 (188,980–494,860) | 1 (0.2) | 22,400 | 22 (4.5) | 1,400,000 | 7 |
| Endothelial injury (pg/ml) | |||||||
| ANG II | 486 | 5673 (3113–12,112) | 7 (1.4) | 744 | 8 (1.6) | 48,000 | 7 |
| Cardiovascular | |||||||
| Troponin (ng/l) | 483 | 82.3 (20.9–481) | 0 (0) | NA | 0 (0) | NA | 10 |
| NT-proBNP (pg/ml) | 492 | 10,462 (4540–21,149) | 34 (6.9) | 548 | 2 (0.4) | 800,000 | 1 |
| Other markers | |||||||
| sTNFR1 (pg/ml) | 492 | 10,664 (5925–17,389) | 0 (0) | NA | 0 (0) | NA | 1 |
| Lactate (mmol/l) | 490 | 2.2 (1.4–3.6) | 0 (0) | NA | 0 (0) | NA | 3 |
| CCL2 (pg/ml) | 490 | 733 (423–1390) | 0 (0) | NA | 6 (1.2) | 48,000 | 3 |
Latent class analysis: the VANISH trial
The latent class modelling was carried out in three stages. The first stage includes only indicator variables (the biomarkers) and assumes a common variance across classes and zero covariance between indicators within class. In the second stage, clinical and demographic characteristics are added as covariates. In the third stage, the variance assumptions are relaxed. We first present the model results and then compare the results and model fit across all the models. Finally, we compare detailed results for a selection of candidate models. For each model we present the estimated distribution of the latent classes and the estimated class means for each indicator. Important indicators are those that have good separation (high between-class variability). As a measure of separation, we present the variance of the estimated class means. All indicators have been log-transformed and standardised to have a mean of zero and a SD of 1.
Stage 1: no covariates, constant variance across classes and uncorrelated errors within classes
For indicators with fewer than five values outside the limits of detection (i.e. IL-18, MPO, ANG II, NT-proBNP and sTNFR1), values were replaced by the limit because of inability of models to converge. Models with more than four classes did not converge. Table 19 shows the results for two-, three- and four-class models. In the two-class model, the inflammatory biomarkers showed the most separation between classes (i.e. low in class 1 and high in class 2). Other biomarkers followed a similar pattern, except for PaO2/FiO2 ratio and platelets, which were high in class 1 and low in class 2. A similar set of biomarkers showed the most separation in the three- and four-class models. Variables were standardised based on the observed data (excluding values outside the limits of detection). The estimated class means are calculated based on all the data, which for some indicators (e.g. IL-1β) includes a large number of observations below the limit of detection, resulting in negative means in all classes.
Stage 2: model including biomarkers as above, demographic and clinical variables
Models did not converge when including all covariates specified a priori. Therefore, a reduced number of covariates were selected as follows. For each covariate we compared the two-class model derived in stage 1 with the same model plus the covariate in question in the logistic model for class membership, using a likelihood ratio test. This was repeated for the three- and four-class models. Any covariate that improved the fit (as indicated by a p-value < 0.05 from the likelihood ratio test) for any of the two-, three- or four-class models was included as a covariate. These covariates were age, source of infection (i.e. lung, abdomen, urine or other), APS-APII and post-surgical admission. APS-APII was also included as a covariate in the regression equations for each indicator, based on clinical plausibility. As in stage 1, the residual variance of the indicators was assumed to be constant across classes and with zero correlation between indicators within classes. The results are shown in Table 20. The same biomarkers contributed to class separation as in stage 1 (unadjusted for clinical covariates). In the three-class model, class 1 was larger, with higher class means for the inflammatory markers than the corresponding unadjusted stage 1 model. Classes 2 and 3 had lower class means than the stage 1 three-class model.
Stage 3: relaxing variance constraints
In stages 1 and 2 we assumed that the residual variance of each indicator did not change across classes and that the indicators were uncorrelated for individuals in the same class. In stage 3 these assumptions were relaxed in three sets of models. In stage 3a we allowed for non-constant variance across classes (see Table 21), in stage 3b no constraints were placed on covariance terms (see Table 22) and in stage 3c both these options were applied together (see Table 23). The four-class models did not converge if non-constant variance across classes was modelled, and so for these specifications only the two- and three-class models are presented.
A similar set of important biomarkers was identified in stage 3 as in the previous stages. The two-class models all had similar estimated class means to stage 2 for the important biomarkers, with the exception of IL-1β. This marker was less important in models that allowed the variance to differ across classes (i.e. stage 3a and stage 3c), possibly because of the large number of observations below the limit of detection. In the stage 2 three-class model, the largest class had low values of the inflammatory markers. When the variance was allowed to differ across classes, the class with the highest values for inflammatory markers (i.e. class 3) was the largest, estimated to be nearly half the population. In the other stage 3 model (i.e. stage 3b), in which only the covariance restriction was relaxed, class 2 was the largest class.
Comparing models derived from stages 1–3
The log-likelihood, class distributions, entropy, mean class probability, AIC and BIC are given in Table 11. Figure 29 shows how the log-likelihood, AIC and BIC change with the number of classes for each model stage. Across all models a similar set of indicators contributed to defining the classes. The estimated class means and class size were similar for the two-class models. Based on the AIC and BIC, the two-class stage 3b model (including covariates and allowing indicators to be correlated for individuals in the same class) appears to offer the best fit. We examined this model further, along with the three-class stage 3b model, which has a similar fit but an additional class, and the more parsimonious stage 2 models (two and three classes).
| Stage | Number of classes | Log-likelihood | Class distribution | Entropy | Mean class probabilitya | AIC | BIC | |
|---|---|---|---|---|---|---|---|---|
| Estimated | Observeda | |||||||
| 1 | 1a | –3937 | 7942 | 8049 | ||||
| 2 | –3732 | 49/51 | 49/51 | 0.87 | 0.96/0.97 | 7568 | 7733 | |
| 3 | –3673 | 29/44/27 | 29/45/26 | 0.82 | 0.93/0.89/0.94 | 7486 | 7708 | |
| 4 | –3638 | 21/13/34/32 | 22/12/35/31 | 0.84 | 0.91/0.90/0.88/0.95 | 7451 | 7730 | |
| 2 | 1a | –3806 | 7714 | 7874 | ||||
| 2 | –3596 | 51/50 | 49/51 | 0.88 | 0.97/0.96 | 7378 | 7671 | |
| 3 | –3514 | 37/28/35 | 36/26/38 | 0.86 | 0.95/0.98/0.90 | 7298 | 7722 | |
| 4 | –3465 | 36/17/24/23 | 35/17/23/24 | 0.88 | 0.95/0.95/0.93/0.91 | 7281 | 7838 | |
| 3a | 1a | –3806 | 7714 | 7875 | ||||
| 2 | –3573 | 51/49 | 49/51 | 0.89 | 0.97/0.96 | 7365 | 7711 | |
| 3 | –3476 | 49/29/23 | 47/28/24 | 0.93 | 0.98/0.96/0.95 | 7290 | 7822 | |
| 4b | ||||||||
| 3b | 1a | –3621 | 7453 | 7787 | ||||
| 2 | –3454 | 46/54 | 44/56 | 0.85 | 0.96/0.95 | 7025 | 7671 | |
| 3 | –3375 | 32/46/22 | 31/45/24 | 0.89 | 0.95/0.94/0.98 | 7130 | 7729 | |
| 4 | –3330 | 25/38/23/15 | 24/37/23/16 | 0.91 | 0.96/0.95/0.95/0.96 | 7125 | 7855 | |
| 3c | 1a | –3621 | 7453 | 7787 | ||||
| 2 | –3393 | 56/44 | 55/45 | 0.90 | 0.97/0.96 | 7226 | 7918 | |
| 3 | –3307 | 48/23/29 | 48/22/31 | 0.93 | 0.97/0.99/0.97 | 7282 | 8333 | |
| 4b | ||||||||
FIGURE 29.
Plots of model fit indicators in the VANISH trial:15 (a) log-likelihood; (b) AIC; and (c) BIC.
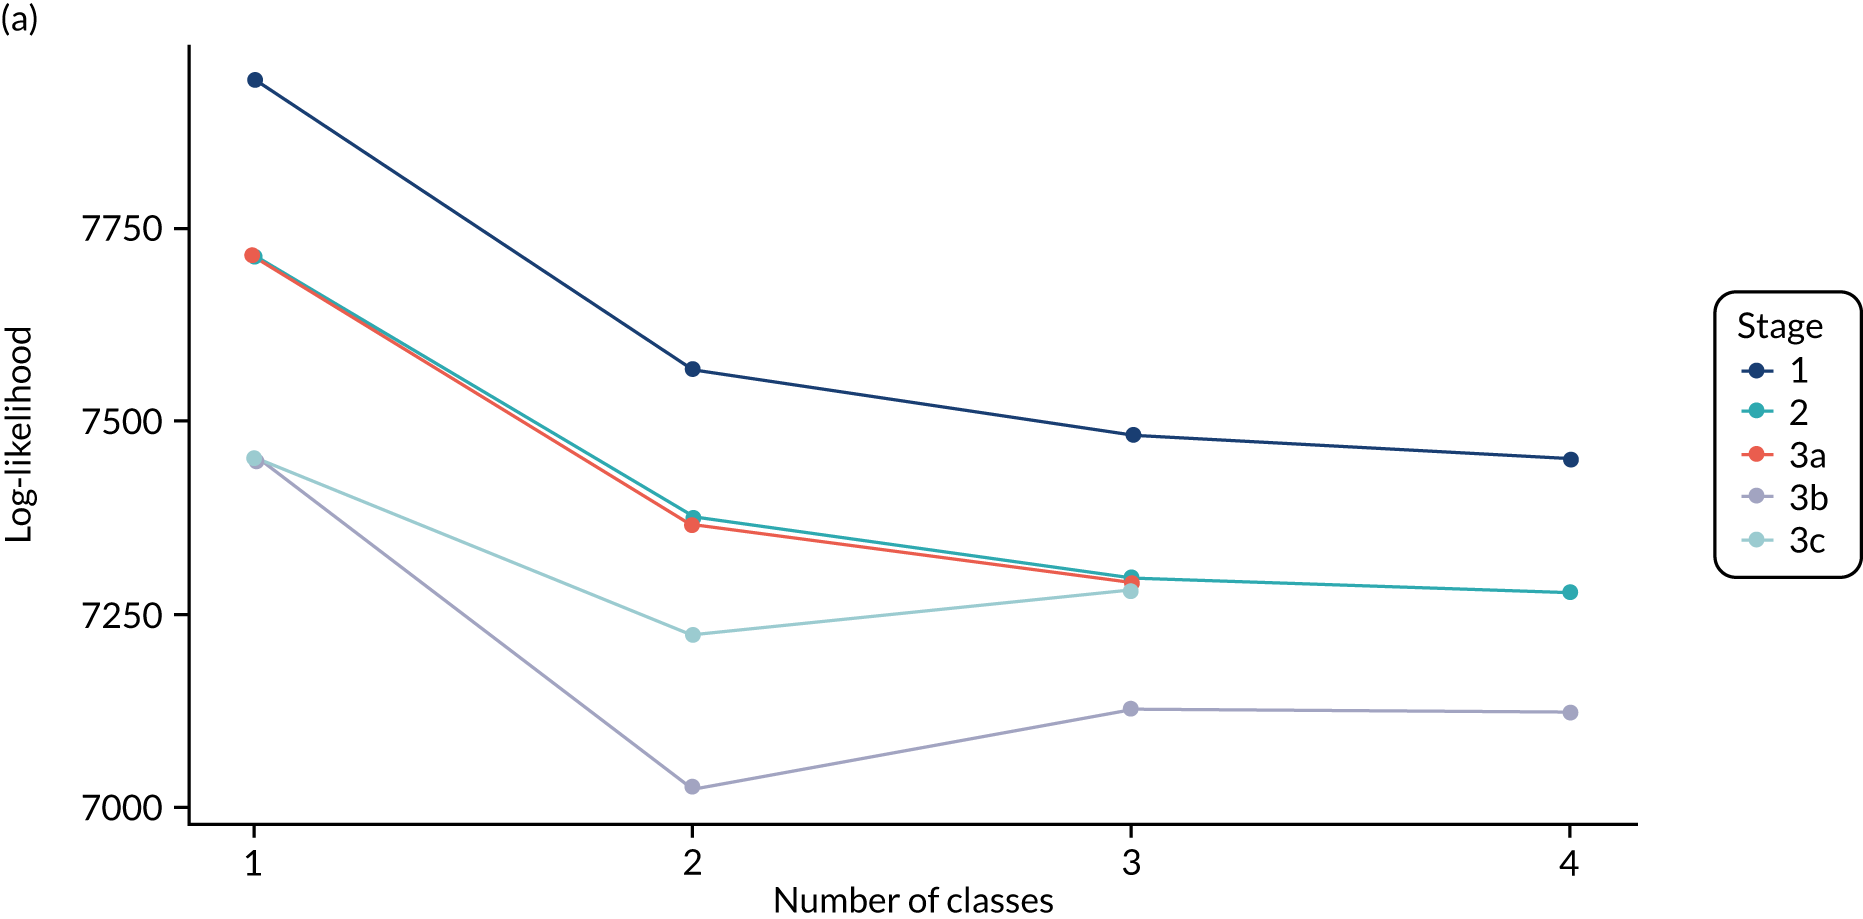
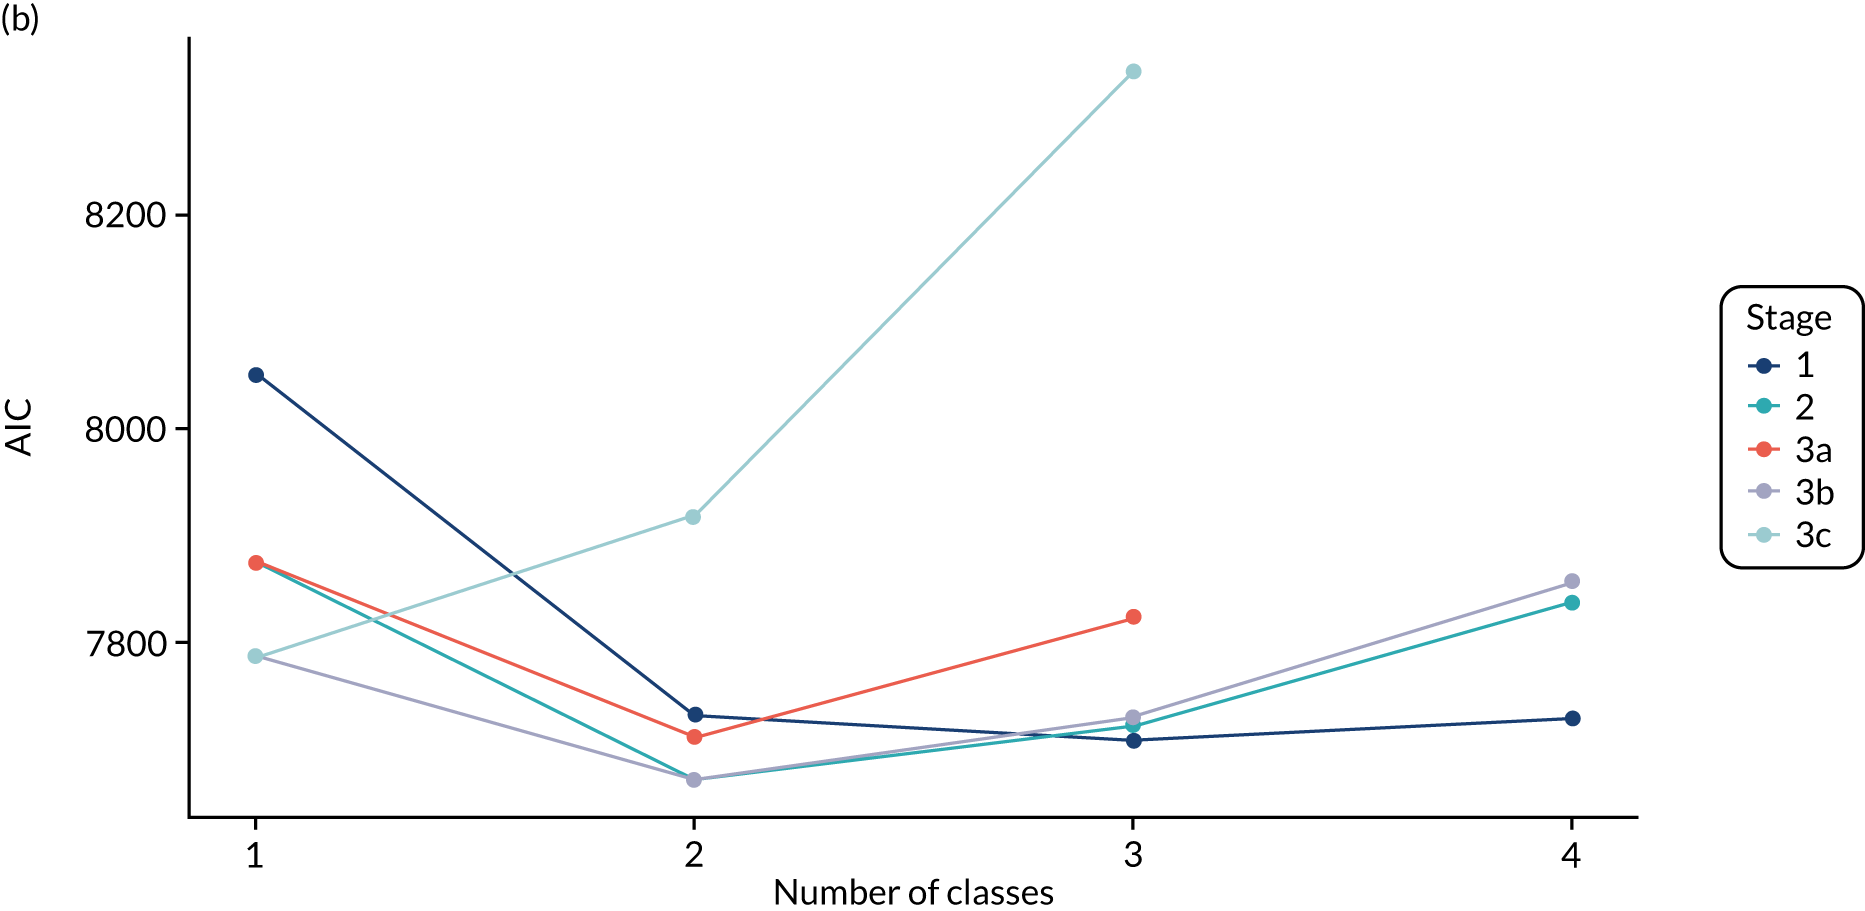
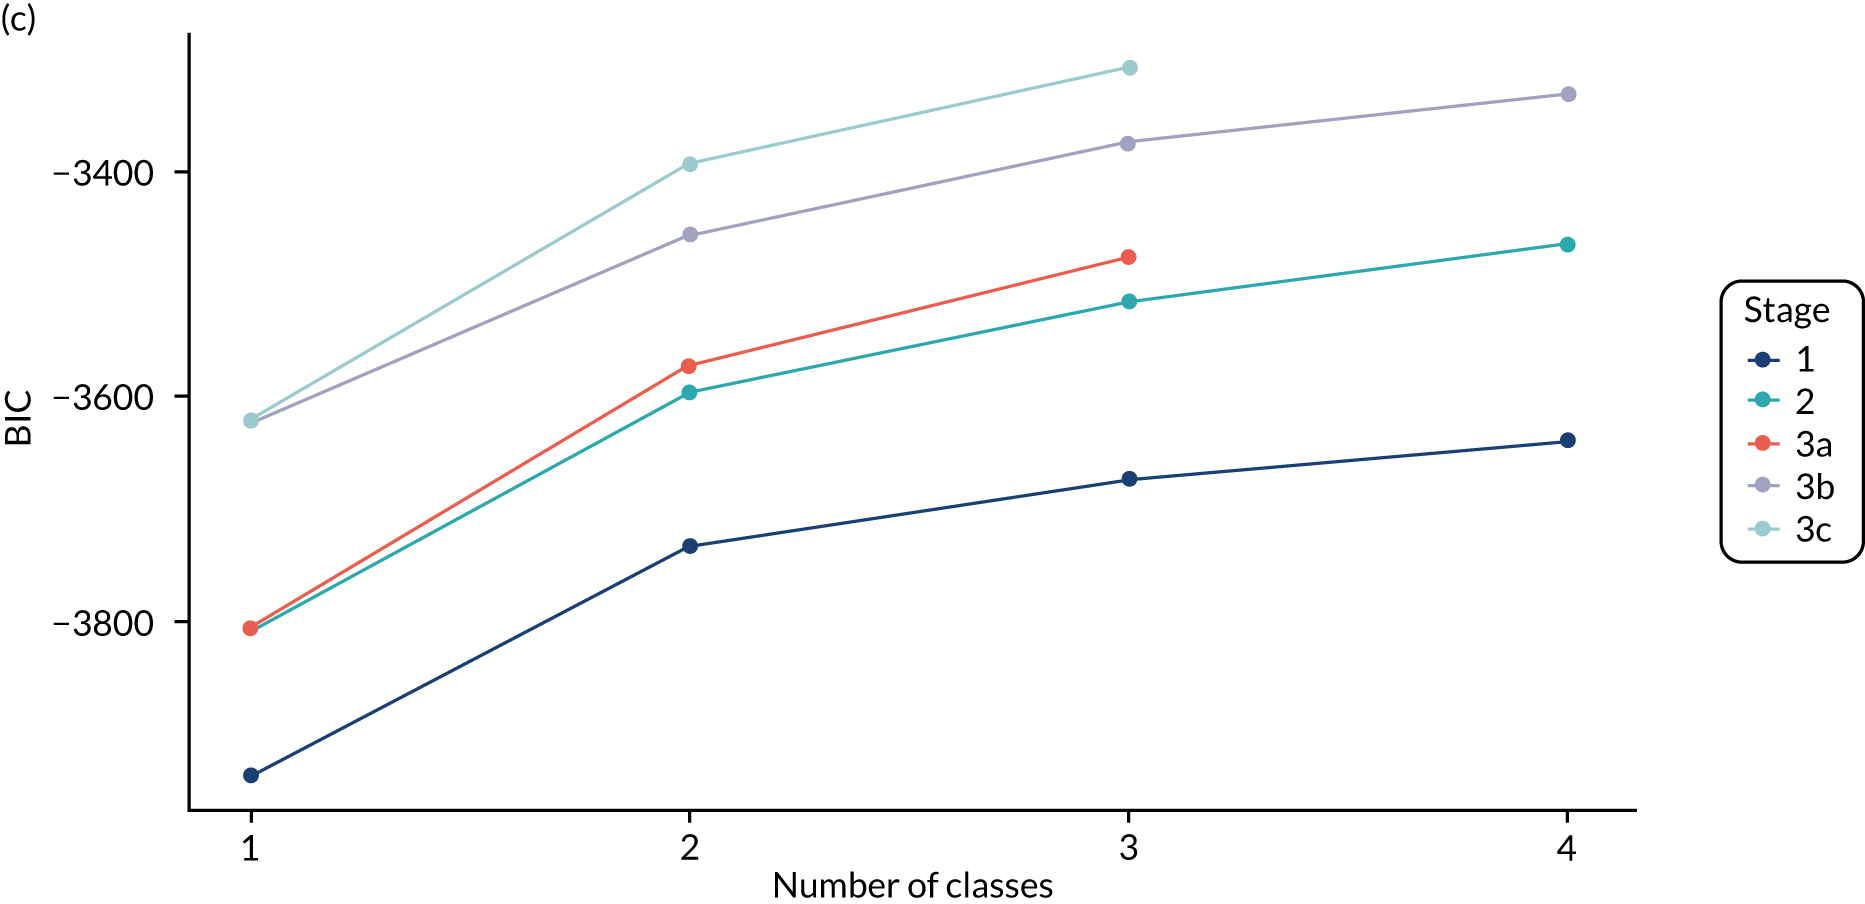
Figure 30 shows the distribution of each indicator by class for each of the candidate models, assigning individuals to their modal class (i.e. the class for which they had the highest posterior class probability). The indicators are ordered by the p-value from a Kruskal–Wallis non-parametric test comparing the distribution across the classes. The test was performed separately for each model and the average p-value taken to get an approximate ordering of importance of the indicators. The results are consistent across the models, with differences observed only for indicators with less separation across the classes. For example, NT-proBNP is highest in class 2 for the stage 2 three-class model, but highest in class 3 for the stage 3 three-class model. Figures 41–43 show separation plots for each of the candidate models reported in stages 1–3. These show the distribution of each of the indicators, with one line representing an individual, coloured according to the modal class. They show how well separated the classes are for each indicator. Only the top few indicators are clearly separated. For the three-class models, stage 3b models appear slightly better separated than their stage 2 counterpart for the most important indicators. There is little difference between the two-class models.
FIGURE 30.
Box plot showing distribution of indicators by class for candidate models, assigning to modal class, in the VANISH trial. 15 The box shows the 25th, 50th and 75th percentiles, the whiskers show the extent of data within 1.5 × IQR and the dots show data points beyond these limits. P/F, PaO2/FiO2.
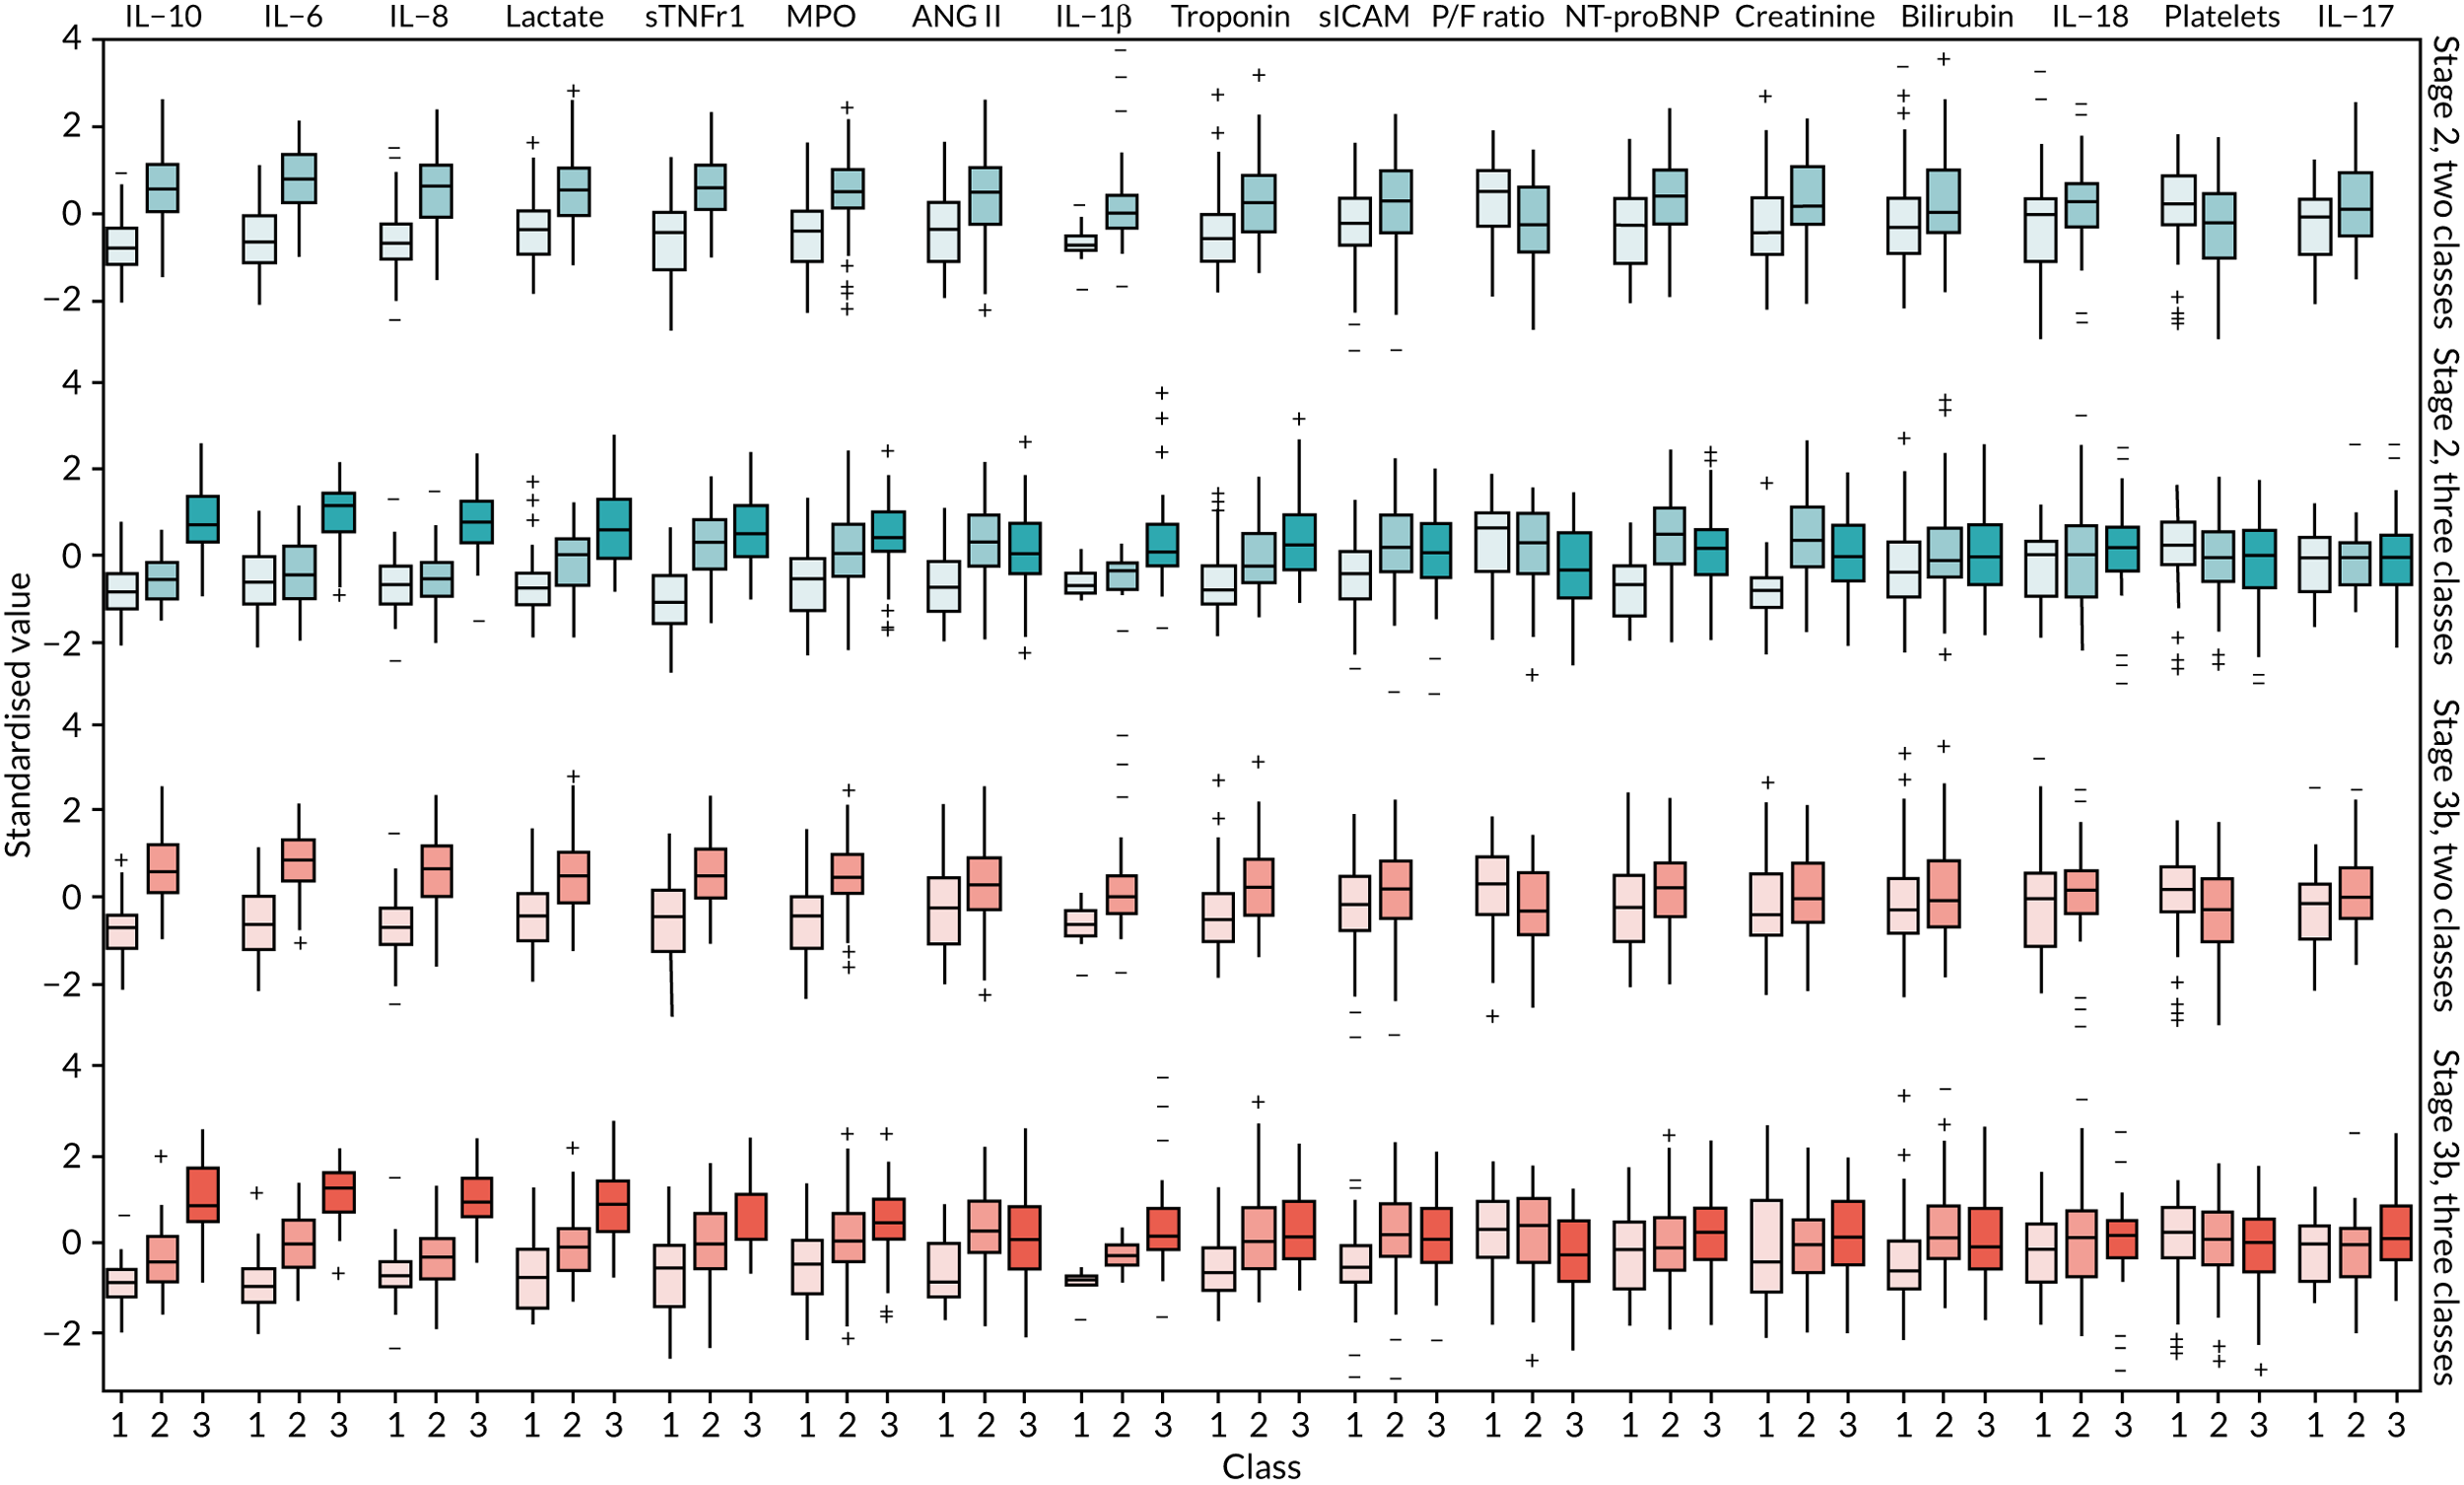
In summary, these comparisons suggest that the simpler two-class model from stage 2 is appropriate, given the minimal differences in indicator distribution, separation and class assignment. The more complex three-class models create a ‘middle’ class that is a mixture of the other two classes, and so does not give a substantively different interpretation. Therefore, the two-class model from stage 2 is used for all our subsequent analysis.
Analysis by modal class: the VANISH trial
There was an almost even split between classes (90 individuals assigned to class 1 and 86 individuals assigned to class 2). The clinical characteristics by latent class in the VANISH trial15 are shown in Table 12, biomarker values are shown in Table 13 and clinical outcomes by class are shown in Table 14. The classes in the final model will be referred to as subphenotype 1 (i.e. class 1) and subphenotype 2 (i.e. class 2) from hereon in the manuscript when referring to the VANISH trial. 15
| Characteristic | LeoPARDS trial16 (N = 493) | VANISH trial15 (N = 176) | |||||
|---|---|---|---|---|---|---|---|
| Class 1 (n = 191) | Class 2 (n = 247) | Class 3 (n = 55) | Missing (n) | Class 1 (n = 90) | Class 2 (n = 86) | Missing (n) | |
| Age (years), median (IQR) | 68 (57–77) | 69 (62–76) | 65 (51–73) | 0 | 65.5 (54–77) | 64.5 (53–76) | 0 |
| Male, n (%) | 108 (56.5) | 138 (55.9) | 28 (50.9) | 0 | 58 (64.4) | 54 (62.8) | 0 |
| Ethnicity, n (%) | 0 | 0 | |||||
| White | 180 (94.2) | 229 (92.7) | 52 (94.6) | 77 (85.6) | 69 (80.2) | ||
| Black | 3 (1.6) | 5 (2) | 2 (3.6) | 8 (8.9) | 6 (7) | ||
| Asian | 7 (3.7) | 11 (4.5) | 1 (1.8) | 4 (4.4) | 9 (10.5) | ||
| Other | 1 (0.5) | 2 (0.8) | 0 (0) | 1 (1.1) | 2 (2.3) | ||
| BMI (kg/m2), median (IQR) | 26.7 (23–30.8) | 27.3 (23.4–30.7) | 27.8 (24.2–33.6) | 6 | 24.7 (22.2–31.6) | 26.2 (22.6–31.1) | 9 |
| Comorbidities, n (%) | |||||||
| NYHA IV | 1 (0.5) | 4 (1.6) | 0 (0) | 0 | 0 (0) | 0 (0) | 0 |
| Severe COPD | 10 (5.2) | 11 (4.5) | 2 (3.6) | 0 | 7 (7.8) | 3 (3.5) | 0 |
| Chronic renal failure | 18 (9.4) | 15 (6.1) | 2 (3.6) | 0 | 2 (2.2) | 6 (7) | 0 |
| Cirrhosis | 6 (3.1) | 3 (1.2) | 0 (0) | 0 | 4 (4.4) | 7 (8.1) | 0 |
| Immunocompromised | 14 (7.3) | 22 (8.9) | 9 (16.4) | 0 | 2 (2.2) | 9 (10.5) | 0 |
| Site of infection, n (%) | 3 | 1 | |||||
| Lung | 106 (55.5) | 74 (30.1) | 12 (21.8) | 42 (48.3) | 32 (37.2) | ||
| Abdomen | 45 (23.6) | 111 (45.1) | 25 (45.5) | 17 (19.5) | 18 (20.9) | ||
| Urine | 13 (6.8) | 13 (5.3) | 3 (5.5) | 10 (11.5) | 18 (20.9) | ||
| Primary bacteraemia | 0 (0) | 6 (2.4) | 4 (7.3) | 2 (2.3) | 1 (1.2) | ||
| Neurological | 3 (1.6) | 2 (0.8) | 0 (0) | 4 (4.6) | 0 (0) | ||
| Soft tissue or line | 10 (5.2) | 10 (4.1) | 6 (10.9) | 3 (3.5) | (3.5) | ||
| Other | 14 (7.3) | 30 (12.2) | 5 (9.1) | 9 (10.3) | 14 (16.3) | ||
| SOFA score (points), median (IQR) | 7 (6–8) | 8 (7–10) | 9 (7–11) | 22 | 6 (4–8) | 8 (5–10) | 16 |
| APACHE II score (points), median (IQR) | 24 (21–30) | 26 (21–31) | 27 (22–30) | 1 | 24 (18–29) | 23.5 (20–30) | 0 |
| Post-surgical admission, n (%) | 49 (25.7) | 114 (46.2) | 17 (30.9) | 0 | 17 (18.9) | 9 (10.5) | 0 |
| Parameter | LeoPARDS trial16 (N = 493) | VANISH trial15 (N = 176) | |||||
|---|---|---|---|---|---|---|---|
| Class 1, median (IQR) | Class 2, median (IQR) | Class 3, median (IQR) | n (%) outside limits | Class 1, median (IQR) | Class 2, median (IQR) | n (%) outside limits | |
| Organ dysfunction | |||||||
| PaO2/FiO2 ratio (kPa) | 29.1 (22–39.7) | 29.3 (20.2–39.4) | 25.8 (16.6–36) | 0/491 (0) | 32.5 (21–43.5) | 21.1 (14.6–34.9) | 0/169 (0) |
| Creatinine (µmol/l) | 107 (69–166) | 151 (107–231) | 173 (137–295) | 0/491 (0) | 91.5 (67–163) | 140 (106–270) | 0/176 (0) |
| Platelets (× 109/l) | 243 (182–350) | 203 (131–294) | 136 (76–215) | 0/490 (0) | 206 (145–335) | 150 (83–246) | 0/171 (0) |
| Bilirubin (µmol/l) | 12 (7–19) | 17 (10–30) | 17 (9–31) | 0/483 (0) | 12 (7–23) | 16.5 (11–42) | 0/156 (0) |
| Inflammation markers (pg/ml) | |||||||
| IL-1β | 0.915 (0.651–1.41) | 1.53 (0.948–2.88) | 7.96 (2.93–11.3) | 43/486 (8.8) | 4.9 (4.34–6.25) | 11.2 (7.71–19.4) | 109/162 (67.3) |
| IL-6 | 232 (92–481) | 1588 (583–3874) | 19,582 (11,926–27,584) | 34/490 (6.9) | 426 (175–1376) | 6385 (2277–19,641) | 15/162 (9.3) |
| IL-8 | 48.2 (30.4–84.8) | 257 (159–516) | 3015 (1252–7336) | 4/490 (0.8) | 64.8 (28.3–173) | 1075 (225–3293) | 16/162 (9.9) |
| IL-10 | 26.3 (17.4–49.8) | 123 (66.1–205) | 554 (314–1429) | 1/490 (0.2) | 15.1 (8.27–32.9) | 159 (66–446) | 16/162 (9.9) |
| IL-17 | 6.61 (4.71–10.1) | 9.79 (6.52–19.5) | 21.5 (8.1–49.9) | 9/486 (1.9) | 15.6 (7.36–22.6) | 18 (10.6–38.8) | 108/162 (66.7) |
| IL-18 | 559 (373–996) | 804 (565–1278) | 1065 (724–1759) | 16/486 (3.3) | 434 (163–595) | 562 (331–836) | 3/162 |
| Leucocytes (pg/ml) | |||||||
| Myeloperoxidase | 332,192 (204,356–581,390) | 489,569 (291,316–987,773) | 541,091 (340,269–1,405,943) | 47/486 (9.7) | 264,802 (122,264–433,825) | 675,769 (448,047–1,195,365) | 3/168 |
| sICAM | 271,181 (168,034–414,706) | 311,864 (187,557–515,209) | 432,439 (298,658–886,124) | 23/486 (4.7) | 243,841 (165,654–326,461) | 341,912 (208,505–550,529) | 6/168 |
| Endothelial injury (pg/ml) | |||||||
| ANG II | 3197 (1906–5419) | 7487 (4491–14,867) | 13,040 (7373–23,168) | 15/486 (3.1) | 3162 (1503–5551) | 6592 (3681–11,564) | 3/168 (1.8) |
| Cardiovascular | |||||||
| Troponin (ng/l) | 62 (16.8–536) | 77.8 (23.7–381) | 139 (45.2–589) | 0/483 | 21 (6–94) | 149 (31–729) | 0/95 |
| NT-proBNP (pg/ml) | 9054 (3318–17,410) | 10,269 (4922–23,317) | 18,406 (9844–31,718) | 36/492 (7.3) | 3611 (1238–7416) | 8130 (3590–16,890) | 3/168 (1.8) |
| Other markers | |||||||
| sTNFR1 (pg/ml) | 5939 (3923–9802) | 13,457 (8749–20,337) | 18,099 (12,379–27,759) | 0/492 | 3856 (2064–5555) | 8315 (5743–12,645) | 2/168 (1.2) |
| Lactate (mmol/l) | 1.5 (1–2.1) | 2.6 (1.8–4) | 5.2 (3–7) | 0/490 | 1.8 (1.2–2.5) | 3.5 (2.3–5.3) | 0/172 |
| CCL2 (pg/ml) | 384 (272–592) | 995 (676–1590) | 4049 (3105–5621) | 6/490 (1.2) | |||
| Trial outcome | Class | p-value for difference | ||
|---|---|---|---|---|
| 1 | 2 | 3 | ||
| LeoPARDS16 | ||||
| 3-month survival, n/N (%) | 132/189 (69.8) | 155/246 (63.0) | 23/55 (41.8) | 0.001a |
| 28-day survival, n/N (%) | 143/190 (75.3) | 165/247 (66.8) | 26/55 (47.3) | < 0.001a |
| Mean daily SOFA score (points), mean (SD) | 4.93 (2.88) | 6.67 (3.94) | 9.97 (4.60) | < 0.001b |
| VANISH15 | ||||
| 28-day renal failure-free survival, n/N (%)c | 51/75 (68.0) | 32/60 (53.3) | 0.08a | |
| 28-day survival, n/N (%) | 72/90 (80.0) | 57/86 (66.3) | 0.04a | |
| Renal failure-free days, median (IQR)d | 19 (3–26) | 8 (0–23) | 0.03e | |
There was no evidence that treatment effects varied by subphenotype for any of the outcomes of the VANISH trial15 (Figures 31 and 32). The effect of vasopressin on renal failure-free survival at 28 days compared with noradrenaline was in opposite directions in class 1 [i.e. 10% reduction in survival (95% CI –31% to 11%)] compared with subphenotype 2 [i.e. 10% increase in survival (95% CI –16% to 35%)], but the CI for the subgroup difference was wide [difference in RD 20% (95% CI –13% to 53%)]. Point estimates for the treatment effect showed a consistent direction of subgroup differences (i.e. all RDs were positive, indicating that treatments were more likely to benefit participants in class 2). This was also seen for renal failure-free days. For subphenotype 1, the median in the vasopressin group was 10 days lower (95% CI –23 to 3 days) than in the noradrenaline group, whereas for class 2 those in the vasopressin group had a median of 6 more renal failure-free days (95% CI –8 to 20 days). The test for subphenotype–treatment interactions was not statistically significant. The sensitivity analysis gave very similar results, with 97% agreement in subphenotype assignment for the VANISH trial15 (see Table 24).
Latent class analysis: the LeoPARDS trial
Stage 1: no covariates, constant variance across classes and uncorrelated errors within classes
Models with more than five classes did not converge. Table 25 shows the results for the two-, three- and four-class models, and Table 26 shows the results for the five-class model. In the two-class model, the inflammatory biomarkers showed the most separation between classes (as with the VANISH trial15), with ANG II and CCL2 also being prominent. These biomarkers were low in class 1 and high in class 2. Other biomarkers followed a similar pattern, except for PaO2/FiO2 ratio and platelets, which were high in class 1 and low in class 2. Except for the five-class model, there was a consistent pattern across all prominent biomarkers (i.e. the order of the classes according to estimated class mean was almost identical).
Stage 2: model including biomarkers, demographic and clinical variables
All variables selected a priori were included as covariates in the models for the LeoPARDS trial. 16 APS-APII was also included as a covariate in the regression equations for each indicator, based on clinical plausibility. As in stage 1, the residual variance of the indicators was assumed to be constant across classes and with zero correlation between indicators within classes. The model with five latent classes did not converge. The results are shown in Table 27. The same biomarkers contributed to class separation, as in stage 1 (i.e. unadjusted for clinical covariates). The two- and three-class models had similar estimated class means and class sizes to their stage 1 counterparts. The four-class model was slightly different, with fewer observations and lower class means in the class with the lowest biomarker values (i.e. class 1).
Stage 3: relaxing variance constraints
In stages 1 and 2 we assumed that the residual variance of each indicator did not change across classes and the indicators were uncorrelated for individuals in the same class. In stage 3 these assumptions were relaxed in three sets of models. In stage 3a we allowed for non-constant variance across classes (see Table 28), in stage 3b no constraints were placed on covariance terms (see Table 29) and in stage 3c both these options were applied together (see Table 30). The five-class models did not converge for any of the models in stage 3.
A similar set of important biomarkers was identified as in the previous stages. The two-class models all had similar estimated class means to stage 2 for the important biomarkers. For the three-class models the estimated class sizes were fairly similar to stage 2, with class 2 (i.e. middle values for important biomarkers) being the largest class. The estimated means differed slightly, but the ordering across the classes was consistent. For the four-class models, the class with the highest values of important markers (i.e. class 4) was consistently the smallest, as in stage 2; however, the distribution across the other classes varied. The estimated class means were slightly different, but showed similar patterns.
Comparing models derived from stages 1–3
A similar set of indicators were important for defining the latent classes, with some overlap with those found in the VANISH trial. 15 The log-likelihood, class distributions, entropy, mean class probability, AIC and BIC are given in Table 15. We present plots showing how the log-likelihood, AIC and BIC change with the number of classes for each model stage in Figure 33.
| Stage | Number of classes | Log-likelihood | Estimated class distribution | Observed distributiona | Entropy | Mean class probabilitya | AIC | BIC |
|---|---|---|---|---|---|---|---|---|
| 1 | 1a | –13,058 | 26,188 | 26,339 | ||||
| 2 | –12,285 | 61/39 | 61/39 | 0.89 | 0.98/0.96 | 24,681 | 24,912 | |
| 3 | –11,942 | 33/14/53 | 32/14/54 | 0.89 | 0.95/0.97/0.95 | 24,031 | 24,342 | |
| 4 | –11,800 | 35/23/13/29 | 35/23/13/30 | 0.86 | 0.95/0.89/0.98/0.88 | 23,787 | 24,178 | |
| 5b | –11,676 | 22/30/17/10/20 | 22/30/17/10/20 | 0.86 | 0.93/0.89/0.91/0.98/0.90 | 23,576 | 24,047 | |
| 2 | 1a | –12,657 | 25,423 | 25,648 | ||||
| 2 | –11,910 | 58/42 | 57/43 | 0.89 | 0.98/0.96 | 24,020 | 24,438 | |
| 3 | –11,555 | 32/12/56 | 31/12/58 | 0.91 | 0.95/0.99/0.95 | 23,402 | 24,013 | |
| 4 | –11,373 | 26/12/21/41 | 25/11/20/43 | 0.89 | 0.96/0.98/0.93/0.92 | 23,129 | 23,932 | |
| 3a | 1a | –12,657 | 25,423 | 25,648 | ||||
| 2 | –11,770 | 54/46 | 53/47 | 0.88 | 0.96/0.97 | 23,776 | 24,270 | |
| 3 | –11,413 | 30/51/19 | 29/51/20 | 0.90 | 0.97/0.95/0.97 | 23,189 | 23,950 | |
| 4 | –11,174 | 31/29/16/24 | 31/29/15/25 | 0.90 | 0.96/0.93/0.98/0.94 | 22,840 | 23,868 | |
| 3b | 1a | –12,470 | 25,091 | 25,404 | ||||
| 2 | –11,796 | 58/42 | 57/43 | 0.87 | 0.97/0.96 | 23,833 | 24,339 | |
| 3 | –11,452 | 39/11/50 | 39/11/50 | 0.91 | 0.94/0.98/0.96 | 23,238 | 23,936 | |
| 4 | –11,285 | 31/11/33/25 | 31/11/32/27 | 0.88 | 0.95/0.98/0.93/0.90 | 22,997 | 23,887 | |
| 3c | 1a | –12,470 | 25,091 | 25,404 | ||||
| 2 | –11,641 | 54/46 | 53/47 | 0.88 | 0.96/0.97 | 23,602 | 24,271 | |
| 3 | –11,283 | 37/43/20 | 36/43/21 | 0.90 | 0.97/0.94/0.98 | 23,055 | 24,079 | |
| 4 | –11,004 | 33/30/16/21 | 32/30/16/23 | 0.91 | 0.97/0.93/0.98/0.95 | 22,749 | 24,128 |
FIGURE 33.
Plots of model fit indicators in the LeoPARDS trial:16 (a) log-likelihood; (b) AIC; and (c) BIC.
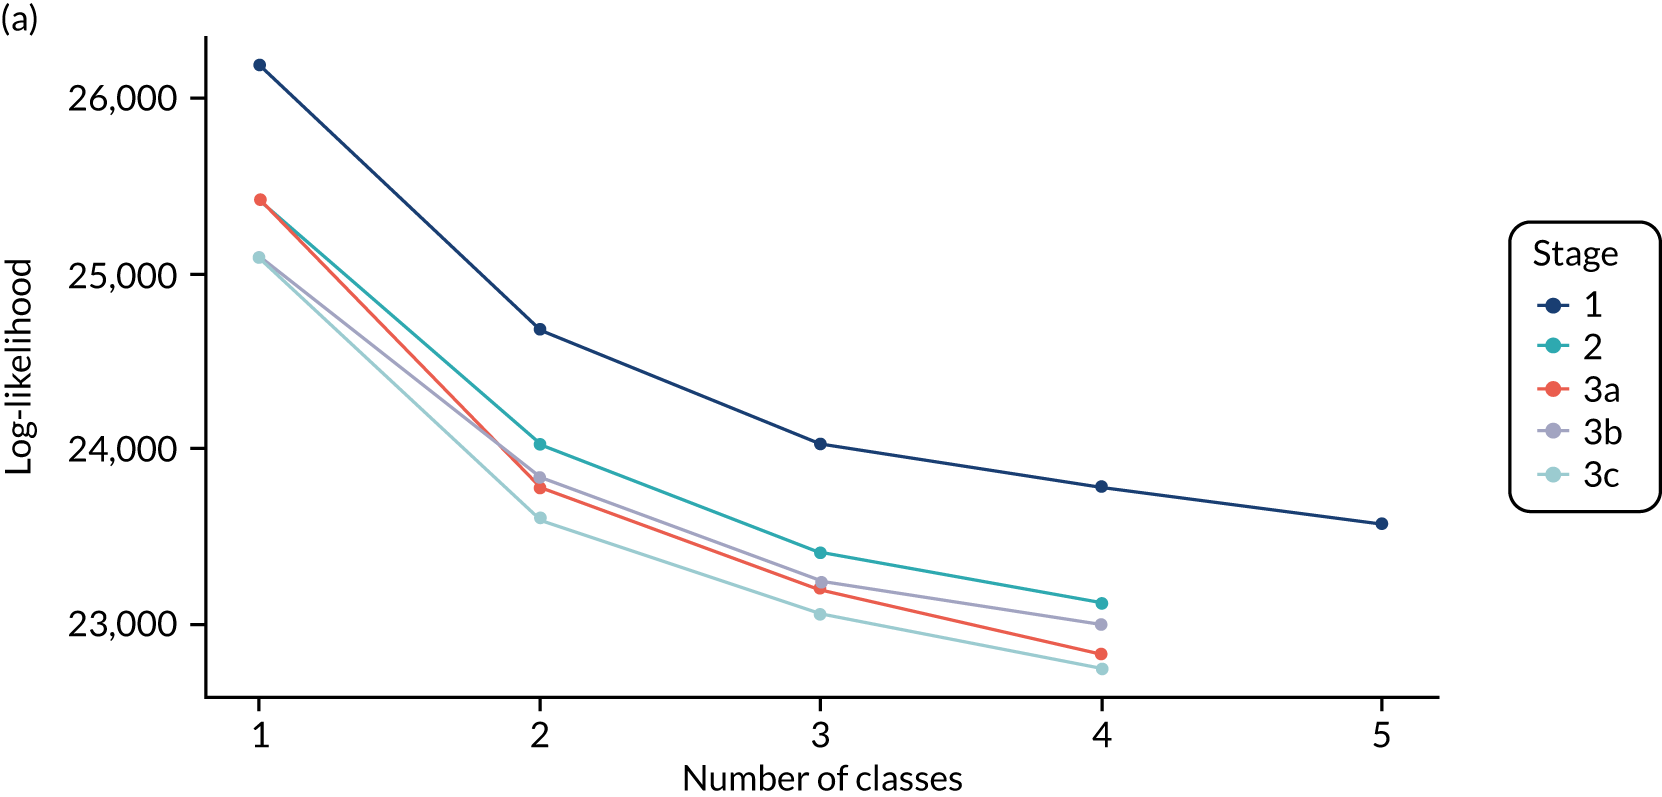
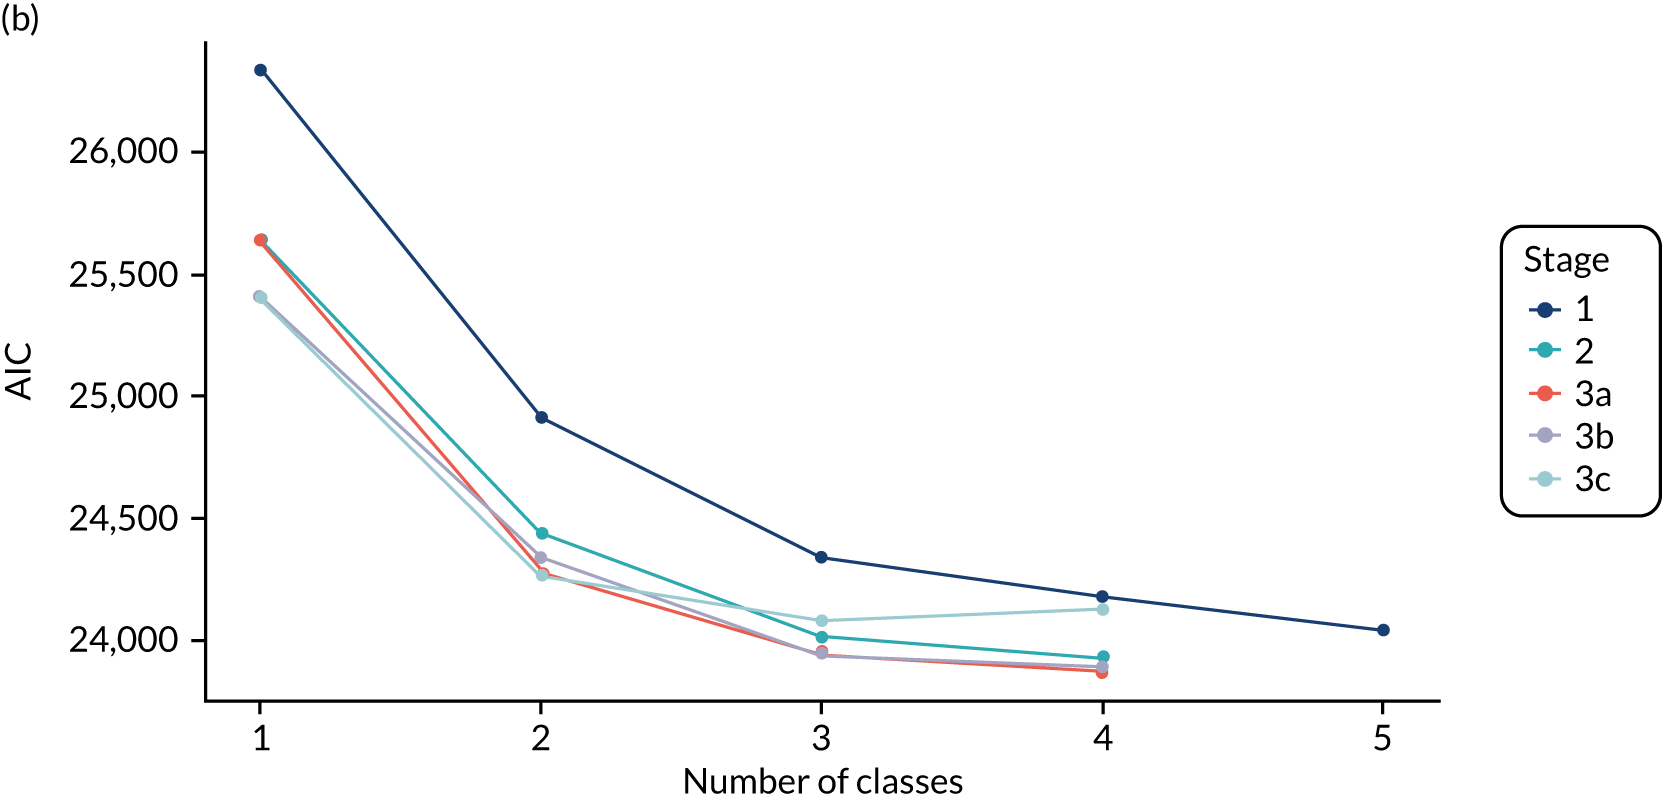
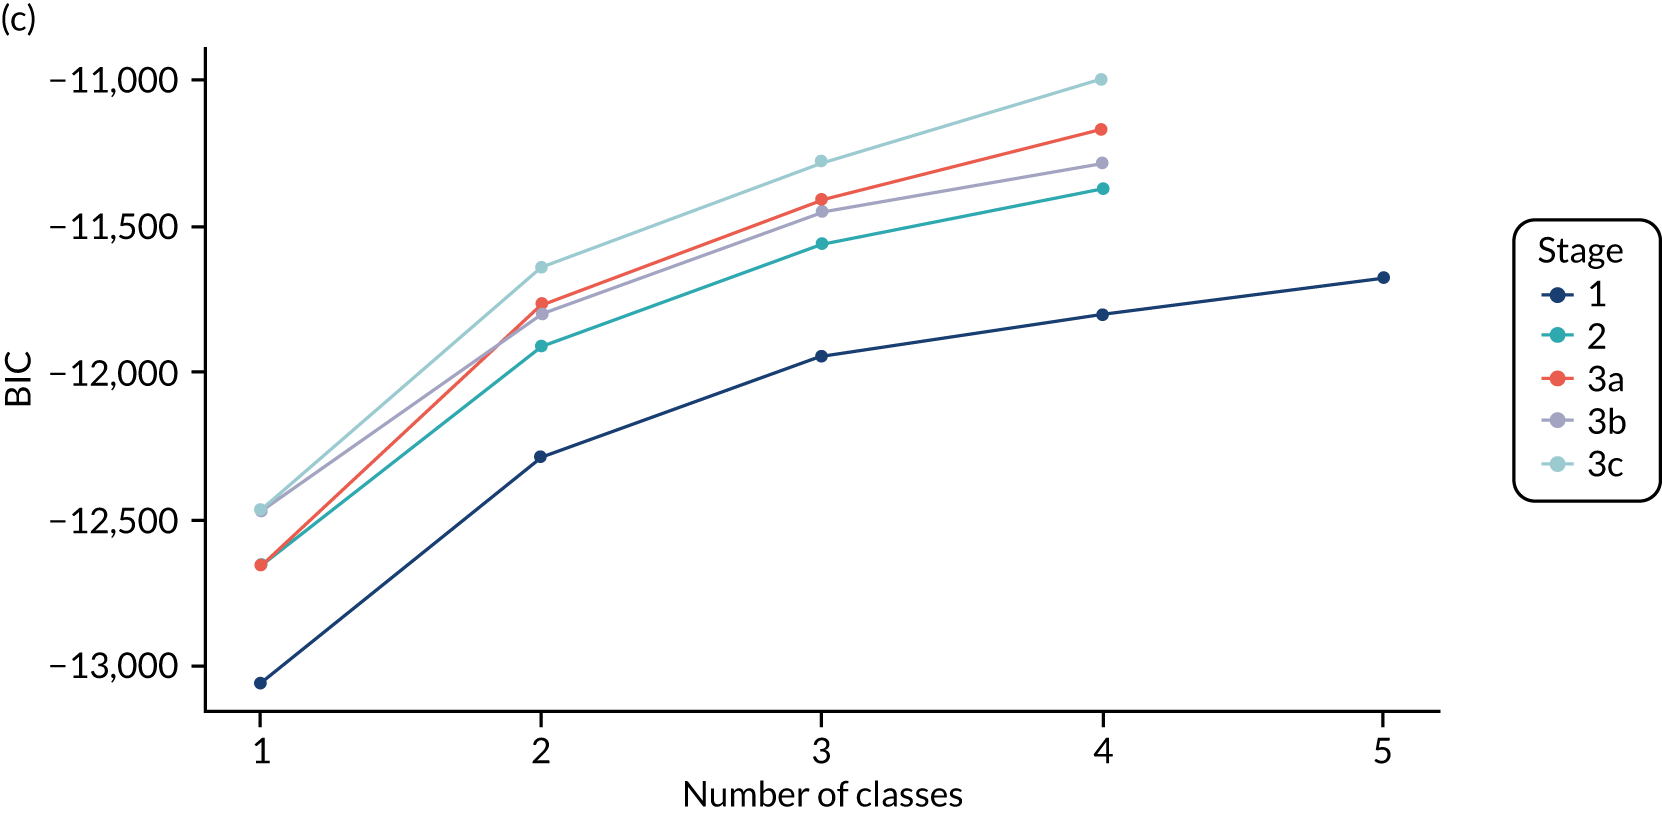
With the exception of the stage 3c model, the information criteria continued to decrease as the number of classes increased. There was negligible improvement after three classes and the BIC for the stage 3c model increased. Fit statistics were close for stages 2–3c and so we examined the three-class model for all of these stages in more detail.
Figure 34 shows the distribution of each indicator by class for each of the candidate models, assigning individuals to their modal class (i.e. the class for which they had the highest posterior class probability). The results are very similar across the models. The most notable difference is for values of IL-6 in class 3, which are more dispersed in the models and allow for the variance to differ across the classes (i.e. stages 3a and 3c).
FIGURE 34.
Box plot showing distribution of indicators by class for candidate models, assigning to modal class, in the LeoPARDS trial. 16 The box shows the 25th, 50th and 75th percentiles, the whiskers show the extent of data within 1.5 × IQR and the dots show data points beyond these limits. P/F, PaO2/FiO2.
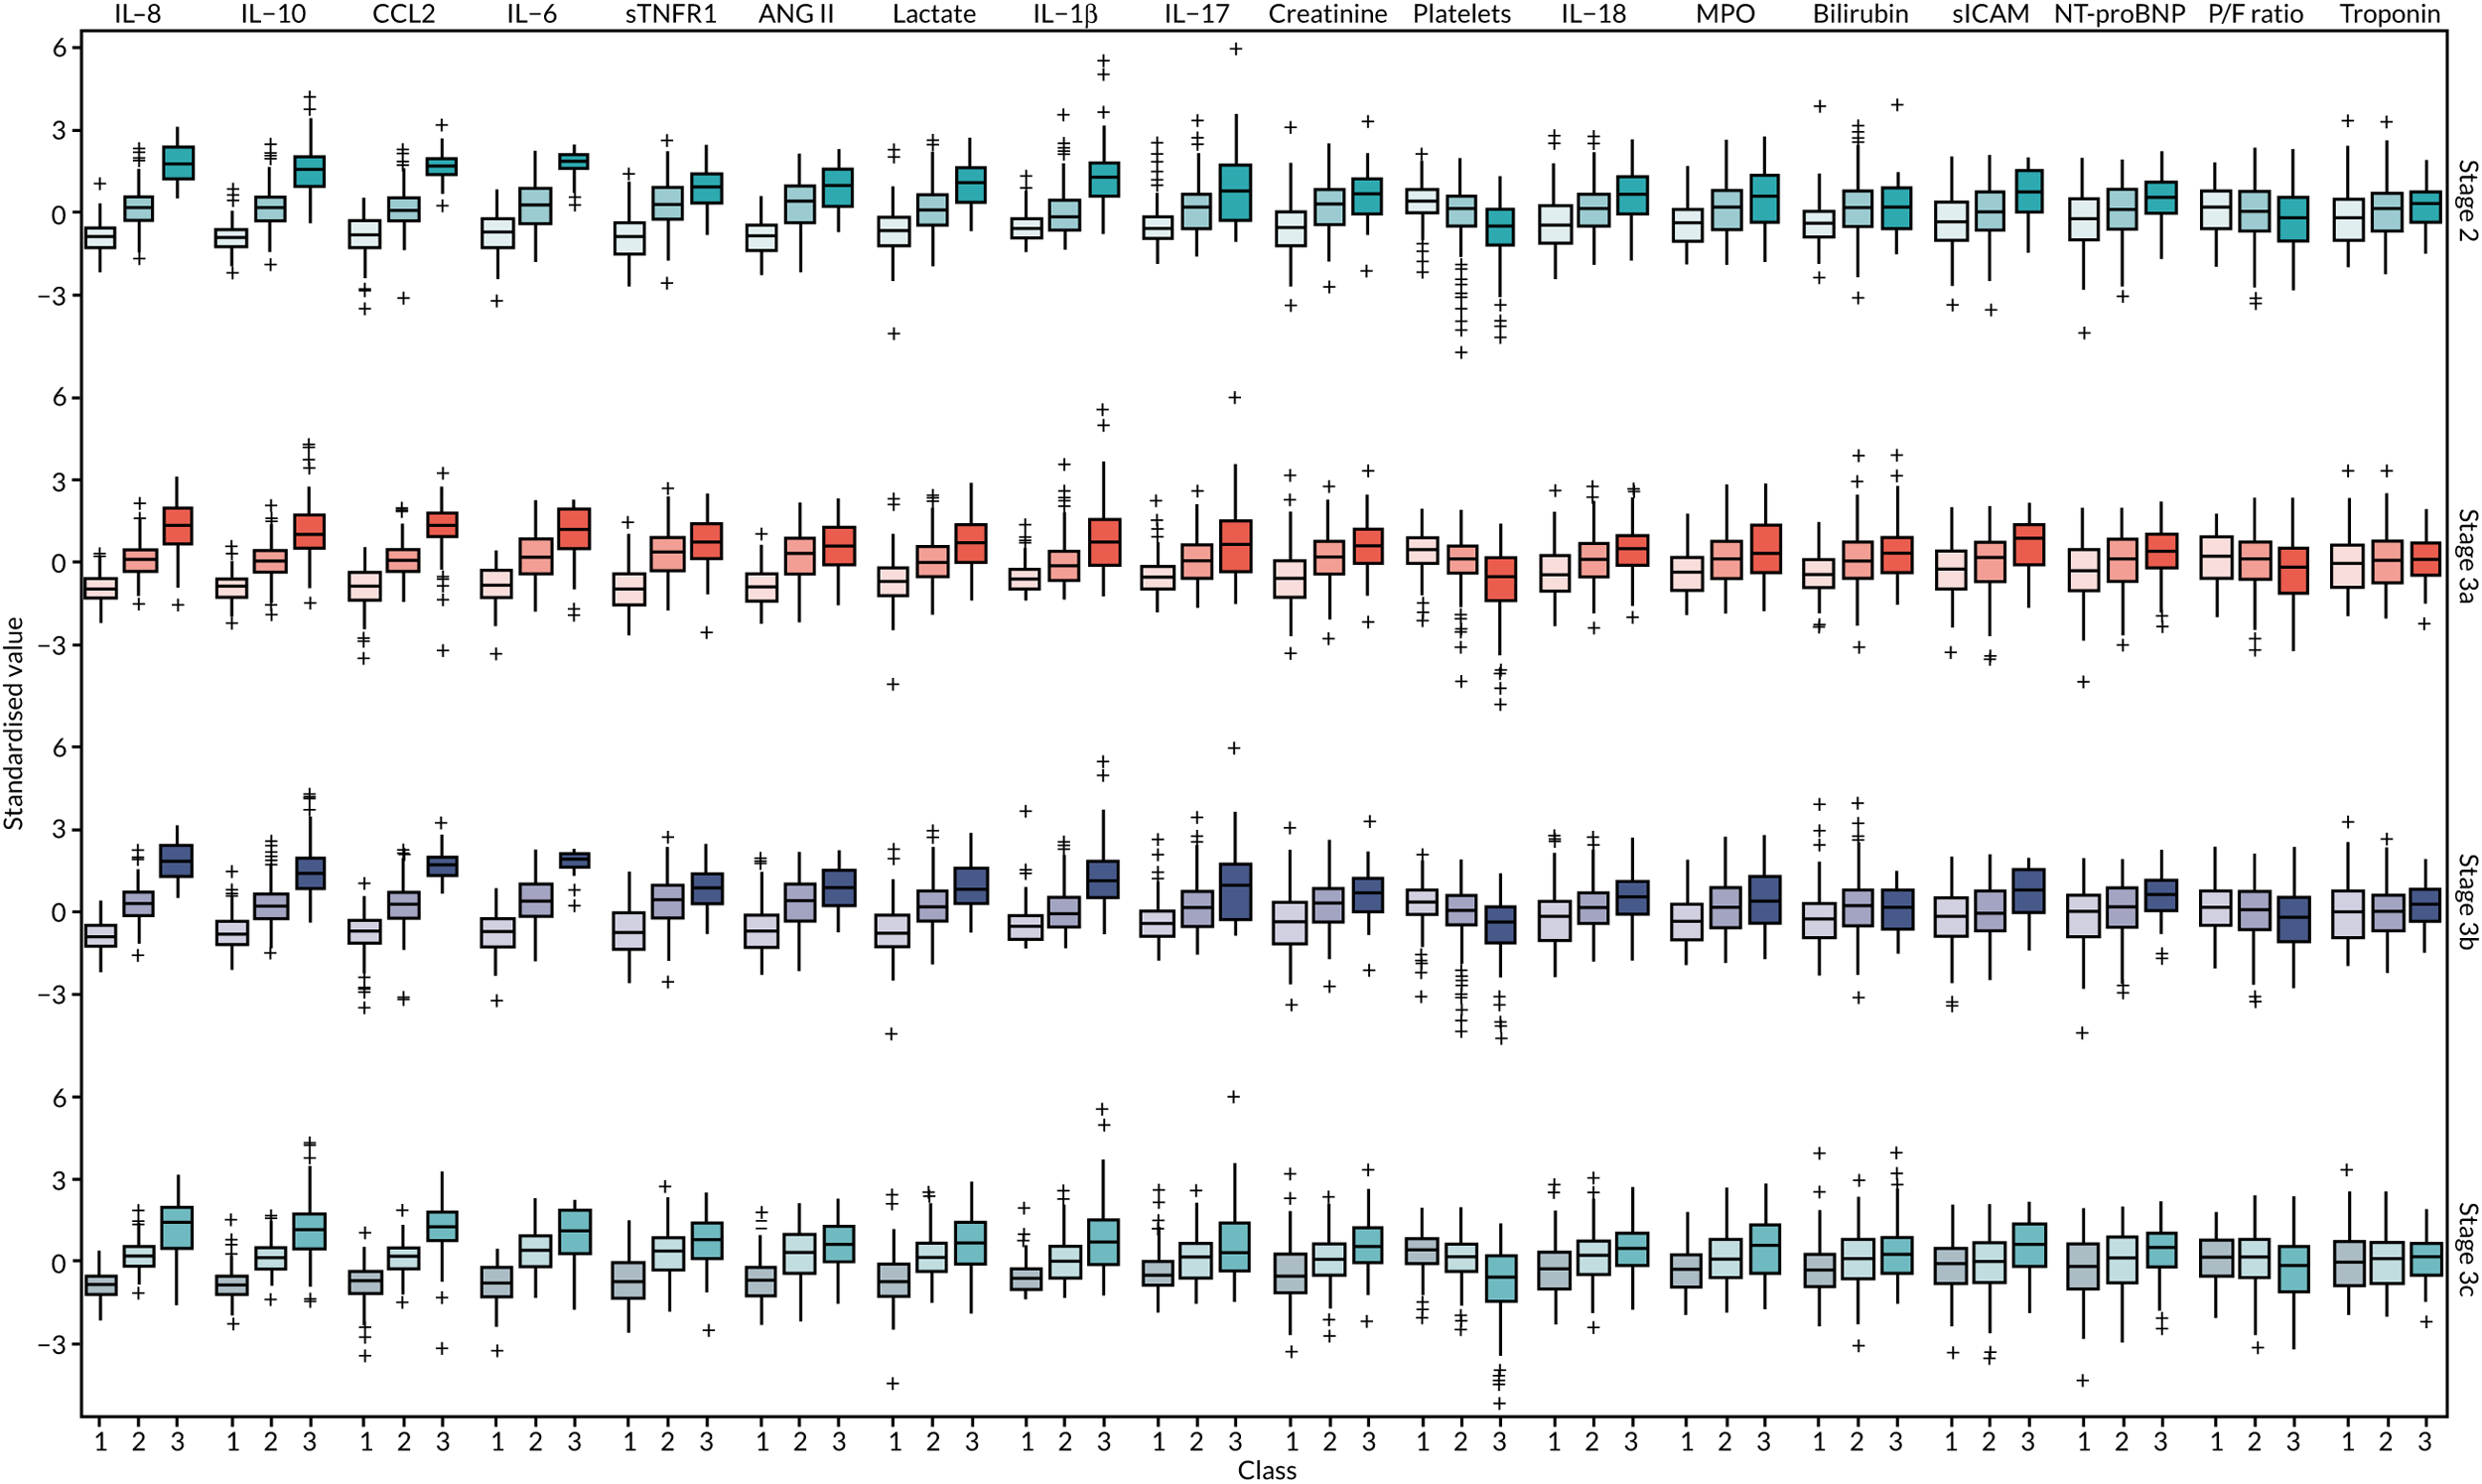
Figures 44–47 show separation plots for each of the candidate models. These show the distribution of each indicators, with one line representing an individual, coloured in accordance with the modal class. They show how well separated the classes are for each indicator. For stages 3a and 3c there are a few low biomarker values that belong to subjects in class 3.
In summary, there are minimal difference in indicator distribution. Models 3a and 3c show some indication of poor separation, and model 2 may be of insufficient complexity, given what is known about the correlations between the indicators. Therefore, model 3b was selected.
Analysis by modal class: the LeoPARDS trial
The baseline clinical and demographic characteristics by classes are shown in Table 12. The final model assigned 191 individuals to class 1, 247 individuals to class 2 and 55 individuals to class 3. As standardised values can be difficult to interpret, the median and IQR for each indicator on the original scale are shown in Table 13 for individuals assigned to each class, based on posterior class probability. The classes in the final model will be referred to as subphenotype 1 (i.e. class 1), subphenotype 2 (i.e. class 2) and subphenotype 3 (i.e. class 3) from hereon in the manuscript.
Survival varied by subphenotype (p = 0.001). In particular, survival was lower in subphenotype 3 (23/55, 41.8%) than in the other subphenotypes [subphenotype 1, 132/189 (69.8%); subphenotype 2, 155/246 (63.0%)]. Similar results were seen for survival to 28 days (see Table 14). The mean daily SOFA score also increased with subphenotype, with score almost twice as high in subphenotype 3 than it was in subphenotype 1.
There was no evidence that treatment effects varied by subphenotype for any of the outcomes of the LeoPARDS trial. 16 Survival was lower in the levosimendan group for all classes (although the difference was not statistically significant in any subphenotype), with no apparent trend across the subphenotypes (see Figure 31). Mean daily SOFA score was higher in the levosimendan group than in the placebo group in subphenotype 1 (RD 0.84, 95% CI 0.02 to 1.65) and in subphenotype 2 (RD 0.88, 95% CI –0.08 to 1.83) (see Figure 32). There was no evidence of treatment difference in subphenotype 3 (RD –0.14, 95% CI –2.55 to 2.28). However, the differences in treatment effect comparing classes were not statistically significant.
A multinomial logit model with IL-6, IL-8, IL-10 and CCL2 as predictors gave a sensitivity of around 0.9 and a specificity of ≥ 0.9 for all subphenotypes (Figure 35). In particular, for subphenotype 3, which is perhaps of most interest for the purposes of identifying a trial population, the specificity was 0.98. The model coefficients are shown in Table 16. The sensitivity analysis gave very similar results, with 94% agreement in subphenotype assignment for the LeoPARDS trial16 (see Table 24).
FIGURE 35.
Class-specific (a) sensitivity, (b) specificity and (c) c-statistics for multinomial logit models with increasing number of predictors in the LeoPARDS trial. 16
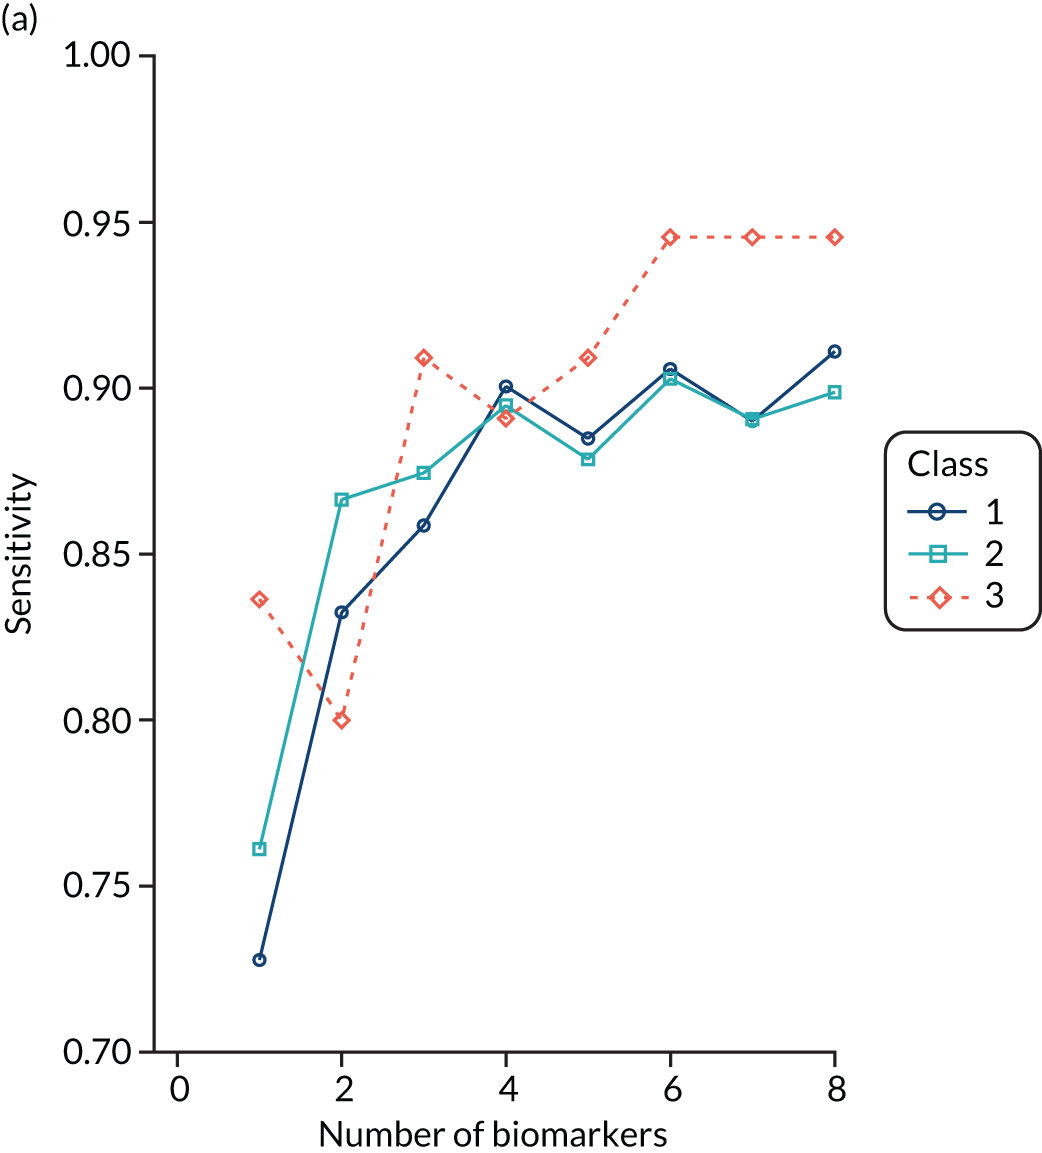
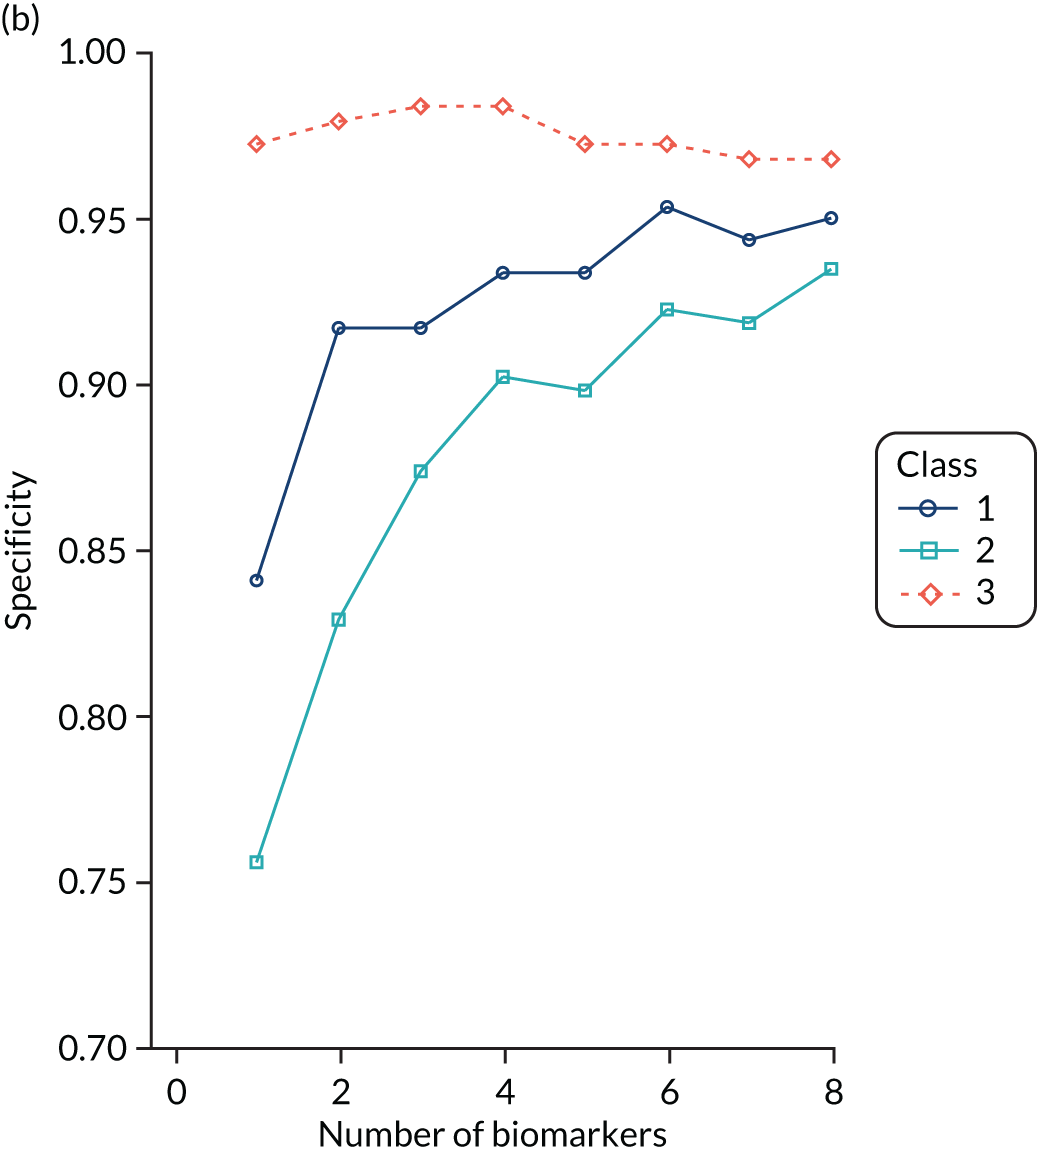
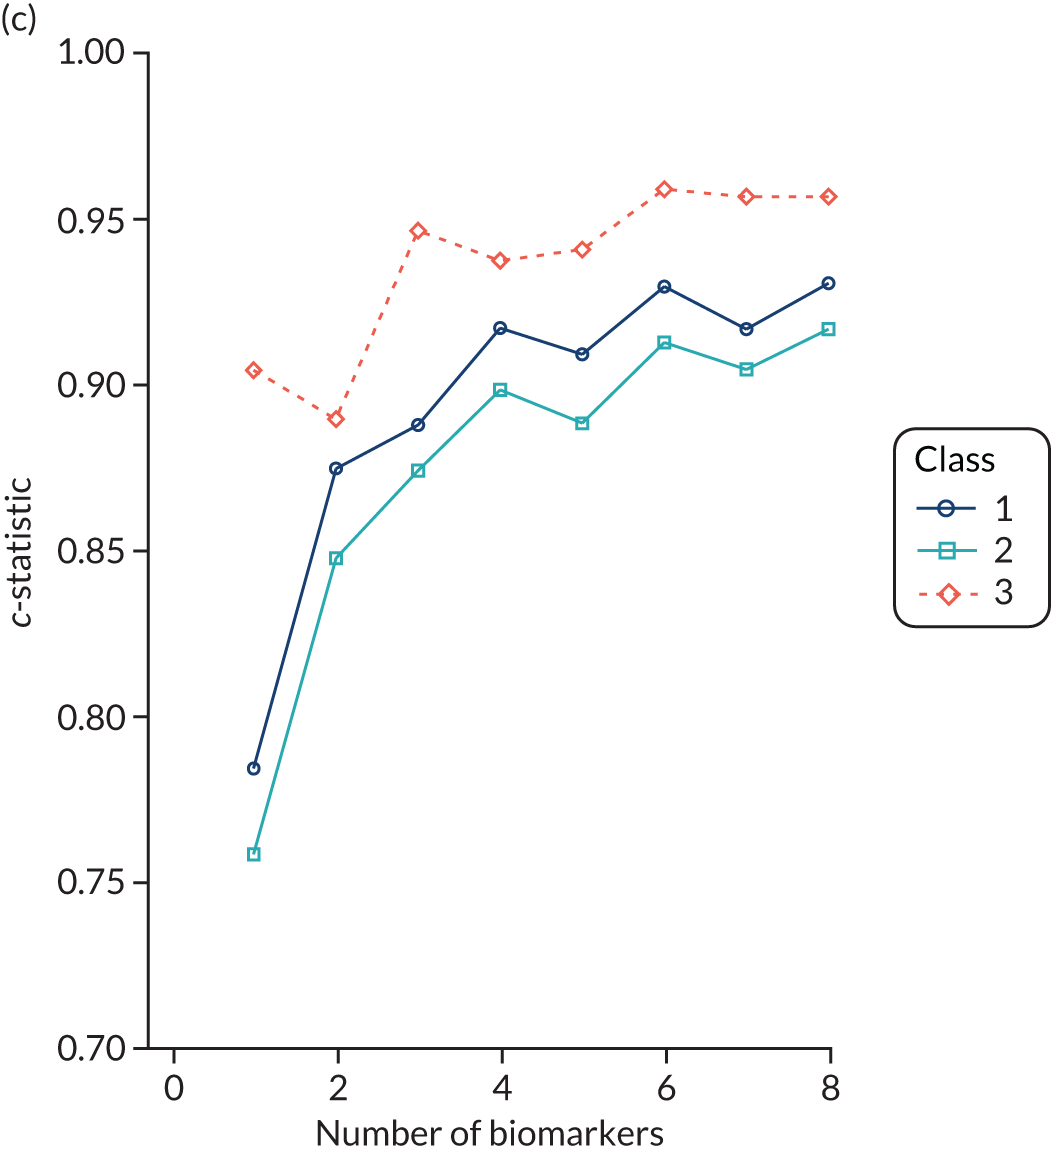
| Predictor | Class 2 vs. class 1 | SE | Class 3 vs. class 1 | SE |
|---|---|---|---|---|
| Log-OR for a 1 SD increase | Log-OR for a 1 SD increase | |||
| IL-6 | 1.404 | 0.356 | 3.803 | 0.771 |
| IL-8 | 2.477 | 0.472 | 4.09 | 0.735 |
| IL-10 | 1.942 | 0.346 | 2.514 | 0.639 |
| CCL2 | 1.314 | 0.328 | 3.976 | 0.853 |
| Baseline odds | 2.236 | 0.301 | –8.264 | 1.952 |
Latent class analysis: the HARP-2 trial
Parts of this section, which presents data on ARDS subphenotypes from the HARP-2 trial,17 includes information based on our previous publication by Calfee and colleagues. 31
Population characteristics
Baseline population characteristics of patients enrolled in the HARP-2 trial,17 including biomarker levels, are fully described in the original publication17 (see also Table 31). Pneumonia was the most common risk factor for ARDS (55%). The mean tidal volume was 8.1 ml per kilogram predicted body weight. Overall, median number of ventilator-free days was 13 days and 28-day mortality was 24.5%.
Two-class model optimally fits the HARP-2 trial population
For performing LCA using the HARP-2 trial17 data, we used fewer clinical and biomarker variables (14 vs. up to 37 variables in previous reports). Class-defining variables used in LCA are reported in Table 32. The two-class model was a better fit for the population than a one-class model (Vuong–Lo–Mendell–Rubin likelihood ratio test p < 0.0001). Additional classes did not improve model fit (Table 17), and class 3 in the three-class model had only 40 patients. The BIC decreased as the number of classes in the model increased, indicating improved model fit with additional classes. Entropy in all models was ≥ 0.75, indicating adequate class separation. Consistent with previous reports,23,42 more patients were assigned to subphenotype 1 [class 1, n = 354 (65%)] than to subphenotype 2 [class 2, n = 186 (35%)]. Average latent class probabilities were 0.93 for class 1 and 0.92 for class 2.
| Number of classes | BIC | Entropy | Number of classes | p-value | |||
|---|---|---|---|---|---|---|---|
| 1 | 2 | 3 | 4 | ||||
| 1 | 16,532 | 540 | |||||
| 2 | 16,188 | 0.75 | 354 | 186 | < 0.0001 | ||
| 3 | 16,147 | 0.82 | 339 | 161 | 40 | 0.08 | |
| 4 | 16,104 | 0.82 | 262 | 128 | 109 | 41 | 0.07 |
Comparison with prior acute respiratory distress syndrome subphenotypes
In our prior studies of ARDS subphenotypes,23 a three-variable model [comprising IL-6, sTNFR1 and vasopressor use (yes/no)] accurately classified patients into subphenotype 1 or 2. We used this model to classify the HARP-2 trial17 patients and found that the AUROC curve for classification was 0.97, compared with classification by latent class models. These findings suggest that the ARDS subphenotypes identified in this analysis are similar to those in our prior studies.
Comparison of phenotypic features and outcomes between subphenotypes
Subphenotype 2 had clinical and biological features similar to those found in our prior studies and consistent with a hyperinflammatory phenotype. Specifically, when compared with subphenotype 1, patients in subphenotype 2 had higher values of sTNFR1 and IL-6, lower platelet counts (Figure 36) and more vasopressor use (p < 0.001). Age and sex were similar across the subphenotypes. Although the distribution of direct and indirect ARDS risk factors was significantly different across the two subphenotypes (p < 0.0001), the most common ARDS risk factors of sepsis, pneumonia and aspiration were highly prevalent among both groups, as in our prior work. 23 In addition, subphenotype 2 patients had fewer ventilator-free days (median of 2 vs. 18 days; p < 0.0001), fewer non-pulmonary organ failure-free days (median of 15 vs. 27 days; p < 0.0001) and higher 28-day mortality (39% vs. 17%; p < 0.0001) than subphenotype 1 patients (Table 18).
FIGURE 36.
Differences in standardised values of each continuous variable by subphenotype in the HARP-2 trial. 17 Standardised means by class. Variables with maximum positive separation are shown on the left (i.e. hyperinflammatory subphenotype higher than hypoinflammatory subphenotype) and variables with maximum negative separation on the right (i.e. hyperinflammatory subphenotype lower than hypoinflammatory subphenotype). The y-axis represents standardised variable values. A value of +1 for the standardised variable signifies that the mean value for a given subphenotype was 1 SD higher than the mean value in the cohort as a whole. The mean values are joined by lines to facilitate display of subphenotype profiles. P/F, PaO2/FiO2.
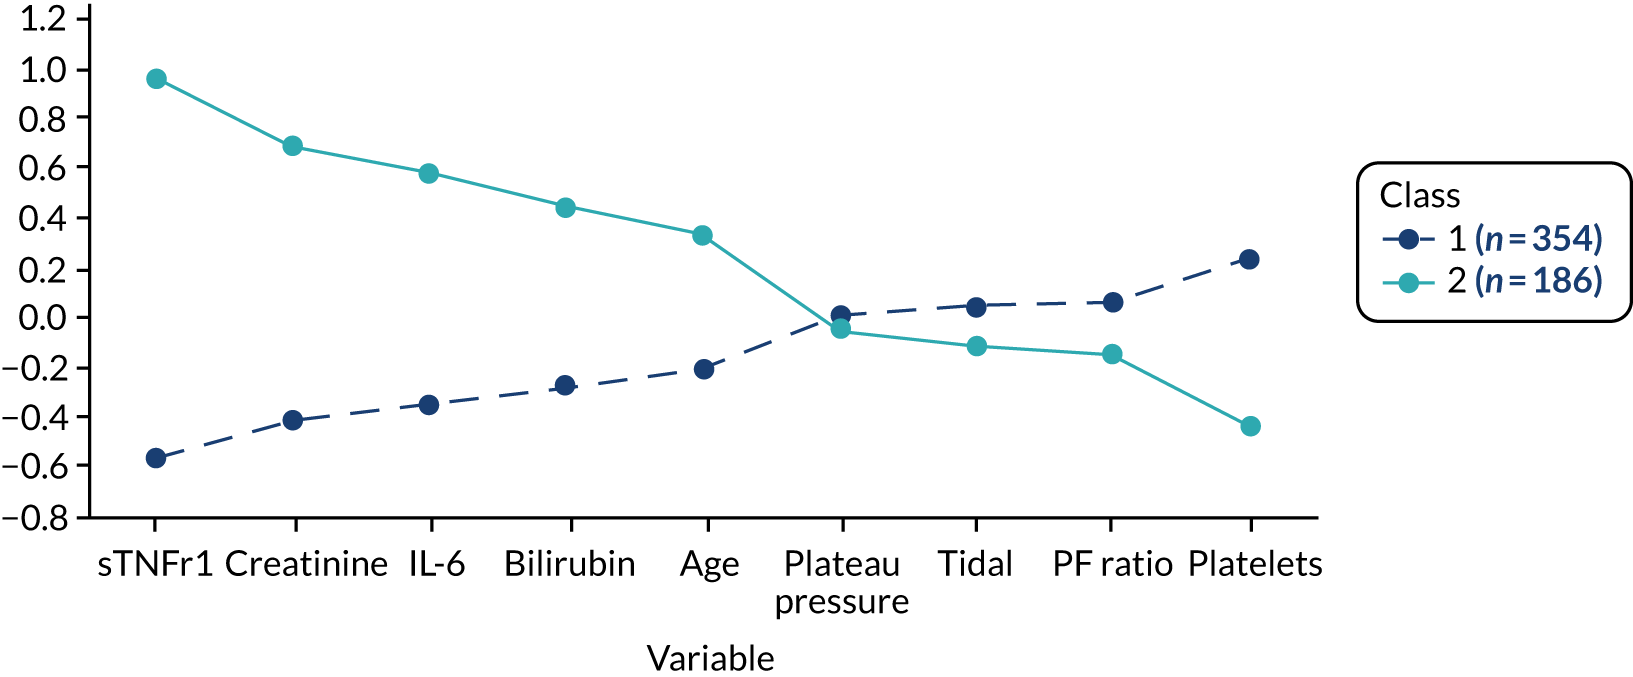
| Outcome | Class | p-value | |
|---|---|---|---|
| 1 (n = 354) | 2 (n = 186) | ||
| 28-day mortality, n (%) | 59 (17) | 73 (3) | < 0.0001 |
| 90-day mortality, n (%) | 78 (22) | 87 (46) | < 0.0001 |
| Ventilator-free days, median (25–75%) | 2 (0–17) | 18 (0–23) | < 0.0001 |
| Non-pulmonary organ failure-free days, median (25–75%) | 27 (21–28) | 15 (0–25) | < 0.0001 |
Survival benefit observed with simvastatin in subphenotype 2
The original trial found no difference in 28-day survival curves between placebo and simvastatin (p = 0.20). The subphenotype 2 had a better 28-day survival (p < 0.0001) (Figure 37) and better 90-day survival (p < 0.0001) (Figure 38) for overall comparison (p = 0.03 for subphenotype 2 simvastatin vs. placebo and p = 0.21 with Bonferroni correction).
FIGURE 37.
Kaplan–Meier survival curves. (a) 28-day patient survival; and (b) 90-day patient survival in HARP-2 trial,17 stratified by subphenotype and treatment (simvastatin vs. placebo).
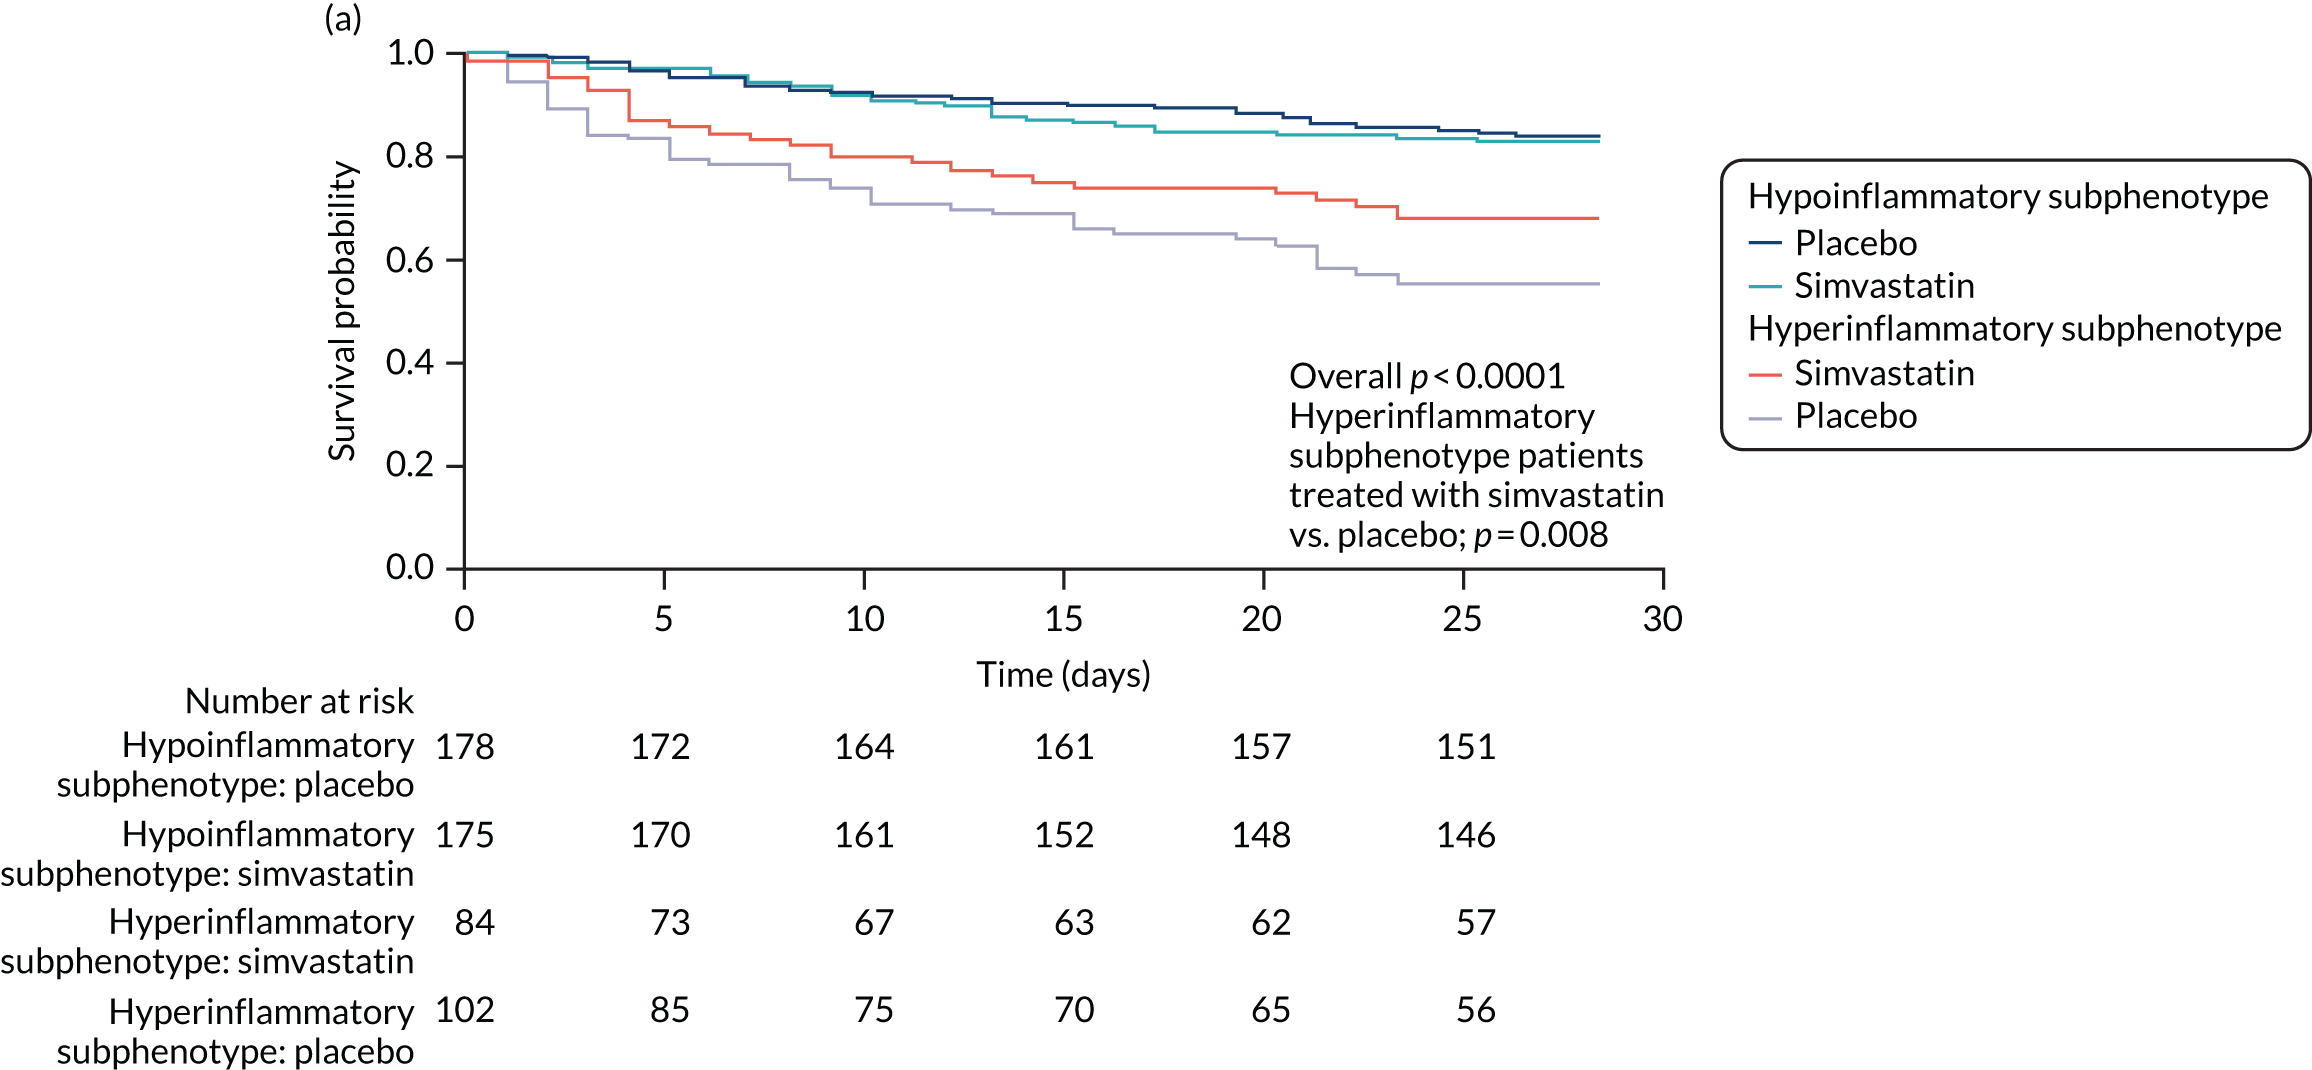
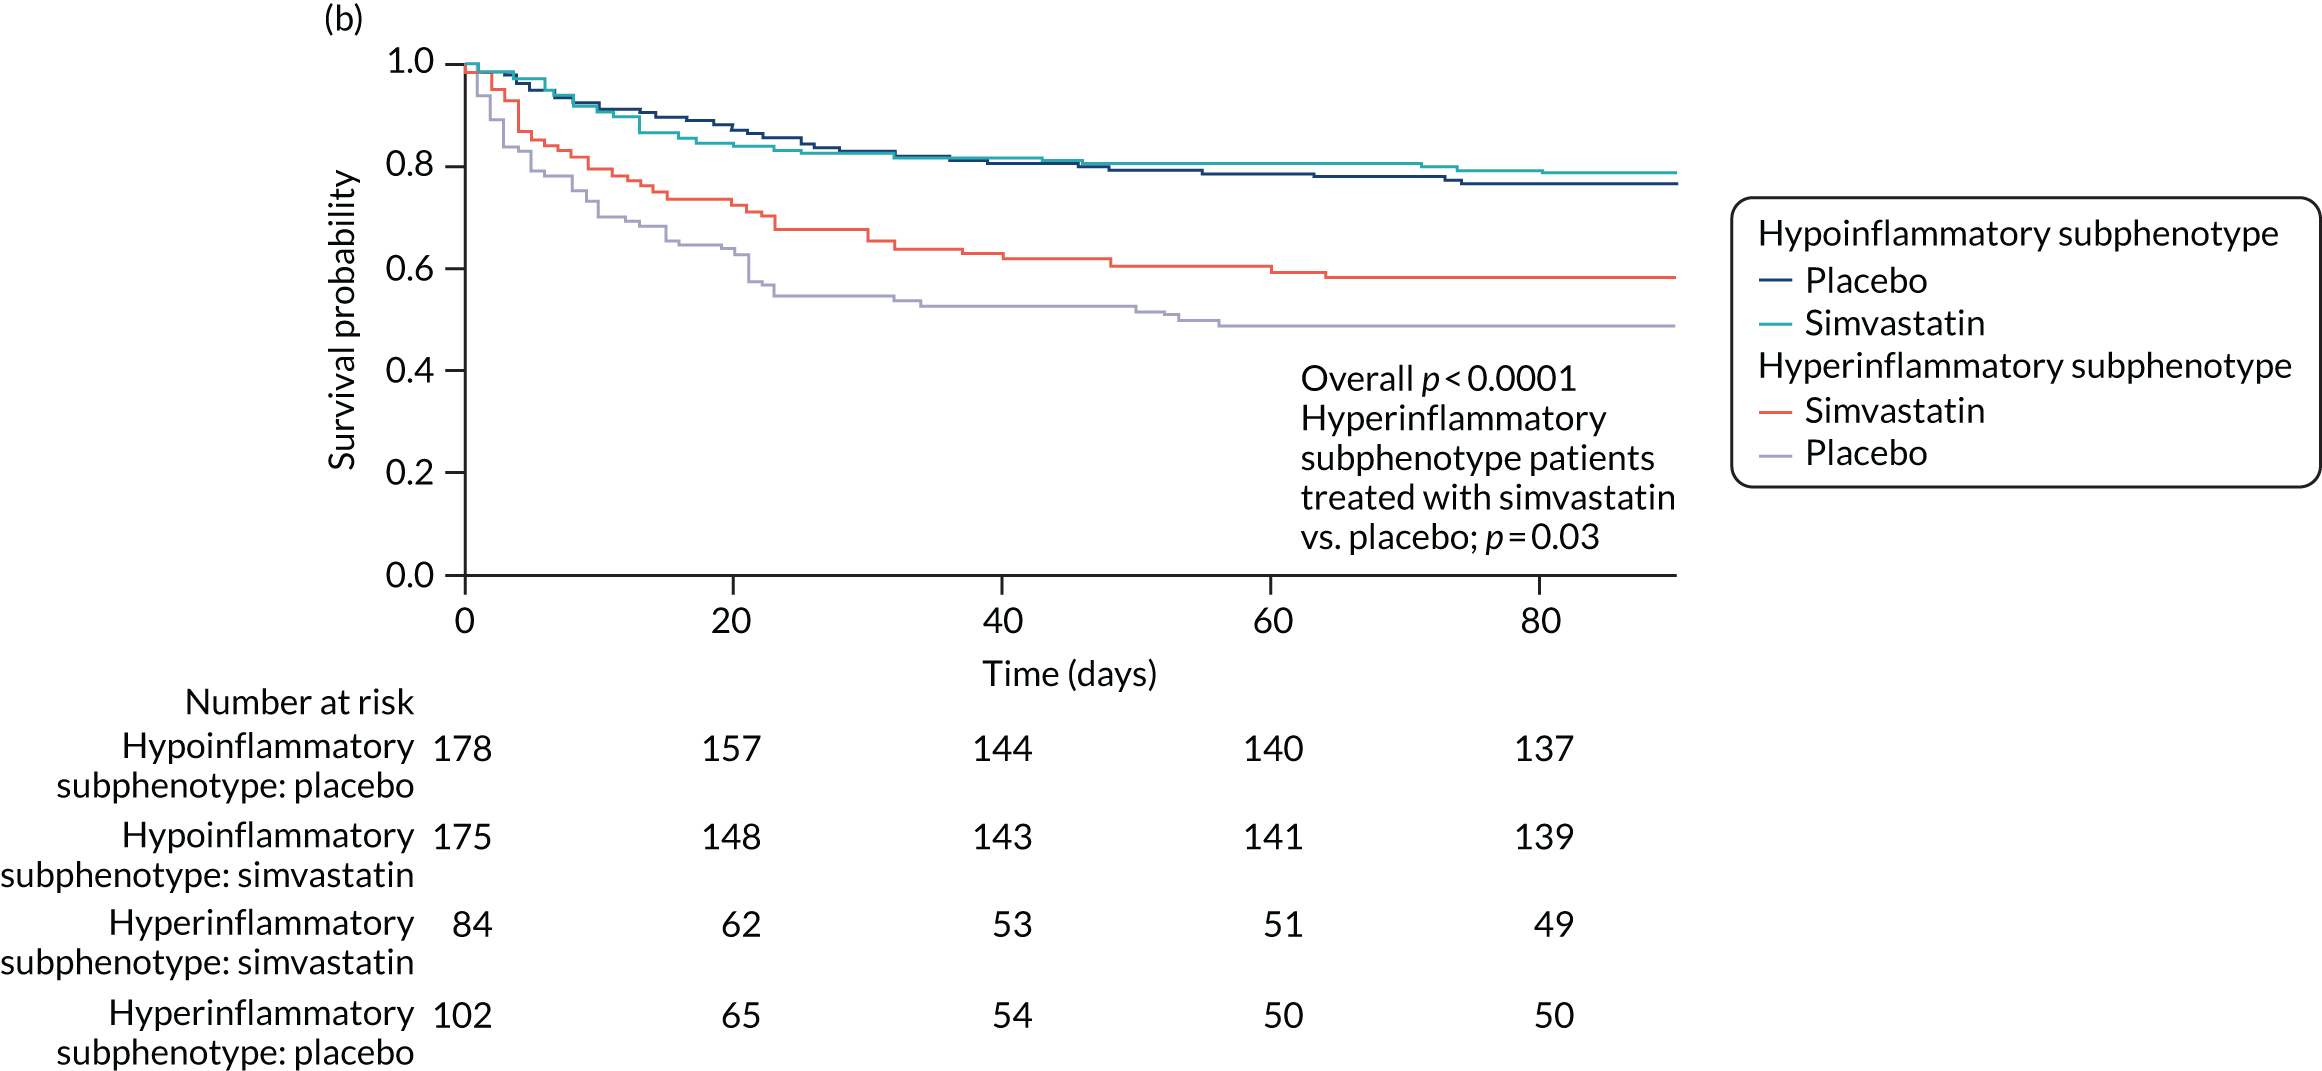
FIGURE 38.
Survival curves stratified by mean APACHE II score. Product-limit survival estimates. (a) 28-day survival; and (b) 90-day patient survival in the HARP-2 trial,17 stratified by ARDS subphenotype and treatment (simvastatin vs. placebo).
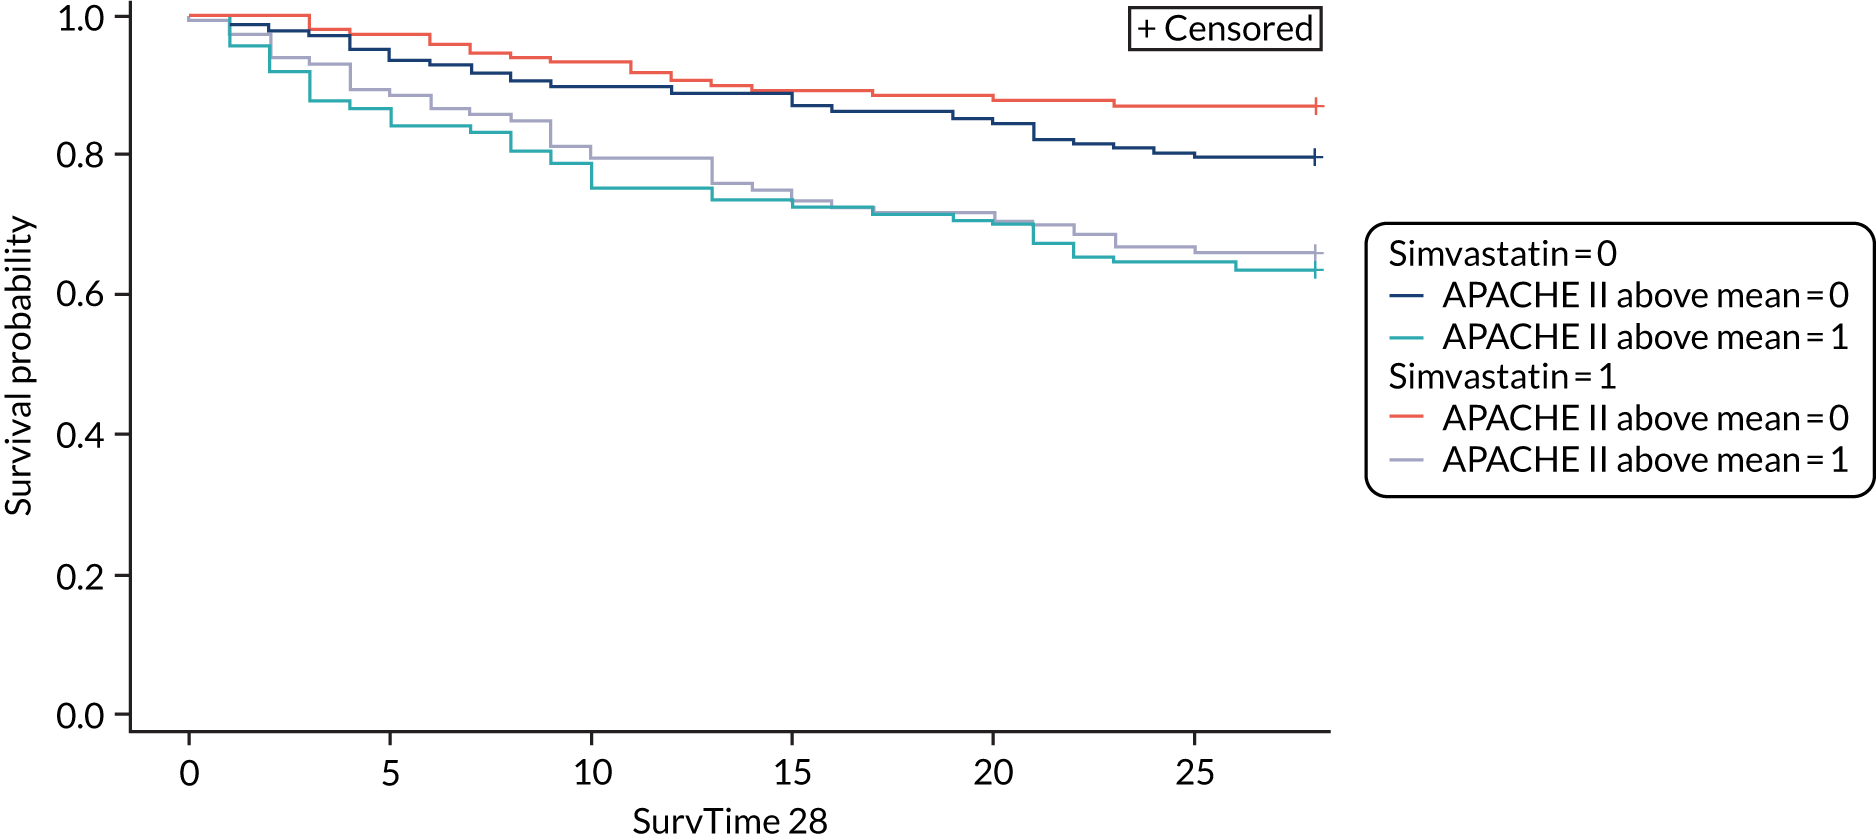
In contrast to the curves stratified by subphenotype and treatment, survival curves stratified by ARDS severity (i.e. PaO2/FiO2 ratio) and treatment were not significantly different (p = 0.12). Survival curves stratified by APACHE II score (dichotomised at the median) and treatment revealed differences in survival by APACHE II score, but no differential effect of treatment in either the high- or low-APACHE II group (see Figure 38).
Mortality at 28 days was 13% lower in subphenotype 2 patients treated with simvastatin than in subphenotype 2 patients treated with placebo (32% vs. 45%). In contrast, 28-day mortality was similar in patients in subphenotype 1 regardless of treatment assignment (16% vs. 17%). The interaction between treatment and subphenotype for mortality was not statistically significant (p = 0.14).
In the original trial, time to unassisted breathing did not differ significantly between simvastatin- and placebo-treated patients, although a trend favouring simvastatin was observed (hazard ratio 0.84; p = 0.09). When stratified by subphenotype and treatment, time to unassisted breathing differed significantly (p < 0.0001) (Figure 39). However, the difference in the curves between subphenotype 2 patients treated with simvastatin and placebo was not statistically significant (p = 0.10). Among subphenotype 2 patients, median ventilator-free days were numerically higher in the simvastatin-treated patients than in placebo-treated patients (7 days vs. 0 days). This is in contrast to patients in subphenotype 1, among whom the median number of ventilator-free days was the same regardless of treatment (18 days in each). However, the interaction between treatment and subphenotype in regression models was not statistically significant (p = 0.15).
Chapter 4 Discussion
Heterogeneity of treatment effect
Main findings
We assessed whether or not HTE could contribute to the results in three recent ICU RCTs, using four different multivariable baseline risk of death models, which included well-established risk factors for acute mortality for sepsis and ARDS as covariates. There was considerable within-trial variation in the baseline risk of death in all three RCTs. We did not find consistent evidence for HTE as an explanation for the original trial results in all three ICU RCTs we assessed, as tests for HTE were inconclusive. We observed that detection of HTE in RCTs may be influenced by the baseline risk model specification, as illustrated by differences in HTE effects seen in the LeoPARDS trial. 16 The lack of evidence of relative HTE may be in part due to low power to detect interaction effects, particularly for the HARP-2 trial,17 in which mortality was lower among those allocated to simvastatin in all risk quartiles except the highest. Parts of this section, which presents data on ARDS subphenotypes from the HARP-2 trial,17 includes information based on our previous publication by Calfee and colleagues. 31
Explanation of key findings
There are a number of possible reasons why we did not observe HTE consistently in our analyses. All three trials we assessed have many features of explanatory trials,60 which by their design limit HTE in comparison with pragmatic trials. Therefore, demonstrable HTE is less likely in these trials, although its evaluation remains important. Our findings may be true in that HTE may be less marked in sepsis and ARDS, in which many ‘minimal causes’ of mortality may be contributory,61 than in illnesses such as retroviral disease. 62 It could be that the effects of the treatments we assessed are small and of limited variability, resulting in minimal HTE. In other words, when HTE is assessed for an intervention using data from a single trial we are unlikely to detect it unless HTE effects are large. This generates an argument to assess HTE using trials of the similar treatment–condition combination or of the same condition, and a broader group of treatments with similar enough mechanism of treatment effect or to consider intervention-specific multivariable models.
Comparison with published literature
A key comparison to consider is the contrasting results with RCT simulations by Iwashyna and colleagues. 24 Their simulations assumed that the trial participants’ odds of 30-day mortality will be influenced by severity of acute respiratory failure, comorbid conditions, the extent to which the treatment reduces mortality from the primary illness and the treatment’s fatal adverse effect rates. Although we used 28-day mortality for our primary analysis, we considered baseline risk as a function of acute illness severity using the total APACHE II score. The data in our trials do not follow the patterns described by Iwashyna and colleagues,24 as we did not have constant relative treatment effects or constant harms, and mortality patterns differed from those predicted by their simulation model. Recently, Semler and colleagues63 reported a pragmatic, cluster-randomised, multiple-crossover trial of saline compared with balance crystalloids in critically ill patients, and found no difference in the primary outcome of major adverse kidney events within 30 days, but a positive result in the composite secondary outcomes of death from any cause, new renal replacement therapy and persistent renal dysfunction. The authors then reported presence of HTE for the primary trial outcome, when assessed with a multivariable model specifically calibrated for the primary outcome. 64 Therefore, it is plausible that the closer a trial is to showing a difference, the greater the chance of finding HTE with multivariable models, which might also explain our findings of a lack of HTE.
Strengths and weakness
We explored HTE in sepsis and ARDS for four different treatments and using four different multivariable models. The primary baseline risk measure, APACHE II score, is an established, validated predictor of mortality in this population. Three variations on this measure were investigated to check the consistency of the results, along with several sensitivity analyses. We used a composite risk score (APACHE II) for its superior performance for baseline risk estimation, as highlighted by Kent and colleagues18 and as recommended for future studies of HTE assessment. 24 Furthermore, lead time bias may influence the impact that APACHE II score might have on the outcome. This may be less relevant here, as all the data sets were from RCTs. None of the RCTs included in this study had 28-day mortality as the primary outcome. Therefore, it is possible that we were underpowered to detect HTE, if it existed. The primary outcomes were not suitable for HTE analysis because they were continuous rather than binary and without an appropriate baseline measure, although the existing HTE framework could be adapted for some continuous outcomes, such as change from baseline organ dysfunction. Similarly, there may have been insufficient numbers to demonstrate non-linear risk and HTE effects that we investigated as sensitivity analyses.
Latent class analysis
Main findings in the VANISH trial and the LeoPARDS trial
The VANISH trial15 two-class (subphenotype) model best represented the data and generated two sepsis subphenotypes with a split of 90 (subphenotype 1) and 86 (subphenotype 2) individuals. The subphenotype 2 individuals had greater inflammation, with higher concentrations of IL-1β, IL-6, IL-8, IL-10, MPO, ANG II, troponin, NT-proBNP and sTNFR1. The class 2 individuals also had reduced survival and fewer renal failure-free days. There were no treatment effect differences between the two classes for corticosteroids or vasopressin.
The LeoPARDS trial16 three-class (subphenotype) model best represented the data and generated three sepsis subphenotypes with a split of 191 individuals to class 1, 247 individuals to class 2 and 55 individuals to class 3. The subphenotype 3 individuals had greatest inflammation, with higher concentrations of IL-1β, IL-6, IL-8, IL-10, IL-17, ANG II, troponin, NT-proBNP, CCL2 and sTNFR1. The subphenotype 3 individuals also had the highest SOFA score and reduced survival at 90 days. There were no treatment effect differences between classes for levosimendan, albeit survival was lower in the levosimendan group for all classes. A multinomial logit model with IL-6, IL-8, IL-10 and CCL2 as predictors gave a sensitivity of around 0.9 and a specificity of ≥ 0.9 for all classes. The differences in number of classes between the two trials may be related to differences in eligibility criteria, differences in sample sizes and the timing of measurements.
Comparison with published literature
Sepsis phenotypes can be categorised into clinical phenotypes that are identified using clinical and commonly acquired laboratory data (such as leucocyte count and C-reactive protein) and into molecular phenotypes that are identified using leucocyte gene expression data. This approach to classify phenotypes into clinical phenotype and molecular phenotypes has been reported in asthma. 65,66 Studies to date have identified four37,38 to six39 sepsis clinical phenotypes and two21,67 to four20 sepsis molecular phenotypes.
Using clinical data from the PROWESS Shock RCT,68 Gårdlund and colleagues39 reported six different sepsis clinical phenotypes using LCA, which were (1) uncomplicated septic shock, (2) pneumonia with ARDS, (3) postoperative abdominal shock, (4) severe septic shock, (5) pneumonia with ARDS and multiple organ dysfunction syndrome and (6) late septic shock. They did not report any biomarker data in their LCA to make direct comparisons with our study. Knox and colleagues38 reported four phenotypes using self-organising maps and grouped them into (1) shock with elevated creatinine; (2) minimal multiorgan dysfunction syndrome; (3) shock with hypoxaemia and altered mental status; and (4) hepatic disease. Seymour and colleagues37 reported four similar sepsis clinical phenotypes using observational cohort data and referred to them as (1) alpha (i.e. fewest abnormal laboratory test results, least organ dysfunction and lowest mortality), (2) beta (i.e. older patients, high prevalence of chronic illnesses and kidney dysfunction), (3) gamma (greater inflammation and pulmonary dysfunction) and (4) delta (i.e. with liver dysfunction and septic shock). In addition, Seymour and colleagues37 correlated the phenotype data with biomarkers, validated these findings within RCT data and simulated for treatment effect heterogeneity. They neither did a direct interaction test with treatment effect nor used the biomarkers we used in their LCA models. Based on pan-leucocyte gene expression data, Davenport and colleagues21 present two sepsis molecular phenotypes named sepsis response signatures [i.e. sepsis response signature 1 (SRS1) and sepsis response signature 2 (SRS2)], with the SRS1 phenotype being more immunosuppressed and having greater mortality than SRS2. A two-subset model based on neutrophils gene expression was reported by Maslove and colleagues,67 with subset 1 showing evidence of greater inflammation and toll-like receptor signalling. Based on pan-leucocyte gene expression data, Scicluna and colleagues20 reported four sepsis molecular phenotypes and subphenotypes assessment, albeit they do not strictly meet the endotype definition. We cannot provide a direct comparison with these results as we do not use transcriptome data in our LCA. Recently, Antcliffe and colleagues69 tested whether or not SRS1 and SRS2 sepsis molecular phenotypes respond differently to corticosteroids, using the VANISH trial15 data. The authors show that the relatively more immunocompetent phenotype (i.e. SRS2) may be harmed from corticosteroid therapy. In contrast, we did not observe any treatment effect differences between the two sepsis subphenotypes identified when using cytokines and clinical data in the VANISH trial. 15
Strengths and weakness
This study has several strengths. First, the LCA plan was defined prior to knowing the results of biomarker measurements. Second, we used data from two high-quality sepsis trials. 15,16 Last, the subphenotypes assessment followed a systematic plan and the model that best explained the heterogeneity within the trial cohorts was used.
The limitations are that this is a post hoc analysis, albeit with an explicit peer-reviewed hypothesis and an analysis plan that was set up prior to measurement of any biomarker data. We report two subphenotypes from the VANISH trial15 and three from the LeoPARDS trial,16 which is partly driven by the sample size. Not all patients in both trials had biomarker data. Some of the biomarker measurements were outside the measurement range. In addition, because of the nature of latent class models, there is uncertainty as to the similarities between two subphenotypes identified in the VANISH trial15 and the three subphenotypes identified in the LeoPARDS trial,16 although the key biomarkers appear similar between subphenotype 2 in the VANISH trial15 and subphenotype 3 in the LeoPARDS trial. 16
Main findings in the HARP-2 trial
The HARP-2 trial17 analysis shows two novel findings. First, two distinct ARDS subphenotypes with features similar to those previously reported were identified for the first time in a non-US patient population. Importantly, this was achieved using a different and much smaller set of clinical and biomarker data than in previous studies. Second, and more importantly, these two subphenotypes of ARDS responded differently to randomly assigned simvastatin, with evidence of improved survival at both 28 and 90 days uniquely among patients with a ‘hyperinflammatory’ subphenotype of ARDS. The finding that patients with a hyperinflammatory ARDS subphenotype preferentially responded to randomly assigned simvastatin treatment has biological plausibility based on the presumed mechanism of action of statins in ARDS. Statins reduce lung inflammation and injury in both animal models of ARDS and pre-clinical human experimental studies,70 and also have endothelium-stabilising properties. Therefore, patients with a higher degree of systemic inflammation, such as those in the hyperinflammatory subphenotype, would seem to be most likely to respond to this therapy.
Comparison with published acute respiratory distress syndrome literature
To date, there have been five RCT cohort reanalyses, including HARP-2 trial analysis23,31,40–42 and one observational cohort study. 22 All RCT reanalyses were conducted using LCA. 36 All RCTs show two phenotypes: (1) a non-inflammatory subphenotype that accounts for two-thirds of the trial population and (2) a less prevalent hyperinflammatory subphenotype that accounts for the remaining one-third of the population. The hyperinflammatory phenotype is associated with higher concentrations of inflammatory biomarkers (i.e. IL-6, IL-8 and sTNFR1), more acidosis and greater prevalence of shock, as suggested by vasopressor requirements. 36 Mortality is significantly higher among patients with the hyperinflammatory subphenotype than among those with the non-inflammatory phenotype. The observational cohort study also highlights a two-subphenotype model (i.e. equal prevalence of reactive and uninflamed populations). 36 When leucocyte gene expression was compared between the reactive and uninflamed subphenotypes in a cohort of 210 patients with sepsis and ARDS, 128 patients had a reactive phenotype and 82 patients had an uninflamed phenotype, with significant differences in 3332 of the 11,443 (29%) transcripts between the phenotypes. These findings highlight the need for a prospective study to validate the two ARDS subphenotypes using key discriminant markers. 71 These findings indicate that these subphenotypes are consistent across geographical sites and are robust to variations in specific data collected, enhancing the generalisability of previous studies.
Strengths and weakness
The HARP-2 trial17 analysis is a post hoc analysis with attendant limitations, including lack of statistical power, as implied by the statistical test for interaction in the analyses of 28-day mortality (p = 0.14). 72 We acknowledge that this analysis was not planned as part of the original trial design because the trial was designed before the descriptions of ARDS subphenotypes. 73 In addition, because of the nature of latent class models, it is not possible to prove that the two subphenotypes identified in the HARP-2 trial17 are ‘the same’ as the two subphenotypes identified in previous studies. 15,16 However, because latent classes were identified using an unbiased, data-driven approach, the results are comparable to those of previous reports that use data from a RCT, allowing potential causal inferences regarding treatment effects and potential similarities to previously reported subphenotypes. 31
Chapter 5 Implications of future research
Heterogeneity of treatment effect analysis
Aside from the ARDS or sepsis illness characteristics, it is likely that biological mechanisms determining differences in treatment effect will vary with the intervention tested. Therefore, studies considering prognostic enrichment (restricting to patients with higher risk of outcome) could consider supplementing a generic physiology-based multivariable model, such as APACHE II, with either illness-specific risk and/or intervention-specific approaches. For example, an ARDS subpopulation with greater inflammation and higher mortality is more likely to benefit from simvastatin31,74 and, aside from severity of septic shock, the treatment effect of vasopressin was associated with biological differences within the trial population. 26,75 The Berlin ARDS definition9 and the Sepsis-3 definition1 provide readily usable illness-specific enrichment criteria, contained within their predictive validity analyses. 2,76 Therefore, identifying biomarkers that provide both prognostic and predictive enrichment or the use of intervention-specific predictive enrichment coupled with illness-specific prognostic enrichment is likely to be a better approach. For example, biomarkers derived from whole-blood transcriptomics could enrich paediatric septic shock patients for corticosteroid therapy77,78 or highlight potential harm adult septic shock subpopulations. 69 Our analysis also highlights the need to for future studies to explore whether or not the intervention will have greater treatment effect with higher or lower baseline risk of outcome and whether or not the intervention effect is best assessed in a relative or absolute scale in the trial design stage. The reason for this is that, in our analysis, in the HARP-2 trial,17 simvastatin had a greater treatment effect in patients with a lower risk of death whereas, in the LeoPARDS trial,16 there was suggestion that the greatest benefit is likely to occur in the population with a higher risk of death. As suggested by Iwashyna and colleagues,24 HTE assessment should perhaps form part of a priori analyses plans in future clinical trials. As HTE is about the variation in effectiveness, standardising the baseline risk measure between RCTs, including HTE assessment as a priori analyses, ensuring that the outcome used in HTE analyses is patient centred (such as mortality) and incorporating the proposals within the Core Outcome Measures in Effectiveness Trials guidelines will enable pooling of HTE analysis across future trials. 79
Latent class analysis
The sepsis subphenotypes from these two trials require prospective validation because consideration of these subphenotypes in enrichment trial designs, based on mechanisms of interventions, requires development of the capability to measure these biomarkers in real time. Moving forward, how might these findings be translated to future clinical trials in ARDS? Our findings suggest that identification of ARDS subphenotypes may be fundamentally important in future ARDS clinical trials and, more broadly, that targeting distinct subphenotypes of critical illness syndromes may finally yield progress after decades of negative pharmacotherapy trials in ICUs. As mentioned in Heterogeneity of treatment effect analysis, the hyperinflammatory ARDS subphenotype can be accurately identified using three variables. 23,36,42 The development of the capability to measure these inflammatory markers in real time will be critical to conducting precision clinical trials in this setting.
Chapter 6 Conclusions
We assessed HTE in three recent ICU RCTs, using multivariable baseline risk of death models. Despite considerable within-trial variation in the baseline risk of death, we did not find consistent evidence that HTE explained the negative results seen with vasopressin, hydrocortisone and levosimendan in the two sepsis trials15,16 and simvastatin in the ARDS trial. 17
Secondary LCA of the ARDS trial17 identified two subphenotypes. In the case of the two sepsis trials,15,16 two subphenotypes of sepsis were identified in the VANISH trial15 and three subphenotypes of sepsis were identified in the LeoPARDS trial. 16 In both sepsis trials15,16 and in the ARDS trial17 the hyperinflammatory subphenotype was associated with higher mortality.
Grant applications to carry forward the hypothesis generated by this work
Findings from this work have led to the PHenotypes IN the Acute Respiratory Distress Syndrome (PHIND) study. This Innovate UK-funded multicentre, prospective, observational study aims to prospectively define hyper- and hypoinflammatory phenotypes in patients with ARDS and determine clinical outcomes associated with each phenotype.
Acknowledgements
Anthony Gordon is funded by a NIHR Research Professorship award (RP-2015-06-018) and by the NIHR Imperial Biomedical Research Centre. Manu Shankar-Hari is funded by a NIHR Clinician Scientist Award (CS-2016-16-011).
Contributions of authors
Manu Shankar-Hari (https://orcid.org/0000-0002-5338-2538) conceived and obtained funding for the study; developed the statistical analysis plan; performed the statistical analysis for the HTE analysis and LCA of the LeoPARDS trial16 and the VANISH trial;15 contributed to the interpretation of data, critical revision of the manuscript and approved the final manuscript; read the final draft of the manuscript and confirmed the accuracy/integrity of the work.
Shalini Santhakumaran (https://orcid.org/0000-0003-0988-9339) developed the statistical analysis plan; performed the statistical analysis for the HTE analysis and LCA of the LeoPARDS trial16 and the VANISH trial;15 contributed to the interpretation of data, critical revision of the manuscript and approved the final manuscript; read the final draft of the manuscript and confirmed the accuracy/integrity of the work.
A Toby Prevost (https://orcid.org/0000-0003-1723-0796) conceived and obtained funding for the study; developed the statistical analysis plan; performed the statistical analysis for the HTE analysis and LCA of the LeoPARDS trial16 and the VANISH trial;15 contributed to the interpretation of data, critical revision of the manuscript and approved the final manuscript; read the final draft of the manuscript and confirmed the accuracy/integrity of the work.
Josie K Ward (https://orcid.org/0000-0003-3680-3043) measured the biomarkers for the study; read the final draft of the manuscript and confirmed the accuracy/integrity of the work.
Timothy Marshall (https://orcid.org/0000-0001-7214-7130) measured the biomarkers for the study; read the final draft of the manuscript and confirmed the accuracy/integrity of the work.
Claire Bradley (https://orcid.org/0000-0001-9184-103X) measured the biomarkers for the study; read the final draft of the manuscript and confirmed the accuracy/integrity of the work.
Carolyn S Calfee (https://orcid.org/0000-0001-9208-6865) contributed to the LCA and reporting of the HARP-2 trial17 data; read the final draft of the manuscript and confirmed the accuracy/integrity of the work.
Kevin L Delucchi (https://orcid.org/0000-0003-2195-9627) contributed to the LCA and reporting of the HARP-2 trial17 data; read the final draft of the manuscript and confirmed the accuracy/integrity of the work.
Pratik Sinha (https://orcid.org/0000-0003-3751-9079) contributed to the LCA and reporting of the HARP-2 trial17 data; read the final draft of the manuscript and confirmed the accuracy/integrity of the work.
Michael A Matthay (https://orcid.org/0000-0003-3039-8155) contributed to the LCA and reporting of the HARP-2 trial17 data; read the final draft of the manuscript and confirmed the accuracy/integrity of the work.
Jonathan Hackett (https://orcid.org/0000-0003-4965-2045) contributed to the LCA and reporting of the HARP-2 trial17 data; read the final draft of the manuscript and confirmed the accuracy/integrity of the work.
Cliona McDowell (https://orcid.org/0000-0002-7644-7197) contributed to the LCA and reporting of the HARP-2 trial17 data; read the final draft of the manuscript and confirmed the accuracy/integrity of the work.
John G Laffey (https://orcid.org/0000-0002-1246-9573) contributed to the LCA and reporting of the HARP-2 trial17 data; read the final draft of the manuscript and confirmed the accuracy/integrity of the work.
Anthony Gordon (https://orcid.org/0000-0002-0419-547X) conceived and obtained funding for the study; contributed to the interpretation of data, critical revision of the manuscript and approved the final manuscript; read the final draft of the manuscript and confirmed the accuracy/integrity of the work.
Cecilia M O’Kane (https://orcid.org/0000-0002-7138-5396) conceived and obtained funding for the study; contributed to the interpretation of data, critical revision of the manuscript and approved the final manuscript; read the final draft of the manuscript and confirmed the accuracy/integrity of the work.
Daniel F McAuley (https://orcid.org/0000-0002-3283-1947) conceived and obtained funding for the study; contributed to the interpretation of data, critical revision of the manuscript and approved the final manuscript; read the final draft of the manuscript and confirmed the accuracy/integrity of the work.
Publications
Original manuscripts
Calfee CS, Delucchi KL, Sinha P, Matthay MA, Hackett J, Shankar-Hari M, et al. Acute respiratory distress syndrome subphenotypes and differential response to simvastatin: secondary analysis of a randomised controlled trial. Lancet Respir Med 2018;6:691–8.
Santhakumaran S, Gordon A, Prevost AT, O’Kane C, McAuley DF, Shankar-Hari M. Heterogeneity of treatment effect by baseline risk of mortality in critically ill patients: re-analysis of three recent sepsis and ARDS randomised controlled trials. Crit Care 2019;23:156.
Reviews and editorials
Shankar-Hari M, McAuley DF. Acute respiratory distress syndrome phenotypes and identifying treatable traits. The dawn of personalized medicine for ARDS. Am J Respir Crit Care Med 2017;195:280–1.
Shankar-Hari M, McAuley DF. Divide and conquer: identifying acute respiratory distress syndrome subphenotypes. Thorax 2017;72:867–9.
Shankar-Hari M, Fan E, Ferguson ND. Acute respiratory distress syndrome (ARDS) phenotyping. Intensive Care Med 2019;45:516–19.
Poster presentation
Ferris P, Boyle A, Conlon J, Gordon AC, Shankar-Hari M, O’Kane C, McAuley D. Baseline NT-proBNP Predicts outcOme and Treatment Response to Statin Therapy in Patients with ARDS. American Thoracic Society 2019 International Conference, Dallas, TX, USA, 17–22 May 2019.
Data-sharing statement
All data requests should be submitted to the corresponding author for consideration. Access to available anonymised data may be granted following review.
Patient data
This work uses data provided by patients and collected by the NHS as part of their care and support. Using patient data is vital to improve health and care for everyone. There is huge potential to make better use of information from people’s patient records, to understand more about disease, develop new treatments, monitor safety, and plan NHS services. Patient data should be kept safe and secure, to protect everyone’s privacy, and it’s important that there are safeguards to make sure that it is stored and used responsibly. Everyone should be able to find out about how patient data are used. #datasaveslives You can find out more about the background to this citation here: https://understandingpatientdata.org.uk/data-citation.
Disclaimers
This report presents independent research. The views and opinions expressed by authors in this publication are those of the authors and do not necessarily reflect those of the NHS, the NIHR, the MRC, NETSCC, the EME programme or the Department of Health and Social Care. If there are verbatim quotations included in this publication the views and opinions expressed by the interviewees are those of the interviewees and do not necessarily reflect those of the authors, those of the NHS, the NIHR, NETSCC, the EME programme or the Department of Health and Social Care.
References
- Singer M, Deutschman CS, Seymour CW, Shankar-Hari M, Annane D, Bauer M, et al. The third international consensus definitions for sepsis and septic shock (Sepsis-3). JAMA 2016;315:801-10. https://doi.org/10.1001/jama.2016.0287.
- Shankar-Hari M, Phillips GS, Levy ML, Seymour CW, Liu VX, Deutschman CS, et al. Developing a new definition and assessing new clinical criteria for septic shock: for the third international consensus definitions for sepsis and septic shock (Sepsis-3). JAMA 2016;315:775-87. https://doi.org/10.1001/jama.2016.0289.
- Shankar-Hari M, Harrison DA, Rubenfeld GD, Rowan K. Epidemiology of sepsis and septic shock in critical care units: comparison between sepsis-2 and sepsis-3 populations using a national critical care database. Br J Anaesth 2017;119:626-36. https://doi.org/10.1093/bja/aex234.
- Fleischmann C, Scherag A, Adhikari NK, Hartog CS, Tsaganos T, Schlattmann P, et al. Assessment of global incidence and mortality of hospital-treated sepsis. Current estimates and limitations. Am J Respir Crit Care Med 2016;193:259-72. https://doi.org/10.1164/rccm.201504-0781OC.
- Kaukonen KM, Bailey M, Suzuki S, Pilcher D, Bellomo R. Mortality related to severe sepsis and septic shock among critically ill patients in Australia and New Zealand, 2000–2012. JAMA 2014;311:1308-16. https://doi.org/10.1001/jama.2014.2637.
- Marshall JC. Why have clinical trials in sepsis failed?. Trends Mol Med 2014;20:195-203. https://doi.org/10.1016/j.molmed.2014.01.007.
- Shankar-Hari M, Harrison DA, Rowan KM. Differences in impact of definitional elements on mortality precludes international comparisons of sepsis epidemiology – a cohort study illustrating the need for standardized reporting. Crit Care Med 2016;44:2223-30. https://doi.org/10.1097/CCM.0000000000001876.
- Prescott HC, Calfee CS, Thompson BT, Angus DC, Liu VX. Toward smarter lumping and smarter splitting: rethinking strategies for sepsis and acute respiratory distress syndrome clinical trial design. Am J Respir Crit Care Med 2016;194:147-55. https://doi.org/10.1164/rccm.201512-2544CP.
- Force ADT, Ranieri VM, Rubenfeld GD, Thompson BT, Ferguson ND, Caldwell E, et al. Acute respiratory distress syndrome: the Berlin definition. JAMA 2012;307:2526-33. https://doi.org/10.1001/jama.2012.5669.
- Rubenfeld GD, Caldwell E, Peabody E, Weaver J, Martin DP, Neff M, et al. Incidence and outcomes of acute lung injury. N Engl J Med 2005;353:1685-93. https://doi.org/10.1056/NEJMoa050333.
- Bellani G, Laffey JG, Pham T, Fan E, Brochard L, Esteban A, et al. Epidemiology, patterns of care, and mortality for patients with acute respiratory distress syndrome in intensive care units in 50 countries. JAMA 2016;315:788-800. https://doi.org/10.1001/jama.2016.0291.
- Bernard GR, Artigas A, Brigham KL, Carlet J, Falke K, Hudson L, et al. The American–European Consensus Conference on ARDS. Definitions, mechanisms, relevant outcomes, and clinical trial coordination. Am J Respir Crit Care Med 1994;149:818-24. https://doi.org/10.1164/ajrccm.149.3.7509706.
- Shankar-Hari M, Rubenfeld GD. The use of enrichment to reduce statistically indeterminate or negative trials in critical care. Anaesthesia 2017;72:560-5. https://doi.org/10.1111/anae.13870.
- Shankar-Hari M, Summers C, Baillie K, Vincent J-L. Annual Update in Intensive Care and Emergency Medicine. New York, NY: Springer; 2018.
- Gordon AC, Mason AJ, Thirunavukkarasu N, Perkins GD, Cecconi M, Cepkova M, et al. Effect of early vasopressin vs norepinephrine on kidney failure in patients with septic shock: the VANISH randomized clinical trial. JAMA 2016;316:509-18. https://doi.org/10.1001/jama.2016.10485.
- Gordon AC, Perkins GD, Singer M, McAuley DF, Orme RM, Santhakumaran S, et al. Levosimendan for the prevention of acute organ dysfunction in sepsis. N Engl J Med 2016;375:1638-48. https://doi.org/10.1056/NEJMoa1609409.
- McAuley DF, Laffey JG, O’Kane CM, Perkins GD, Mullan B, Trinder TJ, et al. Simvastatin in the acute respiratory distress syndrome. N Engl J Med 2014;371:1695-703. https://doi.org/10.1056/NEJMoa1403285.
- Kent DM, Rothwell PM, Ioannidis JP, Altman DG, Hayward RA. Assessing and reporting heterogeneity in treatment effects in clinical trials: a proposal. Trials 2010;11. https://doi.org/10.1186/1745-6215-11-85.
- Senn S. Mastering variation: variance components and personalised medicine. Stat Med 2016;35:966-77. https://doi.org/10.1002/sim.6739.
- Scicluna BP, van Vught LA, Zwinderman AH, Wiewel MA, Davenport EE, Burnham KL, et al. Classification of patients with sepsis according to blood genomic endotype: a prospective cohort study. Lancet Respir Med 2017;5:816-26. https://doi.org/10.1016/S2213-2600(17)30294-1.
- Davenport EE, Burnham KL, Radhakrishnan J, Humburg P, Hutton P, Mills TC, et al. Genomic landscape of the individual host response and outcomes in sepsis: a prospective cohort study. Lancet Respir Med 2016;4:259-71. https://doi.org/10.1016/S2213-2600(16)00046-1.
- Bos LD, Schouten LR, van Vught LA, Wiewel MA, Ong DSY, Cremer O, et al. Identification and validation of distinct biological phenotypes in patients with acute respiratory distress syndrome by cluster analysis. Thorax 2017;72:876-83. https://doi.org/10.1136/thoraxjnl-2016-209719.
- Calfee CS, Delucchi K, Parsons PE, Thompson BT, Ware LB, Matthay MA, et al. Network. Subphenotypes in acute respiratory distress syndrome: latent class analysis of data from two randomised controlled trials. Lancet Respir Med 2014;2:611-20. https://doi.org/10.1016/S2213-2600(14)70097-9.
- Iwashyna TJ, Burke JF, Sussman JB, Prescott HC, Hayward RA, Angus DC. Implications of heterogeneity of treatment effect for reporting and analysis of randomized trials in critical care. Am J Respir Crit Care Med 2015;192:1045-51. https://doi.org/10.1164/rccm.201411-2125CP.
- Shankar-Hari M, Rubenfeld GD. Population enrichment for critical care trials: phenotypes and differential outcomes. Curr Opin Crit Care 2019;25:489-97. https://doi.org/10.1097/MCC.0000000000000641.
- Russell JA, Walley KR, Singer J, Gordon AC, Hébert PC, Cooper DJ, et al. Vasopressin versus norepinephrine infusion in patients with septic shock. N Engl J Med 2008;358:877-87. https://doi.org/10.1056/NEJMoa067373.
- Rochwerg B, Oczkowski SJ, Siemieniuk RAC, Agoritsas T, Belley-Cote E, D’Aragon F, et al. Corticosteroids in sepsis: an updated systematic review and meta-analysis. Crit Care Med 2018;46:1411-20. https://doi.org/10.1097/CCM.0000000000003262.
- Annane D, Renault A, Brun-Buisson C, Megarbane B, Quenot JP, Siami S, et al. Hydrocortisone plus fludrocortisone for adults with septic shock. N Engl J Med 2018;378:809-18. https://doi.org/10.1056/NEJMoa1705716.
- Venkatesh B, Finfer S, Cohen J, Rajbhandari D, Arabi Y, Bellomo R, et al. Adjunctive glucocorticoid therapy in patients with septic shock. N Engl J Med 2018;378:797-808. https://doi.org/10.1056/NEJMoa1705835.
- Annane D, Sébille V, Charpentier C, Bollaert PE, François B, Korach JM, et al. Effect of treatment with low doses of hydrocortisone and fludrocortisone on mortality in patients with septic shock. JAMA 2002;288:862-71. https://doi.org/10.1001/jama.288.7.862.
- Calfee CS, Delucchi KL, Sinha P, Matthay MA, Hackett J, Shankar-Hari M, et al. Acute respiratory distress syndrome subphenotypes and differential response to simvastatin: secondary analysis of a randomised controlled trial. Lancet Respir Med 2018;6:691-8. https://doi.org/10.1016/S2213-2600(18)30177-2.
- Rothenberg FG, Clay MB, Jamali H, Vandivier-Pletsch RH. Systematic review of β blocker, aspirin, and statin in critically ill patients: importance of severity of illness and cardiac troponin. J Investig Med 2017;65:747-53. https://doi.org/10.1136/jim-2016-000374.
- Knaus WA, Harrell FE, LaBrecque JF, Wagner DP, Pribble JP, Draper EA, et al. Use of predicted risk of mortality to evaluate the efficacy of anticytokine therapy in sepsis. The rhIL-1ra Phase III Sepsis Syndrome Study Group. Crit Care Med 1996;24:46-5. https://doi.org/10.1097/00003246-199601000-00010.
- Knaus WA, Draper EA, Wagner DP, Zimmerman JE. APACHE II: a severity of disease classification system. Crit Care Med 1985;13:818-29. https://doi.org/10.1097/00003246-198510000-00009.
- Shankar-Hari M, Harrison DA, Rowan KM, Rubenfeld GD. Estimating attributable fraction of mortality from sepsis to inform clinical trials. J Crit Care 2018;45:33-9. https://doi.org/10.1016/j.jcrc.2018.01.018.
- Shankar-Hari M, Fan E, Ferguson ND. Acute respiratory distress syndrome (ARDS) phenotyping. Intensive Care Med 2019;45:516-19. https://doi.org/10.1007/s00134-018-5480-6.
- Seymour CW, Kennedy JN, Wang S, Chang CH, Elliott CF, Xu Z, et al. Derivation, validation, and potential treatment implications of novel clinical phenotypes for sepsis. JAMA 2019;321:2003-17. https://doi.org/10.1001/jama.2019.5791.
- Knox DB, Lanspa MJ, Kuttler KG, Brewer SC, Brown SM. Phenotypic clusters within sepsis-associated multiple organ dysfunction syndrome. Intensive Care Med 2015;41:814-22. https://doi.org/10.1007/s00134-015-3764-7.
- Gårdlund B, Dmitrieva NO, Pieper CF, Finfer S, Marshall JC, Taylor Thompson B. Six subphenotypes in septic shock: latent class analysis of the PROWESS Shock study. J Crit Care 2018;47:70-9. https://doi.org/10.1016/j.jcrc.2018.06.012.
- Sinha P, Delucchi KL, Thompson BT, McAuley DF, Matthay MA, Calfee CS, et al. Network. Latent class analysis of ARDS subphenotypes: a secondary analysis of the statins for acutely injured lungs from sepsis (SAILS) study. Intensive Care Med 2018;44:1859-69. https://doi.org/10.1007/s00134-018-5378-3.
- Delucchi K, Famous KR, Ware LB, Parsons PE, Thompson BT, Calfee CS. ARDS Network . Stability of ARDS subphenotypes over time in two randomised controlled trials. Thorax 2018;73:439-45. https://doi.org/10.1136/thoraxjnl-2017-211090.
- Famous KR, Delucchi K, Ware LB, Kangelaris KN, Liu KD, Thompson BT, et al. ARDS Network. Acute respiratory distress syndrome subphenotypes respond differently to randomized fluid management strategy. Am J Respir Crit Care Med 2017;195:331-8. https://doi.org/10.1164/rccm.201603-0645OC.
- Thompson BT, Chambers RC, Liu KD. Acute respiratory distress syndrome. N Engl J Med 2017;377:562-72. https://doi.org/10.1056/NEJMra1608077.
- Santhakumaran S, Gordon A, Prevost AT, O’Kane C, McAuley DF, Shankar-Hari M. Heterogeneity of treatment effect by baseline risk of mortality in critically ill patients: re-analysis of three recent sepsis and ARDS randomised controlled trials. Crit Care 2019;23. https://doi.org/10.1186/s13054-019-2446-1.
- Steyerberg EW, Vickers AJ, Cook NR, Gerds T, Gonen M, Obuchowski N, et al. Assessing the performance of prediction models: a framework for traditional and novel measures. Epidemiology 2010;21:128-38. https://doi.org/10.1097/EDE.0b013e3181c30fb2.
- Harrell F. Regression Modeling Strategies. New York, NY: Springer; 2001.
- Burke JF, Hayward RA, Nelson JP, Kent DM. Using internally developed risk models to assess heterogeneity in treatment effects in clinical trials. Circ Cardiovasc Qual Outcomes 2014;7:163-9. https://doi.org/10.1161/CIRCOUTCOMES.113.000497.
- Ioannidis JP, Lau J. Heterogeneity of the baseline risk within patient populations of clinical trials: a proposed evaluation algorithm. Am J Epidemiol 1998;148:1117-26. https://doi.org/10.1093/oxfordjournals.aje.a009590.
- Rubin D. Multiple Imputation for Nonresponse in Surveys. London: Wiley; 1987.
- Ferreira FL, Bota DP, Bross A, Mélot C, Vincent JL. Serial evaluation of the SOFA score to predict outcome in critically ill patients. JAMA 2001;286:1754-8. https://doi.org/10.1001/jama.286.14.1754.
- Vermunt JK, Magidson J, Hagenaars JA, McCutcheon AL. Applied Latent Class Analysis. Cambridge: Cambridge University Press; 2002.
- Masyn KE, Little TD. The Oxford Handbook of Quantitative Methods in Psychology. Oxford: Oxford University Press; 2013.
- Taori G, Ho KM, George C, Bellomo R, Webb SA, Hart GK, et al. Landmark survival as an end-point for trials in critically ill patients – comparison of alternative durations of follow-up: an exploratory analysis. Crit Care 2009;13. https://doi.org/10.1186/cc7988.
- Cheung YB. A modified least-squares regression approach to the estimation of risk difference. Am J Epidemiol 2007;166:1337-44. https://doi.org/10.1093/aje/kwm223.
- Schwartz G. Estimating the dimension of a model. Ann Stat 1978;6:461-4. https://doi.org/10.1214/aos/1176344136.
- Lo YT, Mendell NR, Rubin DB. Testing the number of components in a normal mixture. Biometrika 2001;88:767-78. https://doi.org/10.1093/biomet/88.3.767.
- Austin PC, Lee DS, Fine JP. Introduction to the analysis of survival data in the presence of competing risks. Circulation 2016;133:601-9. https://doi.org/10.1161/CIRCULATIONAHA.115.017719.
- Calfee CS, Delucchi KR, Matthay MA, Hackett J, Shankar-Hari M, McDowell C, et al. Consistent ARDS Endotypes Are Identified Using Minimal Data From a United Kingdom Clinical Trial n.d.
- Austin PC, Fine JP. Practical recommendations for reporting Fine–Gray model analyses for competing risk data. Stat Med 2017;36:4391-400. https://doi.org/10.1002/sim.7501.
- Loudon K, Treweek S, Sullivan F, Donnan P, Thorpe KE, Zwarenstein M. The PRECIS-2 tool: designing trials that are fit for purpose. BMJ 2015;350. https://doi.org/10.1136/bmj.h2147.
- Rothman KJ, Greenland S. Causation and causal inference in epidemiology. Am J Public Health 2005;95:144-50. https://doi.org/10.2105/AJPH.2004.059204.
- Ioannidis JP, Cappelleri JC, Schmid CH, Lau J. Impact of epidemic and individual heterogeneity on the population distribution of disease progression rates. An example from patient populations in trials of human immunodeficiency virus infection. Am J Epidemiol 1996;144:1074-85. https://doi.org/10.1093/oxfordjournals.aje.a008881.
- Semler MW, Self WH, Wanderer JP, Ehrenfeld JM, Wang L, Byrne DW, et al. Balanced crystalloids versus saline in critically ill adults. N Engl J Med 2018;378:829-39. https://doi.org/10.1056/NEJMoa1711584.
- McKown AC, Huerta LE, Rice TW, Semler MW. Pragmatic Critical Care Research Group . Heterogeneity of treatment effect by baseline risk in a trial of balanced crystalloids versus saline. Am J Respir Crit Care Med 2018;198:810-13. https://doi.org/10.1164/rccm.201804-0680LE.
- Kuo CS, Pavlidis S, Loza M, Baribaud F, Rowe A, Pandis I, et al. T-helper cell type 2 (Th2) and non-Th2 molecular phenotypes of asthma using sputum transcriptomics in U-BIOPRED. Eur Respir J 2017;49. https://doi.org/10.1183/13993003.02135-2016.
- Lefaudeux D, De Meulder B, Loza MJ, Peffer N, Rowe A, Baribaud F, et al. U-BIOPRED clinical adult asthma clusters linked to a subset of sputum omics. J Allergy Clin Immunol 2017;139:1797-807. https://doi.org/10.1016/j.jaci.2016.08.048.
- Maslove DM, Tang BM, McLean AS. Identification of sepsis subtypes in critically ill adults using gene expression profiling. Crit Care 2012;16. https://doi.org/10.1186/cc11667.
- Ranieri VM, Thompson BT, Barie PS, Dhainaut JF, Douglas IS, Finfer S, et al. Drotrecogin alfa (activated) in adults with septic shock. N Engl J Med 2012;366:2055-64. https://doi.org/10.1056/NEJMoa1202290.
- Antcliffe DB, Burnham KL, Al-Beidh F, Santhakumaran S, Brett SJ, Hinds CJ, et al. Transcriptomic signatures in sepsis and a differential response to steroids. From the VANISH randomized trial. Am J Respir Crit Care Med 2019;199:980-6. https://doi.org/10.1164/rccm.201807-1419OC.
- Shyamsundar M, McKeown ST, O’Kane CM, Craig TR, Brown V, Thickett DR, et al. Simvastatin decreases lipopolysaccharide-induced pulmonary inflammation in healthy volunteers. Am J Respir Crit Care Med 2009;179:1107-14. https://doi.org/10.1164/rccm.200810-1584OC.
- Bos LD, Scicluna BP, Ong DSY, Cremer OL, van der Poll T, Schultz MJ, et al. Understanding heterogeneity in biological phenotypes of ARDS by leukocyte expression profiles. Am J Respir Crit Care Med 2019;200:42-50. https://doi.org/10.1164/rccm.201809-1808OC.
- Pocock SJ, Assmann SE, Enos LE, Kasten LE. Subgroup analysis, covariate adjustment and baseline comparisons in clinical trial reporting: current practice and problems. Stat Med 2002;21:2917-30. https://doi.org/10.1002/sim.1296.
- McAuley DF, Laffey JG, O’Kane CM, Cross M, Perkins GD, Murphy L, et al. Hydroxymethylglutaryl-CoA reductase inhibition with simvastatin in acute lung injury to reduce pulmonary dysfunction (HARP-2) trial: study protocol for a randomized controlled trial. Trials 2012;13. https://doi.org/10.1186/1745-6215-13-170.
- Shankar-Hari M, McAuley DF. Divide and conquer: identifying acute respiratory distress syndrome subphenotypes. Thorax 2017;72:867-9. https://doi.org/10.1136/thoraxjnl-2017-210422.
- Russell JA, Lee T, Singer J, Boyd JH, Walley KR. Vasopressin and Septic Shock Trial (VASST) Group . The septic shock 3.0 definition and trials: a vasopressin and septic shock trial experience. Crit Care Med 2017;45:940-8. https://doi.org/10.1097/CCM.0000000000002323.
- Ferguson ND, Fan E, Camporota L, Antonelli M, Anzueto A, Beale R, et al. The Berlin definition of ARDS: an expanded rationale, justification, and supplementary material. Intensive Care Med 2012;38:1573-82. https://doi.org/10.1007/s00134-012-2682-1.
- Wong HR, Atkinson SJ, Cvijanovich NZ, Anas N, Allen GL, Thomas NJ, et al. Combining prognostic and predictive enrichment strategies to identify children with septic shock responsive to corticosteroids. Crit Care Med 2016;44:e1000-3. https://doi.org/10.1097/CCM.0000000000001833.
- Wong HR, Cvijanovich NZ, Anas N, Allen GL, Thomas NJ, Bigham MT, et al. Developing a clinically feasible personalized medicine approach to pediatric septic shock. Am J Respir Crit Care Med 2015;191:309-15. https://doi.org/10.1164/rccm.201410-1864OC.
- Williamson PR, Altman DG, Bagley H, Barnes KL, Blazeby JM, Brookes ST, et al. The COMET handbook: version 1.0. Trials 2017;18. https://doi.org/10.1186/s13063-017-1978-4.
Appendix 1 Tables and figures
| Parameter | Model | |||||||||||
|---|---|---|---|---|---|---|---|---|---|---|---|---|
| Two-class | Three-class | Four-class | ||||||||||
| Class | Separation | Class | Separation | Class | Separation | |||||||
| 1 | 2 | 1 | 2 | 3 | 1 | 2 | 3 | 4 | ||||
| Distribution (%) | 51 | 49 | 27 | 44 | 29 | 32 | 13 | 34 | 21 | |||
| Organ dysfunction | ||||||||||||
| PaO2/FiO2 ratio | 0.342 | –0.236 | 0.084 | 0.323 | 0.174 | –0.351 | 0.084 | 0.343 | 0.515 | –0.011 | –0.522 | 0.157 |
| Creatinine | –0.271 | 0.266 | 0.072 | –0.748 | 0.363 | 0.133 | 0.229 | –0.737 | 0.959 | 0.181 | 0.207 | 0.361 |
| Platelets | 0.189 | –0.238 | 0.046 | 0.099 | 0.007 | –0.178 | 0.013 | 0.114 | 0.413 | –0.264 | –0.095 | 0.064 |
| Bilirubin | –0.147 | 0.234 | 0.036 | –0.258 | 0.182 | 0.115 | 0.037 | –0.124 | –0.473 | 0.495 | –0.123 | 0.122 |
| Inflammation markers | ||||||||||||
| IL-1β | –2.786 | –1.088 | 0.721 | –2.803 | –2.08 | –0.816 | 0.674 | –2.608 | –7.864 | –1.592 | –0.429 | 8.086 |
| IL-6 | –0.595 | 1.073 | 0.696 | –0.763 | –0.114 | 1.61 | 1.003 | –0.706 | –0.675 | 0.367 | 1.872 | 1.102 |
| IL-8 | –0.972 | 0.569 | 0.594 | –1.208 | –0.46 | 1.063 | 0.893 | –1.078 | –0.88 | –0.097 | 1.268 | 0.85 |
| IL-10 | –1.008 | 0.604 | 0.65 | –1.319 | –0.343 | 0.964 | 0.875 | –1.197 | –0.83 | 0.15 | 0.984 | 0.728 |
| IL-17 | –2.943 | –1.916 | 0.264 | –3.002 | –2.44 | –1.997 | 0.169 | –2.94 | –3.649 | –1.998 | –1.754 | 0.573 |
| IL-18 | –0.440 | 0.252 | 0.12 | –0.768 | 0.24 | 0.013 | 0.186 | –0.604 | –0.16 | 0.301 | 0.056 | 0.111 |
| Leucocytes | ||||||||||||
| Myeloperoxidase | –0.394 | 0.432 | 0.171 | –0.494 | 0.051 | 0.44 | 0.147 | –0.477 | –0.202 | 0.382 | 0.288 | 0.124 |
| sICAM | –0.464 | 0.223 | 0.118 | –0.583 | 0.088 | –0.002 | 0.088 | –0.518 | –0.797 | 0.581 | –0.277 | 0.266 |
| Endothelial injury | ||||||||||||
| ANG II | –0.431 | 0.403 | 0.174 | –0.809 | 0.288 | 0.275 | 0.264 | –0.707 | 0.038 | 0.506 | 0.14 | 0.194 |
| Cardiovascular | ||||||||||||
| Troponin | –0.35 | 0.346 | 0.121 | –0.575 | 0.117 | 0.407 | 0.17 | –0.558 | 0.357 | 0.187 | 0.356 | 0.143 |
| NT-proBNP | –0.403 | 0.338 | 0.137 | –0.808 | 0.28 | 0.222 | 0.25 | –0.761 | 0.425 | 0.34 | 0.182 | 0.225 |
| Other markers | ||||||||||||
| sTNFR1 | –0.534 | 0.608 | 0.326 | –1.055 | 0.316 | 0.629 | 0.535 | –0.995 | 0.6 | 0.347 | 0.733 | 0.473 |
| Lactate | –0.448 | 0.53 | 0.239 | –0.671 | –0.008 | 0.741 | 0.333 | –0.596 | –0.192 | 0.23 | 0.782 | 0.261 |
| Parameter | Two-class model | Three-class model | Four-class model | |||||||||
|---|---|---|---|---|---|---|---|---|---|---|---|---|
| Class | Separation | Class | Separation | Class | Separation | |||||||
| 1 | 2 | 1 | 2 | 3 | 1 | 2 | 3 | 4 | ||||
| Distribution (%) | 51 | 49 | 40 | 29 | 31 | 29 | 18 | 26 | 28 | |||
| Organ dysfunction | ||||||||||||
| PaO2/FiO2 ratio | 0.314 | –0.149 | 0.054 | 0.258 | 0.21 | –0.188 | 0.04 | 0.337 | 0.38 | –0.084 | –0.174 | 0.061 |
| Creatinine | –0.215 | 0.239 | 0.052 | –0.809 | 0.582 | 0.085 | 0.331 | –0.82 | 0.679 | –0.484 | 0.174 | 0.337 |
| Platelets | 0.179 | –0.223 | 0.04 | 0.173 | –0.066 | –0.102 | 0.015 | –0.019 | –0.172 | 0.398 | –0.11 | 0.05 |
| Bilirubin | –0.136 | 0.236 | 0.035 | –0.101 | 0.151 | 0.082 | 0.011 | –0.366 | 0.109 | 0.273 | 0.068 | 0.056 |
| Inflammation markers | ||||||||||||
| IL-1β | –2.84 | –1.085 | 0.77 | –2.638 | –2.571 | –0.9 | 0.646 | –2.818 | –2.938 | –2.098 | –0.908 | 0.651 |
| IL-6 | –0.624 | 1.014 | 0.671 | –0.58 | –0.387 | 1.272 | 0.691 | –0.974 | –0.623 | 0.054 | 1.279 | 0.74 |
| IL-8 | –0.963 | 0.501 | 0.536 | –0.982 | –0.692 | 0.732 | 0.561 | –1.426 | –0.864 | –0.36 | 0.706 | 0.616 |
| IL-10 | –1.04 | 0.601 | 0.673 | –1.159 | –0.637 | 0.833 | 0.711 | –1.634 | –0.856 | –0.463 | 0.897 | 0.841 |
| IL-17 | –2.963 | –1.806 | 0.335 | –3.067 | –2.446 | –1.828 | 0.256 | –2.914 | –2.713 | –2.664 | –1.672 | 0.232 |
| IL-18 | –0.432 | 0.234 | 0.111 | –0.592 | 0.068 | 0.132 | 0.107 | –1.11 | 0.003 | 0.106 | 0.165 | 0.274 |
| Leucocytes | ||||||||||||
| Myeloperoxidase | –0.414 | 0.454 | 0.188 | –0.606 | 0.043 | 0.44 | 0.186 | –0.67 | 0.173 | –0.248 | 0.458 | 0.182 |
| sICAM | –0.463 | 0.224 | 0.118 | –0.691 | 0.175 | 0 | 0.14 | –0.951 | 0.233 | 0.024 | 0.015 | 0.211 |
| Endothelial injury | ||||||||||||
| ANG II | –0.431 | 0.371 | 0.161 | –0.701 | 0.305 | 0.136 | 0.193 | –0.867 | 0.194 | –0.139 | 0.244 | 0.197 |
| Cardiovascular | ||||||||||||
| Troponin | –0.335 | 0.348 | 0.117 | –0.594 | 0.045 | 0.426 | 0.177 | –0.579 | –0.051 | –0.245 | 0.384 | 0.121 |
| NT-proBNP | –0.368 | 0.301 | 0.112 | –0.803 | 0.421 | 0.145 | 0.275 | –0.88 | 0.238 | –0.265 | 0.234 | 0.211 |
| Other markers | ||||||||||||
| sTNFR1 | –0.524 | 0.598 | 0.315 | –1.037 | 0.35 | 0.573 | 0.507 | –1.317 | 0.331 | –0.237 | 0.611 | 0.545 |
| Lactate | –0.464 | 0.523 | 0.244 | –0.636 | –0.118 | 0.679 | 0.293 | –0.76 | –0.246 | –0.225 | 0.618 | 0.244 |
| Two-class model | Three-class model | ||||||
|---|---|---|---|---|---|---|---|
| Class 1 | Class 2 | Separation | Class 1 | Class 2 | Class 3 | Separation | |
| Distribution (%) | 49 | 51 | 23 | 29 | 49 | ||
| Organ dysfunction | |||||||
| PaO2/FiO2 ratio | 0.301 | –0.142 | 0.049 | 0.199 | 0.306 | –0.103 | 0.03 |
| Creatinine | –0.235 | 0.255 | 0.06 | 0.609 | –0.835 | 0.268 | 0.38 |
| Platelets | 0.166 | –0.217 | 0.037 | 0.261 | 0.117 | –0.221 | 0.041 |
| Bilirubin | –0.099 | 0.193 | 0.021 | –0.473 | 0.152 | 0.211 | 0.096 |
| Inflammation markers | |||||||
| IL-1β | –2.012 | –1.244 | 0.147 | –2.431 | –1.766 | –1.205 | 0.251 |
| IL-6 | –0.607 | 1.036 | 0.675 | –0.717 | –0.484 | 1.048 | 0.613 |
| IL-8 | –0.948 | 0.479 | 0.509 | –1.033 | –0.841 | 0.508 | 0.47 |
| IL-10 | –1.036 | 0.605 | 0.673 | –1.013 | –0.995 | 0.625 | 0.59 |
| IL-17 | –2.947 | –1.927 | 0.26 | –2.778 | –3.263 | –1.863 | 0.337 |
| IL-18 | –0.404 | 0.204 | 0.092 | –0.274 | –0.452 | 0.235 | 0.085 |
| Leucocytes | |||||||
| Myeloperoxidase | –0.442 | 0.469 | 0.207 | –0.15 | –0.698 | 0.481 | 0.232 |
| sICAM | –0.42 | 0.165 | 0.086 | –0.078 | –0.727 | 0.165 | 0.142 |
| Endothelial injury | |||||||
| ANG II | –0.415 | 0.372 | 0.155 | –0.004 | –0.669 | 0.331 | 0.173 |
| Cardiovascular | |||||||
| Troponin | –0.351 | 0.394 | 0.139 | 0.027 | –0.661 | 0.448 | 0.209 |
| NT-proBNP | –0.357 | 0.288 | 0.104 | 0.312 | –0.764 | 0.277 | 0.249 |
| Other markers | |||||||
| sTNFR1 | –0.513 | 0.593 | 0.306 | 0.042 | –0.902 | 0.605 | 0.387 |
| Lactate | –0.468 | 0.529 | 0.249 | –0.216 | –0.63 | 0.545 | 0.237 |
| Parameter | Two-class model | Three-class model | Four-class model | |||||||||
|---|---|---|---|---|---|---|---|---|---|---|---|---|
| Class 1 | Class 2 | Separation | Class 1 | Class 2 | Class 3 | Separation | Class 1 | Class 2 | Class 3 | Class 4 | Separation | |
| Distribution (%) | 54 | 46 | 22 | 46 | 32 | 23 | 38 | 15 | 25 | |||
| Organ dysfunction | ||||||||||||
| PaO2/FiO2 ratio | 0.233 | –0.095 | 0.027 | 0.437 | 0.067 | –0.208 | 0.07 | 0.439 | 0.028 | –0.086 | –0.272 | 0.068 |
| Creatinine | –0.082 | 0.124 | 0.011 | –0.567 | 0.009 | 0.108 | 0.089 | –0.585 | 0.149 | –0.314 | 0.143 | 0.098 |
| Platelets | 0.137 | –0.185 | 0.026 | 0.138 | 0.04 | –0.133 | 0.013 | 0.136 | 0.052 | –0.072 | 0.151 | 0.008 |
| Bilirubin | –0.062 | 0.141 | 0.01 | –0.551 | 0.311 | 0.101 | 0.135 | –0.535 | 0.384 | 0.326 | –0.178 | 0.143 |
| Inflammation markers | ||||||||||||
| IL-1β | –2.764 | –1.037 | 0.746 | –2.724 | –2.204 | –0.691 | 0.744 | –2.608 | –1.915 | –2.583 | –0.517 | 0.72 |
| IL-6 | –0.565 | 1.099 | 0.692 | –1.122 | 0.05 | 1.411 | 1.071 | –1.108 | –0.034 | 0.509 | 1.568 | 0.932 |
| IL-8 | –0.93 | 0.603 | 0.588 | –1.367 | –0.443 | 0.895 | 0.862 | –1.349 | –0.569 | 0.208 | 0.993 | 0.761 |
| IL-10 | –1.004 | 0.717 | 0.74 | –1.777 | –0.414 | 0.942 | 1.232 | –1.758 | –0.541 | 0.575 | 0.865 | 1.069 |
| IL-17 | –2.88 | –1.846 | 0.267 | –2.563 | –2.716 | –1.677 | 0.21 | –2.49 | –2.315 | –3.951 | –1.371 | 0.853 |
| IL-18 | –0.314 | 0.176 | 0.06 | –0.491 | 0.225 | 0.063 | 0.094 | –0.507 | 0.261 | 0.37 | 0.032 | 0.114 |
| Leucocytes | ||||||||||||
| Myeloperoxidase | –0.371 | 0.484 | 0.183 | –0.527 | –0.005 | 0.44 | 0.156 | –0.547 | –0.167 | 0.861 | 0.14 | 0.267 |
| sICAM | –0.344 | 0.137 | 0.058 | –0.763 | 0.16 | 0.038 | 0.168 | –0.788 | 0.221 | 0.585 | –0.503 | 0.302 |
| Endothelial injury | ||||||||||||
| ANG II | –0.294 | 0.291 | 0.086 | –0.635 | 0.18 | 0.165 | 0.145 | –0.658 | 0.32 | –0.202 | 0.032 | 0.128 |
| Cardiovascular | ||||||||||||
| Troponin | –0.298 | 0.254 | 0.076 | –0.614 | 0.149 | 0.071 | 0.117 | –0.623 | –0.054 | 0.991 | 0.009 | 0.337 |
| NT-proBNP | –0.202 | 0.177 | 0.036 | –0.377 | –0.039 | 0.14 | 0.046 | –0.403 | 0.129 | 0.002 | –0.111 | 0.039 |
| Other markers | ||||||||||||
| sTNFR1 | –0.428 | 0.584 | 0.256 | –0.787 | 0.045 | 0.609 | 0.329 | –0.802 | 0.037 | 0.229 | 0.681 | 0.289 |
| Lactate | –0.38 | 0.528 | 0.206 | –1.013 | –0.1 | 0.752 | 0.519 | –1.012 | –0.092 | 0.377 | 0.558 | 0.37 |
| Parameter | Two-class model | Three-class model | |||||
|---|---|---|---|---|---|---|---|
| Class 1 | Class 2 | Separation | Class 1 | Class 2 | Class 3 | Separation | |
| Distribution (%) | 44 | 56 | 29 | 23 | 48 | ||
| Organ dysfunction | |||||||
| PaO2/FiO2 ratio | 0.16 | 0.008 | 0.006 | 0.423 | –0.121 | –0.032 | 0.057 |
| Creatinine | –0.191 | 0.173 | 0.033 | 0.067 | –0.332 | 0.132 | 0.042 |
| Platelets | 0.09 | –0.082 | 0.007 | –0.17 | 0.025 | 0.015 | 0.008 |
| Bilirubin | –0.228 | 0.192 | 0.044 | –0.377 | 0.493 | 0.093 | 0.126 |
| Inflammation markers | |||||||
| IL-1β | –2.15 | –1.332 | 0.167 | –2.418 | –2.475 | –1.168 | 0.364 |
| IL-6 | –0.699 | 0.941 | 0.672 | –0.631 | –0.079 | 0.903 | 0.402 |
| IL-8 | –1.059 | 0.423 | 0.549 | –0.802 | –0.704 | 0.369 | 0.281 |
| IL-10 | –1.168 | 0.538 | 0.728 | –1.023 | –0.634 | 0.493 | 0.413 |
| IL-17 | –3.094 | –1.991 | 0.304 | –3.296 | –3.956 | –1.43 | 1.144 |
| IL-18 | –0.448 | 0.151 | 0.09 | –0.275 | –0.615 | 0.224 | 0.119 |
| Leucocytes | |||||||
| Myeloperoxidase | –0.39 | 0.339 | 0.133 | –0.401 | –0.028 | 0.36 | 0.097 |
| sICAM | –0.25 | –0.022 | 0.013 | –0.238 | –0.381 | 0.099 | 0.04 |
| Endothelial injury | |||||||
| ANG II | –0.335 | 0.223 | 0.078 | –0.186 | –0.24 | 0.216 | 0.041 |
| Cardiovascular | |||||||
| Troponin | –0.286 | 0.127 | 0.043 | –0.228 | –0.538 | 0.025 | 0.053 |
| NT-proBNP | –0.263 | 0.138 | 0.04 | –0.049 | –0.29 | 0.082 | 0.024 |
| Other markers | |||||||
| sTNFR1 | –0.501 | 0.474 | 0.238 | –0.32 | –0.202 | 0.382 | 0.094 |
| Lactate | –0.482 | 0.457 | 0.22 | –0.377 | –0.042 | 0.323 | 0.082 |
| Main analysis | Sensitivity analysis | ||
|---|---|---|---|
| Class 1 | Class 2 | Class 3 | |
| The LeoPARDS trial16 | |||
| Class 1 | 180 | 11 | 0 |
| Class 2 | 5 | 228 | 14 |
| Class 3 | 0 | 0 | 55 |
| The VANISH trial15 | |||
| Class 1 | 87 | 3 | |
| Class 2 | 2 | 84 | |
| Parameter | Two-class model | Three-class model | Four-class model | |||||||||
|---|---|---|---|---|---|---|---|---|---|---|---|---|
| Class 1 | Class 2 | Separation | Class 1 | Class 2 | Class 3 | Separation | Class 1 | Class 2 | Class 3 | Class 4 | Separation | |
| Distribution (%) | 61 | 39 | 33 | 53 | 14 | 35 | 23 | 29 | 13 | |||
| Organ dysfunction | ||||||||||||
| PaO2/FiO2 ratio | 0.144 | –0.227 | 0.034 | 0.137 | 0.014 | –0.367 | 0.046 | 0.12 | 0.045 | –0.004 | –0.389 | 0.039 |
| Creatinine | –0.269 | 0.43 | 0.122 | –0.562 | 0.203 | 0.562 | 0.22 | –0.501 | 0.393 | 0.027 | 0.605 | 0.176 |
| Platelets | 0.262 | –0.416 | 0.115 | 0.368 | –0.053 | –0.671 | 0.182 | 0.362 | –0.359 | 0.164 | –0.722 | 0.183 |
| Bilirubin | –0.26 | 0.404 | 0.11 | –0.409 | 0.188 | 0.247 | 0.088 | –0.398 | 0.721 | –0.222 | 0.284 | 0.193 |
| Inflammation markers | ||||||||||||
| IL-1β | –0.526 | 0.403 | 0.216 | –0.782 | –0.126 | 1.142 | 0.638 | –0.751 | –0.46 | 0.172 | 1.202 | 0.561 |
| IL-6 | –0.388 | 1.12 | 0.569 | –0.715 | 0.23 | 2.265 | 1.546 | –0.709 | –0.186 | 0.679 | 2.28 | 1.283 |
| IL-8 | –0.503 | 0.873 | 0.473 | –0.876 | 0.124 | 1.788 | 1.207 | –0.875 | –0.066 | 0.392 | 1.826 | 0.963 |
| IL-10 | –0.507 | 0.833 | 0.449 | –0.873 | 0.167 | 1.493 | 0.938 | –0.85 | 0.234 | 0.182 | 1.559 | 0.731 |
| IL-17 | –0.394 | 0.515 | 0.207 | –0.555 | 0.037 | 0.86 | 0.337 | –0.534 | 0.111 | 0.004 | 0.91 | 0.266 |
| IL-18 | –0.295 | 0.608 | 0.204 | –0.477 | 0.218 | 0.682 | 0.227 | –0.455 | 0.82 | –0.25 | 0.764 | 0.333 |
| Leucocytes | ||||||||||||
| Myeloperoxidase | –0.428 | 0.432 | 0.185 | –0.659 | 0.075 | 0.578 | 0.258 | –0.617 | 0.384 | –0.182 | 0.66 | 0.245 |
| sICAM | –0.221 | 0.642 | 0.186 | –0.3 | 0.19 | 0.781 | 0.195 | –0.272 | 0.954 | –0.412 | 0.841 | 0.388 |
| Endothelial injury | ||||||||||||
| ANG II | –0.48 | 0.786 | 0.401 | –0.897 | 0.328 | 0.93 | 0.578 | –0.832 | 0.778 | –0.034 | 1.018 | 0.53 |
| Cardiovascular | ||||||||||||
| Troponin | –0.087 | 0.139 | 0.013 | –0.152 | 0.055 | 0.151 | 0.016 | –0.122 | 0.259 | –0.157 | 0.211 | 0.036 |
| NT-proBNP | –0.42 | 0.168 | 0.086 | –0.51 | –0.141 | 0.356 | 0.126 | –0.471 | 0.31 | –0.514 | 0.387 | 0.178 |
| Other markers | ||||||||||||
| sTNFR1 | –0.44 | 0.694 | 0.321 | –0.872 | 0.328 | 0.798 | 0.494 | –0.812 | 0.596 | 0.119 | 0.849 | 0.402 |
| Lactate | –0.422 | 0.661 | 0.293 | –0.665 | 0.144 | 0.991 | 0.457 | –0.652 | 0.264 | 0.102 | 1.036 | 0.359 |
| CCL2 | –0.494 | 0.925 | 0.503 | –0.809 | 0.121 | 1.819 | 1.184 | –0.795 | 0.026 | 0.288 | 1.874 | 0.936 |
| Parameter | Five-class model | |||||
|---|---|---|---|---|---|---|
| Class 1 | Class 2 | Class 3 | Class 5 | Class 4 | Separation | |
| Organ dysfunction | ||||||
| PaO2/FiO2 ratio | 0.103 | 0.126 | –0.062 | –0.017 | –0.455 | 0.044 |
| Creatinine | –0.802 | 0.14 | 0.603 | –0.121 | 0.584 | 0.27 |
| Platelets | 0.382 | 0.154 | –0.666 | 0.193 | –0.576 | 0.186 |
| Bilirubin | –0.514 | –0.011 | 0.999 | –0.287 | 0.032 | 0.267 |
| Inflammation markers | ||||||
| IL-1β | –0.907 | –0.439 | –0.114 | 0.234 | 1.407 | 0.611 |
| IL-6 | –0.891 | –0.374 | 0.365 | 0.927 | 2.608 | 1.468 |
| IL-8 | –1.011 | –0.427 | 0.342 | 0.563 | 2.048 | 1.075 |
| IL-10 | –0.98 | –0.33 | 0.606 | 0.266 | 1.681 | 0.805 |
| IL-17 | –0.635 | –0.228 | 0.332 | 0.019 | 1.068 | 0.329 |
| IL-18 | –0.579 | 0.051 | 1.015 | –0.329 | 0.631 | 0.35 |
| Leucocytes | ||||||
| Myeloperoxidase | –0.678 | –0.176 | 0.726 | –0.281 | 0.426 | 0.256 |
| sICAM | –0.415 | 0.124 | 1.124 | –0.466 | 0.732 | 0.392 |
| Endothelial injury | ||||||
| ANG II | –1.145 | 0.048 | 1.015 | –0.095 | 0.945 | 0.626 |
| Cardiovascular | ||||||
| Troponin | –0.317 | 0.214 | 0.253 | –0.268 | 0.171 | 0.062 |
| NT-proBNP | –0.736 | 0.027 | 0.267 | –0.602 | 0.403 | 0.211 |
| Other markers | ||||||
| sTNFR1 | –1.146 | 0.041 | 0.949 | 0.014 | 0.737 | 0.538 |
| Lactate | –0.762 | –0.312 | 0.669 | 0.22 | 0.985 | 0.403 |
| CCL2 | –0.957 | –0.355 | 0.522 | 0.398 | 2.001 | 0.992 |
| Parameter | Two-class model | Three-class model | Four-class model | |||||||||
|---|---|---|---|---|---|---|---|---|---|---|---|---|
| Class 1 | Class 2 | Separation | Class 1 | Class 2 | Class 3 | Separation | Class 1 | Class 2 | Class 3 | Class 4 | Separation | |
| Distribution (%) | 58 | 42 | 32 | 56 | 12 | 26 | 41 | 21 | 12 | |||
| Organ dysfunction | ||||||||||||
| PaO2/FiO2 ratio | 0.109 | –0.128 | 0.014 | 0.075 | 0.012 | –0.23 | 0.017 | 0.072 | 0.045 | 0.148 | –0.286 | 0.028 |
| Creatinine | –0.248 | 0.314 | 0.079 | –0.513 | 0.171 | 0.432 | 0.159 | –0.715 | 0.13 | 0.289 | 0.428 | 0.198 |
| Platelets | 0.249 | –0.331 | 0.084 | 0.363 | –0.052 | –0.595 | 0.154 | 0.352 | 0.194 | –0.518 | –0.513 | 0.159 |
| Bilirubin | –0.276 | 0.338 | 0.094 | –0.423 | 0.18 | 0.081 | 0.07 | –0.509 | –0.178 | 0.936 | 0.048 | 0.287 |
| Inflammation markers | ||||||||||||
| IL-1β | –0.575 | 0.396 | 0.236 | –0.829 | –0.111 | 1.327 | 0.804 | –0.932 | –0.116 | –0.363 | 1.353 | 0.711 |
| IL-6 | –0.462 | 1.085 | 0.598 | –0.759 | 0.278 | 2.42 | 1.752 | –0.871 | 0.134 | 0.068 | 2.441 | 1.489 |
| IL-8 | –0.54 | 0.818 | 0.461 | –0.891 | 0.154 | 1.909 | 1.335 | –0.986 | –0.03 | 0.174 | 1.921 | 1.101 |
| IL-10 | –0.533 | 0.774 | 0.427 | –0.872 | 0.181 | 1.597 | 1.023 | –0.961 | –0.105 | 0.471 | 1.58 | 0.853 |
| IL-17 | –0.397 | 0.463 | 0.185 | –0.538 | 0.054 | 0.845 | 0.321 | –0.572 | –0.149 | 0.236 | 0.885 | 0.287 |
| IL-18 | –0.277 | 0.503 | 0.152 | –0.463 | 0.204 | 0.599 | 0.192 | –0.515 | –0.146 | 0.907 | 0.505 | 0.306 |
| Leucocytes | ||||||||||||
| Myeloperoxidase | –0.385 | 0.317 | 0.123 | –0.636 | 0.075 | 0.519 | 0.226 | –0.64 | –0.209 | 0.449 | 0.402 | 0.204 |
| sICAM | –0.236 | 0.563 | 0.16 | –0.293 | 0.172 | 0.754 | 0.183 | –0.323 | –0.243 | 1.122 | 0.69 | 0.378 |
| Endothelial injury | ||||||||||||
| ANG II | –0.506 | 0.723 | 0.378 | –0.914 | 0.327 | 0.876 | 0.561 | –1.028 | 0.001 | 0.772 | 0.855 | 0.573 |
| Cardiovascular | ||||||||||||
| Troponin | –0.041 | 0.052 | 0.002 | –0.18 | 0.062 | 0.146 | 0.019 | –0.235 | 0.038 | 0.126 | 0.144 | 0.023 |
| NT-proBNP | –0.389 | 0.099 | 0.06 | –0.465 | –0.137 | 0.334 | 0.108 | –0.591 | –0.274 | 0.163 | 0.348 | 0.135 |
| Other markers | ||||||||||||
| sTNFR1 | –0.433 | 0.583 | 0.258 | –0.862 | 0.313 | 0.701 | 0.442 | –1.051 | 0.09 | 0.638 | 0.652 | 0.479 |
| Lactate | –0.44 | 0.606 | 0.274 | –0.675 | 0.172 | 0.904 | 0.416 | –0.733 | –0.144 | 0.542 | 0.891 | 0.392 |
| CCL2 | –0.527 | 0.863 | 0.483 | –0.814 | 0.152 | 1.908 | 1.27 | –0.913 | –0.054 | 0.283 | 1.897 | 1.037 |
| Parameter | Two-class model | Three-class model | Four-class model | |||||||||
|---|---|---|---|---|---|---|---|---|---|---|---|---|
| Class 1 | Class 2 | Separation | Class 1 | Class 2 | Class 3 | Separation | Class 1 | Class 2 | Class 3 | Class 4 | Separation | |
| Distribution (%) | 54 | 46 | 30 | 51 | 19 | 31 | 24 | 29 | 16 | |||
| Organ dysfunction | ||||||||||||
| PaO2/FiO2 ratio | 0.108 | –0.091 | 0.01 | 0.092 | 0.057 | –0.234 | 0.021 | 0.073 | 0.112 | 0.053 | –0.269 | 0.023 |
| Creatinine | –0.272 | 0.278 | 0.076 | –0.524 | 0.148 | 0.349 | 0.139 | –0.499 | 0.335 | 0.006 | 0.395 | 0.126 |
| Platelets | 0.323 | –0.336 | 0.109 | 0.362 | 0.061 | –0.693 | 0.197 | 0.379 | –0.439 | 0.275 | –0.533 | 0.168 |
| Bilirubin | –0.298 | 0.305 | 0.091 | –0.471 | 0.116 | 0.256 | 0.099 | –0.454 | 0.687 | –0.236 | 0.129 | 0.187 |
| Inflammation markers | ||||||||||||
| IL-1β | –0.591 | 0.327 | 0.211 | –0.834 | –0.113 | 0.79 | 0.441 | –0.798 | –0.507 | 0.147 | 1.112 | 0.538 |
| IL-6 | –0.49 | 0.971 | 0.534 | –0.819 | 0.18 | 1.932 | 1.293 | –0.795 | –0.274 | 0.56 | 2.233 | 1.316 |
| IL-8 | –0.602 | 0.744 | 0.453 | –0.949 | 0.046 | 1.541 | 1.047 | –0.932 | –0.129 | 0.305 | 1.742 | 0.942 |
| IL-10 | –0.591 | 0.698 | 0.415 | –0.925 | 0.066 | 1.371 | 0.884 | –0.919 | 0.209 | 0.129 | 1.465 | 0.714 |
| IL-17 | –0.423 | 0.402 | 0.17 | –0.564 | –0.004 | 0.68 | 0.259 | –0.546 | 0.124 | –0.075 | 0.828 | 0.244 |
| IL-18 | –0.351 | 0.502 | 0.182 | –0.477 | 0.162 | 0.518 | 0.169 | –0.466 | 0.732 | –0.199 | 0.48 | 0.237 |
| Leucocytes | ||||||||||||
| Myeloperoxidase | –0.452 | 0.306 | 0.144 | –0.641 | 0.037 | 0.377 | 0.179 | –0.611 | 0.252 | –0.127 | 0.455 | 0.165 |
| sICAM | –0.26 | 0.518 | 0.151 | –0.302 | 0.118 | 0.687 | 0.164 | –0.276 | 0.919 | –0.396 | 0.692 | 0.334 |
| Endothelial injury | ||||||||||||
| ANG II | –0.563 | 0.648 | 0.367 | –0.941 | 0.269 | 0.729 | 0.496 | –0.884 | 0.631 | –0.053 | 0.838 | 0.453 |
| Cardiovascular | ||||||||||||
| Troponin | –0.051 | 0.041 | 0.002 | –0.163 | 0.065 | 0.08 | 0.012 | –0.143 | 0.214 | –0.062 | 0.08 | 0.019 |
| NT-proBNP | –0.44 | 0.095 | 0.072 | –0.5 | –0.159 | 0.229 | 0.089 | –0.479 | 0.3 | –0.667 | 0.35 | 0.206 |
| Other markers | ||||||||||||
| sTNFR1 | –0.48 | 0.523 | 0.252 | –0.898 | 0.273 | 0.591 | 0.41 | –0.857 | 0.493 | 0.115 | 0.622 | 0.336 |
| Lactate | –0.469 | 0.523 | 0.246 | –0.697 | 0.099 | 0.729 | 0.34 | –0.693 | 0.142 | 0.159 | 0.82 | 0.288 |
| CCL2 | –0.57 | 0.763 | 0.444 | –0.85 | 0.035 | 1.538 | 0.972 | –0.832 | –0.009 | 0.17 | 1.766 | 0.885 |
| Parameter | Two-class model | Three-class model | Four-class model | |||||||||
|---|---|---|---|---|---|---|---|---|---|---|---|---|
| Class 1 | Class 2 | Separation | Class 1 | Class 2 | Class 3 | Separation | Class 1 | Class 2 | Class 3 | Class 4 | Separation | |
| Distribution (%) | 58 | 42 | 39 | 50 | 11 | 31 | 25 | 33 | 11 | |||
| Organ dysfunction | ||||||||||||
| PaO2/FiO2 ratio | 0.12 | –0.15 | 0.018 | 0.098 | –0.01 | –0.252 | 0.021 | 0.076 | 0.109 | –0.096 | –0.232 | 0.019 |
| Creatinine | –0.228 | 0.289 | 0.067 | –0.368 | 0.155 | 0.451 | 0.115 | –0.512 | 0.233 | 0.078 | 0.459 | 0.129 |
| Platelets | 0.238 | –0.319 | 0.078 | 0.304 | –0.087 | –0.58 | 0.131 | 0.378 | –0.335 | 0.119 | –0.627 | 0.152 |
| Bilirubin | –0.231 | 0.284 | 0.066 | –0.295 | 0.196 | 0.021 | 0.041 | –0.454 | 0.585 | –0.01 | 0.054 | 0.136 |
| Inflammation markers | ||||||||||||
| IL-1β | –0.587 | 0.416 | 0.252 | –0.774 | –0.036 | 1.383 | 0.801 | –0.825 | –0.5 | 0.157 | 1.381 | 0.713 |
| IL-6 | –0.487 | 1.123 | 0.648 | –0.746 | 0.428 | 2.506 | 1.808 | –0.773 | –0.369 | 0.795 | 2.456 | 1.571 |
| IL-8 | –0.552 | 0.838 | 0.483 | –0.836 | 0.274 | 1.954 | 1.315 | –0.925 | –0.173 | 0.45 | 1.953 | 1.119 |
| IL-10 | –0.532 | 0.775 | 0.427 | –0.779 | 0.283 | 1.601 | 0.948 | –0.894 | 0.058 | 0.344 | 1.62 | 0.807 |
| IL-17 | –0.4 | 0.465 | 0.187 | –0.499 | 0.106 | 0.9 | 0.328 | –0.565 | 0.079 | 0.079 | 0.924 | 0.28 |
| IL-18 | –0.258 | 0.479 | 0.136 | –0.358 | 0.246 | 0.569 | 0.148 | –0.497 | 0.641 | –0.053 | 0.605 | 0.226 |
| Leucocytes | ||||||||||||
| Myeloperoxidase | –0.373 | 0.303 | 0.114 | –0.531 | 0.125 | 0.461 | 0.17 | –0.64 | 0.194 | –0.008 | 0.49 | 0.172 |
| sICAM | –0.2 | 0.515 | 0.128 | –0.175 | 0.166 | 0.742 | 0.143 | –0.312 | 0.823 | –0.195 | 0.777 | 0.279 |
| Endothelial injury | ||||||||||||
| ANG II | –0.486 | 0.696 | 0.349 | –0.709 | 0.356 | 0.894 | 0.444 | –0.896 | 0.556 | 0.152 | 0.933 | 0.467 |
| Cardiovascular | ||||||||||||
| Troponin | –0.017 | 0.018 | 0 | –0.034 | –0.017 | 0.157 | 0.007 | –0.09 | 0.126 | –0.128 | 0.18 | 0.018 |
| NT-proBNP | –0.368 | 0.07 | 0.048 | –0.346 | –0.184 | 0.361 | 0.091 | –0.496 | 0.166 | –0.359 | 0.359 | 0.126 |
| Other markers | ||||||||||||
| sTNFR1 | –0.414 | 0.56 | 0.237 | –0.659 | 0.333 | 0.705 | 0.331 | –0.865 | 0.404 | 0.229 | 0.719 | 0.355 |
| Lactate | –0.425 | 0.59 | 0.258 | –0.613 | 0.263 | 0.91 | 0.39 | –0.684 | 0.048 | 0.342 | 0.898 | 0.326 |
| CCL2 | –0.533 | 0.873 | 0.494 | –0.753 | 0.262 | 1.944 | 1.237 | –0.817 | –0.087 | 0.369 | 1.966 | 1.041 |
| Parameter | Two-class model | Three-class model | Four-class model | |||||||||
|---|---|---|---|---|---|---|---|---|---|---|---|---|
| Class 1 | Class 2 | Separation | Class 1 | Class 2 | Class 3 | Separation | Class 1 | Class 2 | Class 3 | Class 4 | Separation | |
| Distribution (%) | 54 | 46 | 37 | 43 | 20 | 33 | 21 | 30 | 16 | |||
| Organ dysfunction | ||||||||||||
| PaO2/FiO2 ratio | 0.138 | –0.132 | 0.018 | 0.08 | 0.063 | –0.221 | 0.019 | 0.074 | 0.137 | 0.023 | –0.261 | 0.023 |
| Creatinine | –0.259 | 0.267 | 0.069 | –0.39 | 0.116 | 0.375 | 0.101 | –0.446 | 0.309 | 0.02 | 0.389 | 0.107 |
| Platelets | 0.316 | –0.33 | 0.104 | 0.344 | 0.099 | –0.771 | 0.229 | 0.394 | –0.539 | 0.282 | –0.518 | 0.189 |
| Bilirubin | –0.247 | 0.242 | 0.06 | –0.319 | 0.094 | 0.227 | 0.054 | –0.42 | 0.706 | –0.183 | 0.103 | 0.177 |
| Inflammation markers | ||||||||||||
| IL-1β | –0.612 | 0.367 | 0.24 | –0.801 | –0.027 | 0.734 | 0.393 | –0.78 | –0.521 | 0.15 | 1.096 | 0.526 |
| IL-6 | –0.513 | 1.015 | 0.584 | –0.772 | 0.328 | 1.791 | 1.102 | –0.765 | –0.293 | 0.54 | 2.239 | 1.309 |
| IL-8 | –0.61 | 0.768 | 0.475 | –0.882 | 0.17 | 1.416 | 0.882 | –0.905 | –0.141 | 0.293 | 1.757 | 0.94 |
| IL-10 | –0.591 | 0.714 | 0.426 | –0.832 | 0.153 | 1.327 | 0.779 | –0.885 | 0.219 | 0.141 | 1.459 | 0.69 |
| IL-17 | –0.436 | 0.425 | 0.185 | –0.499 | 0.039 | 0.641 | 0.217 | –0.528 | 0.065 | 0.013 | 0.793 | 0.221 |
| IL-18 | –0.331 | 0.477 | 0.163 | –0.378 | 0.17 | 0.539 | 0.142 | –0.459 | 0.804 | –0.168 | 0.464 | 0.249 |
| Leucocytes | ||||||||||||
| Myeloperoxidase | –0.447 | 0.308 | 0.143 | –0.552 | 0.079 | 0.356 | 0.144 | –0.614 | 0.304 | –0.085 | 0.426 | 0.164 |
| sICAM | –0.217 | 0.46 | 0.115 | –0.15 | 0.061 | 0.693 | 0.128 | –0.248 | 0.937 | –0.334 | 0.662 | 0.308 |
| Endothelial injury | ||||||||||||
| ANG II | –0.541 | 0.634 | 0.345 | –0.736 | 0.289 | 0.707 | 0.368 | –0.855 | 0.664 | 0.015 | 0.797 | 0.428 |
| Cardiovascular | ||||||||||||
| Troponin | –0.033 | 0.018 | 0.001 | –0.049 | 0.008 | 0.069 | 0.002 | –0.13 | 0.264 | –0.109 | 0.057 | 0.025 |
| NT-proBNP | –0.416 | 0.074 | 0.06 | –0.362 | –0.242 | 0.265 | 0.074 | –0.456 | 0.33 | –0.609 | 0.315 | 0.186 |
| Other markers | ||||||||||||
| sTNFR1 | –0.458 | 0.511 | 0.235 | –0.69 | 0.285 | 0.581 | 0.295 | –0.799 | 0.485 | 0.158 | 0.601 | 0.303 |
| Lactate | –0.454 | 0.512 | 0.233 | –0.636 | 0.194 | 0.682 | 0.296 | –0.677 | 0.174 | 0.151 | 0.792 | 0.273 |
| CCL2 | –0.571 | 0.779 | 0.456 | –0.794 | 0.113 | 1.471 | 0.866 | –0.818 | 0.005 | 0.16 | 1.772 | 0.88 |
| Characteristic | Value |
|---|---|
| Age (years), mean (SD) | 53.8 (16.5) |
| Male sex, n (%) | 307 (57) |
| ARDS risk factors: direct, n (%) | |
| Aspiration | 49 (9.1) |
| Pneumonia | 295 (54.6) |
| Trauma | 31 (5.7) |
| Other | 28 (5.2) |
| None | 137 (25.4) |
| ARDS risk factors: indirect, n (%) | |
| Sepsis | 224 (41.9) |
| Pancreatitis | 18 (3.3) |
| Other | 33 (6.1) |
| None | 265 (49.1) |
| APACHE II score (points), mean (SD) | 18.8 (6.6) |
| SOFA score (points), mean (SD) | 8.8 (3.1) |
| Vasopressor dependent, n (%) | 356 (66.1) |
| PaO2/FiO2 ratio (mmHg), mean (SD) | 17.0 (7.4) |
| Tidal volume (ml/kg), mean (SD) | 8.1 (2.7) |
| 28-day mortality, n (%) | 132 (24.5) |
| 90-day mortality, n (%) | 165 (30.6) |
| Ventilator-free days, median (IQR) | 13 (0–22) |
| Non-pulmonary organ failure-free days, median (IQR) | 25 (4–28) |
| Baseline plasma IL-6 (pg/ml) concentration, median (25–75%) | 4.9 (4–5.9) |
| Baseline plasma sTNFR1 (pg/ml) concentration, median (25–75%) | 8.5 (8–9.1) |
| Variable name | Missing (n) |
|---|---|
| Age | 0 |
| Sex | 1 |
| Pulmonary ARDS (i.e. aspiration, pneumonia, trauma, other, none) | 0 |
| Extrapulmonary ARDS (sepsis, pancreatitis, other, none) | 0 |
| Bilirubin | 37 |
| Creatinine | 22 |
| Platelets | 23 |
| PaO2/FiO2 ratio | 1 |
| Plateau pressure | 245 |
| Tidal volume | 45 |
| Vasopressor dependent | 1 |
| IL-6 | 30 |
| sTNFR1 | 29 |
FIGURE 40.
Separation plot for the stage 2 two-class model: the VANISH trial. 15 P/F, PaO2/FiO2 ratio.
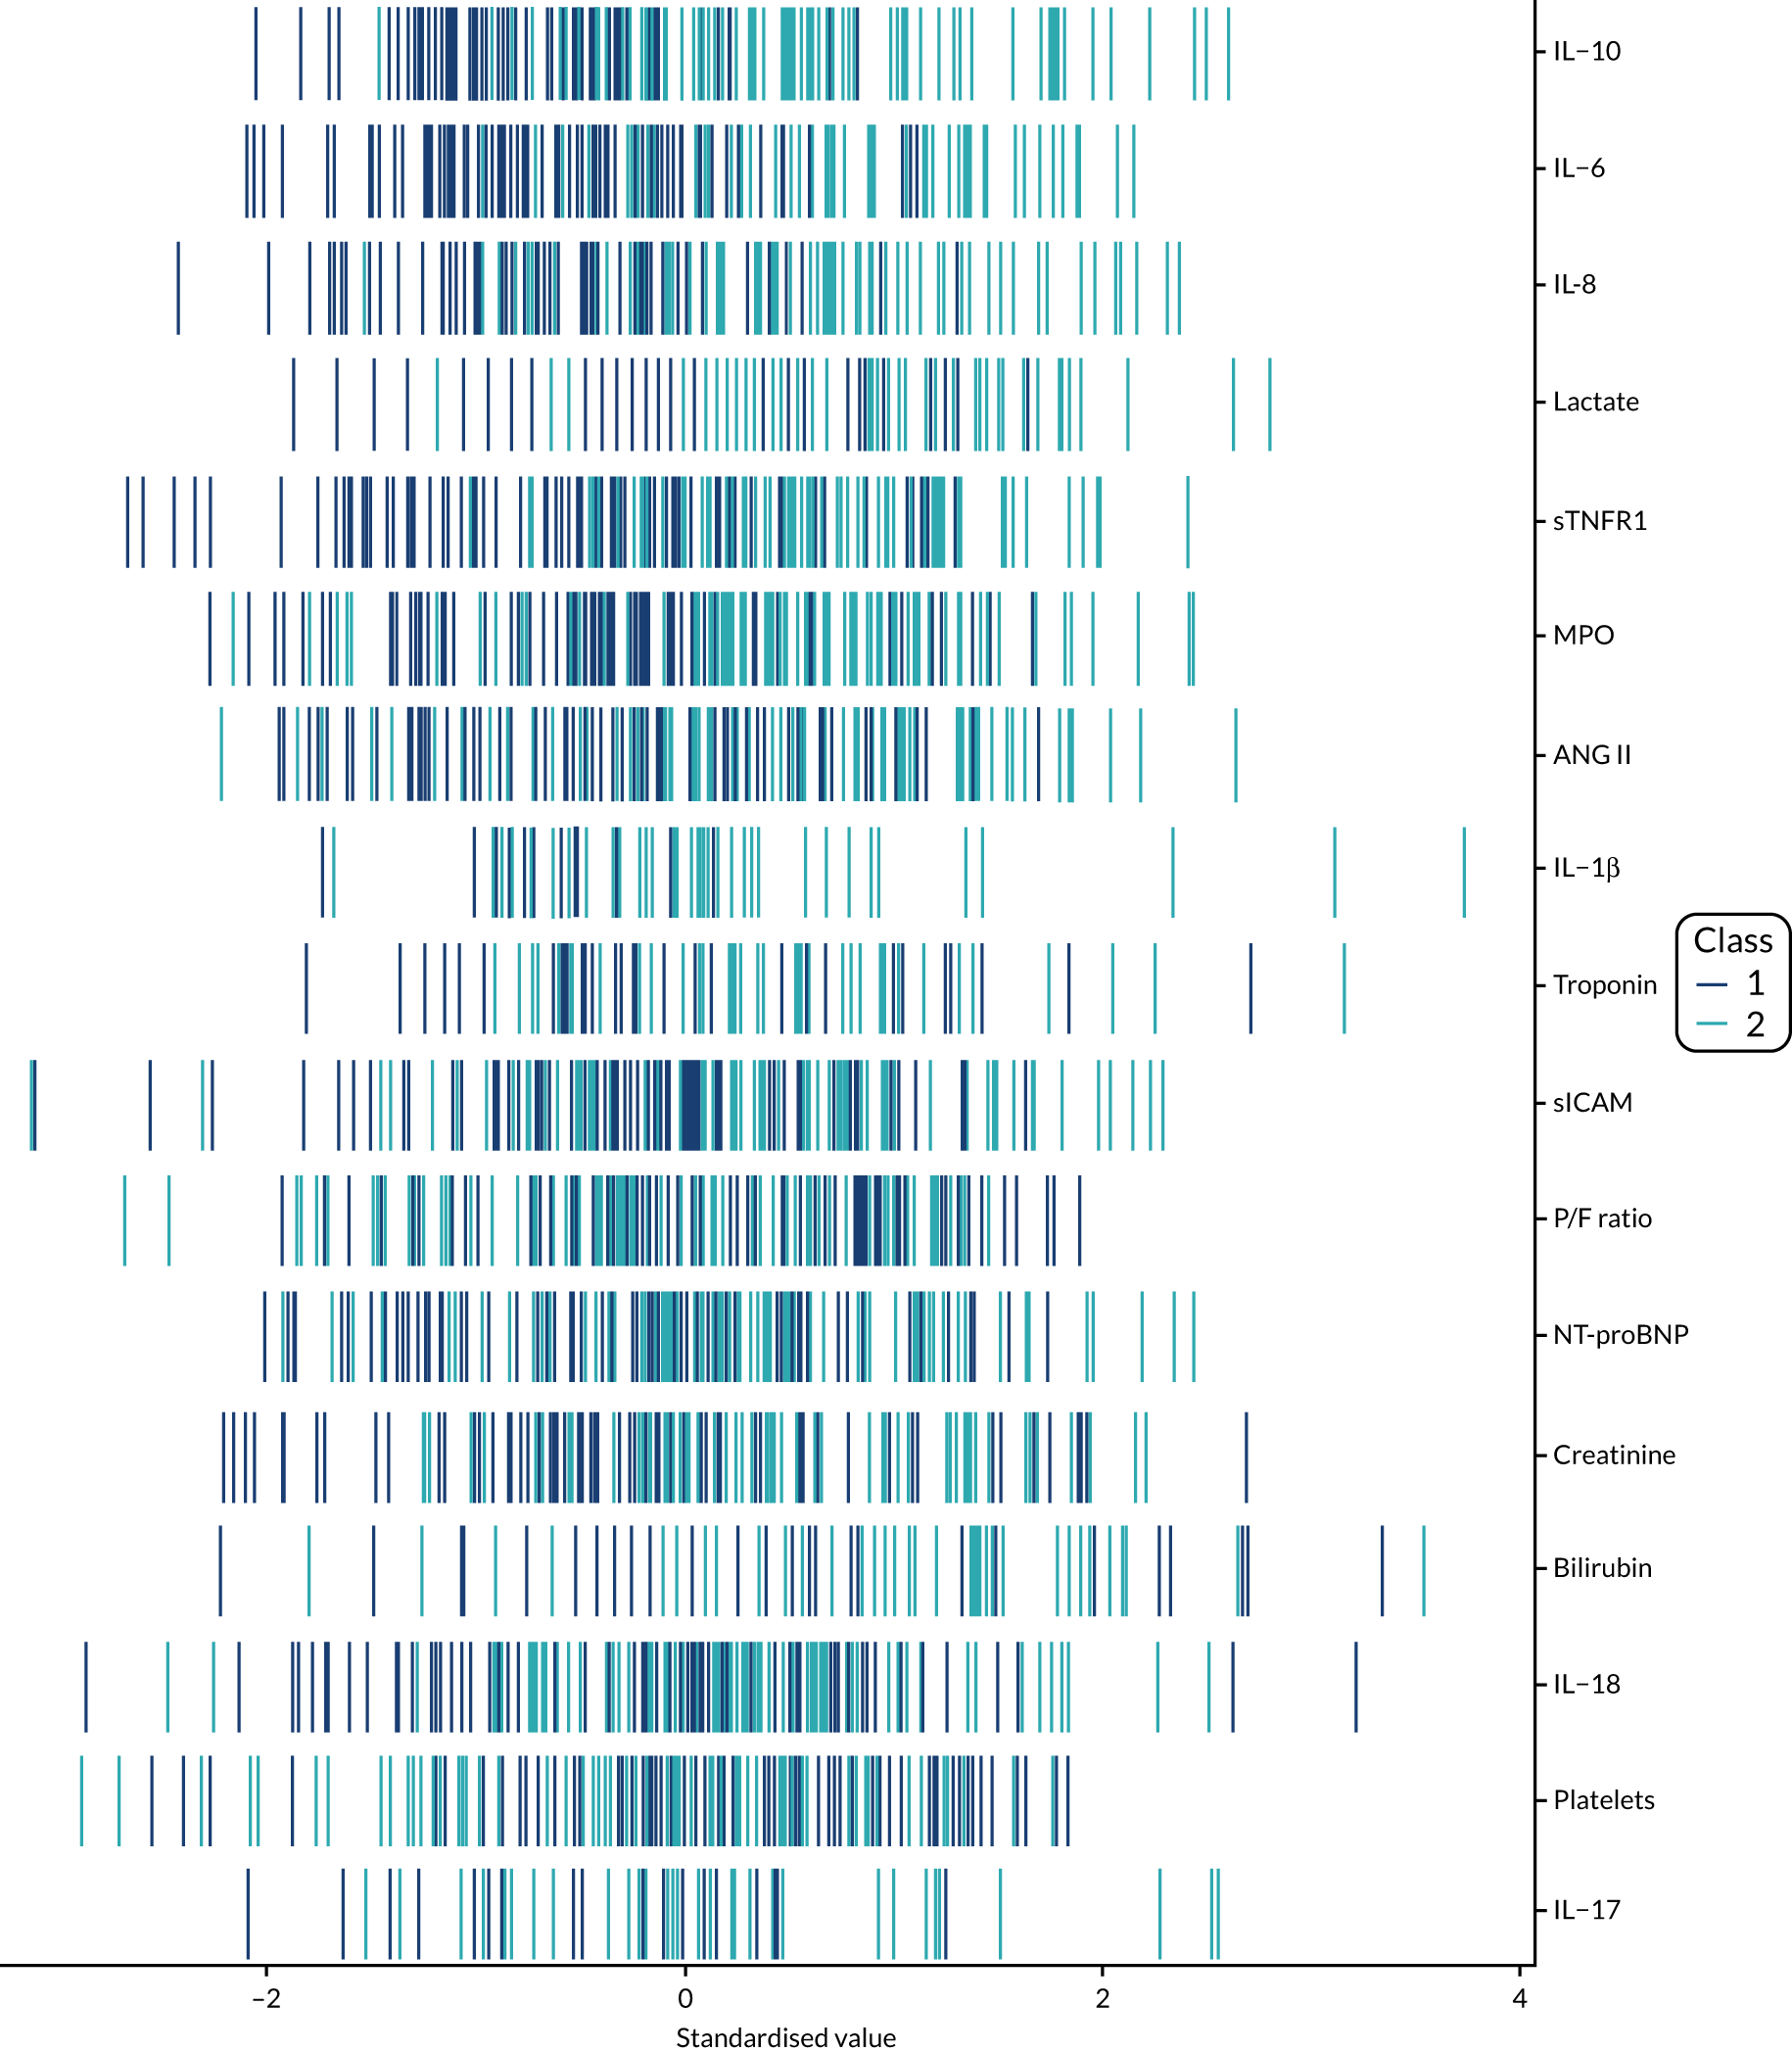
FIGURE 41.
Separation plot for the stage 2 three-class model: the VANISH trial. 15 P/F, PaO2/FiO2 ratio.
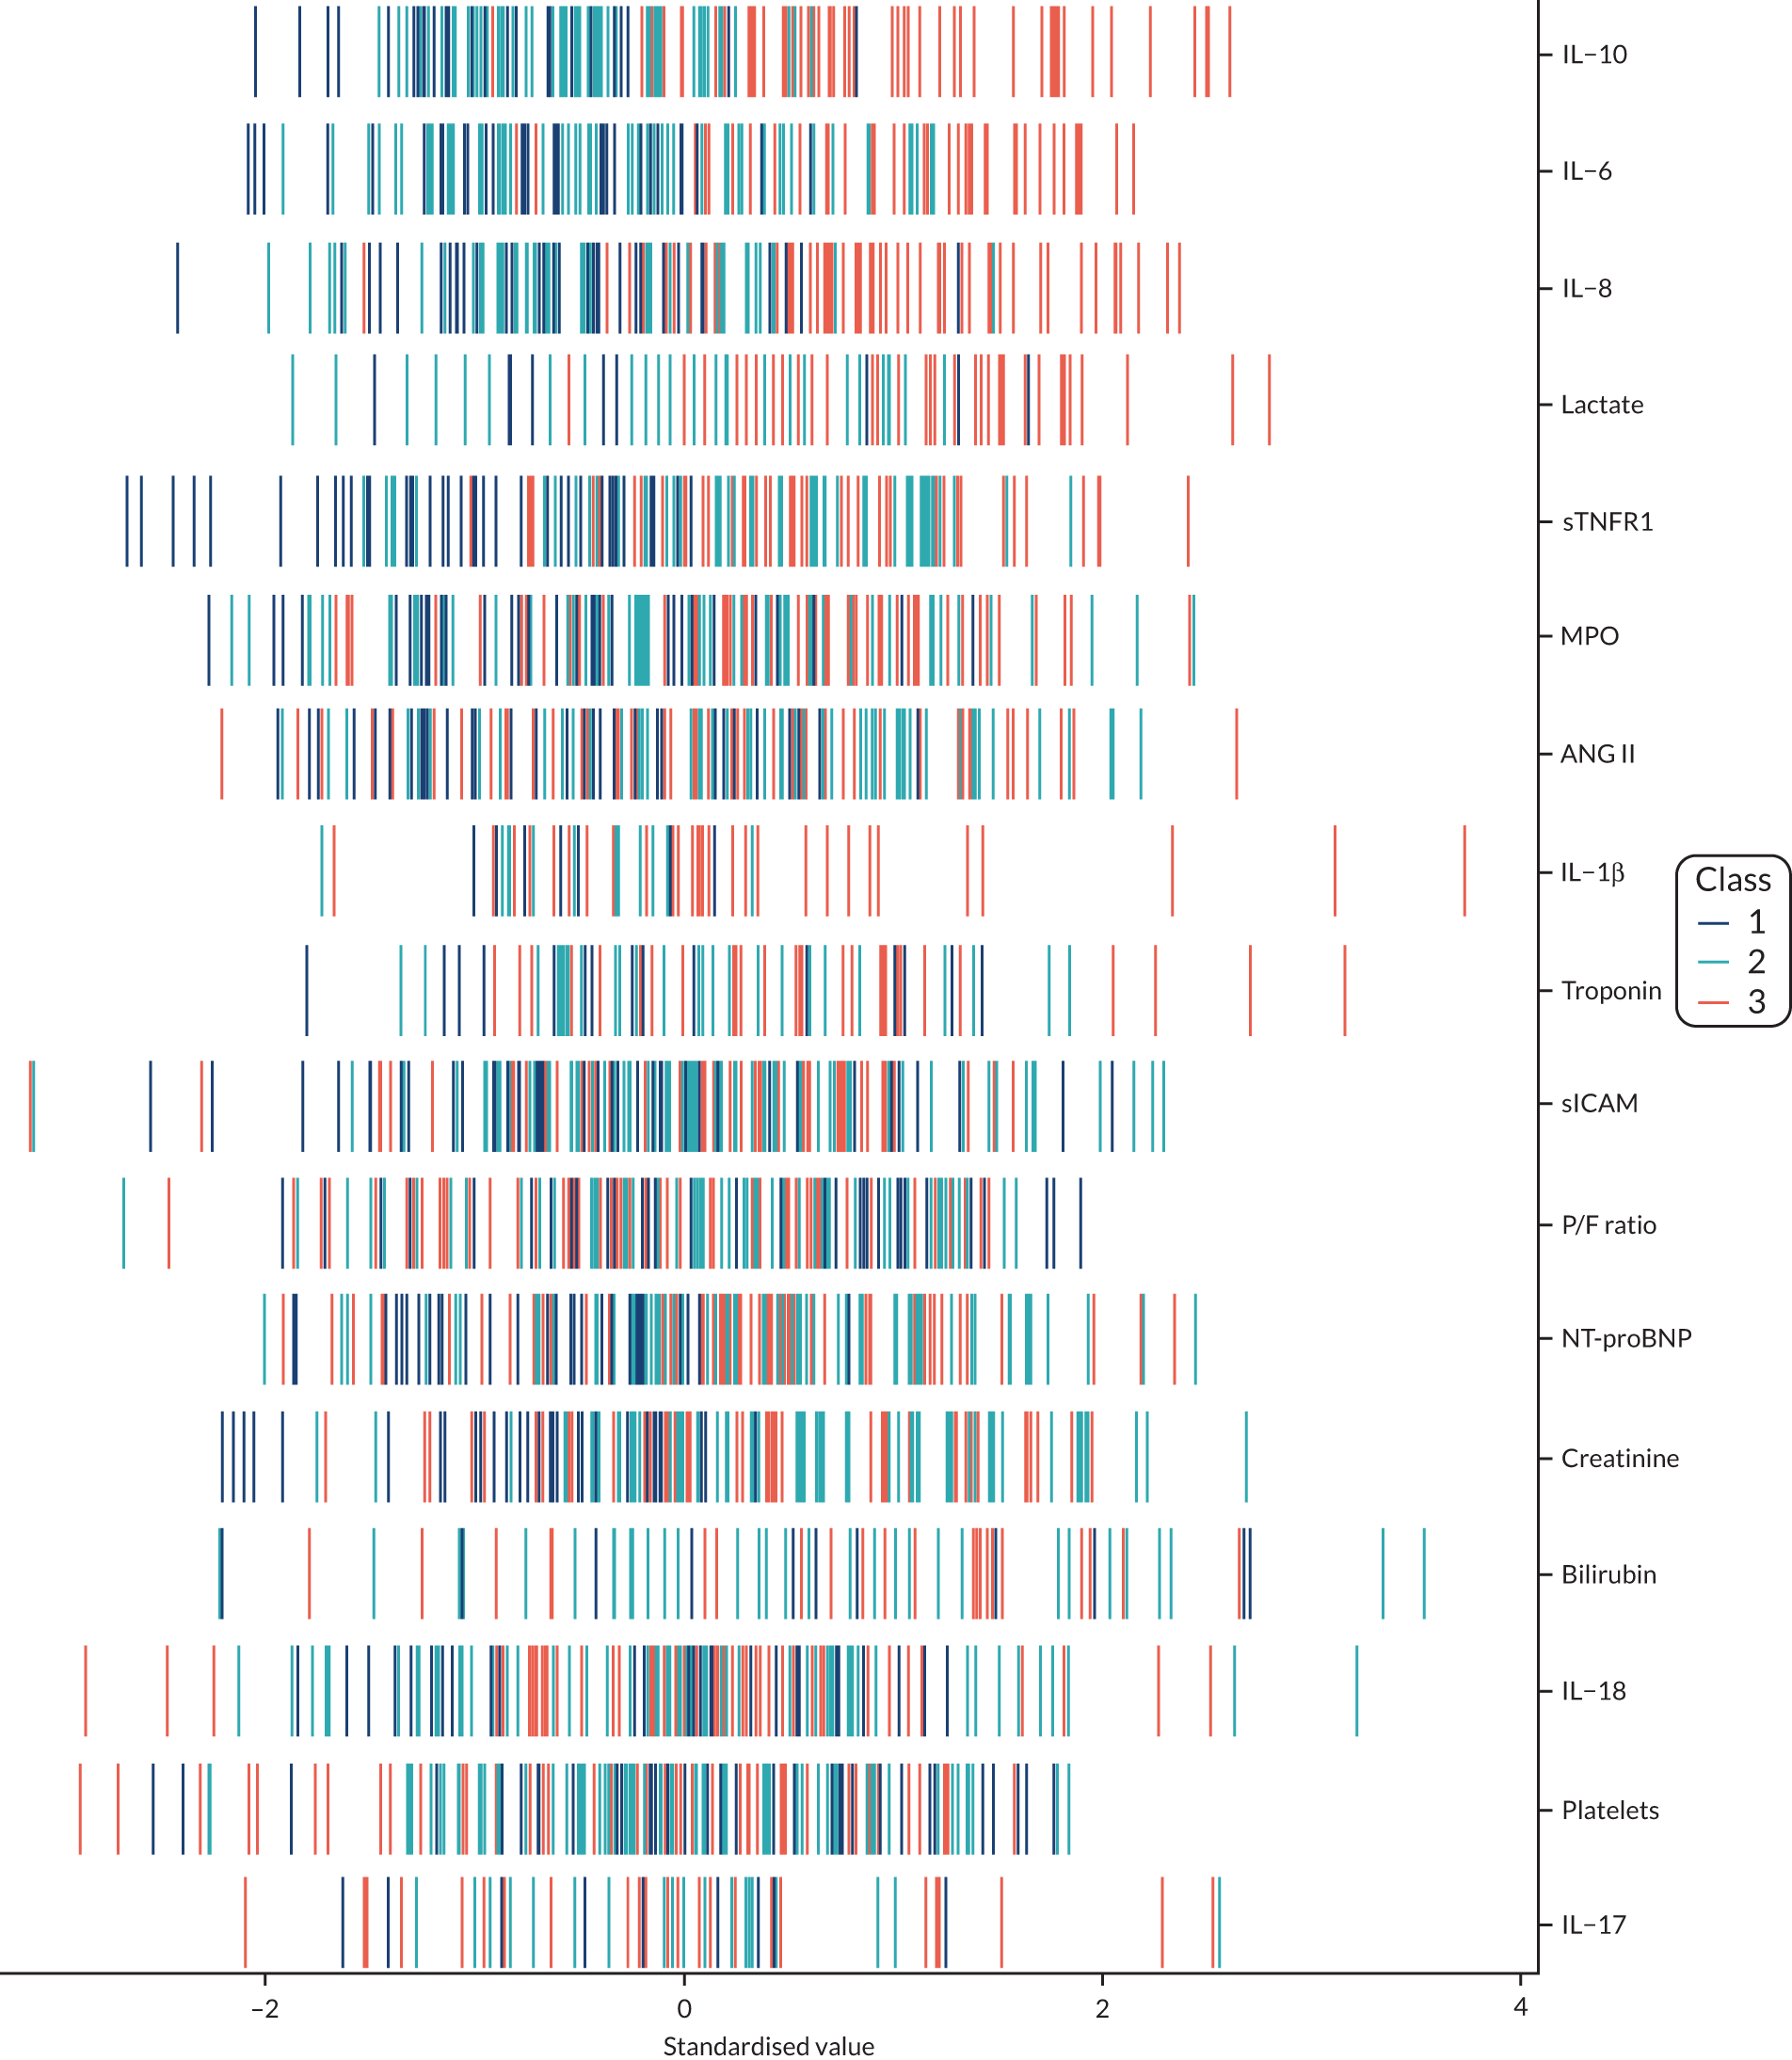
FIGURE 42.
Separation plot for the stage 3b two-class model: the VANISH trial. 15 P/F, PaO2/FiO2 ratio.
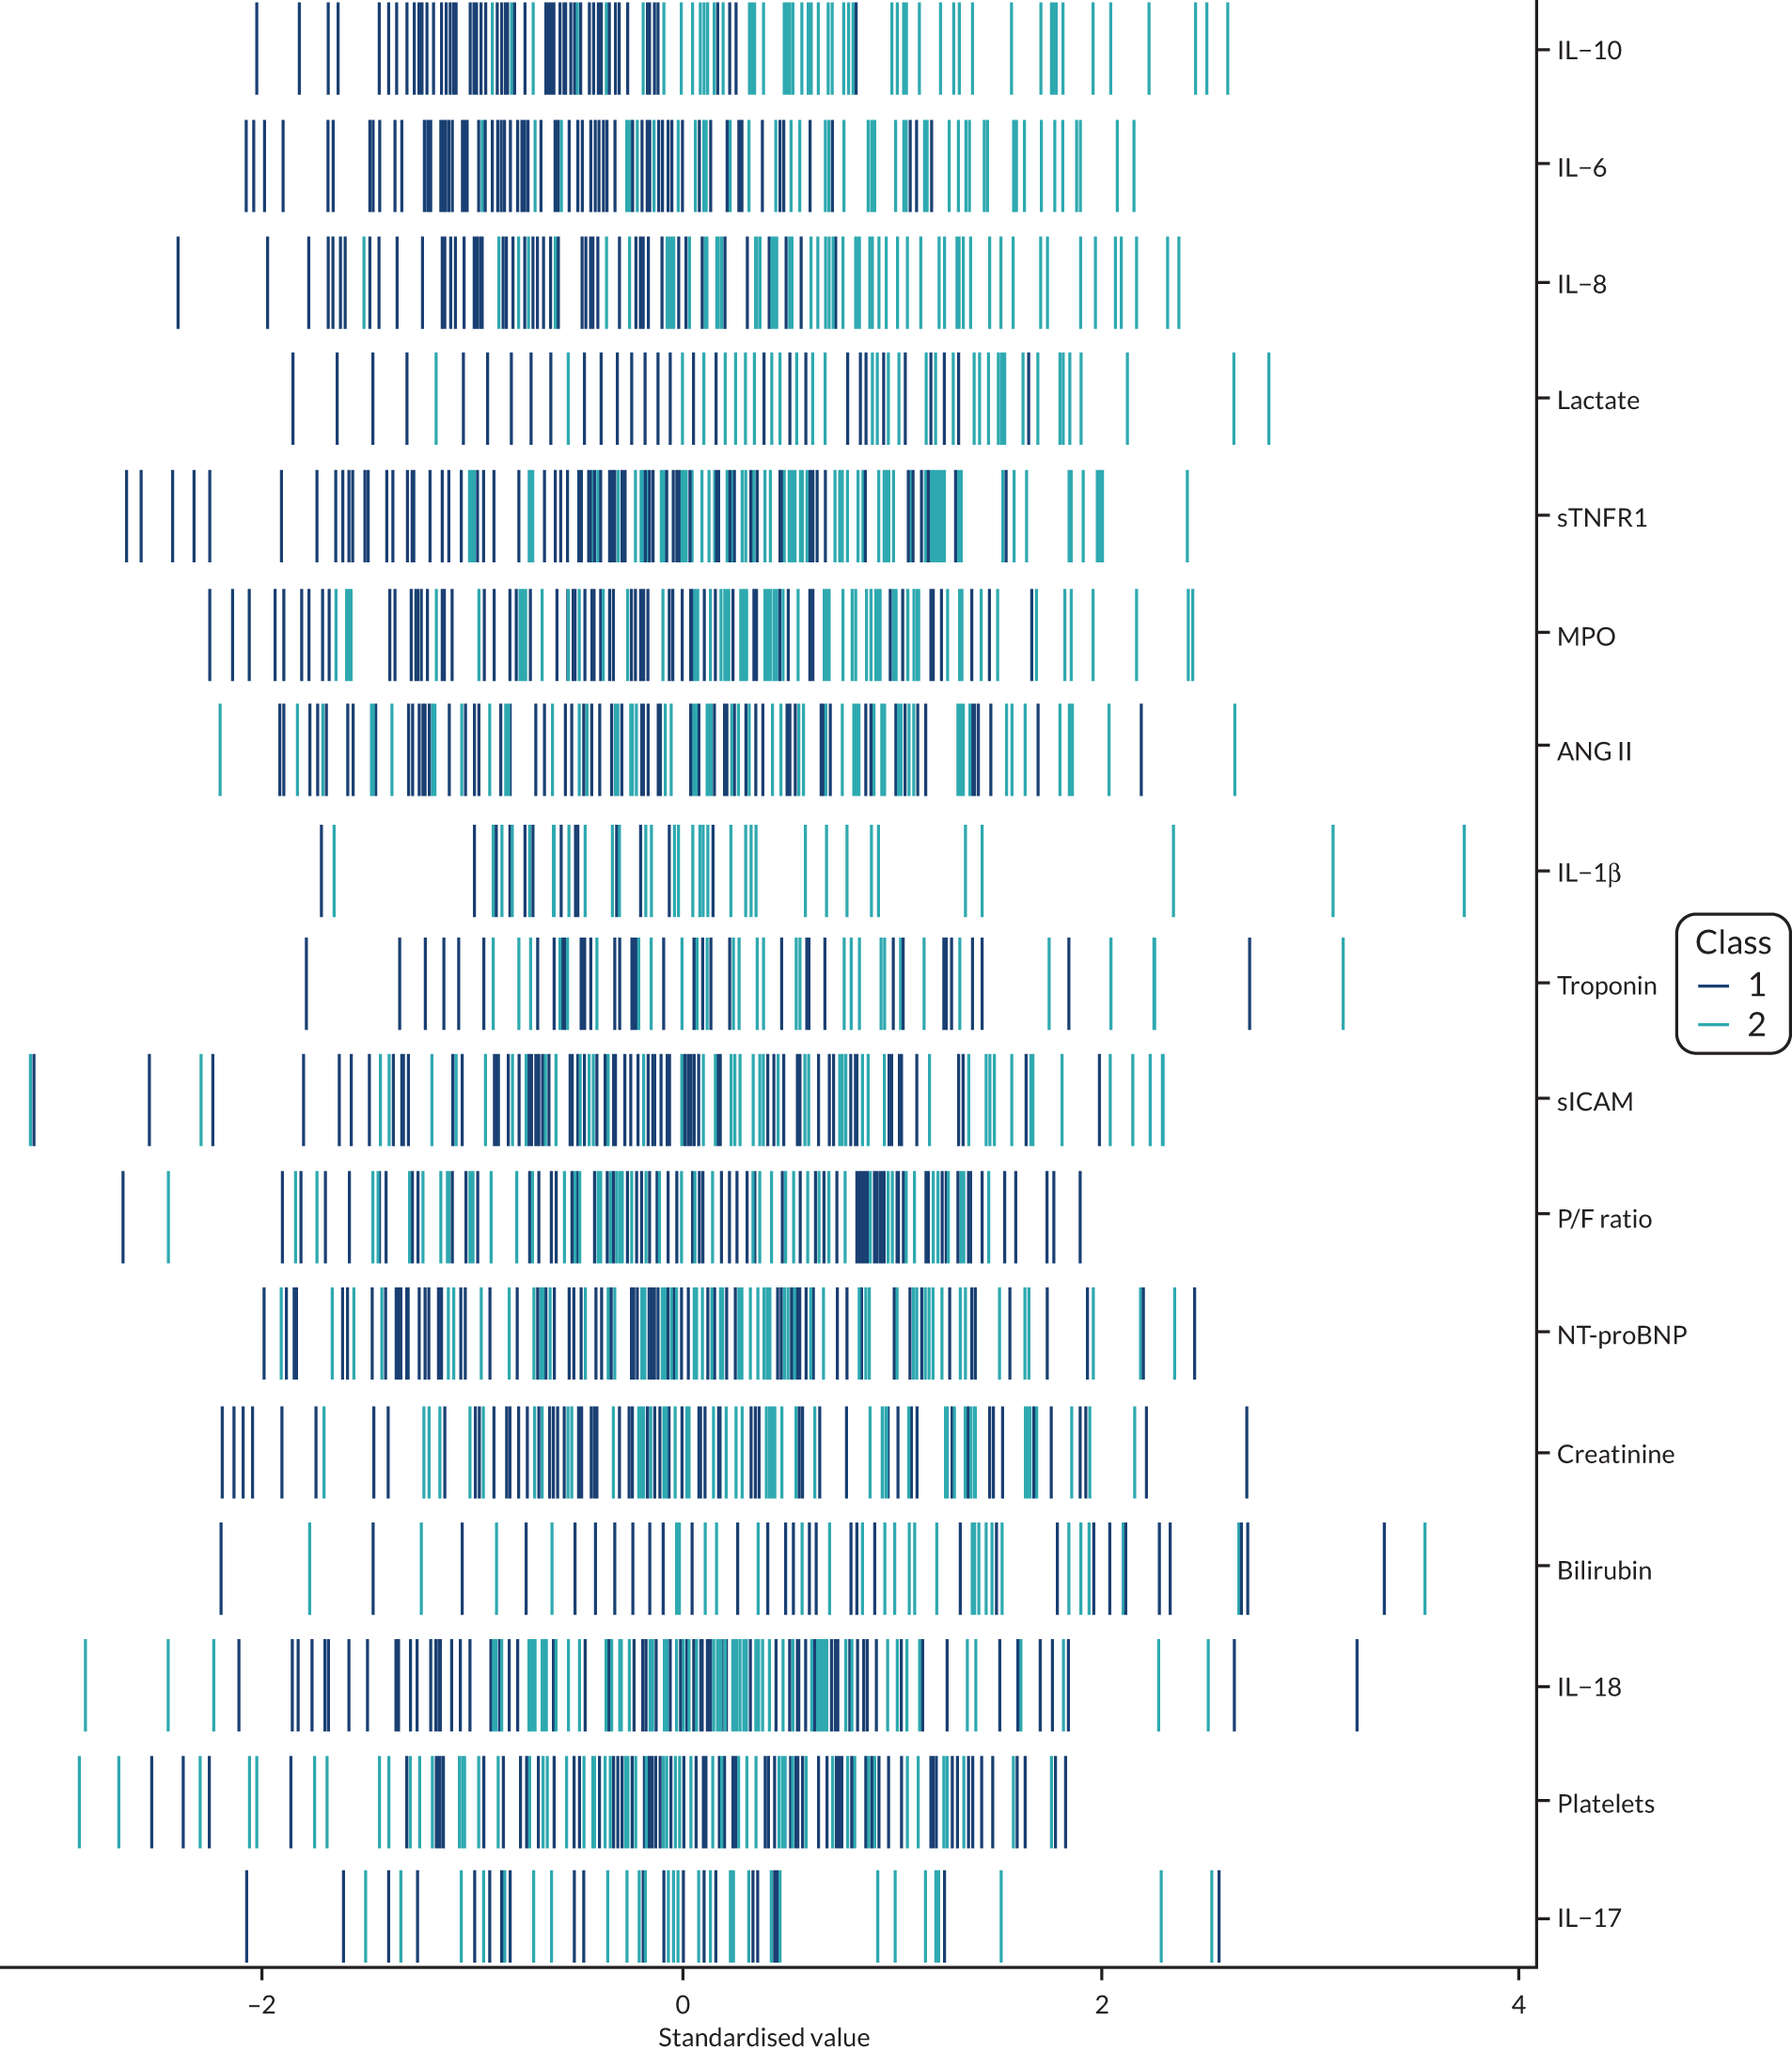
FIGURE 43.
Separation plot for the stage 3 three-class model: the VANISH trial. 15 P/F, PaO2/FiO2 ratio.
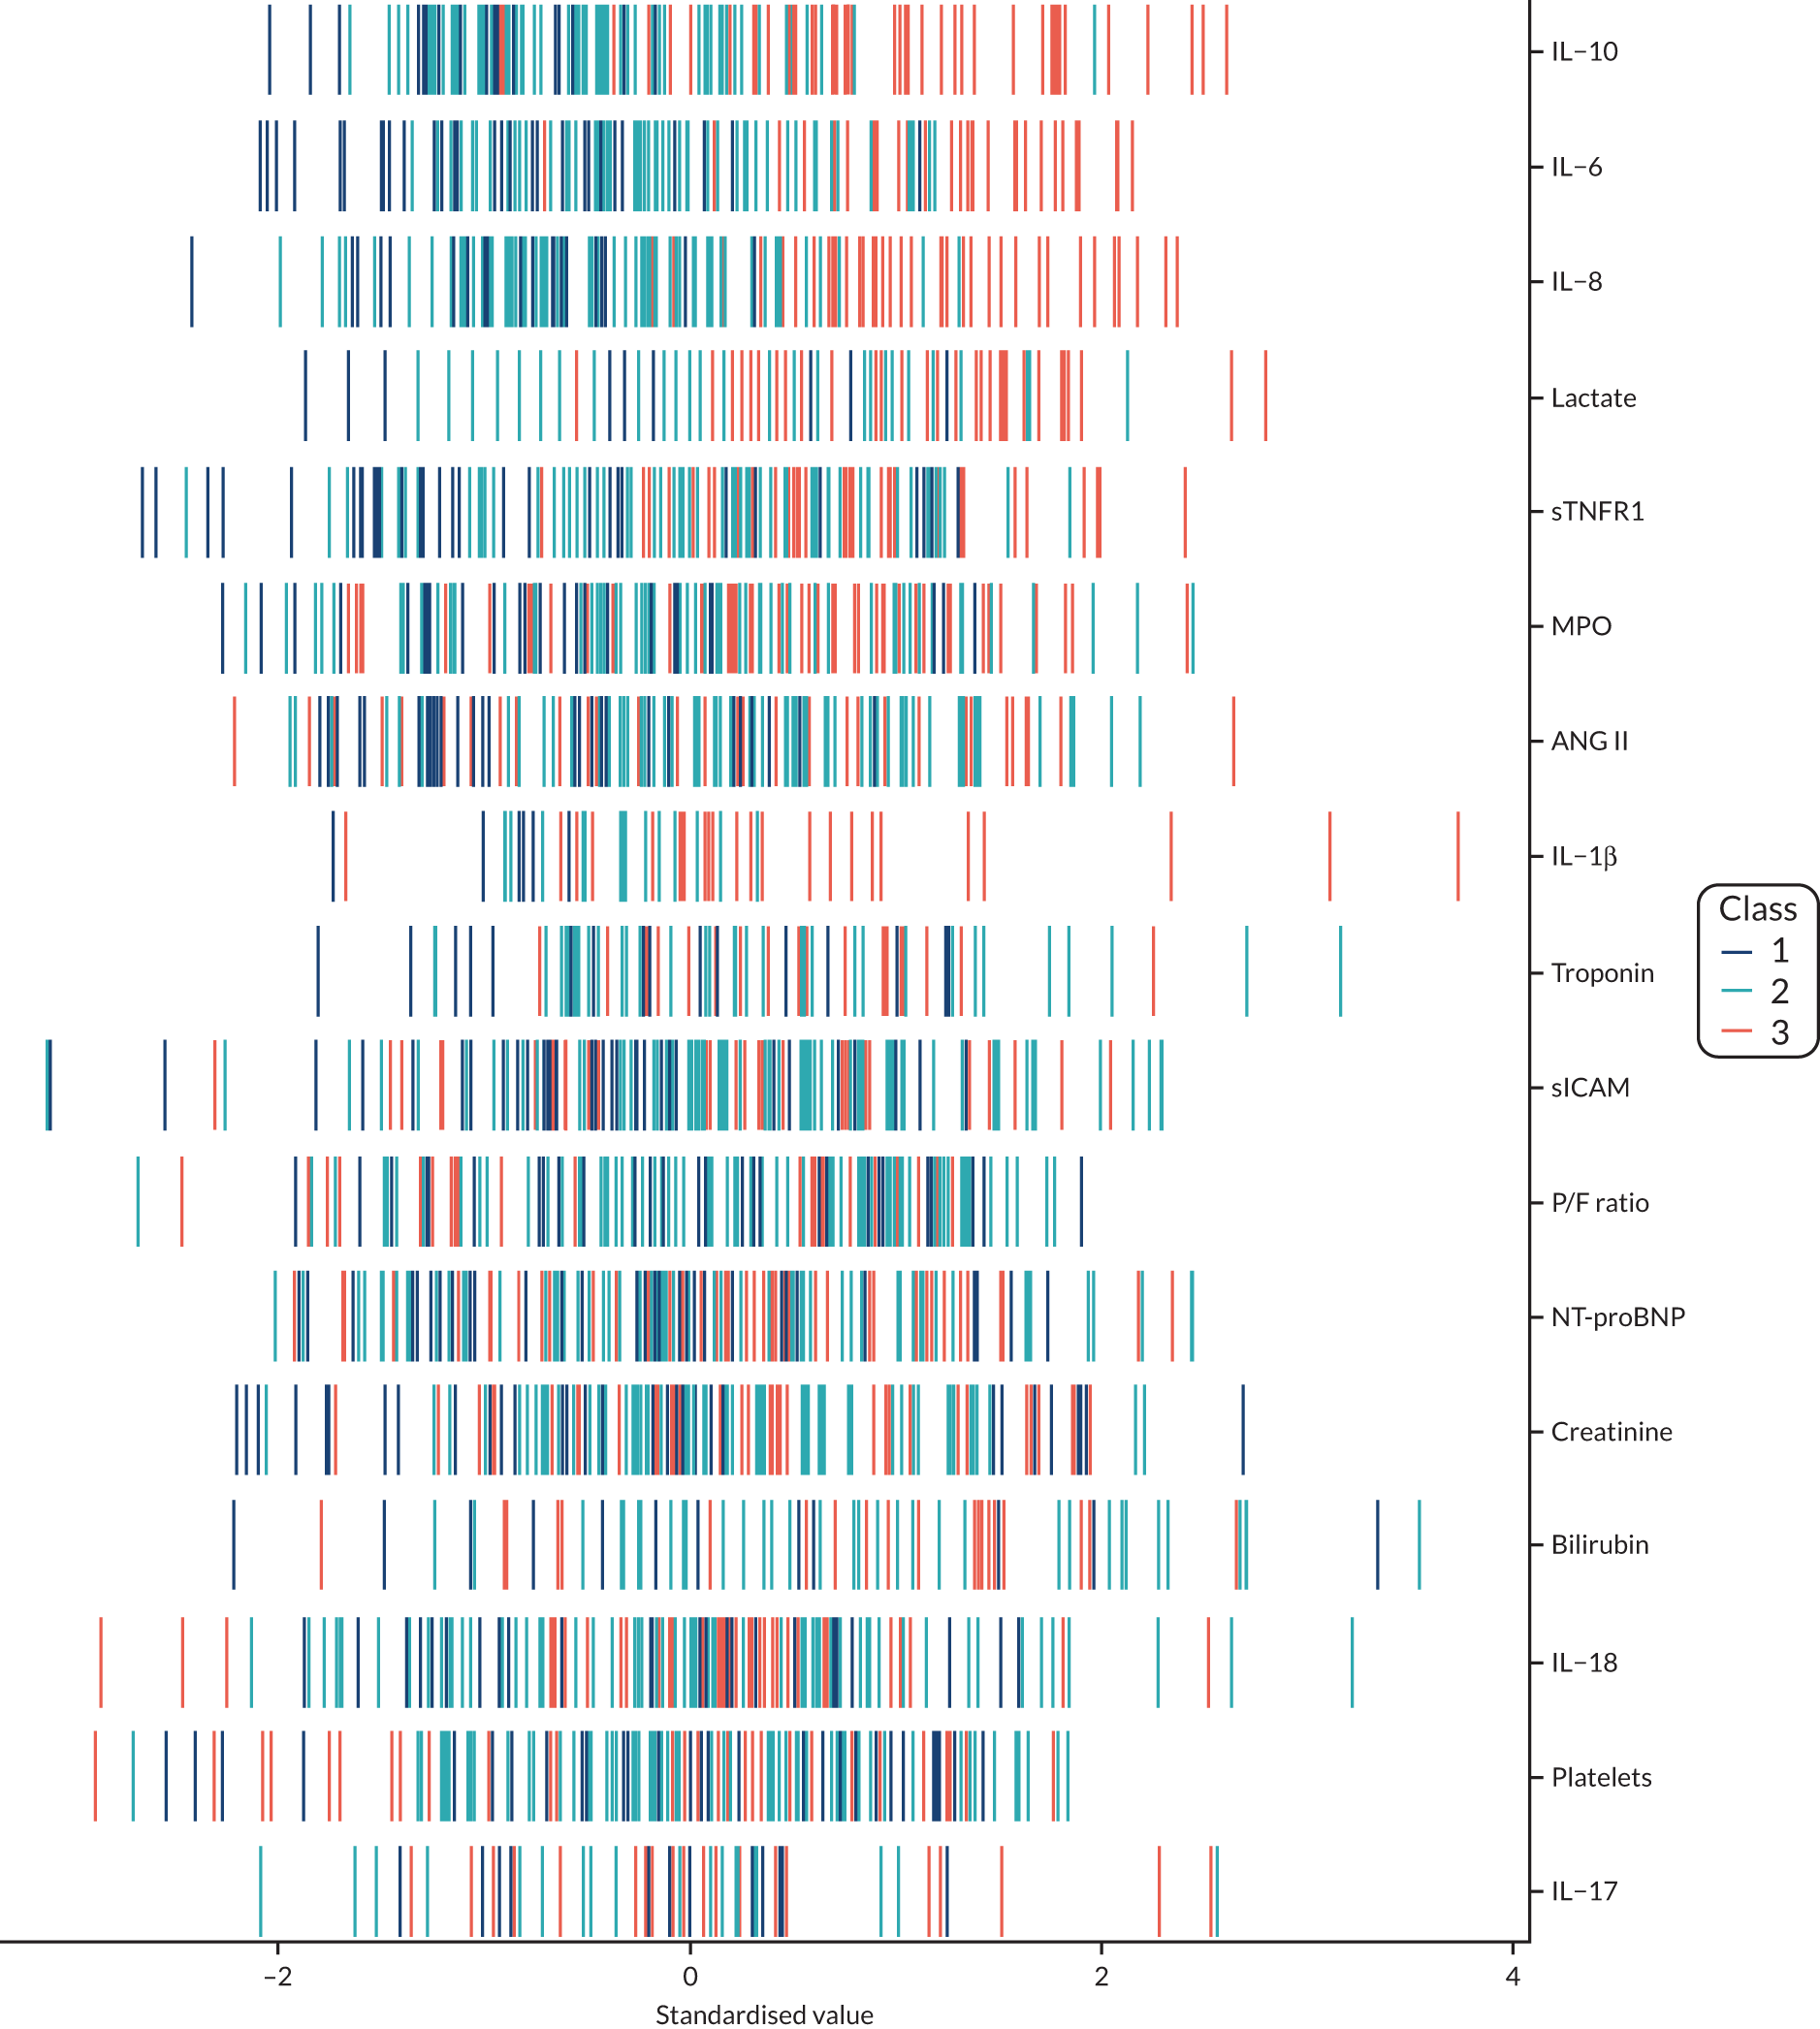
List of abbreviations
- AIC
- Akaike information criterion
- ANG II
- angiotensin II
- APACHE II
- Acute Physiology And Chronic Health Evaluation II
- APS-APII
- APACHE II physiology
- ARDS
- acute respiratory distress syndrome
- AUROC
- area under receiver operating characteristic
- BIC
- Bayesian information criterion
- BMI
- body mass index
- CCL2
- C–C motif chemokine ligand 2
- CI
- confidence interval
- COPD
- chronic obstructive pulmonary disease
- DS
- discrimination slope
- EQuOR
- extreme quartile odds ratio
- FiO2
- fraction of inspired oxygen
- HARP-2
- Hydroxymethylglutaryl-CoA reductase inhibition with simvastatin in Acute lung injury to Reduce Pulmonary dysfunction
- HTE
- heterogeneity of treatment effect
- ICU
- intensive care unit
- IL
- interleukin
- IQR
- interquartile range
- LCA
- latent class analysis
- LeoPARDS
- Levosimendan for the Prevention of Acute oRgan Dysfunction in Sepsis
- MPO
- myeloperoxidase
- NT-proBNP
- N-terminal pro-B-type natriuretic peptide
- NYHA IV
- New York Heart Association class IV
- OR
- odds ratio
- PaO2
- partial pressure of oxygen
- PROWESS
- PROtein C Worldwide Evaluation in Severe Sepsis
- R
- risk
- Rcalc.
- APACHE II-calculated risk of death
- RCT
- randomised controlled trial
- RD
- risk difference
- RR
- risk ratio
- Rrecal.
- Modified APACHE II risk of death model recalibrated
- SD
- standard deviation
- SE
- standard error
- sICAM
- soluble intercellular adhesion molecule
- SOFA
- Sepsis-related Organ Failure Assessment
- SRS1
- sepsis response signature 1
- SRS2
- sepsis response signature 2
- sTNFR1
- soluble tumour necrosis factor receptor 1
- VANISH
- Vasopressin vs Noradrenaline as Initial Therapy in Septic Shock

