Notes
Article history
The research reported in this issue of the journal was funded by the HSDR programme or one of its preceding programmes as project number 14/19/06. The contractual start date was in August 2015. The final report began editorial review in January 2021 and was accepted for publication in March 2022. The authors have been wholly responsible for all data collection, analysis and interpretation, and for writing up their work. The HSDR editors and production house have tried to ensure the accuracy of the authors’ report and would like to thank the reviewers for their constructive comments on the final report document. However, they do not accept liability for damages or losses arising from material published in this report.
Permissions
Copyright statement
Copyright © 2022 Ferrando-Vivas et al. This work was produced by Ferrando-Vivas et al. under the terms of a commissioning contract issued by the Secretary of State for Health and Social Care. This is an Open Access publication distributed under the terms of the Creative Commons Attribution CC BY 4.0 licence, which permits unrestricted use, distribution, reproduction and adaption in any medium and for any purpose provided that it is properly attributed. See: https://creativecommons.org/licenses/by/4.0/. For attribution the title, original author(s), the publication source – NIHR Journals Library, and the DOI of the publication must be cited.
2022 Ferrando-Vivas et al.
Chapter 1 Introduction
In her Annual Report of the Chief Medical Officer 2011, Professor Dame Sally Davies identified the importance and potential ‘to do much more, particularly through the linkage of existing data’ (Contains information licensed under the Non-Commercial Government Licence v3.0). 1 Ten years on from this report, much of this potential has yet to be realised.
Adult critical care has a long history of risk prediction and benchmarking outcomes. 2 In the UK, the Intensive Care National Audit & Research Centre (ICNARC) co-ordinates national clinical audits benchmarking outcomes from adult critical care and in-hospital cardiac arrest. 3,4 Risk prediction models for adult critical care have been developed and improved over many years, combining information on the patient’s functional status (age, comorbidities, dependency) with their acute severity of illness (reason for admission, physiological measurements) to predict the risk of death in acute hospital. 5 Based on large, representative data sets, these models achieve discrimination (c index or area under the receiver operating characteristic curve) exceeding 0.9. Models for in-hospital cardiac arrest are more limited in terms of the availability of data for patients on the ward compared with the detailed physiological measurements recorded in critical care, and consequently have discrimination in the order of 0.8. The models are used to generate regular reports to critical care units and hospitals participating in the audits comparing observed outcomes against the outcomes predicted by the risk model.
A previous National Institute for Health and Care Research (NIHR) study identified a number of important and essential new directions to better understand the epidemiology of, risk factors for and consequences of critical illness in the areas of adult general critical care, cardiothoracic critical care and in-hospital cardiac arrest. 6 A key theme across all these areas was the opportunity to make better use of routinely collected data (both administrative data from death registrations and routine hospital data returns and high-quality clinical data from national clinical audits) to improve the risk models used to underpin the national clinical audits. Data linkage with other routinely collected data sources has the potential to provide enhanced information on risk factors from, at or prior to the episode of critical illness. This may be particularly useful in settings such as in-hospital cardiac arrest where the available data around the point of arrest are more limited, or for subgroups of critically ill patients where specific information not of relevance to all critical care admissions may be available. In addition, data linkage can allow exploration of alternative and additional outcome measures. Current risk prediction models for critical care and in-hospital cardiac arrest are focused on mortality at hospital discharge. 7,8 Alternative and additional outcome measures include assessing mortality at fixed time points rather than at hospital discharge, including longer-term mortality, but also going beyond mortality to explore important chronic health outcomes, resource use and costs.
Aim and objectives
The aim of the current study was to better understand the epidemiology of, risk factors for and consequences of critical illness leading to improvements in the risk models used to underpin national clinical audits for adult general critical care, cardiothoracic critical care and in-hospital cardiac arrest using data linkage with other routinely collected data sources.
Specific objectives were as follows:
-
To improve risk models for adult general critical care by (1a) developing risk models for mortality at fixed time points and time-to-event outcomes, developing risk models for longer-term chronic health outcomes of (1b) end-stage renal disease (ESRD) and (1c) type 2 diabetes, and (1d) developing risk models for subsequent health-care utilisation and costs.
-
To improve risk models for cardiothoracic critical care by (2a) enhancing risk factor data, and (2b) developing risk models for longer-term mortality.
-
To improve risk models for in-hospital cardiac arrest by (3a) enhancing risk factor data, (3b) developing risk models for longer-term mortality and (3c) developing risk models for subsequent critical care utilisation.
-
Immediate translation of the improved risk models into practice through (4a) adoption into routine comparative outcome reporting for the national clinical audits; and (4b) communication of research output to providers, managers, commissioners, policy-makers and academics in critical care.
Chapter 2 describes the data sources and the process of data linkage and data management. Chapter 3 reports the methods that were generic across all streams of work. Chapter 4 reports the long-term (5-year) outcomes for patients discharged alive from hospital following an episode of critical illness. Chapter 5 reports the development and validation of models for mortality at fixed time points and time-to-event outcomes in adult critical care (objective 1a). Chapter 6 reports the development and validation of models for development of ESRD following critical care (objective 1b). Chapter 7 reports the development and validation of models for the development of diabetes following critical care (objective 1c). Chapter 8 reports the development and validation of models for subsequent health-care utilisation and costs following critical care (objective 1d). Chapter 9 reports the development and validation of new models for adult cardiothoracic critical care (objective 2). Chapter 10 reports the development and validation of new models for in-hospital cardiac arrest (objective 3). Finally, Chapter 11 draws conclusions from the project as a whole, including implications for health care (objective 4), and makes recommendations for further research in this field.
Chapter 2 Data linkage and data management
Data sources
The primary sources of data for this project were the Case Mix Programme (CMP) national clinical audit of adult intensive care and the National Cardiac Arrest Audit (NCAA) of in-hospital cardiac arrests. To provide additional information on past medical history and long-term outcomes, data from the CMP and NCAA were linked with data collected for the UK Renal Registry (UKRR), National Diabetes Audit (NDA), National Adult Cardiac Surgery Audit (NACSA), Hospital Episode Statistics (HES) and Office for National Statistics (ONS) death registrations.
The Case Mix Programme
The CMP is the national clinical audit for adult critical care with a remit for England, Wales and Northern Ireland. The CMP has been established for 20 years and the resulting high-quality clinical database (of > 2 million critical care admissions) has underpinned evaluations of policy and practice in critical care. 9 The CMP has 100% participation of adult, general critical care units delivering Level 3 or combined Level 2/3 care (intensive care units and combined intensive care/high-dependency units); over the time period of this study, participation of these units increased from 90% to approaching 100%. Participation of other critical care units, such as specialist units (e.g. neurocritical care units and cardiothoracic critical care units) and stand-alone Level 2 (high dependency) units is lower. Data on consecutive admissions to each participating critical care unit are recorded prospectively and abstracted from the medical records by trained data collectors according to precise rules and definitions. The data collected include demographics, past medical history, physiological and diagnostic data from the first 24 hours following admission to the critical care unit, outcome and activity data. The data undergo extensive validation checks, both within local software systems and centrally on submission to ICNARC, before being pooled into the CMP database. Details of data collection and validation have been reported previously, and the CMP database has been independently assessed and scored highly by the Directory of Clinical Databases (DoCDat) against their 10 domains (describing elements of coverage and accuracy). 3
The National Cardiac Arrest Audit
The NCAA was established in 2009 as a joint venture between ICNARC and the Resuscitation Council (London, UK). The NCAA is the national clinical audit of patients aged > 28 days in acute hospitals in the UK who receive cardiopulmonary resuscitation (CPR) and are attended by the hospital-based resuscitation team (or equivalent) in response to a 2222 call (2222 is the emergency telephone number used to summon a resuscitation team in UK hospitals). CPR is defined in NCAA as the receipt of chest compressions and/or defibrillation. Standardised data are collected at the time of the cardiac arrest and from the medical records according to precise rules and definitions. Staff members at participating hospitals enter data onto a dedicated secure online data entry system. Data are validated, both at the point of entry and centrally, for completeness, logicality and consistency. Details of data collection and validation have been reported previously. 4
The UK Renal Registry
The UKRR (https://renal.org/about-us/who-we-are/uk-renal-registry; accessed 28 October 2022) was established by the Renal Association (now the UK Kidney Association; Bristol, UK) and provides a focus for the collection and analysis of standardised data relating to the incidence, clinical management and outcome of end-stage renal disease. The Registry has been in operation since 1995, with 100% coverage of adult renal units in England and Wales since 2007.
The National Diabetes Audit
The NDA (https://digital.nhs.uk/data-and-information/clinical-audits-and-registries/national-diabetes-audit; accessed 28 October 2022) is the largest annual clinical audit in the world and is managed by NHS Digital working with Diabetes UK (London, UK) and the National Cardiovascular Intelligence Network, Public Health England. The National Diabetes Core audit, covering care processes, treatment targets, complications and mortality for people with diabetes in primary care and specialist services, is now in its ninth year. Over recent years, the audit has included > 80% of people diagnosed with diabetes in England and Wales.
The National Adult Cardiac Surgery Audit
The NACSA (www.nicor.org.uk/national-cardiac-audit-programme/adult-cardiac-surgery-adult-surgery-audit/; accessed 28 October 2022) collects consecutive operation data from all 35 NHS hospitals in the UK that carry out adult heart surgery. It has been running since 1977, making it the longest running of all UK national clinical audits. The audit is managed by the National Institute for Cardiovascular Outcomes Research (NICOR) at Barts Health NHS Trust, in association with the Society for Cardiothoracic Surgery.
Hospital Episode Statistics for England
The HES database is produced by NHS Digital using records provided by hospitals for the purpose of reimbursement of services funded through the NHS. 10 This study used the admitted patient care (APC) section of the HES database, which contains one record for each episode of care under one consultant during a hospital admission. The HES data set captures all publicly funded hospital activity, which is estimated to represent 98–99% of all hospital activity in England. 10 APC records include information about diagnoses and treatments received, alongside admission details (provider, dates, locations, etc.) and limited patient demographics.
Office for National Statistics death registrations
The ONS death registrations (mortality database) contains information abstracted from civil registrations of deaths registered in England and Wales. The database captures 100% of deaths registered in England and Wales but may not capture the deaths of English/Welsh residents occurring in other countries. Registration is delayed in cases of coroners’ investigations. The database includes information about the date, cause and location of death. Although constructed by the ONS, the database is routinely linked to HES and available jointly through NHS Digital.
Selection of records
The following records were extracted from each data source:
-
For the CMP, all patients admitted to a participating critical care unit in England between 1 April 2009 and 31 March 2016.
-
For the NCAA, all patients experiencing an in-hospital cardiac arrest in a participating hospital in England between 1 April 2011 (the start of data collection to the current scope) and 31 March 2016.
-
For the UKRR, all patients in the registry that started renal replacement therapy (RRT) prior to 31 December 2016 and were alive on 1 April 2009, with links to either CMP or NCAA.
-
For the NDA, all registrations in audit years 2008–9 to 2015–16, with links to either CMP or NCAA.
-
For the NACSA, all patients undergoing cardiac surgery between 1 April 2009 and 31 March 2016, with links to either CMP or NCAA.
-
For HES, all finished consultant episodes ending between 1 April 2004 and 31 March 2016 (the earlier start date was selected to allow up to 5 years lookback for evaluation of comorbidities), with links to either CMP or NCAA.
-
For ONS death registrations, all deaths registered from 1 April 2009 to 31 March 2016, with links to either CMP or the NCAA.
National data opt-outs were applied to HES and death registrations (and therefore to the subsequent linked study data sets). The prevalence of opt-out in England was approximately 2.7% at the time of data linkage. 11
Data linkage
NHS Digital, acting as a trusted third party, undertook a bespoke data linkage between the routinely linked HES/ONS data set and the five national clinical audits. The CMP and NCAA were treated as index data sets, with any patient appearing in either of these being included in the final pseudonymised data set for analysis.
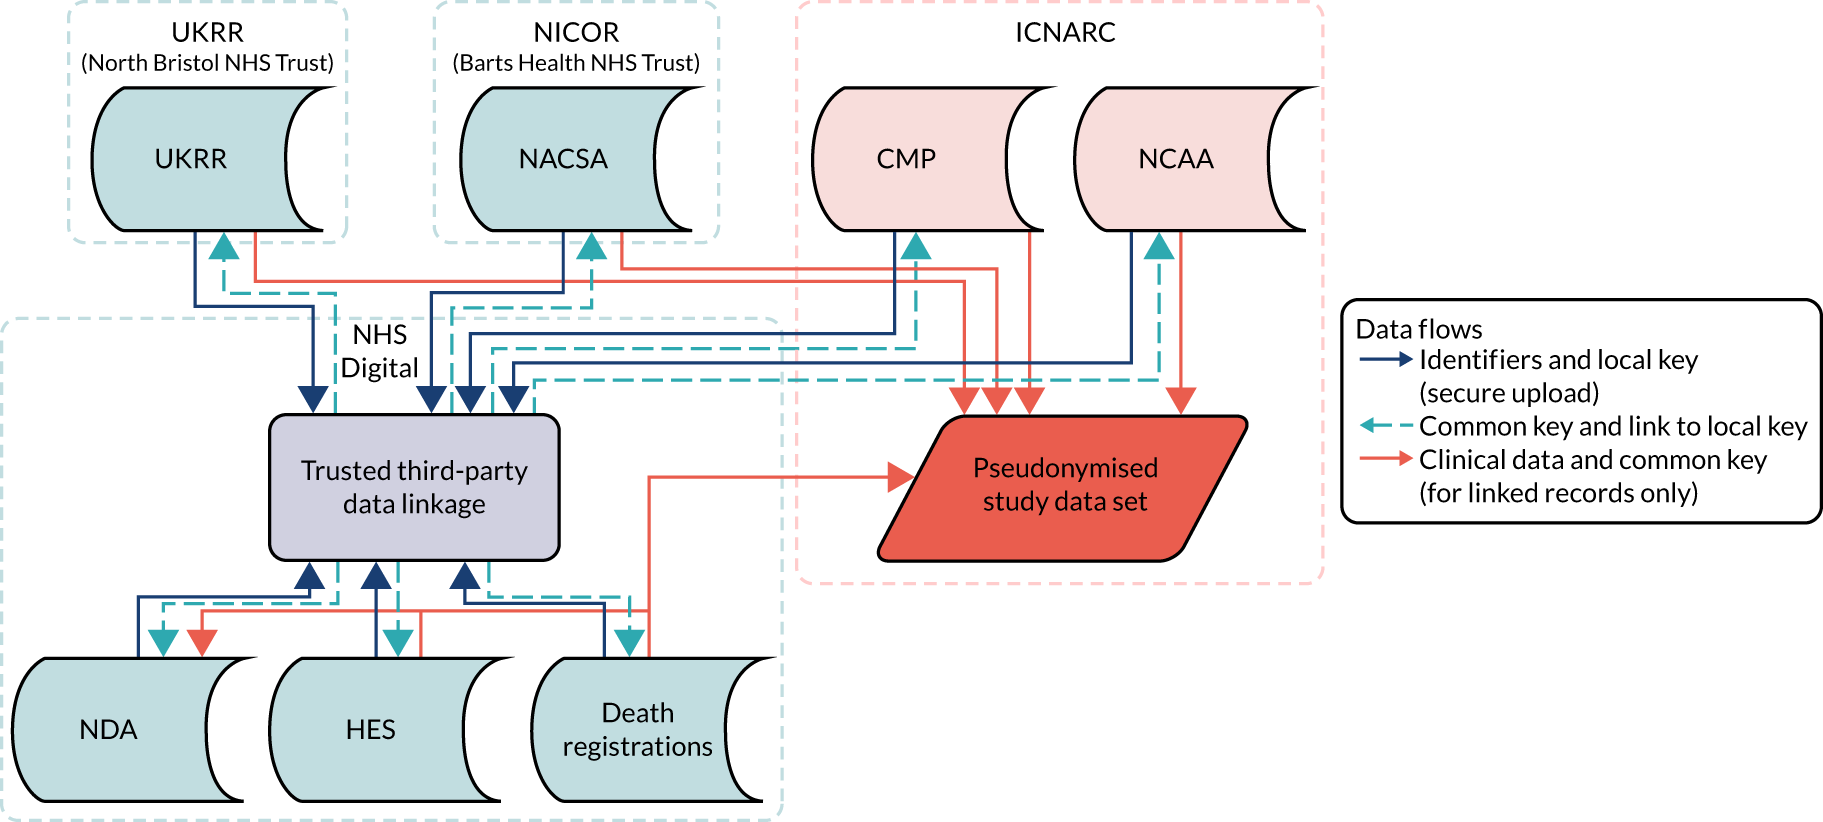
The data linkage process (Figure 1) worked as follows: each national clinical audit provider uploaded to NHS Digital’s secure file sharing platform data sets consisting of the available identifiers for patients included in each national clinical audit, together with an anonymous local key permitting linkage back to locally held data for the audit. NHS Digital linked the data sets and returned to each provider a key consisting of the local identifier and a project-specific, common key for each patient linked to either the CMP or NCAA. Each national audit provider external to ICNARC then supplied direct to ICNARC a pseudonymised data set of the clinical fields required for the project together with the common key, only for those patients linked to the CMP or NCAA. Similarly, NHS Digital provided to ICNARC pseudonymised data extracts of HES and ONS data together with the common key only for patients identified in either the CMP or NCAA. ICNARC used the common key to combine the data extracts provided by the national audit providers and NHS Digital with pseudonymised data extracts from the CMP and NCAA to create the final linked project data set.
FIGURE 1.
Study data flows.
Prior to analysis, ICNARC pseudonymised the CMP and NCAA data extracts by replacing date of birth with age in years, replacing the date of admission to the critical care unit or date of in-hospital cardiac arrest with the month and year, replacing all other dates in the data set (including date of death) with the number of days relative to these index dates, replacing postcode with area-level deprivation measures; and replacing hospital/critical care unit names with pseudo-identifiers. Consequently, the final pseudonymised data set contains no patient-identifiable data.
Initial data linkage was planned to include data up to 31 March 2015 with a subsequent update to 31 March 2016. Owing to delays in the approvals process, only HES and ONS data were included in this two-stage process, with all other data sources linked once over the full time period.
The data for this study were handled under the same security arrangements as for patient-identifiable data from the CMP and NCAA. Data sets resulting from the linkage process were stored on ICNARC’s secure servers. No identifiable information has been retained and only the staff involved in the study have access to the data sets.
Results
The approvals and data linkage processes were extremely protracted, taking over 4 years from submitting the first data access request to receiving the final linked data set (Table 1). Some of the specific causes of delays included the following:
-
Rebranding of the Health and Social Care Information Centre as NHS Digital following the care.data controversy,12 and a resulting pause in all data applications while internal processes were reviewed.
-
Failure of NHS Digital to transfer required forms to ONS.
-
Introduction of a new online application system at NHS Digital, with the ongoing applications transferred onto this system.
-
Introduction of the European General Data Protection Regulation (GDPR)13 and requirement to update fair processing information and privacy notices in line with this.
-
Replacement of the Data Access Advisory Group at NHS Digital with the Independent Group Advising on the Release of Data (IGARD), operating to terms of reference that had not been made available to applicants.
-
Use of an out-of-date application form by NICOR in preparing the submission for approval from the Healthcare Quality Improvement Partnership [(HQIP), data controller for NACSA].
-
Change of data controller for the NDA from HQIP to NHS Digital.
-
NHS Digital providing incorrect data sets back to the national clinical audit providers (containing the wrong audit’s local keys), which took a further 4 months to be replaced with corrected versions.
-
Change of host organisation for NICOR from University College London to Barts Health.
-
Need to renew data-sharing agreements that had expired while waiting for data to be processed.
| Data source | Initial request for data access | Date of approval | Data uploaded to NHS Digital | File returned by NHS Digital to audit providers | Linked data received at ICNARC |
|---|---|---|---|---|---|
| HES/death registrations (initial) | September 2015 | July 2016 | September 2016a | N/A | November 2016 |
| HES/death registrations (update) | March 2017 | August 2017 | February 2018a | N/A | January 2019b |
| NDA | December 2016 | August 2017c | July2018d | January 2019b | April 2019 |
| UKRR | January 2016 | February 2016 | February 2018 | January 2019b | February 2019 |
| NACSA | January 2016 | December 2017 | May 2018 | January 2019b | November 2019 |
In addition to these specific causes, there were numerous unexplained delays waiting for processing to take place, for example a 9-month delay between submitting an application to NICOR for NACSA data and the application being submitted from NICOR to HQIP, and a 7-month delay between uploading data to NHS Digital and receiving a linkage file back.
The final linkage results were as follows:
-
Between 1 April 2009 and 31 March 2016, there were 1,007,149 eligible admissions to 248 adult critical care units participating in the CMP. Of these, 965,576 (95.9%) admissions had identifiable links with HES.
-
Between 1 April 2011 and 31 March 2016, there were 89,030 eligible resuscitation team visits following 2222 calls for cardiac arrest reported by 202 hospitals participating in NCAA. Of these, 83,939 (94.3%) had identifiable links with HES.
Chapter 3 Methods
Study design
This was a risk modelling study linking existing data from multiple sources.
Sample size
The selection of sites was based on those participating in the CMP and NCAA.
The coverage of the CMP is extremely high, with 256 critical care units participating during the time period covered, including 97% of NHS adult general critical care units in England and Wales. We linked data for the period 1 April 2009 to 31 March 2015, enabling exploration of trends and fit of models over time, although only data from the last 2 years were used to fit the final models as our previous research has established that the fit of risk models deteriorates over time. 14 This was anticipated to give a total sample size of over 850,000 admissions (700,000 critical care unit survivors) for exploring trends and fit over time with 330,000 admissions (280,000 critical care unit survivors) for model fitting. As the CMP is an ongoing programme, additional data accrued while the study was ongoing. At 1 year into the study, an additional 170,000 admissions (150,000 critical care unit survivors) were anticipated to be available and the linkage was updated, providing data for external validation.
Of the 27 specialist cardiothoracic critical care units providing Level 3 (intensive) care, eight were participating in the CMP at the outset of the project. From 1 April 2009 to 31 March 2015 the anticipated sample size was approximately 34,000 admissions to these units (3000 deaths) for objective 2. The updated data linkage was anticipated to include an additional 2300 admissions (200 deaths) for external validation.
The coverage of NCAA is increasing over time and at the outset of the project stood at 181 hospitals, including over 75% of acute hospitals in England and Wales. From 1 April 2011 to 31 March 2015 we anticipated a sample size of approximately 56,000 in-hospital cardiac arrests (10,000 survivors) for objective 3. The updated data linkage was anticipated to include an additional 16,000 in-hospital cardiac arrests (3000 survivors) for external validation.
Setting/context
This study was set in adult critical care units, cardiothoracic critical care units and acute hospitals in England.
Data sources and linkage
Data sources and the data linkage process were described in Chapter 2.
Study population
The study population comprised five cohorts: CMP admission cohort, CMP hospital survivor cohort, CMP cardiothoracic critical care cohort, NCAA in-hospital cardiac arrest cohort and NCAA critical care admission cohort. These cohorts are described below.
Case Mix Programme cohorts
For the CMP admission cohort, we selected patients admitted to NHS adult critical care units in England participating in the CMP with identifiable linkage with HES and death registrations. False linkage and errors in linkage with HES and death registrations were excluded. The linked cohort includes patients admitted to participating critical care units between 1 April 2009 and 31 March 2015. The final follow-up date for death registrations was 15 March 2015. For patients with multiple hospital episodes that included critical care unit admissions, we considered the index hospital admission to be the first hospital admission during the analysis period. Re-admissions to critical care and transfers between critical care units during the index hospital admission were excluded.
For the CMP hospital survivor cohort, we selected from the CMP admission cohort those patients who survived to discharge from acute hospital (i.e. the end of the index hospital admission).
For the CMP cardiothoracic critical care cohort, we selected from the CMP admission cohort those patients who were admitted to a cardiothoracic critical care unit participating in the CMP.
National Cardiac Arrest Audit cohorts
For NCAA, data are collected for all individuals (excluding neonates) receiving chest compressions and/or defibrillation and attended by a hospital-based resuscitation team (or equivalent) in response to a 2222 call (2222 is the telephone number used to summon a resuscitation team in UK NHS hospitals). For the NCAA in-hospital cardiac arrest cohort, we selected validated team visits from hospitals in England participating in NCAA with valid linkage with HES and death registrations between 1 October 2009 and 31 March 2015. False linkage and errors in linkage with HES and death registrations were excluded. The final follow-up date for death registrations was 15 March 2015. For patients with multiple hospital episodes that included an in-hospital cardiac arrest, we considered the index hospital admission to be the first hospital admission during the analysis period. Individual team visit records meeting the following criteria were excluded from the cohort: arrests that occurred pre hospital (but were subsequently attended by a hospital-based resuscitation team – usually in the emergency department – and therefore met the scope of NCAA); second and subsequent visits to the same patient during the same hospital stay; and patients for whom it was identified, after commencing resuscitation, that a ‘do not attempt cardiopulmonary resuscitation’ decision was already documented in the patient’s notes.
For the NCAA critical care admission cohort, we selected from the NCAA in-hospital cardiac arrest cohort those patients with valid linkage with CMP, for whom a critical care unit admission occurred after the first in-hospital cardiac arrest recorded in NCAA and during the index hospital admission.
Outcomes
Mortality at discharge from acute hospital
Outcome defined as mortality at discharge from acute hospital (acute hospital mortality), as used for the current risk models. Patients transferred to another acute hospital were followed up until final discharge.
Mortality at 30 days, 90 days and 1 year and survival time
Outcome was defined as mortality at 30 days, 90 days and 1 year following critical care unit admission and time from critical care unit admission or discharge alive to death using the date of death obtained by data linkage with death registrations. In addition, 1-year post-discharge mortality was defined as mortality at 1 year following discharge from acute hospital for patients who survived the index hospitalisation.
Hospital resource use and costs post-critical care
Outcome was defined as number of days in acute hospital, either during the original hospital episode (as identified from CMP data) or during subsequent hospital episodes (as identified through data linkage with HES) and total hospitalisation costs calculated from NHS reference costs. 15
New diagnosis of end-stage renal disease post-critical care
Outcome was defined as new receipt of RRT for ESRD, based on the date of diagnosis recorded in the UKRR database, after the date of discharge from hospital.
New diagnosis of diabetes post-critical care
Outcome was defined as a new registration for type 2 diabetes, based on the date of diagnosis recorded in the NDA database, after the date of discharge from hospital.
Return of spontaneous circulation > 20 minutes (National Cardiac Arrest Audit)
Outcome was defined as return of spontaneous circulation (ROSC) sustained for > 20 minutes.
Hospital survival (National Cardiac Arrest Audit)
Outcome was defined as survival to discharge from the hospital in which the in-hospital cardiac arrest occurred. Patients transferred to another acute hospital are counted as hospital survivors.
Variables
The main body of the risk predictions models for each objective of the present project was the CMP/NCAA predictors previously included in published risk models. 7,8,16
New pre- and intra-operative risk factors obtained by data linkage with the NACSA and risk factors obtained by data linkage with HES such as the Charlson Comorbidity Index derived from International Statistical Classification of Diseases and Related Health Problems, Tenth Revision (ICD-10),17 diagnostic codes were assessed for inclusion in the new risk models for each outcome.
Further details relating to the variables considered in each modelling process are explained in Appendix 1 and/or in their corresponding chapter.
Comorbidities
There are two measures to derive comorbidities: severe conditions in the past medical history – defined according to the Acute Physiology And Chronic Health Evaluation (APACHE) II method18 (Table 2) – and comorbidities based on Armitage and van der Meulen’s 2010 Royal College of Surgeons (RCS) Charlson Score17 (Table 3). Severe conditions in the past medical history are recorded in the CMP. Conditions must have been evident in the 6 months prior to admission to the critical care unit and documented in the patient’s notes at or prior to admission. RCS Charlson comorbidities were identified from linked HES records by relevant ICD-10 codes (see Table 3) in any of the first seven diagnosis fields of the index hospital admission or of any episode that finished during the year preceding the index hospital admission.
| Condition | Definition |
|---|---|
| Very severe cardiovascular disease | Fatigue, claudication, dyspnoea or angina at rest (New York Heart Association Functional Class IV) |
| Severe respiratory disease | Permanent shortness of breath with light activity due to pulmonary disease, or a requirement for home ventilation |
| Severe liver disease | Biopsy-proven cirrhosis, portal hypertension or hepatic encephalopathy |
| ESRD | Ongoing requirement for renal replacement therapy for irreversible renal disease |
| Metastatic disease | Distant metastases documented by surgery, imaging or biopsy |
| Haematological malignancy | Acute or chronic myelogenous leukaemia, acute or chronic lymphocytic leukaemia, multiple myeloma or lymphoma |
| Immunocompromise | AIDS (HIV positive and AIDS-defining illness), congenital immunohumoral or cellular immune deficiency state, chemotherapy, radiotherapy or daily high-dose steroid treatment (≥ 0.3 mg kg–1 prednisolone or equivalent) |
| RCS Charlson comorbidities | ICD-10 codes |
|---|---|
| Previous MI | I21,a I22,a I23,a I252 |
| Congestive cardiac failure | I11, I13, I255, I42, I43, I50, I517 |
| Peripheral vascular disease | I70–I73, I770, I771, K551, K558, K559, R02, Z958, Z959 |
| Cerebrovascular disease | G45, G46, I60–I69 |
| Dementia | A810, F00–F03, G30, G31 |
| Chronic pulmonary disease | I26, I27, J40-J45, J46,a J47, J60–J67, J684, J701, J703 |
| Rheumatological disease | M05, M06, M09, M120, M315, M32–M36 |
| Liver disease | B18, I85, I864, I982, K70, K71, K721, K729, K76, R162, Z944 |
| Diabetes mellitus | E10–E14 |
| Hemiplegia or paraplegia | G114, G81–G83 |
| Chronic renal disease | I12, I13, N01, N03, N05, N07, N08, N171,a N172,a N18, N19,a N25, Z49, Z940, Z992 |
| Malignancy | C00–C26, C30–C34, C37–C41, C43, C45–C58, C60–C76, C80–C85, C88, C90–C97 |
| Metastatic solid tumour | C77–C79 |
| AIDS/HIV | B20–B24 |
To allow the use of both severe and lower levels of comorbidity in the same model, and reduce duplication of these measures, we combined the nine APACHE II comorbidities and 13 of the RCS Charlson comorbidities to produce 19 comorbid categories (Table 4). Acquired immune deficiency syndrome (AIDS) and human immunodeficiency virus (HIV) were not included because these diagnosis codes were supressed in the HES extract, and CMP data indicate it was a rare diagnosis in this patient group.
| Body system | Comorbidities |
|---|---|
| Cardiovascular | Previous MI (excluding very severe cardiovascular disease) |
| Congestive cardiac failure (excluding very severe cardiovascular disease) | |
| Peripheral vascular disease | |
| Very severe cardiovascular disease | |
| Neurological | Cerebrovascular disease |
| Dementia | |
| Hemiplegia or paraplegia | |
| Respiratory | Chronic pulmonary disease (excluding severe respiratory disease) |
| Severe respiratory disease | |
| Liver | Liver disease (excl. severe liver disease) |
| Severe liver disease | |
| Renal | Chronic renal disease (excluding end-stage renal failure) |
| ESRD | |
| Malignancy | Any malignancy (excluding haematological malignancy and metastatic disease) |
| Haematological malignancy | |
| Metastatic disease (including metastatic solid tumour) | |
| Other | Immunocompromise |
| Diabetes mellitus | |
| Rheumatological disease |
Sepsis
The CMP database can be used to identify patients who had sepsis at admission to the unit or who developed sepsis during the first 24 hours in the unit based on their reason for admission to critical care and physiology measured during the first 24 hours following admission. It cannot be used to identify patients who developed sepsis after the first 24 hours following admission to the unit.
Based on the current international consensus definitions,20 sepsis-3 is defined as infection plus new organ dysfunction, defined as an increase in a Sequential Organ Failure Assessment (SOFA) score of ≥ 2 or points. In the CMP, this is operationalised as evidence of infection from the primary or secondary reason for admission to the critical care unit plus organ dysfunction, defined as a SOFA score of ≥ 2 points in any one organ system or a SOFA score of ≥ 1 points in two or more organ systems, based on physiological data from the first 24 hours following admission. 21 Full details of the organ dysfunction definitions are summarised in Appendix 1, Table 37.
Statistics and data analysis
Handling of missing data
The percentage of physiological predictors with missing values in the CMP data set ranged from 0.6% for highest heart rate to 13.9% for blood lactate. In a previous work6 exploring the impact of missing data on developing ICNARC risk prediction models using CMP data, no differences in the inference were found and coefficient estimates appeared to be insensitive to the missing data and the various models used to deal with them. The study6 concluded that under the CMP, missingness scenario benefits of using multiple imputation in developing the risk prediction model are likely to be minimal. Therefore, for objective 1 (risk models for adult critical care using the full CMP cohorts) we decided that the model building and analysis process would be done with non-imputed (complete-case) data and a parallel analysis would be done at the same time on the multiply imputed data set to test the consistency of the results.
For analysis relating to objective 2 (risk models for cardiothoracic critical care) and objective 3 (risk models for in-hospital cardiac arrest), missing data were imputed to address potential bias and loss of precision in these smaller data sets. Fully conditional specification was used as the multiple imputation method. 22 All the candidate predictors (with or without missing values) and the outcome, as well as auxiliary variables related to missingness, were entered into the imputation model. 23,24 When required, simple or zero-skewness log transformation for non-normality was applied. Unless the rate of missing information is unusually high, there tends to be little or no practical benefit to using more than 10 imputations and so, in the following analysis, 10 repeat imputations were performed.
Patient characteristics
Demographic, clinical and other characteristics of the patients included in the development and validation data sets for the risk prediction models for each objective were summarised. Categorical variables were summarised by frequencies and percentages. Percentages were calculated according to the number of patients for whom data were available. Continuous variables were summarised by mean and standard deviation (SD), as well as median and interquartile range (IQR).
Analysis of outcome measures
Methods for model development were based on those used for the development of risk models for acute hospital mortality in the previous NIHR study. 6 Binary outcomes were modelled with logistic regression models.
Models for longer-term chronic health outcomes analyses had to account for competing events, in particular when some patients die before being observed at the stage of interest. Death should be considered as a competing event because it precludes the observation of the stage of interest. To account for both the time-to-onset and competition with death, cause-specific Cox proportional hazards models25 and Fine/Gray models26 were considered.
It is well recognised that the statistical analysis of health-care resource use and cost data poses a number of difficulties. First, we reviewed the literature on methods and models in the field of calculating and predicting health-care resource use and costs, their ability to address with the usually statistical issues that is, skewness, excess zeros, multimodality and heavy right tails, as well as specific challenges of the project such as competing risk and censoring. Before a decision was made, we met with health economics experts to discuss the above issues. Finally, a generalised linear model with a gamma distribution and a log-link function was agreed as the most reasonable approach. 27
An analysis plan was finalised with input from the Clinical Advisory Group for each objective prior to modelling.
In all, the following approaches for model development were applied depending on the outcome and objectives of the analysis:
-
To model mortality/survival at fixed time points (hospital discharge, 30 days, 90 days, 1 year, ROSC > 20 minutes): logistic regression (including, if appropriate, random effects of critical care unit/hospital).
-
To model time-to-event outcomes: standard survival regression methods such as Kaplan–Meier survival curves and Cox regression.
-
To model chronic health outcomes with a competing risk of death: cause-specific Cox proportional hazards models and Fine/Gray models.
-
To model critical care/hospital resource use and costs: generalised linear model with a gamma distribution and a log-link function.
Functional form
In the previous project,6 the functional form of physiological predictors and the optimal approach to deal with these were explored. We decided to use restricted cubic splines because they showed the flexibility of fractional polynomials but with better behaviour in the tails, they captured the most prominent features of the relationship between predictors and outcomes, and the fit was more plausible than the previous categorical approach.
So, after having rejected the hypothesis of linearity, the following approaches for modelling continuous predictors were applied.
The predictor–outcome relationship was explored by expanding the variable into multiple terms and testing pooled and individual non-linearity. Spline fits could be sensitive to the number of knots so, to avoid overfitting, spurious dips and inflexion points, as well as unrealistic features of the curve, three, four or five knots were considered. Knot positions were selected according to the recommendations of Harrell. 28 Right restricted cubic splines (i.e. with the linearity restriction applied only at the right-hand end of the curve) were used when appropriate (e.g. for variables that were bounded by zero) to allow more flexibility.
To judge the plausibility and accuracy of the fitted curves, we plotted observed log-odds against the alternative modelling approaches and used a running line smoother as a reference. The Akaike information criterion (AIC) and Bayesian information criterion (BIC) were calculated to compare the fit of the strategies for modelling continuous variables, taking three-knot restricted cubic splines as reference, to assess if the increased complexity of the model resulting from including more knots was worthwhile.
The best functional form for each predictor was selected based on fitting, plausibility, accuracy and prior knowledge about the predictor.
We finally explored collapsing extreme points to determine if the shape of the curves could be affected by outlying values. Additional analyses using imputed data were done in parallel to provide reassurance about the results.
Approach to model development
For each newly developed or revised risk prediction model, we adopted the following general approach to model development:
-
Potential predictors were identified and patterns of missing data within the potential predictors were explored, with particular attention to the completeness and accuracy of data linkage between the databases. Approaches to handling the missing data were compared, based on the best performing approaches from previous work.
-
The most appropriate functional form for each potential predictor was explored, taking into consideration the use of continuous non-linear models (e.g. restricted cubic splines or right-restricted cubic splines) for continuous predictors and appropriate categorisation and structure of categorical predictors.
-
A main effects model was fitted through a process of deleting terms, re-fitting and verifying, using Wald and/or likelihood ratio tests to remove non-significant predictors, and the BIC as the basis to determine which predictors make an important contribution to the fit of the model.
-
The functional form and significance of each predictor included in the main effects model were then re-examined to confirm if any changes were required based on adjustment for other important predictors.
-
Finally, interactions between the predictors were introduced based on clinical input to identify and prioritise the potentially important interactions to consider and avoid over fitting, with interactions retained if they have a positive effect on the BIC.
The starting point for revised risk models was the previously developed risk model for each outcome. The addition of new predictors was considered and then the effect of those predictors previously included in the existing models was re-assessed to determine whether or not they still made an important contribution to the model (see point 3 above).
For developing risk models for mortality/survival at fixed time points and time-to-event outcomes (objectives 1a, 2b, 3b), the starting point for each new risk model was the risk model for survival to hospital discharge developed in the previous objective (2a and 3a) and the existing model for adult general critical care. In each case, this risk model was refitted to the new outcome, risk factors that were previously considered but were found not to be important predictors for hospital survival were reassessed by adding them to the model and, finally, the effect of those risk factors previously included in the risk model was reassessed to determine whether or not they still made an important contribution to the model (see above). It was anticipated that predictors representing age, chronic ill health and functional status would have a greater impact on longer-term outcomes than on hospital survival, whereas predictors relating to the acute illness would have less impact.
As the important risk factors and their relationships with the outcome may be very different from those considered previously, the new risk models for critical care resource use and for longer-term chronic health outcomes were developed, de novo, using the methods previously described.
Assessing the predictive performance
Throughout the study, risk prediction models were validated for their discrimination, calibration and overall fit. The panel of measures described here was used to give an overall assessment of model performance.
The discrimination of the model was estimated by the c index (equivalent to the area under the receiver operating characteristic curve)29 and accuracy was assessed by Brier’s score (mean squared error between outcome and prediction). 30 We assessed calibration graphically with predicted probability on the x-axis and the observed outcomes on the y-axis in 10 equal-sized risk groups (calibration plot) and by Cox’s calibration regression (linear recalibration of the predicted log odds). 31 The standardised mortality ratio (SMR) with 95% confidence interval (CI) was calculated to observe the difference between actual and expected mortality by dividing the observed number of deaths by the number of deaths predicted by the model. Because of the size of the data sets to be used, we did not assess the calibration of the model with the Hosmer–Lemeshow c-statistic because this may have led to misleading conclusions. 32
Internal and external validation
Each newly developed or revised risk prediction model was validated using the above measures both within the development sample and in independent validation data.
When a prognostic model is based on a very large sample size and relevant variables are included in the final model, optimism is small and so, the apparent estimates of model performance (c index and Brier’s score in the development data) are attractive because of their stability. 33 However, to assess optimistic performance within the development data, the percentage of over-fitting was estimated by refitting the model in 100 bootstrap replications of the data set and evaluating the resulting model in the original development data to calculate the optimism-corrected statistics. 34,35
When existing risk prediction models were modified, the performance of the revised model was compared with the existing model using reclassification techniques. 36 The improvement in reclassification was quantified as the net reclassification improvement (NRI). NRI is an index that attempts to quantify how well a new model reclassifies subjects – either appropriately or inappropriately – as compared with an existing model. We calculated the NRI both using pre-defined categories of risk and also as a continuous measure (i.e. the proportion with any improvement in predicted risk compared against the proportion with any worsening in predicted risk).
In addition, the risk models developed were compared, when relevant, against existing risk models (e.g. the ICNARCH–2015 model7).
Time-to-event analysis
Statistical methods relevant to model time-to-event outcomes are described in the corresponding chapters.
Patient and public involvement
Patient representatives on the ICNARC Board of Trustees and the NCAA Steering Group contributed to the original study proposal. Three independent patient and public members were included in the Study Steering Committee overseeing the study (see Acknowledgements). Patient and public representatives across all these groups consistently highlighted the importance of long-term outcomes and improving recovery pathways following critical care. The patient and public members of the Study Steering Committee also provided assurance that the approaches to handling patient data and maintaining confidentiality were robust and acceptable to the general public.
Chapter 4 Mortality after hospital discharge among critically ill patients in England
Introduction
To date, the main outcome for national clinical audits, including the CMP and NCAA, has been mortality at acute hospital discharge. However, recovery from critical illness can be a slow process, with studies reporting substantial ongoing burden of mortality several years after discharge from hospital. 37,38 Therefore, understanding the consequences of critical illness has become a focus of international interest, as evidenced by the topic of a recent round table conference. 39 In the present project, data linkage with death registrations has permitted follow-up of longer-term mortality, enabling us to better understand the time course of recovery from critical illness and which risk factors have an impact on longer-term mortality.
The aim of this chapter is to describe the long-term (5-year) survival for patients discharged alive from hospital following admission to an adult, general critical care unit overall, compared with age- and sex-matched general population by patient subgroups
Methods
Study cohort
The cohort for this chapter was the CMP hospital survivor cohort (see Chapter 3).
Inclusion and exclusion criteria
From the CMP hospital survivor cohort, patients were selected if they were discharged from acute hospital (from their index hospital admission) between 1 April 2009 and 15 March 2010 – allowing 5 years of follow-up for all patients to the final follow-up date for death registrations of 15 March 2015.
Outcome measure
The outcome measure was time to death following discharge from acute hospital. The outcome was defined as death (from any cause) within 5 years of discharge from hospital and number of days from hospital discharge to death, established by data linkage with death registrations. Patients not reported to have died were censored at 15 March 2015.
Statistical analysis
Kaplan–Meier survival curves were generated to describe mortality after hospital discharge among critical care admissions. Estimated cumulative mortality from 30 days to 5 years is reported both overall and for patient subgroups identified from the primary reason for admission to the critical care unit (pneumonia, bowel tumour, traumatic brain injury, cardiac surgery). The survival curve for critical care survivors was compared with that for the age- and sex-matched general population.
Results
Of the 789,149 CMP admissions with identifiable linkage with HES and death registrations in England between 1 April 2009 and 31 March 2015 (see Chapter 2), there were a total of 50,869 first admissions to adult general critical care units discharged alive from acute hospital between 1 April 2009 and 15 March 2010.
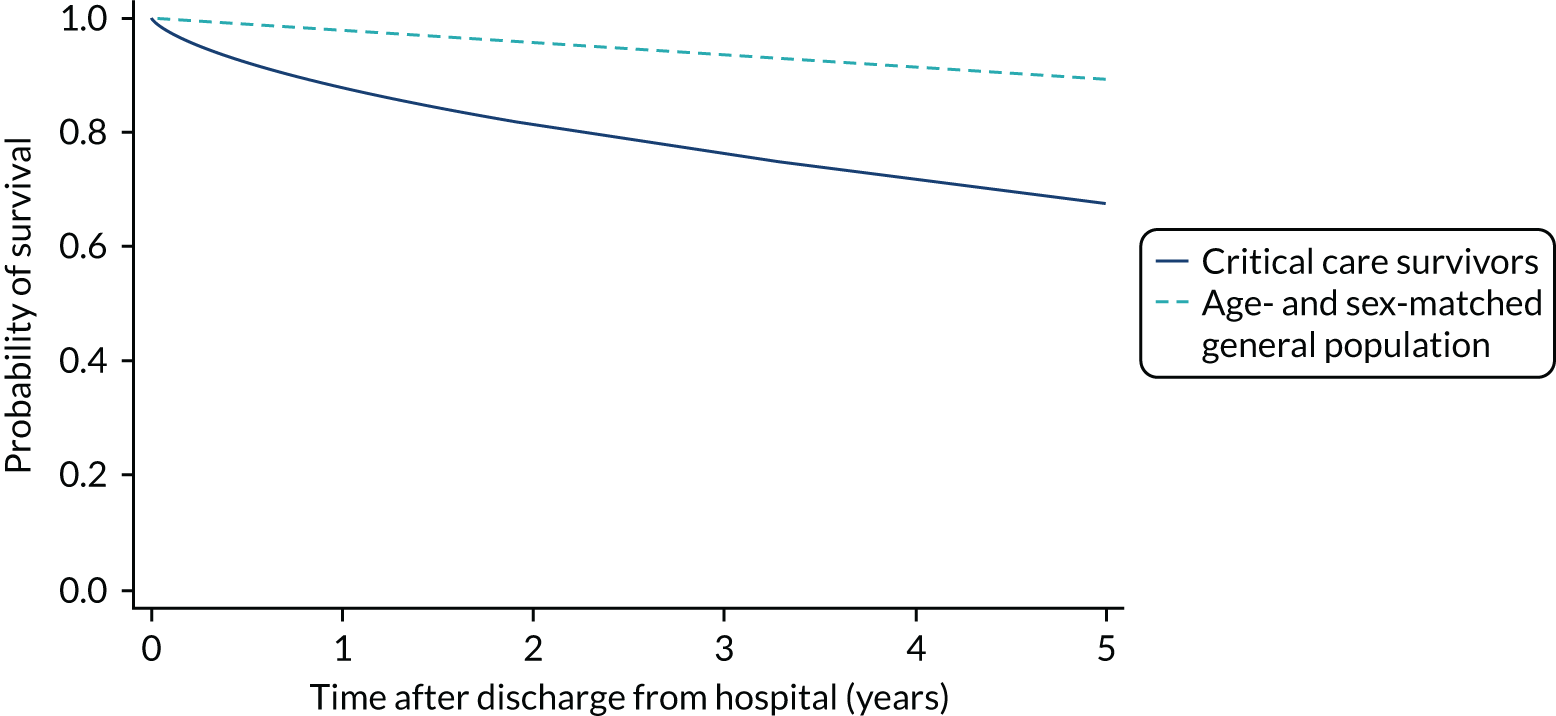
During the follow-up period after hospital discharge, there were 17,489 (34.4%) deaths among critical care hospital survivors. A comparison with the age- and sex-matched general population showed excess mortality among critical care survivors. The overall 5-year survival rate was 67.6% (95% CI 67.2% to 68.0%) compared with a predicted survival rate of 90% based on the general population; this corresponds to more than a three-fold increase in 5-year mortality among critical care survivors (Figure 2).
FIGURE 2.
Kaplan–Meier survival curve for critical care survivors compared with the age- and sex-matched general population.
Mortality rates at 30 days, 90 days and 1 year were 2.1%, 4.7% and 11.8%, respectively. Approximately one-quarter of the deaths within 5 years occurred within the first 6 months following hospital discharge. This pattern of higher death rates over the earlier follow-up time was consistent across all patient subgroups considered, and particularly relevant for patients with severe conditions in their medical history (Table 5).
| Characteristics | Mortality (%) | ||||
|---|---|---|---|---|---|
| 30 days | 90 days | 1 year | 5 years | Overalla | |
| Overall | 2.1 | 4.7 | 11.8 | 32.3 | 34.4 |
| Age (years) | |||||
| < 30 | 0.6 | 1.1 | 2.6 | 6.0 | 6.3 |
| 30–39 | 0.8 | 1.7 | 5.1 | 11.9 | 12.3 |
| 40–49 | 1.4 | 3.0 | 7.4 | 19.1 | 19.9 |
| 50–59 | 1.9 | 4.0 | 11.0 | 27.5 | 29.0 |
| 60–69 | 2.0 | 4.8 | 12.6 | 35.1 | 37.2 |
| 70–79 | 2.7 | 6.2 | 15.6 | 43.7 | 46.7 |
| ≥ 80 | 4.5 | 9.4 | 20.7 | 59.5 | 63.6 |
| Sex | |||||
| Male | 2.3 | 4.9 | 12.6 | 33.8 | 35.8 |
| Female | 1.9 | 4.4 | 11.0 | 30.6 | 32.6 |
| Deprivation | |||||
| 1 (least) | 2.3 | 5.3 | 12.2 | 32.6 | 34.6 |
| 2 | 2.1 | 4.8 | 12.0 | 33.3 | 35.6 |
| 3 | 2.2 | 4.8 | 12.2 | 32.8 | 35.0 |
| 4 | 2.2 | 4.6 | 11.6 | 32.5 | 34.2 |
| 5 (most) | 2.1 | 4.5 | 11.7 | 31.7 | 33.5 |
| Severe conditions in medical history | |||||
| Severe liver disease | |||||
| No | 2.1 | 4.7 | 11.8 | 32.2 | 34.3 |
| Yes | 4.7 | 9.1 | 18.6 | 43.8 | 45.8 |
| Haematological malignancy | |||||
| No | 2.1 | 4.6 | 11.7 | 32.1 | 34.1 |
| Yes | 5.4 | 15.4 | 35.8 | 62.6 | 64.3 |
| Metastatic disease | |||||
| No | 2.0 | 4.4 | 11.3 | 31.4 | 33.5 |
| Yes | 7.9 | 15.6 | 36.5 | 71.7 | 72.9 |
| Severe respiratory disease | |||||
| No | 2.0 | 4.6 | 11.7 | 31.8 | 33.8 |
| Yes | 4.9 | 10.3 | 24.2 | 59.7 | 62.4 |
| End-stage renal disease | |||||
| No | 2.1 | 4.6 | 11.7 | 32.1 | 34.1 |
| Yes | 6.3 | 10.9 | 24.7 | 56.9 | 59.8 |
| Very severe cardiovascular disease | |||||
| No | 2.1 | 4.8 | 11.8 | 32.1 | 34.1 |
| Yes | 4.2 | 8.3 | 21.5 | 55.6 | 59.3 |
| Prior dependency | |||||
| Able to live without assistance | 1.6 | 3.7 | 9.9 | 27.8 | 29.6 |
| Some (minor/major) assistance | 4.4 | 9.1 | 20.6 | 52.6 | 55.5 |
| Total assistance | 6.6 | 10.7 | 18.4 | 42.6 | 44.5 |
Five-year mortality among those aged 70–80 years was 43.7% compared with 6.0% among younger (< 30 years) survivors of critical illness. This pattern of increasing mortality with increasing age was consistent across all time points assessed (see Table 5).
Among admissions with any of the severe comorbidities (APACHE II definition), patients with metastatic disease and haematological malignancy showed the worst prognosis. One-year mortality for metastatic disease was 36.5% (95% CI 33.8% to 39.2%) increasing to 71.7% (95% CI 69.2% to 74.3%) at 5 years after hospital discharge and an increase from 35.8% (95% CI 32.1% to 39.2%) to 62.4% (95% CI 58.7% to 66.5%) for haematological malignancy. All comorbidities survival curves displayed an increased early mortality (at 30/90 days) after discharge but a more gradual decrease during the rest of the period (see Report Supplementary Material 1, Figure S1). Metastatic disease and haematological malignancy showed a steeper gradient during the first year than the other groups, which indicated a higher risk for these patients during this period. Univariable associations with 5-year survival for severe comorbidities were all significant (p < 0.001 by log-rank test).
Five-year mortality increased with acute illness severity, as assessed by the ICNARC Physiology Score (Table 6). 40 The gradient was steeper when considering the APACHE II score, which also incorporates age and comorbidities. 18 There was little association between long-term mortality and the length of stay in critical care or organ supports received, although a longer hospital stay was associated with increased mortality (Table 7).
| Characteristics | Mortality (%) | ||||
|---|---|---|---|---|---|
| 30 days | 90 days | 1 year | 5 years | Overalla | |
| Admission type | |||||
| Medical | 2.7 | 5.5 | 12.3 | 31.1 | 32.9 |
| Elective surgery | 1.1 | 3.1 | 11.2 | 34.9 | 37.3 |
| Emergency surgery | 2.4 | 5.2 | 11.6 | 31.4 | 33.3 |
| CPR within 24 hours prior to admission | |||||
| No CPR | 2.1 | 4.7 | 11.9 | 32.3 | 34.4 |
| Community CPR | 3.0 | 4.7 | 8.3 | 25.8 | 28.1 |
| In-hospital CPR | 3.9 | 6.8 | 14.6 | 38.6 | 41.4 |
| ICNARC physiology score (quintiles) | |||||
| < 10 | 1.1 | 2.5 | 7.9 | 25.4 | 27.0 |
| 10–13 | 1.4 | 3.9 | 10.7 | 30.8 | 32.9 |
| 14–17 | 2.5 | 5.2 | 13.7 | 34.9 | 37.0 |
| 18–24 | 3.1 | 6.8 | 15.3 | 38.4 | 40.5 |
| > 24 | 4.1 | 7.7 | 15.8 | 39.5 | 42.1 |
| APACHE II score (quintiles) | |||||
| < 11 | 0.9 | 2.0 | 5.7 | 17.6 | 18.7 |
| 11–13 | 1.3 | 3.4 | 10.0 | 30.1 | 32.3 |
| 14–16 | 2.1 | 5.0 | 13.0 | 36.5 | 39.1 |
| 17–21 | 3.3 | 6.9 | 16.6 | 42.9 | 45.4 |
| > 21 | 4.9 | 9.8 | 21.8 | 50.2 | 52.5 |
| Characteristics | Mortality (%) | ||||
|---|---|---|---|---|---|
| 30 days | 90 days | 1 year | 5 years | Overalla | |
| Total critical care unit length of stay in hours (quintiles) | |||||
| < 22 | 1.7 | 3.8 | 9.6 | 27.1 | 29.0 |
| 22–41 | 1.4 | 3.4 | 10.1 | 29.8 | 31.8 |
| 42–71 | 1.9 | 4.7 | 12.4 | 33.9 | 35.9 |
| 72–152 | 2.6 | 5.4 | 13.8 | 36.1 | 38.3 |
| > 152 | 3.0 | 6.3 | 13.5 | 35.0 | 40.0 |
| Hospital length of stay in days (quintiles) | |||||
| < 6 | 1.1 | 2.1 | 5.4 | 16.8 | 18.7 |
| 6–9 | 1.0 | 2.4 | 8.2 | 26.0 | 28.0 |
| 10–15 | 1.8 | 3.9 | 11.0 | 32.6 | 34.6 |
| 16–29 | 2.4 | 5.8 | 14.2 | 38.4 | 40.9 |
| > 29 | 3.9 | 8.4 | 18.7 | 44.4 | 46.6 |
| Receipt of advanced respiratory support | |||||
| No | 2.1 | 4.8 | 12.5 | 34.5 | 36.6 |
| Yes | 2.2 | 4.6 | 10.9 | 29.2 | 31.1 |
| Duration of advanced respiratory support (quintiles)b | |||||
| 1–2 | 1.9 | 4.1 | 10.3 | 27.6 | 29.5 |
| 3–7 | 2.5 | 5.5 | 12.3 | 31.6 | 33.3 |
| 8–14 | 2.7 | 5.2 | 10.4 | 29.4 | 31.2 |
| + 14 | 2.3 | 5.2 | 12.2 | 33.8 | 36.2 |
| Receipt of advanced cardiovascular support | |||||
| No | 2.0 | 4.4 | 11.5 | 31.8 | 33.7 |
| Yes | 3.0 | 6.1 | 13.8 | 35,2 | 37.5 |
| Receipt of renal support | |||||
| No | 2.0 | 4.4 | 11.4 | 31.6 | 33.6 |
| Yes | 4.5 | 8.9 | 18.3 | 43.4 | 45.4 |
| Receipt of neurological support | |||||
| No | 2.1 | 4.7 | 12.1 | 33.1 | 35.1 |
| Yes | 2.2 | 4.5 | 10.1 | 25.0 | 26.5 |
Table 8 shows the mortality for specific patient subgroups. Close to 90% of hospital survivors following traumatic brain injury survived for 5 years, but only half of patients with a bowel tumour diagnosis survived for a similar period.
| Patient subgroups | Mortality (%) | ||||
|---|---|---|---|---|---|
| 30 days | 90 days | 1 year | 5 years | Overalla | |
| Pneumonia | 3.0 | 6.1 | 13.6 | 36.0 | 38.0 |
| Bowel tumour | 3.6 | 9.0 | 21.6 | 49.6 | 51.7 |
| Traumatic brain injury | 1.8 | 2.6 | 4.1 | 10.8 | 11.6 |
| Cardiac surgery | 1.2 | 3.0 | 7.8 | 28.9 | 31.9 |
Discussion
Reporting long-term mortality following critical care is essential for a better understanding of the consequences of critical illness, helping to inform clinicians, policy-makers and health service planners. In the present chapter, data linkage with death registrations has enabled us to describe the time course of recovery from critical illness and which risk factors have an impact on longer-term mortality.
We have confirmed that there is an excess mortality among critical care survivors. Of patients discharged alive from acute hospital following an episode of critical care in 2009/10, almost one-third died during the subsequent 5 years compared with 10% of the age- and sex-matched general population. Pre-existing risk factors such as age, comorbidities and functional status had the greatest influence on longer-term outcome. Admissions with oncology conditions in the medical history had the worst prognosis. Acute severity, organ support and length of stay in critical care had comparatively small effects.
We found that the 1-year and 5-year mortality in critical care survivors discharged alive from hospital were 11.8% and 32.3%, respectively. These results are remarkably similar to those reported by Lone et al. 38 in a multicentre study of critical care units in Scotland, which reported mortality of 10.9% and 32.3% at these time points, and also to a large multicentre study from Ontario, Canada, which reported mortality of 11.1% and 29.0%, respectively. 37
Chapter 5 Risk models for mortality following admission to adult critical care
Introduction
Acute hospital mortality has predominantly been selected as the main outcome for national clinical audits. This is partly because of its convenience to record and collect, as follow-up of patients beyond acute hospital discharge has not been practicable. However, some research41 suggests that time-based outcomes, for example, mortality at 30 or 90 days following admission or duration of survival, would be less prone to bias arising from variation in provision of community health and social care services, which may affect the timing at which patients are discharged from acute hospital. Furthermore, exploring longer-term end points, such as 1 year, would also enable us to better understand the time course of recovery from critical illness and which risk factors have an impact on longer-term mortality. 42 Data linkage with death registrations has permitted us to follow up patients admitted to critical care units for both short- and longer-term mortality.
In addition, the risk prediction models developed for adult general critical care were limited to the available predictors within the CMP data set, which, in turn, are limited by what it is feasible to expect providers to routinely collect for the purpose of national clinical audit. Data linkage with HES has expanded the available predictors, permitting us to evaluate the impact of a wider number of comorbidities than are recorded in the CMP, which may be expected to have greater prognostic importance for determining 1-year mortality.
This chapter reports on the development and validation of risk prediction models for patients admitted to adult critical care units, evaluating mortality at fixed time points (30 days, 90 days and 1 year). We focus the present chapter on mortality at 30 days and 1 year, with results for 90 days used to compare and consolidate the 30-day findings.
Methods
Methods common to all objectives and analyses were describe in Chapter 3. Details relating to the study cohorts, inclusion and exclusion criteria and outcomes can be found in the same chapter.
Outcomes and candidate predictors
Risk prediction models were developed for three outcomes: mortality at 30 days, 90 days and 1 year following admission to the critical care unit. Patients were followed up to each end point from the first critical care unit admission during the index hospital admission. This starting point was selected for a benchmarking purpose. 43 A second 1-year follow-up time point from hospital discharge for hospital survivors was also established with the aim to compare the role of comorbidities among hospital survivors.
The starting point for the risk prediction models in the present chapter was the set of physiological and non-physiological predictors from the CMP previously included in the existing model to predict mortality at discharge from acute hospital. 7 Severe conditions in the medical history that were previously considered but were found not to be important predictors for acute hospital mortality were reassessed for short-term outcomes. The full list of candidate predictors from the CMP is presented in Appendix 1, Table 38.
It was anticipated that chronic ill health has had a greater impact on longer term outcomes than on mortality at 30 days or at discharge from acute hospital. Combinations of severe conditions in the past medical history (APACHE II) and RCS Charlson comorbidities, as described in Chapter 3, were therefore included in the 1-year analyses.
Development of a risk model for 30-day mortality
The steps to developing a risk model for 30-day mortality, starting from the predictors in the model for acute hospital mortality, were as outlined in Chapter 3.
Reasons for admission to critical care are recorded in the CMP using the ICNARC Coding Method: a five-tiered (type – surgical or non-surgical/body system/anatomical site/physiological or pathological process/condition) coding system specifically developed for this purpose. 44 Currently, coefficients for the ICNARC model are applied at three levels of the hierarchical code—either at tier 5, the individual condition, or at tier 4, the process, or at process/the body system combination. The following steps were followed in updating the primary reason for admission categories:
-
As starting point, the current process and process/system categories were retained.
-
The set of categories was refined by adding specific conditions.
-
Process/system categories were split into individual conditions that had sufficient sample size (number of events ≥ 20).
-
Each individual condition was retained as a new category if it was significant as a stand-alone variable in the model after adjusting for process/system (likelihood ratio tests, p < 0.001) and made an important contribution to the fit of the model (based on the presence of a strong effect on the BIC).
Finally, interactions between the categories and physiology were introduced based on clinical input to identify and prioritise the potentially important interactions to consider and avoid overfitting, with interactions retained if their likelihood ratio test p-value was < 0.001 and had a positive effect on the BIC.
Use of 30-day mortality for benchmarking
Existing risk prediction models for critical care, including the ICNARC model, have been based on an outcome of mortality at hospital discharge. These models have been used for national clinical audits, including the CMP and NCAA, to underpin fair comparisons among health-care providers. Research from the Netherlands42 has suggested that comparison of risk-adjusted mortality across critical care units using mortality at 30 or 90 days, rather than at hospital discharge, results in less heterogeneity.
To assess the effect of using 30-day mortality for benchmarking instead of acute hospital mortality, the final model for 30-day mortality was used to predict acute hospital mortality in the development data set. We used second-level customisation: acute hospital mortality was set as the outcome and the predictors were the variables included in the final model for 30-day mortality. The performance of this customised model (discrimination, calibration and accuracy) was used to assess whether or not the 30-day model could be used to predict mortality at acute hospital discharge.
As the SMR is used on benchmarking to evaluate the performance of a critical care unit we explored the effect of using 30-day versus in-hospital mortality on the SMR and the impact of the location of critical care units on a funnel plot of SMR against sample size. 45 Upper two and three SD control limits were used to identify higher-than-expected mortality and lower two and three SD control limits were used to identify lower-than-expected mortality.
Development of a risk model for 90-day mortality
The same approach used to customise the model to predict acute hospital mortality was applied when extending mortality prediction from 30 days to 90 days. A second-level customisation of the final 30-day mortality model was used to predict mortality at 90 days following admission to critical care.
Development of a risk model for mortality at 1 year following critical care admission
The risk model for mortality at 1 year following critical care admission was developed using the methods outlined in Chapter 3 using, as a starting point, the previous model for acute hospital mortality and considering the additional comorbidity variables in the development.
Development of a risk model for mortality at 1 year following hospital discharge
The risk model for mortality at 1 year following hospital discharge was developed using the methods outlined in Chapter 3 using, as a starting point, the previous model for mortality at 1 year following critical care admission.
Results
Mortality at 30 days
Between 1 January 2014 and 31 December 2014, there were 153,494 first admissions to 235 adult critical care units in England participating in the CMP with identifiable linkage with HES and death registrations, of which 123,719 (80.6%) had complete data for all candidate physiological predictors (see below). Patients who were dead, were in line for palliative care or had all active treatment withdrawn immediately on admission and patients with missing values in non-physiological predictors were excluded. In total, 119,509 patients were included in the development data set. As described in Chapter 3, missing values were not imputed in the primary analyses for adult critical care.
Of the 119,509 patients, 22,579 (18.9%) died during the 30-day follow-up. Of these, 16,129 (13.5%) died during the critical care admission. The median critical care unit length of stay was 57 hours (IQR 26–122 hours) for 30-day survivors and 68 hours (IQR 28–151 hours) for 30-day non-survivors. The median hospital length of stay was 14 days (IQR 7–29 days) for 30-day survivors and 7 days (IQR 3–15 days) for 30-day non-survivors.
The characteristics of the included patients are described in Table 9. The median age was 66 years (IQR 52–75 years) and most of the admissions were able to live without assistance in daily activities (76.4%).
| Characteristic | Value |
|---|---|
| Number of admissions | 119,509 |
| Demographics | |
| Age (years) | |
| Mean (SD) | 62 (17.1) |
| Median (IQR) | 66 (52–75) |
| Sex, male, n (%) | 67,398 (56.4) |
| Ethnicity, n (%) | |
| White | 107,146 (89.7) |
| Mixed | 603 (0.5) |
| Asian | 4563 (3.8) |
| Black | 2620 (2.2) |
| Other | 4577 (3.8) |
| Reason for admission by body system, n (%) | |
| Respiratory | 23,072 (19.3) |
| Cardiovascular | 23,531 (19.7) |
| Gastrointestinal | 31,288 (26.2) |
| Neurological (including eyes) | 15,463 (12.9) |
| Genito-urinary | 11,870 (9.9) |
| Endocrine, metabolic, thermoregulation and poisoning | 7089 (5.9) |
| Haematological/immunological | 1179 (1.0) |
| Musculoskeletal | 4902 (4.1) |
| Dermatological | 1087 (0.9) |
| Quintile of deprivation, n (%) | |
| 1 (least deprived) | 20,109 (16.9) |
| 2 | 21,633 (18.2) |
| 3 | 23,300 (19.6) |
| 4 | 25,162 (21.2) |
| 5 (most deprived) | 28,657 (24.1) |
| Patient-related factors | |
| CPR within 24 hours prior to admission, n (%) | |
| No CPR | 112,714 (94.3) |
| Community CPR | 3608 (3.0) |
| In-hospital CPR | 3187 (2.7) |
| Prior dependency, n (%) | |
| Able to live without assistance in daily activities | 90,894 (76.4) |
| Some (minor/major) assistance with daily activities | 27,153 (22.8) |
| Total assistance with all daily activities | 884 (0.7) |
| Location prior to critical care admission, n (%) | |
| ED or not in hospital: unplanned | 27,317 (22.9) |
| ED or not in hospital: planned | 843 (0.7) |
| Theatre, elective/scheduled: planned | 29,888 (25.0) |
| Theatre, elective/scheduled – unplanned | 4129 (3.5) |
| Theatre, emergency/urgent | 21,426 (17.9) |
| Ward or intermediate care area | 29,553 (24.7) |
| Other critical care unit – repatriation | 585 (0.5) |
| Other critical care unit – planned/unplanned transfer | 4750 (4.0) |
| Other acute hospital | 1018 (0.9) |
| Medical history | |
| Severe conditions in medical history (APACHE II), n (%) | |
| Very severe cardiovascular disease | 2342 (2.0) |
| Severe respiratory disease | 2756 (2.3) |
| Severe liver disease | 3312 (2.8) |
| ESRD | 1928 (1.6) |
| Metastatic disease | 6001 (5.0) |
| Haematological malignancy | 2327 (1.9) |
| Immunocompromise | 8721 (7.3) |
| RCS Charlson comorbidities, n (%) | |
| Previous MI | 5922 (5.0) |
| Congestive cardiac failure | 6369 (5.3) |
| Peripheral vascular disease | 6200 (5.2) |
| Cerebrovascular disease | 3580 (3.0) |
| Dementia | 1090 (0.9) |
| Chronic pulmonary disease | 15,754 (13.2) |
| Rheumatological disease | 2498 (2.1) |
| Liver disease | 2458 (2.1) |
| Diabetes mellitus | 15,592 (13.0) |
| Hemiplegia or paraplegia | 931 (0.8) |
| Chronic renal disease | 6246 (5.2) |
| Malignancy | 12,789 (10.7) |
| Severity scores from the first 24 hours following critical care admission | |
| ICNARC physiology score | |
| Mean (SD) | 17 (9.0) |
| Median (IQR) | 15 (10–22) |
| APACHE II score | |
| Mean (SD) | 16 (6.8) |
| Median (IQR) | 15 (11–20) |
| Physiology from the first 24 hours following critical care admission | |
| Highest heart rate (min–1), mean (SD) | 104 (23) |
| Lowest systolic blood pressure (mmHg), mean (SD) | 95 (19) |
| Highest temperature (°C), mean (SD) | 37.6 (0.9) |
| Lowest respiratory rate (min–1), mean (SD) | 12.8 (4.1) |
| Urine output (ml), mean (SD) | 1861 (1435) |
| PaO2/FiO2 (kPa), mean (SD) | 34.2 (15.6) |
| Lowest pH, mean (SD) | 7.31 (0.11) |
| PaCO2 (kPa), mean (SD) | 5.9 (1.9) |
| Highest blood lactate (mmol l–1), mean (SD) | 2.7 (2.7) |
| Highest urea (mmol l–1), mean (SD) | 9.9 (9.1) |
| Highest creatinine (µmol l–1), mean (SD) | 134 (149) |
| Highest serum sodium (mmol l–1), mean (SD) | 139 (5) |
| Lowest white blood cell count (× 109 l–1), mean (SD) | 12.2 (8.8) |
| Neutrophil count (× 109 l–1), mean (SD) | 10.0 (6.2) |
| Lowest platelet count (× 109 l–1), mean (SD) | 210 (109) |
| Sepsis, n (%) | 35,138 (29.4) |
| Organ dysfunction, n (%) | 103,921 (87.0) |
| Organ support during critical care stay | |
| Receipt of advanced respiratory support, n (%) | 55,405 (46.4) |
| Duration of advanced respiratory support (calendar dates), median (IQR) | 2 (2–6) |
| Receipt of basic or advanced cardiovascular support, n (%) | 28,975 (24.2) |
| Duration of basic or advanced cardiovascular support (calendar days), median (IQR) | 2 (1–4) |
| Receipt of renal support, n (%) | 12,523 (10.5) |
| Duration of renal support (calendar days), median (IQR) | 3 (2–6) |
| Outcomes | |
| Critical care unit mortality, n (%) | 16,129 (13.5) |
| Acute hospital mortality, n (%) | 23,976 (20.1) |
| 30-day mortality, n (%) | 22,579 (18.9) |
| Critical care unit length of stay (hours), mean (SD) | 119 (194) |
| For 30-day survivors | 120 (207) |
| For 30-day non-survivors | 113 (123) |
| Critical care unit length of stay (hours), median (IQR) | 61 (26–128) |
| For 30-day survivors | 58 (26–122) |
| For 30-day non-survivors | 69 (28–151) |
| Acute hospital length of stay (days), mean (SD) | 22 (33) |
| For 30-day survivors | 24 (34) |
| For 30-day non-survivors | 11 (28) |
| Acute hospital length of stay (days), median (IQR) | 12 (6–25) |
| For 30-day survivors | 14 (7–29) |
| For 30-day non-survivors | 7 (3–15) |
The most common severe condition in the medical history was immunocompromise (7.3%). Regarding RCS Charlson comorbidities, chronic pulmonary disease (13.2%), diabetes mellitus (13%) and malignancy (10.7%) were the most prevalent.
Model development
Functional form and significance of CMP physiological and non-physiological predictors previously included in the existing model for adult general critical were reassessed. Consistency with both optimal functional form and global significance of the predictors was found after fitting a model considering all physiological and non-physiological predictors from the current ICNARC model (Table 10).
| Model | df | LL | BIC | C index (95% CI) | Brier’s score |
|---|---|---|---|---|---|
| Main modela | 110 | –36784.79 | 74867 | 0.888 (0.886 to 0.890) | 0.095 |
| Main model + new predictors | 115 | –36641.15 | 74638 | 0.889 (0.887 to 0.891) | 0.095 |
| Main model + new predictors + reason for admission | 184 | –35210.77 | 72584 | 0.898 (0.896 to 0.901) | 0.091 |
| Final model | 226 | –35028.98 | 72711 | 0.900 (0.897 to 0.902) | 0.091 |
In line with the previous project,6 we decided to use restricted cubic splines to model continuous candidates because these showed the flexibility of fractional polynomials but with better behaviour in the tails and captured the most prominent features of the relationship between predictors and outcomes, and because the fit was more plausible than a categorical approach. 6 For body mass index (BMI), a simplification using three knots was enough to accommodate the non-linear behaviour and had better AIC and BIC than four knots.
Severe conditions in the medical history were added into the model, but the only conditions finally retained were very severe cardiovascular disease, severe respiratory disease and immunocompromise, because of their significant effect and contribution to the model.
After adjusting for current and new potential predictors, deprivation was not retained in the main term model owing to the lower contribution to the model fit.
The new categories of primary reason for admission are shown in Table 11. Conditions were selected after the modelling process described above. A total of 57 process/system combinations and 13 individual conditions from the ICNARC Coding Method form the new reason for admission categories. These accounted for 94.5% and 5.5% of admissions, respectively. Fifteen significant primary reasons for admission/physiology interactions were retained in the model.
| Reason of admission categorical variable | Frequency | Percentage |
|---|---|---|
| Combinations of process and system | ||
| Accidental intoxication or poisoning (endocrine) | 398 | 0.33 |
| Acidaemia (endocrine) | 336 | 0.28 |
| Burns or hyperthermia (dermatological) | 115 | 0.10 |
| Collapse (respiratory) | 501 | 0.42 |
| Coma or encephalopathy (neurological) | 991 | 0.83 |
| Congenital or acquired deformity or abnormality | ||
| Cardiovascular | 556 | 0.47 |
| Cardiovascular, endocrine, gastrointestinal, genitourinary or haematological/immunological | 1549 | 1.30 |
| Musculoskeletal | 1175 | 0.98 |
| Neurological | 654 | 0.55 |
| Respiratory | 763 | 0.64 |
| Degeneration | ||
| Cardiovascular | 2442 | 2.04 |
| Neurological | 39 | 0.03 |
| Diabetes mellitus (endocrine) | 1790 | 1.50 |
| Dissection or aneurysm (cardiovascular) | 3633 | 3.04 |
| Failure | ||
| Cardiovascular | 1138 | 0.95 |
| Genitourinary | 4616 | 3.86 |
| Haemolysis or thrombocytopaenia | 93 | 0.08 |
| Haemorrhage | ||
| Cardiovascular | 141 | 0.12 |
| Gastrointestinal | 2374 | 1.99 |
| Genitourinary | 660 | 0.55 |
| Neurological | 1709 | 1.43 |
| Respiratory | 151 | 0.13 |
| Hyperkalaemia (endocrine) | 284 | 0.24 |
| Hypokalaemia (endocrine) | 103 | 0.09 |
| Hyponatraemia (endocrine) | 266 | 0.22 |
| Hypoplasia or dysplasia (haematological/immunological) | 121 | 0.10 |
| Hypothermia (endocrine) | 83 | 0.07 |
| Infection | ||
| Cardiovascular | 451 | 0.38 |
| Dermatological, gastrointestinal, haematological/immunological, musculoskeletal or neurological | 6438 | 5.39 |
| Genitourinary | 1878 | 1.57 |
| Respiratory | 6133 | 5.13 |
| Inflammation | ||
| Cardiovascular, dermatological, genitourinary, musculoskeletal, respiratory | 2863 | 2.40 |
| Gastrointestinal | 10,189 | 8.53 |
| Neurological | 177 | 0.15 |
| Non-traumatic aneurysm, dissection, perforation or rupture (cardiovascular) | 2677 | 2.24 |
| Obstruction | ||
| Cardiovascular | 7948 | 6.65 |
| Gastrointestinal | 4288 | 3.59 |
| Genitourinary | 606 | 0.51 |
| Respiratory | 1255 | 1.05 |
| Oedema, inflammation, fibrosis or inhalation (respiratory) | 104 | 0.09 |
| Seizures (neurological) | 2388 | 2.00 |
| Self-harm or self-poisoning (endocrine) | 2950 | 2.47 |
| Shock and hypotension (cardiovascular) | 2003 | 1.68 |
| Transplant or related (cardiovascular, endocrine, genitourinary, haematological/immunological, respiratory) | 297 | 0.25 |
| Transplant or related (gastrointestinal) | 523 | 0.44 |
| Trauma | ||
| Neurological | 391 | 0.33 |
| Perforation or rupture (cardiovascular) | 334 | 0.28 |
| Perforation or rupture (dermatological, genitourinary, musculoskeletal, respiratory) | 3348 | 2.80 |
| Perforation or rupture (gastrointestinal) | 5666 | 4.74 |
| Perforation or rupture (neurological) | 2014 | 1.69 |
| Tumour or malignancy | ||
| Cardiovascular, dermatological, endocrine, gastrointestinal, musculoskeletal, respiratory | 12,089 | 10.12 |
| Genitourinary | 4065 | 3.40 |
| Haematological/immunological | 414 | 0.35 |
| Neurological | 2117 | 1.77 |
| Vascular | ||
| Cardiovascular; genitourinary | 138 | 0.12 |
| Gastrointestinal | 891 | 0.75 |
| Neurological | 1579 | 1.32 |
| Specific conditions | ||
| Acute alcoholic hepatitis | 185 | 0.15 |
| Alcoholic cirrhosis | 325 | 0.27 |
| Anoxic or ischaemic coma or encephalopathy | 1037 | 0.87 |
| Asthma attack in new or known asthmatic | 1147 | 0.96 |
| Fungal or yeast pneumonia | 148 | 0.12 |
| Hanging or strangulation | 153 | 0.13 |
| Intracerebral haemorrhage | 1178 | 0.99 |
| Multiple rib fractures | 276 | 0.23 |
| Non-traumatic subdural haemorrhage | 390 | 0.33 |
| Pulmonary fibrosis or fibrosing alveolitis | 182 | 0.15 |
| Secondary hepatic tumour | 895 | 0.75 |
| Secondary hydrocephalus | 137 | 0.11 |
| Thrombo-occlusive disease of brain | 561 | 0.47 |
Interactions included in the previous model between severe liver disease with physiology, CPR with physiology, ventilation with physiology and physiology with physiology were re-assessed. Only the interactions between severe liver disease and temperature and between ventilation and heart rate were not significant after adjusting for the main term model plus the new primary reason categories and interactions. They were finally dropped.
Following the development process, the significance and importance of the predictors in the final model are shown in Appendix 2, Table 41. Full coefficients for the final model are presented in Appendix 3, Table 45. The distribution of predicted acute hospital mortality from the new model is shown in Figure 3. The final model showed good performance (c index 0.900 and Brier’s score 0.091) and, internally, calibration of the model was satisfactory (Figure 4). Overfitting was of limited relevance because of the very large data set and, as expected, model optimism was negligible (0.49% estimated overfitting).
FIGURE 3.
Distribution of predicted risk from the final risk model for mortality at 30 days following critical care admission in the development data set.
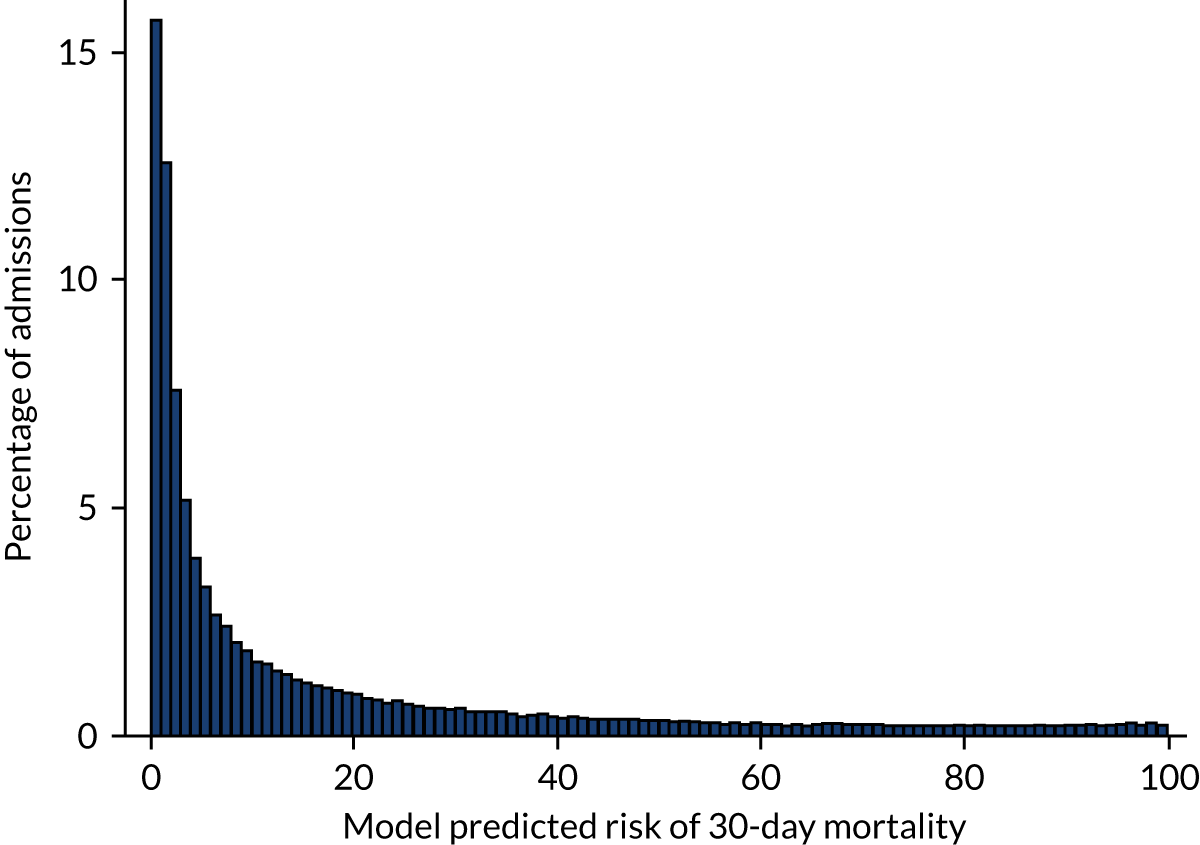
FIGURE 4.
Calibration of the final risk model for mortality at 30 days following critical care admission in the development data set.
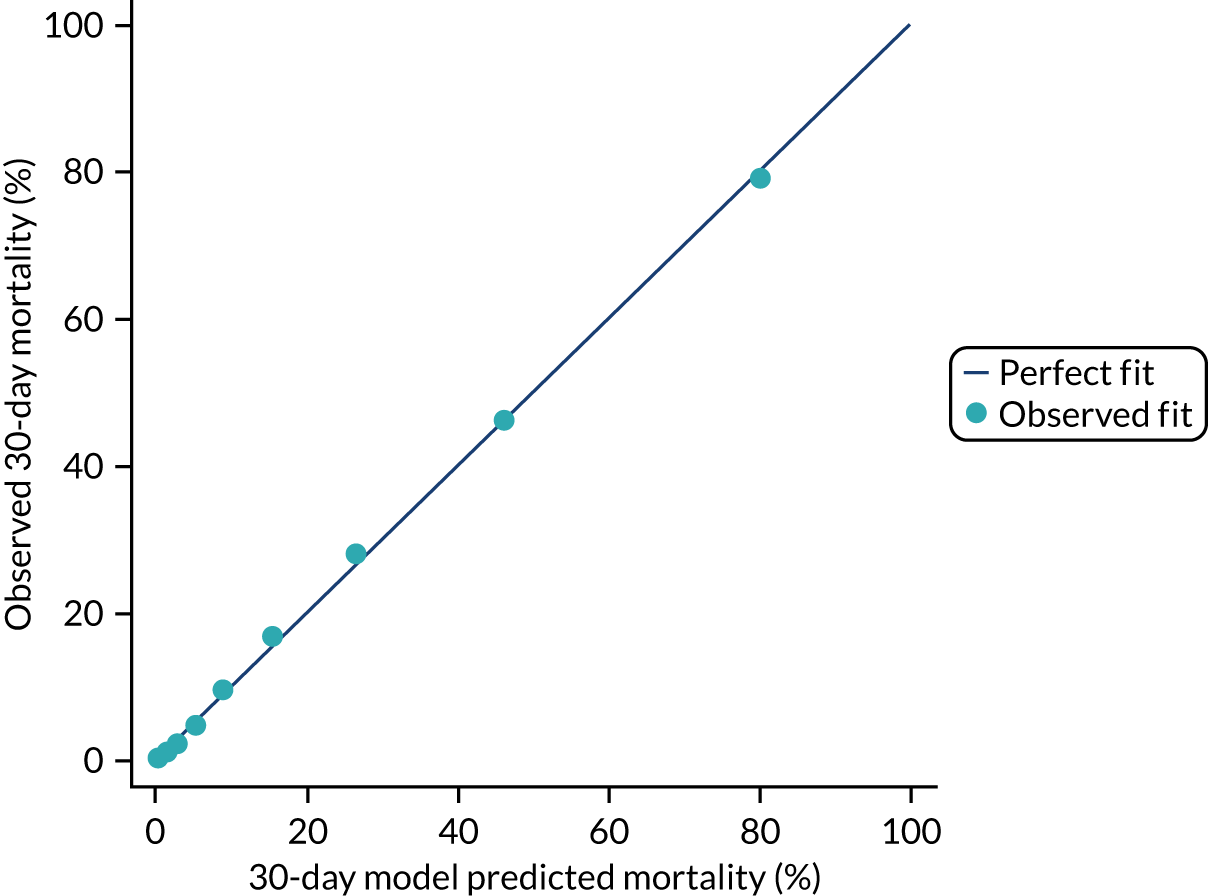
The estimates for the model parameters obtained using data from the multiply imputed data set were similar to values estimated from the development data set and, therefore, the bias that could arise from using only the available information was considered to be very small.
Model validation
The performance in the validation data set of 134,750 admissions from 31 March 2015 to 31 March 2016 is presented in Table 12 and Figure 5. Discrimination and accuracy were excellent: a c index of 0.90 (95% CI 0.89 to 0.91) and Brier’s score of 0.088. The calibration of the model was satisfactory, with a calibration slope of 0.998 and a calibration intercept of 0.013. The observed and mean predicted mortality were 17.8.% and 17.6%, respectively, for a SMR (observed divided by predicted mortality) of 1.01 (95% CI 1.00 to 1.02), which indicated a good calibration in the main.
| Model | c index (95% CI) | Brier’s score | Predicted mortality (%) | Observed mortality (%) | SMR (95% CI) |
|---|---|---|---|---|---|
| Final risk model for mortality at 30 days | 0.900 (0.897 to 0.912) | 0.088 | 17.69 | 17.82 | 1.01 (1.00 to 1.02) |
| Final customised risk model for mortality at 90 days | 0.883 (0.880 to 0.884) | 0.105 | 21.47 | 21.53 | 1.00 (0.99 to 1.01) |
FIGURE 5.
Calibration of (a) the final risk model for mortality at 30 days following critical care admission and (b) the customised risk model for mortality at 90 days following critical care admission in the external validation data set.
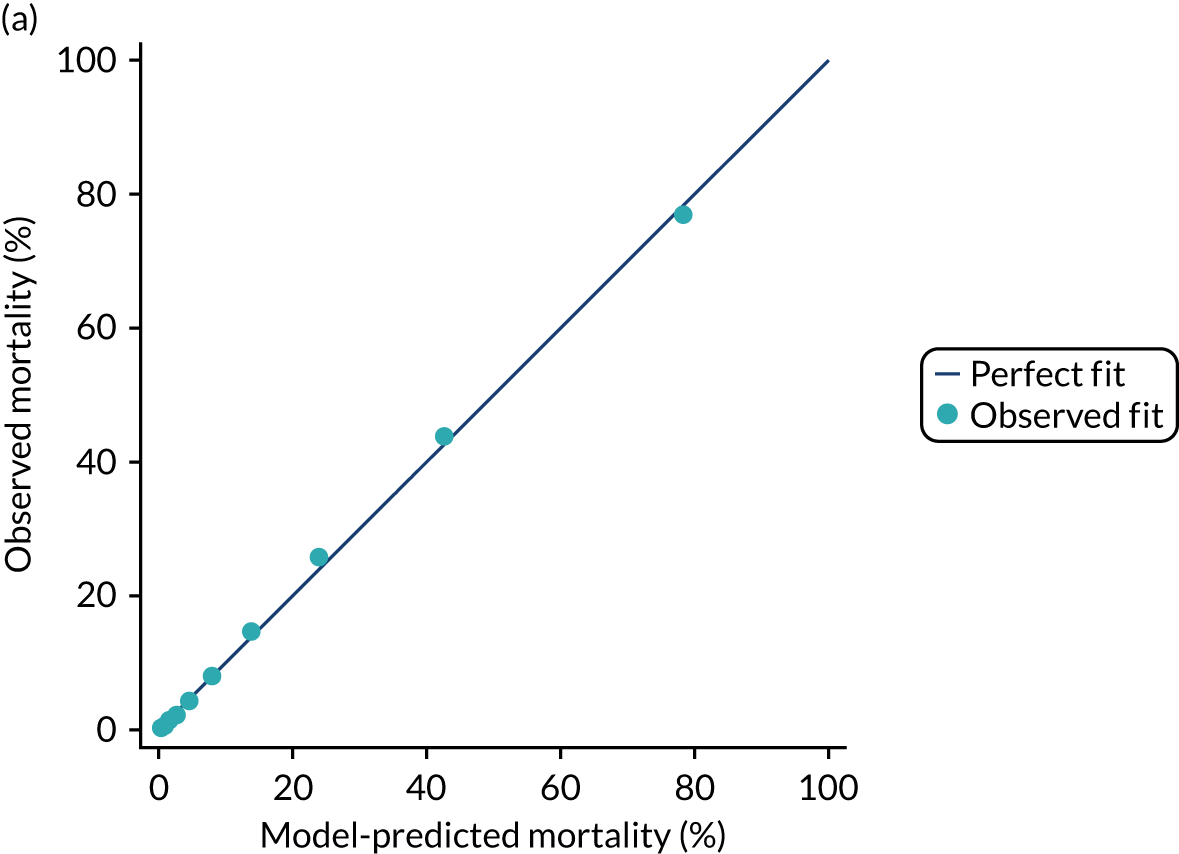
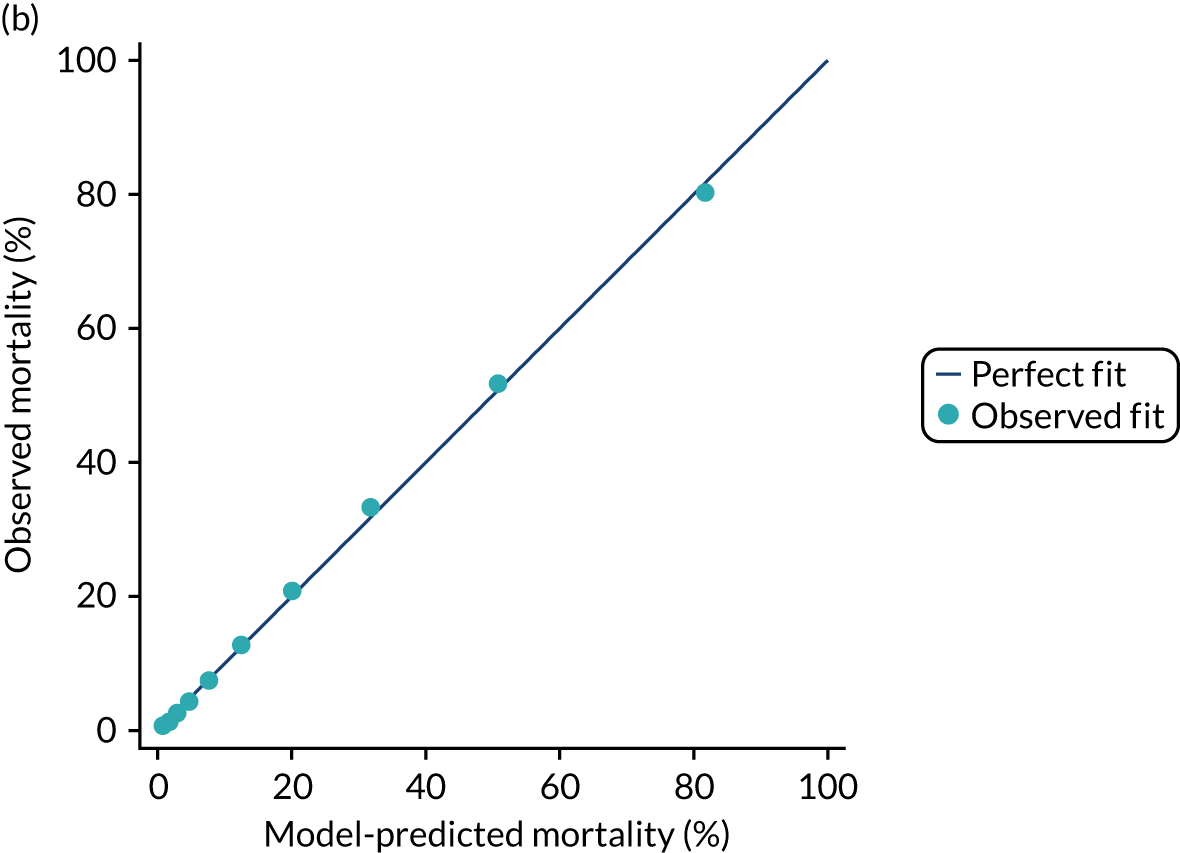
Use of 30-day mortality for benchmarking
The performance in the development data set for the customised model for predicting acute hospital mortality was excellent: a c index of 0.899 (95% CI 0.897 to 0.901) and Brier’s score of 0.095. The calibration of the model was satisfactory (Figure 6). This indicated that the model performs well when applied for prediction of acute hospital mortality.
FIGURE 6.
Calibration of the customised risk model for acute hospital mortality in the development data set.
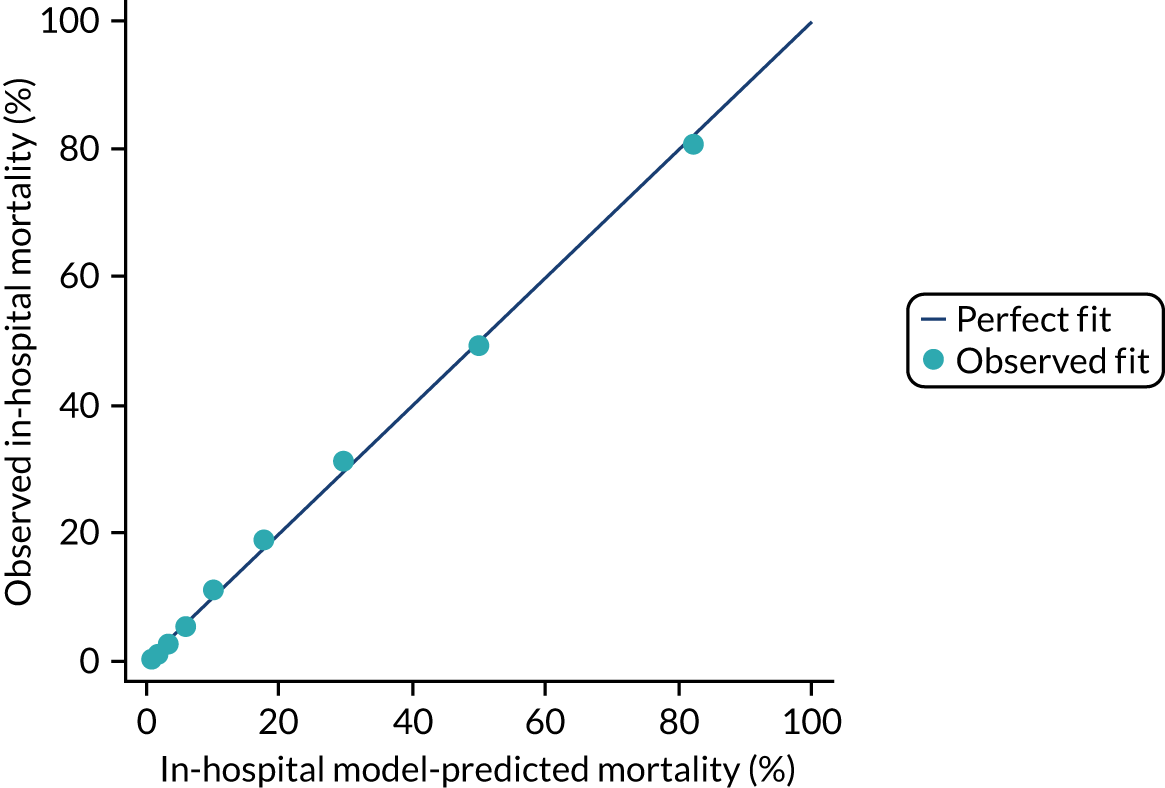
The effect of benchmarking by using mortality at 30 days after critical care admission instead of acute hospital mortality was assessed in the 232 included critical care units. There was strong agreement between SMRs calculated on 30-day mortality and acute hospital mortality (Supplementary material, Figure S2). Funnels plots of SMR for individual critical care units (Figure 7) show that 21 units (9%) moved across the 2SD (dashed funnel line) and 3SD (solid funnel line) boundaries when the outcome was changed to 30-day mortality. Table 13 summarises the comparison of SMR position between acute hospital mortality and 30-day mortality. When changing from acute hospital mortality to 30-day mortality, 12 units moved to less extreme positions in the funnel (one from below 3SD to inside the funnel, six from below 2SD to inside the funnel and five from above 2SD to inside the funnel) and nine units moved to more extreme positions in the funnel (one from below 2SD to below 3SD, five from inside the funnel to below 2SD, one from inside the funnel to above 2SD and two from above 2SD to above 3SD). This suggests that there was little difference in heterogeneity across critical care units when assessed with 30-day mortality rather than acute hospital mortality.
FIGURE 7.
Funnel plots of SMR for (a) acute hospital mortality and (b) 30-day mortality.
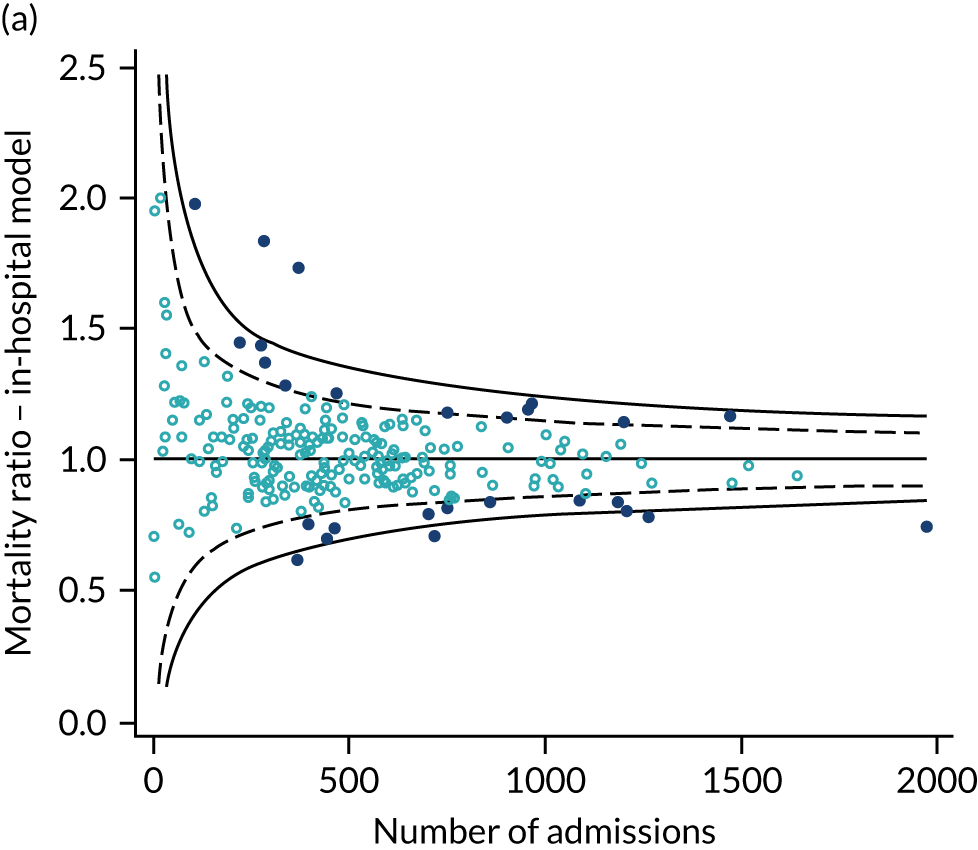
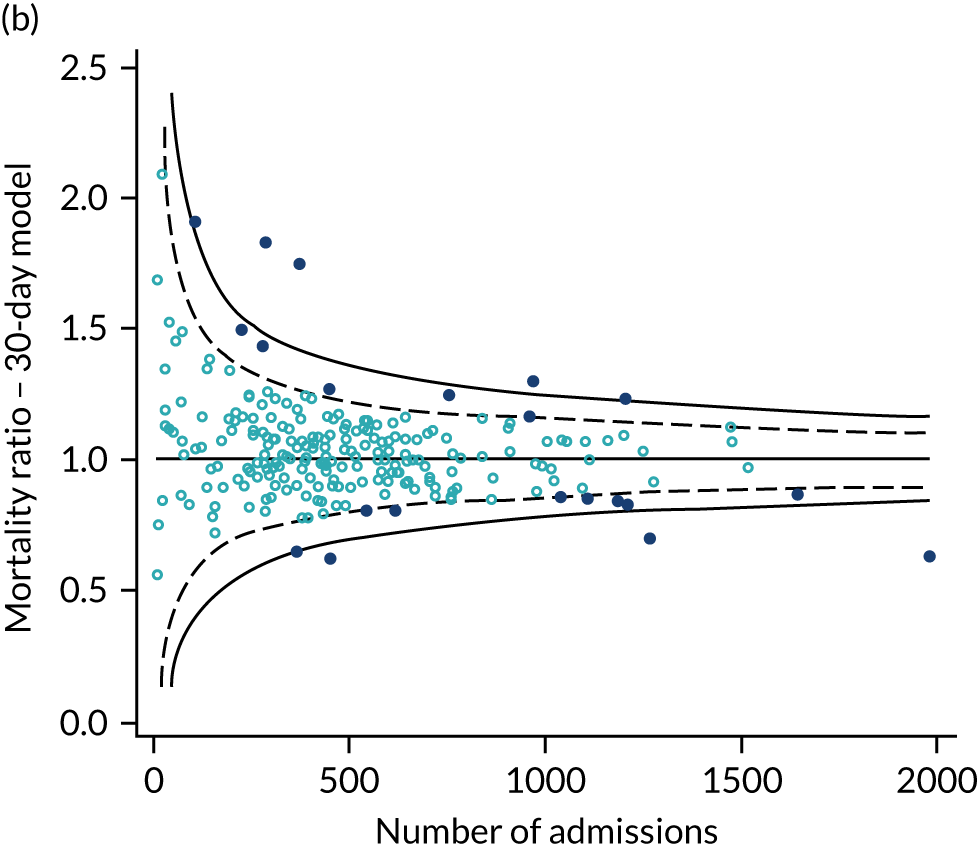
| Acute hospital mortality | 30-day mortality | |||||
|---|---|---|---|---|---|---|
| Below 3SD | Below 2SD | Inside funnel | Above 2SD | Above 3SD | Total | |
| Below 3SD | 3 | 0 | 1 | 0 | 0 | 4 |
| Below 2SD | 1 | 2 | 6 | 0 | 0 | 9 |
| Inside funnel | 0 | 5 | 199 | 1 | 0 | 205 |
| Above 2SD | 0 | 0 | 5 | 4 | 2 | 11 |
| Above 3SD | 0 | 0 | 0 | 0 | 3 | 3 |
| Total | 4 | 7 | 211 | 5 | 5 | 232 |
Mortality at 90 days
The performance of the customised model for 90-day mortality was good, presenting a c index of 0.883 (95% CI 0.881 to 0. 885) and a Brier’s score of 0.1077. Variables’ significance and importance were consistent with the results for 30-day mortality. Age, sedated/paralysed/Glasgow coma scale (GCS) and source of admission/urgency of surgery were the strongest predictors. However, severe conditions in the medical history (such as metastatic disease and severe liver disease) and BMI had a more relevant role in the model (see Appendix 2, Table 41). The model showed good discrimination in the validation data set, a c index of 0.883 (95% CI 0.880 to 0.884) a Brier’s score of 0.1045 and a SMR of 1.00 (95% CI 0.99 to 1.01), which indicated good calibration (see Table 12 and Figure 5). The final coefficients are shown in Appendix 3, Table 46.
Mortality at 1 year following critical care admission
Between January 2013 and December 2013, there were 144,720 first admissions to 235 adult critical care units in England participating in the CMP with identifiable linkage with HES and death registrations. After the exclusions, a total of 127,855 were included in the development data set.
In total, 38,191 (29.9%) patients died during the one-year follow-up. Of these, 18,038 (14.1%) died during the critical care admission.
Baseline severe and chronic conditions of the included patients and associated 1-year mortality are described in Table 14. The most common severe condition in the medical history was immunocompromise (6%) and the highest 1-year mortality was associated with haematological malignancy (62%). Regarding RCS Charlson comorbidities, chronic pulmonary disease (14%), any malignancy (13%) and diabetes mellitus (12%) were the most prevalent. Dementia (48%), metastatic solid tumour (48%) and chronic renal disease (44%) were associated with the highest 1-year mortality. Figure 8 shows the Kaplan–Meier survival curve for 1-year survival after critical care admission.
| Comorbidities | Development data set (n = 126,447), % | Hospital survivors (n = 100,450), % | ||
|---|---|---|---|---|
| Prevalence | One-year mortality following critical care admission | Prevalence | One-year mortality following hospital discharge | |
| Severe conditions in the past medical history (APACHE II) | ||||
| Very severe cardiovascular disease | 2 | 50 | 1 | 20 |
| Severe respiratory disease | 2 | 53 | 2 | 24 |
| Severe liver disease | 2 | 54 | 2 | 20 |
| End-stage renal failure | 2 | 44 | 1 | 24 |
| Haematological malignancy | 2 | 62 | 3 | 41 |
| Metastatic disease | 3 | 55 | 1 | 32 |
| Immunocompromise | 6 | 45 | 6 | 28 |
| RCS Charlson comorbidities | ||||
| Previous MI | 3 | 36 | 3 | 18 |
| Congestive cardiac failure | 6 | 43 | 5 | 21 |
| Peripheral vascular disease | 5 | 34 | 5 | 17 |
| Cerebrovascular disease | 3 | 37 | 3 | 18 |
| Dementia | 1 | 48 | 1 | 27 |
| Hemiplegia or paraplegia | 1 | 37 | 1 | 18 |
| Chronic pulmonary disease | 14 | 36 | 13 | 17 |
| Liver disease | 3 | 43 | 3 | 20 |
| Chronic renal disease | 6 | 44 | 6 | 23 |
| Any malignancy | 13 | 36 | 14 | 24 |
| Metastatic solid tumour | 3 | 48 | 3 | 36 |
| Diabetes mellitus | 12 | 35 | 12 | 17 |
| Rheumatological disease | 2 | 37 | 2 | 17 |
| Overall | 30 | 12 | ||
FIGURE 8.
Kaplan–Meier survival curve for 1 year following critical care admission.
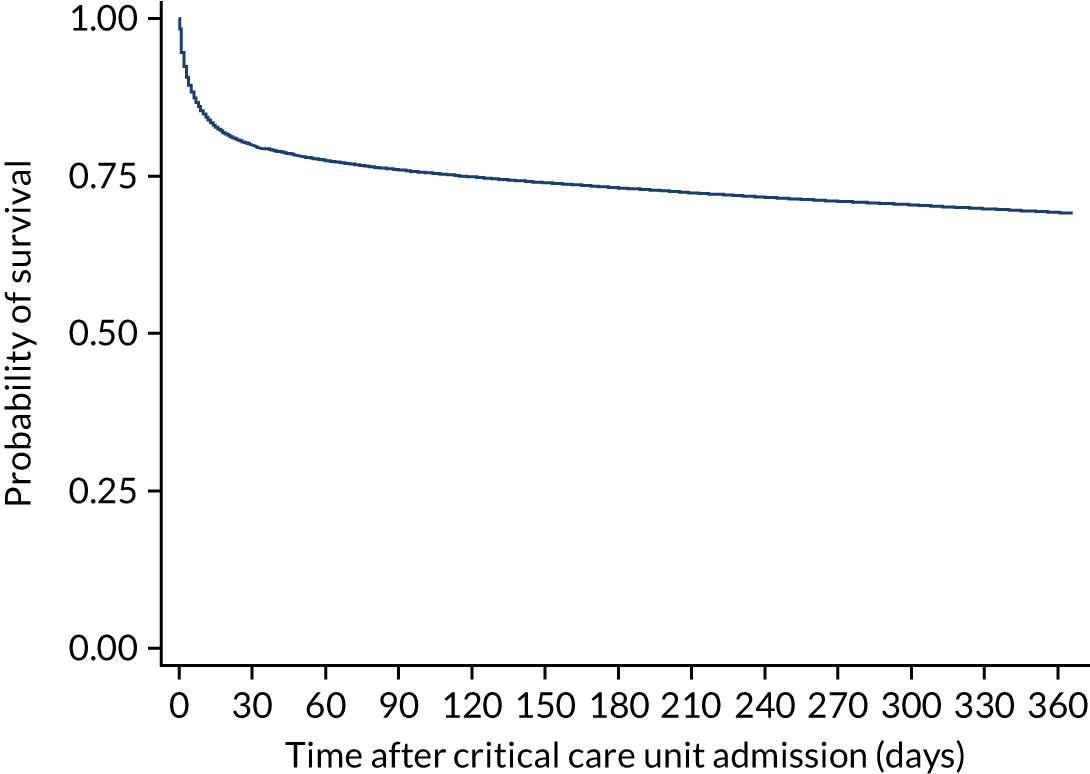
Model development
Functional form and significance of CMP physiological and non-physiological predictors previously included in the existing model for acute hospital mortality were reassessed. Consistency with global significance of the existing predictors was found after fitting a model considering all physiological and non-physiological variables from the current ICNARC model. The functional form of the continuous physiological predictors was reassessed for the 1-year mortality outcome. In all cases, predictors showed significant non-linearity (p < 0.001). The optimal functional form selected to model the continuous physiological predictors was four knots for heart rate, systolic blood pressure and creatinine. For temperature, urine output, PaO2/FiO2, urea, white blood cell count, potassium, glucose, blood lactate, platelet count, neutrophil count and urine output extending to five knots was needed. For arterial pH, a simplification using three knots was enough to accommodate the non-linear behaviour. Finally, respiratory rate and PaCO2 were modelled using right-restricted cubic splines. This was necessary to capture the initial decrease in mortality and ‘spoon’ behaviour. This approach had a better fit than five knots and was more plausible than four.
Age and BMI were modelled as continuous, non-linear relationships using restricted cubic splines with five knots.
Following the development of the main model, severe conditions in the past medical history (APACHE II) and RCS Charlson comorbidities were added into the model. As key predictors for long-term mortality, the significance and importance of the comorbidities are shown in Appendix 2, Table 42. All APACHE II severe conditions and most RCS Charlson comorbidities were retained because of their significant effect and contribution to the model, except previous myocardial infarction (MI), dementia, hemiplegia or paraplegia, diabetes mellitus and rheumatological disease. The incorporation of APACHE II and RCS Charlson comorbidities, in particular metastatic disease and severe liver disease, in the risk prediction model produced better fit (Table 15). The comorbidities with the greatest magnitude of association were metastatic disease, severe liver disease and hematological malignancy (Table 16).
| Model | df | LL | BIC | c index (95% CI) | Brier’s score |
|---|---|---|---|---|---|
| One year following critical care admission | |||||
| Main modela | 81 | –45347.44 | 91637 | 0.825 (0.822 to 0.828) | 0.149 |
| Main model + comorbidities | 100 | –43853.09 | 88867 | 0.839 (0.836 to 0.842) | 0.144 |
| Main model + comorbidities + reason for admission | 167 | –42429.44 | 86790 | 0.851 (0.848 to 0.854) | 0.139 |
| Main model + comorbidities + reason for admission + interactions | 292 | –41992.53 | 84571 | 0.854 (0.851 to 0.856) | 0.138 |
| One year following hospital discharge | |||||
| Main modelb | 81 | –26226.97 | 53376 | 0.721 (0.716 to 0.726) | 0.102 |
| Main model + comorbidities | 100 | –24908.08 | 50952 | 0.766 (0.761 to 0.771) | 0.097 |
| Comorbidity | OR (95% CI) for 1-year mortality following critical care admission | OR (95% CI) for 1-year mortality following hospital discharge |
|---|---|---|
| Previous MI | 1.12 (1.00 to 1.23) | 1.14 (1.00 to 1.28) |
| Congestive cardiac failure | 1.28 (1.19 to 1.38) | 1.40 (1.27 to 1.54) |
| Peripheral vascular disease | 1.19 (1.10 to 1.28) | 1.23 (1.12 to 1.35) |
| Very severe cardiovascular disease | 1.30 (1.15 to 1.46) | 1.17 (0.98 to 1.37) |
| Cerebrovascular disease | 1.16 (1.05 to 1.28) | 1.17 (1.00 to 1.33) |
| Dementia | 1.13 (0.97 to 1.32) | 1.37 (1.13 to 1.65) |
| Hemiplegia or paraplegia | 1.07 (0.88 to 1.28) | 1.22 (0.95 to 1.55) |
| Chronic pulmonary disease | 1.13 (1.07 to 1.19) | 1.21 (1.13 to 1.29) |
| Severe respiratory disease/home ventilation | 1.73 (1.55 to 1.92) | 1.62 (1.40 to 1.87) |
| Liver disease | 1.46 (1.31 to 1.63) | 1.44 (1.24 to 1.66) |
| Severe liver disease | 2.39 (2.16 to 2.63) | 1.87 (1.61 to 2.17) |
| Chronic renal disease | 1.25 (1.15 to 1.34) | 1.29 (1.17 to 1.42) |
| End-stage renal failure | 1.73 (1.55 to 1.92) | 1.56 (1.30 to 1.87) |
| Any malignancy | 1.60 (1.51 to 1.69) | 1.89 (1.76 to 2.02) |
| Haematological malignancy | 2.15 (1.89 to 2.42) | 2.11 (1.79 to 2.47) |
| Metastatic disease | 4.04 (3.74 to 4.36) | 4.46 (4.10 to 4.85) |
| Immunocompromise | 1.47 (1.36 to 1.57) | 1.58 (1.45 to 1.71) |
| Diabetes mellitus | 1.03 (0.97 to 1.08) | 1.17 (1.09 to 1.25) |
| Rheumatological disease | 1.01 (0.90 to 1.12) | 1.01 (0.87 to 1.16) |
After adjusting for comorbidities, deprivation was not retained in the main term model because of a low contribution to the model fit.
A total of 56 process/system combinations and 18 individual conditions from the ICNARC Coding Method (Table 17) were selected after the modelling process described above. Comparing with the ICNARC acute hospital mortality and the 30-days primary reason for admission categories, the selected individual conditions were less acute and more cancer-related. Significant interactions with physiology (n = 24) were incorporated to the model.
| Acute hospital mortality | One-year mortality |
|---|---|
| Toxic or drug-induced coma or encephalopathy | Toxic or drug-induced coma or encephalopathy |
| Lower limb artery stenosis or occlusion | Lower limb artery stenosis or occlusion |
| Anaphylaxis | Anaphylaxis |
| Leaking large bowel anastomosis | Leaking large bowel anastomosis |
| Acute alcoholic hepatitis/alcoholic cirrhosis | Acute alcoholic hepatitis/alcoholic cirrhosis |
| Thrombo-occlusive disease of brain | Thrombo-occlusive disease of brain |
| Secondary hydrocephalus | Secondary hydrocephalus |
| Pulmonary fibrosis or fibrosing alveoli | Pulmonary fibrosis or fibrosing alveolitis |
| Asthma attack in new or known asthmatic | Asthma attack in new or known asthmatic |
| Hanging or strangulation | Hanging or strangulation |
| Anoxic or ischaemic coma or encephalopathy | Anoxic or ischaemic coma or encephalopathy |
| Entero-enteric or entero-cutaneous fistula | CABG for chronic angina |
| Fractured ribs | Pancreatic or pancreato-duodenal tumour |
| Fungal or yeast pneumonia | Secondary hepatic tumour |
| Haemolysis or thrombocytopaenia | Small bowel tumour |
| Intracerebral haemorrhage | Malignant large bowel tumour |
| Large bowel tumour | |
| Carotid or vertebral artery stenosis or occlusion |
Interactions included in the previous model between severe liver disease with physiology, CPR with physiology, ventilation with physiology and physiology with physiology appeared to be less important for 1-year mortality and only the interactions between CPR and temperature and between ventilation and respiratory rate, PaO2/FiO2 and PaCO2 were included after adjusting for the main term model plus the new primary reason categories and interactions.
The final model showed good performance (c index of 0.855 and Brier’s score of 0.118) and internally, calibration of the model was satisfactory (Figure 9). Overfitting was of limited relevance because of the very large data set and, as expected, model optimism was negligible (0.77% estimated overfitting). Full coefficients for the final model are presented in Appendix 3, Table 47.
FIGURE 9.
Calibration of the final risk model for mortality at one year following critical care admission in (a) the development data set and (b) the validation data set.
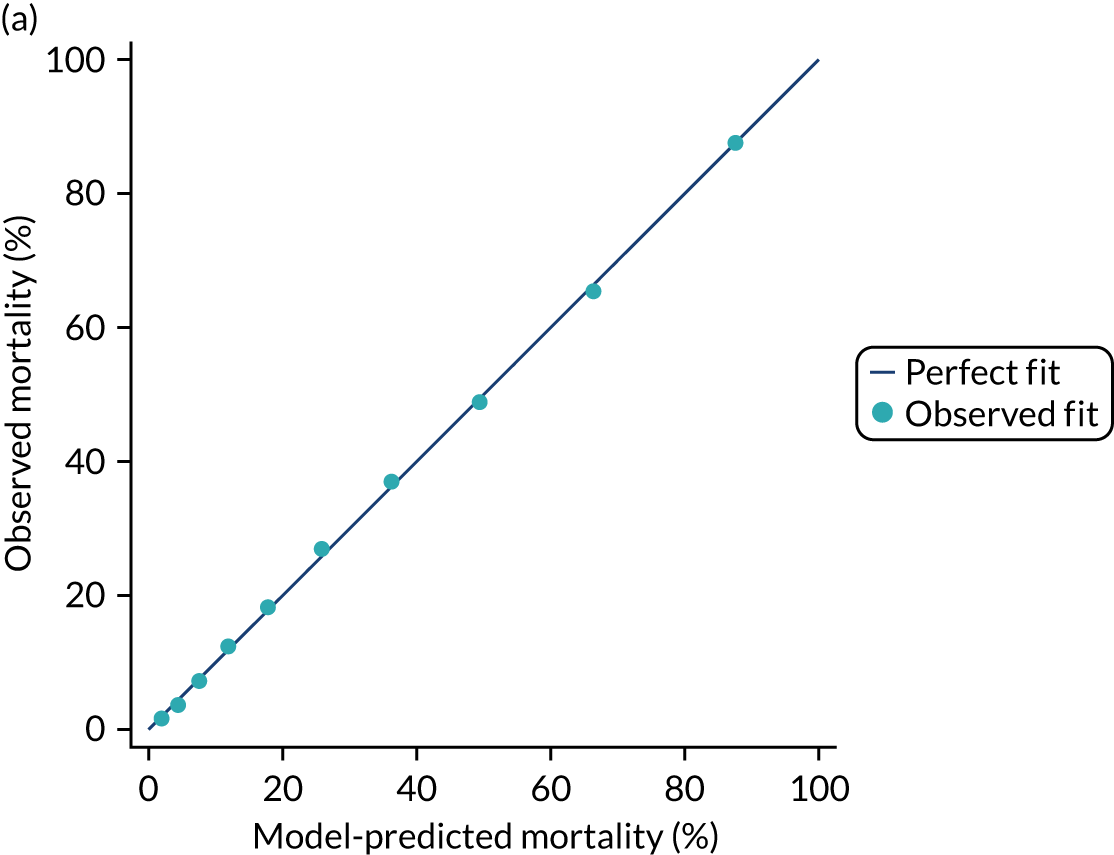
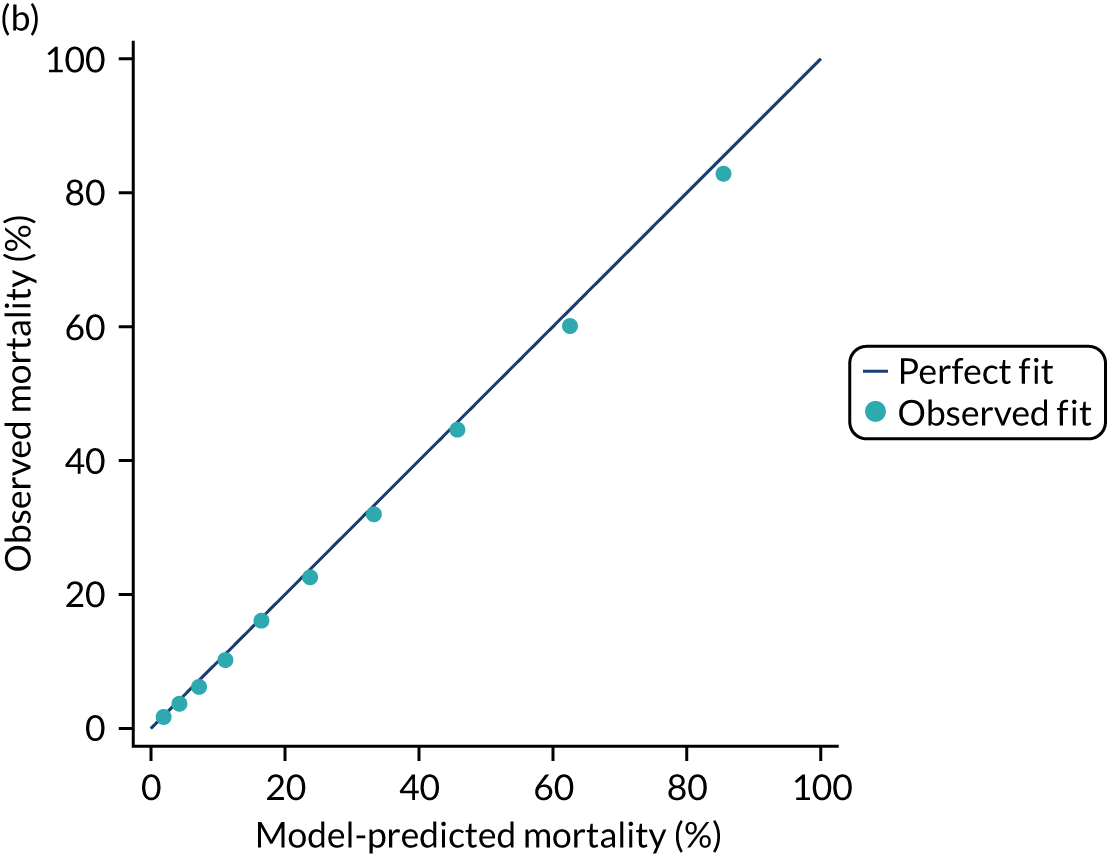
Model validation
A total of 126,447 admissions from 31 March 2015 to 31 March 2016 were selected for the validation data set. The same eligibility and exclusion criteria were applied as for the development data set. Discrimination and accuracy were good with a c index of 0.848 (95% CI 0.846 to 0.851) and a Brier’s score of 0.1348. The calibration of the model was satisfactory, with a calibration slope of 0.983 and a calibration intercept of –0. 097 and supported visually by calibration plots (see Figure 9). The observed and mean predicted mortality were 28.0% and 29.1%, respectively, for a SMR of 0.96 (95% CI 0.95 to 0.97), which indicated a satisfactory calibration.
Mortality at 1 year following hospital discharge
A total of 100,450 admissions discharged alive from hospital between January 2013 and December 2013 were selected for the hospital survival cohort. With the aim of evaluating if the effect of comorbidities is different among hospital survivors, their significance and contribution were retested in a model considering 1-year survival from hospital discharge as outcome and adjusting by the variables resulting in the previous main term model.
Comorbidities were present among hospital survivors in similar proportions to the critical care admission cohort (see Table 14). In general, comorbidity remained in importance as predictors of 1-year mortality (see Appendix 2, Table 42) and showed a similar effect (see Table 16), with dementia and diabetes mellitus arising as significant and important predictors. On the other hand, and liver disease and haematological malignancy became less important predictors of 1-year mortality for hospital survivors. Very severe cardiovascular disease and cerebrovascular disease were not significant after adjusting for main terms.
The c index of the main terms model without and with comorbidities were 0.721 (95% CI 0.716 to 0.726) and 0.766 (95% CI 0.761 to 0.771), respectively. The addition of comorbidities showed a greater improvement of the performance of the model (see Table 15) in the hospital survivor cohort, although the performance was better when predicting 1-year mortality in the critical care admission cohort.
Discussion
We have developed risk models for mortality at 30 days, 90 days and 1 year following critical care admission and at 1 year following hospital discharge. When comparing the model for 30-day mortality with the previous model for acute hospital mortality, all risk factors for acute hospital mortality remained important in predicting 30-day mortality. Differences in benchmarking between acute hospital mortality and 30-day mortality were modest and there was little evidence that using a fixed time point reduced heterogeneity. When the model for 30-day mortality was refitted to 90-day mortality, all risk factors remained important, although the relative importance of severe conditions such as metastatic disease and severe liver disease increased.
When comparing the model for 1-year mortality with the previous model for acute hospital mortality,7 all risk factors for acute hospital mortality remained important in predicting 1-year mortality. Age had a non-linear effect in the model, the importance of BMI increased and all severe comorbidities were important. Individual conditions included as primary reasons for admission to critical care included fewer acute conditions and more cancer-related conditions. When considering additional comorbidities available via data linkage with HES, most of these were important in predicting 1-year mortality; however, the strongest effects remained for the severe conditions already collected in the CMP.
The effects of comorbidities were largely similar when the model for 1-year mortality was refitted to hospital survivors. Dementia and diabetes mellitus became important in the model for 1-year mortality following hospital discharge, and very severe cardiovascular disease and cerebrovascular disease were not important.
Chapter 6 Risk models for development of end-stage renal disease following critical care
Introduction
The occurrence of acute kidney injury (AKI) (formerly known as acute renal failure) is common among critically ill patients; is associated with high mortality;46–49 and has been linked with subsequent chronic kidney disease (CKD), ESRD and high health-care costs. 50,51 In this chapter, we use the data linkage between the CMP and the UKRR to evaluate this relationship and to develop risk models to predict the development of ESRD among survivors of critical illness.
Methods
Methods common to all objectives and analyses were described in Chapter 3.
Study cohort
We selected NHS adult critical care units in England participating in the CMP with identifiable linkage with HES and death registrations. False linkage and errors in linkage with HES and death registrations were excluded. The linked cohort included patients discharged from hospital between 1 April 2009 and 31 March 2016 following a critical care admission. The final follow-up date was 31 December 2016 (based on the latest available data from the UKRR at the time of linkage). For patients with multiple hospital episodes that included critical care admissions, we considered the index admission to be the first hospital admission during the analysis period. Re-admissions to critical care and transfers during the index admission were excluded.
Inclusion and exclusion criteria
Patients included in the model were all those discharged alive from acute hospital following a critical care unit admission. Patients were excluded if they had pre-existing ESRD, identified by:
-
linkage with the UKRR indicating a date of diagnosis of ESRD prior to the date of discharge from hospital of the index admission
-
ICD-10 codes indicating ESRD (I120, I129, N186, Z49, Z940, Z992) in any diagnosis field from linked HES records from a hospital episode either prior to or during the index admission
-
recording of an ongoing requirement for RRT for irreversible ESRD in the CMP.
Outcome
The main outcome was new receipt of RRT for ESRD, based on the date of diagnosis recorded in the UKRR database, after the date of discharge from hospital. The competing risk was death from any cause before ESRD, identified via linkage with death registrations. Deaths after ESRD were not considered.
Candidate variables
As the important risk factors and their relationships with the outcome may be very different from those considered for other outcome measures, risk models for ESRD were developed de novo, using the same methods as previously applied to develop the original risk models for acute hospital mortality in adult critical care. Potentially important candidate predictors were chosen based on expert clinical opinion and availability in the linked data sources. RCS Charlson comorbidities were identified as described in Chapter 3, except for CKD and AKI, for which the lookback period was extended to 5 years. A description of the candidate predictors is given in Appendix 1, Table 38.
Statistical analyses
For the description of cohort characteristics, assessment of optimal functional form and selection of covariables, we followed the same methodology as described in Chapter 3.
The incidence rate was calculated as the number of new cases of ESRD divided by the follow-up time and expressed as the number of events per 1000 person-years. Because outcomes of death and ESRD have an important competing effect, analysis of the predictors of ESRD needs to consider the risk of dying before ESRD. In the competing risk context, two different approaches to regression modelling exist: the Cox proportional cause-specific regression model and the Fine-Gray regression model. The former models the dependence of the cause-specific hazard function on covariates and the latter models the dependence of the cumulative incidence function (CIF) on predictors. Both methods were considered pertinent in the present study as we aimed to explore the role of acute and chronic risk factors on development of ESRD following a critical care admission. For the cause-specific model, the explained variation (R2) was determined. The proportional hazard assumption was tested by visual inspection of Schoenfeld residual plots and log-log plots.
Results
Of 628,562 patients discharged alive from acute hospital between 1 April 2009 and 31 March 2016, 29,959 were excluded owing to pre-existing ESRD, leaving a cohort of 598,603 patients included in the analysis (Figure 10).
FIGURE 10.
Flow-diagram for cohort identification.
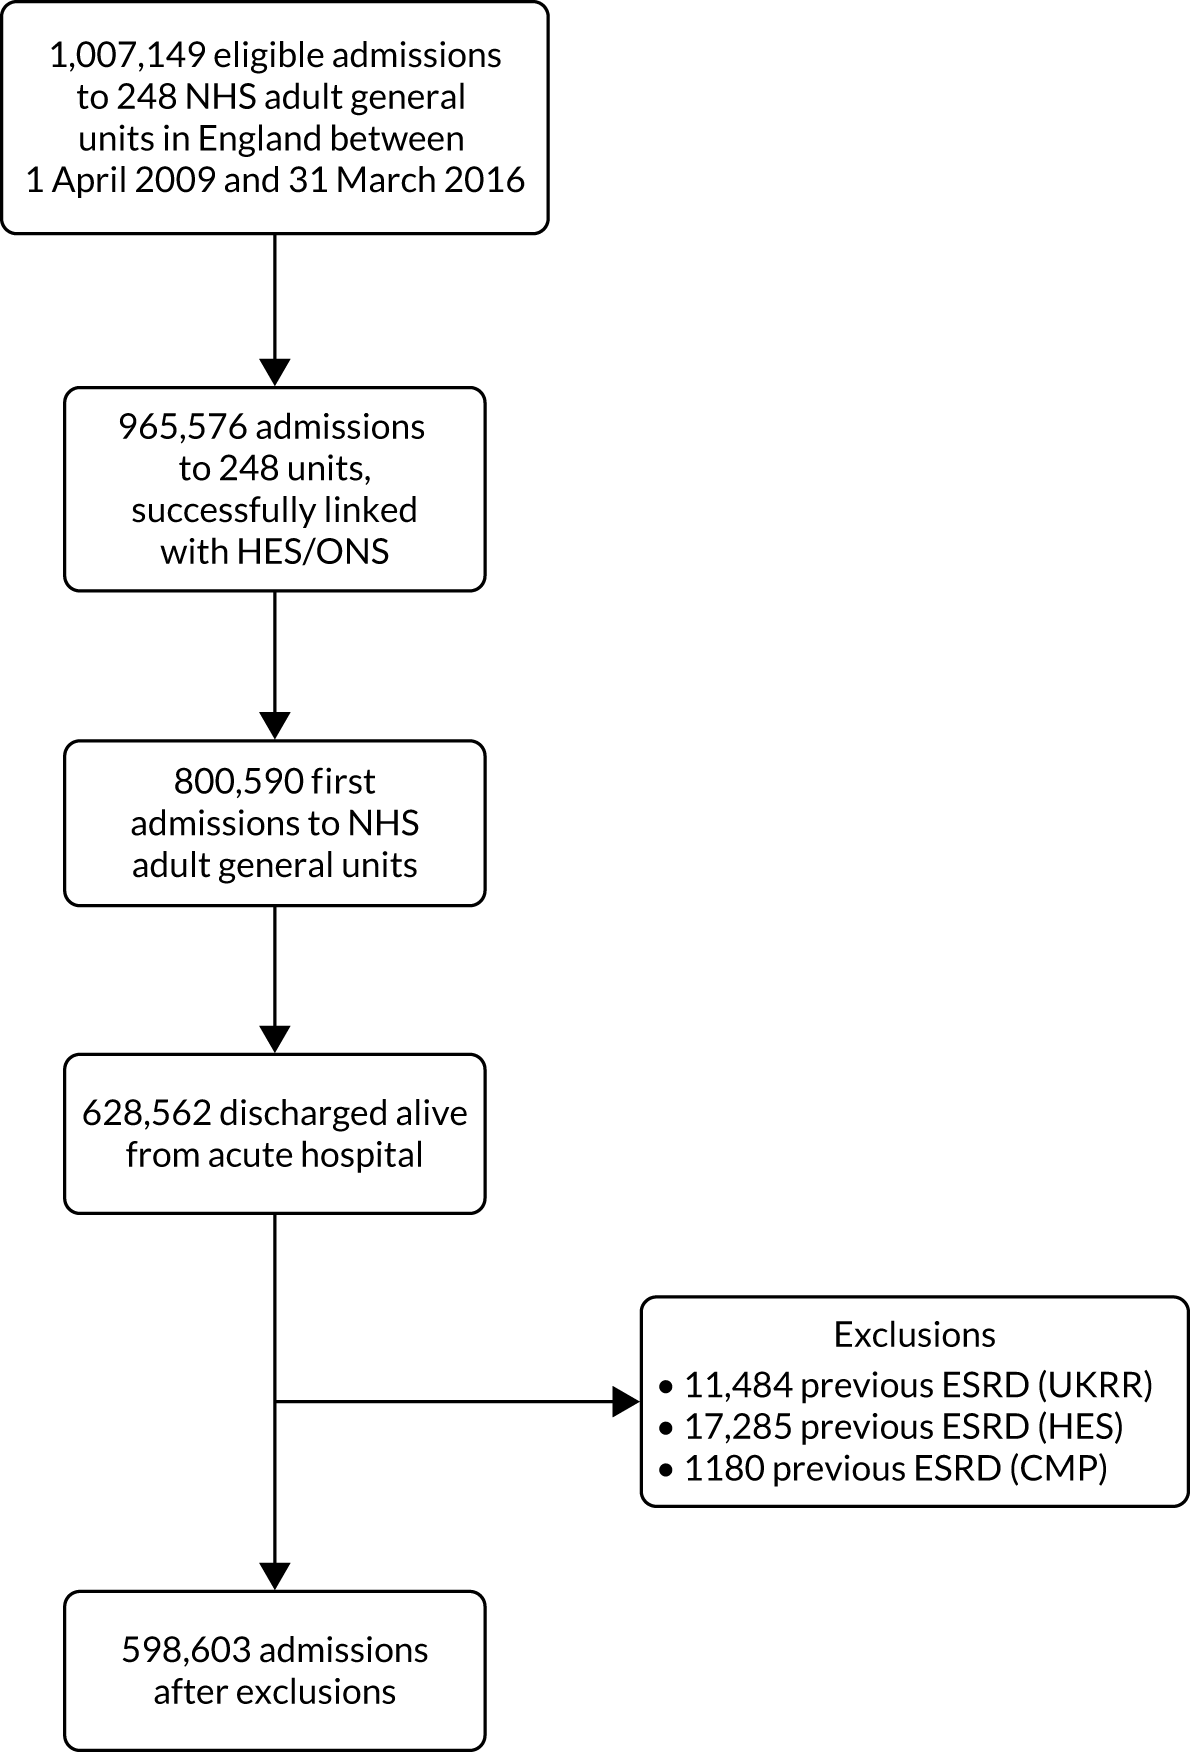
The median duration of follow-up was 2.7 years (IQR 1.4–4.6 years) and 2831 (0.47%) patients developed ESRD during follow-up (incidence rate 1.52 per 1000 person-years; 95% CI 1.46 to 1.58). The CIF for ESRD is shown in Figure 11. A total of 194,691 (32.5%) patients died without developing ESRD.
FIGURE 11.
Cumulative incidence of ESRD.
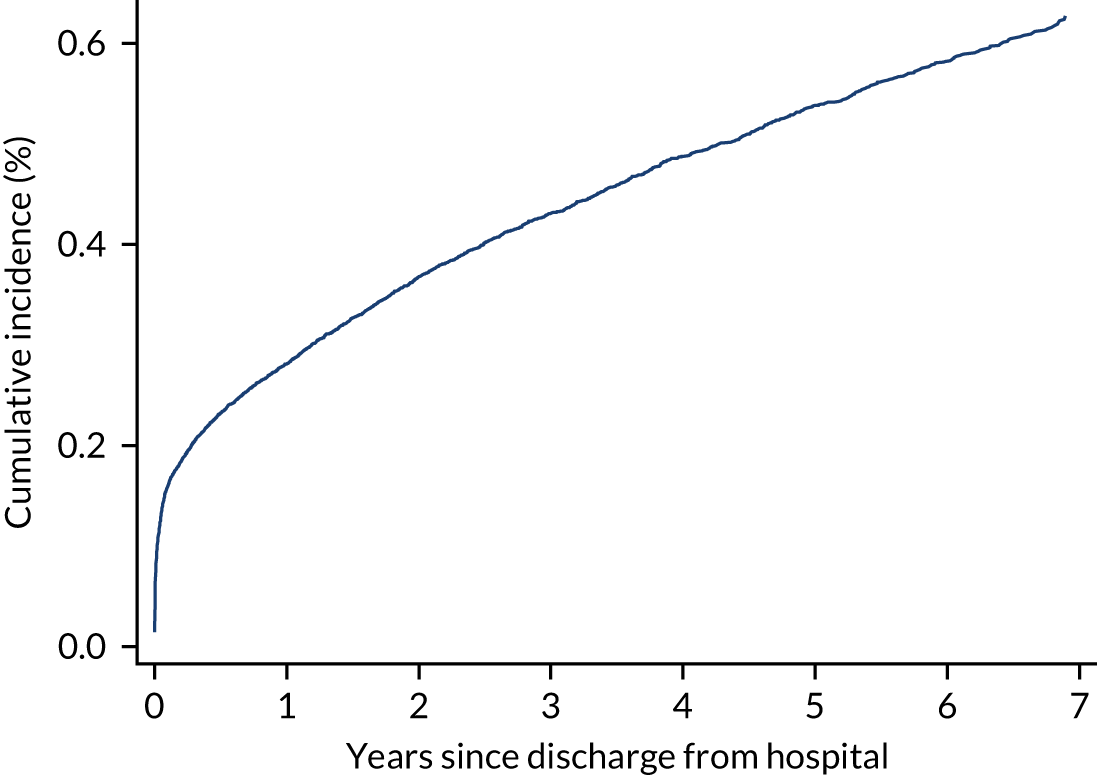
Patient characteristics
Characteristics of the overall cohort, as well as divided by outcome, are detailed in Table 18. Compared with the overall cohort, patients who developed ESRD were similar in age (mean 60 years), with a higher proportion of males (62% vs. 55%) and of non-white ethnicities (16% vs. 7%). More than 30% suffered from CKD in either the current hospital admission or an admission during the previous 5 years (compared with 3.6% for the overall cohort) and 6% (vs. < 1%) had previous hospital admissions involving AKI. The most prevalent non-renal chronic condition in patients who developed ESRD was diabetes (24% vs. 10%). Patients who developed ESRD had higher creatinine levels during the first 24 hours following admission to critical care (mean 530 vs. 111 µmol l−1) and urea (mean 27 vs. 8 µmol l−1) and lower urine output (mean 1354 vs. 2013 ml) and more than half had received renal support during the critical care unit stay (51% vs 5%).
| Characteristics | Cohort | ESRD | Death before ESRD |
|---|---|---|---|
| Number of patients (%) | 598,603 | 2831 (0.47) | 194,691 (32.5) |
| Demographics | |||
| Age (years) | |||
| Mean (SD) | 60 (18.4) | 60 (15.8) | 69 (14.2) |
| Median (IQR) | 63 (48–74) | 62 (49–72) | 71 (61–79) |
| Gender, males (%) | 331,723 (55.4) | 1767 (62.4) | 112,020 (57.5) |
| Ethnicity, n (%) | |||
| White | 538,570 (90.0) | 2293 (81.0) | 181,016 (93.0) |
| Mixed | 3275 (0.5) | 18 (0.6) | 607 (0.3) |
| Asian | 20,212 (3.4) | 228 (8.1) | 4363 (2.2) |
| Black | 12,733 (2.1) | 150 (5.3) | 2619 (1.3) |
| Other | 7261 (1.2) | 58 (2.0) | 1484 (0.8) |
| Not stated | 16,117 (2.7) | 84 (3.0) | 4450 (2.3) |
| Deprivation, n (%) | |||
| 1 (least deprived) | 100,451 (17.4) | 421 (15.4) | 33,661 (17.8) |
| 2 | 108,384 (18.8) | 451 (16.5) | 36,041 (19.1) |
| 3 | 115,576 (20.0) | 565 (20.6) | 38,282 (20.3) |
| 4 | 119,632 (20.7) | 599 (21.9) | 38,668 (20.5) |
| 5 (most deprived) | 132,893 (23.0) | 703 (25.7) | 42,355 (22.4) |
| Medical history | |||
| Kidney disease, n (%) | |||
| CKD (5-year lookback) | 21,336 (3.6) | 869 (30.7) | 10,918 (5.6) |
| Previous AKI (5-year lookback) | 4601 (0.8) | 177 (6.3) | 2528 (1.3) |
| RCS Charlson comorbidities, n (%) | |||
| MI | 14,827 (2.5) | 79 (2.8) | 6141 (3.2) |
| Congestive cardiac failure | 22,958 (3.8) | 205 (7.2) | 11,397 (5.9) |
| Peripheral vascular disease | 26,010 (4.3) | 206 (7.3) | 11,428 (5.9) |
| Cerebrovascular disease | 18,229 (3.0) | 83 (2.9) | 7816 (4.0) |
| Dementia | 4485 (0.7) | 18 (0.6) | 3043 (1.6) |
| Chronic pulmonary disease | 67,705 (11.3) | 291 (10.3) | 29,573 (15.2) |
| Rheumatological disease | 10,381 (1.7) | 70 (2.5) | 4708 (2.4) |
| Liver disease | 10,577 (1.8) | 67 (2.4) | 4940 (2.5) |
| Diabetes mellitus | 60,655 (10.1) | 682 (24.1) | 26,516 (13.6) |
| Hemiplegia or paraplegia | 4291 (0.7) | 18 (0.6) | 1992 (1.0) |
| Malignancy | 72,218 (12.1) | 226 (8.0) | 37,032 (19.0) |
| APACHE II severe conditions in medical history, n (%) | |||
| Severe liver disease | 9866 (1.6) | 53 (1.9) | 4623 (2.4) |
| Metastatic disease | 28,033 (4.7) | 51 (1.8) | 19,756 (10.1) |
| Haematological malignancy | 7441 (1.2) | 54 (1.9) | 4361 (2.2) |
| Severe respiratory disease/home ventilation | 9510 (1.6) | 39 (1.4) | 5859 (3.0) |
| Immunocompromise | 36,134 (6.0) | 143 (5.1) | 20,316 (10.4) |
| Very severe cardiovascular disease | 7650 (1.3) | 51 (1.8) | 3824 (2.0) |
| Prior dependency, n (%) | |||
| Able to live without assistance in daily activities | 488,965 (82.2) | 2237 (79.4) | 138,913 (71.7) |
| Some (minor/major) assistance with daily activities | 101,612 (17.1) | 569 (20.2) | 52,975 (27.3) |
| Total assistance with all daily activities | 4064 (0.7) | 12 (0.4) | 1822 (0.9) |
| Patient-related factors | |||
| CPR within 24 hours prior to admission, n (%) | |||
| No CPR | 581,304 (97.1) | 2764 (97.6) | 189,346 (97.3) |
| Community CPR | 8795 (1.5) | 13 (0.5) | 2044 (1.0) |
| In-hospital CPR | 8497 (1.4) | 54 (1.9) | 3298 (1.7) |
| Location prior to critical care admission, n (%) | |||
| ED or not in hospital, unplanned | 127,237 (21.3) | 778 (27.5) | 34,131 (17.5) |
| ED or not in hospital, planned | 4781 (0.8) | 15 (0.5) | 964 (0.5) |
| Theatre, elective/scheduled, planned | 185,172 (30.9) | 449 (15.9) | 60,665 (31.2) |
| Theatre, elective/scheduled, unplanned | 30,160 (5.0) | 75 (2.6) | 10,267 (5.3) |
| Theatre, emergency/urgent | 113,051 (18.9) | 257 (9.1) | 37,061 (19.0) |
| Ward or intermediate care area | 121,646 (20.3) | 1121 (39.6) | 46,013 (23.6) |
| Other critical care unit, repatriation | 1318 (0.2) | 9 (0.3) | 464 (0.2) |
| Other critical care unit, planned/unplanned transfer | 10,161 (1.7) | 93 (3.3) | 3566 (1.8) |
| Other acute hospital | 5077 (0.8) | 34 (1.2) | 1560 (0.8) |
| Primary reason for admission by body system, n (%) | |||
| Respiratory | 100,767 (16.8) | 387 (13.7) | 37,074 (19.0) |
| Cardiovascular | 109,457 (18.3) | 422 (14.9) | 31,509 (16.2) |
| Gastrointestinal | 163,816 (27.4) | 335 (11.8) | 61,917 (31.8) |
| Neurological (including eyes) | 80,999 (13.5) | 124 (4.4) | 21,555 (11.1) |
| Genito-urinary | 56,793 (9.5) | 1195 (42.2) | 20,396 (10.5) |
| Endocrine, Metabolic, Thermoregulation and Poisoning | 43,029 (7.2) | 243 (8.6) | 7918 (4.1) |
| Haematological/Immunological | 4598 (0.8) | 32 (1.1) | 1842 (0.9) |
| Musculoskeletal | 32,554 (5.4) | 69 (2.4) | 10,615 (5.5) |
| Dermatological | 6327 (1.1) | 24 (0.8) | 1809 (0.9) |
| Psychiatric | 248 (0.0) | 0 (0.0) | 52 (0.0) |
| Sepsis, n (%) | 141,405 (23.6) | 658 (23.2) | 50,746 (26.1) |
| Severity scores from the first 24 hours in the critical care unit | |||
| APACHE II score, mean (SD) | 13 (5.7) | 19 (6.3) | 16 (5.6) |
| APACHE II score, median (IQR) | 13 (10–17) | 19 (15–23) | 15 (12–19) |
| ICNARC physiology score, mean (SD) | 14 (7.1) | 20 (7.4) | 15 (7.1) |
| ICNARC physiology score, median (IQR) | 12 (9–18) | 19 (14–24) | 14 (10–19) |
| Physiology during the first 24 hours in the critical care unit | |||
| Highest heart rate (min−1), mean (SD) | 101 (22) | 102 (22) | 101 (22) |
| Lowest systolic blood pressure (mmHg), mean (SD) | 98 (18) | 108 (25) | 97 (19) |
| Highest temperature (°C), mean (SD) | 37.6 (0.9) | 37.5 (0.9) | 37.6 (0.9) |
| Lowest respiratory rate (min−1), mean (SD) | 12.4 (4.3) | 12.8 (3.6) | 12.5 (3.9) |
| Urine output (ml), mean (SD) | 2012 (1660) | 1353 (1347) | 1796 (1268) |
| PaO2/FiO2 (kPa), mean (SD) | 36.4 (15.8) | 36.1 (16.5) | 35.3 (15.4) |
| Lowest arterial pH, mean (SD) | 7.33 (0.09) | 7.27 (0.12) | 7.33 (0.09) |
| PaCO2 (kPa), mean (SD) | 5.9 (1.7) | 5.1 (1.8) | 5.9 (1.9) |
| Highest blood lactate (mmol l−1), mean (SD) | 2.3 (1.9) | 2.2 (2.3) | 2.3 (1.9) |
| Highest urea (µmol l−1), mean (SD) | 8.4 (8.0) | 26.9 (18.1) | 9.8 (8.8) |
| Highest creatinine (µmol l−1), mean (SD) | 111 (122) | 530 (476) | 121 (131) |
| Highest sodium (mmol l−1), mean (SD) | 139 (5) | 138 (5) | 139 (5) |
| Lowest white blood cell count (× 109 l−1), mean (SD) | 11.5 (7.5) | 11.3 (6.0) | 11.5 (9.0) |
| Neutrophil count (× 109 l−1), mean (SD) | 9.5 (5.5) | 9.4 (5.5) | 9.5 (5.7) |
| Lowest platelet count (× 109 l−1), mean (SD) | 212 (105) | 206 (112) | 215 (111) |
| Mechanical ventilation, n (%) | 230,968 (38.6) | 861 (30.4) | 65,895 (33.8) |
| Organ dysfunction, n (%) | 477,861 (79.8) | 2512 (88.7) | 162,871 (83.7) |
| Length of stay | |||
| Critical care unit length of stay (hours), mean (SD) | 100 (173) | 139 (2038) | 109 (188) |
| Critical care unit length of stay (hours), median (IQR) | 47 (23–102) | 75 (38–158) | 52 (25–116) |
| Acute hospital length of stay (days), mean (SD) | 22 (29.9) | 29 (33.1) | 27 (32.9) |
| Acute hospital length of stay (days), median (IQR) | 12 (7–25) | 19 (10–36) | 16 (9–32) |
| Organ support during critical care stay | |||
| Receipt of advanced respiratory support, n (%) | 230,968 (38.6) | 861 (30.4) | 65,895 (33.8) |
| Duration of advanced respiratory support (days), median (IQR) | 2 (1–5) | 3 (2–7) | 2 (2–6) |
| Receipt of advanced cardiovascular support, n (%) | 103,500 (17.3) | 493 (17.4) | 32,665 (16.8) |
| Duration of advanced cardiovascular support (days), median (IQR) | 2 (1–3) | 2 (1–4) | 2 (1–3) |
| Receipt of renal support, n (%) | 28,963 (4.8) | 1436 (50.7) | 10,855 (5.6) |
| Duration of renal support (days), median (IQR) | 4 (2–7) | 3 (2–6) | 3 (2–6) |
Predictors of end-stage renal disease
Table 19 shows the cHR after the modelling process. Although pregnancy was not associated with development of ESRD, it was kept for confounding. An increasing heart rate, respiratory rate, arterial pH, white blood cell count, PaCO2 and urine output during the first 24 hours of critical care were all linearly associated with a decrease in the risk of developing ESRD. On the other hand, increasing systolic blood pressure was significantly associated with an increased risk of ESRD. Non-linear associations were observed between the risk of ESRD and the following factors: age, sodium, creatinine, urea and blood lactate. These factors were modelled by restricted cubic splines. Figure 12 shows the adjusted cause-specific graphs associated with these non-linear relationships to facilitate the presentation and interpretation. There was a huge increase in the risk of ESRD when creatinine (measured during the first 24 hours of critical care) increased over a range from 100 to 200 µmol l−1. Patients with CKD [adjusted hazard ratio (aHR) 4.11], AKI (aHR 1.73), peripheral vascular disease (aHR 1.29) and diabetes (aHR 1.35) were more likely to receive RRT for ESRD than those without these conditions. Mechanical ventilation (aHR 1.29), vascular surgery (aHR 1.23) and nephrectomy (aHR 1.92) were also associated with an increased risk of ESRD. However, some severe conditions in the medical history [severe liver disease (aHR 0.81) and metastatic disease (aHR 0.65)] were associated with a lower likelihood of RRT for ESRD. The effects of the rest of the variables in the model are presented in Table 19. CPR prior to admission, cardiac surgery, severe cardiovascular disease, MI and congestive cardiac failure were not considered significant after adjusting for the rest of the variables in the model. No significant interactions were demonstrated.
| Predictor | cHR (95% CI) | sHR (95% CI) | cHRa (95% CI) |
|---|---|---|---|
| Age (years) – RCS (33,63,81) | |||
| age1 | 0.99 (0.98 to 1.00) | 0.99 (0.98 to 0.99) | 1.03 (1.03 to 1.04) |
| age2 | 0.98 (0.97 to 0.98) | 0.97 (0.96 to 0.98) | 1.00 (1.00 to 1.00) |
| Male sex | 0.76 (0.70 to 0.83) | 0.78 (0.71 to 0.85) | 1.21 (1.20 to 1.22) |
| Ethnicity | |||
| White | ref | ref | ref |
| Mixed | 1.67 (1.00 to 2.78) | 1.67 (1.02 to 2.70) | 0.91 (0.83 to 0.99) |
| Asian | 1.85 (1.59 to 2.16) | 1.94 (1.60 to 2.35) | 0.84 (0.81 to 0.86) |
| Black | 1.62 (1.34 to 1.96) | 1.65 (1.33 to 2.03) | 0.90 (0.87 to 0.95) |
| Other/not stated | 2.14 (1.63 to 2.81) | 2.16 (1.65 to 2.84) | 0.89 (0.84 to 0.95) |
| Pregnant/recently pregnant | 0.63 (0.40 to 1.00) | 0.68 (0.42 to 1.07) | 0.13 (0.11 to 0.16) |
| Severe liver disease | 0.81 (0.60 to 1.10) | 0.70 (0.51 to 0.95) | 2.00 (1.94 to 2.07) |
| Metastatic disease | 0.65 (0.48 to 0.88) | 0.41 (0.30 to 0.57) | 3.42 (3.36 to 3.48) |
| Peripheral vascular disease | 1.29 (1.09 to 1.53) | 1.25 (1.05 to 1.48) | 1.26 (1.24 to 1.29) |
| Diabetes | 1.35 (1.22 to 1.49) | 1.30 (1.16 to 1.45) | 1.28 (1.26 to 1.30) |
| CKD (5-year lookback) | 4.11 (3.72 to 4.54) | 3.58 (3.18 to 4.03) | 1.45 (1.26 to 1.29) |
| AKI (5-year lookback) | 1.73 (1.45 to 2.05) | 1.64 (1.36 to 1.98) | 1.36 (1.31 to 1.42) |
| Surgical status | |||
| Non-surgical | ref | ref | ref |
| Elective surgery | 1.25 (1.08 to 1.43) | 1.36 (1.16 to 1.60) | 0.80 (0.79 to 0.81) |
| Emergency surgery | 0.98 (0.84 to 1.43) | 1.04 (0.88 to 1.21) | 0.88 (0.87 to 0.89) |
| Sepsis | 0.86 (0.77 to 0.95) | 0.89 (0.79 to 0.99) | 1.00 (0.99 to 1.00) |
| Trauma | 0.78 (0.63 to 0.96) | 0.81 (0.65 to 0.99) | 0.83 (0.81 to 0.85) |
| Nephrectomy | 1.92 (1.50 to 2.46) | 1.91 (1.49 to 2.44) | 1.13 (1.08 to 1.17) |
| Vascular surgery | 1.23 (1.01 to 1.50) | 1.29 (1.05 to 1.53) | 0.78 (0.76 to 0.79) |
| Mechanical ventilationb | 1.29 (1.14 to 1.45) | 1.29 (1.14 to 1.46) | 0.86 (0.84 to 0.86) |
| Highest heart rateb (per 10 min−1 increase) | 0.97 (0.95 to 0.99) | 0.97 (0.95 to 0.99) | 1.03 (1.02 to 1.03) |
| Lowest respiratory rateb (per 5 min−1 increase) | 0.93 (0.88 to 0.99) | 0.94 (0.88 to 0.99) | 1.02 (1.01 to 1.02) |
| Lowest systolic blood pressureb (per 1 mmHg increase) | 1.02 (1.01 to 1.02) | 1.02 (1.01 to 1.02) | 0.99 (0.99 to 0.99) |
| Urine outputb (per 500 ml increase) | 0.89 (0.87 to 0.90) | 0.89 (0.88 to 0.91) | 0.97 (0.96 to 0.97) |
| Lowest arterial pHb (per 1 increase) | 0.52 (0.35 to 0.79) | 0.45 (0.29 to 0.69) | 1.83 (1.83 to 2.14) |
| PaCO2b (per 1 kPa increase) | 0.91 (0.89 to 0.94) | 0.91 (0.88 to 0.94) | 1.05 (1.04 to 1.05) |
| Highest blood lactateb (mmol l−1) – RCS (0.9,1.8,4.2) | |||
| bl1 | 0.72 (0.66 to 0.78) | 0.72 (0.66 to 0.79) | 0.97 (0.96 to 0.98) |
| bl2 | 1.41 (1.25 to 1.59) | 1.40 (1.24 to 1.59) | 1.05 (1.03 to 1.06) |
| Highest sodiumb (mmol l−1) – RCS (134,139,144) | |||
| na1 | 1.04 (1.02 to 1.05) | 1.04 (1.02 to 1.05) | 0.98 (0.97 to 0.98) |
| na2 | 0.95 (0.93 to 0.97) | 0.95 (0.94 to 0.97) | 1.02 (1.01 to 1.02) |
| Highest creatinineb (µmol l−1) – RCS (44,69,96,271) | |||
| cr1 | 0.96 (0.94 to 0.98) | 0.97 (0.94 to 0.98) | 0.98 (0.98 to 0.98) |
| cr2 | 3.49 (2.72 to 4.48) | 3.33 (2.72 to 4.48) | 1.25 (1.23 to 1.26) |
| cr3 | 0.07 (0.04 to 0.12) | 0.08 (0.04 to 0.12) | 0.65 (0.63 to 0.66) |
| Highest ureab (mmol l−1) – RCS (3.2,6.1,14.9) | |||
| ur1 | 1.16 (1.07 to 1.24) | 1.15 (1.06 to 1.25) | 1.06 (1.05 to 1.07) |
| ur2 | 0.83 (0.75 to 0.92) | 0.84 (0.75 to 0.93) | 0.92 (0.75 to 0.92) |
| Lowest white blood cell countb (per 10 × 109 l–1 increase) | 0.90 (0.84 to 0.96) | 0.90 (0.84 to 0.96) | 1.03 (1.03 to 1.04) |
| Duration of advanced respiratory support (calendar days) | 0.97 (0.96 to 0.99) | 0.98 (0.96 to 0.99) | 0.99 (0.99 to 0.99) |
| Duration of basic/advanced cardiovascular support (calendar days) | 0.94 (0.91 to 0.96) | 0.95 (0.92 to 0.97) | 0.97 (0.97 to 0.97) |
| Duration of renal support (calendar days) | 1.13 (1.09 to 1.12) | 1.11 (1.09 to 1.13) | 0.99 (0.98 to 0.99) |
| Critical care unit length of stay (per day) | 0.97 (0.96 to 0.99) | 0.97 (0.96 to 0.99) | 1.00 (1.00 to 1.00) |
| Hospital length of stay after discharge from critical care (per 10 days) | 0.92 (0.91 to 0.96) | 0.92 (0.91 to 0.96) | 1.05 (1.05 to 1.05) |
FIGURE 12.
Cause-specific hazard ratio for (a) ESRD and (b) mortality before ESRD after hospital discharge following critical care for continuous predictors included in the model as non-linear using restricted cubic splines. a a, Physiological parameters assessed during the first 24 hours following admission to critical care.
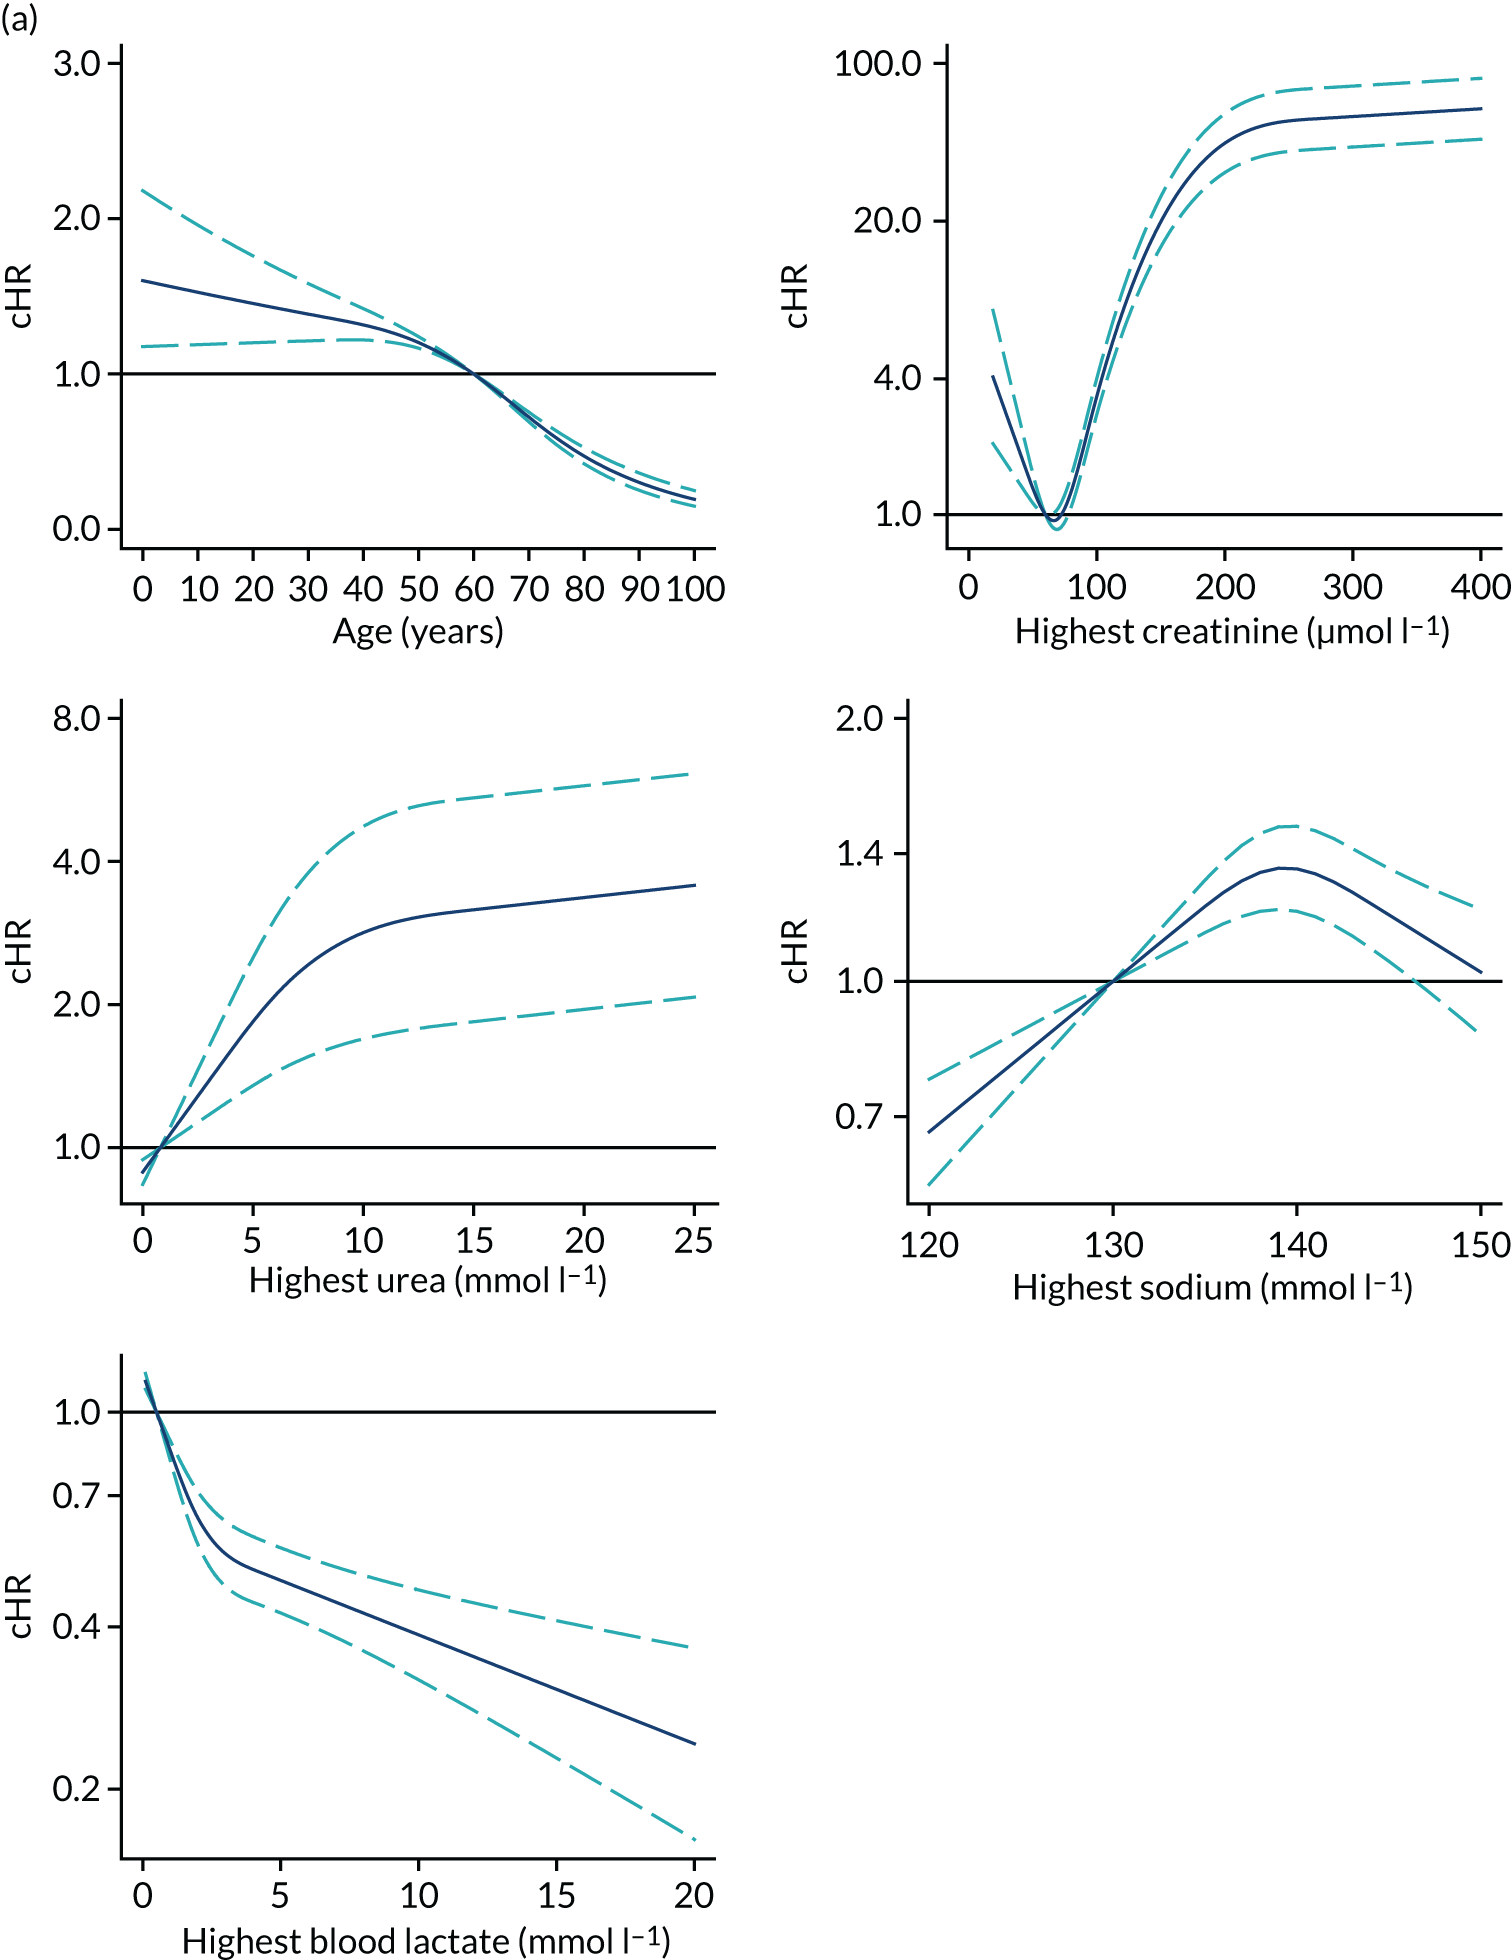
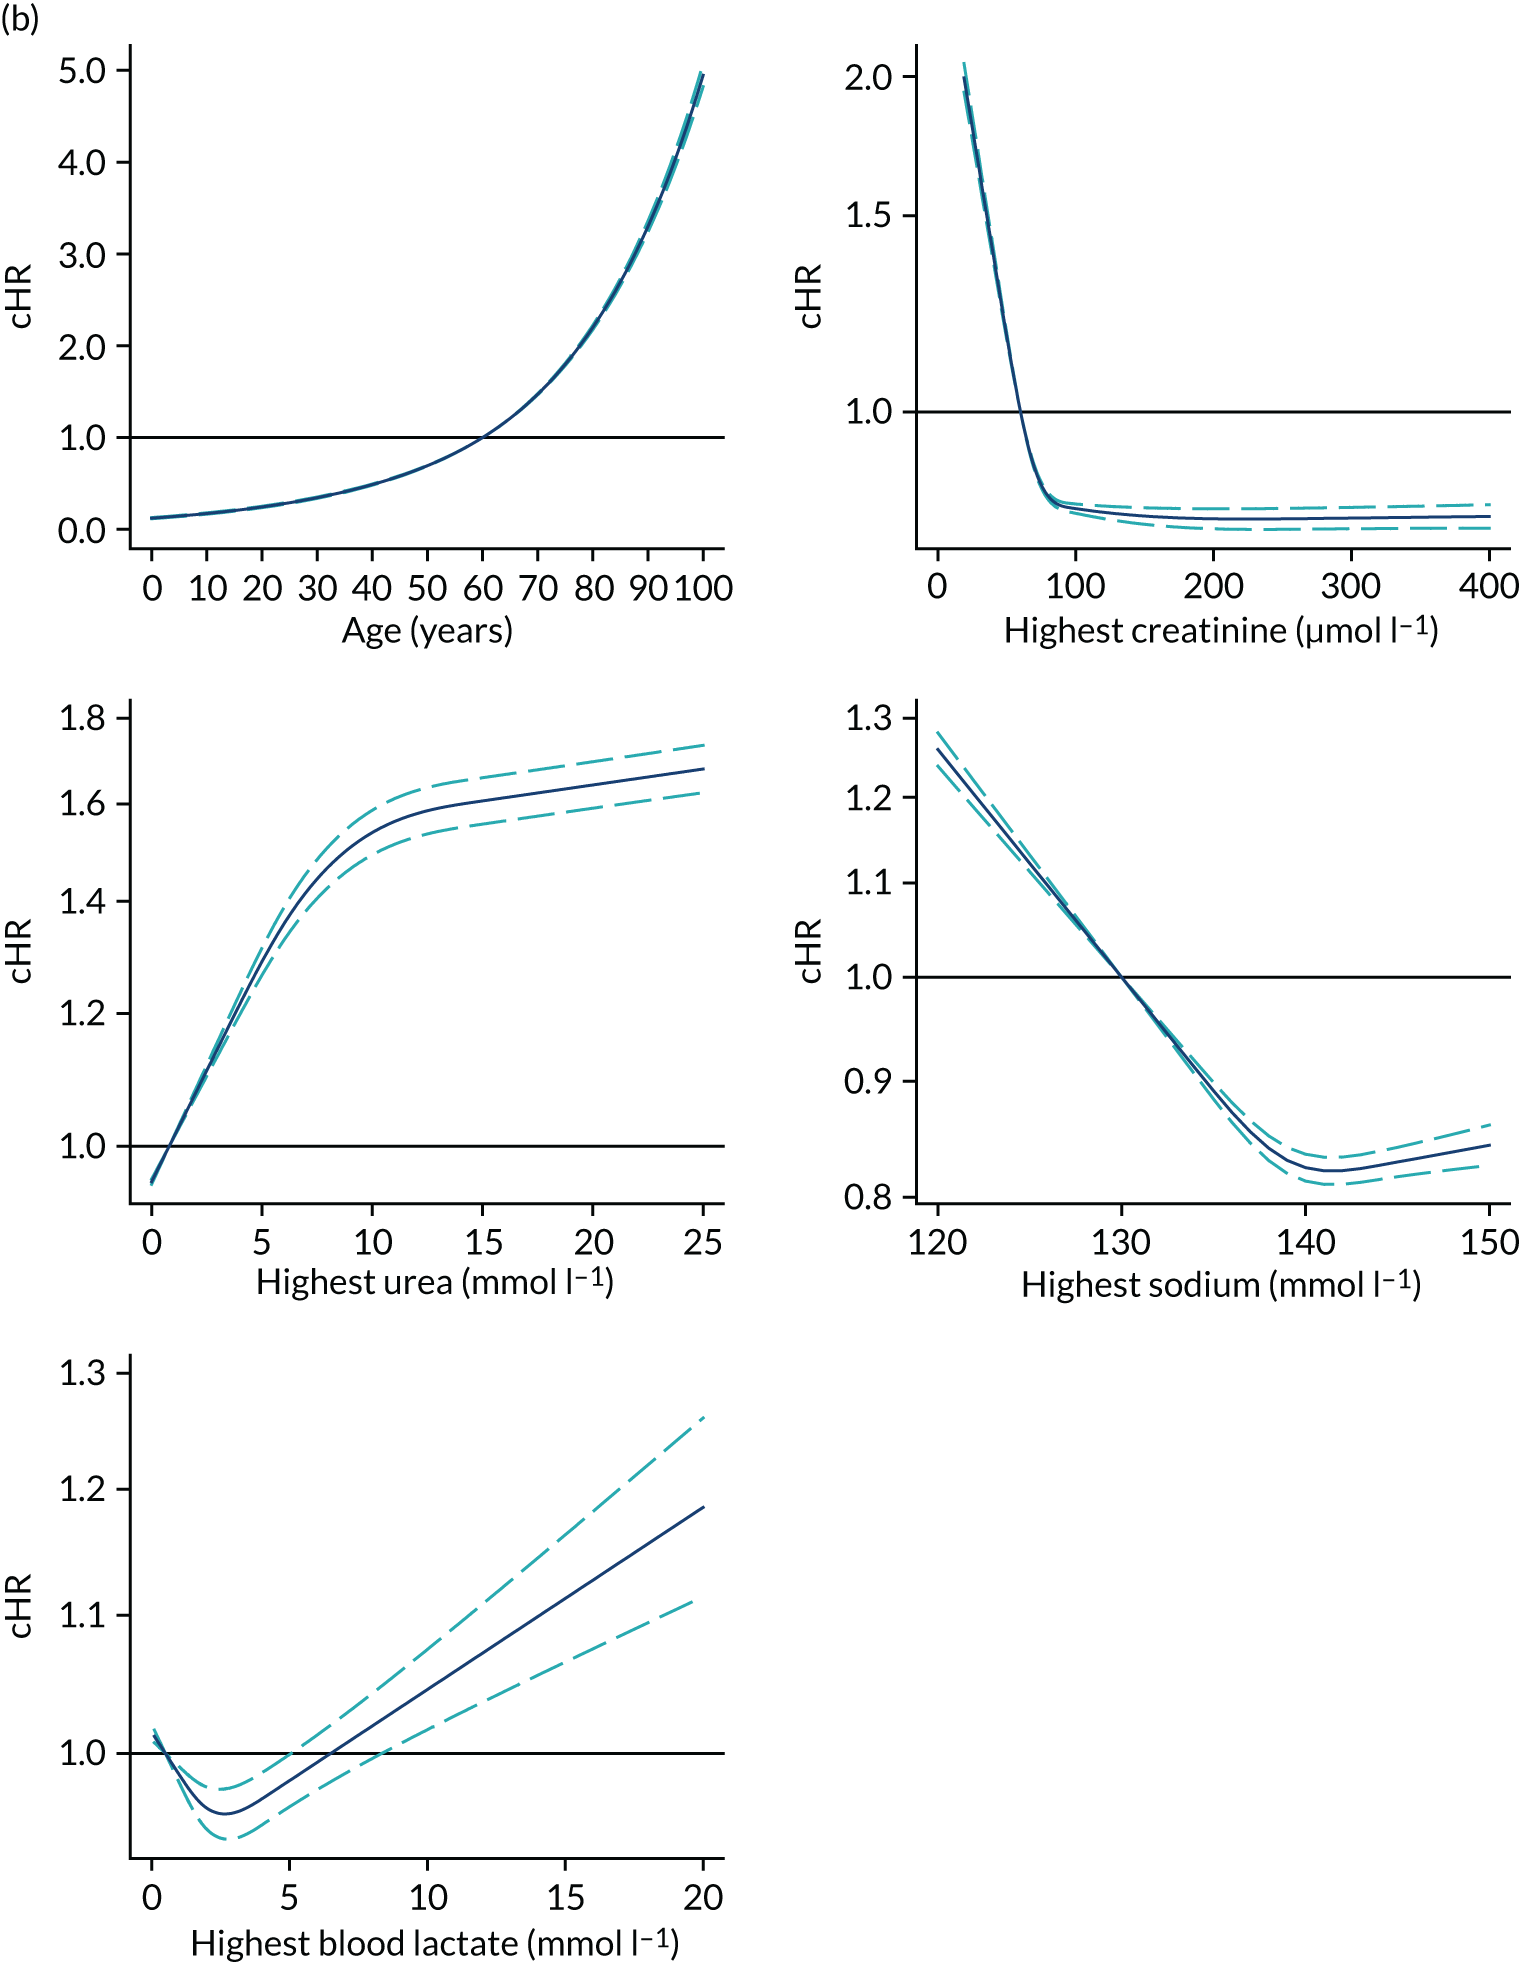
Harrell’s c-statistic for the model was 0.94, with an explained variation (R2) of 0.985 (95% CI 0.982 to 0.987, based on 100 bootstrap samples). Most of the prognostic information was carried by duration of renal support, surgical status, CKD and highest creatinine, because the R2 decreased considerably on dropping those variables (see Report Supplementary Material 1, Table S1).
Predictors of cumulative incidence of end-stage renal disease
Results of the competing risk analysis using the Fine–Gray approach were consistent with the cause-specific Cox results. Significant predictors of cumulative incidence of ESRD and the corresponding adjusted sHR are presented in Table 19. Figure 13 provides a graphical interpretation of the non-linear association between continuous factors and the cumulative incidence (absolute risk over time) of the development of ESRD. Cumulative incidence of ESRD increases with increasing age and urea, particularly in admissions with elevated creatinine. On the other hand, admissions with higher blood lactate had a lower risk of RRT for ESRD (adjusted for other variables in the model). The presence of severe liver disease (sHR 0.70) and metastatic disease (sHR 0.41) were significantly associated with a lower risk of RRT for ESRD. CKD (sHR 3.58) was associated with a substantial increase in the cumulative incidence of ESRD (Figure 14). Previous AKI (sHR 1.64), diabetes (sHR 1.30) and peripheral vascular disease (sHR 1.25) were also all associated with a higher risk of ESRD.
FIGURE 13.
Cumulative incidence of ESRD in the 7 years after hospital discharge following critical care according to predictors included in the Fine–Gray competing risks model. (a) Age; (b) highest creatinine; (c) highest sodium; (d) highest urea; (e) highest blood lactate. a a, Physiological parameters assessed during the first 24 hours following admission to critical care.
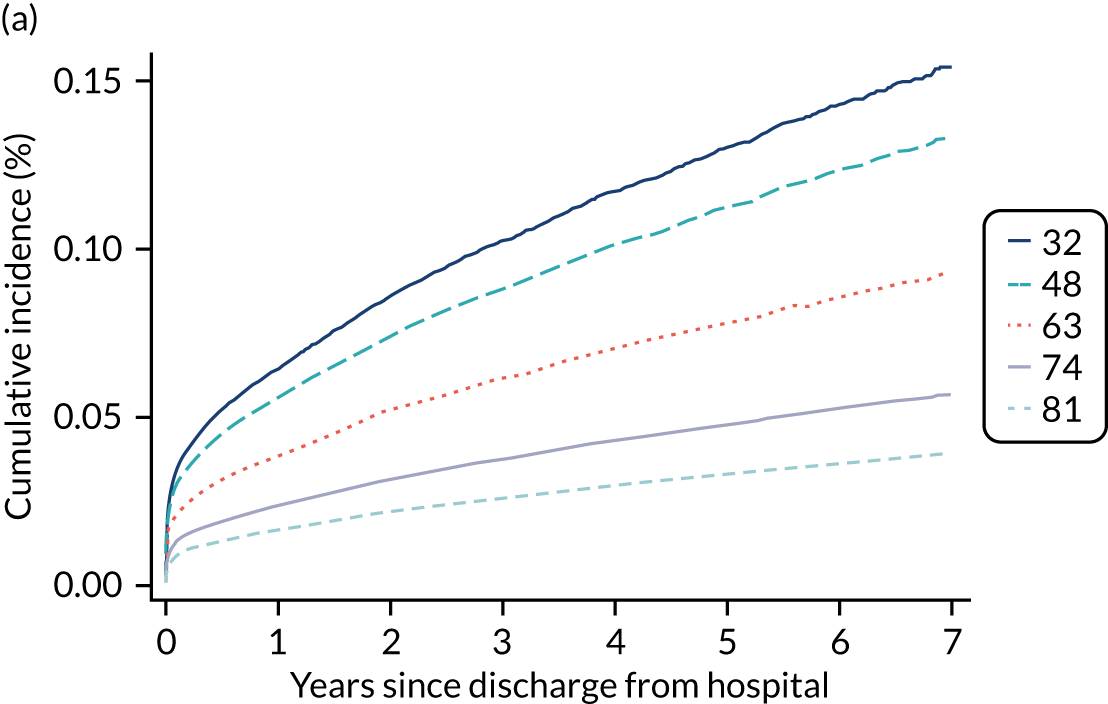
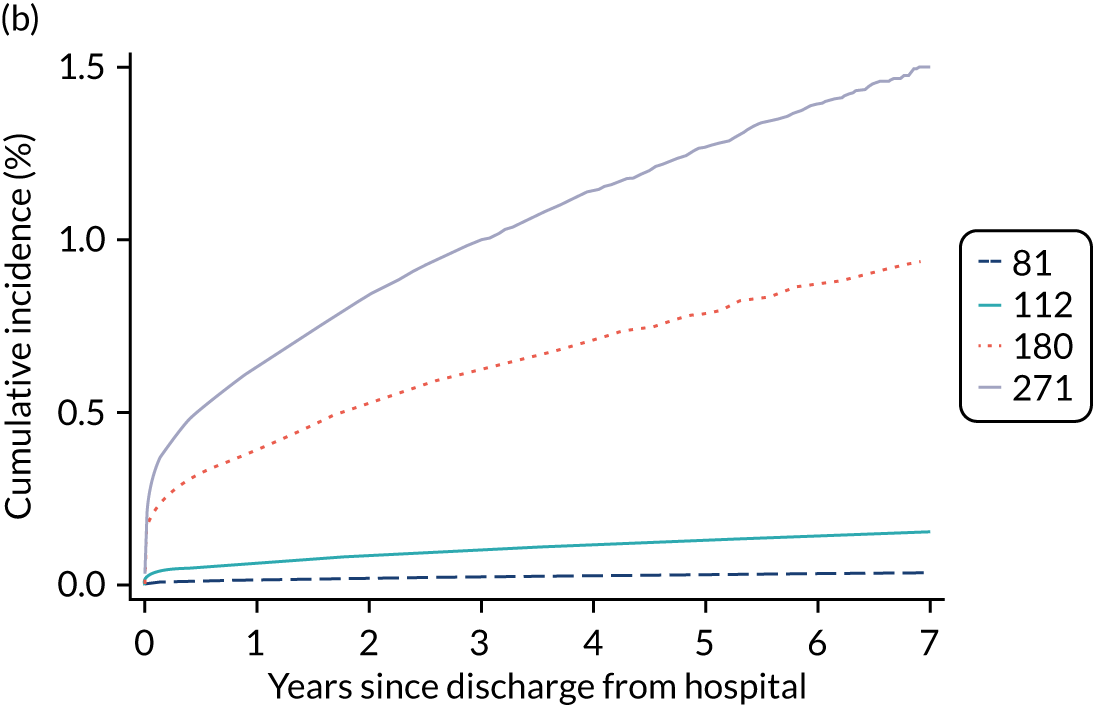
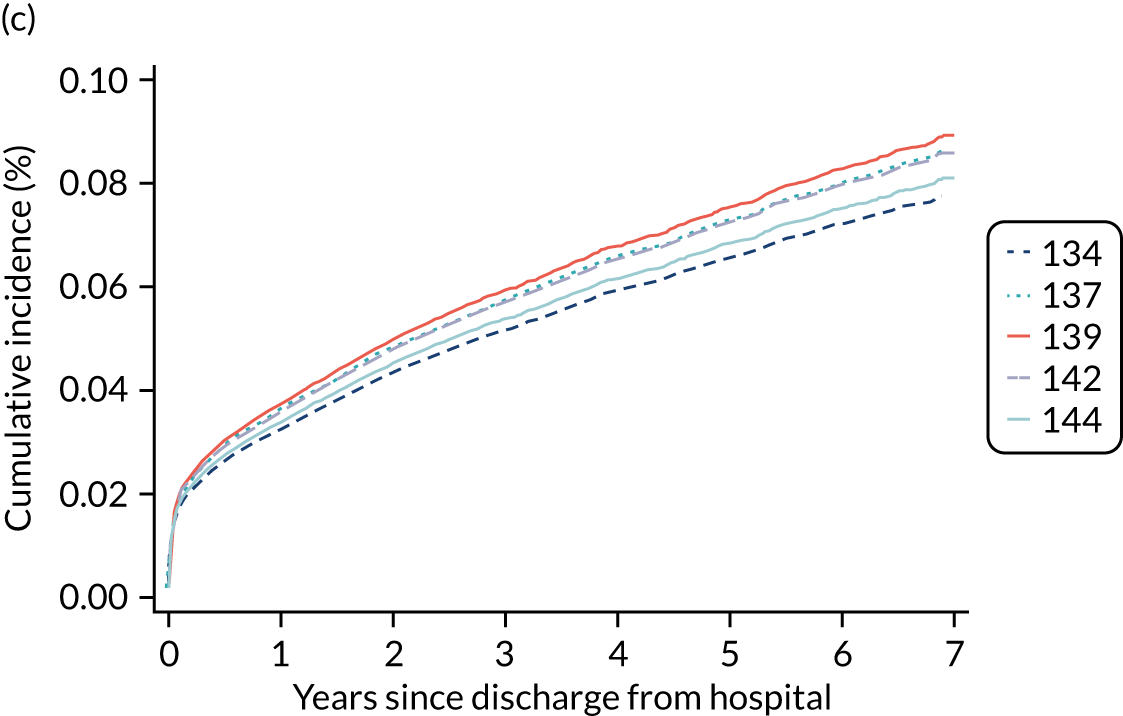
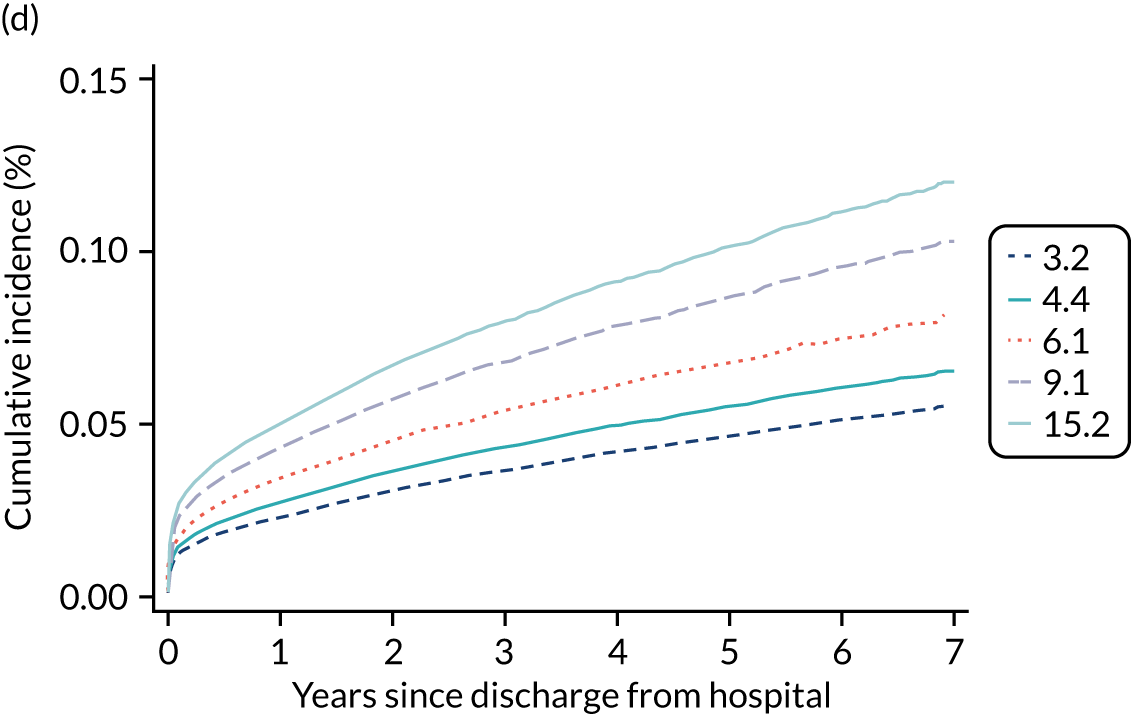
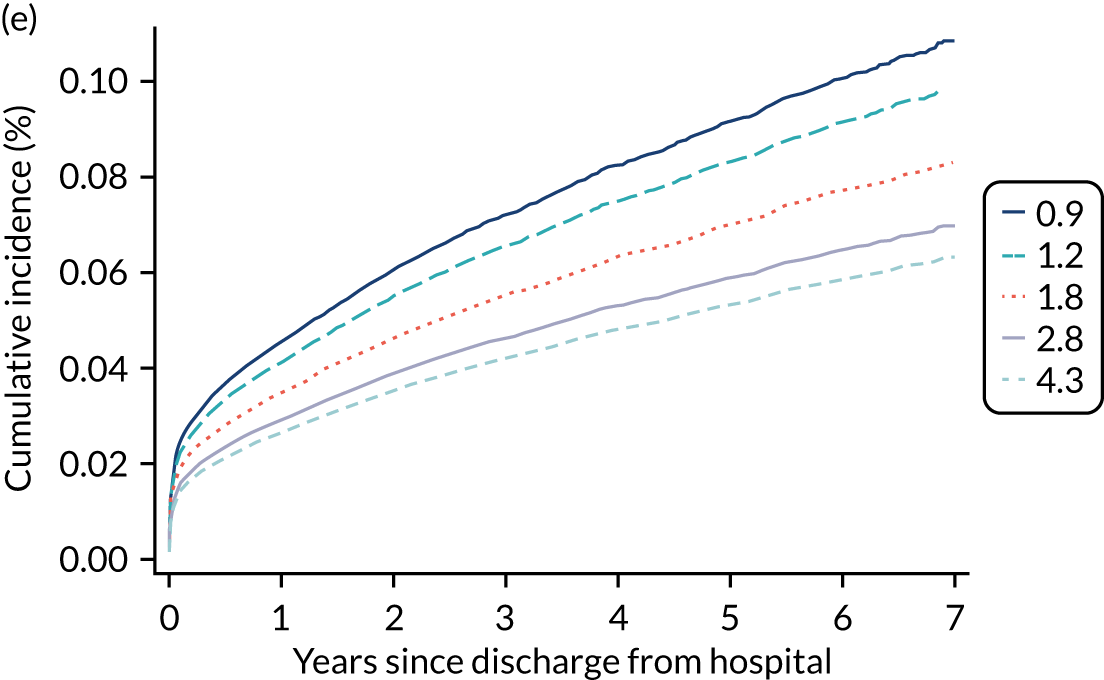
FIGURE 14.
Cumulative incidence of ESRD in the 7 years after hospital discharge following critical care according to predictors included in the Fine–Gray competing risks model (comorbidities). (a) CKD; (b) AKI; (c) PVD; (d) diabetes; (e) severe liver disease; (f) metastatic. PVD, peripheral vascular disease.
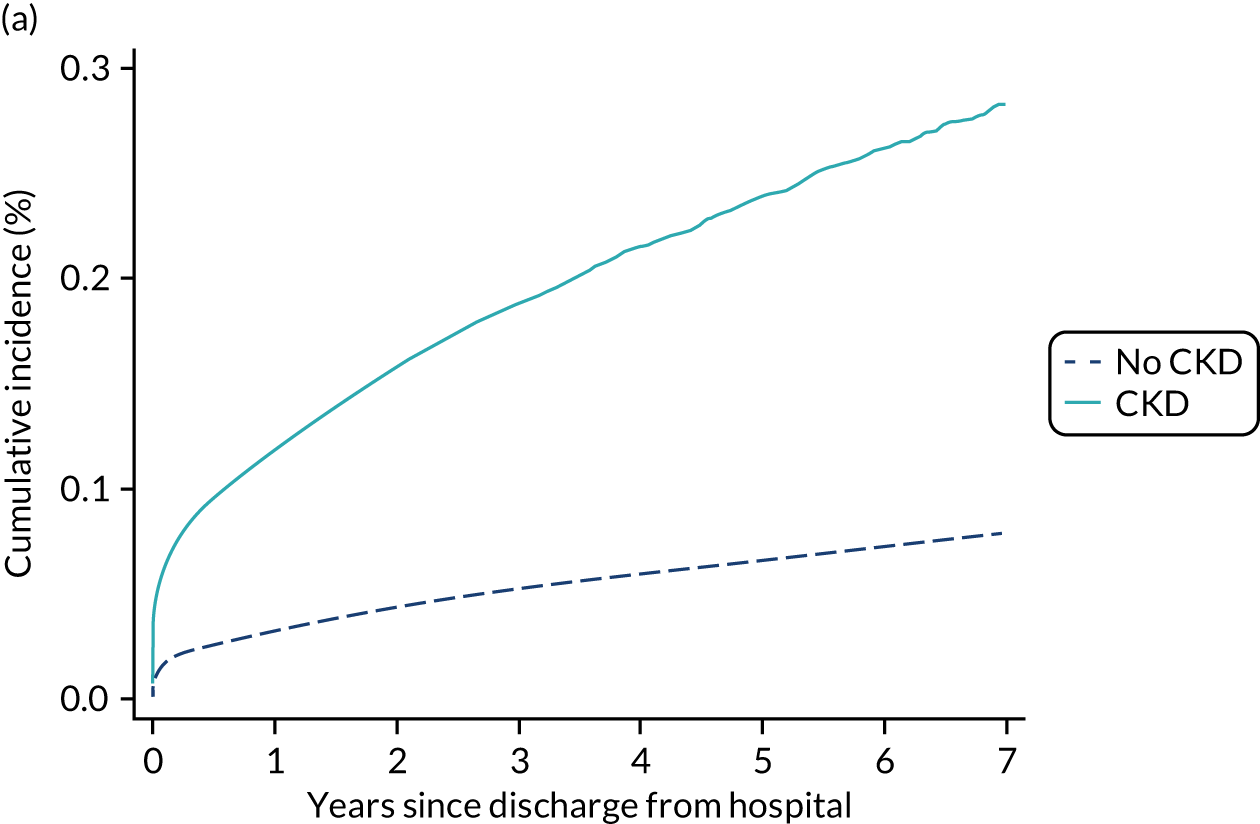
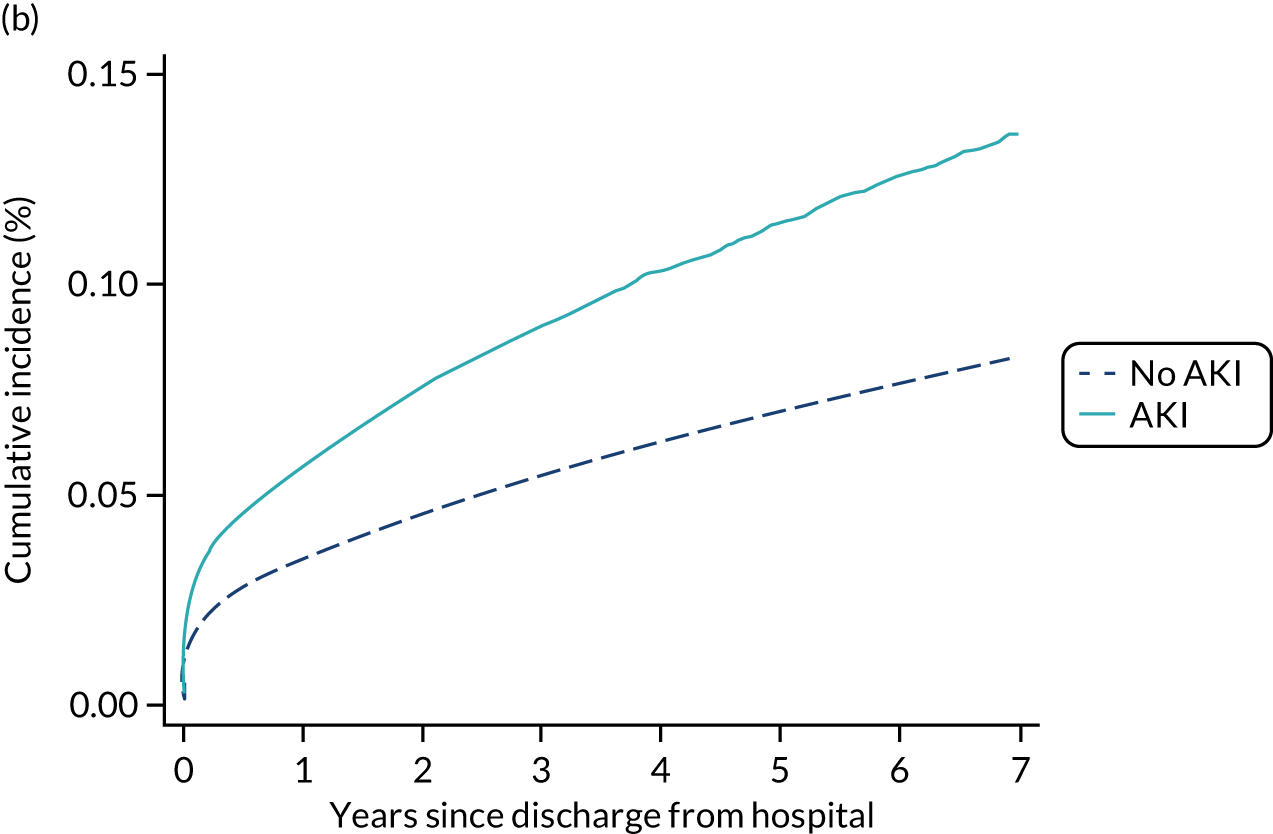
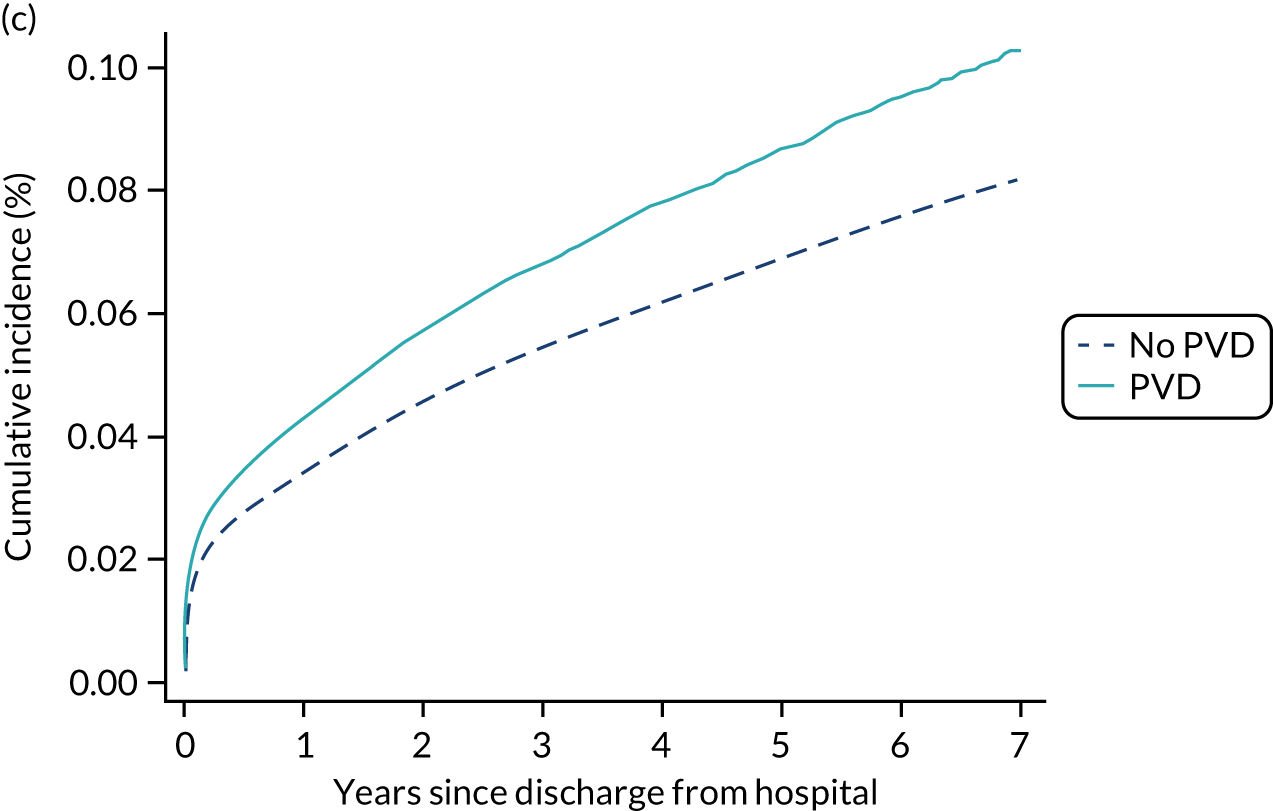
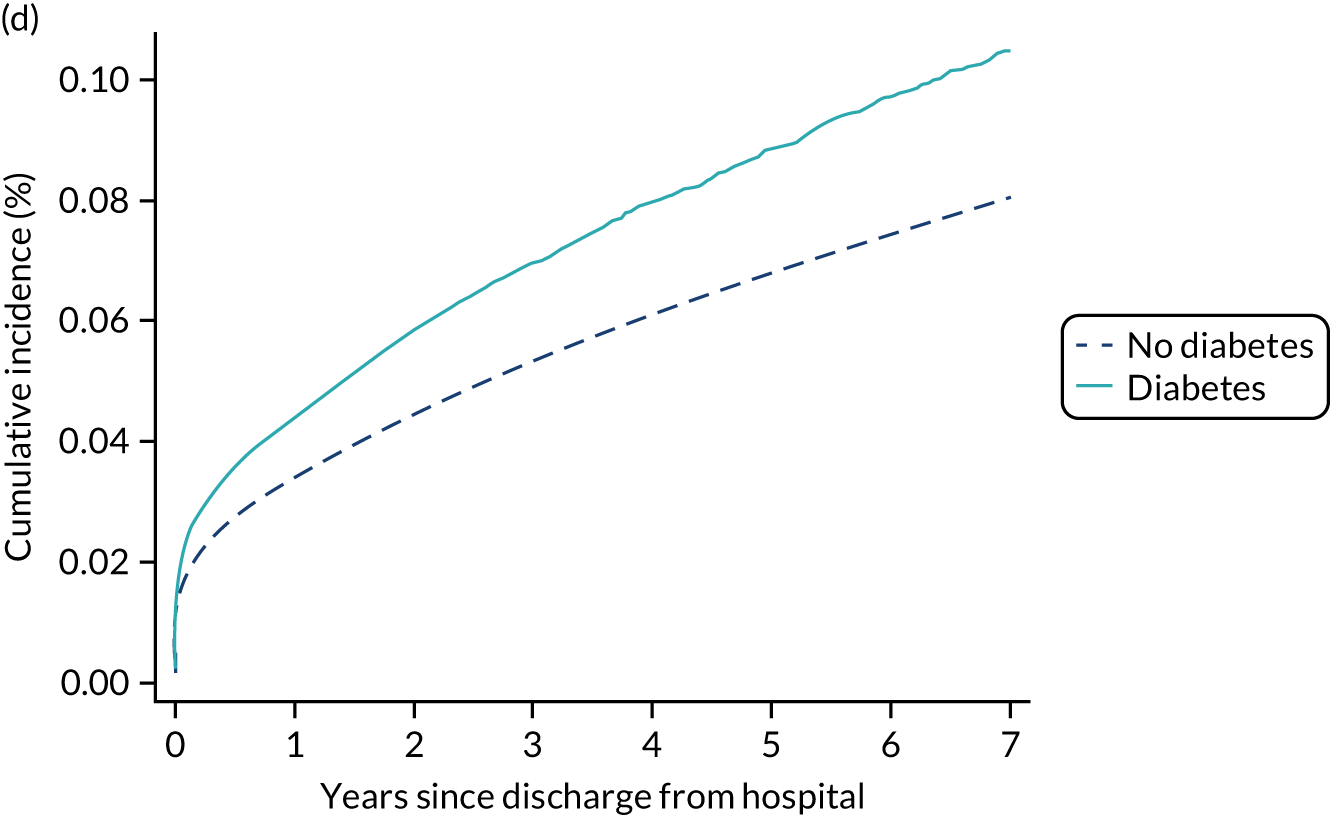
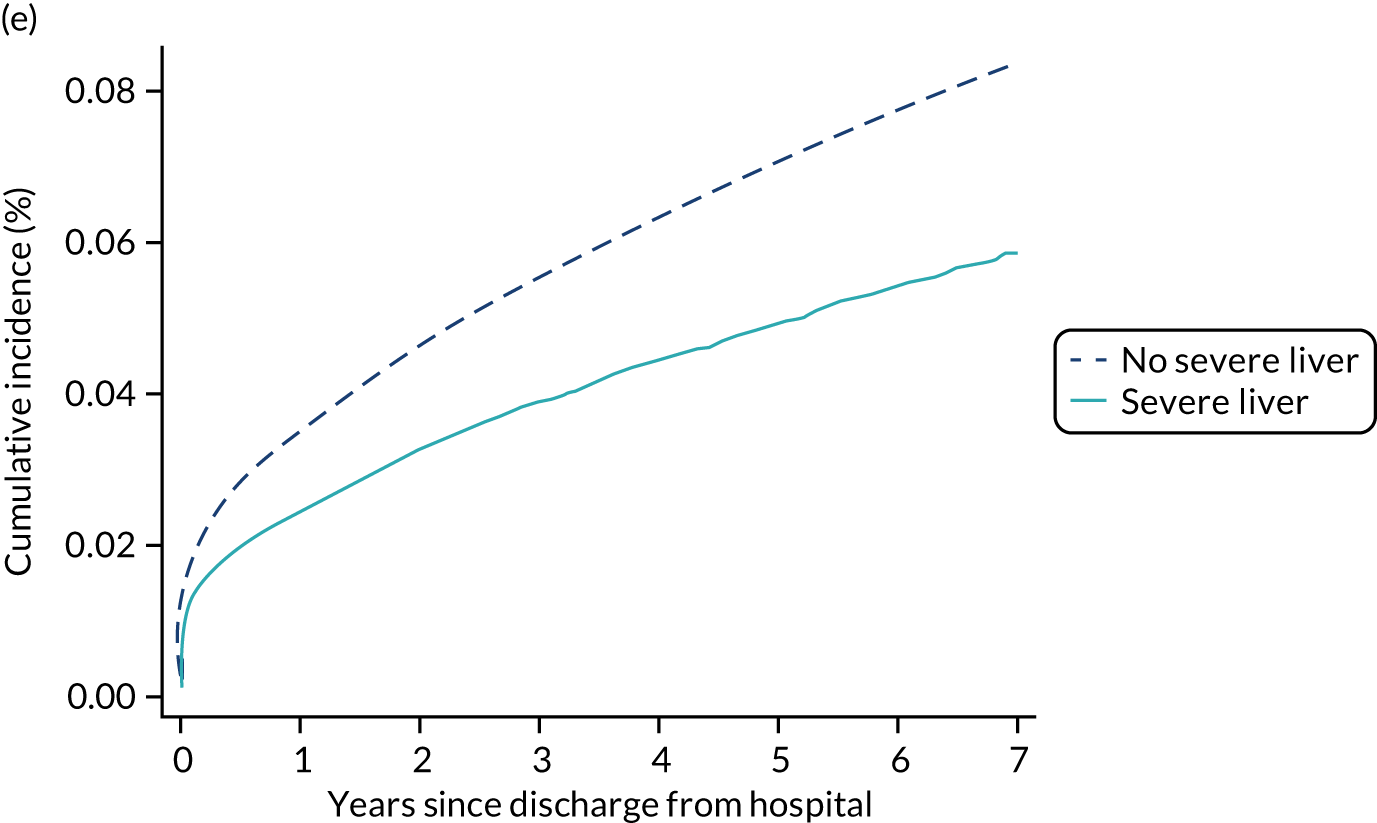
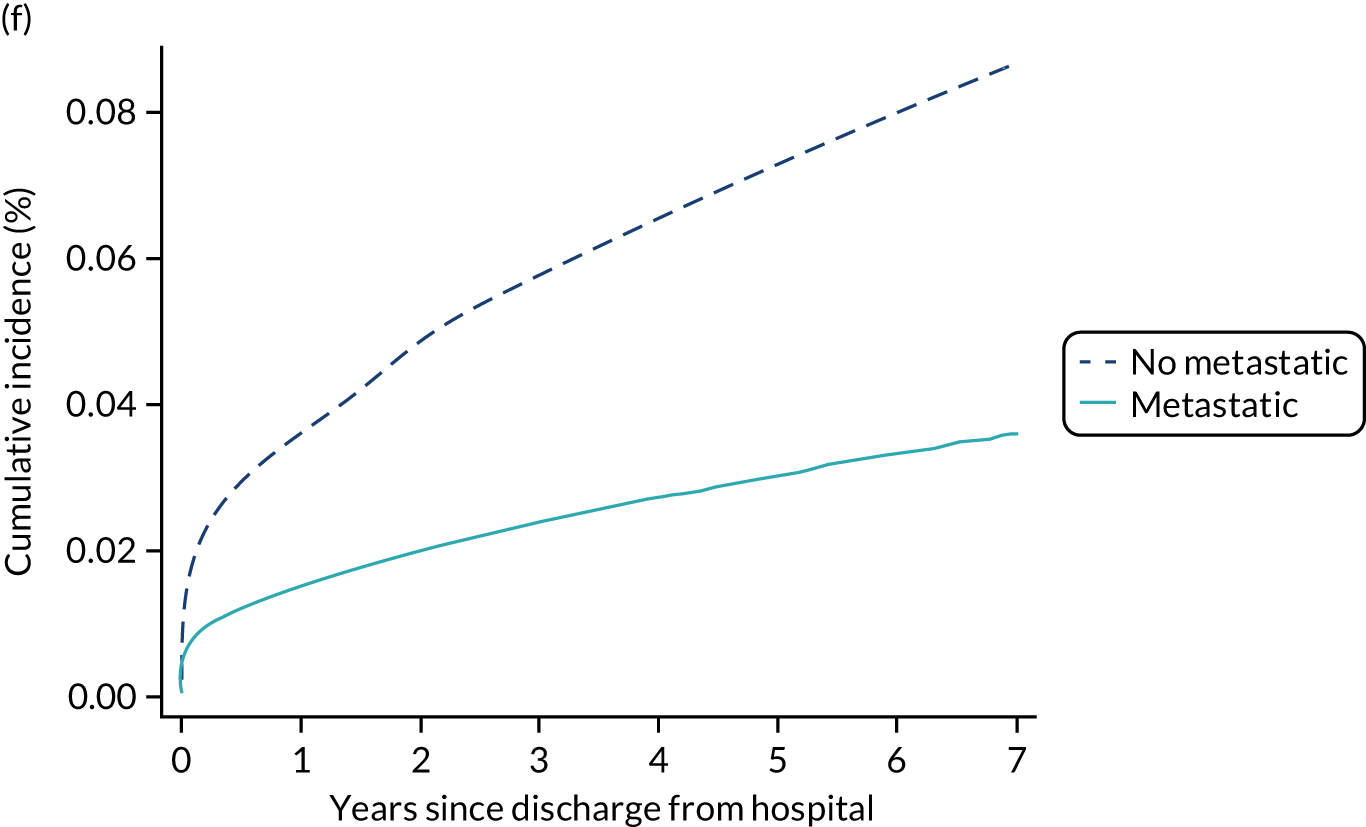
Predictors of pre-end-stage renal disease mortality
Cause-specific hazard ratios for the competing risk of mortality are presented in Table 19 and Figure 12. Notably, severe liver disease (cHR 2.00) and metastatic disease (cHR 3.42) elevated the risk of dying without first developing ESRD.
Discussion
We have successfully linked data between the CMP and UKRR to establish the incidence of RRT for ESRD following an episode of critical illness. Overall, the rate of RRT for ESRD was low (approximately 0.5% over a median of 2.7 years’ follow-up) but a number of factors were predictive of higher rates, most notably CKD, previous hospital episodes with AKI, admission following nephrectomy, creatinine measured during the critical care stay, and duration of renal support.
In the present study, we deliberately focused on the specific outcome of developing ESRD, with the aim of determining the risk factors that are associated with this outcome following a critical care admission. However, the competing risk of death before developing ESRD was considered applying two different approaches: the proportional cause-specific hazards method and the subdistribution hazards approach proposed by Fine and Gray. The two approaches focus on different aspects of analysis and complement each other. The cause-specific Cox model may be preferred for answering aetiological research questions or when the interpretation of the hazard ratio has a special interest. On the other hand, there is currently consensus that for prognostic studies, a formal competing-risk (Fine–Gray) model that looks at the cumulative incidence of an ESRD while also taking into consideration death before ESRD is the most appropriate method to use. 52 Regression models based on the CIF explore the association between predictors and the absolute risk and therefore are essential for medical decision-making and prognosis research questions. However, a complete understanding of effects of prognostic factors on a competing risk end point requires modelling both cause-specific hazards and cumulative incidences. 53 Although the cHR directly measures the association of a covariate on the event of interest as the competing event only contributes passively by removing individuals from the risk set, the sHR is a measure of association that takes into consideration the potential relationship between the covariate with both the event of interest and the competing event. Consequently, the effect of a covariate on the cause-specific hazard for an event can be different from its effect on the corresponding CIF. For most of the covariates in our study, the cause-specific and the cumulative incidence analyses were consistent with each other, and we could interpret the covariate effect on the cumulative incidence of ESRD as a direct effect and not as an indirect effect of the competing risk of death before ESRD. However, special attention should be paid to metastatic disease and severe liver disease. In both cases, we may speculate that patients with these conditions are less likely to receive RRT for ESRD, which may explain the association with a lower risk of RRT for ESRD. Metastatic disease in the medical history presents a strong cHR for mortality (3.42) and, as expected, the sHR for ESRD is lower than the corresponding cHR (0.41 vs. 0.65). 54 This difference suggests that despite the direct effect between metastatic disease and development of ESRD (cHR 0.65), mortality contributes to a lower sHR for ESRD because those with metastatic disease had a higher cause-specific hazard rate for death. In the case of severe liver disease, the 95% CI for the cHR (0.60 to 1.10) suggests no association. However, the cHR for mortality (2.0) drives a sHR for ESRD of < 1 because of the differential modification of the risk sets. Therefore, patients with liver disease will be less likely to have ESRD because of the association of liver disease with the competing event, death before ESRD. These examples demonstrate that both approaches for dealing with competing risk data may yield different results, which is explained by the different composition of the risk sets. These findings are in agreement with previous studies. 55,56 However, as mentioned before, the cHR and the sHR do not have the same interpretation.
A major strength of the present work is the large cohort of admissions to critical care and long follow-up period. This study has some limitations. Unfortunately, information about baseline renal function is not recorded in any of the linked data sources, and consequently its influence in developing ESRD is not studied here. It was possible to only model the outcome of ESRD treated by RRT, as no routine data sources capture kidney failure not treated with RRT. HES and CMP identified substantial numbers of patients with pre-existing ESRD that were not identified from UKRR, suggesting that using UKRR registrations as the outcome measure is likely to under-represent the total burden of ESRD in this patient group. In addition, we explored only the association between AKI, as identified from diagnostic coding during previous hospitalisations, but this did not permit us to explore the risk of ESRD in patients with different stages of AKI. We also did not determine the association between recurrence, duration and aetiology of AKI and ESRD. Furthermore, procedure codes from HES were not available for the complete study period, and therefore it was not possible to identify cardiac surgery, vascular surgery and nephrectomy from the HES data. As an alternative, we were able to identify these using the information recorded in the CMP.
These results are in line with increasing evidence showing that the burden of severe AKI extends beyond hospitalisation and includes an increased risk of death and chronic dialysis dependency. 51,57–62 This analysis is, to our knowledge, the largest study to date with data from the UK and is immediately relevant to the NHS. Long-term follow up after AKI is recommended63,64 but there is still debate and controversy as to what constitutes optimal aftercare. 65 Identifying those who are at highest risk of serious long-term complications is essential.
Chapter 7 Risk models for development of type 2 diabetes following critical care
Introduction
The occurrence of hyperglycaemia is common among critically ill patients, regardless of diabetes status, and is associated with acute severity of illness and outcomes. Critical illness-related hyperglycaemia has previously been linked with subsequent development of type 2 diabetes in small cohorts. 66,67 Data linkage between the CMP, HES, NDA and death registrations has permitted us to explore this in a much larger cohort and establish whether peak blood glucose in the first 24 hours of admission to the critical care unit and other risk factors are associated with the likelihood of developing type 2 diabetes in survivors of critical illness.
Methods
Methods common to all objectives and analyses were described in Chapter 3.
Study cohort
The cohort for this chapter is the CMP hospital survivor cohort (see Chapter 3) of patients discharged from hospital between 1 April 2009 and 31 March 2016 following a critical care episode. The final follow-up date was 31 March 2017 (based on the latest available data from the NDA at the time of linkage).
Exclusion criteria
Patients were excluded if they had pre-existing diabetes (type 1 or type 2), identified by:
-
linkage with the NDA indicating a date of diagnosis prior to or during the critical care episode
-
ICD-10 codes indicating diabetes in any diagnosis field from linked HES records prior to or during the critical care episode
-
a primary or secondary reason for admission to the critical care unit in the CMP associated with diabetes.
Outcome
The main outcome was incidence of type 2 diabetes. As the actual timing of the development of diabetes is unknown, we used as a surrogate measure a new registration for type 2 diabetes, based on the date of diagnosis recorded in the NDA database, after the date of discharge from hospital. The competing risk was death from any cause before type 2 diabetes, identified via linkage with death registrations. Deaths after a diagnosis of type 2 diabetes were not considered. The association between glucose and mortality was also explored as a secondary outcome.
Candidate variables
Potentially important candidate predictors and controlling variables were chosen based on expert clinical opinion and availability in the linked data sources. A description of the candidate predictors is given in Appendix 1, Table 38. The primary aim was to evaluate the association between serum glucose levels in the first 24 hours after admission and subsequent risk of type 2 diabetes.
Statistical analyses
For the description of cohort characteristics, assessment of optimal functional form and selection of covariables, we followed same methodology as described in Chapter 3.
The incidence rate was calculated as the number of cases of new-onset type 2 diabetes divided by the follow-up time and expressed as the number of events per 1000 person-years. The hazard ratios and cumulative mortality function were assessed by Cox (cause-specific hazard) and Fine–Gray (subdistribution hazard) methods; both approaches were described in Chapter 6. For the cause-specific model, the explained variation (R2) was determined. The proportional hazard assumption was tested by visual inspection of Schoenfeld residual plots and log-log plots.
Results
After exclusions, a total of 497,967 patients admitted to 248 NHS adult, general critical care units in England participating in the CMP and discharged alive from hospital between 1 April 2009 and 31 March 2016 were included in the analysis (Figure 15).
FIGURE 15.
Flow-diagram for cohort identification.
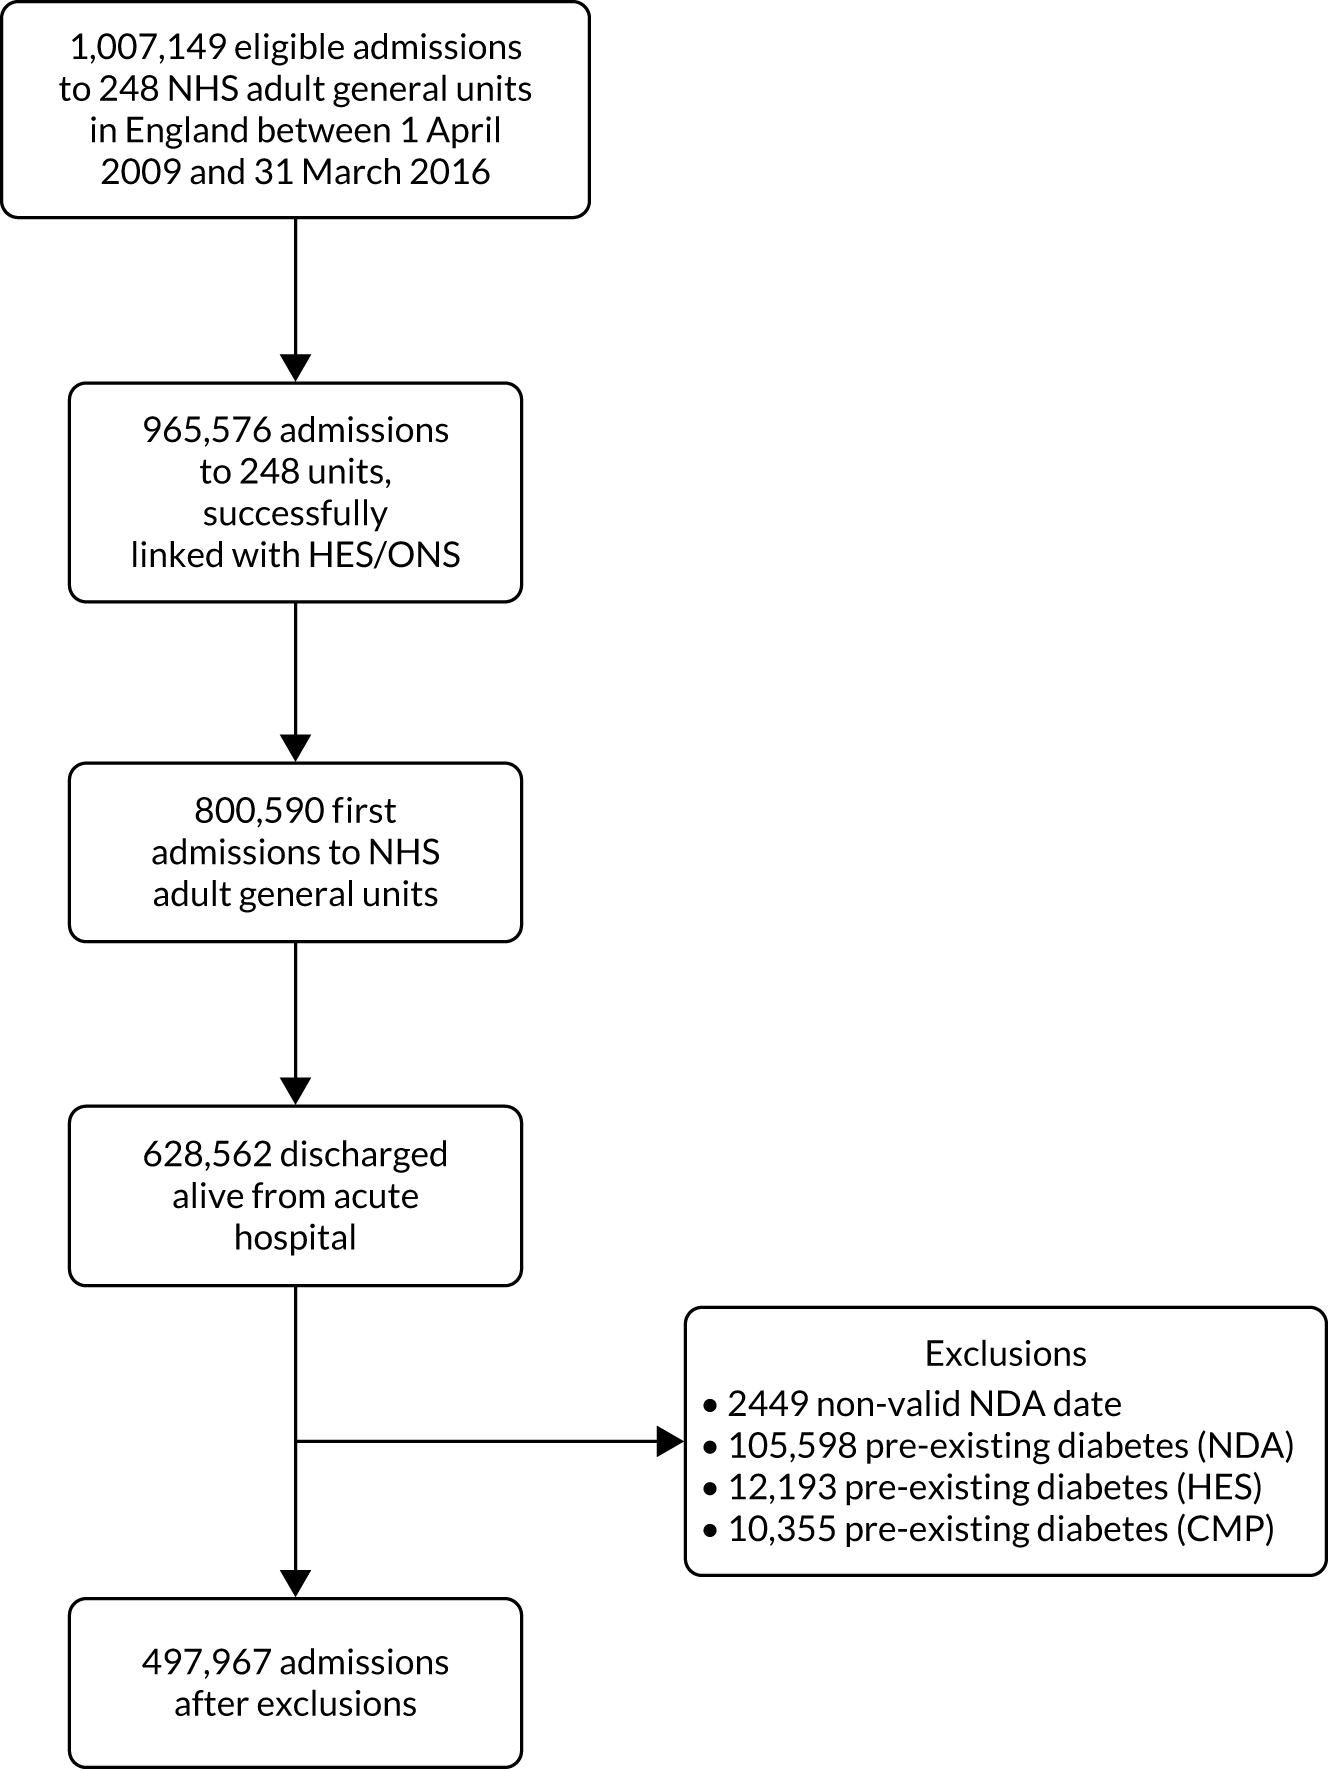
The median follow-up was 2.8 years (IQR 1.5 to 4.6 years) and 12,808 (2.6%) patients were subsequently diagnosed with type 2 diabetes after hospital discharge (incidence rate 7.8 per 1000 person-years; 95% CI 7.6 to 7.9). A total of 155,489 (31.2%) patients died without a diagnosis of type 2 diabetes.
Patient characteristics
Characteristics of the overall cohort, as well as divided by outcome, are detailed in Table 20. Compared with the overall cohort, patients with subsequent type 2 diabetes were slightly older (mean age 62 vs. 59 years), with a higher proportion of males (60% vs. 55%) and higher BMI (mean 30.7 vs. 26.7 kg/m2). Five per cent of the patients who developed type 2 diabetes were Asian compared with only 3% in the overall cohort. There was also a much stronger deprivation gradient across those who developed type 2 diabetes (from 15% in the least deprived quintile to 26% in the most deprived quintile) compared with the overall cohort (18% to 22%). Severity scores were similar for patients who developed type 2 diabetes and the overall cohort, but there were differences in some individual physiological parameters. In particular, the patients who went on to develop type 2 diabetes had higher serum glucose levels (mean 10.2 vs 8.5 mmol l−1) during the first 24 hours in the critical care unit.
| Characteristics | Overall cohort | Diagnosis of type 2 diabetes | Death without a diagnosis of type 2 diabetes |
|---|---|---|---|
| Number of patients (%) | 461,905 | 11,138 (2.4) | 140,570 (30.4) |
| Demographics | |||
| Age (years) | |||
| Mean (SD) | 59 (18.9) | 62 (13.5) | 69 (14.7) |
| Median (IQR) | 62 (46, 74) | 63 (53, 72) | 71 (61, 80) |
| Sex, male (%) | 253,452 (54.9) | 6623 (59.5) | 79,858 (56.8) |
| Body mass index (kg/m2), mean (SD) | 26.7 (6.2) | 30.7 (7.6) | 25.9 (5.7) |
| Ethnicity, n (%) | |||
| White | 417,848 (90.5) | 9827 (88.2) | 131,857 (93.8) |
| Mixed | 2608 (0.6) | 52 (0.5) | 429 (0.3) |
| Asian | 13,335 (2.9) | 544 (4.9) | 2277 (1.6) |
| Black | 9752 (2.1) | 307 (2.8) | 1761 (1.3) |
| Other | 5803 (1.3) | 148 (1.3) | 1052 (0.7) |
| Not stated | 12,187 (2.6) | 245 (2.2) | 3077 (2.2) |
| Deprivation, n (%) | |||
| 1 (least deprived) | 80,630 (18.1) | 1632 (15.1) | 25,630 (18.8) |
| 2 | 85,285 (19.2) | 1912 (17.7) | 26,708 (19.6) |
| 3 | 89,430 (20.1) | 2080 (19.3) | 27,866 (20.4) |
| 4 | 90,513 (20.4) | 2401 (22.3) | 27,232 (20.0) |
| 5 (most deprived) | 98,689 (22.2) | 2756 (25.6) | 28,955 (21.2) |
| Medical history | |||
| RCS Charlson comorbidities, n (%) | |||
| Previous MI | 10,381 (2.2) | 273 (2.5) | 4185 (3.0) |
| Congestive cardiac failure | 17,595 (3.8) | 525 (4.7) | 8392 (6.0) |
| Peripheral vascular disease | 19,344 (4.2) | 528 (4.7) | 8069 (5.7) |
| Cerebrovascular disease | 13,299 (2.9) | 310 (2.8) | 5425 (3.9) |
| Dementia | 3277 (0.7) | 38 (0.3) | 2241 (1.6) |
| Chronic pulmonary disease | 54,239 (11.7) | 1546 (13.9) | 23,632 (16.8) |
| Rheumatological disease | 8270 (1.8) | 194 (1.7) | 3614 (2.6) |
| Liver disease | 11,711 (2.5) | 345 (3.1) | 5348 (3.8) |
| Hemiplegia or paraplegia | 3102 (0.7) | 76 (0.7) | 1365 (1.0) |
| Renal | 16,724 (3.6) | 370 (3.3) | 8913 (6.3) |
| Malignancy | 67,901 (14.7) | 1152 (10.3) | 36,360 (25.9) |
| APACHE II severe conditions in medical history, n (%) | |||
| Very severe cardiovascular disease | 5276 (1.1) | 165 (1.5) | 2477 (1.8) |
| Severe respiratory disease | 6801 (1.5) | 202 (1.8) | 4082 (2.9) |
| Severe liver disease | 7005 (1.5) | 244 (2.2) | 3094 (2.2) |
| ESRD | 29,462 (6.4) | 451 (4.0) | 16,131 (11.5) |
| Metastatic disease | 22,578 (4.9) | 241 (2.2) | 15,626 (11.1) |
| Haematological malignancy | 6046 (1.3) | 76 (0.7) | 3500 (2.5) |
| Immunocompromise | 4092 (0.9) | 80 (0.7) | 2045 (1.5) |
| Prior dependency, n (%) | |||
| Able to live without assistance in daily activities | 381,144 (83.1) | 9277 (83.9) | 100,854 (72.1) |
| Some (minor/major) assistance with daily activities | 74,125 (16.2) | 1745 (15.8) | 37,590 (26.9) |
| Total assistance with all daily activities | 3367 (0.7) | 34 (0.3) | 1397 (1.0) |
| Patient-related factors | |||
| CPR within 24 hours prior to admission, n (%) | |||
| No CPR | 448,443 (97.1) | 10,778 (96.8) | 136,911 (97.4) |
| Community CPR | 7307 (1.6) | 183 (1.6) | 1507 (1.1) |
| In-hospital CPR | 6150 (1.3) | 177 (1.6) | 2151 (1.5) |
| Location prior to critical care admission, n (%) | |||
| ED or not in hospital, unplanned | 96,396 (20.9) | 1936 (17.4) | 23,649 (16.8) |
| ED or not in hospital, planned | 4022 (0.9) | 79 (0.7) | 734 (0.5) |
| Theatre, elective/scheduled, planned | 144,225 (31.2) | 3725 (33.4) | 44,938 (32.0) |
| Theatre, elective/scheduled, unplanned | 22,675 (4.9) | 644 (5.8) | 7166 (5.1) |
| Theatre, emergency/urgent | 90,603 (19.6) | 1939 (17.4) | 27,745 (19.7) |
| Ward or intermediate care area | 91,196 (19.7) | 2461 (22.1) | 32,315 (23.0) |
| Other critical care unit, repatriation | 1024 (0.2) | 17 (0.2) | 336 (0.2) |
| Other critical care unit, planned/unplanned transfer | 7672 (1.7) | 256 (2.3) | 2494 (1.8) |
| Other acute hospital | 4092 (0.9) | 81 (0.7) | 1193 (0.8) |
| Primary reason for admission by body system, n (%) | |||
| Respiratory | 78,585 (17.0) | 2092 (18.8) | 26,854 (19.1) |
| Cardiovascular | 83,804 (18.1) | 2595 (23.3) | 22,079 (15.7) |
| Gastrointestinal | 126,581 (27.4) | 3180 (28.6) | 44,996 (32.0) |
| Neurological (including eyes) | 66,969 (14.5) | 1119 (10.0) | 16,262 (11.6) |
| Genito-urinary | 43,865 (9.5) | 946 (8.5) | 15,298 (10.9) |
| Endocrine, metabolic, thermoregulation and poisoning | 27,680 (6.0) | 473 (4.2) | 4500 (3.2) |
| Haematological/immunological | 3601 (0.8) | 57 (0.5) | 1356 (1.0) |
| Musculoskeletal | 25,863 (5.6) | 538 (4.8) | 8013 (5.7) |
| Dermatological | 4728 (1.0) | 133 (1.2) | 1173 (0.8) |
| Psychiatric | 220 (0.0) | 5 (0.0) | 38 (0.0) |
| Severity scores from the first 24 hours in the critical care unit | |||
| APACHE II score, mean (SD) | 13 (5.7) | 13 (5.6) | 16 (5.6) |
| APACHE II score, median (IQR) | 13 (9–17) | 13 (10–17) | 15 (12–19) |
| ICNARC physiology score, mean (SD) | 14 (7.0) | 14 (7.4) | 15 (7.1) |
| ICNARC physiology score, median (IQR) | 12 (8–17) | 13 (9–18) | 14 (10–19) |
| Physiology during the first 24 hours in the critical care unit | |||
| Highest glucose (mmol l−1), mean (SD) | 8.5 (2.8) | 10.2 (3.8) | 8.5 (2.8) |
| Highest heart rate (min−1), mean (SD) | 101 (22) | 102 (21) | 101 (22) |
| Lowest systolic blood pressure (mmHg), mean (SD) | 97.9 (18.4) | 99.6 (18.9) | 97.0 (18.8) |
| Highest temperature (°C), mean (SD) | 37.6 (0.9) | 37.7 (0.9) | 37.6 (0.9) |
| Lowest respiratory rate (min−1), mean (SD) | 12.3 (4.4) | 12.5 (3.8) | 12.4 (3.8) |
| Urine output (ml), mean (SD) | 1991 (1737) | 2023 (1262) | 1746 (1269) |
| PaO2/FiO2 (kPa), mean (SD) | 36.7 (15.9) | 31.9 (14.1) | 35.7 (15.5) |
| PaCO2 (kPa), mean (SD) | 5.9 (1.7) | 6.3 (1.9) | 5.9 (1.8) |
| Lowest arterial pH, mean (SD) | 7.33 (0.09) | 7.32 (0.09) | 7.33 (0.09) |
| Highest blood lactate (mmol l−1), mean (SD) | 2.3 (1.8) | 2.6 (1.9) | 2.2 (1.8) |
| Highest urea (µmol l−1), mean (SD) | 8.1 (7.9) | 8.7 (7.8) | 9.8 (9.1) |
| Highest creatinine (µmol l−1), mean (SD) | 111 (134) | 119 (123) | 128 (158) |
| Highest sodium (mmol l−1), mean (SD) | 139 (4) | 139 (4) | 139 (5) |
| Lowest white blood cell count (× 109 l−1), mean (SD) | 11.4 (7.4) | 11.9 (6.6) | 11.4 (9.3) |
| Neutrophil count (× 109 l−1), mean (SD) | 9.4 (5.4) | 9.7 (5.2) | 9.4 (5.8) |
| Lowest platelet count (× 109 l−1), mean (SD) | 210 (104) | 211 (102) | 214 (111) |
| Mechanical ventilation, n (%) | 167,419 (36.2) | 4267 (38.3) | 43,454 (30.9) |
| Sepsis, n (%) | 107,315 (23.2) | 2863 (25.7) | 35,904 (25.5) |
| Organ dysfunction, n (%) | 364,663 (78.9) | 8873 (79.7) | 116,751 (83.1) |
| Length of stay | |||
| Critical care unit length of stay (hours), mean (SD) | 99 (173) | 111 (190) | 108 (186) |
| Critical care unit length of stay (hours), median (IQR) | 46 (23–100) | 49 (23–114) | 51 (24–114) |
| Acute hospital length of stay (days), mean (SD) | 21 (30) | 21 (29) | 27 (33) |
| Acute hospital length of stay (days), median (IQR) | 12 (7–24) | 12 (7–24) | 16 (9–32) |
| Organ support during critical care stay | |||
| Receipt of advanced respiratory support, n (%) | 180,520 (39.1) | 4563 (41.0) | 47,065 (33.5) |
| Duration of advanced respiratory support (calendar days), median (IQR) | 2 (1–5) | 2 (1–6) | 2 (2–6) |
| Receipt of advanced cardiovascular support, n (%) | 78,550 (17.0) | 2265 (20.3) | 22,853 (16.3) |
| Duration of advanced cardiovascular support (calendar days), median (IQR) | 2 (1–3) | 2 (1–3) | 2 (1–3) |
| Receipt of renal support, n (%) | 22,176 (4.8) | 656 (5.9) | 8768 (6.2) |
| Duration of renal support (calendar days), median (IQR) | 4 (2–7) | 4 (2–7) | 3 (2–6) |
Predictors of subsequent type 2 diabetes
After exploring non-linearity and their best functional form had been determined, continuous predictors of age, BMI, highest glucose, systolic blood pressure, lowest haemoglobin and lowest white blood cell count were entered into a multivariable model along with the rest of potential factors detailed in Appendix 1, Table 38. Variables significant at p < 0.05 were retained and non-linearity was reassessed. Table 21 shows the cHR and sHR after the modelling process. Non-linear associations were observed between the risk of subsequent type 2 diabetes and age, BMI, glucose and white blood cell count, and these variables were modelled using restricted cubic splines. Figure 16 shows the adjusted cause-specific graphs associated with these non-linear relationships compared with reference values. There was a positive non-linear relationship between highest glucose and subsequent type 2 diabetes, with a marked increase between 8 and 12 mmol l−1. Risk of diagnosis of type 2 diabetes increased steeply with increasing BMI up to around 35 kg/m2, after which the increase was more gradual. Male patients (cHR 1.23), increasing systolic blood pressure, patients with severe liver disease (cHR 1.60), chronic pulmonary disease (cHR 1.20) and notably patients who had received pancreatic surgery (cHR 2.83) were also associated with an increased risk of type 2 diabetes. In addition, Asian (cHR 2.13) and black (cHR 1.43) patients were more likely to develop diabetes type 2 diabetes than white patients. On the other hand, receiving mechanical ventilation (cHR 0.86) and immunocompromise (cHR 0.73) were associated with a decreased risk of subsequent type 2 diabetes.
| cHR (95% CI) | sHR (95% CI) | |
|---|---|---|
| Age (years) – RCS (23,48,62,72,85) | ||
| age1 | 1.08 (1.07 to 1.09) | 1.08 (1.07 to 1.09) |
| age2 | 0.89 (0.87 to 0.91) | 0.89 (0.87 to 0.91) |
| age3 | 1.34 (1.17 to 1.52) | 1.37 (1.20 to 1.56) |
| age4 | 0.69 (0.51 to 0.92) | 0.62 (0.46 to 0.83) |
| Male sex | 1.23 (1.18 to 1.29) | 1.20 (1.15 to 1.26) |
| Ethnicity | ||
| White | Ref | Ref |
| Mixed | 1.14 (0.85 to 1.51) | 1.13 (0.84 to 1.51) |
| Asian | 2.13 (1.94 to 2.35) | 2.17 (1.97 to 2.39) |
| Black | 1.43 (1.26 to 1.62) | 1.44 (1.27 to 1.63) |
| Other | 1.34 (1.12 to 1.59) | 0.91 (0.79 to 1.06) |
| Pregnant/recently pregnant | 0.51 (0.37 to 0.71) | 0.52 (0.38 to 0.72) |
| Deprivation | ||
| 1 (least deprived) | Ref | Ref |
| 2 | 1.08 (1.00 to 1.16) | 1.07 (1.00 to 1.15) |
| 3 | 1.10 (1.02 to 1.18) | 1.09 (1.01 to 1.16) |
| 4 | 1.27 (1.18 to 1.36) | 1.24 (1.16 to 1.33) |
| 5 (most deprived) | 1.37 (1.28 to 1.46) | 1.31 (1.23 to 1.41) |
| Body mass index (kg/m2) – RCS (19,23,26,29,38) | ||
| bmi1 | 1.15 (1.10 to 1.20) | 1.18 (1.13 to 1.23) |
| bmi2 | 0.59 (0.43 to 0.82) | 0.54 (0.39 to 0.75) |
| bmi3 | 14.49 (4.22 to 49.57) | 18.57 (5.31 to 64.93) |
| bmi4 | 0.24 (0.00 to 0.91) | 0.02 (0.00 to 0.07) |
| Immunocompromise | 0.73 (0.66 to 0.81) | 0.57 (0.51 to 0.63) |
| Severe liver disease | 1.60 (1.39 to 1.83) | 1.36 (1.19 to 1.55) |
| Chronic pulmonary disease | 1.20 (1.13 to 1.27) | 1.10 (1.03 to 1.17) |
| Previous MI | 1.19 (1.05 to 1.36) | 1.09 (0.95 to 1.24) |
| Pancreatic surgery | 2.83 (2.48 to 3.23) | 2.35 (2.05 to 2.68) |
| Sepsis | 1.15 (1.10 to 1.21) | 1.15 (1.09 to 1.21) |
| Surgical status | ||
| Elective surgery | Ref | Ref |
| Non-surgical | 1.25 (1.18 to 1.31) | 1.17 (1.11 to 1.23) |
| Emergency surgery | 1.12 (1.06 to 1.20) | 1.10 (1.03 to 1.16) |
| Highest glucose (mmol l−1) – RCS (5.2,6.9,8.1,9.6,13.0) | ||
| gluco1 | 1.09 (1.07 to 1.18) | 1.09 (1.01 to 1.19) |
| gluco2 | 0.67 (0.35 to 1.27) | 0.62 (0.32 to 1.22) |
| gluco3 | 88.61 (9.40 to 834) | 110.61 (10.73 to 1140) |
| gluco4 | 0.0002 (0.000 to 0.002) | 0.0001 (0.000 to 0.002) |
| Lowest systolic blood pressure (per 10 mmHg increase) | 1.05 (1.04 to 1.06) | 1.05 (1.04 to 1.06) |
| Lowest white blood cell count (10 × 109 l−1) – RCS (5.6,10.4,17.9) | ||
| lwbc1 | 1.02 (1.01 to 1.03) | 1.02 (1.01 to 1.04) |
| lwbc2 | 0.97 (0.96 to 0.98) | 0.97 (0.96 to 0.98) |
| Mechanical ventilation | 0.86 (0.83 to 0.91) | 0.91 (0.87 to 0.96) |
| Critical care unit length of stay (per 5 day increase) | 1.01 (1.00 to 1.03) | 1.01 (1.00 to 1.01) |
FIGURE 16.
Cause-specific hazard ratio for subsequent type 2 diabetes after hospital discharge following critical care for continuous predictors included in the model as non-linear using restricted cubic splines. (a) Glucose; (b) BMI; (c) age; (d) lowest white blood cell count.
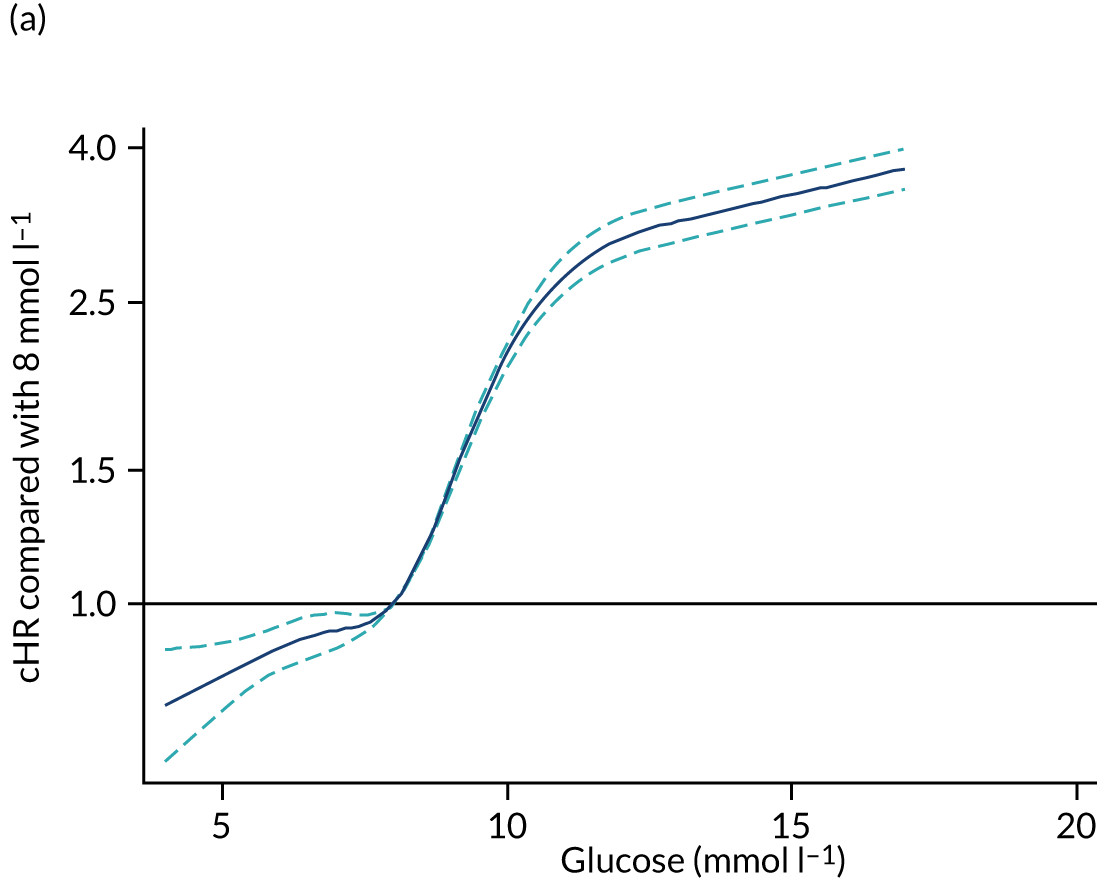
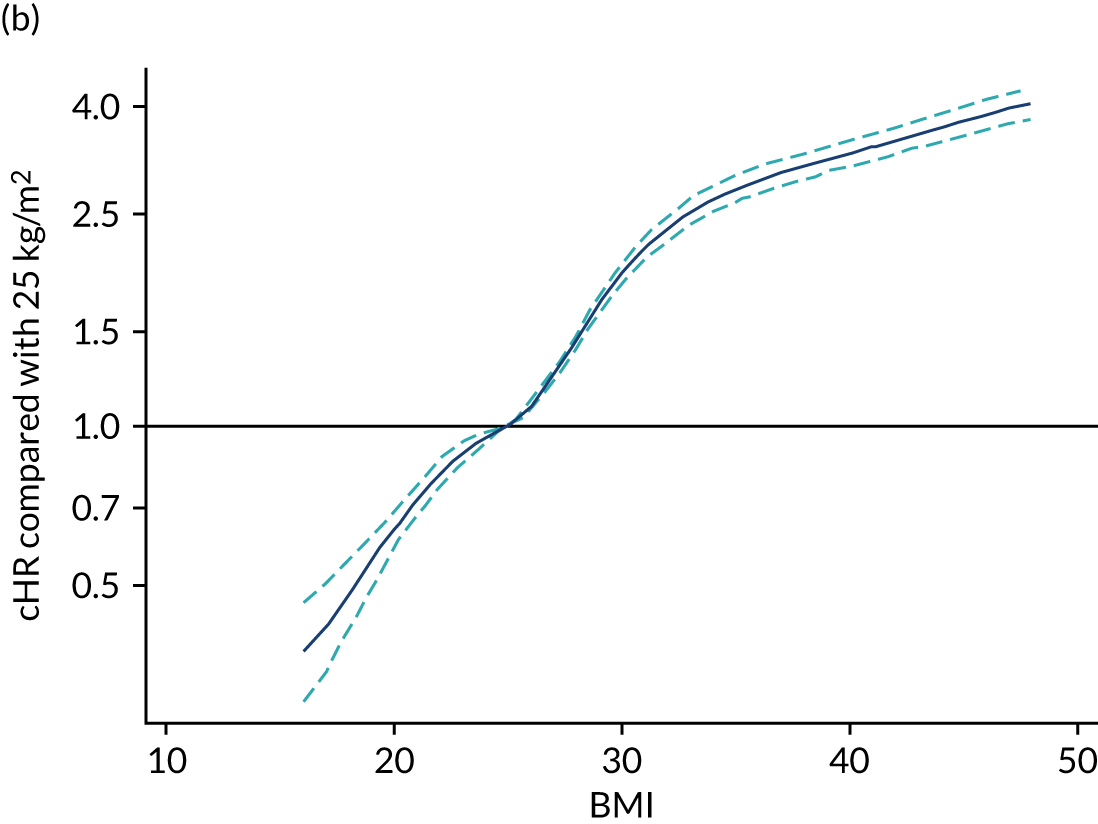
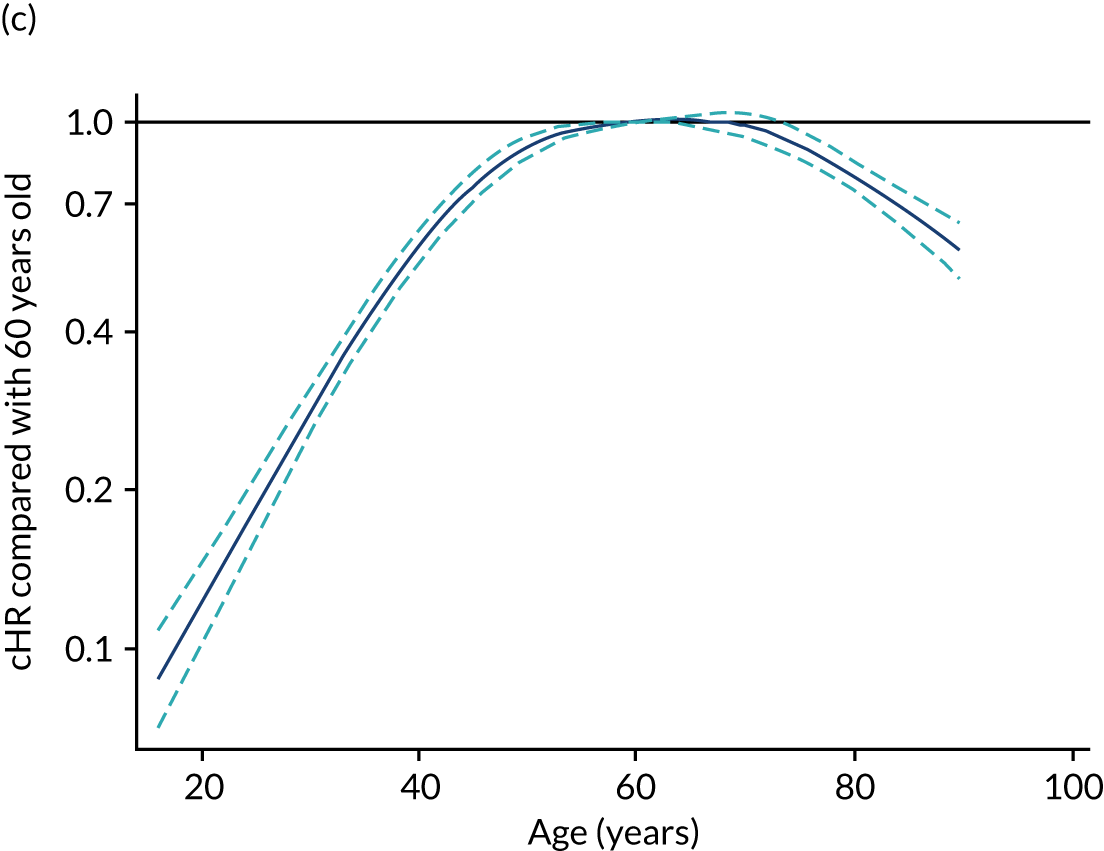
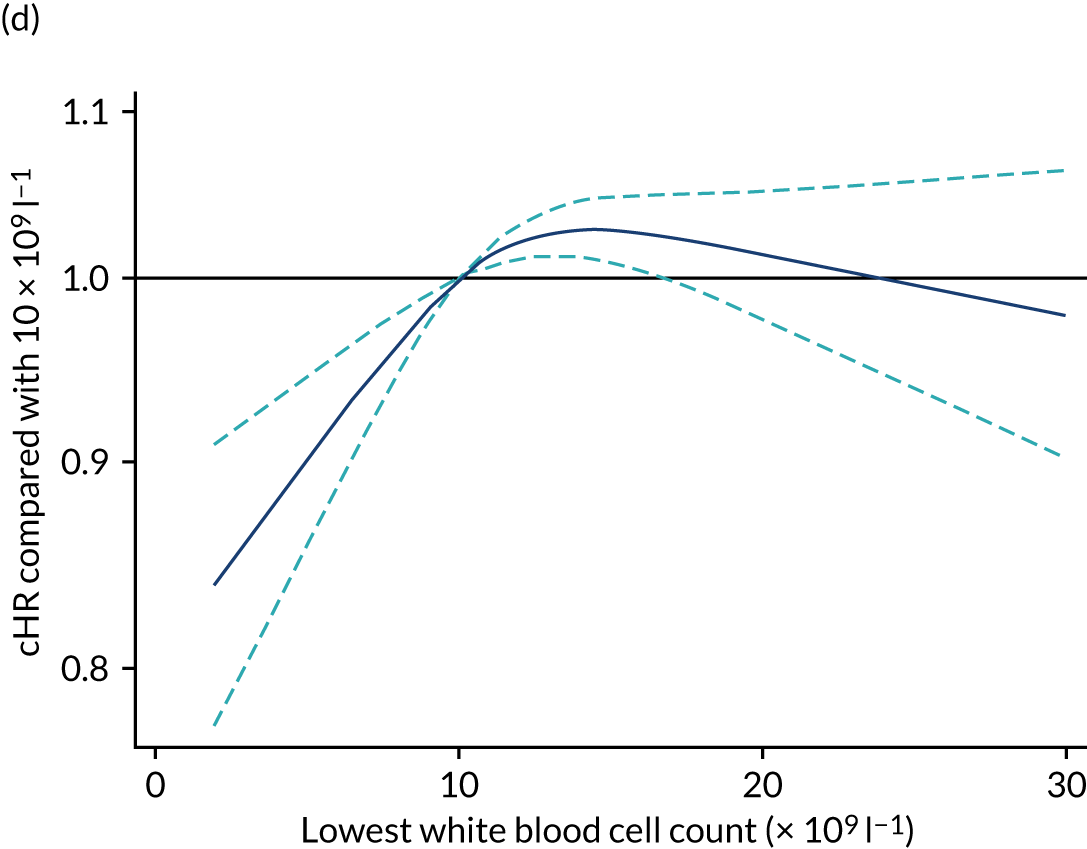
Harrell’s c-statistic for the model was 0.77, with an explained variation (R2) of 0.420 (95% CI 0.407 to 0.435, based on 100 bootstrap samples). Most of the prognostic information was carried by highest glucose and BMI.
Glucose and mortality
Highest glucose had a complex non-linear association with mortality (Figure 17). Compared with a value of 7 mmol l−1, there was an increase in likely mortality associated with low values of glucose; above this value, the risk of mortality increased steeply up to 9 mmol l−1, after which the increase was more gradual.
FIGURE 17.
Cause-specific hazard ratio for mortality after hospital discharge following critical care for highest glucose in the first 24 hours
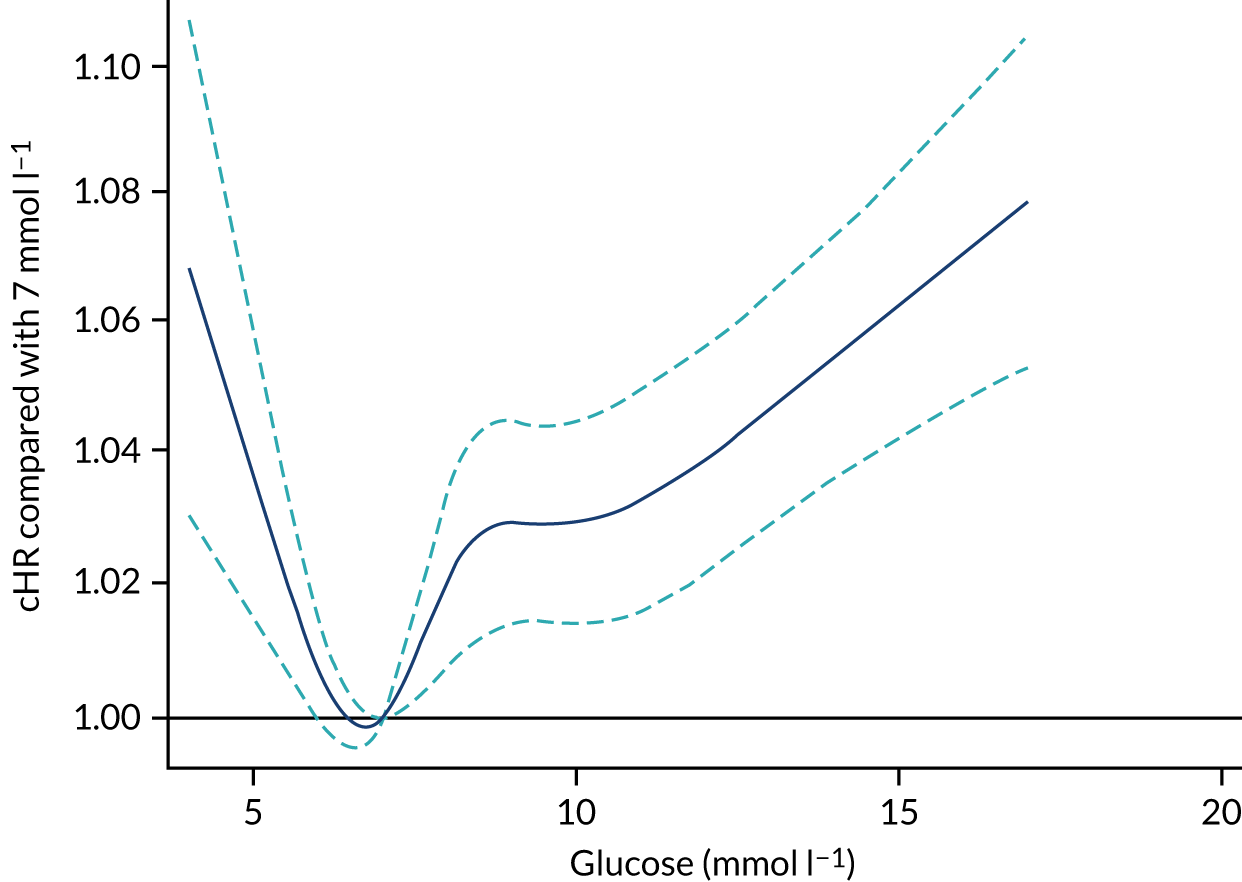
Predictors of cumulative incidence of subsequent type 2 diabetes
Results of the competing risk analysis using the Fine–Gray approach were in line with the cause-specific Cox results (see Table 21). When we plotted the cumulative incidence, that is, the probability of a subsequent diagnosis of type 2 diabetes, adjusted to the mean of the rest of the variables, we observed how the cumulative incidence increased with increasing BMI, and particularly in admissions with elevated glucose (Figure 18). We found the 3-year absolute risk of diagnosis of type 2 diabetes to be > 4% in patients with a glucose level of 11 mmol l−1 compared with a risk of 2% for a level of 9 mmol l−1, and < 1% for a patient with a level of 7 mmol l−1. In addition, pancreatic surgery notably increased the cumulative incidence (Figure 19), with a 3-year absolute risk of type 2 diabetes diagnosis above 3% compared with a risk of 1% for patients who did not undergo pancreatic surgery. Non-white ethnicities showed an increased cumulative incidence, with the 3-year absolute risk of type 2 diabetes being > 3% for Asian patients and > 2% for black patients compared with 1.2% for patients of white ethnicity. Other categorical factors had a smaller impact (Figure 20).
FIGURE 18.
Cumulative incidence of type 2 diabetes in the 7 years after hospital discharge following critical care according to continuous patient factors included in the model. (a) Glucose; (b) BMI; (c) age; (d) lowest white blood cell count; (e) lowest systolic blood pressure.
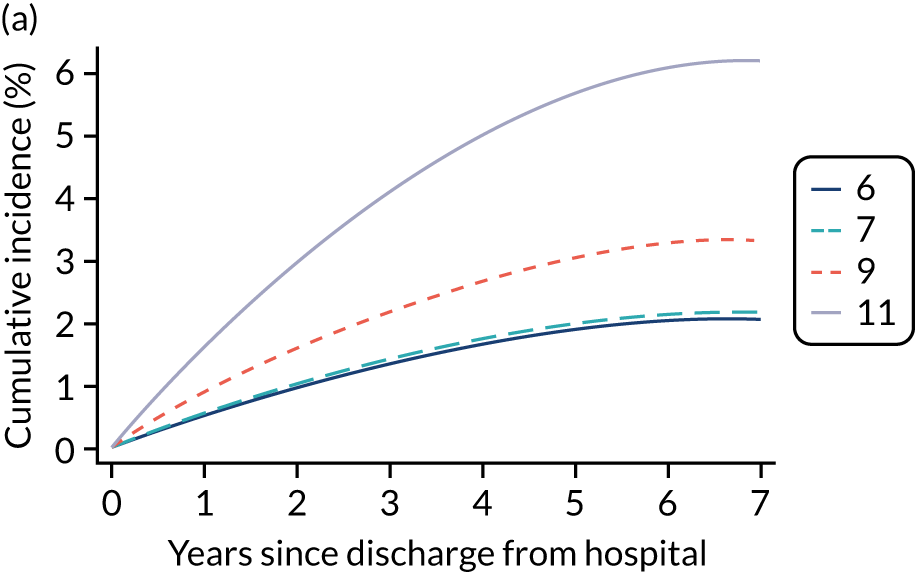
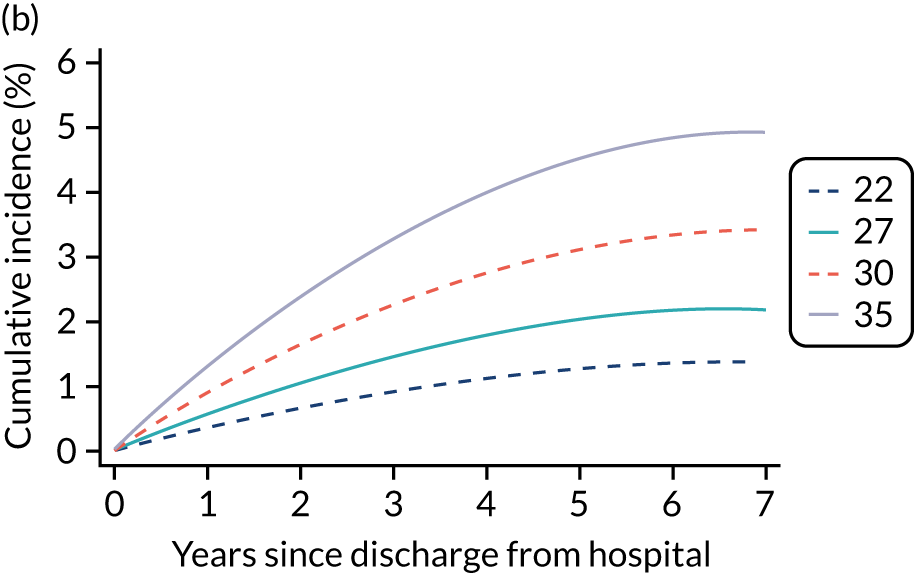
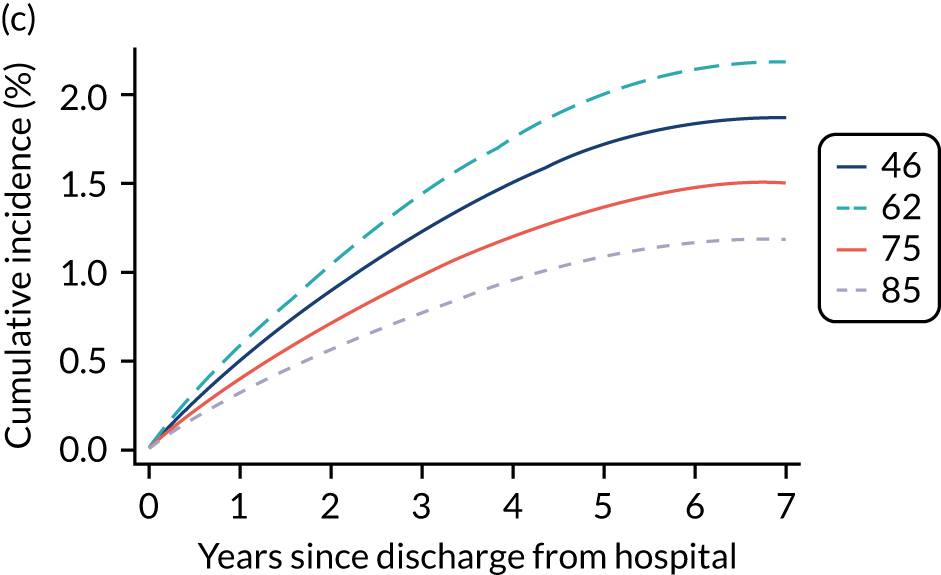
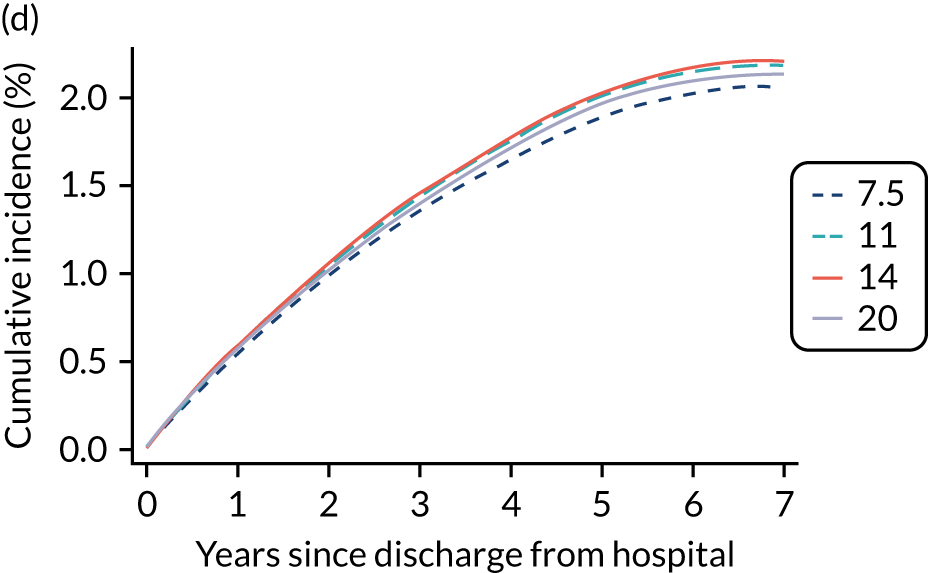
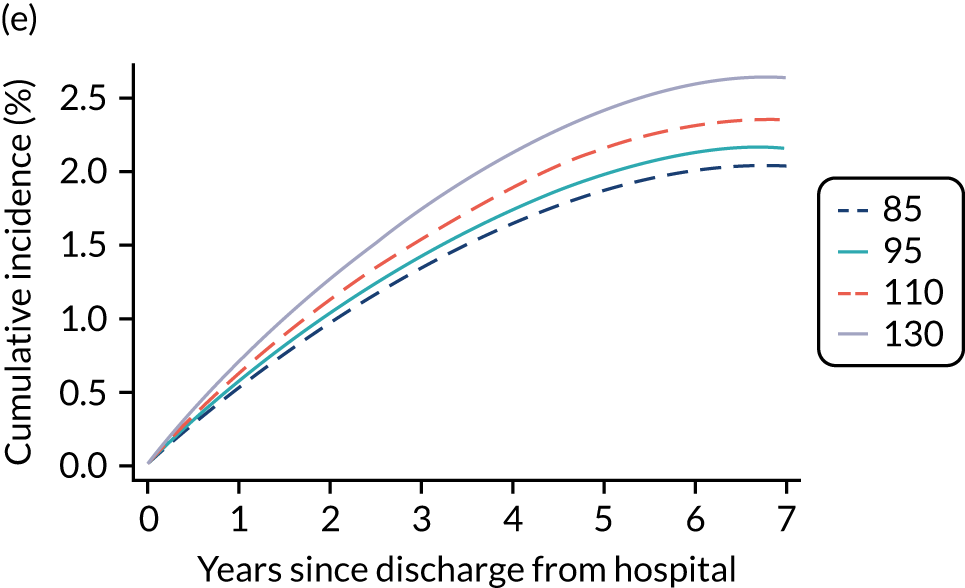
FIGURE 19.
Cumulative incidence of type 2 diabetes in the 7 years after hospital discharge following critical care according to categorical patient factors included in the model. (a) Pancreatic surgery; (b) severe liver disease; (c) ethnicity; (d) deprivation.
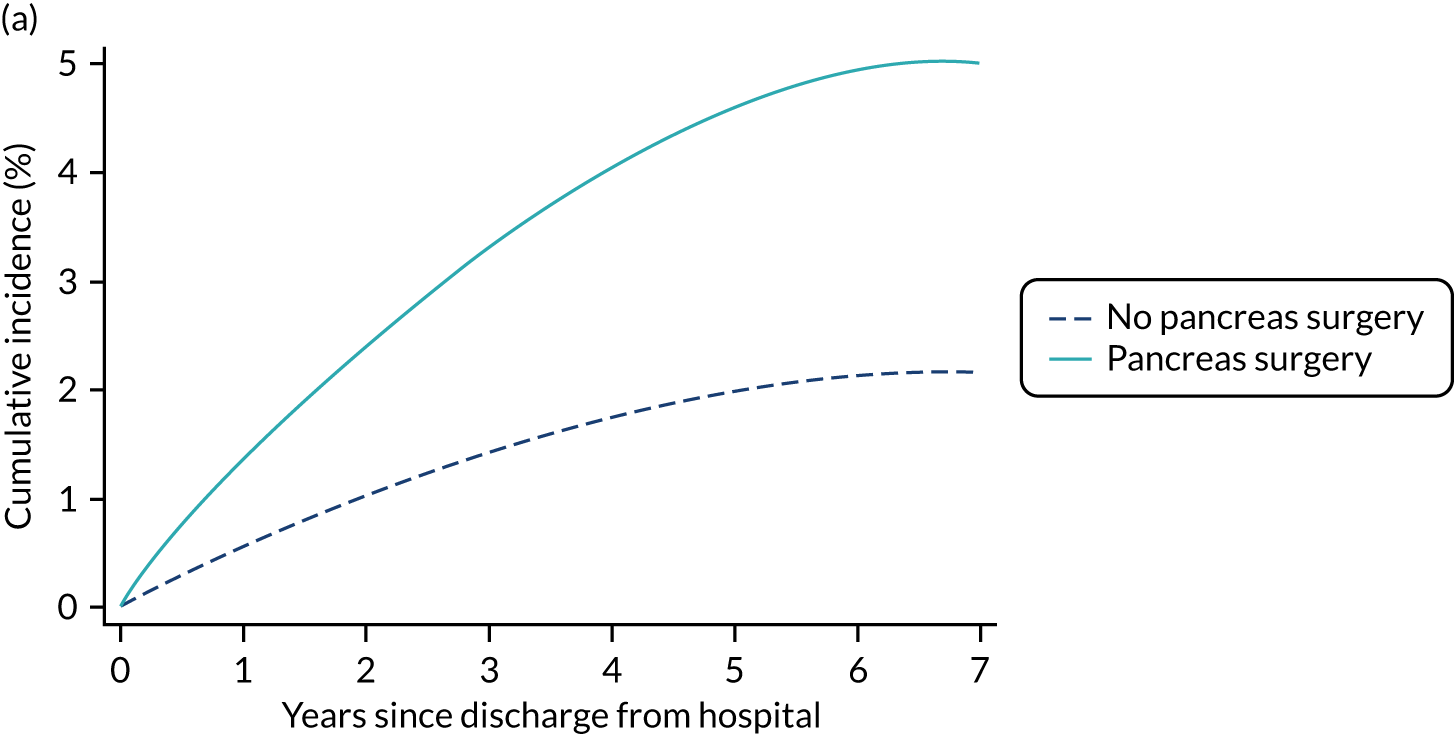
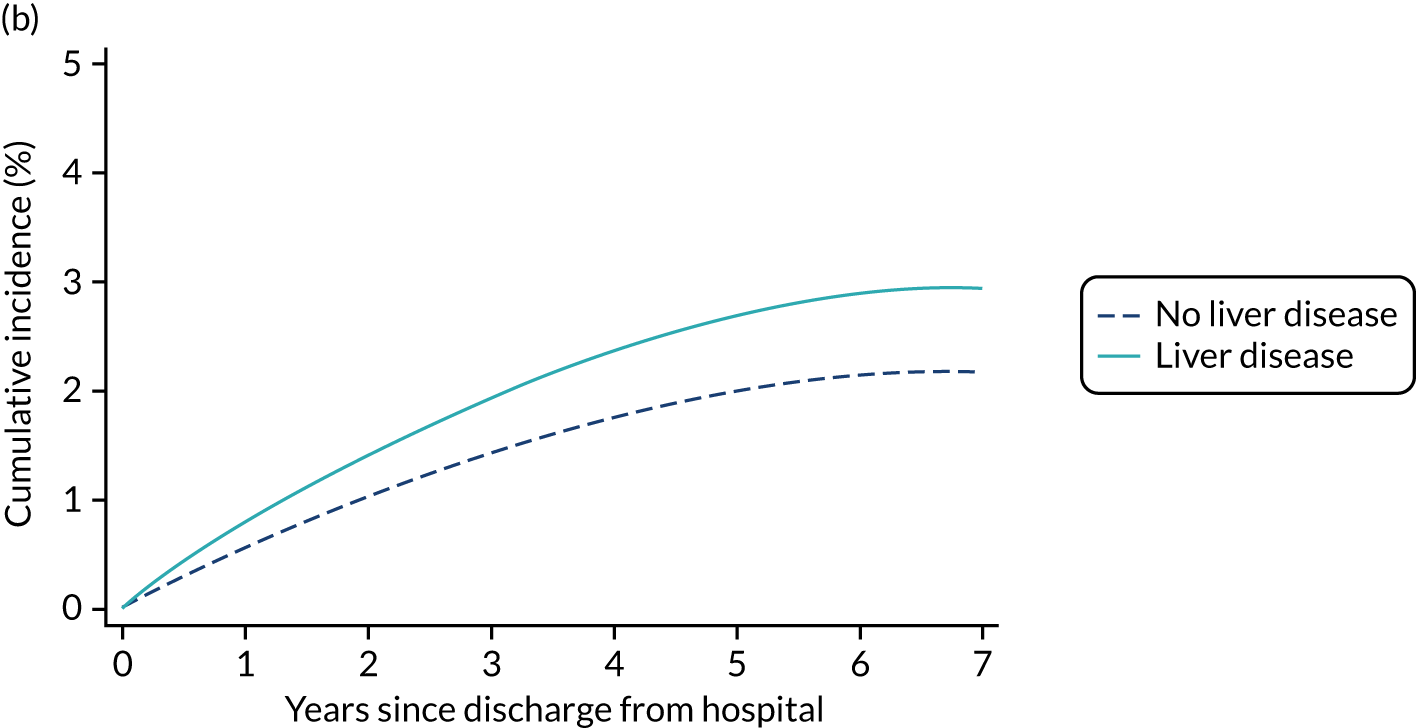
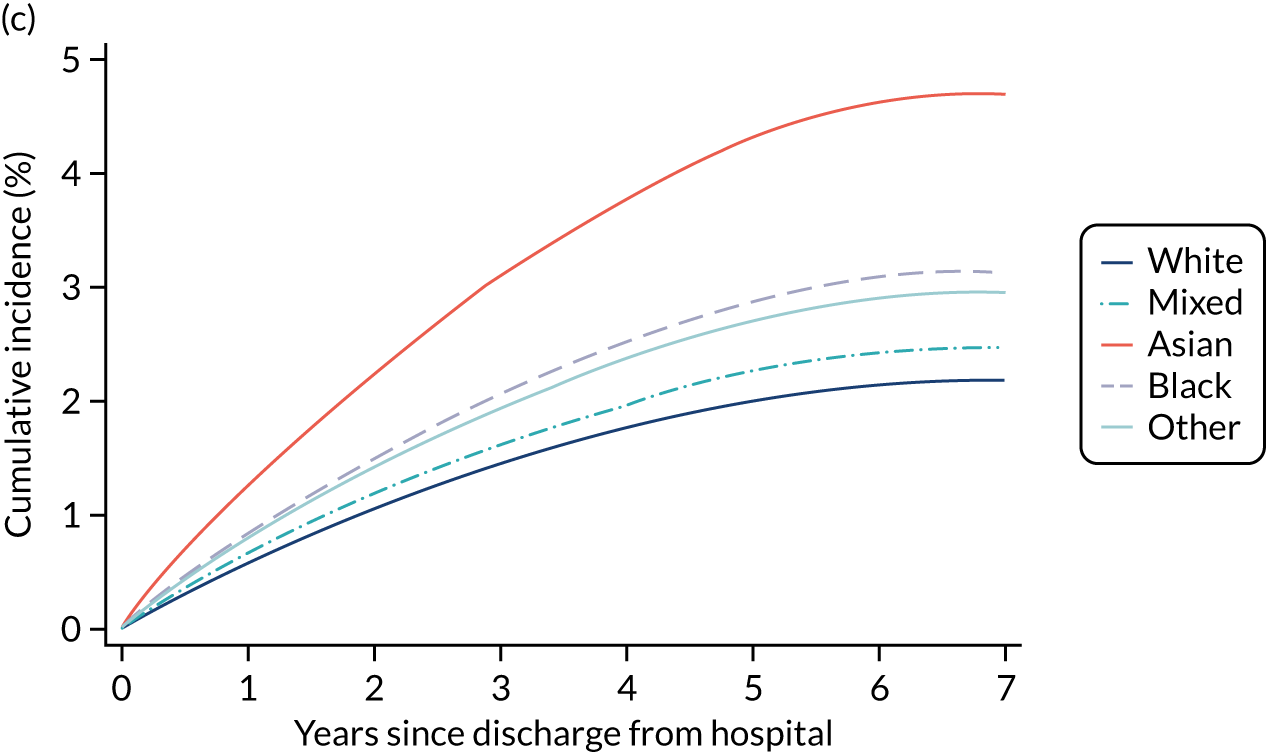
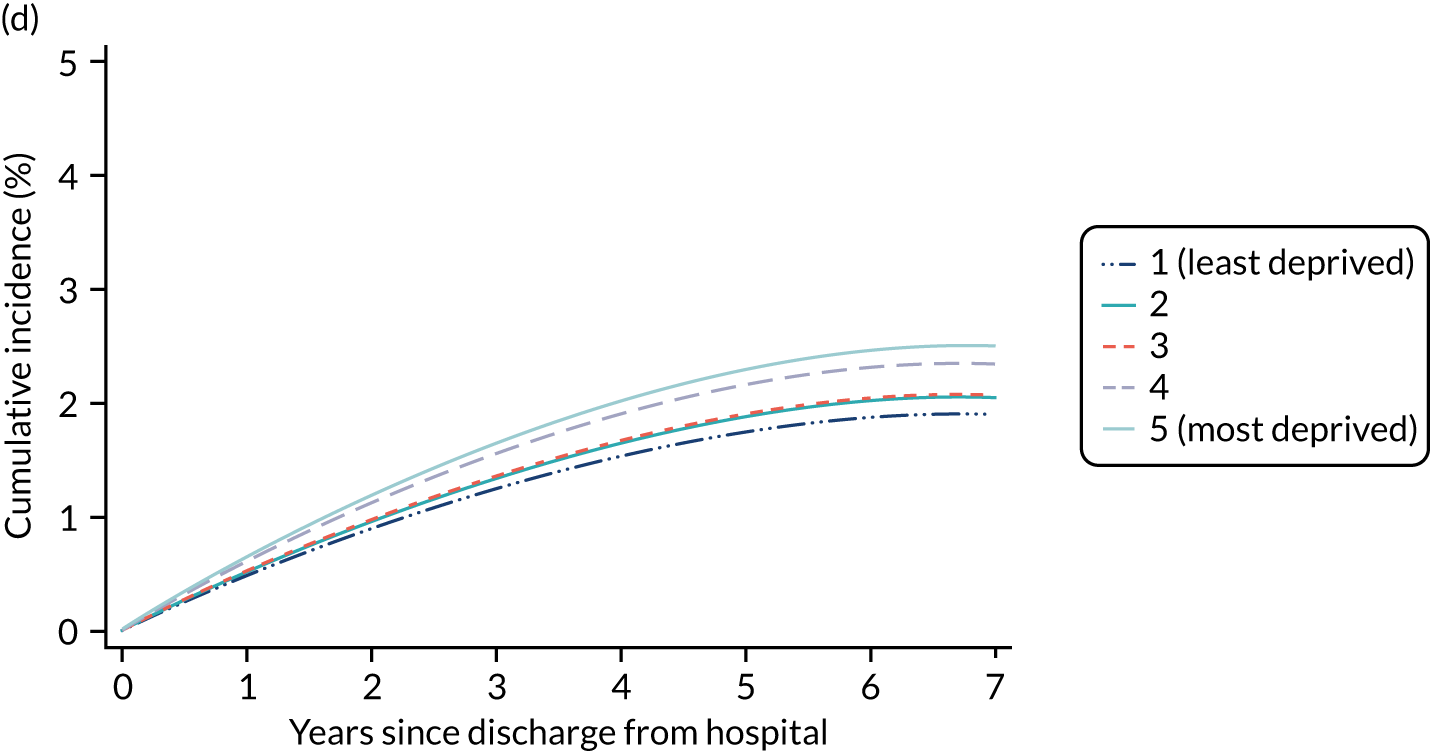
FIGURE 20.
Cumulative incidence of type 2 diabetes in the 7 years after hospital discharge following critical care according to categorical patient factors included in the model (continued). (a) Previous MI; (b) chronic pulmonary disease; (c) sepsis; (d) surgical status; (e) mechanical ventilation; (f) immunocompromise.
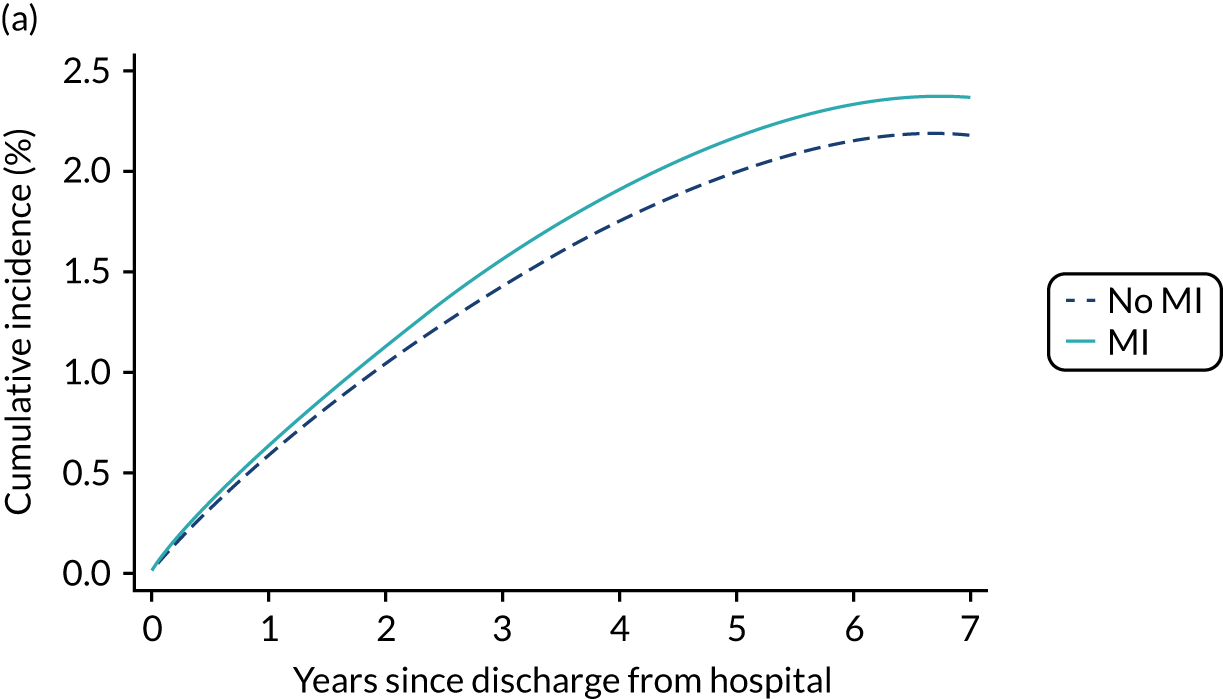
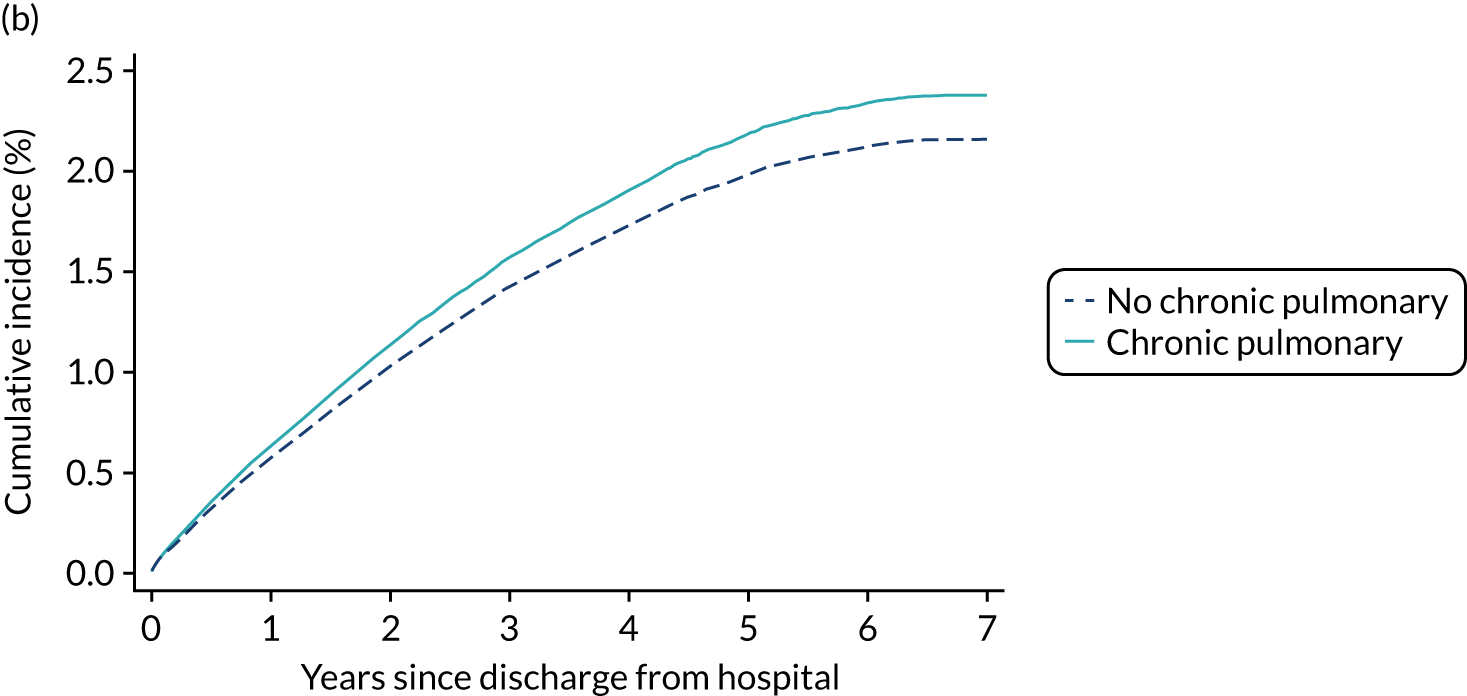
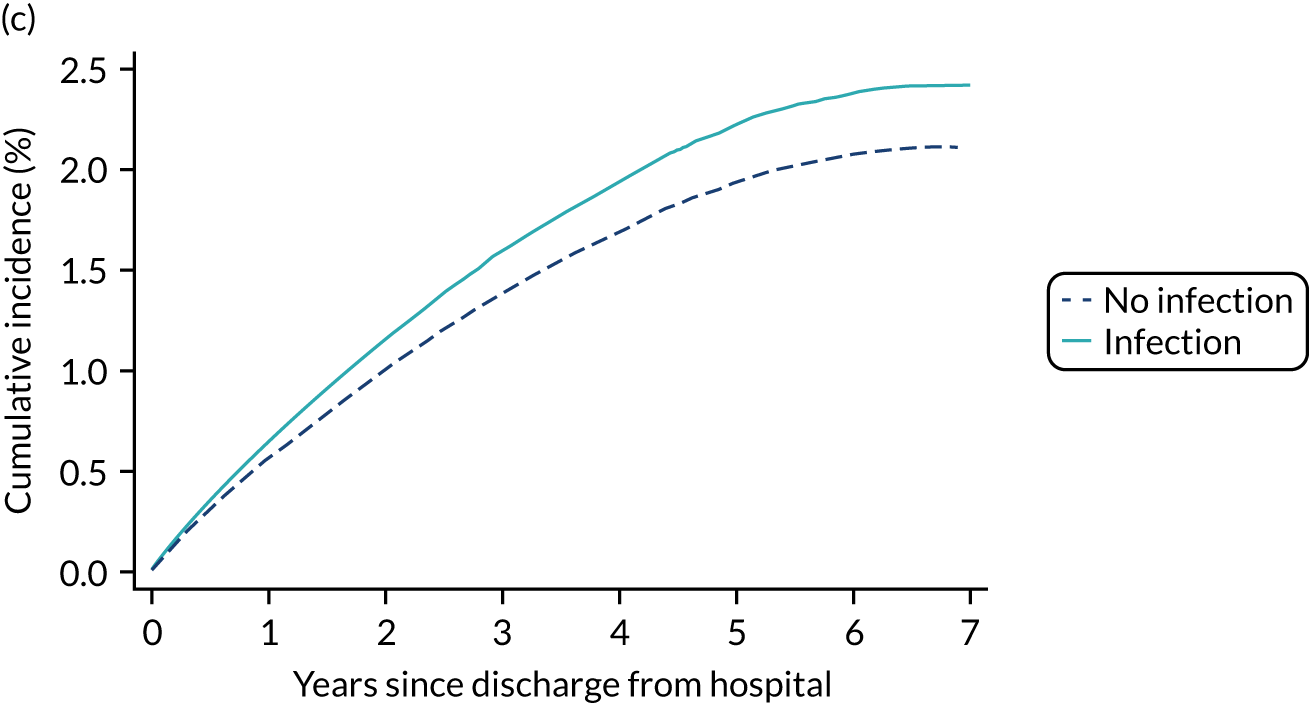
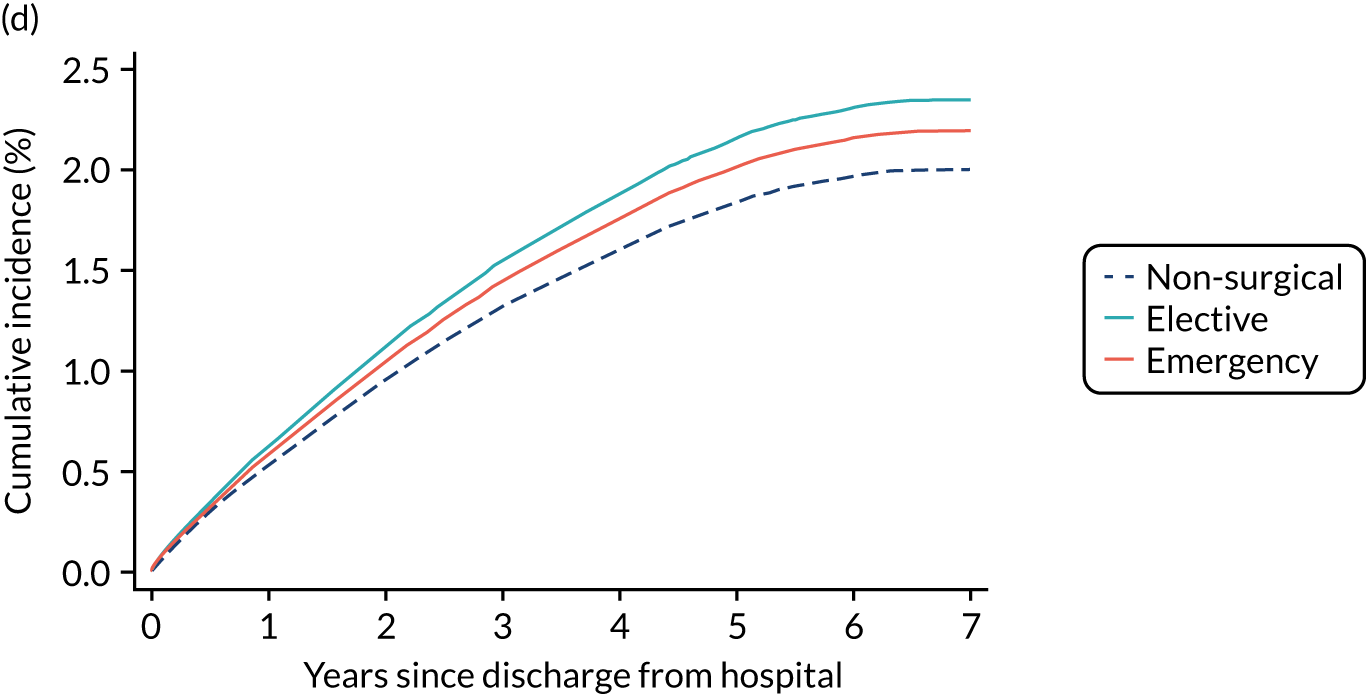
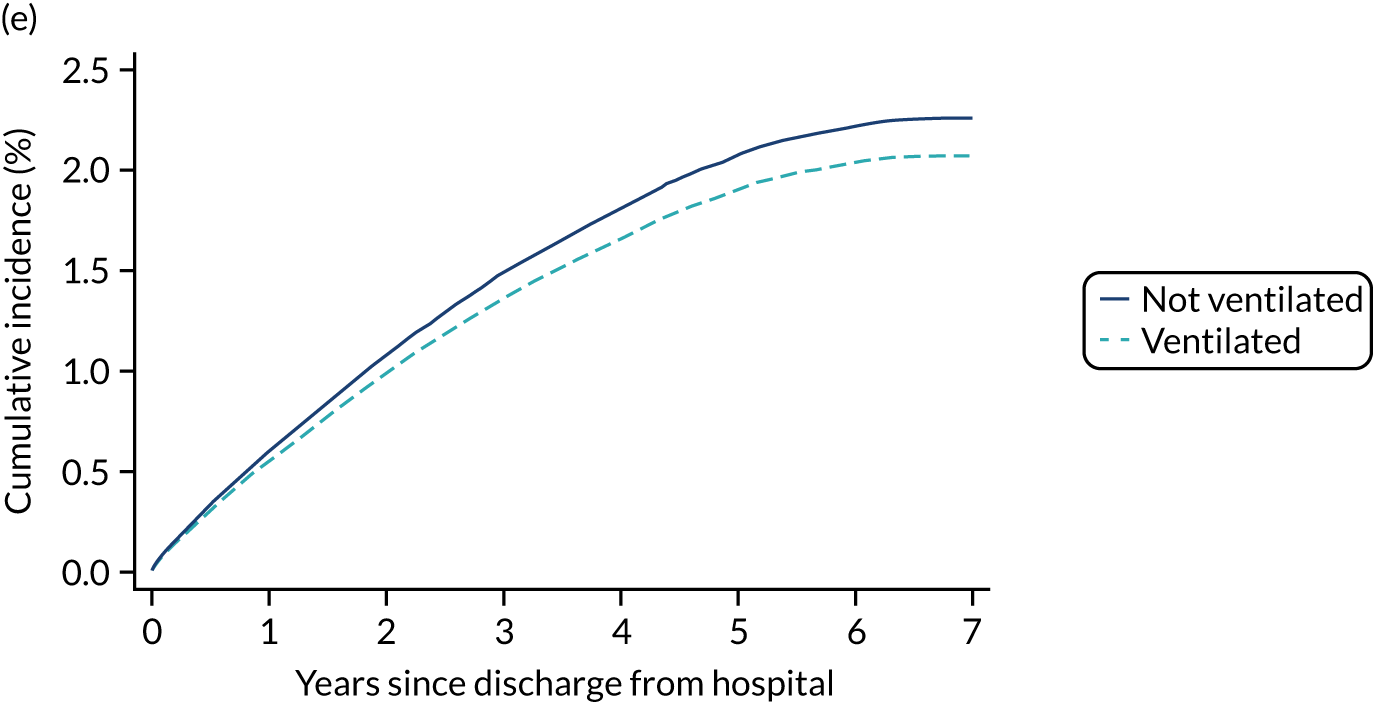
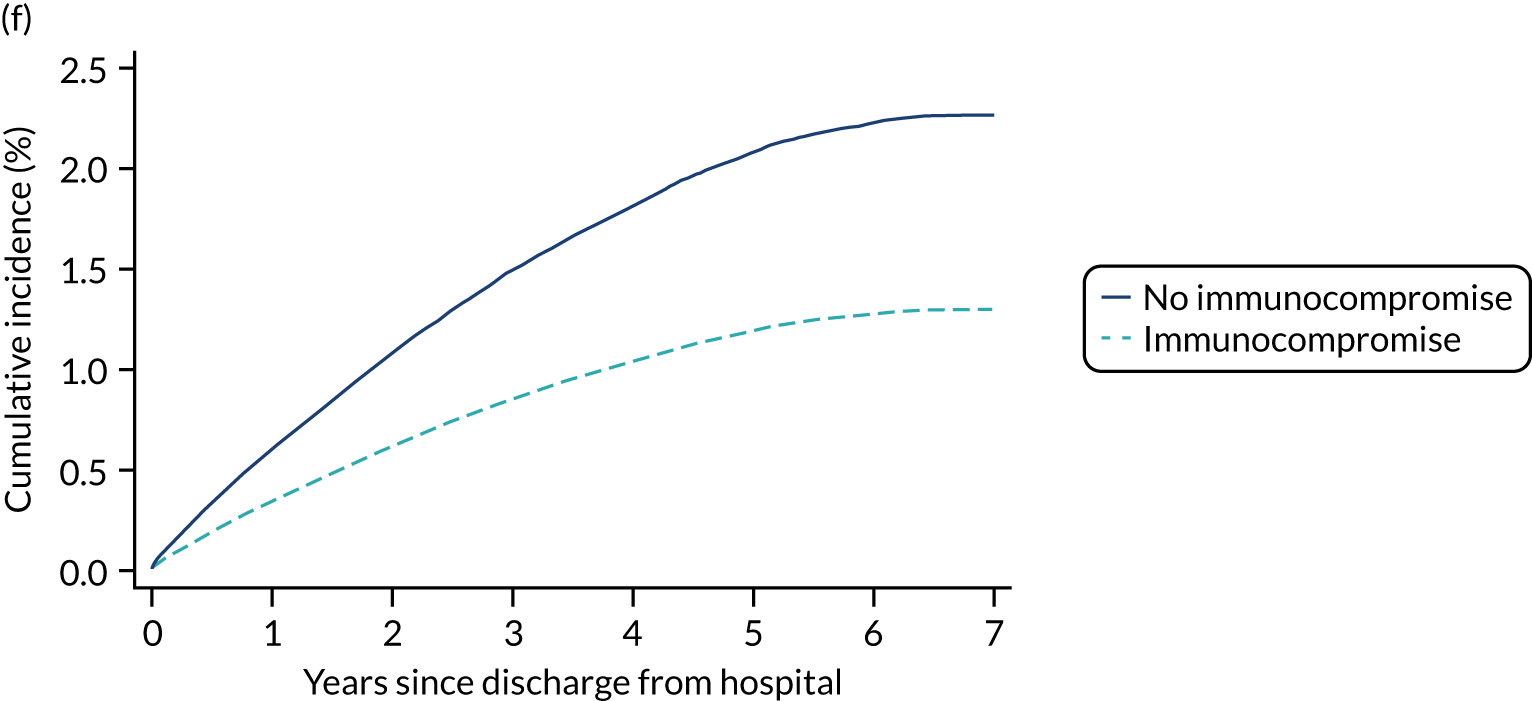
Discussion
We have identified demographic and clinical factors significantly associated with the risk of a subsequent diagnosis of type 2 diabetes in survivors of critical illness and described their association with the outcome. Our results show a strong association of blood glucose during the first 24 hours of critical care with incidence of subsequent type 2 diabetes, which is consistent with previous findings. 66,67 In addition, patients undergoing pancreatic surgery and those with severe liver disease had an increased risk for developing type 2 diabetes. One of the main findings of our study is that BMI is independently non-linearly associated with the risk of developing type 2 diabetes. This is an interesting finding as previous studies have not had available data on BMI. Asian and black ethnicity were also associated with an increased risk when compared with white patients. Mechanical ventilation was associated with a lower risk for diagnosis of type 2 diabetes as well as lower mortality. This could suggest that the sicker patients who received mechanical ventilation likely died during the hospitalisation. Those ventilated patients who survived hospitalisation were a selected group destined to have better outcomes.
The main strengths of the study were the large, representative, high-quality clinical data set and the rigour of variable collection, with coverage of almost 100% of adult general critical care units in England during the study period. There were, however, some limitations. Coverage of the NDA was considerably lower than for the CMP, varying from 56.4% to 88.4% (assessed relative to the Quality and Outcomes Framework)68 across the years included. The low coverage (particularly in the 2013–14 and 2014–15 years) will have been mitigated to some degree by the use of multiple years’ data, as patients first registered in the 2015–16 audit year (with 83.4% coverage) will include patients with a diagnosis date during the years with lower coverage. This will, however, likely result in an underestimation of the incidence of new diagnoses. In addition, new registrations based on the date of diagnosis recorded in the NDA database was used as a surrogate marker for incidence of diabetes, and the true incidence of diabetes might be higher than reported in this study. However, this approach has been used in previous studies and considered to be a valid surrogate. 69 As glycated haemoglobin (HbA1c) is not routinely measured on admission to critical care and not recorded in the CMP, the proportion of patients who had pre-existing but unrecognised type 2 diabetes is unknown. Previous epidemiological studies70 report the prevalence of unknown diabetes to be between 5% and 10% of patients admitted to critical care. The absence of HbA1c from the CMP data set may also have contributed to the worse discrimination of the model for type 2 diabetes than that for ESRD reported in the previous chapter.
These findings suggest that prevention programmes and follow-up after hospital discharge might need to be considered in patients with critical illness and elevated glucose, particularly among patients from ethnic minorities and those with a higher BMI.
Chapter 8 Hospital resource use and costs post critical care
Introduction
Survivors of critical care experience significant morbidity with substantial resultant health-care resource use and costs. 71 Although the ageing of the population together with improvements in critical care will fuel an increase in critical care survivors, there has been limited research on the ongoing costs of illness and the use of health-care resources among survivors of critical care. 71 Data linkage with HES has enabled us to estimate the cost of subsequent hospitalisations and explore their association with severity and/or duration of critical illness and other risk factors.
Methods
Data and resource use
The patients included in the prediction model were those discharged alive from hospital between January 2013 and December 2014. The resource use was measured as the number of days in acute hospital care during subsequent hospital episodes (as identified through data linkage with HES) from the hospital discharge until 1-year follow-up or death within that period. For hospitalisations in which the patient was admitted and discharged on the same day, the number of days in hospital was 0. For those subsequent hospitalisations in which the patient was discharged more than 1-year after index discharge, only the days in hospital occurring during the study period were considered. Total subsequent cost was calculated by summing the cost for subsequent hospitalisations and the cost for subsequent critical care admissions. The cost for each subsequent hospitalisation was measured as the cost of the full hospital spell.
The cost of the full hospital spell was valued using the Department of Health and Social Care’s (DHSC) APC tariff. Information from the HES episodes files were used in the cost for hospitalisation calculation. The dominant health-care resource group (HRG) was identified from HES data [Secondary Uses Service (SUS)-generated core spell HRG]. When the HES field was not available, the HRG attributed to the admission episode was used. The bed-day cost for each HRG was assigned using the DHSC APC tariff. 72 Total spell length of stay was identified from the spell’s discharge information (spell duration) in the final episode of the spell. When the patient was discharged more than 1 year after the index discharge, only the days in hospital occurring during study period were considered. Days in critical care were removed from the overall spell duration as critical care has a different tariff. Each HRG was matched to their corresponding trim point for determining long versus short stays for each spell. We used patient classification and the admission method from the HES data set to identify day case and elective inpatient stay. Those HRGs with a locally determined cost were identified and they were not included in this calculation. We assumed that the reference costs for the same period were proxies for the tariff for non-attached HRGs. Hence, these were cross-matched from the HRG4 to the HRG4+ currency design and valued using spell-level NHS reference costs. 15 Finally, missing or unlinked HRGs were valued using the average by type of admission of all HRGs.
Statistical analysis
Days in hospital and cost were reported as described in Chapter 3.
To assess the predictors of costs during the year after the index hospital discharge, a two-part regression model was used. Health-care costs usually have distributions that are skewed with a large mass at zero. In modelling such outcomes, a two-part model has become a best-practice approach, improving the fit of the model and allowing for better understanding of results. 73 A logistic regression was first used to assess the predictors of having health-care cost (at least one hospital and/or critical care admission) during the year following index hospital discharge. Then, conditional on having any health-care cost, a generalised linear model (GLM) with a gamma distribution and a log-link function was selected to determine the predictors of 1-year cost after index hospital discharge. We checked the log link against several other functional form alternatives. In addition, a modified ‘Park Test’74 was used to test the distribution family. Non-linearity, inclusion of variables and interactions were assessed using methods described in Chapter 3. As recommended,75 we applied the general practice that any variable that is in either the first part or the second part model will be in both. No variables are included in one part but excluded from the other. In addition, final selected variables were tested for jointly significant in both parts of the two-part model. Predicted values and marginal effects were then calculated accounting for the full model.
Results
Between 1 January 2013 and 31 December 2014, a total of 207,805 first adult critical care admissions were discharge alive from hospital in England. Of those, 25,317 (12.2%) individuals died within 1 year following hospital discharge.
Baseline characteristics
The baseline characteristics of the included patients are described in Table 22. The median age was 64 years (IQR 49–75 years) and more than a half of patients were male. Most of the patients were able to live without assistance in daily activities (79.4%). The median critical care length of stay of the cohort was 48 hours (IQR 23–103 hours) and the median hospital length of stay was 12 days (IQR 7–25 days).
| Characteristic | Value |
|---|---|
| Number patients discharged alive from hospital | 207,805 (100.0) |
| Demographics | |
| Age (years), mean (SD) | 61 (17.7) |
| Age (years), median (IQR) | 64 (49–75) |
| Sex, males (%) | 115,122 (55.4) |
| Ethnicity, n (%) | |
| White | 186,625 (89.8) |
| Mixed | 1173 (0.6) |
| Asian | 7611 (3.7) |
| Black | 4819 (2.3) |
| Other | 7577 (3.6) |
| Reason for admission to critical care by body system, n (%) | |
| Respiratory | 34,420 (16.6) |
| Cardiovascular | 39,067 (18.8) |
| Gastrointestinal | 55,951 (26.9) |
| Neurological (including eyes) | 26,477 (12.7) |
| Genito-urinary | 21,781 (10.5) |
| Endocrine, Metabolic, Thermoregulation and Poisoning | 14,932 (7.2) |
| Haematological/Immunological | 1546 (0.7) |
| Musculoskeletal | 11,424 (5.5) |
| Dermatological | 2141 (1.0) |
| Psychiatric | 64 (0.0) |
| Quintile of deprivation, n (%) | |
| 1 (least deprived) | 34,296 (17.2) |
| 2 | 37,072 (18.5) |
| 3 | 39,588 (19.8) |
| 4 | 42,000 (21.0) |
| 5 (most deprived) | 47,013 (23.5) |
| Patient-related factors | |
| CPR within 24 hours prior to admission, n (%) | |
| No CPR | 201,806 (97.1) |
| Community CPR | 3056 (1.5) |
| In-hospital CPR | 2943 (1.4) |
| Prior dependency, n (%) | |
| Able to live without assistance in daily activities | 165,226 (79.9) |
| Some (minor/major) assistance with daily activities | 40,121 (19.4) |
| Total assistance with all daily activities | 1349 (0.7) |
| Location prior to critical care admission, n (%) | |
| ED or not in hospital, unplanned | 44,437 (21.4) |
| ED or not in hospital, planned | 1464 (0.7) |
| Theatre, elective/scheduled, planned | 65,102 (31.3) |
| Theatre, elective/scheduled, unplanned | 9847 (4.7) |
| Theatre, emergency/urgent | 38,796 (18.7) |
| Ward or intermediate care area | 42,769 (20.6) |
| Other critical care unit, repatriation | 487 (0.2) |
| Other critical care unit, planned/unplanned transfer | 3285 (1.6) |
| Other acute hospital | 1618 (0.8) |
| Medical history | |
| Severe conditions in medical history (APACHE II), n (%) | |
| Very severe cardiovascular disease | 2792 (1.3) |
| Severe respiratory disease | 3343 (1.6) |
| Severe liver disease | 3616 (1.7) |
| ESRD | 3019 (1.5) |
| Metastatic disease | 9633 (4.6) |
| Haematological malignancy | 2666 (1.3) |
| Immunocompromise | 12,923 (6.2) |
| RCS Charlson comorbidities, n (%) | |
| Previous MI | 8002 (3.9) |
| Congestive cardiac failure | 10,025 (4.8) |
| Peripheral vascular disease | 10,282 (4.9) |
| Cerebrovascular disease | 6279 (3.0) |
| Dementia | 1848 (0.9) |
| Chronic pulmonary disease | 26,495 (12.7) |
| Rheumatological disease | 4136 (2.0) |
| Liver disease | 3958 (1.9) |
| Diabetes mellitus | 25,453 (12.2) |
| Hemiplegia or paraplegia | 1671 (0.8) |
| Chronic renal disease | 9579 (4.6) |
| Malignancy | 23,863 (11.5) |
| Severity scores from the first 24 hours following critical care admission | |
| ICNARC physiology score, mean (SD) | 14 (7.1) |
| ICNARC physiology score, median (IQR) | 13 (9–18) |
| APACHE II score, mean (SD) | 14 (5.8) |
| APACHE II score, median (IQR) | 13 (10–17) |
| Physiology from the first 24 hours following critical care admission | |
| Highest heart rate (min–1), mean (SD) | 100 (22) |
| Lowest systolic blood pressure (mmHg), mean (SD) | 98 (19) |
| Highest temperature (°C), mean (SD) | 37.6 (0.9) |
| Lowest respiratory rate (min–1), mean (SD) | 12.4 (3.6) |
| Urine output (ml), mean (SD) | 1975 (1347) |
| PaO2/FiO2, mean (SD) | 36.5 (15.4) |
| Lowest arterial pH, mean (SD) | 7.33 (0.09) |
| Associated PaCO2, mean (SD) | 5.9 (1.7) |
| Highest blood lactate, mean (SD) | 2.3 (1.9) |
| Highest urea, mean (SD) | 8.8 (8.5) |
| Highest creatinine, mean (SD) | 123 (149) |
| Highest serum sodium, mean (SD) | 138 (5) |
| Lowest white blood cell count, mean (SD) | 11.6 (7.3) |
| Associated neutrophil count, mean (SD) | 9.6 (5.4) |
| Lowest platelet count, mean (SD) | 212 (103) |
| Sepsis, n (%) | 48,850 (23.5) |
| Organ dysfunction, n (%) | 166,293 (80.0) |
| Organ support during critical care stay | |
| Receipt of advanced respiratory support, n (%) | 76,699 (36.9) |
| Duration of advanced respiratory support (calendar days), median (IQR) | 2 (1–5) |
| Receipt of basic or advanced cardiovascular support, n (%) | 35,751 (17.2) |
| Duration of basic/advanced cardiovascular support (calendar days), median (IQR) | 2 (1–3) |
| Receipt of renal support, n (%) | 12,464 (6.0) |
| Duration of renal support (calendar days), median (IQR) | 3 (2–6) |
| Length of stay | |
| Critical care unit length of stay (hours), mean (SD) | 99 (170.2) |
| Critical care unit length of stay (hours), median (IQR) | 48 (23–103) |
| Acute hospital length of stay (days), mean (SD) | 21 (31) |
| Acute hospital length of stay (days), median (IQR) | 12 (7–25) |
Subsequent hospital/critical care admission during the first year and estimated health-care cost
Results are summarised in Table 23. The rate of subsequent hospitalisations for the first year was 1.06 hospitalisations per patient. The mean health-care cost during the first year after index hospital discharge was £3734, with over half of costs having a value of zero. The distribution of total cost was highly skewed with a large mass at zero (Figure 21). A total of 97,593 patients (47%) had a subsequent health-care cost (hospitalisation/critical care admission) with a mean cost of £7952 (median £4566, IQR £2288–9587). When we split by source of cost, both hospitalisation and critical care costs had a large proportion of zeros and a declining distribution of positive costs (see Figure 21). For the 97,229 (47%) individuals with a subsequent APC cost, the mean cost was £6589 (median £4204, IQR £2207–8482). A total of 14,293 (6.9%) patients were admitted to critical care during the first year after index hospital discharge, with a mean cost of £9465 (median £4142, IQR £2761–9436).
| Outcome | Value |
|---|---|
| Total health-care cost (£), mean (SD) | 3734 (8171) |
| At least one hospitalisation/critical care admission, n (%) | 97,593 (46.9) |
| Total health-care costa (£), mean (SD) | 7952 (11,176) |
| Total health-care costa (£), median (IQR) | 4566 (2288–9587) |
| At least one hospitalisation, n (%) | 97,229 (46.8) |
| Total APC costa (£), mean (SD) | 6589 (7165) |
| Total APC costa (£), median (IQR) | 4204 (2207–8482) |
| At least one critical care admission, n (%) | 14,293 (6.8) |
| Total critical care costa (£), mean (SD) | 9465 (17,123) |
| Total critical care costa (£), median (IQR) | 4142 (2761–9436) |
FIGURE 21.
Distribution of total health-care cost: full distribution including zeros, the histogram of just positive values and split by APC and critical care cost. (a) Total health-care cost; (b) total health-care cost if > £0; (c) total APC health care cost if > £0; (d) total critical care health-care cost, if > £0.
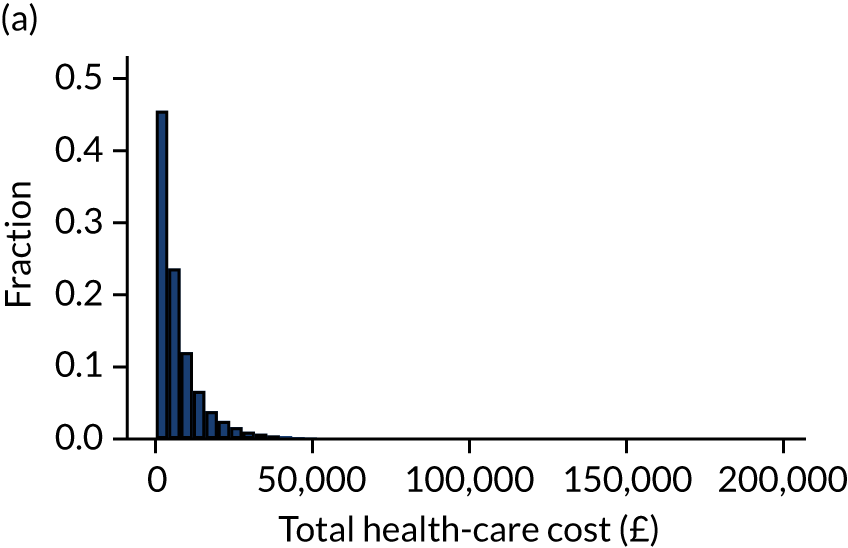
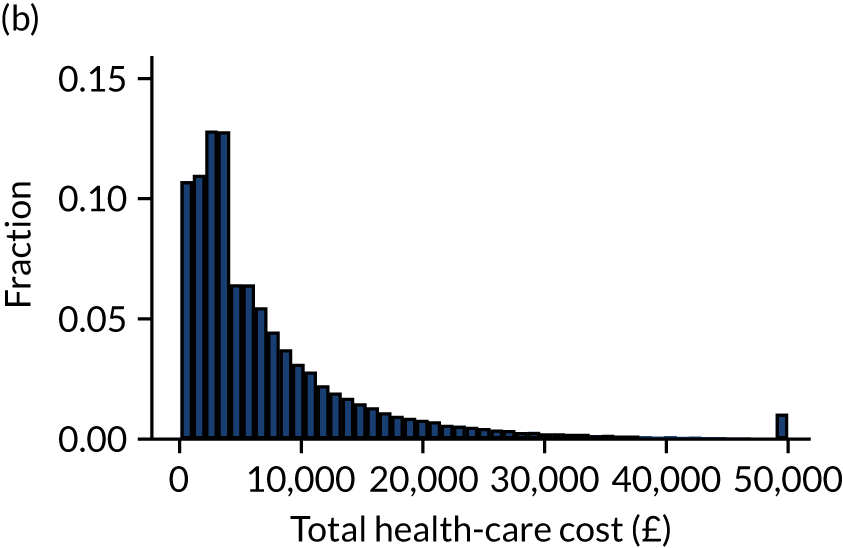
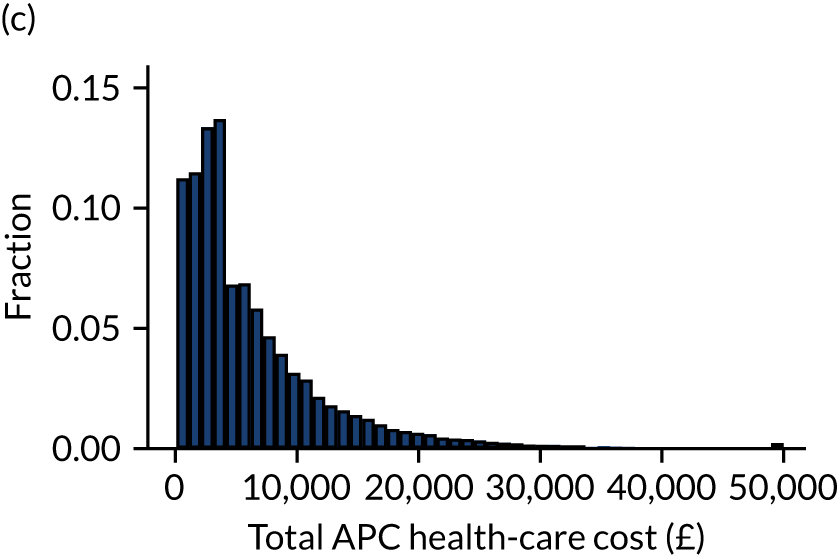
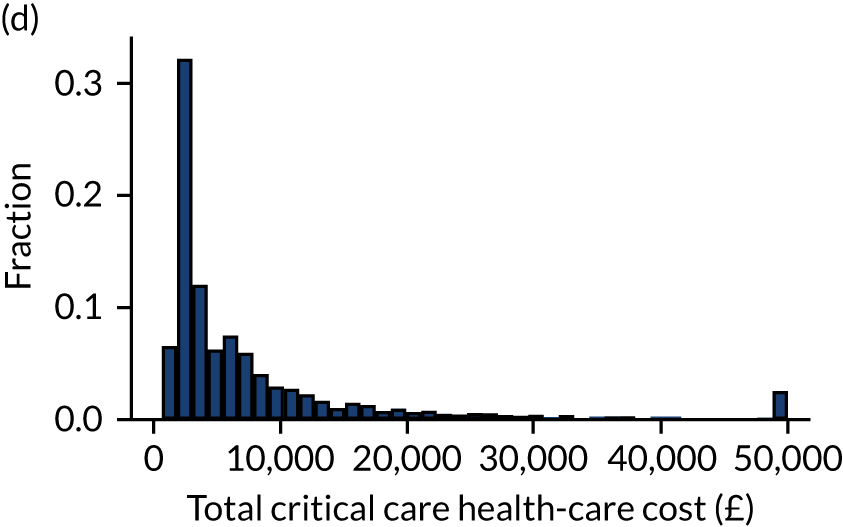
Factors associated with non-zero health-care cost during the first year
After testing for linearity, the continuous variables age, BMI and ICNARC physiology score were modelling using restricted cubic splines. The specification test supported the use of the log-link and the gamma distribution. Results of the two-part model are presented in Appendix 3, Table 48. The predictors of whether the patient would have any subsequent health-care costs were previous hospitalisation, critical care length of stay, age, BMI, illness severity, mechanical ventilation, dependency prior to admission, source of admission, CPR and deprivation. Regarding severe conditions in the medical history, severe liver disease, metastatic disease, haematological malignancy, severe respiratory disease and ESRD were also found to be significant predictors. The model indicated that people with the following comorbidities were also more likely to have non-zero health-care costs in the year following hospital discharge: previous MI, congestive cardiac failure, peripheral vascular disease, dementia, chronic pulmonary disease, rheumatological disease, liver disease, diabetes mellitus, hemiplegia or paraplegia, chronic renal disease and any malignancy.
Factors associated with health-care cost during the first year, conditional on having non-zero cost
Conditional on hospital/critical care admission, the GLM identified similar predictors for health-care cost as those for non-zero cost, apart from CPR, previous MI and dementia. Patients who had previous hospitalisations and patients who required total assistance with daily activities had increased costs during the first year. In general, having severe conditions in the medical history or chronic conditions were found to incur significantly higher costs during the first year, but this declined with age.
Table 24 shows the combined marginal effects from both parts of the model. The predicted mean total cost was £3725 per person in the year following index hospital discharge, which is close to the observed mean of £3708. Previous hospitalisation was associated with an increase in health-care costs of £999. Patients with some or total assistance with daily activities also had higher costs. The results show that all severe or chronic conditions are associated with greater costs. To better understand the effect of the continuous variables and interactions, we plotted the marginal effect of the continuous predictors on the health-care costs (Figures 22–24).
| Category | Predicted mean (£) | 95% CI |
|---|---|---|
| Predicted total health-care cost (£ per patient) | 3725 | 3687 to 3763 |
| Marginal effects | ||
| Critical care unit length of stay (per day increase) | 49.9 | 43.6 to 56.1 |
| Previous hospitalisation | 999.0 | 912.7 to 1085.3 |
| Mechanical ventilation | –582.3 | –666.6 to –497.9 |
| Dependency | ||
| Some assistance with daily activities | 821.6 | 728.0 to 915.1 |
| Total assistance with daily activities | 2643.3 | 2001.7 to 3284.8 |
| Quintile of deprivation | ||
| 2 | –51.2 | –165 to 62.6 |
| 3 | –27.5 | –139.2 to 84.3 |
| 4 | 201.9 | 85.4 to 318.6 |
| 5 (most deprived) | 201.9 | 95.1 to 325.9 |
| Location prior to admission | ||
| ED or not in hospital (planned admission) | –143.3 | –622.1 to 335.6 |
| Other acute hospital (not critical care) | 117.0 | –293.8 to 527.8 |
| Other critical care unit (repatriation) | 301.1 | –453.6 to 1055.8 |
| Other critical care unit (planned or unplanned transfer) | 283.3 | –36.4 to 603.1 |
| Theatre (unplanned admission following elective or scheduled surgery) | –244.7 | –418.2 to –71.2 |
| Theatre (planned admission following elective or scheduled surgery) | –876.8 | –984.5 to –769.0 |
| Theatre (admission following emergency or urgent surgery) | 36.8 | –80.1 to 153.7 |
| Ward or intermediate care area | 571.4 | 452.1 to 690.8 |
| CPR | ||
| In-hospital CPR | 686.3 | 305.3 to 1067.3 |
| No CPR | 747.3 | 468.6 to 1025.9 |
| Severe conditions in medical history (APACHE II) | ||
| Severe respiratory disease | 1516.5 | 1117.5 to 1915.5 |
| Severe liver disease | 2427.0 | 1981.3 to 2872.8 |
| ESRD | 3532.8 | 3101.4 to 3964.2 |
| Metastatic disease | 821.1 | 608.7 to 1033.4 |
| Haematological malignancy | 2587.4 | 2154.8 to 3019.9 |
| Immunocompromise | 516.8 | 358.4 to 675.3 |
| RCS Charlson comorbidities | ||
| Previous MI | 378.2 | 211.3 to 545.2 |
| Congestive cardiac failure | 554.3 | 388.1 to 720.4 |
| Peripheral vascular disease | 904.7 | 741.4 to 1068.0 |
| Dementia | 364.1 | 51.6 to 676.5 |
| Rheumatological disease | 706.0 | 457.6 to 954.3 |
| Hemiplegia or paraplegia | 1869.4 | 1405.8 to 2333.1 |
| Chronic renal disease | 1292.3 | 1110.6 to 1474.0 |
| Chronic pulmonary disease | 798.5 | 684.8 to 912.2 |
| Liver disease | 1216.0 | 936.9 to 1495.0 |
| Diabetes mellitus | 1059.8 | 932.1 to 1187.4 |
| Any malignancy | 680.5 | 526.9 to 834.2 |
FIGURE 22.
Marginal plot of the effect of BMI on total health-care costs.
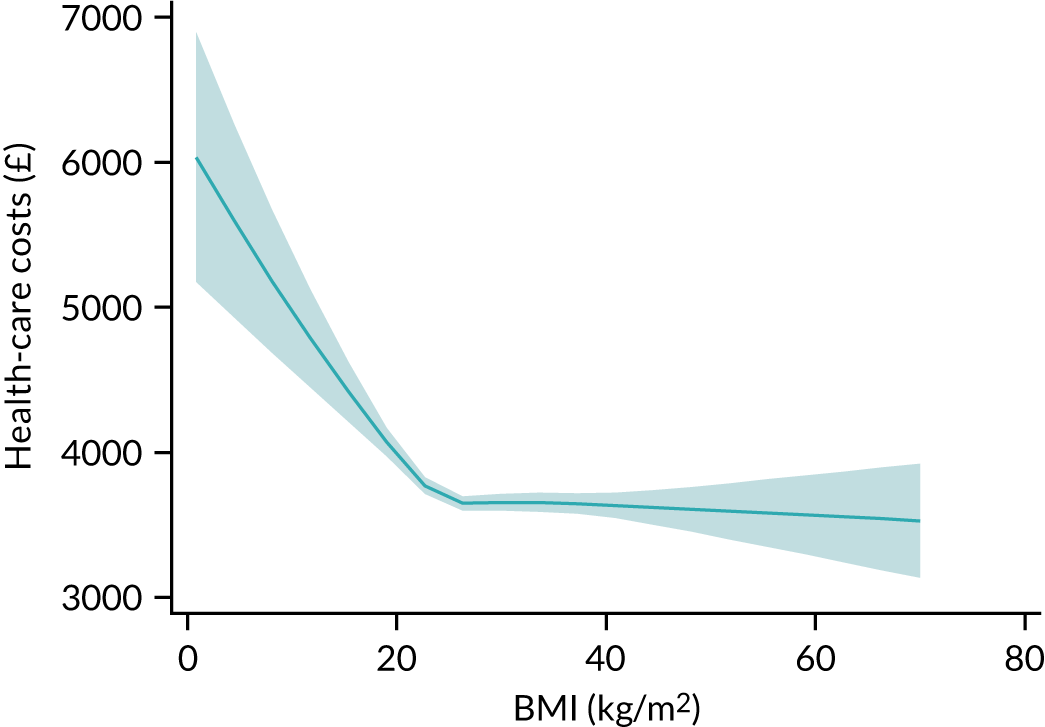
FIGURE 23.
Marginal plot of the effect of ICNARC physiology score and interactions with comorbidities on total health-care cost. (a) Overall marginal effect; (b) severe liver disease in medical history; (c) metastatic disease; (d) chronic pulmonary disease. Solid line: presence of comorbidity. Dashed line signifies absence of comorbidity.
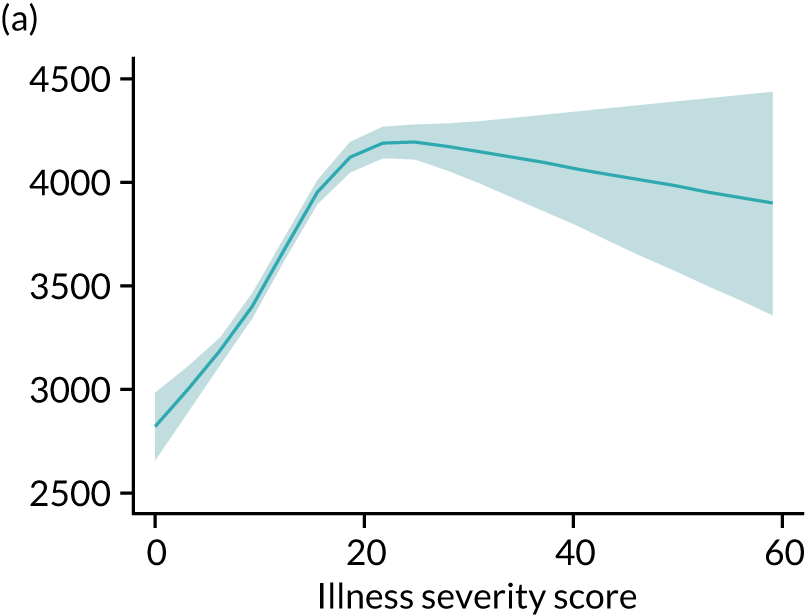
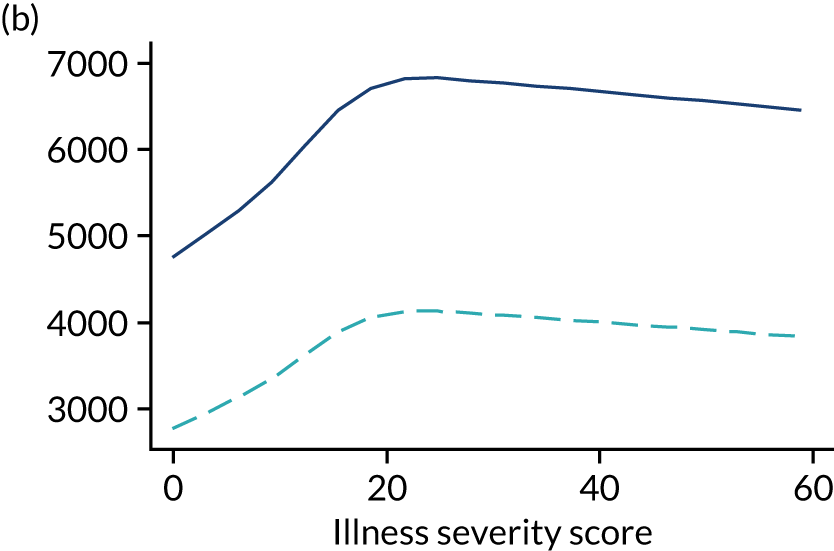
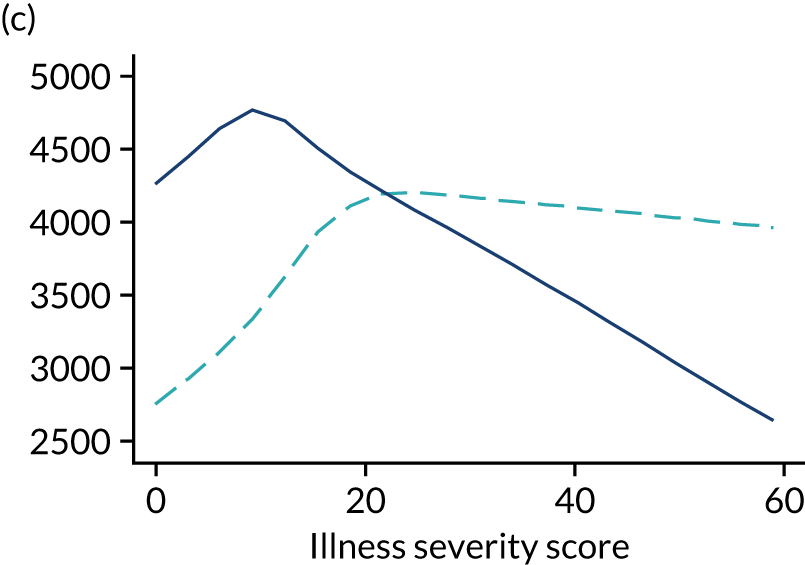
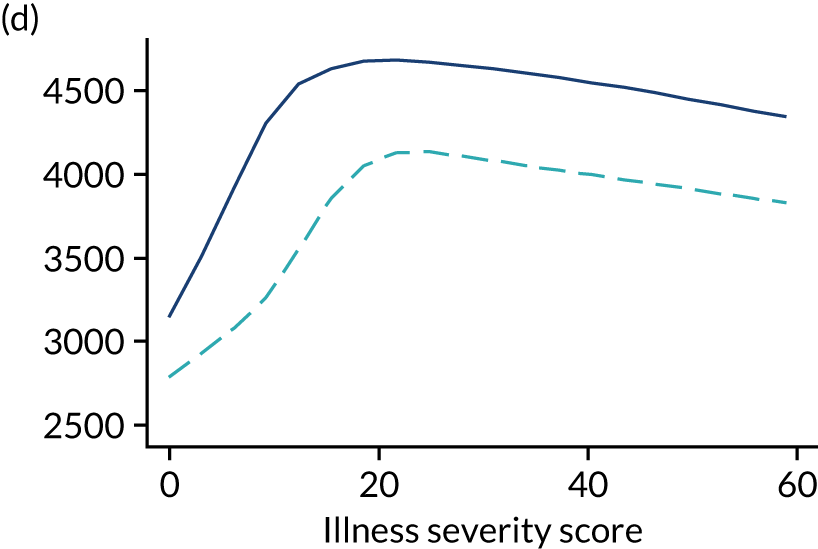
FIGURE 24.
Marginal plot of the effect of age and interactions with comorbidities on total health-care cost (solid line: presence of comorbidity). (a) Overall marginal effect; (b) any malignancy; (c) haematological malignancy; (d) metastatic disease; (e) immunocompromise; (f) chronic pulmonary disease; (g) end-stage renal failure; (h) diabetes mellitus; (i) severe respiratory disease; (j) liver disease. Dashed line signifies absence of comorbidity.
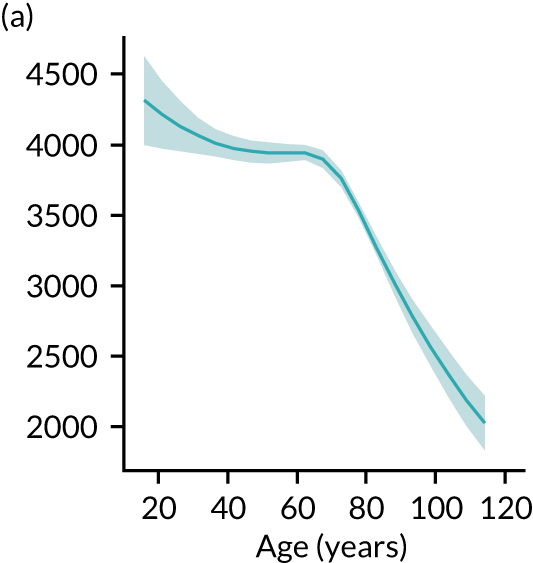
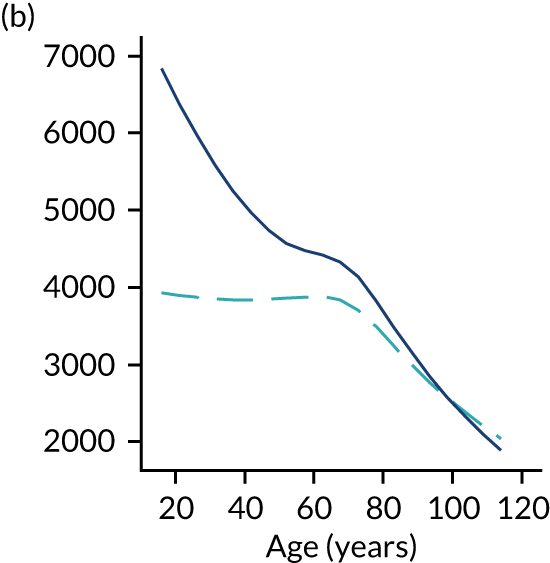
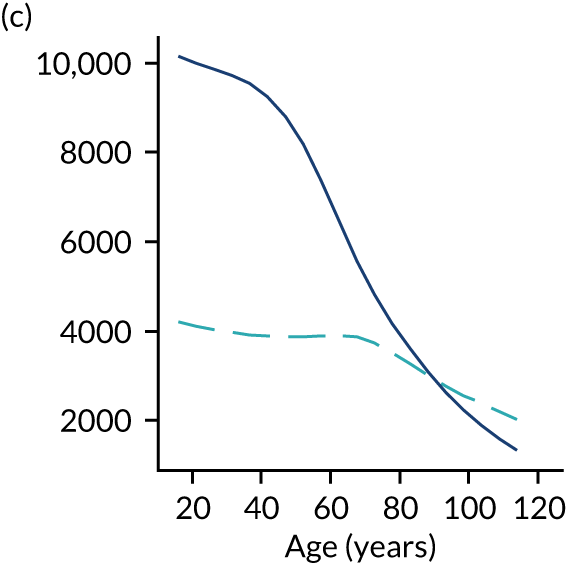
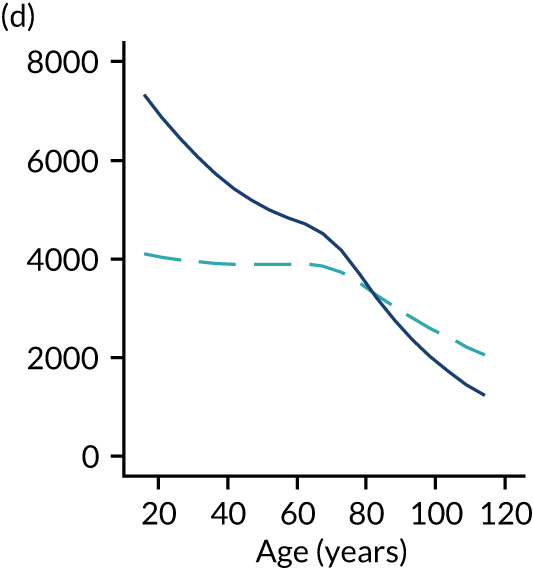
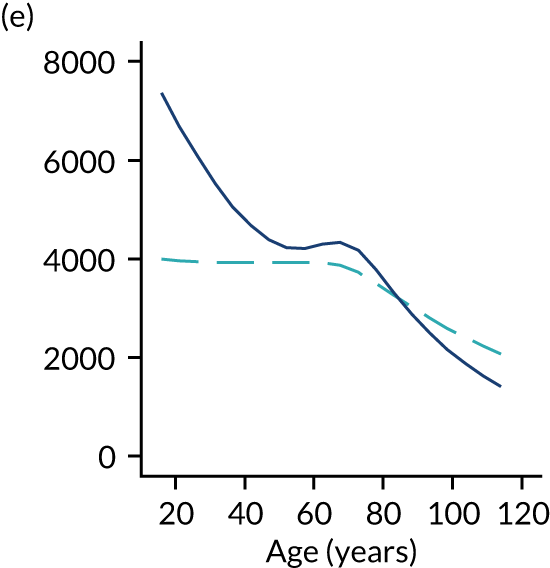
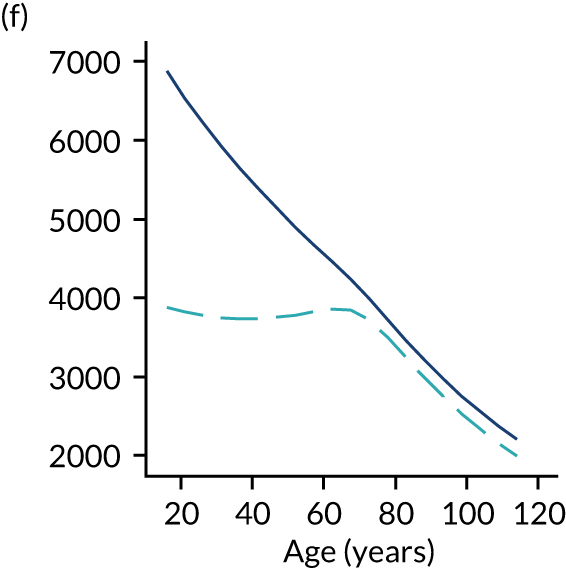
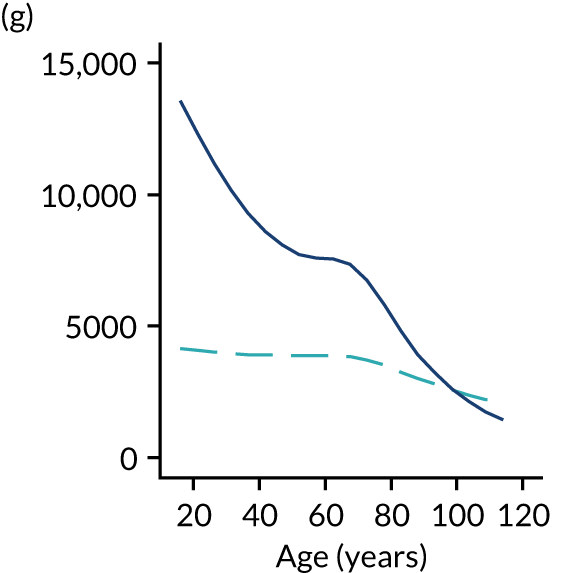
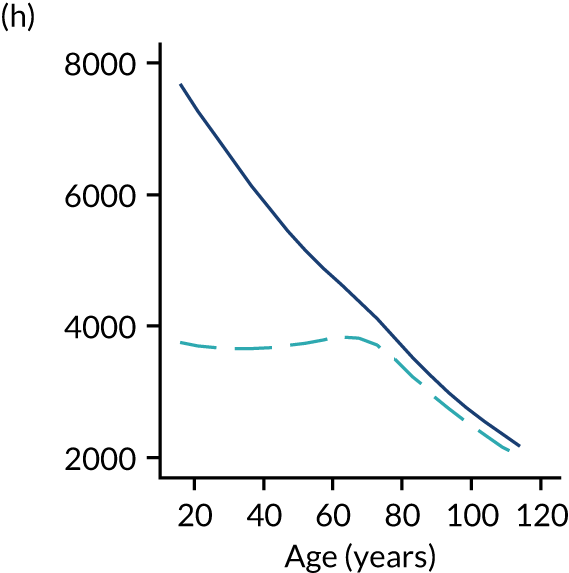
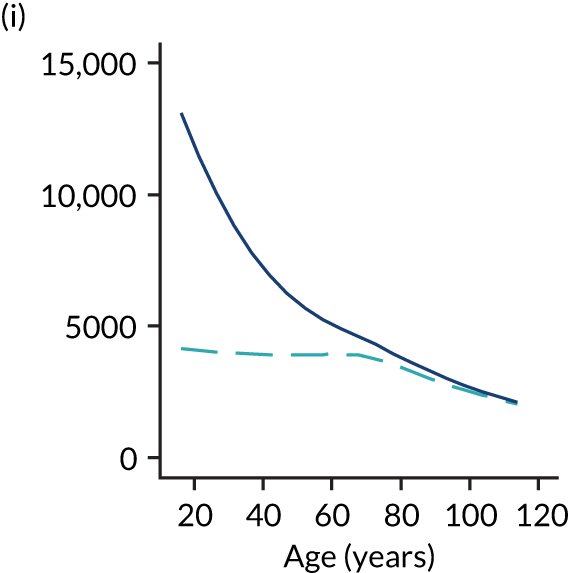
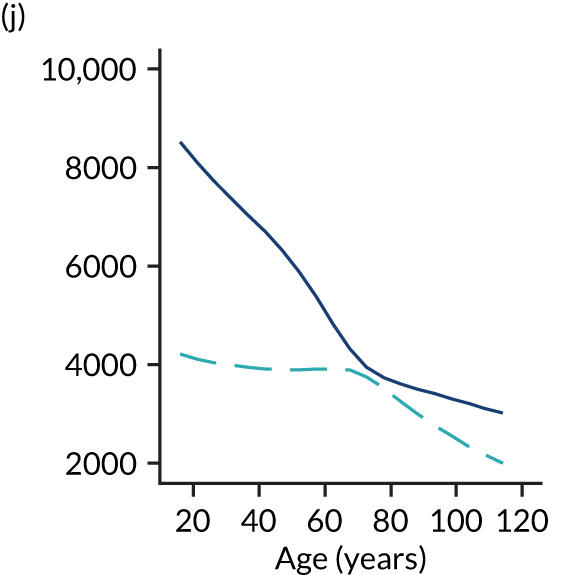
Discussion
This chapter describes a process and its results for estimating health-care costs after critical illness using the DHSC APC tariff and data linkage with HES. Two-part models are an attractive approach to address the peculiar distribution of health-care costs; they also provide insight into the utilisation process. Modelling the outcomes with a two-part model allows for a separate investigation of the effect of covariates on having health-care costs during the first year after hospital discharge and on the value of those costs (if any), while providing cost predictions that account for both parts of the model.
Increasingly, patients admitted to critical care survive to hospital discharge, many with ongoing medical needs and substantial resultant costs. We found that over 47% of hospital survivors following critical care required at least one hospital/critical care admission during the first year after hospital discharge, with a mean health-care cost of £7951 per patient, and 6.9% were re-admitted to critical care during the first year after hospital discharge.
Patients who were in better health condition prior to admission to critical care accrued significantly lower health-care costs than those with poorer health. Our two-part model shows that previous hospitalisations, dependency and comorbidities are all strong and independent predictors of resource use and increased costs. The results are consistent with previous studies. Lone et al. ,38 in a population-based study in Scotland, found that factors present before admission to critical care were much stronger predictors of hospital resource use than those associated with the acute illness and a Dutch study76 of critical care survivors concluded that healthcare costs are greatly influenced by the chronic conditions of critically ill patients. 7 However, our study shows that the prevalence of higher health-care costs in patients with previous comorbidities than in those with no comorbidities is more pronounced in younger patients.
Most factors had effects in the expected direction. Exceptions to this included ventilation in the first 24 hours of critical care and patients with metastatic disease. This effect could be explained by an increased post-discharge mortality in those patients and a corresponding reduction in hospital/critical care length of stay.
Recent literature incorporates proximity to death in health-care expenditure models, especially in elderly or end-of-life populations and mostly focuses on age-related health-care expenditure growth. 77–80 However, this approach has been criticised for potential endogeneity problems. 81,82 Recent research81 shows that the role played by proximity-to-death variables can be explained by available measures of morbidity and suggests that proximity to death is itself a ‘red herring’ that acts as a proxy for morbidity. In addition, proximity-to-death or related variables are less useful for forward planning or forecasting health-care expenditure, because a person’s future time to death is unknown. Our work focused on determinants prior to critical illness such as previous hospitalisations, severity and/or duration of critical illness, underlying levels of dependency, and combinations of severe conditions in the medical history (APACHE II) and RCS Charlson comorbidities, which are themselves detailed measures of morbidity.
This analysis did have limitations. Primary among these was that we were only able to assess secondary care costs (hospital and critical care admissions). These patients would also have had substantial primary care, outpatient and emergency care costs, which could not be assessed with the data sources linked for this project. Wider data linkage may enable a fuller picture of the subsequent costs of critical illness to be obtained. Second, although we considered previous hospitalizations as a surrogate of resource use prior to the critical illness, we did not directly contrast the health-care costs during the period before critical care admission. Consequently, we cannot conclude whether the critical illness episode resulted in a higher level of health-care use or identify different trajectories of health-care use. This must be left to a future extension of the present chapter.
Chapter 9 Risk models for adult cardiothoracic critical care
Introduction
Cardiothoracic critical care presents some particular challenges for risk modelling, with a relatively low-risk population in comparison with other critical care subspecialties. Patients may present with considerable physiological derangement due to the effects on their body of undergoing cardiac surgery, but this is not associated with the same increase in risk that would be anticipated in other critical care settings. For this reason, critical care unit admissions following cardiac surgery have been excluded from many previous critical care risk models. In a previous research study, we developed and validated a novel risk model for cardiothoracic critical care. 16 The resulting model, based on 17,000 admissions to cardiothoracic critical care units, had excellent discrimination (c index 0.90).
For cardiothoracic critical care, our previous work16 has focused on the data items available in the CMP. The data set is designed to implement risk models for adult general critical care. Aside from patient demographics, these are almost exclusively post-operative risk factors. However, the majority of admissions to cardiothoracic critical care units are admitted following cardiac surgery and many pre- and intra-operative risk factors may also influence outcome for these patients. 83 The NACSA collects pre-operative risk factors and intra-operative process measures that provide potentially important additional risk factor information to enhance our risk predictions among the cohort of patients admitted to cardiothoracic critical care units following cardiac surgery and to explore how risks change along the patient journey.
Linkage to death registrations also enables us to extend our risk models for cardiothoracic critical care to predict longer-term mortality. Finally, data linkage with HES enables us to improve the resulting risk prediction models by incorporating additional comorbidity information.
Methods
Study cohort
For the development data set, we selected NHS cardiothoracic critical care units in England participating in the CMP, with identifiable linkage with HES and death registrations between 1 April 2009 and 31 March 2015. The validation data set consisted of admissions to cardiothoracic critical care units between 1 April 2015 and 31 March 2016.
Inclusion and exclusion criteria
Patients included in the model were all admissions following cardiothoracic surgery identified from data linkage with NACSA, excluding any with a date of admissions preceding the NACSA procedure date or not in the first 20 days after surgery. Patients aged < 16 years, re-admissions to the critical care unit and patients transferred from another critical care unit were excluded.
Outcome
Risk models were developed for two outcomes: acute hospital mortality and 1-year mortality. Acute hospital mortality was defined as death before final discharge from acute hospital and included deaths after direct transfer to another acute hospital from the hospital housing the critical care unit. One-year mortality was obtained by data linkage with death registrations.
Candidate predictors
Candidate predictors were chosen based on the previously developed risk prediction model for acute hospital mortality among admissions to cardiothoracic critical care units,16 pre- and intra-operative risk factors obtained by data linkage with NACSA, and APACHE II and RCS Charlson comorbidities (see Appendix 1, Table 39). Severe conditions in the past medical history (APACHE II) and RCS Charlson comorbidities were identified and defined as described in Chapter 3.
Statistical analyses
Methods common to all objectives and analyses were described in Chapter 3.
The starting point for the new risk model was the previously developed risk prediction model for acute hospital mortality among admissions to cardiothoracic critical care units using CMP data only. New pre- and intra-operative risk factors obtained by data linkage with NACSA (see Appendix 1, Table 39) and comorbidities from HES were assessed for inclusion in the new risk models. The effect of those predictors previously included in the risk model were reassessed to determine whether they still made an important contribution to the model (see Chapter 3). Predictors that were non-significant at a cut-off p-value of 0.05 were discarded. The model was refitted and the remaining predictors were retested. The process continued until all the predictors in the model were significant.
For developing a risk model for longer-term mortality (1 year), the resulting risk model was refitted to the new outcome, and predictors that were previously considered but were found not to be important predictors for hospital survival were reassessed by incorporating them to the model. A selection process was run as described above.
Net reclassification improvement was determined to further evaluate the resulting expanded models (see Chapter 3).
In addition, the risk models developed were compared against the best existing generic risk model for adult critical care in the UK, based on the most appropriate calibration for the time period (the ICNARCH–2015 model7). The potential impact on benchmarking was explored by plotting each critical care unit’s observed mortality against 95% and 99.8% reference ranges based on the expected mortality from each model. 84
Results
Development of risk model for acute hospital mortality
Between 1 April 2009 and 31 March 2016, there were 40,516 admissions to seven cardiothoracic critical care units in England participating in the CMP with identifiable linkage with HES and death registrations. Of these, 31,415 (78%) were successfully linked with NACSA. After excluding admissions not following cardiac surgery, a total of 27,687 eligible admissions to seven cardiothoracic critical care units formed the development data set (Figure 25).
FIGURE 25.
Flow diagram.
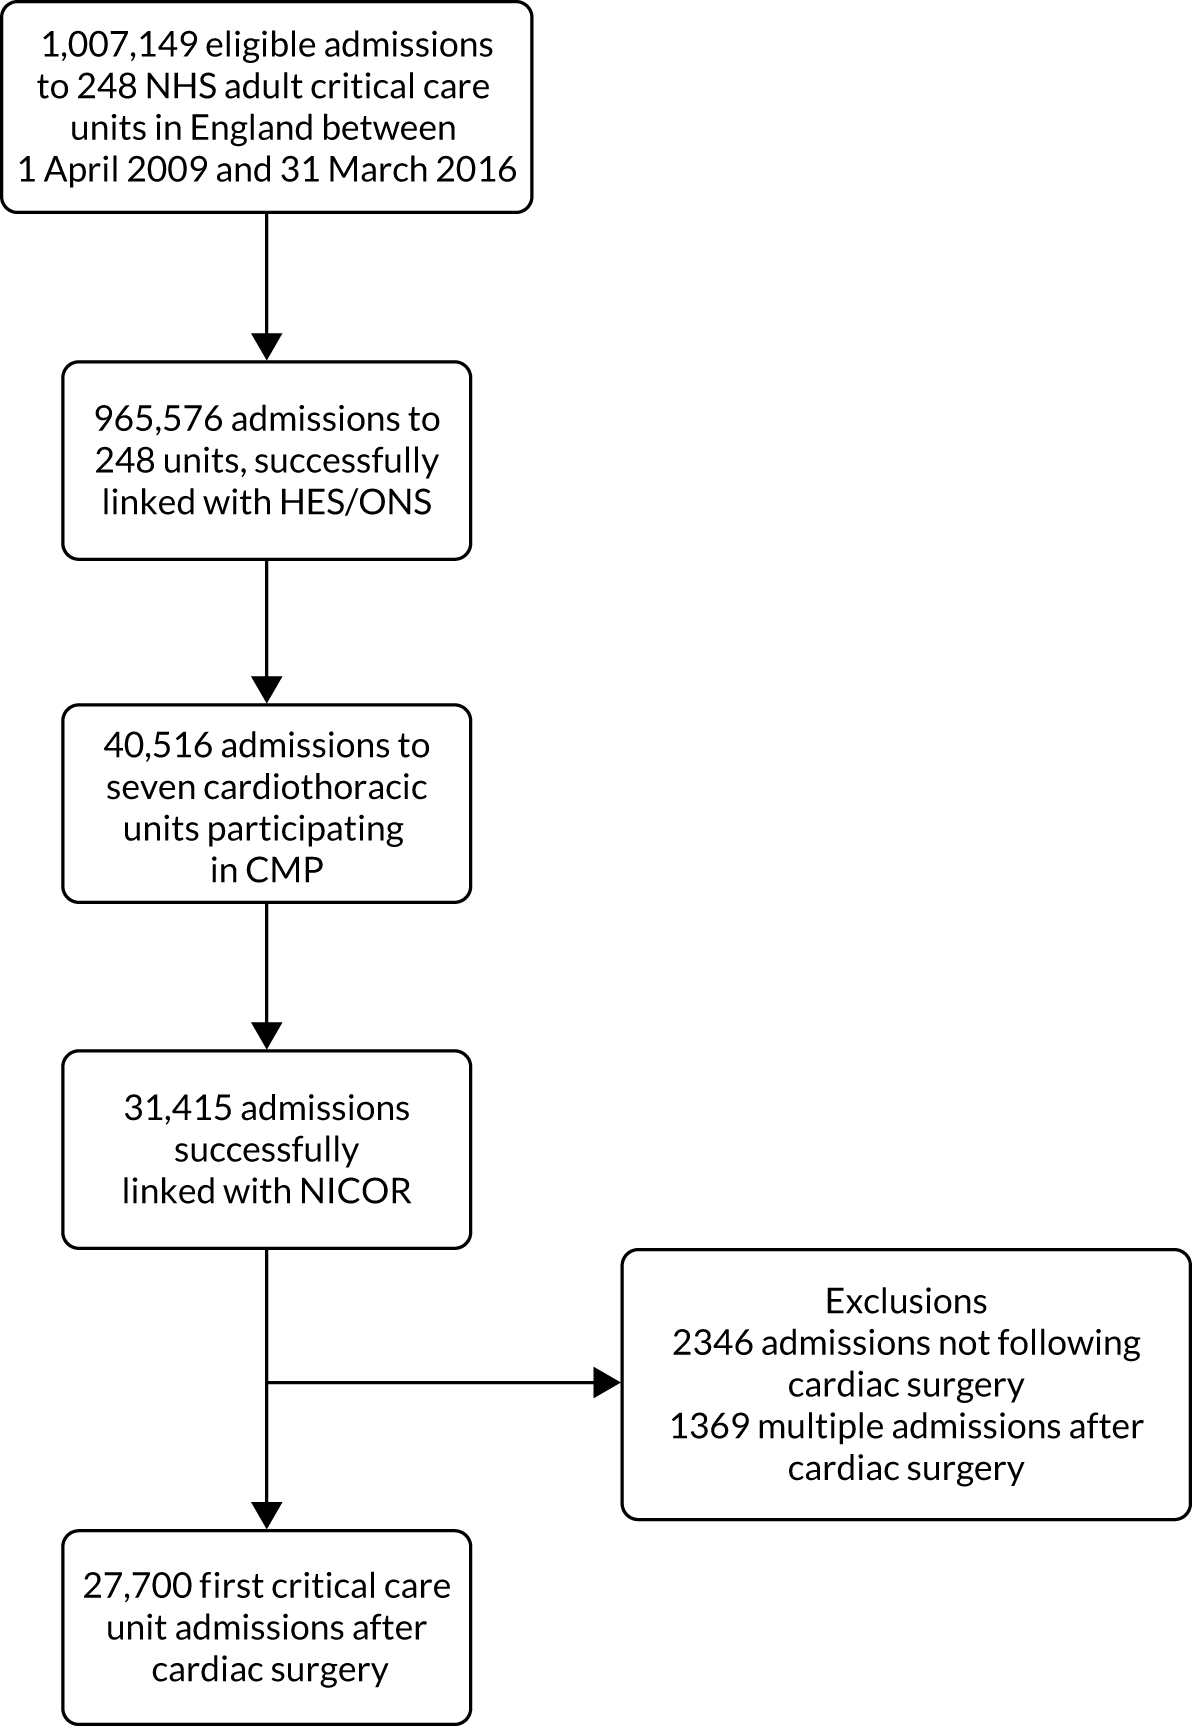
A total of 1072 (3.9%) admissions to cardiothoracic units died during the hospitalisation. Of these, 693 (2.5%) died during the critical care unit admission. The median hospital length of stay of the cohort was 10 days (IQR 7–16 days), with a median critical care unit length of stay 26 hours (IQR 21–68 hours). Cohort characteristics are shown in Table 25.
| Characteristic | Development cohort | Validation cohort |
|---|---|---|
| Number of patients | 27,700 | 8692 |
| Demographics | ||
| Age (years), mean (SD) | 67 (11.3) | 67 (11.8) |
| Age (years), median (IQR) | 69 (61–76) | 69 (60–76) |
| Sex, males (%) | 19,923 (71.9) | 6245 (71.8) |
| Ethnicity, n (%) | ||
| White | 25,848 (93.3) | 8019 (92.3) |
| Mixed | 98 (0.4) | 19 (0.2) |
| Asian | 928 (3.4) | 266 (3.1) |
| Black | 108 (0.4) | 66 (0.8) |
| Other | 718 (2.6) | 322 (3.7) |
| Quintile of deprivation, n (%) | ||
| 1 (least deprived) | 6208 (23.2) | 1777 (21.3) |
| 2 | 5745 (21.5) | 1954 (23.4) |
| 3 | 5464 (20.5) | 1783 (21.4) |
| 4 | 4686 (17.5) | 1431 (17.2) |
| 5 (most deprived) | 4606 (17.2) | 1398 (16.8) |
| Prior dependency, n (%) | ||
| Able to live without assistance in daily activities | 22,798 (82.8) | 8076 (93.1) |
| Some (minor/major) assistance with daily activities | 4745 (17.2) | 584 (6.7) |
| Total assistance with all daily activities | 5 (0.0) | 17 (0.2) |
| Medical history | ||
| Severe conditions in the medical history (APACHE II), n (%) | ||
| Very severe cardiovascular disease | 1453 (5.2) | 228 (2.6) |
| Severe respiratory disease | 131 (0.5) | 26 (0.3) |
| Severe liver disease | 24 (0.1) | 7 (0.1) |
| ESRD | 139 (0.5) | 56 (0.6) |
| Metastatic disease | 93 (0.3) | 20 (0.2) |
| Haematological malignancy | 81 (0.3) | 16 (0.2) |
| Immunocompromise | 186 (0.7) | 42 (0.5) |
| Comorbidities evident in previous year (RCS Charlson and additional specific ICD-10 codes), n (%) | ||
| Previous MI | 1914 (6.9) | 1118 (12.9) |
| Acute MI | 4769 (17.2) | 1437 (16.5) |
| Congestive cardiac failure | 4567 (16.5) | 1570 (18.1) |
| Congestive heart failure | 1223 (4.4) | 396 (4.6) |
| Arrhythmia | 41 (0.1) | 13 (0.1) |
| Peripheral vascular disease | 2901 (10.5) | 890 (10.2) |
| Cerebrovascular disease | 819 (3.0) | 265 (3.0) |
| Cerebrovascular accident | 99 (0.4) | 37 (0.4) |
| Chronic pulmonary disease | 3897 (14.1) | 1219 (14.0) |
| Diabetes mellitus | 5174 (18.7) | 1690 (19.4) |
| Chronic renal disease | 1588 (5.7) | 448 (5.2) |
| Acute renal disease | 154 (0.6) | 36 (0.4) |
| Hemiplegia or paraplegia | 94 (0.3) | 34 (0.4) |
| Malignancy | 626 (2.3) | 220 (2.5) |
| Metastatic disease | 54 (0.2) | 15 (0.2) |
| Pre- and intra-operative factors (NACSA) | ||
| Previous heart operations, n (%) | 1153 (5.8) | 409 (7.5) |
| Left ventricular ejection fraction, n (%) | ||
| Good (> 50%) | 19,758 (71.6) | 6242 (72.1) |
| Fair (30–50%) | 6242 (22.6) | 1968 (22.7) |
| Poor (< 30%) | 1600 (5.8) | 449 (5.2) |
| Angina status pre surgery, n (%) | ||
| No angina | 9268 (33.5) | 3172 (36.5) |
| No limitation of physical activity | 3569 (12.9) | 759 (8.7) |
| Slight limitation of ordinary activity | 7409 (26.8) | 2246 (25.8) |
| Marked limitation of ordinary physical activity | 4982 (18.0) | 1569 (18.1) |
| Symptoms at rest or minimal activity | 2464 (8.9) | 945 (10.9) |
| Dyspnoea status pre surgery, n (%) | ||
| No limitation of physical activity | 6663 (24.1) | 2083 (24.0) |
| Slight limitation of ordinary physical activity | 12,260 (44.4) | 3827 (44.0) |
| Marked limitation of ordinary physical activity | 7312 (26.5) | 2300 (26.5) |
| Symptoms at rest or minimal activity | 1389 (5.0) | 480 (5.5) |
| Number of previous MIs, n (%) | ||
| None | 18,356 (66.3) | 5895 (67.9) |
| One | 7716 (27.9) | 2371 (27.3) |
| Two or more | 1612 (5.8) | 422 (4.9) |
| Interval between surgery and last MI, n (%) | ||
| No previous MI | 18,167 (66.4) | 5846 (68.2) |
| < 6 hours | 67 (0.2) | 13 (0.2) |
| 6–24 hours | 134 (0.5) | 37 (0.4) |
| 1–30 days | 4120 (15.0) | 1439 (16.8) |
| 31–90 days | 919 (3.4) | 223 (2.6) |
| > 90 days | 3973 (14.5) | 1016 (11.8) |
| Previous PCI, n (%) | ||
| No previous PCI | 24,698 (89.2) | 7659 (88.3) |
| PCI < 24 hours before surgery | 113 (0.4) | 20 (0.2) |
| PCI > 24 hours before surgery; same admission | 221 (0.8) | 94 (1.1) |
| PCI > 24 hours before surgery; previous admission | 2663 (9.6) | 904 (10.4) |
| Diabetes management, n (%) | ||
| No diabetes | 21,398 (77.4) | 6643 (76.4) |
| Diet | 1062 (3.8) | 305 (3.5) |
| Oral therapy | 3629 (13.1) | 1203 (13.8) |
| Insulin | 1572 (5.7) | 539 (6.2) |
| Cigarette smoking history, n (%) | ||
| Never smoked | 11,125 (40.3) | 3580 (41.2) |
| Ex-smoker | 13,657 (49.4) | 4181 (48.1) |
| Current smoker | 2854 (10.3) | 927 (10.7) |
| History of hypertension, n (%) | ||
| No hypertension | 8542 (31.0) | 2695 (31.2) |
| Treated or blood pressure > 140/90 on more than one occasion prior to admission | 19,013 (69.0) | 5933 (68.8) |
| Renal function/dialysis, n (%) | ||
| None | 22,977 (98.5) | 8559 (98.5) |
| Dialysis for acute renal failure: onset within 6 weeks of cardiac surgery | 52 (0.2) | 28 (0.3) |
| Dialysis for chronic renal failure: onset more than 6 weeks prior to cardiac surgery | 172 (0.7) | 76 (0.9) |
| No dialysis but pre-operative acute renal failure (anuria or oliguria < 10 ml/hour) | 135 (0.6) | 29 (0.3) |
| History of pulmonary disease, n (%) | ||
| No chronic pulmonary disease | 23,556 (85.1) | 7389 (85.0) |
| COAD/emphysema or asthma | 4133 (14.9) | 1300 (15.0) |
| History of neurological dysfunction, n (%) | 765 (2.8) | 250 (2.9) |
| Extracardiac arteriopathy, n (%) | 3004 (10.8) | 996 (11.5) |
| Pre-operative heart rhythm, n (%) | ||
| Sinus rhythm | 23,549 (85.1) | 7441 (85.7) |
| Atrial fibrillation/flutter | 3465 (12.5) | 1041 (12.0) |
| Complete heart block/pacing | 451 (1.6) | 154 (1.8) |
| Ventricular fibrillation or ventricular tachycardia | 105 (0.4) | 17 (0.2) |
| Other abnormal rhythm | 108 (0.4) | 32 (0.4) |
| Intravenous nitrates or any heparin, n (%) | 1464 (5.3) | 460 (5.3) |
| Cardiogenic shock (pre-operation), n (%) | 338 (1.2) | 92 (1.1) |
| Operative urgency, n (%) | ||
| Elective | 18,524 (66.9) | 5544 (63.8) |
| Urgent | 8157 (29.4) | 2838 (32.7) |
| Emergency | 905 (3.3) | 290 (3.3) |
| Salvage | 112 (0.4) | 20 (0.2) |
| Intravenous inotropes prior to anaesthesia, n (%) | 313 (1.1) | 70 (0.8) |
| CABG, n (%) | 17,768 (65.2) | 5417 (62.7) |
| Valve procedure, n (%) | 12,991 (48.1) | 4216 (49.4) |
| Major aortic procedure, n (%) | 2009 (7.4) | 716 (8.4) |
| Other cardiac procedures, n (%) | 1926 (9.0) | 693 (8.6) |
| Cardiopulmonary bypass, n (%) | 24,713 (89.4) | 7881 (90.7) |
| Intra-aortic balloon pump used (pre operative), n (%) | 472 (2.4) | 146 (2.1) |
| Severity scores from first 24 hours following admission to critical care | ||
| APACHE II score, mean (SD) | 13.0 (4.3) | 12.8 (4.2) |
| APACHE II score, median (IQR) | 13 (10–16) | 13 (10–15) |
| ICNARC physiology score, mean (SD) | 13.0 (5.6) | 13.5 (5.4) |
| ICNARC physiology score, median (IQR) | 12 (10–16) | 12 (10–16) |
| Physiology from first 24 hours following admission to critical care | ||
| Highest heart rate (min−1), mean (SD) | 94.9 (14.2) | 94.1 (14.5) |
| Lowest systolic blood pressure (mmHg), mean (SD) | 90.0 (14.1) | 89.3 (14.3) |
| Highest temperature (°C), mean (SD) | 37.1 (0.8) | 37.0 (0.7) |
| Lowest respiratory rate (min−1), mean (SD) | 10.4 (2.5) | 10.4 (2.3) |
| PaO2/FiO2 (kPa), mean (SD) | 32.3 (12.5) | 33.0 (12.4) |
| Lowest arterial pH, mean (SD) | 7.30 (0.06) | 7.30 (0.05) |
| Highest urea (µmol l−1), mean (SD) | 7.2 (5.4) | 6.8 (3.9) |
| Highest creatinine (µmol l−1), mean (SD) | 101 (55) | 99 (53) |
| Highest sodium (mmol l−1), mean (SD) | 140 (4) | 141 (4) |
| Lowest white blood cell count (×109 l−1), mean (SD) | 11.0 (4.5) | 11.2 (4.1) |
| Urine output (ml), mean (SD) | 2333 (1058) | 2300 (1049) |
| PaCO2 (kPa), mean (SD) | 6.1 (1.0) | 6.2 (1.0) |
| Highest blood lactate (mmol l−1), mean (SD) | 3.0 (2.2) | 3.0 (2.0) |
| Lowest platelet count (×109 l−1), mean (SD) | 157 (61) | 161 (61) |
| Neutrophil count (×109 l−1), mean (SD) | 9.2 (3.5) | 9.4 (3.4) |
| Sepsis, n (%) | 480 (1.7) | 178 (2.0) |
| Organ dysfunction, n (%) | 25,983 (93.8) | 8130 (93.5) |
| Organ support during critical care | ||
| Advanced respiratory support, n (%) | 27,437 (99.1) | 8568 (98.6) |
| Duration of advanced respiratory support (calendar days), median (IQR) | 1 (1–2) | 1 (1–2) |
| Basic/advanced cardiovascular support, n (%) | 20,414 (73.7) | 6484 (74.6) |
| Duration of basic/advanced cardiovascular support (calendar days), median (IQR) | 2 (2–3) | 2 (2–3) |
| Renal support, n (%) | 1612 (5.8) | 386 (4.4) |
| Duration of renal support (calendar days), median (IQR) | 4 (2–6) | 4 (2–7) |
| Outcomes | ||
| Critical care unit length of stay (hours), mean (SD) | 67 (126) | 68 (123) |
| Critical care unit length of stay (hours), median (IQR) | 26 (21–68) | 28 (21–70) |
| Acute hospital length of stay (days), mean (SD) | 15 (17) | 14 (15) |
| Acute hospital length of stay (days), median (IQR) | 10 (7–16) | 9 (7–15) |
| Critical care unit mortality, n (%) | 693 (2.5) | 159 (1.8) |
| Acute hospital mortality, n (%) | 1072 (3.9) | 273 (3.1) |
| One-year mortality, n (%) | 1918 (6.9) | 523 (6.0) |
During our evaluation, the following variables were considered redundant or inoperative because of either high proportions of missing values or small sample sizes in the category of interest and were not included in the analysis: ventricular assist device used (pre operative), aortic valve procedure, mitral valve procedure, tricuspid valve procedure, pulmonary valve procedure, intra-aortic balloon pump used (intra operative), impeller device used (intra operative), ventricular assist device used (intra operative), other support device used (intra operative), aortic pathology – root segment, aortic pathology – ascending segment, aortic pathology – arch segment, aortic pathology – descending aorta segment, aortic pathology – abdominal segment, systolic pulmonary artery pressure (PA systolic), total number of distal coronary anastomoses and number of valves replaced/repaired.
A multivariable model with the factors included in the previous risk prediction model for acute hospital mortality among admissions to cardiothoracic critical care units was refitted, excluding location and cardiac surgery. The significance and functional forms for the remaining predictors were retested. The completeness for those variables was 98.2% and consequently data were not imputed. All predictors were significant, and their functional forms were consistent with the previous findings. Sex was then including and the c index and Brier’s score for the main model were 0.873 and 0.0280, respectively. Comorbidities, pre-operative and factors from NACSA that were significant (p < 0.1) in univariable analyses were introduced into the main model and a final model was developed as described above.
The following factors from NACSA were found to be associated with acute hospital mortality on multivariable analysis: diabetes (categorised as no diabetes vs. diabetes controlled by diet/oral therapy/insulin), atrial fibrillation/flutter, dyspnoea status pre surgery (categorised as no limitation or slight limitation of ordinary physical activity vs. marked limitation of ordinary physical activity vs. symptoms at rest or minimal activity), history of pulmonary disease, history of neurological dysfunction; extracardiac arteriopathy, operative urgency (categorised as elective vs. urgent vs. emergency vs. salvage), and cumulative bypass time. Of the comorbidities and pre-existing conditions, only severe respiratory disease, severe cardiovascular disease and congestive heart failure were significant predictors of acute hospital mortality.
The first expanded model, incorporating factors from NACSA, performed moderately better than the baseline parsimonious model (Table 26). The second expanded model with severe conditions and pre-existing congestive heart failure resulted in minimal change to c index and Brier’s score, with a c index of 0.892 and Brier’s score of 0.0273 for the final model. Appendix 2, Table 43, summarises the significance and importance of the predictors in the final model. Full coefficients for the final model are presented in Appendix 3, Table 49. After comparing the reclassification of the two models using risk categories defined by thresholds of 0%, 2%, 5%, 10%, 20% and 50% (Tables 27 and 28), a total of 5766 (21%) admissions were reclassified and 3088 of those (54%) were placed in more appropriate categories. The total NRI for the expanded model was 7.0% (standard error 2.0%, p < 0.0005). The distribution of predicted acute hospital mortality from the new model is shown in Figure 26.
| Model | df | LL | BIC | c index (95% CI) | Brier’s score |
|---|---|---|---|---|---|
| Main model | 22 | –3047.47 | 6329 | 0.872 (0.859 to 0.883) | 0.0282 |
| Main model + sex | 23 | –3031.00 | 6306 | 0.873 (0.859 to 0.884) | 0.0280 |
| Main model + sex + NACSA factors | 34 | –2914.19 | 6185 | 0.890 (0.878 to 0.899) | 0.0273 |
| Main model + sex + NACSA factors + comorbidities | 37 | –2900.63 | 6189 | 0.892 (0.880 to 0.901) | 0.0273 |
| Risk category (parsimonious model) | Risk category (expanded model incorporating additional predictors) (%) | |||||
|---|---|---|---|---|---|---|
| 0–1.99 | 2–4.99 | 5–9.99 | 10–19.99 | 20–49.99 | 50–100 | |
| Survivors, % | ||||||
| 0–1.99 | 16,930 | 1342 | 83 | 5 | ||
| 2–4.99 | 1605 | 2412 | 570 | 90 | 6 | |
| 5–9.99 | 100 | 595 | 684 | 220 | 35 | |
| 10–19.99 | 25 | 72 | 255 | 327 | 112 | 4 |
| 20–49.99 | 2 | 7 | 25 | 129 | 291 | 37 |
| 50–100 | 1 | 5 | 36 | 74 | ||
| Non-survivors, % | ||||||
| 0–1.99 | 98 | 38 | 2 | |||
| 2–4.99 | 33 | 73 | 35 | 7 | 2 | |
| 5–9.99 | 27 | 53 | 40 | 9 | 1 | |
| 10–19.99 | 1 | 7 | 33 | 66 | 53 | 3 |
| 20–49.99 | 1 | 2 | 42 | 135 | 41 | |
| 50–100 | 27 | 174 | ||||
| Change in classification | Survivors | Non-survivors |
|---|---|---|
| Down, n (%) | 2857 (10.9) | 174 (17.33) |
| No change, n (%) | 20,718 (79.4) | 599 (59.6) |
| Up, n (%) | 2504 (9.6) | 231 (23.0) |
| Net improvementa (SE) | + 1.3% (0.2%) | + 5.6% (2.0%) |
FIGURE 26.
Distribution of predicted risk of acute hospital mortality.
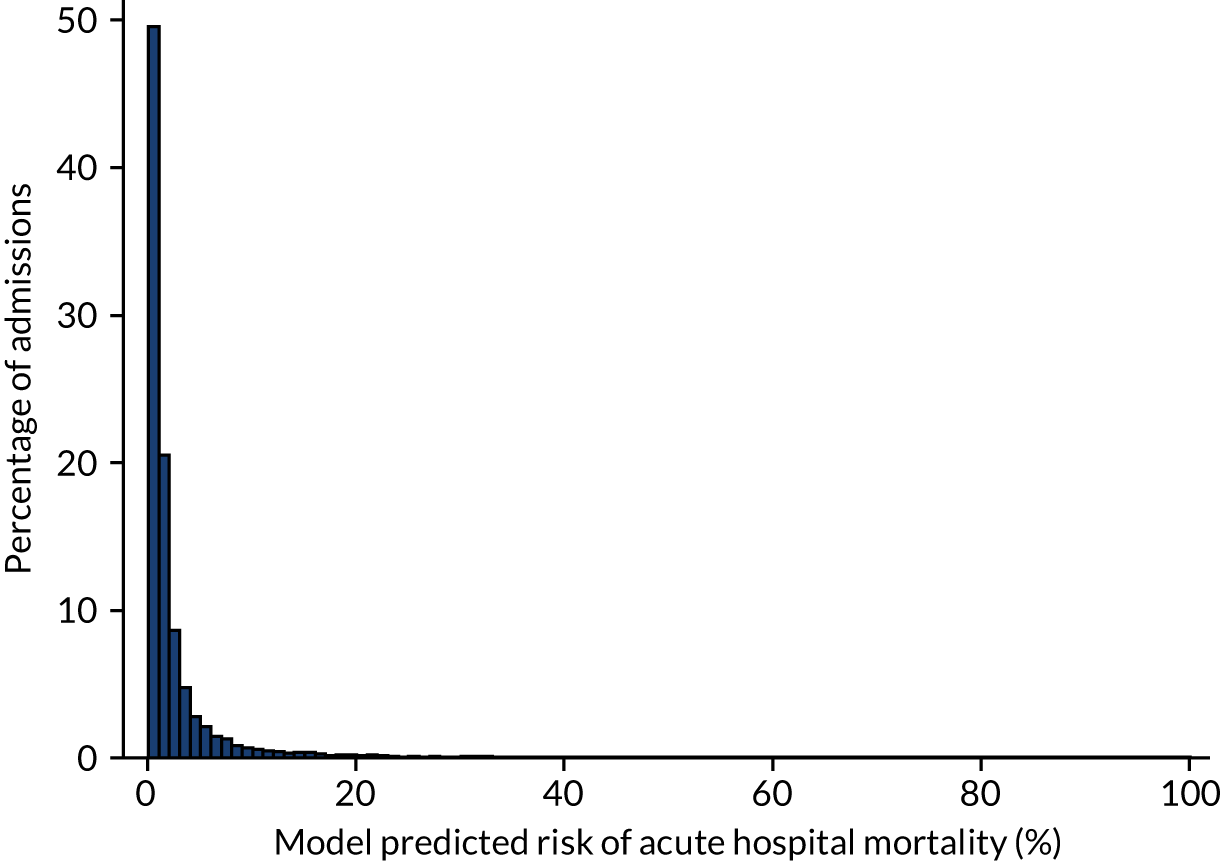
Validation of risk model of acute hospital mortality
The performance of the risk model for acute hospital mortality in the validation data set of 8692 admissions from April 2015 to March 2016 was excellent: a c index of 0.907 (95% CI 0.888 to 0.926) and Brier’s score of 0.022. The calibration of the model was acceptable (Figure 27; see Report Supplementary Material 1, Figure S3), with a calibration slope of 1.06 and a calibration intercept of –0.083.
FIGURE 27.
Calibration of the model for acute hospital mortality in the development cohort.
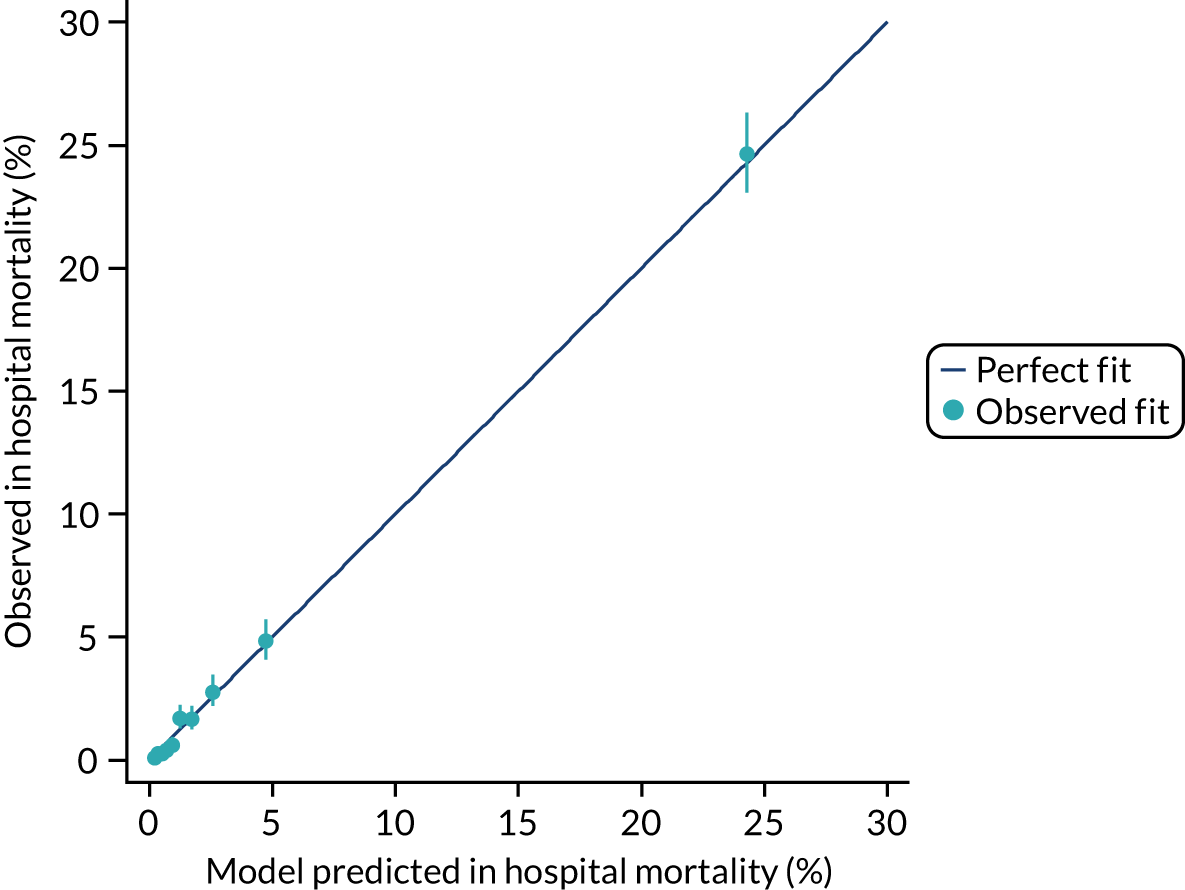
Comparison with the Intensive Care National Audit and Research CentreH-2015 model
We used the validation data set to compare the predictive accuracy of the developed cardiothoracic model with the ICNARCH-2015 model, a general model that is currently used for benchmarking in the CMP for general and specialist units. Compared with the ICNARCH-2015 model, the new model demonstrated small improvements in discrimination and accuracy (Table 29) but, overall, it presented a better calibration (Figure 28). Both the cardiothoracic and the ICNARCH-2015 models tended to slightly overestimate mortality: observed mortality was 3.0% with predicted mortality of 3.5% and 4.1%, respectively, for SMRs of 0.85 (95% CI 0.75 to 0.96) and 0.73 (95% CI 0.65 to 0.83).
| Model | c index (95% CI) | Brier’s score | Predicted mortality (%) | Observed mortality (%) | SMR (95% CI) |
|---|---|---|---|---|---|
| ICNARCH-2015 | 0.8969 (0.8757 to 0.9181) | 0.0225 | 4.1 | 3.0 | 0.73 (0.65 to 0.83) |
| Newa | 0.9073 (0.8881 to 0.9263) | 0.0223 | 3.5 | 3.0 | 0.85 (0.75 to 0.96) |
FIGURE 28.
Calibration of the model for acute hospital mortality compared with the ICNARCH-2015 model in the external validation cohort.
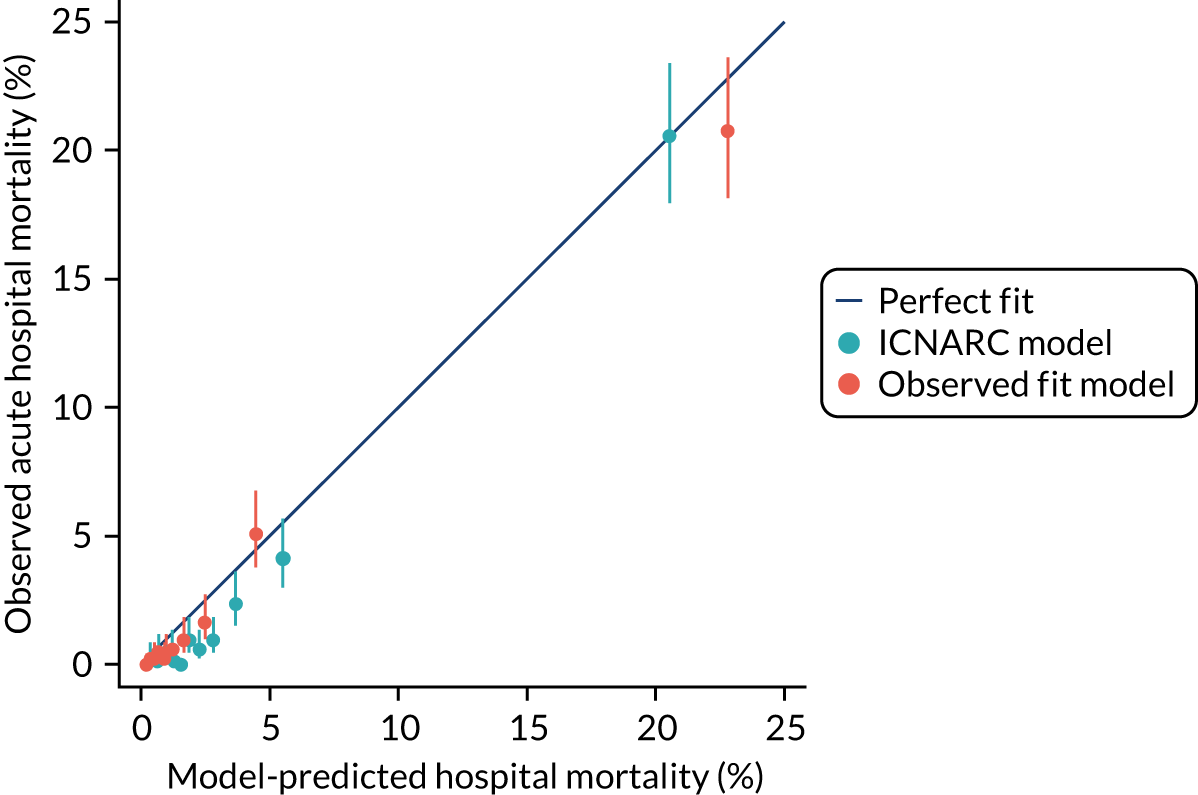
Figure 29 shows the observed value for each cardiothoracic critical care unit against 95% and 99.8% reference ranges for predicted mortality from the cardiothoracic and the ICNARCH-2015 models to evaluate their impact on benchmarking. To compare the observed value with the expected value, we calculated predicted ranges based on the expected value and the number of eligible admissions for each cardiothoracic unit. Although the predicted range showed less variability for the cardiothoracic model, the number of critical care units that lie within the 95% reference range was similar for both models and only one cardiothoracic critical care unit showed some evidence that the acute hospital mortality was better than expected.
FIGURE 29.
Observed acute hospital mortality vs. reference ranges for expected mortality for the seven cardiothoracic critical care units with (a) the ICNARCH-2015 model and (b) the new model.
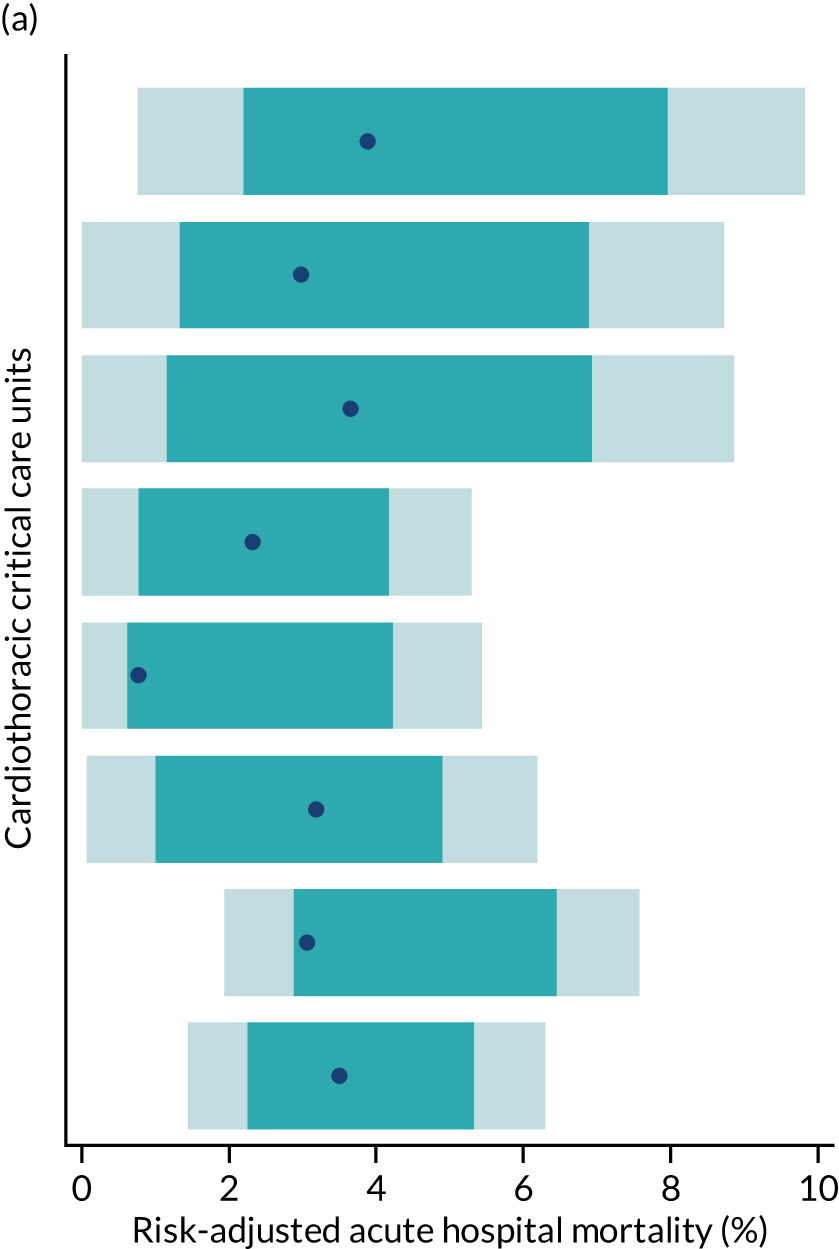
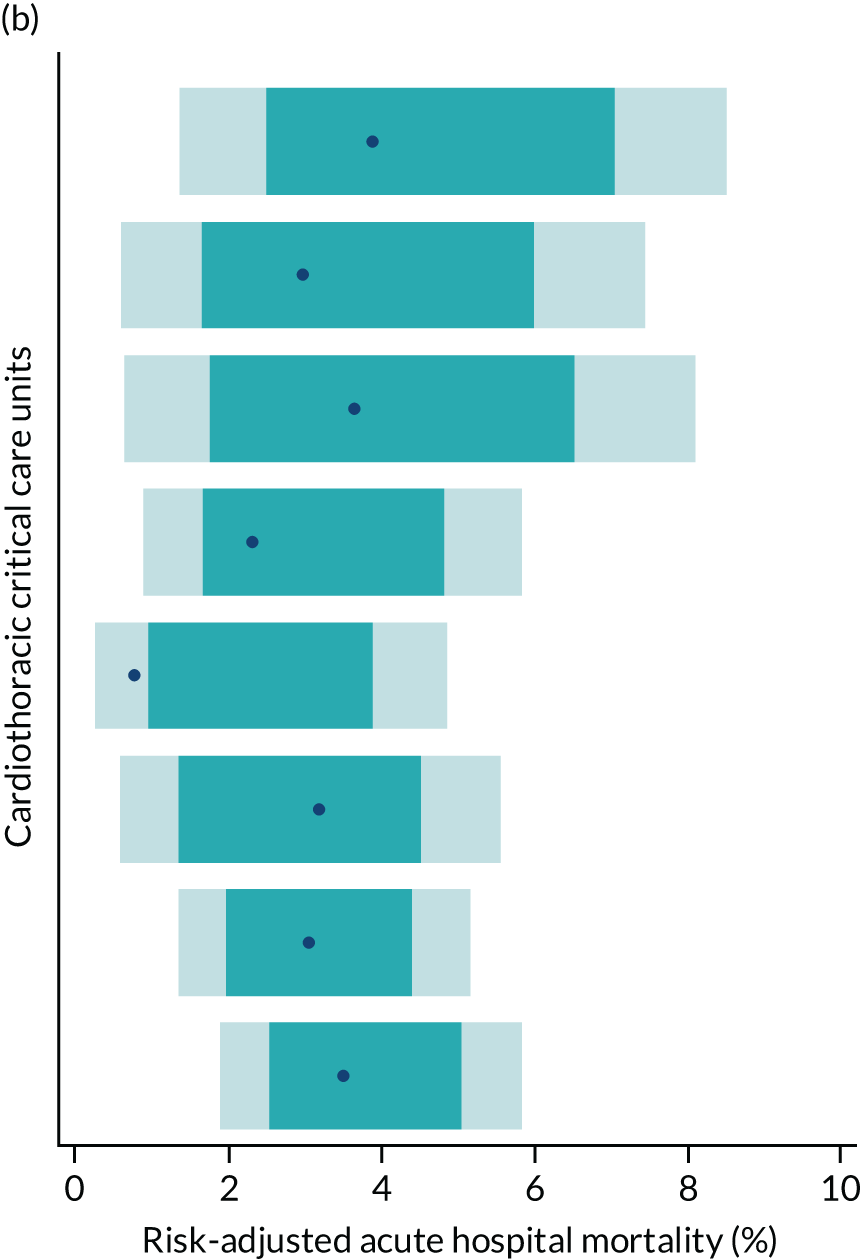
Development of risk model for 1-year mortality
For the development of the 1-year mortality model we used the same cohort that we used for the acute hospital mortality. Two admissions were excluded owing to missing date of death. The median follow-up was 5 years (IQR 3.9–6.4 years). In total, 1918 (6.92%) died during the 1-year follow-up, but most of the deaths were in the first month from admission. A Kaplan–Meier plot of time to death within 1 year is shown in Figure 30.
FIGURE 30.
Kaplan–Meier plot of time to death within 1 year from admission to cardiothoracic unit.
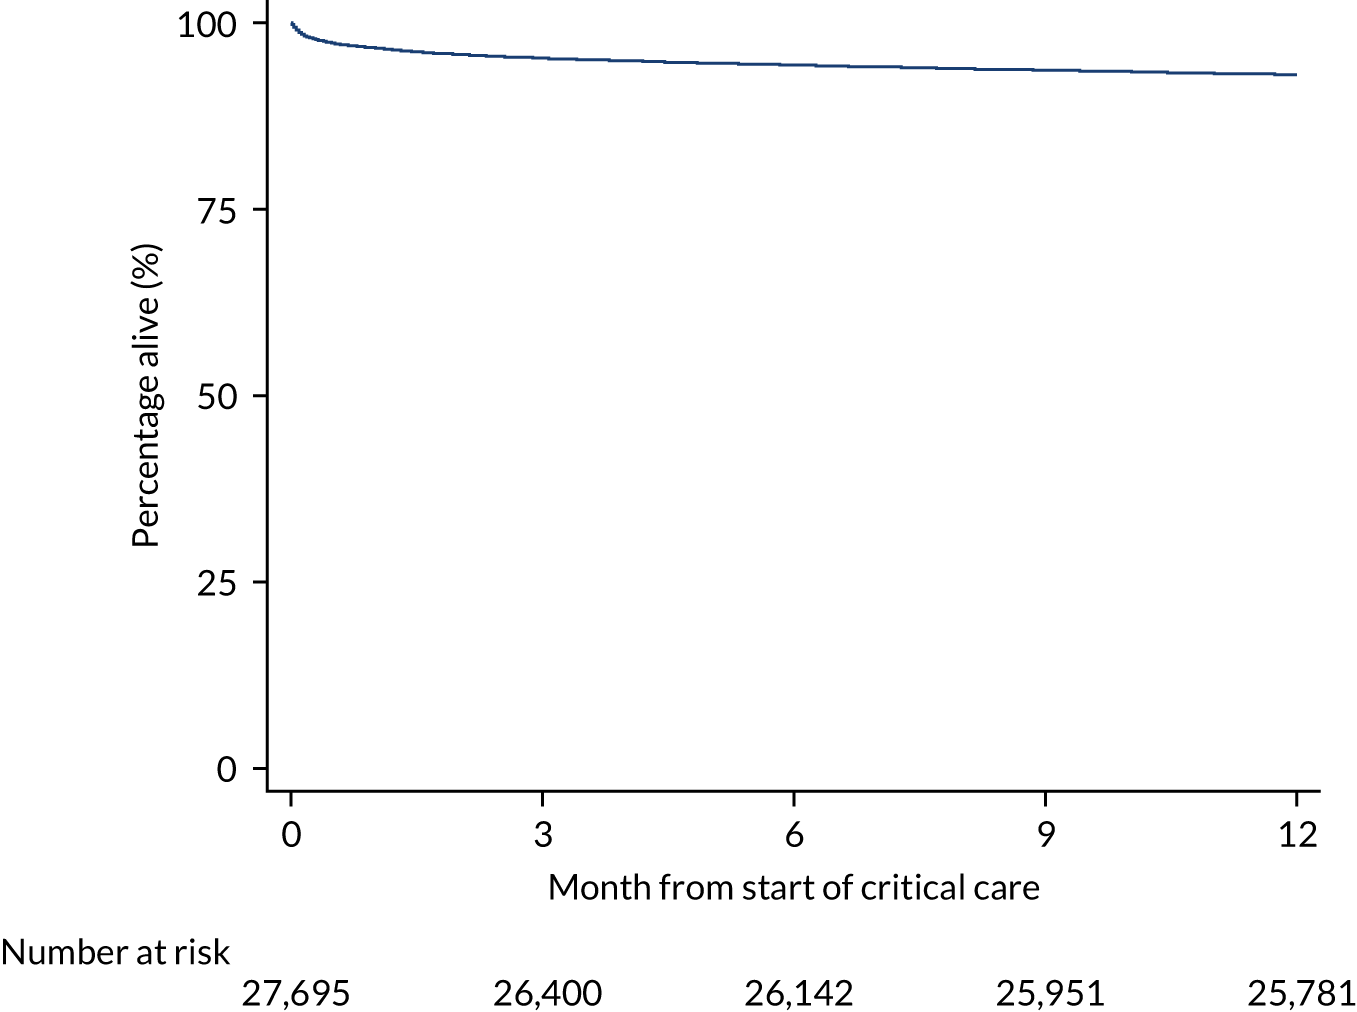
The risk model developed for in hospital mortality was refitted to the new outcome and all predictors were significantly associated. The model showed a good performance, with a c index of 0.824 (95% CI 0.814 to 0.834) and a Brier score of 0.0516. After the addition and reassessment of the predictors that were found not to be important predictors for acute hospital mortality, the following pre-operative factors from NACSA were included in the final model: renal function/dialysis [recategorised as none or dialysis for acute renal failure vs. dialysis for chronic renal failure vs. no dialysis but pre-operative acute renal failure (anuria or oliguria < 10 ml/hour)]; left ventricular ejection fraction, number of previous MIs and major aortic procedure. No additional pre-existing conditions were found to be important predictors. After accounting for these predictors, the discriminative ability of the model improved slightly with a c index of 0.827 (95% CI 0.816 to 0.837). The full model coefficients are presented in Appendix 3, Table 49.
Following the development process described above, the significance and importance of the predictors in the final model are shown in Appendix 2, Table 43. Age was one of the strongest predictors of 1-year mortality, followed by GCS, blood lactate and operative urgency. Compared with the short-term model (acute hospital mortality), pre-operative and pre-existing conditions had a more important role in the model performance, whereas physiological and laboratory variables were stronger predictors of acute hospital mortality.
Validation of risk model for 1-year mortality
The overall predictive performance of the 1-year model was well preserved in the validation data set compared with the development data set, with a c index of 0.815 (95% CI 0.794 to 0.835) and Brier’s score of 0.0467, and presented a SMR of 0.97 (95% CI 0.89 to 1.06). The calibration in the validation cohort was satisfactory (Figure 31; see Report Supplementary Material 1, Figure S3).
FIGURE 31.
Calibration of the 1-year mortality model in the external validation cohort.
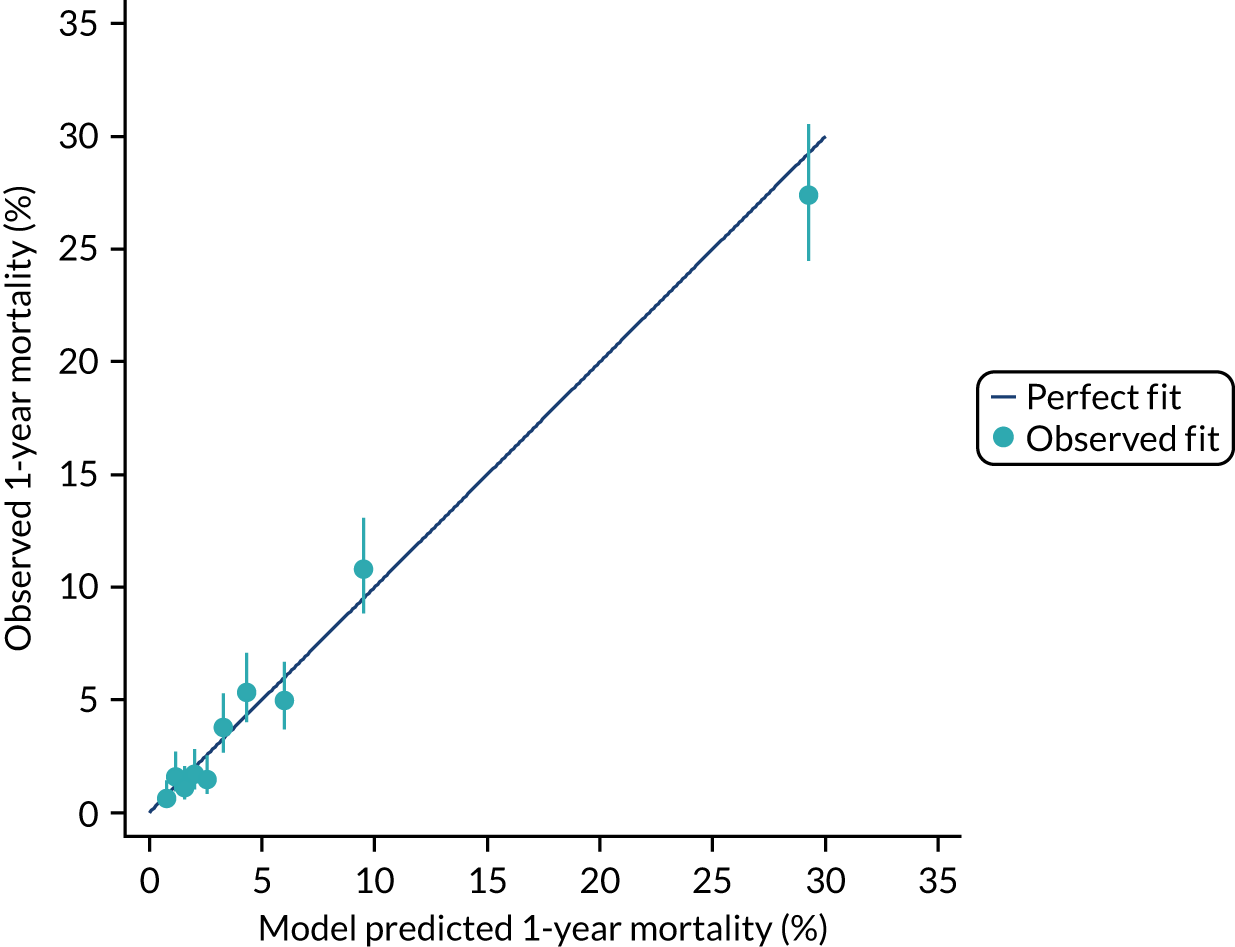
Discussion
Existing literature on predictors of mortality for post-cardiac surgery patients suggests that outcomes are best predicted by a combination of pre-operative, intra-operative and post-operative risk factors. 85,86 The purpose of this chapter was to develop and assess a specific risk model for admissions to cardiothoracic critical care following cardiac surgery using a combination of post-operative information such as clinical and physiological variables collected in the first 24 hours following admission to critical care, combined with pre- and intra-operative information and pre-existing conditions to improve risk prediction among this patient group. We have developed a risk prediction model with good discrimination (c index > 0.9) for predicting acute hospital mortality following cardiac surgery. This model validated well in subsequent data. Our results show that the incorporation of the following pre- and intra-operative variables from NACSA contributed to the model performance: diabetes, atrial fibrillation/flutter, dyspnoea status pre surgery, history of pulmonary disease, history of neurological dysfunction, extracardiac arteriopathy, operative urgency and cumulative bypass time. Also, we identified a set of pre-existing conditions that significantly predicted acute hospital mortality: severe respiratory disease, severe cardiovascular disease and congestive heart failure. However, they did not contribute substantively to the model’s predictive performance.
Models specifically designed for cardiothoracic critical care units may be warranted given the differences in case mix of cardiothoracic critical care units from that of adult, general critical care units. Furthermore, there is potential that a single, general model may under- or over-estimate mortality in selected admission subpopulations or different unit types and so could show worse performance than a specifically designed or calibrated model. So, in addition, using the validation data set, we evaluated the developed model for cardiothoracic critical care units compared with the corresponding contemporary version of the ICNARC risk prediction model, which is currently used in benchmarking for both general and specialist critical care units in the CMP. The performance of both models was similar, although the cardiothoracic model demonstrated slightly better calibration. However, we found little impact on benchmarking when the specific cardiothoracic model was applied in place of the current general model.
In addition, we identified a set of pre- and intra-operative factors from NACSA that were shown to be determinants for longer-term survival of cardiac surgical patients after critical care admission. Apart from the factors included in the acute hospital mortality model, the updated risk model for 1-year mortality following critical care admission incorporated renal function/dialysis, left ventricular ejection fraction, number of previous MIs and major aortic procedures. The adverse effect of diabetes and dialysis-dependent renal failure on cardiac-surgery mortality have been described previously,87,88 but we have confirmed their importance for an extended outcome after critical care admission. Surprisingly, no additional pre-existing conditions were found to be important predictors. This finding was consistent with the acute hospital mortality analysis, in which pre- and intra-operative factors were found to play a more important role than pre-existing conditions after adjusting for age, sex and the core physiological variables. On the other hand, we showed that severe respiratory disease, severe cardiovascular disease and congestive heart failure were significantly associated with both short- and longer-term outcomes after critical care admission.
One of the limitations of the present work was that the models have not been directly compared with specific models for cardiac surgery, such as EuroSCORE II or the latest UK recalibration,89 owing to the lack of some fields required for this comparison. However, such a comparison may not have been fair as our models incorporate post-surgery information and would therefore be expected to out-perform a purely pre-operative model when applied in this setting.
In conclusion, data linkage with NACSA greatly increased the available pre- and intra-operative data. However, clinical and physiological variables collected in the first 24 hours provided good prediction, and the improvements to predictive performance from a model incorporating pre- and intra-operative factors and pre-existing conditions were small.
Chapter 10 Risk models for in-hospital cardiac arrest
Introduction
We have previously developed and published prediction models8 for ROSC > 20 minutes and survival to hospital discharge (hospital survival) following in-hospital cardiac arrest that underpin comparative reporting for NCAA. Simultaneously to our work developing risk models for NCAA,8 a prediction model for hospital survival following in-hospital cardiac arrest was published from the American Heart Association (AHA) Get With the Guidelines–Resuscitation registry. 90 This identified largely similar risk factors to the NCAA risk models but included additional predictors not available in the NCAA data set, most notably pre-existing comorbidities. Data linkage with HES enables calculation of comorbidity indices from diagnoses and procedural codes recorded during the hospital episode, an approach that has been applied successfully in other clinical audits. 91 Combining this information with the existing risk factors enables us to determine the contribution of chronic health conditions to outcome from in-hospital cardiac arrest with a view to either routinely linking data in the future or establishing which comorbidity fields are important to collect directly within NCAA. Little is known about longer-term outcomes following in-hospital cardiac arrest and data linkage with death registrations enables us to extend our prediction models to explore the role of pre-existing conditions in determining 1-year survival.
Although many patients do not survive the initial resuscitation attempt, the treatment of those who do requires substantial resources, and many patients will be admitted to a critical care unit. Prediction models for cost and resource use have been primarily developed for calibration (getting the mean correct). 27 Less attention has been paid to the covariate effects. Data linkage between NCAA and the CMP allows us to better understand patterns of critical care resource use and organ support following successful resuscitation. Length of stay in the critical care unit has been used as a measure of critical care resource utilisation. 92 The aim of this analysis was to assess the impact of covariates on critical care resource utilisation to better understand the importance of patient characteristics in critical care resource utilisation following in-hospital cardiac arrest.
This chapter reports on the development and validation of prediction models for the following outcomes following in-hospital cardiac arrest: ROSC > 20 minutes and hospital survival, 1-year survival, and critical care utilisation.
Prediction models for survival outcomes
Methods
Methods common to all objectives and analyses were describe in Chapter 3. Details relating to the study cohorts and outcomes can be found in the same chapter.
Study cohort
The cohort for these models was the NCAA in-hospital cardiac arrest cohort (see Chapter 3).
Inclusion and exclusion criteria
For development of the prediction models, data were extracted from the NCAA in-hospital cardiac arrest cohort for all individuals with a 2222 call dated between 1 January 2013 and 31 December 2014. Second and subsequent team visits to the same patient were excluded. The following exclusion criteria were applied to individual team visit records: patients whose last known status was still in hospital, patients missing either of the outcomes of ROSC > 20 minutes or hospital survival and patients with missing data for the candidate predictors.
For validation of the risk prediction models, data were extracted from the NCAA in-hospital cardiac arrest cohort for all individuals with a 2222 call dated between 1 January 2015 and 30 June 2015. The same eligibility and exclusion criteria were applied at the individual team visit level as for the development data set.
Outcomes and candidate predictors
Prediction models were developed for three outcomes: ROSC > 20 minutes, hospital survival and 1-year survival. Patients were followed up to discharge from the original acute hospital and any patients transferred to another acute hospital were reported as hospital survivors.
Previously developed prediction models8 for ROSC > 20 minutes and hospital survival were the starting point. Predictors included in the previous model for ROSC > 20 minutes were age, sex, length of stay in hospital prior to arrest, reason for admission to/attendance at/visit to hospital, location of arrest, presenting/first documented rhythm, and interactions between location of arrest and presenting/first documented rhythm. Predictors included in the previous model for hospital survival model were age, length of stay in hospital prior to arrest, reason for admission to/attendance at/visit to hospital, location of arrest, presenting/first documented rhythm, and interactions between location of arrest and presenting/first documented rhythm. In both models, age was modelled as a continuous, non-linear relationship using restricted cubic splines with five knots. All other candidate predictors were modelled as categorical variables. Current predictors and new potential predictors (pre-existing comorbidities) are described in Appendix 1, Table 40.
Development and validation of prediction models for return of spontaneous circulation > 20 minutes and hospital survival
An initial model for each outcome including the current predictors was fitted using multilevel logistic regression. All variables in the current model were reassessed: each predictor was removed, and the reduced model was assessed for discrimination (c index), accuracy (Brier’s score) and model fit (BIC).
All pre-existing comorbidities were added to the model. From this full model, comorbidities were selected for inclusion following the general approach to model development described in Chapter 3.
The resulting models were validated for discrimination, calibration and accuracy in the development data set and the validation data.
Development and validation of a prediction model for 1-year survival
It was anticipated that predictors representing age, chronic ill health and functional status would be stronger predictors of longer-term outcomes than of hospital survival. Using the prediction model for hospital survival as the starting point, a 1-year model was developed with the aim of determining the set of pre-existing comorbidities that could be determinants for longer-term survival following in-hospital cardiac arrest. The prediction model without comorbidities was refitted to the 1-year survival outcome, pre-existing comorbidities in the model and those that were previously considered but were found not to be important predictors for hospital survival were reassessed by adding them to the model. Finally, the effect of those predictors previously included in the prediction model were re-assessed to determine whether or not they still made an important contribution to the model.
Results
One hundred and eighty-one hospitals participated in NCAA between 1 January 2013 and 31 December 2014. During this time there was a total of 33,829 team visits following 2222 calls for cardiac arrest with identifiable linkage with HES and death registrations. After removing records that were ineligible for inclusion in the prediction models, there were a total of 26,904 eligible patients and, of these, 26,748 (99.4%) patients from 172 hospitals were included in the modelling. The breakdown of the inclusion/exclusion process for the development data set is shown in Figure 32. Characteristics and outcomes of in-hospital cardiac arrest patients in the development and validation data sets are summarised in Table 30.
FIGURE 32.
Flow diagram for cohort identification.
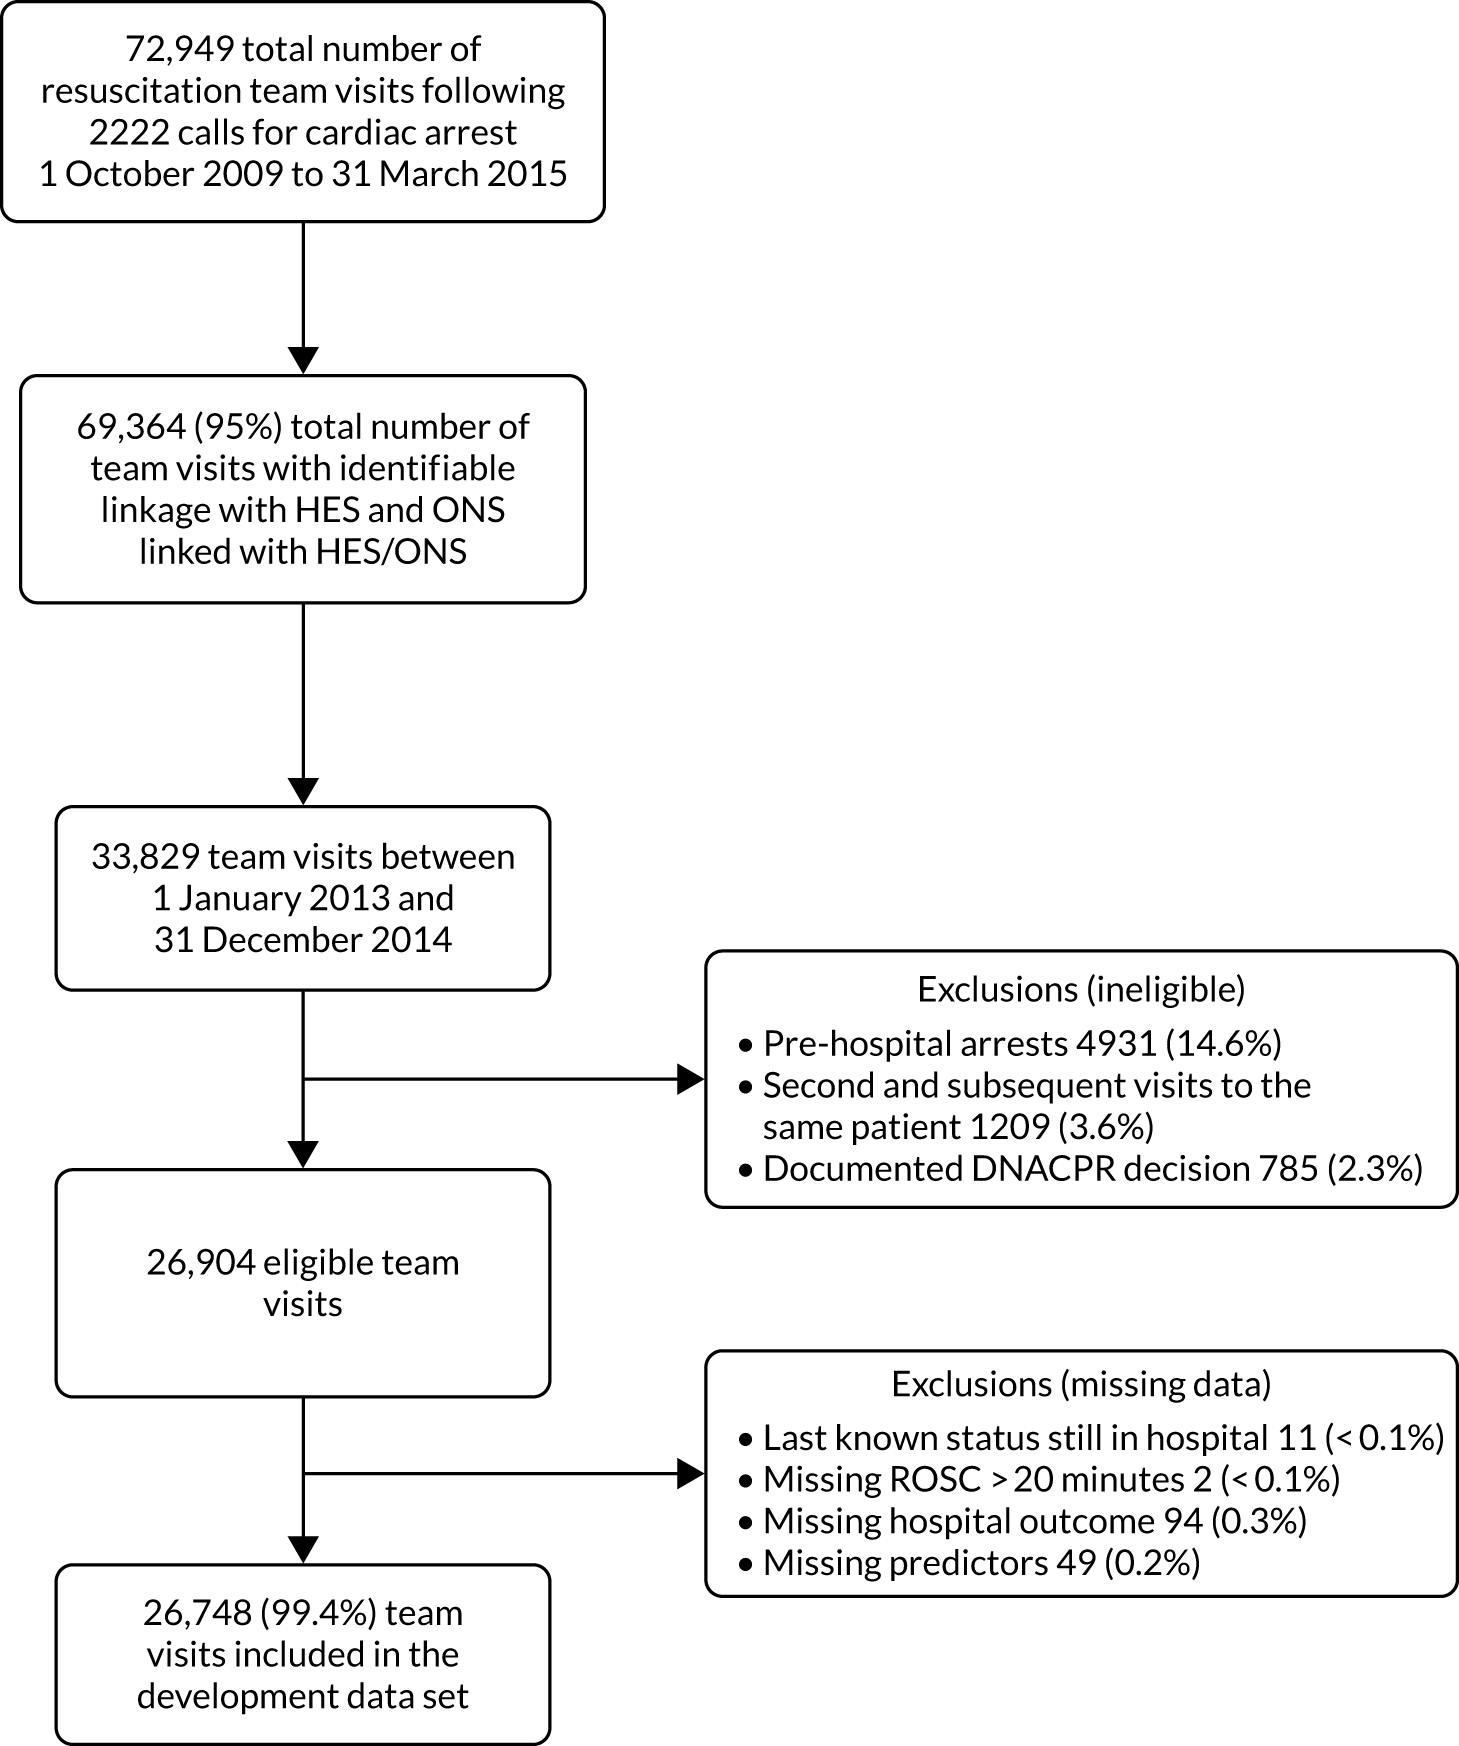
| Characteristic | Development (n = 26,748) | Validation (n = 7073) |
|---|---|---|
| Age (years), mean (SD) | 73 (16.4) | 73 (16.2) |
| Sex male, n (%) | 15,509 (58.0) | 4173 (59.0) |
| Length of stay in hospital (days) prior to 2222 call, median (IQR) | 2 (2–3) | 2 (2–3) |
| Reason for admission to/attendance at/visit to hospital, n (%) | ||
| Patient: medical | 21,752 (81.3) | 5955 (84.2) |
| Patient trauma | 843 (3.2) | 191 (2.7) |
| Patient: elective surgery | 1678 (6.3) | 354 (5.0) |
| Patient: emergency surgery | 2103 (7.9) | 451 (6.4) |
| Patient: obstetric | 41 (0.2) | 16 (0.2) |
| Outpatient | 286 (1.1) | 91 (1.3) |
| Staff or visitor | 50 (0.2) | 15 (0.2) |
| Location of arrest, n (%) | ||
| Obstetrics ward | 15,683 (58.6) | 4255 (60.2) |
| Emergency department | 2486 (9.3) | 643 (9.1) |
| Emergency admissions unit | 2161 (8.1) | 587 (8.3) |
| Theatre and recovery | 400 (1.5) | 96 (1.4) |
| Cardiac catheter laboratory | 876 (3.3) | 260 (3.7) |
| Imaging department | 352 (1.3) | 96 (1.4) |
| Specialist treatment area | 367 (1.4) | 102 (1.4) |
| ICU or ICU/HDU; PICU | 1344 (5.0) | 237 (3.4) |
| HDU; PHDU | 502 (1.9) | 104 (1.5) |
| Coronary care unit | 2329 (8.7) | 636 (9.0) |
| Other intermediate care area | 32 (0.1) | 4 (0.1) |
| Clinic | 111 (0.4) | 28 (0.4) |
| Non-clinical area | 109 (0.4) | 25 (0.4) |
| Patient deteriorating (not yet arrested) at team arrival, n (%) | 1412 (5.3) | 377 (5.3) |
| Presenting/first documented rhythm, n (%) | ||
| Ventricular fibrillation | 2746 (10.3) | 755 (10.7) |
| Ventricular tachycardia | 1218 (4.6) | 310 (4.4) |
| Shockable: unknown rhythm | 128 (0.5) | 45 (0.6) |
| Asystole | 6160 (23.0) | 1611 (22.8) |
| Pulseless electrical activity | 13,908 (52.0) | 3674 (51.9) |
| Bradycardia | 206 (0.8) | 56 (0.8) |
| Non-shockable: unknown rhythm | 566 (2.1) | 135 (1.9) |
| Unknown | 1821 (6.8) | 487 (6.9) |
| ROSC > 20 minutes, n (%) | 12,566 (47.0) | 3318 (46.9) |
| Hospital survival, n (%) | 5349 (20.0) | 1581 (22.4) |
Development of prediction models for return of spontaneous circulation > 20 minutes and hospital survival
Age was significantly non-linear in both models (p < 0.001 for ROSC > 20 minutes, p < 0.001 for hospital survival) and was modelled as a continuous, non-linear relationship using restricted cubic splines with five knots. When the current predictors for each outcome were reassessed, all were retained in the model (see Report Supplementary Material 1, Table S2). The initial main model, including the current predictors and interaction between location of arrest and presenting rhythm, had a c index of 0.718 for ROSC > 20 minutes and 0.816 for hospital survival.
Royal College of Surgeons Charlson comorbidities and their associated outcomes are described in Table 31. All candidate predictors were entered into the full model, which was then simplified based on significance and contribution to the model fit. After adjusting for current and new potential predictors, congestive cardiac failure, peripheral vascular disease, diabetes mellitus, chronic renal disease, malignancy and metastatic solid tumour were retained in the prediction model for ROSC > 20 minutes (see Appendix 2, Table 44). For hospital survival, congestive cardiac failure, peripheral vascular disease, liver disease, hemiplegia or paraplegia, malignancy and metastatic solid tumour were retained (see Appendix 2, Table 44).
| Comorbidity | Development (N = 26,748) | Validation (N = 7073) | ||||
|---|---|---|---|---|---|---|
| n (%) | ROSC > 20 min (%) | Hospital survival (%) | n (%) | ROSC > 20 min (%) | Hospital survival (%) | |
| MI | 1989 (7.4) | 46.0 | 19.5 | 717 (10.1) | 43.4 | 21.2 |
| Congestive cardiac failure | 3751 (14) | 44.0 | 17.2 | 1088 (15.4) | 47.3 | 18.8 |
| Peripheral vascular disease | 1726 (6.5) | 44.4 | 16.8 | 454 (6.4) | 48.0 | 21.1 |
| Cerebrovascular disease | 1247 (4.7) | 44.2 | 16.5 | 295 (4.2) | 48.8 | 21.7 |
| Dementia | 863 (3.2) | 36.1 | 10.2 | 253 (3.6) | 41.5 | 12.3 |
| Chronic pulmonary disease | 4576 (17.1) | 44.1 | 16.3 | 1260 (17.8) | 45.0 | 17.0 |
| Rheumatological disease | 707 (2.6) | 44.3 | 18.1 | 207 (2.9) | 40.6 | 15.9 |
| Liver disease | 708 (2.6) | 51.5 | 16.5 | 171 (2.4) | 42.7 | 12.3 |
| Diabetes mellitus | 4493 (16.8) | 48.6 | 19.0 | 1248 (17.6) | 46.3 | 19.5 |
| Hemiplegia or paraplegia | 265 (1.0) | 43.4 | 11.7 | 50 (0.7) | 52.0 | 28.0 |
| Chronic renal disease | 3242 (12.1) | 46.9 | 16.4 | 934 (13.2) | 45.6 | 17.1 |
| Malignancy | 2403 (9.0) | 39.5 | 12.9 | 641 (9.1) | 38.7 | 14.4 |
| Metastatic solid tumour | 738 (2.8) | 33.6 | 8.3 | 193 (2.7) | 32.6 | 12.4 |
| Full cohort | 26,748 | 47.0 | 20.0 | 7073 | 46.9 | 22.4 |
The incorporation of comorbidities in the prediction models produced a small improvement in the performance for both outcomes (Table 32). When the performance of the models including comorbidities was compared with the recalibrated current models (i.e. without comorbidities) using reclassification techniques (Tables 33 and 34), a total of 3507 (13.1%) patients were reclassified for ROSC > 20 minutes, with 1815 (51.8%) placed into more appropriate categories. The total NRI from including comorbidities was 0.0112 [standard error (SE) 0.0044; p = 0.0116]. When the reclassification for hospital survival was explored, 3646 (13.6%) were reclassified, with 1968 (54.0%) placed into more appropriate categories. The total NRI was 0.0189 (SE 0.0048; p = 0.0001).
| Model | df | LL | BIC | c index (95% CI) | Brier’s score |
|---|---|---|---|---|---|
| ROSC > 20 minutes | |||||
| Full model | 46 | –16263 | 32995 | 0.718 (0.712 to 0.724) | 0.212 |
| Full model + comorbidities | 52 | –16209 | 32949 | 0.722 (0.716 to 0.727) | 0.211 |
| Validation (n = 7073) | 0.718 (0.702 to 0.733) | 0.212 | |||
| Hospital survival | |||||
| Full model | 45 | –10268 | 20996 | 0.816 (0.809 to 0.821) | 0.121 |
| Full model + comorbidities | 51 | –10212 | 20945 | 0.818 (0.811 to 0.824) | 0.120 |
| Validation (n = 7073) | 0.816 (0.799 to 0.833) | 0.116 | |||
| One-year survival | |||||
| Full model | 45 | –9035 | 18529 | 0.823 (0.817 to 0.830) | 0.103 |
| Full model + comorbidities | 50 | –8920 | 18349 | 0.829 (0.822 to 0.835) | 0.102 |
| Validation (n = 7073) | 0.816 (0.799 to 0.833) | 0.116 | |||
| Risk category (currenta) | Risk category (newb) | |||||
|---|---|---|---|---|---|---|
| 0–24.99% | 25–39.99% | 40–49.99% | 50–69.99% | 70–74.99% | 75–100% | |
| Non-ROSC > 20min | ||||||
| 0–24.99% | 3140 | 174 | ||||
| 25–39.99% | 115 | 4012 | 483 | |||
| 40–49.99% | 2 | 438 | 2552 | 174 | ||
| 50–69.99% | 22 | 115 | 970 | 131 | ||
| 70–74.99% | 6 | 112 | 1229 | 42 | ||
| 75–100% | 1 | 29 | 437 | |||
| ROSC > 20min | ||||||
| 0–24.99% | 738 | 65 | ||||
| 25–39.99% | 44 | 2148 | 378 | |||
| 40–49.99% | 246 | 2077 | 212 | |||
| 50–69.99% | 11 | 128 | 1177 | 167 | ||
| 70–74.99% | 14 | 162 | 2616 | 153 | ||
| 75–100% | 83 | 2200 | ||||
| Risk category (currenta) | Risk category (newb) | |||||
|---|---|---|---|---|---|---|
| 0–1.99% | 2–4.99% | 5–9.99% | 10–19.99% | 20–49.99% | 50–100% | |
| Non-survivors | ||||||
| 0–1.99% | 389 | 131 | ||||
| 2–4.99% | 315 | 4025 | 477 | |||
| 5–9.99% | 15 | 534 | 5438 | 518 | ||
| 10–19.99% | 98 | 413 | 3855 | 262 | ||
| 20–49.99% | 22 | 252 | 3685 | 80 | ||
| 50–100% | 71 | 821 | ||||
| Survivors | ||||||
| 0–1.99% | 3 | |||||
| 2–4.99% | 7 | 140 | 21 | |||
| 5–9.99% | 17 | 466 | 71 | |||
| 10–19.99% | 3 | 50 | 682 | 65 | ||
| 20–49.99% | 1 | 70 | 1832 | 91 | ||
| 50–100% | 62 | 1766 | ||||
Full coefficients for the final models for ROSC > 20 minutes and hospital survival are presented in Appendix 3, Tables 50 and 51.
Validation of prediction models for return of spontaneous circulation > 20 minutes and hospital survival
After exclusions, a total of 7073 patients experiencing an in-hospital cardiac arrest between 1 January 2015 and 30 June 2015 comprised the validation cohort. As for the development cohort, discrimination and accuracy were better for hospital survival (c index 0.82, Brier’s score 0.116) than for ROSC > 20 minutes (c index 0.72, Brier’s score 0.212). Calibration plots showed good calibration for the validation cohort (Figure 33; see Report Supplementary Material 1, Figure S4).
FIGURE 33.
Calibration plot for ROSC > 20 minutes, hospital survival and for 1-year survival (validation set). (a) Hospital survival; (b) ROSC > 20 minutes; (c) 1-year survival.
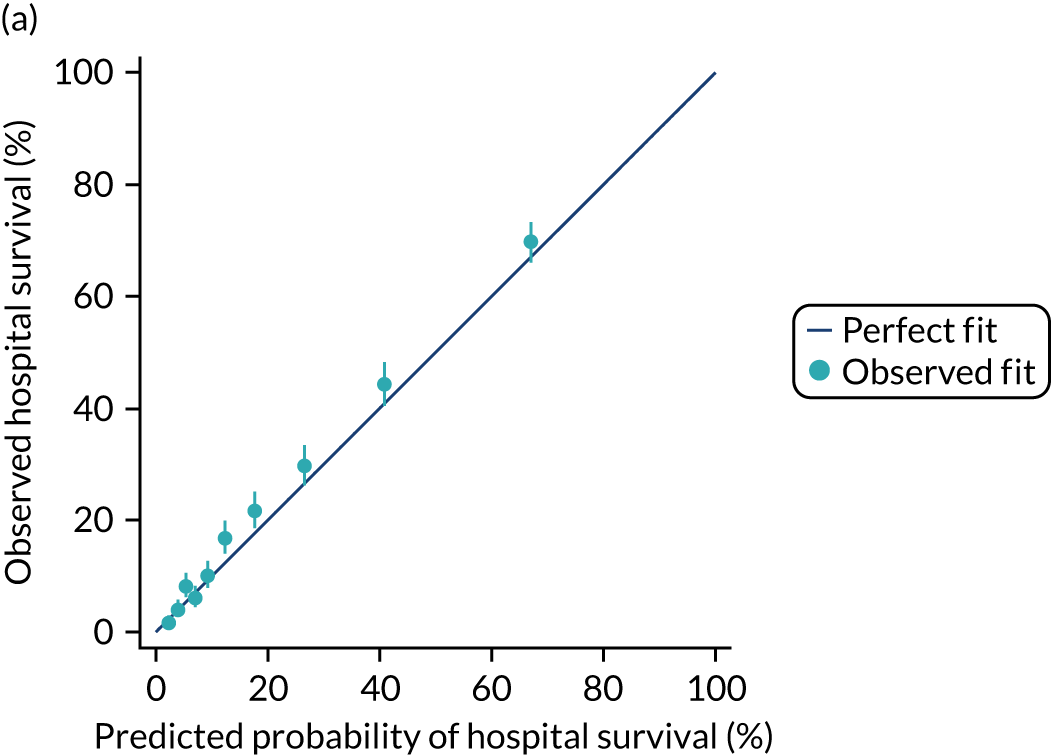
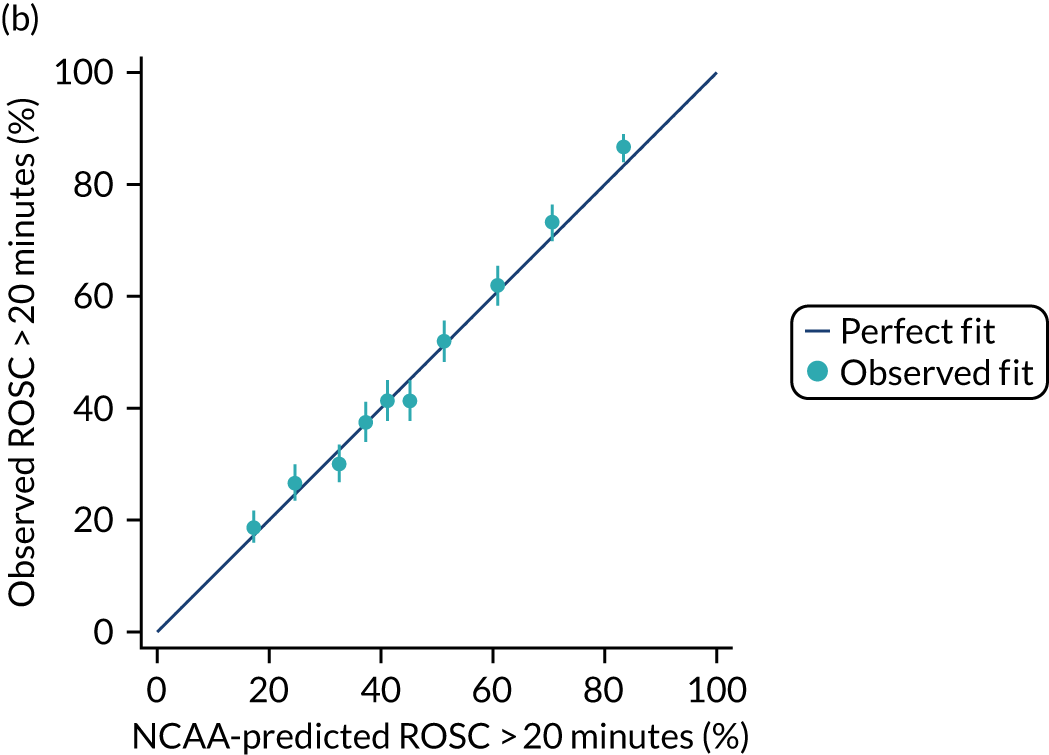
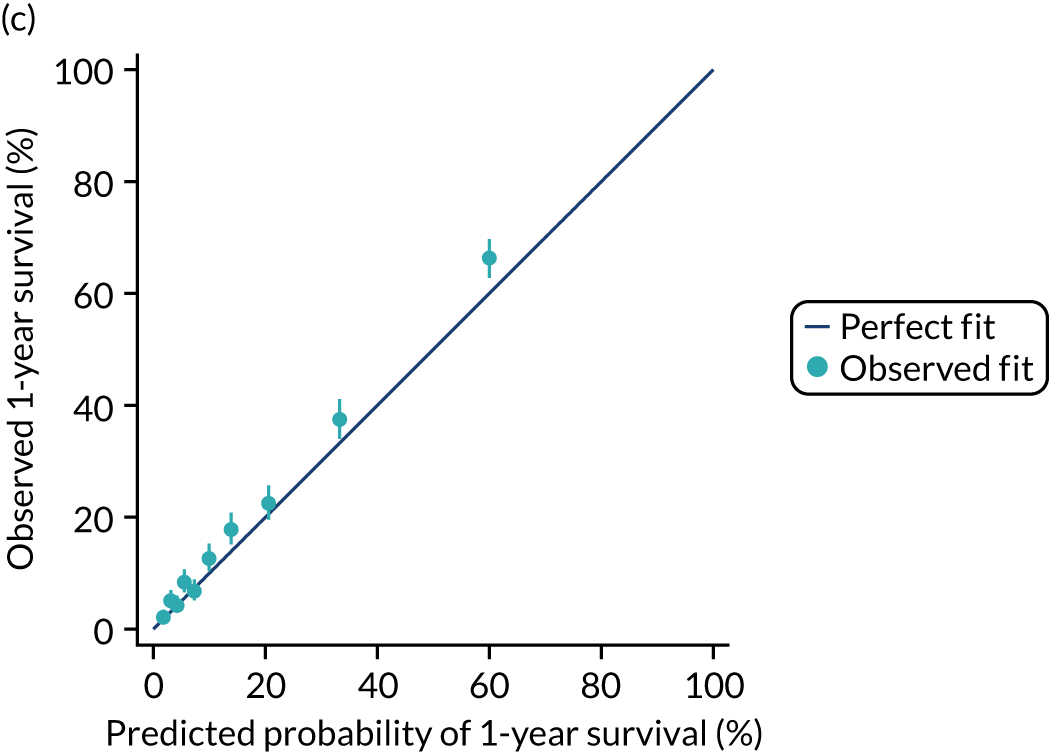
Development and validation of a prediction model for 1-year survival
A total of 4454 (16.7%) patients were alive after 1 year following an in-hospital cardiac arrest (Figure 34), 84% of 60-day survivors. All predictors, excluding pre-existing comorbidities, were reassessed for 1-year survival and were found to be significant (see Report Supplementary Material 1, Table S2). After their addition into the model, the following pre-existing comorbidities that were found significant for hospital survival significantly predicted 1-year survival following an in-hospital cardiac arrest: congestive cardiac failure, peripheral vascular disease, severe liver disease, malignancy and metastatic solid tumour. Chronic renal disease and dementia were also found to be significant predictors of 1-year survival, but hemiplegia or paraplegia was not (see Appendix 2, Table 44). Metastatic solid tumour, malignancy, congestive cardiac failure, severe liver disease and chronic renal disease had a relevant role in predicting 1-year survival. The 1-year survival model coefficients are presented in Appendix 3, Table 52. The model c index after addition of comorbidities was 0.829 (95% CI 0.822 to 0.835). The model showed good discrimination in the validation cohort, with a c index of 0.816 (95% CI 0.799 to 0.833) and a Brier score of 0.116 (see Table 32), and acceptable calibration (see Figure 33 and Report Supplementary Material 1, Figure S4).
FIGURE 34.
Kaplan–Meier survival estimate to 365 days following start cardiac arrest.
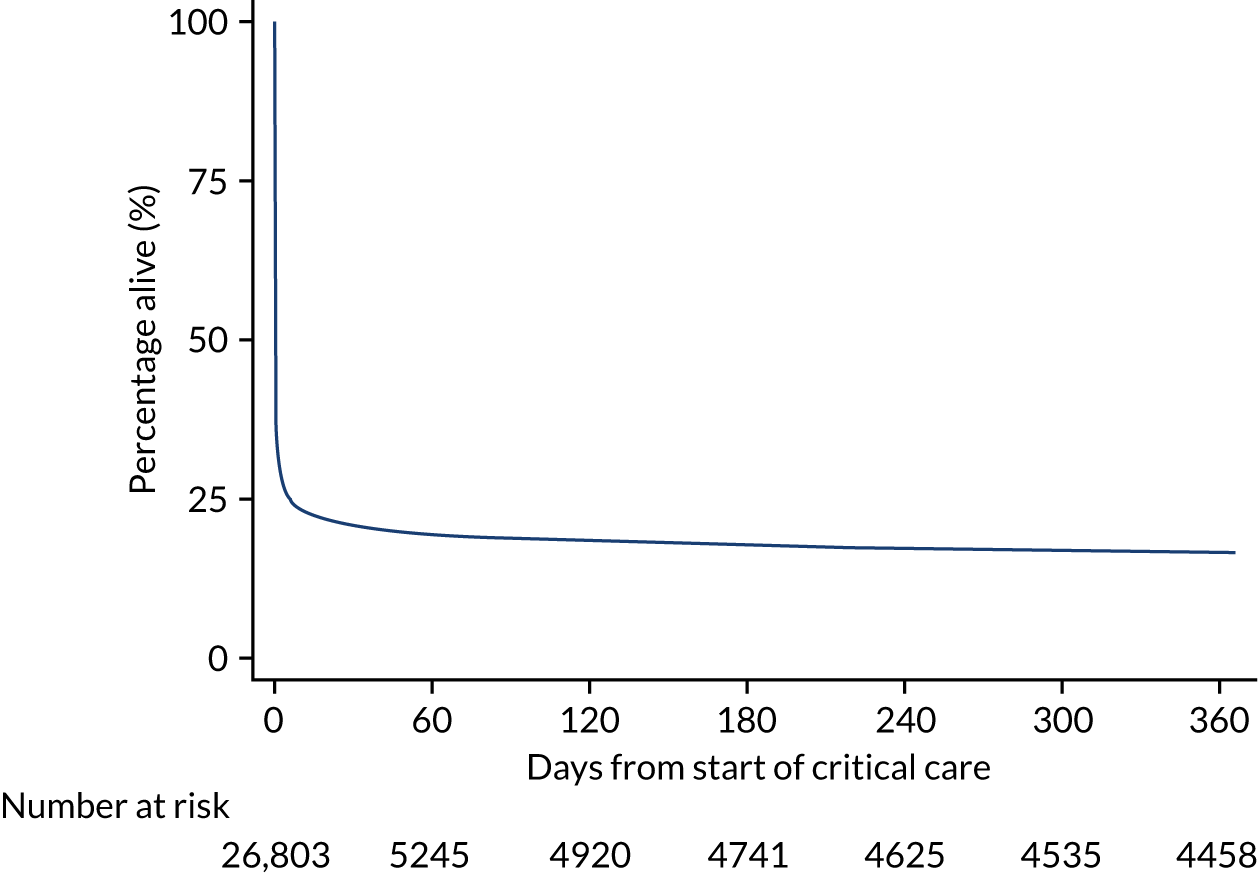
Modelling of critical care resource use following an in-hospital cardiac arrest
Methods
Methods common to all objectives and analyses were describe in Chapter 3. Details relating to the study cohorts and outcomes can be found in the same chapter.
Study cohort
The cohort for these models was the NCAA critical care admission cohort (see Chapter 3) of patients surviving the initial arrest with linked records in the CMP.
Inclusion and exclusion criteria
For development of the models, data were extracted from the NCAA critical care admission cohort for the full time period (1 April 2011 to 31 March 2015).
Outcomes and covariates
The outcome for modelling was defined as the total length of stay (in days and fractions of days) in a critical care unit (obtained through data linkage with the CMP) during the same hospital stay for the first team visit. Individuals with multiple hospital episodes were included multiple times in the analysis. Critical care unit length of stay was calculated using the time in minutes between the date and time of admission to critical care and the date and time of death or discharge from critical care and converted to days for analysis. For descriptive purposes, the critical care cost for each patient was calculated by assigning each critical care unit stay to a Healthcare Resource Group based on organ support data and costing each bed-day of care according to the national tariff for 2013. 93,94
Covariates included in the model for critical care unit length of stay comprised all predictors from the original prediction models for ROSC > 20 minutes and hospital survival (see Appendix 1, Table 40) plus the following baseline covariates from CMP: severe conditions in medical history (any severe condition or specific conditions of severe cardiovascular disease, end-stage renal failure, severe liver disease or severe respiratory disease), source of admission to critical care (via the emergency department, theatre or recovery, ward, clinic or home), diagnostic category (based on the body system of the primary reason for admission to critical care), ICNARC Physiology Score, number of advanced organ supports received (0–4 from advanced respiratory support, advanced cardiovascular support, renal support and neurological support) and type of organ failures (cardiovascular, respiratory, renal, haematological, metabolic acidosis).
Handling of missing data
Although the number of missing data for physiology was moderate, from 1.6% for highest respiratory rate to 7.5% for highest urea, we used multiple imputation to address the potential bias and loss of precision that could result from a complete-case analysis (see Chapter 3). Patients missing all physiology were excluded.
Statistical modelling
Critical care unit length of stay had a highly right-skewed distribution (see Report Supplementary Material 1, Figure S5) with most patients staying < 7 days. To model this, a generalised linear model with a gamma distribution and a log-link function was selected on grounds that it could describe the distribution of the data. 27 As the distribution of length of stay and the association between predictors and length of stay differs between hospital survivors and non-survivors (see Report Supplementary Material 1, Figure S6), analyses were stratified by these two groups. Non-linearity of covariate effects was investigated by using restricted cubic splines and all first order interactions were explored. We used predictive margins to reflect the overall predicted mean critical care unit length of stay and the predicted means for each determinant accounting for the other characteristics in the model. Predicted values were generated with continuous covariates centred and categorical covariates held at the reference category.
Results
There were 64,871 validated team visits between 1 April 2011 and 31 March 2015. After removing cardiac arrest non-survivors, second and subsequent team visits to the same patient, patients < 16 years and arrests in critical care, 18,410 first team visits (patients) were considered for linkage. A total of 4864 were successfully linked with CMP, which corresponded to 5594 unique critical care unit admissions, including transfers and re-admissions. The outcome of total critical care unit length of stay during the same hospital stay was then calculated for each patient. Only the information from the first critical care unit admission was then kept in the analysis. After excluding 23 patients missing all physiology, a total of 4841 patients were entered into the analysis.
Characteristics and outcomes of survivors of in-hospital cardiac arrest admitted to critical care are summarised in Table 35, split by hospital survivors and non-survivors. A total of 1839 (38.0%) patients admitted to critical care following in-hospital cardiac arrest were alive at hospital discharge and 3002 (62.0%) were hospital non-survivors. The mean total critical care unit length of stay was 8 days for survivors and 4 days for non-survivors, with mean costs of approximately £13,000 and £7000, respectively.
| Characteristics | Hospital survivors | Hospital non-survivors |
|---|---|---|
| Number of patients (%) | 1839 (38.0) | 3002 (62.0) |
| Age (years), mean (SD) | 64 (16) | 69 (14) |
| Reason for attendance, n (%) | ||
| Medical | 1293 (70.3) | 2451 (81.6) |
| Trauma | 56 (3.0) | 99 (3.3) |
| Elective/scheduled surgery | 227 (12.3) | 168 (5.6) |
| Emergency/urgent surgery | 145 (7.9) | 231 (7.7) |
| Obstetric | 37 (2.0) | 6 (0.2) |
| Outpatient | 65 (3.5) | 36 (1.2) |
| Staff/visitor | 15 (0.8) | 11 (0.4) |
| Prior hospital LOS, days, n (%) | ||
| 0 | 946 (51.4) | 1073 (35.7) |
| 1 | 331 (18.0) | 528 (17.6) |
| 2–7 | 361 (19.6) | 925 (30.8) |
| 8–30 | 179 (9.7) | 434 (14.5) |
| > 30 | 22 (1.2) | 42 (1.4) |
| Location of arrest, n (%) | ||
| Ward or obstetrics area | 773 (42) | 1676 (55.8) |
| Emergency department | 307 (16.7) | 473 (15.8) |
| Emergency admissions unit | 167 (9.1) | 303 (10.1) |
| Theatre and recovery | 170 (9.2) | 75 (2.5) |
| Cardiac catheter laboratory | 122 (6.6) | 108 (3.6) |
| Imaging department | 70 (3.8) | 73 (2.4) |
| Specialist treatment area | 49 (2.7) | 63 (2.1) |
| Coronary care unit | 126 (6.9) | 199 (6.6) |
| Other intermediate care area | 5 (0.3) | 5 (0.2) |
| Clinic | 24 (1.3) | 9 (0.3) |
| Non-clinical area | 24 (1.3) | 17 (0.6) |
| Status at team arrival, n (%) | ||
| Deteriorating, not yet arrested | 129 (7.0) | 217 (7.2) |
| Resuscitation ongoing | 1488 (80.9) | 2643 (88.1) |
| ROSC achieved | 222 (12.1) | 141 (4.7) |
| Presenting rhythm, n (%) | ||
| Shockable: VF | 383 (20.8) | 318 (10.6) |
| Shockable: VT | 131 (7.1) | 113 (3.8) |
| Shockable: unknown rhythm | 11 (0.6) | 13 (0.4) |
| Non-shockable: asystole | 178 (9.7) | 422 (14.1) |
| Non-shockable: PEA | 907 (49.3) | 1875 (62.5) |
| Non-shockable: Bradycardia | 13 (0.7) | 13 (0.4) |
| Non-shockable: unknown rhythm | 49 (2.7) | 62 (2.1) |
| Unknown/never determined | 167 (9.1) | 182 (6.1) |
| Monitored area non-shockable arrest | 263 (14.3) | 230 (7.7) |
| Severe conditions in the past medical history, n (%) | ||
| Severe cardiovascular disease | 44 (2.4) | 100 (3.3) |
| End-stage renal failure | 104 (5.7) | 122 (4.1) |
| Severe liver disease | 38 (2.1) | 111 (3.7) |
| Severe respiratory disease | 37 (2.0) | 127 (4.2) |
| Any severe condition in the past medical history | 314 (17.1) | 659 (22.0) |
| Reason for admission to critical care by body system, n (%) | ||
| Cardiovascular | 1040 (56.6) | 1638 (54.6) |
| Respiratory | 347 (18.9) | 584 (19.5) |
| Gastrointestinal | 120 (6.5) | 254 (8.5) |
| Neurological (including eyes) | 171 (9.3) | 313 (10.4) |
| Genito-urinary | 67 (3.6) | 72 (2.4) |
| Endocrine, metabolic, thermoregulation and poisoning | 67 (3.6) | 90 (3.0) |
| Haematological/Immunological | 2 (0.1) | 19 (0.6) |
| Musculoskeletal | 18 (1.0) | 22 (0.7) |
| Dermatological | 7 (0.4) | 7 (0.2) |
| ICNARC physiology score, mean (SD) | 22 (8) | 32 (10) |
| Advanced organ supports received, n (%) | ||
| Advanced respiratory support | 1425 (77.5) | 2777 (92.5) |
| Advanced cardiovascular support | 1035 (56.3) | 2129 (70.9) |
| Neurological support | 389 (21.2) | 961 (32.0) |
| Renal support | 302 (16.4) | 621 (20.7) |
| Number of advanced organ supports received, n (%) | ||
| 0 | 247 (13.4) | 106 (3.5) |
| 1 | 516 (28.1) | 556 (18.5) |
| 2 | 655 (35.6) | 1218 (40.6) |
| 3 | 359 (19.5) | 964 (32.1) |
| 4 | 62 (3.4) | 151 (5.0) |
| Total critical care unit length of stay (days), mean (SD) | 8 (12) | 4 (9) |
| Total critical care unit length of stay (days), median (IQR) | 4 (2–10) | 3 (1–6) |
| Total critical care cost (£), mean (SD) | 13,463 (20,309) | 6934 (14,743) |
| Total critical care cost (£), median (IQR) | 6291 (2761–16,567) | 4142 (1573 to 9664) |
Determinants of total critical care unit length of stay following in-hospital cardiac arrest in hospital survivors
Results of the multivariable analysis for total critical care unit length of stay following an in-hospital cardiac arrest in hospital survivors are presented in Appendix 3, Table 53. The following factors were significant in determining total critical care unit length of stay: location of arrest, presenting rhythm, reason for admission to critical care by body system, number of advanced organs supports received and severe conditions in the medical history. In addition, severity of illness, measured by the ICNARC Physiology Score, and age showed significantly non-linear associations with the total critical care unit length of stay. The interaction between severe conditions in the medical history and severity of illness also significantly influenced the total critical care unit length of stay following an in-hospital cardiac arrest.
The overall predicted mean for hospital survivors was 8.5 days (95% CI 8.0 to 9.2 days), being very similar to the observed mean. Taking into account the rest of the patients’ characteristics in the model, the mean for a patient that had an arrest on the ward would be 10 days but if they were located in theatre the mean is 6 days (Table 36). Patients presenting following pulseless electrical activity or bradycardia are likely to have a longer critical care unit length of stay than those who present following shockable rhythms or asystole. Figures 35 and 36 show the predicted values for age and for the ICNARC Physiology Score according to presence or absence of severe conditions in the medical history. We observe that for older patients the length of stay is shorter, and although the length of stay increases for sicker patients, the association is less strong for patients with severe conditions in their medical history.
| Predicted mean | 95% CI | |
|---|---|---|
| Overall predicted mean | 8.5 | 8.0 to 9.2 |
| Location of arrest | ||
| Ward, obstetrics area, other intermediate care area, clinic or non-clinical area | 10.4 | 9.3 to 11.3 |
| ED or emergency admission unit | 7.4 | 6.6 to 8.3 |
| Theatre and recovery | 5.9 | 4.7 to 7.0 |
| Cardiac catheter lab or CCU | 7.2 | 6.1 to 8.4 |
| Imaging department or specialist treatment area | 7.7 | 5.9 to 9.4 |
| Reason for admission by body system | ||
| Respiratory | 11.3 | 9.7 to 12.8 |
| Cardiovascular | 7.5 | 6.9 to 8.17 |
| Gastrointestinal | 10.6 | 8.2 to 13.0 |
| Neurological (including eyes) | 8.5 | 6.8 to 10.1 |
| Others | 7.6 | 6.1 to 9.1 |
| Number of advanced organs supports | ||
| 0 | 4.2 | 3.6 to 4.8 |
| 1 | 5.9 | 5.4 to 6.4 |
| 2 | 8.4 | 7.9 to 9.0 |
| 3 | 12.0 | 10.8 to 13.2 |
| 4 | 17.0 | 14.3 to 18.8 |
| Presenting rhythm | ||
| Shockable | 6.9 | 6.2 to 7.6 |
| Non-shockable | 9.6 | 8.8 to 10.3 |
FIGURE 35.
Predicted mean critical care unit length of stay for (a) hospital survivors and (b) hospital non-survivors by age. LOS, length of stay.
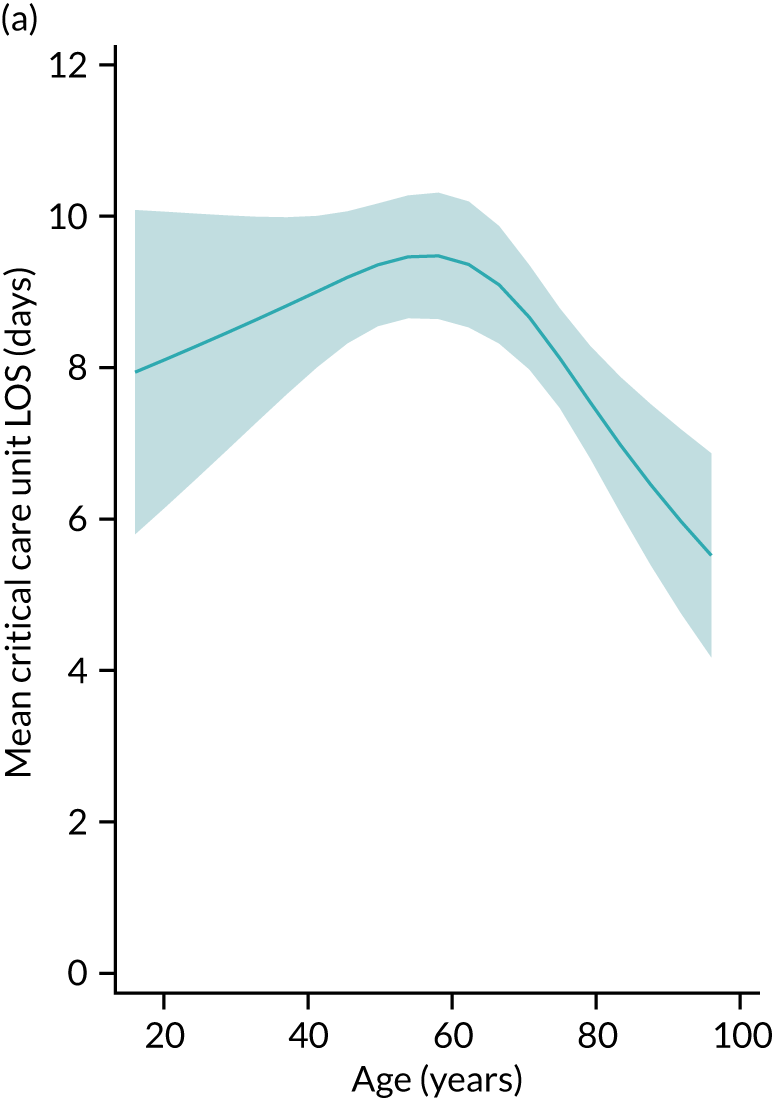
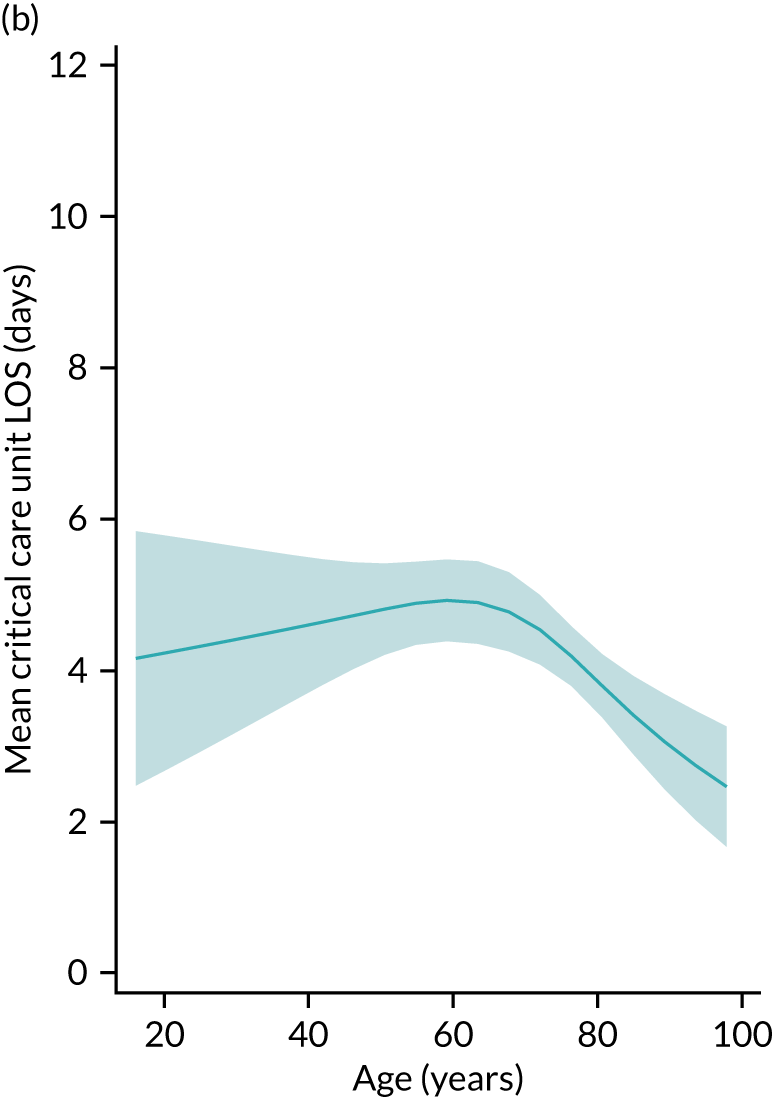
FIGURE 36.
Predicted mean critical care unit length of stay for hospital survivors by severity of illness and severe conditions in the past medical history. (a) No previous comorbidities; (b) previous comorbidities. ICU, intensive care unit; LOS, length of stay.
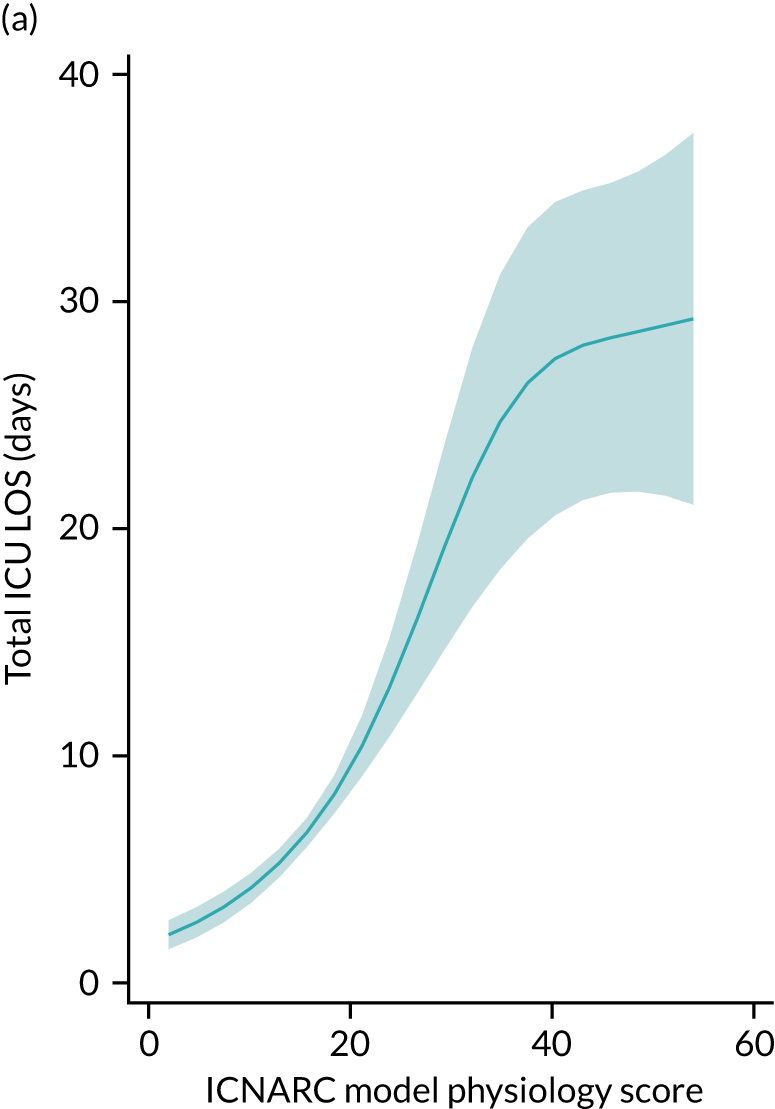
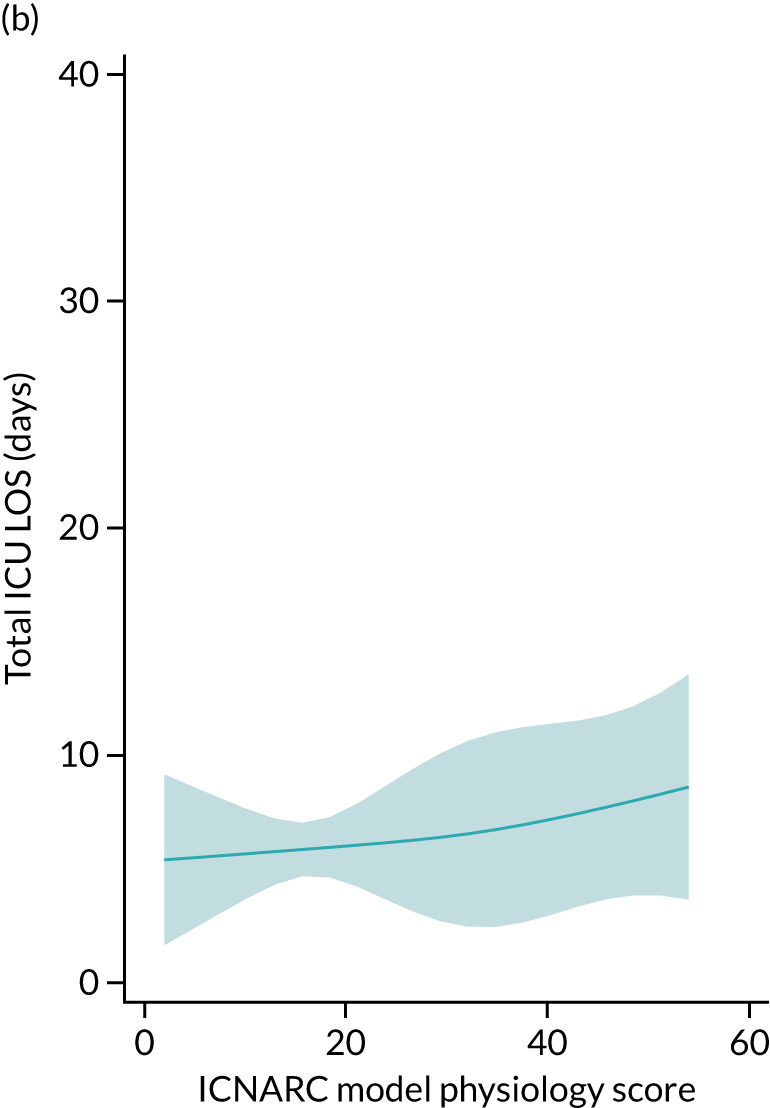
Determinants of total critical care unit length of stay following an in-hospital cardiac arrest in hospital non-survivors
For non-survivors, only the following variables significantly influenced the total critical care unit length of stay following in-hospital cardiac arrest: number of advanced organ supports received, age and the ICNARC physiology score, both modelled using restricted cubic splines. The interaction between the ICNARC physiology score and number of advanced organ supports was significant, meaning that the effect of illness severity varied across the number of organs supported (see Appendix 3, Table 54).
The overall predicted mean total critical care unit length of stay for non-survivors was 4.5 days (95% CI 4.0 to 4.7 days). The association with age was similar to that for survivors but with a lower resource use (see Figure 35). Predicted total critical care unit length of stay decreased for sicker patients but decreased differently according to the number of organs supported (Figure 37).
FIGURE 37.
Predicted mean critical care unit length of stay for hospital survivors by severity of illness and number of advanced organ supports.
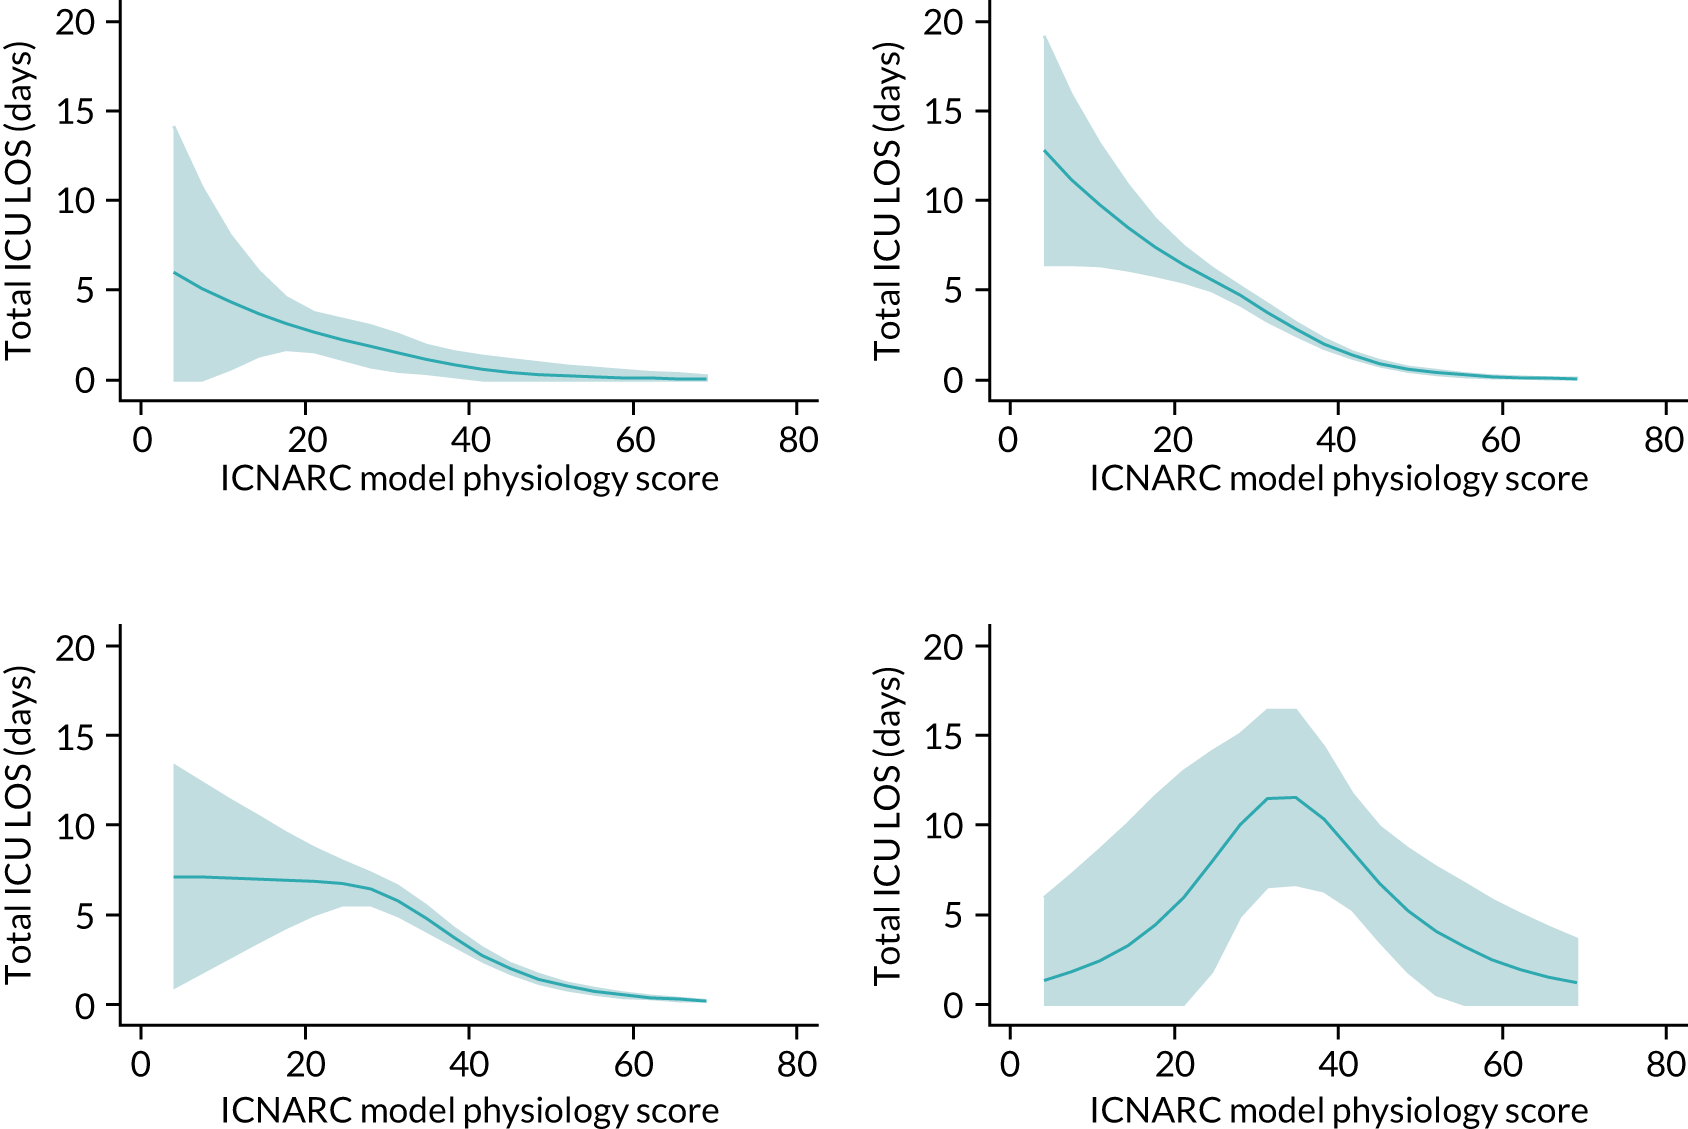
Discussion
Data linkage with HES revealed that comorbidities identified from routine hospital data contribute to predicting outcomes following an in-hospital cardiac arrest. Different comorbidities were important for predicting ROSC > 20 minutes and hospital survival, and some comorbidities were associated with better outcomes rather than worse outcomes (particularly for ROSC > 20 minutes). However, the overall improvement in model performance from adding comorbidities to the existing models was small.
A recent systematic review of prognostic factors identified very few publications evaluating the role of comorbidities. 95 Our findings regarding comorbidities shared many commonalities with the previous work from the AHA Get With The Guidelines – Resuscitation registry. 90 The predictors in their full model for hospital survival included prior heart failure (odds ratio 0.94 compared with 0.87 for congestive cardiac failure in our model), hepatic insufficiency (odds ratio 0.52 compared with 0.72 for liver disease in our model) and metastatic or haematological malignancy (odds ratio 0.47 compared with 0.45 for metastatic solid tumour and 0.73 for any malignancy in our model). Additional comorbidity predictors in the Get With The Guidelines – Resuscitation model were hypotension (odds ratio 0.64), renal insufficiency (odds ratio 0.80) and diabetes mellitus (odds ratio 1.14), whereas our model included peripheral vascular disease (odds ratio 0.82) and hemiplegia or paraplegia (odds ratio 0.64). The finding that diabetes was predictive of improved survival is consistent with our model for ROSC > 20 minutes (odds ratio 1.15), and the coefficients for diabetes were positive in our model for hospital survival although it was not retained in the final model. The reason for the association between diabetes mellitus and a better outcome after an in-hospital cardiac arrest is not clear and contrasts with the findings following out-of-hospital cardiac arrest,96 acute myocardial infarction97 and another study of in-hospital cardiac arrest,98 all of which showed diabetes mellitus to be associated with worse outcomes. In contrast, chronic renal disease was also predictive of improved ROSC > 20 minutes in our model (odds ratio 1.15) but was predictive of worse hospital survival in the Get With The Guidelines – Resuscitation model (odds ratio 0.80) and in other published models. 95 The precise reason for these differences between the NCAA and Get With The Guidelines – Resuscitation models are uncertain. The Get With The Guidelines – Resuscitation registry includes all in-hospital cardiac arrests including those occurring in critical care and perioperative settings, whereas NCAA includes only cardiac arrests attended by the hospital resuscitation team. In many UK hospitals cardiac arrests in closely monitored areas such as an intensive care unit are managed by the patient’s own clinical team, and the hospital resuscitation team is not called. The patient population to derive the Get With The Guidelines – Resuscitation model is therefore different in terms of the patient population from which it is derived.
Data linkage with death registrations allowed us to extend these models to predict 1-year survival following an in-hospital cardiac arrest. Functional conditions such as severe liver disease and chronic renal disease, as well as dementia, were important determinants for 1-year survival. Age and pre-existing conditions, such as malignancy and metastatic solid tumour, had a greater impact on longer-term survival than on hospital survival.
A systematic review99 of 1-year survival found huge variation in survival rates following an in-hospital cardiac arrest (95% prediction interval for a future study 5.6% to 28.8%, I2 = 100%). The review, however, pooled studies with very different inclusion criteria, for example those reporting on hospital survivors only and those on all in-hospital cardiac arrests, as well as studies restricted to particular subpopulations such as patients undergoing cardiac surgery or those in critical care. When restricted to 18 studies in populations of general in-hospital cardiac arrest patients, survival to 1-year post arrest ranged from 3.5% to 25.4%. Our observed survival of 16.6% falls well within this range. On the other hand, the majority of 60-day survivors are still alive 1-year after admission to critical care. This indicates a better long-term prognosis than might be expected by clinicians. To our knowledge, this is the first study to explicitly evaluate predictors of 1-year survival in an in-hospital cardiac arrest cohort. However, a previous study100 has investigated factors associated with 1-year survival without the need of in-home care, anoxic brain damage or nursing home admission.
Data linkage with the CMP allowed us to identify a set of patient characteristics significantly associated with the use of critical care following in-hospital cardiac arrest for hospital survivors and non-survivors. The following factors were significant in determining total critical care unit length of stay in survivors: age, location of arrest, presenting rhythm, reason for admission to critical care, number of advanced organ supports, severe conditions in the medical history, ICNARC physiology score, and the interaction between severe conditions in the medical history and ICNARC physiology score. For non-survivors, only age- and severity of illness-related variables (number of advanced organ supports and the ICNARC physiology score) significantly predicted the total critical care unit length of stay following an in-hospital cardiac arrest. None of the variables from NCAA had an important effect after adjusting for these CMP factors.
Our interest for this analysis was the identification of important determinants in the use of critical care following an in-hospital cardiac arrest. However, in comparatives studies,101 a Gamma regression model has provided more accurate estimation of population mean. We therefore believe that our results provide useful insight into prediction models for likely resource use. In the context of prediction, it is important to note that our models for critical care unit length of stay were stratified by hospital survival, an event that would not be known at the point of prediction. Therefore, two predictions should be considered for each patient: the predicted length of stay conditional on survival and the predicted length of stay conditional on death. If a prediction of overall mean length of stay was required, these two predicted means would need to be weighted by predicted survival.
Chapter 11 Conclusions
Summary of findings
We have successfully linked CMP and NCAA with five other data sources, providing enhancements in risk models for these audits in the form of additional predictors and novel outcome measures.
When developing risk models for mortality following admission to adult critical care, predictors and performance were similar for a model based on 30-day mortality compared with the previous model for acute hospital mortality. Using 30-day mortality in place of acute hospital mortality did not reduce heterogeneity among providers. Models for longer-term outcomes reflected the increasing importance of chronic ill health and comorbidities over acute conditions. We have also developed, for the first time, models for predicting new onset chronic illness (ESRD and type 2 diabetes) following critical care. These offer not only the opportunity to benchmark critical care units on a wider panel of patient-centred longer-term outcomes other than mortality, but also the potential to identify patients at increased risk of these outcomes who may benefit from more intensive post-critical care follow-up. By comparison, the National Institute for Health and Care Excellence guideline on assessment and management of chronic kidney disease102 recommends the use of the Kidney Failure Risk Equation103 to guide decisions about referral to nephrology from primary care.
Almost half of acute hospital survivors following critical care accrued further acute hospital costs during the subsequent year following discharge. We therefore modelled this with a two-part model, first evaluating predictors of hospital re-admission and second modelling costs conditional on re-admission. The strongest predictors of health-care costs following critical care were prior hospitalisation, prior dependency and severe conditions in the medical history (particularly for younger patients).
We extended an existing model for predicting acute hospital mortality among patients admitted to cardiothoracic critical care units following cardiac surgery by incorporating additional pre- and intra-operative predictors. Although a number of these new predictors were identified as making an important contribution to the model, there was little improvement in overall performance. When the new model was compared with the generic ICNARCH-2015 model currently used for benchmarking in these units, performance was similar. Using a generic model offers other advantages over a model specific to cardiac surgery, as the proportion of pure cardiac surgery admissions to cardiothoracic critical care units varies considerably among units, and we would therefore recommend ongoing use of the generic model.
We extended existing models for predicting ROSC > 20 minutes and hospital survival following an in-hospital cardiac arrest by incorporating additional comorbidities. Improvements to model performance were, however, small, and therefore the current models remain fit for purpose. As with the models for mortality following admission to adult critical care, comorbidities were of greater importance in models for longer-term outcomes following an in-hospital cardiac arrest. Different factors were found to be predictive of the critical care unit length of stay among survivors of an in-hospital cardiac arrest depending on hospital survival status. Among hospital survivors, many factors were predictive, including age, chronic health, arrest characteristics and acute severity of illness. Among hospital non-survivors, only age and acute severity of illness remained significant.
The greatest barrier to maximising the full potential of data linkage in this project was the inordinate amount of time required to obtain and maintain approvals for the use of multiple data sources from multiple data controllers. A consequence of this is that the data included in the modelling are already 5 years old at the point of publication, meaning that the models developed will already be in need of recalibration. Regrettably, this observation is neither new nor in any way unique to this project,104–108 although we may be unique in the sheer number of different issues and delays faced in a single project. The COVID-19 pandemic has demonstrated that these barriers can be removed, or at least greatly reduced, when there is sufficient political will and public health imperative to do so. This has resulted in numerous data linkage projects that have helped to move forward our understanding of this novel threat. 109–113 An open letter to the UK Information Commissioner, Chief Medical Officers and data providers with 374 signatories (representing researchers involved in health and administrative data research) identified four ways in which administrative data research should not return to ‘business as usual’ following the pandemic:
-
reduce costs of administrative data access to researchers through core government funding
-
simplify approval processes for de-identified data access, in a way that is proportionate to the risk of re-identification
-
reduce data release delays through increased capacity and more specialised data providers
-
enable more efficient data use through remote systems that comply with data protection requirements. 114
To help address these issues, Health Data Research UK is championing the use of trusted research environments (also known as data safe havens) to enable secure and trustworthy access to health data for research. 115 Health Data Research UK promote the ‘five safes’ model (safe people, safe projects, safe settings, safe data, safe outputs) to ensure a responsible approach to data security and privacy.
If these issues can successfully be addressed, then data linkage with administrative and routine clinical data sources continues to have the potential to benefit national clinical audits, as demonstrated in this project, but also in observational comparative effectiveness research116 and data-enabled trials. 117
Implications for health care
These results have potentially important implications for future benchmarking of critical care units through the CMP and NCAA. Having demonstrated the feasibility of these linkages, ICNARC should investigate cost-effective approaches to routinely link data to support ongoing reporting from the audits. Although there are potential practical benefits for benchmarking based on 30-day mortality rather than hospital mortality, for example the lack of missing data from patients with a long duration of hospital stay, the implications of these for timely reporting are likely to be outweighed by the time and cost associated with the data linkage process. Although comorbidities were found to improve predictions, they had a greater influence on longer-term than shorter-term outcomes. Given the time-lags involved in linking data, we propose that initial quarterly reporting for the audits continue to use directly collected data and that data linkage is undertaken annually to provide enhanced annual reporting including 1-year outcomes. Results of the models presented in this report should be reviewed to identify any key additional predictors to incorporate into direct data collection for the audits.
At the bedside, the new models developed in this report (particularly those relating to longer-term outcomes) may assist in providing objective estimates of potential outcomes to patients and their families. A better understanding of factors predictive of worse longer-term outcomes may help to identify those patients requiring greater support in their recovery following critical illness.
Recommendations for research
To maximise potential for use of linked data for research, it is essential that the research community and data providers come together to streamline approaches to data access. This necessity underpins the following recommendations with regard to further research using linked health-care data:
-
The availability of models developed in this project to predict patients with an increased risk of chronic health outcomes and greater subsequent health-care costs following an episode of critical illness provides the opportunity to target interventions earlier in the recovery phase for those at greater risk. We recommend multidisciplinary research to develop and test care pathways for recovery following critical illness targeted at those with the greatest need.
-
Data linkage with UKRR and NDA has confirmed the feasibility of using linked data to model longer-term outcomes following critical illness. We recommend that further relevant data sources should be explored, for example stroke.
-
Data linkage with HES admitted patient care records allowed us to consider the hospitalisation costs following critical illness. To better understand the resource use and costs following critical illness, we recommend widening data linkage to include primary care, outpatient and emergency department data.
Acknowledgements
We wish to thank all the staff at critical care units participating in the CMP (www.icnarc.org/Our-Audit/Audits/Cmp/About/Participation) and hospitals participating in the NCAA (www.icnarc.org/Our-Audit/Audits/Ncaa/About/Participation).
In addition, we wish to thank Retha Steenkamp (UK Renal Registry), Cher Cartwright (National Diabetes Audit), and Andrew Harrison and Anil Gunesh (NICOR) for their contributions to the data linkage for this study.
Investigators
Professor David A Harrison (Chief Investigator), Ms Paloma Ferrando-Vivas, Dr Fergus J Caskey, Dr Steve Harris, Dr Naomi Holman, Mr David Jenkins, Dr Stephen Webb, Professor Jerry P Nolan, Dr Jasmeet Soar and Professor Kathryn M Rowan.
Study steering committee
Professor David Cromwell (Independent Chair), Professor Gary Collins (Independent), Dr Gillian Fargher (Independent PPI), Ms Paloma Ferrando-Vivas (Investigator), Professor David A Harrison (Chief Investigator), Dr Nazir Lone (Independent), Mr Richard Mills (Independent), Mrs Cathy Taylor (Independent PPI) and Mr Ian Taylor (Independent PPI).
Contributions of authors
Paloma Ferrando-Vivas (https://orcid.org/0000-0002-2163-645X) (Statistician/Risk Modeller) conceived the study; contributed to the design of the study and the acquisition, analysis and interpretation of the data; and drafted and critically reviewed the manuscript.
Manu Shankar-Hari (https://orcid.org/0000-0002-5338-2538) (Professor in Critical Care Medicine and NIHR Clinician Scientist) contributed to the design of the study and the interpretation of the data, and critically reviewed the manuscript.
Karen Thomas (https://orcid.org/0000-0001-7548-4466) (Senior Statistician) contributed to the interpretation of the data and critically reviewed the manuscript.
James C Doidge (https://orcid.org/0000-0002-3674-3100) (Senior Statistician) contributed to the interpretation of the data and critically reviewed the manuscript.
Fergus J Caskey (https://orcid.org/0000-0002-5199-3925) (Consultant Senior Lecturer) conceived the study, contributed to the design of the study and the acquisition and interpretation of the data, and critically reviewed the manuscript.
Lui Forni (https://orcid.org/0000-0002-0617-5309) (Professor and Consultant Intensivist/Nephrologist) contributed to the design of the study and the interpretation of data and critically reviewed the manuscript.
Steve Harris (https://orcid.org/0000-0002-4982-1374) (Consultant in Critical Care & Perioperative Medicine and Honorary Associate Professor) conceived the study, contributed to the design of the study and the interpretation of the data, and critically reviewed the manuscript.
Marlies Ostermann (https://orcid.org/0000-0001-9500-9080) (Consultant in Nephrology and Critical Care) contributed to the design of the study and the interpretation of data and critically reviewed the manuscript.
Ivan Gornik (https://orcid.org/0000-0001-6146-1327) (Assistant Professor of Medicine) contributed to the design of the study and the interpretation of data and critically reviewed the manuscript.
Naomi Holman (https://orcid.org/0000-0002-7432-5786) (Research Assistant) conceived the study, contributed to the design of the study and the acquisition and interpretation of the data, and critically reviewed the manuscript.
Nazir Lone (https://orcid.org/0000-0003-2707-2779) (Senior Clinical Lecturer in Critical Care) contributed to the design of the study and the interpretation of data, and critically reviewed the manuscript.
Bob Young (https://orcid.org/0000-0002-1245-0100) (Clinical Lead, National Diabetes Audit) contributed to the design of the study and the interpretation of data, and critically reviewed the manuscript.
David Jenkins (https://orcid.org/0000-0003-3545-7580) (Consultant Cardiothoracic Surgeon) contributed to the design of the study and the interpretation of data, and critically reviewed the manuscript.
Stephen Webb (https://orcid.org/0000-0002-2413-7883) (Consultant in Intensive Care) conceived the study, contributed to the design of the study and the interpretation of the data, and critically reviewed the manuscript.
Jerry P Nolan (https://orcid.org/0000-0003-3141-3812) (Professor of Resuscitation Medicine and Consultant in Anaesthesia and Intensive Care Medicine) conceived the study, contributed to the design of the study and the interpretation of the data, and critically reviewed the manuscript.
Jasmeet Soar (https://orcid.org/0000-0001-5970-6073) (Consultant in Anaesthetics & Intensive Care Medicine) conceived the study, contributed to the design of the study and the interpretation of the data, and critically reviewed the manuscript.
Kathryn M Rowan (https://orcid.org/0000-0001-8217-5602) (Director and Honorary Professor) conceived the study, contributed to the design of the study and the interpretation of the data, and critically reviewed the manuscript.
David A Harrison (https://orcid.org/0000-0002-9002-9098) (Head Statistician and Honorary Professor) conceived and led the study; contributed to the design of the study and the acquisition, analysis and interpretation of the data; and drafted and critically reviewed the manuscript.
Data-sharing statement
All data requests should be submitted to the corresponding author for consideration. Access to available anonymised data or study materials may be granted following review.
Patient data
This work uses data provided by patients and collected by the NHS as part of their care and support. Using patient data are vital to improve health and care for everyone. There is huge potential to make better use of information from people’s patient records, to understand more about disease, develop new treatments, monitor safety, and plan NHS services. Patient data should be kept safe and secure, to protect everyone’s privacy, and it’s important that there are safeguards to make sure that it is stored and used responsibly. Everyone should be able to find out about how patient data are used. #datasaveslives You can find out more about the background to this citation here: https://understandingpatientdata.org.uk/data-citation.
Disclaimers
This report presents independent research funded by the National Institute for Health and Care Research (NIHR). The views and opinions expressed by authors in this publication are those of the authors and do not necessarily reflect those of the NHS, the NIHR, the HSDR programme or the Department of Health and Social Care. If there are verbatim quotations included in this publication the views and opinions expressed by the interviewees are those of the interviewees and do not necessarily reflect those of the authors, those of the NHS, the NIHR, the HSDR programme or the Department of Health and Social Care.
References
- Davies SC. Annual Report of the Chief Medical Officer, Volume One, 2011: On the State of the Public’s Health 2012.
- Zimmerman JE, Kramer AA. A history of outcome prediction in the ICU. Curr Opin Crit Care 2014;20:550-6. https://doi.org/10.1097/MCC.0000000000000138.
- Harrison DA, Brady AR, Rowan K. Case mix, outcome and length of stay for admissions to adult, general critical care units in England, Wales and Northern Ireland: the Intensive Care National Audit. Research Centre Case Mix Programme Database. Crit Care 2004;8:R99-111. https://doi.org/10.1186/cc2834.
- Nolan JP, Soar J, Smith GB, Gwinnutt C, Parrott F, Power S, et al. Incidence and outcome of in-hospital cardiac arrest in the United Kingdom National Cardiac Arrest Audit. Resuscitation 2014;85:987-92. https://doi.org/10.1016/j.resuscitation.2014.04.002.
- Power GS, Harrison DA. Why try to predict ICU outcomes?. Curr Opin Crit Care 2014;20:544-9. https://doi.org/10.1097/mcc.0000000000000136.
- Harrison DA, Ferrando-Vivas P, Shahin J, Rowan KM. Ensuring comparisons of health-care providers are fair: development and validation of risk prediction models for critically ill patients. Health Serv Deliv Res 2015;3. https://doi.org/10.3310/hsdr03410.
- Ferrando-Vivas P, Jones A, Rowan KM, Harrison DA. Development and validation of the new ICNARC model for prediction of acute hospital mortality in adult critical care. J Crit Care 2017;38:335-9. https://doi.org/10.1016/j.jcrc.2016.11.031.
- Harrison DA, Patel K, Nixon E, Soar J, Smith GB, Gwinnutt C, et al. Development and validation of risk models to predict outcomes following in-hospital cardiac arrest attended by a hospital-based resuscitation team. Resuscitation 2014;85:993-1000. https://doi.org/10.1016/j.resuscitation.2014.05.004.
- Hutchings A, Durand MA, Grieve R, Harrison D, Rowan K, Green J, et al. Evaluation of modernisation of adult critical care services in England: time series and cost effectiveness analysis. BMJ 2009;339. https://doi.org/10.1136/bmj.b4353.
- Herbert A, Wijlaars L, Zylbersztejn A, Cromwell D, Hardelid P. Data resource profile: Hospital Episode Statistics Admitted Patient Care (HES APC). Int J Epidemiol 2017;46:1093-1093i. https://doi.org/10.1093/ije/dyx015.
- NHS Digital . [MI] National Data Opt-Out, July 2018 2018.
- Limb M. Controversial database of medical records is scrapped over security concerns. BMJ 2016;354. https://doi.org/10.1136/bmj.i3804.
- GDPR.EU . Complete Guide to GDPR Compliance n.d. https://gdpr.eu (accessed 28 October 2022).
- Harrison DA, Brady AR, Parry GJ, Carpenter JR, Rowan K. Recalibration of risk prediction models in a large multicenter cohort of admissions to adult, general critical care units in the United Kingdom. Crit Care Med 2006;34:1378-88. https://doi.org/10.1097/01.CCM.0000216702.94014.75.
- Department of Health and Social Care . NHS Reference Costs 2013 to 2014 2014.
- Shahin J, Ferrando-Vivas P, Power GS, Biswas S, Webb ST, Rowan KM, et al. The Assessment of Risk in Cardiothoracic Intensive Care (ARCtIC): prediction of hospital mortality after admission to cardiothoracic critical care. Anaesthesia 2016;71:1410-16. https://doi.org/10.1111/anae.13624.
- Armitage JN, van der Meulen JH. Royal College of Surgeons Co-morbidity Consensus Group . Identifying co-morbidity in surgical patients using administrative data with the Royal College of Surgeons Charlson Score. Br J Surg 2010;97:772-81. https://doi.org/10.1002/bjs.6930.
- Knaus WA, Draper EA, Wagner DP, Zimmerman JE. APACHE II: a severity of disease classification system. Crit Care Med 1985;13:818-29. https://doi.org/10.1097/00003246-198510000-00009.
- Armitage JN. The Epidemiology and Management of Acute Urinary Retention: A Study Based on Hospital Episode Statistics and Systematic Literature Review 2011.
- Singer M, Deutschman CS, Seymour CW, Shankar-Hari M, Annane D, Bauer M, et al. The Third International Consensus Definitions for Sepsis and Septic Shock (Sepsis-3). JAMA 2016;315:801-10. https://doi.org/10.1001/jama.2016.0287.
- Shankar-Hari M, Harrison DA, Rubenfeld GD, Rowan K. Epidemiology of sepsis and septic shock in critical care units: comparison between sepsis-2 and sepsis-3 populations using a national critical care database. Br J Anaesth 2017;119:626-36. https://doi.org/10.1093/bja/aex234.
- van Buuren S. Multiple imputation of discrete and continuous data by fully conditional specification. Stat Methods Med Res 2007;16:219-42. https://doi.org/10.1177/0962280206074463.
- Bartlett JW, Seaman SR, White IR, Carpenter JR. Multiple imputation of covariates by fully conditional specification: accommodating the substantive model. Stat Methods Med Res 2014;24:462-87. https://doi.org/10.1177/0962280214521348.
- Moons KG, Donders RA, Stijnen T, Harrell FE. Using the outcome for imputation of missing predictor values was preferred. J Clin Epidemiol 2006;59:1092-101. https://doi.org/10.1016/j.jclinepi.2006.01.009.
- Prentice RL, Kalbfleisch JD, Peterson AV, Flournoy N, Farewell VT, Breslow NE. The analysis of failure times in the presence of competing risks. Biometrics 1978;34:541-54. https://doi.org/10.2307/2530374.
- Fine JP, Gray RJ. A proportional hazards model for the subdistribution of a competing risk. J Am Stat Assoc 1999;94:496-509. https://doi.org/10.1080/01621459.1999.10474144.
- Malehi AS, Pourmotahari F, Angali KA. Statistical models for the analysis of skewed healthcare cost data: a simulation study. Health Econ Rev 2015;5. https://doi.org/10.1186/s13561-015-0045-7.
- Harrell FE. Regression Modeling Strategies: With Applications to Linear Models, Logistic and Ordinal Regression, and Survival Analysis. New York: Springer Science + Media Business; 2001.
- Hanley JA, McNeil BJ. The meaning and use of the area under a receiver operating characteristic (ROC) curve. Radiology 1982;143:29-36. https://doi.org/10.1148/radiology.143.1.7063747.
- Brier GW. Verification of forecasts expressed in terms of probability. Monthly Weather Rev 1950;75:1-3. https://doi.org/10.1175/1520-0493(1950)078<0001:VOFEIT>2.0.CO;2.
- Cox DR. Two further applications of a model for binary regression. Biometrika 1958;45:562-5. https://doi.org/10.1093/biomet/45.3-4.562.
- Kramer AA, Zimmerman JE. Assessing the calibration of mortality benchmarks in critical care: The Hosmer-Lemeshow test revisited. Crit Care Med 2007;35:2052-6. https://doi.org/10.1097/01.CCM.0000275267.64078.B0.
- Steyerberg EW, Harrell FE, Borsboom GJ, Eijkemans MJ, Vergouwe Y, Habbema JD. Internal validation of predictive models: efficiency of some procedures for logistic regression analysis. J Clin Epidemiol 2001;54:774-81. https://doi.org/10.1016/S0895-4356(01)00341-9.
- Harrell FE, Lee KL, Mark DB. Multivariable prognostic models: issues in developing models, evaluating assumptions and adequacy, and measuring and reducing errors. Stat Med 1996;15:361-87. https://doi.org/10.1002/(SICI)1097-0258(19960229)15:4<361::AID-SIM168>3.0.CO;2-4.
- Miao Y, Cenzer I, Kirby A, Boscardin W. Estimating Harrell’s Optimism on Predictive Indices Using Bootstrap Samples n.d.
- Pencina MJ, D’Agostino RB, D’Agostino RB, Vasan RS. Evaluating the added predictive ability of a new marker: from area under the ROC curve to reclassification and beyond. Stat Med 2008;27:157-72. https://doi.org/10.1002/sim.2929.
- Hill AD, Fowler RA, Pinto R, Herridge MS, Cuthbertson BH, Scales DC. Long-term outcomes and healthcare utilization following critical illness – a population-based study. Crit Care 2016;20. https://doi.org/10.1186/s13054-016-1248-y.
- Lone NI, Gillies MA, Haddow C, Dobbie R, Rowan KM, Wild SH, et al. Five-year mortality and hospital costs associated with surviving intensive care. Am J Respir Crit Care Med 2016;194:198-20. https://doi.org/10.1164/rccm.201511-2234OC.
- Azoulay E, Vincent JL, Angus DC, Arabi YM, Brochard L, Brett SJ, et al. Recovery after critical illness: putting the puzzle together-a consensus of 29. Crit Care 2017;21. https://doi.org/10.1186/s13054-017-1887-7.
- Harrison DA, Parry GJ, Carpenter JR, Short A, Rowan K. A new risk prediction model for critical care: the Intensive Care National Audit & Research Centre (ICNARC) model. Crit Care Med 2007;35:1091-8. https://doi.org/10.1097/01.CCM.0000259468.24532.44.
- Engerström L, Kramer AA, Nolin T, Sjöberg F, Karlström G, Fredrikson M, et al. Comparing time-fixed mortality prediction models and their effect on ICU performance metrics using the Simplified Acute Physiology Score 3. Crit Care Med 2016;44:e1038-44. https://doi.org/10.1097/CCM.0000000000001877.
- Brinkman S, Abu-Hanna A, de Jonge E, de Keizer NF. Prediction of long-term mortality in ICU patients: model validation and assessing the effect of using in-hospital versus long-term mortality on benchmarking. Intensive Care Med 2013;39:1925-31. https://doi.org/10.1007/s00134-013-3042-5.
- Ranzani OT, Zampieri FG, Park M, Salluh JI. Long-term mortality after critical care: what is the starting point?. Crit Care 2013;17. https://doi.org/10.1186/cc13024.
- Young JD, Goldfrad C, Rowan K. Development and testing of a hierarchical method to code the reason for admission to intensive care units: the ICNARC Coding Method. Intensive Care National Audit & Research Centre. Br J Anaesth 2001;87:543-8.
- Spiegelhalter DJ. Funnel plots for comparing institutional performance. Stat Med 2005;24:1185-202. https://doi.org/10.1002/sim.1970.
- Hoste EA, Bagshaw SM, Bellomo R, Cely CM, Colman R, Cruz DN, et al. Epidemiology of acute kidney injury in critically ill patients: the multinational AKI-EPI study. Intensive Care Med 2015;41:1411-23. https://doi.org/10.1007/s00134-015-3934-7.
- Hoste EAJ, Kellum JA, Selby NM, Zarbock A, Palevsky PM, Bagshaw SM, et al. Global epidemiology and outcomes of acute kidney injury. Nat Rev Nephrol 2018;14:607-25. https://doi.org/10.1038/s41581-018-0052-0.
- Ostermann M, Cerdá J. The burden of acute kidney injury and related financial issues. Contrib Nephrol 2018;193:100-12. https://doi.org/10.1159/000484967.
- Ronco C, Bellomo R, Kellum JA. Acute kidney injury. Lancet 2019;394:1949-64. https://doi.org/10.1016/s0140-6736(19)32563-2.
- Chawla LS, Eggers PW, Star RA, Kimmel PL. Acute kidney injury and chronic kidney disease as interconnected syndromes. N Engl J Med 2014;371:58-66. https://doi.org/10.1056/NEJMra1214243.
- Coca SG, Singanamala S, Parikh CR. Chronic kidney disease after acute kidney injury: a systematic review and meta-analysis. Kidney Int 2012;81:442-8. https://doi.org/10.1038/ki.2011.379.
- Austin PC, Lee DS, Fine JP. Introduction to the analysis of survival data in the presence of competing risks. Circulation 2016;133:601-9. https://doi.org/10.1161/CIRCULATIONAHA.115.017719.
- Latouche A, Allignol A, Beyersmann J, Labopin M, Fine JP. A competing risks analysis should report results on all cause-specific hazards and cumulative incidence functions. J Clin Epidemiol 2013;66:648-53. https://doi.org/10.1016/j.jclinepi.2012.09.017.
- Lau B, Cole SR, Gange SJ. Competing risk regression models for epidemiologic data. Am J Epidemiol 2009;170:244-56. https://doi.org/10.1093/aje/kwp107.
- Allignol A, Schumacher M, Wanner C, Drechsler C, Beyersmann J. Understanding competing risks: a simulation point of view. BMC Med Res Methodol 2011;11. https://doi.org/10.1186/1471-2288-11-86.
- Noordzij M, Leffondré K, van Stralen KJ, Zoccali C, Dekker FW, Jager KJ. When do we need competing risks methods for survival analysis in nephrology?. Nephrol Dial Transplant 2013;28:2670-7. https://doi.org/10.1093/ndt/gft355.
- Chawla LS, Amdur RL, Amodeo S, Kimmel PL, Palant CE. The severity of acute kidney injury predicts progression to chronic kidney disease. Kidney Int 2011;79:1361-9. https://doi.org/10.1038/ki.2011.42.
- Fortrie G, de Geus HRH, Betjes MGH. The aftermath of acute kidney injury: a narrative review of long-term mortality and renal function. Crit Care 2019;23. https://doi.org/10.1186/s13054-019-2314-z.
- Gammelager H, Christiansen CF, Johansen MB, Tønnesen E, Jespersen B, Sørensen HT. Five-year risk of end-stage renal disease among intensive care patients surviving dialysis-requiring acute kidney injury: a nationwide cohort study. Crit Care 2013;17. https://doi.org/10.1186/cc12824.
- Harel Z, Bell CM, Dixon SN, McArthur E, James MT, Garg AX, et al. Predictors of progression to chronic dialysis in survivors of severe acute kidney injury: a competing risk study. BMC Nephrol 2014;15. https://doi.org/10.1186/1471-2369-15-114.
- Lo LJ, Go AS, Chertow GM, McCulloch CE, Fan D, Ordoñez JD, et al. Dialysis-requiring acute renal failure increases the risk of progressive chronic kidney disease. Kidney Int 2009;76:893-9. https://doi.org/10.1038/ki.2009.289.
- Wald R, Quinn RR, Luo J, Li P, Scales DC, Mamdani MM, et al. University of Toronto Acute Kidney Injury Research Group . Chronic dialysis and death among survivors of acute kidney injury requiring dialysis. JAMA 2009;302:1179-85. https://doi.org/10.1001/jama.2009.1322.
- Karsanji DJ, Pannu N, Manns BJ, Hemmelgarn BR, Tan Z, Jindal K, et al. Disparity between nephrologists’ opinions and contemporary practices for community follow-up after AKI hospitalization. Clin J Am Soc Nephrol 2017;12:1753-61. https://doi.org/10.2215/CJN.01450217.
- Kashani K, Rosner MH, Haase M, Lewington AJP, O’Donoghue DJ, Wilson FP, et al. Quality improvement goals for acute kidney injury. Clin J Am Soc Nephrol 2019;14:941-53. https://doi.org/10.2215/CJN.01250119.
- Koyner JL, Haines RW, Bouchard J. Individualized acute kidney injury after care. Curr Opin Crit Care 2020;26:581-9. https://doi.org/10.1097/MCC.0000000000000779.
- Gornik I, Vujaklija-Brajkovic A, Renar IP, Gasparovic V. A prospective observational study of the relationship of critical illness associated hyperglycaemia in medical ICU patients and subsequent development of type 2 diabetes. Crit Care 2010;14. https://doi.org/10.1186/cc9101.
- Jivanji CJ, Asrani VM, Windsor JA, Petrov MS. New-onset diabetes after acute and critical illness: a systematic review. Mayo Clin Proc 2017;92:762-73. https://doi.org/10.1016/j.mayocp.2016.12.020.
- NHS Digital . National Diabetes Audit Data Quality Statement, 2015–2016 n.d. https://digital.nhs.uk/data-and-information/publications/statistical/national-diabetes-audit/national-diabetes-audit-2015-2016-report-1-care-processes-and-treatment-targets (accessed 28 October 2022).
- Plummer MP, Finnis ME, Phillips LK, Kar P, Bihari S, Biradar V, et al. Stress induced hyperglycemia and the subsequent risk of type 2 diabetes in survivors of critical illness. PLOS One 2016;11. https://doi.org/10.1371/journal.pone.0165923.
- Carpenter DL, Gregg SR, Xu K, Buchman TG, Coopersmith CM. Prevalence and impact of unknown diabetes in the ICU. Crit Care Med 2015;43:e541-50. https://doi.org/10.1097/CCM.0000000000001353.
- Lone NI, Seretny M, Wild SH, Rowan KM, Murray GD, Walsh TS. Surviving intensive care: a systematic review of healthcare resource use after hospital discharge*. Crit Care Med 2013;41:1832-43. https://doi.org/10.1097/CCM.0b013e31828a409c.
- Monitor and NHS England . NHS National Tariff Payment System 201415 2013.
- Belotti F, Deb P, Manning WG, Norton EC. Twopm: two-part models. Stata J 2015;15:3-20. https://doi.org/10.1177/1536867x1501500102.
- Deb P, Norton EC, Manning WG. Health Econometrics using Stata. College Station, TX, USA: Stata Press; 2017.
- Deb P, Norton EC. Modeling health care expenditures and use. Annu Rev Public Health 2018;39:489-505. https://doi.org/10.1146/annurev-publhealth-040617-013517.
- van Beusekom I, Bakhshi-Raiez F, de Keizer NF, van der Schaaf M, Busschers WB, Dongelmans DA. Healthcare costs of ICU survivors are higher before and after ICU admission compared to a population based control group: A descriptive study combining healthcare insurance data and data from a Dutch national quality registry. J Crit Care 2018;44:345-51. https://doi.org/10.1016/j.jcrc.2017.12.005.
- Stearns SC, Norton EC. Time to include time to death? The future of health care expenditure predictions. Health Econ 2004;13:315-27. https://doi.org/10.1002/hec.831.
- von Wyl V. Proximity to death and health care expenditure increase revisited: a 15-year panel analysis of elderly persons. Health Econ Rev 2019;9. https://doi.org/10.1186/s13561-019-0224-z.
- Werblow A, Felder S, Zweifel P. Population ageing and health care expenditure: a school of ‘red herrings’?. Health Econ 2007;16:1109-26. https://doi.org/10.1002/hec.1213.
- Zweifel PF, Felder S, Werblow A. Population ageing and health care expenditure: new evidence on the ‘red herring’. The Geneva Papers on Risk and Insurance – Issues and Practice 2004;29:652-66. https://doi.org/10.1111/j.1468-0440.2004.00308.x.
- Howdon DDH, Rice N. Health Care Expenditures, Age, Proximity to Death and Morbidity: Implications for an Ageing Population. Discussion Paper. CHE Research Paper 107. York: Centre for Health Economics; 2015.
- Salas C, Raftery JP. Econometric issues in testing the age neutrality of health care expenditure. Health Econ 2001;10:669-71. https://doi.org/10.1002/hec.638.
- Gomes RV, Tura B, Mendonça Filho HT, Almeida Campos LA, Rouge A, Matos Nogueira PM, et al. A first postoperative day predictive score of mortality for cardiac surgery. Ann Thorac Cardiovasc Surg 2007;13:159-64.
- Pagel C, Rogers L, Brown K, Ambler G, Anderson D, Barron D, et al. Improving risk adjustment in the PRAiS (Partial Risk Adjustment in Surgery) model for mortality after paediatric cardiac surgery and improving public understanding of its use in monitoring outcomes. Health Services and Delivery Research 2017;5. https://doi.org/10.3310/hsdr05230.
- Becker RB, Zimmerman JE, Knaus WA, Wagner DP, Seneff MG, Draper EA, et al. The use of APACHE III to evaluate ICU length of stay, resource use, and mortality after coronary artery by-pass surgery. J Cardiovasc Surg 1995;36:1-11.
- Turner JS, Mudaliar YM, Chang RW, Morgan CJ. Acute physiology and chronic health evaluation (APACHE II) scoring in a cardiothoracic intensive care unit. Crit Care Med 1991;19:1266-9. https://doi.org/10.1097/00003246-199110000-00008.
- Clough RA, Leavitt BJ, Morton JR, Plume SK, Hernandez F, Nugent W, et al. The effect of comorbid illness on mortality outcomes in cardiac surgery. Arch Surg 2002;137:428-32. https://doi.org/10.1001/archsurg.137.4.428.
- Hannan EL, Kilburn H, O’Donnell JF, Lukacik G, Shields EP. Adult open heart surgery in New York State. An analysis of risk factors and hospital mortality rates. JAMA 1990;264:2768-74. https://doi.org/10.1001/jama.1990.03450210068035.
- Grant SW, Hickey GL, Dimarakis I, Trivedi U, Bryan A, Treasure T, et al. How does EuroSCORE II perform in UK cardiac surgery; an analysis of 23 740 patients from the Society for Cardiothoracic Surgery in Great Britain and Ireland National Database. Heart 2012;98:1568-72. https://doi.org/10.1136/heartjnl-2012-302483.
- Chan PS, Berg RA, Spertus JA, Schwamm LH, Bhatt DL, Fonarow GC, et al. Risk-standardizing survival for in-hospital cardiac arrest to facilitate hospital comparisons. J Am Coll Cardiol 2013;62:601-9. https://doi.org/10.1016/j.jacc.2013.05.051.
- Fotheringham J, Jacques RM, Fogarty D, Tomson CR, El Nahas M, Campbell MJ. Variation in centre-specific survival in patients starting renal replacement therapy in England is explained by enhanced comorbidity information from hospitalization data. Nephrol Dial Transplant 2014;29:422-30. https://doi.org/10.1093/ndt/gft363.
- Kramer AA, Zimmerman JE. The relationship between hospital and intensive care unit length of stay. Crit Care Med 2011;39:1015-22. https://doi.org/10.1097/CCM.0b013e31820eabab.
- Bittner MI, Donnelly M, van Zanten AR, Andersen JS, Guidet B, Trujillano Cabello JJ, et al. How is intensive care reimbursed? A review of eight European countries. Ann Intensive Care 2013;3. https://doi.org/10.1186/2110-5820-3-37.
- Petrie J, Easton S, Naik V, Lockie C, Brett SJ, Stümpfle R. Hospital costs of out-of-hospital cardiac arrest patients treated in intensive care; a single centre evaluation using the national tariff-based system. BMJ Open 2015;5. https://doi.org/10.1136/bmjopen-2014-005797.
- Fernando SM, Tran A, Cheng W, Rochwerg B, Taljaard M, Vaillancourt C, et al. Pre-arrest and intra-arrest prognostic factors associated with survival after in-hospital cardiac arrest: systematic review and meta-analysis. BMJ 2019;367. https://doi.org/10.1136/bmj.l6373.
- Voruganti DC, Chennamadhavuni A, Garje R, Shantha GPS, Schweizer ML, Girotra S, et al. Association between diabetes mellitus and poor patient outcomes after out-of-hospital cardiac arrest: A systematic review and meta-analysis. Sci Rep 2018;8. https://doi.org/10.1038/s41598-018-36288-1.
- Norhammar A, Lindbäck J, Rydén L, Wallentin L, Stenestrand U. Register of Information and Knowledge about Swedish Heart Intensive Care Admission (RIKS-HIA) . Improved but still high short- and long-term mortality rates after myocardial infarction in patients with diabetes mellitus: a time-trend report from the Swedish Register of Information and Knowledge about Swedish Heart Intensive Care Admission. Heart 2007;93:1577-83. https://doi.org/10.1136/hrt.2006.097956.
- Skrifvars MB, Castrén M, Aune S, Thoren AB, Nurmi J, Herlitz J. Variability in survival after in-hospital cardiac arrest depending on the hospital level of care. Resuscitation 2007;73:73-81. https://doi.org/10.1016/j.resuscitation.2006.08.022.
- Schluep M, Gravesteijn BY, Stolker RJ, Endeman H, Hoeks SE. One-year survival after in-hospital cardiac arrest: a systematic review and meta-analysis. Resuscitation 2018;132:90-100. https://doi.org/10.1016/j.resuscitation.2018.09.001.
- Yonis H, Ringgren KB, Andersen MP, Wissenberg M, Gislason G, Køber L, et al. Long-term outcomes after in-hospital cardiac arrest: 30-day survival and 1-year follow-up of mortality, anoxic brain damage, nursing home admission and in-home care. Resuscitation 2020;157:23-31. https://doi.org/10.1016/j.resuscitation.2020.10.003.
- Mihaylova B, Briggs A, O’Hagan A, Thompson SG. Review of statistical methods for analysing healthcare resources and costs. Health Econ 2011;20:897-916. https://doi.org/10.1002/hec.1653.
- National Institute for Health and Care Excellence (NICE) . Chronic Kidney Disease: Assessment and Management 2021.
- Major RW, Shepherd D, Medcalf JF, Xu G, Gray LJ, Brunskill NJ. The Kidney Failure Risk Equation for prediction of end stage renal disease in UK primary care: an external validation and clinical impact projection cohort study. PLOS Med 2019;16. https://doi.org/10.1371/journal.pmed.1002955.
- Dattani N, Hardelid P, Davey J, Gilbert R. Accessing electronic administrative health data for research takes time. Arch Dis Child 2013;98:391-2. https://doi.org/10.1136/archdischild-2013-303730.
- Harron K, Dibben C, Boyd J, Hjern A, Azimaee M, Barreto ML, et al. Challenges in administrative data linkage for research. Big Data Soc 2017;4. https://doi.org/10.1177/2053951717745678.
- Morris H, Lanati S, Gilbert R. Challenges of administrative data linkages: experiences of Administrative Data Research Centre for England (ADRC-E) researchers. Int J Pop Data Sci 2018;3. https://doi.org/10.23889/ijpds.v3i2.566.
- Mourby MJ, Doidge J, Jones KH, Aidinlis S, Smith H, Bell J, et al. Health data linkage for UK public interest research: key obstacles and solutions. Int J Popul Data Sci 2019;4. https://doi.org/10.23889/ijpds.v4i1.1093.
- Taylor JA, Crowe S, Espuny Pujol F, Franklin RC, Feltbower RG, Norman LJ, et al. The road to hell is paved with good intentions: the experience of applying for national data for linkage and suggestions for improvement. BMJ Open 2021;11. https://doi.org/10.1136/bmjopen-2020-047575.
- Clift AK, Coupland CAC, Keogh RH, Diaz-Ordaz K, Williamson E, Harrison EM, et al. Living risk prediction algorithm (QCOVID) for risk of hospital admission and mortality from coronavirus 19 in adults: national derivation and validation cohort study. BMJ 2020;371. https://doi.org/10.1136/bmj.m3731.
- Hollinghurst J, Lyons J, Fry R, Akbari A, Gravenor M, Watkins A, et al. The impact of COVID-19 on adjusted mortality risk in care homes for older adults in Wales, UK: a retrospective population-based cohort study for mortality in 2016–2020. Age Ageing 2020;50:25-31. https://doi.org/10.1093/ageing/afaa207.
- Holman N, Knighton P, Kar P, O’Keefe J, Curley M, Weaver A, et al. Risk factors for COVID-19-related mortality in people with type 1 and type 2 diabetes in England: a population-based cohort study. Lancet Diabetes Endocrinol 2020;8:823-33.
- Petermann-Rocha F, Hanlon P, Gray SR, Welsh P, Gill JMR, Foster H, et al. Comparison of two different frailty measurements and risk of hospitalisation or death from COVID-19: findings from UK Biobank. BMC Med 2020;18. https://doi.org/10.1186/s12916-020-01822-4.
- Williamson EJ, Walker AJ, Bhaskaran K, Bacon S, Bates C, Morton CE, et al. Factors associated with COVID-19-related death using OpenSAFELY. Nature 2020;584:430-6. https://doi.org/10.1038/s41586-020-2521-4.
- Cavallaro F, Lugg-Widger F, Cannings-John R, Harron K. Reducing Barriers to Data Access for Research in the Public Interest – Lessons from Covid-19 2020. https://blogs.bmj.com/bmj/2020/07/06/reducing-barriers-to-data-access-for-research-in-the-public-interest-lessons-from-covid-19/ (accessed 31 December 2020).
- Hubbard T, Reilly G, Varma S, Seymour D. Trusted Research Environments (TRE) Green Paper (2.0.0) 2020. https://doi.org/10.5281/zenodo.4594704.
- Gould DW, Doidge J, Sadique MZ, Borthwick M, Hatch R, Caskey FJ, et al. Heparin versus citrate anticoagulation for continuous renal replacement therapy in intensive care: the RRAM observational study. Health Technol Assess 2022;26. https://doi.org/10.3310/ZXHI9396.
- Sydes MR, Barbachano Y, Bowman L, Denwood T, Farmer A, Garfield-Birkbeck S, et al. Realising the full potential of data-enabled trials in the UK: a call for action. BMJ Open 2021;11. https://doi.org/10.1136/bmjopen-2020-043906.
- National Confidential Enquiry into Patient Outcome and Death . The NCEPOD Classification of Intervention n.d. www.ncepod.org.uk/classification.html (accessed 28 October 2022).
Appendix 1 Tables 37–40: predictor definitions
| Organ dysfunction (points) | SOFA | Definition used in CMP |
|---|---|---|
| Cardiovascular | ||
| 1 | MAP < 70 mmHg | MAP < 70 mmHg (calculated from lowest systolic blood pressure and paired diastolic blood pressure) |
| ≥ 2 | Administration of vasopressors | Advanced cardiovascular support (CCMDS) |
| Respiratory | ||
| 1 | PaO2/FiO2 < 400 mmHg | PaO2/FiO2 < 400 mmHg (based on arterial blood gas with lowest PaO2) |
| ≥ 2 | PaO2/FiO2 < 300 mmHg | PaO2/FiO2 < 300 mmHg |
| Renal | ||
| 1 | Serum creatinine 1.2–1.9 mg dl–1 (110–170 µmol l–1) | Serum creatinine 1.2–1.9 mg dl–1 (110–170 µmol l–1) |
| ≥ 2 | Serum creatinine ≥ 2 mg dl–1 (≥ 171 µmol l–1) or urine output < 500 ml | Serum creatinine ≥ 2 mg dl–1 (≥ 171 µmol l–1) or urine output < 500 ml or renal support (CCMDS) |
| Haematological | ||
| 1 | Platelet count < 150 × 109 l–1 | Platelet count < 150 × 109 l–1 |
| ≥ 2 | Platelet count < 100 × 109 l–1 | Platelet count < 100 × 109 l–1 |
| Neurological | ||
| 1 | GCS 13–14 | GCS 13–14 |
| ≥ 2 | GCS ≤ 12 | GCS ≤ 12 or sedated for entire of first 24 hours |
| Hepatic | ||
| 1 | Serum bilirubin 1.2–1.9 mg dl–1 (20–32 µmol l–1) | Unable to assess |
| ≥ 2 | Serum bilirubin ≥ 2 mg dl–1 (≥ 33 µmol l–1) | Liver support (CCMDS) |
| Candidate predictor | Definition | Categories | Risk model |
|---|---|---|---|
| Highest heart rate | Highest heart rate during the first 24 hours following admission to the critical care unit | Continuous |
30-day mortality 90-day mortality 1-year mortality ESRD |
| Lowest systolic blood pressure | Lowest systolic blood pressure during the first 24 hours following admission to the critical care unit | Continuous |
30-day mortality 90-day mortality 1-year mortality ESRD |
| Highest temperature | Highest central temperature during the first 24 hours following admission to the critical care unit. (If no central temperatures recorded, highest non-central temperature + 0.5 °C is substituted) | Continuous |
30-day mortality 90-day mortality 1-year mortality ESRD |
| Lowest respiratory rate | Lowest respiratory rate (either ventilated or non-ventilated) during the first 24 hours following admission to the critical care unit. | Continuous |
30-day mortality 90-day mortality 1-year mortality ESRD |
| PaO2/FiO2 | Ratio of PaO2 to FiO2 from the arterial blood gas with the lowest PaO2 from blood sampled during the first 24 hours following admission to the critical care unit | Continuous |
30-day mortality 90-day mortality 1-year mortality ESRD |
| Lowest arterial pH | Lowest arterial pH from blood sampled during the first 24 hours following admission to the critical care unit | Continuous |
30-day mortality 90-day mortality 1-year mortality ESRD |
| PaCO2 | PaCO2 from the arterial blood gas with the lowest pH | Continuous |
30-day mortality 90-day mortality 1-year mortality ESRD |
| Highest blood lactate | Highest blood lactate during the first 24 hours following admission to the critical care unit | Continuous |
30-day mortality 90-day mortality 1-year mortality ESRD |
| Urine output | Total urine output during the first 24 hours following admission to the critical care unit. (For admissions with a critical care unit length of stay < 24 hours, the total urine output over the entire stay is recorded and scaled to represent a 24-hour equivalent) | Continuous |
30-day mortality 90-day mortality 1-year mortality ESRD |
| Highest urea | Highest serum urea during the first 24 hours following admission to the critical care unit | Continuous |
30-day mortality 90-day mortality 1-year mortality ESRD |
| Highest creatinine | Highest serum creatinine during the first 24 hours following admission to the critical care unit | Continuous |
30-day mortality 90-day mortality 1-year mortality ESRD |
| Highest sodium | Highest serum sodium during the first 24 hours following admission to the critical care unit | Continuous |
30-day mortality 90-day mortality 1-year mortality ESRD |
| Lowest glucose | Lowest blood glucose during the first 24 hours following admission to the critical care unit | Continuous |
30-day mortality 90-day mortality 1-year mortality ESRD |
| Lowest haemoglobin | Lowest haemoglobin during the first 24 hours following admission to the critical care unit | Continuous |
30-day mortality 90-day mortality 1-year mortality ESRD Diabetes |
| Lowest white blood cell count | Lowest white blood cell count during the first 24 hours following admission to the critical care unit | Continuous |
30-day mortality 90-day mortality 1-year mortality ESRD Diabetes |
| Neutrophil count | Neutrophil count associated with the lowest white blood cell count during the first 24 hours following admission to the critical care unit | Continuous |
30-day mortality 90-day mortality 1-year mortality ESRD |
| Lowest platelet count | Lowest platelet count during the first 24 hours following admission to the critical care unit | Continuous |
30-day mortality 90-day mortality 1-year mortality ESRD |
| Sedated/paralysed/GCS | Lowest total GCS during the first 24 hours following admission to the critical care unit. GCS must be assessed when the patient is determined to be free of the effects of sedation. (Separate categories included for patients either sedated or paralysed and sedated for the entire of the first 24 hours following admission) | 15; 14; 7–13; 6; 5; 4; 3; sedated; paralysed and sedated |
30-day mortality 90-day mortality 1-year mortality ESRD |
| Age | The age of the patient in whole years at admission to the critical care unit | Continuous |
30-day mortality 90-day mortality 1-year mortality ESRD Diabetes |
| Sex | The genotypical sex of the patient | Female; male |
30-day mortality 90-day mortality 1-year mortality ESRD Diabetes |
| Body mass index | Calculated from the weight (either measured or estimated) and height (either measured or estimated) of the patient as weight in kilograms divided by height in metres squared | Continuous |
30-day mortality 90-day mortality 1-year mortality ESRD |
| Deprivation | Quintiles of deprivation, assigned from the patient’s usual residential postcode according to the Index of Multiple Deprivation 2010 for England, Welsh Index of Multiple Deprivation 2008 or Northern Ireland Multiple Deprivation Measure 2010 | Quintile 1 (least deprived), 2, 3, 4 or 5 (most deprived) |
30-day mortality 90-day mortality 1-year mortality ESRD Diabetes Resource use |
| Severe conditions in the past medical history | Defined according to APACHE II.9 Must have been evident in the 6 months prior to admission to the critical care unit and documented prior to or at admission to the unit | Seven binary variables (see Chapter 3) |
30-day mortality 90-day mortality 1-year mortality ESRD (all conditions except ESRD) Diabetes (severe liver disease, metastatic disease, immunocompromise) Resource use |
| Dependency prior to admission | Dependency prior to admission to acute hospital, assessed as the best description for the dependency of the patient in the 2 weeks prior to admission to acute hospital and prior to the onset of the acute illness based on the level of assistance required with daily activities. (Daily activities include bathing, dressing, going to the toilet, moving in/out of bed/chair, continence and eating) | Able to live without assistance in daily activities, minor assistance with some daily activities, major assistance with majority of/all daily activities, total assistance with all daily activities |
30-day mortality 90-day mortality 1-year mortality ESRD Diabetes Resource use |
| CPR prior to admission | CPR (internal or external cardiac massage) received within 24 hours prior to admission to the critical care unit, categorised as either in-hospital CPR (administered by an in-hospital resuscitation team or equivalent) or community CPR (not administered by an in-hospital resuscitation team or equivalent). When a patient received CPR both in the community and in hospital, this is recorded as community CPR | In-hospital CPR, community CPR, no CPR |
30-day mortality 90-day mortality 1-year mortality ESRD Resource use |
| Source of admission/urgency of surgery/planned admission |
The location of the patient immediately prior to admission to the critical care unit, combined with the urgency of surgery (for patients admitted direct from theatre) assigned according to the definitions of the National Confidential Enquiry into Patient Outcome and Death,118 and whether admission to the critical care unit was planned or unplanned [For patients whose location immediately prior to admission was a transient location of clinic, imaging department, recovery (used as a temporary critical care area) or specialist treatment area, their last non-transient location is used] |
Emergency department or not in hospital (unplanned admission), emergency department or not in hospital (planned admission), other acute hospital (not critical care); other critical care unit (repatriation), other critical care unit (planned or unplanned transfer), theatre (planned admission following elective or scheduled surgery), theatre (unplanned admission following elective or scheduled surgery), theatre (admission following emergency or urgent surgery), ward or intermediate care area |
30-day mortality 90-day mortality 1-year mortality Resource use |
| Primary reason for admission | The primary reason for admission to the critical care unit, coded using the ICNARC coding method22 | Five-tiered, hierarchical code |
30-day mortality 90-day mortality 1-year mortality |
| Mechanical ventilation | Mechanical ventilation at any time during the first 24 hours following admission to the critical care unit, identified by recording of a ventilated respiratory rate | Yes/no |
30-day mortality 90-day mortality 1-year mortality Diabetes Resource use |
| Ethnicity | Ethnicity of the patient | White, mixed, Asian, black, other, not stated |
ESRD Diabetes |
| Pregnancy | Women identified as either currently pregnant or recently pregnant (within previous 42 days) at the time of admission to the critical care unit | Yes/no |
ESRD Diabetes |
| RCS Charlson comorbidities | Defined by ICD-10 codes (see Chapter 3): 1-year look back | Yes/no |
1-year mortality ESRD (previous MI, congestive cardiac failure, peripheral vascular disease, liver disease, diabetes and malignancy) Diabetes (previous MI, congestive cardiac failure, peripheral vascular disease, malignancy) Resource use |
| Chronic kidney disease | Defined by ICD-10 codes (see Chapter 3) excluding ESRD codes (I120, I129, N186, Z49, Z940, Z992): 5-year look back | Yes/no | ESRD |
| AKI | Defined by ICD-10 codes (N171, N172, N19): 5-year look back | Yes/no | ESRD |
| Surgical status | Surgical admissions were defined as those admitted directly to the critical care unit from theatre and recovery in the same hospital. The urgency of surgery was classified as either elective/scheduled or emergency/urgent using the classification of the National Confidential Enquiry into Patient Outcome and Death | Elective surgery, emergency surgery, non-surgical |
ESRD Diabetes |
| Lengths of stay | Total length of stay in days in critical care, acute hospital prior to critical care, acute hospital total, acute hospital following discharge from critical care | Continuous |
ESRD Diabetes Resource use (total critical care length of stay) |
| Sepsis | Defined based on primary reason for admission and physiology recorded during the first 24 hours of critical care (see Chapter 3) | Yes/no |
ESRD Diabetes |
| Pancreatic surgery | Admissions following pancreatic surgery were identified if the following conditions were recorded as a surgical primary or secondary reason for admission to the critical care unit: traumatic pancreatitis or traumatic damage to pancreas, instrumental damage to pancreatic duct, pancreatic haemorrhage, pancreatic abscess or infected pseudocyst, infective pancreatitis, acute pancreatitis, chronic pancreatitis, not alcohol induced, alcohol-induced chronic pancreatitis, cytomegaloviral pancreatitis, mumps pancreatitis, pancreas or kidney/pancreas allograft, pancreatic fistula, pancreatic or pancreato-duodenal tumour, trauma-related pancreatic fistula, non-trauma-related pancreatic fistula and pancreatic pseudocyst | Yes/no | Diabetes |
| Acute myocardial infarction | Admissions following acute MI were identified if acute MI or coronary artery bypass graft for acute MI was recorded as the primary reason for admission | Yes/no | Diabetes |
| Stroke | Admissions following acute stroke were identified if thrombo-occlusive disease of brain was recorded as the primary reason for admission | Yes/no | Diabetes |
| Trauma | Admissions following trauma were identified if trauma or traumatic perforation or rupture were recorded at process level as a primary or secondary reason for admission | Yes/no | Diabetes |
| ICNARC model physiology score | ICNARC illness severity score | Continuous | Resource use |
| Previous hospitalisation | Hospitalisation before index hospitalisation (obtained through data linkage with the HES) | Yes/no | Resource use |
| Predictor | Approach to modelling |
|---|---|
| Existing predictors from previous model | |
| Age (years) | Continuous: RCS (37, 63, 74, 83) |
| Dependency prior to admission | Categorical (no assistance, some assistance, total assistance) |
| Lowest systolic blood pressure (mmHg) | Continuous: RCS (67, 85, 95, 112) |
| Lowest arterial pH | Continuous: RCS (7.16, 7.29, 7.33, 7.41) |
| Highest blood lactate (mmol l−1) | Continuous: linear |
| Highest creatinine (µmol l−1) | Continuous: RCS (51, 80, 106, 247) |
| Lowest white blood cell count (× 109 l−1) | Continuous: RCS (5.8, 9.2, 11.8, 17.8) |
| Lowest platelet count (× 109 l−1) | Continuous: RCS (73, 134, 183, 337) |
| Glasgow coma scale | Categorical (15, 9–14, 3–8, sedated) |
| Candidate predictors from NACSA | |
| Angina status pre surgery | Categorical (no angina, no limitation of physical activity, slight limitation of ordinary activity, marked limitation of ordinary physical activity, symptoms at rest or minimal activity) |
| Dyspnoea status pre surgery | Categorical (no limitation of physical activity, slight limitation of ordinary physical activity, marked limitation of ordinary physical activity, symptoms at rest or minimal activity) |
| Number of previous MIs | Continuous |
| Interval between surgery and last MI | Categorical (no previous MI, MI < 6 hours, MI 6–24 hours, MI 1–30 days, MI 31–90 days, MI > 90 days) |
| Left ventricular ejection fraction | Categorical (good, LVEF > 50%; fair, LVEF 30–50%; poor, LVEF < 30%) |
| Previous PCI | Categorical (no previous PCI; PCI < 24 hours before surgery, PCI > 24 hours before surgery, same admission, PCI > 24 hours before surgery, previous admission) |
| Diabetes management | Categorical (no diabetes, diet, oral therapy, insulin) |
| Cigarette smoking history | Categorical (never smoked, ex-smoker, current smoker) |
| History of hypertension | Categorical (no hypertension, treated or BP > 140/90 on more than one occasion prior to admission, unknown) |
| Actual creatinine at time of surgery | Continuous |
| Renal function/dialysis | Categorical (none; dialysis for acute renal failure: onset within 6 weeks of cardiac surgery; dialysis for chronic renal failure: onset > 6 weeks prior to cardiac surgery; no dialysis but pre-operative acute renal failure (anuria or oliguria < 10 ml/hour) |
| History of pulmonary disease | Categorical (no chronic pulmonary disease, COAD/emphysema, asthma) |
| History of neurological dysfunction | Binary (yes, no) |
| Extracardiac arteriopathy | Binary (yes, no) |
| Pre-operative heart rhythm | Categorical (Sinus rhythm; Atrial fibrillation/flutter; Complete heart block/pacing; Ventricular fibrillation or ventricular tachycardia; Other abnormal rhythm) |
| PA systolic | Continuous (systolic pulmonary artery pressure in mm Hg recorded from echocardiographic, catheterisation data or Swan-Ganz catheter) |
| Intravenous nitrates or any heparin | Binary (yes, no) |
| Ventilated (Pre-Operation) | Binary (yes, no) |
| Cardiogenic shock (Pre-Operation) | Binary (yes, no) |
| Operative urgency | Categorical (elective; urgent; emergency; salvage) |
| Intravenous inotropes prior to anaesthesia | Binary (yes, no) |
| CABG | Binary (yes, no) |
| Valve procedure | Binary (yes, no) |
| Major aortic procedure | Binary (yes, no) |
| Other cardiac procedures | Binary (yes, no) |
| Total number of distal coronary anastomoses | Continuous |
| Number of valves replaced/repaired | Continuous |
| Aortic valve procedure | Categorical (replacement, repair, repair with ring, repair without ring, isolated commissurotomy, excision only; inspection) |
| Mitral valve procedure | Categorical (replacement, repair, repair with ring, repair without ring, isolated commissurotomy, excision only; inspection) |
| Tricuspid valve procedure | Categorical (replacement, repair, repair with ring, repair without ring, isolated commissurotomy, excision only; inspection) |
| Pulmonary valve procedure | Categorical (replacement, repair, repair with ring, repair without ring, isolated commissurotomy, excision only; inspection) |
| Number of aorta segments operated on | Continuous |
| Aortic pathology: root segment | Categorical (aneurysm, chronic dissection, acute dissection, trauma, penetrating atheromatous ulcer, pseudoaneurysm, intramural haematoma, normal, other) |
| Aortic pathology: ascending segment | Categorical (aneurysm, chronic dissection, acute dissection, trauma, penetrating atheromatous ulcer, pseudoaneurysm, intramural haematoma, normal, other) |
| Aortic pathology: arch segment | Categorical (aneurysm, chronic dissection, acute dissection, trauma, penetrating atheromatous ulcer, pseudoaneurysm, intramural haematoma, normal, other) |
| Aortic pathology: descending aorta segment | Categorical (aneurysm, chronic dissection, acute dissection, trauma, penetrating atheromatous ulcer, pseudoaneurysm, intramural haematoma, normal, other) |
| Aortic pathology: abdominal segment | Categorical (aneurysm, chronic dissection, acute dissection, trauma, penetrating atheromatous ulcer, pseudoaneurysm, intramural haematoma, normal, other) |
| Cardiopulmonary bypass | Binary (yes, no) |
| Intra-aortic balloon pump used (pre operative) | Binary (yes, no) |
| Impeller device used (pre operative) | Binary (yes, no) |
| Ventricular assist device used (pre operative) | Binary (yes, no) |
| Other support device used (pre operative) | Binary (yes, no) |
| Intra-aortic balloon pump used (intra operative) | Binary (yes, no) |
| Impeller device used (intra operative) | Binary (yes, no) |
| Ventricular assist device used (intra operative) | Binary (yes, no) |
| Other support device used (intraoperative) | Binary (yes, no) |
| Cumulative bypass time | Continuous (cumulative bypass time in minutes irrespective of the number of times on bypass) |
| Cumulative cross clamp time | Continuous (cumulative cross clamp time in minutes) |
| Total circulatory arrest time | Continuous (total circulatory arrest time in minutes) |
| Candidate predictors from CMP and HES | |
| Severe conditions in the medical history (APACHE II definitions): Respiratory disease; Cardiovascular disease | Binary (yes, no) |
| RCS Charlson comorbidities defined by ICD-10 codes (see Chapter 3) – 1 year look back: previous MI, congestive cardiac failure, peripheral vascular disease, diabetes; cerebrovascular disease, chronic pulmonary disease, hemiplegia or paraplegia, chronic renal disease and malignancy | Binary (yes, no) |
| Congestive heart failure (ICD-10 code I500) | Binary (yes, no) |
| Coronary artery disease (ICD-10 code I2510) | Binary (yes, no) |
| Arrhythmia (ICD-10 code I499) | Binary (yes, no) |
| Cerebrovascular accident (ICD-10 code I639) | Binary (yes, no) |
| Current predictors | Approach to modelling |
|---|---|
| Age | Restricted cubic splines with five knots |
| Sex | Categorical (male, female) |
| Length of stay in hospital prior to 2222 call | Categorical (0 days, 1 day, 2–7 days, ≥ 8 days) |
| Reason for admission to/attendance at/visit to hospital | Categorical (patient–medical, patient–trauma, patient–elective surgery, patient–emergency surgery, patient–obstetric, outpatient, staff or visitor) |
| Location of arrest | Categorical (emergency department; emergency admissions unit; ward, obstetric area, intermediate care area or other inpatient location; coronary care unit; critical care unit; imaging department or specialist treatment area; cardiac catheter laboratory; theatre and recovery) |
| Presenting/first documented rhythm | Categorical (ventricular fibrillation; ventricular tachycardia; shockable, unknown rhythm; asystole; pulseless electrical activity; bradycardia; non-shockable, unknown rhythm; unknown) |
| Interaction between location of arrest and presenting rhythm | Simplified categorisation for location of arrest (emergency department; emergency admissions unit, ward, obstetric area, intermediate care area or other inpatient location; coronary care unit or cardiac catheter lab; critical care unit; imaging department or specialist treatment area; theatre and recovery) and presenting rhythm (ventricular tachycardia, asystole, PEA, other non-shockable) |
| New potential predictors | |
| Pre-existing comorbidities | Defined using the RCS Charlson comorbidity index based on the presence of ICD-10 codes in prior hospitalisations with a 1-year look back (see Chapter 3). Thirteen binary (yes, no) variables: MI, congestive cardiac failure, peripheral vascular disease, cerebrovascular disease, dementia, chronic pulmonary disease, rheumatological disease, liver disease, diabetes mellitus, hemiplegia or paraplegia, chronic renal disease, malignancy, metastatic solid tumour |
Appendix 2 Significance and importance of predictors in the risk models
| Predictor | Mortality at 30 days | Mortality at 90 days | ||||||||
|---|---|---|---|---|---|---|---|---|---|---|
| p-value for non-linearity | p-value for global effect | Difference in BICa | c indexa | Brier’s scorea | p-value for non-linearity | p-value for global effect | Difference in BICa | c indexa | Brier’s scorea | |
| Physiological | ||||||||||
| Highest heart rate | < 0.0001 | < 0.0001 | 250.062 | 0.8988 | 0.0916 | < 0.0001 | < 0.0001 | 234.028 | 0.8823 | 0.1081 |
| Lowest systolic blood pressure | 0.0004 | 0.0012 | 42.787 | 0.8999 | 0.0913 | 0.0004 | 0.0012 | 18.351 | 0.8833 | 0.1078 |
| Highest temperature | 0.0025 | 0.0002 | 38.462 | 0.8999 | 0.0913 | 0.0027 | 0.0005 | 16.458 | 0.8832 | 0.1078 |
| Lowest respiratory rate | 0.0001 | < 0.0001 | 186.982 | 0.8991 | 0.0916 | 0.0001 | < 0.0001 | 147.176 | 0.8827 | 0.1080 |
| PaO2/FiO2 | < 0.0001 | < 0.0001 | 370.549 | 0.8986 | 0.0918 | < 0.0001 | < 0.0001 | 253.337 | 0.8824 | 0.1082 |
| Lowest arterial pH | < 0.0001 | 0.0001 | 38.777 | 0.8999 | 0.0913 | < 0.0001 | 0.0001 | 11.439 | 0.8832 | 0.1078 |
| PaCO2 | < 0.0001 | < 0.0001 | 29.742 | 0.8997 | 0.0913 | < 0.0001 | < 0.0001 | 64.647 | 0.8831 | 0.1079 |
| Highest blood lactate | < 0.0001 | < 0.0001 | 29.866 | 0.8998 | 0.0913 | 0.0002 | 0.0008 | 18.343 | 0.8832 | 0.1078 |
| Urine output | < 0.0001 | < 0.0001 | 256.868 | 0.8990 | 0.0917 | < 0.0001 | < 0.0001 | 268.761 | 0.8825 | 0.1082 |
| Highest urea | < 0.0001 | < 0.0001 | 61.001 | 0.8995 | 0.0914 | < 0.0001 | < 0.0001 | 101.902 | 0.8828 | 0.1080 |
| Highest creatinine | 0.0001 | < 0.0001 | 184.523 | 0.8991 | 0.0916 | 0.0001 | < 0.0001 | 182.823 | 0.8825 | 0.1081 |
| Highest sodium | < 0.0001 | < 0.0001 | 248.721 | 0.8990 | 0.0916 | < 0.0001 | < 0.0001 | 268.567 | 0.8824 | 0.1081 |
| Lowest white blood cell count | < 0.0001 | < 0.0001 | 59.651 | 0.8996 | 0.0914 | < 0.0001 | < 0.0001 | 81.355 | 0.8829 | 0.1079 |
| Lowest platelet count | < 0.0001 | < 0.0001 | 177.737 | 0.8991 | 0.0916 | < 0.0001 | < 0.0001 | 234.962 | 0.8824 | 0.1081 |
| BMI | < 0.0001 | < 0.0001 | 138.239 | 0.8993 | 0.0915 | < 0.0001 | < 0.0001 | 260.538 | 0.8824 | 0.1081 |
| Sedated/paralysed/GCS | – | < 0.0001 | 1070.664 | 0.8959 | 0.0928 | – | < 0.0001 | 1097.521 | 0.8793 | 0.1094 |
| Non-physiological | ||||||||||
| Age | – | < 0.0001 | 2395.651 | 0.8915 | 0.0925 | – | < 0.0001 | 2966.143 | 0.8730 | 0.1117 |
| Very severe cardiovascular disease | – | < 0.0001 | 23.894 | 0.8999 | 0.0913 | – | 0.002 | 1.723 | 0.8833 | 0.1078 |
| Severe respiratory disease | – | < 0.0001 | 20.536 | 0.8997 | 0.0913 | – | < 0.0001 | 44.763 | 0.8831 | 0.1078 |
| Severe liver disease | – | < 0.0001 | 133.173 | 0.8994 | 0.0915 | – | < 0.0001 | 211.030 | 0.8825 | 0.1081 |
| Metastatic disease | – | < 0.0001 | 252.370 | 0.8989 | 0.0916 | – | < 0.0001 | 610.916 | 0.8810 | 0.1086 |
| Haematological malignancy | – | < 0.0001 | 6.491 | 0.8998 | 0.0913 | – | < 0.0001 | 56.260 | 0.8830 | 0.1079 |
| Immunocompromise | – | < 0.0001 | 3.885 | 0.8998 | 0.0913 | – | < 0.0001 | 47.963 | 0.8831 | 0.1078 |
| Dependency prior to admission | – | < 0.0001 | 334.181 | 0.8986 | 0.0917 | – | < 0.0001 | 550.623 | 0.8814 | 0.1085 |
| CPR prior to admission | – | 0.2475 | 45.560 | 0.8999 | 0.0912 | – | 0.6367 | 22.485 | 0.8833 | 0.1077 |
| Source of admission/urgency of surgery | – | < 0.0001 | 943.299 | 0.8965 | 0.0925 | – | < 0.0001 | 1075.626 | 0.8796 | 0.1093 |
| Primary reason for admission | – | < 0.0001 | 410.259 | 0.8957 | 0.0928 | – | < 0.0001 | 510.246 | 0.8788 | 0.1095 |
| Ventilation | – | < 0.0001 | 17.782 | 0.8998 | 0.0913 | – | < 0.0001 | 5.734 | 0.8832 | 0.1078 |
| Interactions | ||||||||||
| Arterial pH × PaCO2 | – | < 0.0001 | 13.037 | 0.8997 | 0.0913 | – | < 0.0001 | 43.615 | 0.8830 | 0.1079 |
| Arterial pH × blood lactate | – | < 0.0001 | 43.768 | 0.8998 | 0.0913 | – | < 0.0001 | 26.304 | 0.8832 | 0.1078 |
| Urine output × urea | – | < 0.0001 | 43.515 | 0.8998 | 0.0913 | – | < 0.0001 | 14.948 | 0.8831 | 0.1078 |
| CPR × temperature | – | 0.0016 | 73.312 | 0.8999 | 0.0913 | – | 0.0002 | 43.391 | 0.8833 | 0.1078 |
| CPR × systolic blood pressure | – | 0.0042 | 75.677 | 0.8999 | 0.0913 | – | 0.0046 | 51.336 | 0.8833 | 0.1078 |
| Dissection or aneurysm (cardiovascular) × lowest white blood cell count | – | 0.0006 | 41.217 | 0.8999 | 0.0913 | – | 0.0026 | 17.991 | 0.8832 | 0.1078 |
| Haemorrhage (neuro) × urine output | – | 0.0008 | 25.852 | 0.8999 | 0.0913 | – | < 0.0001 | 5.126 | 0.8832 | 0.1078 |
| Haemorrhage (neuro) × blood lactate | – | 0.0002 | 42.372 | 0.8999 | 0.0913 | – | < 0.0001 | 1.534 | 0.8832 | 0.1078 |
| Inflammation (gastrointestinal) × PaO2/FiO2 | – | < 0.0001 | 38.753 | 0.8998 | 0.0913 | – | 0.0053 | 22.329 | 0.8832 | 0.1078 |
| Obstruction (gastrointestinal) × urine output | – | 0.0022 | 42.443 | 0.8999 | 0.0912 | – | 0.0007 | 16.439 | 0.8832 | 0.1078 |
| Seizures (neurological) × sodium | – | 0.0004 | 27.244 | 0.8998 | 0.0912 | – | 0.0004 | 4.121 | 0.8832 | 0.1078 |
| Trauma, perforation or rupture (gastrointestinal) × arterial pH | – | < 0.0001 | 35.607 | 0.8999 | 0.0913 | – | < 0.0001 | 9.588 | 0.8832 | 0.1078 |
| Trauma, perforation or rupture (neurological) × sodium | – | < 0.0001 | 24.336 | 0.8999 | 0.0913 | – | < 0.0001 | 0.854 | 0.8832 | 0.1078 |
| Trauma, perforation or rupture (neurological) × urine output | – | < 0.0001 | 33.353 | 0.8999 | 0.0913 | – | < 0.0001 | 0.8832 | 0.8832 | 0.1078 |
| Vascular (neurological) × highest heart rate | – | < 0.0001 | 29.895 | 0.8998 | 0.0913 | – | < 0.0001 | 2.945 | 0.8832 | 0.1078 |
| Alcoholic hepatitis/cirrhosis × pH | – | 0.0004 | 37.934 | 0.8999 | 0.0913 | – | 0.0324 | 25.247 | 0.8833 | 0.1077 |
| Asthma attack in new or known asthmatic × urea | – | 0.0006 | 42.046 | 0.8999 | 0.0912 | – | 0.0001 | 14.665 | 0.8832 | 0.1077 |
| Intracerebral haemorrhage × urine output | – | < 0.0001 | 11.375 | 0.8998 | 0.0913 | – | < 0.0001 | 19.098 | 0.8832 | 0.1078 |
| Non-traumatic subdural haemorrhage × arterial pH | < 0.0001 | 37.952 | 0.8999 | 0.0913 | 0.0005 | 16.446 | 0.8832 | 0.1078 | ||
| Thrombo-occlusive disease of brain × sodium | – | 0.0004 | 28.881 | 0.8999 | 0.0913 | – | 0.0007 | 7.136 | 0.8832 | 0.1078 |
| Ventilation × respiratory rate | – | < 0.0001 | 57.633 | 0.8999 | 0.0913 | – | 0.0006 | 36.849 | 0.8832 | 0.1078 |
| Ventilation × PaO2/FiO2 | – | < 0.0001 | 32.913 | 0.8998 | 0.0913 | – | < 0.0001 | 7.190 | 0.8832 | 0.1078 |
| Ventilation × PaCO2 | – | < 0.0001 | 5.369 | 0.8998 | 0.0913 | – | < 0.0001 | 12.065 | 0.8832 | 0.1078 |
| Predictor | 1-year mortality following critical care admission | 1 year following hospital discharge | ||||||
|---|---|---|---|---|---|---|---|---|
| p-value for Likelihood-ratio test | Difference in BICa | c indexa | Brier’s scorea | p-value for Likelihood-ratio test | Difference in BICa | c indexa | Brier’s scorea | |
| Severe conditions in the medical history | ||||||||
| Very severe cardiovascular disease | < 0.0001 | 7.484 | 0.839 | 0.144 | 0.0691 | –7.943 | 0.766 | 0.097 |
| Severe respiratory disease | < 0.0001 | 92.862 | 0.838 | 0.144 | < 0.0001 | 29.712 | 0.765 | 0.097 |
| Severe liver disease | < 0.0001 | 279.302 | 0.837 | 0.144 | < 0.0001 | 49.394 | 0.765 | 0.098 |
| ESRD | 0.0018 | 1.770 | 0.839 | 0.144 | < 0.0001 | 11.267 | 0.765 | 0.097 |
| Metastatic disease | < 0.0001 | 1239.326 | 0.833 | 0.146 | < 0.0001 | 1109.389 | 0.750 | 0.099 |
| Haematological malignancy | < 0.0001 | 139.259 | 0.838 | 0.144 | < 0.0001 | 68.275 | 0.765 | 0.097 |
| Immunocompromise | < 0.0001 | 102.778 | 0.838 | 0.144 | < 0.0001 | 102.963 | 0.764 | 0.097 |
| RCS Charlson comorbidities | ||||||||
| Previous MI | 0.0296 | –6.766 | 0.839 | 0.144 | 0.0491 | –7.376 | 0.766 | 0.097 |
| Congestive cardiac failure | < 0.0001 | 31.185 | 0.838 | 0.144 | < 0.0001 | 36.655 | 0.765 | 0.097 |
| Peripheral vascular disease | < 0.0001 | 9.509 | 0.839 | 0.144 | < 0.0001 | 7.094 | 0.766 | 0.097 |
| Cerebrovascular disease | 0.0026 | –2.435 | 0.839 | 0.144 | 0.0154 | –5.370 | 0.766 | 0.097 |
| Dementia | 0.1124 | –8.978 | 0.839 | 0.144 | 0.0015 | –1.198 | 0.766 | 0.097 |
| Chronic pulmonary disease | < 0.0001 | 11.947 | 0.839 | 0.144 | < 0.0001 | 21.809 | 0.765 | 0.097 |
| Rheumatological disease | 0.8909 | –11.479 | 0.839 | 0.144 | 0.9006 | –11.231 | 0.766 | 0.097 |
| Liver disease | < 0.0001 | 33.814 | 0.838 | 0.144 | < 0.0001 | 12.167 | 0.765 | 0.097 |
| Diabetes mellitus | 0.2409 | –10.123 | 0.839 | 0.144 | < 0.0001 | 9.416 | 0.765 | 0.097 |
| Hemiplegia or paraplegia | 0.4769 | –10.992 | 0.839 | 0.144 | 0.1153 | –8.766 | 0.766 | 0.097 |
| Chronic renal disease | < 0.0001 | 21.383 | 0.839 | 0.144 | < 0.0001 | 15.289 | 0.765 | 0.097 |
| Malignancy | < 0.0001 | 224.483 | 0.837 | 0.145 | < 0.0001 | 316.247 | 0.758 | 0.097 |
| Predictor | Acute hospital mortality | 1-year mortality | ||||||||
|---|---|---|---|---|---|---|---|---|---|---|
| p-value for nonlinearity | p-value for global effect | Difference in BICa | c indexa | Brier’s scorea | p-value for nonlinearity | p-value for global effect | Difference in BICa | c indexa | Brier’s scorea | |
| Previous model factors | ||||||||||
| Age (years) | 0.0004 | < 0.0001 | 79.704 | 0.8821 | 0.0274 | < 0.0001 | < 0.0001 | 181.565 | 0.8111 | 0.0520 |
| Lowest systolic blood pressure | < 0.0001 | < 0.0001 | 33.378 | 0.8899 | 0.0275 | 0.0008 | < 0.0001 | 12.397 | 0.8255 | 0.0517 |
| Lowest arterial pH | < 0.0001 | < 0.0001 | 26.766 | 0.8879 | 0.0274 | < 0.0001 | < 0.0001 | 23.772 | 0.8247 | 0.0517 |
| Highest creatinine | < 0.0001 | < 0.0001 | 78.280 | 0.8819 | 0.0274 | 0.0004 | < 0.0001 | 25.157 | 0.8231 | 0.0516 |
| Lowest white blood cell count | 0.0039 | 0.0003 | 13.033 | 0.8917 | 0.0273 | 0.0286 | 0.0074 | 19.261 | 0.8266 | 0.0515 |
| Lowest platelet count | < 0.0001 | < 0.0001 | 11.792 | 0.8889 | 0.0274 | < 0.0001 | < 0.0001 | 24.073 | 0.8240 | 0.0517 |
| Highest blood lactate | – | < 0.0001 | 102.872 | 0.8893 | 0.0279 | – | < 0.0001 | 61.024 | 0.8264 | 0.0520 |
| GCS | – | < 0.0001 | 131.644 | 0.8834 | 0.0277 | – | < 0.0001 | 101.039 | 0.8211 | 0.0521 |
| New factors | ||||||||||
| Sex | – | < 0.0001 | 9.822 | 0.8916 | 0.0273 | – | < 0.0001 | 10.156 | 0.8263 | 0.0515 |
| Diabetes (no diabetes, diet/oral therapy/insulin) | – | 0.001 | 1.149 | 0.8908 | 0.0272 | – | < 0.0001 | 15.764 | 0.8260 | 0.0516 |
| Atrial fibrillation/flutter | – | 0.001 | 0.339 | 0.8912 | 0.0272 | – | < 0.0001 | 24.953 | 0.8254 | 0.0516 |
| Dyspnoea status pre-surgery (no limitation or slight limitation of ordinary physical activity, marked limitation of ordinary physical activity, symptoms at rest or minimal activity) | – | < 0.0001 | 3.267 | 0.8903 | 0.0273 | – | < 0.0001 | 4.872 | 0.8256 | 0.0515 |
| History of pulmonary disease | – | < 0.0001 | 18.711 | 0.8902 | 0.0273 | – | < 0.0001 | 22.743 | 0.8254 | 0.0516 |
| History of neurological dysfunction | – | 0.005 | 2.830 | 0.8915 | 0.0273 | – | 0.011 | 4.104 | 0.8270 | 0.0515 |
| Extracardiac arteriopathy | – | < 0.0001 | 1.419 | 0.8910 | 0.0272 | – | < 0.0001 | 11.274 | 0.8258 | 0.0515 |
| Operative urgency (elective, urgent, emergency, salvage) | – | < 0.0001 | 37.774 | 0.8872 | 0.0274 | – | < 0.0001 | 40.605 | 0.8234 | 40.605 |
| Cumulative bypass time | – | 0.001 | 2.057 | 0.8918 | 0.0273 | – | < 0.0001 | 7.967 | 0.8263 | 0.0515 |
| Severe respiratory disease | – | 0.005 | 3.576 | 0.8916 | 0.0272 | – | 0.004 | 2.690 | 0.8266 | 0.0515 |
| Severe cardiovascular disease | – | 0.002 | 0.947 | 0.8911 | 0.0272 | – | < 0.0001 | 10.341 | 0.8254 | 0.0515 |
| Congestive heart failure | – | 0.009 | 3.700 | 0.8914 | 0.0272 | – | < 0.0001 | 12.600 | 0.8261 | 0.0516 |
| 1-year new factors | ||||||||||
| Renal function/dialysis | – | – | – | – | – | – | < 0.0001 | 5.798 | 0.8265 | 0.0515 |
| LVEF | – | – | – | – | – | – | < 0.0001 | 0.424 | 0.8254 | 0.0515 |
| Number of previous MIs | – | – | – | – | – | – | 0.008 | 3.329 | 0.8271 | 0.0515 |
| Major aortic procedure | – | – | – | – | – | – | 0.007 | 3.001 | 0.8267 | 0.0515 |
| Predictor | ROSC > 20 minutes | Hospital survival | 1-year survival | |||||||||
|---|---|---|---|---|---|---|---|---|---|---|---|---|
| p-value for likelihood-ratio test | Difference in BICa | c indexa | Brier’s scorea | p-value for likelihood-ratio test | Difference in BICa | c indexa | Brier’s scorea | p-value for likelihood-ratio test | Difference in BICa | c indexa | Brier’s scorea | |
| MI | 0.5016 | –9.743 | 0.722 | 0.211 | 0.6982 | –10.044 | 0.819 | 0.119 | 0.6122 | –9.939 | 0.829 | 0.101 |
| Congestive cardiac failure | < 0.0001 | 7.703 | 0.721 | 0.211 | 0.0066 | –2.804 | 0.818 | 0.119 | < 0.0001 | 11.692 | 0.828 | 0.102 |
| Peripheral vascular disease | 0.0026 | –1.145 | 0.722 | 0.211 | 0.0039 | –1.858 | 0.818 | 0.119 | 0.0478 | –6.278 | 0.829 | 0.102 |
| Cerebrovascular disease | 0.8146 | –10.139 | 0.722 | 0.211 | 0.3941 | –9.468 | 0.818 | 0.119 | 0.9899 | –10.196 | 0.829 | 0.101 |
| Dementia | 0.0332 | –5.660 | 0.722 | 0.211 | 0.0619 | –6.709 | 0.818 | 0.119 | 0.0265 | –5.276 | 0.829 | 0.102 |
| Chronic pulmonary disease | 0.6941 | –10.040 | 0.722 | 0.211 | 0.6860 | –10.031 | 0.819 | 0.119 | 0.5037 | –9.749 | 0.829 | 0.101 |
| Rheumatological disease | 0.6154 | –9.942 | 0.722 | 0.211 | 0.3022 | –9.130 | 0.818 | 0.119 | 0.8792 | –10.173 | 0.829 | 0.101 |
| Liver disease | 0.0824 | –7.177 | 0.722 | 0.211 | 0.0033 | –1.539 | 0.819 | 0.119 | < 0.0001 | 8.549 | 0.828 | 0.102 |
| Diabetes mellitus | 0.0003 | 2.958 | 0.722 | 0.212 | 0.0433 | –6.111 | 0.818 | 0.119 | 0.5044 | –9.751 | 0.829 | 0.101 |
| Hemiplegia or paraplegia | 0.9552 | –10.191 | 0.722 | 0.211 | 0.0210 | –4.869 | 0.818 | 0.119 | 0.0779 | –7.089 | 0.829 | 0.102 |
| Chronic renal disease | 0.0011 | 0.389 | 0.722 | 0.211 | 0.5438 | –9.826 | 0.819 | 0.119 | < 0.0001 | 8.305 | 0.829 | 0.102 |
| Malignancy | < 0.0001 | 6.718 | 0.722 | 0.211 | < 0.0001 | 7.794 | 0.818 | 0.119 | < 0.0001 | 23.211 | 0.828 | 0.102 |
| Metastatic solid tumour | < 0.0001 | 5.389 | 0.722 | 0.211 | < 0.0001 | 16.667 | 0.817 | 0.119 | < 0.0001 | 37.563 | 0.828 | 0.102 |
Appendix 3 Final model coefficients
| Predictor | Coefficient | 95% CI |
|---|---|---|
| Age (years) | 0.0372 | 0.036 to 0.039 |
| Highest heart rate (min−1): RCS (71,93,110,146) | ||
| hr1 | 0.0002 | –0.004 to 0.004 |
| hr2 | 0.0350 | 0.019 to 0.050 |
| hr3 | –0.1053 | –0.150 to –0.061 |
| Lowest systolic blood pressure (mmHg): RCS (66,89,102,130) | ||
| sbp1 | –0.0226 | –0.035 to -0.010 |
| sbp2 | 0.0736 | 0.026 to 0.121 |
| sbp3 | –0.2476 | –0.463 to –0.033 |
| CPR × lowest systolic blood pressure | ||
| In-hospital CPR × sbp1 | –0.0020 | –0.019 to 0.015 |
| No CPR × sbp1 | 0.0021 | –0.011 to 0.015 |
| In-hospital CPR × sbp2 | 0.0110 | –0.056 to 0.078 |
| No CPR × sbp2 | –0.0422 | –0.091 to 0.006 |
| In-hospital CPR × sbp3 | –0.0801 | –0.386 to 0.226 |
| No CPR ×sbp3 | 0.1781 | –0.042 to 0.398 |
| Highest temperature (°C): RCS (36,37.2,38,39.2) | ||
| temp1 | –0.2494 | –0.380 to –0.119 |
| temp2 | 0.4294 | –0.174 to 1.033 |
| temp3 | –0.8330 | –3.444 to 1.779 |
| CPR × temperature | ||
| In-hospital CPR × temp1 | –0.1356 | –0.375 to 0.104 |
| No CPR × temp1 | –0.1425 | –0.295 to 0.010 |
| In-hospital CPR × temp2 | –0.2133 | –1.148 to 0.722 |
| No CPR × temp2 | –0.0551 | –0.695 to 0.585 |
| In-hospital CPR × temp3 | 1.4697 | –2.403 to 5.343 |
| No CPR × temp3 | 0.3069 | –2.417 to 3.031 |
| Lowest respiratory rate (min−1): RRCS (10,12,13,20) | ||
| rr1 | –0.0695 | –0.081 to –0.058 |
| rr2 | –0.0014 | –0.016 to 0.013 |
| rr3 | 0.0050 | –0.020 to 0.030 |
| rr4 | –0.0038 | –0.018 to 0.011 |
| rr5 | 0.0003 | 0.000 to 0.001 |
| Mechanical ventilation × respiratory rate | ||
| Mechanical ventilation × rr1 | 0.0455 | 0.025 to 0.066 |
| Mechanical ventilation × rr2 | –0.0055 | –0.024 to 0.013 |
| Mechanical ventilation × rr3 | 0.0078 | –0.024 to 0.040 |
| Mechanical ventilation × rr4 | –0.0027 | –0.022 to 0.016 |
| Mechanical ventilation × rr5 | –0.0003 | –0.001 to 0.000 |
| PaO2/FiO2 (kPa): RCS (10,26,40,61) | ||
| pf1 | –0.0400 | –0.049 to -0.031 |
| pf2 | 0.0279 | –0.002 to 0.058 |
| pf3 | –0.0151 | –0.102 to 0.072 |
| Mechanical ventilation × PaO2/FiO2 | ||
| Mechanical ventilation × pf1 | 0.0185 | 0.008 to 0.029 |
| Mechanical ventilation × pf2 | –0.0073 | –0.046 to 0.032 |
| Mechanical ventilation × pf3 | –0.0227 | –0.140 to 0.094 |
| Lowest arterial pH: RCS (7.08,7.3,7.36,7.44) | ||
| ph1 | 2.2280 | 0.240 to 4.216 |
| ph2 | –3.7155 | –6.017 to –1.413 |
| ph3 | 14.8746 | –22.708 to 52.457 |
| Highest urea (mmol l−1): RCS (2.8,5.6,9.3,28.1) | ||
| ur1 | –0.0670 | –0.119 to –0.015 |
| ur2 | 1.7906 | 1.064 to 2.517 |
| ur3 | –3.3285 | –4.641 to –2.016 |
| Highest creatinine (mg dl−1): RRCS (0.7,0.9,1.2,3) | ||
| cr1 | 0.1524 | 0.132 to 0.173 |
| cr2 | 3.5786 | –7.778 to 14.935 |
| cr3 | –2.1249 | –8.890 to 4.640 |
| cr4 | 0.9874 | –0.274 to 2.248 |
| cr5 | –0.0214 | –0.034 to –0.009 |
| Highest sodium (mmol l−1): RCS (133,139,145) | ||
| na1 | –0.0543 | –0.061 to -0.048 |
| na2 | 0.0587 | 0.052 to 0.066 |
| Lowest white blood cell count (× 109 l−1): RCS (3.7,8.7,12.3,22.5) | ||
| wbc1 | –0.0544 | –0.071 to –0.038 |
| wbc2 | 0.3107 | 0.241 to 0.380 |
| wbc3 | –0.8773 | –1.071 to –0.684 |
| Urine output (ml): RCS (164,1215,2020,4255) | ||
| up1 | –0.0013 | –0.001 to –0.001 |
| up2 | 0.0026 | 0.002 to 0.003 |
| up3 | –0.0054 | –0.007 to –0.003 |
| PaCO2 (kPa): RRCS (4.2,5.7,8) | ||
| pc1 | 8.7347 | 6.758 to 10.712 |
| pc2 | –7.0267 | –8.797 to –5.257 |
| Mechanical ventilation × PaCO2 | ||
| Mechanical ventilation × pc1 | –0.1332 | –0.196 to –0.071 |
| Mechanical ventilation × pc2 | 0.0777 | 0.011 to 0.145 |
| Highest blood lactate (mmol l−1): RCS (0.7,1.5,2.5,8.2) | ||
| bl1 | –18.4582 | –25.188 to –11.728 |
| bl2 | 291.0167 | 184.419 to 397.615 |
| bl3 | –535.0153 | –732.095 to –337.936 |
| Lowest platelet count (× 109 l−1): RCS (60,162,232,422) | ||
| plc1 | –0.0064 | –0.007 to –0.006 |
| plc2 | 0.0206 | 0.017 to 0.024 |
| plc3 | –0.0550 | –0.066 to –0.044 |
| BMI (kg/m2): RCS (20.68,26.12,35.18) | ||
| bmi1 | –0.0528 | –0.061 to –0.045 |
| bmi2 | 0.0568 | 0.047 to 0.067 |
| Sedated/paralysed/GCS (15) | ||
| 15 | 0 | |
| 14 | 0.1910 | 0.125 to 0.257 |
| 7–13 | 0.4143 | 0.353 to 0.476 |
| Sedated | 0.7665 | 0.703 to 0.829 |
| 6 | 0.8679 | 0.688 to 1.048 |
| 5 or paralysed and sedated | 0.8237 | 0.695 to 0.953 |
| 4 | 1.3228 | 1.095 to 1.550 |
| 3 | 1.7984 | 1.679 to 1.917 |
| Mechanical ventilation | 1.2108 | 0.657 to 1.764 |
| Source of admission/urgency of surgery | ||
| ED or not in hospital, unplanned admission | 0 | |
| ED or not in hospital, planned admission | –0.0942 | –0.295 to 0.107 |
| Other acute hospital, not critical care | 0.2087 | 0.032 to 0.386 |
| Other critical care unit, repatriation | 0.1204 | –0.120 to 0.361 |
| Other critical care unit, planned or unplanned transfer | 0.0446 | –0.049 to 0.139 |
| Theatre, unplanned admission following elective or scheduled surgery | –0.7735 | –0.932 to –0.615 |
| Theatre, planned admission following elective or scheduled surgery | –1.2495 | –1.357 to –1.142 |
| Theatre, admission following emergency or urgent surgery | –0.3136 | –0.387 to –0.241 |
| Ward or intermediate care area | 0.3238 | 0.271 to 0.377 |
| CPR prior to admission | ||
| Community CPR | 0 | |
| In-hospital CPR | 4.5342 | –4.192 to 13.261 |
| No CPR | 4.1969 | –1.379 to 9.773 |
| Dependency prior to admission | ||
| No assistance with daily activities | 0 | |
| Some assistance with daily activities | 0.4398 | 0.395 to 0.485 |
| Total assistance with daily activities | 0.5825 | 0.397 to 0.768 |
| Severe liver disease | 0.7380 | 0.628 to 0.848 |
| Metastatic disease | 0.9549 | 0.847 to 1.062 |
| Haematological malignancy | 0.4213 | 0.296 to 0.547 |
| Severe respiratory disease/home ventilation | 0.4062 | 0.301 to 0.511 |
| Immunocompromise | 0.2326 | 0.153 to 0.312 |
| Very severe cardiovascular disease | 0.2120 | 0.094 to 0.330 |
| Arterial pH × PaCO2 | ||
| ph1 × pc1 | –1.2177 | –1.492 to –0.944 |
| ph1 × pc2 | 0.9847 | 0.741 to 1.229 |
| ph2 × pc1 | 0.5001 | 0.177 to 0.823 |
| ph3 × pc1 | 0.9259 | –5.178 to 7.029 |
| Arterial pH × blood lactate | ||
| ph1 × bl1 | 2.5711 | 1.649 to 3.493 |
| ph1 × bl2 | –40.2105 | –54.819 to –25.602 |
| ph1 × bl3 | 73.9037 | 46.891 to 100.916 |
| ph2 × bl1 | –0.1771 | –0.425 to 0.070 |
| ph3 × bl1 | 5.6530 | 1.052 to 10.254 |
| Urine output × urea | ||
| up1 × ur1 | 0.0001 | 0.000 to 0.000 |
| up1 × ur2 | –0.0007 | –0.001 to –0.000 |
| up1 × ur3 | 0.0012 | 0.001 to 0.002 |
| up2 × ur1 | –0.0000 | –0.000 to –0.000 |
| up3 × ur1 | 0.0001 | 0.000 to 0.000 |
| Primary reason for admission | ||
| Congenital or acquired deformity or abnormality (cardiovascular) | 0 | |
| Acute alcoholic hepatitis | 1.5041 | 0.998 to 2.010 |
| Secondary hepatic tumour | –0.9741 | –1.573 to –0.376 |
| Alcoholic cirrhosis | 53.3508 | –26.599 to 133.300 |
| Intracerebral haemorrhage | 2.0879 | 1.218 to 2.957 |
| Thrombo-occlusive disease of brain | –25.4085 | –38.885 to –11.932 |
| Secondary hydrocephalus | 1.5237 | 0.971 to 2.076 |
| Non-traumatic subdural haemorrhage | –70.6247 | –133.793 to –7.456 |
| Accidental intoxication or poisoning (endocrine) | –0.7501 | –1.305 to –0.196 |
| Diabetes mellitus (endocrine) | –1.3006 | –1.722 to –0.879 |
| Dissection or aneurysm (cardiovascular) | –1.0128 | –2.015 to –0.011 |
| Haemolysis or thrombocytopaenia | 0.0339 | –0.620 to 0.688 |
| Hyperkalaemia (endocrine) | –0.4174 | –0.904 to 0.069 |
| Acidaemia (endocrine) | –0.3027 | –0.755 to 0.150 |
| Hypokalaemia (endocrine) | –0.4409 | –1.154 to 0.272 |
| Hyponatraemia (endocrine) | –1.2861 | –1.869 to –0.704 |
| Hypoplasia or dysplasia (haematological/immunological) | –0.2886 | –0.855 to 0.278 |
| Hypothermia (endocrine) | –0.6616 | –1.362 to 0.039 |
| Infection (dermatological, gastrointestinal, haematological/immunological, musculoskeletal, neurological) | –0.1243 | –0.473 to 0.224 |
| Inflammation (cardiovascular, dermatological, genitourinary, musculoskeletal, respiratory) | 0.0043 | –0.349 to 0.358 |
| Obstruction (cardiovascular) | 0.1781 | –0.168 to 0.524 |
| Oedema, inflammation, fibrosis or inhalation (respiratory) | 0.2541 | –0.378 to 0.886 |
| Seizures (neurological) | –13.0836 | –19.337 to –6.830 |
| Self-harm or self-poisoning (endocrine) | –0.7964 | –1.195 to –0.398 |
| Shock and hypotension (cardiovascular) | –0.0228 | –0.384 to 0.339 |
| Transplant or related (cardiovascular, endocrine, genitourinary, haematological/immunological, respiratory) | –0.3441 | –0.925 to 0.237 |
| Trauma, perforation or rupture (dermatological, genitourinary, musculoskeletal, respiratory) | –0.0746 | –0.437 to 0.287 |
| Tumour or malignancy (cardiovascular, dermatological, endocrine, gastrointestinal, musculoskeletal, respiratory) | 0.1583 | –0.193 to 0.510 |
| Burns or hyperthermia (dermatological) | 0.5879 | –0.105 to 1.281 |
| Trauma (neurological) | –0.8295 | –1.333 to –0.326 |
| Non-traumatic aneurysm, dissection, perforation or rupture (cardiovascular) | –0.0271 | –0.382 to 0.328 |
| Collapse (respiratory) | –0.2954 | –0.728 to 0.137 |
| Coma or encephalopathy (neurological) | –0.1685 | –0.559 to 0.222 |
| Congenital or acquired deformity or abnormality (cardiovascular, endocrine, gastrointestinal, genitourinary, haematological/immunological) | –0.2133 | –0.629 to 0.202 |
| Failure (cardiovascular) | 0.1727 | –0.195 to 0.541 |
| Failure (genitourinary) | –0.1717 | –0.523 to 0.179 |
| Haemorrhage (respiratory) | –0.1374 | –0.762 to 0.487 |
| Haemorrhage (cardiovascular) | 0.0493 | –0.578 to 0.676 |
| Haemorrhage (gastrointestinal) | 0.0670 | –0.294 to 0.427 |
| Haemorrhage (neurological) | 0.2252 | –1.092 to 1.543 |
| Haemorrhage (genitourinary) | –0.9770 | –1.675 to –0.279 |
| Infection (respiratory) | –0.0473 | –0.394 to 0.300 |
| Infection (cardiovascular) | 0.3124 | –0.112 to 0.737 |
| Infection (genitourinary) | –0.7277 | –1.098 to –0.357 |
| Inflammation (gastrointestinal) | 0.6374 | 0.235 to 1.040 |
| Inflammation (neurological) | –0.3360 | –0.935 to 0.263 |
| Obstruction (respiratory) | –0.1158 | –0.494 to 0.262 |
| Obstruction (gastrointestinal) | 0.4427 | –0.055 to 0.941 |
| Obstruction (genitourinary) | –0.7185 | –1.183 to –0.254 |
| Transplant or related (gastrointestinal) | –2.1372 | –2.870 to –1.404 |
| Trauma, perforation or rupture (cardiovascular) | –0.4556 | –0.966 to 0.055 |
| Trauma, perforation or rupture (gastrointestinal) | 32.4477 | 16.713 to 48.183 |
| Trauma, perforation or rupture (neurological) | –1.4565 | –8.721 to 5.808 |
| Tumour or malignancy (neurological) | 0.7262 | 0.333 to 1.120 |
| Tumour or malignancy (genitourinary) | –0.2742 | –0.675 to 0.126 |
| Tumour or malignancy (haematological/immunological) | 0.0903 | –0.337 to 0.518 |
| Vascular (gastrointestinal) | 0.1237 | –0.263 to 0.510 |
| Vascular (neurological) | –5.4052 | –9.893 to –0.917 |
| Congenital or acquired deformity or abnormality (respiratory) | 0.2974 | –0.118 to 0.713 |
| Congenital or acquired deformity or abnormality (musculoskeletal) | –0.7485 | –1.307 to –0.190 |
| Congenital or acquired deformity or abnormality (neurological) | –0.7022 | –1.249 to –0.155 |
| Degeneration (cardiovascular) | –0.4055 | –0.827 to 0.016 |
| Degeneration (neurological) | 0.8871 | 0.050 to 1.724 |
| Vascular (cardiovascular; genitourinary) | 0.1870 | –0.592 to 0.966 |
| Pulmonary fibrosis or fibrosing alveolitis | 1.7803 | 1.281 to 2.279 |
| Asthma attack in new or known asthmatic | –2.4056 | –4.909 to 0.098 |
| Multiple rib fractures | –0.3466 | –0.910 to 0.217 |
| Fungal or yeast pneumonia | 1.1621 | 0.657 to 1.667 |
| Hanging or strangulation | 1.1366 | 0.590 to 1.683 |
| Anoxic or ischaemic coma or encephalopathy | 1.1334 | 0.757 to 1.510 |
| Alcoholic hepatitis/cirrhosis × arterial pH | ||
| ph1 | –7.2666 | –18.404 to 3.871 |
| ph2 | 10.7613 | –4.226 to 25.749 |
| ph3 | –189.2792 | –356.488 to –22.070 |
| Intracerebral haemorrhage × urine output | ||
| up1 | –0.0005 | –0.001 to 0.000 |
| up2 | 0.0027 | –0.001 to 0.006 |
| up3 | –0.0066 | –0.016 to 0.003 |
| Thrombo-occlusive disease of brain × sodium | ||
| na1 | 0.1971 | 0.099 to 0.295 |
| na2 | –0.1569 | –0.243 to –0.071 |
| Non-traumatic subdural haemorrhage × arterial pH | ||
| ph1 | 10.2106 | 1.418 to 19.003 |
| ph2 | –24.8692 | –37.023 to –12.715 |
| ph3 | 286.1379 | 147.920 to 424.356 |
| Dissection or aneurysm (cardiovascular) × lowest white blood cell count | ||
| wbc1 | 0.1375 | –0.004 to 0.279 |
| wbc2 | –0.4123 | –0.988 to 0.163 |
| wbc3 | 1.1460 | –0.448 to 2.740 |
| Seizures (neurological) × sodium | ||
| na1 | 0.0925 | 0.046 to 0.138 |
| na2 | –0.0935 | –0.145 to –0.042 |
| Haemorrhage (neuro) × urine output | ||
| up1 | 0.0004 | –0.001 to 0.001 |
| up2 | –0.0001 | –0.004 to 0.004 |
| up3 | –0.0001 | –0.010 to 0.010 |
| Haemorrhage (neuro) × blood lactate | ||
| bl1 | 0.2468 | –0.424 to 0.918 |
| bl2 | 1.5342 | –9.865 to 12.934 |
| bl3 | –4.1341 | –25.493 to 17.225 |
| Inflammation (gastrointestinal) × PaO2/FiO2 | ||
| pf1 | –0.0274 | –0.041 to –0.014 |
| pf2 | 0.0751 | 0.014 to 0.136 |
| pf3 | –0.2018 | –0.407 to 0.003 |
| Obstruction (gastrointestinal) × urine output | ||
| up1 | –0.0009 | –0.001 to –0.000 |
| up2 | 0.0048 | 0.002 to 0.008 |
| up3 | –0.0148 | –0.023 to –0.006 |
| Trauma, perforation or rupture (gastrointestinal) × arterial pH | ||
| ph1 | –4.5428 | –6.742 to –2.344 |
| ph2 | 4.8285 | 1.040 to 8.617 |
| ph3 | –23.6019 | –79.114 to 31.911 |
| Trauma, perforation or rupture (neurological) × sodium | ||
| na1 | 0.0182 | –0.035 to 0.071 |
| na2 | 0.0290 | –0.018 to 0.077 |
| Trauma, perforation or rupture (neurological) × urine output | ||
| up1 | –0.0006 | –0.002 to 0.000 |
| up2 | 0.0027 | –0.001 to 0.006 |
| up3 | –0.0065 | –0.016 to 0.003 |
| Vascular (neurological) × highest heart rate | ||
| hr1 | 0.0646 | 0.010 to 0.119 |
| hr2 | –0.0792 | –0.291 to 0.133 |
| hr3 | 0.1404 | –0.488 to 0.769 |
| Asthma attack in new or known asthmatic × urea | ||
| ur1 | 0.0901 | –0.460 to 0.640 |
| ur2 | 4.6763 | –5.109 to 14.461 |
| ur3 | –10.8103 | –29.632 to 8.012 |
| Constant | 2.0047 | –13.203 to 17.213 |
| Predictor | Coefficient | 95% CI |
|---|---|---|
| Age (years) | 0.0377 | 0.036 to 0.039 |
| Highest heart rate (min−1): RCS (71,93,110,146) | ||
| hr1 | 0.0004 | –0.003 to 0.004 |
| hr2 | 0.0313 | 0.017 to 0.045 |
| hr3 | –0.0966 | –0.137 to –0.056 |
| Lowest systolic blood pressure (mmHg): RCS (66,89,102,130) | ||
| sbp1 | –0.0220 | –0.034 to –0.010 |
| sbp2 | 0.0698 | 0.023 to 0.117 |
| sbp3 | –0.2264 | –0.440 to –0.013 |
| CPR × lowest systolic blood pressure | ||
| In-hospital CPR × sbp1 | –0.0022 | –0.019 to 0.015 |
| No CPR × sbp1 | 0.0058 | –0.007 to 0.018 |
| In-hospital CPR × sbp2 | 0.0117 | –0.055 to 0.079 |
| No CPR × sbp2 | –0.0495 | –0.097 to –0.002 |
| In-hospital CPR × sbp3 | –0.0969 | –0.400 to 0.206 |
| No CPR × sbp3 | 0.1916 | –0.026 to 0.409 |
| Highest temperature (°C): RCS (36,37.2,38,39.2) | ||
| temp1 | –0.2421 | –0.371 to –0.113 |
| temp2 | 0.4892 | –0.109 to 1.087 |
| temp3 | –1.1298 | –3.719 to 1.460 |
| CPR × temperature | ||
| In-hospital CPR × temp1 | –0.0925 | –0.330 to 0.145 |
| No CPR × temp1 | –0.1002 | –0.250 to 0.050 |
| In-hospital CPR × temp2 | –0.2787 | –1.206 to 0.648 |
| No CPR × temp2 | –0.2141 | –0.845 to 0.416 |
| In-hospital CPR × temp3 | 1.7937 | –2.056 to 5.643 |
| No CPR × temp3 | 0.8380 | –1.850 to 3.526 |
| Lowest respiratory rate (min−1): RRCS (10,12,13,20) | ||
| rr1 | –0.0625 | –0.074 to –0.051 |
| rr2 | –0.0036 | –0.017 to 0.009 |
| rr3 | 0.0108 | –0.011 to 0.033 |
| rr4 | –0.0075 | –0.020 to 0.005 |
| rr5 | 0.0004 | 0.000 to 0.001 |
| Mechanical ventilation × respiratory rate | ||
| Mechanical ventilation × rr1 | 0.0402 | 0.020 to 0.061 |
| Mechanical ventilation × rr2 | –0.0046 | –0.021 to 0.012 |
| Mechanical ventilation × rr3 | 0.0037 | –0.025 to 0.033 |
| Mechanical ventilation × rr4 | 0.0001 | –0.017 to 0.017 |
| Mechanical ventilation × rr5 | –0.0004 | –0.001 to –0.000 |
| PaO2/FiO2 (kPa): RCS (10,26,40,61) | ||
| pf1 | –0.0367 | –0.045 to –0.028 |
| pf2 | 0.0446 | 0.017 to 0.072 |
| pf3 | –0.0764 | –0.154 to 0.001 |
| Mechanical ventilation × PaO2/FiO2 | ||
| Mechanical ventilation × pf1 | 0.0168 | 0.007 to 0.027 |
| Mechanical ventilation × pf2 | –0.0233 | –0.059 to 0.013 |
| Mechanical ventilation × pf3 | 0.0314 | –0.076 to 0.139 |
| Lowest arterial pH: RCS (7.08,7.3,7.36,7.44) | ||
| ph1 | 3.6166 | 1.768 to 5.466 |
| ph2 | –4.1960 | –6.352 to –2.040 |
| ph3 | 28.1944 | –6.496 to 62.885 |
| Highest urea (mmol l−1): RCS (2.8,5.6,9.3,28.1) | ||
| ur1 | –0.0420 | –0.089 to 0.005 |
| ur2 | 1.5152 | 0.849 to 2.181 |
| ur3 | –2.8502 | –4.055 to –1.646 |
| Highest creatinine (mg dl−1): RRCS (0.7,0.9,1.2,3) | ||
| cr1 | 0.1306 | 0.112 to 0.149 |
| cr2 | 2.8473 | –7.364 to 13.058 |
| cr3 | –2.2416 | –8.330 to 3.847 |
| cr4 | 1.1573 | 0.015 to 2.299 |
| cr5 | –0.0240 | –0.035 to –0.013 |
| Highest sodium (mmol l−1): RCS (133,139,145) | ||
| na1 | –0.0512 | –0.057 to –0.045 |
| na2 | 0.0541 | 0.047 to 0.061 |
| Lowest white blood cell count (× 109 l−1): RCS (3.7,8.7,12.3,22.5) | ||
| wbc1 | –0.0556 | –0.071 to –0.040 |
| wbc2 | 0.2883 | 0.223 to 0.353 |
| wbc3 | –0.7974 | –0.978 to –0.617 |
| Urine output (ml): RCS (164,1215,2020,4255) | ||
| up1 | –0.0012 | –0.001 to –0.001 |
| up2 | 0.0023 | 0.002 to 0.003 |
| up3 | –0.0047 | –0.006 to 0.003 |
| PaCO2 (kPa): RRCS (4.2,5.7,8) | ||
| pc1 | 8.6540 | 6.796 to 10.512 |
| pc2 | –6.6736 | –8.344 to –5.003 |
| Mechanical ventilation × PaCO2 | ||
| Mechanical ventilation × pc1 | –0.1103 | –0.170 to –0.051 |
| Mechanical ventilation × pc2 | 0.0604 | –0.003 to 0.124 |
| Highest blood lactate (mmol l−1): RCS (.7,1.5,2.5,8.2) | ||
| bl1 | –12.1647 | –18.311 to –6.019 |
| bl2 | 204.0701 | 106.168 to 301.972 |
| bl3 | –377.6584 | –558.883 to –196.434 |
| Lowest platelet count (× 109 l−1): RCS (60,162,232,422) | ||
| plc1 | –0.0063 | –0.007 to –0.006 |
| plc2 | 0.0218 | 0.019 to 0.025 |
| plc3 | –0.0585 | –0.068 to –0.049 |
| BMI (kg/m2): RCS (20.68,26.12,35.18) | ||
| bmi1 | –0.0592 | –0.066 to –0.052 |
| bmi2 | 0.0620 | 0.053 to 0.071 |
| Sedated/paralysed/GCS (15) | ||
| 15 | 0 | |
| 14 | 0.2224 | 0.163 to 0.282 |
| 7–13 | 0.4270 | 0.371 to 0.483 |
| Sedated | 0.7300 | 0.671 to 0.789 |
| 6 | 0.8679 | 0.688 to 1.048 |
| 5 or paralysed and sedated | 0.7914 | 0.667 to 0.916 |
| 4 | 1.1629 | 0.940 to 1.386 |
| 3 | 1.7144 | 1.598 to 1.831 |
| Mechanical ventilation | 1.1348 | 0.602 to 1.668 |
| Source of admission/urgency of surgery | ||
| ED or not in hospital (unplanned admission) | 0 | |
| ED or not in hospital (planned admission) | –0.1441 | –0.337 to 0.048 |
| Other acute hospital (not critical care) | 0.1856 | 0.019 to 0.352 |
| Other critical care unit (repatriation) | 0.1397 | –0.077 to 0.356 |
| Other critical care unit (planned or unplanned transfer) | 0.1135 | 0.027 to 0.200 |
| Theatre (unplanned admission following elective or scheduled surgery) | –0.5455 | –0.673 to –0.418 |
| Theatre (planned admission following elective or scheduled surgery) | –1.1287 | –1.220 to –1.037 |
| Theatre (admission following emergency or urgent surgery) | –0.2553 | –0.322 to –0.188 |
| Ward or intermediate care area | 0.3227 | 0.273 to 0.373 |
| CPR prior to admission | ||
| Community CPR | 0 | |
| In-hospital CPR | 3.0502 | –5.590 to 11.690 |
| No CPR | 2.5074 | –2.955 to 7.970 |
| Dependency prior to admission | ||
| No assistance with daily activities | 0 | |
| Some assistance with daily activities | 0.4896 | 0.448 to 0.531 |
| Total assistance with daily activities | 0.7598 | 0.588 to 0.931 |
| Severe liver disease | 0.8008 | 0.696 to 0.905 |
| Metastatic disease | 1.2427 | 1.147 to 1.338 |
| Haematological malignancy | 0.5031 | 0.384 to 0.622 |
| Severe respiratory disease/home ventilation | 0.3853 | 0.285 to 0.485 |
| Immunocompromise | 0.2865 | 0.214 to 0.359 |
| Very severe cardiovascular disease | 0.1798 | 0.069 to 0.291 |
| Arterial pH × PaCO2 | ||
| ph1 × pc1 | –1.2098 | –1.467 to –0.952 |
| ph1 × pc2 | 0.9384 | 0.708 to 1.169 |
| ph2 × pc1 | 0.6997 | 0.397 to 1.003 |
| ph3 × pc1 | –2.4420 | –8.088 to 3.204 |
| Arterial pH × blood lactate | ||
| ph1 × bl1 | 1.6885 | 0.848 to 2.529 |
| ph1 × bl2 | –28.0452 | –41.444 to –14.646 |
| ph1 × bl3 | 51.8930 | 27.086 to 76.700 |
| ph2 × bl1 | –0.2602 | –0.500 to –0.020 |
| ph3 × bl1 | 7.2817 | 2.909 to 11.654 |
| Urine output × urea | ||
| up1 × ur1 | 0.0000 | 0.000 to 0.000 |
| up1 × ur2 | –0.0006 | –0.001 to –0.000 |
| up1 × ur3 | 0.0010 | 0.000 to 0.001 |
| up2 × ur1 | –0.0000 | –0.000 to –0.000 |
| up3 × ur1 | 0.0001 | 0.000 to 0.000 |
| Primary reason for admission | ||
| Congenital or acquired deformity or abnormality (cardiovascular) | 0 | – |
| Acute alcoholic hepatitis | 1.3573 | 0.868 to 1.847 |
| Secondary hepatic tumour | –1.0697 | –1.562 to –0.577 |
| Alcoholic cirrhosis | 53.3078 | –28.277 to 134.893 |
| Intracerebral haemorrhage | 1.9013 | 1.028 to 2.774 |
| Thrombo-occlusive disease of brain | –22.3383 | –34.611 to –10.065 |
| Secondary hydrocephalus | 1.3802 | 0.860 to 1.900 |
| Non-traumatic subdural haemorrhage | –63.1698 | –125.988 to –0.352 |
| Accidental intoxication or poisoning (endocrine) | –0.8558 | –1.369 to –0.343 |
| Diabetes mellitus (endocrine) | –1.0476 | –1.425 to –0.670 |
| Dissection or aneurysm (cardiovascular) | –0.6190 | –1.548 to 0.310 |
| Haemolysis or thrombocytopaenia | –0.0992 | –0.720 to 0.521 |
| Hyperkalaemia (endocrine) | –0.1056 | –0.544 to 0.333 |
| Acidaemia (endocrine) | –0.3262 | –0.750 to 0.098 |
| Hypokalaemia (endocrine) | –0.3658 | –0.998 to 0.267 |
| Hyponatraemia (endocrine) | –1.1033 | –1.605 to –0.601 |
| Hypoplasia or dysplasia (haematological/immunological) | –0.2528 | –0.792 to 0.286 |
| Hypothermia (endocrine) | –0.3638 | –1.004 to 0.276 |
| Infection (dermatological, gastrointestinal, haematological/immunological, musculoskeletal, neurological) | –0.1026 | –0.422 to 0.217 |
| Inflammation (cardiovascular, dermatological, genitourinary, musculoskeletal, respiratory) | –0.0115 | –0.337 to 0.314 |
| Obstruction (cardiovascular) | 0.1067 | –0.211 to 0.425 |
| Oedema, inflammation, fibrosis or inhalation (respiratory) | 0.3037 | –0.282 to 0.889 |
| Seizures (neurological) | –12.8697 | –18.110 to –7.629 |
| Self-harm or self-poisoning (endocrine) | –0.7470 | –1.110 to –0.384 |
| Shock and hypotension (cardiovascular) | 0.0123 | –0.321 to 0.345 |
| Transplant or related (cardiovascular, endocrine, genitourinary haematological/immunological, respiratory) | –0.0969 | –0.603 to 0.409 |
| Trauma, perforation or rupture (dermatological, genitourinary, musculoskeletal, respiratory) | –0.0071 | –0.337 to 0.323 |
| Tumour or malignancy (cardiovascular, dermatological, endocrine, gastrointestinal, musculoskeletal, respiratory) | 0.2613 | –0.059 to 0.581 |
| Burns or hyperthermia (dermatological) | 0.4322 | –0.233 to 1.097 |
| Trauma (neurological) | –0.5736 | –1.024 to –0.123 |
| Non-traumatic aneurysm, dissection, perforation or rupture (cardiovascular) | 0.0084 | –0.319 to 0.336 |
| Collapse (respiratory) | –0.1862 | –0.581 to 0.209 |
| Coma or encephalopathy (neurological) | –0.0842 | –0.443 to 0.274 |
| Congenital or acquired deformity or abnormality (cardiovascular, endocrine, gastrointestinal; genitourinary; or haematological/immunological) | –0.3324 | –0.709 to 0.044 |
| Failure | ||
| Cardiovascular | 0.2470 | –0.094 to 0.588 |
| Genitourinary | –0.1292 | –0.452 to 0.193 |
| Haemorrhage | ||
| Respiratory | –0.0365 | –0.601 to 0.528 |
| Cardiovascular | 0.3360 | –0.218 to 0.890 |
| Gastrointestinal | 0.1104 | –0.221 to 0.441 |
| Neurological | –0.6118 | –1.886 to 0.662 |
| Genitourinary | –1.1498 | –1.796 to –0.504 |
| Infection | ||
| Respiratory | –0.0255 | –0.344 to 0.293 |
| Cardiovascular | 0.5422 | 0.152 to 0.932 |
| Genitourinary | –0.6214 | –0.960 to –0.283 |
| Inflammation | ||
| Gastrointestinal | 0.5584 | 0.182 to 0.934 |
| Neurological | –0.1261 | –0.649 to 0.397 |
| Obstruction | ||
| Respiratory | –0.0402 | –0.387 to 0.307 |
| Gastrointestinal | 0.4012 | –0.063 to 0.865 |
| Genitourinary | –0.2088 | –0.610 to 0.192 |
| Transplant or related (gastrointestinal) | –2.0240 | –2.634 to –1.414 |
| Trauma, perforation or rupture | ||
| Cardiovascular | –0.3750 | –0.842 to 0.092 |
| Gastrointestinal | 37.0740 | 21.185 to 52.963 |
| Neurological | –0.7006 | –7.471 to 6.070 |
| Tumour or malignancy | ||
| Neurological | 0.8926 | 0.544 to 1.242 |
| Genitourinary | 0.0381 | –0.309 to 0.385 |
| Haematological/immunological | 0.1457 | –0.255 to 0.547 |
| Vascular | ||
| Gastrointestinal | –0.0174 | –0.375 to 0.340 |
| Neurological | –4.6421 | –8.294 to –0.990 |
| Congenital or acquired deformity or abnormality | ||
| Respiratory | 0.3014 | –0.080 to 0.683 |
| Musculoskeletal | –0.6118 | –1.066 to –0.158 |
| Neurological | –0.4875 | –0.952 to –0.023 |
| Degeneration | ||
| Cardiovascular | –0.1856 | –0.554 to 0.183 |
| Neurological | 1.2478 | 0.469 to 2.026 |
| Vascular (cardiovascular/genitourinary) | 0.2510 | –0.438 to 0.940 |
| Pulmonary fibrosis or fibrosing alveolitis | 1.9348 | 1.437 to 2.433 |
| Asthma attack in new or known asthmatic | –1.8175 | –3.884 to 0.249 |
| Multiple rib fractures | –0.5563 | –1.087 to –0.025 |
| Fungal or yeast pneumonia | 1.2060 | 0.721 to 1.691 |
| Hanging or strangulation | 1.0532 | 0.533 to 1.573 |
| Anoxic or ischaemic coma or encephalopathy | 1.0522 | 0.701 to 1.404 |
| Alcoholic hepatitis/cirrhosis × arterial pH | ||
| ph1 | –7.2654 | –18.629 to 4.098 |
| ph2 | 8.9448 | –6.144 to 24.034 |
| ph3 | –126.2808 | –290.065 to 37.504 |
| Intracerebral haemorrhage × urine output | ||
| up1 | –0.0005 | –0.001 to 0.000 |
| up2 | 0.0027 | –0.001 to 0.006 |
| up3 | –0.0064 | –0.016 to 0.003 |
| Thrombo-occlusive disease of brain × sodium | ||
| na1 | 0.1737 | 0.084 to 0.263 |
| na2 | –0.1449 | –0.225 to –0.065 |
| Non-traumatic subdural haemorrhage × arterial pH | ||
| ph1 | 9.1336 | 0.389 to 17.878 |
| ph2 | –22.4754 | –34.487 to –10.464 |
| ph3 | 258.9084 | 123.289 to 394.528 |
| Dissection or aneurysm (cardiovascular) × lowest white blood cell count | ||
| wbc1 | 0.0913 | –0.040 to 0.223 |
| wbc2 | –0.3243 | –0.861 to 0.212 |
| wbc3 | 0.9967 | –0.502 to 2.495 |
| Seizures (neurological) × sodium | ||
| na1 | 0.0919 | 0.053 to 0.130 |
| na2 | –0.0918 | –0.136 to –0.048 |
| Haemorrhage (neuro) × urine output | ||
| up1 | 0.0005 | –0.001 to 0.002 |
| up2 | –0.0009 | –0.005 to 0.003 |
| up3 | 0.0022 | –0.008 to 0.012 |
| Haemorrhage (neuro) × blood lactate | ||
| bl1 | 0.6899 | 0.046 to 1.334 |
| bl2 | –4.3553 | –15.336 to 6.626 |
| bl3 | 6.5023 | –14.081 to 27.085 |
| Inflammation (gastrointestinal) × PaO2/FiO2 | ||
| pf1 | –0.0213 | –0.035 to –0.008 |
| pf2 | 0.0610 | 0.004 to 0.118 |
| pf3 | –0.1670 | –0.354 to 0.020 |
| Obstruction (gastrointestinal) × urine output | ||
| up1 | –0.0009 | –0.001 to –0.000 |
| up2 | 0.0050 | 0.003 to 0.007 |
| up3 | –0.0146 | –0.022 to –0.008 |
| Trauma, perforation or rupture (gastrointestinal) × arterial pH | ||
| ph1 | –5.1914 | –7.410 to –2.973 |
| ph2 | 6.4971 | 2.903 to 10.092 |
| ph3 | –54.5498 | –105.038 to –4.061 |
| Trauma, perforation or rupture (neurological) × sodium | ||
| na1 | 0.0117 | –0.037 to 0.061 |
| na2 | 0.0323 | –0.012 to 0.077 |
| Trauma, perforation or rupture (neurological) × urine output | ||
| up1 | –0.0006 | –0.002 to 0.000 |
| up2 | 0.0030 | –0.001 to 0.007 |
| up3 | –0.0074 | –0.017 to 0.002 |
| Vascular (neurological) × highest heart rate | ||
| hr1 | 0.0536 | 0.009 to 0.099 |
| hr2 | –0.0610 | –0.245 to 0.123 |
| hr3 | 0.1049 | –0.448 to 0.658 |
| Asthma attack in new or known asthmatic × urea | ||
| ur1 | –0.0217 | –0.486 to 0.442 |
| ur2 | 6.5180 | –2.004 to 15.040 |
| ur3 | –14.3583 | –30.877 to 2.161 |
| Constant | –8.5962 | –22.840 to 5.647 |
| Predictor | Coefficient | 95% CI |
|---|---|---|
| Age (years): RCS (26,53,66,75,85) | ||
| age1 | 0.0402 | 0.035 to 0.046 |
| age2 | –0.0162 | –0.029 to –0.003 |
| age3 | 0.1154 | 0.019 to 0.212 |
| age4 | –0.1381 | –0.396 to 0.120 |
| Highest heart rate (min−1): RCS (72,92,110,143) | ||
| hr1 | 0.0027 | –0.001 to 0.006 |
| hr2 | 0.0215 | 0.007 to 0.036 |
| hr3 | –0.0610 | –0.098 to –0.024 |
| Lowest systolic blood pressure (mmHg): RCS (70,89,101,130) | ||
| sbp1 | –0.0148 | –0.018 to –0.012 |
| sbp2 | 0.0305 | 0.018 to 0.043 |
| sbp3 | –0.0765 | –0.121 to –0.032 |
| Highest temperature (°C): RCS (36,37,37.6,38.1,39.2) | ||
| temp1 | –0.2375 | –0.348 to –0.032 |
| temp2 | 1.0934 | –0.462 to 2.649 |
| temp3 | –4.3752 | –15.621 to 6.871 |
| temp4 | 7.2029 | –15.989 to 30.395 |
| CPR × temperature | ||
| In-hospital CPR × temp1 | –0.1748 | –0.400 to 0.051 |
| No CPR × temp1 | –0.1905 | –0.337 to –0.044 |
| In-hospital CPR × temp2 | –0.1153 | –2.395 to 2.164 |
| No CPR × temp2 | 0.0085 | –1.615 to 1.632 |
| In-hospital CPR × temp3 | –0.6850 | –16.135 to 14.765 |
| No CPR × temp3 | –0.4952 | –11.999 to 11.009 |
| In-hospital CPR × temp4 | 3.2344 | –27.516 to 33.985 |
| No CPR × temp4 | 0.4438 | –23.106 to 23.994 |
| Lowest respiratory rate (min−1): RRCS (8, to 11,14,20) | ||
| rr1 | –0.0547 | –0.066 to –0.043 |
| rr2 | –0.0068 | –0.019 to 0.005 |
| rr3 | 0.0040 | –0.002 to 0.010 |
| rr4 | –0.0011 | –0.003 to 0.001 |
| rr5 | 0.0002 | 0.000 to 0.000 |
| Mechanical ventilation × respiratory rate | ||
| Mechanical ventilation × rr1 | 0.0360 | 0.014 to 0.058 |
| Mechanical ventilation × rr2 | 0.0120 | –0.003 to 0.027 |
| Mechanical ventilation × rr3 | –0.0090 | –0.018 to 0.000 |
| Mechanical ventilation × rr4 | 0.0038 | 0.001 to 0.007 |
| Mechanical ventilation × rr5 | –0.0006 | –0.001 to 0.000 |
| PaO2/FiO2 (kPa): RCS (11,24,34,44,60) | ||
| pf1 | –0.0327 | –0.043 to –0.022 |
| pf2 | 0.0702 | 0.011 to 0.130 |
| pf3 | –0.1565 | –0.377 to 0.064 |
| pf4 | 0.0855 | –0.204 to 0.375 |
| Mechanical ventilation × PaO2/FiO2 | ||
| Mechanical ventilation × pf1 | –0.0070 | –0.020 to 0.006 |
| Mechanical ventilation × pf2 | 0.0679 | –0.013 to 0.149 |
| Mechanical ventilation × pf3 | –0.2733 | –0.586 to 0.039 |
| Mechanical ventilation × pf4 | 0.3664 | –0.069 to 0.802 |
| Lowest arterial pH: RCS (7.15,7.33,7.41) | ||
| ph1 | –1.7813 | –2.126 to –1.437 |
| ph2 | 1.9573 | 1.631 to 2.284 |
| Highest urea (mmol l−1): RCS (2.8,4.8,6.9,10.7,26.7) | ||
| ur1 | 0.0253 | –0.019 to 0.070 |
| ur2 | 0.7158 | –0.930 to 2.361 |
| ur3 | –1.1823 | –4.961 to 2.596 |
| ur4 | 0.1892 | –2.321 to 2.699 |
| Highest creatinine (mg dl−1): RCS (0.5,0.8,1.2,4.1) | ||
| cr1 | –0.5515 | –0.766 to –0.337 |
| cr2 | 13.6009 | 8.378 to 18.824 |
| cr3 | –24.4843 | –33.797 to –15.172 |
| Highest sodium (mmol l−1): RCS (132,137,139,141,147) | ||
| na1 | –0.0315 | –0.041 to –0.022 |
| na2 | –0.1065 | –0.176 to –0.037 |
| na3 | 1.3354 | 0.672 to 1.999 |
| na4 | –2.1229 | –3.276 to –0.970 |
| Lowest white blood cell count (× 109 l−1): RCS (3.9,8,10.6,13.7,21.9) | ||
| wbc1 | –0.0229 | –0.042 to –0.004 |
| wbc2 | 0.0676 | –0.100 to 0.235 |
| wbc3 | 0.0945 | –0.609 to 0.798 |
| wbc4 | –0.4690 | –1.298 to 0.360 |
| Urine output (ml): RCS (158,1020,1567,2300,4215) | ||
| up1 | –0.0009 | –0.001 to –0.001 |
| up2 | 0.0029 | 0.002 to 0.004 |
| up3 | –0.0072 | –0.011 to –0.003 |
| up4 | 0.0048 | 0.000 to 0.009 |
| PaCO2 (kPa): RRCS (3.7, 5.5, 6.1, 9.1) | ||
| pc1 | –0.0604 | –0.092 to –0.029 |
| pc2 | 0.0816 | –0.050 to 0.213 |
| pc3 | –0.1446 | –0.234 to –0.055 |
| pc4 | 0.0728 | 0.028 to 0.117 |
| pc4 | –0.0012 | –0.004 to 0.002 |
| Mechanical ventilation × PaCO2 | ||
| Mechanical ventilation × pc1 | 0.0357 | 0.002 to 0.069 |
| Mechanical ventilation × pc2 | 0.1008 | –0.166 to 0.368 |
| Mechanical ventilation × pc3 | 0.0003 | –0.142 to 0.142 |
| Mechanical ventilation × pc4 | –0.0340 | –0.098 to 0.030 |
| Mechanical ventilation × pc4 | 0.0035 | 0.000 to 0.007 |
| Highest blood lactate (mmol l−1): RCS (.8,1.3,1.9,2.9,7.1) | ||
| bl1 | 0.2171 | 0.063 to 0.371 |
| bl2 | –7.9005 | –14.312 to –1.490 |
| bl3 | 17.6113 | 3.741 to 31.482 |
| bl4 | –11.7356 | –20.697 to –2.774 |
| Lowest platelet count (× 109 l−1): RCS (62,144,193,248,398) | ||
| plc1 | –0.0063 | –0.007 to –0.005 |
| plc2 | 0.0230 | 0.015 to 0.032 |
| plc3 | –0.0376 | –0.077 to 0.001 |
| plc4 | –0.0173 | –0.067 to 0.032 |
| BMI (kg/m2): RCS (18.5,23.1,25.9,29.4,38.2) | ||
| bmi1 | –0.0734 | –0.091 to –0.055 |
| bmi2 | 0.1101 | –0.035 to 0.255 |
| bmi3 | –0.1581 | –0.789 to 0.473 |
| bmi4 | 0.0222 | –0.720 to 0.764 |
| Sedated/paralysed/GCS (15) | ||
| 15 | 0 | |
| 14 | 0.1648 | 0.107 to 0.223 |
| 7–13 | 0.3286 | 0.272 to 0.385 |
| Sedated | 0.7157 | 0.534 to 0.898 |
| 6 | 0.5969 | 0.538 to 0.656 |
| 5 or paralysed and sedated | 0.6487 | 0.522 to 0.775 |
| 4 | 0.9358 | 0.707 to 1.165 |
| 3 | 1.4348 | 1.309 to 1.561 |
| Mechanical ventilation | 1.0179 | 0.476 to 1.559 |
| Source of admission/urgency of surgery | ||
| ED or not in hospital (unplanned admission) | 0 | |
| ED or not in hospital (planned admission) | –0.1925 | –0.433 to 0.048 |
| Other acute hospital (not critical care) | 0.1291 | –0.050 to 0.308 |
| Other critical care unit (repatriation) | 0.2741 | –0.023 to 0.571 |
| Other critical care unit (planned or unplanned transfer) | 0.1297 | 0.019 to 0.241 |
| Theatre (unplanned admission following elective or scheduled surgery) | –0.4574 | –0.572 to –0.343 |
| Theatre (planned admission following elective or scheduled surgery) | –0.7712 | –0.856 to –0.686 |
| Theatre (admission following emergency or urgent surgery) | –0.1585 | –0.226 to –0.091 |
| Ward or intermediate care area | 0.2743 | 0.224 to 0.325 |
| CPR prior to admission | ||
| Community CPR | 0 | |
| In-hospital CPR | 6.0415 | –2.032 to 14.115 |
| No CPR | 6.2556 | 0.997 to 11.514 |
| Dependency prior to admission | ||
| No assistance with daily activities | 0 | |
| Some assistance with daily activities | 0.4080 | 0.366 to 0.450 |
| Total assistance with daily activities | 0.6734 | 0.485 to 0.862 |
| Severe liver disease | 1.0018 | 0.887 to 1.117 |
| Metastatic disease | 1.3364 | 1.255 to 1.418 |
| Haematological malignancy | 0.6660 | 0.541 to 0.791 |
| Severe respiratory disease/home ventilation | 0.5243 | 0.416 to 0.633 |
| Immunocompromise | 0.4022 | 0.331 to 0.474 |
| End-stage renal failure | 0.2855 | 0.138 to 0.433 |
| Very severe cardiovascular disease | 0.2767 | 0.154 to 0.399 |
| Congestive cardiac failure | 0.2893 | 0.213 to 0.365 |
| Peripheral vascular disease | 0.2573 | 0.177 to 0.337 |
| Cerebrovascular disease | 0.1884 | 0.091 to 0.286 |
| Chronic pulmonary disease | 0.1770 | 0.125 to 0.229 |
| Liver disease | 0.3927 | 0.280 to 0.505 |
| Chronic renal disease | 0.2335 | 0.157 to 0.310 |
| Any malignancy | 0.3475 | 0.283 to 0.411 |
| Primary reason for admission | ||
| Accidental intoxication, poisoning or medication event | 0 | – |
| Diabetes mellitus | –0.6676 | –1.068 to –0.268 |
| Dissection or aneurysm | 16.9270 | 1.789 to 32.065 |
| Failure | –1.9486 | –10.729 to 6.832 |
| Haemolysis or thrombocytopaenia | 0.4483 | –0.272 to 1.169 |
| Haemorrhage | 0.5971 | 0.092 to 1.102 |
| Cardiovascular | –0.3180 | –0.976 to 0.340 |
| Gastrointestinal | 0.5151 | 0.151 to 0.879 |
| Neurological (including eyes) | –5.8257 | –28.807 to 17.156 |
| Genitourinary | –0.2582 | –0.815 to 0.298 |
| Hyperkalaemia | –0.0753 | –0.559 to 0.408 |
| Hypertension (cardiovascular) or over- or under-activity (cardiovascular/genitourinary) | 0.1996 | –0.163 to 0.562 |
| Acidaemia | 0.5458 | 0.083 to 1.008 |
| Hypokalaemia | 0.0024 | –0.636 to 0.641 |
| Hyponatraemia | –0.4733 | –0.995 to 0.049 |
| Hypoplasia or dysplasia | 1.1075 | 0.441 to 1.774 |
| Hypothermia | –0.1838 | –0.756 to 0.389 |
| Infection | 0.3031 | –0.066 to 0.672 |
| Respiratory | 1.0197 | 0.558 to 1.482 |
| Cardiovascular | 0.8110 | 0.381 to 1.241 |
| Gastrointestinal | 0.0700 | –0.290 to 0.430 |
| Neurological (including eyes) | –0.1316 | –1.039 to 0.775 |
| Genitourinary | –0.1171 | –0.487 to 0.253 |
| Inflammation | 0.5741 | 0.116 to 1.032 |
| Respiratory | 0.5149 | 0.154 to 0.876 |
| Gastrointestinal | 0.5988 | –0.034 to 1.231 |
| Neurological (including eyes) | 0.0965 | –0.468 to 0.660 |
| Obstruction | 0.1350 | –0.224 to 0.494 |
| Respiratory | 0.3482 | –0.030 to 0.727 |
| Cardiovascular | 0.3609 | 0.005 to 0.716 |
| Oedema, inflammation, fibrosis or inhalation | 0.2641 | –0.368 to 0.896 |
| Seizures | –11.1015 | –17.311 to –4.892 |
| Self-harm or self-poisoning | –0.2824 | –0.662 to 0.098 |
| Shock or hypotension | 0.5697 | 0.200 to 0.940 |
| Transplant (or related) | 3.3775 | 0.823 to 5.932 |
| Gastrointestinal | –1.6567 | –2.201 to –1.113 |
| Trauma, perforation or rupture | 0.4698 | 0.048 to 0.891 |
| Respiratory | 0.0833 | –0.335 to 0.502 |
| Musculoskeletal | 0.5132 | 0.146 to 0.880 |
| Gastrointestinal | –1.7297 | –3.217 to –0.243 |
| Neurological (including eyes) | –1.7550 | –3.437 to –0.073 |
| Tumour or malignancy | 0.9192 | 0.560 to 1.279 |
| Gastrointestinal | 3.0139 | 2.175 to 3.852 |
| Neurological (including eyes) | 3.6747 | 2.151 to 5.198 |
| Vascular | 0.2480 | –0.380 to 0.876 |
| Gastrointestinal | 0.4165 | 0.031 to 0.802 |
| Neurological (including eyes) | 0.8837 | 0.435 to 1.332 |
| Burns or hyperthermia | 3.2998 | –0.409 to 7.009 |
| otherEndoc | –0.2853 | –0.760 to 0.189 |
| Collapse | 0.4069 | –0.018 to 0.832 |
| Coma or encephalopathy | –0.8792 | –4.851 to 3.093 |
| Congenital or acquired deformity or abnormality | 0.3360 | –0.031 to 0.703 |
| Musculoskeletal | –0.0871 | –0.507 to 0.333 |
| Neurological (including eyes) | 0.2235 | –0.229 to 0.676 |
| Degeneration | ||
| Musculoskeletal | 2.0208 | 1.243 to 2.799 |
| Neurological (including eyes) | –0.0133 | –0.421 to 0.395 |
| Cardiovascular | –14.1255 | –24.495 to –3.756 |
| CABG for chronic angina | 0.9192 | 0.522 to 1.317 |
| Lower limb artery stenosis or occlusion | –0.6020 | –1.181 to –0.023 |
| Anaphylaxis | 1.7791 | 1.381 to 2.177 |
| Pancreatic or pancreato-duodenal tumour | –0.1059 | –0.532 to 0.320 |
| Secondary hepatic tumour | 1.4456 | 1.012 to 1.879 |
| Small bowel tumour | –0.5314 | –1.030 to –0.033 |
| Leaking large bowel anastomosis | –0.4174 | –1.871 to 1.037 |
| Malignant large bowel tumour | 1.4994 | 1.008 to 1.991 |
| Alcoholic cirrhosis | 0.4731 | 0.098 to 0.848 |
| Large bowel tumour | 0.1207 | –0.322 to 0.564 |
| Toxic or drug induced coma or encephalopathy | 1.5003 | 1.098 to 1.902 |
| Thrombo-occlusive disease of brain | 1.8920 | 1.340 to 2.444 |
| Secondary hydrocephalus | 152.3005 | 32.230 to 272.371 |
| Carotid or vertebral artery stenosis or occlusion | 1.9850 | 1.445 to 2.525 |
| Pulmonary fibrosis or fibrosing alveolitis | –1.0007 | –1.475 to –0.526 |
| Asthma attack in new or known asthmatic | 1.2679 | 0.743 to 1.792 |
| Hanging or strangulation | 1.1365 | 0.746 to 1.527 |
| Dissection or aneurysm × arterial pH | ||
| ph1 | –2.2849 | –4.384 to –0.186 |
| ph2 | –0.1132 | –2.470 to 2.243 |
| Failure × temperature | ||
| temp1 | 0.0878 | –0.152 to 0.327 |
| temp2 | –1.0850 | –2.512 to 0.342 |
| temp3 | 5.0662 | –3.501 to 13.634 |
| temp4 | –8.2784 | –24.525 to 7.968 |
| Failure × blood lactate | ||
| bl1 | –0.0659 | –0.572 to 0.440 |
| bl2 | 4.7589 | –17.917 to 27.434 |
| bl3 | –9.3263 | –59.077 to 40.424 |
| bl4 | 4.4999 | –28.325 to 37.325 |
| Failure × PaCO2 | ||
| pc1 | 0.0418 | –0.043 to 0.127 |
| pc2 | –0.0309 | –0.307 to 0.246 |
| pc3 | –0.0331 | –0.256 to 0.190 |
| pc4 | 0.0323 | –0.086 to 0.151 |
| pc4 | –0.0056 | –0.014 to 0.002 |
| Haemorrhage: neurological (including eyes) × temperature | ||
| temp1 | 0.1878 | –0.439 to 0.815 |
| temp2 | –1.3921 | –4.241 to 1.457 |
| temp3 | 4.0789 | –10.164 to 18.322 |
| temp4 | 1.3577 | –21.964 to 24.679 |
| Haemorrhage: neurological (including eyes) × urine output | ||
| up1 | –0.0011 | –0.002 to 0.000 |
| up2 | 0.0120 | 0.003 to 0.021 |
| up3 | –0.0467 | –0.079 to –0.014 |
| up4 | 0.0489 | 0.017 to 0.081 |
| Haemorrhage: neurological (including eyes) × blood lactate | ||
| bl1 | 1.5292 | 0.677 to 2.381 |
| bl2 | –29.1072 | –64.127 to 5.912 |
| bl3 | 49.0447 | –26.818 to 124.907 |
| bl4 | –17.3413 | –66.669 to 31.987 |
| Haemorrhage: neurological (including eyes) × PaCO2 | ||
| pc1 | 0.0521 | –0.080 to 0.184 |
| pc2 | 0.2599 | –2.426 to 2.945 |
| pc3 | –0.4601 | –1.002 to 0.081 |
| pc4 | 0.2745 | 0.067 to 0.482 |
| pc4 | –0.0196 | –0.031 to –0.008 |
| Infection: neurological (including eyes) × urine output | ||
| up1 | 0.0007 | –0.001 to 0.002 |
| up2 | –0.0092 | –0.022 to 0.004 |
| up3 | 0.0427 | –0.008 to 0.093 |
| up4 | –0.0500 | –0.103 to 0.003 |
| Infection: respiratory × PaCO2 | ||
| pc1 | 0.0525 | 0.020 to 0.085 |
| pc2 | –0.1969 | –0.672 to 0.279 |
| pc3 | 0.0903 | –0.113 to 0.293 |
| pc4 | –0.0310 | –0.118 to 0.056 |
| pc4 | –0.0027 | –0.007 to 0.002 |
| Inflammation: gastrointestinal × lowest platelet count | ||
| plc1 | 0.0014 | –0.004 to 0.007 |
| plc2 | 0.0082 | –0.042 to 0.058 |
| plc3 | –0.1248 | –0.364 to 0.114 |
| plc4 | 0.2390 | –0.075 to 0.553 |
| Seizures × sodium | ||
| na1 | 0.0849 | 0.038 to 0.132 |
| na2 | –0.2056 | –0.680 to 0.268 |
| na3 | –0.3675 | –5.093 to 4.358 |
| na4 | 2.4612 | –5.868 to 10.791 |
| Transplant (or related) × lowest white blood cell count | ||
| wbc1 | –0.6301 | –1.125 to –0.135 |
| wbc2 | 2.5151 | –2.138 to 7.168 |
| wbc3 | –5.0071 | –24.896 to 14.881 |
| wbc4 | 0.9611 | –22.733 to 24.655 |
| Trauma, perforation or rupture: gastrointestinal × respiratory rate | ||
| rr1 | –0.0435 | –0.106 to 0.019 |
| rr2 | 0.0059 | –0.021 to 0.033 |
| rr3 | 0.0078 | –0.011 to 0.027 |
| rr4 | –0.0082 | –0.016 to –0.001 |
| rr5 | 0.0014 | 0.000 to 0.002 |
| Trauma, perforation or rupture: gastrointestinal × blood lactate | ||
| bl1 | 0.7457 | –0.085 to 1.577 |
| bl2 | –26.7689 | –59.619 to 6.081 |
| bl3 | 55.5694 | –14.458 to 125.597 |
| bl4 | –32.7333 | –76.836 to 11.370 |
| Trauma, perforation or rupture: neurological (including eyes) × urine output | ||
| up1 | 0.0012 | 0.000 to 0.003 |
| up2 | –0.0070 | –0.018 to 0.004 |
| up3 | 0.0229 | –0.015 to 0.061 |
| up4 | –0.0192 | –0.057 to 0.018 |
| Trauma, perforation or rupture: neurological (including eyes) × blood lactate | ||
| bl1 | 1.1179 | –0.102 to 2.338 |
| bl2 | –30.5768 | –79.059 to 17.906 |
| bl3 | 64.0631 | –39.581 to 167.707 |
| bl4 | –39.1497 | –104.900 to 26.600 |
| Tumour or malignancy: gastrointestinal × highest urea | ||
| ur1 | –0.4347 | –0.631 to –0.238 |
| ur2 | 10.0194 | 2.127 to 17.912 |
| ur3 | –19.1204 | –37.844 to –0.396 |
| ur4 | 8.8289 | –4.280 to 21.938 |
| Tumour or malignancy: neurological (including eyes) × heart rate | ||
| hr1 | –0.0180 | –0.037 to 0.001 |
| hr2 | –0.0292 | –0.125 to 0.066 |
| hr3 | 0.1284 | –0.148 to 0.404 |
| Burns or hyperthermia × PaO2/FiO2 | ||
| pf1 | –0.0428 | –0.263 to 0.178 |
| pf2 | –0.4665 | –1.844 to 0.911 |
| pf3 | 1.0993 | –4.512 to 6.710 |
| pf4 | 0.3428 | –8.083 to 8.769 |
| Coma or encephalopathy × BMI | ||
| bmi1 | 0.0325 | –0.164 to 0.229 |
| bmi2 | 1.6076 | –0.137 to 3.352 |
| bmi3 | –9.1022 | –17.144 to –1.060 |
| bmi4 | 12.1000 | 2.109 to 22.091 |
| CABG for chronic angina × lowest white blood cell count | ||
| wbc1 | 2.2429 | 0.658 to 3.828 |
| wbc2 | –15.9445 | –25.493 to –6.396 |
| wbc3 | 64.1709 | 29.040 to 99.302 |
| wbc4 | –75.1789 | –113.907 to –36.451 |
| Malignant large bowel tumour × lowest platelet count | ||
| plc1 | 0.0087 | –0.004 to 0.022 |
| plc2 | –0.0711 | –0.153 to 0.010 |
| plc3 | 0.3219 | –0.013 to 0.657 |
| plc4 | –0.3808 | –0.770 to 0.009 |
| Carotid or vertebral artery stenosis or occlusion × arterial pH | ||
| ph1 | –20.8485 | –37.379 to –4.318 |
| ph2 | 7.6999 | –3.519 to 18.919 |
| Constant | 25.8772 | 21.050 to 30.704 |
| Predictor | Coefficient (SE) | |
|---|---|---|
| Health-care during 1 year after hospital discharge | If health care, total cost during 1 year after hospital discharge | |
| Previous hospitalisation | 0.426*** (0.012) | 0.067*** (0.011) |
| Critical care unit length of stay (per day) | 0.006*** (0.001) | 0.011*** (0.001) |
| Age (spline base variables) | ||
| age1 | 0.008*** (0.001) | 0.006*** (0.001) |
| age2 | –0.002** (0.002) | –0.000 (0.002) |
| age3 | 0.011 (0.014) | –0.065*** (0.014) |
| BMI (spline base variables) | ||
| bmi1 | –0.022*** (0.004) | –0.012*** (0.003) |
| bmi2 | 0.082*** (0.019) | 0.035** (0.016) |
| bmi3 | –1.99*** (0.050) | –0.077* (0.044) |
| Deprivation | ||
| 1 (least deprived) | 0 | 0 |
| 2 | 0.027 (1.71) | –0.027 (1.90) |
| 3 | 0.046*** (2.93) | –0.029* (2.10) |
| 4 | 0.072*** (4.63) | 0.020 (1.43) |
| 5 (most deprived) | 0.130*** (8.52) | –0.004 (0.31) |
| Dependency prior to admission | ||
| No assistance with daily activities | 0 | 0 |
| Some assistance with daily activities | 0.233*** (0.013) | 0.098*** (0.010) |
| Total assistance with daily activities | 0.572*** (0.062) | 0.315*** (0.048) |
| ICNARC physiology score (spline base variables) | ||
| score1 | 0.018*** (0.004) | 0.006 (0.004) |
| score2 | 0.054** (0.021) | 0.046** (0.020) |
| score3 | –0.179*** (0.050) | –0.132*** (0.048) |
| Source of admission/urgency of surgery | ||
| ED or not in hospital (unplanned admission) | 0 | 0 |
| ED or not in hospital (planned admission) | –0.196*** (0.058) | 0.070(0.059) |
| Other acute hospital (not critical care) | –0.028 (0.054) | 0.056 (0.047) |
| Other critical care unit (repatriation) | –0.054 (0.096) | 0.083 (0.080) |
| Other critical care unit (planned or unplanned transfer) | –0.014 (0.039) | 0.060** (0.035) |
| Theatre (unplanned admission following elective or scheduled surgery) | –0.107*** (0.024) | –0.015 (0.021) |
| Theatre (planned admission following elective or scheduled surgery) | –0.345*** (0.015) | –0.084*** (0.014) |
| Theatre (admission following emergency or urgent surgery) | –0.004 (0.015) | 0.013 (0.014) |
| Ward or intermediate care area | 0.113*** (0.015) | 0.087*** (0.013) |
| CPR prior to admission | ||
| Community CPR | 0 | 0 |
| In-hospital CPR | 0.368*** (0.055) | 0.028 (0.053) |
| No CPR | 0.329*** (0.040) | 0.061 (0.042) |
| Severe conditions in the past medical history (APACHE II) | ||
| Severe respiratory disease | 0.829** (0.388) | 1.283*** (0.307) |
| Severe liver disease | 1.846*** (0.377) | 0.604** (0.277) |
| End-stage renal disease | 1.512*** (0.443) | 1.000*** (0.272) |
| Metastatic disease | 0.569** (0.349) | 0.773*** (0.233) |
| Haematological malignancy | 1.625*** (0.450) | 0.499** (0.232) |
| Immunocompromise | 0.763*** (0.218) | 0.609*** (0.165) |
| RCS Charlson comorbidities | ||
| Previous MI | 0.156*** (0.025) | 0.021 (0.018) |
| Congestive cardiac failure | 0.144*** (0.023) | 0.078*** (0.018) |
| Peripheral vascular disease | 0.172*** (0.022) | 0.144*** (0.016) |
| Dementia | 0.163*** (0.051) | 0.022 (0.032) |
| Chronic pulmonary disease | 1.209*** (0.154) | 0.181* (0.118) |
| Rheumatological disease | 0.200*** (0.034) | 0.092*** (0.025) |
| Liver disease | 0.622* (0.338) | 0.601*** (0.230) |
| Diabetes mellitus | 1.75*** (0.162) | 0.358*** (0.110) |
| Hemiplegia or paraplegia | 0.485*** (0.057) | 0.227*** (0.037) |
| Chronic renal disease | 0.365*** (0.024) | 0.149*** (0.016) |
| Any malignancy (excluding haematological malignancy and metastatic disease) | 0.683** (0.255) | 0.529*** (0.179) |
| Mechanical ventilation | –0.167*** (0.011) | –0.079*** (0.011) |
| Interaction between age and severe respiratory disease | ||
| age1 | –0.005 (0.010) | –0.023*** (0.008) |
| age2 | –0.008 (0.017) | 0.013 (0.013) |
| age3 | 0.048 (0.112) | –0.022 (0.080) |
| Interaction between age and severe liver disease | ||
| age1 | –0.027*** (0.009) | –0.002 (0.007) |
| age2 | 0.014 (0.017) | –0.018 (0.013) |
| age3 | –0.048 (0.131) | 0.150 (0.094) |
| Interaction between age and ESRD | ||
| age1 | –0.014 (0.011) | –0.014** (0.007) |
| age2 | 0.013 (0.019) | 0.016 (0.011) |
| age3 | –0.039 (0.130) | –0.134* (0.074) |
| Interaction between age and metastatic disease | ||
| age1 | –0.003 (0.008) | –0.012** (0.005) |
| age2 | –0.015 (0.012) | 0.011 (0.008) |
| age3 | 0.016 (0.074) | –0.039 (0.047) |
| Interaction between age and haematological malignancy | ||
| age1 | –0.020 (0.011) | 0.002 (0.006) |
| age2 | 0.012 (0.020) | –0.027** (0.012) |
| age3 | –0.127 (0.128) | 0.178** (0.076) |
| Interaction between age and immunocompromise | ||
| age1 | –0.013*** (0.005) | –0.013*** (0.004) |
| age2 | 0.016* (0.010) | 0.017*** (0.007) |
| age3 | –0.093* (0.064) | –0.094** (0.045) |
| Interaction between age and chronic pulmonary disease | ||
| age1 | –0.016*** (0.003) | –0.004* (0.003) |
| age2 | 0.005 (0.006) | –0.005 (0.005) |
| age3 | –0.018 (0.039) | 0.053* (0.029) |
| Interaction between age and chronic renal disease | ||
| age1 | 0.003 (0.009) | –0.008 (0.006) |
| age2 | –0.038*** (0.016) | –0.005 (0.010) |
| age3 | 0.255** (0.110) | 0.070 (0.069) |
| Interaction between age and diabetes mellitus | ||
| age1 | –0.029*** (0.004) | –0.003 (0.003) |
| age2 | 0.019*** (0.007) | –0.006 (0.005) |
| age3 | –0.049 (0.041) | 0.055* (0.029) |
| Interaction between age and any malignancy | ||
| age1 | –0.007 (0.006) | –0.011*** (0.004) |
| age2 | 0.005 (0.009) | 0.009 (0.006) |
| age3 | –0.064 (0.049) | –0.013 (0.035) |
| Interaction between ICNARC physiology score and metastatic disease | ||
| score1 | 0.011 (0.017) | –0.009 (0.010) |
| score2 | –0.207** (0.096) | –0.049 (0.061) |
| score3 | 0.466* (0.233) | 0.150 (0.148) |
| Interaction between ICNARC physiology score and chronic pulmonary disease | ||
| score1 | –0.002 (0.011) | 0.025*** (0.008) |
| score2 | 0.001 (0.058) | –0.166*** (0.045) |
| score3 | –0.017 (0.139) | 0.391*** (0.107) |
| Constant | –1.130*** (0.101) | 8.576*** (0.096) |
| Predictor | Coefficient for acute hospital mortality (95% CI) | Coefficient for 1-year mortality (95% CI) |
|---|---|---|
| Constant | 19.0409 (5.2276 to 32.8542) | 22.7658 (10.4998 to 35.081) |
| Age (years): RCS (37,63,74,83) | ||
| age1 | –0.0084 (–0.0334 to 0.0165) | –0.0026 (–0.0228 to 0.0171) |
| age2 | 0.0581 (0.0214 to 0.0949) | 0.0463 (0.0183 to 0.0745) |
| age3 | –0.3178 (–0.6113 to –0.0242) | –0.1999 (–0.4187 to 0.0180) |
| Lowest systolic blood pressure (mmHg): RCS (67,85,95,112) | ||
| sbp1 | –0.0344 (–0.0448 to –0.0241) | –0.01593 (–0.0248 to –0.0070) |
| sbp2 | 0.0387 (0.0001 to 0.0773) | –0.0060 (–0.0357 to 0.0235) |
| sbp3 | –0.0587 (–0.2478 to 0.1304) | 0.0963 (–0.0456 to 0.2387) |
| Lowest arterial pH: RCS (7.16,7.29,7.33,7.41) | ||
| ph1 | –3.003 (–4.9167 to –1.090) | –3.5008 (–5.2058 to –1.7955) |
| ph2 | –4.7396 (–9.6991 to 0.2196) | –0.6731 (–4.6075 to 3.2181) |
| ph3 | 121.2283 (66.9497 to 175.5069) | 65.9343 (24.0232 to 109.1032) |
| Highest creatinine (µmol l−1): RCS (51,80,106,247) | ||
| cr1 | 0.0060 (–0.0089 to 0.0211) | 0.0005 (–0.0088 to 0.0102) |
| cr2 | 0.0747 (–0.0693 to 0.2189) | 0.0701 (–0.0275 to 0.1624) |
| cr3 | –0.1977 (–0.5138 to 0.1183) | –0.1718 (–0.3744 to 0.0450) |
| Lowest white blood cell count (× 109 l−1): RCS (5.8,9.2,11.8,17.8) | ||
| wbc1 | –0.0460 (–0.1230 to 0.0311) | –0.0124 (–0.0738 to 0.0454) |
| wbc2 | 0.0993 (–0.2264 to 0.4255) | –0.0159 (–0.2587 to 0.2351) |
| wbc3 | –0.1036 (–1.0347 to 0.8271) | 0.1622 (–0.5521 to 0.8574) |
| Lowest platelet count (× 109 l−1): RCS (73,134,183,337) | ||
| pc1 | –0.0083 (–0.0121 to –0.0044) | –0.0098 (–0.0130 to –0.0067) |
| pc2 | 0.0156 (–0.0095 to 0.0409) | 0.0355 (0.0163 to 0.0546) |
| pc3 | –0.0182 (–0.0869 to 0.0504) | –0.0749 (–0.1267 to –0.0228) |
| Highest blood lactate (mmol l−1) | 0.1339 (0.1088 to 0.1589) | 0.0921 (0.0705 to 0.1136) |
| GCS | ||
| 15 | 0 | 0 |
| 9–14 | 0.5298 (0.2525 to 0.8071) | 0.3022 (0.0915 to 0.5128) |
| 3–8 | 1.5054 (0.9681 to 2.0425) | 1.2111 (0.7318 to 1.6870) |
| Sedated | 1.1835 (0.9681 to 1,3689) | 0.8897 (0.7309 to 1.0441) |
| Male | 0.3789 (0.2147 to 0.5431) | –0.2831 (–0.4078 to –0.1638) |
| Diabetes | ||
| No diabetes | 0 | 0 |
| Diet/oral therapy/insulin | 0.2948 (0.1255 to 0.4642) | 0.3251 (0.2043 to 0.4511) |
| Preoperatory heart rhythm | ||
| Sinus rhythm, complete heart block/pacing, ventricular fibrillation or ventricular tachycardia, other abnormal rhythm | 0 | 0 |
| Atrial fibrillation/flutter | 0.2975 (0.1141 to 0.4805) | 0.4164 (0.2835 to 0.5535) |
| Dyspnoea status pre surgery | ||
| No limitation or slight limitation of ordinary physical activity | 0 | |
| Marked limitation of ordinary physical activity | 0.2039 (0.0357 to 0.3721) | 0.2161 (0.0918 to 0.3352) |
| Symptoms at rest or minimal activity | 0.5878 (0.3505 to 0.8252) | 0.4441 (0.2403 to 0.6251) |
| History of pulmonary disease | 0.5020 (0.3238 to 0.6803) | 0.3970 (0.2645 to 0.5298) |
| History of neurological dysfunction | 0.4756 (0.1461 to 0.8052) | 0.3333 (0.0698 to 0.5849) |
| Extracardiac arteriopathy | 0.3470 (0.1520 to 0.5420) | 0.3499 (0.2066 to 0.4961) |
| Operative urgency | ||
| Elective | 0 | |
| Urgent | 0.3561 (0.1884 to 0.5238) | 0.3505 (0.2267 to 0.4715) |
| Emergency | 0.9332 (0.6624 to 1.2040) | 0.8001 (0.5514 to 1.0209) |
| Salvage | 1.7730 (1.1748 to 2.3712) | 1.3225 (0.7514 to 1.8664) |
| Cumulative bypass time (per minute) | 0.0085 (0.0035 to 0.0135) | 0.0071 (0.0036 to 0.0104) |
| Severe respiratory disease | 0.8915 (0.2556 to 1.5274) | 0.7726 (0.2426 to 1.2961) |
| Very severe cardiovascular disease | 0.4161 (0.1561 to 0.6761) | 0.4664 (0.2757 to 0.6655) |
| Congestive heart failure | 0.3243 (0.0800 to 0.5686) | 0.4613 (0.2786 to 0.6479) |
| Renal function/dialysis | ||
| None or dialysis for acute renal failure: onset within 6 weeks of cardiac surgery | – | 0 |
| Dialysis for chronic renal failure: onset more than 6 weeks prior to cardiac surgery | 0.4439 (0.149072 to 0.73891) | |
| No dialysis but pre-operative acute renal failure (anuria or oliguria < 10 ml/hour) | – | 0.3182 (0.1045002 to 0.53192) |
| Left ventricular ejection fraction | ||
| Good (LVEF > 50%) | – | 0 |
| Fair (LVEF 30–50%) | – | 0.2591 (0.1333 to 0.3807) |
| Poor (LVEF < 30%) | – | 0.2855 (0.0944 to 0.4751) |
| Number of previous MIs | – | 0.2676 (0.0752 to 0.4682) |
| Major aortic procedure | – | 0.2625 (0.0725 to 0.4507) |
| Predictor | Patients, N | ROSC > 20 minutes, n (%) | Coefficient (95% CI) |
|---|---|---|---|
| Age: RCS (42,67,76,83,91)a | |||
| age1 | – | – | –0.0065 (–0.0108 to –0.0022) |
| age2 | – | – | –0.0018 (–0.0148 to 0.0111) |
| age3 | – | – | –0.1002 (–0.2904 to 0.0899) |
| age4 | – | – | 0.2704 (–0.2973 to 0.8381) |
| Sex | |||
| Female | 11,241 | 5215 (46.4) | 0 |
| Male | 15,507 | 7349 (47.4) | –0.0728 (–0.1270 to -0.01871) |
| Prior length of stay (days) | |||
| 0 | 7150 | 3961 (55.4) | 0 |
| 1 | 4647 | 2184 (47.0) | –0.1661 (–0.2582 to –0.0740) |
| 2–7 | 8652 | 3705 (42.8) | –0.2534 (–0.3406 to –0.1661) |
| ≥ 8 | 6299 | 2714 (43.1) | –0.2553 (–0.3491 to –0.1615) |
| Reason for attendance | |||
| Patient: medical | 21,750 | 9904 (45.5) | 0 |
| Patient: trauma | 843 | 349 (41.4) | 0.0890 (–0.0647 to 0.2428) |
| Patient: elective surgery | 1678 | 1059 (63.1) | –0.0497 (–0.1524 to 0.0528) |
| Patient: emergency surgery | 2100 | 974 (46.4) | 0.5358 (0.4169 to 0.6547) |
| Patient: obstetric | 41 | 32 (78.0) | 0.8754 (0.0934 to 1.6574) |
| Outpatient | 286 | 214 (74.8) | 0.3928 (0.0250 to 0.7606) |
| Staff or visitor | 50 | 32 (64.0) | 0.0543 (–0.5692 to 0.6780) |
| Location of arrest | |||
| Emergency department | 2486 | 1154 (46.4) | –0.1645 (–0.4105 to 0.0815) |
| Emergency admissions unit | 2161 | 943 (43.6) | 0.0786 (–0.0284 to 0.1856) |
| Ward, obstetric area, intermediate care area or other inpatient location | 15,713 | 6273 (39.9) | 0 |
| Coronary care unit | 2329 | 1449 (62.2) | 0.6763 (0.4786 to 0.8740) |
| Critical care unit | 1846 | 1222 (66.2) | 0.3193 (0.0087 to 0.6301) |
| Imaging department or specialist treatment area | 719 | 440 (61.2) | 0.0684 (–0.3843 to 0.5212) |
| Cardiac catheter laboratory | 874 | 632 (72.3) | 0.0718 (–0.1219 to 0.2656) |
| Theatre and recovery | 400 | 289 (72.3) | –0.8021 (–1.3882 to –0.2159) |
| Clinic or non-clinical area | 220 | 162 (73.6) | 0.6171 (0.2113 to 1.0228) |
| Presenting/first documented rhythm | |||
| Ventricular fibrillation | 2746 | 1987 (72.4) | 0 |
| Ventricular tachycardia | 1218 | 999 (82.0) | 0.5461 (0.37101 to 0.7213) |
| Shockable–unknown rhythm | 128 | 69 (53.9) | –1.9549 (–2.0861 to –1.8236) |
| Asystole | 6160 | 1788 (29.0) | –1.0562 (–1.1739 to –0.9384) |
| Pulseless electrical activity | 13,908 | 6030 (43.4) | –0.0047 (–0.3832 to 0.3737) |
| Bradycardia | 206 | 157 (76.2) | –0.0047 (–0.3832 to 0.3737) |
| Non-shockable–unknown rhythm | 566 | 308 (54.4) | –0.5550 (–0.9474 to –0.1626) |
| Unknown | 1816 | 1226 (67.5) | 0.0614 (–0.3069 to 0.4298) |
| Interaction between asystole and location of arrest | |||
| Emergency department | – | – | 0.3187 (–0.0082 to 0.6456) |
| EAU, ward, obstetric area, intermediate care area or other inpatient location | – | – | 0 |
| CCU or cardiac catheter lab | – | – | 1.141 (0.8601 to 1.4232) |
| Critical care unit | – | – | 1.1163 (0.7441 to 1.4885) |
| Imaging department or specialist treatment area | – | – | 0.9262 (0.3219 to 1.5306) |
| Theatre and recovery | – | – | 3.2121 (2.3529 to 4.0713) |
| Interaction between PEA and location of arrest | |||
| Emergency department | – | – | –0.0053 (–0.2655 to 0.2549) |
| EAU, ward, obstetric area, intermediate care area or other inpatient location | – | – | 0 |
| CCU or cardiac catheter lab | – | – | –0.5772 (–0.7981 to -0.3563) |
| Critical care unit | – | – | 0.3153 (–0.0225 to 0.6532) |
| Imaging department or specialist treatment area | – | – | 0.3245 (–0.1674 to 0.8165) |
| Theatre and recovery | – | – | 1.6769 (1.0236 to 2.3301) |
| Interaction between other non-shockable/unknown rhythms and location of arrest | |||
| Emergency department | – | – | –0.0481 (–0.4443 to 0.3480) |
| EAU, ward, obstetric area, intermediate care area or other inpatient location | – | – | 0 |
| CCU or cardiac catheter lab | – | – | –0.1078 (–0.5557 to 0.3400) |
| Critical care unit | – | – | 0.2421 (–0.3315 to 0.8157) |
| Imaging department or specialist treatment area | – | – | 0.9739 (0.2370 to 1.7109) |
| Theatre and recovery | – | – | 0.9313 (–0.0340 to 1.8966) |
| Congestive cardiac failure | |||
| No | 22,997 | 10,912 (47.4) | 0 |
| Yes | 3741 | 1652 (44.2) | –0.1851 (–0.2665 to –0.1036) |
| Peripheral vascular disease | |||
| No | 25,022 | 11,798 (47.2) | 0 |
| Yes | 1726 | 766 (44.4) | –0.1757 (–0.2864 to –0.0651) |
| Diabetes mellitus | |||
| No | 22,255 | 10,382 (46.7) | 0 |
| Yes | 4493 | 2182 (48.6) | 0.1373 (0.0622 to 0.2124) |
| Chronic renal disease | |||
| No | 23,506 | 11,042 (47.0) | 0 |
| Yes | 3242 | 1522 (46.9) | 0.1429 (0.0554 to 0.2305) |
| Malignancy | |||
| No | 24,345 | 11,615 (47.7) | 0 |
| Yes | 2403 | 949 (39.5) | –0.2221 (–0.3290 to –0.1151) |
| Metastatic solid tumour | |||
| No | 26,010 | 12,316 (47.4) | 0 |
| Yes | 738 | 248 (33.6) | –0.3790 (–0.5695 to –0.1886) |
| Constant | – | – | 1.4779 (1.2239 to 1.7320) |
| SD of random effect | – | – | 0.2674 (0.2263 to 0.3160) |
| ICC | – | – | 0.0213 (0.0153 to 0.0294) |
| Predictor | Patients | Hospital survival, n (%) | Coefficient (95% CI) |
|---|---|---|---|
| Age, RCS: (42,67,76,83,91)a | |||
| age1 | – | – | –0.0214 (–0.0261 to –0.0167) |
| age2 | – | – | 0.0027 (–0.0129 to 0.0185) |
| age3 | – | – | –0.2064 (–0.4562 to 0.0433) |
| age4 | – | – | 0.6048 (–0.1853 to 1.3951) |
| Prior length of stay (days) | |||
| 0 days | 7150 | 2151 (30.1) | 0 |
| 1 | 4647 | 889 (19.1) | –0.2266 (–0.3425 to –0.1106) |
| 2–7 | 8652 | 1381 (16.0) | –0.3695 (–0.4790 to –0.2601) |
| ≥ 8 | 6299 | 926 (14.7) | –0.4948 (–0.6155 to –0.3742) |
| Reason for attendance | |||
| Patient: medical | 21,750 | 3952 (18.2) | 0 |
| Patient: trauma | 843 | 112 (13.3) | 0.0373 (–0.1905 to 0.2652) |
| Patient: elective surgery | 1678 | 670 (39.9) | 1.1162 (0.9836 to 1.2488) |
| Patient: emergency surgery | 2100 | 386 (18.4) | –0.1205 (–0.2609 to 0.0198) |
| Patient: obstetric | 41 | 25 (61.0) | 1.0143 (0.3037 to 1.7249) |
| Outpatient | 286 | 176 (61.5) | 1.0864 (0.7220 to 1.4503) |
| Staff or visitor | 50 | 26 (52.0) | 0.8009 (0.1793 to 1.4224) |
| Location of arrest | |||
| Emergency department | 2486 | 528 (21.2) | 0.1203 (–0.1194 to 0.3602) |
| Emergency admissions unit | 2161 | 305 (14.1) | 0.0394 (–0.1148 to 0.1936) |
| Ward, obstetric area, intermediate care area or other inpatient location | 15,713 | 2043 (13.0) | 0 |
| Coronary care unit | 2329 | 909 (39.0) | 1.0237 (0.8495 to 1.1980) |
| Critical care unit | 1846 | 526 (28.5) | –0.2528 (–0.5163 to 0.0107) |
| Imaging department or specialist treatment area | 719 | 213 (29.6) | –0.0366 (–0.4609 to 0.3876) |
| Cardiac catheter laboratory | 874 | 483 (55.3) | 0.1219 (–0.0724 to 0.3162) |
| Theatre and recovery | 400 | 213 (53.3) | –0.5005 (–1.1159 to 0.1147) |
| Clinic or non-clinical area | 220 | 127 (57.7) | 0.8422 (0.4335 to 1.2511) |
| Presenting/first documented rhythm | |||
| Ventricular fibrillation | 2746 | 1319 (48.0) | 0 |
| Ventricular tachycardia | 1218 | 667 (54.8) | 0.3145 (0.1646 to 0.4644) |
| Shockable–unknown rhythm | 128 | 36 (28.1) | –0.3656 (–0.7882 to 0.0570) |
| Asystole | 6160 | 617 (10.0) | –2.5342 (–2.7184 to –2.3501) |
| Pulseless electrical activity | 13,908 | 1758 (12.6) | –1.6891 (–1.8199 to –1.5584) |
| Bradycardia | 206 | 118 (57.3) | –0.0534 (–0.4171 to 0.3102) |
| Non-shockable–unknown rhythm | 566 | 123 (21.7) | –0.7382 (–1.1337 to –0.3428) |
| Unknown | 1816 | 709 (39.1) | 0.2163 (–0.1353 to 0.5679) |
| Interaction between asystole and location of arrest | |||
| Emergency department | – | – | 0.4315 (0.0199 to 0.8431) |
| EAU, ward, obstetric area, intermediate care area or other inpatient location | – | – | 0 |
| CCU or cardiac catheter lab | – | – | 1.7054 (1.4115 to 1.9993) |
| Critical care unit | – | – | 1.7546 (1.3781 to 2.1312) |
| Imaging department or specialist treatment area | – | – | 1.5438 (0.8745 to 2.2130) |
| Theatre and recovery | – | – | 3.3954 (2.578 to 4.2124) |
| Interaction between PEA and location of arrest | |||
| Emergency department | – | – | –0.0341 (–0.3131 to 0.2449) |
| EAU, ward, obstetric area, intermediate care area or other inpatient location | – | – | 0 |
| CCU or cardiac catheter lab | – | – | –0.3391 (–0.5624 to –0.1156) |
| Critical care unit | – | – | 0.7759 (0.4647 to 1.0872) |
| Imaging department or specialist treatment area | – | – | 0.5762 (0.0835 to 1.0689) |
| Theatre and recovery | – | – | 2.0426 (1.3633 to 2.7218) |
| Interaction between other non-shockable/unknown rhythms and location of arrest | |||
| Emergency department | – | – | –0.4348 (–0.8374 to –0.0321) |
| EAU, ward, obstetric area, intermediate care area or other inpatient location | – | – | 0 |
| CCU or cardiac catheter lab | – | – | –0.3156 (–0.7197 to 0.0883) |
| Critical care unit | – | – | 0.2443 (–0.2539 to 0.7427) |
| Imaging department or specialist treatment area | – | – | 0.5452 (–0.0678 to 1.1583) |
| Theatre and recovery | – | – | 0.7793 (–0.1729 to 1.731) |
| Congestive cardiac failure | |||
| No | 22,997 | 4702 (20.4) | 0 |
| Yes | 3741 | 645 (17.2) | –0.1422 (–0.2492 to –0.0353) |
| Peripheral vascular disease | |||
| No | 25,022 | 5057 (20.2) | 0 |
| Yes | 1726 | 290 (16.8) | –0.2035 (–0.3534 to –0.0537) |
| Liver disease | |||
| No | 26,041 | 5230 (20.1) | 0 |
| Yes | 707 | 117 (16.5) | –0.3348 (–0.5629 to –0.1066) |
| Hemiplegia or paraplegia | |||
| No | 26,483 | 5316 (20.1) | 0 |
| Yes | 265 | 31 (11.7) | –0.4379 (–0.8589 to –0.0169) |
| Malignancy | |||
| No | 24,345 | 5037 (20.7) | 0 |
| Yes | 2403 | 310 (12.9) | –0.3215 (–0.4747 to –0.1683) |
| Metastatic solid tumour | |||
| No | 26,010 | 5286 (20.3) | 0 |
| Yes | 738 | 61 (8.3) | –0.7962 (–1.1124 to –0.4801) |
| Constant | – | – | 1.3090 (1.0394 to 1.5786) |
| SD of random effect | – | – | 0.3156 (0.2627 to 0.3790) |
| ICC | – | – | 0.0293 (0.0205 to 0.0418) |
| Predictor | Patients | 1-year survival, n (%) | Coefficient (95% CI) |
|---|---|---|---|
| Age: RCS (42,67,76,83,91) | |||
| age1 | – | – | –0.015 (–0.020 to –0.010) |
| age2 | – | – | –0.018 (–0.034 to –0.002) |
| age3 | – | – | –0.005 (–0.270 to 0.260) |
| age4 | – | – | 0.111 (–0.740 to 0.963) |
| Prior length of stay (days) | |||
| 0 | 7150 | 1851 (25.8) | 0 |
| 1 | 4647 | 759 (16.3) | –0.184 (–0.305 to –0.063) |
| 2–7 | 8652 | 11,130 (13.0) | –0.367 (–0.482 to –0.253) |
| ≥ 8 | 6299 | 714 (11.3) | –0.556 (–0.684 to –0.428) |
| Reason for attendance | |||
| Patient: medical | 21,750 | 3252 (14.9) | 0 |
| Patient: trauma | 843 | 91 (10.8) | 0.055 (–0.191 to 0.300) |
| Patient: elective surgery | 1678 | 578 (34.4) | 1.092 (0.955 to 1.229) |
| Patient: emergency surgery | 2100 | 337 (16.0) | –0.092 (–0.239 to 0.056) |
| Patient: obstetric | 41 | 25 (70.0) | 1.157 (0.442 to 1.871) |
| Outpatient | 286 | 147 (51.2) | 0.989 (0.617 to 1.361) |
| Staff or visitor | 50 | 24 (48.0) | 0.847 (0.231 to 1.463) |
| Location of arrest | |||
| Emergency department | 2486 | 441 (17.9) | 0.201 (–0.045 to 0.447) |
| Emergency admissions unit | 2161 | 255 (11.8) | 0.057 (–0.107 to 0.221) |
| Ward, obstetric area, intermediate care area or other inpatient location | 15,713 | 1639 (10.4) | 0 |
| Coronary care unit | 2329 | 761 (32.5) | 0.950 (0.775 to 1.126) |
| Critical care unit | 1846 | 435 (23.5) | –0.157 (–0.428 to 0.114) |
| Imaging department or specialist treatment area | 719 | 164 (22.8) | 0.227 (–0.208 to 0.661) |
| Cardiac catheter laboratory | 874 | 450 (51.3) | 0.231 (0.038 to 0.425) |
| Theatre and recovery | 400 | 202 (50.5) | –0.169 (–0.790 to 0.453) |
| Clinic or non-clinical area | 200 | 107 (48.2) | 0.713 (0.303 to 1.124) |
| Presenting/first documented rhythm | |||
| Ventricular fibrillation | 2746 | 1140 (41.4) | 0 |
| Ventricular tachycardia | 1218 | 531 (43.2) | 0.125 (–0.027 to 0.277) |
| Shockable–unknown rhythm | 128 | 25 (19.5) | –0.581 (–1.054 to –0.108) |
| Asystole | 6160 | 556 (9.0) | –2.211 (–2.400 to –2.021) |
| Pulseless electrical activity | 13,908 | 1433 (10.3) | –1.585 (–1.725 to –1.445) |
| Bradycardia | 206 | 103 (48.8) | 0.027 (–0.339 to 0.393) |
| Non-shockable–unknown rhythm | 566 | 98 (17.22) | –0.757 (–1.162 to –0.353) |
| Unknown | 1816 | 568 (31.0) | 0.115 (–0.237 to 0.468) |
| Interaction between asystole and location of arrest | |||
| Emergency department | – | – | 0.137 (–0.298 to 0.572) |
| EAU, ward, obstetric area, intermediate care area or other inpatient location | – | – | 0 |
| CCU or cardiac catheter lab | – | – | 2.991 (2.170 to 3.811) |
| Critical care unit | – | – | 0.743 (–0.002 to 1.488) |
| Imaging department or specialist treatment area | – | – | 1.439 (1.048 to 1.829) |
| Theatre and recovery | – | – | 1.554 (1.256 to 1.852) |
| Interaction between PEA and location of arrest | |||
| Emergency department | – | – | –0.122 (–0.415 to 0.170) |
| EAU, ward, obstetric area, intermediate care area or other inpatient location | – | – | 0 |
| CCU or cardiac catheter lab | – | – | 1.765 (1.079 to 2.452) |
| Critical care unit | – | – | 0.071 (–0.454 to 0.595) |
| Imaging department or specialist treatment area | – | – | 0.631 (0.306 to 0.957) |
| Theatre and recovery | – | – | –0.280 (–0.512 to –0.049) |
| Interaction between other non-shockable/unknown rhythms and location of arrest | |||
| Emergency department | – | – | –0.636 (–1.060 to –0.212) |
| EAU, ward, obstetric area, intermediate care area or other inpatient location | – | – | 0 |
| CCU or cardiac catheter lab | – | – | 0.511 (–0.426 to 1.448) |
| Critical care unit | – | – | 0.297 (–0.320 to 0.914) |
| Imaging department or specialist treatment area | – | – | 0.114 (–0.390 to 0.618) |
| Theatre and recovery | – | – | –0.536 (–0.950 to –0.122) |
| Liver disease | |||
| No | 26,041 | 4371 (16.7) | 0 |
| Yes | 707 | 83 (11.7) | –0.538 (–0.794 to –0.282) |
| Congestive cardiac failure | |||
| No | 22,997 | 4008 (17.4) | 0 |
| Yes | 3741 | 446 (11.9) | –0.338 (–0.460 to –0.216) |
| Renal disease | |||
| No | 23,506 | 4113 (17.5) | 0 |
| Yes | 3242 | 341 (10.5) | –0.348 (–0.484 to –0.212) |
| Malignancy | |||
| No | 24,345 | 4251 (17.4) | 0 |
| Yes | 2403 | 203 (8.4) | –0.537 (–0.712 to –0.363) |
| Metastatic solid tumour | |||
| No | 26,010 | 4,424 (17.0) | 0 |
| Yes | 738 | 30 (4.07) | –1.215 (–1.629 to –0.802) |
| Constant | – | – | 0.794 (0.5199 to 1.069) |
| SD of random effect | – | – | 0.286 (0.030 to 0.353) |
| ICC | – | – | 0.024 (0.005 to 0.036) |
| Predictor | Coefficient (95% CI) | p-value |
|---|---|---|
| Age: RCS (42,67,82) | ||
| age1 | 0.004 (–0.002 to 0.012) | 0.0011 |
| age2 | –0.012 (–0.021 to –0.004) | |
| Severe condition in the past medical history | 1.080 (0.258 to 1.921) | 0.010 |
| Location of arrest | ||
| Ward, obstetrics area, other intermediate care area, clinic or non-clinical area | ref | < 0.0001 |
| ED or emergency admission unit | –0.329 (–0.471 to –0.188) | |
| Theatre and recovery | –0.562 (–0.774 to –0.355) | |
| Cardiac catheter lab or CCU | –0.351 (–0.534 to –0.169) | |
| Imaging department or Specialist treatment area | –0.293 (–0.534 to –0.053) | |
| Presenting rhythm | ||
| Shockable | ref | < 0.0001 |
| Non-shockable | 0.331 (0.209 to 0.452) | |
| Reason for admission to critical care by body system | ||
| Respiratory | ref | < 0.0001 |
| Cardiovascular | –0.404 (–0.563 to –0.245) | |
| Gastrointestinal | –0.064 (–0.327 to 0.198) | |
| Neurological (including eyes) | –0.288 (–0.521 to –0.057) | |
| Other | –0.398 (–0.635 to –0.162) | |
| ICNARC Physiology Score RCS(10,21,33) | ||
| score1 | 0.083 (0.064 to 0.102) | < 0.0001 |
| score2 | –0.057 (–0.081 to –0.035) | |
| Interactions with severe conditions in the past medical history | ||
| score1 | –0.077 (–0.127 to –0.027) | 0.0012 |
| score2 | 0.062 (0.002 to 0.123) | |
| Number of advanced organ supports | 0.352 (0.283 to 0.421) | < 0.0001 |
| Predictor | Coefficient (95% CI) | p-value |
|---|---|---|
| Age: RCS (49,72,84) | ||
| age1 | 0.004 (–0.005 to 0.014) | 0.0015 |
| age2 | –0.014 (–0.026 to –0.004) | |
| Number of advanced organ supports | ||
| 0 | ref | |
| 1 or 2 | 0.728 (–1.041 to 2.495) | 0.33 |
| 3 | –0.006 (–1.963 to 1.954) | |
| 4 | –2.081 (–6.463 to 2.334) | |
| ICNARC Physiology Score: RCS (18,32,46) | ||
| score1 | –0.047 (–0.126 to 0.031) | 0.026 |
| score2 | –0.040 (–0.206 to 0.126) | |
| Interactions with number of advanced organ supports | ||
| 1 or 2 organ supports score1 | 0.007 (–0.074 to 0.089) | 0.0011 |
| 3 organ supports score1 | 0.045 (–0.041 to 0.132) | |
| 4 organ supports score1 | 0.136 (–0.024 to 0.297) | |
| 1 or 2 organ supports score2 | –0.018 (–0.186 to 0.152) | |
| 3 organ supports score2 | –0.029 (–0.199 to 0.141) | |
| 4 organ supports score2 | –0.075 (–0.294 to 0.142) | |
List of abbreviations
- AHA
- American Heart Association
- aHR
- adjusted hazard ratio
- AIC
- Akaike information criterion
- AKI
- acute kidney injury
- APACHE
- Acute Physiology And Chronic Health Evaluation
- APC
- admitted patient care
- BIC
- Bayesian information criterion
- BMI
- body mass index
- cHR
- cause-specific hazard ratio
- CI
- confidence interval
- CIF
- cumulative incidence function
- CKD
- chronic kidney disease
- CMP
- Case Mix Programme
- CPR
- cardiopulmonary resuscitation
- DHSC
- Department of Health and Social Care
- ESRD
- end-stage renal disease
- GCS
- Glasgow coma scale
- GLM
- generalised linear model
- HbA1c
- glycated haemoglobin
- HES
- Hospital Episode Statistics
- HQIP
- Healthcare Quality Improvement Partnership
- HRG
- health-care resource group
- ICD-10
- International Statistical Classification of Diseases and Related Health Problems, Tenth Revision
- ICNARC
- Intensive Care National Audit & Research Centre
- IGARD
- Independent Group Advising on the Release of Data
- IQR
- interquartile range
- MI
- myocardial infarction
- NACSA
- National Adult Cardiac Surgery Audit
- NCAA
- National Cardiac Arrest Audit
- NDA
- National Diabetes Audit
- NICOR
- National Institute for Cardiovascular Outcomes Research
- NIHR
- National Institute for Health and Care Research
- NRI
- net reclassification improvement
- ONS
- Office for National Statistics
- RCS
- Royal College of Surgeons
- ROSC
- return of spontaneous circulation
- RRT
- renal replacement therapy
- SD
- standard deviation
- SE
- standard error
- sHR
- subdistribution hazard ratio
- SMR
- standardised mortality ratio
- SOFA
- Sequential Organ Failure Assessment
- UKRR
- UK Renal Registry
Notes
Supplementary material can be found on the NIHR Journals Library report page (https://doi.org/10.3310/EQAB4594).
Supplementary material has been provided by the authors to support the report and any files provided at submission will have been seen by peer reviewers, but not extensively reviewed. Any supplementary material provided at a later stage in the process may not have been peer reviewed.
