Notes
Article history
The research reported in this issue of the journal was funded by the HS&DR programme or one of its preceding programmes as project number 14/19/08. The contractual start date was in September 2015. The final report began editorial review in July 2017 and was accepted for publication in February 2018. The authors have been wholly responsible for all data collection, analysis and interpretation, and for writing up their work. The HS&DR editors and production house have tried to ensure the accuracy of the authors’ report and would like to thank the reviewers for their constructive comments on the final report document. However, they do not accept liability for damages or losses arising from material published in this report.
Declared competing interests of authors
Michael Allen is employed as an operational research modeller at the Royal Devon and Exeter NHS Foundation Trust. Sue Prosser is a senior nurse in the Exeter Neonatal Unit and reports a grant contribution from the Royal Devon and Exeter NHS Foundation Trust. Neena Modi is the director of the Neonatal Data Analysis Unit, a member of the NHS England Maternity Transformation Stakeholder Council and president of the UK Royal College of Paediatrics and Child Health. Steve Thornton works with the Royal College of Obstetricians and Gynaecologists and is the chairperson of the Lindsay Stewart Committee. He is also a trustee for Wellbeing of Women, a charity that raises funding for research related to women’s health, and undertakes commercial consultancy [non-financial support was given by Hologic Inc. (Slough, UK), GlaxoSmithKline plc (Brentford, UK) and Ferring Pharmaceuticals Ltd (West Drayton, UK)].
Disclaimer
This report contains transcripts of interviews conducted in the course of the research and contains language that may offend some readers.
Permissions
Copyright statement
© Queen’s Printer and Controller of HMSO 2018. This work was produced by Villeneuve et al. under the terms of a commissioning contract issued by the Secretary of State for Health and Social Care. This issue may be freely reproduced for the purposes of private research and study and extracts (or indeed, the full report) may be included in professional journals provided that suitable acknowledgement is made and the reproduction is not associated with any form of advertising. Applications for commercial reproduction should be addressed to: NIHR Journals Library, National Institute for Health Research, Evaluation, Trials and Studies Coordinating Centre, Alpha House, University of Southampton Science Park, Southampton SO16 7NS, UK.
2018 Queen’s Printer and Controller of HMSO
Chapter 1 Clinical setting
Clinical importance
In England and Wales, 86,000 infants (around one in eight births) are admitted to neonatal units each year. 1
Neonatal care comprises four levels of care, each with different staffing recommendations for nurse-to-infant ratios [summarised from the British Association of Perinatal Medicine (BAPM)]:2
-
Intensive care for the sickest infants involves care, such as mechanical respiratory support or the presence of an arterial line. The NHS service specification for neonatal critical care3 requires all units to work towards a 1 : 1 nurse-to-infant staffing ratio in neonatal intensive care.
-
High-dependency care involves care, such as non-invasive respiratory support or parenteral nutrition. A 1 : 2 nurse-to-infant care ratio is recommended.
-
Special care may involve care, such as intranasal oxygen or nasogastric feeding. A 1 : 4 nurse-to-infant care ratio is recommended.
-
Transitional care is the lowest level of care, and may be shared between neonatal and maternity units. The mother is frequently considered the primary carer in transitional care, and no guidelines for staffing levels are given.
Neonatal units are frequently under significant pressure, and units are often required to transfer infants to another unit or work at higher than the BAPM guideline2 for infant-to-staff ratios. 4 In 2007, the neonatal charity Baby Life Support Systems (BLISS) reported that:5
-
Neonatal units were, on average, understaffed by over one-third.
-
Over 6 months, neonatal units were closed to new admissions for an average of 24 days as a result of excessive demand.
-
One in 10 units exceeded their capacity for intensive care for > 50 days during a 6-month period.
-
Of neonatal units providing a full range of intensive care services, 65% did not have enough staffed cots for the infants admitted.
-
One-quarter of twins or triplets were cared for in separate hospitals.
Reports other than those from BLISS have found units working above the BAPM guidelines on workload per nurse. 4 A unit’s capacity may be limited either by the number or level of available cots or by the number of nurses.
The Department of Health and Social Care’s neonatal planning toolkit6 recommends an 80% occupancy of units, but the National Institute for Health and Care Excellence (NICE)7 has reported that units often operate at higher occupancy levels. However, the ≈80% occupancy target often used in the NHS is frequently derived from whole hospital bed modelling,8 and it may not be appropriate to extrapolate this to neonatal care.
There is some evidence to show that infant mortality increases when units work at higher occupancies. 9 General care is also compromised, with nursing activities more likely to be delayed or omitted when the unit is running at nursing ratios below the BAPM guidelines. 4
In contrast to levels of care, neonatal units are described in terms of three basic levels3,6 depending on the most complex care that can be provided. Neonatal intensive care units (NICUs) provide all levels of care, local neonatal units (LNUs) usually provide high-dependency care and special care units (SCUs) provide special care and a stabilisation facility prior to transfer to more specialist units. A further consideration is that care may be provided by a network of units10 in which specialist care is centralised and low-level care is distributed across the network. The performance of one unit is then heavily dependent on the others, so that the reduction in capacity of one will increase workload in the others. This makes planning at a network level, rather than at a unit level, essential. In 2003, a Department of Health and Social Care report11 highlighted the need for better tools for planning neonatal care.
The costs for parents for care that is distant from their home location is significant. In a recent report by BLISS,12 the mean cost to parents of having an infant in neonatal care was £282 per week, or £2256 over the course of their child’s stay.
The relationship between neonatal nursing levels and unit size on clinical outcome
Clinical outcome has been linked to the level of neonatal nursing provision. A 2013 systematic review of NICUs13 concluded that lower nurse staffing was associated with poorer outcome. In an observational study,14 a 10% decrease in the proportion of intensive care days in which one-to-one nursing was provided was associated with an increase in the in-hospital mortality rate of 0.6 deaths per 100 infants receiving neonatal intensive care per month compared with a median monthly mortality rate of 4.5 deaths per 100 infants per month.
In a study of 2585 very low-birthweight (VLBW) (< 1500 g) or preterm (gestational age of < 31 weeks) infants,15 it was found that higher neonatal nurse staffing was associated with reduced mortality: at times when 1 : 1 staffing was achieved for intensive and high-dependency care infants, the risk of mortality was halved compared with at other times. Other outcomes may also be influenced by staffing levels, as increased neonatal nurse staffing has been associated with a reduction in the risk of bloodstream infection. 16
In contrast, in a study of 850 moderately preterm infants (gestational age of 30–34 weeks),17 higher nurse-to-infant ratios were not associated with improved outcome, although this may have been related to the later gestational age (infants with a later gestational age are often at lower risk of poor outcome, and generally require less intensive care).
Larger neonatal units have been linked to lower mortality. In a study of 48,237 VLBW infants born in Californian hospitals between 1991 and 2000,18 there was a significant reduction in mortality associated with birth in higher-volume units. Compared with NICUs with ≥ 100 VLBW admissions per year, smaller units were associated with higher odds ratios (ORs) for death, ranging from 1.19 [95% confidence interval (CI) 1.04 to 1.37] to 2.72 (95% CI 2.37 to 3.12). The authors18 suggest that 20% of deaths may have been preventable if intensive care was centralised in the higher-volume units.
In a large study of 20,554 infants,19 birth in higher-volume units correlated with the survival of babies born at a gestational age of < 33 weeks. Infants who were born at < 33 weeks’ gestation and admitted to a high-volume neonatal unit (defined as being in the upper quartile of care days) at the hospital of birth were at reduced odds of neonatal mortality (OR 0.70, 95% CI 0.53 to 0.92) and any in-hospital mortality (OR 0.68, 95% CI 0.54 to 0.85). The effect was most marked among infants born at < 27 weeks’ gestation (OR 0.51, 95% CI 0.33 to 0.79).
It is noteworthy that in both of these large studies,18,19 the analysis was restricted to infants born in hospitals with large NICUs. The analysis did not extend to infants who were transferred to such units. The interaction between place of birth and place of neonatal intensive care is complex. For infants who were born in 1992/3 with a birthweight of < 2000 g, the mortality OR was 2.4 times higher if the birth was in a hospital without a NICU, with the risk being lowest in the highest-volume regional intensive care units (ICUs). 20 Subsequent transfer to a regional NICU marginally decreased the disadvantage of birth at a hospital without a NICU. Taken alone, this might suggest that the advantage of a large NICU is conferred primarily on those infants born in hospitals with large NICUs. However, the analysis is confounded as infants who die before transfer are excluded, as are those who are not ill enough to warrant transfer. The advantage of delivery in, rather than transfer to, a hospital with a high-volume NICU remains uncertain.
In view of the possible link between volume and outcome, the BAPM21 suggests that:
-
Neonatal intensive care units in the UK should have a throughput of ≥ 100 VLBW infants per year (VLBW is defined as < 1500 g).
-
Neonatal networks that include NICUs admitting < 50 VLBW infants should develop plans to amalgamate NICUs (or NICUs plus LNUs) to increase throughput.
Optimal size of birth centres
The Royal College of Obstetricians and Gynaecologists has drawn attention to the optimal size of obstetric units, based in part on requirements for consultant presence. 22 It has been suggested that the provision of a continuous consultant-led service should theoretically be possible if there is centralisation into units with ≥ 6000 births per year. 22
The large majority of births (87%) in England take place in obstetric units, with 11% taking place in midwifery-led units and 2.4% taking place at home. 23 Although 11% of births are in midwife-led units, only 2% of all births in England take place in freestanding midwife-led units. 24 Obstetric-led units or alongside midwifery-led units (where the midwife-led unit is in the same site as an obstetric-led unit, with near-immediate access to specialist obstetric care if required) therefore account for 95% of all births. It is this very large majority of births that is the focus of the modelling study in this report.
To achieve more births in units with ≥ 6000 births per year requires an increase in the centralisation of service provision. The disadvantage is that it increases the travel distance for some mothers. There is no strong evidence in Featherstone et al. 25 or in a study of 3 million live births in France26 that there is a link between travel time and outcome for VLBW infants. Nevertheless, data from term deliveries in the Netherlands suggest that mortality is correlated with the estimated car travel time from home. 27 Estimated car travel times of > 20 minutes were associated with an increased risk of mortality and adverse outcomes, and when travel time was used as a continuous determinant, the adjusted OR for mortality per minute increase of travel time was 1.01. 27 The authors noted that although the study attempted to adjust for confounding variables, it was possible that the results could be explained by variables other than travel time.
Likewise, in a study of 413,000 singleton births in Wales (1995–2009),28 there was a positive correlation between time of travel to hospital and the adjusted risk of neonatal death. The correlation remained after allowance for various confounding variables (such as gestational age and social deprivation index), although the authors did not have information on type of onset of labour, or medical or surgical conditions affecting the mother or infant. Importantly, the Welsh study also looked at travel time to the closest maternity unit as opposed to the unit to which the woman was actually taken. They did not find any association with mortality, suggesting that the association between travel time and outcome may not be causal, but may reflect the medical condition of the mother or the infant, leading to lengthened travel to a tertiary centre. The overall conclusion was that there was no strong evidence of an association between mortality and the geographic location of maternity services.
As travel time increases, there is a risk of birth before arrival at hospital. In France, the rate of out-of-hospital births for mothers living > 30 km from their nearest maternity unit was double that for those living within 30 km of their nearest maternity unit. 29 Among primiparae (women who have borne only one child), out-of-hospital birth rates increased from 2.3 per 1000 for those living < 5 km from their nearest maternity unit to 7.5 per 1000 for those living ≥ 45 km from their nearest maternity unit. For women with a parity of four or more, the out-of-hospital birth rates were 5.4 per 1000 for those living < 5 km from their nearest maternity unit and 26.2 per 1000 for those living < 5 km from their nearest maternity unit. Although rare, there was an increase in deaths related to out-of-hospital birth, increasing from 4.0 per 100,000 births for distances of up to 14 km to 10.0 per 100,000 births for distances of ≥ 45 km or more, although death following out-of-hospital birth accounts for < 2% of all neonatal deaths. 26 These results suggest that, although there is no strong evidence for a link between distance and neonatal outcome, consideration should be given to avoiding excessive distances or travel times to avoid the low risk of out-of-hospital birth.
As there are no guidelines on targets for distance to maternity units in the UK, we examine a range of measures of access. These include mean and maximum travel times, and the proportion of mothers within 30, 45 and 60 minutes of a maternity unit.
Payment by Results and information on which this is based for neonatal care
Most neonatal units in England are reimbursed on their activity under the Payment by Results system. 30 In this payment system, commissioners pay health-care providers for each infant, taking into account the infant’s health-care needs. 30 Healthcare Resource Groups (HRGs) are used to represent clinically similar treatments that use common levels of health-care resource. In neonatal care, there are five neonatal HRGs that are paid per occupied bed-day (Intensive Care XA01Z, High Dependency XA02Z, Special Care without external carer XA03Z, Special care with external carer XA04Z and Normal Care XA05Z), and a neonatal transport HRG is paid per patient journey (Neonatal Critical Care Transport XA06Z). Some units are still paid under the old ‘block contract’ system, and are assigned a fixed amount of money to deliver neonatal services. Typically, block contracts are now used only to help units maintain services and manage their finances in periods of severe financial pressures.
There is a per diem tariff assigned to each neonatal HRG. Units are paid for the number of occupied bed-days for each level of care and the number of critical care transport journeys, based on locally agreed tariffs assigned to the HRGs. The tariffs are based on information provided by units on the costs of providing these services, which they submit in the reference cost returns each year. 31 The NHS provides guidance on the allocation of costs for reference cost returns and this guidance has been modified over time to try to collect more accurate costing for neonatal services. However, there has been a significant delay in updating the data items that make up the HRG reference costs (units are currently still paid in accordance with the HRG 2001 data set when submitting cost information against revised HRG reference cost guidance)32 and there is disparity in the way that trusts attribute costs between neonatal and paediatric services and how they apportion costs between the different neonatal HRGs. This delay has led to a ‘price cost’ gap, in which the costs of neonatal care may be different from the reimbursements received. For units paid on the Payment by Results system, there is a clear incentive to keep accurate records of costs for reference costs returns and the activity within the unit. For units on a block contract, there are fewer incentives, as their block contract is less explicitly dependent on the tariff system that the reference costs returns informs.
Chapter 2 Background
Across many health-care services, there is an ongoing tension between the expertise, efficiency and specialised care that comes with centralising resources and the provision of locally based services with their associated ease of access for users and community benefits. In neonatal care, this issue is further complicated by the organisation of care into regional networks, where different hospitals provide differing levels of care, and where capacity across, or even between, networks may be used when local capacity is exhausted. In addition, the interface between maternity and neonatal care in hospitals provides further complications and options for the organisation of services that affect service delivery.
This study builds on previous work conducted within the South West of England33 to address many of these key issues. Modelling and geographic analysis are used to assess service distribution options; we also investigate the economic aspects of varying scenarios for service delivery. In addition, we assess the preferences of parents using these services.
The primary components of this study fall into the following areas:
-
Sourcing and analysis of neonatal data – extensive descriptive statistical analysis was applied to data obtained from the National Neonatal Research Database (NNRD) held at the Neonatal Data Analysis Unit (NDAU), as well as Hospital Episode Statistics (HES).
-
Geographic analysis – a range of mathematical methods were used to model service locations in order to analyse and optimise distribution of any number of units with the aims of meeting target admission numbers while reducing travel distances for parents.
-
Simulation modelling – computer software was used to model alternative configurations of units or altered staffing levels. The model was used to predict system performance from the perspective of the service provider (e.g. average and peak loads, proportion of time when staffing meets BAPM guidelines,2 and nurse requirements) and parents (travel distances and costs and the number of parents travelling more than a reasonable daily travel distance).
-
Economic analysis – an exploration of the prediction for mortality and, if feasible, morbidity to service delivery statistics, and costs to both parents and service providers. We explore, through qualitative research and discrete choice experiments (DCEs), the factors that both families and policy-makers consider important in deciding how services should be organised and how these might be weighted when making decisions.
-
Data visualisation – we consider key aspects of information presentation and communication of outcomes to a range of stakeholders in the context of the complexity inherent in many of the key findings.
-
Parental involvement – through a series of workshops involving parents of neonatal infants, we have investigated the key factors of importance to users of neonatal services.
Chapter 3 Project aims and objectives
The central aim of our study was to provide an analytical framework that addresses many of the key questions relating to the configuration of neonatal services in England. It is hoped that this framework will then help inform policy and the development of new models of care in this area.
The main objectives of our study, as outlined in the proposal, are listed below:
-
To analyse neonatal service organisation and investigate the trade-offs inherent in reconfiguration. The centralisation of services has benefits including increased throughput leading to increased expertise and a reduction in the spare capacity needed to deal with peaks in workload; however, centralisation may increase distances that parents need to travel. The effect is further complicated by the transition of the infant through different levels of care, and by the organisation of units into networks. Modelling and location analysis provide excellent tools for understanding the behaviour of this complex system. We use these tools to investigate that trade-off at a national level and address the following key questions.
-
How would reconfiguration (e.g. greater centralisation) affect unit throughput and parent travel times/distances?
-
What is the relationship between the number of units and the expected travel times and throughputs?
-
What is the average and maximum planned distance and travel time from parents’ home location to the point of care? How does this vary across the country?
-
How does changing the number of on-duty staff affect the number of transfers and the travel distances for parents?
-
What happens to travel distances if network boundaries are removed?
-
How might conflicting objectives in service distribution be best balanced?
-
Given any fixed number of units, which locations would minimise travel times?
-
What is the expected impact of population changes?
-
-
To model costs per infant and outcome change associated with service reconfiguration. Neonatal reference costs (e.g. HRGs) have limited utility for modelling as they assume a fixed infant cost regardless of the size of the unit and do not account for variation in nursing costs, which are dependent on configuration. We sought to model neonatal costs in significant detail in order to better predict the relationship between service configuration and costs. Having access to a recent BLISS survey on costs to parents, we also sought to better understand the relationship between network configuration and parental costs. We addressed the following key questions regarding this objective.
-
What components, and in what proportion, contribute to the costs of the different types of neonatal unit?
-
How would changes in the degree of centralisation of services affect the spare capacity needed to deal with peaks and troughs in workload? How would total costs be affected?
-
How would changes in the degree of centralisation of maternity (birth episode) and neonatal services affect parent travel distances and costs?
-
How does the degree of centralisation affect the requirement for local accommodation for parents?
-
-
To investigate the use of visualisation tools to communicate our research outputs to stakeholder groups. A key aspect of dissemination in research is the use of effective tools and media to present information. In this context, it is also essential to recognise the different needs and expertise of the varying stakeholder groups. To this end, we assessed a number of different information visualisation representations in terms of these communication requirements. We addressed the following key questions.
-
What are the key stakeholder communities that need to understand our research outputs?
-
What are the information needs of the different stakeholder groups?
-
Which visualisation tools and media are best suited to convey information effectively to the range of identified users?
-
-
To consult with the parents of neonatal infants to assess their preferences. It is essential to involve parents in the process of decision-making and priority-setting, and to ensure their representation in policy and debate about neonatal service organisation. Within our research, we engaged with parents through a series of workshops in which we elicited views and preferences about neonatal service delivery based on direct experience. These were complemented by qualitative interviews with parents conducted within the health economic research component of the project.
Chapter 4 Data sources
Geographic areas
All of the patient/parent location data used 2011 lower-layer super output areas (LSOAs). LSOAs are geographic areas with approximately equal population sizes (minimum of 1000, average of 1500). The home location of mothers was taken as the population-weighted centroid of each LSOA. 34
Demographic data
The 2015 Index of Multiple Deprivation (IMD) for each LSOA was obtained from the Office for National Statistics. 35
Travel time data
All travel times were based on estimated fastest road travel times. Travel times for patients and parents were taken from the postcode closest to the population-weighted centroid of the parents’ LSOA. Travel times were estimated using Maptitude® 2016 (Caliper, Newton, MA, USA) with the MPMileCharter® (Winwaed Software Technology LLC, Wichita Falls, TX, USA) add-in.
Birth data
Births per LSOA for the 3 years from 2013 to 2015 were obtained from NHS HES36 using Lightfoot Solutions® Signal-from-Noise tool version 2.1 (Lightfoot Solutions, Bracknell, UK). Births were defined as all admissions with a primary procedure code (Office of Population Census and Surveys) of R17–R27. Data obtained were aggregate numbers of births; no patient-level data were obtained.
Demographic projections
Demographic projections were obtained from the Office for National Statistics. 37
Neonatal unit designation
Neonatal-unit-level designation was taken from the 2015 National Neonatal Audit Programme Report. 1
Neonatal unit cost data
Neonatal unit costs were taken from the NHS Reference Costs 2014–15, published by the Department of Health and Social Care. 31 Neonatal costs are associated with critical care services and the HRG codes relative to neonatal care. The HRG system aims to define standard groups of clinically similar treatments that use common levels of health-care resource; it is used by the NHS to determine fair and equitable reimbursement for care services delivered by providers.
Predictions of NHS costs in the evaluation of simulations were based on the level of care received and a microcosting based on whole-time equivalent (WTE) nurses. Unit costs for WTE nurses are based on Unit Costs of Health and Social Care 2014. 38 The costs to families that we include in the model are travel time and vehicle operating costs. The unit costs applied to travel time are based on the Department for Transport’s non-business costs of travel,39 derived from a willingness-to-pay study of non-business travellers. 40
Family cost data
Family costs were obtained from BLISS, a UK charity working to provide the best possible care and support for all premature and sick babies and their families. The data received are from a survey in which parents described the neonatal experience, the family condition and the expenses during the neonatal care period.
A total of 1347 of the questionnaires were returned; however, there was large amount of missing information on costs and family characteristics, which was attributable to the high number of questions and the large presence of free-text options.
Most of the data in the survey were incomplete and this can create some bias in family cost evaluation. Infant length of stay (LOS) data were missing in 6% of the overall observations, whereas the travel distance in miles from the parents’ residence to hospital is missing for 29% of data, and the travel time from the parents’ residence to hospital is missing in 81% of data. Other important data that were missing were regarding the age of parents (15%), the number of overnight stays in hospital and the relative cost (97%), the cost of childcare (90%), the costs of baby care (57%), the cost of food (32%), the cost of parking (48%), the cost of travel (23%) and the amount of unpaid leave (77%).
Neonatal data
Neonatal data were obtained from NNRD held by the NDAU hosted at Imperial College London. 41 These data originate from the ‘BadgerNet’ (Clevermed, Edinburgh, UK) neonatal electronic clinical care records kept in each unit. 42
The following ethics and research and development (R&D) approvals were obtained:
-
Integrated Research Application System – reference number 172210
-
Research Ethics Committee – reference number 15/NW/0503
-
Chelsea and Westminster Hospital R&D approval – reference number C&W16/022.
Out of 161 neonatal units, 145 (90%) gave permission to access NNRD data. Of all units, 41 out of 41 NICUs (100%) gave permission, 67 out of 79 LNUs (85%) gave permission and 37 out of 41 SCUs (90%) gave permission.
Data were obtained for 165,450 infants with 188,253 admissions.
A complete record of neonatal care was obtained for 94.7% of infants, 76.0% of infants in the data set were in LSOAs where the closest unit of each type (NICU, LNU and SCU) was in the data set and 72.5% of infants had a complete record and were in LSOAs where the closest unit of each type (NICU, LNU and SCU) was in the data set.
In order to minimise the risk of bias due to missing data from units that did not give permission to use data, demand and LOS analysis was based on the 72.5% of infants (n = 119,967) who had a complete record and were in LSOAs with all closest unit types represented in the data.
Adjustment of length of stay
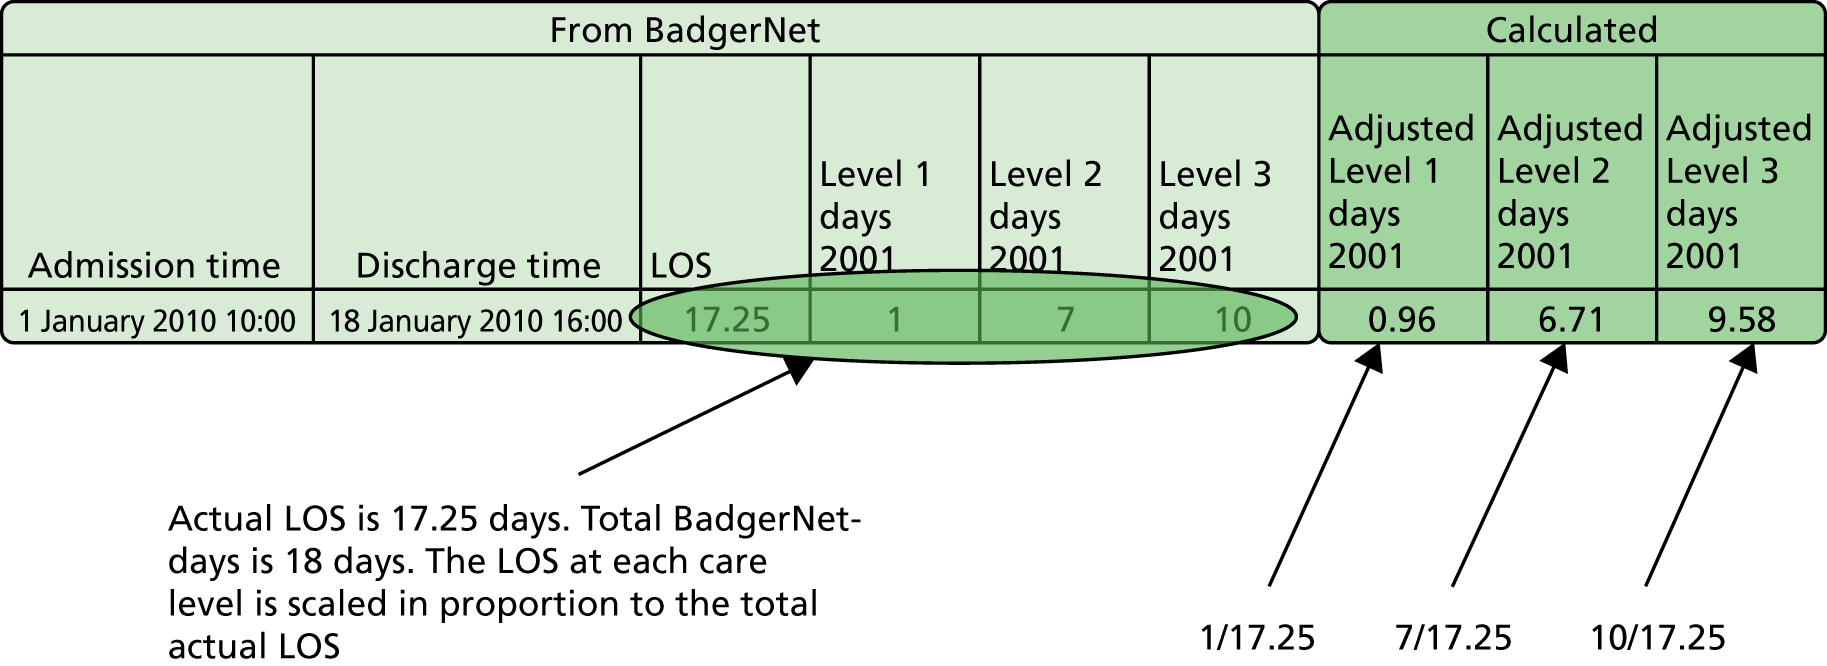
The NNRD data are summarised for each day of care. Total care days add up to more than the actual LOS as any part day is counted as a full day in these raw data. We therefore adjusted the days in each level of care in proportion to the total LOS calculated from admission and discharge times (Figure 1). The level used in this study was the BAPM 2011 level of care. 2
FIGURE 1.
Calculation of LOSs in different care levels.
Geographic data coverage and predicting neonatal demand
The birth model was based on HES data; therefore, our models do not include the small proportion (≈2%) of births that take place at home. 43 Only 2% of births in England take place in freestanding midwife-led units,24 and, although these will be in the HES data set, we do not seek to model freestanding midwife-led units as they are currently such a small part of the neonatal care scene.
Permission was given to use data from all NICUs and 85% and 90% of LNUs and SCUs, respectively. Overall, 90% of units gave permission to use their neonatal care data. Because data are missing from LNUs and SCUs, there is the possibility of bias in the statistics used that underlie the model. In order to minimise any bias, statistical summaries were based on only those infants with a complete data record and who live in an area where all closest levels of care locations are present within the data set. Infants whose closest Level 2 or 3 care locations are not in the data set are not used in the analysis (this does not apply to Level 1 NICU care as all NICUs are present in the data set).
As neonatal demand was not available for all hospitals and LSOAs, a regression model was used to predict demand per LSOA. This model was based on LSOAs that had all closest unit types present in the neonatal data set. These represent 75.4% of all LSOAs in England. A demand regression model for neonatal admissions based on births is also less likely to overfit to very specific geographic neonatal demand patterns that may be present simply because of the lower numbers of admissions per geographic area.
A regression model was built based on births and IMD scores. IMD score was chosen as an independent variable because a link between social deprivation and incidence of preterm births has been demonstrated. 44
The regression model predicted total neonatal admissions for each LSOA. The admissions of VLBW infants and all intensive care, high-dependency care and special care admissions were based on a fixed proportion of total predicted neonatal admissions, based on the number of VLBW infants and use-of-care levels (see Chapter 5, Use-of-care levels and length of stay by gestational age).
Table 1 shows the coefficients obtained from the regression analysis. Neonatal demand is positively correlated with births and IMD score.
| Term | Coefficient | SE coefficient | t-value | p-value |
|---|---|---|---|---|
| 1 year births | 0.115751 | 0.000894 | 129.46 | 0.00000 |
| IMD score | 0.008895 | 0.000716 | 12.43 | 0.00000 |
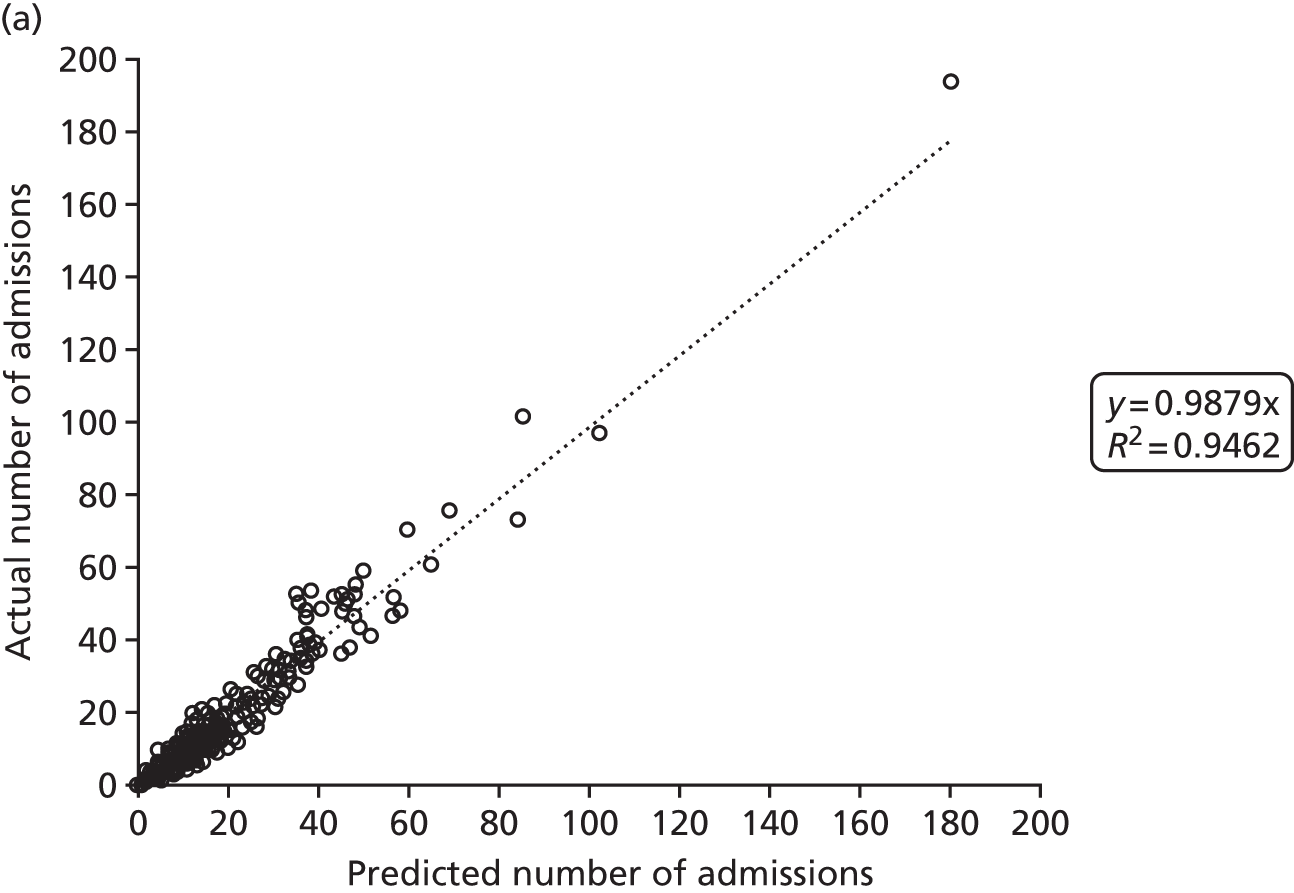
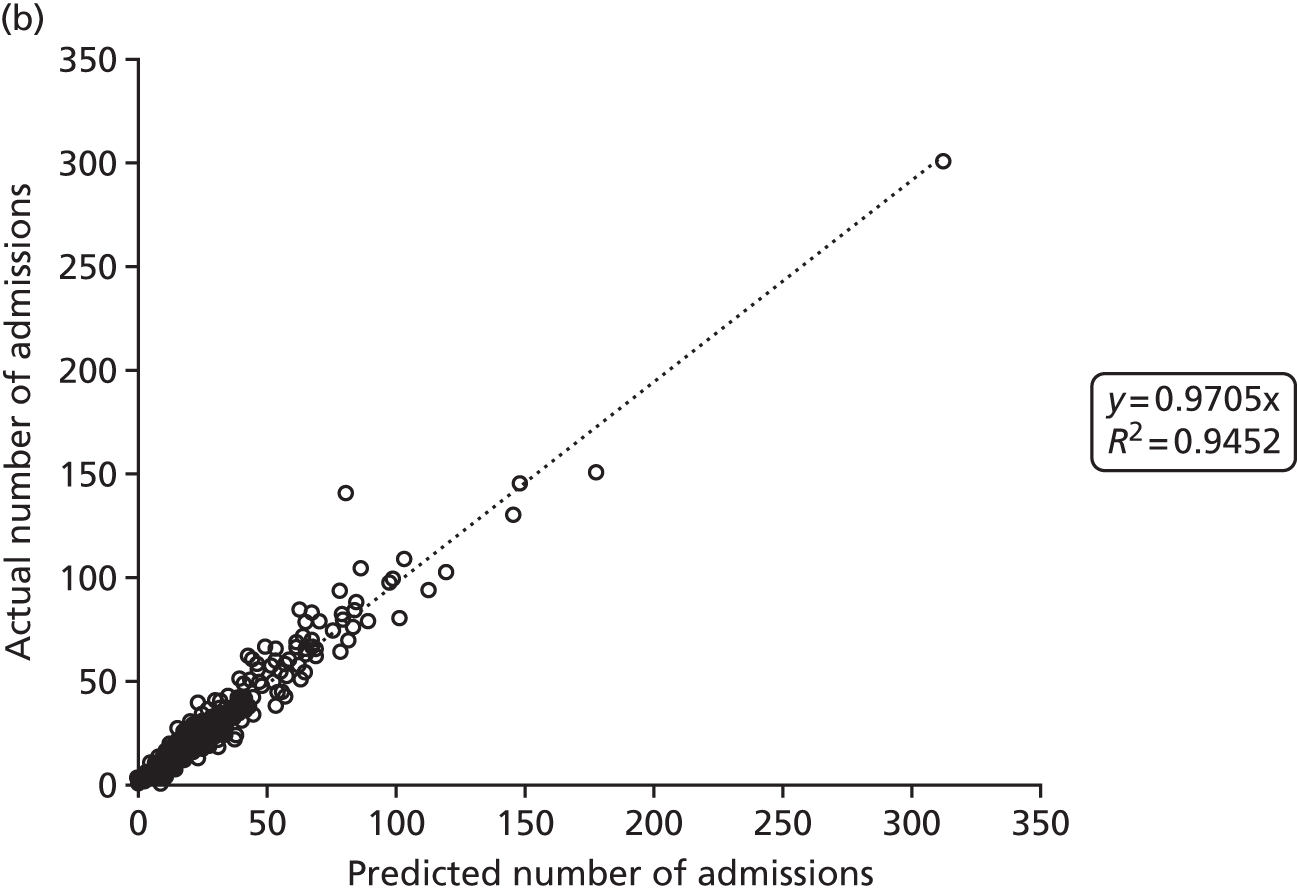
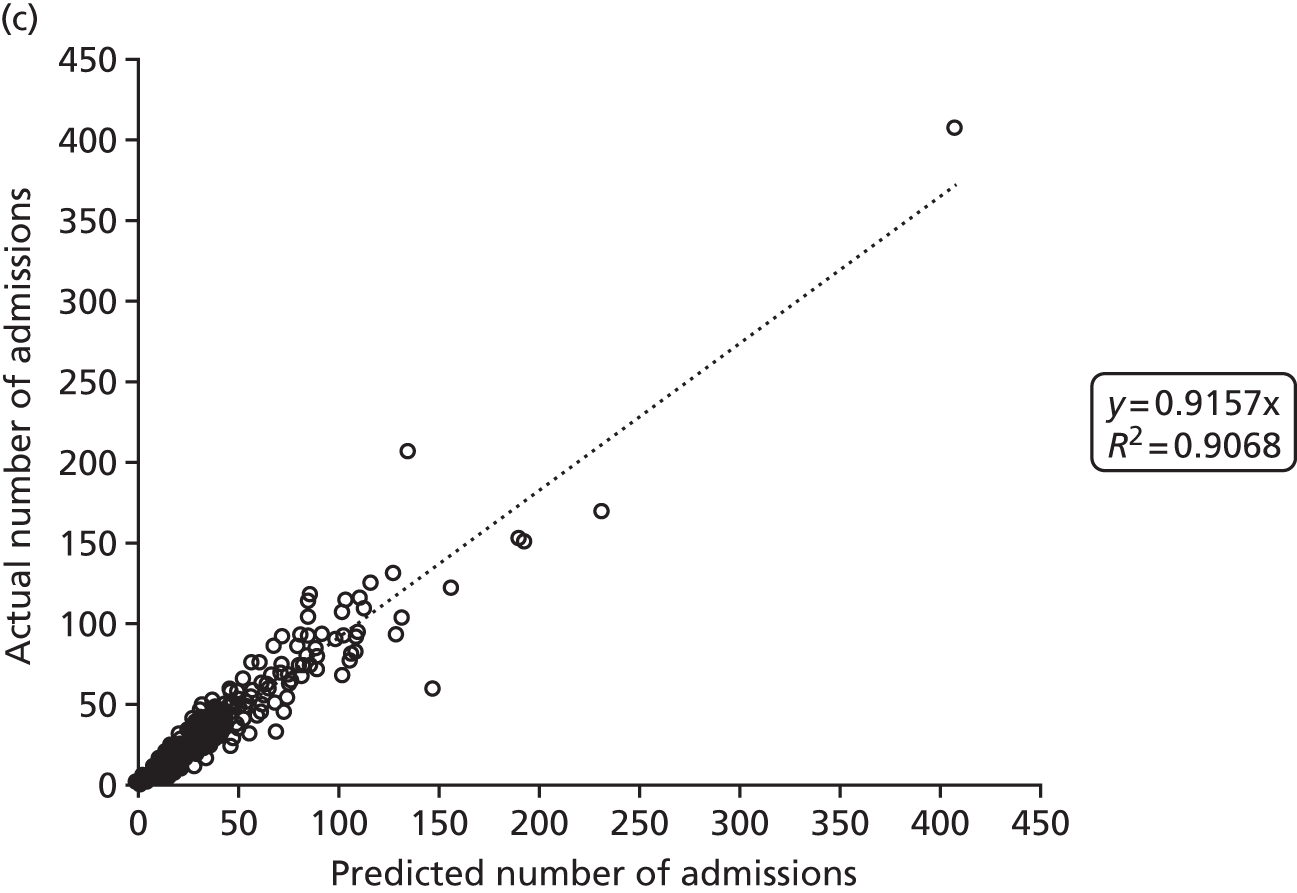
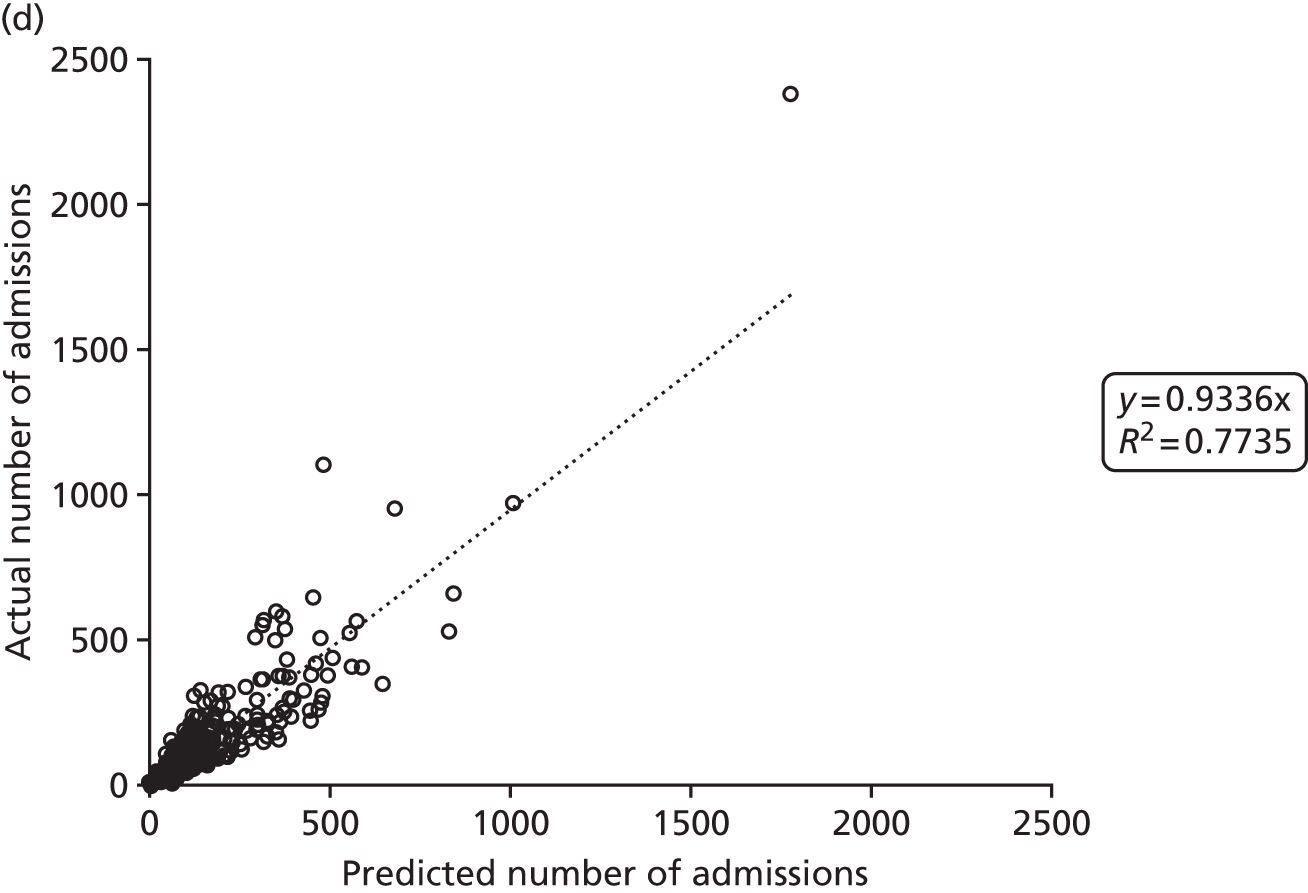
Figure 2 shows the results of the regression analysis when predicting demand at the upper-layer super output area (there are 325 upper-layer super output areas in England). The prediction of demand for VLBW infant admissions, intensive care admissions and high-dependency care admissions all produced correlations with the R2 of > 90%, showing good regional consistency in predicting these levels of demand. Prediction of special care admissions had an R2 of 78%. The slightly lower predictive accuracy of special care admissions may be attributable to more regional variation in the clinical judgement on whether or not an infant needs admitting to neonatal care (with much less variation in the perceived need for neonatal care for higher levels of care).
FIGURE 2.
Correlation between actual and predicted neonatal admissions at upper-layer super output area. (a) VLBW admissions; (b) infants with ≥ 24 hours of intensive care; (c) infants with ≥ 24 hours of high-dependency care; and (d) infants with ≥ 24 hours of special care.
Chapter 5 Descriptive analysis of data
This chapter provides a general descriptive analysis of factors pertinent to neonatal workload, LOS, mortality, travel times and type of unit where care is received.
Data used for descriptive analysis
As described in Chapter 4, Neonatal data, only those infants with a full neonatal record and whose mothers live in areas where all closest levels of care are present in the data set are used. Analysis is based on 119,967 infants. Definitions of intensive care, high-dependency care and special care are in accordance with the BAPM 2011 guidelines. 2
Gestational age is given as completed weeks of gestation; for example, a gestational age of 28 weeks includes those infants with a gestational age of 28+0 to 28+6 (inclusive).
Calculation of nurse workload
Nurse workload is calculated in accordance with BAPM standards of care,2 in which one nurse is recommended to care for one infant in intensive care (Level 1), two infants in high-dependency care (Level 2) or four infants in special care (Level 3). No guidelines exist for nurse requirements for transitional care (Level 4). In this study, we have assumed the same mathematical progression that is seen between other levels of care and assume that one nurse could care for eight infants in transitional care. Calculated nurse workload is for those nurses involved in direct infant care only (nurses in charge of shift, managing nurses and nurses dedicated to infant transfer are not included). Nurse workload was calculated as:
where:
-
Nurse workload = nurse required (BAPM 2011 guidelines2)
-
InfantL1 = infant in Level 1 (intensive) care
-
InfantL2 = infant in Level 2 (high-dependency) care
-
InfantL3 = infant in Level 3 (special) care
-
InfantL4 = infant in Level 4 (transitional) care.
Admissions, bed-days and nurse workload by gestational age at birth
Table 2 shows admissions, bed-days and nurse workload by gestational age. Fifty per cent of admissions are up to 37 weeks’ gestational age at birth, but 50% of beds are occupied by infants with a gestational age at birth of ≤ 32 weeks, and 50% of nurse workload is occupied with infants with a gestational age at birth of ≤ 31 weeks.
| Gestational age (weeks) | % | Cumulative % | ||||
|---|---|---|---|---|---|---|
| Admissions | Bed-days | Nurse workload | Admissions | Bed-days | Nurse workload | |
| 22 | 0.01 | 0.03 | 0.05 | 0.01 | 0.03 | 0.05 |
| 23 | 0.25 | 1.30 | 2.36 | 0.26 | 1.32 | 2.41 |
| 24 | 0.44 | 3.34 | 5.46 | 0.70 | 4.66 | 7.87 |
| 25 | 0.51 | 3.96 | 6.01 | 1.20 | 8.62 | 13.88 |
| 26 | 0.64 | 4.65 | 6.45 | 1.84 | 13.27 | 20.33 |
| 27 | 0.77 | 5.16 | 6.75 | 2.61 | 18.43 | 27.08 |
| 28 | 1.08 | 6.41 | 7.81 | 3.69 | 24.84 | 34.89 |
| 29 | 1.28 | 6.21 | 6.82 | 4.97 | 31.05 | 41.71 |
| 30 | 1.69 | 6.68 | 6.49 | 6.66 | 37.73 | 48.20 |
| 31 | 2.27 | 6.98 | 6.36 | 8.93 | 44.70 | 54.56 |
| 32 | 3.19 | 7.40 | 6.20 | 12.12 | 52.11 | 60.77 |
| 33 | 4.46 | 7.43 | 6.00 | 16.58 | 59.53 | 66.77 |
| 34 | 7.30 | 8.23 | 6.26 | 23.88 | 67.76 | 73.03 |
| 35 | 7.25 | 5.54 | 4.41 | 31.13 | 73.30 | 77.43 |
| 36 | 9.25 | 4.82 | 3.91 | 40.38 | 78.12 | 81.34 |
| 37 | 10.37 | 4.47 | 3.80 | 50.74 | 82.59 | 85.15 |
| 38 | 10.50 | 4.01 | 3.49 | 61.25 | 86.59 | 88.64 |
| 39 | 12.34 | 4.27 | 3.65 | 73.58 | 90.86 | 92.29 |
| 40 | 13.86 | 4.74 | 4.00 | 87.44 | 95.60 | 96.29 |
| 41 | 10.64 | 3.73 | 3.17 | 98.07 | 99.33 | 99.46 |
| 42 | 1.90 | 0.66 | 0.54 | 99.98 | 99.99 | 100.00 |
Mortality by gestational age
Mortality by gestational age at birth is shown in Table 3. Mortality reduced from 86% at a gestational age of 22 weeks at birth to 7% at a gestational age of 28 weeks at birth; however, because of larger numbers of births at higher gestational ages, 50% of all mortality still occurred in infants with a gestational age of ≥ 28 weeks at birth (these deaths include all causes of neonatal death).
| Gestational age at birth (weeks) | Mortality | |
|---|---|---|
| % | Cumulative % | |
| 22 | 85.71 | 0.77 |
| 23 | 63.39 | 12.76 |
| 24 | 40.04 | 26.28 |
| 25 | 22.28 | 34.94 |
| 26 | 15.47 | 42.50 |
| 27 | 8.37 | 47.44 |
| 28 | 6.55 | 52.88 |
| 29 | 3.52 | 56.35 |
| 30 | 2.16 | 59.17 |
| 31 | 1.87 | 62.44 |
| 32 | 1.20 | 65.38 |
| 33 | 0.77 | 68.01 |
| 34 | 0.62 | 71.47 |
| 35 | 0.52 | 74.36 |
| 36 | 0.55 | 78.27 |
| 37 | 0.51 | 82.37 |
| 38 | 0.57 | 86.99 |
| 39 | 0.52 | 91.92 |
| 40 | 0.40 | 96.15 |
| 41 | 0.44 | 99.74 |
| 42 | 0.18 | 100.00 |
Use-of-care levels and length of stay by gestational age
Table 4 shows use-of-care levels and LOS by gestational age at birth. Of those born at a gestational age of < 32 weeks, more than half will require a period in intensive care.
| Gestational age at birth (weeks) | Use-of-care levels (% of all infants) | LOS when level used (days) | LOS, using a value of 0 when level unused (days) | ||||||||||
|---|---|---|---|---|---|---|---|---|---|---|---|---|---|
| L1 | L2 | L3 | L4 | L1 | L2 | L3 | L4 | L1 | L2 | L3 | L4 | Σ | |
| 22 | 100.0 | 14.3 | 21.4 | 7.1 | 12.4 | 75.2 | 4.3 | 0.4 | 12.4 | 10.7 | 0.9 | 0.0 | 24.1 |
| 23 | 100.0 | 41.7 | 38.0 | 2.4 | 28.3 | 50.0 | 23.3 | 3.1 | 28.3 | 20.8 | 8.9 | 0.1 | 58.1 |
| 24 | 100.0 | 65.7 | 60.2 | 7.0 | 30.9 | 54.5 | 27.9 | 3.7 | 30.9 | 35.8 | 16.8 | 0.3 | 83.7 |
| 25 | 99.7 | 81.2 | 79.9 | 11.2 | 27.0 | 44.4 | 28.8 | 2.6 | 27.0 | 36.1 | 23.0 | 0.3 | 86.3 |
| 26 | 99.3 | 87.2 | 84.7 | 14.8 | 20.2 | 37.4 | 32.4 | 2.7 | 20.1 | 32.6 | 27.5 | 0.4 | 80.5 |
| 27 | 99.2 | 92.7 | 90.8 | 19.5 | 16.8 | 28.5 | 33.5 | 2.7 | 16.7 | 26.4 | 30.4 | 0.5 | 74.0 |
| 28 | 96.9 | 91.3 | 92.7 | 21.3 | 13.4 | 21.1 | 35.0 | 2.8 | 13.0 | 19.3 | 32.4 | 0.6 | 65.3 |
| 29 | 94.4 | 92.1 | 95.8 | 25.7 | 9.3 | 12.5 | 33.9 | 2.6 | 8.8 | 11.5 | 32.5 | 0.7 | 53.4 |
| 30 | 76.4 | 86.5 | 98.0 | 25.5 | 6.3 | 9.0 | 30.8 | 2.5 | 4.8 | 7.8 | 30.2 | 0.6 | 43.4 |
| 31 | 59.3 | 80.4 | 98.3 | 25.6 | 5.2 | 6.4 | 25.4 | 2.5 | 3.1 | 5.1 | 25.0 | 0.6 | 33.8 |
| 32 | 36.6 | 66.7 | 98.7 | 27.8 | 4.3 | 4.9 | 20.3 | 2.4 | 1.6 | 3.3 | 20.1 | 0.7 | 25.6 |
| 33 | 23.9 | 50.9 | 99.0 | 25.2 | 3.9 | 4.1 | 14.9 | 2.1 | 0.9 | 2.1 | 14.7 | 0.5 | 18.3 |
| 34 | 14.5 | 34.4 | 98.4 | 22.5 | 3.0 | 3.4 | 10.5 | 2.1 | 0.4 | 1.2 | 10.4 | 0.5 | 12.4 |
| 35 | 11.7 | 24.9 | 97.8 | 20.8 | 3.7 | 3.5 | 6.8 | 2.0 | 0.4 | 0.9 | 6.7 | 0.4 | 8.4 |
| 36 | 10.1 | 17.9 | 96.7 | 17.6 | 3.3 | 3.5 | 4.6 | 1.8 | 0.3 | 0.6 | 4.4 | 0.3 | 5.7 |
| 37 | 11.0 | 16.8 | 96.0 | 15.1 | 3.3 | 3.1 | 3.8 | 1.5 | 0.4 | 0.5 | 3.6 | 0.2 | 4.7 |
| 38 | 10.5 | 13.6 | 95.6 | 13.0 | 3.6 | 3.2 | 3.4 | 1.3 | 0.4 | 0.4 | 3.2 | 0.2 | 4.2 |
| 39 | 9.4 | 12.6 | 95.9 | 11.7 | 3.5 | 2.8 | 3.1 | 1.3 | 0.3 | 0.3 | 3.0 | 0.1 | 3.8 |
| 40 | 10.1 | 12.0 | 96.5 | 10.5 | 3.1 | 2.3 | 3.1 | 1.3 | 0.3 | 0.3 | 3.0 | 0.1 | 3.8 |
| 41 | 10.7 | 12.9 | 96.9 | 10.2 | 3.2 | 2.1 | 3.2 | 1.2 | 0.3 | 0.3 | 3.1 | 0.1 | 3.9 |
| 42 | 9.3 | 11.7 | 97.0 | 9.3 | 2.9 | 2.0 | 3.3 | 1.3 | 0.3 | 0.2 | 3.2 | 0.1 | 3.9 |
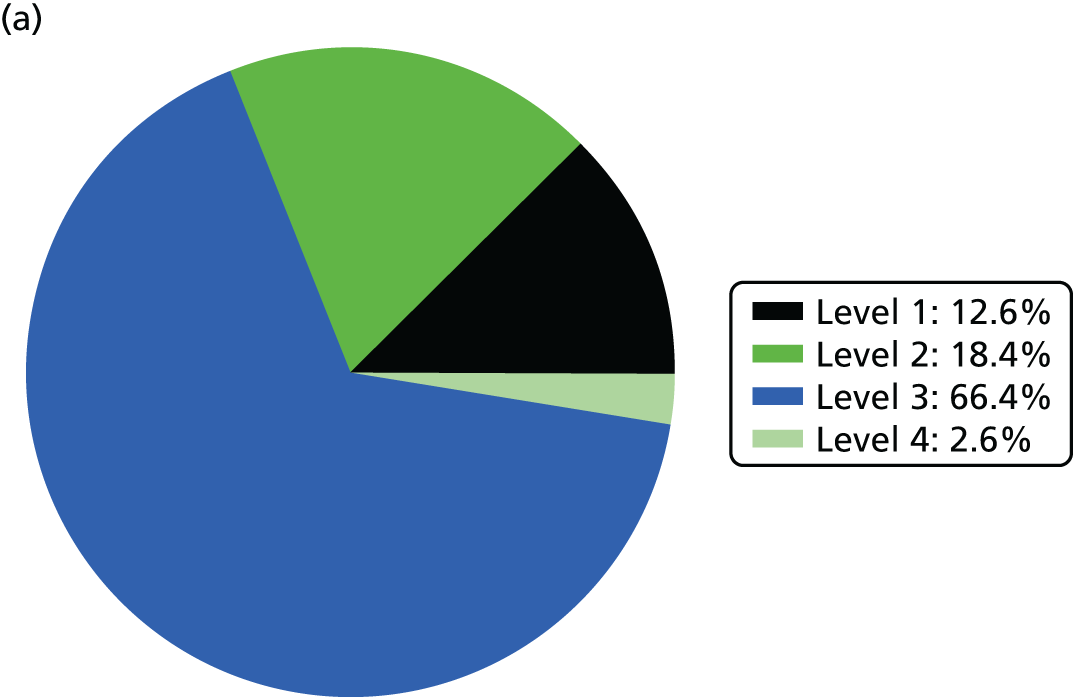
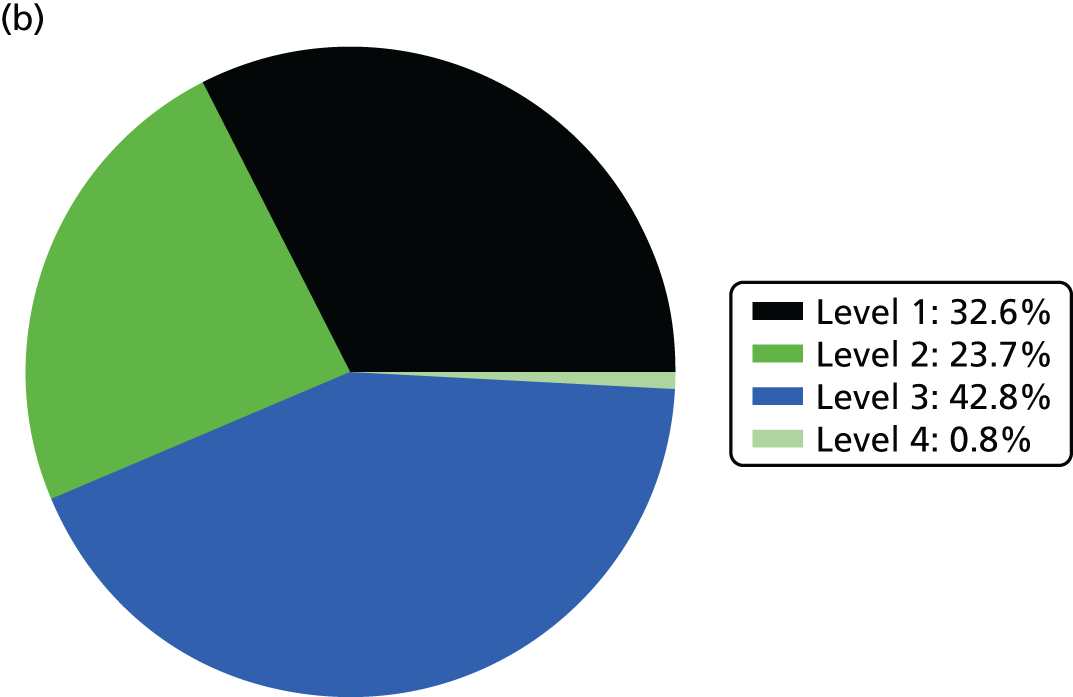
On average, for all neonatal admissions, one infant uses 1.4 days of Level 1 care, 2.0 days of Level 2 care, 7.3 days of Level 3 care and 0.3 days of Level 4 care; this totals 11.0 days of care. The total nurse workload days per infant averages 4.3 nurse-days.
Use of beds and nurse resources is shown in Figure 3.
FIGURE 3.
Use of beds and nurse resources by BAPM care level. (a) Bed use; and (b) nurse workload.
Overall, 1.29% of infants cared for in neonatal units required specialist surgical care carried out in a NICU (when infants with incomplete BadgerNet records, which includes infants who travel to surgical units independent of NICUs, were included in the analysis, this figure rose to 2.45%). This was dependent on gestational age at birth: at 23–25 weeks, 10–13% of infants required specialist surgical care (in a NICU/surgical centre); this fell to 1–2% of infants at 31–33 weeks and < 1% of infants at ≥ 34 weeks.
Gestational age at discharge
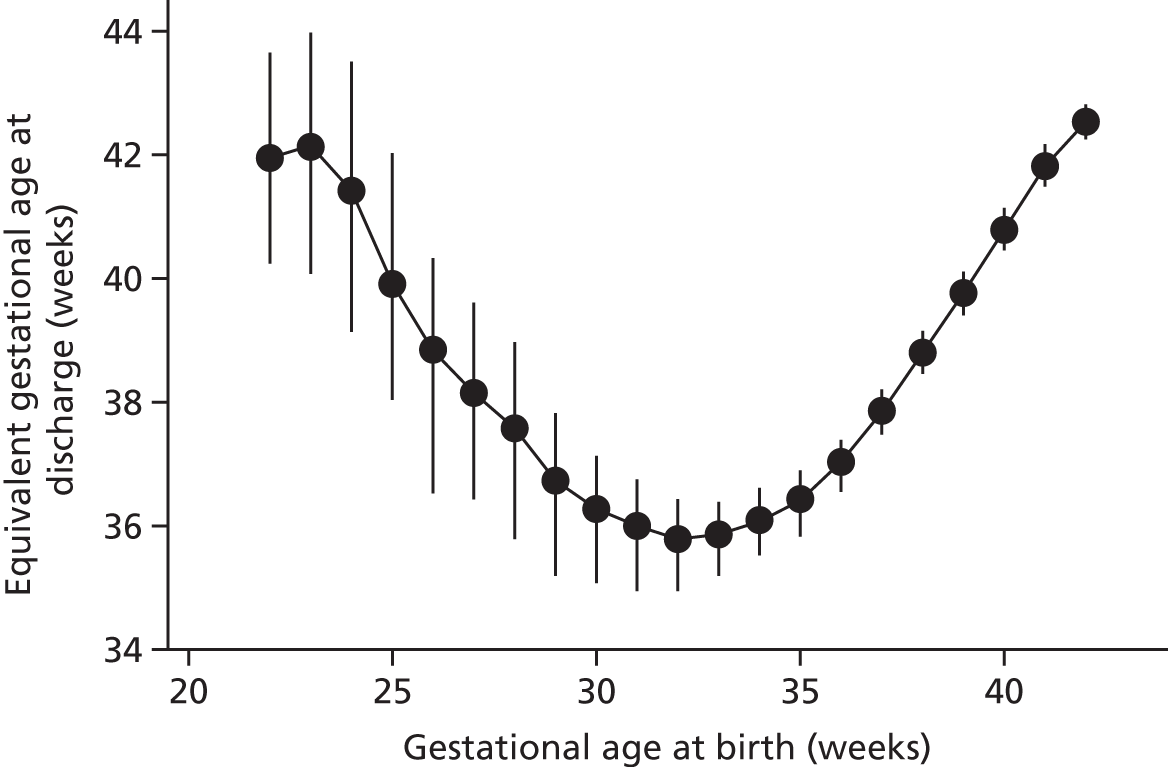
Figure 4 shows gestational age at discharge by gestational age at birth. The lowest gestational age at discharge is for infants who are born between 30 and 35 gestational weeks (discharged, on average, at a gestational age of ≈36 weeks). A low gestational age at birth (≤ 25 weeks) is associated with an average gestational age at discharge of > 40 weeks.
FIGURE 4.
Gestational age at discharge by gestational age at birth. Points represent means and bars represent standard deviations.
Travel time and distance to place of care
The mean distance from the mother’s home to the place of care is shown in Figure 5.
FIGURE 5.
Mean travel (a) distance (miles); and (b) time (minutes) per spell by level of care.
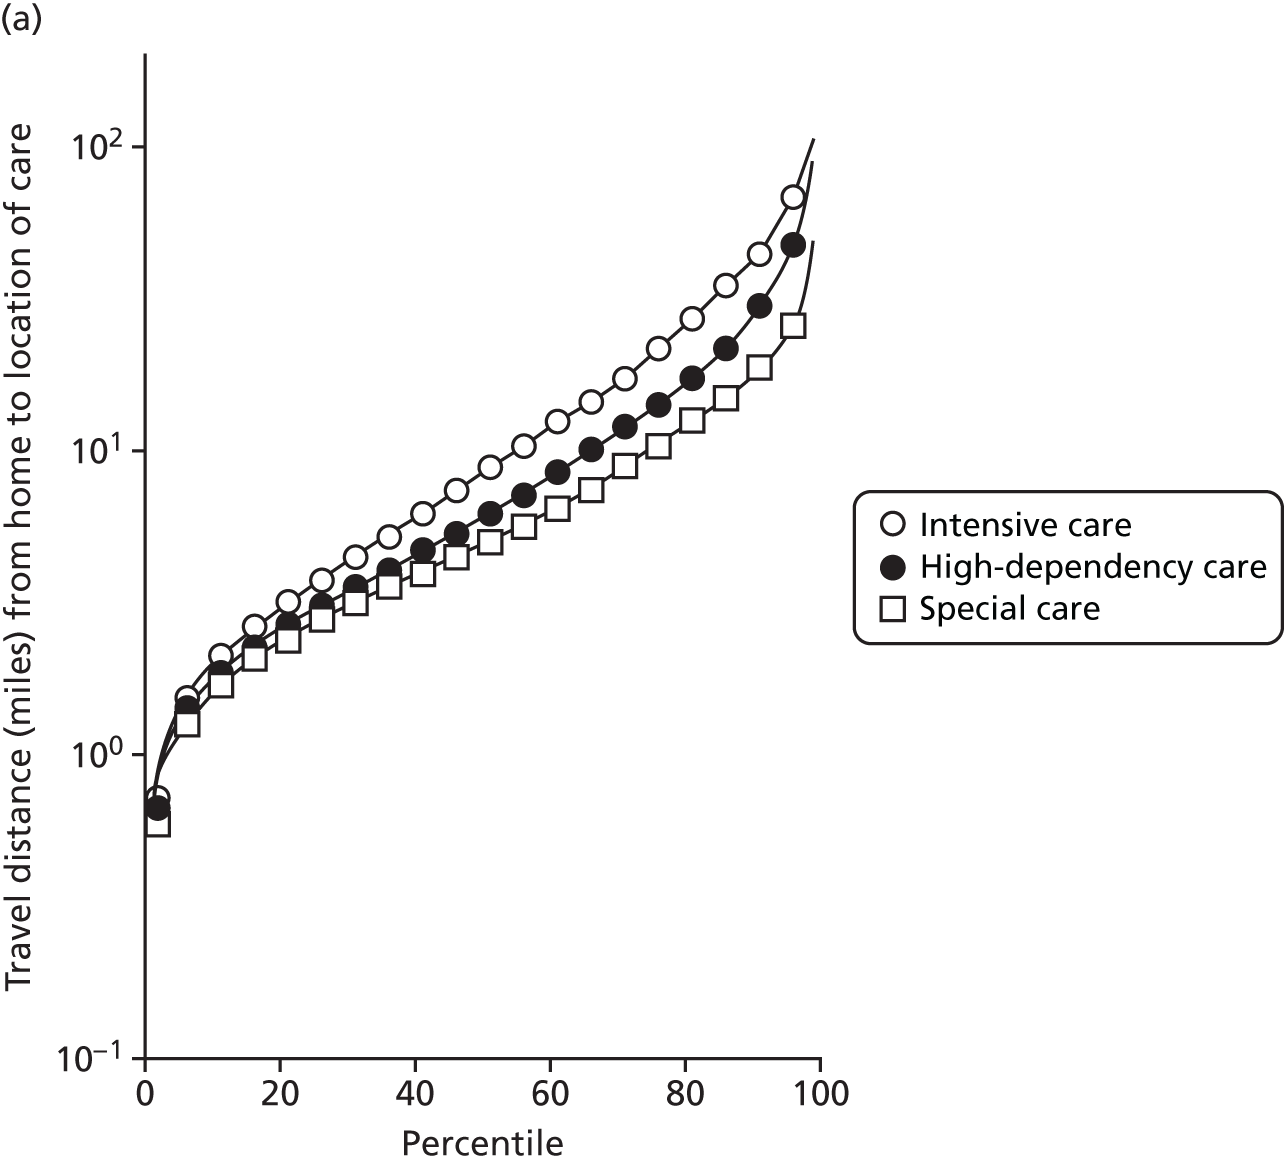
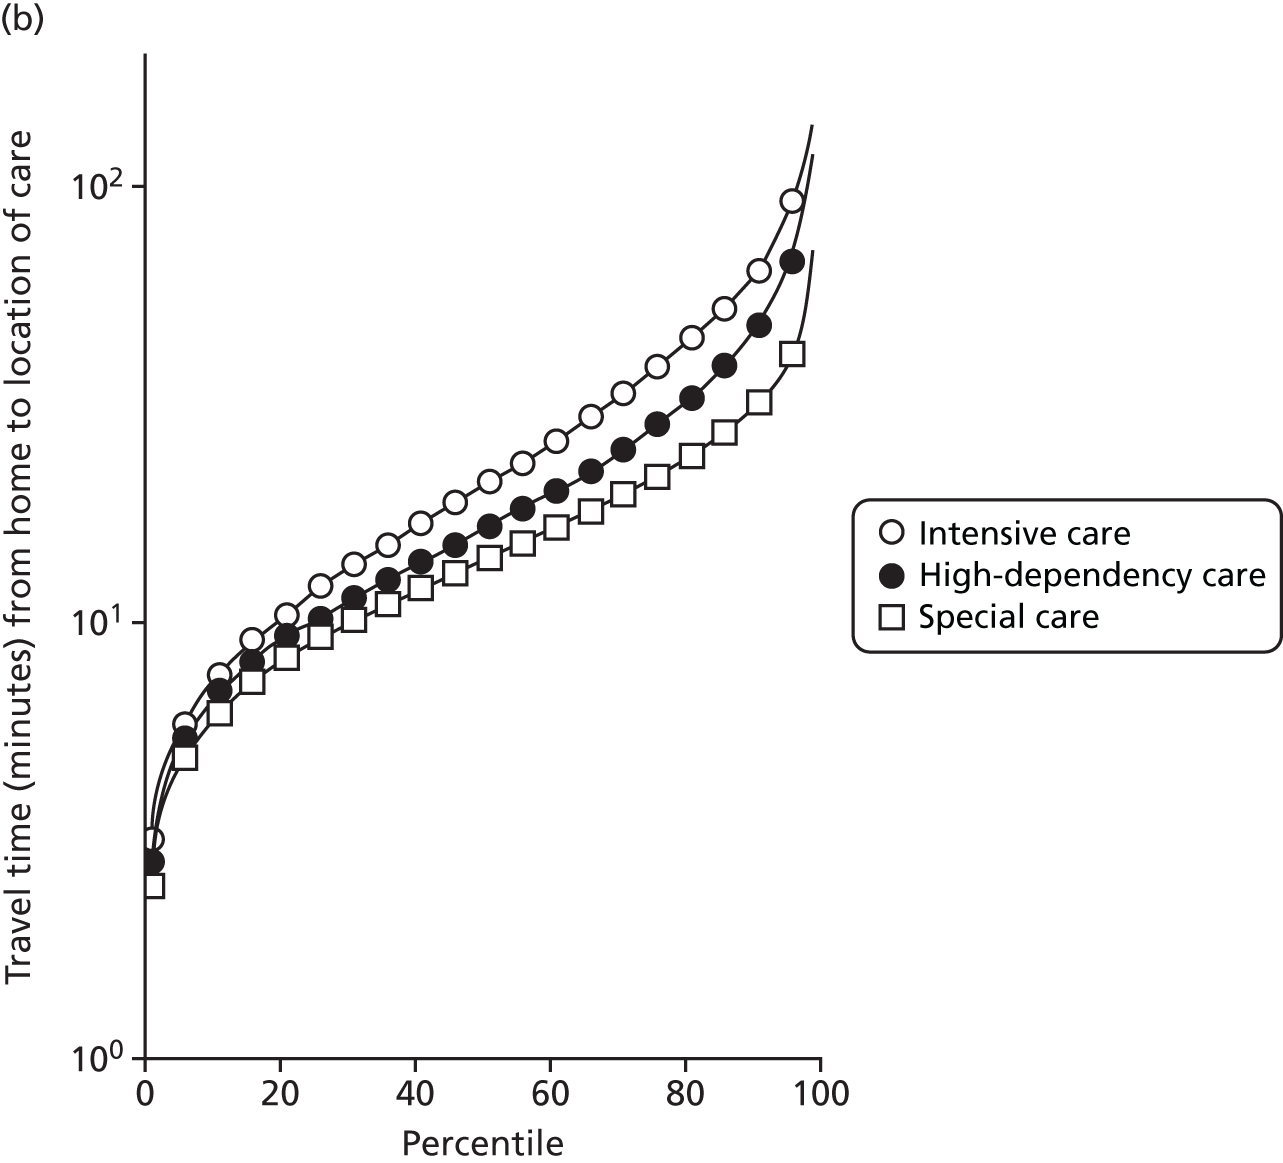
As not all neonatal units provide all levels of care, travel times can depend on the level of care required. A spell refers to the time spent by an infant at one particular neonatal unit.
Spells involving Level 1 (intensive) care had a median travel time from home of 21 minutes, and a median distance from home of 8 miles. Ten per cent of spells were > 61 minutes and > 42 miles from home.
Spells involving Level 2 (high-dependency) care had a median travel time from home of 16 minutes, and a median distance from home of 6 miles. Ten per cent of spells were > 46 minutes and > 28 miles from home.
Spells involving Level 3 (special) care had a median travel time from home of 13 minutes, and a median distance from home of 5 miles. Ten per cent of spells were > 31 minutes and > 18 miles from home.
The data were analysed for infants who received care for > 1 day at a unit that was > 15 minutes further away than their closest appropriate unit:
-
12.9% of spells involving a Level 1 stay of > 1 day were > 15 minutes further away than their closest appropriate unit. On average, the excess travel time was 40 minutes and the average excess duration of stay was 10.6 days.
-
14.1% of spells involving a Level 2 stay of > 1 day were > 15 minutes further away than their closest appropriate unit. Of those not requiring Level 1 care (and so would not be waiting for transfer back from a higher-level unit), 7.9% were cared for at a unit > 15 minutes further away than their closest appropriate unit, with an average excess travel time of 41 minutes and an average excess duration of stay of 5.3 days.
-
6.7% of spells involving a Level 3 stay of > 1 day were > 15 minutes further away than their closest appropriate unit. Of those not requiring Level 1 or 2 care (and so would not be waiting for transfer back to a SCU from a higher-level unit), 4.7% were cared for at a unit > 15 minutes further away than their closest appropriate unit, with an average excess travel time of 38 minutes and an average excess duration of stay of 6.0 days.
Hospital birth by neonatal unit type
An analysis was performed on place of birth and the level of neonatal unit available at the place of birth.
For all infants who have ≥ 1 day of BAPM Level 1 (intensive) care:
-
53.0% are born in a hospital with a NICU
-
18.1% are born in a hospital without a NICU and are transferred to a NICU
-
28.9% are born in a hospital without a NICU and are not transferred to a NICU.
For all infants who have ≥ 7 days of BAPM Level 1 (intensive) care:
-
60.4% are born in a hospital with a NICU
-
20.8% are born in a hospital without a NICU and are transferred to a NICU
-
18.9% are born in a hospital without a NICU and are not transferred to a NICU.
For all infants with a gestational age of < 33 weeks at birth and who have ≥ 7 days of BAPM Level 1 (intensive) care:
-
61.2% are born in a hospital with a NICU
-
18.9% are born in a hospital without a NICU and are transferred to a NICU
-
19.8% are born in a hospital without a NICU and are not transferred to a NICU.
For all infants with a gestational age of < 28 weeks at birth and who have ≥ 7 days of BAPM Level 1 (intensive) care:
-
72.0% are born in a hospital with a NICU
-
20.9% are born in a hospital without a NICU and are transferred to a NICU
-
7.1% are born in a hospital without a NICU and are not transferred to a NICU.
Chapter 6 Location analysis
In acute health-care settings, there can often be a tension between providing local services close to the patients and developing centres of excellence with extensive experience gained through high volumes of specialist work. This chapter examines the compromise between patient travel time and unit size, and analyses the optimal locations for birth centres and neonatal care units.
Model
We consider the space of possible locations given by the existing H neonatal units of England. Given a number of h ∈ 〚1; H〛 available units, we wanted to find the optimal combination of unit locations to optimise a set of criteria. Such combinations are described by vectors, u = {u1, u2, . . ., uh}, where ∀i ∈ 〚1; h〛 ui ∈ 〚1; H〛 without repetition. The set of possible combinations is called the feasible set of the decision space.
Assumptions
We assume that all units have an unlimited capacity. However, the maximum number of admissions to any single unit is kept as low as possible by criterion 6 stated in Decision criteria.
We assume that neonatal care can only take place in the existing neonatal units. Considering that the existing network is already quite dense and the tendency is towards a reduction of the number of units, then this assumption is reasonable.
Decision criteria
The aim of this study is to optimise the location of neonatal units in order to improve the outcome of the infants, the experience of the parents and to align the neonatal network with the current demand. These objectives translate into the following criteria:
-
Minimise the average distance from a mother’s place of residence to an available unit.
-
Minimise the maximum distance for any mother to an available unit.
-
Maximise the proportion of mothers living within 30 minutes of the nearest available unit (other travel time limits, such as 45 and 60 minutes, are also evaluated, but the 30-minute range is used for optimisation as this range is more discriminating between options).
-
Maximise the proportion of births taking place in units with more than a given number, Amin, of admissions per year.
-
Maximise the minimum number of admissions (for any single unit) below a given number of admissions per year.
-
Minimise the maximum number of admissions (for any single unit) over a given number of admissions per year.
-
Maximise the proportion of mothers within 30 minutes of the nearest available unit and going to a unit with more than a given number, Amin, of admissions per year.
The first three coverage criteria, very common in facility location problems, aim to align facility locations with the population distribution. They rely on the assumption that women will go the nearest care facility. 45 The other four criteria are based on the number of admissions to each unit, once every woman has been assigned to an available location. In particular, criterion 4 is specific to this study and favours the creation of big units in order to improve clinical outcomes. 22 Criteria 3 and 4 can conflict in areas with a sparse population. Finally, criterion 6 limits the maximum size of care units. Possible criteria values define the objective space.
Dealing with multiple criteria: Pareto dominance
Our study tackles a multiobjective optimisation (MOO) problem. When solving an optimisation problem based on one objective, the optimal solution is given by the configuration with the best (highest or lowest) objective value. In the case of MOO, comparing several solutions requires reference to the notion of dominance: a vector a of the objective space dominates another vector b if all criteria of a are better or equal to the criteria of b and a ≠ b. 46 Then, there is no single best solution but a set of non-dominated solutions, called the Pareto front.
Complexity of the decision space
If the problem is to find the best combination of h units in a list of H possible locations, then one common method is to compute all objectives for all possible combinations (brute force). The number of h-combinations (combinations of size h) is the binomial coefficient:
if h ≤ H, or equals zero if h > H. With H = 161 possible locations, there are, for instance, 12,880 combinations of two locations and the maximum number of configurations is 1.82 × 1047, reached with half of locations (80) available. With such a large number of combinations, the brute force method cannot be used and the optimisation problem must be solved by heuristic methods. In practice, the size of the decision space means that it is impossible to give an exact solution to this optimisation problem; only an approximate solution can be given.
Optimisation methods in the literature
This study tackles a facility location problem, with several deterministic objective functions. The decision space contains a finite number of potential locations, so the optimisation problem is combinatorial.
Our aim was to find the best h-combinations for all h ∈ 〚1; H〛 that maximise the objective functions. In practice, it means finding the Pareto front of non-dominated solutions. As the optimisation problem is NP (non-deterministic polynomial time) hard, there is no known method to find the exact solution or true Pareto front of this problem in a reasonable time;47 however, the literature offers a lot of heuristic methods that can provide approximate solutions.
According to Berman et al. ,48 large facility location problems can be solved by descent algorithms, simulated annealing and genetic algorithms. Genetic algorithms were shown to produce the best results but are more computationally expensive. 48
Greedy algorithm
The greedy algorithm is a deterministic technique that leads to one local optimum. The greedy algorithm cannot identify a Pareto front, but seeks to find the best solutions based on a composite score (the ‘fitness value’) of all objectives. The solution identified is highly dependent on how the different objectives are weighted. The algorithm starts with the location with the highest fitness value. At each iteration, the algorithm selects the location that brings the most improvement and adds it to the combination. Although this technique is intuitive and fast, it provides only one solution and it strongly relies on weights and fitness.
Steepest-ascent hill climbing
The hill-climbing method is an efficient method to find local optima of the fitness function. From a given individual, candidates are generated by mutating only one gene of the original. Then, the fitness value for each candidate is computed. The individual is then replaced by the candidate that brings the highest improvement (steepest ascent). If no improvement is possible, the local optimum is recorded and the exploration is restarted from another random point.
Simulated annealing
Simulated annealing is a stochastic local search method. 47 Here, annealing refers here to the cooling of materials with a controlled temperature. The probability of accepting combinations with a worse fitness decreases with the temperature, so that the search converges to an optimum.
Genetic algorithms
Genetic algorithms manage a population of individuals encoded as vectors through a given number of generations. At each generation, ‘good’ parents are selected from the population depending on their fitness. Parents are then combined, using a crossover operator, to create children that are finally mutated. Genetic algorithms differ in the parent selection process, in the crossover and mutation processes, and in the way that the population is archived.
Selection
The selection operator chooses a part of the population to become parents. The better individuals in terms of objective values are more likely to become parents.
The selection probability can be proportionate to fitness by roulette-wheel sampling49 or stochastic universal sampling. 50 The sigma scaling method normalises the fitness by its variance in the population, so that the individuals with the highest fitness always have a higher probability than others to produce children. However, these approaches focus on exploitation of an existing population rather than exploration of the decision space, and they can lead to premature convergence.
Other selection methods rely on ranking rather than fitness value. With ranking selection, individuals are ranked depending on their fitness, and their probability to become parents is a function of their rank. 51 Similarly, the tournament selection picks random pairs of individuals and determines which has the highest fitness value. The individual with a higher fitness will be selected with a given probability (e.g. if probability is set at 0.7 then the individual with higher fitness will be selected 70% of the time, and the individual with lower fitness will be selected 30% of the time). 52 Such methods allow the algorithm to keep some individuals with low fitness values (with the advantage of keeping a broader gene pool).
Finally, the Boltzmann selection53 controls the selection rate via a temperature. At the beginning, all individuals have a similar probability to be selected. As the temperature decreases, the selection focuses on high-fitness individuals.
Crossover
The crossover is the process that exchanges genes from parents to create new children. The simplest option is the single-point crossover, which selects one locus and exchanges blocks before and after that locus; for example, we may code whether an individual hospital is open with 0 (closed) or 1 (open). The open/closed status of eight hospitals is given as a vector, such as 00000000 (all closed), 11111111 (all open) or 10000001 (hospitals 1 and 8 are open, and the rest are closed). With crossover, two different configurations (parents) are mixed by exchanging at a random locus within the vector; for instance, mixing vectors 00001111 and 01010101 after the fifth locus gives the children 00001101 and 01010111. The choice of the single-point location can be made by a uniform distribution. In the case of binary vectors, the single-point crossover is less likely to exchange the endpoints of vectors. 54 To reduce this effect, the crossover can rely on two or more exchange points. In the case of integer vectors, an additional repair step is necessary to remove any potential repetition.
Mutation
Mutation changes the gene value of each locus, with a very small probability for each individual generation. According to Holland,55 the mutation process avoids the loss of diversity in the population.
Archive
Genetic algorithms also vary by the way solutions are archived and if the population size is variable. The simple option is to keep only children; however, it assumes that children are better than parents that are lost. Several methods build an archive that is a union of parents and children. If the population size is variable, an option is to keep the Pareto front of this archive; however, the size of this Pareto front can increase dramatically, in particular with many objective functions. Then, individuals from the archive are ranked, based on their Pareto dominance and another metric. Non-Sorting Genetic Algorithm II (NSGA-II)56 and SPEA (Strength Pareto Evolutionary Algorithm) 257 both rank individuals by combining dominance and spread metric in order to maximise population diversity.
The Non-Sorting Genetic Algorithm II method
In NSGA-II,56 the archive and the new population are merged and all individuals are ranked in accordance with a two-step mechanism. In the first step, the merged population is split into layers of non-dominated fronts, the first layer being the Pareto front (the second layer being the next Pareto front after removal of the first layer). In the second step, the spread of the population is measured by the crowding distance, which gives the distance from an individual to its nearest neighbour. To keep the size of the population constant, a given number of individuals is selected from the merged population, preferably from the upper layers and with the largest crowding distance.
The NSGA-II has the opportunity to keep not only optimal solutions, but also near-optimal solutions, in lower layers; however, to do so, the population must be large enough. Another advantage is to provide a diverse population in terms of score values, thanks to the crowding-distance ranking.
The NSGA-II was chosen for this study after a comparison with SPEA 2,57 MOEAD (multiobjective evolutionary algorithm based on decomposition),46 and HypE (hypervolume estimation algorithm),58 which showed that NSGA-II provided similar objective performances with a more diverse population.
Convergence metrics
The number of generations was determined with a steady-state detection-based termination criterion (a chi-squared test based on the generational distance of objective values, or on the Hamming distance of integer vectors) adapted from Wong et al. 59
Maternity unit location analysis
This section focuses on the centralisation of maternity units in England. The relationship between the number and location of obstetric units and the access of care quantified by the model criteria (see Decision criteria) is analysed to measure the impact of a potential reorganisation of care.
Data
Data on the number of births in existing maternity units were provided by the HES database (see Chapter 4, Birth data). Birth numbers per year were averaged using data from 2013 to 2015.
Travel times for patients between the LSOAs of England (country divisions with similar population sizes as defined in 2011) and the 161 existing maternity units were estimated (see Chapter 4, Travel time data). Maternity units were selected from those hospitals that had any level of neonatal care unit.
Estimation
The NSGA-II method56 and the criterion functions defined in Decision criteria were implemented using MATLAB programming software (MathWorks, Natick, MA, USA). In particular, since the Royal College of Obstetricians and Gynaecologists has recommended that units have ≥ 6000 births per year,22 criteria 4 and 1 were applied with a number of births per year defined by Amin = 6000.
Criterion functions were normalised between 0 and 1 using values from Table 5, with 1 being the ideal value. Fitness was computed as the weighted average of normalised objective values, with equal weights for all objectives.
| Criterion | Direction | Normalisation interval (normalisation range) | |||
|---|---|---|---|---|---|
| Maternities study | NICUs study | LNUs study | SCUs study | ||
| Average travel time from mother to closest unit | Minimum | [15–344] minutes | [14–335] minutes | NA | NA |
| Maximum travel time from any mother to closest unit | Minimum | [82–570] minutes | NA | NA | |
| Proportion of mothers living within 30 minutes of the closest unit (target 1) | Maximum | [0–0.94] | [0–0.95] | NA | NA |
| Proportion of admissions in units more than Amin per year (target 2) | Maximum | [0.20–1] (Amin = 6000 births) | [0–1] (Amin = 100 VLBW) | NA | NA |
| Minimum number of admissions for any single unit | Maximum | [1100–6000] | [13–100] | [28–15,386] | [127–68,586] |
| Maximum number of admissions for any single unit | Minimum | [12,000–63,828] | [1000–6806] | [28–15,386] | [127–68,586] |
| Proportion of mothers and infants meeting targets 1 and 2 | Maximum | [0–1] | [0–1] | NA | NA |
The first generation was generated randomly using an integer uniform distribution in 〚1; h〛, so that there was no location repetition inside combination chromosomes and no duplicates in the population.
The population size was set to P = 200 and remained constant through generations. This value was chosen as a compromise between the exploration of the decision space and the computing time.
The population was propagated through G = 200 generations; this value would provide a steady state as described in Convergence metrics.
The MOO process was run independently for all h ∈ 〚1; H〛. Note that the same optimisation algorithm can be applied with a binary location encoding (u1, . . . , uH) ∈ {0; 1}H. In that case, the number of open locations is flexible and only one optimisation run provides a Pareto front with various numbers of locations. However, the range of location numbers in the final solutions is not easily controlled with such encoding and depends on score quality. The integer encoding allows a more thorough exploration of the decision space.
Parents were selected from the population using the tournament selection process. 56 To do so, pairs of individuals are randomly drawn from the population and the one with the highest fitness is selected as a parent with a probability of pt = 0.75. The tournament is an elitist selection process as it favours high fitness values but it allows lower fitness values with a probability of 1 – pt.
Parents are then combined using a single-point crossover; the crossover point location is randomly chosen following a uniform distribution.
The alleles of every child were mutated with a probability of pm = 0.001. After crossover and mutations, additional mutations took place to ensure that children did not contain location repetitions.
The outputs of the optimisation process are the final Pareto front layers up to P individuals and their corresponding objective values. The minimum number of admissions for each combination is also recorded in order to evaluate the impact of the redistribution of locations.
Results
Access to care
Figure 6a shows the relationship between the average and maximum travel time for mothers, assuming that they go to the closest unit, as a function of the number of available obstetric units. Each dot represents the criterion value of one configuration or set of units discovered in the Pareto front of solutions.
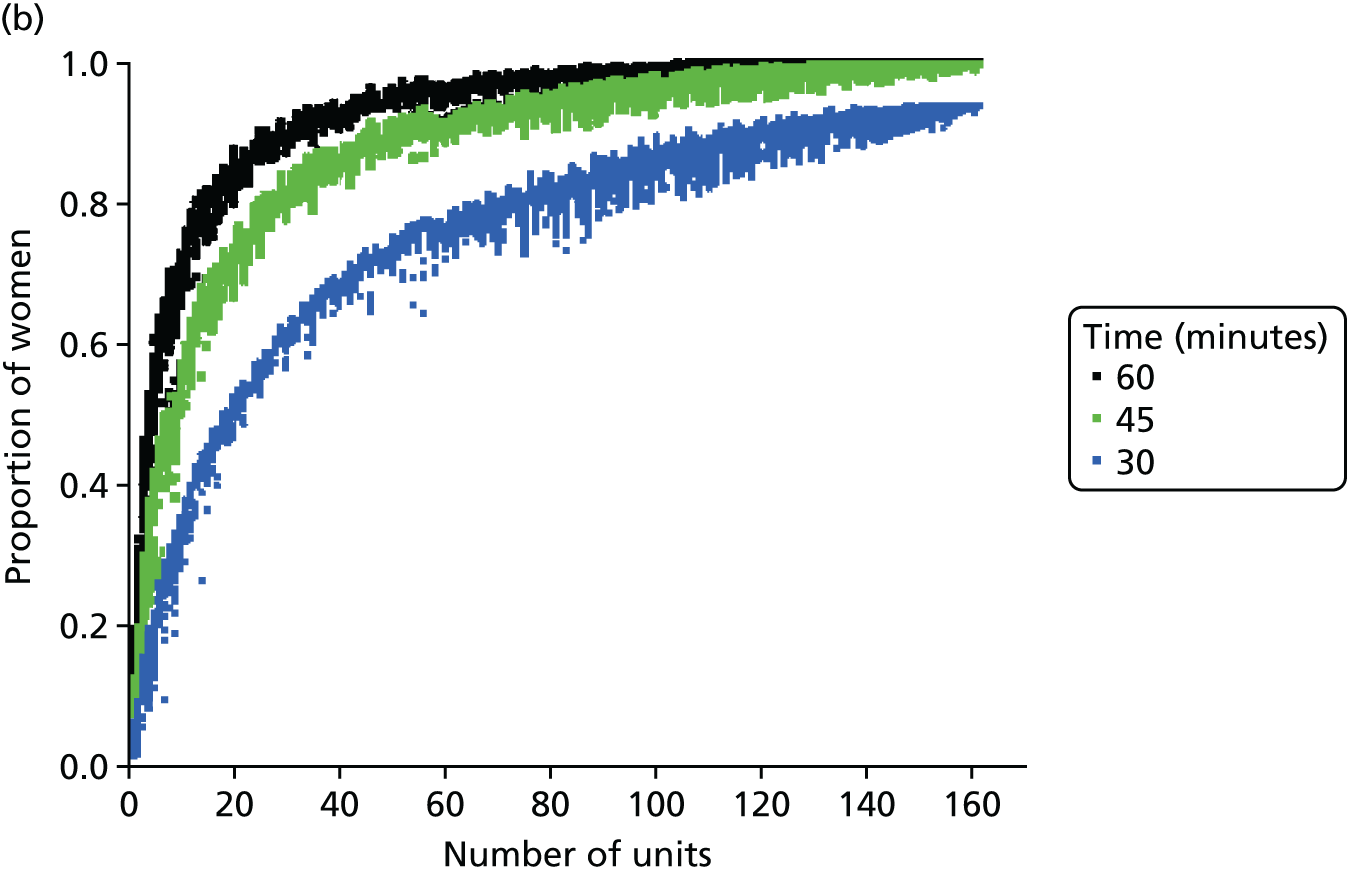
FIGURE 6.
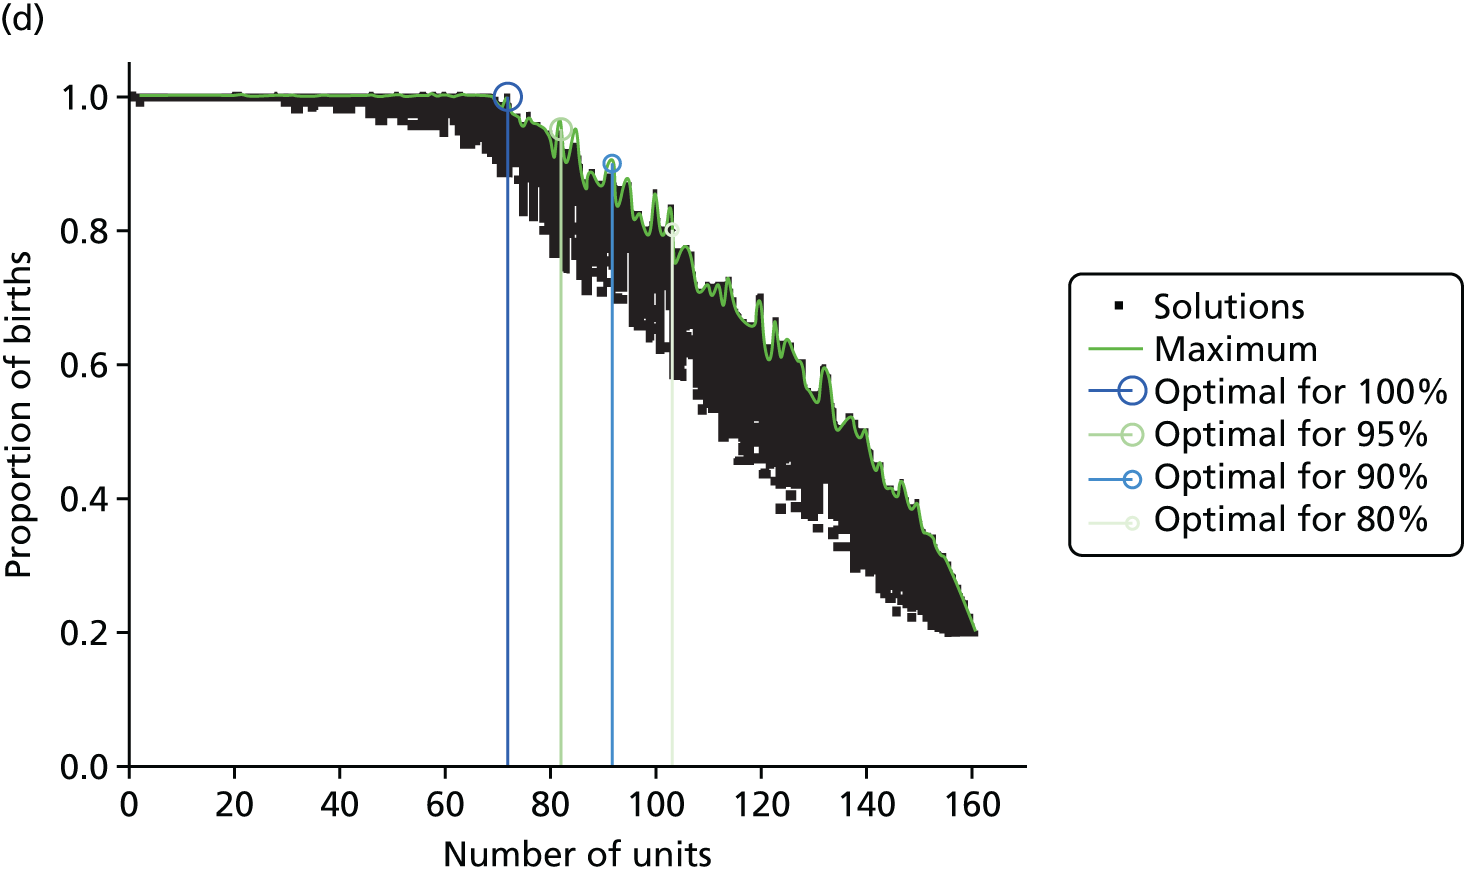
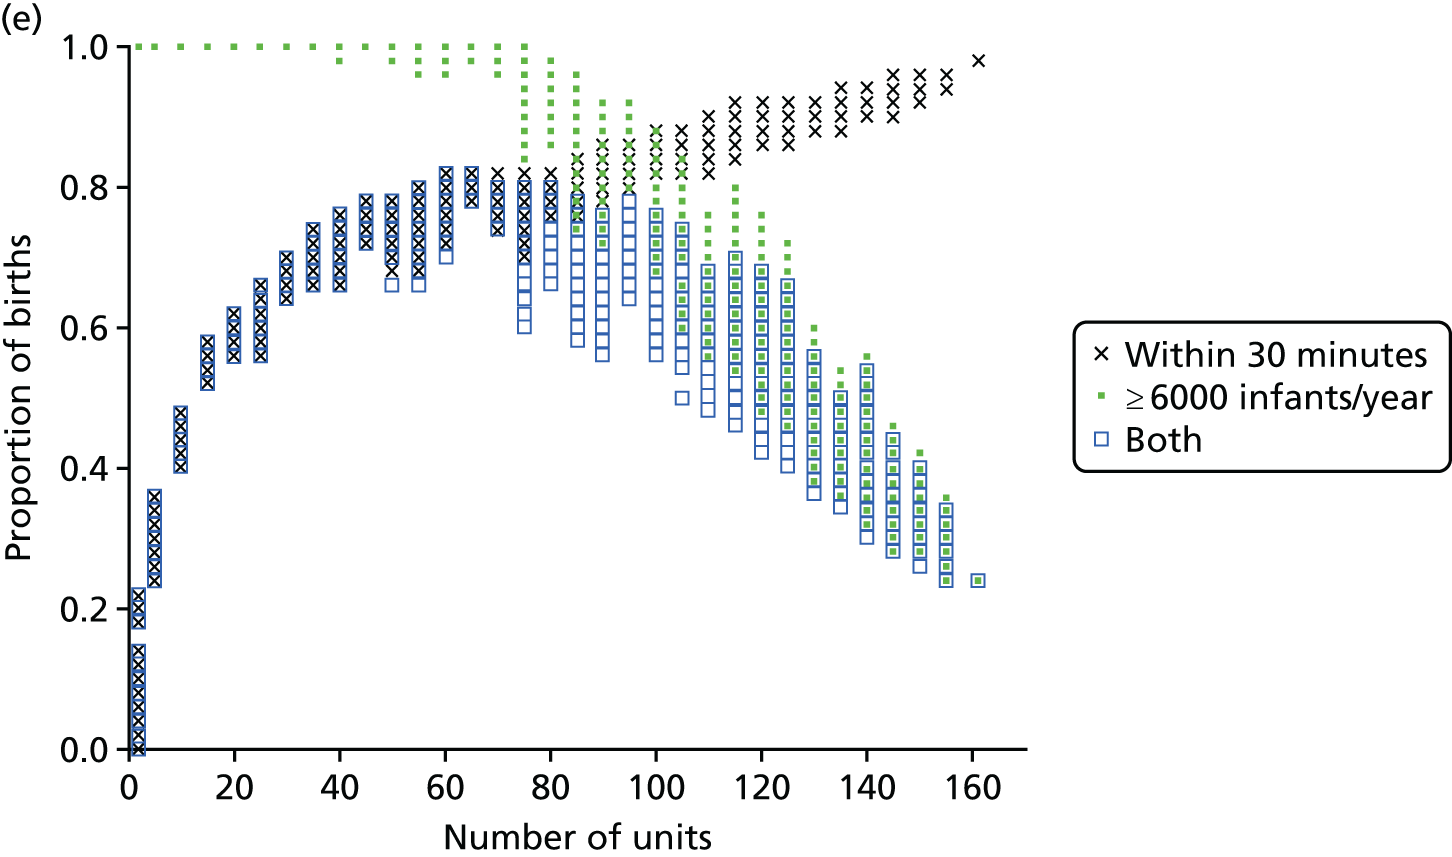
Influence of the number of maternity units on the access to care. (a) Travel time (minutes) (potential configuration: minimum and maximum travel times); (b) proportion of women in target time (potential configuration: proportion of women within 30, 45 or 60 minutes of a maternity unit); (c) number of admissions (potential configuration: minimum and maximum admissions to any single unit); (d) births in units with ≥ 6000 births per year (%) (potential configuration: proportion of births in a unit with ≥ 6000 admissions per year); and (e) proportion of births in target (potential configuration: the proportion of births within 30 minutes, proportion of births in a unit with ≥ 6000 admissions per year, and proportion of births in a unit with 6000 births per year and within 30 minutes). Quantified by the distance to units and the proportion of women in target time, on the number of admissions and on the proportion of births occuring in large units (≥ 6000 births per year).
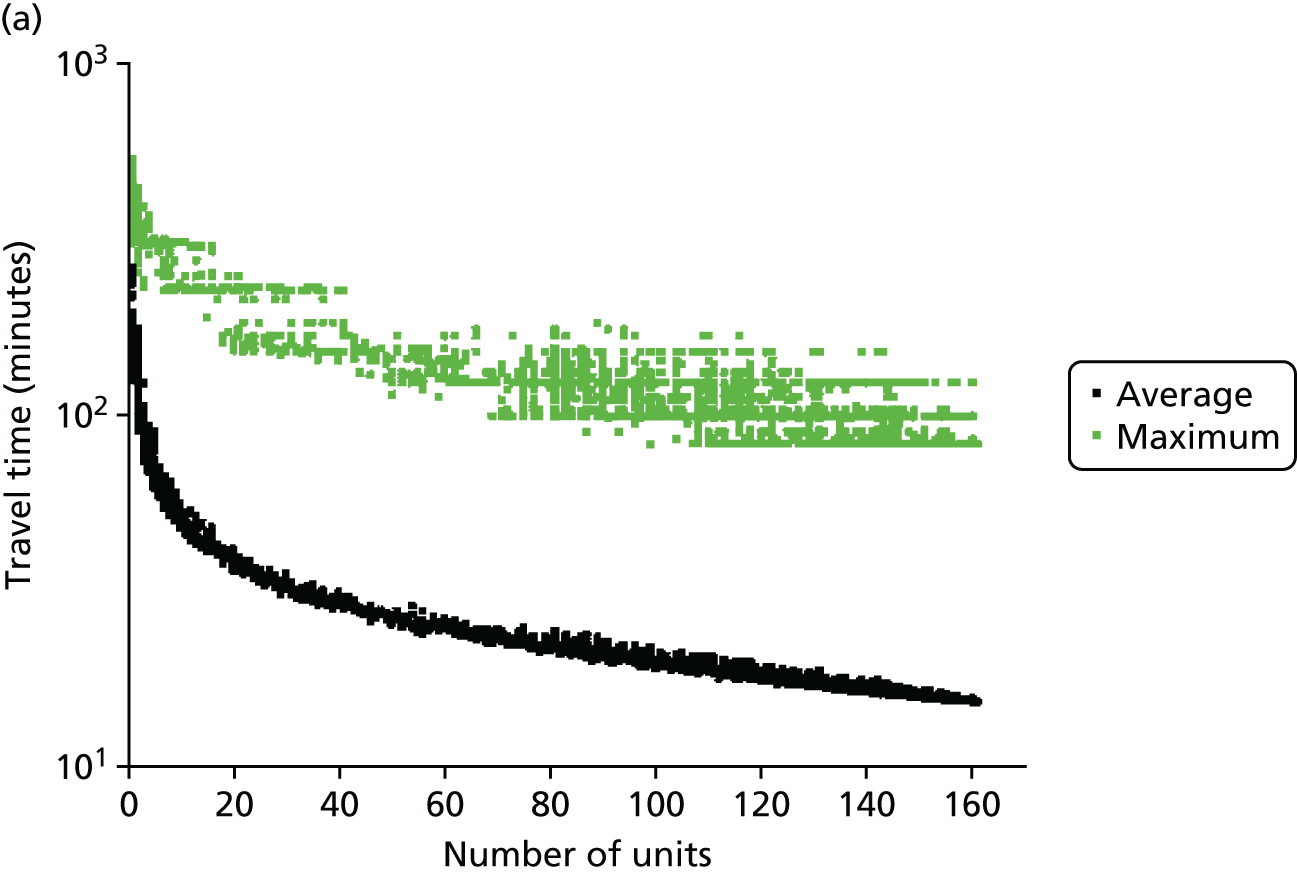
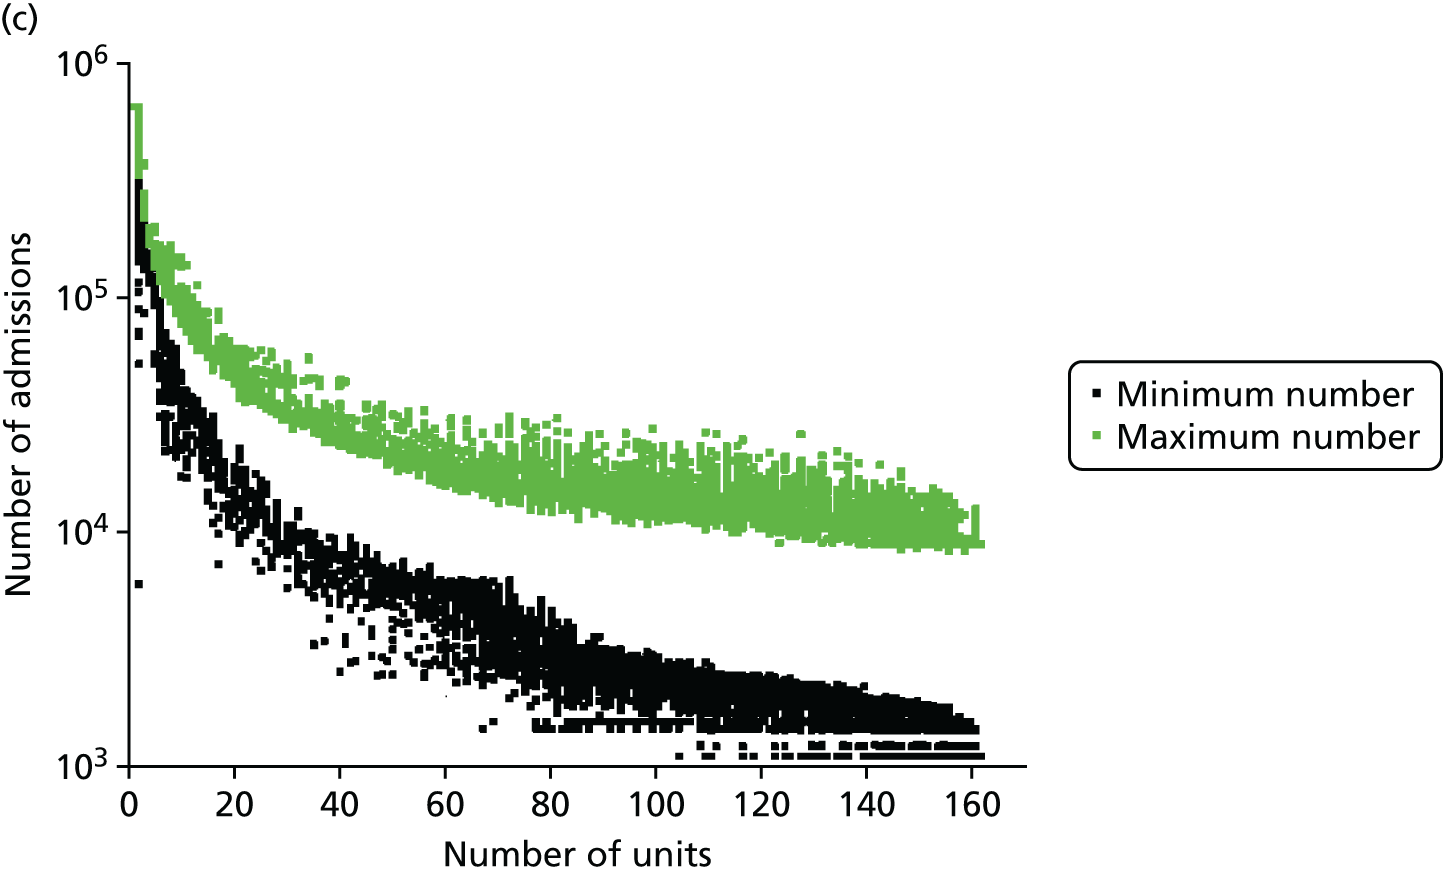
With the current number of 161 obstetric units, the average travel time is 15 minutes and the maximum travel time is 82 minutes. As expected, the travel time increases when the number of units decreases; for instance, reducing the number of units by half to 80 increases the average travel time to 21 minutes (+6 minutes) and the maximum travel time to 99 minutes (+17 minutes). Note that removing one unit only affects the patient access in some LSOAs and the average travel time is computed for all LSOAs. As a consequence, the effect on the average travel time is limited.
In Figure 6b, the proportion of women living within 30/45/60 minutes of the closest obstetric unit increases with the number of units. With 161 units, 93% of women live within 30 minutes and 100% live within 45 minutes of the closest unit. With only half of the units (80), the proportion of women (1) within 30 minutes of the closest unit is reduced to 84% (–9%), (2) within 45 minutes is reduced to 90% (–10%) and (3) within 60 minutes is reduced to 95% (–5%). Similar to the average travel times, the effect of changing the number of units on the proportion of women within a target travel time is rather smooth because it only affects a part of the population.
Size of units
The number of admissions per unit decreases when the number of units increases, as shown in Figure 6c. With 161 units, the number of admissions ranges from 1100 to 8743. With only half of the units (80), the highest estimated minimum of admissions is 4562 and the lowest estimated maximum number is 11,960; however, both values may not be achievable in the same configuration. To achieve a minimum number of 6000 births per year, the highest number of units is estimated to be 72 units.
Figure 6d represents the proportion of births occurring in units with ≥ 6000 births per year as a function of the number of obstetric units. With the current configuration of 161 units, only 20% of births occur in units with ≥ 6000 births per year (or ‘large units’), in accordance with our model. Reducing the number of units by 21, to 140 units, could lead to an increase of 30%, to reach 50%. Thus, the relationship between the number of units and the proportion of births in large units is particularly strong and a small change can lead to a big impact. Furthermore, to reach a proportion of 80%/90%/95%/100%, the number of units would need to be reduced to approximately 103/92/82/72 units, respectively.
Compromise
There is trade-off in the number of units to achieve both a high proportion of mothers within a target travel time and a high proportion of births in units with ≥ 6000 births per year. Figure 6e shows the proportion of patients within 30 minutes of their nearest unit and attending large units, as a function of the number of units. By reducing the number of units from 161 to approximately 65 (±5), the proportion would be increased from 24% to 82%, the maximum achievable based on our results. Note that it is not possible to achieve 100% of patients for both targets because there are not enough patients.
Regional population projections
The 10-year projection for changes in women of child-bearing age (considered to be those aged 15–39 years) ranged from a reduction of about 1% in the North West to an increase of about 4% in London (Table 6).
| Region | Year | |||||
|---|---|---|---|---|---|---|
| 2014 | 2019 | 2024 | 2029 | 2034 | 2039 | |
| Female population aged 15–39 years (000s) (n) | ||||||
| East | 911 | 924 | 933 | 945 | 954 | 978 |
| East Midlands | 716 | 727 | 732 | 743 | 744 | 758 |
| London | 1707 | 1770 | 1778 | 1793 | 1824 | 1881 |
| North East | 408 | 409 | 407 | 408 | 404 | 407 |
| North West | 1127 | 1126 | 1118 | 1118 | 1109 | 1121 |
| South East | 1352 | 1359 | 1363 | 1382 | 1389 | 1421 |
| South West | 786 | 796 | 800 | 813 | 818 | 837 |
| West Midlands | 901 | 916 | 923 | 934 | 937 | 955 |
| Yorkshire and the Humber | 855 | 863 | 863 | 869 | 866 | 876 |
| England | 8763 | 8890 | 8918 | 9004 | 9044 | 9234 |
| Total | 17,525 | 17,779 | 17,836 | 18,009 | 18,088 | 18,467 |
| Change from 2014 (%) | ||||||
| East | 0.0 | +1.5 | +2.4 | +3.8 | +4.7 | +7.4 |
| East Midlands | 0.0 | +1.4 | +2.2 | +3.7 | +3.9 | +5.8 |
| London | 0.0 | +3.7 | +4.2 | +5.1 | +6.9 | +10.2 |
| North East | 0.0 | +0.3 | –0.2 | +0.0 | –1.0 | –0.3 |
| North West | 0.0 | +0.0 | –0.7 | –0.8 | –1.6 | –0.5 |
| South East | 0.0 | +0.5 | +0.8 | +2.2 | +2.7 | +5.1 |
| South West | 0.0 | +1.3 | +1.9 | +3.5 | +4.2 | +6.5 |
| West Midlands | 0.0 | +1.6 | +2.4 | +3.6 | +4.0 | +5.9 |
| Yorkshire and the Humber | 0.0 | +1.0 | +0.9 | +1.6 | +1.3 | +2.5 |
| England | 0.0 | +1.4 | +1.8 | +2.8 | +3.2 | +5.4 |
| Total | 0.0 | +1.4 | +1.8 | +2.8 | +3.2 | +5.4 |
These projections were made before the UK voted to leave the European Union (expected to formally take place in March 2019). There may, therefore, be significant uncertainty about these projections as the age group of interest coincides with the mobile working-age population. Owing to current uncertainty, we have not sought to build projections into our modelling; rather, when considering the output of the modelling, it should be remembered that admission numbers may change to be between 1% lower and 4% higher over the course of 10 years.
Neonatal intensive care location analysis
Neonatal care units are organised in three levels of care: (1) intensive, (2) high-dependency and (3) special care. 6 Following the location analysis of birth centres, the same methodology is applied to analyse the optimal location of NICUs.
Data
Very low-birthweight infants
The number of VLBW infants (weighing < 1500 g) per year was computed by regression analysis for each LSOA using the complete records of the BadgerNet database of NHS England (see Chapter 4, Neonatal data).
Other data
Information submitted by the NDAU for the 2015 National Neonatal Audit Programme report1 provided the locations of 161 existing neonatal care units, containing 45 ICUs.
Travel times for patients between the LSOAs of England (country divisions with similar population sizes as defined in 2011) and the 161 existing neonatal units were estimated (see Chapter 4, Geographic areas).
The map of England was provided by OpenStreetMap© (see Figures 8–11). 60
Model
To study the location of NICUs in England, we adapted the model criteria presented in Decision criteria to focus on improving the clinical outcome for VLBW infants. To do so, we aimed to include ≥ 100 VLBW infants per year in all modelled NICUs. As a result, the set of optimised criteria is a combination of travel time criteria and VLBW number criteria, as detailed in Table 5.
Estimation
In the first stage, the location analysis was restricted to the H = 45 existing NICUs. In the second stage, the location optimisation was extended to all H = 161 existing neonatal care locations.
For both stages, the MOO based on the NSGA-II method56 and the location model (see Model) was applied to the data described in Data, similar to the computation of optimal maternity locations (see Maternity unit location analysis).
The population size was set to P = 100 and remained constant through generations. The population was propagated through G = 200 generations; this value would provide a steady state, as described in Convergence metrics.
The MOO process was run independently 10 times for all h ∈ 〚1; H〛 with different first generations. Such iterations improve the reliability of analysing the content of the Pareto front configurations.
Results
The analysis of the Pareto front configurations provided by the optimisation process enlightens the relationship between the number of NICUs in England, the access to neonatal intensive care and the size of units.
Access to care
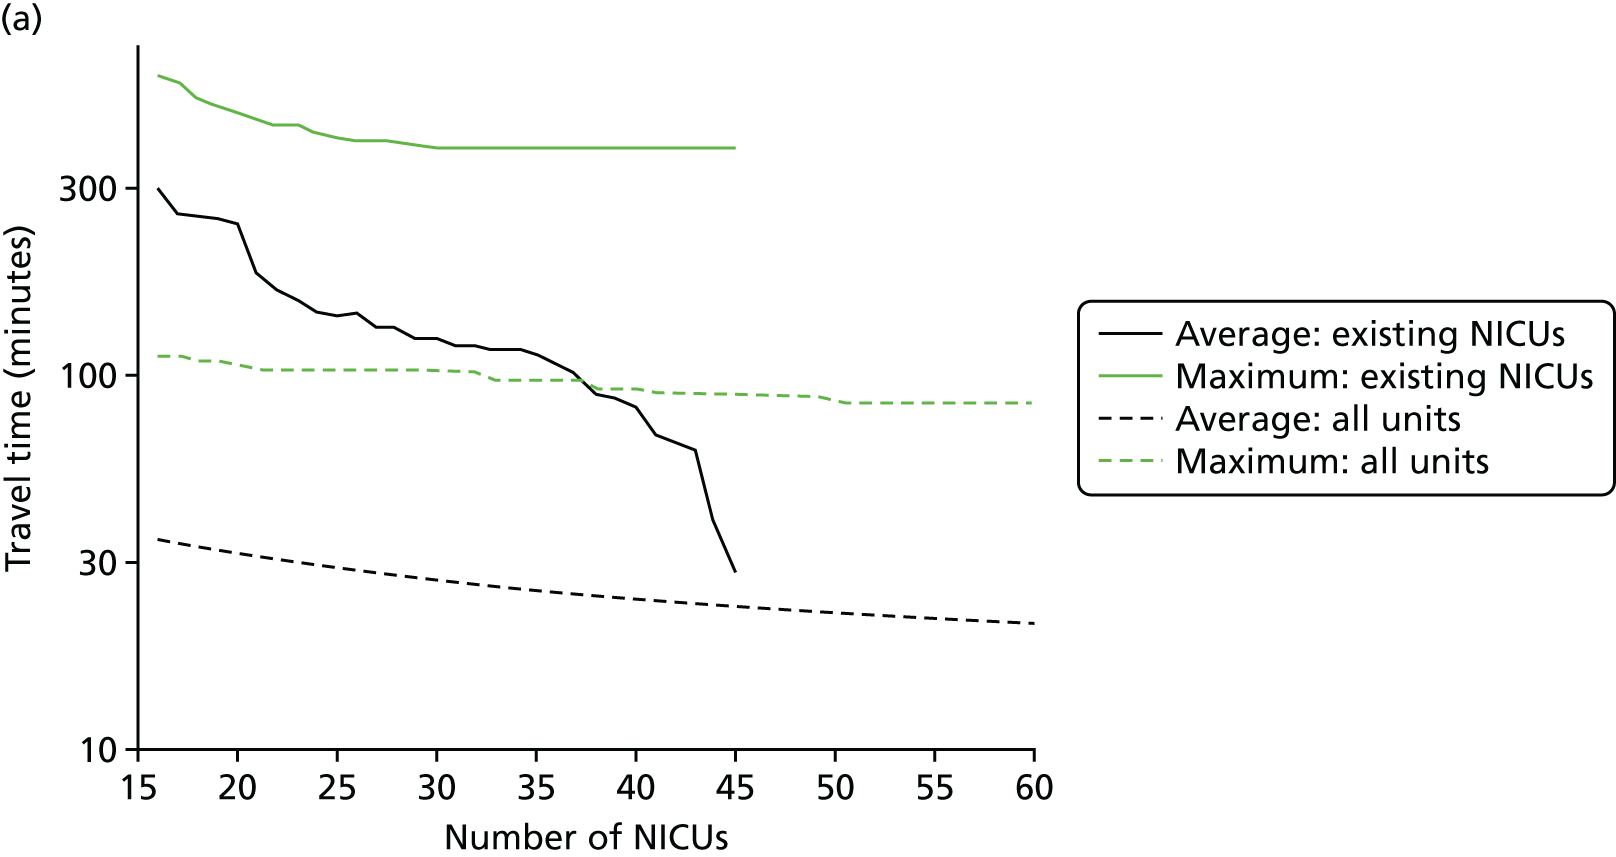
In Figure 7a, the best achievable average and maximum travel times from mother to unit both decrease as the number of NICUs increases. This relationship is tenuous, as the best achievable maximum travel time remains constant in the case of existing NICUs and it decreases by only 5 minutes between 45 and 60 units in the case of all possible locations. This can be explained: the optimisation criteria include the average travel time; as a result, Pareto front configurations are optimal for a majority of mothers. Such comparison highlights that the maximum travel time from any mother to the closest unit could be improved significantly by changing the location of units, reducing the maximum travel time from 142 minutes to 86 minutes with the current number of 45 NICUs.
FIGURE 7.
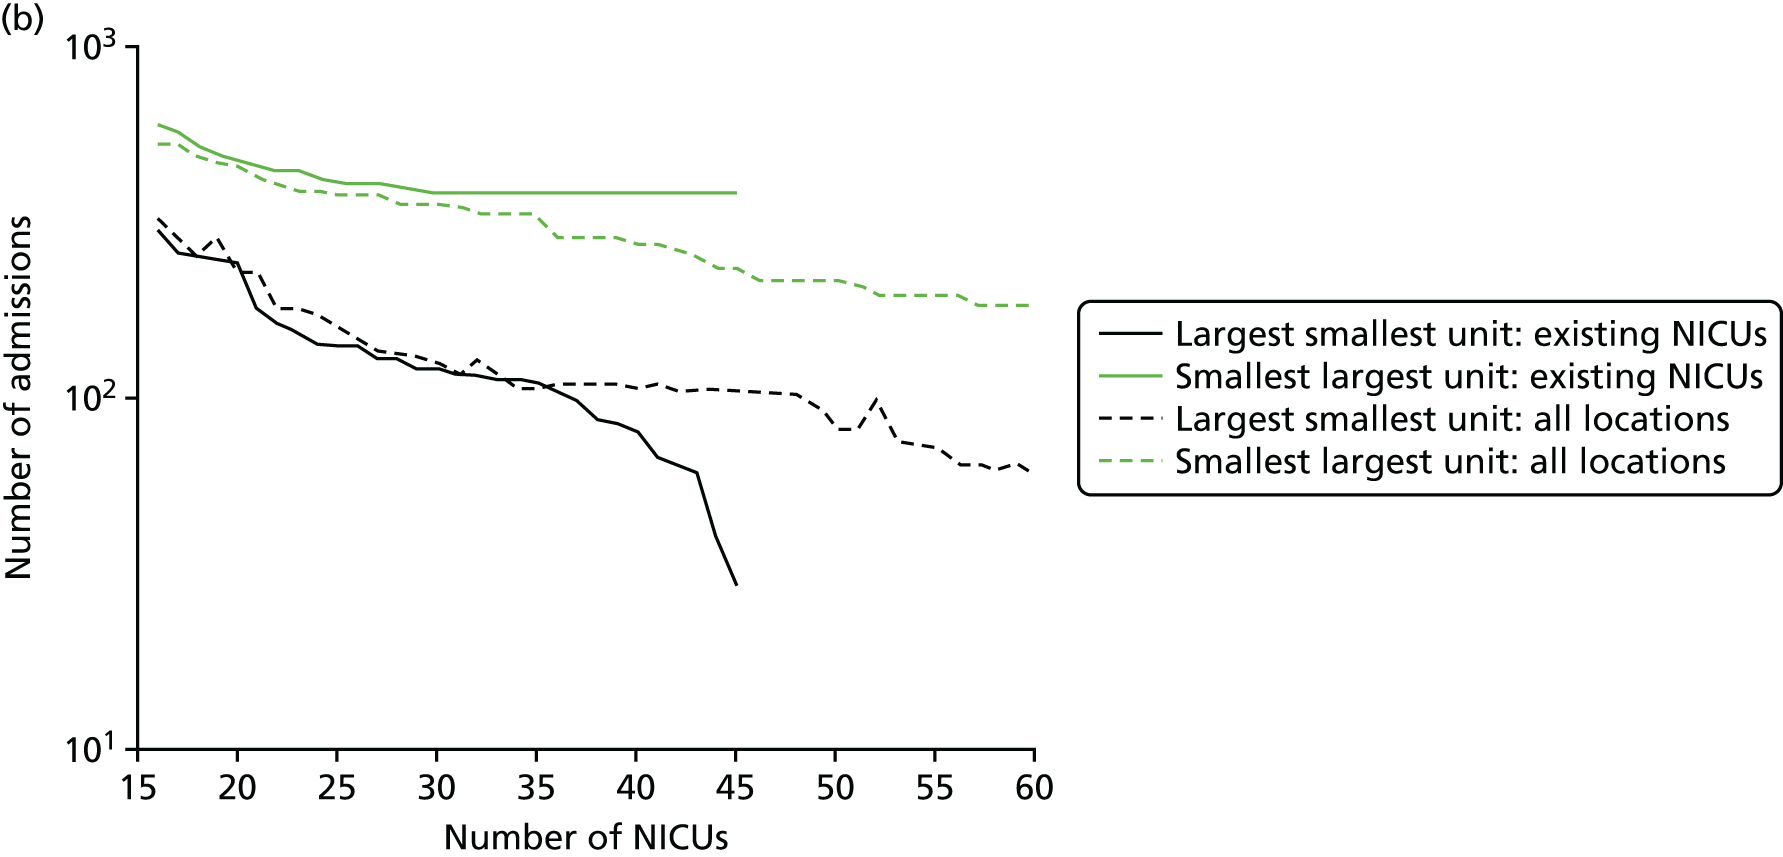
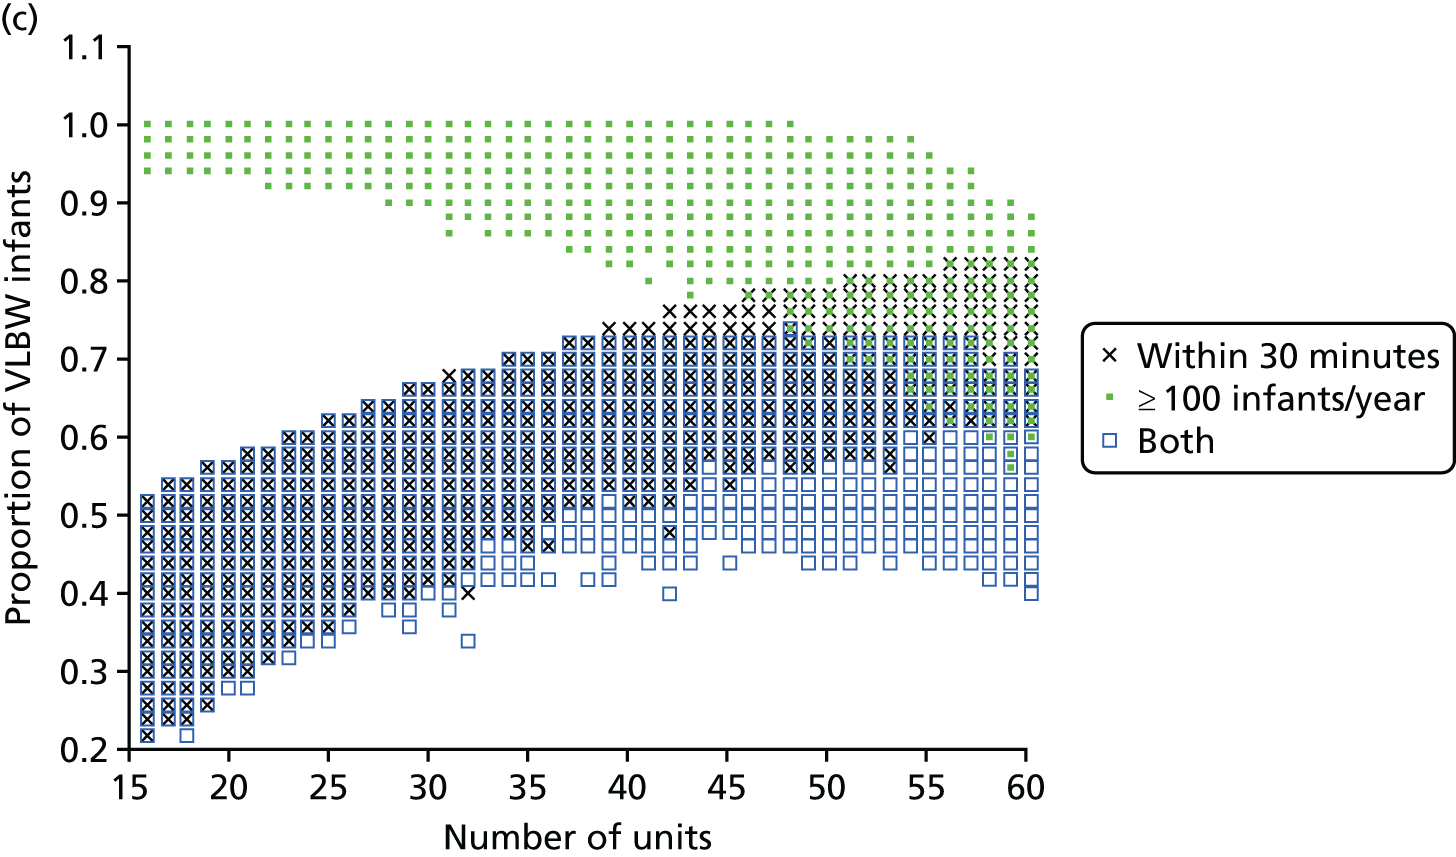
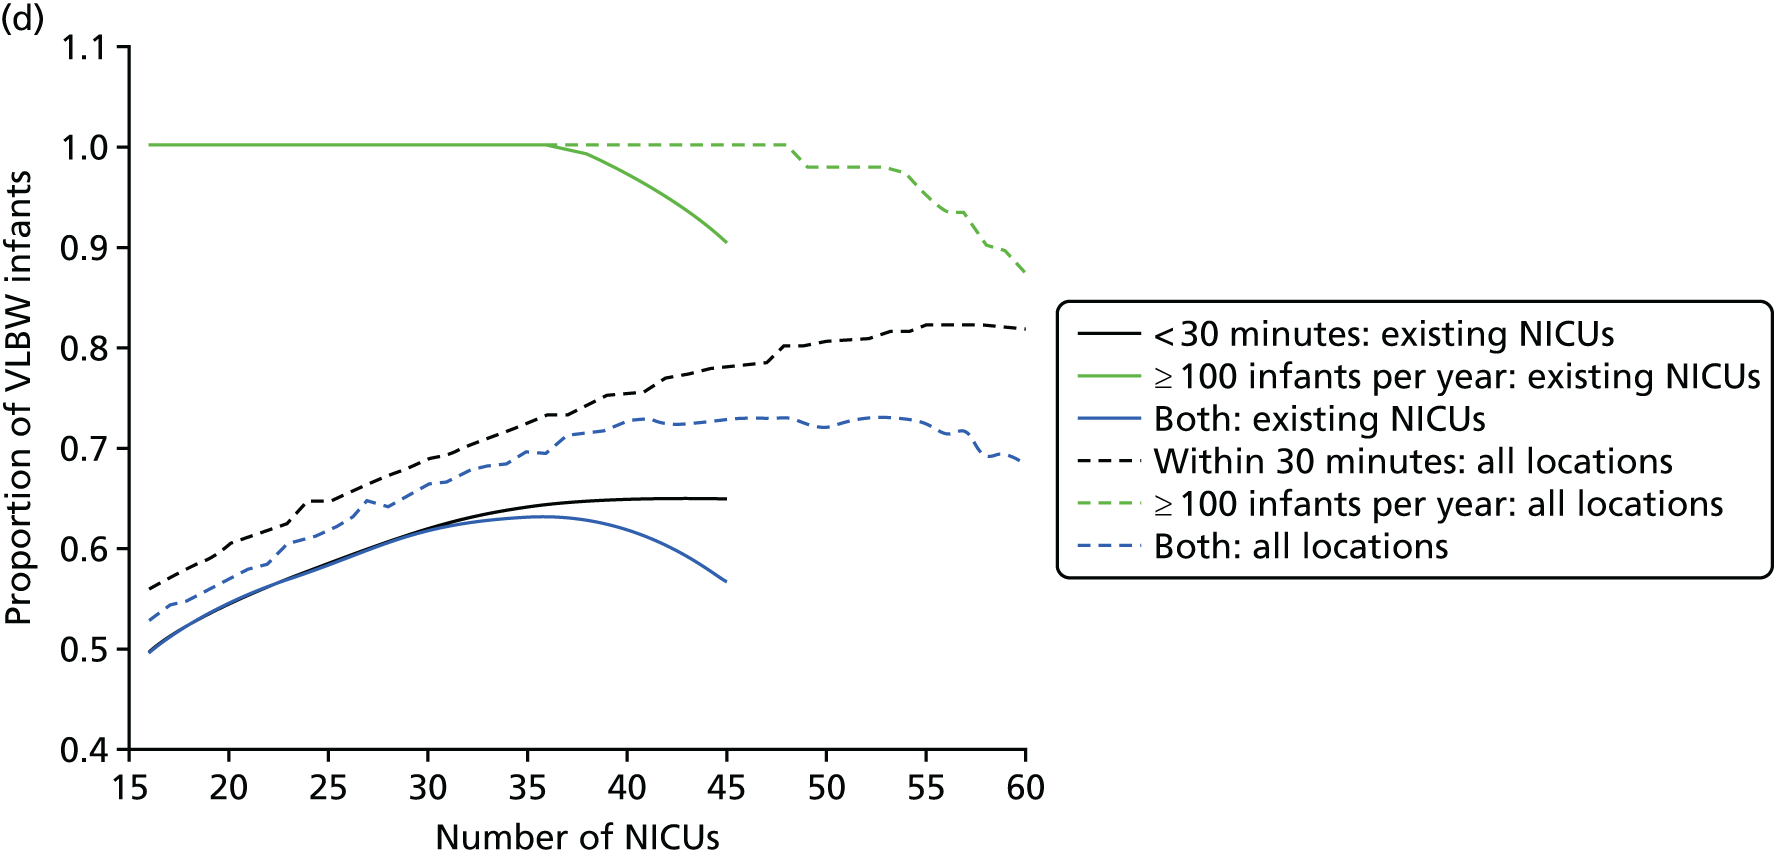
Influence of the number of NICUs on the access to care. (a) Travel time (minutes) (configuration: average and maximum travel times); (b) VLBW admissions (configuration: minimum and maximum number of VLBW admissions per year); (c) proportion of VLBW infants in target (configuration: proportion of admissions within 30 minutes of mother’s home, proportion of VLBW admissions in a unit with ≥ 100 VLBW admissions per year, and proportion of VLBW infants in a unit with ≥ 100 VLBW admissions per year and within 30 minutes of home); and (d) proportion of VLBW infants in target [same configuration as (c) but only showing the best performing configurations]. Quantified by the travel time to units and the proportion of women in target time, on the number of admissions and on the proportion of births occuring in large units. Dotted lines show configurations in which NICUs can be chosen from any neonatal care location; solid lines show configurations in which choice of location is limited to current NICU locations.
Size of units
Figure 7b shows the relationship between the number of NICUs and the number of VLBW infant admissions in Pareto front configurations. As expected, the number of admissions decreases as the number of NICUs increases, with very similar figures for both cases based on existing NICUs or all possible locations between 16 and 36 units. Based on the discovered results, the largest configuration with a minimum number of admissions of ≥ 100 VLBW infants contains 36 NICUs if only selecting existing units, and up to 48 NICUs if using all potential locations. Hence, it is possible to raise the minimum number of admissions from 29 to 100, while keeping the current number of 45 NICUs by changing their location.
Compromise
The impact of the NICU national configuration on the access of care and clinical outcome can be summarised in criteria 3, 4 and 1 (see Decision criteria). Such measures are based on the proportion of mothers living within 30 minutes of the closest NICU, and the proportion of VLBW infants being admitted to NICUs with ≥ 100 VLBW infants per year. Figure 7c shows the criterion values of all Pareto front configurations
Figure 7d compares the benefit of changing the number of NICUs using only existing NICUs or all potential locations.
Based on the estimated results, the maximum number of NICUs needed to have 100% of VLBW infants attending large units is 36 with existing NICUs and 48 with all potential locations. This observation is consistent with the analysis shown in Figure 7b. In particular, the proportion of VLBW infants attending large units can be increased from 90% to 100% while keeping the current number of 45 NICUs by changing their location.
Moreover, the proportion of mothers within 30 minutes of the closest unit can be improved by a minimum of 7% by releasing the set of NICUs from existing locations to all potential locations. In particular, the proportion can be increased from 65% to 78% while keeping the current number of 45 NICUs.
Finally, the proportion of patients meeting both targets (being within 30 minutes of a NICU and for the NICU to admit ≥ 100 VLBW infants per year) can be increased from 56% to 73% while keeping 45 NICUs.
Example of an alternative neonatal intensive care unit configuration
Going beyond the performance metrics, it is interesting to study what the discovered Pareto front configurations mean for the patients locally. To do so, an example of an alternative NICU configuration was selected using the following method:
-
Select the Pareto front configuration in the highest quartile of the proportion of patients both attending units with ≥ 100 VLBW infants per year and living within 30 minutes of the closest unit. This allows the selection of the best-performing configurations.
-
Select the Pareto front configurations with all patients attending units with ≥ 100 VLBW infants per year.
-
Select the Pareto front configurations with the highest number of units.
From the 88,800 discovered configurations, the selection led to two configurations with 48 units, of which the one that was closest to the current configuration was chosen.
In Table 7, the criterion values of this alternative configuration are compared with the model of the current state regarding the care of VLBW infants. The admission numbers are also provided for the infants receiving > 24 hours of intensive care (in an ICU), regardless of their weight.
Overall, the alternative configuration, shown in Figure 8, offers a more homogeneous set of units in terms of admissions. Indeed, although the number of VLBW infant admissions, if VLBW infants attend their closest NICU, varies from 29 to 450 per year in the current model, it varies from 101 to 241 per year in the alternative configuration. The latter has the advantage of increasing the proportion of patients attending units with ≥ 100 VLBW infants per year from 90% to 100% while keeping a similar number of units. Furthermore, the proportion of mothers within 30 minutes of the closest unit is raised from 65% to 73%.
FIGURE 8.
Example of optimal configuration in England with 48 NICUs. (a) Background map © OpenStreetMap contributors;60 the data are available under the Open Database Licence and the cartography is licenced as CC BY-SA (www.openstreetmap.org/copyright); (b) number of admissions per year by unit location; and (c) key performance indicators.
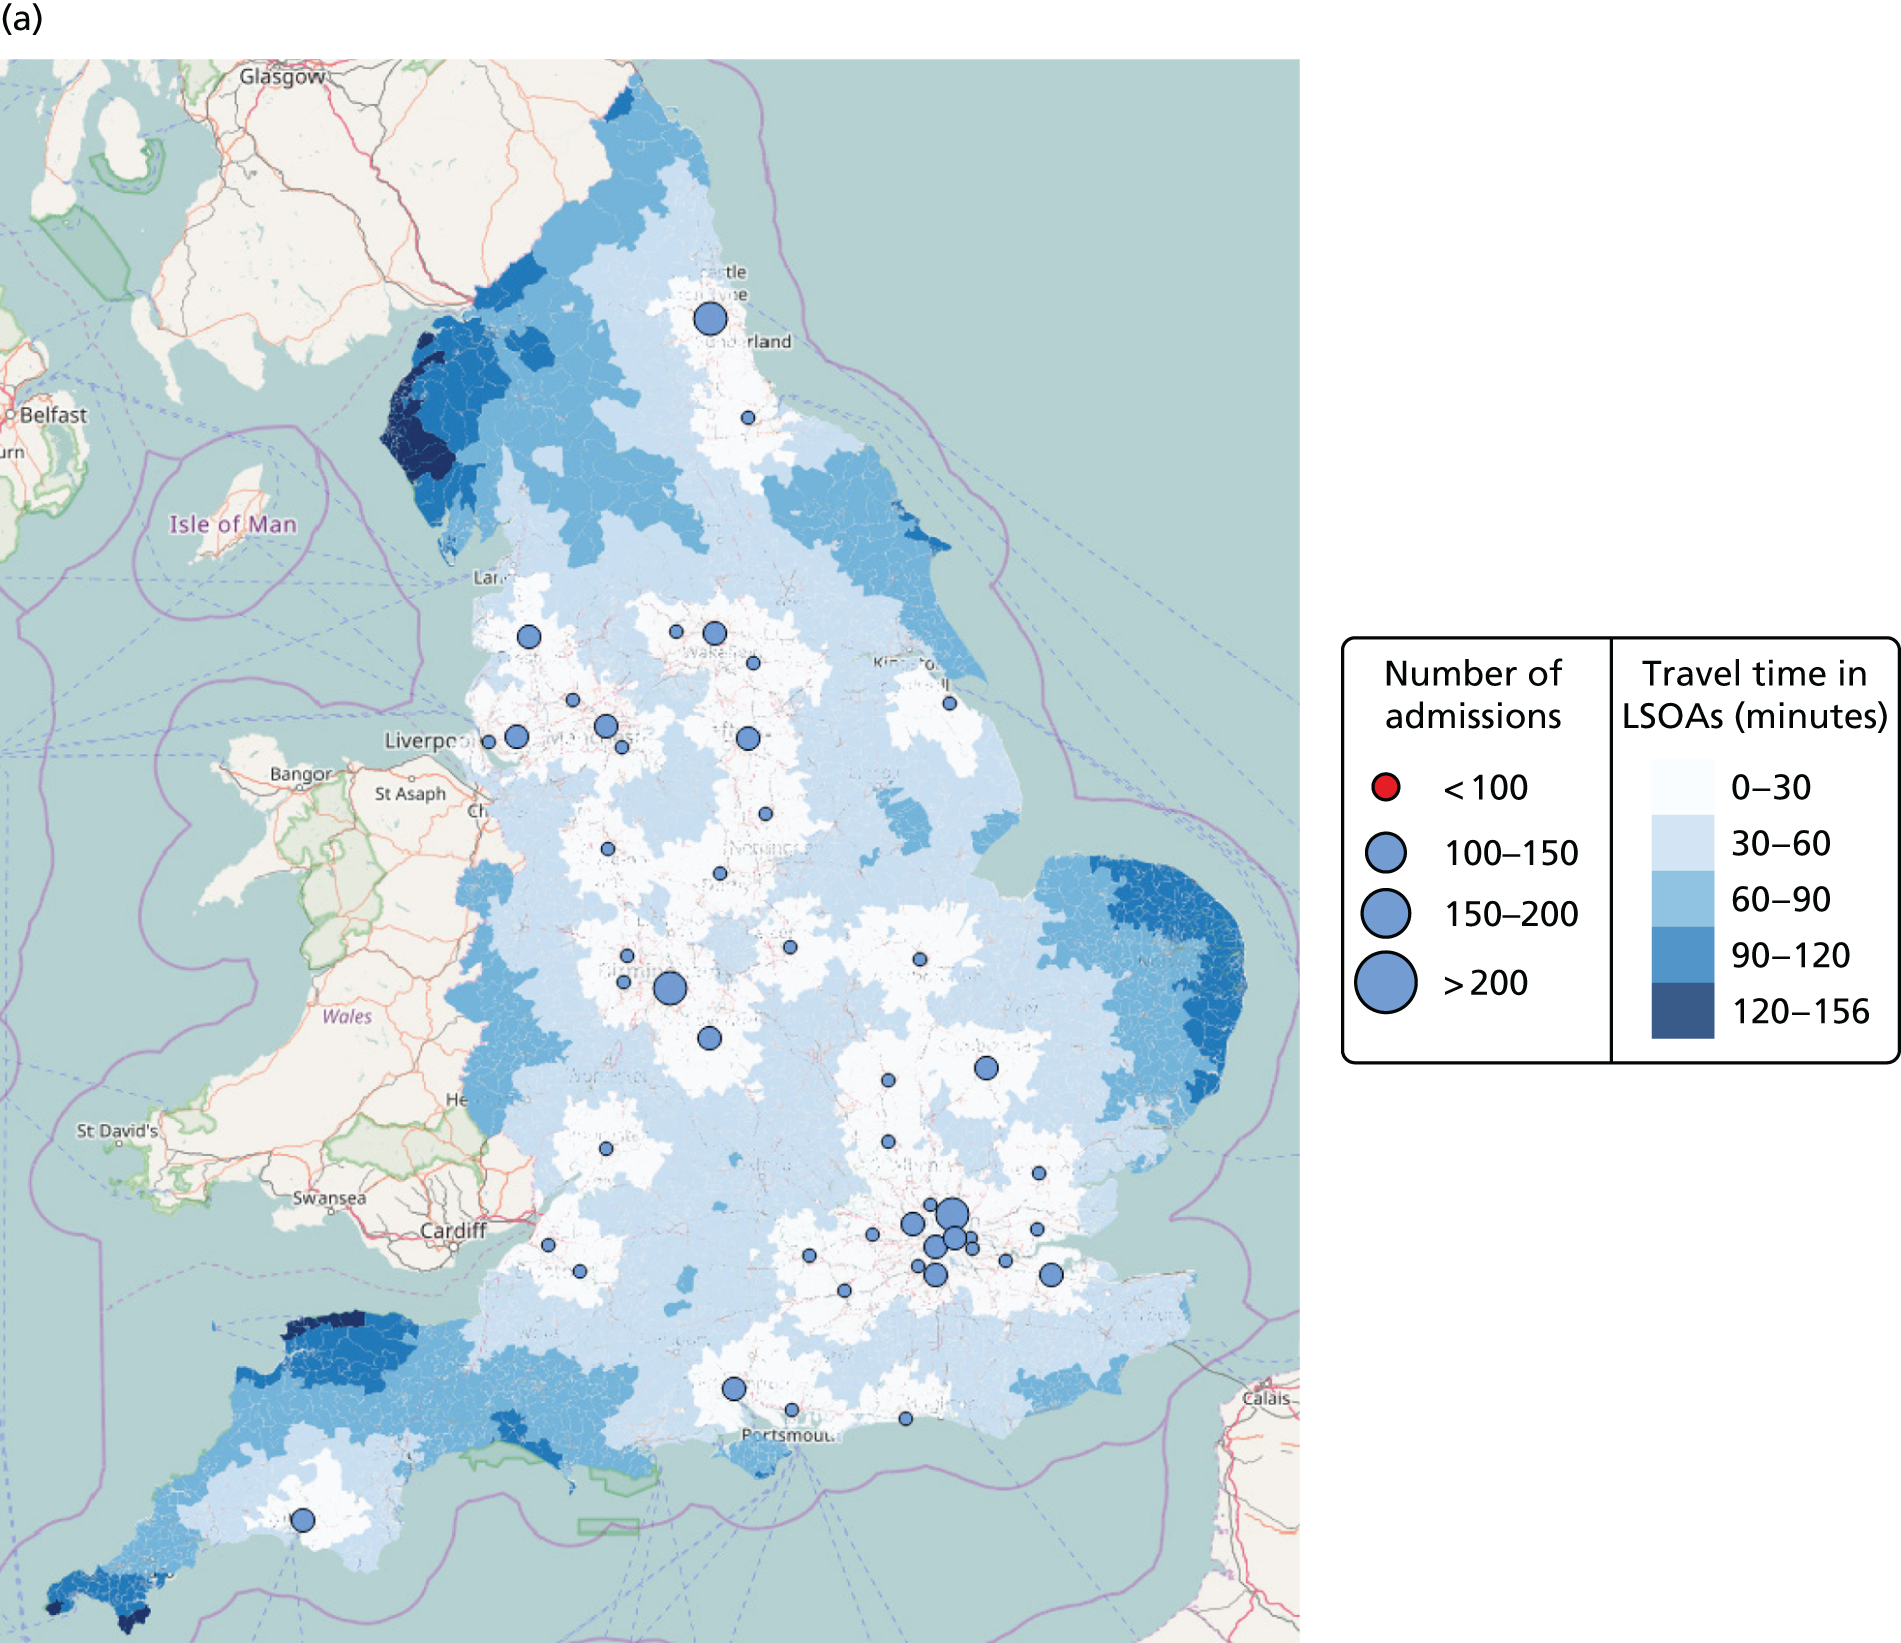
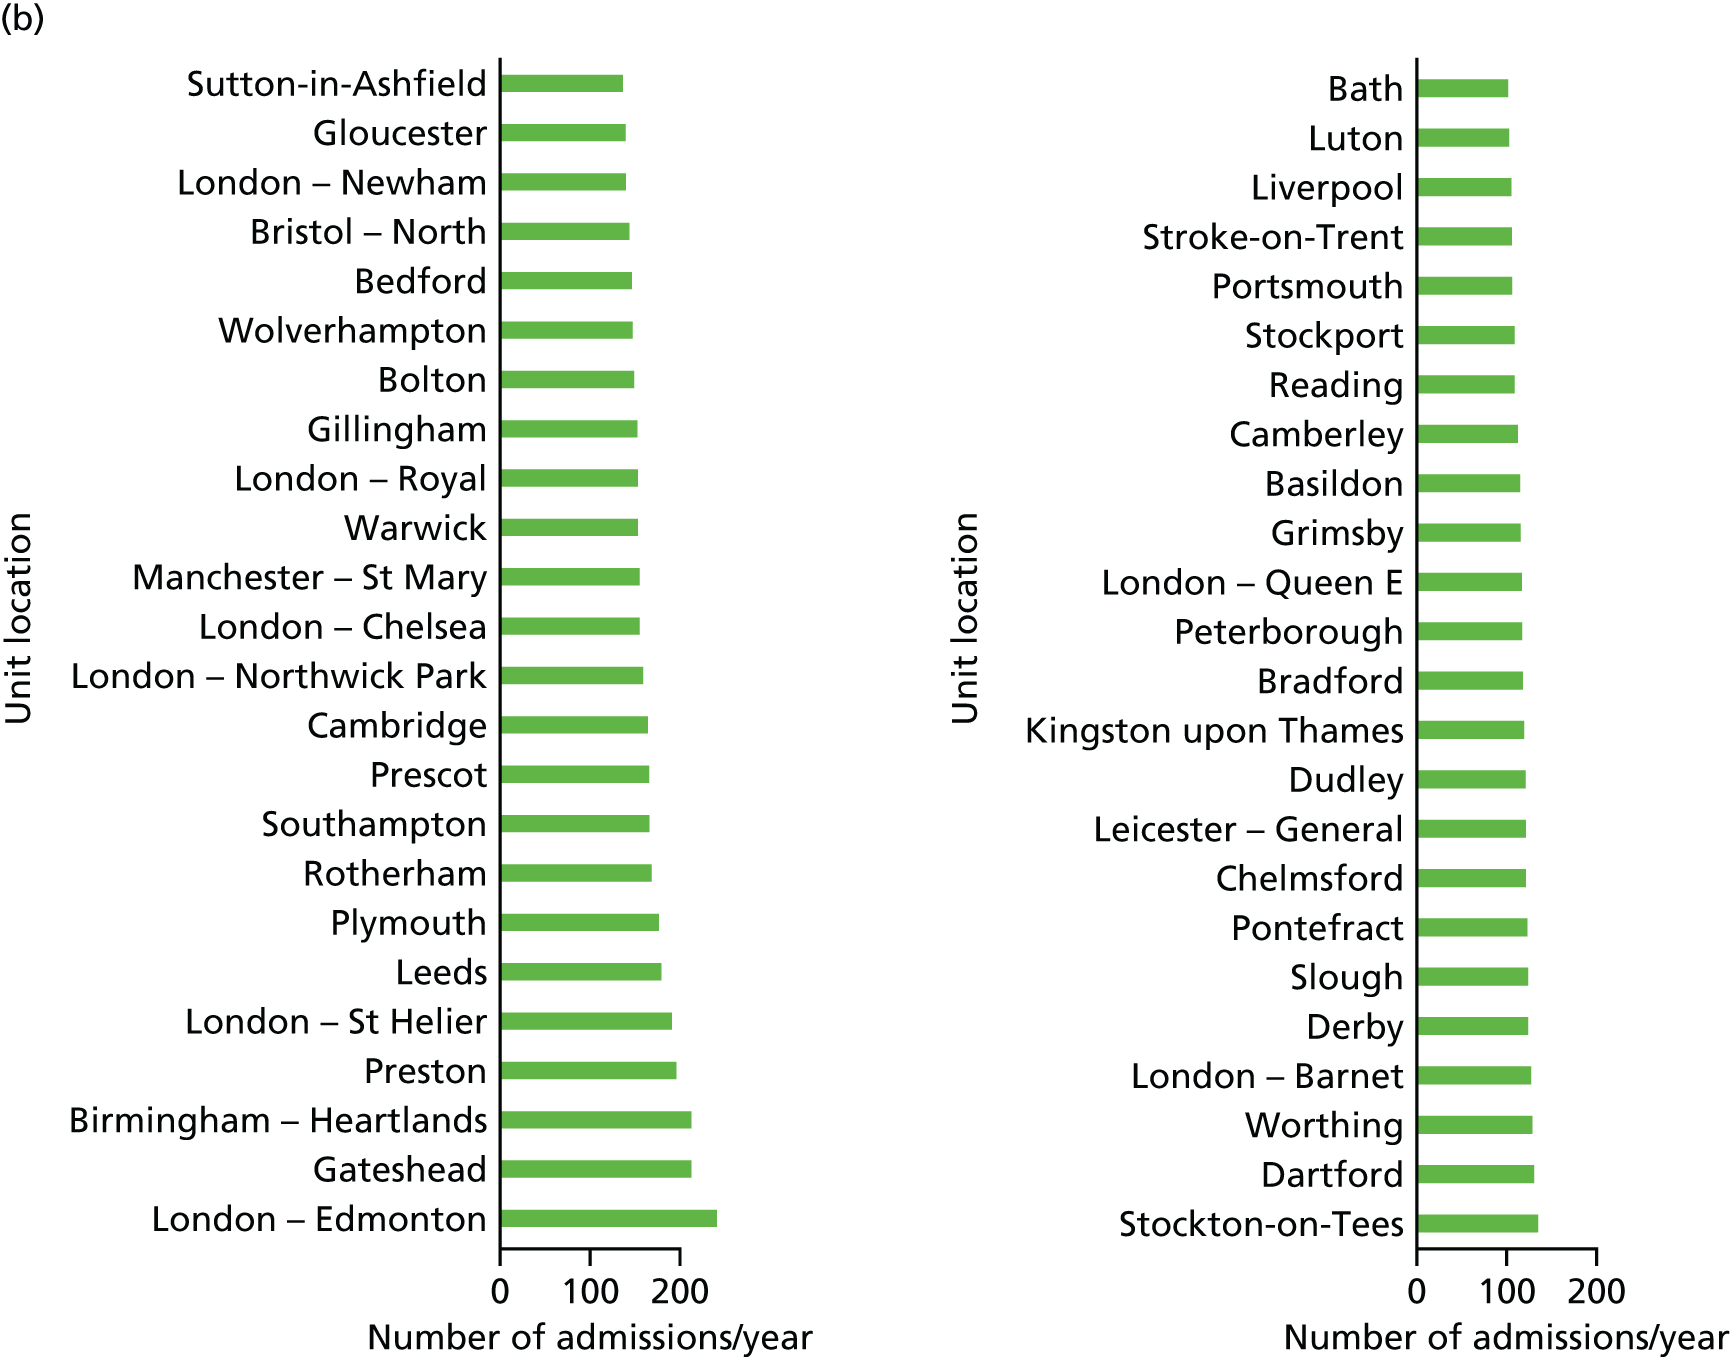
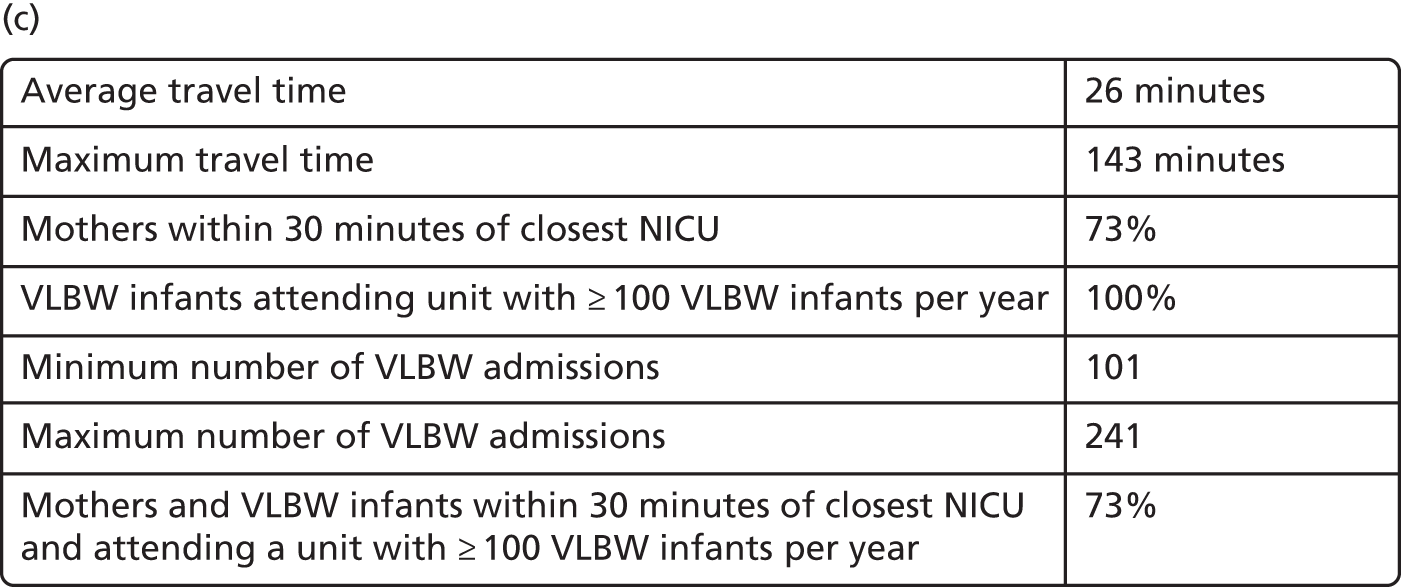
For instance, the area including Somerset, Bristol, Wiltshire and Gloucestershire, in the alternative configuration, is covered by one NICU in Bristol (with 143 VLBW infants), one NICU in Bath (with a predicted admission of 101 VLBW infants per year) and one NICU in Gloucester (with 139 VLBW infants), whereas it is currently covered by two NICUs in Bristol (with a predicted admission of 149 and 178 VLBW infants per year) if VLBW infants attend their closest NICU. This local alternative configuration offers faster access to the population outside Bristol, whereas the impact on the Bristol population is limited.
In the current model (assuming that VLBW infants attend their closest NICU), the Greater London area (as shown in Figure 9) is covered by Chelsea and Westminster Hospital (with a predicted admission of 32 VLBW infants per year), St Thomas’ Hospital (with a predicted admission of 29 VLBW infants per year), Homerton (with a predicted admission of 450 VLBW infants per year), King’s College (with a predicted admission of 136 VLBW infants per year), Queen Charlotte’s (with a predicted admission of 256 VLBW infants per year), Royal London Hospital (with a predicted admission of 210 VLBW infants per year), St George’s (with a predicted admission of 162 VLBW infants per year), St Peter’s (with a predicted admission of 379 VLBW infants per year) and University College London (with a predicted admission of 77 VLBW infants per year). In the alternative configuration, intensive care would be provided by Barnet Hospital (with a predicted admission of 127 VLBW infants per year), Chelsea and Westminster (with a predicted admission of 155 VLBW infants per year), North Middlesex University Hospital in Edmonton (with a predicted admission of 241 VLBW infants per year), Newham General Hospital (with a predicted admission of 140 VLBW infants per year), Northwick Park (with a predicted admission of 159 VLBW infants per year), Queen Elizabeth Hospital in Woolwich (with a predicted admission of 117 VLBW infants per year), Royal London (with a predicted admission of 153 VLBW infants per year), St Helier Hospital (with a predicted admission of 191 VLBW infants per year), Kingston upon Thames (with a predicted admission of 119 VLBW infants per year) as well as Wexham Park Hospital in Slough (with a predicted admission of 124 VLBW infants per year) and Darrent Valley Hospital in Dartford (with a predicted admission of 131 VLBW infants per year) on the periphery of Greater London. The number of VLBW infants per year would vary from 117 to 241 in Greater London as opposed to 29 to 379 with the current mapping and VLBW infants attending their closest NICU. As a result, all patients in Greater London could attend a unit with ≥ 100 VLBW infants per year. Moreover, as can be seen in Figures 9–11 and Table 7, the LSOAs in which mothers can reach a NICU within 30 minutes would be extended from central London to the peripheral areas (see Appendix 1).
FIGURE 9.
Example current configurations for neonatal units with a focus on the Greater London area, with 45 NICUs in England. Admission numbers assume that the closest appropriate unit is used. Chelsea and Westminster (32 VLBW infants), Guy’s and St Thomas’ (29 VLBW infants), Homerton (450 VLBW infants), King’s College (136 VLBW infants), Queen Charlotte’s (256 VLBW infants), Royal London Hospital (210 VLBW infants), St George’s (162 VLBW infants), St Peter’s (379 VLBW infants) and University College London (77 VLBW infants). © OpenStreetMap contributors;60 the data are available under the Open Database Licence and the cartography is licenced as CC BY-SA (www.openstreetmap.org/copyright).
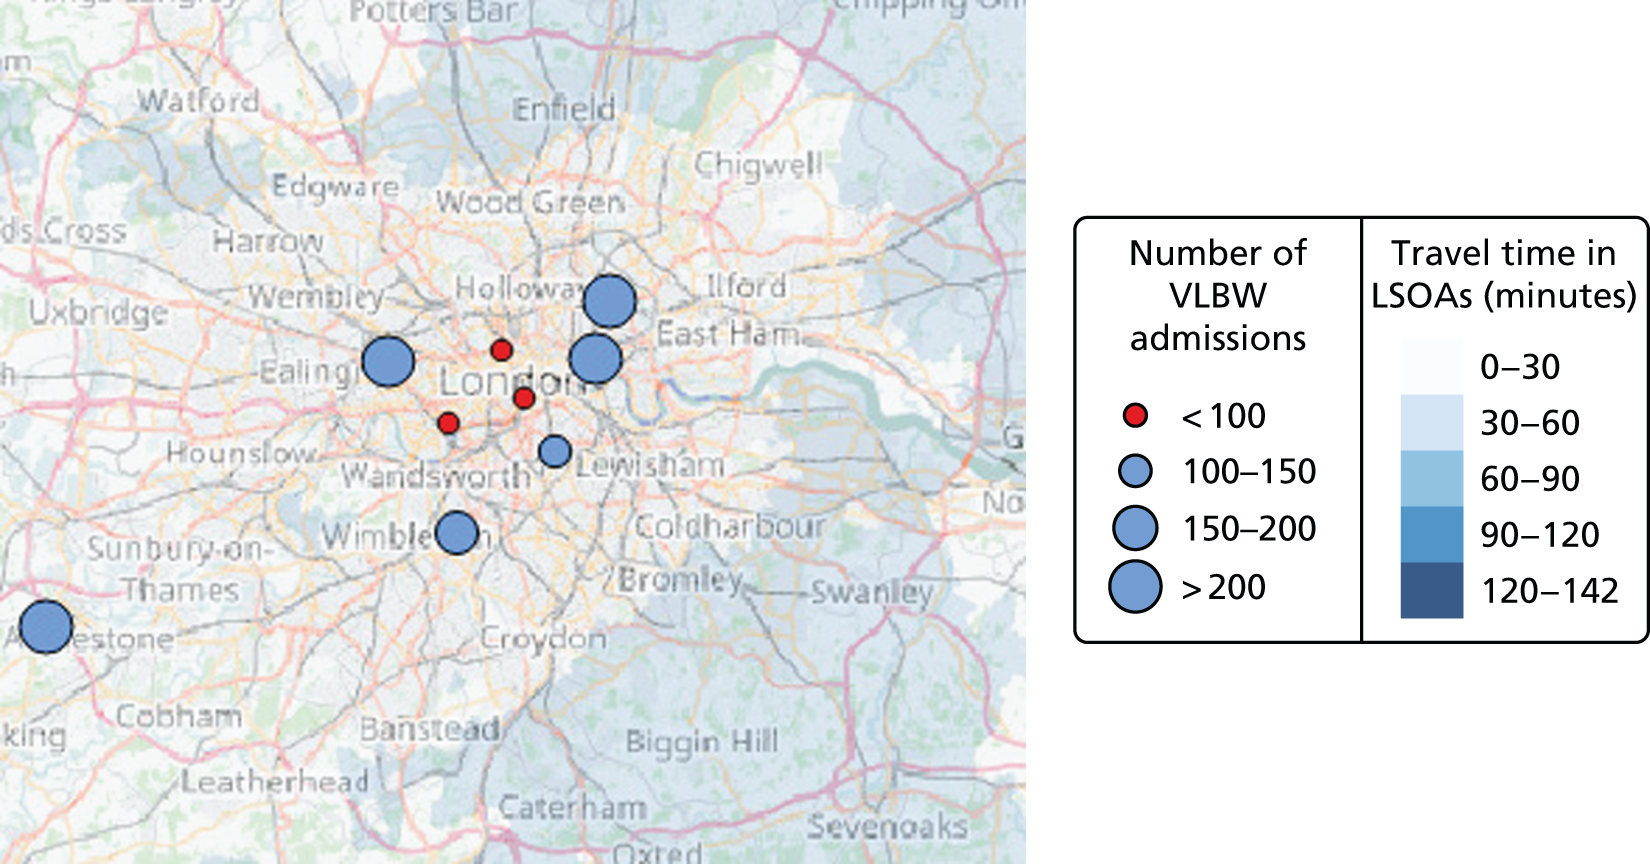
FIGURE 10.
Example alternative configuration for neonatal units in the Greater London area, with 48 NICUs in England. Admission numbers assume that the closest appropriate unit is used. Barnet (127 VLBW infants), Chelsea and Westminster (155 VLBW infants), Edmonton (241 VLBW infants), Newham (140 VLBW infants), Northwick Park (159 VLBW infants), Queen Elizabeth – Woolwich (117 VLBW infants), Royal London (153 VLBW infants), St Helier (191 VLBW infants), Kingston upon Thames (119 VLBW infants), Wexham Park – Slough (124 VLBW infants) and Dartford (131 VLBW infants). © OpenStreetMap contributors;60 the data are available under the Open Database Licence and the cartography is licenced as CC BY-SA (www.openstreetmap.org/copyright).
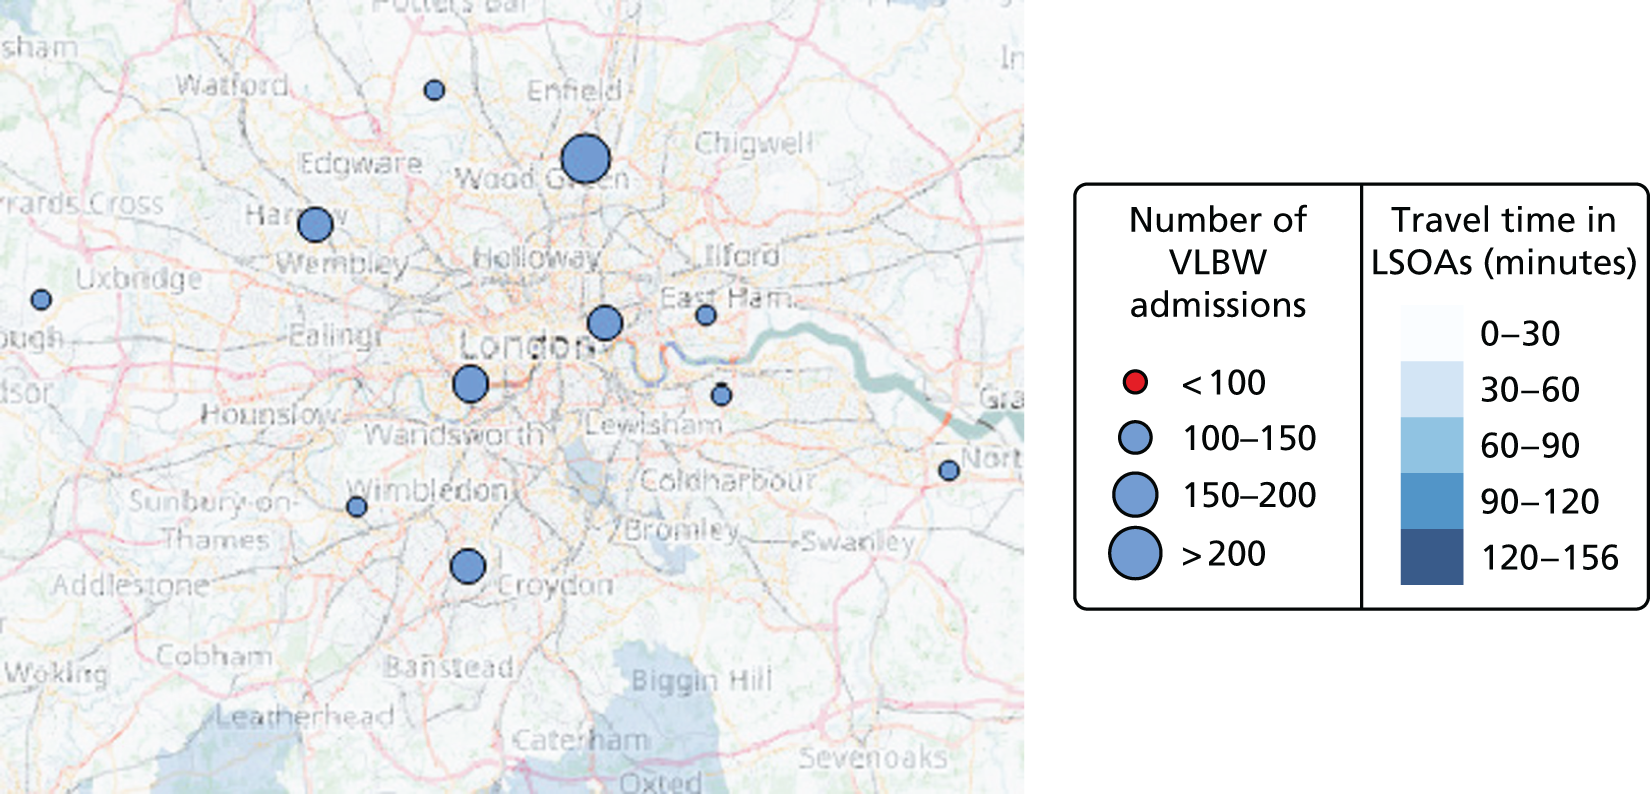
FIGURE 11.
Example centralised configuration for neonatal units in the Greater London area, with 30 NICUs in England. Admission numbers assume that the closest appropriate unit is used. Queen Charlotte’s (231 VLBW infants), Croydon (238 VLBW infants), Dartford (343 VLBW infants), St Peter’s (356 VLBW infants), Edmonton (440 VLBW infants), University College London (176 VLBW infants) and Watford (214 VLBW infants). © OpenStreetMap contributors;60 the data are available under the Open Database Licence and the cartography is licenced as CC BY-SA (www.openstreetmap.org/copyright).
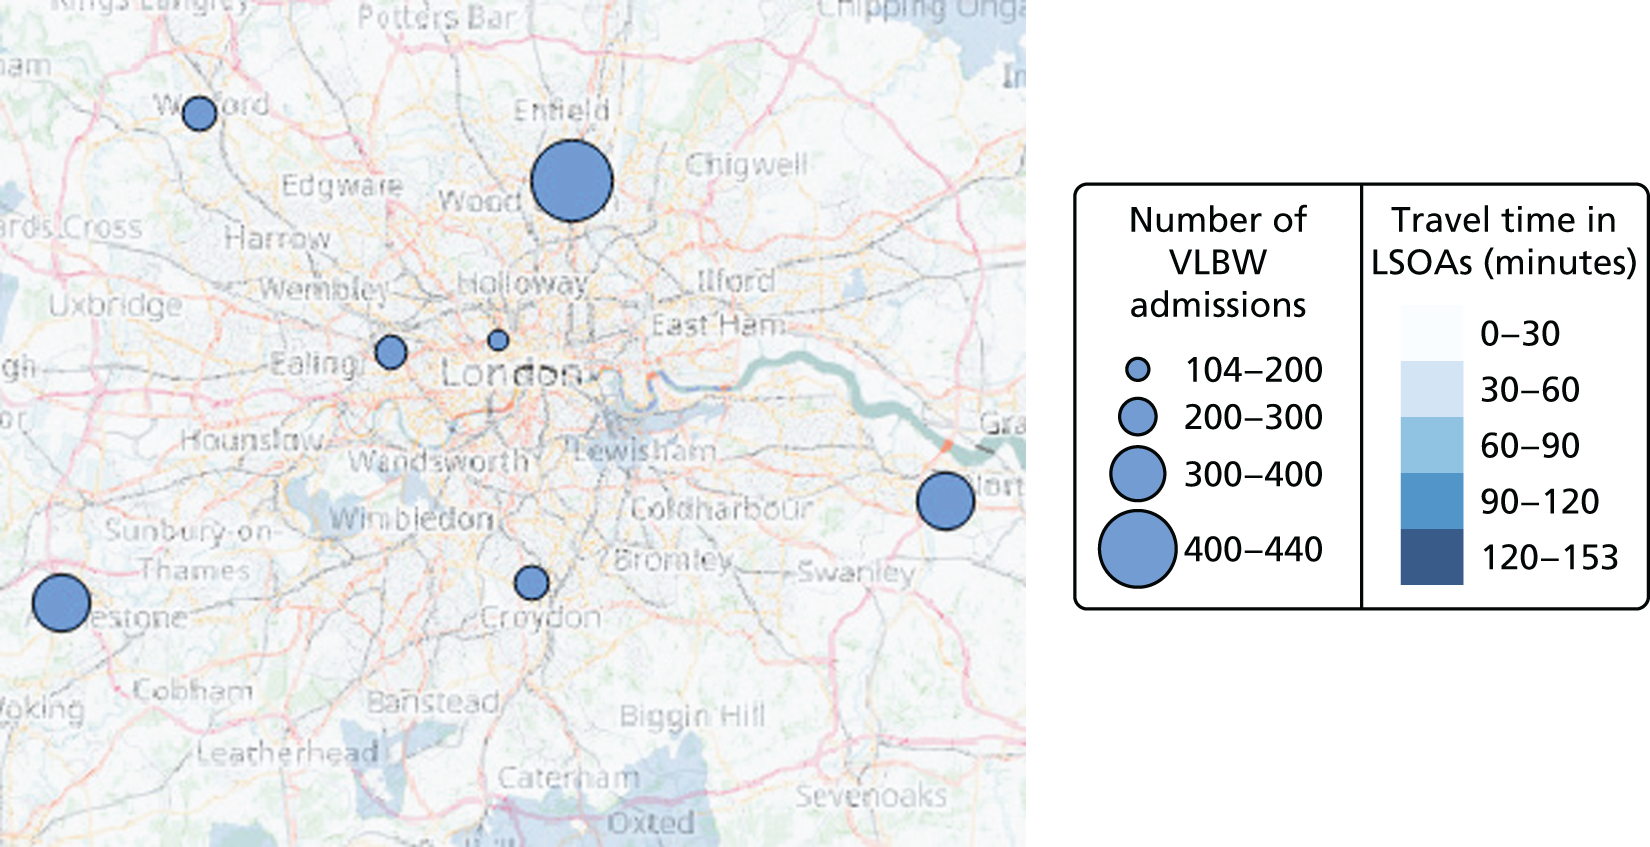
| Patients (by care level) | Average travel time (minutes) | Maximum travel time (minutes) | % (of infants) within 30 minutes | Minimum number of admissions | Maximum number of admissions | % (of infants) in units with ≥ 100 VLBW infants per year |
|---|---|---|---|---|---|---|
| Current configuration: 45 NICUs + 78 LNUs + 38 SCUs (model) | ||||||
| VLBW | 28 | 142 | 65 | 29 | 450 | 90 |
| ICU | 50 | 779 | ||||
| HD | 17 | 131 | 90 | 31 | 322 | N/A |
| SC | 14 | 82 | 95 | 127 | 965 | N/A |
| Example of centralised configuration: 30 NICUs + 30 LNUs + 30 SCUs | ||||||
| VLBW | 29 | 153 | 64 | 104 | 440 | 100 |
| ICU | 108 | 762 | ||||
| HD | 2 | 99 | 82 | 96 | 610 | N/A |
| SC | 17 | 89 | 89 | 137 | 1984 | N/A |
| Example of alternative configuration: 48 NICUs + 78 LNUs + 35 SCUs | ||||||
| VLBW | 26 | 142 | 73 | 101 | 241 | 100 |
| ICU | 175 | 417 | ||||
| HD | 16 | 94 | 92 | 31 | 237 | N/A |
| SC | Identical to current configuration | |||||
A caveat of the observations around London is that we have used estimated road travel times to choose between hospitals. It is possible that the order of choice may be different if public transport is used (as is common in London). However, the observation remains that the hospitals in Greater London are currently concentrated in the centre of London despite many mothers living in the more outlying regions.
Example of a centralised neonatal intensive care unit configuration
An example of a centralised NICU configuration with 30 units was selected using the following method:
-
Select the Pareto front configurations with 30 units.
-
Select the Pareto front configurations in the best half of the proportion of patients both attending units with ≥ 100 VLBW infants per year and living within 30 minutes of the closest unit.
-
Select the Pareto front configurations with all patients attending units with ≥ 100 VLBW infants per year.
-
Select the Pareto front configurations with the highest number of existing NICUs.
If reducing the number of NICUs to 30 optimal locations, the impact on the access of care would be limited as the average travel time would increase to 29 minutes (+1 minute), the maximal travel time would increase to 153 minutes (+11 minutes) and the proportion of mothers within 30 minutes of the closest unit would decrease to 64% (–1%). The main impact would be focused on the minimum number of admissions, which would increase from 29 to 104 VLBW infants per year. Furthermore, changing the location of NICUs by upgrading existing LNUs would equalise the distribution of units in the country, which would then reduce the maximum number of VLBW infant admissions from 450 to 440 per year.
Building a resilient network
Definition of the resilience probability
In order to analyse the possible scenarios, it is interesting to highlight which locations are more likely to appear in the optimal configurations. To do so, we compute the resilience probability of every location in accordance with the following method:
-
Select the Pareto front configurations with 35 to 55 units (current number 45 ± 10). This allows the selection of configurations close to the current state.
-
Select the Pareto front configurations in the highest quartile of the proportion of patients both attending units with ≥ 100 VLBW infants per year and living within 30 minutes of the closest unit. This allows us to select the best-performing configurations.
-
Compute the probability p(ui|h) of each unit ui to appear in the selected ‘h-configurations’ (configurations with h units):
Such probability verifies:
-
Compute the probability p(ui) of each unit ui to appear in the selected configurations:
Such probability verifies:
The locations that appear the most often in the optimal configurations will have a higher resilience probability. Such an indicator is useful in order to select the locations that are the most resilient to network changes.
Resilience charts
Figure 12 shows the resilience or optimality probability of the locations of four Operational Delivery Networks (ODNs), as well as their existing level of care. The equivalent charts for other ODNs are available in Appendix 1. If the resilience probability is high, then the location is likely to contribute to building a NICU network resilient to changes. For instance, the unit in Dartford has a very high resilience probability, which may be attributable to the hospital being easily accessible by road. The unit in Plymouth also has a high resilience probability because there is a high demand in the local area. It is interesting to compare the probability graph with the existing level of care. Some units with a high resilience probability, such as Dartford, Haywards Heath and Gloucester, do not currently provide intensive care. In areas such as the South London Neonatal ODN, the resilience probability is rather low because several units are present in the restricted geographic area. As a consequence, selecting one unit or another would not significantly change the access performances.
FIGURE 12.
Optimality probability and existing level of neonatal care of locations in South East England. Neonatal ODN (first dark green group), South London Neonatal ODN (first medium green group), South West Neonatal ODN (second dark green group) and Southern West Midlands Maternity and Newborn Network (second medium green group). For a full explanation of this chart, see Appendix 1.
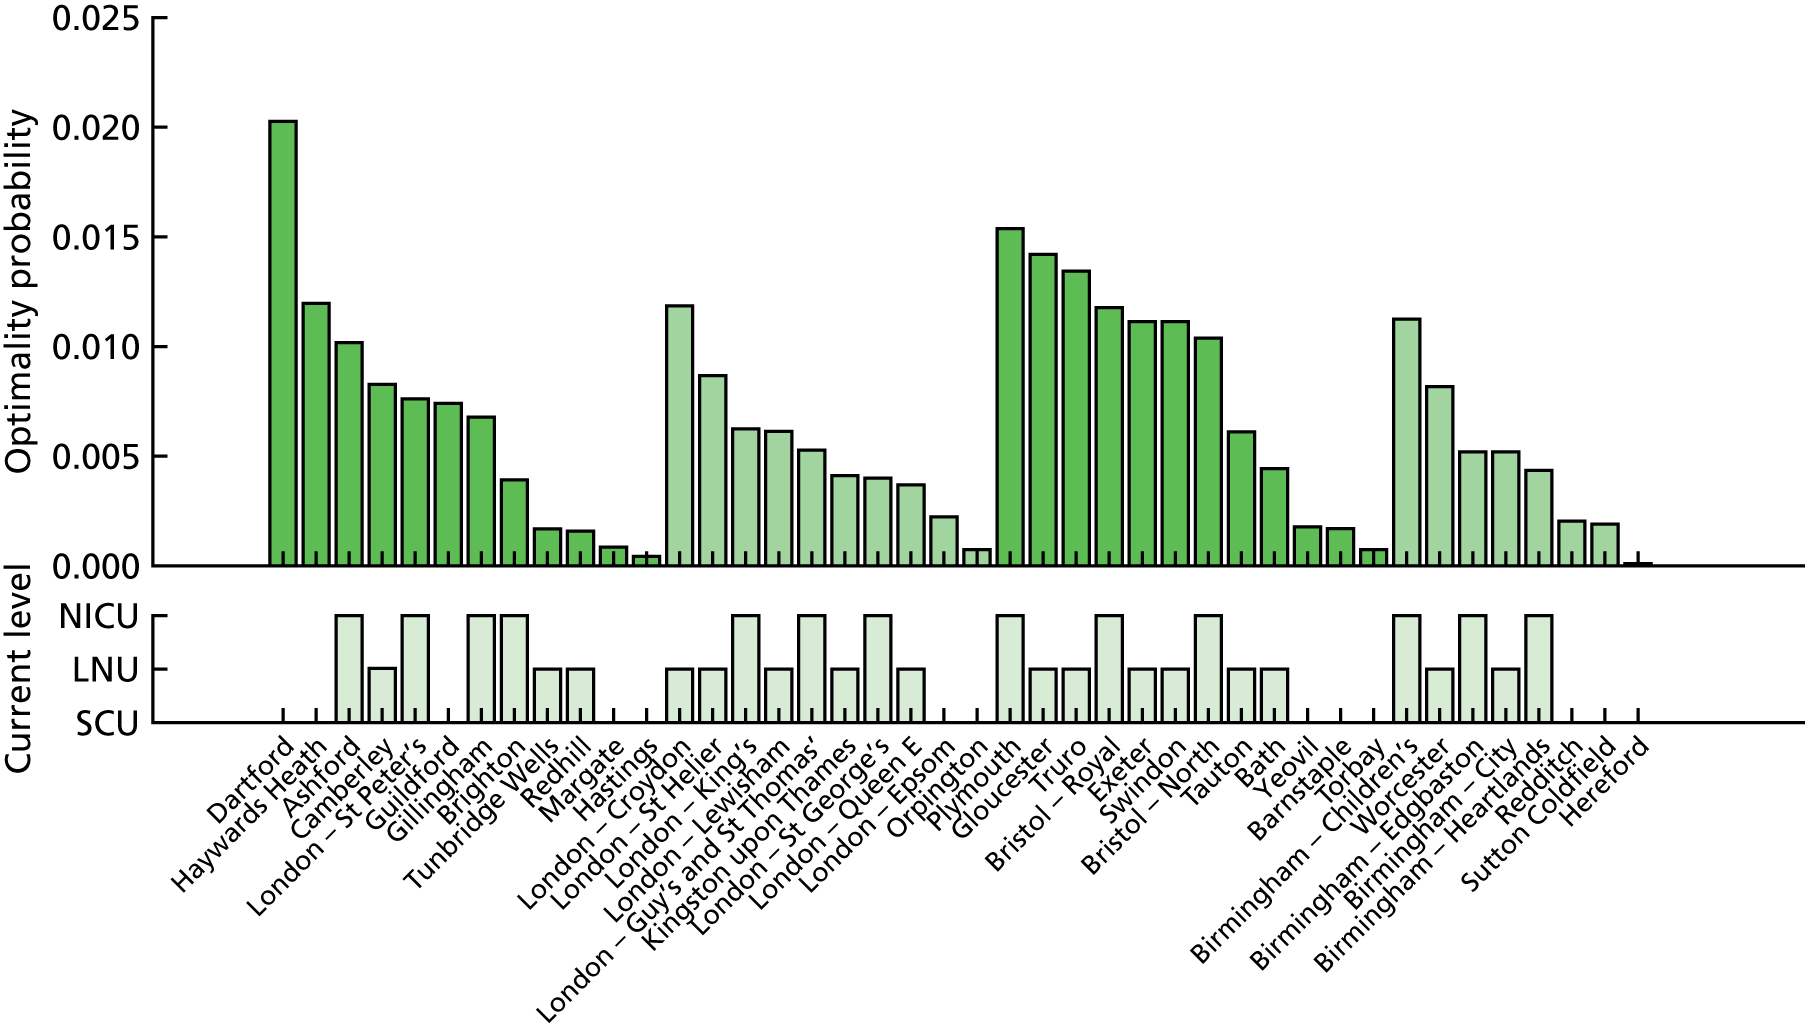
Neonatal high-dependency care location analysis
High-dependency care is provided by both NICUs and LNUs (see Chapter 1, Clinical importance). NICU locations have been previously selected (see Figure 8), and, here, LNUs are added to study the coverage of more units providing high-dependency care.
Data
The demand for high-dependency care was modelled as the number of neonatal admissions needing > 24 hours of high-dependency care. It was estimated in all LSOAs as the number of neonatal admissions predicted by the regression analysis (see Chapter 4, Geographic data coverage and predicting neonatal demand) and multiplied by a factor of 0.185.
The lists of existing neonatal units, geographic data and travel times were the same as those used in the intensive care location analysis (see Neonatal intensive care location analysis).
Example of an alternative local neonatal unit configuration
Following the example of an alternative NICU configuration in Neonatal intensive care location analysis, this section focuses on selecting 78 LNU locations to build an optimal high-dependency network. The number 78 corresponds with the current number of LNUs in England.
Estimation
To study the location of LNUs (providing high-dependency and special care) in England, the model criteria presented in Decision criteria were adapted to become a combination of travel time criteria and high-dependency number criteria, as detailed in Table 6. The 48 NICUs selected in the previous example of centralised NICU configuration (see Neonatal intensive care location analysis, Example of a centralised neonatal intensive care unit configuration) were fixed and the 113 remaining units were considered as potential LNUs.
In order to find 78 optimal LNU sites, the optimisation was applied to the high-dependency demand (see Neonatal high-dependency care location analysis, Data) and the 131 potential locations, using the NSGA-II method56 and the defined criteria, with the same population and generation parameters than for the computation of optimal NICUs locations (see Neonatal high-dependency care location analysis, Data). The MOO process was run independently 10 times with different first generations, leading to 1000 Pareto front configurations of 78 locations.
Selection
An example of a centralised LNU configuration with 78 units was selected using the following method:
-
Select the best half of the Pareto front configurations in accordance with the proportion of patients living within 30 minutes of the closest unit.
-
Select the best half of the Pareto front configurations in accordance with maximum travel time.
-
Select the best half of the Pareto front configurations in accordance with the maximum number of admissions.
-
Select the best half of the Pareto front configurations in accordance with the minimum number of admissions.
-
Select the Pareto front configurations with the highest number of existing LNUs or NICUs.
Discussion
The map and list of units of the selected configuration are available in Appendix 1. The performances can be compared with the current state model in Figure 9. As the total number of units providing high-dependency care remains similar (126 instead of 123), the average travel time, the proportion of mothers within 30 minutes of the nearest unit and the minimum number of high-dependency admissions remains almost unchanged in comparison with the current state model. However, the maximum travel time could be reduced to 94 minutes (–37 minutes) by changing the location of units; this is made possible by selecting NICUs and LNUs from all existing care locations. Moreover, the units would be more homogeneous as the maximum number of high-dependency admissions would be reduced to 241 (–85).
Example of a centralised local neonatal unit configuration
Following the example of a centralised NICU configuration (see Neonatal intensive care location analysis, Example of a centralised neonatal intensive care unit configuration), this section focuses on selecting 30 LNU locations to build an optimal centralised LNU network.
Estimation
The 30 NICUs selected in the previous example of centralised NICU configuration (see Neonatal intensive care location analysis, Example of a centralised neonatal intensive care unit configuration) were fixed and the 131 remaining units were considered as potential LNUs. The MOO process was run independently 10 times with different first generations, leading to 1000 Pareto front configurations of 30 locations. An example centralised LNU configuration with 30 units was selected using the same method as described in Neonatal high-dependency care location analysis, Selection.
Discussion
The map and list of units of the selected centralised LNU configuration are available in Appendix 1. The performances can be compared with the current state model in Figure 9. By reducing the number of high-dependency care units from 123 (45 NICUs and 48 LNUs) to 60 (30 NICUs and 30 LNUs), the quality of access would deteriorate slightly as the average travel time would increase to 22 minutes (+5 minutes) and the proportion of mothers within 30 minutes of the nearest unit would decrease to 82% (–8%). However, such changes would be minimal considering that the number of units providing high-dependency care would be cut in half. It is interesting to notice that the maximum travel time could be reduced to 99 minutes (–34 minutes) by changing the location of units.
Neonatal special care location analysis
The special care is provided by all neonatal care units (see Chapter 1, Clinical importance). NICU and LNU locations have previously been selected, and here SCUs are added to study the coverage of providing special care.
Data
The demand for special care was modelled as the number of neonatal admissions requiring > 24 hours of special care. It was estimated in all LSOAs as the number of neonatal admissions predicted by the regression analysis (see Chapter 4, Geographic data coverage and predicting neonatal demand) and multiplied by a factor of 0.825.
The lists of existing neonatal units, geographic data and travel times were the same as those used in the intensive care location analysis (see Neonatal intensive care location analysis, Data).
Example of a centralised special care unit configuration
Estimation
To study the location of SCUs in England, the model criteria presented in Decision criteria were adapted to become a combination of travel time criteria and high-dependency number criteria, as detailed in Table 6.
The 30 NICUs and 30 LNUs selected in the previous examples (see Neonatal intensive care location analysis, Example of a centralised neonatal intensive care unit configuration, and Neonatal high-dependency care location analysis, Example of a centralised neonatal intensive care unit configuration) were fixed and the 101 remaining units were considered as potential SCUs.
In order to find 30 optimal SCU sites, the optimisation was applied to the special care demand (see Neonatal high-dependency care location analysis, Data) and the 101 potential locations, using the NSGA-II method56 and the defined criteria, with the same population and generation parameters as for the computation of optimal NICU locations (see Neonatal intensive care location analysis, Estimation).
The MOO process was run independently 10 times with different first generations, leading to 1000 Pareto front configurations of 30 locations. An example of a centralised configuration with 30 SCUs was selected using the same method (see Neonatal high-dependency care location analysis, Selection).
Discussion
With 90 optimal units providing special care, instead of 161, the quality of access to care would be only slightly deteriorated, with an average travel time of 17 minutes (+3 minutes), a maximum travel time of 89 minutes (+7 minutes) and 89% (–6%) of mothers within 30 minutes of the closest hospital. The main impact would be on the increased number of special care admissions, ranging from 137 (+10) to 1984 (+1019).
Location analysis discussion
Maternity units
For both maternity care and neonatal care, choosing an optimal configuration of units is a compromise between fair access to local care for every patient and access to experienced medical staff in units with a threshold number of patients.
The Royal College of Obstetricians and Gynaecologists recommends that all maternity units should ideally receive ≥ 6000 babies per year in order to guarantee the 24/7 (24 hours a day, 7 days a week) presence of a consultant on site. 61 The maternity location analysis (see Maternity unit location analysis) has shown that in order to achieve 100% of births occurring in such units, the number of birth centres would need to be reduced from 161 to approximately 72. Although such change is unrealistic, reducing the number of birth centres from 161 to 140 optimal locations could increase the proportion of births in 24/7 units from 30% to 50%.
Reducing the size of the network by a small number of units does not significantly change the average travel time if the new national configuration is optimally chosen, but it increases the maximal travel time. Average travel times have the potential to hide large effects that only affect a few people in more remote areas.
Access to local care is indicated by the proportion of patients within 30 minutes of the closest unit. Achieving this criterion conflicts with achieving all births in 24/7 consultant-led units. By reducing the number of birth centres from 161 to approximately 65, the proportion of patients meeting both the travel time target and the unit size target would be increased from 24% to 82%: the maximum achievable based on our results. Such a low number of birth centres is not necessarily ideal, but it must be expected that, as the number either increases or reduces, the proportion of patients meeting both targets will reduce either because distances become too large or because units become too few.
Neonatal units
An alternative neonatal configuration was analysed in Neonatal intensive care location analysis, Example of a centralised neonatal intensive care unit configuration. By changing the level of care provided by some units, but not the total number of units, it should be possible to admit all VLBW infants to units with ≥ 100 VLBW infants per year. This configuration would guarantee access to experienced staff to all patients. The neonatal units would also be more homogeneous in size, with fewer units receiving a very low or a very high number of VLBW infants (or other infants requiring intensive or high-dependency care). Note that the nurse capacity needed at the national scale for this configuration would remain similar to the current capacity, as the number of units for each level of care would remain almost identical; reconfiguration of this type would therefore be about improving care and access for patients rather than reducing costs to service providers. These results show that the current location of NICUs is not optimal for either access (closeness) or optimising the use of large NICUs admitting ≥ 100 VLBW infants per year; it is theoretically possible to improve both access to and coverage of large NICUs simultaneously if there was the opportunity to upgrade some units and downgrade others.
The analysis of the Greater London area has shown that current NICUs are concentrated in the city centre, probably for historical reasons. With the alternative configuration, the optimal locations for NICUs would be more evenly spread in neonatal units in the conurbation, closer to residential areas and main road axes. The analysis is similar in the Bristol area, where the local population would benefit from NICUs in Bath (rather than two NICUs in Bristol, the current configuration). It is likely that this observation is transferable to other conurbations, such as Birmingham and Manchester.
London is likely to be somewhat of a special case because of the greater provision and use of public transport than in other regions. We have estimated travel times based on typical road travel times. A more focused study of London is likely to benefit from use of public transport times in addition to road distances. Nevertheless, the finding that hospitals in London are not focused on the location where parents live is likely to still be significant; access to care is likely to improve by some movement of locations of care away from central London towards the population centres further away from the city centre.
The interface between obstetric and neonatal care
In our work, we have modelled maternity and neonatal care as two separate problem spaces. For the large majority of births and infants, there is no need for rapid access to specialist neonatal care; however, for a proportion of infants, rapid access to specialist neonatal care may prevent loss of life or avoid/reduce disability. Outcomes for extremely premature infants are improved for those infants born in hospitals with high-volume specialist neonatal care units. 19 Blondel et al. 62 reported that in 2003, across a range of European regions, 2–28% of birth units were associated with a ‘large neonatal unit’ (≥ 50 admissions per year for infants with a gestational age of < 32 weeks). Between 8% and 61% of all births were in hospitals with large neonatal units, but 37–76% of births of infants with a gestational age of < 32 weeks were achieved in such units (20–54% of births of infants with a gestational age of < 32 weeks were achieved in such units without requiring in utero transfer).
There are three general models for trying to achieve births of preterm infants in units with large neonatal units (and these models may be mixed): (1) consolidation of births into higher-volume units that may sustain a large neonatal unit, (2) identifying mothers at a high risk of preterm delivery and booking those mothers to deliver in high-volume neonatal units and (3) in utero transfer during labour. Blondel et al. 62 noted that different European regions were achieving reasonable rates of birth of premature infants in units with large neonatal units by using different organisational models; however, there was still a significant proportion of births (24–63%) of premature infants not occurring in units with large neonatal units.
Increased consolidation of childbirth could increase the proportion of preterm births in units with large neonatal units (especially if the large neonatal units were optimally located to be better matched to demand). But, as Blondel et al. 62 noted, organisation of services around these high-risk births may not be acceptable to the larger population of low-risk mothers whose infants will not require any specialist obstetric neonatal care, and for whom birth is not a medical procedure.
Even given the complexities of balancing the wishes of low-risk mothers and the needs of high-risk mothers, co-ordinated planning of birth and neonatal care could potentially improve services for all. In this study, we have not explicitly linked birth and neonatal care models, but we believe that this would be valuable future work.
General comments
Resilience of solutions
Given the high number of possible configurations, it is impossible to compute exactly the best performances and it is time-consuming to compare lots of scenarios. In the cases of the centralised and the alternative scenarios, a selection method has been proposed to extract a few options from thousands of possibilities, using the performance criteria. It is also possible to choose the potential scenarios that are the closest to the current state (in order to find more pragmatic solutions that require fewer changes to the existing configuration).
Analysing scenarios with up to 161 locations is a complex task. To do so, the resilience probability defined in Building a resilient network measures the optimality of locations for a given set of optimisation criteria. As the national neonatal care network is constantly changing, the resilience probability is an interesting way to study which locations are likely to build an optimal network, adaptable to the demand in the long term. The charts presented (see Resilience charts and Appendix 1) show a picture of the resilience at the national level in order to build a NICU network. The locations with the highest resilience probability should be considered in priority in the case of a network restructuring as these locations are generally less sensitive to changes elsewhere in the network. Such methodology is easily transferable to the other levels of care, and more widely to any geographic analysis.
Networks
The neonatal units are organised by ODNs. The model presented in Neonatal intensive care location analysis, Model, does not constrain the optimisation of units in the ODN framework, for instance with a minimum number of units per network. However, as the optimisation aligns the units with the population, the selected locations are distributed in most networks. The main advantage of this maternity and neonatal location analysis is to consider the delivery network at the national scale rather than at the usual local scale. This is not to say that networks should be avoided, but that networks should be led by, and not lead, choice of locations if reconfiguration is to be designed around patient-centred objectives. Networks are further discussed in the following sections regarding the investigation of their effect in the simulation model.
Limitations of the analysis work
With 161 potential locations to provide neonatal care, there are 1.82 × 1047 possible configurations for maternity and neonatal units. In the case of NICUs, 88,800 Pareto front configurations were discovered after 200 generations of the genetic algorithm, which means that up to 17,760,000 configurations have been analysed. Considering the size of the decision space, it is impossible to be sure that the discovered Pareto front is the best achievable. However, the individual optimisations realised for each number h ∈〚1; H〛 of units, iterated 10 times with different starting points, lead to consistent results. The smoothness of the graphs in Figures 2 and 3 allows us to claim that the optimisation processes have reached convergence and, as a result, some local optima.
In this work, we have assumed that care would normally take place in the closest appropriate unit. Where units are close together or where people are on the boundary between two units (and so travel times are not much different between them), this may not always be the case.
Chapter 7 Simulation modelling
Model description
The model assumes a standard direction of flow of infants, from higher levels of care through to lower levels of care, and then exit (Figure 13). The infant may enter at any point and may not use all levels of care between the entry point and the exit point. The model assumes that an infant is born in the unit closest to the mother’s home location, but is then transferred immediately to the required level of care if the hospital of birth does not provide the necessary level of care.
FIGURE 13.
Schematic flow of infants through the model. HD, high dependency; IC, intensive care; SC, special care. Any one or more levels may be bypassed: an infant could, theoretically, exit intensive care and directly enter transitional care.
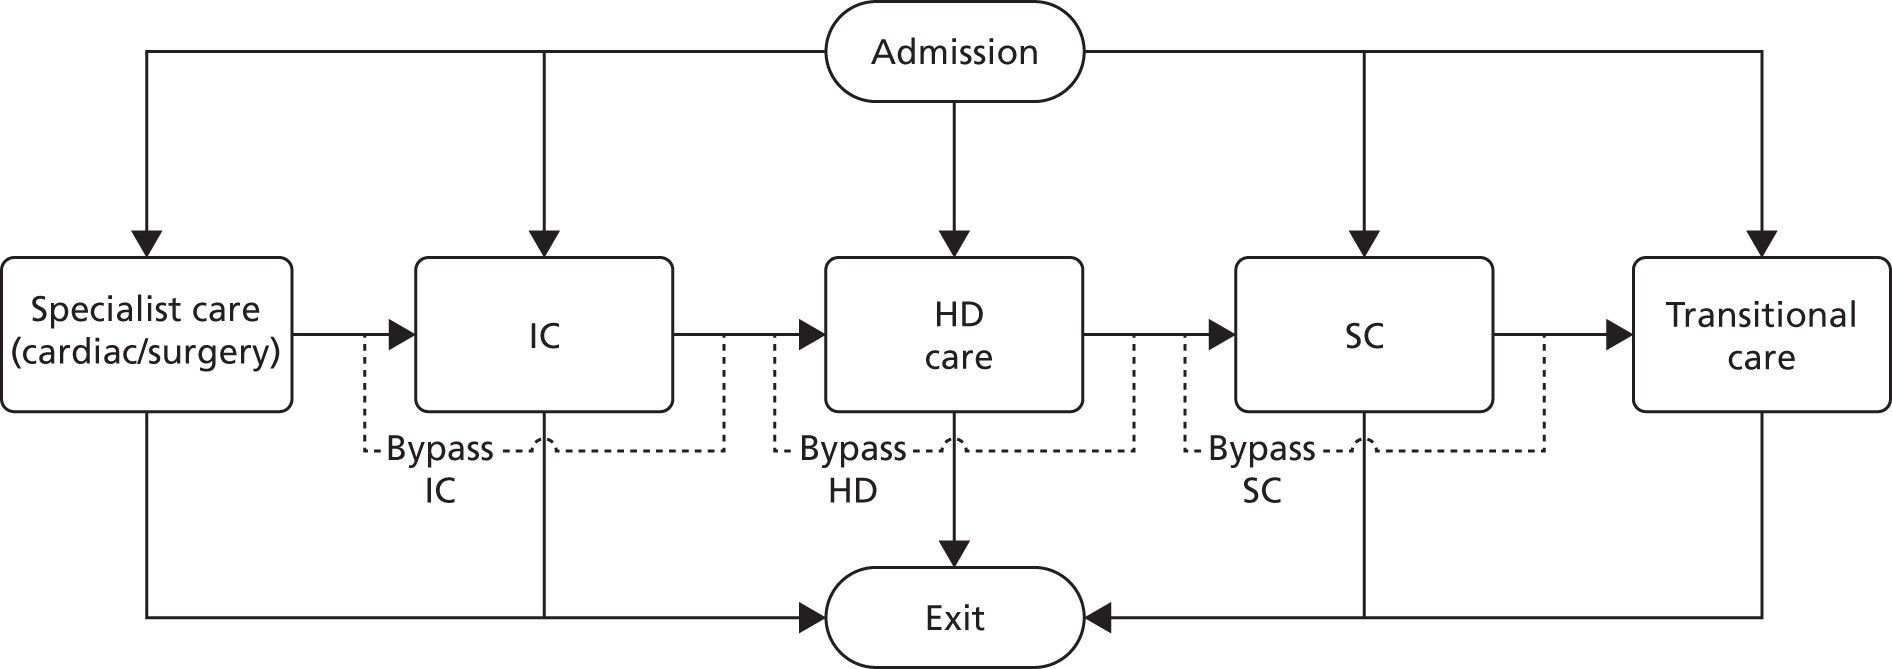
In the model:
-
All surgery-specific care must be within a surgical unit (but the infant may then move to other units for ongoing care).
-
All Level 1 (intensive) care of ≥ 48 hours’ duration must be in a NICU. Level 1 stays of < 48 hours’ duration may also be in a LNU.
-
All Level 2 (high-dependency) care of ≥ 48 hours’ duration must be in a NICU or LNU. Level 2 stays of < 48 hours’ duration may also be in a SCU.
Infant categories and data used in the model
Infants in the model are divided into six categories by gestational age. Infants requiring specialist surgical care form a separate category. Probabilities of movement through the model, and distributions of LOS, depend on the infant category. Table 8 shows the classification by gestational age and the incidence of deliveries by category.
| Infant category | Gestational age at birth (weeks) | All deliveries (%) | Infants requiring specialist surgical care (%) |
|---|---|---|---|
| 1 | < 24 | 0.23 | 9.71 |
| 2 | 24 to < 27 | 1.46 | 11.23 |
| 3 | 27 to < 30 | 2.89 | 5.06 |
| 4 | 30 to < 33 | 6.52 | 1.87 |
| 5 | 33 to < 36 | 17.67 | 0.82 |
| 6 | ≥ 36 | 71.23 | 0.93 |
The model includes a probability of multiple infants per delivery depending on gestational age category at birth (Table 9).
| Infant category | Number of fetuses per delivery (% of deliveries) | ||||
|---|---|---|---|---|---|
| 1 | 2 | 3 | 4 | 5 | |
| 1 | 83.4184 | 14.9235 | 1.6582 | 0.0000 | 0.0000 |
| 2 | 85.5238 | 14.0923 | 0.3233 | 0.0606 | 0.0000 |
| 3 | 85.7055 | 13.3886 | 0.8598 | 0.0461 | 0.0000 |
| 4 | 84.1907 | 14.8712 | 0.9211 | 0.0170 | 0.0000 |
| 5 | 86.0862 | 13.3991 | 0.5019 | 0.0088 | 0.0040 |
| 6 | 97.1603 | 2.8110 | 0.0166 | 0.0069 | 0.0052 |
Infants have probabilities of entry and transition between levels depending on their gestational age category (Table 10). In the model, ‘exit’ may mean discharge to home, discharge to a non-neonatal unit for ongoing care, or death.
| Entry/exit points | Infant category | Level moving to (% of patients) | |||||
|---|---|---|---|---|---|---|---|
| Surgical | Level 1 | Level 2 | Level 3 | Level 4 | Exit | ||
| Entry point | 1 | 0.00 | 100.00 | 0.00 | 0.00 | 0.00 | 0.00 |
| 2 | 0.00 | 100.00 | 0.00 | 0.00 | 0.00 | 0.00 | |
| 3 | 0.00 | 93.41 | 6.59 | 0.00 | 0.00 | 0.00 | |
| 4 | 0.00 | 50.34 | 35.27 | 14.38 | 0.00 | 0.00 | |
| 5 | 0.00 | 8.77 | 29.99 | 59.86 | 1.38 | 0.00 | |
| 6 | 0.00 | 6.32 | 10.61 | 73.73 | 9.34 | 0.00 | |
| 7 | 100.00 | 0.00 | 0.00 | 0.00 | 0.00 | 0.00 | |
| Exit surgical | 1 | 0.00 | 0.00 | 0.00 | 0.00 | 0.00 | 0.00 |
| 2 | 0.00 | 0.00 | 0.00 | 0.00 | 0.00 | 0.00 | |
| 3 | 0.00 | 0.00 | 0.00 | 0.00 | 0.00 | 0.00 | |
| 4 | 0.00 | 0.00 | 0.00 | 0.00 | 0.00 | 0.00 | |
| 5 | 0.00 | 0.00 | 0.00 | 0.00 | 0.00 | 0.00 | |
| 6 | 0.00 | 0.00 | 0.00 | 0.00 | 0.00 | 0.00 | |
| 7 | 0.00 | 47.37 | 11.70 | 39.77 | 1.17 | 0.00 | |
| Exit Level 1 | 1 | 0.00 | 0.00 | 22.22 | 0.00 | 0.00 | 77.78 |
| 2 | 0.00 | 0.00 | 80.43 | 0.00 | 0.00 | 19.57 | |
| 3 | 0.00 | 0.00 | 94.12 | 0.00 | 0.00 | 5.88 | |
| 4 | 0.00 | 0.00 | 86.39 | 6.80 | 0.00 | 6.80 | |
| 5 | 0.00 | 0.00 | 80.26 | 17.11 | 0.00 | 2.63 | |
| 6 | 0.00 | 0.00 | 44.02 | 47.88 | 0.00 | 8.11 | |
| 7 | 0.00 | 0.00 | 64.20 | 11.11 | 0.00 | 24.69 | |
| Exit Level 2 | 1 | 0.00 | 0.00 | 0.00 | 75.00 | 0.00 | 25.00 |
| 2 | 0.00 | 0.00 | 0.00 | 81.08 | 0.00 | 18.92 | |
| 3 | 0.00 | 0.00 | 0.00 | 90.70 | 0.00 | 9.30 | |
| 4 | 0.00 | 0.00 | 0.00 | 97.83 | 0.00 | 2.17 | |
| 5 | 0.00 | 0.00 | 0.00 | 99.07 | 0.31 | 0.62 | |
| 6 | 0.00 | 0.00 | 0.00 | 95.26 | 2.91 | 1.82 | |
| 7 | 0.00 | 0.00 | 0.00 | 90.00 | 0.00 | 10.00 | |
| Exit Level 3 | 1 | 0.00 | 0.00 | 0.00 | 0.00 | 4.95 | 95.05 |
| 2 | 0.00 | 0.00 | 0.00 | 0.00 | 15.67 | 84.33 | |
| 3 | 0.00 | 0.00 | 0.00 | 0.00 | 24.25 | 75.75 | |
| 4 | 0.00 | 0.00 | 0.00 | 0.00 | 27.05 | 72.95 | |
| 5 | 0.00 | 0.00 | 0.00 | 0.00 | 22.86 | 77.14 | |
| 6 | 0.00 | 0.00 | 0.00 | 0.00 | 11.32 | 88.68 | |
| 7 | 0.00 | 0.00 | 0.00 | 0.00 | 20.90 | 79.10 | |
| Exit Level 4 | 1 | 0.00 | 0.00 | 0.00 | 0.00 | 0.00 | 100.00 |
| 2 | 0.00 | 0.00 | 0.00 | 0.00 | 0.00 | 100.00 | |
| 3 | 0.00 | 0.00 | 0.00 | 0.00 | 0.00 | 100.00 | |
| 4 | 0.00 | 0.00 | 0.00 | 0.00 | 0.00 | 100.00 | |
| 5 | 0.00 | 0.00 | 0.00 | 0.00 | 0.00 | 100.00 | |
| 6 | 0.00 | 0.00 | 0.00 | 0.00 | 0.00 | 100.00 | |
| 7 | 0.00 | 0.00 | 0.00 | 0.00 | 0.00 | 100.00 | |
Length of stay
In previous regional work, we identified the log-normal distribution as the best distribution for approximating actual variation in lengths of stay. 33 In this study, we examined whether or not the log transformation was a reasonable distribution to use for the national data set (Figure 14). In order to test the distribution across the combined data set, we examined the distribution of lengths of stay when compared with the category-level mean for that category-level group (there are seven infant categories used, and four general levels of care, with one additional level of care for infants requiring surgery, giving 29 category levels; see Table 10).
FIGURE 14.
Comparison of actual data with an assumed log-normal distribution. IQR, interquartile range. (a) Density with no outlier removal (all data); (b) quantile-quantile plot with no outlier removal (all data: distribution density and distribution assuming log-normal distribution); (c) density with outlier removal [data with outlier detection (3.3% of all data removed by excluding points further than 1.5 × IQR from IQR): distribution density and distribution assuming log-normal distribution]; and (d) quantile-quantile plot with outlier removal [data with outlier detection (3.3% of all data removed by excluding points further than 1.5 × IQR from IQR)]. Each LOS is compared with the mean LOS for category of infant and level.
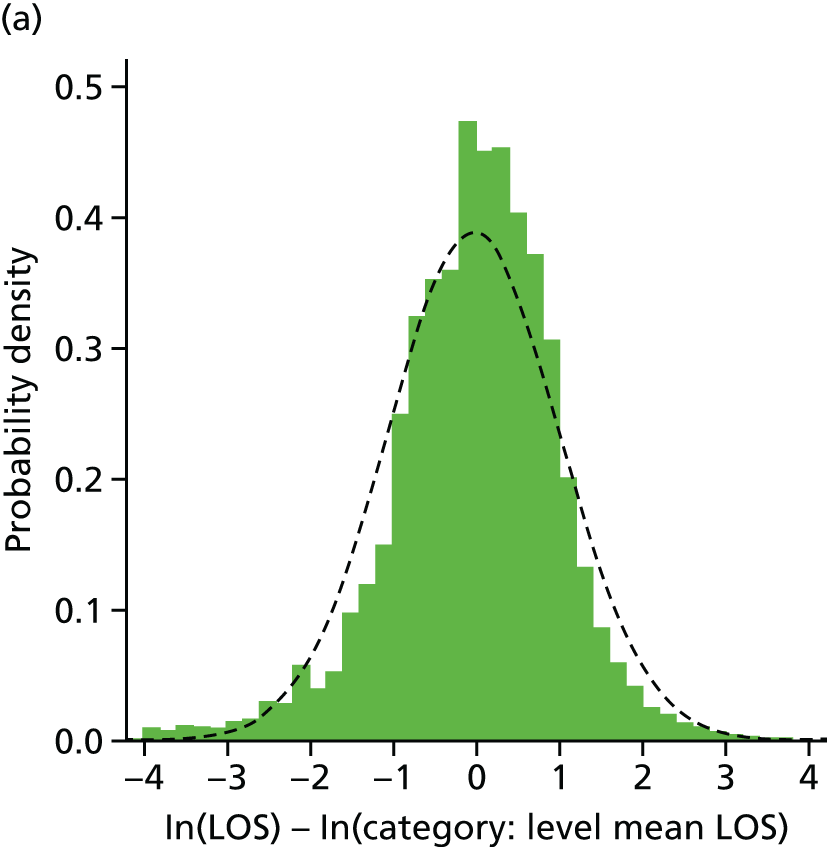
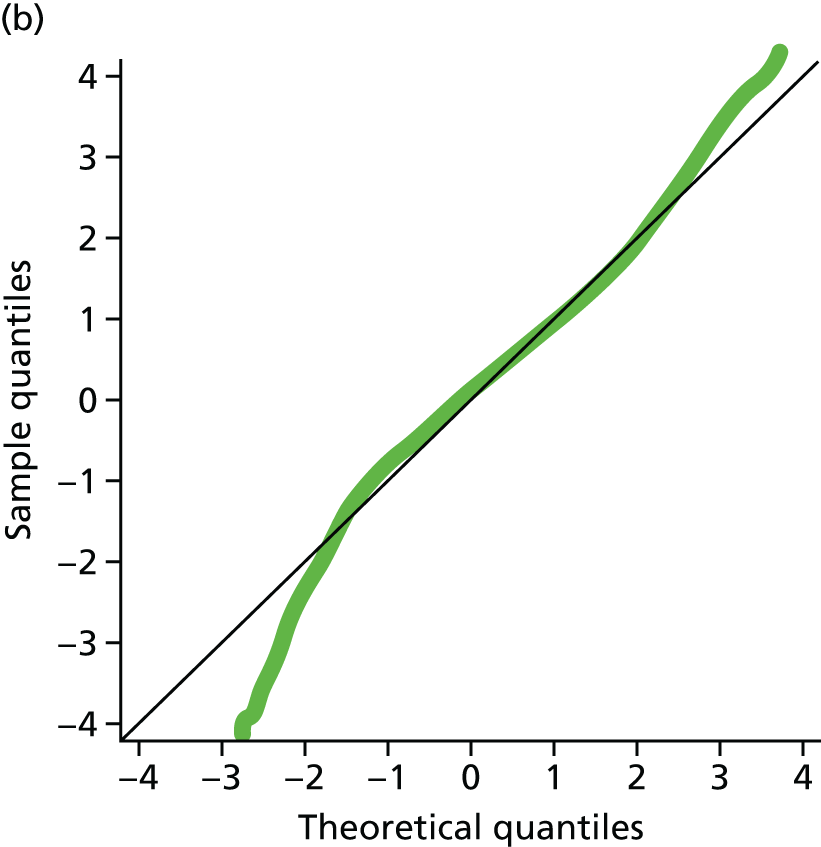
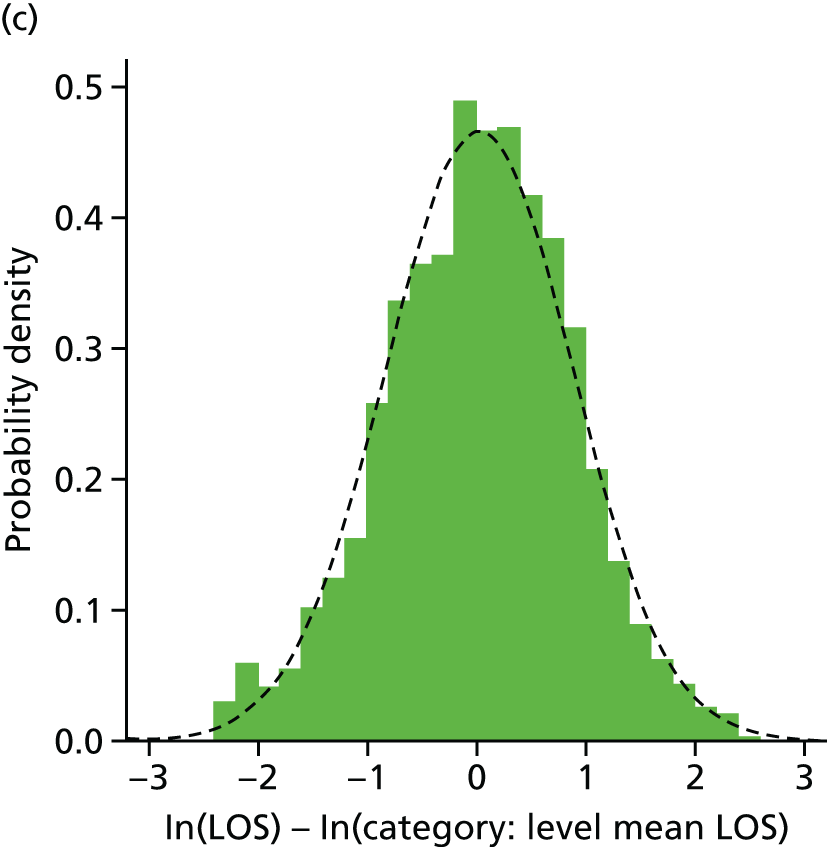
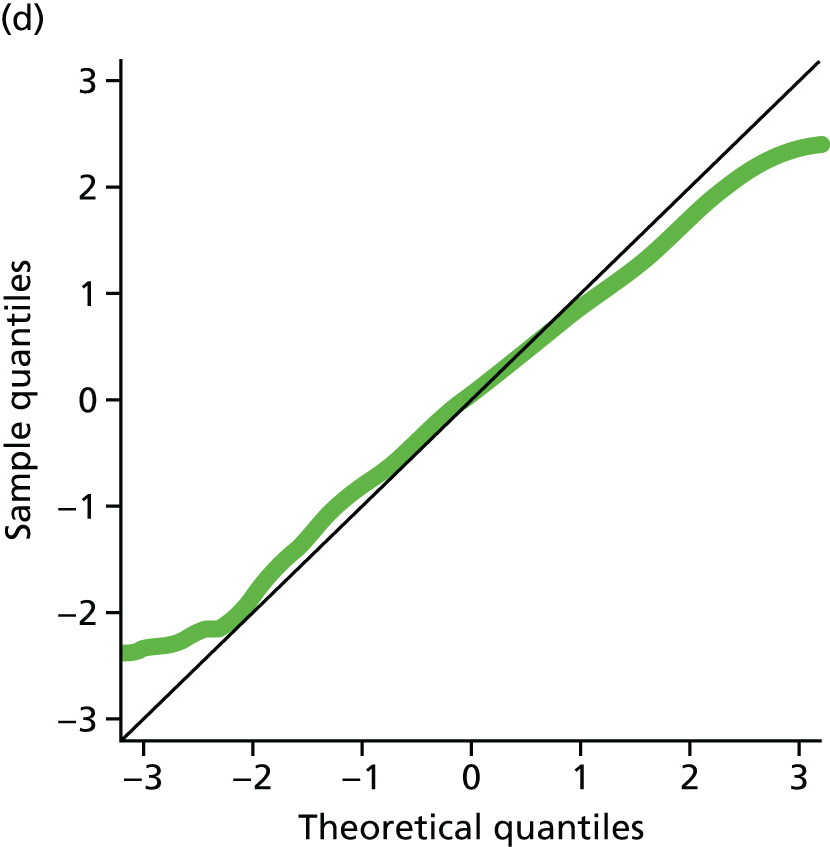
The log-normal distribution fitted the large majority (> 95%) of the data well. The actual data have a slight left-tail compared with the assumed distribution, showing a proportion of patients who have a significantly lower LOS in any particular level than the log-normal distribution would predict; however, this population is very small: 2.3% of episodes are lower than 1.5 × interquartile range (IQR) below the IQR. This cut-off point is used when actual LOS is < 9% of the category-level mean, or a log (ln) difference of < –2.4. Another 1% of all episodes have a LOS of > 1.5 × IQR above the IQR. Resulting lengths of stay used are shown in Table 10.
Length of stay in the model (when a level is used) uses a log-normal distribution as given in Table 11.
| Parameter | Infant category | Log (ln) LOS (days) | ||||
|---|---|---|---|---|---|---|
| Surgical | Level 1 | Level 2 | Level 3 | Level 4 | ||
| Mean | 1 | N/A | 1.952 | 3.648 | 2.723 | 0.928 |
| 2 | N/A | 2.652 | 3.575 | 3.195 | 0.766 | |
| 3 | N/A | 2.156 | 2.475 | 3.427 | 0.704 | |
| 4 | N/A | 1.208 | 1.376 | 3.101 | 0.657 | |
| 5 | N/A | 0.717 | 0.791 | 2.008 | 0.507 | |
| 6 | N/A | 0.697 | 0.397 | 0.768 | 0.104 | |
| 7 | 0.970 | 0.970 | 2.394 | 2.093 | 0.403 | |
| Standard deviation | 1 | N/A | 2.057 | 1.150 | 1.225 | 1.020 |
| 2 | N/A | 1.358 | 0.752 | 0.871 | 0.706 | |
| 3 | N/A | 0.894 | 1.038 | 0.536 | 0.685 | |
| 4 | N/A | 0.928 | 0.946 | 0.463 | 0.653 | |
| 5 | N/A | 0.886 | 0.833 | 0.936 | 0.648 | |
| 6 | N/A | 0.975 | 0.900 | 1.051 | 0.696 | |
| 7 | 1.491 | 1.491 | 1.362 | 1.251 | 0.776 | |
Accuracy of model
Precision of model
The model had a warm-up period of 1 year, followed by 10 years of run-time. Variation between individual years in the base-case model (current configuration without resource constraints) were as follows:
-
average distance from home – 0.6% coefficient of variation (CV)
-
average number of infants in surgical phase intensive care – 6.4% CV
-
average number of infants in Level 1 care – 3.0% CV
-
average number of infants in Level 2 care – 1.1% CV
-
average number of infants in Level 3 care – 0.6% CV
-
average number of infants in Level 4 care – 1.1% CV
-
average total number of infants in any neonatal care – 1.3% CV
-
average nurse workload – 1.1% CV.
All 95% confidence limits of the mean estimated values above were less than ± 5% from the mean value. All results are presented as the mean across the 10 years.
Comparison between model and actual data
The average number of infants present and the average workload were compared between the model and the actual average admissions in the NDAU data. For this validation, the model was run with the assumption that all infants attend their closest appropriate unit.
The difference between predicted and actual admissions depended on the closeness of a unit to its nearest neighbouring unit (Figure 15). For units that were ≥ 15 minutes away from their nearest neighbouring unit, the accuracy of prediction of the number of infants present was typically ± 20–30%, or ± 2–3 infants, and prediction of nurse workload was typically ± 15–20% or ± 1 nurse equivalent workload.
FIGURE 15.
Violin plots showing accuracy of predicting neonatal unit occupancy and workload by proximity of a unit to its nearest neighbouring neonatal unit. Units are binned by proximity to the nearest neonatal unit: 0–15 minutes (18 units), 15–30 units (77 units), 30–45 minutes (35 units), 45–60 minutes (10 units), 60–75 minutes (2 units), and 75–90 minutes (2 units). Bars show the range of error in terms of absolute difference between model and actual occupancies and workload, with the middle cross-bar showing median error. The shaded regions shows distribution of error. The charts show error in occupancy [(a) and (c)] and nurse workload [(b) and (d)] expressed either as differences in numerical occupancy and workload [(a) and (b)] or percentage error from the actual occupancy and workload [(c) and (d)].
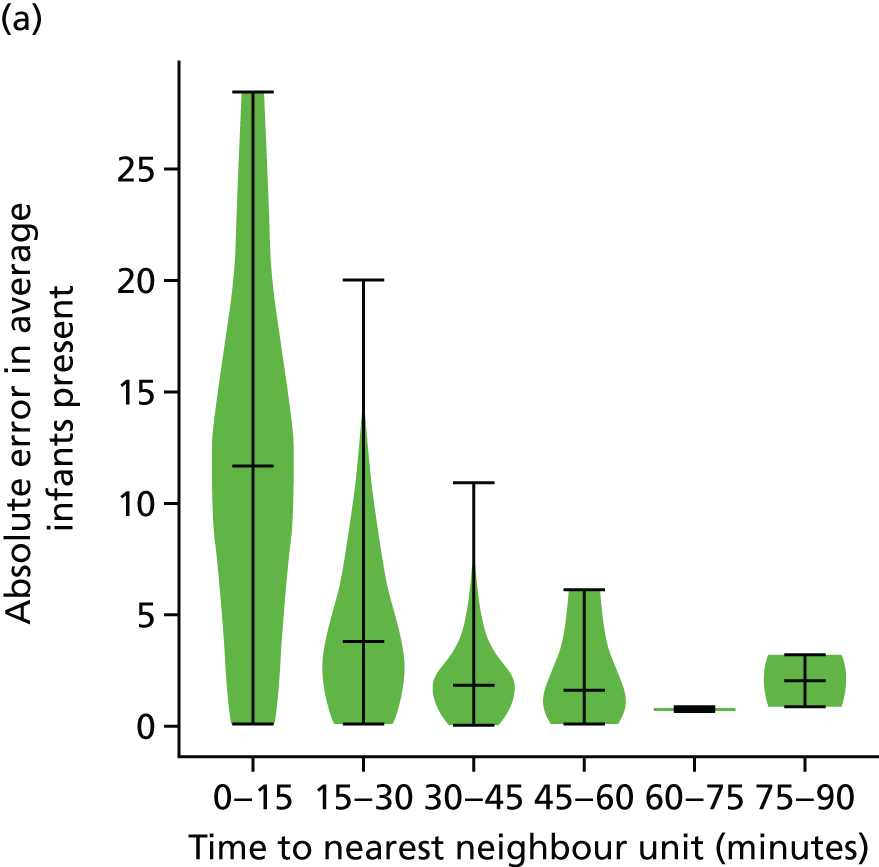
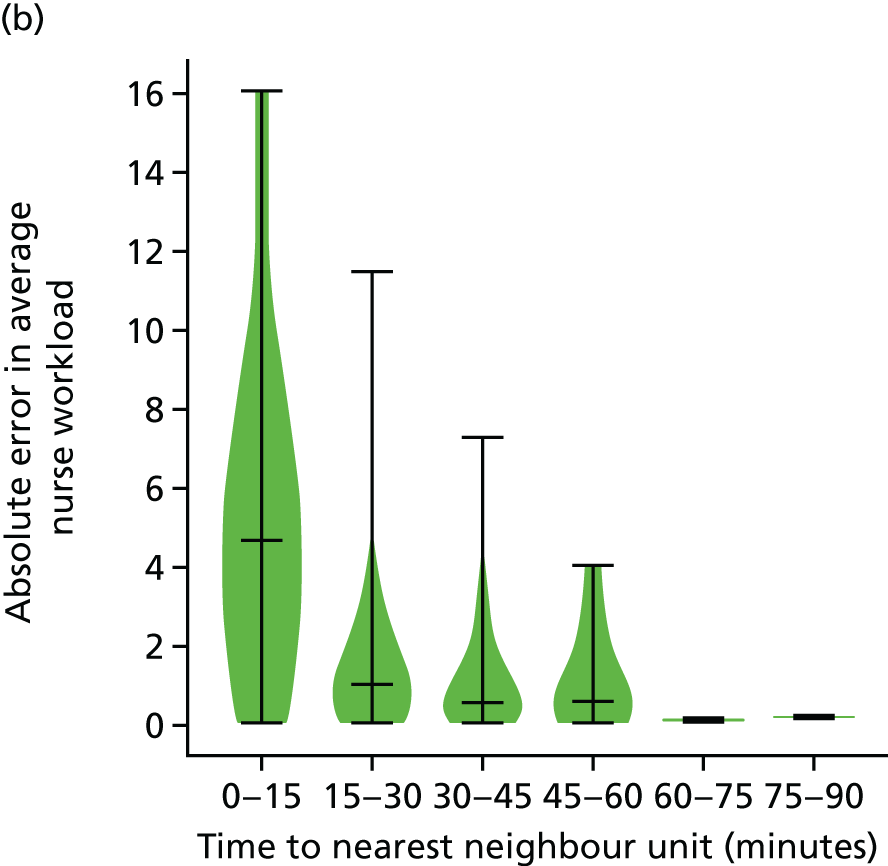
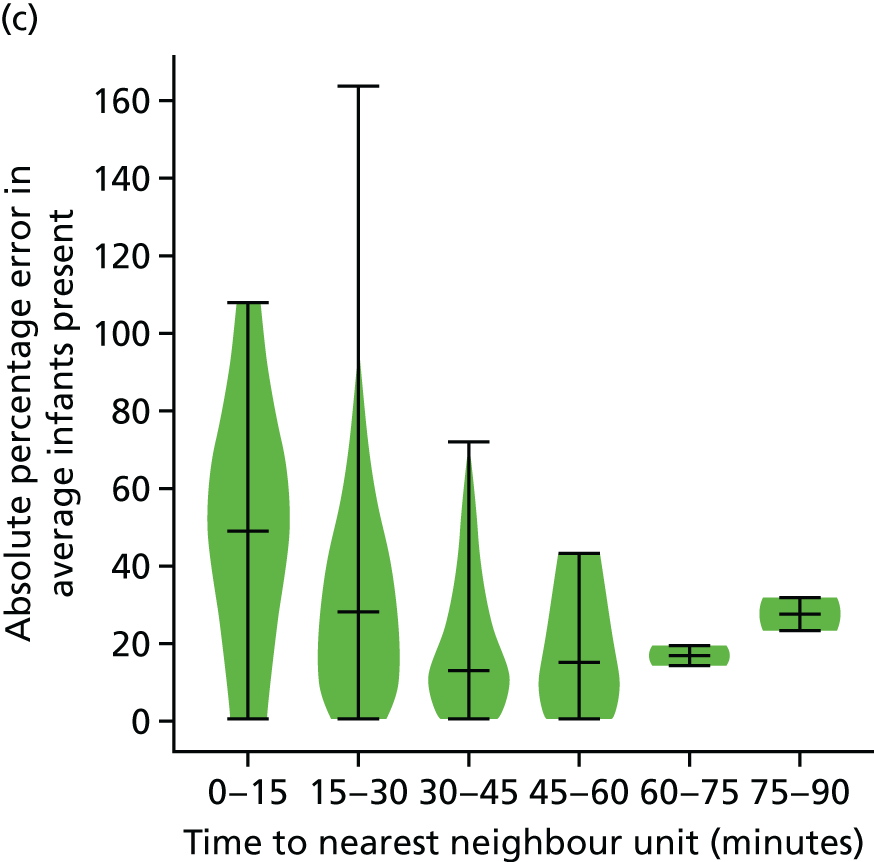
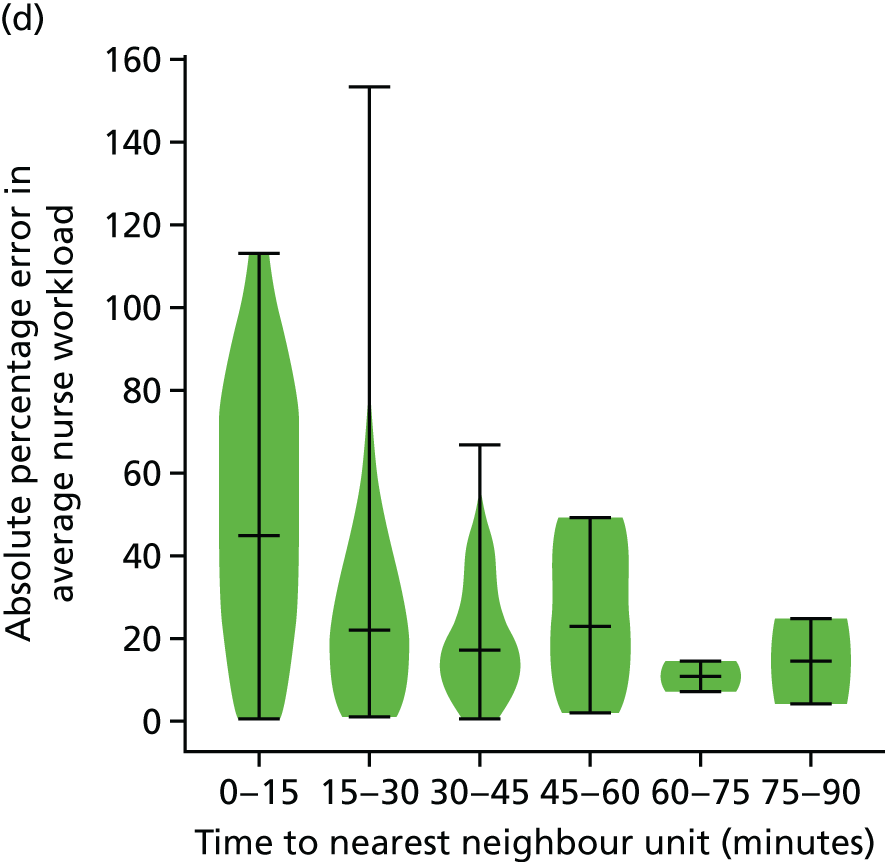
Median travel times from home to place of care compared well between the model and actual data. The median time from home for Level 1 care was 24 minutes in the model (compared with 21 minutes actual), Level 2 care was 14 minutes (compared with 16 minutes actual) and Level 3 care was 12 minutes (compared with 13 minutes actual).
Providing further credence to the principle of this geographic modelling, that infants will usually attend their closest neonatal unit (or one close to it), is that 95.3% of infants who only required local Level 3 care (special care) were cared for in either their closest unit or a unit no more than 15 minutes further than their closest neonatal unit.
Effect of altering capacity in the model
The model allows units to close to new admissions once a given nurse workload is reached (new admissions cannot take the unit above a defined capacity; so it is possible that an infant requiring Level 3 care may be admitted when an infant requiring Level 1 care has just been rejected). In the case of a unit not allowing an admission, the model searches for the closest unit with available space (defined by nurse workload) and that is the appropriate level.
Adverse effects on distance from home and the number of transfers are seen when average capacity utilisation increases to > 60% (Figure 16), with a doubling of the number of infants > 30, 45 or 60 minutes from home at approximately 75% of capacity utilisation.
FIGURE 16.
Effect of altering capacity on distance parents are from the place of care, and on the number of neonatal transfers. Capacity utilisation of 100% means that the unit is closed to further admissions. (a) The percentage of infants attending the closest appropriate unit; (b) the percentage of infants further than 30, 45 or 60 minutes from mother’s home location; (c) the average travel time from mothers home location to place of care; and (d) the number of neonatal transfers (between neonatal units) per year.
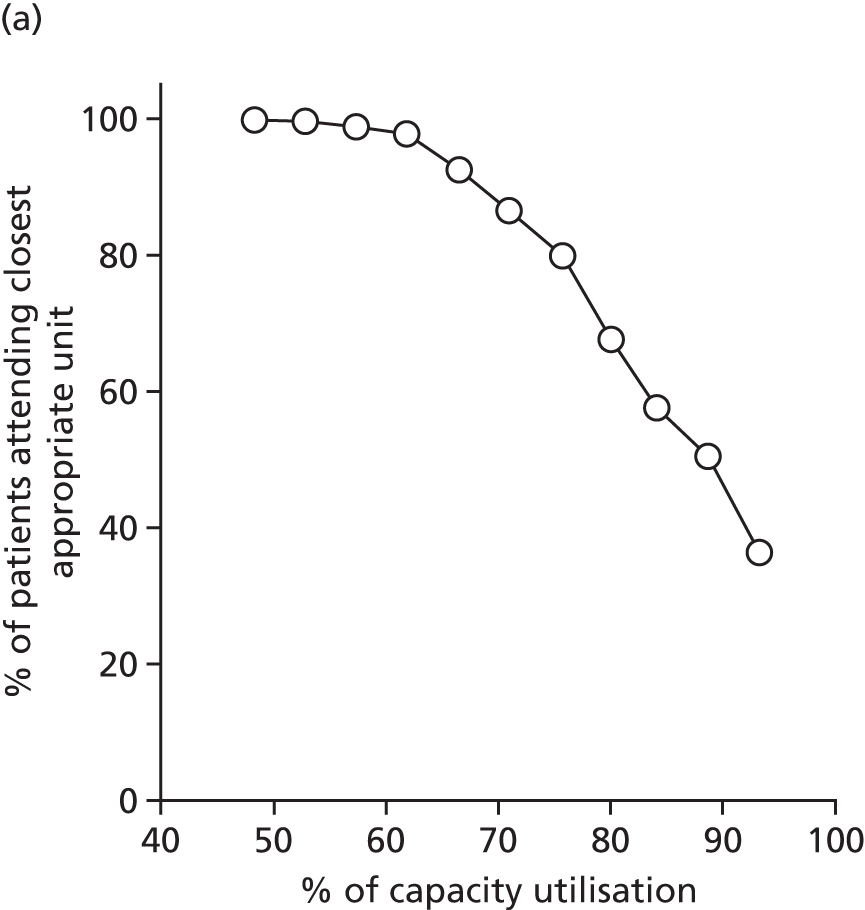
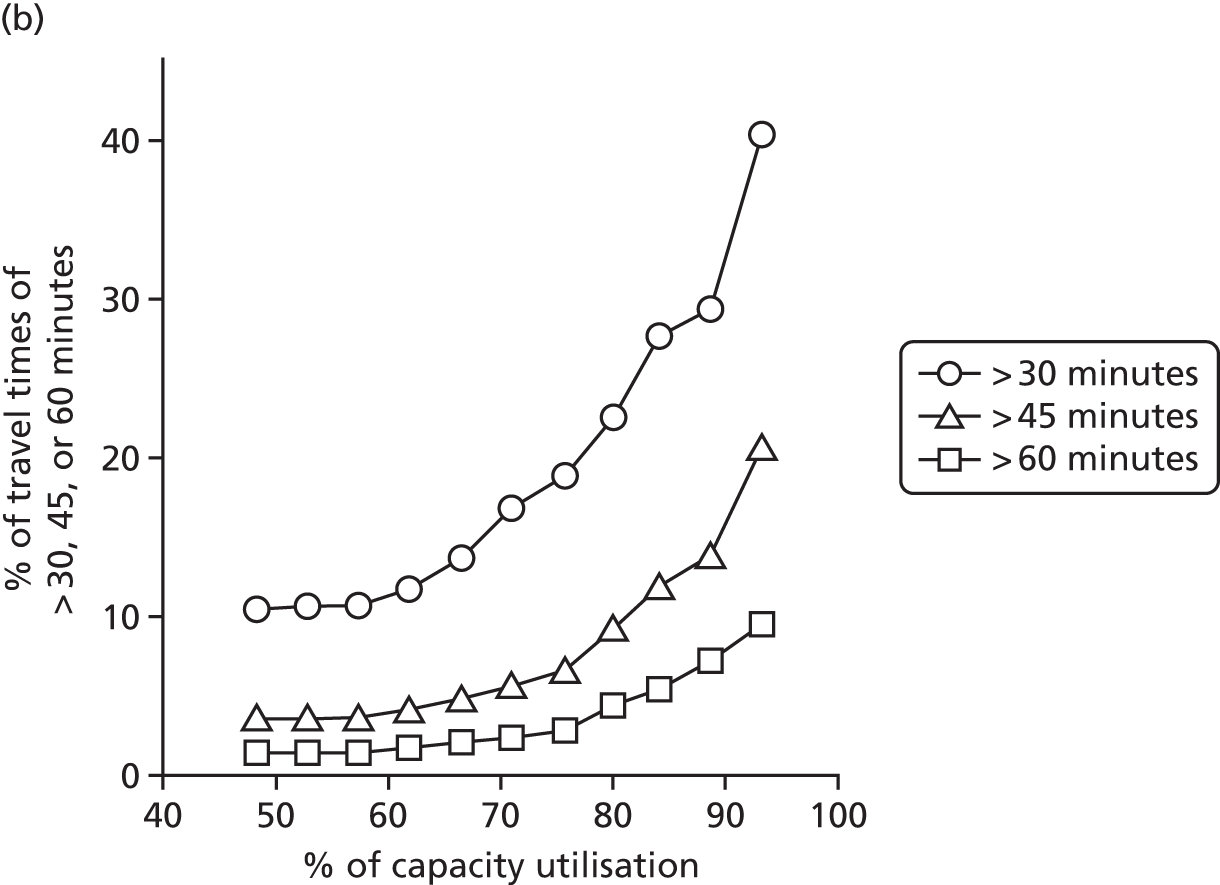
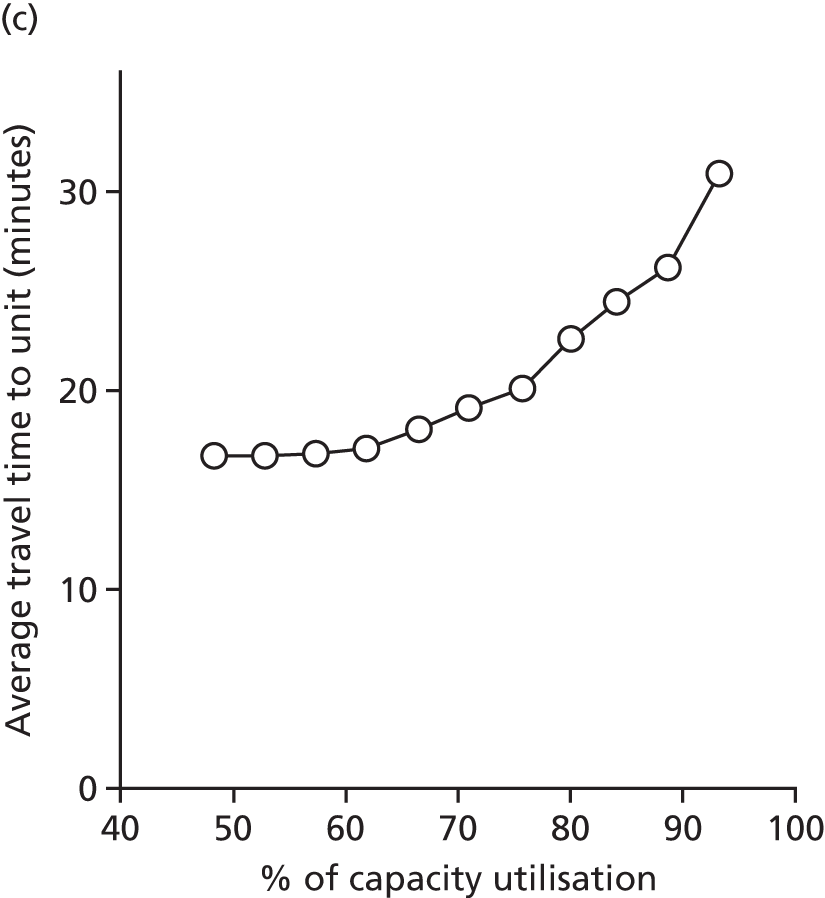
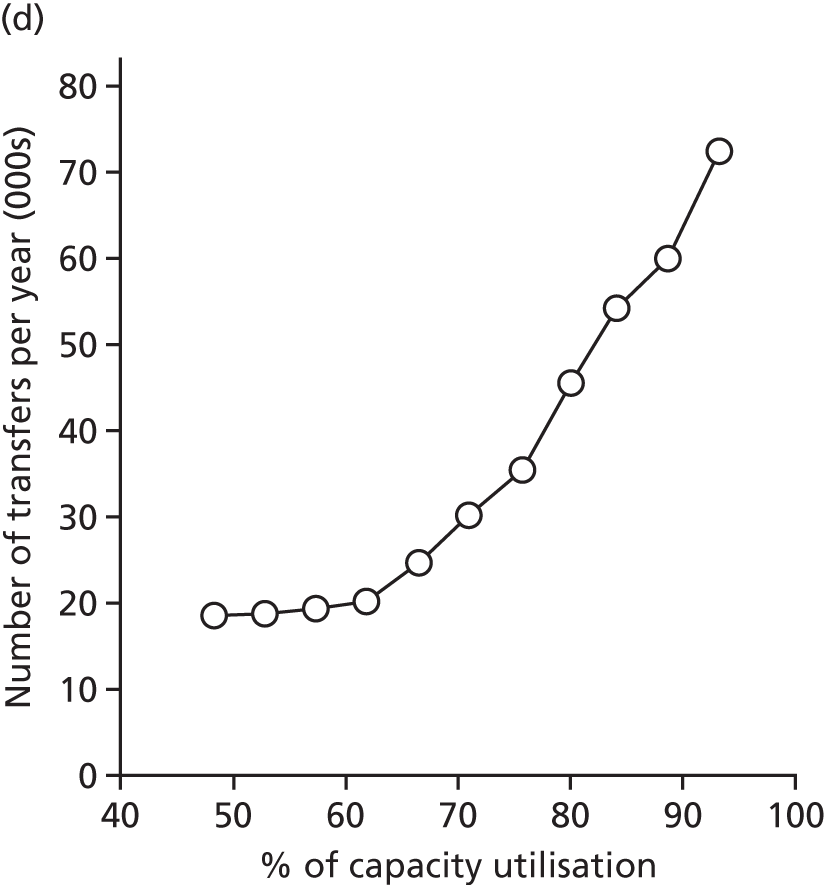
Effect of unit size on variation in workload
The relative variation in workload depends on the size of the unit. As units increase in size, the relative variation in workload (ratio of peak-to-trough workload) reduces (Figure 17). Higher-volume units are therefore more robust against natural variation in workload.
FIGURE 17.
Variation, by hospital, (a) in cot use and (b) nurse workload by average cot use or workload. Variation was measured by calculating the ratio of common peak cot or nurse workload (90th percentile) to common trough cot or nurse workload (10th percentile). In two cases where the 10th percentile number of cots used or nurse workload was zero (giving an infinite workload ratio), the ratio is given a value of the maximum observed elsewhere.
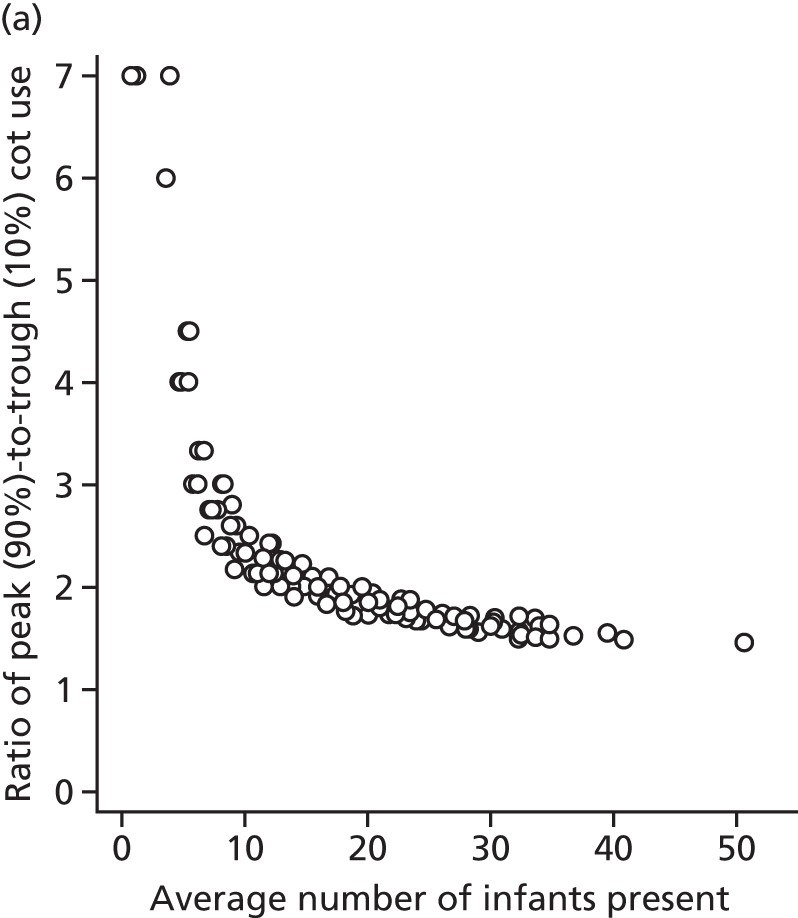
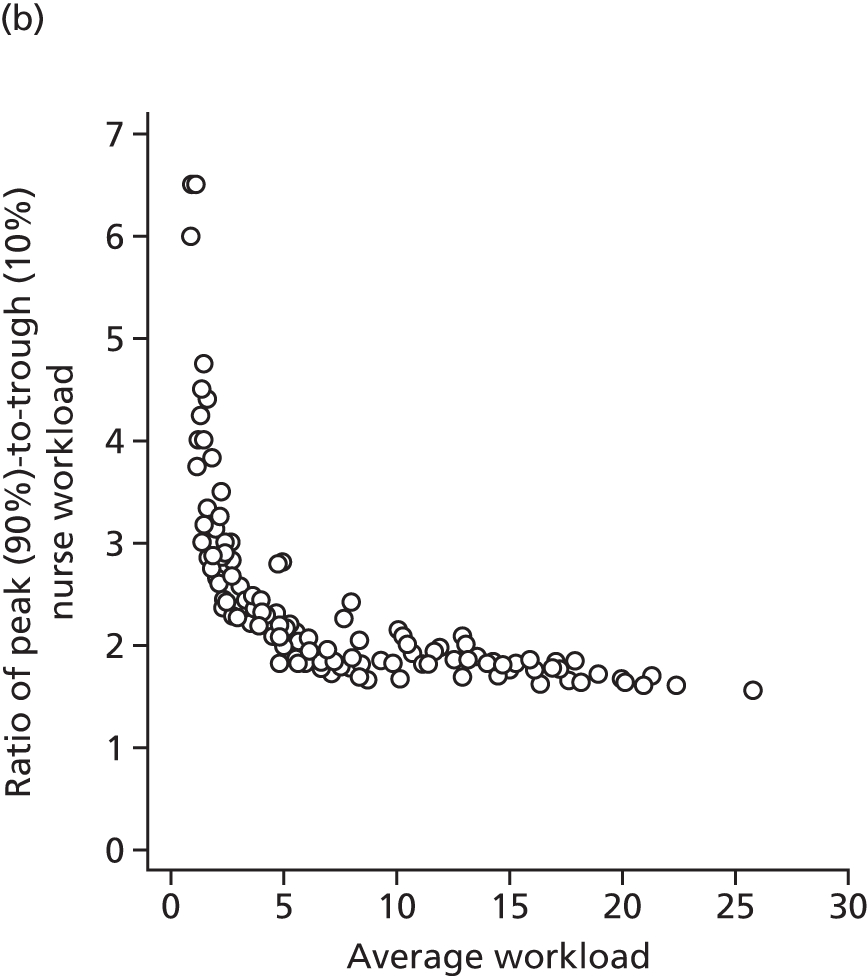
Effect of removing network boundaries
In the base-case model, it was assumed that an infant would always go to their closest unit in their own network if capacity existed in an appropriate-level unit. The model was run without boundaries, such that an infant would always attend their closest appropriate unit that had capacity. Removal of network boundaries led to an improvement in infants cared for within 30, 45 and 60 minutes of their home location (Table 12). The difference was relatively small in absolute terms (typically an improvement of 0.5% to 1.0% of all patients in each travel band), but it is larger when expressed in relative terms.
| Travel time to place of care | Existing network boundaries | No network boundaries | Relative increase in proportion of infants in band by using network boundaries |
|---|---|---|---|
| > 30 minutes (%) | 10.5 | 9.8 | 6 |
| > 45 minutes (%) | 3.6 | 2.8 | 28 |
| > 60 minutes (%) | 1.5 | 1.1 | 33 |
| Average (minutes) | 16.7 | 16.3 | N/A |
Alternative scenarios
Two alternative scenarios, identified by the genetic algorithm (see Chapter 6, Example of an alternative neonatal intensive care unit configuration and Example of a centralised neonatal intensive care unit configuration), were tested in the simulation model. In one case, a configuration was picked that minimises travel distances while ensuring that all NICUs receive ≥ 100 VLBW infants per year. In the second case, we have chosen one example of significant centralisation (picking optimal locations for 30 NICUs, 30 LNUs and 30 SCUs). The scenarios were run either with (1) no resource constraints or (2) resources set so that units ran at an average of 80% of maximum capacity (Table 13). These scenarios were run without the specialist surgical LOS for those infants requiring surgery (although the rest of their stay that could be in non-surgical units was included). The surgery-specific workload, not included in this model, amounts to ≈24 on-duty nurse workload or approximately 2% of the total nurse workload in the model.
| Model outputs | Current configuration (45 NICUs, 78 LNUs and 38 SCUs) | Alternative configurationa (48 NICUs, 78 LNUs and 35 SCUs) | Centralised configuration (30 NICUs, 30 LNUs and 30 SCUs) |
|---|---|---|---|
| No capacity constraints | |||
| Mean daily travel time from home (minutes) | 16 | 16 | 20 |
| Infant days in planned place of care (%) | 100 | 100 | 100 |
| Patient days > 30 minutes from home (%) | 9.4 | 8.2 | 14.6 |
| Patient days > 45 minutes from home (%) | 2.6 | 2.0 | 3.7 |
| Patient days > 60 minutes from home (%) | 0.9 | 0.8 | 1.3 |
| Transfers per year (n) | 17,213 | 16,008 | 17,347 |
| Transfers per infant (n) | 0.20 | 0.19 | 0.20 |
| Transfer distance per year (miles, single direction) | 360,986 | 314,151 | 396,723 |
| Transfer time per year (hours, single direction) | 10,188 | 9036 | 10,895 |
| Average nurse workload present (n) | 1062 | 1062 | 1062 |
| On-duty nurses required to meet BAPM standards 90% of time (n) | 1490 | 1512 | 1366 |
| Average nurse utilisation to meet BAPM standards 90% of time (%) | 71 | 70 | 78 |
| Units planned to run at ≈80–85% of maximum capacityb | |||
| Mean daily travel time from home (minutes) | 22 | 21 | 23 |
| Infant days in planned place of care (%) | 67 | 67 | 83 |
| Patient days > 30 minutes from home (%) | 20.1 | 19.5 | 23.3 |
| Patient days > 45 minutes from home (%) | 8.0 | 7.1 | 8.8 |
| Patient days > 60 minutes from home (%) | 3.3 | 2.8 | 3.1 |
| Transfers per year (n) | 45,274 | 44,061 | 31,257 |
| Transfers per infant (n) | 0.51 | 0.48 | 0.34 |
| Transfer distance per year (miles, singe direction) | 966,975 | 898,714 | 846,293 |
| Transfer time per year (hours, single direction) | 26,767 | 25,418 | 21,815 |
| On-duty nursesc (n) | 1333 | 1338 | 1296 |
| Average nurse utilisation (%) | 80 | 79 | 82 |
As expected from the genetic algorithm, the alternative scenario based on minimising travel distances while having all NICUs with ≥ 100 VLBW infants per year also reduced average travel times and increased the proportion of infants within 30, 45 and 60 minutes of the unit. It is worth noting that the aim of this scenario was primarily for all NICUs to be large enough to have ≥ 100 VLBW infants per year, so it is encouraging that travel distances may also be reduced simultaneously. This scenario also reduced the number of transfers and the transfer distance by ≈9%. The centralised scenario led to a significant increase in travel distances, but was able to reduce, by ≈9%, the number of nurses required to meet BAPM standards 90% of the time.
When capacity limits were placed in the system, such that units worked on average at ≈80% of maximum capacity (with capacity limited by nurses present), the performance of the system, viewed from the desire to have infants cared for in the closest appropriate unit, degraded. When running at an average of 80% of capacity utilisation, one-third of infant days were not in the closest appropriate unit in the two non-centralised scenarios. With the centralised scenario, which is more robust to variation in workload, 17% of patient care days were not in the closest appropriate unit. The increased robustness of the centralised scenario led to a closing of the gap in distances from home between that scenario and the two non-centralised scenarios; indeed, the centralised scenario had the fewest care days that were > 1 hour from the patient’s home. The number of transfers was also lowest in the centralised scenario (it had been highest when resources were not limited at any unit).
The number of on-duty nurses in the centralised scenario is given assuming that capacity is capped at BAPM recommendations. 2 If there is allowed working beyond BAPM workload recommendations, then nurse numbers will scale down proportionally (e.g. if maximum unit capacity occurs when total workload is 30% above BAPM recommendations2 then the number of nurses required would be divided by 1.3).
Simulation modelling discussion
There has been a variety of modelling and simulation work on neonatal care systems. This has included mathematical queuing models,63–67 a simulation model68 and a comparison of mathematical and system dynamics models. 69 We have also previously reported on a simulation model of a regional neonatal network. 33
The simulation model presented here is the first one that models a national networked neonatal care system in which infants may move to different hospitals either for planned care or because of resource constraints in the most local appropriate unit.
The model contains some simplifications compared with the real world, for example:
-
It is assumed that an infant’s condition moves from worse to better; more-intensive levels of care take place first in the model, with no backwards movement from lower to high intensive care.
-
The model assumes that the place of birth is in the closest hospital with any type of neonatal unit, but if higher levels of care are needed immediately then the infant’s first place of care (following immediate transfer) will be in the higher-level unit.
-
The model assumes that location of care is in the closest appropriate unit with capacity.
-
The model assumes that choices on location are made based on estimated road travel time.
The model was run for a period of 10 years, after a warm-up period of 1 year. When model results were divided by year, it was found that the mean results had an expected precision of within ± 5% of the mean. There is therefore little error due to stochastic variation in the model runs. Median travel times to place of care were within ± 2 minutes (or within ± 10%) when comparing the model to the real world. When hospital workloads were compared with modelled workloads (assuming that infants can always be cared for in their closest appropriate unit), the accuracy of the model depended on proximity between units. This suggests that modelling assumptions of an infant attending their closest appropriate unit are valid when there is reasonable travel time between units, but is less valid when units are close together (and when travel time might be less important in unit destination). Inaccuracy of demand in units that are close together does not significantly affect prediction of travel time to place of care as that will be similar and unaffected between choice of unit.
The effect of changing resources/capacity had a profound impact on the incidence of care away from the planned place of care. In a 200-bed hospital model, it was suggested that working at an average of 85% of maximum capacity was sufficient to avoid problems of lack of capacity. 8 In the neonatal system, the model predicts that running at a planned average of 85% of maximum capacity would lead to almost half of the patients being cared for away from their closest appropriate unit. The neonatal system has two key differences compared with Bagust et al. ’s8 work on hospitals. First, units are much smaller, and this causes greater relative variation in workload, making the unit more likely to exceed capacity more often than a whole hospital. Second, in the neonatal unit, exceeding capacity in one unit affects other units adversely; the missed admission to the first unit must be placed in another unit, reducing the destination unit’s capacity for their own local demand. As the system becomes busier, the number of displaced infants (those infants not able to access the closest appropriate unit because of capacity constraints) increases and these displaced infants contribute to the possibility of excessive demand in the units in which they are placed. It is not always easy in the real world to define absolute maximum capacity. When capacity is limited by on-duty nurse staffing, the maximum capacity depends on local decisions on when to close a unit to further admissions – we have previously observed units sometimes working with half the number of nurses recommended by BAPM. 33 Spare capacity may therefore be found by accepting infants when staffing levels are significantly above the level recommended by BAPM, but creating capacity in such a way carries a risk of worsened outcome. 9 The occurrence of having to work at particularly high peaks in workload will be reduced by having fewer higher-volume units (but at the cost of increased travel times).
The effect of unit size on variability of workload was apparent in the simulation results: between-day variation in workload was significantly higher for smaller units. Variation is described as the ratio of peak-to-trough workloads, with a peak defined as the type of workload that can occur in the busiest 10% of days, and a trough defined as the type of workload that can occur in the quietest 10% of days. A unit with an average workload of 2–3 nurse equivalents was found to have a fourfold ratio of peak-to-trough nurse workloads, whereas a unit with an average workload of 10 nurse equivalents will typically have a twofold ratio of peak-to-trough nurse workloads.
There is, therefore, a significant tension in neonatal care. Neonatal care is expensive and financial challenges will tend to apply pressure to increase utilisation of these expensive resources. This pressure unavoidably leads to more neonatal transfers and care further away from home locations. It is not possible to combine high utilisation of neonatal care with care consistently provided close to home. The levels of utilisation (< 65% of the absolute maximum capacity) required to minimise the need for unplanned transfers are likely to be unacceptably low considering the financial pressures existing in health care. If high utilisation (such as ≥ 80%) of resources is required, then the system needs to be adapted to be able to manage the increased number of transfers, and consideration needs to be given to the number of parents for whom daily commuting to/from the place of care may become impossible. The number of parents who live > 60 minutes (driving) away from the location of care could be taken as an indicator of the group who may require overnight accommodation in or close to the hospital (possibly funded by the hospital or by the parents themselves). When capacity is not constrained, centralisation within 90 units might be expected to increase demand for overnight accommodation by about 40%. However, in a capacity-constrained system in the model, there was not an increase in this group of parents; indeed, there was a slight reduction attributable to the centralised system’s better resilience to peaks in workload.
Smaller units are therefore likely to more frequently breach BAPM guidelines2 or capacity limits unless they are staffed with a higher proportional spare average capacity.
The simulation model was used to investigate whether or not boundaries, which can potentially cause a patient to travel further than their closest clinically appropriate unit, had a significant effect on travel times. When removing boundaries, there is a very small (< 1-minute) improvement in average travel time. The number of infants who are > 45 or 60 minutes away is reduced by about 30%, but this is against a backdrop of only a small proportion of infants being over these times with network boundaries in place. Therefore, the model suggests that use of network boundaries has only a minor negative effect on travel times.
Two alternative scenarios were tested in the simulation model. An alternative configuration with a similar number of each type of unit was tested. This configuration was chosen for its ability to have all NICUs receiving ≥ 100 VLBW infants per year (linked with improved clinical outcome). As with the genetic algorithm results, this model also had slightly improved travel times. The model also showed that this configuration required about 10% fewer transfers. Therefore, modelling suggests that there are better configurations of care: configurations that can (1) improve travel time, (2) ensure that all NICUs are large enough to receive ≥ 100 VLBW infants per year and (3) required fewer transfers. A second model was tested to look at the effect of significant centralisation of care: centralisation to 90 units from the current 161. The centralised model had the disadvantage of higher travel distances under conditions in which capacity is not strained. This model did, however, show two significant advantages. First, the number of nurses required to meet BAPM standards 90% of the time for local demand was reduced by about 10% compared with the current configuration (attributable to the smaller relative fluctuations in workload that occur in these higher-volume units). Second, this model, when run with constrained resources, had half the number of displaced infants as the current configuration, with about a one-third fewer transfers. Travel distances in a resource-constrained system became similar to the more localised care configuration.
The performance of the system, from the perspective of travel distances and transfers, was found to be highly dependent on capacity within the system in all the models examined.
Geographic modelling and simulation has shown that there are potentially improved national configurations of neonatal care, increasing both access and the development of NICU centres of excellence with ≥ 100 VLBW infants per year. A practical issue is, then, how much of the gap, between the current configuration and a theoretically ideal solution, can be closed.
Chapter 8 Health economics modelling
Reorganisation of health-care services requires an evaluation of the clinical benefit and costs to the health service and to the wider society. The aims of this chapter are to provide the building blocks for this evaluation by exploring the impact that service reconfiguration has on clinical outcomes (mortality), costs (neonatal bed-days, LOS and parent costs) and to undertake qualitative research on the factors that families and policy-makers would like to see taken into consideration in determining service reconfiguration.
Clinical outcome
Literature review
During the last 20 years, many models have been developed to estimate infant and neonatal mortality. The majority of these models explored the impact of infant characteristics on mortality and estimated mortality for either the VLBW infants, weighing 800–1500 g, or very preterm infants, with a gestational age of 22–32 weeks. Most studies used a logistic regression approach with covariates that have been found to be strong predictors for neonatal mortality (i.e. of gestational age, small for gestational age, sex, birthweight and birthweight z-score). 70–73 A few studies considered sociodemographic and socioeconomic variables including race and ethnicity,18,20,74–76 education, insurance status, percentage of inhabitants living below the poverty line18,20,77 and the lowest decile of the IMD score. 19
A smaller number of studies have investigated the impact of service configuration in terms of (1) working patterns and staffing and (2) organisational level. One of the first studies that looked at the impact of workload and staffing was by the Tucker and UK Neonatal Staffing Study Group,78 which explored the impact of the availability of consultants (high availability defined as ≥ 2 consultants) and nurses relative to the BAPM nurse-to-cot ratio guidelines (high availability is defined as a nurse-to-infant ratio of ≥ 0.84). The UK Neonatal Staffing Study Group78 used three workload measures, including occupancy, which measured the maximum number of infants present in a unit over their study period. The authors reported that for every 10% increase in percentage of maximum occupancy at admission, the odds of mortality increased by 1.09 (95% CI 1.01 to 1.18). Rautava et al. 79 explored the impact of working patterns on mortality and found that the risk of mortality for very preterm infants increased when the infant was born in non-office hours, and that mortality rates could be consequently improved by an increase of resources. Finally, Watson et al. 14 estimated the effect of the 1 : 1 nurse-to-patient ratio for intensive care neonates and found that a 1 : 1 nurse-to-patient ratio reduces infant mortality. A further set of studies explored the degree to which mortality varied depending on the care levels by which services were organised (e.g. NICUs, LNUs and SCUs in the UK). For example, Cifuentes et al. 20 estimated the mortality of low-birthweight infants for different levels of care in the California area and found that the level of care in NICUs can influence the probability of survival. The 2010 systematic review by Lasswell et al. 80 explored the association between the designation level of hospital and VLBW infant mortality based on studies that evaluated the regionalisation of perinatal services for very preterm or VLBW infants. Most studies that looked at the impact of organisation in terms of staffing or hospital level used logistic regression, with the exception of Watson et al. ,19 who used an instrumental variable approach. Care is needed in interpreting estimation of the logistic model when there is a small number of events, as is the case in neonatal mortality, and so these estimates may be affected by small-sample bias.
Other studies have aimed to look at the impact of organisational factors, such as the number or volume of infants treated in neonatal units, based on the idea that staff can become more experienced and skilful as they treat a larger number of different and complex infants. A high-volume unit has been defined as one that treats at least a fixed number of VLBW or very preterm infants per year76,78 or as one that is in the top quartile of all neonatal units. 19 Rogowski et al. 76 explored the impact of hospital-level determinants of mortality among VLBW infants and showed that the number of VLBW infants admitted to a neonatal unit reduced infant mortality. More recently, studies have aimed to look at the causal relationship between infants born in high-volume units and infant mortality using instumental-variable (IV) approach methods. 14,19,77 The effect of designation and volume of neonatal care for preterm birth reported in Watson et al. 19 had a significant effect, especially on neonatal mortality and in-hospital morbidities (bronchopulmonary dysplasia, necrotising enterocolitis and retinopathy of prematurity). For infants with < 33 weeks of gestational age, the risk of death was reduced by 2.6 percentage points if admitted to a high-volume unit, and this effect was higher if infants had a gestational age of < 27 weeks. Finally, some studies explored the impact of hospital volume within different levels of care. For instance, Phibbs et al. 18 examined the impact of hospital volume among different levels of neonatal care units and found that volume and level had a significant impact on risk of infant mortality, showing that the delivery of VLBW infants in NICUs with a high volume can reduce neonatal mortality.
Table 14 summarises the neonatal mortality models that explored the impact of volume on mortality.
| Study, author, year (country) | Volume | Mortality | Effect, OR (95% CI) | Description |
|---|---|---|---|---|
| Tucker and UK Neonatal Staffing Study Group,78 2002 (UK) |
|
There are no differences in the odds of mortality HV units treat sicker infants than MV and LV units do |
|
Generalised estimating equation model (logistic) |
| Watson et al.,19 2014 (UK) |
HV for units with ≥ 100 VLBW infants per year Tertiary units are NICUs |
TUs are NICUs Consistent reduction in OR of mortality for very preterm infants admitted to HV neonatal units |
|
IVs |
| Gale et al.,81 2012 (UK) | HV: unit with ≥ 2000 neonatal intensive care-days annually | Centralisation of neonatal intensive care within a smaller number of neonatal units providing both a high level of intensive care and HV of activity is associated with reduced mortality |
|
Logistic regression analysis |
| Cifuentes et al.,20 2002 (USA) | Patient of VLBW infants:
|
In higher levels of NICUs when volume is considered, there is a marked reduction in average mortality risk |
|
Logistic regression analysis |
| Rogowski et al.,76 2004 (USA) |
Patient volume of VLBW infants: 50 Three levels of NICUs: |
Volume and NICU level explain very little of the variation across hospital in mortality among VLBW infants |
|
Random-effect logistic regression |
| Phibbs et al.,18 2007 (USA) | Five levels:
|
The effects of the volume of VLBW infants varies depending on the NICU level. Mortality decreases as patient volume increases within each level of care and with higher levels of care within each volume group |
|
Multiple logistic regressions |
Thus, the few studies that have attempted to estimate causal effects suggest that there is a positive effect of birth in higher-volume hospitals, whereas there is no evidence that birth in a hospital with a NICU has any effect on mortality. However, previous studies have only compared NICUs against all other hospital designation categories combined without distinguishing between SCU and LNU hospitals. Furthermore, there is no study in England that has evaluated the causal impact on LOS and reimbursement costs. Our aim was to estimate the impact of volume and designation level on mortality and costs between NICUs, SNUs and LNUs, and separately between high-volume units and other hospitals of birth.
Data
Data relative to neonatal care were collected in 2014/15 from units in England as part of the BadgerNet data set. The distance in time and miles was evaluated using LSOAs of the mother and the postcode of the hospital. Mortality was defined as mortality during the in-hospital period from the admission to the discharge.
Mortality was registered between 2014 and 2015 for a total of 2010 infants, out of a total number of 165,450 admissions to neonatal units. Out of all registered deaths, 52% were for infants born with a gestational age of < 28 weeks. By adding infants born between 29 and 32 weeks of gestational age, 65% of deaths are covered; including infants born between 33 and 36 weeks, up to 83% of deaths are accounted for. Figure 18 illustrates the rate of death and survival per gestational age of infants admitted to neonatal units in our study.
FIGURE 18.
Mortality and survival rates of infants by gestational age.
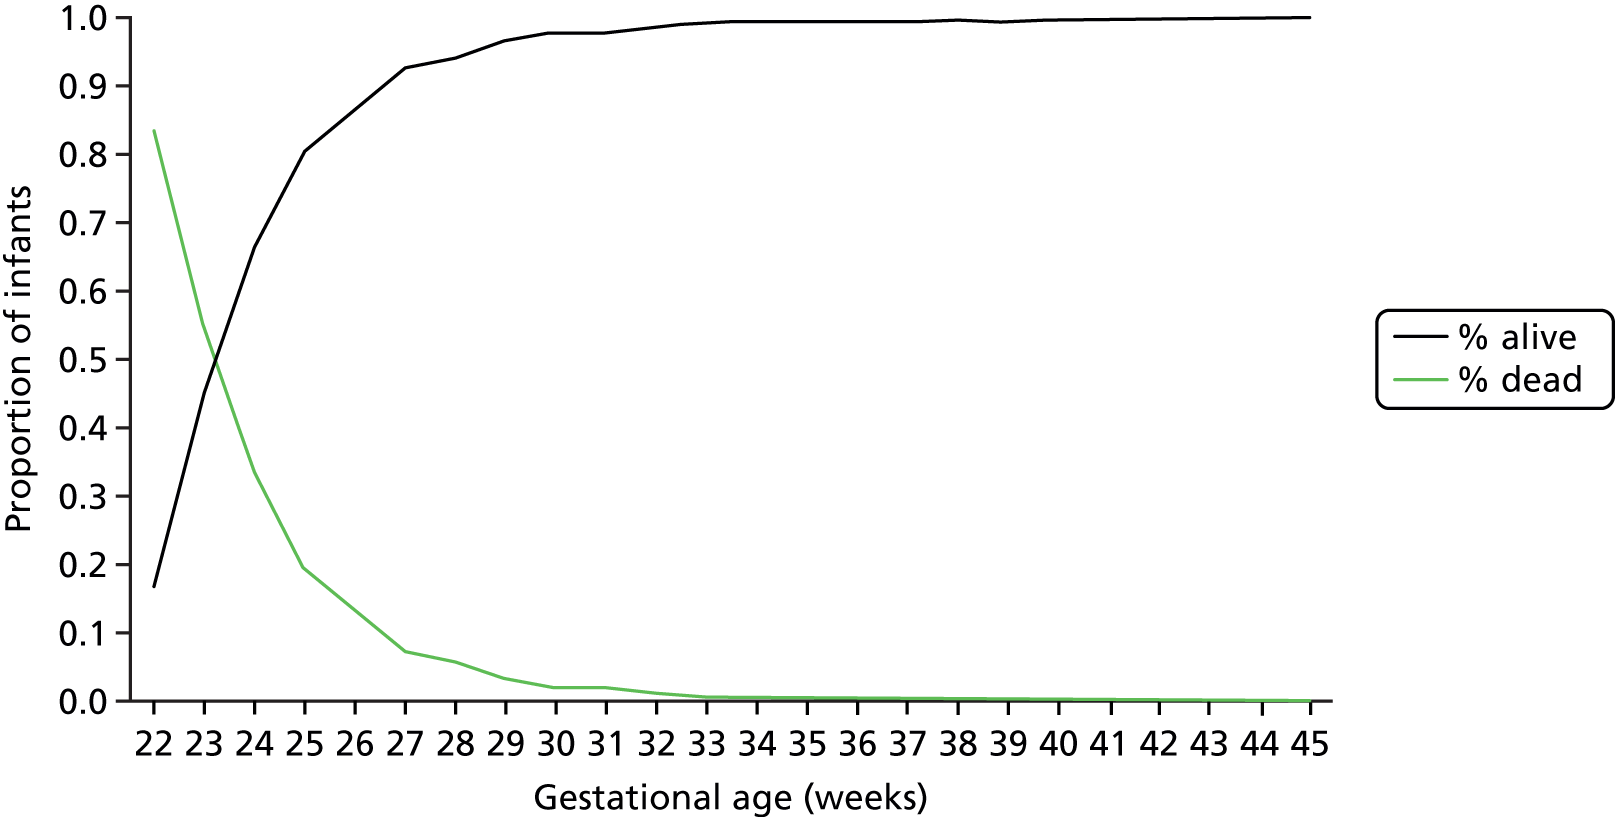
Method
High-risk infants tend to be treated in high-volume units, so in order to estimate the effect of volume on mortality, it is important to measure this effect in a representative sample of infants, including both high- and low-risk infants. More recent studies have aimed to estimate the causal effect of volume using an IV approach to control for confounding. The proximity to care can be used as an instrument that determines the chances of receiving care (e.g. birth in a hospital with a NICU) and should be independent of infant mortality. Proximity to care can be used to control confounding by estimating the difference in mortality between those who live close to NICUs and those who live far from NICUs, and both groups should be made up of a comparable mixture of high- and low-risk infants. The strength of an instrument can be tested by looking at the relationship between the instrument (i.e. travel time) and attendance at high-volume NICUs. In our case, a strong instrument would imply that those who live nearest to high-volume units are more likely to attend at those hospitals (i.e. the t-statistic on travel time, or the F-statistic if there is more than one instrument, is > 10).
Watson et al. 19 used an IV approach based on travel distance alongside eight other instruments [i.e. surgical facilities (1 = yes, 0 = no), high volume (1 = yes, 0 = no), Level 3 (1 = yes, 0 = no), Level 2 (1 = yes, 0 = no), distance × surgical facility, distance × high volume, distance × Level 3 and distance × Level 2]. Level 3 represents NICUs and Level 2 represents LNUs.
The main analyses will use only one instrument (travel time or travel distance) to facilitate interpretation and to eliminate the need to identify and remove weak instruments when multiple instruments are used. The secondary analysis will use multiple instruments. We control for the following covariates in the model: age and age squared at birth, sex, deprivation of residence (quintiles of multiple deprivation), mode of delivery (emergency caesarean without labour, emergency caesarean with labour, vaginal non-spontaneous, elective section, unknown or vaginal spontaneous) and fetus number. A similar approach is used to estimate the impact of high volume on total LOS (sometimes referred as the super stay) and the associated reimbursement costs by level of care (BAPM) actually received, for infants referred to high-volume units, where length of hospital stay is defined as the number of days from admission to hospital discharge or death, whichever took place first. The LOS results are shown in the evaluation section of this report (see Chapter 9).
Two sets of neonatal mortality models are estimated: semiparametric and parametric models. The semiparametric model is a structural mean model (SMM)82 and serves to estimate the treatment effect on the treated, thus allowing for the possibility of different treatment effects between the treated (NICU-born) and untreated (non-NICU-born) infants. The parametric model instead adopts a bivariate (probit) distribution for mortality outcomes and the exposure status (birth in a hospital with a NICU vs. birth in a hospital without a NICU) and allows us to estimate the average treatment effect (i.e. the effect in the whole infant population, at the cost of imposing the assumption of homogeneity of treatment effect and normal distribution of unobservable confounding factors). We present both sets of results, but in the main discussion we focus on the semiparametric results, given that these results are based on less restrictive assumptions and so are more robust estimates of the effect. We have instrumented both the semiparametric and parametric models using an IV approach and, for comparison, run a linear probability model (LPM) that has no instrument [i.e. ordinary least squares (OLS)].
Two different units were considered: high-volume and tertiary units (i.e. NICUs). High-volume units are characterised by a minimum number of 100 admissions per year of infants with a birthweight of < 1500 g. Tertiary units are represented by NICUs that are the highest level of neonatal care, providing a service dedicated to babies needing respiratory support (ventilation) weighing < 1000 g, born at < 28 weeks’ gestation or needing significant continuous positive airway pressure support.
Like Watson et al. ,19 we estimated infant mortality for infants born at a gestational age of < 32 weeks in a high-volume unit or hospital with a NICU. In addition, we conducted analysis to explore the effect of neonatal transfers to a NICU hospital from a lower-level hospital in infants born before 32 weeks’ gestational age. We conducted a sensitivity analysis on the results for those born between 26+0 and 31+6 weeks of gestational age, to account for the possibility of bias due to the effect of imbalance in the distribution of extremely premature babies across treatment (hospital of birth) groups.
Secondary analyses of the relative effects of birth in a hospital with a NICU versus a SCU and a LNU were conducted using three available instruments of travel time to these three types of hospitals. These IV models were formulated as seemingly unrelated equations and estimated by simulated maximum likelihood. 83 In these analyses, neonatal mortality was analysed using multivariate probit distributions. Because we did not have complete information on the closest LNU and SCU units to some infants in the data set, we conducted these analyses excluding infants with incomplete data.
Results
We first checked if travel time was correlated with the exposure variable (i.e. birth in a hospital with a high-volume neonatal unit, and birth in a hospital with a NICU), thus supporting its use as an IV. Second, we looked at whether or not travel time is correlated with any other sample characteristics, such as birthweight and sex, to check if any possible effect of travel time on mortality operating through the exposure variable is confounded by other variables.
The descriptive statistics in Table 15 summarise sample characteristics by tertiles of travel time for high-volume units and NICUs and shows that in most cases there are no systematic differences of sample characteristics across the travel time tertiles. In addition to the exposure variables (delivery at hospital with a NICU and delivery at hospital with a high-volume unit), systematic differences arise only for deprivation of residence and unknown delivery mode; this suggests the need to control for possible confounding by these variables in our analyses.
| Outcomes and sample characteristics | Occurence of outcomes and sample characteristics by travel time to high-volume units and NICUs (%) | ||
|---|---|---|---|
| Travel time to high-volume units | Lower tertile (n = 4187) | Medium tertile (n = 4188) | High tertile (n = 4346) |
| Died | 7.45 | 8.62 | 9.19 |
| Discharged to home | 87.34 | 84.99 | 81.00 |
| Discharged to ward | 1.38 | 1.60 | 1.90 |
| Last record: transferred to another hospital/unit | 3.32 | 4.33 | 7.52 |
| Unknown destination | 0.52 | 0.45 | 0.39 |
| Gestational age at birth (weeks) | 28.40 | 28.49 | 28.43 |
| Birthweight (kg) | 1.19 | 1.21 | 1.20 |
| ≥ 2 fetuses | 26.39 | 27.39 | 27.36 |
| Female sex | 46.62 | 45.22 | 46.38 |
| Residence: most deprived quintile | 41.01 | 27.96 | 29.73 |
| Residence: 2nd most deprived quintile | 26.41 | 22.13 | 20.69 |
| Residence: 3–5 least deprived quintile | 32.57 | 49.90 | 49.58 |
| Caesarean delivery | 49.15 | 50.93 | 50.57 |
| Spontaneous vaginal | 36.52 | 36.34 | 37.75 |
| Unknown delivery mode | 5.85 | 2.79 | 2.99 |
| Delivery at high-volume unit | 37.76 | 14.06 | 10.78 |
| Travel time to a hospital with a NICU | Lower tertile (N = 4191) | Medium tertile (N = 4185) | High tertile (N = 4311) |
| Died | 8.26 | 8.89 | 8.14 |
| Discharged to home | 87.30 | 84.49 | 81.52 |
| Discharged to ward | 1.29 | 1.53 | 2.07 |
| Last record: transferred to another hospital/unit | 2.94 | 4.56 | 7.66 |
| Unknown destination | 0.21 | 0.55 | 0.60 |
| Gestational age at birth (weeks) | 28.41 | 28.43 | 28.47 |
| Birthweight (kg) | 1.19 | 1.20 | 1.21 |
| ≥ 2 fetuses | 25.84 | 27.60 | 27.70 |
| Female sex | 46.36 | 45.16 | 46.69 |
| Residence: most deprived quintile | 47.67 | 29.49 | 21.76 |
| Residence: 2nd most deprived quintile | 23.00 | 24.35 | 21.87 |
| Residence: 3–5 least deprived quintiles | 29.33 | 46.16 | 56.36 |
| Caesarean delivery | 48.34 | 50.75 | 51.54 |
| Spontaneous vaginal delivery | 37.06 | 36.92 | 36.67 |
| Unknown delivery mode | 4.84 | 3.70 | 0.00 |
| Delivery at hospital with NICU | 81.53 | 42.39 | 26.70 |
| Delivery at hospital with LNU | 13.36 | 47.22 | 58.76 |
| Delivery at hospital with SCU | 5.11 | 10.39 | 14.54 |
Table 16 shows the mortality model using LPM, semiparametric IVs and parametric IV bivariate probit model (marginal effect) for the high-volume units and hospitals with NICU. The controlled covariates used in these models are gestational age and age squared at birth, birthweight, sex, deprivation of residence, mode of delivery and fetus number.
| Estimated effect/parameter/test statistic | LPM | IVs linear SMM | IV (marginal effect) bivariate probit model |
|---|---|---|---|
| Causal effect on mortality of neonatal care at hospitals with ≥ 100 babies weighing 1500 g per year | |||
| Delivery at high-volume unit, absolute risk difference vs. non-high-volume unit (SE) | 0.009 (0.006) | –0.050** (0.020) | –0.012*** (0.004) |
| Minimum travel time (minutes) to high-volume unit, coefficient (SE) | N/A | –0.003*** (0.000) | –0.018*** (0.001) |
| Instrument strength: t-/z-test statistic | N/A | 32.2 | 32.0 |
| Hausman test χ2 statistic of H0: no endogeneity of treatment variable | N/A | N/Aa | 15.3*** |
| Causal effect on mortality of neonatal care in hospitals with a NICU | |||
| Birth at hospital with NICU | –0.009** (0.005) | –0.012 (0.012) | –0.006 (0.007) |
| Minimum travel time (minutes) to NICU | N/A | –0.010*** (0.000) | –0.031*** (0.001) |
| Instrument strength: t-/z-test statistic | N/A | 39.8 | 41.8 |
| Hausman test χ2 statistic of H0: no endogeneity of treatment variable | N/A | N/Aa | 0.1 |
The instrument strength reported for the IV model estimates, both in the linear SMM and bivariate probit models, shows that the instrument is strong (e.g. the t-score test statistic on travel time is 32 for high-volume units; rule of thumb is that a robust instrument has an F-test statistic of > 10). In addition, travel time affects the treatment variable (the probability of delivery at a hospital with a high-volume unit in one analysis and delivery at a hospital with a NICU in another) in the expected direction and is negative, implying that the longer travel times are associated with a lower likelihood of birth in hospitals with high-volume units and of birth in hospitals with NICUs.
The estimated causal effects of the IV models indicate that delivery in high-volume units reduces neonatal mortality by 1.2 percentage points in accordance with the bivariate probit model and by 5.0 percentage points with the linear SMM. In contrast, the LPM reports high-volume units having an increased risk of death, but this result is likely to be affected by confounding issues (i.e. high-volume units treat high-risk infants and so are likely to have higher mortality), as indicated by the Hausman test statistic. Sensitivity analyses excluding infants born at < 26 weeks’ gestational age were also conducted and they confirmed these findings (see Appendix 2).
Birth in a hospital with a NICU does not appear to result in any difference in terms of mortality relative to other hospitals, as summarised in Table 13. These results are based only on the use of one instrument: travel time to closest NICU hospital. We ran additional analysis to explore the effectiveness of NICUs for those infants born in a hospital with a NICU or transferred within the first 48-hour period. Of all neonatal transfers with a recorded transfer time (n = 1519), 65% took place within 48 hours of birth. Infants who were born in a hospital with a NICU or who were transferred to a hospital with a NICU had no detectable effect on mortality, using the IV approach based on the single instrument of travel time to closest NICU (or distance to closest NICU). The same results were obtained when the sample was limited to those infants born between 26+0 and 31+6 weeks’ gestational age (see results in Appendix 2).
Secondary analysis of the relative effects of birth in a hospital with a NICU compared with a hospital with a SCU or a LNU were conducted using three available instruments of travel time to these three types of hospitals. In these additional analyses, we find that the NICU does appear to reduce mortality, compared with the other levels of care, by 2 percentage points, and so suggests that NICUs in themselves have some beneficial impact on mortality compared with other levels of care (see Appendix 2).
Discussion
We estimate infant mortality for infants born at a gestational age of < 32 weeks as a function of exposure to high-volume unit or hospital with a NICU at birth. We find that exposure to a high-volume unit at birth reduces mortality relative to other neonatal units. A very preterm infant born in a high-volume unit (≥ 100 babies weighing < 1500 g per year) has a 5-percentage-point lower risk of death in this unit than in other neonatal units when travel time is used as the instrument and mortality is estimated using a semiparametric method (linear SMM). This estimate drops to 1.2 percentage points when the same analysis is run using a parametric method (bivariate probit). There is a debate to be had about which result should be given greater credence. The semiparametric approach is based on less-restrictive assumptions and, therefore, is potentially more robust to violations of assumptions underpinning the analysis, so we have chosen to emphasis this result here; to allow comparisons with existing literature in this area, it is necessary to further discuss the parametric result. The parametric result is also the one that we use in the evaluation section of this report to calculate the incremental cost-effectiveness of high-volume units, to avoid potential problems with predicted values outside the 0–1 probability range.
Watson et al. 19 found that a preterm infant born in a high-volume unit (defined as those in the top quartile of all neonatal units) has a 2.6-percentage-point lower risk of death than in other neonatal units when travel distance is used as the instrument and mortality is estimated using a parametric method. This percentage point risk reduction is not immediately apparent from the paper, but can be calculated from the reported OR of 0.68 for in-hospital mortality reported in the paper (which approximates the risk ratio in cases like this when the deaths are rare), and the in-hospital mortality for high-volume units reported as 5.5 percentage points in the descriptive statistics [giving an estimated percentage point reduction of approximately = (5.5/0.68) – 5.5 = 2.6 percentage points]. The 2014 estimate of Watson et al. 19 is higher than the 1.2 percentage point reduction found by our parametric approach. An obvious explanation for the differences is the definitions used for high-volume units, but similar results were found when we defined high volume as those in the top quartile of all neonatal units. Another reason for the differences is the instruments used, given that Watson et al. 19 used travel distance and we explored the use of both travel distance and travel time. We report here only the results based on travel time as an instrument because there is strong support for travel time accurately representing access to health-care services. Sensitivity analysis excluding infants born at < 26 weeks of gestational age halves the mortality effect of birth in high-volume units compared with other units (2 vs. 5 percentage points in all the infants aged < 32 weeks’ gestational age), but the estimates are imprecise.
A baby being born at < 32 weeks’ gestational age in a hospital with a NICU does not appear to result in any difference in terms of the risk of death compared with other units. Similar results are also found by Watson et al. 19 We ran additional analysis to explore the effectiveness of NICUs for those infants born in a hospital with a NICU or transferred within the first 48-hour period. Birth at a hospital with a NICU or being transferred to a NICU within a 48-hour period had no detectable effect on mortality when using the IV approach based on the single instrument of travel time to closest NICU (or distance to closest NICU).
In our interviews, policy-makers raised queries about the robustness of the finding that NICUs did not affect the risk of death compared with other hospitals. To check the robustness of the result, we present additional analyses comparing the effectiveness of NICUs with other levels of care (i.e. NICU vs. LNU and NICU vs. SCU). All other results for the NICU were based on only one instrument: travel time to closest NICU. The advantage of considering other levels of care is that it opened up the approach to using three instruments: travel time to the closet NICU, LNU and SCU. A slight disadvantage of the approach is that the data set was less complete, because we did not have complete information on the closest LNU and SCU for some infants in the data set; therefore, we were restricted to performing these additional analyses on a smaller data set that excluded infants with incomplete data. In these additional analyses, we find that NICU does appear to reduce mortality by 2 percentage points, compared with the other levels of care.
A limitation of the data and analysis is that it is currently not possible to estimate the impact of mortality for those infants who are transferred into NICUs. The numbers of transfers are not insignificant; for example, for all infants with a gestational age of < 33 weeks at birth and who have ≥ 7 days of BAPM Level 1 (intensive) care, 61.2% are born in a hospital with a NICU, 18.9% are born in a hospital without a NICU and are transferred to a NICU and 19.8% are born in a hospital without a NICU and are not transferred to a NICU. We are therefore unable to separate out the benefits of antenatal care taking place prior to birth. It is clear that birth in a high-volume unit leads to improvements in mortality, and closing down low-volume units might lead to more infants being born in high-volume units, but the impact of changes in transfers is unclear.
Costs
In this part of the study we had planned to look at NHS neonatal costs in more detail by first gaining a better understanding of the national reference costs and how they inform HRGs. We had also planned to assess the components that make up the national reference costs by collecting data from the four main types of neonatal units that currently exist in the UK, and explore how these data are seen to vary by the number of infants. Finally, we had planned to estimate the costs of neonatal care for families, based on a survey of family costs by BLISS.
When looking at the national reference costs84 and how they inform HRGs, it became clear that units were still paid in accordance with the HRG 2001 data set,85 which did not accurately reflect resource usage by BAPM guidelines2 (i.e. nurse-to-infant ratios). The reference cost submissions in July 201786 were the first to ask for units to submit data in accordance with the revised HRG reference cost guidance that took BAPM 2011 guidelines2 into account. During the course of our study and interviews with unit staff, a lot of units were still trying to work out how best to apply the new guidance and so were reluctant to release cost data, making it hard to apportion costs to the different activities. To assess the impact on NHS costs, we decided to shift the focus from assessing the components that make up the reference costs to exploring the impact of high volume on the LOS of infants, to allow us to begin to explore the impacts of reorganisation. Further work on the cost components would be possible using the submissions under the new guidance that became available in January 2018, but which is beyond the scope of this current report.
Literature review
There are a number of papers that look at the impact of gestational age on hospital neonatal costs and families. Rogoswki et al. 87 explored the impact of gestational age on neonatal and perinatal cost in the American Vermont Oxford hospital network for NICUs. Costs were classified into accommodation costs and ancillary costs; ancillary costs were divided into five subcategories: respiratory therapy, laboratory, radiology, pharmacy and other ancillary. The authors show how costs vary within gestational age, birthweight, location of birth and discharge status. The category of infants who have the highest costs are those born between 24 and 26 weeks, with a birthweight of < 1000 g and born outside the hospital. The study also shows an inverse relationship between costs and gestational age; this result is also confirmed for neonatal and childhood costs for extreme preterm88 and preterm births. 89 Further work by Petrou et al. 88 estimated costs for extremely preterm birth for families using evidence from a population study. Results show that extremely preterm births are associated with higher public sector costs and there is an inverse relationship between costs and gestational weeks. Several sociodemographic covariates were included in the model, but only long-term unemployment is associated with an increase in costs.
For service reorganisations, it is important to consider the impact on costs as services change and the effects of economies of scale and scope. One approach used to address this question is to look at the elements that make up the costs and analyse how they vary by case mix. The UK Neonatal Staffing Study Steering Group developed a cost function to evaluate the nature and the degree of economies of scale in the provision of care for NICUs. 90 The economic analysis shows that volume and case mix interact to determine the degree of economies of scale, even if the determinants of costs and efficiency in neonatal costs have a high complexity. The treatment of the sickest infants centralised at a regional level can take advantage of economies of scale. Another study by O’Neill et al. 91 investigated the relationship between activity (total days of care provided and total days of intensive care provided) and costs (clinical staffing, support services and overheads) using a multivariate regression model. They found an inverse relationship between average cost per day and scale of services provided, confirming the benefits of centralisation of intensive care in larger units. The authors91 also show that the adoption of a different form of estimation (i.e. the log–log or double-log function) provided the best fit to the data.
Another approach is to simply look at the costs of high-volume units compared with low-volume units. Watson et al. 92 costed NICU services using the tariffs paid to hospitals to cost high-volume NICUs compared with low-volume NICUs, and compared their effectiveness in terms of reductions in the risk of mortality to estimate the cost-effectiveness of moving £100 to high-volume NICUs. The study estimated an incremental cost per life saved of £420,000 per life-year saved. 92
Reference costs and how they inform Healthcare Resource Groups
Historically, HRGs for infant intensive care tended to be too low and HRGs for infant special care tended to be too high. Intensive care for infants should use similar costs to intensive care for adults and so should be much higher. For example, the ratio of HRGs in 2014/15 were intensive care = 2.8 × special care, high dependency = 2 × special care, special care = transitional care. This anomaly has arisen because of the way units have submitted reference costs; there is a tendency to average the nursing over all infants rather than to apportion nurses’ costs to the care needs of infants based on BAPM guidelines. 2 Differences between units’ costs have also arisen as a result of the way that units apportion:
-
costs between neonates and paediatrics
-
costs between the different neonatal unbundled HRGs
-
diagnostic costs
-
layout and organisation costs, etc.
Reference cost submissions inform HRGs, but there is a lag whereby HRGs change more slowly than the reference cost submissions. Payments continue to be based on the 2001 HRGs despite the new BAPM classification in 2011. An update to BAPM 2011 was agreed in 2015, and this went through the appropriate systems to flow into the NHS data collection systems from December 2016. There are now two sets of data being collected: HRG 2001 for price and payment, and HRG 2016 for reference costs. Figure 19 shows the information flows relative to the two BAPM classifications.
FIGURE 19.
Example of information flows for 2014/15 data.
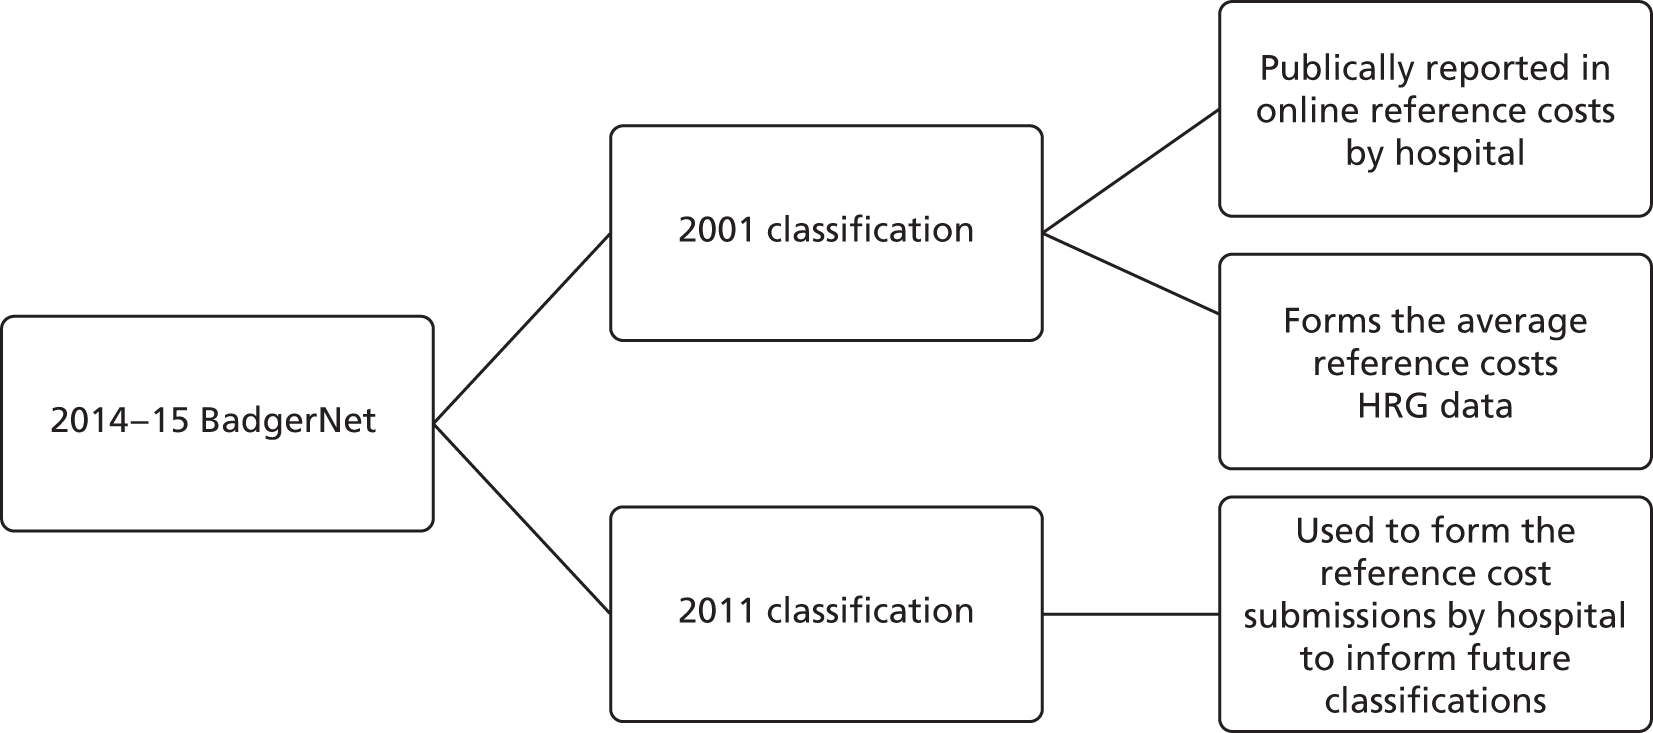
Length of stay and costs
Methods
In this section, we explore the impact of service configuration on LOS and cost the LOS using a microcosting approach based on the HRG per diem reimbursement.
Length of stay (LOS) is defined as the number of days from admission to hospital discharge or death, whichever takes place first. In our analysis, we assumed that the infant spell was censored if the last episode for an infant was a transfer to another hospital (detailed results available from the authors). The costs of reimbursement for neonatal services for the whole inpatient spell were derived by applying HRG per diem reimbursement tariffs for 2015 based on the 2001 reference costs and payment system, which were the reimbursement opportunity cost to hospitals at the time of this study. In 2015, tariff costs were as follows: intensive care-days were reimbursed at £1176.47, high-dependency-days at £847.15, special care-days at £532.95, normal care-days at £424.35 and transitional care-days at £464.23.
We consider the impact on LOS and reimbursement of two service configurations: (1) high volume and (2) birth in a NICU compared with birth in a LNU or SCU. As with the mortality modelling, for the analysis of high-volume units we use the whole data set, whereas, for the comparison of NICUs with other levels of care (LNU and SCU), we use a slightly smaller data set that excluded infants with an incomplete number of data on the closest LNU and SCU.
The analysis used an IV approach similar to the one employed to analyse mortality. Following convention, LOS and costs were assumed to follow a log-normal distribution,93–95 whereas the two additional equations, for the SCU and LNU binary treatment indicators, were modelled as before using a probit equation in each case. The same instruments and covariates as for the analysis of mortality were used for obtaining estimates of these models, and included covariates for gestational age, gestational age squared, infant sex, last decile of IMD score, mode of delivery and number of fetuses. We present the results of naive OLS regressions of the LOS and cost equations for comparison.
In order to avoid problems in convergence of model estimation, the model that was developed included 172 cases that presented incomplete hospital spells without adjustment for censoring (1.5% of overall data).
Results
Table 17 shows that the total LOS following birth in a high-volume unit is 9 days longer and costs £5715 more to commissioning bodies than birth in another neonatal unit.
| Estimated effect/parameter/test statistic | LOS (days) | Reimbursement costs (£) | ||
|---|---|---|---|---|
| Naive univariate OLS regression | IV multivariate linear model with probit treatment equations | Naive univariate OLS regression | IV multivariate linear model with probit treatment equations | |
| Birth at high volume, absolute risk difference (SE) | 0.6 (1.2) | 9.1*** (2.7) | 231 (749) | 5715*** (1676) |
| Instrument strength: the extent to which travel time (minutes) predicts attendance at hospital, coefficient (SE) | N/A | –0.018*** (0.001) | N/A | –0.018 (0.001)*** |
| Likelihood ratio test statistic | N/A | 31.7*** | N/A | 31.8*** |
| Hausman test z-statistic of H0: no endogeneity of birth at high-volume unit | N/A | 3.74*** | N/A | 3.86*** |
Table 18 shows that the mean total LOS following birth in a LNU is shorter by 1–2 days, whereas birth in a SCU results in 3–4 fewer total hospital days, relative to a NICU. Although the IV estimates are not significant, the diagnostic test results are consistent with the idea that the variables of interest, birth at LNU and birth at NICU, are not endogenous and, therefore, a simple OLS model may provide valid approximation to the true effects on LOS. The same result applies to IV estimates of effect on reimbursement costs, which were both statistically insignificant. A simpler OLS model suggests that a birth in a SCU is £1870 less costly to commissioning bodies than a birth in a NICU, although the effects are imprecisely estimated. In contrast, reimbursement costs for a birth in a LNU is £643 less costly to commissioning bodies than a birth in a NICU, but the result is not significant. These log-linear model estimates are back-transformed to original units, adjusting for the non-linear effect of the error variance on treatment effect estimates.
| Outcome | LOS (days) | Reimbursement costs (£) | ||
|---|---|---|---|---|
| Naive univariate OLS regression | IV multivariate linear model with probit treatment equations | Naive univariate OLS regression | IV multivariate linear model with probit treatment equations | |
| Birth at LNU, absolute risk difference (SE) | –1.9* (1.1) | –1.4 (1.9) | –643 (681) | 834 (1180) |
| Birth at SCU, absolute risk difference (SE) | –3.5** (1.7) | –2.7 (2.9) | –1870** (1042) | –1770 (1772) |
| Instrument strength for minimum travel time (minutes) to NICU, absolute risk difference (SE) | N/A | LNU equation 0.033 (0.001)*** | N/A | LNU equation 0.033 (0.001)*** |
| SCU equation 0.015 (0.001)*** | SCU equation 0.015 (0.001)*** | |||
| Instrument strength for minimum travel time (minutes) to LNU, absolute risk difference (SE) | N/A | LNU equation –0.054 (0.001)*** | N/A | LNU equation –0.054 (0.001)*** |
| SCU equation 0.007 (0.001)*** | SCU equation 0.007 (0.001)*** | |||
| Instrument strength for minimum travel time (minutes) to SCU, absolute risk difference (SE) | N/A | LNU equation 0.007 (0.001)*** | N/A | LNU equation 0.007 (0.001)*** |
| SCU equation –0.062 (0.002)*** | SCU equation –0.062 (0.002)*** | |||
| Likelihood ratio test statistic | N/A | 46.04*** | N/A | 45.9*** |
| Hausman test z-statistic of H0: no endogeneity LNU treatment variable | N/A | 0.26 | N/A | 1.57 |
| Hausman test z-statistic of H0: no endogeneity SCU treatment variable | N/A | 0.29 | N/A | 0.03 |
| Test z-statistic of H0: valid overidentifying restriction of minimum travel time to NICU | N/A | 0.40 | N/A | 0.36 |
Discussion
Length of stay following birth in a high-volume unit has a mean duration of 9 days longer and a mean cost of £5715 more to commissioning bodies than LOS following birth in another neonatal unit. LOS following birth in a LNU is shorter by 1–2 days, whereas birth in a SCU results in 3–4 fewer total hospital days, relative to a NICU. For reimbursement costs, a birth in a SCU is £1770 less costly to commissioning bodies than a birth in a NICU, although the effects are imprecisely estimated (with overlapping CIs). The reimbursement costs to commissioning bodies for births in a LNU are no different from those for births in a NICU. This appears paradoxical given the longer total LOS for birth in a LNU; however, a possible explanation for these results is the different production functions between NICUs and LNUs in terms of their relative use of number of days at different levels of care.
We will return to the estimates of LOS and reimbursement again in Chapter 9, Evaluation of high-volume neonatal intensive care units compared with other hospitals, when we calculate the effectiveness of high-volume units and NICUs.
Parent costs
Data
Data were collected by BLISS on 1347 parents for neonatal events between 2010 and 2014 in the UK for infants with a gestational age of between 25 and 34 weeks, most of which took place in England (89%). The questionnaire collected clinical information about the pregnancy, infants and place of birth (gestational weeks, hospital and unit type, infant additional hospitalisation and LOS). Information was also collected on the financial status of individuals during the period when the infant was born and the expenses paid by the parents during the visit to the neonatal unit (overnight stays and the relative cost, costs of parking, food, public transport tickets, travel and childcare, how neonatal hospitalisation affected the family budget and access to new loans). Finally, information was collected on sociodemographic status (such as income, sex, age, relationship status and ethnic group).
Methods
An OLS cost model was developed in order to capture the factors that define and influence the costs borne by families during the event of a birth in a neonatal unit. These costs are considered ‘out of pocket’, meaning that they are not supported by the NHS, but they can have a significant impact on family budget, especially considering the long LOS of preterm infants in neonatal units.
The model evaluated the feasibility of a regression model in relation to several variables or characteristics of infants and families using a linear regression model. The dependent variable (the total costs for families) was defined by the following covariates: cost for food and travel (in GBP), the use of childcare and baby care when parents were away, overnights spent, the purchase of breast pumps, the use of parking, the use of unpaid leave, a dummy variable that represents parents both having had unpaid leave, if the employer of the partner was supportive in the maternity period, the average household income of parents, the days of visit per week in the neonatal unit, the presence of children at home and the relative number, the distance in miles from the birth hospital, the age of the parent, the use of public transport, the use of private and public transport and if the parent is in a couple.
Results
At an early stage of the analysis, concerns were raised over the missing data. Some answers were mostly complete; for example, infant LOS was only missing for 6% of cases. Other missing answers are attributable to families finding it difficult to recall such information; for example, the distance in miles (29% of cases were missing) and time (81% of cases were missing). The questionnaire contained 100 questions, with 22 questions relating to financial information, and some open-text questions. The final model is based on 614 complete observations, so caution is needed regarding the generalisability of these results.
Table 19 summarises the main results and shows that the cost of food and travel, the use of baby care, the use of car parking, the unpaid leave and the presence of unpaid leave for both parents, the average income and the support of the employer of the partner during the maternity period are all significant. Factors that reduce costs are the partner’s employer (a higher availability of the partner can help to reduce parents’ expenses), the LOS of the infant, and if the mother is in a couple (even if all the covariates are not significant). The model shows a good fit to the data with an adjusted R2 of 0.5847.
| Family cost | Coefficient | Standard error | t-value | p-value | 95% CI |
|---|---|---|---|---|---|
| Food*** | 1.260 | 0.277 | 4.550 | 0.000 | 0.717 to 1.804 |
| Travel*** | 1.069 | 0.125 | 8.570 | 0.000 | 0.824 to 1.313 |
| Use of childcare | 3.548 | 30.633 | 0.120 | 0.908 | –56.615 to 63.711 |
| Use of baby care*** | 53.622 | 18.435 | 2.910 | 0.004 | 17.416 to 89.827 |
| Use of overnight stay | 25.758 | 50.885 | 0.510 | 0.613 | –74.179 to 125.695 |
| Purchase and use of breast pump | 28.238 | 131.118 | 0.220 | 0.830 | –229.274 to 285.750 |
| Use of car parking*** | 63.358 | 19.474 | 3.250 | 0.001 | 25.111 to 101.606 |
| Unpaid leave*** | 484.903 | 20.517 | 23.630 | 0.000 | 444.607 to 525.199 |
| Unpaid leave for both parents*** | 228.359 | 47.345 | 4.820 | 0.000 | 135.375 to 321.343 |
| Support from partner’s employer** | –42.203 | 19.859 | –2.130 | 0.034 | –81.206 to –3.201 |
| Household income*** | 0.002 | 0.000 | 3.660 | 0.000 | 0.001 to 0.000 |
| Number of days of visit in unit per week | 7.525 | 8.192 | 0.920 | 0.359 | –8.564 to 23.614 |
| Children at home | 9.601 | 11.147 | 0.860 | 0.389 | –12.292 to 31.494 |
| Distance in miles from birth hospital | 0.037 | 0.318 | 0.120 | 0.908 | –0.588 to 0.661 |
| Age | 2.445 | 1.779 | 1.370 | 0.170 | –1.050 to 5.940 |
| Use of benefits | 22.537 | 23.512 | 0.960 | 0.338 | –23.641 to 68.714 |
| Use of only public transport | 16.565 | 48.250 | 0.340 | 0.731 | –78.198 to 111.327 |
| Use of public and private transport | 31.75 | 22.81 | 1.39 | 0.16 | –13.04 to 76.55 |
| Couple status | –23.07 | 36.86 | –0.63 | 0.53 | –95.46 to 49.32 |
| Weeks of gestational age | 0.11 | 2.77 | 0.04 | 0.97 | –5.33 to 5.55 |
| Weeks of LOS | –1.92 | 1.48 | –1.30 | 0.20 | –4.84 to 0.99 |
| Constant | –204.12 | 130.68 | –1.56 | 0.12 | –460.76 to 52.52 |
Discussion
The model shows that unpaid leave, food, travel, baby care and parking all have a significant impact on costs. The support from a partner’s employer can reduce costs, as does the availability of the partner to help (e.g. with preparation of meals to take to the hospital and other facilities).
The questionnaire was long, which may have increased the likelihood of missing data. To improve completeness, we recommend fewer questions that did not use free text.
What is important to families?
The objective of this part of the study is to undertake qualitative research on the factors that families and policy-makers would like to see taken into consideration when determining service reconfiguration. The aim is then to assess the feasibility of including these aspects in a DCE, which is typically used in health economic evaluations.
The interest in DCEs in health-care decision-making has increased in recent years. DCE is a method that allows a number of characteristics to be traded off against each another. 96,97 Janus et al. 97 report a systematic review of preference elicitation studies, defining categories for studies that informed clinical decision-making, supported reimbursement decisions (as in health technology assessments) or elicited the perceived benefits and risks of health innovation for the market authorisation of drugs; in all of these types of decision, DCEs were adopted.
There are review articles summarising how qualitative research can be used to inform health-care research. 98–100 There are also applied examples of how qualitative research has been used to inform outcomes important to families and policy-makers in other areas (e.g. for children and young people with neurodisability). 101 In addition, we are aware of two methodological papers that give detailed advice about how attributes might be developed for a DCE,102,103 but very few DCEs report the attribute development stage in any detail. 104 In this research, we follow the steps suggested by Coast et al. 102 and, like Klojgaard et al. ,103 we recommend cognitive interviews to help identify if any attribute might prove problematic in the DCE. Data collection may take the form of interviews or focus groups in the absence of a well-constructed meta-ethnography. Coast et al. 102 suggest that the choice between these methods may be a result of practicalities: interviews are recommended for sensitive topics (attitudes towards end of life) and focus groups are recommended if discussion among those affected may reveal additional issues.
The preferences present in DCE studies are related to health and non-health outcomes, processes and service characteristics. 104 A crucial element in the DCE process is the selection of appropriate attributes for outcomes and process characteristics. It is also likely that including qualitatively different attributes can also increase the complexity of the decision and may make the choices harder to complete. If we consider service reorganisation, such as centralising health services, the impacts can be present in both health, non-health and process characteristics. 105 DCEs have been proposed to examine patients’ and decisions-makers’ preferences towards such reorganisations of care, such as those currently under review for centralisation of neonatal care. 33 However, such applications face the additional challenge that the outcomes may take place at different points along the care pathway (e.g. risk of hospital mortality for the mother or child vs. risk of longer-term childhood disability) that increase decision complexity. Although no formal DCE study been undertaken here, the qualitative research will be used to inform the outcomes of interest that will be used in a later DCE and to assess the feasibility of using DCEs in future service reorganisations of neonatal care.
Systematic review
The current guidance for attribute selection in DCEs emphasises the need to achieve a balance between the competing objectives of the participants and the decision-maker, the relevance of the research question(s) and if attributes are related to one another. 106–108 However, the challenges faced in selecting appropriate attributes for service provision, outcome or both have received less attention. The systematic review examines the extent to which researchers investigating antenatal and neonatal care through DCEs consider and justify in their design whether the attributes are for service provision, outcome or both (see Report Supplementary Material 1).
Methods
Systematic electronic searches of prespecified terms were performed in EconLit, EMBASE HMIC (Healthcare Management Information Consortium), MEDLINE, NHS EED (Economic Evaluation Database), PsycINFO and Web of Science databases, from 2000 to June 2016. DCE studies investigating topics on premature infants, neonates, newborns, or mothers/fathers/parents were included. Studies were excluded if the participants were children or adolescents aged < 16 years.
Results
After removing duplicates, 9701 unique results were identified but only 299 DCEs for antenatal and neonatal care were initially considered, of which 13 met the inclusion criteria. The selection of studies is presented in the Preferred Reporting Items for Systematic Reviews and Meta-Analyses (PRISMA) flow diagram109 (see Appendix 3, Figure 31).
Most of the studies were conducted in industrialised countries (UK, n = 4;110–113 Australia, n = 3;114–116 the Netherlands, n = 2;117,118 and Canada, n = 1119), and three were conducted in developing countries. 120–122
The objective of the elicitation exercise varied in all studies from types of obstetric services,117 screening tests for Down syndrome,113 induction of labour114 and delivery,118 perinatal experiences119 and supplementary diet,121 among others. Most of the studies involved women participants, and health-care providers were included in only two studies. 115,122 Almost 80% (10/13) of the studies focused on antenatal care, including one that considered both antenatal and postnatal care. The number of individuals participating in the DCEs varied from 56 to 1464 (mean 284, median 130). The mode of administration was also diverse, with web-based questionnaires;110,115,118 postal questionnaires,111,117 and pen-and-paper questionnaires at clinics and teaching hospitals,113,114,119,121 with the rest reporting using a questionnaire but without specifying the mode of administration. 112,116,120,121 The reduction in studies selected (from 299 to 27) due to eligibility is because the vast majority related to paediatric rather than neonatal care and/or did not relate directly to DCE. Overall, the studies showed a heterogeneous picture of selection of attributes for service provision, outcomes or a mix of both, but there is a lack of consideration or justification for these choices.
Summary of approaches used to develop attributes within these discrete choice experiments
Attributes were selected by reviewing existing studies,111 as part of the characteristics of the intervention being evaluated in a randomised controlled trial,113,118 qualitative interviews with patients and/or stakeholders,112,113,117,118,122–124 literature review and qualitative interviews,110,115,116,120,125–127 and international guidelines. 121 However, in some studies it was unclear how the authors reduced the number of attributes obtained in qualitative research to a manageable set of attributes. 116
Focus group
At the beginning of the study, we started with a set of attributes suggested by the pilot work, which included one process outcome (access to neonatal services) and three health outcomes: maternal mental health, infant death and risk of childhood health problems. We presented these attributes to the first focus group before conducting the qualitative interviews, giving examples of how they might be shown to parents:
-
maternal mental health – reduce anxiety and depression
-
risk of infant death for those born at 24 weeks of gestational age – reduce from 5 in 1000 to 2 in 1000 infants
-
risk of childhood health problems – eyesight problems increase from 1–2 in 100 to 2–5 in 100 infants
-
access to neonatal services – increases travel time for some families from 60 to 120 minutes.
Although some of the outcomes, like access and travel times, are more straightforward, the issues of risk and uncertainties over morbidity are clearly complex, and so the research set out to explore the feasibility of DCEs, or other approaches, to collect data to inform the weights that decision-makers can apply in this context. Examples of framing considered for uncertainty in focus groups were as follows:
-
Low confidence – our confidence in this effect estimate is limited.
-
Medium confidence – we are moderately confident in this effect estimate.
-
High confidence – we are very confident that the true effect lies close to our estimate.
Or:
-
Between 1 and 10 infants, most probably 5 infants, out of 100 will experience eyesight problems.
Most parents felt that the presentation of these options was difficult and not easy to understand and compare, and two parents preferred to use the confidence levels rather than the values reported for risks. We also presented parents with a table to illustrate risk with a pictogram with 100 faces, showing 2% chance as two faces of different colours. Generally, it was felt to be a clear presentation of risk. We also showed parents the protocols we were aiming to use in the qualitative study, which aimed to discuss the parents’ experiences focusing on a set of open questions. Little additional feedback was given on these protocols in the focus group.
Patient preference interview
The qualitative study built on earlier public and patient involvement work,33 which aimed to identify outcomes that were important to families of children requiring neonatal care. The qualitative research explored these outcomes further and aimed to refine the language that is used to describe these outcomes, to explore in what ways these outcomes are perceived to vary by parents and to identify if any attribute might prove problematic in the DCE.
Methods
Recruitment of participants
We purposively sought to interview parents who had a child discharged from the neonatal service within the previous 6 months to 5 years, who were interested and willing to share their experience of using the neonatal service. We aimed to recruit a varied range of parents to provide further insight into the issues and outcomes that are important and how they describe those outcomes. Carrying out the interviews at participants’ houses broadened the scope of who we could interview.
Neonatal support groups, such as BLISS and SNUG (Supporting Neonatal Users and Graduates), hold a list of parents who have consented to be contacted for future research. We advertised the study through this list of parents and through a conference in south-west England on neonatal services to parents held in October 2016 in Torquay, as well as through families known to the neonatal unit at Royal Devon and Exeter NHS Trust through the lead link, Sue Prosser, who is Matron of the neonatal unit at Royal Devon and Exeter NHS Trust. The advertisement is provided in Report Supplementary Material 2.
At the recruitment stage, prospective participants were provided with written information about the purpose of the research, what the interviews would involve, how long the interviews would take and how their data will be used (see Report Supplementary Material 2). Prior to the beginning of the interview, participants were asked to sign a consent form (see Report Supplementary Material 2).
Flexible topic guide
A flexible topic guide for individual interviews with parents (see Report Supplementary Material 2) was developed. The semistructured probing questions were based on a series of attributes that were raised from patient and public involvement (PPI) in a previous study of neonatal care;33 a review of the literature; outcomes suggested by the National Perinatal Epidemiology Unit (www.npeu.ox.ac.uk/research; accessed January 2018); and PPI feedback from a NeoNet PPI group held in Exeter in July 2016. In 2017, a set of outcomes for neonatal care was under development for the COMET initiative (www.comet-initiative.org/; accessed January 2018),128 but the study was at too early a stage to inform our work. The topic guide was piloted with two parents and then amended in the light of feedback prior to commencing data collection.
Interview process
The 10 interviews were carried out by Katie Kelsey, five in the University of Exeter St Luke’s Campus, four in family homes and one in a children’s centre following a SNUG coffee morning. The lengths of the interviews were tailored to suit the participants, and varied from 35 minutes to 2 hours. Both parents were interviewed in two cases, and the mother was interviewed in all other cases.
Data management and analysis
The interviews were recorded digitally and transcribed verbatim. During transcription, all names and places were anonymised: any names of parents reported here are pseudonyms. Thematic analysis supported through a framework approach was used. 99,129
Two researchers (KK and PL) initially read through the transcripts and developed a thematic coding framework that captured the factors that parents would like to see taken into consideration in determining the configuration of neonatal services and how they describe them. The coding framework was then used to code the transcripts to generate relevant themes and subthemes using NVivo version 11 software (QSR International, Warrington, UK). The framework (see Report Supplementary Material 2) was developed further as they (researchers KK and PL) became more familiar with the content.
Katie Kelsey and Paolo Landa separately coded two transcripts to check for comprehensiveness and consistency of coding. Differences that arose in interpretation between the researchers were discussed. Katie Kelsey and Paolo Landa then coded all remaining materials from the interviews.
Thematic charts were developed:
-
Thematic matrices were created in NVivo version 11 to help with the analysis.
-
The coded data for each transcript were summarised in the matrices so that for every theme and subtheme we had a summary of each person’s related dialogue.
-
Each of the themes were then synthesised further so that we had a condensed version of each theme.
The summaries for each of the main themes were presented to a final PPI group meeting on 5 June 2017, to which all of the interviewed parents were invited. This group validated the results and discussions took place to further refine the outcomes.
Ethics approval was granted by the University of Exeter Medical School Research Ethics Committee (reference Dec16/B/096Δ2).
Results
Ten families were interviewed using the flexible topic guide (see Report Supplementary Material 2), which explored the following characteristics:
-
Hospital environment.
-
Travel time and means of transport.
-
Impact on the family (emotional and financial).
-
What is important for the family?
-
Language used, sensitivity, medical language, how parents explain the events, services and treatment.
-
Understanding of risks – infant survival and long-term disabilities.
-
Mitigating aspects – family support, SNUG and BLISS support and hospital staff support.
-
Background – gestation weeks, LOS and other children in family.
The families that were interviewed all had very different stories. The gestational time ranged from 24 to 34 weeks and the LOS ranged from 2 to 17 weeks. For half of the families, this was their first child. Some of the births were in a NICU and some were in a LNU; some of the babies born in a LNU were transferred to a NICU.
A summary of the synthesis under each theme as presented to the PPI group is presented in the following sections. We identified the themes in the coding process (see Report Supplementary Material 2).
Hospital environment
The families that were interviewed reported having very profound experiences in the neonatal units. They reported feeling deep and contrasting emotions of trauma, anxiety, frustration and excitement as they lived through the first weeks of their baby’s life, often not knowing if their baby would survive. One mother spoke of the moment of excitement when the hospital staff began referring to the time ‘when’ she would take her baby home, implying the ‘if’ prior to that. They all had very vivid and detailed memories of their time in the neonatal units, even years after their baby was born. The parents became attached to the care teams/nurses and felt that they were ‘like family’. Communication was very important and parents felt supported by the staff and that they could always ask questions. They would frequently telephone for updates, and felt that their baby was getting the best care.
There were also some occasions when parents noticed a problem with their baby and they had felt that it took a long time for the hospital staff to take notice.
Parents found it very helpful to have a tour of the neonatal unit before the birth, as they were then mentally prepared for the sight of their baby in an incubator and attached to tubes and monitors. An issue highlighted by some parents was the difficulty they found with initial bonding. This was for various reasons: partly because of all the equipment, partly that there were so many other people involved in the care of their baby and also the anxiety around the baby’s vulnerability. It made a big difference when the hospital staff encouraged them to be involved.
The understandable attachment parents felt towards their care teams meant that transferring between hospitals could be a source of anxiety, even when moving nearer home to a lower level of care. On the other hand, those who had other children and were travelling every day to the neonatal unit and managing other childcare found that moving nearer to home was of great benefit. Some parents found the atmosphere in the NICU to be intense and preferred the more hands-on nature of the LNU.
Some families/mothers made good long-term friends while in the neonatal unit, as these were people with whom they had shared an extreme experience.
It was very important to families that they be involved in the care of their baby. If parents were travelling to the unit every day, and/or juggling other childcare, it made a big difference when the hospital staff took into account their timings so that they did not miss their baby being fed or washed.
It has been reported in recent studies130–132 that it is important to involve parents in the process of care when their infant is in a neonatal unit. This process usually consists of feeding the infant with breastmilk, cleaning and bathing, taking care of the infant and letting the infant feel the mother’s presence.
Some parents felt that it was crucial for them to have been able to stay at the neonatal unit. Those who did not stay spent every day there and found that the facilities made a big difference. It was important that they could bring their other children to the unit, and the nurses made this very possible:
[. . .] although it was a stressful, worrying situation you’re in, it was nice at the same time, it was really bizarre, it was . . . It’s just like another family, you know [. . .]
Family 3 d
[. . .] I think it’s just, trying to be there for your baby, because it’s such a strange sensation, because when you have a normal birth and you take your baby home straight away, there’s obviously that bonding that happens immediately. Whereas, with a premature birth, the doctors and nurses have all that first contact, so particularly when you first come on to the unit and you’re around your baby, you’re not really sure what you’re allowed to do or what you should be doing and, you know, when we first came on to the unit, I just didn’t think I’d be able to touch him or have any contact with him at all [. . .]
Family 6 m
Impact of travel
It should be noted that parents are willing to travel anywhere and make whatever sacrifices necessary to help make sure that their infant has the best care possible. Sometimes this is at the expense of the rest of the family. Some parents were travelling by car for ≥ 1 hour each way every day to the neonatal unit. Those parents without cars relied on public transport and family members, and in some cases spent ≥ 3 hours per day travelling. The impact of travel becomes much more pronounced when there are other children in the family, with the parents trying to fit their time at the neonatal unit around school times.
Parents can feel torn between their children at home and the need to look after their baby as much as possible, and they can feel guilty as soon as they leave the hospital. They had been advised by health-care professionals that the older children will remember their lack of attention whereas the baby will not, so they tried to make sure that they included the other children as much as they could:
[. . .] And all of this has a cost involved in it, which is irrelevant, really, because – well, it is relevant, but you’re gonna do everything you can for your child, for your baby, you know [. . .]
Family 2 d
[. . .] I would spend, like, a Sunday night, so I could get all her school uniform ready at home and a Wednesday night at home just so it broke the week up for her [. . .]
Family 7 m
[. . .] that was the toughest time. That was the hardest time, being away from everyone, not having any support [. . .]
Family 4 m
Family disruption
Families are disrupted in different ways and some of the effects are felt for years after the birth. When the mother and baby are in hospital, the separation is felt by the rest of the family. Parents report struggling with difficult behaviour because other children feel neglected and/or are worried about their sibling.
Families spoke about living in bubble away from family, in which parents, especially the mother, is focused only on the baby’s health and development. For parents, it is a stressful and traumatic time affecting the whole family. Parents feel guilty about leaving their baby behind and also feel guilty about neglecting their other children.
Strains are felt between parents who feel that they are on an emotional ‘rollercoaster’, with each parent feeling the strain differently and trying to stay strong for the other. When fathers had to go home, leaving mothers in hospital, this created other tensions and anxieties.
The wider family was also affected as people do not know what to say or how to act. Parents felt that:
[. . .] every day we ended up saying sorry [to each other] and starting each day [. . .]
Family 2 m
[. . .] They came in and saw [baby] all hooked up to god knows what else, you’re trying to explain to them that everything’s OK, but they’re like, ‘well, come on mum, he’s got, like, a tube down his throat, he’s got one in his tummy . . . he’s got a cannula in and he’s . . .’, you need someone to explain to your children, as well, . . . this is fine, . . . this is helping . . . it affects everybody, definitely, my mum and my dad [. . .]
Family 1 m
Information/language used
Parents would try to be in the unit for the doctors’ rounds and would ask nurses afterwards if they did not understand what the doctor had said. They felt that the doctors were good at explaining the information in lay terms. Parents seemed to learn the medical terminology very quickly so that they could follow what was going on.
Mostly, people would appreciate the practical information, in stages, so that they could be involved and know what to do, only having the information they needed for that day.
It took a bit of getting used to the language:
You hear the worst things – . . . ‘brain bleeds’, but then they tell you it’s nothing to be worried about, it’s ‘like a bruise’.
Family 9 m
Parents liked to be given information directly/bluntly, without health-care staff ‘beating round the bush’; they reported always wanting to know the situation, and not to be told that everything is fine. They felt that the neonatal unit was better than the maternity ward at providing information:
[. . .] I think they were pussyfooting around it a little bit too much, maybe . . . they were sort of indirectly telling us what was gonna happen or what would happen if we didn’t do this or didn’t do that, and I think if they’d just said ‘Look, if she stops growing there’ll be serious problems, so we’ve got to get her out, basically [. . .]
Family 3 d
[. . .] Doctor [name removed] was very good and talked to my husband . . . until his questions finished and he had resolutions or some kind of answers . . . the fact that he had been heard was really, really important. You know, you can’t always give an answer or solve the problem but at least he’d been heard [. . .]
Family 5 m
Understanding risks
Parents found discussions about risk difficult to process, particularly because they were immersed in such an emotionally charged experience, and they liked to focus on what they could do.
The possibility of their baby not surviving was always on their minds. For most parents, there had been some sort of discussion between them and the medical staff about the risks. Some people wanted more information than others. Mostly, parents wanted to know what might happen, but not necessarily the percentages (or likelihood).
In some cases, there were discussions about the potential risks of certain treatments (e.g. loss of use of limb when arterial line was put in, but it was to give their baby a better chance so there was no choice). Risks were also discussed in other cases in which the infant was transported by plane or ambulance. When there was a treatment or procedure with more than one possibility, parents tended to defer to the medical expertise.
Parents felt that they were given hope, but that it was realistic. Some felt that discussion was too broad and not specific enough to their case.
They used expressions like ‘if things went the other way’ and ‘still touch and go’ when referring to the condition of their baby:
[. . .] one of the neonatal doctors came to see me when I was in the labour ward . . . told me that he might not survive. They’ve got to tell you the pros and cons haven’t they? I’m just telling you [name removed], he might not survive, he’s very, very early [. . .]
Family 10 m
[. . .] we knew the risks and we know we have a long battle . . . But it was always done in a nice way that there was always hope, which was nice [. . .]
Family 2 m
[. . .] her chances of survival, we didn’t want to know that [. . .]
Family 8 m
[. . .] if something was gonna happen now which would affect in those few weeks, then just tell us straight . . . say – if we don’t do this now, in 3 or 4 weeks this could happen. Brilliant, that’s . . . direct [. . .]
Family 3 d
Mitigating aspects
We looked at the factors that parents felt had helped them. These are summarised in the following list:
-
Confidence in the hospital staff. Parents felt well supported by the hospital staff. In some cases, they had a care team and always knew that they could talk to any member of the team.
-
Being able to stay at the neonatal unit.
-
Being hands-on with their baby. They were able to and were encouraged to be involved in all aspects of their baby’s care. When parents were travelling to the neonatal unit each day, the unit staff would mostly try to hold back the feeding/washing times and doctors’ rounds until they got there.
-
Thoughtful practices, such as when a mother had to be transferred to the NICU after her baby and staff had prepared a room and taken photos of her baby, so that she arrived to a lovely welcome.
-
Playrooms for other children, so that they could come to the unit too and not be left out of the picture.
-
Families rallying together, helping with childcare and providing emotional support.
-
Supportive employers. Some fathers’ employers had given them extra leave, and all had been understanding.
-
SNUG and BLISS – parents were aware of them during their stay and had accessed information leaflets; however, most parents had contacted them once they had gone home and were hit (‘hit me like a tonne of bricks’) by both the trauma of what had just happened and the vulnerability of being at home without all the monitors and medical staff. Parents reported continuing their link with SNUG for years afterwards.
-
Financial support from charities and children’s centres.
-
Friends made in the neonatal unit.
Family 8 mFamily 9 mFamily 7 m
[. . .] The nurses are like your counsellors there, you know, they’re the people that are just always there and listening, aren’t they? [. . .]
[. . .] I sent a message to the SNUG people, I said ‘Yeah, I actually need someone and [SNUG representative] called me immediately, it was really nice and she told me to just talk through what happened – your journey and I was telling her the whole journey [. . .]
[. . .] that was my precious bit, that’s what I could do for my baby, is get her dressed and try and feed her [. . .]
Summary
What was most important to the parents is that their baby had the best health outcome possible, and they were willing to do whatever they could do to help make that happen. The sacrifices made by parents can be disruptive to the family both emotionally and financially.
There was variation in the parents’ preferences regarding staying in the neonatal unit or travelling to the unit each day. This did not depend on whether or not the baby was their first child. Some who had other children chose to stay in the unit if they had family support at home, others travelled to the unit each day to fit around childcare. Some parents for whom this was their first child chose to travel to the unit each day.
Patients also differed in their preferences towards feeding their babies. In one case, the parents did not want to feed their baby through a tube but instead wanted to wait until they could feed their baby with a bottle or breastfeed; other parents preferred to be involved in all aspects of the care.
In order to help understand how the results of the qualitative research can inform the feasibility of and attributes for a DCE, we have broken down the overall care picture into three components:
-
best care for the baby – this refers to/includes the medical care team, medical facilities and the health of the mother, including emotional support from family and friends
-
communication – including parents knowing what is happening to their baby, understanding what might happen (risks), what parents can do ‘now’, how they can prepare for the future (short and long term)
-
family involvement – including the care of the baby (washing, dressing and feeding), facilities for parents to stay, facilities for other children and preparing to take their baby home.
We suggest that parents would be unlikely to consider any attributes that compromise the first component; however, parents’ preferences and circumstances vary enough in components 2 and 3 that we could perhaps develop attributes around communication and family involvement.
Interviews with policy-makers
We conducted a series of 10 interviews with policy-makers, clinicians and staff to assess their views on outcomes of neonatal care, how they might prioritise outcomes and which types of economic measures might be useful for planning. This involved interviewing members of the Neonatal Critical Care Clinical Reference Group as well as specialist commissioning groups (NHS England) and representatives of the Maternity and Children’s Services Strategic Networks. In addition, the interviews were used to check the approach to costing neonatal services, and included questions on the factors that made up the reference cost submissions, how centralisation affects total costs and the facilities that should be provided for parents to mitigate some of the negative consequences of centralisation.
A recurring theme in the policy interviews was the importance of the well-being and health of the baby. Secondary issues were the availability of staff to cover the rotas and the difficulty of recruiting and retaining staff; for example, it became clear that in some areas, even though it may be optimal for parents to relocate to a neonatal unit, it was felt to be infeasible to staff such new centres.
Ten policy interviews were carried out by Paolo Landa and Anne Spencer. For those working within the neonatal units, we used the interviews to explore service-level issues that we may need to take into consideration when using financial and BAPM returns, such as staff composition and duties and exploring how infants were prioritised within the system when there were staff shortages. For those who were responsible for those co-ordinating and managing network services, we explored their role and the challenges arising from service reorganisation. For those working to support families with neonatal infants, we explored how their work helped to shape the neonatal service and the factors that they felt needed to be taken into consideration in service reorganisations. The second part of all of the interviews explored what policy-makers would like to take into consideration when determining service reorganisations.
A topic guide was developed and adapted as the interviews progressed (see Report Supplementary Material 2). All interviews were recorded and notes were then taken. The interviews involved representatives of a charity that works in neonatal care, two neonatologists that work in the organisation of a local neonatal network, two consultants of NICUs, four matrons, and a neonatologist who works both for a local neonatal network and as a consultant lead for a NICU.
Neonatal charity
The neonatal charity represented the families in the neonatal care process and the parents’ needs and preferences in terms of resources and organisation. The main objective of the neonatal charity was to improve health outcomes for neonates through their research, and they engaged with decision-making and the NHS to influence and improve neonatal care. The charity also provided a support service to families by providing leaflets and other sources of information (e.g. videos and multimedia) and offering helplines for psychological support. Parents needed to talk to someone who was able to listen and provide reassurance and to work as a guide in the complex neonatal care setting. In addition, the charity offered training to neonatal staff to encourage good practice.
If neonatal services were centralised, the charity noted the importance of travel distance and the need to provide facilities to reduce the costs and improve the accessibility of services for families, such as by providing accommodation, travel reimbursement, meals and free car parking. They also felt that several resources were still missing for families and were not provided by the NHS, and that these gaps increased when home care, after the infant is discharged from the neonatal unit, is taken into consideration.
Neonatal network neonatologists
The interviews with neonatal network staff were focused on the network organisation and the impact of different policies. The first problem that was reported regarding the neonatal service reconfiguration was the challenge of changing the skill mix of staff. Converting a SCU to a LNU or a LNU to a NICU can cause several difficulties in terms of attracting new staff and developing the supervisory structures, and these could take > 10 years to overcome in terms of training, education and organisation. The neonatologists also acknowledged that it was hard to model the staff composition in the unit, as this depended on several factors including local availability of a trained workforce, the size of the unit and the number of cots.
We asked the neonatologists what type of service organisation they envisaged (e.g. a NICU for each local neonatal network, which seemed to be the main working model). The network neonatologists acknowledged that centralisation would improve mortality for the VLBW infants, but that infants should be located near to home if appropriate services were available. They also acknowledged the regional differences in access to services (e.g. in South West England: in Cornwall and Devon, there is only a NICU but accessibility in terms of travel time is very different from the London area network). As a result, they were aware of the need to support those families that travelled long distances by providing overnight accommodation while their infant was in a neonatal unit. Some of these costs are covered by the NHS and charities, but it was felt that the provision was often not enough.
Neonatal unit neonatologists and matrons
Four hospitals were interviewed in order to understand the organisation in the unit, the availability of resources and the different unit configurations in terms of service delivery. In our interviews, we considered three English NICUs and one English LNU.
We started by asking questions about the organisation of the neonatal services in each area. Most of the units were inside a hospital with a large service availability in terms of diagnostic examinations, laboratory tests and consultation of specialists. One of the units represented in interviews was a women’s hospital in which the availability of some resources, such as psychological support to mothers and tests, were provided by another site, and the unit contracted separate service agreements for these ancillary services. The NICU interviews raised the issue that it was sometimes difficult to discharge back to a local hospital (LNU or SCU), creating some bottlenecks and delays of neonate transfer.
We then asked questions regarding staff and staff composition and how staff members were organised when there were staff shortages. Each unit had a different composition; for example, in one unit there was a large number of advanced neonatal nurse practitioners (ANNPs), whereas in the other units there was a high availability of junior doctors. This variability in the staff configuration can create large differences in terms of staff costs. We asked if some types of infant (e.g. infants in intensive care and infants in high-dependency care) were prioritised when the workload exceeded the BAPM standard and the staff availability could not cover the number of infants in accordance with the BAPM guidelines. 2 Staff from each unit advised that there was no prioritisation of infants and that each infant is treated with the same level of priority, with staff being allocated in accordance with the BAPM guidelines2 where possible.
When we discussed the resources needed if the services were to be centralised further, and if NICUs became larger, all interviewees raised the need to increase staffing. In some areas, this may be a challenge because of the limited availability of training staff. Most units were already not working in accordance with BAPM standards for ≥ 80% of the time, and so there were concerns about staff shortage and the ability to attract staff to new sites if the unit had to be relocated to another part of the network. In terms of facilities offered to families, unit representatives noted the need to expand the provision of accommodation for families and services if services were further centralised. They also talked about the need to make efficient use of resources.
Discussion of qualitative study
The results of the qualitative interviews show that interviewees talked more about the infant as a whole, rather than separating the risks of death and childhood health problems. This notion of a combined attribute is similar to the idea of an aggregate measure of length of quality of life used by NICE,133 which may be more meaningful if extrapolated forward to consider the longer-term impacts on infants, and not just short-term prognoses. In addition, the families made a connection between the baby’s and the mother’s health, and the importance of the mother’s health was considered to be equal to that of the child by the focus group.
The qualitative interviews also raised other process outcomes including communication with the families and family support.
Furthermore, the qualitative study raised questions about the ability and willingness of parents to trade off health attributes for the process attributes. Although no trade-off questions were asked in the patient interviews, it became clear that mothers were unlikely to want to sacrifice these ‘core’ aspects of their baby’s health for improvements in process outcomes. Parents stated in interviews that once they knew that their baby was receiving the best care, they could then perhaps consider other factors. This raised questions about including a DCE with combined health and non-health outcomes, because parents would always choose the configuration that favoured the best health outcomes for the infant (lexicographic preferences). However, in configurations that maintain a high level of care but affect process outcomes, trade-offs and DCEs become more feasible.
Chapter 9 Economic evaluation
The reorganisation of health-care services requires an evaluation of the clinical benefits and costs to the health service and to the wider society. The aims of this chapter are to develop and apply a framework that can be used to capture these wider consequences of neonatal care reorganisation, based on our work in Chapter 8. We estimate the incremental cost-effectiveness analysis based on a comparison of (1) high-volume units and all other units, and NICUs and other unit designations, and (2) three service reconfigurations from the simulation modelling.
Evaluation of high-volume neonatal intensive care units compared with other hospitals
Methods
Our study estimates the cost-effectiveness of an intervention that leads to infants being born in high-volume units rather than in other neonatal units. We also calculate the effectiveness of NICUs versus LNUs and versus SCUs. In contrast, Watson et al. 92 estimated the cost-effectiveness of investing an additional £100 of resources in NICUs per day. Their approach also differs from the one taken here in the way that they estimated costs. In their approach, the costs of neonatal services were based on the HRG for each hospital, which is part of the national reference cost submission and is used to inform future HRG tariffs. They investigate the extent to which hospitals with higher HRG unit (per diem) costs have lower mortality rates. In contrast, our approach is more in line with the traditional cost-effectiveness approach in that we focus on the impact of volume on outcome and LOS and then cost the LOS using the corresponding fixed tariff HRG per diem reimbursement for the number of days spent in each level of care (intensive care, high-dependency care, special care and transitional care).
The methods used to estimate LOS are described in detail in Chapter 8, Methods. In Chapter 9, Results, we bring together the LOS and mortality estimates from these two sections to calculate the incremental cost-effectiveness ratio (ICER).
Results
Table 20 summarises the IV results for LOS and costs for (1) high-volume units compared with other units and (2) unit designation (i.e. NICUs vs. LNU and NICUs vs. SCU). Table 20 shows that birth in a high-volume unit increased the total LOS by almost 9 days, representing an additional mean reimbursement cost to commissioning groups of £5715 relative to births in non-high-volume units. Dividing this additional cost by the reduction in neonatal mortality in high-volume units (£5715/0.012) results in a cost per neonatal life saved of £460,887. If we suppose that an infant survives for 81 years, in line with the average life expectancy at birth for the English population,134 and they remain in full health for the entire period, then we can convert the cost per life saved into cost per life-year gained. We discount costs and effects using an approach recommended in the HM Treasury Green Book for longer-term interventions,135 and the discount rate is 2.5% for first 30 years of life, 3% from the 31st to the 75th year of life and 2.5% for 76th to the 81st year of life. This analysis results in an ICER per life-year gained of £15,620. If data become available on the life expectancies or quality-adjusted life-years of infants admitted to neonatal units, then this figure can be further updated.
| Output metric | Causal effect on LOS and reimbursement costs of neonatal care at a unit with ≥ 100 babies weighing < 1500 g per year | Causal (marginal) effects of birth at a NICU vs. LNU vs. SCU: IVs estimates | ||||||
|---|---|---|---|---|---|---|---|---|
| Potential outcome in high-volume units | Potential outcome in other units | Difference (95% CI) | Potential outcome if born in a NICU | Potential outcome if born in a LNU | Potential outcome if born in a SCU | NICU vs. LNU, difference (95% CI) | NICU vs. SCU, difference (95% CI) | |
| LOS (days)a | 74.28 | 65.14 | 9.14 (3.84 to 14.45) | 67.6 | 66.2 | 64.7 | 1.4 (–2.4 to 5.2) | 2.7 (–3.0 to 8.3) |
| Cost (£)a | 48,925 | 43,209 | 5715 (2431 to 9000) | 43,879 | 44,714 | 42,108 | –834 (–3147 to 1479) | 1770 (–1703 to 5244) |
| In-hospital neonatal mortalityb | 0.025 | 0.039 | –0.012 (–0.021 to –0.0034) | 0.079 | 0.098 | 0.083 | –0.019 (–0.037 to –0.001) | –0.004 (–0.021 to 0.029) |
| ICER (£/life-year gained) | 460,887 | –43,096 | NICU more costly, no difference in effectiveness | |||||
| ICER (£/life-year gained) | 15,620 | –2279 | NICU more costly, no difference in effectiveness | |||||
The results of the analysis for hospital designation show that birth in a NICU exposes infants to a lower risk of neonatal death than birth in a LNU (a 1.9-percentage-point risk reduction), whereas there is a statistically insignificant effect of NICUs relative to SCUs, which may be attributable to the small number of SCU cases (10%), the different type of care provided and the imprecision of the IV method. Furthermore, birth in a NICU results in an additional 1–3 total days in hospital than birth in a LNU or SCU, and higher reimbursement costs for NICUs compared with SCUs, but the effects are imprecisely estimated (with overlapping CIs).
Overall, a NICU is more costly and no more effective than a SCU, whereas a NICU is more effective and cost saving when compared with a LNU with an incremental cost per neonatal life saved of –£43,096 compared with a LNU. If we suppose that an infant survives for 81 years, and again discount costs and effects, the cost per life-year saved is –£2279 for a NICU compared with a LNU; however, more investigation is needed regarding these results to check the robustness of the findings.
Discussion
Births in high-volume units compared with births in other neonatal units have an incremental cost per life saved of £460,887. Comparing this initiative with other similar initiatives that save lives suggests that the intervention is likely to be cost-effective. 92,136,137 When we compare NICUs with LNUs, we find NICUs to be cost saving (although not statistically significant) and to reduce mortality, and so NICUs are likely to be cost-effective.
We also estimated the ICER per life-year gained using a set of simplifying assumptions and a declining long-term discount rate. Births in high-volume units compared with births in other neonatal units have an ICER per life-year gained of £15,620. Currently, NICE uses a threshold range of £20,000 to £30,000 per quality-adjusted life-year gained,133 but there have been a number of projects to further investigate this threshold. 138–140 The ranges from this study of cost per life-year gained seem to fall within these current thresholds, but future work should aim to explore the quality-adjusted life-years for neonates who survive to provide more accurate estimates.
In conclusion, the estimation of LOS analysis seems to be a useful and appropriate metric against which to explore the impact of changes in service delivery, and, given the data available, was used here to estimate the commissioner’s reimbursement costs. However, we are aware that these commissioning costs are likely to be lower than the actual service delivery costs, and that there are recent initiatives within the NHS to collect data that more accurately reflect the BAPM nursing requirement for each level. There are now two sets of data being collected: HRG 2001 for price and payment, and HRG 2016 for reference costs (which are more in line with BAPM nursing requirements). Future estimates of the impact of LOS on actual costs will be greatly improved by the ability to estimate actual costs of service delivery.
This analysis also pointed to areas for future research. For example, recent literature questions the use of a threshold to assess intervention efficiency when there are economies of scale or scope,141 an issue that is most relevant to interventions looking at the cost-effectiveness of service delivery. In addition, service delivery interventions tend to cover a wider range of costs and effects, which need to be fully reflected in the opportunity costs. 142 As we move forward in the evaluative frameworks for service delivery, it seems important that such wide considerations are taken into consideration.
Evaluation of three different service configurations
Methods
Discussions with policy-makers and PPI groups and the review of the literature led to a list of key elements that were likely to be affected by service reconfiguration. In this report, we focus on three main categories that we have data on and can cost: nursing, travel times and transfers. In the current evaluation, we were unable to incorporate childcare costs (because the numbers of parents with other dependent children were unclear), costs of doctors (because, as revealed in the site visits, there are several differences arising from staff composition: the ANNPs and junior consultants have similar tasks but different salaries and categories) and overnight stays (without further consensus when these should be provided). Food, parking and unpaid leave policies also affected the costs for families, but these are not included because they are unlikely to greatly change with service configuration.
Mortality can be estimated by regression analysis, with information on birth weight (continuous, which means we can work with any meaningful categories); sex; mode of delivery (emergency caesarean not labour induced, emergency caesarean labour induced, vaginal spontaneous or unknown); quintiles of multiple deprivation; multiple foetuses (≥ 2 vs. 1); and level of hospital of birth (NICU or other) or, alternatively, high-volume units of birth (≥ 100 infants born weighing < 1500 g per year). We do not include the mortality estimates in these provisional estimations, given concerns about how best to assess the impact of transfers of infants into the analysis.
Predictions of NHS costs are based on the level of care received and a microcosting based on WTE nurses. Unit costs for WTE nurses are based on Curtis. 38 Although each band of nurses has a range of salaries attached to it, the cost of nurses was calculated based on the average unit cost of bands 5, 6 and 7 for neonatal nurses with and without specialisation for 2014/15, which amounted to £48.50 per hour. To cost infant transfers, we used the national reference costs associated with the HRG code XA06Z, which covered Transportation in Neonatal Critical Care and amounted to £1100.97 in 2015.
The costs to families that we include in the current model are travel time and vehicle operating costs. The unit costs applied to travel time are based on the Department for Transport’s non-business costs of travel. 39 Travel for non-business is based on a study estimating the willingness to pay of travellers for shorter travel times. 40 This study found that travellers gave the same value to time in all modes of transport. The Department for Transport costs business travel at a higher rate, which varies between modes of transport based on lost workplace productivity and the wages of employees who typically use that mode of transport. It is recognised that travel may also take place in work time for spouses of women who have undergone caesarean sections (and are advised not to drive in the first 6 weeks), who may take time off work to drive the mothers to the units. The cost of travel time per hour in non-working time is £5.56 and the cost of travel time per hour in working time is £31.98; here we used an average cost of £14.99 per hour. The unit cost of vehicle operating is based on motoring costs set out by the AA (Automobile Association),143 and includes an allowance for car parking.
Results
Table 21 summarises the costs of three different service reconfiguration scenarios under no capacity constraints and in which units run at ≈80–85% of maximum capacity (based on the results of the modelling shown in Table 12). The current configuration represents the actual configuration in England, whereas the centralised configuration considers a large reduction of units at each level of care. An alternative configuration was designed to minimise travel distances while having all NICUs receiving ≥ 100 VLBW infants per year. Table 21 reports the presence of no capacity constraint and the constraint of running units at 80–85% of maximum capacity. On-duty nurse recourses for each unit are set at the next whole number up from a theoretical 85% of capacity utilisation (e.g. if running at 85% of capacity is calculated as requiring 5.4 nurses present at any time, then unit resources are set to six nurses at any one time). The number of on-duty nurses is given here assuming that capacity is capped in accordance with the BAPM recommendations. If there is allowed working beyond the BAPM workload recommendations,2 then nurse numbers will scale down proportionally.
| Costs | Impact (£M) | ||
|---|---|---|---|
| Current configuration (45 NICUs + 78 LNUs + 38 SCUs) | Alternative configuration (48 NICUs + 78 LNUs + 35 SCUs) | Centralised configuration (30 NICUs + 30 LNUs + 30 SCUs) | |
| No capacity constraints | |||
| Nurses | 633.04 | 642.39 | 580.36 |
| Transfers | 18.95 | 17.62 | 19.099 |
| Travel | 35.27 | 35.45 | 44.29 |
| Total NHS costs (nurses and transfers) | 651.99 | 660.01 | 599.46 |
| Total costs (NHS costs and travel) | 651.99 | 660.01 | 599.46 |
| Units planned to run at ≈80–85% of maximum capacity | |||
| Nurses | 566.34 | 568.46 | 550.62 |
| Transfers | 49.85 | 48.51 | 34.41 |
| Travel | 48.84 | 46.48 | 50.96 |
| Total NHS costs (nurses and transfers) | 616.18 | 616.97 | 585.03 |
| Total costs (NHS costs and travel) | 665.02 | 663.46 | 635.99 |
It is clear from the figures in Table 21 that nursing costs are the largest cost component, approximately 18 times higher than travel costs and 33 times higher than transfer costs. Nursing costs also reduce during centralisation, because of economies of scale, and so are likely to be a key driver for any observed changes in overall costs. For example, in the unconstrained system, greater centralisation (from 48 to 45 to 30 NICUs) reduces nurse costs and slightly increases transfers costs, resulting in cost reductions from a NHS perspective. Incorporation of a wider set of costs, for example travel time for families, results in families paying more in travel costs, but overall the more centralised configurations still reduce costs from a societal perspective. A similar result is found for the constrained system, although the reductions in costs are lower.
Discussion
The three scenarios (current, centralised and alternative configurations) show the potential impact on neonatal costs from service reorganisation. Nursing costs are the largest cost component and are reduced by centralisation; overall, this leads to reduced costs from a NHS and societal perspective. To assess the cost-effectiveness of these scenarios, more information is needed on the impact that these service reconfigurations have on mortality. High-volume units reduce mortality, but we can only show that these benefits are accrued for those born within those units. To assess service reconfigurations more fully, future research needs to explore the impact of high-volume units on infants transferred into those units after birth.
Our analysis has a number of limitations. The current analysis identifies potential savings from service reorganisations assuming that resources will be made available. We are, however, aware that some geographic areas may already be experiencing shortages of experienced nurses and consultants, and this analysis does not take into account staff availability. We have also assumed that the changes are instantaneous, and we have not modelled the transitional costs of moving from one type of configuration to another. To minimise disruption to the service, it is likely that reconfigurations will take the form of multiple sequential steps that take place over several years. The approach we have adopted for the economic evaluation is similar to that used by NICE, which does not typically take capacity or transitional costs into account in the economic evaluations underpinning clinical guidelines. However, for implementation, it is clear that these issues have to be factored in on a case-by-case basis.
Chapter 10 Information visualisation
Communication of outputs
One key and often neglected area in applied health-care research is the need to present outputs in a clear and accessible way to a variety of audiences. In this project, a number of stakeholder groups have an interest in understanding and interpreting the work. These include health-care policy-makers, commissioners, clinicians and care workers, researchers, parental groups and individuals who are the recipients of neonatal care in England as well as the public more generally. Commonly, these separate groups will have both different informational needs and differing levels of expertise and experience in the area. Therefore, it is likely that a range of formats and media will be appropriate to cater for these varying requirements and constraints when presenting our work in different contexts to differing audiences.
Using visualisation
The field of information visualisation (sometimes referred to as data visualisation) has developed over many years in recognition of the need to present information in clear and compelling ways. 144,145 It has also reflected the changing basis of media technology, in which many new methods of communicating information have evolved in recent decades (e.g. through the internet and the use of interactive/animated computer displays).
In our study, relatively complex technical outputs and conceptual associations need to be conveyed to a wide variety of audiences and there is a clear potential to use information visualisation to facilitate communication. Although a comprehensive treatment of this subject is beyond the scope of this study, we have summarised some initial thoughts in relation to specific stakeholder groupings in the following sections.
Commissioners and policy-makers
One clear community of interest for our study is policy-makers and commissioners in health care who are keen to understand the issues and evidence supporting different options for neonatal care and to use this information to inform policy decisions as well as justify such decisions to others. Responses from our interviews with policy-makers in this study highlighted the importance of communication as key to promoting change, justifying policy initiatives and for exploring options of new models of care.
A clear need here is for relatively complex data to be conveyed in accessible formats that can be shared in a decision-making context. Such data often bear on the relationships between different (sometimes opposing) parameters of interest; for instance, the relationship between cost and outcome or geographic centralisation and localisation for alternative service delivery options. In such circumstances, the use of graphs or maps to represent a range of policy scenarios and demonstrate the modelled impact of these alternatives against key metrics can be essential.
In this context, graphical standards can be very important in supporting clear communication and understanding between groups; for example, the extensive adoption of forest plots in health-care meta-analysis and systematic reviews146 and cost-effectiveness acceptability curves in health technology assessments147 have greatly facilitated understanding and discourse, especially for relatively complex informational needs in policy contexts. In this project, we would point to our development of the Villeneuve chart (see Appendix 1) as a novel and potentially valuable graphical method of conveying important information in relation to location preferences and resilience of service centres. These charts could be applicable in a variety of contexts. The use of ‘violin plots’ (see Figure 15) demonstrates another use of information graphics to convey relatively complex aspects of the data analysis.
When maps and other graphical media are used to represent important findings, it is important to be aware of potential perceptual biases that can result. This is especially the case when interest groups may wish to promote or advocate different policy alternatives. One example is the undue prominence that can be given to rural areas in shaded heat maps. Rural areas are typically shown as overly large visual areas relative to their population. Cartograms, which scale geographic regions by variables, such as population (rather than physical area), can be used to overcome this perceptual bias,148,149 although such representations produce an unfamiliar and highly distorted image relative to a standard map of the UK. Although we did not explore the use of cartograms, this is clearly an area of interest that could be explored in this context.
Researchers
Researchers and academics commonly need to be able to extract clear and precise technical information from a study. For this reason, relevant data should always be made available in numerical form (e.g. in formatted tables). In addition, however, graphical and visualisation tools can be important to reveal trends, patterns and relationships in outputs, especially when these are not immediately apparent from the numerical data. Descriptive analyses of large data sets can particularly benefit from such methods,144 which often provide a useful synopsis of the key findings.
Parents and the general public
In discussion with parents in the PPI workshops (see Chapter 11, The workshops), it seemed clear that map-based presentations were most helpful when describing the various scenarios for geographic service configuration. In particular, parents could easily relate to maps that described services in their local regional area because they had direct and experiential knowledge of these services. In addition, parents readily understood narratives and examples of pathways of care because stories and case study examples can be readily understood. Line graphs and charts, for example those that describe trade-offs in centralisation versus localisation of services, often needed substantial explanation to be fully appreciated by parents. In such cases, it seems clear that careful consideration needs to be given to the mode and design of communication (e.g. the design of information presentations as well as forms for interviews and choice experiments).
For communication with the general public, it is notable that some of the publicity literature150 makes extensive use of information graphics, such as pictograms, to convey basic statistics about neonatal care in England. This approach seems particularly appropriate to help ensure that the information is both accessible and attractive to general readers and was adopted when communicating with parents in this project for some elicitation processes (see Chapter 8, Focus group).
Importantly, the use of visualisation methods in communication with parents and the public can be valuable in eliciting information as well as in presenting information. In our study, for example, pictorial representations were utilised to identify key concerns in a preference elicitation process. Further work could be useful in determining whether or not such graphical techniques could be deployed in the presentation of options and scenarios for preference elicitation within the proposed framework.
Summary of communication requirements
When communicating research outputs, it is vitally important to consider how information is conveyed as well as what information is presented. This is especially critical when such research outputs need to be used across a range of contexts and understood by a variety of audiences.
It is clear that there is a wide range of options when deciding how best to communicate and present complex information. Options include information graphics, computer media and more traditional numerical tables and text. However, the starting point for designing effective presentations should always be a consideration of the specific needs and expertise of the target audience, as outlined in this section. This will often dictate the level of technical detail required for different levels of understanding and will often support differing ‘languages of discourse’ in different stakeholder groups. Also importantly, visualisation tools can be useful to ‘bridge across’ the different groups with an interest in the area and provide a basis for shared dialogue.
Once these needs are understood, the constraints of the formats that can be used can be taken into account and different options can be explored. For example, black and white paper-based media determine a narrower range of options relative to the interactive and animated potentials of internet-based media.
Chapter 11 Parent involvement
The aims of the PPI in this project were to:
-
ensure that the modelling work and health economics that we carried out took into account the needs and concerns of parents and families who use neonatal services
-
explore the best way to communicate our findings to parents and the public and involve them in decision-making about the design and configuration of neonatal services.
Parents were paid £50 to attend each meeting, in addition to travel and childcare expenses as required. The PPI activities were led by Andrew Gibson and Sue Prosser (research team members).
Recruitment
To maximise the diversity of our parent group, we sent flyers advertising the opportunity to be involved in this project and requesting expressions of interest to all ODN managers and ODN lead nurses in England (see Report Supplementary Material 2). This resulted in a number of enquiries from areas across the country, from Carlisle to Cornwall.
We wanted to involve parents with direct experience of neonatal services. However, by definition, parents with these experiences frequently face various demands and pressures in their lives. They are frequently busy caring for young children who often have complex ongoing health needs. We tried to maximise the accessibility of our involvement activities through using easily reached venues and flexible times for meetings and through offering parents alternative methods to contribute [e.g. through e-mail and Skype™ (Microsoft Corporation, Redmond, WA, USA)].
Although travel and childcare were paid for, attending meetings meant that parents spent time away from their child, the impact of which should not underestimated following a potentially traumatic neonatal experience. We maximised the accessibility of all parents’ meetings by making it clear that children could attend with their parents if they felt that this was important or necessary.
Consideration was also given to our duty of care towards the parents who became involved in our work. Discussions of experiences in neonatal care might raise potentially difficult or traumatic memories. Sue Prosser ensured that all who were involved had ongoing support or were signposted to appropriate additional help as required.
Initial recruitment and contact following expressions of interest was via telephone by Sue Prosser. During these conversations, the needs of the parents and the opportunities to be involved in the project were discussed.
Following initial telephone recruitment, permissions were obtained to share e-mail addresses and contact details to enable a group conversation to take place via e-mail and other media, such as Skype.
Establishing and running the parent groups
Despite our efforts, juggling childcare and hospital appointments led to some parents deciding that they were unable to commit to being involved in the project. In the end, we established two parent groups: one based in London, consisting of three parents, and one based in Exeter, consisting of five parents. We established two groups because we wanted to ensure that a diversity of experiences of using neonatal services were represented in our work and, in particular, we wanted to ensure that parents with experience of accessing neonatal services in both rural and urban environments were adequately represented, given the differential impact that the centralisation of neonatal services might have on these two groups.
Ongoing support for the groups was essential to ensure that members were kept updated and engaged because there were often 6 months between workshops. This was achieved by regular e-mail updates. Other ongoing challenges for continuing involvement included parents being unable to attend meetings because of a child’s illness or because of changes in their own lives including returning to work following a period of maternity leave or finding new employment and/or training as their lives, post a neonatal experience, moved on.
A series of five PPI workshops was carried out in three phases. In the first and second phases, two workshops were run in both Exeter and London. In the third phase, a workshop was held in Exeter and London members were able to join via Skype.
The workshops
June 2016 workshops
These initial workshops were used to introduce the parents to operational research and its potential application to the planning of neonatal services. This was done by demonstrating how a simple operational model might be generated to analyse the flow of customers through a restaurant. We then applied this line of thinking to analysing the distribution of neonatal services and illustrated this with findings from our initial study of neonatal services in South West England. 33 It became apparent that the parents in the group were willing and able to understand how this type of research might be used to plan services and how issues relevant to parents might be built in to such a model so that it could reflect a number of different parameters set by various stakeholders including the parents.
During these workshops, the parents exchanged stories/experiences of using neonatal services. This had two benefits. First, it helped the parents to quickly gel as a group. Second, it was helpful for the researchers involved to appreciate the lived experience of the parents and how this might be taken into account in their work. The issues that were raised fell into the following themes:
-
Daily living. Maintaining routines such as work and siblings attending school. Getting maternity and paternity leave, finding accommodation and food if living away from home for extended periods.
-
Barriers to maintaining daily living. Distance travelled to access services and LOS. The strains placed on families increased as both of these factors increased. Coping with uncertainty was difficult and there was the impact of all of these factors on physical and mental health.
-
Support.
-
Practical. Provision of accommodation [location (e.g. on the ward, in the hospital or in the town)]. Financial support to help with the cost of travel, parking and food.
-
Psychological. Stress on mother and on marital relationships and impact on siblings. A need was identified for ongoing psychological support in some cases, which could be provided through peer support.
-
It became apparent that when considering the potential of centralising neonatal care to improve outcomes for neonates, thought needs to be given to measures to mitigate the potential negative impacts on parents and families. This is likely to have a positive impact on the longer-term health and well-being of the neonate.
These workshops also highlighted the different experiences of living in semirural locations compared with urban locations. Cities potentially offer good public transport links. For people in rural areas, using public transport can greatly increase travel times. Finding accommodation for overnight stays within a hospital may also be more difficult in some urban areas and older hospitals.
Our health economics team also presented a planned DCE to the group. The parents raised concerns about some of the terminology used and the assumptions made: for example, that morbidity had been explained as ‘your baby having eye problems’. The group suggested that the health economics team needed to review its approach to ascertaining the ‘cost’ of using neonatal care (see Chapter 8, Results). Eventually, it was decided to employ a qualitative researcher to carry out interviews with a sample of parents to develop this further.
November 2016 workshops
We held a second pair of workshops in November 2016 in both Exeter and London. Parents were presented with the initial findings from the study. We explored with the parents how best to present differing outputs from the operational research. This included the use of graphs, maps and Pareto fronts. The parents found maps and Pareto fronts very visual and relatively easy ways to understand the data. Graphs were also seen as useful but these needed careful explanation. The parents found Pareto fronts a particularly useful way of visualising the balance that might be struck between the differing demands of providing accessible services and centralising neonatal units to improve clinical outcomes.
The group also discussed the need to explain the methodology that produced the results. The parents did not feel that this needed to be done in great detail. However, they felt that the process behind the production of these results had to be made transparent to deal with concerns that units may be being closed merely to save money. Given the high numbers of potential scenarios generated by operational research, the parents found the evolutionary analogy helpful in explaining how these scenarios might be narrowed down, but care needed to be taken with language and terminology (e.g. referring to variations of a scenario as ‘child’ scenarios).
The parents felt that once a limited number of scenarios had been developed by operational research methods, they should be involved in any final decision-making about neonatal reorganisation. They felt that their local knowledge and experiential expertise would be crucial in making a fully informed final decision. Our work in this workshop demonstrated that it would be feasible and practical to do this.
Parents also felt that, when possible, the transfer of babies between neonatal units should be minimised. They reported that there are sometimes significant differences in the way care is delivered between units, which can create additional stress for families (e.g. because parents have to learn how a new unit works).
In this workshop, a proposed health economics interview schedule was also reviewed. The parents expressed concern about some of the terminology used and the order of questions. After the workshop, Sue Prosser facilitated revisions to the interview schedule, working closely with the qualitative researcher to reorder and rework the interview schedule with parental input. This included a practice/mock interview in a role play with Sue Prosser. The parents also reviewed the flyer that was used to attract volunteer interviewees. Copies of the advertising flyer and interview schedules used for the qualitative interviews with parents are provided in Report Supplementary Material 2.
April 2017 workshop
This was held in Exeter with parents in London able to join via Skype and was a final workshop to present the finding of our work to the parents and to discuss possible dissemination activities. The parents confirmed that they would potentially be interested in being involved in further dissemination work. We discussed what we had learnt and how parents might be involved in the decision-making about potential reorganisations of neonatal care. The parents were very clear that they felt that they could and should be involved in this decision-making process. They felt that the evidence for the clinical benefits of centralisation, including the weaknesses in this evidence, needed to be presented to parents in an unbiased way. They also felt that operational modelling potentially offered opportunities to make the decision-making process more open and transparent but that any final decisions should incorporate their local knowledge alongside the knowledge derived from operational research.
Parent involvement summary
In conclusion, we feel that our work has shown that it is feasible and practical to involve parents in operational research about service reconfigurations in neonatal care. It is important to do this to ensure that this research takes into account the issues and concerns of parents. Our work has also shown that parents can appreciate the complexities involved in making decisions about the reorganisation of neonatal services if they are provided with the relevant information in an accessible manner. Any such decision-making process is likely to benefit from this input.
Chapter 12 General discussion and conclusion
In this study, we have analysed and researched the organisation of neonatal services in England with a focus on demand and capacity issues. Specifically, we have used location analysis and simulation to investigate the geographic placement of services and capacity constraints. We have looked at the number of units required at different service levels, and the flow of patients in the system. In addition, we have examined the economic issues and modelled these against mortality outcomes, and we have engaged with parents to assess their preferences and priorities in relation to neonatal services.
In all of these areas, it is important at the outset to emphasise the variability and diversity of conditions that pertain across the English neonatal care system. For example, differences in geographic conditions and population densities (e.g. rural vs. metropolitan) play an important part in determining the effective placement of services. Size and level of unit also crucially have an impact on service organisation and hospitals often markedly differ in how they choose to organise their systems (e.g. in the deployment of staff and the interface with maternity services). Commissioning arrangements for neonatal care in the NHS also vary and this is likely to have an impact on how services are organised and reported. Turning to parental factors, accommodation and support varies markedly between units and the experience of parents will differ greatly in terms of financial, family and domestic circumstances, as well as geographic and physical needs. This leads to inevitable differences in the preferences and priorities of individual parents, although it should be noted that the overriding concern is the well-being of the mother and child.
Given the multiple dimensions of variability, it is challenging to develop generalised models that can be applied across all neonatal services in England and for all users and all providers. A flexible approach is required that can accommodate these differences yet still provide a framework for both understanding and guiding policy in order to provide the evidence base needed to develop new and improved models of care. Our research aims to provide a methodological framework that can begin to provide a basis to support evidence-informed decision-making in neonatal care across England.
We have included the more technical and detailed comments in relation to the specific components of the research in the relevant sections of the report. In the following sections, we summarise some of the salient points arising, list some key limitations, and outline key areas for further research in this field.
Location analysis
In approaching location analysis, we have focused on understanding the key aspects of capacity and demand in the system and how this relates to service organisation. For this, a comprehensive analysis of the data from across the units provides a necessary basis to understand the current state of neonatal service activity across England. Our analysis suggests that some aspects of the current system could be improved and we have modelled a series of ‘what if’ scenarios to assess the potential impact of different systems. Here, two approaches can be defined. First, it is possible to model idealised scenarios that provide optimised system outputs against the defined performance metrics. Although in most cases these hypothesised scenarios do not provide realistic or practical options, they do provide critical reference points in determining the upper limits to potential organisation. The hypothetical configurations also encourage policy-makers to ‘think outside the box’ in terms of considering options. The second approach is to start with the practical options for reorganisation (e.g. as suggested by policy-makers). These alternative scenarios can then be modelled and the likely effects of changes on key output metrics assessed using the methods outlined in this report.
It is inevitable that economies of scale exist, favouring the increased centralisation of services, especially for the more intensive levels of care. This policy imperative is further reinforced by the research findings that suggest that outcomes are improved in larger higher volume units. 151
Simulation
Simulation, although still working with a simplified model of reality, allows for more complex behaviours to be explored than are possible in the genetic algorithm, which must explore hundreds of thousands of possible configurations. A simulation model may track infants through multiple levels of care and across multiple spells in different hospitals. Hospitals may also have restricted capacity in simulation modelling, forcing infants to be cared for in a unit located further away than their nearest appropriate unit, and units may be organised in networks in which infants are only cared for outside the home network when the network has no appropriate cots available.
The simulation modelling further added to our understanding of the behaviour of the system at a national level. Performance of the system was found to be very sensitive to capacity constraints, with significantly deteriorating performance from about 65% of capacity utilisation. This is attributable, first, to the relatively small size of neonatal units with little or no flexibility within a hospital to care for infant patients who cannot be cared for in the designated ward. Second, additional demand may come from infants who should be cared for at another hospital. The networked model of neonatal care allows for excessive demand to be absorbed by neighbouring units, but this movement of demand may reduce the ability of local units to meet their own local demand.
Higher-volume units were found to be more resilient to fluctuations in local demand because of the relatively smaller variation in demand in large units. This allows high-volume units to meet BAPM standards of care for local demand with fewer nurses. A more centralised model of care (with 90 neonatal units) was found to substantially meet BAPM standards of care with about 10% fewer nurses than the current configuration.
The simulation modelling confirmed results from the genetic algorithm location analysis: that configurations exist, at least theoretically, that can both increase the number of VLBW infants cared for in units that receive ≥ 100 VLBW infants per year, and improve access to care for parents. Modelling indicated that the number of NICUs was approximately right if all NICUs should have ≥ 100 VLBW infant admissions per year, but the locations of those NICUs are not currently optimal for achieving the joint aims of all NICUs receiving ≥ 100 VLBW infants per year and having NICUs as close to parents’ home locations as possible.
The simulation tool developed may be applied to national configurations, as described in this report, but it may also be applied more locally.
Mortality
The EPICure study reported on outcomes for all births before 26 weeks in the UK and the Republic of Ireland for a period of 10 months in 1995. 152 A survival rate of 39% was found for the 20.2% of all infants who were admitted to a NICU. It has been reported that the survival rate for infants with 22+0 to 25+6 weeks of gestation who were admitted to a neonatal unit increased from 36% in 1994 to 47% in 2000–5153 in a region of England. In the English data set for 2015/16 used here (which contained all types of neonatal unit), looking at the same gestational age group, 31.9% died, 58.7% exited neonatal care alive and 9.4% were still in neonatal care when the data were reported. Although the methodology is not identical, this would suggest that survival rates have continued to improve.
Our estimates for infant mortality are for those born in a high-volume hospital, which includes the benefits of antenatal care in the hospital of birth as well as the postnatal care in the NICU. A very preterm infant born in a high-volume hospital (> 100 infants weighing < 1500 g per year) has a 4.5% lower risk of death in this unit than in other hospitals. Slightly larger effects were observed when using distance to a high-volume hospital as the instrument. An infant born at < 32 weeks’ gestation being born in a hospital with a tertiary NICU unit does not appear to result in any difference in terms of the risk of death compared with other hospitals.
Costs
Our economic analysis has concentrated on the underlying neonatal costs for both the NHS and parents in relation to service organisation. For the NHS, costs need to be clearly differentiated from prices, given the variance in contractual and commissioning arrangements for neonatal services in England. This report does not address issues of price and commissioning that fall outside the scope of the study.
In relation to NHS neonatal costs, there is a clear need to go beyond the arguably crude models that are currently used. The site visits and discussion with policy-makers made it clear that the neonatal HRG reference costs currently do not accurately reflect the real overheads of neonatal care, mainly because units typically average neonatal nursing costs across all infants and do not use the BAPM guidelines2 to attribute nursing to the different levels of care. Therefore, in our evaluation section (see Chapter 9) we ran two sets of analyses to (1) calculate the cost-effectiveness of high-volume hospitals compared with other hospitals and (2) cost three simulations from the computer model. The first method used the BAPM 2001 reference costs, which matched the payment system used in 2013–15 that was used to reimburse units, and so was the opportunity cost to hospitals. The second method calculated the costs of the simulations based on the predicted staffing predictions from simulations.
As of 2018, data are available using the 2016 HRG codes that more accurately reflect BAPM guidance for nursing. In addition, more is now known of the thresholds in consultant time and a detailed health economic analysis of these costs, to develop cost models based on these data sets, would more accurately capture economies of scale and scope. In small units, for instance, there may be granularity constraints such that provision of a specific level of care requires at least one specialist nurse even though that nurse may not be fully utilised.
The BLISS data set gave a snapshot of costs for neonatal care for those mothers who are part of the BLISS network, but there were a lot of incomplete data and the sample was not randomly selected, so caution is needed regarding the results. Incomplete data may have arisen because the survey included many questions, and there were problems with coding some of the open questions. In future studies, we would recommend much shorter surveys with simple click boxes to improve completion rates, focusing on only a few key issues. A discussion with PPI members about whether or not these costs would change with different configurations suggests that food costs are unaffected by service configurations, but costs of childcare, travel and overnight stays could be affected.
Factors that families and policy-makers would like to see taken into consideration in determining service configuration
The qualitative study with families suggested that families felt that the following aspects were important to their experience of neonatal care: the baby’s and mother’s health, communication by medical teams and support for families. The interviews with policy-makers also raised the issues of the baby’s health and mother’s well-being, as well as the need to staff units appropriately and recruit and retain staff.
The qualitative study with parents raised questions about the ability and willingness of parents to trade off health attributes (the baby’s and mother’s health) with the process attributes (communication by medical teams and support for families). Although no trade-off questions were asked in the patient interviews, it became clear that mothers were unlikely to want to sacrifice these ‘core’ aspects of their health and their baby’s health for improvements in process outcomes. This raises questions about the use of a DCE with combined health and non-health outcomes, as parents would always choose the configuration that favoured the best health for the infant and the mother. However, if a reconfiguration maintained health but affected process outcomes, then trade-offs and a DCE become more feasible.
Study limitations
There are a number of key limitations and constraints to our study (many of which are outlined above). Some of the most significant limitations are:
-
Our analysis is clearly hampered by the difficulties inherent in assessing morbidity (as distinct from mortality outcomes) in neonatal care.
-
In this project, we have looked at location optimisation algorithms for both childbirth and neonatal care. The planning of each of these in the NHS in England is the responsibility of separate organisations: maternity and childbirth planning is the responsibility of Clinical Commissioning Groups, whereas neonatal care planning is the responsibility of NHS England Specialised Commissioning.
-
Our study assumes that patients attend their closest appropriate unit. When the travel times to units are similar, factors other than travel time may dominate the choice of unit.
-
Our study is based on road travel times. The use of public transport may, at times, change the preferred hospital, and is also likely to change the absolute travel times to all hospitals.
-
In this study, we have not focused on the location of the phase of any surgical care that must be carried out in specialist neonatal surgical units. It is likely that specialist surgical care would usually be carried out in NICUs.
-
It is not clear whether the advantages in outcome associated with high-volume NICUs are attributable solely to the NICU, or are also because those units will often tend to be associated with large maternity units (with the associated outcome advantages of more consistent obstetric consultancy presence). It is not clear how much clinical advantage will be gained by centralising only neonatal intensive care, centralising only childbirth care or by combining both. Joint planning of maternity and neonatal care would help provide hubs of clinical excellence with both ≥ 6000 births per year and NICUs admitting ≥ 100 VLBW infants per year.
-
A limitation of the mortality estimates is that they measure the effectiveness of those infants born in high-volume hospitals or NICUs, but not the effectiveness of postnatal transfers (≈20% of those with a gestational age of < 33 weeks). In addition, the effectiveness of the in utero transfer is likely to be dependent on the point at which antenatal cover began. For example, hospitals may be more effective at reducing mortality for earlier in utero transfers (which tend to be the highest risk transfers) because of the improved antenatal cover.
Opportunities for further work
In terms of extending this research and developing its full potential to inform policy, much still needs to be achieved and we would point to the following specific areas for further research to build on this evidence base:
-
There is a need to model the interface between maternity and neonatal services to fully understand the dynamics of the system and its impact on outcomes and costs. It may be desirable to model births and NICU admissions together to identify the best locations of hospitals to combine the Royal College of Obstetricians and Gynaecologists recommendation22 of ≥ 6000 births for each obstetric unit where possible and the BAPM recommendation21 that all NICUs receive ≥ 100 VLBW infants per year.
-
The current study combined geographic location analysis with simulation modelling for neonatal care, allowing for an investigation of the impact of altered configuration on the number of neonatal nurses required to cope with variation in workload. It is possible to do the same for childbirth, combining a geographic location model with a simulation of labour-ward workload (the latter has previously been carried out in isolation by the authors154).
-
Methods should be developed to assess infant morbidity (as well as mortality) to fully analyse outcomes and the impact on cost-effectiveness of treatment and service delivery options.
-
The effectiveness and impact of transfers between hospitals should be explored (e.g. early and late in utero transfers and postnatal transfers), drawing on data available for the antenatal and postnatal periods.
-
The extent to which high-volume hospitals affect short-term and long-term morbidities, taking account of both the antenatal period and the postnatal period, should be considered.
-
There is a need to understand more fully the effect of network boundaries on the organisation of services.
-
There is a need to explore and evaluate in more detail how effective visualisation tools can be deployed across a range of contexts and for a range of stakeholders to convey the key findings in this area.
-
A DCE should be fully implemented with parents of neonatal infants based on the initial preparatory work presented in this study to systematically assess parental preferences in neonatal care.
Dissemination and outputs
Publications
A range of publications and presentations are planned on the basis of this work. These develop the themes and present them in more technical detail or explore some of the key methodological issues. These publications and presentations comprise:
-
a detailed analysis of the geographic analysis applied to maternity units in the context of current guidance from the Royal College of Obstetricians and Gynaecologists
-
more detailed and technical approaches to the mathematical methods used for the location analysis in this study
-
an expansion of the technical aspects of the health economic modelling and a comparison of alternative approaches to cost and mortality modelling
-
an expanded examination of the use of visualisation tools to communicate research output based in a thorough user-centred requirements analysis
-
a paper that investigates the differences between PPI workshops and qualitative research approaches, using neonatal care and this study as a case study example.
Tools
The methodological framework presented in this report, we believe, provides the basis for a tool set that could be used to support an evidence base for policy-makers in neonatal health and care. Although considerable further development would be required to fully implement this framework, we believe that it has the potential to be readily adapted for general use.
Conclusion
In many respects, this study has generated at least as many questions as answers. However, it has demonstrated a methodological approach and framework for the in-depth analysis of key issues in organising neonatal care for the NHS in England. In particular, we would point to our detailed location analysis for neonatal units in England as an important contribution to a more systematic and evidence-based approach to planned service configuration in the context of the evidence for improved outcomes in high-volume NICUs. In addition, the health economic analysis and mortality modelling point to key issues for differing configurations of care gives key insights into the cost implications for policy alternatives. Our parental interviews and qualitative research provide the crucial perspective of parents and highlighted a number of their key issues and concerns. Likewise, the interviews with policy-makers in neonatal care provided the critical context in which decision-making and consideration of service options take place.
It is clear that much more work needs to be undertaken to develop a comprehensive approach to the challenges facing the NHS for co-ordinated childbirth and neonatal care in England. However, we believe that this study significantly advances this cause and points to a range of further research needs in this context.
Acknowledgements
Contributions of others
We extend our thanks to the following people for their support in the project:
-
Dr Eugene Statnikov and Richard Colquhoun at the NDAU for their support in facilitating the sourcing of data from across the English Neonatal networks.
-
Dr Rebecca Mann and Dr Vaughan Lewis for their on-going clinical support and guidance during the progress of the research.
-
Professor Neil Marlow, Dr Grenville Fox and Dr Eleri Adams and the National Neonatal Clinical Reference Group more generally for their advice and guidance.
-
Zoe Chivers (Research Officer at BLISS) and BLISS more generally for their support in relation to parental involvement and the provision of questionnaire data relating to parental preferences.
-
Leanna Toms (Director of SNUG) for her help in the liaison with and recruitment of parents for the qualitative interview work.
-
All the parents who actively participated in the PPI workshops and qualitative interviews.
-
Dr Jo Day for her assistance in shaping the qualitative research and supporting the ethics approval process.
-
Dr Antonieta Medina-Lara, who developed the framework for the systematic review of neonatal and postnatal care discrete choice studies, supervised Paolo Landa to deliver this, and acted as the second reviewer for the systematic review.
-
Sarah Seaton for her active participation in the research and input into the mortality and costs elements.
Contribution of authors
Emma Villeneuve (Associate Research Fellow) developed the location analysis and mathematical modelling, contributed to obtaining permissions from all neonatal units to source NDAU data. As the first author, she co-ordinated and managed the writing of the report as well as writing relevant sections. Area of specialty: mathematical modelling and location analysis.
Paolo Landa (Associate Research Fellow) conducted the literature review, analysed family costs, prepared data and helped develop results for mortality and costs modelling. He conducted policy-maker interviews along with Anne Spencer and undertook the reading and coding of parent interviews and the development of the NVivo framework with Katie Kelsey. Area of specialty: health economic analysis and modelling.
Michael Allen (Honorary Research Fellow, Operational Research) framed the location analysis and simulation work, performed the descriptive analysis of data and the simulation work, and wrote part of the report. Area of specialty: mathematical modelling and simulation modelling.
Anne Spencer (Associate Professor, Health Economics) developed the framework for health economics analysis and conducted site visits and policy interviews along with Paolo Landa. She also wrote the initial ethics application for the qualitative study and wrote part of the report. Area of specialty: health economics.
Sue Prosser (Senior Neonatal Nurse) advised on neonatal unit working practices and assisted in parent involvement. She co-led recruitment, facilitated the PPI group and supported the qualitative researcher and health economics team. She also contributed to the PPI section of the report. Area of specialty: neonatal nursing.
Andrew Gibson (Associate Professor, PPI) co-led, with Sue Prosser, the PPI research work in the project and co-wrote the PPI section of the report. Area of specialty: PPI.
Katie Kelsey (Qualitative Researcher) conducted parent interviews, carried out qualitative analysis (developing the coding framework with Paolo Landa, coding with NVivo and analysis of responses using framework matrices) and wrote part of the report.
Ruben Mujica-Mota (Senior Lecturer in Health Economics) conducted and developed the mortality models and the cost modelling on LOS. Area of specialty: quantitative research.
Brad Manktelow (Associate Professor, Statistics) contributed to the design of the study and the interpretation of the data and reviewed the report as a whole. Area of specialty: neonatal modelling and mortality analysis.
Neena Modi (Professor, Neonatal Medicine) advised on clinical aspects, oversaw the acquisition of data from the NNRD and reviewed the final report. Area of specialty: neonatal care services.
Steve Thornton (Professor, Obstetrics and Gynaecology) provided clinical guidance for research relating to maternity services and reviewed the report, providing input to relevant sections. Area of specialty: obstetric care.
Martin Pitt (Associate Professor, Health-care Modelling) was the chief investigator for the research and oversaw the management and co-ordination of the project as a whole. He reviewed, amended and finalised the report and authored some sections (e.g. data visualisation). Area of specialty: modelling and simulation applied to health care.
Data-sharing statement
All data requests should be submitted to the corresponding author for consideration. Access to anonymised data may be granted following review.
Patient data
This work uses data provided by patients and collected by the NHS as part of their care and support. Using patient data is vital to improve health and care for everyone. There is huge potential to make better use of information from people’s patient records, to understand more about disease, develop new treatments, monitor safety, and plan NHS services. Patient data should be kept safe and secure, to protect everyone’s privacy, and it’s important that there are safeguards to make sure that it is stored and used responsibly. Everyone should be able to find out about how patient data are used. #datasaveslives You can find out more about the background to this citation here: https://understandingpatientdata.org.uk/data-citation.
Disclaimers
This report presents independent research funded by the National Institute for Health Research (NIHR). The views and opinions expressed by authors in this publication are those of the authors and do not necessarily reflect those of the NHS, the NIHR, NETSCC, the HS&DR programme or the Department of Health and Social Care. If there are verbatim quotations included in this publication the views and opinions expressed by the interviewees are those of the interviewees and do not necessarily reflect those of the authors, those of the NHS, the NIHR, NETSCC, the HS&DR programme or the Department of Health and Social Care.
References
- Royal College of Paediatrics and Child Health . National Neonatal Audit Programme 2015 Annual Report on 2014 Data 2015. www.rcpch.ac.uk/sites/default/files/NNAP_2015_Annual_Report_on_2014_data_-_Extended_Online_Version.pdf (accessed 16 November 2017).
- British Association of Perinatal Care . Categories of Care 2011 n.d. www.bapm.org/sites/default/files/files/CatsofcarereportAug11.pdf (accessed 14 December 2017).
- NHS England . Service Specification E08 S A: Neonatal Critical Care 2013. www.england.nhs.uk/wp-content/uploads/2013/06/e08-neonatal-critical.pdf (accessed 14 December 2017).
- Pillay T, Nightingale P, Owen S, Kirby D, Spencer A. Neonatal nurse staffing and delivery of clinical care in the SSBC Newborn Network. Arch Dis Child Fetal Neonatal Ed 2012;97:F174-8. https://doi.org/10.1136/adc.2011.300224.
- Are We Failing Special Care Babies in the UK?. London: BLISS – The Premature Baby Charity; 2007.
- Toolkit for High Quality Neonatal Services. London: Department of Health and Social Care; 2009.
- Specialist Neonatal Care: Cost Impact and Commissioning Assessment. Quality Standard QS4. London: NICE; 2010.
- Bagust A, Place M, Posnett JW. Dynamics of bed use in accommodating emergency admissions: stochastic simulation model. BMJ 1999;319:155-8. https://doi.org/10.1136/bmj.319.7203.155.
- Tucker J, Parry G, Fowlie PW, McGuire W. Organisation and delivery of perinatal services. BMJ 2004;329:730-2. https://doi.org/10.1136/bmj.329.7468.730.
- Marlow N, Gill AB. Establishing neonatal networks: the reality. Arch Dis Child Fetal Neonatal Ed 2007;92:F137-42. https://doi.org/10.1136/adc.2005.086413.
- Report to The Department of Health Children’s Taskforce from The Maternity and Neonatal Workforce Group. London: Department of Health and Social Care; 2003.
- Baby Life Support Systems (BLISS) . It’s Not a Game: The Very Real Costs of Having a Premature or Sick Baby 2014. www.bliss.org.uk/its-not-a-game (accessed 14 December 2017).
- Sherenian M, Profit J, Schmidt B, Suh S, Xiao R, Zupancic JA, et al. Nurse-to-patient ratios and neonatal outcomes: a brief systematic review. Neonatology 2013;104:179-83. https://doi.org/10.1159/000353458.
- Watson SI, Arulampalam W, Petrou S, Marlow N, Morgan AS, Draper ES, et al. NDAU and the Neonatal Economic, Staffing, and Clinical Outcomes Project (NESCOP) Group . The effects of a one-to-one nurse-to-patient ratio on the mortality rate in neonatal intensive care: a retrospective, longitudinal, population-based study. Arch Dis Child Fetal Neonatal Ed 2016;101:F195-200. https://doi.org/10.1136/archdischild-2015-309435.
- Hamilton KE, Redshaw ME, Tarnow-Mordi W. Nurse staffing in relation to risk-adjusted mortality in neonatal care. Arch Dis Child Fetal Neonatal Ed 2007;92:F99-F103. https://doi.org/10.1136/adc.2006.102988.
- Cimiotti JP, Haas J, Saiman L, Larson EL. Impact of staffing on bloodstream infections in the neonatal intensive care unit. Arch Pediatr Adolesc Med 2006;160:832-6. https://doi.org/10.1001/archpedi.160.8.832.
- Profit J, Petersen LA, McCormick MC, Escobar GJ, Coleman-Phox K, Zheng Z, et al. Patient-to-nurse ratios and outcomes of moderately preterm infants. Pediatrics 2010;125:320-6. https://doi.org/10.1542/peds.2008-3140.
- Phibbs CS, Baker LC, Caughey AB, Danielsen B, Schmitt SK, Phibbs RH. Level and volume of neonatal intensive care and mortality in very-low-birth-weight infants. N Engl J Med 2007;356:2165-75. https://doi.org/10.1056/NEJMsa065029.
- Watson SI, Arulampalam W, Petrou S, Marlow N, Morgan AS, Draper ES, et al. The effects of designation and volume of neonatal care on mortality and morbidity outcomes of very preterm infants in England: retrospective population-based cohort study. BMJ Open 2014;4. https://doi.org/10.1136/bmjopen-2014-004856.
- Cifuentes J, Bronstein J, Phibbs CS, Phibbs RH, Schmitt SK, Carlo WA. Mortality in low birth weight infants according to level of neonatal care at hospital of birth. Pediatrics 2002;109:745-51. https://doi.org/10.1542/peds.109.5.745.
- British Association of Perinatal Medicine . Optimal Arrangements for Neonatal Intensive Care Units in the UK Including Guidance on Their Medical Staffing 2014. www.bapm.org/sites/default/files/files/Optimal%20size%20of%20NICUs%20final%20June%202014.pdf (accessed 22 November 2017).
- Royal College of Obstetricians and Gynaecologists . Reconfiguration of Women’s Services in the UK 2013. www.rcog.org.uk/globalassets/documents/guidelines/reconfiguration_good_practice_no.15_corrected_february_2014.pdf (accessed 14 December 2017).
- Maternity Services in England. London: The Stationery Office; 2013.
- Trends in Freestanding Midwife-Led Units in England and Wales 2001–2013. London: BirthChoice UK; 2013.
- Featherstone P, Eberth JM, Nitcheva D, Liu J. Geographic accessibility to health services and neonatal mortality among very-low birthweight infants in South Carolina. Matern Child Health J 2016;20:2382-91. https://doi.org/10.1007/s10995-016-2065-2.
- Pilkington H, Blondel B, Drewniak N, Zeitlin J. Where does distance matter? Distance to the closest maternity unit and risk of foetal and neonatal mortality in France. Eur J Public Health 2014;24:905-10. https://doi.org/10.1093/eurpub/ckt207.
- Ravelli AC, Jager KJ, de Groot MH, Erwich JJ, Rijninks-van Driel GC, Tromp M, et al. Travel time from home to hospital and adverse perinatal outcomes in women at term in the Netherlands. BJOG 2011;118:457-65. https://doi.org/10.1111/j.1471-0528.2010.02816.x.
- Paranjothy S, Watkins WJ, Rolfe K, Adappa R, Gong Y, Dunstan F, et al. Perinatal outcomes and travel time from home to hospital: Welsh data from 1995 to 2009. Acta Paediatr 2014;103:e522-7. https://doi.org/10.1111/apa.12800.
- Blondel B, Drewniak N, Pilkington H, Zeitlin J. Out-of-hospital births and the supply of maternity units in France. Health Place 2011;17:1170-3. https://doi.org/10.1016/j.healthplace.2011.06.002.
- Payment by Results Team. A Simple Guide to Payment by Results. London: Department of Health and Social Care; 2011.
- NHS Reference Costs 2014 to 2015. London: Department of Health and Social Care; 2015.
- Adams E. The New NCCMDS, Neonatal HRGs 2016 and Reference Costs: a Guide for Clinicians. London: National Casemix Office; 2016.
- Allen M, Spencer A, Gibson A, Matthews J, Allwood A, Prosser S, et al. Right cot, right place, right time: improving the design and organisation of neonatal care networks – a computer simulation study. Health Serv Deliv Res 2015;3.
- Consumer Data Research Centre . CDRC 2011 Population Weighted Centroids – GB n.d. https://data.cdrc.ac.uk/dataset/cdrc-2011-population-weighted-centroids-gb (accessed June 2017).
- Ministry of Housing, Communities and Local Government . English Indices of Deprivation 2015 – LSOA Level 2015 n.d. https://data.gov.uk/dataset/english-indices-of-deprivation-2015-lsoa-level (accessed January 2017).
- NHS Digital . Hospital Episode Statistics 2017 n.d. http://content.digital.nhs.uk/hes (accessed September 2016).
- Office of National Statistics . Subnational Population Projections for Regions in England: 2014-Based Projections 2014. www.ons.gov.uk/peoplepopulationandcommunity/populationandmigration/populationprojections/datasets/regionsinenglandtable1 (accessed 1 October 2017).
- Curtis L. Unit Costs of Health and Social Care 2014. Canterbury: Personal Social Services Research Unit, University of Kent; 2014.
- Department for Transport . Transport Analysis Guidance: WebTAG 2013. www.gov.uk/transport-analysis-guidance-webtag (accessed January 2017).
- Mackie PJ, Wardman M, Fowkes AS, Whelan G, Nellthorp J, Bates J. Values of Travel Time Savings UK. Working Paper. Leeds: Institute of Transport Studies, University of Leeds; 2003.
- Imperial College London . Neonatal Data Analysis Unit 2017 n.d. www.imperial.ac.uk/neonatal-data-analysis-unit (accessed October 2016).
- CleverMed . CleverMed: Intelligent Patient Data Management Services and Solutions 2017. www.clevermed.com/ (accessed 14 December 2017).
- Maternity Services in England. London: Department of Health and Social Care; 2013.
- Gray R, Bonellie SR, Chalmers J, Greer I, Jarvis S, Williams C. Social inequalities in preterm birth in Scotland 1980–2003: findings from an area-based measure of deprivation. BJOG 2008;115:82-90. https://doi.org/10.1111/j.1471-0528.2007.01582.x.
- Phibbs CS, Mark DH, Luft HS, Peltzman-Rennie DJ, Garnick DW, Lichtenberg E, et al. Choice of hospital for delivery: a comparison of high-risk and low-risk women. Health Serv Res 1993;28:201-22.
- Zhou AM, Qu BY, Li H, Zhao SZ, Suganthan PN, Zhang QF. Multiobjective evolutionary algorithms: a survey of the state of the art. Swarm Evol Comput 2011;1:32-49. https://doi.org/10.1016/j.swevo.2011.03.001.
- Kirkpatrick S, Gelatt CD, Vecchi MP. Optimization by simulated annealing. Science 1983;220:671-80. https://doi.org/10.1126/science.220.4598.671.
- Berman O, Drezner Z, Krass D. Generalized coverage: new developments in covering location models. Comput Oper Res 2010;37:1675-87. https://doi.org/10.1016/j.cor.2009.11.003.
- Goldberg DE. Genetic Algorithms in Search, Optimization, and Machine Learning. Reading: Addison-Wesley; 1990.
- Baker JE. Reducing Bias and Inefficiency in the Selection Algorithm. Proceedings of the Second International Conference on Genetic Algorithms. Cambridge, MA: L Erlbaum Associates; 1987.
- Baker JE. Adaptive Selection Methods for Genetic Algorithms. Proceedings of the First International Conference on Genetic Algorithms. Cambridge, MA: L Erlbaum Associates; 1985.
- Goldberg DE, Deb K. A comparative analysis of selection schemes used in genetic algorithms. Foundations of Genetic Algorithms 1991;1:69-93. https://doi.org/10.1016/B978-0-08-050684-5.50008-2.
- Maza M, Tidor B. An Analysis of Selection Procedures with Particular Attention Paid to Proportional and Boltzmann Selection. Proceedings of the Fifth International Conference on Genetic Algorithms. San Francisco, CA: Morgan Kaufmann Publishers Inc.; 1993.
- Mitchell M. An Introduction to Genetic Algorithms. Cambridge, MA: MIT Press; 1998.
- Holland JH. Adaptation in Natural and Artificial Systems: an Introductory Analysis with Applications to Biology, Control, and Artificial Intelligence. Ann Arbor, MI: University of Michigan Press; 1975.
- Deb K, Pratap A, Agarwal S, Meyarivan T. A fast and elitist multiobjective genetic algorithm: NSGA-II. IEEE Trans on Evol Computation 2002;6:182-97. https://doi.org/10.1109/4235.996017.
- Zitzler E, Laumanns M, Thiele L. SPEA2: Improving the strength Pareto evolutionary algorithm. TIK Report 2001;103:1-21.
- Bader J, Zitzler E. HypE: an algorithm for fast hypervolume-based many-objective optimization. Evol Comput 2011;19:45-76. https://doi.org/10.1162/EVCO_a_00009.
- Wong JYQ, Sharma S, Rangaiah GP. Design of shell-and-tube heat exchangers for multiple objectives using elitist non-dominated sorting genetic algorithm with termination criteria. Applied Thermal Engineering 2016;93:888-99. https://doi.org/10.1016/j.applthermaleng.2015.10.055.
- OpenStreetMap . Welcome to OpenStreetMap! 2017 n.d. www.openstreetmap.org/ (accessed June 2017).
- Royal College of Obstetricians and Gynaecologists . Reconfiguration of Women’s Services in the UK 2013;15:1-12.
- Blondel B, Papiernik E, Delmas D, Künzel W, Weber T, Maier RF, et al. Organisation of obstetric services for very preterm births in Europe: results from the MOSAIC project. BJOG 2009;116:1364-72. https://doi.org/10.1111/j.1471-0528.2009.02239.x.
- Asaduzzaman M, Chaussalet TJ. Modelling and Performance Measure of a Perinatal Network Centre in the United Kingdom. Computer-Based Medical Systems, 2008. CBMS ’08 2008:17-9. https://doi.org/10.1109/CBMS.2008.50.
- Asaduzzaman M, Chaussalet TJ, Robertson NJ. A loss network model with overflow for capacity planning of a neonatal unit. Ans of Ops Res 2009;178:67-76. https://doi.org/10.1007/s10479-009-0548-x.
- Asaduzzaman M, Chaussalet TJ, Adeyemi S, Chahed S, Hawdon J, Wood D, et al. Towards effective capacity planning in a perinatal network centre. Arch Dis Child Fetal Neonatal Ed 2010;95:F283-7. https://doi.org/10.1136/adc.2009.161661.
- Assaduzzaman M, Chaussalet TJ. An overflow loss network model for capacity planning for a perinatal network. J R Statist Soc: A 2011;174:403-17. https://doi.org/10.1111/j.1467-985X.2010.00669.x.
- Asaduzzaman M, Chaussalet TJ. An overflow loss network model for capacity planning of a perinatal network. J Royal Stat Soc 2011;174:403-17.
- Fournier DL, Zaric GS. Simulating neonatal intensive care capacity in British Columbia. Socioecon Plann Sci 2013;47:131-41. https://doi.org/10.1016/j.seps.2013.01.001.
- Demir E, Lebcir R, Adeyami S. Modelling length of stay and patient flows: methodological case studies from the UK neonatal care services. J Oper Res Soc 2014;65:532-45. https://doi.org/10.1057/jors.2013.51.
- Medlock S, Ravelli AC, Tamminga P, Mol BW, Abu-Hanna A. Prediction of mortality in very premature infants: a systematic review of prediction models. PLOS ONE 2011;6. https://doi.org/10.1371/journal.pone.0023441.
- Ge WJ, Mirea L, Yang J, Bassil KL, Lee SK, Shah PS. Canadian Neonatal Network . Prediction of neonatal outcomes in extremely preterm neonates. Pediatrics 2013;132:e876-85. https://doi.org/10.1542/peds.2013-0702.
- Hinchliffe SR, Seaton SE, Lambert PC, Draper ES, Field DJ, Manktelow BN. Modelling time to death or discharge in neonatal care: an application of competing risks. Paediatr Perinat Epidemiol 2013;27:426-33. https://doi.org/10.1111/ppe.12053.
- Manktelow BN, Seaton SE, Field DJ, Draper ES. Population-based estimates of in-unit survival for very preterm infants. Pediatrics 2013;131:e425-32. https://doi.org/10.1542/peds.2012-2189.
- Evans N, Hutchinson J, Simpson JM, Donoghue D, Darlow B, Henderson-Smart D. Prenatal predictors of mortality in very preterm infants cared for in the Australian and New Zealand Neonatal Network. Arch Dis Child Fetal Neonatal Ed 2007;92:F34-40. https://doi.org/10.1136/adc.2006.094169.
- MacDorman MF, Declercq E, Menacker F, Malloy MH. Neonatal mortality for primary cesarean and vaginal births to low-risk women: application of an ‘intention-to-treat’ model. Birth 2008;35:3-8. https://doi.org/10.1111/j.1523-536X.2007.00205.x.
- Rogowski JA, Horbar JD, Staiger DO, Kenny M, Carpenter J, Geppert J. Indirect vs direct hospital quality indicators for very low-birth-weight infants. JAMA 2004;291:202-9. https://doi.org/10.1001/jama.291.2.202.
- Lorch SA, Baiocchi M, Ahlberg CE, Small DS. The differential impact of delivery hospital on the outcomes of premature infants. Pediatrics 2012;130:270-8. https://doi.org/10.1542/peds.2011-2820.
- Tucker J. UK Neonatal Staffing Study Group . Patient volume, staffing, and workload in relation to risk-adjusted outcomes in a random stratified sample of UK neonatal intensive care units: a prospective evaluation. Lancet 2002;359:99-107. https://doi.org/10.1016/S0140-6736(02)07366-X.
- Rautava L, Lehtonen L, Peltola M, Korvenranta E, Korvenranta H, Linna M, et al. The effect of birth in secondary- or tertiary-level hospitals in Finland on mortality in very preterm infants: a birth-register study. Pediatrics 2007;119:e257-63. https://doi.org/10.1542/peds.2006-1964.
- Lasswell SM, Barfield WD, Rochat RW, Blackmon L. Perinatal regionalization for very low-birth-weight and very preterm infants: a meta-analysis. JAMA 2010;304:992-1000. https://doi.org/10.1001/jama.2010.1226.
- Gale C, Santhakumaran S, Nagarajan S, Statnikov Y, Modi N. Neonatal Data Analysis Unit and the Medicines for Neonates Investigator Group . Impact of managed clinical networks on NHS specialist neonatal services in England: population based study. BMJ 2012;344. https://doi.org/10.1136/bmj.e2105.
- Robins JM. Correcting for noncompliance in randomized trials using structural nested mean models. Commun Stat Theory Methods 1994;23:2379-412. https://doi.org/10.1080/03610929408831393.
- Miranda A, Rabe-Hesketh S. Maximum likelihood estimation of endogenous switching and sample selection models for binary, ordinal, and count variables. Stata Journal 2006;6:285-308.
- Department of Health and Social Care . NHS Reference Costs 2015 to 2016 n.d. www.gov.uk/government/publications/nhs-reference-costs-2015-to-2016 (accessed October 2018).
- NHS England: The National Casemix Office . The New NCCMDS, Neonatal HRGs 2016 and Reference Costs A Guide for Clinicians n.d. www.bapm.org/sites/default/files/files/NCCMDS.%20Neonatal%20HRGs%20and%20Reference%20Costs%20-%20A%20Guide%20for%20Clinicians%20Dec%202016.pdf (accessed October 2018).
- NHS Improvement . Reference Costs 2016 17: Highlights, Analysis and Introduction to the Data November 2017 n.d. https://improvement.nhs.uk/documents/1972/1_-Reference_costs_publication_VSnAQ5x.pdf (accessed October 2018).
- Rogowski J. Measuring the cost of neonatal and perinatal care. Pediatrics 1999;103:329-35.
- Petrou S, Abangma G, Johnson S, Wolke D, Marlow N. Costs and health utilities associated with extremely preterm birth: evidence from the EPICure study. Value Health 2009;12:1124-34. https://doi.org/10.1111/j.1524-4733.2009.00580.x.
- Mangham LJ, Petrou S, Doyle LW, Draper ES, Marlow N. The cost of preterm birth throughout childhood in England and Wales. Pediatrics 2009;123:e312-27. https://doi.org/10.1542/peds.2008-1827.
- Tarnow-Mordi WO, Tucker JS, McCabe CJ, Nicolson P, Parry GJ. The UK neonatal staffing study: a prospective evaluation of neonatal intensive care in the UK. Seminars in Neonatology 1997;2:171-9. https://doi.org/10.1016/S1084-2756(97)80012-7.
- O’Neill C, Malek M, Mugford M, Normand C, Tarnow-Mordi WO, Hey E, et al. A cost analysis of neonatal care in the UK: results from a multicentre study. ECSURF Study Group. J Public Health Med 2000;22:108-15. https://doi.org/10.1093/pubmed/22.1.108.
- Watson S, Arulampalam W, Petrou S. NESCOP . The effect of health care expenditure on patient outcomes: evidence from English neonatal care. Health Econ 2017;26:e274-e284. https://doi.org/10.1002/hec.3503.
- Mihaylova B, Briggs A, O’Hagan A, Thompson SG. Review of statistical methods for analysing healthcare resources and costs. Health Econ 2011;20:897-916. https://doi.org/10.1002/hec.1653.
- Faddy M, Graves N, Pettitt A. Modeling length of stay in hospital and other right skewed data: comparison of phase-type, gamma and log-normal distributions. Value Health 2009;12:309-14. https://doi.org/10.1111/j.1524-4733.2008.00421.x.
- Marazzi A, Paccaud F, Ruffieux C, Beguin C. Fitting the distributions of length of stay by parametric models. Med Care 1998;36:915-27. https://doi.org/10.1097/00005650-199806000-00014.
- Kuklys W. Stated choice methods: analysis and application. J Appl Econom 2002;17:701-4. https://doi.org/10.1002/jae.701.
- Janus SI, Weernink MG, van Til JA, Raisch DW, van Manen JG, IJzerman MJ. A systematic review to identify the use of preference elicitation methods in health care decision making. Value Health 2014;17:A515-6. https://doi.org/10.1016/j.jval.2014.08.1596.
- Pope C, Ziebland S, Mays N. Qualitative research in health care. Analysing qualitative data. BMJ 2000;320:114-16. https://doi.org/10.1136/bmj.320.7227.114.
- Mays N, Pope C. Qualitative research in health care. Assessing quality in qualitative research. BMJ 2000;320:50-2. https://doi.org/10.1136/bmj.320.7226.50.
- Pope C, Mays N. Reaching the parts other methods cannot reach: an introduction to qualitative methods in health and health services research. BMJ 1995;311:42-5. https://doi.org/10.1136/bmj.311.6996.42.
- Morris C, Janssens A, Shilling V, Allard A, Fellowes A, Tomlinson R, et al. Meaningful health outcomes for paediatric neurodisability: stakeholder prioritisation and appropriateness of patient reported outcome measures. Health Qual Life Outcomes 2015;13. https://doi.org/10.1186/s12955-015-0284-7.
- Coast J, Al-Janabi H, Sutton EJ, Horrocks SA, Vosper AJ, Swancutt DR, et al. Using qualitative methods for attribute development for discrete choice experiments: issues and recommendations. Health Econ 2012;21:730-41. https://doi.org/10.1002/hec.1739.
- Klojgaard ME, Bech M, Sogaard R. Designing a stated choice experiment: the value of a qualitative process. J Choice Model 2012;5:1-18. https://doi.org/10.1016/S1755-5345(13)70050-2.
- de Bekker-Grob EW, Ryan M, Gerard K. Discrete choice experiments in health economics: a review of the literature. Health Econ 2012;21:145-72. https://doi.org/10.1002/hec.1697.
- Bhattarai N, McMeekin P, Price C, Vale L. Economic evaluations on centralisation of specialised healthcare services: a systematic review of methods. BMJ Open 2016;6. https://doi.org/10.1136/bmjopen-2016-011214.
- Louviere JJ, Lancsar E. Choice experiments in health: the good, the bad, the ugly and toward a brighter future. Health Econ Policy Law 2009;4:527-46. https://doi.org/10.1017/S1744133109990193.
- Lancsar E, Louviere J. Conducting discrete choice experiments to inform healthcare decision making: a user’s guide. PharmacoEconomics 2008;26:661-77. https://doi.org/10.2165/00019053-200826080-00004.
- Reed Johnson F, Lancsar E, Marshall D, Kilambi V, Mühlbacher A, Regier DA, et al. Constructing experimental designs for discrete-choice experiments: report of the ISPOR Conjoint Analysis Experimental Design Good Research Practices Task Force. Value Health 2013;16:3-13. https://doi.org/10.1016/j.jval.2012.08.2223.
- Moher D, Shamseer L, Clarke M, Ghersi D, Liberati A, Petticrew M, et al. Preferred Reporting Items for Systematic Review And Meta-Analysis Protocols (PRISMA-P) 2015 statement. Syst Rev 2015;4. https://doi.org/10.1186/2046-4053-4-1.
- Morgan H, Hoddinott P, Thomson G, Crossland N, Farrar S, Yi D, et al. Benefits of Incentives for Breastfeeding and Smoking cessation in pregnancy (BIBS): a mixed-methods study to inform trial design. Health Technol Assess 2015;19. https://doi.org/10.3310/hta19300.
- Hundley V, Ryan M, Graham W. Assessing women’s preferences for intrapartum care. Birth 2001;28:254-63. https://doi.org/10.1046/j.1523-536X.2001.00254.x.
- Hill M, Suri R, Nash EF, Morris S, Chitty LS. Preferences for prenatal tests for cystic fibrosis: a discrete choice experiment to compare the views of adult patients, carriers of cystic fibrosis and health professionals. J Clin Med 2014;3:176-90. https://doi.org/10.3390/jcm3010176.
- Carroll FE, Al-Janabi H, Flynn T, Montgomery AA. Women and their partners’ preferences for Down’s syndrome screening tests: a discrete choice experiment. Prenat Diagn 2013;33:449-56. https://doi.org/10.1002/pd.4086.
- Howard K, Gerard K, Adelson P, Bryce R, Wilkinson C, Turnbull D. Women’s preferences for inpatient and outpatient priming for labour induction: a discrete choice experiment. BMC Health Serv Res 2014;14. https://doi.org/10.1186/1472-6963-14-330.
- Turbitt E, Wiest MM, Halliday JL, Amor DJ, Metcalfe SA. Availability of treatment drives decisions of genetic health professionals about disclosure of incidental findings. Eur J Hum Genet 2014;22:1225-8. https://doi.org/10.1038/ejhg.2014.11.
- Ride J, Lancsar E. Women’s preferences for treatment of perinatal depression and anxiety: a discrete choice experiment. PLOS ONE 2016;11. https://doi.org/10.1371/journal.pone.0156629.
- Bijlenga D, Bonsel GJ, Birnie E. Eliciting willingness to pay in obstetrics: comparing a direct and an indirect valuation method for complex health outcomes. Health Econ 2011;20:1392-406. https://doi.org/10.1002/hec.1678.
- Gartner FR, de Bekker-Grob EW, Stiggelbout AM, Rijnders ME, Freeman LM, Middeldorp JM, et al. Calculating preference weights for the labor and delivery index: a discrete choice experiment on women’s birth experiences. Value Health 2015;18:856-64. https://doi.org/10.1016/j.jval.2015.07.005.
- van der Pol M, Shiell A, Au F, Jonhston D, Tough S. Eliciting individual preferences for health care: a case study of perinatal care. Health Expect 2010;13:4-12. https://doi.org/10.1111/j.1369-7625.2009.00551.x.
- Mazzoni A, Althabe F, Gutierrez L, Gibbons L, Liu NH, Bonotti AM, et al. Women’s preferences and mode of delivery in public and private hospitals: a prospective cohort study. BMC Pregnancy Childbirth 2016;16. https://doi.org/10.1186/s12884-016-0824-0.
- Baxter JA, Roth DE, Al Mahmud A, Ahmed T, Islam M, Zlotkin SH. Tablets are preferred and more acceptable than powdered prenatal calcium supplements among pregnant women in Dhaka, Bangladesh. J Nutr 2014;144:1106-12. https://doi.org/10.3945/jn.113.188524.
- Lagarde M, Smith Paintain L, Antwi G, Jones C, Greenwood B, Chandramohan D, et al. Evaluating health workers’ potential resistance to new interventions: a role for discrete choice experiments. PLOS ONE 2011;6. https://doi.org/10.1371/journal.pone.0023588.
- Bijlenga D, Birnie E, Bonsel GJ. Feasibility, reliability, and validity of three health-state valuation methods using multiple-outcome vignettes on moderate-risk pregnancy at term. Value Health 2009;12:821-7. https://doi.org/10.1111/j.1524-4733.2009.00503.x.
- Carroll FE, Owen-Smith A, Shaw A, Montgomery AA. A qualitative investigation of the decision-making process of couples considering prenatal screening for Down syndrome. Prenat Diagn 2012;32:57-63. https://doi.org/10.1002/pd.2901.
- Turbitt E, Halliday JL, Metcalfe SA. Key informants’ perspectives of implementing chromosomal microarrays into clinical practice in Australia. Twin Res Hum Genet 2013;16:833-9. https://doi.org/10.1017/thg.2013.43.
- Liu NH, Mazzoni A, Zamberlin N, Colomar M, Chang OH, Arnaud L, et al. Preferences for mode of delivery in nulliparous Argentinean women: a qualitative study. Reprod Health 2013;10. https://doi.org/10.1186/1742-4755-10-2.
- Mazzoni A, Althabe F, Liu NH, Bonotti AM, Gibbons L, Sánchez AJ, et al. Women’s preference for caesarean section: a systematic review and meta-analysis of observational studies. BJOG 2011;118:391-9. https://doi.org/10.1111/j.1471-0528.2010.02793.x.
- Webbe J, Brunton G, Ali S, Duffy JMN, Modi N, Gale C. Developing, implementing and disseminating a core outcome set for neonatal medicine. BMJ Paediatr Open 2017;1. https://doi.org/10.1136/bmjpo-2017-000048.
- Ritchie J, Spencer L, Burgess B, Bryman A. Analysing Qualitative Data. London: Routledge; 1994.
- Hall SL, Phillips R, Hynan MT. Transforming NICU care to provide comprehensive family support. Newborn Infant Nurs Rev 2016;16:69-73. https://doi.org/10.1053/j.nainr.2016.03.008.
- O’Brien K, Bracht M, Macdonell K, McBride T, Robson K, O’Leary L, et al. A pilot cohort analytic study of Family Integrated Care in a Canadian neonatal intensive care unit. BMC Pregnancy Childbirth 2013;13. https://doi.org/10.1186/1471-2393-13-S1-S12.
- Jiang S, Warre R, Qiu X, O’Brien K, Lee SK. Parents as practitioners in preterm care. Early Hum Dev 2014;90:781-5. https://doi.org/10.1016/j.earlhumdev.2014.08.019.
- Guide to the Methods of Technology Appraisal 2013. London: NICE; 2013.
- The National Archives . UK Government Web Archive: ONS: Historic and Projected Mortality Data from the Period and Cohort Life Tables, 2012-Based, UK, 1981–2062 2013. http://webarchive.nationalarchives.gov.uk/20160105221532/http://www.ons.gov.uk/ons/rel/lifetables/historic-and-projected-data-from-the-period-and-cohort-life-tables/2012-based/stb-2012-based.html (accessed June 2017).
- HM Treasury . The Green Book: Appraisal and Evaluation in Central Government 2003. www.thenbs.com/PublicationIndex/documents/details?Pub=HMT&DocID=266358 (accessed 17 December 2017).
- Almond D, Doyle JJ, Kowalski AE, Williams H. Estimating marginal returns to medical care: evidence from at-risk newborns. Q J Econ 2010;125:591-634. https://doi.org/10.1162/qjec.2010.125.2.591.
- Black SE, Devereux PJ, Salvanes KG. From the cradle to the labor market? The effect of birth weight on adult outcomes. Q J Econ 2007;122:409-39. https://doi.org/10.1162/qjec.122.1.409.
- Claxton K, Martin S, Soares N, Rice M, Spackman E, Hinde S, et al. Methods for the estimation of the National Institute for Health and Care Excellence cost-effectiveness threshold. Health Technol Assess 2015;19. https://doi.org/10.3310/hta19140.
- Paulden M, O’Mahony J, McCabe C. Determinants of change in the cost-effectiveness threshold. Med Decis Making 2017;37:264-76. https://doi.org/10.1177/0272989X16662242.
- Pennington M, Baker R, Brouwer W, Mason H, Hansen DG, Robinson A, et al. Comparing WTP values of different types of QALY gain elicited from the general public. Health Econ 2015;24:280-93. https://doi.org/10.1002/hec.3018.
- Birch S, Gafni A. On the margins of health economics: a response to ‘resolving NICE’S nasty dilemma’. Health Econ Policy Law 2015;10:183-93. https://doi.org/10.1017/S1744133114000462.
- Sculpher M, Claxton K, Pearson SD. Developing a value framework: the need to reflect the opportunity costs of funding decisions. Value Health 2017;20:234-9. https://doi.org/10.1016/j.jval.2016.11.021.
- Automobile Association . AA Motoring Costs 2013. www.theaa.com/motoring_advice/running_costs/index.html (accessed September 2017).
- Young FW, Valero-Mora PM, Friendly M. Visual Statistics: Seeing Data with Dynamic Interactive Graphics. Hoboken, NJ: Wiley; 2006.
- Tufte ER. The Visual Display of Quantitative Information. Cheshire, CT: Graphics Press; 2001.
- Lewis S, Clarke M. Forest plots: trying to see the wood and the trees. BMJ 2001;322:1479-80. https://doi.org/10.1136/bmj.322.7300.1479.
- Fenwick E, O’Brien BJ, Briggs A. Cost-effectiveness acceptability curves – facts, fallacies and frequently asked questions. Health Econ 2004;13:405-15. https://doi.org/10.1002/hec.903.
- Dorling D. Area Cartograms: Their Use and Creation. Bristol: University of Bristol; 1996.
- Thomas B, Dorling T. Identity in Britain – a Cradle to Grave Atlas. Bristol: Policy Press, University of Bristol; 2007.
- Royal College of Paediatrics and Child Health . National Neonatal Audit Programme 2016 Annual Report on 2015 Data 2016. www.rcpch.ac.uk/sites/default/files/NNAP_2016_Annual_Report_on_2015_data.pdf (accessed 12 December 2017).
- Marlow N, Bennett C, Draper ES, Hennessy EM, Morgan AS, Costeloe KL. Perinatal outcomes for extremely preterm babies in relation to place of birth in England: the EPICure 2 study. Arch Dis Child Fetal Neonatal Ed 2014;99:F181-8. https://doi.org/10.1136/archdischild-2013-305555.
- Costeloe K, Hennessy E, Gibson AT, Marlow N, Wilkinson AR. The EPICure study: outcomes to discharge from hospital for infants born at the threshold of viability. Pediatrics 2000;106:659-71. https://doi.org/10.1542/peds.106.4.659.
- Field DJ, Dorling JS, Manktelow BN, Draper ES. Survival of extremely premature babies in a geographically defined population: prospective cohort study of 1994–9 compared with 2000–5. BMJ 2008;336:1221-3. https://doi.org/10.1136/bmj.39555.670718.BE.
- Allen M, Thornton S. Providing one-to-one care in labour. Analysis of ‘Birthrate Plus’ labour ward staffing in real and simulated labour ward environments. BJOG 2013;120:100-7. https://doi.org/10.1111/j.1471-0528.2012.03483.x.
Appendix 1 Location analysis
Villeneuve charts for resilience probability
Definition of the resilience probability
In order to analyse the possible scenarios, it is interesting to highlight which locations are more likely to appear in the optimal configurations (i.e. those configurations that make up the Pareto front). To do so, we compute the resilience probability of every location in accordance with the following method:
-
Select the Pareto front configurations with 35 to 55 units (current number 45 ± 10). This allows us to select configurations close to the current state.
-
Select the Pareto front configurations in the highest quartile of the proportion of patients both attending units with ≥ 100 VLBW infants per year and living within 30 minutes from the closest unit. This allows us to select the best-performing configurations.
-
Compute the probability p(ui|h) of each unit ui to appear in the selected ‘h-configurations’ (configurations with h units):
Such probability verifies:
-
Compute the probability p(ui) of each unit ui to appear in the selected configurations:
Such probability verifies:
The locations that appear the most often in the optimal configurations will have a higher resilience probability. Such an indicator is useful in order to select the locations that are the most resilient to network changes.
Reading a Villeneuve resilience chart
These charts display the resilience or optimality probability of the locations of four ODNs, as well as their existing levels of care.
The Villeneuve resilience chart provides a means to assess the relative probability that a neonatal unit location appears in an optimal configuration (as output by the genetic algorithm used for location analysis) and is therefore likely to be a good location to place a NICU. In Figure 20, unit locations in four separate networks are shown (represented by the upper level of bars). For each location, the probability of each existing unit appearing in an optimal configuration (coloured bar) as well as the unit’s existing care level [NICU, LNU or SCU (lower level of bars)] are shown.
FIGURE 20.
Elements within a Villeneuve chart.
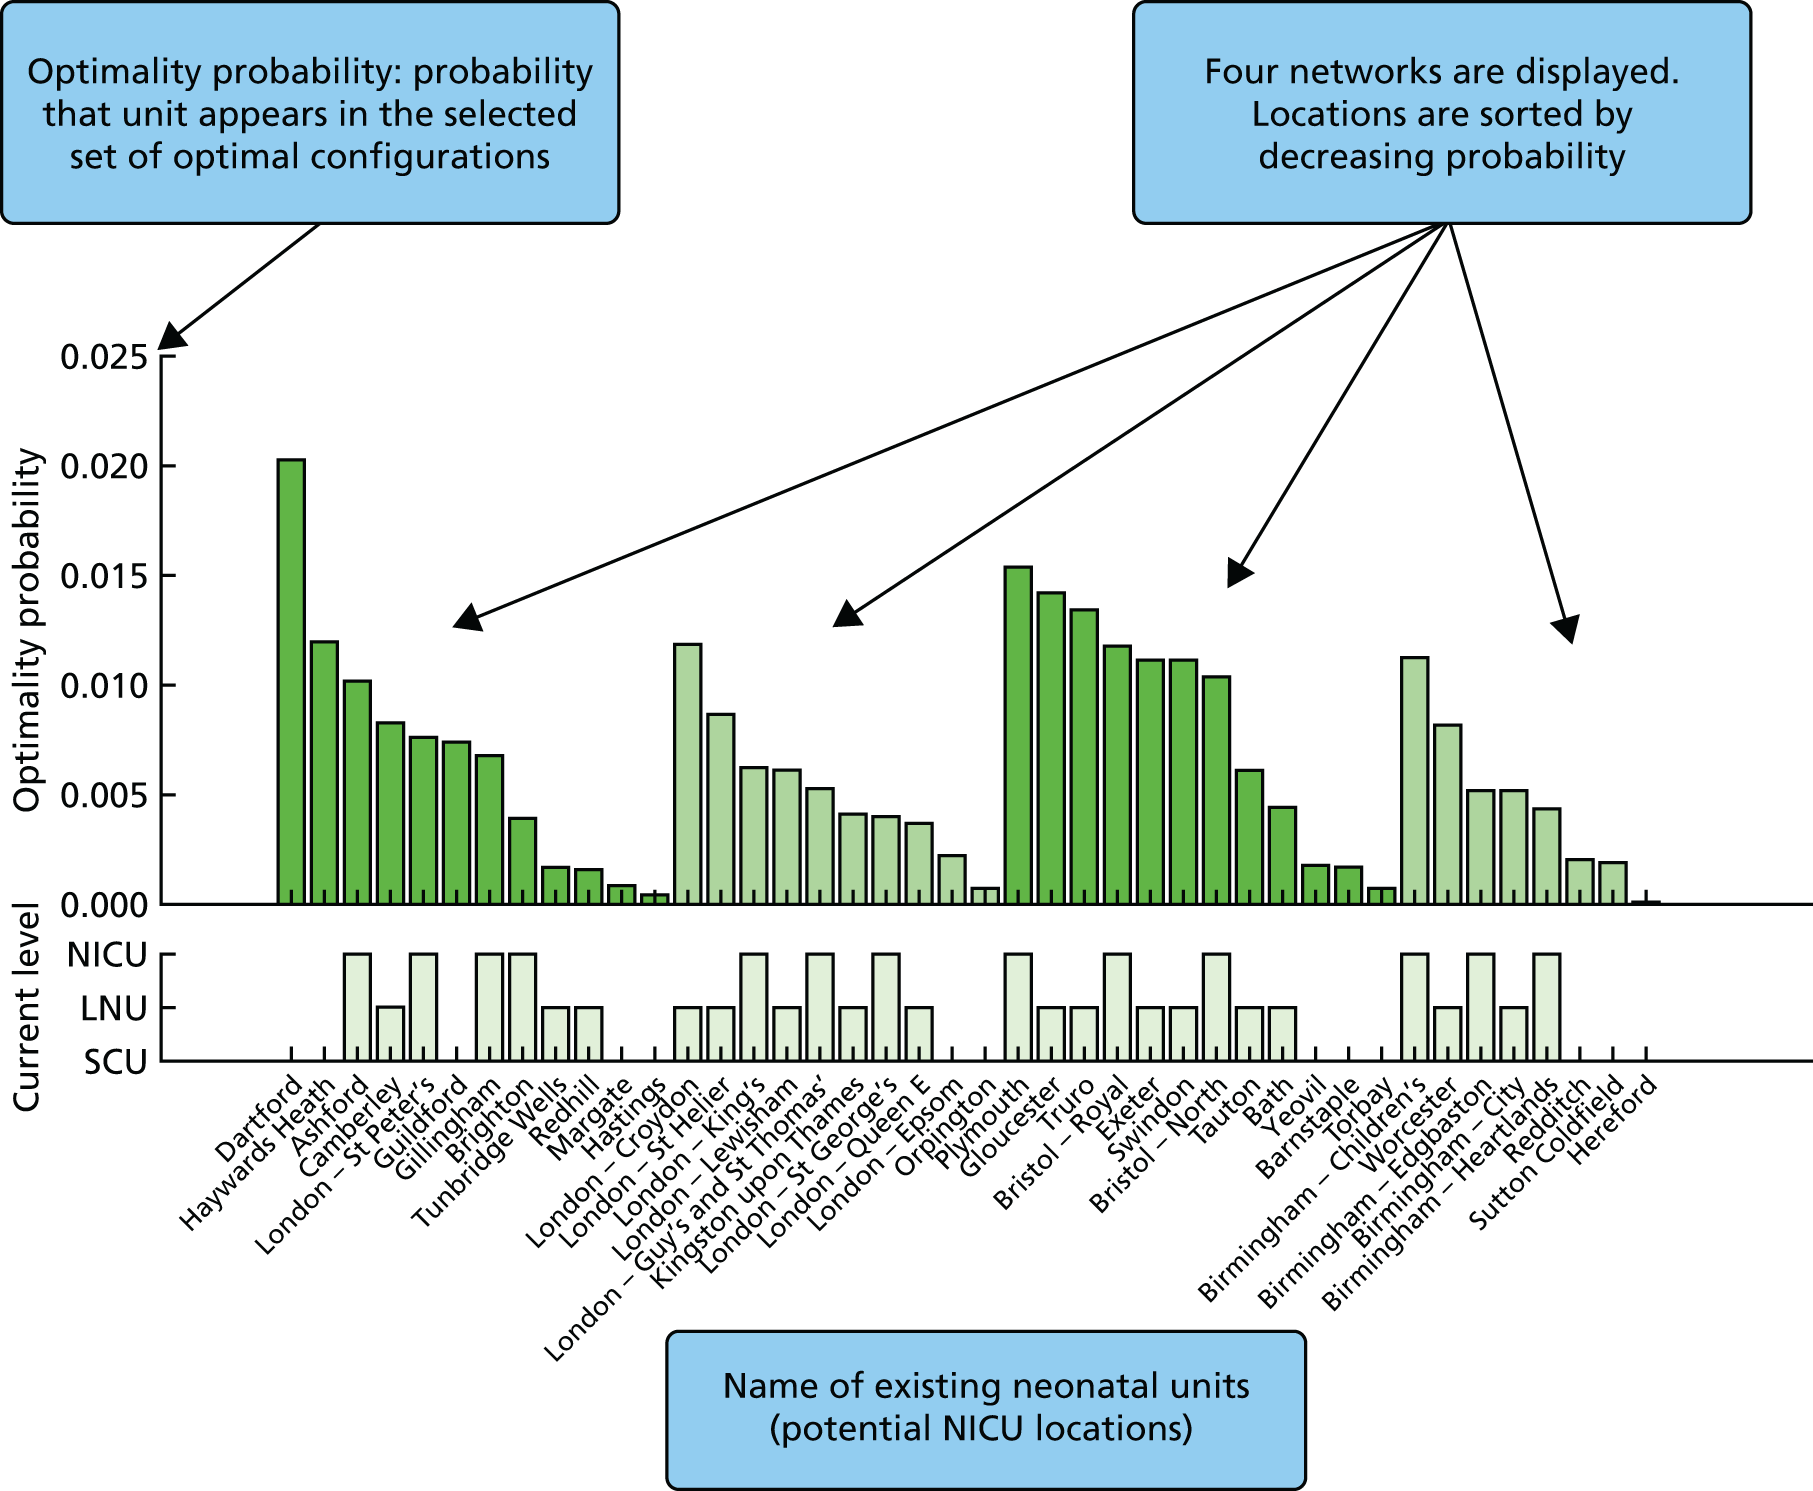
In the example in Figure 20, it can be seen that some lower level units (e.g. Dartford and Haywards Heath) are very likely to be in favourable locations for the establishment of a NICU.
FIGURE 21.
Annotated elements of Villeneuve charts.
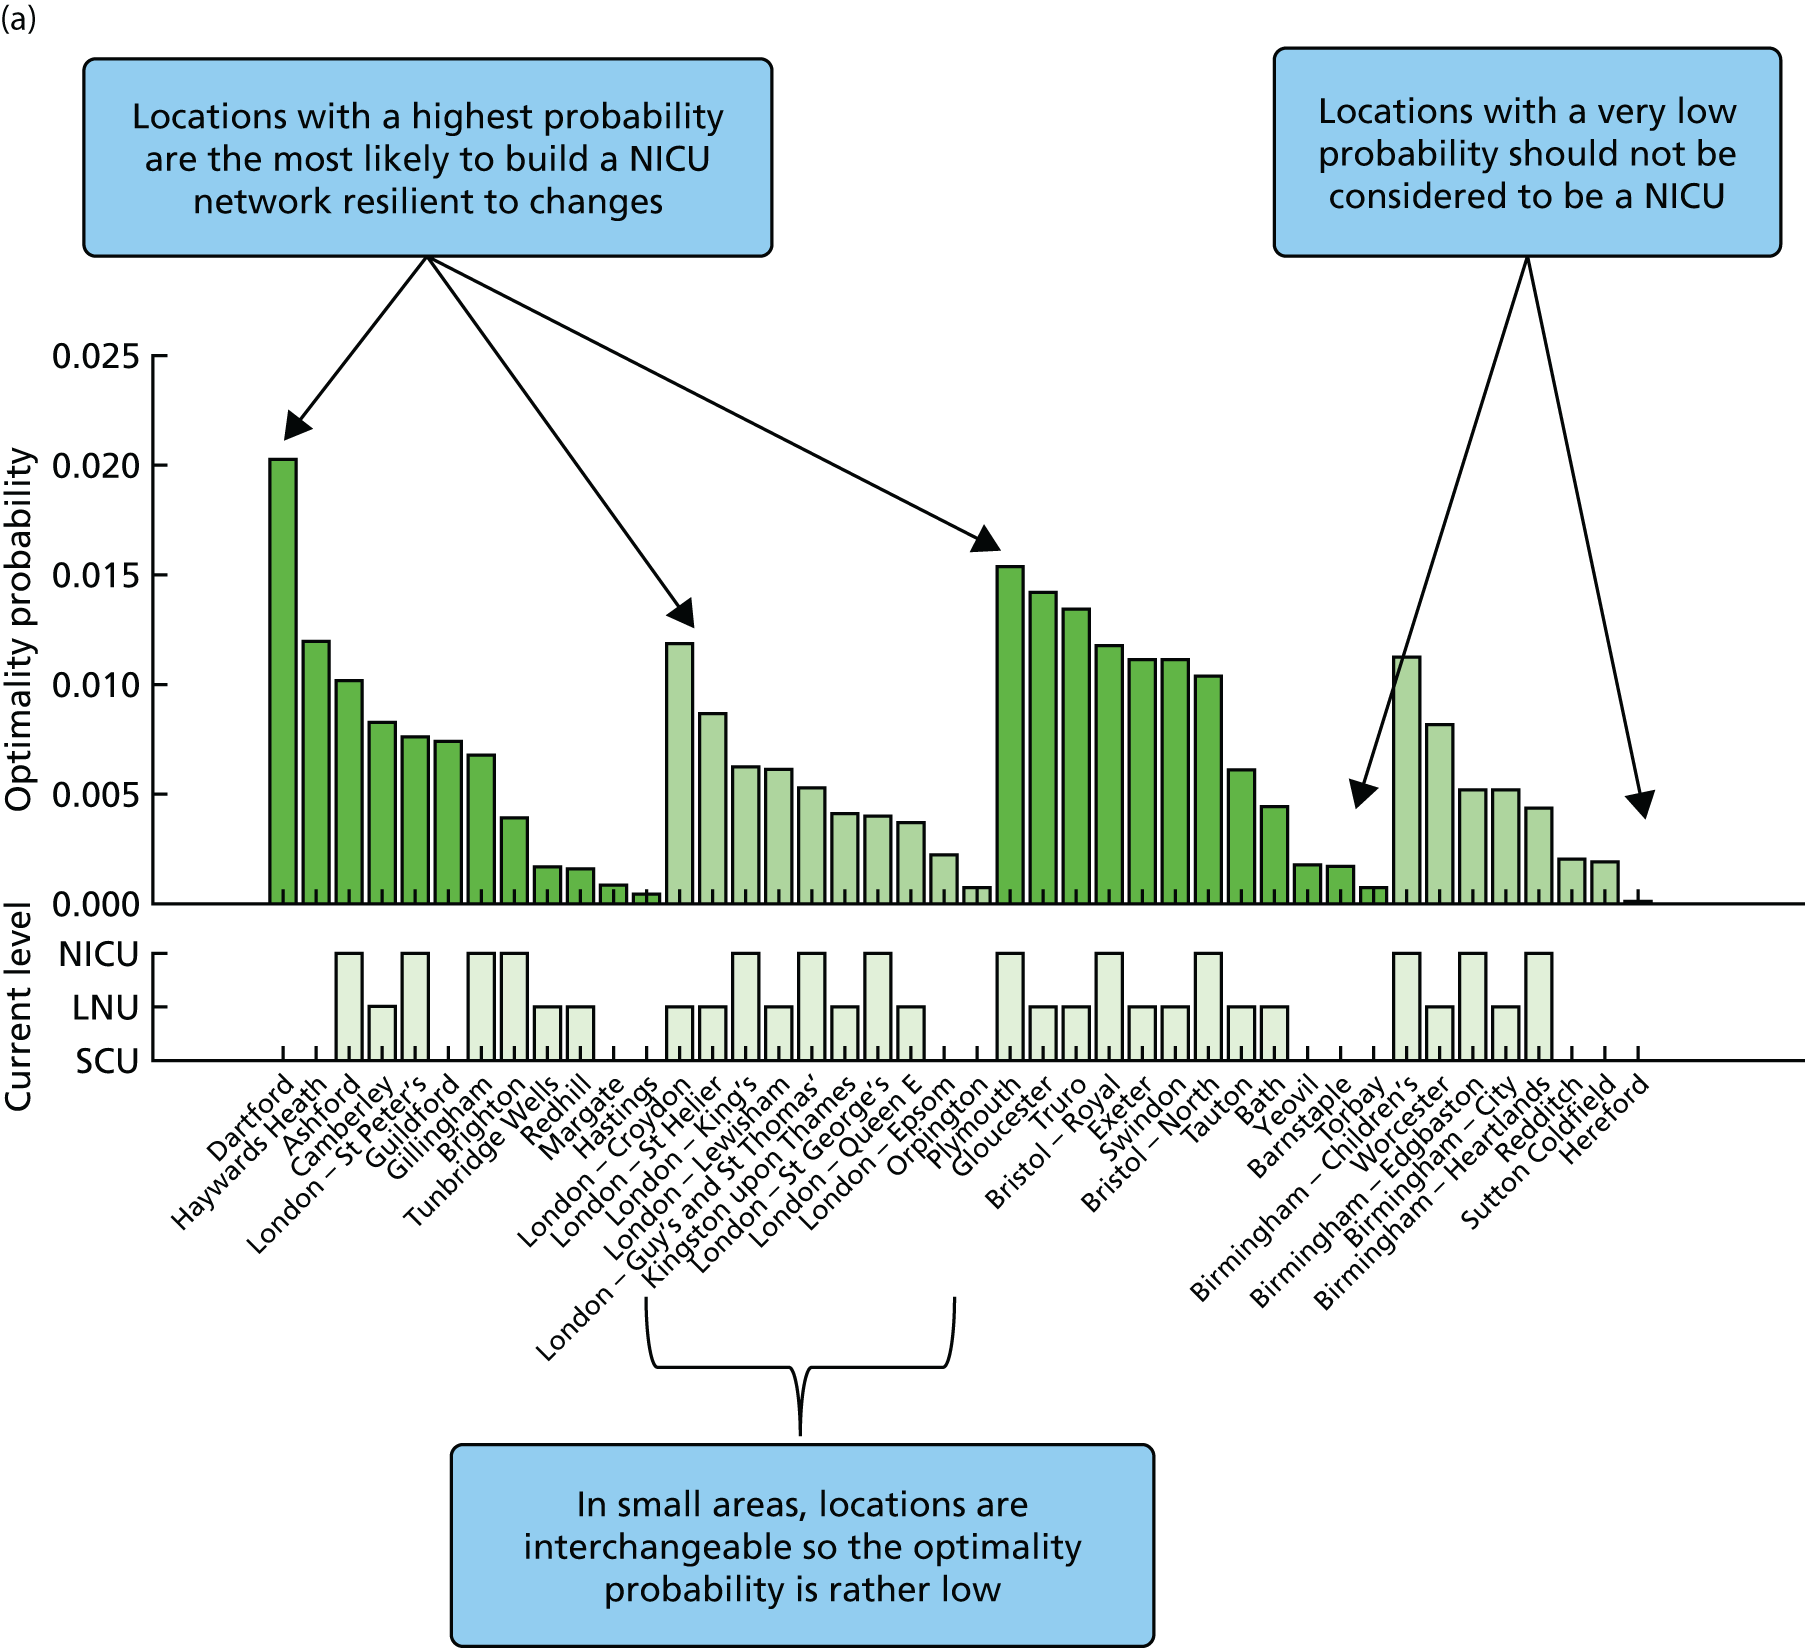
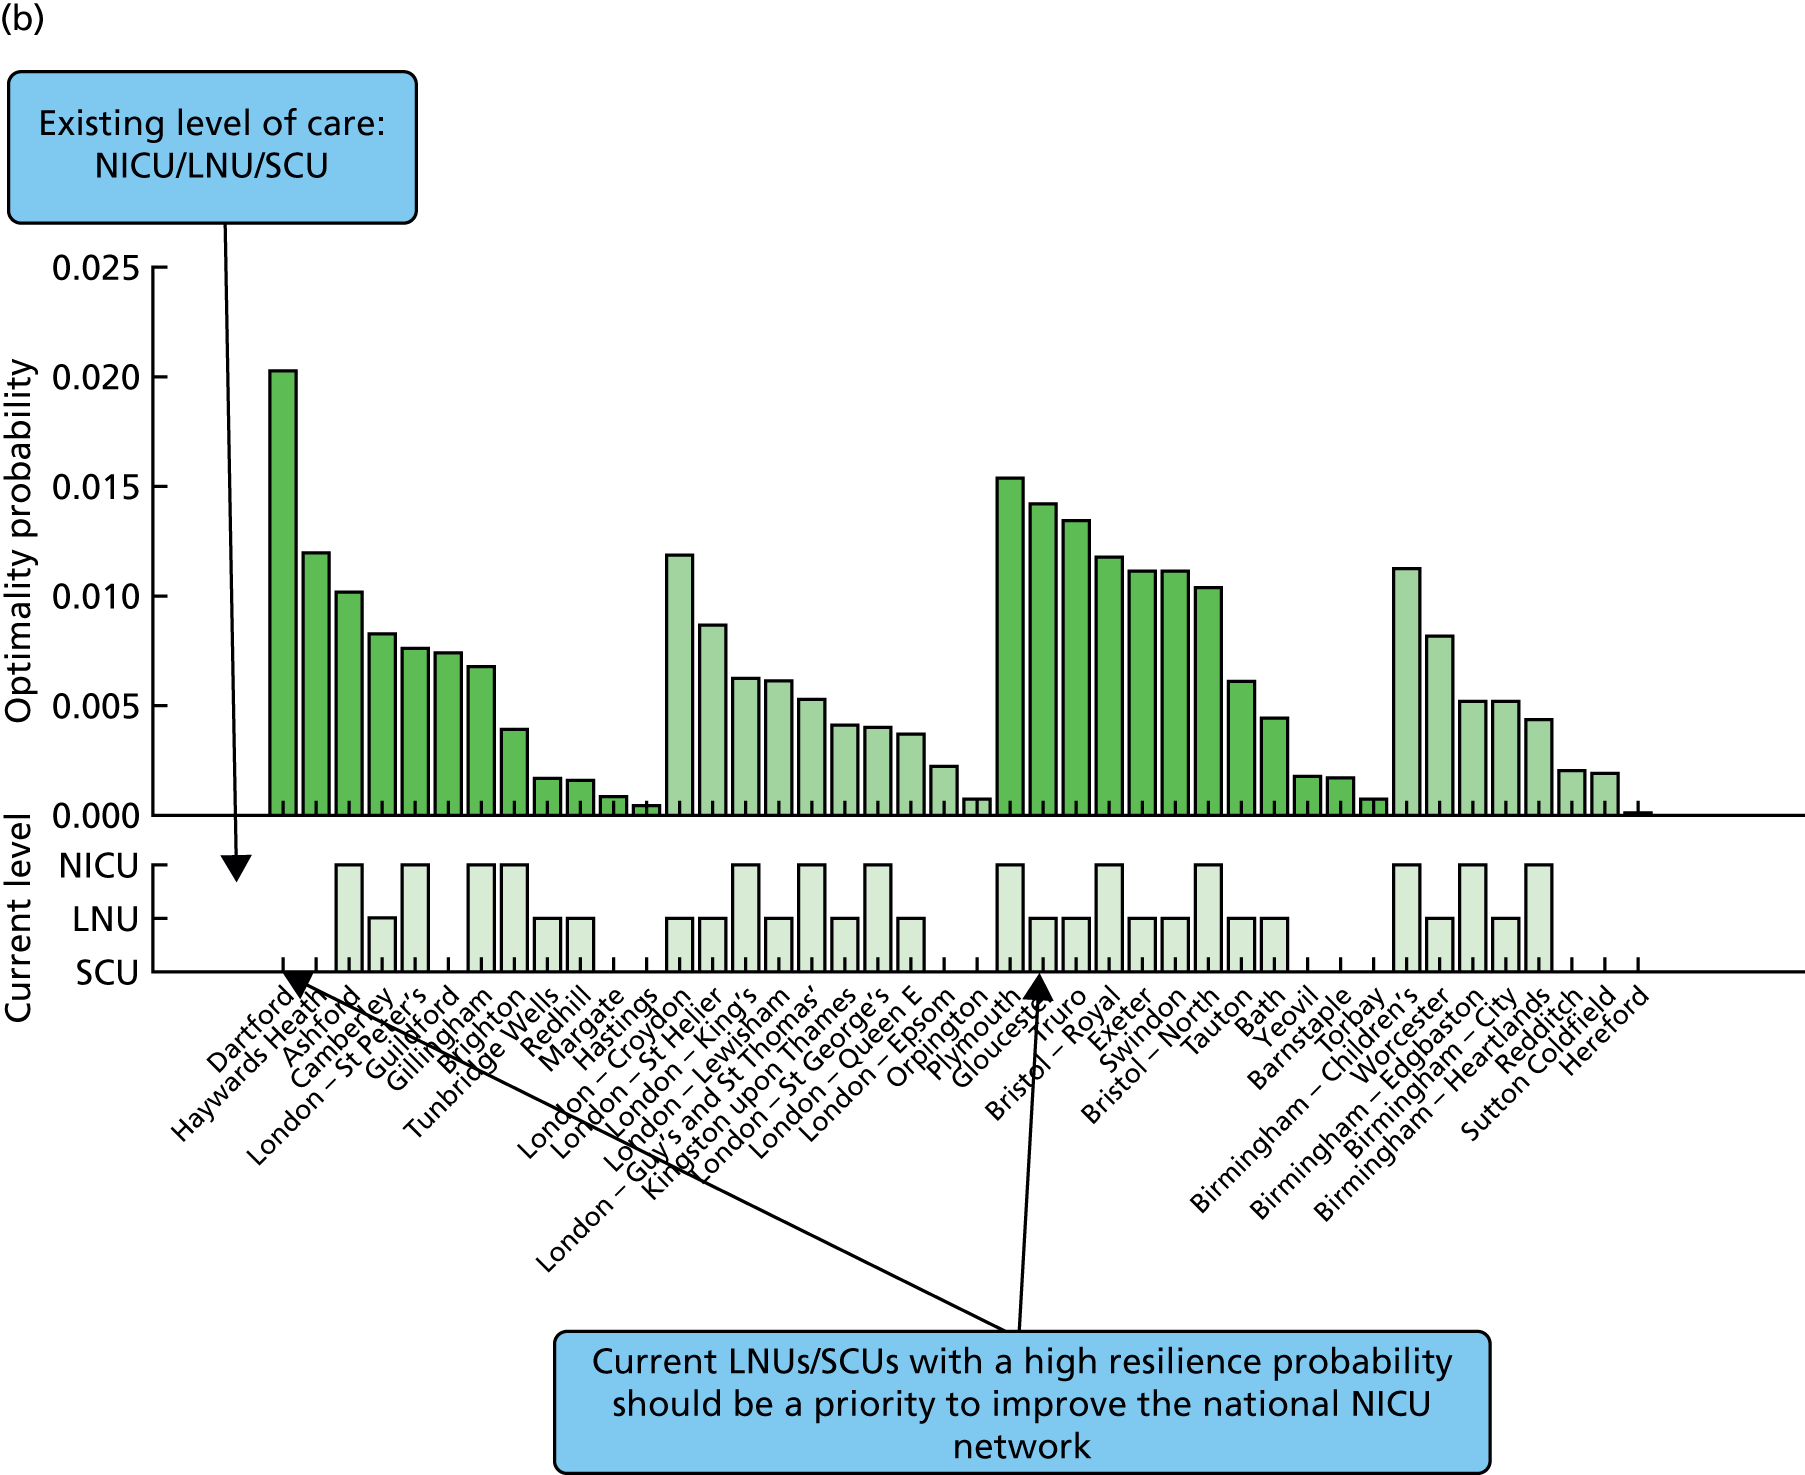
Resilience charts for other networks
FIGURE 22.
Villeneuve charts for specific neonatal network areas.
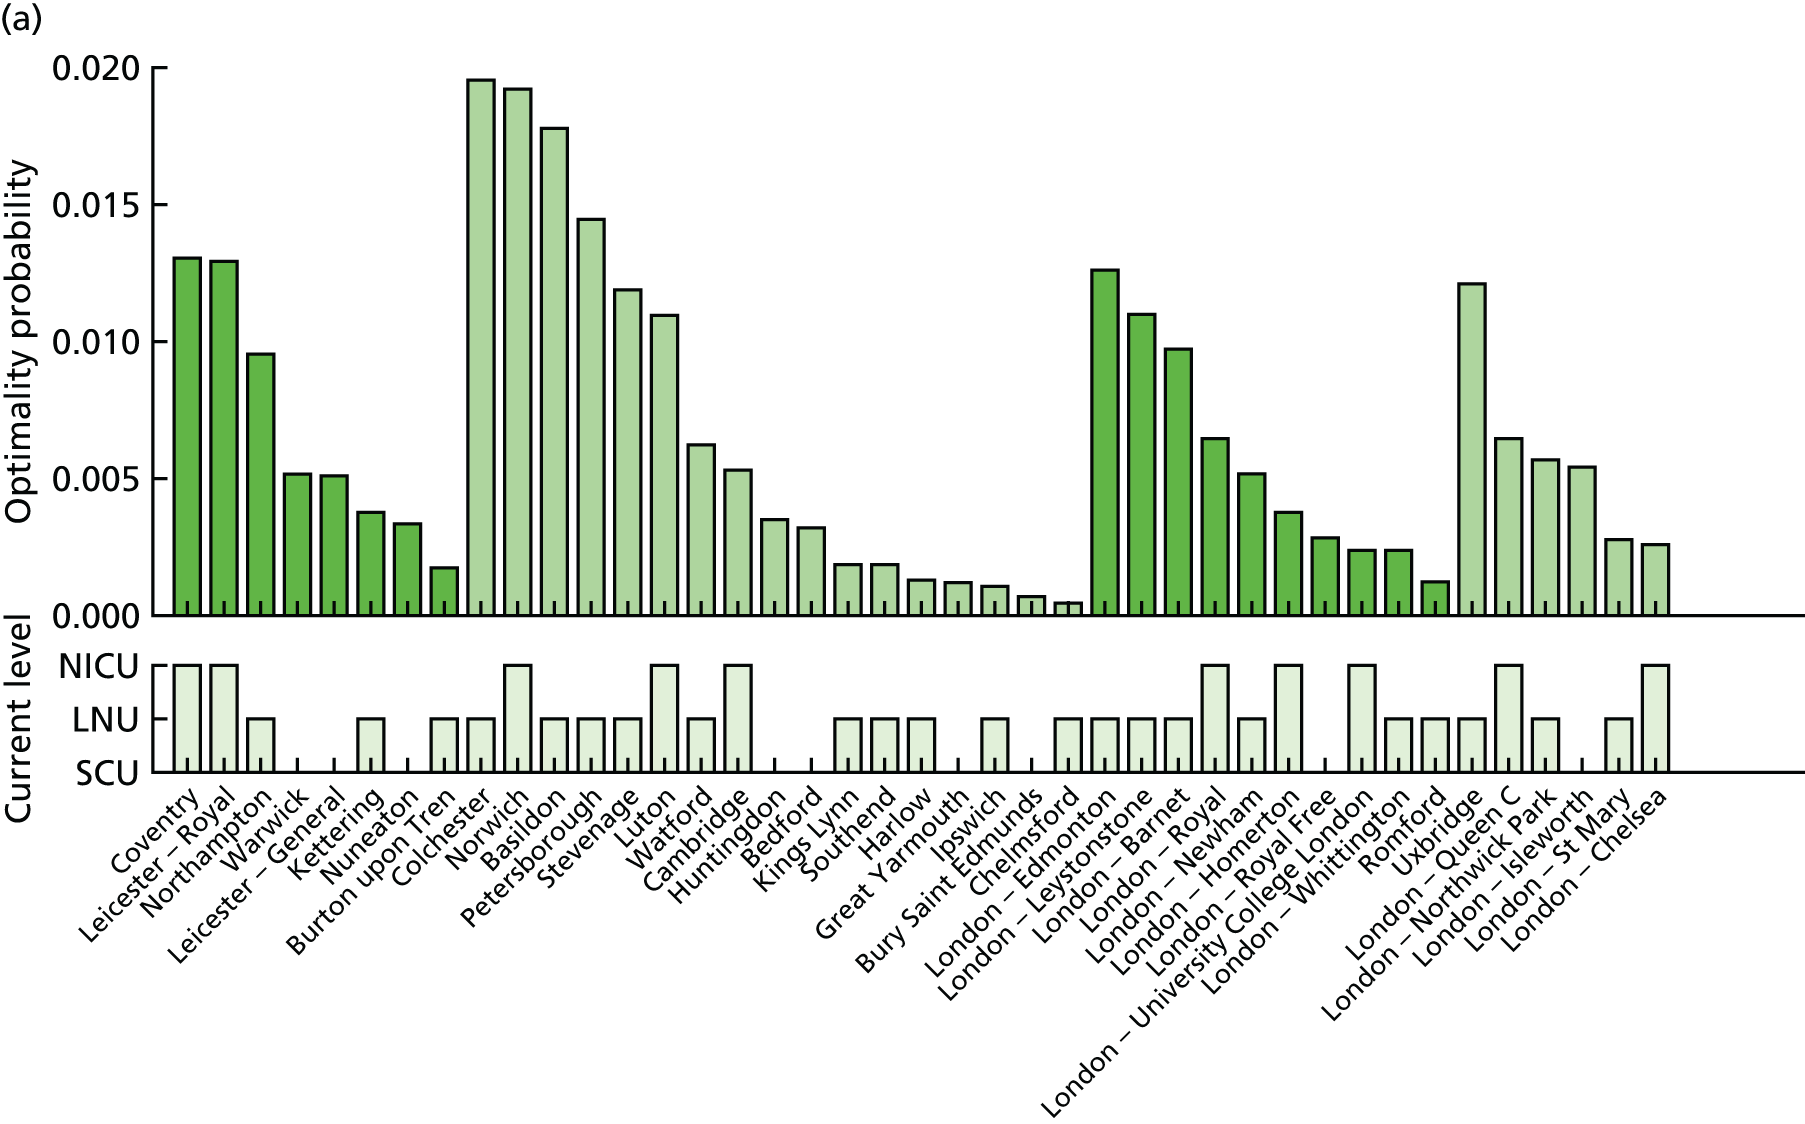
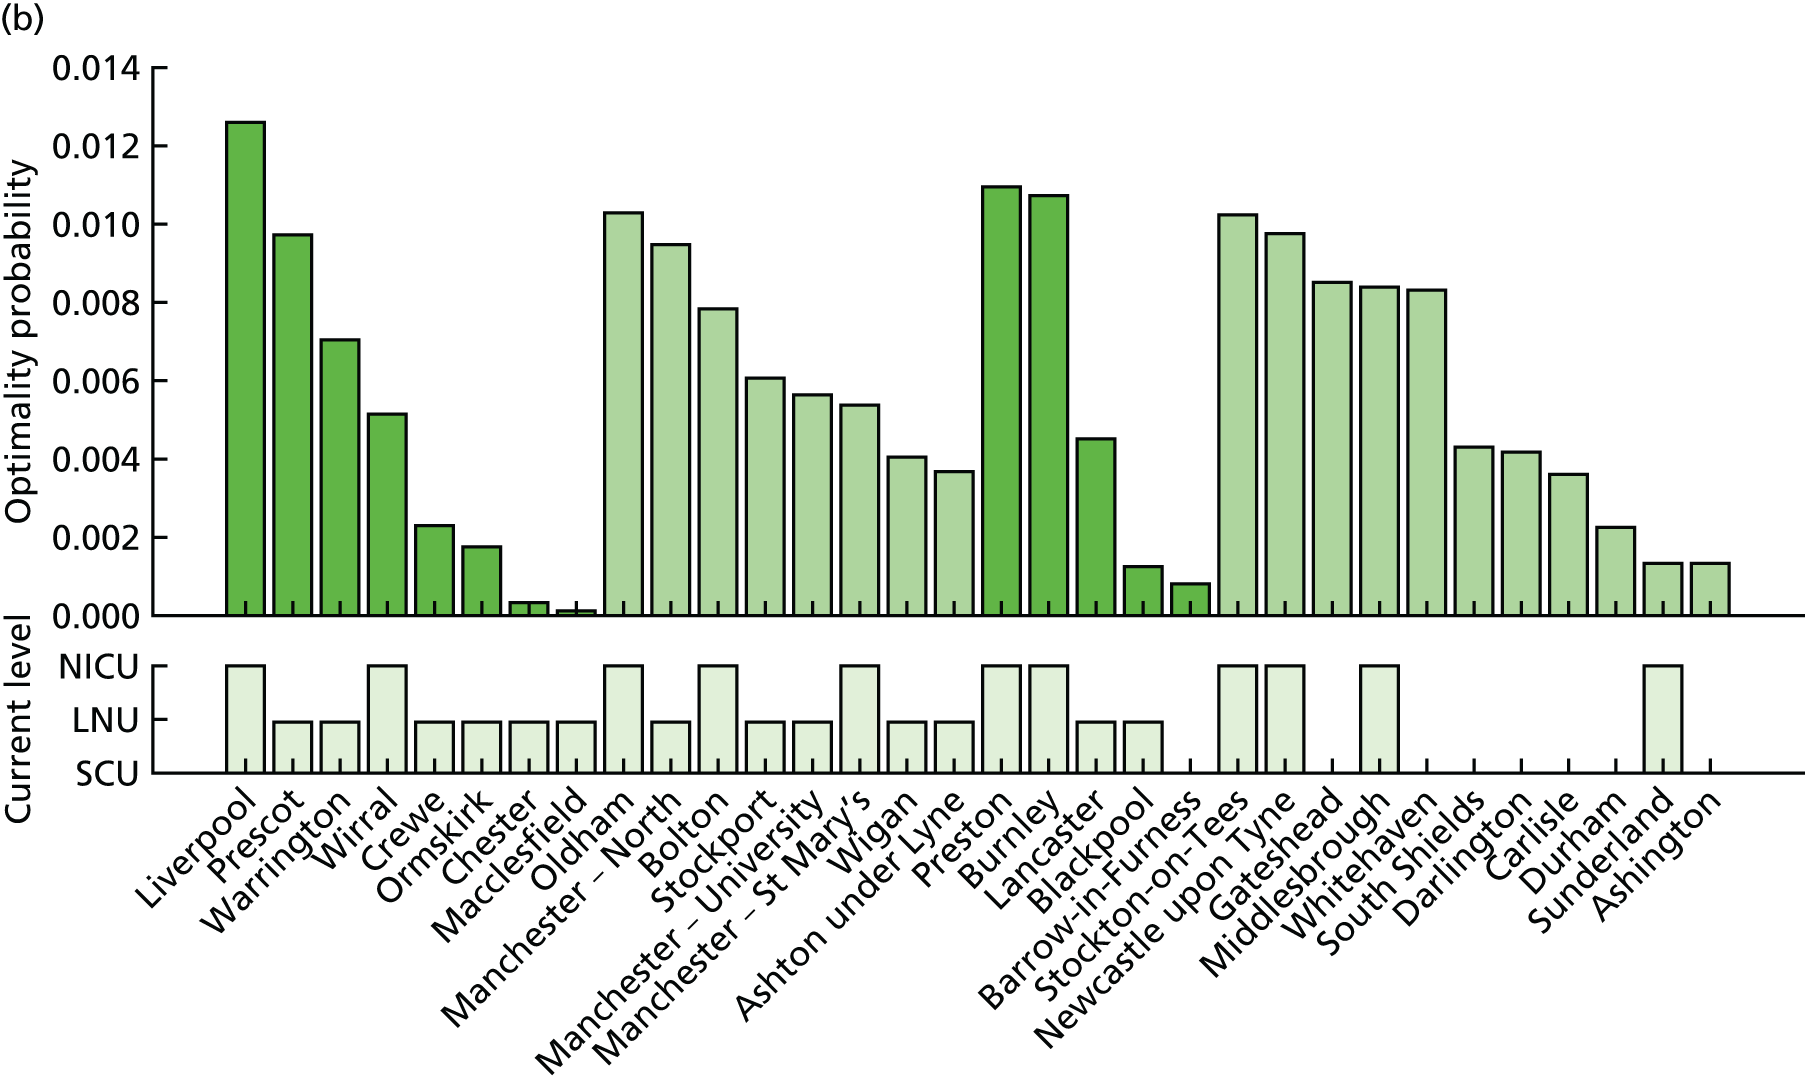
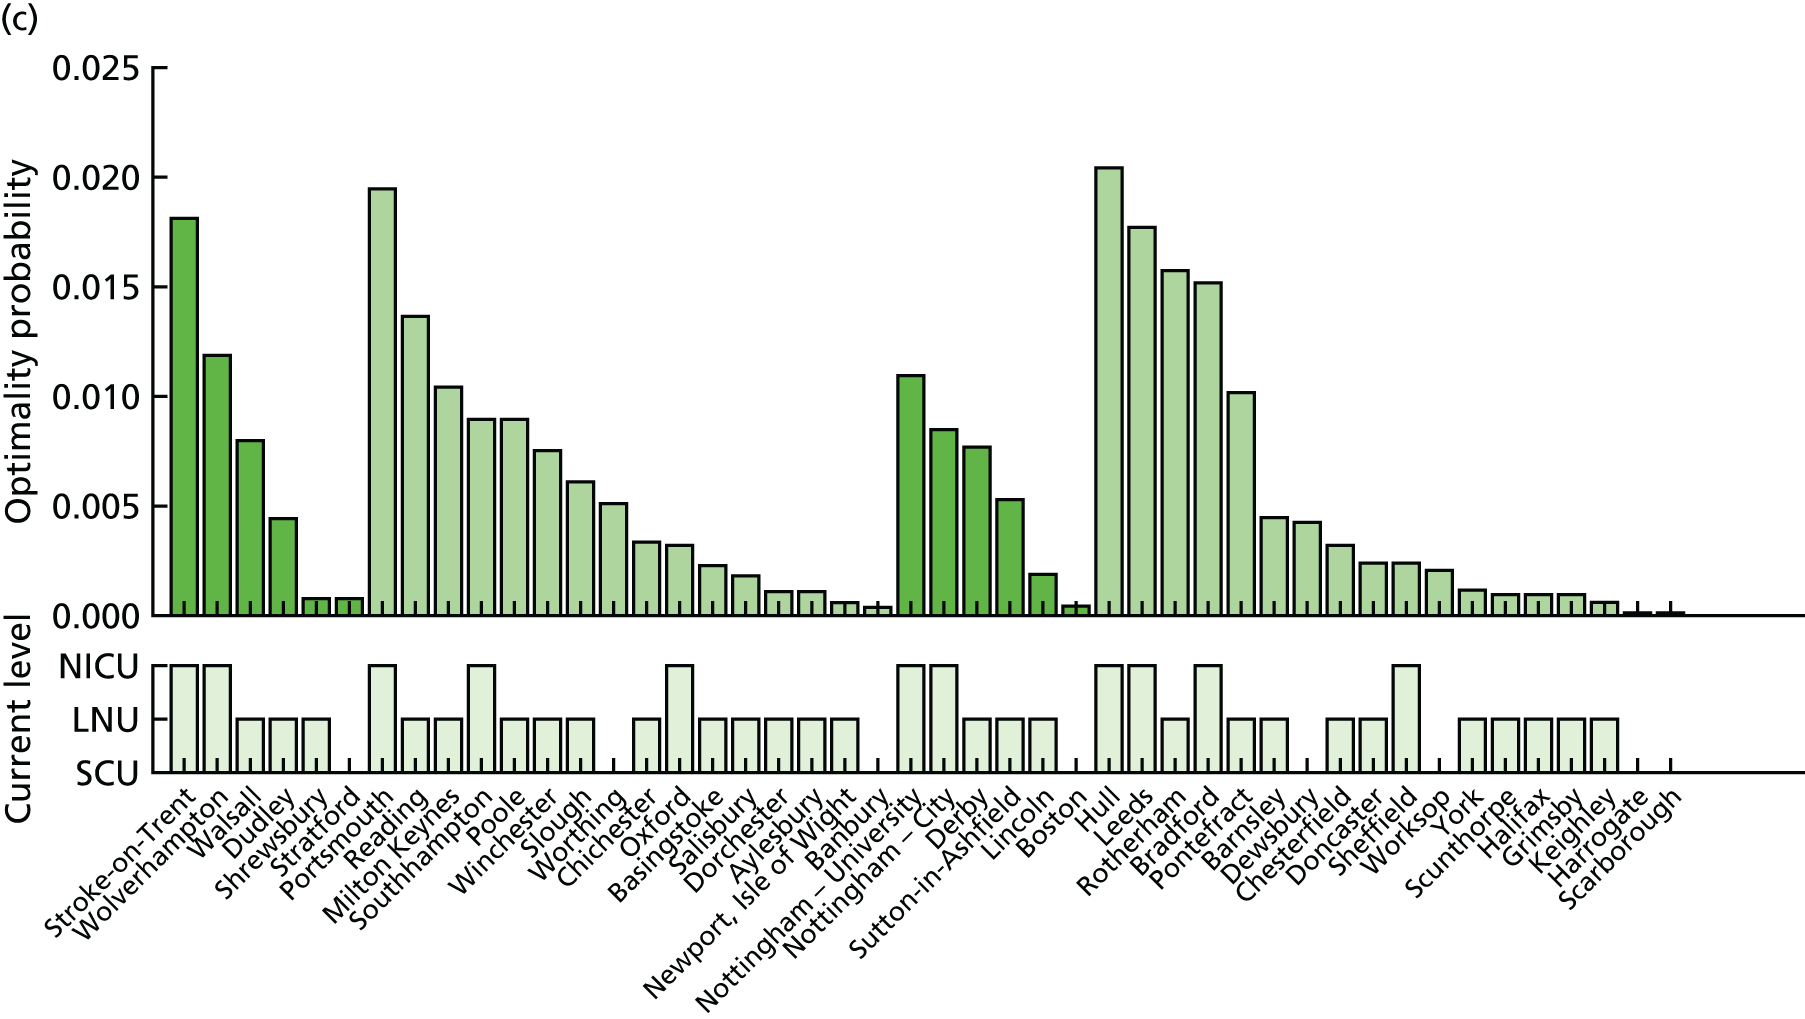
Definition of the resilience scenario score
The optimisation process provides thousands of Pareto front scenarios. To select a representative scenario u = {u1, . . . , uh}, we can compute the resilience score R(u) defined as follows for all scenarios:
Access to intensive care for very low-birthweight infants
FIGURE 23.
Current configuration of NICUs in England with 45 NICUs. (a) Background map © OpenStreetMap contributors;60 the data are available under the Open Database Licence and the cartography is licenced as CC BY-SA (www.openstreetmap.org/copyright); (b) VLBW admissions per year; and (c) key performance indicators.
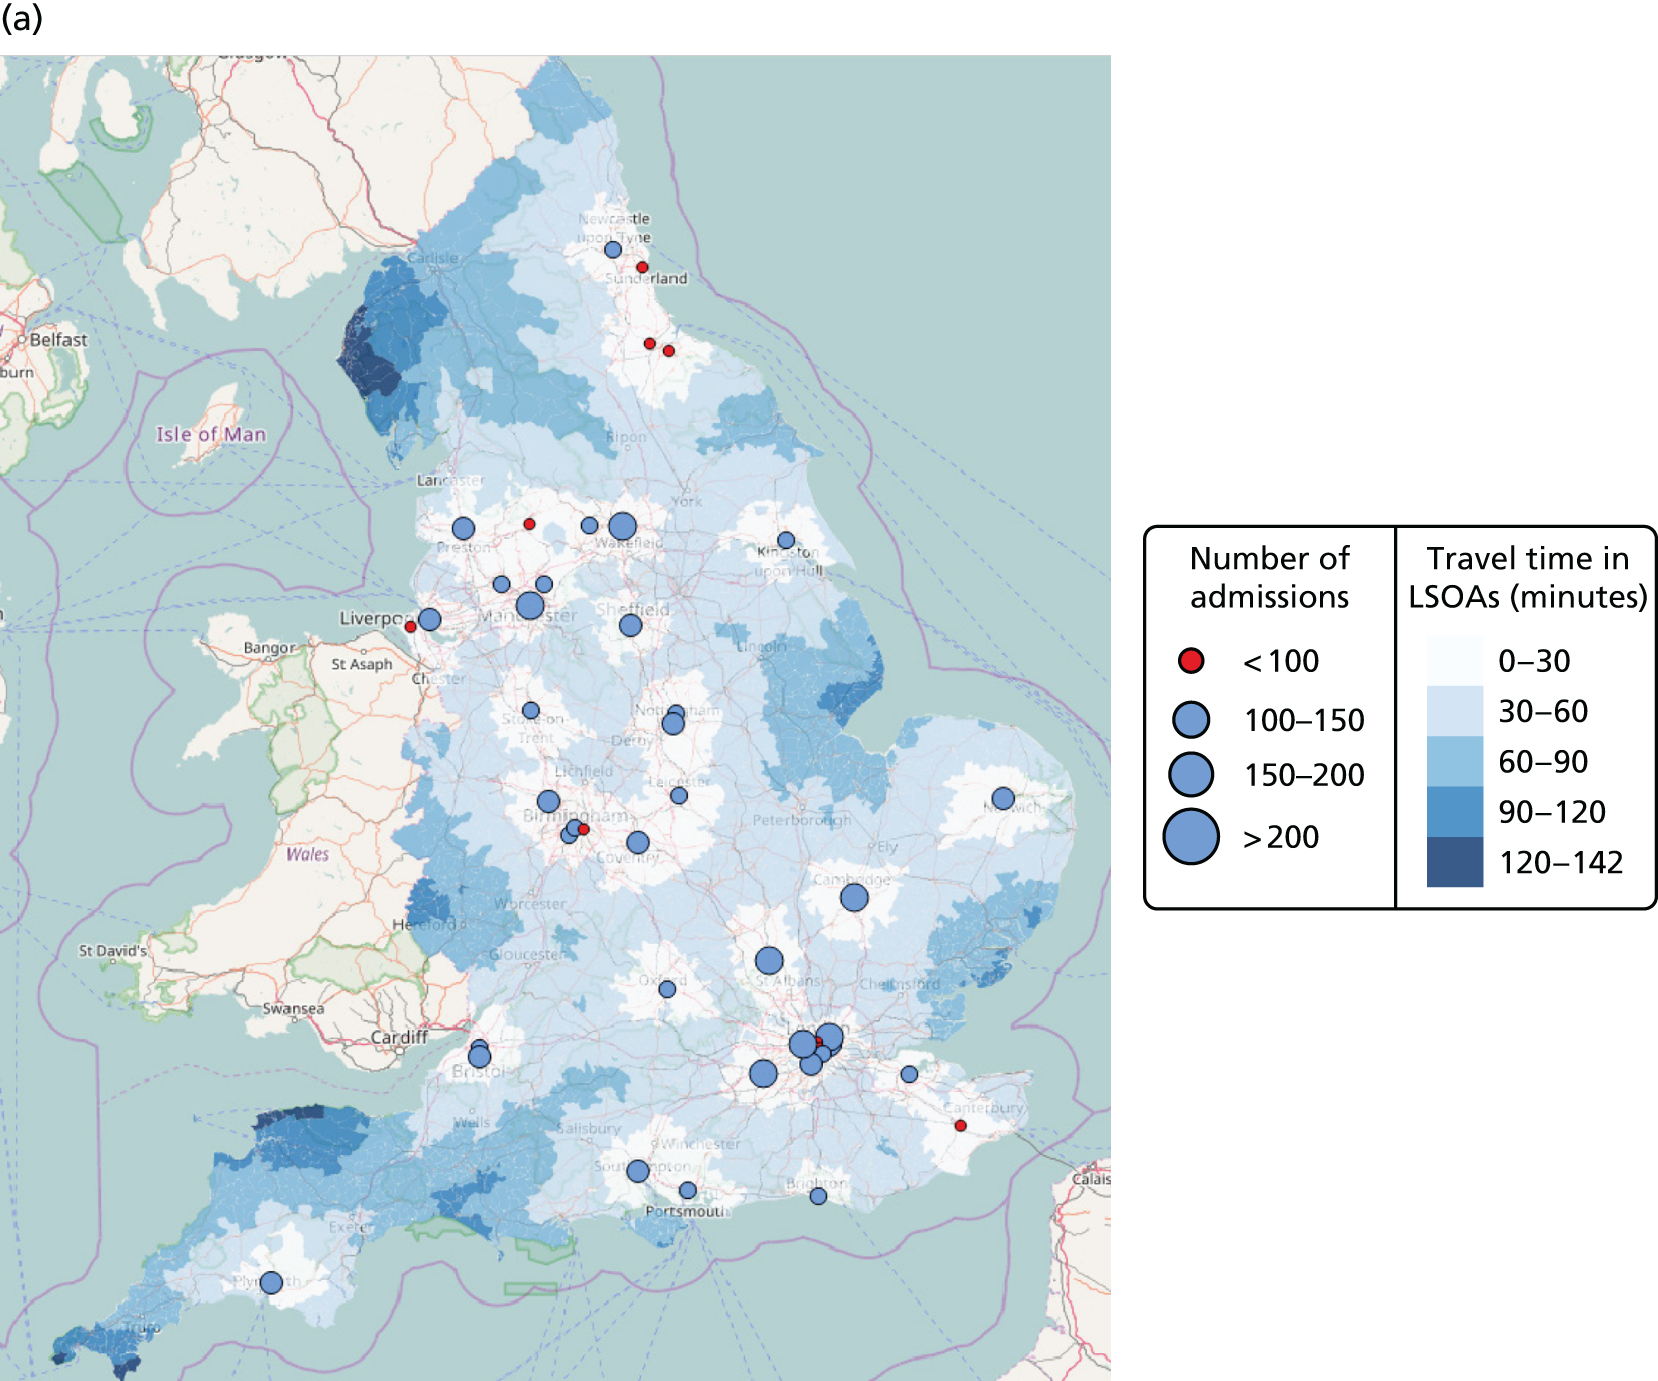
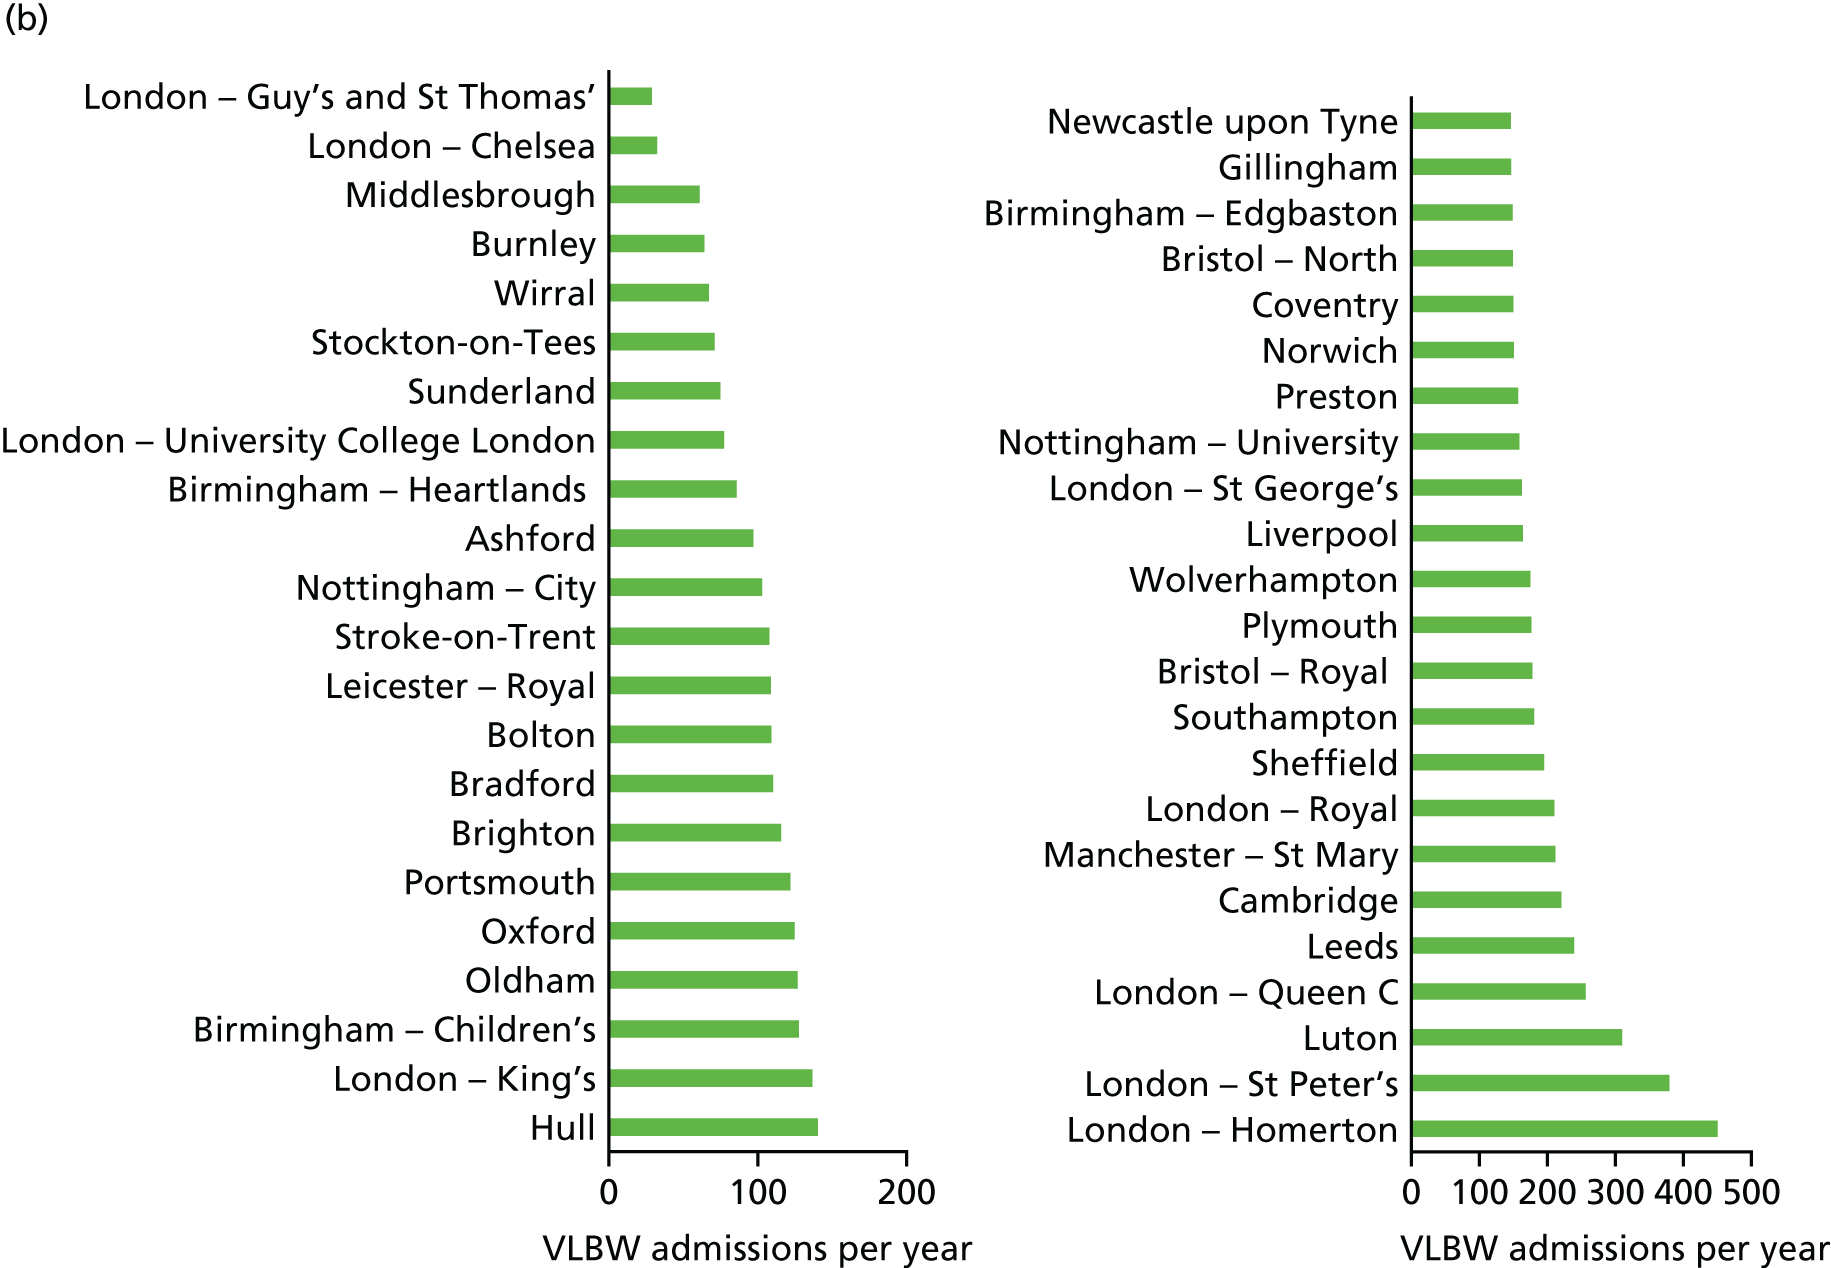
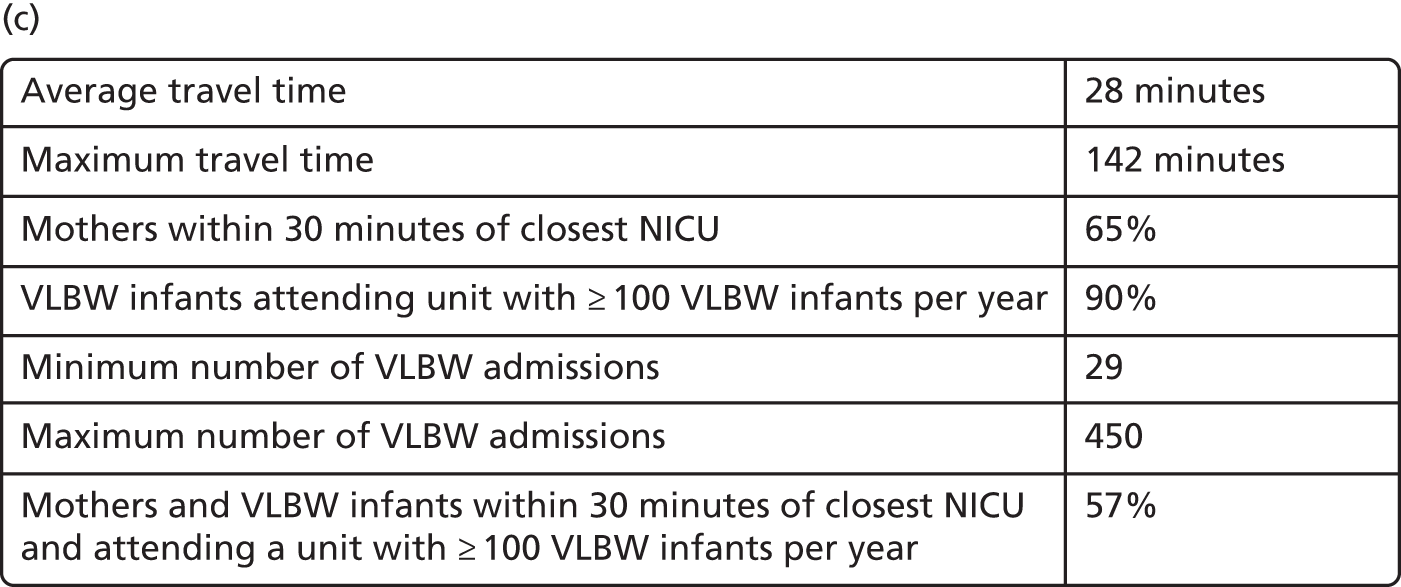
FIGURE 24.
Example configuration of NICUs in England (48 NICUs). (a) Background map © OpenStreetMap contributors;60 the data are available under the Open Database Licence and the cartography is licenced as CC BY-SA (www.openstreetmap.org/copyright); and (b) VLBW admissions per year; and (c) key performance indicators.
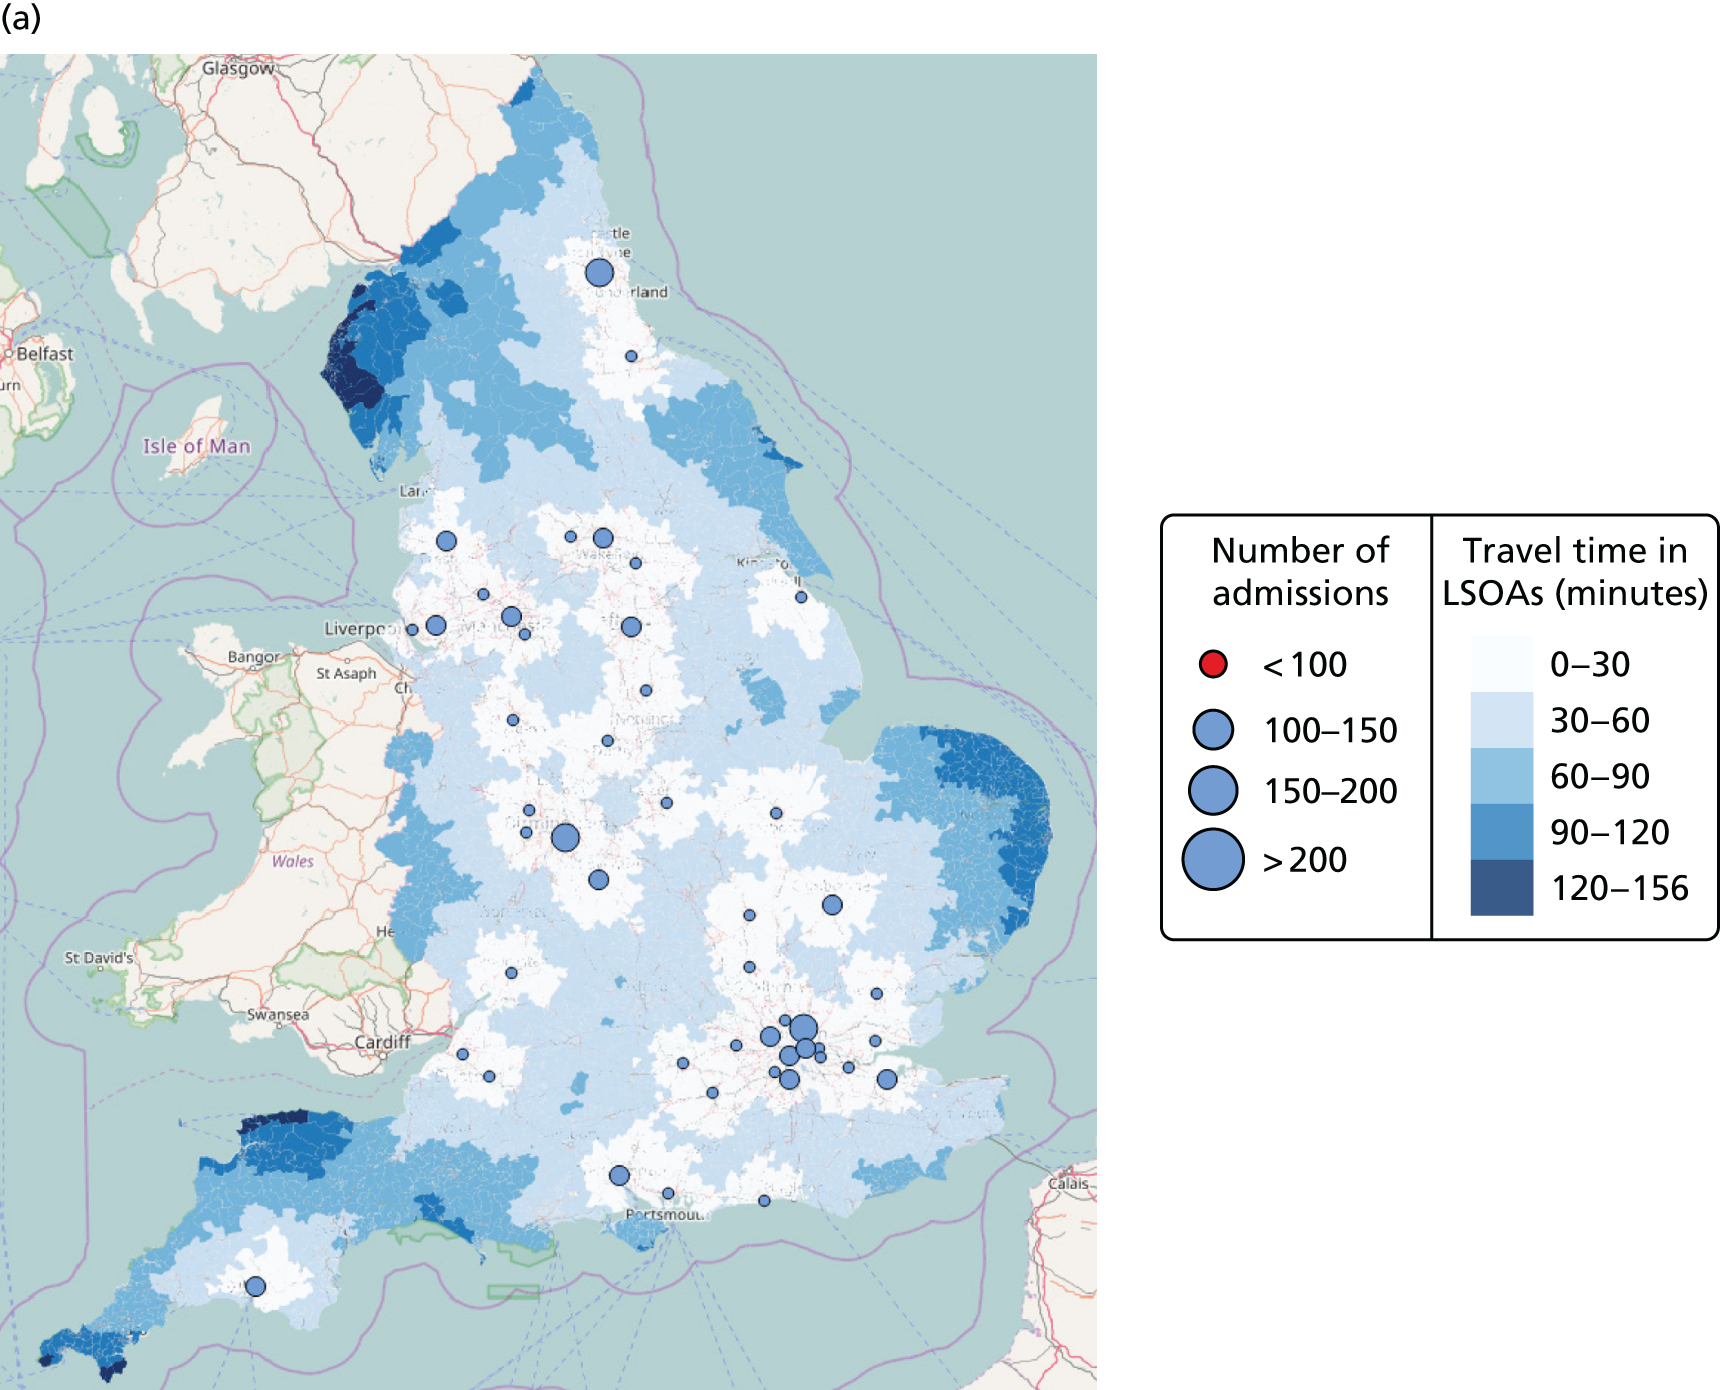
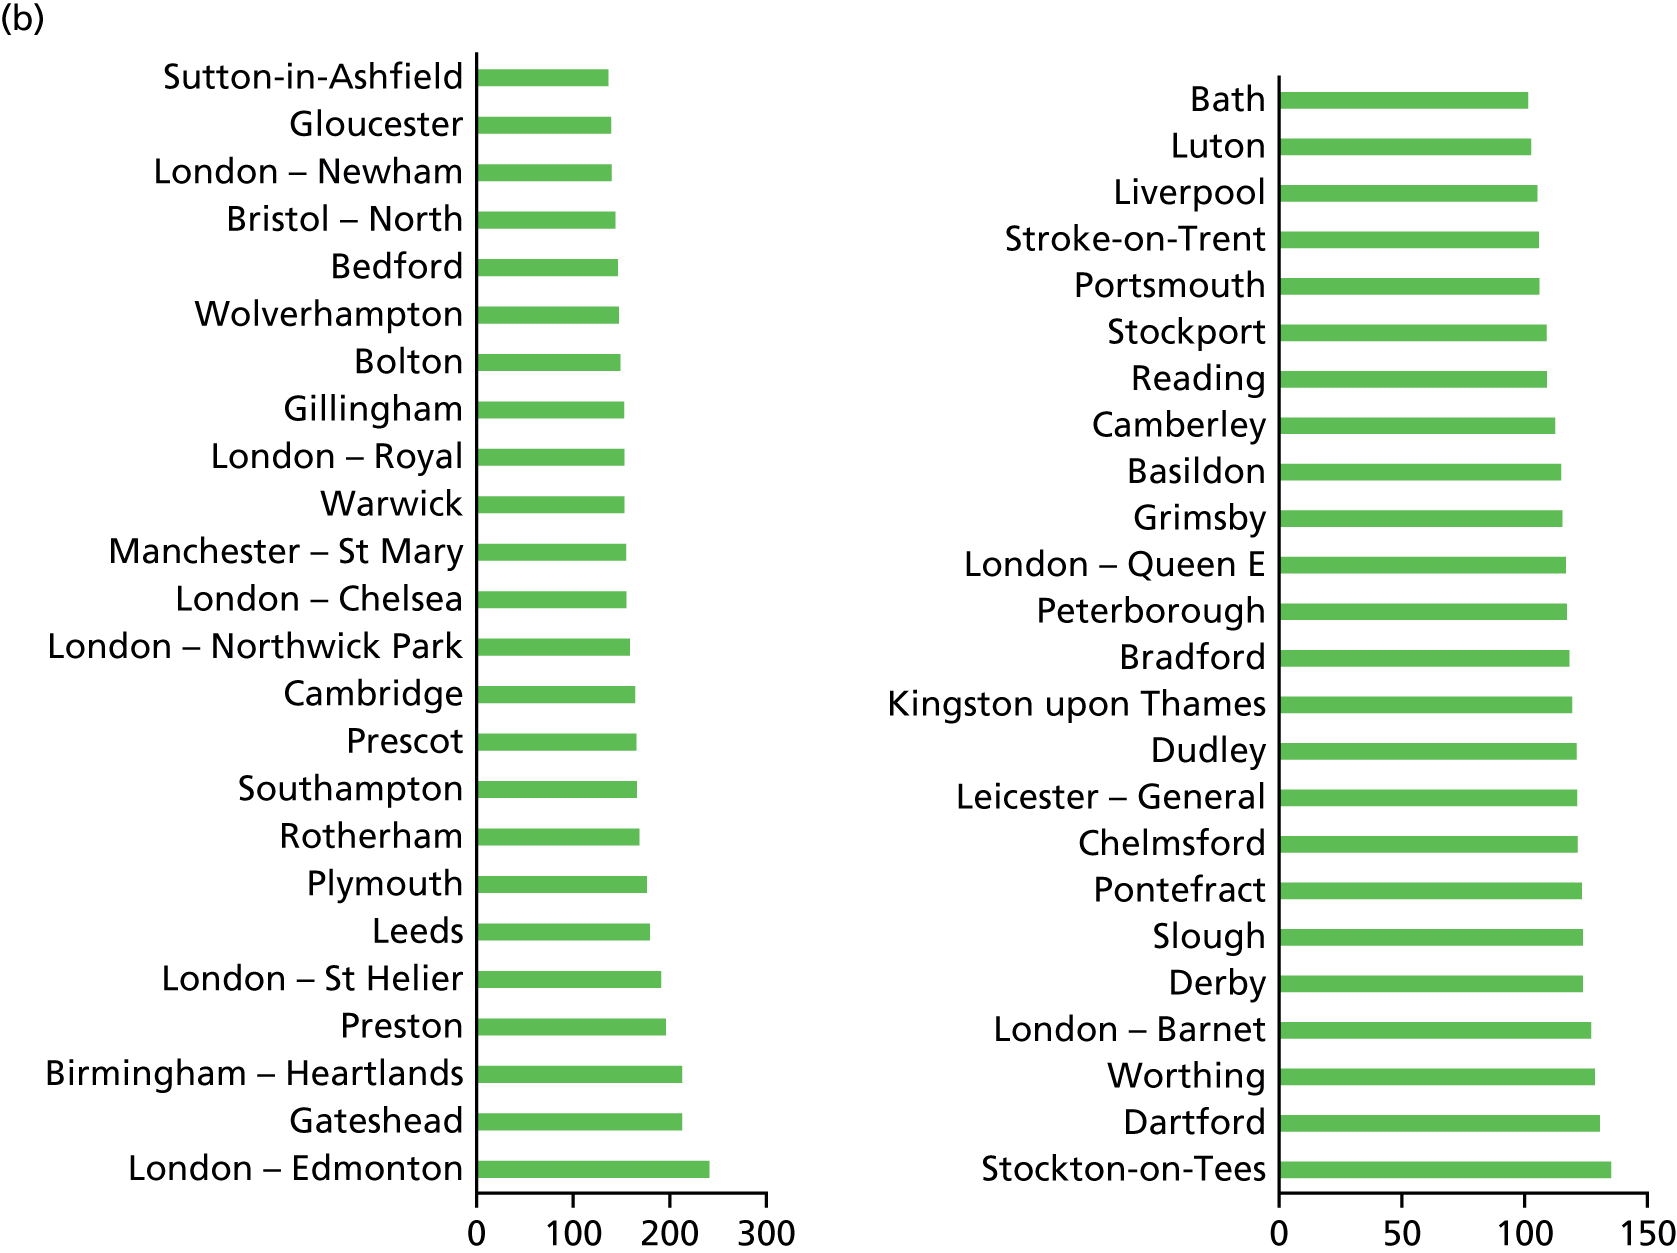
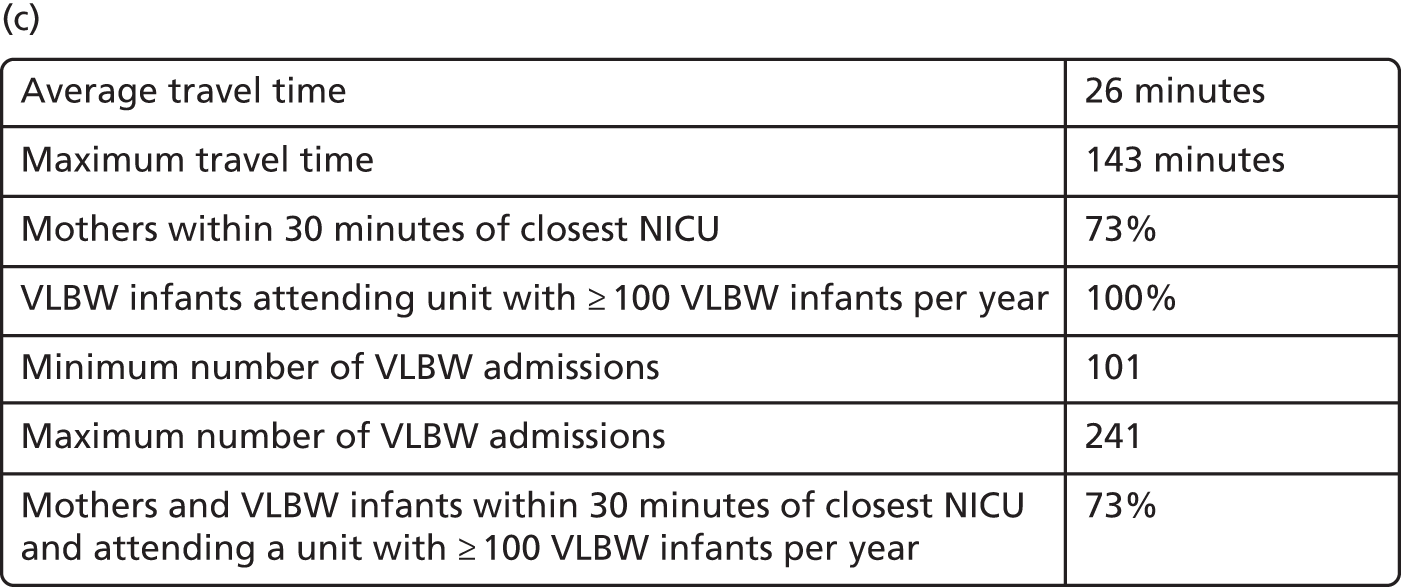
FIGURE 25.
Example configuration of NICUs in England (30 NICUs). (a) Background map © OpenStreetMap contributors;60 the data are available under the Open Database Licence and the cartography is licenced as CC BY-SA (www.openstreetmap.org/copyright); and (b) VLBW admissions per year; and (c) key performance indicators.
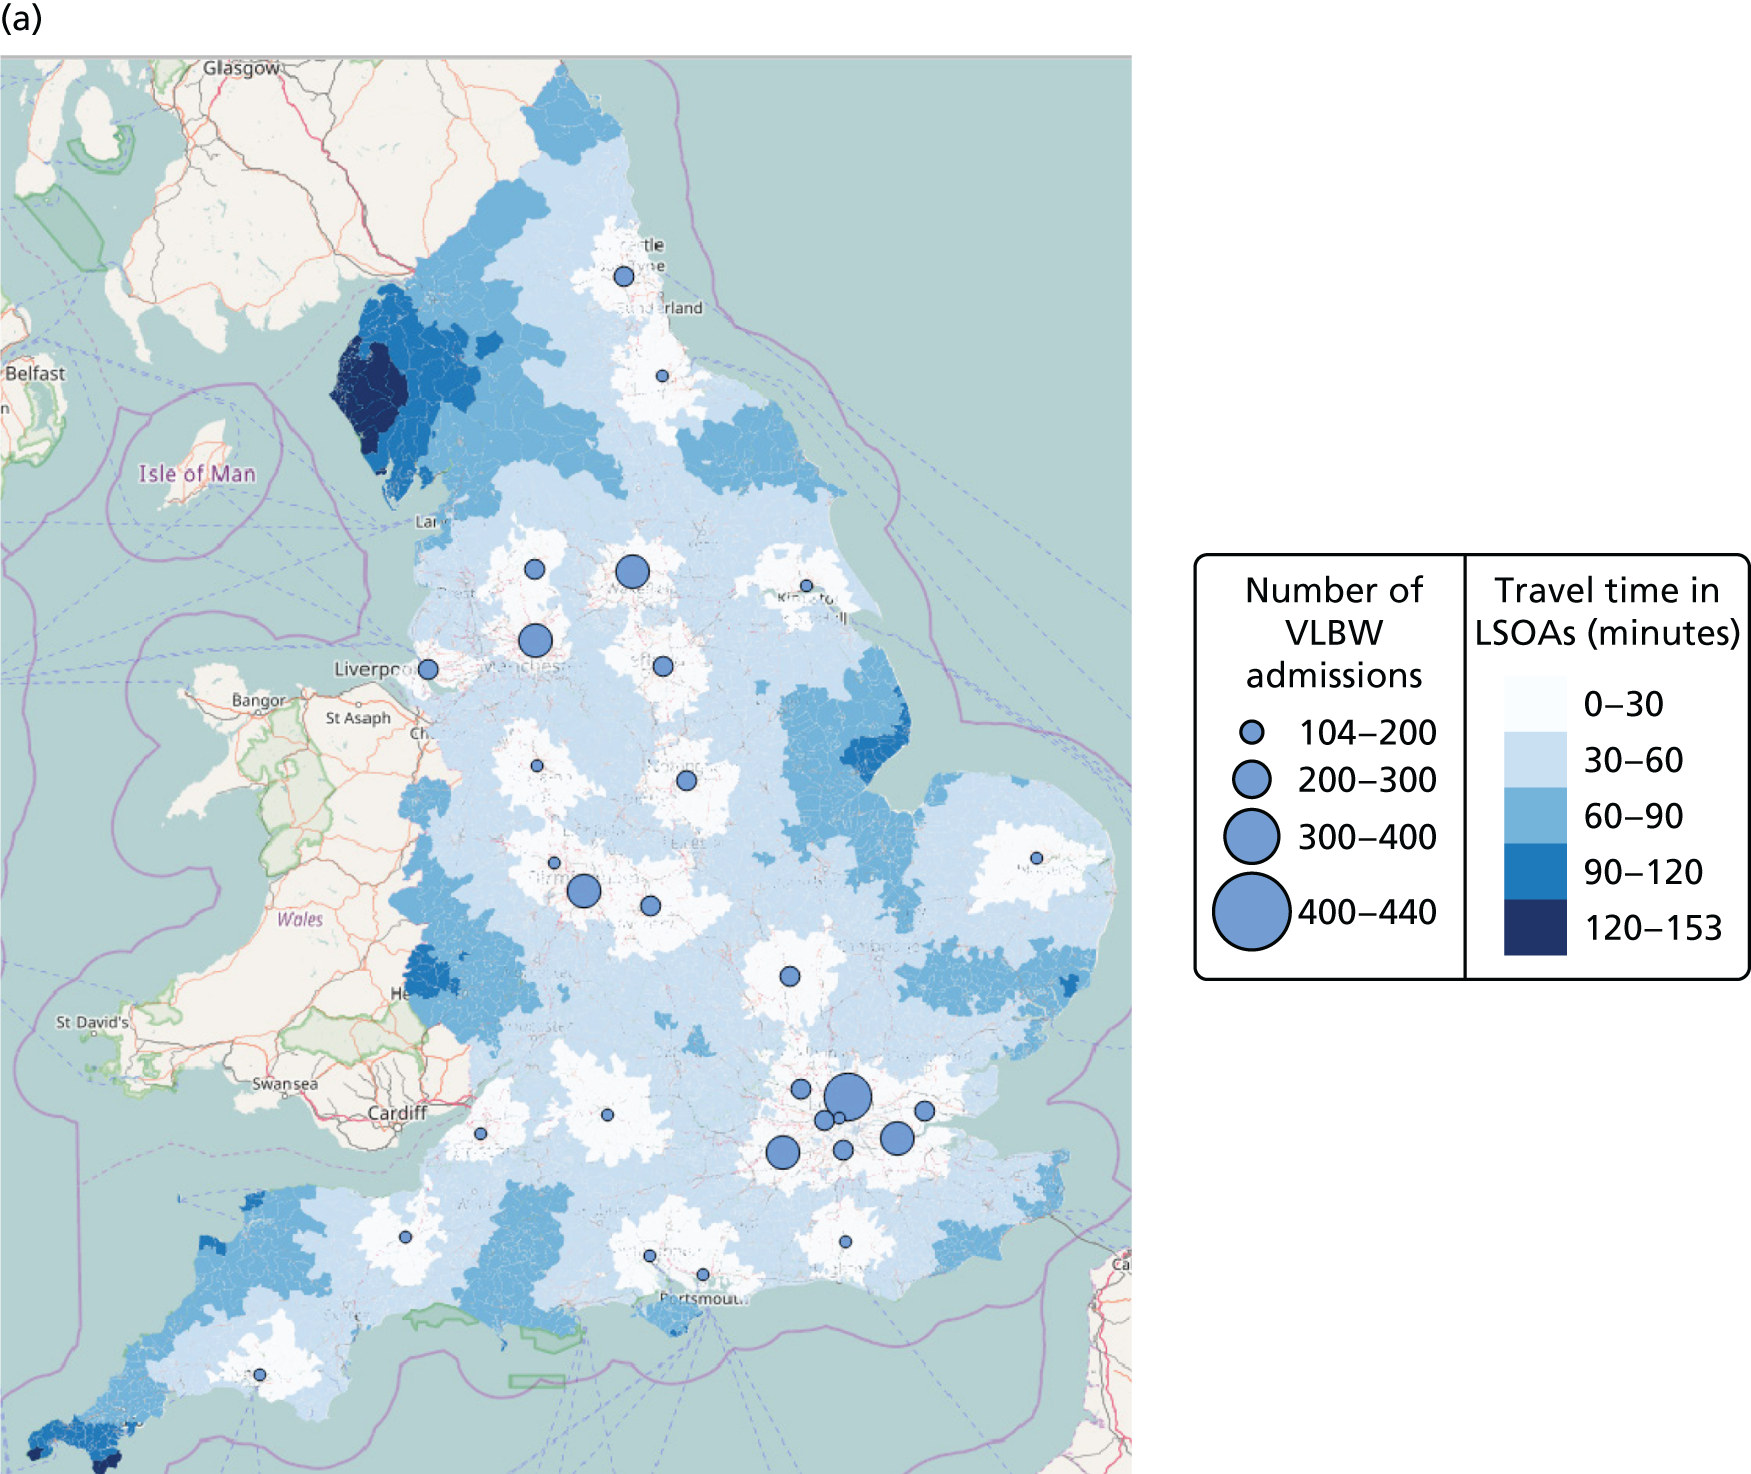
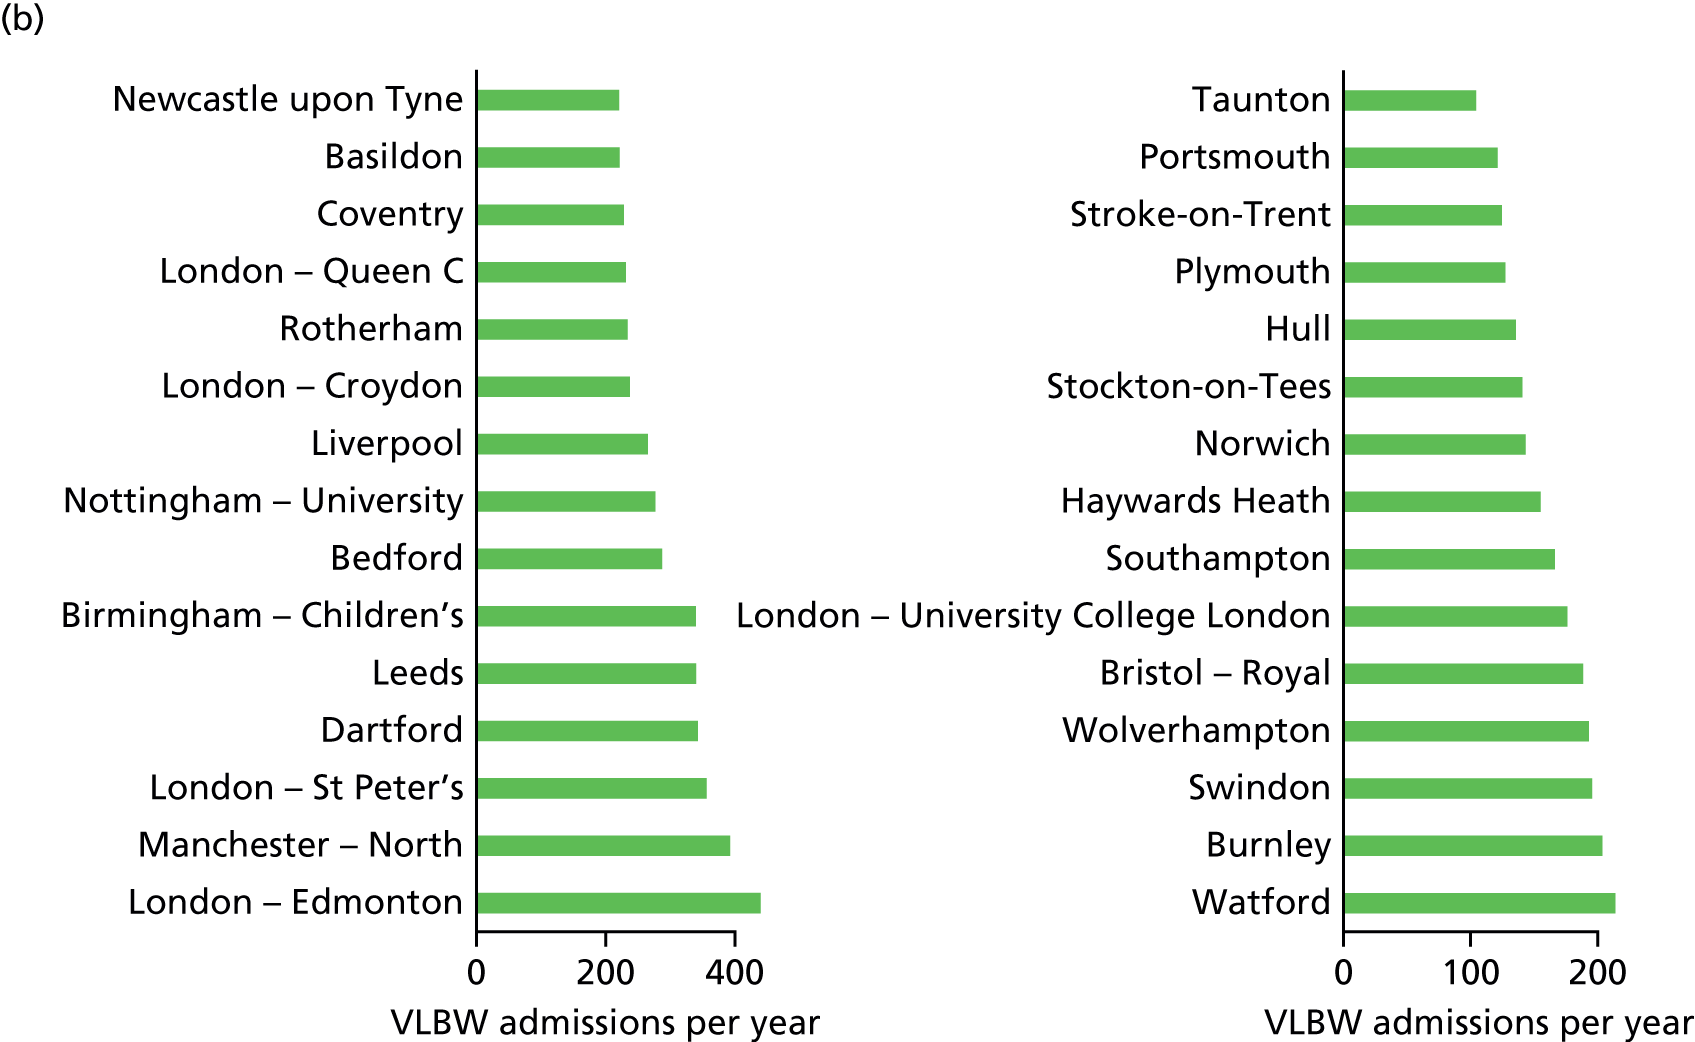
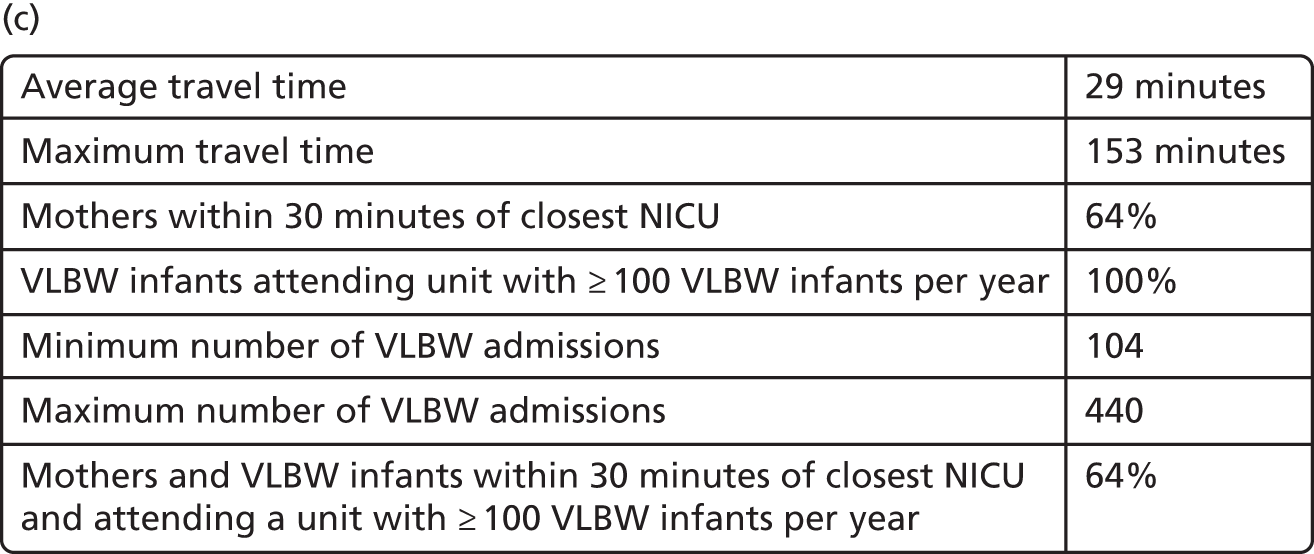
Access to high-dependency care
FIGURE 26.
Configuration with current 45 NICUs and current 78 LNUs with high-dependency demand (Tables 22a and b). HD, high dependency. (a) Background map © OpenStreetMap contributors;60 the data are available under the Open Database Licence and the cartography is licenced as CC BY-SA and the cartography is licenced as CC BY-SA (www.openstreetmap.org/copyright); and (b) key performance indicators.
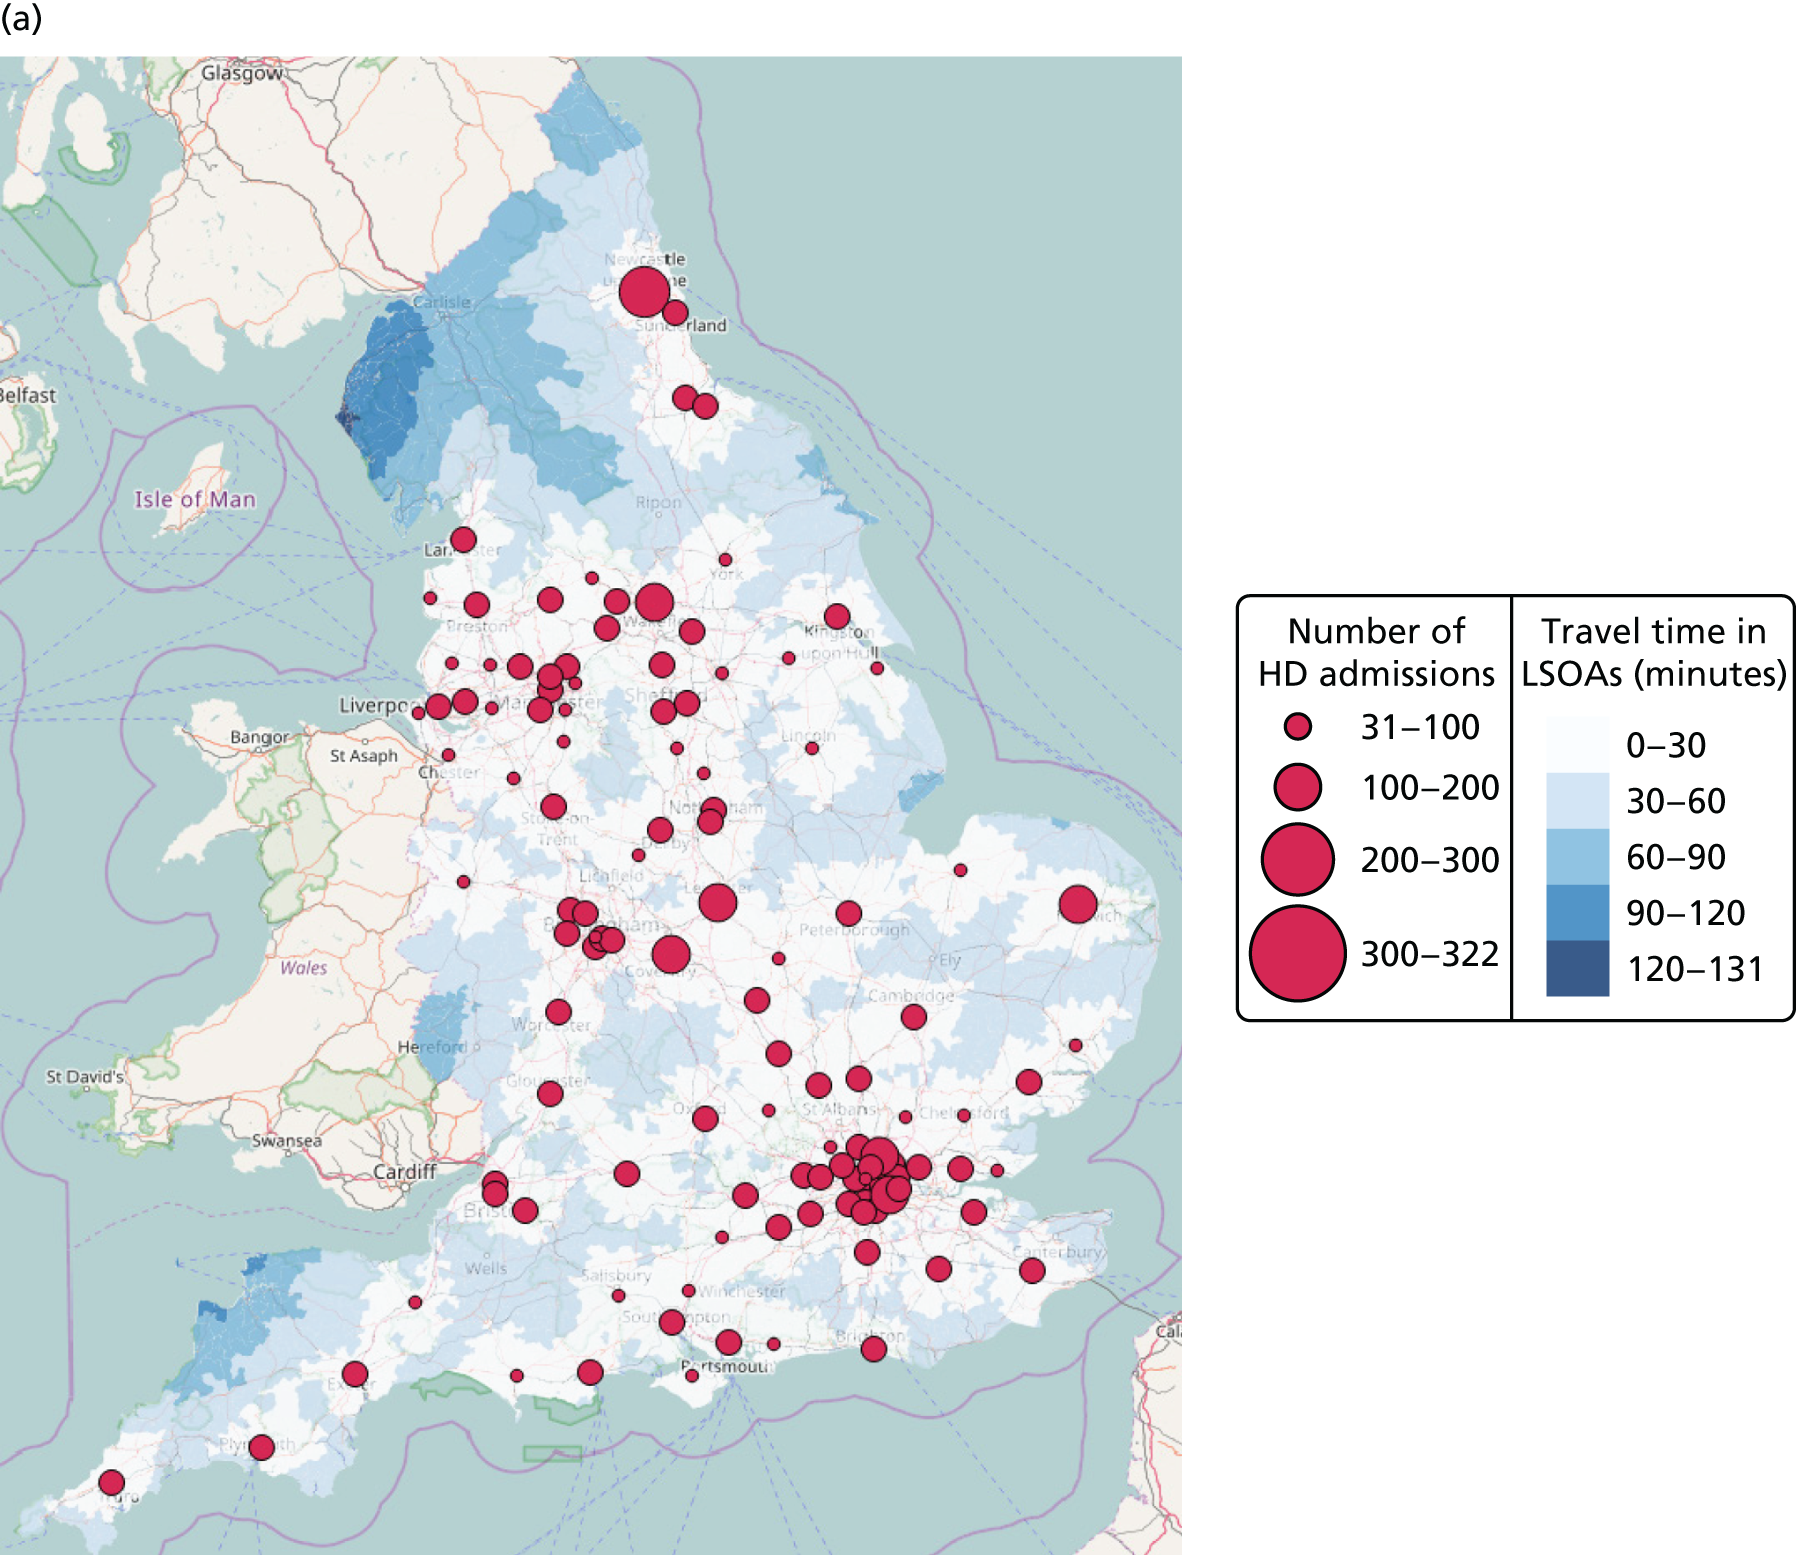

| Existing NICUs (n = 45) | High-dependency demand |
|---|---|
| Newcastle upon Tyne | 321.6 |
| Leeds | 287.7 |
| Coventry | 248.4 |
| Norwich | 203.6 |
| Leicester – Royal | 202.4 |
| Gillingham | 197.1 |
| Birmingham – Heartlands | 193.9 |
| Portsmouth | 187.0 |
| Ashford | 181.7 |
| Birmingham – Children’s | 177.1 |
| London – Queen C | 173.8 |
| Bradford | 172.5 |
| Sunderland | 169.4 |
| Brighton | 169.4 |
| Bolton | 159.5 |
| Stroke-on-Trent | 158.5 |
| Bristol – Royal | 157.6 |
| Stockton-on-Tees | 157.5 |
| Luton | 151.1 |
| Oxford | 151.0 |
| London – St Peter | 150.0 |
| Hull | 149.3 |
| Cambridge | 148.3 |
| Manchester – St Mary | 147.9 |
| London – King’s | 142.3 |
| Nottingham – University | 138.9 |
| Liverpool | 137.1 |
| Burnley | 136.5 |
| Oldham | 129.8 |
| Birmingham – Edgbaston | 128.1 |
| Middlesbrough | 120.8 |
| Southampton | 117.3 |
| Plymouth | 116.7 |
| London – Royal | 114.9 |
| London – Homerton | 114.6 |
| Nottingham – City | 113.0 |
| Preston | 112.6 |
| Bristol – North | 108.3 |
| London – St George | 107.9 |
| Sheffield | 107.5 |
| Wolverhampton | 106.7 |
| Wirral | 88.7 |
| London – Guy’s and St Thomas’ | 65.4 |
| London – Chelsea | 62.6 |
| London – University College London | 57.7 |
| Existing LNUs (n = 78) | High-dependency demand |
|---|---|
| London – Edmonton | 215.0 |
| London – Lewisham | 208.3 |
| London – Northwick Park | 189.3 |
| London – Newham | 188.0 |
| Uxbridge | 183.3 |
| London – Leystonstone | 178.1 |
| Basildon | 175.6 |
| London – Croydon | 172.1 |
| Exeter | 170.2 |
| Peterborough | 164.5 |
| Prescot | 164.0 |
| Milton Keynes | 162.1 |
| Walsall | 159.6 |
| Gloucester | 157.1 |
| Kingston upon Thames | 153.7 |
| Romford | 150.6 |
| London – Queen E | 148.8 |
| Camberley | 145.4 |
| Dudley | 143.6 |
| Rotherham | 142.0 |
| Reading | 140.2 |
| Tunbridge Wells | 138.7 |
| Manchester – North | 135.4 |
| Redhill | 132.1 |
| Slough | 130.3 |
| London – Whittington | 129.3 |
| London – Barnet | 129.3 |
| Worcester | 129.2 |
| Swindon | 124.9 |
| Lancaster | 123.8 |
| Northampton | 122.2 |
| Halifax | 121.1 |
| Bath | 120.6 |
| Derby | 119.8 |
| Poole | 119.7 |
| Barnsley | 116.1 |
| Stevenage | 115.8 |
| London – St Helier | 108.8 |
| Colchester | 108.0 |
| Manchester – University | 106.7 |
| Truro | 105.0 |
| Pontefract | 103.7 |
| York | 98.8 |
| Shrewsbury | 97.5 |
| Ipswich | 95.7 |
| Sutton-in-Ashfield | 93.4 |
| Doncaster | 91.5 |
| Harlow | 89.2 |
| Watford | 88.0 |
| Chichester | 87.4 |
| Taunton | 87.2 |
| Ashton under Lyne | 84.2 |
| Wigan | 84.1 |
| Warrington | 83.7 |
| Kettering | 81.4 |
| Birmingham – City | 81.1 |
| Lincoln | 79.9 |
| Basingstoke | 78.7 |
| Chelmsford | 77.7 |
| Stockport | 75.7 |
| Aylesbury | 75.4 |
| Blackpool | 72.5 |
| Grimsby | 72.2 |
| King’s Lynn | 68.3 |
| Southend | 68.1 |
| Crewe | 67.4 |
| Dorchester | 63.9 |
| Chesterfield | 62.9 |
| Ormskirk | 60.0 |
| Burton upon Trent | 59.7 |
| Salisbury | 58.0 |
| London – St Mary | 57.7 |
| Winchester | 51.6 |
| Chester | 50.8 |
| Scunthorpe | 45.7 |
| Keighley | 43.4 |
| Macclesfield | 40.1 |
| Newport, Isle of Wight | 30.7 |
FIGURE 27.
Example of optimal configuration with 48 NICUs and 78 LNUs with high-dependency demand (Tables 23a and b). HD, high dependency. (a) Background map © OpenStreetMap contributors;60 the data are available under the Open Database Licence and the cartography is licenced as CC BY-SA (www.openstreetmap.org/copyright); and (b) key performance indicators.
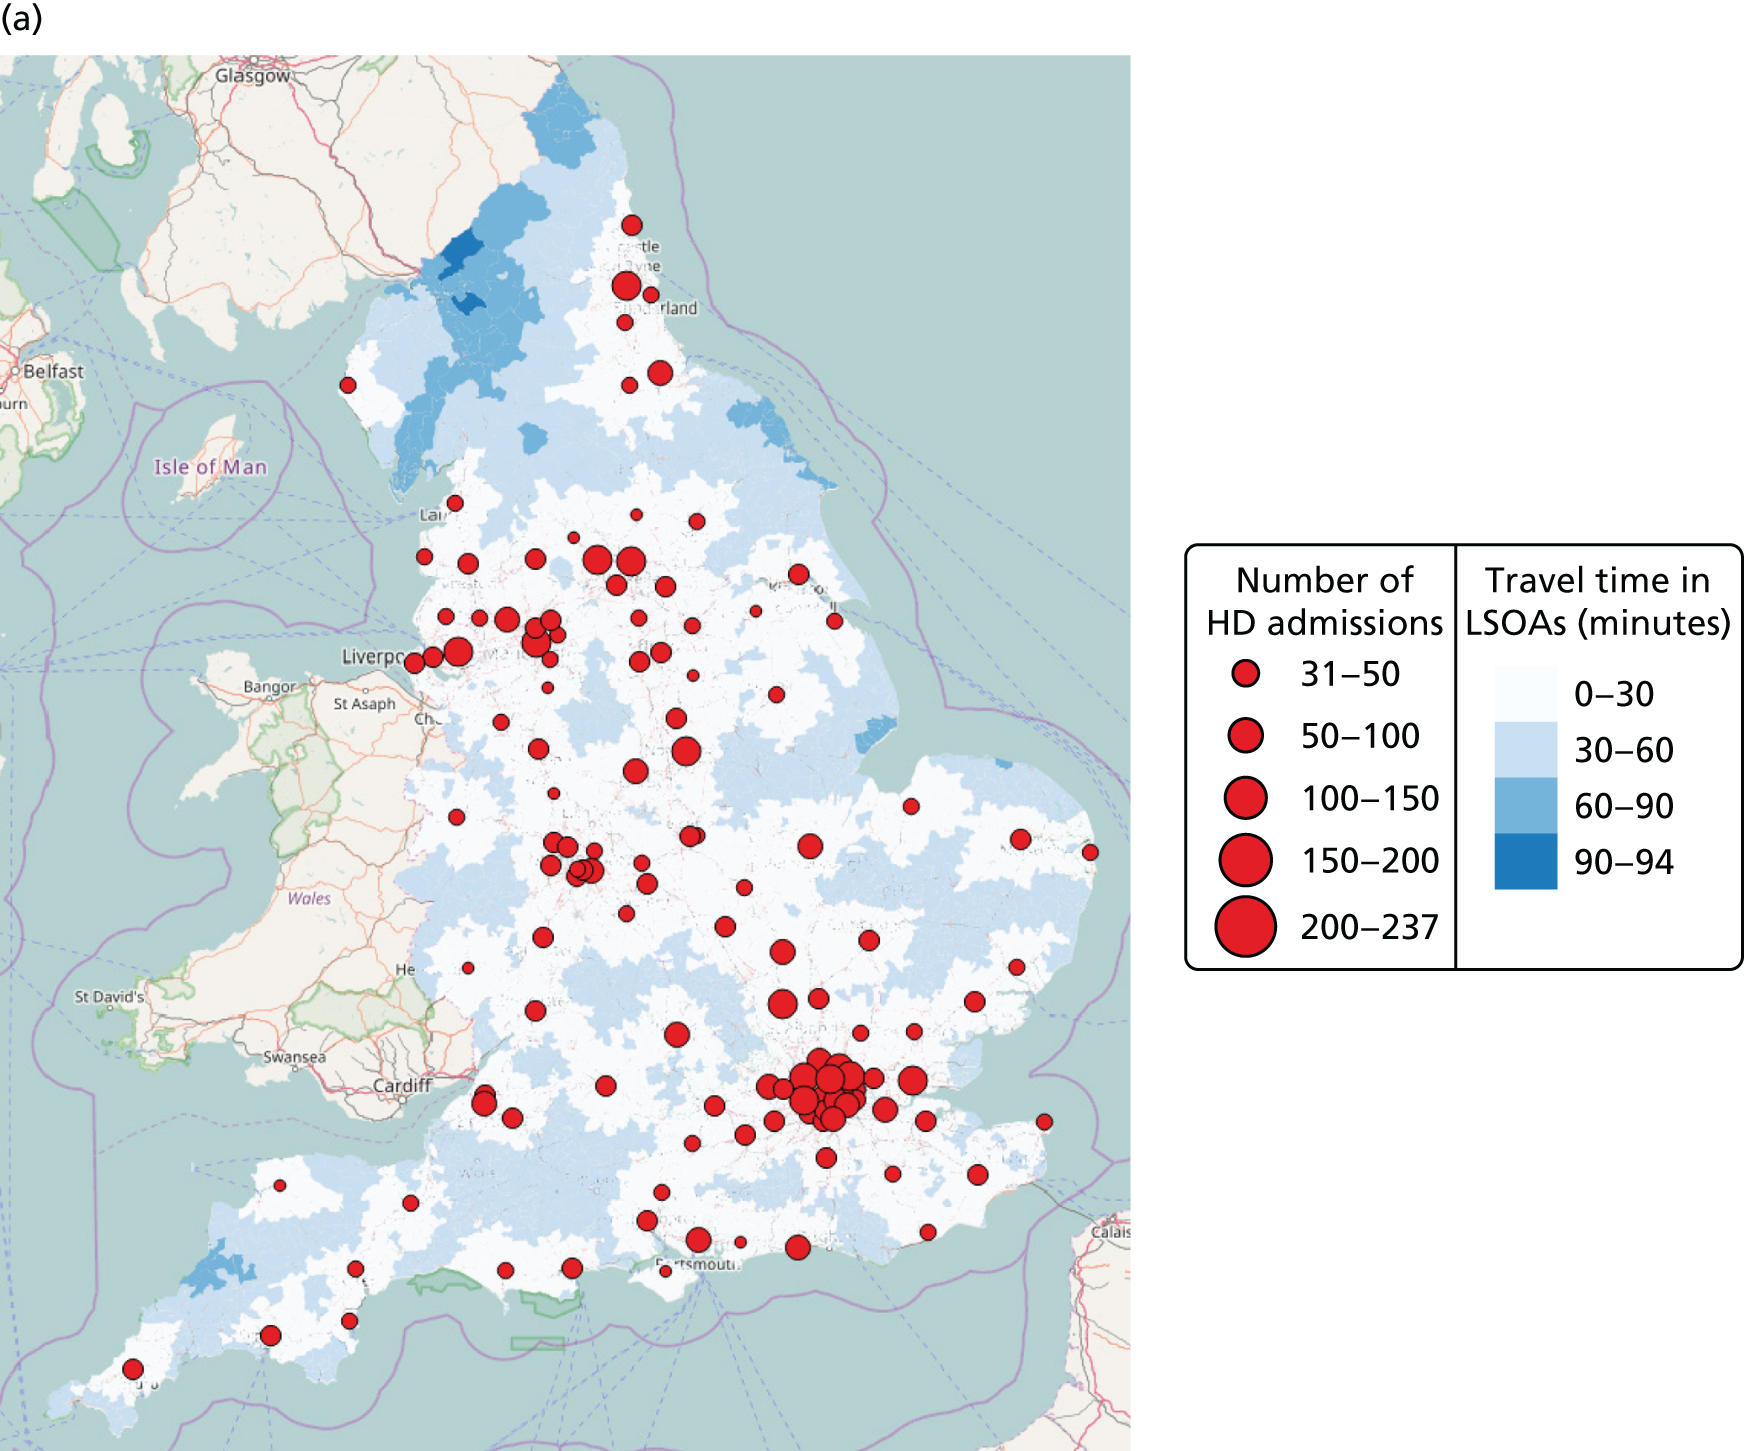
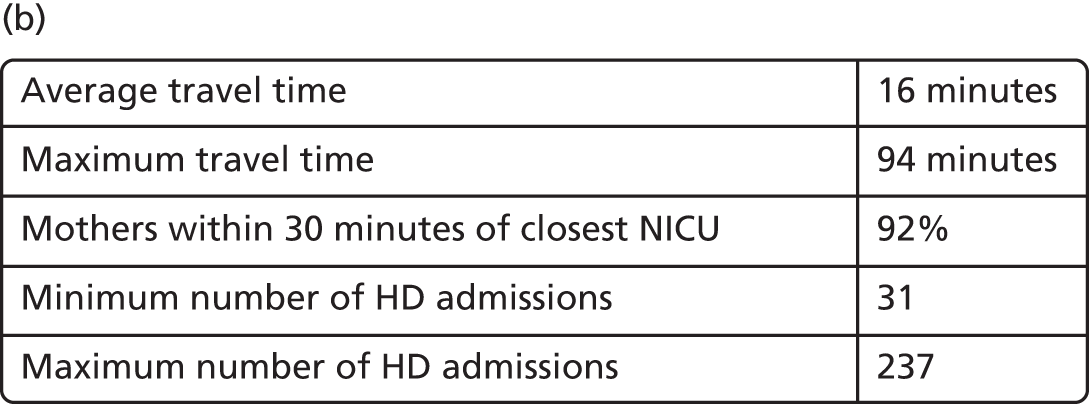
| NICUs (n = 48) | High-dependency demand |
|---|---|
| London – Northwick Park | 237.3 |
| Manchester – St Mary | 234.7 |
| Prescot | 232.7 |
| London – Edmonton | 223.6 |
| Leeds | 216.4 |
| Basildon | 213.5 |
| Bradford | 211.1 |
| Gateshead | 203.3 |
| Luton | 200.2 |
| Birmingham – Heartlands | 191.8 |
| London – Newham | 187.8 |
| Portsmouth | 187.0 |
| Derby | 184.1 |
| Stockton-on-Tees | 184.1 |
| London – Royal | 183.8 |
| London – Barnet | 182.9 |
| Worthing | 180.4 |
| Dartford | 179.1 |
| London – Chelsea | 169.7 |
| Peterborough | 169.3 |
| Bolton | 167.6 |
| Bedford | 153.4 |
| Slough | 152.0 |
| Gillingham | 148.4 |
| Camberley | 145.3 |
| Dudley | 143.6 |
| Cambridge | 143.0 |
| Stroke-on-Trent | 142.0 |
| Reading | 140.2 |
| Liverpool | 137.1 |
| Gloucester | 135.7 |
| Sutton-in-Ashfield | 131.6 |
| Southampton | 128.9 |
| Bath | 127.2 |
| Rotherham | 124.6 |
| Kingston upon Thames | 120.8 |
| Preston | 112.6 |
| Plymouth | 111.7 |
| London – St Helier | 108.8 |
| Bristol – North | 108.3 |
| Wolverhampton | 104.3 |
| London – Queen E | 102.3 |
| Pontefract | 100.2 |
| Warwick | 98.6 |
| Stockport | 85.4 |
| Chelmsford | 77.7 |
| Grimsby | 72.2 |
| Leicester – General | 67.3 |
| LNUs (n = 78) | High-dependency demand |
|---|---|
| London – Whittington | 224.3 |
| Nottingham – City | 205.0 |
| London – Isleworth | 201.5 |
| London – Leystonstone | 201.1 |
| London – King’s | 182.0 |
| London – Lewisham | 171.6 |
| London – Croydon | 169.7 |
| Oxford | 159.9 |
| Bristol – Royal | 157.6 |
| Romford | 149.5 |
| Hull | 149.3 |
| Oldham | 146.9 |
| Leicester – Royal | 146.8 |
| Norwich | 145.5 |
| Northampton | 139.8 |
| Burnley | 137.0 |
| Dewsbury | 136.0 |
| Manchester – North | 135.4 |
| London – St Peter | 134.1 |
| Wirral | 134.0 |
| Poole | 126.6 |
| Swindon | 126.5 |
| Redhill | 125.1 |
| Walsall | 124.5 |
| Uxbridge | 124.4 |
| Coventry | 123.3 |
| Birmingham – Edgbaston | 121.6 |
| Sheffield | 116.2 |
| Birmingham – Children’s | 111.1 |
| London – St George | 109.7 |
| Ashford | 108.6 |
| Colchester | 108.0 |
| Worcester | 105.7 |
| Truro | 102.4 |
| Stevenage | 102.2 |
| Ashington | 101.6 |
| Ipswich | 94.3 |
| Sunderland | 93.5 |
| Wigan | 93.1 |
| Barnsley | 91.7 |
| Shrewsbury | 90.9 |
| Harlow | 89.2 |
| York | 88.3 |
| Tunbridge Wells | 87.2 |
| Ashton under Lyne | 87.2 |
| Sutton Coldfield | 86.7 |
| Taunton | 85.7 |
| Lincoln | 83.7 |
| Hastings | 83.4 |
| Exeter | 81.2 |
| Durham | 81.2 |
| Birmingham – City | 81.1 |
| Winchester | 79.6 |
| Doncaster | 79.6 |
| Kettering | 78.9 |
| Basingstoke | 78.7 |
| Lancaster | 76.2 |
| Darlington | 75.2 |
| Crewe | 73.7 |
| Whitehaven | 73.7 |
| Blackpool | 72.5 |
| Nuneaton | 72.5 |
| Margate | 70.1 |
| King’s Lynn | 68.3 |
| Dorchester | 67.2 |
| Ormskirk | 60.0 |
| Great Yarmouth | 59.5 |
| Torbay | 58.8 |
| Worksop | 47.5 |
| Macclesfield | 46.4 |
| Hereford | 45.1 |
| Scunthorpe | 44.5 |
| Stafford | 43.8 |
| Chichester | 43.7 |
| Harrogate | 43.6 |
| Barnstaple | 39.4 |
| Keighley | 39.3 |
| Newport, Isle of Wight | 30.7 |
FIGURE 28.
Example of optimal configuration with 30 NICUs and 30 LNUs with high-dependency demand (Tables 24a and b). HD, high dependency. (a) Background map © OpenStreetMap contributors;60 the data are available under the Open Database Licence and the cartography is licenced as CC BY-SA (www.openstreetmap.org/copyright); and (b) key performance indicators.
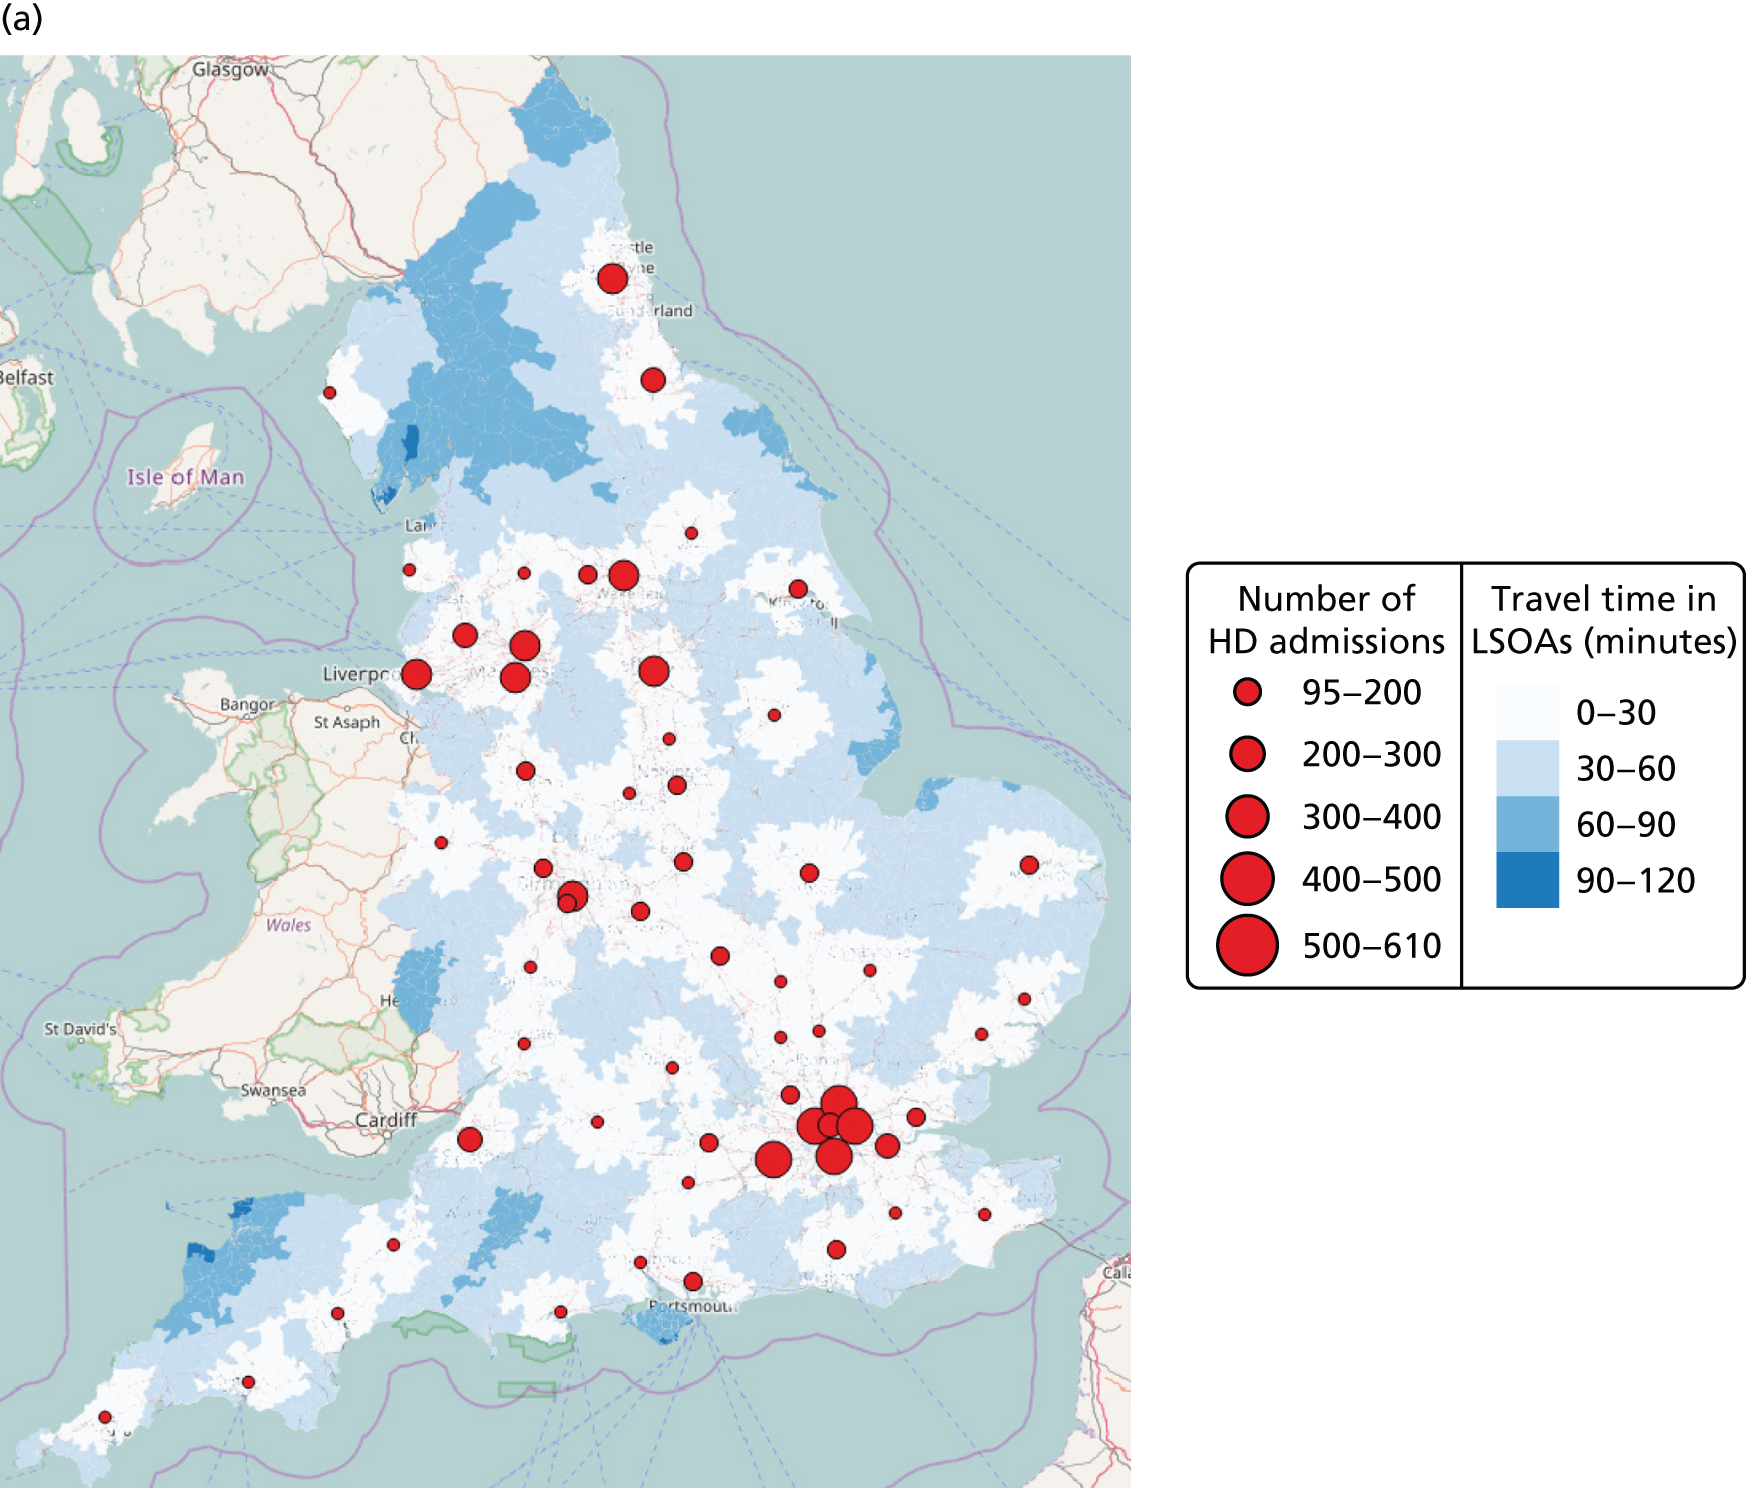
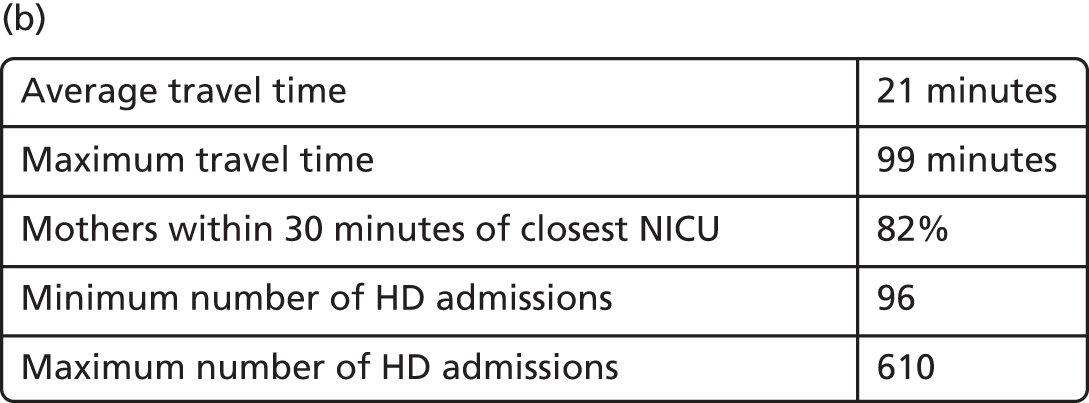
| NICUs (n = 30) | High-dependency demand |
|---|---|
| London – Edmonton | 568.6 |
| London – Queen C | 522.7 |
| London – St Peter | 522.6 |
| London – Croydon | 520.1 |
| Leeds | 476.1 |
| Manchester – North | 470.3 |
| Birmingham – Children’s | 452.1 |
| Rotherham | 446.9 |
| Newcastle upon Tyne | 435.1 |
| Liverpool | 417.4 |
| Dartford | 370.5 |
| Bristol – Royal | 359.2 |
| London – University College London | 306.3 |
| Stockton-on-Tees | 305.4 |
| Basildon | 299.1 |
| Wolverhampton | 298.2 |
| Haywards Heath | 296.5 |
| Watford | 274.2 |
| Portsmouth | 268.5 |
| Coventry | 249.6 |
| Hull | 241.3 |
| Nottingham – University | 239.2 |
| Stroke-on-Trent | 223.8 |
| Norwich | 222.5 |
| Southampton | 182.2 |
| Burnley | 171.3 |
| Swindon | 156.4 |
| Bedford | 153.6 |
| Taunton | 121.9 |
| Plymouth | 116.7 |
| LNUs (n = 30) | High-dependency demand |
|---|---|
| London – Newham | 609.8 |
| Manchester – University | 406.4 |
| Wigan | 304.7 |
| Bradford | 251.8 |
| Birmingham – Edgbaston | 218.9 |
| Peterborough | 213.0 |
| Reading | 209.6 |
| Northampton | 209.0 |
| Leicester – Royal | 207.7 |
| Ashford | 194.8 |
| Luton | 186.7 |
| Oxford | 184.5 |
| Derby | 180.7 |
| Basingstoke | 177.2 |
| Exeter | 170.2 |
| Poole | 164.8 |
| Cambridge | 163.4 |
| Gloucester | 157.8 |
| Blackpool | 157.2 |
| Sutton-in-Ashfield | 152.8 |
| Worcester | 142.8 |
| Colchester | 141.2 |
| Stevenage | 138.6 |
| Tunbridge Wells | 138.1 |
| Lincoln | 113.7 |
| York | 112.3 |
| Truro | 105.0 |
| Shrewsbury | 101.9 |
| Whitehaven | 97.2 |
| Ipswich | 95.7 |
Access to special care
FIGURE 29.
Current configuration with 45 NICUs, 78 LNUs and 38 SCUs with special care demand (Tables 25a–c). SC, special care. (a) Background map © OpenStreetMap contributors;60 the data are available under the Open Database Licence and the cartography is licenced as CC BY-SA (www.openstreetmap.org/copyright); and (b) key performance indicators.
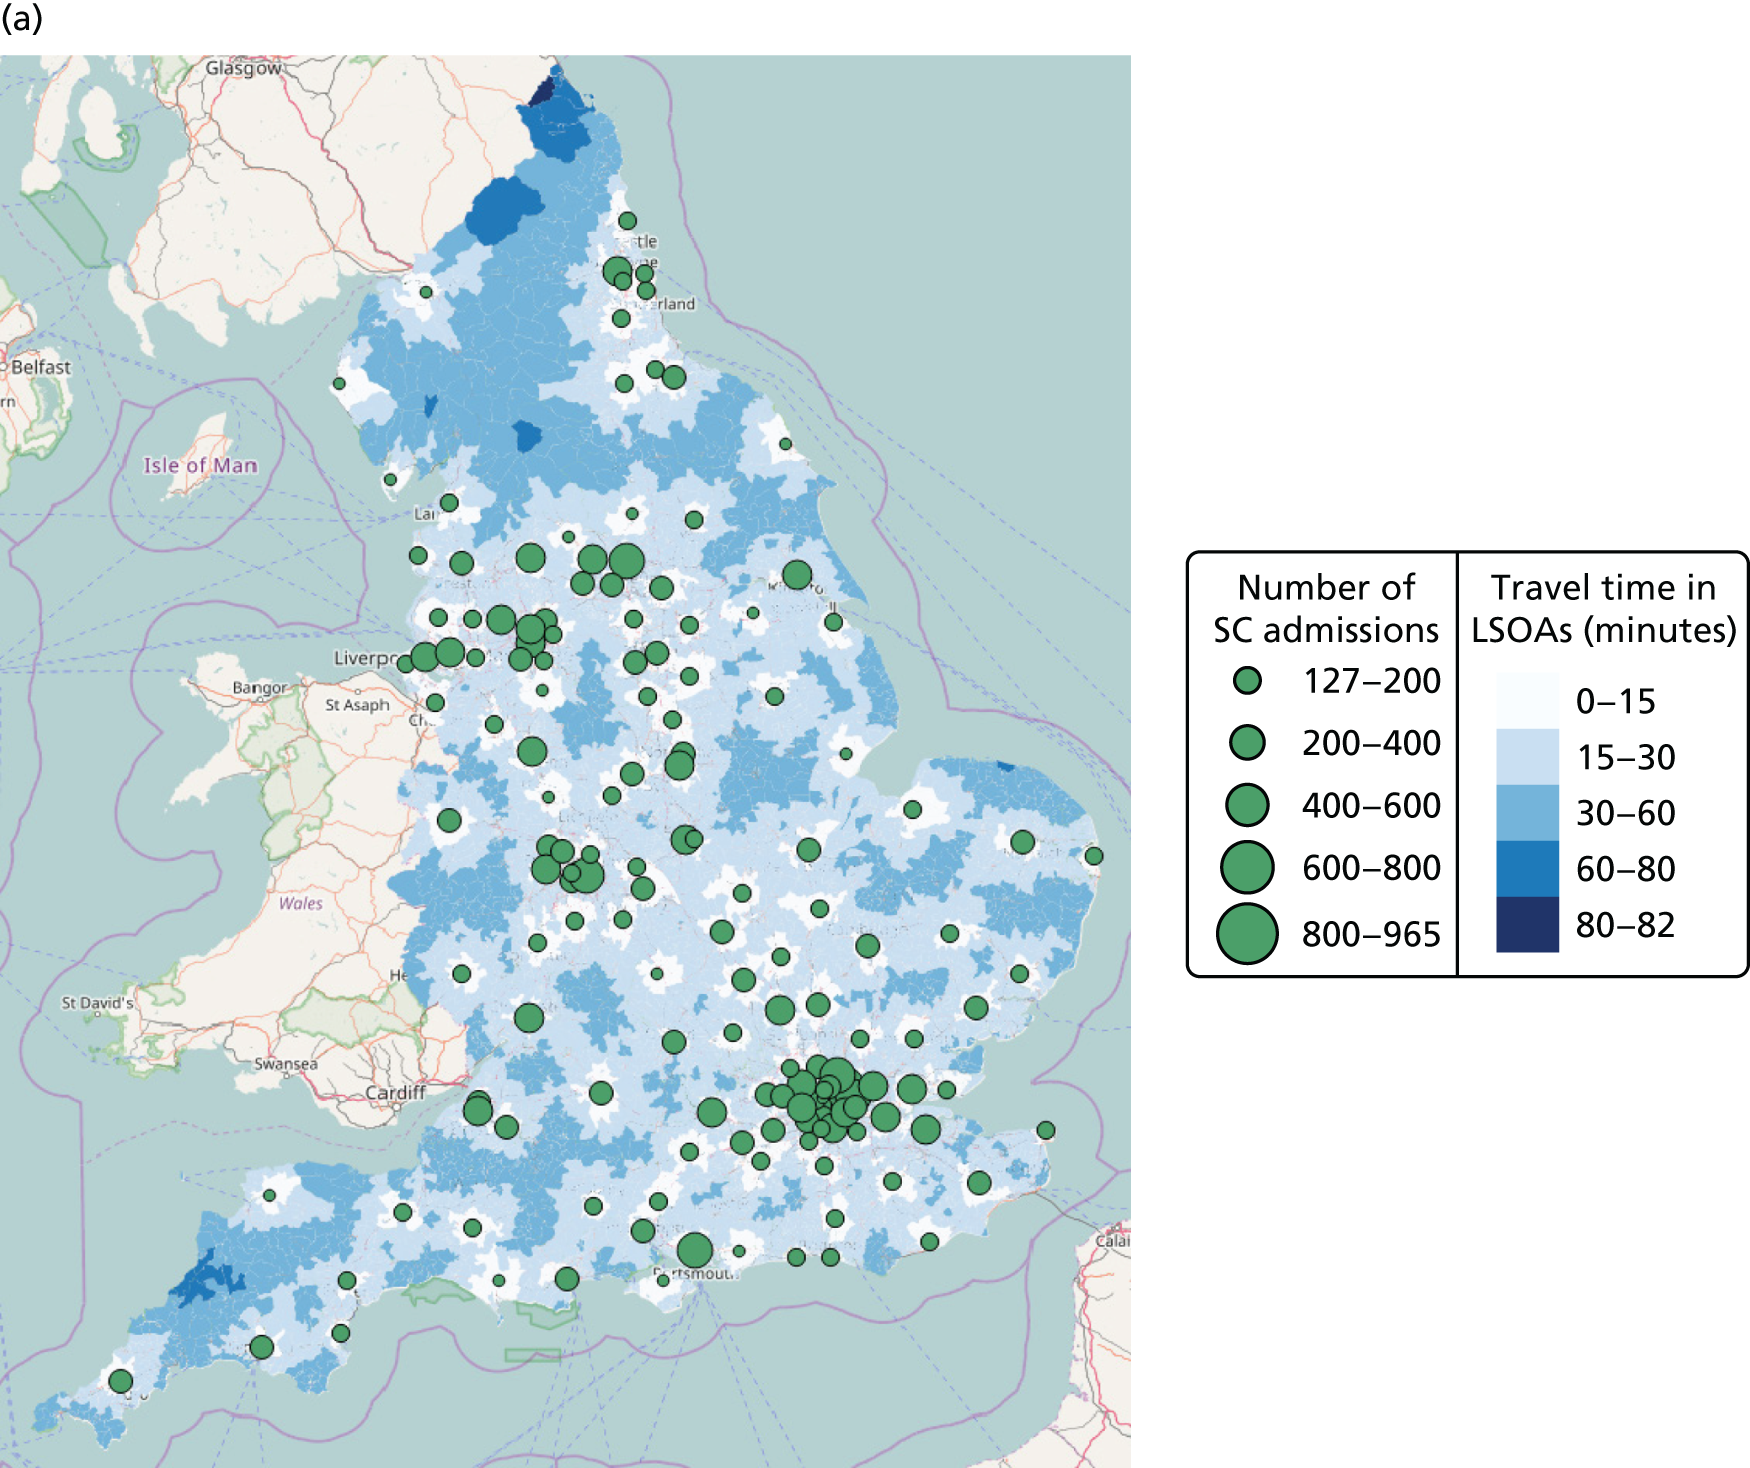
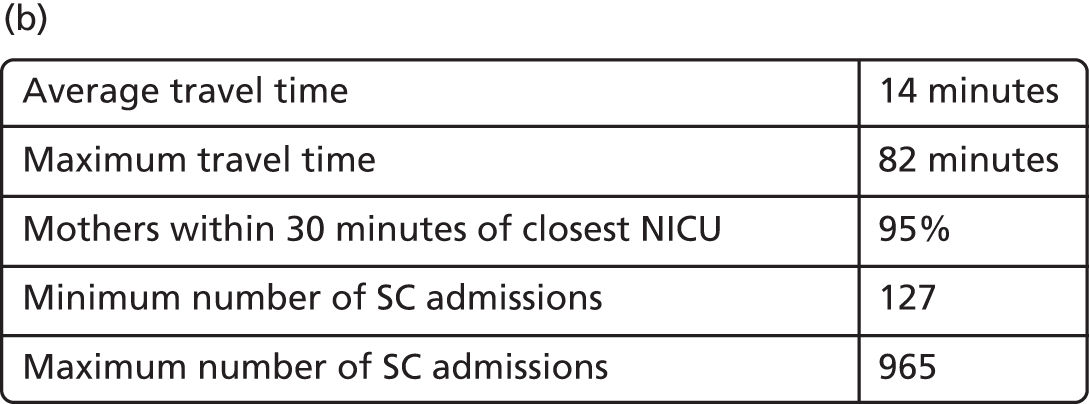
| Existing NICUs (n = 45) | Special care demand |
|---|---|
| Leeds | 964.6 |
| Birmingham – Heartlands | 831.0 |
| Portsmouth | 813.1 |
| Bradford | 769.0 |
| Bolton | 711.2 |
| Newcastle upon Tyne | 702.9 |
| Bristol – Royal | 702.5 |
| Gillingham | 661.5 |
| Luton | 660.6 |
| Manchester – St Mary | 659.3 |
| Leicester – Royal | 640.7 |
| London – King’s | 634.2 |
| Stroke-on-Trent | 633.2 |
| Nottingham – University | 613.2 |
| Liverpool | 611.3 |
| Burnley | 608.5 |
| Hull | 600.3 |
| Norwich | 586.6 |
| Oldham | 578.5 |
| Coventry | 549.7 |
| Oxford | 528.4 |
| Southampton | 523.0 |
| London – Queen C | 520.9 |
| London – Royal | 512.0 |
| London – Homerton | 510.7 |
| Nottingham – City | 503.7 |
| Preston | 502.0 |
| Plymouth | 497.8 |
| Birmingham – Children’s | 489.5 |
| Ashford | 484.3 |
| Bristol – North | 482.9 |
| London – St George’s | 480.8 |
| Middlesbrough | 479.7 |
| Sheffield | 479.3 |
| London – St Peter’s | 476.3 |
| Wolverhampton | 464.9 |
| Birmingham – Edgbaston | 453.9 |
| Cambridge | 428.2 |
| Wirral | 395.5 |
| Brighton | 372.7 |
| Sunderland | 346.9 |
| Stockton-on-Tees | 333.6 |
| London – Guy’s and St Thomas’ | 291.4 |
| London – Chelsea | 279.1 |
| London – University College London | 185.0 |
| Existing LNUs (n = 78) | Special care demand |
|---|---|
| London – Edmonton | 958.3 |
| London – Newham | 829.6 |
| London – Leystonstone | 794.1 |
| London – Northwick Park | 785.4 |
| Prescot | 731.2 |
| London – Lewisham | 676.5 |
| London – Croydon | 676.2 |
| Romford | 666.3 |
| Basildon | 648.3 |
| Dudley | 639.1 |
| Reading | 625.1 |
| Manchester – North | 603.5 |
| Gloucester | 601.9 |
| Slough | 580.7 |
| London – Barnet | 562.7 |
| Swindon | 556.8 |
| Walsall | 554.9 |
| Peterborough | 547.6 |
| Rotherham | 540.7 |
| Poole | 532.6 |
| Derby | 527.0 |
| Uxbridge | 513.8 |
| Bath | 511.5 |
| Northampton | 509.7 |
| Milton Keynes | 492.9 |
| Kingston upon Thames | 487.6 |
| Manchester – University | 475.5 |
| Colchester | 463.2 |
| Halifax | 459.3 |
| Truro | 456.4 |
| London – Queen E | 455.9 |
| Stevenage | 452.8 |
| Pontefract | 446.8 |
| London – Whittington | 445.2 |
| Camberley | 411.3 |
| Shrewsbury | 405.3 |
| Barnsley | 400.0 |
| Harlow | 397.6 |
| London – St Helier | 393.4 |
| Watford | 392.3 |
| Sutton-in-Ashfield | 391.9 |
| Redhill | 381.6 |
| Ashton under Lyne | 375.2 |
| Wigan | 375.0 |
| Warrington | 373.1 |
| Exeter | 362.1 |
| Birmingham – City | 361.7 |
| Doncaster | 354.9 |
| Ipswich | 346.8 |
| Tunbridge Wells | 346.5 |
| Chelmsford | 346.4 |
| Kettering | 345.4 |
| Basingstoke | 344.4 |
| Stockport | 337.3 |
| Aylesbury | 336.1 |
| Taunton | 326.6 |
| Blackpool | 323.1 |
| Worcester | 321.0 |
| Lincoln | 307.2 |
| Southend | 303.5 |
| Crewe | 300.5 |
| King’s Lynn | 296.8 |
| York | 283.5 |
| Ormskirk | 267.6 |
| Grimsby | 261.8 |
| Chesterfield | 261.7 |
| Salisbury | 230.7 |
| Winchester | 230.2 |
| Chester | 226.5 |
| Lancaster | 221.7 |
| Burton upon Trent | 208.4 |
| Scunthorpe | 198.5 |
| Chichester | 189.5 |
| Macclesfield | 178.9 |
| Keighley | 175.0 |
| London – St Mary | 152.1 |
| Dorchester | 150.6 |
| Newport, Isle of Wight | 137.1 |
| Existing SCUs (n = 36) | Special care demand |
|---|---|
| London – Isleworth | 772.0 |
| Dartford | 673.7 |
| Dewsbury | 421.2 |
| London – Royal Free | 378.1 |
| Sutton Coldfield | 378.0 |
| Hastings | 367.5 |
| Durham | 355.3 |
| Guildford | 342.6 |
| Redditch | 326.8 |
| Darlington | 324.7 |
| Nuneaton | 323.0 |
| Margate | 312.5 |
| Worthing | 307.3 |
| Haywards Heath | 303.3 |
| Orpington | 295.5 |
| Bedford | 291.1 |
| Bury Saint Edmunds | 283.8 |
| Warwick | 269.9 |
| Leicester – General | 268.6 |
| Great Yarmouth | 265.4 |
| Ashington | 262.6 |
| Torbay | 262.0 |
| Yeovil | 245.0 |
| Gateshead | 235.3 |
| London – Epsom | 230.0 |
| Huntingdon | 224.4 |
| South Shields | 220.1 |
| Worksop | 209.4 |
| Hereford | 201.2 |
| Boston | 197.2 |
| Carlisle | 194.9 |
| Scarborough | 193.5 |
| Stafford | 193.5 |
| Harrogate | 184.5 |
| Banbury | 184.0 |
| Barnstaple | 175.7 |
| Whitehaven | 146.9 |
| Barrow-in-Furness | 127.0 |
FIGURE 30.
Example of optimal configuration with 30 NICUs, 30 LNUs and 30 SCUs with special care demand (Tables 26a–c). SC, special care. (a) Background map © OpenStreetMap contributors;60 the data are available under the Open Database Licence and the cartography is licenced as CC BY-SA (www.openstreetmap.org/copyright); and (b) key performance indicators.
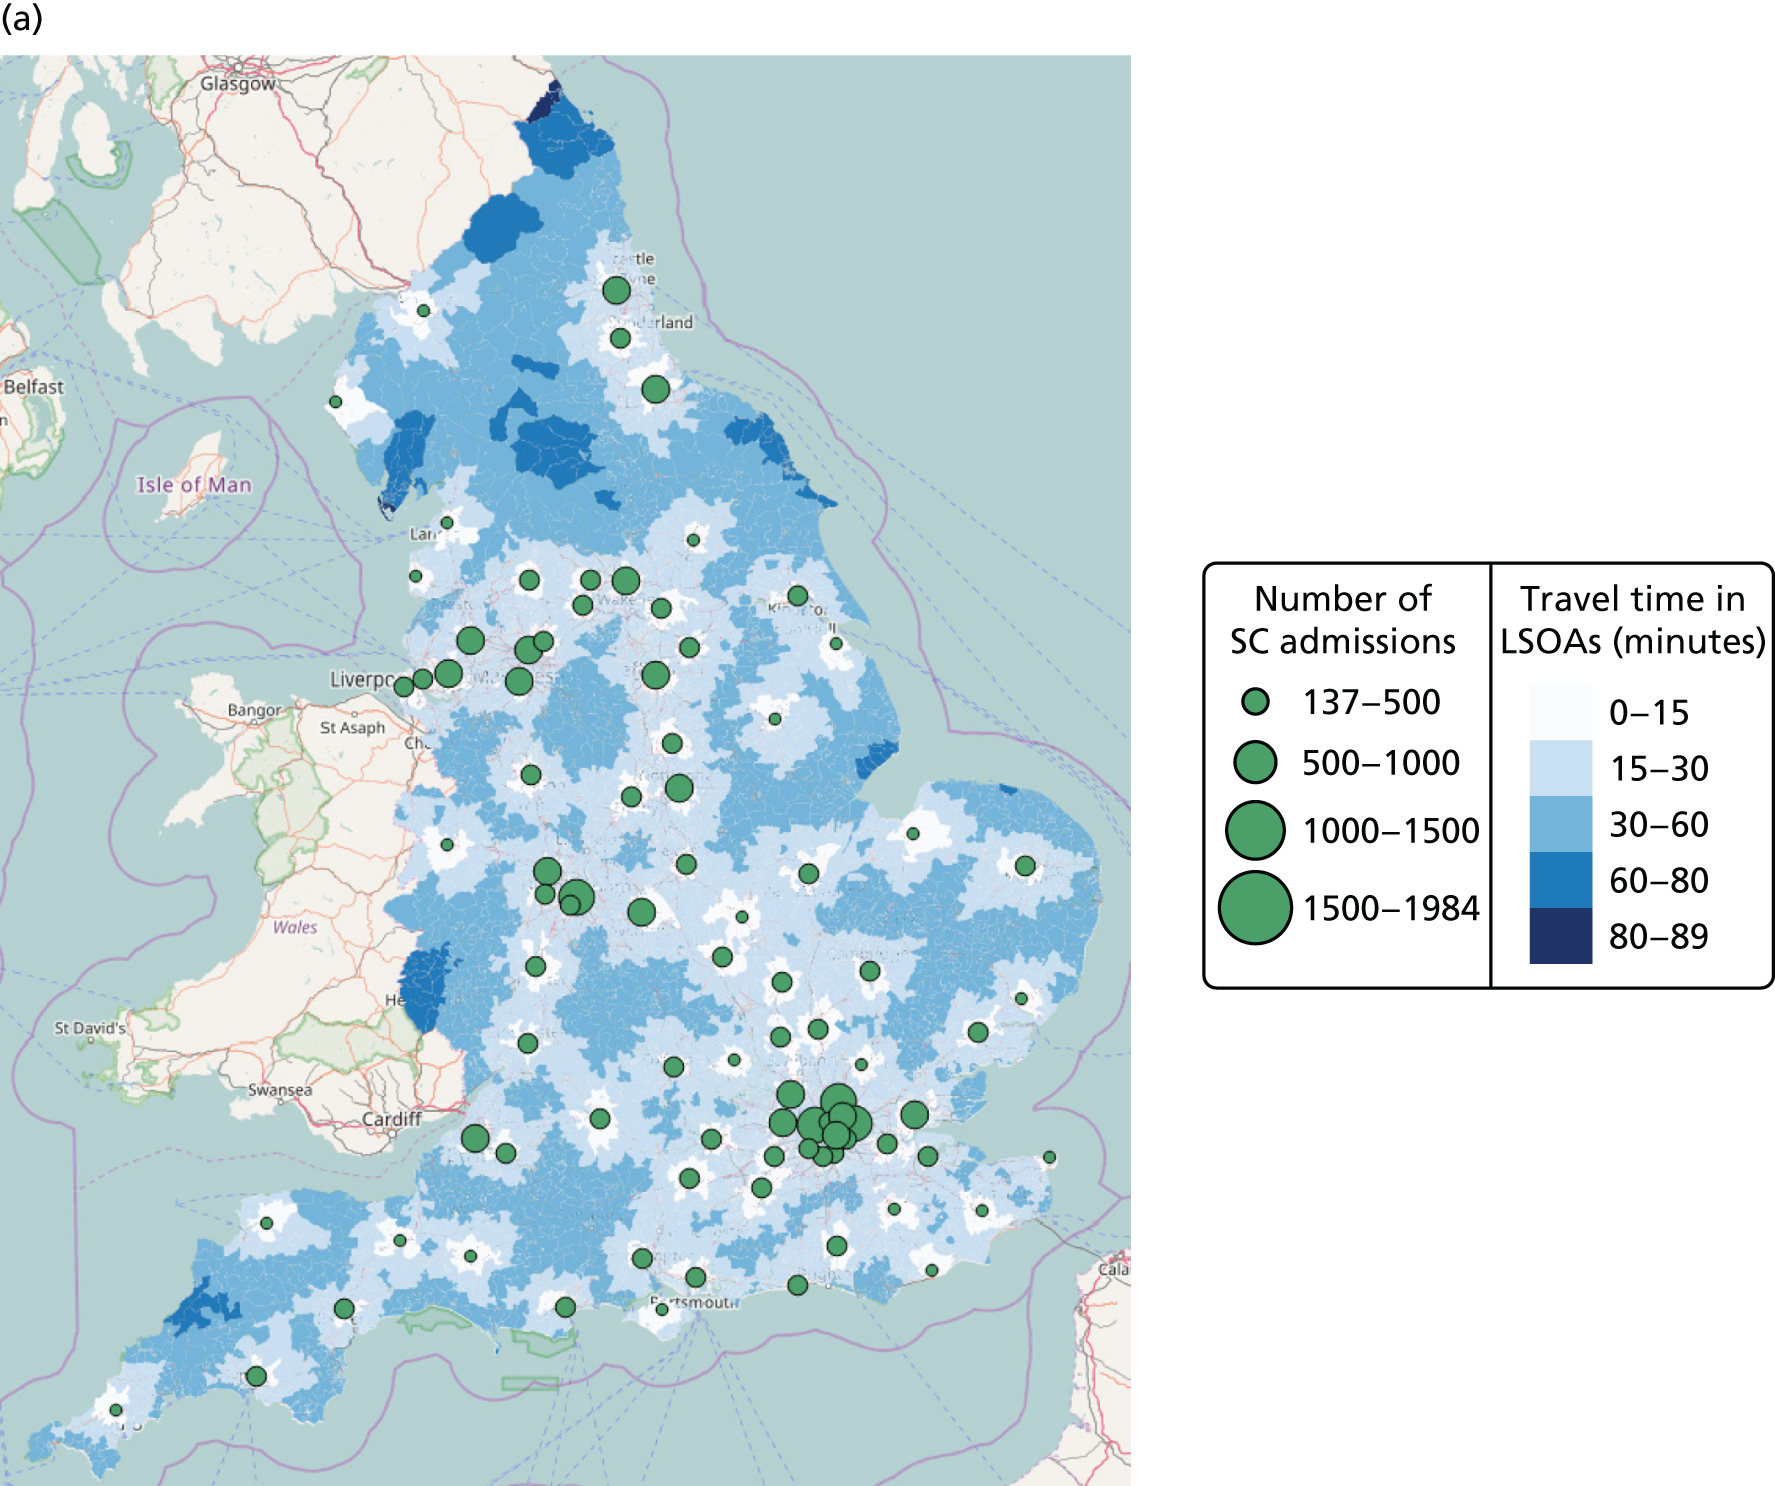
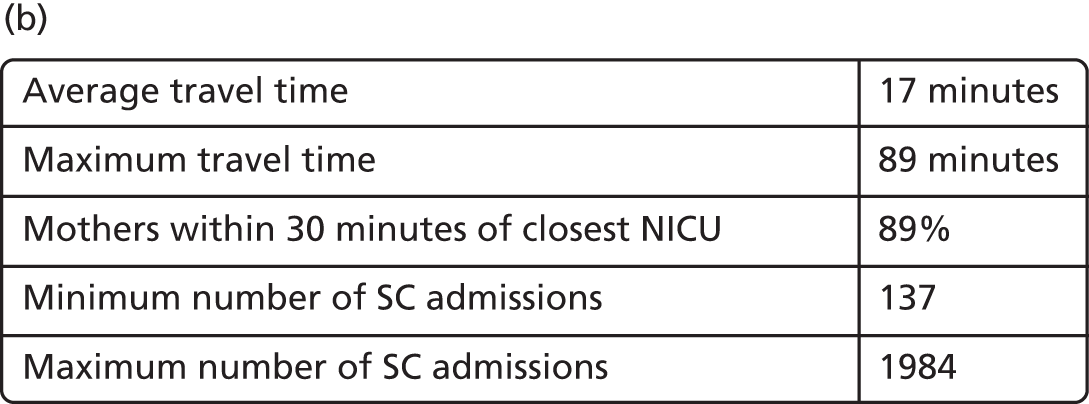
| NICUs (n = 30) | Special care demand |
|---|---|
| Birmingham – Children’s | 1984.1 |
| London – Edmonton | 1852.4 |
| London – Queen C | 1537.7 |
| Leeds | 1435.0 |
| Newcastle upon Tyne | 1419.5 |
| Rotherham | 1388.2 |
| Basildon | 1323.8 |
| Manchester – North | 1295.9 |
| Bristol – Royal | 1175.4 |
| Stockton-on-Tees | 1114.8 |
| Coventry | 1107.3 |
| Nottingham – University | 1066.4 |
| Watford | 1034.5 |
| Wolverhampton | 1007.1 |
| Stroke-on-Trent | 993.4 |
| Portsmouth | 953.9 |
| Dartford | 936.0 |
| Norwich | 907.7 |
| London – Croydon | 875.4 |
| Southampton | 756.5 |
| Burnley | 746.2 |
| London – St Peter | 744.2 |
| Hull | 723.4 |
| London – University College London | 686.8 |
| Bedford | 662.5 |
| Liverpool | 611.3 |
| Haywards Heath | 594.3 |
| Swindon | 580.4 |
| Plymouth | 517.5 |
| Taunton | 337.6 |
| LNUs (n = 30) | Special care demand |
|---|---|
| London – Newham | 1629.1 |
| Manchester – University | 1448.1 |
| Wigan | 1063.5 |
| Bradford | 929.2 |
| Leicester – Royal | 902.2 |
| Derby | 805.3 |
| Reading | 734.7 |
| Peterborough | 724.5 |
| Luton | 715.2 |
| Birmingham – Edgbaston | 710.2 |
| Gloucester | 703.5 |
| Sutton-in-Ashfield | 681.3 |
| Oxford | 678.1 |
| Cambridge | 642.4 |
| Northampton | 621.0 |
| Colchester | 618.6 |
| Exeter | 603.9 |
| Worcester | 575.8 |
| Poole | 572.4 |
| Stevenage | 552.9 |
| Basingstoke | 546.3 |
| Ashford | 484.3 |
| Blackpool | 465.2 |
| Truro | 456.4 |
| York | 454.4 |
| Shrewsbury | 445.7 |
| Ipswich | 426.8 |
| Lincoln | 394.6 |
| Tunbridge Wells | 362.8 |
| Whitehaven | 160.1 |
| SCUs (n = 30) | Special care demand |
|---|---|
| Uxbridge | 1491.2 |
| Prescot | 1166.5 |
| London – King’s | 1090.2 |
| London – Homerton | 1001.7 |
| London – Lewisham | 981.6 |
| Oldham | 947.0 |
| Kingston upon Thames | 819.3 |
| London – St Helier | 748.0 |
| Durham | 743.6 |
| Dudley | 684.0 |
| Gillingham | 661.5 |
| Worthing | 639.5 |
| Wirral | 614.1 |
| Guildford | 592.8 |
| Pontefract | 581.0 |
| Halifax | 576.5 |
| Bath | 525.4 |
| Doncaster | 522.4 |
| Harlow | 439.7 |
| Aylesbury | 405.1 |
| Yeovil | 388.3 |
| Hastings | 372.0 |
| Kettering | 359.3 |
| Lancaster | 341.5 |
| Grimsby | 321.8 |
| Margate | 312.5 |
| King’s Lynn | 304.6 |
| Carlisle | 199.6 |
| Barnstaple | 175.7 |
| Newport, Isle of Wight | 137.1 |
Appendix 2 Mortality model
In this appendix, we report the analysis of causal effect of high-volume units for infants at a gestational age of between 26 and 32 weeks. We present the results of estimating a model of exposure to NICUs at birth or within 48 hours of birth. We present the results of a third, additional, analysis comparing clinical outcomes between NICUs, LNUs and SCUs using travel time to the closest LNU and SCU.
Analysis of causal effect of high-volume units for infants born between 26 and 32 weeks of gestational age
Sensitivity analyses were conducted on mortality estimates for infants born between 26 and 32 weeks of gestational age. Following the advice of policy-makers, infants born at < 26 weeks were excluded from the estimates in the sensitivity analysis because it was felt that they included a subgroup of infants whose chances of survival were low, making them more likely to die at the hospital of birth.
The model estimated the effect of high-volume units that treat ≥ 100 infants born weighing < 1500 g per year. The model used an IV approach using travel time as the instrument and covariates were included for gestational age, gestational age squared, birthweight, birthweight squared, the sex of the infant, the lowest decile of the IMD score of the mother’s residence, the mode of delivery and the number of foetuses.
Table 27 summarises the results of the sensitivity analysis and shows that excluding infants born at < 26 weeks of gestational age halves the mortality effect of birth in high-volume units compared with other units (linear SMM 0.02 vs. 0.05 percentage points in all the infants of < 32 weeks of gestational age; IV bivariate probit 0.6 vs. 1.2 percentage points in all the infants of < 32 weeks of gestational age). The instrument remains strong in this analysis and, as before, the Hausman test statistic confirms that treatment variable (delivery in a high-volume hospital) is endogenous (tested using the Hausman test statistic having a p-value of < 0.01). As anticipated, the reduced number of deaths in this sensitivity analysis leads to an inevitable loss of power, particularly in the linear SMM model (IV linear SMM, p = 0.269; IV bivariate probit, p = 0.108).
| Outcomes and test statistics | LPM | IVs linear SMM | IV bivariate probit model (marginal effect) |
|---|---|---|---|
| Birth at high volume, absolute risk difference (SE) | 0.016** (0.005) | –0.020 (0.018) | –0.006 (0.004) |
| Instrument strength for minimum travel time (minutes) to high-volume hospital, coefficient (SE) | N/A | –0.003*** (0.000) | –0.018*** (0.001) |
| F-/z-test statistic | N/A | 28.8 | 28.7 |
| Hausman test χ2 statistic of H0: no endogeneity of treatment variable | N/A | N/Aa | 9.1*** |
Additional analysis of clinical outcomes of exposure to a neonatal intensive care unit at birth or within 48 hours of birth
In our main IV analysis, we found that NICU level had no effect on neonatal mortality relative to mortality in non-NICU hospitals of birth. We were therefore interested to know whether or not the lack of effect had anything to do with the compensating effects of transfers, which in our data set took place for 1694 infants. Of these, 1519 had data on transfer time available, and 990 (65%) had a recorded first transfer to a NICU from a lower level hospital of birth taking place within 48 hours of delivery. Thus, we investigated the effect of exposure to a NICU within 48 hours of birth in our original sample of infants born at < 32 weeks of gestation and in the subset of those born at < 32 weeks after excluding those born at < 26 weeks. The results are presented in Tables 29 and 30, and suggest that exposure to a NICU because of transfers had no role in the lack of effect of exposure to a NICU on mortality. These results should be interpreted with caution because our instrument may have limited ability to control for confounding associated with neonatal transfers within 48 hours of delivery.
| Outcomes and test statistics | Causal effect on mortality of neonatal care in hospitals with a NICU | ||
|---|---|---|---|
| LPM | IVs linear SMM | IV bivariate probit model (marginal effect) | |
| Birth at NICU, absolute risk difference (SE) | –0.007 (0.005) | –0.014 (0.016) | –0.003 (0.011) |
| Instrument strength for minimum travel time (minutes) to tertiary-level hospital, coefficient (SE) | N/A | –0.008*** (0.000) | –0.022*** (0.001) |
| t-/z-test statistic | N/A | 30.4 | 33.0 |
| Hausman test χ2 statistic of H0: no endogeneity of treatment variable | N/A | N/Aa | 0.3 |
| Causal effect on mortality of neonatal care in hospitals with a NICU | |||
|---|---|---|---|
| LPM | IVs linear SMM | IV bivariate probit model (marginal effect) | |
| Birth at NICU, absolute risk difference (SE) | 0.007* (0.004) | –0.006 (0.013) | –0.003 (0.008) |
| Instrument strength for minimum travel time (minutes) to tertiary-level hospital, coefficient (SE) | N/A | –0.008*** (0.000) | –0.023*** (0.001) |
| t-/z-test statistic | N/A | 29.3 | 32.6 |
| Hausman test χ2 statistic of H0: no endogeneity of treatment variable | N/A | N/Aa | 1.54 |
Additional analysis comparing clinical outcomes between neonatal intensive care units, local neonatal units and special care units using travel time to the closest local neonatal unit and special care unit
Birth in a hospital with a NICU does not appear to result in any difference in terms of mortality relative to other hospitals. These results are based only on using one instrument: travel time to closest hospital. In this appendix, we present additional analyses of the effect of hospital designation on mortality using additional instruments in the form of travel time to the closest LNU and SCU.
A simultaneous equations multivariate probit model was adopted to implement an IV model of neonatal mortality as a function of unit level of birth (considering SCU, LNU and ICU). This model uses the three available instruments represented by the travel time to the closest hospital for each of the three unit levels.
Table 30 summarises the results of the IV model on the marginal effect (first column) and the results using a naive probit model of the same mortality function (second column). In each of these two models, covariates were included for gestational age, birthweight, sex of infant, delivery mode, number of foetuses and the lowest decile of the IMD score of the residence of the mother.
| Output metric | Naive univariate probit regression | IV multivariate probit model (marginal effect) |
|---|---|---|
| Birth in a LNU, absolute risk difference (SE) | 0.004 (0.005) | 0.019** (0.009) |
| Birth in a SCU, absolute risk difference (SE) | 0.016* (0.009) | 0.004 (0.013) |
| Instrument strength | ||
| Minimum travel time (minutes) to NICU, coefficient (SE) | N/A | LNU equation: 0.032 (0.001)*** |
| SCU equation: 0.015 (0.001)*** | ||
| Minimum travel time (minutes) to LNU, coefficient (SE) | N/A | LNU equation: –0.053 (0.001)*** |
| SCU equation: 0.006 (0.001)*** | ||
| Minimum travel time (minutes) to SCU, coefficient (SE) | N/A | LNU equation: 0.007 (0.001)*** |
| SCU equation: –0.063 (0.002)*** | ||
| Likelihood-ratio test statistic | N/A | 46.9*** |
| Hausman test z-statistic of H0: no endogeneity LNU treatment variable | N/A | 2.3** |
| Hausman test z-statistic of H0: no endogeneity SCU treatment variable | N/A | 1.5 |
| Test z-statistic H0: valid over-identifying restriction of minimum travel time to NICU | N/A | 0.5 |
The naive probit model suggests that birth in a SCU is associated with an increased risk of neonatal death relative to birth in a NICU (1.6 percentage points of absolute risk difference), whereas no difference is apparent between birth in a LNU compared with birth in a ICU. However, the opposite result is found with the IV model, in which birth in a LNU exposes infants to additional neonatal death risks (absolute risk difference 1.9 percentage points), whereas no difference is observed between birth in a SCU and a NICU. It must be noted that, in accordance with the IV model diagnostic statistics, the hypothesis that birth in a SCU is exogenous cannot be rejected, which suggests that a simpler model with IVs applied only to the LNU treatment variable may be enough to validly estimate causal effects. At the bottom of Table 30, the non-significant z-test statistic of 0.5 does not lead to rejection of the hypothesis that the extra (over-identifying) instrument of minimum travel time to a NICU estimates the same causal effect as the other two instruments. These additional analyses that were undertaken suggest that the NICU does appear to reduce mortality compared with the other levels of care, by 1–2%, and so suggests that NICUs in themselves have some beneficial impact on mortality compared with other levels of care.
Appendix 3 Preferred Reporting Items for Systematic Reviews and Meta-Analyses flow diagram (outlining literature search)
FIGURE 31.
The PRISMA flow diagram. Reproduced with permission from Moher et al. 109 This is an Open Access article distributed in accordance with the terms of the Creative Commons Attribution (CC BY 4.0) license, which permits others to distribute, remix, adapt and build upon this work, for commercial use, provided the original work is properly cited. IVF denotes in vitro fertilisation.
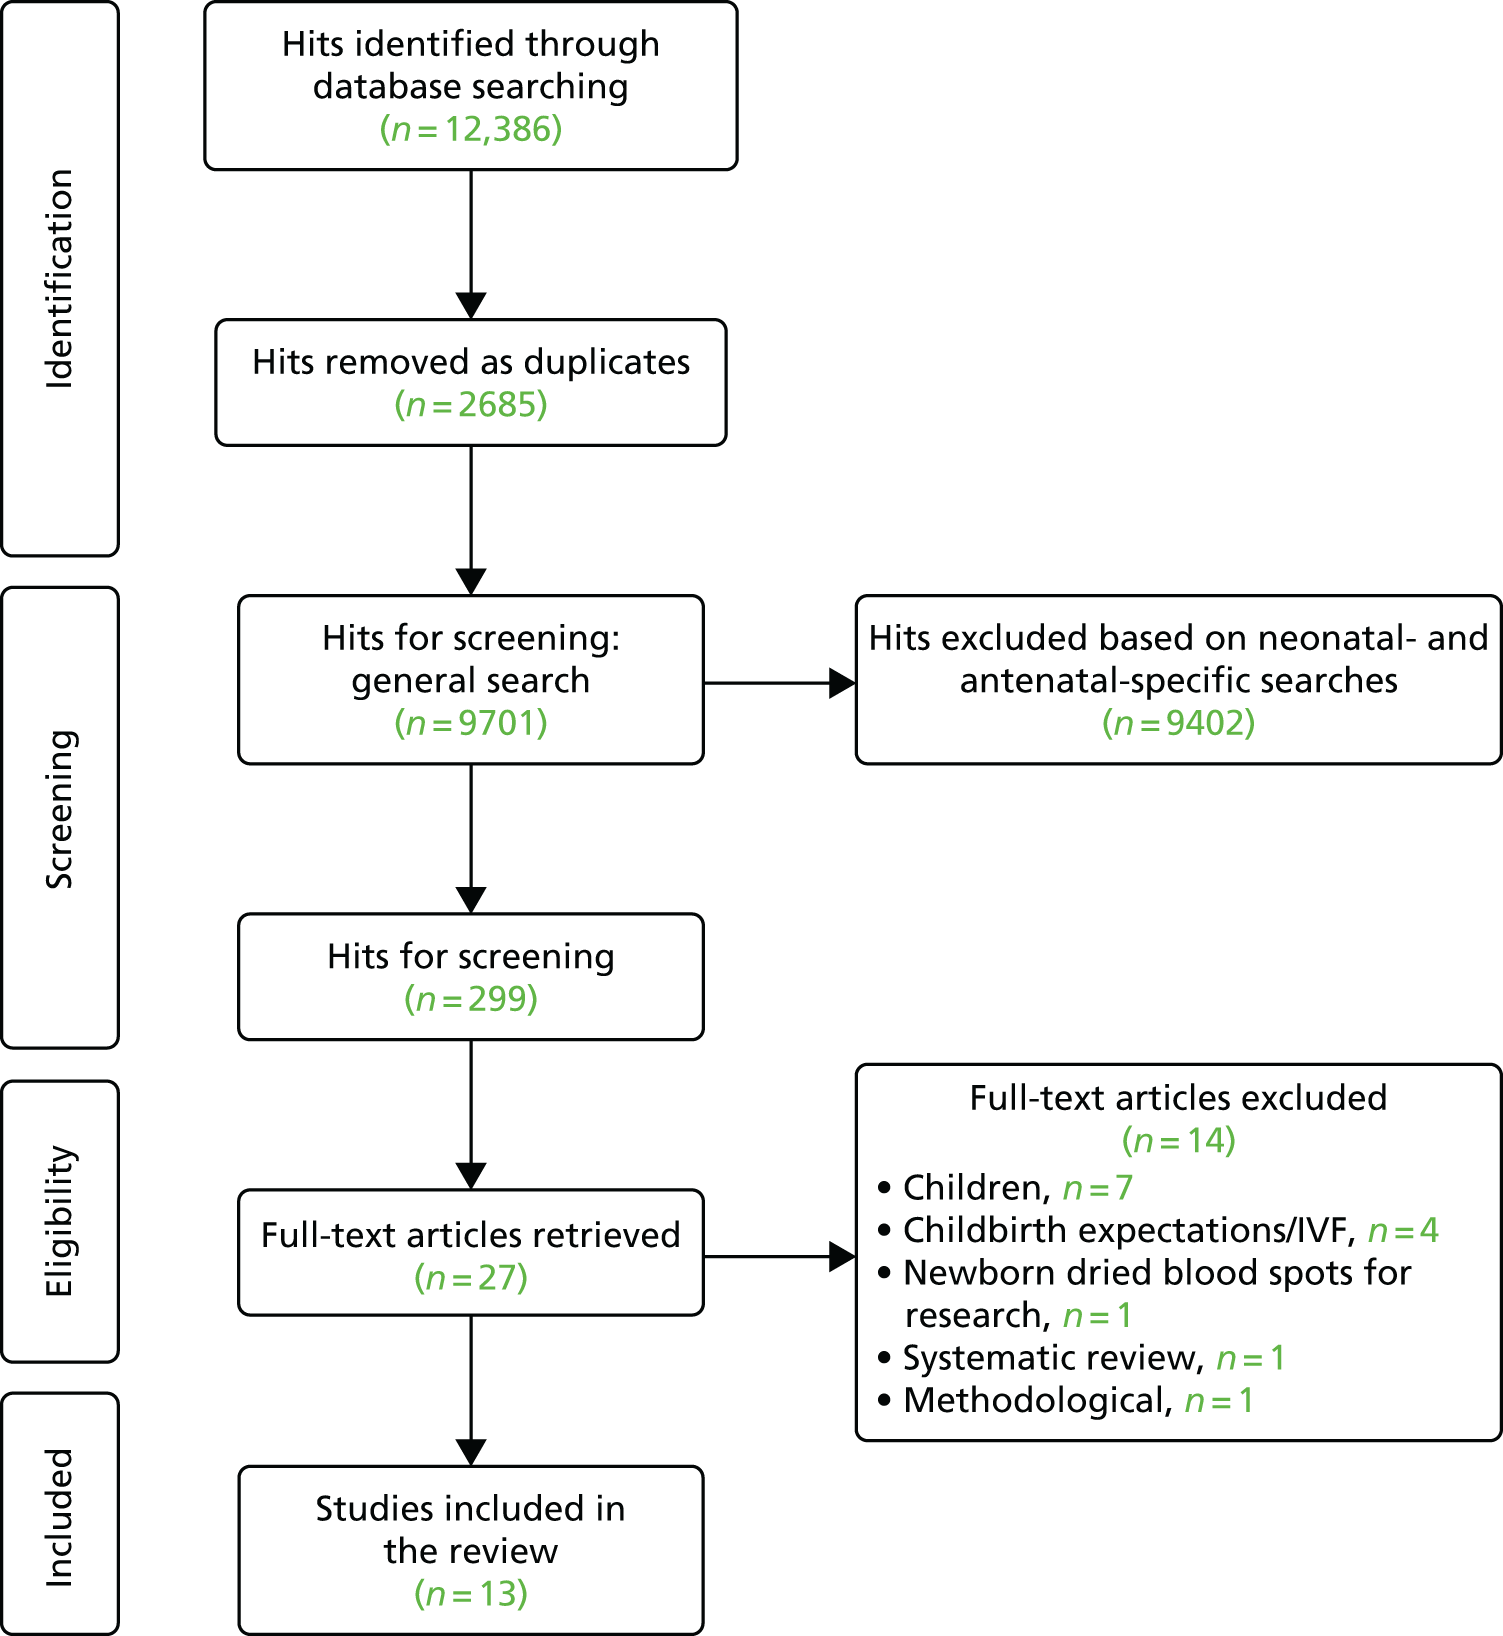
Glossary
- BadgerNet Neonatal Electronic Patient Record
- The electronic patient record system used by the vast majority of neonatal units.
- Birth centre
- A maternity unit usually staffed by midwives and often (but not always) obstetricians.
- BLISS (Baby Life Support Systems)
- A UK charity working to provide the best possible care and support to all premature and ill babies and their families.
- British Association of Perinatal Medicine
- An association of professionals who have a special interest in neonatal care. It was founded in 1976.
- British Association of Perinatal Medicine standards
- A specification of nurse-to-infant ratios for staffing in neonatal care recommended by the British Association of Perinatal Medicine (see Chapter 1, Clinical importance).
- Decision space
- The range of possible options; in this study, it refers to the range of possible configurations of unit locations.
- Fitness function
- An objective function used to summarise in a single figure how close a solution is to achieving the set aims.
- Healthcare Resource Group
- A standard grouping of clinically similar treatments used as a means of determining reimbursement for care services to NHS providers.
- Heuristic method
- A practical method to provide a satisfactory solution to a problem without a guarantee of optimality.
- Instrumental variable approach
- A method used in economic applications when a controlled experiment to test the existence of a causal relationship is not feasible and some correlation between the original explanatory variables and the error term is suspected.
- Lower-layer super output area
- Geographic areas with approximately equal population sizes (a minimum population size of 1000 and an average population size of 1500).
- Maptitude® (Caliper, Newton, MA, USA)
- A geographic information system used in this study for travel time estimation.
- Non-dominated solution
- A solution is non-dominated if none of the objective or criterion functions can be improved in value without degrading some of the other objective values (see Chapter 6, Dealing with multiple criteria: Pareto dominance).
- Nurse workload
- The number of nurses required to care for infants present in a unit (see Chapter 1, Clinical importance).
- Objective space
- A set of objective or criterion values that are achievable from the decision space.
- Pareto front
- A framework for partially evaluating a set of options with multidimensional outputs (see Chapter 6, Dealing with multiple criteria: Pareto dominance): set of non-dominated solutions.
- Primipara
- A woman who has given birth to only one child.
- Probit model
- A type of regression where the dependent variable can take only two values.
- Royal College of Obstetricians and Gynaecologists
- A professional association, founded in 1926, with the objective to encourage the study and advancement of the science and practice of obstetrics and gynaecology.
- SNUG (Supporting Neonatal Users and Graduates)
- An association providing mentoring and befriending services for parents of ill or premature babies in Devon.
- Structural mean model
- A semiparametric model that uses instrumental variables to identify causal parameters.
- Tobit cost model
- A statistical approach to regression that is used extensively in health economics.
- Very low-birthweight infant
- An infant born weighing < 1500 g.
List of abbreviations
- ANNP
- advanced neonatal nurse practitioner
- BAPM
- British Association of Perinatal Medicine
- BLISS
- Baby Life Support Systems
- CI
- confidence interval
- CV
- coefficient of variation
- DCE
- discrete choice experiment
- HES
- Hospital Episode Statistics
- HRG
- Healthcare Resource Group
- ICER
- incremental cost-effectiveness ratio
- ICU
- intensive care unit
- IMD
- Index of Multiple Deprivation
- IQR
- interquartile range
- IV
- instrumental variable
- LNU
- local neonatal unit
- LOS
- length of stay
- LPM
- linear probability model
- LSOA
- lower-layer super output area
- MOO
- multiobjective optimisation
- NDAU
- Neonatal Data Analysis Unit
- NICE
- National Institute for Health and Care Excellence
- NICU
- neonatal intensive care unit
- NNRD
- National Neonatal Research Database
- NSGA-II
- Non-Sorting Genetic Algorithm II
- ODN
- Operational Delivery Network
- OLS
- ordinary least squares
- OR
- odds ratio
- PPI
- patient and public involvement
- PRISMA
- Preferred Reporting Items for Systematic Reviews and Meta-Analyses
- R&D
- research and development
- SCU
- special care unit
- SMM
- structural mean model
- SNUG
- Supporting Neonatal Users and Graduates
- SPEA
- Strength Pareto Evolutionary Algorithm
- VLBW
- very low birthweight
- WTE
- whole-time equivalent
