Notes
Article history
The research reported in this issue of the journal was funded by the HS&DR programme or one of its preceding programmes as project number 14/04/41. The contractual start date was in November 2015. The final report began editorial review in April 2019 and was accepted for publication in April 2020. The authors have been wholly responsible for all data collection, analysis and interpretation, and for writing up their work. The HS&DR editors and production house have tried to ensure the accuracy of the authors’ report and would like to thank the reviewers for their constructive comments on the final report document. However, they do not accept liability for damages or losses arising from material published in this report.
Permissions
Copyright statement
© Queen’s Printer and Controller of HMSO 2020. This work was produced by Memtsa et al. under the terms of a commissioning contract issued by the Secretary of State for Health and Social Care. This issue may be freely reproduced for the purposes of private research and study and extracts (or indeed, the full report) may be included in professional journals provided that suitable acknowledgement is made and the reproduction is not associated with any form of advertising. Applications for commercial reproduction should be addressed to: NIHR Journals Library, National Institute for Health Research, Evaluation, Trials and Studies Coordinating Centre, Alpha House, University of Southampton Science Park, Southampton SO16 7NS, UK.
2020 Queen’s Printer and Controller of HMSO
Chapter 1 Introduction
Clinical background
Early pregnancy complications are common and account for the largest proportion of emergency work performed in gynaecology departments across the UK. 1 The term ‘early pregnancy complications’ encompasses all types of miscarriage in the early pregnancy period (up to 12 weeks of gestation), ectopic pregnancies, trophoblastic disease and maternal complications such as hyperemesis gravidarum.
Miscarriage is the most common early pregnancy complication. Based on Hospital Episode Statistics,2 it is estimated that 15–20% of all pregnancies miscarry spontaneously; however, the actual loss may be much higher, as many cases remain unreported to hospital or are not recognised by women.
Even though the incidence of ectopic pregnancy is considerably lower than the rate of miscarriage (11 per 1000 pregnancies, according to Hospital Episode Statistics),2 every year 12,000 women in the UK are diagnosed with this condition. The mortality rate from ectopic pregnancy has remained fairly constant over the last 20 years and is around 0.47 per 100,000 maternities in the UK. 1
Early pregnancy assessment units in the UK
The early pregnancy assessment unit (EPAU) is a specialised clinical service for women with suspected complications during the first trimester of pregnancy. EPAUs are organisational structures unique to the NHS and there are only a few similar units operating in Europe, Canada and Australia.
Early pregnancy assessment units aim to provide comprehensive care to pregnant women, which includes clinical assessment, ultrasound and laboratory investigations, management planning, counselling and support. The main reported benefits of EPAUs are shortening of time to reach the diagnosis and reduction in the number of hospital admissions for women with suspected early pregnancy complications. 3
There has been a significant increase in the number of EPAUs in NHS hospitals since 1991, when Bigrigg and Read3 first published data on the role of the EPAU in improving quality of care and cost savings following the opening of a unit in Gloucestershire Royal Hospital.
According to the Association of Early Pregnancy Units (AEPU), there are currently an estimated 200 EPAUs and they operate in the majority of acute NHS hospitals in the UK. 4
Variations in the organisation of EPAUs in the UK
The National Service Framework: Children, Young People and Maternity Services5 recommends that EPAUs should be generally available, easy to access and set up in a dedicated area in the hospital, with appropriate staffing and ultrasound equipment, as well as easy access to laboratory facilities. EPAUs should also provide a suitable environment for women and their partners. There should be direct referral access for general practitioners (GPs) and selected patient groups, such as women who have experienced an ectopic or molar pregnancy in the past. In addition, Healthcare Improvement Scotland6 recommends that women presenting to EPAUs have access to ultrasound facilities with trained staff in secondary and tertiary services within 24 hours from initial presentation, as well as a choice of management options for miscarriage and ectopic pregnancy (i.e. surgical, medical and expectant).
The latest National Institute for Health and Care Excellence (NICE) guideline on ectopic pregnancy and miscarriage (Clinical Guideline 154)7 aimed to establish how different models of care within EPAUs might have an impact on service outcomes, clinical outcomes and women’s experience of care. Fourteen studies were identified. 3,8–20 The majority of the studies (n = 10)3,8–16 were conducted in the UK. Of the studies included, two were cross-sectional studies,8,9 four were observational studies3,17–19 that compared outcomes before and after the establishment of an EPAU, and the remaining studies were descriptive. 10–16,20 The quality of the evidence was described as low or very low. 7
Evidence from the cross-sectional studies shows that in approximately half of the EPAUs ultrasound scans are performed by sonographers only, whereas in less than one-quarter of EPAUs the scanning is done by medical, nursing or midwifery staff. 7–9 Professionals from different disciplines perform ultrasound scanning in the rest of the EPAUs. Regarding access to services, all EPAUs accept patients referred from other health-care professionals, whereas only 51% of EPAUs accept self-referrals and the majority of units (70%) provide a weekday service only. 7–9 There is a paucity of data regarding the best indicators for clinical and service outcomes, and women’s views and experience of care were included in only two studies. 14,16
Given the considerable variation between different EPAUs in the levels of access to their services and the levels of care they provide, the best configuration of EPAUs for optimal balance between cost-effectiveness, clinical effectiveness, service- and patient-centred outcomes remains unknown. A key research recommendation of the NICE guideline7 was good-quality research to establish the effectiveness of different EPAU configurations.
Pilot study
A pilot study to test the feasibility of a large-scale service evaluation was conducted in selected EPAUs in London. Eight hospitals in Greater London were approached to participate in the study, seven of which agreed to take part. The EPAUs were selected on the basis of their size, staffing configuration and accessibility. Three of the EPAUs were located within teaching hospitals, with consultant presence in the EPAU for six or more dedicated sessions per week (≥ 60% of regular working hours; type A). The other four EPAUs were located in district general hospitals. Two of the EPAUs had named lead consultants who were present in the unit between three and five sessions per week (30–50% of time; type B). The remaining two EPAUs (type C) also had named lead consultants, but they had only a single or no dedicated sessions in the unit per week (≤ 10% of time). See Report Supplementary Material 1, Table 1, for the EPAUs’ opening hours and staffing levels.
As there are no auditable standards against which the EPAU service can be assessed, the main service outcomes examined were the proportion of women attending for follow-up visits, the proportion of non-diagnostic ultrasound scans, the proportion of visits for blood tests and the proportion of women admitted to hospital.
Data were collected prospectively using purposefully designed data collection forms. Prior to starting the study, two key members of the research team held a series of meetings with clinical teams in all participating hospitals to discuss the study methodology and to define outcomes of interest. Individual clinicians/nursing staff were identified in each unit who volunteered to take responsibility for the running of the study and to ensure contemporaneous data collection. The chief investigator visited each unit on a weekly basis to facilitate data collection and to ensure data quality.
The study was conducted over 2 calendar months. After excluding all duplicate entries, records from 3769 women who attended for a total of 5880 visits were included in the data analysis.
There were no significant differences in the mean gestational age recorded at the time of women attending for initial assessment between different types of EPAUs (p = 0.29). There were significant differences in the proportion of women attending for follow-up visits, the proportion of non-diagnostic scans and the proportion of women having blood tests between individual EPAUs. There were also significant differences in the proportion of admissions for the purpose of diagnostic work up (see Report Supplementary Material 1, Table 2). The pilot study confirmed that there are significant differences in the various clinical and service performance indicators between different EPAUs in a certain geographical area. However, it was not possible to determine the factors that may influence these results. The study also showed that it is feasible to conduct a larger-scale study involving women from a range of EPAUs to identify possible factors affecting outcomes in the delivery of early pregnancy care.
Aims and objective
Primary aim
The primary aim of our study was to test the hypothesis that the rate of hospital admissions for early pregnancy complications is lower in EPAUs with high consultant presence than in EPAUs with low consultant presence.
Secondary aims
-
To test the hypothesis that increased consultant presence in EPAUs improves other clinical outcomes, including the proportion of women having follow-up visits, non-diagnostic ultrasound scans, negative laparoscopies for suspected ectopic pregnancies and ruptured ectopic pregnancies requiring blood transfusion.
-
To assess the effect of variations in opening hours and service accessibility on the overall admission rates and other clinical outcomes.
-
To determine the optimal skill mix to run an effective and efficient EPAU service.
-
To examine the cost-effectiveness of different skill mix models in EPAUs.
-
To explore patient satisfaction with the quality of care received in different EPAUs.
-
To make evidence-based recommendations about the future configuration of EPAUs in the UK.
Chapter 2 Methods
This chapter reports the methods used to conduct the Variations in the organisations of Early Pregnancy Assessment Units in the UK and their effects on clinical, Service and PAtient-centred outcomes (VESPA) study.
Study design
The VESPA study employed a multimethods approach and included:
-
a prospective cohort study of women attending EPAUs (to measure clinical outcomes)
-
a health economic evaluation (including skill mix and cost–utility model development)
-
a patient satisfaction survey
-
qualitative interviews with service users
-
an EPAU staff survey
-
a hospital emergency care audit for women presenting with early pregnancy complications.
The study received a favourable ethics opinion from the North West Research Ethics Committee (reference 16/NW/0587) [see the relevant named documents for the full study approved protocol, patient and staff information leaflets and consent forms, data collection forms, unit data collection forms and unit protocol forms, URL: www.journalslibrary.nihr.ac.uk/programmes/hsdr/140441/#/ (accessed 2 June 2020)]. We recognised that women would be asked to participate in the study at their initial attendance at the EPAU with a lack of ‘cooling-off time’ before consent was obtained and the completion of questionnaires commenced. These issues are often encountered in studies of emergency medical care and in studies of pregnant women in labour. 21,22 The issue of ‘cooling-off time’ was addressed prior to commencing the study at the Study Steering Committee (SSC) meeting. We also consulted with a focus group of service users and the Miscarriage Association about the optimal timing to approach women about research. We concluded that because of the nature of the EPAU clinical service, which mainly looks after emergency patients, it would have been impossible to carry out this study without asking participants to engage with the research team at their initial presentation. However, as a part of the study eligibility criteria, women who presented with severe clinical symptoms or who were in severe distress were not approached. In addition, we emphasised the need to be sensitive, sympathetic and considerate in the approach to potential participants, and informed women that they could withdraw their consent for follow-up at any time. This information was also included in the participant information leaflet (PIL).
National survey of EPAUs
Information about existing EPAUs in the UK and their contact details are held by the AEPU. We used this information to conduct a UK-wide survey of all NHS EPAUs. Our aim was to determine the current set-up of EPAUs across the country and accurately sample potential participating units. An online questionnaire was sent to the named lead clinician of all EPAUs in the country, as it appeared on the AEPU database. A reminder e-mail was sent after 6 weeks in cases of non-reply or missing data. The survey results were used to classify each of the potential centres with respect to the following three key factors: (1) consultant presence, (2) weekend opening and (3) volume. To increase the response rate to the survey, all of the EPAUs that had not responded to the online survey were contacted individually by telephone and the clinician in charge (consultant/nurse) was asked to answer the same questions as the online survey.
The following algorithm was utilised to obtain a sample of 44 centres, ensuring that each key factor is equally represented:
-
The first centre was sampled at random.
-
A score was calculated for the remaining centres, with higher scores given to those centres that had characteristics that were under-represented in the sample.
-
The next centre was sampled using weighted random sampling (using this score).
-
Return to (b) until 44 centres were sampled.
We then grouped the units in eight strata, all of which differed by at least one key factor. The results of the national survey are summarised in Chapter 3.
Recruitment of participating EPAUs
The responses to the national survey were summarised and the units were categorised according to three factors: (1) planned consultant presence (yes vs. no), (2) whether the unit was open at weekends (yes vs. no) and (3) the number of patients seen over 1 year, as reported by the clinicians in charge (low volume of < 3000 appointments annually vs. high volume of ≥ 3000 appointments annually). These cut-off points were chosen following analysis of the survey results. The cut-off point for number of patients was chosen so that there were equal numbers of low- and high-volume units.
Previous studies and the results of our own audit have shown that inpatient admissions could be significantly reduced when consultants are available to review patients in acute clinical settings, such as accident and emergency (A&E) departments or medical assessment units. 23,24 Weekend opening of the EPAU facilitates access to the ultrasound diagnostic service, which is essential for safe and effective management of early pregnancy complications. Without such access, it is likely that a number of women would be admitted as a precaution until potentially harmful early pregnancy complications, such as ectopic pregnancy, are ruled out. We have chosen the size of the unit as the third key confounding factor because the results of previous studies suggest that higher volume leads to better outcomes for certain groups of patients. This is likely to be because of greater exposure to more complex cases, which contributes to better collective team experience and learning, which translates into improved clinical outcomes. 25,26
Eight unique EPAUs configurations were considered and were divided into the following strata:
-
low volume, no consultant presence, no weekend opening (vcw)
-
low volume, no consultant presence, weekend opening (vcW)
-
low volume, consultant presence, no weekend opening (vCw)
-
low volume, consultant presence, weekend opening (vCW)
-
high volume, no consultant presence, no weekend opening (Vcw)
-
high volume, no consultant presence, weekend opening (VcW)
-
high volume, consultant presence, no weekend opening (VCw)
-
high volume, consultant presence, weekend opening (VCW).
The formation of strata was employed to aid the random selection of the participating EPAUs and ensure that EPAUs from all configurations were accurately represented. A computer program randomly selected four or five EPAUs from each stratum. Once the 44 potentially participating EPAUs were identified, the central team contacted the clinician in charge of each EPAU or the research and development team of that trust and officially invited them to participate in the VESPA study. If an EPAU unit declined to participate or was deemed unsuitable to participate because of size (i.e. < 300 reported patient visits per year), another randomly selected unit was invited to participate. The detailed breakdown of all EPAUs randomly selected, whether they accepted or declined the invitation and if they were replaced is presented in Chapter 3. Once the participating EPAUs were confirmed and all the regulatory approvals obtained, site initiation visits were arranged to inform the local research and clinical teams of the study protocol and procedures. At the time of the site initiation visit, the unit characteristics were reconfirmed so that, at the time of data analysis, the EPAU was assigned to the correct stratum. To facilitate accurate data collection and troubleshooting, a member of the central VESPA research team was either present on site on the day that recruitment opened at each EPAU or available to provide advice remotely over the telephone. Staff members were also available to attend whenever any of the EPAUs required additional support. During patient recruitment we recorded the grade of all members of staff who were present in the EPAU during its opening hours, as well as the actual hours that each member of staff spent in the EPAU. Finally, during recruitment, we collected information about the EPAU referral policy regarding the minimum gestational age when women could be seen, as well as the management protocols of early pregnancy complications (including availability of medical/surgical/expectant management of miscarriage and ectopic pregnancy).
Data strands
Given the multimethods approach of the VESPA study, data collection was organised into seven data strands:
-
clinical outcomes in EPAUs
-
emergency hospital care audit
-
patient satisfaction
-
staff satisfaction
-
qualitative interviews
-
health economic evaluation
-
workforce analysis.
The questionnaire arm of the study, which will be routinely referred to throughout the report, includes the patient satisfaction and health economic evaluation data strands.
Eligibility (inclusion and exclusion criteria)
Clinical outcomes in EPAUs
All women (aged ≥ 16 years) attending the participating EPAUs because of suspected early pregnancy complications for the first time during the index pregnancy were included in this strand of the study. A gestational age limit was set at 13+6 weeks’ gestation to standardise recruitment from all EPAUs across the country. There were no exclusion criteria for this strand of the study.
Emergency hospital care audit
Routine data were collected for all women who attended hospital emergency services because of early pregnancy complications over a period of 3 months, following completion of clinical data collection from the EPAU.
Patient satisfaction
All pregnant women (aged ≥ 16 years) attending EPAUs because of suspected early pregnancy complications who agreed to sign a written consent form to participate in the questionnaire arm of the VESPA study were included. Women who were haemodynamically unstable or in severe pain and those who declined consent were excluded.
Staff satisfaction
All members of staff directly involved in providing early pregnancy care were eligible to consent to this data strand. Non-permanent members of staff and locum and agency staff were excluded.
Qualitative interviews
Women who had taken part in the patient satisfaction survey and who had provided consent to being approached later to participate in a telephone interview formed the sampling frame for the qualitative interviews. Using the EPAU location and strata configuration, pregnancy outcome and participants’ 2-week post-discharge satisfaction score [Short Assessment of Patient Satisfaction (SAPS)27], a sampling frame was created to select a maximum variation, purposive sample of women. Please see Report Supplementary Material 1, Table 3, for the strata of each component of the sampling frame.
Health economic evaluation
The health economic evaluation included pregnant women (aged ≥ 16 years) attending EPAUs because of suspected early pregnancy complications who agreed to provide signed consent to participate in the questionnaire arm of the VESPA study. Women who were haemodynamically unstable or in severe pain and those who did not consent to participate in the questionnaire arm of the study were excluded from this data strand.
Workforce analysis
All interactions of women with any member of staff (i.e. administrative, nursing, medical) during their visits to the EPAU, and the duration and type of these interactions, were contemporaneously collected.
Participant flow
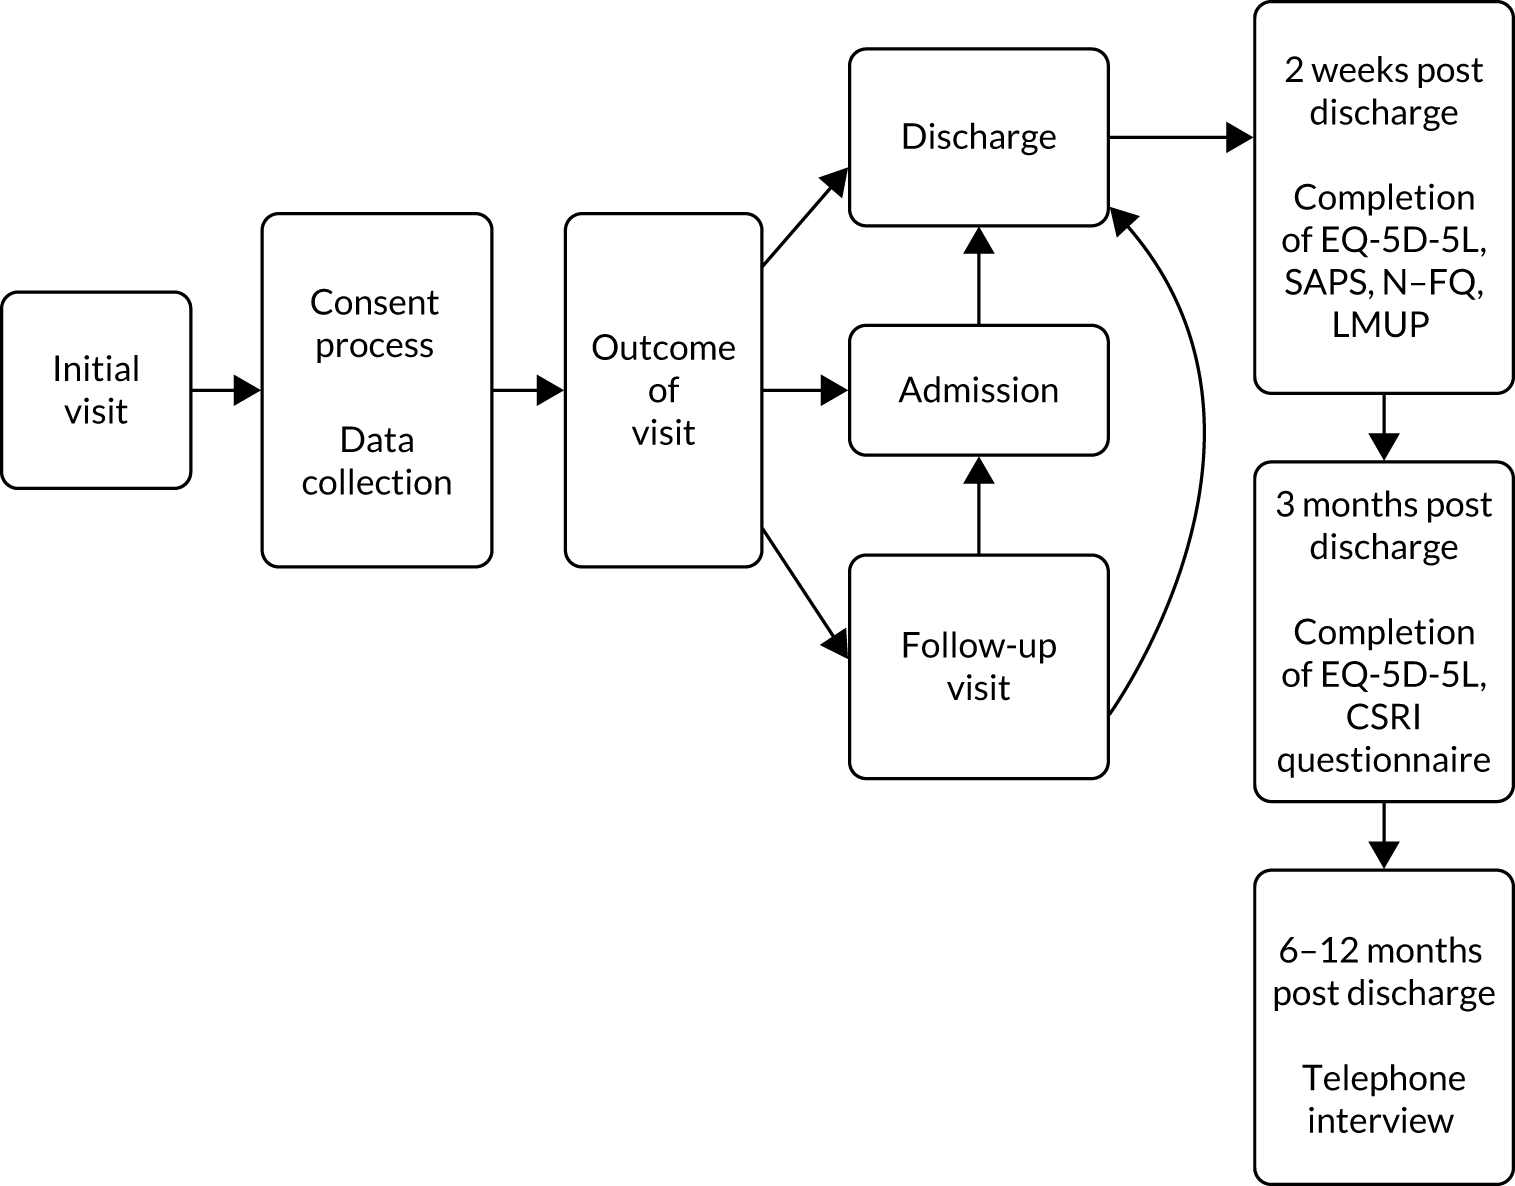
The participant flow is represented diagrammatically in Figure 1.
FIGURE 1.
Participant flow diagram. CSRI, Client Service Receipt Inventory; EQ-5D-5L, EuroQol-5 Dimensions, five-level version; LMUP, London Measure of Unplanned Pregnancy; N–FQ, Newcastle–Farnworth questionnaire.
Recruitment process
The VESPA study recruited from the EPAU population. All eligible women were provided with the study information leaflet as they registered their attendance at the clinic reception. Once they had sufficient time to read the information leaflet, they were then approached by the triage (registered) nurse, midwife, research nurse, nurse sonographer, trial officer, research team lead, clinical research fellow or doctor and were asked to participate in the questionnaire arm of the study. At this point, the local recruiting team completed an enrolment log and women who agreed to participate signed a consent form. All women were informed that participation in the questionnaire arm of the study was entirely voluntary, with the option of withdrawing from the study at any stage. Women were also told that participation or non-participation in the study would not affect their clinical care. Ongoing consent was reconfirmed at every clinical follow-up visit, if applicable, and at any time that the research team made contact with the participating women.
Clinical outcomes in EPAUs
All women who attended the participating EPAUs were included in this data strand. Clinical follow-up of women was organised by the local clinical team based on clinical need; no additional clinical follow-up visits were arranged for the VESPA study.
Emergency hospital care audit
All participating sites were asked to provide data for this data strand.
Patient satisfaction
Women who attended the participating EPAUs and had consented to participate in the questionnaire arm of the study were recruited in this data strand.
Staff satisfaction
Staff (including the principal investigators) were approached by the local research teams and provided with a PIL. A limit of 15 consented members of staff was set per site. If staff members had agreed to take part in the survey they were asked to sign the designated consent form with the consenting member of the local research team. Only staff working at the participating EPAUs during the period of patient recruitment were approached.
Qualitative interviews
Women who attended the participating EPAUs and who had consented to participate in the questionnaire arm of the study were recruited in this data strand. Recruitment began by contacting women who had rare pregnancy outcomes (i.e. molar pregnancies, ectopic pregnancies, terminations) as these accounted for the smallest proportion of women in the VESPA study overall, and it was anticipated that these participants would be the most difficult to recruit. Women who had experienced miscarriages were also contacted, as were women who had ongoing pregnancies. The method of recruitment was determined by the contact details we had for each participant and, therefore, a combination of first contact by e-mail (preferred) or letter, followed by telephone calls, was used.
Health economic evaluation
Women who attended the participating EPAUs and who had consented to participate in the questionnaire arm of the study were recruited to this data strand.
Workforce analysis
All women who attended the participating EPAUs were included into this data strand.
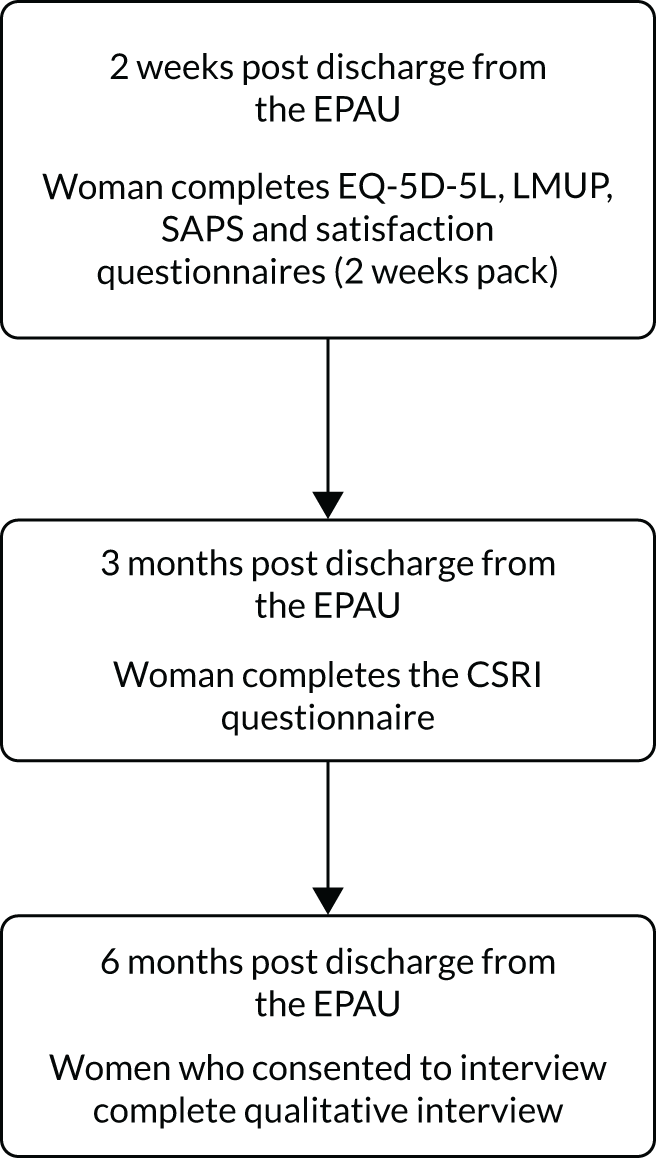
Diagrammatic representations of the journeys that women may have followed are shown in Figures 2–4. Figure 2 shows the journey of women at the initial visit, Figure 3 shows the potential journey of women at clinical follow-up visits and Figure 4 shows the journey of women following discharge from the EPAU.
FIGURE 2.
Journey of women at initial visit. CRF, case report form; EQ-5D-5L, EuroQol-5 Dimensions, five-level version; QA, questionnaire arm of the study; VAS-A, visual analogue anxiety scale.
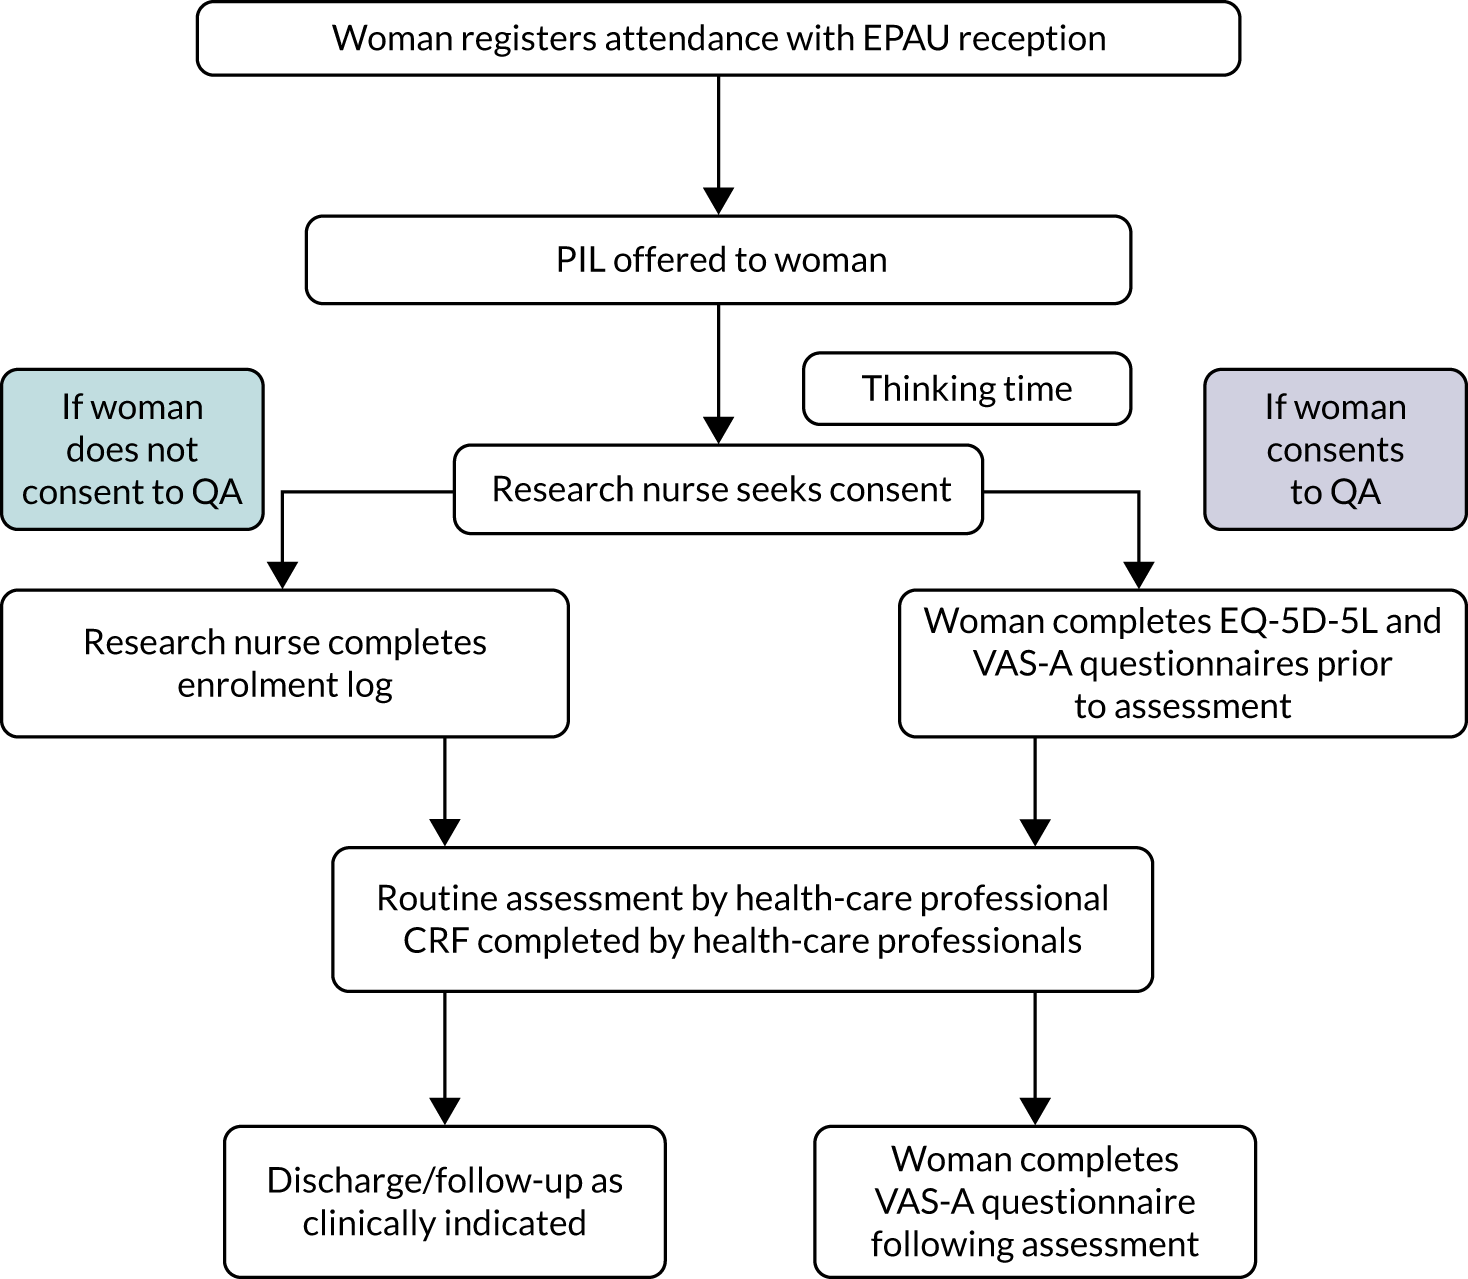
FIGURE 3.
Journey of women at clinical follow-up visits (if applicable). CRF, case report form; QA, questionnaire arm of the study; VAS-A, visual analogue anxiety scale.
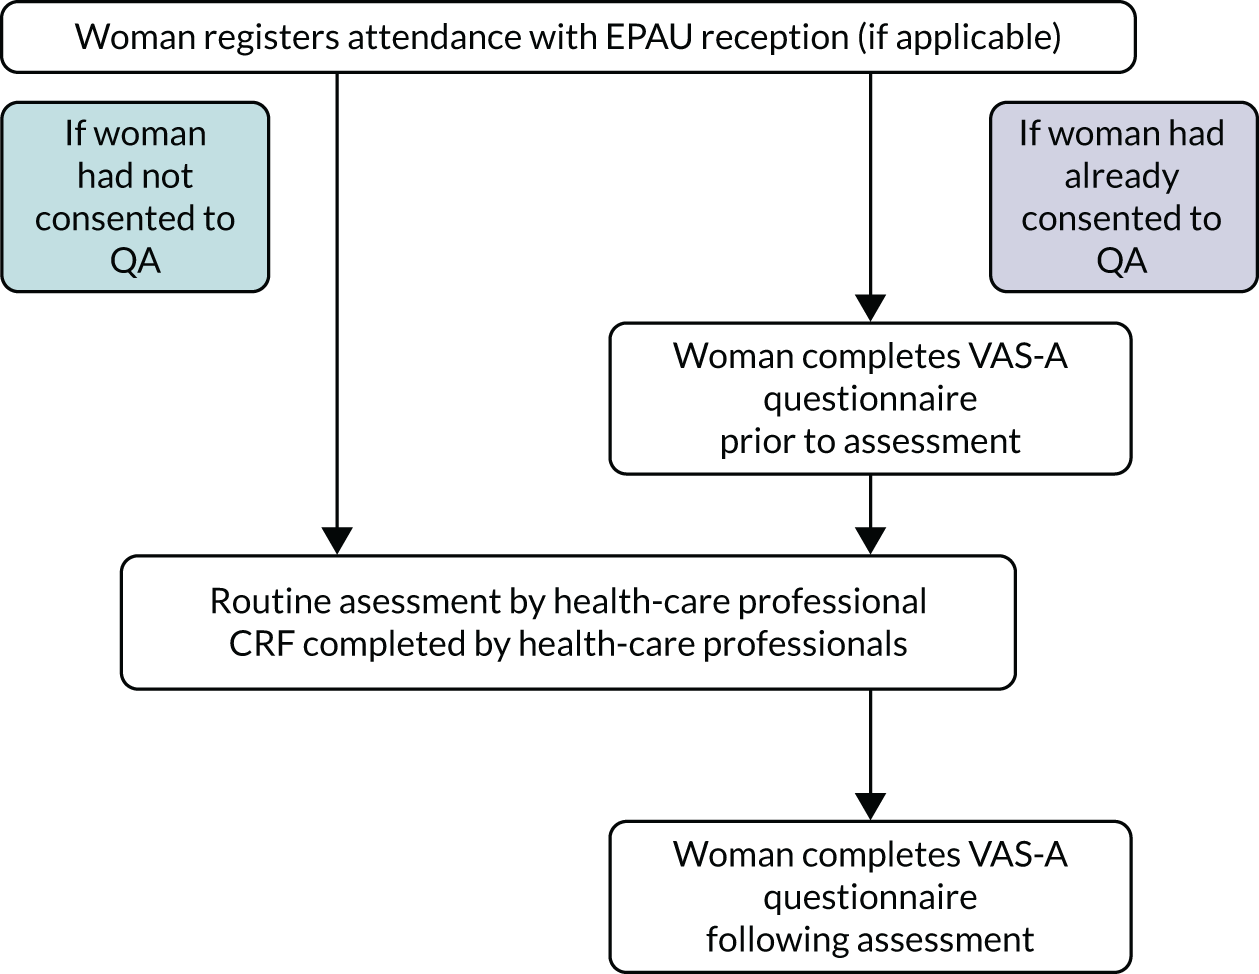
FIGURE 4.
Journey of women following discharge from the EPAU. CSRI, Client Service Receipt Inventory; EQ-5D-5L, EuroQol-5 Dimensions, five-level version; LMUP, London Measure of Unplanned Pregnancy.
Data collection
Demographic and routine clinical data were collected from all women attending the EPAUs. For women who provided consent to complete the questionnaires, clinical data and questionnaires were linked using the woman’s study number. The clinical data from women who did not consent were anonymised, and the data collection forms containing any identifiable data remained on the individual hospital premises and were archived locally following the end of the study.
Clinical outcomes in EPAUs
Demographic and routine clinical data were collected from all women attending the EPAUs [see case report form (CRF), URL: www.journalslibrary.nihr.ac.uk/programmes/hsdr/140441/#/ (accessed 2 June 2020)]. It was designed by the study team based on the CRF used for the pilot study, and modified in accordance with the feedback provided by the researchers and clinical staff who conducted the pilot study. All participating sites were provided with paper CRFs; however, the CRFs were also available online on the secure VESPA study website, hosted by MedSciNet (London, UK), in case sites opted to use the online version. CRFs were uploaded to the secure VESPA study website by a member of the local research team, either concurrently or retrospectively.
Emergency hospital care audit
Data for this data strand were collected following collaboration with the information services departments in participating hospitals to retrieve already collected data (from routine hospital systems). We collected data about the total number of A&E attendances for pregnant women under 14 weeks’ gestation. We also asked for data about the total number of emergency admissions, emergency operations and their outcomes, the number of women receiving blood transfusions and the number of admissions to intensive care units. Wherever possible, all data relating to hospital admissions that were provided by the information services departments were cross-checked by the site principal investigator or the lead local researcher, with support from a member of the central VESPA study research team, against ward admission books/databases, to ensure the accuracy of the data obtained.
The aim of the audit was to capture emergency activities of the hospital with regard to early pregnancy care, looking at A&E attendances for women in early pregnancy and emergency admissions (from A&E and other settings, e.g. outpatient clinics). The time frame covered at each unit was set at 3 months. The data were collected retrospectively, with the end of the 3-month period corresponding to the date when the last woman recruited to the clinical outcome data strand was discharged from EPAU care. The central team contacted the local research teams as soon as the last follow-up visit was established. The teams were provided with a Microsoft Excel® file and a Microsoft Word® document (Microsoft Corporation, Redmond, WA, USA). The documents listed the criteria to be included in the data set and showed the model search that was conducted at the host site as an example of the methodology for extracting the data.
Patient satisfaction
Women who consented to this arm of the study were asked to complete the SAPS27 measure, as well as a condition-specific patient satisfaction questionnaire (i.e. the modified Newcastle–Farnworth Questionnaire) [see modified Newcastle–Farnworth questionnaire, URL: www.journalslibrary.nihr.ac.uk/programmes/hsdr/140441/#/ (accessed 2 June 2020)] and the London Measure of Unplanned Pregnancy (LMUP)28 at 2 weeks post discharge from the EPAU. The SAPS questionnaire was chosen as it is a short, validated, well-established measure of patient satisfaction of hospital care. However, as it is generic and applicable across disciplines, it was supplemented by a pregnancy-specific measure. Given that a validated satisfaction questionnaire specific to early pregnancy care was not available, we modified and used, with permission from the key researcher, the ‘Patient Satisfaction Survey’ that was developed by Allison Farnworth and the team at Newcastle University as part of a Knowledge Transfer Partnership review of the Early Pregnancy Care Policy. The original questionnaire is specific to women who have experienced a miscarriage. The modified Newcastle–Farnworth questionnaire was developed by the co-investigators of the VESPA study for women who had been reviewed in EPAUs, irrespective of clinical outcome. As it is not a validated measure, the score was calculated as the average of the individual component scores. The LMUP, a short, validated measure, was used to define unplanned pregnancies and control for patient satisfaction (as there is emerging evidence that women with unplanned pregnancies report different levels of satisfaction with health-care services). Following careful consideration by the VESPA co-investigators and after consultation with women, through our links with the Miscarriage Association and The Ectopic Pregnancy Trust, the timing of the questionnaire was set at 2 weeks.
Staff satisfaction
Eligible members of staff who had consented were asked to complete a confidential and anonymous online shortened version of the standard NHS staff satisfaction survey. 29 We contacted Picker (Oxford, UK) to obtain permission prior to use; however, it was confirmed that, as the survey was intended for use for an NHS study, additional permissions were not required. To the best of our knowledge, the annual NHS staff satisfaction survey is the largest survey of staff opinion in the UK. The survey gathers views on staff experience at work and includes key areas such as (1) appraisal and development, (2) health and well-being, (3) staff engagement and involvement and (4) raising concerns. The VESPA study staff survey was based on the 2015 NHS staff survey [see VESPA staff survey, URL: www.journalslibrary.nihr.ac.uk/programmes/hsdr/140441/#/ (accessed 2 June 2020)]. Once valid consent was obtained and the designated consent form signed, the local research team would securely e-mail the central VESPA study e-mail account with the e-mail address of each consenting member of staff. The central team set up accounts for each staff member to complete the survey online, on the MedSciNet database system, and sent login details to the staff members individually. Sites had the option to complete the surveys on paper and return them by post to the central VESPA study office, where the responses were uploaded by the central team onto the database and the paper forms were disposed of in a confidential manner.
Qualitative interviews
As soon as fully informed consent was obtained, interviews were conducted with 39 participants over the telephone. The interviews lasted between 20 and 78 minutes. Participants were asked a series of questions as per the topic guide [see topic guide URL: www.journalslibrary.nihr.ac.uk/programmes/hsdr/140441/#/ (accessed 2 June 2020)], relating to the beginning of their pregnancy, their experience of attending the EPAU, their care following discharge from the EPAU, and their suggestions to improve quality of care and women’s experiences of the EPAU.
Two particular research questions were highlighted for this investigation:
-
How do women’s experiences of EPAU services vary by unit configuration?
-
How do women’s experiences of EPAU services vary by clinical outcome?
Health economic evaluation
Data were collected at up to three time points during the study. Quality-of-life [EuroQol-5 Dimensions, five-level version (EQ-5D-5L)30] data were captured before the consultation at the initial visit and then at two time points post discharge from the EPAU (planned at 2 and 12 weeks, but actually at 4 and 18 weeks; see Chapter 3 for clarification). Anxiety data were collected prior to clinical assessment for every visit (whether initial or clinical follow-up visit) using the visual analogue anxiety scale. 31 Patients also completed the same scale at the end of every visit. Data on resource use during visits (e.g. staff contacts, diagnostic tests) were collected as part of the study CRF. Data on additional resources used after the visit were collected from a sample of patients at a planned time point of 3 months.
Health outcomes
Outcomes collected and analysed for the economic analysis included quality of life and anxiety. Quality of life was measured using the EQ-5D-5L at baseline in all eligible patients and at two follow-up time points in a subset of patients. This questionnaire asks patients to score their own health based on five dimensions: (1) mobility, (2) self-care, (3) usual activities, (4) pain/discomfort and (5) anxiety/depression. Each dimension has five levels: (1) no problems, (2) slight problems, (3) moderate problems, (4) severe problems and (5) extreme problems. This decision results in a five-digit number that is converted into a number between 0 (equivalent to death) and 1 (full health) and expresses the patient’s self-reported health at each time point. The replies were then converted to an index score using the value set for England reported by Devlin et al. 32 Index scores were in turn, used to calculate quality-adjusted life-years (QALYs). Anxiety data were collected using the visual analogue anxiety scale, as described above. Patients were asked to indicate how anxious they felt at that moment on a line with marks going from 0 to 100, with a mark at the extreme left indicating not at all anxious and a mark at the extreme right indicating that they were the most anxious they could ever imagine. Pre- and post-assessment scores were then compared.
Resource use and costs
Data were captured on resource use relating to EPAU visits. Resource use during the visit(s) included staff contact time, blood tests ordered, ultrasounds conducted and admissions for surgery or observation. Staff costs were taken from the workforce analysis. This provided an exact salary cost for each patient based on the salary cost of the staff who provided care and assistance to that patient during their EPAU appointment(s). The entire care pathway of each patient was analysed.
The unit cost of an ultrasound associated with an EPAU visit was estimated by the finance team at University College Hospital, London, as £49.21. The cost of a blood test was based on a study by Czoski-Murray et al. 33 and the cost of admissions for surgery or observation was taken from the NHS Reference Costs 2016–17. 34 See Report Supplementary Material 1, Table 4, for the sources for the costs used in the primary analysis.
For the analysis of self-reported health-care usage costs at follow-up, cost estimates were taken from the Unit Costs of Health and Social Care provided by the Personal Social Services Research Unit. 35
Workforce analysis
Data for this data strand were collected as part of the study CRF. All members of staff, including administrative and clinical staff, who had contact with women attending the early pregnancy service were asked to record the type of interaction, the start and end time of their interaction, as well as their staff type. The duration of the interaction was then calculated and recorded on the study database at the time of uploading the CRF information to the VESPA study database.
Summary of data collection methodology
See Report Supplementary Material 1, Table 5, for a summary of the data collection tools used to collect data from the different data strands, the sources and the planned timings of data collection.
Data analysis and reporting of results
Clinical outcomes in EPAUs
We investigated the relationship between outcomes and consultant presence, unit volume and weekend opening hours using appropriate regression models (i.e. linear models for continuous outcomes, logistic models for binary outcomes and Poisson models for count outcomes). Hierarchical models were used when analysing patient-level data. Unit-level data were analysed using standard regression models.
Consultant presence was defined as the percentage of planned hours which consultants were expected to spend in the unit divided by the planned opening hours. We also defined a binary variable indicating planned consultant presence (yes/no), which was used in sensitivity analyses.
Volume was defined as the number of patient visits per year and was estimated using the time taken to obtain data on 150 patients and the average number of visits per patient. We also defined a binary variable indicating whether or not the yearly number of visits was greater than the median of 2500 (yes/no) for sensitivity analyses. This cut-off level was defined based on the data analysis, which showed that half of the EPAUs have a yearly visit volume of < 2500 visits per year.
Weekend opening was defined as the total number of opening hours per weekend. We also defined a binary variable indicating whether or not an EPAU was open at weekends (yes/no). In addition, a three-level weekend opening variable was defined: no/Saturday, only/Saturday and Sunday. The latter variables were used for sensitivity analyses.
Most models were adjusted using two sets of potential confounder variables:
-
final diagnosis (FD) and maternal age at initial visit (MA)
-
FD, MA, deprivation score (DS) and Gestational Age Policy (GAP).
Two sets were used because the DS (10 decile groups) and GAP had a reasonable number of missing data. Analyses based on the first set are described first in each instance.
Most of the statistical models are adjusted for FD (five groups), MA, DS (10 decile groups) and GAP. The FD and GAP groups are defined as follows.
Final diagnosis (five groups):
-
early intrauterine and normal/live intrauterine pregnancy
-
early embryonic demise, incomplete miscarriage, complete miscarriage, retained products of conception
-
ectopic pregnancy
-
inconclusive scan
-
other (molar, twin, not pregnant, etc.).
Gestational Age Policy (two groups):
-
< 6 weeks
-
≥ 6 weeks.
The main analyses modelled consultant presence, unit volume and weekend opening hours using continuous variables. Sensitivity analyses were performed by replacing these continuous variables with the corresponding binary or categorical variables.
Emergency hospital care audit
The relationship between emergency admissions from A&E and consultant presence, unit volume and weekend opening hours was investigated by fitting multivariable logistic models. ‘Emergency admissions from A&E’ was defined as a binary outcome to indicate whether or not a patient had an emergency admission from A&E. Data from 29 EPAUs were used for this analysis. Models were either unadjusted or adjusted for GAP.
Patient satisfaction
We investigated patient satisfaction by exploring the relationship between the SAPS or the modified Newcastle–Farnworth score and consultant presence, unit volume and weekend opening hours [see modified Newcastle–Farnworth questionnaire; URL: www.journalslibrary.nihr.ac.uk/programmes/hsdr/140441/#/ (accessed 2 June 2020)].
The SAPS questionnaire consists of seven questions, with most of them having the following categorisation: 0 ‘very dissatisfied’, 1 ‘dissatisfied’, 2 ‘neither satisfied nor dissatisfied’, 3 ‘satisfied’ and 4 ‘very satisfied’.
Based on the above, the SAPS score may range between 0 and 28 points. 27 The modified Newcastle–Farnworth score was calculated as the average of the individual component scores.
Models were adjusted using three sets of potential confounder variables, two of which are defined in Clinical outcomes in EPAUs (FD + MA and FD + MA + DS + GAP). The third set of confounders was FD, MA, DS, GAP, ethnicity, parity, gravidity and LMUP score.
Staff satisfaction
The association between staff experience of providing early pregnancy care and consultant presence, unit volume and weekend opening was explored using descriptive statistics.
Qualitative interviews
Thirty-nine interviews were transcribed verbatim and analysis was conducted by members of the qualitative team, in an iterative and consultative manner,36 cross-checking with members of the wider VESPA study team for clinical and other facts related to other data collection strands, when appropriate. The data were analysed using a thematic framework analysis,37,38 focusing on women’s clinical and emotional pathways through their care experience at the EPAU, and how these were influenced by the configuration and practices of the service they used. The thematic framework was devised and agreed for the preliminary analysis. It was produced from the interview guide, the researchers’ knowledge of the content of each interview and the associated memo writings for each interview, as well as notes made during the refamiliarisation process.
In accordance with a thematic framework analysis approach appropriate for multidisciplinary health research,39 the interview transcripts were first read in their entirety to achieve refamiliarisation with the interviews and uploaded to NVivo software (QSR International, Warrington, UK) for management and analytical work up. Coding was initially broad and used text from within the transcript data as the preliminary codes, before the merging or splitting of some codes to form more defined strata. The second coding was more granular and further refined subthemes were generated, leading to a hierarchical structure of themes and subthemes which aligned with the pre-existing thematic framework.
All transcripts were coded by two members of the qualitative research team independently, and regular meetings were held to discuss and revise the coding thematic framework. Any discrepancies between researchers were resolved through explanations, debate and revisiting the data, to ensure that they had been completely coded and that the analysis satisfied a psychological, clinical and public health perspective40 for a dynamic health-care system (as in Zubairu et al. 41). We explored recommendations made by women for improvements to service and drew additional recommendations from our analysis.
Particular attention was paid to women’s emotional experience. These data were first coded to demarcate them as relating to an experience of emotions and then were refined with specific codes to reflect the emotion being expressed (e.g. ‘anxious’, ‘concern’, ‘worried’, ‘upset’, ‘uncertainty’). These codes were then grouped into four strata: (1) anxiety, (2) procedure-related uncertainty; (3) diagnosis-related uncertainty; and (4) upset. We also noted when women expressed feeling ‘guilty’ or ‘vulnerable’, or when women drew positives from a negative situation. Through iterative coding, reworking of the data regarding women’s emotions and comparison between interviews, we produced six robust and distinct emotional typologies which mapped to different care pathways through the EPAU.
For each of the other main themes we undertook a process of charting, creating a matrix for each theme for which text from each transcript was summarised, allowing retention of the original sense and meaning of each transcript. We then looked for patterns within the theme in accordance with strata or emotional typology to see how these factors influenced women’s experiences. If relevant, we linked back to the satisfaction score from the 2 weeks post-discharge SAPS score.
Health economic evaluation
The analysis takes that of an NHS health and social care payer perspective. Personal and productivity costs collected from a subsample of patients were analysed separately.
We analysed costs and outcomes at baseline and each follow-up time point. Costs were analysed, adjusting for the site-level stratification variables, as well as age and FD. We used a multilevel model to estimate adjusted costs. Multilevel models have been recommended for use in health economics as they are able to incorporate the hierarchical structure of data, including patients within centres, and provide more appropriate estimates of patient- and centre-level effects than ordinary least squares models. 32
We examined mean total costs and mean QALYs for each stratum, as well as mean change in anxiety pre and post consultation. We also carried out a probabilistic sensitivity analysis, which reflects uncertainty around the estimates of costs and QALYs. As the probabilistic analysis requires simulated samples from the mean cost and utility estimates, Monte Carlo simulation was performed within Microsoft Excel to obtain 10,000 simulated samples.
For each stratum we analysed the expected total QALYs and expected total cost, averaged over the simulation sample, together with 95% confidence intervals (CIs). We also computed net benefit for a given willingness to pay per QALY, λ (ceiling ratio), where net benefit is defined as:
This converts utilities to a monetary scale, so that the costs and QALYs can be compared directly. Expected net benefit is the average net benefit over the simulation samples. For a given willingness-to-pay threshold, λ, the optimal stratum is that with the highest expected net benefit. We present expected net benefit for λ = £20,000.
We allowed for the uncertainty in the optimal stratum by plotting the probability that each stratum is the most cost-effective (has highest net benefit) against willingness to pay per QALY, using cost-effectiveness acceptability curves (CEACs).
We also analysed mean total costs, QALYs and anxiety change at the unit level.
Workforce analysis
The workforce analysis calculated the time spent with each staff type for each visit and interaction, and used this time to calculate the salary cost for each staff type. The total cost for each staff type for each EPAU was amalgamated into a stratum. In this way, the staff cost profiles (showing each EPAU’s staff type makeup) could be presented by individual unit and stratum per 1000 patients. This also allowed comparisons between salary cost of staff types across EPAUs and strata.
The staff salary costs were further examined by FD, allowing further analyses. The average, median and standard deviations (SDs) of salary cost by diagnosis were computed and presented. Any statistically significant variations were identified using two-way analysis of variance. Other breakdowns/categorisations of staff salary costs, such as the number of patients seen and the time spent per patient, by each staff type, were also studied.
Among the final diagnoses, the number of inconclusive scans [pregnancies of unknown location (PULs)] was determined to be a useful indicator of the quality of an EPAU’s patient care: the higher number of PULs, the lower the level of care, and the lower number of PULs, the better the care. Number of admissions and number of visits were also identified as useful indicators. The analysis focused on the six clinical staff types: (1) consultant, (2) specialist nurse, (3) sonographer, (4) doctor, (5) nurse and (6) midwife. These indicators were investigated using correlation coefficients and ratios to determine if any of the staff types had an effect on them.
Outcomes and assessment
Primary outcome measure
-
The proportion of emergency hospital admissions for further investigations and treatment, as a proportion of women attending the participating EPAUs (data strand 1).
Secondary outcome measures
-
Total number of emergency admissions of women presenting with early pregnancy complications (data strands 1 and 2).
-
Ratio of new to follow-up visits (data strand 1).
-
Rate of non-diagnostic ultrasound scans (PUL). This has traditionally been used in early pregnancy as an indicator of quality of care (data strand 1).
-
Proportion of laparoscopies performed for a suspected ectopic pregnancy with a negative finding (data strand 2).
-
Ruptured ectopic pregnancies requiring blood transfusion (data strand 2).
-
Estimated blood loss at operation (data strand 2).
-
Patient satisfaction with the quality of care received (data strands 3 and 4).
-
Staff experience of providing care in EPAUs (data strand 4).
-
Proportion of women diagnosed with miscarriage and treated surgically, medically or expectantly (data strand 1).
-
Proportion of women diagnosed with ectopic pregnancy and treated surgically, medically or expectantly (data strand 1).
-
Visits to A&E departments (data strand 2).
-
Admissions to intensive therapy units (data strand 2).
-
Duration of admissions (data strand 2).
-
Waiting times from referral to assessment (data strand 1).
-
Quality-of-life measures before and after assessment of women at the EPAU during initial and follow-up visits (data strand 6).
-
Anxiety before and after assessment of women at the EPAU during initial and follow-up visits (data strand 6).
-
Cost-effectiveness of different staffing models (data strand 7).
Definition of end of study
The end of the study was defined as the last 3-month follow-up visit for a participating patient at each individual site. The study was considered closed when the last patient reached this time point, all data were complete and all data queries were resolved.
Withdrawal from study
Participants who gave consent to provide data were able to voluntarily withdraw from the study at any time. If a participant did not return a questionnaire, two attempts were made to contact her using the preferred method of contact (indicated by the participant at the time she provided consent). If a participant explicitly withdrew consent to any further data collection, then this decision was documented on the database and no further contact attempts were made.
Statistical considerations
Sample size
Clinical outcomes in EPAUs
We planned to recruit 44 EPAUs, each contributing the required 150 patients. This gave us 90% power to detect a difference in admission rates of 5% (8.5% vs. 3.5%) between units with a low consultant presence and units with a high consultant presence, at the 5% significance level. The results from our pilot study suggested that such a difference in admission rates was both clinically relevant and plausible.
This sample size calculation was based on a simplified analysis for which EPAUs were classed as having either low or high consultant presence based on a dichotomisation at the median level of consultant presence. The admission rates for the patients in the 22 EPAUs with ‘high’ consultant presence could then be compared with those from EPAUs with ‘low’ consultant presence. A basic sample size calculation (that assumes no clustering) suggested that we required 946 patients in total (or 22 patients per EPAU). However, assuming a moderate level of clustering (intracluster correlation coefficient = 0.04), we required 150 patients per EPAU. Data collection for each unit was for a minimum of 7 days to ensure that weekday/weekend variation was captured.
Emergency hospital care audit
Results from the pilot study and the national survey of EPAUs showed that the average number of women reviewed in different EPAUs across the country is 105 per week. Collecting hospital statistics data over 3 months would enable us to detect differences in rare outcomes, such as the proportion of negative laparoscopies for suspected ectopic pregnancy, transfusion rates and intensive therapy unit admissions.
Patient satisfaction
Our study population comprised 6600 women (150 for each of the 44 EPAUs). With a response rate of 30%, a 95% CI (for a yes/no question) would have a margin of error of, at most, 2.2%. If the response rate was just 10%, then the error would have been, at most, 3.8%.
Staff satisfaction
We expected that there would have been approximately 200 staff members in the sample of 44 EPAUs. If our response rate was 50%, then a 95% CI (for a yes/no question) would have a margin of error of, at most, 10%.
Qualitative interviews
Forty interviews with EPAU service users were planned. This calculation was based on the needs of the intended maximum variation sample42,43 (enabling representation by region, pregnancy outcome and reported level of satisfaction) to provide a wealth of qualitative data for analysis.
Health economic evaluation
In the absence of prior knowledge of the expected values and SDs of costs and effects (in this case, QALYs) it was not possible to formally estimate a required response rate. Therefore, we took a pragmatic approach to determining the number of resource use questionnaires to collect. Our aim was to balance the collection of sufficient data to make inferences about cost-effectiveness against the burden on women of being asked to complete data collection forms potentially soon after experiencing a pregnancy loss.
Questionnaires were sent to randomly chosen women from each stratum. The women selected were those who had given consent at their first visit for further contact, who had not withdrawn their consent and who had been discharged within 2 months. The sample was stratified using the same criteria as were used to select participating EPAUs. We anticipated that 320 completed questionnaires would provide sufficient data, based on the assumption of 40 completed questionnaires per stratum.
An algorithm and approach to sampling similar to that used to select units for participation in the study were used to select women who were approached to complete the resource use questionnaire. The key factors used to sample were the level of consultant presence, weekend service and number of patients attending. Each stratum of each key factor was equally represented. The breakdown for consultant presence consisted of 80 women in strata 1—4. Likewise, the breakdown for weekend opening was 160 women for strata 1 and 2, and similarly for number of patients attending a unit similarly for number of patients attending a unit. Women were approached to complete the resource use questionnaire until we achieved the target of 320 responses balanced across factors and strata.
Workforce analysis
To accurately capture the workforce resources needed to run each EPAU, we prospectively collected data on members and the grades of staff involved in providing care, as well as the time spent providing this care. Consultant presence was collected prospectively for each session/day that data were collected for (i.e. a record of whether or not a consultant was physically present in the unit reviewing patients was collected for every session for which we collected data).
The staff salary costs were further examined by the FD, allowing additional analyses. The average, median and SDs of salary cost by diagnosis were computed and presented. Any statistically significant variations were identified using two-way analysis of variance. Other breakdowns/categorisations of staff salary costs, such as the number of patients seen and the time spent per patient, by each staff type, were also studied.
Among the final diagnoses, the number of inconclusive scans (PULs) was determined to be a useful indicator of the quality of a EPAU’s patient care: the higher number of PULs, the lower the level of care. Number of admissions and number of visits were also identified as useful indicators. The analysis focused on six clinical staff types: (1) consultant, (2) specialist nurse, (3) sonographer, (4) doctor, (5) nurse and (6) midwife. These indicators were investigated using correlation coefficients and ratios to determine if any of the staff types had a measurable effect on them.
Study oversight
Study oversight was provided by a SSC and an Expert Reference Group. The SSC provided independent supervision for the study, advising the chief investigator, co-investigators and the sponsor on all aspects of the study throughout. The SSC met at regular intervals during the study period and the Expert Reference Group provided advice at the planning and data analysis stage.
Chapter 3 Results
This chapter presents the results of the VESPA study.
EPAU and patient recruitment
EPAU recruitment
A national survey was undertaken with the help of the AEPU. We approached 212 EPAUs and we received responses from 205. Each responding EPAU provided information about the key factors: planned weekly consultant presence, yearly number of attendances and weekend opening hours. Using a random sampling methodology we recruited 44 EPAUs with equal distribution of planned weekly consultant presence (yes/no), volume (< 3000 and ≥ 3000 attendances) and weekend opening (yes/no). The recruitment of the EPAUs was completed between December 2015 and April 2016. Following site initiation visits, four hospitals were moved to different strata as a result of changes in their configuration.
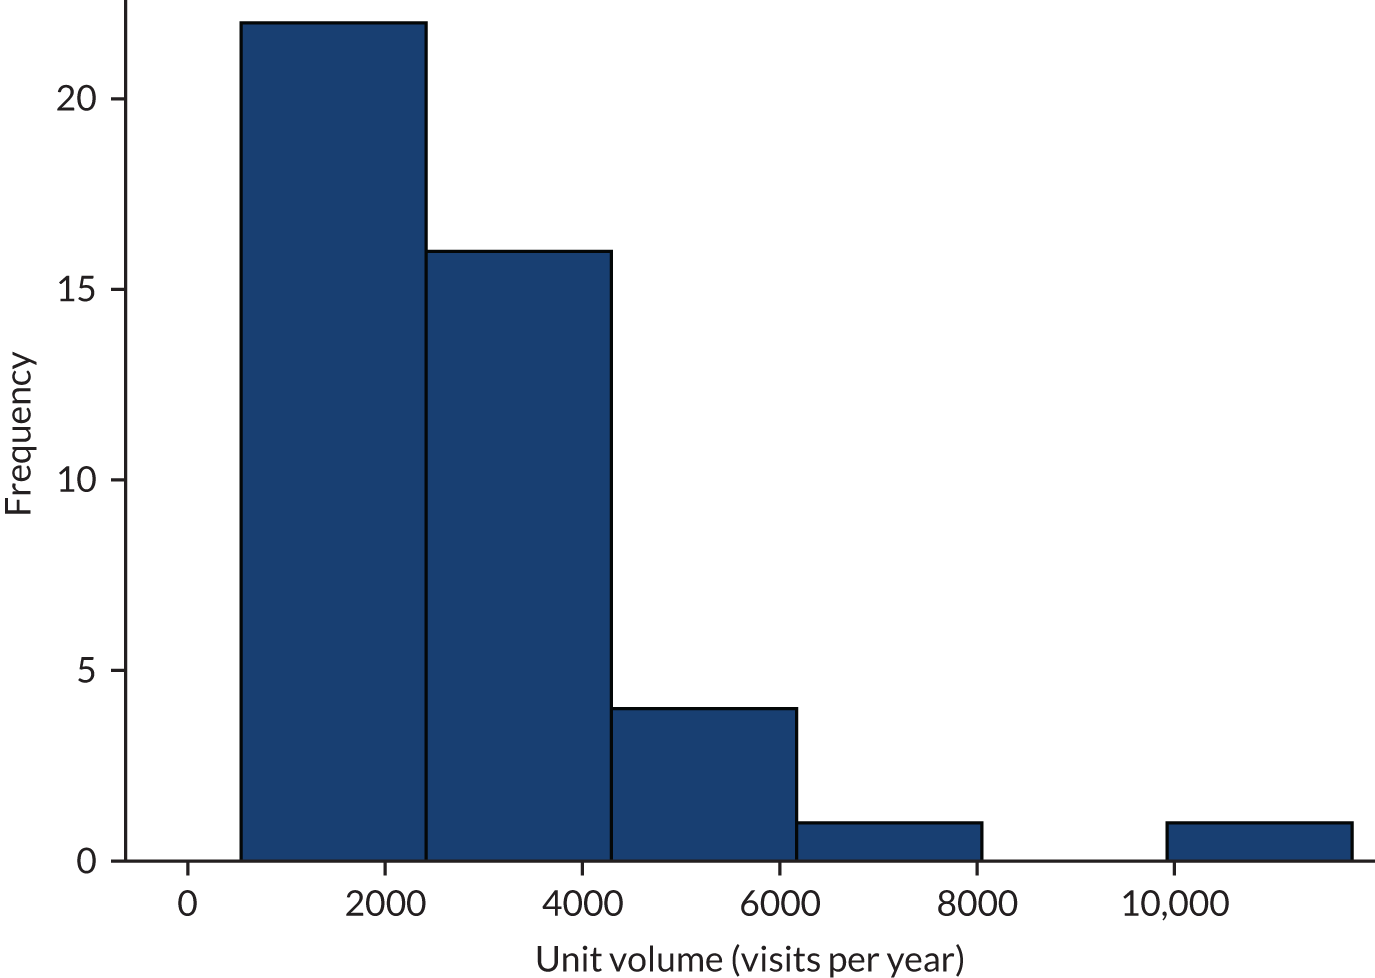
When data collection was complete, we reviewed the level of activity in all EPAUs. The volume of each EPAU was defined as the number of patient visits per year, and was estimated using the time taken to obtain data on 150 patients and the average number of visits per patient. The majority of the EPAUs (37/44) had a unit volume of < 4000 visits per year and 22 EPAUs had a yearly visit volume of < 2500 visits per year. In view of this, we used a cut-off point of 2500 visits to describe the units as high or low volume in the final data analysis.
See Report Supplementary Material 1, Table 6, for all participating EPAUs and their characteristics. Random three-letter codes were generated for each EPAU and used to anonymise data in accordance with our study protocol.
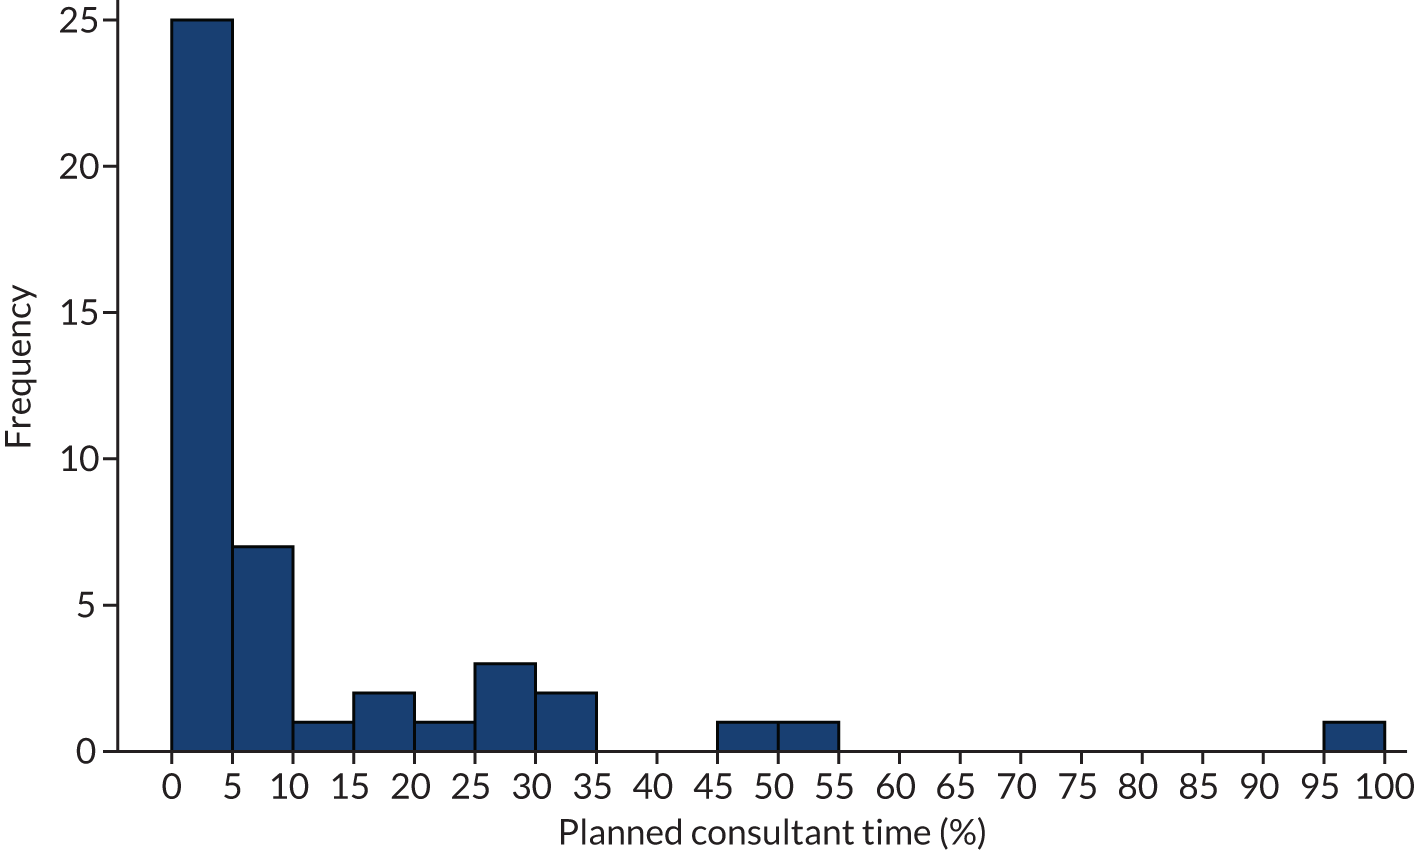
The distribution of planned consultant presence in the recruited units is shown in Figure 5. The majority of the EPAUs (41/44) had a planned presence of < 35% of opening time and 25 EPAUs had no planned consultant presence.
FIGURE 5.
Planned consultant presence at EPAUs, expressed as percentage of opening hours across 44 EPAUs.
The distribution of unit volume is shown in Figure 6.
FIGURE 6.
Estimated number of visits per year across the 44 participating EPAUs.
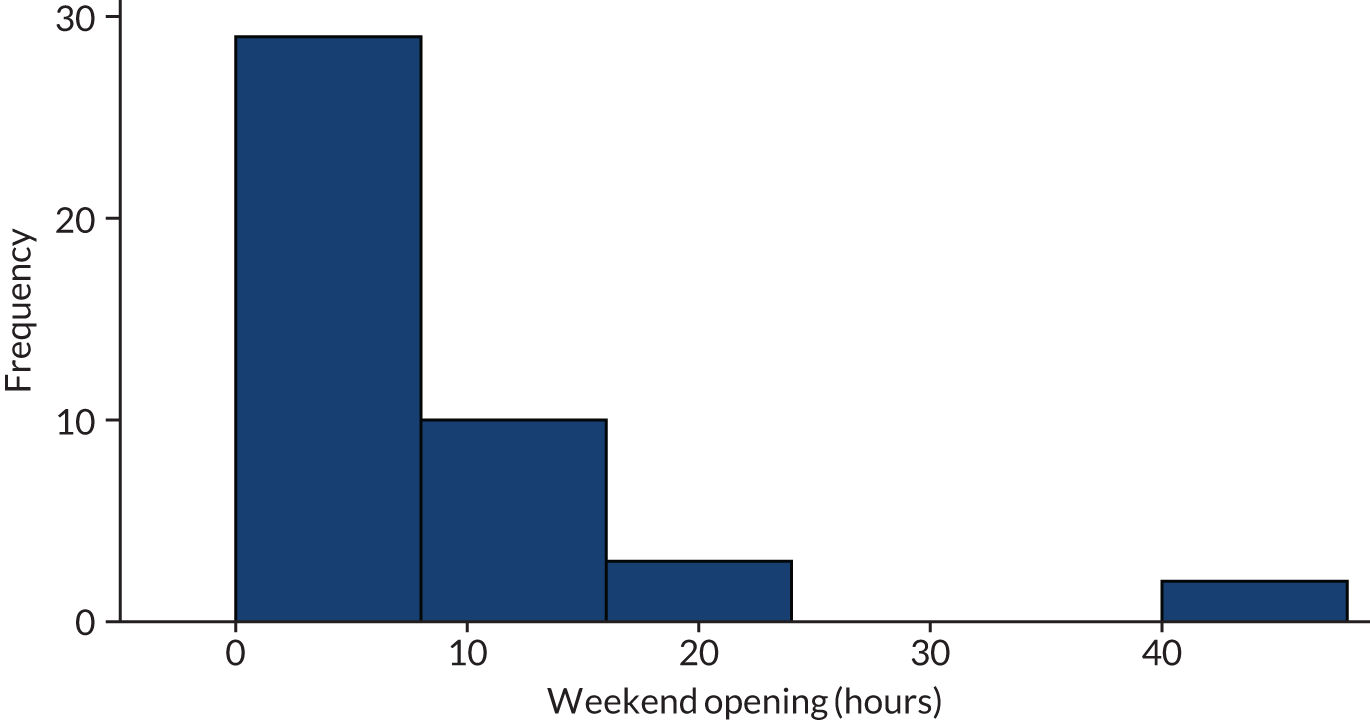
The distribution of weekend opening hours is shown in Figure 7. Approximately half of the EPAUs (23/44) were open at weekends, but the majority of these EPAUs (12/23) were open for < 10 hours.
FIGURE 7.
Distribution of weekend opening hours across EPAUs.
Patient and staff recruitment
Clinical outcomes in EPAUs
Patient recruitment and collection of clinical data were carried out over a period of 8 months between December 2016 and July 2017. All EPAUs were asked to recruit a minimum of 150 women each. Forty EPAUs met this target and four EPAUs recruited between 143 and 149 women (see Report Supplementary Material 1, Table 7). The median time for units to complete recruitment was 33 (interquartile range 24–47) days.
Data cleaning was carried out by the central study team to resolve any discrepancies in the data set and to ensure data completeness. Several duplicate patient entries were identified, and some patients were identified who did not fulfil the eligibility criteria. These entries were removed from the database and relevant sites were asked to meet their recruiting target of 150 patients by collecting anonymous data about the next patient who would have been seen in the EPAU at the end of recruitment. We were unable to complete this process at all sites, which explains the small shortfall in the number of recruited patients at four sites.
The total number of recruited patients was 6606.
Emergency hospital care audit
Audit of emergency care was carried out in 42 EPAUs operating in acute hospitals with functional A&E departments. The aim of the audit was to capture emergency hospital activity with regard to early pregnancy care, by looking at A&E attendances for women in early pregnancy and at emergency admissions which were not generated from EPAUs (i.e. admissions from A&E departments, any of the outpatient clinics and other settings). The time frame covered at each EPAU was set to 3 months. The data were collected retrospectively, with the end of the 3-month period corresponding to the date of when the last woman recruited to the clinical outcome arm of the study was discharged from the EPAU.
Forty-one sets of data were received between June 2017 and September 2018. One site was unable to provide data. Data quality and completeness varied between the sites. Coding practices differed between trusts and obtaining high-quality and complete audit data was a difficult and complex task. Extensive data checks were carried out to assess for discrepancies between data sets and local admission lists and to assess the reliability of the data.
Of the 41 sets of data received, 10 EPAUs provided data for all emergency admissions, 19 EPAUs provided data for admissions from A&E only, six EPAUs provided data for emergency admissions from sources other than A&E, and the remaining six EPAUs provided data considered to be unreliable. In view of this, data from only 29 EPAUs were used to assess factors associated with emergency admissions from sources other than the EPAU.
Patient satisfaction
All eligible women were approached to consent to take part in the questionnaire arm of the study. This involved women completing the SAPS and the modified Newcastle–Farnworth questionnaires 2 weeks after their attendance at the EPAU. A total of 4217 women agreed to take part, with 414 women subsequently withdrawing consent and the remaining 3803 women completing the questionnaires.
Staff satisfaction
The staff satisfaction survey was carried out between February 2017 and July 2018. A total of 338 staff members were approached to take part. A total response rate of 52% was achieved, with 158 surveys fully completed and 18 surveys partially completed.
Qualitative interviews
A total of 153 women were contacted between January and May 2018 and asked to take a part in the qualitative interviews. Of the 60 women who responded, 17 declined to take part and four withdrew. Thirty-nine women were interviewed, but one woman was excluded from the analysis because of the content of her interview (which focussed on other clinical experiences outside her time at the EPAU). Therefore, the final analysis was of 38 women.
We achieved a fairly even distribution across the sampling frame for all components (see Report Supplementary Material 1, Table 8). We deliberately sampled more women with pregnancy losses than women with ongoing pregnancies, as we expected these women to provide richer data. Of the women included in this study, 17 had ongoing pregnancies, 15 had experienced miscarriages, two had a PUL, two received treatment for ectopic pregnancies, one experienced a molar pregnancy and one underwent a termination of pregnancy. Women in this study were mostly aged 30–39 years at the time of interview. The majority were married, although some were single with a partner and one woman was single with no partner. Six women in our sample were unemployed, many were currently on maternity leave and most women reported having planned the pregnancy they discussed in the interview.
Health economic evaluation
The health economics protocol specified two follow-up time points for data collection: at 2 weeks and 3 months after the participant’s final visit to the EPAU. A total of 3803 women were requested to complete the 2-week pack containing the EQ-5D-5L questionnaire; 1576 questionnaires were returned (giving a response rate of 41%). Of the questionnaires returned, 573 were returned between 2 and 6 weeks after women visited their EPAUs. The remaining questionnaires were returned after 6 weeks and up to 26 weeks after the initial visit. The median number of days between baseline and follow-up was 42 days.
We had estimated that for the secondary analysis we needed 320 women to complete the EQ-5D-5L questionnaires 3 months after their last hospital visit. We sent out a total of 1415 questionnaires and received 364 responses (a response rate of 26%). This exceeded our original target. The median number of days between baseline and second follow-up was 104 (range 8–259).
Many patients returned either the 2-week or 3-month questionnaires late. Strict adherence to the analysis plan in the protocol would have excluded many of the data, particularly around the 2-week questionnaire and outcome. To maximise use of the data, we made the following changes to the timings of the follow-up analysis. The 2-week follow-up became a 4-week follow-up and all EQ-5D-5L responses received between 2 and 6 weeks post visit were included in this analysis. This gave a total sample size for analysis of 573. If we included only responses received between 2 and 3 weeks, the total sample would have been 228. Including responses received between 2 and 4 weeks would give a sample of 347. The 3-month follow-up time point became an 18-week follow-up time point. Any EQ-5D-5L responses received between 12 and 24 weeks post visit were then included in this analysis. This gave a total of 316 responses to the EQ-5D-5L questionnaire.
Workforce analysis
Timing data, which included the length of women’s interactions with different EPAU staff members, were collected during each visit. A total of 6531 complete records were used for the workforce analysis
Demographic characteristics of the study population
See Report Supplementary Material 1, Table 9, for the demographic characteristics of women included in the study across the EPAUs.
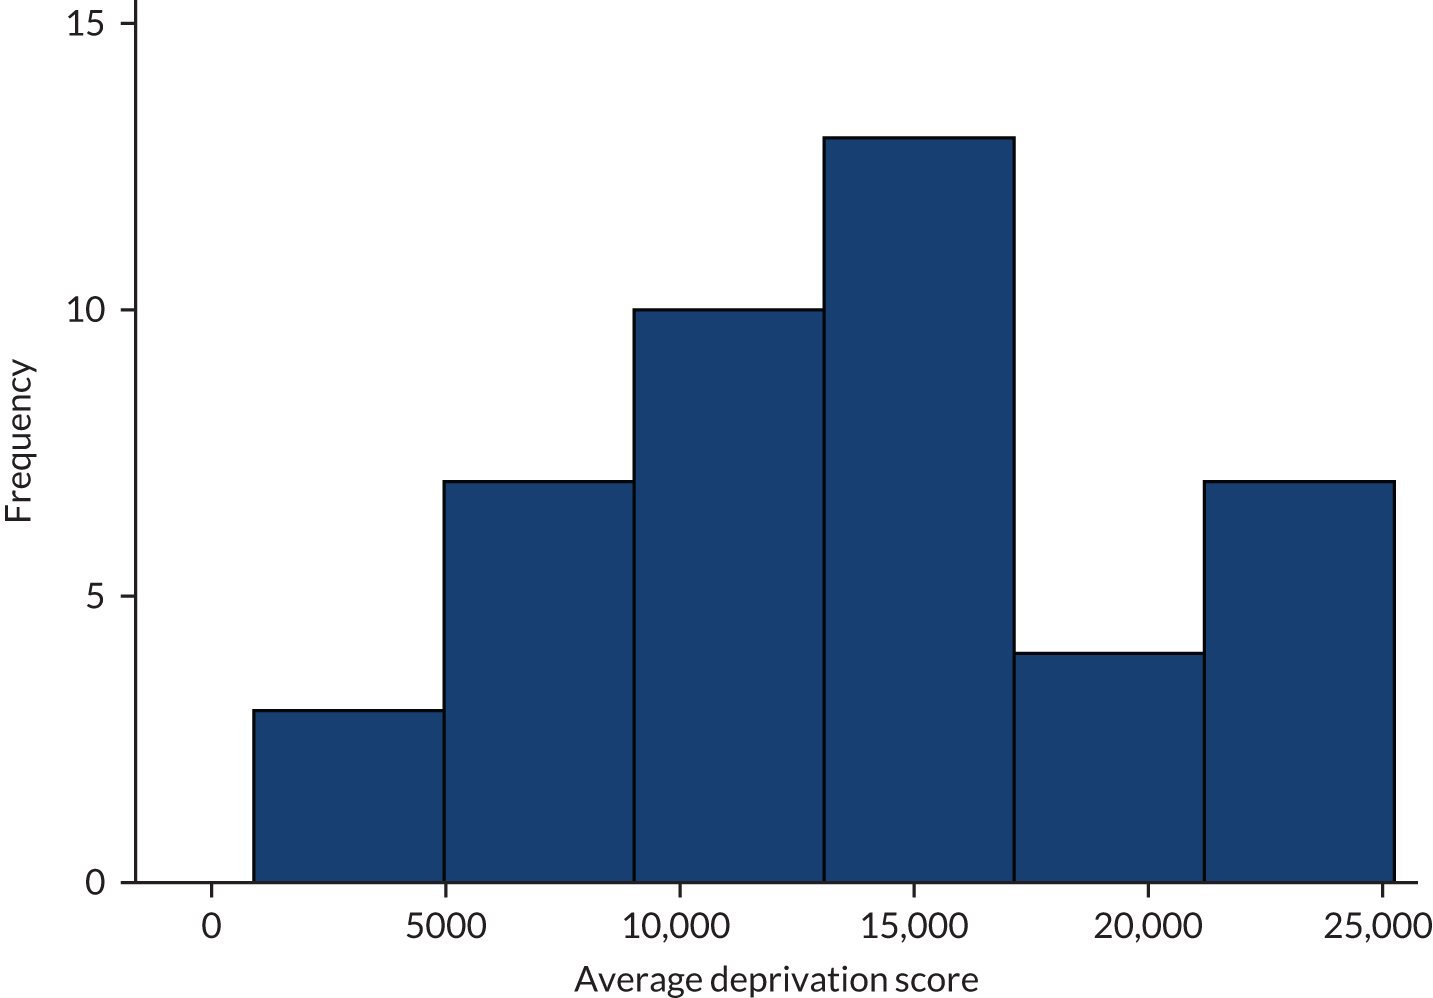
The distribution of women’s average age, parity and gestational age at presentation across the EPAUs are shown in Figures 8–10. The average DSs across the units are shown in Figure 11.
FIGURE 8.
Distribution of women’s average age across units.
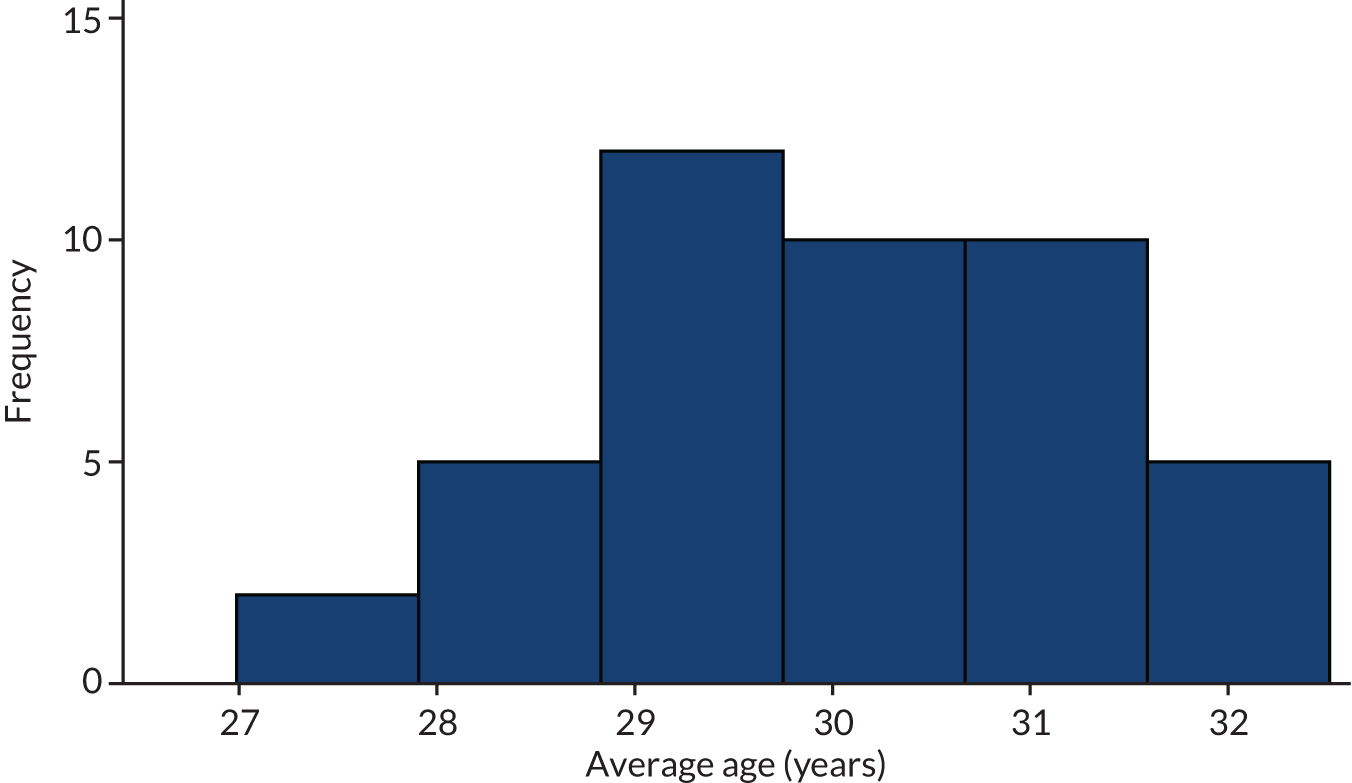
FIGURE 9.
Distribution of average parity across units.
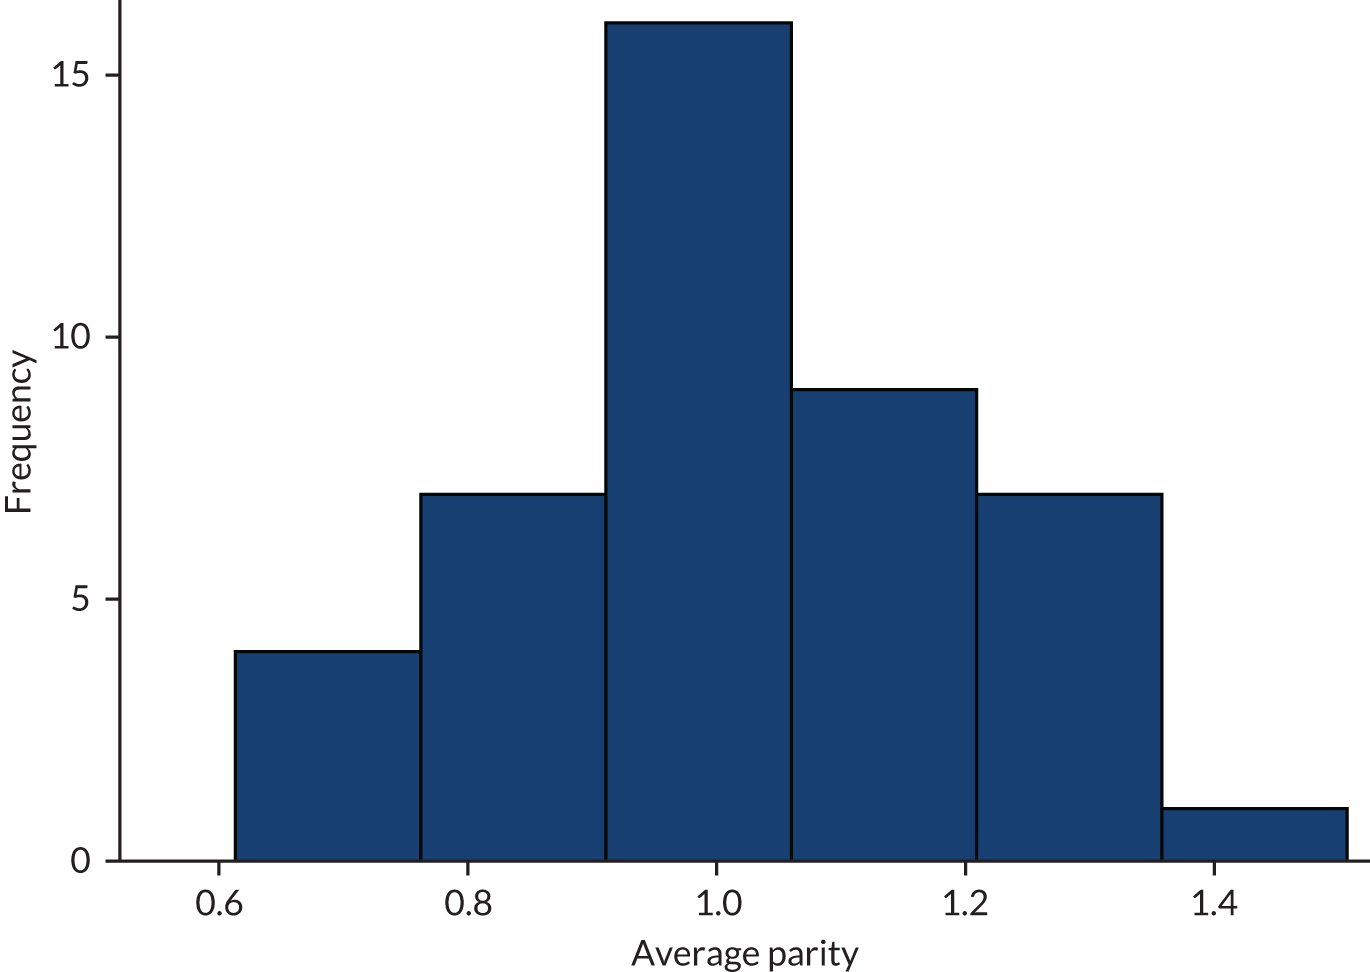
FIGURE 10.
Distribution of average gestational age at presentation across units.
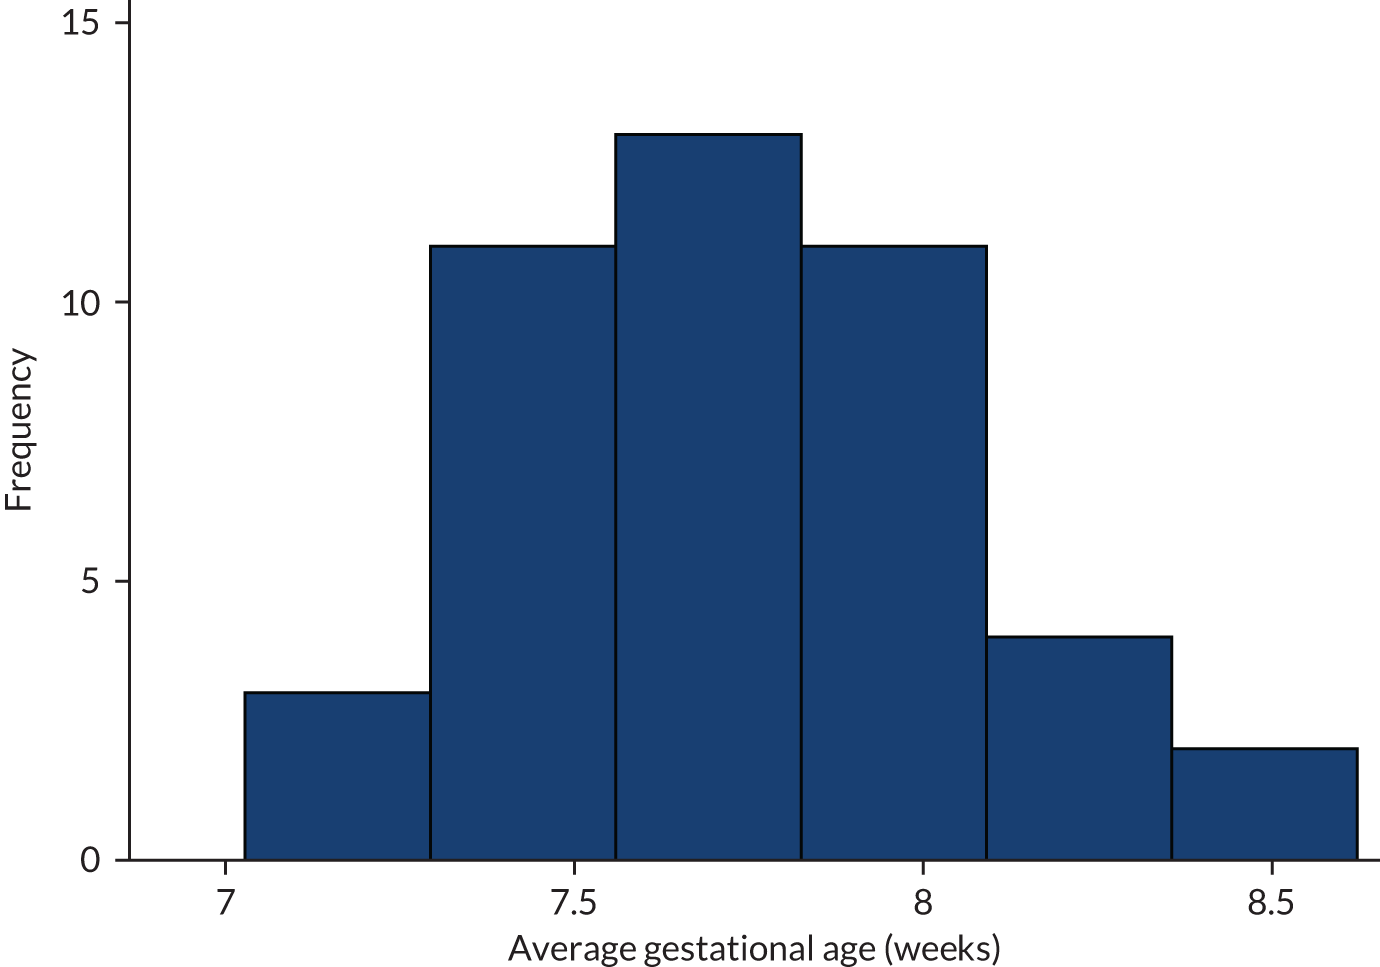
FIGURE 11.
Distribution of average DS across units.
Summary of clinical data
We collected clinical data from 6606 women. A total of 2422 (36.7%) women attended EPAUs for follow-up visits. Of those who had a follow-up visit, the median number of follow-up visits was 1 (range 1–14) visit. The overall ratio of new to all follow-up visits was 6606 to 3512 (1.88).
We then compared the units in terms of follow-up visits adjusted for MA and FD. The majority of women [5891/6606 (89.2%)] attended for one or two visits. We postulated that higher numbers of follow-up visits (i.e. three or more visits) is more likely to reflect the quality of clinical care, and we decided to use it as a basis for our comparisons (Table 1).
| Unit | n | Follow-up visits (three or more visits), n (%) | Ranka |
|---|---|---|---|
| JDG | 150 | 0 (0) | 1 |
| RPR | 150 | 3 (2) | 2 |
| OYN | 150 | 4 (2.7) | 3 |
| BVU | 150 | 3 (2) | 4 |
| HYG | 150 | 4 (2.7) | 5 |
| NSK | 150 | 6 (4) | 6 |
| RXO | 156 | 6 (3.8) | 7 |
| TCS | 150 | 6 (4) | 8 |
| YUS | 150 | 7 (4.7) | 9 |
| SXM | 143 | 9 (6.3) | 10 |
| QAR | 151 | 8 (5.3) | 11 |
| BDX | 150 | 8 (5.3) | 12 |
| CXP | 150 | 8 (5.3) | 13 |
| WYW | 149 | 10 (6.7) | 14 |
| SXB | 151 | 10 (6.6) | 15 |
| VXL | 149 | 10 (6.7) | 16 |
| PCO | 149 | 10 (6.7) | 17 |
| HJZ | 150 | 11 (7.3) | 18 |
| SHS | 150 | 11 (7.3) | 19 |
| GLR | 150 | 12 (8) | 20 |
| AIS | 150 | 12 (8) | 21 |
| ULV | 151 | 12 (7.9) | 22 |
| MJL | 150 | 14 (9.3) | 23 |
| XQZ | 151 | 16 (10.6) | 24 |
| JII | 150 | 16 (10.7) | 25 |
| QSL | 150 | 20 (13.3) | 26 |
| JPM | 150 | 22 (14.7) | 27 |
| ZAR | 151 | 21 (13.9) | 28 |
| SCC | 151 | 21 (13.9) | 29 |
| ZNI | 151 | 22 (14.6) | 30 |
| XNL | 150 | 26 (17.3) | 31 |
| GFY | 151 | 25 (16.6) | 32 |
| OVA | 150 | 27 (18) | 33 |
| YLJ | 150 | 25 (16.7) | 34 |
| UOY | 150 | 24 (16) | 35 |
| IWX | 150 | 24 (16) | 36 |
| CZX | 152 | 25 (16.4) | 37 |
| ZAM | 150 | 24 (16) | 38 |
| JNM | 150 | 29 (19.3) | 39 |
| SDD | 150 | 27 (18) | 40 |
| FVX | 150 | 29 (19.3) | 41 |
| WWR | 150 | 23 (15.3) | 42 |
| WDI | 150 | 39 (26) | 43 |
| XQD | 150 | 46 (30.7) | 44 |
A total of 6122 (92.7%) women had an ultrasound scan at their initial visit. Most follow-up visits also involved ultrasound scans, but the proportion of visits that included scans decreased with increasing numbers of visits (Table 2).
| Initial visits | Initial (N = 6606), n (%) | Follow-up visit | |||||||
|---|---|---|---|---|---|---|---|---|---|
| 1 (N = 2252), n (%) | 2 (N = 715), n (%) | 3 (N = 271), n (%) | 4 (N = 120), n (%) | 5 (N = 65), n (%) | 6 (N = 43), n (%) | 7 (N = 27), n (%) | 8 (N = 19), n (%) | ||
| Ultrasound scan | 6122 (92.7) | 1697 (75.4) | 507 (70.9) | 180 (66.4) | 58 (48.3) | 22 (33.8) | 14 (32.6) | 6 (22.2) | 2 (10.5) |
The majority of women (68.9%) were diagnosed with normal or early intrauterine pregnancies at the initial visit. However, the proportion of abnormal pregnancies increased with the number of follow-up visits. This trend was particularly strong with ectopic pregnancies, which were diagnosed in 1.3% of women at the initial visit and in 7.6% of women at the fourth follow-up visit (Table 3). Out of a total of 109 ectopic pregnancies, 80 (73%) were diagnosed at the initial visit.
| Ultrasound diagnosis | Initial (N = 6190), n (%) | Follow-up visit | |||||
|---|---|---|---|---|---|---|---|
| 1 (N = 1812), n (%) | 2 (N = 549), n (%) | 3 (N = 197), n (%) | 4 (N = 66), n (%) | 5 (N = 26), n (%) | 6 (N = 16), n (%) | ||
| Early intrauterine pregnancy | 1460 (23.6) | 218 (12.0) | 75 (13.7) | 24 (12.2) | 7 (10.6) | 1 (3.8) | 1 (6.3) |
| Normal/live intrauterine pregnancy | 2802 (45.3) | 784 (43.3) | 162 (29.5) | 56 (28.4) | 12 (18.2) | 4 (15.4) | 1 (6.3) |
| Early embryonic demise | 511 (8.3) | 260 (14.3) | 85 (15.5) | 35 (17.8) | 11 (16.7) | 3 (11.5) | 3 (18.8) |
| Incomplete miscarriage | 205 (3.3) | 141 (7.8) | 46 (8.4) | 19 (9.6) | 7 (10.6) | 5 (19.2) | 2 (12.5) |
| Retained products of conception | 59 (1.0) | 67 (3.7) | 32 (5.8) | 11 (5.6) | 8 (12.1) | 4 (15.4) | 3 (18.8) |
| Complete miscarriage | 352 (5.7) | 233 (12.9) | 90 (16.4) | 25 (12.7) | 8 (12.1) | 3 (11.5) | 2 (12.5) |
| Ectopic pregnancy | 80 (1.3) | 28 (1.5) | 19 (3.5) | 13 (6.6) | 5 (7.6) | 4 (15.4) | 3 (18.8) |
| Inconclusive scan (PUL) | 697 (11.3) | 76 (4.2) | 39 (7.1) | 13 (6.6) | 8 (12.1) | 1 (3.8) | 1 (6.3) |
| Other | 13 (0.2) | 4(0.2) | 0 | 1 (0.5) | 0 | 1 (3.8) | 0 |
The overall proportion of PULs was 11.3% at the initial visit, decreasing to 7% at the third follow-up visit. However, the proportion increased again to 12.1% at the fourth follow-up visit. The rate of inconclusive scans differed between the EPAUs, ranging from 1.3% to 27.3%. Observed and ranked data at the unit level for PUL diagnosis are shown in Table 4. Ranking was adjusted for MA.
| Unit | n | PUL at first scan, n (%) | Ranka |
|---|---|---|---|
| JDG | 150 | 2 (1.3) | 1 |
| SCC | 138 | 8 (5.8) | 2 |
| RXO | 156 | 3 (1.9) | 3 |
| BVU | 147 | 5 (3.4) | 4 |
| ZAR | 151 | 5 (3.3) | 5 |
| UOY | 135 | 7 (5.2) | 6 |
| HYG | 150 | 10 (6.7) | 7 |
| RPR | 149 | 10 (6.7) | 8 |
| IWX | 150 | 9 (6) | 9 |
| NSK | 149 | 12 (8.1) | 10 |
| SHS | 150 | 11 (7.3) | 11 |
| AIS | 150 | 10 (6.7) | 12 |
| ULV | 150 | 9 (6) | 13 |
| XNL | 139 | 11 (7.9) | 14 |
| WYW | 148 | 13 (8.8) | 15 |
| GLR | 150 | 15 (10) | 16 |
| WWR | 106 | 9 (8.5) | 17 |
| OYN | 150 | 22 (14.7) | 18 |
| SXB | 151 | 15 (9.9) | 19 |
| PCO | 149 | 12 (8.1) | 20 |
| YUS | 146 | 14 (9.6) | 21 |
| BDX | 147 | 16 (10.9) | 22 |
| VXL | 147 | 16 (10.9) | 23 |
| XQD | 135 | 19 (14.1) | 24 |
| OVA | 150 | 17 (11.3) | 25 |
| QAR | 147 | 17 (11.6) | 26 |
| JII | 149 | 15 (10.1) | 27 |
| ZNI | 149 | 20 (13.4) | 28 |
| MJL | 150 | 19 (12.7) | 29 |
| QSL | 146 | 22 (15.1) | 30 |
| HJZ | 150 | 23 (15.3) | 31 |
| GFY | 151 | 20 (13.2) | 32 |
| CXP | 128 | 22 (17.2) | 33 |
| ZAM | 142 | 18 (12.7) | 34 |
| SDD | 149 | 19 (12.8) | 35 |
| FVX | 143 | 20 (14) | 36 |
| JPM | 149 | 29 (19.5) | 37 |
| XQZ | 151 | 23 (15.2) | 38 |
| TCS | 149 | 21 (14.1) | 39 |
| YLJ | 145 | 29 (20) | 40 |
| CZX | 140 | 26 (18.6) | 41 |
| WDI | 136 | 29 (21.3) | 42 |
| SXM | 143 | 39 (27.3) | 43 |
| JNM | 149 | 35 (23.5) | 44 |
A total of 1295 (19.6%) women had a blood test at their initial visit. The proportion of women having a blood test showed the opposite trend to ultrasound scans, with the number of blood tests increasing with increasing number of visits (Table 5).
| Initial visits | Initial (N = 6603), n (%) | Follow-up visit | |||||
|---|---|---|---|---|---|---|---|
| 1 (N = 2242), n (%) | 2 (N = 715), n (%) | 3 (N = 271), n (%) | 4 (N = 120), n (%) | 5 (N = 65), n (%) | 6 (N = 43), n (%) | ||
| Blood test | 1295 (19.6) | 476 (21.2) | 194 (27.1) | 85 (31.4) | 48 (40) | 30 (46.2) | 23 (53.5) |
The majority of blood tests were carried out in women with PULs and ectopic pregnancies. A relatively large proportion of women who were diagnosed with a miscarriage [369/1126 (32.8%)] also underwent blood tests. A total of 513 blood tests were carried out in women with a conclusive diagnosis of an intrauterine pregnancy (513/1143, 44.9%) (Table 6).
| Ultrasound diagnosis (n) | Blood test, n (%) |
|---|---|
| Early intrauterine pregnancy (1459) | 81 (5.6) |
| Normal/live intrauterine pregnancy (2802) | 63 (2.2) |
| Early embryonic demise (511) | 235 (46.0) |
| Incomplete miscarriage (204) | 42 (20.6) |
| Retained products of conception (59) | 21 (35.6) |
| Complete miscarriage (352) | 71 (20.2) |
| Ectopic pregnancy (80) | 59 (73.8) |
| Inconclusive scan (PUL) (697) | 562 (80.6) |
| Molar pregnancy (8) | 5 (62.5) |
| Other (16) | 4 (25.0) |
The FD in the majority of women was a normal intrauterine pregnancy, whereas 29.9% of women were diagnosed with a miscarriage and 1.7% with an ectopic pregnancy. There was little variation in the final pregnancy outcomes between the units (Table 7).
| Unit (n) | Diagnosis, n (%) | |||
|---|---|---|---|---|
| Normal intrauterine pregnancya (N = 4202) | Miscarriageb (N = 1919) | Ectopic pregnancy (N = 109) | Other (N = 179) | |
| AIS (150) | 102 (68.0) | 46 (30.7) | 1 (0.7) | 1 (0.7) |
| BDX (147) | 98 (66.7) | 42 (28.6) | 3 (2.0) | 4 (2.7) |
| BVU (147) | 108 (73.5) | 37 (25.2) | 1 (0.7) | 1 (0.7) |
| CXP (128) | 72 (56.3) | 50 (39.1) | 0 (0.0) | 6 (4.7) |
| CZX (140) | 92 (65.7) | 41 (29.3) | 4 (2.9) | 3 (2.1) |
| FVX (143) | 91 (63.6) | 49 (34.3) | 2 (1.4) | 1 (0.7) |
| GFY (151) | 101 (66.9) | 40 (26.5) | 5 (3.3) | 5 (3.3) |
| GLR (150) | 103 (68.7) | 37 (24.7) | 4 (2.7) | 6 (4.0) |
| HJZ (150) | 93 (62.0) | 47 (31.3) | 3 (2.0) | 7 (4.0) |
| HYG (150) | 93 (62.0) | 51 (34.0) | 1 (0.7) | 5 (3.4) |
| IWX (150) | 108 (72.0) | 38 (25.3) | 1 (0.7) | 3 (2.0) |
| JDG (150) | 97 (64.7) | 48 (32.0) | 3 (2.0) | 2 (1.4) |
| JII (149) | 103 (69.1) | 45 (30.2) | 0 (0.0) | 1 (0.7) |
| JNM (149) | 93 (62.4) | 49 (32.9) | 3 (2.0) | 2 (1.3) |
| JPM (149) | 75 (50.3) | 63 (42.3) | 4 (2.7) | 7 (4.7) |
| MJL (150) | 102 (68.0) | 45 (30.0) | 1 (0.7) | 2 (1.3) |
| NSK (149) | 106 (71.1) | 35 (23.5) | 1 (0.7) | 7 (4.7) |
| OVA (150) | 89 (59.3) | 53 (35.3) | 3 (2.0) | 4 (2.7) |
| OYN (150) | 86 (57.3) | 44 (29.3) | 6 (4.0) | 14 (9.4) |
| PCO (149) | 99 (66.4) | 50 (33.6) | 0 (0.0) | 0 (0.0) |
| QAR (147) | 95 (64.6) | 50 (34.0) | 0 (0.0) | 2 (1.4) |
| QSL (146) | 87 (59.6) | 45 (30.8) | 9 (6.2) | 5 (3.4) |
| RPR (149) | 95 (63.8) | 48 (32.2) | 3 (2.0) | 3 (2.0) |
| RXO (156) | 119 (76.3) | 35 (22.4) | 1 (0.6) | 1 (0.6) |
| SCC (138) | 90 (65.2) | 38 (27.5) | 2 (1.4) | 8 (5.8) |
| SDD (149) | 103 (69.1) | 40 (26.8) | 4 (2.7) | 1 (0.7) |
| SHS (150) | 103 (68.7) | 41 (27.3) | 3 (2.0) | 3 (2.0) |
| SXB (151) | 95 (62.9) | 47 (31.1) | 3 (2.0) | 6 (4.0) |
| SXM (143) | 77 (53.8) | 51 (35.7) | 2 (1.4) | 13 (9.1) |
| TCS (149) | 113 (75.8) | 32 (21.5) | 3 (2.0) | 1 (0.7) |
| ULV (150) | 108 (72.0) | 37 (24.7) | 2 (1.3) | 3 (2.0) |
| UOY (135) | 91 (67.4) | 37 (27.4) | 4 (3.0) | 3 (2.2) |
| VXL (147) | 91 (61.9) | 51 (34.7) | 1 (0.7) | 4 (2.8) |
| WDI (136) | 95 (69.9) | 30 (22.1) | 2 (1.5) | 9 (6.6) |
| WWR (106) | 76 (71.7) | 24 (22.6) | 2 (1.9) | 4 (3.7) |
| WYW (148) | 90 (60.8) | 52 (35.1) | 3 (2.0) | 3 (2.0) |
| XNL (139) | 82 (59.0) | 53 (38.1) | 3 (2.2) | 1 (0.7) |
| XQD (135) | 86 (63.7) | 40 (29.6) | 2 (1.5) | 7 (5.2) |
| XQZ (151) | 95 (62.9) | 52 (34.4) | 4 (2.6) | 0 (0.0) |
| YLJ (145) | 89 (61.4) | 51 (35.2) | 0 (0.0) | 5 (3.4) |
| YUS (146) | 106 (72.6) | 35 (24.0) | 2 (1.4) | 3 (2.1) |
| ZAM (142) | 97 (68.3) | 40 (28.2) | 1 (0.7) | 4 (2.8) |
| ZAR (151) | 106 (70.2) | 41 (27.2) | 4 (2.6) | 0 (0.0) |
| ZNI (149) | 102 (68.5) | 39 (26.2) | 3 (2.0) | 5 (3.4) |
| Total (6409) | 4202 (65.6) | 1919 (29.9) | 109 (1.7) | 179 (2.8) |
A total of 205 (3.2%) women were admitted following their EPAU attendance. The highest admission rates (64.2%) were recorded in women diagnosed with ectopic pregnancies. Nearly 10% of women with a FD of PUL were also admitted as an emergency (Table 8).
| FD (n) | Hospital admission, n (%) |
|---|---|
| Early intrauterine and normal/live intrauterine pregnancy (4175) | 44 (1.1) |
| Early embryonic demise, incomplete miscarriage, complete miscarriage, retained products of conception (1915) | 73 (3.8) |
| Ectopic pregnancy (109) | 70 (64.2) |
| Inconclusive scan/PUL (145) | 14 (9.7) |
| Other (e.g. molar, twin, not pregnant) (29) | 4 (13.8) |
The admission rate among EPAUs varied between 0.7% and 13.3%. The ranking of the EPAUs adjusted for FD and MA are provided in Table 9 (199 patients were omitted from this analysis because of missing data).
| Code | n | Emergency admissions from the EPAU, n (%) | Ranka |
|---|---|---|---|
| CZX | 152 | 1 (0.7) | 1 |
| WWR | 150 | 4 (2.7) | 2 |
| RXO | 156 | 0 (0) | 3 |
| FVX | 150 | 1 (0.7) | 4 |
| SDD | 150 | 2 (1.3) | 5 |
| JNM | 149 | 2 (1.3) | 6 |
| ZAM | 150 | 1 (0.7) | 7 |
| JPM | 150 | 3 (2) | 8 |
| BVU | 148 | 1 (0.7) | 9 |
| ZAR | 151 | 3 (2) | 10 |
| QSL | 150 | 6 (4) | 11 |
| QAR | 150 | 1 (0.7) | 12 |
| PCO | 149 | 1 (0.7) | 13 |
| JII | 150 | 1 (0.7) | 14 |
| YUS | 150 | 3 (2) | 15 |
| JDG | 150 | 3 (2) | 16 |
| RPR | 150 | 3 (2) | 17 |
| ZNI | 151 | 3 (2) | 18 |
| SHS | 150 | 3 (2) | 19 |
| IWX | 150 | 2 (1.3) | 20 |
| TCS | 150 | 3 (2) | 21 |
| WYW | 148 | 4 (2.7) | 22 |
| SXM | 143 | 4 (2.8) | 23 |
| AIS | 150 | 3 (2) | 24 |
| XQZ | 151 | 5 (3.3) | 25 |
| VXL | 148 | 4 (2.7) | 26 |
| OVA | 150 | 6 (4) | 27 |
| HJZ | 150 | 6 (4) | 28 |
| YLJ | 150 | 5 (3.3) | 29 |
| OYN | 149 | 9 (6) | 30 |
| GLR | 150 | 7 (4.7) | 31 |
| GFY | 151 | 8 (5.3) | 32 |
| MJL | 150 | 5 (3.3) | 33 |
| SXB | 151 | 7 (4.6) | 34 |
| UOY | 150 | 7 (4.7) | 35 |
| XNL | 150 | 7 (4.7) | 36 |
| CXP | 149 | 6 (4) | 37 |
| ULV | 151 | 7 (4.6) | 38 |
| HYG | 150 | 8 (5.3) | 39 |
| SCC | 149 | 8 (5.4) | 40 |
| NSK | 150 | 8 (5.3) | 41 |
| WDI | 150 | 11 (7.3) | 42 |
| XQD | 150 | 20 (13.3) | 43 |
| BDX | 150 | 16 (10.7) | 44 |
Primary outcome analysis
Our primary outcome was the proportion of women attending EPAUs who were admitted to hospital for further investigations and treatment. We also analysed emergency admissions from A&E and the contribution of admissions via EPAUs to total emergency admissions.
Our clinical data set contains information on 6606 patients.
Emergency hospital admissions as a proportion of women attending EPAUs
We first investigated the association between emergency admissions from the EPAU and consultant presence, unit volume and weekend opening hours. We used a binary outcome to indicate whether or not a patient had an emergency admission from the EPAU following any of her visits.
The relationship between emergency admissions and consultant presence is shown in Figure 12. There was only one unit without any emergency admissions from the EPAU.
FIGURE 12.
Emergency admissions from the EPAU vs. consultant presence for each unit.
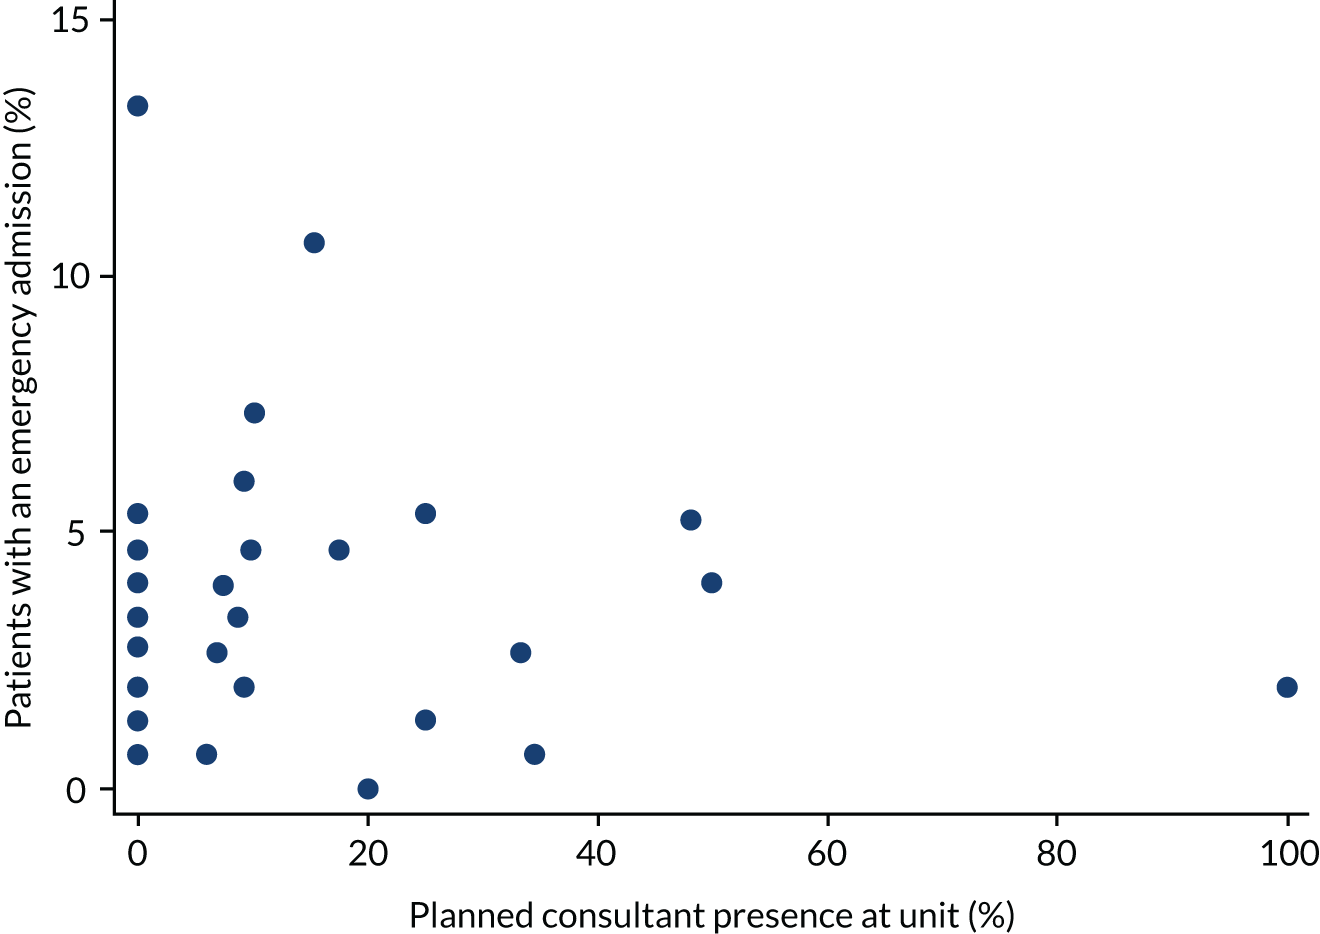
The relationship between emergency admissions and unit volume is shown in Figure 13. The majority of the units (31/44) had an emergency admission rate between 1% and 5%, and a unit volume of < 5000 visits. There is no obvious trend.
FIGURE 13.
Emergency admissions from the EPAU vs. unit volume.
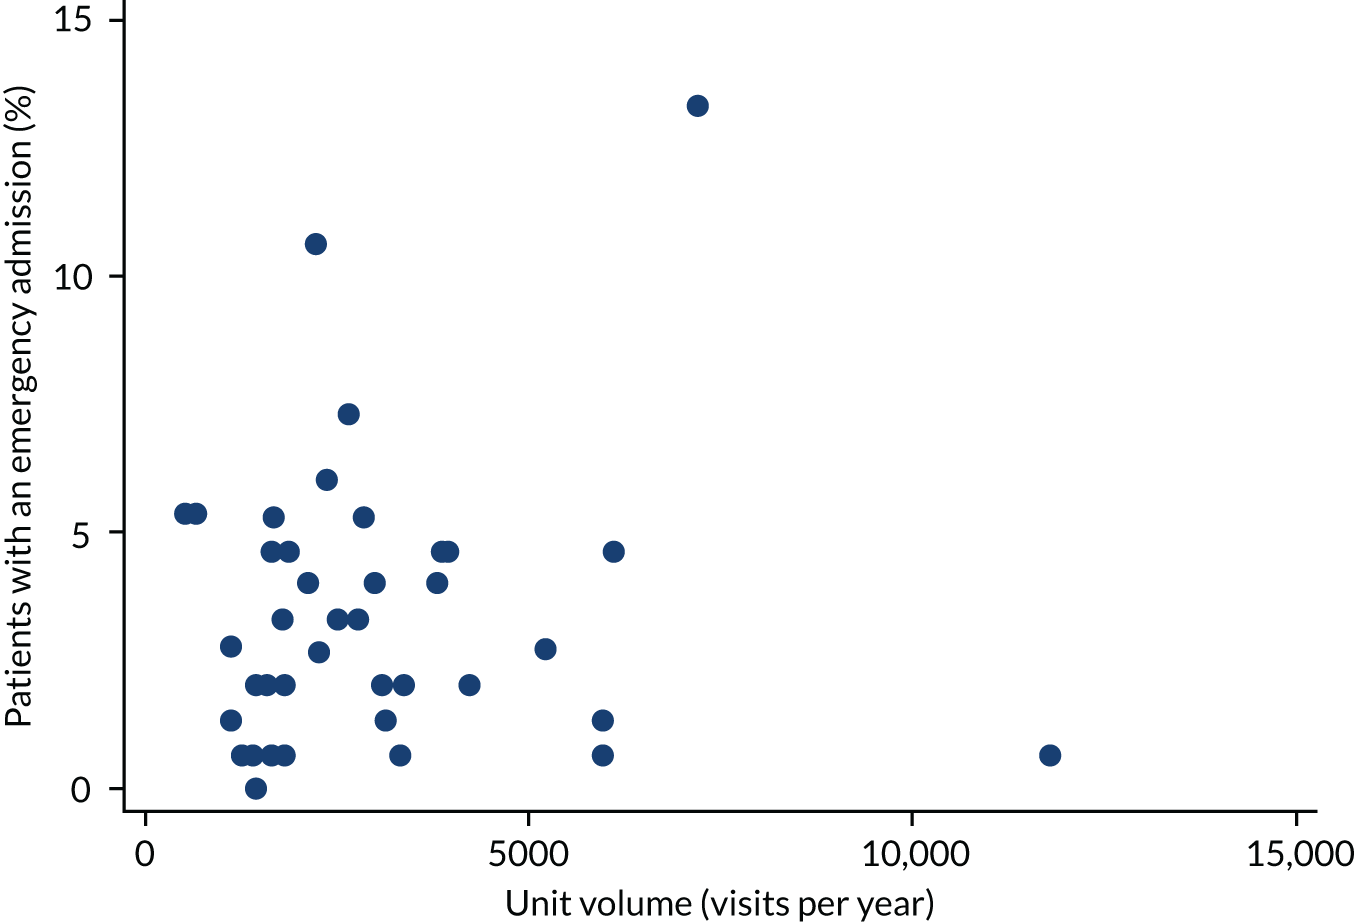
The relationship between emergency admissions and weekend opening is shown in Figure 14. Again, there is no obvious trend.
FIGURE 14.
Emergency admissions from the EPAU vs. weekend opening.
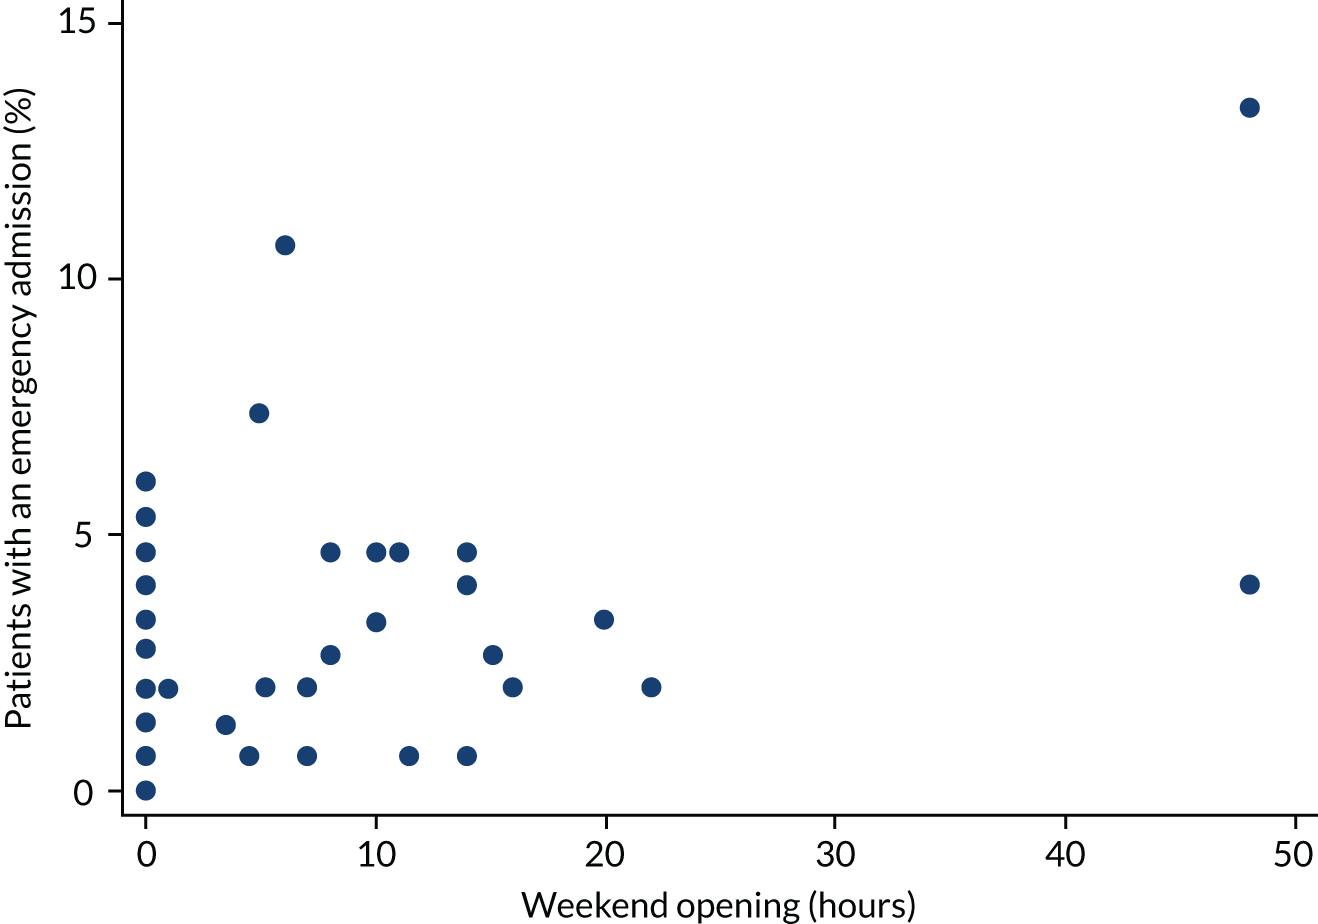
Fitting hierarchical logistic regression models for ‘emergency admission from the EPAU’ produced the results in Table 10. There is no evidence of an association with consultant time (p = 0.874) or unit volume (p = 0.247). However, there is evidence of an association with weekend opening hours (p = 0.027). That is, a 1-hour increase in weekend opening hours is associated with a 3.0% (95% CI 0.3% to 5.8%) higher odds of an emergency admission from the EPAU. These associations do not change after further confounder adjustment.
| Variable | Adjustment | OR (95% CI) | p-value |
|---|---|---|---|
| Consultant time (%) | FD + MA (n = 6397) | 1.001 (0.986 to 1.017) | 0.874 |
| Volume (per 100 visits) | 0.990 (0.974 to 1.007) | 0.247 | |
| Weekend opening (hours) | 1.030 (1.003 to 1.058) | 0.027 | |
| Consultant time (%) | FD + MA + DS + GAP (n = 5851) | 1.000 (0.984 to 1.017) | 0.969 |
| Volume (per 100 visits) | 0.991 (0.974 to 1.008) | 0.286 | |
| Weekend opening (hours) | 1.032 (1.003 to 1.063) | 0.031 |
See Report Supplementary Material 1, Table 10, for the results of repeating the analyses using categorical variables. There is no evidence of an association when using categorical variables.
A sensitivity analysis was performed by excluding (statistical) outliers from the analyses. Specifically, units with large residuals (absolute value > 1) were removed. The analysis adjusting for FD and MA excludes four units (i.e. BDX, CZX, WWR and WDI), whereas the analysis adjusting for FD, MA, DS and GAP excludes four units with large residuals (i.e. BDX, CZX, WWR and WDI) and a further unit (i.e. SXM) because of missing data (GAP).
See Report Supplementary Material 1, Table 11, for the results of refitting the multivariable logistic models for admissions. There is now strong evidence of an association with weekend opening hours (p = 0.001) and weak evidence of an association with unit volume (p = 0.169). These associations do not change after further confounder adjustment.
We also recorded the actual amount of time the consultants spent in the EPAU delivering clinical care and compared it with the planned consultant presence (Figure 15). We found that, in general, the actual amount of time spent by the consultants in the units was less than planned and they were present for > 5% of time in just five units.
FIGURE 15.
Actual vs. planned consultant presence in the EPAU.
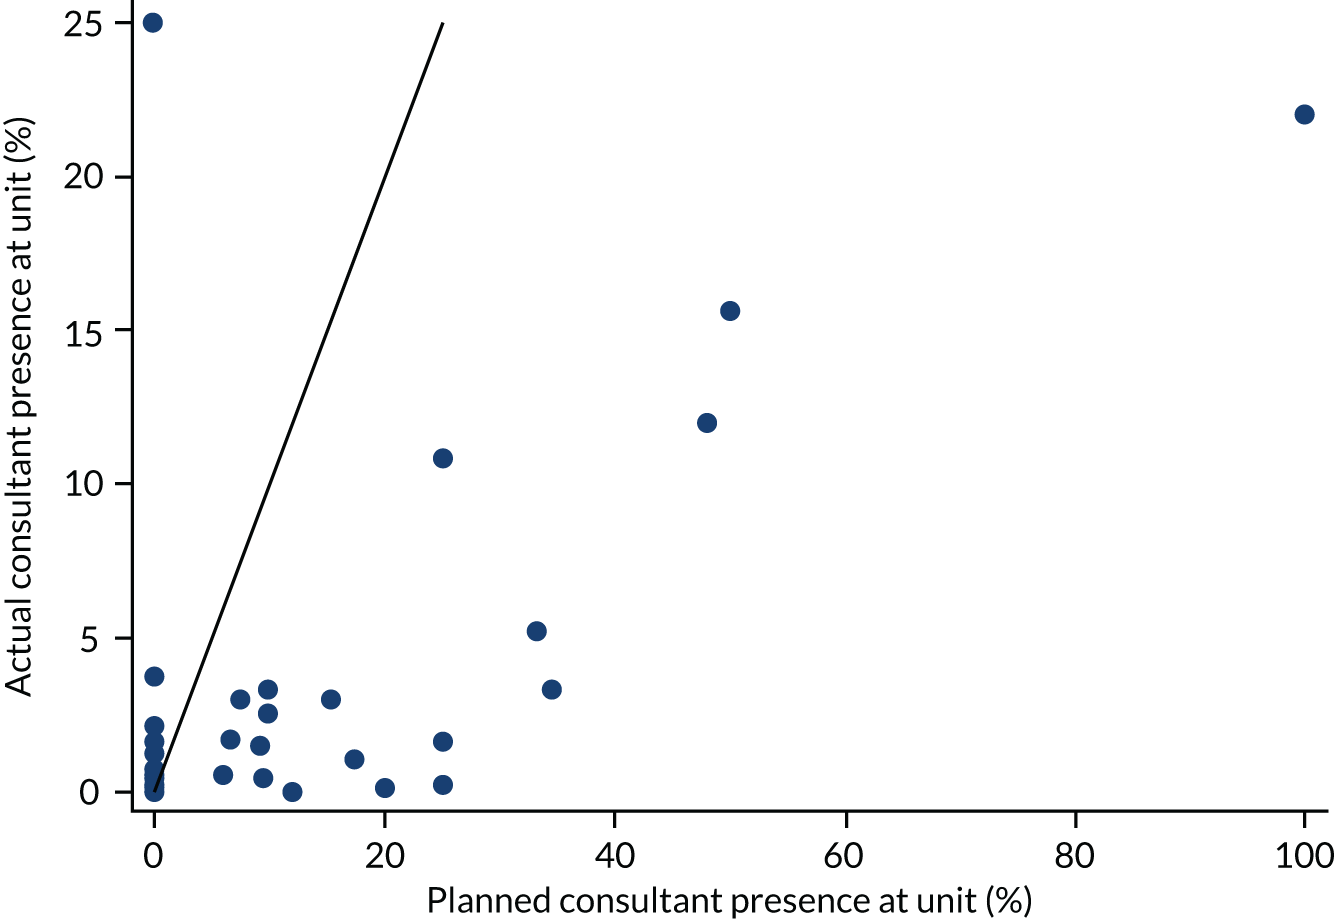
We then compared the emergency admissions and actual consultant presence (Figure 16).
FIGURE 16.
Emergency admissions from the EPAU and actual consultant presence.
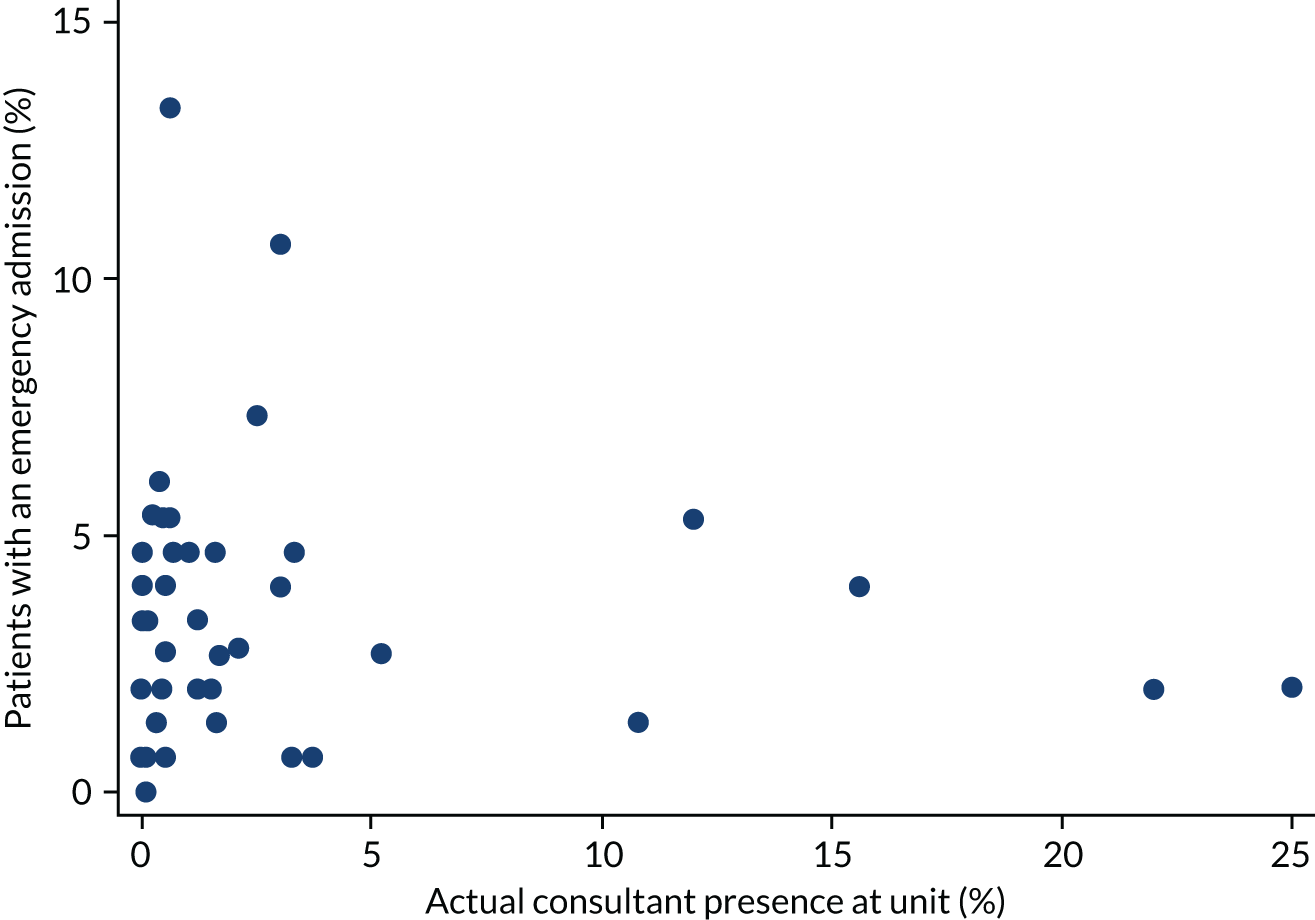
We then repeated the analysis based on the actual consultant presence in the EPAU. The analyses adjusted for FD and MA were based on 6397 patients (97% of the total), whereas the analyses adjusted for FD, MA, DS and GAP were based on 5841 patients (43 units) (see Report Supplementary Material 1, Table 12).
There was no evidence of an association between the admission rate and consultant presence (p = 0.497). This relationship was consistent across adjustment models and different definitions of consultant presence.
As a sensitivity analysis, we also investigated this association by using a binary variable indicating consultant presence at each unit (see Report Supplementary Material 1, Table 13).
There was little evidence of an association between the admission rate and actual consultant presence (p = 0.376).
Emergency admissions as a proportion of women attending accident and emergency
We then investigated the relationship between emergency admissions from A&E and consultant presence, unit volume and weekend opening hours. We used a binary outcome for whether or not a patient had an emergency admission from A&E. This analysis is based on just 29 units (5464 patients). In total, 1445 (26.5%) patients had an emergency admission from A&E. The percentage of emergency admissions from A&E ranges from 7% to 58%, with the majority of the units having an emergency admission rate of between 10% and 30%.
The relationship between emergency admissions from A&E and consultant presence is shown in Figure 17. There is no obvious trend.
FIGURE 17.
Emergency admissions from A&E vs. consultant presence for each unit.
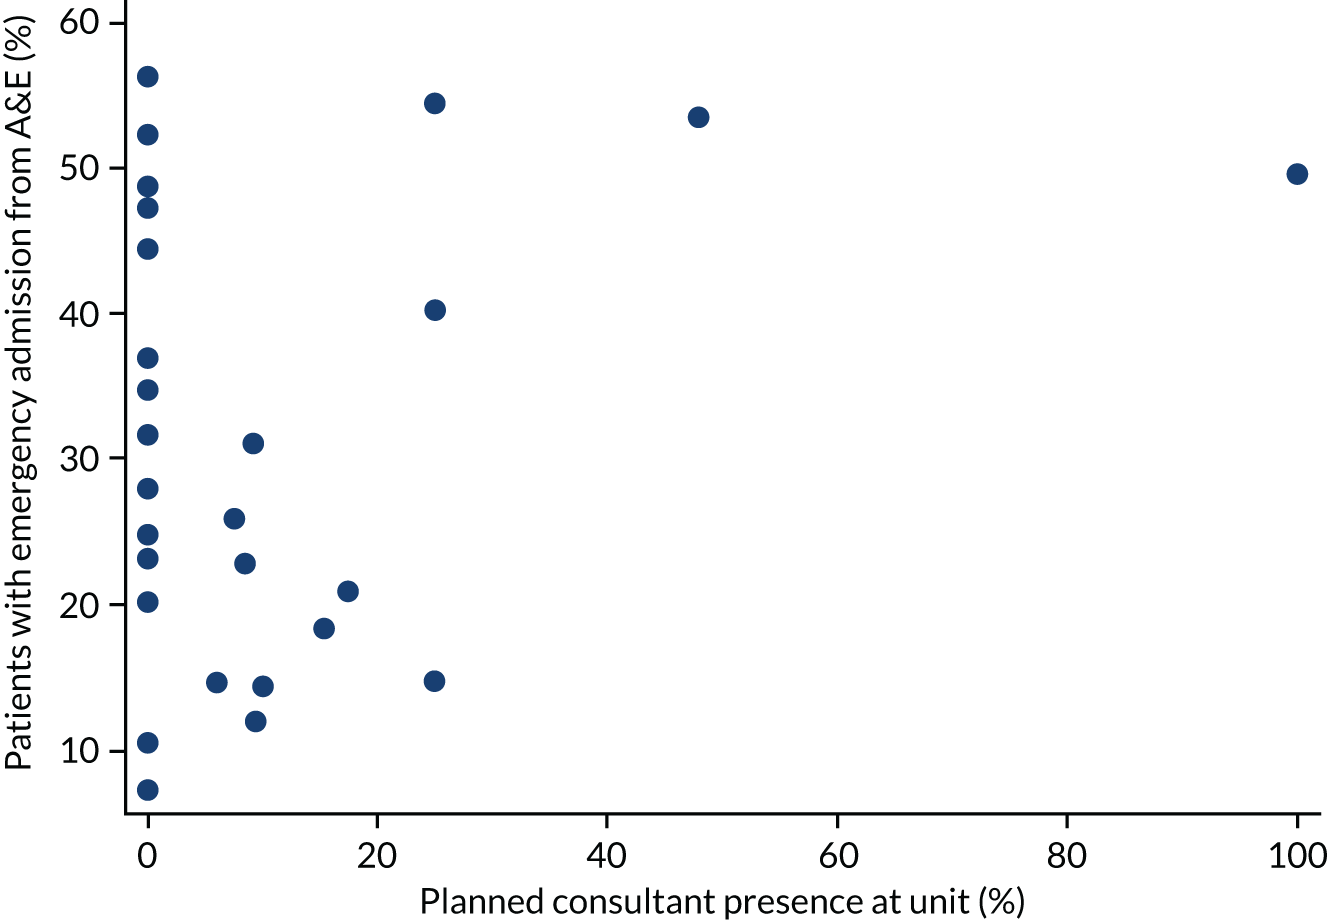
The relationship between emergency admissions from A&E and unit volume is shown in Figure 18. There is an indication of a decreasing trend.
FIGURE 18.
Emergency admissions from A&E vs. unit volume for each unit.
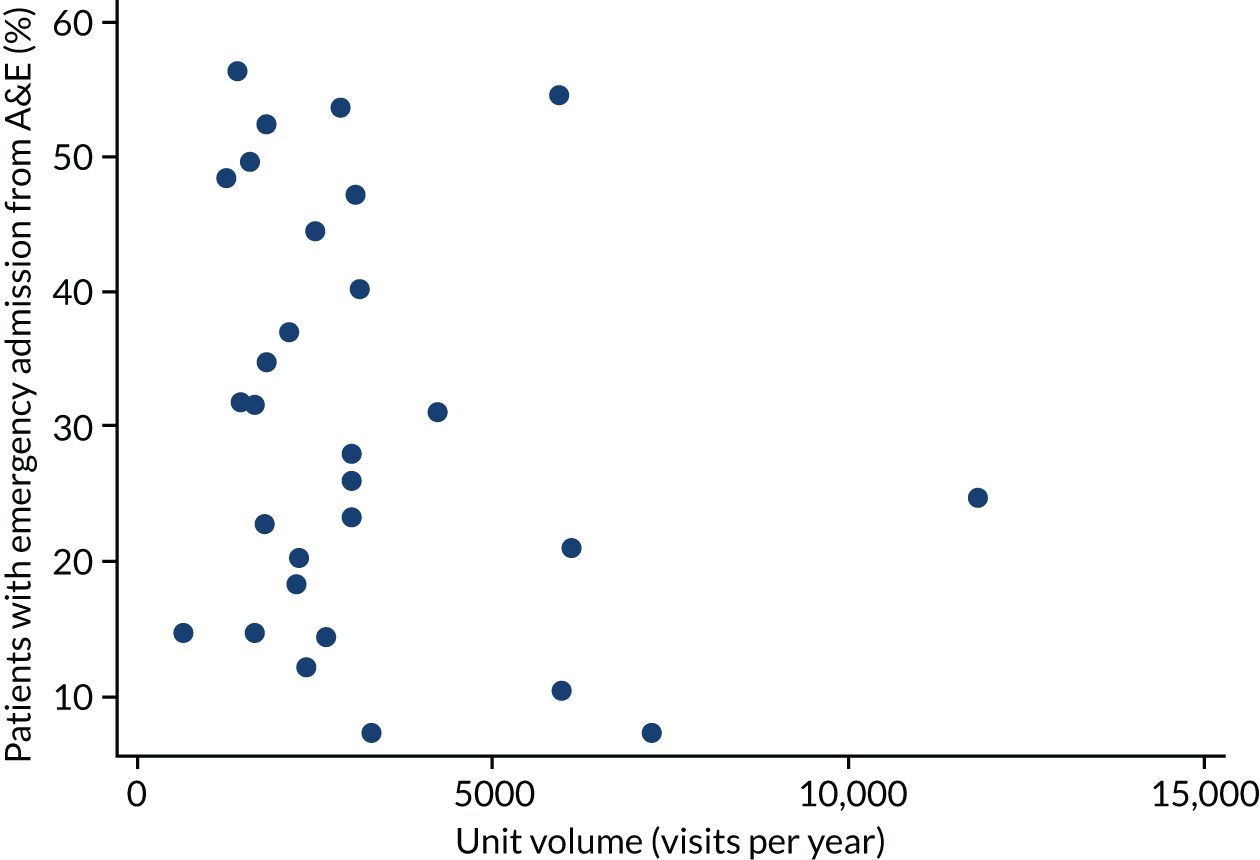
The relationship between emergency admissions from A&E and weekend opening is shown in Figure 19. There is a suggestion of a negative association between emergency admissions and weekend opening.
FIGURE 19.
Emergency admissions from A&E vs. weekend opening for each unit.
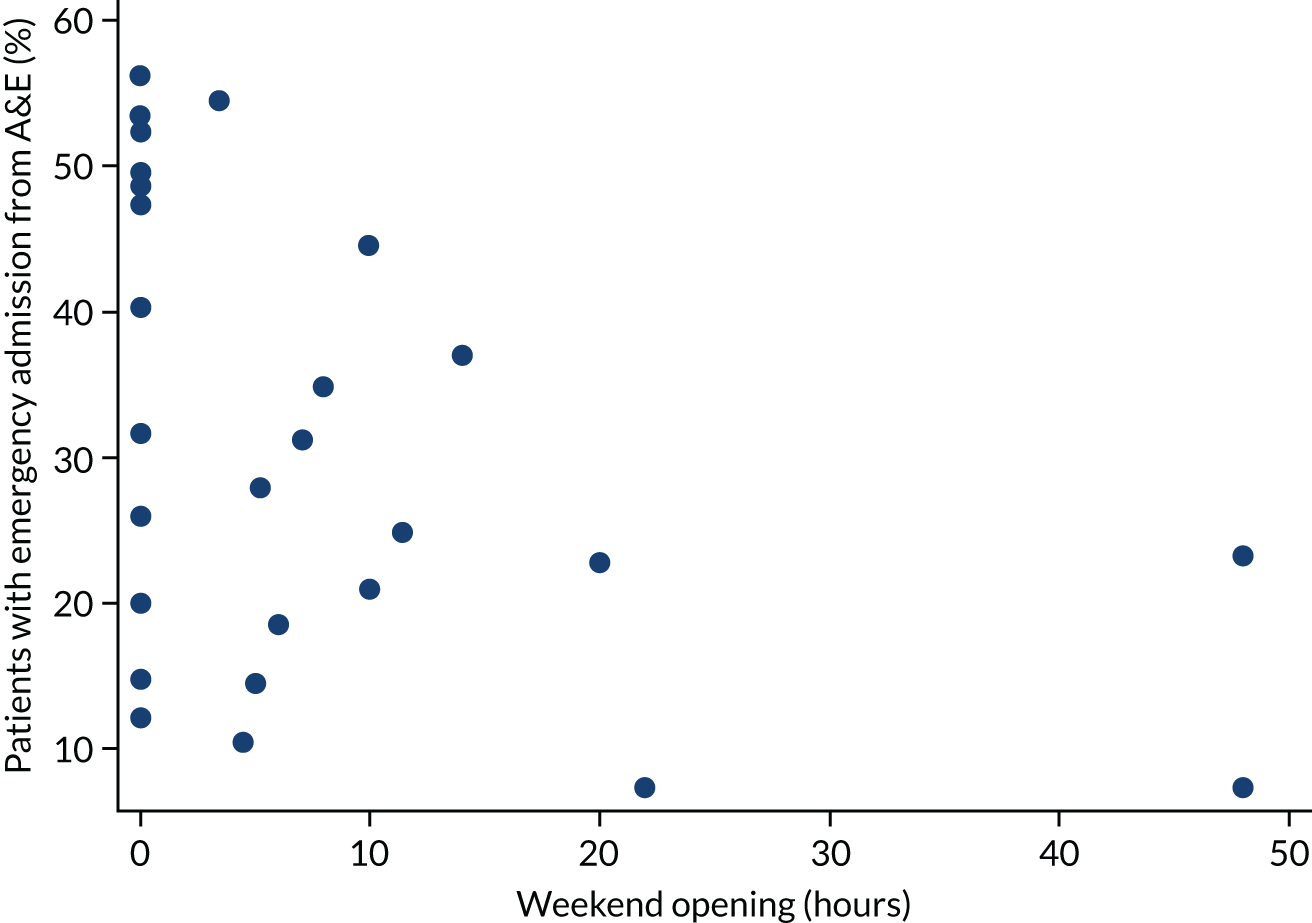
Fitting multivariable logistic models for ‘emergency admissions from A&E’ produced the following results (see also Report Supplementary Material 1, Table 14). These models were either not adjusted for potential confounders or adjusted for the GAP only. There is some evidence of an association between the emergency admissions from A&E and weekend opening (p = 0.037). A 1-hour increase in weekend opening hours is associated with 2.4% (95% CI 0.1% to 4.7%) lower odds of an emergency admission from A&E. However, there is no evidence of an association with unit volume (p = 0.647) or planned consultant time (p = 0.280). Adjusting for GAP does not change the conclusions. Repeating the analysis with categorical variables also leads to similar conclusions.
Ratio of emergency admissions from the EPAU and accident and emergency
The proportion of emergency admissions via the EPAU out of the total number of emergency admissions was calculated for 29 units, after adjusting for the different time periods used for data collection in the EPAU and emergency care audit data sets:
The relationship between the number of emergency admissions from the EPAU and A&E is shown in Figure 20. The number of emergency admissions via A&E is higher than that for the EPAU for the majority of the units (23/29).
FIGURE 20.
Emergency admissions from the EPAU vs. A&E over a period of 3 months.
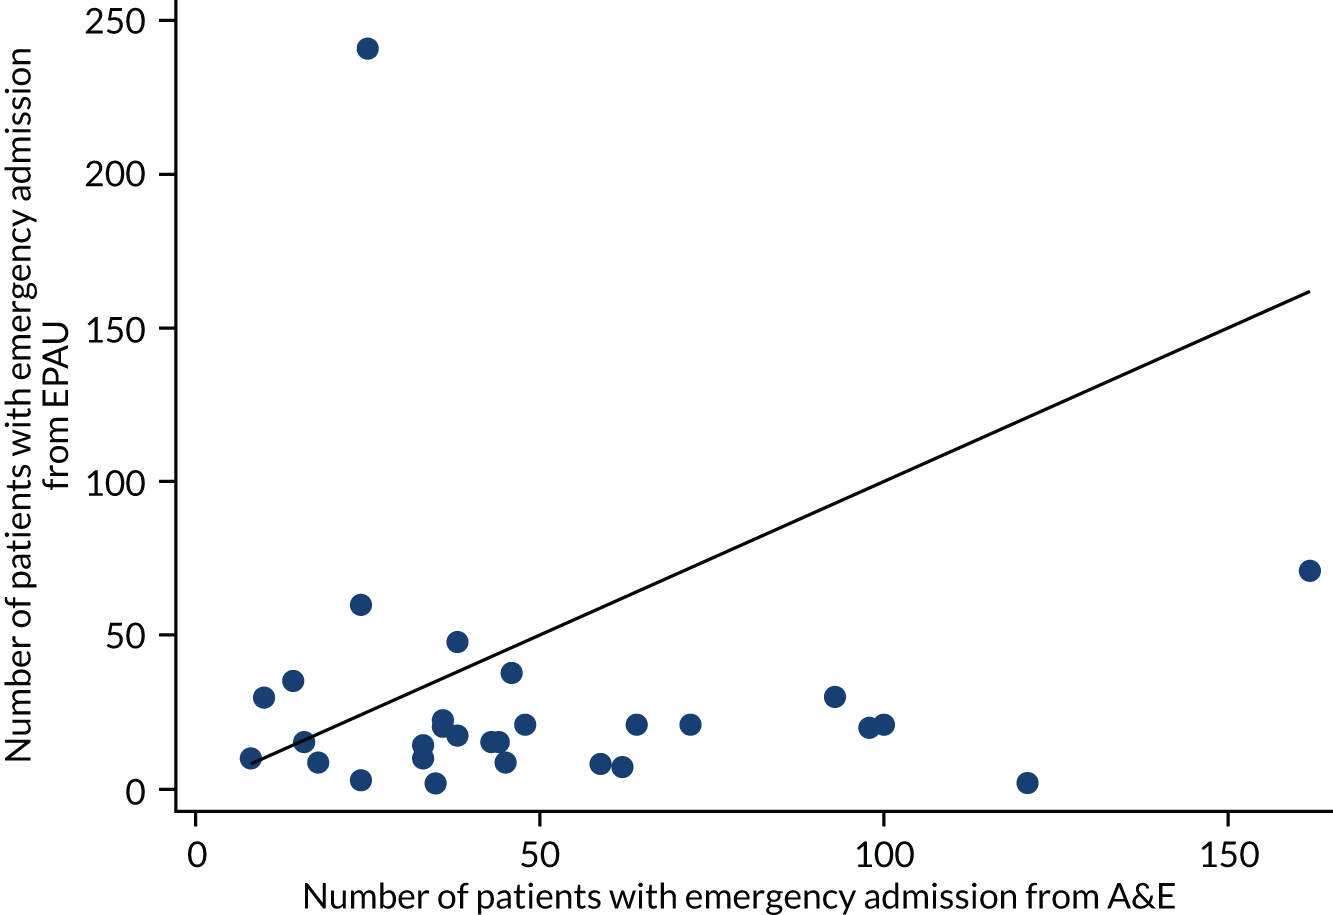
The distribution of the percentage of emergency admissions via the EPAU out of the total emergency admissions is shown in Figure 21. The distribution is right-skewed and hence we used a log-transformation for our analyses.
FIGURE 21.
Percentage of emergency admissions via the EPAU out of the total number of emergency admissions across units.
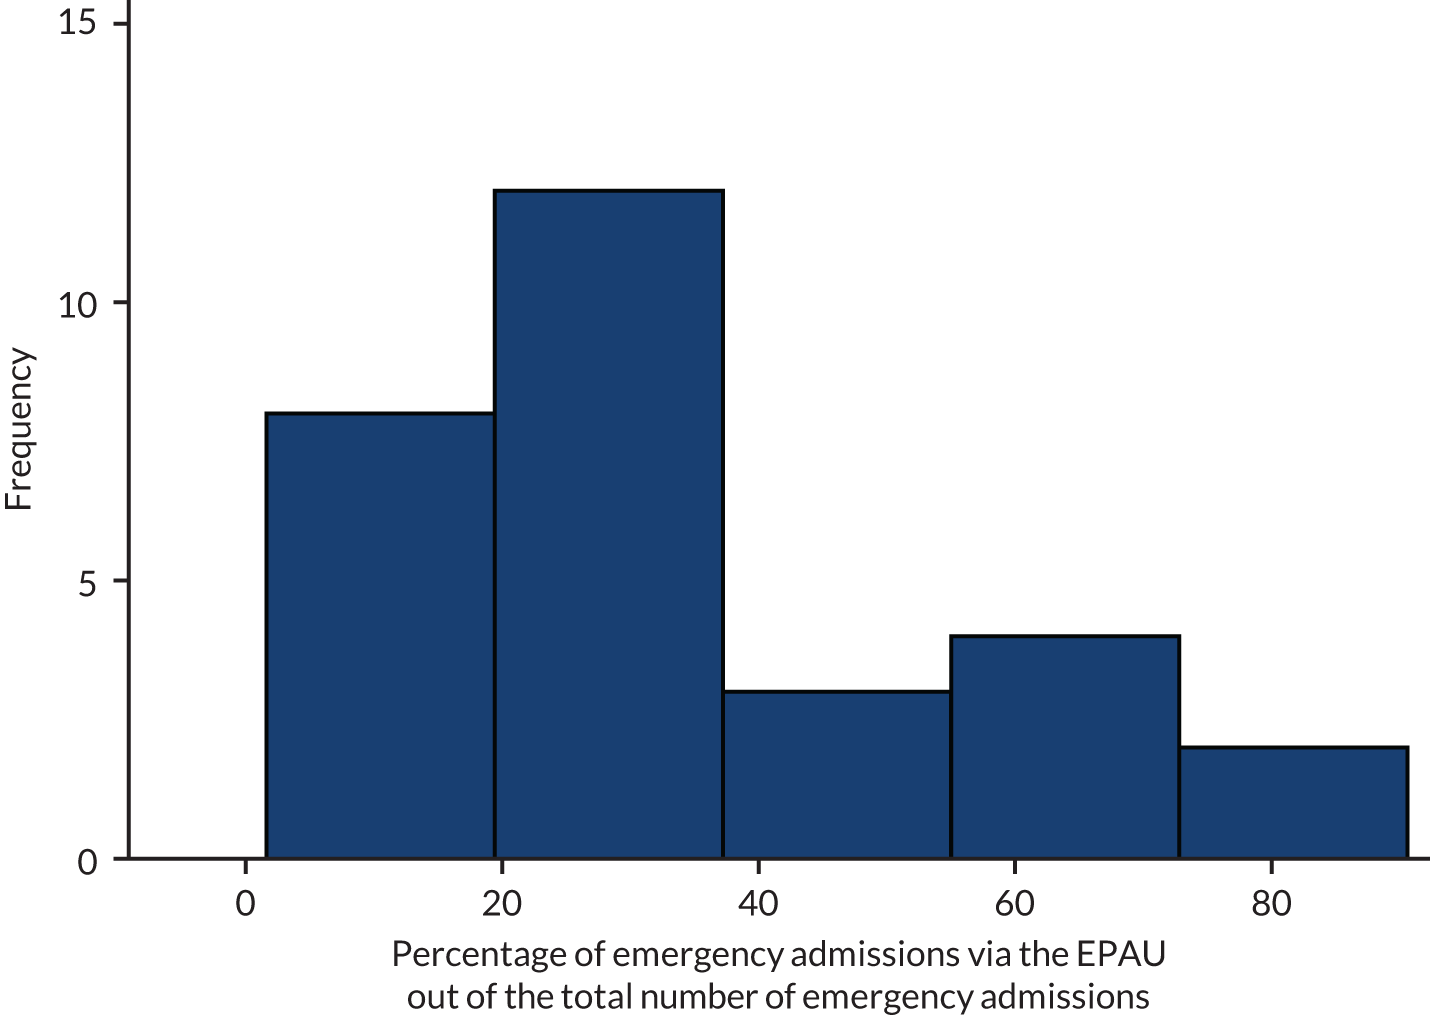
The relationship between the percentage of emergency admissions via the EPAU and consultant presence is shown in Figure 22. There is perhaps a suggestion of a negative association.
FIGURE 22.
Percentage of emergency admissions via the EPAU out of the total number of emergency admissions vs. consultant presence for each unit.
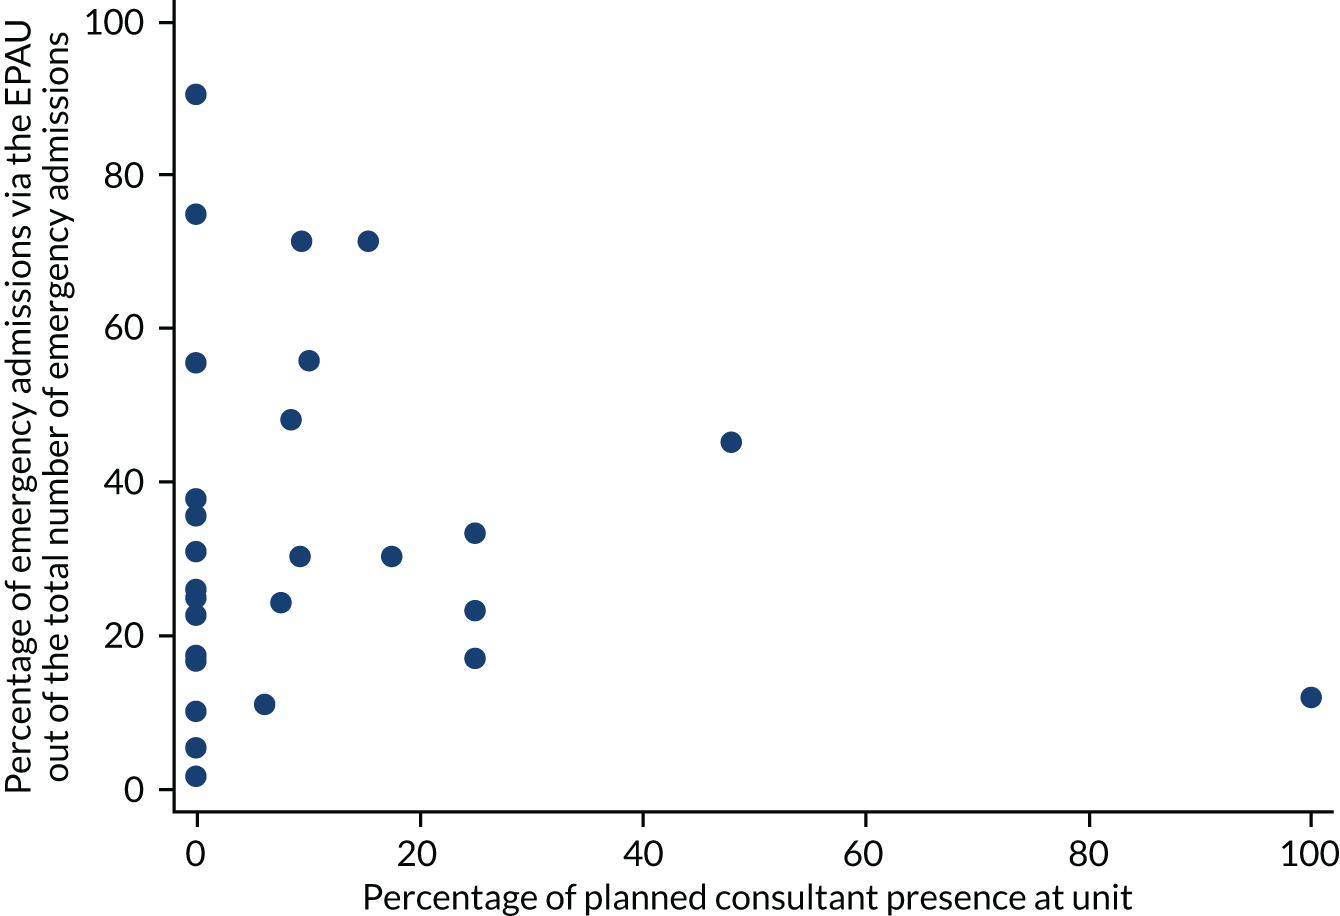
The relationship between the percentage of emergency admissions via the EPAU and unit volume is shown in Figure 23. There is a suggestion of a positive association between the variables.
FIGURE 23.
Percentage of emergency admissions via the EPAU out of the total number of emergency admissions vs. unit volume for each unit.
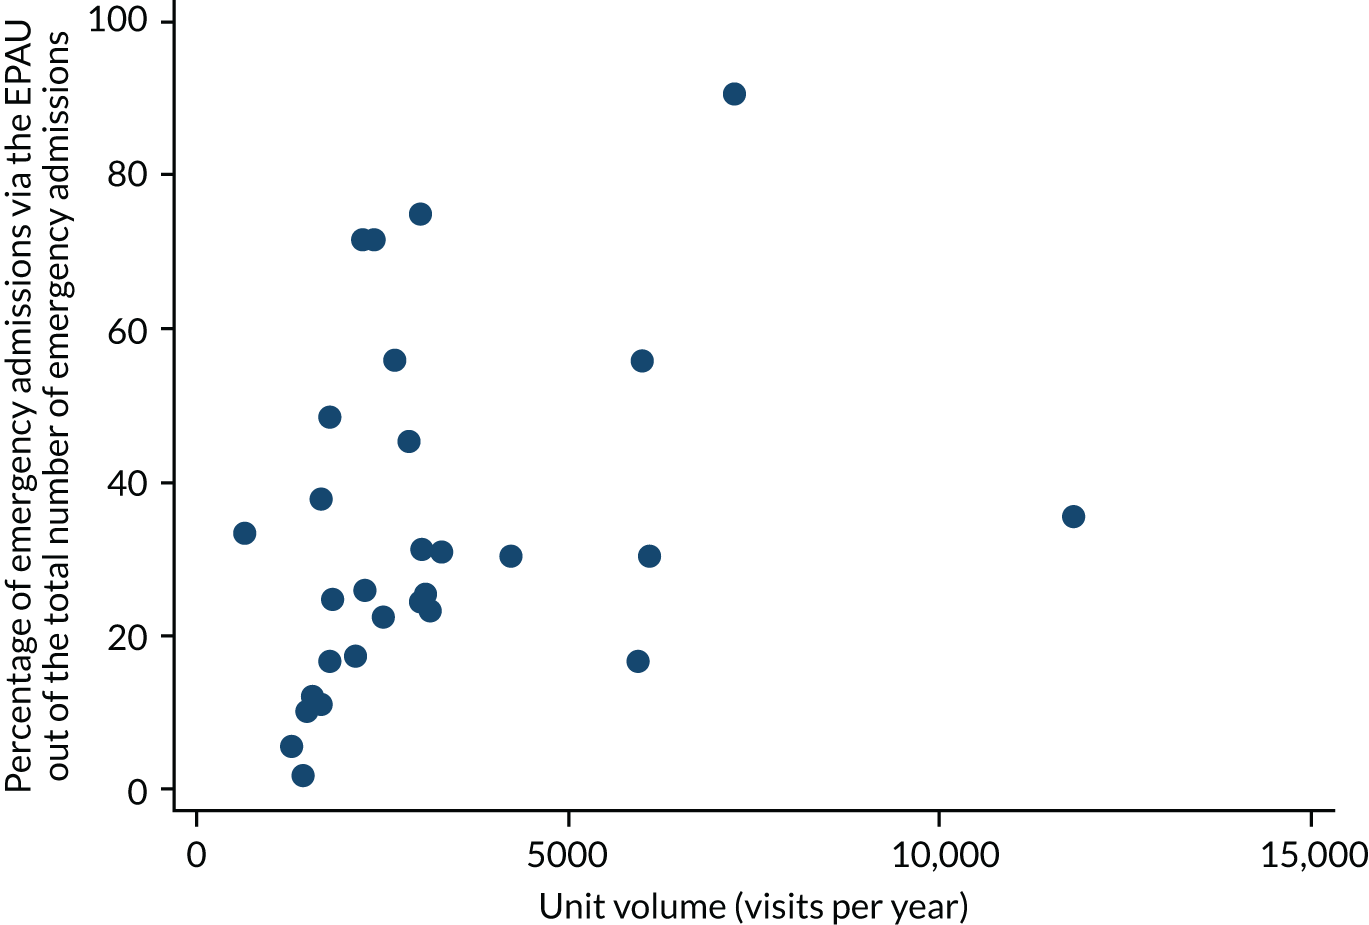
The relationship between the percentage of emergency admissions via the EPAU and weekend opening is shown in Figure 24. There appears to be a positive association.
FIGURE 24.
Percentage of emergency admissions via the EPAU out of the total number of emergency admissions vs. weekend opening for each unit.
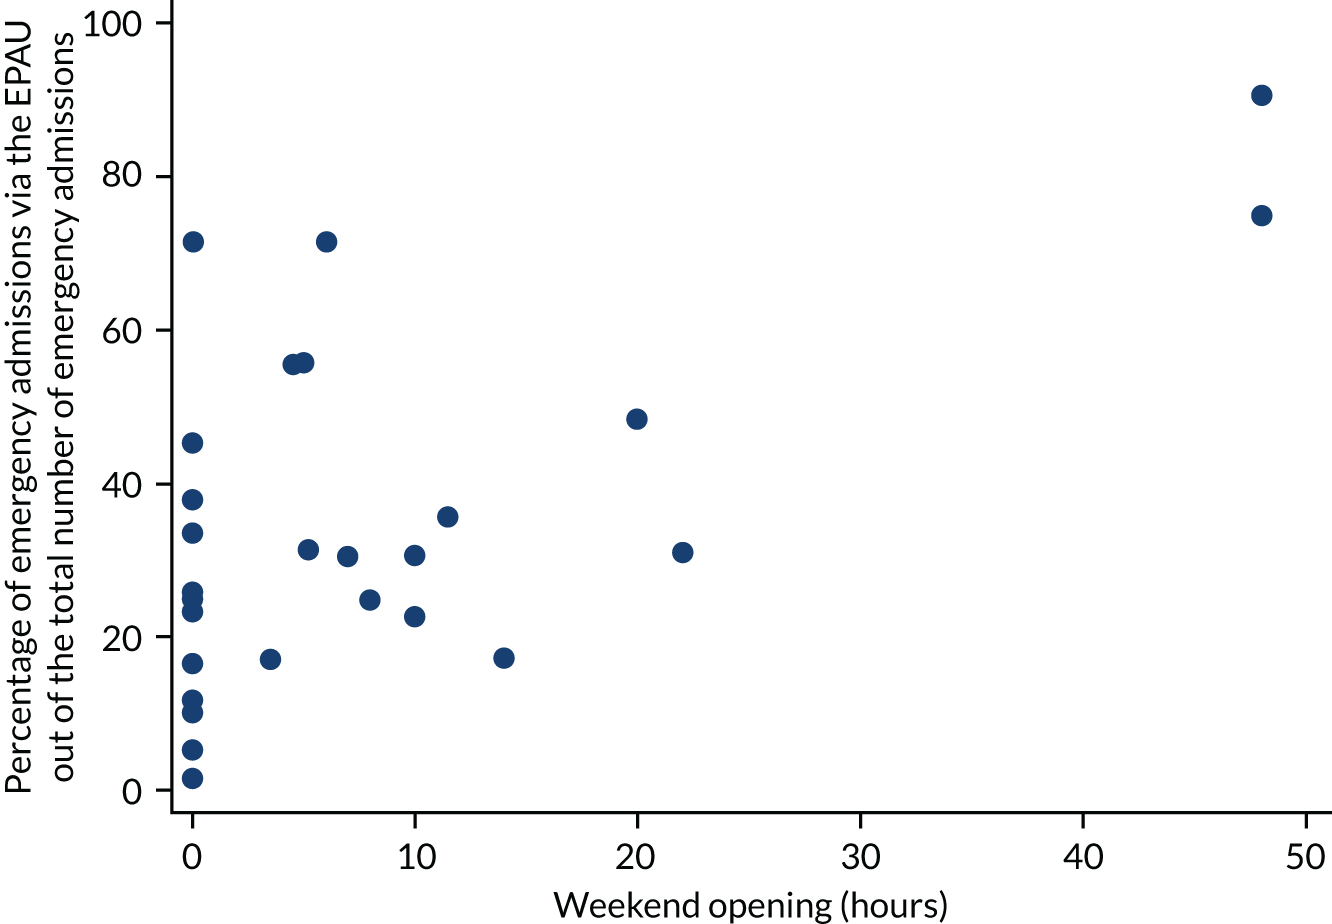
Report Supplementary Material 1, Table 15, shows the results of fitting multivariable linear regression models for ‘(log)-proportion of emergency admissions via the EPAU’. There is evidence that the proportion increases as weekend opening hours increase (p = 0.040).
Primary outcome analysis: key findings
-
Consultant presence (both planned and actual) had no significant effect on emergency admission rates from EPAUs.
-
Unit volume was not significantly associated with emergency admission rates.
-
Emergency admissions through EPAUs were significantly higher with weekend opening.
-
Rates of emergency admissions from A&E were significantly higher than admissions from the EPAU.
-
Emergency admissions from A&E were significantly lower in EPAUs with weekend service, but there was no association with planned consultant time or unit volume.
Secondary outcomes
Ratio of new to follow-up visits
We investigated the association between the ratio of new to follow-up visits and consultant presence, unit volume and weekend opening hours, using a binary outcome to indicate whether or not a patient had three or more visits.
The relationship between this outcome and consultant presence is shown in Figure 25.
FIGURE 25.
The percentage of patients with three or more visits vs. planned consultant presence for each unit.
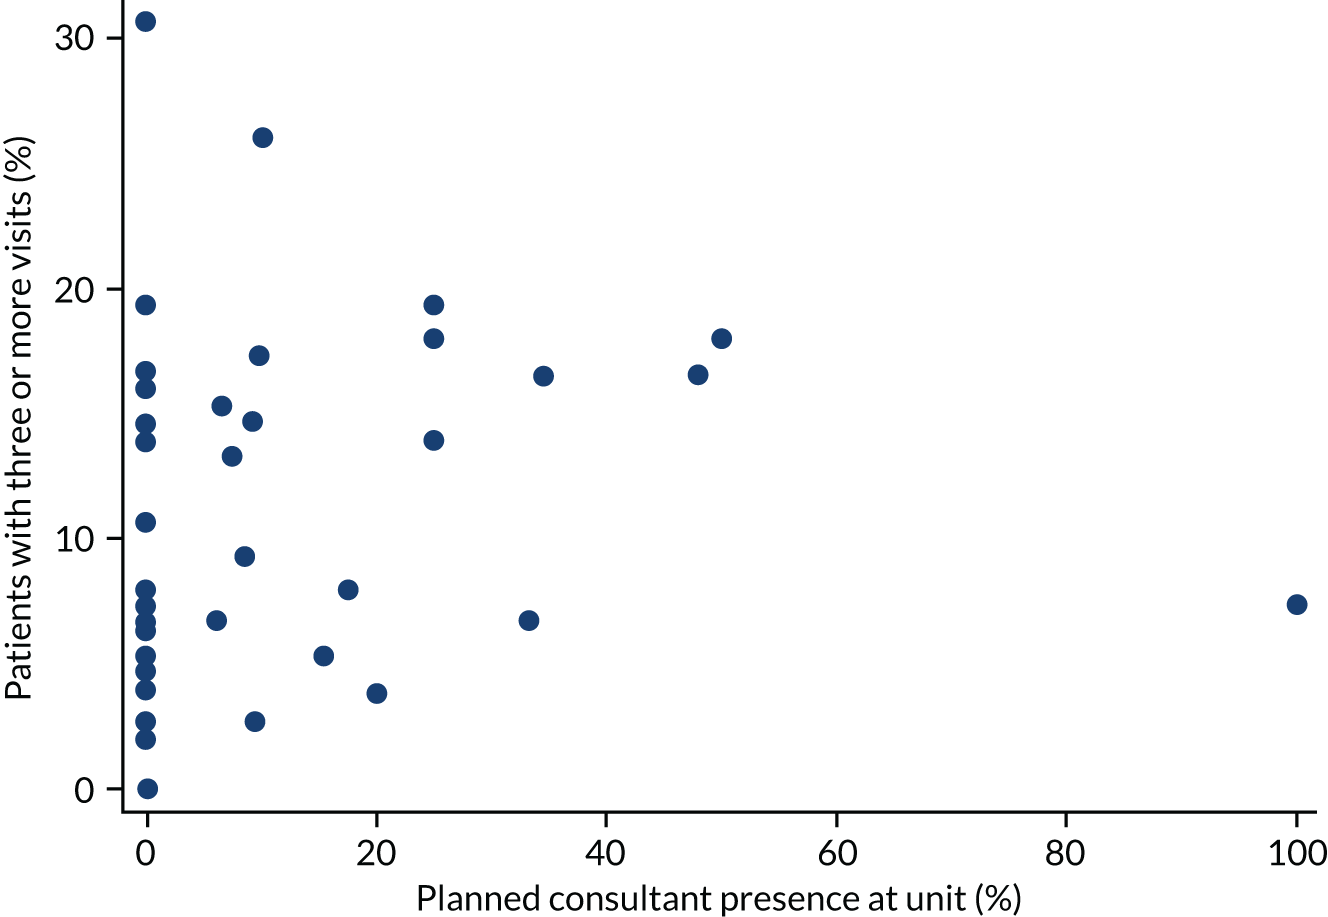
The relationship between the ratio of new visits to follow-up visits and unit volume is shown in Figure 26. There is a suggestion that the percentage of patients with three or more visits increases as unit volume increases.
FIGURE 26.
The percentage of patients with three or more visits vs. unit volume for each unit.
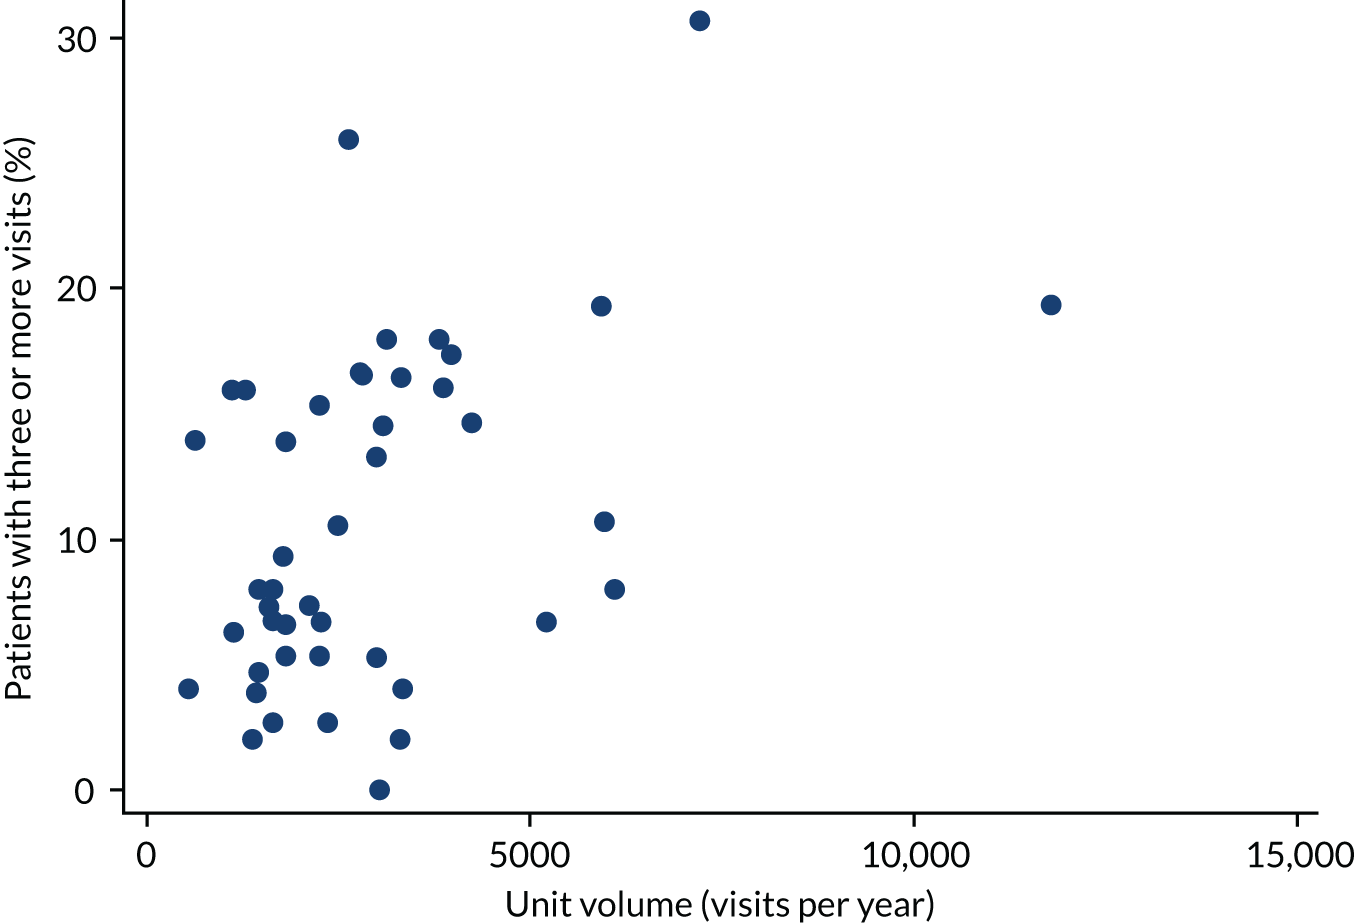
The relationship between the ratio of new visits to follow-up visits and weekend opening hours is shown in Figure 27.
FIGURE 27.
The percentage of patients with three or more visits vs. weekend opening for each unit.
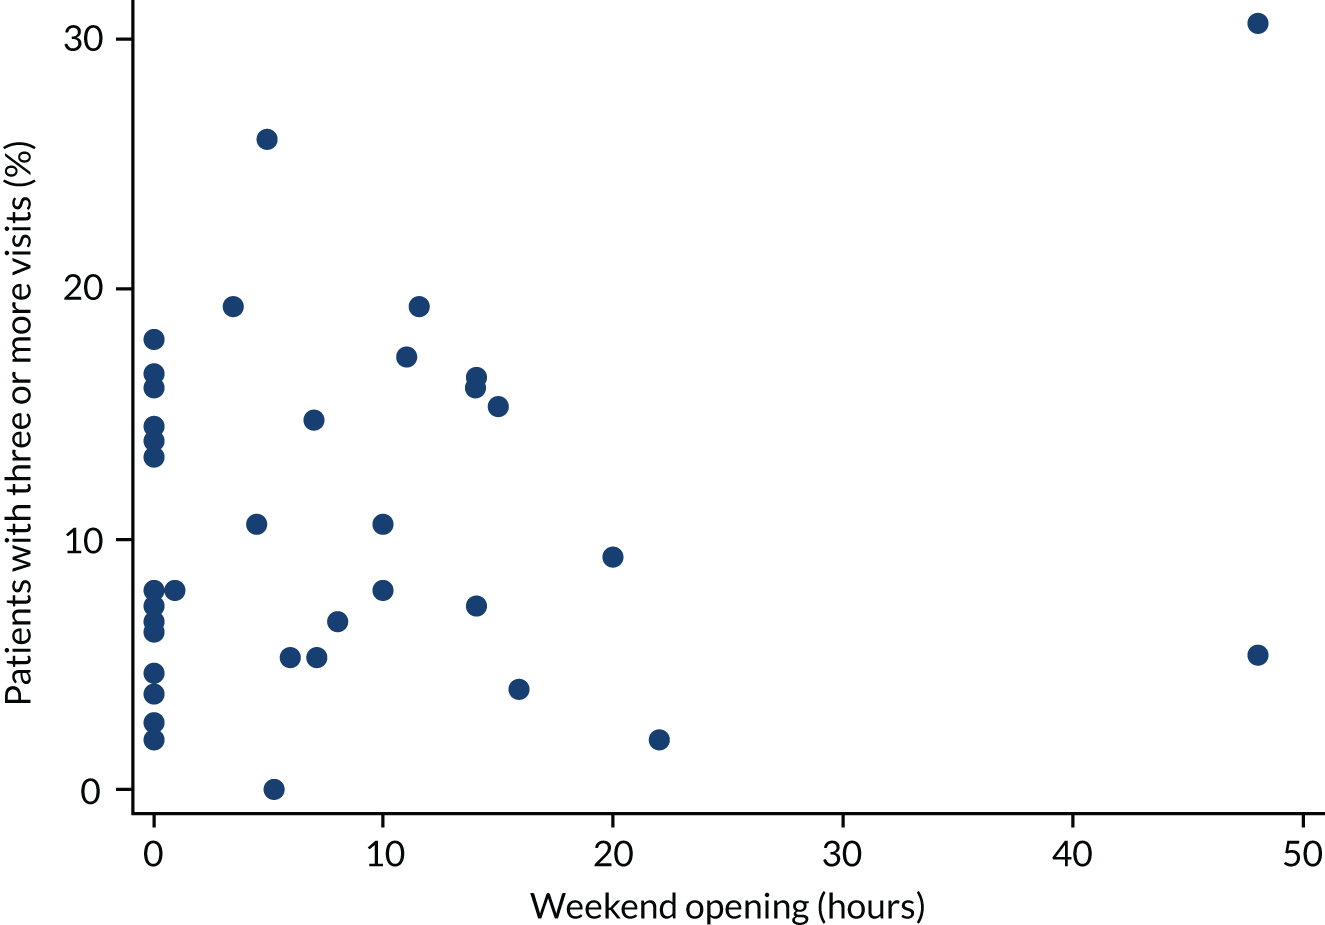
Report Supplementary Material 1, Table 16, shows the results of fitting multivariable logistic regression models for the ‘proportion of patients with three or more visits’. There is no evidence of an association with planned consultant time (p = 0.281) or weekend opening (p = 0.443). However, there is evidence of an association with unit volume (p = 0.025).
We also considered the relationship between the number of patient visits and consultant presence, unit volume and weekend opening hours.
The relationship between the number of visits and consultant presence is shown in Figure 28. There is little suggestion of an association.
FIGURE 28.
Number of visits vs. planned consultant presence for each unit.
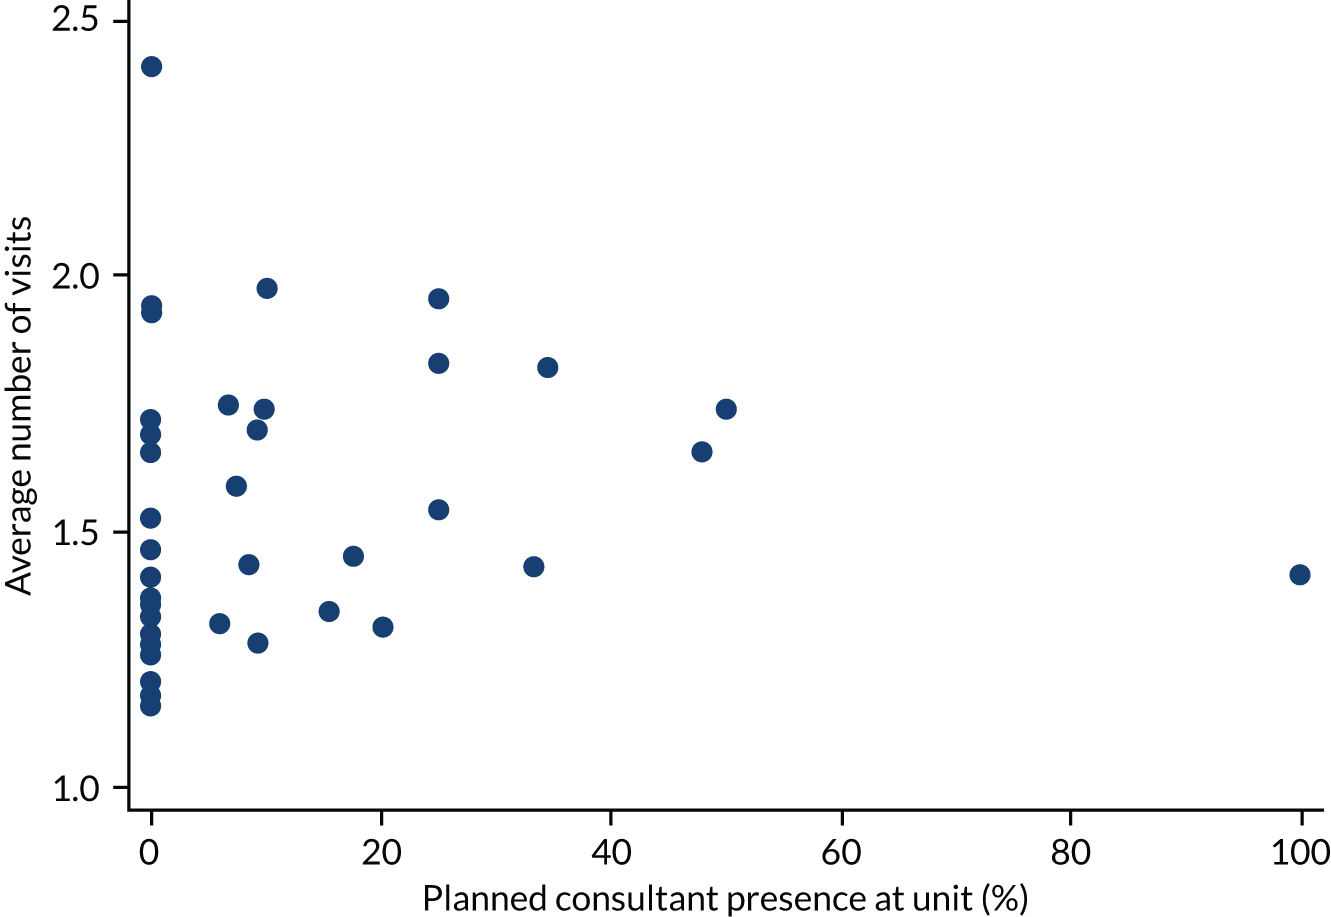
The relationship between the number of visits and unit volume is shown in Figure 29. The number of visits appear to increase as unit volume increases.
FIGURE 29.
Number of visits vs. unit volume for each unit.
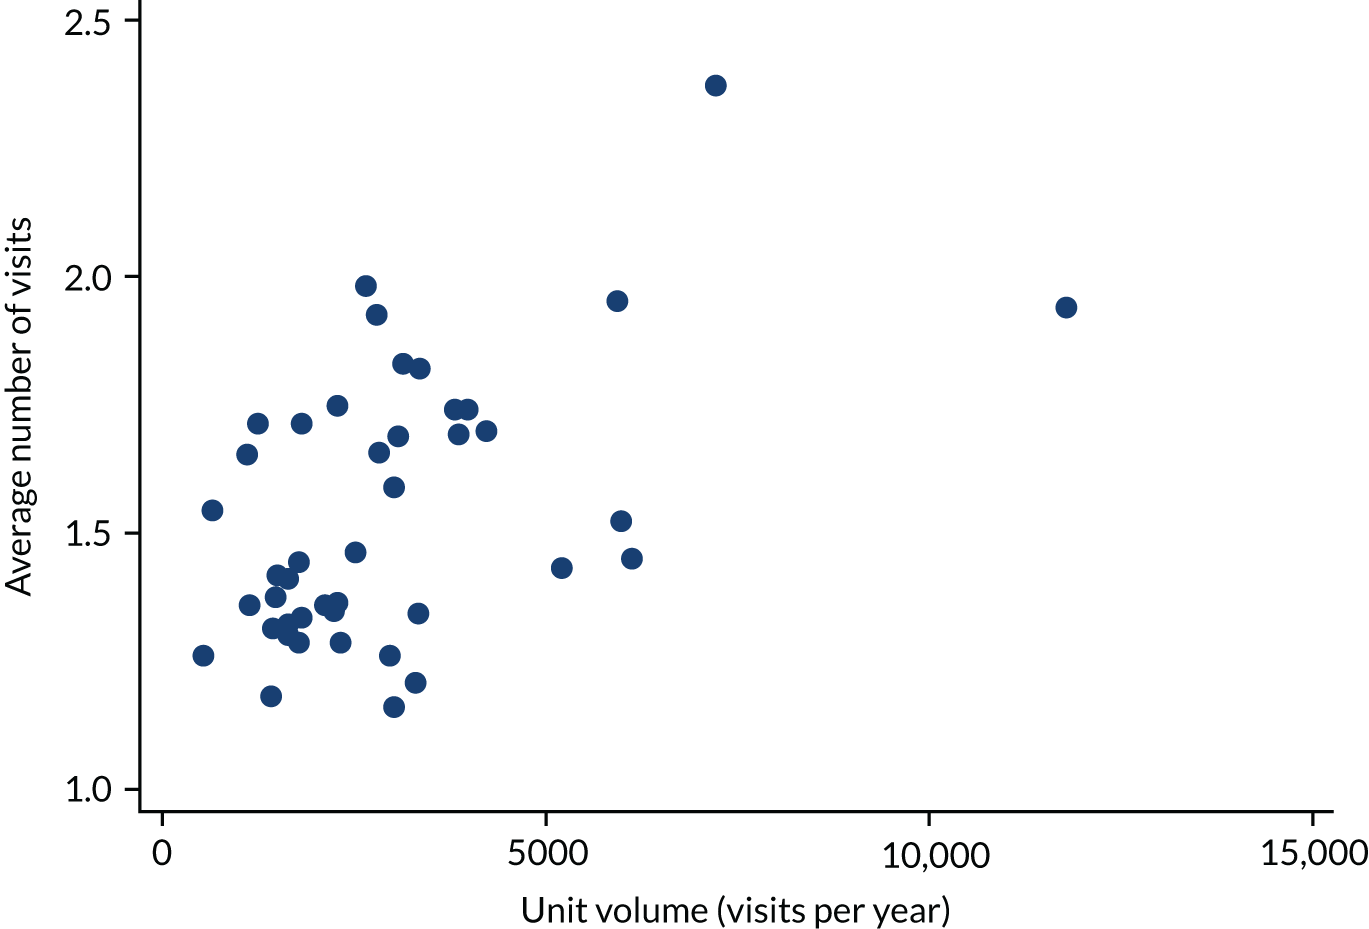
The relationship between the number of visits and weekend opening hours is shown in Figure 30.
FIGURE 30.
Number of visits vs. weekend opening for each unit.
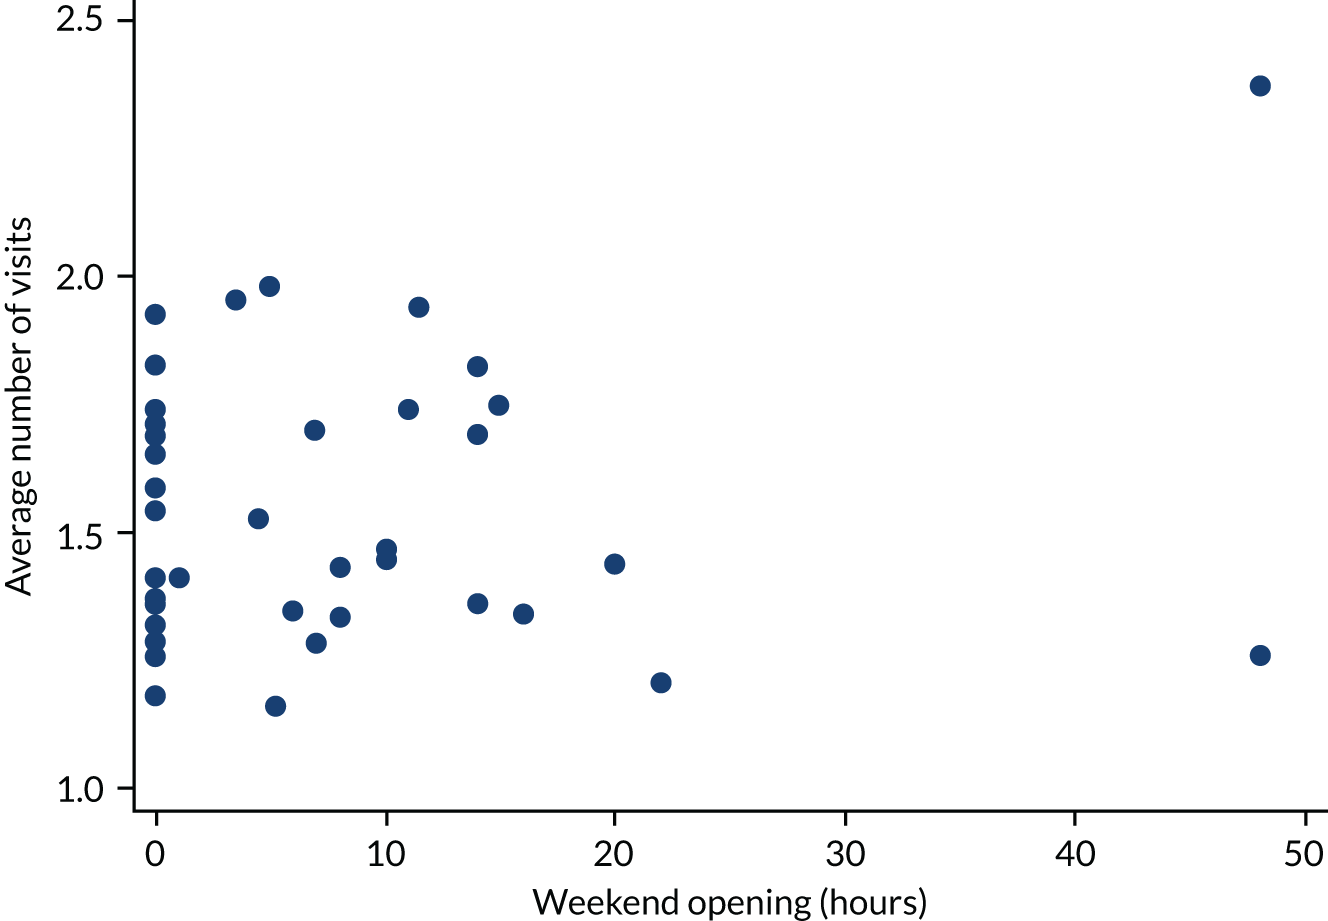
Report Supplementary Material 1, Table 17, shows the results of fitting multivariable Poisson regression models for the number of visits. There is evidence that the number of visits increase as unit volume increases (p = 0.002).
Rate of pregnancy of unknown location
We analysed the relationship between the PUL rate at the initial visit and consultant presence, unit volume and weekend opening hours.
The relationships between the PUL rate at first scan and consultant presence, unit volume and weekend openings are shown in Figures 31–33, respectively.
FIGURE 31.
Rate of PUL scans at first scan vs. planned consultant presence for each unit.
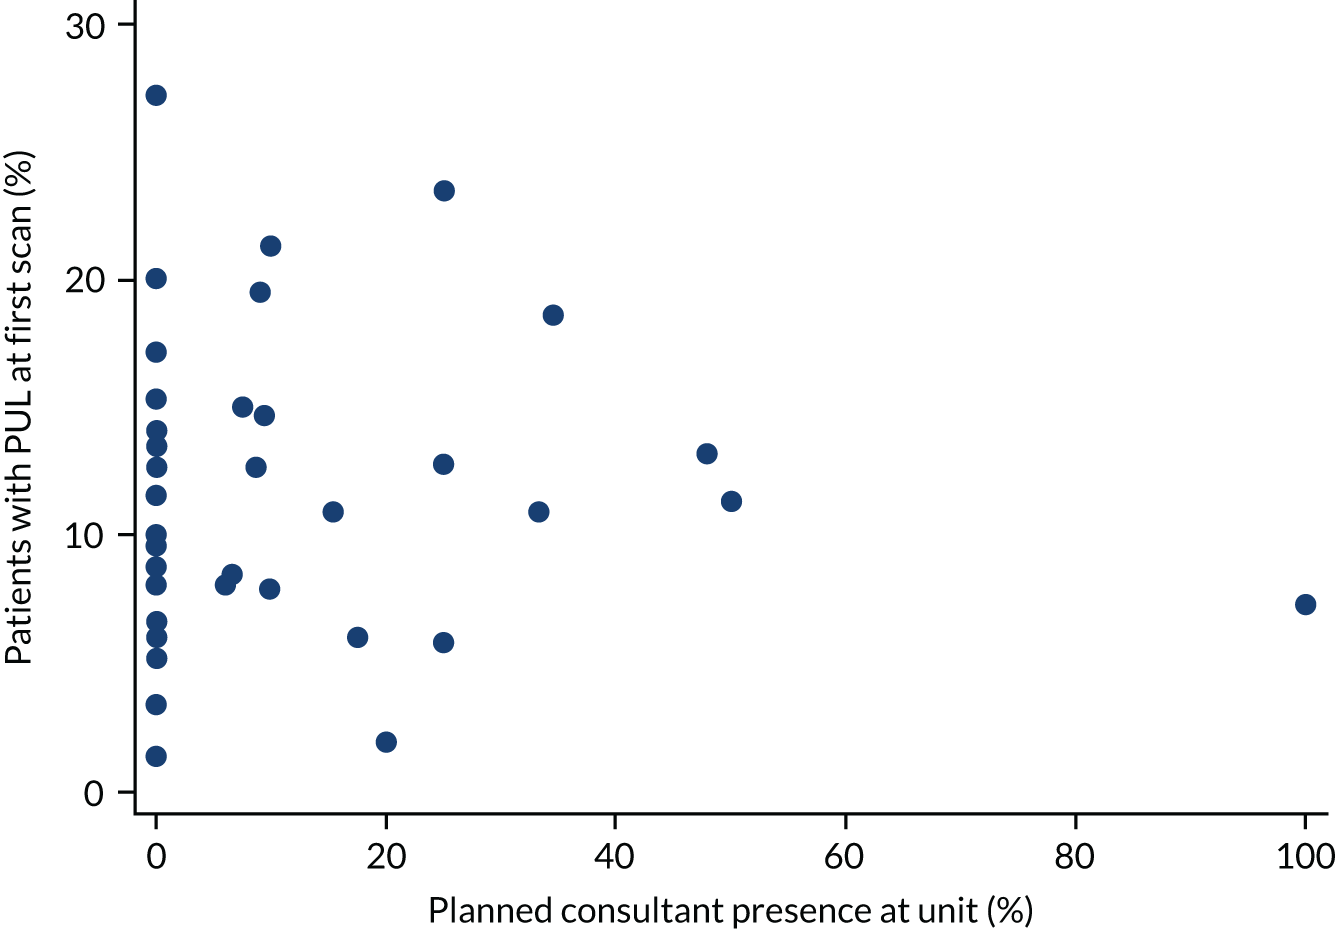
FIGURE 32.
Rate of PUL scans at first visit vs. unit volume for each unit.
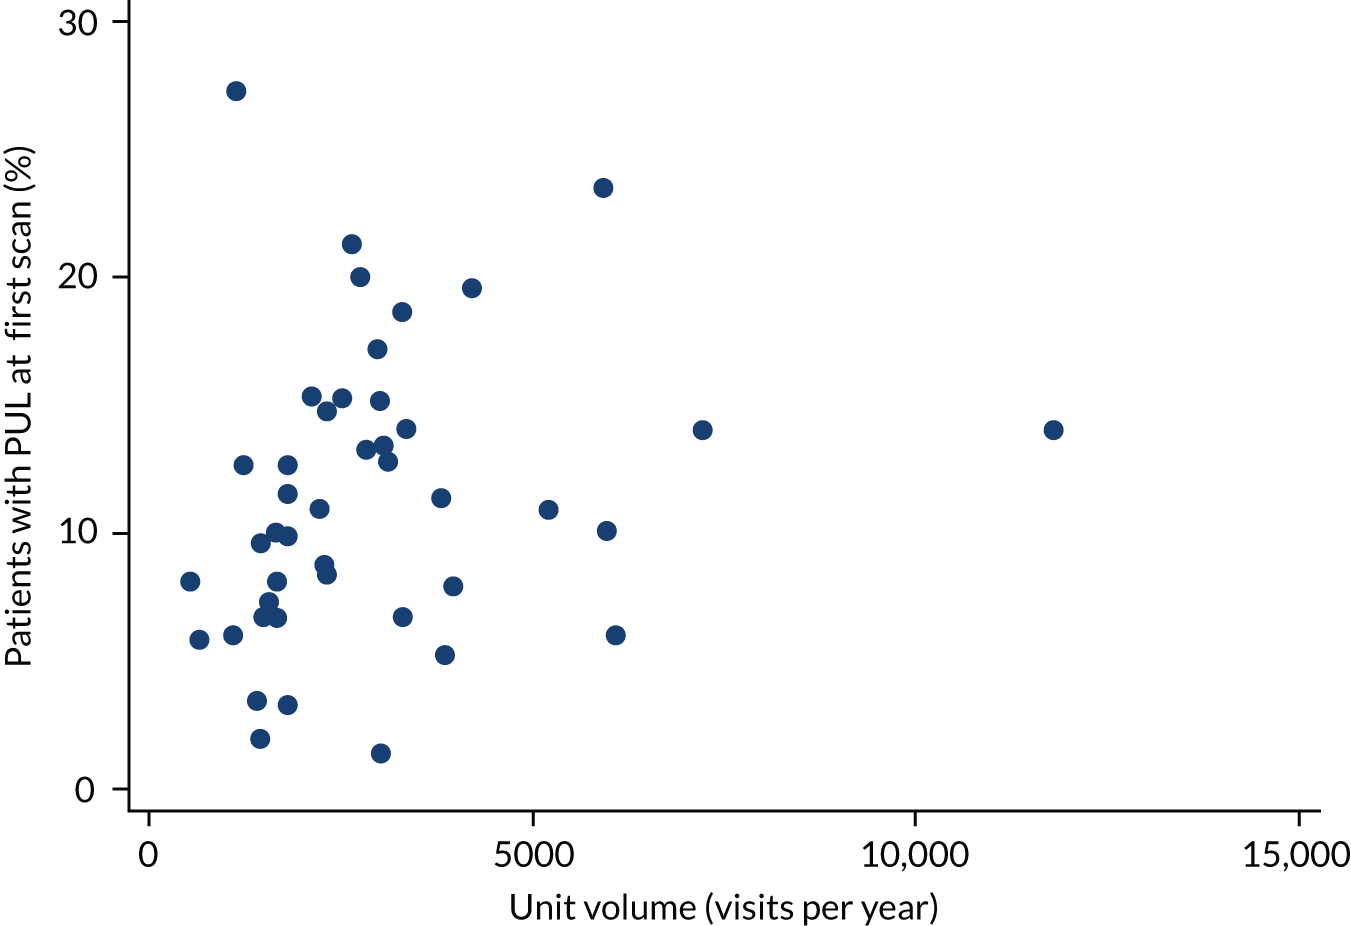
FIGURE 33.
Rate of PUL scans at first visit vs. weekend opening for each unit.
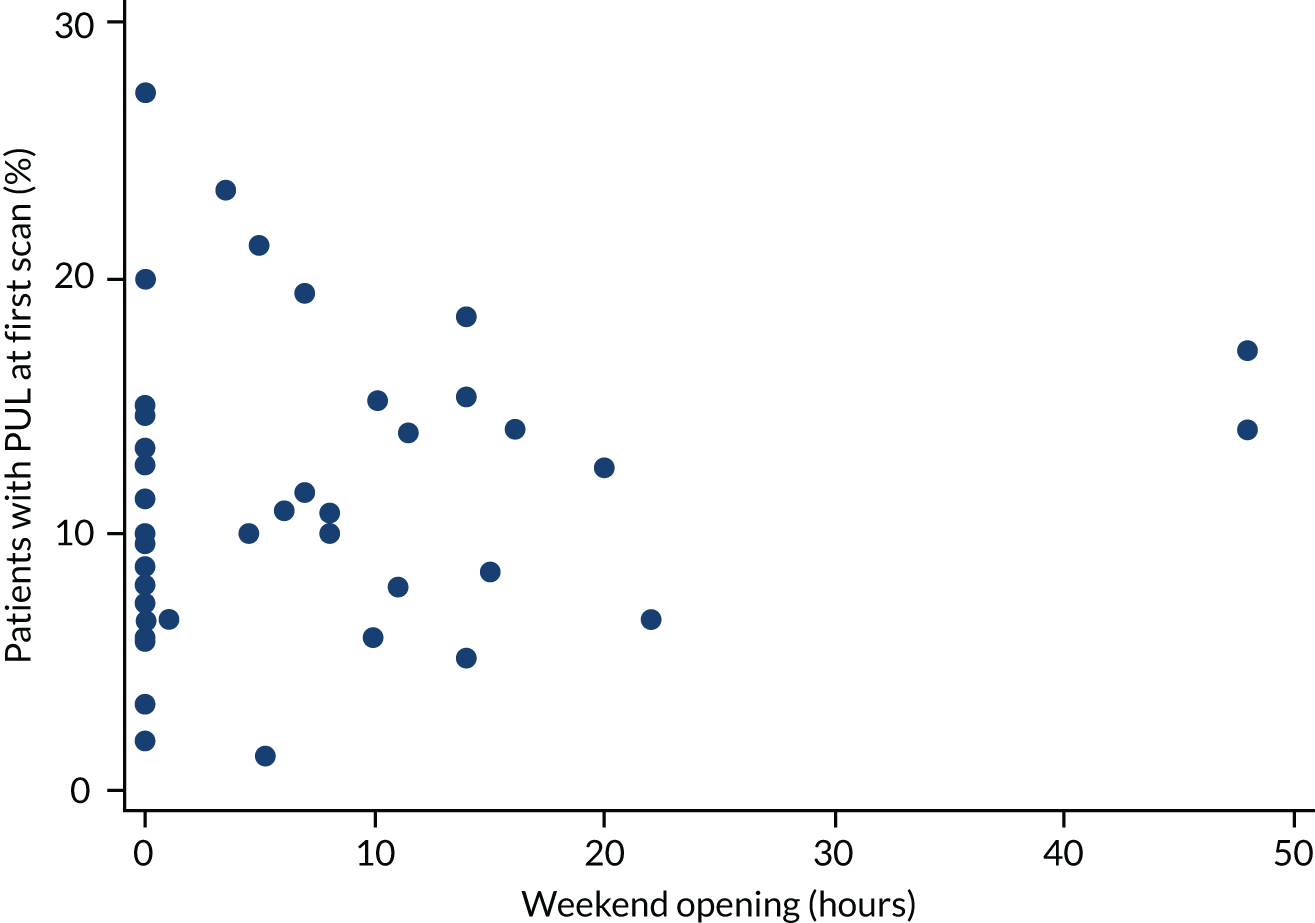
Report Supplementary Material 1, Table 18, shows the results of fitting multivariable logistic regression models for PULs at the initial visit. There is some evidence of a positive association between the PUL rate at first scan and unit volume (p = 0.07).
We also investigated the relationship between the total inconclusive scan rate (PUL) and consultant presence, unit volume and weekend opening hours. We used a binary outcome to indicate whether or not a patient had an inconclusive scan at any time during their follow-up.
The relationship between the rate of non-diagnostic ultrasound scans and consultant presence is shown in Figure 34. There is little suggestion of an association between PUL rate and consultant presence.
FIGURE 34.
Rate of PUL scans vs. planned consultant presence for each unit.
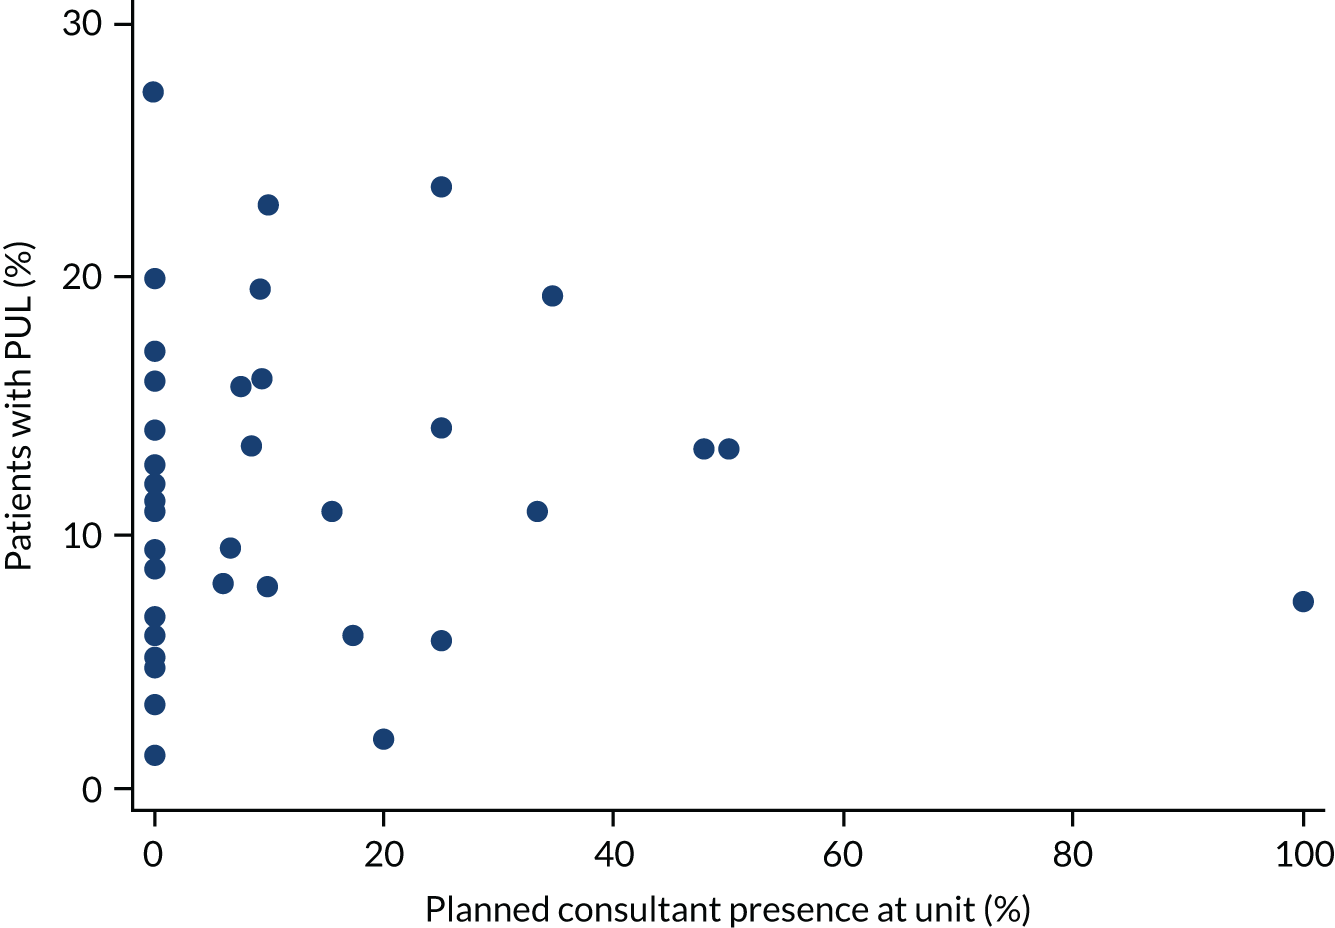
The relationship between the rate of non-diagnostic ultrasound scans and unit volume is shown in Figure 35. There is a suggestion that the PUL rate increases as unit volume increases.
FIGURE 35.
Rate of PUL scans vs. unit volume for each unit.
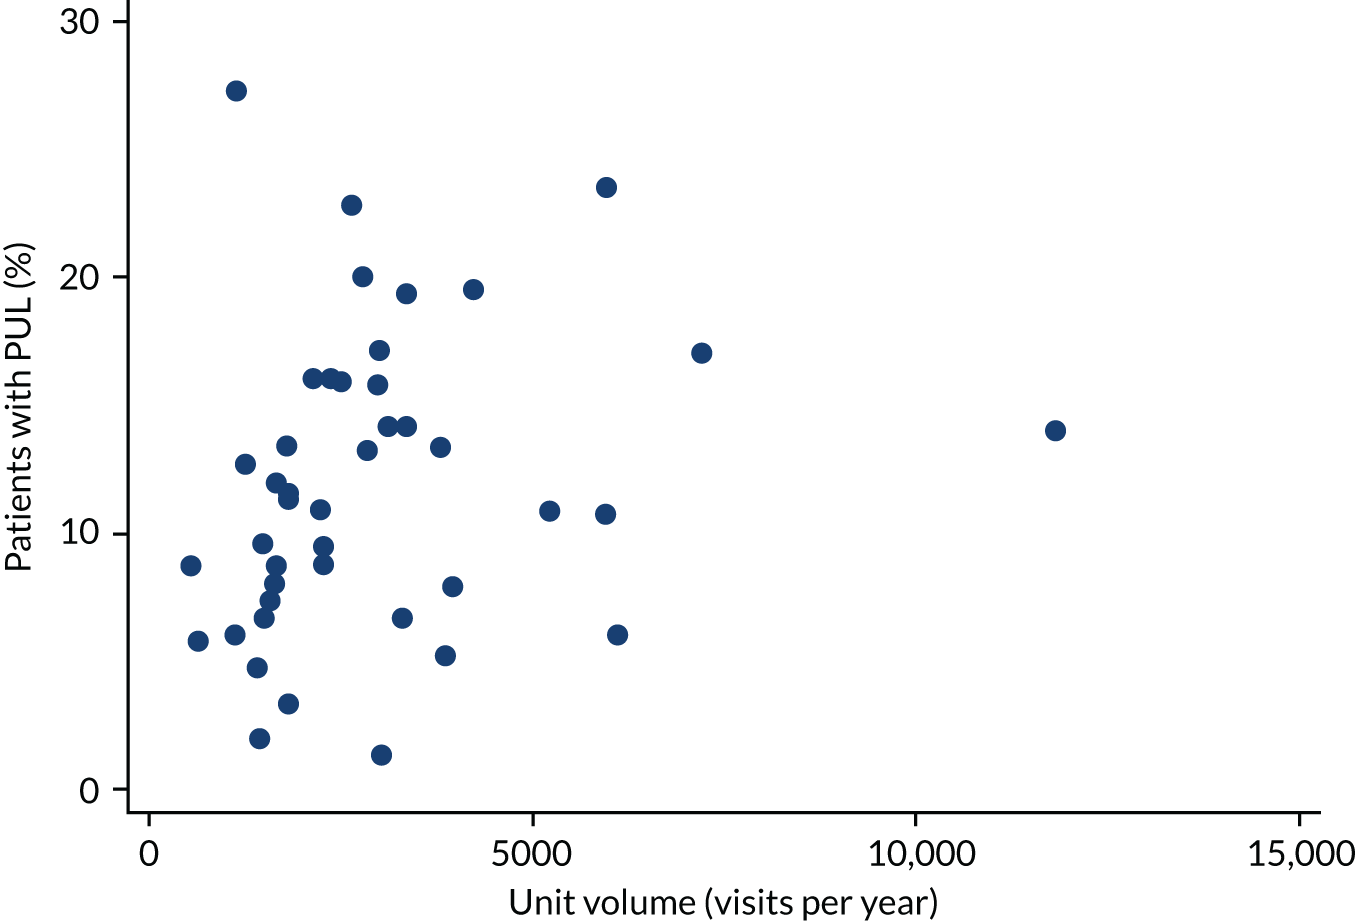
The relationship between the rate of non-diagnostic ultrasound scans and weekend opening is shown in Figure 36. There is no clear trend.
FIGURE 36.
Rate of PUL scans vs. weekend opening for each unit.
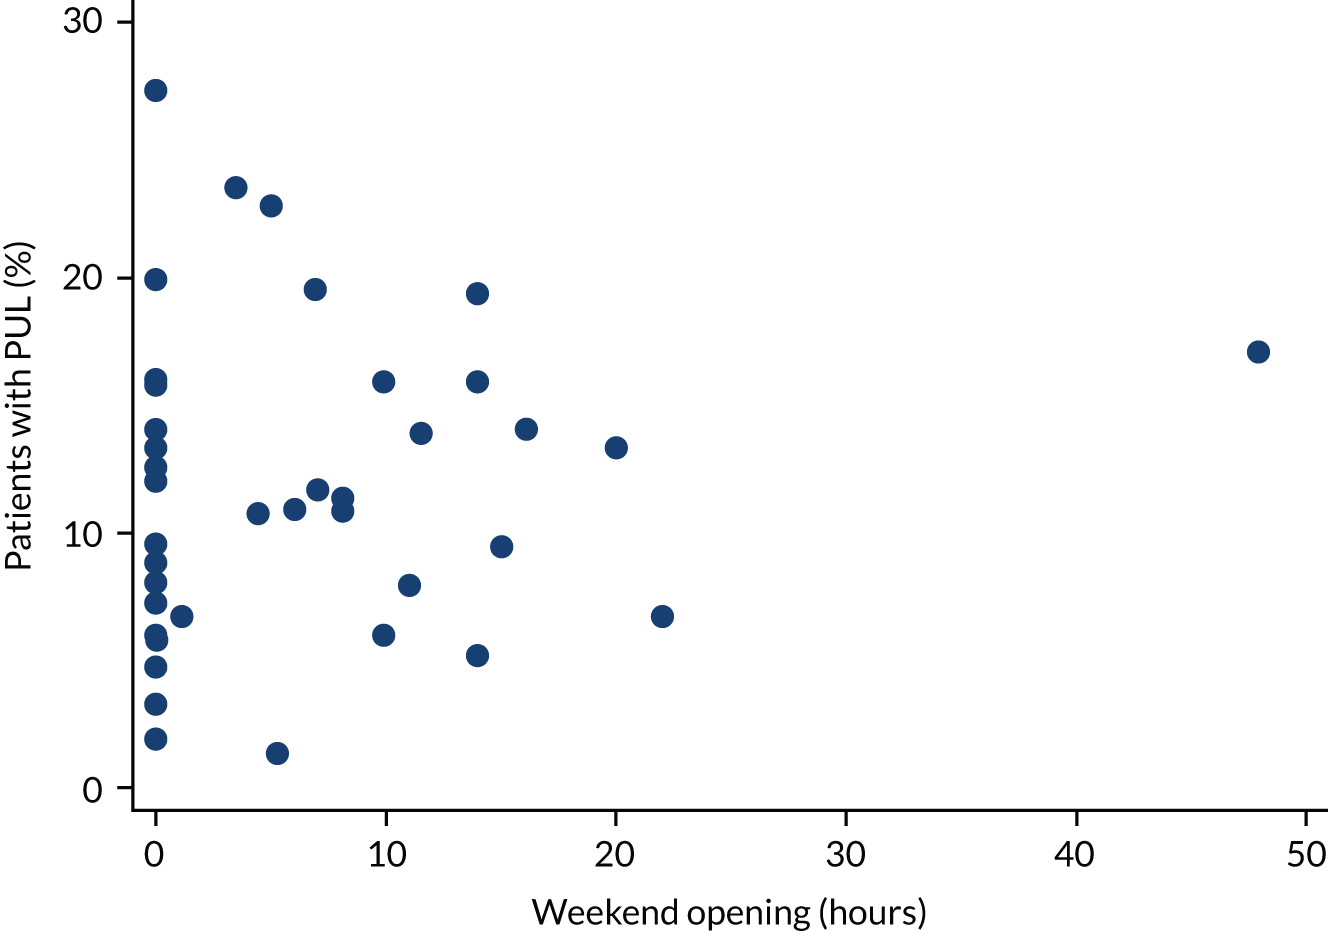
Report Supplementary Material 1, Table 19, shows the results of fitting multivariable logistic regression models for PUL rate. There is no evidence of an association between the PUL rate and consultant presence (p = 0.955) and weekend opening (p = 0.658). However, there is some evidence of a positive association with unit volume (p = 0.075).
Proportion of laparoscopies negative for ectopic pregnancy
We investigated the relationship between the rate of negative laparoscopies for suspected ectopic pregnancy and consultant presence, unit volume and weekend opening hours. However, only 90 laparoscopies were performed in 21 units, of which 16 (18%) were negative. There were six units at which all laparoscopies were negative and nine units with no negative laparoscopies.
The relationships between negative laparoscopies and consultant presence, unit volume and weekend opening are shown in Figures 37–39, respectively.
FIGURE 37.
The percentage of negative laparoscopies vs. planned consultant presence for each unit. The numbers indicate the number of laparoscopies at each unit (some points and numbers are overlaid).
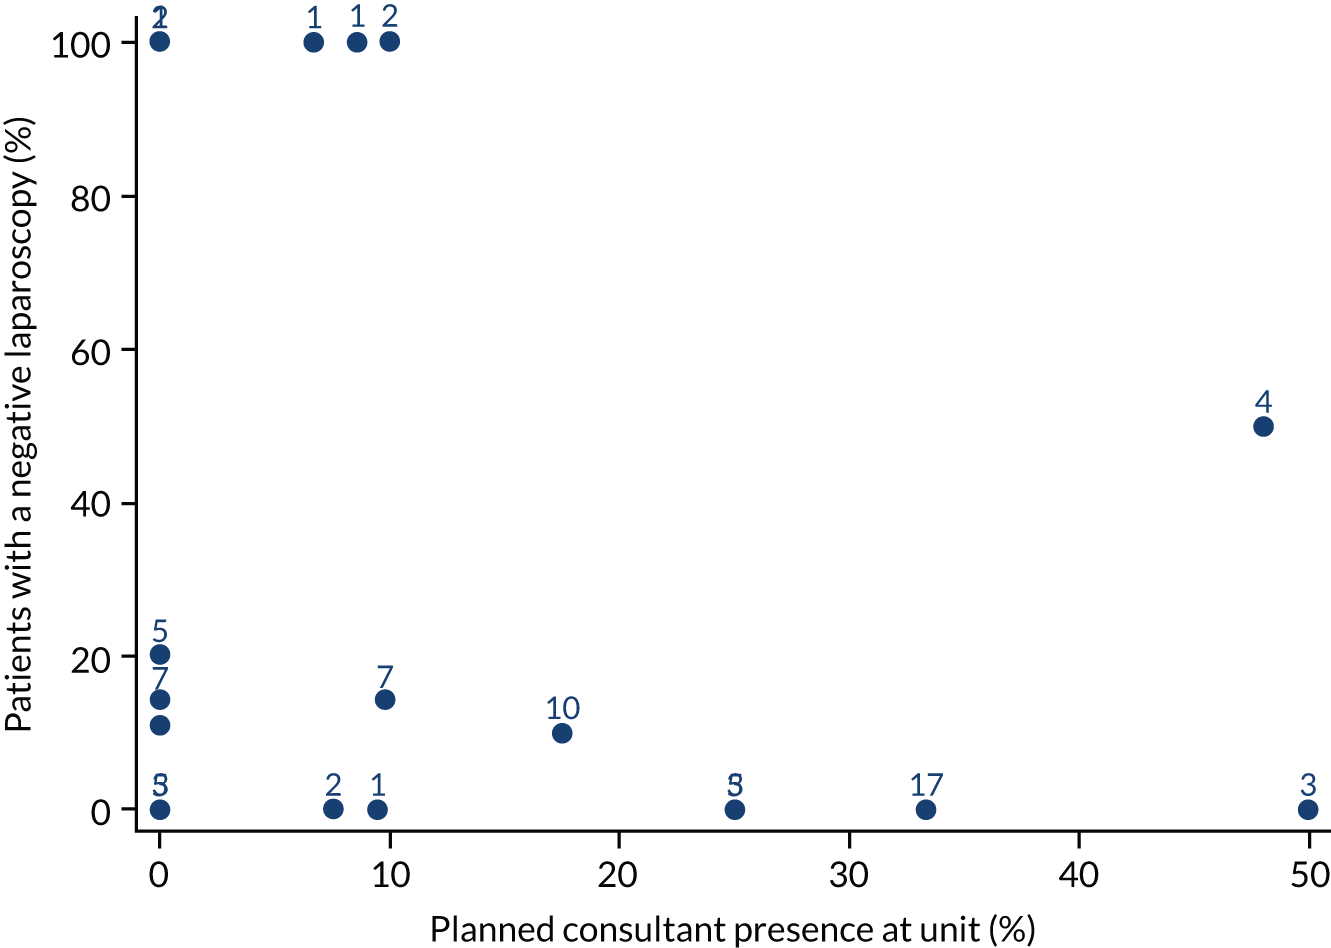
FIGURE 38.
The percentage of negative laparoscopies vs. unit volume for each unit. The numbers indicate the number of laparoscopies at each unit (some points and numbers are overlaid).
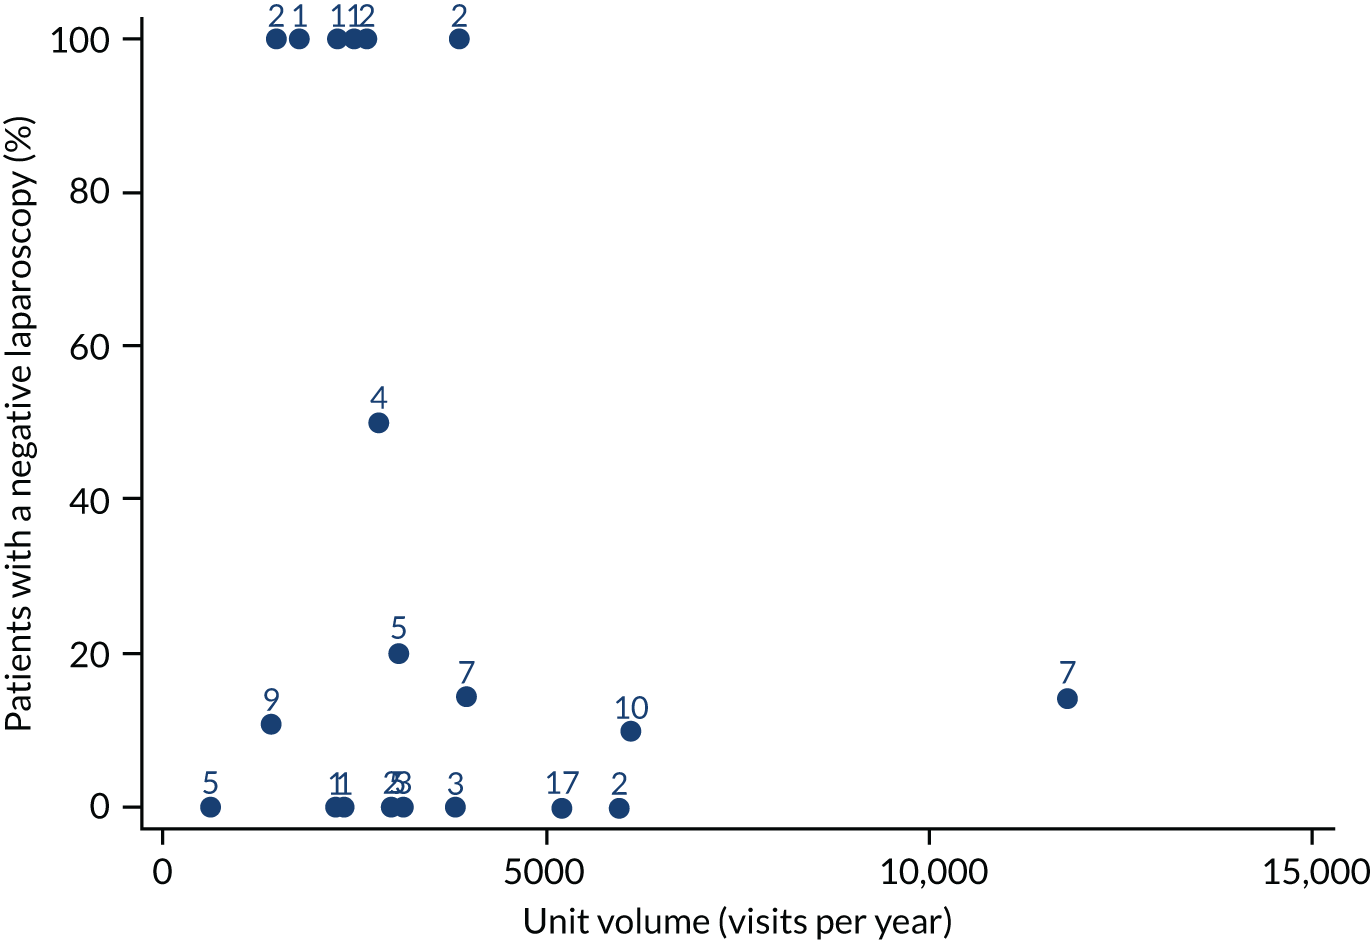
FIGURE 39.
The percentage of negative laparoscopies vs. weekend opening hours for each unit. The numbers indicate the number of laparoscopies at each unit (some points and numbers are overlaid).
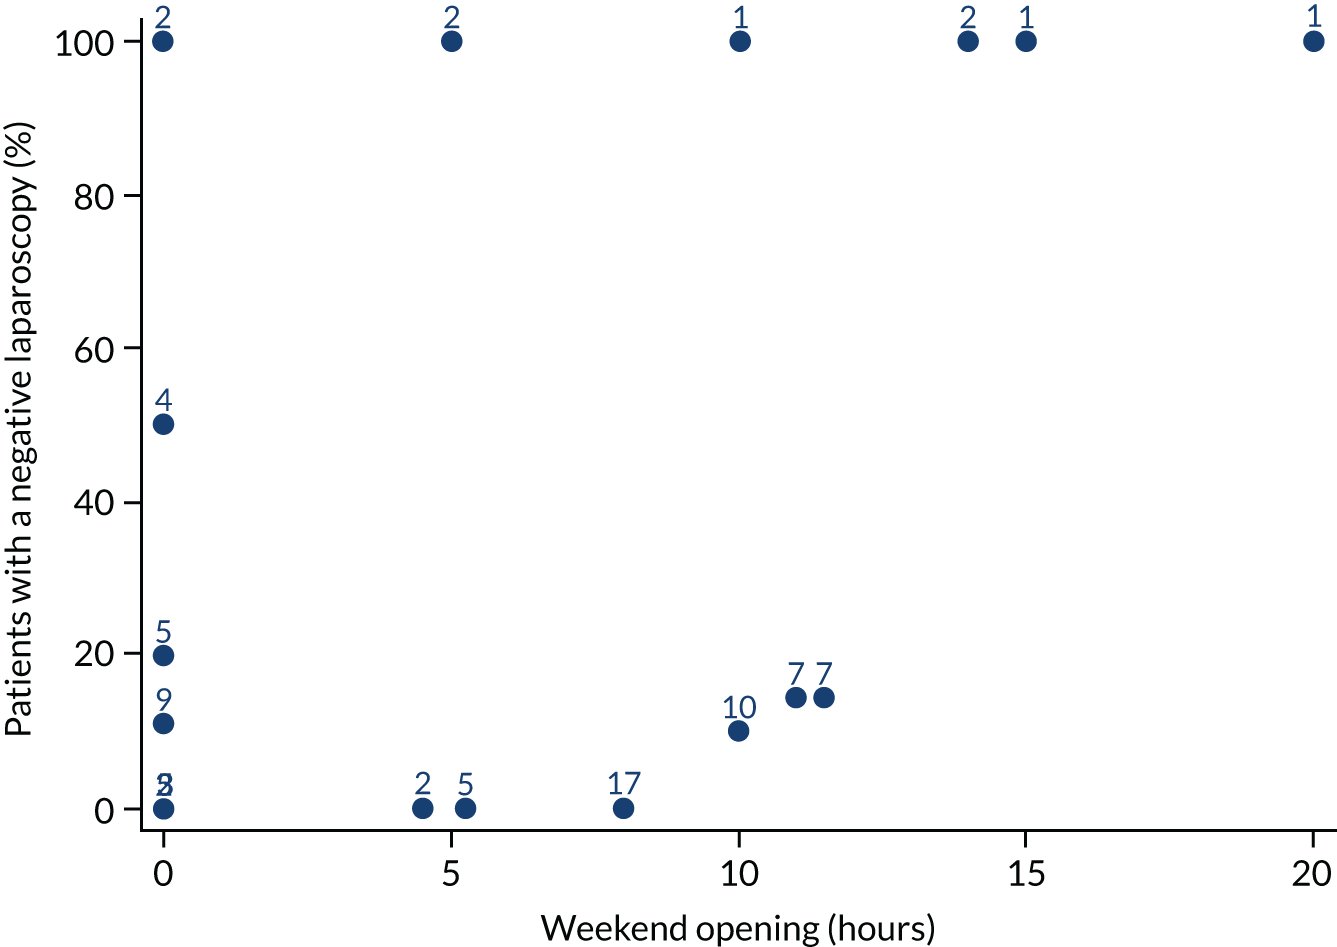
We fitted separate univariable logistic regression models for the rate of negative laparoscopies, with no confounder adjustment because of the small sample size (see Report Supplementary Material 1, Table 20). There is perhaps some weak evidence of an association with weekend opening hours (p = 0.112).
Patient satisfaction
Short Assessment of Patient Satisfaction score
The SAPS questionnaire consisted of seven questions, most of which have the following categorisation: 0 (very dissatisfied), 1 (dissatisfied), 2 (neither satisfied nor dissatisfied), 3 (satisfied) or 4 (very satisfied).
We investigated the relationship between SAPS score and consultant presence, unit volume and weekend opening hours.
There were variations in patient satisfaction between units. Some units have satisfaction rates in excess of 95%, whereas in other units the rates could be as low as 66%. The satisfaction scores for all individual units are shown in Table 11.
| Unit | n | Satisfied patients, n (%) | Ranka |
|---|---|---|---|
| MJL | 41 | 40 (97.6) | 1 |
| ZAR | 52 | 50 (96.2) | 2 |
| QSL | 44 | 42 (95.5) | 3 |
| YUS | 37 | 36 (97.3) | 4 |
| GFY | 57 | 54 (94.7) | 5 |
| XQZ | 46 | 44 (95.7) | 6 |
| AIS | 44 | 42 (95.5) | 7 |
| OVA | 28 | 27 (96.4) | 8 |
| RXO | 63 | 59 (93.7) | 9 |
| XNL | 47 | 44 (93.6) | 10 |
| CXP | 27 | 26 (96.3) | 11 |
| ZNI | 59 | 55 (93.2) | 12 |
| IWX | 25 | 24 (96) | 13 |
| OYN | 25 | 24 (96) | 14 |
| JPM | 64 | 58 (90.6) | 15 |
| BDX | 39 | 36 (92.3) | 16 |
| TCS | 20 | 19 (95) | 17 |
| PCO | 41 | 37 (90.2) | 18 |
| JNM | 40 | 36 (90) | 19 |
| JDG | 23 | 21 (91.3) | 20 |
| WDI | 23 | 21 (91.3) | 21 |
| SCC | 31 | 28 (90.3) | 22 |
| QAR | 35 | 31 (88.6) | 23 |
| SXB | 32 | 28 (87.5) | 24 |
| NSK | 34 | 30 (88.2) | 25 |
| SHS | 24 | 21 (87.5) | 26 |
| YLJ | 47 | 41 (87.2) | 27 |
| HJZ | 39 | 33 (84.6) | 28 |
| ZAM | 28 | 24 (85.7) | 29 |
| XQD | 21 | 18 (85.7) | 30 |
| SXM | 10 | 8 (80) | 31 |
| WYW | 50 | 43 (86) | 32 |
| BVU | 42 | 36 (85.7) | 33 |
| VXL | 36 | 31 (86.1) | 34 |
| FVX | 49 | 42 (85.7) | 35 |
| ULV | 35 | 30 (85.7) | 36 |
| GLR | 35 | 30 (85.7) | 37 |
| JII | 39 | 33 (84.6) | 38 |
| WWR | 19 | 15 (78.9) | 39 |
| CZX | 9 | 6 (66.7) | 40 |
| SDD | 17 | 13 (76.5) | 41 |
| UOY | 30 | 24 (80) | 42 |
| HYG | 52 | 43 (82.7) | 43 |
| RPR | 31 | 23 (74.2) | 44 |
The relationship between the SAPS score and consultant presence is shown in Figure 40. There is some evidence that the SAPS score (satisfaction) decreases as consultant presence at the unit increases.
FIGURE 40.
Short Assessment of Patient Satisfaction score vs. planned consultant presence for each unit.
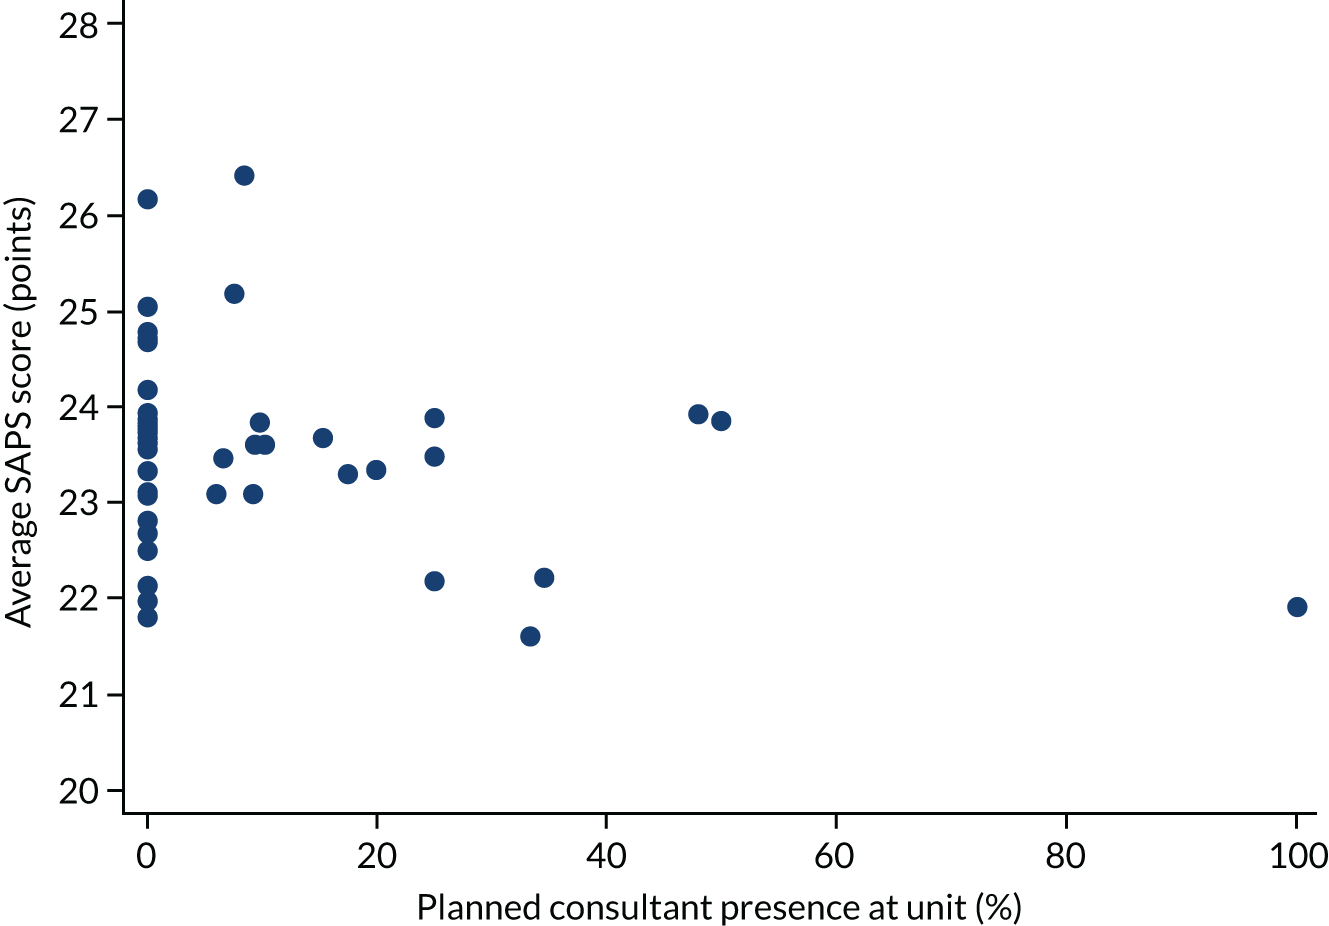
The relationship between the SAPS score and unit volume is shown in Figure 41. There is a suggestion that satisfaction decreases as unit volume increases.
FIGURE 41.
Short Assessment of Patient Satisfaction score vs. unit volume for each unit.
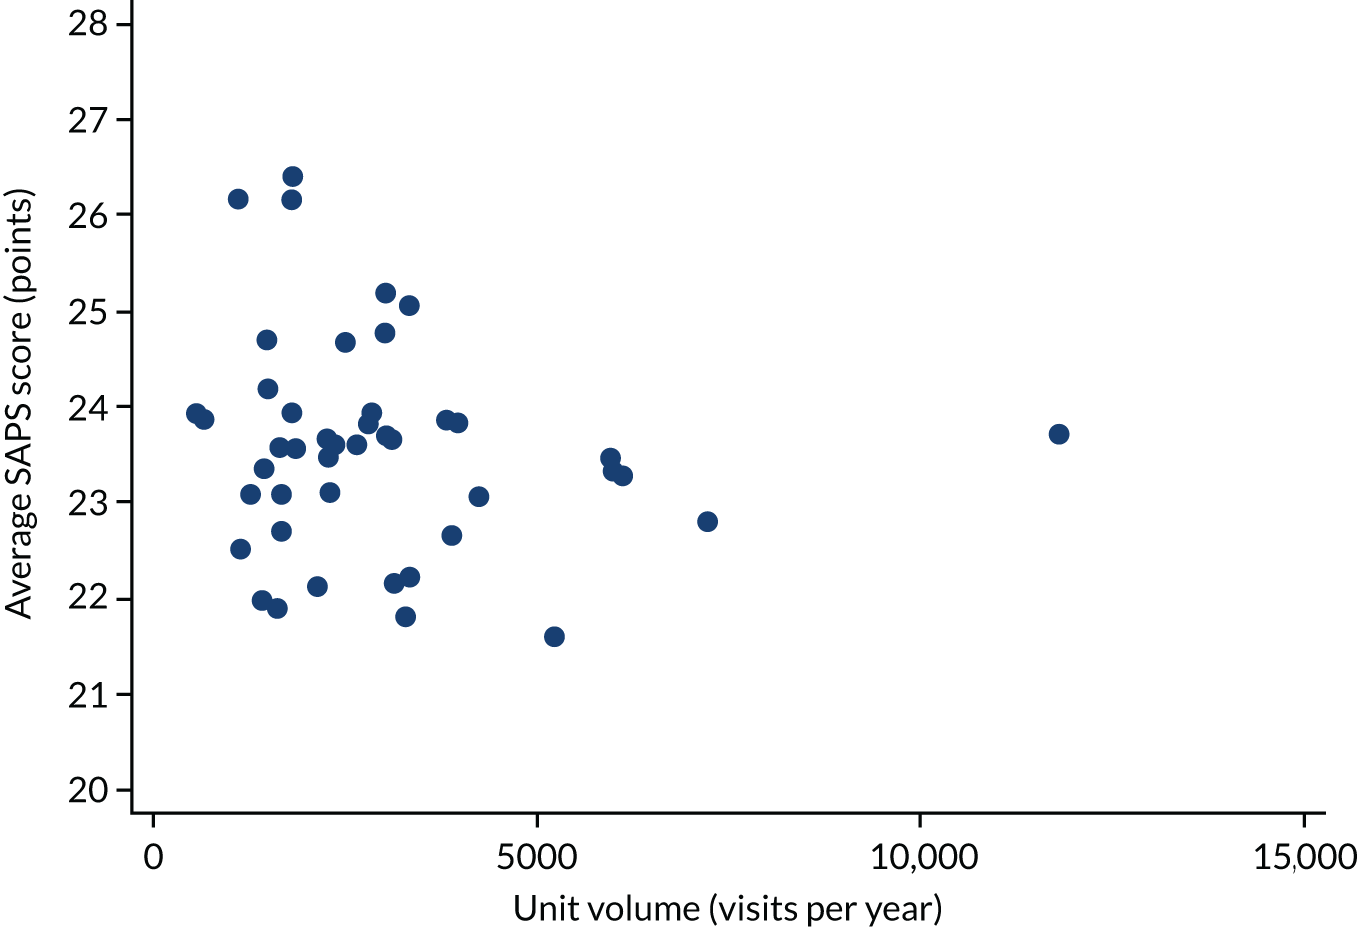
The relationship between the SAPS score and weekend opening hours is shown in Figure 42. There is no clear trend.
FIGURE 42.
Short Assessment of Patient Satisfaction score vs. weekend opening for each unit.
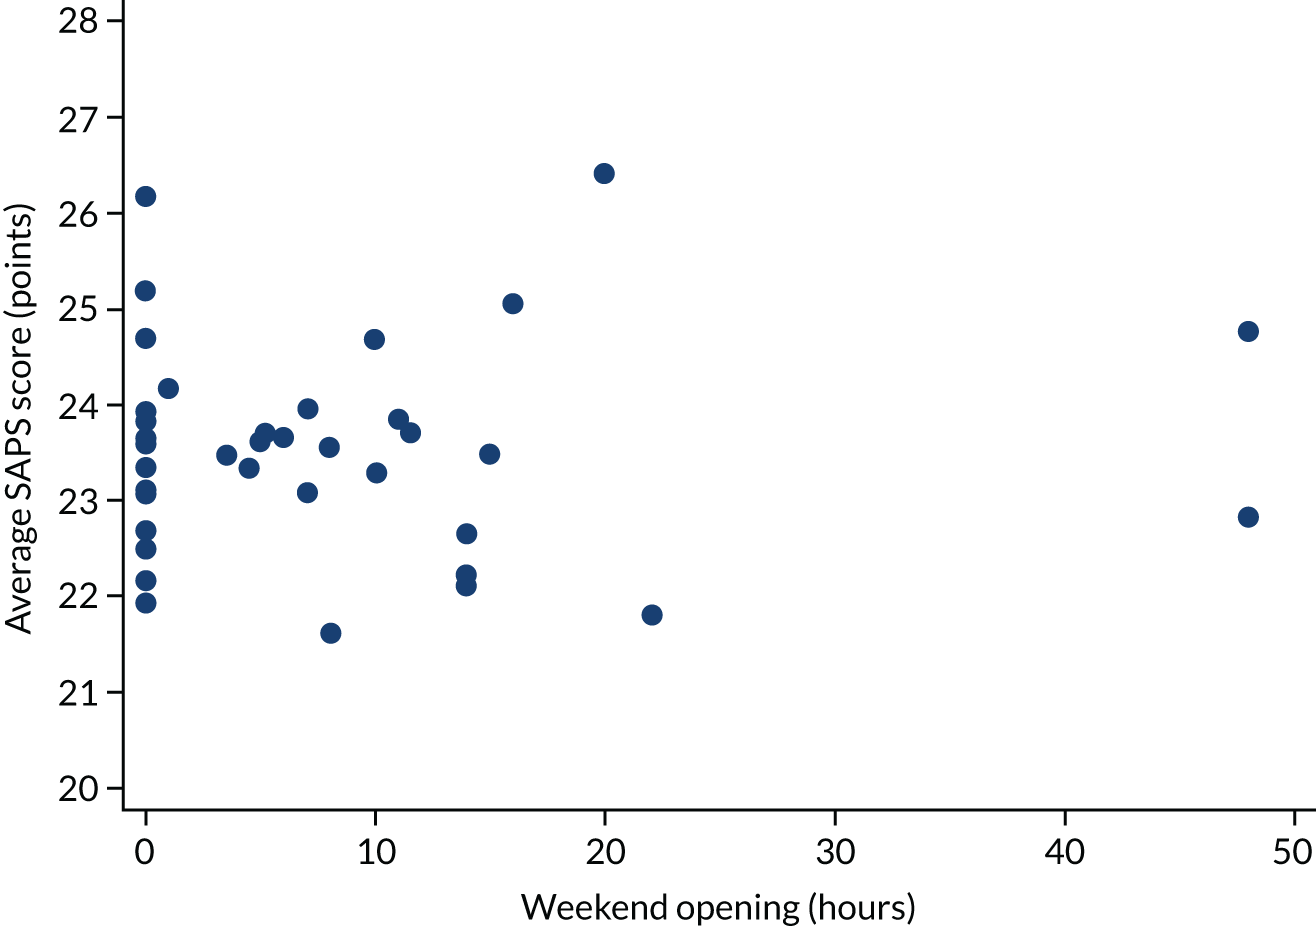
Fitting multivariable linear regression models for SAPS score produced the results shown in Table 12. A third set of confounders was used for these analyses, with additional adjustment for ethnicity, parity, gravidity and the LMUP score. There is some evidence of a negative association between SAPS score and planned consultant presence (p = 0.075).
| Variable | Adjustment | Coefficient (95% CI) | p-value |
|---|---|---|---|
| Consultant time (%) | FD + MA (n = 1585) | –0.016 (–0.033 to 0.002) | 0.075 |
| Volume (per 100 visits) | –0.007 (–0.024 to 0.009) | 0.361 | |
| Weekend opening (hours) | 0.001 (–0.032 to 0.033) | 0.973 | |
| Consultant time (%) | FD + MA + DS + GAP (n = 1555) | –0.017 (–0.035 to 0.002) | 0.072 |
| Volume (per 100 visits) | –0.008 (–0.025 to 0.009) | 0.349 | |
| Weekend opening (hours) | 0.003 (–0.031 to 0.037) | 0.876 | |
| Consultant time (%) | FD + MA + DS + GAP + E + P + G + L (n = 1505) | –0.015 (–0.033 to 0.004) | 0.117 |
| Volume (per 100 visits) | –0.005 (–0.022 to 0.012) | 0.538 | |
| Weekend opening (hours) | –0.0004 (–0.034 to 0.033) | 0.980 | |
| Consultant presence (yes/no) | FD + MA (n = 1585) | –0.12 (–0.78 to 0.54) | 0.717 |
| Volume (≥ 2500 visits) | –0.17 (–0.88 to 0.53) | 0.629 | |
| Weekend opening (yes/no) | –0.04 (–0.74 to 0.66) | 0.914 | |
| Consultant presence (yes/no) | FD + MA + DS + GAP (n = 1555) | –0.13 (–0.83 to 0.57) | 0.718 |
| Volume (≥ 2500 visits) | –0.21 (–0.94 to 0.53) | 0.584 | |
| Weekend opening (yes/no) | –0.02 (–0.76 to 0.72) | 0.962 | |
| Consultant presence (yes/no) | FD + MA + DS + GAP + E + P + G + L (n = 1505) | –0.06 (–0.74 to 0.62) | 0.859 |
| Volume (≥ 2500 visits) | –0.15 (–0.87 to 0.56) | 0.674 | |
| Weekend opening (yes/no) | –0.04 (–0.77 to 0.68) | 0.905 |
Satisfaction versus waiting time for appointment
We investigated the relationship between the SAPS score and the waiting time for women’s first appointment (based on number of days from referral, self or other, to point in time seen in the EPAU). This analysis is based on 1576 patients.
The relationship between the average SAPS score and waiting time for the first appointment is shown in Figure 43.
FIGURE 43.
Average SAPS score vs. waiting time for appointment for each unit.
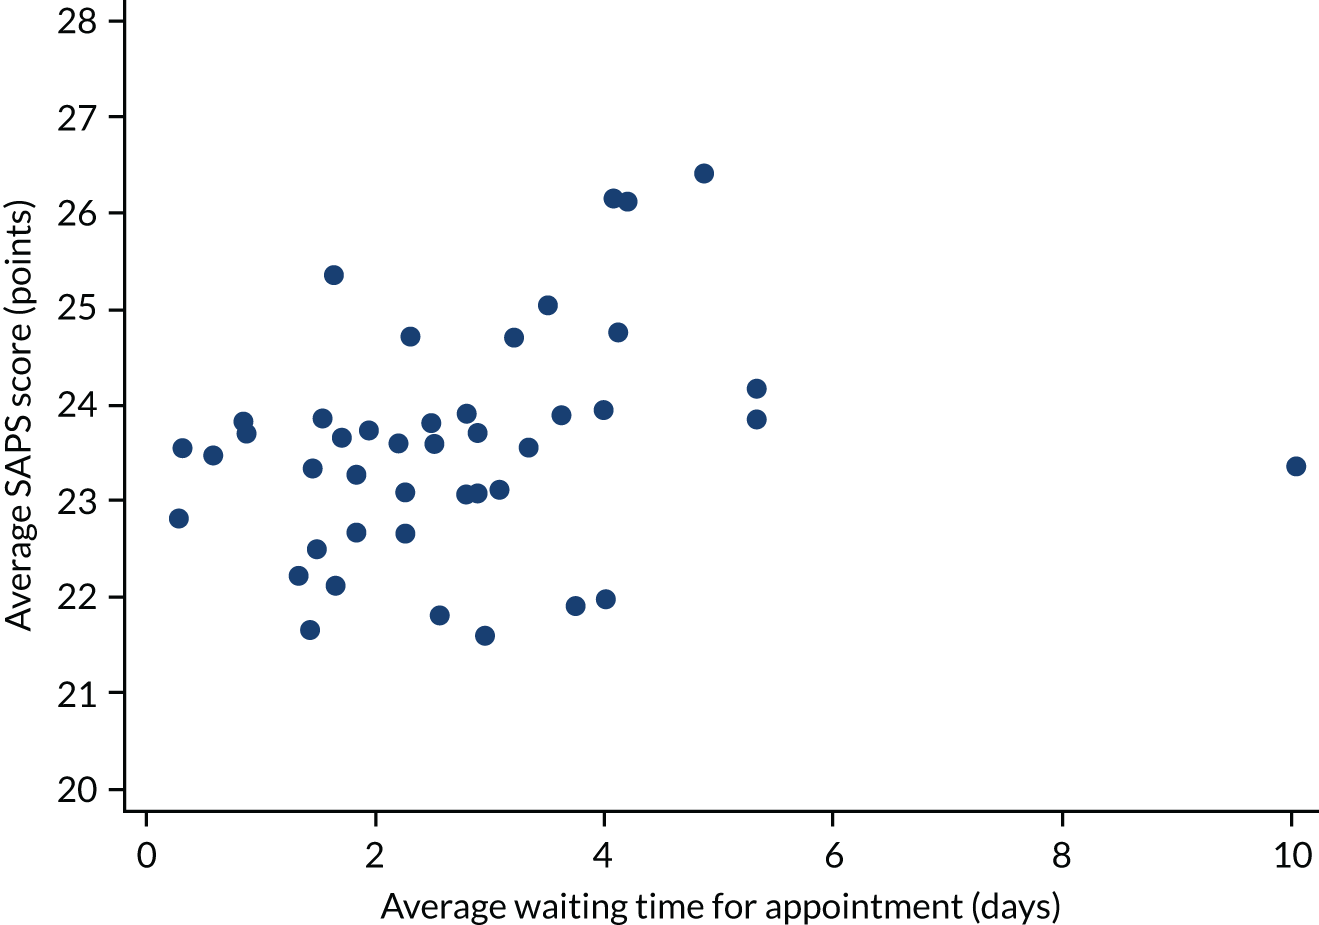
Fitting a linear regression model to model this relationship produced the results shown in Table 13. There is little evidence of an association between the SAPS score and waiting time for the first appointment (p = 0.203).
| Variable | Coefficient (95% CI) | p-value |
|---|---|---|
| Waiting time (log-transformed) | 0.187 (–0.101 to 0.474) | 0.203 |
Modified Newcastle–Farnworth questionnaire score
We investigated the relationship between the modified Newcastle–Farnworth questionnaire score and consultant presence, unit volume and weekend opening hours [see modified Newcastle–Farnworth questionnaire; URL: www.journalslibrary.nihr.ac.uk/programmes/hsdr/140441/#/ (accessed 2 June 2020)]. The Newcastle–Farnworth questionnaire score was calculated as the average of the individual component scores.
The relationship between the Newcastle–Farnworth questionnaire score and consultant presence is shown in Figure 44. Figure 44 suggests that the Newcastle–Farnworth questionnaire score decreases as consultant presence increases.
FIGURE 44.
Newcastle–Farnworth questionnaire score vs. planned consultant presence for each unit.
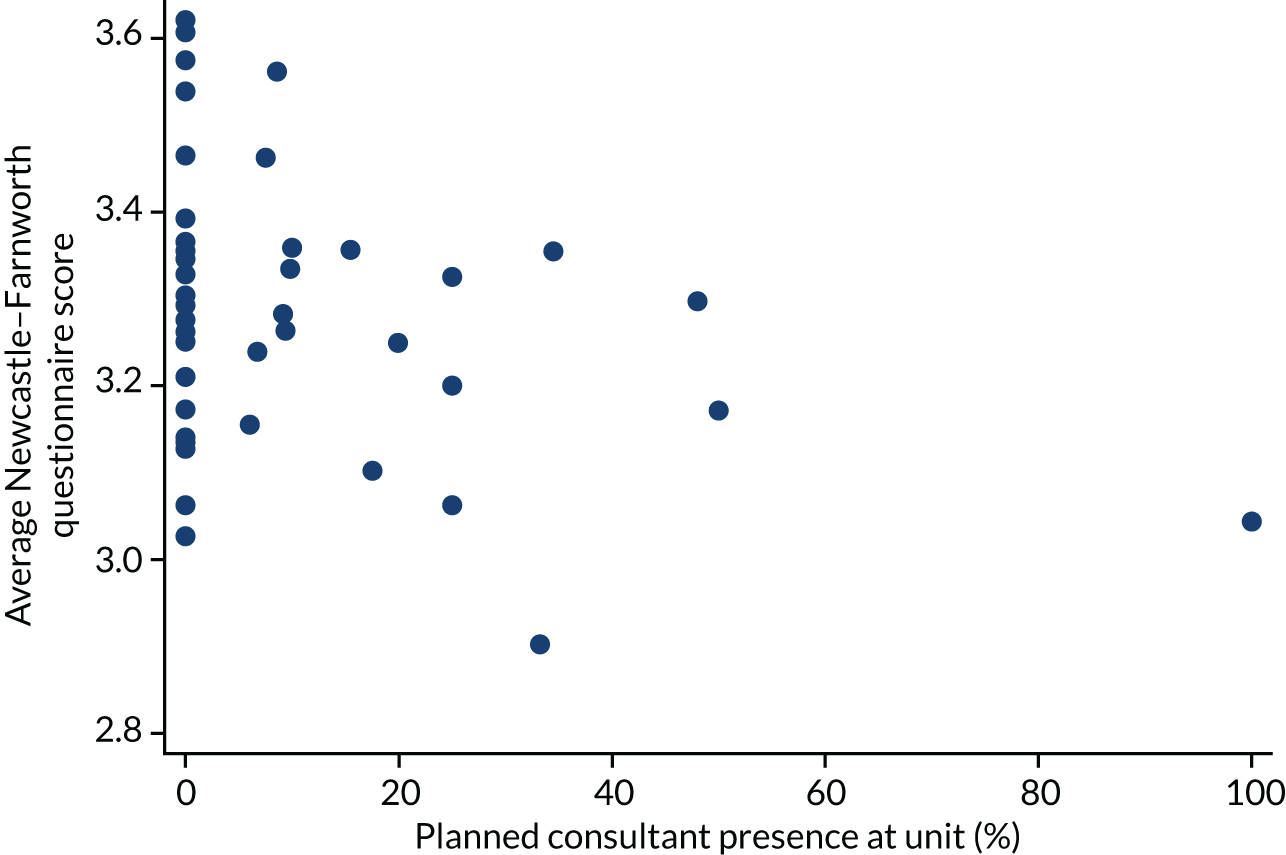
The relationship between the Newcastle–Farnworth questionnaire score and unit volume is shown in Figure 45. Figure 45 suggests that the Newcastle–Farnworth questionnaire score decreases as unit volume increases.
FIGURE 45.
Newcastle–Farnworth questionnaire score vs. unit volume for each unit.

The relationship between the Newcastle–Farnworth questionnaire score and weekend opening hours is shown in Figure 46. Figure 46 suggests that the Newcastle–Farnworth questionnaire score is not associated with weekend opening hours.
FIGURE 46.
Newcastle–Farnworth questionnaire score vs. weekend opening for each unit.
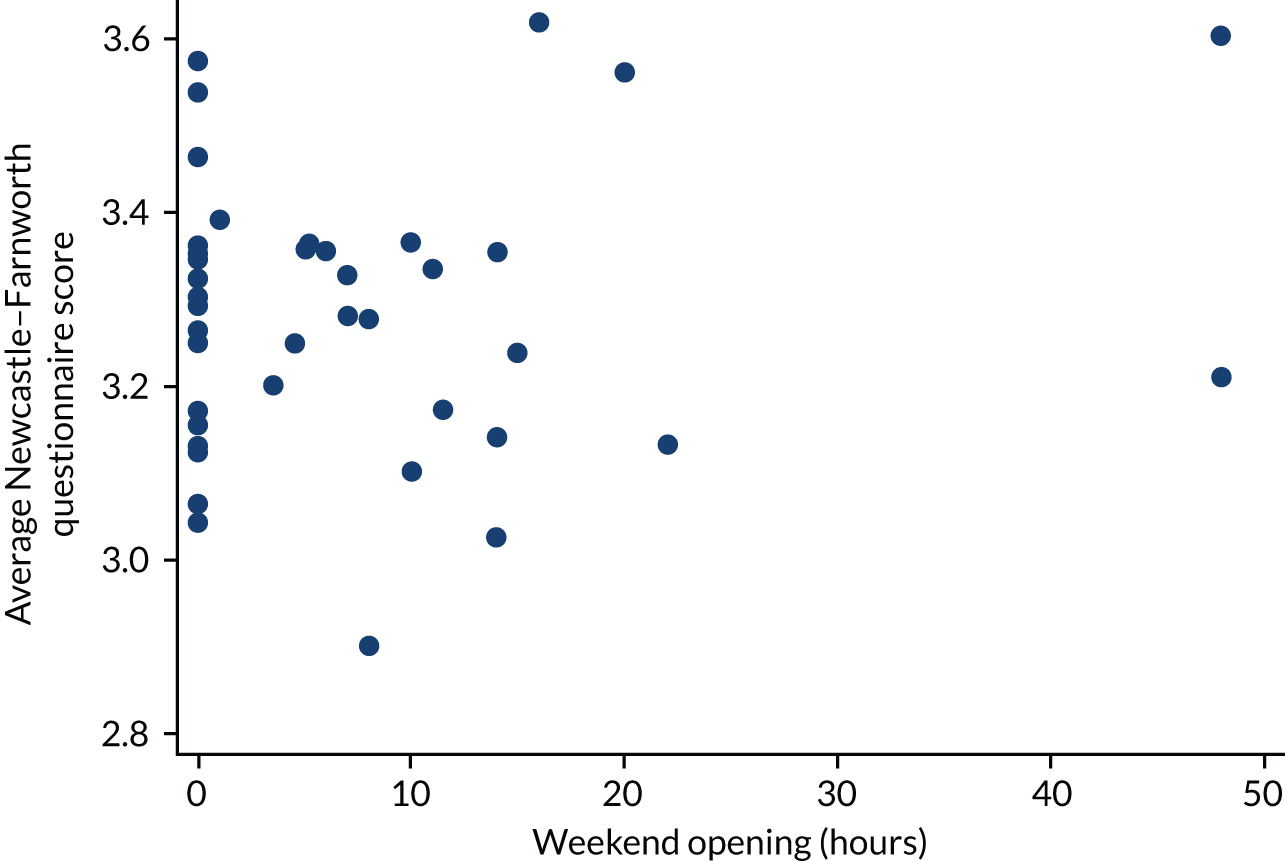
Fitting multivariable linear regression models for the Newcastle–Farnworth questionnaire score produced the results shown in Table 14. There is evidence of negative associations with planned consultant presence (p = 0.027) and unit volume (p = 0.021).
| Variable | Adjustment | Coefficient (95% CI) | p-value |
|---|---|---|---|
| Consultant time (%) | FD + MA (n = 1597) | –0.003 (–0.005 to –0.0003) | 0.027 |
| Volume (per 100 visits) | –0.003 (–0.005 to –0.0004) | 0.021 | |
| Weekend opening (hours) | 0.003 (–0.001 to 0.007) | 0.188 | |
| Consultant time (%) | FD + MA + DS + GAP (n = 1566) | –0.003 (–0.005 to 0.0001) | 0.063 |
| Volume (per 100 visits) | –0.002 (–0.005 to –0.0001) | 0.041 | |
| Weekend opening (hours) | 0.004 (–0.001 to 0.008) | 0.092 | |
| Consultant time (%) | FD + MA + DS + GAP + E + P + G + L (n = 1517) | –0.001 (–0.004 to 0.001) | 0.268 |
| Volume (per 100 visits) | –0.002 (–0.004 to 0.0004) | 0.114 | |
| Weekend opening (hours) | 0.003 (–0.001 to 0.008) | 0.113 | |
| Consultant presence (yes/no) | FD + MA (n = 1597) | –0.05 (–0.14 to 0.05) | 0.310 |
| Volume (≥ 2500 visits) | –0.02 (–0.12 to 0.08) | 0.641 | |
| Weekend opening (yes/no) | 0.02 (–0.08 to 0.11) | 0.768 | |
| Consultant presence (yes/no) | FD + MA + DS + GAP (n = 1566) | –0.03 (–0.13 to 0.06) | 0.507 |
| Volume (≥ 2500 visits) | –0.02 (–0.13 to 0.08) | 0.659 | |
| Weekend opening (yes/no) | 0.02 (–0.08 to 0.13) | 0.658 | |
| Consultant presence (yes/no) | FD + MA + DS + GAP + E + P + G + L (n = 1517) | –0.004 (–0.09 to 0.08) | 0.925 |
| Volume (≥ 2500 visits) | –0.01 (–0.10 to 0.08) | 0.858 | |
| Weekend opening (yes/no) | 0.02 (–0.07 to 0.11) | 0.637 |
Staff satisfaction
We investigated the association between staff experience of providing care and consultant presence, unit volume and weekend opening.
The relationships between staff experience of providing care and consultant presence, unit volume and weekend opening are described in Table 15. There is a large observed difference of 17% in the percentage of staff who ‘witnessed potentially harmful errors, near-misses or incidents in the last month’ between the units with and units without consultant presence. In addition, the pressure felt by staff is 17% higher in units that are closed at weekends than in units open at weekends.
| Staff experience | n | Planned consultant presence | Unit volume (visits) | Weekend opening | |||
|---|---|---|---|---|---|---|---|
| No | Yes | < 2500 | ≥ 2500 | No | Yes | ||
| Staff satisfaction with resourcing and support, mean (SD) | 175 | 3.5 (0.6) | 3.5 (0.7) | 3.5 (0.7) | 3.6 (0.6) | 3.5 (0.7) | 3.6 (0.6) |
| Staff feeling satisfied with the quality of work and patient care they are able to deliver, mean (SD) | 175 | 4.0 (0.7) | 4.2 (0.6) | 4.1 (0.7) | 4.1 (0.6) | 4.2 (0.7) | 4.0 (0.7) |
| Effective teamworking, mean (SD) | 151 | 3.8 (0.6) | 4.1 (0.5) | 3.8 (0.6) | 3.9 (0.6) | 3.8 (0.7) | 3.9 (0.6) |
| Staff agreeing that patient feedback is used to make informed decisions, mean (SD) | 157 | 3.6 (0.6) | 3.8 (0.6) | 3.6 (0.6) | 3.7 (0.6) | 3.6 (0.6) | 3.7 (0.6) |
| Fairness and effectiveness of procedures for reporting errors, near misses or incidents, mean (SD) | 164 | 3.4 (0.9) | 3.5 (0.8) | 3.5 (0.7) | 3.4 (0.9) | 3.4 (0.7) | 3.5 (0.9) |
| Staff believing trust provides equal opportunities for career progression or promotion, mean (SD) | 162 | 1.5 (0.6) | 1.5 (0.6) | 1.6 (0.6) | 1.4 (0.6) | 1.5 (0.6) | 1.5 (0.6) |
| Experiencing physical violence from colleagues in last 12 months, n (%) | 163 | 0 (0) | 1 (2) | 0 (0) | 1 (1) | 1 (1) | 0 (0) |
| Staff experiencing discrimination at work in last 12 months, n (%) | 164 | 14 (14) | 11 (18) | 12 (18) | 13 (14) | 15 (20) | 10 (11) |
| Staff witnessing potentially harmful errors, near misses or incidents in last month, n (%) | 166 | 42 (41) | 37 (58) | 31 (45) | 48 (50) | 34 (44) | 45 (51) |
| Work pressure felt by staff, n (%) | 176 | 49 (46) | 36 (52) | 37 (52) | 48 (46) | 46 (58) | 39 (41) |
Secondary outcome analysis: key findings
-
There was no association between consultant presence or weekend opening with the proportion of women attending for multiple follow-up visits.
-
The proportion of women attending for multiple follow-up visits was significantly increased in high-volume units.
-
Consultant presence and weekend opening had no effect on PUL rates.
-
PUL rates were significantly higher in high-volume units.
-
The rate of negative laparoscopies for suspected ectopic pregnancies was excessively high.
-
Patient satisfaction tends to decrease with increasing unit volume and consultant presence.
-
The proportion of staff reporting excessive work pressure is higher in units that are closed over weekends.
Qualitative interviews
Short Assessment of Patient Satisfaction score
Short Assessment of Patient Satisfaction score ranged from 11 to 28 points in 38 participants (possible score range of 0–28 points). The median score was 25 points; this was lower than in the overall study as we oversampled adverse outcomes, which tended to have a lower score. Sixteen of the 38 women (42.1%) scored 27 or 28 points.
Question 6 [How much do you agree with the statement ‘the time you had with the (doctor/other health-care professional) was too short’?] was when most women dropped from a full score. Question 4 (How satisfied were you with the choices you had in decisions affecting your health care?) was the next hardest to endorse, with four women reporting that they were either dissatisfied or very dissatisfied. Conversely, question 5 [How much of the time did you feel respected by the (doctor/other health-care professional)?] was the easiest to endorse, with all but one woman saying that they felt respected all or most of the time. Overall, 37 of the 38 women reported being satisfied or very satisfied with the care they received (question 7).
Attendance at EPAUs
Women in this study each had different journeys through the EPAU service. Most reported their reason for attendance as bleeding or spotting and/or pain, although some used the service because of other pregnancy-related health complaints, such as vomiting, nausea, feeling unwell or lethargy. Some attended for early reassurance because they had prior history of pregnancy loss and, although not common, women were occasionally referred to clarify an inconclusive pregnancy test result.
Women in the sample either self-referred or were referred by a health-care professional (i.e. GPs, A&E staff or their midwives).
Within the EPAU, most women recalled having seen a sonographer, midwife or a nurse. Reception staff were next most commonly reported, followed by a doctor, an unidentified health-care professional, a health-care assistant or a consultant. One participant reported meeting a registrar and another reported meeting a student health-care professional. Women often struggled to distinguish between the different types of health-care professionals and their level of seniority. A ‘sonographer’ could potentially have been a midwife or a doctor.
Transabdominal and transvaginal ultrasound scans were the most common procedures women underwent at the EPAU, although blood tests, other physical health examinations and urinalyses were also reported (in descending frequency).
At the conclusion of their visit the majority of women were asked to attend for further follow-ups or to continue with their routine antenatal care. Some women, however, were referred on to other health-care professionals for further medical care.
Clinical care pathways and emotional typologies
One woman was given the diagnosis of a normal ongoing pregnancy at her first visit, but on her follow-up visit was diagnosed with a miscarriage. In view of this, we created 39 typology assignments, although the analysis is based on 38 women.
Women in this study had six distinct clinical care pathways through which they could progress when using EPAU services. Two of these pathways resulted in a positive outcome (i.e. an ongoing pregnancy), whereas the other four pathways resulted in a negative outcome (i.e. a miscarriage, ectopic or molar pregnancy, or a PUL). Whether the diagnosis was ‘rapid’ or ‘delayed’ was purely in relation to the time required to reach the diagnosis and therefore does not account for referral pathways into the EPAU service. Each pathway mapped onto one of six corresponding emotional typologies (Table 16 and Figure 47).
| Clinical care pathway | Emotional typology |
|---|---|
| Rapid positive diagnosis (positive outcome) | Anxious presentation |
| Delayed positive diagnosis (positive outcome) | Sustained anxiety presentation because of diagnostic uncertainty |
| Rapid negative diagnosis (negative outcome) | Anxious/upset |
| Delayed negative diagnosis, no intervention required (negative outcome) | Anxious/upset after diagnostic uncertainty |
| Rapid negative diagnosis, intervention required (negative outcome) | Anxious/upset with procedural uncertainty |
| Delayed negative diagnosis, intervention required (negative outcome) | Anxious with sustained uncertainty |
FIGURE 47.
Clinical care pathways and mapped emotional typologies.
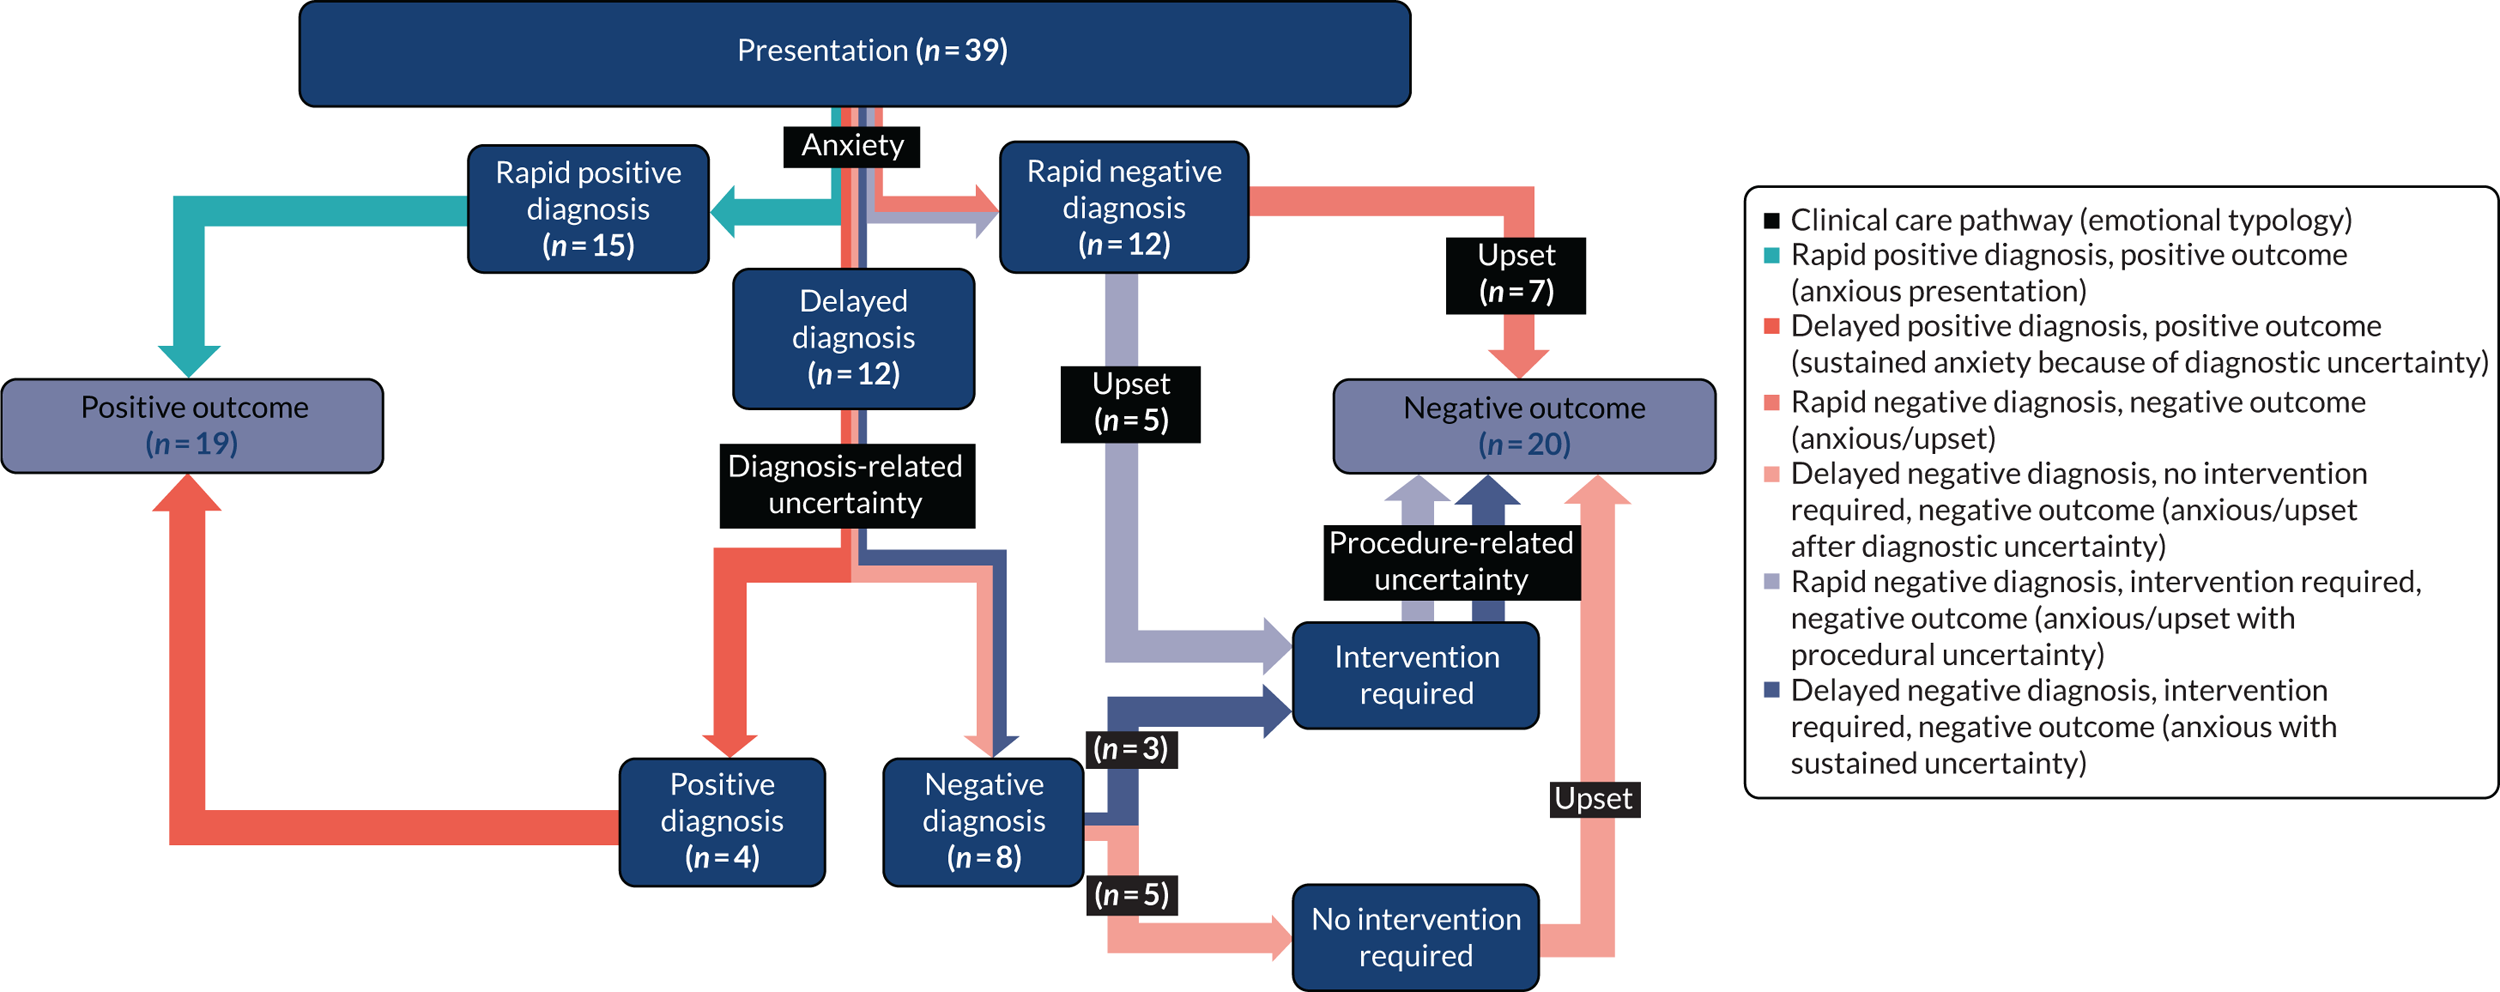
Pathway 1: rapid positive diagnosis, positive outcome (anxious presentation)
Women presented to the EPAU with anxiety about their pregnancy. After investigation, these women were discharged with the positive outcome of a viable pregnancy, relieving their anxiety (at least to some extent). Of the 16 women who followed this clinical care pathway, 14 went on to have a livebirth; however, two women later lost the pregnancy (one had a surgically managed miscarriage and the other a termination for medical reasons).
Case study: Fearne
(Note that all names have been changed to maintain confidentiality.)
Fearne was pregnant for the first time and started to worry when she experienced spotting when on holiday. She contacted the EPAU and was booked in for a scan the next day. Her anxiety was sustained until the embryonic heart beat was documented on the scan. Fearne later went on to have a livebirth, not requiring the services of the EPAU again:
I’m the kind of person I quite like answers, I like to know why something is happening or what’s caused it. I was quite, not frustrated, I was quite anxious about why they couldn’t tell me what could cause the spotting, so that was kind of playing in the back of my mind, but I definitely left more reassured, I think that was just purely seeing the heart beat.
Fearne (participant 034, ongoing, configuration VcW)
Pathway 2: delayed positive diagnosis, positive outcome (sustained anxiety because of diagnostic uncertainty)
Women were anxious when they presented to the EPAU, but the initial scan or scans were inconclusive (often because of the pregnancy being too early to visualise on the scan), meaning that their concerns were not allayed. Women in this clinical care pathway often visited the EPAU on multiple occasions. All women on this pathway were eventually diagnosed with a viable pregnancy; this helped to relieve their anxieties to some extent and they were discharged from the EPAU. Four women followed this pathway.
Case study: Jasmine
Jasmine experienced bleeding and some cramping in the first few weeks of her pregnancy, causing her to worry. She arranged an appointment at the EPAU via her GP and was booked in for a scan. The sonographer explained that there was a sack, but as yet no heart beat and so a viable pregnancy could not be confirmed. Jasmine was asked to come back 10 days later for another scan, when the embryonic heart beat was detected. She went on to have a livebirth requiring no further visits to the EPAU:
Initially I was very worried, I thought I’d lost it, then when they said there was something there then that was kind of a relief. Obviously, there was no heart beat so then kind of gone back worried again. Yes, I was still quite worried. It put my mind at rest a little bit that at least it was in the right place and that’s something promising.
Jasmine (participant 039, ongoing, configuration vCw)
Pathway 3: rapid negative diagnosis, negative outcome (anxious/upset)
Women in this pathway presented to the EPAU with concerns about their pregnancy and it was rapidly confirmed that the pregnancy was lost. As a result, their main emotion then became ‘upset’. There were seven women in this pathway (six had a miscarriage and one had a PUL).
Case study: Poppy
Experiencing some spotting early on in pregnancy which later turned into heavier bleeding, Poppy was referred to the EPAU. She was seen the next day, when she was told that she had a complete miscarriage:
I just felt really anxious and nervous as I walked in, I think because I knew what I was going to be told, and then once I went through the meeting with the first nurse, I did feel a lot more relaxed. I mean, I was sad about what was happening, but I just felt a lot . . . like I was in safe hands, if that makes sense. I felt cared for, yes, I did throughout the whole thing. My anxiety did lessen a lot.
Poppy (participant 038, miscarriage, configuration Vcw)
Pathway 4: delayed negative diagnosis, no intervention required, negative outcome (anxious/upset after diagnostic uncertainty)
Women whose initial scan was inconclusive and whose pregnancy was deemed non-viable at their follow-up scan were discharged. Women in this pathway experienced anxiety at presentation, uncertainty while they waited for a diagnosis and became upset on confirmation that the pregnancy was lost. Five women followed this pathway (four had a miscarriage and one had a PUL).
Case study: Rose
Rose had recently stopped contraception and fell pregnant for the first time soon after. When she began spotting, she called the EPAU and was advised to monitor the spotting and to call back if her symptoms worsened or if she was worried. Within 2 days the spotting turned to bleeding and Rose rang the EPAU and was booked in for an appointment (within a few days). On ultrasound scan the clinicians at the EPAU could see the embryo with no heart beat. She was advised that it might be too early to detect one and she was asked to return to the EPAU in 2 weeks. Within a few days Rose began to miscarry at home and returned to the EPAU. The EPAU clinicians were confident that the miscarriage would clear without the need for medical intervention, but they booked a further two appointments for her. At the first appointment the diagnosis of a complete miscarriage was confirmed and she was discharged:
For me it was more the not knowing. It was more being in that kind of in between state where you are not sure whether you are allowed to get excited about it progressing or you don’t know whether you are supposed to start preparing yourself for the worst.
Rose (participant 027, miscarriage, configuration vcW)
Pathway 5: rapid negative diagnosis, intervention required, negative outcome (anxious/upset with procedural uncertainty)
In this pathway women presented to the EPAU and were immediately confirmed to have a non-viable pregnancy or to be experiencing a pregnancy loss that required medical or surgical intervention. In this typology women experienced anxiety, followed by uncertainty surrounding the procedure and, finally, upset at the loss of their pregnancy. Five women followed this pathway (two had ectopic pregnancies, two had miscarriages and one initially had an ongoing pregnancy confirmed, but later re-presented to the service requiring surgical management of a miscarriage).
Case study: Daisy
Approximately 9 weeks into her pregnancy, Daisy awoke with severe abdominal pain followed by bleeding. She suspected she was miscarrying and, having had previous experience of the EPAU service, she called and arranged an appointment. At the EPAU she was scanned, an ectopic was diagnosed and she was rushed onto the hospital ward for surgical treatment of a rupturing ectopic pregnancy:
I don’t think they mentioned to me the EPAU, that it would be surgery, they just said to me that whatever it was shouldn’t be there and they were going to look after me and I’d be referred up to the ward, but they didn’t explain what would happen when I got up to the ward. I don’t think that was mentioned until I got up actually onto the gynaecology ward and spoke with the consultant . . .
Daisy (participant 009, ectopic, configuration vcw)
Pathway 6: delayed negative diagnosis, intervention required, negative outcome (anxious with sustained uncertainty)
Women in this pathway had to attend their EPAU on multiple occasions to establish whether or not the pregnancy was viable. When they finally received the negative diagnosis, it was coupled with the need for medical or surgical intervention. Having presented with anxiety, they then experienced uncertainty at both the diagnostic and procedural stages. Three women followed this pathway (two had miscarriages and one had a molar pregnancy).
Case study: Hazel
Hazel experienced some bleeding early in her pregnancy and was referred to the EPAU by her GP. Her pregnancy could not be localised at the first scan and the findings were classified as inconclusive. On her second visit the pregnancy was seen within the uterus, but there was no evidence of cardiac activity. The findings were similar on her third scan, but then on her further follow-up she was told that she had a molar pregnancy and would need immediate surgery:
I mean, everyone was really empathetic. It felt like everyone understood what I was going through and everyone wanted me to get an answer but it was just really frustrating and everyone was like, ‘Oh we just need to be sure, we don’t want to do the wrong thing’, but, as you can imagine, it was a bit of a difficult time thinking am I pregnant, am I not pregnant and every time you think you’ll get an answer it was like, ‘Oh go away and come back next week’. It was quite trying. It was quite a difficult period of time.
I’d never had a general anaesthetic before. I don’t know . . . but it was just a huge thing in my head, it was like a really scary thing coming up, about going to sleep and being anaesthetised but actually everyone made me feel completely at ease and when I came round afterwards I was like what was I worried about, it was so simple.
Hazel (participant 013, molar, configuration Vcw)
Other emotional outcomes
Some women also reported experiencing emotions which were found not to be specific to either emotional typologies or clinical care pathways. These emotions were grouped as ‘blame, guilt, or shame’, ‘isolation and vulnerability’ and ‘reassurance’.
The first of these, ‘blame, guilt, or shame’, was exclusively identified in women who had lost their pregnancy and was in relation to women not knowing why they were losing the pregnancy. Only five women mentioned feelings of ‘blame, guilt, or shame’ in their interviews, but those who did were found to question whether or not they themselves were at fault in some way for the loss.
Ten women spoke about ‘isolation and vulnerability’ in their interviews. During these interviews, it was noted that these feelings were usually present when women were discussing waiting for results to be discussed (especially if the waiting area they were in was public), how they felt immediately after being told they were going to lose their pregnancy, if they felt unsupported by EPAU staff, or if they had attended the EPAU alone.
Finally, ‘reassurance’ was evident in more than half of the interviews and across women with a range of clinical outcomes. The main essence of this theme was one of ‘taking positive emotions away from negative events’, whereby women were often relieved and reassured that their pregnancy was fine and they could continue with their pregnancy, or that they had indeed lost their pregnancy and they could now put that event behind them and try for another baby:
Yes, I think a big difference, it was when my partner came over, because I was . . . I wasn’t by myself any more. Yes, by the end of the night I was feeling better. When I realised, OK, it wasn’t my fault, I didn’t do anything to create this, it just happens, it’s very common and that my partner was there, so yes, slowly, slowly, I started to feel better. Then I had a very hard week. That week was quite hard, but yes.
Participant 016 (miscarriage, pathway 5, configuration VcW)
These supplementary emotional outcomes identified through our analysis are important to illustrate how emotionally charged women’s journeys through the EPAU can be. In addition, they emphasise how important psychological care is in EPAU consultations, patient management and in the aftercare provided to women.
Analysis of women’s experiences of EPAU services
Our thematic framework had four main areas: (1) EPAUs and current pregnancy, (2) emotional responses to experiences, (3) experiences of EPAU services and (4) recommendations for EPAU services. The first of these, ‘EPAUs and current pregnancy,’ covered information about the pregnancy for which they attended the EPAU and any clinical care (EPAU and otherwise) they had experienced. These data were used to summarise each woman’s pregnancy and reason for attending the EPAU, as already presented, and ensure that analysis focused only on the experiences pertaining to women’s pregnancy during the VESPA study. The second area was ‘emotional responses to experiences’ and this captured all information relating to women’s emotional experiences during their time at the EPAU. With these data we were able to generate the emotional typology and clinical care pathway models already discussed.
We grouped women’s ‘recommendations for EPAU services’ and have supplemented these with our own analysis of the data to provide overall recommendations emanating from this study. These are presented last.
The area of ‘experiences of EPAU services’ is where our analysis focused and contains five broad themes: (1) ‘barriers’, (2) ‘communication and information’, (3) ‘experiences of care’ (analysed as two separate subthemes of ‘continuity of care’ and ‘involvement in care decisions’), (4) ‘staff attitudes or approach’ and (5) ‘ EPAU functionality’ (analysed as two separate subthemes of ‘efficiency’ and ‘sensitive patient management’), rendering a total of seven themes of analytical interest.
We analysed these seven themes in detail, taking into account unit configuration and/or emotional responses to facilitate exploration of patterns across the data set. Three of the themes were analysed using only one attribute, rather than both attributes, as the issues were mainly aligned to one or other of them. ‘Barriers’ and ‘efficiency’ were analysed by only unit configuration and ‘communication and information’ was analysed by emotional typology. The remaining themes were analysed and interpreted using both unit configuration and emotional typology. We also took into account women’s satisfaction levels, which were derived from the SAPS score and were classified as high or low. Examples of quotations have been provided per theme to illustrate the findings and recommendations, and a summary of findings can be found in Table 17.
Theme 1: barriers
The theme of ‘barriers’ included data on the difficulties women encountered when accessing and attending the EPAU. This was analysed by unit configuration only. Barriers included factors such as lack of awareness of the service, inability to obtain appointments and accessibility (i.e. travelling and parking facilities at the EPAU/local hospital).
Women reported that obtaining appointments was the most commonly raised barrier to accessing EPAUs. Analysis of awareness and accessibility by unit configuration showed no distinctive pattern. Lack of awareness of the EPAU service was a service-wide issue, whereas accessibility of the service in terms of distance from home and parking (including associated charges) was a location-specific issue (e.g. participants who had attended EPAUs in Scotland reported no parking charges, but those who had attended EPAUs in England did).
Unit configuration had an effect on women’s ability to obtain appointments. Inconvenient opening times and lack of available appointments were the main issues raised by women, with weekend closures highlighted as a particularly important issue. Availability of only daytime appointments was raised by some women as a barrier, particularly for follow-up appointments. Women mentioned the need to take time off work or to arrange child care to attend these appointments. Although the ability to obtain appointments was raised across all unit configuration strata, there were some differences. For example, over half of the women who had attended EPAUs that were closed over the weekend (i.e. configurations vcw, vCw, Vcw and VCw) reported the ability to obtain appointments as a barrier; however, approximately one-third of women who had attended EPAUs that were open at weekends (i.e. configurations vcW, vCW, VcW and VCW) also reported the ability to obtain appointments as a barrier:
I’d seen my GP on the Friday and this was the Monday. I had to wait the weekend out basically . . . But I think I probably would have gone sooner if it hadn’t been the weekend.
Participant 013 (molar, pathway 6, configuration Vcw)
Theme 2: efficiency
This theme includes data from women on how efficiently the EPAU they attended was run, including delays and waiting times (potential examples of understaffing) and how timely the service was delivered. It was analysed by unit configuration only. There was no particular pattern by configuration, but configuration types Vcw and VcW were notable for higher proportions of women (both with 50% of women per unit type) reporting ‘good’ efficiency. Examples of efficiency centred on short waiting times and few delays, leading to a smooth, clear process through the EPAU, with clinicians doing what they said they would do:
Obviously the unit is quite understaffed, and I know that a lot of the time it closes which isn’t great. But yes, in general it’s really good. I can’t really fault anything other than levels of staffing . . . I felt a bit rushed.
Participant 004 (ongoing, pathway 1, configuration VcW)
Theme 3: communication and information
Within this theme examples from women of where ‘communication and information’ had been sufficient (and participants had been satisfied) and insufficient (and therefore participants were unsatisfied) are included and have been analysed solely by emotional typology. Examples of ‘communication and information’ which left women unsatisfied included the use of jargon and giving out irrelevant information, which often compelled women to conduct their own research. Women who were provided with easily understandable information, in both verbal and written forms, and who were given the opportunity to ask questions, were more likely to be satisfied.
By typology, women who experienced an ‘anxious presentation’ emotional pathway were least likely to be satisfied with the level of ‘communication and information’. This was unexpected as these women had the fastest route through the EPAU and left with a viable, ongoing pregnancy. However, this was generally because their pregnancy complications and symptoms had not been explained, either at all or in sufficient detail. Another pattern was that of longer clinical journeys involving interventions (‘anxious/upset with procedural uncertainty’ and ‘anxious with sustained uncertainty’); the requirement for good ‘communication and information’ in these cases was higher, and women in this group were at greater risk of not receiving adequate or sufficient information:
. . . at the end of that appointment that was when we were then told, right, these are your options. I think probably a little bit of frustration as well that we weren’t told that the week beforehand but again I kind of understand why, because at that point I guess there’s the potential that it could have been a different result, hence why you have to go back on the second time, but it might have been nice just to have walked away from that first appointment feeling, OK, I’m coming back in a week’s time but the option that I will then have if the result is X will look like this, this, this, and then we kind of did our own research between the two appointments. It might have just given us a bit more time to think through what the right options really were.
Participant 026 (miscarriage, pathway 6, configuration vcw)
Theme 4: involvement in care decisions
This theme explored if and to what degree women felt adequately involved in their care. It was analysed by both unit configuration and emotional typology. The level of ‘involvement in care decisions’ varied: most women either felt sufficiently involved or reported that there were no decisions to be made. A few women, however, felt that they had complete control of their care. Some participants spoke about EPAU staff involving their partners in care decisions. Most women in configuration types vCW, VcW and VCw (between 75% and 100%) reported ‘good’ involvement in their care. Configuration types vcW and Vcw had the fewest women reporting ‘good’ involvement in decision-making. The common trait between these two configuration types was the fact that hospitals in neither configuration offered consultant-led sessions.
Only two women reported poor ‘involvement in care decisions’, limiting any meaningful analysis by typology. Given that the emotional typologies of ‘anxious presentation’ and ‘anxious/upset’ followed clinical care pathways which resulted in immediate discharge from the EPAU, with either an ongoing pregnancy or a miscarriage, most women in these typologies felt sufficiently involved, had no decision to make or made no comment. Two women who reported low levels of involvement had different emotional typologies and so a typology-specific issue was ruled out. Both women had been informed of the available management options, but they were not permitted to make their own decisions. Both these women gave low scores on question 4 of the SAPS regarding satisfaction with choices relating to their care:
. . . the nurse was explaining to me that, ‘Look, you can leave it happen naturally or we can keep you in and give you medication’, but it ended up that I didn’t really have a choice in the end, they were saying, ‘Look, we are just going to leave you, leave it to happen naturally’. So, at that point I was sent home and when I began to bleed very heavy and I didn’t know what to do . . .
Participant 019 (miscarriage, pathway 3, configuration VCW)
Theme 5: staff attitudes or approach
This theme investigated the way in which staff interacted with their patients at the EPAUs and was analysed by both unit configuration and emotional typology. All women, regardless of typology or level of satisfaction, reported good interactions with staff, describing them as kind, compassionate, empathic, competent and taking time to explain things, meaning that experiences were overwhelmingly positive in this theme. This finding supports the outcome on question 6 of the SAPS, with 37 out of 38 women saying that they felt respected most or all of the time:
I’d say the quality of care from the health-care professionals when I actually saw them was great, was nothing more than I would have expected. They had sound medical advice, they were able to support me emotionally. So, I think from the health-care professional’s point of view, I have absolutely no complaints, they were empathetic, they were lovely, they were supportive, they understood the situation, maybe not from a personal level but they were able to say the right things.
Participant 021 (miscarriage, pathways 1 and 5, configuration VCw)
However, one-third of women did report a negative experience at some point during their care, such as staff being cold, clinical or impolite. Some women reported feeling like ‘being on a conveyer belt’ during ultrasound scans. Analysis by unit configuration showed no clear pattern, other than vcw hospitals performing significantly worse than all others, with 50% of women reporting issues with staff. By emotional typology, shorter pathways (‘anxious presentation’, ‘sustained anxiety due to diagnostic uncertainty’ and ‘anxious/upset’) were less likely to result in experiences of poor staff attitudes, whereas longer pathways (‘anxious/upset after diagnostic uncertainty’, ‘anxious/upset with procedural uncertainty’ and ‘anxious/upset with sustained uncertainty’) were more likely to result in suboptimal interactions, possibly because these women had a greater number of interactions with more staff. Interestingly, participants who reported feeling rushed by staff all came from the ‘anxious presentation’ emotional typology, that is were found to have a viable pregnancy and did not need any further care from the EPAU. The fact that all the women who felt rushed were all in the typologies in which pregnancy was rapidly confirmed as either ongoing or lost highlights the need to remember that the EPAU’s job is not done at diagnosis. Women felt that the lack of any discussion or explanation as to their symptoms, particularly if the pregnancy was ongoing, affected their EPAU experience:
From memory, I remember it being quite quick. I don’t really know what I was expecting, I’ve never had a scan before, but I did remember thinking ‘Oh OK, is that . . . that’s it then, that’s that done?’ But again, she did say we are just checking the heart beat. I guess at 6 weeks there’s not really much else they can see, it’s so tiny, but I do remember thinking ‘Ooh OK that’s quick, we go now?’
Participant 034 (ongoing, pathway 1, configuration VcW)
Most experiences of poor care reported in this theme originated from the interaction with the person who was undertaking the scan, whom women sometimes perceived to be ‘cold’ or ‘clinical’. This is most likely because the person doing the scan was focused on technical aspects of the procedure, whereas the woman was wondering whether or not her pregnancy was healthy, and this came across as ‘clinical’. Simply explaining to the woman that the examination will be carried out in silence, as one woman experienced during her EPAU visit, could prevent health-care professionals being perceived as removed or detached:
The only thing I would say with the experience of going there is I wish there was some signs on the wall to say we will be quiet . . . When I went to the other unit, they had signs, ‘We’ll be quiet when we are looking at the scan’. I fed this back . . . ‘Please bear with us, we’ll speak to you as soon as we get the chance to’, sort of thing . . . Because they have that on the wall . . . It kind of reassures you that actually they are silent for a reason here, but when you are lying in that bed with the silence and you think ‘what the hell is . . . please just tell me is everything all right’, that would be beneficial.
Participant 029 (ongoing, pathway 2, configuration vcw)
Theme 6: continuity of care
In this theme women discussed how well their care was integrated. There were two types of continuity: (1) external (i.e. referral into the EPAU from A&E and discharge from the EPAU into other clinical or routine care) and (2) internal (i.e. within the EPAU service). This theme was analysed in relation to both unit configuration and emotional typology. Only six women reported aspects of poor continuity of care (two in each of configurations vcW, vCw and VCw). The two women in the VCw configuration had attended the same EPAU, which suggests that there may be a site-specific issue, rather than a configuration issue. Lack of communication between staff in individual EPAUs, and poor linkages between EPAUs and other parts of the hospital, GPs and community midwives, were issues which transcended unit type:
I think the overall system and process was . . . well, added to anxiety from the point of having to repeat myself so many times about what had happened, sometimes I felt like they didn’t really know me or know my situation and that actually if I hadn’t have said the right thing I could have ended up with a very different treatment path.
Participant 021 (miscarriage, pathways 1 and 5, configuration VCw)
By emotional typology, the main finding was that all women felt that the community-based health-care professionals were informed of their visit to the EPAU. Women diagnosed with miscarriages were particularly keen that this information was passed to their GP and/or midwife so that their post-loss care could be managed sensitively:
I don’t understand why an e-mail can’t be sent at the point that it’s clear that you’ve had a miscarriage to the GP to let them know that. I don’t know why we’re still relying on snail mail to get that information to GPs and that’s both times that I’ve had the miscarriage, the information has not made it to the GP by the time that I go to see the GP to get a sick line for my work and that must happen to a lot of people. And certainly the GP said, ‘I wish that I had been informed’, because he was on the verge of saying congratulations when I went in to see him and had no idea, so again other people might experience that and the doctor does say congratulations to them and it’s even more distressing to then have to say, ‘Well actually I’m here because I’ve had a miscarriage and I need a sick note’. So, I think that that is something that they could improve on and I don’t see why it would be a difficult thing to do.
Participant 015 (miscarriage, pathway 4, configuration vcW)
Although not particular to analysis either by unit configuration or by emotional typology, many women did report that they would welcome having access to, or at least some information about, psychological support services. In addition, there was a reported desire to have access to a form of aftercare or further check-ups to ensure not only that their physical health was continuing to improve, but that good psychological health was maintained after the loss of a pregnancy:
I suppose in one way it’s a little odd that you can have quite a physically horrific experience and potentially have no other interaction beyond that event. I don’t know if that is an oversight. I mean, I’m proactive, happy to go and see the doctor and I suppose I felt I had those options available to me. I just wonder if other people would and for anybody who didn’t have that support or the confidence, perhaps, I wonder if they could fall through the net in a very emotional point in their life.
Participant 014 (miscarriage, pathway 4, configuration vcw)
Women suggested that this could be provided by different health-care professionals, such as trained EPAU staff, health visitors, professional bereavement counsellors or specialist advisors. Other options worth considering are advice lines, listening services or informal buddies (volunteers who have had similar experiences in the past). What each suggestion had in common was the ability for women, and their partners, to speak about their loss, validate their feelings of grief, obtain reassurance about future pregnancies, and have the time to process and organise their thoughts surrounding their pregnancy loss:
. . . I think the main thing for me is just having some form of counselling or psychotherapy in place and just almost checking the welfare of the mother, for example . . . when I gave birth to my little one, the health visitor comes out and she checks on you, ‘Have you got baby blues? Is the baby OK?’ But when you have a miscarriage, it’s like you are not given the same treatment I suppose and I think what I would like to see in place in the future that it is treated like a real pregnancy, yes you have had a miscarriage but a health visitor is checking on, ‘Do you have depression, are you grieving, what support can we give you?’
Participant 019 (miscarriage, pathway 3, configuration VCW)
Theme 7: sensitive patient management
The final theme, ‘sensitive patient management’, was analysed by both unit configuration and emotional typology. This theme raised issues and best practices around privacy and practical sensitivity issues, such as the location of an EPAU service in terms of whether it was a separate unit or located within another hospital department (e.g. maternity or gynaecology ward) and the issues that such co-location can bring. Informing the GP or midwife that a pregnancy had been lost and cancelling scans and other appointments so that the women did not have to were examples of ‘sensitive patient management’:
No, they did tell me they would inform the midwife and my GP, and they would cancel any upcoming appointments, which they did do, which was really nice . . . Yes, that was really great because to ring up and have to say what’s happened wouldn’t have been very nice. So yes, it was nice to not have to think about cancelling any appointments.
Participant 038 (miscarriage, pathway 3, configuration Vcw)
By unit configuration, we found that women who attended low-volume EPAUs (i.e. vcw and vCw) were more likely to have a poor or mixed experience of ‘sensitive patient management’. Women were particularly concerned when the EPAU waiting area was shared with women at more advanced stages of pregnancy. They were also worried about privacy issues when personal information was discussed in a confined space in which the EPAU was run. Women were more likely to report good experiences of ‘sensitive patient management’ in high-volume EPAUs (e.g. Vcw, VcW and VCW): > 26% of women who had reported good experiences and < 8% of women who had reported poor or mixed experiences had attended an EPAU with configuration Vcw, VcW, VCw or VCW. This compared with < 11% of all women reporting good experiences and > 26% of women reporting poor or mixed experiences in EPAUs with configuration vcw, vcW, vCw or vCW.
The desire for a separate EPAU waiting area or building to maintain privacy was the dominant finding in this theme. When analysed by emotional typology, the desire for a separate EPAU waiting area or building to maintain privacy was present across all typologies. This desire stemmed from the fact that women who are losing pregnancies may become upset when waiting with women who are not only excited and visibly happy about their ongoing pregnancies, but also undergoing practices that go alongside ongoing pregnancies, such as offering flu vaccinations to pregnant women while they are waiting for scans:
Women going through miscarriages need to be in a slightly more isolated area, they don’t need to be walking into a door where there’s a woman walking out with her newborn baby, and I think the early pregnancy units, although they are run by midwives, I think they need to be carefully placed, not directly in the line of a labour ward or an antenatal clinic. I think that is so important.
Participant 001 (PUL, pathway 3, configuration vCw)
. . . you feel very vulnerable and in public when you are feeling a bit like oh this is a horrible thing that’s maybe happening, I would just rather have been in a quiet room somewhere on my own.
Participant 013 (molar, pathway 6, configuration Vcw)
. . . I had a woman come up to me and try and force me to have the flu jab because she was trying to go round and make it . . . you know, when it became recommended for you to have it in pregnancy and I said quite quietly, ‘I don’t need to, I’m here because I’m having a miscarriage’, and she didn’t hear, so I ended up having to say it quite loudly and then everyone stared. Yes, it sort of added to what was already a nasty experience.
Participant 006 (ectopic, pathway 5, configuration vcw)
I think I’d have found being so close to the maternity hospital and seeing these women coming out with their new babies or heavily pregnant women going into labour, I’d have found that really hard.
Participant 034 (ongoing, pathway 1, configuration VcW)
Privacy within the unit so that women are not overheard in their consultations and sensitivity when the EPAU staff are interacting with their patients in person or over the telephone were key factors in improving women’s experiences. However, overwhelmingly, the desire to separate EPAUs from other services was mentioned by all women irrespective of unit type, emotional typology and clinical outcome, as combined or shared EPAU services can be insensitive to women’s emotional states.
The analysis of themes is summarised in Table 17.
| Theme | Analysis by unit configuration | Analysis by emotional typology |
|---|---|---|
| Barriers |
|
|
| Efficiency |
|
|
| Communication and information |
|
|
| Involvement in care decisions |
|
|
| Staff attitudes or approach |
|
|
| Continuity of care |
|
|
| Sensitive patient management |
|
|
Recommendations
The following recommendations are based on what women said would have improved their experiences. These are formalised according to our analyses of what contributed to women’s experiences of EPAU services being good or bad.
Recommendation 1: general pregnancy and pre-pregnancy care and information
-
Raise awareness of EPAUs among women of reproductive age.
-
Provide women with the information that they need when they leave the EPAU, dependent on their outcome. For example, for women experiencing a spontaneous miscarriage this could be information on what to expect in terms of the amount and duration of bleeding, how long to wait before trying to conceive again and preconception advice, such as folic acid supplementation, to improve their chances of a subsequent ongoing pregnancy.
Recommendation 2: accessibility of EPAUs
-
Provide suitable opening times.
-
Re-evaluate weekend opening and address bank holiday closures.
-
Provide alternative opening hours to accommodate working women and women in need of child care.
-
When this is not possible, ensure that there are alternatives for when the EPAU is closed (e.g. A&E or maternity assessment units) and that there are clear protocols in place to manage women with early pregnancy complications when the EPAU is closed.
-
-
Increase availability of appointments.
-
Ensure that telephone lines are answered so that women do not have to leave a voicemail and wait to be contacted to be booked in.
-
Introduce a telephone advice line for out-of-EPAU opening hours.
-
Ensure that appointments are not subject to blocking on referral, apart from required checks to ensure appropriateness of attendance.
-
Recommendation 3: staffing
-
Ensure that EPAUs are appropriately staffed.
-
When viable, prevent staff from having to take on multiple roles (such as EPAU receptionist, sonographer and consulting nurse).
-
-
Maintain optimal staff attitudes and approaches to care.
-
Discuss each process and procedure with women, keeping them informed of where they are in the process and what to expect next.
-
Ensure that whoever is conducting the scans explains the scanning process and engages with the woman to avoid a ‘conveyer belt’ experience.
-
Recommendation 4: within-EPAU experience
-
Increase EPAU efficiency.
-
Ensure that waiting times are kept short and delays are kept to a minimum.
-
Allocate appropriate amounts of time for appointments.
-
Highlight the reasons for certain procedures and delays.
-
-
Offer women a smooth process through the EPAU.
-
Introduce posters into EPAUs that explain the processes women can expect to go through when they are attending the unit.
-
Make sure that women’s notes are passed on to the EPAU staff they will see next, to prevent having to re-explain history, symptoms, etc.
-
Recommendation 5: managing patients sensitively
-
Provide a distinct but integrated EPAU service by physically separating EPAUs from other hospital services, when possible, and maintain good cross-health-care links for ongoing care.
-
Prevent co-location with other maternity services.
-
Waiting areas should be EPAU specific.
-
-
Emphasise to staff the sensitive nature of EPAU visits and ensure that they act accordingly.
-
Ensure that staff confirm that they have the correct person when contacting women about appointments via telephone, before announcing it is the EPAU.
-
Ensure that reception staff understand that women may ask to cancel appointments because of pregnancy loss and allow them to do so without questioning.
-
Prevent staff from inappropriately undertaking routine processes with women attending the EPAU (i.e. recruiting for flu vaccinations).
-
-
Ensure privacy.
-
Allow women to fill out a referral form on arrival, rather than making them discuss their issue verbally among other people waiting.
-
Ensure that consultations are not overheard by either providing background noise (e.g. television) or ensuring a private location.
-
Recommendation 6: communicating and decision-making
-
Provide clear and accessible information that is specific to the condition a woman has and/or procedures they will have.
-
Involve women in their care decisions.
-
Provide women with a full range of options that are appropriate to their condition.
-
Ensure that women’s choices are respected and followed (while still clinically safe).
-
-
Involve women’s partners in the processes and procedures (should women want them to be).
-
Plan for the journey a woman has ahead of them.
-
Provide (in written form) the information a woman will need to understand and use to make decisions about what happens when they are discharged from the EPAU; be that when they go home (whether or not the pregnancy is ongoing), or when they are heading to theatre for surgery, onto a ward or to another specialty.
-
Recommendation 7: continuity of care
-
Review referral and discharge processes to ensure a smooth transition into and out of EPAUs.
-
Make sure that whoever is taking over care after discharge from the EPAU is fully informed of women’s notes from the EPAU.
-
-
Ensure that there is efficient communication between the EPAU and the rest of maternity, ongoing and/or hospital care.
-
Send notes promptly (electronically) from the EPAU to health-care professionals who will next provide care for women who have visited the EPAU.
-
-
Provide appropriate aftercare.
-
Develop new, or reinforce, links with psychological support services to work with women requiring ongoing support after using EPAU services.
-
Ensure that information on psychological support services is provided.
-
Explain to women the availability and location of follow-up (GP, community midwife, EPAU, etc.).
-
Health economic evaluation
Resource use and costs
The analysis included costs associated with ultrasounds, blood tests, admissions and staff time for which data were available for 6531 patients. Total costs take into account repeated tests and admissions, as well as staff salary costs. The mean total cost per patient was £225 (SD £537). The main contributor to total costs was surgical admissions, followed by ultrasounds. The mean total cost per patient for each cost component is shown in Table 18. Costs were assessed for the within-study period only (up to 3 months post visit) and no discounting was applied.
| Cost component | Mean cost per patient (£) | SD (£) |
|---|---|---|
| Ultrasound | 64 | 36 |
| Blood test | 2 | 5 |
| Admissions for observation only | 33 | 237 |
| Admissions for surgery | 112 | 475 |
| Salary costs | 14 | 13 |
Total cost varied from £1 to £4390. The distribution of total cost is shown in Figure 48. It is clear that the majority of patients had a total cost of < £200, with a minority of patients incurring higher costs because of admission to hospital.
FIGURE 48.
Distribution of total cost.
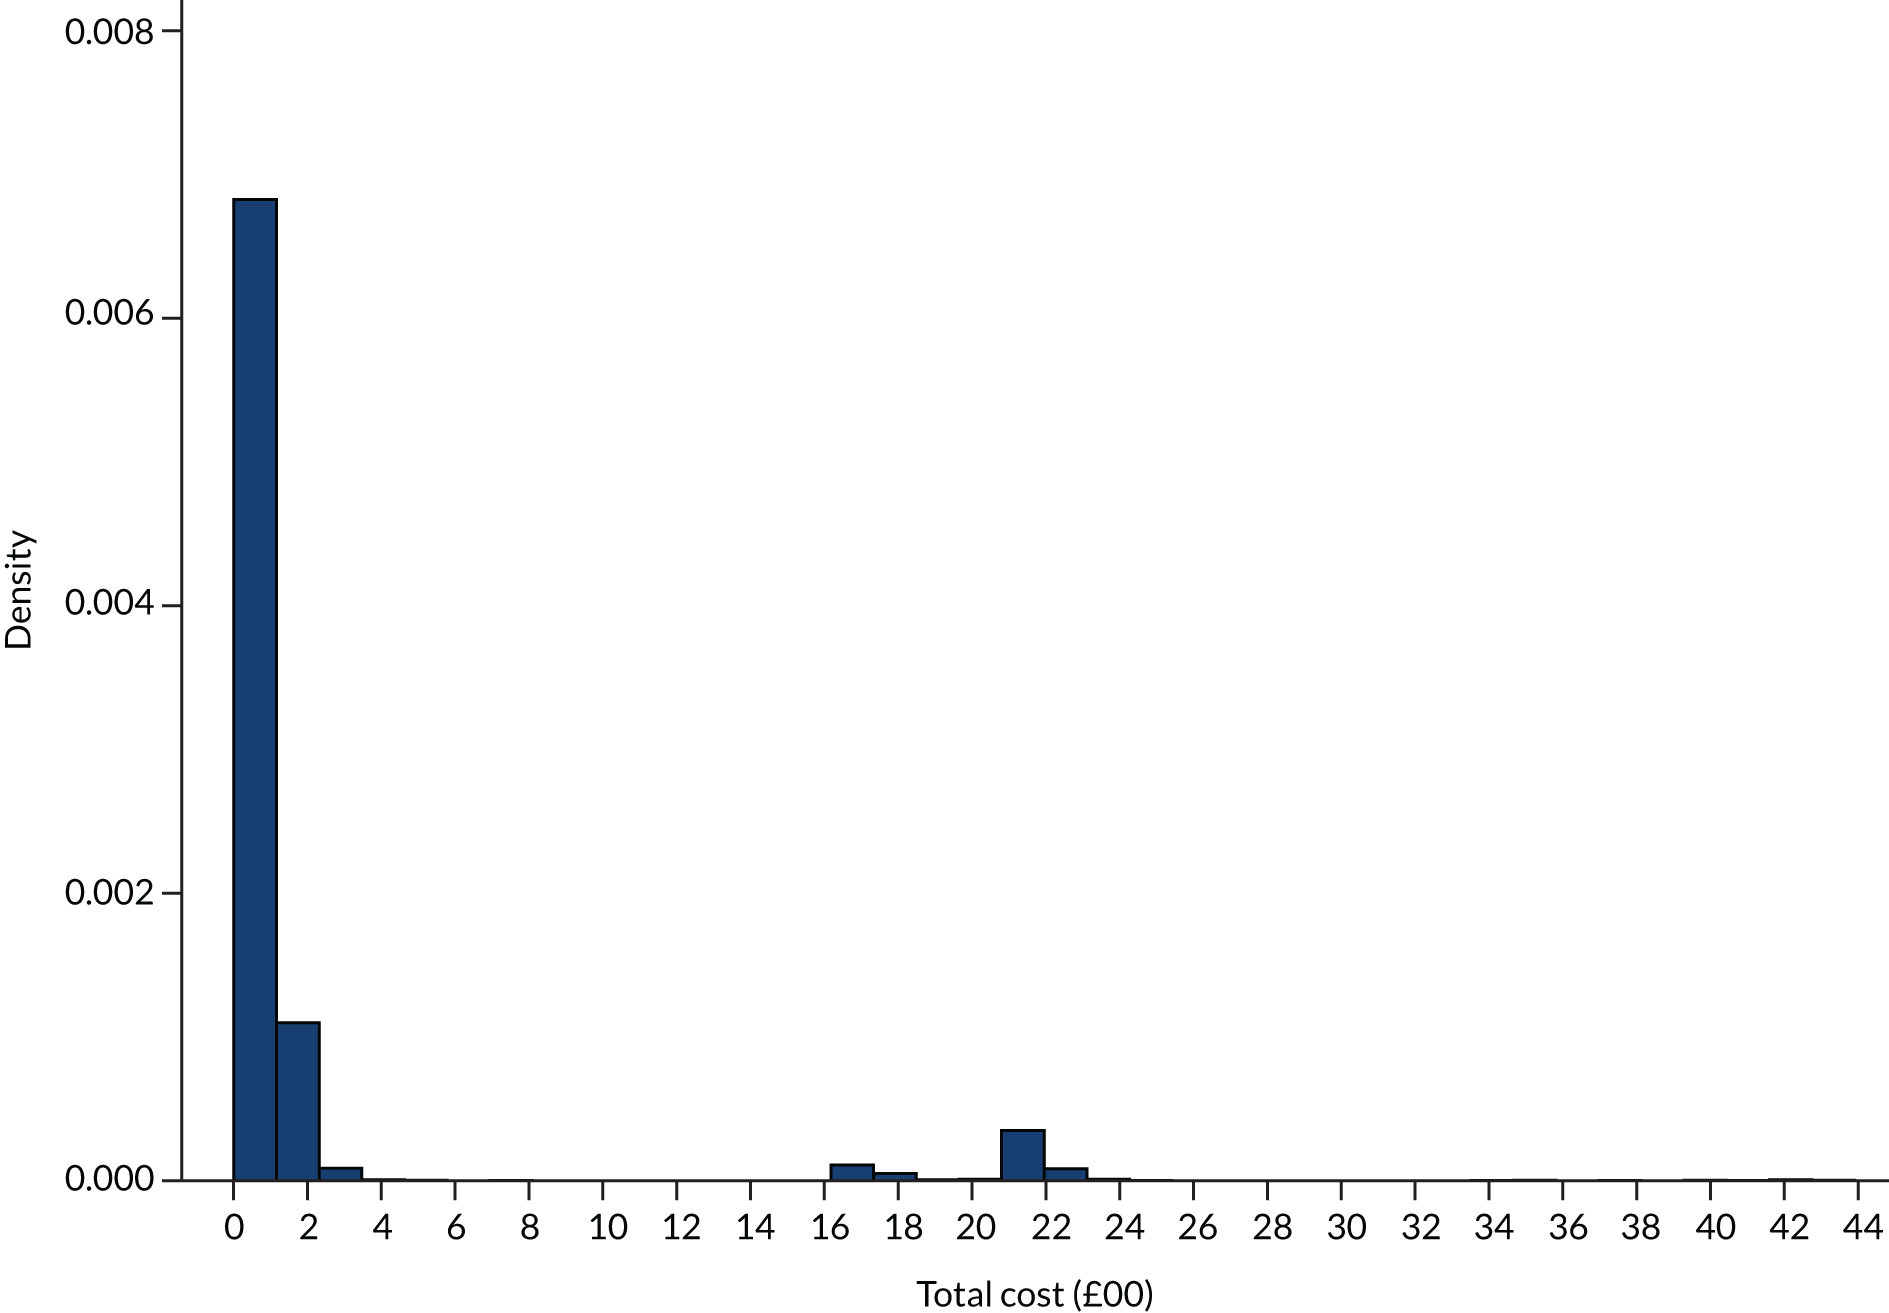
The mean total cost per patient masks large differences in mean total cost by FD. The mean total cost in patients with a normal pregnancy was £92, in patients with early embryonic demise it was £473 and in the 12 patients with molar pregnancy it was £1793 (Table 19).
| Diagnosis | Mean cost (£) | SD (£) | Number of women |
|---|---|---|---|
| Normal/live intrauterine pregnancy | 92 | 178 | 3344 |
| Twin pregnancy | 94 | 45 | 2 |
| Early intrauterine pregnancy | 106 | 250 | 812 |
| Other | 112 | 77 | 3 |
| Complete miscarriage | 180 | 388 | 685 |
| Not pregnant | 238 | 607 | 12 |
| Inconclusive scan (PUL) | 275 | 621 | 149 |
| Early embryonic demise | 473 | 814 | 800 |
| Incomplete miscarriage | 694 | 952 | 293 |
| Retained products of conception | 1005 | 1177 | 123 |
| Ectopic pregnancy | 1493 | 950 | 108 |
| Molar pregnancy | 1793 | 790 | 12 |
We looked at the mean total cost depending on annual patient volume, consultant presence during opening hours and weekend opening. The mean total costs are shown in Table 20.
| Unit type | Mean total cost (£) | SD (£) | Number of women | Adjusteda mean total cost (£) | SD (£) |
|---|---|---|---|---|---|
| Volume < 2500 visits | 203 | 497 | 3262 | 219 | 662 |
| Volume ≥ 2500 visits | 247 | 574 | 3269 | 239 | 665 |
| Consultant presence: no | 220 | 532 | 3851 | 225 | 609 |
| Consultant presence: yes | 232 | 544 | 2680 | 234 | 733 |
| Weekend opening: no | 220 | 522 | 3120 | 226 | 673 |
| Weekend opening: yes | 230 | 551 | 3411 | 232 | 654 |
Lower-volume units and no consultant presence were associated with lower costs than their alternatives. Lack of weekend opening was also associated with a lower mean total cost. The differences became less pronounced when age and FD were adjusted/controlled for.
We adjusted total cost for FD, age, yearly volume, consultant presence and hours open at the weekend using a multilevel model, allowing for clustering at the unit level. The results of the regression are shown in Table 21. Age (b = 2.74) is statistically significant at the 0.05 level (p = 0.005). This means that, for every year increase in age, a £3 increase in total cost is predicted, holding all other variables constant. A FD of early embryonic demise, incomplete miscarriage, retained products of conception, complete miscarriage, ectopic pregnancy, inconclusive scan or molar pregnancy is also associated with higher costs of early pregnancy care. There was no evidence of a relationship between the other variables and total cost.
| Patient characteristic and FD | Coefficient | SE | p > t | 95% CI |
|---|---|---|---|---|
| Age | 2.74 | 0.97 | 0.005 | 0.84 to 4.64 |
| Early intrauterine pregnancy | 15.90 | 18.96 | 0.40 | –21.27 to 53.07 |
| Early embryonic demise | 373.34 | 18.56 | 0.00 | 336.97 to 409.71 |
| Incomplete miscarriage | 597.60 | 28.78 | 0.00 | 541.18 to 654.01 |
| Retained products of conception | 891.65 | 43.03 | 0.00 | 807.31 to 975.98 |
| Complete miscarriage | 83.26 | 19.75 | 0.00 | 44.56 to 121.97 |
| Ectopic pregnancy | 1398.97 | 45.64 | 0.00 | 1309.52 to 1488.42 |
| Inconclusive scan (PUL) | 165.68 | 39.23 | 0.00 | 88.80 to 242.57 |
| Molar pregnancy | 1696.73 | 134.90 | 0.00 | 1432.32 to 1961.13 |
| Other | –2.56 | 269.49 | 0.99 | –530.74 to 525.63 |
| Twin pregnancy | –61.68 | 330.24 | 0.85 | –708.95 to 585.58 |
| Not pregnant | 142.53 | 134.92 | 0.29 | –121.90 to 406.96 |
| Yearly volume (visits) | 0.00 | 0.01 | 0.81 | –0.01 to 0.12 |
| Weekend opening | 0.58 | 1.01 | 0.57 | –1.40 to 2.56 |
| Consultant presence | 1.42 | 1.63 | 0.38 | –1.76 to 4.61 |
Mean total cost by configuration
The results in terms of mean total cost by configuration are shown in Table 22, along with the SD and the number of people in each configuration. The configuration type with the highest mean total cost is type VCw, whereas the configuration type with the lowest mean total cost is type vCw. The results did not change when we adjusted these costs for age and FD.
| Configuration | Mean total cost (£) | SD (£) | n | Adjusteda mean total cost (£) | SD (£) |
|---|---|---|---|---|---|
| vcw | 216 | 509 | 1479 | 227 | 977 |
| vcW | 226 | 578 | 589 | 241 | 1551 |
| vCw | 173 | 439 | 751 | 189 | 1375 |
| vCW | 180 | 428 | 443 | 196 | 1882 |
| Vcw | 240 | 565 | 297 | 243 | 2193 |
| VcW | 226 | 545 | 1335 | 230 | 1044 |
| VCw | 279 | 614 | 593 | 257 | 1541 |
| VCW | 258 | 589 | 1044 | 242 | 1179 |
Mean total cost by unit
We looked at the mean total cost by unit. The results are shown in Table 23, along with the SD and the number of people in each unit. The unit with the highest mean total cost is SXM (yearly volume 830, no weekend opening, 2.1% consultant time), followed closely by GFY (yearly volume 1711, no weekend opening, 12% consultant time). The unit with the lowest mean total cost is RPR (yearly volume 2738, open for 22 hours at weekends, 1.3% consultant time) followed by PCO (yearly volume 1244, no weekend opening, 0.5% consultant time).
| Unit | Mean total cost (£) | SD (£) | Mean adjusted total cost (£) | SD (£) |
|---|---|---|---|---|
| RPR | 106 | 288 | 133 | 467 |
| PCO | 110 | 277 | 141 | 466 |
| RXO | 113 | 292 | 153 | 467 |
| WWR | 118 | 309 | 103 | 554 |
| BVU | 123 | 341 | 161 | 471 |
| JDG | 129 | 343 | 110 | 466 |
| ZAR | 141 | 344 | 191 | 467 |
| ZAM | 143 | 361 | 135 | 480 |
| CZX | 146 | 375 | 128 | 488 |
| SDD | 159 | 350 | 183 | 468 |
| MJL | 160 | 379 | 201 | 467 |
| YUS | 167 | 411 | 199 | 474 |
| SHS | 170 | 415 | 194 | 467 |
| QAR | 179 | 465 | 207 | 472 |
| NSK | 192 | 458 | 252 | 468 |
| TCS | 194 | 489 | 227 | 470 |
| GLR | 198 | 462 | 203 | 466 |
| AIS | 217 | 559 | 229 | 476 |
| FVX | 220 | 509 | 204 | 476 |
| HYG | 221 | 513 | 212 | 466 |
| SCC | 227 | 500 | 272 | 486 |
| ULV | 227 | 520 | 251 | 468 |
| IWX | 230 | 505 | 287 | 467 |
| ZNI | 236 | 552 | 235 | 474 |
| SXB | 240 | 613 | 264 | 467 |
| YLJ | 241 | 576 | 250 | 474 |
| VXL | 243 | 551 | 254 | 474 |
| QSL | 253 | 589 | 189 | 471 |
| JII | 258 | 578 | 291 | 468 |
| CXP | 262 | 606 | 291 | 505 |
| OYN | 262 | 627 | 193 | 467 |
| BDX | 264 | 551 | 275 | 471 |
| HJZ | 265 | 657 | 265 | 468 |
| XQZ | 268 | 599 | 227 | 467 |
| WDI | 275 | 609 | 311 | 488 |
| JNM | 279 | 603 | 241 | 468 |
| WYW | 280 | 610 | 251 | 466 |
| OVA | 283 | 596 | 269 | 470 |
| UOY | 291 | 684 | 315 | 489 |
| JPM | 311 | 646 | 251 | 468 |
| XNL | 320 | 741 | 258 | 491 |
| XQD | 324 | 661 | 288 | 490 |
| GFY | 416 | 807 | 384 | 467 |
| SXM | 479 | 824 | 380 | 473 |
When we adjusted these costs for age and FD using a linear regression, the units with the highest mean total costs were still GFY and SXM, and the units with the lowest cost were WWR (yearly volume 1304, open for 15 hours at weekends, 1.7% consultant time) and JDG (yearly volume 2607, open for 5.25 hours at weekends, no consultant time), although RPR and PCO were still in the top six units in terms of lowest costs.
Table 24 indicates the percentage of patients in each unit with a FD other than normal/early intrauterine pregnancy, the percentage of all patients seen who were admitted for surgery and the percentage of all patients seen who were admitted for observation.
| Unit | Women (n) | Non-normal pregnancy | Admitted for surgery | Admitted for observation | |||
|---|---|---|---|---|---|---|---|
| n | % | n | % | n | % | ||
| ZAR | 150 | 45 | 30 | 0 | 0 | 3 | 1 |
| PCO | 147 | 50 | 34 | 2 | 1 | 1 | 1 |
| RPR | 147 | 54 | 37 | 2 | 1 | 1 | 1 |
| WWR | 150 | 74 | 49 | 1 | 1 | 4 | 3 |
| RXO | 156 | 37 | 24 | 3 | 2 | 0 | 0 |
| SDD | 149 | 47 | 31 | 3 | 2 | 2 | 1 |
| MJL | 146 | 46 | 32 | 3 | 2 | 3 | 2 |
| BDX | 147 | 51 | 35 | 3 | 2 | 14 | 10 |
| JDG | 149 | 53 | 36 | 3 | 2 | 2 | 1 |
| XQD | 146 | 61 | 42 | 3 | 2 | 16 | 10 |
| BVU | 146 | 40 | 27 | 4 | 3 | 0 | 0 |
| NSK | 148 | 43 | 29 | 4 | 3 | 6 | 4 |
| YUS | 149 | 44 | 30 | 5 | 3 | 2 | 1 |
| ZAM | 150 | 53 | 35 | 4 | 3 | 1 | 1 |
| WDI | 148 | 54 | 36 | 6 | 3 | 8 | 5 |
| CZX | 152 | 60 | 39 | 5 | 3 | 0 | 0 |
| SCC | 149 | 60 | 40 | 5 | 3 | 7 | 5 |
| GLR | 150 | 47 | 31 | 6 | 4 | 3 | 2 |
| SHS | 150 | 46 | 31 | 5 | 4 | 0 | 0 |
| HYG | 150 | 57 | 38 | 6 | 4 | 6 | 4 |
| IWX | 148 | 42 | 28 | 8 | 5 | 2 | 1 |
| ULV | 150 | 43 | 29 | 7 | 5 | 5 | 3 |
| SXB | 151 | 56 | 36 | 8 | 5 | 4 | 3 |
| QAR | 148 | 55 | 37 | 7 | 5 | 1 | 1 |
| HJZ | 150 | 57 | 38 | 8 | 5 | 5 | 3 |
| YLJ | 149 | 60 | 40 | 7 | 5 | 5 | 3 |
| TCS | 150 | 37 | 25 | 9 | 6 | 0 | 0 |
| AIS | 141 | 47 | 33 | 8 | 6 | 2 | 1 |
| FVX | 148 | 56 | 39 | 8 | 6 | 0 | 0 |
| XNL | 150 | 67 | 45 | 11 | 6 | 6 | 4 |
| VXL | 148 | 58 | 39 | 10 | 7 | 2 | 1 |
| OYN | 150 | 64 | 43 | 11 | 7 | 2 | 1 |
| CXP | 150 | 78 | 52 | 11 | 7 | 5 | 3 |
| OVA | 148 | 57 | 39 | 12 | 8 | 2 | 1 |
| UOY | 147 | 58 | 39 | 13 | 8 | 2 | 1 |
| JII | 150 | 47 | 31 | 13 | 9 | 0 | 0 |
| XQZ | 150 | 56 | 37 | 13 | 9 | 1 | 1 |
| JNM | 150 | 57 | 38 | 13 | 9 | 1 | 1 |
| WYW | 147 | 57 | 39 | 13 | 9 | 2 | 1 |
| QSL | 148 | 62 | 42 | 13 | 9 | 0 | 0 |
| ZNI | 150 | 7 | 48 | 1 | 10 | 2 | 2 |
| JPM | 150 | 75 | 50 | 16 | 11 | 0 | 0 |
| GFY | 150 | 50 | 33 | 22 | 14 | 1 | 1 |
| SXM | 142 | 66 | 46 | 27 | 19 | 1 | 1 |
Quality of life
We measured patients’ quality of life at baseline using the EQ-5D-5L questionnaire to calculate an index score. Baseline quality of life was available for 3764 patients. The distribution of index scores is shown in Figure 49.
FIGURE 49.
Distribution of index scores of quality of life/EQ-5D-5L at baseline.
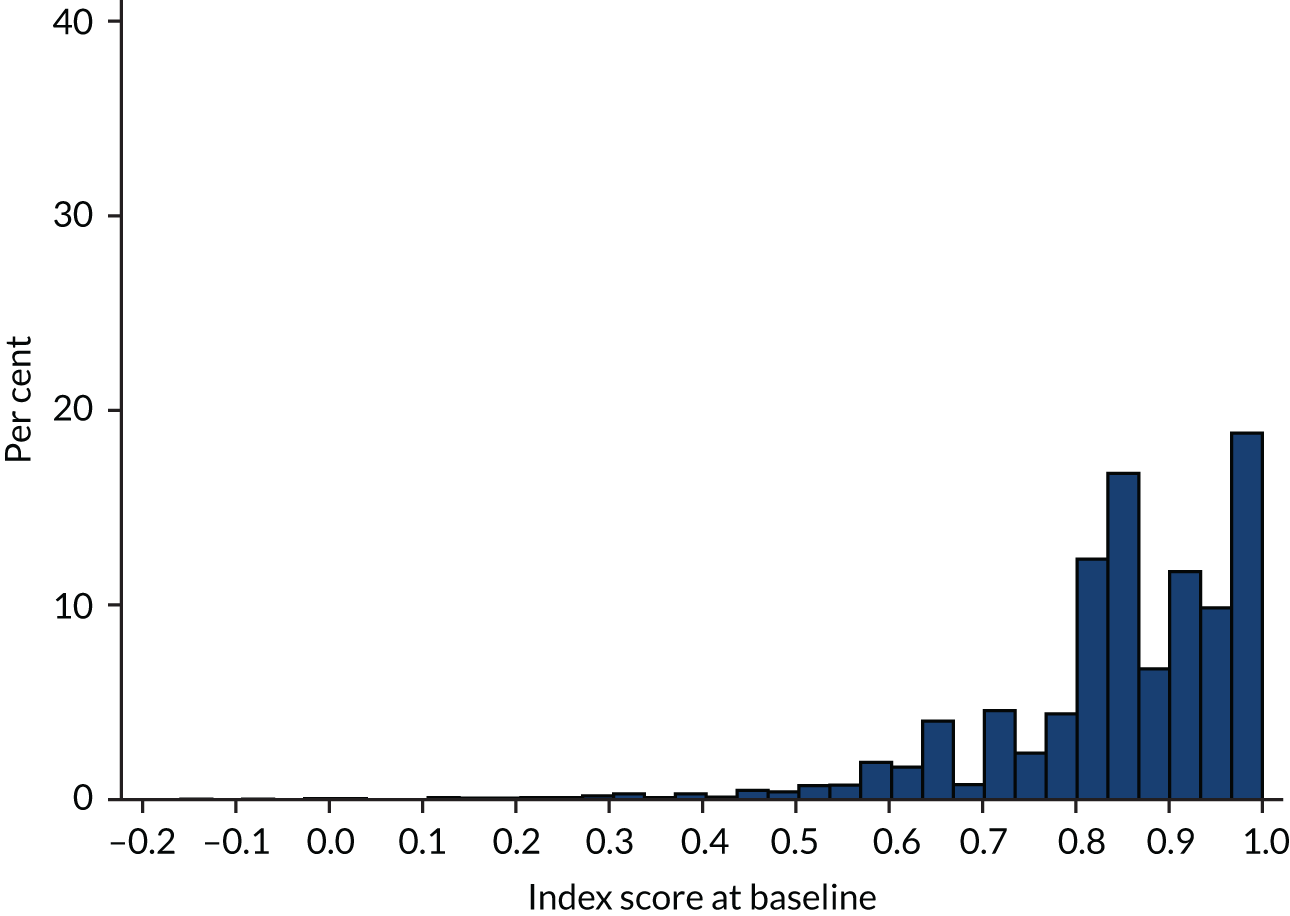
The mean score at baseline in each configuration type is shown in Table 25.
| Configuration | Mean index score | SD | Frequency |
|---|---|---|---|
| vcw | 0.863 | 0.13 | 943 |
| vcW | 0.846 | 0.13 | 379 |
| vCw | 0.876 | 0.12 | 433 |
| vCW | 0.843 | 0.14 | 270 |
| Vcw | 0.852 | 0.14 | 186 |
| VcW | 0.835 | 0.16 | 698 |
| VCw | 0.826 | 0.15 | 328 |
| VCW | 0.836 | 0.14 | 527 |
Mean quality-adjusted life-years at 4 weeks by configuration
The mean score at baseline for patients who returned both baseline and 4-week questionnaires (573 women) was 0.854 (SD 0.13). The mean score at an average follow-up of 26 days was 0.91 (SD 0.11).
Table 26 shows baseline and follow-up index scores by configuration, along with the mean index score, the SD of the mean, the utility gain [mean index score × (4/52 weeks)] and the number of women who completed the questionnaire at both time points in each configuration. The biggest utility gain was seen in configuration Vcw (although this was based on questionnaires from only 12 women) and the smallest utility gain was seen in configuration VcW.
| Configuration | Baseline index score | Index score at 4 weeks | Mean index score (SD) | Utility gain | n |
|---|---|---|---|---|---|
| Vcw | 0.871 | 0.909 | 0.890 (0.09) | 0.068 | 112 |
| vcW | 0.882 | 0.926 | 0.904 (0.07) | 0.070 | 58 |
| vCw | 0.883 | 0.907 | 0.895 (0.11) | 0.069 | 76 |
| vCW | 0.871 | 0.915 | 0.893 (0.09) | 0.069 | 52 |
| Vcw | 0.907 | 0.950 | 0.929 (0.09) | 0.071 | 12 |
| VcW | 0.799 | 0.898 | 0.849 (0.13) | 0.065 | 113 |
| VCw | 0.838 | 0.912 | 0.875 (0.09) | 0.067 | 56 |
| VCW | 0.849 | 0.907 | 0.878 (0.09) | 0.068 | 94 |
Table 27 shows utility gain by unit, which varied from 0.072 to 0.058. The biggest utility gain was seen in QAR and the smallest in XQD.
| Unit | Utility gain | SD | n |
|---|---|---|---|
| QAR | 0.072 | 0.00 | 6 |
| ZNI | 0.072 | 0.00 | 2 |
| OVA | 0.071 | 0.00 | 10 |
| YLJ | 0.071 | 0.01 | 10 |
| ZAM | 0.071 | 0.00 | 11 |
| AIS | 0.071 | 0.00 | 22 |
| XNL | 0.071 | 0.00 | 16 |
| ZAR | 0.070 | 0.01 | 23 |
| SXM | 0.070 | 0.01 | 5 |
| SHS | 0.070 | 0.01 | 12 |
| BDX | 0.070 | 0.01 | 20 |
| CZX | 0.070 | 0.00 | 2 |
| IWX | 0.069 | 0.00 | 12 |
| MJL | 0.069 | 0.01 | 25 |
| OYN | 0.069 | 0.00 | 12 |
| RXO | 0.069 | 0.01 | 34 |
| JPM | 0.069 | 0.01 | 29 |
| FVX | 0.069 | 0.01 | 21 |
| HJZ | 0.068 | 0.00 | 12 |
| WYW | 0.068 | 0.01 | 27 |
| PCO | 0.068 | 0.01 | 18 |
| HYG | 0.068 | 0.01 | 5 |
| NSK | 0.068 | 0.01 | 15 |
| TCS | 0.068 | 0.00 | 9 |
| SXB | 0.068 | 0.01 | 18 |
| GFY | 0.067 | 0.01 | 29 |
| WDI | 0.067 | 0.01 | 9 |
| JDG | 0.066 | 0.01 | 12 |
| VXL | 0.066 | 0.01 | 10 |
| XQZ | 0.065 | 0.01 | 20 |
| JII | 0.065 | 0.01 | 20 |
| ULV | 0.065 | 0.01 | 10 |
| JNM | 0.065 | 0.01 | 18 |
| SDD | 0.065 | 0.00 | 4 |
| RPR | 0.065 | 0.01 | 10 |
| WWR | 0.065 | 0.01 | 7 |
| QSL | 0.065 | 0.01 | 13 |
| GLR | 0.063 | 0.01 | 14 |
| CXP | 0.062 | 0.01 | 13 |
| XQD | 0.058 | 0.02 | 8 |
We adjusted utility gain at 4 weeks for FD, age, yearly volume, hours open at the weekend and consultant time using a multilevel model. The results of the regression are shown in Table 28. Hours open at the weekend (b = –0.0001) is statistically significant at the 0.05 level (p < 0.001). This means that, for every 1-hour increase in weekend opening hours, a 0.0001 decrease in utility gain at 4 weeks is predicted, holding all other variables constant. There was no evidence of a relationship between any of the other variables and utility gain.
| Patient characteristic and FD | Coefficient | SE | p > t | 95% CI |
|---|---|---|---|---|
| Age | 0.0000 | 0.000 | 0.84 | –0.0001 to 0.0001 |
| Early intrauterine pregnancy | –0.0008 | 0.001 | 0.45 | –0.0028 to 0.0012 |
| Early embryonic demise | –0.0007 | 0.001 | 0.53 | –0.0027 to 0.0014 |
| Incomplete miscarriage | 0.0016 | 0.002 | 0.32 | –0.0015 to 0.0046 |
| Retained products of conception | –0.0019 | 0.003 | 0.55 | –0.0083 to 0.0044 |
| Complete miscarriage | 0.0002 | 0.001 | 0.89 | –0.0020 to 0.0023 |
| Ectopic pregnancy | 0.0037 | 0.006 | 0.51 | –0.0071 to 0.0145 |
| Inconclusive scan (PUL) | 0.0029 | 0.004 | 0.42 | –0.0040 to 0.0097 |
| Molar pregnancy | –0.0051 | 0.008 | 0.51 | –0.0204 to 0.0102 |
| Yearly volume (visits) | 0.0000 | 0.000 | 0.45 | 0.0000 to 0.0000 |
| Consultant presence (hours) | 0.0000 | 0.000 | 0.95 | –0.0001 to 0.0001 |
| Weekend opening (hours) | –0.0001 | 0.000 | 0.00 | –0.0002 to –0.0001 |
Percentages of people reporting problems at baseline and 4 weeks
We looked at the percentage of patients reporting each level of problem on each dimension of the EQ-5D-5L at baseline and at 4 weeks. This showed that the positive change in patient’s overall health at 4 weeks was largely due to changes in pain/discomfort and anxiety/depression, with considerably fewer people reporting problems in each dimension of the EQ-5D-5L. There was little change in the percentages of women reporting problems with mobility, self-care or usual activities (Tables 29 and 30).
| Level | Mobility | Self-care | Usual activities | |||
|---|---|---|---|---|---|---|
| Baseline, % | 4 weeks, % | Baseline, % | 4 weeks, % | Baseline, % | 4 weeks, % | |
| No problems | 93 | 93 | 98 | 98 | 78 | 80 |
| Slight problems | 5 | 6 | 2 | 1 | 17 | 16 |
| Moderate problems | 1 | 1 | 0 | 0 | 4 | 3 |
| Severe problems | 1 | 0 | 0 | 0 | 1 | 1 |
| Unable | 0 | 0 | 0 | 0 | 1 | 1 |
| Reporting some problems | 7 | 7 | 2 | 2 | 22 | 20 |
| Level | Pain/discomfort | Anxiety/depression | ||
|---|---|---|---|---|
| Baseline, % | 4 weeks, % | Baseline, % | 4 weeks, % | |
| No | 42 | 60 | 32 | 55 |
| Slight | 41 | 34 | 34 | 32 |
| Moderate | 15 | 4 | 23 | 11 |
| Severe | 2 | 1 | 7 | 1 |
| Extreme | 0 | 0 | 3 | 1 |
| Reporting some problems | 58 | 40 | 68 | 46 |
Cost per quality-adjusted life-year at 4 weeks (configuration level)
Table 31 shows the expected total cost and expected total QALYs at 4 weeks for each configuration, along with their 95% CIs, estimated from the probabilistic analysis. Configurations are ordered by increasing expected total cost, with configurations vCw and vCW having the lowest expected costs and configuration VCw having the highest expected costs. Configurations Vcw and vcW have the highest expected QALYs at 4 weeks. Configuration VcW has the lowest expected QALYs. As the configurations have no more than a 0.007 difference in expected QALYs between them, they could be assumed to be clinically equivalent and so a decision between them is effectively based on minimising total costs. Note that the CIs show that there is a high degree of uncertainty in these estimates.
| Configuration | Mean cost (£) | 95% CI (£) | Mean utility gain | 95% CI | Probabilistic NMB (£) | 95% CI (£) |
|---|---|---|---|---|---|---|
| vCw | 173 | 143 to 206 | 0.069 | 0.053 to 0.086 | 1203 | 882 to 1556 |
| vCW | 180 | 143 to 223 | 0.069 | 0.055 to 0.083 | 1191 | 915 to 1496 |
| vcW | 216 | 191 to 243 | 0.070 | 0.059 to 0.081 | 1176 | 956 to 1409 |
| vcw | 226 | 183 to 277 | 0.069 | 0.055 to 0.083 | 1146 | 873 to 1440 |
| VcW | 227 | 198 to 257 | 0.065 | 0.047 to 0.087 | 1079 | 705 to 1508 |
| Vcw | 240 | 180 to 308 | 0.072 | 0.059 to 0.085 | 1190 | 935 to 1463 |
| VCW | 258 | 224 to 296 | 0.068 | 0.055 to 0.081 | 1092 | 834 to 1373 |
| VCw | 280 | 232 to 332 | 0.067 | 0.055 to 0.081 | 1064 | 812 to 1345 |
The expected net benefit at a £20,000 willingness-to-pay threshold is highest for configuration vCw (£1203) and lowest for VCw (£1064).
We present the uncertainty surrounding the cost-effectiveness of the various configurations, using a CEAC (Figure 50). The CEACs plot the probability that each configuration type is the most cost-effective by computing the proportion of simulations for which that configuration had the highest net benefit for a given willingness to pay per unit increase in utility. None of the eight configurations compared had a probability of > 30% of being the most cost-effective at any willingness-to-pay value > £10,000, indicating a large degree of uncertainty in the optimal configuration type. The configuration with the highest probability of being cost-effective at a willingness-to-pay value of ≤ £40,000 is vCw. At higher willingness-to-pay values, configuration Vcw has the highest probability of being cost-effective (see Table 31). However, because of uncertainty, it is not possible from these data to conclusively recommend a particular EPAU configuration.
FIGURE 50.
Cost-effectiveness acceptability curve: plotted against different willingness-to-pay values per unit increase in utility (ceiling ratio) at 4 weeks.
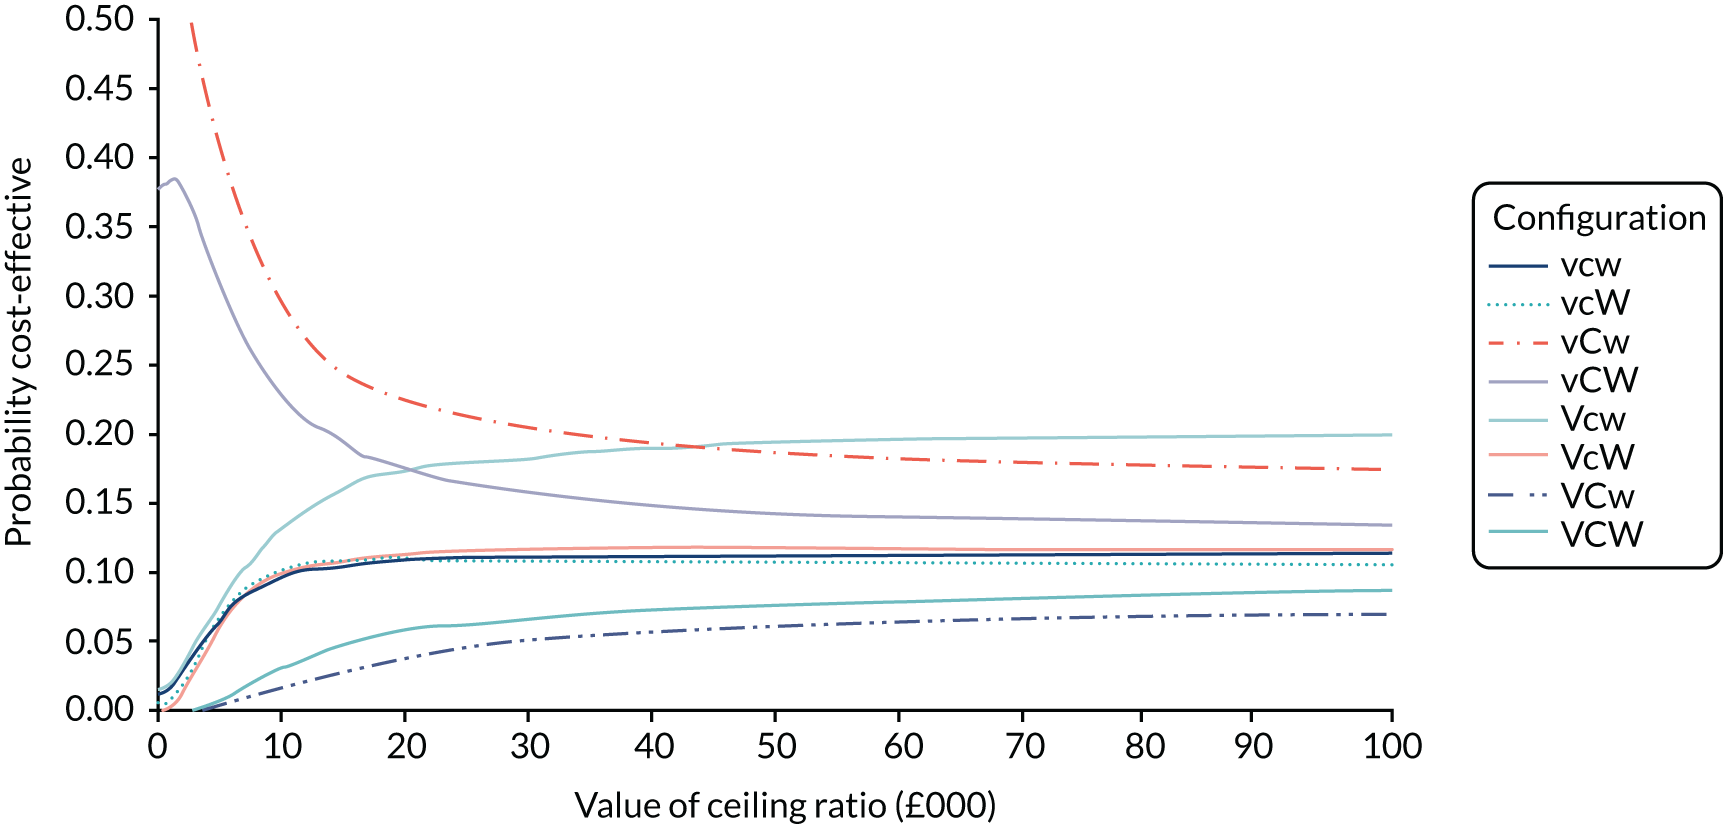
Cost per quality-adjusted life-year at 4 weeks (unit level)
Table 32 shows the expected total cost and expected total QALYs at 4 weeks for each unit, along with their 95% CIs. Units are ordered by increasing expected total cost, with RPR and PCO having the lowest expected costs and SXM having the highest. QAR had the highest expected QALYs at 4 weeks. XQD had the lowest expected QALYs. Note that the CIs show that there is a very high degree of uncertainty in these estimates.
| Unit | Mean cost (£) | 95% CI (£) | Utility gain | 95% CI | Probabilistic NMB (£) | 95% CI (£) |
|---|---|---|---|---|---|---|
| RPR | 106 | 65 to 158 | 0.065 | 0.047 to 0.085 | 1200 | 839 to 1602 |
| PCO | 109 | 69 to 159 | 0.068 | 0.055 to 0.082 | 1252 | 977 to 1545 |
| RXO | 113 | 72 to 163 | 0.069 | 0.049 to 0.091 | 1266 | 864 to 1708 |
| WWR | 118 | 73 to 172 | 0.065 | 0.045 to 0.089 | 1180 | 776 to 1669 |
| JDG | 128 | 78 to 189 | 0.066 | 0.056 to 0.078 | 1197 | 978 to 1431 |
| ZAR | 141 | 91 to 202 | 0.070 | 0.06 to 0.082 | 1267 | 1054 to 1500 |
| ZAM | 143 | 89 to 207 | 0.071 | 0.062 to 0.082 | 1281 | 1078 to 1492 |
| CZX | 145 | 92 to 208 | 0.070 | 0.064 to 0.075 | 1245 | 1122 to 1374 |
| SDD | 159 | 106 to 221 | 0.065 | 0.059 to 0.072 | 1143 | 1004 to 1286 |
| MJL | 160 | 105 to 227 | 0.069 | 0.055 to 0.083 | 1216 | 935 to 1509 |
| SHS | 169 | 109 to 242 | 0.070 | 0.06 to 0.081 | 1236 | 1023 to 1461 |
| QAR | 179 | 111 to 261 | 0.072 | 0.062 to 0.082 | 1253 | 1056 to 1470 |
| NSK | 191 | 125 to 270 | 0.068 | 0.056 to 0.081 | 1166 | 910 to 1430 |
| TCS | 194 | 123 to 278 | 0.068 | 0.059 to 0.076 | 1159 | 973 to 1347 |
| GLR | 197 | 131 to 278 | 0.063 | 0.043 to 0.085 | 1055 | 663 to 1514 |
| AIS | 216 | 135 to 319 | 0.071 | 0.062 to 0.081 | 1211 | 1005 to 1424 |
| FVX | 220 | 147 to 310 | 0.069 | 0.057 to 0.081 | 1151 | 910 to 1415 |
| HYG | 220 | 146 to 307 | 0.068 | 0.055 to 0.082 | 1135 | 864 to 1438 |
| ULV | 226 | 150 to 317 | 0.066 | 0.049 to 0.084 | 1085 | 747 to 1465 |
| IWX | 231 | 158 to 319 | 0.070 | 0.061 to 0.078 | 1159 | 975 to 1349 |
| ZNI | 236 | 156 to 332 | 0.071 | 0.063 to 0.08 | 1192 | 1004 to 1376 |
| SXB | 240 | 151 to 351 | 0.067 | 0.054 to 0.083 | 1109 | 831 to 1420 |
| YLJ | 240 | 156 to 343 | 0.071 | 0.058 to 0.086 | 1183 | 910 to 1488 |
| VXL | 242 | 162 to 338 | 0.065 | 0.048 to 0.085 | 1067 | 707 to 1462 |
| QSL | 253 | 167 to 354 | 0.065 | 0.047 to 0.085 | 1043 | 674 to 1452 |
| JII | 258 | 174 to 359 | 0.065 | 0.053 to 0.078 | 1046 | 774 to 1324 |
| CXP | 262 | 173 to 366 | 0.062 | 0.036 to 0.093 | 969 | 445 to 1612 |
| BDX | 264 | 181 to 357 | 0.070 | 0.06 to 0.08 | 1132 | 912 to 1367 |
| OYN | 264 | 172 to 377 | 0.069 | 0.061 to 0.076 | 1112 | 931 to 1294 |
| HJZ | 266 | 169 to 384 | 0.069 | 0.06 to 0.078 | 1105 | 897 to 1313 |
| XQZ | 267 | 181 to 369 | 0.065 | 0.047 to 0.086 | 1039 | 660 to 1473 |
| WDI | 275 | 186 to 378 | 0.067 | 0.054 to 0.081 | 1070 | 793 to 1362 |
| WYW | 279 | 191 to 382 | 0.068 | 0.054 to 0.085 | 1087 | 784 to 1425 |
| JNM | 280 | 194 to 380 | 0.065 | 0.053 to 0.079 | 1024 | 752 to 1326 |
| OVA | 282 | 195 to 387 | 0.071 | 0.065 to 0.078 | 1146 | 976 to 1317 |
| JPM | 310 | 218 to 422 | 0.069 | 0.057 to 0.081 | 1065 | 812 to 1331 |
| XNL | 320 | 213 to 453 | 0.071 | 0.063 to 0.079 | 1095 | 887 to 1298 |
| XQD | 324 | 227 to 438 | 0.057 | 0.024 to 0.104 | 817 | 163 to 1741 |
| GFY | 417 | 297 to 555 | 0.067 | 0.057 to 0.079 | 931 | 674 to 1191 |
| SXM | 478 | 355 to 614 | 0.070 | 0.06 to 0.082 | 931 | 683 to 1189 |
The expected net benefit at a £20,000 willingness-to-pay threshold is highest for ZAM (£1281), closely followed by ZAR (£1267) and RXO (£1266), and lowest for XQD (£817), followed by GFY (£931) and SXM (£931).
Sensitivity analysis: cost per quality-adjusted life-year at 18 weeks by configuration (n = 316)
As a sensitivity analysis we repeated the analysis using QALY scores at 18 weeks rather than 4 weeks. The mean score at baseline for the patients was 0.85 (SD 0.14) and at an average follow-up of 130 days the mean score was 0.90 (SD 0.13). Table 33 shows baseline and follow-up index scores by configuration, along with the mean index score, the SD of the mean, the utility gain [mean index score × (18 weeks)] and the number of women who completed the questionnaire at both time points in each configuration type.
| Configuration | n | Baseline index score | Index score at 18 weeks | Mean index score | SD | Utility gain |
|---|---|---|---|---|---|---|
| vcw | 68 | 0.865 | 0.893 | 0.879 | 0.104 | 0.304 |
| vcW | 33 | 0.843 | 0.900 | 0.872 | 0.092 | 0.302 |
| vCw | 37 | 0.884 | 0.917 | 0.900 | 0.099 | 0.312 |
| vCW | 12 | 0.864 | 0.898 | 0.881 | 0.125 | 0.305 |
| Vcw | 51 | 0.850 | 0.927 | 0.888 | 0.088 | 0.308 |
| VcW | 54 | 0.830 | 0.883 | 0.857 | 0.173 | 0.296 |
| VCw | 23 | 0.806 | 0.931 | 0.868 | 0.140 | 0.301 |
| VCW | 38 | 0.877 | 0.897 | 0.887 | 0.100 | 0.307 |
Table 34 shows the expected total cost and expected total QALYs at 18 weeks for each configuration type, averaged over the simulation sample, along with their 95% CIs. At this time point configuration vCw still has the highest expected QALYs and configuration VCw has the lowest. The expected net benefit at a £20,000 willingness-to-pay threshold is highest for configuration vCw (£6067), followed by configuration vCW (£5918) and lowest for configuration VcW (£5718).
| Configuration | Mean cost (£) | 95% CI (£) | Utility gain | 95% CI | Probabilistic NMB (£) | 95% CI (£) |
|---|---|---|---|---|---|---|
| vCw | 173 | 144 to 205 | 0.312 | 0.247 to 0.379 | 6067 | 4768 to 7409 |
| vCW | 180 | 142 to 221 | 0.305 | 0.224 to 0.393 | 5918 | 4308 to 7681 |
| vcW | 216 | 191 to 244 | 0.302 | 0.242 to 0.367 | 5816 | 4624 to 7131 |
| vcw | 226 | 181 to 274 | 0.303 | 0.234 to 0.376 | 5840 | 4455 to 7306 |
| VcW | 227 | 199 to 256 | 0.297 | 0.185 to 0.422 | 5718 | 3488 to 8196 |
| Vcw | 240 | 180 to 308 | 0.307 | 0.25 to 0.369 | 5899 | 4741 to 7135 |
| VCW | 258 | 223 to 294 | 0.307 | 0.241 to 0.379 | 5888 | 4573 to 7305 |
| VCw | 279 | 233.5 to 332 | 0.301 | 0.212 to 0.399 | 5732 | 3970 to 7707 |
We again present the uncertainty surrounding the cost-effectiveness of the various configuration types using a CEAC (Figure 51). There is more uncertainty at this point, with none of the configurations having a probability of > 20% of being the most cost-effective at any willingness-to-pay value > £10,000. At a willingness-to-pay threshold of £20,000 per QALY, VcW has the highest probability of being cost-effective, followed by vCw and vCW. As at 4 weeks, no recommendations can be made about optimal cost-effective EPAU configurations based on these findings.
FIGURE 51.
Cost-effectiveness acceptability curve: plotted against different willingness-to-pay value per unit increase in utility (ceiling ratio) at 18 weeks.
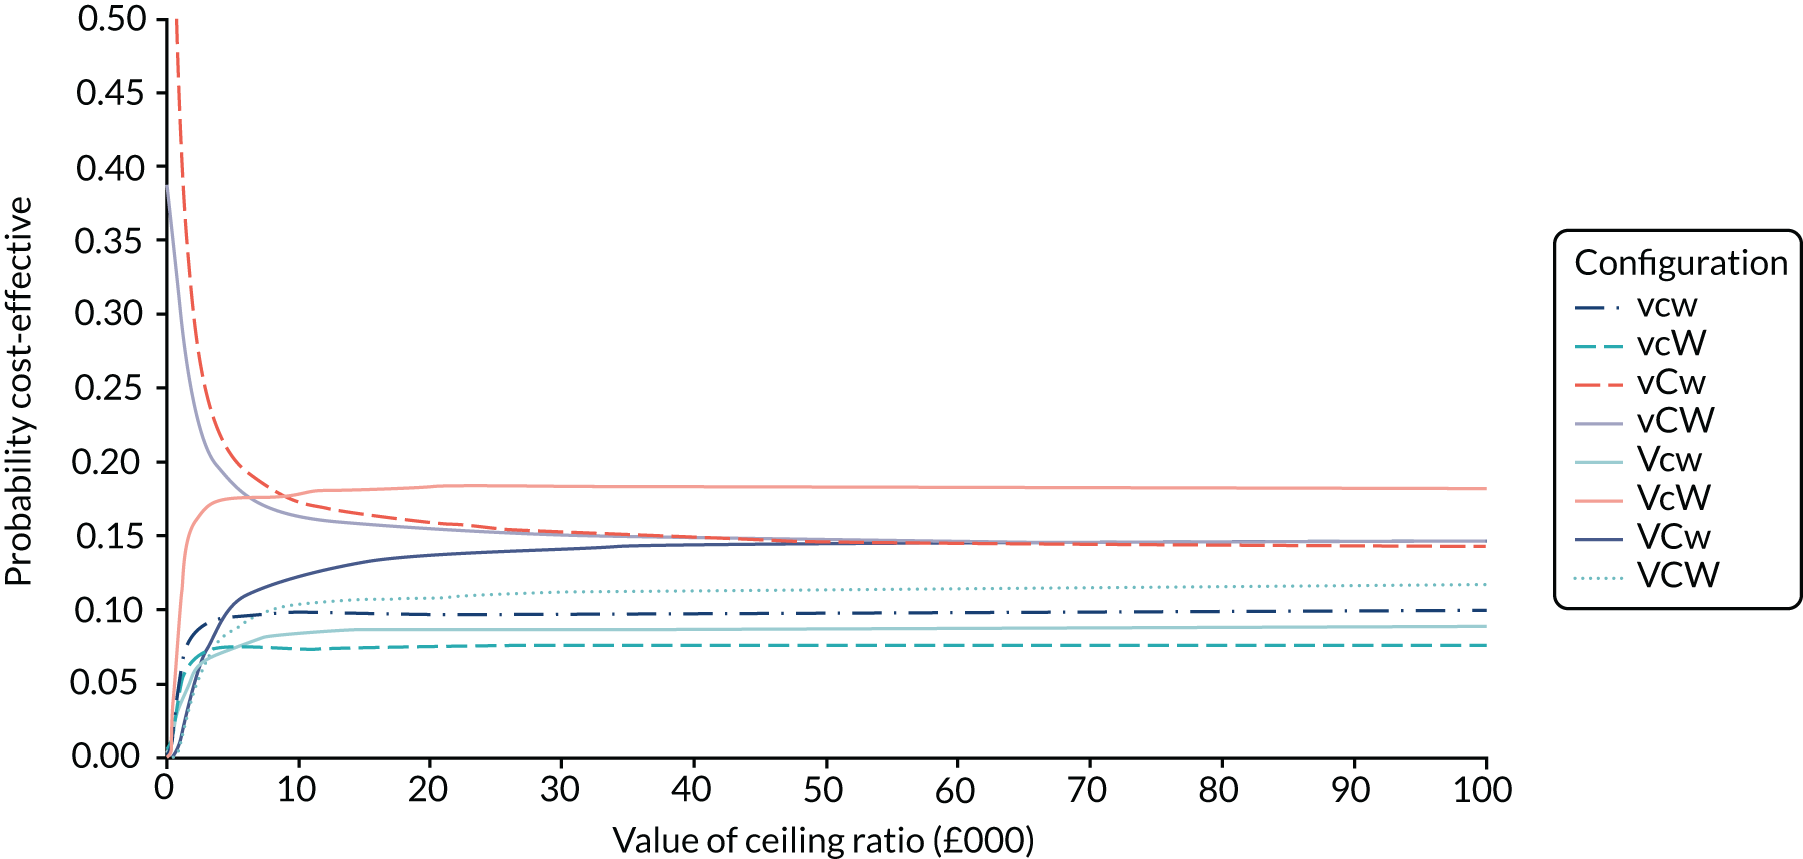
Pre- and post-consultation anxiety
Patients were asked to report their anxiety pre and post consultation for every visit to the EPAU. A total of 3550 pre- and post-consultation anxiety scores were available. Figures 52 and 53 show the distribution of anxiety scores pre and post consultation. It is clear that pre consultation there is a relatively even distribution of anxiety scores, ranging from 0 to 100, but post consultation the majority of women report an anxiety score of < 20 points.
FIGURE 52.
Distribution of pre-consultation anxiety scores.
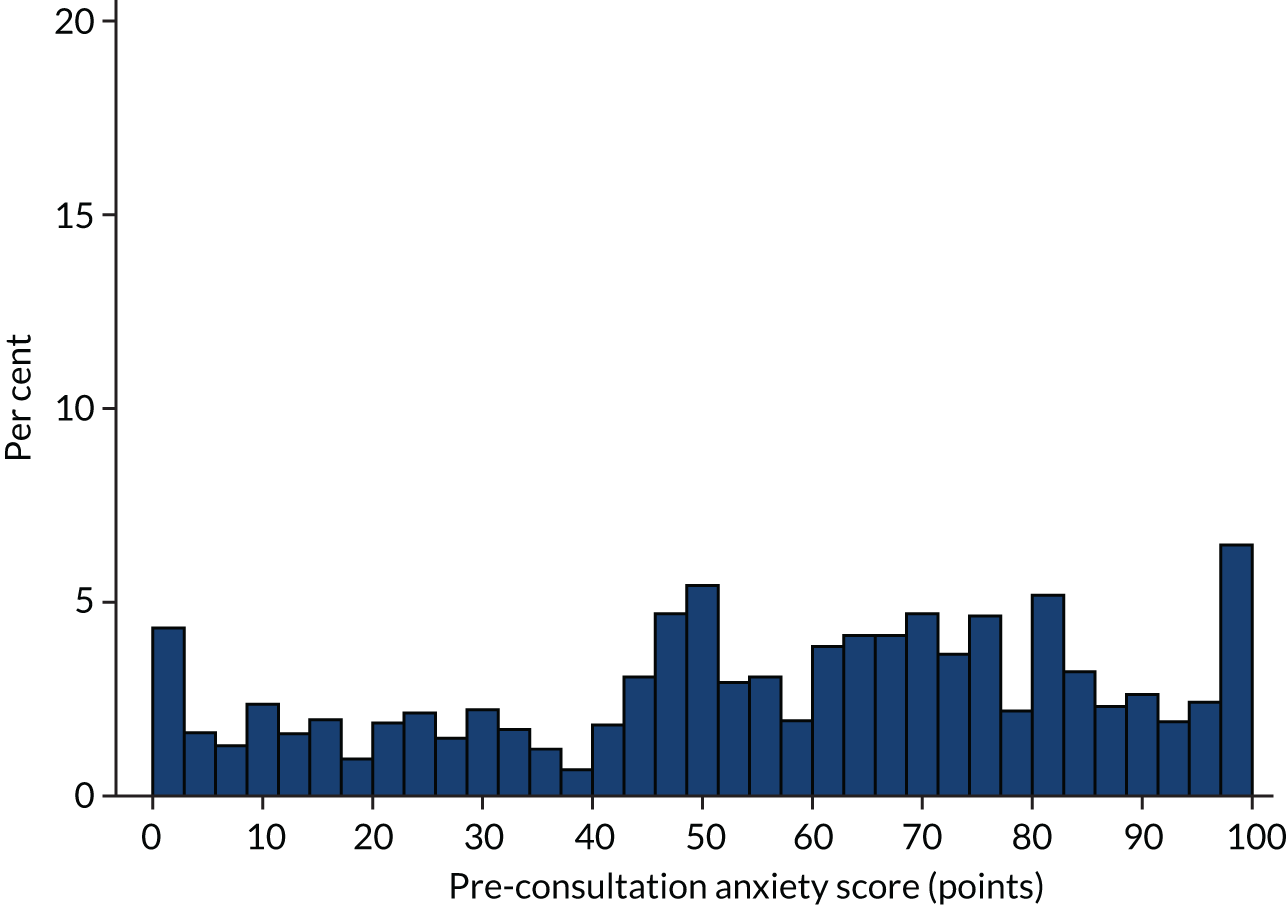
FIGURE 53.
Distribution of post-consultation anxiety scores.
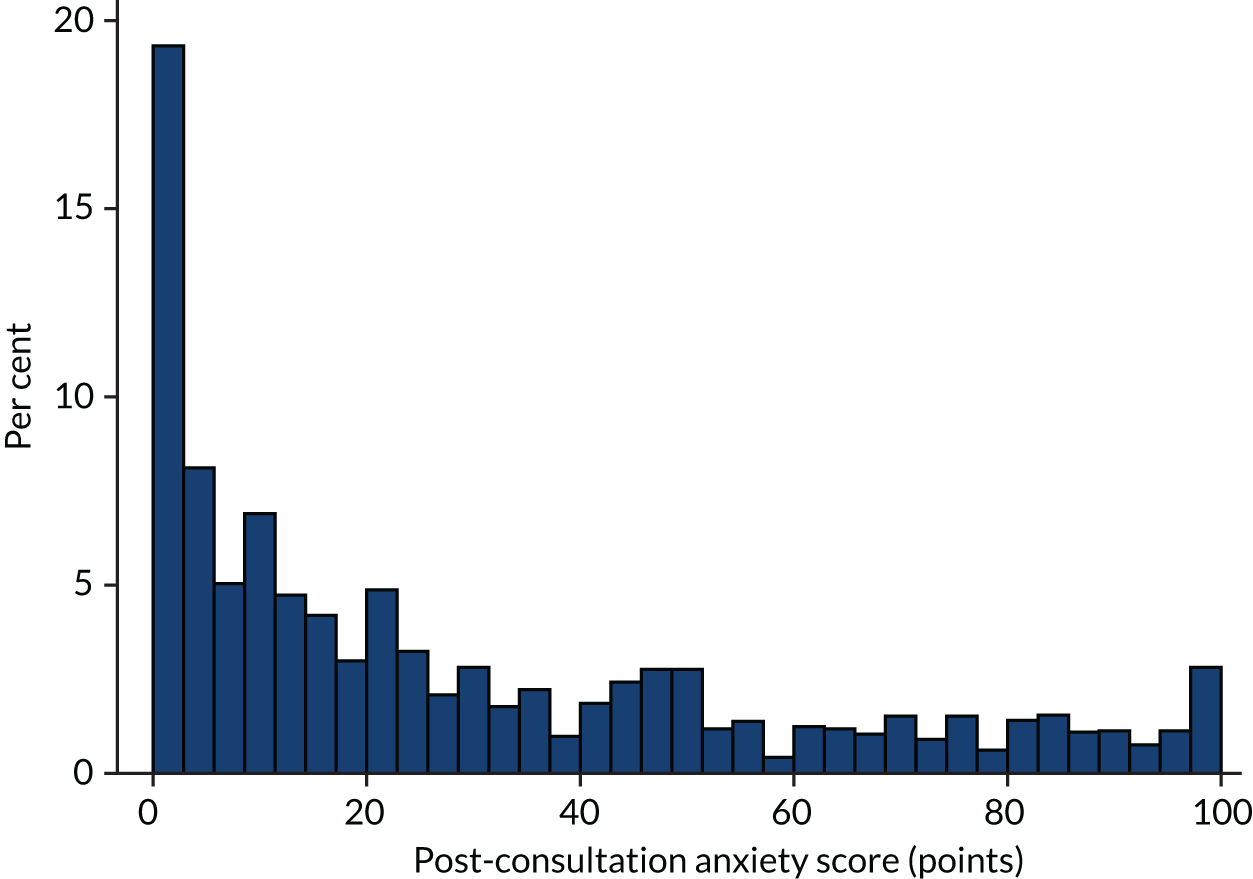
Figure 54 shows that most women (78%) experienced a decrease in their anxiety following their EPAU appointment (difference in score < 0 points). Of the 195 women whose anxiety score did not change from pre to post consultation, 69 had a score of 0 points to begin with (i.e. not at all anxious) and 27 had a score of 100 points (i.e. the most anxious they could ever imagine) at both time points.
FIGURE 54.
Change in anxiety score pre and post consultation.
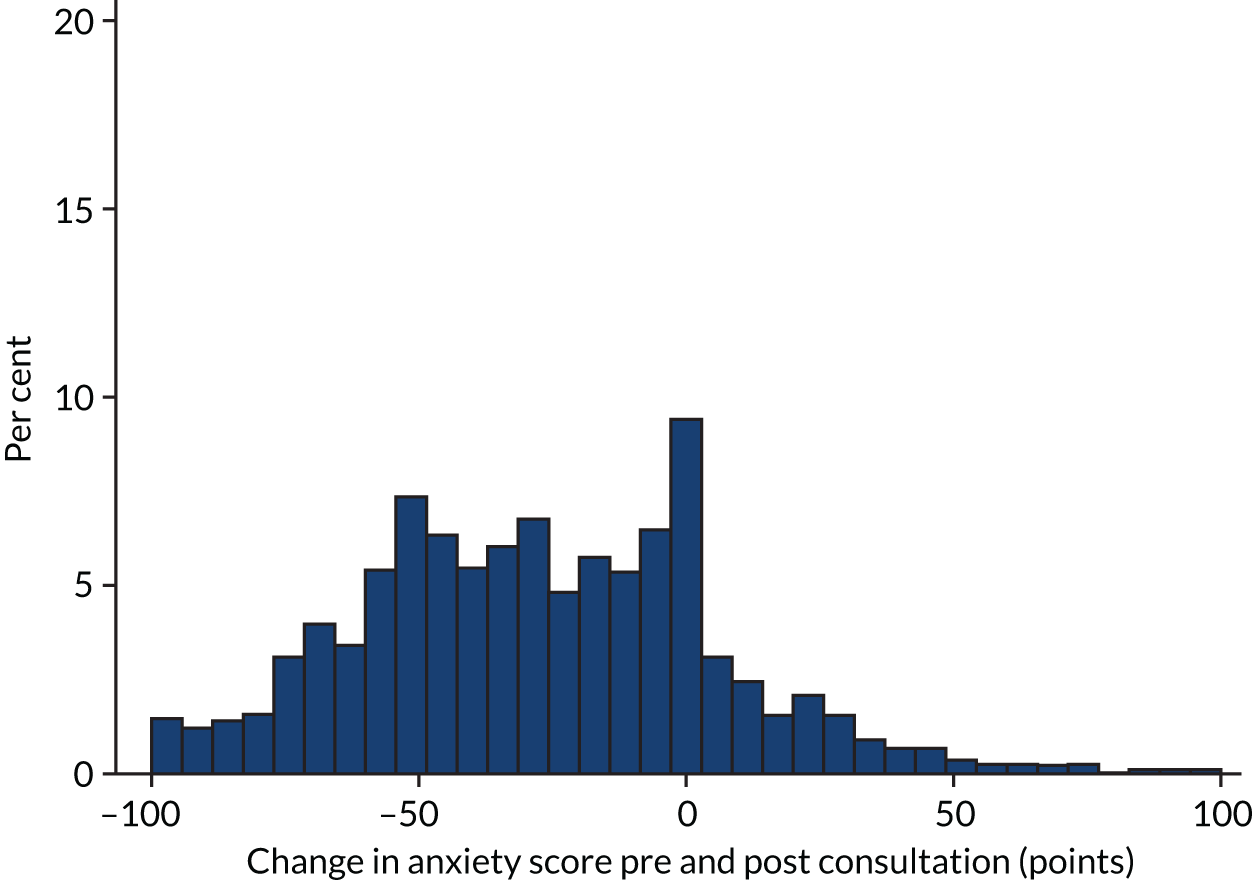
The mean anxiety score pre and post consultation and the mean change in anxiety for each configuration and each unit are shown in Tables 35 and 36. Configuration vCw had the largest mean decrease in anxiety, whereas configuration vcW had the smallest mean decrease in anxiety.
| Configuration | Mean anxiety score (points) | Mean change in anxiety score (points) pre and post consultation | |
|---|---|---|---|
| Pre consultation | Post consultation | ||
| vcw | 56 | 27 | –29 |
| vcW | 54 | 31 | –23 |
| vCw | 56 | 26 | –30 |
| vCW | 57 | 30 | –28 |
| Vcw | 56 | 27 | –29 |
| VcW | 56 | 29 | –27 |
| VCw | 59 | 34 | –25 |
| VCW | 59 | 31 | –28 |
| Unit | Mean change in anxiety score (points) pre and post consultation | SD | n |
|---|---|---|---|
| IWX | –43 | 26 | 53 |
| XQZ | –37 | 29 | 77 |
| XNL | –37 | 26 | 84 |
| ULV | –37 | 35 | 69 |
| HYG | –35 | 32 | 109 |
| SCC | –34 | 29 | 90 |
| CXP | –33 | 24 | 61 |
| CZX | –33 | 31 | 30 |
| SXM | –33 | 34 | 33 |
| MJL | –32 | 37 | 103 |
| TCS | –32 | 37 | 33 |
| ZAM | –32 | 33 | 72 |
| YLJ | –31 | 32 | 85 |
| GLR | –31 | 31 | 101 |
| BVU | –30 | 34 | 117 |
| RXO | –30 | 28 | 109 |
| RPR | –30 | 36 | 88 |
| PCO | –29 | 36 | 101 |
| JNM | –29 | 34 | 84 |
| QSL | –29 | 33 | 89 |
| SXB | –28 | 35 | 99 |
| ZAR | –28 | 34 | 129 |
| OVA | –28 | 29 | 59 |
| WYW | –27 | 32 | 81 |
| HJZ | –27 | 38 | 78 |
| SHS | –27 | 39 | 62 |
| BDX | –27 | 34 | 103 |
| JDG | –27 | 33 | 63 |
| UOY | –27 | 29 | 77 |
| ZNI | –26 | 28 | 72 |
| OYN | –26 | 33 | 58 |
| GFY | –25 | 33 | 103 |
| JPM | –24 | 31 | 94 |
| AIS | –23 | 37 | 95 |
| WWR | –23 | 30 | 63 |
| NSK | –22 | 39 | 87 |
| YUS | –22 | 35 | 126 |
| FVX | –22 | 30 | 89 |
| VXL | –20 | 33 | 75 |
| XQD | –19 | 31 | 57 |
| WDI | –19 | 31 | 65 |
| JII | –16 | 38 | 81 |
| QAR | –16 | 34 | 101 |
| SDD | –13 | 32 | 45 |
The mean change in anxiety score by diagnosis is shown in Table 37. Women diagnosed with a normal pregnancy during their visit had the biggest decrease in anxiety, as might be expected, whereas women with molar pregnancies experienced an increase in anxiety.
| Diagnosis | Mean change in anxiety score (points) | SD | n |
|---|---|---|---|
| Normal/live intrauterine pregnancy | –35 | 30 | 2044 |
| Early intrauterine pregnancy | –30 | 34 | 435 |
| Other | –16 | 0 | 1 |
| Complete miscarriage | –15 | 32 | 341 |
| Retained products of conception | –14 | 32 | 50 |
| Incomplete miscarriage | –13 | 33 | 123 |
| Early embryonic demise | –10 | 33 | 391 |
| Not pregnant | –9 | 0 | 1 |
| Inconclusive scan | –6 | 29 | 45 |
| Ectopic pregnancy | –3 | 37 | 53 |
| Molar pregnancy | 18 | 33 | 6 |
Table 38 shows that there is evidence of a relationship between change in anxiety score and all final diagnoses other than not pregnant and ‘other’. There is no evidence of a relationship between age or unit configuration and change in anxiety.
| Variable | Coefficient | SE | p > t | 95% CI |
|---|---|---|---|---|
| Age | –0.03 | 0.09 | 0.76 | –0.21 to 0.15 |
| Early intrauterine pregnancy | 4.86 | 1.72 | 0.01 | 1.48 to 8.24 |
| Early embryonic demise | 25.61 | 1.75 | 0.00 | 22.18 to 29.05 |
| Incomplete miscarriage | 23.89 | 2.95 | 0.00 | 18.11 to 29.67 |
| Retained products of conception | 21.94 | 4.49 | 0.00 | 13.15 to 30.73 |
| Complete miscarriage | 19.96 | 1.86 | 0.00 | 16.32 to 23.60 |
| Ectopic pregnancy | 32.17 | 4.36 | 0.00 | 23.61 to 40.72 |
| Inconclusive scan (PUL) | 29.40 | 4.73 | 0.00 | 20.12 to 38.67 |
| Molar pregnancy | 54.25 | 12.81 | 0.00 | 29.14 to 79.35 |
| Other | 20.78 | 31.32 | 0.51 | –40.61 to 82.17 |
| Not pregnant | 25.90 | 31.32 | 0.41 | –35.49 to 87.29 |
| Weekend opening (hours) | 0.00 | 0.10 | 0.97 | –0.19 to 0.20 |
| Consultant presence (hours) | 0.16 | 0.17 | 0.35 | –0.17 to 0.48 |
| Yearly volume (visits) | 0.00 | 0.00 | 0.31 | 0.00 to 0.00 |
Three-month questionnaire
The subset of women (n = 364) contacted at a second time point to inform the longer-term health economic analysis were asked to complete a questionnaire asking about their health-care usage since their visit. Table 39 shows the number of women who said they had no health-care contacts of a particular type, the numbers who had one, and the numbers who had two or three or more contacts. The table shows that around half of women self-reported at least one GP consultation. This was similar for community midwife visits. Thirty-five per cent of women had at least one outpatient visit and 25% of women had at least one hospital midwife visit. Table 40 shows the number of women with normal pregnancies who made contact with health-care services following their visit to the EPAU. Similarly, Table 41 shows number of women with non-normal pregnancies who made contact with health-care services following their visit to the EPAU.
| Type of consultation | Number of health-care contacts following a visit to the EPAU | |||
|---|---|---|---|---|
| 0 | 1 | 2 | ≥ 3 | |
| GP consultation | 170 | 108 | 51 | 35 |
| Community midwife visit | 185 | 83 | 57 | 39 |
| Outpatient visit | 237 | 60 | 29 | 38 |
| Hospital midwife visit | 274 | 48 | 26 | 16 |
| Telephoned GP for advice | 283 | 54 | 23 | 4 |
| General practice nurse visit | 315 | 39 | 9 | 1 |
| Inpatient stay | 327 | 32 | 1 | 4 |
| Charities (e.g. the Miscarriage Association) | 345 | 15 | 4 | 0 |
| Telephoned general practice nurse for advice | 349 | 15 | 0 | 0 |
| NHS counselling or psychology services | 349 | 10 | 1 | 4 |
| Recurrent miscarriage service | 355 | 6 | 2 | 1 |
| Private counselling or psychology services | 356 | 4 | 1 | 3 |
| GP home visit | 362 | 2 | 0 | 0 |
| Social worker visit | 362 | 0 | 1 | 1 |
| Telephoned social worker | 362 | 0 | 1 | 1 |
| Social worker telephoned | 362 | 0 | 0 | 2 |
| Type of consultation | Number of health-care contacts following a visit to the EPAU | |||
|---|---|---|---|---|
| 0 | 1 | 2 | ≥ 3 | |
| GP consultation | 102 | 76 | 37 | 30 |
| Community midwife visit | 79 | 72 | 56 | 38 |
| Outpatient visit | 142 | 47 | 24 | 32 |
| Hospital midwife visit | 159 | 47 | 23 | 16 |
| Telephoned GP for advice | 187 | 40 | 15 | 3 |
| General practice nurse visit | 203 | 33 | 9 | 0 |
| Inpatient stay | 222 | 18 | 1 | 4 |
| Charities (e.g. the Miscarriage Association) | 240 | 4 | 1 | 0 |
| Telephoned general practice nurse for advice | 238 | 7 | 0 | 0 |
| NHS counselling or psychology services | 233 | 7 | 1 | 4 |
| Recurrent miscarriage service | 244 | 0 | 0 | 1 |
| Private counselling or psychology services | 243 | 1 | 0 | 1 |
| GP home visit | 243 | 2 | 0 | 0 |
| Social worker visit | 243 | 0 | 1 | 1 |
| Telephoned social worker | 243 | 0 | 1 | 1 |
| Social worker telephoned | 243 | 0 | 0 | 2 |
| Type of consultation | Number of health-care contacts following a visit to the EPAU | |||
|---|---|---|---|---|
| 0 | 1 | 2 | ≥ 3 | |
| GP consultation | 68 | 32 | 14 | 5 |
| Community midwife visit | 106 | 11 | 1 | 1 |
| Outpatient visit | 95 | 13 | 5 | 6 |
| Hospital midwife visit | 115 | 1 | 3 | 0 |
| Telephoned GP for advice | 96 | 14 | 8 | 1 |
| General practice nurse visit | 112 | 6 | 0 | 1 |
| Inpatient stay | 105 | 14 | 0 | 0 |
| Charities (e.g. the Miscarriage Association) | 108 | 8 | 3 | 0 |
| Telephoned general practice nurse for advice | 117 | 2 | 0 | 0 |
| NHS counselling or psychology services | 116 | 3 | 0 | 0 |
| Recurrent miscarriage service | 112 | 5 | 2 | 0 |
| Private counselling or psychology services | 116 | 0 | 1 | 2 |
| GP home visit | 119 | 0 | 0 | 0 |
| Social worker visit | 119 | 0 | 0 | 0 |
| Telephoned social worker | 119 | 0 | 0 | 0 |
| Social worker telephoned | 119 | 0 | 0 | 0 |
We calculated an average cost to the NHS for these women, taking into account costs associated with each health-care contact. We excluded any non-NHS costs, such as charities and private counselling. Women were asked to record the outpatient department they attended. Of those who answered, 30% said that they had attended an antenatal clinic, 18% said that they had attended an A&E department and 12% said that they had attended a maternity unit. The other 40% of women used a combination of terms such as ‘triage’, ‘out of hours’, and ‘Brook ward’. An outpatient visit was therefore costed as a routine ultrasound scan in an antenatal unit, as this was the most common response. The unit costs used in these calculations are shown in Table 42.
| Type of consultation | Cost (£) | Source |
|---|---|---|
| GP surgery visit | 37.00 | PSSRU 201735 |
| GP home visit | 114.00 | PSSRU 2013:44 cost of GP out of surgery visit |
| GP telephone call | 14.80 | PSSRU 2017:35 cost of GP-led telephone triage |
| General practice nurse telephone call | 7.90 | PSSRU 2017:35 cost of nurse-led telephone triage |
| General practice nurse visit | 13.43 | PSSRU 2013:44 £52 per hour of face-to-face contact with a nurse (15.5 minutes) |
| Community midwife visit | 23.33 |
PSSRU 2013:44 £70 per hour of home visiting with a community nurse PSSRU 2010:45 duration of a home visit (20 minutes) |
| Hospital midwife visit | 29.67 | PSSRU 2017:35 cost of hospital-based nurse, band 5, £89 per hour of patient contact (assumed 20 minutes) |
| NHS counselling or psychology session | 137.73 | Radhakrishnan et al.:46 cost of Improving Access to Psychological Therapies programme – an analysis of cost of session, treatment and recovery in selected primary care trusts in the East of England region |
| Social worker visit | 27.00 | PSSRU 2017:35 £82 per hour of client-related work (assumed 20 minutes) |
| Outpatient visit | 112.00 | NHS Reference Costs 2016–17:34 antenatal standard routine ultrasound scan, obstetrics, outpatient procedure. NZ21Z |
| Inpatient stay | 1787.00 | NHS Reference Costs 2016–17:34 average cost of antenatal inpatient stays. NZ16Z–NZ20B |
The mean cost per patient at a mean follow-up of 118 days, including EPAU and self-reported follow-up costs, was £407. The mean cost per configuration is shown in Table 43. Configuration VCW had the highest mean cost and configuration vcW had the lowest mean cost. Tables 44 and 45 show the mean NHS cost per configuration at 17 weeks in women with a normal and non-normal pregnancy, respectively.
| Configuration | Mean cost (£) | SD (£) | n |
|---|---|---|---|
| vcw | 795 | 1348 | 80 |
| vcW | 514 | 1061 | 48 |
| vCw | 572 | 716 | 44 |
| vCW | 684 | 1187 | 32 |
| Vcw | 683 | 865 | 21 |
| VcW | 557 | 842 | 68 |
| VCw | 644 | 767 | 22 |
| VCW | 1029 | 1315 | 49 |
| Configuration | Mean cost (£) | SD (£) | n |
|---|---|---|---|
| vcw | 676 | 1363 | 53 |
| vcW | 509 | 1161 | 34 |
| vCw | 460 | 543 | 32 |
| vCW | 709 | 1299 | 24 |
| Vcw | 549 | 745 | 12 |
| VcW | 433 | 566 | 47 |
| VCw | 439 | 534 | 15 |
| VCW | 765 | 1309 | 28 |
| Configuration | Mean cost (£) | SD (£) | n |
|---|---|---|---|
| vcw | 1027 | 1311 | 27 |
| vcW | 525 | 804 | 14 |
| vCw | 873 | 1020 | 12 |
| vCW | 608 | 829 | 8 |
| Vcw | 862 | 1023 | 9 |
| VcW | 835 | 1233 | 21 |
| VCw | 1081 | 1034 | 7 |
| VCW | 1381 | 1269 | 21 |
Personal costs
The questionnaire asked patients about their personal costs in terms of travel to appointments and time off work. Forty-three per cent of patients travelled by car to their health-care appointments at least once (Table 46). The mean price paid for parking was £2.96 (minimum £0, maximum £25, median £2.75) and the mean number of miles per round trip made by car was 11 (minimum 0, maximum 70, median 8).
| Travel | Number of times | |||
|---|---|---|---|---|
| Never | 1–3 | 4–6 | ≥ 7 | |
| Travelled by car to health-care appointments | 158 | 116 | 59 | 31 |
| Travelled by car to health-care appointments: normal pregnancy | 86 | 84 | 49 | 26 |
| Travelled by car to health-care appointments: non-normal pregnancy | 72 | 32 | 10 | 5 |
Table 47 shows the number of patients who used other forms of transport (e.g. bus, taxi, train or other) to travel to health-care appointments and the mean cost of travel by these means.
| Transport | No | Yes | Mean cost (£) | Minimum cost (£) | Maximum cost (£) |
|---|---|---|---|---|---|
| Bus | 312 | 52 | 3.03 | 1 | 6 |
| Taxi | 336 | 28 | 10.83 | 4.10 | 25 |
| Train | 346 | 18 | 5.66 | 1.80 | 20 |
| Other | 339 | 25 | 3.96 | 1.30 | 6 |
Productivity costs
The questionnaire also asked women about time taken off work, if they were in employment. Fifty-eight per cent of women were employed full time (Table 48) and 58% of those who replied said that they had taken time off work since their last EPAU visit (Table 49). The mean number of days taken off work was 12 (minimum 0, maximum 168, median 5). The mean number of hours reduced per week was 12 (minimum 0, maximum 30, median 10). If women were employed part time, the mean number of hours they worked per week was 22 (minimum 0, maximum 45, median 22).
| Employment status | n | % |
|---|---|---|
| Full-time paid or self-employment | 207 | 58.15 |
| Part-time paid or self-employment | 75 | 21.07 |
| Homemaker | 38 | 10.67 |
| On maternity leave | 12 | 3.37 |
| Unemployed | 12 | 3.37 |
| Full-time student | 5 | 1.4 |
| Other | 5 | 1.4 |
| Voluntary work | 2 | 0.56 |
| Time off work | If you are employed, have you had to take time off work since your last EPAU visit? n/N (%) | If you are employed, have you had to reduce the number of hours you worked each week since your visit to the EPAU? n/N (%) |
|---|---|---|
| Yes: normal pregnancy | 103/190 (54) | 14/193 (7) |
| Yes: non-normal pregnancy | 62/96 (65) | 9/97 (9) |
Health economic evaluation: key findings
-
Main contributor to total cost was surgical admission.
-
Mean total cost per woman with incomplete miscarriage was seven times more and mean total cost per woman with an ectopic pregnancy was 15 times more than the cost of care for a woman with a normal pregnancy.
-
Low-volume units with no consultant presence were associated with lower costs.
-
There was a positive change in a woman’s overall health at 4 weeks, largely due to changes in the pain/discomfort and anxiety/depression dimensions of the EQ-5D-5L.
-
Mean utility gain varied from 0.065 to 0.071 per patient by configuration type and from 0.058 to 0.072 per patient by unit. The mean utility gain was similar across the board and it was not linked to age, FD, consultant presence or number of patients seen.
-
Three-quarters of women reported a reduction in anxiety scores following their visit to an EPAU. The largest decrease in anxiety was in women diagnosed with normal pregnancies, but anxiety scores increased in those diagnosed with molar pregnancy.
Workforce analysis
We provide a summary of the results of the workforce analysis for the VESPA study. The analysis looked at 6531 patients who attended the 44 EPAUs and had their visit timing data recorded. The analysis focuses on the workforce, specifically the salary cost of the staff who provided care and assistance to the patients.
In this analysis we seek to determine the ideal workforce configuration for EPAUs. The factors we used to investigate the ideal workforce configuration were:
-
overall salary cost per 1000 patients (efficiency of workforce)
-
average time spent with a patient across all staff types (efficiency of staff type)
-
number of admissions (effectiveness)
-
proportion of multiple visits (three or more) (effectiveness)
-
number of PULs per 1000 patients (effectiveness).
Staff categorisation and salary costs
Overall salary cost per 1000 patients
The salary cost of each EPAU’s workforce can be considered an efficiency factor for the overall workforce. On average, 150 patients attended each of the 44 EPAUs. However, the salary costs of the workforce in each unit is different because of the different types of staff utilised and the variable amount of time they spent with each patient across all visits. In view of this, the salary cost is determined by the workforce configuration and the time staff spend with patients.
There are differences between the EPAUs in the descriptions of staff types they employ; however, they broadly fit into eight strata:
-
administrative staff
-
health-care assistant
-
midwife (includes all types of midwives)
-
consultant
-
doctor (includes all doctors below consultant grade)
-
specialist nurse (includes all nurses above staff nurse)
-
nurse (includes all staff grade nurses)
-
sonographer.
Figure 55 shows the salary costs for each unit per 1000 patients. Although the costs are three times as high in the unit with the highest salary cost than the unit with the lowest salary cost, the overall variation is not statistically significant. The lowest salary cost (£7530) of all the units is coded JDG, whereas the highest salary cost (£23,310) is coded JPM. The average cost across all units is £13,500.
FIGURE 55.
Staff salary costs profile across all configurations per 1000 patients.

We analysed the data further by grouping units of similar key characteristics (volume, consultant presence and weekend opening) into eight different configuration types. Figure 56 shows the staff salary cost profile across all configurations. The widths of the bars indicate the overall salary cost for a particular staff type. The y-axis is arranged in order of individual staff salary [i.e. consultants earn the most (top of axis) and administrative staff earn the least (bottom of axis)].
FIGURE 56.
Staff salary costs profile across all configurations overall.
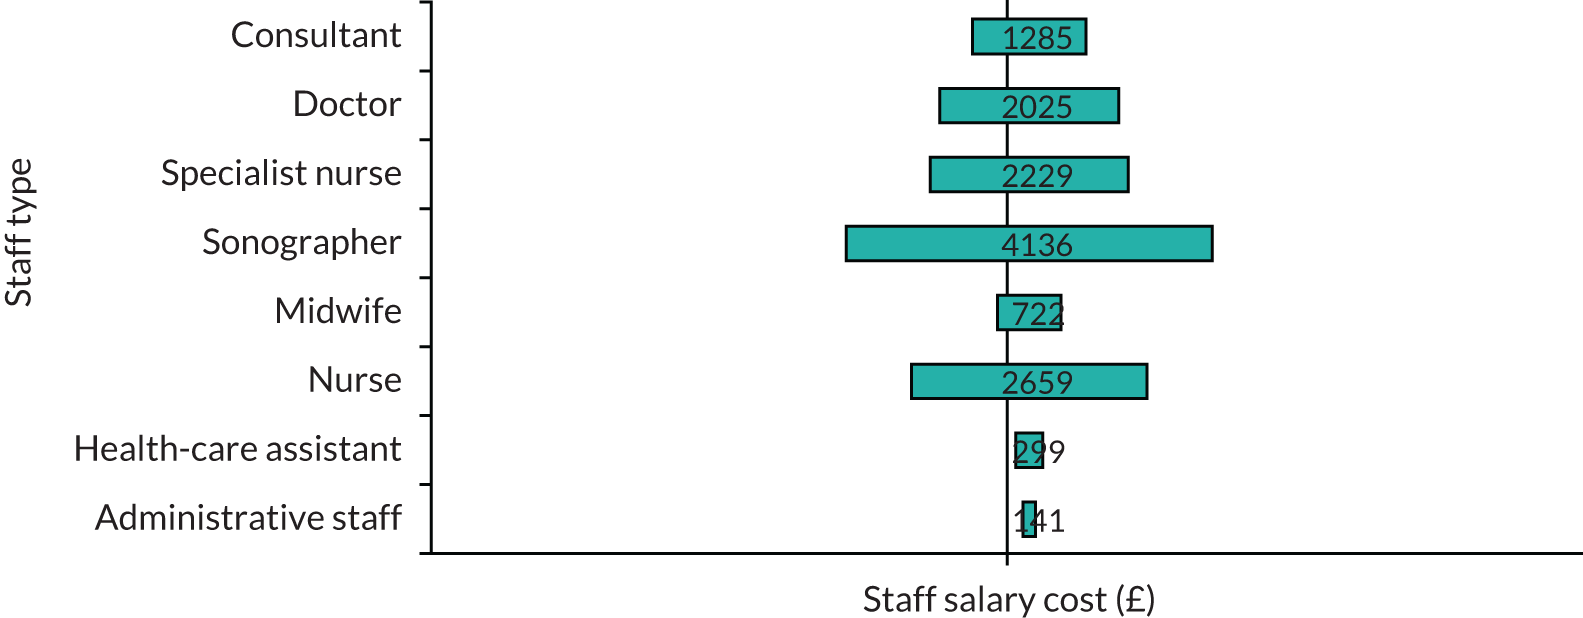
The largest overall cost is for sonographers. If the costs for all strata/bands of nurses are added together, then all nurses will be the largest cost, followed by sonographers and all strata/bands of doctors.
Table 50 shows the salary cost profile of each staff type for each of the eight configuration types. Configurations vcw, vcW, vCw, Vcw and VcW all have similarly below average overall salary costs, whereas configurations vCW, VCw and VCW all have similar above average overall salary costs. Configuration VCW has the highest (£16,505) overall salary costs across all configurations. There is a significant difference between the configuration types when grouped as consultant present compared with non-consultant present (p = 0.037); this is not surprising as consultants are the highest cost staff type.
| Staff type | Configuration cost (£) | Overall cost (£) | |||||||
|---|---|---|---|---|---|---|---|---|---|
| Vcw | vcW | vCw | vCW | Vcw | VcW | VCw | VCW | ||
| All staff | 12,453 | 12,170 | 12,374 | 15,043 | 12,755 | 12,539 | 15,575 | 16,505 | 13,557 |
| Administrative staff | 200 | 77 | 89 | 14 | 228 | 62 | 290 | 209 | 146 |
| Health-care assistant | 36 | N/A | 162 | 551 | 1598 | 558 | 39 | 284 | 300 |
| Midwife | 1378 | 45 | 1024 | 2465 | 73 | 583 | N/A | 5 | 724 |
| Consultant | 984 | 70 | 2443 | 1048 | 708 | 485 | 3682 | 1581 | 1300 |
| Doctor | 1251 | 1233 | 2171 | 2095 | 941 | 1894 | 3650 | 2960 | 2021 |
| Specialist nurse | 2554 | 824 | 1443 | 422 | 2312 | 2129 | 527 | 5011 | 2237 |
| Nurse | 2282 | 3570 | 1662 | 2140 | 2821 | 3118 | 3921 | 2360 | 2674 |
| Sonographer | 3768 | 6351 | 3380 | 6308 | 4074 | 3709 | 3466 | 4096 | 4155 |
Staff salary costs profiles by configuration and units
Figure 57a–h shows the overall staff salary costs per 1000 patients for each EPAU within each configuration type. The overall variation of salary costs within each configuration is not significant. Figure 58 shows the proportions of staff salary costs across all individual patients and all visits for all EPAUs.
FIGURE 57.
Staff salary costs per 1000 patients for each configuration type and individual EPAUs [mean salary cost for configuration (red line) ± SD (diagonally shaded area)]. (a) Configuration vcw; (b) configuration vcW; (c) configuration vCw; (d) configuration vCW; (e) configuration vCW; (f) configuration VcW; (g) configuration VCw; and (h) configuration VCW.
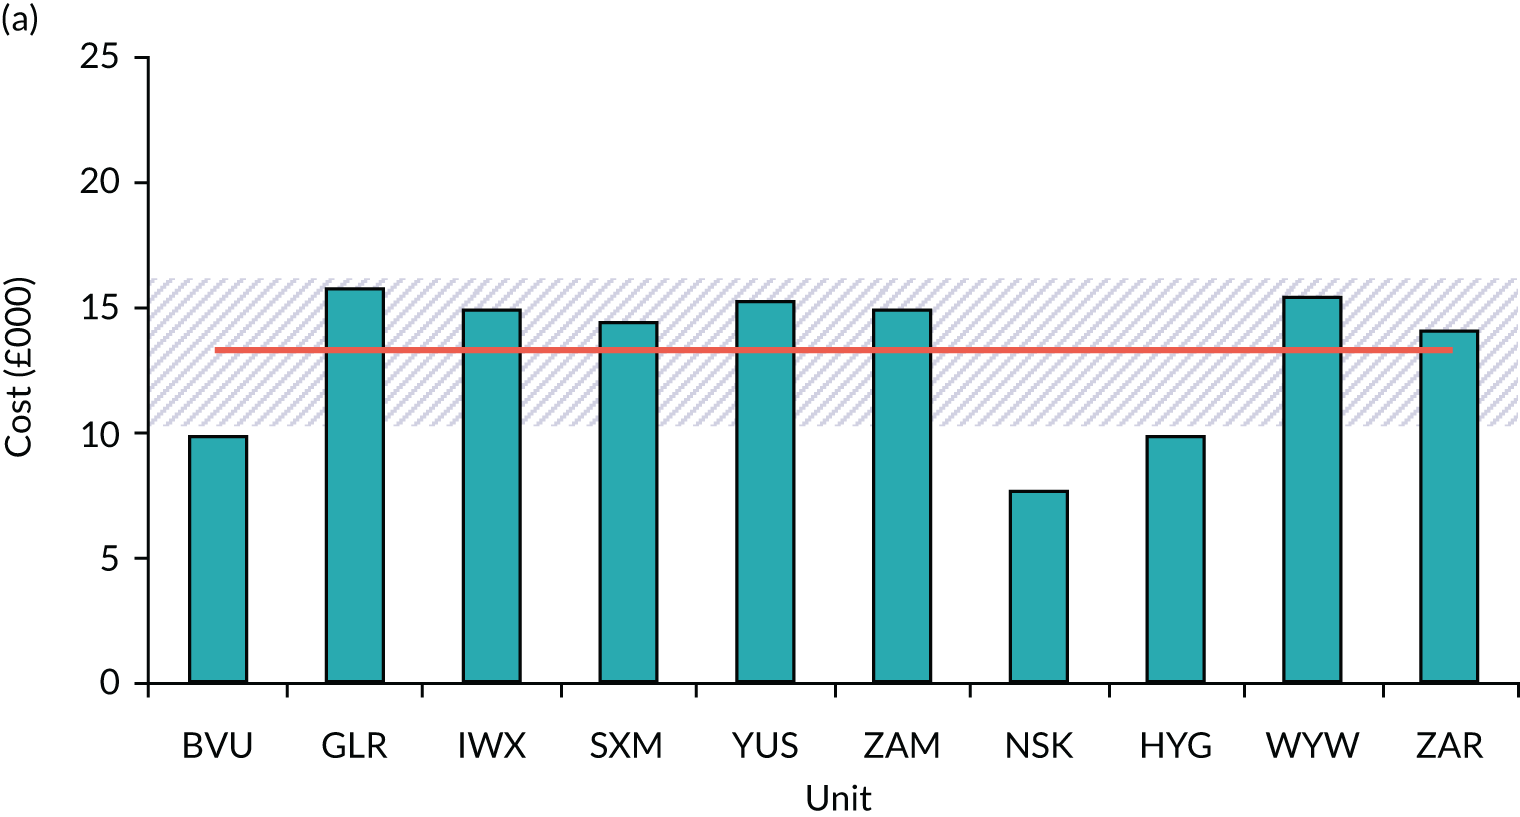
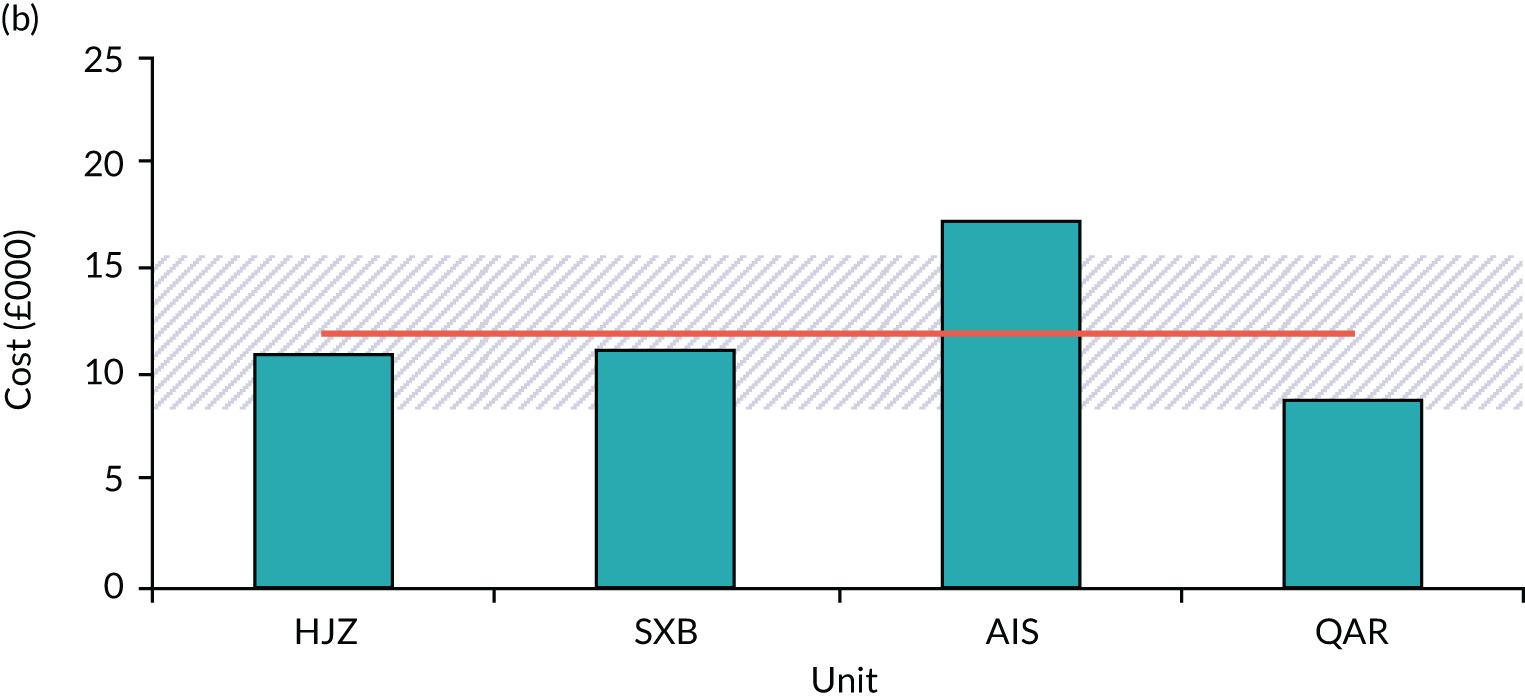
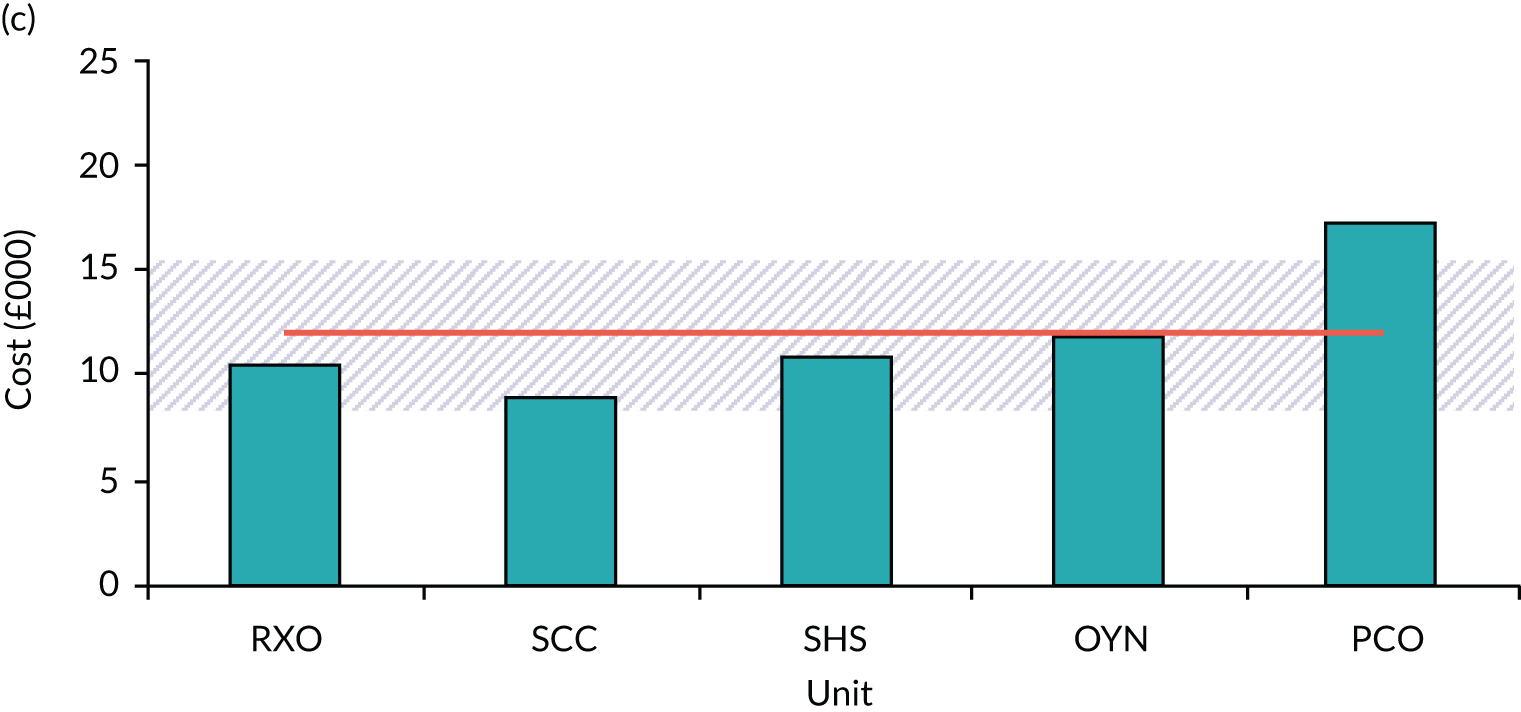
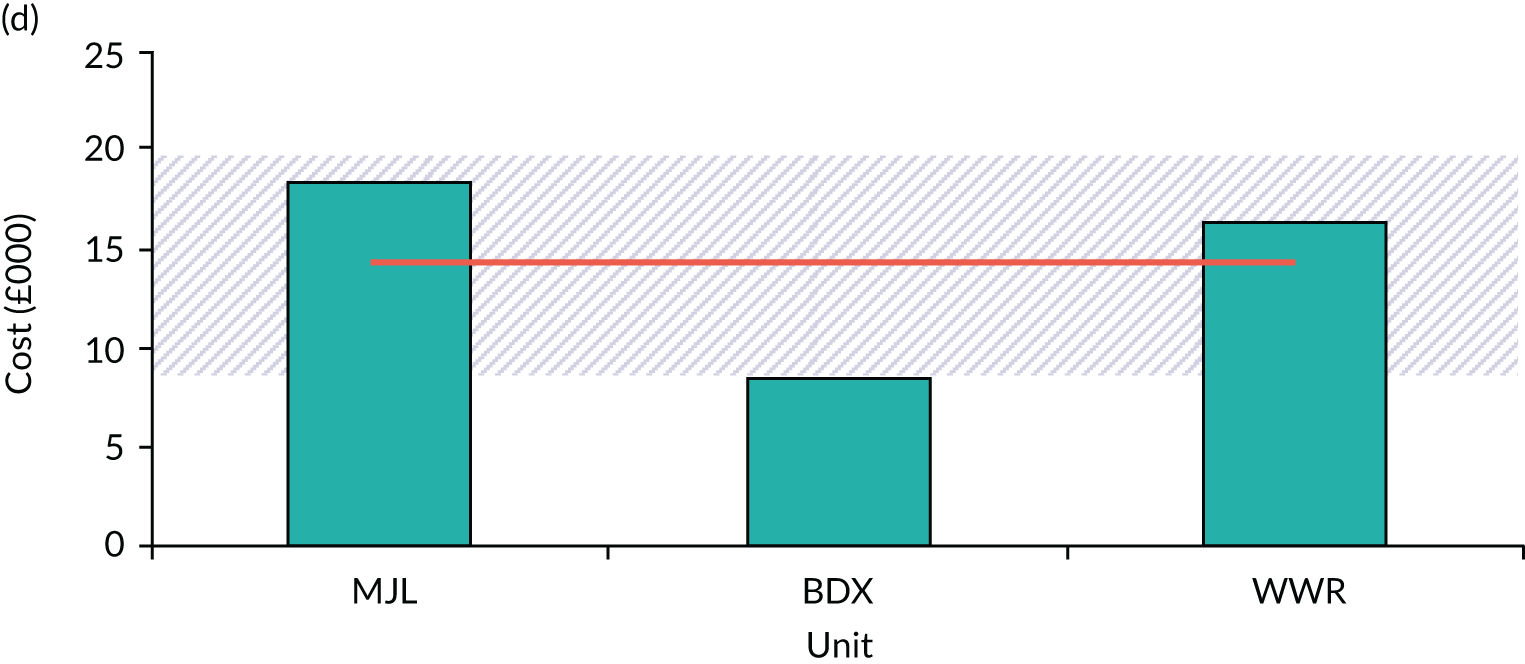
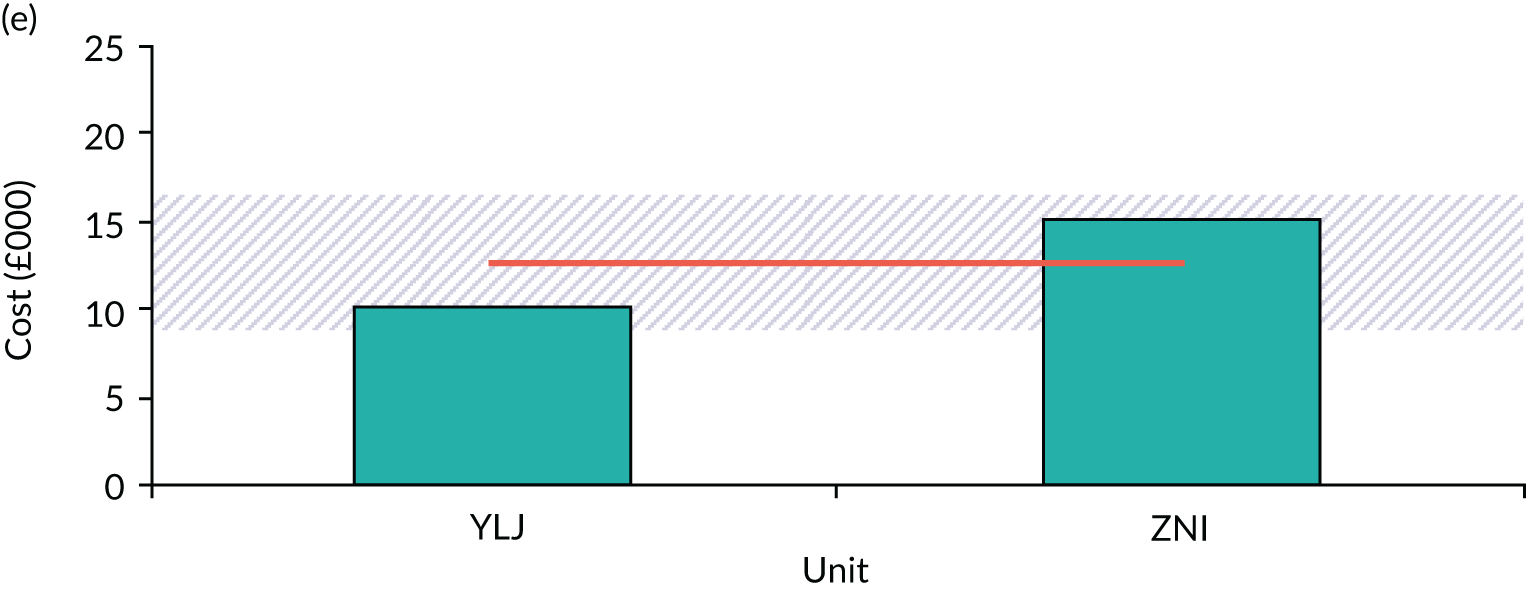
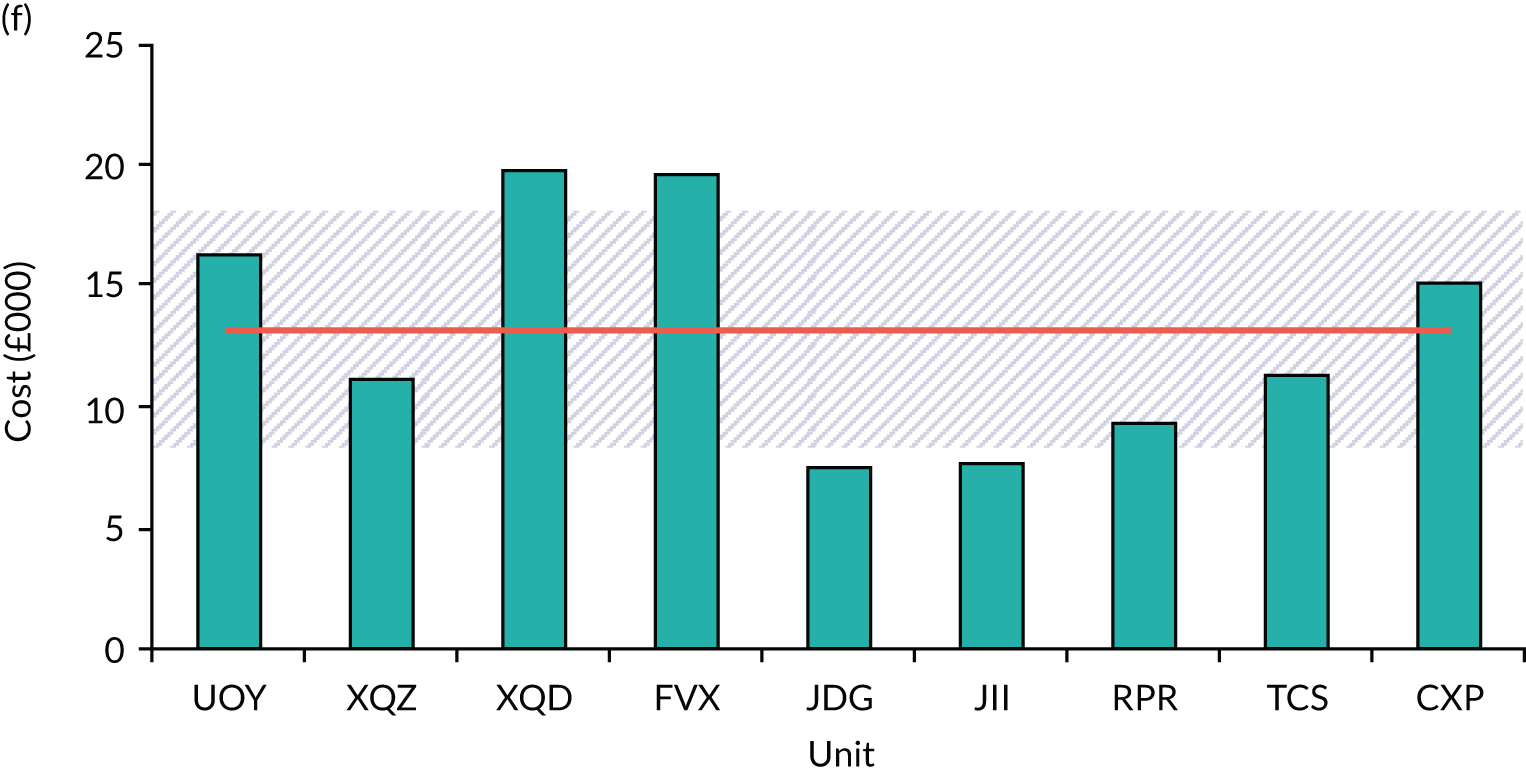
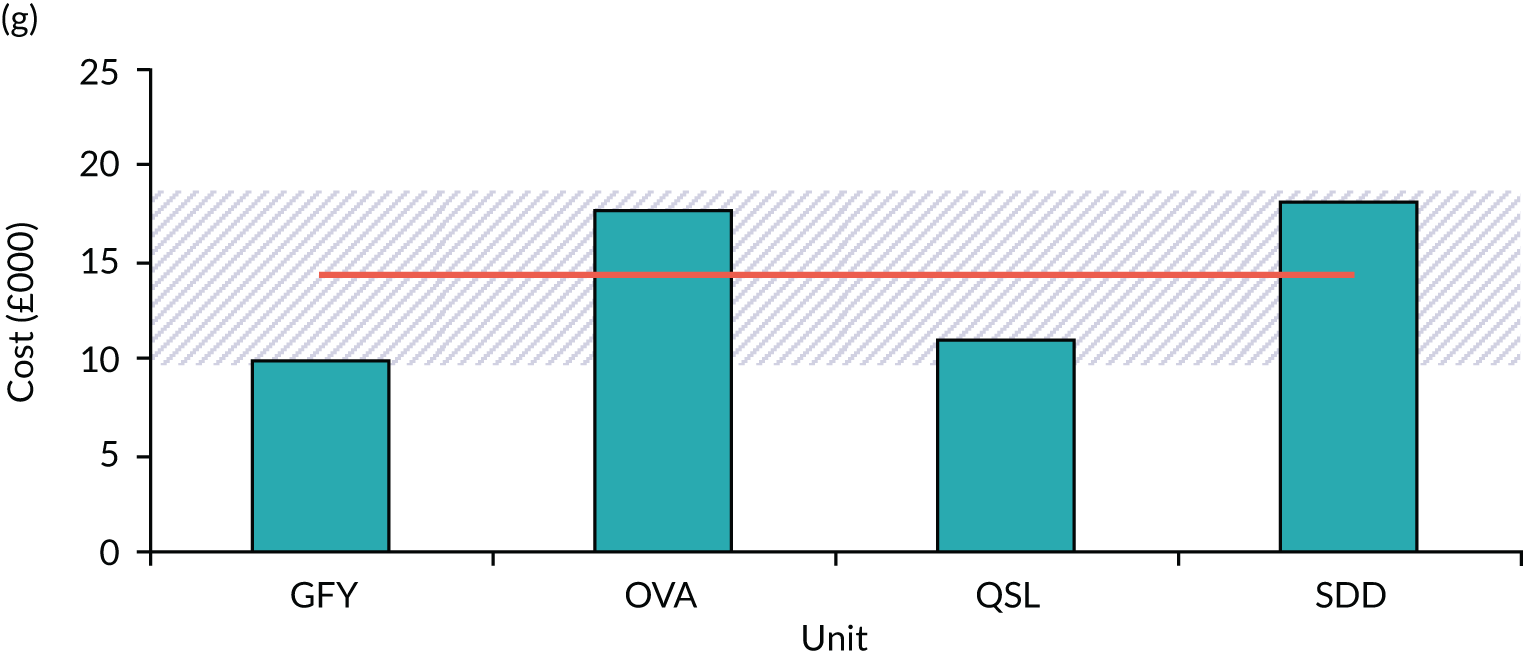
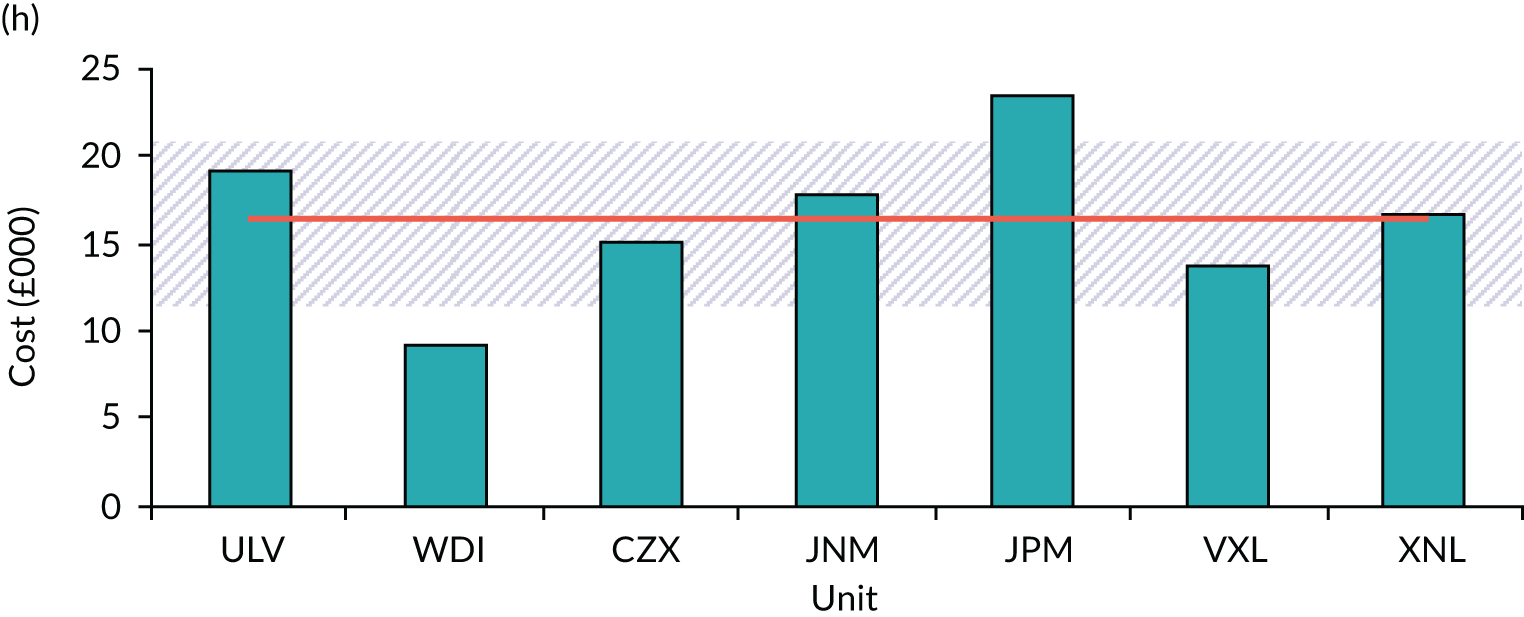
FIGURE 58.
Proportions of staff salary costs across all individual patients and all visits for all EPAUs.
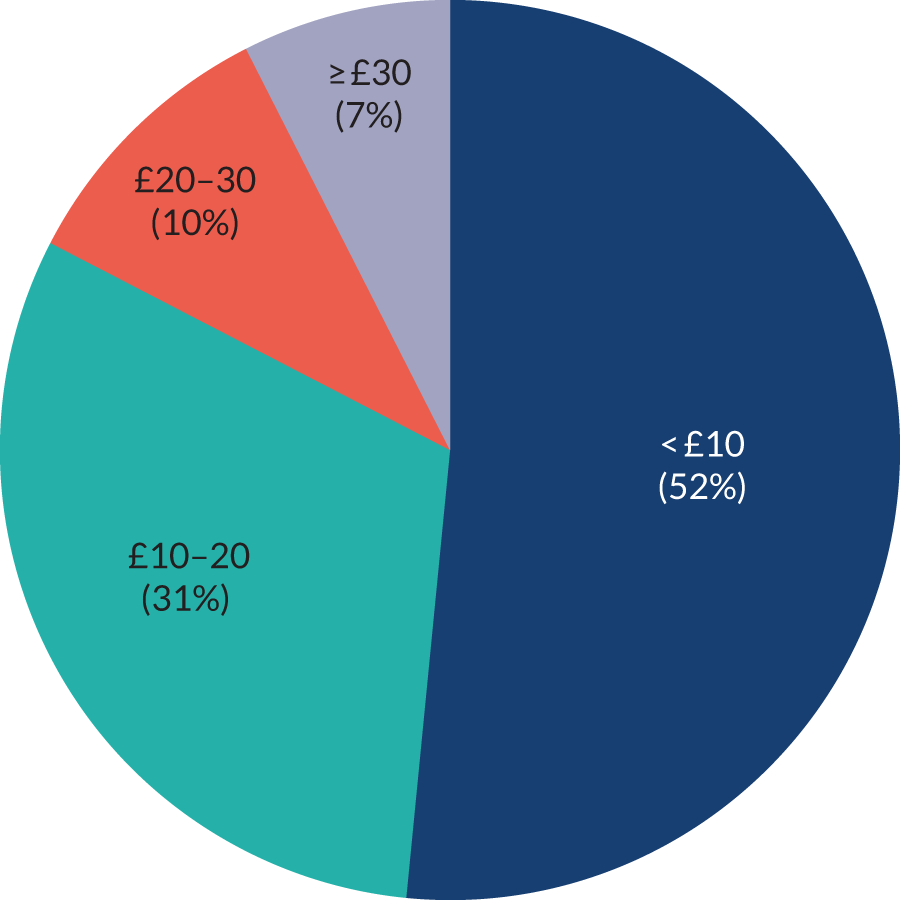
We analysed the staff costs per each patient visit. We found that the staff salary costs for over half of all visits was < £10. In the stratum of staff salary costs > £30 there are a few patients whose visits have individual costs of between £100 and £380 (see Figure 58). In these cases, women typically stayed in the EPAU for several hours, having bloods taken, intravenous fluids administered, long consultations and/or counselling sessions, resulting in higher staff salary costs.
Figure 59 shows the distribution of staff salary cost in relation to the visits across all configuration types. Configuration VCW has the largest proportion of all visits that cost > £30, whereas configurations Vcw and VcW have the highest proportion of visits that cost < £10. Configuration vCW had the lowest proportion of visits that cost < £10. Configurations VCw and VCW utilise higher proportions of the more expensive staff types (i.e. consultants, doctors and specialist nurses), which resulted in a higher proportion of high-cost visits.
FIGURE 59.
Distribution of staff salary costs across all individual patients visits by configuration type.
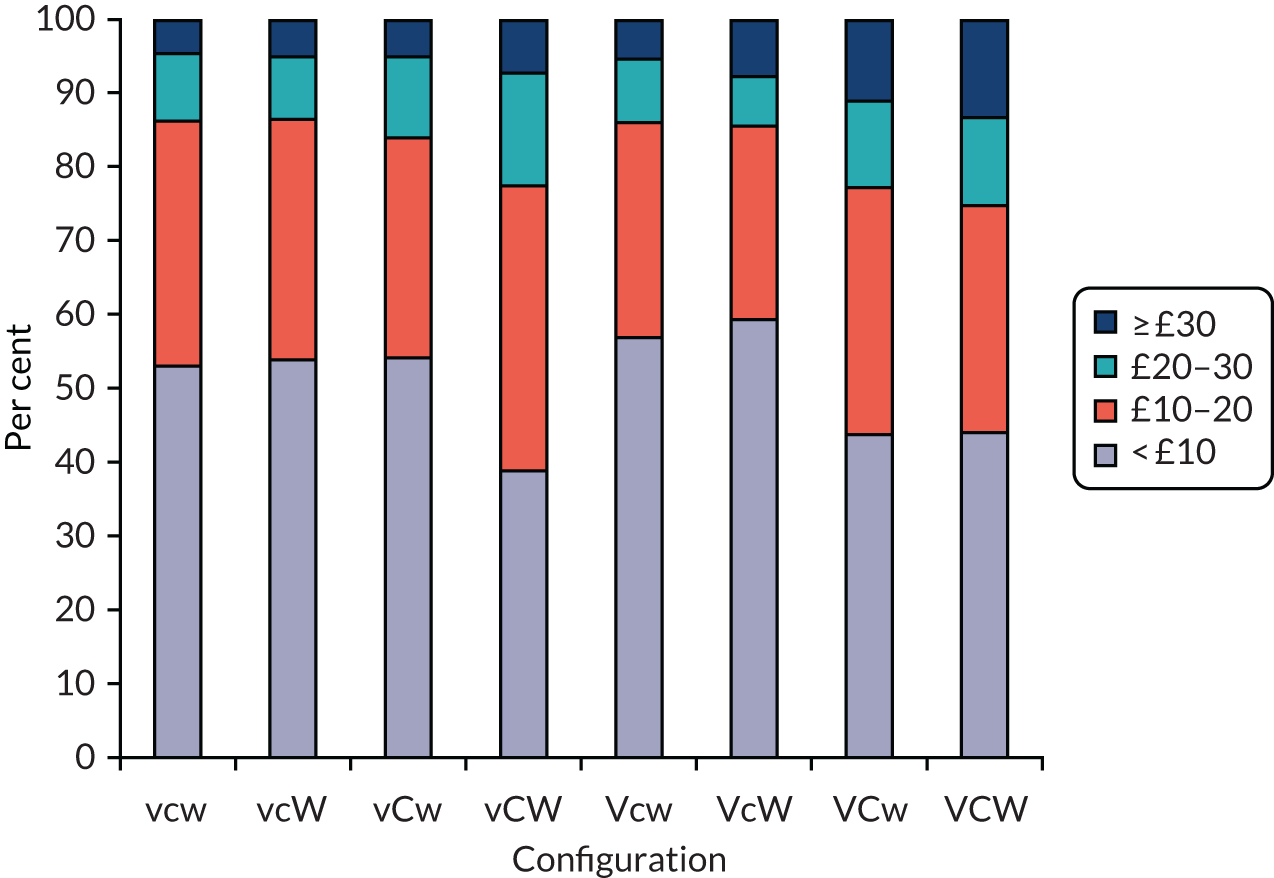
Average time spent with a patient
Figure 60 shows the average time spent with each patient across all staff types. The lowest average time spent with patients is 28 minutes (unit codes NSK and JDG), with the largest amount of time spent with patients being 71 minutes (unit code MJL). The average time spent across all units is 45 (SD 12) minutes. The observed overall variation is not statistically significant. A more detailed look at the specific units at either end of the average time distribution reveals that the longer times spent with patients are explained by longer consultations and counselling, whereas some patients required medical treatment (e.g. intravenous infusions). In units with shorter average times, there are no such patient interactions, which suggests that women requiring more complex care are referred to a nearby ward and not managed in the EPAU.
FIGURE 60.
Total time spent by all staff with each patient for each EPAU, showing overall mean and ± 1 SD.

Figure 61 shows the relationship between the time spent with patients and staff salary cost. The green markers are the individual unit salary costs and the red square is the average salary cost across all EPAUs. This figure shows the salary costs with the overall amount of time spent with the patient. The R2 value of 0.6953 implies positive correlation between increasing time with patients and salary costs. Units with higher average salary costs are marked in green (i.e. OVA, YUS, SHS, VXL and JPM). When these five units are more closely examined, we find that the increased salary costs are explained by the higher use of consultants (i.e. OVA, YUS, SHS), doctors (i.e. OVA and VXL) and specialist nurses (i.e. JPM).
FIGURE 61.
Total salary costs per 1000 patients vs. the average total time spent by all staff with each patient for each EPAU, showing the mean and best linear fit.

Investigating the individual staff types’ time spent with a patient across all units reveals that there are some units which have individual patients who require a disparate amount of time compared with the vast majority of patients. The median of all the time spent with each patient for each staff type for each unit was computed and is shown in Figure 62.
FIGURE 62.
Median time each clinician type spends with patients across all units.

Figure 62 shows that the median times for consultant, nurse, sonographer and specialist nurse are all very similar. We found that the doctor and midwife staff types spend over 5 minutes more with patients than each of the other four staff types. The doctor staff type is made up of specialist registrars (88%) and specialist doctors, and has the second highest salary among all staff types. Table 51 shows that the doctor staff type sees more patients who have more complicated needs than any other staff type, as expected. Doctors are also typically asked to prepare women for admission, obtain consent for operative treatment and take blood samples. In view of this, the increasing length of time that doctors spend with patients is more likely to reflect the complexity of their tasks, rather than their lower efficiency. Similar considerations apply to midwives, who are typically expected to undertake more complex tasks than other nursing staff.
| FD | Staff type (%) | |||||
|---|---|---|---|---|---|---|
| Consultant | Doctor | Midwife | Nurse | Sonographer | Specialist nurse | |
| Normal/live intrauterine pregnancy | 46 | 40 | 55 | 48 | 52 | 55 |
| Early intrauterine pregnancy | 11 | 11 | 11 | 14 | 13 | 9 |
| Not pregnant | 0 | 0 | 0 | 0 | 0 | 0 |
| Complete miscarriage | 13 | 12 | 9 | 10 | 11 | 13 |
| Inconclusive scan (PUL) | 2 | 4 | 2 | 2 | 3 | 2 |
| Early embryonic demise | 13 | 16 | 14 | 15 | 12 | 14 |
| Incomplete miscarriage | 4 | 8 | 6 | 6 | 5 | 4 |
| Molar pregnancy | 0 | 0 | 0 | 0 | 0 | 0 |
| Retained products of conception | 3 | 5 | 2 | 2 | 2 | 1 |
| Ectopic pregnancy | 6 | 4 | 1 | 2 | 2 | 2 |
| Twin pregnancy | 0 | 0 | 0 | 0 | 0 | 0 |
| Other | 0 | 0 | 0 | 0 | 0 | 0 |
| Total | 100 | 100 | 100 | 100 | 100 | 100 |
Workforce costs by diagnoses: salary costs
Figure 63 shows the staff salary cost per patient for all diagnoses. Figure 64 shows the total number of women in each configuration type across all diagnoses. In total, there were 6314 women with recorded diagnoses in the data set. The variations across configuration type are not significant. The average salary cost for staff attending to a woman in an EPAU across the UK is < £14 (range £10–17). Configuration VcW has the lowest staff salary costs and configuration VCW has the highest staff salary costs.
FIGURE 63.
Staff salary costs per patient for each configuration for all diagnoses.
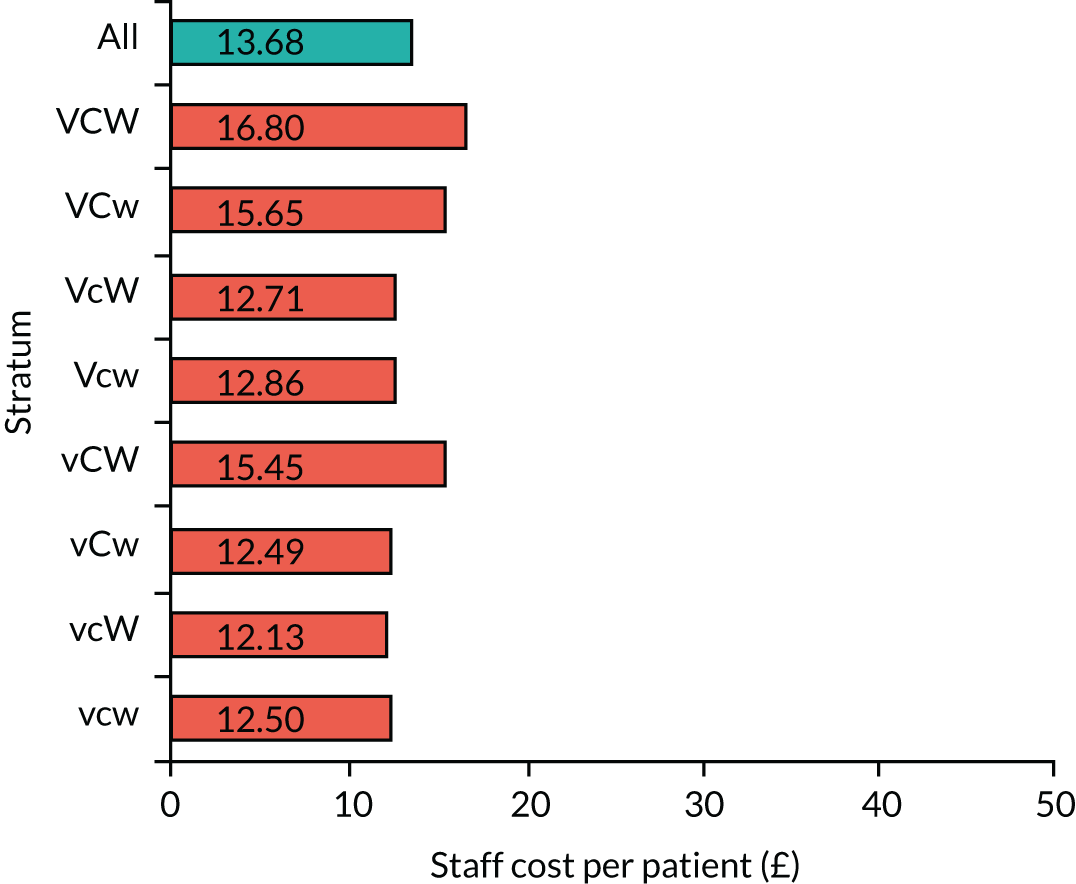
FIGURE 64.
Total number of women in each configuration for all diagnoses. Note, there are 6531 women with timing data and 6409 valid diagnose in total, but only 6343 women with both timing data and diagnosis data.
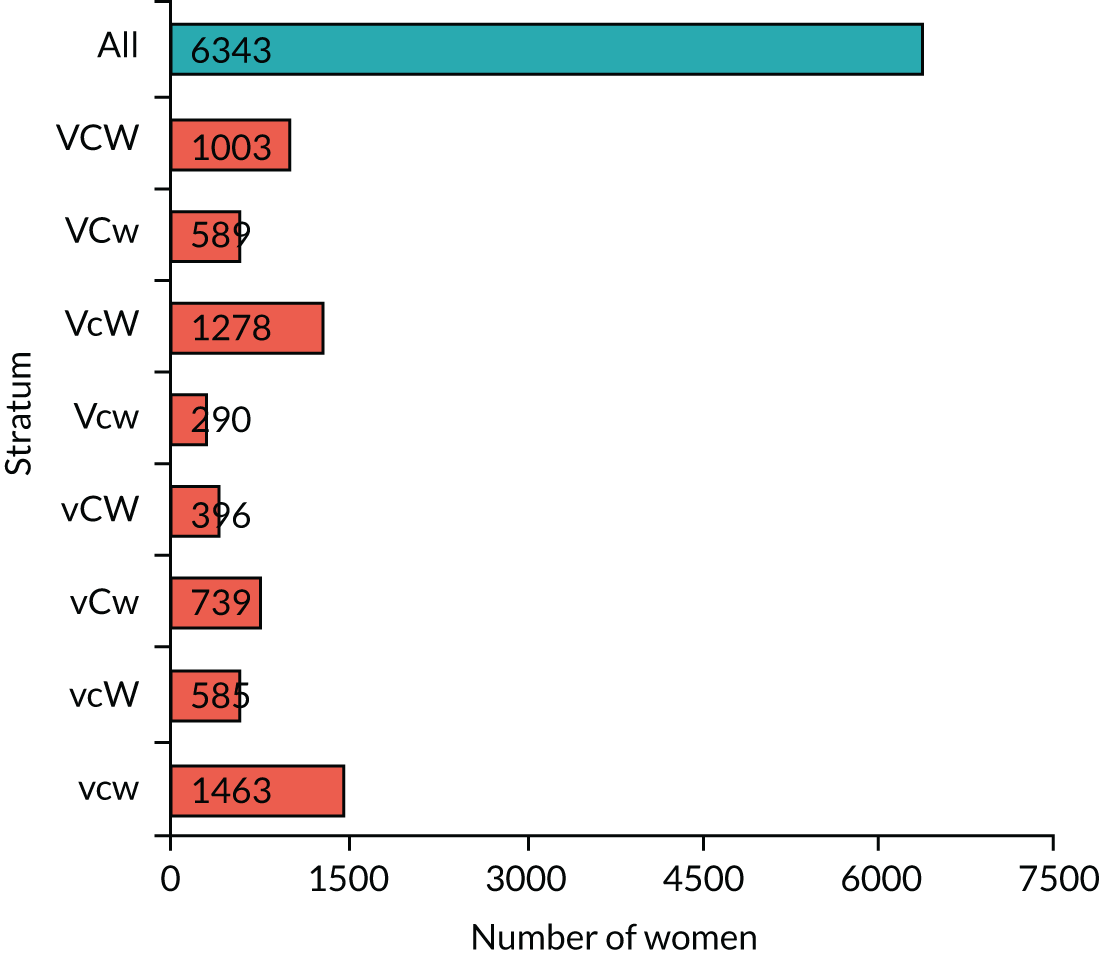
Figure 65a–j shows the staff cost per patient by diagnosis stratum. The graphs are arranged in ascending order of staff cost based on the overall average cost per patient, as shown by the blue bar on each graph. Diagnoses of normal/live intrauterine pregnancy tend to have the lowest staff cost incurred for the time the patient interacts with, and is cared for, by the EPAU staff, with a cost of around £10 per patient across all configurations. Diagnoses of ectopic pregnancies are the most costly with an average of approximately £35, but reaching £46 for configuration VCW. The diagnoses across each configuration type have similar costs, except molar pregnancy. However, there are only 12 diagnoses of molar pregnancy in the data set.
FIGURE 65.
Staff salary cost per patient for the top 10 diagnosis strata by configuration type. Staff cost per patient with (a) normal/live intrauterine pregnancy; (b) early intrauterine pregnancy; (c) not pregnant; (d) complete miscarriage; (e) inconclusive scan (PUL); (f) early embryonic demise; (g) incomplete miscarriage; (h) molar pregnancy; (i) retained production of conception; and (j) ectopic pregnancy.
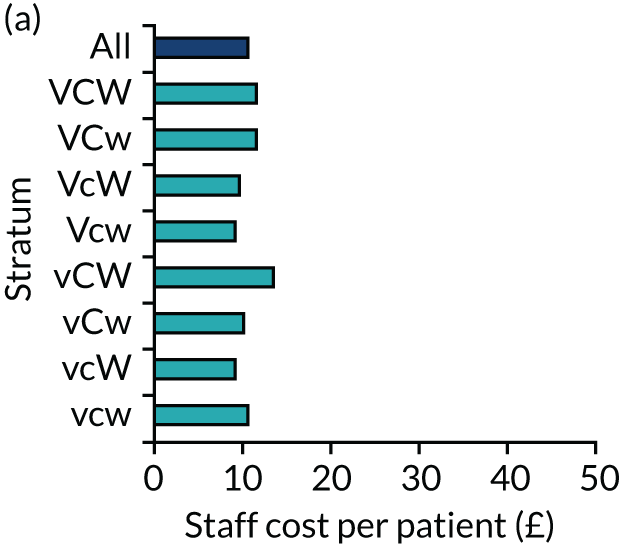
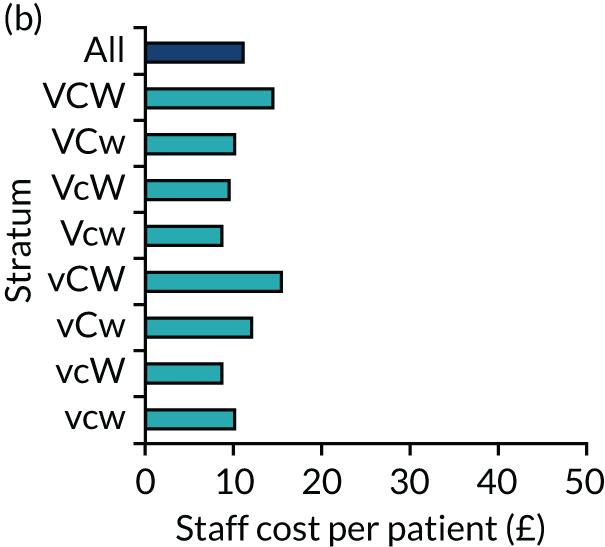
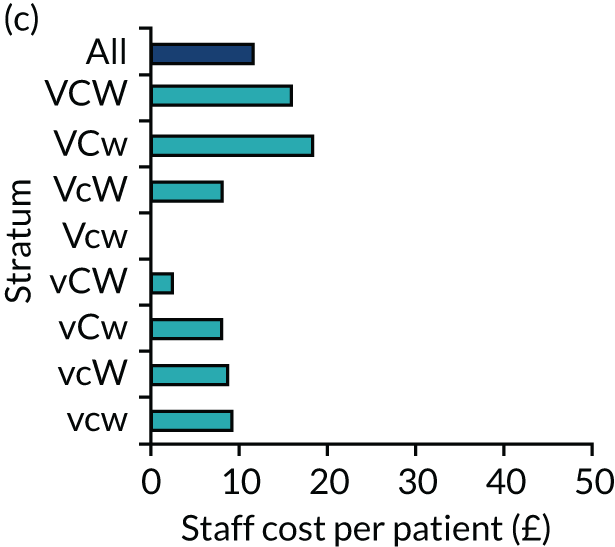
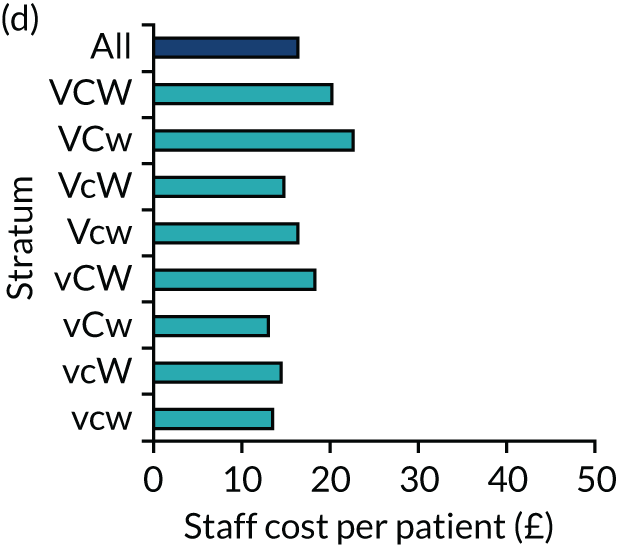
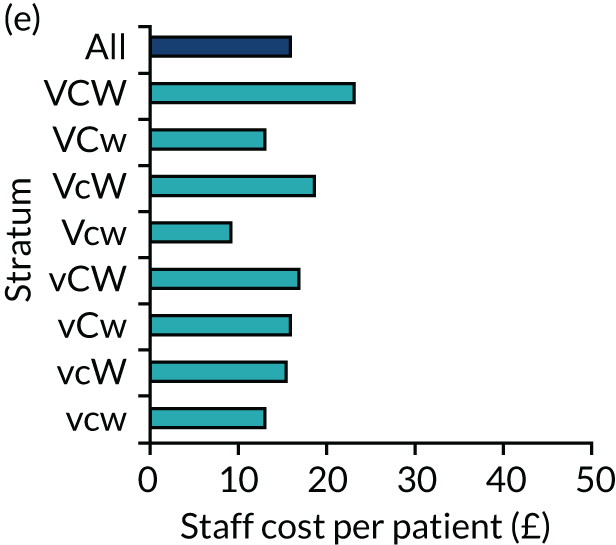
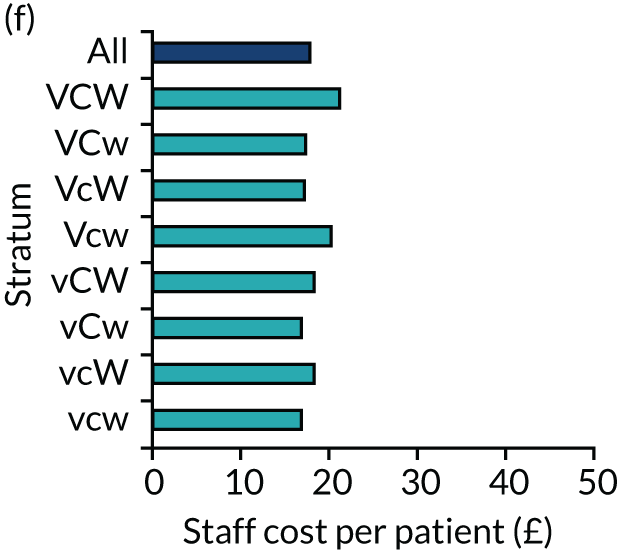
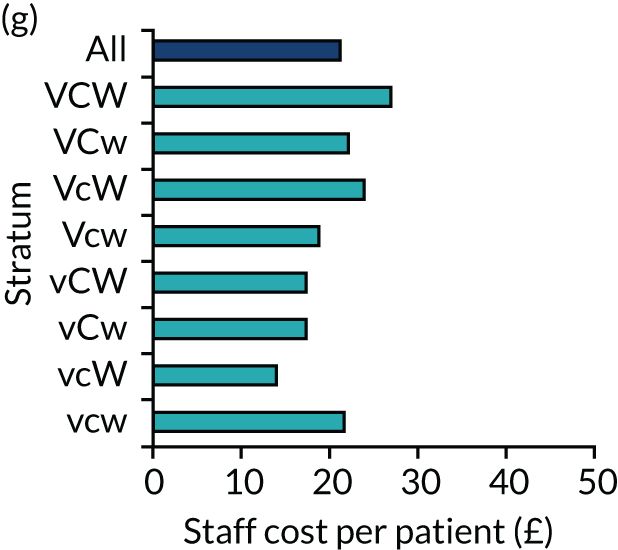
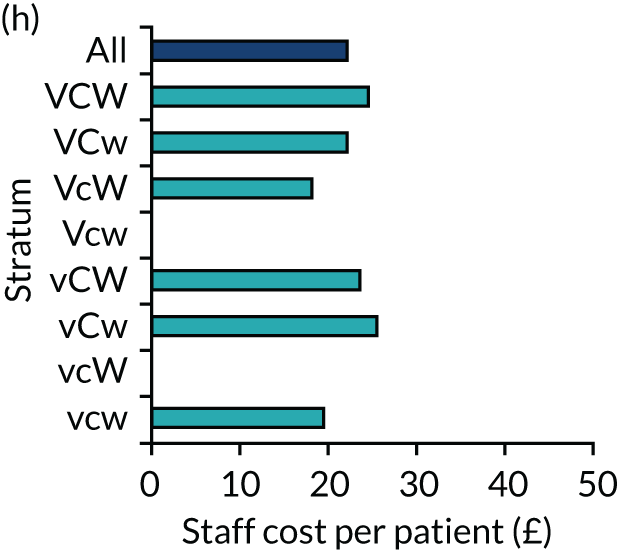
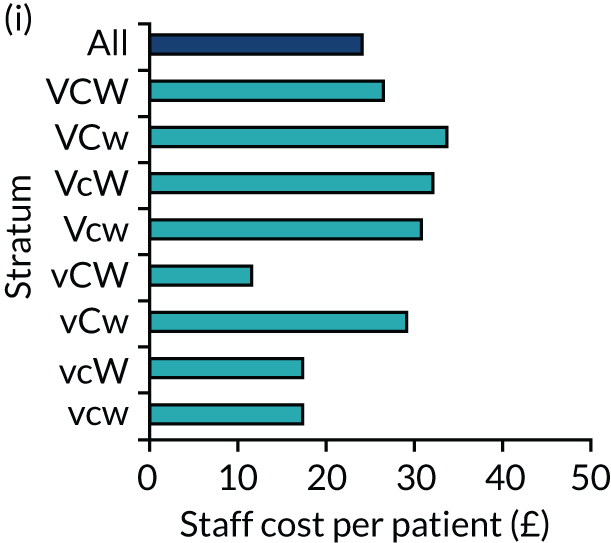
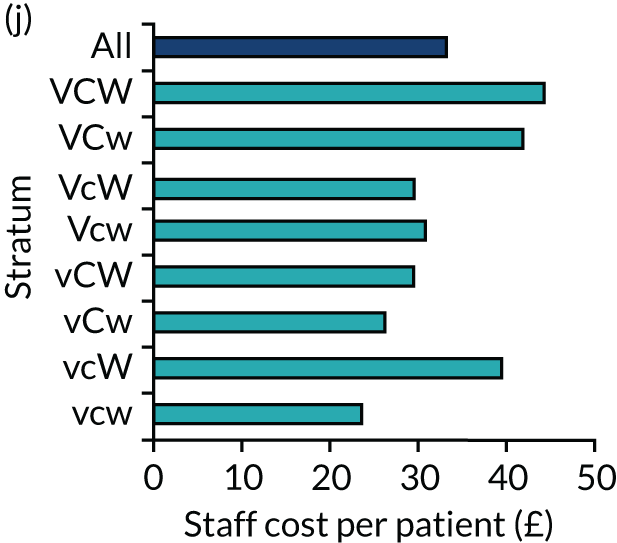
The differences observed were mainly due to the length of time spent by staff with women presenting with normal and abnormal pregnancies. Staff spend on average < 40 minutes with women presenting with normal pregnancies, but this increases to 60–75 minutes with women diagnosed with miscarriages and to > 100 minutes with women diagnosed with ectopic pregnancies. The spread in time spent by staff per patient shows differences between different configuration types. As a result, efficiency could be improved by shortening the length of interaction between staff and patients (Table 52).
| FD | Configuration (n) | Average | SD | SD/average (%) | ||||||||
|---|---|---|---|---|---|---|---|---|---|---|---|---|
| Vcw | vcW | vCw | vCW | Vcw | VcW | VCw | VCW | All | ||||
| Normal/live intrauterine pregnancy | 817 | 244 | 442 | 196 | 164 | 704 | 310 | 467 | 3344 | 418.00 | 238.96 | 57 |
| Early intrauterine pregnancy | 168 | 130 | 52 | 76 | 25 | 131 | 67 | 163 | 812 | 101.50 | 53.49 | 53 |
| Not pregnant | 3 | 1 | 1 | 1 | 0 | 1 | 2 | 3 | 12 | 1.50 | 1.07 | 71 |
| Complete miscarriage | 167 | 85 | 79 | 37 | 24 | 134 | 64 | 95 | 685 | 85.63 | 47.39 | 55 |
| Inconclusive scan (PUL) | 39 | 13 | 24 | 8 | 10 | 21 | 10 | 24 | 149 | 18.63 | 10.50 | 56 |
| Early embryonic demise | 134 | 62 | 85 | 49 | 49 | 192 | 86 | 143 | 800 | 100.00 | 51.46 | 51 |
| Incomplete miscarriage | 72 | 33 | 37 | 17 | 8 | 49 | 17 | 60 | 293 | 36.63 | 22.53 | 62 |
| Molar pregnancy | 3 | 0 | 1 | 1 | 0 | 2 | 2 | 3 | 12 | 1.50 | 1.20 | 80 |
| Retained products of conception | 40 | 8 | 7 | 5 | 7 | 23 | 8 | 25 | 123 | 15.38 | 12.61 | 82 |
| Ectopic pregnancy | 20 | 7 | 11 | 6 | 3 | 21 | 21 | 19 | 108 | 13.50 | 7.56 | 56 |
| Twin pregnancy | 0 | 1 | 0 | 0 | 0 | 0 | 0 | 1 | 2 | |||
| Other | 0 | 1 | 0 | 0 | 0 | 0 | 2 | 0 | 3 | |||
| All | 1463 | 585 | 739 | 396 | 290 | 1278 | 589 | 1003 | 6343 | 792.88 | 418.61 | 53 |
Proportion of multiple visits
We found that most women (89%) attended for up to two visits, but some women were seen 10 or more times. Across the 44 EPAUs the lowest recorded proportion of visits that were first or second visits was 77% and the highest was 100%. By configuration type the corresponding range was between 83% (i.e. configuration Vcw) and 95% (i.e. configurations vcW and vCw) (Figure 66).
FIGURE 66.
Proportion of visits that were first or second visits.
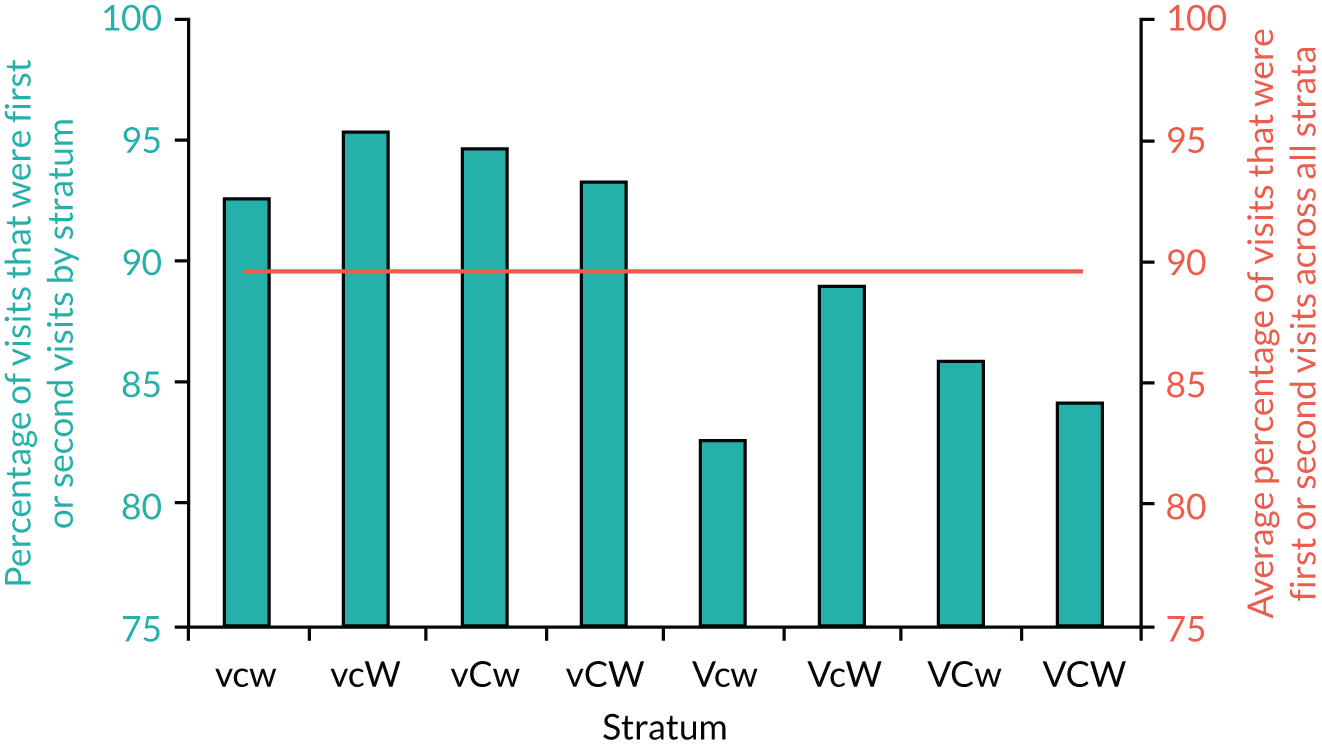
The proportion of multiple follow-up visits (i.e. up to two visits) was significantly higher in high- than in low-volume units (p = 0.0013). There were no significant differences when considering consultant presence or weekend opening.
Pregnancy of unknown location rates
We reported on the relationships between the PUL rate at the initial visit and consultant presence, unit volume and weekend opening hours in Rate of pregnancy of unknown location. Here we are looking at the PUL rates in relation to the staff types assessing the patients (Table 53). The PUL numbers are slightly different as, in the analysis, we included only women whose visit was timed and the time recorded.
| Staff type | Configuration (%) | Ratio: PUL/all (%) | |||||||||
|---|---|---|---|---|---|---|---|---|---|---|---|
| vcw | vcW | vCw | vCW | Vcw | VcW | VCw | VCW | First/all | Final/all | First/final | |
| Specialist nurse | 7 | 13 | 10 | 11 | 18 | 11 | 28 | 20 | 13 | 2.2 | 5.87 |
| Sonographer | 10 | 11 | 8 | 11 | 19 | 12 | 15 | 17 | 12 | 2.6 | 4.72 |
| Nurse | 10 | 13 | 10 | 9 | 19 | 12 | 18 | 19 | 13 | 2.5 | 5.32 |
| Consultant | 11 | 0 | 10 | 7 | 47 | 16 | 15 | 32 | 17 | 1.6 | 10.66 |
| Doctor | 28 | 23 | 13 | 7 | 29 | 17 | 11 | 22 | 18 | 4.2 | 4.28 |
| Midwife | 11 | 14 | 2 | 12 | 100 | 16 | N/A | 50 | 10 | 2.0 | 4.94 |
| Overall | 11 | 13 | 9 | 10 | 20 | 13 | 16 | 20 | 13 | 2.6 | 5.13 |
The overall PUL rate is 13%. The lowest recorded rate was for the midwife staff type and the highest recorded rate was for the doctor staff type. The final two columns (first/final) show the final PUL rate and the ‘improvement ratio’, which was calculated by dividing the initial and final PUL rates. A higher ratio indicates a greater level of improvement. The consultant staff type has the highest improvement ratio, whereas the doctor staff type has the lowest improvement ratio. This means that a greater proportion of PULs were resolved between the first diagnosis and the FD when the consultant staff group had seen the patient at least once.
The impact of staff type and time spent with patients on admissions, repeated visits and inconclusive scans (pregnancies of unknown location)
In this part of the analysis we tried to explore further the impact of different staff types and the length of time they spent with each patient on three ‘effectiveness’ factors: (1) number of admissions, (2) number of visits and (3) number of inconclusive scans. The correlation coefficients were calculated with respect to the number of patients attended to by staff type, the total time each staff type spends with all patients and the average time that each staff type spends with each patient (Table 54).
| Factor | Staff type | |||||
|---|---|---|---|---|---|---|
| Consultant | Doctor | Midwife | Nurse | Sonographer | Specialist nurse | |
| Number of admissions | ||||||
| Number of patients attended to by staff type | 0.054 | 0.248 | –0.170 | 0.236 | 0.106 | –0.198 |
| Median time | –0.101 | 0.094 | 0.320 | –0.007 | 0.165 | 0.009 |
| Number of visits | ||||||
| Number of patients attended to by staff type | 0.169 | 0.216 | –0.146 | –0.095 | –0.142 | 0.343 |
| Median time | –0.121 | –0.016 | 0.267 | –0.134 | –0.041 | 0.460 |
| Inconclusive scans (PULs) | ||||||
| Number of patients attended to by staff type | –0.046 | 0.280 | –0.066 | 0.021 | 0.220 | –0.041 |
| Median time | 0.302 | 0.028 | 0.164 | 0.496 | 0.025 | 0.035 |
A ratio analysis method was utilised to gain some insight into the relationship between each staff type and the three effectiveness factors (Table 55). This analysis examines trends in the number of admissions, number of visits and number of PULs with the variations in the number of patients attended to by each different staff type and the length of time they spent with patients. Unfavourable tendencies for a particular staff type caused by attending to more patients or spending more time per patient may indicate that that staff type is less effective (expressed as negative percentage) than a staff type for which the factors show favourable trends (expressed as positive percentage) (see Table 55). If the result is positive (see Table 54, blue shading) suggests that staff type has a beneficial effect on that factor; a negative result, in contrast (see Table 54, purple shading), suggests that staff type has a detrimental effect on that factor. For example, consultants have beneficial effects on the number of admissions and the number of inconclusive scans; however, they have a negative effect on the number of visits as the number of patients they attend to increases. Doctors have a negative effect across all three factors. It should be noted, however, that the doctor staff type attends to a higher proportion of patients with complex needs than all other staff types, which may explain this observation. Specialist nurses show a similar pattern to consultants. Nurses and sonographers have a favourable effect on the number of visits, which indicates that, as the number of patients attended to and/or the time spent with each patient increases, the number of visits goes down. Midwives are included in the analysis for completion, but little can be indicated because the number of midwives utilised by the units in this study is very small.
| Factor | Staff type (%) | |||||
|---|---|---|---|---|---|---|
| Consultant | Doctor | Midwife | Nurse | Sonographer | Specialist nurse | |
| Number of admissions | ||||||
| Number of patients attended to by staff type | 14 | –54 | 40 | –20 | –5 | 48 |
| Range of median time spent with each patient | 39 | –51 | –61 | 30 | 8 | 28 |
| Number of visits | ||||||
| Number of patients attended to by staff type | –62 | –20 | 71 | 40 | 57 | –60 |
| Range of median time spent with each patient | 13 | 2 | 35 | 28 | 14 | –84 |
| Inconclusive scans (PULs) | ||||||
| Number of patients attended to by staff type | 24 | –96 | –3 | 11 | 8 | 28 |
| Range of median time spent with each patient | 6 | 1 | –144 | –27 | 2 | 9 |
The number of patients attended to by each staff type is split into quartiles and the number of units that fall within each quartile is counted. The number of admissions reported by each unit within a quartile is summed. Finally, the number of admissions per unit is computed for each quartile. Table 56 summarises the results for the number of admissions only. The quartiles can be compared for any obvious variations. The number of patients attended to can be very small in the first two quartiles, as not all units utilise all staff types equally. Therefore, comparing the fourth quartile (which represents the greatest number of patients attended to) with the aggregated average of the other three quartiles allows us to assess what happens when the number of patients attended to is greatest.
| Quartile | Staff type | |||||||||||
|---|---|---|---|---|---|---|---|---|---|---|---|---|
| Consultant | Doctor | Midwife | Nurse | Sonographer | Specialist nurse | |||||||
| Number of patients seen | Ratio: admission per unit | Number of patients seen | Ratio: admission per unit | Number of patients seen | Ratio: admission per unit | Number of patients seen | Ratio: admission per unit | Number of patients seen | Ratio: admission per unit | Number of patients seen | Ratio: admission per unit | |
| First quartile | 1 | 4.0 | 3 | 4.3 | 0 | – | 21 | 2.5 | 105 | 6.3 | 0 | – |
| Second quartile | 4 | 4.2 | 12 | 4.0 | 0 | – | 84 | 5.4 | 134 | 6.1 | 21 | 7.3 |
| Third quartile | 16 | 7.7 | 46 | 4.5 | 1 | 7.4 | 133 | 5.6 | 145 | 3.5 | 97 | 5.7 |
| Fourth quartile | 96 | 4.8 | 134 | 6.5 | 155 | 4.4 | 150 | 5.8 | 155 | 5.3 | 165 | 3.4 |
| Average | 5.4 | 4.9 | 5.9 | 5.1 | 5.1 | 5.4 | ||||||
| Quartiles 0–3 | 5.6 | 4.2 | 7.4 | 4.9 | 5.1 | 6.5 | ||||||
| Quartile 4 | 4.8 | 6.5 | 4.4 | 5.8 | 5.3 | 3.4 | ||||||
| % change | 14 | –54 | 40 | –20 | –5 | 48 | ||||||
Table 55 summarises these results for three effectiveness factors: (1) number of admissions, (2) number of visits and (3) number of non-diagnostic scans.
Unit ranking
We recorded for each unit the admission rate, proportion of multiple follow-up visits and proportion of PULs, as well as staff salary cost per 1000 patients and average time spent with patients. Each unit was ranked in each of these five indicators. A ranking of 1 signifies that the individual unit had the highest favourable value in that particular indicator. After all the units are ranked for each factor, the ranks are added together assuming an equal weighting across all five factors. The sum of the ranks of the five factors for each unit is then computed. This sum of the ranks is then itself ranked, with rank 1 being given to the unit with the lowest sum and rank 44 given to the unit with the highest sum. Unit volume, consultant presence and weekend opening status are included in the table for reference only and are not used in the ranking.
See Report Supplementary Material 1, Table 21, for a summary of the unit ranking. The values used to calculate the ranks are provided in columns 2–6. The corresponding ranks are provided in columns 11–15. Of the top 10 units, seven are open on the weekends, with the volume evenly spread across the volume range. Half of the top 10 units are recorded as having a ‘consultant present’. Report Supplementary Material 1, Table 22, shows that, of the top 10 units, eight utilise nurse and sonographers, with a reduced role for specialist nurses. Of the remaining two units, one utilises midwives as its main staff type (along with sonographers) and the other utilises the doctor staff type, with a very small input from nurses and sonographers.
The two lowest ranked units (i.e. XQD and WDI) rank low in all five factors. These units rely heavily on the doctor staff type. We found that 12 (75%) of the 16 units that utilise the doctor staff type for a total time of > 10 hours appear in the lower half of the ranking table. Among all staff types, doctor staff type is proportionally more represented in the lower half of the ranking table; this suggests that the doctor staff type is the least effective of all the staff types when highly utilised. Please note that the doctor staff type is made up of predominantly specialist registrars (88%) and only 12% specialty doctors.
Workforce analysis: key findings
-
The largest salary cost across all the units was for sonographers.
-
Diagnosis of normal/live intrauterine pregnancy is associated with the lowest staff cost. Diagnoses of ectopic pregnancies is the most costly and costs up to 4.5 times more than a normal/live intrauterine pregnancy.
-
Staff spend on average < 40 minutes with women presenting with normal pregnancies, but this increases to 60–75 minutes with women diagnosed with miscarriages and to > 100 minutes with women diagnosed with ectopic pregnancies.
-
Subconsultant grade doctor staff type is the least effective of all staff types providing early pregnancy care.
Chapter 4 Discussion
This chapter discusses the results of the VESPA study.
Clinical outcomes in the EPAUs and emergency hospital care audit
Primary outcome: emergency hospital admissions for further investigations and treatment as a proportion of women attending the participating EPAUs
We found a very wide range of emergency admission rates in the participating EPAUs. The lowest admission rates were < 1%; however, in some EPAUs > 10% of women were admitted to hospital. There was no significant association between consultant presence in the EPAU and the proportion of women who required emergency admission for suspected early pregnancy complications. We obtained the same results whether we analysed for consultant presence as a binary outcome or as a continuum, taking into account the proportion of both planned and actual time consultants spent in the EPAU during opening hours. Statistical models were adjusted for FD, MA, DS and GAP (i.e. variables with a known effect on the rate of emergency admissions).
The majority of early pregnancy complications are self-limiting and they can be safely managed conservatively on an outpatient basis. We postulated that indicators of good-quality care include lower follow-up rates, fewer blood tests, reaching the correct diagnosis faster and fewer emergency admissions. This was supported by the results of previous studies,23,24 which showed that involvement of more experienced clinicians in delivering emergency care results in better clinical outcomes and improves cost-effectiveness. The findings of the VESPA study in respect of consultant presence are also at odds with the results of our audit, in which we found that the proportions of emergency admissions, non-diagnostic ultrasound scans and additional investigations were significantly lower in EPAUs with higher involvement of consultants delivering early pregnancy care.
There are several possible explanations for these findings. In our audit, we found that the rates of admission to hospital were significantly reduced when consultants were present in the units ≥ 60% of time. However, there are very few EPAUs nationally with such a high level of consultant involvement in delivering early pregnancy care. In the VESPA study, in 15 (79%) of the 19 EPAUs with planned consultant presence, consultants were timetabled to cover the EPAU for < 35% of working time. When we compared actual with planned consultant presence we found that in only three EPAUs (3/19, 16%) did consultants spend > 15% of their time actively delivering clinical care, and in 13 EPAUs (13/19, 68%) their actual recorded presence was < 5%. This relatively low level of consultant involvement could possibly explain their lack of significant impact on the quality of care.
The other possibility is that consultants who are fully trained in general obstetrics and gynaecology do not possess the additional clinical and ultrasound skills required for effective running of an EPAU. The Royal College of Obstetricians and Gynaecologists has been providing an advanced training module in acute gynaecology and early pregnancy for more than 15 years. 47 The module has been designed to provide future consultants with the knowledge and skills which are necessary for providing acute gynaecological and early pregnancy care. We are not aware, however, if this training programme has ever undergone a robust audit to assess its effectiveness. In addition, the completion of advanced training module is not an essential requirement for running an EPAU and it is possible that a proportion of consultants working in the units included in this study have never received any additional training in early pregnancy care.
The availability of an ultrasound diagnostic service is essential for safe and effective running of EPAUs. The quality of ultrasound diagnosis, however, is heavily operator dependent. 48 Lower-quality ultrasound scanning services is reflected by a higher number of cases where a conclusive diagnosis of early pregnancy abnormality cannot be reached. 49 This typically leads to a higher number of follow-up visits, blood tests, interventions and admissions for both diagnostic workup and treatment. We found that consultant presence in EPAUs did not have a significant impact on the proportion of non-diagnostic scans. We will discuss this result in more detail in Rate of non-diagnostic ultrasound scans (pregnancy of unknown location), but this finding indicates that consultants working in EPAUs may not be able to offer a better-quality ultrasound service than other health-care professionals. Ultrasound training is not included in the core specialist curriculum in the UK and there are few opportunities for clinicians to receive advanced training in gynaecological and early pregnancy ultrasound. These considerations could also help to explain the absence of a significant effect of consultant presence on the rate of emergency admissions.
Medical care in large clinical units is typically delivered by larger clinical teams, which offer better opportunities for staff supervision, education and training. A large number of patients also facilitates exposure to relatively rare and complex clinical problems. This helps to develop collective experience and confidence in managing difficult cases. Our results, however, showed that high-volume units did not deliver better-quality care than low-volume units when measured by the proportion of emergency admissions. This remained the case even after controlling for women’s age, FD and social deprivation. These findings indicate that clinical teams delivering clinical care in high-volume units could be organised differently to deliver more effective care. It is possible that a low level of consultant presence is associated with a lack of effective leadership, which in turn prevents the development of highly functional and cohesive clinical teams. Frequent staff changes and rotation could also affect the quality and continuity of clinical care, which is less likely to be an issue in low-volume units, where staff changes tend to be less frequent.
Secondary outcomes
Total number of emergency admissions of women presenting with early pregnancy complications: emergency admissions from accident and emergency compared with admissions from the EPAU
There is a consensus endorsed by the 2012 NICE guideline7 that A&E departments are not suitable environments for delivering high-quality early pregnancy care, and that all women with early pregnancy complications should attend EPAUs instead. Women presenting with early pregnancy problems are often treated as low priority in the A&E departments and, as a result, they may wait longer to be seen. In addition, staff in the A&E departments do not have the clinical and ultrasound skills required to assess women with suspected early pregnancy complications, and there are no facilities to provide emotional and psychological support to women who suffer early pregnancy losses. 50
In view of all these considerations, it is of some concern that the majority of women who required emergency admission because of early pregnancy problems were seen in their local A&E departments, rather than in the EPAU. Indeed, 80% of sites included in this study reported that the proportion of emergency admissions from A&E was higher than the admissions from the EPAU. We found that the level of consultant presence in the EPAU and the size of the unit had little effect on admissions from A&E. There was evidence, however, that the proportion of emergency admissions through A&E was significantly lower in units which provided weekend services. This effect was stronger as weekend opening hours increased. This is an important finding which supports the NICE recommendation that dedicated early pregnancy services should be available during weekends. Our survey, however, showed that 82 (40%) of 205 EPAUs provide some weekend service, but only 53 (26%) EPAUs offer services on both Saturday and Sunday. In view of this, efforts should be made in the future to reconfigure EPAUs and increase the number of EPAUs that provide weekend services.
Ratio of new to follow-up visits
The ratio of new to follow-up visits is defined as the number of outpatient first attendances taking place divided by the number of outpatient follow-up attendances in the same period of time. This indicator which is often used to assess productivity in the NHS, could be used to highlight services that have a relatively low ratio, indicating that too many follow-up appointments may be taking place. It can assist trusts in ensuring that they achieve best results in the level of new to follow-up appointments. Payment by Results has transformed the way funding for secondary care flows around the NHS in England. This payment system awards greater tariffs for first clinical appointments, to encourage reduction in the number of unnecessary follow-up visits. A higher ratio of new to follow-up visits therefore offers a greater potential for saving, which is calculated as the number of excess follow-up attendances (based on the 25th percentile of all trusts for each specialty) multiplied by the Payment by Results tariff. 51
We found that 34% of women attending the EPAUs had additional follow-up visits. One in 10 women had two or more follow-up visits. The maximum recorded number of follow-up visits was 14. Women presenting with early pregnancy problems often require follow-up visits to determine pregnancy viability and to monitor outcomes of conservative management of early pregnancy failure. However, these issues can usually be resolved in one or two follow-up visits. In view of this, in our analysis we focused on the number of women who attended for three or more follow-up-visits, which is more likely to reflect differences in the quality of care between EPAUs.
Our results did not show any association between consultant presence or weekend opening and the proportion of women attending for multiple follow-up visits. However, the proportion of women attending for multiple follow-up visits was significantly higher in high-volume units than in low-volume units. We also considered the relationship between the number of follow-up visits and consultant presence, unit volume and weekend opening hours. Again, we found that the number of visits increased significantly as the unit volume increased. This result is another indication that high-volume EPAUs may be less effective in delivering optimal clinical outcomes.
Rate of non-diagnostic ultrasound scans (pregnancy of unknown location)
Clinical examination and blood tests are of limited value in assessing women with suspected early pregnancy complications, and an ultrasound scan is the only test which can differentiate accurately between normally and abnormally developing first-trimester pregnancies. 52 Ultrasound scanning is therefore routinely provided in EPAUs across the UK. Our study has shown that 93% of all women had an ultrasound scan during their initial visit to the EPAU. The accuracy of ultrasound diagnosis, however, is largely determined by the skill and experience of the operator. The rate of non-diagnostic scans (PUL) is often seen as an accurate measure of the quality of scanning in any particular unit. 49 Non-diagnostic scans cannot be completely avoided, as some women attend EPAUs very early in their pregnancy (in a window between 10 days after conception, when the pregnancy test becomes positive, and 17 days, when the pregnancy can first be detected on ultrasound scan). In addition, a number of women present in the aftermath of a complete miscarriage, when no pregnancy tissue remains within the uterine cavity. As ectopic pregnancy is relatively rare in comparison with miscarriage,53 the key reason for the differences in the rates of PUL between operators is differences in their ability to diagnose incomplete miscarriage (retained products of conception). A consensus between experts has concluded that the rate of non-diagnostic scans should be < 10% in high-quality and expert tertiary referral units and < 15% in units where scanning is done by midwives and/or sonographers. 49 However, these figures are arbitrary, and they are based on expert opinion rather than on extensive audit of clinical practice.
The overall rate of PUL at the initial visit in our study was 11.3%, which would be indicative of good to average quality of scanning. However, 5.7% of all women were diagnosed with a complete miscarriage on the initial ultrasound scan. According to the current guidelines, this diagnosis should be made only on a follow-up visit in women with a previous conclusive diagnosis of an intrauterine pregnancy. 54 In the absence of that, the scan findings should be classified as a PUL. If this policy had been implemented across the board, it is likely that the PUL rate could have been > 15%.
Consultant presence had no significant effect on the proportion of non-diagnostic ultrasound scans. This indicates that consultants’ ultrasound skills may not be significantly better than those of non-specialist sonographers. Our findings suggest that the current ultrasound training, delivered in the form of the intermediate ultrasound training module by the Royal College of Obstetricians and Gynaecologists,55 may need to be modified to achieve better scanning competencies by senior clinicians. As discussed in Primary outcome: emergency hospital admissions for further investigations and treatment as a proportion of women attending the participating EPAUs, there is also a need to review training delivered through the advanced training module in acute gynaecology and early pregnancy, which was introduced with the aim of providing future consultants with the clinical, ultrasound and surgical skills to deliver high-quality care to women presenting with complications of early pregnancy.
The results of our study provide evidence-based criteria which could be used for audit of PUL rates in individual EPAUs. Our data have shown that the rate of PULs at the initial visit was very wide, ranging between 1% and 27% (25th centile 7.3% and 75th centile 14.1%). This finding should be helpful to individual EPAUs when assessing the quality of the service they provide. According to our results and the previous consensus, EPAUs with a PUL rate of > 10% at the initial visit should look into ways of improving their quality of scanning, whereas EPAUs with rates of > 14% should consider taking immediate steps to reduce the rates of PUL. This may involve offering clinicians and sonographers additional training in early pregnancy ultrasound. The problem of high PUL rates could also be partially resolved by having more experienced operators available to offer support and supervision to the staff who carry out routine early ultrasound examinations. Regular audits could also help to identify factors contributing to higher PUL rates and devise measures to improve the quality of ultrasound scanning.
Women’s anxiety, understandably, increases with any uncertain diagnosis;56 therefore, a low PUL rate can help women with their emotional and social well-being and also help reduce the risk of unnecessary medical or surgical interventions. In addition, reducing PUL rates can result in EPAUs being run more efficiently by decreasing the number of unnecessary follow-up visits and blood tests. This, in turn, can increase the number of clinical appointments for new patients, therefore helping to reduce waiting times for the initial visits and increasing patients’ safety and satisfaction.
As expected, the majority of women diagnosed with an ectopic pregnancy and those presenting with a PUL had a blood test during their visit. However, we also found that nearly half of blood tests were carried out in women with a conclusive ultrasound diagnosis of an intrauterine pregnancy. In these women, measuring serum human chorionic gonadotrophin levels is of no diagnostic value and is not helpful in planning their management. The reasons for so many women with intrauterine pregnancies having blood tests are not clear, but there is little doubt that reducing the number of these unnecessary tests could result in significant savings to the local EPAUs and to the NHS.
Proportion of laparoscopies performed for a suspected ectopic pregnancy with a negative finding
In the past, prior to the advent of transvaginal ultrasound, laparoscopy was often used as a test to diagnose ectopic pregnancy. Ultrasound scanning in combination with the measurement of serum human chorionic gonadotrophin levels is a highly accurate method for the diagnosis of ectopic pregnancy. 57 In view of this, in modern clinical practice the diagnosis of ectopic pregnancy should be achieved in most cases using non-invasive diagnostic methods and laparoscopic surgery should be mainly used for treatment. 58 Our results show that 73% of all ectopic pregnancies were diagnosed at the initial visit, which was comparable to the previously reported detection rates of 73–83% in expert units. 59 Studies from tertiary referral EPAUs show that in optimal settings the rate of negative laparoscopies for suspected ectopic pregnancy is < 1%. 57 Therefore, laparoscopies negative for ectopic pregnancy should occur very rarely and their rate could be also used as an indicator of the quality of early pregnancy care.
Our results showed that 18% of all laparoscopies carried out for suspected ectopic pregnancies were negative, with a wide variation between different EPAUs. This was much higher than expected and it suggests that a significant proportion of ectopic pregnancies diagnosed on ultrasound scan were in fact false-positive findings. We investigated the relationship between the rate of negative laparoscopies and consultant presence, unit volume and weekend opening, but we could not find any significant associations. This could be because of the relatively small sample size, as only 21 EPAUs provided accurate data regarding inpatient care and only 90 laparoscopies were performed during the study period.
Negative laparoscopies could result in harm to healthy, wanted intrauterine pregnancies60 and they are also associated with an increased risk of removing healthy fallopian tubes because of the fear of missing a small ectopic pregnancy. Operative interventions also carry a risk of major surgical and anaesthetic complications. The results of our health economic analysis showed that the mean cost of admission and laparoscopy for a presumed ectopic pregnancy is more than double the cost of treating an incomplete miscarriage, and 14 times greater than the cost of looking after a woman with a normal intrauterine pregnancy in the early pregnancy period. Bearing in mind that there are approximately 11,000 ectopic pregnancies diagnosed in the UK each year,61 there is a possibility that up to 2000 women may be undergoing unnecessary surgery. An important message from our study is that the high negative laparoscopy rate should be recognised as a clinical risk issue. All EPAUs should consider auditing all operations in an effort to reduce the number of unnecessary surgical interventions. This could be achieved by routinely involving senior clinicians in the management of women perceived to be at risk of having an ectopic pregnancy, placing greater emphasis on clinical history and findings on physical examination (when ultrasound findings are non-diagnostic) and raising the quality of ultrasound scanning to minimise the risk of false-positive diagnoses. 62
Clinical outcomes in the EPAUs and emergency hospital care audit: study limitations
The primary aim of our study was to assess the impact of consultant presence on the rate of emergency admissions to hospital of women presenting with early pregnancy complications. The consultants were spending a much lower proportion of their working time in EPAUs than we anticipated, based on the results of our audit. Therefore, it was not possible to determine what proportion of time the consultants would need to spend in the EPAUs to deliver optimal clinical care outcomes. We were also unable to obtain good-quality data from all EPAUs regarding emergency admissions from the A&E department and other sources. This made it hard to evaluate the impact of the EPAU organisation on the overall emergency admission rates for early pregnancy complications.
Although we provided all of the EPAUs with a detailed and comprehensive guideline of ultrasound criteria for the diagnosis of various early pregnancy complications, including the definition of PUL, it appears that not all EPAUs were following that advice. This was reflected in a relatively large number of complete miscarriages being diagnosed at the first visit and the unusually low PUL rates in some units. In addition, we did not record the reasons for staff carrying out blood tests and, therefore, we cannot explain the large proportion of women with conclusive diagnoses of intrauterine pregnancies having blood samples taken for further investigations.
We obtained information about the type of staff examining ultrasounds; however, we had no data about their experience or competence. Therefore, we were unable to determine if there was a link between the experience of ultrasound operators and PUL rates in individual units. However, increased operator experience does not necessarily translate into better diagnostic competence. 62 Unfortunately, we are not aware of any standardised tools for assessing diagnostic competence of operators in early pregnancy ultrasound.
There was also a limited amount of information on the number of inpatient and day case surgical procedures to treat early pregnancy complications. We were able to obtain data on the number of laparoscopies to treat ectopic pregnancies from only 21 (48%) of 44 units. Although the audit of laparoscopies provided interesting and important information, our conclusions would have been stronger if we had managed to collect the data from more units.
We were also unable to obtain sufficient number of data regarding several secondary outcomes, including duration of emergency admissions, the proportion of women diagnosed with miscarriage and ectopic pregnancy who were treated surgically, medically or expectantly, total numbers of visits to A&E departments and admissions to intensive therapy units. Although lack of this information did not compromise the primary aim of the study, it made it harder to come to firm conclusions about all possible effects of the EPAU organisation on the overall quality of emergency early pregnancy care.
Patient satisfaction
Our study showed that women were, overall, satisfied with the quality of care they received in EPAUs. Their satisfaction was measured using the SAPS questionnaire, which has a maximum score of 28 points. The average satisfaction scores for all EPAUs were between 22 and 26 points, which indicates that women were satisfied or very satisfied in over half of the SAPS items. However, we found substantial differences between the units in the proportions of women who were dissatisfied with their care. In one-quarter of the units with the best reported satisfaction scores, only 2–5% of women were dissatisfied with their care, whereas the dissatisfaction rate was 15–33% in the one-quarter of the units with the lowest scores.
We investigated the relationship between the SAPS scores and consultant presence, unit volume and weekend opening hours. We found that there was a tendency for satisfaction scores to decrease as consultant presence and volume of the units increase. Regression analysis with adjustments for the FD and MA confirmed that there was a negative association between the SAPS score and planned consultant presence. Analysis of responses to the modified Newcastle–Farnworth questionnaire showed significant negative associations with planned consultant presence (p = 0.027) and higher unit volume (p = 0.021). It is difficult to explain these findings; however, a lack of continuity of care provided by staff, including consultants, in high-volume units could be the reasons for lower satisfaction scores reported by women. Overall, our findings are encouraging and they demonstrate that women are generally satisfied with the quality of early pregnancy care, despite a significant proportion of the women experiencing pregnancy losses. Our results indicate that satisfaction rates ≥ 95% are achievable. The differences in patients’ satisfaction between the units, however, are large and our ranking table (see Table 11) could be used by the individual units to study their patient satisfaction levels and improve women’s experiences of early pregnancy care in the future.
Staff satisfaction
Staff experiences of providing care were similar to the findings of the NHS national survey for acute trusts carried out in 2015,29 on which our modified questionnaire was based. The only notable difference was much higher proportions of the EPAU staff witnessing potentially harmful errors or near-misses than in the national survey (50% vs. 31%, respectively). This may reflect the relative complexity of early pregnancy care, where the diagnostic workup and management plan often have to be completed in a single visit.
We investigated the relationships between staff experience in providing care and consultant presence, unit volume and weekend opening. There was a particularly large difference in the proportion of harmful errors/near-misses in the units with and without planned consultant presence (58% vs. 41%, respectively). This could be due to consultants being more effective in identifying errors and communicating them to other staff. Alternatively, there is a possibility that non-consultant staff in the unit had concerns about the quality of care provided by consultants. Either way, this finding indicates that diagnostic pathways and EPAU team organisation could be improved to address this issue.
In addition, the pressure felt by staff was 17% higher in units that are closed at weekends than in units that are open at weekends. A possible explanation for this observation is that large numbers of women attend these units on Mondays and Fridays, making it harder to run clinics and causing stress to both women and staff.
Qualitative interviews
The results of the VESPA study showed that women’s experiences of care in the EPAU are generally positive, but there are several areas of possible improvement. These could be achieved by making relatively minor organisational changes and improvements in communication and by changing staff attitudes through education and listening to feedback from women. To the best of our knowledge, our study was the first attempt to formally investigate clinical, public health and psychological experiences of women who have used EPAUs using a qualitative approach. We also investigated how their experience is influenced by the organisational structure of the EPAU.
Previous evaluations of EPAUs have often focused on one EPAU63 or one aspect of how EPAUs operate, such as multidisciplinary working64 or staffing structures. 12,65 Our study provides insight into a cross-section of a variety of individual EPAUs, and also their configuration and working practices. We could not find evidence to support practices of multidisciplinary working or particular health-care professionals leading EPAU services, as reported in previous studies. 65 However, our study provides further evidence to support the claim by Edey et al. 11 that EPAUs are a health-care success and are needed and valued by women who use them.
It is difficult to suggest whether or not our recommendations substantiate previous findings regarding EPAUs because of the general paucity of research into their clinical effectiveness and cost-effectiveness and evaluations of the working practices in EPAUs. This study does, however, summarise several practices that could be optimised to further improve women’s experiences of EPAUs, which were generally positive. From these recommendations we note that better availability of appointments and accessibility of EPAUs was strongly desired by women to ensure that they promptly receive the correct care if they suspect that they are experiencing early pregnancy complications. Furthermore, sensitivity about EPAU location and journey through EPAUs was also raised as an issue that is highly important to women. The women who were interviewed also made it clear that they thought that the care should be delivered in a private environment with enough time to provide them with detailed information about the diagnosis and available treatment options.
Previous studies66 have concluded that the loss of a pregnancy has a ‘deleterious effect on women’s health’, whether that loss has occurred because of an early pregnancy complication, a stillbirth or a termination of pregnancy. 66 Grief is said to be especially difficult to navigate if there is a decision to terminate the pregnancy,66 and is often experienced with mixed emotions about the loss, ranging from shame and guilt to relief. 67 These negative psychological responses to the loss of a pregnancy can manifest over time. Previous reports have shown that these responses sometimes have the potential to cause psychological harm and, in extreme cases, severe mental health issues. 68–70 Negative psychological responses to the loss of a pregnancy could also be experienced by women’s partners67,70 and have the potential to affect future pregnancies too. 71
In the wider psycho-obstetrics literature72 depression is usually associated with delivery and the puerperium. However, in recent years it has been recognised that anxiety is also a significant issue during the antenatal period. 69,73,74 Anxiety was the predominant emotion we found throughout all women’s transcripts in our analysis of their experiences. Anxiety was present regardless of clinical outcomes, particularly when women were faced with an uncertain diagnosis or when awaiting emergency surgery. A mixture of guilt, shame and relief when women begin to process their pregnancy losses has also been documented in the present study. We have documented these emotions across all our participants, with each woman demonstrating one of six distinct emotional pathways, which was illustrative of their clinical pathway through the EPAU.
The range of women’s emotional experiences while receiving care in the EPAU has, until now, been largely unexplored, as similar studies have mainly focused on different aspects of service evaluation. 12,64,65 The novelty of this study and its subsequent analysis has been the clear mapping of women’s psychoemotional journeys overlaid onto their clinical care pathways, showing how varied pathways can be, yet also demonstrating distinct similarities across all women who present to EPAUs with early pregnancy complications (e.g. anxiety, which was reported and recalled by every woman we interviewed).
Qualitative interviews: study limitations
Our sample was large, the analysis was detailed and date examination was rigorous, which gives credibility to our analysis, results and recommendations. However, there are several limitations to our study which should be noted. First, the sample, although large for a qualitative study, is a small proportion of the more than 6000 women who participated in other strands of the VESPA study. Future studies should aim to poll opinion and gather data on women’s experiences of EPAUs from a different sample population to the one documented in this study, to ensure that our findings are generalisable to EPAUs outside the VESPA study and in other geographical locations. Second, women with rare early pregnancy complications, such as molar pregnancies, ectopic pregnancies and terminations, were both hard to recruit and small in number (n = 1, n = 2 and n = 1, respectively). This could affect the generalisability of our findings to more complex early pregnancy complications. Further studies are required to better understand the psychological needs of women who experience these less common early pregnancy complications. Given that the emotional experience and psychosocial requirements for pregnancy and pregnancy loss can be affected by age,75 marital status,76 socioeconomic factors (including occupational status77) and pregnancy intention,78 we would suggest that future studies include women with a wider range of sociodemographic backgrounds.
Health economic evaluation
This analysis has shown that the total cost per woman attending an EPAU in terms of blood tests, ultrasounds, admissions and staff costs can vary from £1 to £4390, and is strongly dependent on the FD and, to a lesser degree, the woman’s age. Over 60% of women seen in this study had a diagnosis of normal or early intrauterine pregnancy, with a mean cost of £92 and £106, respectively. Women with higher service use costs were those experiencing miscarriage or ectopic pregnancy (£180 and £1493, respectively).
The mean total cost by stratum varied from £189 to £257 per patient and mean total cost by unit varied from £103 to £384 per patient, when adjusted for age and FD. Unit configuration vCw had the lowest average cost per patient. There was no evidence to suggest that differences in cost were related to consultant presence, number of patients seen or weekend opening, suggesting that it was other individual unit factors that were driving increased admissions and therefore differences in costs.
The mean EQ-5D-5L score increased from 0.854 at baseline to 0.91 at an average follow-up of 26 days for the 573 women who had completed questionnaires at both time points. The positive change in women’s overall health at 4 weeks was largely due to changes in the pain/discomfort and anxiety/depression dimensions of the EQ-5D-5L, with considerably fewer women reporting problems in each of these dimensions.
Mean utility gain varied from 0.065 to 0.071 per patient by stratum and from 0.058 to 0.072 per patient by unit. Mean utility gain was highest for configuration vcw at 4 weeks and configuration vCw at 18 weeks. There was no evidence to suggest that this was related to age, FD, consultant presence or number of patients seen. There was a slight negative relationship with weekend opening hours, but although this was statistically significant it is clinically unimportant.
The probabilistic cost-effectiveness analysis showed that configuration vCw had the highest expected net benefit at a £20,000 willingness-to-pay threshold at 4 weeks (£1203). Configuration vcW had the lowest expected net benefit (i.e. £1064). The CEAC showed that, out of the eight configuration types compared, none had a probability of > 30% of being the most cost-effective at any willingness-to-pay value > £10,000, indicating a large degree of uncertainty in the optimal unit configuration. The configuration with the highest probability of being cost-effective at a willingness-to-pay value of ≤ £40,000 was vCw. At higher willingness-to-pay values, configuration Vcw had the highest probability of being cost-effective. However, because of uncertainty, it is not possible from these data to conclusively recommend a particular EPAU configuration. A similar degree of uncertainty was found when using QALYs reported at 18 weeks.
Our data show that 78% of 3550 women experienced a decrease in anxiety score immediately following their EPAU appointment. Decrease in anxiety varied from 23 to 30 points on the anxiety scale across configuration types, and from 13 to 43 points on the anxiety scale across units. Configuration vCw had the largest mean decrease in anxiety score. Anxiety related to a diagnosis of a normal pregnancy resulted in a mean decrease in anxiety score of 35 points. Anxiety related to a diagnosis of a molar pregnancy resulted in an increase in anxiety score of 18 points.
Health economic evaluation: study limitations
The VESPA study results ought to be considered in the context of limitations imposed by study design requirements and completeness of data collection. In particular, we need to consider the way in which EPAUs were selected for participation in the study, the overall response rate and the times at which responses were received.
Unit selection
The selection of units for the study was based on the characteristics of individual EPAUs, as reported by the lead clinician of each EPAU. These characteristics (presence of consultants, weekend opening hours and number of appointments per year) were believed, a priori, to have an impact on the costs and outcomes of women being treated. As an EPAU is operational, we were unable to conduct a randomised controlled study (to compare hospitals with an EPAU with hospitals without an EPAU). As a result, a large number of possible confounding factors remained unobserved.
It was also necessary to categorise units based on a certain set of characteristics, to make it possible to select a sample of them with enough variation of characteristics to be meaningfully different. However, as the number of characteristics increases and the number of ways of dividing units based on those characteristics increases, so too does the number of units and patients required to detect any effect attributable to those characteristics. To keep the sample size feasible we were required to limit the number of characteristics to three and the ways in which we categorised units according to those characteristics to two. However, splitting the units dichotomously within each characteristic decreases the information available for analysis. As a result, we cannot undertake a sensitivity analysis to see if a different threshold would lead to different results. This further limits the conclusions we can draw in the absence of any observed effects.
Data completeness
We must also highlight the limited response rate observed at the 2-week and 3-month follow-ups. Despite efforts being made in line with best practice for maximising response rates, obtaining the target number of observations at each time point required sending a large number of questionnaires. In addition, many questionnaires were returned late (e.g. a number of the 4-week questionnaires were returned closer to the 3-month follow-up time point). This limited the ways in which we could use the data. To maximise the number of data available for analysis at each time point we used any EQ-5D-5L responses received within 2 weeks of the 2-week follow-up and within 4 weeks of the 3-month follow-up.
To calculate a QALY score at 18 weeks (3 months) we excluded any questionnaires that had been filled in prior to 12 weeks (84 days) or after 24 weeks (168 days). We also included the questionnaires from the earlier follow-up time point that had been filled in between 12 and 24 weeks. This meant that we had 479 completed EQ-5D-5L questionnaires, with a mean follow-up of 123 days (18 weeks). For the 4-week follow-up analysis we used any questionnaire that was returned between 2 and 6 weeks post visit. Although this approach is not optimal, compared with a more positive response rate being achieved, we believe it is more robust than using only the 3-month questionnaires that were returned. We believe our approach captures information on quality of life at a time point relevant to the follow-up time periods.
Workforce analysis
The results of our workforce analyses suggest that the nurses and sonographers provide reasonable efficiency and effectiveness, but they are neither more nor less efficient than the other staff types. The doctor staff type (consisting mainly of specialist registrars) and to a lesser extent consultants are utilised by the EPAUs to manage more complex cases. However, they are still used to care for 40–46% of ‘normal’ cases, which could probably be equally well handled by the less expensive staff types. Confirming this would require a more detailed study of patient interactions with doctors and consultants. Unfortunately, because of the lack of robust data in the interaction stratum, it was not possible to do any meaningful analysis with the current data set. Although the results were not statistically significant, it is reasonable to conclude that consultants could have a positive effect on the number of admissions and the number of PULs if they treat a number of patients above a certain minimum (e.g. consultants treating > 14% of patients may decrease the number of PULs). Specialist nurses may have a similar positive impact as consultants on the rates of admissions and PULs.
The aim of the workforce analysis was to identify the ‘ideal workforce’ EPAU configuration. In an attempt to do so we have considered the following factors.
The unit volume was measured by the number of patients seen over a fixed period of time
Unit volume is an important factor as the higher-volume units are potentially exposed to larger number of complex cases, which helps to increase clinical expertise of the EPAU staff. This learning, however, will be evident only as a collective staff group rather than individuals, because individual staff members will still see roughly the same number of patients over a given time.
The equipment available to the staff
The equipment available to the staff is more likely to affect the actual number of patients seen rather than the quality of the service provided to patients. However, the availability of the equipment will have a significant impact on the service as a whole.
Opening times
In most instances immediate access to an EPAU is not required, and therefore convenience and discretion are more important than medical necessity. This factor can also be linked to the unit volume: as the number of patients increases, the capacity or the amount of time that the service is available will need to increase. In view of this, the patient throughput has an effect on both the opening hours and the number of staff.
If we categorise patients as complex and non-complex we can roughly determine an effective workforce configuration. Indeed, almost any of the current EPAU workforce configurations could work, as there is no significant evidence to suggest any one configuration is superior to another. However, there is some evidence to suggest that consultants could reduce the rates of inconclusive scans by actively delivering care for at least 13% of patients, although having consultants spending more time than this would not necessarily increase the overall quality of care, but could significantly increase the salary costs.
Throughput of patients is an important factor to consider, as it determines the number of staff required to deliver patient care. In view of this, we could try to define ideal (workforce) service configurations separately for high- and low-volume services. Consultant presence can also be explored in two forms: (1) consultant-delivered care and (2) consultant available to provide support to other staff delivering care. Consultant-delivered care implies consultants’ direct involvement in providing routine care to patients (seeing approximately one in eight patients on average), whereas the consultant available would see patients when requested by other clinical staff only, such as a nurse or sonographer. Consultant-delivered care would probably be more cost-effective in high-volume units, as the consultant would be fully utilised. In small-volume units, however, the consultant’s time might not be used as efficiently. In the low-volume units, having a more qualified nurse at the senior level supported by a consultant could be the optimal configuration. In high-volume units with the consultant on site delivering care, less qualified personnel, such as a staff nurse, could be utilised. In either scenario there is a need for a trained sonographer. The health-care assistants could be utilised as chaperones to reduce the workload of nurses and other junior staff. Likewise, health-care assistants can be used to help with the administrative duties and simple clinical tasks, such as assisting with diagnostic procedures and carrying out pregnancy tests, thus reducing the workload for other clinical staff.
Based on these findings, the ideal workforce for an EPAU should be made up of consultants, doctors, nurses (including some specialist nurses), sonographers and an administrative assistant or health-care assistant. Staff-level nurses and sonographers should attend to most patients, with specialist nurses, doctors and consultants seeing a smaller proportion of the patients with more complex clinical needs, as assessed by the staff nurse (Figure 67). As a rough guide, EPAUs should strive to provide around 45 ± 12 minutes per patient during their care pathway. There will be always some patients who will require significantly more time than this average, and they should be given that time. Our study has shown that staff utilised in the EPAUs provide a similar level of care across the UK and therefore any of the existing staff configurations could be used in clinical practice. In view of this, improvements to efficiency and effectiveness may be achieved by better deployment of the existing staff, rather than changing the staffing configuration of the EPAU.
FIGURE 67.
A schematic representation of the ‘ideal workforce’ in an EPAU (including an indication of women’s journeys through the unit).
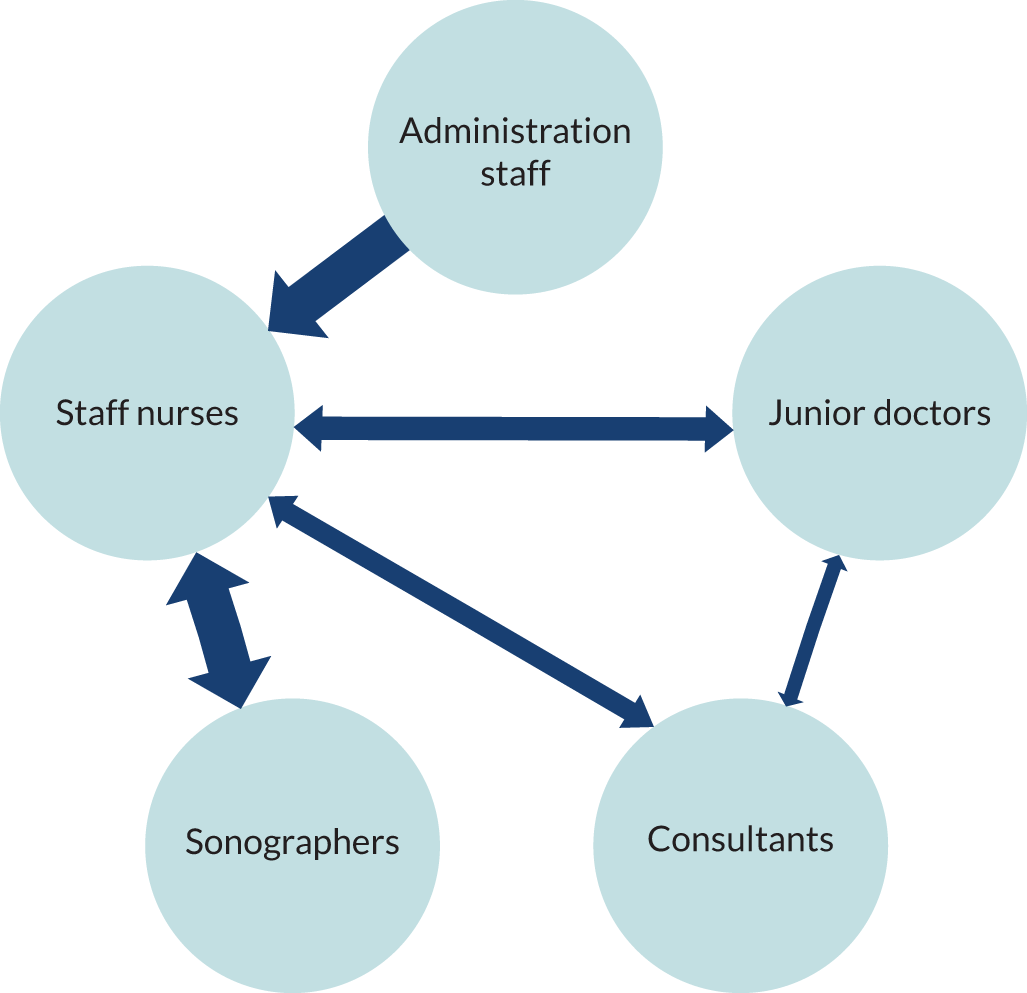
Workforce analysis: study limitations
It was not possible to come to firm conclusions about efficiency of some staff types (e.g. midwives are utilised in only the minority of EPAUs). We were also unable to take into account staff vacancies and the use of locum staff, which could have an effect on efficiency and efficacy of clinical teams. In addition, we assumed that the proportion of complex cases was similar across all units. As we were unable to assess complexity of individual cases, it is possible that the higher number of very complex cases in some EPAUs could have had a negative effect of their overall efficiency and effectiveness.
Patient and public involvement
Patient and public involvement occurred at all stages of the VESPA study, from design and development of the study protocol to interpretation of results. Patient feedback from Care Opinion (www.careopinion.org.uk), the independent feedback platform for health care, and from a public focus group we held, helped us develop a patient survey we conducted to identify service user views about the set-up of an EPAU at the design stage. The acceptability of the timing of the administration of the questionnaires used in the VESPA study was also informed by patients who had experienced a pregnancy loss, through our links with the Miscarriage Association and The Ectopic Pregnancy Trust, bodies with strong patient representation. In addition, a representative of the Miscarriage Association is a named co-applicant of the VESPA study and a representative of The Ectopic Pregnancy Trust is on SSC. We believe these roles were important to ensure appropriate communication with study participants and project oversight throughout the duration of the research.
Chapter 5 Conclusions
Implications for health care
Our study has shown that consultant presence in the EPAU has limited impact on clinical outcomes measured: the proportion of women who are admitted as an emergency and PUL rates. This was contrary to our hypothesis and data from the literature,23,24 which show that in acute settings hands-on involvement of senior clinicians has a positive effect on the quality of clinical service. Our finding could be explained by the generally low level of consultant presence in EPAUs. In the majority of cases, consultants were timetabled to spend one-third (or less) of their time in the EPAU. However, in two-thirds of cases their actual recorded presence accounted for < 5% of their time. This relatively low level of consultant involvement in direct clinical care could possibly explain their lack of significant impact on the quality of care. We were also unable to estimate the potential impact of certain factors, such as contribution of different staff members to service delivery, scanning practices and level of supervision, quality of ultrasound equipment and clinical care pathway protocols in individual units.
We found that women are generally satisfied with the quality of early pregnancy care, but consultant presence did not have a significant positive effect on either patient or staff satisfaction levels. Qualitative interviews with service users identified EPAU opening times as a key area for improvement, with the need for the services to be accessible out of regular working hours, during weekends and bank holidays. Women also emphasised the need for privacy and sensitivity, with a clear request to avoid co-location of EPAUs with other maternity services. In view of this, health-care providers should consider reconfiguring their EPAU services to respond to women’s requests for better access and more privacy.
Our data also provide standards for auditing the quality of early pregnancy clinical care, ultrasound diagnosis and patient satisfaction, which, to the best of our knowledge, have not been available until now. Individual units will now be able to compare their performance with other units across the UK, which should eventually lead to overall improvements in early pregnancy care.
The health economic analysis confirmed that the main contributor to total cost of early pregnancy care was admission of women for emergency surgery. The cost of care for women with ectopic pregnancies was particularly high. We found that one in five surgeries for presumed ectopic pregnancy was unnecessary and there is a clear incentive for health-care providers to reduce this rate to improve both clinical safety and cost-effectiveness of early pregnancy care. Care provided in the EPAU had a positive effect on women’s health and emotional well-being, with three-quarters of women reporting a decrease in anxiety scores and a positive change in their overall health at 4 weeks.
From the organisational perspective, we found that low-volume units with < 2500 visits per year tend to perform better than large units in terms of the quality of the ultrasound diagnostic service and patient satisfaction. Low-volume units were also associated with lower costs, particularly when run without direct consultant presence. Workforce analysis indicated that consultant-delivered care would probably be more cost-effective in high-volume units, as the consultants’ time may not be well utilised in low-volume units.
All these findings indicate that low-volume units run by senior or specialist nurses, supported by sonographers and consultants, may represent optimal EPAU configuration in terms of quality of care, cost-effectiveness and patient satisfaction. The units should consider opening during weekends to meet women’s demands for more accessible care and reduce emergency hospital admissions generated by A&E attendances.
It is important, however, to recognise that there were shortfalls and gaps in both participant samples and other contextual issues, such as hospital reputation, deterrent parking fees and variations in women’s socioeconomic profiles, which could have had an effect on our findings and conclusions.
Recommendations for research
Our results show that further research is needed to assess the potential impact of enhanced clinical and ultrasound training on the performance of consultants working in early pregnancy units.
There is a need to evaluate whether or not strengthening competencies of the trained nursing, midwifery and paramedical staff could result in better quality of patient care. In addition, future research should focus on developing effective tools to asses clinical and ultrasound competence of staff providing early pregnancy care.
Further independent studies are required to assess the impact of proposed changes to the EPAU configuration on clinical outcomes and patients’ experience. In-depth case studies in areas with particular sociodemographic profiles and a wider multifactorial analysis would also be welcome.
We were unable to obtain sufficient numbers of data regarding inpatient care and use of different management strategies to treat miscarriage and ectopic pregnancy. Further studies investigating the impact of the EPAU organisation and staffing configuration would help to obtain additional data about the overall quality of emergency early pregnancy care.
Finally, there is also a need for another national study looking at the factors contributing to the high rate of laparoscopies negative for ectopic pregnancy, such as decision-making process and consultant input, and the strategies to minimise it.
Summary of recommendations
Information
Raise awareness of EPAUs among women of reproductive age and provide women with written and oral information with regard to different management options, what to expect and advice on future pregnancies.
Accessibility
Consider extending opening hours to encompass weekends and, if this is not possible, ensure that clear protocols are in place for emergency care when the EPAU is closed.
Size
Low-volume units with < 2500 visits per year tend to perform better than large units in terms of the quality of the ultrasound diagnostic service and patient satisfaction.
Staffing
Senior or specialist nurses supported by sonographers and consultants may represent optimal EPAU staffing configuration in terms of quality of care, cost-effectiveness and patient satisfaction. Appropriate staffing levels should be ensured.
EPAU experience
Increase efficiency through reduction of waiting times and keep patients informed of all processes and procedures in the EPAU. Visual materials, such as posters, should be utilised.
Managing patients sensitively
Prevent co-location of the EPAU with other maternity services and protect women’s confidentiality and privacy.
Communication and decision-making
Involve women and their partners in care decisions.
Continuity of care
Review referral processes and communication with maternity and GP services.
Audit
Regularly audit PUL and negative laparoscopy rates to monitor quality of ultrasound services and clinical decision-making processes.
Research
Further studies should look at the impact of enhanced clinical and ultrasound training on the performance of consultants working in EPAUs, and developing effective tools to asses clinical and ultrasound competencies of staff providing early pregnancy care.
Acknowledgements
This national study has been realised thanks to the participation and hard work of 44 EPAUs and their supporting research staff, a large number of patients who took the time to complete the questionnaires and take part in interviews, and a number of organisations and individuals, to whom we are extremely grateful. We apologise for any inaccuracies in the following list of contributors, whose primary role has been described.
We would like to express our gratitude to the 44 participating EPAUs and their supporting research staff:
-
Aberdeen Maternity Hospital, Aberdeen
-
Addenbrooke’s Hospital, Cambridge
-
Barnsley Hospital, Barnsley
-
Bishop Auckland Hospital, Bishop Auckland
-
Bradford Royal Infirmary, Bradford
-
City Hospitals Sunderland NHS Foundation Trust
-
Ealing Hospital, Ealing
-
Epsom Hospital, Epsom
-
Forth Valley Royal Hospital, Larbert
-
Frimley Park Hospital, Camberley
-
Glangwili General Hospital, Carmarthen
-
Gloucestershire Royal Hospital, Gloucester
-
Good Hope Hospital, Sutton Coldfield
-
Heartlands Hospital, Birmingham
-
Heatherwood Hospital, Ascot
-
Hereford County Hospital, Hereford
-
Homerton University Hospital, London
-
Ipswich Hospital, Ipswich
-
Kettering General Hospital, Kettering
-
Lincoln County Hospital, Lincoln
-
Luton and Dunstable University Hospital, Luton
-
Maidstone Hospital, Maidstone
-
Newham University Hospital, Newham
-
Peterborough City Hospital, Peterborough
-
Princess Anne Hospital, Southampton
-
Queen Elizabeth Hospital, Gateshead
-
Queen Elizabeth The Queen Mother Hospital, Margate
-
Rotherham General Hospital, Rotherham
-
Royal Derby Hospital, Derby
-
Royal Devon and Exeter Hospital, Exeter
-
Royal Hallamshire Hospital, Sheffield
-
Royal Oldham Hospital, Oldham
-
Royal Surrey County Hospital, Guildford
-
Royal Sussex County Hospital, Brighton
-
Salisbury District Hospital, Salisbury
-
St George’s University Hospitals NHS Foundation Trust
-
St Mary’s Hospital, London
-
St Thomas’ Hospital, London
-
Tameside Hospital, Ashton-under-Lyne
-
The James Cook University Hospital, Middlesborough
-
Queen’s Medical Centre, Nottingham
-
Warwick Hospital, Warwick
-
Wexham Park Hospital, Slough
-
York Hospital, York.
Organisations
-
AEPU.
-
The Ectopic Pregnancy Trust.
-
Miscarriage Association.
Study Steering Committee
Pat Doyle (chairperson), Professor in Epidemiology, London School of Hygiene and Tropical Medicine.
Cecilia Bottomley, Lead Clinician for Early Pregnancy, Chelsea and Westminster Hospital.
Elizabeth Bradley, GP, Hampstead Group Practice.
Hannah-Rose Douglas, Research Lead for Analytical Services, NHS England.
Marjory Maclean, Consultant Obstetrician and Gynaecologist, NHS Ayrshire and Arran.
Brad Manktelow, Associate Statistics Professor, University of Leicester.
Alex Peace-Gadsby, chairperson, The Ectopic Pregnancy Trust.
Central Study Team
Chiara Messina, Sarah Ekladios and Israel Serralvo-Caballero.
Contributions of authors
Maria Memtsa (https://orcid.org/0000-0002-5237-0914) developed the project, was the study manager during the set-up and data collection phase, assisted with the analyses, contributed to the writing of the report, provided critical feedback and helped shape the research, analysis and the report.
Venetia Goodhart (https://orcid.org/0000-0003-3470-4025) was the study manager during the data collection phase, assisted with the analyses, contributed to the writing of the report, provided critical feedback and helped shape the research, analysis and the report.
Gareth Ambler (https://orcid.org/0000-0002-5322-7327) developed and conducted the statistical analyses, contributed to the writing of the report, provided critical feedback and helped shape the research, analysis and the report.
Peter Brocklehurst (https://orcid.org/0000-0002-9950-6751) developed the project, led the co-applicants, provided critical feedback and helped shape the research, analysis and the report.
Edna Keeney (https://orcid.org/0000-0002-4763-8891) conducted the health economics analysis, contributed to the writing of the report, provided critical feedback and helped shape the research, analysis and the report.
Sergio Silverio (https://orcid.org/0000-0001-7177-3471) conducted the qualitative interviews and analysed the results, contributed to the writing of the report, provided critical feedback and helped shape the research, analysis and the report.
Zacharias Anastasiou (https://orcid.org/0000-0003-3813-7769) conducted the statistical analyses, contributed to the writing of the report, provided critical feedback and helped shape the research, analysis and the report.
Jeff Round (https://orcid.org/0000-0002-3103-6984) developed and supervised the health economics evaluation, contributed to the writing of the report, provided critical feedback and helped shape the research, analysis and the report.
Nazim Khan (https://orcid.org/0000-0002-6991-1916) led the workforce analysis, contributed to the writing of the report, provided critical feedback and helped shape the research, analysis and the report.
Jennifer Hall (https://orcid.org/0000-0002-2084-9568) supervised the qualitative interviews of the study, advised on integrating the different strands of the study, provided critical feedback and helped shape the research, analysis and the report.
Geraldine Barrett (https://orcid.org/0000-0002-9738-1051) developed the qualitative interviews of the study, provided critical feedback and helped shape the research, analysis and the report.
Ruth Bender-Atik (https://orcid.org/0000-0002-6751-5901) provided guidance on the patient focus of the study, provided critical feedback and helped shape the research, analysis and the report.
Judith Stephenson (https://orcid.org/0000-0002-8852-0881) developed and advised on the project overall, provided critical feedback and helped shape the research, analysis and the report.
Davor Jurkovic (https://orcid.org/0000-0001-6487-5736) was the chief investigator of the study, provided strategic leadership, oversaw all aspects of the project, contributed to the writing of the report, provided critical feedback and helped shape the research, analysis and the report.
Data-sharing statement
Data will be made available to each participating unit that requests access to the data collected at the respective site and anonymised data will be made available to other researchers on request.
Patient data
This work uses data provided by patients and collected by the NHS as part of their care and support. Using patient data is vital to improve health and care for everyone. There is huge potential to make better use of information from people’s patient records, to understand more about disease, develop new treatments, monitor safety, and plan NHS services. Patient data should be kept safe and secure, to protect everyone’s privacy, and it’s important that there are safeguards to make sure that it is stored and used responsibly. Everyone should be able to find out about how patient data are used. #datasaveslives You can find out more about the background to this citation here: https://understandingpatientdata.org.uk/data-citation
Disclaimers
This report presents independent research funded by the National Institute for Health Research (NIHR). The views and opinions expressed by authors in this publication are those of the authors and do not necessarily reflect those of the NHS, the NIHR, NETSCC, the HS&DR programme or the Department of Health and Social Care. If there are verbatim quotations included in this publication the views and opinions expressed by the interviewees are those of the interviewees and do not necessarily reflect those of the authors, those of the NHS, the NIHR, NETSCC, the HS&DR programme or the Department of Health and Social Care.
References
- Mothers and Babies: Reducing Risk through Audits and Confidential Enquiries across the UK (MBRRACE-UK) . Saving Lives, Improving Mothers’ Care n.d. www.npeu.ox.ac.uk/downloads/files/mbrrace-uk/reports/MBRRACE-UK%20Maternal%20Report%202016%20-%20website.pdf (accessed 3 December 2018).
- NHS Digital . Miscarriages That Resulted in an NHS Hospital Stay; Rates Per 100 Deliveries by Age, 2008–09 n.d. https://files.digital.nhs.uk/publicationimport/pub01xxx/pub01705/nhs-mate-2008-2009-fig4.pdf (accessed 22 August 2020).
- Bigrigg MA, Read MD. Management of women referred to early pregnancy assessment unit: care and cost effectiveness. BMJ 1991;302:577-9. https://doi.org/10.1136/bmj.302.6776.577.
- Association of Early Pregnancy Units . Early Pregnancy Information Centre n.d. www.aepu.org.uk (accessed 26 March 2016).
- Department of Health and Social Care . National Service Framework: Children, Young People and Maternity Services 2004. https://assets.publishing.service.gov.uk/government/uploads/system/uploads/attachment_data/file/199957/National_Service_Framework_for_Children_Young_People_and_Maternity_Services_-_Maternity_Services.pdf (accessed 25 August 2020).
- NHS Quality Improvement Scotland . Maternity Services, National Overview – January 2007 n.d. https://www.google.com/url?sa=t&rct=j&q=&esrc=s&source=web&cd=&ved=2ahUKEwi1qpiFl7frAhXHUxUIHQdRCwAQFjAAegQIAxAB&url=http%3A%2F%2Fhealthcareimprovementscotland.org%2Fhis%2Fidoc.ashx%3Fdocid%3De6d8f8bf-c7e7-421d-9d2e-362fc828377e%26version%3D-1&usg=AOvVaw3sXn9wk8sIuOUQC4yH1v1J (accessed 25 August 2020).
- National Institute for Health and Care Excellence (NICE) . Ectopic Pregnancy and Miscarriage: Diagnosis and Initial Management n.d. http://guidance.nice.org.uk/CG154 (accessed 23 March 2016).
- Poddar A, Tyagi J, Hawkins E, Opemuyi I. Standards of care provided by early pregnancy assessment units (EPAU): a UK-wide survey. J Obstet Gynaecol 2011;7:640-4. https://doi.org/10.3109/01443615.2011.593650.
- Twigg J, Moshy R, Walker JJ, Evans J. Early pregnancy assessment units in the United Kingdom: an audit of current clinical practice. J Clin Excell 2002;4:391-402.
- Davies M, Geoghegan J. Developing an early pregnancy assessment unit. Nurs Times 1994;90:36-7.
- Edey K, Draycott T, Akande V. Early pregnancy assessment units. Clin Obstet Gynecol 2007;50:146-53. https://doi.org/10.1097/GRF.0b013e3180305ef4.
- Fox R, Savage R, Evans T, Moore L. Early pregnancy assessment; a role for the gynaecology nurse-practitioner. J Obstet Gynaecol 1999;19:615-16. https://doi.org/10.1080/01443619963851.
- Harper J. Midwives and miscarriage: the development of an early pregnancy unit. Midwifery Dig 2003;2:183-5.
- Hill K. Improving services provided in an early pregnancy assessment clinic. Nurs Times 2009;105:18-9.
- Sellappan K, Mcgeown A, Archer A. A survey to assess the efficiency of an early pregnancy unit. Int J Gynecol Obstet 2009. https://doi.org/10.1016/S0020-7292(09)61944-5.
- Shillito J, Walker JJ. Early pregnancy assessment units. Br J Hosp Med 1997;58:505-9.
- Bignardi T, Burnet S, Alhamdan D, Lu C, Pardey J, Benzie R, et al. Management of women referred to an acute gynecology unit: impact of an ultrasound-based model of care. Ultrasound Obstet Gynecol 2010;35:344-8. https://doi.org/10.1002/uog.7523.
- Brownlea S, Holdgate A, Thou ST, Davis GK. Impact of an early pregnancy problem service on patient care and Emergency Department presentations. Aust N Z J Obstet Gynaecol 2005;45:108-11. https://doi.org/10.1111/j.1479-828X.2005.00351.x.
- Tunde-Byass M, Cheung VYT. The value of the early pregnancy assessment clinic in the management of early pregnancy complications. J Obstet Gynaecol Can 2009;31:841-4. https://doi.org/10.1016/S1701-2163(16)34302-X.
- Akhter P, Padmanabhan A, Babiker W, Sayed A, Molelekwa V, Geary M. Introduction of an early pregnancy assessment unit: audit on the first 6 months of service. Ir J Med Sci 2007;176:23-6. https://doi.org/10.1007/s11845-007-0013-2.
- Jackson A, Henry R, Avery N, VanDenKerkhof E, Milne B. Informed consent for labour epidurals: what labouring women want to know. Can J Anaesth 2000;47:1068-73. https://doi.org/10.1007/BF03027957.
- Vernon G, Alfirevic Z, Weeks A. Issues of informed consent for intrapartum trials: a suggested consent pathway from the experience of the Release trial [ISRCTN13204258.]. Trials 2006;7. https://doi.org/10.1186/1745-6215-7-13.
- White AL, Armstrong PA, Thakore S. Impact of senior clinical review on patient disposition from the emergency department. Emerg Med J 2010;27:262-5. https://doi.org/10.1136/emj.2009.077842.
- Bell D, Lambourne A, Percival F, Laverty AA, Ward DK. Consultant input in acute medical admissions and patient outcomes in hospitals in England: a multivariate analysis. PLOS ONE 2013;8. https://doi.org/10.1371/journal.pone.0061476.
- Black N, Johnston A. Volume and outcome in hospital care: evidence, explanations and implications. Health Serv Manage Res 1990;3:108-14. https://doi.org/10.1177/095148489000300205.
- Farley DE, Ozminkowski RJ. Volume–outcome relationships and in-hospital mortality: the effect of changes in volume over time. Med Care 1992;30:77-94. https://doi.org/10.1097/00005650-199201000-00009.
- Hawthorne G, Sansoni J, Hayes L, Marosszeky N, Sansoni E. Measuring patient satisfaction with health care treatment using the Short Assessment of Patient Satisfaction measure delivered superior and robust satisfaction estimates. J Clin Epidemiol 2014;67:527-37. https://doi.org/10.1016/j.jclinepi.2013.12.010.
- Barrett G, Smith SC, Wellings K. Conceptualisation, development and evaluation of a measure of unplanned pregnancy. J Epidemiol Community Health 2004;58:426-33. https://doi.org/10.1136/jech.2003.014787.
- Survey Coordination Centre . Survey Documents n.d. www.nhsstaffsurveys.com/Page/1058/Survey-Documents/Survey-Documents/ (accessed 3 December 2018).
- EQ-5D . EQ-5D-5L About n.d. https://euroqol.org/eq-5d-instruments/eq-5d-5l-about/ (accessed 25 March 2016).
- Aitken RC. Measurement of feelings using visual analogue scales. Proc R Soc Med 1969;62:989-93. https://doi.org/10.1177/003591576906201005.
- Devlin NJ, Shah KK, Feng Y, Mulhern B, van Hout B. Valuing health-related quality of life: an EQ-5D-5L value set for England. Health Econ 2018;27:7-22. https://doi.org/10.1002/hec.3564.
- Czoski-Murray C, Lloyd Jones M, McCabe C, Claxton K, Oluboyede Y, Roberts J, et al. What is the value of routinely testing full blood count, electrolytes and urea, and pulmonary function tests before elective surgery in patients with no apparent clinical indication and in subgroups of patients with common comorbidities: a systematic review of the clinical and cost-effective literature. Health Technol Assess 2012;16. https://doi.org/10.3310/hta16500.
- Department of Health and Social Care (DHSC) . NHS Reference Costs 2016–17 2017.
- Curtis L. Unit Costs of Health and Social Care 2017. Canterbury: PSSRU, University of Kent; 2017.
- Terry G, Hayfield N, Clarke V, Braun V, Willig C, Stainton-Rogers W. The SAGE Handbook of Qualitative Research in Psychology. London: SAGE Publications Ltd; 2017.
- Spencer L, Ritchie J, O’Connor W, Morrell G, Ormston R, Ritchie J, et al. Qualitative Research Practice: A Guide for Social Science Students and Researchers. Thousand Oaks, CA: SAGE Publishing Inc.; 2013.
- Spencer L, Ritchie J, Ormston R, O’Connor W, Barnard M, Ritchie J, et al. Qualitative Research Practice: A Guide for Social Science Students and Researchers. Thousand Oaks, CA: SAGE Publishing Inc.; 2013.
- Gale NK, Heath G, Cameron E, Rashid S, Redwood S. Using the framework method for the analysis of qualitative data in multi-disciplinary health research. BMC Med Res Methodol 2013;13. https://doi.org/10.1186/1471-2288-13-117.
- Pope C, Ziebland S, Mays N. Qualitative research in health care. Analysing qualitative data. BMJ 2000;320:114-16. https://doi.org/10.1136/bmj.320.7227.114.
- Zubairu K, Lievesley K, Silverio SA, McCann S, Fillingham J, Kaehne A, et al. A process evaluation of the first year of Leading Change, Adding Value. Br J Nurs 2018;27:817-24. https://doi.org/10.12968/bjon.2018.27.14.817.
- Morse JM. Determining sample size. Qual Health Res 2000;10:3-5. https://doi.org/10.1177/104973200129118183.
- Morse JM. Analytic strategies and sample size. Qual Health Res 2015;25:1317-18. https://doi.org/10.1177/1049732315602867.
- Curtis L. Unit Costs of Health and Social Care 2013. Canterbury: PSSRU, University of Kent; 2013.
- Curtis L. Unit Costs of Health and Social Care 2010. Canterbury: PSSRU, University of Kent; 2010.
- Radhakrishnan M, Hammond G, Jones PB, Watson A, McMillan-Shields F, Lafortune L. Cost of improving Access to Psychological Therapies (IAPT) programme: an analysis of cost of session, treatment and recovery in selected Primary Care Trusts in the East of England region. Behav Res Ther 2013;51:37-45. https://doi.org/10.1016/j.brat.2012.10.001.
- Royal College of Obstetricians and Gynaecologists n.d. www.rcog.org.uk/globalassets/documents/careers-and-training/atsms/atsm_acutegynae_curriculum.pdf (accessed 25 August 2020).
- Valentin L. High-quality gynecological ultrasound can be highly beneficial, but poor-quality gynecological ultrasound can do harm. Ultrasound Obstet Gynecol 1999;13:1-7. https://doi.org/10.1046/j.1469-0705.1999.13010001.x.
- Condous G, Timmerman D, Goldstein S, Valentin L, Jurkovic D, Bourne T. Pregnancies of unknown location: consensus statement. Ultrasound Obstet Gynecol 2006;28:121-2. https://doi.org/10.1002/uog.2838.
- Gilling-Smith C, Toozs-Hobson P, Potts DJ, Touquet R, Beard RW. Management of bleeding in early pregnancy in accident and emergency departments. BMJ 1994;309:574-5. https://doi.org/10.1136/bmj.309.6954.574a.
- Department of Health and Social Care . Payment by Results Guidance for 2013–14 n.d. https://assets.publishing.service.gov.uk/government/uploads/system/uploads/attachment_data/file/214902/PbR-Guidance-2013-14.pdf (accessed 25 August 2020).
- Bottomley C, Bourne T. Diagnosing miscarriage. Best Pract Res Clin Obstet Gynaecol 2009;23:463-77. https://doi.org/10.1016/j.bpobgyn.2009.02.004.
- Mavrelos D, Nicks H, Jamil A, Hoo W, Jauniaux E, Jurkovic D. Efficacy and safety of a clinical protocol for expectant management of selected women diagnosed with a tubal ectopic pregnancy. Ultrasound Obstet Gynecol 2013;42:102-7. https://doi.org/10.1002/uog.12401.
- American College of Obstetricians and Gynecologists . Early Pregnancy Loss n.d. www.acog.org/Clinical-Guidance-and-Publications/Practice-Bulletins/Committee-on-Practice-Bulletins-Gynecology/Early-Pregnancy-Loss (accessed 3 December 2018).
- Royal College of Obstetricians and Gynaecologists . Module 5: Intermediate Ultrasound of Early Pregnancy Complications (2014). n.d. www.rcog.org.uk/globalassets/documents/careers-and-training/ultrasound/ultrasound-modules/us_module5_curriculum_2014.pdf (accessed 3 December 2018).
- Richardson A, Raine-Fenning N, Deb S, Campbell B, Vedhara K. Anxiety associated with diagnostic uncertainty in early pregnancy. Ultrasound Obstet Gynecol 2017;50:247-54. https://doi.org/10.1002/uog.17214.
- Farahani L, Sinha A, Lloyd J, Islam M, Ross JA. Negative histology with surgically treated tubal ectopic pregnancies - A retrospective cohort study. Eur J Obstet Gynecol Reprod Biol 2017;213:98-101. https://doi.org/10.1016/j.ejogrb.2017.04.001.
- Elson CJ, Salim R, Potdar N, Chetty M, Ross JA, Kirk EJ. on behalf of the Royal College of Obstetricians and Gynaecologists. Diagnosis and management of ectopic pregnancy. BJOG 2016;123:e15-e55. https://doi.org/10.1111/1471-0528.14189.
- Kirk E, Papageorghiou AT, Condous G, Tan L, Bora S, Bourne T. The diagnostic effectiveness of an initial transvaginal scan in detecting ectopic pregnancy. Hum Reprod 2007;22:2824-8. https://doi.org/10.1093/humrep/dem283.
- Wilasrusmee C, Sukrat B, McEvoy M, Attia J, Thakkinstian A. Systematic review and meta-analysis of safety of laparoscopic versus open appendicectomy for suspected appendicitis in pregnancy. Br J Surg 2012;99:1470-8. https://doi.org/10.1002/bjs.8889.
- The Confidential Enquiry into Maternal and Child Health (CEMACH) . Saving Mothers’ Lives. Reviewing maternal deaths to make motherhood safer: 2006–8. The Eighth Report of the Confidential Enquiries into Maternal Deaths in the United Kingdom. BJOG 2011;118:1-203. https://doi.org/10.1111/j.1471-0528.2010.02847.x.
- Van Holsbeke C, Daemen A, Yazbek J, Holland TK, Bourne T, Mesens T, et al. Ultrasound experience substantially impacts on diagnostic performance and confidence when adnexal masses are classified using pattern recognition. Gynecol Obstet Invest 2010;69:160-8. https://doi.org/10.1159/000265012.
- O’Brien N. An early pregnancy assessment unit. Br J Midwifery 1996;4:187-90. https://doi.org/10.12968/bjom.1996.4.4.187.
- Bharathan R, Farag M, Hayes K. The value of multidisciplinary team meetings within an early pregnancy assessment unit. J Obstet Gynaecol 2016;36:789-93. https://doi.org/10.3109/01443615.2016.1154510.
- Tan TL, Khoo CL, Sawant S. Impact of consultant-led care in early pregnancy unit. J Obstet Gynaecol 2014;34:412-14. https://doi.org/10.3109/01443615.2014.896324.
- Ney PG, Fung T, Wickett AR, Beaman-Dodd C. The effects of pregnancy loss on women’s health. Soc Sci Med 1994;38:1193-200. https://doi.org/10.1016/0277-9536(94)90184-8.
- Carter D, Misri S, Tomfohr L. Psychologic aspects of early pregnancy loss. Clin Obstet Gynecol 2007;50:154-65. https://doi.org/10.1097/GRF.0b013e31802f1d28.
- Engelhard IM, van den Hout MA, Arntz A. Posttraumatic stress disorder after pregnancy loss. Gen Hosp Psychiatry 2001;23:62-6. https://doi.org/10.1016/S0163-8343(01)00124-4.
- Rubertsson C, Hellström J, Cross M, Sydsjö G. Anxiety in early pregnancy: prevalence and contributing factors. Arch Womens Ment Health 2014;17:221-8. https://doi.org/10.1007/s00737-013-0409-0.
- Volgsten H, Jansson C, Svanberg AS, Darj E, Stavreus-Evers A. Longitudinal study of emotional experiences, grief and depressive symptoms in women and men after miscarriage. Midwifery 2018;64:23-8. https://doi.org/10.1016/j.midw.2018.05.003.
- Wojcieszek AM, Boyle FM, Belizán JM, Cassidy J, Cassidy P, Erwich J, et al. Care in subsequent pregnancies following stillbirth: an international survey of parents. BJOG 2018;125:193-201. https://doi.org/10.1111/1471-0528.14424.
- Biaggi A, Conroy S, Pawlby S, Pariante CM. Identifying the women at risk of antenatal anxiety and depression: a systematic review. J Affect Disord 2016;191:62-77. https://doi.org/10.1016/j.jad.2015.11.014.
- Ayers S, Coates R, Matthey S, Milgrom J, Gemmill AW. Identifying Perinatal Depression and Anxiety: Evidence-Based Practice in Screening, Psychosocial Assessment and Management. Hoboken, NJ: Wiley Blackwell; 2015.
- Fallon V, Halford JCG, Bennett KM, Harrold JA. The Postpartum Specific Anxiety Scale: development and preliminary validation. Arch Womens Ment Health 2016;19:1079-90. https://doi.org/10.1007/s00737-016-0658-9.
- Guedes M, Canavarro MC. Characteristics of primiparous women of advanced age and their partners: a homogenous or heterogenous group?. Birth 2014;41:46-55. https://doi.org/10.1111/birt.12089.
- Holt VL, Danoff NL, Mueller BA, Swanson MW. The association of change in maternal marital status between births and adverse pregnancy outcomes in the second birth. Paediatr Perinat Epidemiol 1997;11:31-40. https://doi.org/10.1046/j.1365-3016.11.s1.6.x.
- Lojewski J, Flothow A, Harth V, Mache S. Employed and expecting in Germany: a qualitative investigation into pregnancy-related occupational stress and coping behavior. Work 2018;59:183-99. https://doi.org/10.3233/WOR-172673.
- Maxson P, Miranda ML. Pregnancy intention, demographic differences, and psychosocial health. J Womens Health 2011;20:1215-23. https://doi.org/10.1089/jwh.2010.2379.
List of abbreviations
- A&E
- accident and emergency
- AEPU
- Association of Early Pregnancy Units
- CEAC
- cost-effectiveness acceptability curve
- CI
- confidence interval
- CRF
- case report form
- DS
- deprivation score
- EPAU
- early pregnancy assessment unit
- EQ-5D-5L
- EuroQol-5 Dimensions, five-level version
- FD
- final diagnosis
- GAP
- Gestational Age Policy
- GP
- general practitioner
- LMUP
- London Measure of Unplanned Pregnancy
- MA
- maternal age at initial visit
- NICE
- National Institute for Health and Care Excellence
- PIL
- participant information leaflet
- PUL
- pregnancy of unknown location
- QALY
- quality-adjusted life-year
- SAPS
- Short Assessment of Patient Satisfaction
- SD
- standard deviation
- SSC
- Study Steering Committee
- VCw
- high volume, consultant presence, no weekend opening
- VCW
- high volume, consultant presence, weekend opening
- Vcw
- high volume, no consultant presence, no weekend opening
- VcW
- high volume, no consultant presence, weekend opening
- vCw
- low volume, consultant presence, no weekend opening
- vCW
- low volume, consultant presence, weekend opening
- vcw
- low volume, no consultant presence, no weekend opening
- vcW
- low volume, no consultant presence, weekend opening
- VESPA
- Variations in the organisations of Early Pregnancy Assessment Units in the UK and their effects on clinical, Service and PAtient-centred outcomes
Notes
Supplementary material can be found on the NIHR Journals Library report page (https://doi.org/10.3310/hsdr08460).
Supplementary material has been provided by the authors to support the report and any files provided at submission will have been seen by peer reviewers, but not extensively reviewed. Any supplementary material provided at a later stage in the process may not have been peer reviewed.
