
Notes
Article history
The research reported in this issue of the journal was commissioned and funded by the HTA programme on behalf of NICE as project number 07/74/01. The protocol was agreed in January 2008. The assessment report began editorial review in September 2008 and was accepted for publication in December 2008. The authors have been wholly responsible for all data collection, analysis and interpretation, and for writing up their work. The HTA editors and publisher have tried to ensure the accuracy of the authors’ report and would like to thank the referees for their constructive comments on the draft document. However, they do not accept liability for damages or losses arising from material published in this report.
Declared competing interests of authors
AJ Elliot has received funding from the pharmaceutical industry to attend an influenza-related conference. No other authors declare any competing interests.
Permissions
Copyright statement
© 2009 Queen’s Printer and Controller of HMSO. This monograph may be freely reproduced for the purposes of private research and study and may be included in professional journals provided that suitable acknowledgement is made and the reproduction is not associated with any form of advertising. Applications for commercial reproduction should be addressed to: NETSCC, Health Technology Assessment, Alpha House, University of Southampton Science Park, Southampton SO16 7NS, UK.
2009 Queen’s Printer and Controller of HMSO
Chapter 1 Background
Description of health problem
The influenza virus
The influenza virus is a single-stranded ribonucleic acid (RNA) virus of the family Orthomyxoviridae. There are three types of influenza virus that are classified according to their core proteins;1 types A, B and C. Only A and B cause the large outbreaks that are familiar during the winter season,2 with influenza A occurring more frequently, and being more virulent, than influenza B. 3 Type C influenza is poorly understood and tends to cause sporadic subclinical infection,1 therefore this review will concentrate on types A and B. Influenza A and B viruses have two surface glycoproteins, haemagglutinin and neuraminidase, which stimulate an immune response and are used to classify influenza viruses into subtypes. 1 Neuraminidase inhibition is the mode of action of the antiviral drugs most commonly used to treat influenza. There are 15 subtypes of the influenza A haemagglutinin and nine subtypes of the neuraminidase; of these, three haemagglutinin (H1/2/3) and two neuraminidase (N1/2) subtypes have formed stable lineages in humans. 2 There is only one subtype of influenza B. 2 Three subtypes of influenza A that do not normally use humans as a natural host, H5N1, H7N7 and H9N2, have recently caused outbreaks of ‘bird flu’ in humans. 2 The influenza virus frequently mutates at antibody binding sites, producing new strains that can evade the body’s immune system (antigenic drift). 4 Antigenic drift takes place in all strains of influenza A and B, although the rate at which it occurs varies depending on the strain. 4 Influenza A is also subject to antigenic shift, genetic recombination in which the haemagglutinin, and sometimes the neuraminidase, result in a new subtype substantially different from recently circulating strains. Such a strain has the potential to cause a pandemic, with substantial increases in influenza-related deaths worldwide. 4
Clinical presentation and diagnosis
Influenza can cause annual outbreaks of varying distribution and degrees of severity. The period of heightened surveillance activity in the UK is from week 40 to week 20 of the calendar year (October to May). 5 Influenza outbreaks have tended to have a sudden onset, peaking rapidly over a period of a few weeks and disappearing gradually over several months. 1 More recently, the increase in activity has been slower, with low peaks of activity. In England and Wales, nine of the 11 years from 1990 to 2000 have seen significant outbreaks of influenza A and four outbreaks of influenza B; two years had outbreaks of both influenza A and influenza B. Since 1990, approximately 74% of influenza has been caused by type A, with the seasonal rates varying between 20% and 97%. 3
The most commonly reported symptoms of influenza are cough and fever,2,6,7 with nasal congestion, headache, sore throat, fatigue, and joint and muscle aches also common. 6 The incubation period of influenza ranges from 1 to 7 days, but most commonly lasts for 2–3 days. 1,3,6 In healthy adults, the symptoms usually last for up to 8 days and resolve without treatment. 6 For the elderly and people with comorbid conditions or who are immunocompromised, the illness may be more prolonged, and influenza-related complications (for example pneumonia) more likely to occur. 6 There are a number of case definitions that assist in the identification of influenza-like illnesses (ILIs) from presenting symptoms (examples are given in Box 1); however, it is difficult to give a positive diagnosis of influenza based on these alone. For example, one study showed that of 207 hospitalised patients who tested positive for influenza, only 51% would have passed the Centers for Disease Control and Prevention’s (CDC’s) case definition for an ILI. 7 A second study showed that of 79 patients who passed the Netherlands Institute of Primary Health Care (NIVEL) criteria, 52% were confirmed with influenza A, and of 72 patients that passed the International Classification of Health Problems in Primary Care (ICHPPC-2) criteria, 54% had influenza A. In contrast, 76% of the patients with influenza A were correctly diagnosed by the GP’s opinion of the aetiology of the illness. 8
Acute onset (a prodromal stage of no more than 4 days)
Rectal temperature of at least 38°C, and at least one of the following symptoms:
-
Cough
-
Coryza (inflamed mucous membranes)
-
Sore throat
-
Frontal headache
-
Retrosternal pain
-
Myalgia
Either:
Influenza epidemic present, plus four of the following criteria:
-
Sudden onset (within 12 hours)
-
Cough
-
Rigors and chills
-
Fever
-
Prostration and weakness
-
Headache
-
Myalgia
-
Widespread aches and pain
-
No significant physical signs other than redness of nasal mucous membrane and throat
-
Influenza in close contact
Or:
The absence of an influenza epidemic, plus any six of the above nine criteria
CDCTemperature of 37.8°C, plus either a cough or a sore throat.
There are a range of rapid diagnostic tests for influenza that can provide results within 30 minutes. These detect influenza but do not distinguish between types, detect one or other influenza type, or can distinguish between influenza A and B. Most rapid tests are immunoassays, which detect influenza viral antigen, but Z-StatFlu™ (ZymeTx, Inc. Oklahoma City, OK) detects viral neuraminidase activity. According to the CDC, the sensitivity and specificity of rapid tests compared with viral culture vary, with median sensitivities of approximately 70–75%, and specificities approximately 90–95%; however, these values may be lower in the elderly, in whom viral shedding may be lower. 9
Laboratory tests include enzyme-linked immunosorbent assay (ELISA), direct immunofluorescence, viral culture, polymerase chain reaction (PCR) and serologic testing. Each laboratory technique has advantages and disadvantages. ELISA is frequently used as it is fairly simple and rapid (up to 2 hours), but it does not provide information about the type of influenza. Viral culture has high specificity and sensitivity, and is identified by the CDC as the reference standard, but it takes up to 7 days for a diagnosis to be made. 9 Some PCR methods can be rapid (giving results within 2–4 hours, although feedback of the results to a GP may take longer) and the technique is more sensitive than cell culture, particularly in the elderly where viral shedding may be lower, but it is expensive and requires specialised laboratory equipment and personnel. Serological testing is used for epidemiological evaluation, but clinical application is limited as the diagnosis takes at least 2 weeks. Direct immunofluorescence is not used routinely as it requires skilled technicians to undertake the processing required. PCR is the standard test for influenza in reference laboratories in the UK.
Mode of transmission
Secretions expelled during coughing and sneezing that are heavily laden with the influenza virus are the primary mode of transmission. 1,10 This means that transmission is most rapid and effective in crowded areas or where ventilation is poor. Viral shedding peaks and remains high for approximately 24–72 hours after the onset of symptoms, decreasing to low values by day 5 in otherwise healthy adults. 2 Children and immunocompromised patients may show prolonged viral shedding beyond the 7 days normally considered the time of infectivity, therefore potentially increasing the time over which influenza can be transmitted. 2,11
Burden of influenza on the NHS
A study by Pitman and colleagues12 used data from the Health Protection Agency (HPA) Centre for Infections, the General Practice Research Database (GPRD), hospital episodes statistics (HES), and the Office for National Statistics in a multiple linear regression analysis to determine the burden of influenza in terms of general practice and hospital admissions in England and Wales. The results of this study estimated that 585,000 [95% confidence interval (CI) ± 169,000] GP consultations, 19,000 (95% CI ± 5000) hospital admissions and 9700 (95% CI ± 800) deaths from respiratory disease can be attributed to influenza A, annually. 12 The burden of influenza B was lower, estimated to cause 194,000 (95% CI ± 89,000) GP consultations and 800 (95% CI ± 300) deaths from respiratory disease, annually. 12 Although most of the burden of influenza was on those under 45 years of age, most of the hospitalisations were in the elderly. 12 Table 1 gives the frequency of hospitalisations as reported in the current National Institute for Health and Clinical Excellence (NICE) guidance, and clearly shows the increased hospitalisation rates for people aged 65 years and over, particularly those at higher risk due to comorbid conditions. 3 Influenza B primarily affects school-age children and, therefore, when influenza B is the predominant virus circulating in the community, excess hospital admissions in the elderly tend to be lower than in years when influenza A is circulating. 13
| Risk/age group | Frequency of hospital admissions |
|---|---|
| High-risk patients aged ≥ 75 years | 1 in 24 people with influenza (4.2%) |
| Low-risk patients aged ≥ 75 years | 1 in 89 (1.1%) |
| High-risk patients aged 65–75 years | 1 in 42 (2.4%) |
| Low-risk patients aged 65–75 years | 1 in 230 (0.4%) |
| High-risk patients aged 16–64 years | 1 in 250 (0.4%) |
| Low-risk patients aged 16–64 years | 1 in 4000 (0.03%) |
A different strategy to assess the impact of influenza is to compare the GP consultation and complication rates recorded during the weeks when influenza is circulating in the community with a baseline rate calculated from averaging the weekly rates over a 9-year period when influenza was not circulating. Using this method on data from the weekly returns service (WRS) of the Royal College of General Practitioners (RCGP), proportionate excesses in GP visits as a result of influenza were 400% in 1989, 300% in 1993 and 150% in 1995. 14 Excess pneumonia cases ranged from 2200 in 1995 to 12,500 in 1989, and acute bronchitis from 200,000 in 1989 and 1995 to 403,000 in 1993. 14 There was also a minimum excess of 25% of people, primarily children, presenting with otitis media. 14
A large population-based study using the GPRD (141,293 people with ILI-related physician visits) aimed to quantify clinical complications of, and risks associated with, influenza in all age groups from 1991 to 1996. 15 They reported higher 30-day mortality rates in ‘at-risk’ groups than in otherwise healthy populations, particularly in patients aged 65 years and older. These results refer to patients presenting with ILI who are not necessarily infected with the influenza virus. A second study explored mortality in patients with confirmed influenza or respiratory syncytial virus infections using US national mortality and viral surveillance data for the 1976–7 to 1998–9 influenza seasons. 16 This study reported that, on average, influenza virus infections were associated with three times as many deaths as respiratory syncytial virus infections. Together, the findings of these studies suggest that the risk of premature mortality from secondary complications of influenza may vary according to age and risk group.
In a recent review of data from NHS Direct to determine the increase in enquiries as a result of respiratory pathogens, 601,454 calls over a 2-year period were related to four respiratory syndromes. Of these, 45% of calls were classified as being about fever, 32% cough, 13% difficulty breathing, and 10% cold and flu. 17 The proportion of calls attributed to influenza were estimated at 13% in the fever category, 15% in the cough category, and 22% in the cold and flu category. 17 The mean annual incidence of NHS Direct respiratory calls in these three categories attributed to influenza was estimated as 72.6 per 100,000 population. 17
Surveillance
The World Health Organization (WHO)18 provides a global surveillance network which, as of May 2007, comprised four Collaborating Centres (UK, USA, Japan, Australia), and 118 National Influenza Centres (NICs) in 89 countries. 19 The NICs conduct seasonal influenza surveillance, which assists in determining the annual vaccine composition, and defining when influenza is circulating in a country. 19 In the UK, there are four NICs based in London, Glasgow, Belfast and Aberdeen.
The European Influenza Surveillance Scheme (EISS)20 collects clinical and virological data, exchanges information on influenza activity and contributes to the annual determination of the influenza vaccine content. Twenty-six European Union member states, Norway, Serbia, Switzerland and Ukraine, participate in the EISS, which is funded by the European Centre for Disease Prevention and Control (ECDC). 21 The UK is represented by the four surveillance networks in England, Northern Ireland, Scotland and Wales. EISS publishes weekly surveillance reports on influenza activity in the 30 member countries. The reports are based on data reported by 25,750 sentinel physicians, and cover a total population of 498 million people.
UK surveillance of influenza is co-ordinated and collated by the HPA Colindale Surveillance of Influenza Group, based at the London NIC centre. 22 The HPA monitors and records the incidence of seasonal influenza in the UK and uptake of seasonal influenza vaccine in England, and releases data on a weekly basis to the WHO. 22
The RCGP23 uses a network of 100 GPs located throughout England and Wales to collect information on every consultation and new episode of illness diagnosed in general practice, particularly the incidence of ILIs and other common respiratory conditions, as part of the WRS. The population covered by the WRS is approximately 900,000 across three regions: the North, Central and South Reporting Areas. 22 A study using geographical information systems’ techniques compared the population covered by the RCGP WRS with the national population, to give an indication of its representativeness. 24 The RCGP WRS population was found to be less deprived than the general population, with the most deprived wards in London not being represented. 24 However, at the time of this study, the RCGP WRS had 78 GPs providing data across England and Wales; there are currently 100 practices following a recruitment drive in 2005 in areas where the WRS was under-representative. 24 The Birmingham Research Unit is the Records and Statistical Unit of the RCGP, and provides weekly reports of the data for respiratory tract infections (RTIs) which can be downloaded from the RCGP website. 23
Other surveillance schemes which report weekly information on influenza activity are provided by the National Public Health Service (NPHS) for Wales, Health Protection Scotland (HPS) and the Communicable Disease Surveillance Centre (CDSC) Northern Ireland. The data in these schemes are collected mainly from networks of sentinel GP practices. A further surveillance scheme is undertaken by the Department of Primary Care at Nottingham University. It is called Qsurveillance® (previously know as Q-FLU) and utilises approximately 3300 GP practices, covering a population of almost 22 million, which makes it the largest scheme of its kind in Europe. Data from ILI consultations are automatically extracted from participating practices’ computer systems and made immediately available for analysis.
NHS Direct offers a 24-hour nurse-led telephone service that covers England and Wales. Algorithms from clinical decision support systems are utilised so that symptom-based advice can be given to callers. The collected syndromic surveillance data are analysed by the West Midlands Regional Surveillance Unit. In another scheme, the Medical Officers of Schools Association (MOSA) collects information about influenza activity in approximately 12,000 school children at 42 boarding schools. During the school terms, MOSA sends weekly reports to the centre for infections. Most of the schools participating in this scheme are located in southern England, with pupils aged between 5 and 18 years; the majority of the pupils are boys aged from 13 to 18 years.
Up until 2003, the threshold for influenza circulating in the community was 50 consultations for ILI per 100,000 population, based on the collated figures from the RCGP WRS (with equivalent levels calculated for the different Welsh and Scottish systems). However, over the period between 1997 and 2003, influenza activity was at such a low level that the threshold for circulating in the community was reduced in 2003 to 30 per 100,000. 5
Management of disease
Vaccination
Vulnerable groups can be protected from influenza to some degree by vaccination. Viruses are grown in fertile hens’ eggs, and then chemically inactivated, treated and purified. 2,10 There are three types of vaccine which are equal in terms of efficacy and adverse events:10
-
‘split virion, inactivated’ or ‘disrupted virus’ vaccines containing virus components prepared by treating whole viruses with organic solvents or detergents10
-
‘surface antigen, inactivated’ vaccines containing highly purified haemagglutinin and neuraminidase antigens prepared from disrupted virus particles10
-
‘surface antigen, inactivated, virosome’ vaccines containing highly purified haemagglutinin and neuraminidase antigens prepared from disrupted virus particles reconstituted into virosomes with phospholipids. 10
Influenza immunisation to protect people at a higher risk of serious morbidity and mortality has been recommended in the UK since the late 1960s; in 2000 the policy was extended to include all people aged 65 years or over. 10 Uptake was limited, even in the elderly, until the 1990s, since when uptake has increased in this group to around 75%. The influenza vaccine is also offered to health professionals and carers, although uptake in this group is poor. 10 The effectiveness of influenza vaccination has been evaluated in a systematic review of prophylaxis by the University of Sheffield School of Health and Related Research (ScHARR) and is therefore not being assessed in the current review. 25
Antiviral drugs
The first step in the replication of influenza virus is mediated by attachment of the virus haemagglutinin to sialic acid (neuraminic acid) receptors on the cell surface of the respiratory epithelium,26 thereby initiating virus penetration and fusion of viral and cellular membranes. 2,27 The virus is hence engulfed by the cell membrane and enters the cell (endocytosis) where it replicates. 26 Following viral replication, progeny virions accumulate at the cell surface and are released from the cell by the action of viral neuraminidase. Neuraminidase also aids the movement of influenza virus from sites of infection in the respiratory tract. 2,27,28 Antiviral drugs used for the management of influenza have two different modes of action; inhibition of M2 membrane protein, or inhibition of the neuraminidase surface glycoprotein.
Treatment
M2 membrane protein inhibitors
The anti-influenza action of amantadine (Lysovir®, symmetrel syrup; Alliance Pharmaceuticals) was recognised in 1964, leading to the first licence for antiviral treatment for influenza. 29 Rimantadine (Flumadine®; Forest Pharmaceuticals) is a derivative of amantadine, and was first approved for use in 1993. Both amantadine and rimantadine inhibit the M2 membrane protein ion-channel activity of influenza A, but have no effect on influenza B. 2,3 The blocking of the proton pump of the M2 protein stops the virus uncoating and inactivates newly synthesised viral haemagglutinin. Rimantadine is not licensed for use in the UK. 29 Amantadine is licensed for treatment of influenza A in people over the age of 10 years who are deemed to be at risk.
Neuraminidase inhibitors
The first sialic acid analogue, Neu5Ac2en, was developed in 1969. 27,30 However, this early analogue had low potency and poor specificity. 27 Subsequent development led to the production of zanamivir (first trialled in 1994) and oseltamivir (first described in 1997). 27 Zanamivir and oseltamivir are effective against both influenza A and influenza B. 2,3,27
Zanamivir is a second-generation neuraminidase inhibitor (NI). It is poorly absorbed via the gastrointestinal (GI) tract, and is therefore most commonly administered via inhalation, it can also be given intravenously; however, this is not a licensed mode of administration. 26 Zanamivir is licensed for treatment of both influenza A and influenza B in adults and children (5 years or over) who present with symptoms typical of influenza when it is circulating in the community. 31 The recommended dose of zanamivir in this population is two inhalations (10 mg) twice daily for 5 days. 31,32 Treatment should begin within 48 hours of onset of symptoms for adults, and within 36 hours of onset of symptoms for children. 31 As zanamivir contains lactose, its use is contraindicated in patients with galactose intolerance, Lapp lactase deficiency or glucose–galactose malabsorption. 31 Use of zanamivir is not recommended during pregnancy or in mothers who are breast-feeding. 31
Oseltamivir is a third-generation neuraminidase inhibitor that is readily absorbed from the gastrointestinal tract and is therefore administered orally. 26 Oseltamivir is licensed for treatment of influenza A and B in people over the age of 1 year if given within 48 hours of the onset of symptoms, only when influenza is circulating. 3,31 The recommended dose of oseltamivir is 75 mg twice daily for 5 days, with a reduction to 75 mg once daily in patients with impaired creatinine clearance. 33 For children aged between 1 and 12 years, there are recommended doses of oseltamivir oral suspension based on weight (Table 2). 31 Treatment should be initiated as soon as possible within the first 2 days of onset of symptoms of influenza. 31 Use of oseltamivir is not recommended during pregnancy or in mothers who are breast-feeding. 31
| Body weight | Recommended dose for 5 days |
|---|---|
| ≤ 15 kg | 30 mg twice daily |
| 15–23 kg | 45 mg twice daily |
| 23–40 kg | 60 mg twice daily |
| > 40 kg | 75 mg twice daily |
Prophylaxis
Oseltamivir, zanamivir and amantadine are licensed for use as prophylaxis against influenza. The current NICE guidance states that oseltamivir and zanamivir are recommended for the postexposure prophylaxis of influenza within their marketing authorisations in at-risk people who are not effectively protected by vaccination, when influenza is circulating in the community, if prophylaxis can begin within 48 or 36 hours of exposure respectively. 37 Amantadine is licensed for seasonal and postexposure prophylaxis of influenza A, particularly in at-risk patients; however, NICE guidance states that amantadine is not recommended for either postexposure or seasonal prophylaxis of influenza. 37 The review of effectiveness of drugs as prophylaxis against influenza has been undertaken separately, and is therefore not evaluated in the current review. 25
Resistance to antiviral drugs
The emergence of viral resistance is a potential problem where the use of antiviral drugs becomes widespread. An increase in resistance to amantadine (first noted in 1981)2,29 has been observed in Asia and the USA since 2003. 29,38
To date, there has been a single reported case of resistance to zanamivir in an immunocompromised child who had a prolonged influenza infection and received treatment for 15 days. 29,39 Until recently, the rate of resistance to oseltamivir has generally been low. Two reviews reported incidences of naturally occurring resistance to oseltamivir of 0.32%40 and 1–4%29 in adults, and 4.1%40 and 5–6%29 in children respectively. A third review published in 2007 stated that resistance was reported in up to 2% of oseltamivir-treated patients in trials, rising to 18% in children in two small studies in Japan which used a dosing system not based on the child’s weight. 28,40 Over the 2007–8 influenza season, surveillance of the antiviral susceptibility of influenza viruses showed a substantial increase in the rate of resistance of the H1N1 subtype of type A influenza to oseltamivir across Europe, including the UK (H1N1-H247Y). 21,41–43 This resistance is a result of an amino acid mutation of the neuraminidase protein. 21,41
The rate of resistance has been as high as 70% in Norway. 41 According to the last HPA weekly bulletin of the 2007–8 influenza season, 11% of H1N1 viruses showed resistance to oseltamivir in the UK. 42,44 Data were provided by the HPA regarding the number of samples that were identified for each subtype of influenza for the last six influenza seasons in England and Wales and used to calculate the number of swabs collected by GPs and from GPs and hospitals that would be expected to show resistance. These data were academic in confidence and cannot be presented here. Resistance has, to date, been observed only in the H1N1 subtype of type A influenza. Given the early stage of investigation of this new subtype, some caution must be observed when considering its potential impact. The information is from a relatively small number of isolates, and continued surveillance is required to detect any trend in the rate of resistance. In addition, H1N1 viruses are often associated with milder illness than other influenza subtypes and the oseltamivir-resistant subtypes remain sensitive to zanamivir. 21,28 WHO is collecting global data and producing a summary table which is being updated on a regular basis as reports become available. 42 There was no concomitant increase in the rate of resistance to zanamivir. The difference between oseltamivir and zanamivir has been attributed to the differences in the way they bind at the neuraminidase catalytic site, with resistance more likely with oseltamivir. 28
Anticipated costs associated with intervention
According to the current version of the British National Formulary (BNF; March 2008) at the time the model was developed the net price for five discs of dry powder zanamivir for inhalation with the Diskhaler® (GlaxoSmithKline) device is £24.55. 45 This covers the recommended dose for both adults and children of 10 mg twice daily over a 5-day course of treatment. However, a reduction in the price of zanamivir has recently been agreed with the Department of Health (DH). This will lower the price of zanamivir to the same as oseltamivir (£16.36 for a course of treatment). The net prices for oseltamivir are £16.36 for capsules (45 or 75 mg in 10 cap-packs) as well as for oral suspension (75 ml with 60 mg/5 ml) and £8.18 for capsules (30 mg in 10 cap-pack). 45
Current NICE guidance
Certain groups of people are considered more likely to develop influenza-related complications, and are therefore at risk; immunisation is recommended in these groups. Current NICE guidance states that zanamivir and oseltamivir are recommended only for the treatment of influenza in children and adults who are at risk. The use of amantadine is not recommended. At-risk populations are defined in the DH’s Green Book as those aged 65 years and over, and all those aged 6 months and over in clinically at-risk groups (Table 3). 3,10 The effectiveness and safety of oseltamivir and zanamivir will be investigated in these subgroups where sufficient data are presented. In addition, immunisation is provided to reduce the transmission of influenza within health- and social-care premises, to contribute to the protection of individuals who may have a suboptimal response to their own immunisations, or to avoid disruption to services that provide their care.
| Clinical risk category | Examples |
|---|---|
| Chronic respiratory disease, including asthma |
Chronic obstructive pulmonary disease, including chronic bronchitis and emphysema, and such conditions as bronchiectasis, cystic fibrosis, interstitial lung fibrosis, pneumoconiosis and bronchopulmonary dysplasia Asthma requiring continuous or repeated use of inhaled or systemic steroids, or with previous exacerbations requiring hospital admission Children who have previously been admitted to hospital for lower respiratory tract disease |
| Chronic heart disease |
Congenital heart disease Hypertension with cardiac complications Chronic heart failure Individuals requiring regular medication and/or follow-up for ischaemic heart disease |
| Chronic renal disease |
Nephrotic syndrome Chronic renal failure Renal transplantation |
| Chronic liver disease |
Cirrhosis Biliary atresia Chronic hepatitis |
| Diabetes requiring insulin or oral hypoglycaemic drugs |
Type 1 diabetes Type 2 diabetes requiring oral hypoglycaemic drugs |
| Immunosuppression |
Due to disease or treatment Asplenia or splenic dysfunction Human immunodeficiency virus (HIV) infection at all stages Patients undergoing chemotherapy leading to immunosuppression Individuals on or likely to be on systemic steroids for more than a month at a dose equivalent to prednisolone at ≥ 20 mg per day (any age), or for children less than 20 kg in weight a dose of ≥ 1 mg/kg per day Some immunocompromised patients may have a suboptimal immunological response to the vaccine |
Annual immunisation is recommended for:
-
health- and social-care staff directly involved in patient care
-
those living in long-stay residential care homes or other long-stay care facilities where rapid spread is likely to follow introduction of infection and cause high morbidity and mortality (this does not include prisons, young offender institutions, university halls of residence, etc.)
-
those who are the main carer for an elderly (over 65 years of age) or disabled person whose welfare may be at risk if the carer falls ill. Vaccination should be given at the GP’s discretion.
Chapter 2 Definition of the decision problem
Decision problem
Treatment with antivirals has the potential to reduce the duration of symptoms in influenza, and hence facilitate return to normal activities. Treatment may also reduce the incidence of influenza-related complications, hospitalisations and mortality. These potential effects are of particular interest in patient groups considered to be at risk from influenza (over 65 years of age with or without comorbid conditions, under 65 years of age with comorbid conditions, or immunocompromised), in whom the duration of illness is generally longer and the incidence of complications, hospitalisations and mortality higher.
A previous technology appraisal by Turner and colleagues,46 which helped inform the current NICE guidelines (TA58), concluded that zanamivir and oseltamivir reduce the length of influenza illness by similar durations when compared, separately, with placebo and/or symptom relief. However, no comparison of clinical effectiveness was made between the two drugs. Uncertainties also remain regarding relative effectiveness in at-risk patients, and the impact of NIs on the incidence of influenza-related complications, hospitalisations, and mortality. In addition, since the previous appraisal, new trials have been reported and the licence of zanamivir has been extended to include children aged 5 years and over.
An expansion of the previous appraisal is therefore needed, to incorporate new evidence and, where possible, to address the outstanding questions.
Overall aims and objectives of the assessment
The aim of this review is to inform the update of NICE guidance (TA58) using currently available data from RCTs on the clinical effectiveness. Data on antiviral drugs, compared with each other, placebo or symptomatic care, will be synthesised using standard meta-analytic methods. Where direct comparisons between interventions are not available, indirect comparisons will be made through the development of a Bayesian multiparameter evidence synthesis. The outcomes considered will be duration of influenza symptoms/time to return to normal activities, incidence of influenza-related complications, hospitalisations, mortality, adverse effects and health-related quality of life (HRQoL). Analysis of clinically important subgroups will be undertaken where sufficient data are available. The results from these analyses will inform an economic model, which will consider the clinical and cost outcomes from the NHS and Personal Social Services’ (PSS) perspective.
Chapter 3 Assessment of clinical effectiveness
Methods for reviewing clinical effectiveness
Search strategy
Resources searched
Studies were identified by searching the following databases: MEDLINE, EMBASE, Cumulative Index to Nursing and Allied Health Literature (CINAHL), Pascal, Science Citation Index (SCI), BIOSIS, Latin American and Caribbean Health Sciences (LILACS), Cochrane Database of Systematic Reviews (CDSR), Cochrane Central Register of Controlled Trials (CENTRAL), Database of Abstracts of Reviews of Effects (DARE) and Health Technology Assessment (HTA) Database. TOXLINE was also searched for studies with adverse event data. In addition, information on studies in progress, unpublished research and research reported in the grey literature was identified by searching Inside Conferences, Dissertation Abstracts, ClinicalTrials.gov, Current Controlled Trials, ClinicalStudyResults.org, Clinical Trial Results, World Health Organization International Clinical Trials Registry Platform (ICTRP), GlaxoSmithKline Clinical Trials Register, and Roche Clinical Trial Protocol Registry and Results Database. A methodological search filter was used to help identify RCTs. The searches updated those undertaken for the original guidance, and so were run from October 2001 to the present. Trial reports and additional data were provided by GlaxoSmithKline (zanamivir) and Roche (oseltamivir); no additional data were provided for amantadine (Alliance Pharmaceuticals).
Searches for economic evaluations were undertaken in the databases listed above, replacing the RCT search filter with an economic/cost methodological search filter. In addition, searches of NHS EED and HEED were carried out, alongside a search of the Economics Working Papers archive (IDEAS). Searches for HRQoL studies were also undertaken.
Internet searches were carried out using the specialist search gateways, Intute (www.intute.ac.uk) and MedlinePlus (www.nlm.nih.gov/medlineplus/), to identify relevant resources. Relevant websites were identified and searched including the British Lung Foundation, the US National Institute of Allergy and Infectious Diseases, and CDC. Websites of regulatory agencies the US Food and Drug Administration (FDA) and the European Agency for the Evaluation of Medicinal Products were also searched. The full search strategies, dates and results of all searches are provided in Appendix 7, Table 98.
A supplementary search was undertaken to retrieve studies about drug resistance during the 2007–8 influenza season. This consisted of brief searches in MEDLINE, EMBASE, and the following disease surveillance websites: HPA, WHO Epidemic and Pandemic Alert and Response programme, and the European Centre for Disease Prevention and Control.
Inclusion and exclusion criteria
Two reviewers independently screened all titles and abstracts. Full paper manuscripts of any studies thought to be potentially relevant by either reviewer were obtained. The relevance of each study was assessed by two independent reviewers according to the criteria stated below. Any discrepancies were resolved by consensus or, when consensus could not be reached, a third reviewer was consulted. Non-English language papers were screened by one reviewer with a native speaker. Details of included studies are provided in Appendix 7, Table 99, and a list excluded of studies and the reasons for their exclusion in Appendix 7, Table 100. For studies retrieved only as an abstract, authors were contacted to request additional information. Where additional information was not obtained, abstracts were included only if sufficient outcome data were available. Studies written in any language were included.
Study designs
Only RCTs were included in the review of clinical effectiveness.
Interventions and comparators
Studies of treatment with antiviral drugs compared with each other, with placebo, or with best symptomatic care were included. Only UK licensed antiviral doses and durations of use were included (Appendix 7, Table 101). Studies of prophylaxis were excluded, as were studies of intravenous and nebulised zanamivir, as these are not licensed modes of administration.
Population
Studies of adults and/or children (in the age ranges indicated by the relevant licences) who presented with symptoms typical of influenza were included, whether influenza was reported as circulating in the community or not. Studies reporting the efficacy of treatments during a pandemic, or a widespread epidemic of a new strain of influenza, were excluded, as these situations will not be covered by the new guidance. Studies of healthy volunteers with experimentally induced influenza were also excluded. Subgroups, as specified in Chapter 1, Current NICE guidance, were planned, conditional upon the availability of data.
Outcomes
The outcome measures were time to alleviation of symptoms (composite of five or more symptoms); time to return to normal activity (encompassing varying definitions: ability to perform usual daily activities, return to work or school, return to normal health and return to feeling as before illness); time to alleviation of fever; adverse events (overall, serious, minor and drug related); and the incidence of influenza-related complications (overall, serious, antibiotic use, pneumonia, bronchitis and otitis media in children), hospitalisation, mortality and HRQoL. The numbers still with symptoms at final follow-up were extracted or calculated where possible.
Data extraction strategy
Data relating to both study content and quality were extracted by one reviewer, using a standardised data extraction form, and checked by a second reviewer. Discrepancies were resolved by discussion, with involvement of a third reviewer when necessary. Non-English language studies were extracted by one reviewer with a native speaker. Attempts were made to contact authors and pharmaceutical companies for missing data. Additional data were provided by the manufacturers, GlaxoSmithKline (zanamivir) and Roche (oseltamivir). There was no company submission for amantadine (Alliance Pharmaceuticals). Data from multiple publications of the same study were extracted and reported as a single study unless there was no overlap in the outcomes reported. When overlap did occur, results from the largest population were extracted. Extraction included data on study characteristics (e.g. study ID, author, year, location, duration of follow-up, time from onset of symptoms to initiation of treatment, whether the study was reported as being conducted while influenza was circulating in community), patient characteristics (e.g. age, gender, number of participants and withdrawals, subgroups reported), interventions (dose and frequency of administration), comparators (placebo, symptomatic relief, or active comparator), study quality and reported outcomes, as specified in Outcomes, above.
Quality assessment strategy
The quality of the individual studies was assessed by one reviewer and independently checked for agreement by a second reviewer. Any disagreements were resolved by consensus and, if necessary, a third reviewer was consulted. The quality of the RCTs was assessed using standard checklists47 which were adapted to incorporate topic-specific quality issues (Appendix 7, Table 102).
Data analysis
Studies were analysed within the following categories: otherwise healthy adults, at-risk, elderly, and children. Analyses of all trials, including those with mixed populations in which data could not be subdivided according to the above categories, were also undertaken. Analyses were carried out for both the ITT (intention to treat; representative of the entire population recruited in the trials) and the ITTI (intention to treat, confirmed, influenza positive) populations whenever possible.
Odds ratio (OR) and 95% CI were calculated for dichotomous outcomes. For continuous outcomes (time to event data), median differences and 95% CI were calculated. When SEs were not available in publications or supplied by the companies for each arm of the trial, SEs around the medians were estimated from CI using the delta method,48 or from SDs. When an SE, SD, or CI were not provided, SEs were calculated using percentiles extrapolated from Kaplan–Meier graphs whenever possible, using the method reported by Collet. 49
Median differences and 95% CI were pooled to produce a weighted median difference (WMD). A random effects model was used, unless there were four or fewer studies included in the analysis, in which case a fixed effects model was used, as the estimate of the heterogeneity parameter is likely to be unreliable with small numbers of trials. 50 All meta-analyses were conducted in revman 4.2.9 (Cochrane Collaboration). The impact of using the number of patients randomised (n) in the analyses of continuous outcomes rather than the number with alleviated symptoms (r) (as used in the previous review by Turner et al. )46 was assessed by reanalysing the data from the previous review using n, and comparing these with the original results in which r was used.
Heterogeneity was assessed using the chi-squared test and I2 statistic. When the results of the tests for heterogeneity were statistically significant (p < 0.1), the potential sources of the heterogeneity, such as patient population, different durations of symptoms prior to treatment, vaccination status and quality criteria, were identified. For the binary outcomes, sensitivity analyses were conducted to explore the impact of the extent of loss to follow-up, in which the overall dropout rate was 10% or more. This could not be investigated for the continuous outcomes, as these were reported as medians, and individual patient data were unavailable for most trials.
As there were no direct head-to-head studies comparing zanamivir with oseltamivir that provided data for the outcomes being evaluated, an indirect comparison was undertaken using placebo as the common comparator, enabling indirect evidence to be utilised;51,52 this is described and reported in Chapter 4.
Results of review of clinical effectiveness
The scope and protocol of this review included amantadine hydrochloride, as well as the NIs, oseltamivir and zanamivir, as interventions. Amantadine was not considered a relevant comparator, as current NICE guidance does not recommend its use for the treatment of influenza.
The current NICE guidance, that amantadine is not recommended for the treatment of influenza, was informed by the previous report by Turner et al. 46 which extended a Cochrane review on the effectiveness of amantadine53 to include children and the elderly. It included two studies in children by Kitamoto54,55 with 104 patients overall who had a confirmed influenza diagnosis. No treatment trials in the elderly were identified. For data on the effectiveness of amantadine in otherwise healthy adults, Turner et al. 46 referred to an earlier version of the Cochrane review by Jefferson et al. 56 published in the year 2000. This review, in its current version, includes eight studies assessing the effectiveness of amantadine for influenza treatment (all published between 1968 and 1981), and concludes that amantadine should ‘be used only in emergency situations when all other measures fail’. 56
For the current review, studies of amantadine for the treatment of influenza, additional to those included in the review by Turner et al. ,46 were sought. However, no new RCTs could be identified. There was no manufacturer submission for amantadine. The Turner review noted both the poor quality of amantadine trial data and its lack of comparability with other antiviral treatments, and this was reflected in the previous NICE guidance. As no new data are available, this review focuses on determining the relative clinical effectiveness and cost-effectiveness of zanamivir and oseltamivir, and amantadine is not considered further.
Quantity and quality of research available
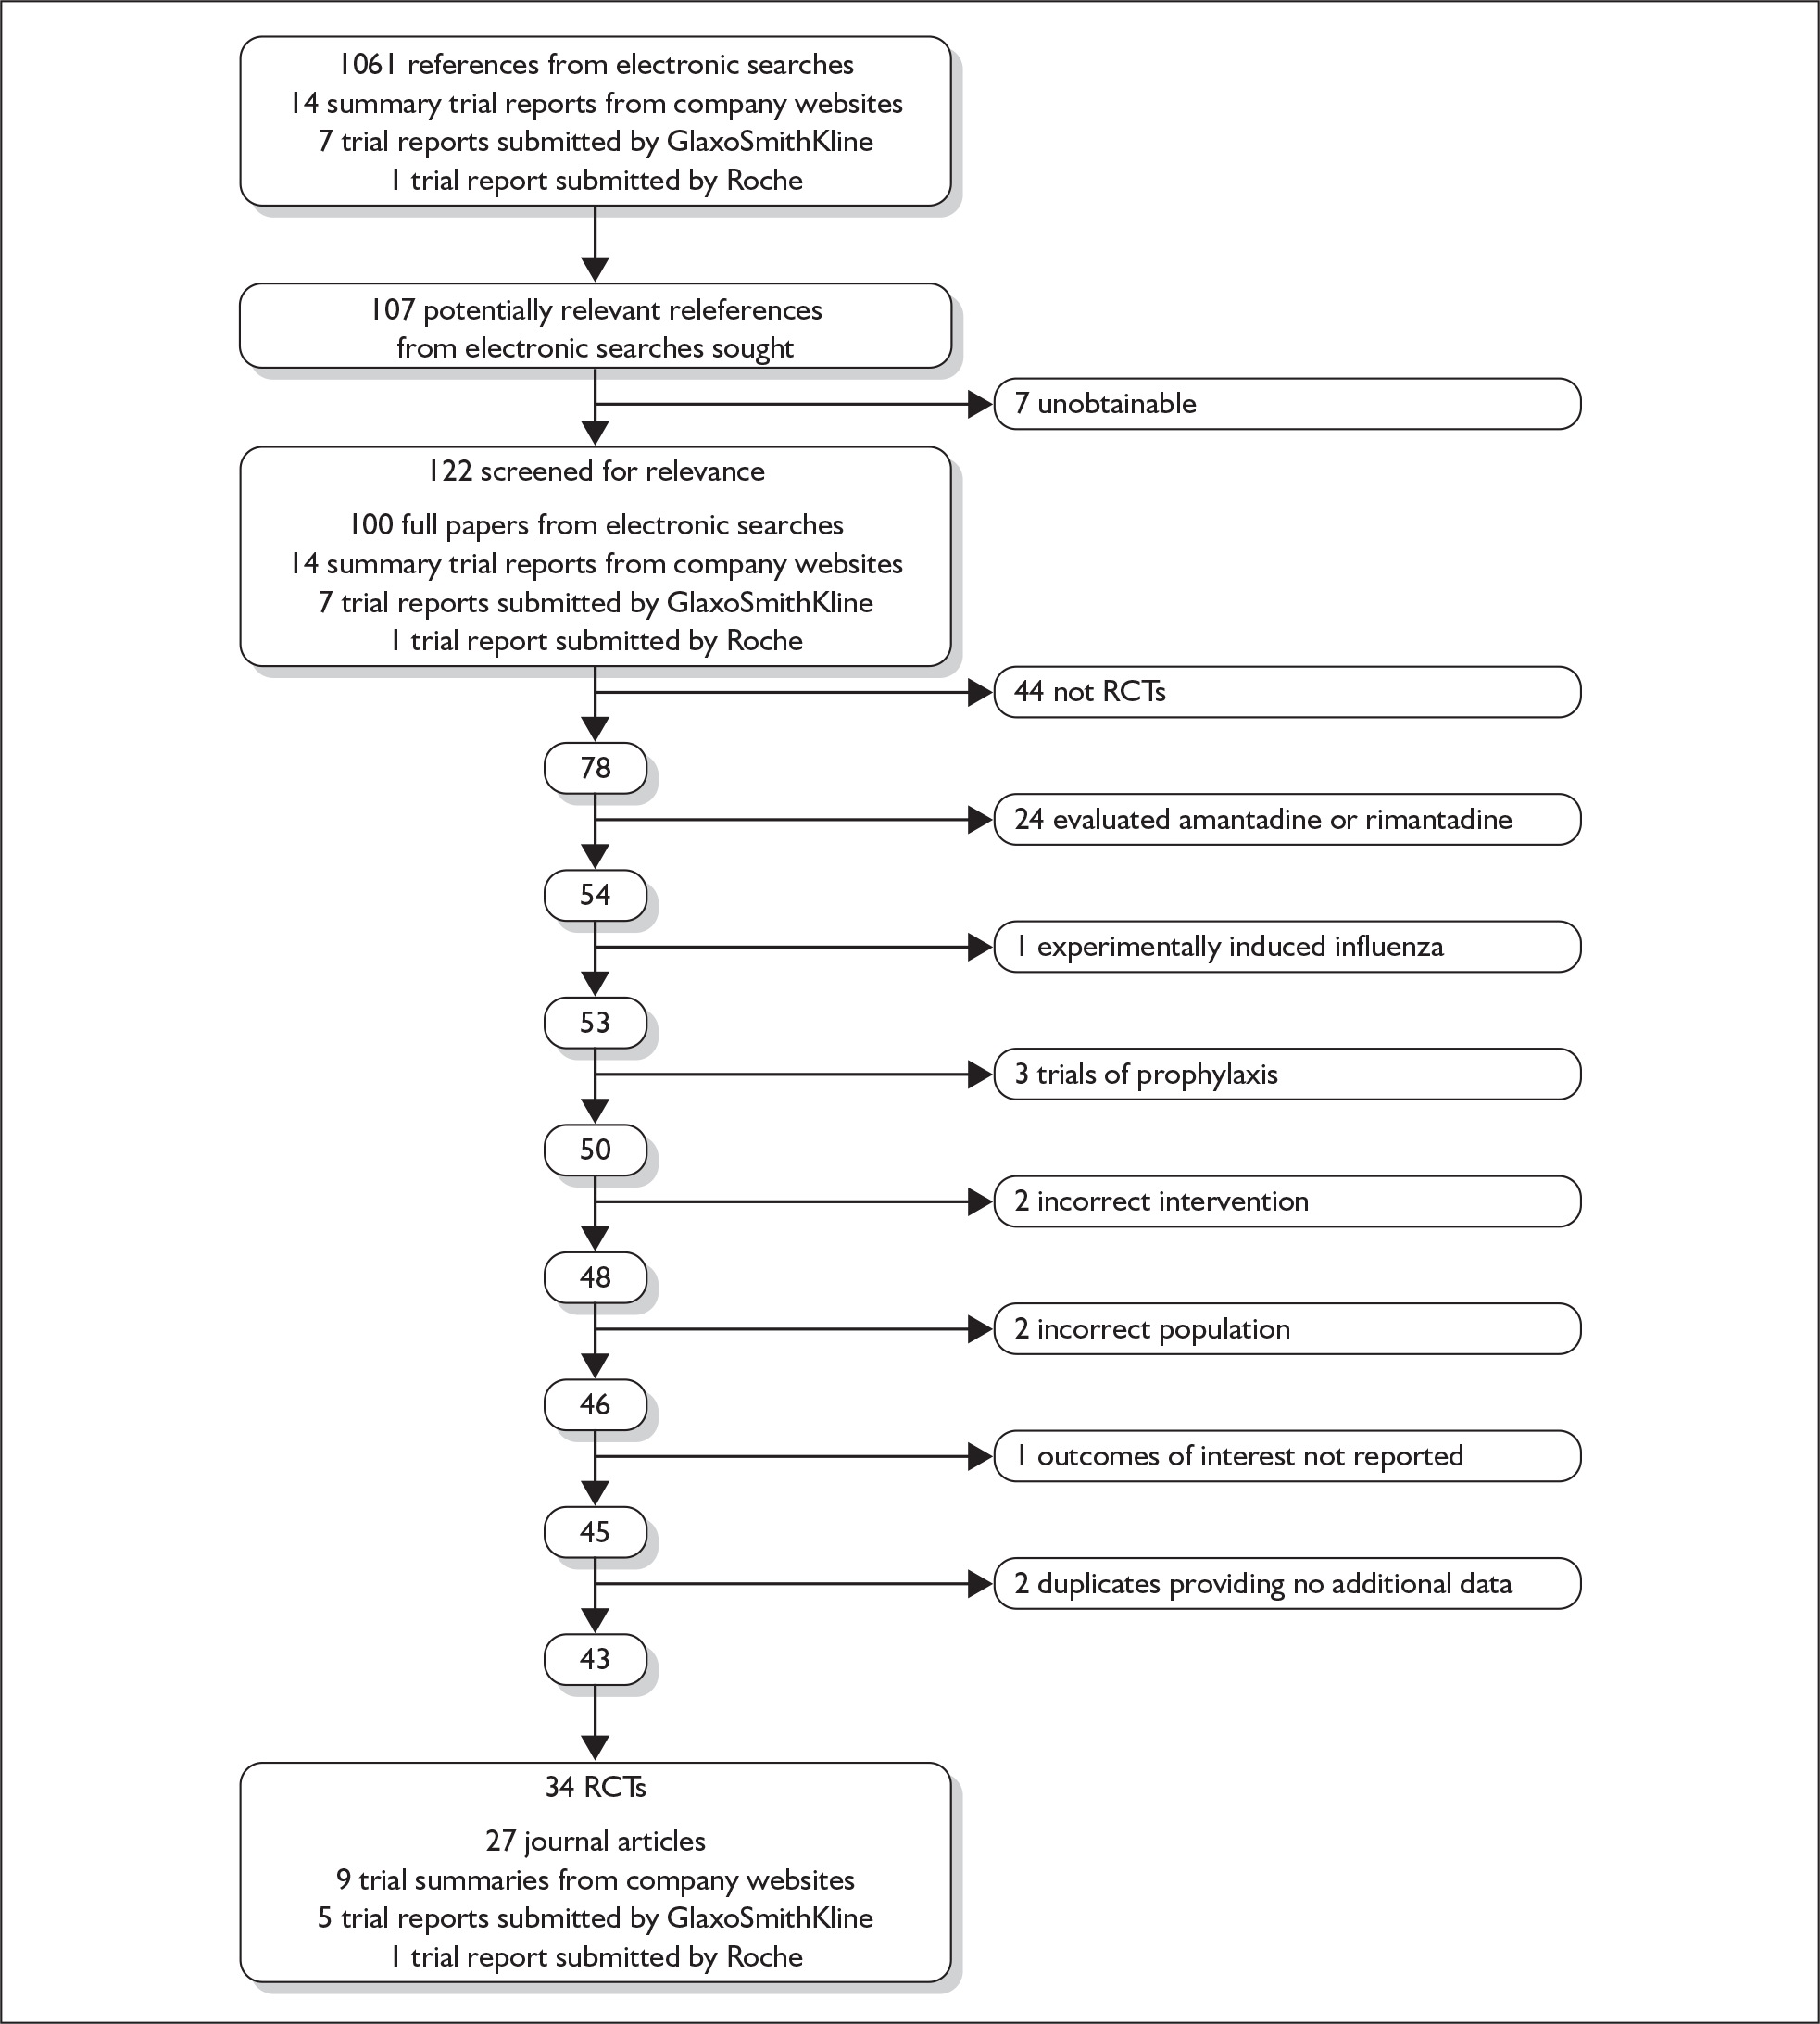
The electronic and hand searches retrieved 1061 references. Of these, 107 full papers were considered potentially relevant to the review of clinical effectiveness of zanamivir or oseltamivir; of which we were unable to locate seven. 57–64 Two of these were available only as project details on the searchable database of US federally funded biomedical research projects (CRISP, Computer Retrieval of Information on Scientific Projects). 59,60 One appeared to be a commentary61 relating to an included study. 65 The remaining four were meeting abstracts,58,62–64 one of which did not appear to have been published in the located proceedings. 58 Therefore 100 full papers and abstracts from these searches, along with 14 summary trial reports from company websites, seven trial reports of zanamivir submitted by GlaxoSmithKline, and one trial report of oseltamivir submitted by Roche, were screened for relevance. We included 34 trials and reported across 27 publications, nine trial summaries from company websites, five trial reports from a submission by GlaxoSmithKline, and one trial report from a submission by Roche (see Table 4). Three trials were included where the primary source of data was published in a language other than English: two Chinese66,67 and one Japanese. 68 Two further trials were published in English and Chinese;69–72 data were extracted only from the English language papers. 69,71 Figure 1 shows the flow of studies through the review. Study details are available in Appendix 7, Table 99.
| Trial | Population | Source |
|---|---|---|
| Matsumoto (1999)86 | Healthy adults | Full paper |
| NAI30011 | Healthy adults | Company submission87 |
| NAI30015 | Healthy adults |
Puhakka (2003),88 full paper Trial data from company website89 Company submission90 |
| NAIA2005a | Healthy adults | Hayden (1997),76 full paper |
| NAIB2005a | ||
| NAIB3001a | Mixed population |
MIST (1998),91 full paper Trial data from company website92 FDA medical review79 Additional data provided by GlaxoSmithKline |
| NAIB2007a | Mixed population |
Data available from last HTA report46 Additional data provided by GlaxoSmithKline |
| NAIA2008a | Mixed population at risk |
Aoki (2000),74 full paper Monto (1999),75 full paper FDA medical review79 |
| NAIB2008a | ||
| NAIA3002a | Mixed population at risk |
Boivin (2000),93 full paper Lalezari (1999),94 abstract Trial data from company website95 FDA medical review79 Additional data provided by GlaxoSmithKline |
| NAIB3002a | Mixed population at risk |
Mäkelä (2000),96 full paper Trial data from company website97 FDA medical review79 Additional data provided by GlaxoSmithKline |
| NAI30008a | ‘At risk’ |
Murphy (2000),98 full paper Additional data provided by GlaxoSmithKline |
| NAI30020 | ‘At risk’ | Trial data from company website99 |
| NAI30009a | Children |
Hedrick (2000),100 full paper Trial data from company website101 Company submission102 |
| NAI30028 | Children |
Trial data from company website103 Company submission104 |
| NAI30012 | Elderly |
Trial data from company website105 Company submission106 |
FIGURE 1.
Flow of studies though the review.
Data for one study were originally available only from the previous HTA report (NAIB2007). 46 Further data from this trial were provided by the company, although these differed from those included in the previous review in that the majority of patients were allocated an arbitrary day for alleviation of symptoms and time to return to normal activity (28 days) beyond the trial follow-up period (7 days). The data used in the previous report were included in the current meta-analysis for consistency. Five trials were published in a single paper, three recruiting an elderly population were combined (WV15819, WV15876, WV15978), and two recruiting an at-risk population were combined (WV15812, WV15873). 73 Data from these trials individually were available only from the previous HTA report. 46 Data from the NAIA2008 and NAIB2008 trials were combined and reported in two papers;74,75 these papers reported different outcomes and are therefore presented separately. Data from the NAIA2005 and NAIB2005 trials were available only in combined form. 76 Data from the NV16871 trial were identified by Roche77 as being published in two sources, one reported results for children and adolescents (6–17 years of age) and the other for children only (6–12 years of age). 78 When there was overlap in the reporting of outcomes, results were extracted for children only, as this was the later publication, with a greater number of participants and more complete reporting. Data for some outcomes from six RCTs were obtained from medical reviews by the Food and Drug Administration (FDA). 79,80
The trial M76001 has been included in a number of previous reviews, often combined with data from three other trials (WV15670, WV15671, WV15730). However, the only published source of separate data for this trial was an abstract which contained insufficient information to be included in the analysis. 81 Additional information was requested from the author, from the principal trial investigator and from Roche; Roche provided some outcome data which has been included in the review. A second abstract that met the inclusion criteria also contained insufficient information to be included in the analysis;82 this was identified as being related to the WV15730 trial for which Roche subsequently submitted a trial report. 83 One study of zanamivir included in the treatment section of the last HTA report was excluded from the current review (NAI30010). 84 This trial was primarily a prophylactic trial, in which households were randomised prior to an outbreak of influenza, and the entire household received either zanamivir or placebo once one household member contracted influenza. This trial therefore did not meet the inclusion criterion that participants were randomised at presentation of ILI.
Six trials of zanamivir and eight of oseltamivir were not included in the Turner et al. 46 review and were therefore new to this review (Tables 4 and 5). One new trial comparing zanamivir with oseltamivir in children was identified; however, this did not provide usable outcome data. 85
| Trial | Population | Source |
|---|---|---|
| Oseltamivir | ||
| Deng (2004)66 | Healthy adults | Full paper published in Chinese |
| Kashiwagi (2000)68 | Healthy adults | Full paper published in Japanese |
| Li (2003) | Healthy adults | Full papers: one English,69 one Chinese70 |
| Tan (2002)67 | Healthy adults | Full paper published in Chinese |
| WV15670a | Healthy adults |
Nicholson (2000),107 full paper FDA medical review80 Additional data provided by Roche |
| WV15671a | Healthy adults |
Treanor (2000),65 full paper FDA medical review80 Additional data provided by Roche |
| WV15730a | Healthy adults |
Company submission83 Robson (2000),82 abstract Last HTA report46 |
| Markovski (2002)57 | Mixed population | Full paper |
| M76001 | Mixed population |
Treanor (2000b),81 abstract Additional data provided by Roche |
| Lin et al. | ‘At risk’ |
Full papers: one English,71 one Chinese72 Abstract108 |
| WV15812a | ‘At risk’ |
Martin (2001),73 full paper, trials combined Martin (2000),109 abstract |
| WV15872a |
Individual trial data from previous HTA report46 Additional data provided by Roche |
|
| NV16871 | Children (6–12 years) |
Johnston (2005),78 full paper Additional data provided by Roche |
| Children and adolescents (6–17 years) |
Trial data from company website77 Additional data provided by Roche |
|
| WV15758a | Children | Whitley (2001),110 full paper |
| WV15819a | Elderly | Martin (2001),73 full paper, trials combined |
| WV15876a | Individual trial data from previous HTA report46 | |
| WV15978a | ||
| Trials of both zanamivir and oseltamivir | ||
| Sato (2005)85 | Children | Full paper |
After accounting for duplicate publications, 29 trial reports underwent quality assessment. Summary results of the quality assessment are presented in Figure 2; full results are available in Appendix 7, Table 102. All 29 reported being randomised, with 25 (86%) also reporting being double blinded. An appropriate method of randomisation was explicitly reported in 13 (45%), allocation concealment in 8 (28%), patient blinding in 13 (45%), outcome assessor blinding in 10 (34%), and care-giver blinding in 11 (38%). Two reports specified being open label. 66,71 Eligibility criteria were reported in 28 (97%).
FIGURE 2.
Proportion of trials with Yes, No, Unclear or Not applicable (N/A) for each quality criterion.
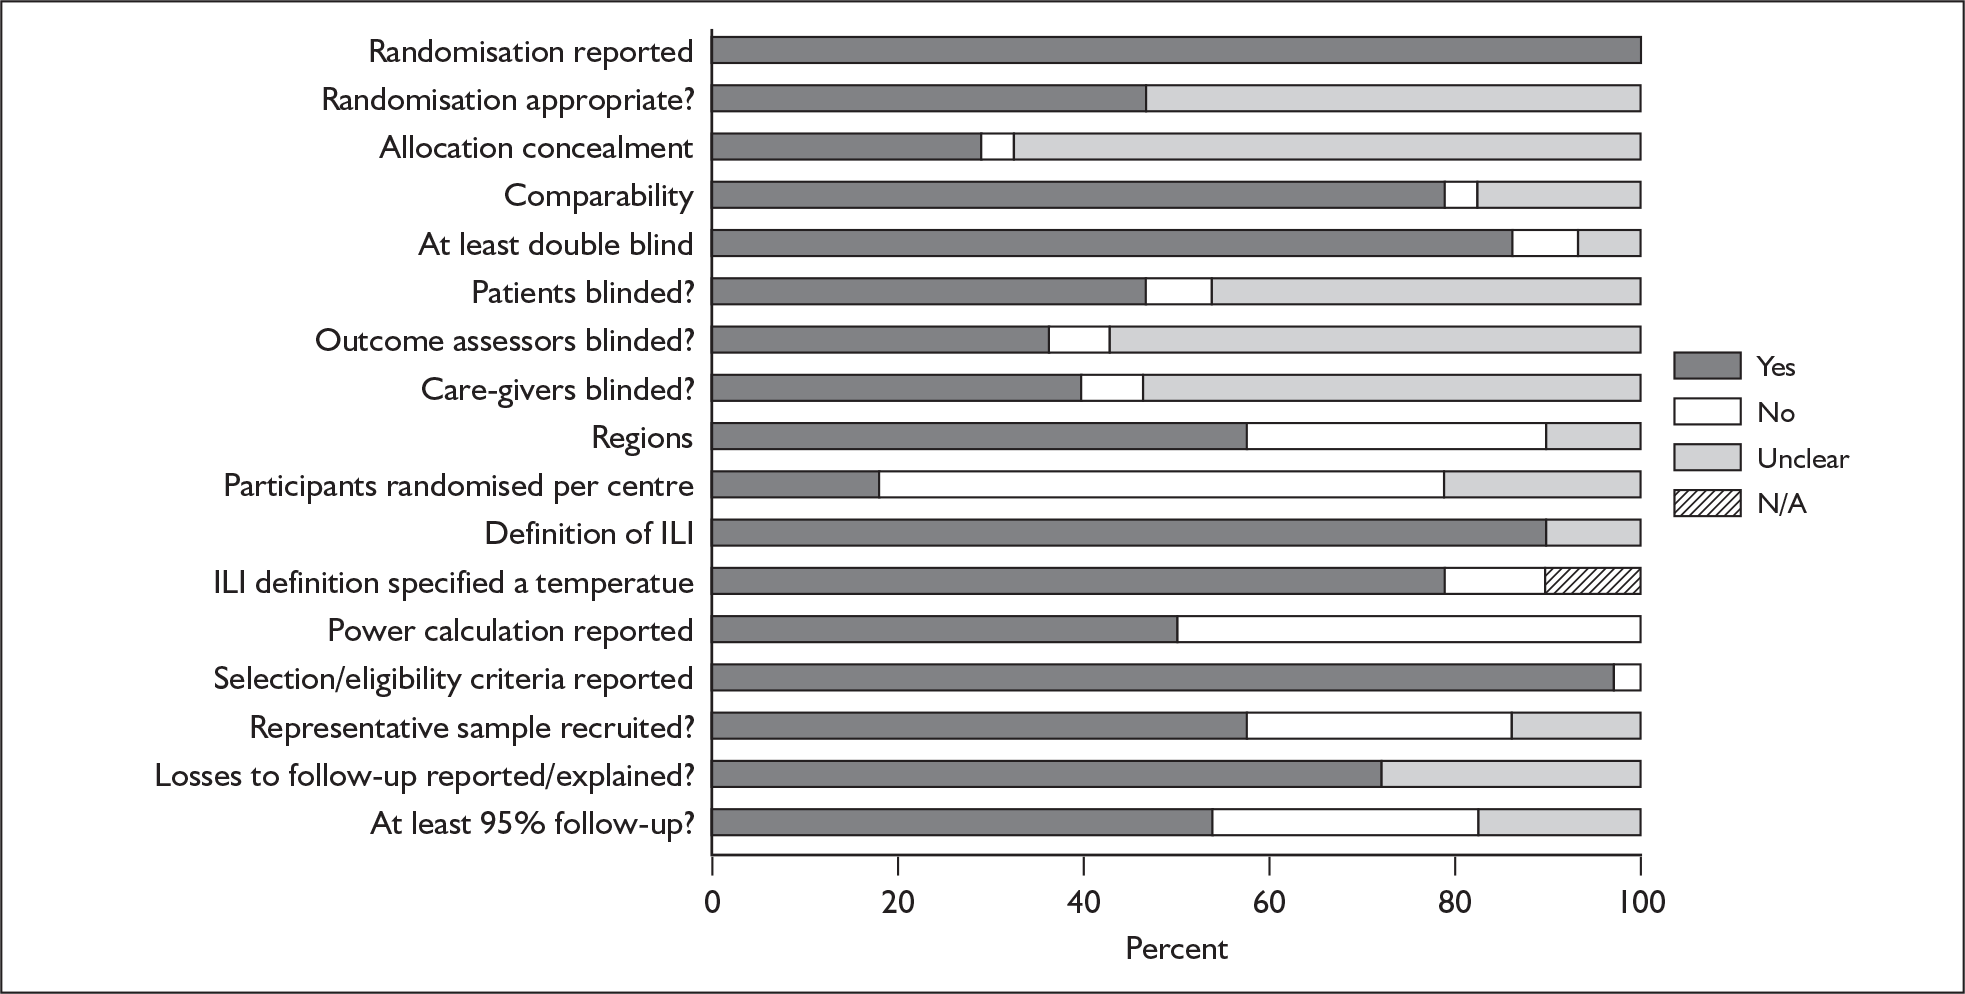
One factor identified specific to this review, and included in the quality assessment, was the number of participants recruited per centre, and whether centres were located across one or more continents. It has been suggested that a site’s performance is a function of the number of patients enrolled, with studies that use fewer sites with greater numbers of patients at each site having more reliable results than those that use large numbers of sites with fewer patients per site. 111 Several included studies had a large number of recruiting centres, resulting in a very small mean number of participants recruited at any one centre. Only six reports (21%) recruited at least 15 participants at each centre taking part in the trial. Seventeen reports (59%) recruited participants from a single continent. Another review-specific criterion was the reporting of a case definition of ILI. Twenty-six reports (90%) provided such a definition; three did not specify a temperature as part of the definition. 74–76
The rate of loss to follow-up depends upon a variety of factors, one of which is the duration of follow-up; trials of short duration would be expected to have lower rates of loss to follow-up than those of longer duration. 112 Given the short-term duration of the included studies (up to 28 days), it was disappointing to note that a large number of trials had losses to follow-up of greater than 5%. Only 15 (52%) reported 95% follow-up or more, with eight (28%) having a dropout rate greater than 5%, and six (21%) not reporting on dropouts. The highest overall dropout rate across the trials was 9%. 67,78 Twenty trials (69%) reported the reasons for losses to follow-up.
Effectiveness in healthy adults
Eleven studies were restricted to healthy adults, four of zanamivir76,86–90 and seven of oseltamivir. 65–70,83,107,113 Results for healthy adults from a further four zanamivir studies recruiting a mixed population were also available. 46,91–97 Three trials of zanamivir86–89 and four of oseltamivir66–69 were not included in the Turner et al. 46 review.
The majority of the studies defined healthy adults as people aged between 18 and 65 years who were not otherwise at risk. 65,67,69,70,82,83,86,91–96,107 Four studies recruited populations with age ranges different from the other studies: 18–99 years;87 16–80 years;68 a minimum of 13 years in the USA and 18 years in Europe with no upper age limit specified;76 and 17–29 years. 88–90 One study reported a population with a mean age of 32 years (SD ± 16 years). 66 Forest plots for pooled results are provided in Appendix 6; see also Appendix 7, Table 103.
Zanamivir compared with placebo
Symptoms
Seven trials of zanamivir in healthy adults reported the time to the alleviation of fever or all symptoms, or to the return to normal activity. 46,76,79,87–89,91–97 The follow-up period was 5 days in one trial,46 14 days in one trial,93–95 21 days in one trial,87 28 days in three trials,88,89,91,92,96,97 and between 21 and 28 days in one trial. 76 Three of the trials had a dropout rate greater than 5%, but none had one greater than 10%. 76,87,91,92
Treatment with zanamivir significantly reduced the time to the alleviation of all symptoms, but there was no clear evidence of an effect on the time to return to normal activity, in either the ITT (Table 6) or the ITTI (Table 7) population. Statistically significant heterogeneity was observed in the analyses of the time to return to normal activity in the ITT population. All the trials included in this analysis used the same outcome definition, and there are no consistent differences between the studies in terms of trial methodology or quality to account for the observed heterogeneity. One study reported the time to alleviation of fever, showing no difference between zanamivir and placebo in either the ITT or the ITTI population. 88,89 This same study reported a time to the alleviation of symptoms that was shorter than the other studies, although this was not reflected in the time to return to normal activity. This is most likely due to this study recruiting healthy young (17–29 years) men (99%) who were in the Finnish Defence Force, who may have recovered more quickly but may not have returned to full duties immediately after symptoms had been relieved.
| Study | Number randomised | Zanamivir Median (SE) |
Placebo Median (SE) |
Median difference (95% CI) | |
|---|---|---|---|---|---|
| Zanamivir | Placebo | ||||
| Alleviation of symptoms | |||||
| aBoivin (2000)93–95 | 363 | 305 | 5 (0.21) | 5 (0.27) | 0.0 (–0.69 to 0.69) |
| GlaxoSmithKline NAI3001187 | 229 | 237 | 4.5 (0.34) | 4.5 (0.25) | 0.0 (–0.84 to 0.84) |
| aHayden (1997)76 | 132 | 144 | 3.5 (0.28) | 4.5 (0.28) | –1.00 (–1.78 to –0.22) |
| aMäkelä (2000)96,97 | 161 | 163 | 5 (0.35) | 6.5 (0.61) | –1.50 (–2.88 to –0.12) |
| aMIST (1998)79,91,92 | 190 | 189 | 5 (0.40) | 6 (0.41) | –1.00 (–1.94 to –0.06) |
| Puhakka (2003)88,89 | 293 | 295 | 2.17 (0.89) | 2.67 (0.23) | –0.50 (–2.30 to 1.30) |
| Pooled result (Figure 24) | WMD –0.57 (95% CI –1.0 7 to –0.08), p = 0.02 | ||||
| Heterogeneity | χ2 = 8.08; p = 0.15; I2 = 38.1% | ||||
| Time to normal activity | |||||
| GlaxoSmithKline NAI3001187 | 229 | 237 | 2.1 (0.20) | 2.2 (0.22) | –0.10 (–0.68 to 0.48) |
| aHayden (1997)76 | 132 | 144 | 3.5 (0.24) | 3.5 (0.21) | 0.0 (–0.63 to 0.63) |
| aBoivin (2000)93–95 | 363 | 305 | 6.5 (0.3) | 6.5 (0.25) | 0.0 (–0.77 to 0.77) |
| aMIST (1998)79,91,92 | 190 | 189 | 7 (0.29) | 8.5 (0.86) | –1.50 (–3.28 to 0.28) |
| aMäkelä (2000)96,97 | 161 | 163 | 6 (0.39) | 8 (0.6) | –2.00 (–3.40 to –0.60) |
| Puhakka (2003)88,89 | 293 | 295 | 5 (0.48) | 6.3 (0.52) | –1.30 (–2.69 to 0.09) |
| aGlaxoSmithKline NAIB200746 | 165 | 159 | 3.5 (0.24) | 3.5 (0.22) | 0.0 (–0.64 to 0.64) |
| Pooled result (Figure 25) | WMD –0.37 (95% CI –0.84 to 0.09), p = 0.11 | ||||
| Heterogeneity | χ2 = 11.90; p = 0.06; I2 = 49.6% | ||||
| Alleviation of fever | |||||
| Puhakka (2003)88,89 | 293 | 295 | 2.00 (N/A) | 2.00 (N/A) | 0.0 |
| Study | Number randomised | Zanamivir Median (SE) |
Placebo Median (SE) |
Median difference (95% CI) | |
|---|---|---|---|---|---|
| Zanamivir | Placebo | ||||
| Alleviation of symptoms | |||||
| Puhakka (2003)88,89 | 222 | 213 | 2 (0.82) | 2.33 (0.27) | –0.33 (–2.02 to 1.36) |
| GlaxoSmithKline NAI3001187 | 104 | 107 | 4.5 (0.32) | 5.0 (0.34) | –0.50 (–1.42 to 0.42) |
| aHayden (1997)76 | 85 | 89 | 3.5 (0.31) | 4.5 (0.46) | –1.00 (–2.09 to 0.09) |
| aBoivin (2000)93–95 | 276 | 214 | 5 (0.19) | 6 (0.3) | –1.00 (–1.70 to –0.30) |
| aMIST (1998)79,91,92 | 137 | 132 | 4.5 (0.36) | 6 (0.48) | –1.50 (–2.65 to –0.35) |
| aMäkelä (2000)96,97 | 124 | 123 | 5 (0.36) | 6.5 (0.71) | –1.50 (–3.06 to 0.06) |
| Pooled result (Figure 26) | WMD –0.96 (95% CI –1.3 8 to –0.54), p < 0.0001 | ||||
| Heterogeneity | χ2 = 2.82; p = 0.73; I2 = 0% | ||||
| Time to normal activity | |||||
| Puhakka (2003)88,89 | 222 | 213 | 4.5 (0.55) | 6.33 (0.76) | –1.83 (–3.67 to 0.01) |
| GlaxoSmithKline NAI3001187 | 104 | 107 | 2.4 (0.20) | 2.5 (0.21) | –0.10 (–0.67 to 0.47) |
| aHayden (1997)76 | 85 | 89 | 3.5 (0.37) | 3.5 (0.29) | 0.0 (–0.92 to 0.92) |
| aBoivin (2000)93–95 | 276 | 214 | 6.5 (0.32) | 7 (0.3) | –0.50 (–1.36 to 0.36) |
| aMIST (1998)79,91,92 | 137 | 132 | 7 (0.33) | 8 (0.90) | –1.00 (–2.88 to 0.88) |
| aMäkelä (2000)96,97 | 124 | 123 | 6.5 (0.46) | 8.5 (0.69) | –2.00 (–3.62 to –0.38) |
| aGlaxoSmithKline NAIB200746 | 96 | 101 | 3.5 (0.28) | 3.5 (0.28) | 0.0 (–0.57 to 0.57) |
| Pooled result (Figure 27) | WMD –0.39 (95% CI –0.84 to 0.06), p = 0.09 | ||||
| Heterogeneity | χ2 = 9.50; p = 0.15; I2 = 36.8% | ||||
| Alleviation of fever | |||||
| Puhakka (2003)88,89 | 222 | 213 | 2.0 (N/A) | 2.0 (N/A) | 0.0 |
Complications
Outcomes relating to complications in healthy adults were poorly reported, with only three zanamivir trials reporting any complication rates (Table 8 and 9). 76,87–89 Two of these had a dropout rate greater than 5%, but not greater than 10%. 76,87
| Study | Zanamivir n/N |
Placebo n/N |
OR (95% CI) |
|---|---|---|---|
| Pneumonia | |||
| Puhakka (2003)88,89 | 16/293 | 12/295 | 1.36 (0.63 to 2.93) |
| Bronchitis | |||
| Puhakka (2003)88,89 | 9/293 | 11/295 | 0.82 (0.33 to 2.00) |
| GlaxoSmithKline NAI3001187 | 8/229 | 5/237 | 1.68 (0.54 to 5.21) |
| Pooled result (Figure 28) | OR 1.08 (95% CI 0.54 to 2.17), p = 0.82 | ||
| Heterogeneity | χ2 = 0.95; p = 0.33; I2 = 0% | ||
| Antibiotic use | |||
| Hayden (1997)76 | 11/132 | 17/144 | 0.68 (0.31 to 1.51) |
| Complications requiring hospitalisation | |||
| Puhakka (2003)88,89 | 48/293 | 37/295 | 1.37 (0.86 to 2.17) |
| GP consultations | |||
| Puhakka (2003)88,89 | 182/293 | 180/295 | 1.05 (0.75 to 1.46) |
| Study | Zanamivir n/N |
Placebo n/N |
OR (95% CI) |
|---|---|---|---|
| Overall complications | |||
| Puhakka (2003)88,89 | 115/222 | 108/213 | 1.04 (0.72 to 1.52) |
| Complications requiring hospitalisation | |||
| Puhakka (2003)88,89 | 34/222 | 20/213 | 1.75 (0.97 to 3.14) |
| Antibiotic use | |||
| Puhakka (2003)88,89 | 93/222 | 83/213 | 1.13 (0.77 to 1.66) |
| GP consultations | |||
| Puhakka (2003)88,89 | 139/222 | 126/213 | 1.16 (0.79 to 1.70) |
The majority of the available information is from a study of primarily healthy young men in the Finnish Defence Forces. 88,89 This study reported high rates of hospitalisation and GP consultations, as those suffering with influenza were isolated from their colleagues; these data are unlikely to be representative of complication rates seen in a presenting population in general practice. The information available from the other two trials is limited, with the incidence of complications low. There is therefore insufficient relevant information from which to draw conclusions.
Adverse events
Four trials of healthy adults reported adverse events, all of which were in the ITT population (Table 10). 76,86–89 The pooled results showed no significant differences between zanamivir and placebo in overall, drug-related or serious adverse events. There was no statistically significant heterogeneity between studies for any of the pooled results.
| Study | Zanamivir n/N |
Placebo n/N |
OR (95% CI) |
|---|---|---|---|
| Overall adverse events | |||
| Puhakka (2003)88,89 | 77/293 | 80/295 | 0.96 (0.66 to 1.38) |
| GlaxoSmithKline NAI3001187 | 80/229 | 77/237 | 1.12 (0.76 to 1.64) |
| Pooled result (Figure 29) | OR 1.03 (95% CI 0.79 to 1.34), p = 0.83 | ||
| Heterogeneity | χ2 = 0.32; p = 0.57; I2 = 0% | ||
| Drug-related adverse events | |||
| Puhakka (2003)88,89 | 11//293 | 13/295 | 0.85 (0.37 to 1.92) |
| GlaxoSmithKline NAI3001187 | 15/229 | 13/237 | 1.21 (0.56 to 2.60) |
| Matsumoto (1999)86 | 6/37 | 8/39 | 0.75 (0.23 to 2.42) |
| Hayden (1997)76 | 30/132 | 26/144 | 1.33 (0.74 to 2.40) |
| Pooled result (Figure 30) | OR 1.11 (95% CI 0.76 to 1.62), p = 0.60 | ||
| Heterogeneity | χ2 = 1.28; p = 0.73; I2 = 0% | ||
| Serious adverse events | |||
| Puhakka (2003)88,89 | 1/293 | 0/295 | 3.03 (0.12 to 74.70) |
| GlaxoSmithKline NAI3001187 | 2/229 | 2/237 | 1.04 (0.14 to 7.4134) |
| Matsumoto (1999)86 | 0/37 | 0/39 | – |
| Pooled result (Figure 31) | OR 1.44 (95% CI 0.28 to 7.35), p = 0.66 | ||
| Heterogeneity | χ2 = 0.32; p = 0.57; I2 = 0% | ||
Oseltamivir compared with placebo
Symptoms
Six trials of oseltamivir in healthy adults reported the time to the alleviation of fever or all symptoms, or to return to normal activity. 46,65,67–69,80,82,107 The follow-up period was 21 days in all six trials. Three of the trials had a dropout rate greater than 5%, but not greater than 10%. 65,67,82,83
Treatment with oseltamivir significantly reduced the time to the alleviation of all symptoms and to the time to return to normal activity in both the ITT and the ITTI populations (Tables 11 and 12 respectively). Statistically significant heterogeneity was observed only in the analysis of the alleviation of all symptoms in the ITTI population. This seems to be primarily driven by one small trial (Roche, WV15730). 48,82,83 When this trial was removed from the analysis, the impact of oseltamivir remained statistically significant (WMD –19.06; 95% CI –33.02 to –5.10; p = 0.007), but there was no longer statistically significant heterogeneity between the studies (χ2 = 7.53; p = 0.11; I2 = 46.9%). When there was sufficient information reported, oseltamivir also reduced the time to the alleviation of fever.
| Study | Number randomised | Oseltamivir Median (SE) |
Placebo Median (SE) |
Median difference (95% CI) | |
|---|---|---|---|---|---|
| Oseltamivir | Placebo | ||||
| Alleviation of symptoms | |||||
| Li (2003)69 | 216 | 235 | 83.5 (5.47a) | 87.7 (5.14a) | –4.20 (–18.91 to 10.51) |
| bNicholson (2000)107 | 243 | 239 | 97.6 (9.38) | 116.1 (7.60) | –18.50 (–43.02 to 6.02) |
| bTreanor (2000)65 | 210 | 209 | 76.3 (6.43) | 97 (5.29) | –20.70 (–37.02 to –4.38) |
| bRoche WV1573046,82,83 | 31 | 27 | 74.5 (8.2) | 109.8 (31.2) | –35.30 (–98.53 to 27.93) |
| Pooled result (Figure 32) | WMD –13.29 (95% CI –25.1 5 to –3.43), p = 0.008 | ||||
| Heterogeneity | χ2 = 2.90; p = 0.41; I2 = 0% | ||||
| Time to normal activity | |||||
| bTreanor (2000)65 | 210 | 209 | 108.73 (6.97a) | 132.98 (7.82a) | –24.25 (–44.78 to –3.72) |
| bNicholson (2000)80,107 | 240 | 234 | 132.4 (8.17) | 172.98 (8.25) | –40.58 (–63.33 to –17.83) |
| bRoche WV1573046,82,83 | 31 | 27 | 152.6 (24.8) | 196.2 (36.3) | –43.60 (–129.77 to 42.57) |
| Pooled result (Figure 33) | WMD –31.94 (95% CI –46.95 to –16.93), p < 0.0001 | ||||
| Heterogeneity | χ2 = 1.16; p = 0.56; I2 = 0% | ||||
| Alleviation of fever | |||||
| Li (2003)69 | 216 | 235 | 28.7 (N/A) | 32.5 (N/A) | –3.80 |
| bNicholson (2000)107 | 243 | 239 | 45 (3.6a) | 59 (5.24a) | –14.00 (–26.46 to –1.54) |
| Study | Number randomised | Oseltamivir Median (SE) |
Placebo Median (SE) |
Median difference (95% CI) | |
|---|---|---|---|---|---|
| Oseltamivir | Placebo | ||||
| Alleviation of symptoms | |||||
| Li (2003)69 | 134 | 139 | 91.6 (5.46a) | 95 (5.33a) | –3.40 (–18.35 to 11.55) |
| Tan (2002)67 | 22 | 25 | 100.25 (19.43a) | 93.75 (21.27a) | 6.50 (–49.96 to 62.96) |
| Kashiwagi (2000)68 | 122 | 130 | 70 (8.36a) | 93.3 (8.86a) | –23.30 (–47.18 to 0.58) |
| bNicholson (2000)80,107 | 158 | 161 | 87.4 (7.8) | 116.5 (8.5) | –29.10 (–57.71 to –6.49) |
| bTreanor (2000)65,80 | 124 | 129 | 71.5 (5.6) | 103.3 (7.9) | –31.80 (–50.78 to –12.82) |
| bRoche WV1573046,82,83 | 19 | 19 | 78.2 (10.6) | 143.9 (24.8) | –65.70 (–118.56 to –12.84) |
| Pooled result (Figure 34) | WMD –22.19 (95% CI –37.32 to –7.07), p = 0.004 | ||||
| Heterogeneity | χ2 = 10.60; p = 0.06; I2 = 52.8% | ||||
| Time to normal activity | |||||
| bNicholson (2000)80,107 | 158 | 161 | 197.5 (19.02a) | 241 (23.12a) | –43.50 (–102.18 to 15.18) |
| bRoche WV1573046,82,83 | 19 | 19 | 130.7 (17.4) | 218.7 (36.1) | –88.00 (–166.55 to –9.45) |
| bTreanor (2000)65 | 124 | 129 | 156.7 (10.75a) | 225.1 (26.27a) | –68.40 (–124.03 to –12.77) |
| Pooled result (Figure 35) | WMD –63.17 (95% CI –99.08 to –27.27), p = 0.0006 | ||||
| Heterogeneity | χ2 = 0.85; p = 0.65; I2 = 0% | ||||
| Alleviation of fever | |||||
| Li (2003)69 | 134 | 139 | 27.9 (N/A) | 51.5 (N/A) | –23.60 |
| Tan (2002)67 | 22 | 25 | 22.75 (4.83a) | 29.83 (9.0b) | –7.08 (–27.10 to 12.94) |
| Kashiwagi (2000)68 | 122 | 130 | 33.1 (N/A) | 60.5 (N/A) | –27.4 |
| bNicholson (2000)107 | 158 | 161 | 39 (3.71a) | 67 (4.76a) | –28.00 (–39.83 to –16.17) |
| bTreanor (2000)65,80 | 124 | 129 | 41.5 (3.65a) | 64.6 (4.18a) | –23.10 (–33.98 to –12.22) |
| bRoche WV1573046,82,83 | 19 | 19 | 39.5 (6.21a) | 80.5 (10.0a) | –41.00 (–64.07 to –17.93) |
| Pooled result (Figure 36) | WMD –24.54 (95% CI –31.61 to –17.46), p < 0.0001 | ||||
| Heterogeneity | χ2 = 5.27; p = 0.15; I2 = 43.1% | ||||
Complications
Six oseltamivir studies reported outcomes relating to complications in healthy adults (Tables 13 and 14),46,65,66,68,69,83,107 three of which were conducted in China66,69 or Japan,68 with two published in their respective languages. 66,68 Oseltamivir showed a statistically significantly reduction in the rate of antibiotic use in the ITT population. However, this result was based on only two studies, one of which was the trial by Deng et al. ,66 which was conducted in China and had a particularly high rate of antibiotic use in both arms, and which therefore has most weight in and drives the pooled result. In addition, the study by Deng et al. 66 was described as open label. Nonetheless, the Canadian trial by Nicholson,107 which used a matching placebo and appeared to be double blinded, showed a similar size of relative effect. The pooled result for the ITTI analysis has the same direction of effect, does not include the trial by Deng et al. and is of borderline statistical significance.
| Study | Oseltamivir n/N |
Placebo n/N |
OR (95% CI) |
|---|---|---|---|
| Overall complications | |||
| Treanor (2000)65 | 18/210 | 28/209 | 0.61 (0.32 to 1.13) |
| Complications requiring hospitalisation | |||
| aDeng (2004)66 | 5/599 | 3/577 | 1.61 (0.38 to 6.77) |
| Nicholson (2000)107 | 1/241 | 1/235 | 0.98 (0.06 to 15.68) |
| Treanor (2000)65,80 | 0/210 | 2/209 | 0.20 (0.01 to 4.13) |
| Pooled result (Figure 37) | OR 0.97 (95% CI 0.33 to 2.90), p = 0.96 | ||
| Heterogeneity | χ2 = 1.53; p = 0.47; I2 = 0% | ||
| Bronchitis | |||
| Nicholson (2000)107 | 7/241 | 5/235 | 1.38 (0.43 to 4.40) |
| Pneumonia | |||
| Kashiwagi (2000)68 | 0/154 | 1/154 | 0.33 (0.01 to 8.19) |
| Nicholson (2000)107 | 0/241 | 1/235 | 0.32 (0.01 to 7.99) |
| Pooled result (Figure 38) | OR 0.33 (95% CI 0.03 to 3.16), p = 0.33 | ||
| Heterogeneity | χ2 = 0.00; p = 0.99; I2 = 0% | ||
| Antibiotic use | |||
| aDeng (2004)66 | 129/599 | 248/577 | 0.36 (0.28 to 0.47) |
| Nicholson (2000)107 | 6/241 | 10/235 | 0.57 (0.21 to 1.61) |
| Pooled result (Figure 39) | OR 0.37 (95% CI 0.29 to 0.48), p < 0.0001 | ||
| Heterogeneity | χ2 = 0.71; p = 0.40; I2 = 0% | ||
| Study | Oseltamivir n/N |
Placebo n/N |
OR (95% CI) |
|---|---|---|---|
| Overall complications | |||
| Li (2003)69 | 7/134 | 7/139 | 1.04 (0.35 to 3.05) |
| Treanor (2000)65 | 11/124 | 19/129 | 0.56 (0.26 to 1.24) |
| Roche WV1573046,82,83 | 2/19 | 1/19 | 2.12 (0.18 to 25.55) |
| Pooled result (Figure 40) | OR 0.75 (95% CI 0.41 to 1.37), p = 0.35 | ||
| Heterogeneity | χ2 = 1.53; p = 0.47; I2 = 0% | ||
| Pneumonia | |||
| Nicholson (2000)107 | 0/158 | 1/161 | 0.34 (0.01 to 8.35) |
| Treanor (2000)65 | 0/124 | 1/129 | 0.34 (0.01 to 8.53) |
| Roche WV1573046,82,83 | 0/19 | 1/19 | 0.32 (0.01 to 8.26) |
| Pooled result (Figure 41) | OR 0.33 (95% CI 0.05 to 2.14), p = 0.25 | ||
| Heterogeneity | χ2 = 0.0; p = 1.00; I2 = 0% | ||
| Bronchitis | |||
| Nicholson (2000)107 | 5/158 | 3/161 | 1.72 (0.40 to 7.33) |
| Treanor (2000)65 | 5/124 | 8/129 | 0.64 (0.20 to 2.00) |
| Pooled result (Figure 42) | OR 0.94 (95% CI 0.39 to 2.24), p = 0.88 | ||
| Heterogeneity | χ2 = 1.12; p = 0.29; I2 = 10.6% | ||
| Antibiotic use | |||
| Li (2003)69 | 5/134 | 5/139 | 1.04 (0.29 to 3.67) |
| Nicholson (2000)107 | 1/158 | 8/161 | 0.12 (0.02 to 0.99) |
| Treanor (2000)65 | 8/124 | 14/129 | 0.57 (0.23 to 1.40) |
|
Pooled result (Figure 43) Heterogeneity |
OR 0.52 (95% CI 0.27 to 1.00), p = 0.05 χ2 = 3.05; p = 0.22; I2 = 34.4% |
||
Overall, there was limited information on complications, their incidence was low, and no other statistically significant differences in complication rates between oseltamivir and placebo were observed. There was no statistically significant heterogeneity between studies in any of the analyses. Two trials had a dropout rate greater than 5%, but not greater than 10%. 65,82,83
Adverse events
Adverse events were reported in six oseltamivir studies of healthy adults, all of which were in the ITT population (Table 15). 46,66–69,80,82,83,107 Four of the studies were conducted in China66,67,69 or Japan,68 with three published in their respective languages. 66–68 Adverse event data were only reported for ITT populations. There were few events, and no clear evidence of differences in drug-related or serious adverse events was observed between oseltamivir and placebo. There was no statistically significant heterogeneity between studies in any of the pooled analyses. Two trials had dropout rates greater than 5% but not greater than 10%. 67,82,83
| Study | Oseltamivir n/N |
Placebo n/N |
OR (95% CI) |
|---|---|---|---|
| Overall adverse events | |||
| Deng (2004)66 | 31/599 | 26/577 | 1.16 (0.68 to 1.97) |
| Tan (2002)67 | 4/36 | 5/40 | 0.88 (0.22 to 3.55) |
| Kashiwagi (2000)68 | 71/154 | 89/159 | 0.67 (0.43 to 1.05) |
| Roche WV1573046,82,83 | 19/31 | 20/27 | 0.55 (0.18 to 1.71) |
| Pooled result (Figure 44) | OR 0.81 (95% CI 0.59 to 1.12), p = 0.20 | ||
| Heterogeneity | χ2 = 2.82; p = 0.42; I2 = 0% | ||
| Drug-related adverse events | |||
| Roche WV1573046,82,83 | 14/31 | 7/27 | 2.35 (0.77 to 7.17) |
| Li (2003)69 | 21/216 | 19/235 | 1.22 (0.64 to 2.35) |
| Pooled result (Figure 45) | OR 1.45 (95% CI 0.83 to 2.53), p = 0.19 | ||
| Heterogeneity | χ2 = 0.99; p = 0.32; I2 = 0% | ||
| Serious adverse events | |||
| Li (2003)69 | 0/216 | 0/235 | – |
| Nicholson (2000)80,107 | 1/241 | 3/235 | 0.32 (0.03 to 1.17) |
| Roche WV1573046,82,83 | 0/31 | 0/27 | – |
Effectiveness in the overall at-risk population
This section includes studies that specifically recruited children with comorbid conditions and who were therefore classified as at risk, the elderly or a population described as at risk, together with the subgroups of patients from studies recruiting a mixed population where results for those at risk were available separately. Two trials of zanamivir99,105,106 and two of oseltamivir71,72,77,78 were not included in the Turner et al. 46 review.
Zanamivir compared with placebo
Symptoms
Nine trials of zanamivir in an at-risk population reported the time to alleviation of fever or symptoms, or to return to normal activity. Of these, six were in a general at-risk population,46,75,91–97,99 one in children, with results for those at risk provided separately by GlaxoSmithKline,46,100,101 one in the elderly,105,106 and one in adults with chronic obstructive airways disease (COAD) or asthma. 98,114,115 The follow-up period was 5 days in two trials,46,99 6 days in one trial,103 14 days in one trial,93–95 21 days in one trial,75 28 days in four trials,91,92,96–98,100,101,114,115 and 29 days (with a follow-up telephone call at 56 days) in one trial. 105,106 Three of the trials had a dropout rate greater than 5%, but not greater than 10%. 75,91,92,98,114,115
Treatment with zanamivir significantly reduced the time to the alleviation of all symptoms in the overall at-risk group in both the ITT and the ITTI populations. There was no clear evidence of an effect of zanamivir on the time to the return to normal activity in either population (Tables 16 and 17). There was statistically significant heterogeneity between studies for the time to return to normal activity when results for the overall at-risk groups were pooled.
| Study | Number randomised | Zanamivir Median (SE) |
Placebo Median (SE) |
Median difference (95% CI) | |
|---|---|---|---|---|---|
| Zanamivir | Placebo | ||||
| Alleviation of symptoms | |||||
| aMäkelä (2000)79,96,97 | 13 of 136 | 19 of 141 | 9 (2.97) | 11.5 (1.43) | –2.5 (–8.96 to 3.96) |
| aMonto (1999)75 | 48 of 419 | 68 of 422 | 6.3 (N/A) | 7.8 (N/A) | –1.5 |
| aMurphy (2000)98,114,115 | 262 | 263 | 5.5 (0.34) | 6.5 (0.46) | –1.00 (–2.12 to 0.12) |
| aBoivin (2000)79,93–95 | 49 of 312 | 60 of 257 | 7.5 (1.45) | 6 (0.93) | 1.50 (–1.88 to 4.88) |
| aMIST (1998)79,91,92 | 37 of 227 | 39 of 228 | 5 (0.48) | 7 (1.43) | –2.00 (–4.96 to 0.96) |
| aHedrick (2000)100,101 | 22 of 224 | 14 of 247 | 3.75 (1.01) | 5.75 (2.31) | –2.00 (–6.94 to 2.94) |
| GlaxoSmithKline NAI30012105,106 | 191 | 167 | 6.5 (0.73) | 7.5 (0.66) | –1.0 (–2.92 to 0.92) |
|
Pooled result (Figure 46) Heterogeneity |
WMD –0.98 (95% CI –1.8 4 to –0.11), p = 0.03 χ2 = 2.91; p = 0.71; I2 = 0% |
||||
|
Pooled result for at-risk adults; trial by Hedrick (2000) removed Heterogeneity |
WMD –0.95 (95% CI –1.8 3 to –0.07), p = 0.03 χ2 = 2.74; p = 0.60; I2 = 0% |
||||
| Result for at-risk children; trial by Hedrick (2000) only | WMD –2.00 (95% CI –6.94 to 2.94), p = 0.43 | ||||
| Time to normal activity | |||||
| aMurphy (2000)98,114,115 | 160 | 153 | 8.5 (0.52) | 9 (0.57) | –0.50 (–2.01 to 1.01) |
| aGlaxoSmithKline NAIB200746 | 23 | 24 | 3.5 (0.23) | 3.5 (0.52) | 0.0 (–1.11 to 1.11) |
| aMäkelä (2000)79,96,97 | 13 of 136 | 19 of 141 | 9 (0.85) | 14.5 (5.85) | –5.50 (–17.09 to 6.09) |
| aMIST (1998)79,91,92 | 37 of 227 | 39 of 228 | 8 (1.38) | 13 (1.01) | –5.00 (–8.3 6 to –1.64) |
| aHedrick (2000)100,101 | 22 of 224 | 14 of 247 | 6 (1.17) | 7 (0.46) | –1.00 (–3.46 to 1.46) |
| aBoivin (2000)79,93–95 | 49 of 312 | 60 of 257 | 11 (3.28) | 9.5 (1.05) | 1.50 (–5.25 to 8.25) |
|
Pooled result (Figure 47) Heterogeneity |
WMD –0.96 (95% CI –2.32 to 0.41), p = 0.17 χ2 = 8.88; p = 0.11; I2 = 43.7% |
||||
|
Pooled result for at-risk adults; trial by Hedrick (2000) removed Heterogeneity |
WMD –1.07 (95% CI –2.81 to 0.68), p = 0.23 χ2 = 8.73; p = 0.07; I2 = 54.2% |
||||
| Result for at-risk children; trial by Hedrick (2000) only | WMD –1.00 (95% CI –3.46 to 1.46), p = 0.43 | ||||
| Alleviation of fever | |||||
| GlaxoSmithKline NAI3002099 | 224 | 107 | 47.5 (0.325b) hours | 57 (0.465b) hours | –9.50 (–10.6 1 to –8.39) |
| Study | Number randomised | Zanamivir Median (SE) |
Placebo Median (SE) |
Median difference (95% CI) | |
|---|---|---|---|---|---|
| Zanamivir | Placebo | ||||
| Alleviation of symptoms | |||||
| aMurphy (2000)98,114,115 | 160 | 153 | 5 (0.31) | 7 (0.52) | –2.00 (–3.1 9 to –0.81) |
| aBoivin (2000)79,93–95 | 36 of 312 | 43 of 257 | 5.5 (1.8) | 6 (1.14) | –0.50 (–4.68 to 3.68) |
| aMIST (1998)79,91,92 | 24 of 161 | 28 of 160 | 5 (0.61) | 8 (2.75) | –3.00 (–8.52 to 2.52) |
| aMäkelä (2000)79,96,97 | 12 of 136 | 18 of 141 | 9 (2.19) | 11.5 (1.58) | –2.50 (–7.79 to 2.79) |
| aHedrick (2000)100,101 | 12 of 164 | 10 of 182 | 2 (0.28) | 5.75 (1.94) | –3.75 (–7.59 to 0.09) |
| GlaxoSmithKline NAI30012105,106 | 120 | 114 | 7.25 (0.86) | 7.5 (1.01) | –0.25 (–2.85 to 2.35) |
|
Pooled result (Figure 48) Heterogeneity |
WMD –1.83 (95% CI –2.8 1 to –0.86), p = 0.0002 χ2 = 3.09; p = 0.69; I2 = 0% |
||||
|
Pooled result for at-risk adults; trial by Hedrick (2000) removed Heterogeneity |
WMD –1.70 (95% CI –2.7 1 to –0.69), p = 0.0004 χ2 = 2.0609; p = 0.72; I2 = 0% |
||||
| Result for at-risk children; trial by Hedrick (2000) only | WMD –3.75 (95% CI –7.59 to 0.09), p = 0.06 | ||||
| Time to normal activity | |||||
| aMurphy (2000)98,114,115 | 160 | 153 | 8.5 (0.61) | 9 (0.79) | –0.50 (–2.46 to 1.46) |
| aGlaxoSmithKline NAIB200746 | 17 | 17 | 3.5 (0.19) | 3.5 (0.47) | 0.0 (–0.99 to 0.99) |
| aMäkelä (2000)79,96,97 | 12 of 136 | 18 of 141 | 8.5 (1.09) | 14.5 (6.06) | –6.00 (–18.07 to 6.07) |
| aMIST (1998)79,91,92 | 24 of 161 | 28 of 160 | 6.5 (1.36) | 13 (0.85) | –6.50 (–9.6 4 to –3.36) |
| aBoivin (2000)79,93–95 | 36 of 312 | 43 of 257 | 11 (3.3) | 9.5 (1.56) | 1.50 (–5.65 to 8.65) |
| aHedrick (2000)100,101 | 12 of 164 | 10 of 182 | 4.5 (0.87) | 7 (0.39) | –2.50 (–4.3 7 to –0.63) |
| GlaxoSmithKline NAI30012105,106 | 120 | 114 | 11 (N/A) | 13.75 (N/A) | –2.75 |
|
Pooled result (Figure 49) Heterogeneity |
WMD –1.89 (95% CI –3.95 to 0.17), p = 0.07 χ2 = 19.48; p = 0.002; I2 = 74.3% |
||||
| Pooled result for at-risk adults; trial by Hedrick (2000) removed Heterogeneity |
WMD –1.77 (95% CI –4.40 to 0.86), p = 0.19 χ2 = 16.08; p = 0.003; I2 = 75.1% |
||||
| Result for at-risk children; trial by Hedrick (2000) only | WMD –2.50 (95% CI –4.3 7 to –0.63), p = 0.009 | ||||
| Alleviation of fever | |||||
| GlaxoSmithKline NAI30012105,106 | 120 | 114 | 4.0 (N/A) | 4.5 (N/A) | –0.5 |
For comparability with the Turner et al. 46 review’s separate analyses of at-risk adults and children, a sensitivity analysis was undertaken in which the study in children was excluded from the overall pooled results (see Tables 15 and 16). 100,101 At-risk adults showed the same pattern of response as the whole at-risk population, with treatment with zanamivir resulting in a statistically significant reduction in the time to the alleviation of all symptoms in both the ITT and the ITTI populations. There was no clear evidence of an effect of treatment on the time to return to normal activity in either population. Statistically significant heterogeneity across studies was observed in the analyses of the time to return to normal activity in both the ITT and the ITTI populations. One study showed a significant reduction with zanamivir in the time to alleviation of fever in the ITT population. 99
Complications
Six zanamivir trials reported complications in an at-risk population. Of these, one was in patients with COAD or asthma,98,114,115 one in the elderly,105,106 and four in general at-risk populations. 91–97,99 Two had dropout rates of greater than 5%, but not greater than 10%. 91,92,98,114,115 Two trials had follow-up periods of only 5 days,99,103 and one of 14 days. 93–95
The incidence of complications was low, and there was no clear evidence of a difference in rates of overall complications between zanamivir and placebo in either the ITT or the ITTI populations (Tables 18 and 19). With a total of eight events, there was no evidence of a difference in the rates of pneumonia between groups in either population. Analysis of antibiotic use was also based on limited data, and there was no clear evidence of a difference in either population. The incidence of bronchitis was significantly lower with zanamivir in the ITT populations, which included one study restricted to an elderly population105 and another restricted to patients with COAD or asthma. 98,114,115 Statistically significant heterogeneity was observed in three analyses, overall complications in the ITT population, and antibiotic use in both the ITT and the ITTI populations.
| Study | Zanamivir n/N |
Placebo n/N |
OR (95% CI) |
|---|---|---|---|
| Overall complications | |||
| Boivin (2000)79,93–95 | 17/49 | 17/60 | 1.34 (0.60 to 3.03) |
| Mäkelä (2000)79,96,97 | 4/13 | 11/19 | 0.32 (0.07 to 1.43) |
| MIST (1998)79,91,92 | 5/37 | 18/39 | 0.18 (0.06 to 0.57) |
| GlaxoSmithKline NAI30012105,106 | 57/191 | 56/167 | 0.84 (0.54 to 1.32) |
|
Pooled result (Figure 50) Heterogeneity |
OR 0.73 (95% CI 0.51 to 1.04), p = 0.08 χ2 = 9.47; p = 0.02; I2 = 68.3% |
||
| Complications requiring hospitalisation | |||
| Murphy (2000)98,114,115 | 3/261 | 6/263 | 0.50 (0.12 to 2.01) |
| Pneumonia | |||
| Murphy (2000)98,114,115 | 0/261 | 2/263 | 0.20 (0.01 to 4.19) |
| GlaxoSmithKline NAI30012105,106 | 3/191 | 3/166 | 0.87 (0.17 to 4.35) |
|
Pooled result (Figure 51) Heterogeneity |
OR 0.57 (95% CI 0.15 to 2.23), p = 0.42 χ2 = 0.71; p = 0.40; I2 = 0% |
||
| Bronchitis | |||
| Murphy (2000)98,114,115 | 9/261 | 26/263 | 0.33 (0.15 to 0.71) |
| GlaxoSmithKline NAI3002099 | 4/223 | 2/106 | 0.95 (0.17 to 5.27) |
| GlaxoSmithKline NAI30012105,106 | 10/191 | 18/166 | 0.45 (0.20 to 1.01) |
|
Pooled result (Figure 52) Heterogeneity |
OR 0.41 (95% CI 0.24 to 0.70), p = 0.0009 χ2 = 1.32; p = 0.52; I2 = 0% |
||
| Antibiotic use | |||
| Boivin (2000)79,93–95 | 13/49 | 9/60 | 2.05 (0.79 to 5.30) |
| Mäkelä (2000)79,96,97 | 0/13 | 5/19 | 0.10 (0.00 to 1.94) |
| MIST (1998)79,91,92 | 5/37 | 15/39 | 0.25 (0.08 to 0.78) |
| GlaxoSmithKline NAI30012105,106 | 32/191 | 36/167 | 0.73 (0.43 to 1.24) |
|
Pooled result (Figure 53) Heterogeneity |
OR 0.71(95% CI 0.47 to 1.07), p = 0.10 χ2 = 9.67; p = 0.02; I2 = 69.0% |
||
| Study | Zanamivir n/N |
Placebo n/N |
OR (95% CI) |
|---|---|---|---|
| Overall complications | |||
| Mäkelä (2000)79,96,97 | 4/12 | 11/18 | 0.32 (0.07 to 1.47) |
| Murphy (2000)98,114,115 | 52/160 | 56/153 | 0.83 (0.52 to 1.33) |
| Boivin (2000)93–95 | 12/36 | 9/43 | 1.89 (0.69 to 5.19) |
| GlaxoSmithKline NAI30012105,106 | 39/120 | 46/114 | 0.71 (0.42 to 1.21) |
|
Pooled result (Figure 54) Heterogeneity |
OR 0.82 (95% CI 0.59 to 1.13), p = 0.23 χ2 = 4.37; p = 0.22; I2 = 31.3% |
||
| Complications requiring hospitalisation | |||
| GlaxoSmithKline NAI30012105,106 | 5/120 | 4/114 | 1.20 (0.31 to 4.57) |
| Pneumonia | |||
| Murphy (2000)98,114,115 | 0/160 | 0/153 | – |
| Antibiotic use | |||
| Mäkelä (2000)79,96,97 | 0/12 | 5/18 | 0.10 (0.00 to 1.96) |
| Murphy (2000)98,114,115 | 7/160 | 16/153 | 0.39 (0.16 to 0.98) |
| Boivin (2000)93–95 | 9/36 | 5/43 | 2.53 (0.76 to 8.41) |
| GlaxoSmithKline NAI30012105,106 | 23/120 | 30/114 | 0.66 (0.36 to 1.23) |
|
Pooled result (Figure 55) Heterogeneity |
OR 0.66 (95% CI 0.42 to 1.03), p = 0.07 χ2 = 7.63; p = 0.05; I2 = 60.7% |
||
Adverse events
Four zanamivir trials reported overall adverse events in an ITT, at-risk, population (Table 20). Of these, one was in patients with COAD or asthma,98,114,115 one in the elderly,105,106 and two in general at-risk populations. 91,92,99 There was no significant difference in the number of overall, drug-related or serious adverse events. The analysis of overall adverse events was subject to a high degree of statistical heterogeneity, seemingly caused by the study conducted in the elderly population.
| Study | Zanamivir n/N |
Placebo n/N |
OR (95% CI) |
|---|---|---|---|
| Overall adverse events | |||
| Murphy (2000)98,114,115 | 99/261 | 111/263 | 0.84 (0.59 to 1.19) |
| MIST (1998)79,91,92 | 14a/37 | 22a/39 | 0.47 (0.19 to 1.18) |
| GlaxoSmithKline NAI3002099 | 11/223 | 10/106 | 0.50 (0.20 to 1.21) |
| GlaxoSmithKline NAI30012105,106 | 66a/191 | 50a/166 | 6.12 (3.47 to 10.80) |
|
Pooled result (Figure 56) Heterogeneity |
OR 1.24 (95% CI 0.96 to 1.60), p = 0.10 χ2 = 43.63; p < 0.0001; I2 = 93.1% |
||
| Drug-related adverse events | |||
| Murphy (2000)98,114,115 | 23/261 | 23/263 | 1.01 (0.55 to 1.85) |
| Serious adverse events | |||
| GlaxoSmithKline NAI30012105,106 | 5/191 | 9/166 | 1.01 (0.33 to 3.12) |
| GlaxoSmithKline NAI3002099 | 2/223 | 1/106 | 0.95 (0.09 to 10.60) |
| Murphy (2000)98,114,115 | 3/261 | 7/263 | 0.43 (0.11 to 1.66) |
|
Pooled result (Figure 57) Heterogeneity |
OR 0.72 (95% CI 0.32 to 1.62), p = 0.41 χ2 = 0.98; p = 0.61; I2 = 0% |
||
Oseltamivir compared with placebo
Symptoms
Six trials of oseltamivir in an at-risk population reported the time to alleviation of fever, all symptoms, or return to normal activity. Of these, two were in a general at-risk population,46,73 one in children with asthma,78 and three in the elderly. 46,73 The follow-up period was 21 days in five trials46,73,109 and 28 days in two trials. 77,110 The dropout rates were unclear in six of the studies; only Whitley et al. 110 reported a dropout rate lower than 5%.
Although the direction of effect favoured oseltamivir, there was no clear evidence of a reduction in the time to the alleviation of symptoms or return to normal activity in the overall at-risk population with oseltamivir, in either the ITT or the ITTI populations (Tables 21 and 22 respectively). For comparability with the Turner et al. 46 review’s separate analyses of at-risk adults and children, sensitivity analyses were undertaken in which the study in children was excluded from the overall pooled results and analysed separately. 78,110 When this trial was removed, the time to return to normal activity was significantly less (by approximately 3 days) with oseltamivir in the ITTI at-risk adult population (Tables 21 and 22). There were no statistically significant differences between oseltamivir and placebo in at-risk children for either outcome in either population. There was no statistically significant heterogeneity across studies in any of the analyses.
| Study | Number randomised | Oseltamivir Median (SE) |
Placebo Median (SE) |
Median difference (95% CI) | |
|---|---|---|---|---|---|
| Oseltamivir | Placebo | ||||
| Alleviation of symptoms | |||||
| aMartin (2001)73,109 at-risk | 199 | 203 | 143 (13.45) | 163 (16.27) | –9.80 (–44.87 to 25.27) |
| aMartin (2001)73,109 elderly | 360 | 376 | 139.2 (12.2) | 149 (13.09) | –20.00 (–61.37 to 21.37) |
| Johnston (2005)78 | 170 | 164 | 118.6 (9.87) | 139.8 (8.28) | –21.20 (–46.45 to 4.05) |
|
Pooled result (Figure 58) Heterogeneity |
WMD –17.84 (95% CI –36.20 to 0.52), p = 0.06 χ2 = 0.28; p = 0.87; I2 = 0% |
||||
|
Pooled result for at-risk adults; trial by Johnston (2005) excluded Heterogeneity |
WMD –14.06 (95% CI –40.82 to 12.96), p = 0.30 χ2 = 0.14; p = 0.71; I2 = 0% |
||||
| Time to normal activity | |||||
| aRoche WV1581246,73 | 152 | 148 | 344.4 (56.12) | 349.23 (57.68) | –4.83 (–162.55 to 152.89) |
| aRoche WV1587246,73 | 47 | 53 | 205.57 (51.50) | 191.73 (31.33) | 13.84 (–104.31 to 131.99) |
| aRoche WV1581946,73 | 75 | 93 | 298.48 (66.80) | 388.4 (31.55) | –89.92 (–234.72 to 54.88) |
| aRoche WV1587646,73 | 55 | 44 | 395.23 (110.09) | 394.9 (76.22) | 0.33 (–262.10 to 262.76) |
| aRoche WV1597846,73 | 229 | 238 | 304.48 (34.54) | 416.98 (29.57) | –112.50 (–201.6 2 to –23.38) |
|
Pooled result for at-risk adults (Figure 59) Heterogeneity |
WMD –58.84 (95% CI –116.5 8 to –1.11), p = 0.05 χ2 = 3.67; p = 0.45; I2 = 0% |
||||
| Study | Number randomised | Oseltamivir Median (SE) |
Placebo Median (SE) |
Median difference (95% CI) | |
|---|---|---|---|---|---|
| Oseltamivir | Placebo | ||||
| Alleviation of symptoms | |||||
| aMartin (2001)73,109 at-risk | 118 | 133 | 151.5 (21.88) | 161 (24.98) | –24.90 (–68.77 to 18.97) |
| aMartin (2001)73,109 elderly | 223 | 254 | 150 (12.72) | 174.9 (18.42) | –9.50 (–74.59 to 55.59) |
| Johnston (2005)78 | 84 | 95 | 123.9 (11.99) | 134.3 (7.98) | –10.40 (–38.63 to 17.83) |
|
Pooled result (Figure 60) Heterogeneity |
WMD –14.04 (95% CI –36.34 to 8.26), p = 0.22 χ2 = 0.32; p = 0.85; I2 = 0% |
||||
|
Pooled result for at-risk adults; trial by Johnston (2005) excluded Heterogeneity |
WMD –20.09 (95% CI –56.47 to 16.29), p = 0.28 χ2 = 0.15; p = 0.70; I2 = 0% |
||||
| Time to normal activity | |||||
| Johnston NV16871 (2005)78 | 84 | 95 | 101.4 (8.73) | 114 (8.29) | –12.60 (–36.20 to 11.00) |
| aRoche WV1581246,73 | 97 | 104 | 299.9 (83.28) | 335.48 (53.40) | –35.58 (–229.48 to 158.32) |
| aRoche WV1587246,73 | 21 | 29 | 199.73 (59.09) | 282.9 (59.70) | –83.17 (–247.81 to 81.47) |
| aRoche WV1581946,73 | 52 | 69 | 277.9 (60.00) | 370.48 (51.5) | –92.58 (–247.55 to 62.39) |
| aRoche WV1587646,73 | 26 | 20 | 464.73 (129.48) | 428.53 (44.70) | 36.20 (–232.28 to 304.68) |
| aRoche WV1597846,73 | 145 | 165 | 336.65 (46.18) | 416.98 (14.65) | –80.33 (–175.29 to 14.63) |
|
Pooled result (Figure 61) Heterogeneity |
WMD –19.20 (95% CI –41.42 to 3.01), p = 0.09 χ2 = 3.52; p = 0.62; I2 = 0% |
||||
|
Pooled result for at-risk adults; trial by Johnston (2005) excluded Heterogeneity |
WMD –70.79 (95% CI –136.7 5 to –4.84), p = 0.04 χ2 = 0.87; p = 0.93; I2 = 0% |
||||
| Alleviation of fever | |||||
| aMartin (2001)73,109 at-risk | 118 | 133 | 42.8 (N/A) | 67.9 (N/A) | –25.1 |
| aMartin (2001)73,109 elderly | 222 | 254 | 66.9 (N/A) | 89.5 (N/A) | –22.6 |
Complications
Seven trials reported the rate of complications in at-risk populations in trials of oseltamivir, one in children with asthma,78 two in the elderly (combined),73 and four in a general at-risk population, three of which were combined71–73 (Tables 23 and 24). Treatment with oseltamivir significantly reduced antibiotic use in the ITTI population. However, the incidence of other outcomes was low, and there was no clear evidence of other differences between oseltamivir and the comparator. No statistically significant heterogeneity was observed in the pooled analyses.
| Study | Oseltamivir n/N |
Placebo n/N |
OR (95% CI) |
|---|---|---|---|
| Complications requiring hospitalisation | |||
| Roche NV1687177 | 0/165 | 1/164 | 0.33 (0.01 to 8.14) |
| Pneumonia | |||
| Johnston NV16871 (2005)78 | 1/170 | 2/164 | 0.48 (0.04 to 5.34) |
| Bronchitis | |||
| Johnston NV16871 (2005)78 | 5/170 | 1/164 | 4.94 (0.57 to 42.74) |
| Antibiotic use | |||
| Johnston NV16871 (2005)78 | 16/170 | 16/164 | 0.96 (0.46 to 1.99) |
| Study | Oseltamivir n/N |
Placebo n/N |
OR (95% CI) |
|---|---|---|---|
| Overall complications | |||
| Roche NV1687177 | 1/43 | 8/51 | 0.13 (0.02 to 1.07) |
| Complications requiring hospitalisation | |||
| Johnston NV16871 (2005)78 | 2/84 | 1/95 | 2.29 (0.20 to 25.75) |
| Lin (2006)71,72 | 2/27 | 5/29 | 0.38 (0.07 to 2.17) |
| Martin (2001)73,109 elderly | 3/223 | 8/254 | 0.42 (0.11 to 1.60) |
|
Pooled result (Figure 62) Heterogeneity |
OR 0.54 (95% CI 0.21 to 1.37), p = 0.20 χ2 = 1.66; p = 0.44; I2 = 0% |
||
| Pneumonia | |||
| Martin (2001)73,109 elderly | 5/223 | 6/254 | 0.95 (0.29 to 3.15) |
| Martin (2001)73,109 at-risk | 2/118 | 2/133 | 1.13 (0.16 to 8.15) |
|
Pooled result (Figure 63) Heterogeneity |
OR 0.99 (95% CI 0.36 to 2.77), p = 0.99 χ2 = 0.02; p = 0.88; I2 = 0% |
||
| GP consultations | |||
| Johnston NV16871 (2005)78 | 21/84 | 21/95 | 1.17 (0.59 to 2.35) |
| Antibiotic use | |||
| aLin (2006)71,72 | 10/27 | 20/29 | 0.26 (0.09 to 0.80) |
| Martin (2001)73,109 elderly | 31/223 | 49/254 | 0.68 (0.41 to 1.10) |
| Martin (2001)73,109 at-risk | 21/118 | 27/133 | 0.85 (0.45 to 1.60) |
| Roche NV1687177 | 1/43 | 7/51 | 0.15 (0.02 to 1.27) |
|
Pooled result (Figure 64) Heterogeneity |
OR 0.57 (95% CI 0.33 to 0.98), p = 0.04 χ2 = 5.04; p = 0.17; I2 = 40.5% |
||
Adverse events
Two trials reported the incidence of adverse events in at-risk populations in trials of oseltamivir, one in children with asthma78 and one in a general at-risk71,72 population (Table 25). There was no evidence of a difference in the rate of overall, drug-related or serious adverse events in the ITT or ITTI populations between oseltamivir and placebo. No statistically significant heterogeneity was observed in the pooled analysis.
| Study | Oseltamivir n/N |
Placebo n/N |
OR (95% CI) |
|---|---|---|---|
| Overall adverse events (ITT) | |||
| aLin (2006)71,72 | 2/58 | 0/60 | 5.35 (0.25 to 113.95) |
| Johnston NV16871 (2005)78 | 83/170 | 84/164 | 0.91 (0.59 to 1.40) |
|
Pooled result (Figure 65) Heterogeneity |
OR 0.96 (95% CI 0.63 to 1.46), p = 0.83 χ2 = 1.27; p = 0.26; I2 = 21.53% |
||
| Overall adverse events (ITTI) | |||
| Roche NV1687177 | 10/43 | 11/51 | 1.10 (0.42 to 2.91) |
| Serious adverse events (ITTI) | |||
| Roche NV1687177 | 1/43 | 1/51 | 1.19 (0.07 to 19.62) |
Effectiveness in children
Four studies reported the effectiveness of zanamivir100–104 or oseltamivir78,110 specifically in children. One trial of zanamivir103,104 and one of oseltamivir78 were not included in the Turner et al. 46 review. 46 One direct head-to-head comparison between zanamivir and oseltamivir that met the inclusion criteria,85 and was not included in the Turner et al. 46 review, did not provide data in a format that could be used in the current review; therefore, four studies are included in the analyses. These are analysed separately from the general at-risk population. The age of the children recruited varied across studies; two recruited 5- to12-year-olds,78,100,101 one 5- to14-year-olds,103,104 one 6- to 17-year-olds,77 and one 1- to 12-year-olds. 110
Zanamivir compared with placebo
Symptoms
Two studies reported the effectiveness of zanamivir on the time to the alleviation of symptoms and return to normal activity in children (Tables 26 and 27). 100,101,103 The follow-up period was 6 days in one trial103 and 28 days in the other. 100,101 Both trials had a dropout rate less than 5%. 100,101,103 Data were available for healthy and at-risk children separately for the trial by Hedrick et al. ,100,101 but not for the NAI30028 trial. 103
| Study | Number randomised | Zanamivir Median (SE) |
Placebo Median (SE) |
Median difference (95% CI) | |
|---|---|---|---|---|---|
| Zanamivir | Placebo | ||||
| Alleviation of symptoms | |||||
| GlaxoSmithKline NAI30028103,104 | 176 | 90 | 5 (0.371) | 5.5 (0.633) | –0.50 (–1.94 to 0.94) |
| aHedrick (2000)100,101 all children | 224 | 247 | 4 (0.21) | 5.0 (0.16) | –1.00 (–1.5 2 to –0.48) |
|
Pooled result for all children (Figure 66) Heterogeneity |
WMD –0.94 (95% CI –1.4 3 to –0.46), p < 0.0001 χ2 = 0.41; p = 0.52; I2 = 0.3% |
||||
| aHedrick (2000)100,101 healthy children | 202 of 224 | 233 of 247 | 4 (0.2) | 5.0 (0.16) | –1.00 (–1.5 0 to –0.50) |
| aHedrick (2000)100,101 at-risk children | 22 of 224 | 14 of 247 | 3.75 (1.01) | 5.75 (2.31) | –2.00 (–6.94 to 2.94) |
| Time to normal activity | |||||
| aHedrick (2000)100,101 all children | 224 | 247 | 5.5 (0.26) | 6 (0.28) | –0.50 (–1.25 to 0.25) |
| aHedrick (2000)100,101 healthy children | 202 of 224 | 233 of 247 | 5.5 (0.26) | 6 (0.29) | –0.50 (–1.26 to 0.26) |
| aHedrick (2000)100,101 at-risk children | 22 of 224 | 14 of 247 | 6 (1.17) | 7 (0.46) | –1.00 (–3.46 to 1.46) |
| Alleviation of fever | |||||
| GlaxoSmithKline NAI30028103,104 | 176 | 90 | 2.5 (N/A) | 3.0 (N/A) | –0.5 |
| Study | Number randomised | Zanamivir Median (SE) |
Placebo Median (SE) |
Median difference (95% CI) | |
|---|---|---|---|---|---|
| Zanamivir | Placebo | ||||
| Alleviation of symptoms | |||||
| aHedrick (2000)100,101 all children | 164 | 182 | 4 (0.24) | 5 (0.19) | –1.00 (–1.6 0 to –0.40) |
| aHedrick (2000)100,101 healthy children | 152 of 164 | 172 of 182 | 4 (0.23) | 5 (0.19) | –1.00 (–1.5 9 to –0.41) |
| aHedrick (2000)100,101 at-risk children | 12 of 164 | 10 of 182 | 2 (0.28) | 5.75 (1.94) | –3.75 (–7.59 to 0.09) |
| Time to normal activity | |||||
| aHedrick (2000)100,101 all children | 164 | 182 | 5.5 (0.30) | 6 (0.31) | –0.50 (–1.35 to 0.35) |
| aHedrick (2000)100,101 healthy children | 152 of 164 | 172 of 182 | 5.5 (0.30) | 6 (0.32) | –0.50 (–1.36 to 0.36) |
| aHedrick (2000)100,101 at-risk children | 12 of 164 | 10 of 182 | 4.5 (0.87) | 7 (0.39) | –2.50 (–4.3 7 to –0.63) |
Zanamivir resulted in a significant reduction in the time to alleviation of symptoms, with no statistically significant heterogeneity observed in the pooled analysis of the ITT population. When the population recruited in Hedrick et al. 100,101 was split into healthy and at-risk children, this study showed a statistically significant reduction in the time to normal activity in the ITTI at-risk population; however, this analysis included only 22 children. The effect of zanamivir was less pronounced in healthy children, and the analysis was based upon 324 children. There were no significant differences between zanamivir and placebo for the time to return to normal activity.
Complications
Two studies of zanamivir in children reported data on complications (Tables 28 and 29);100–104 one of these had a follow-up period of only 5 days. 103 There was no clear evidence of differences between zanamivir and placebo for any complication in the ITT or ITTI populations.
| Study | Zanamivir n/N |
Placebo n/N |
OR (95% CI) |
|---|---|---|---|
| Overall complications | |||
| Hedrick (2000)100,101 | 37/224 | 53/247 | 0.72 (0.45 to 1.15) |
| GlaxoSmithKline NAI30028103 | 59/172 | 28/89 | 1.14 (0.66 to 1.97) |
|
Pooled result (Figure 67) Heterogeneity |
OR 0.88 (95% CI 0.62 to 1.24), p = 0.46 χ2 = 1.52; p = 0.22; I2 = 34.1% |
||
| Complications requiring hospitalisation | |||
| GlaxoSmithKline NAI30028103,104 | 1/176 | 0/90 | 1.55 (0.06 to 38.36) |
| Pneumonia | |||
| GlaxoSmithKline NAI30028103,104 | 2/176 | 2/90 | 0.51 (0.07 to 3.65) |
| Bronchitis | |||
| Hedrick (2000)100–102 | 2/224 | 0/247 | 5.56 (0.27 to 116.48) |
| GlaxoSmithKline NAI30028103,104 | 3/176 | 3/90 | 0.50 (0.10 to 2.54) |
|
Pooled result (Figure 68) Heterogeneity |
OR 1.05 (95% CI 0.28 to 3.89), p = 0.95 χ2 = 1.94; p = 0.16; I2 = 48.6% |
||
| Antibiotic use | |||
| Hedrick (2000)100–102 | 2/224 | 35/247 | 0.05 (0.01 to 0.23) |
| GP consultations | |||
| GlaxoSmithKline NAI30028103,104 | 29/176 | 17/90 | 0.85 (0.44 to 1.64) |
| Otitis media | |||
| GlaxoSmithKline NAI30028103,104 | 5/176 | 4/90 | 0.63 (0.16 to 2.40) |
| Study | Zanamivir n/N |
Placebo n/N |
OR (95% CI) |
|---|---|---|---|
| Overall complications | |||
| Hedrick (2000)100–102 | 26/164 | 41/182 | 0.65 (0.38 to 1.12) |
| Pneumonia | |||
| Hedrick (2000)100–102 | 1/164 | 2/182 | 0.55 (0.05 to 6.15) |
| Bronchitis | |||
| Hedrick (2000)100–102 | 3/164 | 2/182 | 1.68 (0.28 to 10.16) |
| Antibiotic use | |||
| Hedrick (2000)100–102 | 19/164 | 27/182 | 0.75 (0.40 to 1.41) |
| Otitis media | |||
| Hedrick (2000)100–102 | 15/164 | 17/182 | 0.98 (0.47 to 2.03) |
Adverse events
The same two studies reported adverse event data;100,101,103,104 the study with a follow-up period of 5 days for previous outcomes had a follow-up period of 14 days for adverse events. 103 Adverse event data were reported only for the ITT population (Table 30). The pooled ORs revealed no significant differences between the zanamivir and placebo groups for overall, drug-related, or serious, adverse events. No statistically significant heterogeneity was observed in any analysis.
| Study | Zanamivir n/N |
Placebo n/N |
OR (95% CI) |
|---|---|---|---|
| Overall adverse events | |||
| Hedrick (2000)100,101 | 48/224 | 65/247 | 0.76 (0.50 to 1.17) |
| GlaxoSmithKline NAI30028103,104 | 40a/176 | 18a/90 | 1.18 (0.63 to 2.20) |
|
Pooled result (Figure 69) Heterogeneity |
OR 0.88 (95% CI 0.62 to 1.24), p = 0.46 χ2 = 1.25; p = 0.26; I2 = 20.1% |
||
| Drug-related adverse events | |||
| Hedrick (2000)100,101 | 7/224 | 5/247 | 1.56 (0.49 to 4.99) |
| GlaxoSmithKline NAI30028103,104 | 11/176 | 5/90 | 1.13 (0.38 to 3.37) |
|
Pooled result (Figure 70) Heterogeneity |
OR 1.32 (95% CI 0.59 to 2.92), p = 0.50 χ2 = 0.16; p = 0.69; I2 = 0% |
||
| Serious adverse events | |||
| Hedrick (2000)100,101 | 1/224 | 0/247 | 3.32 (0.13 to 81.97) |
| GlaxoSmithKline NAI30028103,104 | 1/176 | 0/90 | 1.55 (0.06 to 38.36) |
|
Pooled result (Figure 71) Heterogeneity |
OR 2.29 (95% CI 0.24 to 22.09), p = 0.47 χ2 = 0.11; p = 0.74; I2 = 0% |
||
Oseltamivir compared with placebo
Symptoms
Two studies reported the effectiveness of oseltamivir on the time to the alleviation of symptoms and return to normal activity in children;78,110 one was restricted to children with asthma. 78 The follow-up period was 21 days in one trial78 and 28 days in the other. 110 The dropout rate was less than 10% in both trials. The time to the alleviation of fever, all symptoms, and return to normal activity were significantly lower with oseltamivir than with placebo (Tables 31 and 32). The analysis of time to normal activity in the ITTI population was subject to statistically significant heterogeneity. One of the studies was restricted to children aged 6–12 years who had asthma,78 whereas the other included a larger number of children from a more representative population, aged between 1 and 12 years,110 which could explain the observed heterogeneity. 78
| Study | Number randomised | Oseltamivir Median (SE) |
Placebo Median (SE) |
Median difference (95% CI) | |
|---|---|---|---|---|---|
| Oseltamivir | Placebo | ||||
| Alleviation of symptoms | |||||
| Johnston (2005)78 at-risk children | 170 | 164 | 118.6 (9.87a) | 139.8 (8.28a) | –21.20 (–46.45 to 4.05) |
| bWhitley (2001)110 | 344 | 351 | 105 (5.58) | 126 (5.08) | –21.00 (–35.7 9 to –6.21) |
|
Pooled result (Figure 72) Heterogeneity |
WMD –21.05 (95% CI –33.8 1 to –8.29), p = 0.001 χ2 = 0.0; p = 0.99; I2 = 0% |
||||
| Time to normal activity | |||||
| bWhitley (2001)110 | 331 | 338 | 70 (4.26) | 100.08 (5.26) | –30.08 (–43.3 5 to –16.81) |
| Alleviation of fever | |||||
| bWhitley (2001)110 | 344 | 351 | 44 (2.05a) | 68 (6.38a) | –24.00 (–37.1 3 to –10.87) |
| Study | Number randomised | Oseltamivir Median (SE) |
Placebo Median (SE) |
Median difference (95% CI) | |
|---|---|---|---|---|---|
| Oseltamivir | Placebo | ||||
| Alleviation of symptoms | |||||
| aWhitley (2001)110 | 217 | 235 | 101 (7.15) | 137 (5.36) | –36.00 (–53.5 1 to –18.49) |
| Johnston NV16871 (2005)78 at-risk children | 84 | 95 | 123.9 (11.99b) | 134.3 (7.98b) | –10.40 (–38.63 to 17.83) |
|
Pooled result (Figure 73) Heterogeneity |
WMD –28.88 (95% CI –43.7 7 to –14.0), p = 0.0001 χ2 = 2.28; p = 0.13; I2 = 56.2% |
||||
| Time to normal activity | |||||
| Johnston NV16871 (2005)78 at-risk children | 84 | 95 | 101.4 (8.73) | 114 (8.29) | –12.60 (–36.20 to 11.00) |
| aWhitley (2001)110 | 209 | 225 | 67.1 (6.28) | 111.667 (7.50) | –44.57 (–63.7 5 to –25.39) |
|
Pooled result (Figure 74) Heterogeneity |
WMD –31.85 (95% CI –46.7 3 to –16.96), p < 0.0001 χ2 = 4.25; p = 0.04; I2 = 76.4% |
||||
Complications
The same two studies reported on complications (Tables 33 and 34);78,110 one reported a significant reduction in antibiotic use and the incidence of otitis media in the ITTI population. 110 The other study, restricted to children with asthma, reported no statistically significant difference between oseltamivir and placebo for any complication, GP consultations or hospitalisation rates. 78 The trials had dropout rates of 3%110 and 9%. 78
| Study | Oseltamivir n/N |
Placebo n/N |
OR (95% CI) |
|---|---|---|---|
| Complications requiring hospitalisation | |||
| Whitley (2001)110 | 0/344 | 2/351 | 0.20 (0.01 to 4.24) |
| Pneumonia | |||
| Johnston NV16871 (2005)78 at-risk children | 3/170 | 6/164 | 0.47 (0.12 to 1.92) |
| Whitley (2001)110 | 7/344 | 11/351 | 0.64 (0.25 to 1.68) |
|
Pooled result (Figure 75) Heterogeneity |
OR 0.58 (95% CI 0.26 to 1.28), p = 0.18 χ2 = 0.12; p = 0.72; I2 = 0% |
||
| Bronchitis | |||
| Johnston NV16871 (2005)78 at-risk children | 5/170 | 1/164 | 4.94 (0.57 to 42.74) |
| Otitis media | |||
| Johnston NV16871 (2005)78 at-risk children | 6/170 | 7/164 | 0.82 (0.27 to 2.50) |
| Antibiotic use | |||
| Johnston NV16871 (2005)78 at-risk children | 16/170 | 16/164 | 0.96 (0.46 to 1.99) |
| Study | Oseltamivir n/N |
Placebo n/N |
OR (95% CI) |
|---|---|---|---|
| Complications requiring hospitalisation | |||
| Johnston NV16871 (2005)78 at-risk children | 2/84 | 1/95 | 2.29 (0.20 to 25.75) |
| Whitley (2001)110 | 0/217 | 2/235 | 0.21 (0.01 to 4.50) |
|
Pooled result (Figure 76) Heterogeneity |
OR 0.79 (95% CI 0.16 to 4.02), p = 0.78 χ2 = 1.45; p = 0.23; I2 = 31.0% |
||
| Pneumonia | |||
| Whitley (2001)110 | 3/217 | 4/235 | 0.81 (0.18 to 3.66) |
| GP consultations | |||
| Johnston NV16871 (2005)78 at-risk children | 21/84 | 21/95 | 1.17 (0.59 to 2.35) |
| Otitis media | |||
| Whitley (2001)110 | 36/217 | 65/235 | 0.52 (0.33 to 0.82) |
| Antibiotic use | |||
| Whitley (2001)110 | 26/217 | 50/235 | 0.50 (0.30 to 0.84) |
Adverse events
The same two trials reported the numbers of overall or serious adverse events in the ITT population, with no evidence of differences between oseltamivir and placebo (Table 35). 78,110 The trial by Johnston et al. 78 had a particularly high rate of adverse events, which may have been due to the fact that the trial was restricted to children with asthma, and classed complications such as bronchitis and pneumonia as adverse events.
| Study | Oseltamivir n/N |
Placebo n/N |
OR (95% CI) |
|---|---|---|---|
| Overall adverse events | |||
| Johnston NV16871 (2005)78 at-risk children | 83a/170 | 84a/164 | 0.91 (0.59 to 1.40) |
| Serious adverse events | |||
| Whitley (2001)110 | 3/344 | 2/351 | 1.54 (0.25 to 9.24) |
Effectiveness in the elderly
Eight studies reported effectiveness in the elderly (aged 65 years and over), five of zanamivir93–98,105,106,114,115 and three of oseltamivir. 73 All of the trials of oseltamivir were conducted in a population restricted to the elderly, whereas only one study of zanamivir recruited an exclusively elderly population;105,106 the results for the other studies were small subgroups from mixed populations. These data are analysed separately from the general at-risk population. One trial of zanamivir was not included in the Turner et al. 46 review105,106 and, although the trials of mixed populations evaluating zanamivir were included in that review,46 the separate data for the elderly are new to this review. There were no new trials for oseltamivir.
Zanamivir compared with placebo
Symptoms
Five studies reported the effectiveness of zanamivir on the time to the alleviation of symptoms and return to normal activity in the elderly, although the numbers of patients in four of these were very small as the data were obtained from studies with mixed populations. 91,92,96–98,105,106,115,116 The follow-up period was 14 days in one trial,93–95 28 days in three trials,91,92,96–98,115,116 and 29 days with a further telephone call at 59 days in one trial. 105,106 The dropout rate was less than 5% in all trials. There was no clear evidence of differences between zanamivir and placebo for either outcome in any population assessed (Tables 36 and 37).
| Study | Number randomised | Zanamivir Median (SE) |
Placebo Median (SE) |
Median difference (95% CI) | |
|---|---|---|---|---|---|
| Zanamivir | Placebo | ||||
| Alleviation of symptoms | |||||
| Boivin (2000)93–95 | 23 | 21 | 7 (2.01) | 7.5 (1.83) | –0.50 (–5.83 to 4.83) |
| GlaxoSmithKline NAI30012105,106 | 191 | 167 | 6.5 (0.73) | 7.5 (0.66) | –1.00 (–2.92 to 0.92) |
| Mäkelä (2000)96,97 | 4 | 9 | 11 (6.10) | 14.5 (8.35) | –3.50 (–23.77 to 16.77) |
| MIST (1998)79,91,92 | 7 | 7 | 5.5 (3.74) | 13 (3.42) | –7.50 (–17.43 to 2.43) |
| Murphy (2000)98,114,115 | 24 | 22 | 12.5 (6.22) | 10 (6.25) | 2.50 (–14.78 to 19.78) |
|
Pooled result (Figure 77) Heterogeneity |
WMD –1.13 (95% CI –2.90 to 0.63), p = 0.21 χ2 = 1.87; p = 0.76; I2 = 0% |
||||
| Study | Number randomised | Zanamivir Median (SE) |
Placebo Median (SE) |
Median difference (95% CI) |
|
|---|---|---|---|---|---|
| Zanamivir | Placebo | ||||
| Alleviation of symptoms | |||||
| Boivin (2000)93–95 | 21 | 16 | 4.5 (2.23) | 7.25 (1.68) | –2.75 (–8.22 to 2.72) |
| MIST (1998)79,91,92 | 4 | 5 | 2.75 (3.23) | 13 (4.34) | –10.25 (–20.85 to 0.35) |
| Mäkelä (2000)96,97 | 4 | 8 | 11 (6.19) | 21.25 (7.21) | –10.25 (–28.88 to 8.38) |
| Murphy (2000)98,114,115 | 16 | 15 | 10 (4.27) | 12 (6.94) | –2.00 (–17.97 to 13.97) |
| GlaxoSmithKline NAI30012105,106 | 120 | 114 | 7.25 (0.86) | 7.5 (1.01) | –0.25 (–2.85 to 2.35) |
|
Pooled result (Figure 78) Heterogeneity |
WMD –1.85 (95% CI –4.77 to 1.07), p = 0.21 χ2 = 4.53; p = 0.34; I2 = 11.7% |
||||
| Time to normal activity | |||||
| GlaxoSmithKline NAI30012105,106 | 120 | 114 | 11 (N/A) | 13.75 (N/A) | –2.75 |
| Alleviation of fever | |||||
| GlaxoSmithKline NAI30012105,106 | 120 | 114 | 4 (N/A) | 4.5 (N/A) | –0.5 |
Complications
One study reported no significant differences between the treatment groups for any complication measured in the elderly (Tables 38 and 39). 105
| Zanamivir n/N |
Placebo n/N |
OR (95% CI) |
|---|---|---|
| Overall complications | ||
| 57/191 | 56/167 | 0.84 (0.54 to 1.32) |
| Pneumonia | ||
| 3/191 | 3/167 | 0.87 (0.17 to 4.38) |
| Bronchitis | ||
| 10/191 | 18/167 | 0.46 (0.20 to 1.02) |
| Antibiotic use | ||
| 32/191 | 36/167 | 0.73 (0.43 to 1.24) |
| Zanamivir n/N |
Placebo n/N |
OR (95% CI) |
|---|---|---|
| Overall complications | ||
| 39/120 | 46/114 | 0.71 (0.42 to 1.21) |
| Complications requiring hospitalisation | ||
| 5/120 | 4/114 | 1.20 (0.31 to 4.57) |
| Antibiotic use | ||
| 23/120 | 30/114 | 0.66 (0.36 to 1.23) |
Adverse events
One study reported no significant differences between zanamivir and placebo in the incidence of overall (zanamivir, 66/191; placebo, 50/166; OR 1.22, 95% CI 0.78 to 1.91) or serious (zanamivir, 5/191; placebo, 9/166; OR 0.47, 95% CI 0.15 to 1.43) adverse events. 105
Oseltamivir compared with placebo
Symptoms
Three trials evaluated the effectiveness of oseltamivir in the elderly with regards to the time to the alleviation of symptoms and return to normal activity. Results for these were reported either combined in the publication by Martin et al. ,73 or separately in the previous review by Turner et al. 46 The follow-up periods were 21 days, and the dropout rates unclear. There was no evidence that oseltamivir reduced the time to the alleviation of symptoms in either the ITT or the ITTI population. Oseltamivir significantly reduced the time to normal activities in the ITT population, but not in the ITTI population (Tables 40 and 41). There was no statistically significant heterogeneity across studies in either of the analyses.
| Study | Number randomised | Oseltamivir Median (SE) |
Placebo Median (SE) |
Median difference (95% CI) | |
|---|---|---|---|---|---|
| Oseltamivir | Placebo | ||||
| Alleviation of symptoms | |||||
| Martin (2001)73,109 | 360 | 376 | 139.2 (12.2a) | 149 (13.09a) | –10.00 (–45.05 to 25.05) |
| Time to normal activity | |||||
| bRoche WV1581946,73 | 75 | 93 | 298.48 (66.80) | 388.4 (31.55) | –89.92 (–234.72 to 54.88) |
| bRoche WV1587646,73 | 55 | 44 | 395.23 (110.09) | 394.9 (76.22) | 0.33 (–262.10 to 262.76) |
| bRoche WV1597846,73 | 229 | 238 | 304.48 (34.54) | 416.98 (29.57) | –112.50 (–201.6 2 to –23.38) |
|
Pooled result (Figure 79) Heterogeneity |
WMD –98.07 (95% CI –170.9 8 to –25.16), p = 0.008 χ2 = 0.65; p = 0.72; I2 = 0% |
||||
| Study | Number randomised | Oseltamivir Median (SE) |
Placebo Median (SE) |
Median difference (95% CI) | |
|---|---|---|---|---|---|
| Oseltamivir | Placebo | ||||
| Alleviation of symptoms | |||||
| Martin (2001)73,109 | 223 | 254 | 150 (12.72a) | 174.9 (18.42a) | –24.9 (–68.77 to 18.97) |
| Time to normal activity | |||||
| bRoche WV1581946,73 | 52 | 69 | 277.9 (60.00) | 370.48 (51.5) | –92.58 (–247.55 to 62.39) |
| bRoche WV1587646,73 | 26 | 20 | 464.73 (129.48) | 428.525 (44.70) | 36.20 (–232.28 to 304.68) |
| bRoche WV1597846,73 | 145 | 165 | 336.65 (46.18) | 416.983 (14.65) | –80.33 (–175.30 to 14.63) |
|
Pooled result (Figure 80) Heterogeneity |
WMD –73.68 (95% CI –151.20 to 3.84), p = 0.06 χ2 = 0.72; p = 0.70; I2 = 0% |
||||
| Alleviation of fever | |||||
| Martin (2001)73,109 | 222 | 254 | 66.9 (N/A) | 89.5 (N/A) | –22.6 |
Complications
Three trials with results combined reported complications in an elderly ITTI population (Table 42). 73 The numbers of patients and events were small, and there were no significant differences between oseltamivir and placebo.
Adverse events
No data were available for adverse events associated with oseltamivir in the elderly.
Effectiveness in all patients
This section combines the results from all the studies described above, together with those recruiting mixed populations where results for individual subgroups of patients were not available. For the trials of zanamivir recruiting mixed populations, data for the alleviation of symptoms and the time to the return to normal activity for healthy and at-risk adults were available separately, and those data are used in these analyses. For oseltamivir, the largest trial (1459 participants) recruited a mixed population, with no separate symptom data available for healthy and at-risk adults. 81
Six trials of zanamivir were not included in the Turner et al. 46 review: three in healthy adults,86–90 one in an at-risk population,99 one in children103,104 and one in the elderly. 105,106 Eight trials of oseltamivir were not included in the Turner et al. 46 review: four in healthy adults,66–70 two in mixed populations,57,81 one in an at-risk population,71,72,108 and one in children/adolescents. 77,78 One direct head-to-head comparison between zanamivir and oseltamivir that met the inclusion criteria,111 and was not included in the Turner et al. 46 review, did not provide data in a format that could be used in the current review.
Zanamivir compared with placebo
Symptoms
Thirteen trials evaluated the impact of zanamivir on the duration of symptoms and the time to return to normal activity. Of these, five recruited a mixed population (for which symptoms data for healthy and at-risk adults were available separately),46,75,79,91–97 three healthy adults,76,87–89 two those at risk,98,99,114,115 two children,100,101,103 and one the elderly. 88,89 The follow-up period was 5 days in two trials,46,99 6 days in one trial,103 14 days in one trial,93–95 21 days in two trials,75,87 28 days in five trials,88,89,91,92,96–98,100,101,114,115 between 21 and 28 days in one trial76 and 29 days with a follow-up telephone call at 56 days in one trial. 105,106 Four of the trials had a dropout rate greater than 5% but not greater than 10%. 75,76,91,92,98,114 Figures 3–6 illustrate the results for all trials of zanamivir versus placebo, grouped according to the participant subgroups described in previous sections.
FIGURE 3.
Time to the alleviation of all symptoms for zanamivir and placebo in the overall ITT population.
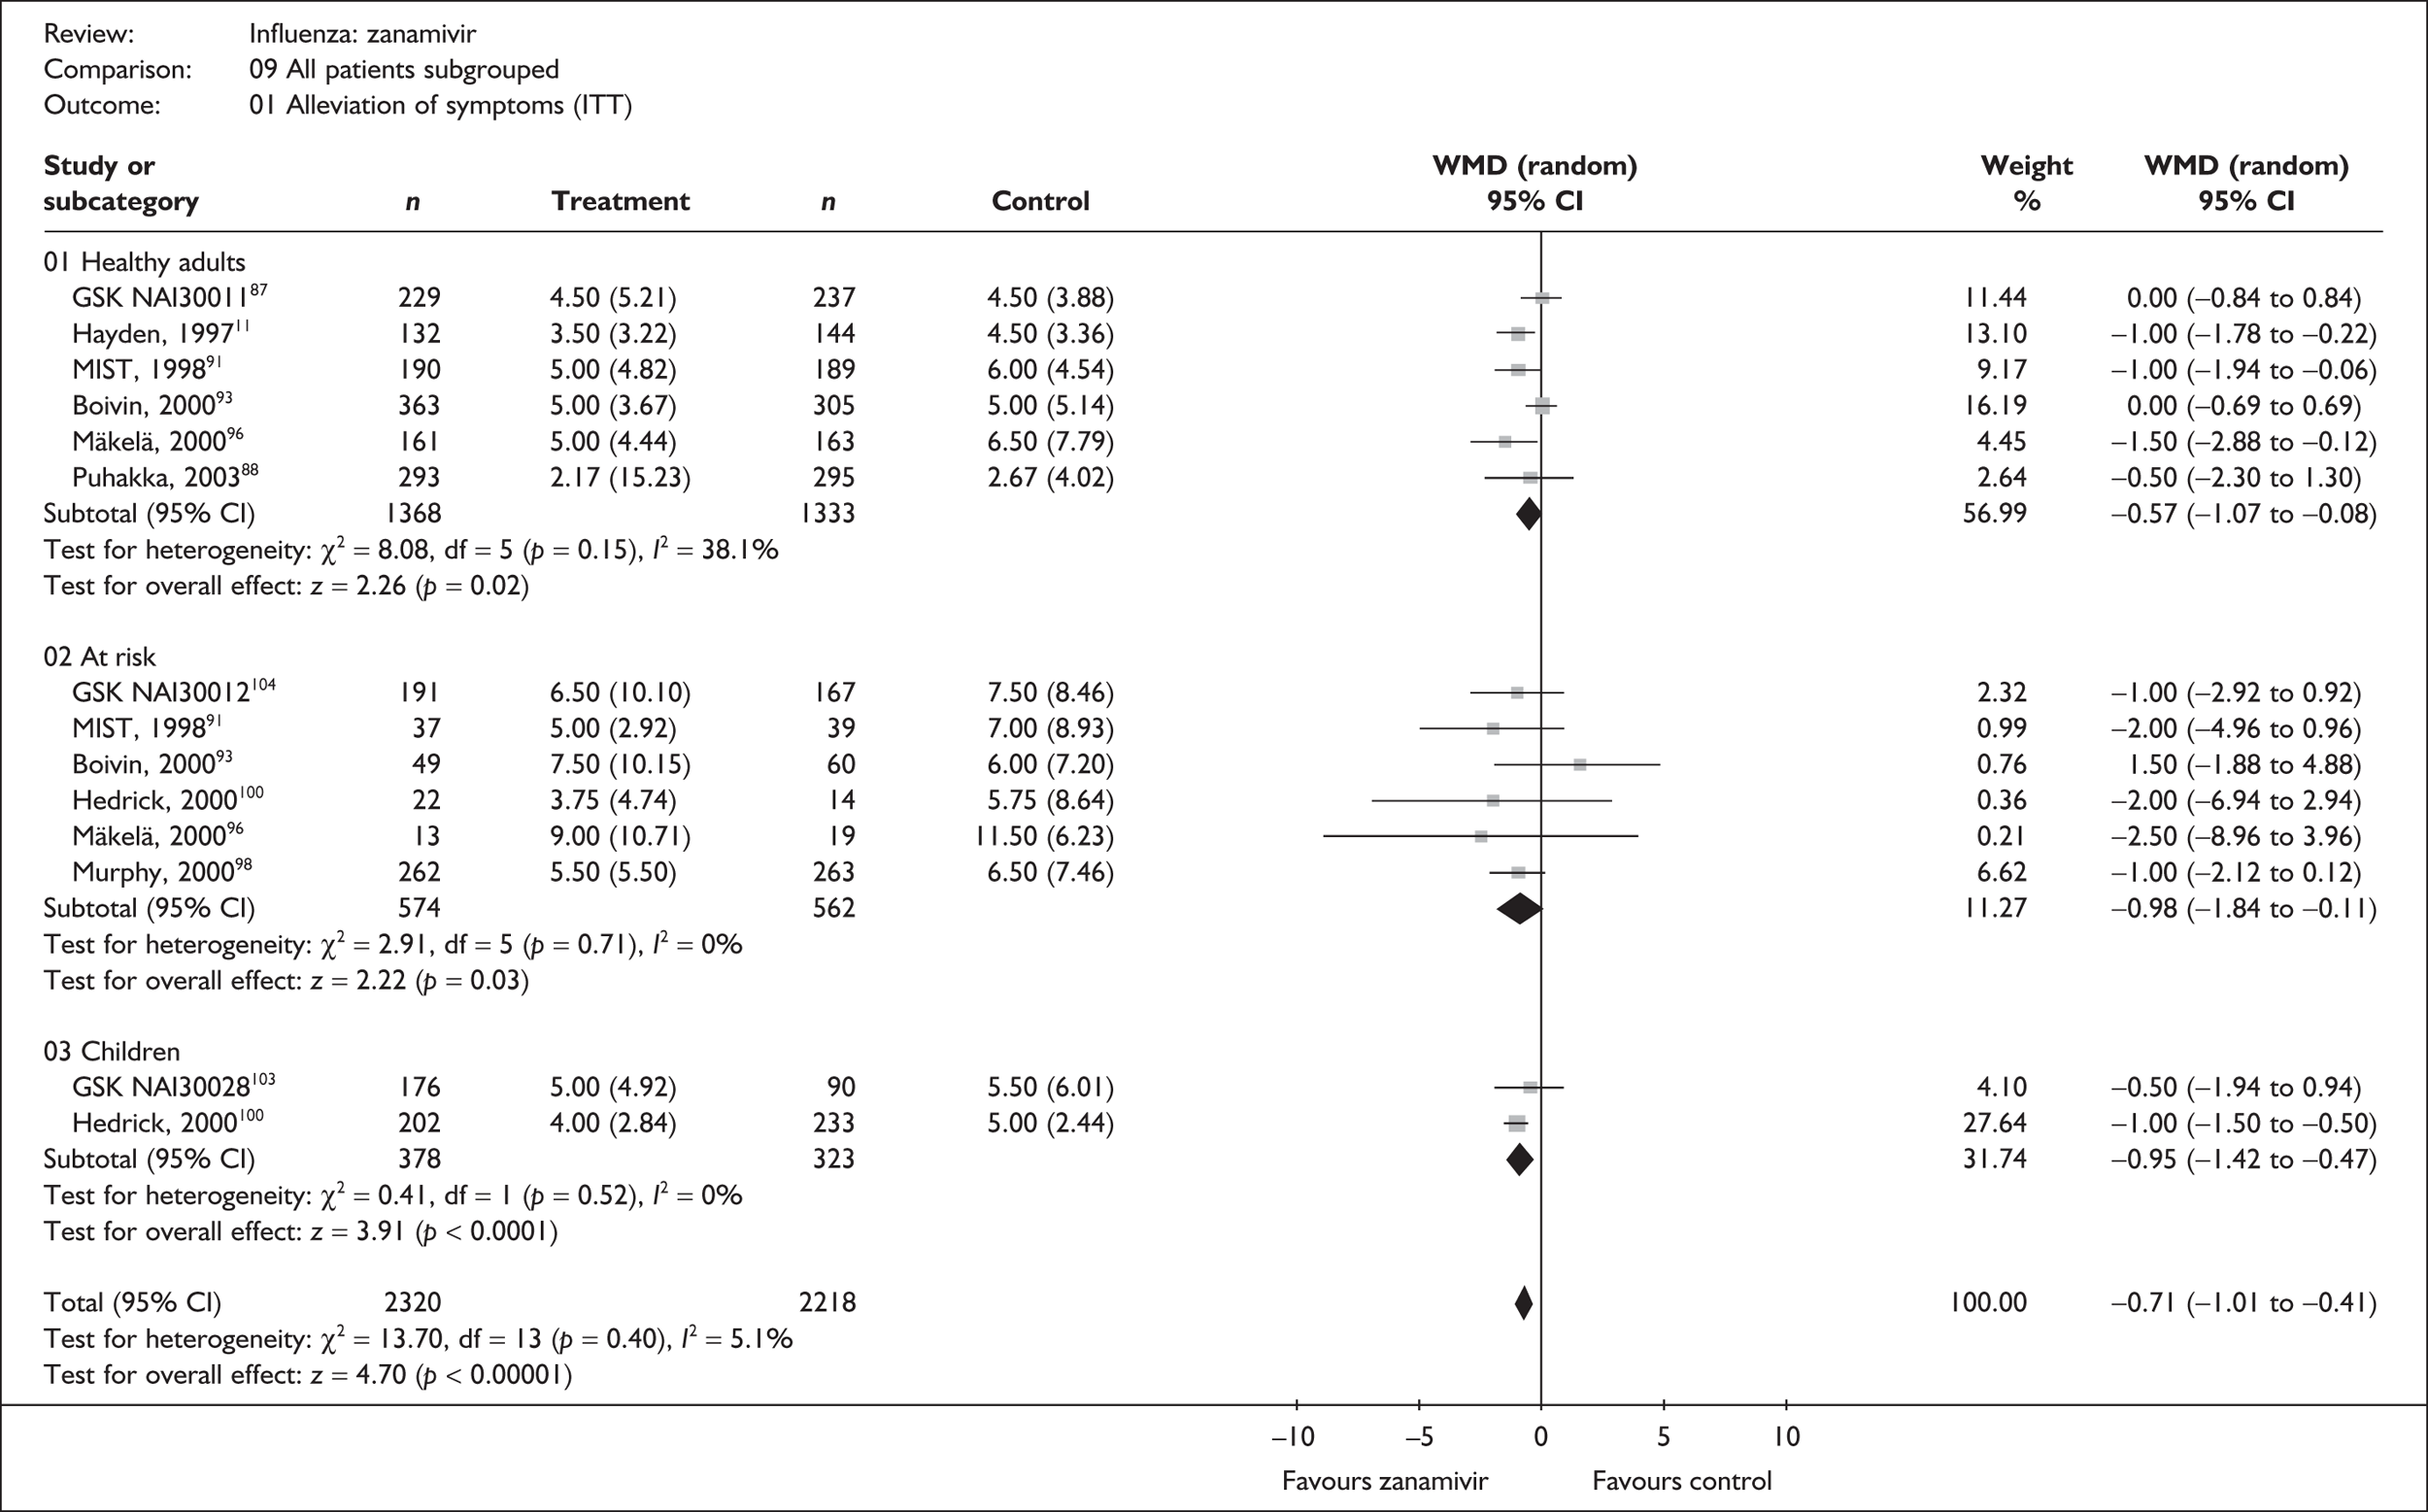
FIGURE 4.
Time to the alleviation of all symptoms for zanamivir and placebo in the overall ITTI population.
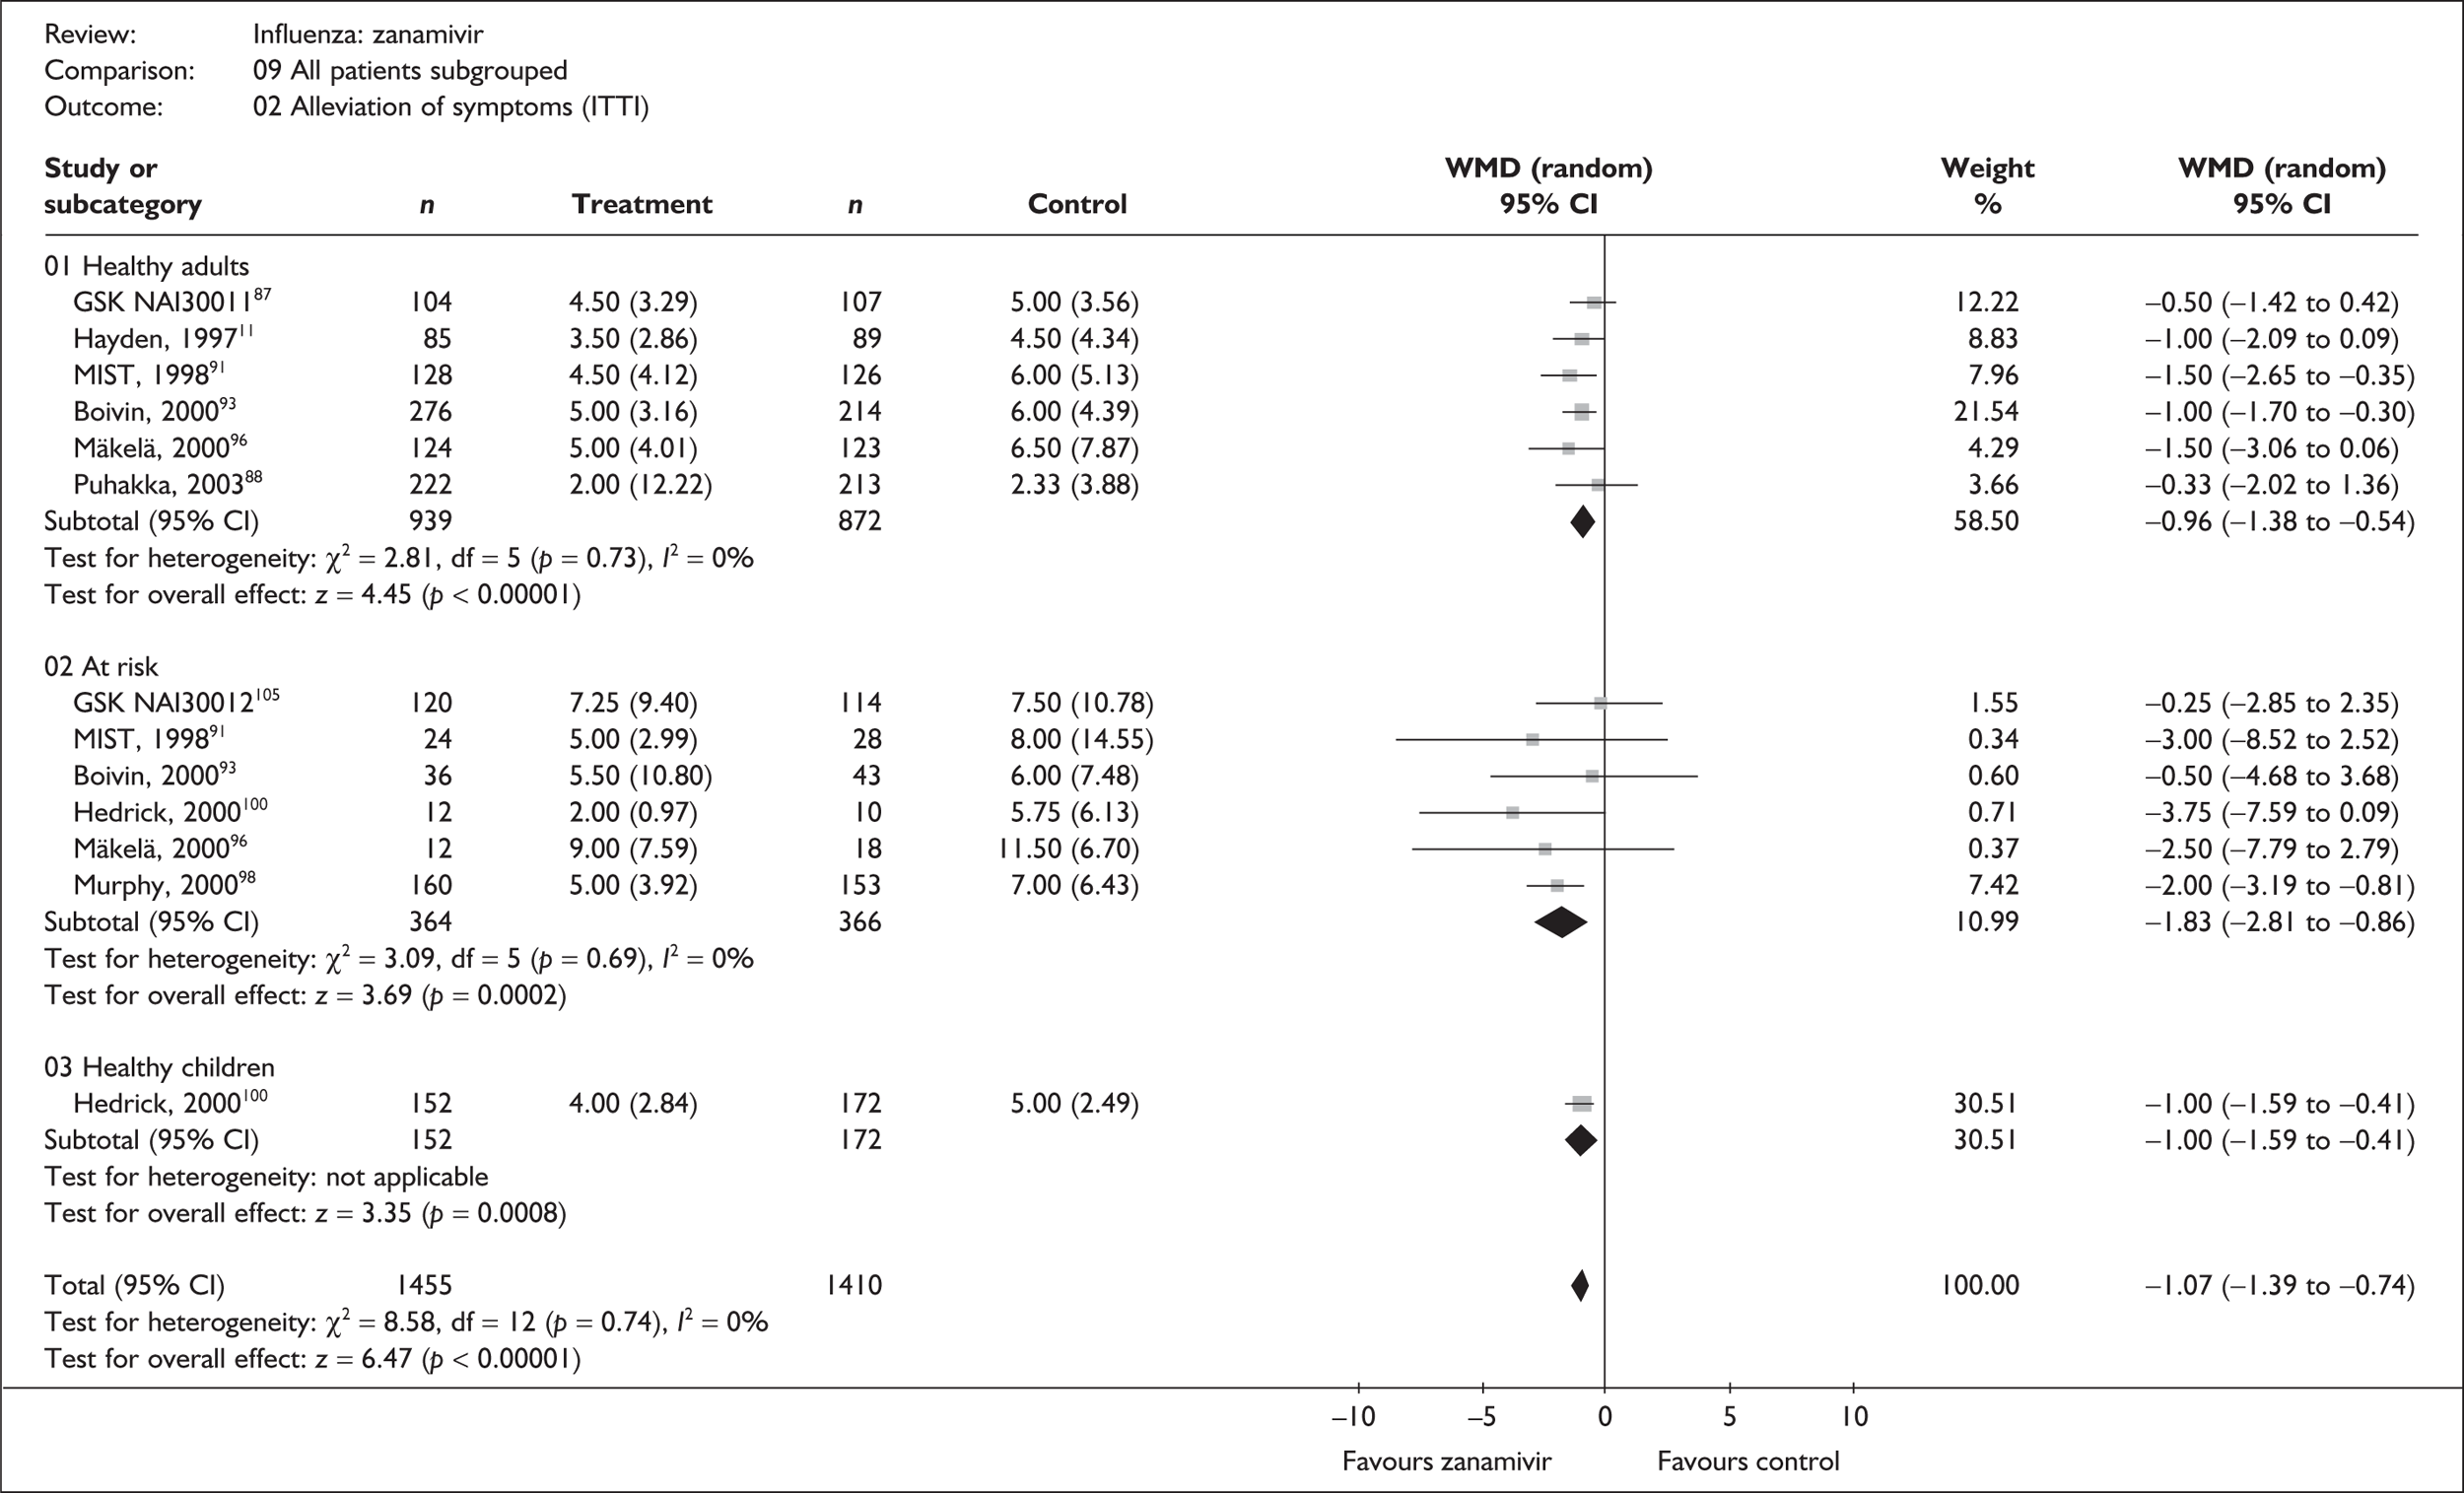
FIGURE 5.
Time to return to normal activity for zanamivir and placebo in the overall ITT population.

FIGURE 6.
Time to return to normal activity for zanamivir and placebo in the overall ITTI population.
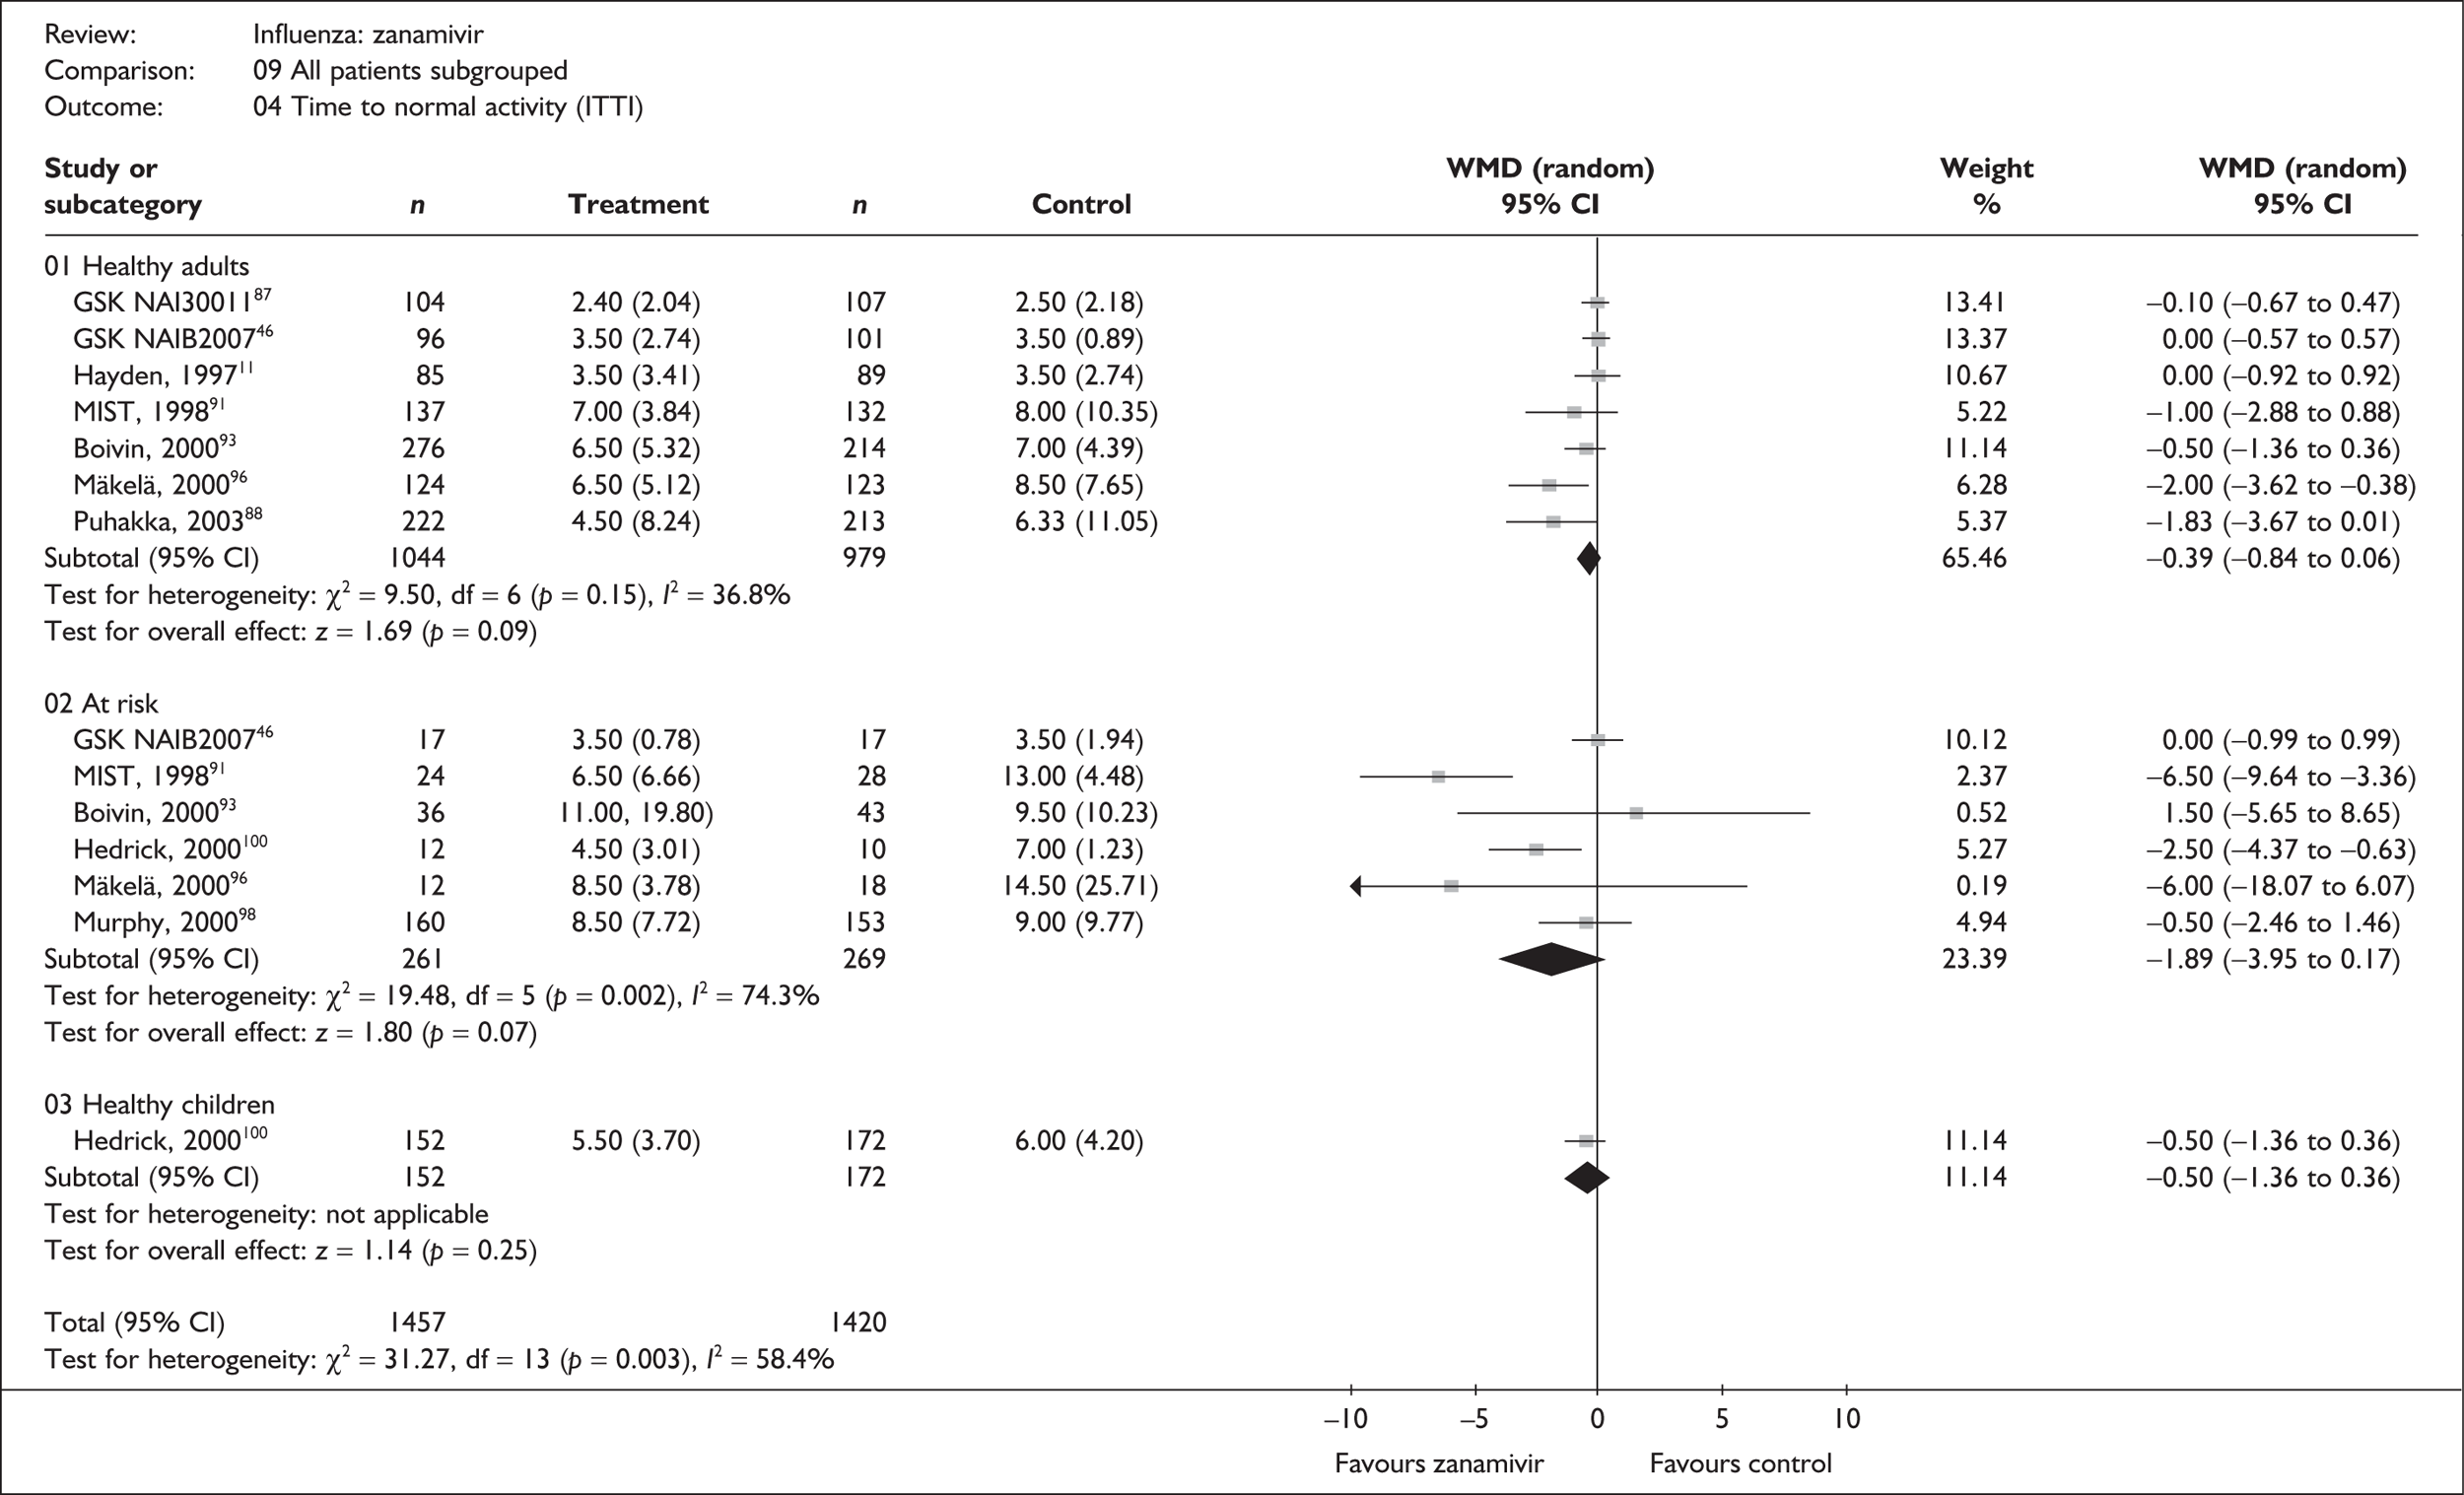
For time to alleviation of symptoms, results in all patient subgroups favour the use of zanamivir and are statistically significant in both the ITT and the ITTI analyses. As might be expected, the size of treatment effects was larger in the ITTI analyses, reducing the median time to alleviation of symptoms by about 1 day in healthy adults (WMD –0.96; 95% CI –1.38 to –0.54) and healthy children (WMD –1.00; 95% CI –1.59 to –0.41), and by about 2 days in the at-risk population (WMD –1.83; 95% CI –2.81 to –0.86).
There is no overall statistically significant heterogeneity in either the ITT or the ITTI population. Therefore, although the focus of this review is on the individual subgroups that populate the decision model, on this basis it is not unreasonable to pool results across all trials to obtain overall ‘average’ estimates, with the use of zanamivir reducing the median time to alleviation of symptoms by 1 day (WMD –1.07; 95% CI –1.39 to –0.74) in the ITTI population.
A similar pattern of results is observed for time to return to normal activity where all subgroups in both the ITT and the ITTI populations favour the use of zanamivir, reducing the median time to return to normal activity by about 0.5 days in healthy adults and by about 2 days in at-risk adults with confirmed influenza. However, none of these differences were statistically significant. Statistically significant heterogeneity was observed within the healthy adult ITT and at-risk ITTI groups, and also for the overall population in both the ITT and the ITTI analyses.
There was no measure of variance available for two studies,75,105,106 therefore these could not be included in the pooled analyses. One trial reported a reduction in the median time to alleviation of symptoms of 1 day in the ITT population and 1.5 days in the ITTI population. The other reported a reduction of 2.75 days in the median time to return to normal activity in the ITTI population. These are therefore broadly consistent with the results of the trials included in the analyses.
Very few data were available on time to resolution of fever, which was reported in only four trials. Only one of these trials, which reported a statistically significant reduction with zanamivir in the ITT population, provided a measure of variance. Therefore, pooled analyses could not be done (Table 43). 99
| Study | Number randomised | Zanamivir Median (SE) |
Placebo Median (SE) |
Median difference (95% CI) | |
|---|---|---|---|---|---|
| Zanamivir | Placebo | ||||
| ITT | |||||
| Puhakka (2003)88,89 | 293 | 295 | 2.0 (N/A) | 0.0 | |
| GlaxoSmithKline NAI3002099 | 224 | 107 | 47.5 (0.33a) hours | 57 (0.47a) hours | –9.50 (–10.6 1 to –8.39) |
| GlaxoSmithKline NAI30028103 | 176 | 90 | 2.5 (N/A) | 3 (N/A) | –0.5 |
| ITTI | |||||
| Puhakka (2003)88,89 | 222 | 213 | 2.0 (N/A) | 2.0 (N/A) | 0.0 |
| GlaxoSmithKline NAI30012105,106 | 120 | 114 | 4 (N/A) | 4.5 (N/A) | –0.5 |
Complications
Of the 13 trials of zanamivir reporting complications, three recruited healthy adults,76,87–89 two children,100–104 one patients with COAD or asthma,98,114,115 one the elderly,105,106 one a general at-risk population,99 and five a mixed population of people aged 12 or 13 years and older including those with comorbid conditions. 74,75,79,91–97
The data for the incidence of complications were sparse, and are presented in Figures 7 and 8. The incidence of overall complications and the use of antibiotics showed a statistically significant reduction in both the ITT and the ITTI analyses for those treated with zanamivir. In the ITTI population, the OR for overall complications was 0.77 (95% CI 0.65 to 0.92). However, trials differed in which events were included in the composite of overall complications, and it is unclear whether this is a meaningful clinical outcome. Antibiotic use was significantly reduced in both the ITT (OR 0.76; 95% CI 0.62 to 0.94) and the ITTI (OR 0.79; 95% CI 0.63 to 0.99) populations.
FIGURE 7.
Complication rates associated with zanamivir and placebo in the overall ITT population.
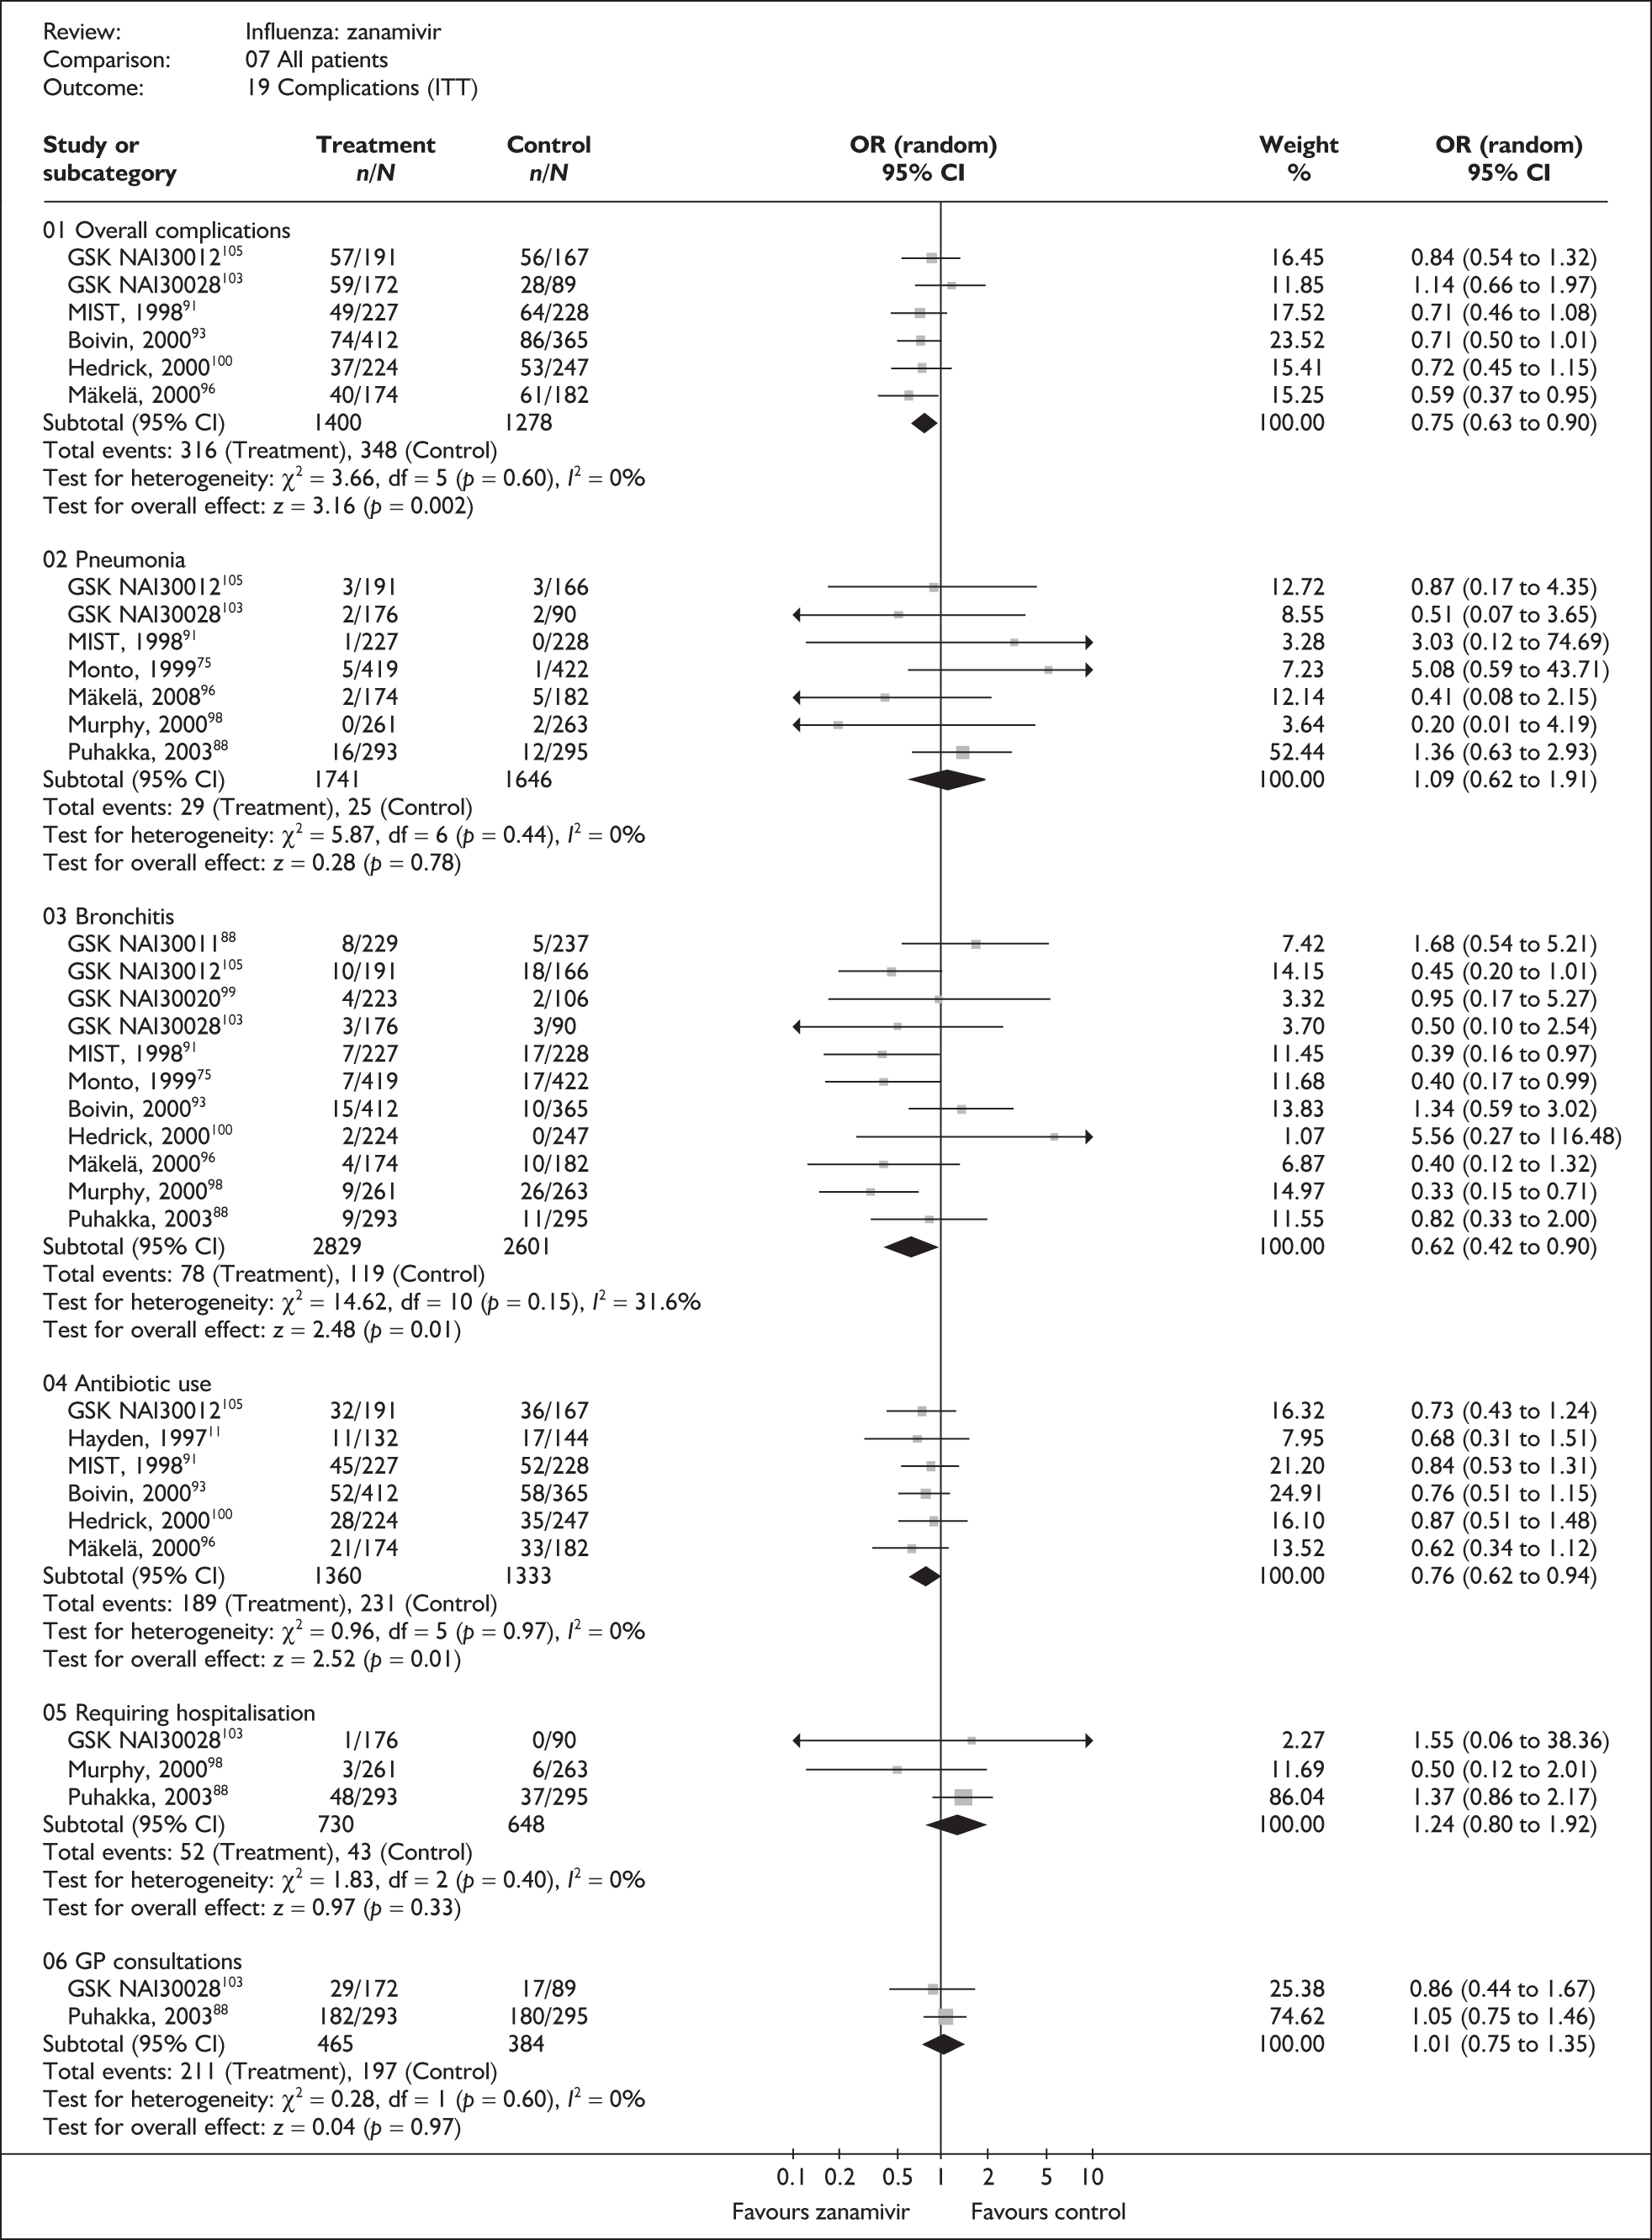
FIGURE 8.
Complication rates associated with zanamivir and placebo in the overall ITTI population.
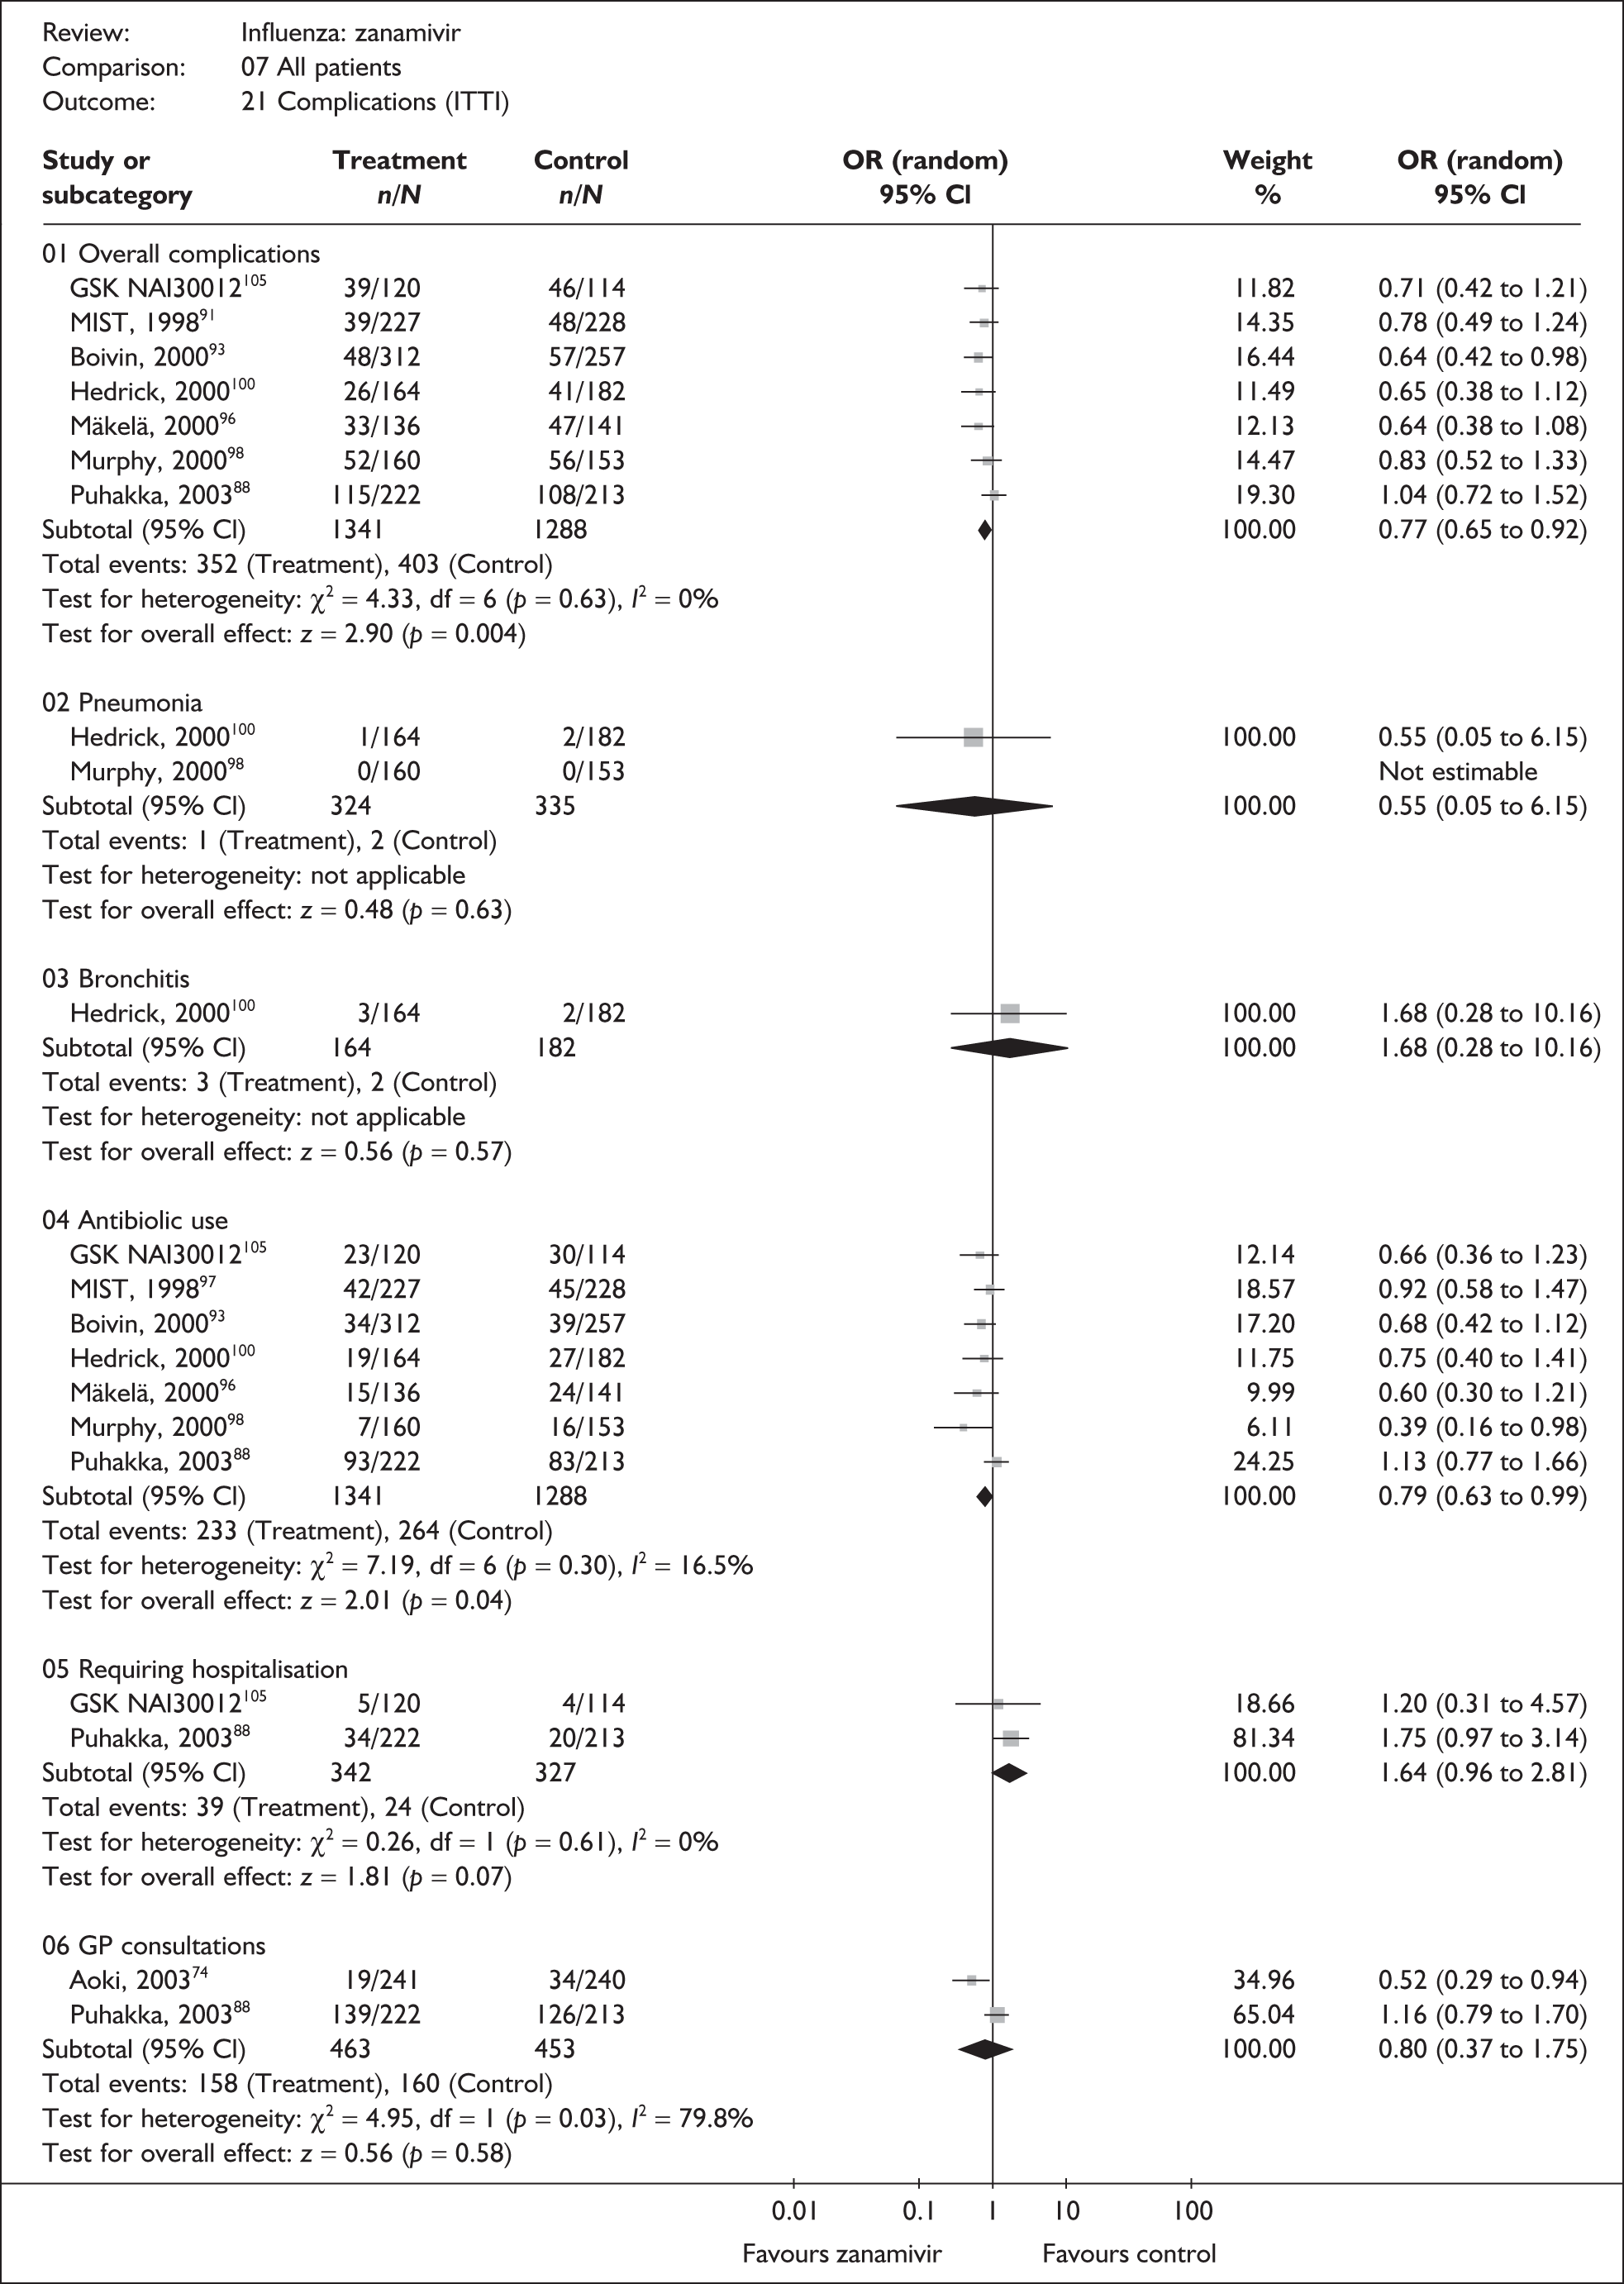
There was little information on bronchitis in the ITTI populations, but in the ITT population in which there were more data, zanamivir appeared to be associated with a statistically significant reduction in the incidence of bronchitis (OR 0.62; 95% CI 0.4 to 0.90).
Numbers of events were low and there was no clear evidence of differences in the incidence of pneumonia, GP consultations or hospitalisations. Statistically significant heterogeneity was observed only in the analysis of GP consultations in the ITTI population. This was based on only two studies, one of which, as discussed previously, was a study of young Finnish soldiers reporting a particularly high rate of consultations, which was unlikely to be representative of a civilian population. 88–90
There were no deaths in the seven trials that reported on mortality. 79,87–89,91–95,98,99,103,114,115
Adverse events
Of the 13 trials of zanamivir reporting adverse events in ITT populations, four recruited healthy adults,76,86–89 two children,100–104 one patients with COAD or asthma,98,114,115 one the elderly,105,106 one a general at-risk population99 and four a mixed population of people aged 12 or 13 years and older that included those with comorbid conditions. 75,79,91–97
Across all trials, treatment with zanamivir significantly reduced the incidence of overall adverse events (OR 0.85; 95% CI 0.75 to 0.96). There was no evidence of a difference in the incidence of drug-related adverse events between zanamivir and placebo. Even when pooled across all studies, there were very few serious adverse events and there was no evidence of a difference between zanamivir and placebo (Figure 9). There was no statistically significant heterogeneity in any of the analyses.
FIGURE 9.
Adverse event rates associated with zanamivir and placebo in the overall ITT population.
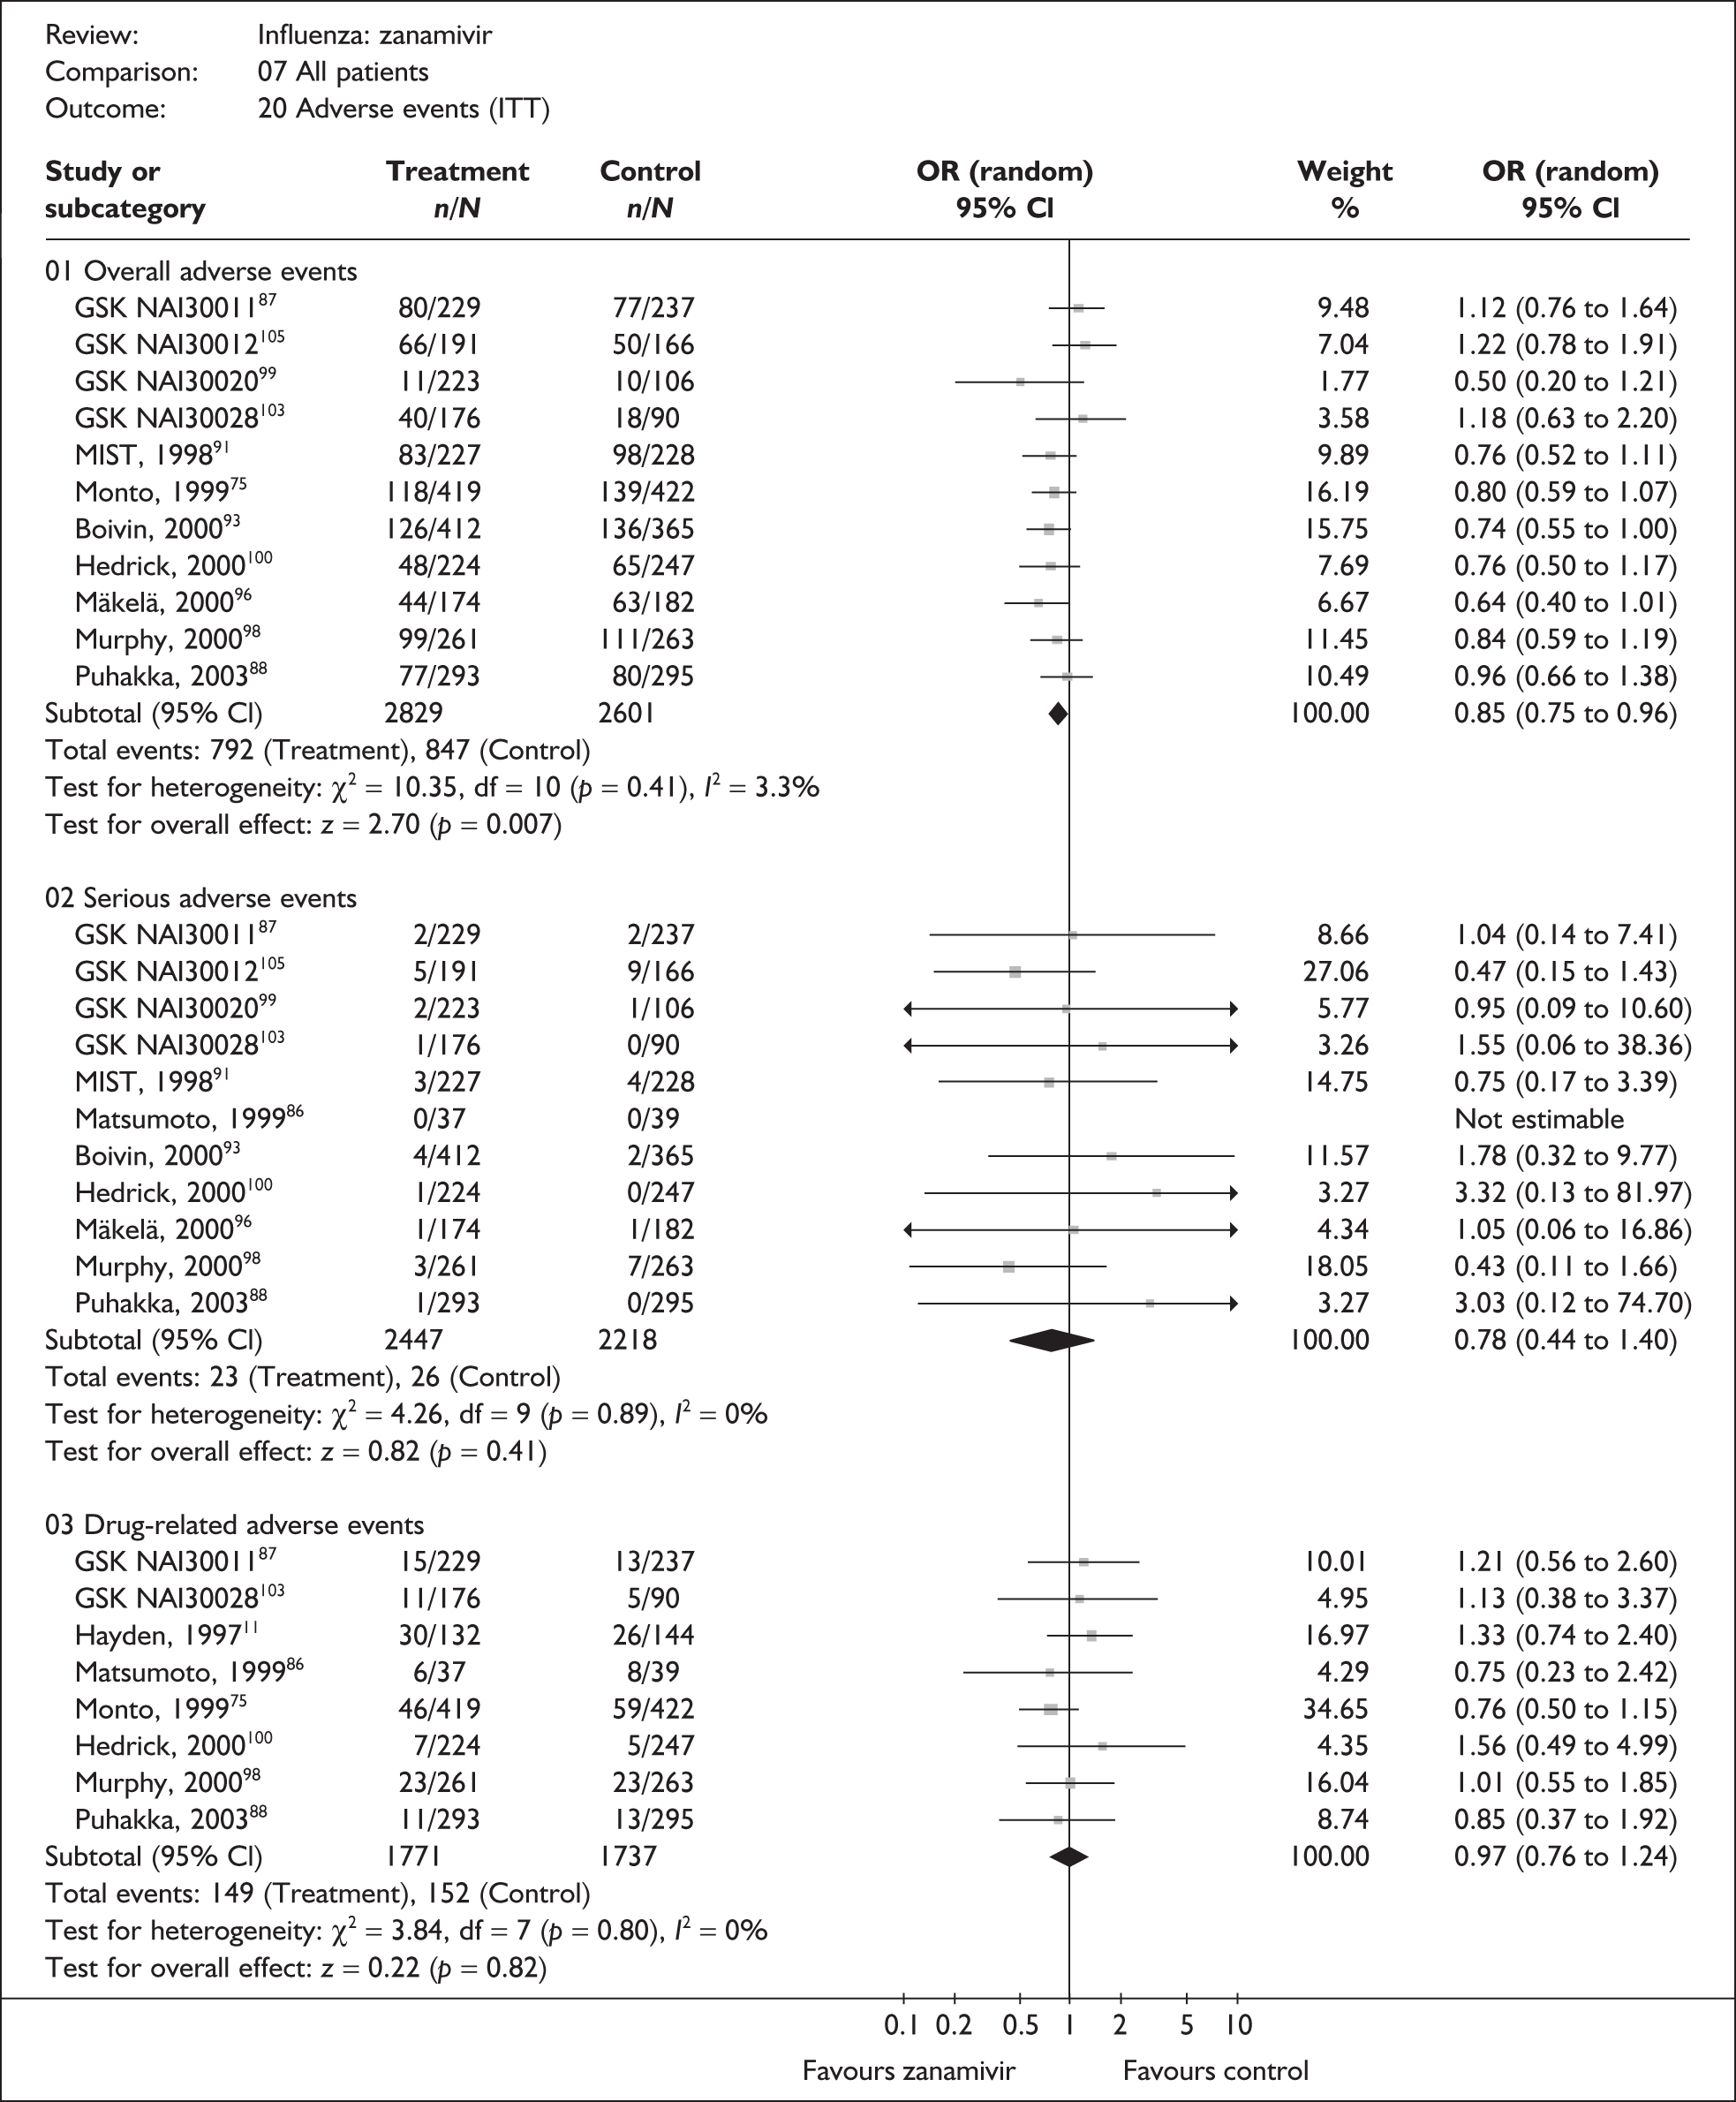
Summary for the effectiveness of zanamivir
The strength of evidence for the effectiveness of zanamivir in alleviating symptoms was greatest in the healthy adult population with analyses based on between 1811 and 3005 individuals. In those with confirmed influenza, reductions of approximately 1 day were seen in the median time to alleviation of symptoms and approximately 0.5 days in the median time taken to return to normal activity. The evidence base was more limited for the subgroups of healthy children and at-risk populations. Children were studied in only two trials (for one of these, data for healthy children and at-risk children were available separately100) and analyses were based on between 324 and 701 individuals. Results for healthy children showed similar reductions in time to alleviation of symptoms and time to return to normal activity as for healthy adults. Analyses for the at-risk group, which comprised adults and children with comorbid conditions and the elderly, were based on between 530 and 1136 individuals, and there is more uncertainty around the results for this group. In at-risk individuals with confirmed influenza, the results suggest that zanamivir reduces the median time to the alleviation of symptoms and the time to return to normal activity by approximately 2 days. Data for most individual complications were sparse and results largely inconclusive. The evidence is strongest for overall complications and use of antibiotics, which both show reduced incidence associated with zanamivir.
Oseltamivir compared with placebo
Symptoms
Fourteen trials evaluated the impact of oseltamivir on the duration of symptoms and the time to normal activity. Of these, six recruited healthy adults,46,65,67–69,80,82,83,107 one a mixed adult population,57 two those at risk,46,73 two children77,110 and three the elderly. 46,73 The follow-up period was 10 days in one trial,57 21 days in eleven,46,65,67–69,73,80,82,83,107 and 28 days in two trials. 77,110 The dropout rate was unclear in eight trials46,57,65,73,77 and was between 5% and 10% in two trials. 67,81,83 Figures 10–13 illustrate the results for all trials of oseltamivir versus placebo, grouped according to the participant subgroups described in previous sections together with a further ‘mixed’ subgroup which includes a large trial that could not be separated into subgroups. 81
FIGURE 10.
Time to the alleviation of all symptoms for oseltamivir and placebo in the overall ITT population.
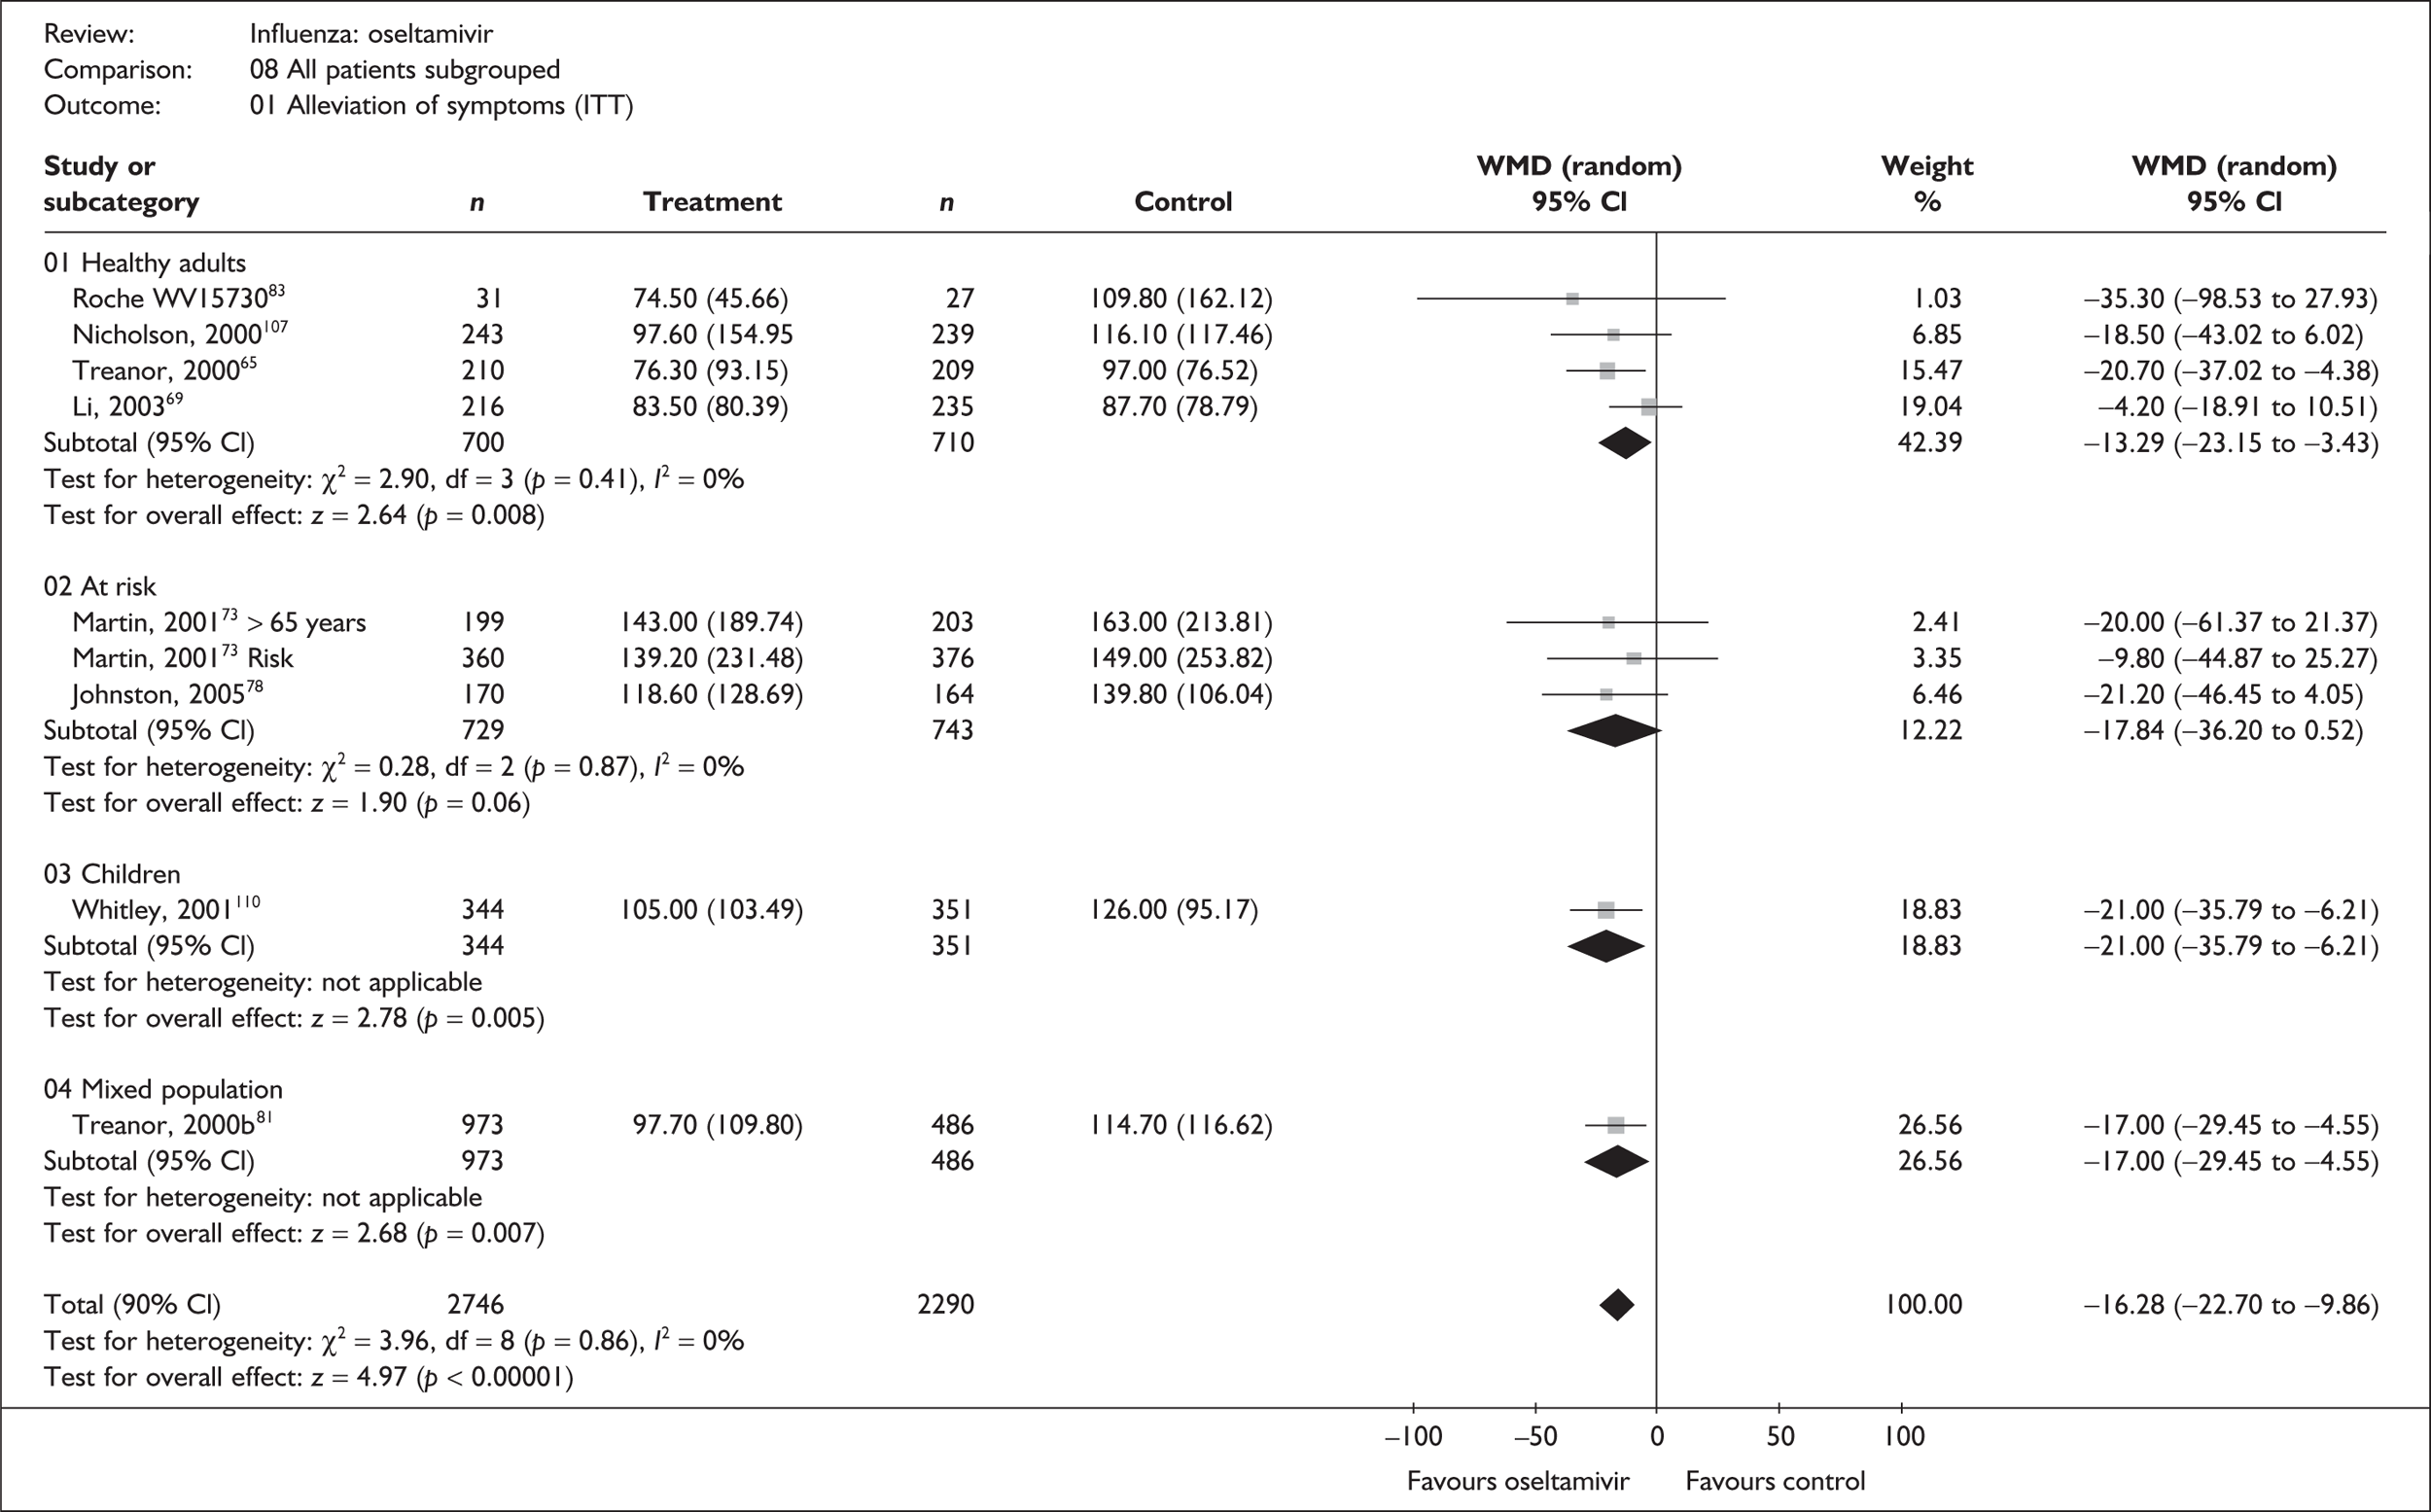
FIGURE 11.
Time to the alleviation of all symptoms for oseltamivir and placebo in the overall ITTI population.
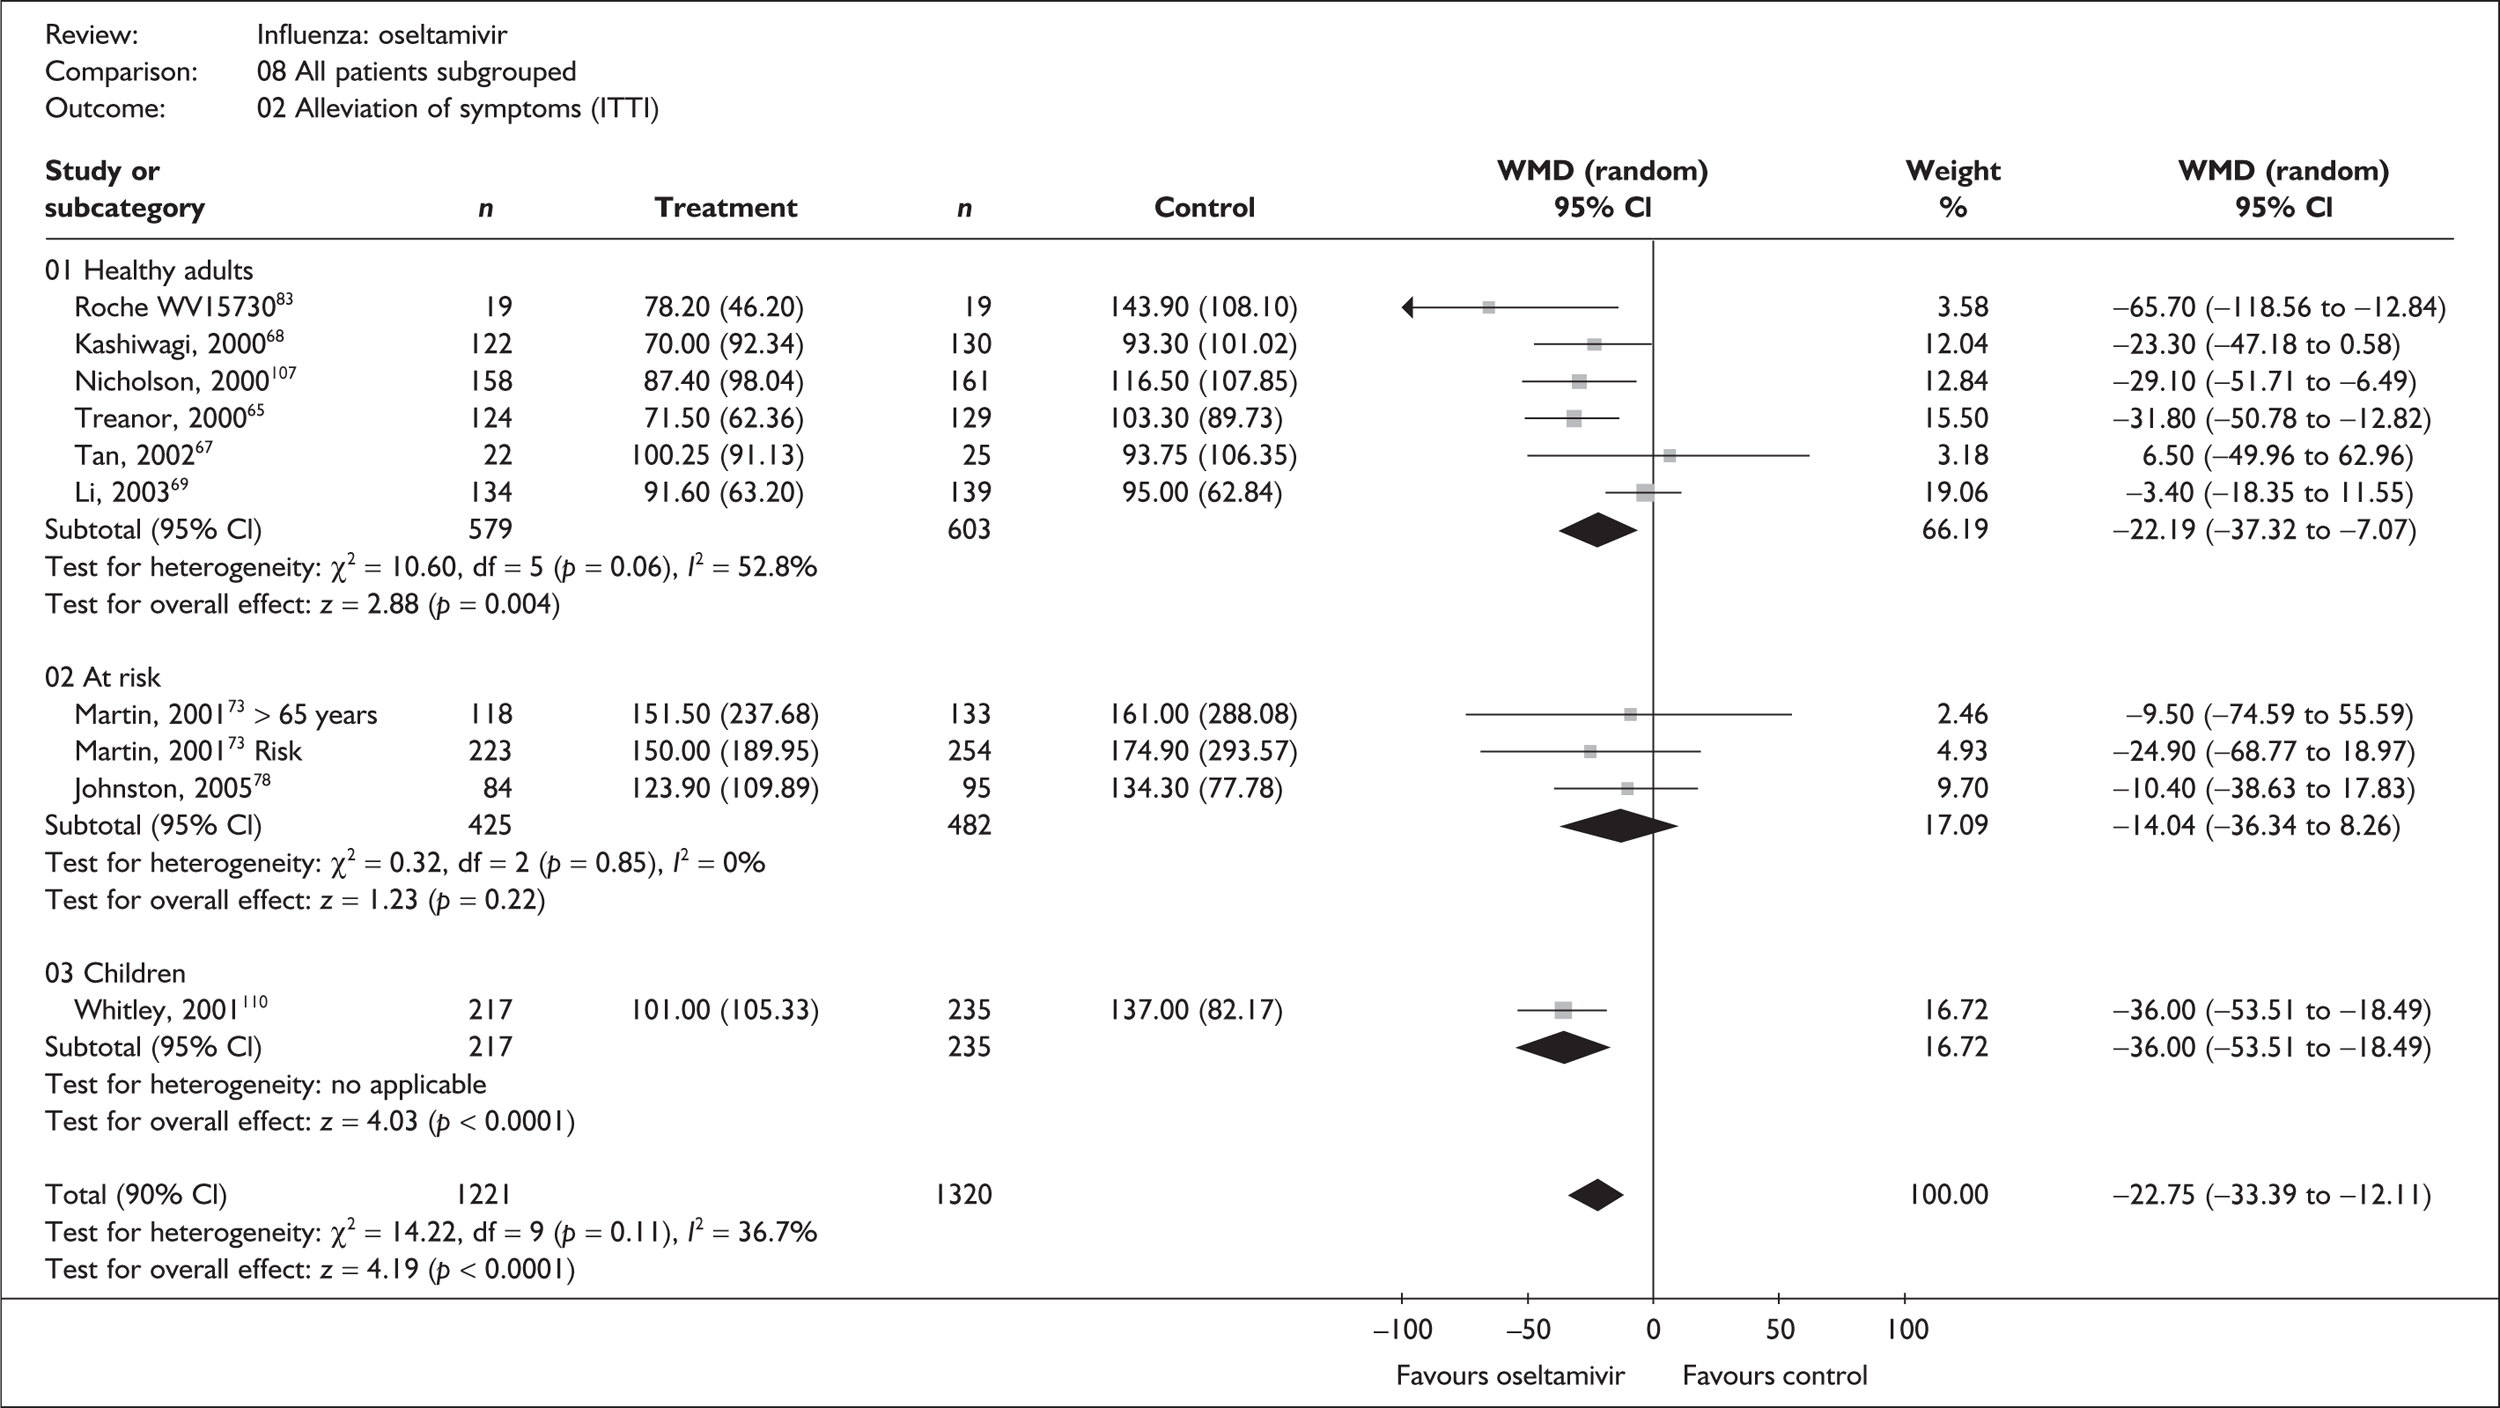
FIGURE 12.
Time to the return to normal activity for oseltamivir and placebo in the overall ITT population.
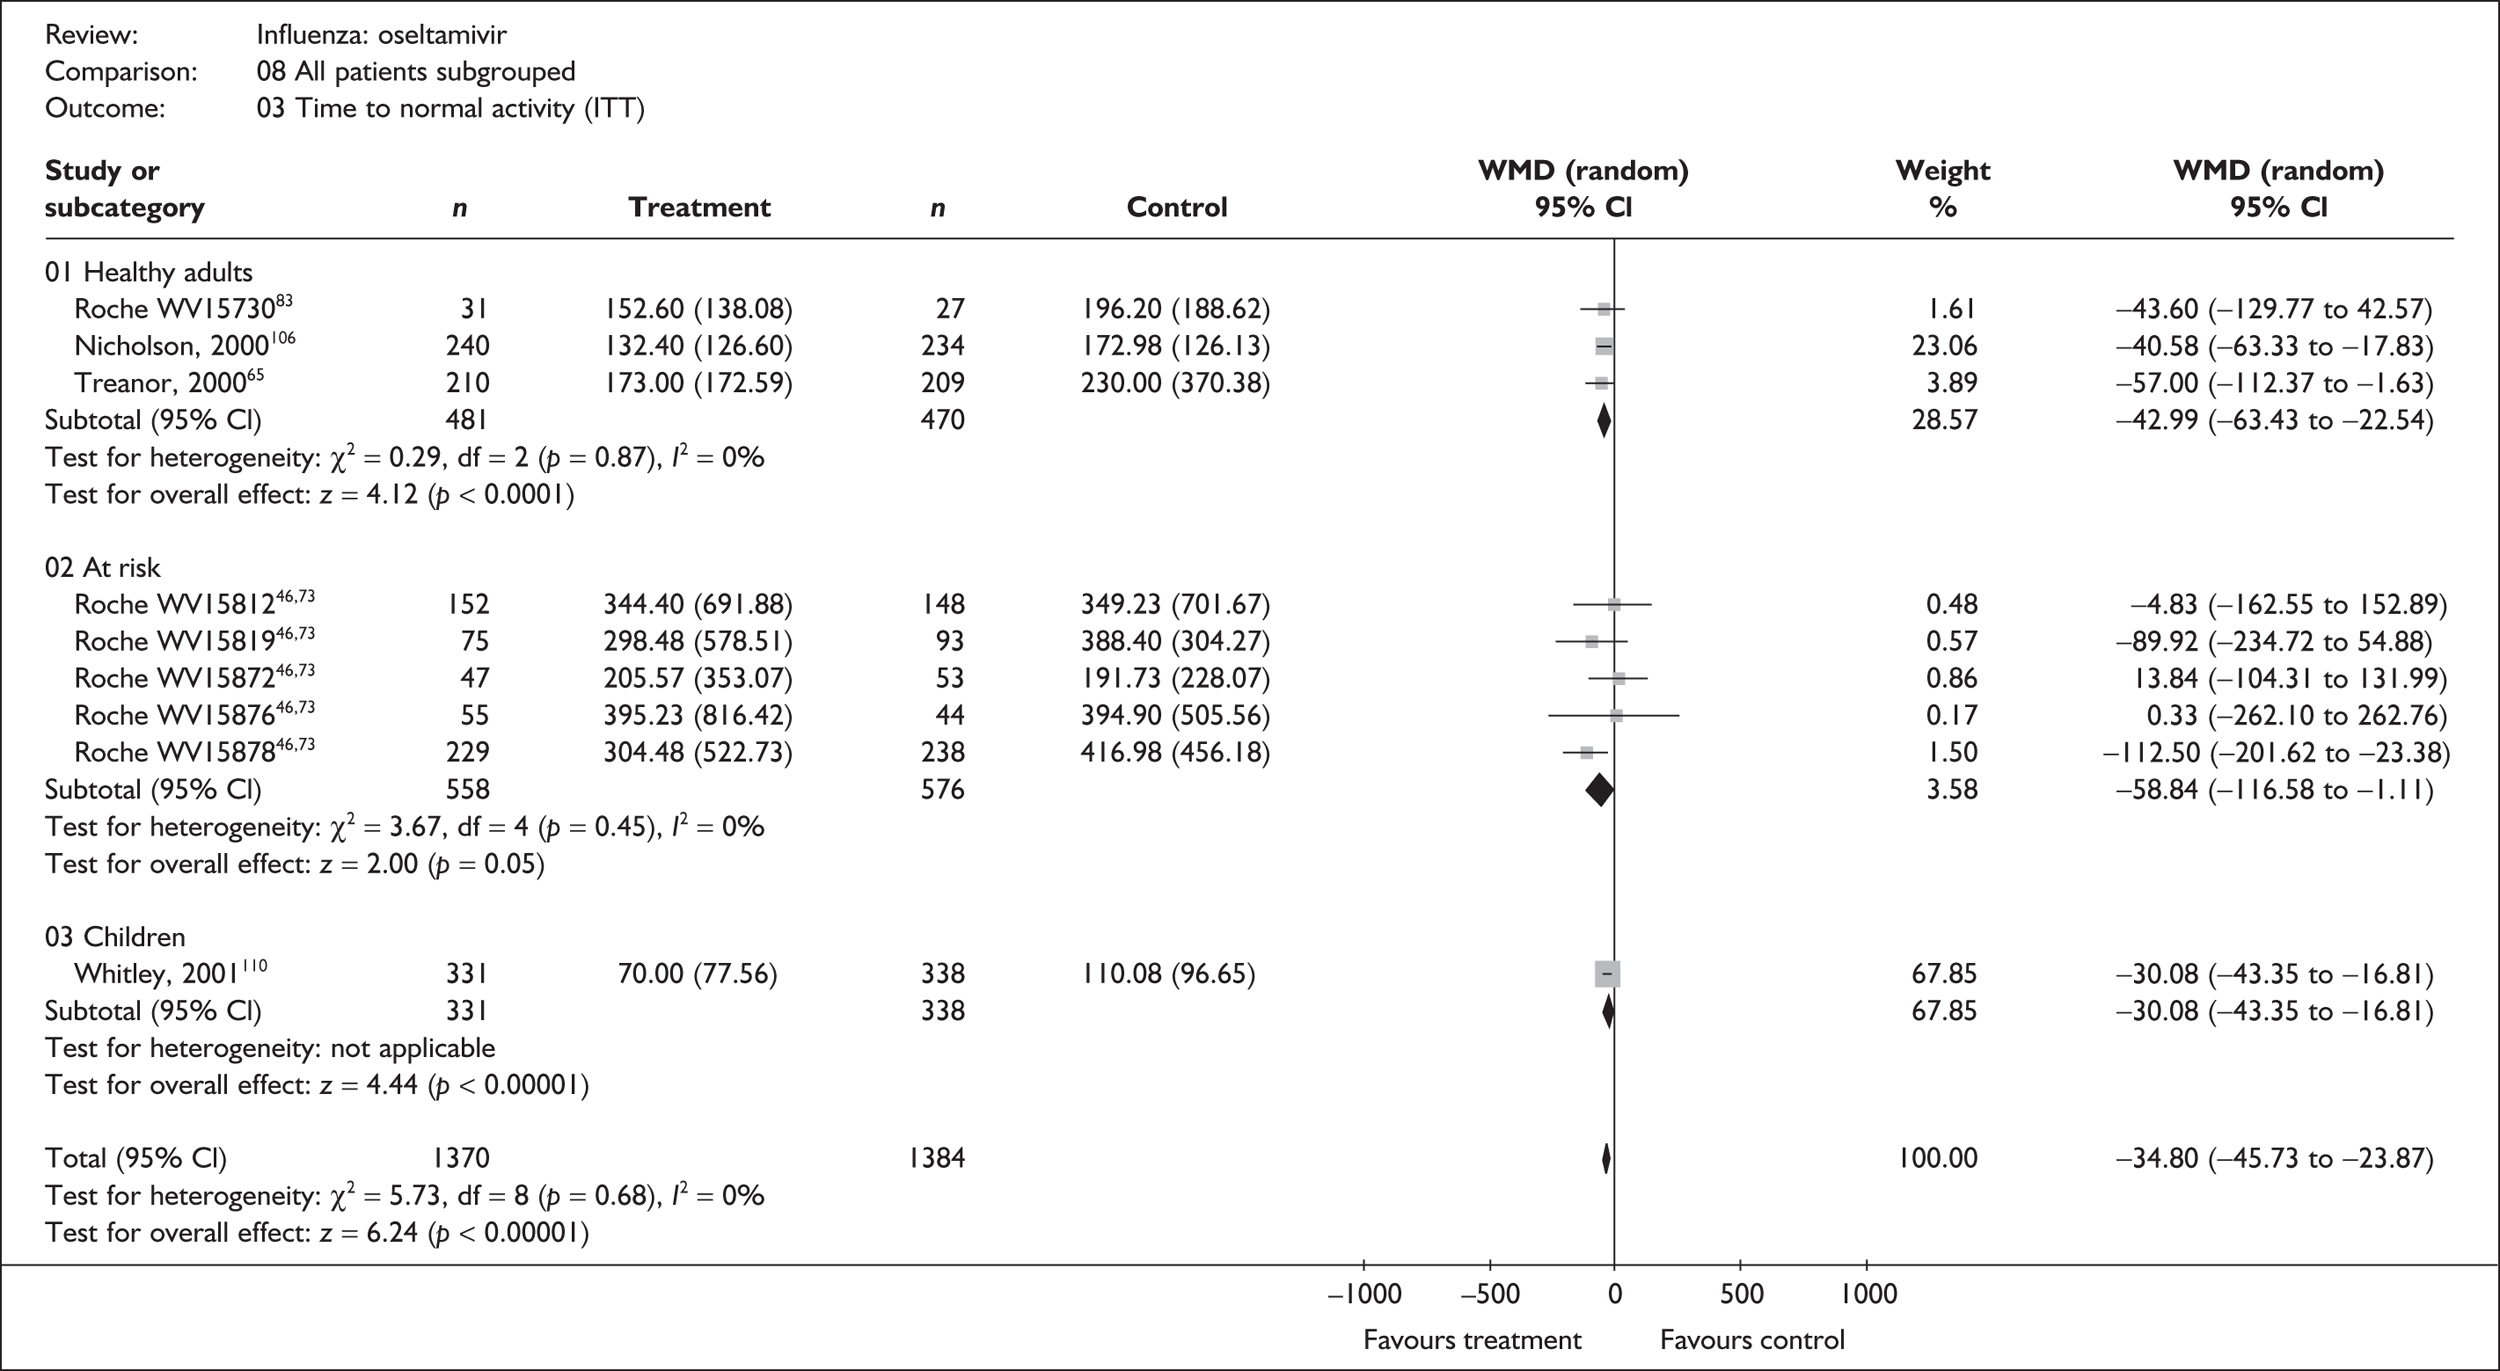
FIGURE 13.
Time to the return to normal activity for oseltamivir and placebo in the overall ITTI population.
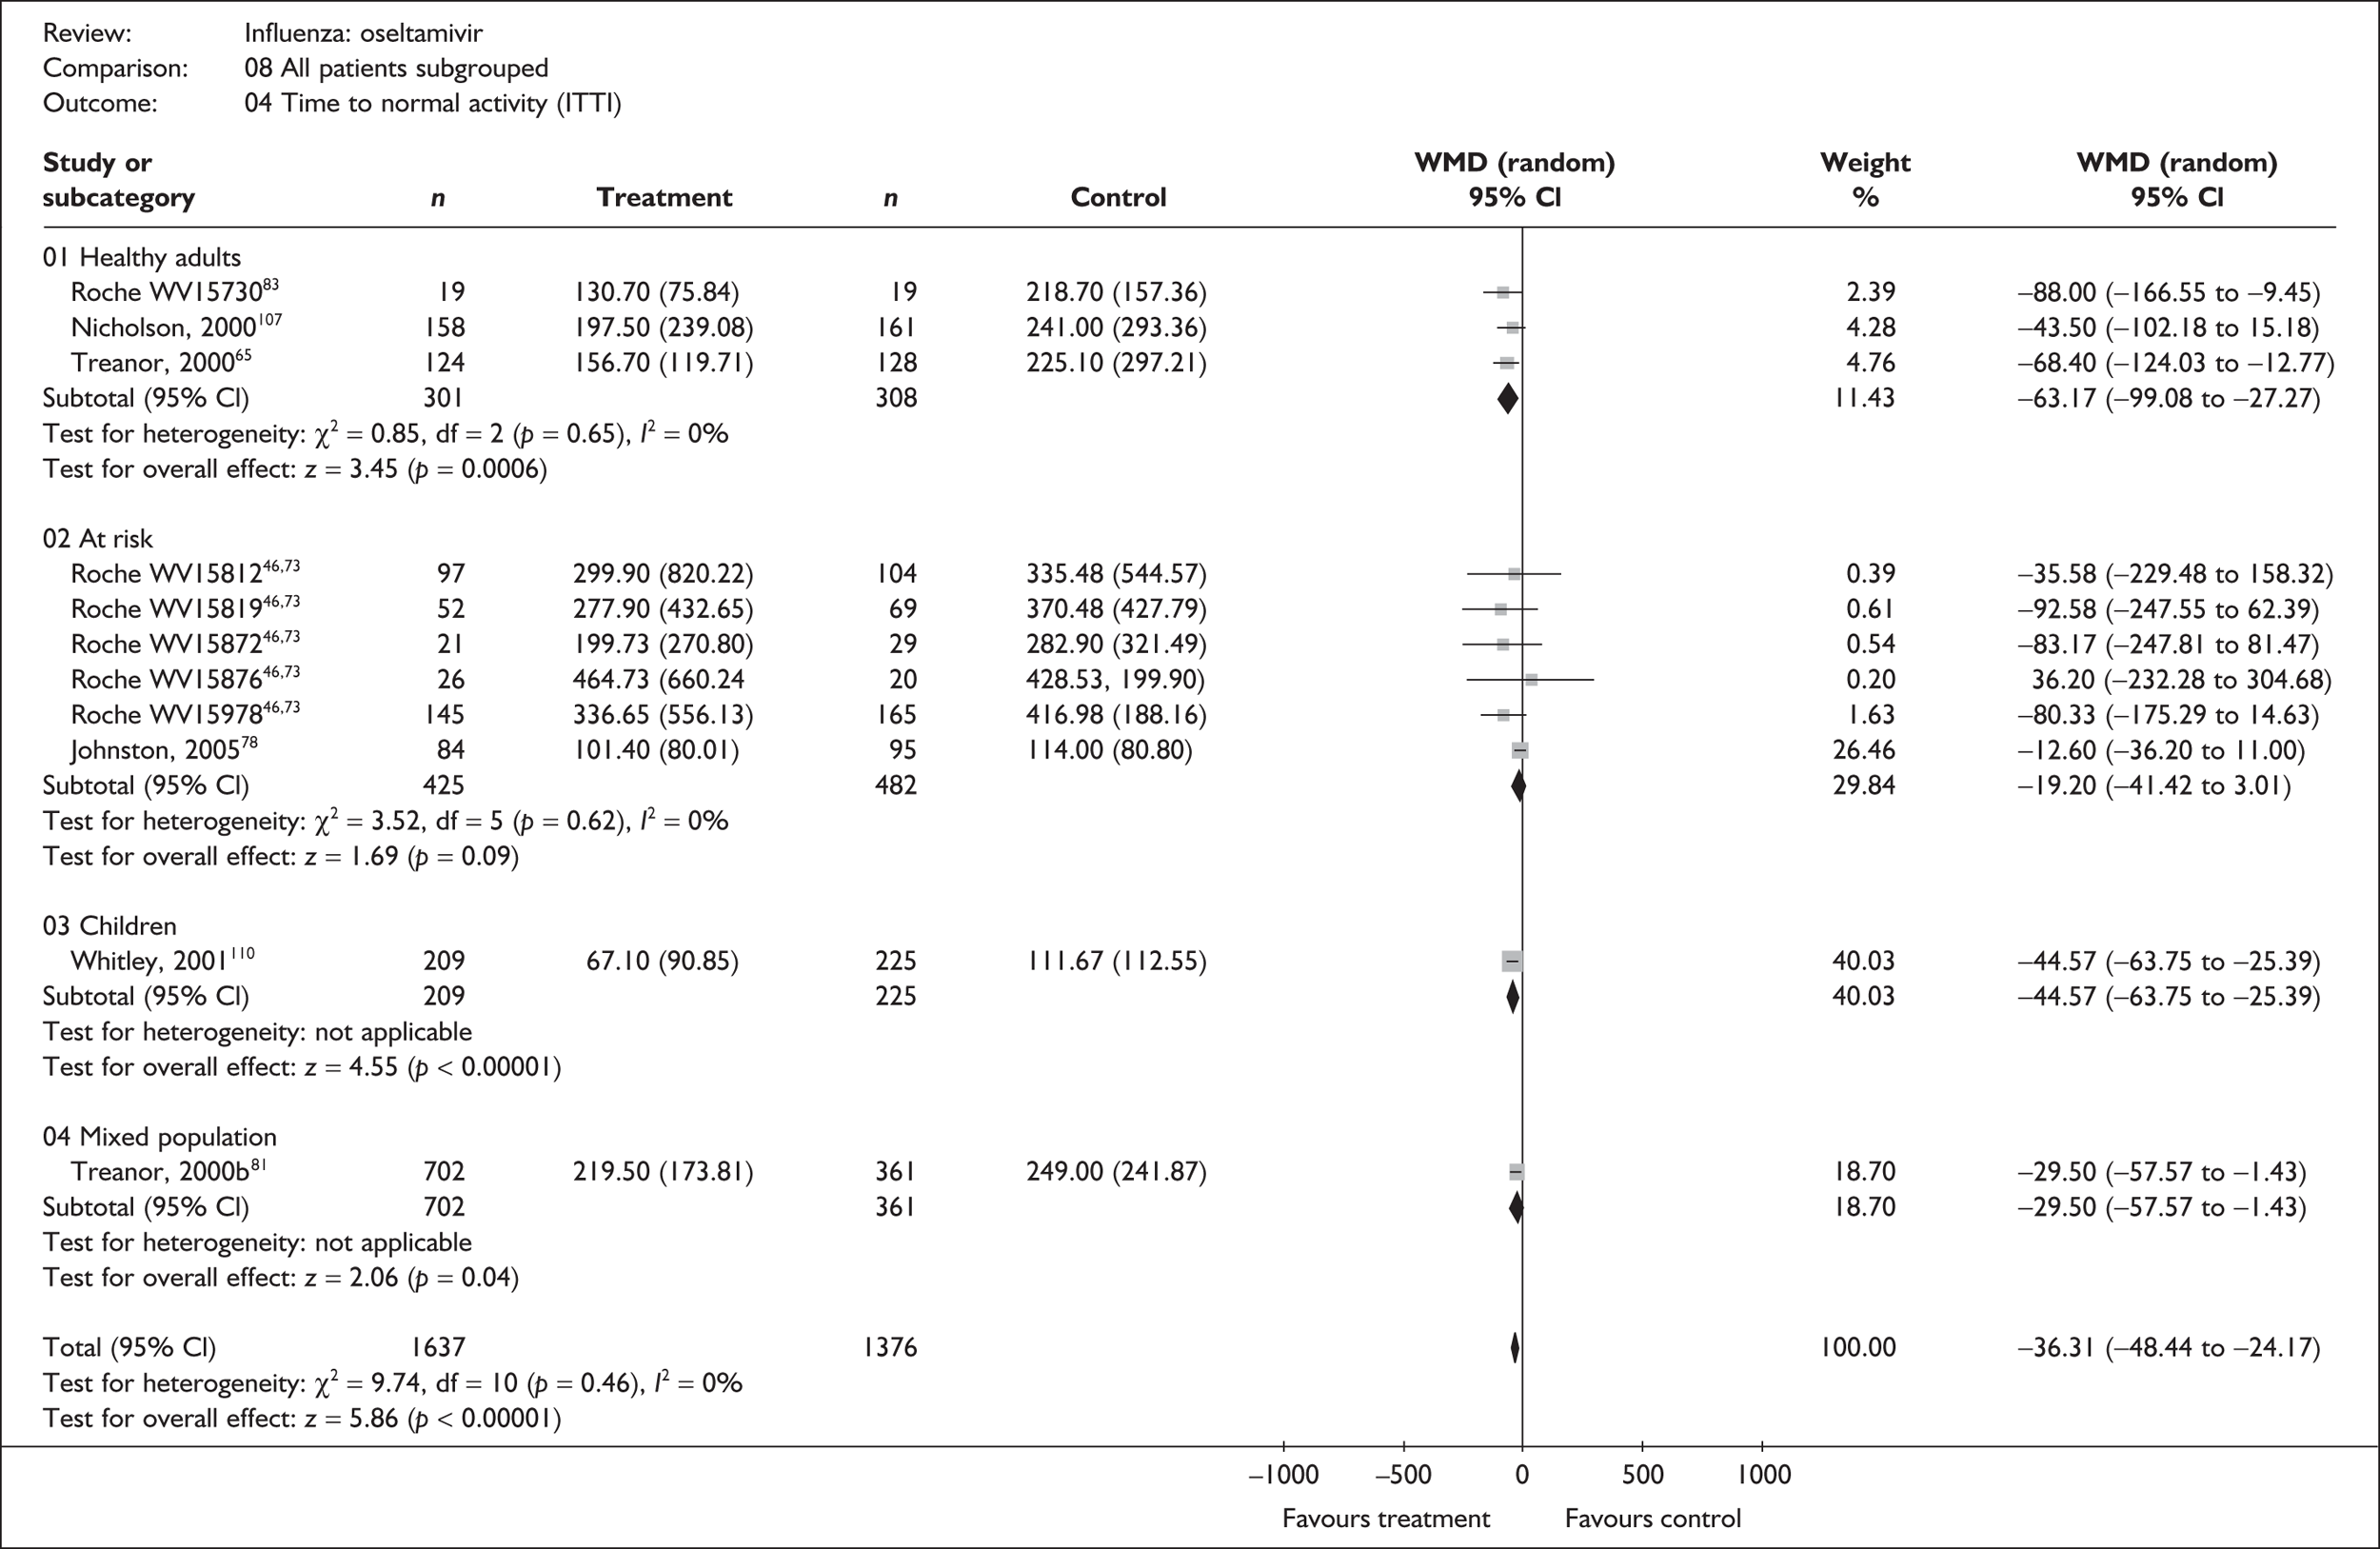
For time to the alleviation of symptoms, results in each patient subgroup favoured the use of oseltamivir in both the ITT and the ITTI analyses. These were statistically significant for healthy adults, for healthy children and for the trial with a mix of participant types (data only for ITT). For the at-risk group, results were in the same direction and comparable with the other subgroups, but there was more uncertainty around these findings. Treatment effects were generally greater in the analyses of individuals with confirmed influenza, in which oseltamivir reduced the median time to alleviation of symptoms by about 1 day in healthy adults (WMD –22.19 hours; 95% CI –37.32 to –7.07), by about 1.5 days in healthy children (WMD –36.00 hours; 95% CI –53.51 to –18.49) and by approximately 0.5 days in the at-risk group (WMD –14.04 hours; 95% CI –36.34 to 8.26). With the exception of the ITT analyses of healthy adults, there was no statistically significant heterogeneity within any of the subgroups. There was no overall statistically significant heterogeneity across all trials in either the ITT or the ITTI population. Therefore, although the focus of this review is around the individual subgroups that populate the decision model, on this basis it is not unreasonable to pool results across all trials to obtain the overall ‘average’ estimate that the use of oseltamivir reduces the time to alleviation of symptoms by about 1 day (WMD –22.75 hours; 95% CI –33.39 to 12.11) in individuals with confirmed influenza.
A similar pattern of results is observed for time to return to normal activity where all subgroups in both the ITT and the ITTI populations favour the use of oseltamivir. Results are statistically significant in all groups except the at-risk subgroup in the ITTI analyses. In individuals with confirmed influenza, oseltamivir reduced the median time to return to normal activity by approximately 2.5 days (WMD –63.17 hours; 95% CI –99.08 to –27.22) in healthy adults, approximately 1 day in the at-risk subgroup (WMD –19.20 hours; 95% CI –41.42 to 3.01) and approximately 2 days (WMD –44.57 hours; 95% CI –63.75 to –25.39) in the trial of healthy children. There was no consistency across subgroups as to whether the size of reduction was greater in the ITT or ITTI analysis. Again, there is no overall statistically significant heterogeneity in the results within any of the subgroups or over all trials in either the ITT or the ITTI analyses. Pooling results across all trials gives an overall estimate that ‘on average’ the use of oseltamivir reduces the median time to return to normal activity by about 1.5 days (WMD –36.31 hours; 95% CI –48.44 to –24.17) in individuals with confirmed influenza.
Some studies did not provide a measure of variance, and could therefore not be included in the meta-analyses (Table 44), but results are broadly consistent with the trials that could be analysed.
| Study | Number randomised | Oseltamivir Median (SE) |
Placebo Median (SE) |
Median difference | |
|---|---|---|---|---|---|
| Oseltamivir | Placebo | ||||
| Alleviation of fever (ITT) | |||||
| Li (2003)69 | 216 | 235 | 28.7 | 32.5 | –3.80 |
| Alleviation of symptoms (ITTI) | |||||
| Markovski (2002)57 | 17 | 24 | 4 days | 6 days | –2.0 |
| Alleviation of fever (ITTI) | |||||
| aMartin (2001)73,109 at-risk | 118 | 133 | 42.8 | 67.9 | –25.10 |
| aMartin (2001)73,109 elderly | 222 | 254 | 66.9 | 89.5 | –22.60 |
| Kashiwagi (2000)68 | 122 | 130 | 33.1 | 60.5 | –27.40 |
| Li (2003)69 | 134 | 139 | 27.9 | 51.5 | –23.60 |
Figures 14 and 15 illustrate the data that were available on time to alleviation of fever. As data were given for only a small number of trials, and primarily in healthy or mixed populations, they are not shown by subgroup. All trials show a reduction in the time to alleviation of fever associated with oseltamivir and, with the exception of one small trial, individually show statistically significant results. There is no statistically significant heterogeneity. Overall, oseltamivir reduced the median time to alleviation of fever by about 1 day in the ITTI population (WMD –24.41 hours, 95% CI –31.64 to –17.17).
FIGURE 14.
Time to the alleviation of fever for oseltamivir and placebo in the overall ITT population.
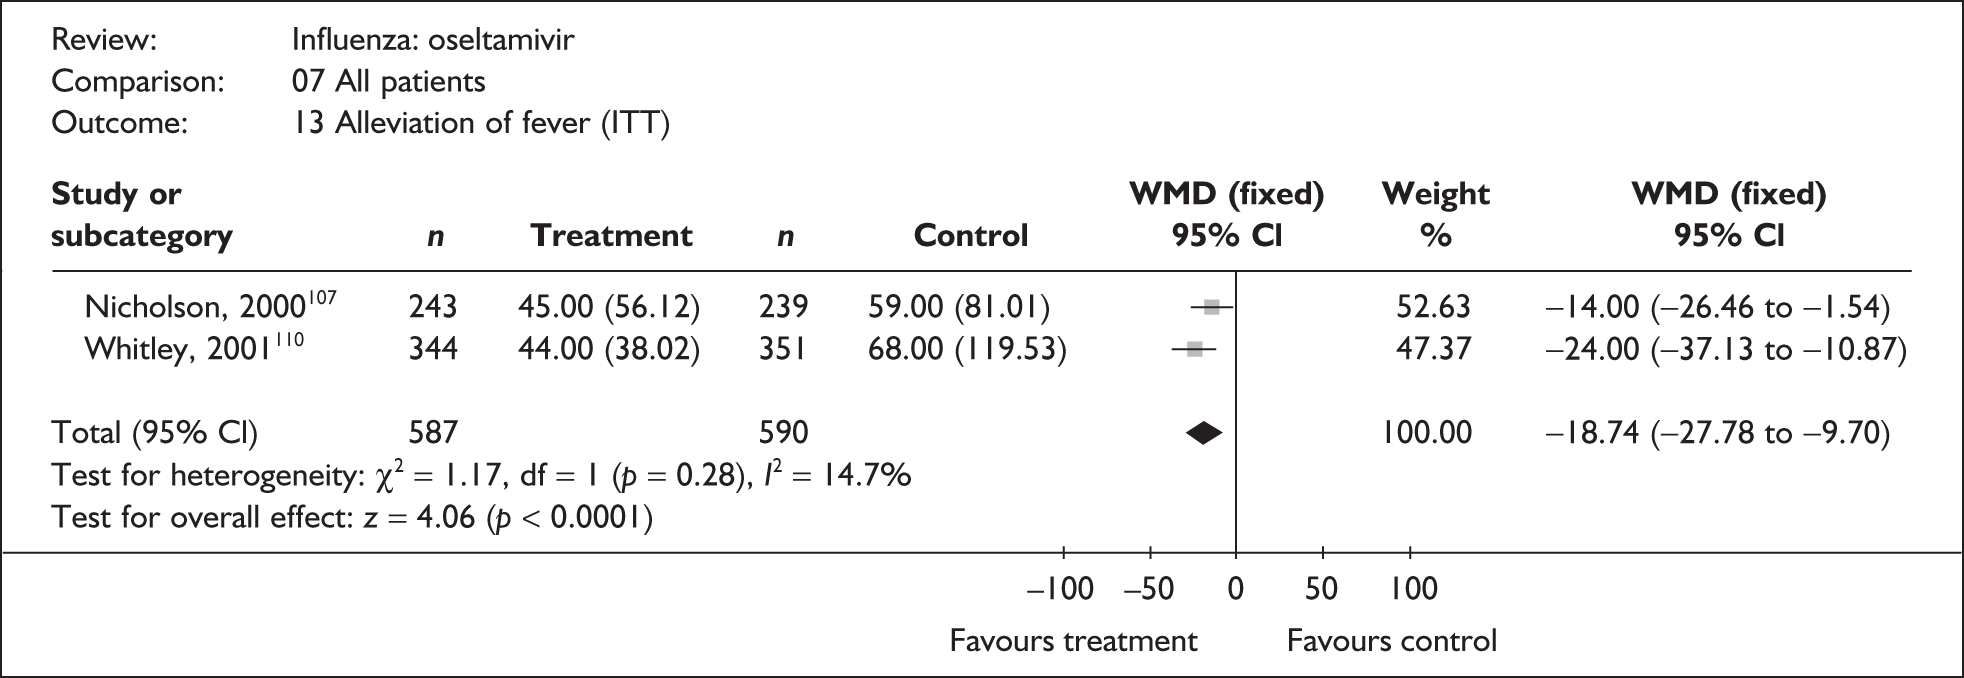
FIGURE 15.
Time to the alleviation of fever for oseltamivir and placebo in the overall ITTI population.
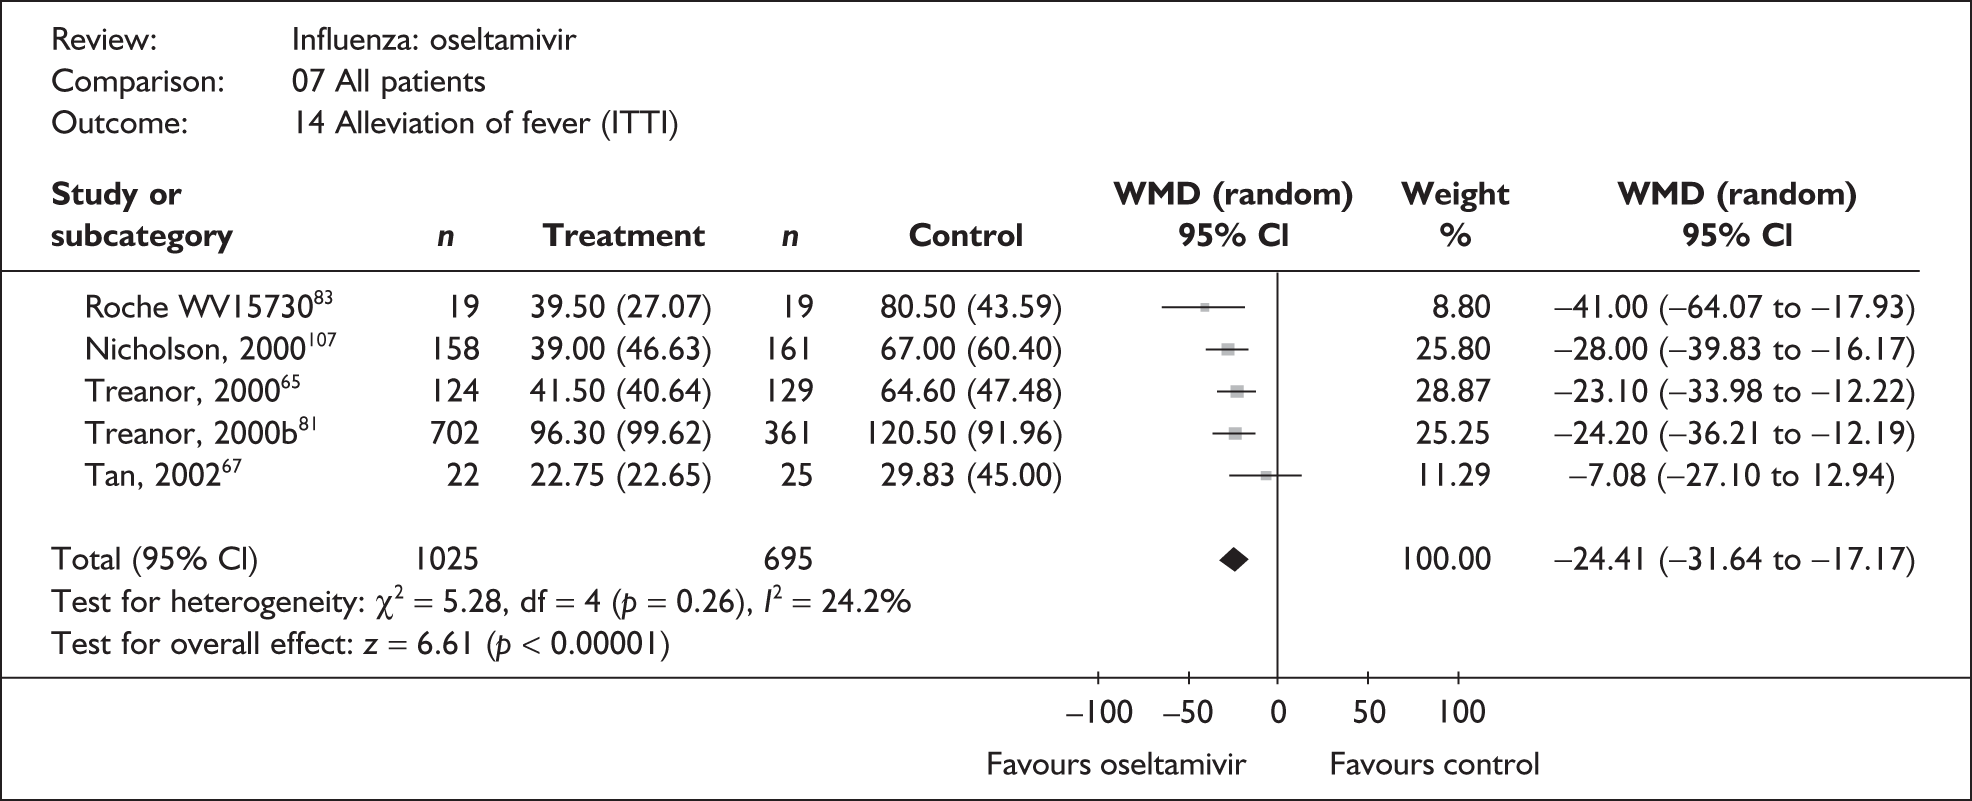
Complications
Of the 16 trials of oseltamivir reporting complications, two were in mixed populations,57,81 two in children,77,78,110 three in a general at-risk population,71–73,108 three in the elderly,73 and six in healthy adults. 46,65,66,68,69,83,107 Three trials were conducted in China66,69 or Japan,68 with two published in their respective languages. 66,68 One trial had a dropout rate greater than 5% but not greater than 10%. 82,83
As for zanamivir, data on complications were sparse, and results are presented for all trials combined rather than split into different patient subgroups (Figures 16 and 17). Very little data were available for the ITT analysis; for example, across all trials a total of only 46 overall complications were reported. There is therefore considerable uncertainty in these results and there was no clear evidence of differences in the incidence of bronchitis, pneumonia, GP consultation, hospitalisation or overall complications.
FIGURE 16.
Complication rates associated with oseltamivir and placebo in the overall ITT population.
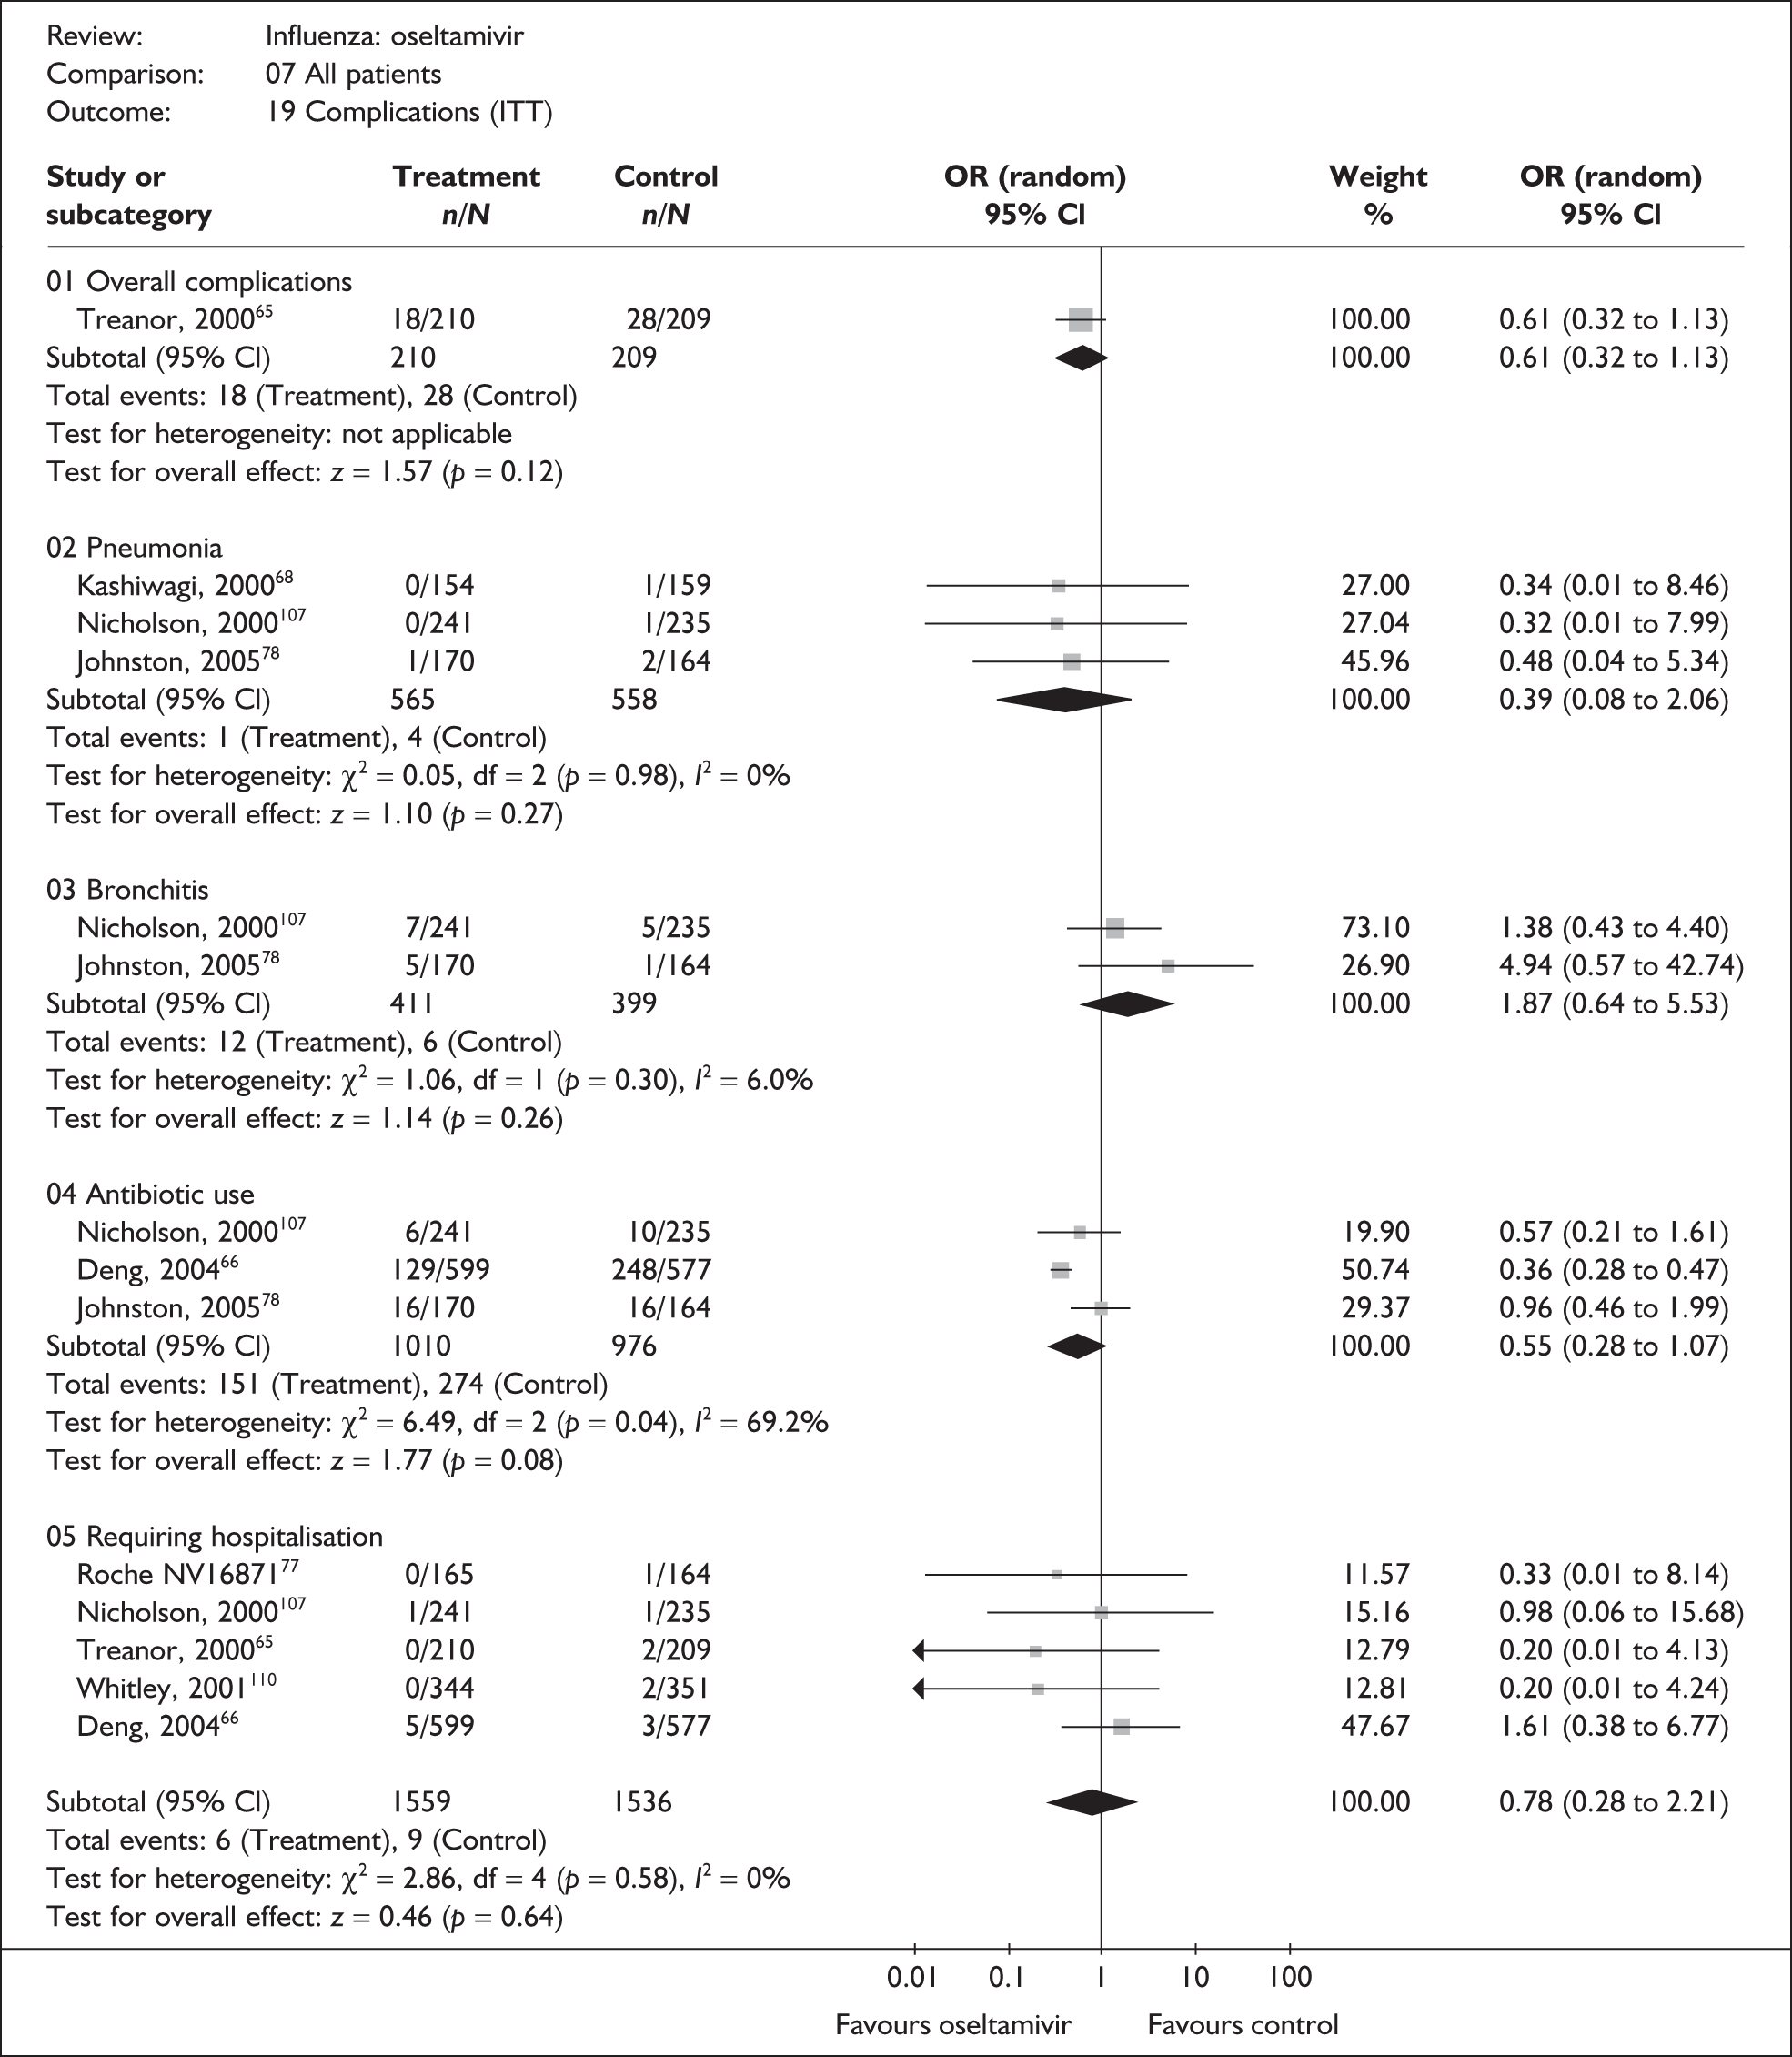
FIGURE 17.
Complication rates associated with oseltamivir and placebo in the overall ITTI population.
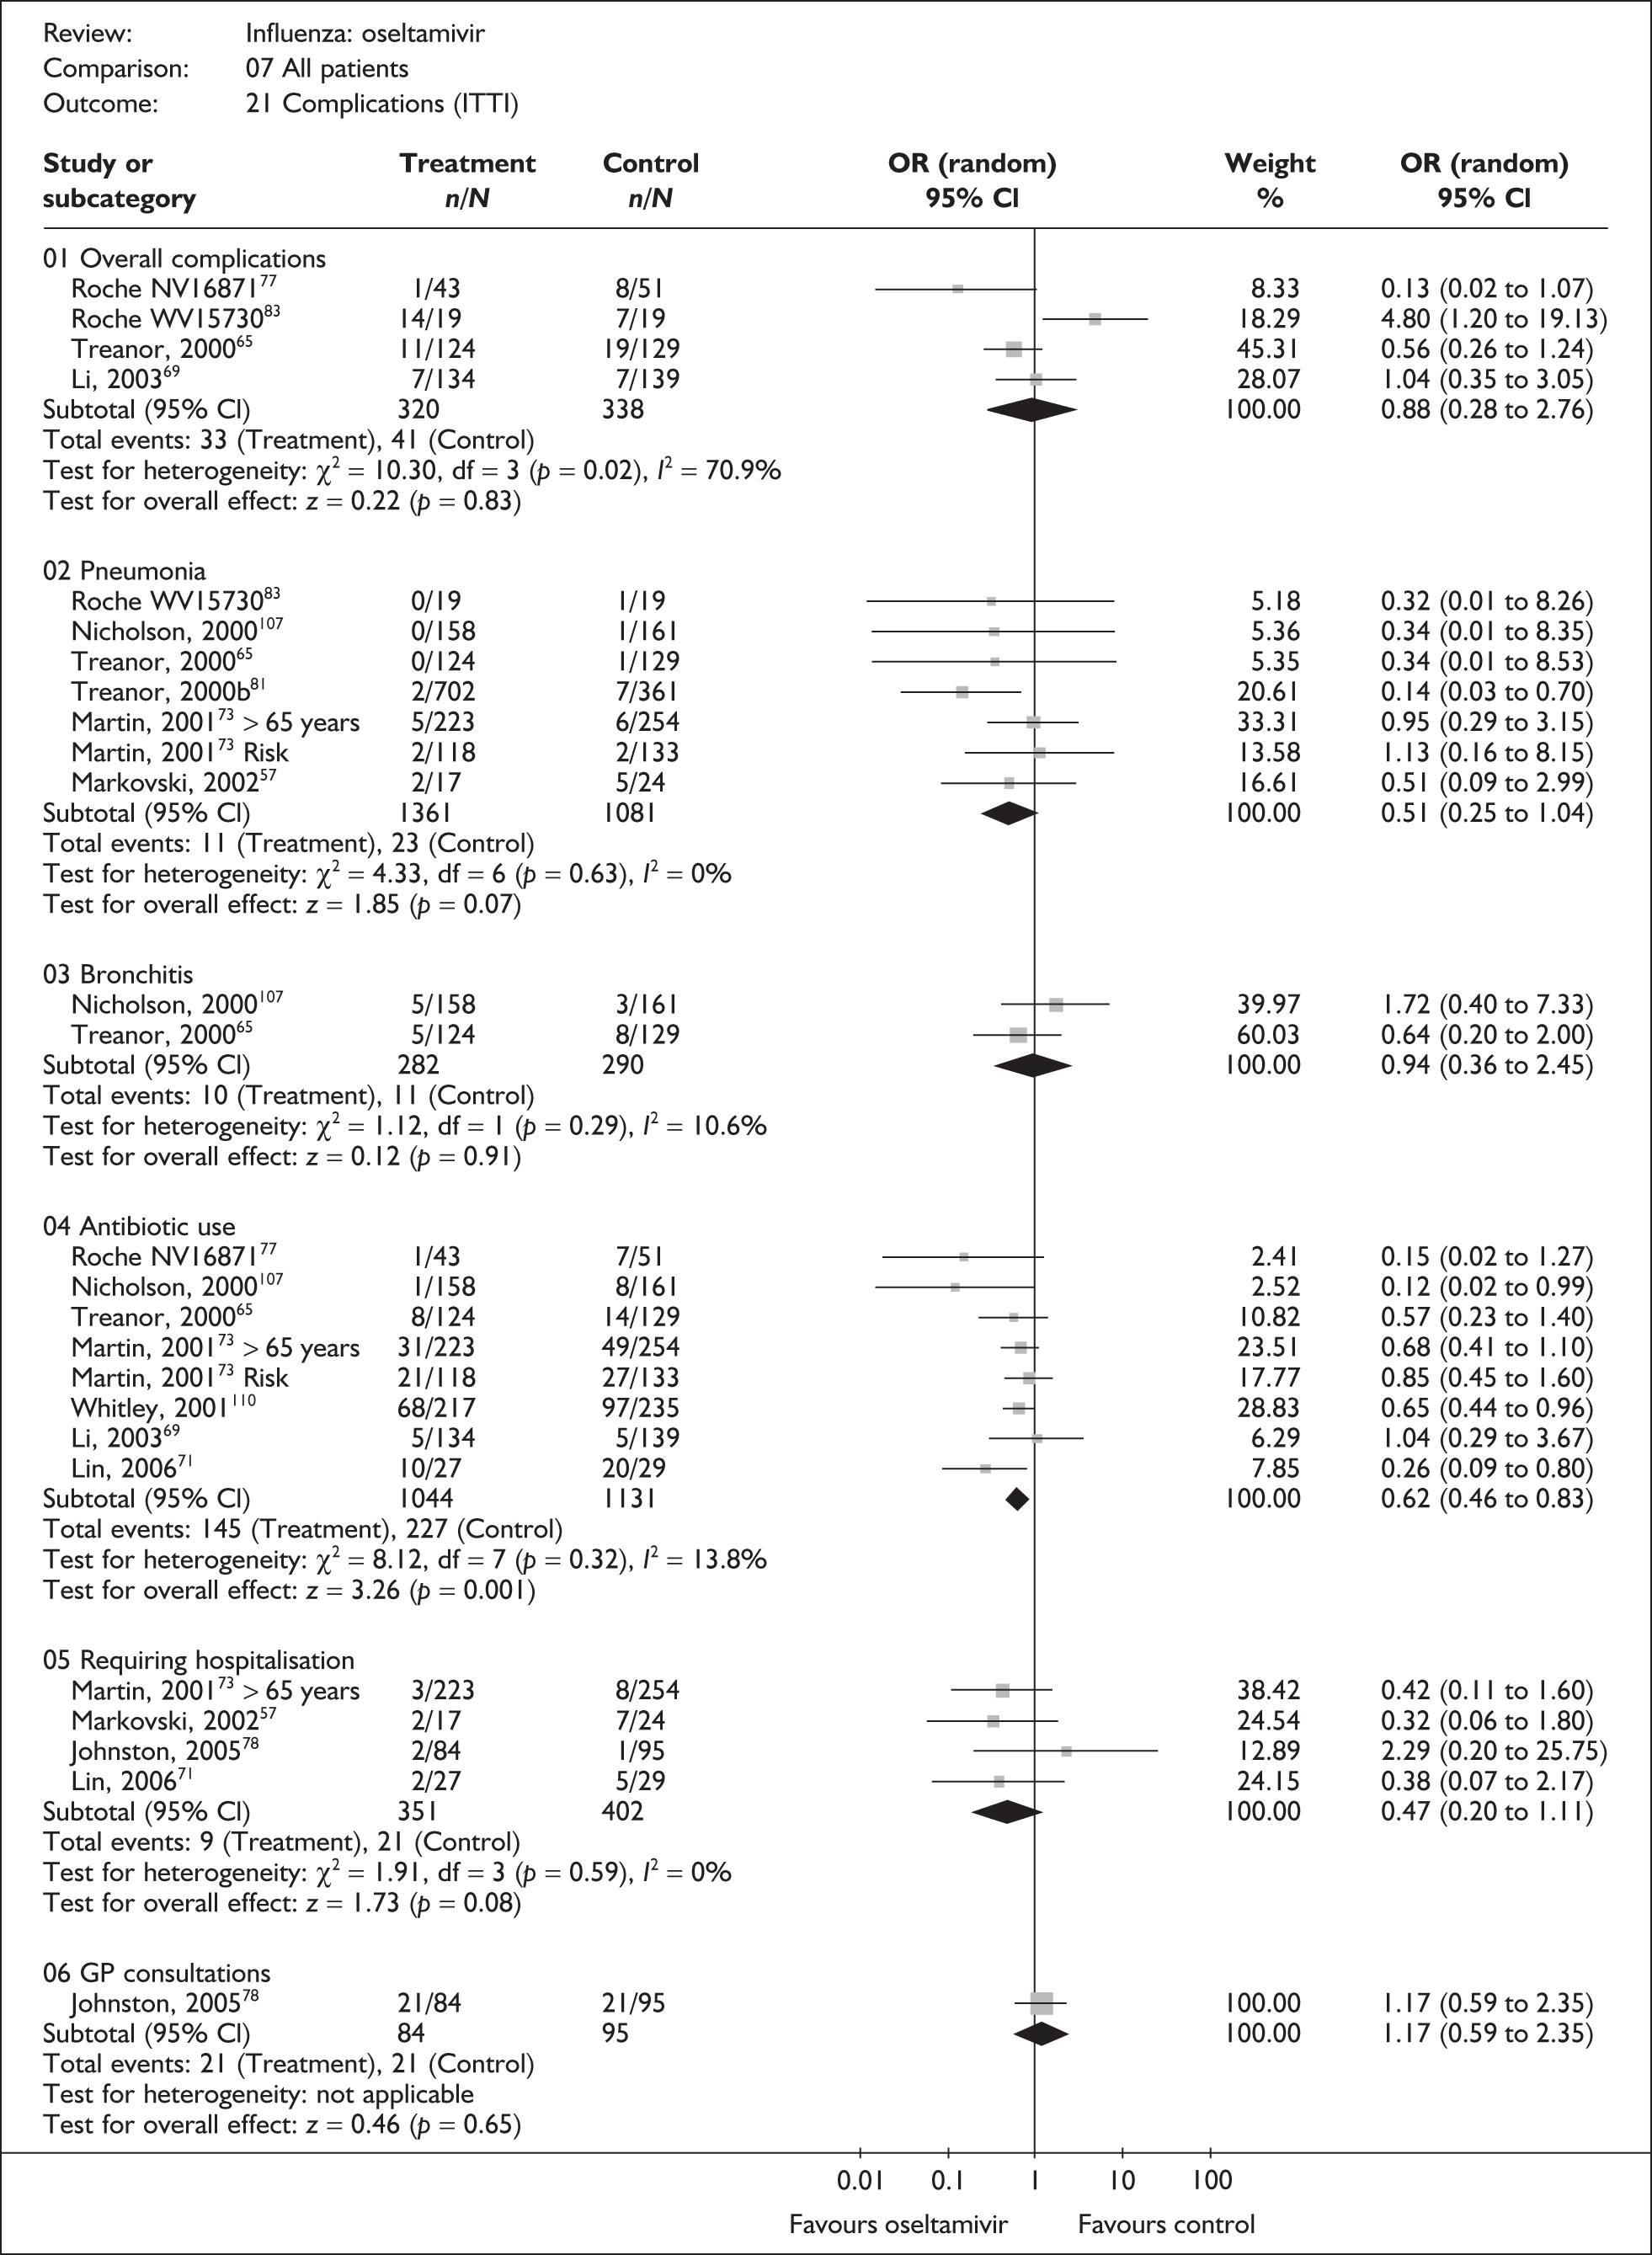
More data were available for the ITTI analyses in which the incidence of the use of antibiotics showed a statistically significant reduction for those treated with oseltamivir with an OR of 0.62 (95% CI 0.46 to 0.83).
With the exception of the ITT analysis of antibiotic use and the ITTI analysis of overall complications, there was no statistically significant heterogeneity observed in the results when analysed in this way.
Of the nine trials that reported on mortality,65,69,73,78,80,83,85,107,109,110 a single death was reported in the placebo arm of a trial in an at-risk population; it was unclear whether this was related to influenza. 73
Adverse events
Of the nine oseltamivir trials that reported adverse events, six were in healthy adults,46,66–69,80,83,107 (of which four were conducted in China66,67,69 or Japan68), two in children77,78,110 and one in a general at-risk population. 71,72 Two trials had a dropout rate of greater than 5% but not greater than 10%. 67,82,83
Analyses of adverse event data are shown in Figures 18 and 19. Data were limited and there was no evidence of a difference in the incidence of overall, serious or drug-related adverse effects in either the ITT or the ITTI analyses. There was no statistically significant heterogeneity in any of the pooled analyses.
FIGURE 18.
Adverse event rates associated with oseltamivir and placebo in the overall ITT population.
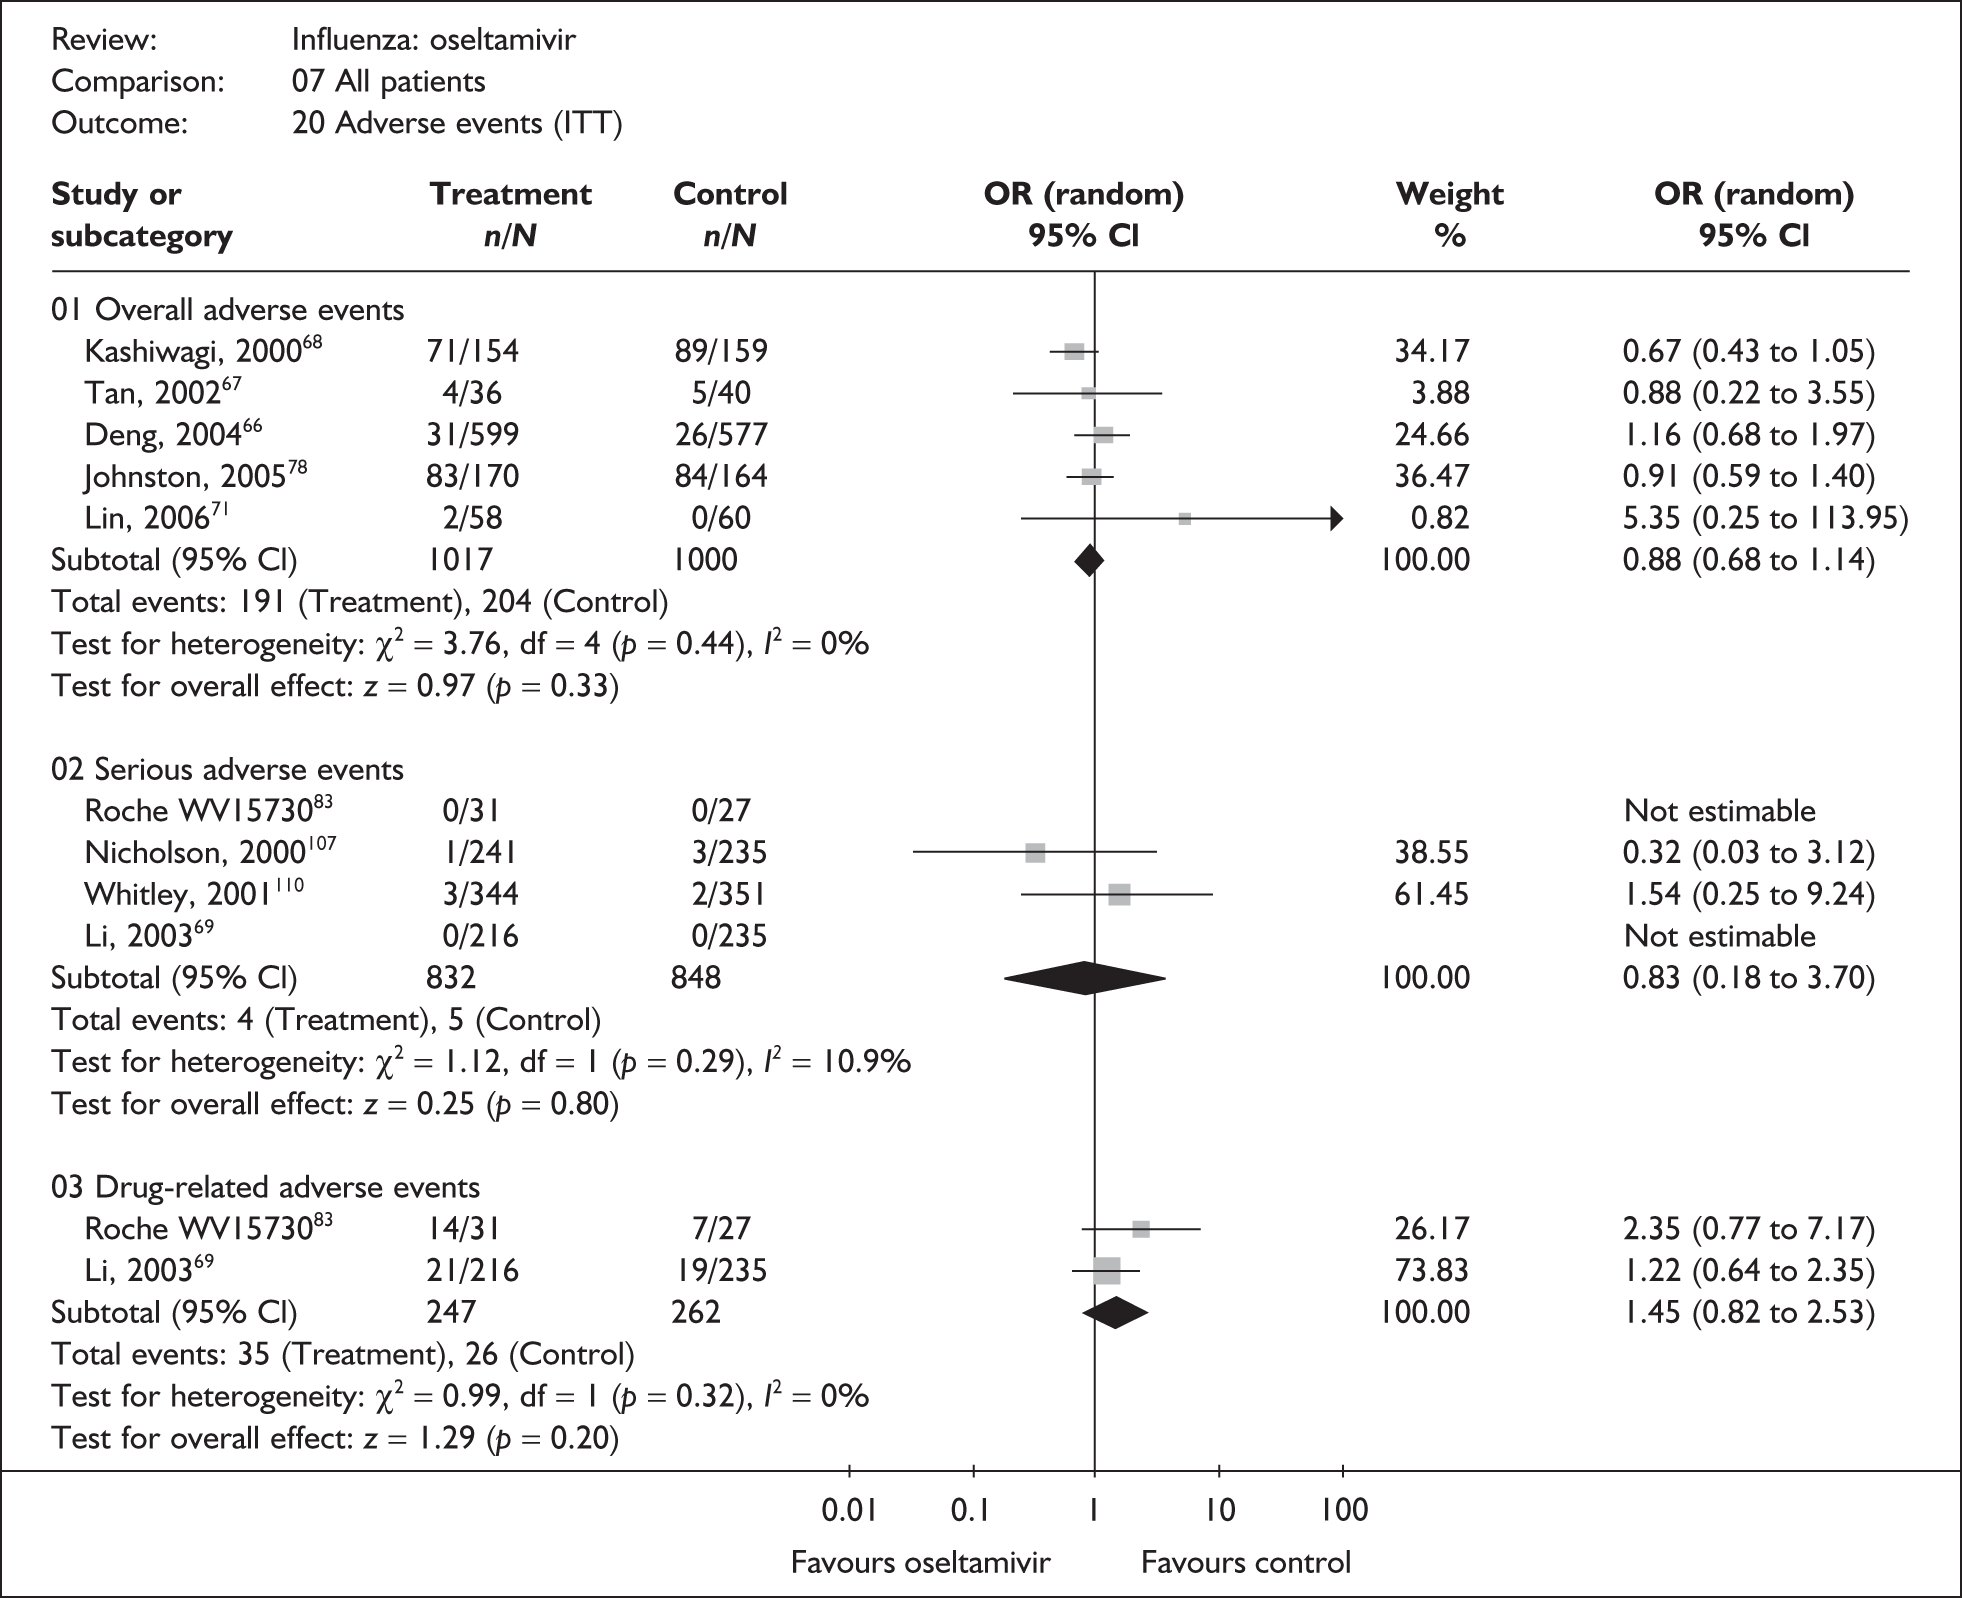
FIGURE 19.
Adverse event rates associated with oseltamivir and placebo in the overall ITTI population.
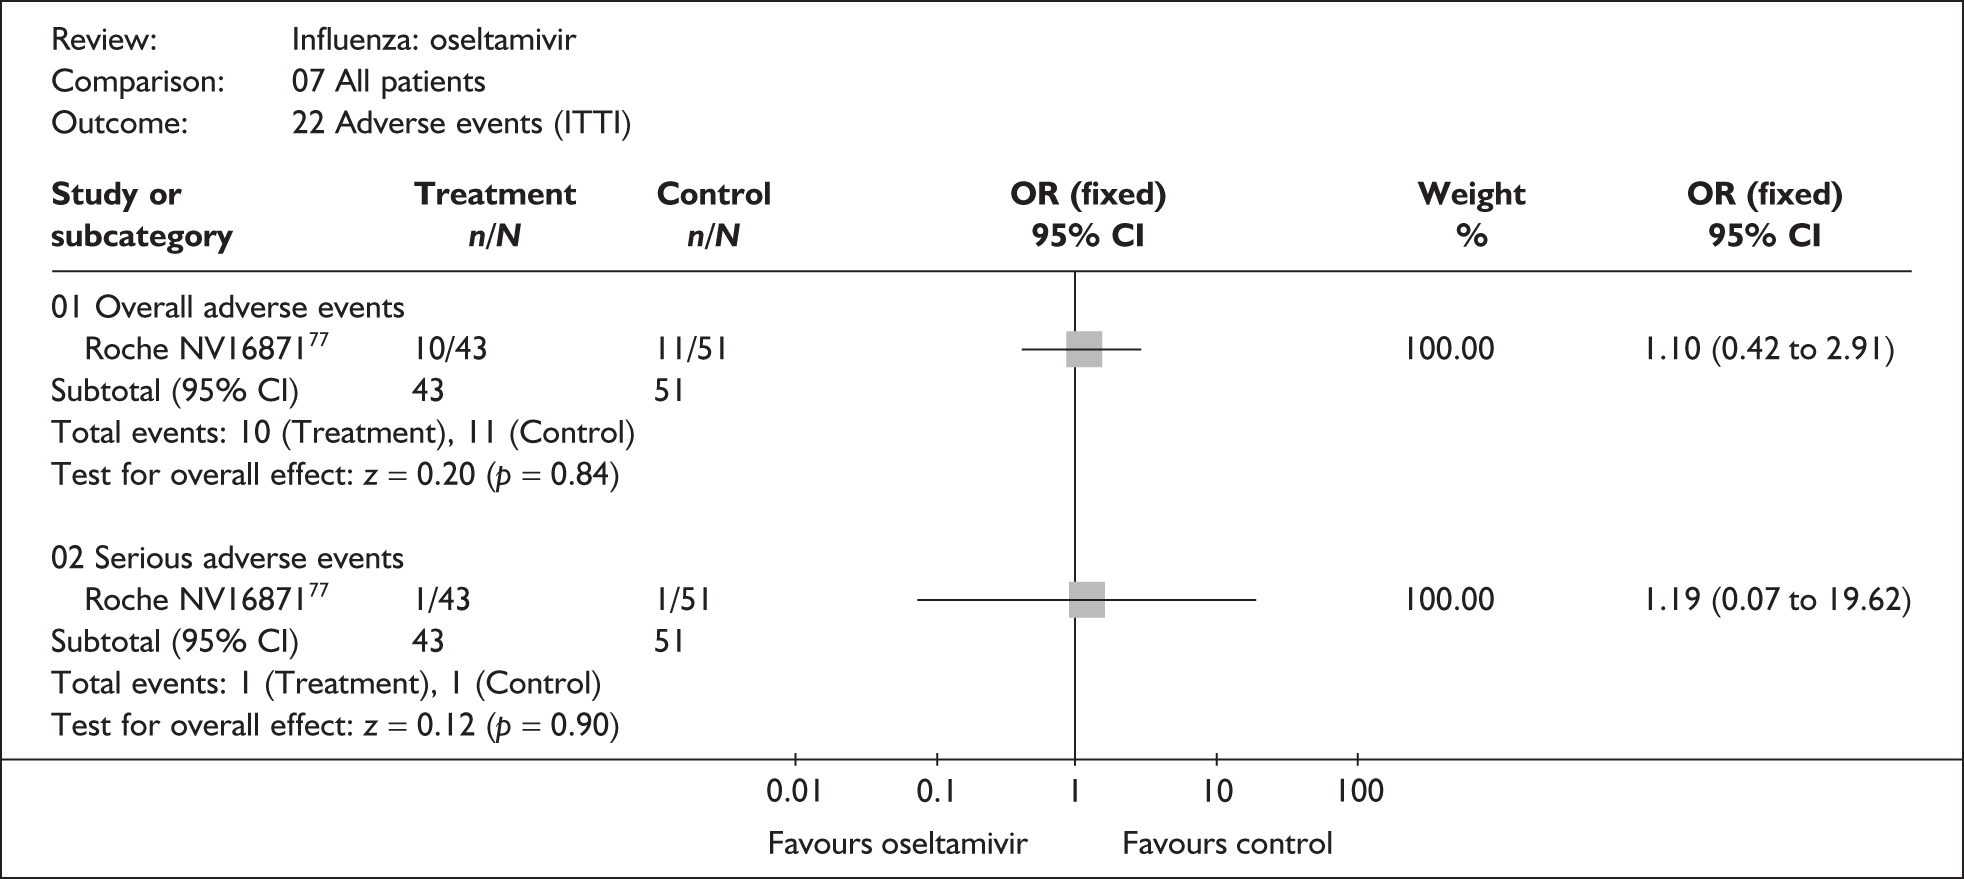
Summary for the effectiveness of oseltamivir
Although analyses are based on similar numbers of individuals (between 609 and 1410 in the healthy adult subgroup and between 907 and 1472 in the at-risk subgroup), the evidence for the effectiveness of oseltamivir in alleviating symptoms was stronger in healthy adults and children. Results in healthy adults and children showed statistically significant reductions in the median time to the alleviation of symptoms and the time to return to normal activity, in both the ITT and the ITTI analyses. For healthy adults with confirmed influenza, reductions of approximately 1 day were seen in median duration of symptoms and approximately 2.5 days in the median time taken to return to normal activity. Healthy children were studied in only one trial, which showed a reduction in median time to alleviation of symptoms of 1.5 days, and median time to return to normal activity of around 2 days. Results for at-risk individuals were broadly similar, but there was more uncertainty around these results, and there was no clear evidence that oseltamivir reduced median time to alleviation of symptoms or return to normal activity. In at-risk individuals with confirmed influenza, the median time to alleviation of symptoms was reduced by about half a day and the median time to return to normal activity reduced by about 1 day (reduction in the median time to return to normal activity in the ITT analysis was approximately 2.5 days and of borderline statistical significance). There was little statistical heterogeneity observed in any of these analyses. Data for most individual complications were sparse, and results largely inconclusive. The evidence is strongest for the use of antibiotics in the ITTI population, which showed reduced incidence associated with oseltamivir use.
Discussion of the clinical evaluation
Effectiveness
The decision problem emphasised the need to give specific consideration to healthy and vulnerable patient groups. Data were therefore described and analysed within patient subgroups, primarily healthy adults, healthy children and individuals considered to be at risk. This required that data from trials that recruited a mixed patient population were, where possible, subdivided and analysed within these subgroups. Trials that could not be split in this way therefore contributed only to final summary meta-analyses that present results for each subgroup alongside each other. All comparisons made in this section are of the individual drugs versus placebo or symptomatic relief; they do not consider the relative effectiveness of zanamivir and oseltamivir.
Key findings
This review showed that treatment with zanamivir or oseltamivir, when compared with placebo, generally reduced the median duration of symptoms and median time to return to normal activity.
In healthy adults, zanamivir reduced the median duration of symptoms by between approximately 0.5 and 1 days, and oseltamivir by between 0.5 and 1 days. The median reduction in the time taken to return to normal activity was about 0.5 days with zanamivir and approximately 1–2.5 days with oseltamivir. Although these results were statistically significant, the absolute effects were small and their clinical significance questionable, particularly in an otherwise healthy population. As might be expected, estimates derived from the analyses of those with confirmed influenza generally produced greater effect sizes than those derived from all randomised patients.
For the at-risk subgroups, estimates of difference in symptom duration often failed to reach statistical significance, although the direction of effect remained in favour of the NI treatments. Treatment reduced the median duration of symptoms in at-risk populations by approximately 1–3.75 days (ITTI high-risk children) with zanamivir, and by 0.5–1 days (elderly ITTI population) with oseltamivir. A similar pattern was seen in the time taken to return to normal activity, with the median time being reduced by between 1 and 2.5 days (ITTI high-risk children) with zanamivir and by 0.5–4 days (elderly ITT population) with oseltamivir in at-risk populations. These effect sizes were generally larger, and potentially more clinically significant, than those seen in healthy adults. However, there was greater uncertainty around these results. Very limited data were available for the at-risk subgroups of children and the elderly. The ranges for the overall at-risk population may therefore be more representative of the response in these subgroups. In the overall at-risk population, treatment reduced the median duration of symptoms by approximately 1–2 days with zanamivir, and by 0.5–0.75 days with oseltamivir, and the median time to return to normal activity by between 1 and 2 days with zanamivir and by 0.75–2.5 (data for at-risk adults only) days with oseltamivir.
When data were available for adverse events and complication rates, there was little overall difference associated with the use of either zanamivir or oseltamivir when compared individually with placebo. However, data were reported for few trials, studies were not designed to detect changes in these outcomes, and the numbers of events were generally very small. There is therefore considerable remaining uncertainty in all subgroups with respect to these outcomes. The majority of available data were for ‘overall complications’ and antibiotic use. However, the definition of overall complications varied considerably between studies, and the clinical value of this composite outcome is unclear. The most consistent data and strongest evidence related to antibiotic use. Both zanamivir and oseltamivir appeared to reduce antibiotic use, which could be regarded as a surrogate measure for reduced incidence of bacterial infections.
Comparison with the review by Turner et al.46
The results reported here expand on those reported by Turner et al. ,46 which helped inform the current NICE guidelines (TA58). This review adds 14 trials to those used by Turner, six in zanamivir (three in healthy adults, one in the elderly, one in at-risk adults and one in children which included a minority of at-risk participants) and eight in oseltamivir (four in healthy adults, one in an at-risk population of undefined age, one in at-risk children and two in adult populations which included both healthy and at-risk individuals). It additionally analyses incidence of complications and adverse events. This review also excluded one trial (NA130010)84 that was primarily of prophylaxis and found to be ineligible here, but had been included in the Turner et al. 46 review. Despite the inclusion of additional studies, the results for median time to resolution of symptoms and median time to return to normal activity remain similar to those reported by Turner. The results of both reviews are summarised in Tables 45 and 46. For ease of comparison, the results for oseltamivir have been converted from hours to days.
| Population | Zanamivir WMD (95% CI) |
Oseltamivir WMD (95% CI) |
||
|---|---|---|---|---|
| Previous HTA report46 | Current review | Previous HTA report46 | Current review | |
| Time to alleviation of symptoms | ||||
| Healthy adults | –0.78a (–1.3 1 to –0.26) | –0.57b (–1.0 7 to –0.07) | –0.86 (–1.4 2 to –0.31) | –0.55b (–1.0 5 to –0.14) |
| High-risk adults | –0.93a (–1.90 to 0.05) | –0.95 (–1.8 3 to –0.07) | –0.35 (–1.40 to 0.71) | –0.59b (–1.70 to 0.54) |
| Healthy children | –1.00 (–1.5 0 to –0.50) | –1.00 (–1.5 0 to –0.50) | –0.87 (–1.4 9 to –0.25) | –0.88 (–1.4 1 to –0.26) |
| High-risk children | –2.00 (–6.90 to 2.90) | –2.00 (–6.94 to 2.94) | N/A | –0.88 (–1.94 to 0.17) |
| All children | N/A | –0.94b (–1.4 3 to –0.46) | N/A | –0.88b (–1.4 1 to –0.35) |
| Elderly | N/A | –1.13b (–2.90 to 0.63) | N/A | –0.41b (–1.87 to 1.05) |
| All at risk | N/A | –0.98b (–1.8 4 to –0.11) | N/A | –0.74b (–36.20 to 0.52) |
| Whole population | –0.94a (–1.2 3 to –0.65) | –0.71b (–1.0 1 to –0.41) | –0.80 (–1.1 8 to –0.41) | –0.68b (–0.9 5 to –0.41) |
| Time to return to normal activities | ||||
| Healthy adults | –0.51a (–1.04 to 0.02) | –0.37b (–0.84 to 0.09) | –1.33 (–1.9 6 to –0.71) | –1.33 (–1.9 6 to –0.71) |
| High-risk adults | –0.09a (–0.95 to 0.78) | –1.07b (–2.81 to 0.68) | –2.45 (–4.8 6 to –0.05) | –2.45 (–4.8 6 to –0.05) |
| Healthy children | –0.50 (–1.30 to 0.30) | –0.50 (–1.26 to 0.26) | –1.25 (–1.8 0 to –0.70) | –1.25 (–1.8 1 to –0.70) |
| High-risk children | –1.00 (–3.50 to 1.50) | –1.00 (–3.46 to 1.46) | N/A | N/A |
| All children | N/A | N/A | N/A | N/A |
| Elderly | N/A | N/A | N/A | –4.09b (–7.1 2 to –1.05) |
| All at risk | N/A | –0.96b (–2.32 to 0.41) | N/A | N/A |
| Whole population | –0.37a (–0.7 4 to –0.01) | –0.44b (–0.8 4 to –0.05) | –1.32 (–1.7 3 to –0.91) | –1.32 (–1.7 3 to –0.91) |
| Population | Zanamivir WMD (95% CI) |
Oseltamivir WMD (95% CI) |
||
|---|---|---|---|---|
| Previous HTA report 46 | Current review | Previous HTA report 46 | Current review | |
| Time to alleviation of symptoms | ||||
| Healthy adults | –1.26a (–1.9 3 to –0.59) | –0.96b (–1.3 8 to –0.54) | –1.38 (–1.9 6 to –0.80) | –0.92b (–1.5 6 to –0.29) |
| High-risk adults | –1.99a (–3.0 8 to –0.90) | –1.96 (–3.0 5 to –0.86) | –0.45 (–1.88 to 0.97) | –0.84 (–2.35 to 0.68) |
| Healthy children | –1.00 (–1.6 0 to –0.4) | –1.00 (–1.5 9 to –0.41) | –1.49 (–2.2 2 to –0.76) | –1.50 (–2.2 3 to –0.77) |
| High-risk children | –3.80 (–7.60 to 0.10) | –3.75 (–7.59 to 0.09) | N/A | –0.43b (–1.61 to 0.74) |
| All children | N/A | N/A | N/A | –1.20b (–1.8 2 to –0.58) |
| Elderly | N/A | –1.85b (–4.77 to 1.07) | N/A | –1.00b (–2.83 to 0.83) |
| All at risk | N/A | –1.83b (–2.8 1 to –0.86) | N/A | –0.59b (–1.51 to 0.34) |
| Whole population | –1.26a (–1.61 6 to –0.90) | –1.07b (–1.3 9 to –0.74) | –1.33 (–1.7 7 to –0.90) | –0.95b (–1.3 9 to –0.50) |
| Time to return to normal activities | ||||
| Healthy adults | –0.46a (–0.9 0 to –0.02) | –0.39b (–0.84 to 0.06) | –1.64 (–2.5 8 to –0.69) | –2.63 (–4.1 3 to –1.14), |
| High-risk adults | –0.20a (–1.19 to 0.79) | –1.77 (–4.40 to 0.86) | –3.00 (–5.8 8 to –0.13) | –2.95 (–5.7 0 to –0.20) |
| Healthy children | –0.50 (–1.40 to 0.40) | –0.50 (–1.36 to 0.36) | –1.86 (–2.6 5 to –1.06) | –1.86 (–2.6 6 to –1.06) |
| High-risk children | –2.50 (–4.4 0 to –0.60) | –2.50 (–4.3 7 to –0.63) | N/A | –0.50b (–1.51 to 0.46) |
| All children | N/A | N/A | N/A | –1.33b (–1.9 5 to –0.71) |
| Elderly | N/A | N/A | N/A | –3.07b (–6.30 to 0.16) |
| All at risk | N/A | –1.89b (–3.95 to 0.17) | N/A | –0.80b (–1.73 to 0.13) |
| Whole population | –0.37a (–0.7 2 to –0.02) | –0.71b (–1.2 4 to –0.19) | –1.64 (–2.1 1 to –1.17) | –1.51b (–2.0 2 to –1.01) |
Zanamivir
When comparing the results of the two reviews, the new data for zanamivir resulted in a slightly smaller pooled effect estimate for the time to alleviation of symptoms in healthy adults; nevertheless, this remained statistically significant in favour of zanamivir for both the ITT and the ITTI populations, and the conclusion drawn stayed the same. Likewise, there was a slightly reduced pooled effect estimate for the impact of zanamivir on the time to return to normal activities in the healthy adult ITTI population such that the confidence interval now includes zero effect and there is no longer a statistically significant reduction with zanamivir. However, the overall direction of effect was the same, and the difference in the actual pooled estimates between the two reviews was very small.
The overall at-risk group in the current review included children with comorbid conditions. Therefore, in order to be able to make a direct comparison with the previous report, we also analysed data for at-risk children and at-risk adults separately. There were no differences in effectiveness in either the ITT or the ITTI populations for time to alleviation of symptoms between the two reviews. There were no new data relating to high-risk children. The current review included approximately twice as many patients in the analyses of time to normal activity for at-risk adults, making these analyses less dominated by one study, NAIB2007,46 that reported a zero effect with very narrow CIs. As a result, the WMD was increased in favour of zanamivir compared with the previous report, for both the ITT and the ITTI populations, although there remained no statistically significant difference when zanamivir was compared with placebo.
Oseltamivir
The new data available for oseltamivir in this review resulted in smaller effect estimates for the time to alleviation of symptoms in otherwise healthy adults,67–69 and the results were statistically significant in both reviews. There were no new trials included in this analysis; the increase in the effect size in the ITTI population appears to result from the use of N rather than r, as the studies included in this particular analysis had high numbers of patients who had not returned to normal activity (the number censored is unclear); for the studies combined, the rate was substantially higher in patients receiving placebo than in those receiving oseltamivir (35% and 20% respectively).
The overall at-risk group in the current review included children with comorbid conditions. Therefore, in order to be able to make a direct comparison with the previous report, we also analysed data for at-risk children and at-risk adults separately. There is a difference between the two reviews in the results for the time to the alleviation of symptoms in at-risk ITTI adults, despite data from the same studies being used. The reported WMDs were –10.91 hours (0.45 days) and –20.09 hours (0.84 days) from the previous and current review respectively. We repeated the analysis using the data we extracted, SDs calculated from the SEs reported in the previous review, and r instead of N. All these analyses resulted in a WMD of approximately –20 hours. Despite this discrepancy, none of these analyses reported a significant difference between oseltamivir and placebo, and therefore the conclusions drawn from these data would not be altered. No differences in effectiveness were seen in either ITT or ITTI populations for time to return to normal activity.
Generally, zanamivir and oseltamivir reduced the median duration of symptoms and median time to return to normal activity when compared with placebo, in both the current and the Turner et al. 46 review, and in terms of symptom relief the conclusions drawn from the two reviews are similar. There was no comparison of complication or adverse event data undertaken by Turner et al.
Trial design and quality
The majority of included studies were described as randomised, double blind, controlled trials, although the details of the methods of randomisation, allocation concealment and particularly blinding were poorly reported. Two trials specified that they were open label. 66,71
The types of participants recruited to some subgroups differed across studies. Although the elderly were consistently defined (over 65 years of age), there was less consistency for other subgroups. The age of the children recruited varied from 1–12 to 6–17 years. Most studies that reported results specifically for healthy adults defined this group as aged between 18 and 65 years of age and not otherwise at risk. However, some studies included healthy elderly patients and/or older children (over 12 years) and adolescents. Although heterogeneity was observed in some analyses of children and healthy adults, this did not seem to be attributable to these differing definitions.
Definitions of outcomes varied across studies. Time to alleviation of symptoms incorporated a composite of between 3 and 18 symptoms, and time to return to normal activity was defined as time to return to work/school, ‘feeling better’ or ‘feeling as before illness’. In a few trials, time to alleviation of symptoms was greater than time to normal activity. However, given that the most common definition used was the time to return to work, it is not inconceivable that participants would consider themselves to be back to normal activity before all symptoms were alleviated.
Definitions of adverse events also varied across trials and often incorporated data on complications, notably so in the zanamivir trials (insufficient data were available to examine this in any detail for the oseltamivir trials), such that some studies appeared to have very high overall adverse event rates. However, provided that definitions were applied consistently across treatment arms within trials, this is unlikely to have led to systematic bias. The definition of a serious adverse event was also unclear in most trials.
Most trial protocols specified follow-up periods of either 21 or 28 days; the minimum period over which a trial evaluated patients was the duration of treatment, 5 days. Despite such a short period of follow-up, there was often incomplete follow-up of participants. Censoring data meant that participants who were still ill at the end of the follow-up period had either missing or inaccurate symptom data, depending on the manner in which a given trial reported data. Given that those who are still ill at the end of follow-up are likely to be so because of a complication or a serious adverse event, if censoring differs by treatment arms, outcomes could be biased (i.e. those with the worst outcomes are not contributing to the analysis of symptoms). Losses to follow-up of more than 5% occurred in a quarter of the trials. Considering the relatively low numbers of participants recruited and the short duration of follow-up, it is disappointing that for many trials full follow-up was not achieved.
Many trials recruited patients in small numbers over a large number of sites, which may lead to trial data quality issues. 111 For example, one trial of zanamivir recruited 525 participants from 159 sites98 and one oseltamivir trial recruited 316 participants from 79 sites. 68
Fourteen out of 29 studies (nine zanamivir75,76,87,88,93,96,98,100,106 and five oseltamivir65,78,83,107,110) reported the use of a power calculation to determine sample sizes. Of these, five (three zanamivir 76,100,106 and two oseltamivir78,83) did not recruit their stated required size. A further five studies that did not report the use of a power calculation recruited low numbers (maximum of 60 participants per arm). 57,71,77,85,86 In addition, data for the children, elderly, and at-risk subgroups were often obtained from studies of mixed populations, which were unlikely to be designed to be powered to detect treatment effects in these subgroups. As a consequence, even meta-analyses of subgroup data lack statistical power.
All except one zanamivir trial reported continuous outcomes in days, rounded to either full or half days. This rounding depended on whether participants were randomised before or after 2 pm, this being the halfway point between when routine doses were taken and symptoms recorded (8 am and 8 pm respectively). Most zanamivir trials recorded symptoms twice daily, but some recorded symptom scores four times daily during treatment, providing a more accurate measurement. All except one of the oseltamivir trials reported the continuous outcomes in hours; however, it was largely unclear how this level of precision was achieved. The imprecision of measurements of symptom duration should be borne in mind when interpreting the relatively modest observed reductions in time to recovery.
Factors potentially impacting on the effectiveness of neuraminidase inhibitors when data are limited
A number of factors that could not be addressed directly using the trial data may also be pertinent in evaluating the likely role of these drugs, and are discussed below.
Antipyretics and other symptomatic relief were variously banned, restricted or freely available in studies. Although this is likely to have most effect on the time to alleviation of fever, which was poorly reported across the studies, differing use of symptomatic relief could also affect the time to alleviation of symptoms or return to normal activity. Not all patients may present with fever, particularly the elderly and those who have undergone immunisation. 118 Without further data, the impact of antipyretics and other symptomatic relief in the included trials is unclear.
Limited information was available on the number of vaccinated individuals present in the included trials. Five trials did not mention whether participants were vaccinated or not (two zanamivir99,103 and three oseltamivir66,67,69). Seven studies either excluded individuals vaccinated within the previous 12 months or reported a zero recruitment without indicating whether lack of vaccination was a criterion for inclusion (two zanamivir76,85 and five oseltamivir65,68,71,83,107). The highest rate of vaccination in a study of healthy adults was 9%. 87 Six studies had higher rates of vaccination than this, all of which were either in a mixed population that included at-risk people (14%93) or restricted to at-risk populations (general at risk, 23%98 and 28%;73 children, 19%;78 and the elderly, 40%105 and 43%73). The remaining studies reported vaccinated proportions of between 1% and 4%, with similar rates across treatment arms. There were insufficient data to explore the impact of vaccination on the effectiveness of zanamivir or oseltamivir in these analyses.
The eligibility criterion concerning the maximum permitted time delay between onset of symptoms and treatment varied across studies. Where reported, this was either 36 or 48 hours, with most studies specifying 48 hours. The actual time between symptom onset and the initiation of treatment was reported in approximately 50% of the oseltamivir trials and 75% of the zanamivir trials. Of these, six studies recruited a few participants who had exceeded the maximum duration specified by the study protocols, two zanamivir86,87 and four oseltamivir trials. 65,68,107,110 Where reported, the mean time between the onset of symptoms and initiation of treatment was similar across the studies despite the inclusion criteria. Very few trials reported analyses comparing efficacy in groups according to time to the initiation of treatment, but those that did suggested that earlier treatment might yield greater benefit. 76,87,100,107 However, there were insufficient data available for us to examine this further. In current clinical practice, time between symptom onset and GP presentation is likely to be linked to patient type; children and those with more severe disease are most likely to present to the GP within 48 hours and the elderly are perhaps least likely due to absence of fever and the reluctance to ‘disturb the doctor’. 118
As described previously, surveillance schemes monitor the number of people presenting to GPs with ILIs in the UK, and once a threshold of consultations for presentation of ILI is reached (currently 30 per 100,000 population), antiviral drugs are currently recommended for use as treatment for influenza in at-risk groups. Of the 29 studies included in this review, 18 stated that influenza was circulating in the community prior to recruitment into the study. Only six of these stated that participants were recruited in the UK, and UK citizens constituted a minority of the population in these studies. While other countries have surveillance schemes, we are unclear as to the method of diagnosis used, the threshold over which influenza is deemed to be circulating, and the consistency of application of these factors across countries or continents.
The true-positive rate (TPR) for influenza in those presenting with ILI is related to the threshold for influenza circulating in the community; data from the RCGP suggest that the TPR during peak weeks of influenza activity was approximately 50%. Clearly the TPR will impact on the effectiveness of antiviral treatment in an ITT population, which is the effective clinical population given that rapid diagnosis is not currently an option. As NIs are specific for influenza, the lower the TPR, the less effective the treatment is likely to be in the presenting population as a whole. There are several areas of uncertainty surrounding this issue. These include the extent to which the presentation rate for ILI will be affected by the availability of drugs, how varying TPR will impact on effectiveness, and how representative the trials population is of the general population. The impact of these factors is explored in the economic model (see Chapter 5). In practice, these issues could be potentially addressed by using rapid diagnostic tests prior to prescribing antiviral treatment. However, the clinical effectiveness and cost-effectiveness of introducing such screening was beyond the scope of the current review.
It has been suggested that, during periods of increased influenza activity, general practitioners may not have the resources to meet the increased demand for consultation, particularly within the 48 hours of onset required for the prescription of antiviral drugs. 119 It has been suggested that community pharmacists could assist with dispensing medications if activity increases and GP resources are stretched. 119 One study, conducted over the 2003–5 influenza seasons, investigated the accuracy of the diagnosis of 217 patients with ILI by 15 community pharmacists, using PCR as the gold standard. 120 Of 54 patients who were diagnosed with influenza by pharmacists, 27 were confirmed influenza positive by PCR [positive predictive value (PPV) of 51%; 95% CI 33% to 64%]. This level of accuracy was stated as being comparable to trials of NIs in which recruitment was limited to early presentation (58–79%), and it was also suggested that there may be a role for pharmacists in the clinical management of influenza epidemics. 120 Expectant treatment of NIs for family members, or those who have been in contact with those already diagnosed as suffering from influenza, to be taken at onset of fever, could help to address the difficulty of obtaining a prescription within 48 hours and lessen the consultation burden on GPs, although the evidence for this seems limited and its effectiveness may require investigation.
Limited information on antiviral resistance was reported in the trials. When it was assessed as an outcome (two oseltamivir65,78 and two zanamivir93,100 studies), only one case of potential resistance to oseltamivir was encountered. 65 There was therefore insufficient evidence in the trials to estimate the rate of naturally occurring resistance to either drug. However, naturally occurring resistance has been noted, primarily to oseltamivir,28,29,39,40 with a single reported case of resistance to zanamivir. 29,39 Until recently, the rate of resistance to oseltamivir has generally been low. However, over the 2007–8 influenza season, European surveillance has shown an increase in resistance of the H1N1 subtype of type A influenza to oseltamivir, with an 11% resistance rate observed in the UK. 21,41–43 To date, this increase has been observed only in the H1N1 A influenza subtype, often associated with milder illness than other influenza subtypes, and the data available are from a relatively small number of isolates. It is not yet clear whether the 2007–8 figures are anomalous or indicate the start of a trend. Oseltamivir-resistant subtypes remain sensitive to zanamivir. 21,28
The studies included in this review recruited patient groups that were narrower than the current licensed population (zanamivir 5 years of age and over; oseltamivir 1 year of age and over), limiting the ability to draw general conclusions on the effectiveness of antiviral drugs in the wider licensed population. Combining the results across all the included studies considers a wider patient group, with 36% of the patients recruited into studies restricted to subgroups considered as at risk according to the DH’s Green Book,10 and between 9% and 17% of patients in the trials of mixed populations were classified as at risk by the trialists; however, it is uncertain whether this is representative of those that present to GPs in practice.
The meta-analyses presented here have found reasonable evidence that both zanamivir and oseltamivir reduce the median time to alleviation of symptoms and to return to normal activity when compared with placebo. The clinical significance of the modest sizes of effect observed is, however, debatable. These analyses have not compared, either directly or indirectly, the relative efficacy of zanamivir and oseltamivir. This is explored in Chapter 4. Data on the effect of these drugs on complications were limited, but suggest that both drugs may reduce the use of antibiotics. Data on adverse effects were limited, but there is no clear evidence of an effect of either drug on the incidence of serious or drug-related adverse effects. A number of other factors that could impact on the effectiveness of these drugs in practice could not be addressed from the trial data. These are explored further in the economic model (see Chapter 5).
Chapter 4 Bayesian multiparameter evidence synthesis of symptom data with indirect comparisons
Introduction
The results of the meta-analysis reported in earlier sections considered each of the two NI treatments compared with standard care separately, but they do not address how the NIs compare with each other – which treatment for influenza is ‘best’. The meta-analyses evaluated differences in median symptom duration, which is consistent with how individual trial results were reported, and with the methods used by Turner et al. 46 in the previous clinical effectiveness review. However, the economic model, reported in Chapter 5, requires estimates of the differences in mean symptom duration.
Therefore, in the absence of head-to-head trials comparing zanamivir and oseltamivir directly, and given the lack of routinely reported data on mean symptom duration, we have developed a Bayesian multiparameter evidence synthesis with indirect comparisons. The term ‘multi-parameter evidence synthesis’, adapted from Hasselblad and McCrory,121 is generally used to refer to complex forms of synthesis, including extension of standard meta-analysis to indirect comparisons, and combinations of evidence on multiple endpoints. 122 This approach addresses the need for suitable statistical methods for comparing multiple treatments that fully respect randomisation for decision-making purposes. 123
The approach reported here is based on recent methodological work by Welton et al. 124 that was originally developed using data from the earlier appraisal of antiviral treatment by Turner et al. 46 This work has been further developed as part of this review to include the addition of more recent data that have been made available since the earlier appraisal and alterations to the model to more explicitly account for the separate subgroups presented here.
A Bayesian ‘hierarchical’ model is used to characterise the joint distribution of the efficacy of the treatments simultaneously, using information on time to resolution of symptoms, time to return to normal activity and numbers still ill at the end of the reported follow-up. By considering outcomes together, the model takes account of differences in which trials are available for analysis in each outcome, as some report only resolution of symptoms and others report time to return to normal activities, although many report both. The model is fitted separately to the ITT and ITTI populations. Given the relatively short follow-up and censoring present in the symptom data reported, the model also uses the number of trial participants who are still suffering from one or more influenza symptoms at the end of the trial follow-up period to inform symptom outcomes. This is potentially relevant information in relation to the shape of the distribution, and helps to inform the extrapolation required to estimate mean durations for the economic model.
These issues present a number of potential challenges to conventional synthesis approaches: (1) to be able to combine information on two different (but potentially related) outcomes related to recovery from influenza; (2) to combine data on medians and the survivor function at specific points in time (e.g. 21 and 28 days); and (3) to allow for implied correlations between median time to end of symptoms and the survivor function, where studies report both of these measures calculated from the same data. The approach outlined here is based on a flexible statistical model that can accommodate the full ‘network’ of evidence represented by the different (and sometimes incomplete) sources of information available for each treatment option and according to different patient subgroups.
The approach further develops the pair-wise results presented previously in the following respects:
-
It allows a single coherent analysis of several inter-related outcomes, time to resolution of symptoms and time to normal activity, both of which are considered within the economic model.
-
It simultaneously considers evidence on symptom duration reported in different forms (time to resolution of symptoms/return to normal activities), corroborating this with information on asymptomatic patient numbers at different time points when available.
-
Estimates are presented based on a common ‘metric’ (i.e. days) to improve comparability between data from zanamivir (reported in days) and oseltamivir (reported in hours).
-
The model is fitted to the entirety of the symptom data considered in the previous meta-analyses and, while respecting potential differences between subgroups, ‘borrows strength’ across different studies for each treatment/subgroup combination, thereby improving the precision of the subgroup-specific estimates.
-
Additional data reported on the survivor function can inform the distributional assumptions necessary to obtain estimates of mean symptom duration for the economic analysis.
-
It facilitates a direct comparison between the separate antiviral treatments simultaneously with comparison to no antiviral treatment.
-
Separate pair-wise evaluations can be made for all possible comparisons of interest (i.e. even those without direct evidence) to help identify issues of data consistency with the direct evidence.
In addition to providing a single and coherent approach to comparing the relative efficacy of all relevant alternative treatment options, this approach also provides estimates suitable for the requirements of both the clinical effectiveness and the cost-effectiveness analyses. It does not, however, examine data on complications, and the economic model draws on the pair-wise comparison of this data.
Methods
The model considers the two main outcome measures reported in previous sections: the time to alleviation of symptoms and the time to return to normal activity. Based on the prior methodological work by Welton and colleagues,124 a Weibull model was assumed for both outcomes determined by shape and scale parameters. A random effects model was assumed for the shape parameters across studies and outcome with common mean and between study and outcome SD. The scale parameters were modelled on the log-scale and the baseline scale parameter was defined to be the time to alleviation of symptoms on the placebo arm. A separate random effects model for these baselines was applied to each subgroup, i.e. it was assumed that the time to alleviation of symptoms on placebo depended on the subgroup with a between trial and subgroup SD. It was assumed that the time to return to normal activity on the placebo arm differs from the time to alleviation of symptoms on the placebo arm, and there is a random effects model for these differences across study and subgroup.
An additive treatment effect on a log scale is assumed, with a random effects model for treatment effect across study and subgroup. Two cases for the mean treatment effect were considered: (a) the treatment effect is assumed to be the same for all subgroups; and (b) the treatment effect also depends on patient subgroup (i.e. there is a treatment by subgroup interaction).
The separate models (a) and (b) were compared using the deviance information criteria to aid model selection. The deviance information criteria are the sum of the residual deviance and the effective number of model parameters, and they provide a measure of model fit that penalises model complexity. For the ITTI data, model (b) gave the best fit, suggesting that treatment effect differs according to patient subgroup for those with confirmed influenza. However, for the ITT data there was little to choose between the models, suggesting that treatment effect does not depend on subgroup when considering all those treated (and not just those with confirmed influenza). The results of model (b) are reported in this chapter. Results for the ITTI population were subsequently applied in the economic model.
The data were split into four types: median time to alleviation of symptoms; median time to return to normal activity; number of trial participants still ill at end of follow-up conditional on median time to alleviation of symptoms; and number of trial participants still ill at end of follow-up with no median time to alleviation of symptoms reported. The modelling was carried out using Markov Chain Monte Carlo (MCMC) methods, as implemented in the Bayesian analysis software winbugs. 125 The winbugs model and code applied is reported in Appendix 7. Convergence was assessed using the Brooks–Gelman–Rubin diagnostic tool, and considered adequate after 50,000 iterations. For each model, a further sample of 100,000 simulations (using two separate chains) was then run. These were subsequently thinned to a sample of 20,000 to eliminate any auto-correlation, and they provide the basis for the results presented here.
Results
Results from the multiparameter evidence synthesis of the two symptom outcomes, for both the ITT and the ITTI populations, are reported in Tables 47–54. Separate results are presented for otherwise healthy adults, otherwise healthy children and an at-risk group. The at-risk group combines the separate at-risk populations into a single group (at-risk children, at-risk adults and the elderly). The at-risk groups were combined in this way because of the small number of trials in each of the separate populations. Prior to combination of the at-risk groups, the model was run for each subgroup separately. It was also run for the at-risk adults and elderly combined, keeping the at-risk children separate. Although the results of each of the separate analyses were broadly consistent in their findings in relation to the separate treatments, the differences across the separate individual populations appeared to lack internal consistency suggesting that particular trials in some of the at-risk populations may not be entirely consistent with the broader set of studies considered. Given these discrepancies and the relatively sparse data for the individual at-risk groups, the final results are presented for a single, combined at-risk group.
| Subgroup | Treatment | Probability ‘best’ | Median (95% CrI) | Mean (95% CrI) |
|---|---|---|---|---|
| Healthy adults | Placebo | 0.00 | 5.48 (2.04 to 12.08) | 9.88 (3.69 to 21.82) |
| Zanamivir | 0.05 | 4.99 (1.86 to 11.04) | 8.99 (3.35 to 19.91) | |
| Oseltamivir | 0.95 | 4.43 (1.63 to 9.88) | 7.98 (2.93 to 17.72) | |
| At risk | Placebo | 0.00 | 8.29 (3.15 to 18.15) | 14.92 (5.65 to 32.78) |
| Zanamivir | 0.89 | 6.67 (2.51 to 14.66) | 12.01 (4.54 to 26.43) | |
| Oseltamivir | 0.11 | 7.65 (2.9 to 16.76) | 13.78 (5.21 to 30.31) | |
| Healthy children | Placebo | 0.00 | 3.79 (1.25 to 8.77) | 6.82 (2.26 to 15.89) |
| Zanamivir | 0.74 | 2.96 (0.98 to 6.91) | 5.33 (1.76 to 12.48) | |
| Oseltamivir | 0.26 | 3.19 (1.03 to 7.52) | 5.74 (1.87 to 13.52) |
| Subgroup | Treatment | Difference in symptom duration | |
|---|---|---|---|
| Median (95% CrI) | Mean (95% CrI) | ||
| Healthy adults | Zanamivir vs placebo | –0.49 (–1.35 to –0.05) | –0.89 (–2.43 to –0.09) |
| Oseltamivir vs placebo | –1.05 (–2.57 to –0.28) | –1.90 (–4.60 to –0.51) | |
| Zanamivir vs oseltamivir | 0.56 (–0.16 to 1.72) | 1.01 (–0.28 to 3.09) | |
| At risk | Zanamivir vs placebo | –1.62 (–3.95 to –0.47) | –2.91 (–7.15 to –0.85) |
| Oseltamivir vs placebo | –0.63 (–2.24 to 0.50) | –1.14 (–4.04 to 0.90) | |
| Zanamivir vs oseltamivir | –0.98 (–3.27 to 0.30) | –1.77 (–5.89 to 0.54) | |
| Healthy children | Zanamivir vs placebo | –0.83 (–2.17 to –0.17) | –1.49 (–3.93 to –0.30) |
| Oseltamivir vs placebo | –0.60 (–1.74 to 0.01) | –1.08 (–3.14 to 0.03) | |
| Zanamivir vs oseltamivir | –0.23 (–1.28 to 0.59) | –0.41 (–2.29 to 1.05) | |
| Subgroup | Treatment | Probability ‘best’ | Median (95% CrI) | Mean (95% CrI) |
|---|---|---|---|---|
| Healthy adults | Placebo | 0.00 | 5.36 (2.47 to 10.12) | 8.96 (4.11 to 16.89) |
| Zanamivir | 0.12 | 4.58 (2.09 to 8.64) | 7.66 (3.49 to 14.46) | |
| Oseltamivir | 0.88 | 4.12 (1.86 to 7.86) | 6.88 (3.12 to 13.15) | |
| At risk | Placebo | 0.00 | 8.28 (3.84 to 15.84) | 13.83 (6.41 to 26.45) |
| Zanamivir | 0.99 | 5.47 (2.48 to 10.53) | 9.13 (4.14 to 17.59) | |
| Oseltamivir | 0.01 | 7.34 (3.33 to 14.24) | 12.27 (5.53 to 23.70) | |
| Healthy children | Placebo | 0.00 | 5.80 (2.32 to 12.03) | 9.69 (3.88 to 20.22) |
| Zanamivir | 0.26 | 4.74 (1.83 to 10.13) | 7.92 (3.07 to 16.86) | |
| Oseltamivir | 0.74 | 4.22 (1.61 to 9.04) | 7.06 (2.69 to 15.18) |
| Subgroup | Treatment | Difference in symptom duration | |
|---|---|---|---|
| Median (95% CrI) | Mean (95% CrI) | ||
| Healthy adults | Zanamivir vs placebo | –0.78 (–1.77 to –0.18) | –1.3 (–2.96 to –0.30) |
| Oseltamivir vs placebo | –1.25 (–2.61 to –0.43) | –2.08 (–4.34 to –0.73) | |
| Zanamivir vs oseltamivir | 0.47 (–0.3 to 1.50) | 0.78 (–0.52 to 2.51) | |
| At risk | Zanamivir vs placebo | –2.81 (–5.64 to –1.18) | –4.70 (–9.44 to –1.98) |
| Oseltamivir vs placebo | –0.93 (–2.79 to 0.47) | –1.56 (–4.66 to 0.78) | |
| Zanamivir vs oseltamivir | –1.88 (–4.57 to –0.27) | –3.14 (–7.73 to –0.44) | |
| Healthy children | Zanamivir vs placebo | –1.06 (–3.07 to 0.25) | –1.77 (–5.10 to 0.41) |
| Oseltamivir vs placebo | –1.58 (–3.93 to –0.23) | –2.63 (–6.53 to –0.38) | |
| Zanamivir vs oseltamivir | 0.52 (–1.20 to 2.68) | 0.86 (–2.01 to 4.47) | |
| Subgroup | Treatment | Probability ‘best’ | Median (95% CrI) | Mean (95% CrI) |
|---|---|---|---|---|
| Healthy adults | Placebo | 0.00 | 6.50 (2.25 to 14.79) | 11.71 (4.03 to 26.69) |
| Zanamivir | 0.05 | 5.91 (2.04 to 13.38) | 10.66 (3.67 to 24.28) | |
| Oseltamivir | 0.95 | 5.25 (1.80 to 12.01) | 9.46 (3.24 to 21.66) | |
| At risk | Placebo | 0.00 | 9.81 (3.49 to 22.21) | 17.68 (6.23 to 40.3) |
| Zanamivir | 0.89 | 7.89 (2.77 to 17.89) | 14.23 (4.97 to 32.42) | |
| Oseltamivir | 0.11 | 9.06 (3.16 to 20.65) | 16.33 (5.7 to 37.67) | |
| Healthy children | Placebo | 0.00 | 4.49 (1.39 to 10.97) | 8.09 (2.51 to 19.66) |
| Zanamivir | 0.74 | 3.51 (1.08 to 8.62) | 6.32 (1.94 to 15.46) | |
| Oseltamivir | 0.26 | 3.78 (1.16 to 9.27) | 6.81 (2.08 to 16.82) |
| Subgroup | Treatment | Difference in the time to normal activity | |
|---|---|---|---|
| Median (95% CrI) | Mean (95% CrI) | ||
| Healthy adults | Zanamivir vs placebo | –0.58 (–1.64 to –0.06) | –1.05 (–2.95 to –0.11) |
| Oseltamivir vs placebo | –1.25 (–3.16 to –0.32) | –2.25 (–5.69 to –0.57) | |
| Zanamivir vs oseltamivir | 0.67 (–0.18 to 2.09) | 1.20 (–0.32 to 3.80) | |
| At risk | Zanamivir vs placebo | –1.91 (–4.84 to –0.52) | –3.45 (–8.78 to –0.94) |
| Oseltamivir vs placebo | –0.75 (–2.72 to 0.60) | –1.35 (–4.96 to 1.08) | |
| Zanamivir vs oseltamivir | –1.16 (–3.94 to 0.35) | –2.10 (–7.13 to 0.63) | |
| Healthy children | Zanamivir vs placebo | –0.98 (–2.64 to –0.19) | –1.77 (–4.78 to –0.34) |
| Oseltamivir vs placebo | –0.71 (–2.15 to 0.02) | –1.28 (–3.88 to 0.03) | |
| Zanamivir vs oseltamivir | –0.27 (–1.53 to 0.71) | –0.49 (–2.78 to 1.28) | |
| Subgroup | Treatment | Probability ‘best’ | Median (95% CrI) | Mean (95% CrI) |
|---|---|---|---|---|
| Healthy adults | Placebo | 0.00 | 6.80 (2.91 to 13.42) | 11.37 (4.83 to 22.66) |
| Zanamivir | 0.12 | 5.81 (2.47 to 11.44) | 9.72 (4.12 to 19.28) | |
| Oseltamivir | 0.88 | 5.22 (2.22 to 10.38) | 8.73 (3.68 to 17.54) | |
| At risk | Placebo | 0.00 | 10.50 (4.51 to 21.03) | 17.56 (7.49 to 35.39) |
| Zanamivir | 0.99 | 6.93 (2.91 to 14.01) | 11.59 (4.85 to 23.46) | |
| Oseltamivir | 0.01 | 9.32 (3.92 to 18.92) | 15.58 (6.54 to 31.64) | |
| Healthy children | Placebo | 0.00 | 7.36 (2.73 to 15.90) | 12.31 (4.57 to 26.78) |
| Zanamivir | 0.26 | 6.02 (2.15 to 13.43) | 10.06 (3.57 to 22.34) | |
| Oseltamivir | 0.74 | 5.36 (1.92 to 11.86) | 8.97 (3.20 to 19.95) |
| Subgroup | Treatment | Difference in the time to normal activity | |
|---|---|---|---|
| Median (95% CrI) | Mean (95% CrI) | ||
| Healthy adults | Zanamivir vs placebo | –0.99 (–2.34 to –0.21) | –1.65 (–3.94 to –0.35) |
| Oseltamivir vs placebo | –1.58 (–3.44 to –0.52) | –2.64 (–5.83 to –0.86) | |
| Zanamivir vs oseltamivir | 0.59 (–0.39 to 1.97) | 0.99 (–0.66 to 3.29) | |
| At risk | Zanamivir vs placebo | –3.57 (–7.48 to –1.39) | –5.97 (–12.65 to –2.32) |
| Oseltamivir vs placebo | –1.18 (–3.64 to 0.59) | –1.98 (–6.09 to 0.99) | |
| Zanamivir vs oseltamivir | –2.39 (–6.04 to –0.33) | –3.99 (–10.15 to –0.55) | |
| Healthy children | Zanamivir vs placebo | –1.35 (–3.96 to 0.31) | –2.25 (–6.66 to 0.52) |
| Oseltamivir vs placebo | –2.00 (–5.16 to –0.28) | –3.34 (–8.60 to –0.47) | |
| Zanamivir vs oseltamivir | 0.65 (–1.53 to 3.48) | 1.09 (–2.56 to 5.78) | |
Each table presents estimates of median and mean days [together with the 95% credibility intervals (CrIs)] separately for each treatment for each of the three main subgroups, along with the estimated probability that each treatment is best. The multiparameter synthesis model with indirect comparisons also provides a full set of comparisons of the three potential pair-wise comparisons of interest (e.g. zanamivir vs placebo, oseltamivir vs placebo and zanamivir vs oseltamivir). Comparisons of the individual pair-wise results for active treatment versus placebo derived from the multiparameter synthesis model with those from the standard meta-analysis indicated broad consistency. In particular subgroups (e.g. the comparison of zanamivir versus placebo for return to normal activities in both the ITT and the ITTI analyses), the ‘borrowing of strength’ and consideration of wider evidence (i.e. the proportion of patients still ill at the end of follow-up), provided by the multiparameter synthesis model, increased the precision of the subsequent estimates of effect size such that the 95% CrI of the difference in median duration between active treatment and placebo did not overlap zero as they did previously.
Across all analyses and subgroups, the probability that an NI treatment was more effective than placebo was 100%. However, there was clearly variation across both the subgroups and the different sets of results (e.g. ITT versus ITTI) in terms of which NI treatment had the greater probability of being ‘best’. In general, the overall results for the otherwise healthy adult and at-risk populations appeared consistent across the different analyses. For healthy adults, oseltamivir consistently had a higher probability of being the better treatment, while for at-risk populations zanamivir consistently had a higher probability of being better. Despite the large differences observed in the probability that each intervention was optimal, the pair-wise results for the comparison of the separate NIs revealed that in each of the subgroups and for each of the different symptom measures, the 95% CrI consistently overlapped each other, and in all instances (with the exception the ITTI results for at-risk populations) the credibility interval around the indirect comparison of the separate NIs included zero.
The results for the otherwise healthy children were more varied across the separate analyses. In the analyses based on the ITT population, zanamivir had the highest associated probability of being best, whereas in the ITTI population this changed to oseltamivir. This suggests that the different set of trials available for the analysis of otherwise healthy children in the ITT and ITTI analyses influence which treatment appears optimal. However, it should also be recognised that the pair-wise comparison of median duration between the separate NIs revealed that the overall difference was relatively small across the separate analyses (between 0.23 and 0.65 days) and the associated CrIs were wide and overlapped, a finding of no difference.
As expected, the differences in median and mean symptom duration between active treatments and placebo were consistently greater in the ITTI populations. Similarly, time to return to normal activities was generally longer than time to resolution of symptoms. Finally, it is worth noting that the differences between treatments based on the mean difference in symptom measures between the NI treatments and placebo were larger than those based on the median differences, as expected from a skewed distribution. However, the associated CrIs indicated higher uncertainty in these estimates. This is important as the estimates of mean duration are those subsequently employed in the base-case analysis of the cost-effectiveness model, although separate scenarios are also undertaken using differences based on median symptom duration.
Given the potential inconsistency noted when considering individual at-risk populations, further checks were undertaken on the studies informing these estimates and also for RCTs reporting both at-risk and otherwise healthy subgroup data. An inconsistency was identified within the ITTI subgroup data reported in Hedrick et al. ,100 in which the median symptom duration in at-risk children receiving zanamivir was shorter than the comparable estimate for otherwise healthy children (the placebo median time was longer in the at-risk group as would be expected). The importance of this inconsistency in the subgroup also needs to be considered against the much smaller number of at-risk children reported in this study than the healthy children population (36 in the at-risk group compared with 435 in the otherwise healthy ITT population). In order to ensure that this inconsistency was not adversely influencing the model, a separate analysis was undertaken which excluded the at-risk children subgroup data. This is reported in Appendix 7.
This reanalysis provided consistent results in the ITT population, although there was minor variation within the ITTI results in children, with the difference in median time to resolution of symptoms between oseltamivir and zanamivir lowering to 0.15 days (95% CrI –1.01 to 1.53), and the associated probability that oseltamivir is best also being lower (0.60). This difference was relatively small and simply reinforced the existing uncertainty surrounding whether oseltamivir and zanamivir are ‘best’ in a population of healthy children. While these differences were not considered significant, a separate scenario was considered in the cost-effectiveness analysis employing the results from the analysis excluding at-risk children subgroup data.
Discussion
This multiparameter evidence synthesis approach provides a number of potential advantages for decision-making purposes. It addresses some of the problems caused by variation in reporting summary statistics and in combining evidence on multiple parameters related to the summary outcome of interest. This approach also ensures that the appropriate summary outputs (mean durations) are available for the economic model.
Despite the potential advantages, it is also worth considering the additional assumptions required in this analysis. The key assumption used in the model is that the relative effects for each of the subgroups in each trial are derived from a common distribution that is the same across each set of trials in the separate groups. This assumption is similar to that employed in standard pair-wise meta-analysis, except that there is an additional assumption that the similarity of the relative effect of treatment holds across the entire set of trials, regardless of which treatments were actually evaluated. 123 If this assumption does not hold, then the subsequent results are subject to potential bias (although the bias would not be expected generally to work in any particular direction). Given that the assumptions employed here are not likely to be statistically verifiable (this is compounded by the inclusion of additional parameters for the proportion of patients remaining ill at the end of the trial), the subsequent results need to be considered in the light of both clinical and epidemiological judgement in terms of whether these additional assumptions are reasonable. However, the comparison of a subset of results from the multiparameter synthesis and its subsequent interpretation appears consistent with the results presented in earlier sections.
The results suggest that oseltamivir was consistently the ‘best’ treatment in terms of reduction in symptom duration for healthy adults, and equally zanamivir appears the ‘best’ for at-risk populations. For healthy children, the results were less consistent between the different set of analyses due in part to the limited data available in this population. Indeed, the ‘best’ treatment for healthy children actually switched between the alternative NIs in the ITT and ITTI populations. Consequently, the conclusions that can be drawn in a healthy children population in terms of which is the ‘best’ NI treatment remain highly uncertain. Furthermore, in addition to the assumptions of the model employed here, these results also need to be set in a wider context. The amount of weight that can be subsequently placed on the relative differences between the NIs needs to be considered against the clinical plausibility that a particular NI treatment could work more effectively in one particular population (and that this relationship could be different in another population), the lack of confirmatory direct ‘head-to-head’ evidence and also the finding that the 95% CrI on the difference between the NIs consistently overlapped a finding of no difference.
Finally, it should also be recognised that the analysis presented here is primarily used as the basis for providing the required estimates for the economic model in terms of mean symptom durations. Clearly, the probability ‘best’ statements reported in this section refer only to the symptom duration themselves and not to the wider clinical (e.g. their relative impact on complications) and economic [e.g. their impact on quality of life (QoL) and costs] considerations. However, a framework for combining the relevant evidence on each of these different elements is considered more formally in the cost-effectiveness model reported in Chapter 5.
Chapter 5 Assessment of cost-effectiveness evidence
Systematic review of existing cost-effectiveness evidence
Methods
A broad range of studies was considered for inclusion in the assessment of cost-effectiveness, including economic evaluations conducted alongside trials, modelling studies and analyses of administrative databases. Only full economic evaluations that compared two or more options and considered both costs and consequences (including cost-effectiveness, cost–utility and cost–benefit analyses) were included.
Two reviewers independently assessed all obtained titles and abstracts for inclusion based on the search strategies reported in Chapter 3, Resources searched, and Appendix 1. Any discrepancies were resolved by discussion and consultation with a third reviewer. All studies meeting the inclusion criteria were summarised and used as the basis for identifying major structural issues, assumptions and key drivers of cost-effectiveness. Due to the large number of individual studies identified, only the most relevant studies from the perspective of the NHS were then considered in more detail. The quality of these particular studies was assessed according to a general checklist based on that developed by Drummond and Jefferson126 together with a more specific checklist for decision-models from Philips et al. 127 This information is summarised within the text of the report, alongside a detailed critique of each study and its relevance to the UK NHS. The differences in approaches and assumptions are then explored in detail in order to explain any discrepancies in findings and to identify key areas of remaining uncertainty. The findings from the review provide the basis for the development of a new model reported in the section on the York Economic Assessment, below.
The following sections provide a detailed overview of the cost-effectiveness evidence and an assessment of the quality and relevance of the data from the perspective of the UK NHS. Summary data extraction tables (all studies) and the quality checklists applied to the most relevant studies are reported in Appendices 2 and 5 respectively. An overall summary of the cost-effectiveness evidence and the key issues is provided at the end of the section.
Results
The systematic literature search identified 358 references, of which 21 studies subsequently met the inclusion criteria. In addition, a separate cost-effectiveness analysis and electronic model was also submitted by Roche. 128 No separate cost-effectiveness submission was made by GlaxoSmithKline as part of their overall submission.
A brief summary of the 22 studies is reported in Table 55. More detailed summary tables are reported in Appendix 2. The majority of studies evaluated the cost-effectiveness of NIs for the treatment of influenza. However, there was significant variation in the choice of comparators assumed in the different studies. Importantly, 50% of studies considered the cost-effectiveness of only a single NI [either oseltamivir (seven studies) or zanamivir (four studies)] compared with usual care, and hence no comparisons were made with other NIs or alternative treatments. Of the remaining studies, five included both oseltamivir and zanamivir, although these were often presented as separate pair-wise comparisons against usual care, and no attempt was made to consider the relative cost-effectiveness of the alternative NIs; in the remaining six studies, at least one NI was assessed in combination with rapid diagnostic testing, other antiviral treatment (amantadine and/or rimantadine) and/or vaccination.
| Study | Country (perspective) | Population | Comparators | Outcome | Incremental cost-effectiveness ratio |
|---|---|---|---|---|---|
| Armstrong (2000)129 | USA (managed care) | Otherwise healthy adults | Oseltamivir, zanamivir, usual care | Incremental cost per symptom-free day |
$16 (zanamivir vs usual care) $39 (oseltamivir vs usual care) |
| Brady (2001)130 | Canada (government payer, societal) | (i) Otherwise healthy adults, (ii) at-risk adults | Zanamivir, usual care | Incremental cost per QALY |
(i) $94,600–235,000 (ii) $77,500–195,000 |
| Burls (2002)131 | UK (NHS) | (i) Otherwise healthy adults, (ii) at-risk | Zanamivir, usual care | Incremental cost per QALY |
(i) £65,000 (ii) £54,000 |
| Griffin (2001)132 | UK (NHS) | At-risk adults | Zanamivir, usual care | Incremental cost per QALY | £7490 |
| Husereau (2002)133 | Canada (government payer, societal) | (i) Otherwise healthy adults, (ii) at-risk elderly | Oseltamivir, usual care | Incremental cost per QALY |
(i) $61,300–299,500 (ii) $78,800–454,800 |
| Inoue (2005)134 | Japan (health-care payer) | (i) Otherwise healthy adults, (ii) at-risk adults | Oseltamivir, zanamivir, usual care | Incremental cost per QALY |
(i) Dominant; (ii) $2139 (oseltamivir vs usual care) (ii) $107; (ii) dominant (zanamivir vs usual care) |
| Jarvinen (2007)135 | Finland (payer, societal) | (i) Otherwise healthy adults, (ii) at-risk elderly, (iii) children | Oseltamivir, usual care | Incremental cost per QALY |
(i) €13,405 (payer), dominant (societal) (ii) €754 (payer), dominant (societal) (iiii) €15,404 (payer), €5745 (societal) |
| Lee (2002)136 | USA (societal) | Otherwise healthy adults | Vaccination (yes/no) + rimantadine, zanamivir, oseltamivir or usual care | Incremental net benefit | N/A |
| Masukopf (2000)137 | Australia (payer) | At-risk elderly | Zanamivir, usual care | Incremental cost per QALY | $11,715 |
| O’Brien (2003)138 | Canada (payer) | Otherwise healthy adults | Oseltamivir, usual care | Incremental cost per QALY | $57,863 |
| Postma (2007)139 | Netherlands (payer, societal) | (i) Otherwise healthy adults, (ii) at-risk elderly, (iii) at-risk adults | Oseltamivir, usual care | Incremental cost per QALY |
(i) €1759 (ii) Dominant iii) €429 (payer)/dominant (societal) |
| Reisinger (2004)140 | UK (NHS) | (i) Otherwise healthy children (1–12 years), (ii) otherwise healthy children (1–5 years) | Oseltamivir, usual care | Incremental cost per QALY |
(i) £11,173 (ii) Dominant |
| Roche submission (2008)128 | UK (NHS) | (i) Otherwise healthy adults, (ii) at-risk adults, (iii) otherwise healthy children (1–12 years), (iv) otherwise healthy children (1–5 years) | Oseltamivir, zanamivir, usual care | Incremental cost per QALY |
Oseltamivir vs usual care (zanamivir not reported in table due to error in costs) (i) £5452 (ii) £652 (iii) £5992 (iv) £4687 |
| Rothberg (2003a)141 | USA (societal) | Otherwise healthy elderly | Alternative antivirals (amantadine, rimantadine, oseltamivir, zanamivir), diagnostic test plus antiviral, usual care | Incremental cost per QALY |
$1129 (amantadine vs usual care) $5025 (flu test plus oseltamivir vs amantadine) $19,296 (oseltamivir vs flu test plus oseltamivir) |
| Rothberg (2003b)142 | USA (societal) | Otherwise healthy adults | Alternative antivirals (amantadine, rimantadine, oseltamivir, zanamivir), diagnostic test plus antiviral, usual care | Incremental cost per QALY |
$77,000 (amantadine vs usual care) $133,000 (zanamivir vs oseltamivir) |
| Rothberg (2005)143 | USA (societal) | Otherwise healthy children aged: (i) 2, (ii) 7, (iii) 15 | Alternative antivirals, alternative diagnostic tests, usual care | Incremental cost per QALY | Numerous |
| Sander (2004)144 | UK (NHS) | Otherwise healthy elderly and at-risk adults | Oseltamivir, standard care | Incremental cost per QALY | £225 |
| Sander (2005)145 | UK (NHS and societal) | Otherwise healthy adults | Oseltamivir, zanamivir, usual care | Incremental cost per QALY | £5600 (oseltamivir vs usual care), zanamivir dominated (vs oseltamivir) |
| Schwarzinger (2003)146 | USA (societal) | Otherwise healthy adults | Flu test plus zanamivir, zanamivir, usual care | Incremental cost per flu day averted | $37 (zanamivir vs usual care), $22 (flu test plus zanamivir) |
| Smith (2002)146 | USA (payer, societal) | Otherwise healthy adults | NI treatment, amantadine, flu test plus NI, flu test plus amantadine, usual care | Incremental cost per flu day averted | $12 (amantadine vs usual care), $185 (zanamivir vs amantadine) |
| Turner (2003)46 | UK (NHS, societal) | (i) Otherwise healthy adults, (ii) at-risk adults, (iii) children, (iv) residential care elderly | Amantadine, oseltamivir, zanamivir, usual care | Incremental cost per QALY |
(i) £6190 (amantadine vs usual care), £19,015 (oseltamivir vs usual care), £31,529 (zanamivir vs usual care) (ii) £4535 (amantadine vs usual care), £22,502 (oseltamivir vs usual care), £17,289 (zanamivir vs usual care) (iii) £6117 (amantadine vs usual care), £19,461 (oseltamivir vs usual care), £30,825 (zanamivir vs usual care) (iv) £6117 (amantadine vs usual care), £19,461 (oseltamivir vs usual care), £30,825 (zanamivir vs usual care) |
| Vindt Holm (2004)148 | Denmark (payer, societal) | Otherwise healthy adults | Oseltamivir, usual care | Incremental cost per QALY | €5063 (payer), dominant (societal) |
The majority of studies (17/22) were conducted primarily from a health-care or payer perspective, although approximately half of all studies also considered productivity losses attributed to workdays lost due to influenza illness (and/or premature mortality). The studies covered a broad scope in terms of population settings, including otherwise healthy or at-risk (i.e. with chronic respiratory, cardiac or gastro-intestinal comorbidities) adults, elderly and children. Eleven of the 22 studies were solely restricted to otherwise healthy populations (children, adults or elderly). Nine of the remaining studies considered a mixture of populations including both otherwise healthy and at-risk populations, and two considered only at-risk populations. Most studies considered a relatively short timespan (typically a single influenza season), although nine explicitly allowed for appropriately discounted (in either base-case or sensitivity analysis) quality-adjusted life-years (QALYs) lost due to mortality resulting from secondary complications.
With the exception of one study (Griffin et al. ),132 which was based on individual patient data, all studies were based on decision-analytic models typically employing a decision tree to represent the potential pathways during the course of an influenza illness over a single season. In those studies that considered the potential loss in QALYs due to premature mortality, this was modelled as a separate extrapolation exercise based on an assessment of the remaining life-years and associated QoL.
There was marked variation across the studies in the data sources and assumptions employed in relation to a number of important aspects, including (1) the clinical epidemiology of influenza (i.e. the relevant pathways, associated probabilities and variation across the different patient groups – including the likelihood of experiencing secondary complications and mortality); (2) behavioural aspects such as the probability that an individual consults a health-care provider; (3) the probability that a patient who presents to a health-care provider has influenza as opposed to an alternative ILI; (4) the QoL associated with influenza, associated complications and premature mortality; and (5) the relative effectiveness of the different treatment strategies in terms of symptoms as well as potentially in relation to the subsequent course of secondary complications.
Despite the differences noted above, all models typically assumed that the benefits of antivirals, compared with standard care, were only conferred to patients with influenza (as opposed to other ILIs). Symptomatic benefits were typically evaluated with respect to the duration of illness, with the majority employing ITTI analyses to estimate the duration of illness and relative impact of antivirals. However, the duration of illness was evaluated in a variety of ways – notably time to symptom resolution or time to return to normal activity. There were also differences in whether the mean or median duration of illness was used in the model.
The probability of ILI being influenza in a subject presenting to a health-care provider was largely obtained with reference to a typical influenza season (only three studies also presented alternative rates to reflect epidemic or peri-epidemic periods) from trial data or surveillance reports, and was commonly subjected to detailed sensitivity analysis. The majority of evaluations derived estimates of the probability from trial-based estimates, as opposed to employing data from routine surveillance programmes. This is of particular importance because the estimates emerging from the RCTs (65–80%) appear markedly higher than those informed by national surveillance data (15–47%).
Information on the subtype split (type A/B) featured only within studies including amantadine among the comparators. However, all studies assumed that the alternative NIs were equally effective against either circulating influenza type, and no distinction was made between the course of the illness due to the different types.
Resource utilisation and costs were commonly evaluated with respect to GP/physician contacts and associated drug prescribing [e.g. the antivirals themselves, antibiotics and over-the-counter (OTC) medications]. Moreover, a minority of studies also addressed (through sensitivity analysis only) the potential impact that the availability of NIs themselves might have on consultation rates with a GP and on the associated estimates of the probability that ILI is influenza. There was more variation between studies in whether secondary complications (including associated hospitalisation and mortality) were considered relevant or not. Typically there were three approaches employed: (1) secondary complications were excluded altogether; (2) they were presented as sensitivity analyses only; or (3) they formed part of the base case, which could differ according to the group considered (i.e. in at-risk only).
The variation in approaches to secondary complications appears to be due to the limited information on both the complication rates themselves and the impact of antivirals reported in the RCTs (primarily due to the low power of the RCTs and the associated uncertainty). Paucity of reliable data informing the relationship between influenza, hospitalisations and mortality rates was normally tackled at a subgroup (e.g. for at-risk patients only) or sensitivity analysis level, by combining information gathered from population-based studies with alternative assumptions regarding the potential treatment effect of the NIs. The relative effect of treatments on major complications and hospitalisations was typically modelled via a proxy measure (e.g. applying the relative risk reported for a reduction in antibiotic usage) or with reference to published meta-analyses focusing more specifically on these events. Any impact on mortality, when this was considered, was always modelled via a similar proxy approach (e.g. employing the relative risk of hospitalisation or pneumonia) due to the lack of direct evidence in relation to mortality benefits.
Adverse events due to influenza treatment were inconsistently reported across clinical trials and were often not clearly distinguishable from certain complications; moreover, those related to the NIs were usually reported to be infrequent, mild and transient. Due to scarce trial-based and observational evidence, the eight evaluations allowing for adverse events in the base-case scenario formalised them via assumptions (subsequently tested in sensitivity analysis in only five cases) on extended length of illness or of hospital stay (either directly or indirectly through treatment discontinuance) or reduced QoL. Antiviral resistance was rarely considered.
The impact of HRQoL associated with the incidence of influenza and ensuing health states was modelled in all but three evaluations. Symptomatic benefits were commonly informed by patient level visual analogue scale (VAS) data collected as part of oseltamivir trials (often transformed into an equivalent utility score using an algorithm) or via the use of generic preference-based instruments (e.g. EQ-5D, HUI-3). In general, the available QoL data were recognised as a major limitation in most studies. Although several studies were reported to be based on generic instruments such as EQ-5D, these were subject to a number of limitations including the size of the sample, the timing of administration (often undertaken retrospectively) or their completion by a limited number of clinical experts. HRQoL was generally recognised as an important driver in most evaluations, and the uncertainty surrounding it was frequently addressed through sensitivity analysis.
The variation in approaches, settings, populations and assumptions employed inevitably led to important differences in the subsequent cost-effectiveness estimates. Although no clear consensus exists, the use of NIs appeared consistently more cost-effective in particular populations such as at-risk, elderly and paediatric populations. The variation between studies was most evident in terms of whether the NIs appeared cost-effective in otherwise healthy populations. More favourable estimates were largely reported in studies adopting a high probability that ILI is influenza (i.e. employing estimates from RCTs as opposed to national surveillance systems) and when complications and productivity costs were also considered. However, the more consistent findings in particular populations (e.g. at-risk, elderly) also need to be balanced against the more limited data (and uncertainty therein) related to these groups.
Across the full range of studies considered, a number of common issues and limitations were identified that preclude reliable conclusions to be drawn from the existing evidence base. These include:
-
a lack of robust data for the different subgroups considered (in terms of both the absolute event rates and the relative effectiveness of NIs)
-
variability in the populations used to estimate the various model parameters (while the assessment of clinical efficacy was usually conducted on an ITTI basis, other inputs to the economic models, such as hospitalisation and mortality estimates, appeared to be informed by the wider ITT population including other ILIs which may be less generalisable)
-
the lack of head-to-head RCTs on the efficacy of alternative NIs, resulting in the presentation of separate pair-wise comparisons or the exclusion of relevant alternatives
-
marked variability in the estimates that ILI is influenza and differences in sources (e.g. RCTs versus routine surveillance data)
-
a lack of reliable estimates employing preference-based valuations, related to the impact on QoL of influenza and the respective antiviral treatments
-
variation in approaches employed to model secondary complications and associated mortality, including the use of proxy estimates given the lack of direct evidence from the RCTs.
As previously noted, 7 of the 22 studies were undertaken from a UK perspective. Four of these (including the submission from Roche128) were published after the evaluation by Turner et al.,46 undertaken as part of the previous NICE appraisal. All of the studies published after the Turner et al. report, including the submission by Roche,128 are largely derived from the same source – the SAVE (Simulating Anti-influenza Value and Effectiveness) model. Given the overlap in approaches between these studies, only the more recent submission by Roche is considered in detail, alongside the earlier report by Turner et al. 46
The incremental cost-effectiveness ratio (ICER) estimates reported in Table 55 reveal important differences between these two sources in terms of the subsequent results. The approaches, assumptions and results are therefore contrasted to identify key differences and issues in relation to their relevance to current NHS practice and also to assist in the development of the new model reported in the section on the York Economic Assessment.
Summary of Turner et al.46
Overview
The study was designed to compare alternative options for the treatment and prophylaxis of influenza in four separate patient groups: (1) otherwise healthy adults, (2) high-risk adults, (3) children, and (4) the elderly in residential care. The treatment model compared four alternative strategies in each of the patient groups: usual care (i.e. no use of antivirals) and treatment with antivirals (amantadine, zanamivir, oseltamivir). The analysis adopted an NHS perspective, although the impact of incorporating productivity costs was addressed in the sensitivity analysis. A range of scenarios was undertaken to reflect alternative assumptions for key inputs. In addition, probabilistic sensitivity analysis using second-order Monte Carlo simulation was used to reflect parameter uncertainty in the model. Results were expressed as a series of pair-wise estimates in terms of the incremental cost per QALY gained for each antiviral relative to usual care. A lifetime time horizon was adopted, although all influenza-related events were assumed to take place within a single season, and a lifetime horizon was employed solely to capture QALYs lost due to influenza mortality.
The treatment model took the form of a decision tree, outlined in Figure 20. The model considered all patients in each group with ILI during periods when influenza was reported by surveillance schemes to be ‘circulating in the community’ (i.e. when the rate of ILI referrals exceeded 50 per 100,000 of the population, based on the definition in use at the time of the study). Progression through the model was dependent upon a series of separate considerations reflecting a broad range of policy, behavioural and epidemiological issues. These included: (1) the policy decision (e.g. whether antivirals were routinely available to health-care providers and the potential impact this might have on subsequent consultation rates and other model parameters such as the probability that an ILI is influenza); (2) the disease status of the patient (i.e. whether patient had influenza or other ILI; the proportion of influenza cases that were due to influenza type A or B); (3) behavioural aspects related to the individual with an ILI (i.e. whether they present to a health-care provider, and timing of presentation) and the health-care provider themselves (e.g. compliance with recommendations on the use of antivirals, inappropriate prescription of antivirals and antibiotics, etc.); and (4) the outcome of the illness and the impact of alternative treatments (in terms of symptomatic relief and also subsequent influenza-related complications comprising both minor and major events and potentially mortality).
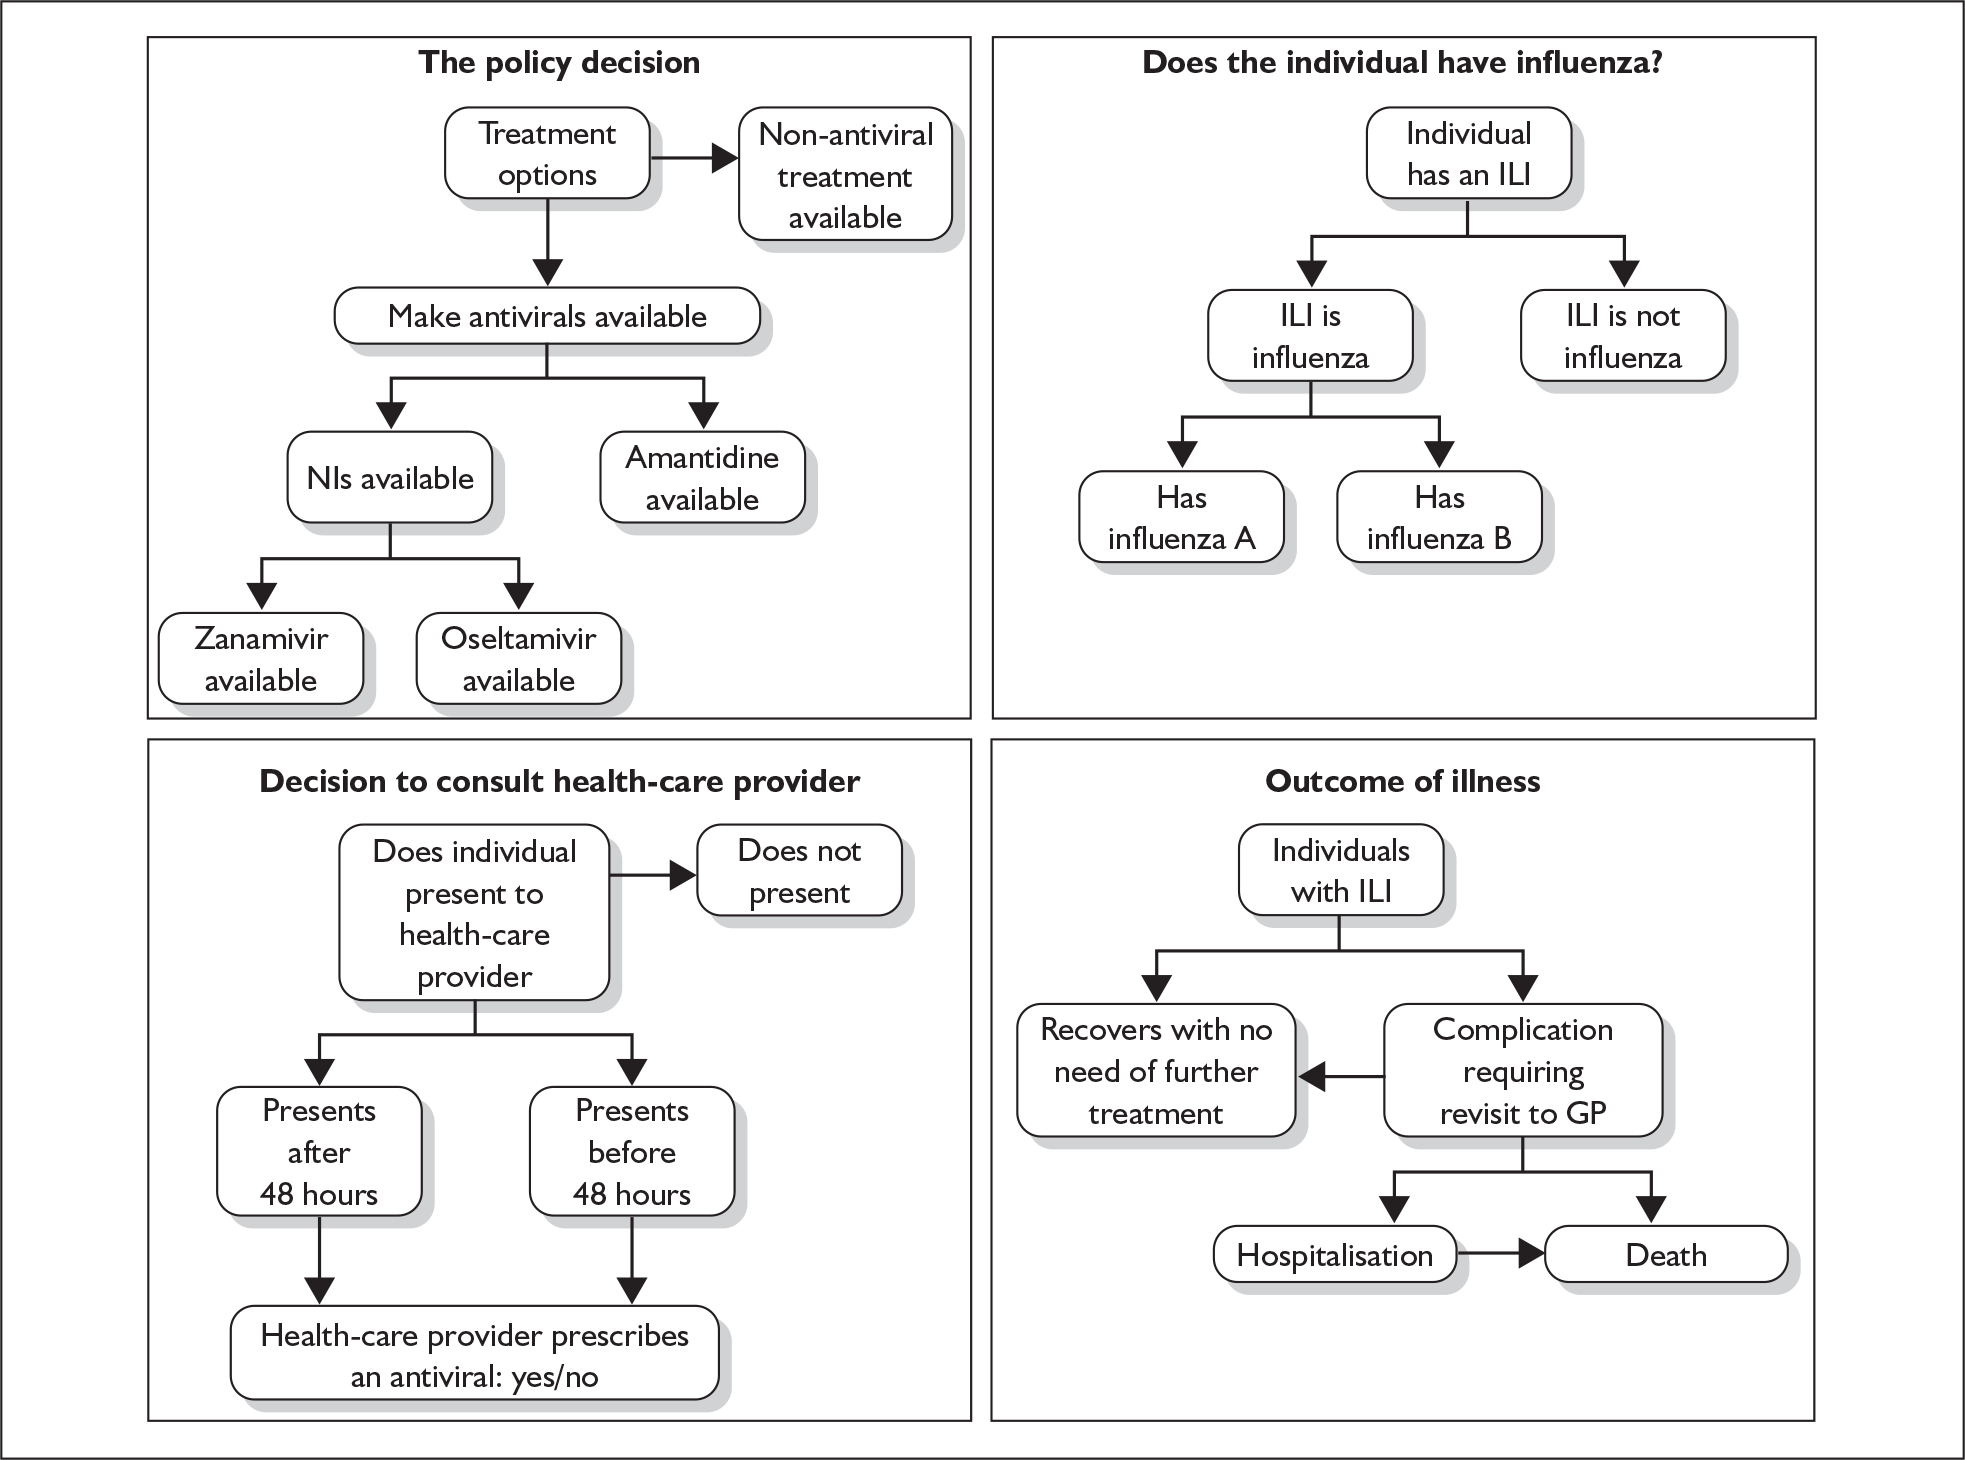
The antivirals (amantadine, zanamivir or oseltamivir) were assumed to provide additional benefits relative to usual care alone only for those individuals who: (1) have influenza A or B (only influenza A in the case of amantadine), rather than an alternative ILI; and (2) present to a GP within 48 hours of the onset of symptoms (with some exceptions, see below).
In each scenario, it was assumed that the patient would either recover directly from treatment without experiencing complications (in which case the benefits of antivirals were based on QoL gains associated with symptomatic relief alone) or encounter complications (either minor or severe) and subsequently recover (non-fatal) or not (fatal). Minor complications were assumed to result in additional consultations with a GP only (and potentially additional use of antibiotics), whereas more severe complications resulted in hospitalisation and potentially mortality.
In the base-case analysis, the authors assumed that antivirals conferred additional benefits, relative to usual care, only in terms of symptomatic relief and reductions in minor complications requiring a revisit to a GP (and subsequent use of antibiotics). Hence, the base-case analysis assumed that the antivirals had no additional impact on major complications associated with influenza requiring hospitalisation or leading to premature mortality. The sensitivity analysis considered an alternative scenario (termed the ‘extrapolated’ model) in which the use of NIs only (oseltamivir and zanamivir) also resulted in reductions in major complications requiring hospitalisation and an associated reduction in influenza-related mortality. The adverse events associated with the use of NIs were considered to be sufficiently minor not to impact the model and hence were not included. However, an additional probability of adverse events was assigned to amantadine due to the more serious nature of these events. Issues of resistance to the use of antivirals were not considered.
The model assumed that all patients with ILI presenting to a GP within 48 hours of the onset of symptoms would be prescribed an antiviral in the relevant treatment strategies. However, due to difficulties in accurately gauging the timing of symptom onset, a small proportion of these were assumed to actually have experienced symptom duration in excess of 48 hours (i.e. in those presenting within the last 12 hours of the 48-hour period and with ‘insidious onset of influenza symptoms’ as opposed to an abrupt onset). It was argued that such patients ‘would be presenting within 48 hours of apparently developing symptoms but would actually be outside 48 hours from onset’. For this proportion of individuals, it was assumed that, although antivirals would be prescribed, they would confer no additional benefits compared to usual care alone. Meanwhile, it was assumed that those presenting to a GP after 48 hours would not be prescribed any antiviral treatment except in cases in which the patient falsely reports the time of onset of symptoms or cannot recollect the time of onset accurately (more likely when the onset is ‘insidious’ rather than ‘abrupt’), or the GP inappropriately prescribes an antiviral treatment as a means of satisfying the patient’s wish to leave with a prescription.
Summary of effectiveness data
Estimates of the proportion of all ILIs that is influenza in individuals presenting to a health-care provider (47.5% in the children group, 46% in all other groups) were based on national surveillance data over a 10-year period (1992–3 to 2000–1) from the RCGP obtained through personal communication. Estimates for the children group were based on data for the under 15 years age group, all other groups were derived from the population aged over 15 years for periods in which the threshold for ‘circulating in the community’ had been reached. For amantadine treatment it was necessary to distinguish between influenza A and B; the probabilities that influenza is type A (68.4% for healthy adults, 79.9% for high-risk adults and the elderly, 70.5% for children) were estimated from surveillance data for the period 1992–2001. The distinction between influenza A and B was only important in estimating the proportion of individuals in whom amatandine was assumed to be effective. No distinction was made in terms of subsequent differences in prognosis, costs or QoL for the different influenza types, and the NIs were assumed to be equally effective in both types.
The probability that a patient with ILI presents to a GP (28.2% for healthy adults, 32.5% for high-risk adults and the elderly, 15.5% for children) was derived from estimates of the size of the population, excess influenza consultations and attack rates obtained from a variety of separate sources. The probability that this presentation occurs within 48 hours of the onset of symptoms (17.8% for healthy adults, 12.2% for high-risk adults and the elderly, 57.2% for children) was derived from Ross et al. ,118 adjusted according to the proportion of persons experiencing abrupt onset of influenza using data derived from a meta-analysis of studies reporting rates of abrupt onset in subjects with influenza A. Estimates of the proportion of those presenting within 48 hours of onset of symptoms who do not receive a drug treatment (4.8% for all groups) and the proportion of those presenting after 48 hours who do receive a drug treatment (2.8% for healthy adults, 1.1% for high-risk adults and the elderly, 12.1% for children) were also derived from Ross et al.
The beneficial health effects of drug treatments were assumed to arise from improved QoL resulting from shorter duration of illness and, in the sensitivity analysis, a reduction in probability of severe complications and associated mortality with the NIs. The probability of severe complications was proxied by the probability of pneumonia and, in the children group only, otitis media. For usual care and amantadine treatment, the probability of pneumonia (1.3% for healthy adults and children, 2.87% for high-risk adults) was based on the pooled control arms of the oseltamivir and zanamivir trials, while for oseltamivir (0.2% for healthy adults and children, 2.19% for high-risk adults) and zanamivir (0.4% for healthy adults and children, 2.0% for high-risk adults), it was based on the treatment arms of the respective trials. Using data from Roche trials, the probability of otitis media complications in children was assumed to be 21.3% for usual care and 12.0% for oseltamivir treatment; for zanamivir or amantadine treatment the probability associated with usual care was adopted due to lack of data.
Hospitalisations were only considered as part of the ‘extrapolated’ model. The probability of hospitalisation for usual care was based on UK data reporting excess hospital admissions, combined with estimates of influenza attack rates and population estimates to derive the estimated probability of hospital admission. The relative risk of pneumonia was applied to these estimates to obtain the hospitalisation rates associated with each NI. The probability of influenza-related mortality was derived from a large UK observational study15 for each patient group, and was assumed to be constant (0.039% for healthy adults, 0.7% for high-risk adults and the elderly, 0.0048% for children) across all treatment strategies in the base case. In the sensitivity analysis, it was assumed that the estimated relative risk reductions in pneumonia associated with oseltamivir or zanamivir treatment also reduced mortality by the same proportion.
Summary of resource utilisation and cost data
The mean costs of GP visits (£21.38 for healthy adults and children, £27.43 for high-risk adults were derived from UK published sources, weighted by the proportion of patients receiving home visits. 118,149 The cost of zanamivir (£24.98) was taken from published sources, the expected cost of oseltamivir (£19.16) was obtained from Roche, while the cost of amantadine (£3.38) was taken from the 2001 Alliance Pharmaceuticals submission to NICE. The cost of antibiotics (£4.05) was derived from Davey et al. 150 The drug costs were increased to take into account pharmacy prescribing fees and container allowances.
The cost of inpatient stays was based on estimates of mean length of stay and mean cost per diem. The mean duration of stay was assumed to be 2.3 days for children, 11.9 days for adults and 15 days for those older than 65 years based on national hospital statistics. It was assumed that 4.9% of adults admitted with pneumonia received assisted ventilation in an intensive care unit; the length of intensive therapy unit (ITU) stay and mechanical ventilation were 28 days and 21.5 days respectively.
The unit costs of hospitalisation were calculated with reference to the National Schedule for Reference Costs: the mean cost per day for adults was taken from Healthcare Resource Group (HRG) code D14 (£189), HRG code D13 (£164) for the elderly and HRG code P04 (£309) for children. The mean cost per diem for an intensive care unit was assumed to be £1193.
Summary of quality of life data
The estimation of QoL benefits was expressed in terms of mean QALYs. The estimates of QALYs comprised a number of separate elements: (1) symptoms – based on the illness duration; (2) minor complications; (3) adverse events (amantadine only); (4) major complications; and (5) premature mortality and associated loss of remaining quality-adjusted life expectancy (QALE). The base-case analysis evaluated the differential QALYs between the antiviral treatments and usual care in terms of elements (1), (2) and (3). As part of the sensitivity analysis, termed the ‘extrapolated model’, differential QALYs were estimated for all separate elements; only the NIs were assumed to result in differential QALYs, compared with usual care, for elements (4) and (5).
The QALY estimates representing symptomatic benefits were derived from the mean duration of the illness for each treatment, and the associated QoL during this period. The base-case analysis derived estimates based on the time to resolution of symptoms; sensitivity analysis explored the robustness of the results to the inclusion of productivity costs based on time to return to normal activity. Given that estimates of the symptom duration were mainly reported in terms of median estimates in the clinical trials, a parametric survival analysis approach was employed in order to estimate the mean values required for the economic model. The authors assumed that the survival curve for time to recovery followed an exponential distribution (i.e. assuming a constant hazard). Median estimates were thus extrapolated, assuming an exponential distribution, in order to obtain the required mean estimates, converted into days, for input into the model. Estimates for the length of influenza illness for patients receiving usual care and oseltamivir and zanamivir were obtained directly from the relevant trials, while the length of illness for those receiving amantadine was based on the observed length of fever in the Cochrane review of amantadine (modified to include only those trials using doses of 100 mg per day, extrapolated to give length of influenza illness using meta-regression results based on the observed lengths of fever and length of influenza illness observed in the oseltamivir trials). This alternative approach to estimating the duration of illness for amantadine was due to the lack of comparable outcomes to data reported for the NIs (i.e. outcomes were expressed in terms of the duration of fever as opposed to resolution of symptoms or return to normal activities).
QALYs based on symptoms estimated for each of the four treatment alternatives were derived from the mean duration of illness with respect to data reported for influenza positive patient health valuations conducted alongside a number of randomised trials of oseltamivir. In these trials, a 10-point Likert scale was completed daily over a 21-day period; this was recalibrated to mean VAS scores from the Measurement and Valuation of Health (MVH) study, which were then converted to time trade-off (TTO) equivalent utility scores using an equation. 151 Separate scores were used for healthy and at-risk populations. The TTO values for those receiving placebo and oseltamivir were used directly in the model as the QoL values for the usual care and oseltamivir treatment strategies respectively. To derive the QoL values for the zanamivir and the amantadine treatment strategies, the QoL values for the oseltamivir treatment strategy were adjusted according to the respective length of influenza illness associated with zanamivir and amantadine treatment.
The QoL associated with minor complications was assumed to be reflected in the patient health valuations given alongside the trials, while the QoL associated with severe complications was estimated separately based on WHO disability weights for lower respiratory conditions. 152 These were 0.724 in the healthy adult population and 0.72 in the other populations. In the children’s model, the QoL associated with otitis media was taken to be 0.977 from the same source. The valuation of adverse events resulting from amantadine (0.81 for healthy adults and children, 0.74 for high-risk adults) was based on an assumed EQ-5D status, and the length of illness from amantadine adverse events was assumed to be 5 days.
QALYs lost due to premature mortality were estimated according to the QALE for the separate patient groups based on estimation of the mean age of influenza deaths, remaining life expectancy (based on standard lifetables), the discount rate (1.5%) and quality adjustment according to age (based on the mean EQ-5D values derived from UK population norms). This approach assumed that individuals who die from influenza would have otherwise had a normal life expectancy with an associated QoL similar to that of the general population. The authors noted that this approach may overstate the benefit of preventing influenza deaths, as those who die of influenza may be a less healthy subgroup. As previously stated, the relative risk reduction reported for pneumonia for the separate NIs was employed as proxy for the relative risk reduction for mortality.
Summary of cost-effectiveness data
In each subgroup, the base-case results show that all three treatments were more costly and more effective than usual care. The ICERs given for each of the antiviral treatment strategies were reported separately relative to usual care. Hence, the results are presented as a series of pair-wise comparisons as opposed to a simultaneous assessment of the full range of relevant alternatives. As such, the results indicate whether each individual treatment is cost-effective relative to standard care; they do not, however, indicate which of the alternatives is optimal on cost-effectiveness grounds (which would require the interventions to be ranked in terms of costs or QALYs and then ICERs estimated following the exclusion of any dominated or extendedly dominated alternatives). The base-case results are reported in Table 56.
| Population | Strategy | Incremental cost | Incremental QALY | ICER |
|---|---|---|---|---|
| Healthy adults | Amantadine | 0.107 | 0.0000173 | £6190 |
| Oseltamivir | 0.895 | 0.0000474 | £19,015 | |
| Zanamivir | 1.290 | 0.0000409 | £31,529 | |
| High risk | Amantadine | 0.063 | 0.000014 | £4535 |
| Oseltamivir | 0.712 | 0.0000317 | £22,502 | |
| Zanamivir | 0.960 | 0.0000555 | £17,289 | |
| Residential care elderly | Amantadine | 0.077 | 0.000015 | £5057 |
| Oseltamivir | 0.85 | 0.000039 | £21,781 | |
| Zanamivir | 1.14 | 0.000068 | £16,819 | |
| Children | Amantadine | 0.229 | 0.0000375 | £6117 |
| Oseltamivir | 1.661 | 0.0000854 | £19,461 | |
| Zanamivir | 2.222 | 0.0000721 | £30,825 |
Oseltamivir is therefore slightly more cost-effective in the healthy adult and children populations than in the high-risk and residential care elderly populations, and conversely zanamivir is substantially more cost-effective in the high-risk and residential care populations than in the healthy adult and children populations.
Sensitivity analysis
In the healthy adult sensitivity analyses, ‘extrapolating’ the base case to include the impact of treatment on hospitalisations and deaths substantially improves the ICERs of oseltamivir and zanamivir for each of the subgroups. This effect is most evident in the high-risk and residential care elderly populations in which the baseline risk of hospitalisation and mortality is highest (and hence the absolute gain associated with treatment is potentially greater). The ICER for amantadine remains unaltered from the base case as no additional effect was assumed, relative to usual care, for hospitalisations and mortality. The ICERs for each of the antivirals across the subgroups was below £20,000 per QALY. In the residential care model, both oseltamivir and zanamivir dominated (i.e. less costly and more effective) usual care. The results are summarised in Table 57.
| Population | Strategy | Incremental cost | Incremental QALY | ICER |
|---|---|---|---|---|
| Healthy adults | Amantadine | 0.11 | 0.000017 | £6190 |
| Oseltamivir | 0.88 | 0.00019 | £4729 | |
| Zanamivir | 1.28 | 0.00014 | £8884 | |
| High risk | Amantadine | 0.063 | 0.000014 | £4535 |
| Oseltamivir | 0.505 | 0.00017 | £3016 | |
| Zanamivir | 0.696 | 0.0002296 | £3029 | |
| Residential care elderly | Amantadine | 0.076 | 0.000015 | £5199 |
| Oseltamivir | –0.98 | 0.0013 | Dominates usual care | |
| Zanamivir | –0.21 | 0.001 | Dominates usual care | |
| Children | Amantadine | 0.23 | 0.0000375 | £6117 |
| Oseltamivir | 1.66 | 0.00015 | £11,381 | |
| Zanamivir | 2.230 | 0.00012 | £19,127 |
A number of additional scenarios (presented as one-way and two-way sensitivity analyses) were explored to examine the robustness of the model assumptions. The results indicated that the results were particularly sensitive to the probability that patients presenting with ILI have influenza. The results of the one-way sensitivity analyses are summarised in Table 58. As expected, lower probabilities (i.e. akin to a higher false positive rate) resulted in marked deteriorations in the ICERs of antiviral treatment and vice versa for higher probabilities.
| Population | Strategy | Probability ILI is influenza (base case = 0.47) | ||||
|---|---|---|---|---|---|---|
| 0.1 | 0.3 | 0.5 | 0.7 | 0.9 | ||
| Healthy adults | Amantadine | £79,993 | £10,389 | £5555 | £3791 | £2878 |
| Oseltamivir | £95,130 | £29,998 | £16,972 | £11,389 | £8288 | |
| Zanamivir | Zero effect | £62,500 | £30,500 | £20,000 | £16,857 | |
| At-risk population | Amantadine | Neg. effect | £9830 | £3928 | £2455 | £1785 |
| Oseltamivir | £107,165 | £34,123 | £19,514 | £13,253 | £9775 | |
| Zanamivir | £82,102 | £26,178 | £14,993 | £10,200 | £7536 | |
| Residential care elderly | Amantadine | N/A | N/A | N/A | N/A | N/A |
| Oseltamivir | N/A | N/A | N/A | N/A | N/A | |
| Zanamivir | N/A | N/A | N/A | N/A | N/A | |
| Children | Amantadine | £55,921 | £10,135 | £5573 | £3843 | £2932 |
| Oseltamivir | £96,079 | £31,598 | £18,702 | £13,175 | £10,104 | |
| Zanamivir | £111,000 | £44,000 | £27,250 | £19,636 | £16,385 | |
Two-way sensitivity analyses were also undertaken to link the probability that ILI is influenza to higher consultation rates that may arise if NIs became routinely available following a positive recommendation on their use (Tables 59 and 60). The two-way analysis explored the hypothesis that a positive recommendation in favour of the use of NIs in particular populations (healthy and high-risk adults) would subsequently lead to an increase in the proportion of individuals consulting with a GP. This, in turn, was assumed to potentially lead to a reduction in the probability that ILI is influenza.
| Probability that ILI is influenza | Probability of presenting to GP if NI available | ||||
|---|---|---|---|---|---|
| 0.28 | 0.32 | 0.36 | 0.40 | ||
| Healthy adult base case | |||||
| 0.46 | Zanamivir | £30,096 | £51,613 | £67,363 | £79,738 |
| Oseltamivir | £17,765 | £36,049 | £49,684 | £61,325 | |
| 0.41 | Zanamivir | £34,688 | £58,395 | £76,714 | £91,294 |
| Oseltamivir | £20,198 | £40,279 | £56,819 | £69,170 | |
| 0.36 | Zanamivir | £39,501 | £67,172 | £86,735 | £104,220 |
| Oseltamivir | £23,442 | £46,680 | £64,754 | £79,213 | |
| 0.31 | Zanamivir | £44,100 | £76,343 | £99,703 | £118,145 |
| Oseltamivir | £26,872 | £53,758 | £75,130 | £90,422 | |
| Healthy adult extrapolated case | |||||
| 0.46 | Zanamivir | £8120 | £13,760 | £18,217 | £21,695 |
| Oseltamivir | £4280 | £8791 | £12,277 | £15,063 | |
| 0.41 | Zanamivir | £9127 | £15,511 | £20,370 | £24,357 |
| Oseltamivir | £4897 | £9925 | £13,841 | £16,904 | |
| 0.36 | Zanamivir | £10,493 | £17,755 | £23,403 | £27,921 |
| Oseltamivir | £5687 | £11,435 | £15,920 | £19,420 | |
| 0.31 | Zanamivir | £12,188 | £20,733 | £27,250 | £32,445 |
| Oseltamivir | £6737 | £13,349 | £18,572 | £22,644 | |
| Probability that ILI is influenza | Probability of presenting to GP if NI available | ||||
|---|---|---|---|---|---|
| 0.33 | 0.37 | 0.41 | 0.45 | ||
| High-risk base case | |||||
| 0.46 | Zanamivir | £19,031 | £38,967 | £55,223 | £67,776 |
| Oseltamivir | £26,250 | £60,327 | £87,230 | £111,667 | |
| 0.41 | Zanamivir | £21,677 | £44,432 | £62,106 | £76,465 |
| Oseltamivir | £29,456 | £68,663 | £100,741 | £127,473 | |
| 0.36 | Zanamivir | £25,098 | £50,476 | £70,878 | £87,637 |
| Oseltamivir | £33,464 | £76,617 | £114,972 | £143,740 | |
| 0.31 | Zanamivir | £29,691 | £59,829 | £82,442 | £102,533 |
| Oseltamivir | £40,549 | £94,429 | £133,756 | £170,754 | |
| High-risk extrapolated case | |||||
| 0.46 | Zanamivir | £3677 | £8674 | £12,658 | £15,973 |
| Oseltamivir | £3918 | £10,761 | £16,216 | £20,778 | |
| 0.41 | Zanamivir | £4304 | £9907 | £14,380 | £18,047 |
| Oseltamivir | £4615 | £12,235 | £18,439 | £23,443 | |
| 0.36 | Zanamivir | £5160 | £11,537 | £16,657 | £20,858 |
| Oseltamivir | £5512 | £14,206 | £21,292 | £26,987 | |
| 0.31 | Zanamivir | £6222 | £13,619 | £19,579 | £24,357 |
| Oseltamivir | £6643 | £16,684 | £24,894 | £31,472 | |
The results indicate that the cost-effectiveness of antivirals appears sensitive to a number of important issues, in particular:
-
whether antivirals result in reductions in hospitalisation and mortality associated with influenza
-
whether the impact on hospitalisation and mortality is more plausible in particular groups (e.g. high-risk and elderly)
-
the probability that ILI is influenza
-
the potential impact on consultation rates following a positive recommendation on the use of antivirals.
Although (3) and (4) are presented as separate issues, they are inevitably closely linked, and the results from the two-way analysis suggest that relatively small changes to these estimates can have a significant impact on the ICER.
Critique of Turner et al.46
The approach, methodology and interpretation of both the data and the results in the report appear to be generally of high quality. Significant efforts were clearly made to populate the different component parts of the model in a systematic and transparent manner. The checklists and critical appraisal of the report did not identify any significant concerns related to the majority of approaches employed. When assumptions were employed, extensive sensitivity analyses were used to highlight the robustness of the base-case model to a variety of alternative assumptions. This process was informative in identifying a number of key issues likely to be important determinants of the cost-effectiveness of the use of antivirals generally and specifically concerning the use of NIs (oseltamivir and zanamivir). Of all the published studies considered in the review, the report from Turner et al. 46 was considered to be the most comprehensive and relevant study from the perspective of the UK NHS.
A number of limitations of the model are discussed by the authors themselves, including the uncertainty inherent in the derivation of the QALY values for zanamivir and amantadine (in addition to that incorporated in the probabilistic sensitivity analysis), the poor quality of the evidence base for amantadine, the insignificance of the differences in rates of pneumonia observed in trials and uncertainty over the ability of elderly people to use the Diskhaler for zanamivir. It was suggested that there may be merit in further subgroup analysis of children given the greater rate of severe complications in very young children. Finally, as previously noted, the approach to the extrapolated model assumed that individuals who die from influenza would have otherwise had a normal life expectancy (and QoL). The authors noted that this approach may overstate the benefit of preventing influenza deaths as those who die of influenza may be a less healthy subgroup. However, it should also be noted that the discounted QALE calculations for the at-risk adult group and elderly in residential care population were based on the same estimate (4.1 QALYs) which was derived from the mean age of death for subjects aged 65 years (i.e. the average age of influenza mortality in this group was 84 years and hence the remaining life expectancies are derived from an estimate from the general population of the expected remaining life-years of someone who had survived to this age). Hence, concerns noted regarding the potential for this approach to overstate the benefits in particular groups need to be considered against the potential to understate the benefits in others (e.g. at-risk subjects aged less than 65 years).
The critical appraisal identified several other possible limitations and issues that need to be considered in relation to the subsequent interpretation of the results. Firstly, the model itself addresses a number of behavioural elements (i.e. whether health-care providers adhere to guidance or not, prescription of antivirals to placate patients regardless of their subsequent effectiveness, etc.) which reflect more of a positive approach to the decision problem rather than the normative perspective that typically underpins many decision models. The positive and normative distinction is applied in economics to distinguish approaches that model ‘what is’ (positive) as opposed to ‘what ought to be’ (normative). Hence, the model incorporates a level of inefficiency that, while reflecting the reality of clinical practice, means that the subsequent cost-effectiveness estimates do not represent the cost-effectiveness of antivirals as they should be used (i.e. in accordance with guidelines, etc.). As a result, the current estimates are likely to underestimate the cost-effectiveness of antivirals used in accordance with their respective licences and subsequent guidance. Lack of adherence to these aspects is primarily an implementation issue and is separable from establishing whether the correct use of antivirals is, in itself, cost-effective. Despite these concerns, it is unlikely that this aspect would have a significant effect on the cost-effectiveness results.
The second limitation concerns the presentation of cost-effectiveness results as a series of pair-wise comparisons. Hence, the cost-effectiveness results are not fully incremental; the ICERs given for each treatment were incremental to usual care in every case, not the next most costly (or effective) non-dominated strategy. A related issue concerns the presentation of decision uncertainty in the form of cost-effectiveness acceptability curves (CEACs). The presentation of a series of CEACs representing each pair-wise comparison is similarly misleading in relation to adequately reflecting uncertainty surrounding the relevant decision problem (which refers to all relevant alternatives and not to specific subsets of comparators).
While the model considered the potential impact of NIs on hospitalisation and mortality rates as part of the ‘extrapolated’ model, only two serious complications resulting from ILI (pneumonia and otitis media) were considered. Additional complications documented in Meier et al. 15 and modelled in other studies (e.g. bronchitis, as in the Roche submission) were not considered. Similarly, the impact on mortality applied in the ‘extrapolated’ model was proxied via the relative risk of the NIs in relation to pneumonia (hence assuming that all mortality is due to pneumonia). If the risk of mortality is attributable to a wider set of complications, it is unclear whether this approach is likely to over- or underestimate the potential impact of NIs.
Another potential concern relates to the distributional assumption employed to extrapolate median illness durations into mean estimates for the model. The authors assumed that the survival curve for time to recovery followed an exponential distribution (i.e. assuming a constant hazard). However, it is unclear whether illness duration is exponentially distributed, hence the validity of the methods of extrapolation to derive the mean duration of illness remains unclear. It should also be noted that the duration of illness estimated from the meta-analysis (and survival analysis) was only used to adjust the QoL data obtained from the VAS scores for amantadine and zanamivir (estimates were adjusted based on the differential duration of illness vis-à-vis oseltamivir). The QoL estimates applied for oseltamivir and usual care were taken directly from the VAS data reported in a subset of the oseltamivir trials. Hence, the differential QoL reported between oseltamivir and usual care does not necessarily reflect the difference in mean duration of illness from the broader set of studies considered in the review itself.
It should also be recognised that the modelling stage, which considers the decision to consult the health-care provider, evaluates the probability that an individual presents within 48 hours. However, this is not strictly in accordance with either the respective licences or existing NICE guidance, which stipulates that patients should both present to the health-care provider and be able to start antiviral treatment within 48 hours (36 hours in the case of children for zanamivir). Therefore, it is not strictly correct to model this probability in terms of presentation rates within the 48-hour period, due to potential delays that may arise in actually receiving the treatment itself. In terms of presentation times, in accordance with the respective licences, this has previously been interpreted in adults as presenting within 36 hours of illness and can thus begin treatment within 48 hours. 153 As a result, it may have been more appropriate to consider presentation rates within a 36-hour period, which may also have obviated the need for the subsequent adjustment to the 48-hour presentation rates to account for ‘insidious’ onset.
Finally, although the sensitivity analysis provides a useful approach to identifying the key drivers of the cost-effectiveness results, many of the proposed analyses appear to be based on arbitrary estimates (i.e. fixed increments or decrements to key probability estimates). In particular, the results of the one- and two-way sensitivity analyses highlight that the probability that ILI is influenza and the potential impact on consultation rates following a positive recommendation on the use of antivirals (and the potential link between the two) are important determinants of cost-effectiveness. However, no evidence is provided that supports the range of estimates applied in these scenarios or even that there is a link between these two elements. Consequently, it is difficult to interpret whether these are reasonable assumptions or not. It should also be recognised that uncertainty surrounding the probability that ILI is influenza and the probability of consultations is already, to a degree, characterised by the distributions assigned as part of the probabilistic analysis.
A key remaining uncertainty is whether the variability in the probability that ILI is influenza has been adequately represented and, more importantly, whether an increase in consultation rates would alter the case mix of patients presenting to a GP. If the case mix remains unaffected, such that the probability that ILI is influenza is the same in individuals who currently present to a GP as it is in those who do not, then a higher consultation rate should have no material effect on the estimates of the ICER. While the ICER would remain unaffected in this scenario, clearly there are important budgetary implications that may arise. This issue is revisited in the section on Parameter estimates for inclusion in the York model, below.
Summary of Roche submission128
Overview
The study was designed to compare oseltamivir with zanamivir and usual care for the treatment of influenza in four separate patient groups: (1) otherwise healthy adults, (2) at-risk adults (including all adults older than 64 years), (3) otherwise healthy children aged 1–12 years, and (4) otherwise healthy children aged 1–5 years. The model separately compared the strategy of oseltamivir treatment with that of usual care and zanamivir treatment across all patient groups (with the exception of otherwise healthy children aged 1–5 years, for whom only oseltamivir treatment was compared with usual care as zanamivir is not licensed for that age group).
The treatment model took the form of a decision tree outlined in Figure 21. The model considered all patients in each patient group presenting to a GP with an ILI during periods in which surveillance schemes reported influenza to be ‘circulating in the community’. A lifetime time horizon was adopted, although all influenza-related events were assumed to take place within a single influenza season, and so the lifetime horizon is employed solely to capture QALYs lost due to influenza mortality. QALYs lost were discounted at 3.5% per annum, as per the NICE reference case; all other costs and health effects were captured within 1 year and so were not discounted. The analysis primarily adopted an NHS perspective, although a societal perspective was considered in the sensitivity analysis. Probabilistic sensitivity analysis, using second-order Monte Carlo simulation, was used to analyse uncertainty in the model.
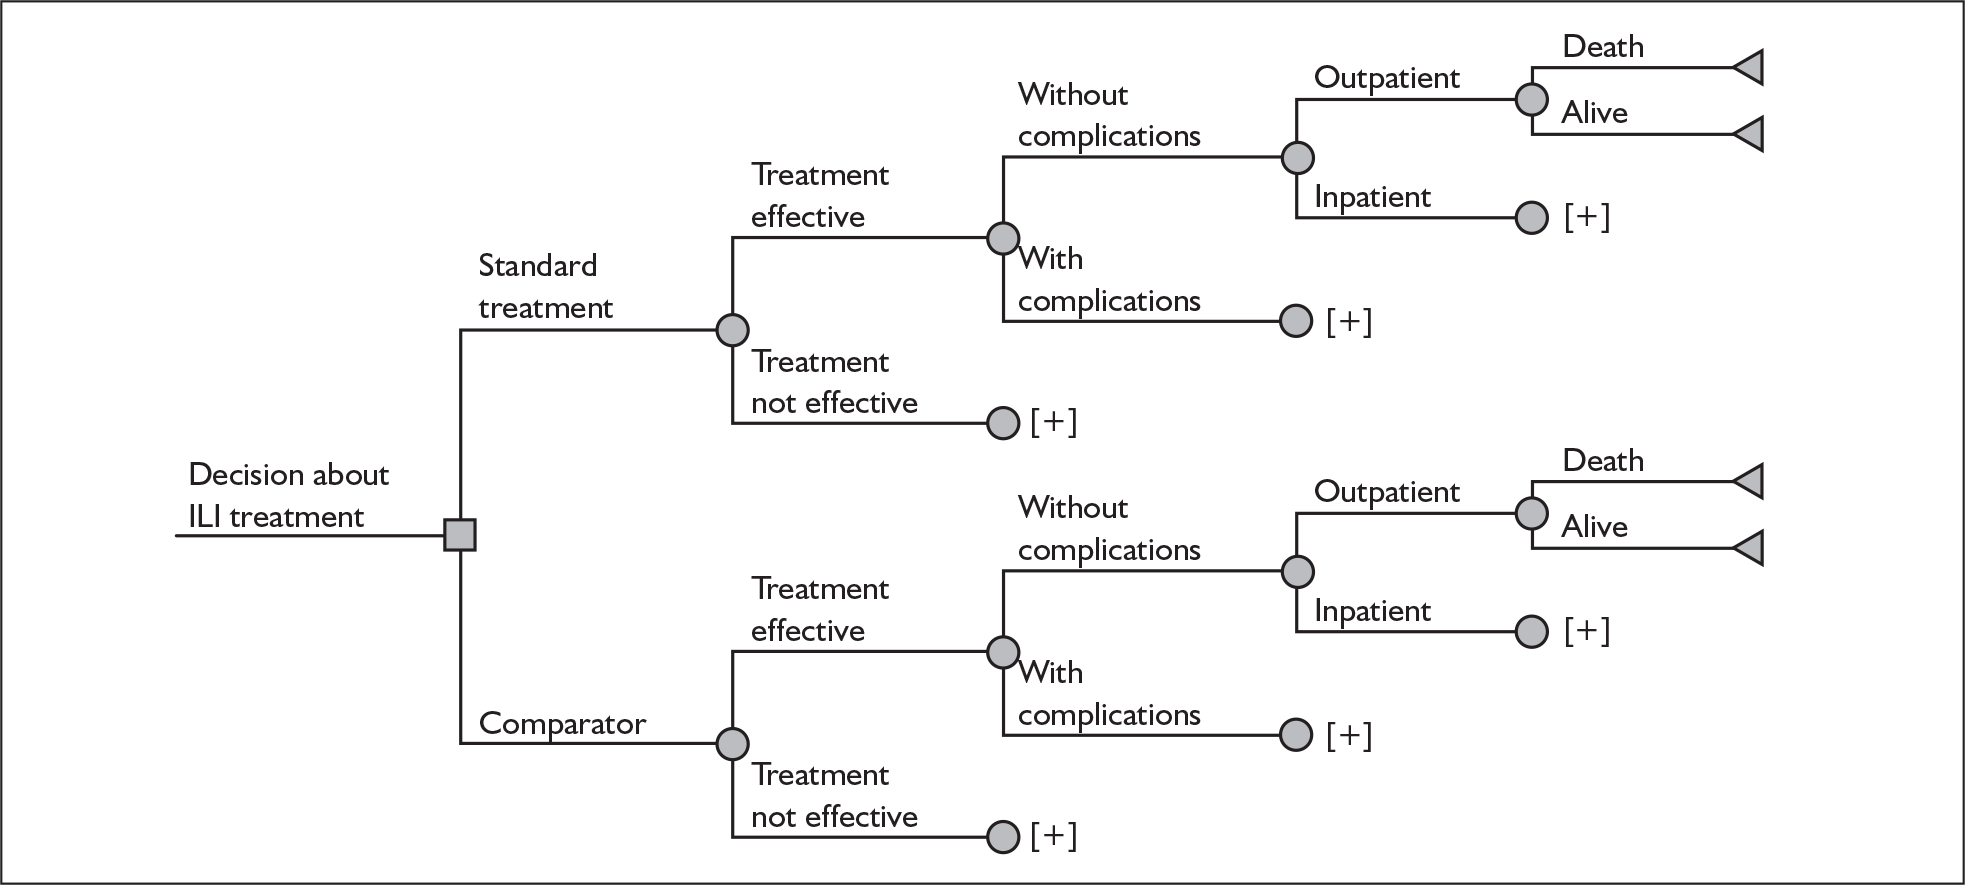
The overall structure of the Roche model reflects a narrower range of issues considered compared with the approach employed by Turner et al. 46 Importantly, the Roche model starts at a later decision node; the decision problem considered by Roche begins at the point at which a patient has already presented to a GP. Hence, the probability that an individual will actually present to a health-care provider, and the potential impact that a positive recommendation for NIs may have on this probability due to increased attendance rates, are not explicitly considered in the base-case analysis.
The branches derived from the ‘treatment effective/not effective’ chance node are used to estimate the proportion of patients in whom NIs are assumed to provide additional benefits over and above those of usual care. In the base case, this chance node is populated solely by the probability that ILI is influenza. Hence, issues related to inappropriate prescription of NIs and difficulties in accurately gauging the time of onset of symptoms (considered by Turner et al. 46) are not part of the base-case analysis. Additional sensitivity analyses are, however, used to consider alternative factors that may alter the ‘treatment effective/not effective’ chance node, including the probability of developing resistance to the antivirals and the probability that patients present within 48 hours.
The base-case analysis of the Roche submission128 incorporates the benefit of NI in terms of both symptomatic improvements and reductions in minor complications, as well as their potential benefit in terms of preventing hospitalisations and mortality. As previously noted, this latter assumption formed part of the ‘extrapolated’ model reported by Turner et al. ,46 but was not part of their base-case analysis. We have previously outlined that the inclusion/exclusion of the potential effectiveness of NIs in terms of hospitalisations and mortality was an important driver of cost-effectiveness in the report by Turner et al.
The [+] sign in Figure 21 is used to simplify the graphical presentation and indicates that the pathways included in the branches above (e.g. death/alive after the outpatient pathway) are identical to those in which the [+] sign is used. Hence, the model assumes that hospitalisations and mortality are not solely related to the onset of complications. In effect, this means that complications, hospitalisations and subsequent mortality are largely treated as independent events in the Roche submission.
The model compared oseltamivir with usual care and zanamivir using separate pair-wise comparisons. For the pair-wise comparison between oseltamivir and zanamivir, the submission assumed that both NIs were equivalent in terms of their efficacy, and so a cost-minimisation (rather than cost-effectiveness) approach was carried out for this particular pair-wise comparison. However, it should be recognised from the outset that the premise for the cost-minimisation approach appears largely based on the differential costs reported in the Roche submission for the separate NIs. The total cost of a course of treatment for adults was assumed to be £16.36 for oseltamivir and £16.55 for zanamivir – a difference of £0.19. The total cost of zanamivir reported in the Roche submission was ‘based on the new proposed price which has been approved by the Department of Health with effect from 1 February 2008’ (p. 67). 128 However, the actual approved price of zanamivir is identical to that of oseltamivir (£16.36). Hence, in the case of the adult populations considered, any differences reported in the submission between oseltamivir and zanamivir are driven entirely by this error. For the children population, there remained a potential difference in the price of the two NIs due to the availability of an oral suspension form of oseltamivir (60 mg/5 ml, net price 75 ml = £16.36). In this instance, any difference between the cost of oseltamivir and zanamivir is reliant on the assumption that any remaining suspension can be reused by the pharmacist. This appears to be an optimistic assumption and, hence, it might be more appropriate to assume identical costs for the NIs throughout, in which case there would be no difference in cost-effectiveness between the NIs based on the assumption of equivalent efficacy (and hence no reason on cost-effectiveness grounds to recommend one in preference to the other, assuming either one is demonstrated to be more cost-effective than usual care without the use of antivirals).
Summary of effectiveness data
The previous review of the report by Turner et al. 46 indicated that the probability that ILI is influenza (akin to a measure of the TPR) was an important driver of cost-effectiveness, particularly when combined with assumptions related to increased consultation rates arising from a positive recommendation for the usage of NIs. In the Roche submission128 it was assumed that the proportion of patients presenting to a GP with ILI who had influenza was 31%. This estimate was subsequently applied to all the separate populations. This contrasts with the approach used by Turner et al. which applied separate estimates to the adult (46%) and children (47.5%) populations. It should also be noted that the estimate of 31% employed in the Roche submission is considerably lower than either of the estimates reported by Turner et al. This assumption is referenced in the submission to NICE guidance TA58, which in itself appears to be one of the alternative scenarios adopted in the sensitivity analyses undertaken by Turner et al. This lower estimate appeared to be considered by the NICE Appraisal Committee for TA58 to more appropriately reflect the potential impact that the availability of NIs may have in specific populations due to increased consultation following a positive recommendation. We have previously noted that the basis of this estimate appears largely arbitrary and, in addition, it remains questionable whether this assumption would be relevant to all populations (particularly as NIs have already been recommended in ‘high-risk’ populations).
The probability that influenza was type A (76%) was reported in the submission but was irrelevant to the reported outcomes given that no distinction was made between the NIs in terms of their efficacy in terms of influenza types A and B. It was also assumed in the model that all patients presenting with ILI after 48 hours of the onset of symptoms were filtered out by the GP; that is, 100% of those diagnosed with ILI presented within 48 hours and so could benefit from treatment (this assumption was reconsidered in the sensitivity analysis by adopting the estimates used by Turner et al. ,46 derived in turn from Ross et al. ). 118
In each scenario it was assumed that a patient would either recover directly from treatment or encounter a single complication (one of three types): bronchitis, pneumonia or – in the two children groups only – otitis media. The probabilities of developing bronchitis or pneumonia with usual care were taken from a large UK population-based study by Meier et al. ;15 the risk reductions resulting from NI treatment for healthy or at-risk adults were taken from a published meta-analysis of oseltamivir trials,154 while the risk reductions associated with children were taken directly from Roche trial data. For each of the children groups, the probability of developing otitis media with usual care was taken from the placebo arm from the Roche clinical trials of children, while the probability associated with either NI treatment was calculated by applying the risk reduction observed in the trial for oseltamivir to the probability associated with usual care.
It was assumed that there was a probability of hospitalisation resulting from ILI (without any complication), bronchitis or pneumonia, but not from otitis media. The probability of hospitalisation from ILI with usual care was stated as being derived from US National Hospital Discharge Survey Data reported in Cox and Subbarao,116 and was given as 1.93% for all patient groups; the risk reduction for NI treatment was sourced from Kaiser et al. ,154 resulting in a probability of hospitalisation following NI treatment of 0.97% in the at-risk adults group and 0.78% in all other groups. The probability of hospitalisation associated with bronchitis was assumed to be identical to that for ILI with usual care, while the probability of hospitalisation associated with pneumonia was stated as being taken from Cox and Subbarao. 116 NI treatment was assumed to reduce the probability of hospitalisation only in those patients who did not develop a complication.
It was assumed that there was a probability of mortality resulting from ILI (without any complication), as well as for bronchitis, pneumonia or otitis media. For ILI with usual care these were taken from Meier et al. 15 and were given as 0.0387% for otherwise healthy adults, 0.0271% for otherwise healthy children (of both age ranges) and 0.685% for at-risk adults. For either NI treatment, the reduction in the probability of mortality from ILI was assumed to be equivalent to the reduction in hospitalisations associated with NI treatment reported in Kaiser et al. ;154 for otherwise healthy adults the probability of mortality from ILI was 0.0157%, for otherwise healthy children this was 0.0109% (mistakenly given as 0.3445% in the printed submission) and for at-risk adults this was 0.3445%. The mortality associated with those who developed a complication was assumed to be identical to the ILI mortality for usual care, irrespective of the treatment strategy adopted or whether hospitalisation occurred (in common with the probability of hospitalisation, NI treatment was assumed to reduce the probability of mortality only in those patients who did not develop a complication). In effect, there are two benefits being modelled in relation to mortality for the NIs: (1) a reduction in the complication rate – which means that subjects face the mortality rate from ILI (without any complication) as opposed to the mortality rate applied to the specific complication – and (2) a reduction in the mortality rate applied to patients entering the pathway represented by ILI (without any complication).
Summary of resource utilisation and cost data
The resource utilisation and costs associated with GP visits, diagnostic tests, antibiotics, treatments and hospital visits were derived from a variety of sources including the National Ambulatory Medical Care Survey (NAMCS) from the US as well as other US databases. These estimates were reported to have been reviewed by three clinical experts from the UK. The source of the drug costs for oseltamivir is not given; the total cost of treatment is assumed to be £16.36 for adults (tabs), £16.36 for children (small capsules), or £8.18 and £10.91 for children aged 1–5 years and 1–12 years (suspension) respectively. The costings reported for children assume no wastage or reuse of any remaining powder for the preparation of the oral suspension. The total cost of zanamivir (£16.55 for all patient groups) is ‘based on the new proposed price which has been approved by the Department of Health with effect from 1 February 2008’ (p. 67). 128 We have previously noted the error regarding the cost of zanamivir and the assumptions employed with respect to the use of oral suspension.
The probabilities of hospitalisation stated in the previous section are key drivers of the expected costs of each strategy. Inpatients were assumed to incur two GP visits costing £34 each (as opposed to between 1.20 and 2.50 visits for outpatients, depending on patient group and complication) and £107 of hospitalisation costs for each day spent in hospital. For children aged 1–5 years, the estimated length of stay is based on unpublished analysis by Dr J Watkins (Senior Lecturer and Honorary Consultant in Public Health Medicine, Cardiff University, personal communication, 2008) (3 days), for children aged 1–12 years and otherwise healthy adults it is taken from the Assessment Group report for TA58 (8 days and 10 days respectively), while for at-risk adults it is taken from Nguyen-Van-Tam et al. 155 (12 days). The expected cost of 1 day in an intensive care unit (£1153) for 10% of patients developing a complication is considered in the sensitivity analysis, while the cost of hospitalisation per day is estimated to be £107, based on HRGs D14, D40 and D43. It was assumed that no costs were incurred as a result of any adverse events from either NI treatment, as these were expected to be minor and so any cost implications would be small.
Summary of quality of life data
The beneficial health effects of NI treatments were assumed to arise from improved QoL during the period of illness, a reduction in the probability of developing a complication following treatment and, for those who did not develop a complication, a reduction in the probability of mortality. As in Turner et al. ,46 the QoL associated with minor complications was assumed to be reflected in the patient health valuations based on VAS reported alongside the trials for oseltamivir and so were not considered separately.
Utility weights associated with ILI (without complications), bronchitis, pneumonia and otitis media were assumed not to vary between patient groups. The utility value associated with ILI (without complications) for patients receiving usual care (0.840) was sourced from ‘Harvard utility scores’ (no further reference given). The submission neither discusses nor justifies the use of the Harvard utility score for ILI (no complications). The relative improvement with either NI treatment was assumed to be 11.52% (resulting in a utility value of 0.937). This figure of 11.52% was calculated by converting the patient health valuations conducted alongside the oseltamivir clinical trials into QoL scores (using the same methodology as Turner et al. ) and then deriving the percentage difference in the sum of expected QALYs between usual care and oseltamivir over the first 7 days of the valuation. Utility values associated with complications – bronchitis (0.990), pneumonia (0.900) or otitis media (0.910) – were based on a Dutch study156 and assumed not to vary with the treatment strategy. All utility values were given triangular distributions.
These utility weights were applied to each day of illness – the duration of ILI was defined as the time to return to normal activities (this was considered in Turner et al. 46 only as part of the sensitivity analysis in order to calculate productivity losses). This was given separately for those patients who required hospitalisation and those who did not, and varied by patient group, complication and, for those with no complication, treatment strategy.
The time to return to normal activities for outpatients was based on the data collected through the self-reported VAS instruments in the oseltamivir clinical trials. For patients without complications these were given as a single number of days and assumed to have gamma distributions, while for patients with complications these were given in two parts – days of illness before the complication occurred and days of illness with the complication – with each part assumed to have a triangular distribution. The durations of illness for those hospitalised were derived by adding the length of stay in hospital (given earlier for each patient group) to 50% of the respective outpatient duration of illness. As with outpatients, those who developed a complication were assumed to spend a number of days with ILI before developing the complication.
The QALYs lost through influenza-related mortality were derived for patients in each group by weighting the average life-years lost by the EuroQoL tariff for that group. It was assumed that the average age of death for patients in each group was the mid-point of the group (3 years for children aged 1–5 years, 7 years for children aged 1–12 years, 38 years for otherwise healthy adults aged 13–64 years and an assumed 45 years for at-risk adults aged 13–64 years and all those older than 65 years); for this mid-point age, average remaining life expectancy was derived from life tables published by the UK government’s Actuary Department (76 years for children 1–5 years, 72 years for children 1–12 years, 42 years for otherwise healthy adults 13–64 years, and 36 years for at-risk adults 13–64 years and all those > 65 years). The mean EuroQoL tariff for all adults (0.85) was used for otherwise healthy adults and both children groups, while for at-risk adults the average of the EuroQoL tariffs for adults aged 65–74 years (0.78) and over 75 years (0.73) was used (0.76). All EuroQoL tariffs were assumed to have beta distributions.
Although not mentioned in the printed report, the electronic model applied a utility weight of one (equivalent to perfect health) to each day within the first year of the model start-point spent without ILI or any of its complications.
Summary of cost-effectiveness data
The cost-effectiveness results for each subgroup are presented as pair-wise comparisons of oseltamivir versus usual care and oseltamivir versus zanamivir (except for otherwise healthy children aged 1–5 years in whom zanamivir is not licensed). The base-case results are reported in Table 61. Given that oseltamivir and zanamivir are assumed to have identical efficacy and that oseltamivir is assumed to be less costly (particularly for children), it is unsurprising that in each of the pair-wise comparisons oseltamivir is found to be more cost-saving than zanamivir (by £0.19, £5.65 and £0.19 per patient in the otherwise healthy adult, otherwise healthy children aged 1–12 years and at-risk adult groups respectively). The key results of interest are therefore the pair-wise comparisons of oseltamivir versus usual care.
| Population | Strategy | Incremental cost | Incremental QALY | ICER |
|---|---|---|---|---|
| Healthy adults | Oseltamivir vs usual care | 11.75 | 0.00216 | £5452 |
| Oseltamivir vs zanamivir | –0.19 | 0 | Oseltamivir dominates | |
| Children aged 1–12 years | Oseltamivir vs usual care | 9.34 | 0.00156 | £5992 |
| Oseltamivir vs zanamivir | –5.65 | 0 | Oseltamivir dominates | |
| Children aged 1–5 years | Oseltamivir vs usual care | 8.17 | 0.00174 | £4687 |
| at-risk adults | Oseltamivir vs usual care | 11.54 | 0.0177 | £652 |
| Oseltamivir vs zanamivir | –0.19 | 0 | Oseltamivir dominates |
A number of one-way sensitivity analyses were carried out to assess the sensitivity of the base-case results to variations in single parameters. When a higher probability that ILI is influenza (50%) is assumed (approximately the same as applied in the base-case analysis in the Turner et al. 46 model), the ICERs improve to £2567, £2904, £3333 and £301 per QALY in the otherwise healthy adults, otherwise healthy children aged 1–5 years, otherwise healthy children aged 1–12 years and at-risk adults groups respectively. When the probabilities of patients presenting to a GP within 48 hours are taken from Ross et al. 118 (as opposed to the base-case assumption of 100% in all groups), these ICERs are less favourable: £35,821, £6090, £9677 and £4129 per QALY respectively. Assuming that 10% of patients incur 1 day in an intensive care unit substantially improves the ICERs to £3211, £4235, £4570 and £381 per QALY, while assuming that children are prescribed the more expensive small capsules rather than suspension raises the ICERs for children aged 1–5 years and 1–12 years to £9382 and £9496 per QALY respectively. The reported results do not appear to be particularly sensitive to variation made in relation to the number of years of life lost as a result of ILI mortality, the utility associated with usual care, whether a patient makes one or two GP visits or whether a 5% rate of resistance to antivirals is considered.
Critique of Roche submission128
Overview
Perhaps the most important criticism of the submission by Roche was that there was no attempt to compare any of the results with those of other studies (such as Turner et al. 46), despite the substantially lower ICERs calculated for oseltamivir versus usual care in particular patient groups. Hence, it is difficult to establish from the report itself what is driving these differences and the validity of the resulting ICER estimates.
Table 62 provides a comparison of the base-case results from Roche with the base-case estimates reported in Turner et al. as well as the results from the ‘extrapolated’ model. These comparisons are based on the pair-wise comparison between oseltamivir and usual care. As previously described, the assumptions employed in the base-case analysis of the Roche submission are more similar to the approach employed in the ‘extrapolated’ model reported by Turner et al. As expected, the differences between the estimates are smaller when the ICERs for Roche are compared with those from the ‘extrapolated’ model. However, important differences remain, particularly in the children and at-risk adult populations.
| Population | Strategy | Incremental cost | Incremental QALY | ICER |
|---|---|---|---|---|
| Healthy adults | Oseltamivir vs usual care (Roche) | 11.75 | 0.00216 | £5452 |
| Oseltamivir vs usual care (Turner ‘base case’) | 0.895 | 0.0000474 | £19,015 | |
| Oseltamivir vs usual care (Turner ‘extrapolated’) | 0.88 | 0.00019 | £4729 | |
| Children aged 1–12 years | Oseltamivir vs usual care (Roche) | 9.34 | 0.00156 | £5992 |
| Oseltamivir vs usual care (Turner ‘base case’) | 1.66 | 0.0000854 | £22,502 | |
| Oseltamivir vs usual care (Turner ‘extrapolated’) | 1.66 | 0.00012 | £19,127 | |
| At-risk adults | Oseltamivir vs usual care (Roche) | 11.54 | 0.0177 | £652 |
| Oseltamivir vs usual care (Turner ‘base case’) | 0.712 | 0.0000317 | £19,461 | |
| Oseltamivir vs usual care (Turner ‘extrapolated’) | 0.505 | 0.00017 | £3016 |
A comparison of the incremental cost and QALY estimates is problematic due to the different decision problems addressed by the separate models. The approach used by Turner et al. focuses on all patients with ILI regardless of whether they subsequently present to a health-care provider or, if they do present, whether they are considered eligible for treatment with antivirals. As a result, the reported mean differences in terms of the incremental costs and QALYs in the Turner et al. model are actually only influenced by the relatively small proportion of patients who both consult and then receive antiviral therapy (i.e. within 48 hours). The incremental differences reported thus reflect the mean difference in the overall population of individuals with ILI, as opposed to the differences in the proportion of patients who are actually subsequently affected by treatment with NIs. This contrasts with the Roche submission which focuses specifically on the mean costs and QALYs in those patients who are considered eligible (i.e. present to a health-care provider) and are eligible to receive treatment with antivirals, as opposed to the wider population of people with ILI more generally. Given the different decision problems being addressed, it is difficult to identify whether the differences between the submission and the report by Turner et al. are reflected in the cost and/or the QALY estimates (and assumptions employed therein).
It should also be noted that neither the Roche submission128 nor the Turner et al. 46 model considered at-risk children as a separate patient group. Given that one of the key reasons for reviewing TA58 is the recent licence extension for zanamivir to 5- to 12-year-olds, and that NI treatments are currently recommended only for at-risk groups (adults and children), this was considered to be a potentially significant oversight in terms of patient groups considered within the submission.
In attempting to make a direct comparison between the different models, other important differences should also be noted that make a ‘like for like’ comparison problematic:
-
The current prices of the NIs are now lower than those applied in the report by Turner et al. (which should result in improvement to the ICER).
-
The discount rates applied to outcomes are now higher (3.5% versus 1.5%) than those applied to the QALY estimates associated with premature mortality (which should result in a deterioration of the ICER).
-
The ‘threshold’ used to establish that influenza is circulating in the community is now lower (it is unclear what effect this would have but it might be reasonable to hypothesise that this might worsen the ICER, assuming that a lower threshold could result in a higher number of false positives).
-
The probability that ILI is influenza is markedly lower in the Roche submission than in the base-case analysis in Turner et al. (which should result in a deterioration in the ICER).
-
There is new evidence available since Turner et al.
Given these different issues, a direct comparison of the different ICERs may not be appropriate. However, some form of comparison clearly helps to identify possible areas of concern regarding differences in assumptions, even if this is just in terms of highlighting intuitive differences that appear to arise (e.g. why the results in the Roche submission are more favourable for particular groups, relative to those reported in the Turner et al. model, but not for the healthy adult population).
In the absence of a clear explanation for the potential differences based on the reported data, the critical review focuses more closely on the specific assumptions and approaches employed within the Roche submission. These are contrasted with those used in the Turner et al. model to attempt to highlight any major discrepancies between the two, in order to identify potential biases which may be causing these differences. A general checklist and a more detailed checklist specific to decision models are reported in Appendix 5.
In general, the critical appraisal of the Roche submission was made more difficult due to a lack of transparency in both the printed submission and the electronic model, as well as a number of inconsistencies between the two. For example, the printed submission did not describe the distributions adopted for every parameter, and a number of parameters adopted distributions without justification. A number of inconsistencies were identified in terms of references and data inputs between the report and the electronic model. However, most of the inaccuracies appeared to be in the report itself and the data reported for particular parameters, as opposed to the electronic model, hence it is unlikely that this would cause major issues with the results themselves.
There are a number of key assumptions made in the Roche submission that are likely to have an important effect on the relative cost-effectiveness of the alternatives considered. For ease of interpretation we have categorised these into a number of separate aspects: structural issues; symptomatic benefits; resource utilisation and costs; complications; and mortality. Each of these is considered in more detail below.
Structural issues
A key issue that arises from the Roche submission is the decision to start the decision model at a later point in the pathway than with the earlier Turner et al. 46 model (at the point an individual presents to a GP, as opposed to an earlier stage which considers the probability that an individual actually presents to a GP). By starting at a later decision node, the issue of presentation rates to a GP is not considered in the base-case analysis. The Roche submission acknowledges that one of the concerns expressed by the Appraisal Committee about Roche’s previous submission as part of the earlier appraisal (TA58) was that:
There was no assumed increase in GP consultations. The Committee considered it likely that more people with symptoms of ILI would consult their GP if they thought they could be prescribed an anti-influenza drug.
(p. 47, emphasis added)128
In the overview of the current model this concern is misrepresented:
The economic model begins when an individual presents to the GP with ILI. The model therefore doesn’t address the issue of whether existence of a new technology will increase patient consultation rates. However, if the consultation rate does increase this will not change the individual cost effectiveness estimates as the cost of the initial GP consultation is included in the base case (sic) ICER.
(p. 49, emphasis added)128
Roche is correct in stating that any increase in the consultation rate caused by the existence of a new technology will have no effect on individual cost-effectiveness estimates, as the consultation rate will be increased irrespective of the strategy adopted. However, the question posed by the Appraisal Committee is whether the availability of an anti-influenza drug might increase consultation rates; if so, the consultation rate will increase if a strategy of NI treatment is adopted, but will not increase if the usual treatment strategy is adopted, and so the individual cost-effectiveness estimates may indeed be affected. Equally importantly, and a point that has already been raised during the report, is that regardless of whether an increased consultation is due to either the existence or availability of a technology, the critical aspect is whether this will lead to a change in the subsequent case-mix of patients consulting the GP (i.e. whether the additional patients who present following a change in policy have a lower probability that ILI is influenza than those who presented prior to such a change). If the case-mix remains the same, then this should not have a material effect on the ICER itself, although the budgetary implications will clearly be different. As such, the exclusion of this issue from the base-case analysis does not appear to have been adequately justified by the argument employed by Roche.
As we have previously noted, the potential link between the consultation rate and the probability that ILI is influenza is a key consideration. The Roche submission adopted a probability that ILI is influenza in patients presenting with ILI symptoms during periods in which influenza had been reported to be ‘circulating in the community’ of 31% in all patient groups, citing this as an assumption from TA58. As noted in the current submission by Roche, the Appraisal Committee at the time for TA58 considered the base-case estimate of 46% (based on UK surveillance data) adopted by both Roche and the previous assessment group in the earlier appraisal as potentially being too high. As part of their sensitivity analysis, the previous assessment group considered other probabilities that ILI is influenza – 41%, 36% and 31% – which appear to have been chosen arbitrarily. In the published guidance for TA58, the Appraisal Committee discussed an ‘alternative case’ which appeared to favour the last of these, 31%. This probability appears to be the source of the 31% estimate adopted in the current submission by Roche.
There are a number of issues that arise from the estimate applied to the probability that ILI is influenza. Clearly the estimate applied by Roche is markedly lower than the base case employed in the Turner et al. model and more in line with the comments made by the previous Appraisal Committee. Hence, the concerns noted previously about the decision to start at a later decision node in the Roche model are partially attenuated due to the more conservative estimate employed in the submission (although the costs of any additional visits to GP are not considered). Consequently, the more favourable ICER estimates reported in the Roche submission cannot simply be attributed to the structural alteration.
While the figure of 31% may be considered potentially conservative, concerns remain about the reliability of this estimate in terms of both the Roche submission128 and the previous report by Turner et al. 46 We have previously outlined our concern regarding the arbitrary nature of this figure and the lack of data providing a robust link between a potential increase in the consultation rate and the probability that ILI is influenza. Focusing specifically on the Roche submission, it should also be noted that this estimate appears to have been related to specific populations in TA58 as opposed to the entire population (results employing this estimate in the Turner et al. model are reported only for healthy adults and at-risk groups for these alternative scenarios). As such, the validity of this estimate remains unclear to the different populations considered. Furthermore, this figure is based on a sensitivity analysis reflecting the threshold used to determine that influenza is circulating in the community that was applied at the time of the earlier appraisal (50 per 100,000 consultations), which may not adequately reflect the probability based on the current threshold (30 per 100,000 consultations). Finally, uncertainty surrounding this key probability was not considered in the probabilistic analysis and it was entered as a fixed input. As such, the subsequent results are likely to underestimate the uncertainty surrounding the cost-effectiveness results. While alternative assumptions were employed as part of a range of one-way sensitivity analyses, the range of probabilities (10–50%) appears equally arbitrary.
Another structural difference relates to the proportion of those subjects presenting to a healthcare provider and who do so within the licensed period covered by the NI treatments. The base-case assumption in the Roche submission assumes that 100% of those diagnosed with ILI present within 48 hours of the onset of symptoms (and so could benefit from treatment). This contrasts with the Turner et al. 46 model which assumes that a proportion of these will present after 48 hours or, amongst those who do, a proportion of these will not be able to adequately judge the timing of onset of symptoms. A sensitivity analysis was undertaken in the Roche submission, however, employing similar estimates adopted in the Turner et al. model. This resulted in a deterioration of the ICERs in all subgroups (and in the case of otherwise healthy adults this increased to over £30,000 per QALY).
Finally, although not necessarily a structural issue, the Roche submission assumes equivalence in terms of relative efficacy between oseltamivir and zanamivir (in terms of symptomatic and other benefits). This assumption is not properly justified, and hence the basis for adopting a cost-minimisation (as opposed to a cost-effectiveness) analysis for the two NI treatments appears unsubstantiated.
Symptomatic benefits
There are two main differences in terms of the Roche submission and the Turner et al. model in relation to quantifying the potential symptomatic benefits with the NIs: (1) the primary outcome measure and (2) the QoL benefits assigned.
In terms of the primary outcome measure employed to reflect illness duration, Roche apply estimates based on the median time to return to normal activities. This contrasts with the Turner et al. model which utilises the mean time to resolution of symptoms. This difference is potentially important as the time to return to normal activities is typically (though not always) longer than the time to resolution of symptoms. All other things being equal, the same relative effect (i.e. in terms of a relative reduction in symptom duration) applied to a longer illness duration will result in higher absolute gains (and hence improvements in the subsequent ICER estimate). In the Turner et al. model, return to normal activities was used as part of a sensitivity analysis considered to represent a wider societal perspective (using time return to normal activities as a basis for estimating productivity costs). However, it should also be recognised that the Turner et al. model employed estimates of mean duration of illness as opposed to the median estimates used in the Roche submission. Given the censoring and skewed distribution of illness durations, the potential gains in symptom duration inherent in the decision to employ an estimate based on the time to return to normal activities will, partly or even wholly, be offset by the potentially shorter gains implied by utilising median as opposed to mean times.
Hence, it is unlikely that the analytic differences in the choice of outcome measure will lead to important differences in the ICER estimates. However, what is likely to be a more important distinction is the differences in the approaches subsequently employed to quality adjust these durations as the basis for the calculation of the symptomatic gains in QALYs. In Turner et al. , the QoL values assigned to symptomatic benefits under usual care or oseltamivir treatment were taken directly from the TTO conversion of the VAS scores collected alongside the oseltamivir clinical trials; these suggested that, over 21 days, oseltamivir treatment was associated with an increase of 0.7225 quality-adjusted life-days (QALDs) (5.28% greater than usual care) in otherwise healthy adults, and an increase of 0.5758 QALDs (5.59% greater than usual care) in high-risk adults.
In the Roche submission, these QoL values were not used in the model directly. Instead, the QoL values from the first 7 days of the TTO data were used to estimate the percentage difference in QoL between oseltamivir and usual care. This relative difference was then applied to a single, externally derived, literature-based estimate of the QoL associated with influenza under usual care (0.84). These were then applied to the median duration of illness for each alternative. This approach differs in two important aspects to that reported in Turner et al. : (1) the prevailing QoL of a day of influenza was higher than the equivalent reported on the basis of the TTO data (the 7-day TTO values associated with usual care ranged from 0.1129 on day one to 0.7047 on day seven, while Roche assumed a utility of 0.84 for every day); (2) the percentage increase was derived from only the first 7 of the 21 days of data based on otherwise healthy adults (resulting in an increase of 11.52%, approximately double that based on the 21-day data).
The different approaches led to important differences in the subsequent estimates of QALYs gained. All other things being equal, the same relative difference in QoL applied to a higher baseline QoL value will result in proportionately higher gains in QALYs. In addition, the basis for the percentage difference in QoL was based on only 7 days in the Roche submission (versus 21 days in the base case of Turner et al. ) and estimates for the otherwise healthy adult population were applied to all patient groups. Both of these assumptions lead to higher QoL gains than would have been derived from the approach employed in the Turner et al. model. For example, the comparable percentage improvement reported for at-risk adults (over 7 days) was 7.82%. Hence, applying an estimate of 11.52% to the at-risk group will potentially overestimate QoL gains in this particular group. However, the more pertinent issue is that the estimates based on 7-day differences are markedly higher than those based on the 21-day data.
Roche therefore estimated a higher QoL improvement of oseltamivir treatment during the period of illness in two key ways: by calculating a higher percentage increase in QALDs associated with oseltamivir (using 7-day as opposed to 21-day data), and then by subsequently applying this percentage increase to a much higher (baseline) QoL value for ILI with usual care than is suggested by the very same data used to calculate the percentage increase. By way of example, the TTO data derived by Roche (using the same methods as Turner et al. but with an additional study included) suggest that, over 7 days, an otherwise healthy adult treated with oseltamivir instead of usual care would gain 0.3752 QALDs, with an average utility across the 7 days of 0.5190. By representing this as a percentage improvement over usual care (11.52%), and assuming that each day with usual care would instead have a utility of 0.84, Roche’s model assumes that each day of ILI with oseltamivir treatment has a utility of 0.937, resulting in a gain over 7 days of illness of 0.679 QALDs (hence inflating the QALDs gained by 81%). Over a 21-day illness, the TTO data derived by Turner et al. (21-day data is not given in the Roche submission) would suggest a gain of 0.72254 QALDs from oseltamivir treatment in an otherwise healthy adult; the assumptions adopted by Roche would inflate this gain by 182% to 2.037 QALDs.
In addition, Roche also potentially overestimated the QoL improvement of patients receiving oseltamivir treatment immediately after illness. Although not mentioned in the printed submission, the model assumed that every day during the first year after presenting to a GP with ILI that is not spent in a state of ILI carries a utility weight of one. As oseltamivir treatment is assumed to result in a shorter period of illness than usual care, this utility weight is applied to a greater number of days in the oseltamivir arm of the model, lowering the ICER for oseltamivir versus usual care (particularly for at-risk adults, for whom the difference in duration of illness between oseltamivir and usual care is most pronounced). This issue compounds the potential overestimation already noted in relation to the use of TTO data.
It is clear that there are important differences between the approaches employed to estimate symptomatic improvements in QoL. In general, the approaches employed by Roche will result in significantly higher QoL gains. These gains do not appear to be substantiated and arise due to the potential selective use of data (i.e. 7 days as opposed to 21 days), application of a percentage improvement to a high-baseline QoL (not referenced appropriately and potentially derived from a different valuation approach) and inappropriate assumptions (i.e. patients revert back to perfect health after influenza).
Resource utilisation and cost assumptions
As previously noted, the costs associated with GP visits, diagnostic tests, antibiotics, treatments and hospital visits were derived from NAMCS, a US database, and so may not reflect UK treatment patterns (although these were reported to have been reviewed by three UK clinical experts).
The probabilities of hospitalisation are key drivers of the expected costs of each strategy. The estimates cited as being derived from Cox and Subbarao116 appear incorrectly referenced, so the probabilities of 1.93% for ILI with usual care or 14.86% for pneumonia (all treatment strategies) cannot be verified. According to Roche,128 the Cox and Subbarao study estimated excess pneumonia and influenza hospitalisations from US health-care data, and it was assumed that these would not differ for UK patients. However, the estimate of 1.93% for those hospitalised under usual care may include both patients with complications and those without (this cannot be confirmed as the source is not properly referenced); if so, adopting a higher estimate for those patients with pneumonia suggests that the 1.93% figure is likely to be an overestimate for patients without complications (i.e. pneumonia admissions may have been counted twice). Furthermore, the assumption that the probability of hospitalisation under usual care is the same across all patient groups and is unaffected by whether or not complications occur appears unrealistic – the assumption that those with ILI and no complications require hospitalisation is an assumption adopted by very few other studies. Equally important is that the figure of 1.93% is applied to all patient groups; that is, the underlying hospitalisation rate is not considered to vary by age or risk status. This appears to be an important limitation of the data and the assumptions employed therein. It would seem reasonable to assume that hospitalisation rates are likely to differ according to these factors.
Table 63 provides a comparison of the probability of hospitalisation applied in the Roche submission (US data) against those used in the Turner et al. model (UK data) to represent usual care. The table demonstrates significant variation between the approaches, particularly in the healthy adult and children populations. The differences indicate that influenza appears to be associated with markedly high admission rates in the US and hence the generalisability of these estimates to UK practice is questionable. In terms of cost-effectiveness estimates, a higher baseline event rate (resulting in a higher absolute gain when combined with the relative risks of particular treatment) will result in improved estimates for the ICER.
| Source | Population | ||
|---|---|---|---|
| Children | Healthy adults | High-risk adults | |
| aRoche128 | 1.95% (1 in 51) | 1.97% (1 in 51) | 2.03% (1 in 49) |
| Turner et al.46 | 0.029% (1 in 3448) | 0.025% (1 in 4000) |
1.2% (1 in 83) 14.8% for elderly in residential care (1 in 7) |
A relatively minor issue, but one which highlights some of the concerns regarding the implementation of the model, relates to the assumption that children will not be hospitalised for otitis media. While this may be the case, it should be noted that the model also assumes that children with ILI and no complications have a risk of hospitalisation. Due to the model structure, children who develop otitis media face a zero risk of hospitalisation; that is, they no longer face the comparable risk of children who do not develop this complication. As a result, there is an unanticipated (and illogical) potential beneficial effect associated with the development of otitis media.
Finally, in terms of the drug costs applied, the base-case model assumes that all children offered oseltamivir treatment will be prescribed oral suspension rather than the more expensive small capsules, although this is not clear in the printed submission and no evidence is given to support this assumption. This lowers the cost of oseltamivir treatment substantially. We have already noted that the costings applied to oral suspension assume no wastage and that any remaining powder for reconstitution can be reused by other patients and also the error in the cost assumed for zanamivir.
Complications
A number of separate issues relate to the approaches employed to handling the cost and QoL associated with complications. These include: (1) the range of complications considered; (2) the costs and QoL estimates applied to complications; (3) the baseline probability of major complications (usual care); and (4) the relative effect estimates for oseltamivir.
In terms of minor complications, the approaches were broadly comparable. Minor complications were assumed to be mainly accounted for in the VAS TTO data in terms of QoL implications (with the exception of a number of particular complications), and costs were assumed to be related to additional GP consultations and use of antibiotics in both. There were slight differences in terms of the approaches used to quantify GP consultations and antibiotic use associated with minor complications, with Roche assuming additional (and complication-specific estimates of) GP visits and antibiotic use for the three main complications considered (the rates of these complications were derived from a UK population-based study),15 while the Turner et al. 46 model considered the overall complication rate (for all ILI complications) reported in the same study, assuming a single additional GP visit and the same proportion of antibiotic use in each. There were also differences in the source of relative risks applied to minor complications; estimates for Roche were derived from a previous meta-analysis154 for pneumonia and bronchitis and individual trial data for children in relation to otitis media, while Turner et al. 46 applied a relative risk (estimated separately for the different subgroups) to minor complications derived from published RCTs reporting antibiotic usage.
The major differences in approaches between the two models relate to the approaches to quantifying the costs and benefits of major complications requiring hospitalisation and to mortality (mortality is considered separately in the following section). We have previously outlined the different approaches and sources applied to estimate the probability of hospitalisation with usual care, leading to significantly higher hospitalisation rates in the Roche submission. In addition to differences in terms of the baseline event rates, there were also different approaches employed to estimating the relative effect of oseltamivir. The Roche submission128 employed estimates based on the relative risk of hospitalisation, while Turner et al. 46 applied the relative risk of pneumonia (citing a lack of evidence related to hospitalisation) as a proxy. The alternative approaches subsequently led to different estimates reported in Table 64. The estimates applied in the Roche submission were less favourable for the children and healthy adult population and more favourable in the high-risk population, than the estimates employed in the Turner et al. model.
| Source | Population | ||
|---|---|---|---|
| Children | Healthy adults | High-risk adults | |
| Roche128 | 0.41 | 0.41 | 0.50 |
| Turner et al.46 | 0.15 | 0.15 | 0.76 |
There were also differences between the approaches used to estimate the impact on QoL related to severe complications. In the Roche model, separate utility weights were applied to bronchitis (0.990, not 0.913 as stated in the printed submission), pneumonia (0.900) and otitis media (0.910) based on estimates reported in Stouthard et al. 156 These utility values were applied to the expected duration of each complication derived from Roche clinical trial data (longer durations were assigned to patients subsequently hospitalised for a particular complication). However, it should be noted that the utility values were applied as absolute estimates in the Roche model as opposed to a decrement in relation to the QoL of an equivalent individual without a complication. Applying absolute values, as opposed to decrements, results in counterintuitive results such that a patient assigned usual care has a higher expected utility from developing bronchitis, pneumonia or otitis media than from remaining free of complications. In the model by Turner et al. ,46 separate utility weights were applied to pneumonia (0.724 for healthy adults and 0.72 for high-risk adults and children) and otitis media (0.977) based on WHO disability weights. However, it was unclear how these estimates were subsequently applied in the model as the QALY values for pneumonia or otitis media presented in the parameters table do not define whether these are annual (which would not be correct) or daily estimates.
Although differences were observed in relation to a number of separate aspects, the main differences likely to have an important impact on the ICER estimates are the underlying probability of hospitalisation and the associated relative risks applied to the different subgroups. Differences in the costs and benefits of minor complications were relatively unimportant and not considered to be an important driver of any subsequent differences in the reported ICER estimates. The approach used by Roche in relation to modelling the QoL impact of more severe complications appeared to lack face validity, while the approach employed by Turner et al. lacked transparency and hence it was difficult to assess the validity of the final estimates employed in the model.
Mortality
In addition to the differences noted for complications, there were also important differences in the approaches employed to quantify the potential mortality benefits associated with the use of NIs. The probability of influenza-related mortality without antiviral treatment (usual care) and the relative effectiveness estimates applied to oseltamivir are reported in Table 65. Although both Roche and Turner et al. 46 used the same source to estimate the baseline probability of influenza-related death (Meier et al. ),15 the estimates differ in the children population. Mortality estimates are significantly higher for this subgroup in the Roche submission. The difference is due to Roche applying mortality estimates obtained from Meier et al. 15 from the subgroup of at-risk children group, while Turner et al. 46 combines the estimates for the healthy and at-risk children groups in the children population. Hence, it appears that Roche overestimates the mortality probability in the children group.
| Parameter | Approach | Healthy adults | Children | ‘At-risk’ adults |
|---|---|---|---|---|
| Probability (usual care) | Roche128 | 0.000387 | 0.00271 | 0.00685 |
| Turner et al.46 | 0.000387 | 0.000048 | 0.00685 | |
| Relative effect (oseltamivir) | Roche128 | 60% reduction | 60% reduction | 50% reduction |
| Turner et al.46 | 65% reduction | 85% reduction | 24% reduction | |
| Absolute difference (oseltamivir vs usual care) | Roche128 | 0.000232 | 0.001626 | 0.003425 |
| Turner et al.46 | 0.000252 | 0.000041 | 0.001644 |
There are also differences in terms of the relative effects applied to reflect the impact of oseltamivir. Due to the absence of direct data on the impact of oseltamivir on the relative risk of mortality, both approaches used proxy estimates for relative risks derived from other events. Estimates from Turner et al. were based on the relative risks reported in the trials for pneumonia (hence assuming that similar reductions would be observed in mortality and that mortality was primarily driven by pneumonia), while Roche employed the relative risks reported by Kaiser et al. 154 corresponding to the reduction in hospitalisations for lower RTIs. The different approaches result in relatively larger relative gains for healthy adults and children by Turner et al. 46 and for at-risk adults by Roche. When the relative effects are applied to the baseline probabilities, differences in the probabilities assigned to the children population result in larger absolute gains in the Roche model for the children (despite the lower relative risk reduction applied) as well as the at-risk groups, although the gains remain lower in the healthy adult population.
In addition to the different mortality probabilities employed, there are also major differences in terms of how the QALYs lost due to premature mortality are estimated. A comparison of the different estimates employed in the separate models is presented in Table 66. The lost QALYs employed in the two models are presented in italics. Clearly some of the differences simply reflect the different discount rates applied to outcomes that were relevant at the different appraisal times (3.5% for Roche, 1.5% for Turner et al. ). For ease of interpretation, we have also presented the equivalent estimates derived from the approach used by Roche for the same discount rate used by Turner et al. (1.5%). These highlight those groups for which the different approaches appear to make a meaningful difference after adjusting for the variation in the discount rate itself.
| Patient group | Roche128 | Turner et al.46 | ||
|---|---|---|---|---|
| Life-years lost | Discounted QALYs (3.5%) | Discounted QALYs (1.5%) | Discounted QALYs (1.5%) | |
| Children (1–5 years old) | 76 | 23.30 | 38.9 | N/A |
| Children (1–12 years old) | 72 | 23.17 | 37.98 | 41.7 |
| Healthy adults | 42 | 19.21 | 26.74 | 19 |
| At-risk adults | 36 | 17.18 | 23.91 | 4.1 |
The comparison reveals differences in the results attributable to the different approaches employed. In particular, the difference is most evident in the at-risk adult population, in which the subsequent estimates of QALYs lost (discounted at a common rate of 1.5%) due to premature mortality are more than five times greater in the Roche submission.
There are two assumptions central to this calculation: (1) the utility weights applied to each year of life lost and (2) the expected number of life-years lost. Both of these assumptions in the Roche submission appear to overestimate the subsequent estimates representing the potential loss of QALYs. In the first place, Roche applies utility weights based on the mean weighted health state index value based on EuroQoL (EQ-5D) data representing UK population norms. 157 For otherwise healthy adults and children the estimates are reported to be based on the mean EQ-5D value based on all adults (0.85). However, this value is actually based on the value corresponding to adults aged 45–54 years; the corresponding value for all adults is 0.86. This value is then applied throughout the period of extrapolation and hence takes no account of the deterioration in QoL that patients might expect as they become older. This approach appears to be optimistic for the adult and at-risk populations for whom the overall EQ-5D value will significantly overestimate QoL in later years of life. This differs from the approach employed by Turner et al. 46 which employs the corresponding age-matched EuroQol tariffs for each group and thus allows for the expected deterioration in the QoL in later years. Due to the lack of EuroQol values for children, Roche conservatively applies the EQ-5D value for all adults (0.85), whereas Turner et al. assume perfect health (i.e. 1) in the analysis for children prior to 18 years of age, at which point the age-matched EQ-5D value is applied based on UK norms. This difference in the approaches employed for children appears to be the main reason why the approach used by Roche results in lower discounted QALYs than those for Turner et al. for this population. However, differences for the other groups are likely to be driven by the different approaches to quality adjustment and also the lost years of life assumed.
In the Roche submission, the mid-point age of each of the groups considered is used as the basis for estimating the expected number of life-years lost (i.e. the remaining life expectancy). Hence, the average age at premature death for children aged 1–12 years is assumed to be 7 years, and for otherwise healthy adults aged 13–64 years this is assumed to be 38 years. However, no justification is given for the estimate of 45 years as the mid-point age for the combined group of at-risk adults (13–64 years defined as being at risk and those aged over 65 years). General population estimates from life-tables are then employed to estimate the average remaining life expectancy based on these ages. In contrast, Turner et al. use data from the WHO annual mortality statistics to estimate the mean age at which influenza deaths actually occur in the different age groups, hence assuming that the mid-point estimate from the group itself is not necessarily an accurate gauge of the age of patients in each respective group who actually die. Using this approach, Turner et al. assume that the average age at premature death is 3 years for children, 51 years for otherwise healthy adults and 84 years for those aged over 65 years. No separate estimate is reported by Turner et al. for the at-risk population, and it appears that estimates based on those aged over 65 years are subsequently employed for both the at-risk adult group and the elderly residential care population. The differences in approaches to quantifying the expected number of life-years lost is the main cause of the differences between the two models in the otherwise healthy adult and high-risk adult populations (the difference in utilities driving the difference in the children model), resulting in higher estimates being applied in the Roche submission. The general approach used by Turner et al. appears to be more realistic, such that the Roche submission is likely to provide overly optimistic estimates of remaining life expectancy. However, legitimate concerns remain over the assumption employed in the at-risk population by Turner et al. (i.e. applying estimates from a population aged over 65 years).
Discussion of existing cost-effectiveness evidence
The review of cost-effectiveness evidence identified a large number of existing studies evaluating the cost-effectiveness of antivirals for the treatment of influenza. Of these studies, two were considered the most relevant from the perspective of the UK NHS: the previous report by Turner et al. 46 used in the earlier NICE appraisal and the new submission by Roche. 128 A number of important differences were identified with respect to the approaches and assumptions employed therein. These subsequently resulted in marked differences in the reported ICERs, particularly for the children and at-risk adult groups. Cost-effectiveness estimates for these groups were more favourable in the Roche submission than the comparable estimates reported by Turner et al. A number of key differences between the models were identified in five aspects, summarised in Table 67. In conclusion, the main drivers for these differences were considered to be attributable to: (1) the reduction in the cost of antivirals since the earlier appraisal; (2) the different approaches to quantifying symptomatic QoL benefits; (3) the higher rate of hospitalisations assumed across each of the groups based on US hospitalisation data (Roche); (4) the application of mortality data for at-risk children in the children analysis (Roche); and (5) approaches to quantifying QALYs lost due to premature mortality. With the exception of the first issue, all the remaining aspects were considered to provide optimistic estimates (Roche) of the subsequent cost-effectiveness of oseltamivir compared with the approaches employed in the previous report by Turner et al. These factors also need to be considered against the more conservative estimate of the probability that ILI is influenza applied in the Roche submission. In addition to the observed differences between the models, a number of uncertainties remained related to the approaches employed in both sources. These aspects are now considered in more detail as part of the development of a new decision model to evaluate the cost-effectiveness of NIs for the treatment of influenza.
| Aspect | Turner et al.46 vs Roche submission128 | Remaining uncertainties |
|---|---|---|
| Structural issues | The separate models commence from different points in the overall pathway. Turner et al. focus on a broader decision problem, examining a range of behavioural and policy issues which influence the probability an individual presents to a health-care provider, whereas Roche focus more specifically on the cost-effectiveness in those patients who actually present and are considered eligible to receive an NI. Despite these differences, both consider the potential relationship between consultation rates and the probability that ILI is influenza via sensitivity analysis |
Unclear as to the whether the availability of NIs in particular groups would lead to an increased consultation rate with health-care providers. More importantly, the link between an increased consultation rate and the probability that ILI is influenza remains unsubstantiated. Unclear whether this has implications in terms of budgetary implications and also cost-effectiveness estimates Neither study provides an adequate representation of the probability that ILI is influenza based on the current threshold |
| Symptomatic benefits | The separate models employ data from a similar source in terms of the QoL associated with influenza and the impact of treatment. However, the two models subsequently employ this data in a number of different ways. The duration of illness itself is based on different definitions (resolution of symptoms and return to normal activities) and different estimates of the appropriate input (e.g. median vs mean times). The subsequent quality adjustment applied to these estimates also differs markedly, with Turner et al. applying QoL estimates direct from patient level data (21 days) for oseltamivir and usual care, and using differences in mean illness times to adjust these estimates to obtain results for zanamivir. Roche employs the same data (restricted to the first 7 days) but uses it as the basis for estimating a percentage decrement which is then applied to an external estimate of the QoL of influenza. This percentage decrement is then applied to the median duration of illness |
A number of uncertainties remain due to the paucity of QoL data in this area. Firstly, the approach employed by Turner et al. utilises only data on the mean duration of illness as a basis for adjusting QoL for zanamivir and amantadine. Data for oseltamivir and usual care are used directly and may not reflect the mean duration of illness based on the wider set of trials where QoL data was not collected. The extrapolation approach to obtain mean duration of illness assumes an exponential distribution which may not be appropriate The approach employed by Roche is potentially more flexible, using the patient-level data to estimate the relative QoL improvement associated with NI treatment; this estimate is then applied to the median duration of illness which is allowed to differ from that observed in the subset of oseltamivir trials reporting QoL data. However, the percentage improvements are obtained from a selective period and the absolute QoL gains are influenced by the underlying QoL associated with influenza which is not adequately justified A number of uncertainties remain including the outcome of interest (resolution of symptoms, return to normal activities), application and approach to estimating the duration (e.g. mean vs median) as well as the appropriate approach to characterising QoL gains (i.e. employing the patient-level data directly or considering the duration of illness and the implied decrement associated with influenza more directly) |
| Resource utilisation and costs | The major difference between the approaches relates to the probability of hospitalisation associated with influenza assigned to usual care. Estimates from Roche are derived from US sources and the same estimates are used for each of the different groups. Turner et al. employs separate estimates for the different groups based on UK data but base their calculation on a number of uncertain links in the data (i.e. size of the population, attack rates and excess hospitalisation rates). Reductions in the probability of hospitalisations are considered only in the sensitivity analysis in the Turner model, whereas these form part of the base case in the Roche submission | The probability of hospitalisation is potentially a key driver of cost-effectiveness. There remains significant uncertainty as to the underlying probabilities of hospitalisation used as a baseline (usual care) as well as the relative effects assumed for the NIs. These uncertainties also relate to the separate subgroups considered |
| Complications | Linked to the issues described for ‘resource utilisation and costs’ | Linked to the issues described for ‘resource utilisation and costs’. Also uncertainty as to the QoL implications of major complications |
| Mortality | The separate models employ different markedly different estimates for the remaining life expectancy of patients in the at-risk group. In general, the approach employed by Roche appears likely to overestimate the potential gains in life-years. Both approaches apply QoL weights from UK population norms, although the approach by Roche does not allow for QoL to deteriorate in later years of life. Both approaches based the life expectancy calculation on life table data from national statistics which may not be generalisable to the at-risk groups. The life expectancy for the at-risk group in the Turner model is taken from patients aged > 65 years and it is unclear how representative this is for at-risk patients aged < 65 years. Reductions in the probability of mortality are only considered in the sensitivity analysis in the model by Turner et al., whereas these form part of the base case in the Roche submission. Both approaches use proxy estimates related to either the reduction in pneumonia (Turner) or hospitalisations (Roche) |
There remain a number of uncertainties in relation to the potential loss in QALYs due to premature mortality. These relate to a number of separate aspects: |
York Economic Assessment
Overview
The review of cost-effectiveness studies in Systematic review of existing cost-effectiveness evidence, above, alongside the more detailed critique of Turner et al. 46 and the submission by Roche, identified a number of remaining uncertainties regarding the existing cost-effectiveness estimates for the treatment of influenza with NIs in the NHS. A new decision-analytic model was therefore developed to more formally address these issues and to re-evaluate the cost-effectiveness of NIs in different populations, incorporating the more recent evidence reported in earlier sections. This model provides a framework for combining data from the Bayesian synthesis of symptom outcomes, complication data and other relevant parameters required for cost-effectiveness considerations. The model was developed using Microsoft excel with particular parameters estimated using winbugs.
The review of cost-effectiveness studies provided the basis for developing a preliminary model structure and initial set of assumptions. The final structure of the model was agreed following a discussion with a clinical expert (Dr J Watkins) to provide feedback on structure, data inputs and assumptions. Additional literature searches were also undertaken to inform the QoL weights applied to symptoms and complications in the model. In common with both Turner et al. 46 and Roche, the model considers events within a single influenza season with a lifetime horizon employed to appropriately quantify lost QALYs associated with premature mortality. The model evaluates costs from the perspective of the NHS and Personal Social Services (NHS & PSS), expressed in pounds sterling at a 2006–7 price base. Outcomes in the model are expressed in terms of QALYs. Costs are not discounted as only resource-generating events occurring within a single season are considered; QALE estimates over the lifetime horizon are discounted using a 3.5% annual discount rate according to the NICE reference case. 158
The model is probabilistic in that input parameters are entered into the model as probability distributions to reflect uncertainty in the mean estimates. 159 Monte Carlo simulation is used to propagate uncertainty in input parameters through the model in such a way that the results of the analysis can also be presented with their uncertainty. However, as the model is linear, the mean estimates of the ICER are identical to those undertaken using deterministic approaches, although probabilistic simulations are needed in order to appropriately characterise the uncertainty surrounding these results. Results from a ‘base-case’ analysis are presented alongside a broad range of scenarios considering alternative assumptions.
The following sections outline the decision problem and the structure of the model and also provide an overview of the key assumptions and data sources used to populate the model in more detail.
Treatment strategies and populations
The decision problem addressed by the model relates to the cost-effectiveness of oseltamivir and zanamivir for the treatment of influenza compared with standard care without antiviral treatment. The model considers this in the context of individuals presenting to a health-care provider who are also considered eligible for treatment according to the respective licences for each of the NIs (i.e. patients presenting with symptoms typical of influenza, when influenza virus is circulating in the community, and who are able to start antiviral treatment within 48 hours of symptom onset). Although the separate NIs are considered together in the overall decision problem, the differences in their respective licences (zanamivir is licensed only in children older than 5 years who can receive treatment within 36 hours of time of symptom onset, while oseltamivir is licensed in children older than 1 year who can receive treatment within 48 hours of symptom onset) are reflected in the subsequent interpretation of the cost-effectiveness results.
Cost-effectiveness estimates for influenza treatment are presented for five separate subgroups: (1) otherwise healthy children aged 1–14 years; (2) at-risk children aged 1–14 years; (3) otherwise healthy adults aged 15–64 years; (4) at-risk adults aged 15–64 years; and (5) the elderly (aged 65 years or over). No separate analyses are presented for an at-risk elderly population, since age itself is considered a risk factor according to existing definitions for at-risk groups. Consequently, all subjects aged 65 years or over are considered together, regardless of whether other pre-existing comorbidities are present or not.
The distinction between otherwise healthy subjects and at-risk subjects, in terms of the alternative age groupings, are principally driven by the different underlying baseline rates of complication and mortality and the remaining life expectancy associated with these different populations. However, differences between otherwise healthy adults, otherwise healthy children and at-risk groups (as a whole) are also informed by subgroup-specific estimates of the relative effectiveness of each NI in terms of symptom duration and reductions in complications (proxied by the reduction in antibiotic use).
Model structure
The model is based on a decision-analytic approach employing a decision-tree structure. The decision tree is used to map the range of potential pathways an individual may follow depending on particular decisions (e.g. whether an NI is administered or not) and uncertain events (e.g. whether a particular individual is resistant to a particular NI treatment or experiences a secondary complication). A simplified schematic of the overall model structure is presented in Figure 22, together with a more detailed schematic of the full range of pathways considered for those patients experiencing a secondary complication in Figure 23.
FIGURE 22.
Simplified schematic of decision model. [+] is used to simplify the schematic. This is used to avoid repeating similar pathways of the model and means that the same pathways represented above the [+] are also applied here.
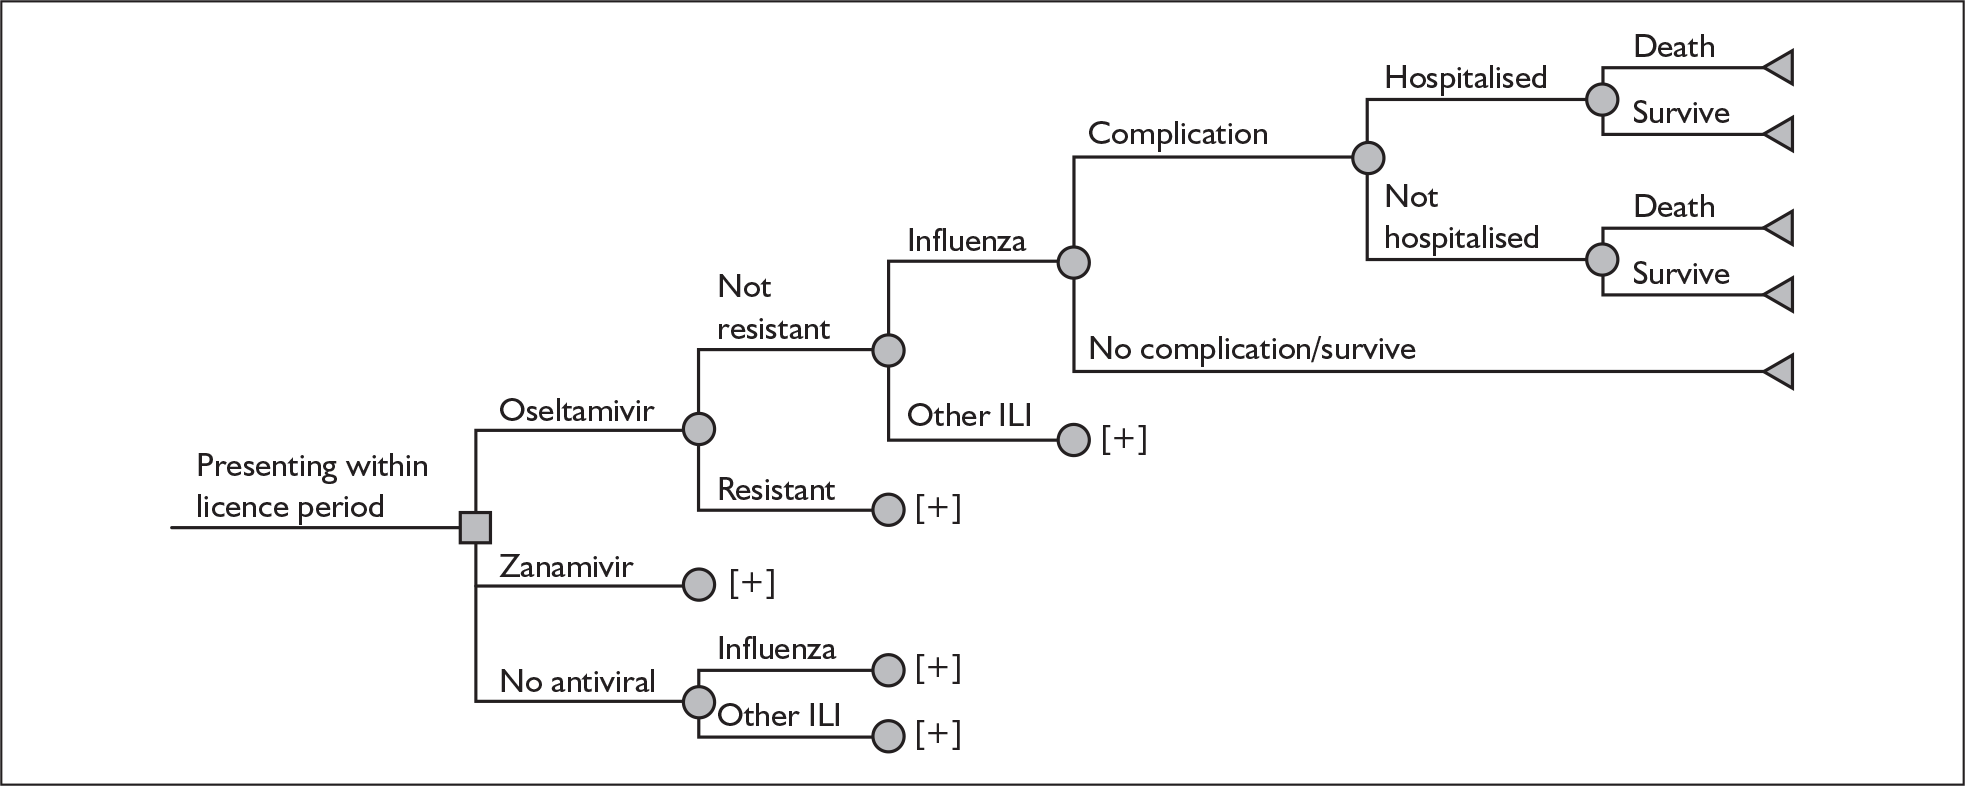
FIGURE 23.
Detailed schematic of complications. [+] is used to simplify the schematic. This is used to avoid repeating similar pathways of the model and means that the same pathways represented above the [+] are also applied here. CNS, central nervous system; GI, gastrointestinal; ICU, intensive care unit; URTI, upper respiratory tract infection.
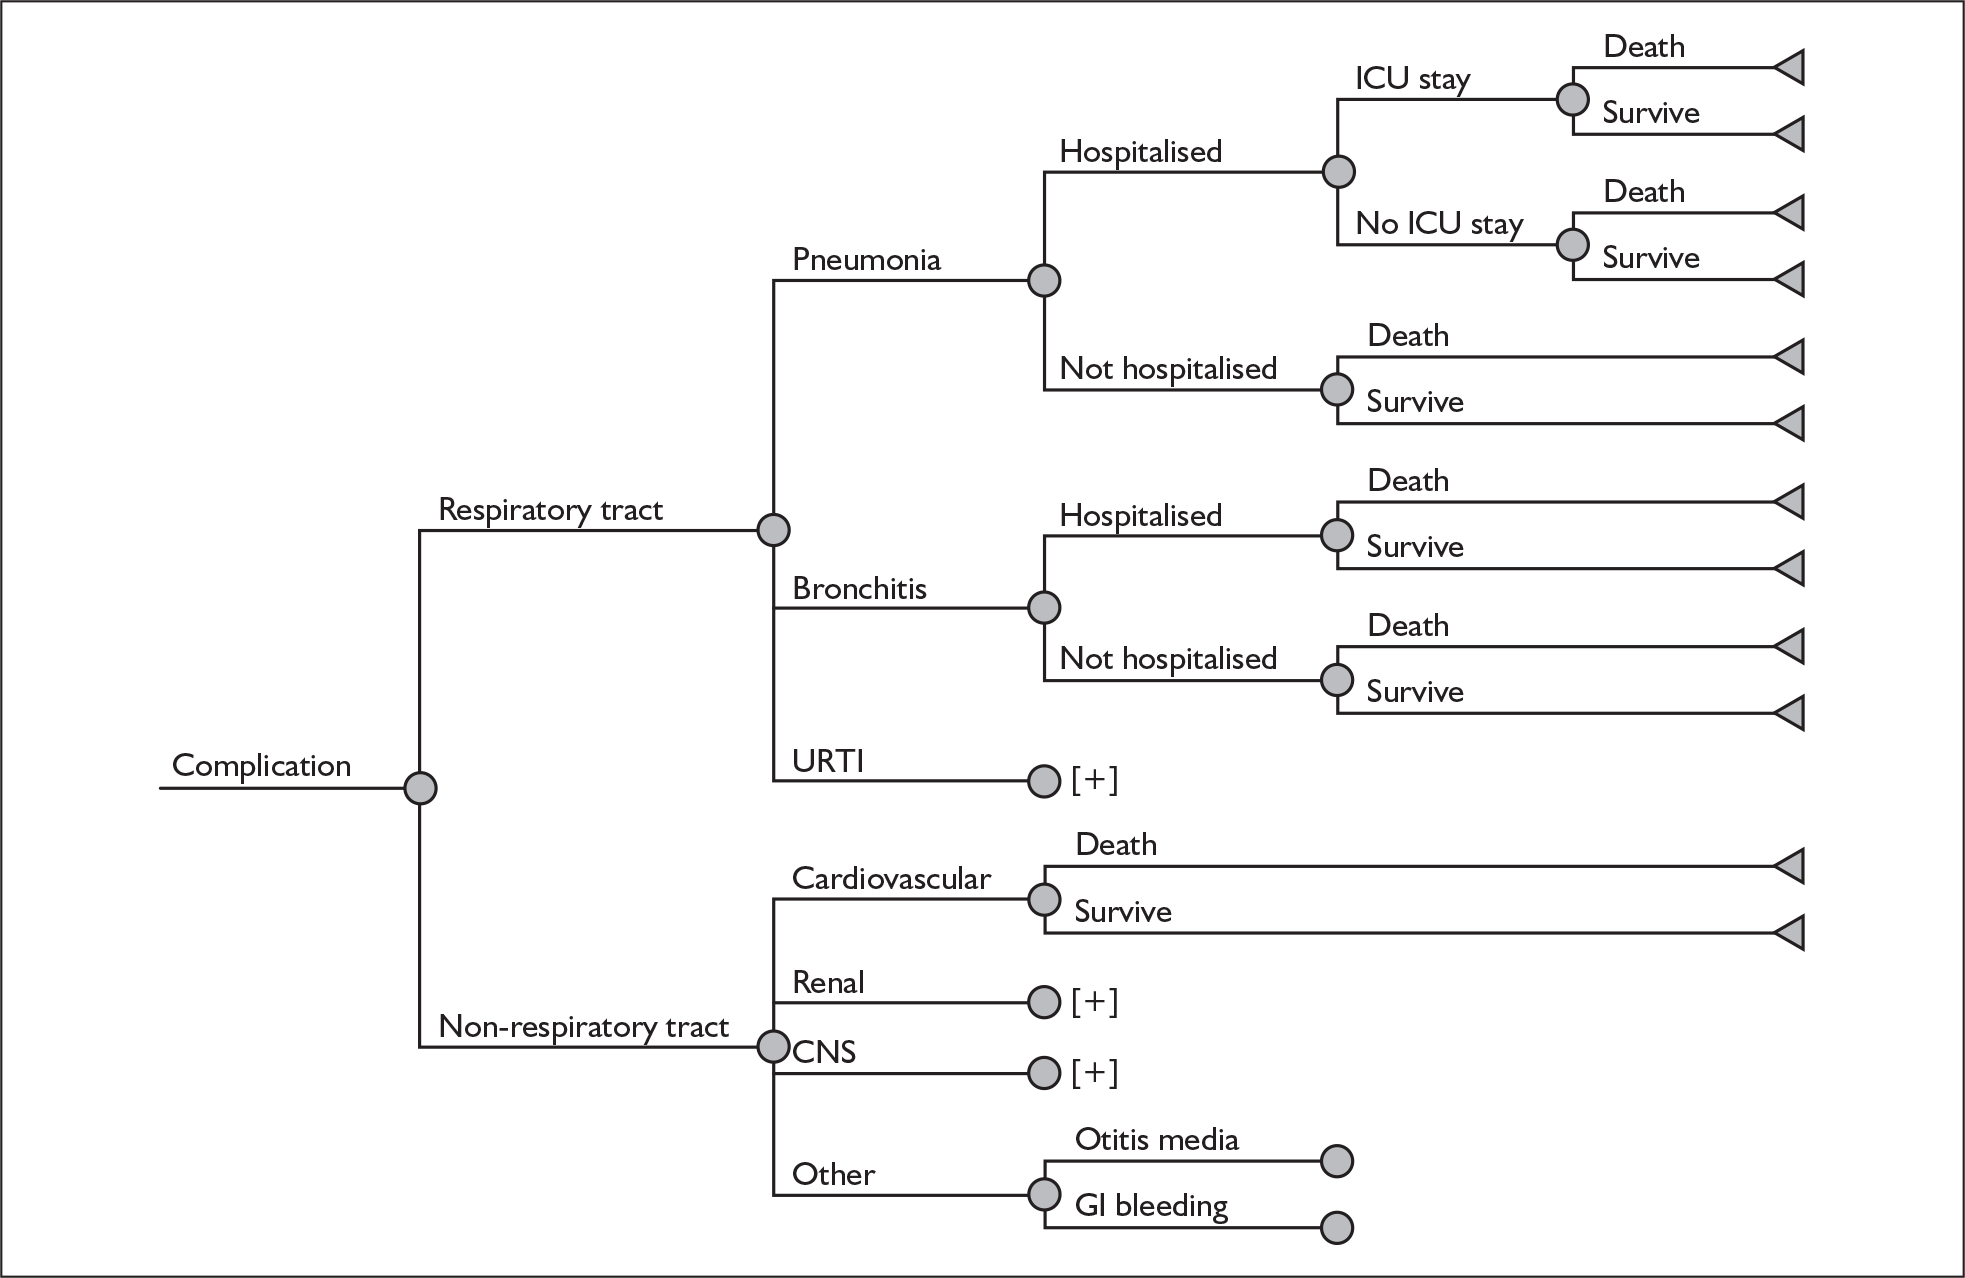
The model starts at the point an individual patient presents to a health-care provider and is considered eligible for treatment with an NI. The initial decision node (represented by a square) corresponds to the decision faced by the health-care provider: whether to prescribe an NI (oseltamivir or zanamivir) or not. Following this decision, subsequent pathways are characterised by a series of uncertain events (called ‘chance’ nodes and represented by a circle), such as whether an individual patient experiences a secondary complication and is subsequently hospitalised or not. Chance nodes are populated by probability estimates which may be influenced by the initial decision (and hence vary by treatment) such as the probability of experiencing a complication, or may be considered to be unaffected by the treatment at a particular chance node. For example, the probability of mortality in a patient who has been hospitalised, termed a ‘conditional’ probability, may not be affected by the initial treatment received.
The decision tree represents the complete set of pathways considered within the scope of the model. For each treatment alternative a number of possible pathways are considered, each potentially associated with unique resource use, cost and quality of life implications. The end points of the tree are characterised by terminal nodes (represented by a triangle). These terminal nodes are used to evaluate the costs and quality of life implications (e.g. QALYs) of each of the respective pathways. These estimates are subsequently weighted according to their respective probabilities of arising (which will vary by both treatment and subgroup) and summed to provide the mean cost and QALY estimates, subsequently used to evaluate the relative cost-effectiveness of each of the alternatives considered.
The overall schematics represent the main pathways considered within the tree. Following the initial decision node there are five main uncertain events considered for each NI: whether an individual (1) is resistant to an NI or not (not considered in the base case); (2) has true influenza or other ILI; (3) experiences a complication or not; (4) is hospitalised or not due to the complication; and (5) either dies as a result of a complication (in both patients who are hospitalised and those not) or survives. Patients experiencing an uncomplicated illness are assumed to both survive and require no hospitalisations. A similar set of pathways is considered for patients not receiving NIs, although the issue of resistance to NIs is not relevant in this situation and hence not considered.
The more detailed schematic of complications shows the full range of potential pathways modelled for patients progressing down the complication branch for each of the treatment alternatives considered. A total of eight complications is considered in two main groupings (respiratory tract and non-respiratory tract). This distinction is important as hospitalisations are considered in the model only in relation to respiratory tract complications. Respiratory complications are further subdivided into three subcategories: (1) pneumonia; (2) bronchitis; and (3) other upper RTIs. Each of the three main RTIs considered may also subsequently lead to hospitalisation (and, in the case of pneumonia, a stay in an ICU). Non-respiratory tract complications are assumed to be either: cardiovascular; central nervous system (CNS); renal; or other (otitis media or GI bleeding). Hospitalisations are not modelled for these events. Patients experiencing any of the six complications are assumed to incur additional GP consultation costs (and potentially antibiotic costs) and reduced QoL. Although hospitalisations are considered only for RTIs, patients experiencing any complication are assumed to face an elevated risk of mortality.
The overall model considers patients with true influenza as well as those with other ILI [such as respiratory syncytial virus (RSV)]. This is important because, at the point of the decision as to whether to administer an NI, a decision-maker cannot perfectly discriminate between individuals with true influenza and those with other ILI. Consequently, both the costs and the outcomes of true influenza and other ILI are considered. It should also be noted that much of the epidemiological literature relating to the consequences of influenza is derived from studies related to ILI (not specifically influenza). 15 However, the distinction between true influenza and other ILI is clearly important as the NIs are assumed to be effective only in those individuals with true influenza (and hence no effect on the costs and consequences associated with other ILI is considered).
The decision model includes the acquisition costs of the NIs themselves as well as the costs of managing secondary complications (in terms of additional GP consultations and antibiotic use, as well as the costs of hospitalisation for respiratory tract complications). Outcomes are evaluated using QALYs, based on symptom duration (in all individuals), complications (type and duration) and premature mortality due to secondary complications.
Key model assumptions
The cost-effectiveness of NIs from an NHS perspective will be determined by a number of factors. These factors relate to the potential impact on symptom duration, as well as complications and associated mortality, and also to the generalisability of the existing clinical and epidemiological evidence base to an NHS setting. In addition, as outlined in the earlier review of cost-effectiveness studies, there are a number of important considerations related to the wider context in which NIs are likely to be used, including (1) the probability that ILI is influenza during periods in which NI treatment is considered, and (2) the potential impact that the availability of NIs may have on the subsequent probability that an individual is likely to consult a health-care provider and whether (specifically) this could also alter the underlying probability that ILI is influenza.
In contrast with Turner et al. ,46 our model focuses on a more constrained decision problem (more similar to the approach employed by Roche) – specifically focusing on the decision at the point at which an individual has already presented to a health-care provider and is considered eligible to receive an NI treatment. Hence, the probability that a patient actually presents to a health-care provider is not considered in the base-case analysis. The decision to start the model at this decision node was based on a number of separate considerations. Firstly, this appears to more closely reflect the decision problem actually faced by the health-care provider in relation to the treatment of influenza. Secondly, there remains a lack of clarity as to what the probability represented by an earlier node should actually represent. As previously stated in the review section, this has commonly been interpreted as the probability that an individual consults with a GP within 48 hours of symptom onset, with no reference to their ability to start treatment. 46 However, this assumption does not actually reflect the current licence or existing guidance on the use of NIs which refer to an individual both presenting within a particular time period and being able to start treatment. Similarly, it should also be recognised that for children there is a difference between the respective licences of oseltamivir and zanamivir which further complicates matters as these refer to different symptom durations (i.e. within 48 hours of onset of symptoms for oseltamivir and 36 hours for zanamivir).
Thirdly, and most important, this decision should not alter the cost-effectiveness results in at-risk groups for whom NIs are already recommended. Furthermore, even for those otherwise healthy populations in whom NIs are not currently recommended, estimates of the ICER would be affected only by considering an earlier decision point if two other conditions subsequently hold, namely that following a positive recommendation: (1) individual behaviour in these groups will actually be influenced by a positive recommendation, and (2) even if individual behaviour is influenced and consultation rates increase, that this will also lower the probability that ILI is influenza, based on current presentation rates. In other words, the underlying probability for otherwise healthy populations who do not present would have to be lower than the estimates for an equivalent population who do currently present. As previously stated, the evidence to support these assumptions and to quantify appropriately in a decision model is limited. However, given the potential importance of this issue as part of the earlier appraisal, a number of separate scenarios are considered to ensure consistency with the scenarios employed previously by Turner et al. 46
In addition, the model makes a number of separate assumptions (as part of a base-case analysis) in considering the cost-effectiveness of NIs to the UK NHS. These include the assumption that:
-
NIs would be used for treatment only when influenza is known to be circulating in the community at the current threshold (based on 30 ILI consultations per 100,000 population).
-
The probability that ILI is influenza, based on national surveillance programmes obtained from sentinel practices during periods in which influenza is circulating in the community, is representative of national practice.
-
Amantadine is not a relevant comparator on the basis that it is neither widely used (nor recommended for use) nor likely to be ever considered a relevant treatment option in the NHS in non-pandemic situations. In addition, it is also assumed that the existing evidence base regarding amantadine is too limited to improve the overall precision of the estimates associated with the NIs as part of a wider Bayesian ‘network’.
-
NIs are assumed to be effective only in patients with true influenza and have no impact on other ILIs.
-
The relative effectiveness of NIs is assumed to be the same for both influenza A and influenza B and hence no distinction between these types is made in the model.
-
The relative effectiveness of NIs in terms of symptoms and complications for patients with true influenza is most appropriately derived from the ITTI population from the trials (i.e. those with true influenza). In terms of relative effectiveness estimates applied in the model, the relative differences between NIs and placebo based on the ITTI trials are transferable to a UK setting.
-
The relative effectiveness estimates from the ITTI populations are assumed to be independent of prior vaccination status or prophylactic use of NIs (or it is equally assumed that those with prior exposure to these would be similar in practice to the patients recruited to the trials).
-
The average delay from the timing of the onset of symptoms to patients receiving NIs in routine practice (i.e. for those who both consult a health-care provider and are able to start treatment according to the licence for each NI) is similar to the average delay reported in the trials.
-
Differences in symptom durations are most appropriately quantified and valued, for decisions based on cost-effectiveness considerations, in terms of mean durations as opposed to median durations. From an NHS perspective, time to resolution of symptoms is assumed to be more relevant than time to return to normal activities.
-
Adverse events associated with NIs are mild and self-limiting and have no additional impact on QoL or costs.
-
Patients eligible to receive NI treatments for influenza develop complications after their initial consultation with a health-care provider. All patients who develop complications due to influenza and ILI subsequently present to a health-care provider for treatment and may be prescribed antibiotics. Only complicated cases are assumed to lead to hospitalisation and death. Premature death due to influenza is assumed to occur only following a secondary complication (irrespective of whether or not a patient is hospitalised).
-
Given limitations in the evidence base it is assumed that hospitalisations occur only as a result of RTIs (or equally that the NI treatments themselves will have no additional effects on reducing hospitalisations associated with non-respiratory complications compared with standard care, in which case the exclusion of these hospitalisations from the scope of the model would not alter the incremental cost-effectiveness estimates for the NIs).
-
In the absence of robust estimates of the relative treatment effects in relation to complications as a whole (including hospitalisations and mortality), estimates of the relative effectiveness of reducing all of these events are driven by a single estimate of the relative effect – the relative risk of antibiotic use.
Clearly there exists significant uncertainty in relation to a number of these separate assumptions. Consequently, in addition to the base-case analysis, a series of separate scenarios are considered, exploring a range of alternative assumptions and their impact on the subsequent cost-effectiveness results.
Parameter estimates for inclusion in the York economic model
The complete list of model parameters for each subgroup is presented in Appendix 9. The following sections provide a description of the main model inputs and the main assumptions. These are outlined in terms of four key elements: the probability that ILI is influenza; symptoms; complications; and mortality.
Probability that ILI is influenza
The probability that ILI is influenza is derived from national surveillance data provided by the RCGP (Dr A Elliot, The Royal College of General Practitioners Research and Surveillance Centre, personal communication, 2008). The probability was based on an analysis of swabs taken from individuals with symptomatic ILI collected during routine surveillance across the influenza seasons 2003–4 to 2006–7. These data are shown in Table 68. The analysis of swabs provides data from which it is possible to establish the proportion of ILI consultations that were positive for influenza. Across all weeks (and years) the overall probability that ILI is influenza is approximately 0.495 (622/1256).
| Season | Week | ILI consultation rate | Number of swabs | Number with influenza A | Number with influenza B | Influenza total |
|---|---|---|---|---|---|---|
| 2003–4 | 44 | 36.42 | 7 | 1 | 1 | |
| 45 | 47.24 | 73 | 35 | 35 | ||
| 46 | 61.79 | 120 | 60 | 60 | ||
| 47 | 54.69 | 58 | 36 | 36 | ||
| 48 | 52.79 | 43 | 20 | 20 | ||
| 49 | 57.86 | 78 | 31 | 31 | ||
| 50 | 36.96 | 53 | 18 | 18 | ||
| 51 | 41.20 | 25 | 9 | 9 | ||
| 52 | 33.03 | 23 | 4 | 4 | ||
| 2004–5 | 1 | 38.91 | 15 | 5 | 5 | |
| 2 | 34.89 | 27 | 13 | 13 | ||
| 3 | 33.26 | 16 | 4 | 4 | ||
| 4 | 30.45 | 29 | 14 | 1 | 15 | |
| 5 | 34.26 | 27 | 15 | 2 | 17 | |
| 6 | 32.28 | 31 | 14 | 1 | 15 | |
| 2005–6 | 5 | 36.90 | 81 | 10 | 42 | 52 |
| 6 | 41.60 | 89 | 8 | 43 | 51 | |
| 7 | 42.21 | 63 | 10 | 19 | 29 | |
| 2006–7 | 6 | 37.64 | 120 | 69 | 1 | 70 |
| 7 | 43.85 | 153 | 82 | 82 | ||
| 8 | 38.17 | 125 | 55 | 55 | ||
| All weeks/years | 1256 | 513 | 109 | 622 |
However, the estimate of 0.495 represents a rather crude approximation of the ‘average’ probability as it ignores variability both within and across different seasons and also ignores subgroups (e.g. age). Additional data were therefore supplied on request from the RCGP to more formally consider different age groups (Dr A Elliott, personal communication). The number of swabs and the total number with influenza were provided according to different age groups. Separate analyses were then undertaken to consider the variability of this estimate across alternative age groupings. This formed part of a more explicit consideration of the variability both within and across the different seasons.
Using a similar approach to that employed in the Bayesian analysis of symptom data, a separate Bayesian ‘hierarchical’ model was fitted to the data using winbugs. The model is reported in Appendix 10. This approach was used to synthesise the surveillance data in order to obtain more appropriate probability estimates (and their associated uncertainty), accounting for variability attributed to the different seasons as well as the variability due to different age groups. Three main age categories were initially considered: aged less than 15 years, aged 15–64 years and aged over 65 years (corresponding to children, adult and elderly populations). No data were available to separately consider risk status, with the exception of the elderly. However, due to the limited number of swabs obtained in the elderly (only 93 of the swabs were in this group), the results of the base-case model are derived from a final analysis combining the adult and elderly populations into a single category.
Results from the model estimated the probabilities to be 0.56 (95% CrI 0.26 to 0.79) in subjects aged less than 15 years and 0.41 (95% CrI 0.21 to 0.66) in subjects aged 15 and over. The wide CrIs clearly reveal the high uncertainty surrounding these estimates, reflecting the variability observed both within and across the separate seasons. An analysis ignoring the separate subgroups and the seasonal variability would not adequately reflect this. To illustrate this more clearly, a simple application of a beta (622, 634) distribution to the entire data, hence ignoring subgroups and seasonal variability, would result in a mean of 0.495 (95% CI 0.468 to 0.522). These results clearly show that such an approach would not appropriately reflect the level of variability and uncertainty considered using a hierarchical approach. Uncertainty in the estimates obtained from the hierarchical model was subsequently reflected in the probabilistic analysis by applying the simulated output directly from winbugs.
Symptoms
There are two elements considered in the economic model: (1) the overall duration of symptoms themselves and how these vary across both subgroups and treatments; and (2) the quality adjustment of these durations required in order to estimate QALYs.
The overall duration of symptoms for the different subgroups applied in the model were taken directly from the ITTI results from the Bayesian multiparameter evidence synthesis model reported in Chapter 4. The summary estimates applied in the model are reported in Table 69. A separate scenario was undertaken to address the inconsistent data noted in the previous section. As part of the Bayesian synthesis, the separate at-risk populations (at-risk children, at-risk adults and the elderly) were combined into a single group. Consequently, the same mean duration of symptoms is applied to each of the separate at-risk populations considered in the economic model.
| Subgroup | Treatment | Median (days) (95% CrI) | Mean (days) (95% CrI) |
|---|---|---|---|
| Healthy adults | Placebo | 5.36 (2.47 to 10.12) | 8.96 (4.11 to 16.89) |
| Zanamivir | 4.58 (2.09 to 8.64) | 7.66 (3.49 to 14.46) | |
| Oseltamivir | 4.12 (1.86 to 7.86) | 6.88 (3.12 to 13.15) | |
| At-risk | Placebo | 8.28 (3.84 to 15.84) | 13.83 (6.41 to 26.45) |
| Zanamivir | 5.47 (2.48 to 10.53) | 9.13 (4.14 to 17.59) | |
| Oseltamivir | 7.34 (3.33 to 14.24) | 12.27 (5.53 to 23.70) | |
| Healthy children | Placebo | 5.80 (2.32 to 12.03) | 9.69 (3.88 to 20.22) |
| Zanamivir | 4.74 (1.83 to 10.13) | 7.92 (3.07 to 16.86) | |
| Oseltamivir | 4.22 (1.61 to 9.04) | 7.06 (2.69 to 15.18) |
To maintain correlation between the symptom durations, the simulated output (20,000 iterations) from winbugs was exported directly into excel.
Scenario analyses were also undertaken using output based on the ITTI populations employing median estimates as well as estimates based on different symptom definitions (return to normal activities).
The durations were then used as the basis for estimating the potential QALY gains associated with the reduction in symptom durations reported for each individual NI compared with usual care. In order to inform this aspect of the model, a separate systematic search of the literature was also undertaken in order to identify studies reporting preference-based valuations of the impact of influenza in different risk groups. These are summarised in Appendix 1. Although a number of studies were identified, none of these presented comparable estimates for different risk groups. In addition, even within the populations that were considered, there were a number of limitations related to the methods themselves (e.g. retrospective data collection) as well as the selection of respondents (e.g. small numbers of patients or experts). In the absence of more appropriate data from studies published since the earlier appraisal, quality weights are applied to the periods of symptom duration based on those previously applied by Turner et al. 46 and reported in Table 70.
| Day | Healthy adults | At-risk groups | ||||
|---|---|---|---|---|---|---|
| Placebo | Oseltamivir | Difference | Placebo | Oseltamivir | Difference | |
| 1 | 0.067543 | 0.082757 | 0.015214 | 0.117313 | 0.111745 | –0.005568 |
| 2 | 0.244658 | 0.369697 | 0.125039 | 0.197075 | 0.213862 | 0.016787 |
| 3 | 0.396576 | 0.513446 | 0.116870 | 0.270045 | 0.311437 | 0.041392 |
| 4 | 0.526019 | 0.611720 | 0.085701 | 0.348902 | 0.384854 | 0.035952 |
| 5 | 0.611720 | 0.693377 | 0.081657 | 0.401373 | 0.436523 | 0.035150 |
| 6 | 0.658876 | 0.738223 | 0.079347 | 0.432902 | 0.460356 | 0.027454 |
| 7 | 0.704713 | 0.760151 | 0.055438 | 0.460299 | 0.483436 | 0.023137 |
| 8 | 0.757784 | 0.784536 | 0.026752 | 0.463900 | 0.509715 | 0.045815 |
| 9 | 0.778053 | 0.792279 | 0.014226 | 0.494421 | 0.543382 | 0.048961 |
| 10 | 0.787365 | 0.804462 | 0.017097 | 0.502314 | 0.547231 | 0.044917 |
| 11 | 0.795763 | 0.812164 | 0.016401 | 0.532226 | 0.565495 | 0.033269 |
| 12 | 0.797749 | 0.817108 | 0.019359 | 0.543382 | 0.576452 | 0.033070 |
| 13 | 0.798634 | 0.817179 | 0.018545 | 0.561641 | 0.594872 | 0.033231 |
| 14 | 0.802947 | 0.817715 | 0.014768 | 0.572611 | 0.601892 | 0.029281 |
| 15 | 0.807632 | 0.820322 | 0.012690 | 0.576452 | 0.615933 | 0.039481 |
| 16 | 0.809530 | 0.821819 | 0.012289 | 0.612671 | 0.619619 | 0.006948 |
| 17 | 0.809846 | 0.824986 | 0.015140 | 0.616314 | 0.637228 | 0.020914 |
| 18 | 0.811355 | 0.823955 | 0.012600 | 0.626906 | 0.651299 | 0.024393 |
| 19 | 0.811705 | 0.824773 | 0.013068 | 0.640805 | 0.658247 | 0.017442 |
| 20 | 0.813527 | 0.824702 | 0.011175 | 0.651299 | 0.665139 | 0.013840 |
| 21 | 0.864840 | 0.864840 | 0.000000 | 0.668569 | 0.678469 | 0.009900 |
| Total QALD | 14.456835 | 15.220211 | 0.763376 | 10.291420 | 10.867186 | 0.575766 |
| Total QALY | 0.002223 | 0.002257 | 0.000035 | 0.001718 | 0.001784 | 0.000067 |
It has previously been outlined that these values were derived based on the transformation of VAS data reported in a number of the oseltamivir trials into TTO utilities. Comparable estimates were not available for zanamivir. Separate values are reported for otherwise healthy adults and at-risk adult populations. In the absence of comparable estimates for otherwise healthy children and at-risk children, the values corresponding to the equivalent adult populations are applied in the model.
The values reported over a 21-day period were used directly in the previous model by Turner et al. to estimate QALY gains for oseltamivir compared with standard care. The respective QALY gains associated with zanamivir and amantadine were then estimated by comparing the differences in symptom duration with oseltamivir (with an adjustment applied to account for the relative difference between these treatments). In the earlier critique section of previous models, we highlighted the potential limitations of this approach, in particular that the QALY gains estimates for oseltamivir were derived directly from the subset of trials in which the VAS data were reported (as opposed to the wider set of trials considered in the review of symptom data). This represents an important source of uncertainty as the use of these estimates directly in the model reported here would make no use of any additional RCT evidence that has become available since the previous review. Hence, the QALY gains associated with oseltamivir would not differ from those reported previously despite the existence of new evidence.
In order to address this potential limitation, and to more appropriately reflect differences in symptom duration across the full range of RCTs included in the evidence synthesis sections, data from the placebo arms in the healthy adult and at-risk populations were used to establish a ‘baseline’ QoL for the period of influenza without NI treatment. These data were then used to estimate the additional QALY gains associated with oseltamivir and zanamivir respectively based on the different symptom durations obtained from the Bayesian multiparameter synthesis approach. This approach ensures that the respective QALY gains are subsequently informed by the complete set of RCT evidence with respect to both NI treatments.
For each simulated estimate of the mean duration of illness associated with standard care (i.e. placebo) derived from the winbugs simulation, the model derives the corresponding utility decrements based on the average VAS score over this particular duration from the TTO data for standard care (i.e. assuming that these scores reflect the QoL anchored to an upper bound representing the normal health for someone of a similar age). These data represent the ‘baseline’ which is then used to estimate the average decrements over the period represented by standard care. This, in turn, provides the basis for estimating the associated QALY gains with oseltamivir and zanamivir. For each simulated estimate of the mean duration of illness with standard care, the corresponding estimates of the mean duration of illness with oseltamivir and zanamivir are then estimated. The difference between the two individual NI treatments and standard care subsequently reflect the reduction in the number of symptom days associated with each subgroup. The QoL decrements estimated from the mean duration of illness reported for standard care are then used as the basis for estimating the incremental QALY gains with each NI treatment (i.e. the QALY gains reflect the additional days valued at the average decrement reported across the duration of the ‘baseline’).
The aforementioned approach makes the assumption that the reduction in mean symptom durations for zanamivir and oseltamivir arises across the entire distribution of the equivalent symptom duration represented by standard care. Consequently, the utility weights reflect the average decrement reported across the average symptom duration for standard care. However, it is plausible that the differences relate to the later periods of illness for which the associated decrement of QoL could be considerably lower than the associated average (or, indeed, that these differences are attributed to reductions in symptoms at an earlier stage, in which case the average decrement would be an underestimate). In the absence of reliable data on when these differences arise, or alternative more robust QoL estimates from other sources, a series of scenarios is subsequently employed, reflecting a wide range of potential decrements.
Complications
Baseline probabilities
The model assumes that all patients with ILI (whether influenza or an alternative ILI) had a probability of developing a complication. Estimates of the baseline probabilities of developing each complication (and mortality subsequently) were derived separately for each subgroup from data reported in a large UK population-based study. 15 Meier et al. 15 was selected after detailed consideration of a number of potential UK-based studies identified as part of the clinical effectiveness searches. This study was selected as it was the only one to report relevant data in relation to both age and at-risk status. Meier et al. 15 was also previously used to derive similar baselines by Turner et al. 46 and also Roche as part of their submission. The model inputs were derived in a number of stages:
-
The data for the 15–49 years’ age group were combined with those given for the 50–64 years’ age group to form a pooled ‘adult’ group more appropriate to the present analysis (with the distinction between ‘healthy’ and ‘predisposed’ patients maintained, representing healthy and at-risk patients respectively). In addition, the data for ‘healthy’ patients over 65 years old were combined with those for ‘predisposed’ patients over 65 years old to form a single pooled ‘elderly’ group.
-
In each subgroup, the mean probability of a patient developing a complication was derived by dividing the number of patients with a complication by the number of patients with ILI. A beta distribution was fitted to each probability for the probabilistic sensitivity analysis.
-
When a patient developed a complication, this was assumed to fall into one of five categories (as reported in Meier et al. ):15 RTI, cardiovascular, CNS, renal or ‘other’. The mean conditional probability of the complication falling under each category was then derived by dividing the number of complications in that category by the total number of complications in all five categories. A dirichlet distribution was assigned to each probability for the probabilistic sensitivity analysis. 160
-
When a patient developed an RTI, this was assumed to fall into one of three subcategories: bronchitis, pneumonia or upper RTI. As before, the mean conditional probability of the complication falling under each subcategory was derived by dividing the number of complications in that subcategory by the total number of complications in all three subcategories, with a dirichlet distribution assigned to each probability for the probabilistic sensitivity analysis.
-
When a patient developed an ‘other’ complication, this was assumed to be either otitis media or GI bleeding – the mean conditional probability of developing otitis media was derived by dividing the number of otitis media complications by the total number of otitis media and GI bleeding complications, with a beta distribution assigned for the probabilistic sensitivity analysis.
These probabilities are reported in Table 71.
| Healthy children (1–14 years) |
‘At-risk’ children (1–14 years) |
Healthy adults (15–64 years) |
At-risk adults (15–64 years) |
Elderly (65+ years) |
|
|---|---|---|---|---|---|
| Probability of any type of complication | |||||
| Probability of complication |
0.1344 (n = 2,311) |
0.1759 (n = 650) |
0.0755 (n = 6437) |
0.1217 (n = 2142) |
0.1092 (n = 1917) |
| Total patients | 17,201 | 3695 | 85,248 | 17,597 | 17,552 |
| Probability of a specific type of complication | |||||
| RTI complication |
0.7021 (n = 1697) |
0.7692 (n = 520) |
0.8612 (n = 5636) |
0.7521 (n = 1941) |
0.7625 (n = 1573) |
| Cardiovascular complication |
0.0000 (n = 0) |
0.0000 (n = 0) |
0.0017 (n = 11) |
0.0133 (n = 29) |
0.0329 (n = 68) |
| CNS complication |
0.0070 (n = 17) |
0.0000 (n = 0) |
0.0154 (n = 101) |
0.0069 (n = 15) |
0.0213 (n = 44) |
| Renal complication |
0.0008 (n = 2) |
0.0000 (n = 0) |
0.0014 (n = 9) |
0.0023 (n = 5) |
0.0082 (n = 17) |
| ‘Other’ complication |
0.2900 (n = 701) |
0.2308 (n = 156) |
0.1203 (n = 787) |
0.0880 (n = 192) |
0.1770 (n = 366) |
| Total complications | 2417 | 675 | 6511 | 2166 | 1844 |
| Probability of an RTI complication | |||||
| Bronchitis |
0.0701 (n = 113) |
0.0633 (n = 21) |
0.1916 (n = 1057) |
0.2613 (n = 370) |
0.3446 (n = 529) |
| Pneumonia |
0.0180 (n = 29) |
0.0271 (n = 9) |
0.0430 (n = 237) |
0.0438 (n = 62) |
0.1322 (n = 203) |
| Upper RTI |
0.9119 (n = 1470) |
0.9096 (n = 302) |
0.7655 (n = 4224) |
0.6949 (n = 984) |
0.5231 (n = 803) |
| Total RTI complications | 1612 | 332 | 5518 | 1416 | 1535 |
| Probability of ‘other’ complication | |||||
| Otitis media |
0.9757 (n = 684) |
0.9871 (n = 153) |
0.6649 (n = 500) |
0.6250 (n = 110) |
0.2162 (n = 32) |
| GI bleeding |
0.0243 (n = 17) |
0.0129 (n = 2) |
0.3351 (n = 252) |
0.3750 (n = 66) |
0.7838 (n = 116) |
| Total ‘other’ complications | 701 | 155 | 752 | 176 | 148 |
It was noted that the possibility exists for a patient to develop more than one complication; consequently, the additional costs and utility decrements attributable to each complication were inflated by the mean number of complications estimated per patient in each subgroup.
The model assumes that patients who develop an RTI face a (conditional) probability of hospitalisation due to the complication. This conditional probability was taken from hospitalisation rates for lower RTIs reported within a meta-analysis of 10 trials of oseltamivir reported by Kaiser et al. 154 For healthy adults and healthy children, the mean probability of hospitalisation, conditional upon developing a complication, was estimated to be 0.1087 (5/46), while for at-risk groups this was estimated to be 0.1579 (15/95). Due to limitations in the data, these conditional probabilities could not be further divided by age. Beta distributions were fitted to the conditional probabilities for the probabilistic sensitivity analysis.
The model also assumed that, of those patients hospitalised for pneumonia, approximately 5% (22/453) would require ITU care with or without mechanical ventilation. This figure was derived from Turner et al. 46 in the absence of any alternative evidence identified. Again, a beta distribution was assigned to this conditional probability.
Relative risk of a complication
For each of the NI treatment strategies, the baseline probability of a complication was adjusted according to the relative risk (versus placebo) of requiring antibiotics, as given in Table 72 for each subgroup. However, it was assumed that when a complication did occur, receiving NI treatment did not affect the conditional probabilities of a complication falling into each category or subcategory, nor did it affect the conditional probabilities of a complication resulting in hospitalisation or mortality (discussed in more detail below). Reductions in hospitalisations and mortality associated with NI treatments were therefore driven structurally by the model by the lower probability of developing a complication itself.
| Subgroup | Comparison | Relative risk (95% CI) |
|---|---|---|
| Healthy adults | Zanamivir vs placebo | 0.71 (0.34 to 1.45) |
| Oseltamivir vs placebo | 0.57 (0.24 to 1.35) | |
| At-risk | Zanamivir vs placebo | 0.74 (0.35 to 1.57) |
| Oseltamivir vs placebo | 0.69 (0.50 to 0.93) | |
| Children | Zanamivir vs placebo | 0.78 (0.45 to 1.35) |
| Oseltamivir vs placebo | 0.56 (0.36 to 0.87) |
The decision to relate hospitalisations and mortality structurally to complications as a whole, as opposed to treating these as potentially independent events and/or applying separate relative risks to each element, was made on several grounds. Firstly, it appears to make clinical sense to relate these issues, as it is unclear why an uncomplicated illness would require either hospitalisation or would subsequently result in death. Secondly, the evidence on the relative effectiveness of the NIs in relation to hospitalisation and mortality is either limited (hospitalisation data reported in earlier sections is highly variable and reported only in a small number of potentially selective studies) or entirely absent (mortality). However, it equally needs to be recognised that the current RCTs are themselves not adequately powered on these particular outcomes, so the lack of suitable estimates is not sufficient evidence in itself that these events are not potentially reduced by the use of NI treatment. Consequently, the model structurally relates these aspects and applies the most robust ‘proxy’ estimate of the relative effectiveness of the NIs derived from the results of the clinical effectiveness review, namely the relative risk of a reduction in the use of antibiotics. Clearly there remains significant uncertainty surrounding this assumption and hence a number of alternative scenarios are subsequently explored.
Resource use and costs of complications
The model assumes that each patient developing a complication requires a single GP visit and faces a higher probability of requiring antibiotics than patients who did not develop a complication. The estimated cost of a GP visit was derived in a similar manner to that of Turner et al. ,46 unit costs for surgery visits (£30) and home visits (£48) were taken from published sources;161 these were then weighted by an estimate of the proportion of patients in each subgroup receiving home visits, for the elderly group (25%) and for the adult and children groups (7%). 46
The probabilities that patients required antibiotics were taken directly from Meier et al. 15 and assumed to vary by subgroup and presence of complications. Beta distributions were assigned to each probability for the probabilistic sensitivity analysis. The costs of these antibiotics were taken from Roche’s submission: the costs for patients without complications and those with all non-RTI complications (including otitis media) were assumed to be those given by Roche for patients with ILI, while the costs for all RTIs were assumed to be those given by Roche for patients with bronchitis and pneumonia (Roche did not consider upper RTI). Where separate costs were given by Roche for children aged 1–5 years and children aged 1–12 years, the costs for children aged 1–12 years were used to inform the 1–14 years’ age groups in the York analyses. These data are reported in Table 73.
| Healthy children (1–14 years) |
At-risk children (1–14 years) |
Healthy adults (15–64 years) |
At-risk adults (15–64 years) |
Elderly (65+ years) |
|
|---|---|---|---|---|---|
| No RTI complication |
0.279 (£0.21) |
0.279 (£0.21) |
0.420 (£0.46) |
0.420 (£0.46) |
0.547 (£0.46) |
| RTI complication |
0.737 (£2.39) |
0.737 (£2.39) |
0.814 (£3.71) |
0.814 (£5.66) |
0.797 (£5.66) |
Estimates for length of hospital stay were derived from national hospital episode statistics for 2006–7; these were used to calculate both the duration of utility decrements resulting from complications as well as the costs of hospitalisation (Table 74). 163 Length of stay estimates varied by subgroup and by complication. For pneumonia, national data for diagnosis chapters J12–J18 were used to estimate a mean length of stay for children (0–14 years, 2.93 days), adults (15–74 years, 7.41 days) and elderly (75+ years, 14.51 days) – these were derived by weighting the mean length of stay given by sex, age group and diagnosis chapter by the corresponding number of finished consultant episodes. For bronchitis, a similar method was used across diagnosis chapters J20 and J21 to derive estimates of mean length of stay for children, adults and elderly of 2.47, 2.51 and 6.58 days respectively, while for upper RTI a similar method was employed across diagnosis chapter J22 to derive estimates of mean length of stay for children, adults and elderly of 2.15, 3.77 and 11.46 days respectively. Unit cost per diems were derived from the respective HRG costs estimates obtained using per diem estimates derived from ‘excess bed’ estimates (Table 74).
| Complication | Children (0–14 years) |
Adults (15–74 years) |
Elderly (75+ years) |
Cost per diem (£) |
|---|---|---|---|---|
| Pneumonia | 2.9292 | 7.4115 | 14.5126 | 166 |
| Bronchitis | 2.4664 | 2.5077 | 6.5828 | 172 |
| Upper RTI | 2.1467 | 3.7665 | 11.4650 | 182 |
Quality of life implications of complications
The model assumes that those patients who develop a complication receive a reduction in their QoL for a particular duration. As part of the review of economic models, a number of sources were identified that reported utility values for particular complications. These were assessed and considered in relation to whether they provide values derived from preference-based methods for the range of RTI and other particular complications considered. No single study was identified that addressed the full range of estimates required. However, the final estimates were derived from a study reporting utility values from the Health Utility Index (HUI) and decrements assumed are reported in Table 75. 162 For RTI complications, these decrements were applied for a time equivalent to the estimated length of hospital stay for the respective complication, irrespective of whether the patient was hospitalised for the complication or not, while for non-RTI complications the appropriate decrement was applied for a time equivalent to the estimated length of hospital stay for bronchitis (in the absence of any more appropriate data).
| Complication | Utility decrement |
|---|---|
| Bronchitis | 0.15 |
| Pneumonia | 0.25 |
| Upper RTI | 0.15 |
| Cardiovascular | 0.37 |
| CNS | 0.15 |
| Renal | 0.15 |
| Otitis media | 0.15 |
| GI bleeding | 0.15 |
The model assumed that hospitalisation itself did not result in any further decrement in patients’ utility, with the exception of those admitted to an ITU with pneumonia who received a further utility decrement of 0.13 in addition to the decrement of 0.25 associated with pneumonia. 162 This additional decrement was applied for a length of time equivalent to the estimated length of hospital stay for pneumonia.
Mortality
The model assumed that all patients who develop a complication face a subsequent probability of mortality. This (conditional) probability was assumed to vary by subgroup but not by whether a patient was hospitalised (due to a lack of suitable data) nor by treatment strategy (although, as with hospitalisation, the unconditional probability of mortality for a typical patient with ILI was lower with NI treatment than with usual care due to the lower probability of developing a complication in the first instance).
As with the baseline probabilities of developing a complication, estimates of the conditional probabilities of mortality were derived separately for each subgroup from data provided in Meier et al. 15 As it was assumed that all patients whose ILI resulted in mortality experienced at least one other complication, the mean conditional probability of mortality given a complication was derived by dividing the number of deaths in each subgroup by the number of patients experiencing a complication. These conditional probabilities are given in Table 76.
| Healthy children (1–14 years) |
At-risk children (1–14 years) |
Healthy adults (15–64 years) |
At-risk adults (15–64 years) |
Elderly (65+ years) |
|
|---|---|---|---|---|---|
| Probability of mortality given a complication |
0.0000 (n = 0) |
0.0015 (n = 1) |
0.0051 (n = 33) |
0.0075 (n = 16) |
0.1168 (n = 224) |
| Total patients with complication | 2311 | 650 | 6437 | 2142 | 1917 |
Mortality was assumed not to incur any cost; however, it was assumed to result in potential loss of QALYs. In each age group (children, adults, elderly), the expected age of death from ILI-related complications was derived from data from the national statistics reporting influenza deaths (J10–J18) by age group. 163 For each age group, the remaining life expectancy at this age of (premature) death was then derived from general population life-table statistics,164 with these estimated remaining years of life quality weighted according to age-matched UK population norms reported using EQ-5D. 157 The utility estimates derived from EQ-5D were also adjusted in the model to reflect the increasing age of particular populations in later years of life. The resulting QALE was then discounted at 3.5% per annum. The resulting discounted estimates applied in the model are reported in Table 77.
| Children | Adults | Elderly | |
|---|---|---|---|
| Expected age of death (years) | 4.75 | 53.66 | 86.76 |
| Life expectancy at this age (years) | 75.02 | 28.01 | 5.29 |
| QALE (years) | 65.95 | 22.54 | 4.59 |
| Discounted (3.5%) QALE (years) | 24.95 | 14.66 | 4.20 |
Cost of antivirals
The acquisition costs of oseltamivir (£16.36) were derived from national sources,45 with identical estimates applied for zanamivir based on the revised price agreement. It was also assumed that any remaining powder related to the use of oral suspension (oseltamivir) in children would not be reused, and hence the full cost £16.36 was assumed throughout in each subgroup.
Validation
The validity of the model was considered in detail. An initial structure and set of assumptions were developed from the review of previous cost-effectiveness models. These were discussed extensively by the group and reviewed by a clinical expert. Through this process the final model structure and associated assumptions were finalised. Detailed reference was also made to Turner et al. 46 and the Roche submission in order to identify possible areas of uncertainty to be considered using separate scenarios. As part of an overall quality assurance process for the final model, the internal model validity was investigated extensively, exploring logical consistency throughout. Model inputs were cross-checked against the source data.
Base-case analysis and scenarios
The model results are presented according to a particular set of assumptions employed as part of a base-case analysis. The impact of employing alternative assumptions to those proposed in the base-case analysis is then explored using detailed scenario analysis.
Table 78 summarises the alternative scenarios considered. For each element, the position in the base-case analysis is outlined, alongside the alternative assumption applied. The scenarios are undertaken to assess the robustness of the base-case model results to variation in (1) the sources of data used to populate the model, and (2) alternative assumptions related to key parameters in the model.
| Scenario | Element | Position in base-case analysis | Variation considered in scenario analysis |
|---|---|---|---|
| 1 | Inclusion of potential hospitalisation and mortality benefits with NIs | Included for all populations, treatment effects based on subgroup and treatment-specific estimates of the relative risk reduction in antibiotic use | Hospitalisation and mortality benefits excluded across all populations |
| 2 | Complications and mortality | Included for all populations, treatment effects based on subgroup and treatment-specific estimates of relative risk reduction in antibiotics | Treatment effects specific for individual treatments but not subgroup specific. Separate scenarios considered including and excluding hospitalisation and mortality |
| 3 | Definition of symptoms | Mean time to resolution of symptoms | Mean and median estimates (time to resolution of symptoms and time to return to normal activities) |
| 4 | RCTs and subgroup data used in Bayesian synthesis | All RCTs and subgroups in which data on median and standard error are reported included | Excluding at-risk children RCT data |
| 5 | Probability ILI is influenza | Derived from surveillance data, ‘hierarchical’ model to give estimates for children (< 15 years) and adults (> 15 years) | Alternative, common estimates applied (probabilities between 0.1 and 0.9) to all groups. Separate scenarios considered including and excluding hospitalisation and mortality |
| 6 | Probability that ILI is influenza and increased GP consultations (otherwise healthy populations only) | As above, for probability that ILI is influenza. Additional GP consultations not considered | Two-way analyses combining alternative reductions in the probability that ILI is influenza (–5% to –15%) and increased GP consultations (5–15%) consistent with Turner et al.46 |
| 7 | Viral resistance | Not considered for either oseltamivir or zanamivir | Alternative resistance rates modelled for oseltamivir only (range 1–10%) |
| 8 | QoL decrements associated with symptom duration | Derived from VAS TTO data from oseltamivir trials | Alternative decrements applied (range between 0.1 and 0.9) |
| 9 | Training costs associated with use of zanamivir (Diskhaler) | Not considered. Assumed to be £0 | Alternative costs applied (range £7–21 per patient) |
| 10 | QALE in at-risk groups | Derived from equivalent age-matched estimates from general population | QALE reduced (range 10–50%) |
| 11 | Baseline complication and mortality rates | Derived from UK source related to ILI (i.e. includes influenza and other ILI) | Adjustment made to adjust for potential differences in an influenza population (adjustment made using influenza/RSV data) |
| 12 | Relative efficacy of NIs | Derived from Bayesian synthesis. Mean estimates both treatment and subgroup specific | Assume equivalent efficacy between the NIs. Best- and worst-case analyses undertaken including and excluding hospitalisation and mortality benefits |
Results of the York Economic Assessment
The results of the model are presented in two ways. Firstly, mean costs and QALYs for the various comparators are presented and their cost-effectiveness compared using standard decision rules and estimating ICERs as appropriate. 165 The ICER examines the additional costs that one strategy incurs over another and compares these with the additional benefits. When more than two interventions are being compared, the ICERs are calculated using the following process:
-
The strategies are ranked in terms of cost (from the least expensive to the most costly).
-
If a strategy is more expensive and less effective than any previous strategy, then this strategy is said to be dominated and is excluded from the calculation of the ICERs.
-
The ICERs are calculated for each successive alternative, from the cheapest to the most costly. If the ICER for a given strategy is higher than that of any more effective strategy, then this strategy is ruled out on the basis of extended dominance.
Secondly, the results of the probabilistic analysis using Monte Carlo simulation are then used to calculate the combined impact of the model’s various uncertainties on the overall uncertainty surrounding the cost-effectiveness results themselves. Tabulated results are presented for the base case and select scenario values of the probability, each intervention is cost-effective at a threshold of £20,000 and £30,000 per additional QALY.
Results of the base-case analysis
Table 79 reports the base-case results according to the separate populations. In each population, the ICER for either oseltamivir or zanamivir (relative to standard care) appears well below conventional thresholds applied to determine cost-effectiveness. Across the separate populations there is variability in terms of the ICER itself (ranging from between £563 and £7038 per additional QALY) and also which particular NI is considered optimal according to cost-effectiveness considerations.
| Strategy | Mean cost | Mean QALY | ICER | Probabilitya | |
|---|---|---|---|---|---|
| £20,000 | £30,000 | ||||
| Healthy children | |||||
| Usual care | £5.03 | 24.9629 | N/A | 0.04 | 0.02 |
| Zanamivir | £18.60 | 24.9641 | D | 0.23 | 0.25 |
| Oseltamivir | £18.21 | 24.9647 | £7035 | 0.72 | 0.74 |
| At-risk children | |||||
| Usual care | £8.60 | 24.9600 | N/A | 0.02 | 0.02 |
| Zanamivir | £20.04 | 24.9666 | £1752 | 0.85 | 0.85 |
| Oseltamivir | £19.89 | 24.9638 | ED | 0.13 | 0.13 |
| Healthy adults | |||||
| Usual care | £3.29 | 14.6671 | N/A | 0.00 | 0.00 |
| Zanamivir | £17.83 | 14.6692 | D | 0.23 | 0.23 |
| Oseltamivir | £17.68 | 14.6697 | £5521 | 0.77 | 0.77 |
| At-risk adults | |||||
| Usual care | £6.82 | 11.0038 | N/A | 0.00 | 0.00 |
| Zanamivir | £19.36 | 11.0093 | £2270 | 0.90 | 0.90 |
| Oseltamivir | £19.25 | 11.0073 | ED | 0.10 | 0.10 |
| Elderly | |||||
| Usual care | £13.13 | 4.1939 | N/A | 0.00 | 0.00 |
| Zanamivir | £22.07 | 4.2098 | £562 | 0.64 | 0.64 |
| Oseltamivir | £21.84 | 4.2081 | ED | 0.36 | 0.36 |
In general, estimates of the ICER appear more favourable in the at-risk groups than in the otherwise healthy populations. This appears to be driven by the slightly higher reductions in symptom duration derived from the Bayesian synthesis for the at-risk groups, relative to the healthy populations, and the higher baseline risks of complications and their sequelae (higher hospitalisation and mortality estimates), resulting in higher absolute gains attributed to these populations. Within the at-risk populations, the ICER estimates are most favourable for the elderly population, principally due to this group having the highest baseline complication rate. Zanamivir was consistently reported as the most cost-effective treatment in each of the at-risk groups (oseltamivir was ruled out on the grounds of extended dominance in each of the at-risk groups). This reflects the higher reductions in symptom duration for zanamivir in these groups estimated on average than for both standard care and oseltamivir derived from the Bayesian synthesis. However, this also needs to be considered in relation to the current licences as zanamivir is not currently licensed in at-risk children aged less than 5 years.
The uncertainty surrounding the results in at-risk populations, based on the probability statements related to cost-effectiveness, appears higher in those groups with higher baseline complication rates such as the elderly. In these instances, the relative difference between zanamivir and oseltamivir in terms of mean reduction in symptom duration is partly attenuated by the more favourable relative risk reductions assumed for oseltamivir in terms of complications. However, even in these groups, zanamivir remains the most cost-effective intervention taking both symptomatic benefits and complications into consideration.
In the otherwise healthy populations (both adults and children), oseltamivir dominated zanamivir (i.e. oseltamivir is associated with higher QALYs and lower costs overall). The ICER estimates for oseltamivir compared with standard care are between £5522 (adults) and £7038 (children). The slightly more favourable ICERs in the healthy adult population are partly explained due to the zero mortality rate applied to the healthy children population based on data from Meier et al. 15
At a threshold of £20,000 per QALY there appears very little uncertainty that an NI treatment is cost-effective. In the otherwise healthy populations the probability that usual care (without an NI treatment) was optimal on cost-effectiveness grounds was 0.04 or less (i.e. only on 4% or less of simulations did usual care appear to be cost-effective), similarly in the at-risk populations this was lower still (0.03 or less). In the otherwise healthy populations, oseltamivir had a probability of being cost-effective at a threshold of £20,000 of between 0.72 and 0.78. In the at-risk populations the probability that zanamivir is optimal was highest in the at-risk adult population (0.9) with less certainty in the children (0.84) and elderly (0.64) populations. Again, the results in at-risk children need to be considered in relation to current licences.
Results of the scenario analysis
Scenario 1: Exclusion of potential hospitalisation and mortality benefits with NIs
As part of the base-case analysis, potential reductions in associated hospitalisations and mortality benefits related to the NIs are included. This position more closely reflects the approach considered in the ‘extrapolated’ model by Turner et al. 46 as opposed to their original base-case approach which excluded these elements. Our updated clinical effectiveness review identified limited RCT data in relation to hospitalisations and no evidence in relation to mortality reductions. Consequently, the base-case analysis employs a ‘proxy’ estimate based on the relative risk of antibiotic usage which, via the structure of the model, feeds through into similar reductions in hospitalisations and mortality. Clearly this is an important assumption which may also be considered more plausible in particular populations (e.g. at risk and elderly compared with otherwise healthy populations). This concern is already partially reflected in the base-case analysis, as the absolute benefit associated with the use of NIs attributed to hospitalisation and mortality benefits will ultimately be driven by two related issues: (1) the baseline risk of hospitalisation and mortality, as well as (2) the relative effectiveness of NI treatment. As previously demonstrated, the baseline risk of hospitalisation and mortality is clearly lower in the otherwise healthy population and is highest in the elderly. However, given the remaining uncertainty related to the relative effectiveness applied to oseltamivir and zanamivir, a separate scenario was considered excluding these benefits.
Given that these elements are structurally driven in the current model, it is not possible simply to ‘switch off’ the relative effects for these benefits without major structural alterations. Hence, the results presented here are obtained by setting the conditional probability of hospitalisation following a complication to zero and excluding the probability of influenza-related mortality. Although this approach will alter the resulting mean values of the costs and QALYs, the subsequent ICER estimates are identical to those that would be obtained by excluding the relative risks of these separate elements. The results of this scenario are presented in Table 80.
| Strategy | Mean Cost | Mean QALY | ICER | Probabilitya | |
|---|---|---|---|---|---|
| £20,000 | £30,000 | ||||
| Healthy children | |||||
| Usual care | £2.63 | 24.9629 | N/A | 0.05 | 0.02 |
| Zanamivir | £17.55 | 24.9641 | D | 0.24 | 0.25 |
| Oseltamivir | £17.35 | 24.9647 | £7852 | 0.72 | 0.73 |
| At-risk children | |||||
| Usual care | £3.42 | 24.9639 | N/A | 0.00 | 0.00 |
| Zanamivir | £17.84 | 24.9682 | £3327 | 0.99 | 0.99 |
| Oseltamivir | £17.78 | 24.9653 | ED | 0.01 | 0.01 |
| Healthy adults | |||||
| Usual care | £1.25 | 14.6694 | N/A | 0.12 | 0.01 |
| Zanamivir | £16.99 | 14.6701 | D | 0.09 | 0.12 |
| Oseltamivir | £16.94 | 14.6705 | £13,985 | 0.79 | 0.87 |
| At-risk adults | |||||
| Usual care | £1.97 | 11.0079 | N/A | 0.00 | 0.00 |
| Zanamivir | £17.31 | 11.0111 | £4850 | 0.99 | 0.99 |
| Oseltamivir | £17.28 | 11.0090 | ED | 0.01 | 0.01 |
| Elderly | |||||
| Usual care | £1.90 | 4.2159 | N/A | 0.00 | 0.00 |
| Zanamivir | £17.31 | 4.2192 | £4763 | 0.99 | 0.99 |
| Oseltamivir | £17.28 | 4.2171 | ED | 0.01 | 0.01 |
As expected, the exclusion of hospitalisation and mortality benefits results in less favourable ICERs across each of the subgroups. The differences are most evident in the otherwise healthy adult population for whom the ICER increases to £13,985 per QALY (compared with the base-case results of £5521). The subgroup least affected is the otherwise healthy children population with an associated ICER of £7852 per QALY (compared with £7035 in the base-case). The smaller effect observed for the otherwise healthy children population is mainly due to the fact that mortality benefits are not actually different to those from the base-case analysis, as the probability of mortality was already assumed to be zero in this population in the base case.
Despite the higher estimates of the ICER obtained in all subgroups, the estimates remained below £20,000 per QALY in each of these. In addition, in each subgroup, the same strategies were excluded on the grounds of dominance and extended dominance as occurred in the base-case analysis. The associated probability that no antiviral treatment was the most cost-effective strategy was 0.12 in the healthy adult population and 0.05 or lower in the other subgroups.
Scenario 2: Further considerations of complications and mortality
Two additional analyses were undertaken to further examine the robustness of the base-case results to alternative assumptions related to the relative risks of complications and mortality. These are reported in Table 81. Only the ICERs for these analyses are reported for ease of presentation.
| Subgroup | ICER | |
|---|---|---|
| Oseltamivir | Zanamivir | |
| Application of ‘all patient’ results for the relative risk of complications | ||
| Healthy children | £7203 | D |
| At-risk children | ED | £1766 |
| Healthy adults | £5879 | D |
| At-risk adults | ED | £2288 |
| Elderly | ED | £571 |
| No effect of NIs on mortality | ||
| Healthy children | £7035 | D |
| At-risk children | ED | £2639 |
| Healthy adults | £12,828 | D |
| At-risk adults | ED | £3968 |
| Elderly | ED | £2764 |
For the first of these issues, it was previously reported in the clinical effectiveness review section that no significant heterogeneity was observed between the different subgroups in terms of the pair-wise estimates of the relative treatment effects for each NI in terms of antibiotic use. Consequently, we apply common (but treatment-specific) estimates of the relative risks to antibiotic use (and hence also to hospitalisation and mortality). The results of this analysis did not have an important effect on the ICER estimates and the same strategies remained ruled out on the grounds of dominance and extended dominance.
As part of Scenario 1, the potential impact on the ICER estimates excluding reductions in both hospitalisation and mortality was explored. Given the differences in the ICER noted for particular populations (e.g. healthy adults), it remains unclear how each of these individual elements was contributing to these differences and whether this varied across the respective subgroups. A separate analysis was therefore undertaken to exclude the benefits of just mortality, hence leaving the potential reduction in hospitalisations still in place.
The exclusion of mortality appeared to have the largest effect on the ICER for the otherwise healthy adult population, suggesting that the mortality benefits for this subgroup are proportionately more influential in terms of the base-case ICER estimates than they are for the other subgroups.
Scenario 3: Definition of symptoms
Scenario 3 considers the robustness of the base-case results to both alternative definitions of symptoms (return to normal activities) and alternative measures of the difference in symptom duration based on the median estimates. Each of these analyses was directly informed by the different outputs reported from the Bayesian synthesis. These results are reported in Table 82.
| Subgroup | ICER | |
|---|---|---|
| Oseltamivir | Zanamivir | |
| Mean time to return to normal activities | ||
| Healthy children | £5965 | D |
| At-risk children | ED | £1485 |
| Healthy adults | £5198 | D |
| At-risk adults | ED | £1965 |
| Elderly | ED | £533 |
| Median time to resolution of symptoms | ||
| Healthy children | £9245 | D |
| At-risk children | ED | £2254 |
| Healthy adults | £6139 | D |
| At-risk adults | ED | £2808 |
| Elderly | ED | £602 |
| Median time to return to normal activities | ||
| Healthy children | £8175 | D |
| At-risk children | ED | £2020 |
| Healthy adults | £5859 | D |
| At-risk adults | ED | £2562 |
| Elderly | ED | £585 |
Overall, the conclusions remained robust to both the use of different symptom definitions and alternative measures of the difference in duration. As expected, the ICER estimates were slightly more favourable when the mean time to return to normal activities was employed instead of resolution of symptoms. This is primarily due to the longer overall durations of illness reported using this measure as opposed to major differences in the relative effectiveness estimates. Similarly, employing estimates of the median (as opposed to mean) durations results in less favourable estimates of the ICER. Again this is not unexpected as the absolute gains in symptom benefits (assuming a similar relative effect) for each NI relative to usual care will be higher based on the extrapolation required to estimate the mean estimate. However, these differences did not appear to result in marked differences in the subsequent estimates of the ICER.
Scenario 4: RCTs and subgroup data used in Bayesian synthesis
Given the inconsistency identified in Hedrick et al. 100 related to at-risk children and the limited data in general in at-risk children, a separate scenario was considered using the results from the revised synthesis excluding the at-risk children data from the model. These results are reported in Table 83. The ICERs in each population increased marginally compared with the base-case analysis.
| Subgroup | ICER | |
|---|---|---|
| Oseltamivir | Zanamivir | |
| Including hospitalisations and mortality | ||
| Healthy children | £7428 | D |
| At-risk children | ED | £2059 |
| Healthy adults | £5671 | D |
| At-risk adults | ED | £2604 |
| Elderly | ED | £588 |
| Excluding hospitalisations and mortality | ||
| Healthy children | £8292 | D |
| At-risk children | ED | £4290 |
| Healthy adults | £14,902 | D |
| At-risk adults | ED | £6251 |
| Elderly | ED | £6098 |
Scenario 5: Probability that ILI is influenza
The base-case analysis utilises data from national surveillance data, employing a ‘hierarchical’ model to account for variability across influenza seasons and separate age groups. Clearly there remains potential uncertainty in relation to the generalisability of these estimates and also to whether the variability is adequately reflected in the approach used. It is also worth reiterating that the probability estimates were markedly higher in the group aged under 15 years than in those aged 15 and over. In order to explore the robustness of the base-case results to variations in this probability, a detailed series of analyses were undertaken employing a range of common estimates applied to each of the separate populations (ranging from 0.1 to 0.9). A two-way scenario analysis is also considered, both including and excluding the potential benefits of reductions in hospitalisation and mortality. These results are presented in Tables 84 and 85. Given the large number of comparisons presented, only the ICER of the non-dominated strategy (or strategies) is presented together with an indication of what the optimal NI strategy is in each scenario.
| Subgroup | 0.1 | 0.2 | 0.3 | 0.4 | 0.5 | 0.6 | 0.7 | 0.8 | 0.9 |
|---|---|---|---|---|---|---|---|---|---|
| Healthy children | £47,573 (O) | £22,939 (O) | £14,727 (O) | £10,621 (O) | £8158 (O) | £6515 (O) | £5342 (O) | £4463 (O) | £3778 (O) |
| At-risk children | £13,384 (Z) | £6316 (Z) | £3960 (Z) | £2781 (Z) | £2075 (Z) | £1603 (Z) | £1267 (Z) | £1014 (Z) | £818 (Z) |
| Healthy adults | £25,023 (O) | £12,133 (O) | £7837 (O) | £5689 (O) | £4400 (O) | £3,540 (O) | £2926 (O) | £2466 (O) | £2108 (O) |
| At-risk adults | £11,469 (Z) | £5389 (Z) | £3363 (Z) | £2349 (Z) | £1741 (O) | £1336 (Z) | £1047 (Z) | £829 (Z) | £661 (Z) |
| Elderly | £3756 (Z) | £1645 (Z) | £941 (Z) | £589 (Z) | £378 (Z) | £238 (Z) | £137 (Z) |
£53 (O) £136 (Z)a |
£136 (Z)a |
| Subgroup | 0.1 | 0.2 | 0.3 | 0.4 | 0.5 | 0.6 | 0.7 | 0.8 | 0.9 |
|---|---|---|---|---|---|---|---|---|---|
| Healthy children | £48,390 (O) | £23,755 (O) | £15,544 (O) | £11,438 (O) | £8974 (O) | £7332 (O) | £6159 (O) | £5279 (O) | £4595 (O) |
| At-risk children | £20,845 (Z) | £10,199 (Z) | £6651 (Z) | £4877 (Z) | £3812 (Z) | £3102 (Z) | £2595 (Z) | £2215 (Z) | £1919 (Z) |
| Healthy adults | £59,300 (O) | £29,349 (O) | £19,366 (O) | £14,374 (O) | £11,379 (O) | £9382 (O) | £7956 (O) | £6887 (O) | £6055 (O) |
| At-risk adults | £20,928 (Z) | £10,302 (Z) | £6960 (Z) | £4989 (Z) | £3926 (Z) | £3218 (Z) | £2711 (Z) | £2332 (Z) | £2037 (Z) |
| Elderly | £20,472 (Z) | £10,090 (Z) | £6629 (Z) | £4898 (Z) | £3860 (Z) | £3168 (Z) | £2674 (Z) | £2303 (Z) | £2014 (Z) |
In each of these analyses, the same strategies that were excluded from the ICER calculations in the base-case analysis were also ruled out here. Hence, altering the probability that ILI is influenza did not affect the relevant comparison providing the basis for the ICER estimate for each subgroup. In all cases (with the exception of the elderly subgroup when the probability that ILI is influenza was 0.8 or higher) the ICER represents the comparison between the non-dominated NI strategy (oseltamivir in healthy adults and healthy children and zanamivir in at-risk populations) and no antiviral treatment. As the results indicate, the ICER estimates are sensitive to alternative estimates of the probability that ILI is influenza. This was most apparent in the otherwise healthy populations, with ICER estimates exceeding £20,000 per QALY when the probability was reduced to 0.2 in both children (regardless of whether hospitalisation and mortality benefits were considered or not) and adults (when hospitalisation and mortality benefits were excluded). Results in the at-risk populations remained more robust to this source of variation, with ICERs consistently lower than £20,000 per QALY in all scenarios except the most extreme considered (i.e. when the probability that ILI is influenza is reduced to 0.1 and hospitalisation and mortality benefits are excluded). These results can also be interpreted alongside the 95% CrIs associated with this probability in both children (CrI 0.26 to 0.79) and adults (CrI 0.21 to 0.66). These represent the variability in the probability that ILI is influenza both within influenza seasons and across seasons according to the current threshold used to determine that influenza is circulating in the community.
Scenario 6: Probability that ILI is influenza and increased GP consultations
Although the results of Scenario 5 indicate that the overall ICER results appear quite robust to relatively large deviations from the estimates employed in the base-case analysis, the strength of these conclusions needs to be related to another core assumption of the model: that a positive recommendation in particular populations would not result in any additional GP consultations or, if consultations did increase, this would not lead to a reduction in the associated probability that ILI is influenza (and hence would not alter the ICER estimates). However, the results of Turner et al. 46 demonstrated that relatively small changes to both the probability that ILI is influenza and the underlying GP consultation rate can have important impacts on the subsequent ICER estimates. Although the evidence related to this link remains highly uncertain, a number of separate scenarios are considered. These scenarios are undertaken only in those populations in which NI treatment is not currently recommended by existing guidance, namely otherwise healthy adults and healthy children.
In the absence of suitable data to inform the estimates considered in these scenarios, we employed comparable ranges to those reported by Turner et al. , representing absolute increases of between 5% and 15% in terms of the proportion of the populations presenting to a GP and similar associated absolute reductions in the probability that ILI is influenza. The absolute reductions in the probability that ILI is influenza are applied to the base-case estimates applied to children (0.56) and adults (0.41). Consequently, nine possible combinations are considered in two separate scenarios (including and excluding hospitalisation and mortality benefits). Again, for ease of presentation, only the ICER of the non-dominated NI is presented based on a comparison with standard care.
In common with Turner et al. 46 these results, reported in Tables 84–87, indicate that relatively minor changes in the probability that ILI is influenza, when combined simultaneously with changes in the probability that an individual consults a GP, lead to more marked variation in the subsequent ICER estimates. This was most evident in the adult population, primarily due to the fact that while the same absolute decrements were applied to both populations, in terms of the probability that ILI is influenza, the baseline estimate to which these were applied remains higher in the subgroup of healthy children (0.56 versus 0.41).
| Subgroup | Probability that ILI is influenza (–5%) | Probability that ILI is influenza (–10%) | Probability that ILI is influenza (–15%) | ||||||
|---|---|---|---|---|---|---|---|---|---|
| GP (+5%) | GP (+10%) | GP (+15%) | GP (+5%) | GP (+10%) | GP (+15%) | GP (+5%) | GP (+10%) | GP (+15%) | |
| Healthy children | £8798 (O) | £9711 (O) | £10,625 (O) | £9928 (O) | £10,940 (O) | £11,951 (O) | £11,331 (O) | £12,465 (O) | £13,959 (O) |
| Healthy adults | £7023 (O) | £7754 (O) | £8436 (O) | £8332 (O) | £9124 (O) | £9915 (O) | £10,076 (O) | £11,019 (O) | £11,962 (O) |
| Subgroup | Probability that ILI is influenza (–5%) | Probability that ILI is influenza (–10%) | Probability that ILI is influenza (–15%) | ||||||
|---|---|---|---|---|---|---|---|---|---|
| GP (+5%) | GP (+10%) | GP (+15%) | GP (+5%) | GP (+10%) | GP (+15%) | GP (+5%) | GP (+10%) | GP (+15%) | |
| Healthy children | £9614 (O) | £10,528 (O) | £11,441 (O) | £10,744 (O) | £11,756 (O) | £12,768 (O) | £12,147 (O) | £13,281 (O) | £14,415 (O) |
| Healthy adults | £17,590 (O) | £19,174 (O) | £20,757 (O) | £20,518 (O) | £22,356 (O) | £24,195 (O) | £24,568 (O) | £26,759 (O) | £28,950 (O) |
Clearly the key question here is whether these differences in the probability that ILI is influenza estimated for children and adults are meaningful or not, and ultimately what the actual probability that ILI is influenza is at a national level for the separate populations. Clearly, if the difference between healthy adults and healthy children is not considered reasonable, then the subsequent ICERs for these separate populations should be carefully considered. Furthermore, if the ‘true’ probability that ILI is influenza is lower in both groups than the estimates derived from routine surveillance data, then the estimates presented in Scenario 6 are likely to under-represent the potential variability in the subsequent ICER estimates and also overstate the potential cost-effectiveness of NIs across these scenarios. For example, reducing the probability that ILI is influenza in healthy children from the base-case estimate (0.56) to 0.3 in itself approximately doubles the ICER estimate (£14,696 versus £7038, including hospitalisation and mortality benefits). Clearly if the 0.3 estimate was then applied as the base-case probability to which the absolute decreases in the probability that ILI is influenza are applied, then the ICER estimates would increase more dramatically.
Scenario 7: Viral resistance
The base-case analysis assumes that viral strains are not resistant to either oseltamivir or zanamivir. We have previously described in Chapter 1, Resistance to antiviral drugs, that potential concerns are emerging related to issues of viral resistance and also that the different profiles of the separate NIs mean that resistance could conceivably be higher for oseltamivir. In order to examine the robustness of the base-case ICER to this issue, a number of alternative resistance rates were applied to oseltamivir in the model. As oseltamivir was ruled out on the grounds of dominance/extended dominance in at-risk groups, this scenario was undertaken only in the otherwise healthy populations (on the basis that the ICER estimates in at-risk groups would not be affected by this alteration).
Table 88 reports the impact on the ICER results for the healthy populations, applying estimates of resistance between 1% and 10% across all individuals (and viral subtypes). These ranges cover the potential ranges derived from the most recent UK data surveillance data from 2007–8, in which the proportion of H1N1 viruses was high, as well as earlier years in which the proportion of H1N1 viruses was lower as reported in Chapter 1, Resistance to antiviral drugs.
| Subgroup | 1% | 2.5% | 5% | 7.5% | 10% |
|---|---|---|---|---|---|
| Healthy children | £7123 | £7259 | £7495 | £7743 | £8005 |
| Healthy adults | £5584 | £5682 | £5851 | £6030 | £6218 |
The results demonstrate that the ICER results from the base-case analysis appear robust to this issue. However, the issue of resistance also needs to be considered in a wider context that is not considered within the model presented here. Clearly, the more widespread use of NIs in otherwise healthy populations could increase the overall resistance levels and this, in itself, could have related implications for the overall cost-effectiveness in other at-risk groups, as well as in other indications (e.g. prophylactic use). Hence, while the results appear robust, they also need to be interpreted with a degree of caution, given the scope of the decision problem addressed here.
Scenario 8: Quality of life decrements applied to symptom duration
The model inputs section has previously described in detail the use of the VAS TTO data to estimate QALY gains due to shorter symptom duration as part of the base-case analysis. This is based on a relatively complex calculation which takes account of uncertainty both in terms of the underlying duration of illness for the different populations as well as the difference in symptom duration for the NI treatments. However, uncertainty inherent in the utility values is not considered. These are two sources of uncertainty that therefore need further consideration. The first relates to the uncertainty in the utility values themselves (i.e. the actual decrement in QoL applied to characterise the impact of influenza). The literature search that was undertaken in relation to QoL did not identify alternative estimates that were considered to provide more robust estimates than those adopted here. However, such a search may not actually address what could be considered an equally important source of remaining uncertainty. This second source of uncertainty relates to what this decrement should actually represent. That is, should this decrement reflect the ‘average’ impact on QoL over the course of the influenza illness or, alternatively, should this represent the ‘worst’ day of the illness or even the period close to the end of the illness? This source of uncertainty is important as it is closely related to the assumption about the point at which, over the course of an influenza illness, the reduction in symptom duration reported for the NIs is being achieved.
Tables 89 and 90 report the results of a detailed series of scenarios which are used to address these issues. The approach employed in the base case is equivalent to applying a utility decrement in the region of 0.4–0.5 over the entire duration of illness for otherwise healthy adults and children and 0.5–0.6 for at-risk groups. In terms of the first source of uncertainty considered, the table presents alternative estimates representing larger and smaller decrements than those employed in the base case.
| Subgroup | QoL decrements | ||||||||
|---|---|---|---|---|---|---|---|---|---|
| 0.1 | 0.2 | 0.3 | 0.4 | 0.5 | 0.6 | 0.7 | 0.8 | 0.9 | |
| Healthy children | £29,115 (O) | £15,369 (O) | £10,440 (O) | £7904 (O) | £6360 (O) | £5320 (O) | £4573 (O) | £4010 (O) | £3570 (O) |
| At-risk children | £3843 (Z) | £3088 (Z) | £2581 (Z) | £2217 (Z) | £1943 (Z) | £1729 (Z) | £1558 (Z) | £1417 (Z) | £1300 (Z) |
| Healthy adults | £8234 (O) | £7269 (O) | £6506 (O) | £5888 (O) | £5377 (O) | £4948 (O) | £4582 (O) | £4267 (O) | £3992 (O) |
| At-risk adults | £4266 (Z) | £3615 (Z) | £3136 (Z) | £2769 (Z) | £2479 (Z) | £2244 (Z) | £2050 (Z) | £1887 (Z) | £1747 (Z) |
| Elderly | £652 (O) |
£643 (O) £732 (Z) |
£622 (Z) | £599 (Z) | £579 (Z) | £560 (Z) | £542 (Z) | £525 (Z) | £509 (Z) |
| Subgroup | QoL decrements | ||||||||
|---|---|---|---|---|---|---|---|---|---|
| 0.1 | 0.2 | 0.3 | 0.4 | 0.5 | 0.6 | 0.7 | 0.8 | 0.9 | |
| Healthy children | £32,495 (O) | £17,053 (O) | £11,651 (O) | £8822 (O) | £7098 (O) | £5938 (O) | £5104 (O) | £4475 (O) | £3984 (O) |
| At-risk children | £18,402 (Z) | £9541 (Z) | £6440 (Z) | £4861 (Z) | £3903 (Z) | £3261 (Z) | £2800 (Z) | £2453 (Z) | £2183 (Z) |
| Healthy adults | £59,684 (O) | £31,691 (O) | £21,573 (O) | £16,352 (O) | £13,166 (O) | £11,019 (O) | £9474 (O) | £8309 (O) | £7399 (O) |
| At-risk adults | £26,606 (Z) | £13,863 (Z) | £9373 (Z) | £7080 (Z) | £5689 (Z) | £4754 (Z) | £4084 (Z) | £3579 (Z) | £3185 (Z) |
| Elderly | £23,691 (Z) | £13,057 (Z) | £9012 (Z) | £6881 (Z) | £5564 (Z) | £4671 (Z) | £4025 (Z) | £3536 (Z) | £3152 (Z) |
As expected, the ICERs become more (less) favourable when higher (lower) decrements are applied. However, interestingly, the results demonstrate that the ICERs remain relatively stable when higher decrements are applied but appear much more sensitive to lower decrements. This finding is particularly important in terms of the second source of uncertainty that needs to be considered. That is, at which point over the distribution of the duration of influenza illness is the duration of symptom reduction being achieved? This is also potentially important, in particular subgroups, in terms of which NI is considered optimal. For example, applying a smaller decrement in the order of 0.1–0.2 results in oseltamivir no longer being ruled out on the grounds of dominance or extended dominance by zanamivir in elderly patients. This is because, while zanamivir is associated with higher reductions (on average) in mean symptom duration in the model, oseltamivir is assumed to have more favourable (on average) relative risk reductions associated with complications. As the decrements applied to symptoms become smaller, the relative contribution of hospitalisation and mortality becomes more important in particular risk groups, such that applying a decrement of 0.1 for symptoms results in zanamivir actually becoming dominated by oseltamivir in the elderly group.
The approach employed in the base case is akin to assuming that the gains in symptom duration are occurring across the entire distribution of illness durations. Hence, the decrements in QoL assigned reflect the ‘average’ QoL impact of influenza over its entire course. However, in the absence of more reliable data, it might equally be assumed that any gains in symptom duration achieved with the use of NIs may actually occur at the start or tail end of the distribution of illness duration. The previous results have demonstrated that if these gains are occurring earlier in the distribution, implying that a higher decrement than the average applied might be more appropriate, the subsequent ICERs do not appear markedly affected. However, if these gains are being achieved closer to the end of the influenza illness, when lower decrements than the ‘average’ may be appropriate, then this may have a more marked effect on the subsequent results.
For a scenario based on the tail end of the distribution, there remains a question over what an appropriate decrement might be in these instances. One approach might be to consider the mean symptom durations applied to no antiviral treatment (approximately 9–10 days in healthy populations and 14 days in the at-risk populations) and consider the TTO decrements from the VAS scores for the days immediately preceding these. The equivalent decrements for healthy populations for these times are clearly lower than the average, with a decrement of about 0.22–0.23 for healthy populations and 0.45 for at-risk populations. Application of these decrements would not significantly alter the ICER estimates for the at-risk groups; however, the decrements applied to healthy populations lead to marked increases in the ICERs (even increasing to more than £20,000 per QALY in the otherwise healthy adult population). Consequently, the results appear more sensitive in otherwise healthy populations than in the at-risk groups to the uncertainties that were not considered within the base-case approach to modelling the QoL associated with symptomatic benefits.
Scenario 9: Additional training costs associated with the use of zanamivir
In terms of the specific costs associated with the NIs, the base-case analysis considers only the acquisition costs of the drugs themselves. An important source of uncertainty is whether patients need training to administer zanamivir (Diskhaler) effectively. However, who would provide training to an individual patient (e.g. GP, practice nurse, pharmacist), the duration of training required or whether this would represent a cost to the NHS or not all remain unclear. In the absence of a clear perspective on this issue, a separate scenario was undertaken assuming that the GP would provide guidance to the patient. The cost of this was quantified by considering the cost difference between a routine GP consultation and one requiring an extended consultation (£14). 160 Given the various uncertainties which remain, this estimate is varied by 50% in either direction (£7 and £21). Separate scenarios are presented only in those populations for which zanamivir was not ruled out previously on grounds of dominance or extended dominance (as imposing an additional cost in this instance would simply strengthen this finding).
Table 91 reports the results from this scenario. The results indicate that oseltamivir is no longer ruled out in the majority of scenarios considered for the separate at-risk population. This contrasts with the base case results in which oseltamivir was consistently ruled out by zanamivir. In these scenarios, the additional value attributed to the reduction in symptom benefits assumed for zanamivir (relative to both oseltamivir and usual care) is becoming partly offset by the increased cost of training.
| Subgroup | Additional costs | ||
|---|---|---|---|
| £7 | £14 | £21 | |
| At-risk children | £2824 (Z) |
£3016 (O) £5079 (Z) |
£3016 (O) £7591 (Z) |
| At-risk adults |
£3529 (O) £3551 (Z) |
£3529 (O) £7044 (Z) |
£3529 (O) £10,537 (Z) |
| Elderly |
£612 (O) £4291 (Z) |
£612 (O) £8447 (Z) |
£612 (O) £12,603 (Z) |
Scenario 10: Reduced quality-adjusted life expectancy in at-risk groups
In the absence of more appropriate data for the at-risk populations, the remaining life expectancy and QoL estimates used to populate the base-case analysis are derived from general population estimates. The generalisability of both of these aspects to an at-risk population may be subject to uncertainty and it might be reasonable to consider that both the remaining life expectancy and/or QoL would be lower in at-risk groups than in the general population. Hence, a separate scenario was employed to more formally consider the robustness of the base-case results to reductions in the estimates used to value the QALYs lost due to premature mortality in these groups.
In both the at-risk children and adult populations, the QALE was reduced by between 10% and 50%. These results are reported in Table 92. The revised ICERs remained robust to this adjustment.
| Subgroup | Reduced quality-adjusted life expectancy | ||
|---|---|---|---|
| –10% | –25% | –50% | |
| At-risk children | £1813 (Z) | £1913 (Z) | £2106 (Z) |
| At-risk adults | £2372 (Z) | £2542 (Z) | £2888 (Z) |
Scenario 11: Adjustment to (baseline) complication and mortality rates to adjust for influenza and other ILI
In common with both Turner et al. 46 and the Roche submission,128 the baseline rates of complications were derived from a large UK population-based study using the GPRD, Meier et al. 15 It should be noted that this includes subjects with a diagnosis of influenza or other ILI. The underlying assumption of the model is, therefore, that while the NIs are only effective in terms of true influenza, the baseline complication and mortality rates are similar in true influenza and other ILI (e.g. RSV). However, recent studies have demonstrated that influenza may contribute proportionally more to overall mortality than RSV in particular populations. 16
In order to consider this uncertainty in the model, a separate scenario was undertaken by applying the relative proportion of mortality reported for pneumonia and influenza deaths attributed to influenza and RSV respectively reported by Thompson et al. 16 This proportion was used as the basis for adjusting both the complication and the mortality rates assigned to true influenza and other ILI in the model. The results of this are reported in Table 93. In each subgroup, the ICER was more favourable than the equivalent result from the base-case analysis, although the ICERs were not markedly different.
| Subgroup | ICER | |
|---|---|---|
| Oseltamivir | Zanamivir | |
| Healthy children | £6448 | D |
| At-risk children | ED | £1366 |
| Healthy adults | £3752 | D |
| At-risk adults | ED | £1469 |
| Elderly | £231 | £232 |
Scenario 12: Equivalent effectiveness for NIs (best-case and worse-case scenarios)
In both the base-case analysis and each of the scenarios considered to this point, the model has applied treatment-specific estimates for oseltamivir and zanamivir in relation to estimates of both symptom duration and the relative risk of antibiotic use (and hence structurally also hospitalisations and mortality). However, these estimates are derived on the basis of indirect evidence. Furthermore, the results of the Bayesian synthesis in terms of symptom duration showed that the 95% CrI obtained from an indirect comparison of oseltamivir and zanamivir consistently overlapped. In the absence of direct evidence from head-to-head studies reporting the relative effectiveness of oseltamivir and zanamivir, an important source of uncertainty is whether a decision-maker would consider it appropriate to make separate recommendations regarding each individual NI.
To address this uncertainty, a separate scenario was undertaken assuming that oseltamivir and zanamivir are equivalent in terms of clinical effectiveness. These scenarios then consider ‘best case’ and ‘worse case’ assumptions related to the mean differences in symptom duration and the relative risks of antibiotic use. In the best-case scenario, the model applies the highest mean reduction in symptoms from the separate NI results and also the highest relative risk reduction (and equally the lowest for both in the worse-case scenario).
These results are presented in Tables 94 and 95 including and excluding hospitalisation and mortality benefits. In all scenarios, except otherwise healthy adults, the range of ICERs remained below £20,000 per QALY. However, the range of ICERs for otherwise healthy adults exceeded this threshold in the worse-case analysis (£5537–22,364).
| Subgroup | ICER for NI | |
|---|---|---|
| Best case | Worse case | |
| Healthy children | £7035 | £10,656 |
| At-risk children | £1711 | £3114 |
| Healthy adults | £5521 | £7007 |
| At-risk adults | £2219 | £3639 |
| Elderly | £534 | £646 |
| Subgroup | ICER for NI | |
|---|---|---|
| Best case | Worse case | |
| Healthy children | £7852 | £11,711 |
| At-risk children | £3312 | £9745 |
| Healthy adults | £13,985 | £22,161 |
| At-risk adults | £4838 | £14,157 |
| Elderly | £4749 | £13,317 |
Discussion
The results from the base-case analysis demonstrated important variation across the separate populations in terms of the cost-effectiveness results. In general, the ICER estimates were lower (and hence more favourable) in at-risk populations than in otherwise healthy populations. This finding partly reflects the inclusion of potential benefits attributed to reductions in hospitalisation and mortality and the higher underlying baseline rates of these events in at-risk populations. However, it is also worth noting that differences in mean symptom duration were also assumed to be larger for at-risk populations than those for healthy populations, based on the results from the Bayesian synthesis of symptom data (with the highest gains estimated for zanamivir).
Within each of the separate at-risk populations considered, zanamivir appeared the optimal NI treatment based on cost-effectiveness considerations. This reflects the higher reduction in the mean duration of symptoms obtained with zanamivir for the at-risk populations, rather than differences attributed to a reduction in complications (which, on average, were assumed to favour oseltamivir in both the at-risk and the healthy populations).
In contrast, oseltamivir was considered the optimal NI treatment for healthy populations (both adults and children). This reflects the higher (on average) reduction in the mean duration of symptoms for oseltamivir estimated from the Bayesian synthesis, as well as the higher (on average) reduction in complications assumed in the economic model for this NI.
The strength of these conclusions also needs to be considered in the context of the findings from the earlier sections, as well as the range of scenarios subsequently considered employing alternative assumptions. In particular, the estimates applied in the economic model for both symptom reduction and reduction in complications are derived from indirect comparisons made in the absence of head-to-head RCT evidence. In terms of symptom reductions, the 95% CrI for the individual NIs derived from the Bayesian synthesis were found to consistently overlap each other. The only exception to this related to the ITTI analysis for the at-risk group in terms of the time to resolution of symptoms and return to normal activities (both median and mean estimates). For these outcomes, and within this population, the 95% CrI for the difference between zanamivir and oseltamivir did not include zero, suggesting a statistically significant difference (with an associated probability that zanamivir was optimal of 0.99).
The result for the at-risk group from the Bayesian synthesis of symptom data is particularly important as these estimates are applied directly in the base-case analysis of the economic model. This also largely explains why zanamivir is identified as the optimal intervention in the at-risk populations and not in the otherwise healthy populations. The strength of this finding also needs to be considered in relation to the potential inconsistency noted in the RCT data in the at-risk children group. When this group was excluded from the synthesis, the associated 95% CrI for the difference between zanamivir and oseltamivir included zero, suggesting a finding of no significant treatment difference. However, even after the potential inconsistency in evidence was excluded, zanamivir remained the optimal intervention in the at-risk group based on both symptom data (probability of zanamivir being optimal = 0.95) and in terms of subsequent cost-effectiveness considerations. Finally, it should be noted that there remains uncertainty regarding whether patients require training to administer zanamivir and the potential additional costs that this may accrue. When additional training costs were included as part of a separate scenario, oseltamivir was no longer ruled out by zanamivir based on grounds of either dominance or extended dominance in at-risk populations.
In terms of the otherwise healthy populations, the mean reductions in terms of symptom duration between the NIs were comparatively small. Hence, although one or other of the NIs was consistently found to be the optimal treatment in the cost-effectiveness model, the resulting differences in terms of the absolute estimates of mean costs and QALYs for the separate NIs were relatively minor. A similar finding also eventually emerged in terms of the cost-effectiveness results in the at-risk population. While more favourable results were assumed in terms of symptom benefits for zanamivir, these were partly (or even wholly in particular scenarios) offset by the more favourable reduction in complications assumed for oseltamivir. Consequently, differences in terms of the absolute estimate of the mean costs and QALYs for the two separate NIs were, as a whole, relatively small across all populations.
The overall difference between the cost-effectiveness results for the separate scenarios including and excluding potential hospitalisation and mortality benefits also needs to be put in the context of the conclusions from the review of clinical effectiveness. In general, the data related to complications were considered limited and while the results appeared relatively strong in terms of reduction in antibiotic use with both NIs, there were limited data with which to conclude that this would be generalisable to the reductions in hospitalisation and mortality subsequently assumed in the economic model. Again, as with the symptom data, there was no head-to-head evidence to inform the relative effectiveness of the individual NIs and hence some caution is needed in interpreting the subsequent estimates based on the indirect evidence considered which, on average, appear to favour oseltamivir. The biological and clinical plausibility of the differences applied in the model in terms of symptoms and complications also needs to be considered.
Across the numerous separate scenarios undertaken, the overall conclusions and ICER estimates in the at-risk populations appeared remarkably robust to a wider range of alternative assumptions. However, in a limited number of scenarios, oseltamivir was no longer ruled out on the grounds of dominance or extended dominance. This demonstrates how the relative contribution of symptomatic benefits (which favoured zanamivir in the at-risk populations) and complications (which favoured oseltamivir) can alter the overall cost-effectiveness results as these separate aspects are varied across the alternative sets of assumptions.
The ICER results appeared more sensitive in the otherwise healthy populations. However, zanamivir remained consistently dominated by oseltamivir in both adults and children across the separate scenarios. The base-case estimate of the ICER of oseltamivir compared with standard care was sensitive to a number of key assumptions, namely:
-
the exclusion of hospitalisation and mortality benefits with NI treatment
-
the probability that ILI is influenza
-
the potential link between a positive recommendation, increased consultations with health-care providers and the subsequent estimate of the probability that ILI is influenza
-
the decrement applied to quantify the impact of influenza on QoL and the assumption about when the mean reductions in symptom duration were being achieved (i.e. across the entire illness period or closer to the beginning or end of the illness) with NI treatment compared with standard care.
Finally, it is important to compare the results of the cost-effectiveness model presented here (referred to from this point onwards as the ‘York model’) with the key results from other relevant models (Turner et al. 46 and Roche128) considered in detail earlier as part of the cost-effectiveness review section. This allows any major discrepancies to be identified and explained where possible. However, as the York model and Turner et al. 46 models were undertaken at different times, some of these differences will invariably simply reflect the guidance (e.g. choice of discount rate) or data (e.g. the costs of the NIs) relevant at a particular point, as opposed to different analytic approaches and/or assumptions.
Tables 96 and 97 presents a comparison of results from the three different models in the particular populations considered in each. These are presented separately using the base-case set of assumptions in each and considering scenarios both including (Table 96) and excluding (Table 97) hospitalisation and mortality benefits. The ICER results from Turner et al. 46 have been re-estimated here employing similar decision rules to the York model, enabling a simultaneous comparison of both NIs and standard care. This contrasts with the separate pair-wise comparisons originally presented by Turner et al. Similarly, in the absence of results from the Roche model excluding hospitalisation and mortality benefits, these were re-estimated using the same approach applied within the York model (i.e. by setting the probability of hospitalisation and influenza mortality to zero).
| Subgroup | ICER | |
|---|---|---|
| Oseltamivir | Zanamivir | |
| York model | ||
| Healthy children | £7035 | D |
| At-risk children | ED | £1752 |
| Healthy adults | £5521 | D |
| At-risk adults | ED | £2270 |
| Elderly | ED | £562 |
| Turner et al.46 | ||
| Children | £11,381 | D |
| At-risk children | Not reported separately | Not reported separately |
| Healthy adults | £4729 | D |
| At-risk adults | £3205 vs zanamivir | £3016 vs usual care |
| Residential care elderly | Dominated by zanamivir | Dominates usual care |
| Roche128 | ||
| Children 1–5 | £4687 | Not relevant comparator |
| Children 1–12 | £5992 | D |
| At-risk children | Not reported separately | Not reported separately |
| Healthy adults | £5452 | D |
| At-risk adults | £652 | D |
| Elderly | Not reported separately | Not reported separately |
| Subgroup | ICER | |
|---|---|---|
| Oseltamivir | Zanamivir | |
| York model | ||
| Healthy children | £7852 | D |
| At-risk children | ED | £3327 |
| Healthy adults | £13,985 | D |
| At-risk adults | ED | £4850 |
| Elderly | ED | £4763 |
| Turner et al.46 | ||
| Children | £19,461 | ED |
| At-risk children | Not reported separately | Not reported separately |
| Healthy adults | £19,015 | D |
| At-risk adults | ED | £17,289 |
| Residential care elderly | ED | £16,819 |
| Rochea | ||
| Children 1–5 | £12,152 | Not relevant comparator |
| Children 1–12 | £18,144 | D |
| At-risk children | Not reported separately | Not reported separately |
| Healthy adults | £20,283 | D |
| At-risk adults | £8937 | D |
| Elderly | Not reported separately | Not reported separately |
Despite the different structures and assumptions employed, the results of the York model and Turner et al. ,46 including hospitalisation and mortality benefits, were broadly consistent in their findings for the comparable populations considered. Zanamivir was dominated by oseltamivir in both models in the healthy adult population. The subsequent ICERs for oseltamivir compared with standard care were also very similar for this population.
A similar finding was also observed in the healthy children population (York model) and the overall children population (Turner et al. ). 46 The more favourable ICERs estimated in the York model were driven largely by the higher probability that ILI is influenza applied therein (0.56 versus 0.48), resulting in a higher proportion of children who are assumed to benefit from treatment with an NI.
The ICER estimates for the at-risk adult population also appeared very consistent across the two models. The more favourable results reported in the ‘residential care’ elderly population by Turner et al. for zanamivir (which dominated both usual care and oseltamivir) than the ICER of £562 (zanamivir versus usual care) in the elderly population in the York model are largely due to the higher underlying hospitalisation rate assumed in Turner et al. 46 for this specific setting (14% hospitalisation rate compared with 1.31% applied to the broader elderly population considered in the York model). No separate analysis of an at-risk children population was undertaken by either Turner et al. or Roche.
Although Roche applied the most conservative estimate of the probability that ILI is influenza (0.31 in all populations), their subsequent ICER results were the most favourable of the three models in each of the populations (with the exception of the ICER for otherwise healthy adults in which Turner et al. 46 reported the lowest ICER). Roche also consistently reported zanamivir to be dominated by oseltamivir in all populations considered, as opposed to the York model and Turner et al. which identified different NIs to be optimal depending upon the particular population.
The major set of assumptions leading to the more favourable ICERs reported in the Roche submission have previously been described in detail (e.g. in relation to QoL benefit related to symptoms, application of hospitalisation rates from the USA and estimates of the remaining life expectancy used in particular populations). These assumptions act in favour of NI treatment and more than offset the more conservative estimate applied to the probability that ILI is influenza. The consistent finding that oseltamivir dominates zanamivir has previously been attributed to the assumption of equivalent clinical effectiveness for both oseltamivir and zanamivir and the error regarding the revised price of zanamivir.
The more favourable assumptions employed within the Roche submission in relation to particular aspects become more evident when the separate models are compared excluding the potential benefits of hospitalisation and mortality. In this scenario, the ICER estimates for the comparable populations based on the Roche model are now markedly less favourable than those from the equivalent set of results based on the York model (demonstrating that the assumptions applied to these elements are key drivers of the base-case results presented by Roche).
The comparison between the York model and Turner et al. ,46 excluding hospitalisations and mortality, is reported in Table 97. This reveals more marked variation between the ICER estimates than in the previous comparison. However, there is consistency in the optimal treatment identified across the separate populations at a threshold of £20,000 per QALY. There are three key elements that appear to explain the differences in the subsequent ICER estimates: (1) the higher estimate applied to the probability that ILI is influenza in the York model for children (likely to lead to lower ICERs in this population); (2) the duration of symptoms and the data and methods employed; and (3) the alternative approaches to valuing QALY gains due to symptomatic benefits.
In terms of the approaches used to estimate the mean symptom durations, there appear to be two main differences that may result in the subsequent differences in the ICERs. Firstly, the York model includes additional data published since the earlier appraisal. Secondly, different methods are employed within the separate reviews to estimate the mean duration of symptoms. While the York model is based on a Bayesian synthesis of symptom data employing a Weibull distribution to estimate the mean duration from the median data reported in the RCTs, the model by Turner et al. 46 employs a more conventional meta-analysis with an exponential assumption to estimate mean durations. Despite the different approaches employed here, it is unlikely that differences in the alternative analytic approaches themselves are driving the resulting differences in the ICER. Rather, these differences are likely to be due to the approaches used to estimate the QALY gains attributed to reduction in the mean estimates of symptom duration.
We have previously noted that Turner et al. use the TTO (VAS) data reported in a number of the oseltamivir trials as a direct input into their model. Hence, the overall differences reported across the entire 21-day TTO data are used to estimate the mean QALY gains associated with oseltamivir (compared with standard care). Consequently, the estimates of mean symptom duration synthesised from the wider set of RCTs are used only as a method to adjust the mean QALY gains estimated for oseltamivir in order to obtain the gains for zanamivir. Hence, while the relative differences in QALY gains between oseltamivir and zanamivir are informed by the wider set of RCTs considered in the earlier review, the absolute QALY gains associated with oseltamivir and standard care are derived entirely from the subset of the oseltamivir RCTs in which the VAS data were reported.
In contrast, the York model uses the results from the Bayesian synthesis as the basis for estimating the QALY gains for each of the NI treatments and standard care. This approach then employs the placebo TTO data as a ‘baseline’. The mean duration of symptoms estimated from the synthesis for placebo is then used to estimate the corresponding ‘average’ decrement in utility over this period. The QALY gains for oseltamivir and zanamivir are then estimated based on the reductions in mean symptom duration reported for each treatment (i.e. the decrement is not applied to these additional days). Consequently the York model and Turner et al. employ different assumptions and data to this aspect. In general, the York model will result in higher QALY gains, as invariably it will be based on mean symptom durations that are shorter than the 21-day data employed in the base-case analysis of Turner et al. Consequently, the ‘average’ decrement will be greater than that considered by Turner et al.
Hence, although the initial comparison of the York model and Turner et al. , including hospitalisation and mortality benefits, revealed largely consistent findings and also comparable ICER results, the differences observed in symptoms ultimately imply that these differences are offset by other assumptions in the Turner et al. ‘extrapolated’ model. In the children analysis this is likely to be due to the inclusion of complication data for both at-risk and healthy children in the population being considered by Turner et al. , resulting in a higher baseline risk than the ‘healthy’ children population considered in the York model. The remaining differences in the otherwise healthy and at-risk adult group are likely to be due to a number of different elements, including the different probabilities that ILI is influenza (0.41 for adults in the York model and 0.46 in Turner et al. ), the different underlying hospitalisation rates assumed, the different relative risks employed as proxies for reduction in hospitalisation and mortality, and the different QALEs applied to premature mortality.
Important differences were noted between the at-risk adult estimates for the remaining QALE. Although both approaches were based on general population estimates of remaining life expectancy – estimates applied in Turner et al. (4.1 years; 1.5% discount rate) were markedly different from those employed by York (14.66 years; 3.5% discount rate). Indeed, the estimates used in Turner et al. were more comparable to the estimates applied to the elderly population in the York model (4.20 years; 3.5% discount rate). In the earlier review section it was noted that the assumption employed in the at-risk population by Turner et al. appeared to have been derived from estimates from a population aged over 65 years (estimates in the at-risk and residential care elderly populations were the same). Hence, the results for the at-risk group reported by Turner et al. appear more representative of an elderly at-risk population.
Despite the differences noted in the modelling approaches, assumptions and data inputs, the results of the York model and those reported previously by Turner et al. were consistent in their findings that the ICER estimates appear more favourable in at-risk populations than in the otherwise healthy populations. Similarly, the various scenarios considered in both models demonstrate that the results in otherwise healthy populations were sensitive to a number of common issues and uncertainties.
Chapter 6 Discussion
Statement of principal findings
Clinical evaluation
This review showed that treatment with zanamivir or oseltamivir, when compared with placebo, generally reduced the median duration of symptoms and median time to return to normal activity across all subgroups. Limited data were available on rates of complications and adverse events; therefore, there is considerable uncertainty around these effects and little evidence of an overall impact of either drug on these outcomes. The most consistent data and the strongest evidence related to antibiotic use, with both zanamivir and oseltamivir resulting in reductions in this outcome.
Both this and the previous review by Turner et al. 46 found that zanamivir and oseltamivir generally reduced the median duration of symptoms and median time to return to normal activity when compared with placebo.
Comparisons with placebo
When compared with placebo, zanamivir reduced the median duration of symptoms by between approximately 0.5 and 1 days, and oseltamivir by between 0.5 and 1.5 days in healthy adults. The median reduction in the time taken to return to normal activity was about 0.5 days with zanamivir and 1.5–2.5 days with oseltamivir. Although these results were statistically significant, the absolute effects were small and their clinical significance in an otherwise healthy population questionable.
For the at-risk subgroups, effect sizes for differences in symptom duration were generally larger, and potentially more clinically significant, than those seen in healthy adults. However, there was greater uncertainty around these results with estimates often failing to reach statistical significance, although the direction of effect remained in favour of treatment with NIs. For the overall at-risk population, treatment reduced the median duration of symptoms by approximately 1–2 days with zanamivir, and by 0.5–0.75 days with oseltamivir. A similar pattern was seen in the time taken to return to normal activity, with the median time being between 1 and 2 days with zanamivir and 0.75 and 2.5 (data for at-risk adults only) days with oseltamivir.
Data for adverse events and complication rates were inconsistently reported, and little overall difference between zanamivir or oseltamivir and placebo was observed. A considerable degree of uncertainty remains around these outcomes for all subgroups. The Turner et al. 46 review did not directly analyse data on complications or adverse effects.
We were unable to formally evaluate a number of associated clinical and implementation issues. Of primary importance is the impact of delayed initiation of treatment after the onset of symptoms, prior vaccination status, and the probability that a person presenting to their GP with an ILI had influenza (TPR). Other issues that may also be important include the use of antipyretics and other symptomatic relief on the time to alleviation of fever and all symptoms, and antiviral resistance. There was insufficient evidence available to undertake a formal assessment of the impact of these on the clinical effectiveness of NIs, and a thorough investigation of this would undoubtedly require obtaining individual patient data. While some of these factors have been explored further in the economic model (e.g. the impact of altering the TPR), additional investigation may be required.
A number of additional considerations that may also impact on the effectiveness and use of NIs became apparent during the course of the review. These included the incidence of bronchospasm with zanamivir in people with underlying respiratory disease, the apparent emergence of resistance in the influenza A H1N1 subtype to oseltamivir over the 2007–8 influenza season, and the increase in neuropsychiatric events associated with oseltamivir that has been observed primarily in children which has resulted in a recent revision of the labelling of both oseltamivir and zanamivir for health-care professionals in the USA. Furthermore, it has been suggested that during periods of increased influenza activity, the difficulty of obtaining a prescription within 48 hours of onset could be addressed by community pharmacists assisting with dispensing medications, or by the use of expectant treatment with NIs.While these particular issues were outside the scope of the review, some relate closely to the impact of delayed initiation of treatment after the onset of symptoms. A more formal evaluation of alternative management strategies should also be considered.
Bayesian multiparameter evidence synthesis
In the absence of head-to-head trials comparing zanamivir and oseltamivir directly, and given the lack of routinely available data on mean symptom duration required for the cost-effectiveness model, a separate Bayesian multiparameter evidence synthesis of symptom data with indirect comparisons was conducted.
A comparison of the individual pair-wise results for active treatment versus placebo derived from the multiparameter synthesis model with those from the standard meta-analyses indicated general consistency across the two approaches. However, the ‘borrowing of strength’ and consideration of wider evidence provided by the multiparameter synthesis model increased the precision of the subsequent estimates of effect sizes in particular populations.
Across all analyses and subgroups, the probability that an NI treatment was more effective than placebo was 100%. However, variation was observed across both clinical subgroups and the different sets of results (e.g. ITT versus ITTI) in terms of which NI treatment had the highest probability of being ‘best’ (as measured by reduction in symptom duration). For healthy adults, oseltamivir consistently had a higher probability of being the better treatment, while for at-risk populations zanamivir consistently had a higher probability of being better. The results for the otherwise healthy children were more varied across the separate analyses due to the more limited data available. The strength of these findings needs to be considered against the overall findings of the clinical effectiveness review, the indirect nature of these comparisons and the clinical (and biological) plausibility of the results.
Economic evaluation
The results from the Bayesian synthesis were combined with other relevant clinical effectiveness parameters (i.e. the relative treatment effect for complications) as well as other data related to costs and QoL in order to assess the cost-effectiveness of oseltamivir and zanamivir for the treatment of influenza.
The model considered the decision problem in the context of individuals presenting to a health-care provider who are eligible for treatment according to the respective licences for each of the NIs. Cost-effectiveness estimates for influenza treatment were presented for five separate subgroups: (1) otherwise healthy children aged 1–14 years, (2) at-risk children aged 1–14 years, (3) otherwise healthy adults aged 15–64 years; (4) at-risk adults aged 15–64 years; and (5) elderly (aged 65 years or over). A base-case analysis was undertaken including both symptomatic benefits as well as potential benefits associated with reductions in hospitalisation and mortality. A series of scenarios were also employed to reflect a wide range of alternative assumptions (e.g. the exclusion of benefits attributed to reductions in hospitalisation and mortality).
The results from the base-case analysis demonstrated important variation across the separate populations in terms of the cost-effectiveness results. In general, the ICER estimates were more favourable in at-risk populations than in the otherwise healthy populations. Within each of the separate at-risk populations considered, zanamivir appeared the optimal NI treatment based on cost-effectiveness considerations. This reflected the higher reduction in the mean duration of symptoms obtained with zanamivir for the at-risk groups, rather than differences attributed to a reduction in complications. In contrast, oseltamivir was considered the optimal NI treatment for healthy populations (both adults and children). This reflected the higher reduction in the mean duration of symptoms for oseltamivir, as well as the higher reduction in complications assumed in the economic model for this NI.
Despite the alternative parameters applied to estimate the relative effectiveness in terms of symptoms and complications for the individual NIs, the subsequent differences in terms of the absolute estimate of the mean costs and QALYs were relatively small across all populations.
Across the numerous scenarios considered, the overall conclusions and cost-effectiveness estimates in the at-risk populations appeared robust to a wider range of alternative assumptions. The ICER results appeared less robust in the otherwise healthy populations and cost-effectiveness estimates were potentially sensitive to a number of key aspects, including whether hospitalisation and mortality benefits arise with NI treatment; the probability that a patient presenting to a health-care provider actually has true influenza (as NI treatments were assumed to be effective only for these patients); the potential link between a positive recommendation, increased consultations with health-care providers and the subsequent estimate of the probability that a patient has true influenza; and the assumptions related to the QoL impact attributed to a reduction in symptom duration.
The overall cost-effectiveness results appeared generally consistent with the findings reported in the earlier review by Turner et al. Furthermore, the various scenarios considered in both models demonstrated a number of common issues and uncertainties leading to remaining uncertainties regarding the cost-effectiveness of NIs in the otherwise healthy populations. However, the ICER results for the at-risk populations reported here largely appeared more favourable overall and were more robust to alternative assumptions than in the earlier review. Indeed, the ICER estimates for the at-risk group remained below a threshold of £20,000 per QALY across all scenarios considered here with only one exception. In this instance, the probability that ILI is influenza in patients presenting to a GP had to be as low as 0.1 and potential benefits in terms of reductions in hospitalisation and mortality benefits had to be excluded.
The robustness of the overall cost-effectiveness results in the at-risk population, and with particular reference to the underlying probability that ILI is influenza, raises some important policy issues. Clearly the current model has considered the cost-effectiveness of NI treatment in accordance with the current licences of the treatments and hence for periods in which influenza is reported to be ‘circulating in the community’ by appropriate surveillance schemes. Within the model considered here, this has been interpreted using the current national threshold of 30 per 100,000 consultations. Hence, the probability estimate applied in the economic model was derived from RCGP data (2003–4 to 2006–7) for those weeks in which this threshold was met or exceeded. However, it should be recognised that this threshold was reached for only a total of 21 weeks across the period 2003–4 to 2006–7 (i.e. an average of 5.25 weeks in each season). The robustness of the cost-effectiveness results in at-risk groups to markedly lower estimates of the probability that ILI is influenza clearly poses the question of whether adopting a lower threshold could be a cost-effective approach to the management of influenza with NIs in the at-risk population. Clearly, any alternative to the current ‘threshold’ approach would need to ensure that the probability that ILI is influenza remains sufficiently high to ensure that subsequent treatment is still cost-effective. However, reanalysis of the RCGP data for the period 2003–4 to 2006–7 across all weeks of the influenza season (i.e. not just those weeks in which the threshold had been met) using the same ‘hierarchical’ approach employed as part of the base-case analysis revealed that the probability that ILI is influenza was, on average, 0.29 (ranging from between 0.26 and 0.34 in the separate populations considered). The cost-effectiveness results for the at-risk populations demonstrated that ICER estimates remained below £20,000 per QALY when these alternative probabilities were employed.
A formal consideration of the full range of potential strategies (including alternative thresholds) for the management of influenza was not possible within the constraints of this review. There remain a number of important issues, particularly related to the management of at-risk populations, that could be evaluated using cost-effectiveness analysis. A broader analysis could consider a wide range of possible strategies including those already highlighted such as the use of community pharmacists, near-patient testing and also ‘expectant’ treatment.
Strengths and limitations of the assessment
Strengths
We conducted a comprehensive and rigorous systematic review which addressed a clear research question using predefined inclusion criteria. Extensive literature searches were undertaken to locate all relevant studies, both published and unpublished, in any language. Efforts were made to contact authors and publishers to identify further studies and obtain additional information to ensure that as many studies could be included in the meta-analyses as possible. The study selection, data extraction, and quality assessment were conducted in duplicate, reducing the potential for error and bias. Subgroups of interest were identified a priori and analyses were pre-planned.
Compared with the previous review by Turner et al. ,46 the current review included a larger body of evidence. Data were sought from a wider range of sources (e.g. FDA medical reviews); 14 additional studies were included, six RCTs of zanamivir (three in healthy adults, one in the elderly, one in at-risk adults and one in children, which included a minority of at-risk participants) and eight of oseltamivir (four in healthy adults, one in an at-risk population of undefined age, one in at-risk children and two in adult populations, which included both healthy and at-risk individuals). In addition, data on influenza-related complications and adverse events were systematically reviewed and meta-analyses were undertaken when appropriate.
In the absence of head-to-head evidence on the relative effectiveness of the alternative antiviral treatments, an indirect comparison was also undertaken using Bayesian approaches to characterise the joint distribution of the efficacy of the antiviral treatments in terms of symptom duration. These estimates were subsequently used to inform the independent economic model which provided an overall framework for combining data from the synthesis of symptom outcomes, with the wider data on complications and other relevant parameters required for cost-effectiveness considerations.
Limitations
By necessity, this appraisal is limited by the data that could be extracted from published reports or provided by companies. Although the majority of included studies were described as randomised and double blind, details of the methods of randomisation, allocation concealment and particularly blinding were poorly reported; two trials were reported as being open label. Many trials were small and several recruited very small numbers of participants from each participating centre, often spanning several countries or continents. Most trials had short follow-up periods of either 21 or 28 days, which were inadequate to fully assess the rates of complications, hospitalisation and mortality. Despite this, there was often incomplete follow-up with losses to follow-up of more than 5% in approximately 25% of included studies. There is therefore uncertainty in the estimates of effectiveness in alleviation of symptoms and time to return to normal activity within some subgroups, particularly for the ‘at-risk ‘groups. Information on complications and adverse events was inconsistently reported and data were sparse. No trial recruited a population representative of the currently licensed population for the respective drug, limiting the ability to draw general conclusions about the use of antiviral drugs in the licensed population.
Uncertainties
The main areas of outstanding uncertainty are:
-
the impact of NI treatments on the rates of complications, hospitalisation and mortality associated with influenza
-
the effect size of antiviral drugs in at-risk populations
-
the relative effectiveness of the separate NIs
-
the probability that a patient presenting to a health-care provider has true influenza, as opposed to other ILI, and the impact of this upon clinical and cost-effectiveness of NIs
-
the impact on QoL of influenza symptoms and the relative effect of NI treatments on this aspect.
Conclusions
Implications for service provision
The overall clinical and cost-effectiveness results appeared generally consistent with the findings reported in the earlier review by Turner et al. 46
Zanamivir and oseltamivir reduced the median duration of symptoms and median time to return to normal activity, when compared with placebo, in all populations assessed, although effect size estimates were subject to greater uncertainty in at-risk subgroups. When data were available for adverse events and complication rates, there was little overall difference associated with the use of either zanamivir or oseltamivir when compared individually with placebo; the most consistent data and strongest evidence related to antibiotic use, with both zanamivir and oseltamivir resulting in statistically significant reductions in antibiotic use.
In general, the cost-effectiveness estimates were more favourable in at-risk populations than in the otherwise healthy populations, as well as being more robust to a range of alternative assumptions (e.g. variation of the probability that ILI is influenza and whether hospitalisation and mortality benefits arise with NI treatment). Within each of the separate at-risk populations considered, zanamivir appeared the optimal NI treatment based on cost-effectiveness considerations. In contrast, oseltamivir was considered the optimal NI treatment for healthy populations (both adults and children). However, the overall differences between the NIs, in terms of the absolute estimates of both costs and outcomes, were minor across all populations.
Recommendations for research
A well-designed, adequately powered head-to-head trial (with a placebo arm) in a representative at-risk population (with sufficient follow-up time to also evaluate complications) would reduce the uncertainty around the estimates of clinical effectiveness of antiviral drugs in this population. However, the conduct of such a trial would need to be carefully assessed in terms of the cost-effectiveness of the research itself, as well as the potential feasibility and ethical issues (i.e. the inclusion of a placebo arm) that may arise. In addition, researchers would need to consider using methods to reduce the numbers lost to follow-up, such as the use of telephone interviews to those that miss follow-up appointments. Well-designed observational studies might also be considered to evaluate the clinical course of influenza in terms of complications, hospitalisation, mortality and QoL as well as the impact of NIs.
Additional detailed consideration of the existing evidence related to the impact of delayed initiation of treatment after the onset of symptoms would also be potentially valuable research. This could be undertaken in conjunction with a more formal evaluation of the clinical effectiveness and cost-effectiveness of alternative management strategies that could be used to reduce this delay (e.g. expectant treatment).
Acknowledgements
The authors would like to thank Professor Keith Abrams (Professor of Medical Statistics, Department of Health Sciences, University of Leicester) and Dr Douglas Fleming (Director of the Royal College of General Practitioners Birmingham Research Unit), for their advice; Piers Mook, Joy Field, Praveen Sebastianpillai, Angie Lackenby, and Maria Zambon from the Health Protection Agency for providing additional data; the authors and publishers who responded to requests for additional information; and our translators Bartosz Ziolko, Baurzhan Aituov, Koji Kawahara, and Sophie Cheng. The authors would also like to thank Dr John Watkins (Senior Lecturer and Honarary Consultant in Public Health Medicine, Department of Epidemiology, Statistics and Public Health, Cardiff University) for his advice on the economic model structure, data inputs and assumptions.
Contribution of authors
Dr Jane Burch was responsible for study selection, data extraction, validity assessment, data analysis and writing the report. Michael Paulden was responsible for the review of cost-effectiveness evidence and the overall development of the economic model. Dr Stefano Conti was responsible for the Bayesian synthesis section, review of cost-effectiveness and quality of life evidence, and he also assisted in the development of the economic model. Christian Stock and Mark Corbett assisted in study selection, data extraction, validity assessment, data analysis and writing the report. Dr Nicky J Welton developed the Bayesian multiparameter evidence synthesis model for the indirect comparisons and contributed to the writing of that section, and commented on drafts of the report. Professor AE Ades provided advice related to the development of the Bayesian multiparameter synthesis model and contributed to the writing of that section, and commented on drafts of the report. Drs Alex Sutton and Nicola Cooper provided input on aspects of data extraction, evidence synthesis and economic modelling and commented on the draft report. Dr Alex Elliot provided data from the Royal College of General Practitioners Weekly Return Service and commented on the draft report. Professor Karl Nicholson provided clinical advice and commented on the draft report. Steve Duffy devised the search strategy, carried out the literature searches and wrote the search methodology sections of the report. Dr Claire McKenna assisted in the development of the economic model. Professor Lesley Stewart and Dr Marie Westwood provided input at all stages of the review and commented on drafts of the report. Stephen Palmer contributed to all aspects of the Bayesian synthesis and economic sections and took overall responsibility for the report.
Disclaimers
The views expressed in this publication are those of the authors and not necessarily those of the HTA programme or the Department of Health.
References
- Stephenson I, Zambon M. The epidemiology of influenza. Occup Med 2002;52:241-7.
- Nicholson KG, Wood JM, Zambon M. Influenza. Lancet 2003;362:1733-45.
- National Institute for Clinical Excellence . Guidance on the Use of Zanamivir, Oseltamivir and Amantadine for the Treatment of Influenza 2003.
- Carrat F, Flahault A. Influenza vaccine: the challenge of antigenic drift. Vaccine 2007;25:6852-62.
- Elliot AJ, Fleming DM. Surveillance of influenza-like illness in England and Wales during 1966–2006. Euro Surveill 2006;11:249-50.
- Lynch JP, Walsh EE. Influenza: evolving strategies in treatment and prevention. Semin Respir Crit Care Med 2007;28:144-58.
- Babcock HM, Merz LR, Fraser VJ. Is influenza an influenza-like illness? Clinical presentation of influenza in hospitalized patients. Infect Control Hosp Epidemiol 2006;27:266-70.
- van Elden LJ, van Essen GA, Boucher CA, van Loon AM, Nijhuis M, Schipper P, et al. Clinical diagnosis of influenza virus infection: evaluation of diagnostic tools in general practice. Br J Gen Pract 2001;51:630-4.
- Centers for Disease Control and Prevention . Rapid Diagnostic Testing for Influenza: Information for Clinical Laboratory Directors n.d. www.cdc.gov/flu/professionals/diagnosis/rapidlab.htm (accessed 18 April 2008).
- Salisbury D, Ramsay M, Noakes K. Immunisation against infectious disease. London: The Stationery Office; 2006.
- Hayden FG. Prevention and treatment of influenza in immunocompromised patients. Am J Med 1997;102:55-60.
- Pitman RJ, Melegaro A, Gelb D, Siddiqui MR, Gay NJ, Edmunds WJ. Assessing the burden of influenza and other respiratory infections in England and Wales. J Infect 2007;54:530-38.
- Fleming DM. The contribution of influenza to combined acute respiratory infections, hospital admissions, and deaths in winter. Commun Dis Public Health 2000;3:32-8.
- Fleming DM. The impact of three influenza epidemics on primary care in England and Wales. Pharmacoeconomics 1996;9:38-45.
- Meier CR, Napalkov PN, Wegmüller Y, Jefferson T, Jick H. Population-based study on incidence, risk factors, clinical complications and drug utilisation associated with influenza in the United Kingdom. Eur J Clin Microbiol Infect Dis 2000;19:834-42.
- Thompson WW, Shay DK, Weintraub E, Brammer L, Cox N, Anderson LJ, et al. Mortality associated with influenza and respiratory syncytial virus in the United States. JAMA 2003;289:179-86.
- Cooper DL, Smith GE, Edmunds WJ, Joseph C, Gerard E, George RC. The contribution of respiratory pathogens to the seasonality of NHS Direct calls. J Infect 2007;55:240-8.
- World Health Organization . World Health Organization n.d. https://www.who.int (accessed 20 February 2008).
- World Health Orgnization . The Role of National Influenza Centres (NICs) During Interpandemic, Pandemic Alert and Pandemic Periods. Interim Document, May 2007 2007.
- European Influenza Surveillance Scheme (EISS) n.d. www.eiss.org (accessed 13 June 2008).
- European Centre for Disease Prevention and Control . Emergence of Seasonal Influenza Viruses Type A H1N1 With Oseltamivir Resistance in Some European Countries at the Start of the 2007–8 Influenza Season. Interim ECDC Risk Assessment – January 27th 2008 2008.
- Health Protection Agency . Health Protection Agency n.d. www.hpa.org.uk (accessed 20 February 2008).
- Royal College of General Practitioners . Royal College of General Practitioners n.d. www.rcgp.org.uk (accessed 20 February 2008).
- Harcourt SE, Edwards DE, Fleming DM, Smith RL, Smith GE. How representative is the population covered by the RCGP spotter practice scheme? Using Geographical Information Systems to assess. J Public Health 2004;26:88-94.
- Tappenden P, Jackson R, Cooper K, Rees A, Simpson E, Read R, et al. Amantadine, oseltamivir and zanamivir for the prophylaxis of influenza (including a review of existing guidance no. 67): a systematic review and economic evaluation. Health Technol Assess 2009;13:1-312.
- Schmidt AC. Antiviral therapy for influenza: a clinical and economic comparative review. Drugs 2004;64:2031-46.
- Gubareva LV, Kaiser L, Hayden FG. Influenza virus neuraminidase inhibitors. Lancet 2000;355:827-35.
- Reece PA. Neuraminidase inhibitor resistance in influenza viruses. J Med Virol 2007;79:1577-86.
- Hurt AC, Ho H-T, Barr I. Resistance to anti-influenza drugs: adamantanes and neuraminidase inhibitors. Expert Rev Anti Infect Ther 2006;4:795-80.
- Colman PM. Neuraminidase inhibitors as antivirals. Vaccine 2002;20:S55-8.
- Datapharm Communications Ltd . Electronic Medicines Compendium n.d. emc.medicines.org.uk (accessed 20 February 2008).
- Dunn CJ, Goa KL. Zanamivir: a review of its use in influenza. Drugs 1999;58:761-84.
- McClellan K, Perry CM. Oseltamivir: a review of its use in influenza. Drugs 2001;61:263-83.
- Peramivir ineffective against influenza. Infect Med 2002;19.
- Kati WM, Montgomery D, Carrick R, Gubareva L, Maring C, McDaniel K, et al. In vitro characterization of A–315675, a highly potent inhibitor of A and B strain influenza virus neuraminidases and influenza virus replication. Antimicrob Agents Chemother 2002;46:1014-21.
- Abed Y, Nehmé B, Baz M, Boivin G. Activity of the neuraminidase inhibitor A–315675 against oseltamivir-resistant influenza neuraminidases of N1 and N2 subtypes. Antiviral Res 2008;77.
- National Institute for Clinical Excellence . Guidance on the Use of Oseltamivir and Amantadine for the Prophylaxis of Influenza. Technology Appraisal Guidance 67 2003.
- Kawai N, Ikematsu H, Iwaki N, Kawamura K, Kawashima T, Kashiwagi S. A change in the effectiveness of amantadine for the treatment of influenza over the 2003–2004, 2004–2005, and 2005–2006 influenza seasons in Japan. J Infect Chemother 2007;13:314-19.
- McKimm-Breschkin JL. Management of influenza virus infections with neuraminidase inhibitors: detection, incidence, and implications of drug resistance. Treat Respir Med 2005;4:107-16.
- Aoki FY, Boivin G, Roberts N. Influenza virus susceptibility and resistance to oseltamivir. Antiviral Therapy 2007;12:603-16.
- Lackenby A, Hungnes O, Dudman SG, Meijer A, Paget WJ, Hay AJ, et al. Emergence of resistance to oseltamivir among influenza A(H1N1) viruses in Europe. Euro Surveill 2008;13.
- World Health Organization . Influenza A(H1N1) Virus Resistance to Oseltamivir – Last Quarter 2007 to 5 May 2008 2008. www.who.int/csr/disease/influenza/H1N1ResistanceWeb20080505.pdf.
- Nicoll A, Ciancio B, Kramarz P. Influenza Project Team . Observed oseltamivir resistance in seasonal influenza viruses in Europe interpretation and potential implications. Euro Surveill 2008;13.
- Influenza/Respiratory Virus Team, HPA Centre for Infections. HPA Weekly National Influenza Report. Summary of UK Surveillance of Influenza and Other Seasonal Respiratory Illness. 14 May 2008 (Week 20) 2008. www.hpa.org.uk/web/HPAwebFile/HPAweb_C/1210750112352.
- British National Formulary 55. London: British Medical Association and Royal Pharmaceutical Society of Great Britain; 2008.
- Turner D, Wailoo A, Nicholson K, Cooper N, Sutton A, Abrams K. Systematic review and economic decision modelling for the prevention and treatment of influenza A and B. Health Technol Assess 2003;7:1-182.
- NHS Centre for Reviews and Dissemination . Undertaking Systematic Reviews of Research on Effectiveness. CRD Report 4 2001.
- Casella G, Berger RL. Statistical inference. Pacific Grove, CA: Duxbury; 2002.
- Collett D. Modelling survival data in medical research. London: Chapman & Hall; 1994.
- Whitehead A. Meta-analysis of controlled clinical trials. Chichester: John Wiley & Sons, Ltd; 2002.
- Lu G, Ades AE. Combination of direct and indirect evidence in mixed treatment comparisons. Stat Med 2004;23:3105-24.
- Lu G, Ades AE. Assessing evidence inconsistency in mixed treatment comparisons. J Am Stat Assoc 2006;101:447-59.
- Buda A, Alves de Cunha AJL. Amantadine and rimantadine for influenza A in children and the elderly (Protocol). Cochrane Database Syst Rev 2000. 10.1002/14651858.CD002745.
- Kitamoto O. Therapeutic effectiveness of amantadine hydrochloride in influenza A2: double blind studies. Jpn J Tuberc Chest Dis 1968;15:17-26.
- Kitamoto O. Therapeutic effectiveness of amantadine hydrochloride in naturally occurring Hong Kong influenza: double-blind studies. Jpn J Tuberc Chest Dis 1971;17:1-7.
- Jefferson T, Demicheli V, Di Pietrantonj C, Rivetti D. Amantadine and rimantadine for influenza A in adults. Cochrane Database Syst Rev 2006. 10.1002/14651858.CD001169.pub3.
- Markovski V, Milenkovic Z, Dimzova M, Tosevski B. Clinical experience in the treatment of flu patients with oseltamivir during the interpandemic period. Probl Infect Parasitic Dis 2002;30:21-2.
- Osterhaus ADME, Tisdale M, Elliot M. A Double Blind Randomised Trial of Zanamivir in the Treatment of Acute Influenza: Clinical and Virological Efficacy Results [meeting Abstract] n.d.
- Paar DP. Sudy of Ro64–0796 for treatment against human influenza virus. CRISP Database. Bethesda, MA: National Institutes of Health; 2003.
- Treanor JJ. Ph II study of antiviral effect of nebulized zanamivir influenza vira. CRISP Database. Bethesda, MA: National Institutes of Health; 2004.
- Slawson D. Is oseltamivir effective and safe in the treatment of naturally acquired acute influenza?. Evid Based Pract 2000;3.
- Sander B, Gyldmark M, Morris J. n.d.
- Sander B, Gyldmark M, Morris J, Mueller E, Bergemann R. Influenza Treatment With Oseltamivir in an Otherwise Healthy Adult Population: A Cost-Effective Option for the Health Care Payer [meeting Abstract] n.d.
- Whitley R, Reisinger KS, Dutkowski R. Early Oseltamivir Initiation Produces Marked Reductions in Illness Duration, Symptom Severity and Secondary Complications in Children With Influenza [meeting Abstract] n.d.
- Treanor JJ, Hayden FG, Vrooman PS, Barbarash R, Bettis R, Riff D, et al. Efficacy and safety of the oral neuraminidase inhibitor oseltamivir in treating acute influenza: a randomized controlled trial. US Oral Neuraminidase Study Group. JAMA 2000;283:1016-24.
- Deng W-w, Li Q-y, Zhong N-s. ‘Oseltamivir in the treatment of suspected influenza patients' Study Group. [A multicenter study of efficacy and safety of oseltamivir in the treatment of suspected influenza patients]. Chung Hua I Hsueh Tsa Chih 2004;84:2132-6.
- Tan W, Hou J, Chen X, Xiong H, Li XQ, Zhang H. A randomized, double-blinded and controlled clinical evaluation of oseltamivir in the treatment of influenza. Clin Med J China 2002;9:528-31.
- Kashiwagi S, Kudoh S, Watanabe A, Yoshimura I. Clinical efficacy and safety of the selective oral neuraminidase inhibitor oseltamivir in treating acute influenza--placebo-controlled double-blind multicenter phase III trial. Kansenshogaku Zasshi 2000;74:1044-61.
- Li L, Cai B, Wang M, Zhu Y. A double-blind, randomized, placebo-controlled multicenter study of oseltamivir phosphate for treatment of influenza infection in China. Chin Med J 2003;116:44-8.
- Li L, Cai B, Wang M, Zhu Y. A multicenter study of efficacy and safety of oseltamivir in treatment of naturally acquired influenza. Chung Hua Nei Ko Tsa Chih 2001;40:838-42.
- Lin J-T, Yu X-Z, Cui D-J, Chen X-Y, Zhu J-H, Wang Y-Z, et al. A multicentre, randomized, controlled trial of oseltamivir in the treatment of influenza in a high-risk Chinese population. Curr Med Res Opin 2006;22:75-82.
- Lin J-T, Yu X-Z, Cui D-J, Chen X-Y, Zhu J-H, Wang Y-Z, et al. A multicenter randomized controlled study of the efficacy and safety of oseltamivir in the treatment of influenza in a high risk population. Chung-Hua Chieh Ho Ho Hu Hsi Tsa Chih – Chin J Tuberc Respir Dis 2004;27:455-9.
- Martin C, Mahoney P, Ward P. Oral oseltamivir reduces febrile illness in patients considered at high risk of influenza complications. Int Congr Ser 2001;1219:807-11.
- Aoki FY, Fleming DM, Griffin AD, Lacey LA, Edmundson S. on behalf of the Zanamivir Study Group . Impact of zanamivir treatment on productivity, health status and healthcare resource use in patients with influenza. Pharmacoeconomics 2000;17:187-95.
- Monto AS, Fleming DM, Henry D, de Groot R, Mäkelä M, Klein T, et al. Efficacy and safety of the neuraminidase inhibitor zanamivirin the treatment of influenza A and B virus infections. J Infect Dis 1999;180:254-61.
- Hayden FG, Osterhaus AD, Treanor JJ, Fleming DM, Aoki FY, Nicholson KG, et al. Efficacy and safety of the neuraminidase inhibitor zanamivir in the treatment of influenzavirus infections. GG167 Influenza Study Group. N Engl J Med 1997;337:874-80.
- Roche . NV16871. A Double-Blind, Randomized, Stratified, Placebo-Controlled Study of Oseltamivir in the Treatment of Influenza in Children With Asthma n.d. www.roche-trials.com/patient/trialresults/stur40.html (accessed 30 November 2007).
- Johnston SL, Ferrero F, Garcia ML, Dutkowski R. Oral oseltamivir improves pulmonary function and reduces exacerbation frequency for influenza-infected children with asthma. Pediatr Infect Dis J 2005;24:225-32.
- FDA Center for Drug Evaluation and Research . Relenza (zanamivir Dry Powder for Inhalation) for Treatment of Influenza A and B Infections. Medical Review n.d. www.fda.gov/cder/foi/nda/99/21036.htm (accessed 12 December 2007).
- FDA Center for Drug Evaluation and Research . Oseltamivir (Tamiflu) for Treatment of Uncomplicated Acute Illness Due to Influenza Infection in Adults Who Have Been Symptomatic for No More Than Two Days. Medical Review 1999. www.fda.gov/cder/foi/nda/99/21087_Tamiflu_medr_P1.pdf and www.fda.gov/cder/foi/nda/99/21087_Tamiflu_medr_P2.pdf.
- Treanor JJ. Reduction in the Symptoms and Complications of Influenza A and B in Patients Treated With Oseltamivir [meeting Abstract] n.d.
- Robson R, Saiedabadi N, Ward P. Oral Oseltamivir Reduces the Duration of Influenza Illness by 2.7 Days in Previously Healthy Adults [meeting Abstract] n.d.
- Grossel M, Leigh C, Martin C, Saiedabadi N, Savage E, Ward P. Clinical Study Report Protocol WV15730: A Double-Blind, Stratified, Randomized, Placebo Controlled Study of Ro 64–0796 (GS4104) in the Treatment of Influenza Infection in Adults 1999.
- Hayden FG, Gubareva LV, Monto AS, Klein TC, Elliot MJ, Hammond JM, et al. Inhaled zanamivir for the prevention of influenza in families. Zanamivir Family Study Group. N Engl J Med 2000;343:1282-9.
- Sato M, Hosoya M, Kato K, Suzuki H. Viral shedding in children with influenza virus infections treated with neuraminidase inhibitors. Pediatr Infect Dis J 2005;24:931-2.
- Matsumoto K, Ogawa N, Nerome K, Numazaki Y, Kawakami Y, Shirato K, et al. Safety and efficacy of the neuraminidase inhibitor zanamivir in treating influenza virus infection in adults: results from Japan. GG167 Group. Antiviral Therapy 1999;4:61-8.
- GlaxoSmithKline . A Randomized, Double-Blind, Placebo-Controlled Study to Evaluate the Impact of Inhaled Zanamivir Treatment on Workplace Attendance and Healthcare Outcomes Due to Influenza A and B Infections. Clinical Study Report for Study NAI30011 2001.
- Puhakka T, Lehti H, Vainionpaa R, Jormanainen V, Pulkkinen M, Sharp S, et al. Zanamivir: a significant reduction in viral load during treatment in military conscripts with influenza. Scand J Infect Dis 2003;35:52-8.
- GlaxoSmithKline . NAI30015. III A Double-Blind, Randomised, Placebo-Controlled, Parallel-Group, Multicentre Study to Investigate the Efficacy and Safety of Inhaled Zanamivir 10mg Administered Twice Daily for Five Days in the Treatment of Symptomatic Influenza A and B Viral Infections in Armed Services Personnel n.d. www.gsk-clinicalstudyregister.com/files/pdf/3302.pdf (accessed 25 August 2009).
- GlaxoSmithKline . NAI30015. A Double-Blind, Randomised, Placebo-Controlled, Parallel-Group, Multicentre Study to Investigate the Efficacy and Safety of Inhaled Zanamivir 10mg Administered Twice Daily for Five Days in the Treatment of Symptomatic Influenza A and B Viral Infections in Armed Services Personnel. Clinical Study Report for Study NAI30015 (Phase IIIB IV) 2001.
- MIST . Randomised trial of efficacy and safety of inhaled zanamivir in treatment of influenza A and B virus infections. The MIST (Management of Influenza in the Southern Hemisphere Trialists) Study Group. Lancet 1998;352:1877-81.
- GlaxoSmithKline . NAIB3001. III A Double-Blind, Randomized, Placebo-Controlled, Parallel-Group, Multicenter Study to Investigate the Efficacy and Safety of Zanamivir Administered Twice Daily in the Treatment of Influenza A and B Viral Infections in Adults n.d. www.gsk-clinicalstudyregister.com/files/pdf/3380.pdf (accessed 25 August 2009).
- Boivin G, Goyette N, Hardy I, Aoki F, Wagner A, Trottier S. Rapid antiviral effect of inhaled zanamivir in the treatment of naturally occurring influenza in otherwise healthy adults. J Infect Dis 2000;181:1471-4.
- Lalezari J, Klein T, Stapleton J, Elliott M, Flack N, Keene O. The Efficacy and Safety of Inhaled Zanamivir of Influenza in Otherwise Healthy and ‘high risk' Individuals in North America [meeting Abstract] n.d.
- GlaxoSmithKline . NAIA3002. III A Double-Blind, Randomized, Placebo-Controlled, Parallel-Group, Multicenter Study to Investigate the Efficacy and Safety of Inhaled Zanamivir (GG167) 10 Mg Administered Twice a Day for Five Days in the Treatment of Symptomatic Influenza A and B Viral Infections in Adolescents and Adults n.d.
- Mäkelä MJ, Pauksens K, Rostila T, Fleming DM, Man CY, Keene ON, et al. Clinical efficacy and safety of the orally inhaled neuraminidase inhibitor zanamivir in the treatment of influenza: a randomized, double-blind, placebo-controlled European study. J Infect 2000;40:42-8.
- GlaxoSmithKline . NAIB3002. III A Double-Blind, Randomised, Placebo-Controlled, Parallel-Group, Multicentre Study to Investigate the Efficacy and Safety of Inhaled Zanamivir (GG167) 10mg Administered Twice a Day for Five Days in the Treatment of Symptomatic Influenza A and B Viral Infections in Adolescents and Adults n.d. www.gsk-clinicalstudyregister.com/files/pdf/3379.pdf (accessed 25 August 2009).
- Murphy KR, Eivindson A, Pauksens K, Stein WJ, Tellier G, Watts R, et al. Efficacy and safety of inhaled zanamivir for the treatment of influenza in patients with asthma or chronic obstrucitve pulmonary disease: a double-blind, randomised, placebo-controlled, multicentre study. Clin Drug Invest 2000;20:337-49.
- GlaxoSmithKline . NAI30020. III A Double-Blind, Randomised, Placebo-Controlled, Multicenter Study in 2 Parallel Groups, to Investigate the Efficacy and Safety of Inhaled Zanamivir (10 Mg Bd. via Diskhaler), for 5 Days, in High Risk Patients With Symptomatic Influenza A and Or B Infection n.d. www.gsk-clinicalstudyregister.com/files/pdf/3303.pdf (accessed 25 August 2009).
- Hedrick JA, Barzilai A, Behre U, Henderson FW, Hammond J, Reilly L, et al. Zanamivir for treatment of symptomatic influenza A and B infection in children five to twelve years of age: a randomized controlled trial. Pediatr Infect Dis J 2000;19:410-17.
- GlaxoSmithKline . NAI30009. III A Double-Blind, Randomized, Placebo-Controlled, Parallel-Group, Multicenter Study to Investigate the Efficacy and Safety of Zanamivir (GG167) 10 Mg Administered by Inhalation Twice Daily for Five Days in the Treatment of Symptomatic Influenza A and B Viral Infections in Children Ages 5–12 n.d. www.gsk-clinicalstudyregister.com/files/pdf/3298.pdf (accessed 25 August 2009).
- GlaxoWellcome Research and Development . A Double-Blind, Randomized, Placebo-Controlled, Parallel-Group Multicenter Study to Investigate the Efficacy and Safety of Zanamivir (GG167) 10mg Administered by Inhalation Twice Daily for Five Days in the Treatment of Symptomatic Influenza A and B Viral Infections in Children Ages 5–12. Protocol: NAI30009. Phase: III 1997.
- GlaxoSmithKline . NAI30028 III A Double-Blind, Randomised, Placebo-Controlled, Multicenter Study in 2 Parallel Groups, to Investigate the Efficacy and Safety of Inhaled Zanamivir (10 Mg Bd via Diskhaler), for 5 Days, in Children Aged 5 to 12 Years With Symptomatic Influenza A and Or B Infection n.d. ctr.gsk.co.uk/Summary/zanamivir/III_NAI30028.pdf (accessed 29 November 2007).
- GlaxoSmithKline . A Double-Blind, Randomised, Placebo-Controlled, Multicentre, Comparative Study in Parallel Groups to Investigate the Efficacy and Tolerability of Inhaled Zanamivir, Administered 2 X Daily for 5 Days, in Children Aged from 5 to 12 Years With Symptomatic Influenza A and Or Influenza B Infection. Study: NAI30028. Development Phase: [II, III, IV] 2003.
- GlaxoSmithKline . NAI30012. III A Double-Blind, Randomised, Placebo-Controlled, Parallel-Group, Multicentre Study to Investigate the Efficacy and Safety of Inhaled Zanamivir 10mg Administered Twice Daily for Five Days in the Treatment of Symptomatic Influenza A and B Viral Infections in Subjects Aged = 65 Years n.d. www.gsk-clinicalstudyregister.com/files/pdf/3301.pdf (accessed 25 August 2009).
- GlaxoSmithKline . A Double-Blind, Randomised, Placebo-Controlled, Parallel-Group, Multicentre Study to Investigate the Efficacy and Safety of Inhaled Zanamivir 10mg Administered Twice Daily for Five Days in the Treatment of Symptomatic Influenza A and B Viral Infections in Subjects Aged ≥ 65 Years. Study: NAI30012. Development Phase: III 2002.
- Nicholson KG, Aoki FY, Osterhaus AD, Trottier S, Carewicz O, Mercier CH, et al. Efficacy and safety of oseltamivir in treatment of acute influenza: a randomised controlled trial. Neuraminidase Inhibitor Flu Treatment Investigator Group. Lancet 2000;355:1845-50.
- Lin J, Yu X, Cui D, Chen X, Zhu J, Wang Y, et al. A multicenter study of efficacy and safety of oseltamivir in the treatment of influenza in the high risk population [meeting abstract]. Respirology 2004;9.
- Martin C, Mahoney P, Ward P. Oral Oseltamivir Reduces Febrile Illness and Is Safe in Patients With Chronic Cardiac and Or Respiratory Disease [meeting Abstract] n.d.
- Whitley RJ, Hayden FG, Reisinger KS, Young N, Dutkowski R, Ipe D, et al. Oral oseltamivir treatment of influenza in children. Pediatr Infect Dis J 2001;20:127-33.
- Sylvester RJ, Pinedo HM, De Pauw M, Staquet MJ, Buyse ME, Renard J, et al. Quality of institutional participation in multicenter clinical trials. N Engl J Med 1981;305:852-5.
- Schulz KF, Grimes DA. Sample size slippages in randomised trials: exclusions and the lost and wayward. Lancet 2002;359:781-5.
- Hoffken G, Gillissen A. Efficacy and safety of zanamivir in patients with influenza: impact of age, severity of infections and specific risk factors. Med Microbiol Immunol 2002;191:169-73.
- GlaxoSmithKline . NAI30008. III A Double-Blind, Randomized, Placebo-Controlled, Parallel Group, Multi-Center Study to Investigate the Efficacy and Safety of Inhaled Zanamivir 10mg Administered Twice Daily for Five Days in the Treatment of Influenza in Patients 12 Years or over Diagnosed With Asthma or Chronic Obstructive Pulmonary Disease n.d. www.gsk-clinicalstudyregister.com/files/pdf/3299.pdf (accessed 25 August 2009).
- Berger W, Stein WJ, Sharp SJ, Szymborski PG. Effect of inhaled zanamivir on pulmonary function and illness duration in asthma and/or chronic obstructive pulmonary disease COPD patients with influenza [meeting abstract]. Ann Allergy Asthma Immunol 2001;86.
- Cox NJ, Subbarao K. Global epidemiology of influenza: past and present. Annu Rev Med 2000;51:407-21.
- Kawai N, Ikematsu H, Iwaki N, Tanaka O, Yamanishi Y, Hirotsu N, et al. Zanamivir treatment is equally effective for both influenza A and influenza B. Clin Infect Dis 2007;44.
- Ross AM, Kai J, Salter R, Ross J, Fleming DM. Presentation with influenza-like illness in general practice: implications for use of neuraminidase inhibitors. Commun Dis Public Health 2000;3:256-60.
- Department of Health . Choosing Health through Pharmacy: A Programme for Pharmaceutical Public Health 2005–2015 2005.
- Fleming D. Assessing the accuracy of influenza diagnosis by community pharmacists. Pharmaceutl J 2007;279:441-4.
- Hasselblad V, McCrory DC. Meta-analytic tools for medical decision making: a practical guide. Med Decis Making 1995;15:81-96.
- Ades AE, Sutton AJ. Multiparameter evidence synthesis in epidemiology and medical decision-making: current approaches. J R Stat Soc Ser A Stat Soc 2006;169:5-35.
- Caldwell DM, Ades AE, Higgins JPT. Simultaneous comparison of multiple treatments: combining direct and indirect evidence. BMJ 2005;331:897-900.
- Welton NJ, Cooper NJ, Ades AE, Sutton AJ. Mixed treatment comparison with multiple outcomes reported inconsistently across trials: evaluation of antivirals for treatment of influenza A and B. Stat Med 2008;27:5620-39.
- Lunn DJ, Thomas A, Best N, Spiegelhalter D. WinBUGS – a Bayesian modelling framework: concepts, structure, and extensibility. Stat Comput 2000;10:325-37.
- Drummond MF, Jefferson TO. Guidelines for authors and peer reviewers of economic submissions to the BMJ. The BMJ Economic Evaluation Working Party. BMJ 1996;313:275-83.
- Philips Z, Ginnelly L, Sculpher M, Claxton K, Golder S, Riemsma R, et al. Review of guidelines for good practice in decision-analytic modelling in health technology assessment. Health Technol Assess 2004;8:1-158.
- Roche . Tamiflu (oseltamivir) for Seasonal Influenza 2008.
- Armstrong EP, Khan ZM, Perry AS, Perri LR. The cost effectiveness of zanamivir and oseltamivir for influenza treatment. Formulary 2000;35:979-89.
- Brady B, McAuley L, Shukla VK. Economic evaluation of zanamivir for the treatment of influenza. Ottawa: Canadian Coordinating Office for Health Technology Assessment/Office Canadien de Coordination de l'Evaluation des Technologies de la Sante (CCOHTA); 2001.
- Burls A, Clark W, Stewart T, Preston C, Bryan S, Jefferson T, et al. Zanamivir for the treatment of influenza in adults: a systematic review and economic evaluation. Health Technol Assess 2002;6:1-87.
- Griffin AD, Perry AS, Fleming DM. Cost-effectiveness analysis of inhaled zanamivir in the treatment of influenza A and B in high-risk patients. Pharmacoeconomics 2001;19:293-301.
- Husereau DR, Brady B, McGeer A. An assessment of oseltamivir for the treatment of suspected influenza. Ottawa: Canadian Coordinating Office for Health Technology Assessment (CCOHTA); 2002.
- Inoue T, Watanabe K, Chonabayashi N, Uetsuka Y. Pharmacoeconomics of antiviral therapy for influenza in a Japanese hospital setting. Clin Drug Invest 2005;25:49-63.
- Jarvinen A, Joutseno J, Gyldmark M. Cost effectiveness of oseltamivir for the treatment of influenza in adults, adolescents and children in Finland. J Med Econ 2007;10:199-214.
- Lee PY, Matchar DB, Clements DA, Huber J, Hamilton JD, Peterson ED. Economic analysis of influenza vaccination and antiviral treatment for healthy working adults. Ann Intern Med 2002;137:225-31.
- Mauskopf JA, Cates SC, Griffin AD, Neighbors DM, Lamb SC, Rutherford C. Cost effectiveness of zanamivir for the treatment of influenza in a high risk population in Australia. Pharmacoeconomics 2000;17:611-20.
- O’Brien BJ, Goeree R, Blackhouse G, Smieja M, Loeb M. Oseltamivir for treatment of influenza in healthy adults: pooled trial evidence and cost-effectiveness model for Canada. Value Health 2003;6:116-25.
- Postma MJ, Novak A, Scheijbeler HWKFH, Gyldmark M, van Genugten MLL, Wilschut JC. Cost effectiveness of oseltamivir treatment for patients with influenza-like illness who are at increased risk for serious complications of influenza: illustration for the Netherlands. Pharmacoeconomics 2007;25:497-509.
- Reisinger K, Greene G, Aultman R, Sander B, Gyldmark M. Effect of influenza treatment with oseltamivir on health outcome and costs in otherwise healthy children. Clin Drug Invest 2004;24:395-407.
- Rothberg MB, Bellantonio S, Rose DN. Management of influenza in adults older than 65 years of age: cost-effectiveness of rapid testing and antiviral therapy. Ann Intern Med 2003;139.
- Rothberg MB, He S, Rose DN. Management of influenza symptoms in healthy adults: cost-effectiveness of rapid testing and antiviral therapy. J Gen Intern Med 2003;18:808-15.
- Rothberg MB. Cost-effective approaches to influenza prevention and treatment. Expert Rev Pharmacoecon Outcomes Res 2005;5:141-52.
- Sander B, Gyldmark M, Aultman R, Aoki FY. Impact on health outcome and costs of influenza treatment with oseltamivir in elderly and high-risk patients. J Med Econ 2004;7:67-83.
- Sander B, Gyldmark M, Hayden FG, Morris J, Mueller E, Bergemann R. Influenza treatment with neuraminidase inhibitors: cost-effectiveness and cost-utility in healthy adults in the United Kingdom. Eur J Health Econ 2005;6:244-52.
- Schwarzinger M, Lacombe K, Carrat F. Economic evaluations of neuraminidase inhibitors to control influenza. Expert Rev Pharmacoecon Outcomes Res 2003;3:147-58.
- Smith KJ, Roberts MS. Cost-effectiveness of newer treatment strategies for influenza. Am J Med 2002;113:300-7.
- Vindt Holm M, Gyldmark M, Holme Hansen E. Pharmacoeconomic assessment of oseltamivir in treating influenza: the case of otherwise healthy Danish adolescents and adults. Pharm World Sci 2004;26:339-45.
- Nicholson KG, Kent J, Hammersley V, Cancio E. Acute viral infections of upper respiratory tract in elderly people living in the community: comparative, prospective, population based study of disease burden. BMJ 1997;315:1060-4.
- Davey P, Rutherford D, Graham B, Lynch B, Malek M. Repeat consultations after antibiotic prescribing for respiratory infection: a study in one general practice. Br J Gen Pract 1994;44:509-13.
- MVH Group . The Measurement and Valuation of Health. Final Report on the Modelling of Valuation Tariffs 1995.
- Murray CJ, Lopez AD. The global burden of disease: a comprehensive assessment of mortality and disabilities from diseases, injuries and risk factors in 1990 and projected to 2020. Boston, MA: Harvard University, School of Public Health; 1996.
- Da Silva PR, Nguyen V-TJS, Hayward AC. Logistic issues and potential prescribing costs associated with use of neuraminidase inhibitors for the treatment of influenza in primary care. J R Soc Med 2003;96:66-9.
- Kaiser L, Wat C, Mills T, Mahoney P, Ward P, Hayden F. Impact of oseltamivir treatment on influenza-related lower respiratory tract complications and hospitalizations. Arch Intern Med 2003;163:1667-72.
- Nguyen-Van-Tam JS, Brockway CR, Pearson JC, Hayward AC, Fleming DM. Excess hospital admissions for pneumonia and influenza in persons > or = 65 years associated with influenza epidemics in three English health districts: 1987–95. Epidemiol Infect 2001;126.
- Stouthard MEA, Essink-Bot M-L, Bonsel GJ, Barendregt JJ, Kramers PGN, van de Water HPA, et al. Disability weights for disease in the Netherlands. Rotterdam: Department of Public Health, Erasmus University, Rotterdam, The Netherlands; 1997.
- Kind P, Hardman G, Macran S. UK Population Norms for EQ-5D. Centre for Health Economics Discussion Paper 172. York: Centre for Health Economics, University of York; 1999.
- National Institute for Clinical Excellence . Guide to the Methods of Technology Appraisal 2004. www.nice.org.uk/download.aspx?o=201973.
- Doubilet P, Begg CB, Weinstein MC, Braun P, McNeil BJ. Probabilistic sensitivity analysis using Monte Carlo simulation: a practical approach. Med Decis Making 1985;5:155-77.
- Briggs AH, Ades AE, Price MJ. Probabilistic sensitivity analysis for decision trees with multiple branches: use of the Dirichlet distribution in a Bayesian framework. Med Decis Making 2003;23:341-50.
- Curtis L. Unit costs of health and social care 2007. Canterbury: Personal Social Services Research Unit, University of Kent; 2008.
- Stratton KR, Durch JS, Lawrence RS. Vaccines for the 21st century: a tool for decisionmaking. Washington, DC: Institute of Medicine, National Academy Press; 2000.
- HESonline. Hospital Episode Statistics [Internet]. London: The NHS Information Centre for Health and Social Care; 2008.
- Office for National Statistics . Mortality Statistics: Cause: Review of the Registrar General on Deaths by Cause, Sex and Age, in England and Wales, 2005. Series DH2 no.32 2006.
- Johannesson M, Weinstein MC. On the decision rules of cost-effectiveness analysis. J Health Econ 1993;12:459-67.
- Zanamivir: a second look. Still no tangible impact on influenza. Prescrire Int 2001;10:175-7.
- Concerns raised over use of zanamivir. Pharm J 2001;266.
- Oseltamivir for the treatment of influenza in children. Deutsche Apotheker Zeitung 2001;141.
- Barr CE, Schulman K, Iacuzio D, Bradley JS. Effect of oseltamivir on the risk of pneumonia and use of health care services in children with clinically diagnosed influenza. Curr Med Res Opin 2007;23:523-31.
- Bettis R, Iacuzio D, Jung T, Fuchs R, Aultman R, Gyldmark M. Impact of influenza treatment with oseltamivir on health, sleep and daily activities of otherwise healthy adults and adolescents. Clin Drug Invest 2006;26:329-40.
- Blumentals WA, Schulman KL. Impact of oseltamivir on the incidence of secondary complications of influenza in adolescent and adult patients: results from a retrospective population-based study. Curr Med Res Opin 2007;23:2961-70.
- Collier J. Zanamivir: an alternative translation. Philos Trans R Soc Lond B Biol Sci 2001;356:1945-6.
- Enger C, Nordstrom BL, Thakrar B, Sacks S, Rothman KJ. Health outcomes among patients receiving oseltamivir. Pharmacoepidemiol Drug Saf 2004;13:227-37.
- Fagan HB, Moeller AH. What is the best antiviral agent for influenza infection?. Am Fam Physician 2004;70:1331-2.
- Fleming DM. Treating influenza with zanamivir. Lancet 1999;353:668-9.
- GlaxoSmithKline . C94–085 (NAIB1002). I A Study to Evaluate the Effect of Repeat Doses of GG167 Dry Powder on Pulmonary Function and Bronchial Hyper-Responsiveness in Asthmatic Subjects n.d. www.gsk-clinicalstudyregister.com/files/pdf/3378.pdf (accessed 25 August 2009).
- GlaxoSmithKline . NAI10901. I A Double-Blind, Randomised, Placebo-Controlled Study to Evaluate the Effect of Inhaled Zanamivir 10mg Od for 28 Days on Anti-Haemagglutinin Antibody Production (HAI Titre) Following Co-Administration With fluvirin™ Trivalent Influenza Vaccine in Healthy Adult Subjects n.d. www.gsk-clinicalstudyregister.com/files/pdf/3297.pdf (accessed 25 August 2009).
- GlaxoSmithKline . NAI40012. IV An Open-Label, Multi-Center Study of the Patient Instructional Leaflet for RELENZA DISKHALER n.d. www.gsk-clinicalstudyregister.com/files/pdf/3373.pdf (accessed 25 August 2009).
- GlaxoSmithKline . NAIA1009. I Pharmacokinetics of Zanamivir (GG167) Following Inhaled Administration in Pediatric Subjects With Signs and Symptoms of Respiratory Illness n.d. www.gsk-clinicalstudyregister.com/files/pdf/3411.pdf (accessed 25 August 2009).
- Imamura T, Hosoya M, Oonishi N, Sato K, Katayose M, Kawasaki Y, et al. The study on efficacy of oseltamivir for influenza A in children. Kansenshogaku Zasshi 2003;77:971-6.
- Ison MG, Gnann JW, Nagy-Agren S, Treannor J, Paya C, Steigbigel R, et al. Safety and efficacy of nebulized zanamivir in hospitalized patients with serious influenza. Antiviral Therapy 2003;8:183-90.
- Ison MG, Gnann J, Treanor J, Nagy-Agren S, Whitley RJ, Elliott M, et al. Phase II study of the safety and efficacy of nebulized zanamivir in patients with serious influenza virus infections [meeting abstract]. Abstr Intersci Conf Antimicrob Agents Chemother 2001;41:H-664.
- Iyer GR, Liao S, Massarella J. Population analysis of the pharmacokinetics and pharmacodynamics of RWJ–270201 (BCX–1812) in treating experimental influenza A and B virus in healthy volunteers. Aaps Pharmsci 2002;4.
- Kaiser L, Keene ON, Hammond JM, Elliott M, Hayden FG. Impact of zanamivir on antibiotic use for respiratory events following acute influenza in adolescents and adults. Arch Intern Med 2000;160:3234-40.
- Kawai N, Ikematsu H, Iwaki N, Satoh I, Kawashima T, Maeda T, et al. The clinical outcomes of anti-influenza drug therapy: a Japanese multi-center study of the 2002/2003 influenza season. Int Congr Ser 2004;1263.
- Kawai N, Ikematsu H, Iwaki N, Satoh I, Kawashima T, Maeda T, et al. Factors influencing the effectiveness of oseltamivir and amantadine for the treatment of influenza: a multicenter study from Japan of the 2002–2003 influenza season. Clin Infect Dis 2005;40.
- Kawai N, Ikematsu H, Iwaki N, Maeda T, Satoh I, Hirotsu N, et al. A comparison of the effectiveness of oseltamivir for the treatment of influenza A and influenza B: a Japanese multicenter study of the 2003–2004 and 2004–2005 influenza seasons. Clin Infect Dis 2006;43.
- Kawai N, Ikematsu H, Iwaki N, Maeda T, Kanazawa H, Kawashima T, et al. A comparison of the effectiveness of zanamivir and oseltamivir for the treatment of influenza A and B. J Infect 2008;56:51-7.
- LaForce C, Man CY, Henderson FW, McElhaney JE, Hampel FC, Bettis R, et al. Efficacy and safety of inhaled zanamivir in the prevention of influenza in community-dwelling, high-risk adult and adolescent subjects: a 28-day, multicenter, randomized, double-blind, placebo-controlled trial. Clin Ther 2007;29:1579-90.
- McGeer A, Green KA, Plevneshi A, Shigayeva A, Siddiqi N, Raboud J, et al. Antiviral therapy and outcomes of influenza requiring hospitalization in Ontario, Canada. Clin Infect Dis 2007;45:1568-75.
- Mitamura K. Antiviral agents for influenza. Nippon Rinsho 2007;65:401-6.
- Monto AS, Webster A, Keene O. Randomized, placebo-controlled studies of inhaled zanamivir in the treatment of influenza A and B: pooled efficacy analysis. J Antimicrob Chemother 1999;44:23-9.
- Monto AS, Moult AB, Sharp SJ. Effect of zanamivir on duration and resolution of influenza symptoms. Clin Ther 2000;22:1294-305.
- Phillips TG. Neuraminidase inhibitors slightly beneficial for shortening flu symptoms. J Fam Pract 2003;52:747-8.
- Pitts SR. Evidence-based emergency medicine/systematic review abstract. Ann Emerg Med 2002;39:552-4.
- Reina J. Peramivir. A new and potent neuraminidase inhibitor for the treatment of influenza. Rev Esp Quimioter 2006;19:317-22.
- Robson R, Buttimore A, Lynn K, Brewster M, Ward P. The pharmacokinetics and tolerability of oseltamivir suspension in patients on haemodialysis and continuous ambulatory peritoneal dialysis. Nephrol Dial Transplant 2006;21:2556-62.
- Sander B, Gyldmark M, Morris J, Bergemann R. Influenza treatment with oseltamivir in a high-risk population: a cost-effective option for the health care payer [meeting abstract]. Value Health 2002;5:567-8.
- Satoh N, Akiba T, Yokoshima S, Fukuyama T. A practical synthesis of (-)-oseltamivir. Angew Chem Int Ed Engl 2007;46:5734-6.
- Uyeki TM. Influenza diagnosis and treatment in children: a review of studies on clinically useful tests and antiviral treatment for influenza. Pediatr Infect Dis J 2003;22:164-77.
- von Bremen KK, Martin E, Holly A, Paccaud F. Reducing influenza symptoms by 1.5 days: a prospective randomized trial using the contingent valuation method to elicit preferences for neuraminidase inhibitors [meeting abstract]. Value Health 2003;6.
- Williamson JC, Pegramm PS. Respiratory distress associated with zanamivir. N Engl J Med 2000;342:661-2.
- Yamaura K, Yoshihara M. Investigation of the reconsultation rate and pharmacoeconomic evaluation of period of influenza treatment by oseltamivir. Yakugaku Zasshi 2003;123:887-91.
- Muennig PA, Khan K. Cost-effectiveness of vaccination versus treatment of influenza in healthy adolescents and adults. Clin Infect Dis 2001;33:1879-85.
- Rothberg MB, Rose DN. Vaccination versus treatment of influenza in working adults: a cost-effectiveness analysis. Am J Med 2005;118:68-77.
- Prosser LA, Bridges CB, Uyeki TM, Rego VH, Ray GT, Meltzer MI, et al. Values for preventing influenza-related morbidity and vaccine adverse events in children. Health Qual Life Outcomes 2005;3:1-18.
- Demicheli V, Jefferson T, Rivetti D, Deeks J. Prevention and early treatment of influenza in healthy adults. Vaccine 2000;18:957-1030.
Appendix 1 Literature search strategies
Clinical effectiveness
MEDLINE and MEDLINE In-Process & Other Non-Indexed Citations (OVID gateway)
October 2001–week 2, November 2007. 23 November 2007. 492 records retrieved in MEDLINE; eight in MEDLINE In-Process & Other Non-Indexed Citations.
-
clinical trial.pt.
-
randomized.ab.
-
placebo.ab.
-
randomly.ab.
-
trial.ab.
-
groups.ab.
-
dt.fs.
-
or/1–7
-
Influenza, Human/
-
influenza$.ti,ab.
-
flu.ti,ab.
-
grippe.ti,ab.
-
or/9–12
-
Zanamivir/
-
zanamivir$.ti,ab.
-
relenza$.ti,ab.
-
(gg167 or gg 167).mp.
-
(gr121167 or gr 121167 or gr 121167x or gr121167x).mp.
-
139110–80–8.rn.
-
or/14–19
-
oseltamivir$.ti,ab,rn.
-
tamiflu$.ti,ab.
-
(gs4104 or gs 4104).mp.
-
(gs4171 or gs 4171 or gs4071 or gs 4071).mp.
-
(ro–0796 or ro0796 or ro64–0796 or ro 64–0796 or ro64–0802 or ro640802).mp.
-
or/21–25
-
Neuraminidase/
-
((neuraminidase or sialidase) adj2 (inhibit$or antagonist$)).ti,ab.
-
(NA adj2 (inhibit$or antagonist$)).ti,ab.
-
or/27–29
-
Amantadine/
-
amantadin$.ti,ab.
-
(symmetrel or symetrel).ti,ab.
-
lysovir.ti,ab.
-
aminoadamantane.ti,ab.
-
adamantylamine.ti,ab.
-
adekin.ti,ab.
-
(aman or amanta or amanta-hci-azu or amanta-sulfate-azu).ti,ab.
-
amixx.ti,ab.
-
cerebramed.ti,ab.
-
endantadine.ti,ab.
-
(gen-amantadine or genamantadine or pms-amantadine or pmsamantadine).ti,ab.
-
(infecto-flu or infectoflu).ti,ab.
-
infex.ti,ab.
-
(mantadix or midantan).ti,ab.
-
symadine.ti,ab.
-
(viregyt or wiregyt).ti,ab.
-
virofral.ti,ab.
-
tregor.ti,ab.
-
768–94–5.rn.
-
or/31–50
-
8 and 13 and (20 or 26 or 30 or 51)
-
Animals/
-
Humans/
-
53 not (53 and 54)
-
52 not 55
-
(200110$or 200111$or 200112$or 2002$or 2003$or 2004$or 2005$or 2006$or 2007$).ed
-
56 and 57
Trials filter:
Glanville JM, Lefebvre C, Miles JN, Camosso-Stefinovic J. How to identify randomized controlled trials in MEDLINE: ten years on. J Med Libr Assoc 2006;94(2):130–6.
EMBASE (OVID gateway)
2001–week 46, 2007. 23 November 2007. 580 records were retrieved.
-
random.tw.
-
clinical trial.mp.
-
exp Health Care Quality/
-
or/1–3
-
exp Influenza/
-
influenza$.ti,ab.
-
flu.ti,ab.
-
grippe.ti,ab.
-
or/5–8
-
Zanamivir/
-
zanamivir$.ti,ab.
-
relenza$.ti,ab.
-
(gg167 or gg 167).mp.
-
(gr121167 or gr 121167 or gr 121167x or gr121167x).mp.
-
139110 80 8.rn.
-
or/10–15
-
Oseltamivir/
-
oseltamivir$.ti,ab.
-
tamiflu$.ti,ab.
-
(gs4104 or gs 4104).mp.
-
(gs4171 or gs 4171 or gs4071 or gs 4071).mp.
-
(ro–0796 or ro0796 or ro64–0796 or ro 64–0796 or ro64–0802 or ro640802).mp.
-
or/17–22
-
Sialidase Inhibitor/
-
((neuraminidase or sialidase) adj2 (inhibit$or antagonist$)).ti,ab.
-
(NA adj2 (inhibit$or antagonist$)).ti,ab.
-
or/24–26
-
Amantadine/
-
amantadin$.ti,ab.
-
(symmetrel or symetrel).ti,ab.
-
lysovir.ti,ab.
-
aminoadamantane.ti,ab.
-
adamantylamine.ti,ab.
-
adekin.ti,ab.
-
(aman or amanta or amanta-hci-azu or amanta-sulfate-azu).ti,ab.
-
amixx.ti,ab.
-
cerebramed.ti,ab.
-
endantadine.ti,ab.
-
(gen-amantadine or genamantadine or pms-amantadine or pmsamantadine).ti,ab.
-
(infecto-flu or infectoflu).ti,ab
-
infex.ti,ab.
-
(mantadix or midantan).ti,ab.
-
symadine.ti,ab.
-
(viregyt or wiregyt).ti,ab.
-
virofral.ti,ab.
-
tregor.ti,ab.
-
768 94 5.rn.
-
or/28–47
-
4 and 9 and (16 or 23 or 27 or 48)
-
Animal/or Animal Experiment/or Nonhuman/
-
(rat or rats or mouse or mice or murine or rodent or rodents or hamster or hamsters or pig or pigs or porcine or rabbit or rabbits or animal or animals or dogs or dog or cats or cow or bovine or sheep or ovine or monkey or monkeys).ti,ab,sh.
-
or/50–51
-
exp Human/or Human Experiment/
-
52 not (52 and 53)
-
49 not 54
-
(2001$or 2002$or 2003$or 2004$or 2005$or 2006$or 2007$).em
-
55 and 56
Trials filter:
Wong SS, Wilczynski NL, Haynes RB. Developing optimal search strategies for detecting clinically sound treatment studies in EMBASE. J Med Libr Assoc 2006;94(1):41–7.
CINAHL (OVID gateway)
October 2001–week 2, November 2007. 23 November 2007. 61 records were retrieved.
-
exp prognosis/
-
exp study design/
-
random.mp.
-
or/1–3
-
Influenza/
-
influenza$.ti,ab.
-
flu.ti,ab.
-
grippe.ti,ab.
-
or/5–8
-
zanamivir$.ti,ab.
-
relenza$.ti,ab.
-
(gg167 or gg 167).mp.
-
(gr121167 or gr 121167 or gr 121167x or gr121167x).mp.
-
139110–80–8.mp.
-
or/10–14
-
oseltamivir$.ti,ab.
-
tamiflu$.ti,ab.
-
(gs4104 or gs 4104).mp.
-
(gs4171 or gs 4171 or gs4071 or gs 4071).mp.
-
(ro–0796 or ro0796 or ro64–0796 or ro 64–0796 or ro64–0802 or ro640802).mp.
-
or/16–20
-
((neuraminidase or sialidase) adj2 (inhibit$or antagonist$)).ti,ab.
-
(NA adj2 (inhibit$or antagonist$)).ti,ab.
-
22 or 23
-
Amantadine/
-
amantadin$.ti,ab.
-
(symmetrel or symetrel).ti,ab.
-
lysovir.ti,ab.
-
aminoadamantane.ti,ab.
-
adamantylamine.ti,ab.
-
adamantylamine.ti,ab.
-
adekin.ti,ab.
-
(aman or amanta or amanta-hci-azu or amanta-sulfate-azu).ti,ab.
-
amixx.ti,ab.
-
cerebramed.ti,ab.
-
endantadine.ti,ab.
-
(gen-amantadine or genamantadine or pms-amantadine or pmsamantadine).ti,ab.
-
(infecto-flu or infectoflu).ti,ab.
-
infex.ti,ab.
-
(mantadix or midantan).ti,ab.
-
symadine.ti,ab.
-
(viregyt or wiregyt).ti,ab.
-
virofral.ti,ab.
-
tregor.ti,ab.
-
768–94–5.mp.
-
or/25–45
-
4 and 9 and (15 or 21 or 24 or 46)
-
(200110$or 200111$or 200112$or 2002$or 2003$or 2004$or 2005$or 2006$or 2007$).ew.
-
47 and 48
-
Trials filter:
McMaster University. Health Information Research Unit (HiRU). Evidence-Based Informatics. Hedges Project.
Search strategies for CINAHL: therapy.
http://hiru.mcmaster.ca/hiru/HIRU_Hedges_CINAHL_Strategies.htm
Science Citation Index (Web of Science)
2001–22 November 2007. 23 November 2007. 249 records were retrieved.
-
TS = (clinical* SAME trial*)
-
TS = (controlled SAME trial*) OR TS = (controlled SAME stud*)
-
TS = (random OR randomisation OR randomization OR randomized or randomised)
-
TS = (singl* or doubl* or tripl* or trebl*) SAME TS = (mask* or blind*)
-
TS = placebo*
-
#1 or #2 or #3 or #4 or #5
-
TS = (influenza* or flu or grippe)
-
TS = (zanamivir* or relenza*)
-
TS = (oseltamivir* or tamiflu*)
-
TS = (neuraminidase or sialidase or NA) SAME TS = (inhibit* or antagonist*)
-
TS = (neuraminidase or sialidase) SAME TS = (inhibitor* or antagonist*)
-
TS = (amantadin* or symmetrel or symetrel or lysovir)
-
TS = (aminoadamantane or adamantylamine or adekin or aman or amanta*)
-
TS = (amixx or cerebramed or endantadine or infecto-flu or infectoflu or infex or mantadix or midantan or symadine or viregyt or wiregyt or virofral or tregor)
-
#8 or #9 or #10 or #11 or #12 or #13 or #14
-
#6 and #7 and #15
Timespan = 2001–2007
CDSR and CENTRAL (Cochrane Library)
2001–2007, issue 4. 23 November 2007. 17 reviews were retrieved in CDSR and 56 records in CENTRAL.
-
MeSH descriptor Influenza, Human explode all trees
-
(influenza* or flu or grippe)
-
(#1 OR #2)
-
MeSH descriptor Zanamivir explode all trees
-
(zanamivir* or relenza*)
-
(gg167 or ‘gg 167’ or gg–167 or gr121167 or ‘gr 121167’ or gr–121167 or gr 121167x or gr121167x)
-
(139110–80–8 or 139110808 or ‘139110 80 8’)
-
(#4 OR #5 OR #6 OR #7)
-
(oseltamivir* or tamiflu*)
-
(gs4104 or ‘gs 4104’ or gs–4104)
-
(gs4171 or ‘gs 4171’ or gs–4171)
-
(ro–0796 or ro0796 or ‘ro 0796’ or ro64–0796 or ro 64–0796 or ro64–0802 or ro640802)
-
(#9 OR #10 OR #11 OR #12)
-
MeSH descriptor Neuraminidase explode all trees
-
(neuraminidase or sialidase) NEAR/2 (inhibit* or antagonist*)
-
NA NEAR/2 (inhibit* or antagonist*)
-
(#14 OR #15 OR #16)
-
MeSH descriptor Amantadine explode all trees
-
(amantadin* or symmetrel or symetrel or lysovir or aminoadamantane or adamantylamine or adekin)
-
(aman or amanta or amanta-hci-azu or amanta-sulfate-azu or amixx or cerebramed or endantadine)
-
(gen-amantadine or pms-amantadine or genamantadine or pmsamantadine or infecto-flu or infectoflu or infex or mantadix or midantan or symadine or viregyt or wiregyt or virofral or tregor)
-
(768–94–5 or 768945 or ‘768 94 5’)
-
(#18 OR #19 OR #20 OR #21 OR #22)
-
(#3 AND (#8 OR #13 OR #17 OR #23)), from 2001 to 2007
DARE and HTA (CRD internal databases)
2001–October 2007. 23 November 2007. Six records were retrieved in DARE and 15 records were retrieved in HTA.
-
s influenza$or flu or grippe
-
s zanamivir$or relenza$
-
s oseltamivir$or tamiflu$
-
s (neuraminidase or sialidase)(w2)(inhibit$or antagonist$) or NA(w2)(inhibitor$or antagonist$)
-
s amantadin$or symmetrel or symetrel or lysovir or aminoadamantane or adamantylamine or adekin or aman or amanta$or amixx or cerebramed or endantadine or infecto(w)flu or infectoflu or infex or mantadix or midantan or symadine or viregyt or wiregyt or virofral or tregor
-
s s1 and (s2 or s3 or s4 or s5)
-
s 2001/xyr or 2002/xyr or 2003/xyr or 2004/xyr or 2005/xyr or 2006/xyr or 2007/xyr
-
s s6 and s7
LILACS (Birme Virtual Health Library)
2001–October 2007. 23 November 2007. Zero records were retrieved.
(clinical$trial$) or (controlled trial$) or (controlled stud$) or random OR randomisation OR randomization OR randomized or randomized or (singl$blind$) or (singl$mask$) or (doubl$blind$) or (doubl$mask$) or (tripl$blind$) or (tripl$mask$) or (trebl$blind$) or (trebl$mask$) or placebo$or crossover or evaluation or (prospective stud$) or (comparative stud$) or (phase 4) or (phase four) or (phase IV) or (post market$surveillance)[words]
AND
Influenza$or flu or grippe [words]
AND
zanamivir$or relenza$or oseltamivir$or tamiflu$or (neuraminidase inhibit$) or (sialidase inhibit$) or (neuraminidase antagonist$) or (sialidase antagonist$) or amantadin$or symmetrel or symetrel or lysovir or aminoadamantane or adamantylamine or adekin or aman or amanta or amixx or cerebramed or endantadine or (gen amantadine) or genamantadine or (pms amantadine) or pmsamantadine or (infecto flu) or infectoflu or infex or mantadix or midantan or symadine or viregyt or wiregyt or virofral or tregor
[words]
BIOSIS (Dialog)
2001–week 4, November 2007. 29 November 2007. 89 records were retrieved.
-
s clinical(2w)trial?
-
s controlled(2w)(trial? or stud?)
-
s random or randomi?ation or randomi?ed
-
s (singl? or doubl? or tripl? or trebl?)(2w)(mask? or blind?)
-
s placebo?
-
s (prospective(2w)stud?) or (comparative(2w)stud?)
-
s phase(w)4 or phase(w)four or phase(w)IV
-
s post(w)market?(w)surveillance
-
s s1:s8
-
s influenza? or flu or grippe
-
s zanamivir? or relenza?
-
s oseltamivir? or tamiflu?
-
s (neuraminidase or sialidase or NA)(2n)(inhibit? or antagonist?)
-
s amantadin? or symmetrel or symetrel or lysovir or aminoadamantane or adamantylamine or adekin or aman or amanta or amixx or cerebramed or endantadine or gen(w)amantadine or genamantadine or pms(w)amantadine or pmsamantadine or infecto(w)flu or infectoflu or infex or mantadix or midantan or symadine or viregyt or wiregyt or virofral or tregor
-
s s11:s14
-
s s9 and s10 and s15
-
s s16/2001–2007
Pascal (Dialog)
2001–week 2, November 2007. 29 November 2007. 33 records were retrieved.
-
s clinical(2w)trial?
-
s controlled(2w)(trial? or stud?)
-
s random or randomi?ation or randomi?ed
-
s (singl? or doubl? or tripl? or trebl?)(2w)(mask? or blind?)
-
s placebo?
-
s (prospective(2w)stud?) or (comparative(2w)stud?)
-
s phase(w)4 or phase(w)four or phase(w)IV
-
s post(w)market?(w)surveillance
-
s s1:s8
-
s influenza? or flu or grippe
-
s zanamivir? or relenza?
-
s oseltamivir? or tamiflu?
-
s (neuraminidase or sialidase or NA)(2n)(inhibit? or antagonist?)
-
s amantadin? or symmetrel or symetrel or lysovir or aminoadamantane or adamantylamine or adekin or aman or amanta or amixx or cerebramed or endantadine or gen(w)amantadine or genamantadine or pms(w)amantadine or pmsamantadine or infecto(w)flu or infectoflu or infex or mantadix or midantan or symadine or viregyt or wiregyt or virofral or tregor
-
s s11:s14
-
s s9 and s10 and s15
-
s s16/2001–2007
Dissertation Abstracts (Dialog)
2001–August 2007. 29 November 2007. Zero records were retrieved.
-
s clinical(2w)trial?
-
s controlled(2w)(trial? or stud?)
-
s random or randomi?ation or randomi?ed
-
s (singl? or doubl? or tripl? or trebl?)(2w)(mask? or blind?)
-
s placebo?
-
s (prospective(2w)stud?) or (comparative(2w)stud?)
-
s phase(w)4 or phase(w)four or phase(w)IV
-
s post(w)market?(w)surveillance
-
s s1:s8
-
s influenza? or flu or grippe
-
s zanamivir? or relenza?
-
s oseltamivir? or tamiflu?
-
s (neuraminidase or sialidase or NA)(2n)(inhibit? or antagonist?)
-
s amantadin? or symmetrel or symetrel or lysovir or aminoadamantane or adamantylamine or adekin or aman or amanta or amixx or cerebramed or endantadine or gen(w)amantadine or genamantadine or pms(w)amantadine or pmsamantadine or infecto(w)flu or infectoflu or infex or mantadix or midantan or symadine or viregyt or wiregyt or virofral or tregor
-
s s11:s14
-
s s9 and s10 and s15
-
s s16/2001–2007
Inside Conferences (Dialog)
2001–28 November 2007. 29 November 2007. One record was retrieved.
-
s clinical(2w)trial?
-
s controlled(2w)(trial? or stud?)
-
s random or randomi?ation or randomi?ed
-
s (singl? or doubl? or tripl? or trebl?)(2w)(mask? or blind?)
-
s placebo?
-
s (prospective(2w)stud?) or (comparative(2w)stud?)
-
s phase(w)4 or phase(w)four or phase(w)IV
-
s post(w)market?(w)surveillance
-
s s1:s8
-
s influenza? or flu or grippe
-
s zanamivir? or relenza?
-
s oseltamivir? or tamiflu?
-
s (neuraminidase or sialidase or NA)(2n)(inhibit? or antagonist?)
-
s amantadin? or symmetrel or symetrel or lysovir or aminoadamantane or adamantylamine or adekin or aman or amanta or amixx or cerebramed or endantadine or gen(w)amantadine or genamantadine or pms(w)amantadine or pmsamantadine or infecto(w)flu or infectoflu or infex or mantadix or midantan or symadine or viregyt or wiregyt or virofral or tregor
-
s s11:s14
-
s s9 and s10 and s15
-
s s16/2001–2007
TOXLINE (TOXNET – US National Library of Medicine)
2001–30 November 2007. 30 November 2007. 202 records were retrieved.
-
influenza
-
zanamivir
-
relenza
-
oseltamivir
-
tamiflu
-
neuraminidase
-
amantadine
-
symmetrel
-
aminoadamantane aminoadamantanes
-
aman
-
mantadix
-
midantan
-
symadine
-
viregyt
-
139110–80–8 [rn]
-
768–94–5 [rn]
-
(#2 OR #3 OR #4 OR #5 OR #6 OR #7 OR #8 OR #9 OR #10 OR #11 OR #12 OR #13 OR #14 OR #15 OR #16)
-
(#1 AND #17)
-
AND 2001:2007 [yr]
-
(#18 AND #19)
National Research Register (update software)
2001–2007, issue 4. 29 November 2007. 12 records were retrieved.
-
INFLUENZA HUMAN explode all trees (MeSH)
-
(influenza* or flu or grippe)
-
(#1 or #2)
-
(zanamivir* or relenza*)
-
(gg167 or gg–167 or gr121167 or gr–121167 or (gr next 121167x) or gr121167x)
-
(139110–80–8 or 139110808)
-
(oseltamivir* or tamiflu*)
-
(gs4104 or gs–4104)
-
(gs4171 or gs–4171)
-
(ro–0796 or ro0796 or ro64–0796 or (ro next 64–0796) or ro64–0802 or ro640802)
-
NEURAMINIDASE single term (MeSH)
-
((neuraminidase near inhibit*) or (neuraminidase near antagonist*))
-
((sialidase near inhibit*) or (sialidase near antagonist*))
-
((na near inhibit*) or (na near antagonist*))
-
AMANTADINE explode tree 1 (MeSH)
-
(amantadin* or symmetrel or symetrel or lysovir or aminoadamantane or adamantylamine or adekin)
-
(aman or amanta or amanta-hci-azu or amanta-sulfate-azu or amixx or cerebramed or endantadine)
-
(gen-amantadine or pms-amantadine or genamantadine or pmsamantadine or infecto-flu or infectoflu or infex or mantadix or midantan or symadine or viregyt or wiregyt or virofral or tregor)
-
(768–94–5 or 768945)
-
(#4 or #5 or #6 or #7 or #8 or #9 or #10 or #11 or #12 or #13 or #14 or #15 or #16 or #17 or #18 or #19)
-
(#3 and #20)
ClinicalTrials.gov (US National Library of Medicine)
November 2007. 30 November 2007. 16 records were retrieved. Each line searched separately.
(zanamivir OR relenza) AND influenza
(oseltamivir OR tamiflu) AND influenza
(neuraminidase OR sialidase) AND influenza
(amantadine OR symmetrel OR symetrel OR lysovir OR aminoadamantane OR adamantylamine OR adekin OR aman OR amanta) AND influenza
(amixx OR cerebramed OR endantadine OR infecto-flu OR infex OR mantadix OR midantan OR symadine OR viregyt OR wiregyt OR virofral OR tregor) AND influenza
Current Controlled Trials (MetaRegister of Current Controlled Trials – mRCT)
November 2007. 30 November 2007. 21 records were retrieved. Each line searched separately.
(zanamivir OR relenza) AND influenza
(oseltamivir OR tamiflu) AND influenza
(neuraminidase OR sialidase) AND influenza
(amantadine OR symmetrel OR symetrel OR lysovir OR aminoadamantane OR adamantylamine OR adekin OR aman OR amanta) AND influenza
(amixx OR cerebramed OR endantadine OR ‘infecto-flu’ OR infex OR mantadix OR midantan OR symadine OR viregyt OR wiregyt OR virofral OR tregor) AND influenza
ClinicalStudyResults.org (Clinical Study Results website)
November 2007. 30 November 2007. Five records were retrieved. Each line searched separately.
-
zanamivir
-
relenza
-
oseltamivir
-
tamiflu
-
(neuraminidase OR sialidase) AND influenza
-
amantadine
ClinicalTrialResults.org (Clinical Trial Results website)
November 2007. 30 November 2007. Zero records were retrieved. Each line searched separately.
-
zanamivir
-
relenza
-
oseltamivir
-
tamiflu
-
(neuraminidase OR sialidase) AND influenza
-
amantadine
International Clinical Trials Registry Platform (ICTRP)
November 2007. 30 November 2007. 12 records were retrieved. Each line searched separately.
-
zanamivir influenza [All words match]
-
relenza influenza [All words match]
-
oseltamivir influenza [All words match]
-
tamiflu [All words match]
-
neuraminidase influenza [All words match]
-
sialidase influenza [All words match]
GlaxoSmithKline Clinical Trial Register
November 2007. 30 November 2007. 23 records were retrieved.
-
Zanamivir studies
Roche Clinical Trial Protocol Registry and Results Database
November 2007. 30 November 2007. Four protocol and five trial records were retrieved.
-
oseltamivir [Tamiflu]
-
Tamiflu [oseltamivir]
Supplementary search: influenza season 2007–8 drug resistance
MEDLINE and MEDLINE In-Process & Other Non-Indexed Citations (OvidSP)
2007–week 4, May 2008. 6 June 2008. 54 records were retrieved in MEDLINE and 41 in MEDLINE In-Process & Other Non-Indexed Citations.
-
Influenza, Human/
-
influenza$.ti,ab.
-
flu.ti,ab.
-
grippe.ti,ab.
-
or/1–4
-
Zanamivir/
-
zanamivir$.ti,ab.
-
relenza$.ti,ab.
-
(gg167 or gg 167).mp.
-
(gr121167 or gr 121167 or gr 121167x or gr121167x).mp.
-
139110–80–8.rn.
-
or/6–11
-
oseltamivir$.ti,ab,rn.
-
tamiflu$.ti,ab.
-
(gs4104 or gs 4104).mp.
-
(gs4171 or gs 4171 or gs4071 or gs 4071).mp.
-
(ro–0796 or ro0796 or ro64–0796 or ro 64–0796 or ro64–0802 or ro640802).mp.
-
or/13–17
-
Neuraminidase/
-
((neuraminidase or sialidase) adj2 (inhibit$or antagonist$)).ti,ab.
-
(NA adj2 (inhibit$or antagonist$)).ti,ab.
-
or/19–21
-
Amantadine/
-
amantadin$.ti,ab.
-
(symmetrel or symetrel).ti,ab.
-
lysovir.ti,ab.
-
aminoadamantane.ti,ab.
-
adamantylamine.ti,ab.
-
adekin.ti,ab.
-
(aman or amanta or amanta-hci-azu or amanta-sulfate-azu).ti,ab.
-
amixx.ti,ab.
-
cerebramed.ti,ab.
-
endantadine.ti,ab.
-
(gen-amantadine or genamantadine or pms-amantadine or pmsamantadine).ti,ab.
-
(infecto-flu or infectoflu).ti,ab.
-
infex.ti,ab.
-
(mantadix or midantan).ti,ab.
-
symadine.ti,ab.
-
(viregyt or wiregyt).ti,ab.
-
virofral.ti,ab.
-
tregor.ti,ab.
-
768–94–5.rn.
-
or/23–42
-
5 and (12 or 18 or 22 or 43)
-
Animals/
-
Humans/
-
45 not (45 and 46)
-
44 not 47
-
exp Drug Resistance, Viral/
-
(resist or resists or resistance or resistances or resistant or resisted).mp.
-
49 or 50
-
48 and 51
-
(200709$or 200710$or 200711$or 200712$or 2008$).ed.
-
52 and 53
EMBASE (OvidSP)
2007–week 22, 2008. 6 June 2008. 61 records were retrieved.
-
exp Influenza/
-
influenza$.ti,ab.
-
flu.ti,ab.
-
grippe.ti,ab.
-
or/1–4
-
Zanamivir/
-
zanamivir$.ti,ab.
-
relenza$.ti,ab.
-
(gg167 or gg 167).mp.
-
(gr121167 or gr 121167 or gr 121167x or gr121167x).mp.
-
139110 80 8.rn.
-
or/6–11
-
Oseltamivir/
-
oseltamivir$.ti,ab.
-
tamiflu$.ti,ab.
-
(gs4104 or gs 4104).mp.
-
(gs4171 or gs 4171 or gs4071 or gs 4071).mp.
-
(ro–0796 or ro0796 or ro64–0796 or ro 64–0796 or ro64–0802 or ro640802).mp.
-
or/13–18
-
Sialidase Inhibitor/
-
((neuraminidase or sialidase) adj2 (inhibit$or antagonist$)).ti,ab.
-
(NA adj2 (inhibit$or antagonist$)).ti,ab.
-
or/20–22
-
Amantadine/
-
amantadin$.ti,ab.
-
(symmetrel or symetrel).ti,ab.
-
lysovir.ti,ab.
-
aminoadamantane.ti,ab.
-
adamantylamine.ti,ab.
-
adekin.ti,ab.
-
(aman or amanta or amanta-hci-azu or amanta-sulfate-azu).ti,ab.
-
amixx.ti,ab.
-
cerebramed.ti,ab.
-
endantadine.ti,ab.
-
(gen-amantadine or genamantadine or pms-amantadine or pmsamantadine).ti,ab.
-
(infecto-flu or infectoflu).ti,ab.
-
infex.ti,ab.
-
(mantadix or midantan).ti,ab.
-
symadine.ti,ab.
-
(viregyt or wiregyt).ti,ab.
-
virofral.ti,ab.
-
tregor.ti,ab.
-
768 94 5.rn.
-
or/24–43
-
5 and (12 or 19 or 23 or 44)
-
exp drug resistance/
-
(resist or resists or resistance or resistances or resistant or resisted).mp.
-
46 or 47
-
45 and 48
-
Animal/or Animal Experiment/or Nonhuman/
-
(rat or rats or mouse or mice or murine or rodent or rodents or hamster or hamsters or pig or pigs or porcine or rabbit or rabbits or animal or animals or dogs or dog or cats or cow or bovine or sheep or ovine or monkey or monkeys).ti,ab,sh.
-
50 or 51
-
exp Human/or Human Experiment/
-
52 not (52 and 53)
-
49 not 54
-
(‘200736’ or ‘200737’ or ‘200738’ or ‘200739’ or ‘200740’ or ‘200741’ or ‘200742’ or ‘200743’ or ‘200744’ or ‘200745’ or ‘200746’ or ‘200747’ or ‘200748’ or ‘200749’ or ‘200750’ or ‘200751’ or ‘200752’).em.
-
2008$.em.
-
56 or 57
-
55 and 58
Cost-effectiveness
MEDLINE and MEDLINE In-Process & Other Non-Indexed Citations (OVID gateway)
October 2001–week 2, November 2007. 5 December 2007. 103 records were retrieved in MEDLINE and three in MEDLINE In-Process & Other Non-Indexed Citations.
-
economics/
-
exp ‘costs and cost analysis’/
-
economics, dental/
-
exp ‘economics, hospital’/
-
economics, medical/
-
economics, nursing/
-
economics, pharmaceutical/
-
(economic$or cost or costs or costly or costing or price or prices or pricing or pharmacoeconomic$).tw.
-
(expenditure$not energy).tw.
-
(value adj1 money).tw.
-
budget$.tw.
-
or/1–11
-
((energy or oxygen) adj cost).ti,ab.
-
(metabolic adj cost).ti,ab.
-
((energy or oxygen) adj expenditure).ti,ab.
-
or/13–15
-
12 not 16
-
Influenza, Human/
-
influenza$.ti,ab.
-
flu.ti,ab.
-
grippe.ti,ab.
-
or/18–21
-
Zanamivir/
-
zanamivir$.ti,ab.
-
relenza$.ti,ab.
-
(gg167 or gg 167).mp.
-
(gr121167 or gr 121167 or gr 121167x or gr121167x).mp.
-
139110–80–8.rn.
-
or/23–28
-
oseltamivir$.ti,ab,rn.
-
tamiflu$.ti,ab.
-
(gs4104 or gs 4104).mp.
-
(gs4171 or gs 4171 or gs4071 or gs 4071).mp.
-
(ro–0796 or ro0796 or ro64–0796 or ro 64–0796 or ro64–0802 or ro640802).mp.
-
or/30–34
-
Neuraminidase/
-
((neuraminidase or sialidase) adj2 (inhibit$or antagonist$)).ti,ab.
-
(NA adj2 (inhibit$or antagonist$)).ti,ab.
-
or/36–38
-
Amantadine/
-
amantadin$.ti,ab.
-
(symmetrel or symetrel).ti,ab.
-
lysovir.ti,ab.
-
aminoadamantane.ti,ab.
-
adamantylamine.ti,ab.
-
adekin.ti,ab.
-
(aman or amanta or amanta-hci-azu or amanta-sulfate-azu).ti,ab.
-
amixx.ti,ab.
-
cerebramed.ti,ab.
-
endantadine.ti,ab.
-
(gen-amantadine or genamantadine or pms-amantadine or pmsamantadine).ti,ab.
-
(infecto-flu or infectoflu).ti,ab.
-
infex.ti,ab.
-
(mantadix or midantan).ti,ab.
-
symadine.ti,ab.
-
(viregyt or wiregyt).ti,ab.
-
virofral.ti,ab.
-
tregor.ti,ab.
-
768–94–5.rn.
-
or/40–59
-
17 and 22 and (29 or 35 or 39 or 60)
-
Animals/
-
Humans/
-
62 not (62 and 63)
-
61 not 64
-
(200110$or 200111$or 200112$or 2002$or 2003$or 2004$or 2005$or 2006$or 2007$).ed
-
65 and 66
EMBASE (OVID gateway)
2001– week 48, 2007. 5 December 2007. 276 records were retrieved.
-
Health Economics/
-
exp Economic Evaluation/
-
exp Health Care Cost/
-
exp PHARMACOECONOMICS/
-
or/1–4
-
(econom$or cost or costs or costly or costing or price or prices or pricing or pharmacoeconomic$).ti,ab.
-
(expenditure$not energy).ti,ab.
-
(value adj2 money).ti,ab.
-
budget$.ti,ab.
-
or/6–9
-
5 or 10
-
(metabolic adj cost).ti,ab.
-
((energy or oxygen) adj cost).ti,ab.
-
((energy or oxygen) adj expenditure).ti,ab.
-
or/12–14
-
11 not 15
-
editorial.pt.
-
note.pt.
-
letter.pt.
-
or/17–19
-
16 not 20
-
(rat or rats or mouse or mice or hamster or hamsters or animal or animals or dogs or dog or cats or bovine or sheep).ti,ab,sh.
-
exp animal/
-
Nonhuman/
-
or/22–24
-
exp human/
-
exp human experiment/
-
26 or 27
-
25 not (25 and 28)
-
21 not 29
-
exp Influenza/
-
influenza$.ti,ab.
-
flu.ti,ab.
-
grippe.ti,ab.
-
or/31–34
-
Zanamivir/
-
zanamivir$.ti,ab.
-
relenza$.ti,ab.
-
(gg167 or gg 167).mp.
-
(gr121167 or gr 121167 or gr 121167x or gr121167x).mp.
-
139110 80 8.rn.
-
or/36–41
-
Oseltamivir/
-
oseltamivir$.ti,ab.
-
tamiflu$.ti,ab.
-
(gs4104 or gs 4104).mp.
-
(gs4171 or gs 4171 or gs4071 or gs 4071).mp.
-
(ro–0796 or ro0796 or ro64–0796 or ro 64–0796 or ro64–0802 or ro640802).mp.
-
or/43–48
-
Sialidase Inhibitor/
-
((neuraminidase or sialidase) adj2 (inhibit$or antagonist$)).ti,ab.
-
(NA adj2 (inhibit$or antagonist$)).ti,ab.
-
or/50–52
-
Amantadine/
-
amantadin$.ti,ab.
-
(symmetrel or symetrel).ti,ab.
-
lysovir.ti,ab.
-
aminoadamantane.ti,ab.
-
adamantylamine.ti,ab.
-
adekin.ti,ab.
-
(aman or amanta or amanta-hci-azu or amanta-sulfate-azu).ti,ab.
-
amixx.ti,ab.
-
cerebramed.ti,ab.
-
endantadine.ti,ab.
-
(gen-amantadine or genamantadine or pms-amantadine or pmsamantadine).ti,ab.
-
(infecto-flu or infectoflu).ti,ab.
-
infex.ti,ab.
-
(mantadix or midantan).ti,ab.
-
symadine.ti,ab.
-
(viregyt or wiregyt).ti,ab.
-
virofral.ti,ab.
-
tregor.ti,ab.
-
768 94 5.rn.
-
or/54–73
-
30 and 35 and (42 or 49 or 53 or 74)
-
(2001$or 2002$or 2003$or 2004$or 2005$or 2006$or 2007$).em
-
75 and 76
CINAHL (OVID gateway)
October 2001–week 5, November 2007. 6 December 2007. 22 records were retrieved.
-
exp ‘costs and cost analysis’/or ‘economic aspects of illness’/or ‘economic value of life’/or economics, pharmaceutical/
-
((cost or costs or costed or costly or costing) adj (utilit$or benefit$or effective$or stud$or minimi$or analys$)).ti,ab.
-
(economic$or pharmacoeconomic$or price$or pricing).ti,ab.
-
(expenditure$not energy).ti,ab.
-
(value adj1 money).ti,ab.
-
budget$.ti,ab.
-
or/1–6
-
Influenza/
-
influenza$.ti,ab.
-
flu.ti,ab.
-
grippe.ti,ab.
-
or/8–11
-
zanamivir$.ti,ab.
-
relenza$.ti,ab.
-
(gg167 or gg 167).mp.
-
(gr121167 or gr 121167 or gr 121167x or gr121167x).mp.
-
139110–80–8.mp.
-
or/13–17
-
oseltamivir$.ti,ab.
-
tamiflu$.ti,ab.
-
(gs4104 or gs 4104).mp.
-
(gs4171 or gs 4171 or gs4071 or gs 4071).mp.
-
(ro–0796 or ro0796 or ro64–0796 or ro 64–0796 or ro64–0802 or ro640802).mp.
-
or/19–23
-
((neuraminidase or sialidase) adj2 (inhibit$or antagonist$)).ti,ab.
-
(NA adj2 (inhibit$or antagonist$)).ti,ab.
-
25 or 26
-
Amantadine/
-
amantadin$.ti,ab.
-
(symmetrel or symetrel).ti,ab.
-
lysovir.ti,ab.
-
aminoadamantane.ti,ab.
-
adamantylamine.ti,ab.
-
adamantylamine.ti,ab.
-
adekin.ti,ab.
-
(aman or amanta or amanta-hci-azu or amanta-sulfate-azu).ti,ab.
-
amixx.ti,ab.
-
cerebramed.ti,ab.
-
endantadine.ti,ab.
-
(gen-amantadine or genamantadine or pms-amantadine or pmsamantadine).ti,ab.
-
(infecto-flu or infectoflu).ti,ab.
-
infex.ti,ab.
-
(mantadix or midantan).ti,ab.
-
symadine.ti,ab.
-
(viregyt or wiregyt).ti,ab.
-
virofral.ti,ab.
-
tregor.ti,ab.
-
768–94–5.mp.
-
or/28–48
-
7 and 12 and (18 or 24 or 27 or 49)
-
(200110$or 200111$or 200112$or 2002$or 2003$or 2004$or 2005$or 2006$or 2007$).ew.
-
50 and 51
Science Citation Index (Web of Science)
2001–6 December 2007. 6 December 2007. 94 records were retrieved.
-
TS = (economic* or cost or costs or costly or costing or price or prices or pricing or pharmacoeconomic*)
-
TS = (value SAME money)
-
TS = budget*
-
TS = (expenditure* NOT energy)
-
#1 OR #2 OR #3 OR #4
-
TS = (influenza* or flu or grippe)
-
TS = (zanamivir* or relenza*)
-
TS = (oseltamivir* or tamiflu*)
-
TS = (neuraminidase or sialidase or NA) SAME TS = (inhibit* or antagonist*)
-
TS = (neuraminidase or sialidase) SAME TS = (inhibitor* or antagonist*)
-
TS = (amantadin* or symmetrel or symetrel or lysovir)
-
TS = (aminoadamantane or adamantylamine or adekin or aman or amanta*)
-
TS = (amixx or cerebramed or endantadine or infecto-flu or infectoflu or infex or mantadix or midantan or symadine or viregyt or wiregyt or virofral or tregor)
-
#7 or #8 or #9 or #10 or #11 or #12 or #13
-
#5 and #6 and #14
-
Timespan = 2001–2007
NHS EED (CRD Internal Databases)
2001–November 2007. 6 December 2007. 25 records were retrieved.
-
s influenza$or flu or grippe
-
s zanamivir$or relenza$
-
s oseltamivir$or tamiflu$
-
s (neuraminidase or sialidase)(w2)(inhibit$or antagonist$) or NA(w2)(inhibitor$or antagonist$)
-
s amantadin$or symmetrel or symetrel or lysovir or aminoadamantane or adamantylamine or adekin or aman or amanta$or amixx or cerebramed or endantadine or infecto(w)flu or infectoflu or infex or mantadix or midantan or symadine or viregyt or wiregyt or virofral or tregor
-
s s1 and (s2 or s3 or s4 or s5)
-
s 2001/xyr or 2002/xyr or 2003/xyr or 2004/xyr or 2005/xyr or 2006/xyr or 2007/xyr
-
s s6 and s7
HEED (Wiley Online)
2001–November 2007. 6 December 2007. 38 records were retrieved.
-
AX = influenza or flu or grippe
-
AX = zanamivir or relenza or gg167 or (gg 167) or gr121167 or (gr 121167) or (gr 121167x) or (139110–80–8)
-
AX = oseltamivir or tamiflu or gs4104 or (gs 4104) or gs4171 or (gs 4171) or (ro–0796) or ro0796 or (ro 0796) or (ro64–0796) or (ro 64–0796)
-
AX = (neuraminidase inhibitor) or (neuraminidase inhibitors) or (sialidase inhibitor) or (sialidase inhibitors) or (NA inhibitor) or (NA inhibitors)
-
AX = (neuraminidase antagonist) or (neuraminidase antagonists) or (sialidase antagonist) or (sialidase antagonists) or (NA antagonist) or (NA antagonists)
-
AX = amantadine or symmetrel or symetrel or lysovir or aminoadamantane or adamantylamine or adekin or aman or amanta or amixx or cerebramed or endantadine or (infecto-flu) or infectoflu or infex or mantadix or midantan or symadine or viregyt or wiregyt or virofral or tregor or (768–94–5)
-
CS = 1 and (2 or 3 or 4 or 5 or 6)
-
JD> = 2001
-
CS = 7 and 8
CDSR and CENTRAL (Cochrane Library)
2001–2007, issue 4. 6 December 2007. 12 reviews were retrieved in CDSR and three records in CENTRAL.
-
MeSH descriptor Influenza, Human explode all trees
-
(influenza* or flu or grippe)
-
(#1 OR #2)
-
MeSH descriptor Zanamivir explode all trees
-
(zanamivir* or relenza*)
-
(gg167 or ‘gg 167’ or gg–167 or gr121167 or ‘gr 121167’ or gr–121167 or gr 121167x or gr121167x)
-
(139110–80–8 or 139110808 or ‘139110 80 8’)
-
(#4 OR #5 OR #6 OR #7)
-
(oseltamivir* or tamiflu*)
-
(gs4104 or ‘gs 4104’ or gs–4104)
-
(gs4171 or ‘gs 4171’ or gs–4171)
-
(ro–0796 or ro0796 or ‘ro 0796’ or ro64–0796 or ro 64–0796 or ro64–0802 or ro640802)
-
(#9 OR #10 OR #11 OR #12)
-
MeSH descriptor Neuraminidase explode all trees
-
(neuraminidase or sialidase) NEAR/2 (inhibit* or antagonist*)
-
NA NEAR/2 (inhibit* or antagonist*)
-
(#14 OR #15 OR #16)
-
MeSH descriptor Amantadine explode all trees
-
(amantadin* or symmetrel or symetrel or lysovir or aminoadamantane or adamantylamine or adekin)
-
(aman or amanta or amanta-hci-azu or amanta-sulfate-azu or amixx or cerebramed or endantadine)
-
(gen-amantadine or pms-amantadine or genamantadine or pmsamantadine or infecto-flu or infectoflu or infex or mantadix or midantan or symadine or viregyt or wiregyt or virofral or tregor)
-
(768–94–5 or 768945 or ‘768 94 5’)
-
(#18 OR #19 OR #20 OR #21 OR #22)
-
(#3 AND (#8 OR #13 OR #17 OR #23)), from 2001 to 2007
-
MeSH descriptor Economics, this term only
-
MeSH descriptor Costs and Cost Analysis explode all trees
-
MeSH descriptor Economics, Dental explode all trees
-
MeSH descriptor Economics, Hospital explode all trees
-
MeSH descriptor Economics, Medical explode all trees
-
MeSH descriptor Economics, Nursing explode all trees
-
MeSH descriptor Economics, Pharmaceutical explode all trees
-
(economic* or cost or costs or costly or costing or price or prices or pricing or pharmacoeconomic*)
-
(expenditure* not energy)
-
(value NEAR/3 money)
-
(budget*)
-
(#25 OR #26 OR #27 OR #28 OR #29 OR #30 OR #31 OR #32 OR #33 OR #34 OR #33 OR #34 OR #35)
-
(#24 AND #36)
LILACS (Birme Virtual Health Library)
2001–November 2007. 6 December 2007. One record was retrieved.
economic$or cost or costs or costly or costing or price or prices or pricing or pharmacoeconomic$or budget$[words]
AND
Influenza$or flu or grippe [words]
AND
zanamivir$or relenza$or oseltamivir$or tamiflu$or (neuraminidase inhibit$) or (sialidase inhibit$) or (neuraminidase antagonist$) or (sialidase antagonist$) or amantadin$or symmetrel or symetrel or lysovir or aminoadamantane or adamantylamine or adekin or aman or amanta or amixx or cerebramed or endantadine or (gen amantadine) or genamantadine or (pms amantadine) or pmsamantadine or (infecto flu) or infectoflu or infex or mantadix or midantan or symadine or viregyt or wiregyt or virofral or tregor
[words]
BIOSIS (Dialog)
2001–week 1, December 2007. 6 December 2007. 47 records were retrieved.
-
s economic? or cost or costs or costly or costing or price or prices or pricing or pharmacoeconomic?
-
s expenditure? not energy
-
s value(2w)money
-
s budget?
-
s s1:s4
-
s influenza? or flu or grippe
-
s zanamivir? or relenza?
-
s oseltamivir? or tamiflu?
-
s (neuraminidase or sialidase or NA)(2n)(inhibit? or antagonist?)
-
s amantadin? or symmetrel or symetrel or lysovir or aminoadamantane or adamantylamine or adekin or aman or amanta or amixx or cerebramed or endantadine or gen(w)amantadine or genamantadine or pms(w)amantadine or pmsamantadine or infecto(w)flu or infectoflu or infex or mantadix or midantan or symadine or viregyt or wiregyt or virofral or tregor
-
s s7:s10
-
s s5 and s6 and s11
-
s s12/2001–2007
Pascal (Dialog)
2001–week 3, November 2007. 6 December 2007. 16 records were retrieved.
-
s economic? or cost or costs or costly or costing or price or prices or pricing or pharmacoeconomic?
-
s expenditure? not energy
-
s value(2w)money
-
s budget?
-
s s1:s4
-
s influenza? or flu or grippe
-
s zanamivir? or relenza?
-
s oseltamivir? or tamiflu?
-
s (neuraminidase or sialidase or NA)(2n)(inhibit? or antagonist?)
-
s amantadin? or symmetrel or symetrel or lysovir or aminoadamantane or adamantylamine or adekin or aman or amanta or amixx or cerebramed or endantadine or gen(w)amantadine or genamantadine or pms(w)amantadine or pmsamantadine or infecto(w)flu or infectoflu or infex or mantadix or midantan or symadine or viregyt or wiregyt or virofral or tregor
-
s s7:s10
-
s s5 and s6 and s11
-
s s12/2001–2007
Dissertation Abstracts (Dialog)
2001–August 2007. 6 December 2007. One record was retrieved.
-
s economic? or cost or costs or costly or costing or price or prices or pricing or pharmacoeconomic?
-
s expenditure? not energy
-
s value(2w)money
-
s budget?
-
s s1:s4
-
s influenza? or flu or grippe
-
s zanamivir? or relenza?
-
s oseltamivir? or tamiflu?
-
s (neuraminidase or sialidase or NA)(2n)(inhibit? or antagonist?)
-
s amantadin? or symmetrel or symetrel or lysovir or aminoadamantane or adamantylamine or adekin or aman or amanta or amixx or cerebramed or endantadine or gen(w)amantadine or genamantadine or pms(w)amantadine or pmsamantadine or infecto(w)flu or infectoflu or infex or mantadix or midantan or symadine or viregyt or wiregyt or virofral or tregor
-
s s7:s10
-
s s5 and s6 and s11
-
s s12/2001–2007
Inside Conferences (Dialog)
2001–6 December 2007. 6 December 2007. Two records were retrieved.
-
s economic? or cost or costs or costly or costing or price or prices or pricing or pharmacoeconomic?
-
s expenditure? not energy
-
s value(2w)money
-
s budget?
-
s s1:s4
-
s influenza? or flu or grippe
-
s zanamivir? or relenza?
-
s oseltamivir? or tamiflu?
-
s (neuraminidase or sialidase or NA)(2n)(inhibit? or antagonist?)
-
s amantadin? or symmetrel or symetrel or lysovir or aminoadamantane or adamantylamine or adekin or aman or amanta or amixx or cerebramed or endantadine or gen(w)amantadine or genamantadine or pms(w)amantadine or pmsamantadine or infecto(w)flu or infectoflu or infex or mantadix or midantan or symadine or viregyt or wiregyt or virofral or tregor
-
s s7:s10
-
s s5 and s6 and s11
-
s s12/2001–2007
IDEAS (RePeC)
2001–November 2007. 6 December 2007. Zero records were retrieved. Each line searched separately.
-
zanamivir
-
relenza
-
oseltamivir
-
tamiflu
-
neuraminidase
-
sialidase
-
amantadine
-
symmetrel
-
symetrel
Health-related quality of life
MEDLINE and MEDLINE In-Process & Other Non-Indexed Citations (OVID gateway)
1950–week 4, January 2008. 31 January 2008. 87 records were retrieved in MEDLINE and two in MEDLINE In-Process & Other Non-Indexed Citations.
-
Influenza, Human/
-
influenza$.ti,ab.
-
flu.ti,ab.
-
grippe.ti,ab.
-
or/1–4
-
‘Quality of Life’/
-
qol.ti,ab.
-
(index of wellbeing or quality of wellbeing or qwb).ti,ab.
-
(multiattribute$health or multi attribute$health).ti,ab.
-
(health utilit$index or health utilit$indices).ti,ab.
-
(multiattribute$theor$or multi attribute$theor$or multiattribute$analys$or multi attribute$analys$).ti,ab.
-
(health utilit$scale$or classification of illness state$).ti,ab.
-
health state$utilit$.ti,ab.
-
(multiattribute$utilit$or multi attribute$utilit$).ti,ab.
-
health utilit$scale$.ti,ab.
-
(euro qual or euro qol or EQ-5D or eq5d or eq 5d or euroqual or euroqol).ti,ab.
-
(sf36 or sf 36).ti,ab.
-
(short form 36 or shortform 36 or sf thirtysix or sf thirty six or shortform thirtysix or shortform thirty six or short form thirtysix or short form thirty six).ti,ab.
-
(sf12 or sf 12).ti,ab.
-
(short form 12 or shortform 12 or sf twelve or short form twelve).ti,ab.
-
(qlq-c30 or fact-c or facit or qli-cp).ti,ab.
-
(sf 6d or sf6d or short form 6d or shortform 6d or sf six$or shortform six$or short form six$).ti,ab.
-
hrqol.ti,ab.
-
hrql.ti,ab.
-
(health related quality adj2 life$).ti,ab.
-
cost utilit$.ti,ab.
-
(proms or Patient Reported Outcome Measure$).ti,ab.
-
(IIWS or Influenza Impact Wellbeing Scale).ti,ab.
-
(ISS or Influenza Symptom Severity scale).ti,ab.
-
or/6–29
-
5 and 30
-
Animals/
-
Humans/
-
32 not (32 and 33)
-
31 not 34
EMBASE (OVID gateway)
1980–week 4, 2008. 31 January 2008. 267 records were retrieved.
-
exp Influenza/
-
influenza$.ti,ab.
-
flu.ti,ab.
-
grippe.ti,ab.
-
or/1–4
-
‘Quality of Life’/
-
qol.ti,ab.
-
(index of wellbeing or quality of wellbeing or qwb).ti,ab.
-
(multiattribute$health or multi attribute$health).ti,ab.
-
(health utilit$index or health utilit$indices).ti,ab.
-
(multiattribute$theor$or multi attribute$theor$or multiattribute$analys$or multi attribute$analys$).ti,ab.
-
(health utilit$scale$or classification of illness state$).ti,ab.
-
health state$utilit$.ti,ab.
-
(multiattribute$utilit$or multi attribute$utilit$).ti,ab.
-
health utilit$scale$.ti,ab.
-
(euro qual or euro qol or EQ-5D or eq5d or eq 5d or euroqual or euroqol).ti,ab.
-
(sf36 or sf 36).ti,ab.
-
(short form 36 or shortform 36 or sf thirtysix or sf thirty six or shortform thirtysix or shortform thirty six or short form thirtysix or short form thirty six).ti,ab.
-
(sf12 or sf 12).ti,ab.
-
(short form 12 or shortform 12 or sf twelve or short form twelve).ti,ab.
-
(qlq-c30 or fact-c or facit or qli-cp).ti,ab.
-
(sf 6d or sf6d or short form 6d or shortform 6d or sf six$or shortform six$or short form six$).ti,ab.
-
hrqol.ti,ab.
-
hrql.ti,ab.
-
(health related quality adj2 life$).ti,ab.
-
cost utilit$.ti,ab.
-
(proms or Patient Reported Outcome Measure$).ti,ab.
-
(IIWS or Influenza Impact Wellbeing Scale).ti,ab.
-
(ISS or Influenza Symptom Severity scale).ti,ab.
-
or/6–29
-
5 and 30
-
Animal/or Animal Experiment/or Nonhuman/
-
(rat or rats or mouse or mice or murine or rodent or rodents or hamster or hamsters or pig or pigs or porcine or rabbit or rabbits or animal or animals or dogs or dog or cats or cow or bovine or sheep or ovine or monkey or monkeys).ti,ab,sh.
-
32 or 33
-
exp Human/or Human Experiment/
-
34 not (34 and 35)
-
31 not 36
CINAHL (OVID gateway)
1982–week 1, December 2007. 31 January 2008. 21 records were retrieved.
-
Influenza/
-
influenza$.ti,ab.
-
flu.ti,ab.
-
grippe.ti,ab.
-
or/1–4
-
exp ‘Quality of Life’/
-
qol.ti,ab.
-
(index of wellbeing or quality of wellbeing or qwb).ti,ab.
-
(multiattribute$health or multi attribute$health).ti,ab.
-
(health utilit$index or health utilit$indices).ti,ab.
-
(multiattribute$theor$or multi attribute$theor$or multiattribute$analys$or multi attribute$analys$).ti,ab.
-
(health utilit$scale$or classification of illness state$).ti,ab.
-
health state$utilit$.ti,ab.
-
(multiattribute$utilit$or multi attribute$utilit$).ti,ab.
-
health utilit$scale$.ti,ab.
-
(euro qual or euro qol or EQ-5D or eq5d or eq 5d or euroqual or euroqol).ti,ab.
-
(sf36 or sf 36).ti,ab.
-
(short form 36 or shortform 36 or sf thirtysix or sf thirty six or shortform thirtysix or shortform thirty six or short form thirtysix or short form thirty six).ti,ab.
-
(sf12 or sf 12).ti,ab.
-
(short form 12 or shortform 12 or sf twelve or short form twelve).ti,ab.
-
(qlq-c30 or fact-c or facit or qli-cp).ti,ab.
-
(sf 6d or sf6d or short form 6d or shortform 6d or sf six$or shortform six$or short form six$).ti,ab.
-
hrqol.ti,ab.
-
hrql.ti,ab.
-
(health related quality adj2 life$).ti,ab.
-
cost utilit$.ti,ab.
-
(proms or Patient Reported Outcome Measure$).ti,ab.
-
(IIWS or Influenza Impact Wellbeing Scale).ti,ab.
-
(ISS or Influenza Symptom Severity scale).ti,ab.
-
or/6–29
-
5 and 30
Science Citation Index (Web of Science)
1900–26 January 2008. 31 January 2008. 255 records were retrieved.
-
TS = (influenza* or flu or grippe)
-
TS = (quality of life or qol or index of wellbeing or quality of wellbeing or qwb)
-
TS = (multiattribute* health or multi attribute* health or health utilit* index or health utilit* indices or multiattribute* theor* or multi attribute* theor* or multiattribute* analys* or multi attribute* analys*)
-
TS = (health utilit* scale* or classification of illness state* or health state* utilit* or multiattribute* utilit* or multi attribute* utilit* or health utilit* scale*)
-
TS = (euro qual or euro qol or EQ-5D or eq5d or eq 5d or euroqual or euroqol)
-
TS = (sf36 or sf 36 or short form 36 or shortform 36 or sf thirtysix or sf thirty six or shortform thirtysix or shortform thirty six or short form thirtysix or short form thirty six or sf12 or sf 12 or short form 12 or shortform 12 or sf twelve or short form twelve)
-
TS = (qlq-c30 or fact-c or facit or qli-cp or sf 6d or sf6d or short form 6d or shortform 6d or sf six* or shortform six* or short form six*)
-
TS = (hrqol or hrql)
-
TS = (health related quality) SAME TS = (life*)
-
TS = (cost utilit*)
-
TS = (proms or Patient Reported Outcome Measure*)
-
TS = (IIWS or Influenza Impact Wellbeing Scale)
-
TS = (ISS or Influenza Symptom Severity scale)
-
#2 or #3 or #4 or #5 or #6 or #7 or #8 or #9 or #10 or #11 or #12 or #13
-
#1 and #14
NHS EED, DARE and HTA (CRD internal databases)
1994–December 2007. 31 January 2008. 32 records were retrieved in NHS EED, three in DARE, and three in HTA.
-
s influenza$or flu or grippe
-
s quality(w)of(w)life or qol
-
s index(w)of(w)wellbeing or quality(w)of(w)wellbeing or qwb
-
s multiattribute$(w)health or multi(w)attribute$(w)health or health(w)utilit$(w)index or health utilit$(w)indices
-
s multiattribute$(w)theor$or multi(w)attribute$(w)theor$or multiattribute$(w)analys$or multi(w)attribute$(w)analys$
-
s health(w)utilit$(w)scale$or classification(w)of(w)illness(w)state$or health(w)state$(w)utilit$or multiattribute$(w)utilit$or multi(w)attribute$(w)utilit$
-
s health(w)utilit$(w)scale$
-
s euro(w)qual or euro(w)qol or eq(w)5d or eq5d or euroqual or euroqol
-
s sf36 or sf(w)36 or short(w)form(w)36 or shortform(w)36 or sf(w)thirtysix or sf(w)thirty(w)six or shortform(w)thirtysix or shortform(w)thirty(w)six or short(w)form(w)thirtysix or short(w)form(w)thirty(w)six
-
s sf12 or sf(w)12 or short(w)form(w)12 or shortform(w)12 or sf(w)twelve or short(w)form(w)twelve
-
s qlq(w)c30 or fact(w)c or facit or qli(w)cp
-
s sf(w)6d or sf6d or short(w)form(w)6d or shortform(w)6d or sf(w)six$or shortform(w)six$or short(w)form(w)six$
-
s hrqol or hrql or health(w)related(w)quality(w2)life$
-
s cost(w)utilit$
-
s proms or Patient(w)Reported(w)Outcome(w)Measure$
-
s IIWS or Influenza(w)Impact(w)Wellbeing(w)Scale
-
s ISS or Influenza(w)Symptom(w)Severity(w)scale
-
s s2 or s3 or s4 or s5 or s6 or s7 or s8 or s9 or s10 or s11 or s12 or s13 or s14 or s15 or s16 or s17
-
s s1 and s18
HEED (Wiley Online)
1990–January 2008. 31 January 2008. 13 records were retrieved.
-
AX = influenza or flu or grippe
-
AX = (index of wellbeing) OR (quality wellbeing) OR (qwb)
-
AX = (multiattribute health) OR (multi attribute health)
-
AX = (health utility index) OR (health utility indices)
-
AX = (multiattribute theory) OR (multi attribute theory) OR (multiattribute analysis) OR (multi attribute analysis)
-
AX = (health utility scale) OR (classification illness state)
-
AX = (health state utility)
-
AX = (multiattribute utility) OR (multi attribute utility)
-
AX = (euro qual) OR (eruo qol) OR (EQ-5D) OR (eq5d) OR (euroqual) OR (euroqol)
-
AX = (sf36) OR (sf 36)
-
AX = (short form 36) OR (shortform 36) OR (sf thirtysix) OR (sf thirty six) OR (shortform thirtysix) OR (shortform thirty six) OR (short form thirtysix) OR (short form thirty six)
-
AX = (sf 6d) OR (sf6d) OR (short form 6d) OR (shortform 6d) OR (sf six) OR (shortform six) OR (short form six)
-
AX = hrqol
-
AX = hrql
-
AX = (health related quality of life)
-
AX = (quality of life)
-
AX = qol
-
AX = (IIWS) OR (Influenza Impact Wellbeing Scale)
-
AX = (ISS) OR (Influenza Symptom Severity scale)
-
CS = 2 or 3 or 4 or 5 or 6 or 7 or 8 or 9 or 10 or 11 or 12 or 13 or 14 or 15 or 16 or 17 or 18 or 19
-
CS = 1 and 20
CEA Registry (Tufts – New England Medical Center website)
November 2007. 31 January 2008. 19 records were retrieved. Each line searched separately.
-
influenza
-
influenzae
Internet sites searched
Websites were browsed (publications, guidelines and research) and searched using a variety of combinations of the following terms: zanamivir, relenza, oseltamivir, tamiflu, neuraminidase, sialidase, amantadine, influenza.
-
MedlinePlus: www.nlm.nih.gov/medlineplus/medlineplus.html
-
Intute: www.intute.ac.uk/
-
National Library for Health (NLH): www.library.nhs.uk/
-
National electronic Library of Infection (NeLI): www.neli.org.uk/
-
Department of Health: www.dh.gov.uk/en/Home
-
Health Protection Agency: www.hpa.org.uk/
-
British Infection Society: www.britishinfectionsociety.org/
-
British Lung Foundation: www.lunguk.org/
-
British Thoracic Society: www.brit-thoracic.org.uk/
-
Association of Public Health Observatories (APHO): www.apho.org.uk/apho/index.htm
-
European Centre for Disease Prevention and Control (ECDC): www.ecdc.eu.int/
-
European Scientific Working group on Influenza (ESWI): www.eswi.org/
-
US National Institute of Allergy and Infectious Diseases (NIAID): www3.niaid.nih.gov/
-
US Center for Disease Control and Prevention (CDC): www.cdc.gov/
-
American Lung Association: www.lungusa.org/
-
Medicines and Healthcare products Regulatory Agency (MHRA): www.mhra.gov.uk/
-
European Agency for Evaluation of Medicinal Products (EMEA): www.emea.europa.eu/
-
US Food and Drug Administration (FDA): www.fda.gov/
Appendix 2 Details of included studies
Clinical effectiveness
| Study ID | Study details | Population details | Intervention/Comparator details | |
|---|---|---|---|---|
|
Aoki et al. 74 Data source Full published paper Language English |
Influenza season 1995–6 Regions UK, Western Europe, USA/Canada Number of centres recruiting Not reported Was influenza reported as circulating in the community? No Definition of ILI Feverish with any other two symptoms Delay to start of treatment 48 hours Mean 30 hours (SD 11 hours) for zanamivir; 29 hours (SD 11 hours) for placebo Use of antipyretics Not reported Length of follow-up 21 days |
Number recruited Overall: 1256 Number influenza positive Overall: 722 Intervention: 241 Comparator: 240 Groups/subgroups for which data are presented Mixed population Proportion male Overall: 92/441 (21%) Intervention: 46/241 (19%) Comparator: 46/240 (19%) Number of withdrawals Not reported Proportion vaccinated within last year Intervention: 1% Comparator: 3% Age range Minimum: 13 |
Intervention Zanamivir 10-mg inhalation plus nasal spray twice daily Comparator Placebo |
|
|
Data source Full published paper Company website trials data Language English |
Influenza season 1997–8 Region USA/Canada Number of centres recruiting 84 Was influenza reported as circulating in the community? Yes Definition of ILI Temperature > 37.8°C with any two symptoms Temperature ≥ 37.2 for subjects ≥ 65 years Delay to start of treatment 48 hours Use of antipyretics Relief medication was used but it is unclear whether it was unrestricted |
Number recruited Overall: 777 Intervention: 412 Comparator: 365 Number influenza positive Overall: 569 Intervention: 312 Comparator: 257 Groups/subgroups for which data are presented Mixed population At risk Proportion male Overall: 374/777 (48%) Intervention: 205/412 (50%) Comparator: 169/365 (46%) Number of withdrawals Overall: 33/777 (4%) Intervention: 17/412 (4%) Comparator: 16/365 (4%) |
Intervention Zanamivir 10-mg inhalation twice daily Comparator Placebo |
|
|
Length of follow-up 14 days |
Proportion vaccinated within last year Overall: 108/777 (14%) Intervention: 55/412 (13%) Comparator: 53/365 (15%) Age range Minimum: 12 |
|||
|
Deng et al. 66 Data source Full published paper Language Chinese |
Influenza season Dates not reported Region Asia Number of centres recruiting Unclear Was influenza reported as circulating in the community? No Definition of ILI Not reported Delay to start of treatment 48 hours Use of antipyretics Not reported Length of follow-up Unclear (9 days plus additional follow-up until symptoms relieved) |
Number recruited Overall: 1176 Intervention: 599 Comparator: 577 Number influenza positive Not reported Groups/subgroups for which data are presented Healthy adults Proportion male Overall: 0.52 Intervention: 0.52 Comparator: 0.52 Number of withdrawals Not reported Proportion vaccinated within last year Not reported Age range Mean: 32 ± 16 years |
Intervention Oseltamivir 75 mg twice daily Comparator Symptomatic relief Ephedrine |
|
|
GlaxoSmithKline NAI30012105,106 Data source Company website trials data Company submission Language English |
Influenza season 1999–2001 Regions UK, Western and Eastern Europe, USA/Canada and other America, Australia/NZ, Russia, South Africa, Israel Number of centres recruiting 119 Was influenza reported as circulating in the community? Yes Definition of ILI Temperature > 37.8°C with any two symptoms Delay to start of treatment Maximum 48 hours Use of antipyretics Unrestricted Length of follow-up Visit at 29 days with further telephone call at 56 days |
Number recruited Overall: 358 Intervention: 191 Comparator: 167 Number influenza positive Overall: 234 Intervention: 120 Comparator: 114 Groups/subgroups for which data are presented Elderly Proportion male Overall: ITTI 102/234 = 44%; ITT 41% Intervention: ITTI 52/120 = 43%; ITT 39% Comparator: ITTI 50/114 = 44%; ITT 44% Number of withdrawals Overall: 17 (5%) Intervention: 10 (5%) Comparator: 7 (4%) |
Intervention Zanamivir 10-mg inhalation twice daily Comparator Placebo |
|
|
Proportion vaccinated within last year Overall: ITTI 40%; ITT 46% Intervention: ITTI 50/120 = 42%; ITT 47% Comparator: ITTI 44/114 = 39%; ITT 44% Age range Minimum: 65 |
||||
|
GlaxoSmithKline NAI3002099 Data source Company website trials data Language English |
Influenza season 1999–2001 Region Western Europe Number of centres recruiting 94 Was influenza reported as circulating in the community? No Definition of ILI Temperature > 37.8°C with any two symptoms Delay to start of treatment Maximum 48 hours Length of follow-up 5 days |
Number recruited Overall: 331 Intervention: 224 Comparator: 107 Number influenza positive Not reported Groups/subgroups for which data are presented At risk Proportion male Overall: 141/286 (49%) Intervention: 97/189 (51%) Comparator: 44/97 (45%) Number of withdrawals Overall: 6 (2%) Intervention: 4 (2%) Comparator: 2 (2%) Proportion vaccinated within last year Not reported Age range Minimum: 18 |
Intervention Zanamivir 10-mg inhalation twice daily Comparator Placebo |
|
|
GlaxoSmithKline NAI30028103,104 Data source Company website trials data Company submission Language English |
Influenza season 2000–1 Region Western Europe Number of centres recruiting 45 Was influenza reported as circulating in the community? No Definition of ILI Temperature ≥ 37.8°C with no evidence of bacteria infection Delay to start of treatment Maximum 48 hours Use of antipyretics Unrestricted |
Number recruited Overall: 266 Intervention: 176 Comparator: 90 Number influenza positive Not reported Groups/subgroups for which data are presented Children Proportion male Overall: 61% Intervention: 63% Comparator: 59% Number of withdrawals Overall: 6 (2%) Intervention: 5 (3%) Comparator: 1 (1%) |
Intervention Zanamivir 10-mg inhalation twice daily Comparator Placebo |
|
|
Length of follow-up 6 days for main outcomes 14 days for adverse events |
Proportion vaccinated within last year Not reported Age range 5–12 years (oldest child recruited was 14 years) |
|||
|
GlaxoSmithKline NAI3001187 Data source Company submission Language English |
Influenza season 1999–2000 Region USA/Canada Number of centres recruiting 53 Was influenza reported as circulating in the community? Yes Definition of ILI Temperature > 37.8°C with any two symptoms (temperature > 37.2°C for the elderly) Delay to start of treatment Maximum 48 hours Mean 28.1 hours for zanamivir; 28.7 hours for placebo Range 3–64 hours for zanamivir; 4–48 hours for placebo Use of antipyretics Restricted Length of follow-up 21 days |
Number recruited Overall: 466 Intervention: 229 Comparator: 237 Number influenza positive Overall: 211 Intervention: 104 Comparator: 107 Groups/subgroups for which data are presented Healthy adults (included elderly without comorbidity) Proportion male Overall: 202/466 (43%) Intervention: 91/229 (40%) Comparator: 111/237 (47%) Number of withdrawals Overall: 31/466 (7%) Intervention: 16/229 (7%) Comparator: 15/237 (6%) Proportion vaccinated within last year Overall: 42/466 (9%) Intervention: 21/229 (9%) Comparator: 21/237 (9%) Age range 18–99 years [maximum age for ITTI, 61; 5 patients over 65 years (1 zanamivir; 4 placebo)] |
Intervention Zanamivir 10-mg inhalation twice daily Comparator Placebo |
|
|
Hayden et al. 76 Data source Full published paper Language English |
Influenza season 1994–5 Regions UK, Western Europe, USA/Canada Number of centres recruiting 70 Was influenza reported as circulating in the community? Yes Definition of ILI Feverish with any other two symptoms |
Number recruited Overall: 417 Intervention: 132 Comparator: 144 Number influenza positive Overall: 262 Intervention: 85 Comparator: 89 Groups/subgroups for which data are presented Healthy adults Proportion male Overall: 56% (ITTI) Intervention: 59% (ITTI) Comparator: 54% (ITTI) years (USA) |
Intervention Zanamivir 10-mg inhalation twice daily Comparator Placebo |
|
|
Delay to start of treatment Maximum 48 hours Mean 31 hours (SD 12 hours) for zanamivir; 30 hours (SD 12 hours) for placebo Use of antipyretics Unrestricted Length of follow-up 21–28 days |
Number of withdrawals Overall Prior to treatment: 1 On treatment: 28 (7%) Intervention: 10 (8%) Comparator: 8 (6%) Proportion vaccinated within last year Vaccinated individuals were excluded from the trial Age range Minimum: 18 years (Europe), 13 |
|||
|
Data source Full published paper Company website trials data Company submission |
Influenza season 1999 Regions UK, Western Europe, USA/Canada, Israel, Russia Number of centres recruiting 67 Was influenza reported as circulating in the community? Yes Definition of ILI Temperature > 37.8°C and no clinical evidence of bacterial infection Delay to start of treatment Maximum 36 hours Mean (ITT population) 20.3 hours (SD 9.4 hours) for zanamivir; 20.0 hours (SD 8.8 hours) for placebo Mean (ITTI population) 21.6 hours (SD 9.3 hours) for zanamivir; 20.1 hours (SD 9.0 hours) for placebo Use of antipyretics Restricted Length of follow-up 28 days |
Number recruited Overall: 471 Intervention: 224 Comparator: 247 Number influenza positive Overall: 346 Intervention: 164 Comparator: 182 Groups/subgroups for which data are presented Children Proportion male Overall: 0.55 Intervention: 0.57 Comparator: 0.53 Number of withdrawals Overall: 16 (3%) Intervention: 5 (2%) Comparator: 11 (4%) Proportion vaccinated within last year Overall: 0.02 Intervention: 0.03 Comparator: 0.02 Age range 5–12 years |
Intervention Zanamivir 10-mg inhalation twice daily Comparator Placebo |
|
|
Kashiwagi et al. 68 Data source Full published paper Language Japanese |
Influenza season 1998–2000 Region Asia Number of centres recruiting 79 Was influenza reported as circulating in the community? No |
Number recruited Overall: 316 Intervention: 154 Comparator: 162 Number influenza positive Overall: 252 Intervention: 122 Comparator: 130 |
Intervention Oseltamivir 75 mg twice daily Comparator Placebo |
|
|
Definition of ILI Temperature > 38°C with any two symptoms Delay to start of treatment Maximum 36 hours Mean 24.5 hours (SD 7.7 hours) for oseltamivir; 22.5 hours (SD 8.4 hours) for placebo Range 4.9–38.5 hours for oseltamivir; 4.7–43.0 hours for placebo Use of antipyretics Unrestricted Length of follow-up 21 days |
Groups/subgroups for which data are presented Healthy adults Proportion male Overall: 116/252 (46%) Intervention: 47/122 (39%) Comparator: 69/130 (53%) Number of withdrawals Overall: 14 (4%) Intervention: 3 (2%) Comparator: 11 (7%) Proportion vaccinated within last year Vaccinated individuals were excluded from the trial Age range 16–80 years |
|||
|
Data source Full published paper Language English |
Influenza season 2001 Region Asia Number of centres recruiting 7 Was influenza reported as circulating in the community? Yes Definition of ILI Temperature > 37.8°C with any two symptoms Delay to start of treatment Maximum 36 hours Mean 23.09 hours (SD 8.51 hours) for oseltamivir; 22.29 hours (SD 7.96 hours) for placebo Use of antipyretics Unrestricted Length of follow-up 21 days |
Number recruited Overall: 478 Intervention: 216 Comparator: 235 Number influenza positive Overall: 273 Intervention: 134 Comparator: 139 Groups/subgroups for which data are presented Healthy adults Proportion male Overall: 136/273 (50%) Intervention: 63/134 (47%) Comparator: 73/139 (53%) Number of withdrawals Overall: 16 (3%) Proportion vaccinated within last year Not reported Age range 18–65 years |
Intervention Oseltamivir 75 mg twice daily Comparator Placebo |
|
|
Data source Full published paper Language English |
Influenza season 2002–3 Region Asia Number of centres recruiting 9 Was influenza reported as circulating in the community? No Definition of ILI Temperature > 37.8°C with any two symptoms |
Number recruited Overall: 118 Intervention: 58 Comparator: 60 Number influenza positive Overall: 56 Intervention: 27 Comparator: 29 Groups/subgroups for which data are presented At risk: general respiratory and cardiac comorbidities |
Intervention Oseltamivir 75 mg twice daily Comparator Symptomatic relief |
|
|
Delay to start of treatment Maximum 48 hours Mean 25 hours (SD 10 hours) for oseltamivir; 26 hours (SD 12 hours) for symptomatic relief Use of antipyretics Unrestricted for the first 8 days Length of follow-up 21 days |
Proportion male Overall: 33/56 (59%) Intervention: 17/27 (63%) Comparator: 16/29 (55%) Number of withdrawals None Proportion vaccinated within last year Vaccinated individuals were excluded from the trial Age range Not reported |
|||
|
Mäkelä et al. 96 Data source Full published paper Language English |
Influenza season 1997–8 Region Western Europe Number of centres recruiting 42 Was influenza reported as circulating in the community? Yes Definition of ILI Temperature > 37.8°C with any two symptoms Temperature ≥ 37.2°C for patients ≥ 65 years of age Delay to start of treatment Maximum 48 hours Use of antipyretics Restricted Length of follow-up 28 days |
Number recruited Overall: 356 Intervention: 174 Comparator: 182 Number influenza positive Overall: 277 Intervention: 136 Comparator: 141 Groups/subgroups for which data are presented Mixed population At risk Proportion male Overall: 165/356 (46%) Intervention: 84/174 (48%) Comparator: 81/182 (45%) Number of withdrawals Overall: 7 (2%) Intervention: 4 (2%) Comparator: 3 (2%) Proportion vaccinated within last year Overall: 14/356 (4%) Age range Minimum: 12 |
Intervention Zanamivir 10-mg inhalation twice daily Comparator Placebo |
|
|
Markovski et al. 57 Data source Full published paper Language English |
Influenza season 2001–2 Region Macedonia Number of centres recruiting 1 Was influenza reported as circulating in the community? Yes |
Number recruited Overall: 50 Intervention: 20 Comparator: 30 Number influenza positive Overall: 41 Intervention: 17 Comparator: 24 |
Intervention Oseltamivir 75 mg twice daily Comparator Placebo |
|
|
Definition of ILI Temperature > 37.5°C, chills and the presence of any two other symptoms Delay to start of treatment Maximum 48 hours Use of antipyretics Unrestricted Length of follow-up 10 days |
Groups/subgroups for which data are presented Mixed population Proportion male Not reported Number of withdrawals Not reported Proportion vaccinated within last year Not reported Age range Minimum: 18 |
|||
|
Data source Full published paper Language English |
Influenza season Dates not reported Region Not reported Number of centres recruiting Not reported Was influenza reported as circulating in the community? No Definition of ILI Temperature > 38°C with one systemic and one respiratory symptom Temperature ≥ 37.5°C for elderly patients Delay to start of treatment Maximum 36 hours Use of antipyretics Not reported Length of follow-up 21 days |
Number recruited Overall: 1138 Intervention: 559 Comparator: 579 Groups/subgroups for which data are presented Elderly At risk: general respiratory and cardiac comorbidities Proportion male Overall: 177/402 (44%) at risk; 316/736 (43%) elderly Intervention: 86/199 (43%) at risk; 150/360 (42%) elderly Comparator: 91/203 (45%) at risk; 166/376 (44%) elderly Proportion vaccinated within last year Overall: 111/402 (28%) at risk; 15/736 (43%) elderly Intervention: 56/199 (28%) at risk; 143/360 (40%) elderly Comparator: 55/203 (27%) at risk; 172/376 (46%) elderly Number of withdrawals Not reported Age range 13–88 years |
Intervention Oseltamivir 75 mg twice daily Comparator Placebo |
|
|
Matsumoto et al. 86 Data source Full published paper Language English |
Influenza season 1995 Region Asia Number of centres recruiting 28 Was influenza reported as circulating in the community? Yes |
Number recruited Overall: 116 (third arm not considered in current review) Intervention: 37 Comparator: 39 Number influenza positive Overall: 51/76 (67%) Intervention: 22 (59%) Comparator: 29 (74%) Groups/subgroups for which data are presented Healthy adults |
Intervention Zanamivir 10-mg inhalation twice daily Comparator Placebo |
|
|
Definition of ILI Axillary temperature ≥ 37.5°C and any two symptoms Delay to start of treatment Maximum 36 hours Mean 25.4 hours (SD 15.0 hours) for zanamivir; 24.6 hours (SD 14.9) for placebo Use of antipyretics Restricted Length of follow-up 28 days |
Proportion male Overall: 48/76 (63%) Intervention: 13/37 (35%) Comparator: 15/39 (38%) Number of withdrawals Not reported Proportion vaccinated within last year None Age range 16–65 years |
|||
|
Data source Full published paper Company website trials data Language English |
Influenza season 1997 Regions Australia/NZ, South Africa Number of centres recruiting 13 Was influenza reported as circulating in the community? Yes Definition of ILI Temperature > 37.8°C or feverishness with any two symptoms Delay to start of treatment Maximum 36 hours Mean 24.8 hours (SD 7.4 hours) for zanamivir; 25 hours (SD 7.4 hours) for placebo Use of antipyretics Restricted Length of follow-up 28 days |
Number recruited Overall: 455 Intervention: 227 Comparator: 228 Number influenza positive Overall: 321 Intervention: 161 Comparator: 160 Groups/subgroups for which data are presented Mixed population Proportion male Overall: 241/455 (53%) Intervention: 135/227 (59%) Comparator: 106/228 (46%) Number of withdrawals Overall: 31 (7%) Intervention: 13 (6%) Comparator: 18 (8%) Proportion vaccinated within last year Overall: 26/455 (6%) Intervention: 14/227 (6%) Comparator: 12/228 (5%) Age range Minimum: 12 |
Intervention Zanamivir 10-mg inhalation twice daily Comparator Placebo |
|
|
Monto et al. 75 Data source Full published paper Language English |
Influenza season 1995–6 Regions UK, Western Europe, USA/Canada Number of centres recruiting Not reported Was influenza reported as circulating in the community? Yes |
Number recruited Overall: 1256 (including third arm) Intervention: 419 Comparator: 422 Number influenza positive Overall: 481 (57%) Intervention: 241 (58%) Comparator: 240 (57%) |
Intervention Zanamivir 10-mg inhalation plus nasal spray twice daily Comparator Placebo |
|
|
Definition of ILI Feverish with any other two symptoms Delay to start of treatment Maximum 48 hours Mean 29 hours (SD 11 hours) for both zanamivir and placebo Use of antipyretics Restricted Length of follow-up 21 days |
Groups/subgroups for which data are presented Mixed population At risk Proportion male Overall: 368/841 (44%) Intervention: 181/419 (43%) Comparator: 187/422 (44%) Number of withdrawals Overall: 48 (6%) Intervention: 24 (6%) Comparator: 24 (6%) Proportion vaccinated within last year Overall: 11/841 (1%) Intervention: 3/419 (1%) Comparator: 8/422 (2%) Age range Minimum: 13 |
|||
|
Data source Full published paper Language English |
Influenza season 1998–2000 Regions UK, Western Europe, Eastern Europe, USA/Canada, Other America, Australia/NZ, South Africa, Israel Number of centres recruiting 159 Was influenza reported as circulating in the community? Yes Definition of ILI Temperature > 37.8°C with any two symptoms Delay to start of treatment Maximum 36 hours Mean 22.5 hours for zanamivir; 22.7 hours for placebo Use of antipyretics Restricted Length of follow-up 28 days |
Number recruited Overall: 525 Intervention: 262 Comparator: 263 Number influenza positive Overall: 312 Intervention: 160 Comparator: 152 Groups/subgroups for which data are presented COAD/asthma Proportion male Overall: 223/525 (42%) Intervention: 109/262 (42%) Comparator: 114/263 (43%) Number of withdrawals Overall: 37 (7%) Intervention: 16 (6%) Comparator: 21 (8%) Proportion vaccinated within last year Overall: 122/525 (23%) Intervention: 65/262 (25%) Comparator: 57/263 (22%) Age range Minimum: 12 |
Intervention Zanamivir 10-mg inhalation twice daily Comparator Placebo |
|
|
Nicholson et al. 107 Data source Full published paper Language English |
Influenza season 1998 Regions UK, Western Europe, USA/Canada, Asia Number of centres recruiting 63 Was influenza reported as circulating in the community? Yes Definition of ILI Temperature > 38°C with one respiratory symptom and one systemic Delay to start of treatment Maximum 36 hours Median 24 hours for oseltamivir (4–60 hours); 23 hours for placebo (0–59 hours) Use of antipyretics Unrestricted Length of follow-up 21 days |
Number recruited Overall: 726 Intervention: 243 Comparator: 239 Number influenza positive Overall: 475 Intervention: 158 Comparator: 161 Groups/subgroups for which data are presented Healthy adults Proportion male Intervention: 50% Comparator: 50% Number of withdrawals Overall: 38 (5%) Intervention: 8 (3%) Comparator: 15 (6%) Proportion vaccinated within last year Vaccinated individuals were excluded from the trial Age range 18–65 years |
Intervention Oseltamivir 75 mg twice daily Comparator Placebo |
|
|
Data sources Full published paper Company website trials data Company submission Language English |
Influenza season 1999–2001 Region Western Europe Number of centres recruiting Five residential units of the Finish Defence Forces Was influenza reported as circulating in the community? Yes Definition of ILI Temperature > 37.8°C with any two symptoms Delay to start of treatment Maximum 48 hours Mean 23.6 hours (SD 11.4) for zanamivir; 24.5 hours (SD 11.4) for placebo Use of antipyretics Restricted |
Number recruited Overall: 588 Intervention: 293 Comparator: 295 Number influenza positive Overall: 435 Intervention: 222 Comparator: 213 Groups/subgroups for which data are presented Healthy adults Proportion male Overall: 99% Intervention: 99% Comparator: 100% Number of withdrawals Overall: 14 (2%) Intervention: 5 (2%) Comparator: 9 (3%) |
Intervention Zanamivir 10-mg inhalation twice daily Comparator Placebo |
|
|
Length of follow-up 28 days |
Proportion vaccinated within last year Overall: < 0.01 Intervention: < 0.01 Comparator: < 0.01 Age range 17–29 years |
|||
|
Data source Company submission Abstract Language English |
Influenza season 1998 Regions Australia/NZ, South Africa Number of centres recruiting 12 Was influenza reported as circulating in the community? Yes Definition of ILI Temperature > 38°C with one respiratory and one systemic symptom Delay to start of treatment Maximum 36 hours Mean 25.6 (SD 7.7) hours for oseltamivir; 24.2 (SD 9) hours for placebo Range 8.9–35.5 hours for oseltamivir; 5.8–36 hours for placebo Use of antipyretics Unrestricted Length of follow-up 21 days |
Number recruited Overall: 60 Intervention: 31 Comparator: 27 Number influenza positive Overall: 38 Intervention: 19 Comparator: 19 Groups/subgroups for which data are presented Healthy adults Proportion male Overall: 30/58 (52%) Intervention: 16/31 (52%) Comparator: 14/27 (52%) Number of withdrawals Before treatment: 2/60 (3%) Overall on treatment: 4/58 (7%) Intervention: 1/31 (7%) Comparator: 3/27 (6%) Proportion vaccinated within last year Overall: 42/466 (9%) Intervention: 21/229 (9%) Comparator: 21/237 (9%) Age range 18–65 years |
Intervention Oseltamivir 75 mg twice daily Comparator Placebo |
|
|
Data source Full paper Company website trials data Language English |
Influenza season 1998–9 Region Not reported Number of centres recruiting Not reported Was influenza reported as circulating in the community? No |
Children and/or adolescents with asthma Johnston et al. 78 Number recruited Overall: 335 Intervention: 170 Comparator: 164 |
Roche website77 Number recruited Overall: 329 Number influenza positive Overall: 94 Intervention: 43 Comparator: 51 |
Intervention Johnston et al. 78 – oseltamivir 2 mg/kg Company web site77 – 45 to 60 or 75 mg oseltamivir depending on weight Comparator Placebo |
|
Definition of ILI Temperature > 37.8°C with one respiratory symptom Delay to start of treatment Maximum 48 hours Mean 27.5 hours (SD 12.1 hours) for oseltamivir; 26.9 hours (SD 12.1 hours) for placebo Use of antipyretics Unrestricted Length of follow-up 28 days |
Number influenza positive Overall: 179 Intervention: 84 Comparator: 95 Proportion male Overall: 212/334 (63%) Intervention: 111/170 (65%) Comparator: 101/164 (62%) Proportion vaccinated within last year Overall: 65/334 (19%) Intervention: 31/170 = 18% Comparator: 34/164 (21%) Number of withdrawals (ITTI) Overall: 17 (9%) Intervention: 11 (13%) Comparator: 6 (6%) Age range 5–12 years |
Age range 6–17 |
||
|
Sato et al. 85 Data source Full published paper Language English |
Influenza season 2002–3 Region Asia Number of centres recruiting One Was influenza reported as circulating in the community? Yes Definition of ILI All diagnosed with influenza using a rapid diagnosis kit Delay to start of treatment Maximum 48 hours |
Number recruited Overall: 63 Intervention: 21 Comparator: 22 Number influenza positive Overall: 59 Intervention: 20 Comparator: 20 Groups/subgroups for which data are presented Children: hospitalised for dehydration or respiratory complication |
Intervention Oseltamivir 2 mg/kg Comparator Zanamivir 10-mg inhalation twice daily |
|
|
Use of antipyretics Not reported Length of follow-up 21 days |
Proportion male Not reported Number of withdrawals Not reported Proportion vaccinated within last year Not reported Age range 5 months–12 years |
|||
|
Tan et al. 67 Data source Full published paper Language Chinese |
Influenza season Unclear Region Asia Number of centres recruiting Unclear Was influenza reported as circulating in the community? No Definition of ILI Unclear Delay to start of treatment Not reported Use of antipyretics Unclear Length of follow-up 21 days |
Number recruited Overall: 80 Intervention: 34 completed Comparator: 39 completed Number influenza positive Overall: 47 Intervention: 22 Comparator: 25 Groups/subgroups for which data are presented Healthy adults Number of withdrawals Overall: 7 (9%) Age range 18–65 years |
Intervention Oseltamivir 75 mg twice daily Comparator Placebo |
|
|
Treanor et al. 65 Data source Full published paper Language English |
Influenza season 1998 Region USA/Canada Number of centres recruiting 60 Was influenza reported as circulating in the community? No Definition of ILI Temperature > 38°C with one systemic and one respiratory symptom Delay to start of treatment Maximum 36 hours Median 24 hours for oseltamivir (0–41 hours); 26 hours for placebo (2–39 hours) Use of antipyretics Unrestricted Length of follow-up 21 days |
Number recruited Overall: 629 (including third arm) Intervention: 211 Comparator: 209 Number influenza positive Overall: 253/419 (60%) Intervention: 124/210 (59%) Comparator: 129/209 (62%) Groups/subgroups for which data are presented Healthy adults Proportion male Overall: 195/419 (47%) Intervention: 98/210 (47%) Comparator: 97/209 (46%) Number of withdrawals Overall: 27 (4%) Intervention: 16 (8%) Comparator: 11 (4%) Proportion vaccinated within last year Vaccinated individuals were excluded from the trial Age range 18–65 years |
Intervention Oseltamivir 75 mg twice daily Comparator Placebo |
|
|
Treanor81 Data source Abstract Language English |
Influenza season Dates not specified Region USA/Canada Number of centres recruiting 164 Was influenza reported as circulating in the community? No Definition of ILI Temperature > 37.8°C with one respiratory symptom and one systemic Delay to start of treatment Not reported Use of antipyretics Not reported Length of follow-up Unclear |
Number recruited Overall: 1459 Number influenza positive Overall: 1063 Groups/subgroups for which data are presented Mixed population Proportion male Not reported Number of withdrawals Not reported Proportion vaccinated within last year Overall: 16% Age range 13–80 years |
Intervention Oseltamivir 75 mg twice daily Comparator Placebo |
|
|
Whitley et al. 110 Data source Full published paper Language English |
Influenza season 1998–9 Region USA/Canada Number of centres recruiting 80 Was influenza reported as circulating in the community? Yes Definition of ILI Temperature > 37.8°C with one respiratory symptom Delay to start of treatment Maximum 48 hours; some patients included after 48 hours Median (ITTI) 26.7 hours for oseltamivir; 28.0 hours for placebo Use of antipyretics Unrestricted Length of follow-up 28 days |
Number recruited Overall: 698 enrolled, 3 withdrew prior to medication Intervention: 344 Comparator: 351 Number influenza positive Overall: 452 Intervention: 217 Comparator: 235 Groups/subgroups for which data are presented Children Proportion male Overall: 50% Intervention: 50% Comparator: 51% Number of withdrawals Overall: prior to treatment: 3; on treatment: 18 (3%) Intervention: 10 (3%) Comparator: 8 (2%) Proportion vaccinated within last year Overall: 3% (ITTI) Intervention: 3% (ITTI) Comparator: 2% (ITTI) Age range 1–12 years |
Intervention Oseltamivir 2 mg/kg Comparator Placebo |
|
Cost-effectiveness
| Study details | Armstrong et al. (2000)129 | Brady et al. (2001)130 | Burls et al. (2002)131 |
|---|---|---|---|
| Economic evaluation type | Cost-effectiveness analysis | Cost-effectiveness and cost–utility analysis | Cost-effectiveness and cost–utility analysis |
| Currency (year) | USD (2000) | CAD (2000) | GBP (2000) |
| Study design | Decision tree | Decision tree | Decision tree |
| Perspective | Managed care organisation | Government payer, society | NHS |
| Setting | USA | Canada | UK |
| Patient population | Otherwise healthy (aged 12–65 years) and at-risk patients presenting within either 36 hours or 48 hours of ILI symptom onset with either confirmed or unconfirmed influenza | Otherwise healthy (aged 12–65 years) and at-risk patients presenting within 48 hours of ILI symptom onset with either confirmed or unconfirmed influenza | Otherwise healthy (aged 12–65 years) and at-risk patients presenting within 48 hours of ILI symptom onset with either confirmed or unconfirmed influenza |
| Time horizon | 1997–8 influenza season | Influenza season. Extrapolated to up to 10 years in sensitivity analysis of mortality | 1997–8 influenza season |
| Comparators |
Oseltamivir 5 days 75 mg twice daily Zanamivir 5 days 10 mg inhaled twice daily Placebo |
Zanamivir 5 days 10 mg inhaled twice daily Symptomatic relief |
Zanamivir 5 days 10 mg inhaled twice daily Symptomatic relief |
| Resources used and costs | NIs and antibiotic use, follow-up physician visits, hospitalisations. Direct costs were included | Follow-up physician visits, NI and antibacterial use, hospitalisations and length of stay. OTC medication use, productivity losses (societal perspective only). Direct and indirect (societal perspective only) costs were included | NI and antibacterial use, GP visits (all patients). Hospitalisations and length of stay (at-risk subgroup only). Direct costs were included |
| Source of resources used |
NIs and antibiotic use were both estimated from trial data Follow-up visits were taken from zanamivir trials, and then applied to oseltamivir trials Hospitalisations were estimated for no treatment from two national surveys, and then adjusted for NI treatment with corresponding lower RTIs reduction rate estimated from trials |
Follow-up physician visits were taken from a national study. Antibacterial use was estimated from a national study for otherwise healthy patients, and taken from the UK NICE HTA for at-risk patients. Hospitalisations were estimated from US (national) national databases for otherwise healthy (at-risk) patients. Length of stay was taken from a national database for otherwise healthy patients, and assumed fixed for at-risk patients. OTC medications were estimated from a national survey. Productivity losses were assumed fixed across subgroups |
Antibacterial use was taken from two meta-analysis of different RCTs for all and at-risk patients GP visit and hospitalisation rates were obtained from a UK population study and applied across treatment strategies. Length of hospital stay was derived from the literature |
| Source of costs | NI costs were average wholesale prices. Antibiotics and follow-up visits were costed from a published economic study. Hospital costs were derived from a retrospective database study | Cost of zanamivir was based on average wholesale price. Physician visits were costed at the average provincial fee. Antibacterial cost was based on average formulary price. Hospitalisation costs were estimated from three provincial cost lists. OTC medication costs were based on average symptomatic relief costs. Productivity losses were valued via a human capital–cost approach | Cost of zanamivir was taken from the BNF. Antibacterial cost was obtained from an international study. Costs of GP visits and hospital days were derived from a published UK source |
| Clinical outcomes | Number of symptom-free days, complications | Symptom-free days, complications, mortality (at-risk subgroup only) | Time to alleviation of major symptoms, complications, hospitalisation and mortality (at-risk subgroup only) |
| Source of clinical outcomes | Oseltamivir data were compiled from two published RCTs. Zanamivir data were compiled from a published RCT, a RCT available in abstract form and data on file (GlaxoWellcome) | Symptom-free days were estimated from a meta-analysis of influenza-positive patients from RCTs. Complications were taken from a GlaxoWellcome meta-analysis of RCTs for otherwise healthy patients, and from the UK NICE HTA for at-risk patients. Assumptions on mortality originated from national studies | Efficacy data were taken from a meta-analysis of 11 international RCTs for influenza-positive patients. Baseline mortality for at-risk patients was taken from a US retrospective study. Zanamivir was assumed to impact on hospitalisations and mortality at its antibiotic reduction rate (6%) |
| HRQoL | Not included | QALY | QALY |
| Source of HRQoL | Not applicable | Elicited from 11 adults via the HUI–3 instrument due to lack of data | Influenza was assumed to score 2 on each dimension of the EQ-5D instrument due to lack of data (utility = 0.516). A UK survey informed a score of 0.8 for the non-influenza health state |
| Adverse events | Not included in base-case analysis. Bronchospasm included in sensitivity analysis | Not included in base-case analysis. A 1 per 1000–10,000 incidence in patients on zanamivir, entailing 4 days of hospital stay, was tested in a sensitivity analysis | Not included as no excess of adverse events between treatment strategies was observed in the trials |
| Subgroup analysis |
Incremental costs were computed for zanamivir on at risk (aged 65+ years, with chronic cardiovascular, respiratory or metabolic disorder, immunocompromised) patients Not performed for oseltamivir due to lack of data |
Separate results were reported for at risk (aged 65+ years, with chronic cardiovascular, respiratory or metabolic disorder, diabetic, immunocompromised) patients | Separate results were reported for at risk (aged 65+ years, with chronic cardiovascular or respiratory disorder, diabetic, immunocompromised) patients |
| Diagnostic accuracy (ITT/ITTI) | Efficacy measures were informed on an ITTI basis, due to between-study heterogeneity in diagnostic accuracy; no specific use of ITT data was made explicit. Diagnostic accuracy was not accounted for in base case | Efficacy measures were informed on an ITTI basis; no specific use of ITT data was made explicit. Base-case diagnostic accuracies of 14% (A) and 35% (B) were chosen for the influenza season and viral activity period respectively, based on UK NICE HTA, observational studies and expert opinion | Efficacy measures were derived from ITTI patients. Base-case influenza prevalences during the influenza season and epidemic periods were estimated at 14% and 34% respectively from national PHLS (now HPA) surveillance data and a UK GlaxoWellcome study. ITT data informed a sensitivity analysis of influenza prevalence |
| Discounting | Not applied | Not applied in base-case. 5% used on life-years gained in sensitivity analysis of mortality | Not applied |
| Cost-effectiveness analysis results |
Incremental cost per successfully treated patient w.r.t. no treatment: $358 (zanamivir); $677 (oseltamivir) Incremental cost per complication averted: same as (1) in base case Incremental cost per symptom-free day: $16 (zanamivir); $39 (oseltamivir) |
Incremental cost per symptom-free day: otherwise healthy $194 (A), $77 (B); at risk $234 (A), $93 (B) Incremental cost per QALY gained: otherwise healthy $235,000 (A), $94,600 (B); at risk $195,000 (A), $77,500 (B) Results were reported for increasing diagnostic accuracy |
Incremental cost per symptom-free day: £50 (otherwise healthy), £42 (at risk) Incremental cost per QALY gained: £65,000 (otherwise healthy), £54,000 (at risk) |
| Quadrant on cost-effectiveness plane | NE | NE | NE |
| Sensitivity analysis | One-way analysis of adverse events rate, hospitalisation rate and cost, probability of antibiotic prescription, probability of follow-up visit, cost of NIs and diagnostic accuracy | One- and multiway analysis of symptom-free days, utilities, diagnostic accuracy, zanamivir and antibacterial use and costs, follow-up visits, hospitalisation rate, mortality (in at-risk subgroup), compliance, adverse events, new and late presentation, indirect costs | One-way analysis of antibiotic use, hospitalisation rates, follow-up GP visits, influenza prevalence, symptom-free days, utilities, diagnostic accuracy and cost and availability of zanamivir |
| Conclusions | Zanamivir was more cost-effective than oseltamivir w.r.t. standard care across all outcome measures and scenarios. Zanamivir dominates standard care in the at-risk patient subgroup | From a government payer perspective, zanamivir was not cost-effective for the treatment of influenza in individuals not at risk. Its cost-effective profile for at-risk patients was unclear but unlikely cost-saving, so its inclusion in a drug plan would have required additional budgetary resources | Zanamivir was unlikely to be cost-effective in the treatment of influenza in all patients under any scenario considered. Results in at-risk patients (£15,000–117,000 cost/QALY) suggested a potential cost-effective profile for zanamivir under optimistic assumptions. |
| Key cost-effectiveness drivers | Cost of NIs, probability of hospitalisation, at-risk status | Symptom-free days, utilities, diagnostic accuracy, zanamivir cost (all patients); hospitalisation rate, mortality, compliance, new and late presentation (at-risk subgroup) | Utilities, prevalence, cost and availability of zanamivir, symptom-free days |
| Conflicts of interest | Authors employed by GlaxoWellcome | None | None |
| Study details | Griffin et al. (2001)132 | Husereau et al. (2002)133 | Inoue et al. (2005)134 |
|---|---|---|---|
| Economic evaluation type | Cost-effectiveness and cost–utility analysis | Cost-effectiveness and cost–utility analysis | Cost–utility analysis |
| Currency (year) | GBP (1999) | CAD (2001) | USD (2002) |
| Study design | IPD bootstrap analysis of six pooled multinational RCTs | Decision tree | Decision tree |
| Perspective | Government payer | Government payer, society | Health-care payer |
| Setting | UK | Canada | Japan |
| Patient population | At-risk patients aged 12+ years presenting within 48 hours of ILI symptom onset with either confirmed or unconfirmed influenza | Otherwise healthy (aged 12+ years) and at-risk patients presenting within 48 hours of ILI symptom onset with either confirmed or unconfirmed influenza | Otherwise healthy (aged 12–65 years) and at-risk patients presenting within 48 hours of ILI symptom onset with either confirmed or unconfirmed influenza |
| Time horizon | Influenza season. Censored efficacy measures were extrapolated to 28 days | Influenza season | 2 weeks (based on duration of influenza infection) |
| Comparators |
Zanamivir 5 days 10mg inhaled twice daily Placebo |
Oseltamivir 5 days 75 mg twice daily No treatment |
Oseltamivir 5 days 75 mg twice daily Zanamivir 5 days 10 mg inhaled twice daily Symptomatic relief (e.g. antibacterials) |
| Resources used and costs | NI and antibacterial use, GP/nurse consultations, hospitalisations, OTC medication use. Direct costs were included | NI and antibacterial use, physician visits, hospitalisations and length of stay. Direct and indirect (societal perspective only) costs were included | Hospitalisations, NI and antibiotic use, physician visits. Direct costs were included (also for diagnostic tests) |
| Source of resources used | Resource use data were collected alongside the RCTs as part of the case report form (CRF). Hospitalisation data were derived retrospectively from serious adverse events (SAEs) forms | Hospitalisations (otherwise healthy patients) were taken from a national economic evaluation. Hospitalisations (at-risk subgroup) and antibacterial use were derived from influenza-positive patients on placebo in the RCTs. Physician visits were derived by at-risk status from CCOHTA’s zanamivir report. Length of hospital stay was obtained by at-risk status from a national database. Work-days lost were estimated from otherwise healthy influenza-positive patients enrolled in two RCTs | Hospitalisation rates were derived from a national observational study (the national health ministry) for otherwise healthy (at-risk) patients on no treatment, and adjusted by at-risk status with the pneumonia rates taken from the UK NICE HTA for each NI strategy. Hospital length of stay was assumed the same across treatment strategies. Baseline antibiotic use was derived for otherwise healthy patients from the UK NICE HTA due to lack of data, and adjusted for each NI by at-risk status with complication rates estimated from the trials’ corresponding arms. Physician visits were estimated from a national (international) study for patients on no treatment (NIs) |
| Source of costs | GP/nurse consultations and hospitalisations were valued at standard UK unit costs. Antibacterial cost was derived from the UK Medical Data Index and BNF. OTC medication use was costed from a GlaxoWellcome market research | Cost of oseltamivir was based on average wholesale price. Physician visits were costed at the average provincial fee. Antibacterial cost was based on a provincial formulary price. Hospitalisation costs were estimated from a provincial cost list. Productivity losses were valued as in the CCOHTA zanamivir report (i.e. via a human cost–capital approach) | Physician visits, antibiotic use and hospitalisations were costed using a national survey. Diagnostic tests were priced through medical fee tables. NIs costs were taken from the National Health Insurance Price List |
| Clinical outcomes | Time to return to normal activity, time to alleviation of symptoms, treatment effect on complications and hospitalisations | Time to alleviation of symptoms, time to return to normal activity, treatment effect on antibacterial use and hospitalisations (at-risk subgroup only) | Time to alleviation of symptoms |
| Source of clinical outcomes | Time to return to normal activity and to alleviation of symptoms and information on complications were part of the CRFs compiled alongside (after) the RCTs. Treatment impact on hospitalisation was derived from serious adverse events forms compiled after the trials | Treatment effects on hospitalisation, on duration of symptoms and on time to return to normal activity were estimated from a pooled analysis of influenza-positive patients from RCTs. Due to lack of data oseltamivir was assumed not to impact on hospitalisations (otherwise healthy patients only) and physician visits | Time to alleviation of symptoms was taken by at-risk status and treatment strategy from the UK NICE HTA due to lack of data |
| HRQoL | QALY | QALY | QALY |
| Source of HRQoL | Estimated from EQ-5D questionnaires retrospectively completed by patients from a UK GP database and double-checked with an EQ-5D questionnaire from a UK GP panel for a hypothetical at-risk patient | Due to lack of data utilities were taken for influenza, outpatient state (0.636) from CCOHTA’s zanamivir report (i.e. from 11 adults via the HUI-3 instrument), while for influenza, inpatient state was assumed fixed (0.35) | Utility was measured on the EQ-5D instrument from a national study as the difference between QoL without and with influenza (0.883) |
| Adverse events | Hospitalisations resulting from SAEs were included in base-case analysis | Not included as those observed from the trials were not significant | Not included |
| Subgroup analysis | Results presented for at risk (aged 65+ years, with chronic cardiovascular or respiratory disorder, diabetic, immunocompromised) patients only | Separate results were reported for at risk (aged 65+ years, with chronic cardiovascular, respiratory or metabolic disorder, diabetic, immunocompromised) patients | Separate results were reported for at risk (aged 65+ years, with chronic cardiovascular or respiratory disorder, diabetic, immunocompromised) patients |
| Diagnostic accuracy (ITT/ITTI) | Evaluation conducted on an ITT basis; no specific use of ITTI data was made explicit. Influenza prevalence was estimated at 71% from at-risk patients in the trials | ITTI data were utilised to estimate productivity losses (societal persp. only) and reduced symptom days. No specific use of ITT data was made explicit. Four diagnostic accuracies (A = 14%, B = 35%, C = 50%, D = 68%) reflecting influenza season/viral activity period were used in base-case and sensitivity analysis, based on the UK NICE HTA, ITTI data from the pooled trials, international studies and expert opinion | Efficacy was evaluated on an ITTI basis; no specific use of ITT data was made explicit. Influenza prevalence was estimated at 66.4% from national RCTs |
| Discounting | Not applied | Not applied | Not applied |
| Cost-effectiveness analysis results |
ICER for time to return to normal activity: £18.14 ICER for time to alleviation of symptoms: £22.08 ICER for incidence of complications: £501 Incremental cost per QALY gained: £7490 |
Incremental cost per symptom-free day: otherwise healthy $299 (A), $119 (B), $83 (C) and $61 (D); at risk $478 (A), $180 (B), $120 (C) and $83 (D) Incremental cost per QALY gained: otherwise healthy $299,500 (A), $119,500 (B), $83,500 (C) and $61,300 (D); at risk $454,800 (A), $170,700 (B), $113,900 (C) and $78,800 (D) Results were reported for increasing diagnostic accuracy |
Incremental cost per QALY gained w.r.t. no treatment: oseltamivir dominant (otherwise healthy), $2138.77 (at risk); zanamivir $107.34 (otherwise healthy), dominant (at risk) |
| Quadrant on cost-effectiveness plane | NE | NE | NE/SE (depending on at-risk status) |
| Sensitivity analysis | Two scenario analyses excluding either hospitalisations or one patient hospitalised with pneumonia | One- and multiway analysis of diagnostic accuracy, symptom-free days, utilities, physician visits, antibacterial use, hospitalisation, late presentation, compliance, early return to normal activity (societal perspective) | One-way analysis of hospitalisation costs, two-way analysis of probability of hospitalisation by treatment strategy, PSA of direct costs |
| Conclusions | Zanamivir was a cost-effective strategy for the treatment of flu in at-risk patients | From a government payer perspective, oseltamivir was unlikely to be cost-effective for the treatment of flu in either otherwise healthy and at-risk patients, unless very favourable assumptions applied | Treatment of influenza with NIs led to higher clinical efficacy and cost savings compared to symptomatic care. Oseltamivir was not recommended for treating influenza in otherwise healthy patients, and was less cost-effective than zanamivir in at-risk patients |
| Key cost-effectiveness drivers | Zanamivir cost, hospitalisation costs, outlying patient (i.e. one hospitalisation with pneumonia) | Symptom-free days, QALY, diagnostic accuracy, compliance, late presentation, hospitalisation (at-risk subgroup) | Cost and probability of hospitalisation, direct costs |
| Conflicts of interest | Authors employed by GlaxoWellcome | None | None |
| Study details | Järvinen et al. (2007)135 | Lee et al. (2002)136 | Mauskopf et al. (2000)137 |
|---|---|---|---|
| Economic evaluation type | Cost–utility analysis | Cost-effectiveness analysis | Cost-effectiveness and cost–utility analysis |
| Currency (year) | EUR (2005) | USD (2001) | AUD (1998) |
| Study design | Decision tree | Decision tree | Decision tree populated with the double-blind multinational MIST RCT |
| Perspective | Health-care payer, society | Society | Health-care payer |
| Setting | Finland | USA | Australia |
| Patient population | Separate assessment of (i) otherwise healthy adults (aged 13–64 years), (ii) at risk (aged 65+ years, with comorbidities) patients and (iii) children (aged 1–12 years) presenting within 48 hours of ILI symptom onset with either confirmed or unconfirmed influenza | Otherwise healthy patients aged 18–50 years presenting within 48 hours of ILI symptom onset with either confirmed or unconfirmed influenza | At risk (aged 65+ years, with co-morbidities) patients presenting within 36 hours of ILI symptom onset with either confirmed or unconfirmed influenza |
| Time horizon | Lifetime (to account for life-years lost to mortality) | Single influenza season | 4 weeks (single influenza season) |
| Comparators |
Oseltamivir 5 days 75 mg twice daily Symptomatic relief (OTC medication) |
Vaccination + rimantadine Vaccination + zanamivir Vaccination + oseltamivir Vaccination + no treatment No vaccination + rimantadine No vaccination + zanamivir No vaccination + oseltamivir No vaccination + no treatment Treatments administered as per licensed indications |
Zanamivir 5 days 10 mg inhaled twice Standard care |
| Resources used and costs | GP/specialist visits, hospitalisations, NI, antibiotic and OTC medication use. Direct and indirect (societal perspective only) costs were included | Vaccine, antiviral and antibiotic use, physician visits, work-days lost. Direct and indirect costs were included | Hospitalisations and length of stay, physician visits, NI and antibacterial use. Direct costs were included |
| Source of resources used | Resource use data were taken from published RCTs or the literature | Vaccine, antiviral and antibiotic use were taken from trial data. A physician visit was assumed upon infection onset. Work-days lost were derived from various trial-based and observational studies | Hospitalisations were estimated with data from the national health institute. Length of hospital stay was assumed equal to the national average for a DRG. Physician visits were taken from the national RCGP and health insurance data. Antibacterial use was estimated from the MIST trial |
| Source of costs | Oseltamivir, antibiotics and OTC medication were costed from national price guidelines. GP/specialist visits were costed from both national official health-care costs and a US survey. Hospitalisation costs were taken from national official health-care costs. Productivity losses were valued at the national average gross income using the human-capital approach | Antibiotic use was costed from an International Classifications of Disease code. Vaccination costs were informed by data from a previous trial. NIs were valued at average retail prices, whereas rimantadine was costed from a national health-care cost database Work-days lost were valued at the average national gross wage | Zanamivir cost was its dispensed price. Antibacterial costs were taken from two national price lists. Physician visits were costed from the national Medicare Benefits Schedule |
| Clinical outcomes | Time to return to normal activity, complications, hospitalisation and mortality rates | Illness duration, time to return to normal activity | Time to alleviation of major symptoms, complications |
| Source of clinical outcomes | Time to return to normal activity was derived from two clinical studies and an international RCT. Complication and corresponding hospitalisation rates were taken from a UK population study, a meta-analysis of international RCTs and an epidemiological study. Mortality rates by causing complication were obtained from various clinical and observational studies and from assumptions | Health outcomes were estimated from published evaluations of various RCTs | Time to alleviation of major symptoms was derived for all treatment strategies from the MIST trial in the outpatient setting, and assumed equal to length of hospital stay + 7 days in the inpatient setting. Treatment was assumed not to impact on the course of complications. Probabilities of complications were estimated by treatment strategy from the MIST trial |
| HRQoL | QALY | Willingness to pay for a symptom-free and side effects day averted | QALY |
| Source of HRQoL | Utilities on ILI, bronchitis, pneumonia, otitis media and sinusitis were taken from two international studies through the EQ-5D instrument recalibrated onto VAS and TTO scores | Utilities were obtained through a conjoint analysis of a national primary care survey of 210 patients | Measured from the MIST trial through the QWB instrument |
| Adverse events | Not included | Side effects were assumed not to attract additional physician visits. Side effect rates for rimantadine (nervous = 2%, gastrointestinal = 1%) and oseltamivir (gastrointestinal = 9%) were informed by two national reviews and a clinical study respectively. Zanamivir and prophylaxis were assumed not to cause side effects, in line with trial evidence | Not included |
| Subgroup analysis | Not implemented | Not implemented | Not implemented |
| Diagnostic accuracy (ITT/ITTI) | Baseline complication rates were computed from the ITTI population; no specific use of ITT data was made explicit. Base case assumed 70% patients were influenza-positive based on oseltamivir RCTs | The evaluation was conducted on an ITTI basis; no specific use of ITT data was made explicit. Seasonal influenza prevalence was estimated at 15% from various published sources. Type A influenza prevalence was estimated at 83.7% from unpublished national average rates over a 10-year period | Clinical effectiveness was measured on an ITTI basis. Hospitalisations and length of stay were assumed the same across ITT/ITTI populations irrespective of treatment. Base-case influenza prevalence was estimated at 70% from the MIST RCT |
| Discounting | Health outcomes discounted at 5% | Not applied | Not applied |
| Cost-effectiveness analysis results | Incremental cost per QALY gained: otherwise healthy €13,405 (health-care payer perspective), dominant (societal perspective); at risk €754 (health-care payer perspective); children €15,404 (health-care payer perspective), €5745 (societal perspective) | Incremental net benefit w.r.t. no treatment/vaccination: $30.97 (vaccination + rimantadine), $30.13 (vaccination + zanamivir), $29.50 (vaccination + no treatment), $29.39 (vaccination + oseltamivir), $4.61 (no vaccination + rimantadine), $1.97 (no vaccination + zanamivir), -$0.032 (no vaccination + oseltamivir) |
Incremental cost per symptom-free day: $14.20 Incremental cost per QALY gained: $11,715 |
| Quadrant on cost-effectiveness plane | NE/SE (depending on health-care perspective and population) | NE/SE (depending on comparison) | NE |
| Sensitivity analysis | One-way analysis of probability of ILI being influenza, late presentation, NI efficacy, discount rate and productivity loss. PSA of time to return to normal activity, length of hospital stay and probabilities of complications, hospitalisation and death | One-way analysis and PSA of all inputs | One-way analysis of influenza prevalence, hospitalisation rate and length of stay, utility, NI efficacy and diagnostic accuracy |
| Conclusions | Oseltamivir was found to be equally cost-effective for treating influenza in otherwise healthy adults and children, and also very cost-effective in at-risk individuals, from both a health-care payer and societal perspective | Vaccination was found to be cost-effective for otherwise healthy working adults in a wide variety of settings. Its combining antiviral choice mostly depended on drug cost and circulating viral strain | Zanamivir was a cost-effective treatment for influenza in at-risk patients under a wide variety of assumptions |
| Key cost-effectiveness drivers | Diagnostic accuracy, late presentation | Influenza prevalence (overall and by type), antiviral efficacy, work-days lost | Hospitalisation rate, NI efficacy, diagnostic accuracy |
| Conflicts of interest | Two authors employed by Roche | None | Two authors employed by GlaxoWellcome |
| Study details | O’Brien et al. (2003)138 | Postma et al. (2007)139 | Reisinger et al. (2004)140 |
|---|---|---|---|
| Economic evaluation type | Cost-effectiveness and cost–utility analysis | Cost-effectiveness analysis | Cost-effectiveness and cost–utility analysis |
| Currency (year) | CAD (1999) | EUR (2003) | GBP (2002) |
| Study design | Decision tree populated with IPD analysis of four pooled international RCTs | Decision tree | Decision tree |
| Perspective | Health-care payer | Health-care payer, society | Health-care payer |
| Setting | Canada | Netherlands | UK |
| Patient population | Otherwise healthy, unvaccinated patients aged 16–64 years presenting within 48 hours of ILI symptom onset with either confirmed or unconfirmed influenza | Separate assessment of (i) otherwise healthy, (ii) at-risk (with comorbidities) elderly (aged 65+ years) and (iii) at-risk adults (aged 12+ years with comorbidities) presenting within 48 hours of ILI symptom onset with either confirmed or unconfirmed influenza | Otherwise healthy patients aged 1–12 years presenting within 48 hours of ILI symptom onset with either confirmed or unconfirmed influenza |
| Time horizon | 1 week | Unspecified | Influenza season (extrapolated to account for life-years lost due to mortality) |
| Comparators |
Oseltamivir 5 days 75 mg twice daily No treatment |
Oseltamivir 5 days 75 mg twice daily Symptomatic relief (OTC medication) |
Oseltamivir 5 days 2 mg/kg twice daily Symptomatic relief (OTC medication) |
| Resources used and costs | Hospitalisations, NI and antibiotic use, physician visits. Direct costs were included | NI and antibacterial use, hospitalisations and length of stay, initial GP visit with OTC medication prescription, work-days lost (non-elderly, societal perspective only). Direct and indirect (societal perspective only) costs were included | GP/specialist visits, tests for complications, NI and antibiotic use, hospitalisations. Direct costs were included |
| Source of resources used | Hospitalisations were derived from a US observational study. Antibiotic use and physician visits were taken from a US health insurance database. Base case assumed no late presentation to a physician, in line with market research data | Antibacterial use was informed by expert opinion. Hospitalisations and length of stay were separately estimated for pneumonia and other complications from a national health-care database. Base case assumed no follow-up GP visits. Days lost were assumed to average 1.5 based on various economic studies | Resource use data by complication (bronchitis, pneumonia, otitis media) were taken from a US health-care database due to lack of national detailed sources. Base case assumed no late presentation |
| Source of costs | Oseltamivir was costed at its dispensing price. Antibiotics were costed from the national formulary. Hospitalisation costs were taken from a regional hospital. Physician visits were costed from a regional health-care fees list | Oseltamivir was costed at a national average dispensing cost. A fixed cost was assumed for an initial GP visit including OTC medication course. Work-days lost were valued via a friction-costing approach | Physician visits, tests and hospitalisations were costed from a UK health-care database. The cost of antibiotics was taken from the UK BNF. Oseltamivir was costed at its average wholesale price |
| Clinical outcomes | Time to symptoms resolution, complications | Antibacterial use, complication, hospitalisation and mortality reduction rates | Time to return to normal activity, complication, hospitalisation and mortality reduction rates |
| Source of clinical outcomes | Time to symptoms resolution was estimated from four pooled and separate RCTs. Complications (including pneumonia) were recorded from the RCTs | Health outcomes were derived for oseltamivir across assessed populations from a meta-analysis of 11 international RCTs, and for no treatment for each population from three national observational studies adjusted with vaccination coverage and efficacy rates informed by national studies | Time to return to normal activity and complication reduction rates were derived from a multinational RCT data and a UK population study. Hospitalisation and mortality rates by causing complication were estimated for each treatment strategy from observational studies, a meta-analysis of 11 international RCTs and assumptions |
| HRQoL | QALY | Not included | QALY |
| Source of HRQoL | Reported daily for a week by enrolled patients through VAS instrument | Not applicable | Unspecified utilities for each health state were recorded from the efficacy trials during the first week of illness. Same QoL improvement was assumed in the trials for otherwise healthy children and adults due to lack of data |
| Adverse events | Implicitly accounted for by VAS evaluations | Not included | Not included |
| Subgroup analysis | Not implemented | Not implemented | Separate results were reported for children aged 1–5 years |
| Diagnostic accuracy (ITT/ITTI) | Clinical efficacy was obtained on an ITTI basis; no specific use of ITT data was made explicit. Influenza prevalence was estimated at 69% from available RCTs | Efficacy was measured on an ITT basis; no specific use of ITTI data was made explicit. An influenza prevalence rate of 65% was assumed based on a meta-analysis of 11 international RCTs | Efficacy outcomes were informed by influenza-positive patients only. No specific use of ITT data was made explicit. Diagnostic accuracy was estimated at 60% from the trials |
| Discounting | Not applied | 4% used on life-years lost | 1.5% used on life-years lost |
| Cost-effectiveness analysis results |
Incremental cost per influenza day averted: $48.52 (CI $30.72 to $107.32) Incremental cost per QALY gained: $57,863 (CI $48,919 to $70,149) |
ICER: €1759 (otherwise healthy elderly), dominant (at-risk elderly), dominant (at-risk adults including indirect costs), €429 (at-risk adults excluding indirect costs) |
Incremental cost per illness day averted: 1–12 years £9.52 (CI £6.88 to £13.61); 1–5 years dominant (CI dominant to £9.06) Incremental cost per QALY gained: 1–12 years £11,173 (CI £18.10 to dominated); 1–5 years dominant (CI dominant to dominated) |
| Quadrant on cost-effectiveness plane | NE | NE/SE (depending on subgroup and inclusion of indirect costs) | NE/SE (depending on age group) |
| Sensitivity analysis | Two-way analysis of influenza prevalence and late presentation. PSA on complications, pneumonia hospitalisation, antibiotic use and influenza prevalence | One-way analysis of 1-day ICU stay, one extra GP visit for 50% patients with ILI, treatment effectiveness, discount rate, late presentation. PSA of antibacterial prescription rate, days lost, productivity loss (adults) | One-way analysis of diagnostic accuracy, late presentation, influenza hospitalisation rate, treatment efficacy. PSA of complications, hospitalisations, mortality, treatment efficacy and costs |
| Conclusions | Oseltamivir was potentially a cost-effective strategy for influenza treatment in otherwise healthy adults depending on influenza prevalence and treatment compliance | Oseltamivir was likely a cost-saving, when not cost-effective, treatment for influenza in at-risk elderly and adults (provided productivity losses incurred by the latter were included) under various scenarios | Oseltamivir treatment of influenza in children was found to be cost-effective even under conservative assumptions with most ICERs per QALY gained under £30,000 |
| Key cost-effectiveness drivers | Influenza prevalence, late presentation | Indirect costs, discount rate, one extra GP visit for 50% patients with ILI, productivity loss, late presentation | Diagnostic accuracy, late presentation, influenza hospitalisation rate, treatment efficacy |
| Conflicts of interest | Study funded by Hoffman-La Roche | Two authors supported by Roche | Study funded by Hoffman-La Roche |
| Study details | Roche submission to NICE (2008)128 | Rothberg et al. (2003a)141 | Rothberg et al. (2003b)142 |
|---|---|---|---|
| Economic evaluation type | Cost–utility analysis | Cost–utility analysis | Cost–utility analysis |
| Currency (year) | GBP (2007) | USD (2001) | USD (2001) |
| Study design | Decision tree | Decision tree | Decision tree |
| Perspective | NHS | Society | Society |
| Setting | UK | USA | USA |
| Patient population | Otherwise healthy and at-risk patients aged 1–64 years presenting within 48 hours of ILI symptom onset with either confirmed or unconfirmed influenza | Otherwise healthy patients aged 65+ years presenting within 48 hours of ILI symptom onset with either confirmed or unconfirmed influenza | Otherwise healthy, unvaccinated patients aged 20–50 years presenting within 48 hours of ILI symptom onset with either confirmed or unconfirmed influenza |
| Time horizon | Lifetime (to account for life-years lost due to mortality) | Lifetime | Single influenza season |
| Comparators |
Oseltamivir 5 days 75 mg twice daily Zanamivir 5 days 10 mg inhaled twice daily (not administered to children aged 1–5 years due to licence restrictions) Standard care (OTC medication) |
1. No treatment 2–5. Amantadine, rimantadine, oseltamivir or zanamivir treatment as per licensed indications 6–9. QuickVue test + antiviral treatment |
1. No treatment 2–5. Amantadine, rimantadine, oseltamivir or zanamivir treatment as per licensed indications 6–9. Non-discriminating influenza test + antiviral treatment 10–13. Discriminating influenza test (Directigen AB) + antiviral treatment |
| Resources used and costs | GP visits, NI and antibiotic use, OTC medication, hospitalisations. Direct costs were included | Hospitalisations and length of stay, physician visits, influenza test, antibiotic and antiviral use. Due to the average patient’s age, only direct costs were included | Hospitalisations, rapid tests, physician visits, antibiotic and antiviral use, work-days lost. Direct and indirect costs were included |
| Source of resources used | Resource use data were taken and reviewed from the UK NICE TA58, which referred to a US health-care database. Antibiotic use was informed by expert opinion | Hospitalisations were taken for patients by low, intermediate and high risk (depending on comorbidities) from a national study. Physician visits and antibiotic use were derived from a US health-care database | Hospitalisations were derived from three national studies. Physician visits and antibiotic use were derived from trials on treatment efficacy. Work-days lost were derived from three international studies |
| Source of costs | GP fees were taken from a national health-care cost table. NIs were valued at average wholesale prices. Antibiotics and hospitalisations were respectively costed according to assumptions and national HRG figures | Hospitalisation costs were based on data from a national hospital network. Influenza tests were costed at average retail prices; antivirals and antibiotics were costed at average wholesale prices. Physician visits were valued from a national study | Hospitalisation costs were based on data from a network of national hospitals. Influenza tests were costed at average retail prices; antivirals and antibiotics were costed at average wholesale prices. Physician visits were valued from a national study. Work-days lost were valued at the national average employee wage |
| Clinical outcomes | Time to return to normal activity, complication, hospitalisation and mortality reduction rates | Length of influenza illness, hospitalisation and length of stay, antibiotic reduction rate, treatment impact on complications requiring antibiotics, vaccine efficacy, mortality | Length of influenza illness, length of hospital stay, treatment impact on complications requiring antibiotics, mortality |
| Source of clinical outcomes | NIs were assumed equally effective and not to alter the course of complications. Time to return to normal activity was collected through self-reported VAS instruments in the oseltamivir trials. Subgroup-adjusted baseline complications were observed from a national population study (pneumonia, bronchitis) and the placebo arms of the oseltamivir RCTs (otitis media), and were adjusted with NI reduction rates from various published and unpublished oseltamivir trials. Hospitalisation reduction rates by causing complications were obtained from both trial-based and observational studies and assumptions. Subgroup-specific mortality rates were taken from a national population study and adjusted across treatments with the hospitalisations reduction rate | Length of influenza illness was estimated from two RCTs. Based on published trial results, antivirals were assumed to impact equally on influenza duration. Adamantanes were assumed not to impact on complications, hospitalisation or mortality due to lack of data. Treatment impact on antibiotic use, complications requiring antibiotics and hospitalisation was estimated for each NI from various RCTs. Vaccine efficacies by disease state were derived from published trial and observational data. Mortality was extrapolated from the hospitalisation rate, in line with an observational study | Length of influenza illness was derived from an economic evaluation (adamantanes) and trial data (NIs). Antivirals were assumed to equally impact on influenza duration. Length of hospital stay was derived from a national observational study. Due to lack of evidence, adamantanes were assumed not to impact on complications and no drug was assumed to impact on hospitalisation or mortality. Treatment impact on antibiotic use and complications requiring antibiotics and hospitalisation were estimated for each NI from various RCTs. Mortality was extrapolated from the hospitalisation rate, in line with an observational study |
| HRQoL | QALY | QALY | QALY |
| Source of HRQoL | Health-state utilities (ILI usual care = 0.811, ILI oseltamivir = ILI zanamivir = 0.904, bronchitis = 0.913, pneumonia = 0.9, otitis media = 0.91) were collected from patients in oseltamivir trials for 21 days through a 3 × 11-point VAS instrument and transformed into TTO scores | Utility values (influenza = –0.883, hospitalisation = –0.983, side effects = –0.23) were assessed from elderly trial patients via the EQ-5D instrument | Utility values (influenza = 0.25, hospitalisation = 0.2, side effects = 0.88) were retrospectively collected from a sample of 15 otherwise healthy adults via the HUI-3 instrument |
| Adverse events | Not included | Side effects were estimated for each treatment from studies of nursing home prophylaxis and were assumed to last 2 days | Side effects were estimated for each treatment from the trials on efficacy and were assumed to last 2 days |
| Subgroup analysis | Separate results were reported for (i) otherwise healthy and (ii) at-risk (with comorbidities) adults (aged 13–64 years) and children (aged 1–12 years and 1–5 years) | Not implemented | Not implemented |
| Diagnostic accuracy (ITT/ITTI) | No specific use of ITT/ITTI data was made explicit. Influenza prevalence was fixed at 31% from the UK NICE TA58 (alternative case). Type A influenza prevalence was estimated at 76% from RCTs on both NIs | Efficacy was evaluated on an ITTI basis; no specific use of ITT data was made explicit. Base-case influenza prevalence was estimated at 35% to reflect influenza seasonal activity, based on a primary care study. Lower and higher rates for influenza prevalence as tested in sensitivity analysis were informed by various published sources and assumptions. Influenza prevalence by type A was estimated at 89% from national influenza surveillance reports | Efficacy was evaluated on an ITTI basis; no specific use of ITT data was made explicit. Base-case influenza prevalence was estimated at 77% from a pooled analysis of national RCTs. Lower and higher rates for influenza prevalence as tested in sensitivity analysis were informed by various published sources and assumptions. Influenza prevalence by type A was estimated at 89% from national influenza surveillance reports |
| Discounting | 3.5% used on life-years lost | Not applied | Not applied |
| Cost-effectiveness analysis results | Incremental cost per QALY gained: oseltamivir vs usual care £5452 (otherwise healthy adults), £652 (at-risk adults), £5992 (children 1–12 years), £4687 (children 1–5 years); oseltamivir vs zanamivir –£0.19 (otherwise healthy and at-risk adults), £5.65 (children 1–12 years) |
Incremental cost per QALY gained: $1129 (amantadine vs. no treatment), $5025 (influenza test + oseltamivir vs amantadine), $19,296 (oseltamivir vs influenza test + oseltamivir), dominated or extendedly dominated (otherwise) Base-case results referred to an otherwise healthy, unvaccinated patient |
Incremental cost per QALY gained: $77,000 (amantadine vs no treatment), $133,000 (zanamivir vs amantadine), dominated or extendedly dominated (otherwise) |
| Quadrant on cost-effectiveness plane | NE/SE (depending on comparison) | NE/SE | NE/SE |
| Sensitivity analysis | One-way analysis of diagnostic accuracy, late presentation, GP visits, life-years lost, hospitalisations, critical care cost, resistance, NI cost (children only), utilities. PSA of all inputs | One- and multiway analysis of all variables except drug costs, at risk and vaccination status, adamantane efficacy. PSA of length of hospital stay and hospitalisation, complication and mortality rates | One- and multiway analysis of influenza prevalence (overall and by type), treatment efficacy, side effects, workday value, utilities, influenza test |
| Conclusions | Oseltamivir exhibited a cost-effective profile compared with standard care under a wide variety of assumptions, yielding an ICER well below £20,000. It also proved a cost-saving option relative to zanamivir across all patients subgroups | Oseltamivir was cost-effective for the treatment of influenza in unvaccinated or high-risk vaccinated patients. Influenza test followed by oseltamivir treatment was usually found to be cost-effective in other subgroups | Depending on the active viral strain, amantadine and zanamivir were found to be cost-effective influenza therapies in otherwise healthy adults. Influenza testing was generally found to have no role |
| Key cost-effectiveness drivers | Diagnostic accuracy, late presentation, NI and critical care costs | At risk and vaccination status, influenza prevalence, impact of oseltamivir on hospitalisations, hospitalisation and mortality rates | Influenza prevalence (overall and by type), treatment efficacy, work-day value |
| Conflicts of interest | NICE submission sponsored by Roche | None | None |
| Study details | Rothberg et al. (2005)143 | Sander et al. (2004)144 | Sander et al. (2005)145 |
|---|---|---|---|
| Economic evaluation type | Cost–utility analysis | Cost-effectiveness and cost–utility analysis | Cost-effectiveness and cost–utility analysis |
| Currency (year) | USD (2003) | GBP (2001) | GBP (2001) |
| Study design | Decision tree | Decision tree | Decision tree |
| Perspective | Society | Health-care payer | NHS, society |
| Setting | USA | UK | UK |
| Patient population | Separate assessment of otherwise healthy children aged (i) 2, (ii) 7 and (iii) 15 years presenting within 48 hours of ILI symptom onset with either confirmed or unconfirmed influenza | Otherwise healthy elderly (aged 65+ years) and at-risk (aged 13–64 years with comorbidities) patients presenting within 48 hours of ILI symptom onset with either confirmed or unconfirmed influenza | Otherwise healthy patients aged 13–64 years presenting within 48 hours of ILI symptom onset with either confirmed or unconfirmed influenza |
| Time horizon | Two influenza seasons | Single influenza season (extrapolated to account for life-years lost due to mortality) | 21 days, with censored time to return to normal activity (life-years lost) not extrapolated (extrapolated to account for mortality) |
| Comparators |
1. No treatment 2. Amantadine as per licensed indications 3. Oseltamivir 5 days 75 mg twice daily 4–5. QuickVue test + amantadine or oseltamivir treatment 6–7. Z-StatFlu test + amantadine or oseltamivir treatment |
Oseltamivir 5 days 75 mg twice daily Standard care (symptomatic relief with OTC medication) |
Oseltamivir 5 days 75 mg twice daily Zanamivir 5 days 10 mg inhaled twice daily Standard care (OTC medication) |
| Resources used and costs | Hospitalisations, physician visits, two influenza tests, antiviral and antibacterial use, work-days lost. Direct and indirect costs were included | GP and specialist visits, influenza tests, OTC medications, NI use, hospitalisations. Direct costs were included | GP/specialist visits, tests, antibiotic and NI use, OTC medications, hospitalisations and length of stay, work-days lost (societal perspective only). Direct and indirect (societal perspective only) costs were included |
| Source of resources used | Hospitalisations were taken from a national study. Physician visits were extracted from a national observational study. Influenza tests were evaluated from a published review. Work-days lost were derived from three regional elementary schools | Resource use data were taken from a US health-care population survey due to lack of detailed national sources. Hospitalisations by causing complication (ILI, bronchitis, pneumonia) were derived from trial and observational data and from assumptions | Resource use data were taken from a US health-care population survey due to lack of detailed national sources. Hospitalisations by causing complication (ILI, bronchitis, pneumonia) were informed by trial and observational data and from assumptions. Work-days lost were taken from the days to return to normal activity estimated from trial and epidemiological sources |
| Source of costs | Hospitalisations were costed from a national health-care database. Physician fees were based on Medicare relative value units. Influenza tests were costed at average retail prices; antivirals and antibacterials were costed at average wholesale prices. Parental work-days lost were valued at the national average employee compensation | Hospitalisations and GP and specialist visits were costed from a national health-care cost list. Influenza tests and antibiotics were costed from a US health-care database. OTC medications cost was assumed fixed | Hospitalisations and length of stay and GP/specialist visits were costed from a national health-care cost list. Tests were costed from a US health-care database. Antibiotic costs were taken from the UK BNF. NIs were costed at the average wholesale prices. Cost of OTC medications was assumed fixed. Productivity losses were valued via a human-capital approach based on the national average gross income. Indirect costs of mortality were excluded, since they were already captured by the QALYs |
| Clinical outcomes | Hospitalisations and length of stay, complications requiring antibiotics, mortality, time to return to school | Time to return to normal activity, treatment impact on QoL, complications, hospitalisation and mortality | Time to return to normal activity, complications and influenza-related hospitalisation reduction rates, mortality |
| Source of clinical outcomes | Antivirals were assumed not to impact on hospitalisation or mortality. Length of hospital stay was estimated from a national health-care database. Complications requiring antibiotics (otitis media) were observed from placebo arms of three RCTs. Mortality was estimated from a national health-care database. Time to return to school for the oseltamivir strategy was taken from the UK NICE HTA, and was applied to amantadine due to lack of data | Time to return to normal activity was estimated from a pooled analysis of six multicentre RCTs. Treatment impact on QoL was taken from the UK NICE HTA. Treatment impact on complications (bronchitis, pneumonia) and hospitalisations was derived from a meta-analysis of 11 international RCTs. Baseline mortality was estimated by causing complication (ILI, pneumonia, bronchitis) from two national studies, and extrapolated to oseltamivir using overall reduction in hospitalisations from the trials | Time to return to normal activity was recorded on diary cards alongside RCTs. Influenza-related hospitalisation reduction rates were derived from published trial data and assumed the same for the two NIs. Baseline complications were estimated from a national population study, and adjusted by treatment strategy with reduction rates derived from published trial data. Mortality by causing complications (ILI, pneumonia, bronchitis) was derived from trial and observational data and assumptions. Treatments were assumed not to impact on mortality |
| HRQoL | QALY | QALY | QALY |
| Source of HRQoL | Measured on the EQ-5D instrument from unpublished data from zanamivir trials of children combined with carers’ opinion | Utilities (ILI = 0.89, bronchitis = 0.99, pneumonia = 0.9) were assessed from influenza-positive patients in the trials on 3 × 11-point VAS and projected onto TTO scores | The incremental utility for oseltamivir relative to standard care for ILI (0.94) was taken from diary records relative to the first 9 days of patients in oseltamivir trials on Likert scores recalibrated into VAS and projected onto a TTO scale. Same QoL improvement was assumed for patients on zanamivir due to lack of data. Generic utility weights from an international study were applied to bronchitis (0.99) and pneumonia (0.9) |
| Adverse events | Side effects were estimated for each treatment from various RCTs and were assumed to start on day 2 of treatment and last for 4 days | Not included | Not included |
| Subgroup analysis | Not reported | Not implemented | Not implemented |
| Diagnostic accuracy (ITT/ITTI) | No specific use of ITTI data was made explicit. Influenza prevalence during the activity period was estimated at 68% from two published RCTs. Influenza type A prevalence was estimated for dominant (99%) and mixed (55%) seasons from national surveillance reports | Clinical efficacy was assessed on an ITTI basis; no specific use of ITT data was made explicit. Base-case influenza prevalence was estimated at 70% based on the oseltamivir trials; the UK NICE HTA informed a low diagnostic accuracy of 34% for sensitivity analysis purposes | Baseline inputs were informed on an ITT basis. Base-case diagnostic accuracy was fixed at 70% based on European oseltamivir trials; the UK NICE HTA informed a low diagnostic accuracy of 34% which was used in sensitivity analysis. No specific use of ITTI data was made explicit |
| Discounting | Not applied | 1.5% used on life-years lost | 1.5% used on life-years lost |
| Cost-effectiveness analysis results | Incremental cost per QALY gained: type A dominant seasons $1775 (amantadine vs no therapy, 15 years), dominated (otherwise); mixed influenza seasons $7440 (oseltamivir vs amantadine, 7 years), $4329 (amantadine vs no therapy, 15 years), $47,153 (oseltamivir vs amantadine, 15 years), dominated (otherwise) |
Incremental cost per illness day averted: £3.16 (range = dominant to £8.63) Incremental cost per QALY gained: £225.48 (range = oseltamivir dominant to dominated) |
Incremental cost per QALY gained: oseltamivir vs no treatment £5600 (range = £1403 to dominated), zanamivir vs oseltamivir dominated (range = £3737 to dominated) Incremental cost per illness day averted: oseltamivir vs no treatment £14.36 (range = £10.69–17.67), zanamivir vs oseltamivir £112.84 (range = £93.88–149.67) Results were also reported from a societal perspective |
| Quadrant on cost-effectiveness plane | NE/SE (depending on influenza type prevalence and age) | NE significantly | NE/SE (depending on comparisons and health-care perspective) |
| Sensitivity analysis | One- and multiway analyses and PSA of all variables except drug cost, influenza prevalence (overall and by type) | One- and multiway analyses of diagnostic accuracy, late presentation, treatment impact on adverse events. PSA of complication, hospitalisation and mortality rates, time to return to normal activity | One- and multiway analyses of diagnostic accuracy, late presentation, treatment impact on adverse events, discount rate, productivity loss. PSA of complication, hospitalisation and mortality rates, length of hospital stay, time to return to normal activity |
| Conclusions | Antiviral therapy for influenza in children generally showed a favourable cost-effective profile. Oseltamivir was preferred (equivalent) to amantadine in cases of significant (insignificant) influenza type B prevalence. Influenza testing was generally found to have no role | Oseltamivir showed a cost-effective profile compared with usual care for treating influenza in at-risk patients even under conservative assumptions (i.e. with ICERs between £225 and £17,900) | Oseltamivir generally exhibited a cost-effective profile compared with usual care and zanamivir for treating influenza in otherwise healthy adults from an NHS perspective, and it was dominant under a societal perspective |
| Key cost-effectiveness drivers | Influenza prevalence (overall and by type), cost and specificity of one test, treatment efficacy, influenza morbidity, work-day cost, oseltamivir cost | Complication, hospitalisation and mortality rates, diagnostic accuracy, treatment impact on adverse events | Diagnostic accuracy, late presentation, treatment impact on adverse events |
| Conflicts of interest | None | One author supported by Hoffman-La Roche | Study funded by Hoffman-La Roche |
| Study details | Schwarzinger et al. (2003)146 | Smith and Roberts (2002)147 | Turner et al. (2003)46 |
|---|---|---|---|
| Economic evaluation type | Cost-effectiveness analysis | Cost-effectiveness and cost–utility analysis | Cost-effectiveness and cost–utility analysis |
| Currency (year) | USD (1999) | USD (2000) | GBP (2001) |
| Study design | Decision tree | Decision tree | Decision tree |
| Perspective | Society | Society, third-party payer | NHS |
| Setting | USA | USA | UK |
| Patient population | Otherwise healthy, unvaccinated patients aged 14–64 years presenting within 48 hours of ILI symptom onset with either confirmed or unconfirmed influenza | Otherwise healthy patients aged on average 32 years presenting within 48 hours of ILI symptom onset with either confirmed or unconfirmed influenza | Otherwise healthy and at-risk patients presenting within 48 hours of ILI symptom onset with either confirmed or unconfirmed influenza |
| Time horizon | ILI duration | Single illness episode | Single influenza season (extrapolated to account for life-years lost due to mortality) |
| Comparators |
Influenza test + zanamivir treatment as per licensed indications Zanamivir treatment No test/treatment |
1. No test/treatment 2. Any NI treatment as per licensed indications 3–4. Adamantane treatment as per licensed indications 5. Influenza test + any NI treatment 6–7. Influenza test + adamantane treatment |
Amantadine 5 days 100 mg daily Oseltamivir 5 days 75 mg twice daily Zanamivir 5 days 10 mg inhaled twice daily Standard care (antibiotics or no treatment) |
| Resources used and costs | Antibacterial and zanamivir use, influenza test, OTC medications, follow-up physician visits, work-days lost. Direct and indirect costs were included | Influenza tests, antiviral and antibacterial use, physician visits, hospitalisations, work-hours lost. Direct and indirect (societal perspective only) costs were included | GP visits, drug and antibiotic use. Hospitalisations and work-days lost (sensitivity analysis only). Direct and indirect (sensitivity analysis only) costs were included |
| Source of resources used | Baseline antibacterial use and OTC medications were estimated based on a pooled analysis of placebo arms from RCTs. Test specificity and sensitivity were fixed at 80% and 90% respectively, based on three published evaluations. Follow-up physician visits were estimated from a meta-analysis of 11 multinational RCTs. Work-days lost were estimated from a multinational RCT | Each influenza and complications episode was assumed to attract a physician visit and 1 hour of work lost. Pneumonia episodes were assumed to lead to hospitalisation | Subgroup-adjusted GP visits were derived from the population size, excess influenza consultations and attack rates. Antibiotic use was taken from a national population study. Baseline hospitalisations were obtained from two national observational studies. Work-days lost were taken from illness durations estimated from the trials for otherwise healthy adults |
| Source of costs | Antibacterial use and OTC medications were costed at an average wholesale price. Zanamivir and influenza test were costed from medical studies. Physician fees were taken from the US Medicare database. Work-days lost were valued via a human-capital approach based on the national average gross income | Influenza testing was costed from a published study. Antiviral and antibacterial costs were average wholesale prices. Hospitalisations were costed relative to a national Medicare DRG. Work-hours lost were valued at a national average gross wage | GP visits were costed from a national health-care cost table. Drug (antibiotic) costs were average wholesale (retail) prices. Hospitalisations were costed according to national HRG codes. Work-days lost were valued at the national average gross wage |
| Clinical outcomes | Time to alleviation of symptoms, reduction rates for antibacterial and OTC medication use and for follow-up visits | Treated and untreated illness duration, complications and mortality reduction rates | Illness duration, serious complications rates. Hospitalisation and mortality reduction rates (sensitivity analysis only) |
| Source of clinical outcomes | Time to alleviation of symptoms was derived from a pooled analysis of a multinational RCT. Antibacterial and follow-up reductions due to treatment were obtained from a meta-analysis of 11 multinational RCTs. OTC medication reductions were extracted from published trial results | Illness durations were estimated from trial data. Antiviral agents were assumed to be equally effective on illness duration in the base case. Both complications (pneumonia, bronchitis/sinusitis) and pneumonia-related mortality rates were informed by various published RCTs, and were assumed the same regardless of the treatment strategy | Illness duration was estimated by at-risk status and age group from placebo (no treatment strategy) and treatment (oseltamivir and zanamivir) arms of the reviewed RCTs and from a Cochrane Review (amantadine). Amantadine was assumed not to influence the course of complications due to lack of data. Baseline serious complication rates were obtained from the national Weekly Returns Service, and adjusted for each NI with the antibiotic prescription rate. Baseline hospitalisation rates were adjusted for each NI with the corresponding pneumonia rate, in turn estimated from adult patients enrolled in the placebo arms of NI trials and applied to children due to lack of data. Otitis media rates for children on oseltamivir (other comparators) were derived from the treatment (placebo) arms of the oseltamivir trials. Subgroup-adjusted baseline mortality was extracted from a national population study, and was adjusted for each NI with the corresponding pneumonia rate |
| HRQoL | Not included | Not specified | QALY |
| Source of HRQoL | Not applicable | Utilities were taken from a national health survey (well state adjusted by age group) or from a national study on short-term diseases (non-influenza illness = 0.65). Illness (treated = 0.783, untreated = 0.65), pneumonia (0.5) and side effects (0.9) utilities were derived by adjusting well state utilities with corresponding disability weights | Subgroup-specific utilities were collected for each health state (ILI for each treatment, pneumonia, otitis media, death) from influenza-positive patients alongside the oseltamivir trials for 21 days (7 days for sensitivity analysis) through a 10-point Likert scale instrument calibrated to VAS and transformed into TTO scores |
| Adverse events | Not included | Side effects were modelled through discontinuances, in turn estimated from trial data for each treatment and assumed to lead to no influenza moderation and disutility (assumed the same for all antivirals) | Amantadine-related side effects were incorporated into corresponding utilities in line with trial evidence |
| Subgroup analysis | Not implemented | Not implemented | Separate results were reported for (i) otherwise healthy adults (aged 12–65 years), (ii) at-risk (aged 65+ years and/or with comorbidities) patients and (iii) children (aged 1–12 years) |
| Diagnostic accuracy (ITT/ITTI) | Efficacy was assessed on an ITTI basis; no specific use of ITT data was made explicit. Influenza prevalence was estimated at 66% from pooled oseltamivir trial data | No specific use of ITTI data was made explicit. NI trials informed a 60% base-case influenza prevalence. Type A influenza prevalence was estimated at 81.5% from national surveillance data | Efficacy analysis and utility assessment were conducted on an ITTI basis; no specific use of ITT data was made explicit. Influenza prevalence was estimated at 46% (47.5% for children) from national RCGP surveillance reports. Subgroup-adjusted type A influenza prevalence was obtained from national PHLS (now HPA) data |
| Discounting | Not applied | Not applied | 1.5% applied in base case to life-years gained; 0% and 6% applied in sensitivity analysis |
| Cost-effectiveness analysis results | Incremental costs per influenza day averted w.r.t. no test/treatment: $36.79 (zanamivir), $22.15 (influenza test + zanamivir) |
Incremental cost per illness day averted: $9.06 (amantadine vs no test/treatment), $198 (zanamivir vs amantadine), dominated or extendedly dominated (otherwise) Incremental cost per influenza day averted: $11.60 (amantadine vs no test/treatment), $185 (zanamivir vs amantadine), dominated or extendedly dominated (otherwise) |
Incremental cost per QALY gained w.r.t. standard care: healthy adults £6132 (amantadine), £18,690 (oseltamivir), £30,750 (zanamivir); at-risk adults £4471 (amantadine), £21,441 (oseltamivir), £16,468 (zanamivir); residential care elderly £4471 (amantadine), £22,350 (oseltamivir), £16,838 (zanamivir); children £5911 (amantadine), £19,739 (oseltamivir), £31,142 (zanamivir) Incremental cost per illness day averted: healthy adults £5.05 (amantadine), £20.01 (oseltamivir), £33.24 (zanamivir); at-risk adults £2.99 (amantadine), £24.25 (oseltamivir), £18.25 (zanamivir); residential care elderly £2.99 (amantadine), £23.49 (oseltamivir), £17.7 (zanamivir); children £5.96 (amantadine), £24.94 (oseltamivir), £38.86 (zanamivir) |
| Quadrant on cost-effectiveness plane | NE | NE/SE (depending on comparison and outcome) | NE |
| Sensitivity analysis | One-way analysis of influenza prevalence, influenza test specificity and sensitivity, baseline antibacterial use, impact of zanamivir on antibacterial and OTC medication use, zanamivir and influenza test costs, work-days lost and daily earnings. Two-way analysis of influenza prevalence and each remaining input | One- and multiway analysis of all (selected) inputs and late presentation. PSA of treated and untreated influenza duration, influenza prevalence (overall and by type), influenza utility, discontinuance | One- and two-way analyses of utilities, influenza prevalence (overall and by type), GP visits, late presentation, antibiotic prescription, productivity loss, oseltamivir price, discount rate. PSA of all inputs except drug prices, utilities, pneumonia and adverse events rates |
| Conclusions | Zanamivir alone was a dominant strategy compared with no influenza treatment for otherwise healthy adults at influenza prevalence rates greater than 39%. Influenza testing combined with zanamivir was generally cost-effective depending on the test’s reliability and cost | Antiviral treatment without testing was reasonably cost-effective for the treatment of influenza in otherwise healthy adults. Testing was found to be cost-effective at low influenza prevalence depending on utilities, circulating viral strain and willingness to pay | The cost-effective profile of the examined influenza treatment options was generally unfavourable and markedly variable across patient subgroups, due to uncertainties in the available evidence base |
| Key cost-effectiveness drivers | Influenza prevalence, influenza test specificity and sensitivity, influenza test cost, work-days lost and daily earnings | Influenza prevalence (overall and by type), influenza utility, untreated influenza duration | GP visits, late presentation, influenza prevalence (overall and by type), pneumonia and adverse events rates |
| Conflicts of interest | None | None | None |
| Study details | Vindt Holm et al. (2004)148 | Study details | Vindt Holm et al. (2004)148 |
|---|---|---|---|
| Economic evaluation type | Cost-utility analysis | HRQoL | QALY |
| Currency (year) | EUR (2002) | Source of HRQoL | Utilities (adjusted for the time spent in each health state) were measured for 21 days alongside the RCTs for each treatment strategy with the EQ-5D instrument on the Likert scale calibrated to VAS and transformed into TTO scores |
| Study design | Decision tree | Adverse events | Not included |
| Perspective | Health-care payer, society | Subgroup analysis | Not implemented |
| Setting | Denmark | Diagnostic accuracy (ITT/ITTI) | Time to return to normal activity was derived on an ITTI basis. Complication, hospitalisation and mortality rates were obtained on a ITT basis. Base-case influenza prevalence was fixed at 70% in line with the efficacy trials |
| Patient population | Otherwise healthy patients aged 13–64 years presenting within 48 hours of ILI symptom onset with either confirmed or unconfirmed influenza | Discounting | 3% applied to both costs and benefits |
| Time horizon | Single influenza season (extrapolated to account for life-years lost and income loss due to mortality) | Cost-effectiveness analysis results | Incremental cost per QALY gained: oseltamivir dominant (societal perspective), €5063 (health-care payer perspective) |
| Comparators |
Oseltamivir 5 days 75 mg twice daily Standard care (OTC medication) |
Quadrant on cost-effectiveness plane | NE/SE |
| Resources used and costs | GP visits, antibiotic and OTC medication use, oseltamivir use, hospitalisations, work-hours lost (societal perspective only). Direct and indirect (societal perspective only) costs were included | Sensitivity analysis | Multiway analysis assuming no complications, hospitalisations or mortality |
| Source of resources used | Antibiotic and OTC medication use were estimated by the authors from own data. Baseline hospitalisations were derived from an US observational study. The source for GP visits was left unclear. Work-hours lost were taken from hours to return to normal activity as estimated from the trials | Conclusions | Oseltamivir was a cost-effective influenza treatment strategy for otherwise healthy adolescents and adults even under conservative assumptions, yielding up to a €11,448 cost per QALY gained |
| Source of costs | Direct costs were based on national formulary and fee tables. Work-hours lost were valued at a national average wage | Key cost-effectiveness drivers | Complications, hospitalisations and mortality (health-care payer perspective only), productivity loss (societal perspective only) |
| Clinical outcomes | Time to return to normal activity, complications, hospitalisations and mortality reduction rates | Conflicts of interest | One author employed by Hoffman-La Roche |
| Source of clinical outcomes | Time to return to normal activity and treatment impact on hospitalisation were estimated from Roche RCTs. Complication rates for pneumonia and bronchitis were derived by outcome (outpatient, inpatient, death) from a UK population study, international reviews or assumptions. Treatment impact on mortality was extrapolated using the reduction in hospitalisations |
Appendix 3 Excluded clinical effectiveness studies with rationale
Full papers retrieved that did not meet the inclusion criteria are listed along with their reasons for exclusion.
Appendix 4 Protocol change
The original protocol stated that studies evaluating any treatment dose and duration of regimen would be included in the review, with separate analyses being undertaking for licensed and unlicensed regimens. However, during the course of the review, difficulties obtaining data resulted in time constraints that precluded such a wide-ranging analysis, and the review was restricted to evaluations of the licensed treatment regimens.
Appendix 5 Quality assessment
Clinical effectiveness
| Author/year | Randomisation reported | Randomisation appropriate? | Allocation concealment | Comparability | At least double blind | Patients blinded? | Outcome assessors blinded? | Care-givers blinded? | Regions | Participants randomised per centre | Definition of ILI | ILI definition specified a temperature | Power calculation | Selection/eligibility criteria reported | Representative sample recruited? | Losses to follow-up reported/explained? | At least 95% follow-up? |
|---|---|---|---|---|---|---|---|---|---|---|---|---|---|---|---|---|---|
| Aoki et al.74 | Y | UC | UC | Y | Y | UC | UC | UC | N | UC | Y | N | N | Y | Y | N | Y |
| Boivin et al.79,93–95 | Y | UC | UC | Y | Y | UC | UC | UC | Y | N | Y | Y | Y | Y | N | Y | Y |
| Deng et al.66 | Y | UC | UC | Y | N | N | N | N | Y | UC | N | N/A | N | Y | UC | N | UC |
| GlaxoSmithKline 200187 | Y | Y | Y | Y | Y | Y | Y | Y | Y | N | Y | Y | Y | Y | Y | Y | N |
| GlaxoSmithKline 2005105,106 | Y | UC | UC | Y | Y | Y | Y | Y | N | N | Y | Y | Y | Y | Y | Y | Y |
| GlaxoSmithKline 2006103,104 | Y | Y | Y | N | Y | Y | Y | Y | Y | N | Y | Y | N | Y | Y | Y | Y |
| GlaxoSmithKline 200699 | Y | UC | UC | UC | Y | UC | UC | UC | Y | N | Y | Y | N | Y | Y | Y | Y |
| Hayden et al.76 | Y | UC | UC | Y | Y | UC | UC | UC | N | N | Y | N | Y | Y | Y | Y | N |
| Hedrick et al.100,101 | Y | Y | Y | Y | Y | Y | Y | Y | N | N | Y | Y | Y | Y | Y | Y | Y |
| Johnston et al.78 NV16871 | Y | UC | UC | Y | Y | UC | UC | UC | UC | UC | Y | Y | Y | Y | N | Y | N |
| Kashiwagi et al.68 | Y | UC | UC | Y | Y | Y | Y | Y | Y | N | Y | Y | N | Y | Y | Y | Y |
| Li et al.69 | Y | Y | Y | Y | Y | Y | Y | Y | Y | Y | Y | Y | N | Y | Y | Y | Y |
| Lin et al.71,72 | Y | UC | N | Y | N | N | N | N | Y | N | Y | Y | N | Y | N | Y | Y |
| Mäkelä et al.79,96,97 | Y | Y | Y | Y | Y | UC | UC | UC | Y | N | Y | Y | Y | Y | Y | Y | Y |
| Martin et al.73,109 | Y | UC | UC | UC | Y | UC | UC | UC | Y | Y | Y | Y | N | Y | UC | N | UC |
| Martin et al.73,109 | Y | UC | UC | Y | Y | UC | UC | UC | UC | UC | Y | Y | N | Y | UC | N | UC |
| Matsumoto et al.86 | Y | UC | UC | Y | Y | Y | Y | Y | Y | N | Y | Y | N | Y | Y | N | Y |
| MIST79,91,92 | Y | Y | UC | Y | Y | UC | UC | UC | N | Y | Y | Y | N | Y | Y | Y | N |
| Monto et al.75,79 | Y | UC | UC | Y | Y | UC | UC | UC | N | UC | Y | N | Y | Y | Y | Y | N |
| Murphy et al.98,114,115 | Y | Y | Y | Y | Y | Y | Y | Y | N | N | Y | Y | Y | Y | N | Y | N |
| Nicholson et al.80,107 | Y | Y | UC | Y | UC | UC | UC | UC | N | N | Y | Y | Y | Y | Y | Y | Y |
| Puhakka et al.88,89 | Y | Y | UC | Y | Y | Y | Y | Y | Y | Y | Y | Y | Y | Y | N | Y | Y |
| Roche WV15730 (1999)46,83 | Y | Y | Y | Y | Y | Y | Y | Y | N | N | Y | Y | Y | Y | N | Y | Y |
| Roche NV1687177 | Y | UC | UC | UC | Y | UC | UC | UC | UC | UC | Y | Y | N | Y | N | N | UC |
| Sato et al.85 | Y | Y | UC | UC | UC | UC | UC | UC | Y | Y | N | N/A | N | Y | N | N | UC |
| Tan et al.67 | Y | Y | UC | UC | Y | Y | UC | Y | Y | Y | N | N/A | N | Y | UC | Y | N |
| Treanor et al.65 | Y | Y | Y | Y | Y | Y | UC | UC | Y | N | Y | Y | Y | Y | Y | Y | N |
| Treanor81 | Y | UC | UC | UC | Y | UC | UC | UC | Y | N | Y | Y | N | N | UC | N | UC |
| Whitley et al.110 | Y | UC | UC | Y | Y | Y | UC | UC | Y | N | Y | Y | Y | Y | Y | N | Y |
Guidelines for completing the quality assessment
| 1. Was the number of participants randomised stated? |
|
Yes: Number of people randomised to each arm of the trial was reported No: Only the total number of participants was reported or only the number that actually received each treatment was reported |
| 2. Was the method of randomisation appropriate? |
|
Yes: Computer-generated random numbers or the use of random number tables No: Any other method of randomisation Unclear: The study stated that randomisation occurred, but did not report the method |
| 3. Was allocation concealment adequate? |
|
Yes: Any robust method that would not allow the patient status to influence the allocation of treatment No: Other methods of allocation concealment Unclear: Either allocation was concealed but the method was not reported, or the concealment of allocation was not reported |
| 4. Were the treatment groups comparable at baseline? |
|
Yes: There were no significant differences between the participants of the treatment arms at baseline No: There were significant differences between the participants of the treatment arms at baseline Unclear: Baseline characteristics were not reported |
| 5. Was the study reported as being at least double blind? |
|
Yes: The study was reported as being double or triple blind No: The study did not report whether it was double blind or not |
| 6. Patients blinded? |
|
Yes: It was explicitly stated that patients were blinded to treatment or methods described that implied that patients were blinded No: It was explicitly stated that patients were not blinded to treatment Unclear: There was no specific information regarding the blinding of patients |
| 7. Outcome assessors blinded? |
|
Yes: It was explicitly stated that outcome assessors were blinded to treatment or methods described that implied that outcome assessors were blinded No: It was explicitly stated that outcome assessors were not blinded to treatment Unclear: There was no specific information regarding the blinding of outcome assessors |
| 8. Care-givers blinded? |
|
Yes: It was explicitly stated that care-givers were blinded to treatment or methods described that implied care-givers were blinded No: It was explicitly stated that care-givers were not blinded to treatment Unclear: There was no specific information regarding the blinding of care-givers |
| 9. Did the study run in only one continent? |
|
Yes: The study recruited participants from only one continent No: The study recruited participants from more than one continent Unclear: Location of sites was not adequately reported |
| 10. Was the mean number of participants randomised per centre ≥ 15? |
|
Yes: The mean number of participants randomised per centre was ≥ 15 No: The mean number of participants randomised per centre was not ≥ 15 Unclear: The total number of centres was not stated |
| 11. Definition of ILI? |
|
Yes: The authors did define what was meant by ILI No: The authors did not define what was meant by ILI |
| 12. ILI definition specify a temperature? |
|
Yes: The definition of ILI did specify a temperature No: The definition of ILI did not specify a temperature or there was no definition of ILI given |
| 13. Power calculation used? |
|
Yes: Power calculation was used No: Power calculation was not used, or its use was not reported |
| 14. Selection/eligibility criteria reported? |
|
Yes: Selection/eligibility criteria were reported No: Selection/eligibility criteria were not adequately reported |
| 15. Representative sample recruited? |
|
Yes: The study sample was representative of the study population in clinical practice No: The study sample was not truly representative of the study population (e.g. age range for a given group was too narrow) Unclear: Criteria were not adequately reported |
| 16. Losses to follow-up reported/explained? |
|
Yes: Losses to follow-up were reported/explained No: Losses to follow-up were not reported/explained |
| 17. Were at least 95% of those randomised followed up? |
|
Yes: At least 95% were followed up at the final time point reported No: < 95% were followed up at the final time point reported Unclear: Loss to follow up was not reported |
Economic evaluation
| Turner et al.46 | Roche submission128 | |
|---|---|---|
| Study question | ||
| 1. Costs and effects examined | ✓ | ✓ |
| 2. Alternatives compared | ✓ | ✓ |
| 3. The viewpoint(s)/perspective of the analysis is clearly stated (e.g. NHS, society) | ✓ | ✓ |
| Selection of alternatives | ||
| 4. All relevant alternatives are compared (including do nothing if applicable) | ✓ | ✓/✗ |
| 5. The alternatives being compared are clearly described (who did what, to whom, where and how often) | ✓ | ✓ |
| 6. The rationale for choosing the alternative programmes or interventions compared is stated | ✓ | ✓ |
| Form of evaluation | ||
| 7. The choice of form of economic evaluation is justified in relation to the questions addressed. | ✓ | ✗ |
| 8. If a cost-minimisation design is chosen, have equivalent outcomes been adequately demonstrated? | N/A | ✗ |
| Effectiveness data | ||
| 9. The source(s) of effectiveness estimates used are stated (e.g. single study, selection of studies, systematic review, expert opinion) | ✓ | ✓ |
| 10. Effectiveness data from RCT or review of RCTs | ✓/✗ | ✗ |
| 11. Potential biases identified (especially if data not from RCTs) | ✗ | ✗ |
| 12. Details of the method of synthesis or meta-analysis of estimates are given (if based on an overview of a number of effectiveness studies) | N/A | N/A |
| Costs | ||
| 13. All the important and relevant resource use included | ✓ | ✓ |
| 14. All the important and relevant resource use measured accurately (with methodology) | ✓ | ✗ |
| 15. Appropriate unit costs estimated (with methodology) | ✓ | ✓ |
| 16. Unit costs reported separately from resource use data | ✗ | ✓ |
| 17. Productivity costs treated separately from other costs | N/A | ✓ |
| 18. The year and country to which unit costs apply is stated with appropriate adjustments for inflation and/or currency conversion | ✓ | ✓ |
| Benefit measurement and valuation | ||
| 19. The primary outcome measure(s) for the economic evaluation are clearly stated | ✓ | ✓ |
| 20. Methods to value health states and other benefits are stated | ✗ | ✓ |
| 21. Details of the individuals from whom valuations were obtained are given | N/A | N/A |
| Decision modelling | ||
| 22. Details of any decision model used are given (e.g. decision tree, Markov model) | ✓ | ✓ |
| 23. The choice of model used and the key input parameters on which it is based are adequately detailed and justified | ✓ | ✓ |
| 24. All model outputs described adequately | ✓ | ✓ |
| Discounting | ||
| 25. Discount rate used for both costs and benefits | ✓ | ✓ |
| 26. Do discount rates accord with NHS guidance? | ✓ | ✓ |
| Allowance for uncertainty | ||
| Stochastic analysis of patient-level data | ✓ | ✓ |
| 27. Details of statistical tests and confidence intervals are given for stochastic data | ✓ | ✓ |
| 28. Uncertainty around cost-effectiveness expressed (e.g. confidence interval around incremental cost-effectiveness ratio (ICER), cost-effectiveness acceptability curves). | ✓ | ✓ |
| 29. Sensitivity analysis used to assess uncertainty in non-stochastic variables (e.g. unit costs, discount rates) and analytic decisions (e.g. methods to handle missing data). | ✓ | ✓ |
| Stochastic analysis of decision models | ||
| 30. Are all appropriate input parameters included with uncertainty? | ✓ | ✓ |
| 31. Is second-order uncertainty (uncertainty in means) included rather than first order (uncertainty between patients)? | ✓ | ✓ |
| 32. Are the probability distributions adequately detailed and appropriate? | ✓ | ✗ |
| 33. Sensitivity analysis used to assess uncertainty in non-stochastic variables (e.g. unit costs, discount rates) and analytic decisions (e.g. methods to handle missing data) | ✓ | ✓ |
| Deterministic analysis | ||
| 34. The approach to sensitivity analysis is given (e.g. univariate, threshold analysis, etc.) | ✓ | ✓ |
| 35. The choice of variables for sensitivity analysis is justified | ✓ | ✓ |
| 36. The ranges over which the variables are varied are stated | ✓ | ✓ |
| Presentation of results | ||
| 37. Incremental analysis is reported using appropriate decision rules | ✗ | ✗ |
| 38. Major outcomes are presented in a disaggregated as well as aggregated form | ✓ | ✓ |
| 39. Applicable to the NHS setting | ✓ | ✓ |
Modelling checklist for Turner et al.46
| Quality criterion | Question(s) | Response (✓, ✗, N/A) | Comments |
|---|---|---|---|
| S1 | Is there a clear statement of the decision problem? | ✓ | ‘To identify the optimal prevention and treatment strategies for influenza and, in particular the role, if any, that neuraminidase inhibitors (NI) have to play’ (p.1) |
| Is the objective of the evaluation and model specified consistent with the stated decision problem? | ✓ | ‘Alternative options for the treatment and prophylaxis of influenza were assessed in terms of cost-effectiveness using decision analytic models for four separate patient groups: healthy adults, high-risk adults, children and residential care elderly’ (p.108) | |
| Is the primary decision-maker specified? | ✓/✗ | Not explicitly, although the report is written for HTA/NICE | |
| S2 | Is the perspective of the model stated clearly? | ✓ | ‘The analysis is primarily undertaken from the perspective of the NHS’ (p.110) |
| Are the model inputs consistent with the stated perspective? | ✓ | NHS/PSS costs and QALYs (pp.119–23) | |
| Has the scope of the model been stated and justified? | ✓ | Patient groups and options under evaluation are specified clearly. Each structural assumption is discussed and (in some cases) justified (pp.123–6) | |
| Are the outcomes of the model consistent with the perspective, scope and overall objective of the model? | ✓ | ‘Main results are reported in terms of incremental cost per QALY gained and we also report the cost per influenza day avoided’ (p.108). Length of illness is determined from the control arms of trials or from Cochrane review data | |
| S3 | Is the structure of the model consistent with a coherent theory of the health condition under evaluation? | ✓ | The model structure is consistent with an assumed treatment pathway, although this pathway is not fully justified. The progression of disease is not modelled (not applicable) |
| Are the sources of data used to develop the structure of the model specified? | ✗ | No details are given regarding the development of the structure of the model | |
| Are the causal relationships described by the model structure justified appropriately? | ✓/✗ | Some justification given (pp.123–6) | |
| S4 | Are the structural assumptions transparent and justified? | ✓ | A list of all assumptions is provided along with the likely effect of bias (pp.135–6) |
| Are the structural assumptions reasonable given the overall objective, perspective and scope of the model? | ✓ | All structural assumptions are justifiable, whether or not explicit justification is given | |
| S5 | Is there a clear definition of the options under evaluation? | ✓ | All options are specified clearly (p.109) |
| Have all feasible and practical options been evaluated? | ✓ | Amantadine treatment considered; rimantadine not considered but in the absence of a UK licence this may not necessarily be considered a feasible or practical alternative | |
| Is there justification for the exclusion of feasible options? | N/A | ||
| S6 | Is the chosen model type appropriate given the decision problem and specified causal relationships within the model? | ✓ | Tree model represents probabilities of events (probability of influenza, presentation to the GP, presentation within 48 hours of onset of symptoms, of drug treatment if presenting before or after 48 hours, probability of severe complications and resultant death). Model examines a single treatment episode; repeat treatment over time is not considered, but lack of reliable data on resistance limits the usefulness of such analysis |
| S7 | Is the time horizon of the model sufficient to reflect all important differences between options? | ✓ | Lifetime time horizon (to capture life-years lost due to influenza mortality), although only a single influenza season considered. ‘An 10-point (sic) Likert scale was completed daily over a 21-day period. Patients continued to complete the instrument after 7 days only if they had not recovered’ (pp. 119–21) |
| Are the time horizon of the model, the duration of treatment and the duration of treatment effect described and justified? | ✓ | ||
| S8 | Do the disease states (state transition model) or the pathways (decision tree model) reflect the underlying biological process of the disease in question and the impact of interventions? | ✓ | Decision tree represents the pathways patients may follow when they have ILI |
| S9 | Is the cycle length defined and justified in terms of the natural history of disease? | N/A | |
| D1 | Are the data identification methods transparent and appropriate given the objectives of the model? | ✓ | Effectiveness data come from full systematic review of the trial evidence and Cochrane reviews. Data for other parameters in the model are based on reviews of the literature and meta-analyses |
| Where choices have been made between data sources, are these justified appropriately? | ✓ | ||
| Has particular attention been paid to identifying data for the important parameters in the model? | ✗ | Main treatment effects are derived from trial data, while probabilities are derived from reviews of evidence. A key uncertainty was found to be the QALY values associated with adverse events: ‘We estimated the EQ-5D status for persons suffering from these conditions from expert opinion’ (p. 207); no further research was carried out to reduce the uncertainty around this estimate | |
| Has the quality of the data been assessed appropriately? | ✓ | An assessment of quality was undertaken for the systematic review | |
| When expert opinion has been used, are the methods described and justified? | ✗ | Expert opinion was used to identify EQ-5D scores for adverse events – no details are given regarding the methods used | |
| D2 | Is the data modelling methodology based on justifiable statistical and epidemiological techniques? | ✓ | Random effects meta-analysis used to estimate time to symptoms across all trials of NIs. Meta-regression used to estimate the relationship between time to symptoms alleviated and time to fever in days |
| D2a | Is the choice of baseline data described and justified? | ✓ | All data are derived from the control group of trials |
| Are transition probabilities calculated appropriately? | N/A | ||
| Has a half-cycle correction been applied to both cost and outcome? | N/A | ||
| If not, has this omission been justified? | N/A | ||
| D2b | If relative treatment effects have been derived from trial data, have they been synthesised using appropriate techniques? | ✓ | Random effects meta-analysis |
| Have the methods and assumptions used to extrapolate short-term results to final outcomes been documented and justified? | ✓ | Length of influenza illness for amantadine was extrapolated using meta-regression techniques based on the observed relationship between length of fever and length of illness | |
| Have alternative extrapolation assumptions been explored through sensitivity analysis? | ✓ | Different time-frames for extrapolation explored (7 days, 21 days) | |
| Have assumptions regarding the continuing effect of treatment once treatment is complete been documented and justified? | ✓ | ||
| Have alternative assumptions regarding the continuing effect of treatment been explored through sensitivity analysis? | ✓ | Different time-frames explored (7 days, 21 days) | |
| D2c | Are the costs incorporated into the model justified? | ✓ | All come from standard sources |
| Has the source for all costs been described? | ✓ | ||
| Have discount rates been described and justified given the target decision-maker? | ✓ | 1.5% benefits, 6% costs | |
| D2d | Are the utilities incorporated into the model appropriate? | ✓/✗ | Utilities are derived from trial data; quality-adjusted life expectancy calculated from life tables (p.205); no details are given regarding the methods used to identify EQ-5D scores for adverse events |
| Is the source for the utility weights referenced? | ✓ | ||
| Are the methods of derivation for the utility weights justified? | ✓ | QALY weights were taken from a Likert scale administered in the trials, which were manipulated to mean visual analogue scale scores from the Measurement and Validation of Health (MVH) study. These were then converted into TTO estimates (p. 119). No data existed for children, therefore adults weights were applied. The effect of using 7 days of data instead of 21 days was examined through sensitivity analysis. Justification given for using expert opinion to derive EQ-5D scores for adverse events (p. 207) | |
| D3 | Have all data incorporated into the model been described and referenced in sufficient detail? | ✓ | All sources are referenced |
| Has the use of mutually inconsistent data been justified (i.e. are assumptions and choices appropriate)? | ✓ | US data used to determine attack rates on the basis that over time attack rates in the USA and Europe would be the same | |
| Is the process of data incorporation transparent? | ✓ | Data incorporated as distributions and as point estimates | |
| If data have been incorporated as distributions, has the choice of distribution for each parameter been described and justified? | ✓ | All distributions are described for each parameter but not justified. However, the choice does reflect the properties of the parameter | |
| If data have been incorporated as distributions, is it clear that second-order uncertainty is reflected? | ✓ | Monte Carlo simulation used to reflect second-order uncertainty | |
| D4 | Have the four principal types of uncertainty been addressed? | ✓ | Although this is not explicitly stated |
| If not, has the omission of particular forms of uncertainty been justified? | N/A | ||
| D4a | Have methodological uncertainties been addressed by running alternative versions of the model with different methodological assumptions? | ✓ | Effect of discount rates assessed |
| D4b | Is there evidence that structural uncertainties have been addressed via sensitivity analysis? | ✓ | The effect of structural assumptions is assessed. For example, data used to derive the length of illness varied from using 21 days’ worth of data to using just 7 days |
| D4c | Has heterogeneity been dealt with by running the model separately for different subgroups? | ✓ | The model was run for four groups |
| D4d | Are the methods of assessment of parameter uncertainty appropriate? | ✓ | Probabilistic sensitivity analysis plus a series of one-way sensitivity analyses |
| If data are incorporated as point estimates, are the ranges used for sensitivity analysis stated clearly and justified? | ✓ | Mean value used for deterministic analysis | |
| C1 | Is there evidence that the mathematical logic of the model has been tested thoroughly before use? | ✗ | |
| C2 | Are any counterintuitive results from the model explained and justified? | N/A | The model results do not appear to be counterintuitive |
| If the model has been calibrated against independent data, have any differences been explained and justified? | N/A | ||
| Have the results of the model been compared with those of previous models and any differences in results explained? | ✓ | The results are compared with three other models (pp.136–7). The reasons for differences are explained clearly |
Modelling checklist for Roche submission128
| Quality criterion | Question(s) | Response (✓, ✗, N/A) | Comments |
|---|---|---|---|
| S1 | Is there a clear statement of the decision problem? | ✓ | ‘The economic case for treating all individuals who present to the GP with influenza like illness (ILI).’ (p. 47) |
| Is the objective of the evaluation and model specified consistent with the stated decision problem? | ✓ | ‘The cost effectiveness case… will be presented comparing oseltamivir to usual care and zanamivir, as defined in the final scope’ (p. 48) | |
| Is the primary decision-maker specified? | ✓ | Given in title of the report | |
| S2 | Is the perspective of the model stated clearly? | ✓ | ‘The economic analysis is performed from the NHS and PSS perspective as per the NICE reference case’ (p. 51) |
| Are the model inputs consistent with the stated perspective? | ✓ | ‘The total QALYs and direct NHS costs of each cohort are compared…’ (p. 50) | |
| Has the scope of the model been stated and justified? | ✓/✗ | Scope stated (pp. 48–51). Justification for considering only one complication given later (p. 83). Flawed justification given for not addressing the issue of whether the availability of a new technology will increase patient consultation rates (p. 49) | |
| Are the outcomes of the model consistent with the perspective, scope and overall objective of the model? | ✗ | ‘The duration of ILI is defined as time to return to normal activities’ (p. 59). Turner et al.46 considered time to return to normal activities only as part of the sensitivity analysis in order to value productivity costs, which are not considered relevant under the NICE reference case | |
| S3 | Is the structure of the model consistent with a coherent theory of the health condition under evaluation? | ✓/✗ | The model structure is consistent with an assumed treatment pathway, although this pathway is not fully justified and has some unusual implications regarding hospitalisation and mortality (see critique). The progression of disease is not modelled (not applicable) |
| Are the sources of data used to develop the structure of the model specified? | ✓ | ‘The economic model … is similar to that previously used in [Roche’s submission to] TA58 and also the model developed by the Assessment Groups [for TA58]’ (p. 48) | |
| Are the causal relationships described by the model structure justified appropriately? | ✓/✗ | Not explicitly, but some justification is given in Turner et al.46 and it is explicitly stated that this model follows a similar structure (p. 48) | |
| S4 | Are the structural assumptions transparent and justified? | ✓/✗ | A list of all assumptions is provided. While these are not fully justified, some of the limitations of the model are given (pp. 83–4) |
| Are the structural assumptions reasonable given the overall objective, perspective and scope of the model? | ✓ | All structural assumptions are justifiable, whether or not explicit justification is given (not addressing the issue of whether the availability of a new technology will increase patient consultation rates is justifiable given the lack of data, but not for the reason stated) | |
| S5 | Is there a clear definition of the options under evaluation? | ✓ | All options are specified clearly (p. 50). Information on doses is given (p. 13) |
| Have all feasible and practical options been evaluated? | ✗ | Amantadine treatment is not considered; rimantadine is not considered either but in the absence of a UK licence this may not necessarily be considered a feasible or practical alternative | |
| Is there justification for the exclusion of feasible options? | ✓ | Amantadine has been excluded from the final scope | |
| S6 | Is the chosen model type appropriate given the decision problem and specified causal relationships within the model? | ✓ | Tree model represents probabilities of events (probability of influenza, presentation to the GP, presentation within 48 hours of onset of symptoms, of drug treatment if presenting before or after 48 hours, probability of severe complications and resultant death). Model examines a single treatment episode; repeat treatment over time is not considered, but lack of reliable data on resistance limits the usefulness of such analysis |
| S7 | Is the time horizon of the model sufficient to reflect all important differences between options? | ✓ | ‘The time horizon employed in the model is a lifetime time horizon … Although all the influenza related events are captured within 1 year, the lifetime horizon is applied in the model in order to capture life years lost due to influenza mortality’ (p. 51) |
| Are the time horizon of the model, the duration of treatment and the duration of treatment effect described and justified? | ✓ | ||
| S8 | Do the disease states (state transition model) or the pathways (decision tree model) reflect the underlying biological process of the disease in question and the impact of interventions? | ✓ | Decision tree represents the pathways patients may follow when they have ILI |
| S9 | Is the cycle length defined and justified in terms of the natural history of disease? | N/A | |
| D1 | Are the data identification methods transparent and appropriate given the objectives of the model? | ✗ | |
| Where choices have been made between data sources, are these justified appropriately? | ✗ | See critique. Lack of justification of data sources, particularly around utility values | |
| Has particular attention been paid to identifying data for the important parameters in the model? | ✗ | ||
| Has the quality of the data been assessed appropriately? | ✗ | ||
| Where expert opinion has been used, are the methods described and justified? | ✗ | The estimate of 31% for diagnostic accuracy is arbitrary (originating in the sensitivity analysis conducted by Turner et al.46 ). The submission states that the estimate was ‘validated at a 2008 UK Roche advisory board as being an appropriate assumption’ (p. 53) but no details are given | |
| D2 | Is the data modelling methodology based on justifiable statistical and epidemiological techniques? | ✓ | |
| D2a | Is the choice of baseline data described and justified? | ✓/✗ | In most cases, although choice of baseline utility scores not justified |
| Are transition probabilities calculated appropriately? | N/A | ||
| Has a half-cycle correction been applied to both cost and outcome? | N/A | ||
| If not, has this omission been justified? | N/A | ||
| D2b | If relative treatment effects have been derived from trial data, have they been synthesised using appropriate techniques? | ✓/✗ | |
| Have the methods and assumptions used to extrapolate short-term results to final outcomes been documented and justified? | ? | ||
| Have alternative extrapolation assumptions been explored through sensitivity analysis? | N/A | ||
| Have assumptions regarding the continuing effect of treatment once treatment is complete been documented and justified? | ✗ | The model assumes that, once treatment is complete, patients may have a reduced duration of illness and that each of the days on which patients no longer have ILI should carry a utility weight of 1 – this is undocumented and unjustified in the printed submission | |
| Have alternative assumptions regarding the continuing effect of treatment been explored through sensitivity analysis? | N/A | ||
| D2c | Are the costs incorporated into the model justified? | ✓/✗ | All cost data are stated and justified, although drug cost for zanamivir (£16.55 per treatment) appears to be incorrect |
| Has the source for all costs been described? | ✓ | ||
| Have discount rates been described and justified given the target decision-maker? | ✓ | ‘All health care costs occur within 1 year and are not discounted. However, life-years gained due to avoided premature mortality which occur in the future are discounted at a rate of 3.5%, as per the NICE reference case’ (p. 51) | |
| D2d | Are the utilities incorporated into the model appropriate? | ✗ | Utilities are derived from trial data and the literature; quality-adjusted life expectancy is calculated from life tables and EuroQoL data (p. 66). However, there appears to be considerable bias in the choice of trial data analysed and assumptions made in calculating life-years lost |
| Is the source for the utility weights referenced? | ✗ | Harvard utility scores not properly referenced | |
| Are the methods of derivation for the utility weights justified? | ✗ | Utilities for patients receiving usual care were taken from Harvard utility weights and Stouthard (1997). To calculate the relative improvement from antivirals, QALY weights were taken from a Likert scale administered in the trials for oseltamivir, which were manipulated to mean visual analogue scale scores from the MVH study – these were then converted into TTO estimates in order to calculate a relative improvement from oseltamivir of 11.52% (pp. 64–5). The same relative improvement was assumed for all antivirals in all subgroups (p. 64). However, despite stating in the text that VAS scores were completed for 21 days, the 11.52% figure was calculated using just 7 days of data, without explanation (p. 65). It was assumed that any utility loss resulting from minor complications would already be incorporated in the VAS scores and so was not considered separately (p. 72) | |
| D3 | Have all data incorporated into the model been described and referenced in sufficient detail? | ✗ | Harvard utility scores and Cox data not properly referenced |
| Has the use of mutually inconsistent data been justified (i.e. are assumptions and choices appropriate)? | ✓ | ||
| Is the process of data incorporation transparent? | ✓/✗ | Data incorporated as distributions and as point estimates, but the printed submission does not detail all distributions considered in the model | |
| If data have been incorporated as distributions, has the choice of distribution for each parameter been described and justified? | ✗ | Distributions are described for most parameters but not justified. However, while in some cases the choice of distribution reflect the properties of the parameter, for a substantial number of parameters a triangular distribution has been chosen without any justification | |
| If data have been incorporated as distributions, is it clear that second-order uncertainty is reflected? | ✓ | Monte Carlo simulation used to reflect second-order uncertainty (5000 simulations) | |
| D4 | Have the four principal types of uncertainty been addressed? | ✓ | Although this is not explicitly stated |
| If not, has the omission of particular forms of uncertainty been justified? | N/A | ||
| D4a | Have methodological uncertainties been addressed by running alternative versions of the model with different methodological assumptions? | ✓ | |
| D4b | Is there evidence that structural uncertainties have been addressed via sensitivity analysis? | ✓ | The effect of structural assumptions is assessed |
| D4c | Has heterogeneity been dealt with by running the model separately for different subgroups? | ✓ | The model was run for four groups |
| D4d | Are the methods of assessment of parameter uncertainty appropriate? | ✓ | Probabilistic sensitivity analysis plus a series of one-way sensitivity analyses |
| If data are incorporated as point estimates, are the ranges used for sensitivity analysis stated clearly and justified? | ✗ | ||
| C1 | Is there evidence that the mathematical logic of the model has been tested thoroughly before use? | ✗ | |
| C2 | Are any counterintuitive results from the model explained and justified? | N/A | The model results do not appear to be counterintuitive |
| If the model has been calibrated against independent data, have any differences been explained and justified? | N/A | ||
| Have the results of the model been compared with those of previous models and any differences in results explained? | ✗ |
Appendix 6 Forest plots
Healthy adults
FIGURE 24.
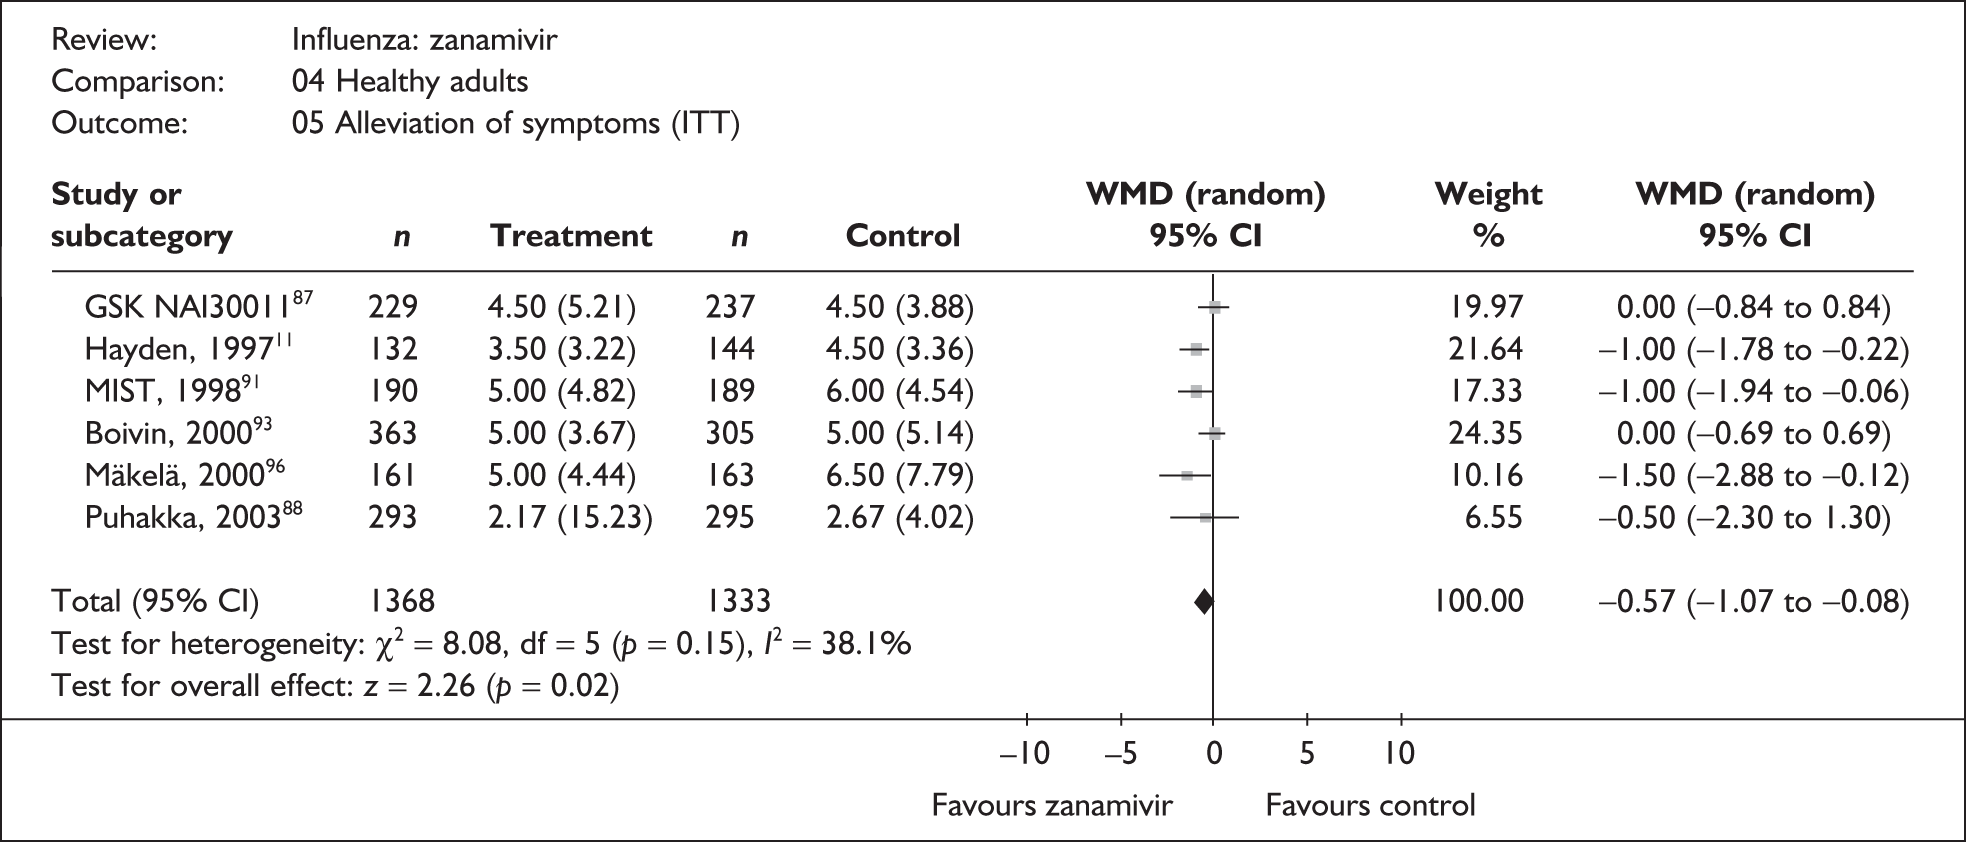
FIGURE 25.
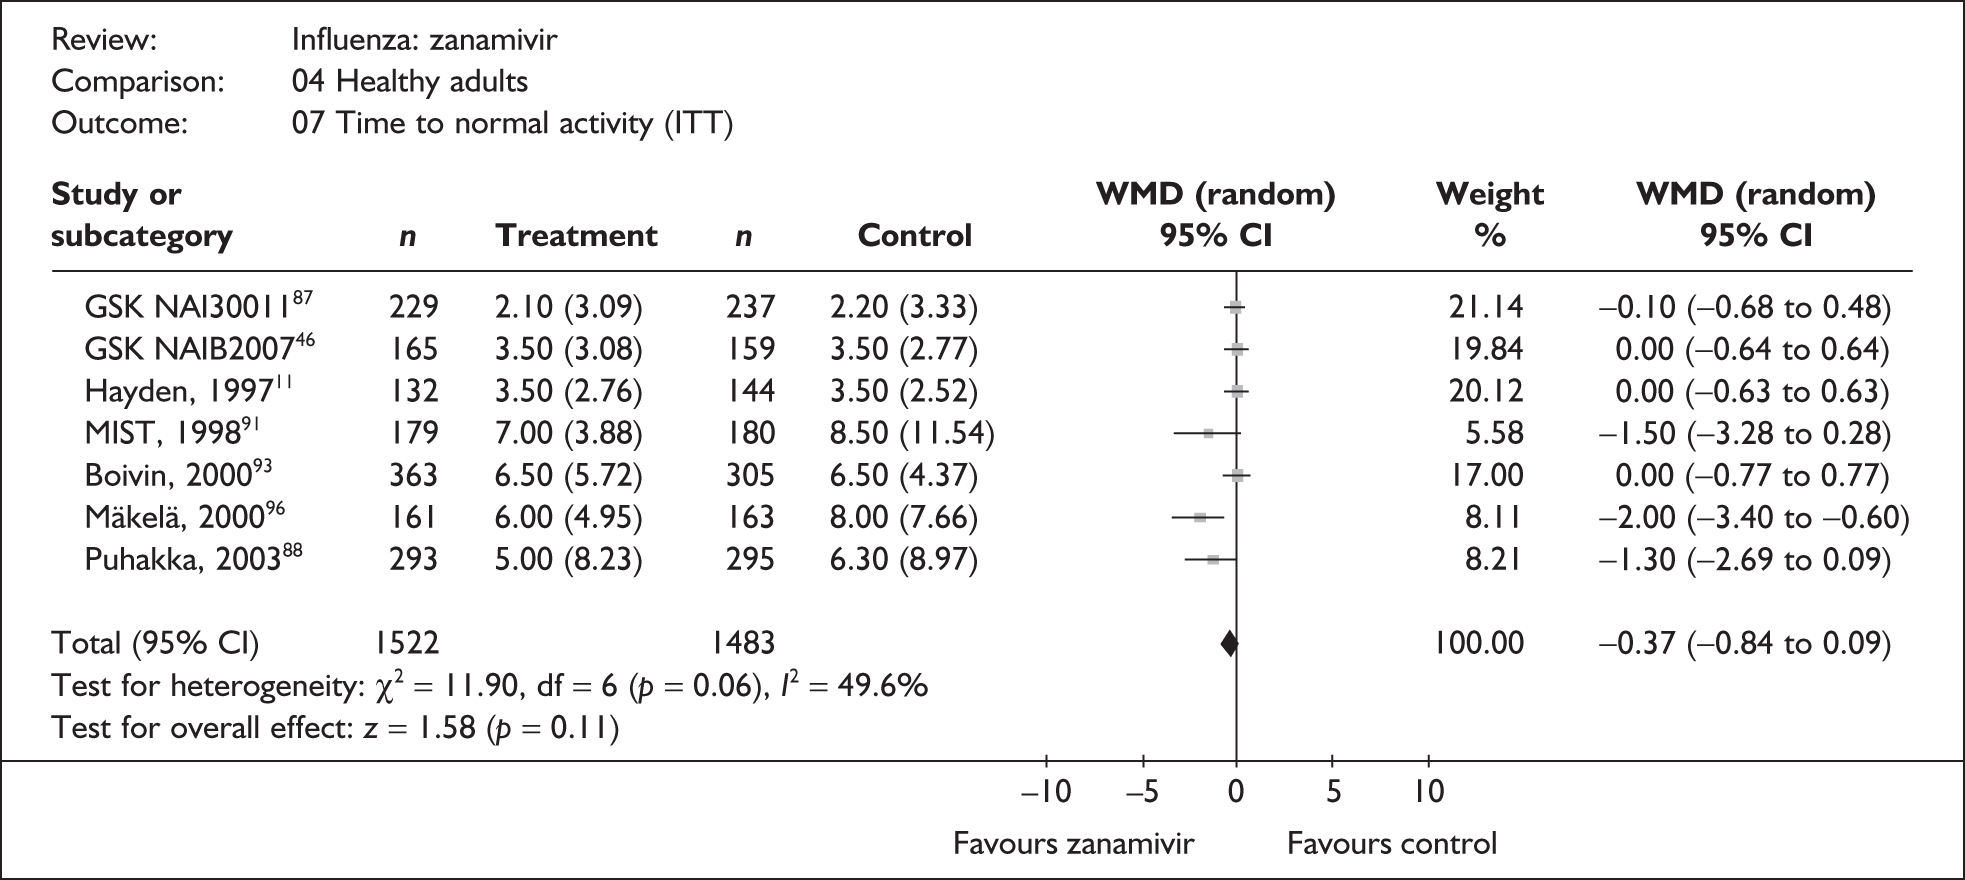
FIGURE 26.
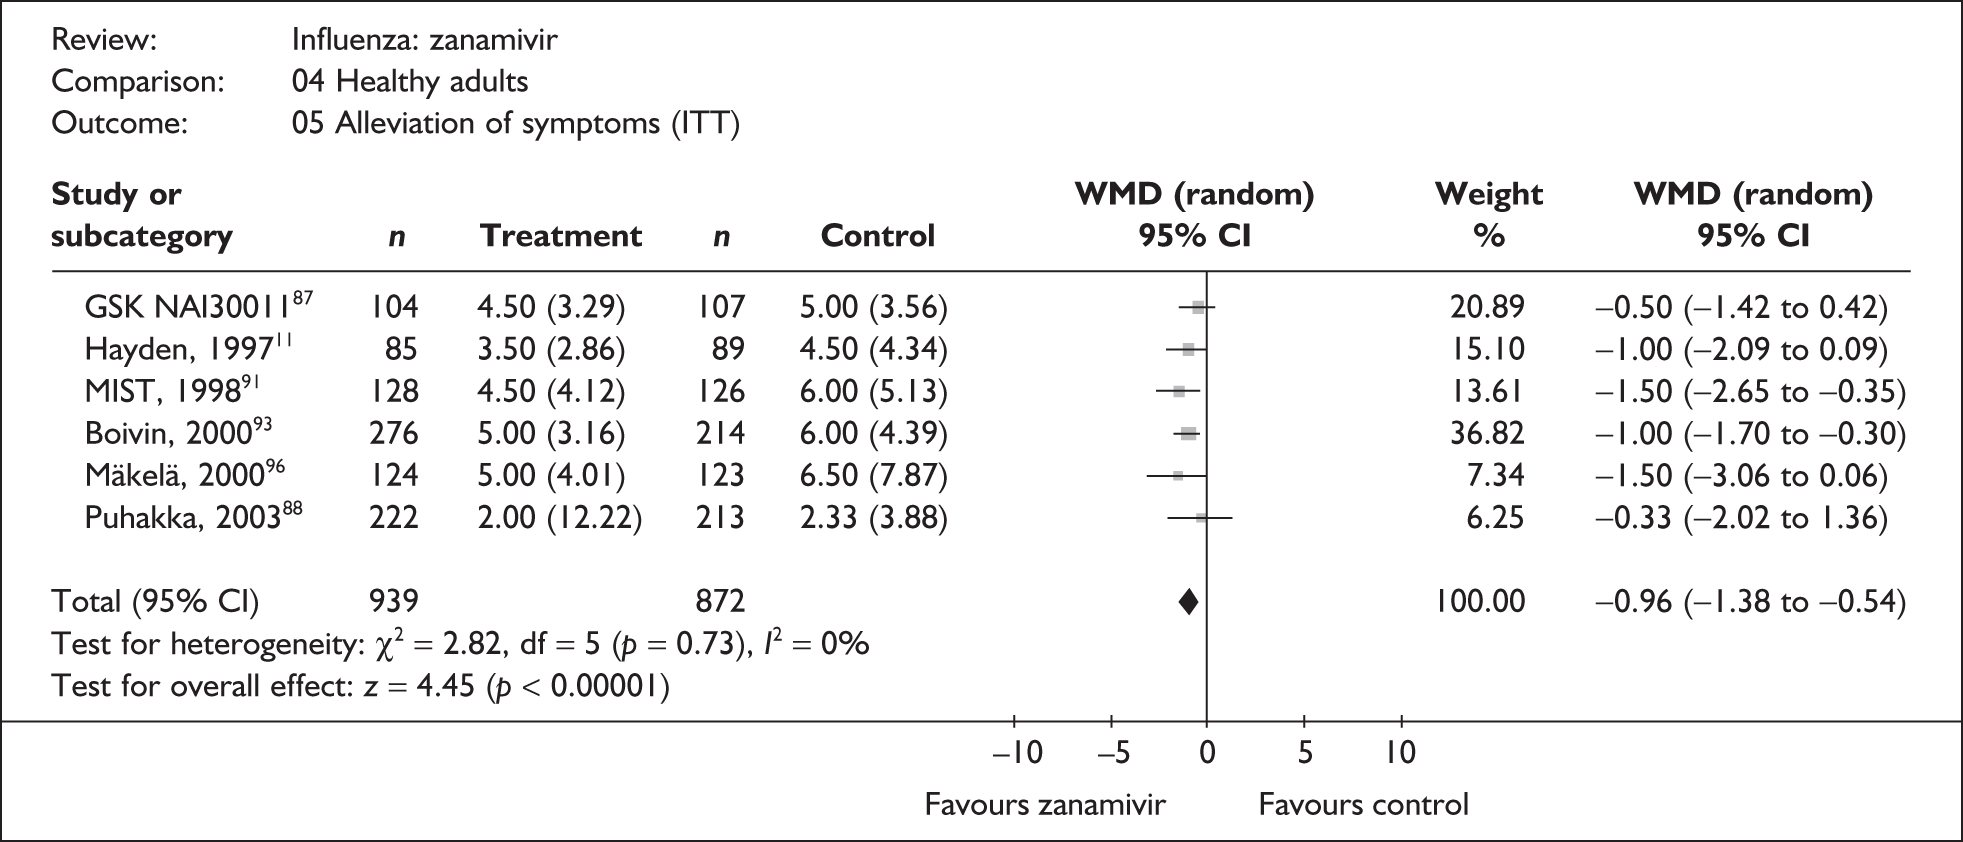
FIGURE 27.
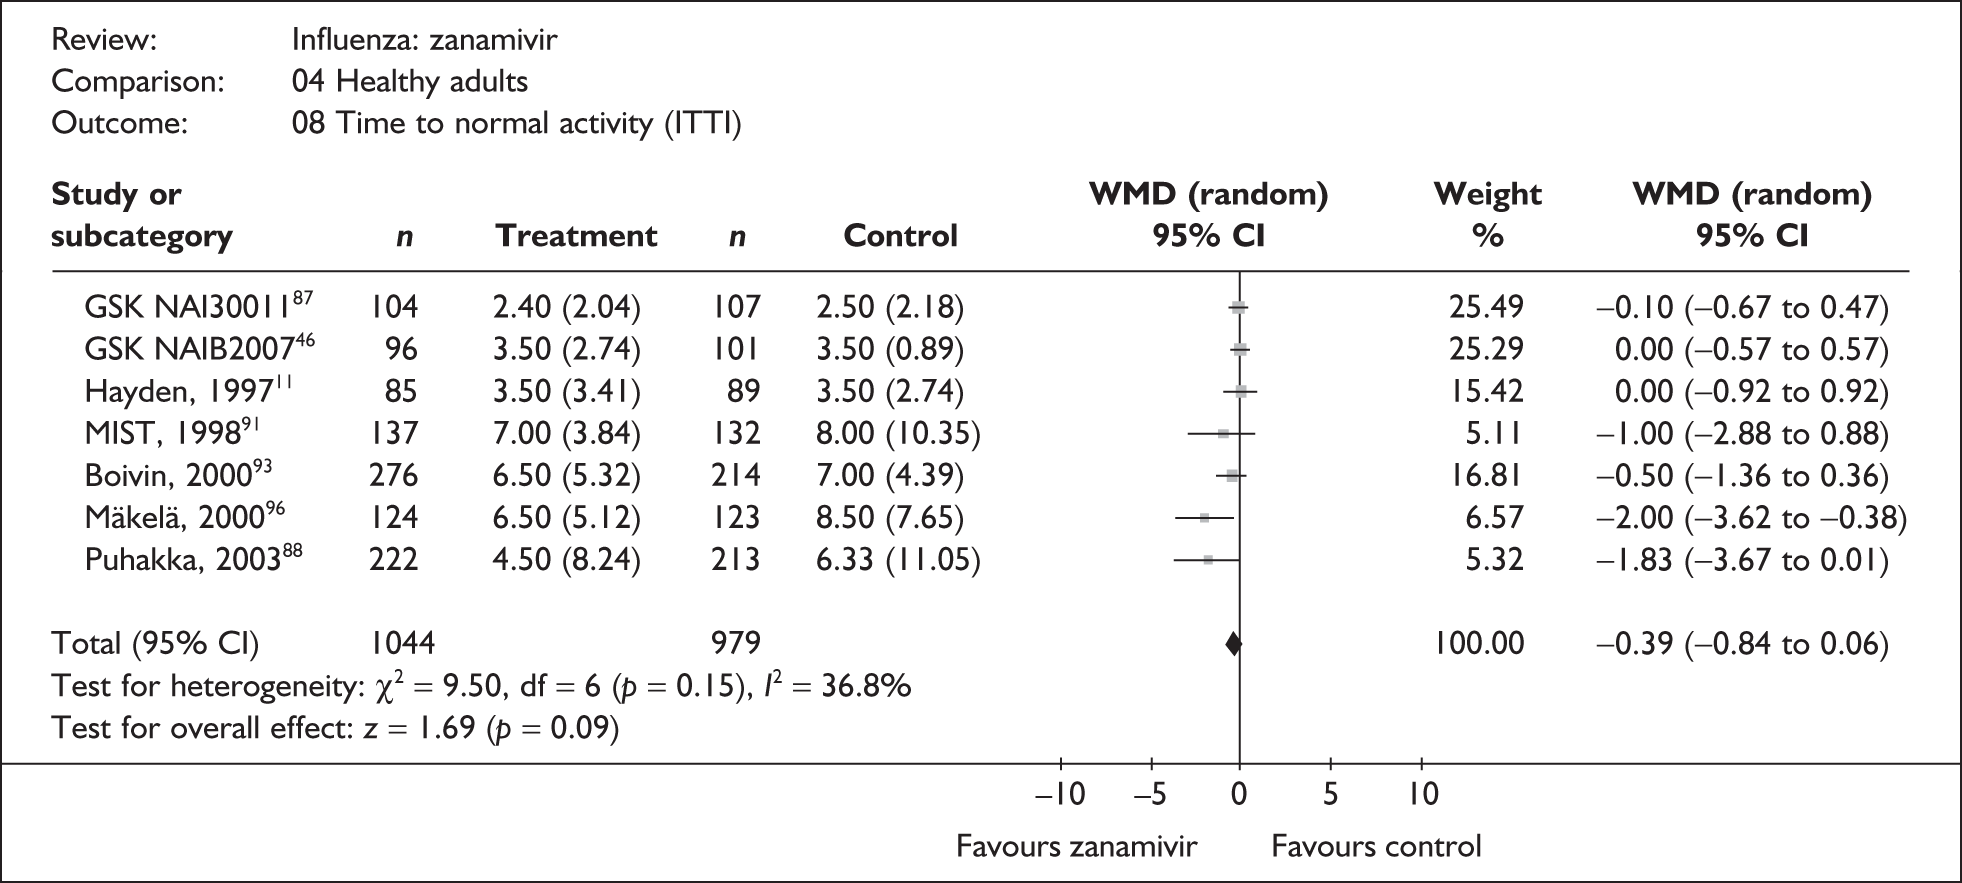
FIGURE 28.
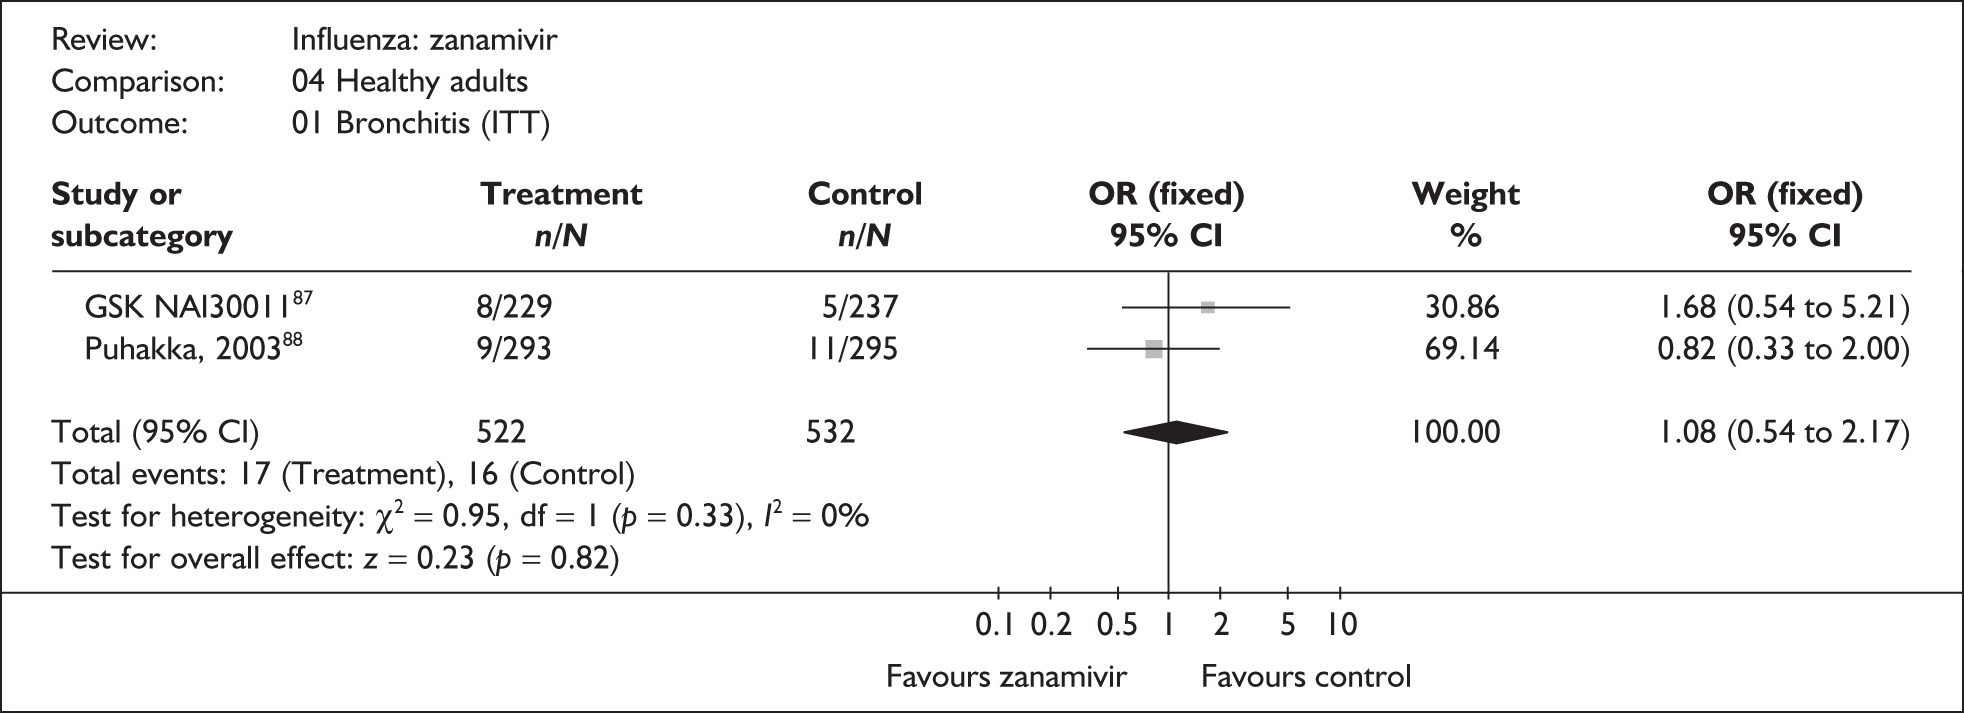
FIGURE 29.
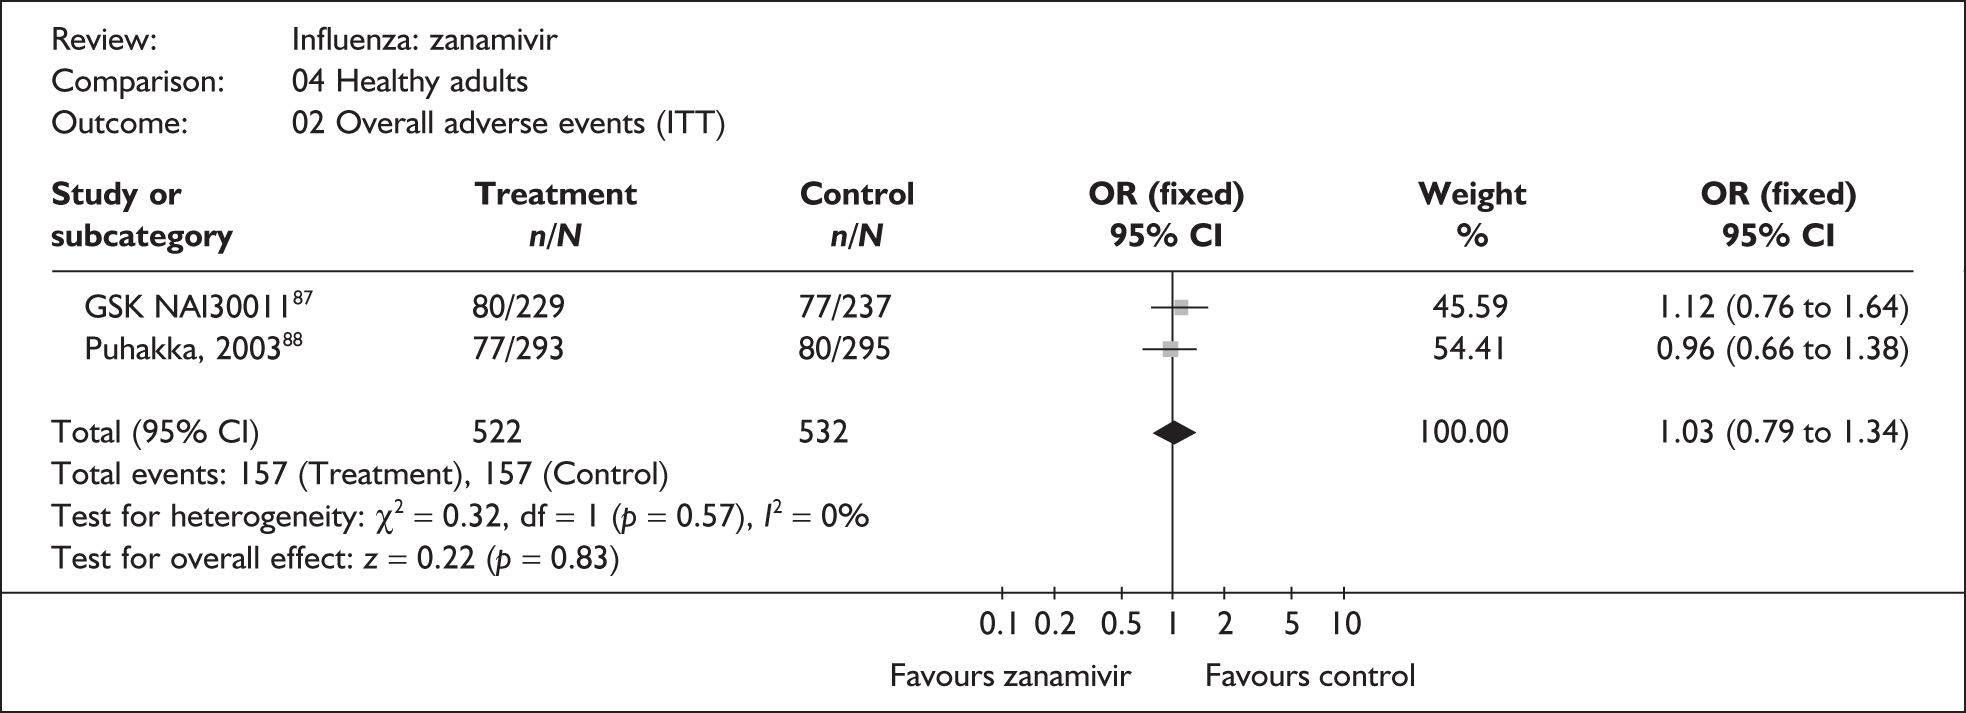
FIGURE 30.
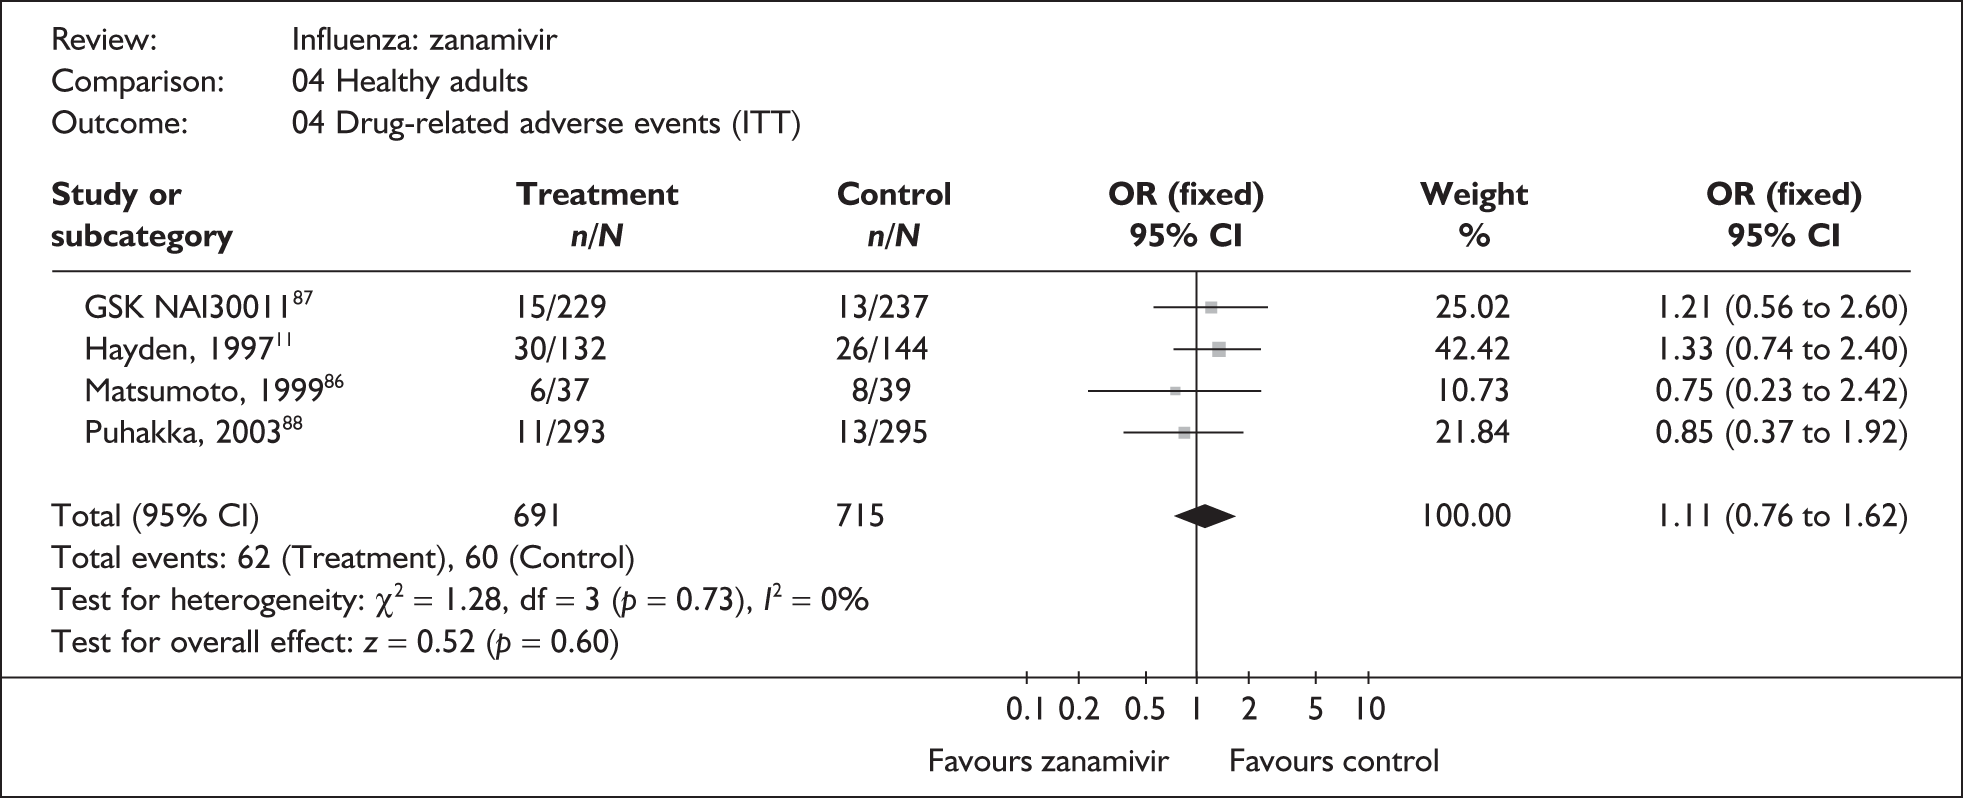
FIGURE 31.
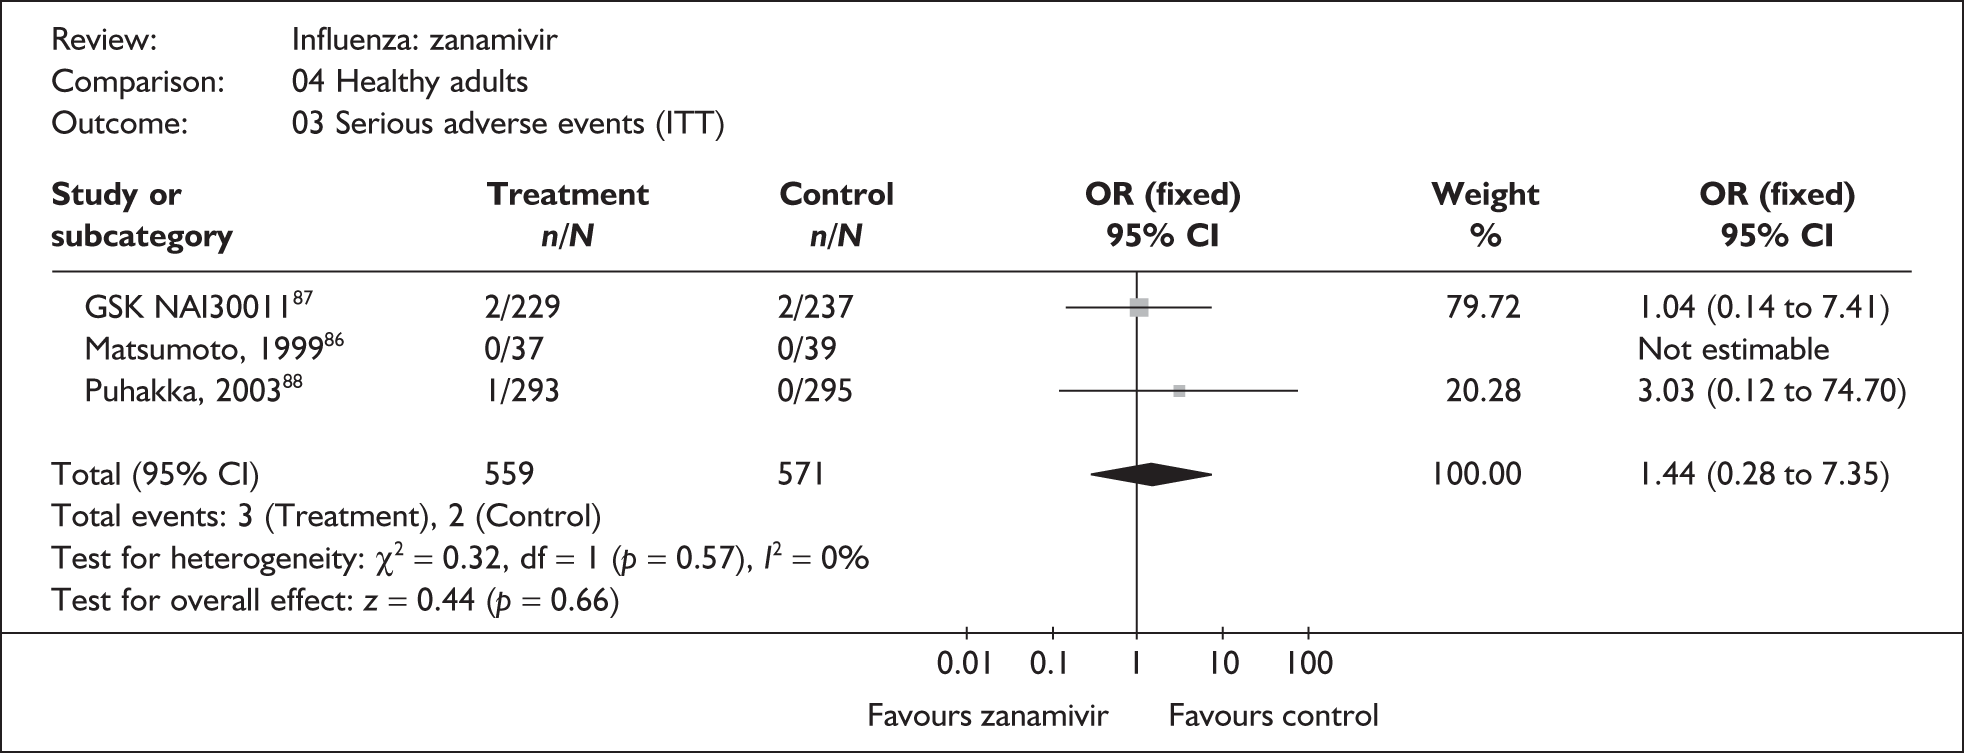
FIGURE 32.
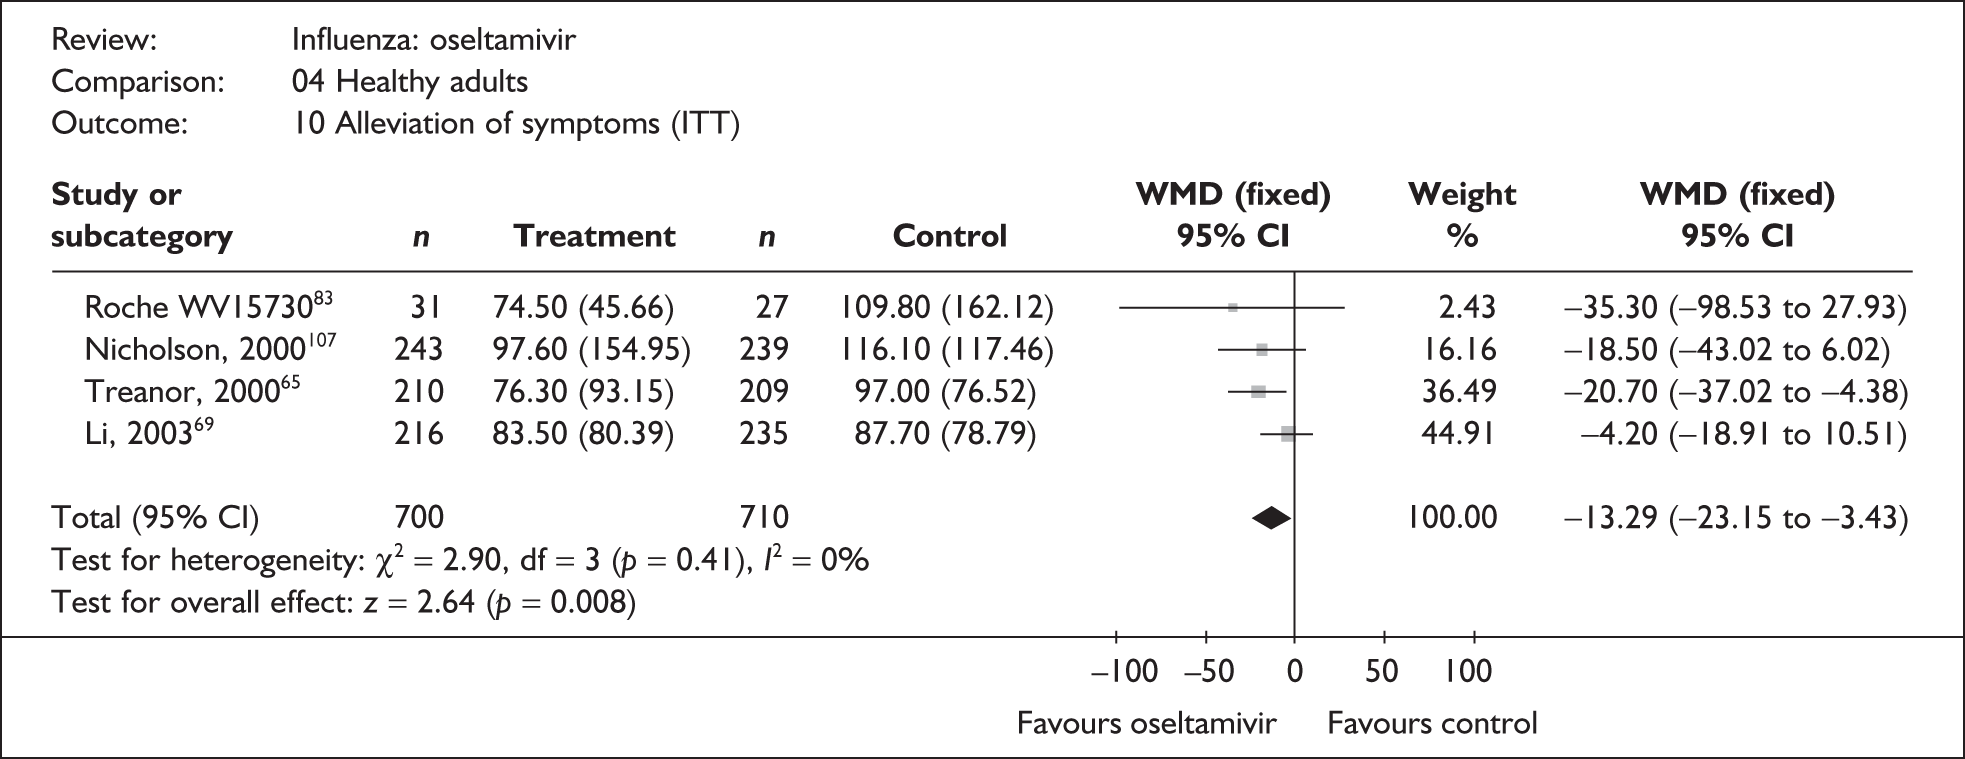
FIGURE 33.
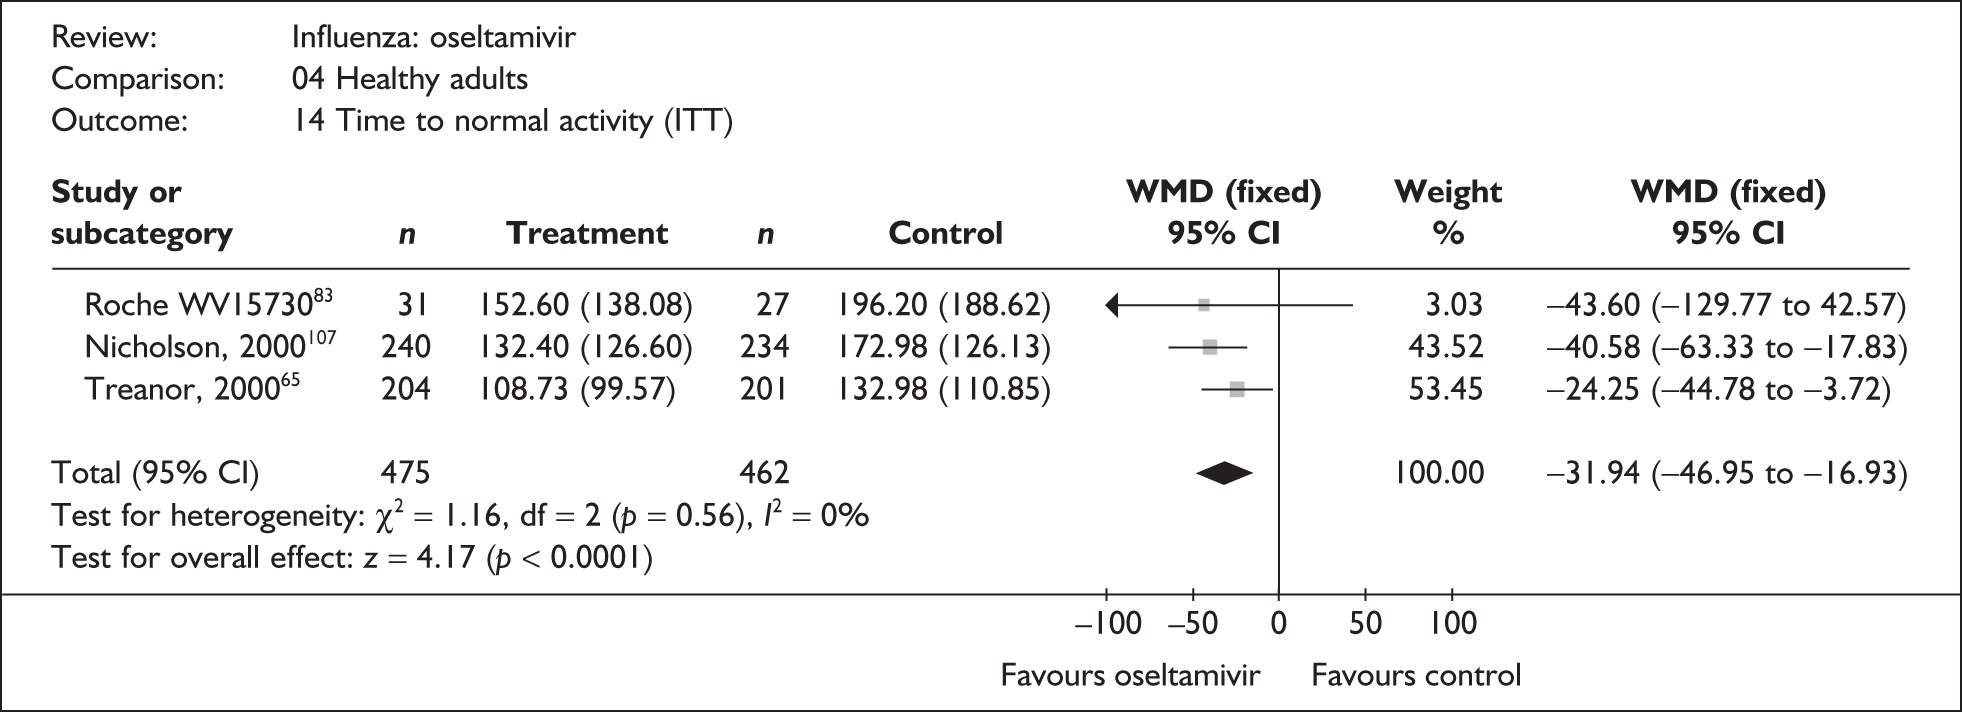
FIGURE 34.
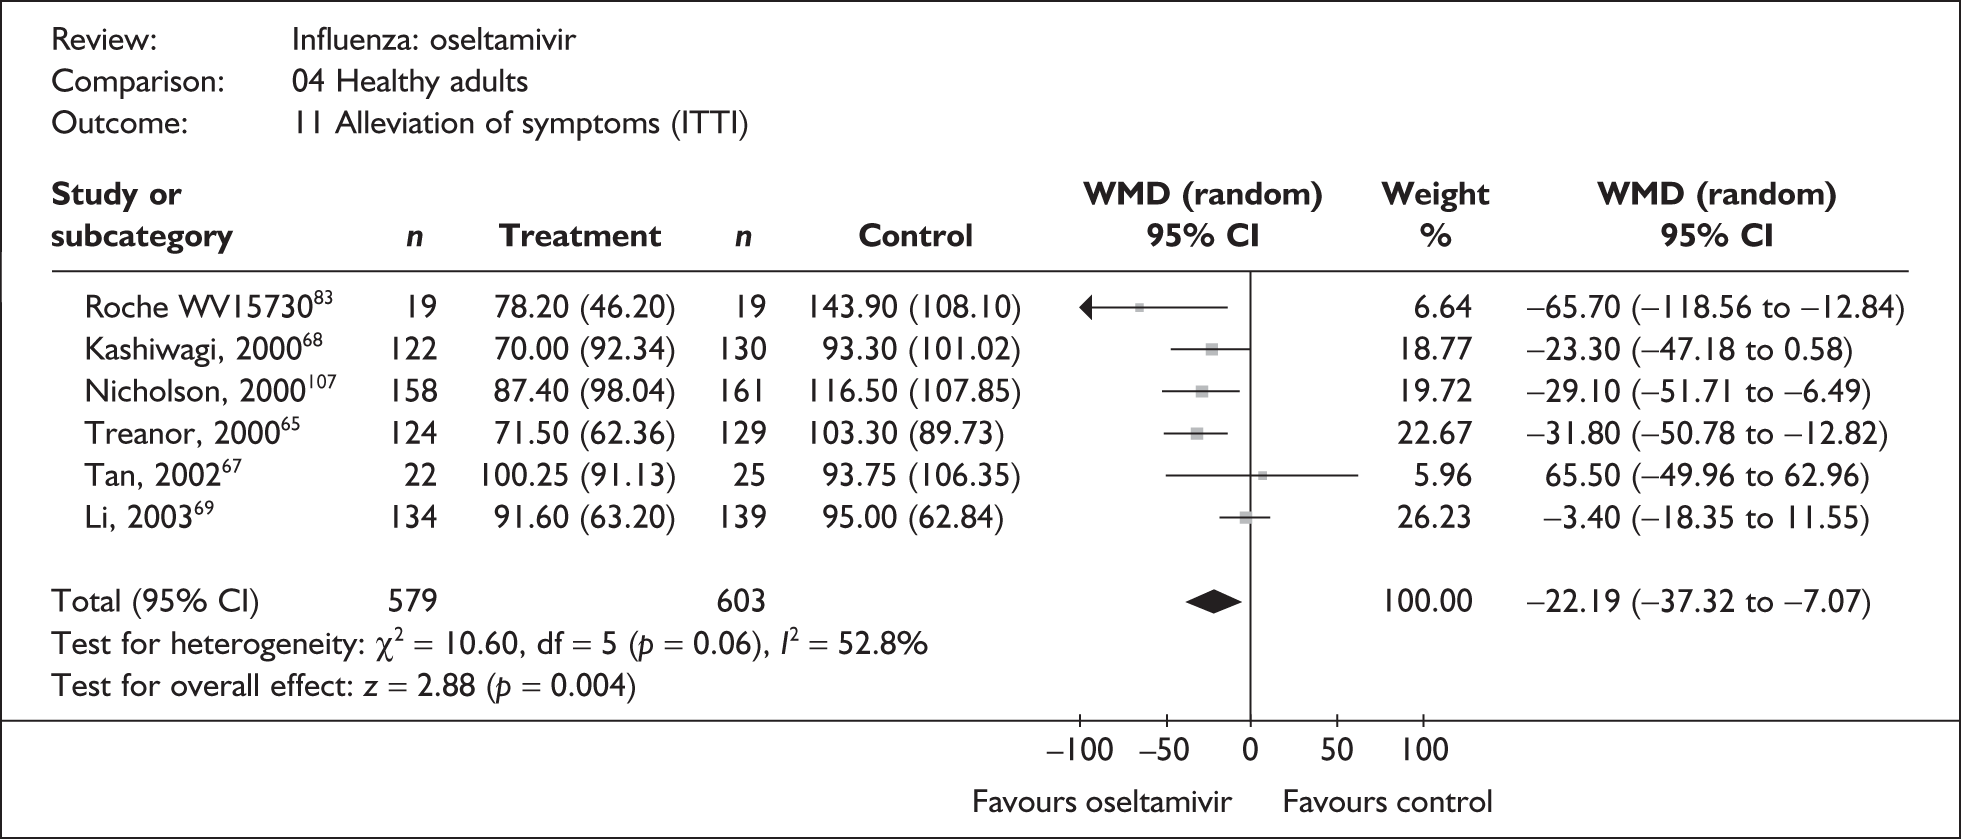
FIGURE 35.
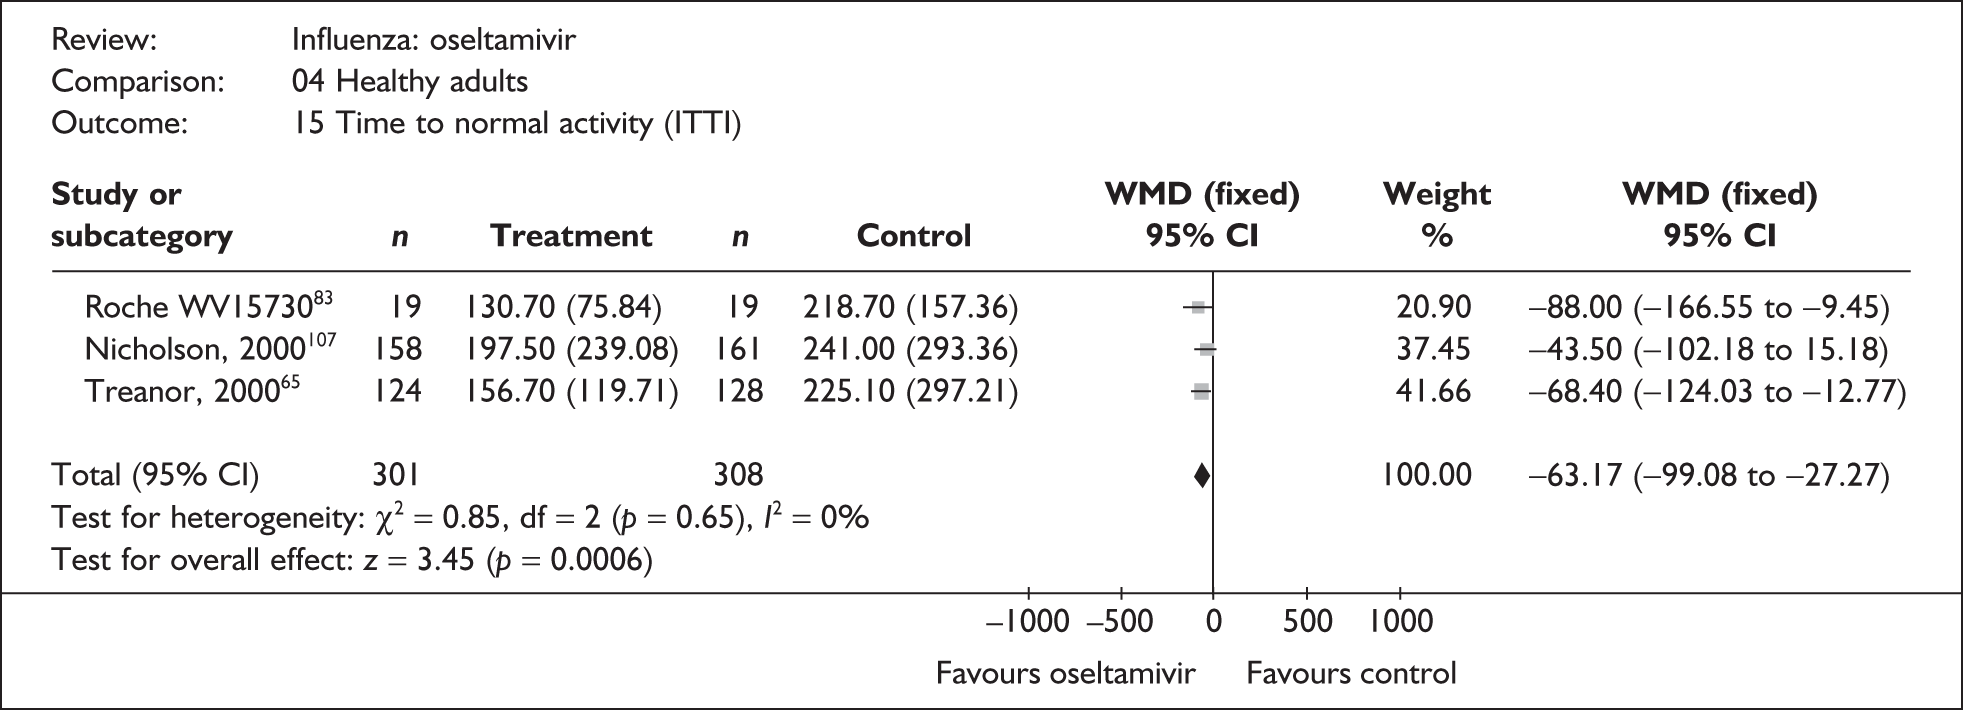
FIGURE 36.
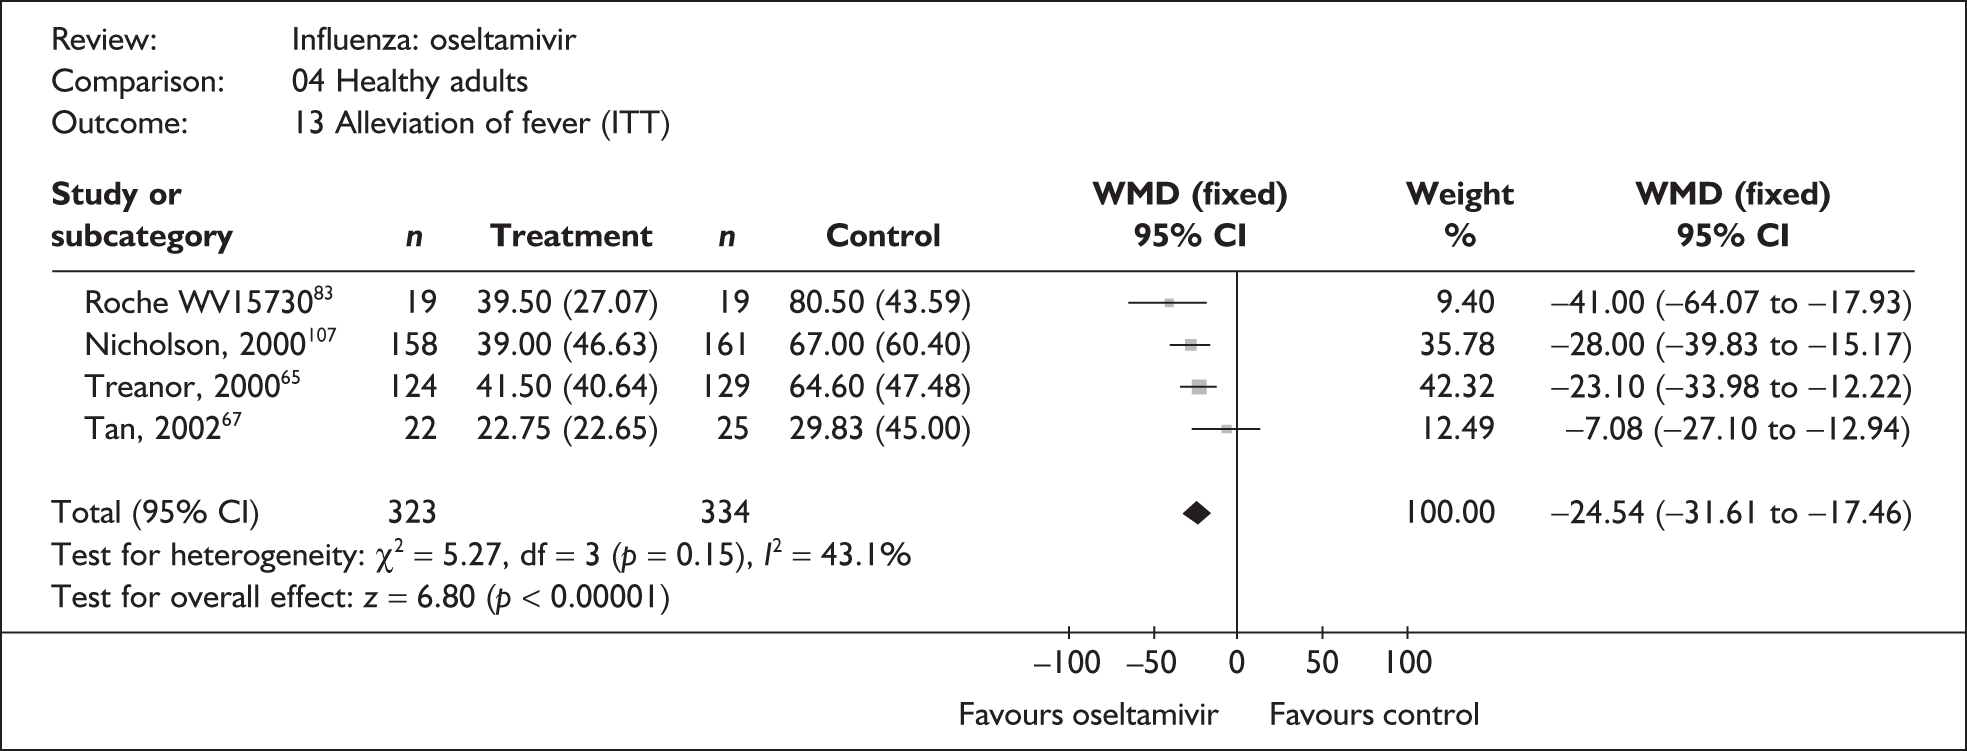
FIGURE 37.
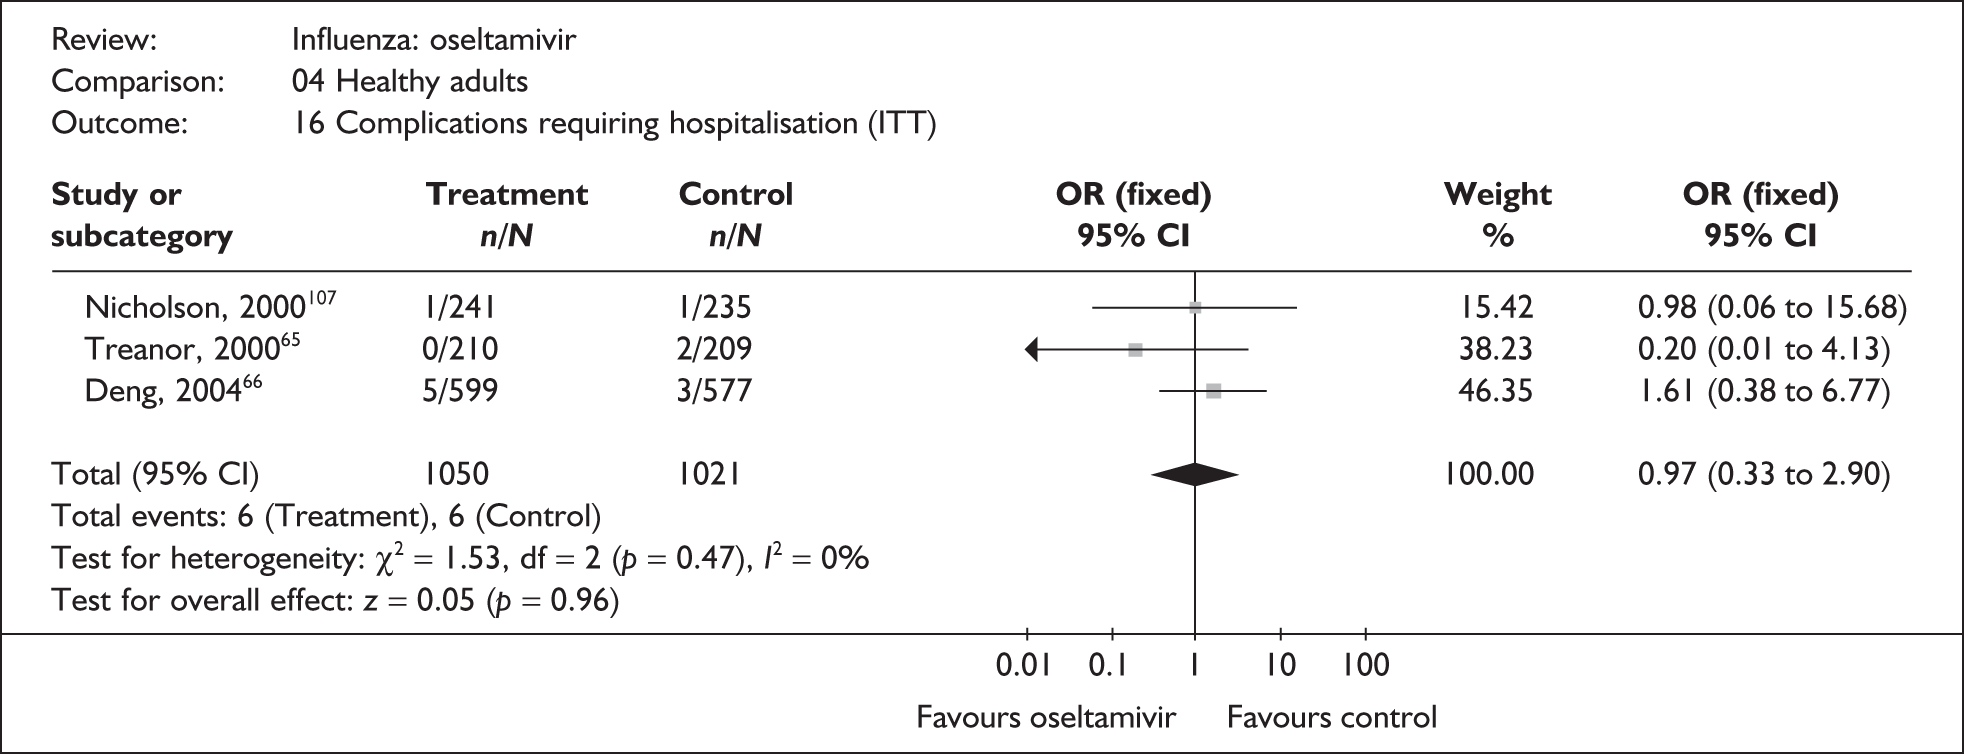
FIGURE 38.

FIGURE 39.
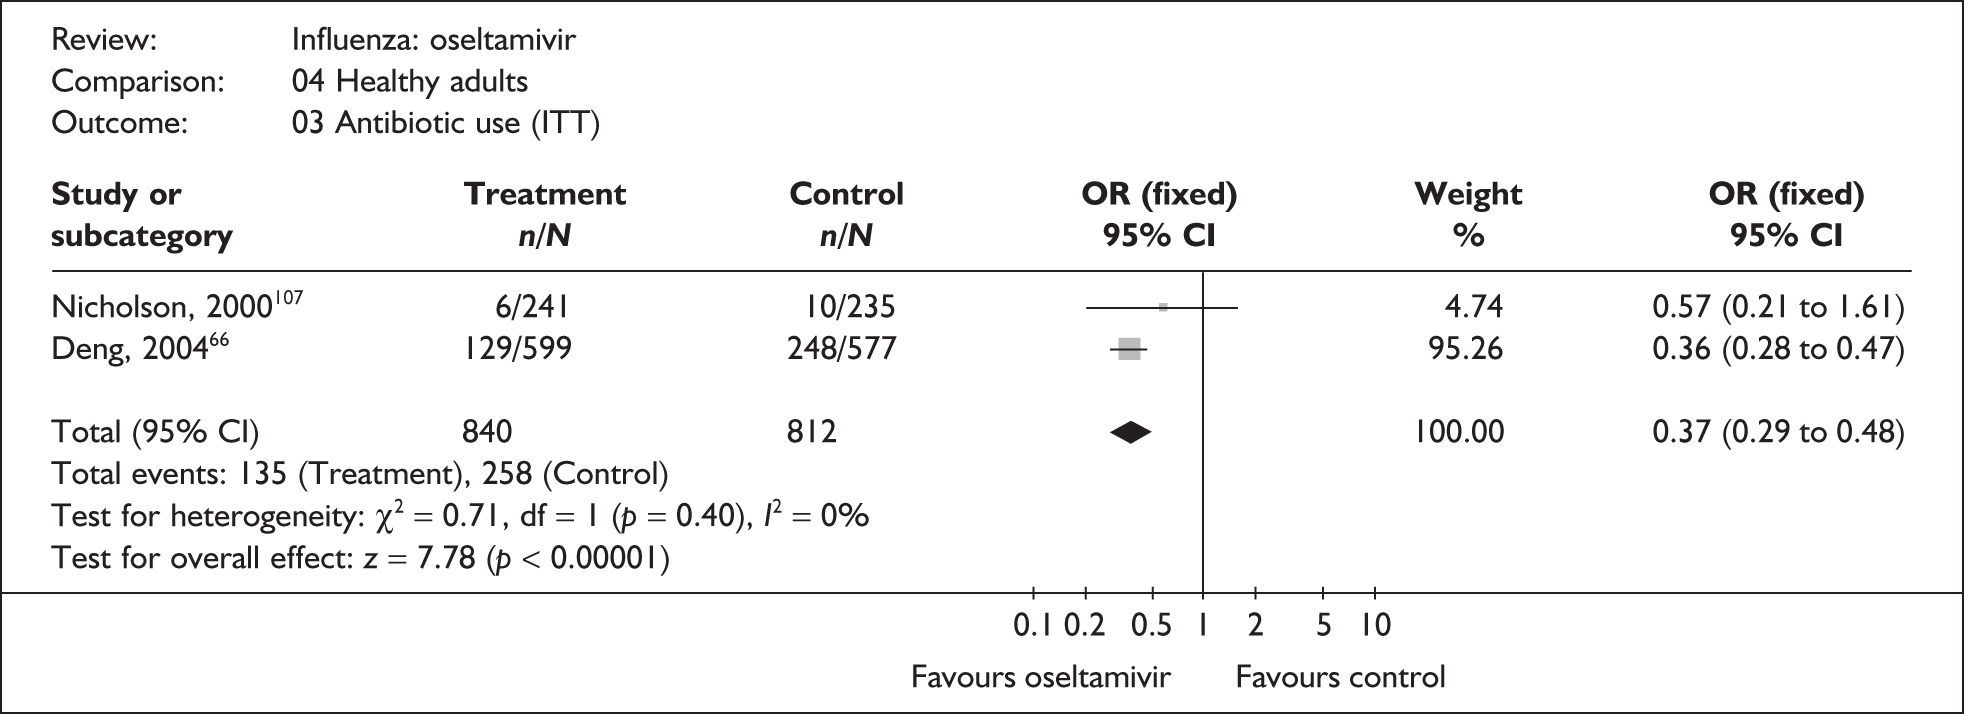
FIGURE 40.
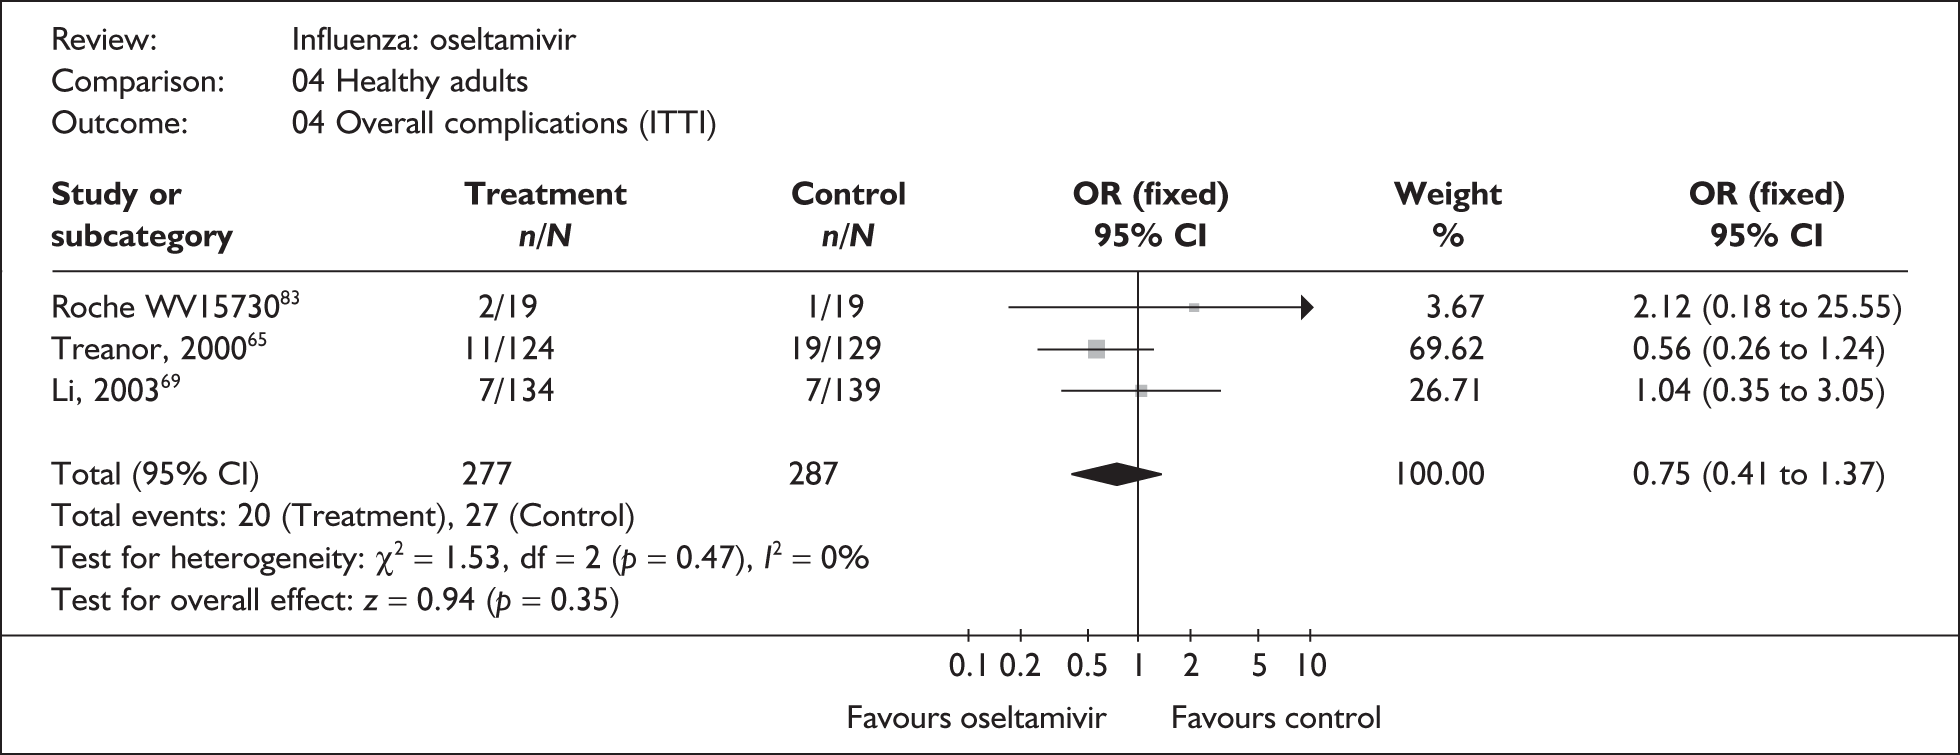
FIGURE 41.
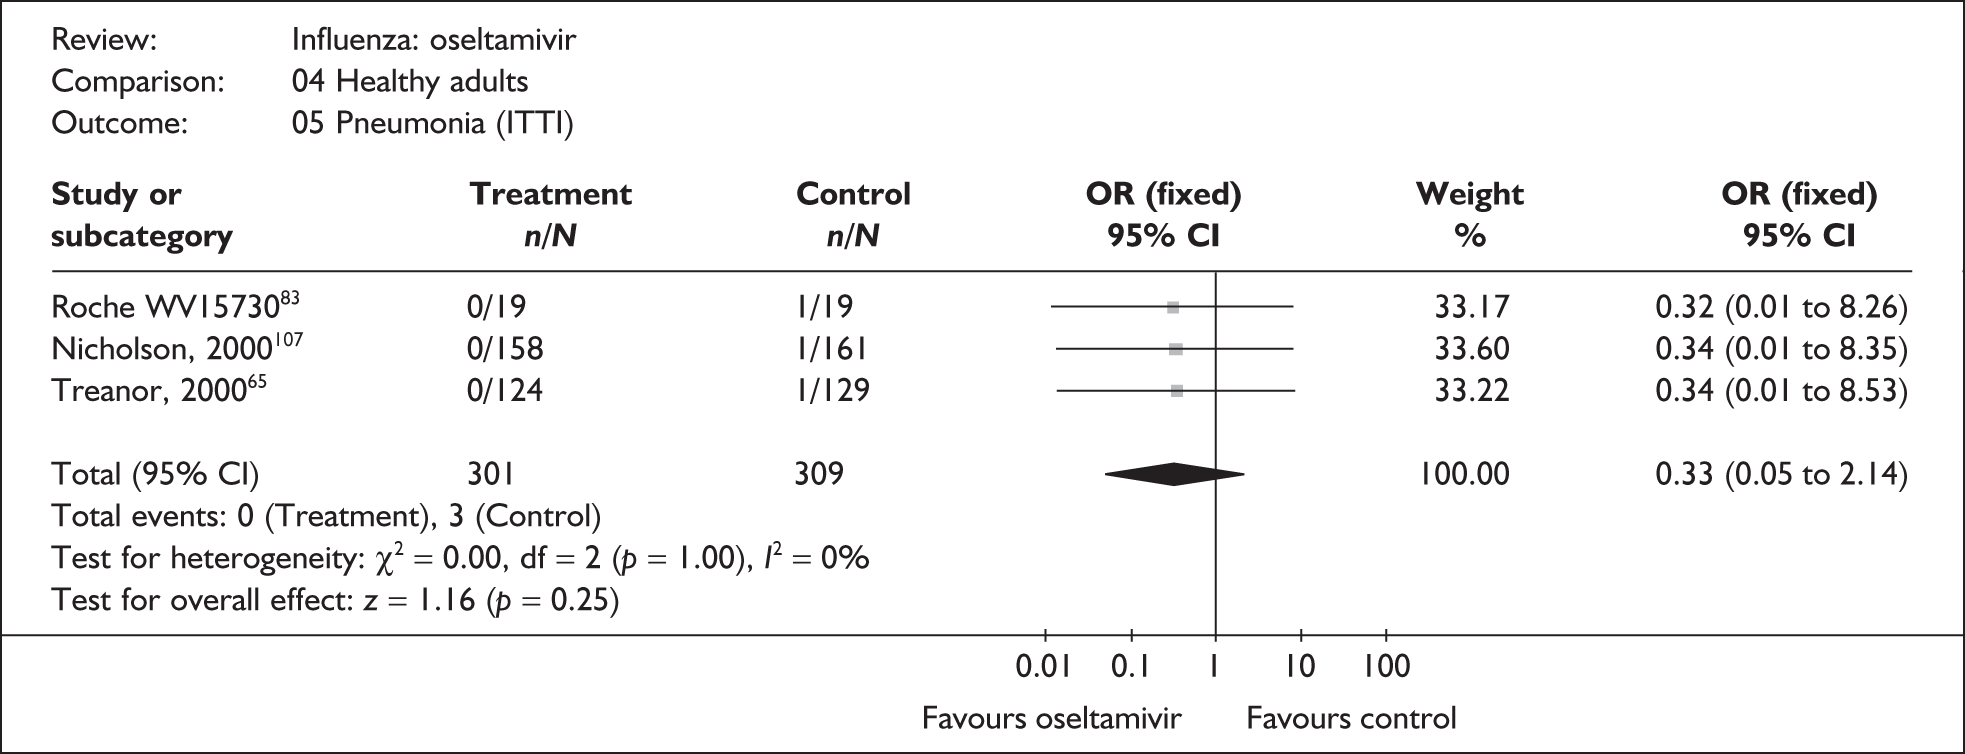
FIGURE 42.
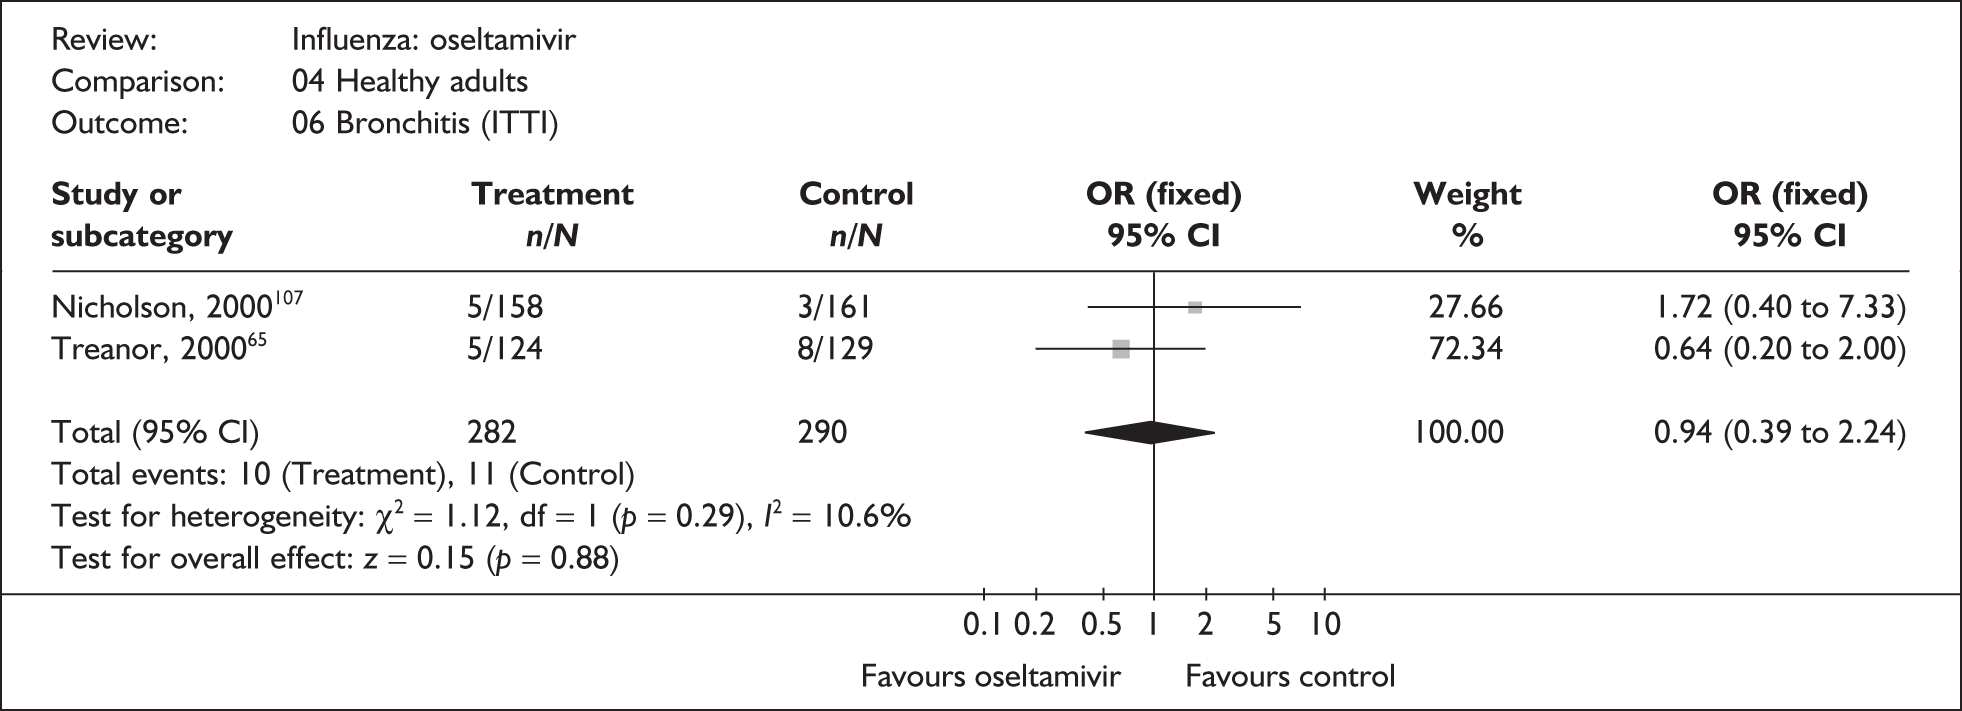
FIGURE 43.
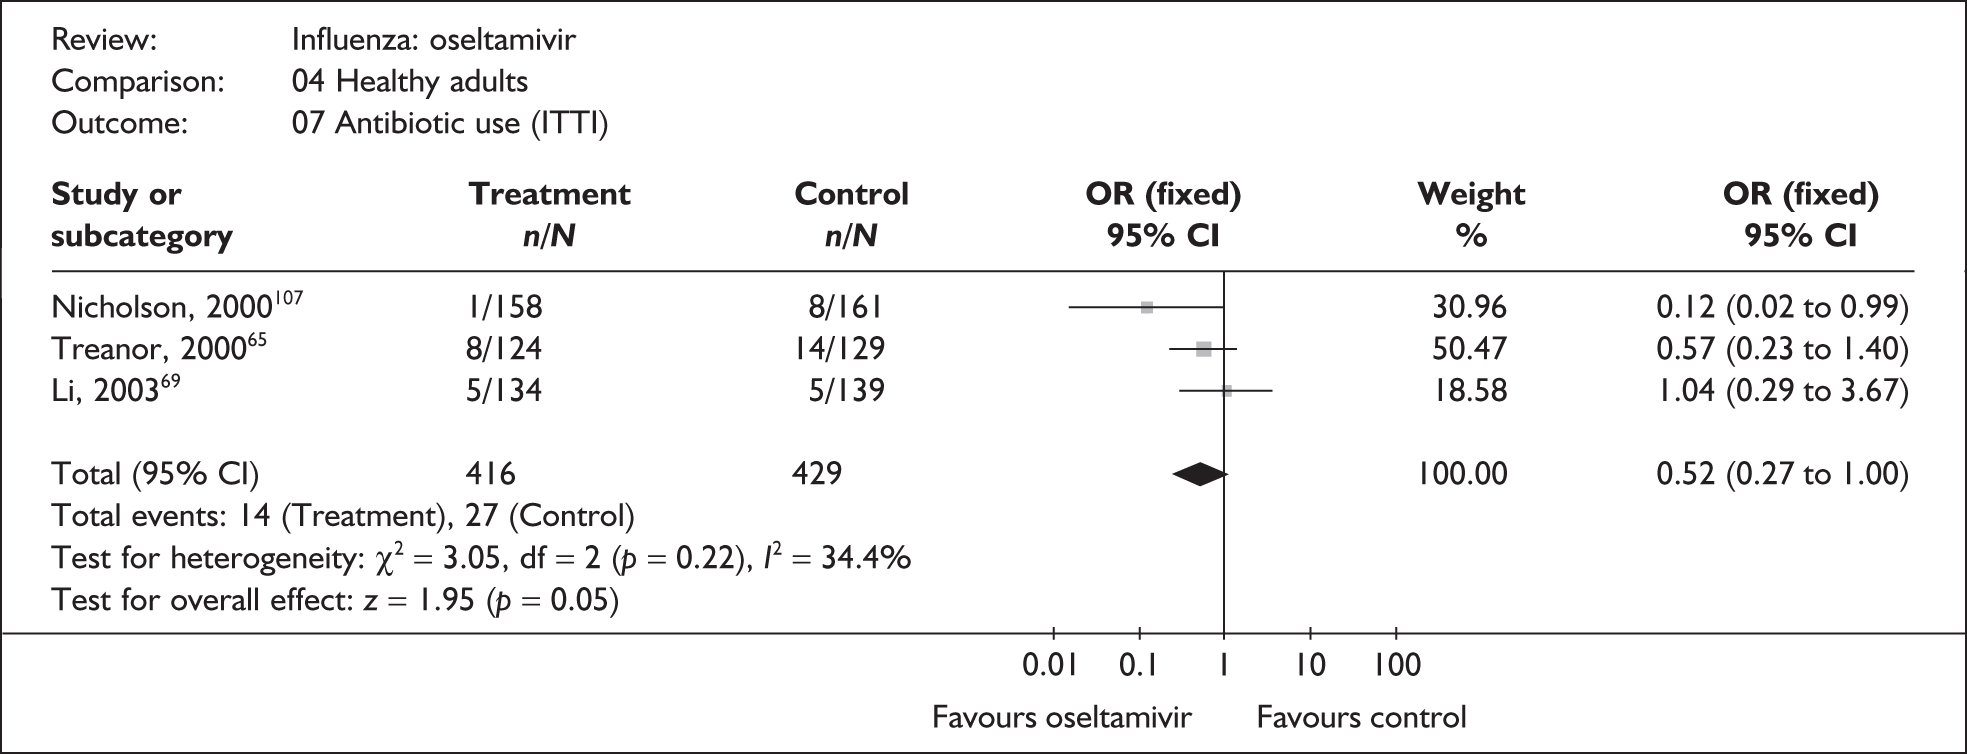
FIGURE 44.
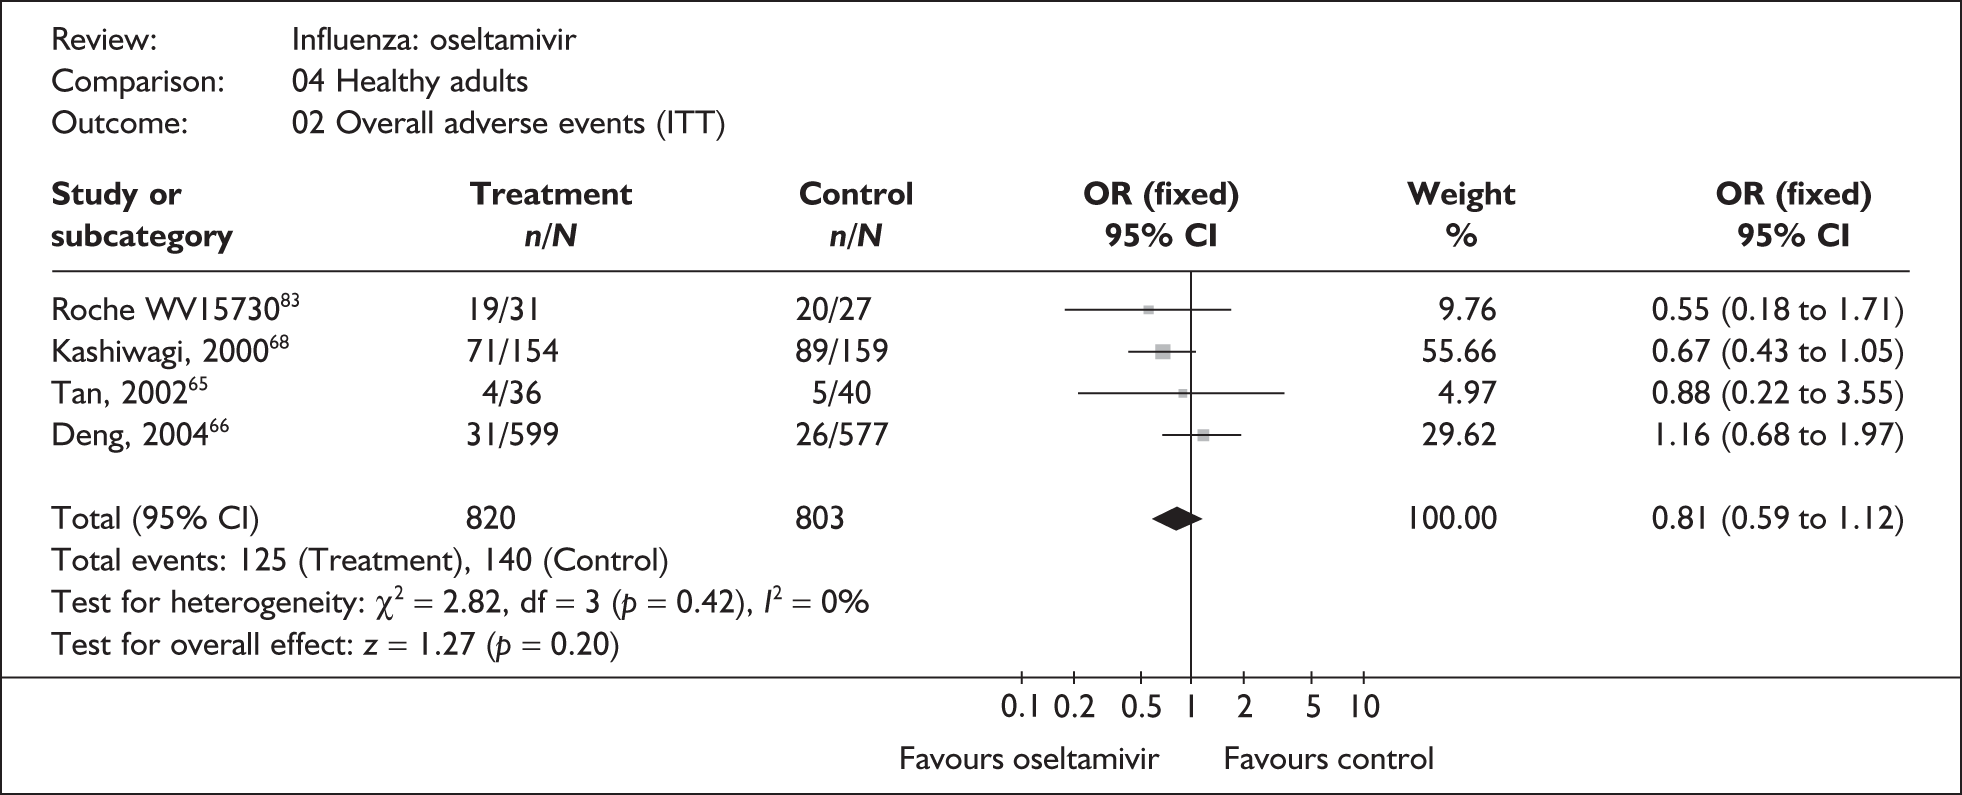
FIGURE 45.
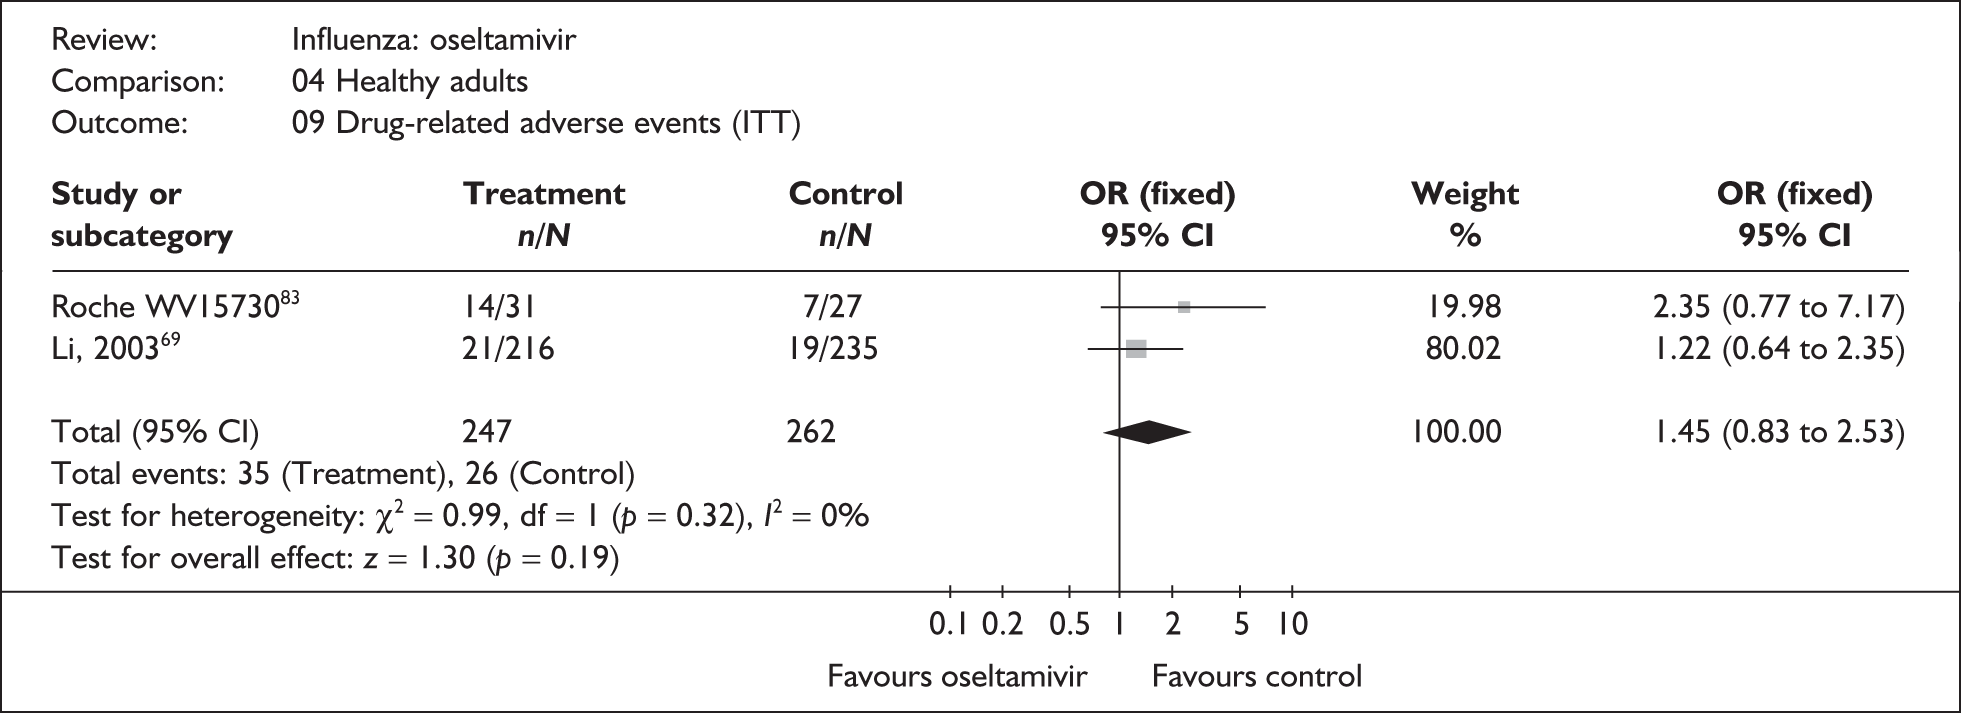
At risk
FIGURE 46.
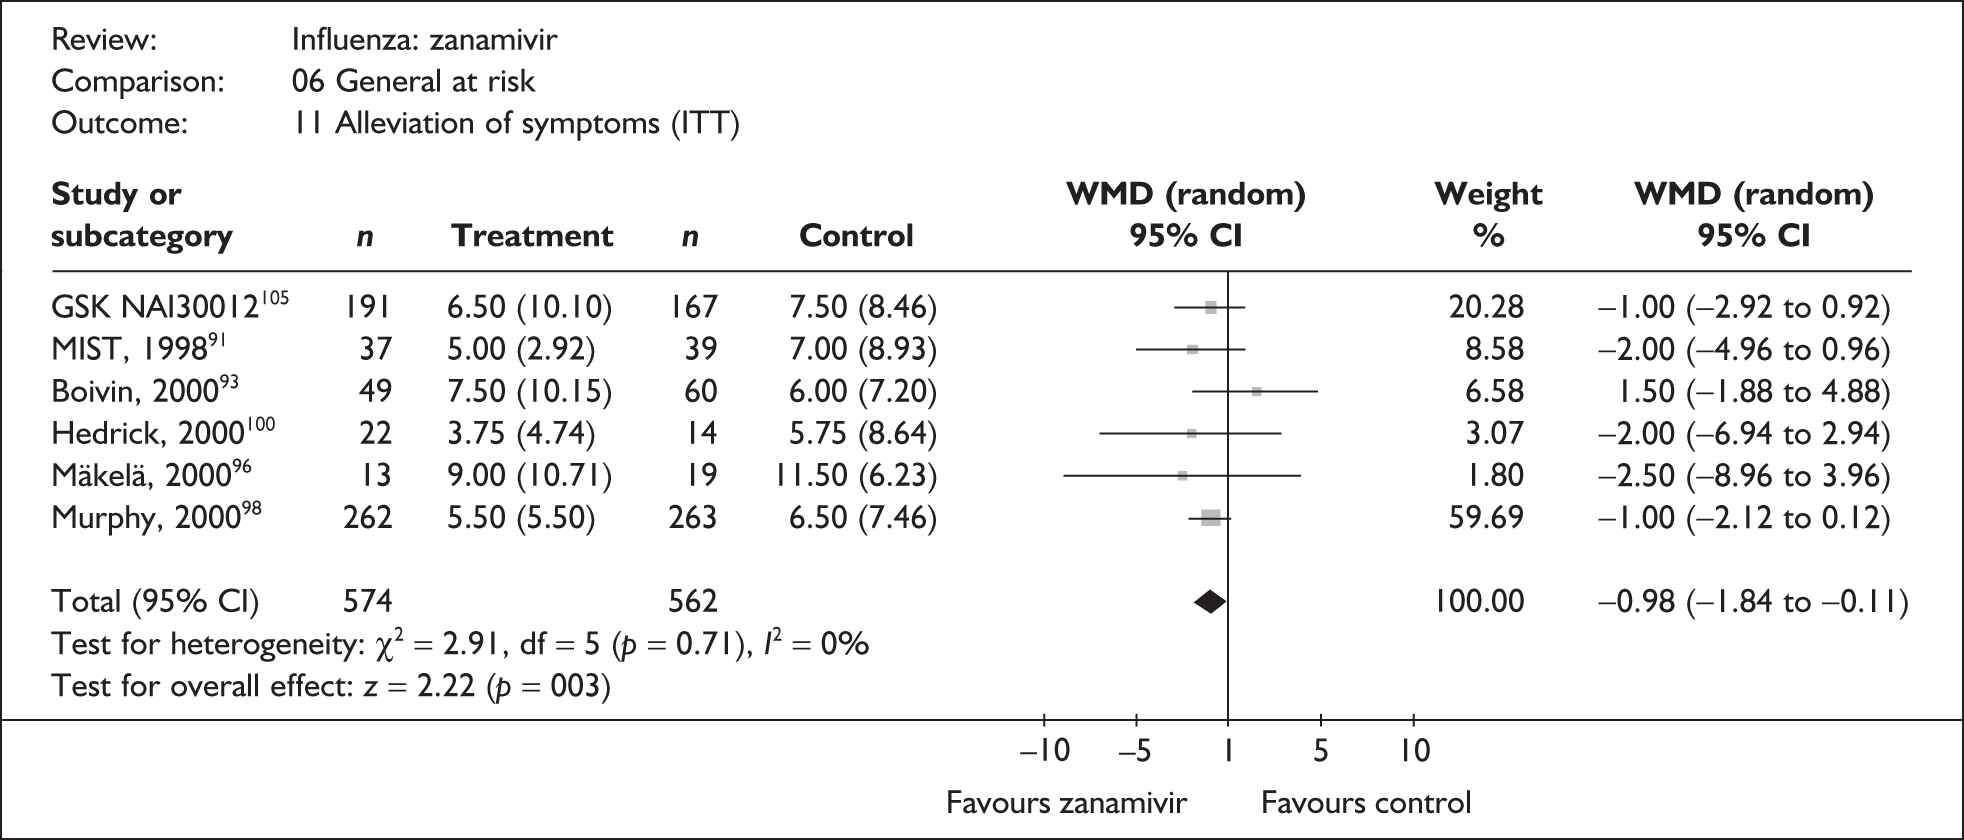
FIGURE 47.
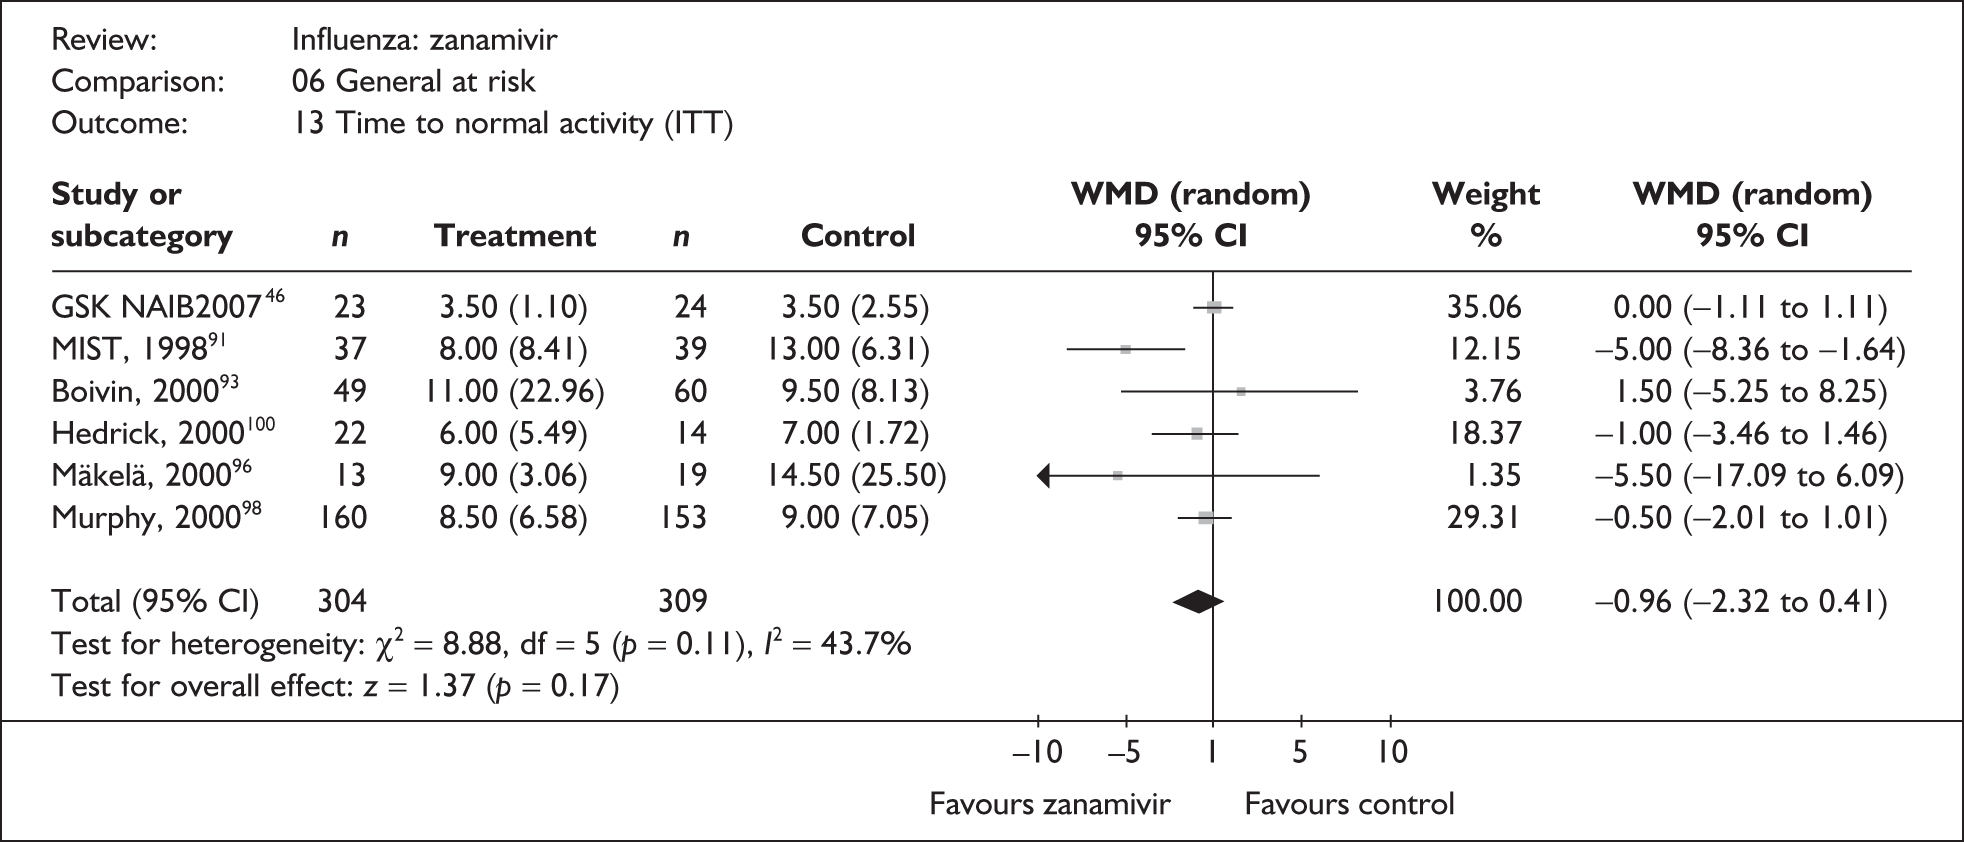
FIGURE 48.
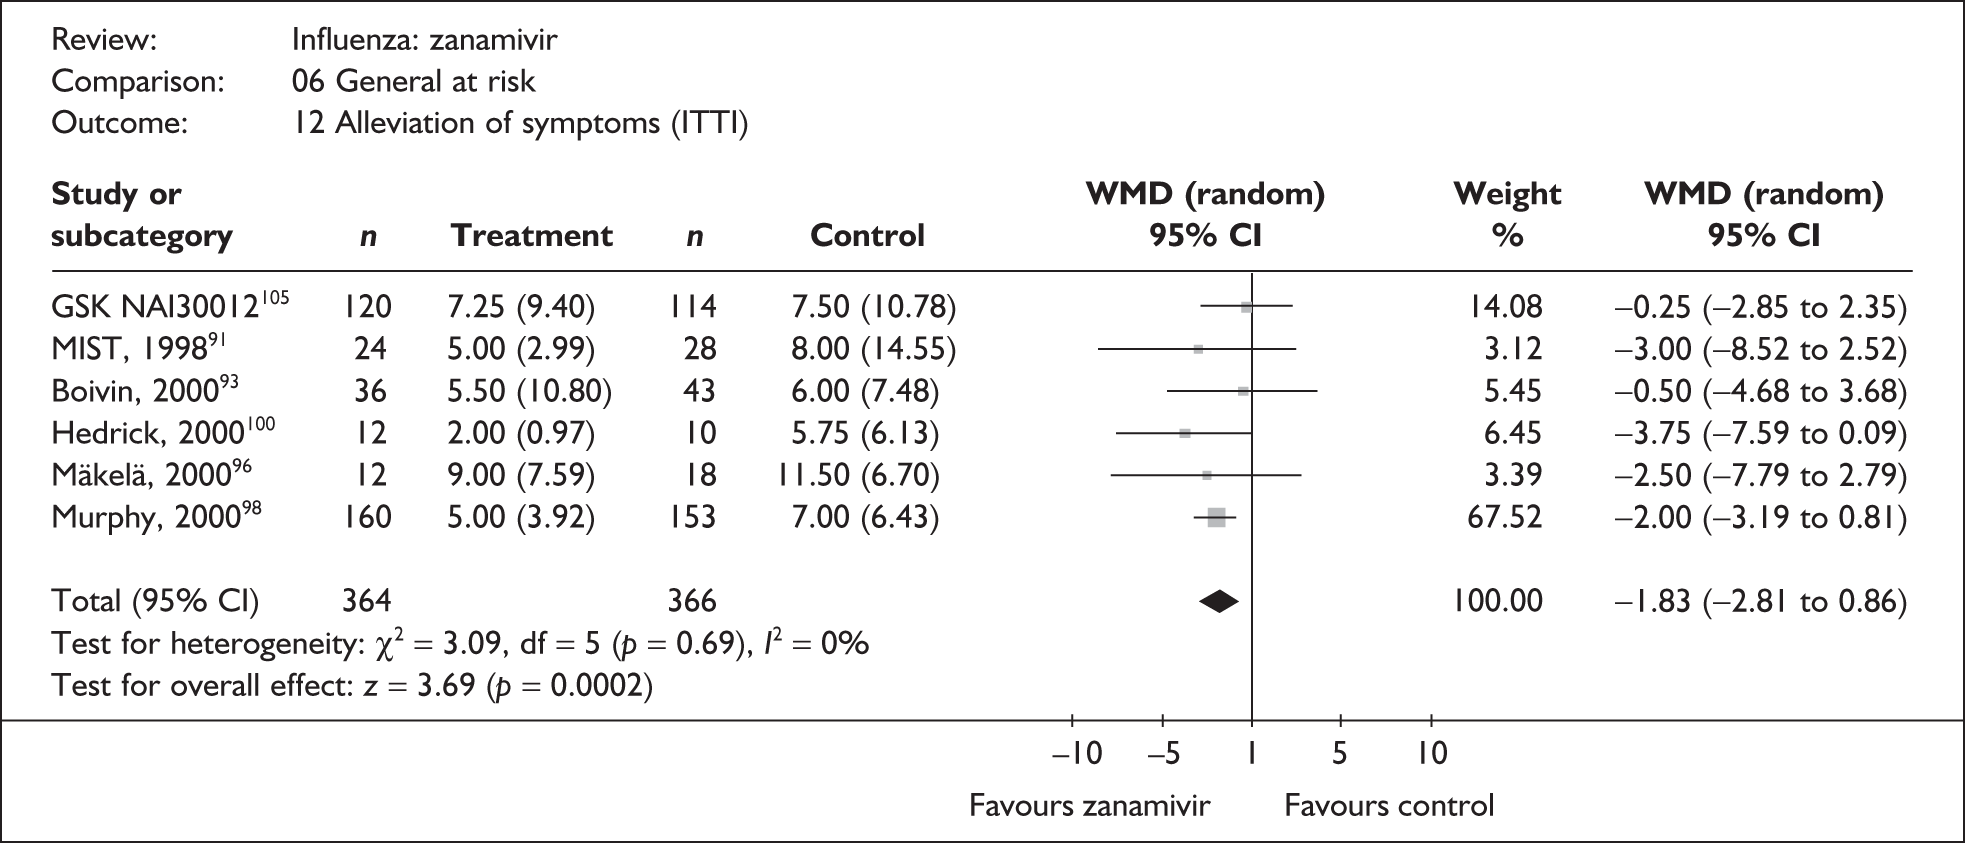
FIGURE 49.
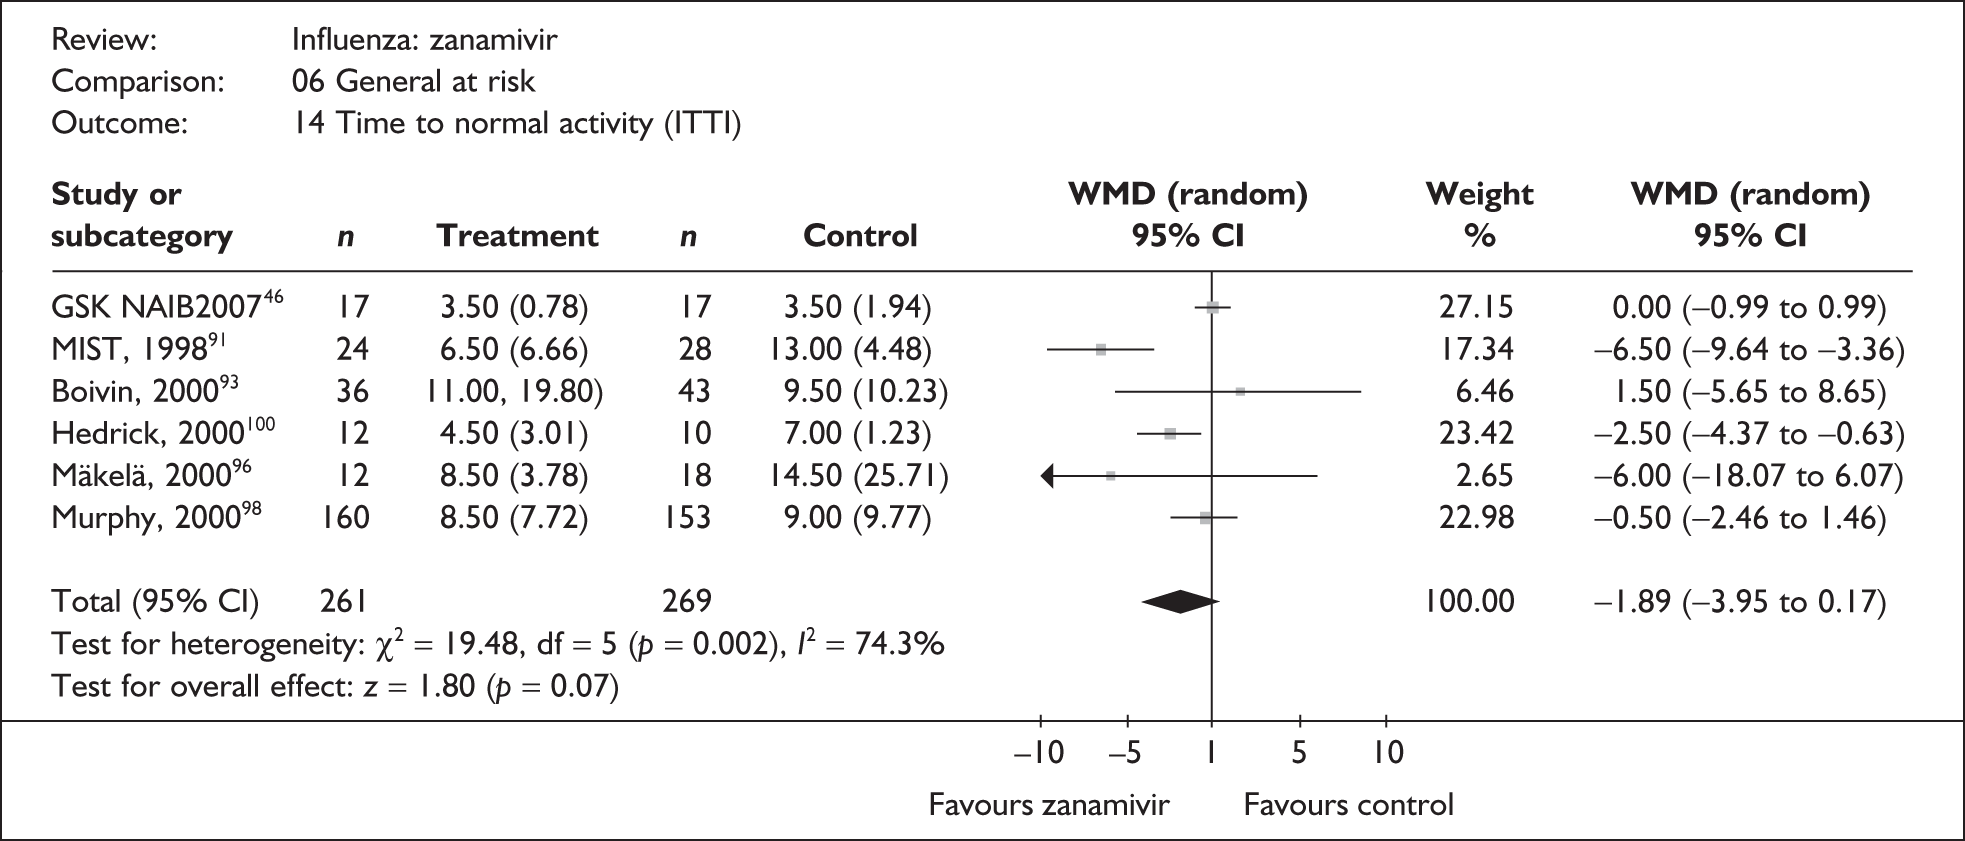
FIGURE 50.
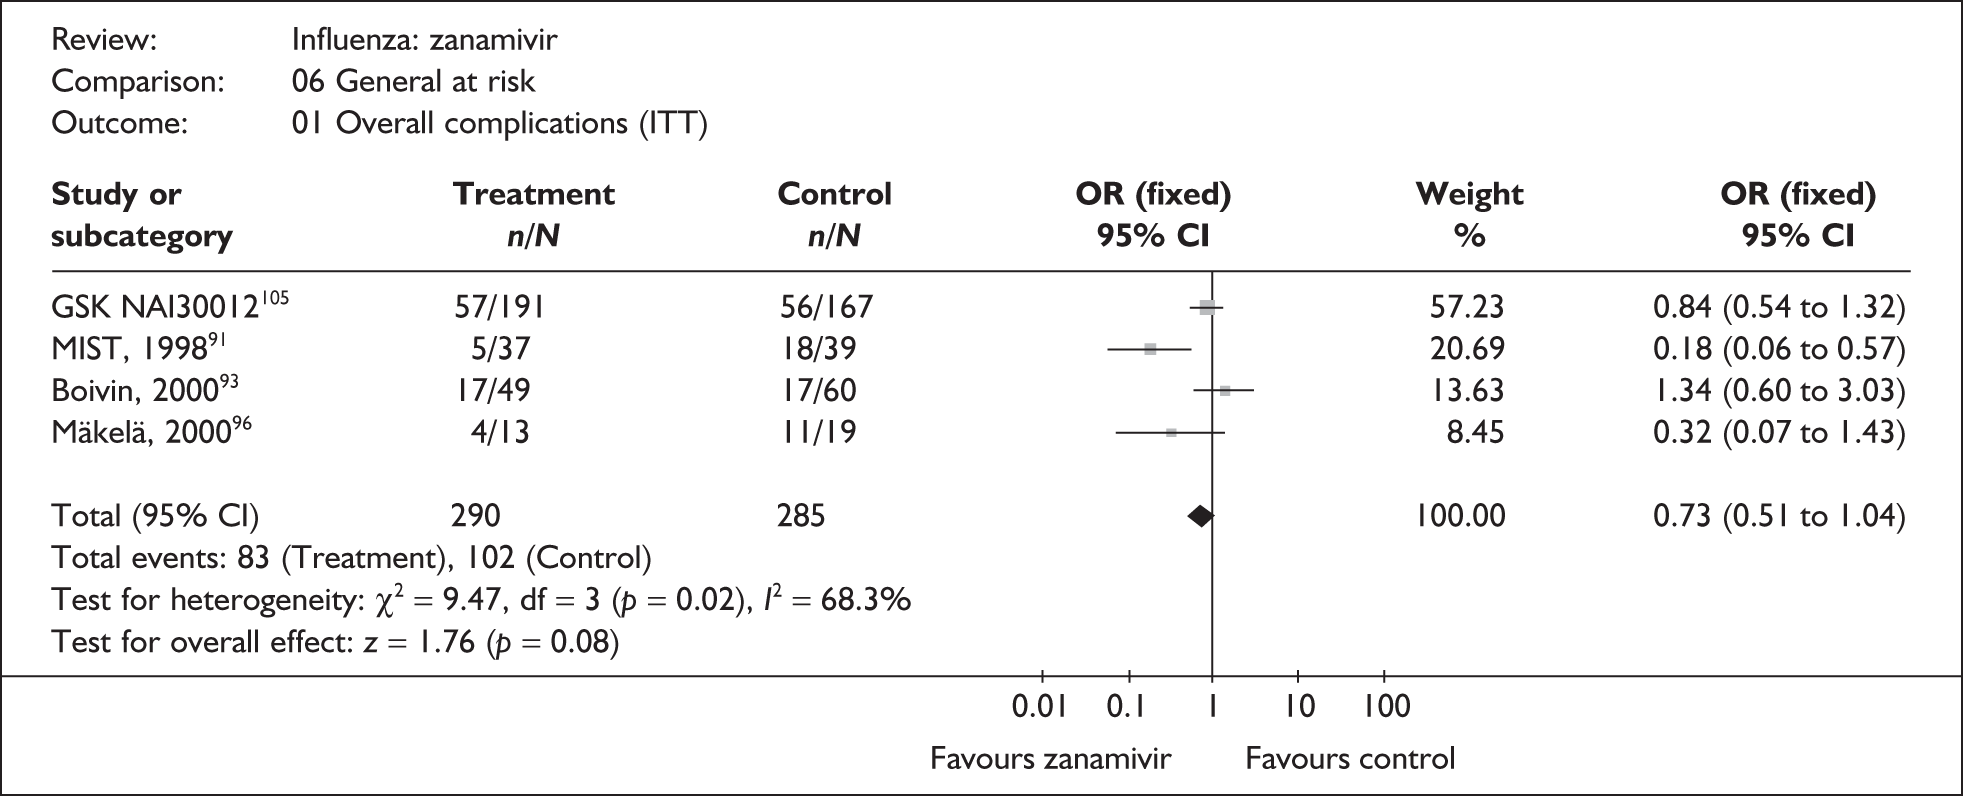
FIGURE 51.

FIGURE 52.
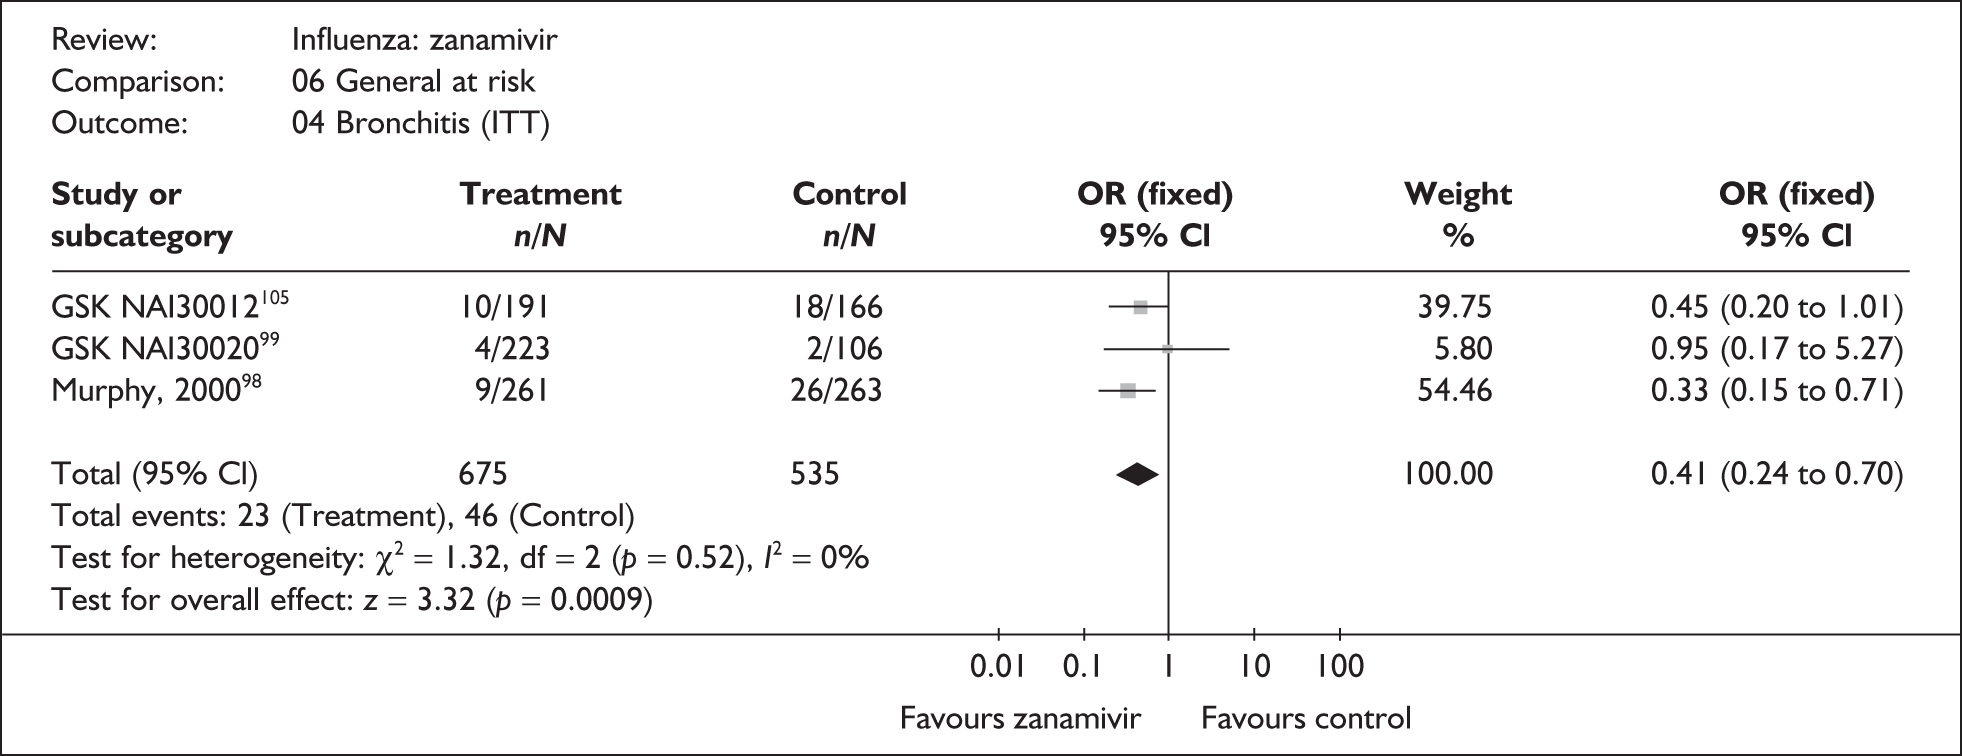
FIGURE 53.
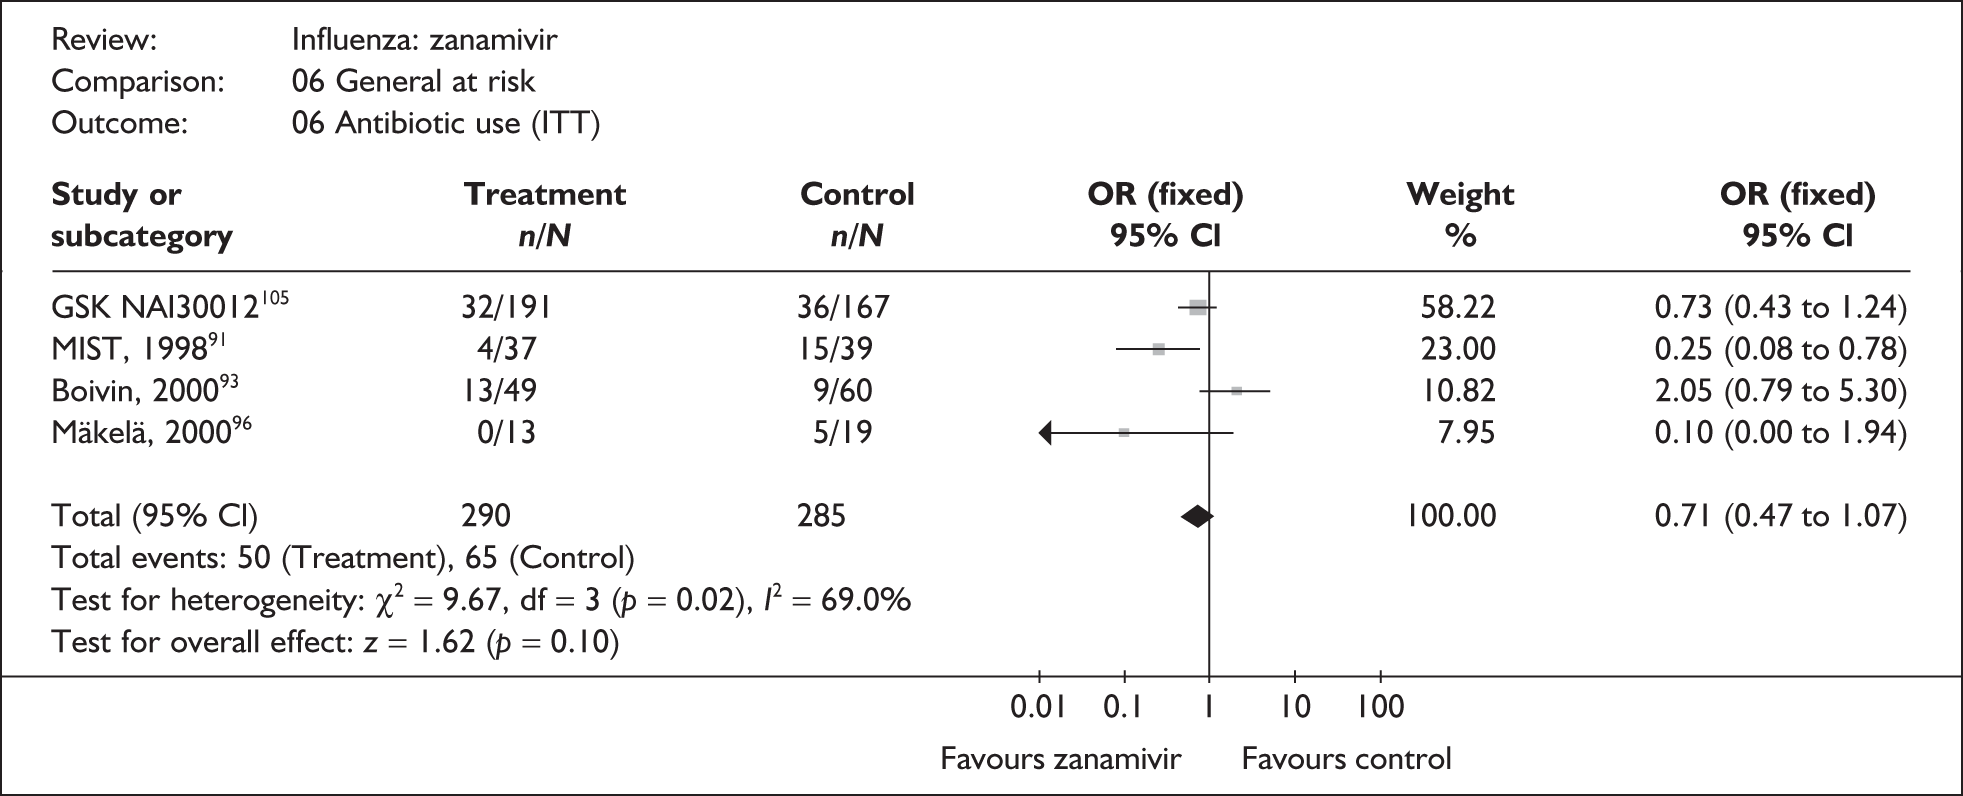
FIGURE 54.
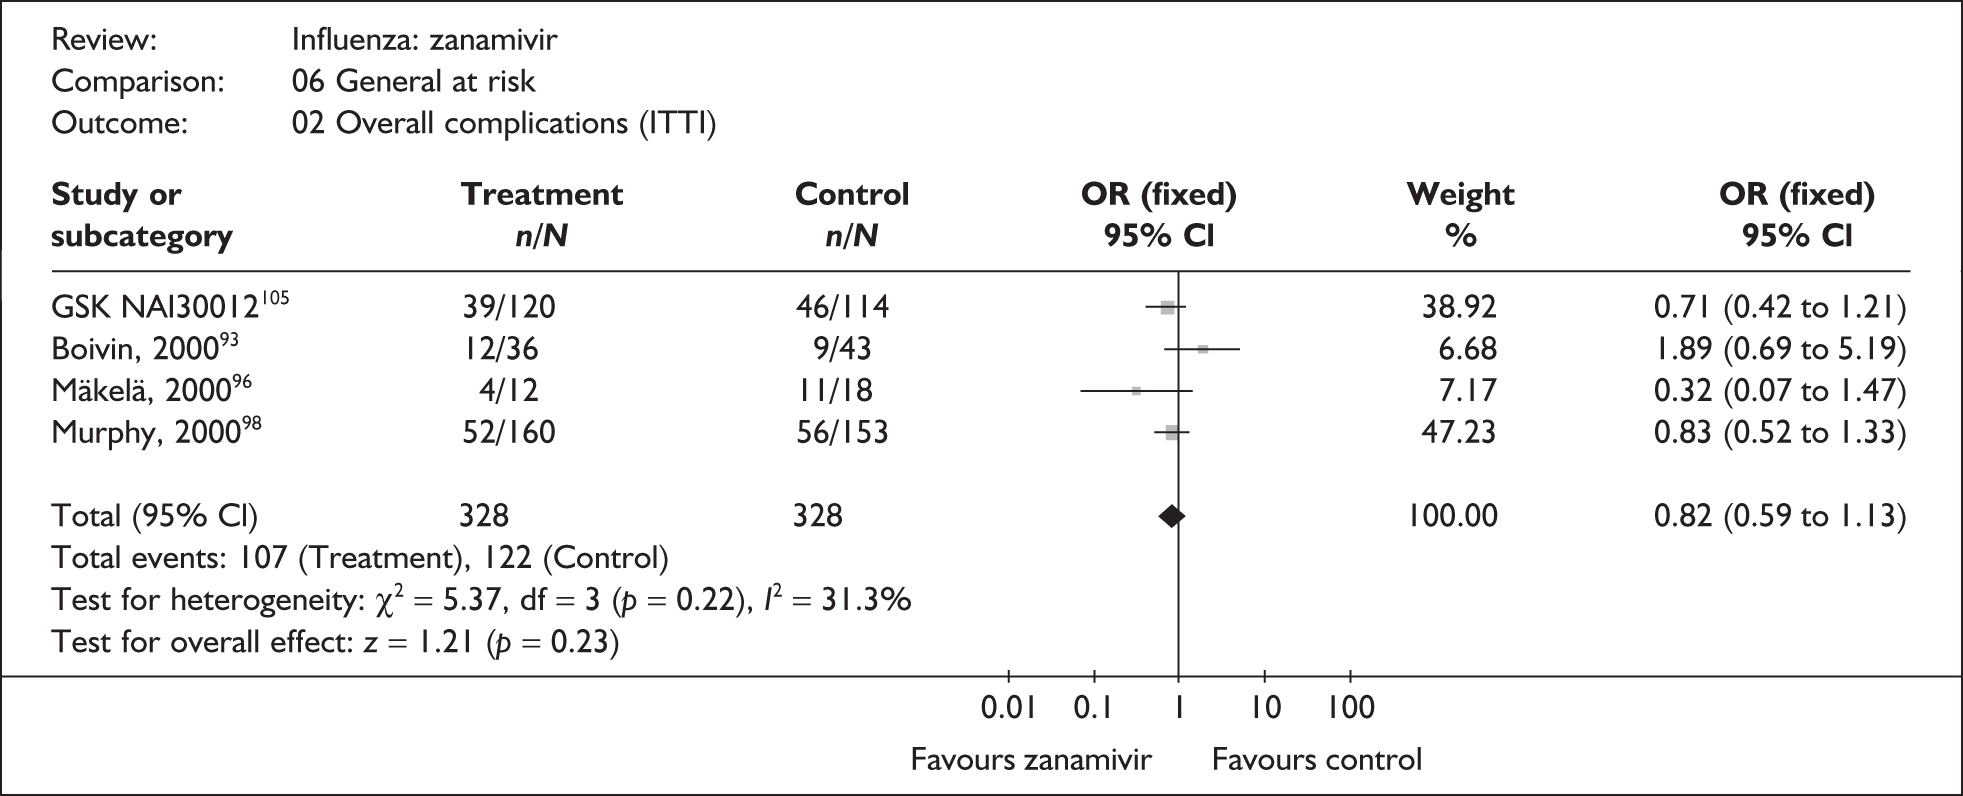
FIGURE 55.
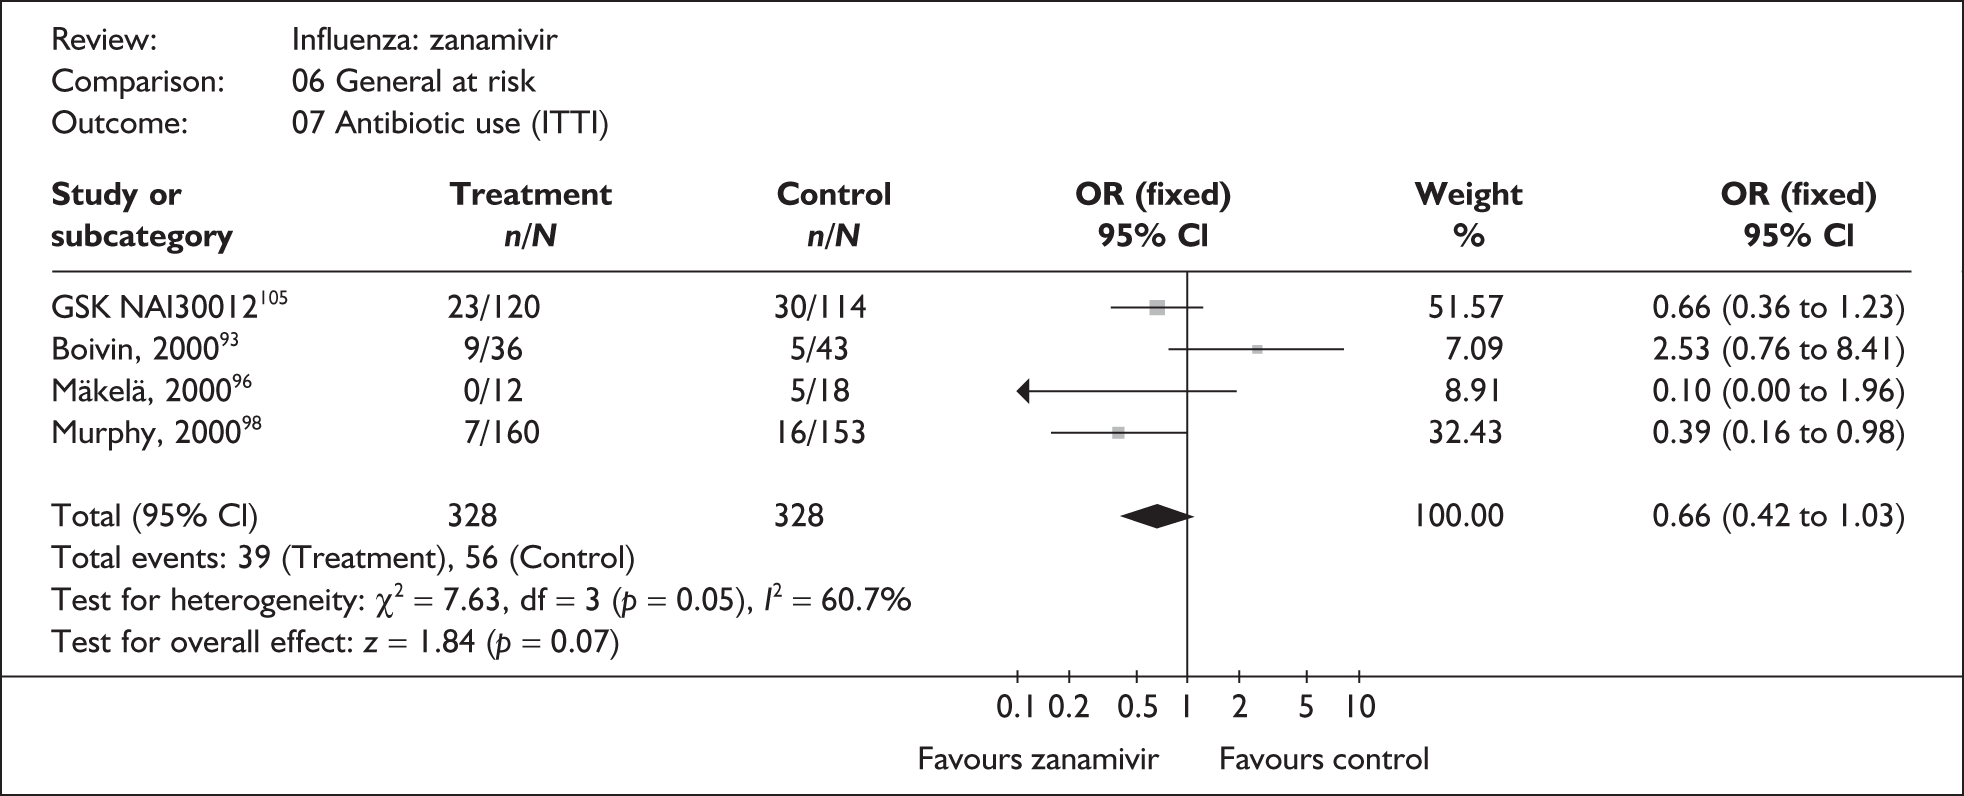
FIGURE 56.
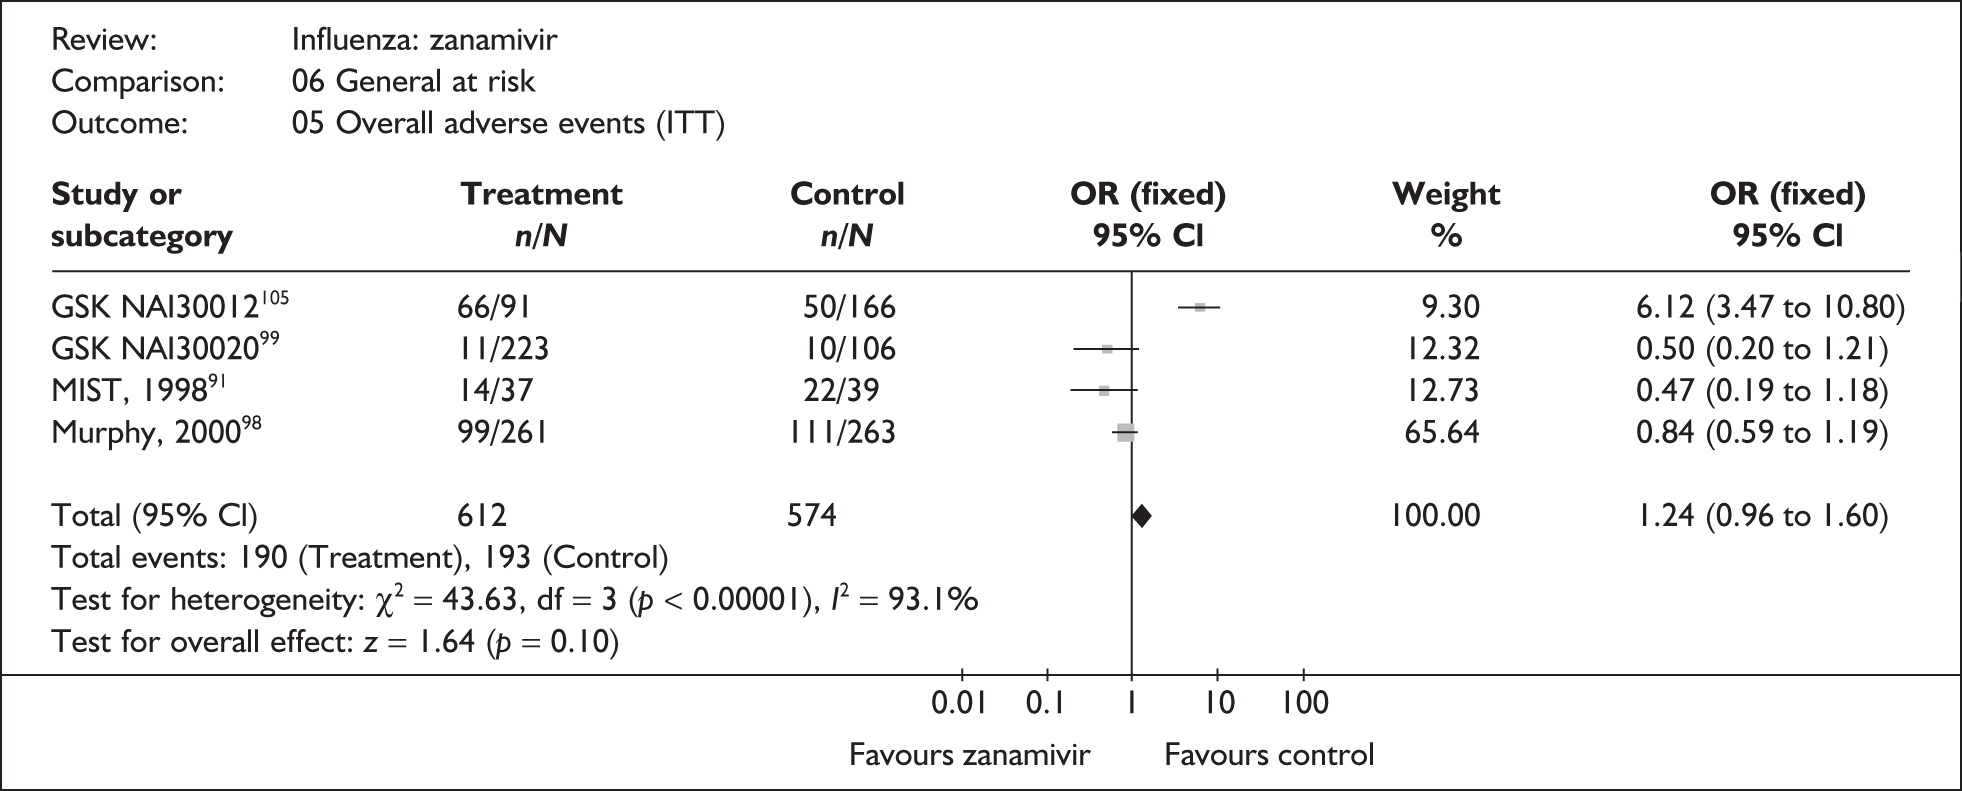
FIGURE 57.
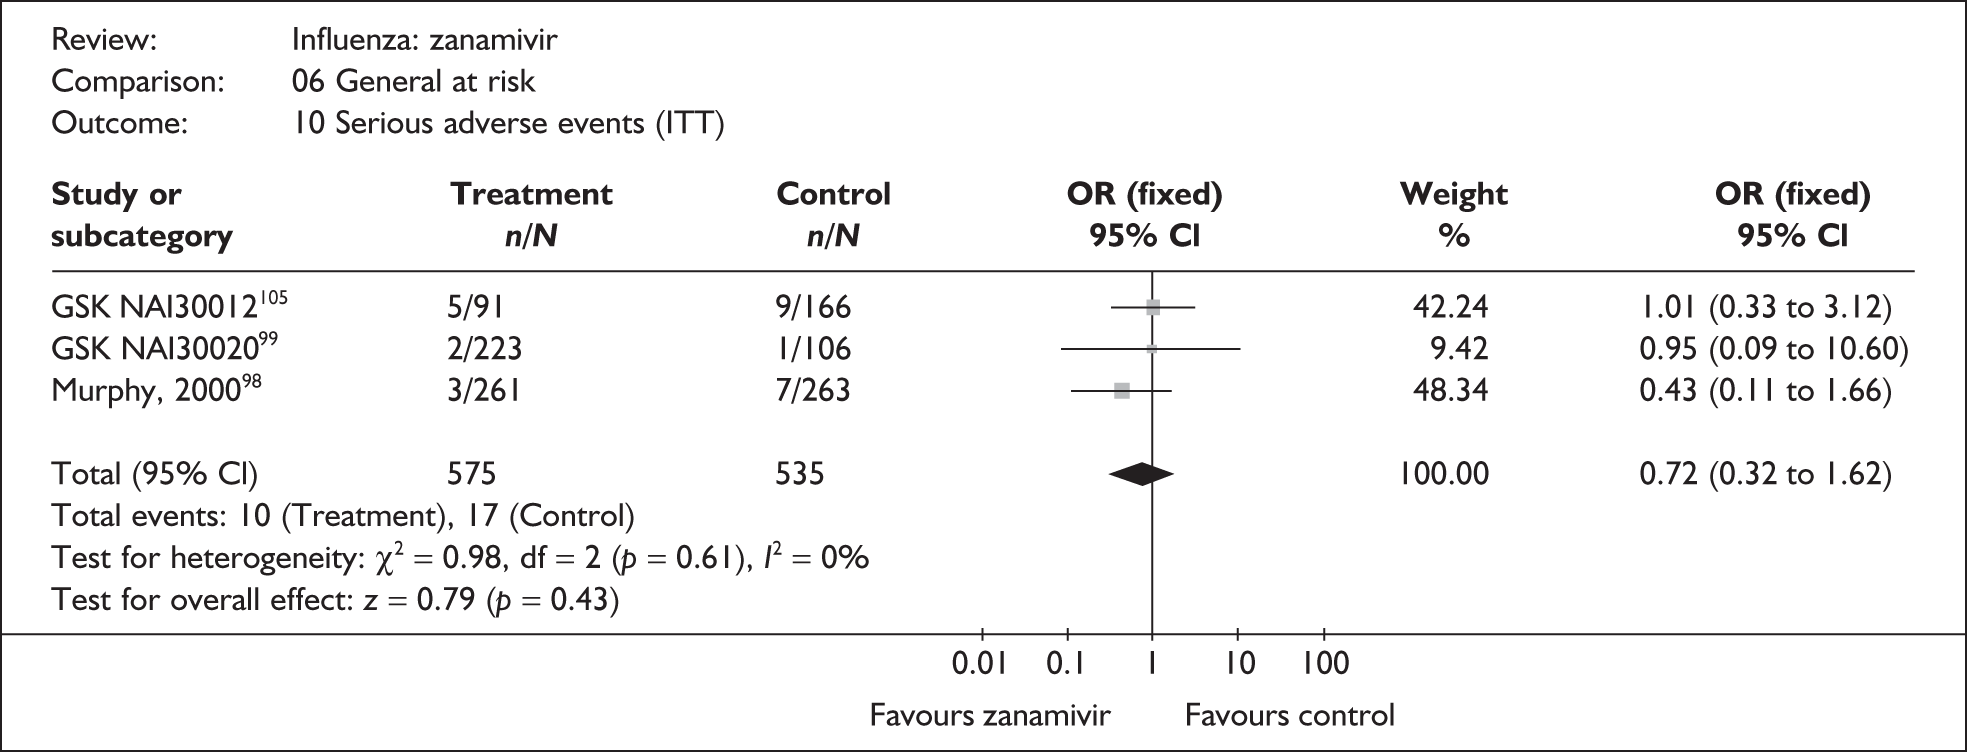
FIGURE 58.
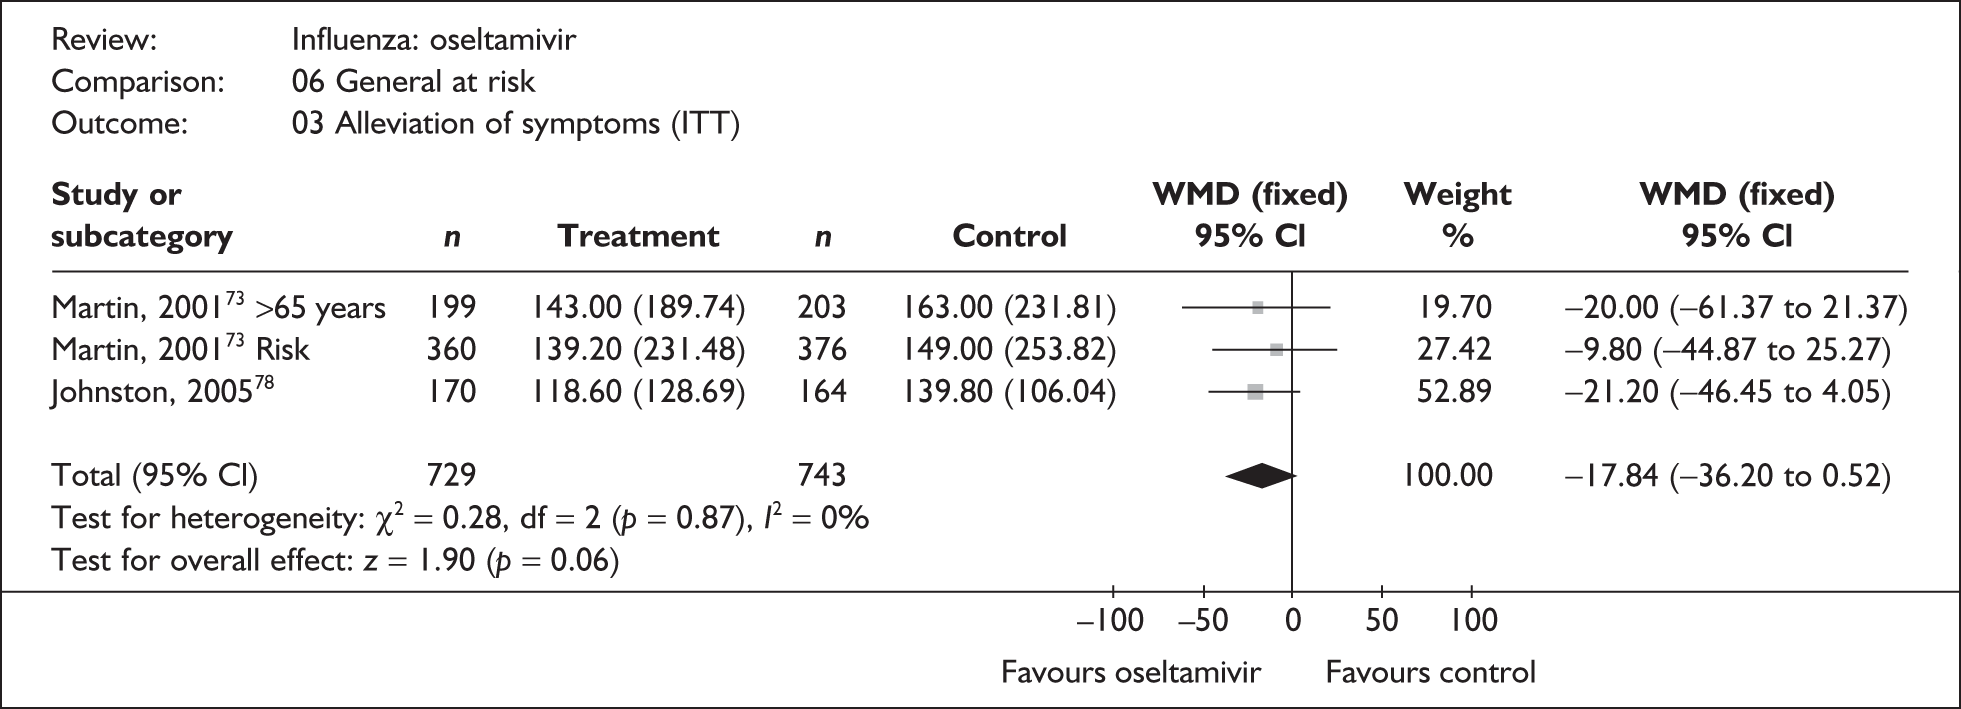
FIGURE 59.
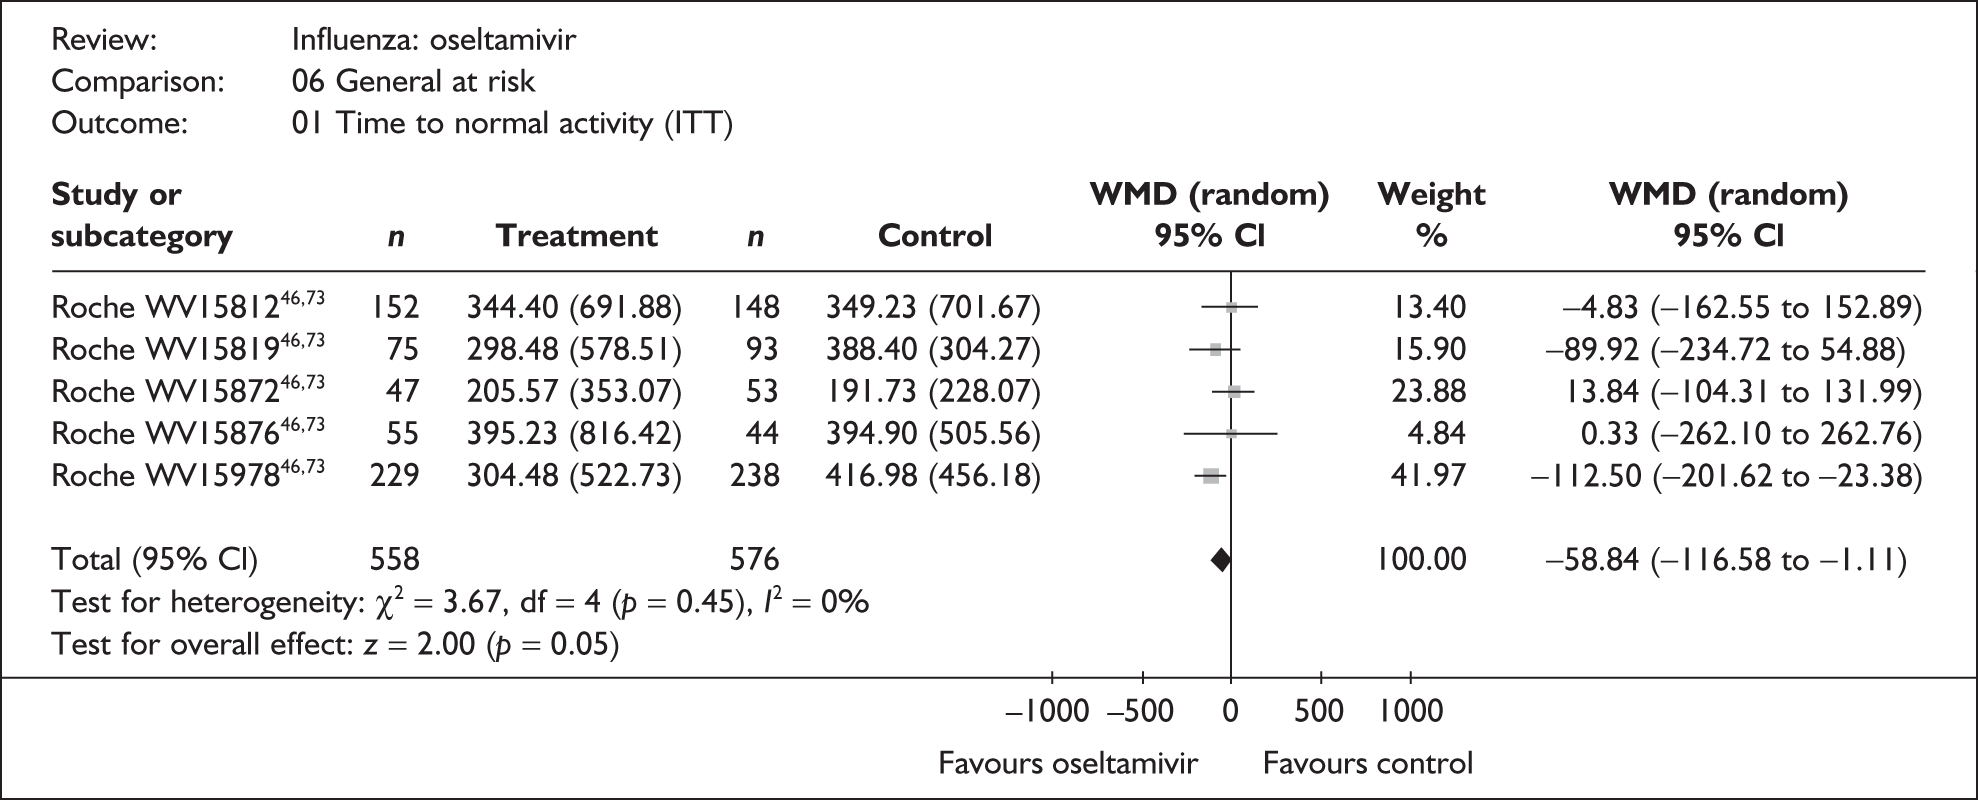
FIGURE 60.
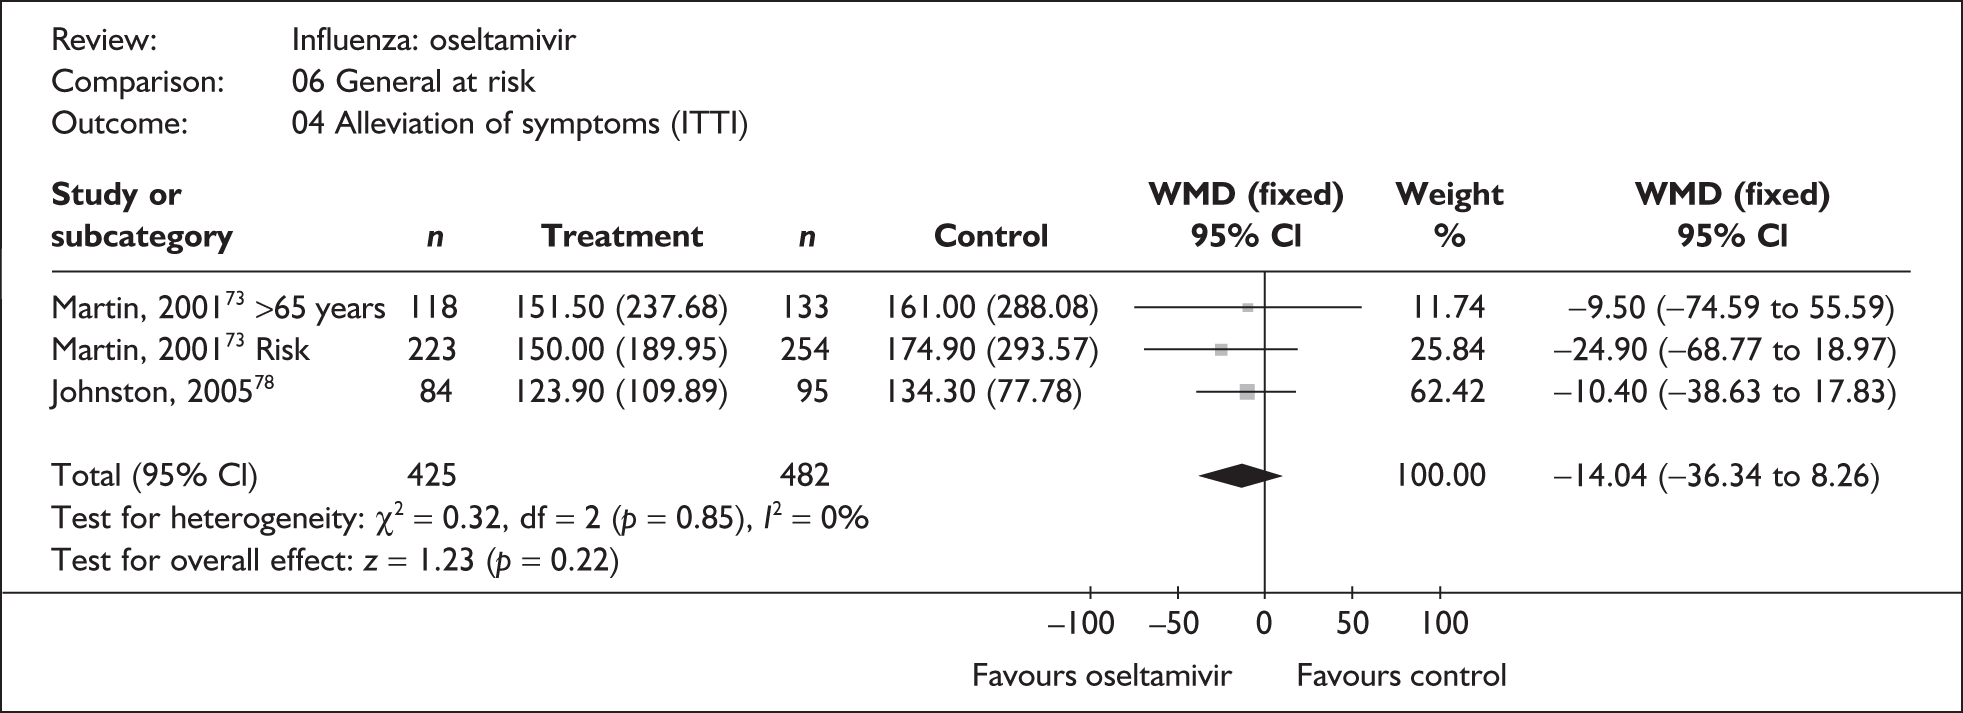
FIGURE 61.
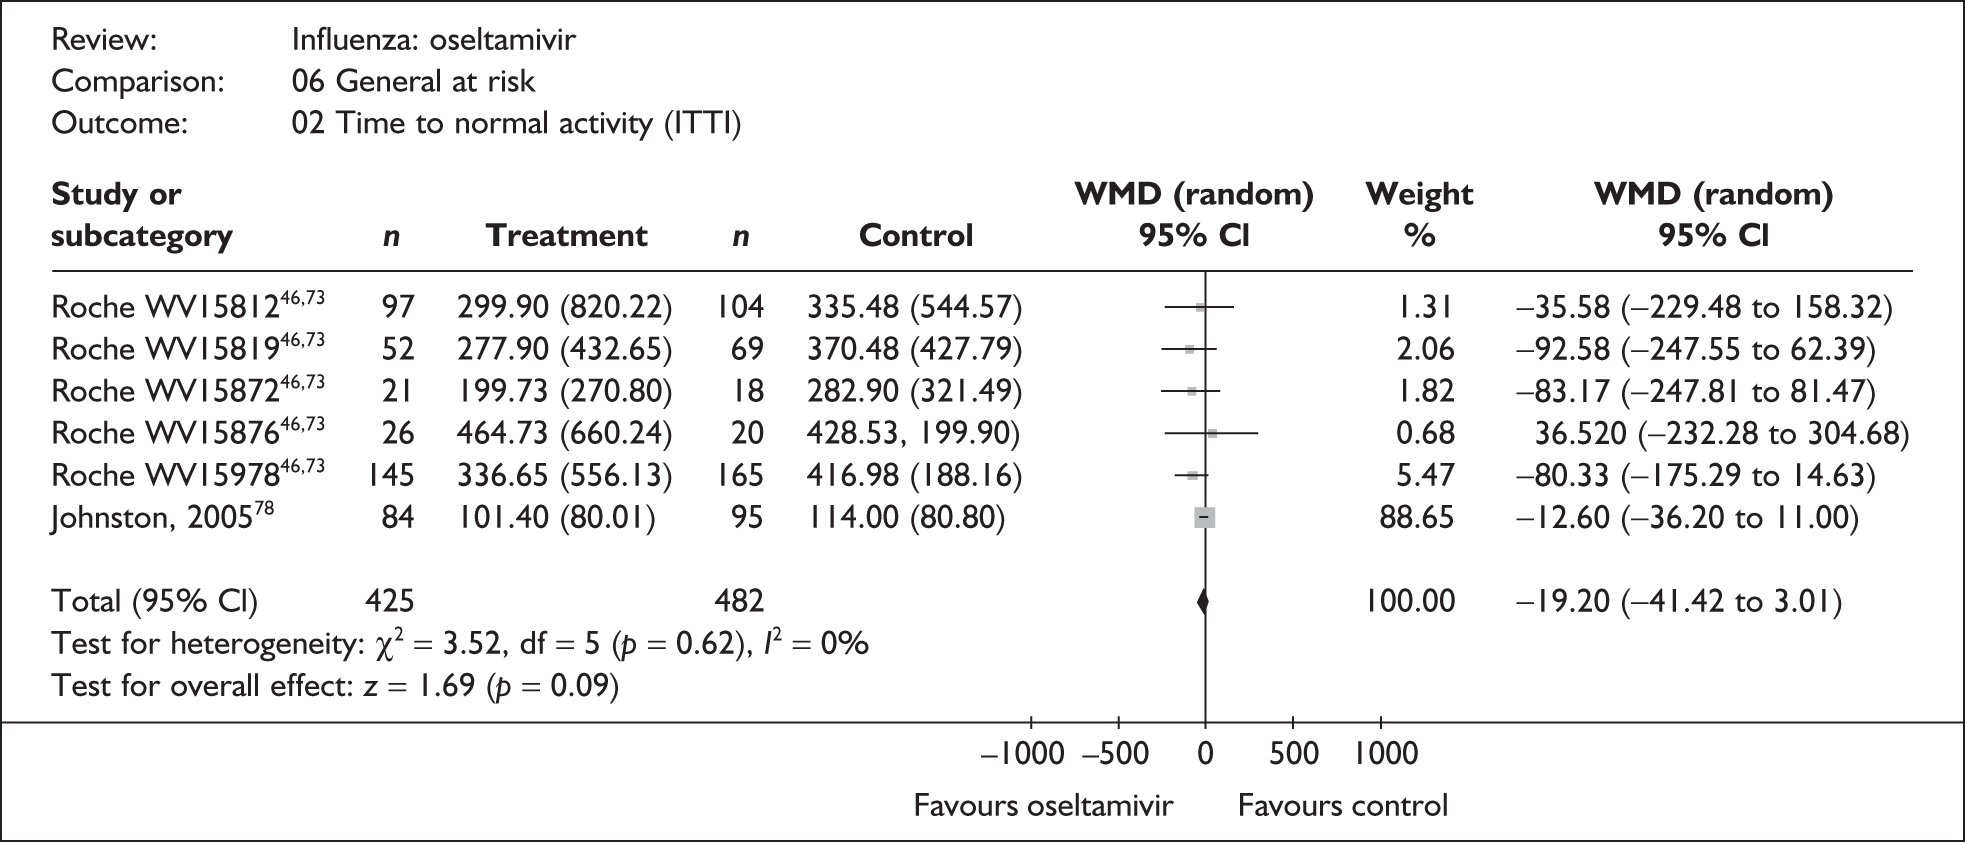
FIGURE 62.
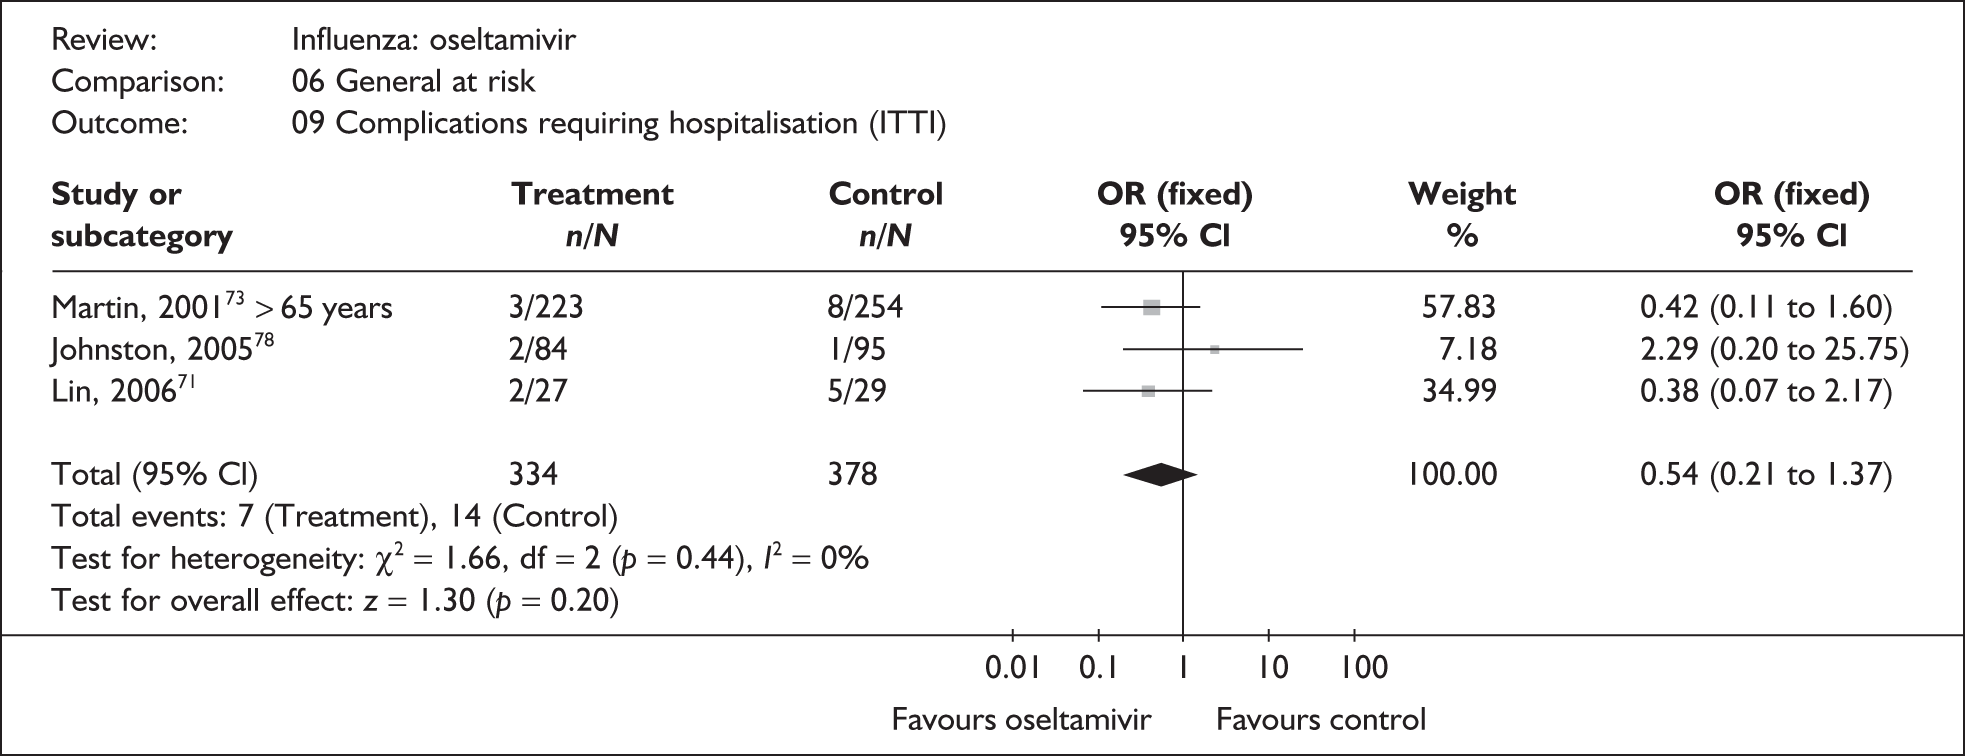
FIGURE 63.
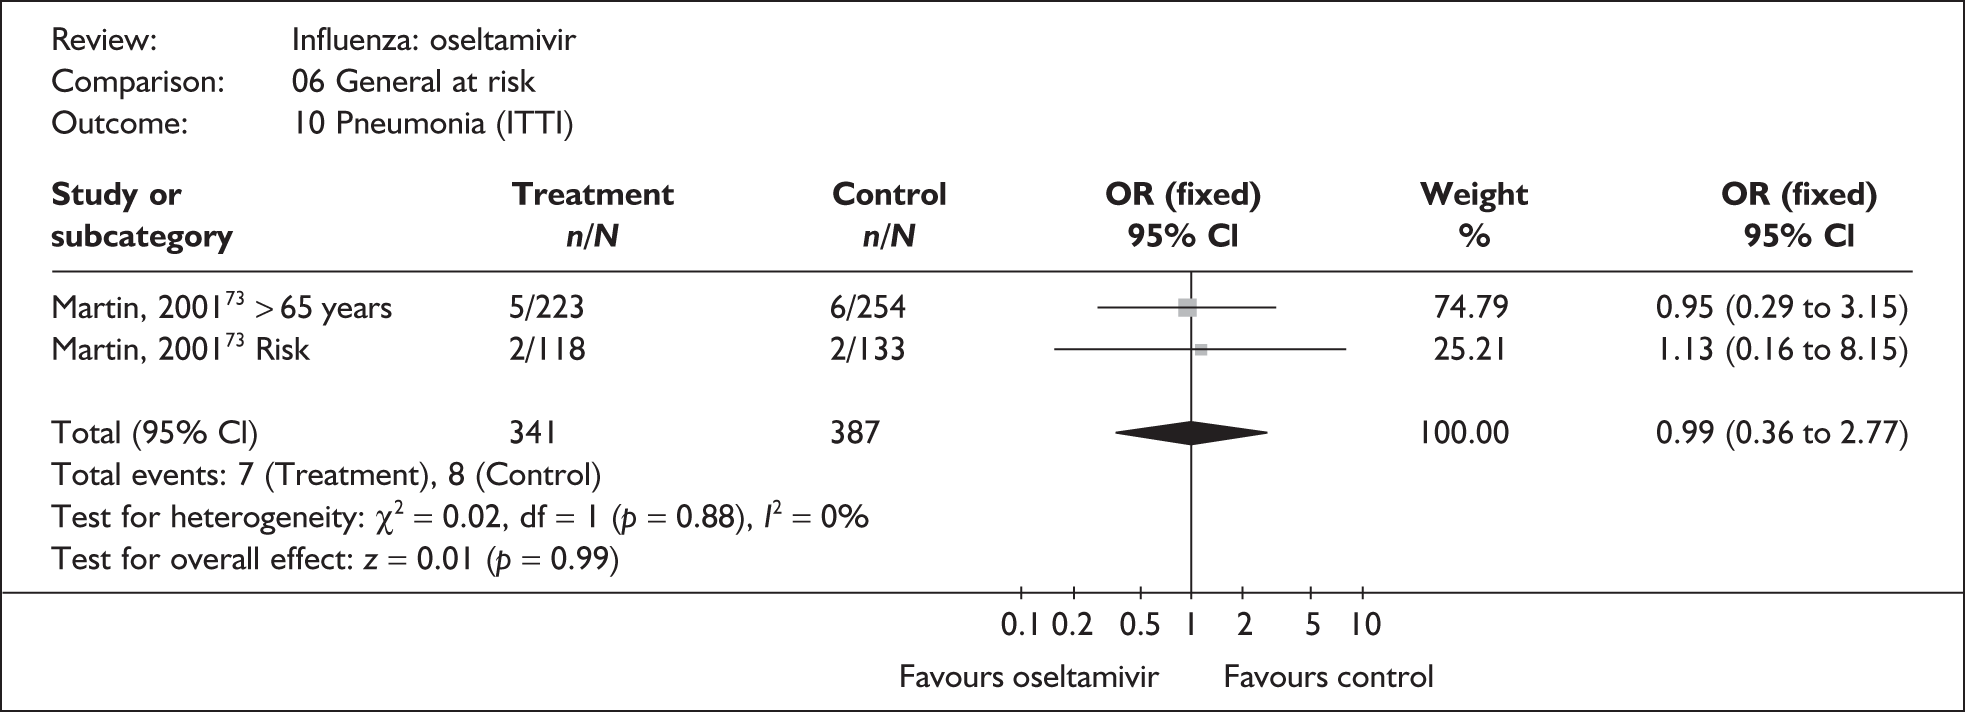
FIGURE 64.
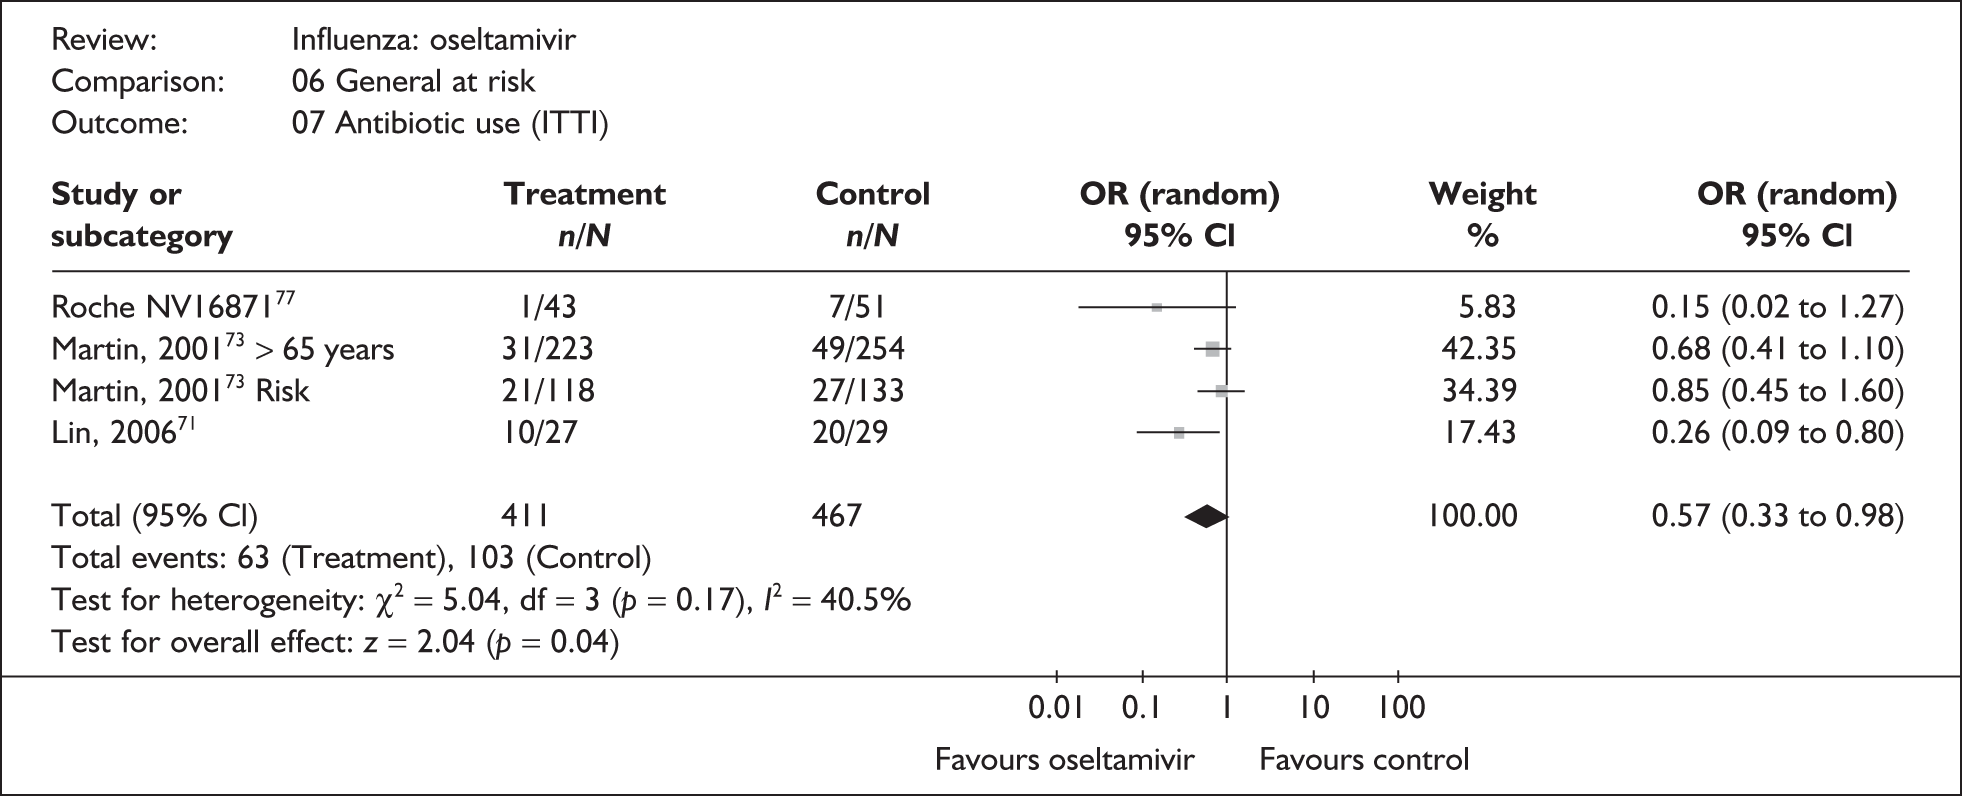
FIGURE 65.
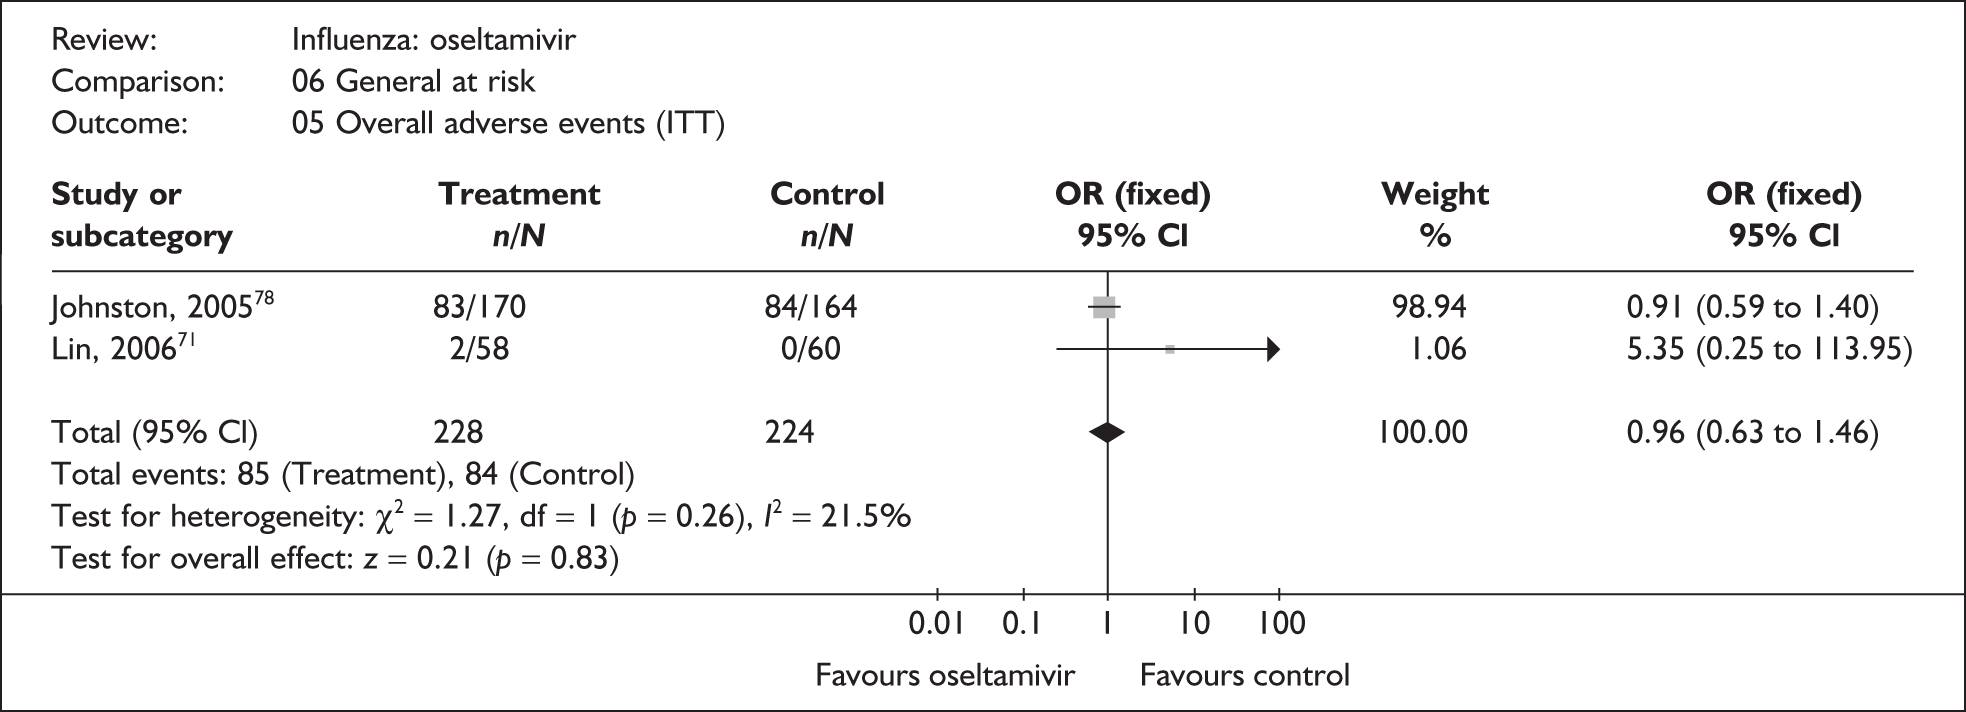
Children
FIGURE 66.
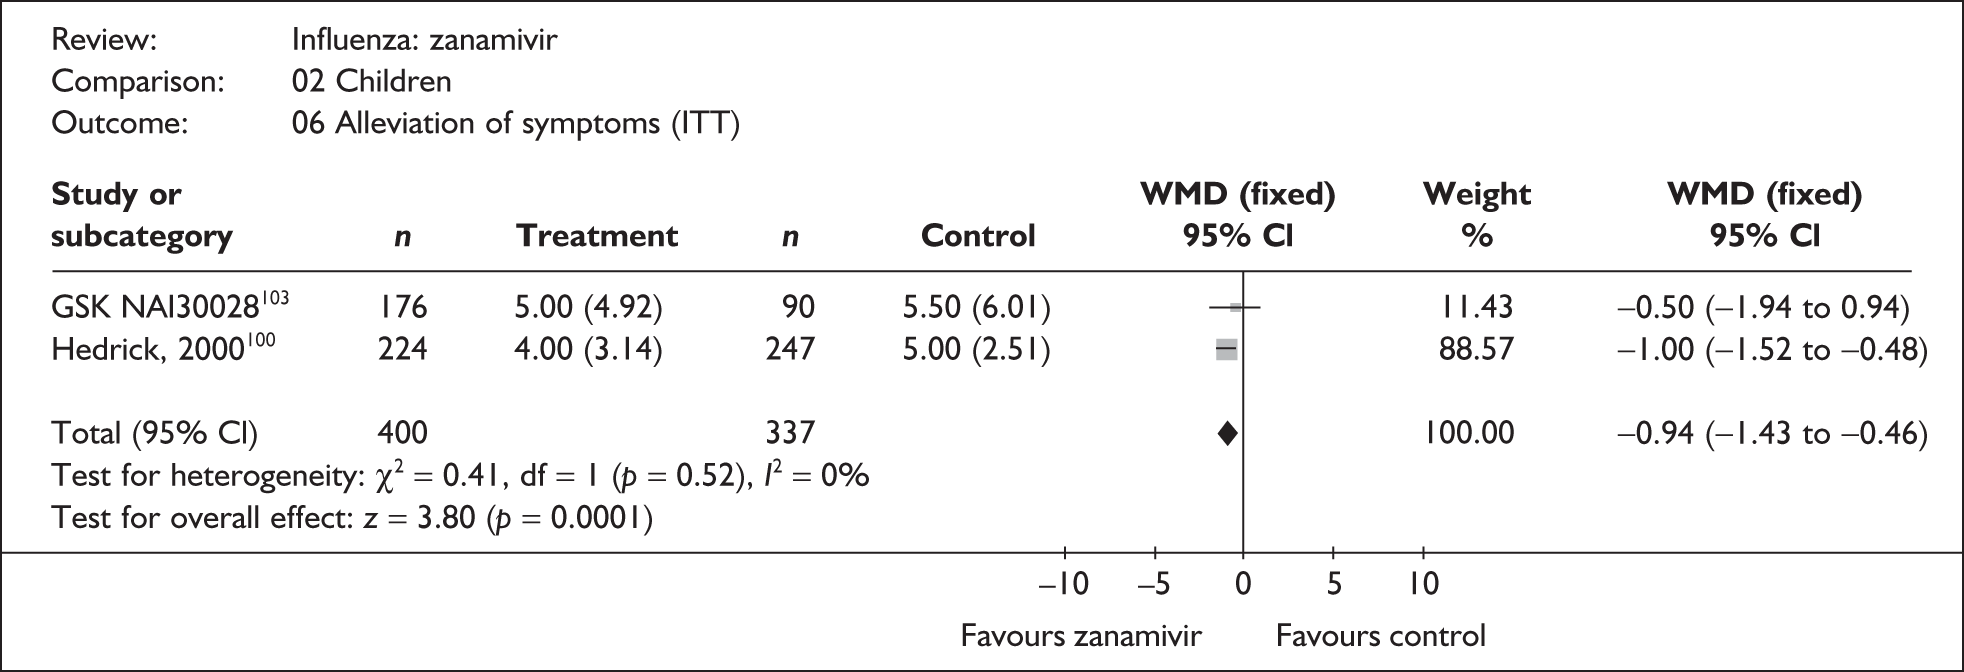
FIGURE 67.
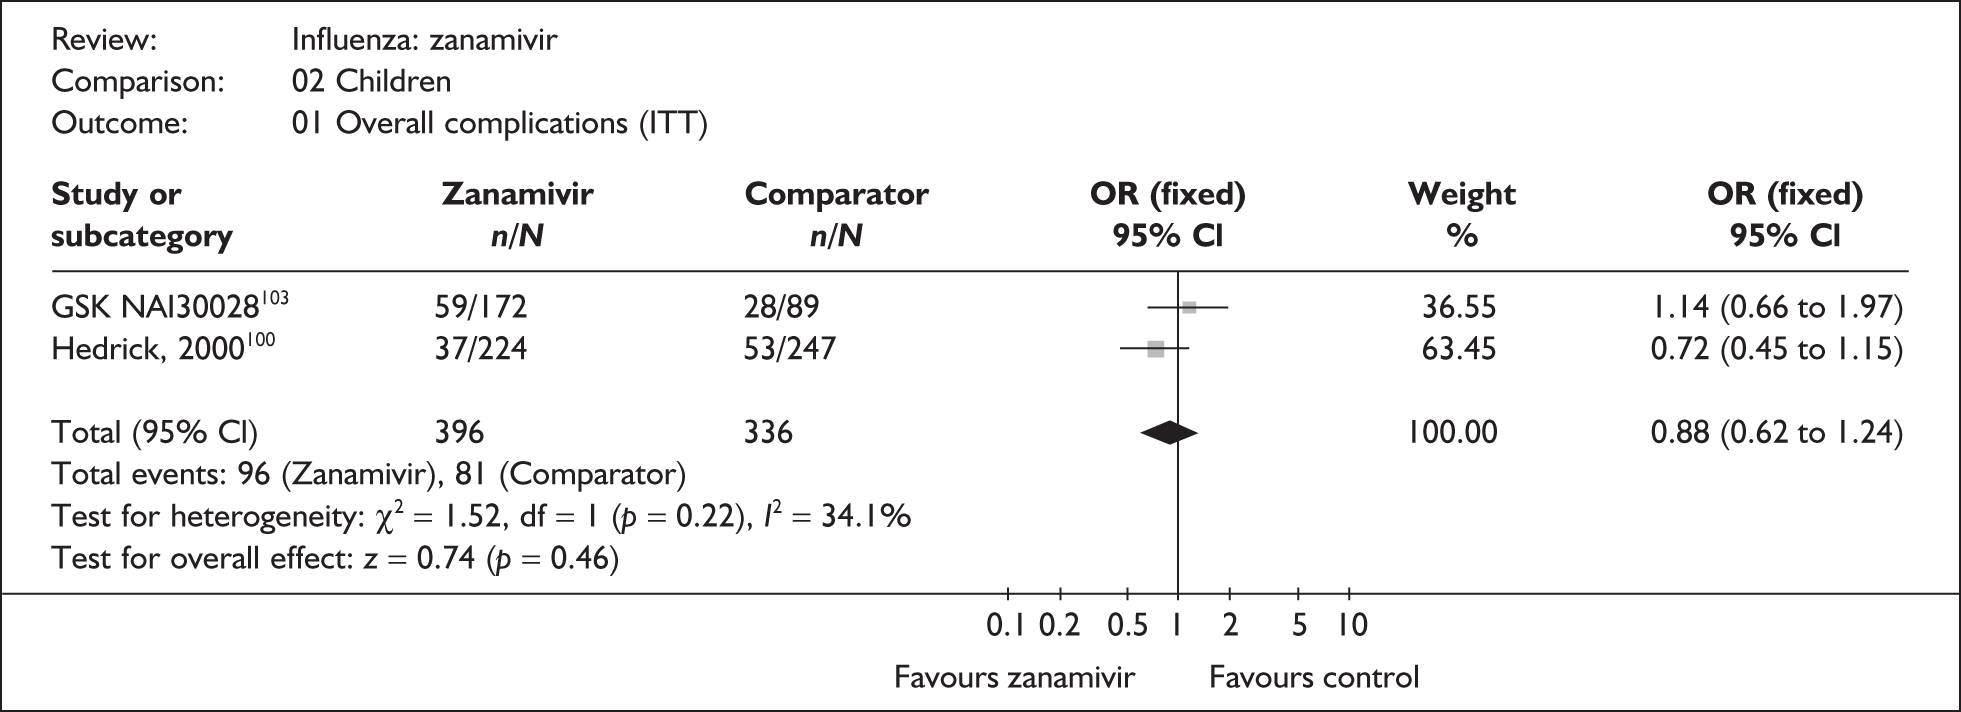
FIGURE 68.
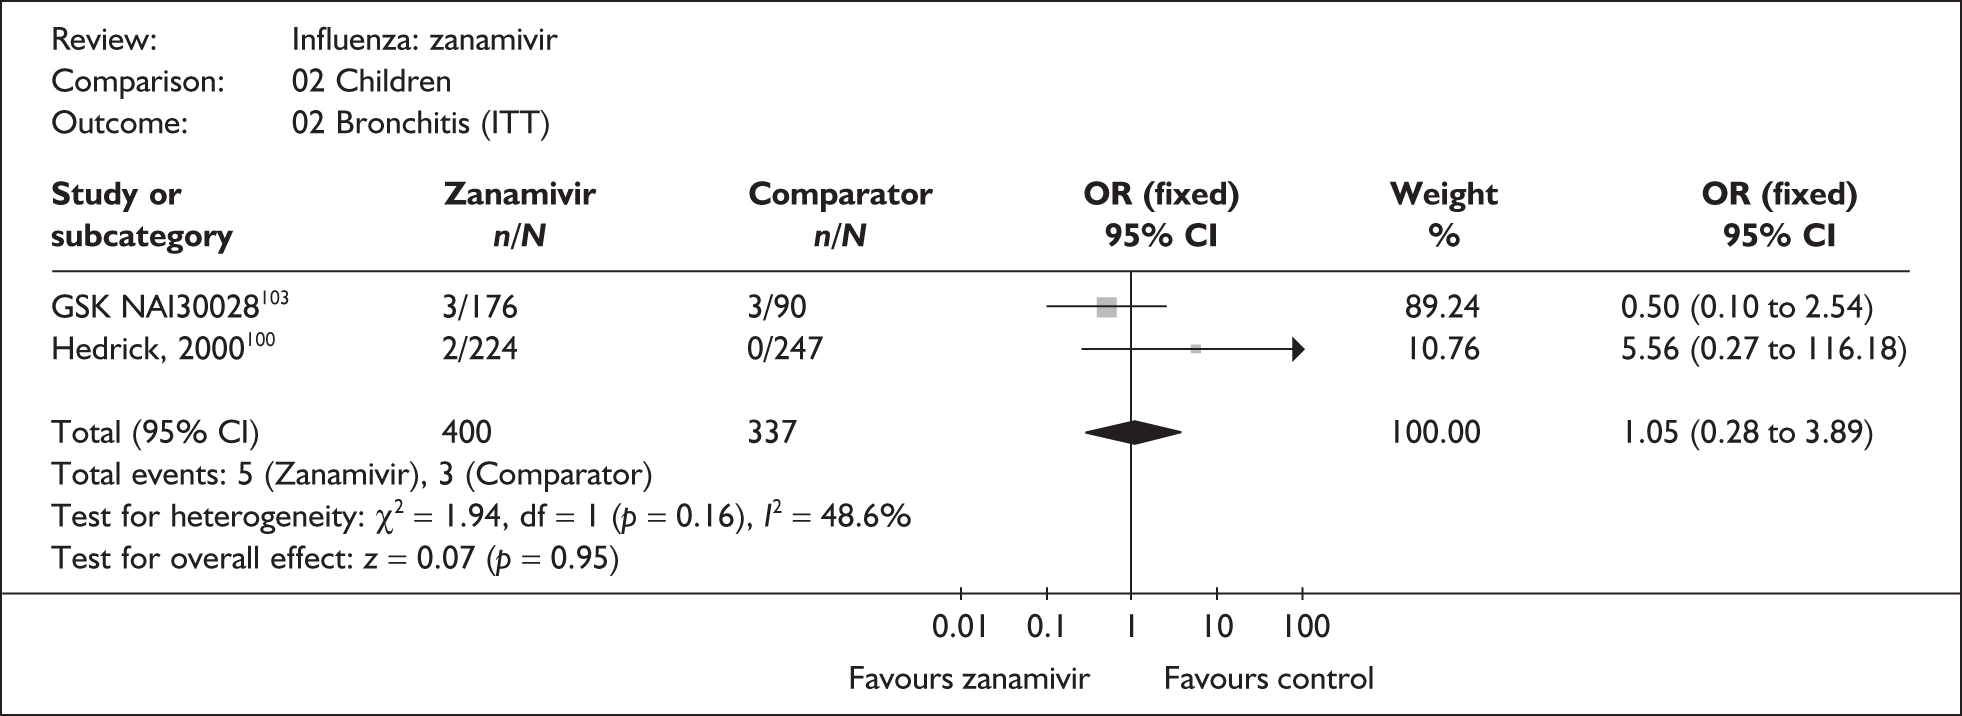
FIGURE 69.
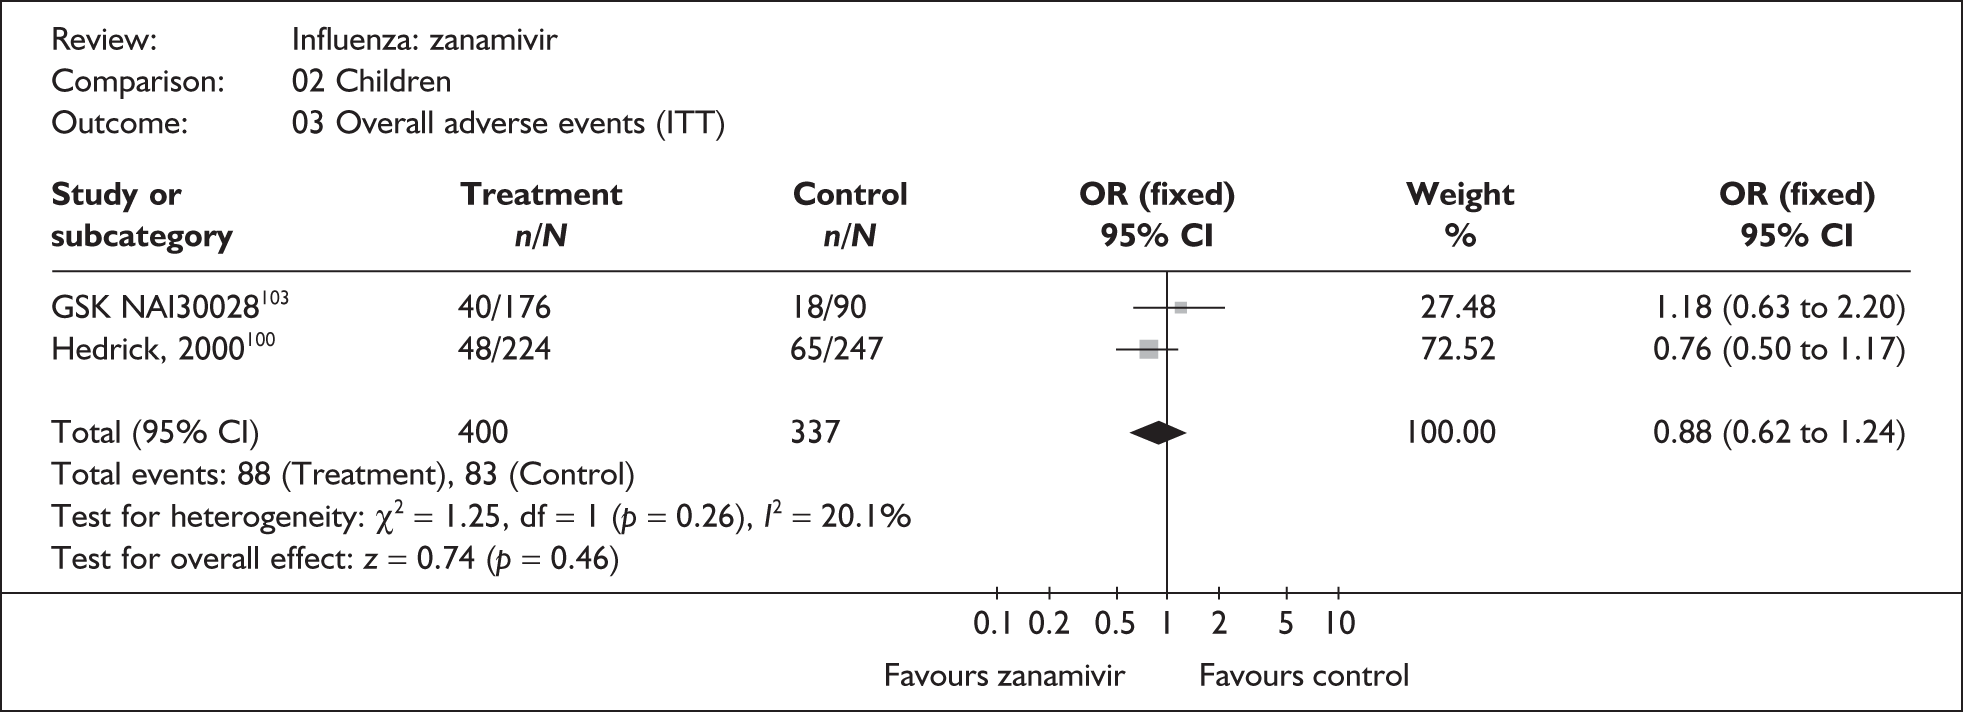
FIGURE 70.
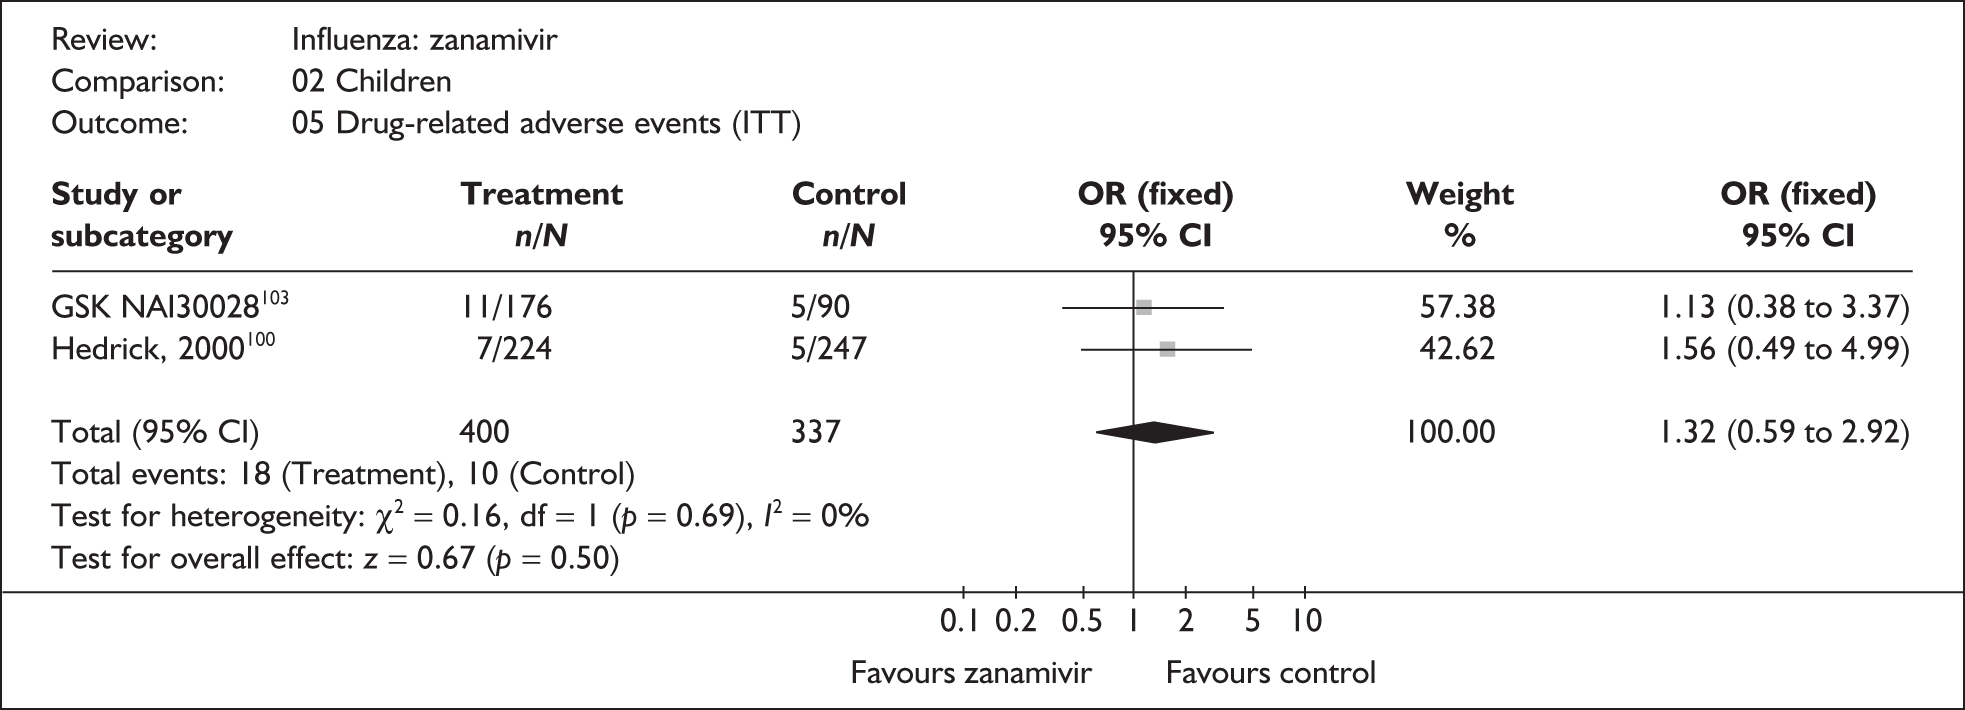
FIGURE 71.
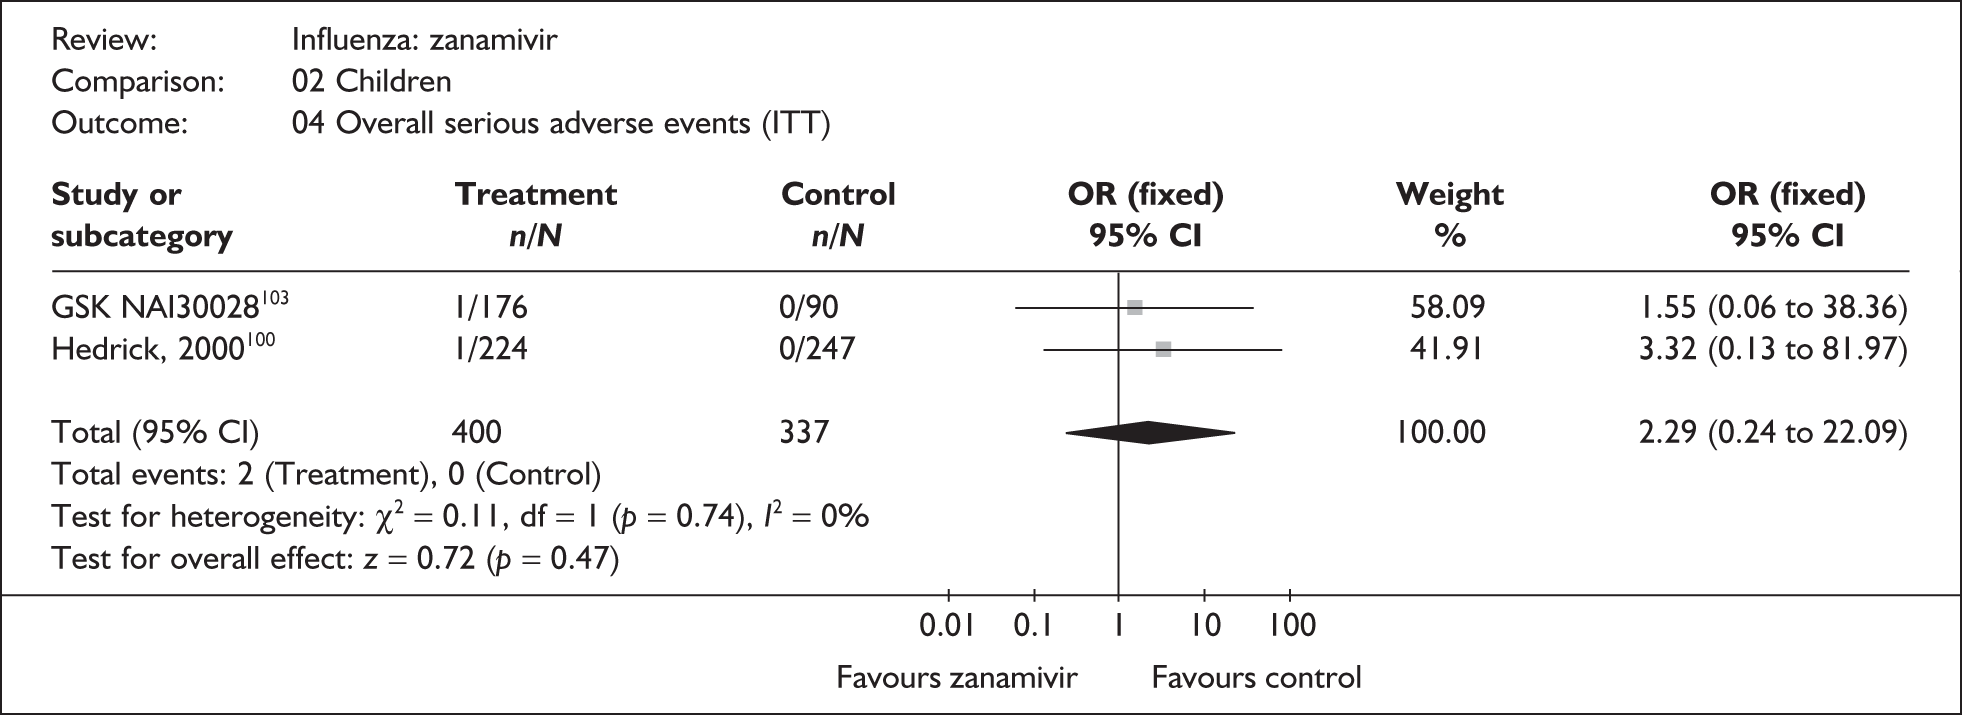
FIGURE 72.
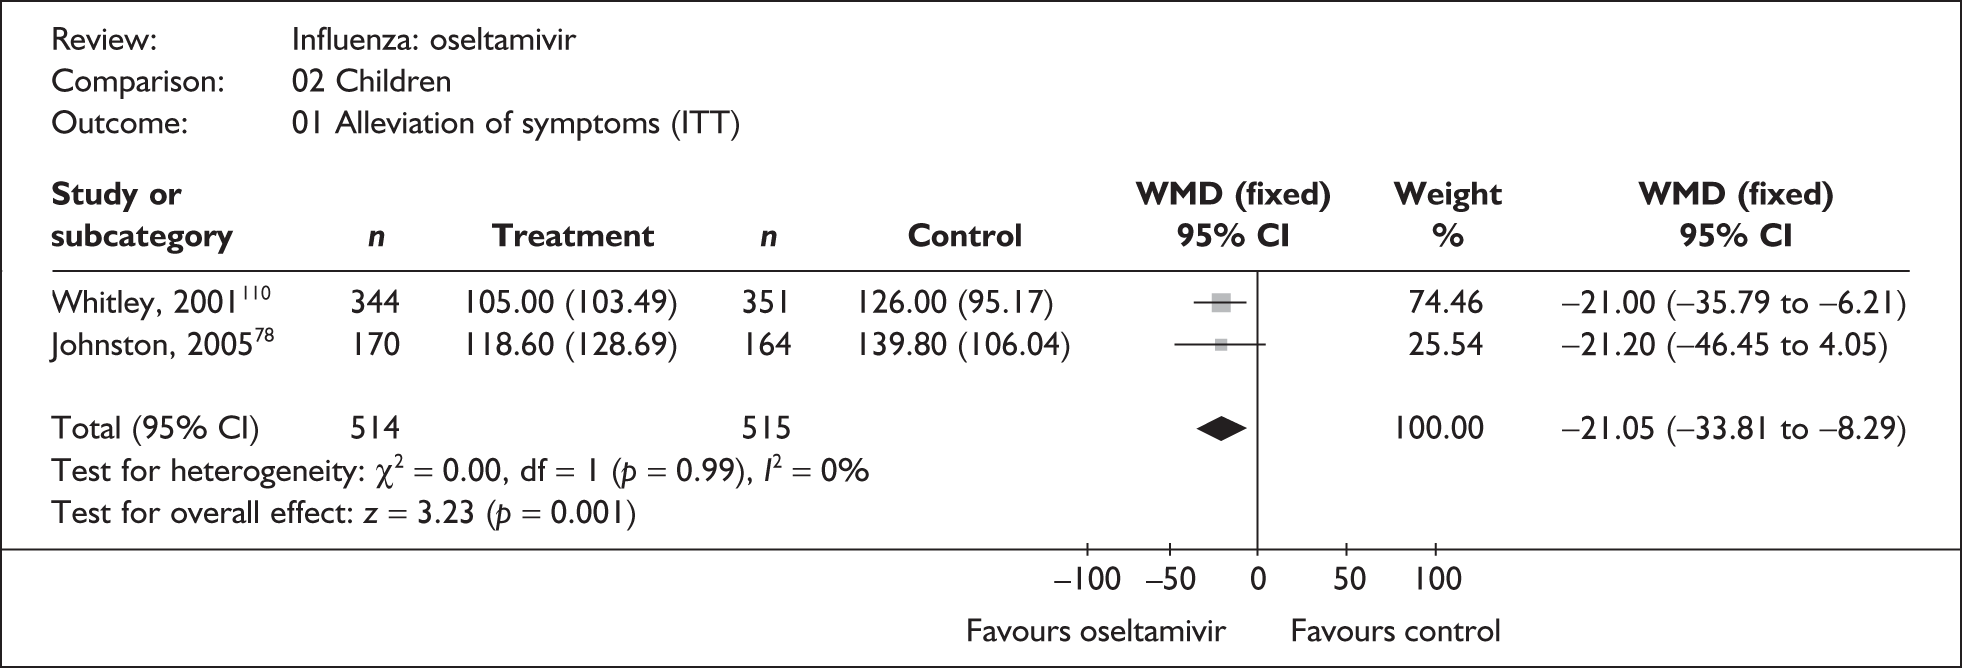
FIGURE 73.
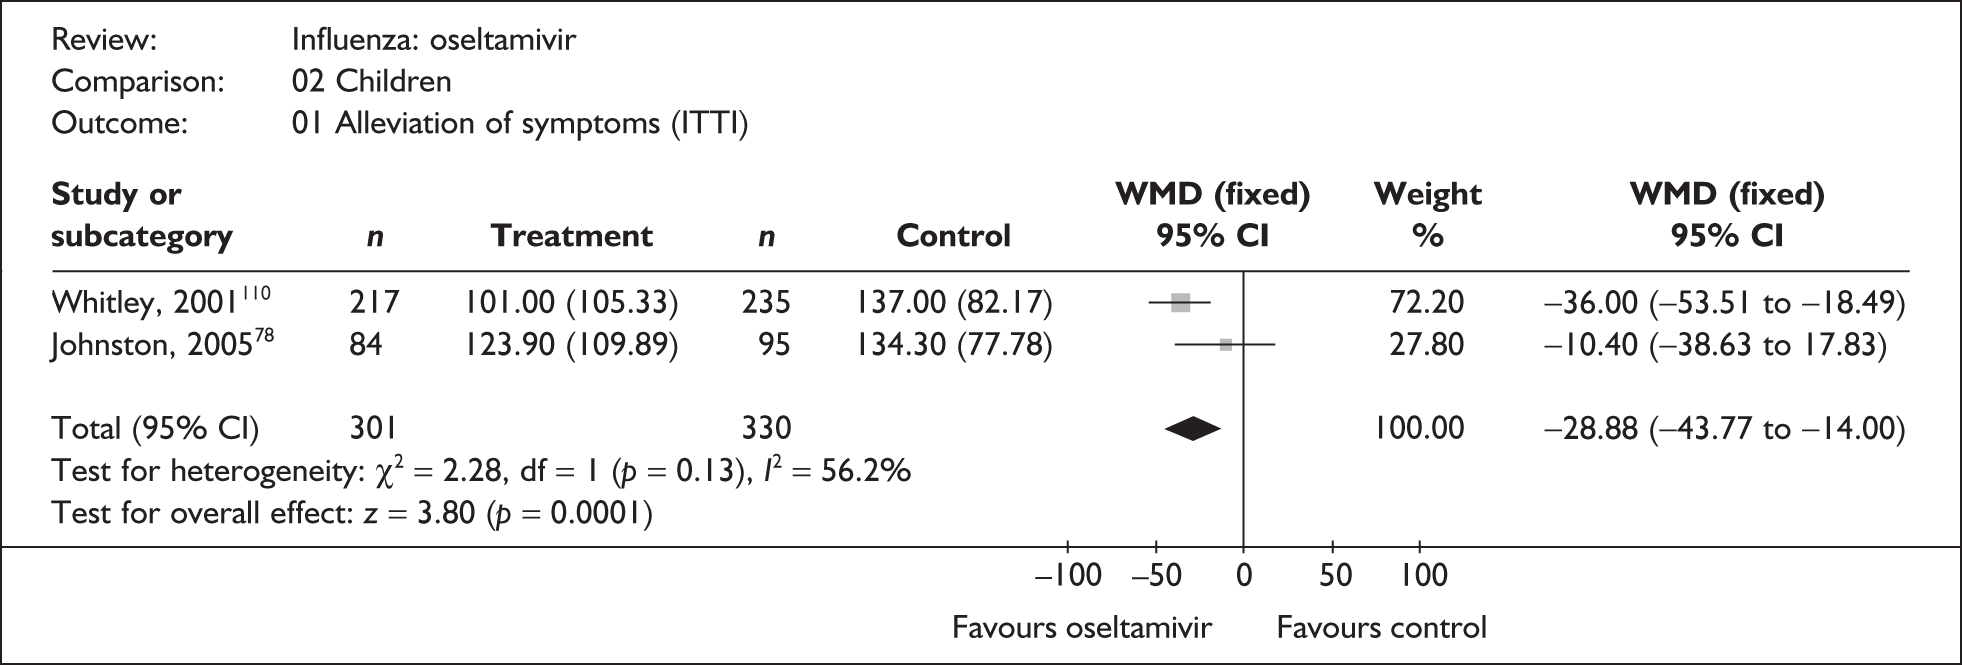
FIGURE 74.
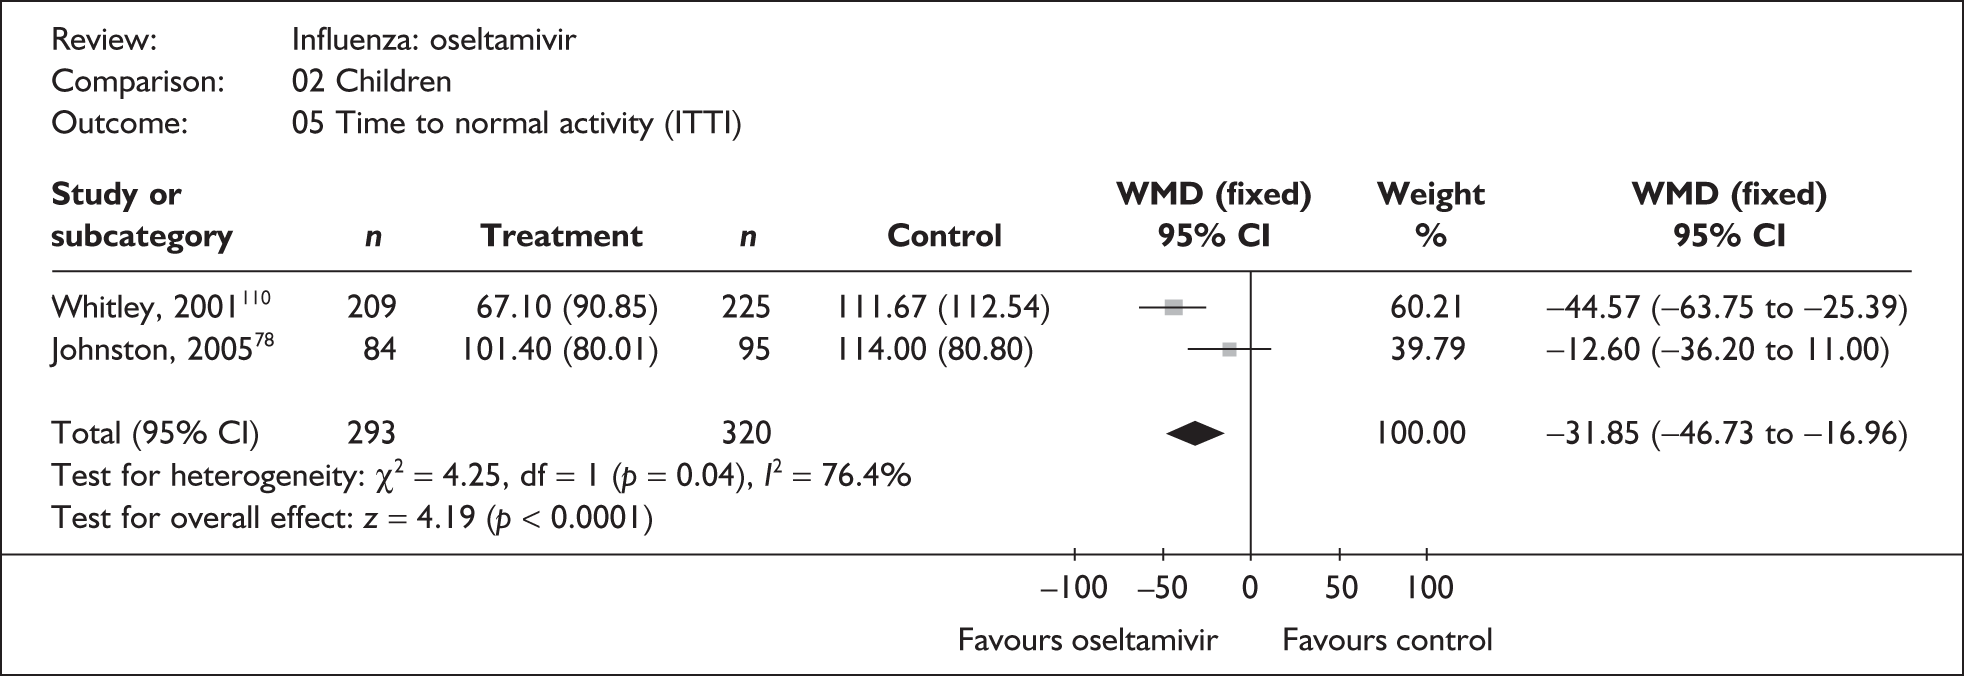
FIGURE 75.
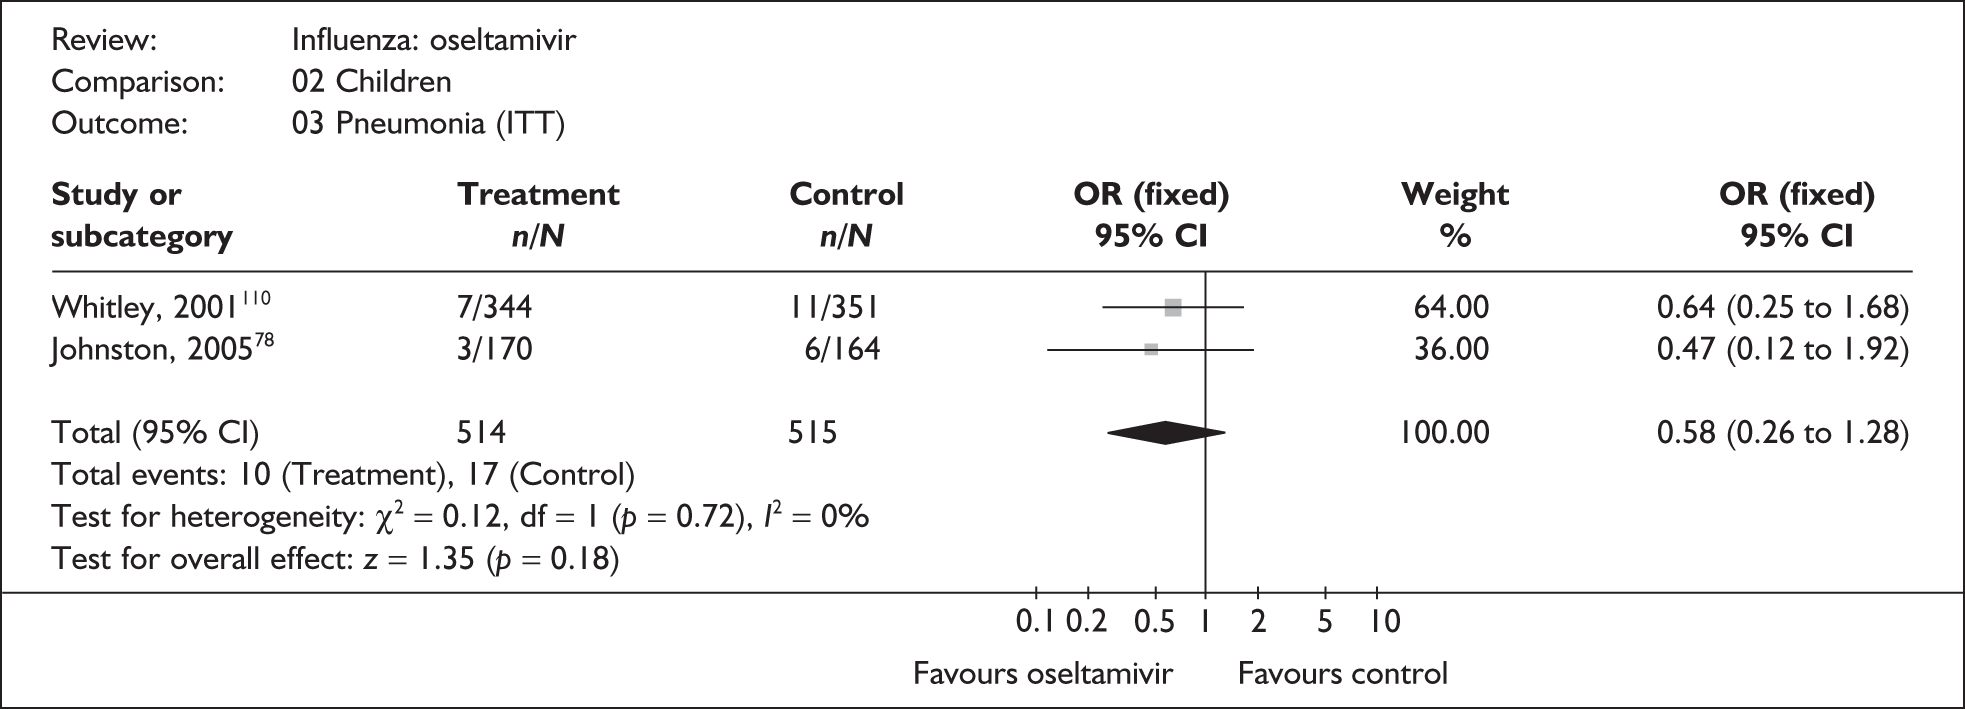
FIGURE 76.
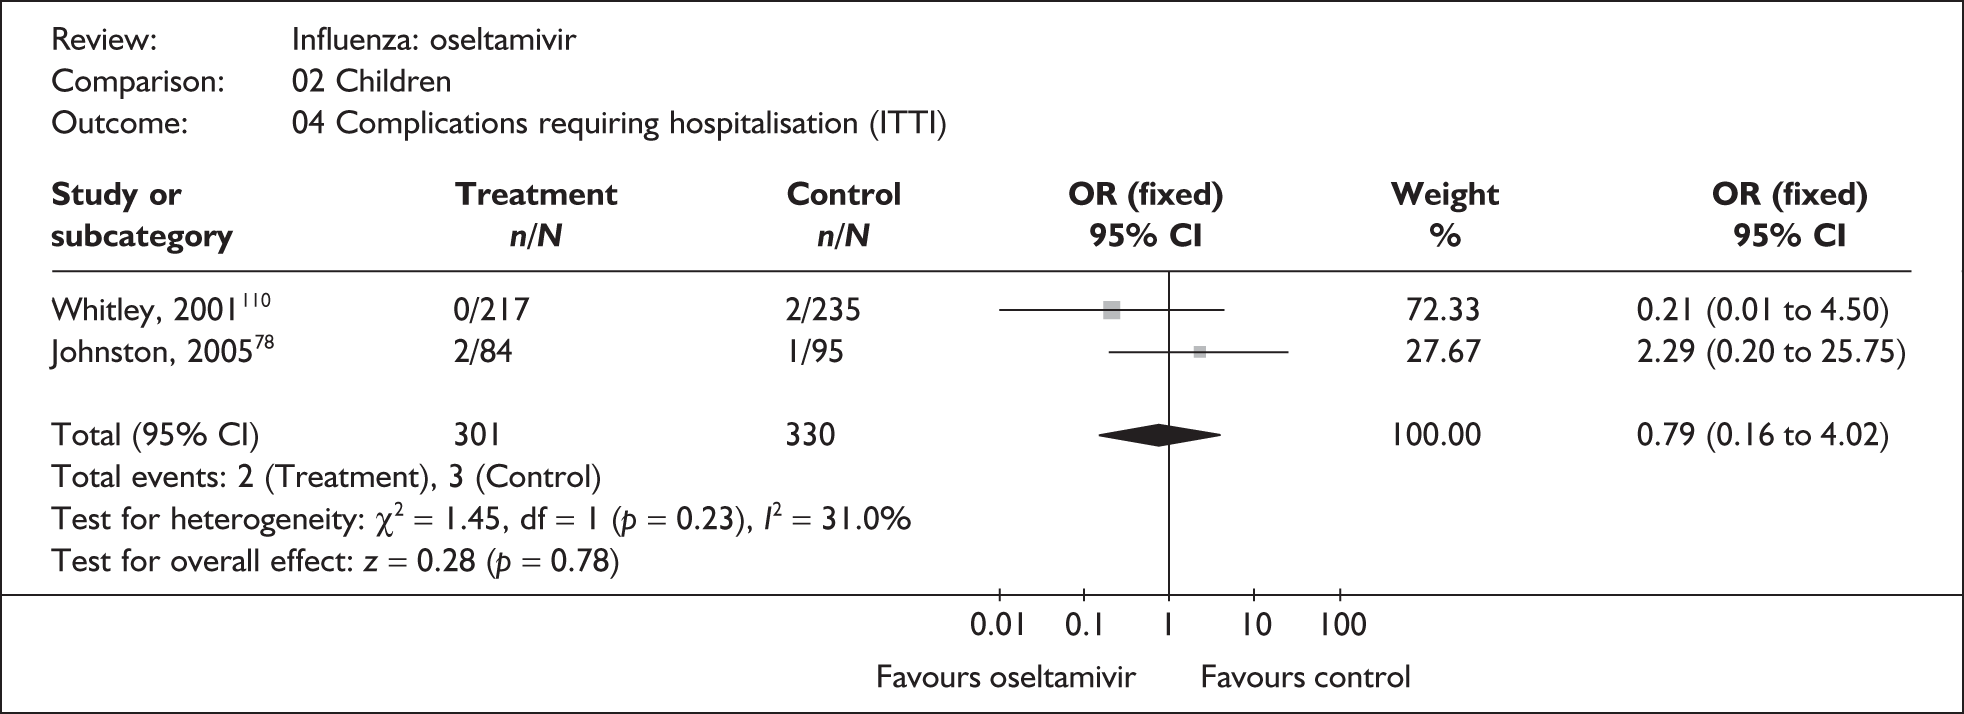
Elderly
FIGURE 77.
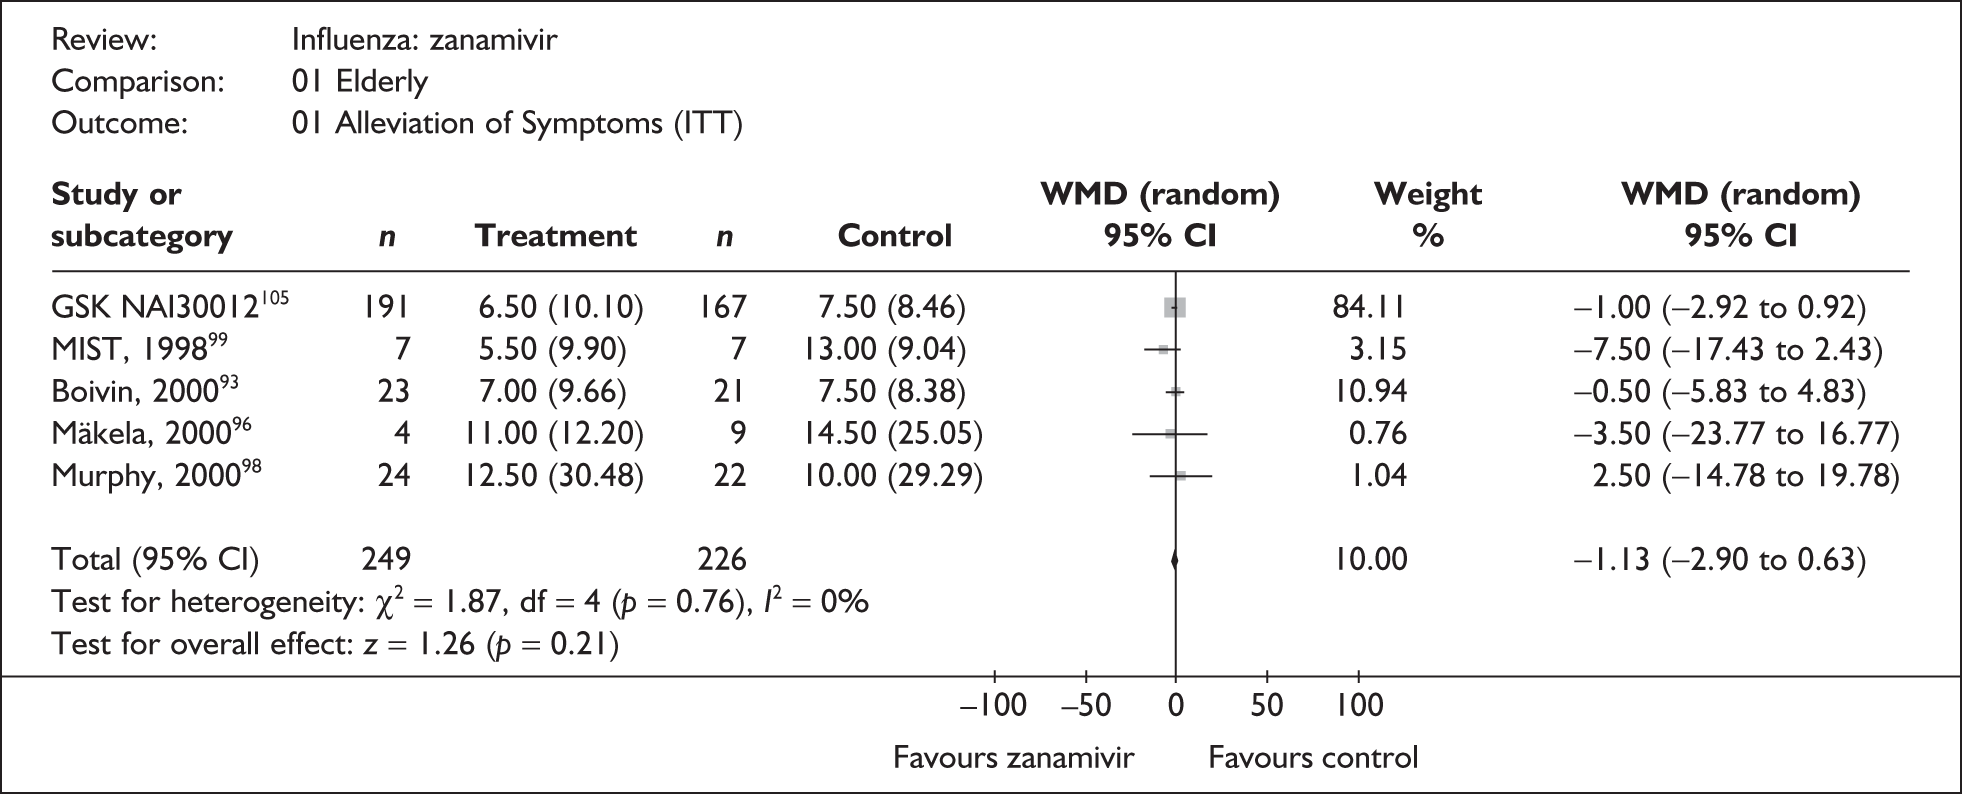
FIGURE 78.
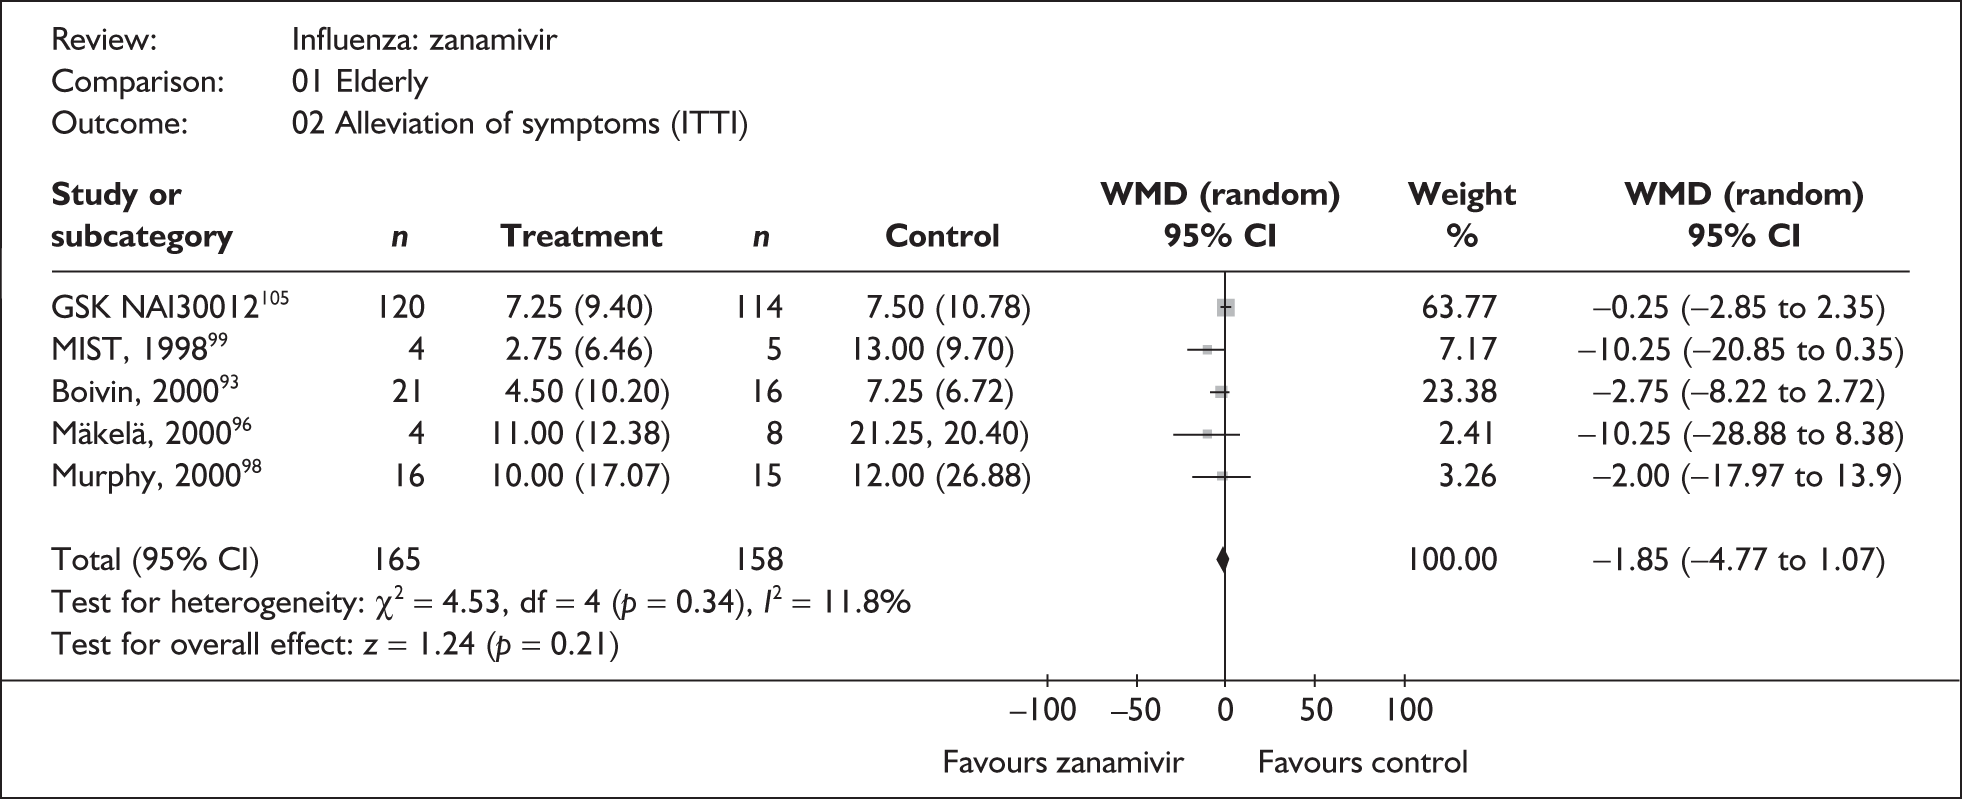
FIGURE 79.
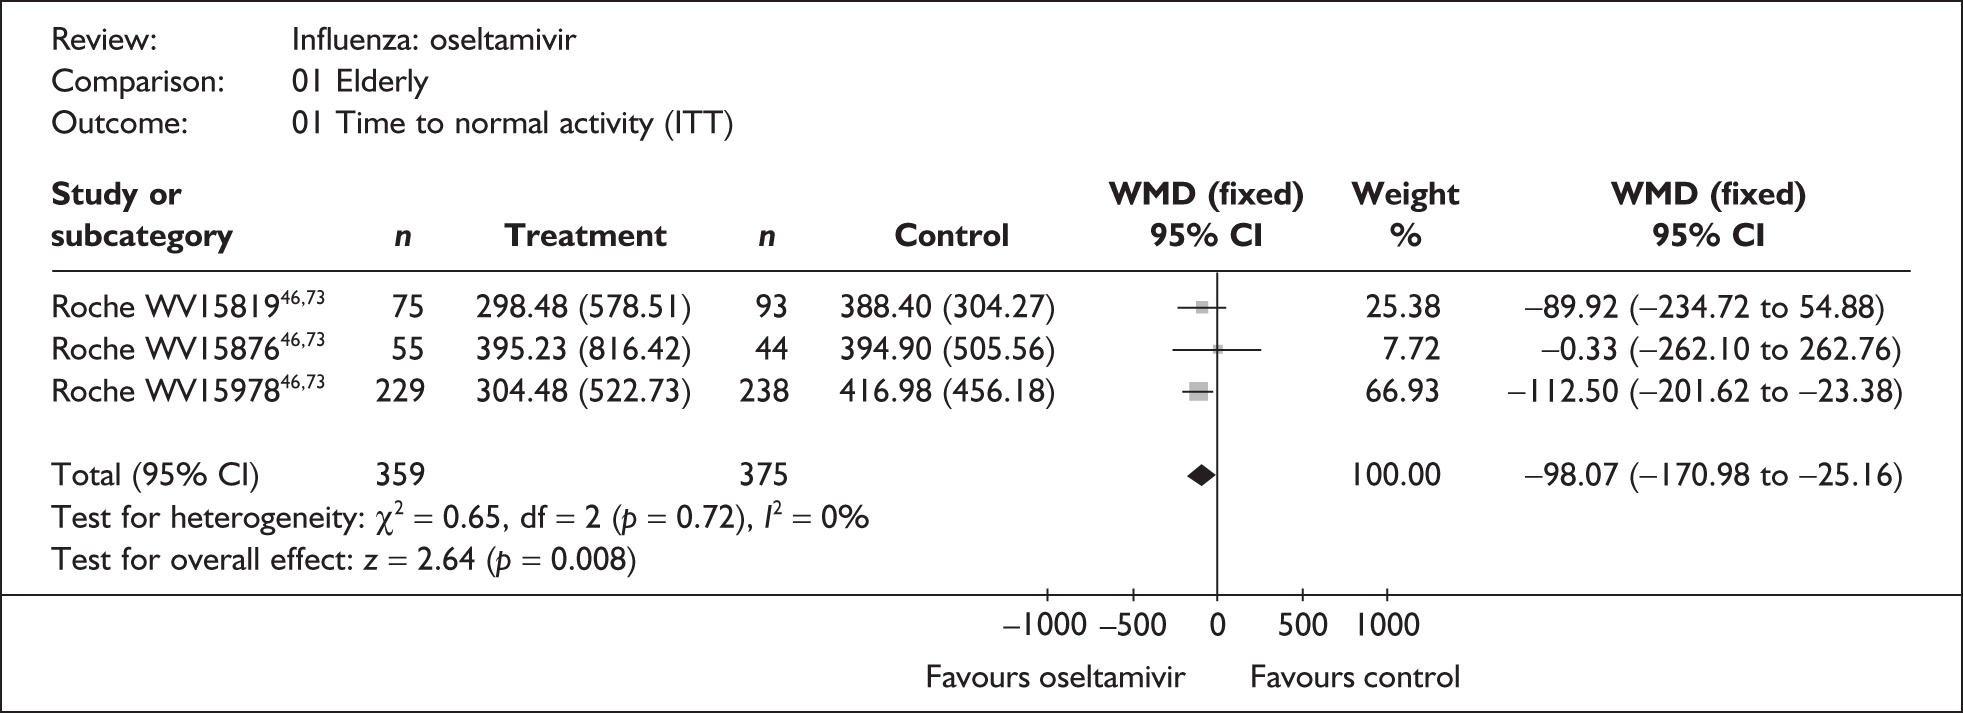
FIGURE 80.

Appendix 7 Bayesian multi-parameter evidence synthesis with indirect comparisons
winbugs model
Results of Bayesian multi-parameter evidence synthesis with indirect comparisons – excluding at-risk children data
| Subgroup | Treatment | Probability ‘best’ | Median (95% CrI) |
Mean (95% CrI) |
|---|---|---|---|---|
| Healthy adults | Placebo | 0.00 | 5.50 (1.99 to 12.24) | 9.89 (3.60 to 22.12) |
| Zanamivir | 0.06 | 5.01 (1.80 to 11.15) | 9.03 (3.25 to 20.22) | |
| Oseltamivir | 0.94 | 4.44 (1.60 to 9.93) | 7.99 (2.88 to 17.91) | |
| At-risk | Placebo | 0.00 | 8.87 (3.13 to 20.08) | 15.96 (5.60 to 36.14) |
| Zanamivir | 0.92 | 7.23 (2.55 to 16.39) | 13.01 (4.55 to 29.46) | |
| Oseltamivir | 0.08 | 8.36 (2.9 to 19.05) | 15.04 (5.17 to 34.29) | |
| Healthy children | Placebo | 0.00 | 3.82 (1.20 to 9.20) | 6.87 (2.16 to 16.42) |
| Zanamivir | 0.75 | 2.94 (0.91 to 7.13) | 5.29 (1.65 to 12.85) | |
| Oseltamivir | 0.25 | 3.21 (0.98 to 7.78) | 5.78 (1.78 to 14.04) |
| Subgroup | Treatment | Difference in symptom duration | |
|---|---|---|---|
| Median (95% CrI) |
Mean (95% CrI) |
||
| Healthy adults | Zanamivir vs placebo | –0.48 (–1.3 0 to –0.06) | –0.87 (–2.3 5 to –0.10) |
| Oseltamivir vs placebo | –1.06 (–2.5 8 to –0.27) | –1.91 (–4.6 5 to –0.50) | |
| Zanamivir vs oseltamivir | 0.58 (–0.14 to 1.75) | 1.04 (–0.26 to 3.17) | |
| At-risk | Zanamivir vs placebo | –1.64 (–4.1 9 to –0.40) | –2.95 (–7.6 0 to –0.71) |
| Oseltamivir vs placebo | –0.51 (–2.28 to 0.86) | –0.92 (–4.10 to 1.55) | |
| Zanamivir vs oseltamivir | –1.13 (–3.73 to 0.39) | –2.03 (–6.77 to 0.70) | |
| Healthy children | Zanamivir vs placebo | –0.88 (–2.3 6 to –0.17) | –1.58 (–4.2 7 to –0.31) |
| Oseltamivir vs placebo | –0.60 (–1.82 to 0.02) | –1.09 (–3.25 to 0.03) | |
| Zanamivir vs oseltamivir | –0.27 (–1.41 to 0.56) | –0.49 (–2.55 to 1.00) | |
| Subgroup | Treatment | Probability ‘best’ | Median (95% CrI) |
Mean (95% CrI) |
|---|---|---|---|---|
| Healthy adults | Placebo | 0.00 | 5.27 (2.57 to 9.64) | 8.77 (4.30 to 16.19) |
| Zanamivir | 0.06 | 4.58 (2.23 to 8.41) | 7.63 (3.72 to 14.13) | |
| Oseltamivir | 0.94 | 4.11 (2.00 to 7.58) | 6.84 (3.33 to 12.65) | |
| At-risk | Placebo | 0.00 | 8.75 (4.22 to 16.34) | 14.58 (7.02 to 27.26) |
| Zanamivir | 0.95 | 6.57 (3.15 to 12.32) | 10.93 (5.21 to 20.53) | |
| Oseltamivir | 0.05 | 7.78 (3.66 to 14.70) | 12.95 (6.12 to 24.59) | |
| Healthy children | Placebo | 0.00 | 5.83 (2.45 to 11.65) | 9.71 (4.09 to 19.53) |
| Zanamivir | 0.40 | 4.49 (1.88 to 9.04) | 7.48 (3.11 to 15.16) | |
| Oseltamivir | 0.60 | 4.34 (1.79 to 8.82) | 7.23 (2.99 to 14.70) |
| Subgroup | Treatment | Difference in symptom duration | |
|---|---|---|---|
| Median (95% CrI) |
Mean (95% CrI) |
||
| Healthy adults | Zanamivir vs placebo | –0.68 (–1.4 3 to –0.23) | –1.14 (–2.3 9 to –0.39) |
| Oseltamivir vs placebo | –1.16 (–2.2 7 to –0.48) | –1.93 (–3.8 0 to –0.81) | |
| Zanamivir vs oseltamivir | 0.47 (–0.12 to 1.27) | 0.79 (–0.20 to 2.13) | |
| At-risk | Zanamivir vs placebo | –2.19 (–4.4 4 to –0.87) | –3.64 (–7.4 4 to –1.44) |
| Oseltamivir vs placebo | –0.98 (–2.68 to 0.30) | –1.62 (–4.48 to 0.5) | |
| Zanamivir vs oseltamivir | –1.21 (–3.37 to 0.27) | –2.02 (–5.64 to 0.44) | |
| Healthy children | Zanamivir vs placebo | –1.34 (–3.0 7 to –0.33) | –2.23 (–5.1 3 to –0.55) |
| Oseltamivir vs placebo | –1.49 (–3.3 2 to –0.46) | –2.47 (–5.5 5 to –0.76) | |
| Zanamivir vs oseltamivir | 0.15 (–1.01 to 1.53) | 0.24 (–1.68 to 2.55) | |
| Subgroup | Treatment | Probability ‘best’ | Median (95% CrI) |
Mean (95% CrI) |
|---|---|---|---|---|
| Healthy adults | Placebo | 0.00 | 6.49 (2.22 to 14.92) | 11.69 (3.97 to 27.09) |
| Zanamivir | 0.06 | 5.92 (2.02 to 13.74) | 10.67 (3.61 to 24.77) | |
| Oseltamivir | 0.94 | 5.24 (1.79 to 12.12) | 9.44 (3.19 to 22.09) | |
| At-risk | Placebo | 0.00 | 10.46 (3.49 to 24.47) | 18.85 (6.26 to 44.23) |
| Zanamivir | 0.92 | 8.53 (2.85 to 20.03) | 15.36 (5.09 to 36.07) | |
| Oseltamivir | 0.08 | 9.86 (3.25 to 23.19) | 17.77 (5.84 to 41.71) | |
| Healthy children | Placebo | 0.00 | 4.51 (1.32 to 11.20) | 8.12 (2.39 to 20.25) |
| Zanamivir | 0.75 | 3.47 (1.02 to 8.75) | 6.25 (1.84 to 15.66) | |
| Oseltamivir | 0.25 | 3.80 (1.09 to 9.51) | 6.83 (1.97 to 17.22) |
| Subgroup | Treatment | Difference in symptom duration | |
|---|---|---|---|
| Median (95% CrI) |
Mean (95% CrI) |
||
| Healthy adults | Zanamivir vs placebo | –0.57 (–1.5 9 to –0.07) | –1.03 (–2.8 7 to –0.12) |
| Oseltamivir vs placebo | –1.25 (–3.1 3 to –0.31) | –2.26 (–5.6 7 to –0.55) | |
| Zanamivir vs oseltamivir | 0.68 (–0.17 to 2.12) | 1.23 (–0.31 to 3.85) | |
| At-risk | Zanamivir vs placebo | –1.64 (–4.1 9 to –0.40) | –2.95 (–7.6 0 to –0.71) |
| Oseltamivir vs placebo | –0.60 (–2.73 to 1.00) | –1.08 (–4.90 to 1.82) | |
| Zanamivir vs oseltamivir | –1.33 (–4.45 to 0.45) | –2.4 (–8.09 to 0.81) | |
| Healthy children | Zanamivir vs placebo | –1.04 (–2.8 9 to –0.19) | –1.87 (–5.2 5 to –0.34) |
| Oseltamivir vs placebo | –0.71 (–2.18 to 0.02) | –1.28 (–3.92 to 0.03) | |
| Zanamivir vs oseltamivir | –0.33 (–1.7 to 0.66) | –0.59 (–3.07 to 1.19) | |
| Subgroup | Treatment | Probability ‘best’ | Median (95% CrI) |
Mean (95% CrI) |
|---|---|---|---|---|
| Healthy adults | Placebo | 0.00 | 6.82 (3.08 to 13.13) | 11.37 (5.09 to 21.99) |
| Zanamivir | 0.06 | 5.94 (2.67 to 11.37) | 9.90 (4.44 to 19.19) | |
| Oseltamivir | 0.94 | 5.32 (2.39 to 10.25) | 8.87 (3.96 to 17.17) | |
| At-risk | Placebo | 0.00 | 11.34 (5.11 to 22.24) | 18.91 (8.41 to 37.29) |
| Zanamivir | 0.95 | 8.51 (3.75 to 16.62) | 14.18 (6.27 to 27.95) | |
| Oseltamivir | 0.05 | 10.08 (4.43 to 20.13) | 16.80 (7.31 to 33.59) | |
| Healthy children | Placebo | 0.00 | 7.56 (2.96 to 15.86) | 12.60 (4.89 to 26.55) |
| Zanamivir | 0.40 | 5.82 (2.24 to 12.32) | 9.70 (3.71 to 20.61) | |
| Oseltamivir | 0.60 | 5.63 (2.16 to 11.93) | 9.39 (3.59 to 19.96) |
| Subgroup | Treatment | Difference in symptom duration | |
|---|---|---|---|
| Median (95% CrI) |
Mean (95% CrI) |
||
| Healthy adults | Zanamivir vs placebo | –0.89 (–1.9 4 to –0.28) | –1.48 (–3.2 5 to –0.47) |
| Oseltamivir vs placebo | –1.50 (–3. 1 to –0.58) | –2.50 (–5.1 8 to –0.97) | |
| Zanamivir vs oseltamivir | 0.61 (–0.15 to 1.72) | 1.02 (–0.25 to 2.88) | |
| At-risk | Zanamivir vs placebo | –2.19 (–4.4 4 to –0.87) | –3.64 (–7.4 4 to –1.44) |
| Oseltamivir vs placebo | –1.26 (–3.65 to 0.38) | –2.10 (–6.04 to 0.64) | |
| Zanamivir vs oseltamivir | –1.57 (–4.50 to 0.34) | –2.62 (–7.56 to 0.56) | |
| Healthy children | Zanamivir vs placebo | –1.74 (–4.1 4 to –0.41) | –2.89 (–6.9 2 to –0.68) |
| Oseltamivir vs placebo | –1.93 (–4.4 4 to –0.55) | –3.21 (–7.4 3 to –0.92) | |
| Zanamivir vs oseltamivir | 0.19 (–1.35 to 2.00) | 0.32 (–2.24 to 3.35) | |
Appendix 8 Literature review of utility scores for influenza
| Study details | Method | Health state | Source | Results | Utility decrements |
|---|---|---|---|---|---|
| Burls et al. (2002)131 | EQ-5D |
(i) Influenza (ii) No influenza |
Experts: authors’ assumptions |
(i) 0.516 (ii) 0.8 |
0.284 |
| Griffin et al. (2001)132 | EQ-5D |
(i) Normal health (ii) Influenza (during whole illness) (iii) Influenza (on worst day) |
Patients: sample of 21 retrospectively self-assessed patients aged 18+ years influenza-positive during previous influenza season from a UK GP database Experts (cross-check not used in analysis): panel of eight UK GPs completed questionnaires on a hypothetical influenza-positive at-risk patient |
(i) 0.817 (patients), 0.72 (experts) (ii) –0.066 (patients), –0.263 (experts) (iii) –0.342 (patients), not collected (experts) |
(i–ii) 0.883 (patients), 0.982 (experts) (i–iii) 1.159 (patients) |
| Inonue et al. (2005)134 | EQ-5D |
(i) Influenza symptoms (ii) No influenza symptoms |
Patients: taken from a published Japanese study. |
(i) –0.066 (ii) 0.817 |
0.883 |
| Rothberg et al. (2003a)141 | EQ-5D |
(i) No QoL reduction (ii) QoL reduction due to influenza (iii) Complete QoL loss |
Patients: daily QoL reductions taken from Griffin et al. (2001) |
(i) 0 (ii) –0.883 (iii) –1 |
0.883 |
| Rothberg et al. (2005)143 | EQ-5D |
(i) No QoL reduction (ii) QoL reduction due to influenza (iii) Complete QoL loss |
Patients: daily QoL reductions taken from unpublished data from children enrolled in zanamivir RCTs |
(i) 0 (ii) –0.68 (iii) –1 |
0.68 |
| Husereau et al. (2002)133 | HUI-3 |
(i) No influenza (ii) Influenza (outpatient) (iii) Influenza (inpatient) (iv) Death |
Public: sample of 11 self-assessed healthy adults |
(i) 1 (ii) 0.636 (iii) 0.35 (+5 extra hospital days) (iv) 0 |
(i)-(ii) 0.364 (i)-(iii) 0.65 |
| Rothberg et al. (2003b)142 | HUI-3 |
(i) Full health (ii) Influenza |
Patients: retrospectively collected from a sample of 15 working age patients and health-care workers with a history of influenza |
(i) 1 (ii) 0.25 |
0.75 |
| Mauskopf et al. (2000)137 | QWB |
(i) Influenza symptoms (ii) No influenza symptoms |
Experts: authors’ assumptions |
(i) 0.5579 (ii) 1 |
0.4421 |
| Muenning and Khan (2001)204 | QWB (base case), HUI-2 (sensitivity analysis) | (i) Influenza | Public: taken from a US health survey of 866 individuals | 0.61 (base case), 0.79 (sensitivity analysis) | 0.39 (base case), 0.21 (sensitivity analysis) |
| Rothberg and Rose (2005)205 | QWB |
(i) Full health (ii) Influenza |
Experts: taken from a published US study and from Muenning and Khan (2001)204 |
(i) 1 (ii) 0.6 |
0.4 |
| Prosser et al. (2005)206 | TTO |
(i) Influenza prevention in own 1-year-old child (ii) Influenza prevention in own 14-year-old child |
Public: telephone interview of sample of 112 adults enrolled in a US health plan asked to trade their own life to prevent influenza in their children |
Undiscounted: (i) 68 days (ii) 86 days Discounted at 3%: (i) 29dys (ii) 41dys |
Not reported |
| O’Brien et al. (2003)138 | VAS |
(i) Worst possible health (ii–viii) Mean daily health during influenza week (ix) Normal health |
Patients: daily QoL self-reported by influenza infection status over 7 days by 2207 (69.69% influenza-positive) otherwise healthy adults aged 16–64 years enrolled into four oseltamivir RCTs | Mean daily utility scores reported by influenza infection status | Mean daily differences reported over 7 days by influenza infection status |
| Roche submission to NICE (2008)128 | VAS |
(i) Full health (ii) ILI (standard care) (iii) ILI (either NI) |
Experts: QoL for standard care was taken from a Dutch study on disability weights Patients: estimated from self-reported valuations collected for 21 days alongside Roche oseltamivir RCTs |
(i) 1 (ii) 0.811 (iii) 0.904 |
(i–ii) 0.189 (i–iii) 0.096 |
| Sander et al. (2004)144 | 3 11-point VAS |
(i) Full health (ii) Influenza |
Experts: taken from a Dutch study on disability weights |
(i) 1 (ii) 0.84 |
0.16 |
| Sander et al. (2005)145 | 3 11-point VAS |
(i) Full health (ii) ILI (standard care) (iii) ILI (oseltamivir) (iv) ILI (zanamivir) |
Experts: QoL for no-treatment was taken from a Dutch study on disability weights Patients: estimated from self-reported valuations collected for 9 days alongside Roche oseltamivir RCTs |
(i) 1 (ii) 0.84 (iii) 0.94 (iv) 0.94 |
(i–ii) 0.16 (i–iii) 0.06 (i–iv) 0.06 |
| Turner et al. (2003)46 | VAS |
(i) 21/7 days no treatment (ii) 21/7 days zanamivir (iii) 21/7 days oseltamivir (iv) 21/7 days amantadine |
Patients: estimated from self-reported valuations collected for 21 days (base case) and 7 days (sensitivity analysis) from 1336 patients enrolled in eight oseltamivir RCTs |
(i) 0.043/0.009 (adults), 0.028/0.006 (at risk), 0.043/0.009 (children) (ii) 0.045/0.01 (adults), 0.031/0.007 (at risk), 0.044/0.01 (children) (iii) 0.045/0.01 (adults), 0.03/0.007 (at risk), 0.045/0.01 (children) |
Mean daily differences reported over 21 days by at-risk status |
| Demicheli et al. (2000)207 | Category rating combined with TTO |
(i) Influenza and nausea (ii) Full health |
Public: sample of 40 British Army soldiers |
(i) –0.95 (ii) 1 |
1.05 |
| Vindt Holm et al. (2004)148 | EQ-5D combined with PTO and 3 11-point VAS |
(i) Influenza (standard care) (ii) Influenza (oseltamivir) |
Experts: QoL weights were taken from Dutch study on disability weights | Mean daily utility scores reported over 21 days | Mean daily differences reported over 21 days |
| Smith and Roberts (2002)147 | Unspecified |
(i) Well health (25–54 years) (ii) Well health (men aged 55–64 years) (iii) Well health (women aged 55–64 years) (iv) Well health (65+ years) (v) Influenza (treated) (vi) Influenza (untreated) (vii) Non-influenza illness |
Public: age-adjusted QoL scores for good health were derived from a US population health survey; QoL for untreated influenza and non-influenza illness were obtained from generic US population-based values Patients: symptoms reduction rate, estimated at 38% from an oseltamivir RCT, was applied to illness disutility to obtain QoL for influenza (treated) |
(i) 0.92 (ii) 0.92 (iii) 0.84 (iv) 0.84 (v) 0.783 (vi) 0.65 (vii) 0.65 |
(i)/(ii–v) 0.137 (i)/(ii–vi) 0.27 (i)/(ii–vii) 0.27 (iii)/(iv–v) 0.057 (iii)/(iv–vi) 0.19 (iii)/(iv–vii) 0.19 |
Appendix 9 Detailed economic model inputs
| No. | Population | Treatment | Distribution | Mean | SE | α | β |
|---|---|---|---|---|---|---|---|
| Probability ILI is influenza | |||||||
| Baseline probability ILI is influenza | |||||||
| 1. | Children | N/A | Simulation output | 0.5643 | winbugs analysis | ||
| 2. | Adults and elderly | N/A | Simulation output | 0.4107 | winbugs analysis | ||
| Probability of complication | |||||||
| Baseline probability of complication | |||||||
| 3. | Healthy children | N/A | Beta | 0.1344 | N/A | 2311 | 14890 |
| 4. | At-risk children | N/A | Beta | 0.1759 | N/A | 650 | 3045 |
| 5. | Healthy adults | N/A | Beta | 0.0755 | N/A | 6437 | 78811 |
| 6. | At-risk adults | N/A | Beta | 0.1217 | N/A | 2142 | 15455 |
| 7. | Elderly | N/A | Beta | 0.1092 | N/A | 1917 | 15635 |
| Relative risk of complication | |||||||
| 8. | Healthy children | Oseltamivir | Log-normal | 0.3603 | 0.5554 | N/A | N/A |
| 9. | Healthy children | Zanamivir | Log-normal | 0.4386 | 0.5694 | N/A | N/A |
| 10. | Healthy adults | Oseltamivir | Log-normal | 0.3629 | 0.6085 | N/A | N/A |
| 11. | Healthy adults | Zanamivir | Log-normal | 0.4139 | 0.5909 | N/A | N/A |
| 12. | All at-risk groups | Oseltamivir | Log-normal | 0.4064 | 0.5390 | N/A | N/A |
| 13. | All at-risk groups | Zanamivir | Log-normal | 0.4241 | 0.5952 | N/A | N/A |
| Probability of RTI complication given patient has complication | |||||||
| 14. | Healthy children | N/A | Dirichlet | 0.7021 | N/A | 1697 | 720 |
| 15. | At-risk children | N/A | Dirichlet | 0.7704 | N/A | 520 | 155 |
| 16. | Healthy adults | N/A | Dirichlet | 0.8656 | N/A | 5636 | 875 |
| 17. | At-risk adults | N/A | Dirichlet | 0.8961 | N/A | 1941 | 225 |
| 18. | Elderly | N/A | Dirichlet | 0.8530 | N/A | 1573 | 271 |
| Probability of cardiovascular complication given patient has complication | |||||||
| 19. | Healthy children | N/A | Dirichlet | 0.0000 | N/A | 0 | 2417 |
| 20. | At-risk children | N/A | Dirichlet | 0.0000 | N/A | 0 | 675 |
| 21. | Healthy adults | N/A | Dirichlet | 0.0017 | N/A | 11 | 6500 |
| 22. | At-risk adults | N/A | Dirichlet | 0.0134 | N/A | 29 | 2137 |
| 23. | Elderly | N/A | Dirichlet | 0.0369 | N/A | 68 | 1776 |
| Probability of CNS complication given patient has complication | |||||||
| 24. | Healthy children | N/A | Dirichlet | 0.0070 | N/A | 17 | 2400 |
| 25. | At-risk children | N/A | Dirichlet | 0.0000 | N/A | 0 | 675 |
| 26. | Healthy adults | N/A | Dirichlet | 0.0155 | N/A | 101 | 6410 |
| 27. | At-risk adults | N/A | Dirichlet | 0.0069 | N/A | 15 | 2151 |
| 28. | Elderly | N/A | Dirichlet | 0.0239 | N/A | 44 | 1800 |
| Probability of renal complication given patient has complication | |||||||
| 29. | Healthy children | N/A | Dirichlet | 0.0008 | N/A | 2 | 2415 |
| 30. | At-risk children | N/A | Dirichlet | 0.0000 | N/A | 0 | 675 |
| 31. | Healthy adults | N/A | Dirichlet | 0.0014 | N/A | 9 | 6502 |
| 32. | At-risk adults | N/A | Dirichlet | 0.0023 | N/A | 5 | 2161 |
| 33. | Elderly | N/A | Dirichlet | 0.0092 | N/A | 17 | 1827 |
| Probability of ‘other’ complication given patient has complication | |||||||
| 34. | Healthy children | N/A | Dirichlet | 0.2900 | N/A | 701 | 1716 |
| 35. | At-risk children | N/A | Dirichlet | 0.2296 | N/A | 155 | 520 |
| 36. | Healthy adults | N/A | Dirichlet | 0.1158 | N/A | 754 | 5757 |
| 37. | At-risk adults | N/A | Dirichlet | 0.0813 | N/A | 176 | 1990 |
| 38. | Elderly | N/A | Dirichlet | 0.0770 | N/A | 142 | 1702 |
| Probability of bronchitis given patient has RTI complication | |||||||
| 39. | Healthy children | N/A | Dirichlet | 0.0701 | N/A | 113 | 1499 |
| 40. | At-risk children | N/A | Dirichlet | 0.0633 | N/A | 21 | 311 |
| 41. | Healthy adults | N/A | Dirichlet | 0.1916 | N/A | 1057 | 4461 |
| 42. | At-risk adults | N/A | Dirichlet | 0.2613 | N/A | 370 | 1046 |
| 43. | Elderly | N/A | Dirichlet | 0.3446 | N/A | 529 | 1006 |
| Probability of pneumonia given patient has RTI complication | |||||||
| 44. | Healthy children | N/A | Dirichlet | 0.0180 | N/A | 29 | 1583 |
| 45. | At-risk children | N/A | Dirichlet | 0.0271 | N/A | 9 | 323 |
| 46. | Healthy adults | N/A | Dirichlet | 0.0430 | N/A | 237 | 5281 |
| 47. | At-risk adults | N/A | Dirichlet | 0.0438 | N/A | 62 | 1354 |
| 48. | Elderly | N/A | Dirichlet | 0.1322 | N/A | 203 | 1332 |
| Probability of upper RTI given patient has RTI complication | |||||||
| 49. | Healthy children | N/A | Dirichlet | 0.9119 | N/A | 1470 | 142 |
| 50. | At-risk children | N/A | Dirichlet | 0.9096 | N/A | 302 | 30 |
| 51. | Healthy adults | N/A | Dirichlet | 0.7655 | N/A | 4224 | 1294 |
| 52. | At-risk adults | N/A | Dirichlet | 0.6949 | N/A | 984 | 432 |
| 53. | Elderly | N/A | Dirichlet | 0.5231 | N/A | 803 | 732 |
| Probability of otitis media given patient has ‘other’ complication | |||||||
| 54. | Healthy children | N/A | Beta | 0.9757 | N/A | 684 | 17 |
| 55. | At-risk children | N/A | Beta | 0.9871 | N/A | 153 | 2 |
| 56. | Healthy adults | N/A | Beta | 0.6649 | N/A | 500 | 252 |
| 57. | At-risk adults | N/A | Beta | 0.6250 | N/A | 110 | 66 |
| 58. | Elderly | N/A | Beta | 0.2162 | N/A | 32 | 116 |
| Proportion of influenza and RSV deaths attributable to influenza (used to weigh probability of complication in scenario 11) | |||||||
| 59. | Children | N/A | Beta | 0.6579 | N/A | 25 | 13 |
| 60. | Adults | N/A | Beta | 0.8011 | N/A | 733 | 182 |
| 61. | Elderly | N/A | Beta | 0.7542 | N/A | 7326 | 2388 |
| Probability of antibiotics | |||||||
| Baseline probability of antibiotics given patient has no complication or a non-RTI complication | |||||||
| 62. | Children | N/A | Beta | 0.2790 | N/A | 4997 | 12913.39 |
| 63. | Adults | N/A | Beta | 0.4200 | N/A | 39622 | 54716.10 |
| 64. | Elderly | N/A | Beta | 0.5470 | N/A | 8554 | 7084.03 |
| Baseline probability of antibiotics given patient has RTI complication | |||||||
| 65. | Children | N/A | Beta | 0.7370 | N/A | 2183 | 779.01 |
| 66. | Adults | N/A | Beta | 0.8140 | N/A | 6983 | 1595.62 |
| 67. | Elderly | N/A | Beta | 0.7970 | N/A | 1527 | 388.93 |
| Probability of hospitalisation | |||||||
| Baseline probability of hospitalisation given patient has RTI complication | |||||||
| 68. | Healthy children and adults | N/A | Beta | 0.1087 | N/A | 5 | 41 |
| 69. | All at-risk groups | N/A | Beta | 0.1579 | N/A | 15 | 80 |
| Baseline probability of stay in ICU given patient has pneumonia | |||||||
| 70. | All populations | N/A | Beta | 0.0486 | N/A | 22 | 431 |
| Probability of mortality | |||||||
| Baseline probability of mortality given patient has complication | |||||||
| 71. | Healthy children | N/A | Fixed | 0.0000 | N/A | N/A | N/A |
| 72. | At-risk children | N/A | Beta | 0.0015 | N/A | 1 | 649 |
| 73. | Healthy adults | N/A | Beta | 0.0051 | N/A | 33 | 6404 |
| 74. | At-risk adults | N/A | Beta | 0.0075 | N/A | 16 | 2126 |
| 75. | Elderly | N/A | Beta | 0.1168 | N/A | 224 | 1693 |
| Cost of treatment | |||||||
| Baseline cost of treatment | |||||||
| 76. | All populations | Usual care | Fixed | £0.00 | N/A | N/A | N/A |
| 77. | All populations | Oseltamivir | Fixed | £16.36 | N/A | N/A | N/A |
| 78. | All populations | Zanamivir | Fixed | £16.36 | N/A | N/A | N/A |
| Cost of GP visit | |||||||
| Baseline cost of GP visit | |||||||
| 79. | Children and adults | N/A | Fixed | £31.26 | N/A | N/A | N/A |
| 80. | Elderly | N/A | Fixed | £34.50 | N/A | N/A | N/A |
| Cost of hospitalisation | |||||||
| Length of inpatient stay for bronchitis (days) | |||||||
| 81. | Children | N/A | Fixed | 2.4664 | N/A | N/A | N/A |
| 82. | Adults | N/A | Fixed | 2.5077 | N/A | N/A | N/A |
| 83. | Elderly | N/A | Fixed | 6.5828 | N/A | N/A | N/A |
| Length of inpatient stay for pneumonia (days) | |||||||
| 84. | Children | N/A | Fixed | 2.9292 | N/A | N/A | N/A |
| 85. | Adults | N/A | Fixed | 7.4115 | N/A | N/A | N/A |
| 86. | Elderly | N/A | Fixed | 14.5126 | N/A | N/A | N/A |
| Length of inpatient stay for upper RTI (days) | |||||||
| 87. | Children | N/A | Fixed | 2.1467 | N/A | N/A | N/A |
| 88. | Adults | N/A | Fixed | 3.7665 | N/A | N/A | N/A |
| 89. | Elderly | N/A | Fixed | 11.4650 | N/A | N/A | N/A |
| Length of inpatient stay for ICU (days) | |||||||
| 90. | All populations | N/A | Fixed | 28 | N/A | N/A | N/A |
| Cost per diem for bronchitis | |||||||
| 91. | All populations | N/A | Fixed | £175.00 | N/A | N/A | N/A |
| Cost per diem for pneumonia | |||||||
| 92. | All populations | N/A | Fixed | £166.00 | N/A | N/A | N/A |
| Cost per diem for URTI | |||||||
| 93. | All populations | N/A | Fixed | £182.00 | N/A | N/A | N/A |
| Cost per diem for ICU | |||||||
| 94. | All populations | N/A | Fixed | £1345.39 | N/A | N/A | N/A |
| Cost of antibiotics | |||||||
| Cost of antibiotics given patient has no complication or a non-RTI complication | |||||||
| 95. | Children | N/A | Fixed | £0.21 | N/A | N/A | N/A |
| 96. | Adults and elderly | N/A | Fixed | £0.46 | N/A | N/A | N/A |
| Cost of antibiotics given patient has RTI complication | |||||||
| 97. | Children | N/A | Fixed | £2.39 | N/A | N/A | N/A |
| 98. | Healthy adults | N/A | Fixed | £3.71 | N/A | N/A | N/A |
| 99. | At-risk adults and elderly | N/A | Fixed | £5.66 | N/A | N/A | N/A |
| Utility decrement from complications | |||||||
| Utility decrement resulting from bronchitis, URTI, CNS and renal complications, otitis media and GI bleeding | |||||||
| 100. | All populations | N/A | Fixed | 0.15 | N/A | N/A | N/A |
| Utility decrement resulting from pneumonia | |||||||
| 101. | All populations | N/A | Fixed | 0.25 | N/A | N/A | N/A |
| Utility decrement resulting from cardiovascular complication | |||||||
| 102. | All populations | N/A | Fixed | 0.37 | N/A | N/A | N/A |
| Utility decrement from ICU stay | |||||||
| Utility decrement resulting from ICU stay (applicable for period of illness) | |||||||
| 103. | All populations | N/A | Fixed | 0.13 | N/A | N/A | N/A |
Appendix 10 winbugs model to estimate the probability that an ILI is influenza
List of abbreviations
- BNF
- British National Formulary
- CDC
- Centers for Disease Control and Prevention
- CDSC
- Communicable Disease Surveillance Centre
- CEAC
- cost-effectiveness acceptability curve
- CENTRAL
- Cochrane Central Register of Controlled Trials
- CHE
- Centre for Health Economics
- CI
- confidence interval
- CNS
- central nervous system
- COAD
- chronic obstructive airways disease
- CRD
- Centre for Reviews and Dissemination
- CrI
- credibility interval
- DARE
- Database of Abstracts of Reviews of Effects
- DH
- Department of Health
- DRG
- diagnosis-related group
- ECDC
- European Centre for Disease Prevention and Control
- ED
- extendedly dominated
- EISS
- European Influenza Surveillance Scheme
- ELISA
- enzyme-linked immunosorbent assay
- EQ-5D
- EuroQoL 5-dimension measure of health-related quality of life
- FDA
- Food and Drug Administration
- GCP
- good clinical practice
- GI
- gastrointestinal
- GPRD
- General Practice Research Database
- H1, 2 or 3
- haemagglutinin subtype 1, 2 or 3
- HES
- hospital episodes statistics
- HPA
- Health Protection Agency
- HRG
- Healthcare Resource Group
- HRQoL
- health-related quality of life
- HTA
- Health Technology Assessment
- HUI-3
- Health Utilities Index Mark 3
- ICER
- incremental cost-effectiveness ratio
- ICU
- intensive care unit
- ILI
- influenza-like illness
- ITT
- intention to treat
- ITTI
- intention to treat, infected (those with confirmed influenza)
- ITU
- intensive therapy unit
- MCMC
- Markov Chain Monte Carlo
- MeSH
- medical subject headings in the MEDLINE thesaurus
- MOSA
- Medical Officers of Schools Association
- MVH
- Measurement and Valuation of Health study
- N1 or 2
- neuraminidase subtype 1 or 2
- N/A
- not available
- NAMCS
- National Ambulatory Medical Care Survey
- NI
- neuraminidase inhibitor
- NIC
- National Influenza Centre
- NICE
- National Institute for Health and Clinical Excellence
- NIVEL
- Netherlands Institute of Primary Health Care
- NPHS
- National Public Health Service
- NRR
- National Research Register
- OR
- odds ratio
- Os.
- oseltamivir
- OTC
- over-the-counter
- PCR
- polymerase chain reaction
- Pl.
- placebo
- PSS
- Personal Social Services
- PPV
- positive predictive value
- QALD
- quality-adjusted life-day
- QALE
- quality-adjusted life expectancy
- QALY
- quality-adjusted life-year
- QoL
- quality of life
- QWB
- quality of well-being
- RCGP
- Royal College of General Practitioners
- RCT
- randomised controlled trial
- RNA
- ribonucleic acid
- RSV
- respiratory syncytial virus
- RTI
- respiratory tract infection
- SARS
- severe acute respiratory syndrome
- SAVE
- Simulating Anti-influenza Value and Effectiveness model
- ScHARR
- University of Sheffield School of Health and Related Research
- SPC
- summary of product characteristics
- TA58
- Technology Assessment No. 58
- TPR
- true-positive rate
- TTO
- time trade-off
- VAS
- visual analogue scale
- WHO
- World Health Organization
- WMD
- weighted median difference
- WRS
- weekly returns service
- w.r.t.
- with respect to
All abbreviations that have been used in this report are listed here unless the abbreviation is well known (e.g. NHS), or it has been used only once, or it is a non-standard abbreviation used only in figures/tables/appendices, in which case the abbreviation is defined in the figure legend or in the notes at the end of the table.
Notes
Health Technology Assessment reports published to date
-
Home parenteral nutrition: a systematic review.
By Richards DM, Deeks JJ, Sheldon TA, Shaffer JL.
-
Diagnosis, management and screening of early localised prostate cancer.
A review by Selley S, Donovan J, Faulkner A, Coast J, Gillatt D.
-
The diagnosis, management, treatment and costs of prostate cancer in England and Wales.
A review by Chamberlain J, Melia J, Moss S, Brown J.
-
Screening for fragile X syndrome.
A review by Murray J, Cuckle H, Taylor G, Hewison J.
-
A review of near patient testing in primary care.
By Hobbs FDR, Delaney BC, Fitzmaurice DA, Wilson S, Hyde CJ, Thorpe GH, et al.
-
Systematic review of outpatient services for chronic pain control.
By McQuay HJ, Moore RA, Eccleston C, Morley S, de C Williams AC.
-
Neonatal screening for inborn errors of metabolism: cost, yield and outcome.
A review by Pollitt RJ, Green A, McCabe CJ, Booth A, Cooper NJ, Leonard JV, et al.
-
Preschool vision screening.
A review by Snowdon SK, Stewart-Brown SL.
-
Implications of socio-cultural contexts for the ethics of clinical trials.
A review by Ashcroft RE, Chadwick DW, Clark SRL, Edwards RHT, Frith L, Hutton JL.
-
A critical review of the role of neonatal hearing screening in the detection of congenital hearing impairment.
By Davis A, Bamford J, Wilson I, Ramkalawan T, Forshaw M, Wright S.
-
Newborn screening for inborn errors of metabolism: a systematic review.
By Seymour CA, Thomason MJ, Chalmers RA, Addison GM, Bain MD, Cockburn F, et al.
-
Routine preoperative testing: a systematic review of the evidence.
By Munro J, Booth A, Nicholl J.
-
Systematic review of the effectiveness of laxatives in the elderly.
By Petticrew M, Watt I, Sheldon T.
-
When and how to assess fast-changing technologies: a comparative study of medical applications of four generic technologies.
A review by Mowatt G, Bower DJ, Brebner JA, Cairns JA, Grant AM, McKee L.
-
Antenatal screening for Down’s syndrome.
A review by Wald NJ, Kennard A, Hackshaw A, McGuire A.
-
Screening for ovarian cancer: a systematic review.
By Bell R, Petticrew M, Luengo S, Sheldon TA.
-
Consensus development methods, and their use in clinical guideline development.
A review by Murphy MK, Black NA, Lamping DL, McKee CM, Sanderson CFB, Askham J, et al.
-
A cost–utility analysis of interferon beta for multiple sclerosis.
By Parkin D, McNamee P, Jacoby A, Miller P, Thomas S, Bates D.
-
Effectiveness and efficiency of methods of dialysis therapy for end-stage renal disease: systematic reviews.
By MacLeod A, Grant A, Donaldson C, Khan I, Campbell M, Daly C, et al.
-
Effectiveness of hip prostheses in primary total hip replacement: a critical review of evidence and an economic model.
By Faulkner A, Kennedy LG, Baxter K, Donovan J, Wilkinson M, Bevan G.
-
Antimicrobial prophylaxis in colorectal surgery: a systematic review of randomised controlled trials.
By Song F, Glenny AM.
-
Bone marrow and peripheral blood stem cell transplantation for malignancy.
A review by Johnson PWM, Simnett SJ, Sweetenham JW, Morgan GJ, Stewart LA.
-
Screening for speech and language delay: a systematic review of the literature.
By Law J, Boyle J, Harris F, Harkness A, Nye C.
-
Resource allocation for chronic stable angina: a systematic review of effectiveness, costs and cost-effectiveness of alternative interventions.
By Sculpher MJ, Petticrew M, Kelland JL, Elliott RA, Holdright DR, Buxton MJ.
-
Detection, adherence and control of hypertension for the prevention of stroke: a systematic review.
By Ebrahim S.
-
Postoperative analgesia and vomiting, with special reference to day-case surgery: a systematic review.
By McQuay HJ, Moore RA.
-
Choosing between randomised and nonrandomised studies: a systematic review.
By Britton A, McKee M, Black N, McPherson K, Sanderson C, Bain C.
-
Evaluating patient-based outcome measures for use in clinical trials.
A review by Fitzpatrick R, Davey C, Buxton MJ, Jones DR.
-
Ethical issues in the design and conduct of randomised controlled trials.
A review by Edwards SJL, Lilford RJ, Braunholtz DA, Jackson JC, Hewison J, Thornton J.
-
Qualitative research methods in health technology assessment: a review of the literature.
By Murphy E, Dingwall R, Greatbatch D, Parker S, Watson P.
-
The costs and benefits of paramedic skills in pre-hospital trauma care.
By Nicholl J, Hughes S, Dixon S, Turner J, Yates D.
-
Systematic review of endoscopic ultrasound in gastro-oesophageal cancer.
By Harris KM, Kelly S, Berry E, Hutton J, Roderick P, Cullingworth J, et al.
-
Systematic reviews of trials and other studies.
By Sutton AJ, Abrams KR, Jones DR, Sheldon TA, Song F.
-
Primary total hip replacement surgery: a systematic review of outcomes and modelling of cost-effectiveness associated with different prostheses.
A review by Fitzpatrick R, Shortall E, Sculpher M, Murray D, Morris R, Lodge M, et al.
-
Informed decision making: an annotated bibliography and systematic review.
By Bekker H, Thornton JG, Airey CM, Connelly JB, Hewison J, Robinson MB, et al.
-
Handling uncertainty when performing economic evaluation of healthcare interventions.
A review by Briggs AH, Gray AM.
-
The role of expectancies in the placebo effect and their use in the delivery of health care: a systematic review.
By Crow R, Gage H, Hampson S, Hart J, Kimber A, Thomas H.
-
A randomised controlled trial of different approaches to universal antenatal HIV testing: uptake and acceptability. Annex: Antenatal HIV testing – assessment of a routine voluntary approach.
By Simpson WM, Johnstone FD, Boyd FM, Goldberg DJ, Hart GJ, Gormley SM, et al.
-
Methods for evaluating area-wide and organisation-based interventions in health and health care: a systematic review.
By Ukoumunne OC, Gulliford MC, Chinn S, Sterne JAC, Burney PGJ.
-
Assessing the costs of healthcare technologies in clinical trials.
A review by Johnston K, Buxton MJ, Jones DR, Fitzpatrick R.
-
Cooperatives and their primary care emergency centres: organisation and impact.
By Hallam L, Henthorne K.
-
Screening for cystic fibrosis.
A review by Murray J, Cuckle H, Taylor G, Littlewood J, Hewison J.
-
A review of the use of health status measures in economic evaluation.
By Brazier J, Deverill M, Green C, Harper R, Booth A.
-
Methods for the analysis of quality-of-life and survival data in health technology assessment.
A review by Billingham LJ, Abrams KR, Jones DR.
-
Antenatal and neonatal haemoglobinopathy screening in the UK: review and economic analysis.
By Zeuner D, Ades AE, Karnon J, Brown J, Dezateux C, Anionwu EN.
-
Assessing the quality of reports of randomised trials: implications for the conduct of meta-analyses.
A review by Moher D, Cook DJ, Jadad AR, Tugwell P, Moher M, Jones A, et al.
-
‘Early warning systems’ for identifying new healthcare technologies.
By Robert G, Stevens A, Gabbay J.
-
A systematic review of the role of human papillomavirus testing within a cervical screening programme.
By Cuzick J, Sasieni P, Davies P, Adams J, Normand C, Frater A, et al.
-
Near patient testing in diabetes clinics: appraising the costs and outcomes.
By Grieve R, Beech R, Vincent J, Mazurkiewicz J.
-
Positron emission tomography: establishing priorities for health technology assessment.
A review by Robert G, Milne R.
-
The debridement of chronic wounds: a systematic review.
By Bradley M, Cullum N, Sheldon T.
-
Systematic reviews of wound care management: (2) Dressings and topical agents used in the healing of chronic wounds.
By Bradley M, Cullum N, Nelson EA, Petticrew M, Sheldon T, Torgerson D.
-
A systematic literature review of spiral and electron beam computed tomography: with particular reference to clinical applications in hepatic lesions, pulmonary embolus and coronary artery disease.
By Berry E, Kelly S, Hutton J, Harris KM, Roderick P, Boyce JC, et al.
-
What role for statins? A review and economic model.
By Ebrahim S, Davey Smith G, McCabe C, Payne N, Pickin M, Sheldon TA, et al.
-
Factors that limit the quality, number and progress of randomised controlled trials.
A review by Prescott RJ, Counsell CE, Gillespie WJ, Grant AM, Russell IT, Kiauka S, et al.
-
Antimicrobial prophylaxis in total hip replacement: a systematic review.
By Glenny AM, Song F.
-
Health promoting schools and health promotion in schools: two systematic reviews.
By Lister-Sharp D, Chapman S, Stewart-Brown S, Sowden A.
-
Economic evaluation of a primary care-based education programme for patients with osteoarthritis of the knee.
A review by Lord J, Victor C, Littlejohns P, Ross FM, Axford JS.
-
The estimation of marginal time preference in a UK-wide sample (TEMPUS) project.
A review by Cairns JA, van der Pol MM.
-
Geriatric rehabilitation following fractures in older people: a systematic review.
By Cameron I, Crotty M, Currie C, Finnegan T, Gillespie L, Gillespie W, et al.
-
Screening for sickle cell disease and thalassaemia: a systematic review with supplementary research.
By Davies SC, Cronin E, Gill M, Greengross P, Hickman M, Normand C.
-
Community provision of hearing aids and related audiology services.
A review by Reeves DJ, Alborz A, Hickson FS, Bamford JM.
-
False-negative results in screening programmes: systematic review of impact and implications.
By Petticrew MP, Sowden AJ, Lister-Sharp D, Wright K.
-
Costs and benefits of community postnatal support workers: a randomised controlled trial.
By Morrell CJ, Spiby H, Stewart P, Walters S, Morgan A.
-
Implantable contraceptives (subdermal implants and hormonally impregnated intrauterine systems) versus other forms of reversible contraceptives: two systematic reviews to assess relative effectiveness, acceptability, tolerability and cost-effectiveness.
By French RS, Cowan FM, Mansour DJA, Morris S, Procter T, Hughes D, et al.
-
An introduction to statistical methods for health technology assessment.
A review by White SJ, Ashby D, Brown PJ.
-
Disease-modifying drugs for multiple sclerosis: a rapid and systematic review.
By Clegg A, Bryant J, Milne R.
-
Publication and related biases.
A review by Song F, Eastwood AJ, Gilbody S, Duley L, Sutton AJ.
-
Cost and outcome implications of the organisation of vascular services.
By Michaels J, Brazier J, Palfreyman S, Shackley P, Slack R.
-
Monitoring blood glucose control in diabetes mellitus: a systematic review.
By Coster S, Gulliford MC, Seed PT, Powrie JK, Swaminathan R.
-
The effectiveness of domiciliary health visiting: a systematic review of international studies and a selective review of the British literature.
By Elkan R, Kendrick D, Hewitt M, Robinson JJA, Tolley K, Blair M, et al.
-
The determinants of screening uptake and interventions for increasing uptake: a systematic review.
By Jepson R, Clegg A, Forbes C, Lewis R, Sowden A, Kleijnen J.
-
The effectiveness and cost-effectiveness of prophylactic removal of wisdom teeth.
A rapid review by Song F, O’Meara S, Wilson P, Golder S, Kleijnen J.
-
Ultrasound screening in pregnancy: a systematic review of the clinical effectiveness, cost-effectiveness and women’s views.
By Bricker L, Garcia J, Henderson J, Mugford M, Neilson J, Roberts T, et al.
-
A rapid and systematic review of the effectiveness and cost-effectiveness of the taxanes used in the treatment of advanced breast and ovarian cancer.
By Lister-Sharp D, McDonagh MS, Khan KS, Kleijnen J.
-
Liquid-based cytology in cervical screening: a rapid and systematic review.
By Payne N, Chilcott J, McGoogan E.
-
Randomised controlled trial of non-directive counselling, cognitive–behaviour therapy and usual general practitioner care in the management of depression as well as mixed anxiety and depression in primary care.
By King M, Sibbald B, Ward E, Bower P, Lloyd M, Gabbay M, et al.
-
Routine referral for radiography of patients presenting with low back pain: is patients’ outcome influenced by GPs’ referral for plain radiography?
By Kerry S, Hilton S, Patel S, Dundas D, Rink E, Lord J.
-
Systematic reviews of wound care management: (3) antimicrobial agents for chronic wounds; (4) diabetic foot ulceration.
By O’Meara S, Cullum N, Majid M, Sheldon T.
-
Using routine data to complement and enhance the results of randomised controlled trials.
By Lewsey JD, Leyland AH, Murray GD, Boddy FA.
-
Coronary artery stents in the treatment of ischaemic heart disease: a rapid and systematic review.
By Meads C, Cummins C, Jolly K, Stevens A, Burls A, Hyde C.
-
Outcome measures for adult critical care: a systematic review.
By Hayes JA, Black NA, Jenkinson C, Young JD, Rowan KM, Daly K, et al.
-
A systematic review to evaluate the effectiveness of interventions to promote the initiation of breastfeeding.
By Fairbank L, O’Meara S, Renfrew MJ, Woolridge M, Sowden AJ, Lister-Sharp D.
-
Implantable cardioverter defibrillators: arrhythmias. A rapid and systematic review.
By Parkes J, Bryant J, Milne R.
-
Treatments for fatigue in multiple sclerosis: a rapid and systematic review.
By Brañas P, Jordan R, Fry-Smith A, Burls A, Hyde C.
-
Early asthma prophylaxis, natural history, skeletal development and economy (EASE): a pilot randomised controlled trial.
By Baxter-Jones ADG, Helms PJ, Russell G, Grant A, Ross S, Cairns JA, et al.
-
Screening for hypercholesterolaemia versus case finding for familial hypercholesterolaemia: a systematic review and cost-effectiveness analysis.
By Marks D, Wonderling D, Thorogood M, Lambert H, Humphries SE, Neil HAW.
-
A rapid and systematic review of the clinical effectiveness and cost-effectiveness of glycoprotein IIb/IIIa antagonists in the medical management of unstable angina.
By McDonagh MS, Bachmann LM, Golder S, Kleijnen J, ter Riet G.
-
A randomised controlled trial of prehospital intravenous fluid replacement therapy in serious trauma.
By Turner J, Nicholl J, Webber L, Cox H, Dixon S, Yates D.
-
Intrathecal pumps for giving opioids in chronic pain: a systematic review.
By Williams JE, Louw G, Towlerton G.
-
Combination therapy (interferon alfa and ribavirin) in the treatment of chronic hepatitis C: a rapid and systematic review.
By Shepherd J, Waugh N, Hewitson P.
-
A systematic review of comparisons of effect sizes derived from randomised and non-randomised studies.
By MacLehose RR, Reeves BC, Harvey IM, Sheldon TA, Russell IT, Black AMS.
-
Intravascular ultrasound-guided interventions in coronary artery disease: a systematic literature review, with decision-analytic modelling, of outcomes and cost-effectiveness.
By Berry E, Kelly S, Hutton J, Lindsay HSJ, Blaxill JM, Evans JA, et al.
-
A randomised controlled trial to evaluate the effectiveness and cost-effectiveness of counselling patients with chronic depression.
By Simpson S, Corney R, Fitzgerald P, Beecham J.
-
Systematic review of treatments for atopic eczema.
By Hoare C, Li Wan Po A, Williams H.
-
Bayesian methods in health technology assessment: a review.
By Spiegelhalter DJ, Myles JP, Jones DR, Abrams KR.
-
The management of dyspepsia: a systematic review.
By Delaney B, Moayyedi P, Deeks J, Innes M, Soo S, Barton P, et al.
-
A systematic review of treatments for severe psoriasis.
By Griffiths CEM, Clark CM, Chalmers RJG, Li Wan Po A, Williams HC.
-
Clinical and cost-effectiveness of donepezil, rivastigmine and galantamine for Alzheimer’s disease: a rapid and systematic review.
By Clegg A, Bryant J, Nicholson T, McIntyre L, De Broe S, Gerard K, et al.
-
The clinical effectiveness and cost-effectiveness of riluzole for motor neurone disease: a rapid and systematic review.
By Stewart A, Sandercock J, Bryan S, Hyde C, Barton PM, Fry-Smith A, et al.
-
Equity and the economic evaluation of healthcare.
By Sassi F, Archard L, Le Grand J.
-
Quality-of-life measures in chronic diseases of childhood.
By Eiser C, Morse R.
-
Eliciting public preferences for healthcare: a systematic review of techniques.
By Ryan M, Scott DA, Reeves C, Bate A, van Teijlingen ER, Russell EM, et al.
-
General health status measures for people with cognitive impairment: learning disability and acquired brain injury.
By Riemsma RP, Forbes CA, Glanville JM, Eastwood AJ, Kleijnen J.
-
An assessment of screening strategies for fragile X syndrome in the UK.
By Pembrey ME, Barnicoat AJ, Carmichael B, Bobrow M, Turner G.
-
Issues in methodological research: perspectives from researchers and commissioners.
By Lilford RJ, Richardson A, Stevens A, Fitzpatrick R, Edwards S, Rock F, et al.
-
Systematic reviews of wound care management: (5) beds; (6) compression; (7) laser therapy, therapeutic ultrasound, electrotherapy and electromagnetic therapy.
By Cullum N, Nelson EA, Flemming K, Sheldon T.
-
Effects of educational and psychosocial interventions for adolescents with diabetes mellitus: a systematic review.
By Hampson SE, Skinner TC, Hart J, Storey L, Gage H, Foxcroft D, et al.
-
Effectiveness of autologous chondrocyte transplantation for hyaline cartilage defects in knees: a rapid and systematic review.
By Jobanputra P, Parry D, Fry-Smith A, Burls A.
-
Statistical assessment of the learning curves of health technologies.
By Ramsay CR, Grant AM, Wallace SA, Garthwaite PH, Monk AF, Russell IT.
-
The effectiveness and cost-effectiveness of temozolomide for the treatment of recurrent malignant glioma: a rapid and systematic review.
By Dinnes J, Cave C, Huang S, Major K, Milne R.
-
A rapid and systematic review of the clinical effectiveness and cost-effectiveness of debriding agents in treating surgical wounds healing by secondary intention.
By Lewis R, Whiting P, ter Riet G, O’Meara S, Glanville J.
-
Home treatment for mental health problems: a systematic review.
By Burns T, Knapp M, Catty J, Healey A, Henderson J, Watt H, et al.
-
How to develop cost-conscious guidelines.
By Eccles M, Mason J.
-
The role of specialist nurses in multiple sclerosis: a rapid and systematic review.
By De Broe S, Christopher F, Waugh N.
-
A rapid and systematic review of the clinical effectiveness and cost-effectiveness of orlistat in the management of obesity.
By O’Meara S, Riemsma R, Shirran L, Mather L, ter Riet G.
-
The clinical effectiveness and cost-effectiveness of pioglitazone for type 2 diabetes mellitus: a rapid and systematic review.
By Chilcott J, Wight J, Lloyd Jones M, Tappenden P.
-
Extended scope of nursing practice: a multicentre randomised controlled trial of appropriately trained nurses and preregistration house officers in preoperative assessment in elective general surgery.
By Kinley H, Czoski-Murray C, George S, McCabe C, Primrose J, Reilly C, et al.
-
Systematic reviews of the effectiveness of day care for people with severe mental disorders: (1) Acute day hospital versus admission; (2) Vocational rehabilitation; (3) Day hospital versus outpatient care.
By Marshall M, Crowther R, Almaraz- Serrano A, Creed F, Sledge W, Kluiter H, et al.
-
The measurement and monitoring of surgical adverse events.
By Bruce J, Russell EM, Mollison J, Krukowski ZH.
-
Action research: a systematic review and guidance for assessment.
By Waterman H, Tillen D, Dickson R, de Koning K.
-
A rapid and systematic review of the clinical effectiveness and cost-effectiveness of gemcitabine for the treatment of pancreatic cancer.
By Ward S, Morris E, Bansback N, Calvert N, Crellin A, Forman D, et al.
-
A rapid and systematic review of the evidence for the clinical effectiveness and cost-effectiveness of irinotecan, oxaliplatin and raltitrexed for the treatment of advanced colorectal cancer.
By Lloyd Jones M, Hummel S, Bansback N, Orr B, Seymour M.
-
Comparison of the effectiveness of inhaler devices in asthma and chronic obstructive airways disease: a systematic review of the literature.
By Brocklebank D, Ram F, Wright J, Barry P, Cates C, Davies L, et al.
-
The cost-effectiveness of magnetic resonance imaging for investigation of the knee joint.
By Bryan S, Weatherburn G, Bungay H, Hatrick C, Salas C, Parry D, et al.
-
A rapid and systematic review of the clinical effectiveness and cost-effectiveness of topotecan for ovarian cancer.
By Forbes C, Shirran L, Bagnall A-M, Duffy S, ter Riet G.
-
Superseded by a report published in a later volume.
-
The role of radiography in primary care patients with low back pain of at least 6 weeks duration: a randomised (unblinded) controlled trial.
By Kendrick D, Fielding K, Bentley E, Miller P, Kerslake R, Pringle M.
-
Design and use of questionnaires: a review of best practice applicable to surveys of health service staff and patients.
By McColl E, Jacoby A, Thomas L, Soutter J, Bamford C, Steen N, et al.
-
A rapid and systematic review of the clinical effectiveness and cost-effectiveness of paclitaxel, docetaxel, gemcitabine and vinorelbine in non-small-cell lung cancer.
By Clegg A, Scott DA, Sidhu M, Hewitson P, Waugh N.
-
Subgroup analyses in randomised controlled trials: quantifying the risks of false-positives and false-negatives.
By Brookes ST, Whitley E, Peters TJ, Mulheran PA, Egger M, Davey Smith G.
-
Depot antipsychotic medication in the treatment of patients with schizophrenia: (1) Meta-review; (2) Patient and nurse attitudes.
By David AS, Adams C.
-
A systematic review of controlled trials of the effectiveness and cost-effectiveness of brief psychological treatments for depression.
By Churchill R, Hunot V, Corney R, Knapp M, McGuire H, Tylee A, et al.
-
Cost analysis of child health surveillance.
By Sanderson D, Wright D, Acton C, Duree D.
-
A study of the methods used to select review criteria for clinical audit.
By Hearnshaw H, Harker R, Cheater F, Baker R, Grimshaw G.
-
Fludarabine as second-line therapy for B cell chronic lymphocytic leukaemia: a technology assessment.
By Hyde C, Wake B, Bryan S, Barton P, Fry-Smith A, Davenport C, et al.
-
Rituximab as third-line treatment for refractory or recurrent Stage III or IV follicular non-Hodgkin’s lymphoma: a systematic review and economic evaluation.
By Wake B, Hyde C, Bryan S, Barton P, Song F, Fry-Smith A, et al.
-
A systematic review of discharge arrangements for older people.
By Parker SG, Peet SM, McPherson A, Cannaby AM, Baker R, Wilson A, et al.
-
The clinical effectiveness and cost-effectiveness of inhaler devices used in the routine management of chronic asthma in older children: a systematic review and economic evaluation.
By Peters J, Stevenson M, Beverley C, Lim J, Smith S.
-
The clinical effectiveness and cost-effectiveness of sibutramine in the management of obesity: a technology assessment.
By O’Meara S, Riemsma R, Shirran L, Mather L, ter Riet G.
-
The cost-effectiveness of magnetic resonance angiography for carotid artery stenosis and peripheral vascular disease: a systematic review.
By Berry E, Kelly S, Westwood ME, Davies LM, Gough MJ, Bamford JM, et al.
-
Promoting physical activity in South Asian Muslim women through ‘exercise on prescription’.
By Carroll B, Ali N, Azam N.
-
Zanamivir for the treatment of influenza in adults: a systematic review and economic evaluation.
By Burls A, Clark W, Stewart T, Preston C, Bryan S, Jefferson T, et al.
-
A review of the natural history and epidemiology of multiple sclerosis: implications for resource allocation and health economic models.
By Richards RG, Sampson FC, Beard SM, Tappenden P.
-
Screening for gestational diabetes: a systematic review and economic evaluation.
By Scott DA, Loveman E, McIntyre L, Waugh N.
-
The clinical effectiveness and cost-effectiveness of surgery for people with morbid obesity: a systematic review and economic evaluation.
By Clegg AJ, Colquitt J, Sidhu MK, Royle P, Loveman E, Walker A.
-
The clinical effectiveness of trastuzumab for breast cancer: a systematic review.
By Lewis R, Bagnall A-M, Forbes C, Shirran E, Duffy S, Kleijnen J, et al.
-
The clinical effectiveness and cost-effectiveness of vinorelbine for breast cancer: a systematic review and economic evaluation.
By Lewis R, Bagnall A-M, King S, Woolacott N, Forbes C, Shirran L, et al.
-
A systematic review of the effectiveness and cost-effectiveness of metal-on-metal hip resurfacing arthroplasty for treatment of hip disease.
By Vale L, Wyness L, McCormack K, McKenzie L, Brazzelli M, Stearns SC.
-
The clinical effectiveness and cost-effectiveness of bupropion and nicotine replacement therapy for smoking cessation: a systematic review and economic evaluation.
By Woolacott NF, Jones L, Forbes CA, Mather LC, Sowden AJ, Song FJ, et al.
-
A systematic review of effectiveness and economic evaluation of new drug treatments for juvenile idiopathic arthritis: etanercept.
By Cummins C, Connock M, Fry-Smith A, Burls A.
-
Clinical effectiveness and cost-effectiveness of growth hormone in children: a systematic review and economic evaluation.
By Bryant J, Cave C, Mihaylova B, Chase D, McIntyre L, Gerard K, et al.
-
Clinical effectiveness and cost-effectiveness of growth hormone in adults in relation to impact on quality of life: a systematic review and economic evaluation.
By Bryant J, Loveman E, Chase D, Mihaylova B, Cave C, Gerard K, et al.
-
Clinical medication review by a pharmacist of patients on repeat prescriptions in general practice: a randomised controlled trial.
By Zermansky AG, Petty DR, Raynor DK, Lowe CJ, Freementle N, Vail A.
-
The effectiveness of infliximab and etanercept for the treatment of rheumatoid arthritis: a systematic review and economic evaluation.
By Jobanputra P, Barton P, Bryan S, Burls A.
-
A systematic review and economic evaluation of computerised cognitive behaviour therapy for depression and anxiety.
By Kaltenthaler E, Shackley P, Stevens K, Beverley C, Parry G, Chilcott J.
-
A systematic review and economic evaluation of pegylated liposomal doxorubicin hydrochloride for ovarian cancer.
By Forbes C, Wilby J, Richardson G, Sculpher M, Mather L, Reimsma R.
-
A systematic review of the effectiveness of interventions based on a stages-of-change approach to promote individual behaviour change.
By Riemsma RP, Pattenden J, Bridle C, Sowden AJ, Mather L, Watt IS, et al.
-
A systematic review update of the clinical effectiveness and cost-effectiveness of glycoprotein IIb/IIIa antagonists.
By Robinson M, Ginnelly L, Sculpher M, Jones L, Riemsma R, Palmer S, et al.
-
A systematic review of the effectiveness, cost-effectiveness and barriers to implementation of thrombolytic and neuroprotective therapy for acute ischaemic stroke in the NHS.
By Sandercock P, Berge E, Dennis M, Forbes J, Hand P, Kwan J, et al.
-
A randomised controlled crossover trial of nurse practitioner versus doctor-led outpatient care in a bronchiectasis clinic.
By Caine N, Sharples LD, Hollingworth W, French J, Keogan M, Exley A, et al.
-
Clinical effectiveness and cost – consequences of selective serotonin reuptake inhibitors in the treatment of sex offenders.
By Adi Y, Ashcroft D, Browne K, Beech A, Fry-Smith A, Hyde C.
-
Treatment of established osteoporosis: a systematic review and cost–utility analysis.
By Kanis JA, Brazier JE, Stevenson M, Calvert NW, Lloyd Jones M.
-
Which anaesthetic agents are cost-effective in day surgery? Literature review, national survey of practice and randomised controlled trial.
By Elliott RA Payne K, Moore JK, Davies LM, Harper NJN, St Leger AS, et al.
-
Screening for hepatitis C among injecting drug users and in genitourinary medicine clinics: systematic reviews of effectiveness, modelling study and national survey of current practice.
By Stein K, Dalziel K, Walker A, McIntyre L, Jenkins B, Horne J, et al.
-
The measurement of satisfaction with healthcare: implications for practice from a systematic review of the literature.
By Crow R, Gage H, Hampson S, Hart J, Kimber A, Storey L, et al.
-
The effectiveness and cost-effectiveness of imatinib in chronic myeloid leukaemia: a systematic review.
By Garside R, Round A, Dalziel K, Stein K, Royle R.
-
A comparative study of hypertonic saline, daily and alternate-day rhDNase in children with cystic fibrosis.
By Suri R, Wallis C, Bush A, Thompson S, Normand C, Flather M, et al.
-
A systematic review of the costs and effectiveness of different models of paediatric home care.
By Parker G, Bhakta P, Lovett CA, Paisley S, Olsen R, Turner D, et al.
-
How important are comprehensive literature searches and the assessment of trial quality in systematic reviews? Empirical study.
By Egger M, Jüni P, Bartlett C, Holenstein F, Sterne J.
-
Systematic review of the effectiveness and cost-effectiveness, and economic evaluation, of home versus hospital or satellite unit haemodialysis for people with end-stage renal failure.
By Mowatt G, Vale L, Perez J, Wyness L, Fraser C, MacLeod A, et al.
-
Systematic review and economic evaluation of the effectiveness of infliximab for the treatment of Crohn’s disease.
By Clark W, Raftery J, Barton P, Song F, Fry-Smith A, Burls A.
-
A review of the clinical effectiveness and cost-effectiveness of routine anti-D prophylaxis for pregnant women who are rhesus negative.
By Chilcott J, Lloyd Jones M, Wight J, Forman K, Wray J, Beverley C, et al.
-
Systematic review and evaluation of the use of tumour markers in paediatric oncology: Ewing’s sarcoma and neuroblastoma.
By Riley RD, Burchill SA, Abrams KR, Heney D, Lambert PC, Jones DR, et al.
-
The cost-effectiveness of screening for Helicobacter pylori to reduce mortality and morbidity from gastric cancer and peptic ulcer disease: a discrete-event simulation model.
By Roderick P, Davies R, Raftery J, Crabbe D, Pearce R, Bhandari P, et al.
-
The clinical effectiveness and cost-effectiveness of routine dental checks: a systematic review and economic evaluation.
By Davenport C, Elley K, Salas C, Taylor-Weetman CL, Fry-Smith A, Bryan S, et al.
-
A multicentre randomised controlled trial assessing the costs and benefits of using structured information and analysis of women’s preferences in the management of menorrhagia.
By Kennedy ADM, Sculpher MJ, Coulter A, Dwyer N, Rees M, Horsley S, et al.
-
Clinical effectiveness and cost–utility of photodynamic therapy for wet age-related macular degeneration: a systematic review and economic evaluation.
By Meads C, Salas C, Roberts T, Moore D, Fry-Smith A, Hyde C.
-
Evaluation of molecular tests for prenatal diagnosis of chromosome abnormalities.
By Grimshaw GM, Szczepura A, Hultén M, MacDonald F, Nevin NC, Sutton F, et al.
-
First and second trimester antenatal screening for Down’s syndrome: the results of the Serum, Urine and Ultrasound Screening Study (SURUSS).
By Wald NJ, Rodeck C, Hackshaw AK, Walters J, Chitty L, Mackinson AM.
-
The effectiveness and cost-effectiveness of ultrasound locating devices for central venous access: a systematic review and economic evaluation.
By Calvert N, Hind D, McWilliams RG, Thomas SM, Beverley C, Davidson A.
-
A systematic review of atypical antipsychotics in schizophrenia.
By Bagnall A-M, Jones L, Lewis R, Ginnelly L, Glanville J, Torgerson D, et al.
-
Prostate Testing for Cancer and Treatment (ProtecT) feasibility study.
By Donovan J, Hamdy F, Neal D, Peters T, Oliver S, Brindle L, et al.
-
Early thrombolysis for the treatment of acute myocardial infarction: a systematic review and economic evaluation.
By Boland A, Dundar Y, Bagust A, Haycox A, Hill R, Mujica Mota R, et al.
-
Screening for fragile X syndrome: a literature review and modelling.
By Song FJ, Barton P, Sleightholme V, Yao GL, Fry-Smith A.
-
Systematic review of endoscopic sinus surgery for nasal polyps.
By Dalziel K, Stein K, Round A, Garside R, Royle P.
-
Towards efficient guidelines: how to monitor guideline use in primary care.
By Hutchinson A, McIntosh A, Cox S, Gilbert C.
-
Effectiveness and cost-effectiveness of acute hospital-based spinal cord injuries services: systematic review.
By Bagnall A-M, Jones L, Richardson G, Duffy S, Riemsma R.
-
Prioritisation of health technology assessment. The PATHS model: methods and case studies.
By Townsend J, Buxton M, Harper G.
-
Systematic review of the clinical effectiveness and cost-effectiveness of tension-free vaginal tape for treatment of urinary stress incontinence.
By Cody J, Wyness L, Wallace S, Glazener C, Kilonzo M, Stearns S, et al.
-
The clinical and cost-effectiveness of patient education models for diabetes: a systematic review and economic evaluation.
By Loveman E, Cave C, Green C, Royle P, Dunn N, Waugh N.
-
The role of modelling in prioritising and planning clinical trials.
By Chilcott J, Brennan A, Booth A, Karnon J, Tappenden P.
-
Cost–benefit evaluation of routine influenza immunisation in people 65–74 years of age.
By Allsup S, Gosney M, Haycox A, Regan M.
-
The clinical and cost-effectiveness of pulsatile machine perfusion versus cold storage of kidneys for transplantation retrieved from heart-beating and non-heart-beating donors.
By Wight J, Chilcott J, Holmes M, Brewer N.
-
Can randomised trials rely on existing electronic data? A feasibility study to explore the value of routine data in health technology assessment.
By Williams JG, Cheung WY, Cohen DR, Hutchings HA, Longo MF, Russell IT.
-
Evaluating non-randomised intervention studies.
By Deeks JJ, Dinnes J, D’Amico R, Sowden AJ, Sakarovitch C, Song F, et al.
-
A randomised controlled trial to assess the impact of a package comprising a patient-orientated, evidence-based self- help guidebook and patient-centred consultations on disease management and satisfaction in inflammatory bowel disease.
By Kennedy A, Nelson E, Reeves D, Richardson G, Roberts C, Robinson A, et al.
-
The effectiveness of diagnostic tests for the assessment of shoulder pain due to soft tissue disorders: a systematic review.
By Dinnes J, Loveman E, McIntyre L, Waugh N.
-
The value of digital imaging in diabetic retinopathy.
By Sharp PF, Olson J, Strachan F, Hipwell J, Ludbrook A, O’Donnell M, et al.
-
Lowering blood pressure to prevent myocardial infarction and stroke: a new preventive strategy.
By Law M, Wald N, Morris J.
-
Clinical and cost-effectiveness of capecitabine and tegafur with uracil for the treatment of metastatic colorectal cancer: systematic review and economic evaluation.
By Ward S, Kaltenthaler E, Cowan J, Brewer N.
-
Clinical and cost-effectiveness of new and emerging technologies for early localised prostate cancer: a systematic review.
By Hummel S, Paisley S, Morgan A, Currie E, Brewer N.
-
Literature searching for clinical and cost-effectiveness studies used in health technology assessment reports carried out for the National Institute for Clinical Excellence appraisal system.
By Royle P, Waugh N.
-
Systematic review and economic decision modelling for the prevention and treatment of influenza A and B.
By Turner D, Wailoo A, Nicholson K, Cooper N, Sutton A, Abrams K.
-
A randomised controlled trial to evaluate the clinical and cost-effectiveness of Hickman line insertions in adult cancer patients by nurses.
By Boland A, Haycox A, Bagust A, Fitzsimmons L.
-
Redesigning postnatal care: a randomised controlled trial of protocol-based midwifery-led care focused on individual women’s physical and psychological health needs.
By MacArthur C, Winter HR, Bick DE, Lilford RJ, Lancashire RJ, Knowles H, et al.
-
Estimating implied rates of discount in healthcare decision-making.
By West RR, McNabb R, Thompson AGH, Sheldon TA, Grimley Evans J.
-
Systematic review of isolation policies in the hospital management of methicillin-resistant Staphylococcus aureus: a review of the literature with epidemiological and economic modelling.
By Cooper BS, Stone SP, Kibbler CC, Cookson BD, Roberts JA, Medley GF, et al.
-
Treatments for spasticity and pain in multiple sclerosis: a systematic review.
By Beard S, Hunn A, Wight J.
-
The inclusion of reports of randomised trials published in languages other than English in systematic reviews.
By Moher D, Pham B, Lawson ML, Klassen TP.
-
The impact of screening on future health-promoting behaviours and health beliefs: a systematic review.
By Bankhead CR, Brett J, Bukach C, Webster P, Stewart-Brown S, Munafo M, et al.
-
What is the best imaging strategy for acute stroke?
By Wardlaw JM, Keir SL, Seymour J, Lewis S, Sandercock PAG, Dennis MS, et al.
-
Systematic review and modelling of the investigation of acute and chronic chest pain presenting in primary care.
By Mant J, McManus RJ, Oakes RAL, Delaney BC, Barton PM, Deeks JJ, et al.
-
The effectiveness and cost-effectiveness of microwave and thermal balloon endometrial ablation for heavy menstrual bleeding: a systematic review and economic modelling.
By Garside R, Stein K, Wyatt K, Round A, Price A.
-
A systematic review of the role of bisphosphonates in metastatic disease.
By Ross JR, Saunders Y, Edmonds PM, Patel S, Wonderling D, Normand C, et al.
-
Systematic review of the clinical effectiveness and cost-effectiveness of capecitabine (Xeloda®) for locally advanced and/or metastatic breast cancer.
By Jones L, Hawkins N, Westwood M, Wright K, Richardson G, Riemsma R.
-
Effectiveness and efficiency of guideline dissemination and implementation strategies.
By Grimshaw JM, Thomas RE, MacLennan G, Fraser C, Ramsay CR, Vale L, et al.
-
Clinical effectiveness and costs of the Sugarbaker procedure for the treatment of pseudomyxoma peritonei.
By Bryant J, Clegg AJ, Sidhu MK, Brodin H, Royle P, Davidson P.
-
Psychological treatment for insomnia in the regulation of long-term hypnotic drug use.
By Morgan K, Dixon S, Mathers N, Thompson J, Tomeny M.
-
Improving the evaluation of therapeutic interventions in multiple sclerosis: development of a patient-based measure of outcome.
By Hobart JC, Riazi A, Lamping DL, Fitzpatrick R, Thompson AJ.
-
A systematic review and economic evaluation of magnetic resonance cholangiopancreatography compared with diagnostic endoscopic retrograde cholangiopancreatography.
By Kaltenthaler E, Bravo Vergel Y, Chilcott J, Thomas S, Blakeborough T, Walters SJ, et al.
-
The use of modelling to evaluate new drugs for patients with a chronic condition: the case of antibodies against tumour necrosis factor in rheumatoid arthritis.
By Barton P, Jobanputra P, Wilson J, Bryan S, Burls A.
-
Clinical effectiveness and cost-effectiveness of neonatal screening for inborn errors of metabolism using tandem mass spectrometry: a systematic review.
By Pandor A, Eastham J, Beverley C, Chilcott J, Paisley S.
-
Clinical effectiveness and cost-effectiveness of pioglitazone and rosiglitazone in the treatment of type 2 diabetes: a systematic review and economic evaluation.
By Czoski-Murray C, Warren E, Chilcott J, Beverley C, Psyllaki MA, Cowan J.
-
Routine examination of the newborn: the EMREN study. Evaluation of an extension of the midwife role including a randomised controlled trial of appropriately trained midwives and paediatric senior house officers.
By Townsend J, Wolke D, Hayes J, Davé S, Rogers C, Bloomfield L, et al.
-
Involving consumers in research and development agenda setting for the NHS: developing an evidence-based approach.
By Oliver S, Clarke-Jones L, Rees R, Milne R, Buchanan P, Gabbay J, et al.
-
A multi-centre randomised controlled trial of minimally invasive direct coronary bypass grafting versus percutaneous transluminal coronary angioplasty with stenting for proximal stenosis of the left anterior descending coronary artery.
By Reeves BC, Angelini GD, Bryan AJ, Taylor FC, Cripps T, Spyt TJ, et al.
-
Does early magnetic resonance imaging influence management or improve outcome in patients referred to secondary care with low back pain? A pragmatic randomised controlled trial.
By Gilbert FJ, Grant AM, Gillan MGC, Vale L, Scott NW, Campbell MK, et al.
-
The clinical and cost-effectiveness of anakinra for the treatment of rheumatoid arthritis in adults: a systematic review and economic analysis.
By Clark W, Jobanputra P, Barton P, Burls A.
-
A rapid and systematic review and economic evaluation of the clinical and cost-effectiveness of newer drugs for treatment of mania associated with bipolar affective disorder.
By Bridle C, Palmer S, Bagnall A-M, Darba J, Duffy S, Sculpher M, et al.
-
Liquid-based cytology in cervical screening: an updated rapid and systematic review and economic analysis.
By Karnon J, Peters J, Platt J, Chilcott J, McGoogan E, Brewer N.
-
Systematic review of the long-term effects and economic consequences of treatments for obesity and implications for health improvement.
By Avenell A, Broom J, Brown TJ, Poobalan A, Aucott L, Stearns SC, et al.
-
Autoantibody testing in children with newly diagnosed type 1 diabetes mellitus.
By Dretzke J, Cummins C, Sandercock J, Fry-Smith A, Barrett T, Burls A.
-
Clinical effectiveness and cost-effectiveness of prehospital intravenous fluids in trauma patients.
By Dretzke J, Sandercock J, Bayliss S, Burls A.
-
Newer hypnotic drugs for the short-term management of insomnia: a systematic review and economic evaluation.
By Dündar Y, Boland A, Strobl J, Dodd S, Haycox A, Bagust A, et al.
-
Development and validation of methods for assessing the quality of diagnostic accuracy studies.
By Whiting P, Rutjes AWS, Dinnes J, Reitsma JB, Bossuyt PMM, Kleijnen J.
-
EVALUATE hysterectomy trial: a multicentre randomised trial comparing abdominal, vaginal and laparoscopic methods of hysterectomy.
By Garry R, Fountain J, Brown J, Manca A, Mason S, Sculpher M, et al.
-
Methods for expected value of information analysis in complex health economic models: developments on the health economics of interferon-β and glatiramer acetate for multiple sclerosis.
By Tappenden P, Chilcott JB, Eggington S, Oakley J, McCabe C.
-
Effectiveness and cost-effectiveness of imatinib for first-line treatment of chronic myeloid leukaemia in chronic phase: a systematic review and economic analysis.
By Dalziel K, Round A, Stein K, Garside R, Price A.
-
VenUS I: a randomised controlled trial of two types of bandage for treating venous leg ulcers.
By Iglesias C, Nelson EA, Cullum NA, Torgerson DJ, on behalf of the VenUS Team.
-
Systematic review of the effectiveness and cost-effectiveness, and economic evaluation, of myocardial perfusion scintigraphy for the diagnosis and management of angina and myocardial infarction.
By Mowatt G, Vale L, Brazzelli M, Hernandez R, Murray A, Scott N, et al.
-
A pilot study on the use of decision theory and value of information analysis as part of the NHS Health Technology Assessment programme.
By Claxton K, Ginnelly L, Sculpher M, Philips Z, Palmer S.
-
The Social Support and Family Health Study: a randomised controlled trial and economic evaluation of two alternative forms of postnatal support for mothers living in disadvantaged inner-city areas.
By Wiggins M, Oakley A, Roberts I, Turner H, Rajan L, Austerberry H, et al.
-
Psychosocial aspects of genetic screening of pregnant women and newborns: a systematic review.
By Green JM, Hewison J, Bekker HL, Bryant, Cuckle HS.
-
Evaluation of abnormal uterine bleeding: comparison of three outpatient procedures within cohorts defined by age and menopausal status.
By Critchley HOD, Warner P, Lee AJ, Brechin S, Guise J, Graham B.
-
Coronary artery stents: a rapid systematic review and economic evaluation.
By Hill R, Bagust A, Bakhai A, Dickson R, Dündar Y, Haycox A, et al.
-
Review of guidelines for good practice in decision-analytic modelling in health technology assessment.
By Philips Z, Ginnelly L, Sculpher M, Claxton K, Golder S, Riemsma R, et al.
-
Rituximab (MabThera®) for aggressive non-Hodgkin’s lymphoma: systematic review and economic evaluation.
By Knight C, Hind D, Brewer N, Abbott V.
-
Clinical effectiveness and cost-effectiveness of clopidogrel and modified-release dipyridamole in the secondary prevention of occlusive vascular events: a systematic review and economic evaluation.
By Jones L, Griffin S, Palmer S, Main C, Orton V, Sculpher M, et al.
-
Pegylated interferon α-2a and -2b in combination with ribavirin in the treatment of chronic hepatitis C: a systematic review and economic evaluation.
By Shepherd J, Brodin H, Cave C, Waugh N, Price A, Gabbay J.
-
Clopidogrel used in combination with aspirin compared with aspirin alone in the treatment of non-ST-segment- elevation acute coronary syndromes: a systematic review and economic evaluation.
By Main C, Palmer S, Griffin S, Jones L, Orton V, Sculpher M, et al.
-
Provision, uptake and cost of cardiac rehabilitation programmes: improving services to under-represented groups.
By Beswick AD, Rees K, Griebsch I, Taylor FC, Burke M, West RR, et al.
-
Involving South Asian patients in clinical trials.
By Hussain-Gambles M, Leese B, Atkin K, Brown J, Mason S, Tovey P.
-
Clinical and cost-effectiveness of continuous subcutaneous insulin infusion for diabetes.
By Colquitt JL, Green C, Sidhu MK, Hartwell D, Waugh N.
-
Identification and assessment of ongoing trials in health technology assessment reviews.
By Song FJ, Fry-Smith A, Davenport C, Bayliss S, Adi Y, Wilson JS, et al.
-
Systematic review and economic evaluation of a long-acting insulin analogue, insulin glargine
By Warren E, Weatherley-Jones E, Chilcott J, Beverley C.
-
Supplementation of a home-based exercise programme with a class-based programme for people with osteoarthritis of the knees: a randomised controlled trial and health economic analysis.
By McCarthy CJ, Mills PM, Pullen R, Richardson G, Hawkins N, Roberts CR, et al.
-
Clinical and cost-effectiveness of once-daily versus more frequent use of same potency topical corticosteroids for atopic eczema: a systematic review and economic evaluation.
By Green C, Colquitt JL, Kirby J, Davidson P, Payne E.
-
Acupuncture of chronic headache disorders in primary care: randomised controlled trial and economic analysis.
By Vickers AJ, Rees RW, Zollman CE, McCarney R, Smith CM, Ellis N, et al.
-
Generalisability in economic evaluation studies in healthcare: a review and case studies.
By Sculpher MJ, Pang FS, Manca A, Drummond MF, Golder S, Urdahl H, et al.
-
Virtual outreach: a randomised controlled trial and economic evaluation of joint teleconferenced medical consultations.
By Wallace P, Barber J, Clayton W, Currell R, Fleming K, Garner P, et al.
-
Randomised controlled multiple treatment comparison to provide a cost-effectiveness rationale for the selection of antimicrobial therapy in acne.
By Ozolins M, Eady EA, Avery A, Cunliffe WJ, O’Neill C, Simpson NB, et al.
-
Do the findings of case series studies vary significantly according to methodological characteristics?
By Dalziel K, Round A, Stein K, Garside R, Castelnuovo E, Payne L.
-
Improving the referral process for familial breast cancer genetic counselling: findings of three randomised controlled trials of two interventions.
By Wilson BJ, Torrance N, Mollison J, Wordsworth S, Gray JR, Haites NE, et al.
-
Randomised evaluation of alternative electrosurgical modalities to treat bladder outflow obstruction in men with benign prostatic hyperplasia.
By Fowler C, McAllister W, Plail R, Karim O, Yang Q.
-
A pragmatic randomised controlled trial of the cost-effectiveness of palliative therapies for patients with inoperable oesophageal cancer.
By Shenfine J, McNamee P, Steen N, Bond J, Griffin SM.
-
Impact of computer-aided detection prompts on the sensitivity and specificity of screening mammography.
By Taylor P, Champness J, Given- Wilson R, Johnston K, Potts H.
-
Issues in data monitoring and interim analysis of trials.
By Grant AM, Altman DG, Babiker AB, Campbell MK, Clemens FJ, Darbyshire JH, et al.
-
Lay public’s understanding of equipoise and randomisation in randomised controlled trials.
By Robinson EJ, Kerr CEP, Stevens AJ, Lilford RJ, Braunholtz DA, Edwards SJ, et al.
-
Clinical and cost-effectiveness of electroconvulsive therapy for depressive illness, schizophrenia, catatonia and mania: systematic reviews and economic modelling studies.
By Greenhalgh J, Knight C, Hind D, Beverley C, Walters S.
-
Measurement of health-related quality of life for people with dementia: development of a new instrument (DEMQOL) and an evaluation of current methodology.
By Smith SC, Lamping DL, Banerjee S, Harwood R, Foley B, Smith P, et al.
-
Clinical effectiveness and cost-effectiveness of drotrecogin alfa (activated) (Xigris®) for the treatment of severe sepsis in adults: a systematic review and economic evaluation.
By Green C, Dinnes J, Takeda A, Shepherd J, Hartwell D, Cave C, et al.
-
A methodological review of how heterogeneity has been examined in systematic reviews of diagnostic test accuracy.
By Dinnes J, Deeks J, Kirby J, Roderick P.
-
Cervical screening programmes: can automation help? Evidence from systematic reviews, an economic analysis and a simulation modelling exercise applied to the UK.
By Willis BH, Barton P, Pearmain P, Bryan S, Hyde C.
-
Laparoscopic surgery for inguinal hernia repair: systematic review of effectiveness and economic evaluation.
By McCormack K, Wake B, Perez J, Fraser C, Cook J, McIntosh E, et al.
-
Clinical effectiveness, tolerability and cost-effectiveness of newer drugs for epilepsy in adults: a systematic review and economic evaluation.
By Wilby J, Kainth A, Hawkins N, Epstein D, McIntosh H, McDaid C, et al.
-
A randomised controlled trial to compare the cost-effectiveness of tricyclic antidepressants, selective serotonin reuptake inhibitors and lofepramine.
By Peveler R, Kendrick T, Buxton M, Longworth L, Baldwin D, Moore M, et al.
-
Clinical effectiveness and cost-effectiveness of immediate angioplasty for acute myocardial infarction: systematic review and economic evaluation.
By Hartwell D, Colquitt J, Loveman E, Clegg AJ, Brodin H, Waugh N, et al.
-
A randomised controlled comparison of alternative strategies in stroke care.
By Kalra L, Evans A, Perez I, Knapp M, Swift C, Donaldson N.
-
The investigation and analysis of critical incidents and adverse events in healthcare.
By Woloshynowych M, Rogers S, Taylor-Adams S, Vincent C.
-
Potential use of routine databases in health technology assessment.
By Raftery J, Roderick P, Stevens A.
-
Clinical and cost-effectiveness of newer immunosuppressive regimens in renal transplantation: a systematic review and modelling study.
By Woodroffe R, Yao GL, Meads C, Bayliss S, Ready A, Raftery J, et al.
-
A systematic review and economic evaluation of alendronate, etidronate, risedronate, raloxifene and teriparatide for the prevention and treatment of postmenopausal osteoporosis.
By Stevenson M, Lloyd Jones M, De Nigris E, Brewer N, Davis S, Oakley J.
-
A systematic review to examine the impact of psycho-educational interventions on health outcomes and costs in adults and children with difficult asthma.
By Smith JR, Mugford M, Holland R, Candy B, Noble MJ, Harrison BDW, et al.
-
An evaluation of the costs, effectiveness and quality of renal replacement therapy provision in renal satellite units in England and Wales.
By Roderick P, Nicholson T, Armitage A, Mehta R, Mullee M, Gerard K, et al.
-
Imatinib for the treatment of patients with unresectable and/or metastatic gastrointestinal stromal tumours: systematic review and economic evaluation.
By Wilson J, Connock M, Song F, Yao G, Fry-Smith A, Raftery J, et al.
-
Indirect comparisons of competing interventions.
By Glenny AM, Altman DG, Song F, Sakarovitch C, Deeks JJ, D’Amico R, et al.
-
Cost-effectiveness of alternative strategies for the initial medical management of non-ST elevation acute coronary syndrome: systematic review and decision-analytical modelling.
By Robinson M, Palmer S, Sculpher M, Philips Z, Ginnelly L, Bowens A, et al.
-
Outcomes of electrically stimulated gracilis neosphincter surgery.
By Tillin T, Chambers M, Feldman R.
-
The effectiveness and cost-effectiveness of pimecrolimus and tacrolimus for atopic eczema: a systematic review and economic evaluation.
By Garside R, Stein K, Castelnuovo E, Pitt M, Ashcroft D, Dimmock P, et al.
-
Systematic review on urine albumin testing for early detection of diabetic complications.
By Newman DJ, Mattock MB, Dawnay ABS, Kerry S, McGuire A, Yaqoob M, et al.
-
Randomised controlled trial of the cost-effectiveness of water-based therapy for lower limb osteoarthritis.
By Cochrane T, Davey RC, Matthes Edwards SM.
-
Longer term clinical and economic benefits of offering acupuncture care to patients with chronic low back pain.
By Thomas KJ, MacPherson H, Ratcliffe J, Thorpe L, Brazier J, Campbell M, et al.
-
Cost-effectiveness and safety of epidural steroids in the management of sciatica.
By Price C, Arden N, Coglan L, Rogers P.
-
The British Rheumatoid Outcome Study Group (BROSG) randomised controlled trial to compare the effectiveness and cost-effectiveness of aggressive versus symptomatic therapy in established rheumatoid arthritis.
By Symmons D, Tricker K, Roberts C, Davies L, Dawes P, Scott DL.
-
Conceptual framework and systematic review of the effects of participants’ and professionals’ preferences in randomised controlled trials.
By King M, Nazareth I, Lampe F, Bower P, Chandler M, Morou M, et al.
-
The clinical and cost-effectiveness of implantable cardioverter defibrillators: a systematic review.
By Bryant J, Brodin H, Loveman E, Payne E, Clegg A.
-
A trial of problem-solving by community mental health nurses for anxiety, depression and life difficulties among general practice patients. The CPN-GP study.
By Kendrick T, Simons L, Mynors-Wallis L, Gray A, Lathlean J, Pickering R, et al.
-
The causes and effects of socio-demographic exclusions from clinical trials.
By Bartlett C, Doyal L, Ebrahim S, Davey P, Bachmann M, Egger M, et al.
-
Is hydrotherapy cost-effective? A randomised controlled trial of combined hydrotherapy programmes compared with physiotherapy land techniques in children with juvenile idiopathic arthritis.
By Epps H, Ginnelly L, Utley M, Southwood T, Gallivan S, Sculpher M, et al.
-
A randomised controlled trial and cost-effectiveness study of systematic screening (targeted and total population screening) versus routine practice for the detection of atrial fibrillation in people aged 65 and over. The SAFE study.
By Hobbs FDR, Fitzmaurice DA, Mant J, Murray E, Jowett S, Bryan S, et al.
-
Displaced intracapsular hip fractures in fit, older people: a randomised comparison of reduction and fixation, bipolar hemiarthroplasty and total hip arthroplasty.
By Keating JF, Grant A, Masson M, Scott NW, Forbes JF.
-
Long-term outcome of cognitive behaviour therapy clinical trials in central Scotland.
By Durham RC, Chambers JA, Power KG, Sharp DM, Macdonald RR, Major KA, et al.
-
The effectiveness and cost-effectiveness of dual-chamber pacemakers compared with single-chamber pacemakers for bradycardia due to atrioventricular block or sick sinus syndrome: systematic review and economic evaluation.
By Castelnuovo E, Stein K, Pitt M, Garside R, Payne E.
-
Newborn screening for congenital heart defects: a systematic review and cost-effectiveness analysis.
By Knowles R, Griebsch I, Dezateux C, Brown J, Bull C, Wren C.
-
The clinical and cost-effectiveness of left ventricular assist devices for end-stage heart failure: a systematic review and economic evaluation.
By Clegg AJ, Scott DA, Loveman E, Colquitt J, Hutchinson J, Royle P, et al.
-
The effectiveness of the Heidelberg Retina Tomograph and laser diagnostic glaucoma scanning system (GDx) in detecting and monitoring glaucoma.
By Kwartz AJ, Henson DB, Harper RA, Spencer AF, McLeod D.
-
Clinical and cost-effectiveness of autologous chondrocyte implantation for cartilage defects in knee joints: systematic review and economic evaluation.
By Clar C, Cummins E, McIntyre L, Thomas S, Lamb J, Bain L, et al.
-
Systematic review of effectiveness of different treatments for childhood retinoblastoma.
By McDaid C, Hartley S, Bagnall A-M, Ritchie G, Light K, Riemsma R.
-
Towards evidence-based guidelines for the prevention of venous thromboembolism: systematic reviews of mechanical methods, oral anticoagulation, dextran and regional anaesthesia as thromboprophylaxis.
By Roderick P, Ferris G, Wilson K, Halls H, Jackson D, Collins R, et al.
-
The effectiveness and cost-effectiveness of parent training/education programmes for the treatment of conduct disorder, including oppositional defiant disorder, in children.
By Dretzke J, Frew E, Davenport C, Barlow J, Stewart-Brown S, Sandercock J, et al.
-
The clinical and cost-effectiveness of donepezil, rivastigmine, galantamine and memantine for Alzheimer’s disease.
By Loveman E, Green C, Kirby J, Takeda A, Picot J, Payne E, et al.
-
FOOD: a multicentre randomised trial evaluating feeding policies in patients admitted to hospital with a recent stroke.
By Dennis M, Lewis S, Cranswick G, Forbes J.
-
The clinical effectiveness and cost-effectiveness of computed tomography screening for lung cancer: systematic reviews.
By Black C, Bagust A, Boland A, Walker S, McLeod C, De Verteuil R, et al.
-
A systematic review of the effectiveness and cost-effectiveness of neuroimaging assessments used to visualise the seizure focus in people with refractory epilepsy being considered for surgery.
By Whiting P, Gupta R, Burch J, Mujica Mota RE, Wright K, Marson A, et al.
-
Comparison of conference abstracts and presentations with full-text articles in the health technology assessments of rapidly evolving technologies.
By Dundar Y, Dodd S, Dickson R, Walley T, Haycox A, Williamson PR.
-
Systematic review and evaluation of methods of assessing urinary incontinence.
By Martin JL, Williams KS, Abrams KR, Turner DA, Sutton AJ, Chapple C, et al.
-
The clinical effectiveness and cost-effectiveness of newer drugs for children with epilepsy. A systematic review.
By Connock M, Frew E, Evans B-W, Bryan S, Cummins C, Fry-Smith A, et al.
-
Surveillance of Barrett’s oesophagus: exploring the uncertainty through systematic review, expert workshop and economic modelling.
By Garside R, Pitt M, Somerville M, Stein K, Price A, Gilbert N.
-
Topotecan, pegylated liposomal doxorubicin hydrochloride and paclitaxel for second-line or subsequent treatment of advanced ovarian cancer: a systematic review and economic evaluation.
By Main C, Bojke L, Griffin S, Norman G, Barbieri M, Mather L, et al.
-
Evaluation of molecular techniques in prediction and diagnosis of cytomegalovirus disease in immunocompromised patients.
By Szczepura A, Westmoreland D, Vinogradova Y, Fox J, Clark M.
-
Screening for thrombophilia in high-risk situations: systematic review and cost-effectiveness analysis. The Thrombosis: Risk and Economic Assessment of Thrombophilia Screening (TREATS) study.
By Wu O, Robertson L, Twaddle S, Lowe GDO, Clark P, Greaves M, et al.
-
A series of systematic reviews to inform a decision analysis for sampling and treating infected diabetic foot ulcers.
By Nelson EA, O’Meara S, Craig D, Iglesias C, Golder S, Dalton J, et al.
-
Randomised clinical trial, observational study and assessment of cost-effectiveness of the treatment of varicose veins (REACTIV trial).
By Michaels JA, Campbell WB, Brazier JE, MacIntyre JB, Palfreyman SJ, Ratcliffe J, et al.
-
The cost-effectiveness of screening for oral cancer in primary care.
By Speight PM, Palmer S, Moles DR, Downer MC, Smith DH, Henriksson M, et al.
-
Measurement of the clinical and cost-effectiveness of non-invasive diagnostic testing strategies for deep vein thrombosis.
By Goodacre S, Sampson F, Stevenson M, Wailoo A, Sutton A, Thomas S, et al.
-
Systematic review of the effectiveness and cost-effectiveness of HealOzone® for the treatment of occlusal pit/fissure caries and root caries.
By Brazzelli M, McKenzie L, Fielding S, Fraser C, Clarkson J, Kilonzo M, et al.
-
Randomised controlled trials of conventional antipsychotic versus new atypical drugs, and new atypical drugs versus clozapine, in people with schizophrenia responding poorly to, or intolerant of, current drug treatment.
By Lewis SW, Davies L, Jones PB, Barnes TRE, Murray RM, Kerwin R, et al.
-
Diagnostic tests and algorithms used in the investigation of haematuria: systematic reviews and economic evaluation.
By Rodgers M, Nixon J, Hempel S, Aho T, Kelly J, Neal D, et al.
-
Cognitive behavioural therapy in addition to antispasmodic therapy for irritable bowel syndrome in primary care: randomised controlled trial.
By Kennedy TM, Chalder T, McCrone P, Darnley S, Knapp M, Jones RH, et al.
-
A systematic review of the clinical effectiveness and cost-effectiveness of enzyme replacement therapies for Fabry’s disease and mucopolysaccharidosis type 1.
By Connock M, Juarez-Garcia A, Frew E, Mans A, Dretzke J, Fry-Smith A, et al.
-
Health benefits of antiviral therapy for mild chronic hepatitis C: randomised controlled trial and economic evaluation.
By Wright M, Grieve R, Roberts J, Main J, Thomas HC, on behalf of the UK Mild Hepatitis C Trial Investigators.
-
Pressure relieving support surfaces: a randomised evaluation.
By Nixon J, Nelson EA, Cranny G, Iglesias CP, Hawkins K, Cullum NA, et al.
-
A systematic review and economic model of the effectiveness and cost-effectiveness of methylphenidate, dexamfetamine and atomoxetine for the treatment of attention deficit hyperactivity disorder in children and adolescents.
By King S, Griffin S, Hodges Z, Weatherly H, Asseburg C, Richardson G, et al.
-
The clinical effectiveness and cost-effectiveness of enzyme replacement therapy for Gaucher’s disease: a systematic review.
By Connock M, Burls A, Frew E, Fry-Smith A, Juarez-Garcia A, McCabe C, et al.
-
Effectiveness and cost-effectiveness of salicylic acid and cryotherapy for cutaneous warts. An economic decision model.
By Thomas KS, Keogh-Brown MR, Chalmers JR, Fordham RJ, Holland RC, Armstrong SJ, et al.
-
A systematic literature review of the effectiveness of non-pharmacological interventions to prevent wandering in dementia and evaluation of the ethical implications and acceptability of their use.
By Robinson L, Hutchings D, Corner L, Beyer F, Dickinson H, Vanoli A, et al.
-
A review of the evidence on the effects and costs of implantable cardioverter defibrillator therapy in different patient groups, and modelling of cost-effectiveness and cost–utility for these groups in a UK context.
By Buxton M, Caine N, Chase D, Connelly D, Grace A, Jackson C, et al.
-
Adefovir dipivoxil and pegylated interferon alfa-2a for the treatment of chronic hepatitis B: a systematic review and economic evaluation.
By Shepherd J, Jones J, Takeda A, Davidson P, Price A.
-
An evaluation of the clinical and cost-effectiveness of pulmonary artery catheters in patient management in intensive care: a systematic review and a randomised controlled trial.
By Harvey S, Stevens K, Harrison D, Young D, Brampton W, McCabe C, et al.
-
Accurate, practical and cost-effective assessment of carotid stenosis in the UK.
By Wardlaw JM, Chappell FM, Stevenson M, De Nigris E, Thomas S, Gillard J, et al.
-
Etanercept and infliximab for the treatment of psoriatic arthritis: a systematic review and economic evaluation.
By Woolacott N, Bravo Vergel Y, Hawkins N, Kainth A, Khadjesari Z, Misso K, et al.
-
The cost-effectiveness of testing for hepatitis C in former injecting drug users.
By Castelnuovo E, Thompson-Coon J, Pitt M, Cramp M, Siebert U, Price A, et al.
-
Computerised cognitive behaviour therapy for depression and anxiety update: a systematic review and economic evaluation.
By Kaltenthaler E, Brazier J, De Nigris E, Tumur I, Ferriter M, Beverley C, et al.
-
Cost-effectiveness of using prognostic information to select women with breast cancer for adjuvant systemic therapy.
By Williams C, Brunskill S, Altman D, Briggs A, Campbell H, Clarke M, et al.
-
Psychological therapies including dialectical behaviour therapy for borderline personality disorder: a systematic review and preliminary economic evaluation.
By Brazier J, Tumur I, Holmes M, Ferriter M, Parry G, Dent-Brown K, et al.
-
Clinical effectiveness and cost-effectiveness of tests for the diagnosis and investigation of urinary tract infection in children: a systematic review and economic model.
By Whiting P, Westwood M, Bojke L, Palmer S, Richardson G, Cooper J, et al.
-
Cognitive behavioural therapy in chronic fatigue syndrome: a randomised controlled trial of an outpatient group programme.
By O’Dowd H, Gladwell P, Rogers CA, Hollinghurst S, Gregory A.
-
A comparison of the cost-effectiveness of five strategies for the prevention of nonsteroidal anti-inflammatory drug-induced gastrointestinal toxicity: a systematic review with economic modelling.
By Brown TJ, Hooper L, Elliott RA, Payne K, Webb R, Roberts C, et al.
-
The effectiveness and cost-effectiveness of computed tomography screening for coronary artery disease: systematic review.
By Waugh N, Black C, Walker S, McIntyre L, Cummins E, Hillis G.
-
What are the clinical outcome and cost-effectiveness of endoscopy undertaken by nurses when compared with doctors? A Multi-Institution Nurse Endoscopy Trial (MINuET).
By Williams J, Russell I, Durai D, Cheung W-Y, Farrin A, Bloor K, et al.
-
The clinical and cost-effectiveness of oxaliplatin and capecitabine for the adjuvant treatment of colon cancer: systematic review and economic evaluation.
By Pandor A, Eggington S, Paisley S, Tappenden P, Sutcliffe P.
-
A systematic review of the effectiveness of adalimumab, etanercept and infliximab for the treatment of rheumatoid arthritis in adults and an economic evaluation of their cost-effectiveness.
By Chen Y-F, Jobanputra P, Barton P, Jowett S, Bryan S, Clark W, et al.
-
Telemedicine in dermatology: a randomised controlled trial.
By Bowns IR, Collins K, Walters SJ, McDonagh AJG.
-
Cost-effectiveness of cell salvage and alternative methods of minimising perioperative allogeneic blood transfusion: a systematic review and economic model.
By Davies L, Brown TJ, Haynes S, Payne K, Elliott RA, McCollum C.
-
Clinical effectiveness and cost-effectiveness of laparoscopic surgery for colorectal cancer: systematic reviews and economic evaluation.
By Murray A, Lourenco T, de Verteuil R, Hernandez R, Fraser C, McKinley A, et al.
-
Etanercept and efalizumab for the treatment of psoriasis: a systematic review.
By Woolacott N, Hawkins N, Mason A, Kainth A, Khadjesari Z, Bravo Vergel Y, et al.
-
Systematic reviews of clinical decision tools for acute abdominal pain.
By Liu JLY, Wyatt JC, Deeks JJ, Clamp S, Keen J, Verde P, et al.
-
Evaluation of the ventricular assist device programme in the UK.
By Sharples L, Buxton M, Caine N, Cafferty F, Demiris N, Dyer M, et al.
-
A systematic review and economic model of the clinical and cost-effectiveness of immunosuppressive therapy for renal transplantation in children.
By Yao G, Albon E, Adi Y, Milford D, Bayliss S, Ready A, et al.
-
Amniocentesis results: investigation of anxiety. The ARIA trial.
By Hewison J, Nixon J, Fountain J, Cocks K, Jones C, Mason G, et al.
-
Pemetrexed disodium for the treatment of malignant pleural mesothelioma: a systematic review and economic evaluation.
By Dundar Y, Bagust A, Dickson R, Dodd S, Green J, Haycox A, et al.
-
A systematic review and economic model of the clinical effectiveness and cost-effectiveness of docetaxel in combination with prednisone or prednisolone for the treatment of hormone-refractory metastatic prostate cancer.
By Collins R, Fenwick E, Trowman R, Perard R, Norman G, Light K, et al.
-
A systematic review of rapid diagnostic tests for the detection of tuberculosis infection.
By Dinnes J, Deeks J, Kunst H, Gibson A, Cummins E, Waugh N, et al.
-
The clinical effectiveness and cost-effectiveness of strontium ranelate for the prevention of osteoporotic fragility fractures in postmenopausal women.
By Stevenson M, Davis S, Lloyd-Jones M, Beverley C.
-
A systematic review of quantitative and qualitative research on the role and effectiveness of written information available to patients about individual medicines.
By Raynor DK, Blenkinsopp A, Knapp P, Grime J, Nicolson DJ, Pollock K, et al.
-
Oral naltrexone as a treatment for relapse prevention in formerly opioid-dependent drug users: a systematic review and economic evaluation.
By Adi Y, Juarez-Garcia A, Wang D, Jowett S, Frew E, Day E, et al.
-
Glucocorticoid-induced osteoporosis: a systematic review and cost–utility analysis.
By Kanis JA, Stevenson M, McCloskey EV, Davis S, Lloyd-Jones M.
-
Epidemiological, social, diagnostic and economic evaluation of population screening for genital chlamydial infection.
By Low N, McCarthy A, Macleod J, Salisbury C, Campbell R, Roberts TE, et al.
-
Methadone and buprenorphine for the management of opioid dependence: a systematic review and economic evaluation.
By Connock M, Juarez-Garcia A, Jowett S, Frew E, Liu Z, Taylor RJ, et al.
-
Exercise Evaluation Randomised Trial (EXERT): a randomised trial comparing GP referral for leisure centre-based exercise, community-based walking and advice only.
By Isaacs AJ, Critchley JA, See Tai S, Buckingham K, Westley D, Harridge SDR, et al.
-
Interferon alfa (pegylated and non-pegylated) and ribavirin for the treatment of mild chronic hepatitis C: a systematic review and economic evaluation.
By Shepherd J, Jones J, Hartwell D, Davidson P, Price A, Waugh N.
-
Systematic review and economic evaluation of bevacizumab and cetuximab for the treatment of metastatic colorectal cancer.
By Tappenden P, Jones R, Paisley S, Carroll C.
-
A systematic review and economic evaluation of epoetin alfa, epoetin beta and darbepoetin alfa in anaemia associated with cancer, especially that attributable to cancer treatment.
By Wilson J, Yao GL, Raftery J, Bohlius J, Brunskill S, Sandercock J, et al.
-
A systematic review and economic evaluation of statins for the prevention of coronary events.
By Ward S, Lloyd Jones M, Pandor A, Holmes M, Ara R, Ryan A, et al.
-
A systematic review of the effectiveness and cost-effectiveness of different models of community-based respite care for frail older people and their carers.
By Mason A, Weatherly H, Spilsbury K, Arksey H, Golder S, Adamson J, et al.
-
Additional therapy for young children with spastic cerebral palsy: a randomised controlled trial.
By Weindling AM, Cunningham CC, Glenn SM, Edwards RT, Reeves DJ.
-
Screening for type 2 diabetes: literature review and economic modelling.
By Waugh N, Scotland G, McNamee P, Gillett M, Brennan A, Goyder E, et al.
-
The effectiveness and cost-effectiveness of cinacalcet for secondary hyperparathyroidism in end-stage renal disease patients on dialysis: a systematic review and economic evaluation.
By Garside R, Pitt M, Anderson R, Mealing S, Roome C, Snaith A, et al.
-
The clinical effectiveness and cost-effectiveness of gemcitabine for metastatic breast cancer: a systematic review and economic evaluation.
By Takeda AL, Jones J, Loveman E, Tan SC, Clegg AJ.
-
A systematic review of duplex ultrasound, magnetic resonance angiography and computed tomography angiography for the diagnosis and assessment of symptomatic, lower limb peripheral arterial disease.
By Collins R, Cranny G, Burch J, Aguiar-Ibáñez R, Craig D, Wright K, et al.
-
The clinical effectiveness and cost-effectiveness of treatments for children with idiopathic steroid-resistant nephrotic syndrome: a systematic review.
By Colquitt JL, Kirby J, Green C, Cooper K, Trompeter RS.
-
A systematic review of the routine monitoring of growth in children of primary school age to identify growth-related conditions.
By Fayter D, Nixon J, Hartley S, Rithalia A, Butler G, Rudolf M, et al.
-
Systematic review of the effectiveness of preventing and treating Staphylococcus aureus carriage in reducing peritoneal catheter-related infections.
By McCormack K, Rabindranath K, Kilonzo M, Vale L, Fraser C, McIntyre L, et al.
-
The clinical effectiveness and cost of repetitive transcranial magnetic stimulation versus electroconvulsive therapy in severe depression: a multicentre pragmatic randomised controlled trial and economic analysis.
By McLoughlin DM, Mogg A, Eranti S, Pluck G, Purvis R, Edwards D, et al.
-
A randomised controlled trial and economic evaluation of direct versus indirect and individual versus group modes of speech and language therapy for children with primary language impairment.
By Boyle J, McCartney E, Forbes J, O’Hare A.
-
Hormonal therapies for early breast cancer: systematic review and economic evaluation.
By Hind D, Ward S, De Nigris E, Simpson E, Carroll C, Wyld L.
-
Cardioprotection against the toxic effects of anthracyclines given to children with cancer: a systematic review.
By Bryant J, Picot J, Levitt G, Sullivan I, Baxter L, Clegg A.
-
Adalimumab, etanercept and infliximab for the treatment of ankylosing spondylitis: a systematic review and economic evaluation.
By McLeod C, Bagust A, Boland A, Dagenais P, Dickson R, Dundar Y, et al.
-
Prenatal screening and treatment strategies to prevent group B streptococcal and other bacterial infections in early infancy: cost-effectiveness and expected value of information analyses.
By Colbourn T, Asseburg C, Bojke L, Philips Z, Claxton K, Ades AE, et al.
-
Clinical effectiveness and cost-effectiveness of bone morphogenetic proteins in the non-healing of fractures and spinal fusion: a systematic review.
By Garrison KR, Donell S, Ryder J, Shemilt I, Mugford M, Harvey I, et al.
-
A randomised controlled trial of postoperative radiotherapy following breast-conserving surgery in a minimum-risk older population. The PRIME trial.
By Prescott RJ, Kunkler IH, Williams LJ, King CC, Jack W, van der Pol M, et al.
-
Current practice, accuracy, effectiveness and cost-effectiveness of the school entry hearing screen.
By Bamford J, Fortnum H, Bristow K, Smith J, Vamvakas G, Davies L, et al.
-
The clinical effectiveness and cost-effectiveness of inhaled insulin in diabetes mellitus: a systematic review and economic evaluation.
By Black C, Cummins E, Royle P, Philip S, Waugh N.
-
Surveillance of cirrhosis for hepatocellular carcinoma: systematic review and economic analysis.
By Thompson Coon J, Rogers G, Hewson P, Wright D, Anderson R, Cramp M, et al.
-
The Birmingham Rehabilitation Uptake Maximisation Study (BRUM). Homebased compared with hospital-based cardiac rehabilitation in a multi-ethnic population: cost-effectiveness and patient adherence.
By Jolly K, Taylor R, Lip GYH, Greenfield S, Raftery J, Mant J, et al.
-
A systematic review of the clinical, public health and cost-effectiveness of rapid diagnostic tests for the detection and identification of bacterial intestinal pathogens in faeces and food.
By Abubakar I, Irvine L, Aldus CF, Wyatt GM, Fordham R, Schelenz S, et al.
-
A randomised controlled trial examining the longer-term outcomes of standard versus new antiepileptic drugs. The SANAD trial.
By Marson AG, Appleton R, Baker GA, Chadwick DW, Doughty J, Eaton B, et al.
-
Clinical effectiveness and cost-effectiveness of different models of managing long-term oral anti-coagulation therapy: a systematic review and economic modelling.
By Connock M, Stevens C, Fry-Smith A, Jowett S, Fitzmaurice D, Moore D, et al.
-
A systematic review and economic model of the clinical effectiveness and cost-effectiveness of interventions for preventing relapse in people with bipolar disorder.
By Soares-Weiser K, Bravo Vergel Y, Beynon S, Dunn G, Barbieri M, Duffy S, et al.
-
Taxanes for the adjuvant treatment of early breast cancer: systematic review and economic evaluation.
By Ward S, Simpson E, Davis S, Hind D, Rees A, Wilkinson A.
-
The clinical effectiveness and cost-effectiveness of screening for open angle glaucoma: a systematic review and economic evaluation.
By Burr JM, Mowatt G, Hernández R, Siddiqui MAR, Cook J, Lourenco T, et al.
-
Acceptability, benefit and costs of early screening for hearing disability: a study of potential screening tests and models.
By Davis A, Smith P, Ferguson M, Stephens D, Gianopoulos I.
-
Contamination in trials of educational interventions.
By Keogh-Brown MR, Bachmann MO, Shepstone L, Hewitt C, Howe A, Ramsay CR, et al.
-
Overview of the clinical effectiveness of positron emission tomography imaging in selected cancers.
By Facey K, Bradbury I, Laking G, Payne E.
-
The effectiveness and cost-effectiveness of carmustine implants and temozolomide for the treatment of newly diagnosed high-grade glioma: a systematic review and economic evaluation.
By Garside R, Pitt M, Anderson R, Rogers G, Dyer M, Mealing S, et al.
-
Drug-eluting stents: a systematic review and economic evaluation.
By Hill RA, Boland A, Dickson R, Dündar Y, Haycox A, McLeod C, et al.
-
The clinical effectiveness and cost-effectiveness of cardiac resynchronisation (biventricular pacing) for heart failure: systematic review and economic model.
By Fox M, Mealing S, Anderson R, Dean J, Stein K, Price A, et al.
-
Recruitment to randomised trials: strategies for trial enrolment and participation study. The STEPS study.
By Campbell MK, Snowdon C, Francis D, Elbourne D, McDonald AM, Knight R, et al.
-
Cost-effectiveness of functional cardiac testing in the diagnosis and management of coronary artery disease: a randomised controlled trial. The CECaT trial.
By Sharples L, Hughes V, Crean A, Dyer M, Buxton M, Goldsmith K, et al.
-
Evaluation of diagnostic tests when there is no gold standard. A review of methods.
By Rutjes AWS, Reitsma JB, Coomarasamy A, Khan KS, Bossuyt PMM.
-
Systematic reviews of the clinical effectiveness and cost-effectiveness of proton pump inhibitors in acute upper gastrointestinal bleeding.
By Leontiadis GI, Sreedharan A, Dorward S, Barton P, Delaney B, Howden CW, et al.
-
A review and critique of modelling in prioritising and designing screening programmes.
By Karnon J, Goyder E, Tappenden P, McPhie S, Towers I, Brazier J, et al.
-
An assessment of the impact of the NHS Health Technology Assessment Programme.
By Hanney S, Buxton M, Green C, Coulson D, Raftery J.
-
A systematic review and economic model of switching from nonglycopeptide to glycopeptide antibiotic prophylaxis for surgery.
By Cranny G, Elliott R, Weatherly H, Chambers D, Hawkins N, Myers L, et al.
-
‘Cut down to quit’ with nicotine replacement therapies in smoking cessation: a systematic review of effectiveness and economic analysis.
By Wang D, Connock M, Barton P, Fry-Smith A, Aveyard P, Moore D.
-
A systematic review of the effectiveness of strategies for reducing fracture risk in children with juvenile idiopathic arthritis with additional data on long-term risk of fracture and cost of disease management.
By Thornton J, Ashcroft D, O’Neill T, Elliott R, Adams J, Roberts C, et al.
-
Does befriending by trained lay workers improve psychological well-being and quality of life for carers of people with dementia, and at what cost? A randomised controlled trial.
By Charlesworth G, Shepstone L, Wilson E, Thalanany M, Mugford M, Poland F.
-
A multi-centre retrospective cohort study comparing the efficacy, safety and cost-effectiveness of hysterectomy and uterine artery embolisation for the treatment of symptomatic uterine fibroids. The HOPEFUL study.
By Hirst A, Dutton S, Wu O, Briggs A, Edwards C, Waldenmaier L, et al.
-
Methods of prediction and prevention of pre-eclampsia: systematic reviews of accuracy and effectiveness literature with economic modelling.
By Meads CA, Cnossen JS, Meher S, Juarez-Garcia A, ter Riet G, Duley L, et al.
-
The use of economic evaluations in NHS decision-making: a review and empirical investigation.
By Williams I, McIver S, Moore D, Bryan S.
-
Stapled haemorrhoidectomy (haemorrhoidopexy) for the treatment of haemorrhoids: a systematic review and economic evaluation.
By Burch J, Epstein D, Baba-Akbari A, Weatherly H, Fox D, Golder S, et al.
-
The clinical effectiveness of diabetes education models for Type 2 diabetes: a systematic review.
By Loveman E, Frampton GK, Clegg AJ.
-
Payment to healthcare professionals for patient recruitment to trials: systematic review and qualitative study.
By Raftery J, Bryant J, Powell J, Kerr C, Hawker S.
-
Cyclooxygenase-2 selective non-steroidal anti-inflammatory drugs (etodolac, meloxicam, celecoxib, rofecoxib, etoricoxib, valdecoxib and lumiracoxib) for osteoarthritis and rheumatoid arthritis: a systematic review and economic evaluation.
By Chen Y-F, Jobanputra P, Barton P, Bryan S, Fry-Smith A, Harris G, et al.
-
The clinical effectiveness and cost-effectiveness of central venous catheters treated with anti-infective agents in preventing bloodstream infections: a systematic review and economic evaluation.
By Hockenhull JC, Dwan K, Boland A, Smith G, Bagust A, Dundar Y, et al.
-
Stepped treatment of older adults on laxatives. The STOOL trial.
By Mihaylov S, Stark C, McColl E, Steen N, Vanoli A, Rubin G, et al.
-
A randomised controlled trial of cognitive behaviour therapy in adolescents with major depression treated by selective serotonin reuptake inhibitors. The ADAPT trial.
By Goodyer IM, Dubicka B, Wilkinson P, Kelvin R, Roberts C, Byford S, et al.
-
The use of irinotecan, oxaliplatin and raltitrexed for the treatment of advanced colorectal cancer: systematic review and economic evaluation.
By Hind D, Tappenden P, Tumur I, Eggington E, Sutcliffe P, Ryan A.
-
Ranibizumab and pegaptanib for the treatment of age-related macular degeneration: a systematic review and economic evaluation.
By Colquitt JL, Jones J, Tan SC, Takeda A, Clegg AJ, Price A.
-
Systematic review of the clinical effectiveness and cost-effectiveness of 64-slice or higher computed tomography angiography as an alternative to invasive coronary angiography in the investigation of coronary artery disease.
By Mowatt G, Cummins E, Waugh N, Walker S, Cook J, Jia X, et al.
-
Structural neuroimaging in psychosis: a systematic review and economic evaluation.
By Albon E, Tsourapas A, Frew E, Davenport C, Oyebode F, Bayliss S, et al.
-
Systematic review and economic analysis of the comparative effectiveness of different inhaled corticosteroids and their usage with long-acting beta2 agonists for the treatment of chronic asthma in adults and children aged 12 years and over.
By Shepherd J, Rogers G, Anderson R, Main C, Thompson-Coon J, Hartwell D, et al.
-
Systematic review and economic analysis of the comparative effectiveness of different inhaled corticosteroids and their usage with long-acting beta2 agonists for the treatment of chronic asthma in children under the age of 12 years.
By Main C, Shepherd J, Anderson R, Rogers G, Thompson-Coon J, Liu Z, et al.
-
Ezetimibe for the treatment of hypercholesterolaemia: a systematic review and economic evaluation.
By Ara R, Tumur I, Pandor A, Duenas A, Williams R, Wilkinson A, et al.
-
Topical or oral ibuprofen for chronic knee pain in older people. The TOIB study.
By Underwood M, Ashby D, Carnes D, Castelnuovo E, Cross P, Harding G, et al.
-
A prospective randomised comparison of minor surgery in primary and secondary care. The MiSTIC trial.
By George S, Pockney P, Primrose J, Smith H, Little P, Kinley H, et al.
-
A review and critical appraisal of measures of therapist–patient interactions in mental health settings.
By Cahill J, Barkham M, Hardy G, Gilbody S, Richards D, Bower P, et al.
-
The clinical effectiveness and cost-effectiveness of screening programmes for amblyopia and strabismus in children up to the age of 4–5 years: a systematic review and economic evaluation.
By Carlton J, Karnon J, Czoski-Murray C, Smith KJ, Marr J.
-
A systematic review of the clinical effectiveness and cost-effectiveness and economic modelling of minimal incision total hip replacement approaches in the management of arthritic disease of the hip.
By de Verteuil R, Imamura M, Zhu S, Glazener C, Fraser C, Munro N, et al.
-
A preliminary model-based assessment of the cost–utility of a screening programme for early age-related macular degeneration.
By Karnon J, Czoski-Murray C, Smith K, Brand C, Chakravarthy U, Davis S, et al.
-
Intravenous magnesium sulphate and sotalol for prevention of atrial fibrillation after coronary artery bypass surgery: a systematic review and economic evaluation.
By Shepherd J, Jones J, Frampton GK, Tanajewski L, Turner D, Price A.
-
Absorbent products for urinary/faecal incontinence: a comparative evaluation of key product categories.
By Fader M, Cottenden A, Getliffe K, Gage H, Clarke-O’Neill S, Jamieson K, et al.
-
A systematic review of repetitive functional task practice with modelling of resource use, costs and effectiveness.
By French B, Leathley M, Sutton C, McAdam J, Thomas L, Forster A, et al.
-
The effectiveness and cost-effectivness of minimal access surgery amongst people with gastro-oesophageal reflux disease – a UK collaborative study. The reflux trial.
By Grant A, Wileman S, Ramsay C, Bojke L, Epstein D, Sculpher M, et al.
-
Time to full publication of studies of anti-cancer medicines for breast cancer and the potential for publication bias: a short systematic review.
By Takeda A, Loveman E, Harris P, Hartwell D, Welch K.
-
Performance of screening tests for child physical abuse in accident and emergency departments.
By Woodman J, Pitt M, Wentz R, Taylor B, Hodes D, Gilbert RE.
-
Curative catheter ablation in atrial fibrillation and typical atrial flutter: systematic review and economic evaluation.
By Rodgers M, McKenna C, Palmer S, Chambers D, Van Hout S, Golder S, et al.
-
Systematic review and economic modelling of effectiveness and cost utility of surgical treatments for men with benign prostatic enlargement.
By Lourenco T, Armstrong N, N’Dow J, Nabi G, Deverill M, Pickard R, et al.
-
Immunoprophylaxis against respiratory syncytial virus (RSV) with palivizumab in children: a systematic review and economic evaluation.
By Wang D, Cummins C, Bayliss S, Sandercock J, Burls A.
-
Deferasirox for the treatment of iron overload associated with regular blood transfusions (transfusional haemosiderosis) in patients suffering with chronic anaemia: a systematic review and economic evaluation.
By McLeod C, Fleeman N, Kirkham J, Bagust A, Boland A, Chu P, et al.
-
Thrombophilia testing in people with venous thromboembolism: systematic review and cost-effectiveness analysis.
By Simpson EL, Stevenson MD, Rawdin A, Papaioannou D.
-
Surgical procedures and non-surgical devices for the management of non-apnoeic snoring: a systematic review of clinical effects and associated treatment costs.
By Main C, Liu Z, Welch K, Weiner G, Quentin Jones S, Stein K.
-
Continuous positive airway pressure devices for the treatment of obstructive sleep apnoea–hypopnoea syndrome: a systematic review and economic analysis.
By McDaid C, Griffin S, Weatherly H, Durée K, van der Burgt M, van Hout S, Akers J, et al.
-
Use of classical and novel biomarkers as prognostic risk factors for localised prostate cancer: a systematic review.
By Sutcliffe P, Hummel S, Simpson E, Young T, Rees A, Wilkinson A, et al.
-
The harmful health effects of recreational ecstasy: a systematic review of observational evidence.
By Rogers G, Elston J, Garside R, Roome C, Taylor R, Younger P, et al.
-
Systematic review of the clinical effectiveness and cost-effectiveness of oesophageal Doppler monitoring in critically ill and high-risk surgical patients.
By Mowatt G, Houston G, Hernández R, de Verteuil R, Fraser C, Cuthbertson B, et al.
-
The use of surrogate outcomes in model-based cost-effectiveness analyses: a survey of UK Health Technology Assessment reports.
By Taylor RS, Elston J.
-
Controlling Hypertension and Hypotension Immediately Post Stroke (CHHIPS) – a randomised controlled trial.
By Potter J, Mistri A, Brodie F, Chernova J, Wilson E, Jagger C, et al.
-
Routine antenatal anti-D prophylaxis for RhD-negative women: a systematic review and economic evaluation.
By Pilgrim H, Lloyd-Jones M, Rees A.
-
Amantadine, oseltamivir and zanamivir for the prophylaxis of influenza (including a review of existing guidance no. 67): a systematic review and economic evaluation.
By Tappenden P, Jackson R, Cooper K, Rees A, Simpson E, Read R, et al.
-
Improving the evaluation of therapeutic interventions in multiple sclerosis: the role of new psychometric methods.
By Hobart J, Cano S.
-
Treatment of severe ankle sprain: a pragmatic randomised controlled trial comparing the clinical effectiveness and cost-effectiveness of three types of mechanical ankle support with tubular bandage. The CAST trial.
By Cooke MW, Marsh JL, Clark M, Nakash R, Jarvis RM, Hutton JL, et al. , on behalf of the CAST trial group.
-
Non-occupational postexposure prophylaxis for HIV: a systematic review.
By Bryant J, Baxter L, Hird S.
-
Blood glucose self-monitoring in type 2 diabetes: a randomised controlled trial.
By Farmer AJ, Wade AN, French DP, Simon J, Yudkin P, Gray A, et al.
-
How far does screening women for domestic (partner) violence in different health-care settings meet criteria for a screening programme? Systematic reviews of nine UK National Screening Committee criteria.
By Feder G, Ramsay J, Dunne D, Rose M, Arsene C, Norman R, et al.
-
Spinal cord stimulation for chronic pain of neuropathic or ischaemic origin: systematic review and economic evaluation.
By Simpson, EL, Duenas A, Holmes MW, Papaioannou D, Chilcott J.
-
The role of magnetic resonance imaging in the identification of suspected acoustic neuroma: a systematic review of clinical and costeffectiveness and natural history.
By Fortnum H, O’Neill C, Taylor R, Lenthall R, Nikolopoulos T, Lightfoot G, et al.
-
Dipsticks and diagnostic algorithms in urinary tract infection: development and validation, randomised trial, economic analysis, observational cohort and qualitative study.
By Little P, Turner S, Rumsby K, Warner G, Moore M, Lowes JA, et al.
-
Systematic review of respite care in the frail elderly.
By Shaw C, McNamara R, Abrams K, Cannings-John R, Hood K, Longo M, et al.
-
Neuroleptics in the treatment of aggressive challenging behaviour for people with intellectual disabilities: a randomised controlled trial (NACHBID).
By Tyrer P, Oliver-Africano P, Romeo R, Knapp M, Dickens S, Bouras N, et al.
-
Randomised controlled trial to determine the clinical effectiveness and cost-effectiveness of selective serotonin reuptake inhibitors plus supportive care, versus supportive care alone, for mild to moderate depression with somatic symptoms in primary care: the THREAD (THREshold for AntiDepressant response) study.
By Kendrick T, Chatwin J, Dowrick C, Tylee A, Morriss R, Peveler R, et al.
-
Diagnostic strategies using DNA testing for hereditary haemochromatosis in at-risk populations: a systematic review and economic evaluation.
By Bryant J, Cooper K, Picot J, Clegg A, Roderick P, Rosenberg W, et al.
-
Enhanced external counterpulsation for the treatment of stable angina and heart failure: a systematic review and economic analysis.
By McKenna C, McDaid C, Suekarran S, Hawkins N, Claxton K, Light K, et al.
-
Development of a decision support tool for primary care management of patients with abnormal liver function tests without clinically apparent liver disease: a record-linkage population cohort study and decision analysis (ALFIE).
By Donnan PT, McLernon D, Dillon JF, Ryder S, Roderick P, Sullivan F, et al.
-
A systematic review of presumed consent systems for deceased organ donation.
By Rithalia A, McDaid C, Suekarran S, Norman G, Myers L, Sowden A.
-
Paracetamol and ibuprofen for the treatment of fever in children: the PITCH randomised controlled trial.
By Hay AD, Redmond NM, Costelloe C, Montgomery AA, Fletcher M, Hollinghurst S, et al.
-
A randomised controlled trial to compare minimally invasive glucose monitoring devices with conventional monitoring in the management of insulin-treated diabetes mellitus (MITRE).
By Newman SP, Cooke D, Casbard A, Walker S, Meredith S, Nunn A, et al.
-
Sensitivity analysis in economic evaluation: an audit of NICE current practice and a review of its use and value in decision-making.
By Andronis L, Barton P, Bryan S.
-
Trastuzumab for the treatment of primary breast cancer in HER2-positive women: a single technology appraisal.
By Ward S, Pilgrim H, Hind D.
-
Docetaxel for the adjuvant treatment of early node-positive breast cancer: a single technology appraisal.
By Chilcott J, Lloyd Jones M, Wilkinson A.
-
The use of paclitaxel in the management of early stage breast cancer.
By Griffin S, Dunn G, Palmer S, Macfarlane K, Brent S, Dyker A, et al.
-
Rituximab for the first-line treatment of stage III/IV follicular non-Hodgkin’s lymphoma.
By Dundar Y, Bagust A, Hounsome J, McLeod C, Boland A, Davis H, et al.
-
Bortezomib for the treatment of multiple myeloma patients.
By Green C, Bryant J, Takeda A, Cooper K, Clegg A, Smith A, et al.
-
Fludarabine phosphate for the firstline treatment of chronic lymphocytic leukaemia.
By Walker S, Palmer S, Erhorn S, Brent S, Dyker A, Ferrie L, et al.
-
Erlotinib for the treatment of relapsed non-small cell lung cancer.
By McLeod C, Bagust A, Boland A, Hockenhull J, Dundar Y, Proudlove C, et al.
-
Cetuximab plus radiotherapy for the treatment of locally advanced squamous cell carcinoma of the head and neck.
By Griffin S, Walker S, Sculpher M, White S, Erhorn S, Brent S, et al.
-
Infliximab for the treatment of adults with psoriasis.
By Loveman E, Turner D, Hartwell D, Cooper K, Clegg A
-
Psychological interventions for postnatal depression: cluster randomised trial and economic evaluation. The PoNDER trial.
By Morrell CJ, Warner R, Slade P, Dixon S, Walters S, Paley G, et al.
-
The effect of different treatment durations of clopidogrel in patients with non-ST-segment elevation acute coronary syndromes: a systematic review and value of information analysis.
By Rogowski R, Burch J, Palmer S, Craigs C, Golder S, Woolacott N.
-
Systematic review and individual patient data meta-analysis of diagnosis of heart failure, with modelling of implications of different diagnostic strategies in primary care.
By Mant J, Doust J, Roalfe A, Barton P, Cowie MR, Glasziou P, et al.
-
A multicentre randomised controlled trial of the use of continuous positive airway pressure and non-invasive positive pressure ventilation in the early treatment of patients presenting to the emergency department with severe acute cardiogenic pulmonary oedema: the 3CPO trial.
By Gray AJ, Goodacre S, Newby DE, Masson MA, Sampson F, Dixon S, et al. , on behalf of the 3CPO study investigators.
-
Early high-dose lipid-lowering therapy to avoid cardiac events: a systematic review and economic evaluation.
By Ara R, Pandor A, Stevens J, Rees A, Rafia R.
-
Adefovir dipivoxil and pegylated interferon alpha for the treatment of chronic hepatitis B: an updated systematic review and economic evaluation.
By Jones J, Shepherd J, Baxter L, Gospodarevskaya E, Hartwell D, Harris P, et al.
-
Methods to identify postnatal depression in primary care: an integrated evidence synthesis and value of information analysis.
By Hewitt CE, Gilbody SM, Brealey S, Paulden M, Palmer S, Mann R, et al.
-
A double-blind randomised placebocontrolled trial of topical intranasal corticosteroids in 4- to 11-year-old children with persistent bilateral otitis media with effusion in primary care.
By Williamson I, Benge S, Barton S, Petrou S, Letley L, Fasey N, et al.
-
The effectiveness and cost-effectiveness of methods of storing donated kidneys from deceased donors: a systematic review and economic model.
By Bond M, Pitt M, Akoh J, Moxham T, Hoyle M, Anderson R.
-
Rehabilitation of older patients: day hospital compared with rehabilitation at home. A randomised controlled trial.
By Parker SG, Oliver P, Pennington M, Bond J, Jagger C, Enderby PM, et al.
-
Breastfeeding promotion for infants in neonatal units: a systematic review and economic analysis.
By Renfrew MJ, Craig D, Dyson L, McCormick F, Rice S, King SE, et al.
-
The clinical effectiveness and costeffectiveness of bariatric (weight loss) surgery for obesity: a systematic review and economic evaluation.
By Picot J, Jones J, Colquitt JL, Gospodarevskaya E, Loveman E, Baxter L, et al.
-
Rapid testing for group B streptococcus during labour: a test accuracy study with evaluation of acceptability and cost-effectiveness.
By Daniels J, Gray J, Pattison H, Roberts T, Edwards E, Milner P, et al.
-
Screening to prevent spontaneous preterm birth: systematic reviews of accuracy and effectiveness literature with economic modelling.
By Honest H, Forbes CA, Durée KH, Norman G, Duffy SB, Tsourapas A, et al.
-
The effectiveness and cost-effectiveness of cochlear implants for severe to profound deafness in children and adults: a systematic review and economic model.
By Bond M, Mealing S, Anderson R, Elston J, Weiner G, Taylor RS, et al.
-
Gemcitabine for the treatment of metastatic breast cancer.
By Jones J, Takeda A, Tan SC, Cooper K, Loveman E, Clegg A.
-
Varenicline in the management of smoking cessation: a single technology appraisal.
By Hind D, Tappenden P, Peters J, Kenjegalieva K.
-
Alteplase for the treatment of acute ischaemic stroke: a single technology appraisal.
By Lloyd Jones M, Holmes M.
-
Rituximab for the treatment of rheumatoid arthritis.
By Bagust A, Boland A, Hockenhull J, Fleeman N, Greenhalgh J, Dundar Y, et al.
-
Omalizumab for the treatment of severe persistent allergic asthma.
By Jones J, Shepherd J, Hartwell D, Harris P, Cooper K, Takeda A, et al.
-
Rituximab for the treatment of relapsed or refractory stage III or IV follicular non-Hodgkin’s lymphoma.
By Boland A, Bagust A, Hockenhull J, Davis H, Chu P, Dickson R.
-
Adalimumab for the treatment of psoriasis.
By Turner D, Picot J, Cooper K, Loveman E.
-
Dabigatran etexilate for the prevention of venous thromboembolism in patients undergoing elective hip and knee surgery: a single technology appraisal.
By Holmes M, C Carroll C, Papaioannou D.
-
Romiplostim for the treatment of chronic immune or idiopathic thrombocytopenic purpura: a single technology appraisal.
By Mowatt G, Boachie C, Crowther M, Fraser C, Hernández R, Jia X, et al.
-
Sunitinib for the treatment of gastrointestinal stromal tumours: a critique of the submission from Pfizer.
By Bond M, Hoyle M, Moxham T, Napier M, Anderson R.
-
Vitamin K to prevent fractures in older women: systematic review and economic evaluation.
By Stevenson M, Lloyd-Jones M, Papaioannou D.
-
The effects of biofeedback for the treatment of essential hypertension: a systematic review.
By Greenhalgh J, Dickson R, Dundar Y.
-
A randomised controlled trial of the use of aciclovir and/or prednisolone for the early treatment of Bell’s palsy: the BELLS study.
By Sullivan FM, Swan IRC, Donnan PT, Morrison JM, Smith BH, McKinstry B, et al.
-
Lapatinib for the treatment of HER2-overexpressing breast cancer.
By Jones J, Takeda A, Picot J, von Keyserlingk C, Clegg A.
-
Infliximab for the treatment of ulcerative colitis.
By Hyde C, Bryan S, Juarez-Garcia A, Andronis L, Fry-Smith A.
-
Rimonabant for the treatment of overweight and obese people.
By Burch J, McKenna C, Palmer S, Norman G, Glanville J, Sculpher M, et al.
-
Telbivudine for the treatment of chronic hepatitis B infection.
By Hartwell D, Jones J, Harris P, Cooper K.
-
Entecavir for the treatment of chronic hepatitis B infection.
By Shepherd J, Gospodarevskaya E, Frampton G, Cooper, K.
-
Febuxostat for the treatment of hyperuricaemia in people with gout: a single technology appraisal.
By Stevenson M, Pandor A.
-
Rivaroxaban for the prevention of venous thromboembolism: a single technology appraisal.
By Stevenson M, Scope A, Holmes M, Rees A, Kaltenthaler E.
-
Cetuximab for the treatment of recurrent and/or metastatic squamous cell carcinoma of the head and neck.
By Greenhalgh J, Bagust A, Boland A, Fleeman N, McLeod C, Dundar Y, et al.
-
Mifamurtide for the treatment of osteosarcoma: a single technology appraisal.
By Pandor A, Fitzgerald P, Stevenson M, Papaioannou D.
-
Ustekinumab for the treatment of moderate to severe psoriasis.
By Gospodarevskaya E, Picot J, Cooper K, Loveman E, Takeda A.
-
Endovascular stents for abdominal aortic aneurysms: a systematic review and economic model.
By Chambers D, Epstein D, Walker S, Fayter D, Paton F, Wright K, et al.
-
Clinical and cost-effectiveness of epoprostenol, iloprost, bosentan, sitaxentan and sildenafil for pulmonary arterial hypertension within their licensed indications: a systematic review and economic evaluation.
By Chen Y-F, Jowett S, Barton P, Malottki K, Hyde C, Gibbs JSR, et al.
-
Cessation of attention deficit hyperactivity disorder drugs in the young (CADDY) – a pharmacoepidemiological and qualitative study.
By Wong ICK, Asherson P, Bilbow A, Clifford S, Coghill D, R DeSoysa R, et al.
-
ARTISTIC: a randomised trial of human papillomavirus (HPV) testing in primary cervical screening.
By Kitchener HC, Almonte M, Gilham C, Dowie R, Stoykova B, Sargent A, et al.
-
The clinical effectiveness of glucosamine and chondroitin supplements in slowing or arresting progression of osteoarthritis of the knee: a systematic review and economic evaluation.
By Black C, Clar C, Henderson R, MacEachern C, McNamee P, Quayyum Z, et al.
-
Randomised preference trial of medical versus surgical termination of pregnancy less than 14 weeks’ gestation (TOPS).
By Robson SC, Kelly T, Howel D, Deverill M, Hewison J, Lie MLS, et al.
-
Randomised controlled trial of the use of three dressing preparations in the management of chronic ulceration of the foot in diabetes.
By Jeffcoate WJ, Price PE, Phillips CJ, Game FL, Mudge E, Davies S, et al.
-
VenUS II: a randomised controlled trial of larval therapy in the management of leg ulcers.
By Dumville JC, Worthy G, Soares MO, Bland JM, Cullum N, Dowson C, et al.
-
A prospective randomised controlled trial and economic modelling of antimicrobial silver dressings versus non-adherent control dressings for venous leg ulcers: the VULCAN trial
By Michaels JA, Campbell WB, King BM, MacIntyre J, Palfreyman SJ, Shackley P, et al.
-
Communication of carrier status information following universal newborn screening for sickle cell disorders and cystic fibrosis: qualitative study of experience and practice.
By Kai J, Ulph F, Cullinan T, Qureshi N.
Health Technology Assessment programme
-
Director, NIHR HTA programme, Professor of Clinical Pharmacology, University of Liverpool
-
Director, Medical Care Research Unit, University of Sheffield
Prioritisation Strategy Group
-
Director, NIHR HTA programme, Professor of Clinical Pharmacology, University of Liverpool
-
Director, Medical Care Research Unit, University of Sheffield
-
Dr Bob Coates, Consultant Advisor, NETSCC, HTA
-
Dr Andrew Cook, Consultant Advisor, NETSCC, HTA
-
Dr Peter Davidson, Director of Science Support, NETSCC, HTA
-
Professor Robin E Ferner, Consultant Physician and Director, West Midlands Centre for Adverse Drug Reactions, City Hospital NHS Trust, Birmingham
-
Professor Paul Glasziou, Professor of Evidence-Based Medicine, University of Oxford
-
Dr Nick Hicks, Director of NHS Support, NETSCC, HTA
-
Dr Edmund Jessop, Medical Adviser, National Specialist, National Commissioning Group (NCG), Department of Health, London
-
Ms Lynn Kerridge, Chief Executive Officer, NETSCC and NETSCC, HTA
-
Dr Ruairidh Milne, Director of Strategy and Development, NETSCC
-
Ms Kay Pattison, Section Head, NHS R&D Programme, Department of Health
-
Ms Pamela Young, Specialist Programme Manager, NETSCC, HTA
HTA Commissioning Board
-
Director, NIHR HTA programme, Professor of Clinical Pharmacology, University of Liverpool
-
Director, Medical Care Research Unit, University of Sheffield
-
Senior Lecturer in General Practice, Department of Primary Health Care, University of Oxford
-
Professor Ann Ashburn, Professor of Rehabilitation and Head of Research, Southampton General Hospital
-
Professor Deborah Ashby, Professor of Medical Statistics, Queen Mary, University of London
-
Professor John Cairns, Professor of Health Economics, London School of Hygiene and Tropical Medicine
-
Professor Peter Croft, Director of Primary Care Sciences Research Centre, Keele University
-
Professor Nicky Cullum, Director of Centre for Evidence-Based Nursing, University of York
-
Professor Jenny Donovan, Professor of Social Medicine, University of Bristol
-
Professor Steve Halligan, Professor of Gastrointestinal Radiology, University College Hospital, London
-
Professor Freddie Hamdy, Professor of Urology, University of Sheffield
-
Professor Allan House, Professor of Liaison Psychiatry, University of Leeds
-
Dr Martin J Landray, Reader in Epidemiology, Honorary Consultant Physician, Clinical Trial Service Unit, University of Oxford?
-
Professor Stuart Logan, Director of Health & Social Care Research, The Peninsula Medical School, Universities of Exeter and Plymouth
-
Dr Rafael Perera, Lecturer in Medical Statisitics, Department of Primary Health Care, Univeristy of Oxford
-
Professor Ian Roberts, Professor of Epidemiology & Public Health, London School of Hygiene and Tropical Medicine
-
Professor Mark Sculpher, Professor of Health Economics, University of York
-
Professor Helen Smith, Professor of Primary Care, University of Brighton
-
Professor Kate Thomas, Professor of Complementary & Alternative Medicine Research, University of Leeds
-
Professor David John Torgerson, Director of York Trials Unit, University of York
-
Professor Hywel Williams, Professor of Dermato-Epidemiology, University of Nottingham
-
Ms Kay Pattison, Section Head, NHS R&D Programme, Department of Health
-
Dr Morven Roberts, Clinical Trials Manager, Medical Research Council
Diagnostic Technologies & Screening Panel
-
Professor of Evidence-Based Medicine, University of Oxford
-
Consultant Paediatrician and Honorary Senior Lecturer, Great Ormond Street Hospital, London
-
Professor Judith E Adams, Consultant Radiologist, Manchester Royal Infirmary, Central Manchester & Manchester Children’s University Hospitals NHS Trust, and Professor of Diagnostic Radiology, Imaging Science and Biomedical Engineering, Cancer & Imaging Sciences, University of Manchester
-
Ms Jane Bates, Consultant Ultrasound Practitioner, Ultrasound Department, Leeds Teaching Hospital NHS Trust
-
Dr Stephanie Dancer, Consultant Microbiologist, Hairmyres Hospital, East Kilbride
-
Professor Glyn Elwyn, Primary Medical Care Research Group, Swansea Clinical School, University of Wales
-
Dr Ron Gray, Consultant Clinical Epidemiologist, Department of Public Health, University of Oxford
-
Professor Paul D Griffiths, Professor of Radiology, University of Sheffield
-
Dr Jennifer J Kurinczuk, Consultant Clinical Epidemiologist, National Perinatal Epidemiology Unit, Oxford
-
Dr Susanne M Ludgate, Medical Director, Medicines & Healthcare Products Regulatory Agency, London
-
Dr Anne Mackie, Director of Programmes, UK National Screening Committee
-
Dr Michael Millar, Consultant Senior Lecturer in Microbiology, Barts and The London NHS Trust, Royal London Hospital
-
Mr Stephen Pilling, Director, Centre for Outcomes, Research & Effectiveness, Joint Director, National Collaborating Centre for Mental Health, University College London
-
Mrs Una Rennard, Service User Representative
-
Dr Phil Shackley, Senior Lecturer in Health Economics, School of Population and Health Sciences, University of Newcastle upon Tyne
-
Dr W Stuart A Smellie, Consultant in Chemical Pathology, Bishop Auckland General Hospital
-
Dr Nicholas Summerton, Consultant Clinical and Public Health Advisor, NICE
-
Ms Dawn Talbot, Service User Representative
-
Dr Graham Taylor, Scientific Advisor, Regional DNA Laboratory, St James’s University Hospital, Leeds
-
Professor Lindsay Wilson Turnbull, Scientific Director of the Centre for Magnetic Resonance Investigations and YCR Professor of Radiology, Hull Royal Infirmary
-
Dr Tim Elliott, Team Leader, Cancer Screening, Department of Health
-
Dr Catherine Moody, Programme Manager, Neuroscience and Mental Health Board
-
Dr Ursula Wells, Principal Research Officer, Department of Health
Pharmaceuticals Panel
-
Consultant Physician and Director, West Midlands Centre for Adverse Drug Reactions, City Hospital NHS Trust, Birmingham
-
Professor in Child Health, University of Nottingham
-
Mrs Nicola Carey, Senior Research Fellow, School of Health and Social Care, The University of Reading
-
Mr John Chapman, Service User Representative
-
Dr Peter Elton, Director of Public Health, Bury Primary Care Trust
-
Dr Ben Goldacre, Research Fellow, Division of Psychological Medicine and Psychiatry, King’s College London
-
Mrs Barbara Greggains, Service User Representative
-
Dr Bill Gutteridge, Medical Adviser, London Strategic Health Authority
-
Dr Dyfrig Hughes, Reader in Pharmacoeconomics and Deputy Director, Centre for Economics and Policy in Health, IMSCaR, Bangor University
-
Professor Jonathan Ledermann, Professor of Medical Oncology and Director of the Cancer Research UK and University College London Cancer Trials Centre
-
Dr Yoon K Loke, Senior Lecturer in Clinical Pharmacology, University of East Anglia
-
Professor Femi Oyebode, Consultant Psychiatrist and Head of Department, University of Birmingham
-
Dr Andrew Prentice, Senior Lecturer and Consultant Obstetrician and Gynaecologist, The Rosie Hospital, University of Cambridge
-
Dr Martin Shelly, General Practitioner, Leeds, and Associate Director, NHS Clinical Governance Support Team, Leicester
-
Dr Gillian Shepherd, Director, Health and Clinical Excellence, Merck Serono Ltd
-
Mrs Katrina Simister, Assistant Director New Medicines, National Prescribing Centre, Liverpool
-
Mr David Symes, Service User Representative
-
Dr Lesley Wise, Unit Manager, Pharmacoepidemiology Research Unit, VRMM, Medicines & Healthcare Products Regulatory Agency
-
Ms Kay Pattison, Section Head, NHS R&D Programme, Department of Health
-
Mr Simon Reeve, Head of Clinical and Cost-Effectiveness, Medicines, Pharmacy and Industry Group, Department of Health
-
Dr Heike Weber, Programme Manager, Medical Research Council
-
Dr Ursula Wells, Principal Research Officer, Department of Health
Therapeutic Procedures Panel
-
Consultant Physician, North Bristol NHS Trust
-
Professor of Psychiatry, Division of Health in the Community, University of Warwick, Coventry
-
Professor Jane Barlow, Professor of Public Health in the Early Years, Health Sciences Research Institute, Warwick Medical School, Coventry
-
Ms Maree Barnett, Acting Branch Head of Vascular Programme, Department of Health
-
Mrs Val Carlill, Service User Representative
-
Mrs Anthea De Barton-Watson, Service User Representative
-
Mr Mark Emberton, Senior Lecturer in Oncological Urology, Institute of Urology, University College Hospital, London
-
Professor Steve Goodacre, Professor of Emergency Medicine, University of Sheffield
-
Professor Christopher Griffiths, Professor of Primary Care, Barts and The London School of Medicine and Dentistry
-
Mr Paul Hilton, Consultant Gynaecologist and Urogynaecologist, Royal Victoria Infirmary, Newcastle upon Tyne
-
Professor Nicholas James, Professor of Clinical Oncology, University of Birmingham, and Consultant in Clinical Oncology, Queen Elizabeth Hospital
-
Dr Peter Martin, Consultant Neurologist, Addenbrooke’s Hospital, Cambridge
-
Dr Kate Radford, Senior Lecturer (Research), Clinical Practice Research Unit, University of Central Lancashire, Preston
-
Mr Jim Reece Service User Representative
-
Dr Karen Roberts, Nurse Consultant, Dunston Hill Hospital Cottages
-
Dr Phillip Leech, Principal Medical Officer for Primary Care, Department of Health
-
Ms Kay Pattison, Section Head, NHS R&D Programme, Department of Health
-
Dr Morven Roberts, Clinical Trials Manager, Medical Research Council
-
Professor Tom Walley, Director, NIHR HTA programme, Professor of Clinical Pharmacology, University of Liverpool
-
Dr Ursula Wells, Principal Research Officer, Department of Health
Disease Prevention Panel
-
Medical Adviser, National Specialist, National Commissioning Group (NCG), London
-
Director, NHS Sustainable Development Unit, Cambridge
-
Dr Elizabeth Fellow-Smith, Medical Director, West London Mental Health Trust, Middlesex
-
Dr John Jackson, General Practitioner, Parkway Medical Centre, Newcastle upon Tyne
-
Professor Mike Kelly, Director, Centre for Public Health Excellence, NICE, London
-
Dr Chris McCall, General Practitioner, The Hadleigh Practice, Corfe Mullen, Dorset
-
Ms Jeanett Martin, Director of Nursing, BarnDoc Limited, Lewisham Primary Care Trust
-
Dr Julie Mytton, Locum Consultant in Public Health Medicine, Bristol Primary Care Trust
-
Miss Nicky Mullany, Service User Representative
-
Professor Ian Roberts, Professor of Epidemiology and Public Health, London School of Hygiene & Tropical Medicine
-
Professor Ken Stein, Senior Clinical Lecturer in Public Health, University of Exeter
-
Dr Kieran Sweeney, Honorary Clinical Senior Lecturer, Peninsula College of Medicine and Dentistry, Universities of Exeter and Plymouth
-
Professor Carol Tannahill, Glasgow Centre for Population Health
-
Professor Margaret Thorogood, Professor of Epidemiology, University of Warwick Medical School, Coventry
-
Ms Christine McGuire, Research & Development, Department of Health
-
Dr Caroline Stone, Programme Manager, Medical Research Council
Expert Advisory Network
-
Professor Douglas Altman, Professor of Statistics in Medicine, Centre for Statistics in Medicine, University of Oxford
-
Professor John Bond, Professor of Social Gerontology & Health Services Research, University of Newcastle upon Tyne
-
Professor Andrew Bradbury, Professor of Vascular Surgery, Solihull Hospital, Birmingham
-
Mr Shaun Brogan, Chief Executive, Ridgeway Primary Care Group, Aylesbury
-
Mrs Stella Burnside OBE, Chief Executive, Regulation and Improvement Authority, Belfast
-
Ms Tracy Bury, Project Manager, World Confederation for Physical Therapy, London
-
Professor Iain T Cameron, Professor of Obstetrics and Gynaecology and Head of the School of Medicine, University of Southampton
-
Dr Christine Clark, Medical Writer and Consultant Pharmacist, Rossendale
-
Professor Collette Clifford, Professor of Nursing and Head of Research, The Medical School, University of Birmingham
-
Professor Barry Cookson, Director, Laboratory of Hospital Infection, Public Health Laboratory Service, London
-
Dr Carl Counsell, Clinical Senior Lecturer in Neurology, University of Aberdeen
-
Professor Howard Cuckle, Professor of Reproductive Epidemiology, Department of Paediatrics, Obstetrics & Gynaecology, University of Leeds
-
Dr Katherine Darton, Information Unit, MIND – The Mental Health Charity, London
-
Professor Carol Dezateux, Professor of Paediatric Epidemiology, Institute of Child Health, London
-
Mr John Dunning, Consultant Cardiothoracic Surgeon, Papworth Hospital NHS Trust, Cambridge
-
Mr Jonothan Earnshaw, Consultant Vascular Surgeon, Gloucestershire Royal Hospital, Gloucester
-
Professor Martin Eccles, Professor of Clinical Effectiveness, Centre for Health Services Research, University of Newcastle upon Tyne
-
Professor Pam Enderby, Dean of Faculty of Medicine, Institute of General Practice and Primary Care, University of Sheffield
-
Professor Gene Feder, Professor of Primary Care Research & Development, Centre for Health Sciences, Barts and The London School of Medicine and Dentistry
-
Mr Leonard R Fenwick, Chief Executive, Freeman Hospital, Newcastle upon Tyne
-
Mrs Gillian Fletcher, Antenatal Teacher and Tutor and President, National Childbirth Trust, Henfield
-
Professor Jayne Franklyn, Professor of Medicine, University of Birmingham
-
Mr Tam Fry, Honorary Chairman, Child Growth Foundation, London
-
Professor Fiona Gilbert, Consultant Radiologist and NCRN Member, University of Aberdeen
-
Professor Paul Gregg, Professor of Orthopaedic Surgical Science, South Tees Hospital NHS Trust
-
Bec Hanley, Co-director, TwoCan Associates, West Sussex
-
Dr Maryann L Hardy, Senior Lecturer, University of Bradford
-
Mrs Sharon Hart, Healthcare Management Consultant, Reading
-
Professor Robert E Hawkins, CRC Professor and Director of Medical Oncology, Christie CRC Research Centre, Christie Hospital NHS Trust, Manchester
-
Professor Richard Hobbs, Head of Department of Primary Care & General Practice, University of Birmingham
-
Professor Alan Horwich, Dean and Section Chairman, The Institute of Cancer Research, London
-
Professor Allen Hutchinson, Director of Public Health and Deputy Dean of ScHARR, University of Sheffield
-
Professor Peter Jones, Professor of Psychiatry, University of Cambridge, Cambridge
-
Professor Stan Kaye, Cancer Research UK Professor of Medical Oncology, Royal Marsden Hospital and Institute of Cancer Research, Surrey
-
Dr Duncan Keeley, General Practitioner (Dr Burch & Ptnrs), The Health Centre, Thame
-
Dr Donna Lamping, Research Degrees Programme Director and Reader in Psychology, Health Services Research Unit, London School of Hygiene and Tropical Medicine, London
-
Mr George Levvy, Chief Executive, Motor Neurone Disease Association, Northampton
-
Professor James Lindesay, Professor of Psychiatry for the Elderly, University of Leicester
-
Professor Julian Little, Professor of Human Genome Epidemiology, University of Ottawa
-
Professor Alistaire McGuire, Professor of Health Economics, London School of Economics
-
Professor Rajan Madhok, Medical Director and Director of Public Health, Directorate of Clinical Strategy & Public Health, North & East Yorkshire & Northern Lincolnshire Health Authority, York
-
Professor Alexander Markham, Director, Molecular Medicine Unit, St James’s University Hospital, Leeds
-
Dr Peter Moore, Freelance Science Writer, Ashtead
-
Dr Andrew Mortimore, Public Health Director, Southampton City Primary Care Trust
-
Dr Sue Moss, Associate Director, Cancer Screening Evaluation Unit, Institute of Cancer Research, Sutton
-
Professor Miranda Mugford, Professor of Health Economics and Group Co-ordinator, University of East Anglia
-
Professor Jim Neilson, Head of School of Reproductive & Developmental Medicine and Professor of Obstetrics and Gynaecology, University of Liverpool
-
Mrs Julietta Patnick, National Co-ordinator, NHS Cancer Screening Programmes, Sheffield
-
Professor Robert Peveler, Professor of Liaison Psychiatry, Royal South Hants Hospital, Southampton
-
Professor Chris Price, Director of Clinical Research, Bayer Diagnostics Europe, Stoke Poges
-
Professor William Rosenberg, Professor of Hepatology and Consultant Physician, University of Southampton
-
Professor Peter Sandercock, Professor of Medical Neurology, Department of Clinical Neurosciences, University of Edinburgh
-
Dr Susan Schonfield, Consultant in Public Health, Hillingdon Primary Care Trust, Middlesex
-
Dr Eamonn Sheridan, Consultant in Clinical Genetics, St James’s University Hospital, Leeds
-
Dr Margaret Somerville, Director of Public Health Learning, Peninsula Medical School, University of Plymouth
-
Professor Sarah Stewart-Brown, Professor of Public Health, Division of Health in the Community, University of Warwick, Coventry
-
Professor Ala Szczepura, Professor of Health Service Research, Centre for Health Services Studies, University of Warwick, Coventry
-
Mrs Joan Webster, Consumer Member, Southern Derbyshire Community Health Council
-
Professor Martin Whittle, Clinical Co-director, National Co-ordinating Centre for Women’s and Children’s Health, Lymington