Notes
Article history paragraph text
The research reported in this issue of the journal was funded by the HTA programme as project number 08/16/01. The contractual start date was in November 2009. The draft report began editorial review in August 2011 and was accepted for publication in March 2012. The authors have been wholly responsible for all data collection, analysis and interpretation, and for writing up their work. The HTA editors and publisher have tried to ensure the accuracy of the authors' report and would like to thank the reviewers for their constructive comments on the draft document. However, they do not accept liability for damages or losses arising from material published in this report.
Permissions
Copyright statement
© Queen's Printer and Controller of HMSO 2013. This work was produced by Abubakar et al. under the terms of a commissioning contract issued by the Secretary of State for Health. This issue may be freely reproduced for the purposes of private research and study and extracts (or indeed, the full report) may be included in professional journals provided that suitable acknowledgement is made and the reproduction is not associated with any form of advertising. Applications for commercial reproduction should be addressed to: NIHR Journals Library, National Institute for Health Research, Evaluation, Trials and Studies Coordinating Centre, Alpha House, University of Southampton Science Park, Southampton SO16 7NS, UK.
Chapter 1 Aim of the review
Tuberculosis is a UK public health priority. Rates have increased > 0% over the last two decades. 1 Immunisation with bacillus Calmette–Guérin (BCG) vaccine has been an important component of the national control programme since 1953. In 2005, the policy on BCG vaccination was moved from the universal vaccination of all tuberculin skin test-negative schoolchildren to an approach that targets high-risk groups. This decision was informed by the changing epidemiology of tuberculosis and criteria laid down by the International Union Against Tuberculosis and Lung Disease (IUATLD). 2
Data on the clinical effectiveness of BCG vaccination have been summarised in several reviews, and show reasonable yet variable levels of protective efficacy. 3,4 One key element of the application of this information to national tuberculosis control programmes is the duration of protection provided by the BCG vaccination. In common with many other vaccines, information on duration of protection (and diminution of effect over time since vaccination) by the BCG vaccination is scarce. Evidence has emerged over recent years5,6 to suggest that the measurable duration of protection by BCG vaccination may exceed previous estimates. 7 Such information is essential both to estimate the impact of BCG vaccination programmes (including cost efficacy) and for rational decisions on the utility of repeat vaccination and introduction of new booster vaccines. This systematic review was commissioned by the National Institute of Health Research (NIHR) Health Technology Assessment programme to assess the available evidence on duration of protection by BCG vaccine.
Key research objectives
Primary objective
To assess and quantify changes in protection by BCG vaccination over time, against all tuberculosis, tuberculosis mortality, pulmonary tuberculosis and extrapulmonary tuberculosis (meningeal, military and other extrapulmonary sites separately and together), based on controlled trials and observational studies.
Secondary objectives
To estimate, where the data are available:
-
overall efficacy for the above tuberculosis disease categories
-
variations in efficacy according to:
-
latitude/geographic region
-
whether prior tuberculin sensitivity was an exclusion criterion for BCG vaccination and, if so, the stringency of the test criterion
-
time since vaccination and age at vaccination (neonatal, school age, adult/occupational), if possible separating the effect of time since vaccination from that of age
-
risk of bias in the different study designs
-
vaccine strain
-
gender
-
human immunodeficiency virus (HIV) status.
-
Chapter 2 Background
Tuberculosis epidemiology
Tuberculosis remains a significant and preventable cause of morbidity and mortality globally. The World Health Organization (WHO) estimates that there are about 9 million new cases of, and 1.6 million deaths from, tuberculosis annually. 8 Globally, tuberculosis continues to disproportionately affect low- to middle-income countries, with the highest burden of disease in South-East Asia, Africa and Eastern Europe. 8 The incidence of tuberculosis is currently declining; however, there is considerable variation in the rates at which this is happening in different regions of the world. 8
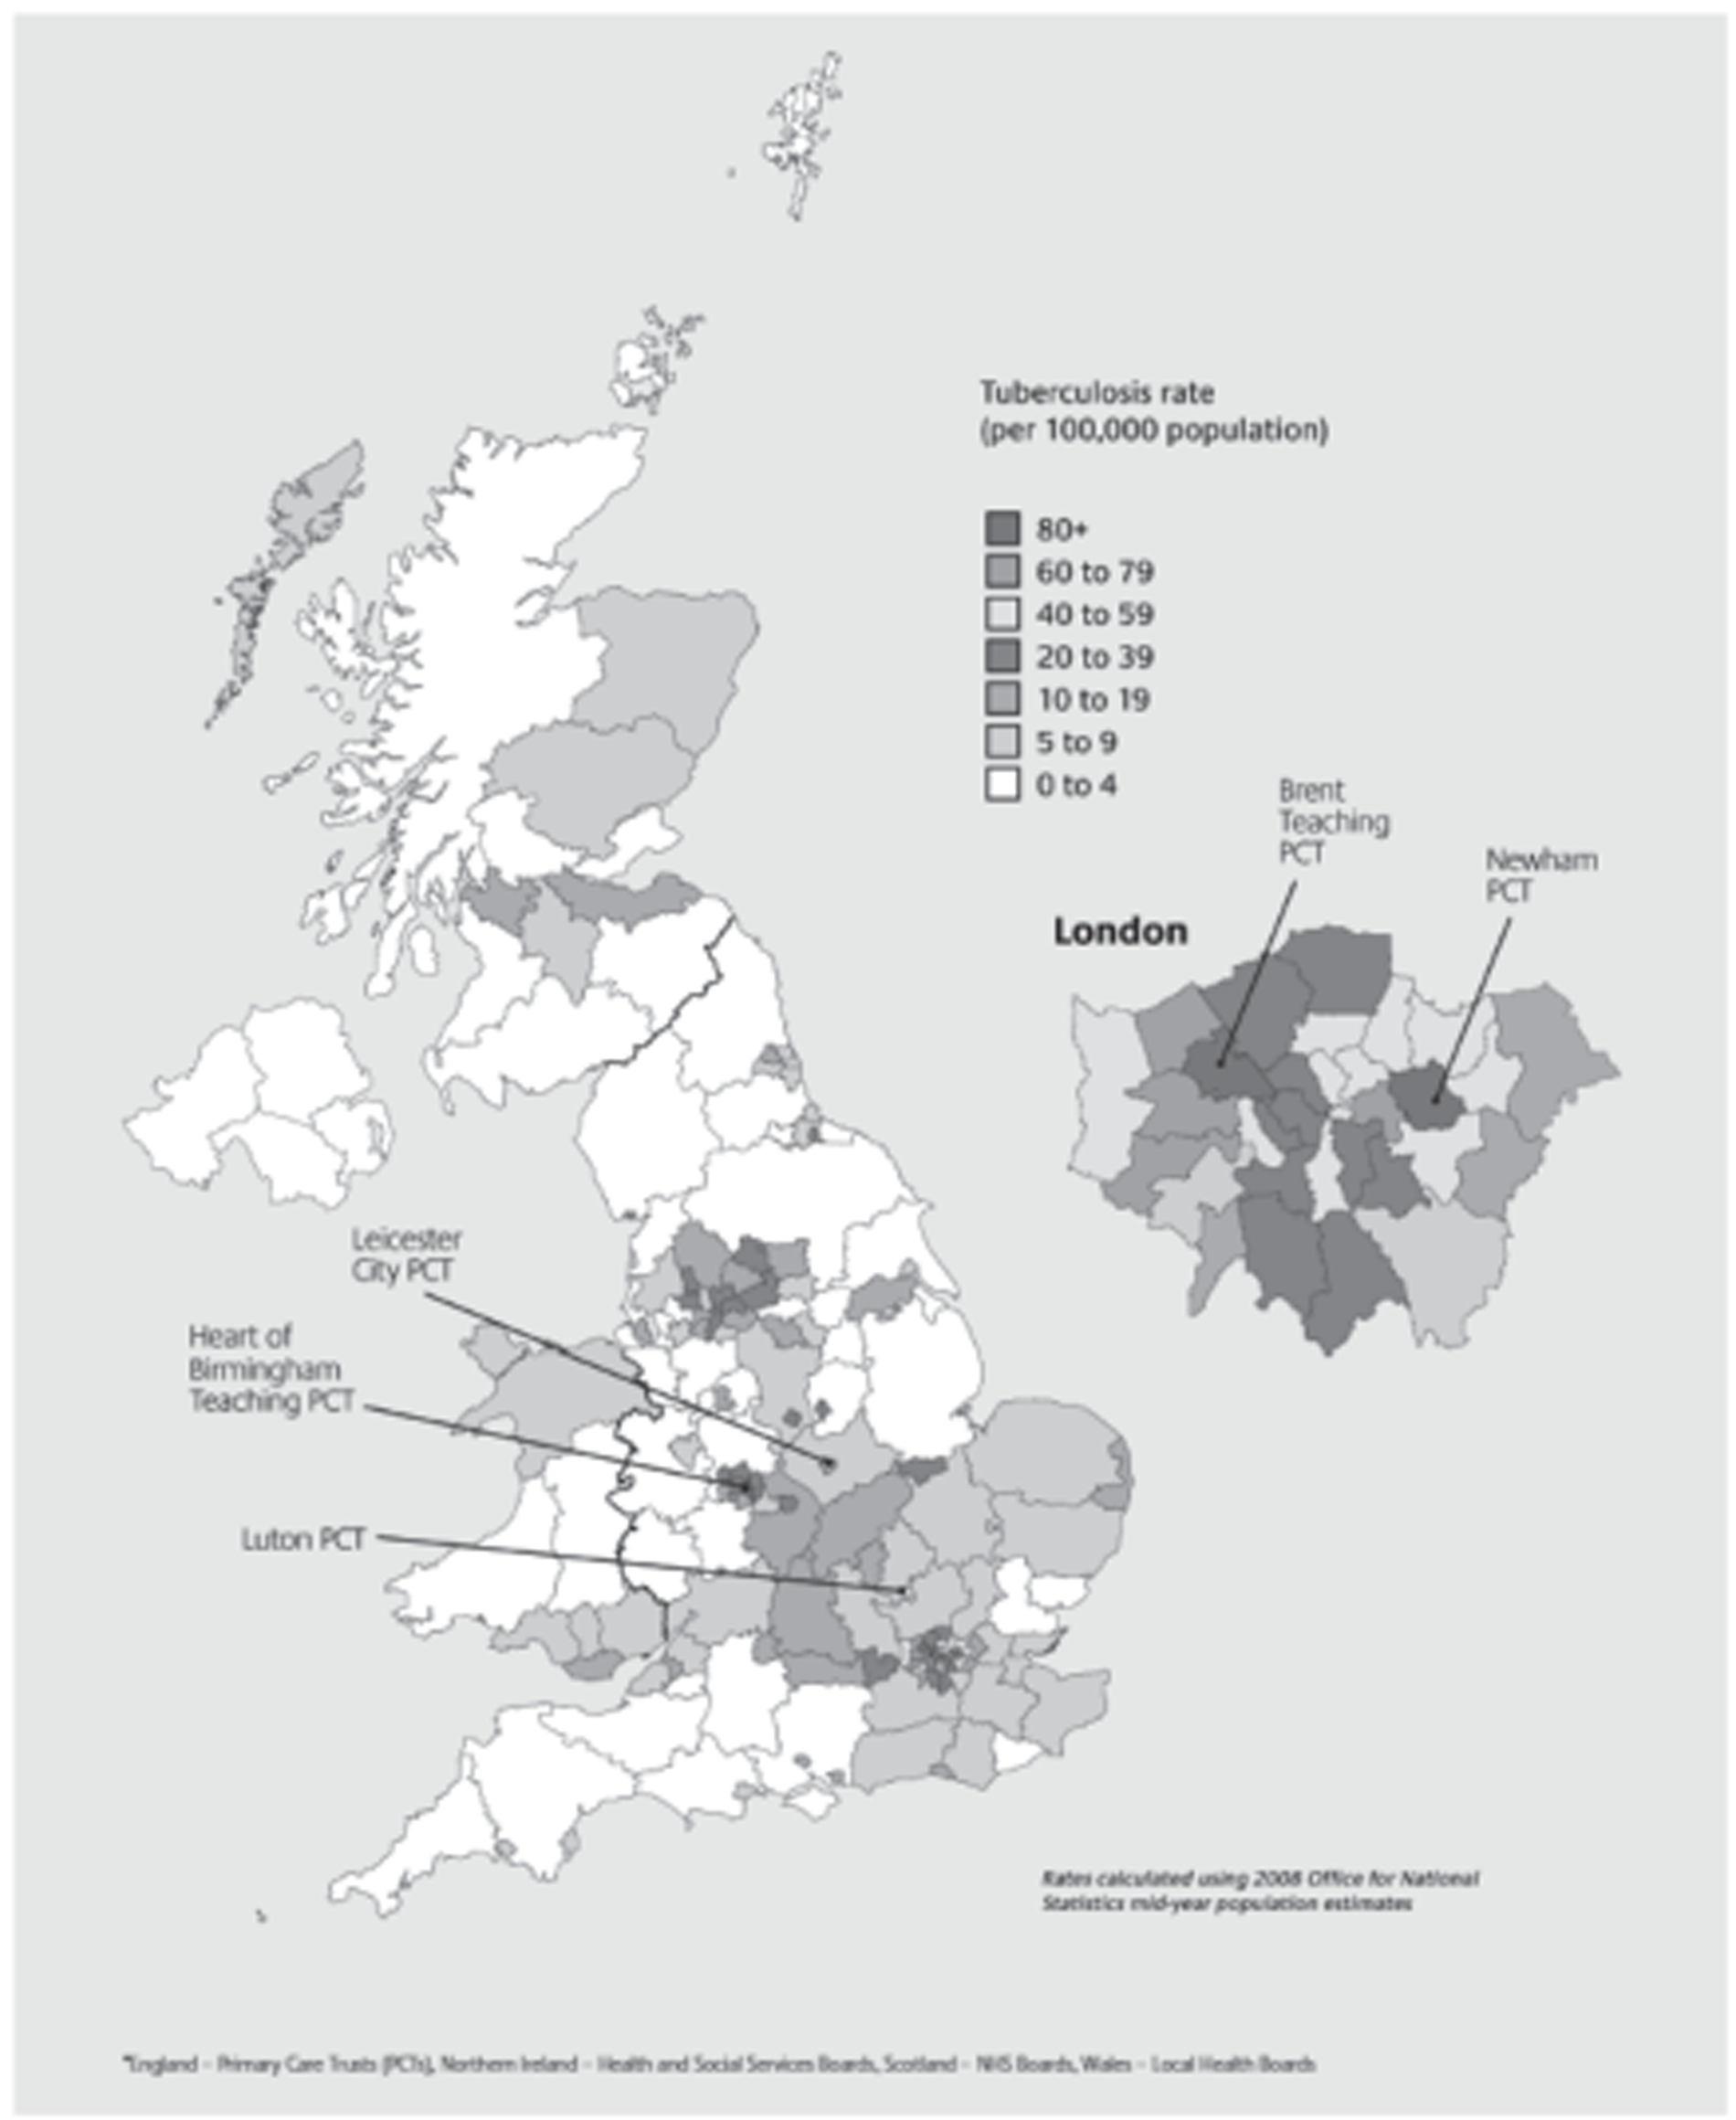
The incidence of tuberculosis has increased steadily over the last two decades in the UK, with over 9000 cases reported annually (Table 1). 9,10 There is significant variation in the incidence of tuberculosis by region and within regions. The highest burden of disease is in urban areas (Figure 1), with London accounting for about 40% of cases. The incidence of childhood tuberculosis, including military disease and meningitis, has remained stable in the UK. 11 The proportion of cases with anti-Mycobacterium tuberculosis Koch drug resistance is also increasing in the UK. 9 One of the advantages of an effective vaccine is that it should protect against drug-resistant strains.
| Year | Region | |||||||||
|---|---|---|---|---|---|---|---|---|---|---|
| East Midlands | East of England | London | North-east | North-west | South-east | South-west | West Midlands | Yorkshire and the Humber | Total | |
| 2000 | 10.1 | 5.3 | 36.5 | 6.2 | 9.2 | 5.8 | 4.7 | 13.4 | 11.1 | 12.4 |
| 2001 | 13.2 | 6.0 | 35.9 | 7.0 | 9.5 | 5.8 | 4.3 | 13.4 | 11.1 | 12.7 |
| 2002 | 11.4 | 6.4 | 40.6 | 6.0 | 9.4 | 6.0 | 4.6 | 15.1 | 10.1 | 13.4 |
| 2003 | 10.9 | 5.8 | 41.5 | 5.6 | 8.5 | 6.9 | 4.2 | 14.7 | 10.9 | 13.4 |
| 2004 | 10.2 | 7.1 | 42.1 | 5.7 | 8.4 | 7.2 | 5.4 | 17.3 | 10.7 | 14.0 |
| 2005 | 12.5 | 8.1 | 46.2 | 5.2 | 10.9 | 6.9 | 5.2 | 17.3 | 11.0 | 15.1 |
| 2006 | 13.0 | 7.8 | 44.2 | 5.5 | 10.3 | 8.0 | 5.4 | 17.5 | 13.0 | 15.4 |
| 2007 | 12.5 | 6.7 | 42.7 | 7.7 | 10.7 | 8.2 | 5.3 | 17.4 | 12.4 | 15.1 |
| 2008 | 12.3 | 8.2 | 44.4 | 6.9 | 10.8 | 8.2 | 5.5 | 18.7 | 12.2 | 15.4 |
| 2009 | 12.3 | 8.4 | 44.4 | 6.5 | 11.8 | 9.3 | 6.1 | 18.7 | 13.4 | 16.0 |
FIGURE 1.
Map of tuberculosis rates per 100,000 population by primary care trust in the UK 2007–9. 10 Reproduced with permission from Public Health England. Contains public sector information licensed under the Open Government Licence v1.0.
Bacillus Calmette–Guérin vaccine and its history
The BCG vaccine, derived from an isolate of Mycobacterium bovis at the Institut Pasteur in Lille, France, was first given to a human, orally, in 1921 to prevent tuberculosis. Following this, its use increased across Europe. It was not until the 1930s, however, that the first formal trial of BCG vaccination was undertaken, in Native Americans. 5 By the 1940s, BCG vaccination, administered percutaneously or intradermally, had been shown to be efficacious in several studies. 5,12,13 In the 1950s, two major trials were initiated in the UK and the USA, by the Medical Research Council (MRC) and the United States Public Health Service, respectively. 14,15 The results of the two trials were conflicting: the study in the UK found that BCG vaccination was highly efficacious against tuberculosis, whereas the US study concluded that it provided very little protection. Based on this, the UK implemented a policy of universal vaccination of all school-age children who were tuberculin skin test negative, and the USA opted not to use BCG vaccination routinely other than for select high-risk situations. Globally, the use of BCG vaccination increased, supported by recommendations from the WHO.
Bacillus Calmette–Guérin vaccine efficacy
The efficacy of a vaccine is defined as the per cent reduction in risk of disease in vaccines when compared with similar and similarly exposed unvaccinated individuals. There has been a trend in recent years to restrict the word ‘efficacy’ to refer to measures derived in randomly controlled trials, and to use the word ‘effectiveness’ in observational studies. It is important to note that this is not always accurate, as some trials will, strictly speaking, be assessing effectiveness and not efficacy. Nevertheless, as this review covers both trials and observational studies, we will use the term ‘efficacy’ when referring to trials and effectiveness for the results of observational studies to simplify the presentation of data.
Despite considerable debate regarding its role in tuberculosis control globally BCG vaccination is widely used, with over 100 million doses given annually. Randomised controlled trials (RCTs) and case-control studies have shown consistently high efficacy of infant vaccination in preventing severe forms of primary tuberculosis, which usually present as meningitis and military disease, but also as pulmonary disease in childhood. Its effectiveness against pulmonary disease in adults is more complex. 3 More recently, Trunz et al. ,4 using the data from the same trials included in previous reviews, estimated the efficacy of BCG vaccination against meningitis and military tuberculosis to be 73% and 77%, respectively. There is evidence that neonatal vaccination is very cost-effective in medium- and high-incidence settings on the basis of prevention of meningeal and military tuberculosis alone. 4 Several systematic reviews3,4,16–18 have shown that efficacy is variable and have controversially produced pooled estimates of the efficacy of BCG vaccination from overall protective efficacy estimates of 5016–74% against mainly pulmonary disease if vaccinated in infancy and 86% for military disease or meningitis. 3 However, there is substantial heterogeneity in protection against mostly pulmonary disease between studies,18 with estimated efficacy ranging from 0% in the South India trial to 84% in the MRC trial conducted in the UK during the 1950s and 1960s. 19–21 There is evidence that BCG vaccination does protect individuals who are already infected with M. tuberculosis. 22 Furthermore, there appears to be a strong association between vaccine efficacy (VE) and the latitude at which the study was conducted. 23 BCG vaccination has also been shown to be protective against other infections such as leprosy. 24 Only limited evidence on the efficacy of repeat BCG vaccination is available, largely consistent with the absence of additional benefit from further doses. 25,26
Several hypotheses have been proposed to explain the different estimates of efficacy obtained in various BCG vaccination trials. These include the potential for different BCG strains to induce different levels of protection, and environmental factors, in particular variation between populations in their exposure to environmental mycobacteria. There appears to be a strong association between VE and the latitude at which the study was conducted,23 and this has been interpreted as resulting from variations in prevalence of mycobacteria. A previous review concluded that the strain of BCG vaccine does not explain the differences in efficacy. 17 In addition, BCG vaccination may be better at protecting against certain forms of tuberculosis disease (such as primary disease) than other forms (such as reactivating disease). 3
The idea of genetic differences in strains of M. tuberculosis explaining observed differences was initially suggested by Mitchinson et al. 27 as an explanation for the lack of effect observed in the Chingleput study,28 but this was subsequently abandoned following further experiments in guinea pigs. 29 Although there is no new evidence that genetic difference between strains of M. tuberculosis is an important factor in explaining the observed heterogeneity, interest in this subject may re-emerge with more widespread deoxyribonucleic acid (DNA) fingerprinting of M. tuberculosis, as well as the advent of whole-genome sequencing as a tool for investigating outbreaks of tuberculosis. 30
Recent data suggest that human genes influence susceptibility to tuberculosis. The exact mechanisms for genetic susceptibility still remain unclear. Several genes have been implicated, including those that control the immune response to M. tuberculosis [such as 5-hydroxycholecalciferol receptor polymorphisms, natural resistance-associated macrophage protein (NRAMP) and human leucocyte antigen (HLA) types]. This has led to the suggestion that genetic differences may explain some of the variation observed in the effect of BCG vaccination. Some observed non-significant racial differences in susceptibility also point to a genetic cause for the observed variation. 31 By contrast, UK data show that BCG vaccination provides protection among Asians in the UK,32,33 despite the negative results from India. 19
Several candidate vaccines are in various stages of clinical trials. The vaccines range from those that improve the current vaccine BCG to recombinant vaccines which can replace the BCG vaccination. The most promising appear to be booster vaccines to top up the immunity of existing BCG vaccination. 34 The process of developing a new tuberculosis vaccine is extremely complex, as the immune response produced by an effective vaccine needs to go beyond the level of the initial natural immune reaction of the body, which failed to prevent infection in the first place. An understanding of the mechanism by which BCG vaccination protects when it does, and what explains variation in protection, will allow further work to investigate why immunity appears to wane over time and for how long it remains at an appreciable level, and also inform the development of future vaccines.
It is recognised that various BCG vaccines result in different reactogenicity and tuberculin skin sensitivity. Some of this is thought to arise from differences in the numbers of viable and dead organisms as a result of processing techniques, as well as possible differences in vaccine strain. However, tuberculin sensitivity is not a correlate for protection.
A well-recognised limitation affecting studies of BCG vaccination efficacy, and future vaccines against tuberculosis, is the lack of a good marker of an effective immune protection. 35 This has implications for the development of new vaccines against tuberculosis. Current approaches include the use of assays to measure T-cell responses. There is little evidence that these measures are correlated with protective effects of vaccination. Ongoing research to better understand responding T-cell populations and the inclusion of functional bactericidal assays into clinical trials may improve this situation. 35 A further limitation of studies investigating VE is the lack of good animal models; most current available models allow the investigation of primary progressive disease rather that subsequent reactivation disease. The latter is the main cause of morbidity and mortality globally.
Evidence relating to the duration of protection by bacillus Calmette–Guérin vaccination
Until recently there was little evidence of protection lasting beyond 10 years. 7 This raises a concern in the UK given the move to neonatal BCG vaccination in at-risk populations in which risk is greatest in early adulthood. Although infant vaccination prevents serious childhood forms of tuberculosis, the incidence of tuberculosis is greatest in early adulthood. Recent additional follow-up of BCG vaccine studies, however, have reported protection (at a lower but measurable levels) lasting for decades. 5,6 An updated systematic assessment of duration of protection is required for evidence-based policy. The only published review7 investigating the duration of protection by BCG vaccination was unable to identify convincing evidence of a consistent pattern of protection over time, or of any evidence of protection against pulmonary disease lasting > 10 years. In that review, the pooled estimate of protection after 10 years was 14% [95% confidence interval (CI) −9% to 32%]. Considerable heterogeneity was observed between studies in the annual change in BCG VE with time since vaccination. There was also no relation between average annual change in efficacy and overall efficacy.
The heterogeneity observed in changes in BCG vaccine protection over time may result from a variety of factors (including those proposed as an explanation for differences in overall efficacy) or from differences in the rate of decline between studies with higher and lower initial protection. As with most vaccines, immunological memory may wane with time, leading to lower protection among the vaccinated. In addition, the inclusion in the study population of a large proportion of infected individuals at the outset (whom BCG vaccination would not be expected to protect) may lead to apparently lower protection in the initial period. Other explanations proposed include decreasing susceptibility among the unvaccinated as a result of continued exposure to environmental mycobacteria and an increase in the proportion of cases caused by reactivation or reinfection, against which BCG vaccination may not protect.
It is important to note, however, that the absence of evidence of an effect is not evidence of absence of an effect. Evidence on duration of the effect of BCG vaccination is needed to improve the reliability of estimates of the impact of BCG vaccination on disease. Furthermore, it would be important for cost-effectiveness analysis and would inform the rationale for booster doses of vaccine.
Current local and international policy
UK policy on bacillus Calmette–Guérin vaccination
Along with targeting risk groups from high tuberculosis burden countries, routine BCG vaccination of schoolchildren of aged 10–13 years has been part of the vaccination programme in the UK since 1953. In 2005, the Department of Health restricted the BCG vaccination policy to a risk-based approach, according to which children are eligible for vaccination in infancy if they have a parent/grandparent originating from a high-incidence country. Infants are also eligible if living in a part of the UK with a high incidence of tuberculosis (> 40 per 100,000). Some occupational groups, and uninfected contacts of tuberculosis cases, are also recommended to receive BCG vaccination. 36
International policy comparison
The current global recommendation is to administer BCG vaccination at birth (or first contact with health services), in particular in developing countries. This advice is based, to a large extent, on consistent evidence that BCG vaccination protects against serious childhood forms of tuberculosis, whereas it does not consistently protect to a high degree against adult pulmonary tuberculosis. A limited number of countries have used repeated/booster BCG vaccinations in the past, for example Switzerland and Portugal (BCG vaccination in infancy and then at school entry or leaving), and in some Eastern Europe countries BCG vaccination has been given up to five times using a variety of criteria. The USA and the Netherlands have never recommended routine BCG vaccination in their tuberculosis control programmes. 37
International Union Against Tuberculosis and Lung Disease criteria
The IUATLD has suggested criteria under which it may be reasonable for a country to move from routine BCG vaccination to selective vaccination of high-risk groups. 2 The IUATLD recommends that BCG vaccination be discontinued where:
-
an efficient notification system is in place and
-
the average annual notification rate of smear-positive pulmonary tuberculosis is < 5 per 100,000, or
-
the average annual notification rate of tuberculous meningitis in children of < 5 years of age is < 1 per 10 million population over the previous 5 years, or
-
the average annual risk of tuberculous infection is < 0.1%.
Several low-incidence countries including the UK have met these criteria and have discontinued universal BCG vaccination and moved to a selective policy based on these criteria.
Bacillus Calmette–Guérin coverage
At the moment it is not possible to calculate BCG vaccination uptake for the UK overall, or by primary care trust (PCT) or local authority. This is because one cannot ascertain the number of vaccinated infants [only aggregate data on the doses of BCG vaccine given are collected nationally through Korner Code 50 (KC50) returns] or the number of eligible children. Furthermore, there is no estimate of children at risk based either on national guidelines in England or on specific PCT policies. The very limited, and imperfect, estimates carried out suggest variable coverage.
In addition to the KC50 returns, the national tuberculosis surveillance system started collecting data on the BCG vaccination status of tuberculosis cases in 2009. Data on previous BCG vaccination were available for 52% of cases in England, Wales and Northern Ireland (4473/8555) in 2009; 71% (3166) were reported to have previously received BCG vaccination.
Chapter 3 Systematic review methods
Introduction
There were four stages of literature retrieval and appraisal:
-
search of medical literature databases and hand-searching reference lists of relevant reviews
-
screening search hits for potential eligibility based on title and abstract
-
inclusion assessment of full papers
-
data extraction and bias assessment.
Search strategy
Search engines
Studies were systematically identified by searching electronic medical literature databases, trial registers, grey literature sources and relevant websites. The following databases were searched from inception/1920 to May 2009: MEDLINE (1950 to May 2009), MEDLINE In-Process & Other Non-Indexed Citations (1950 to May 2009), Old MEDLINE (1946–65), Excerpta Medica Database (EMBASE) (1980 to May 2009), Cochrane Central Register of Controlled Trials (CENTRAL), Cochrane Database of Systematic Reviews (CDSR), Database of Abstracts of Reviews of Effects (DARE), Health Technology Assessment (HTA) database and NHS Economic Evaluation Database (NHS EED) databases on The Cochrane Library Issue 2 2009, Science Citation Index (ISI) Web of Knowledge (1900 to May 2009), Bioscience Information Service BIOSIS (1985 to May 2009), Latin American and Caribbean Health Sciences Literature (LILACs) (1980 to May 2009), MEDCARIB (1920 to May 2009) and Cumulative Index to Nursing and Allied Health Literature (CINAHL) (1982 to May 2009). Between April 2009 and October 2009, additional databases were searched, including Index to Theses, System for Information on Grey Literature in Europe (SIGLE), Centre for Agricultural Bioscience International (CABI) Abstracts, Scopus, Article First, Academic Complete, Africa-Wide Information, Google Scholar, Global Health, British National Bibliography for Report Literature, http://clinicaltrials.gov and www.controlled-trials.com. Full details of the search engines used and websites consulted are documented in Appendix 1.
Search terms
Medical subject headings and text-word terms for the disease and the intervention were combined in a search strategy that was developed by an experienced information specialist (MB) and in discussion with tuberculosis specialists (IA, PF, DE, PS and ML). Disease terms included TB, tuberculosis, tubercle bacill*, M. tuberculosis complex, M. bovis, M. africanum, M. canetti, M. microti and M. tuberculosis. Terms for the intervention included BCG Vaccine, BCG, BCG Vacc*, BCG Imm*, bacillus calmette. The search strategy was modified as appropriate for use in the various databases. In order to maximise sensitivity we did not add any additional terms for study design and did not restrict on language. Details of the databases searched and search strategies used are described in Appendix 1. All references were downloaded into Reference Manager, version 11 (Tomson ResearchSoft, San Francisco, CA, USA), and de-duplicated.
Hand-searching
Reference lists of included studies and previous reviews of BCG vaccine were screened and experts in the area of tuberculosis and BCG were contacted to identify additional studies. All studies previously included in Sterne and Rodrigues7 were searched for and included.
Selection of papers
All stages of the review process were managed using a Microsoft Access 2007 (Microsoft Corporation, Redmond, WA, USA) database developed specifically for the review.
Abstract appraisal
Titles and abstracts of publications identified by the searches were independently assessed for potential inclusion by two members of the review team (LND and RB). Discrepancies were discussed and disagreements resolved through consensus or referral to a third reviewer (IA, PM, PW or JACS). Primary studies reporting on the efficacy of BCG vaccination in preventing tuberculosis diseases were considered potentially eligible. Full, peer-reviewed articles and non-peer reviewed articles (e.g. conference abstracts and dissertations) reporting primary data on the efficacy of protection by BCG vaccination in preventing tuberculosis disease were included. Studies available only as abstracts were included only if sufficient data were available from the abstract. Any reference nominated for inclusion by one or both assessors was retrieved for full paper inclusion assessment. When it was not possible to determine study eligibility from the title and/or abstract, the full manuscript was retrieved.
Inclusion criteria
Full-text papers were independently assessed for inclusion in the systematic review by three members of the review team (LND, RB and LP).
Studies that met the following criteria were included in the review:
-
primary study of any design except case series and ecological studies
-
appropriate study design: trial or observational, not ecological or case series
-
study including both vaccinated and unvaccinated participants
-
study reporting on protection against tuberculosis disease not infection
-
study not including revaccination
-
study reporting sufficient data to construct a 2 × 2 table or relevant outcome data.
Appendix 5 contains details of all papers that were excluded after initial review, with justifications.
Data extraction strategy
Data extraction methods
Data extraction of English-language papers was carried out by one reviewer (RB, LND or LP) and checked by a second reviewer (RB, LND or LP); any disagreements were resolved by consensus. If an agreement could not be reached, a third reviewer was consulted (IA, PM, PW or JACS). Foreign-language papers were reviewed by trained and supervised extractors (LND and LP) for final inclusion. Further cleaning during the data analysis phase was conducted (CA and LP). A baseline data extraction form was used to collect information on study design, participants' characteristics, dates of recruitment, tuberculosis infection, regional vaccination policies, and BCG vaccination procedures and properties (see Appendix 2).
Duplicate publications reporting results from the same study, or reporting additional data on the same study, were identified. Studies that were similar in terms of one or more of the following variables were identified: region of study, calendar-years of participant recruitment and authors. These were reviewed to determine whether or not they related to the same study. If two or more studies related to exactly the same population with no additional information, only one publication was included in the review, with the publication selected being the one that reported the most detail or was most recently published. If multiple publications related to the same study and provided additional details, all were included in the review but they were included as a single study to ensure that the same patients did not contribute more than one set of data to the meta-analysis. Publications were identified using their Reference Manager ID, and an additional ‘study ID’ was assigned to all publications; multiple publications relating to the same study had a single study ID.
Data on study results were extracted into a separate form to allow for multiple results to be extracted on a single study linked by study ID. Tuberculosis case definition, reported outcome, 2 × 2 data on BCG vaccination efficacy, summary results and any adjustments were also extracted.
Reviewers were not blinded to the names of study authors, institutions or publications. When case definition or background details were not present in the paper from which the results were extracted, but in another paper, this additional information was extracted with a note stating that it came from another publication. The decision was made not to contact authors of publications if 2 × 2 data of BCG vaccination efficacy or summary estimates because the majority of papers were published before 1973.
For studies assessing BCG vaccination status through scar reading, it was assumed that BCG vaccination was intradermal, and this assumption was recorded in the extraction form. Tuberculin sensitivity tests were recorded if they had been conducted, along with the strength of purified protein derivative (PPD) used and the size of the reaction and whether or not two-stage testing was used, which was used as the definition of stringent tuberculin testing.
Only studies of injectable BCG vaccination were extracted. All studies using oral BCG or non-BCG tuberculosis vaccines (e.g. vole bacillus, Savioli anti-tuberculosis vaccine or other heat-killed bacillus vaccines) were excluded. Only studies with a comparator group that had received no vaccination, placebo or other control were extracted.
Studies with outcome measures of tuberculosis disease and/or tuberculosis mortality reported in sufficient detail to construct a 2 × 2 table or relevant outcome data that were sufficient to calculate efficacy measures were extracted.
Studies were not extracted if they met any of the following criteria:
-
Studies reporting on the efficacy of BCG vaccination in preventing M. tuberculosis infection, as measured by a positive interferon-gamma release assay (IGRA) or tuberculin skin test.
-
Any study in which the outcome was only M. tuberculosis infection and not tuberculosis disease or mortality.
-
Studies evaluating the effect of revaccination only. However, if a study reported on revaccination but it was possible to extract data on those that were vaccinated only once, it was included in the review.
-
Studies examining the site or severity of tuberculosis disease among cases only in BCG vaccine recipients and non-recipients.
Randomised controlled trials
Studies that attempted to allocate participants (even those in which the mode of allocation was not clearly described) were classified as clinical trials. This decision was based on the fact that all reviewed trials were conducted several decades ago, prior to the development of modern standards for the reporting of trials. A few studies allocated a proportion of participants and not another. When data could be separated, the allocated section was considered as a clinical trial and the non-allocated section extracted as a cohort. If data could not be separated, the whole study was recorded as a cohort.
Case–control studies
In assessing case–control study eligibility for extraction, we assessed whether the control subjects were likely to have come from the same population as cases (scope for selection bias was reduced). For hospital-based studies, selection bias was judged to be minimal (1) if there was no detail on the disease status of control subjects but there was no mention of the hospital being a specialist reference centre for a particular disease or (2) if < 30% of control subjects were admitted for diseases that might indicate a different health-seeking behaviour than cases and other control subjects.
If either of the above criteria was not fulfilled for hospital control subjects, the study was not classed as having control subjects from the ‘same population’, and publications were excluded. To avoid exclusion of infected subjects from vaccinated but not from unvaccinated groups, we excluded case–control studies conducted in populations vaccinated outside the neonatal period, if tuberculin testing was undertaken to exclude positive reactors before vaccination. This was unless all unvaccinated subjects (cases or control subjects) were also tuberculin tested at the age of recommended vaccination. This is because studies that were not able to restrict the study population to those not already infected at the age when they would have received vaccination may be biased because the number of tuberculosis cases in the unvaccinated group would be higher than normal, because those infected with tuberculosis would be over-represented among those unvaccinated, and thus would lead to an overestimate of the effect of the BCG vaccination. 38 Case–control studies with a matched design but no matched analysis were included to avoid losing useful information; this was addressed in the analysis.
Cohort studies
Cohorts were extracted only of children, vaccinated and unvaccinated, who were tuberculin tested before vaccination and were tuberculin negative.
Case population studies
A case population study is undertaken on the total population of a geographical area. Data on all cases emerging during the study period in the population of interest are ascertained through surveillance and all other persons in the population are regarded as ‘control subjects’. The characteristics of cases occurring in the population (notably, their possible previous exposure to a given risk factor) are compared with those of the entire set of subjects in the population (supposing that demographic, health or drug use statistics for the whole population are available). The validity of this approach assumes the existence of a surveillance system capable of identifying all of the cases of an event within the population. The null hypothesis is that, in the absence of an association between risk factors and event, the odds of exposure are identical among cases and the rest of the population, barring sampling variations. 39
Cross-sectional and outbreak studies
Cross-sectional studies are those in which data on BCG vaccination and tuberculosis outcome are collected at the same point in time, whereas outbreak studies refer to investigation of BCG vaccination effectiveness that were undertaken using an observation study design following the occurrence of an outbreak of tuberculosis.
To be included case population studies, cross-sectional contact and outbreak studies had to account for tuberculin positivity in the design or analysis, or BCG vaccine must have been administered neonatally.
The detailed data extraction forms are included in Appendix 2.
Bias assessment criteria
As part of the extraction procedure, one reviewer (RB, LND or LP) independently assessed the risk of bias of each study. This was checked by a second reviewer (RB, LND or LP) and consensus reached in cases of disagreement. The risk of bias assessment of foreign-language publications was discussed and agreed on between the foreign-language extractor and supervising reviewer. Risk of bias assessments were extracted once per study (i.e. if a study was reported in multiple papers, a single bias assessment was completed). A risk of bias assessment form was developed for each study type. The results of this are listed in Appendix 2.
Clinical trials
The Cochrane Risk of Bias tool was used to assess bias in RCTs and quasi-randomised trials. Studies in which the mode of allocation was alternation or birth date were considered ‘quasi-randomised’ and the method of sequence generation was extracted as ‘alternation’, ‘birth date’, ‘employee number’ or any other quasi-method used.
If a placebo vaccination was given, the study was considered blinded only at the point of vaccination, and the patient and vaccinator were considered adequately blinded. The nature of the participants was not taken into account while assessing blinding, i.e. no account was taken of whether subjects were adults, such as nurses, or infants.
Specific quality assessment criteria ‘Diagnostic Detection bias’ were used for tuberculosis trials based on a paper by Clemens et al. 40 This was assessed a priori from a combination of two fields: the method of follow-up (active, i.e. regular chest radiography or active forms of follow-up, or passive, i.e. obtaining cases from routine surveillance) and whether or not the outcome assessors were blinded to the BCG vaccination status of the patient. Studies with passive case finding and no blinding of outcome assessors with regards to the vaccination status of participants were considered to have a higher risk of detection bias. Other studies were considered to have a lower risk of diagnostic bias.
Observational studies
Observational studies were assessed for bias using criteria that we developed, with risks of bias qualified as high, low or unclear.
Case–control studies
Following discussion within the BCG systematic review group, rules were agreed and case–control studies were assessed for risk of bias using the following criteria:
-
Were BCG vaccination definitions the same for cases and control subjects?
-
Was disease status blinded to BCG assessors?
-
Were cases diagnosed assessed independently of vaccination status?
For case–control studies with a matched design, a criterion was developed based on whether or not matching was performed in the analysis, as an unmatched analysis may have introduced some bias.
Cohort studies
Cohort studies were assessed with regard to risk of loss to follow-up bias, treatment allocation concealment, case ascertainment bias and incomplete case ascertainment bias.
Case population studies
Case population studies were evaluated based on whether or not cases and the populations were consistent in terms of geography, time and age, as well as according to whether case ascertainment was blind to vaccination status, disease status was blind to BCG assessors and methods of case ascertainment were the same for vaccinated and unvaccinated.
Cross-sectional studies
Cross-sectional studies were assessed on whether BCG vaccination definitions were the same for cases and control subjects, whether disease status was blinded to BCG assessors and whether cases and control subjects were assessed independently of vaccination status.
Statistical analysis
Types of study
Study design affects the robustness of findings owing to differing ability to control for confounding or to minimise bias. All analyses were therefore stratified according to study design, as follows:
-
clinical trials
-
observational studies:
-
case–control studies
-
cohort studies
-
case population studies (studies in which cases were compared with the general population rather than with individual control subjects)
-
cross-sectional studies in the general population
-
cross-sectional studies in contacts.
-
Analysis of single studies
Data for each study were checked to identify possible data entry problems. For each study, the rate ratio for vaccinated compared with unvaccinated individuals was derived for the longest duration of follow-up (see Table 3), with 95% CI. For case–control and cross-sectional studies, odds ratios (ORs) (which were assumed to approximate rate ratios in the general population) were derived. If sufficient data were available, published estimates were compared with those directly calculated from summary data (e.g. 2 × 2 tables) and if data existed for two or more time periods then estimates of effect [ORs, rate ratios or risk ratios (RRs)] and 95% CIs were plotted over time. If published results from cohort studies were shown as rate ratios or VE, these were used directly. If person-years (PYs) were provided, calculations of the rate ratios and CIs were based on these. If data were in the form of a 2 × 2 table, the calculated rate ratios and CIs made no adjustments for losses to follow-up, and so assumed a fixed follow-up period. If some of the randomised groups had no cases, 0.5 was added to calculate RRs. Poisson regression was used to quantify changes in rate ratios with time, by estimating the increase in log-rate ratios per unit time. We also compared rate ratios between fixed time periods (e.g. efficacy in the first 10 years since vaccination compared with efficacy beyond 10 years). If data permitted, rates of change were examined for non-linearity. RCTs were assessed according to a variable combining age at vaccination and stringency of tuberculin testing protocols prior to vaccination. This variable contained studies of neonatal vaccination, in which participants are considered to be tuberculin negative prior to vaccination, regardless of prior tuberculin testing. Other vaccination ages were classified according to whether or not tuberculin testing was stringent. A stringent tuberculin testing protocol was defined as a two-stage testing, with retesting of initially tuberculin-negative participants using a higher dose of tuberculin to confirm negativity before vaccination.
A non-stringent tuberculin testing study was defined as one that did not exclude participants based on tuberculin testing prior to vaccination or excluded subjects based on a single round of tuberculin testing. Although the strength and type of PPD used differed between studies, our criteria of ‘Stringent’ testing, which includes a two-stage testing with retesting of initial non-reactors with a stronger dose of tuberculin, allowed exclusion of participants previously sensitised with M. tuberculosis. (The strength and type of PPD ranged from 1 TU of RT23 and Tween 80 in 0.1 ml on the volar surface of the left forearm, with no information on the time of reading to a two-stage testing protocol with intracutaneous injection of 0.00002 mg PPD-S from Phipps Institute into the forearm, followed by 0.005 mg PPD-S for non-reactors to the first dose, both read at 48 hours.)
Bacillus Calmette–Guérin strain
Randomised controlled trials were analysed according to strain of BCG used. Studies that provided information on the strain of BCG used were classified using information from Brewer et al. 17 to place within a phylogenetic group defined by Brosch et al. 41 When the BCG strain was not provided, efforts were made to identify the strain lineage from Brewer et al. 42 and other literature sources. 43 As the greatest number of trials reporting which BCG strain was used reported on efficacy for all types of tuberculosis not separately by site, this analysis was performed only for all tuberculosis morbidity outcomes, and not for pulmonary tuberculosis alone.
Meta-analyses
Overall efficacy by categories of tuberculosis outcomes
Results from each study, together with both fixed- and random-effects summary effect estimates, were displayed in forest plots. Meta-analyses were carried out using (log-) rate ratios, and results were displayed both as rate ratios and as VE (= 1 − rate ratios) if this was appropriate. Differences between fixed- and random-effects estimates suggest that there are differences between RRs estimated from smaller and larger studies.
In some studies, vaccination was restricted to individuals who were screened for M. tuberculosis infection and confirmed uninfected, whereas the control group may have included individuals who were not eligible for vaccination. Studies in which an attempt was made to adjust estimated efficacy for the tuberculin-positive population were included in meta-analyses. Studies that did not account for the tuberculin-positive population were reported separately, and excluded from meta-analyses.
Variation in efficacy according to characteristics of individuals and studies
Whenever possible, differences in efficacy according to characteristics of individuals (e.g. gender or age) were estimated by comparing efficacy [using ratios of RRs (RRRs)] between subgroups of individuals within studies. Investigation of the reason behind variation in efficacy in different studies used meta-regression, and quantified how much of the heterogeneity in estimates of efficacy was explained by selected factors.
Differences in efficacy between subgroups of studies (e.g. those classified as at low or high risk of bias, or those conducted at different latitudes) were quantified using random-effects meta-regression to estimate RRRs. Heterogeneity (differences between the true vaccine effects in the different studies) was quantified by estimating the between-study variance tau-squared (τ2). This is based on the assumption that the distribution of the true vaccine effects is normal: τ2 corresponds with the variance of this distribution. To illustrate the meaning of this quantity, Table 2 shows the ratio of the effect (e.g. RR or rate ratio) at the 90th centile of the distribution to the effect in a study at the 10th centile.
| Variance τ2 | Standard deviation τ | Ratio of effect in study at 90th centile to study at 10th centile |
|---|---|---|
| 0.02 | 0.141 | 1.44 |
| 0.05 | 0.224 | 1.77 |
| 0.10 | 0.316 | 2.25 |
| 0.20 | 0.447 | 3.15 |
| 0.40 | 0.632 | 5.06 |
In forest plots and meta-analyses, τ2 was estimated using the method-of-moments estimator proposed by DerSimonian and Laird. Within meta-regression analyses, τ2 was estimated by restricted maximum likelihood, using the metareg command in Stata. We conducted both univariable and multivariable meta-regression analyses: results from multivariable analyses were interpreted with caution because the number of studies was typically small compared with the number of study characteristics of interest.
We examined variation in efficacy according to the following characteristics.
Latitude of study location
Latitude of study location was stratified into groups of 10° latitude either side of the equator. Meta-regression analyses collapsed these into 20° latitude groups. Forest plots stratified by 20° latitude, for reference, are found in Appendix 6.
Age at vaccination and stringency of tuberculin testing
Bacillus Calmette–Guérin VE is known to vary widely with age at which vaccination is given. Studies were classified depending on whether vaccination was given in infancy, at school age or at any other age. The latter category includes studies in which vaccination was given to participants of all ages.
Tuberculin sensitivity testing used for exclusion of participants prior to enrolment into a randomised clinical trial was classified into two categories as ‘more stringent’ and ‘less stringent’. Studies with more stringent testing included those in which vaccination was neonatal, assuming that neonates were not infected with M. tuberculosis before randomisation to vaccination or control groups. Studies qualified as ‘less stringent tuberculin testing’ and ‘no tuberculin testing’ were combined into one category for the purposes of presenting the forest plots and meta-regression.
Vaccine strain
Bacillus Calmette–Guérin strain variation in VE was examined in terms of phylogeny and attenuation lineage, both in a forest plot and as a scatterplot of the vaccine efficacy estimates for study by year or study start, grouped by BCG strain lineage. Using the review by Brewer et al.,17 all studies were classified into a lineage group, the molecular basis of which was classified by Brosch et al. 41 Studies with strains not falling into any strain lineage family were each analysed as a separate group. Studies in which the strain used was not reported were classified into a separate ‘not reported’ group.
Risk of bias in the different study designs
The study-specific risk of bias criteria were analysed in the meta-analysis. Criteria for which there were very few details (e.g. all low risk of bias but for one study) were not included in the meta-analyses but presented in the appendices.
Time since vaccination
To account for the stringency of tuberculin testing at baseline, we compared VE during the first 5 years with efficacy after 5 years since vaccination, within two strata of tuberculin testing stringency.
Gender
Data presented on efficacy according to gender were presented if these were available.
Human immunodeficiency virus status
Data on efficacy according to HIV infection status were presented if these were available.
Duration of protection
Analyses of the duration of protection by BCG vaccination included only studies in which efficacy can be estimated separately according to time since vaccination, age at vaccination, or both. Changes in efficacy with time since vaccination (or age for infant vaccination) were estimated within studies and these estimates were then combined in meta-analyses. Random-effects Poisson regression was used to estimate rates of change in the duration of protection with time, allowing for between-study heterogeneity. If data permitted, we examined evidence for non-linearity in the rate of waning protection, for example by including a quadratic term for time. These models were also used to examine associations of study characteristics with the extent and duration of protection. We also derived indirect estimates of changes in efficacy, for instance by comparing estimates from case–control studies in adults and children who were vaccinated at birth. However, such estimates should be interpreted with caution because of the potential for confounding by other study characteristics (ecological fallacy). Decisions were made not to plot studies in the duration plots for which there was no specified age at vaccination and/or age at outcome assessment. Time since vaccination was broken down into four categories: 0–5 years after vaccination, 5–10 years, 10–15 years, ≥ 15 years after vaccination. However, some studies present data only for 0–5 years and are therefore missing from these plots.
Design-specific issues: controlled trials
For each outcome in each controlled trial, we classified results as at low, unclear or high risk of bias, based on domain-specific assessments of risk of bias conducted using the Cochrane Collaboration's Risk of Bias tool. We compared estimates of extent and duration of protection according with risk of bias. We reported sensitivity analyses restricted to studies assessed as at low, and low or unclear, risk of bias if this was feasible.
Tuberculin sensitivity testing was assessed only in trials; cohort studies were included only if all participants were tested before vaccination.
Only trials reports contained sufficient data on BCG strain to allow analyses on the variation of efficacy by strain lineage.
Design-specific issues: observational studies
Meta-analyses of crude and adjusted rate ratios were derived separately for each observational study design. An a priori minimum set of confounders to designate a rate ratio as adjusted was agreed based on consideration (blind to study results) of a tabulation of all the confounders used in each study, stratified by study design. At minimum, results were not considered adjusted unless they were controlled at least for age and sex.
We reported sensitivity analyses restricted to studies that adjusted for socioeconomic status (SES) in their analyses.
Case–control studies
Further analyses were made of case–control studies that account for SES in adjustment or matching. Factors that may bias estimates from case–control studies were examined by displaying the results in forest plots stratified by these factors and their effects were estimated in meta-regression analyses. These factors include whether a matched design had been ignored in the analysis (giving ‘crude’ estimates from studies that have a matched design), and whether the control subjects were sampled from the same population as the cases.
Cohort studies
Analyses were made of cohort studies that account for SES in adjustment.
Case population studies
The analyses were broken down only by latitude and age at vaccination for case population studies.
Cross-sectional studies
Cross-sectional contact studies were not combined with cohort contact studies.
Issues of interpretation
We investigated whether it is possible to classify regions or settings according to categories of VE (e.g. low, medium, high), based on whether it is possible to identify subgroups of settings and studies within which the effect of BCG vaccination appears relatively consistent.
All meta-analyses were carried out using the metan and metareg commands for Stata version 11.0 (StataCorp L P, College Station, TX, USA).
Chapter 4 Results
Studies included in the review
A total of 21,030 titles and abstracts were identified, through database searches and reference screening, and screened. A total of 847 articles were considered potentially relevant, based on title and abstract; attempts were made to retrieve all the full papers. Full-text copies of 800 articles selected from potential inclusions were retrieved (Figure 2). It was not possible to retrieve or obtain further information on 48 articles. This was mainly due to incorrect referencing in the databases searched, which made the references impossible to identify and retrieve. A few references were requested from specific libraries but were not identified or retrieved and were classified as unobtainable owing to time limits on the project.
FIGURE 2.
Flow diagram outlining the screening process for the review of BCG vaccination duration and efficacy. a, Inappropriate study types include ecological studies, case-series, and case–control studies with inappropriate vaccination and tuberculin testing protocols, in which tuberculin testing was performed prior to vaccination and only non-reactors were vaccinated or where control subjects were not considered to come from the same populations from which cases arose.
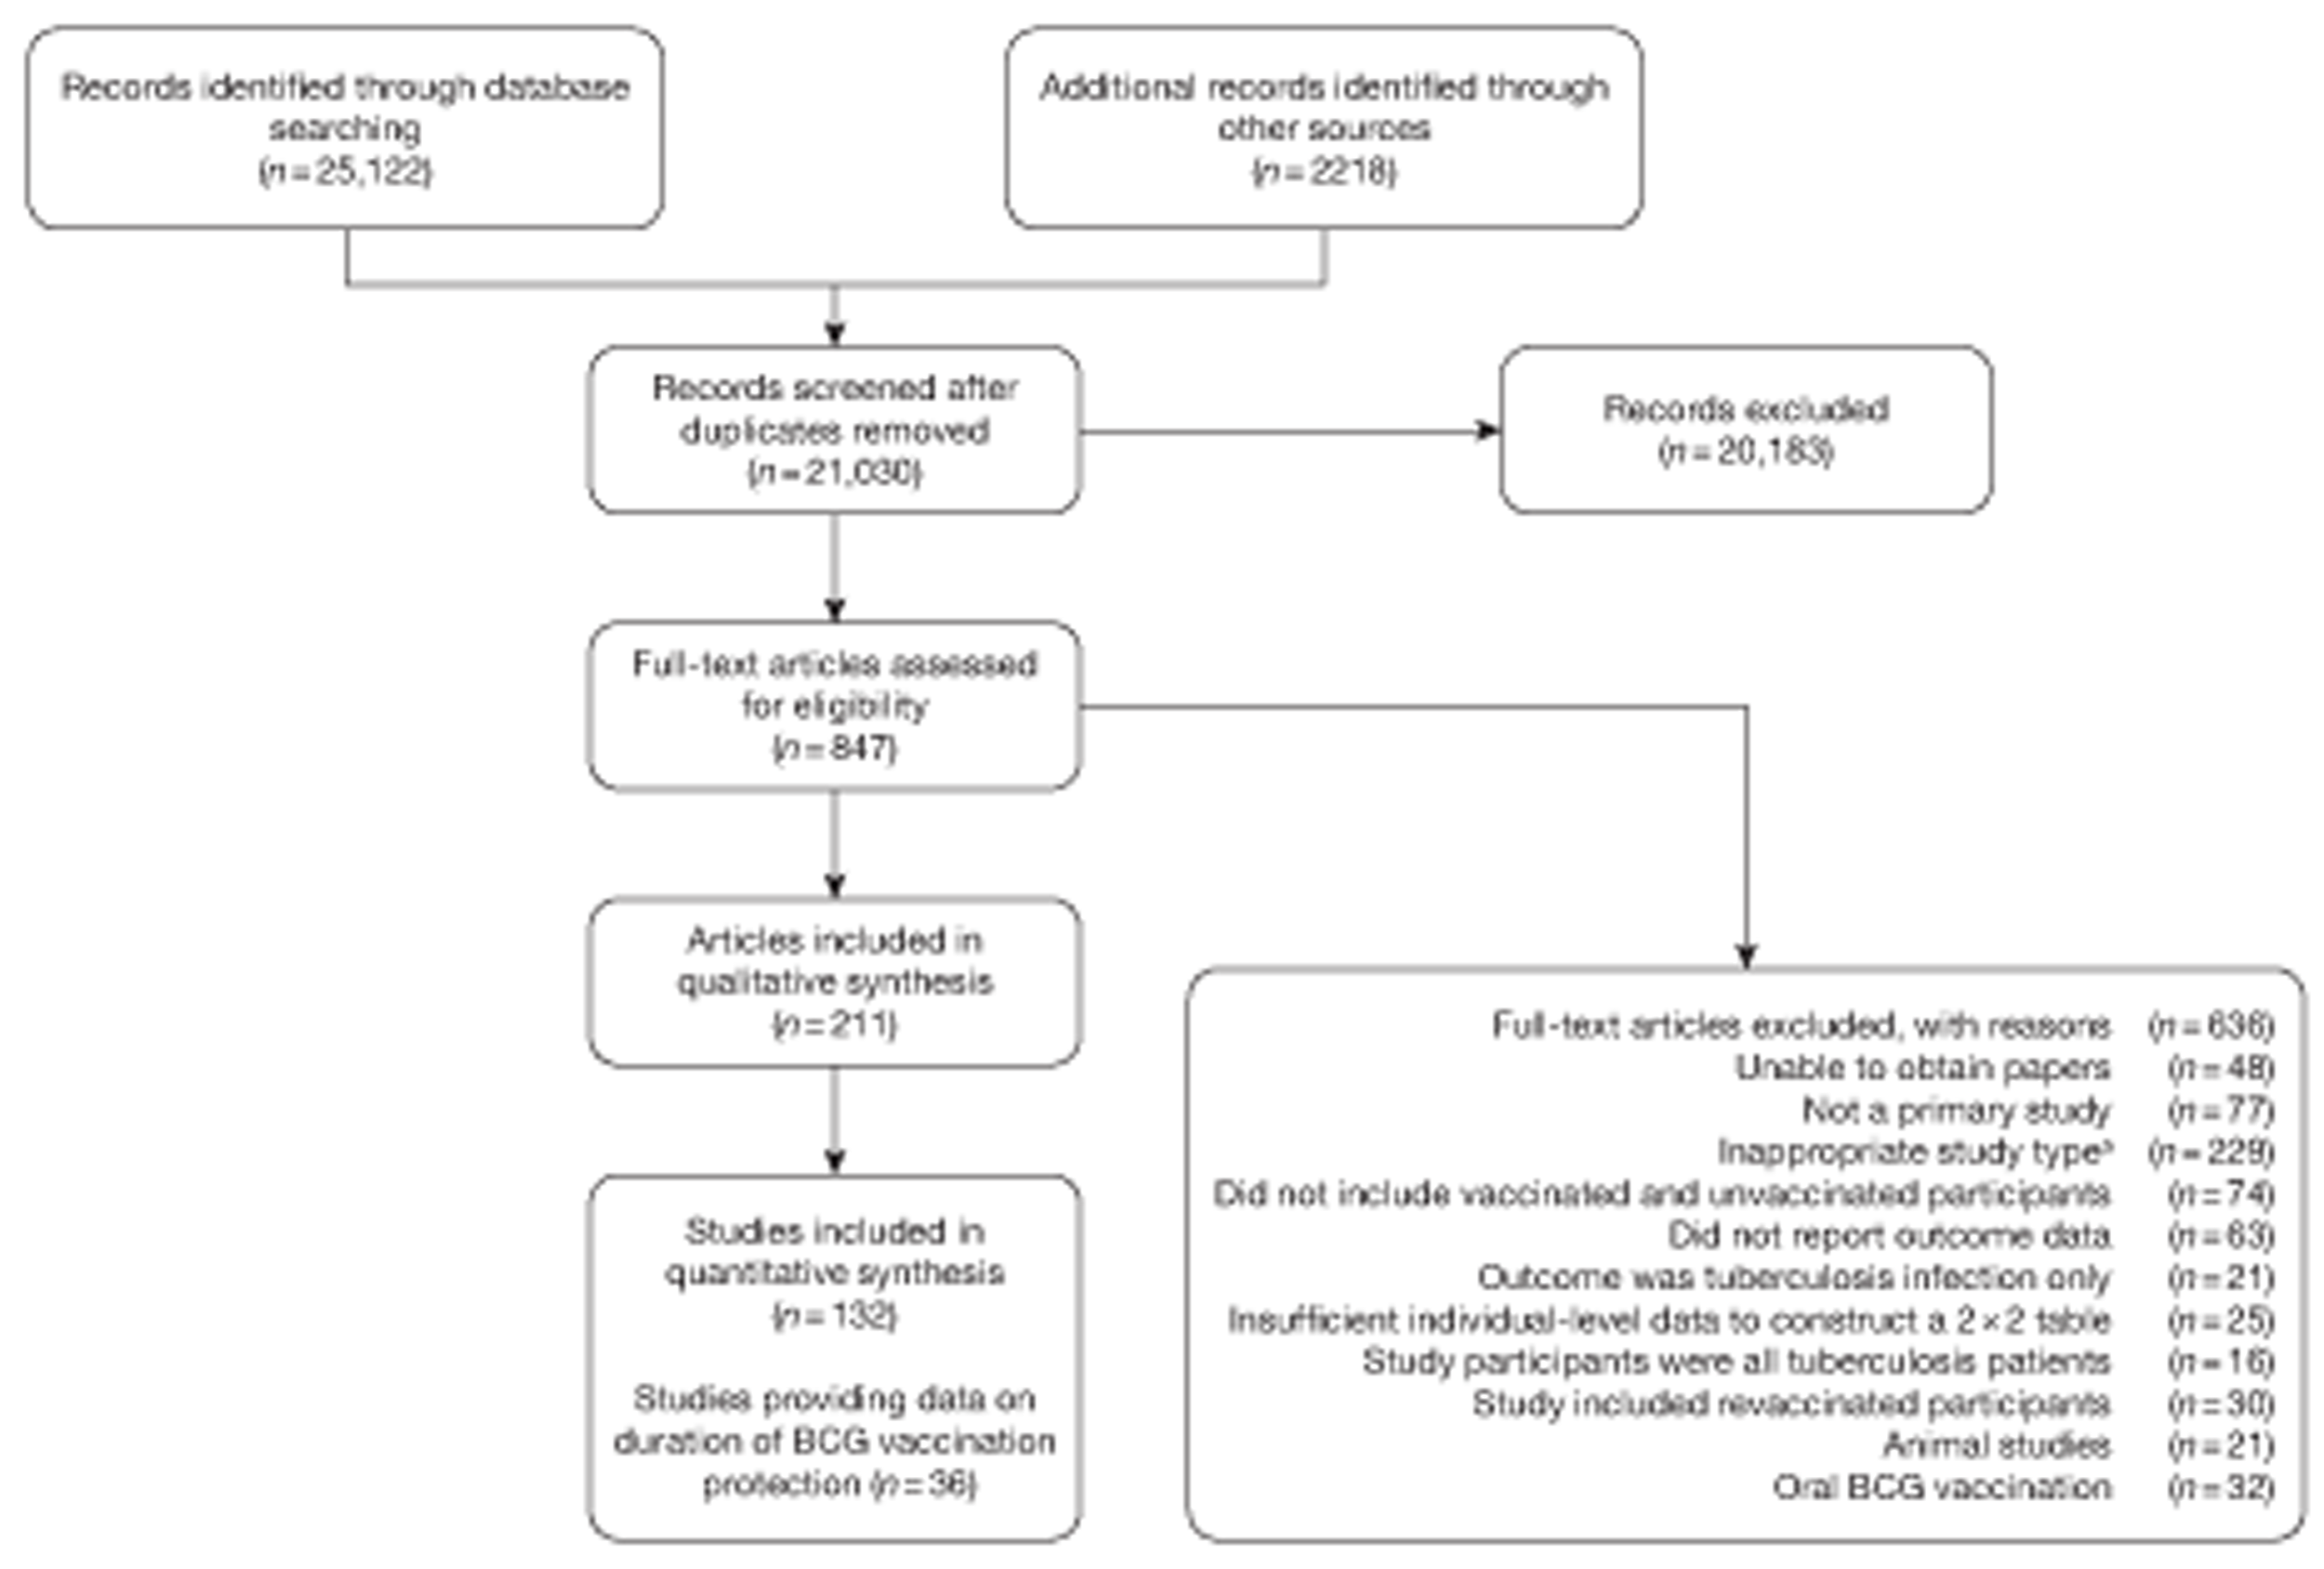
In total, 211 articles met the inclusion criteria for this review, of which 60 were not published in English. The included articles reported data on 132 individual studies: several papers were published in relation to the same groups of patients. These were grouped together and data were extracted from the most informative or most recent article. Forty-eight of these additional papers provided further information on the studies, and 37 provided duplicate data on the 132 studies.
Overview of available evidence
The characteristics of the individual included studies are shown in Appendix 3.
A total of 132 studies provided data on the efficacy of BCG vaccination against tuberculosis outcomes. The included studies were categorised into six design types: 21 randomised control trials, 26 case–control studies, 38 cohort studies, 20 case population studies, 19 cross-sectional studies and eight outbreak studies.
Thirty-six studies gave sufficient data to estimate the duration of BCG vaccination protection. A majority of studies (51) provided data on pulmonary tuberculosis as a specific outcome, 13 of which gave data on BCG vaccination protection duration. Meningitis was an outcome reported in 34 studies, while 13 reported on military tuberculosis. Twenty-six studies provided data on extrapulmonary tuberculosis outcomes (with five giving sufficient data to evaluate duration of BCG vaccination protection), and 19 studies reported tuberculosis mortality as an outcome.
Randomised control trials
Fifty-eight references gave information on 21 individual RCT studies, with 18 references providing sufficient original data (three articles provided data on two separate studies). Thirty articles gave additional data on these 21 trials and 10 provided duplicate data. Quasi-randomisation was used in 13 trials, individualised randomisation in two, and the remaining six studies provided no details on the method of randomisation.
Eighteen trials provided data on pulmonary tuberculosis, six provided outcome data on tuberculosis meningitis and/or military tuberculosis (five on both outcomes and one on military tuberculosis only), six studies also provided outcome data for extrapulmonary tuberculosis (not recorded as tuberculosis meningitis or military tuberculosis) and six studies gave data on BCG vaccination efficacy against tuberculosis mortality. Thirteen of the trials were conducted in the USA and were initiated between 1933 and 1950. 5,12,15,44–50 Four trials were initiated in India between 1950 and 1988 (the latter is the publication date). 28,51–53 One trial each was conducted in Canada (started in 1933),13 the UK (1950),14 South Africa (1965)54 and Haiti (1965)55(Table 3).
| Trial | Author | Duration | Years | Latitude | Age at vaccination and tuberculin testing stringency |
|---|---|---|---|---|---|
| Saskatchewan infants13 | Ferguson | 15 years | 1933–48 | > 50° | Neonatal |
| New York infants, randomised12 | Levine | 11 years | 1933–44 | 40–50° | Neonatal |
| Native American5 | Aronson | 63 years | 1935–98 | 40–50° | School-age vaccination – stringent testing |
| Chicago Infants CCH48 | Rosenthal | 23 years | 1937–60 | 40–50° | Neonatal |
| Turtle and Rosebud infants45 | Aronson | 8 years | 1938–46 | 40–50° | Neonatal |
| Chicago medical students46 | Rosenthal | 4 years | 1939–43 | 40–50° | Other age vaccination – stringent testing |
| Chicago nurses47 | Rosenthal | 5 years | 1940–45 | 40–50° | Other age vaccination – stringent testing |
| Chicago Infants (TT HH)48 | Rosenthal | 12 years | 1941–53 | 40–50° | Neonatal |
| Ida B Wells housing project44 | Rosenthal | 13 years | 1942–56 | 40–50° | School-age vaccination – stringent testing |
| US mental health patients44 | Rosenthal | 4 years | 1944–48 | 30–40° | Other age vaccination – stringent testing |
| Illinois mentally handicapped50 | Bettag | 12 years | 1947–59 | 40–50° | Other age vaccination – stringent testing |
| Georgia (school)49 | Shaw | 20 years | 1947–67 | 30–40° | School-age vaccination – stringent testing |
| Puerto Rican children15 | Palmer | 19 years | 1949–68 | 10–20° | School-age vaccination – non-stringent testing |
| Madanapalle53 | Frimodt-Moller | 21 years | 1950–71 | 10–20° | Other age vaccination – stringent testing |
| Georgia/Alabama15 | Palmer | 20 years | 1950–70 | 30–40° | Other age vaccination – non-stringent testing |
| MRC14 | MRC | 20 years | 1950–70 | > 50° | School-age vaccination – stringent testing |
| African gold miners54 | Coetzee | 3 years | 1965–68 | 20–30° | Other age vaccination – non-stringent testing |
| Haiti55 | Vandivière | 3 years | 1965–68 | 10–20° | Other age vaccination – non-stringent testing |
| Chingleput28 | TBPT | 15 years | 1968–83 | 10–20° | Other age vaccination – non-stringent testing |
| Bombay infants52 | Mehta | 30 months | 1976a | 10–20° | Neonatal |
| Agra51 | Mehrotra | 5 years | 1988a | 20–30° | School-age vaccination – non-stringent testing |
The trial with the smallest number of participants (n = 35) was the US Mental Health Patients study. 44 The study with the most participants, with 73,459, was Chingleput. 28 The average number of participants was 14,826.
Case–control studies
Thirty-five articles32,33,56–88 provided data on 26 case–control studies,32,33,56–79 seven gave additional data80–86 and two were duplicates. 87,88 Seven examined pulmonary tuberculosis,56,62,66,70,72–74 14 examined tuberculosis meningitis and/or military tuberculosis57–62,66–69,71,72,74,76 (11 provided data only on tuberculosis meningitis57–62,66–68,71,74), seven provided data on other extrapulmonary tuberculosis outcomes,56,62,66,72–74,78 and no case–control studies provided tuberculosis mortality data. Seven of the case–control studies were initiated in India between 1981 and 2005 (the latter is the publication date),56–62 with two studies started in each of the UK (1965; 1991),32,33 Canada (1975; 1979),63,64 Thailand (1980; 1987)65,66 and Brazil (1975; 1981)67,68 and one study each in Papua New Guinea (1975),69 Colombia (1977),70 Republic of Korea (1979),71 Argentina (1981),72 Indonesia (1981),73 Myanmar (1983),74 Nepal (1983),75 Japan (1988),76 Saudi Arabia (1991),77 Mexico (1991)78 and Madagascar (1992). 79
The case–control study with the smallest number of participants (n = 63) is the Delhi 1989–90 study, 57 whereas the largest case–control study (6293 participants) was the Saudi Arabian study. 77 The case–control studies had an average of 714 participants.
Cohort studies
A total of 65 papers6,7,12,24,88–148 provided information on 38 individual cohort studies (13 prospectively recruited participants,6,24,89,91,93,94,101,104,109,117,118,122,123 20 did this retrospectively7,90,92,95,96,100,102,103,105–108,110–116,119 and five were cohort studies in contacts of tuberculosis patients97–99,120,121). Eleven papers12,125,132–138,140,147 gave additional data on these studies and 1688,124,126–131,139,141–146,148 provided duplicate data. Twelve cohort studies3,24,100,105,108,109,115–117,119,122,149 provided outcome data on pulmonary tuberculosis, whereas six94,108,109,113,123,149 provided data on tuberculosis meningitis and/or military tuberculosis (four94,109,123,149 on tuberculosis meningitis and one108 on military tuberculosis only). Eight cohort studies6,24,101,108,109,116,119,149 gave data on other forms of extrapulmonary tuberculosis, and nine91,94,109,111,113,114,116,122,123 had tuberculosis mortality as an outcome. The USA contributed seven cohort studies (initiated between 1927, the earliest date of a BCG study, and 1950),89–95 while five studies were started in both the UK (between 1955 and 1985),86–100 and in Norway (between 1927 and 1956),101–104,150 four studies in Germany (between 1947 and 1954)105–107,149 and three studies in France (between 1947 and 1956)108–110 (Table 4). One cohort study was identified as undertaken in each of the following countries: Denmark (1936),151 Italy (1938),111 the Netherlands (1939),102 Sweden (1941),113 Uruguay (1943),114 Ireland (1949),115 Morocco (1950),116 Algeria (1950),117 Poland (1965),118 Malawi (1979),24 Jordan (1980),119 Republic of Korea (1989),120 Central African Republic (1989)121 and Brazil (1996). 6 The smallest cohort study is the Dublin nurses,115 with a total of 80 participants enrolled. The largest cohort study is the Norway 1956–7393 study, with 1,047,550 participants enrolled.
| Cohort studies | Author | Duration |
|---|---|---|
| Ancona children111 | Mariotti | 23 years |
| Bangui contacts121 | Lanckriet | 7 years |
| Bornholm122 | Olsen | 9 years |
| Boston nurses84 | DeFriez | 16 months |
| Bougie schoolchildren117 | Sarrouy | 3 years |
| Brazil REVAC6 | Barreto | 6 years |
| Chicago medical students90 | Geiseler | 43 years |
| Dublin nurses115 | Counihan | 6 years |
| Dusseldorf children149 | Trub | 15 years |
| Dutch nurses112 | Bergsma | 11 years |
| Edinburgh 1977 contacts97 | Capewell | 5 years |
| Edinburgh96 | Capewell | 8 years |
| Edinburgh contacts98 | Rubilar | 10 1/2 |
| Hamburg children105 | Ehrengut | 7 years |
| Hesse 23 districts106 | Daelen | 5 years |
| Jordan119 | Batieha | 15 years |
| Seoul contacts120 | Jin | 2.5 years |
| Lyon students108 | Despierres | 7 years |
| Karonga24 | Ponnighaus | 10 years |
| Morocco children116 | Gaud | 2.5 years |
| New York infants91 | Kereszturi | 6 years |
| France schoolchildren109 | Gernez-Rieux | 20 years |
| Norway 1947101 | Borgen | 2 years |
| Norway102 | Tverdal | 10 years |
| Norwegian deported103 | Oeding | |
| Oslo nurses123 | Heimbeck | 2 years |
| Philadelphia nurses92 | Chakravarty | 2 years |
| Richmond infants93 | Kendig | 7 years |
| Rzeszow children118 | Kubit | |
| Siblings cohort107 | Liebknecht | 15 years |
| Strasbourg students110 | Vaucher | 3 years |
| Swedish conscripts113 | Dahlstrom | 6 years |
| Trysil Norway104 | None | 3 years |
| UK contacts99 | Horne | 2 years |
| Medical students UK100 | Verney | 3 years |
| Uruguay infants114 | Gomez | 10 years |
| US physicians95 | Barrett-Connor | 24 years |
| Virginia infants94 | Kendig | 20 years |
Case population studies
In total, 23 references were included,152–174 providing data on 20 case population studies (Table 5). One paper159 gave details on three studies, four articles171–174 provided additional data on these studies, and one161 gave duplicate data. Four156,158,160,162 of the 20 case population studies provided data specifically on pulmonary tuberculosis and five157,159,166,169,170 on tuberculosis meningitis. Four case population studies were identified from the UK (started between 1956 and 1983), 152–155 three in Canada (1949; 1969),156–158 two in Malaysia (1976; 1977)159 and one each for Poland (1950),160 Czechoslovakia (1954),161 Israel (1956),162 Hungary (1964),163 Germany (1967),164 Singapore (1972),165 Republic of Korea (1976),159 Brazil (1983),166 Ireland (1986),167 France (1990)168 and Taiwan, Province of China (2002). 169
| Study name | Author (year) | Case-finding duration | Case-finding start and end dates |
|---|---|---|---|
| Malaysia 0- to 19-year-olds159 | WHO | 3 years | 1977–9 |
| Malaysia meningitis159 | WHO | 3 years | 1976–8 |
| Korea neonatal159 | WHO | 1 year | 1976–6 |
| Britain surveys153 | Sutherland | 1 year | 1973–3 |
| 1 year | 1978–8 | ||
| 1 year | 1983–3 | ||
| Birmingham schoolchildren152 | Springett | 2 years | 1954–8 |
| 7 years | 1956–62 | ||
| 8 years | 1962–9 | ||
| Israel neonatal162 | Zilber | 4 years | 1956–79 |
| Canadian nurses156 | Burril | 11 years | 1969–79 |
| Brazil meningitis166 | Martins | 1 years | 1983–3 |
| South Asian adults155 | Chaloner | 8 years | 1982–2000 |
| Quebec meningitis157 | Frappier | 9 years | 1949–56 |
| Taiwan meningitis169 | Chan | 6 years | 2002–7 |
| Bydgoszcz children160 | Krzyszkowska | 4 years | 1950–3 |
| Singapore schoolchildren165 | Chew | 1 year | 1972–2 |
| France schoolchildren168 | Schwoebel | 1 year | 1990–0 |
| Manchester hospital154 | Curtis | 6 years | 1975–80 |
| Czechoslovakia meningitis170 | Votjek | 3 years | 1954–8 |
| Quebec pulmonary158 | Frappier | 5 years | 1956–61 |
| Ireland survey167 | Kelly | 5 years | 1989–91 |
| Cologne children164 | Lotschert | 10 years | 1967–76 |
| Hungary 4 to 14-year-olds163 | Lugosi | 1 year | 1964–4 |
Cross-sectional studies
Twenty-two articles were identified175–196 and 12 provided original data on cross-sectional studies in the general population,176,180–187,190,191,193 seven gave data on studies in contacts of tuberculosis patients,175,177–179,188,189,192 and two gave duplicate data. 194,196 In total, 19 cross-sectional studies provided data on efficacy of BCG vaccination:175–196 six on pulmonary tuberculosis,178,181,182,187,189,193 six on the combined outcome of tuberculosis meningitis and/or military tuberculosis177,181,182,184,186,190 (three reported data on both forms of tuberculosis,177,186,190 two only on tuberculosis meningitis184,186 and one on military tuberculosis only181); two studies reported data on other forms of extrapulmonary tuberculosis181,182 and two on tuberculosis mortality. 186,187 Two studies were conducted in each of Spain (starting in 1969 and 1991*),175,176 Togo (1988 and 1986*)177,178 and Brazil (between 1988 and 2003). 179,180 Single studies were conducted in Japan (1949),181 Belgium (1950),182 Yugoslavia (1959),183 France (1965),184 Italy (1967),185 India (1968),186 Kenya (1979),187 Thailand (1981),188 Egypt (1986*),189 South Africa (1999),190 Colombia (2001),191 Russia (2003)192 and Lebanon (2004)193 (*date of study publication was used if study start date was not available). The smallest cross-sectional study was the Naples classroom,185 with 33 participants, whereas the greatest number of participants (4,264,400) was in the Bas-Rhin meningitis184 study.
Outbreak studies
Nine articles197–205 provided data on eight outbreak studies, with one article200 providing data on two separate outbreaks, and two articles206,207 giving duplicate data. Tree of these studies197,198,201 provided data on pulmonary tuberculosis, one199 on meningitis and military tuberculosis and one200 on extrapulmonary tuberculosis. Tree outbreaks occurred in Ireland between 1991 and 2009,197–199 two in Canada (2004),200 and one each in Sweden (1947),201 Norway (1947)202 and Denmark (1957). 203 The smallest outbreak included, Community I Canada outbreak,200 involved only 40 individuals, whereas the Donegal school outbreak199 involved a total of 1175 school children.
Efficacy of bacillus Calmette–Guérin vaccination
Results on the efficacy of BCG vaccination are divided first by study type (RCTs and observational studies), and within each study type are presented by type of tubercular disease/mortality outcome (pulmonary tuberculosis, all tuberculosis outcomes, meningeal and/or military tuberculosis, extrapulmonary tuberculosis and tuberculosis mortality) where results for these outcomes were available. Within each outcome, results are stratified according to study and participant characteristics. Meta-regression results for each variable examined, where available, are provided below the corresponding forest plot and refer to the summary table of meta-regression analyses performed, which can be found at the end of each tuberculosis disease/mortality outcome section.
Randomised control trials
Pulmonary tuberculosis
This section of the report first presents overall results, followed by results stratified according to study characteristics (latitude, age at vaccination/stringency of tuberculin testing and risk of diagnostic detection bias). Unstratified analyses are ordered by year trial started.
Figure 3 shows the results of 18 trials evaluating the efficacy of BCG vaccination against pulmonary tuberculosis, listed by date of study start. Nine studies were conducted in the USA,5,44,45,48–50 four in India,28,51–53 and the others in Canada,13 Puerto Rico,15 the UK,14 Haiti55 and South Africa. 54 There was substantial variation in the protective efficacy of BCG vaccination against pulmonary tuberculosis, ranging from substantial protection, as in the UK MRC14 trial [rate ratio 0.22 (95% CI 0.16 to 0.31)], to absence of clinically important benefit, as in the large Chingleput28 trial [rate ratio 1.05 (95% CI 0.88 to 1.25)].
FIGURE 3.
Rate ratios (with 95% CI) comparing the incidence of pulmonary tuberculosis among BCG vaccinated individuals with that in unvaccinated individuals for the longest duration of follow-up (see Table 3) in RCTs, by year of study start. a, Date of study publication was used if study start date was not available. CCH, Cook County Hospital; TB HH, tuberculosis households; TBPT, Tuberculosis Prevention Trial.

Stratified analysis by latitude (10°), ordered by year study started
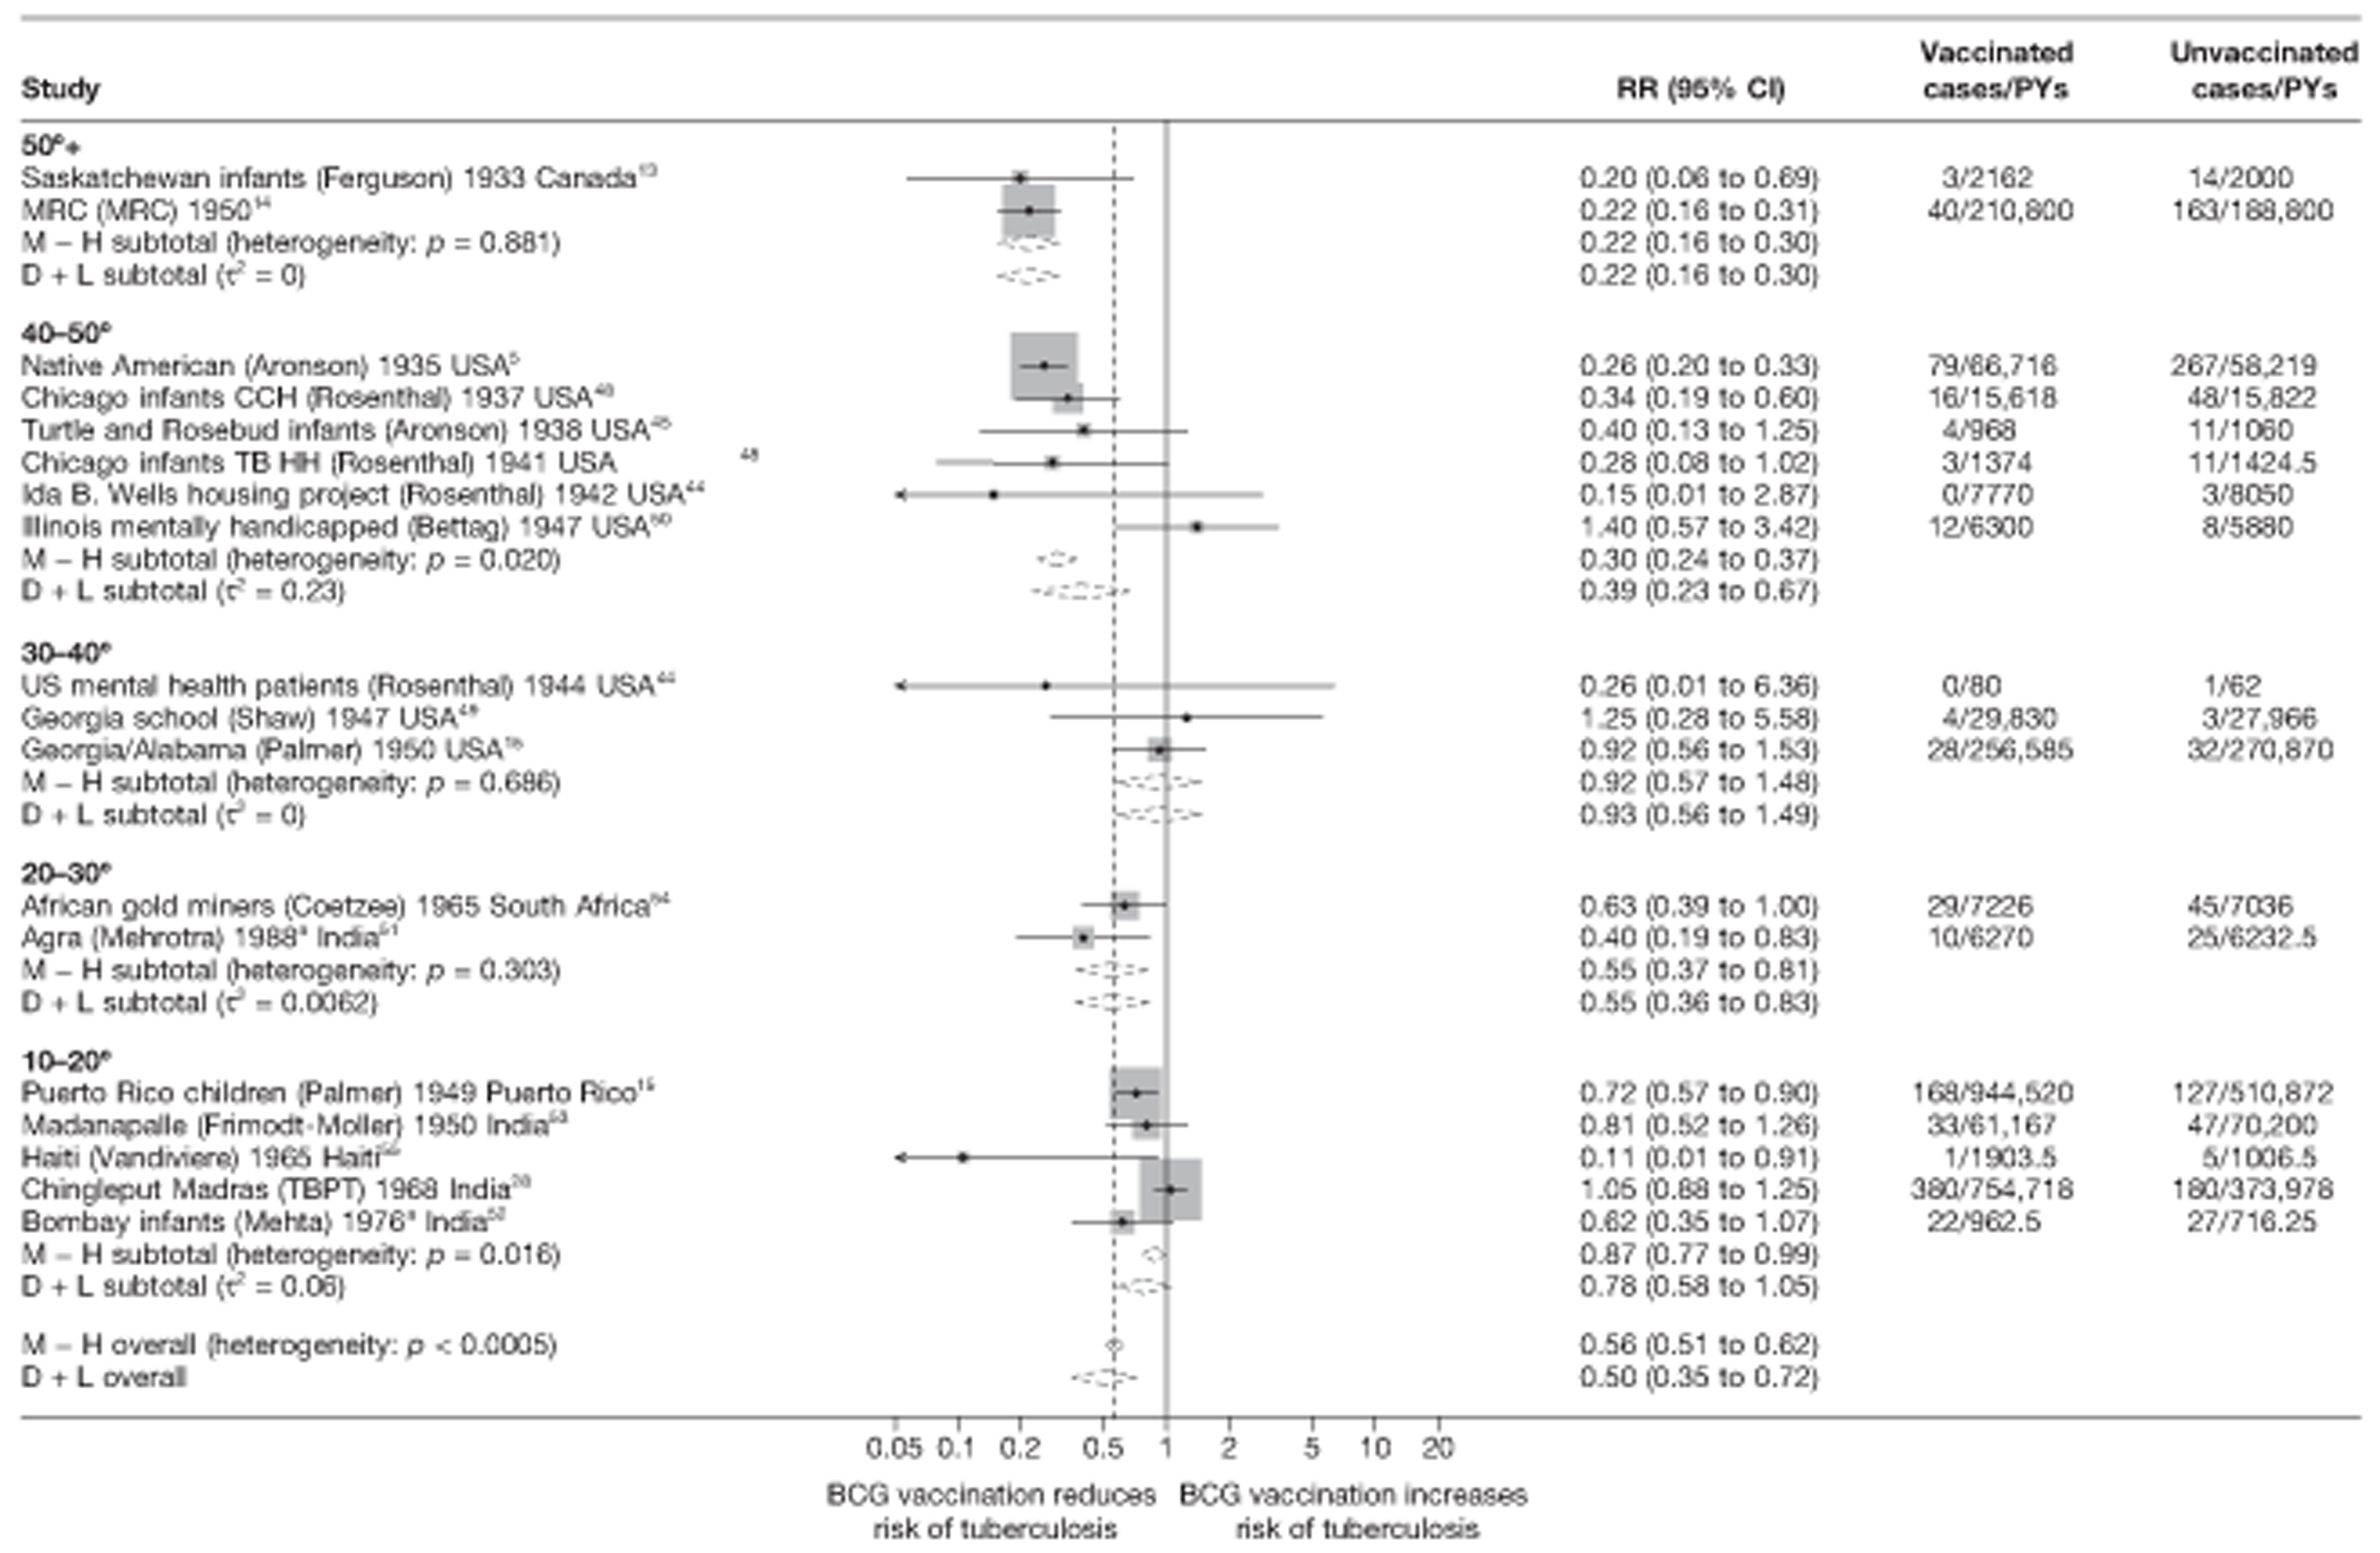
Figure 4 shows estimated effects of BCG vaccination against pulmonary tuberculosis, stratified by latitude of the study location (10° bands either side of the equator). In general, the protective effect of BCG vaccination was either absent or low in studies conducted close to the equator, whereas there was reasonably consistent evidence of good protection observed in studies conducted at latitudes exceeding 40°. Relatively high protection was observed in studies (Saskatchewan Infants13 and MRC14) conducted above 50° latitude: rate ratio 0.22 (95% CI 0.16 to 0.30), corresponding to a VE of 78% (95% CI 70% to 84%). Latitude explained a substantial amount of the between-study variation in the protective effect of BCG vaccination.
FIGURE 4.
Rate ratios (with 95% Cl) comparing the incidence of pulmonary tuberculosis among BCG vaccinated individuals with that in unvaccinated individuals for the longest duration of follow-up (see Table 3) in RCTs, stratified by latitude of study location (10° bands), ordered by year of study start, a, Date of study publication was used if study start date was not available. CCH, Cook County Hospital; D + L, DerSimonian and Laird method; M-H, Mantel-Haenszel method; TB HH, tuberculosis households; TBPT, Tuberculosis Prevention Trial.
Meta-regression analysis
Based on univariable meta-regression analyses, stratification on latitude appeared to explain 70% of the between-study variation (τ2 values before and after stratification using 20° strata were 0.284 and 0.086, respectively) (Table 6). There was evidence (p = 0.008) that efficacy varied with latitude: rate ratios for studies between 0° and 20° latitude and between 20° and 40° latitude were, respectively, 2.45 (95% CI 1.42 to 4.21) and 2.17 (95% CI 1.14 to 4.10) times that of studies > 40° latitude (thus VEs are correspondingly lower).
| Meta-regression results | Number of trials | Univariable rate ratios (95% CI) | Univariable model | Two-variable model | Multivariable model (τ2 = 0.000) | |||||
|---|---|---|---|---|---|---|---|---|---|---|
| Variable | Ratio of rate ratios (95% CI) | p-value | τ2 | Ratio of rate ratiosa (95% CI) | p-value | τ2 | Ratio of rate ratiosb (95% CI) | p-value | ||
| Null model | 18 | 0.284 | 0.284 | < 0.001c | ||||||
| Latitude | ||||||||||
| > 40° | 8 | 0.31 (0.21 to 0.46) | 1.00 (ref.) | 1.00 (ref.) | ||||||
| 20–40° | 5 | 0.68 (0.41 to 1.13) | 2.17 (1.14 to 4.10) | Included in all models | 1.17 (0.58 to 2.36) | |||||
| 0–20° | 5 | 0.77 (0.52 to 1.13) | 2.45 (1.42 to 4.21) | 0.008 | 0.086 | 1.73 (0.93 to 3.25) | 0.054d | |||
| Age at vaccination/tuberculin testing stringency | ||||||||||
| Neonatal | 5 | 0.39 (0.24 to 0.64) | 1.00 (ref.) | 1.00 (ref.) | 1.00 (ref.) | |||||
| School age/stringent | 4 | 0.26 (0.17 to 0.40) | 0.66 (0.35 to 1.25) | 0.74 (0.52 to 2.67) | 0.76 (0.45 to 1.26) | |||||
| School age/non-stringent | 2 | 0.62 (0.38 to 1.01) | 1.58 (0.80 to 3.13) | 1.29 (0.64 to 2.61) | 0.80 (0.37 to 1.72) | |||||
| Other age/stringent | 3 | 0.94 (0.51 to 1.73) | 2.38 (1.09 to 5.18) | 1.83 (0.85 to 3.92) | 1.60 (0.82 to 3.12) | |||||
| Other age/non-stringent | 4 | 0.85 (0.58 to 1.24) | 2.16 (1.17 to 3.98) | 0.003 | 0.044 | 1.90 (0.97 to 3.73) | 0.064d | 0.000 | 1.75 (0.98 to 3.15) | 0.013d |
| Diagnostic detection bias | ||||||||||
| Lower risk of bias | 13 | 0.43 (0.30 to 0.62) | 1.00 (ref.) | 1.00 (ref.) | 1.00 (ref.) | |||||
| Higher risk of bias | 5 | 0.95 (0.50 to 1.81) | 2.22 (1.10 to 4.60) | 0.036 | 0.232 | 1.71 (0.93 to 3.14) | 0.077d | 0.114 | 1.60 (1.01 to 2.54) | 0.045d |
| Was the allocation sequence adequately generated? | ||||||||||
| Lower risk of bias | 1 | 1.05 (0.35 to 3.11) | 1.00 (ref.) | 1.00 (ref.) | ||||||
| Higher risk of bias | 17 | 0.48 (0.34 to 0.68) | 0.46 (0.15 to 1.44) | 0.169 | 0.253 | 0.64 (0.29 to 1.43) | 0.255d | 0.078 | ||
| Was treatment allocation adequately concealed? | ||||||||||
| Lower risk of bias | 3 | 0.56 (0.22 to 1.41) | 1.00 (ref.) | 1.00 (ref.) | ||||||
| Higher risk of bias | 15 | 0.51 (0.34 to 0.75) | 0.92 (0.34 to 2.49) | 0.856 | 0.303 | 0.86 (0.40 to 1.83) | 0.670d | 0.091 | ||
| Was knowledge of the allocated intervention prevented during the study? | ||||||||||
| Lower risk of bias | 3 | 0.45 (0.20 to 1.02) | 1.00 (ref.) | 1.00 (ref.) | ||||||
| Higher risk of bias | 15 | 0.53 (0.36 to 0.80) | 1.19 (0.48 to 2.96) | 0.691 | 0.319 | 1.05 (0.48 to 2.05) | 0.867d | 0.128 | ||
| Are reports of the study free from the suggestion of selective outcome reporting? | ||||||||||
| Lower risk of bias | 17 | 0.50 (0.34 to 0.72) | 1.00 (ref.) | 1.00 (ref.) | ||||||
| Higher risk of bias | 1 | 0.81 (0.23 to 2.84) | 1.62 (0.44 to 5.98) | 0.445 | 0.299 | 1.09 (0.39 to 3.05) | 0.860d | 0.120 | ||
| Was ascertainment of cases complete? | ||||||||||
| Lower risk of bias | 15 | 0.51 (0.34 to 0.74) | 1.00 (ref.) | 1.00 (ref.) | ||||||
| Higher risk of bias | 3 | 0.59 (0.23 to 1.53) | 1.17 (0.42 to 3.24) | 0.756 | 0.310 | 0.80 (0.37 to 1.74) | 0.551d | 0.103 | ||
Stratified analysis by age at vaccination and tuberculin testing stringency, ordered by year study started
Figure 5 shows estimated effects of BCG vaccination against pulmonary tuberculosis, stratified by the age at which vaccination was administered and the stringency of tuberculin testing performed, grouped into neonatal vaccination, school-aged vaccination, both stringent and less stringent, and an ‘other’ age group which includes studies in which older persons were vaccinated as well as those in which BCG vaccination, was given at any age, also divided into stringent and non-stringent tuberculin testing. Within these strata, there was little evidence of between-study heterogeneity, other than for studies with non-stringent tuberculin testing (school-age non-stringent testing τ2 = 0.095 and other age non-stringent testing τ2 = 0.091). In studies of school-age vaccination with stringent tuberculin testing prior to vaccination, the overall rate ratio was 0.26 (95% CI 0.18 to 0.37), corresponding to a good protective effect, with VE of 74% (95% CI 63% to 82%). There was also evidence of moderate levels of protection with neonatal vaccination [summary rate ratio 0.41 (95% CI 0.29 to 0.58), equivalent to a VE of 59% (95% CI 42% to 71%)]. Other strata showed less clear-cut evidence of protection, ranging from a moderate protection with rate ratio 0.59 (95% CI 0.65 to 1.01), equivalent to VE of 41% (95% CI −1% to 65%) in school-age vaccination studies with non-stringent tuberculin testing, to 0.88 (95% CI 0.59 to 1.31) equivalent to a VE of 12% (95% CI −0.31% to 41%) in studies of vaccination in other age groups with stringent tuberculin testing protocols.
FIGURE 5.
Rate ratios (with 95% CI) comparing the incidence of pulmonary tuberculosis among BCG vaccinated individuals compared with unvaccinated individuals for the longest duration of follow-up (see Table 3) in RCTs, stratified by age at vaccination/tuberculin testing stringency, ordered by year of study start. a, Date of study publication was used if study start date was not available. CCH, Cook County Hospital; D + L, DerSimonian and Laird method; M-H, Mantel-Haenszel method; TB HH, tuberculosis households; TBPT, Tuberculosis Prevention Trial.
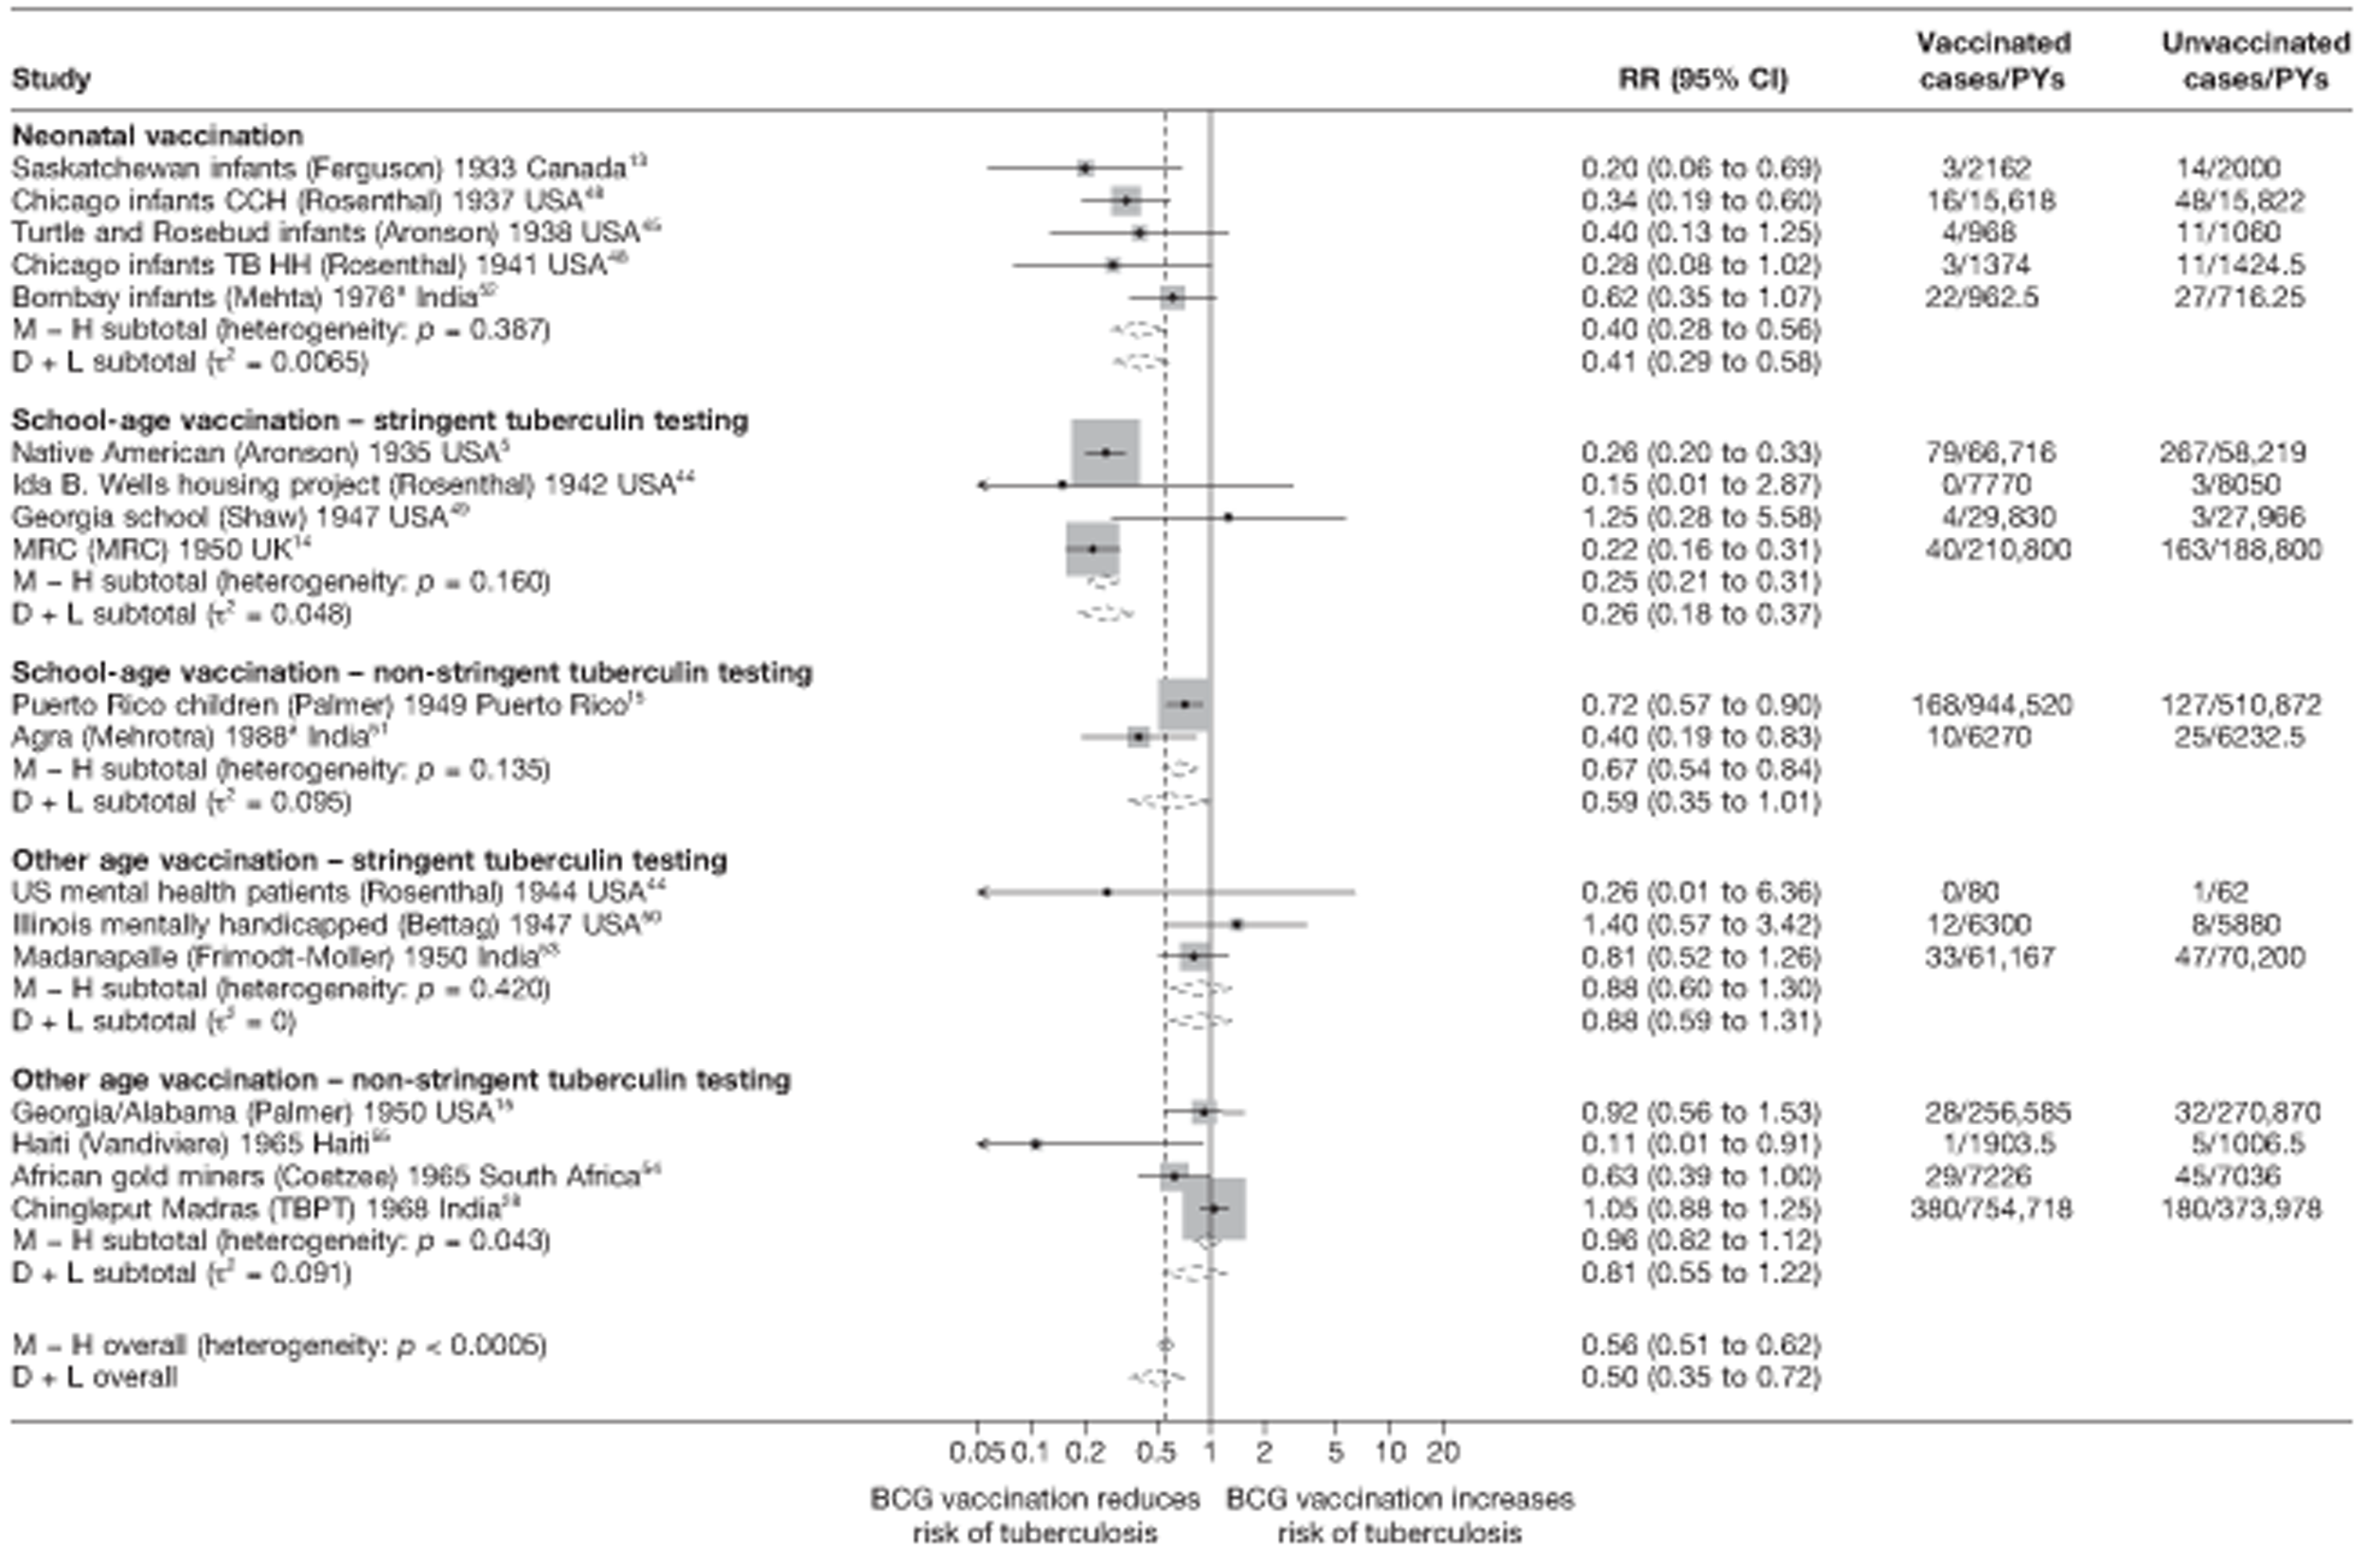
Meta-regression analysis
Based on univariable meta-regression analyses, 85% of the between-study variation appeared to be explained by age at vaccination and tuberculin stringency (τ2 before and after stratification 0.284 and 0.044 respectively) (see Table 6). There was clear evidence (p< 0.003) that the effect of BCG vaccination varied with age at vaccination/tuberculin testing stringency: the rate ratio in studies in the ‘other’ vaccination group with stringent tuberculin testing was estimated to be 2.38 (95% CI 1.09 to 5.18) times the overall rate ratio from studies with neonatal vaccination, while stringent tuberculin testing and school-age vaccination was 0.66 (95% CI 0.35 to 1.25) times that of neonatal vaccination studies.
Stratified analysis by risk of diagnostic detection bias, ordered by year study started
Figure 6 presents results from trials classified according to the level of risk of diagnostic detection bias. Among studies in which the outcome assessors were adequately blinded to the vaccination status of participants, or that performed active surveillance (which would act to lower the risk of diagnostic detection bias), there was substantial between-study variation, but the average protective efficacy of BCG vaccination against pulmonary tuberculosis was good [overall rate ratio 0.40 (95% CI 0.25 to 0.64), corresponding VE of 60% (95% CI 36% to 75%)] and was greater than for studies with higher risk of diagnostic detection bias, which showed a low protective effect [rate ratio 0.78 (95% CI 0.64 to 0.95), corresponding to VE of 22% (95% CI 5% to 37%)].
FIGURE 6.
Rate ratios (with 95% CI) comparing the incidence of pulmonary tuberculosis among BCG vaccinated individuals compared with unvaccinated individuals for the longest duration of follow-up (see Table 3) in RCTs, stratified by risk of diagnostic detection bias,b ordered by year of study start. a, Date of study publication was used if study start date was not available; b, Diagnostic detection bias is considered to occur if the assessor of BCG vaccination outcome is not blinded to vaccination status. CCH, Cook County Hospital; D + L, DerSimonian and Laird method; M-H, Mantel-Haenszel method; TB HH, tuberculosis households; TBPT, Tuberculosis Prevention Trial.
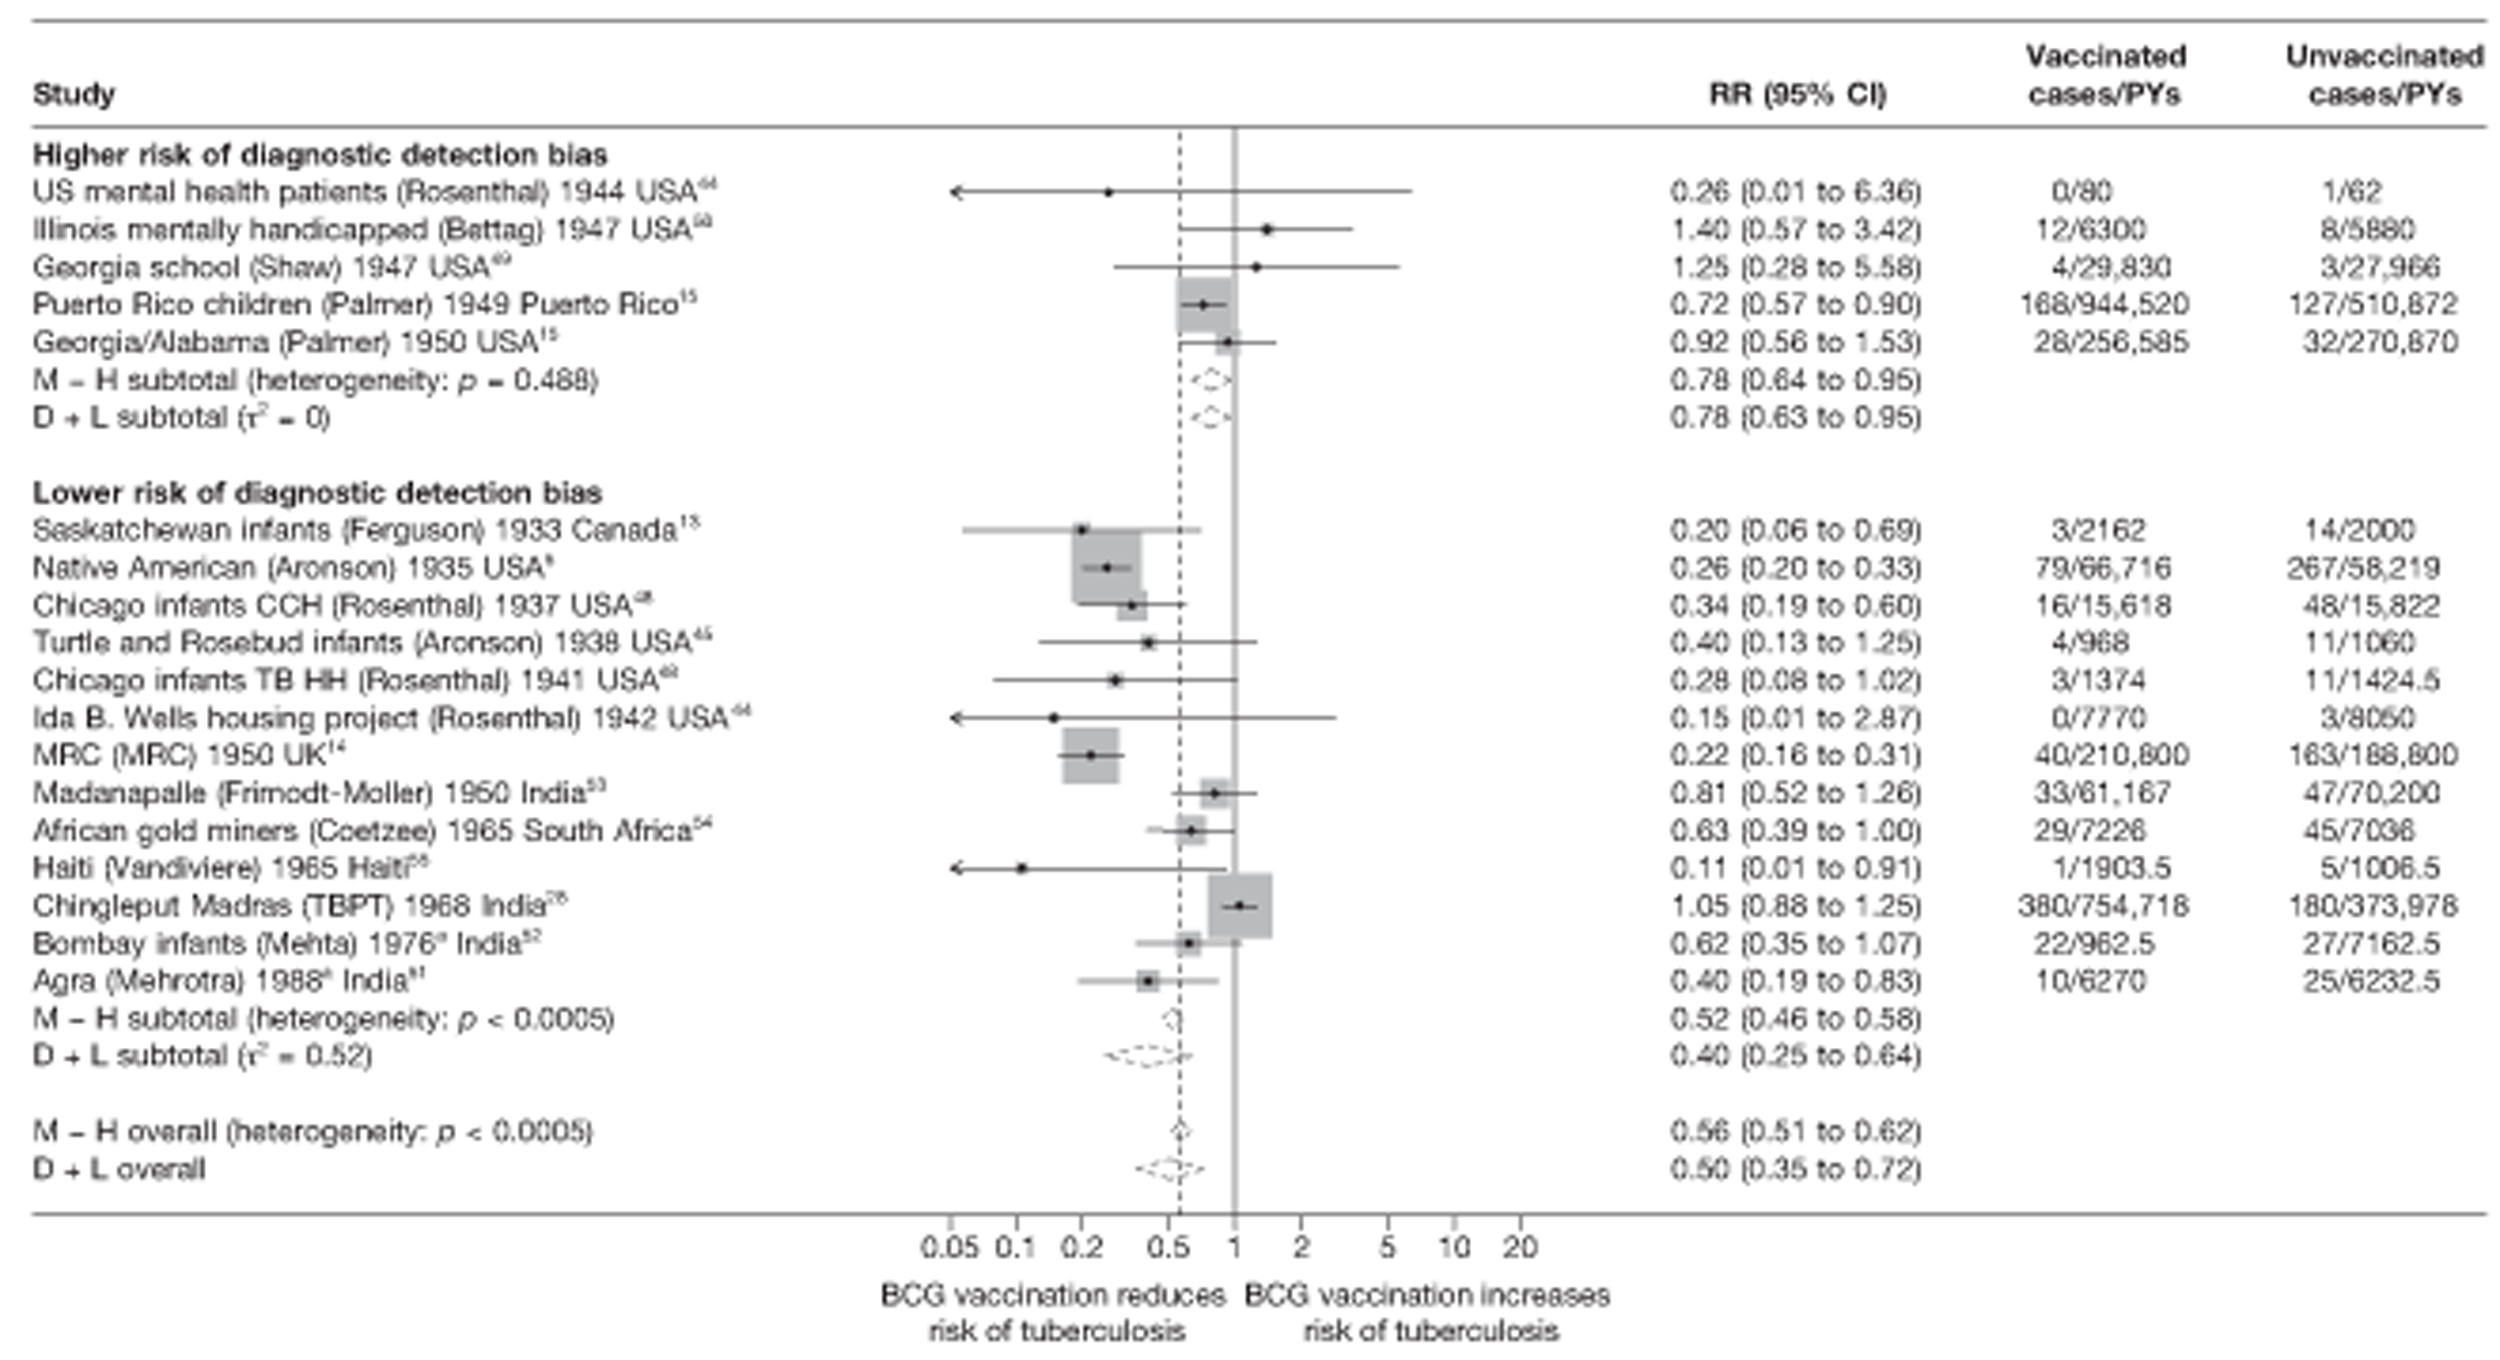
Meta-regression analysis
Meta-regression analyses stratifying on risk of diagnostic detection bias explained 18% of the heterogeneity between studies (null model τ2 = 0.284, after stratification τ2 = 0.232) (see Table 6). There was evidence (p-value = 0.036) that BCG vaccination efficacy varied according to the level of diagnostic detection bias introduced in the study design: studies with a higher risk of bias had a rate ratio 2.22 (95% CI 1.10 to 4.60) times that of studies with lower risk of bias (and therefore a correspondingly lower VE).
Results from univariable meta-regression analyses indicate that latitude and age at vaccination/tuberculin testing stringency explained the largest amount of between-study variation in overall BCG vaccination efficacy (τ2 0.086 and 0.044 respectively, baseline τ2 0.284). Bivariable analysis showed that models including latitude and either the variables age at vaccination/tuberculin testing stringency or ‘Was the allocation sequence adequately generated’ accounted for the largest amount of between-study heterogeneity. The final multi-variable regression model, which explained all between-study variation (τ2 = 0) was one including the variables latitude, age at vaccination/tuberculin testing stringency and risk of diagnostic detection bias.
All tuberculosis disease morbidity outcomes
Figure 7 shows the overall results of 21 trials evaluating the efficacy of BCG vaccination against all tuberculosis morbidity outcomes, ordered by the year of study start.
FIGURE 7.
Rate ratios (with 95% CI) comparing the incidence of all tuberculosis morbidity outcomes among BCG vaccinated individuals with that in unvaccinated individuals for the longest duration of follow-up (see Table 3) in RCTs, ordered by year of study start. a, Date of study publication was used if study start date was not available. CCH, Cook County Hospital; TB HH, tuberculosis households; TBPT, Tuberculosis Prevention Trial.
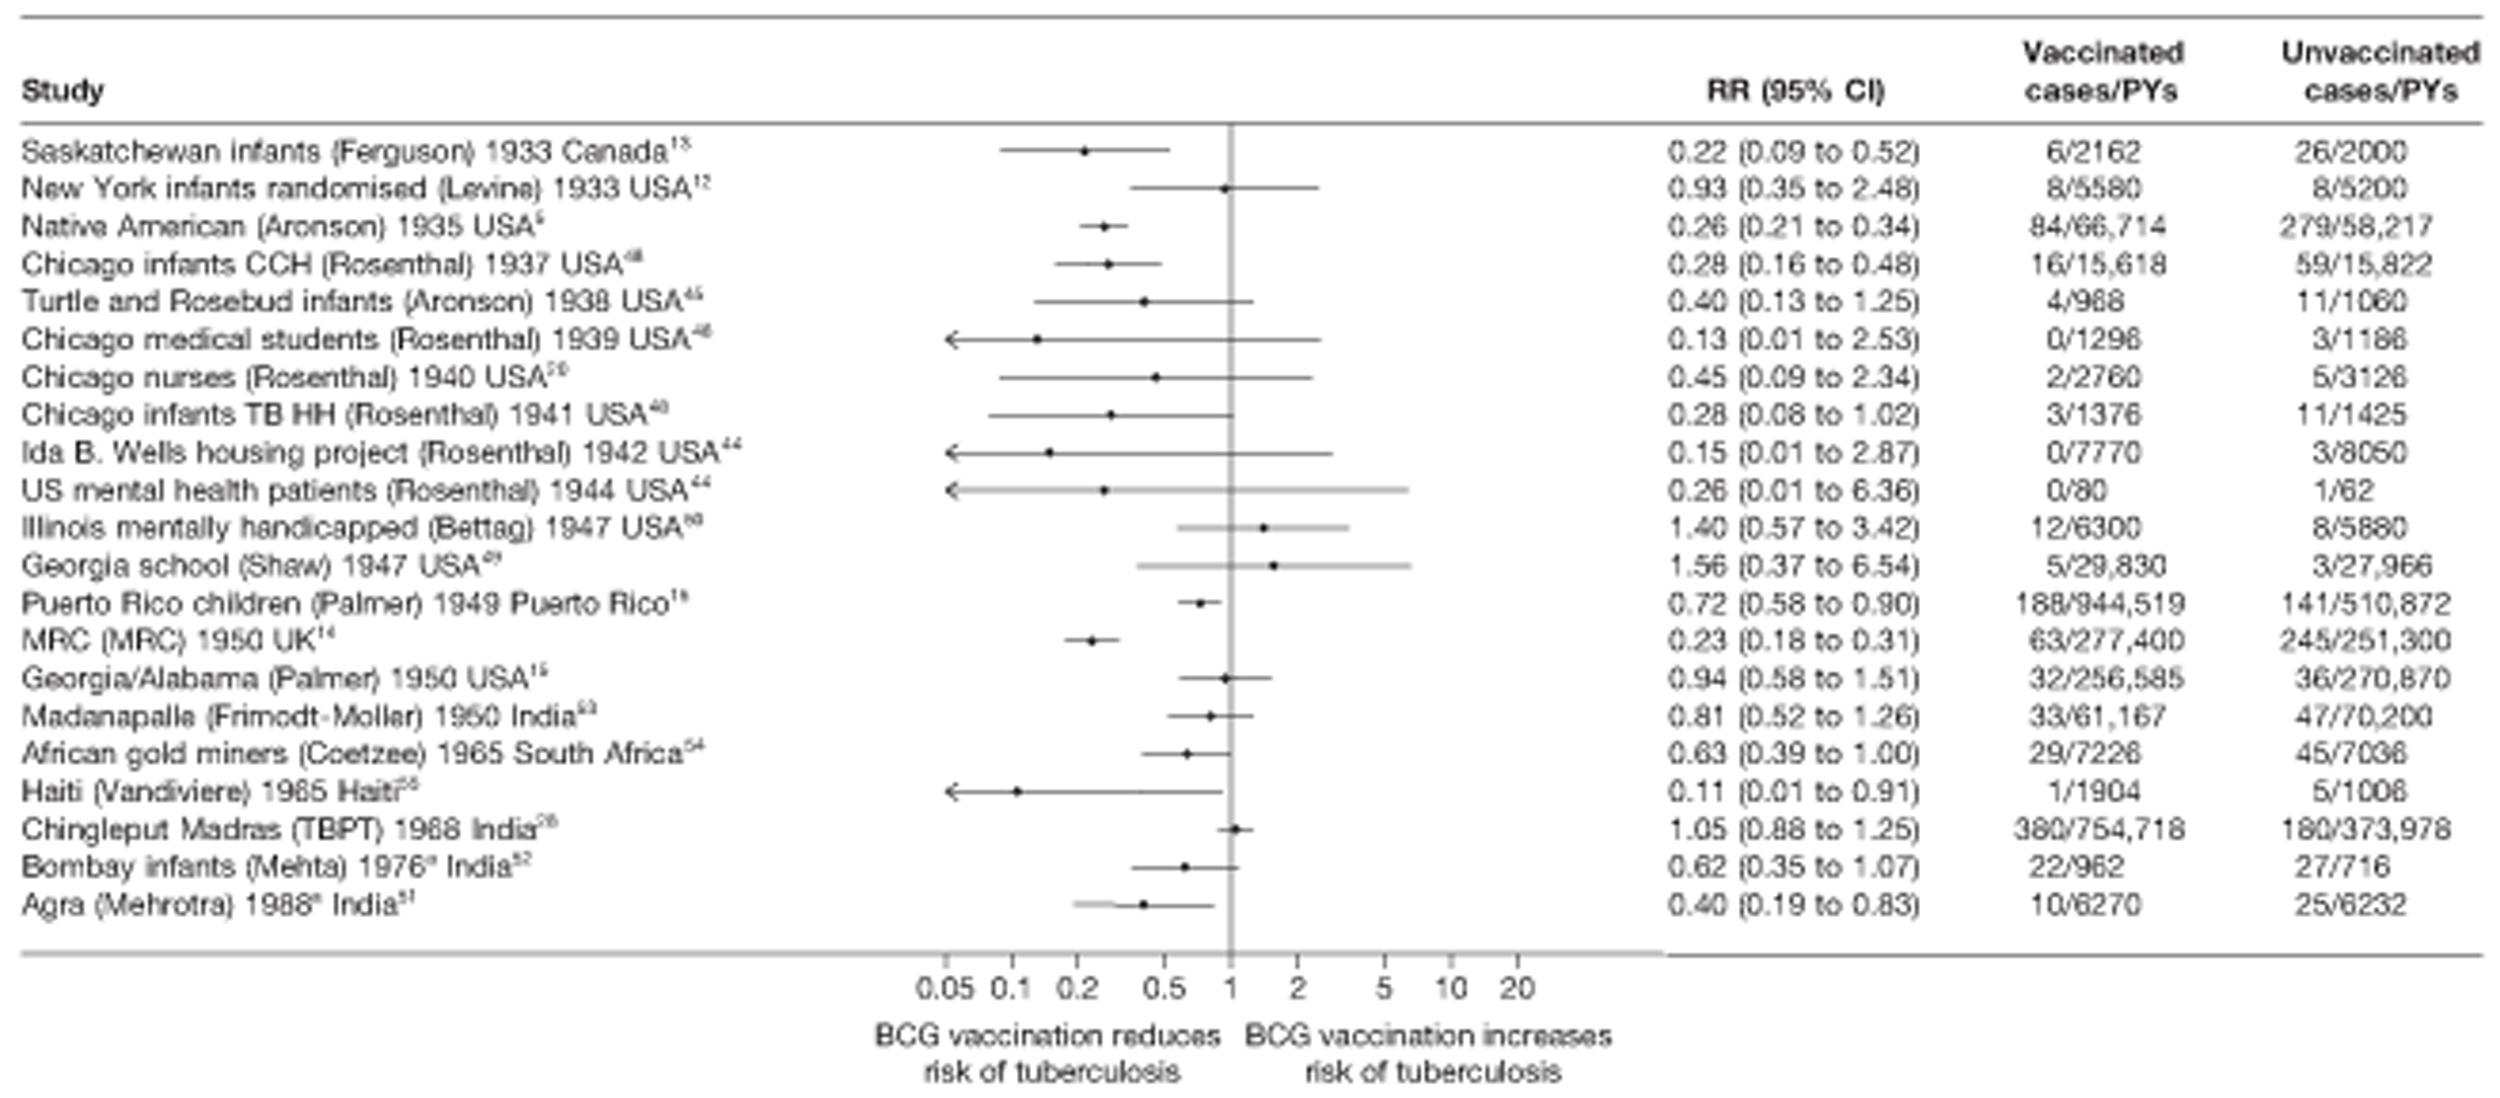
Unstratified analysis ordered by year trial started
An additional three trials did not disaggregate results by type of disease, compared with results on pulmonary tuberculosis. Observation of data from all 21 RCTs shows that the estimates of BCG vaccination efficacy against all disease from tuberculosis (except death) vary considerably (see Figure 7). Similarly to the pulmonary tuberculosis outcome results, the observed effect varies from a good protective effect, as in the Native American,5 Chicago Infants CCH48 and MRC trials,14 to an absence of protection against all tuberculosis morbidity outcomes, as in the Georgia School,49 Chingleput28 and in a residential school for people with learning difficulties (Illinois mentally handicapped50) trials. Most of the efficacy point estimates suggest that BCG vaccination reduces risk of tuberculosis, although the CIs are wide and include 1 in 14 of 21 studies.
Figures 8–11 present the results of RCTs stratified by latitude, age at vaccination/stringency of tuberculin testing and diagnostic detection bias, stringency of tuberculin testing and BCG strain lineage; the last was only possible to examine for all trials with all tuberculosis morbidity as the outcome.
FIGURE 8.
Rate ratios (with 95% CI) comparing the incidence of all tuberculosis morbidity outcomes among BCG vaccinated individuals with that in unvaccinated individuals for the longest duration of follow-up (see Table 3), in RCTs, stratified by latitude of study location (10° bands), ordered by year of study start. a, Date of study publication was used if study start date was not available. CCH, Cook County Hospital; D + L, DerSimonian and Laird method; M-H, Mantel-Haenszel method; TB HH, tuberculosis households; TBPT, Tuberculosis Prevention Trial.
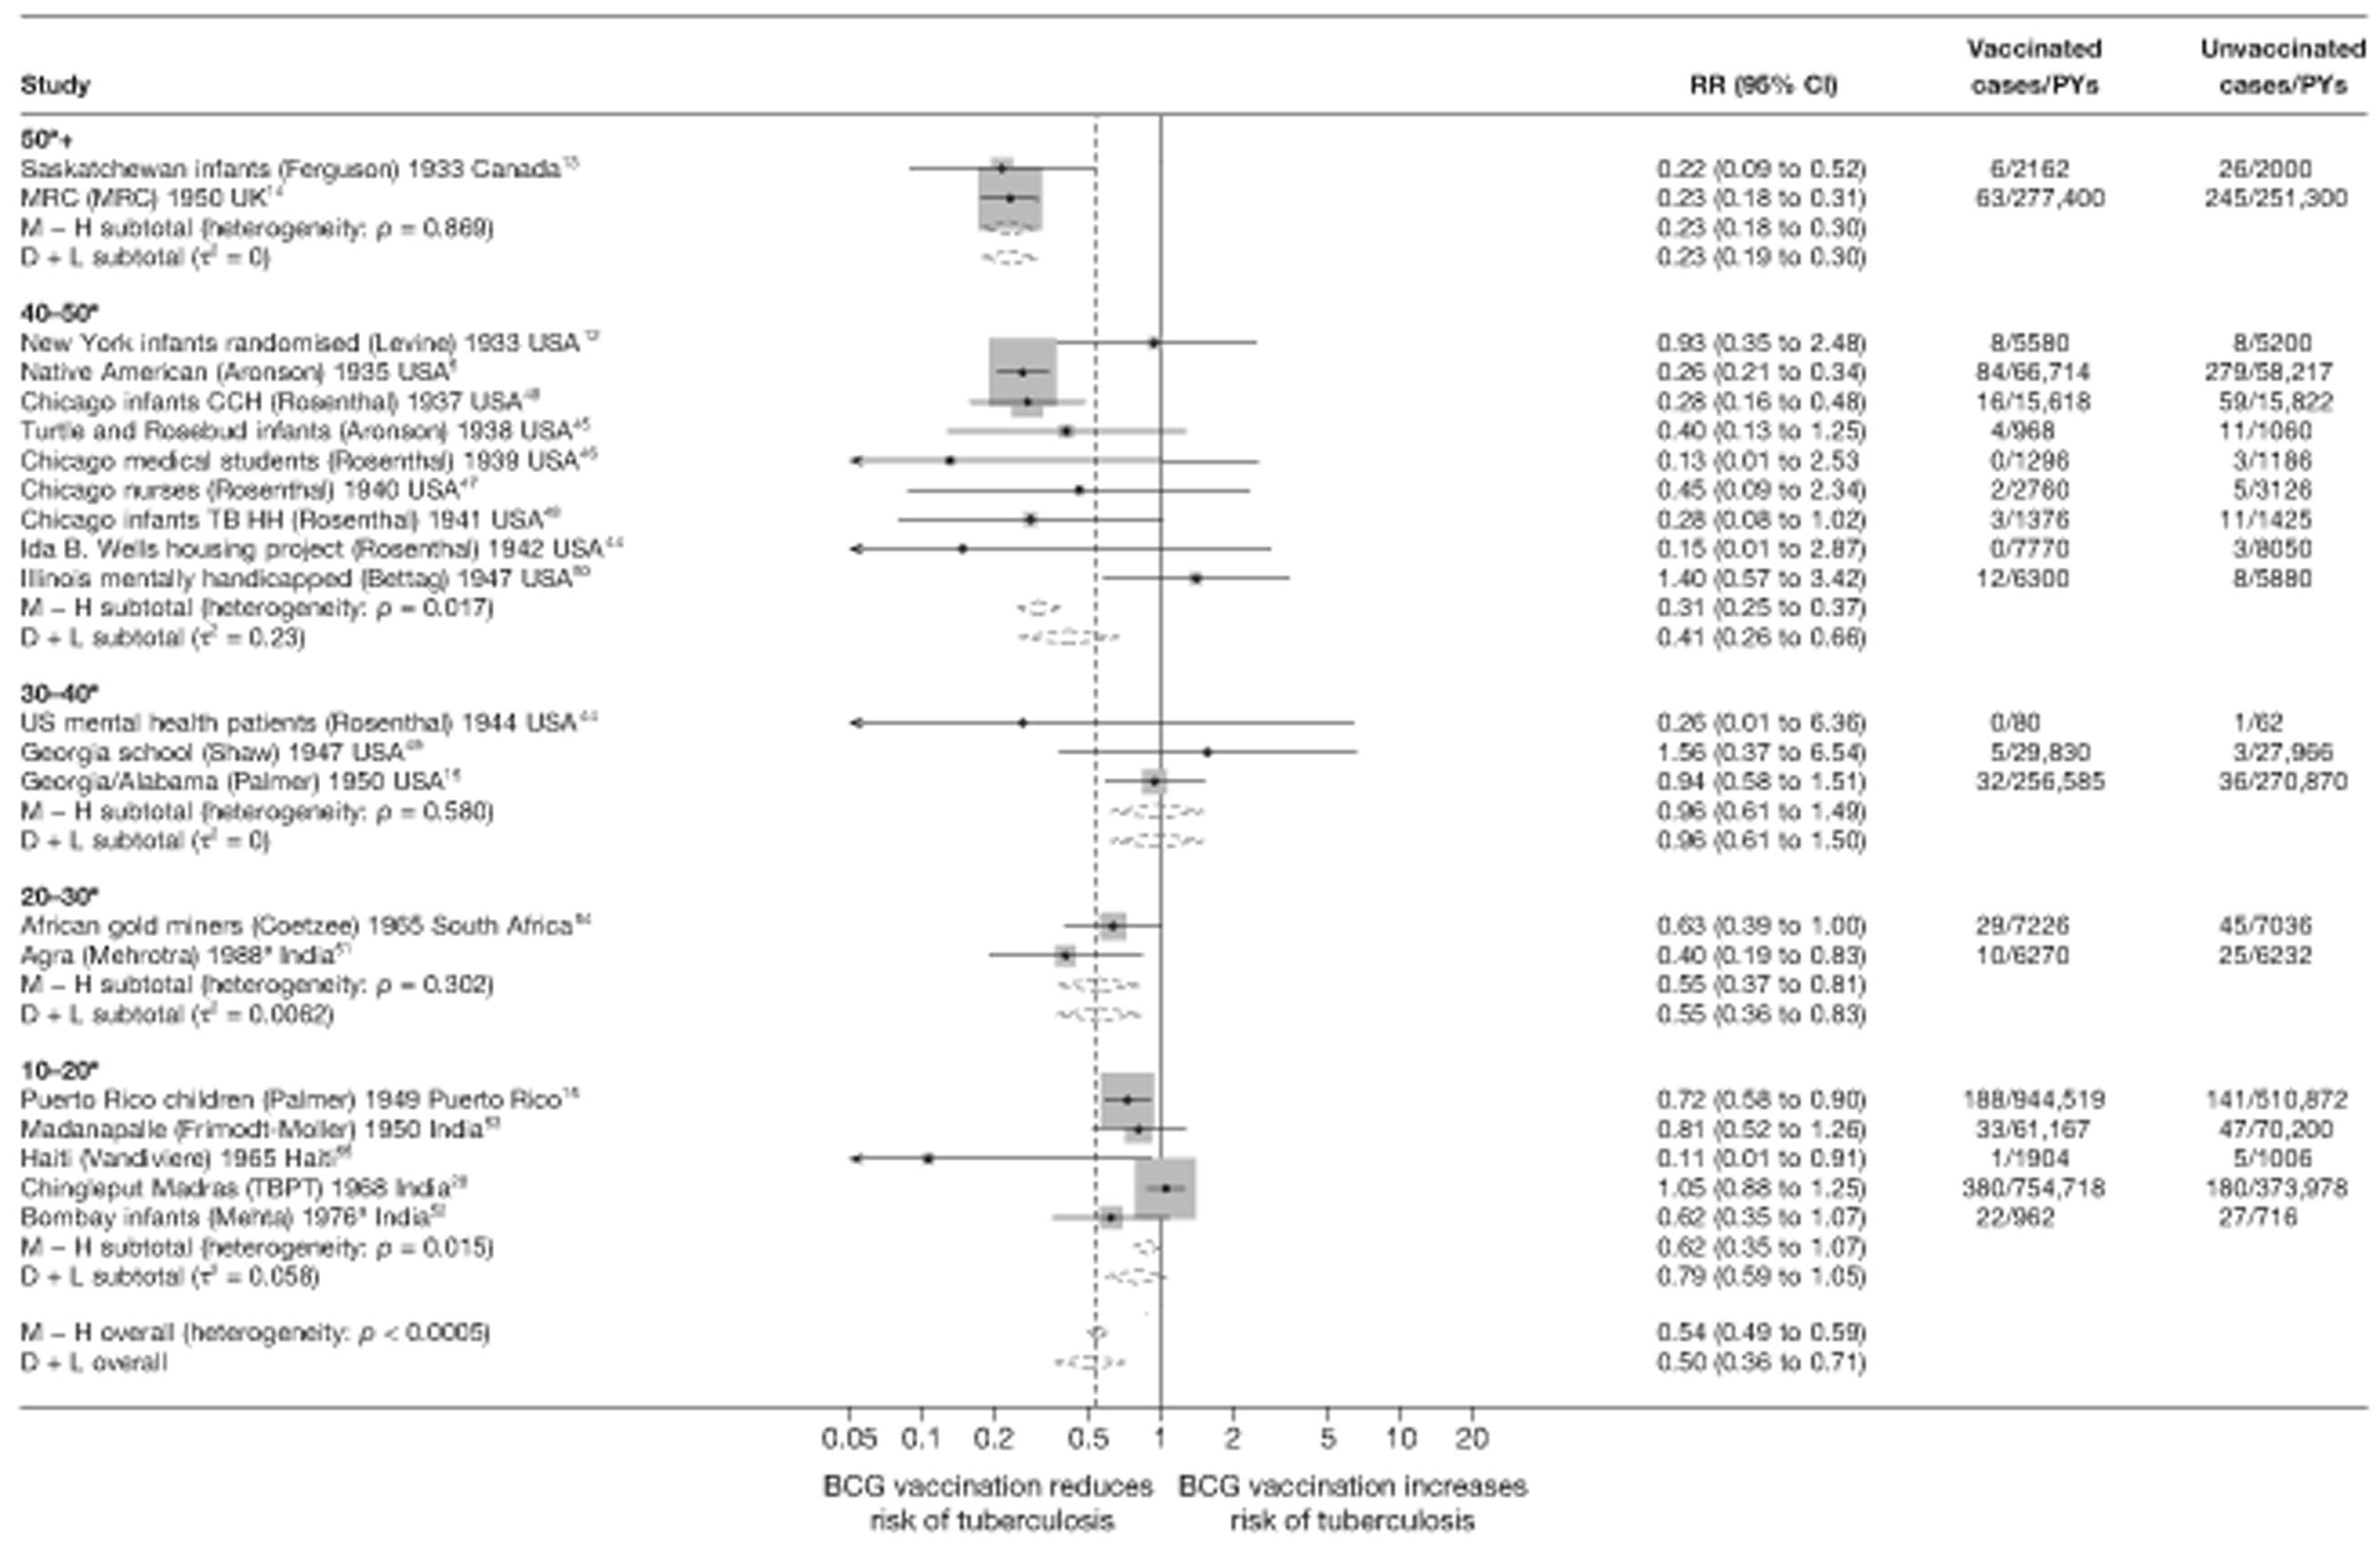
FIGURE 9.
Rate ratios (with 95% CI) comparing the incidence of all tuberculosis morbidity outcomes among BCG vaccinated individuals with that in unvaccinated individuals for the longest duration of follow-up (see Table 3), in RCTs, stratified by age at vaccination, ordered by year of study start. a, Date of study publication was used if the study start date was not available. CCH, Cook County Hospital; D + L, DerSimonian and Laird method; M-H, Mantel-Haenszel method; TB HH, tuberculosis households; TBPT, Tuberculosis Prevention Trial.

FIGURE 10.
Rate ratios (with 95% CI) comparing the incidence of all tuberculosis morbidity outcomes among BCG vaccinated individuals with that in unvaccinated individuals for the longest duration of follow-up (see Table 3), in RCTs, stratified by risk of diagnostic detection bias,b ordered by year of study start. a, Date of study publication was used if study start date was not available; b, Diagnostic detection bias is said to occur if the assessor of BCG vaccination outcome is not blinded to vaccination status. CCH, Cook County Hospital; D + L, DerSimonian and Laird method; M-H, Mantel-Haenszel method; TB HH, tuberculosis Households; TBPT, Tuberculosis Prevention Trial.
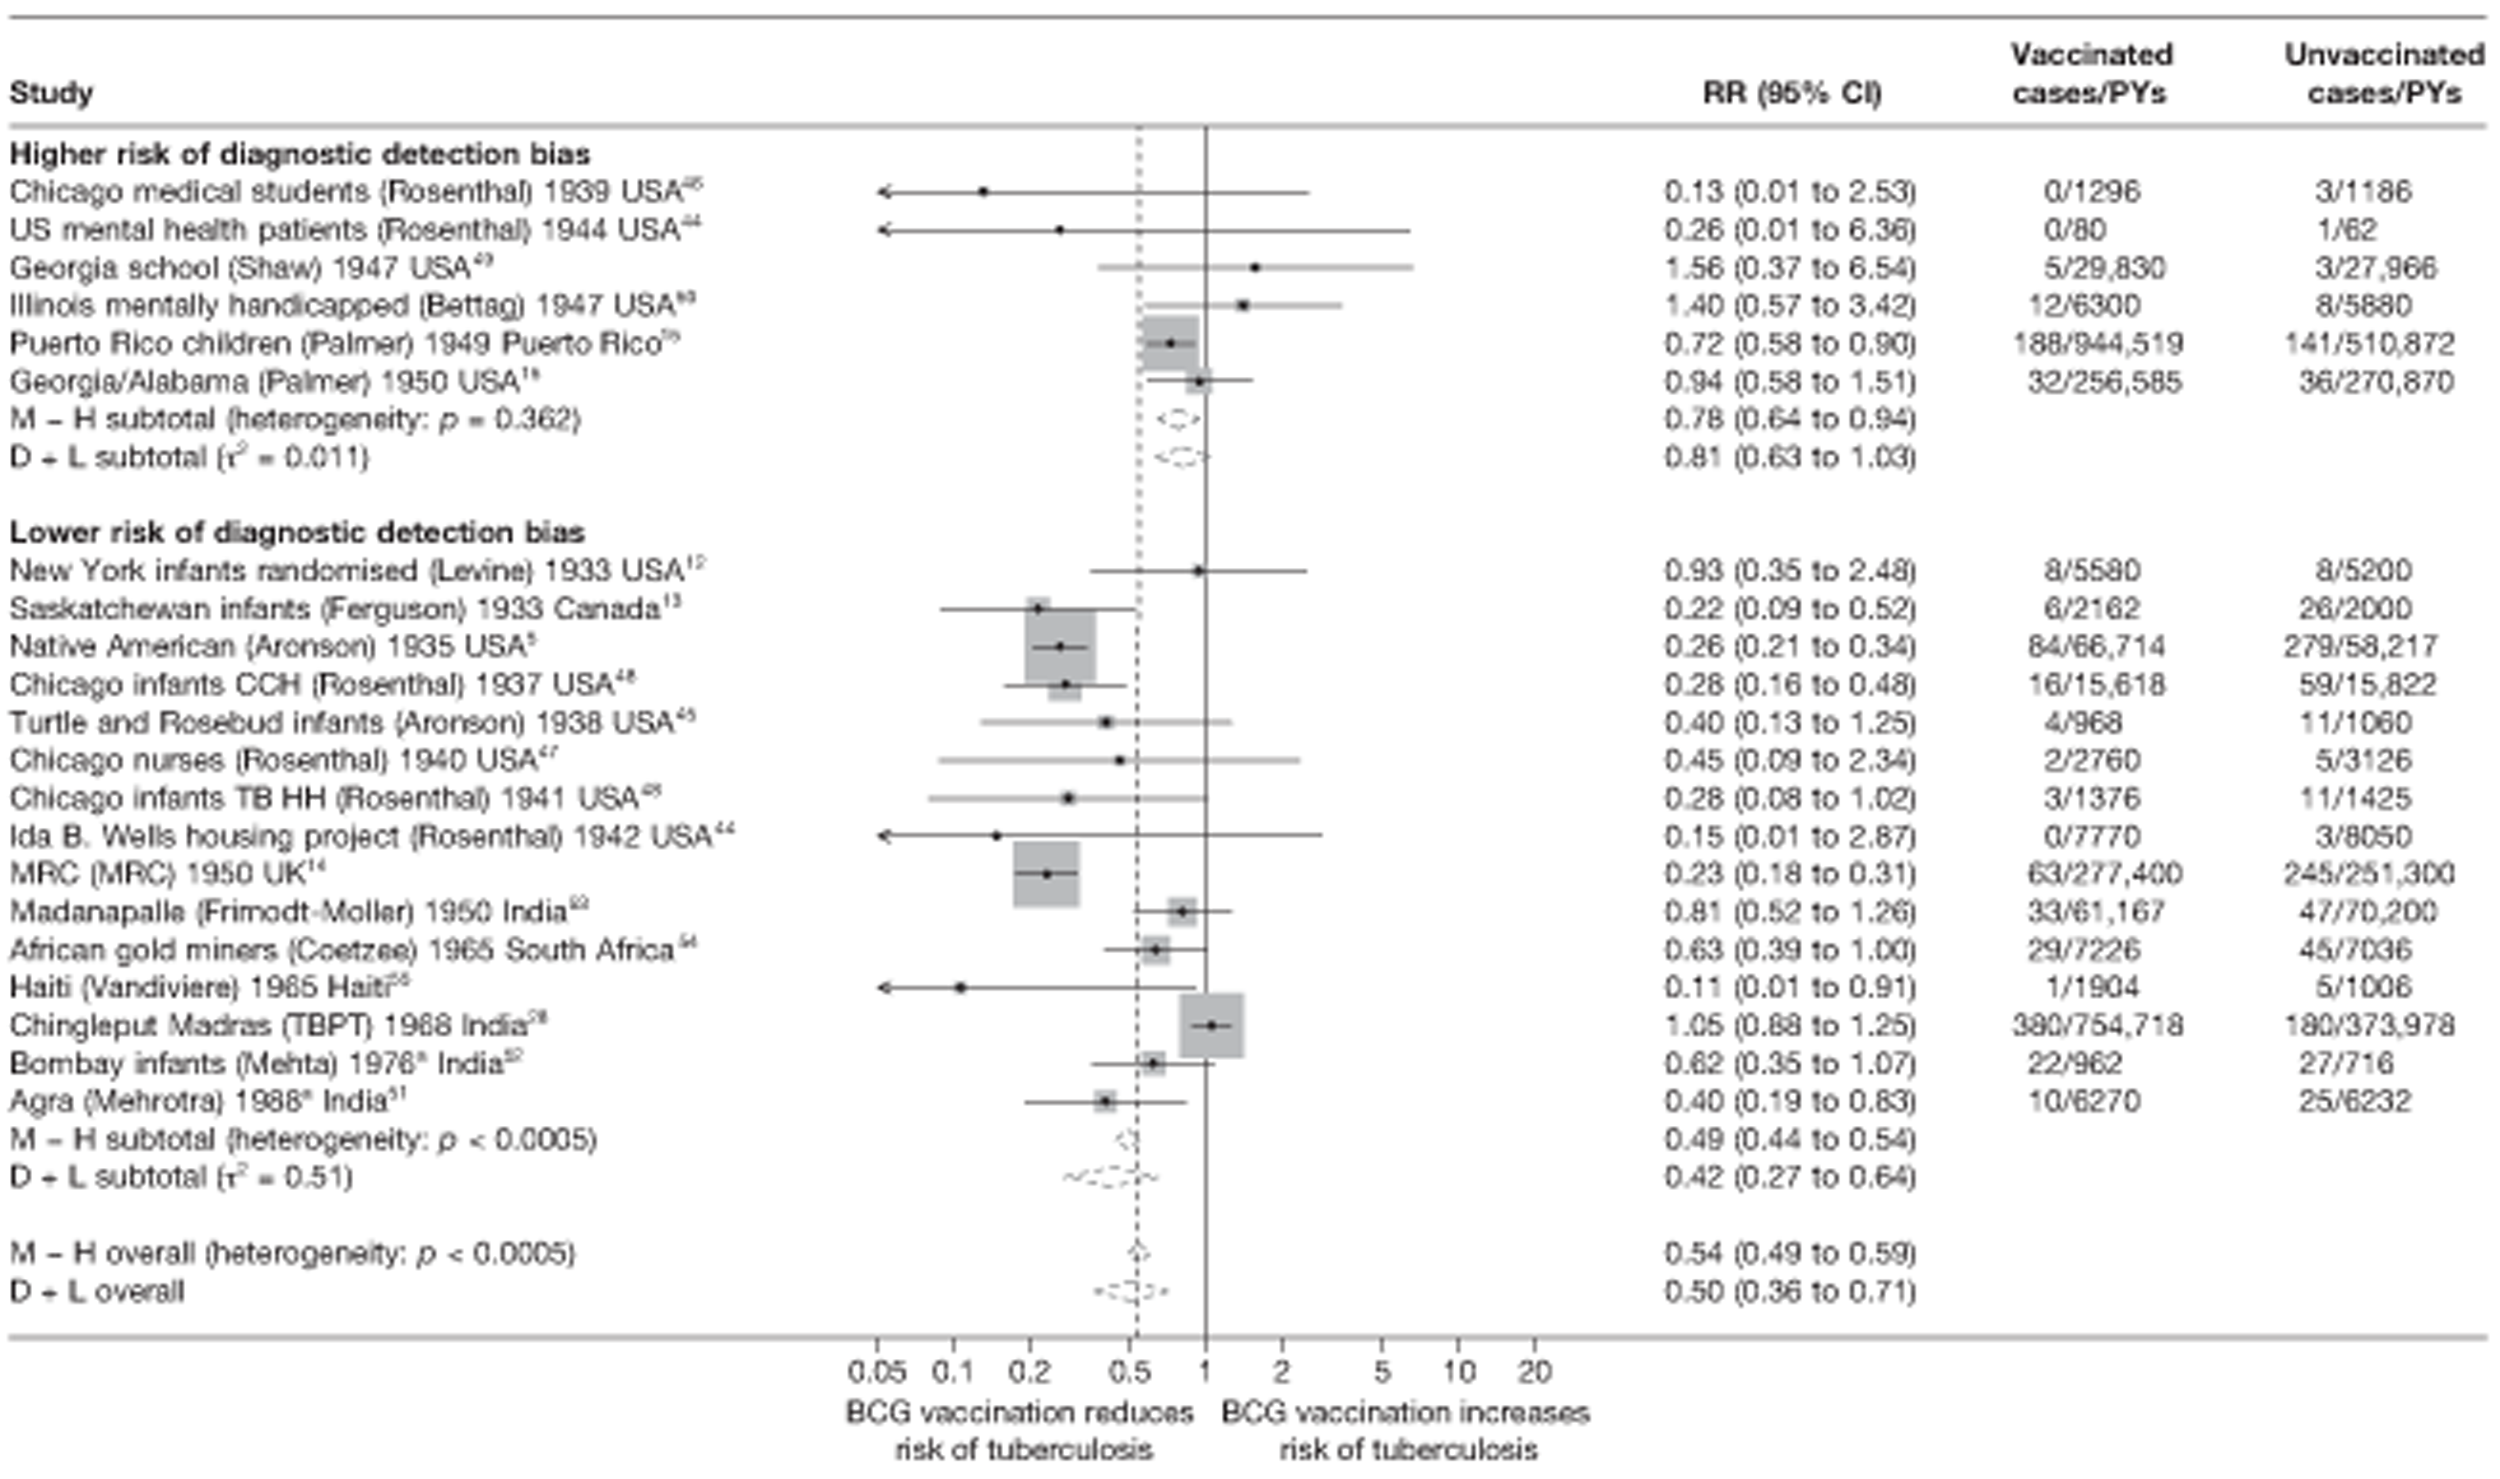
FIGURE 11.
Rate ratios (with 95% CI) comparing the incidence of all tuberculosis morbidity outcomes among BCG vaccinated individuals with that in unvaccinated individuals for the longest duration of follow-up (see Table 3), in RCTs, stratified by BCG strain lineage, ordered by year of study start. a, As per Brosch et al. 41b, Date of study publication was used if study start date was not available. The efficacy data for two trials (Native American5 and Chingleput28), were provided for two different strains of BCG, accounting for two extra sets of results in this graph). CCH, Cook County Hospital; D + L, DerSimonian and Laird method; DU2-IIIa, third form of tandem duplication 2; DU2-IVa, fourth form of tandem duplication 2; M-H, Mantel-Haenszel method; TB HH, tuberculosis households; TBPT, Tuberculosis Prevention Trial.
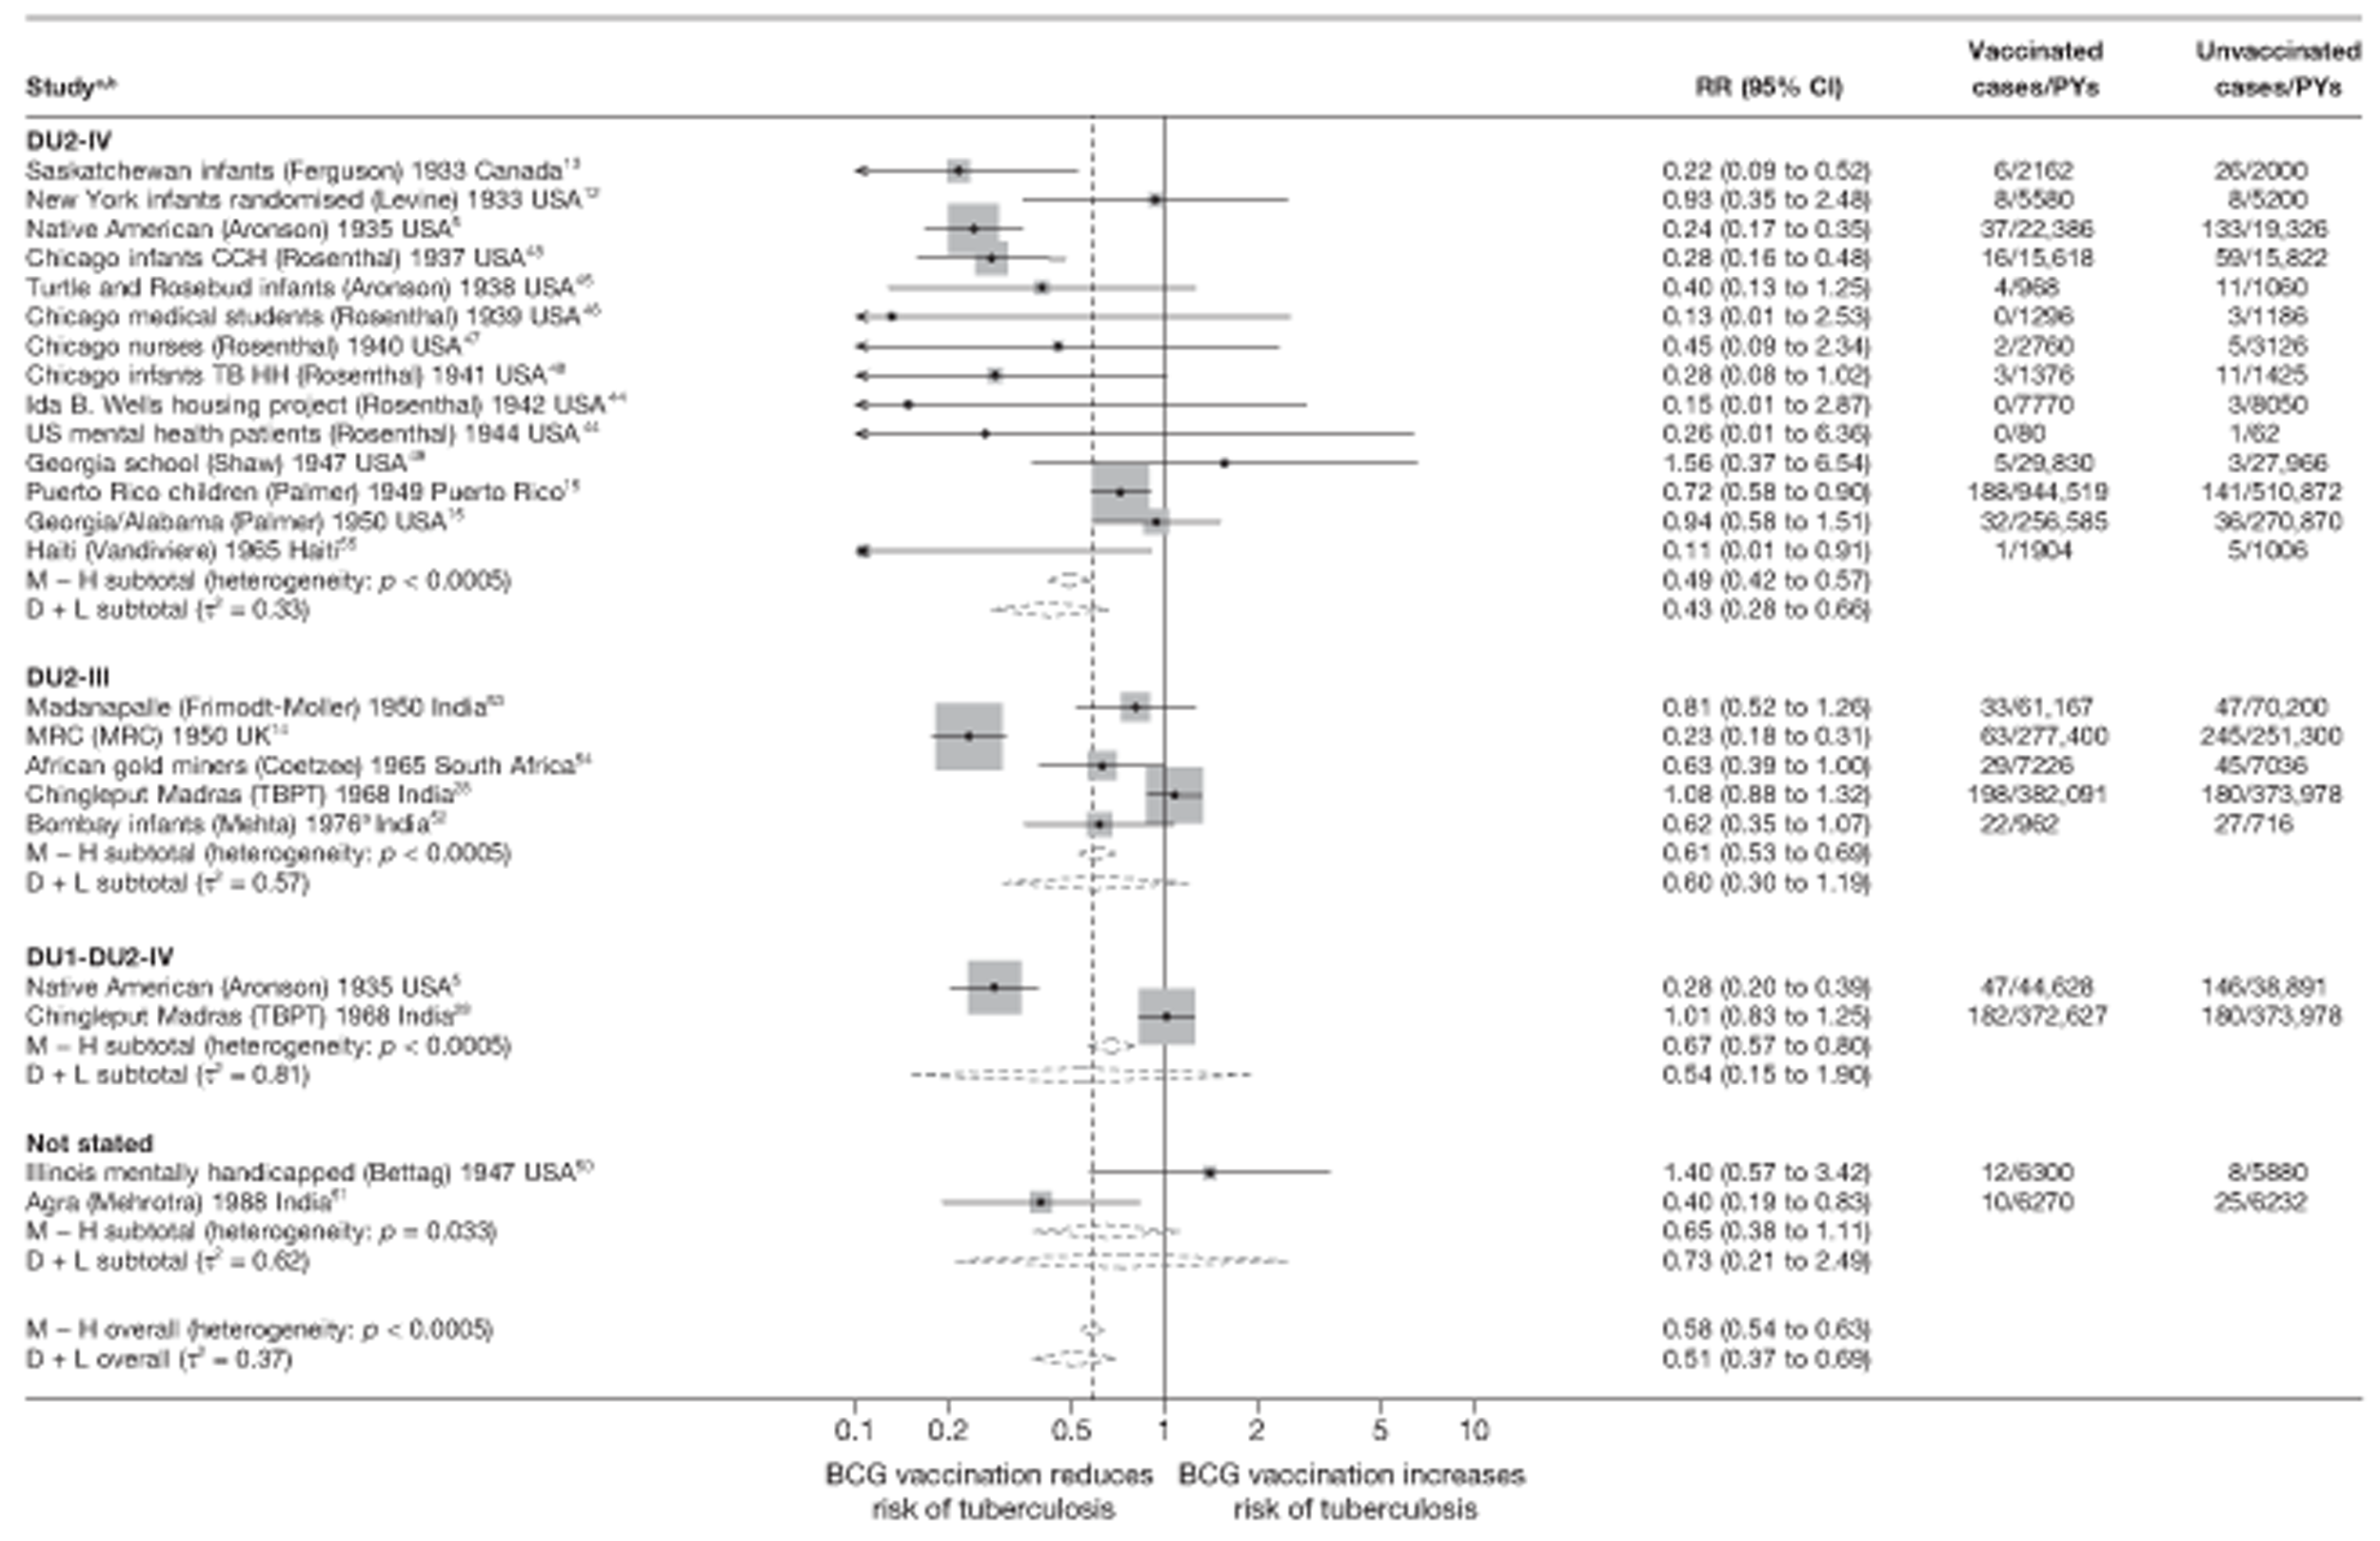
Stratified analysis by latitude (10°), ordered by year study started
Figure 8 presents the overall efficacy of BCG vaccination reported in each controlled trial categorised into 10° bands of latitude. Overall, studies conducted > 40° latitude showed consistent evidence of a higher level of effect of BCG vaccination against all tuberculosis morbidity outcomes in comparison with studies conducted at lower latitudes. The highest level of protection was seen among studies conducted > 50°, with an overall rate ratio of 0.23 (95% CI 0.18 to 0.30) corresponding to a good VE of 77% (95% CI 70% to 82%). Latitude accounted for a substantial amount of the heterogeneity between studies.
Meta-regression analysis
Stratification only on latitude within which a study was conducted appeared to explain 38% of the variation in BCG vaccination protective effect estimates (τ2 = 0.118 after stratification by 20° bands of latitude (null model τ2 = 0.292) (Table 8). There was some evidence (p-value = 0.014) that efficacy varied with latitude. Studies in the 0–20° latitude groups had an overall estimated rate ratio 2.21 (95% CI 1.28 to 3.81) times that of studies conducted above 40° latitude. Similarly, the rate ratio for studies conducted in the 20–40° latitude group was 2.05 (95% CI 1.09 to 3.87) times the overall rate ratio for studies > 40° latitude.
| Variable | Number of trials | Univariable rate ratios (95% CI) | Univariable model | Two-variable model | Multivariable model (τ2 = 0.037) | |||||
|---|---|---|---|---|---|---|---|---|---|---|
| Ratio of rate ratios (95% CI) | p-value | τ2 | Ratio of rate ratiosa (95% CI) | p-value | τ2 | Ratio of rate ratiosb (95% CI) | p-value | |||
| Null model | 21 | 0.292 | 0.292 | 0.002c | ||||||
| Latitude | ||||||||||
| > 40° | 5 | 0.34 (0.24 to 0.49) | 1.00 (ref.) | 1.00 (ref.) | ||||||
| 20–40° | 5 | 0.70 (0.42 to 1.18) | 2.05 (1.09 to 3.87) | Included in all models | 1.38 (0.63 to 3.02) | |||||
| 0–20° | 11 | 0.76 (0.50 to 1.14) | 2.21 (1.28 to 3.81) | 0.014 | 0.118 | 1.80 (0.94 to 3.46) | 0.143d | |||
| Age at vaccination/tuberculin testing stringency, combined | ||||||||||
| Neonatal | 6 | 0.40 (0.25 to 0.64) | 1.00 (ref.) | 1.00 (ref.) | 1.00 (ref.) | |||||
| School age/stringent | 4 | 0.28 (0.18 to 0.46) | 0.71 (0.36 to 1.39) | 0.80 (0.39 to 1.64) | 0.77 (0.44 to 1.34) | |||||
| School age/non-stringent | 2 | 0.60 (0.34 to 1.08) | 1.52 (0.73 to 3.18) | 1.02 (0.39 to 2.69) | 0.71 (0.30 to 1.68) | |||||
| Other age/stringent | 5 | 0.88 (0.47 to 1.69) | 2.23 (1.01 to 4.92) | 1.86 (0.79 to 4.36) | 1.53 (0.74 to 3.16) | |||||
| Other age/non-stringent | 4 | 0.83 (0.53 to 1.28) | 2.08 (1.10 to 3.93) | 0.015 | 0.080 | 1.41 (0.56 to 3.56) | 0.354d | 0.100 | 1.41 (0.68 to 2.93) | 0.083d |
| Diagnostic detection bias | ||||||||||
| Lower risk of bias | 15 | 0.44 (0.31 to 0.61) | 1.00 (ref.) | 1.00 (ref.) | 1.00 (ref.) | |||||
| Higher risk of bias | 6 | 0.98 (0.52 to 1.84) | 2.25 (1.10 to 4.60) | 0.028 | 0.233 | 1.76 (0.95 to 3.28) | 0.071d | 0.132 | 1.77 (1.04 to 3.03) | 0.036d |
| Was the allocation sequence adequately generated? | ||||||||||
| Lower risk of bias | 1 | 1.05 (0.35 to 3.14) | 1.00 (ref.) | 1.00 (ref.) | ||||||
| Higher risk of bias | 20 | 0.48 (0.34 to 0.68) | 0.47 (0.15 to 1.48) | 0.184 | 0.265 | 0.63 (0.25 to 1.57) | 0.300d | 0.125 | ||
| Was treatment allocation adequately concealed? | ||||||||||
| Lower risk of bias | 3 | 0.55 (0.22 to 1.39) | 1.00 (ref.) | 1.00 (ref.) | ||||||
| Higher risk of bias | 18 | 0.52 (0.36 to 0.74) | 0.94(0.35 to 2.53) | 0.898 | 0.311 | 0.94 (0.42 to 2.12) | 0.876d | 0.142 | ||
| Was knowledge of the allocated intervention prevented during the study? | ||||||||||
| Lower risk of bias | 3 | 0.45 (0.20 to 1.02) | 1.00 (ref.) | 1.00 (ref.) | ||||||
| Higher risk of bias | 18 | 0.54 (0.37 to 0.79) | 1.20 (0.49 to 2.94) | 0.676 | 0.324 | 1.13 (0.55 to 2.28) | 0.728d | 0.166 | ||
| Are reports of the study free from the suggestion of selective outcome reporting? | ||||||||||
| Lower risk of bias | 20 | 0.51 (0.36 to 0.72) | 1.00 (ref.) | 1.00 (ref.) | ||||||
| Higher risk of bias | 1 | 0.81 (0.23 to 2.82) | 1.59 (0.44 to 5.81) | 0.463 | 0.304 | 1.11 (0.37 to 3.29) | 0.843d | 0.156 | ||
| Was ascertainment of cases complete? | ||||||||||
| Lower risk of bias | 17 | 0.51 (0.36 to 0.74) | 1.00 (ref.) | 1.00 (ref.) | ||||||
| Higher risk of bias | 4 | 0.59 (0.23 to 1.52) | 1.14 (0.42 to 3.14) | 0.785 | 0.315 | 0.78 (0.35 to 1.75) | 0.533d | 0.138 | ||
Stratified analysis by age at vaccination and tuberculin testing stringency, ordered by year study started
Stratification of studies by age at vaccination and tuberculin testing stringency (Figure 9) shows that the estimated effect of BCG vaccination on all tuberculosis morbidity outcomes was substantial in studies of neonatal BCG vaccination [overall rate ratio 0.38 (95% CI 0.28 to 0.52)] corresponding to a good protection and VE of 62% (95% CI 48% to 72%). Similarly, studies of vaccination in school-age children with stringent tuberculin testing showed evidence of a good level of protection against all tuberculosis morbidity outcomes [overall rate ratio 0.28 (95% CI 0.19 to 0.40)] equivalent to VE of 72% (95% CI 60% to 81%)]. Studies in which vaccination was performed both at school age without stringent tuberculin testing protocols, and in other age groups regardless of tuberculin testing stringency, showed low overall estimates of BCG vaccination efficacy. Overall levels of protection from studies in these categories were low, ranging from rate ratio 0.60 (95% CI 0.35 to 1.03) to rate ratio 0.82 (95% CI 0.56 to 1.21). Stratification on age at vaccination/tuberculin testing accounted for substantial amount of the heterogeneity in the estimates of effect of BCG vaccination; however, residual heterogeneity within strata remained (τ2 = 0.14 in the neonatal vaccination strata and τ2 = 0.1 in school-age vaccination non-stringent tuberculin testing).
Meta-regression analysis
Based on univariable meta-regression analyses, age at vaccination/tuberculin testing stringency appeared to account for 73% of the between-study variation (τ2 after stratification = 0.080; null model τ2 = 0.292) (see Table 8). There was evidence that the effect of BCG vaccination varied with age at vaccination and tuberculin testing stringency (p-value 0.015). The rate ratio in studies of school-age vaccination with stringent tuberculin testing was 0.71 (95% 0.36 to 1.39) times that of the rate ratio for neonatal vaccination (and therefore VE correspondingly higher), whereas for vaccination in other age groups with stringent tuberculin testing the rate ratio was 2.23 (95% CI 1.01 to 4.92) times the overall rate ratio of that for neonatal vaccination studies (and VE correspondingly lower).
Stratified analysis by risk of diagnostic detection bias, ordered by year study started
Figure 10 shows estimated effects of the BCG vaccination on all tuberculosis morbidity outcomes, stratified by risk of diagnostic detection bias. Overall, the protective effect of BCG vaccination was lower in studies with a higher risk of bias, while there was reasonably consistent evidence of higher protection observed in studies with a ‘lower risk of bias’ (i.e. the assessors of the study outcome, usually the diagnosis of tuberculosis, were blinded to BCG vaccination status or active surveillance was conducted). There was considerable residual heterogeneity between studies within the same strata, despite stratification by risk of diagnostic detection bias. This risk of bias criteria did not explain any of the observed between-study variability.
Meta-regression analysis
Univariable meta-regression analyses appeared to suggest that very little of the between-study variance was explained by stratifying on this quality assessment criteria (τ2 values before and after stratification were respectively 0.292 and 0.233) (see Table 8). There was weak evidence that BCG vaccination efficacy varied with risk of diagnostic detection bias (p-value = 0.028). Studies with a higher risk of diagnostic detection bias had an overall rate ratio 2.25 (95% CI 1.10 to 4.60) times that of studies with a lower risk of diagnostic detection bias.
Stratified analysis by bacillus Calmette–Guérin strain as per Brosch et al.,41 ordered by year study started
Randomised controlled trials reporting the protective effect of BCG vaccination against all tuberculosis morbidity outcomes were also stratified according to the lineage of BCG strain used for vaccination of participants based on the criteria derived from Brosch et al. 41 (Figure 11). This stratification showed that the effect of BCG vaccination in studies in each stratum varied considerably from a clinically unimportant effect to some trials showing substantial protection. The pooled effect size was similar for studies using all strain families [Pasteur, which contains tandem duplication 1 (DU1) and tandem duplication 2 (DU2-I), and strains containing DU2- II, DU2-III and DU2-IV]. Stratification did not explain the between-study variation in BCG vaccination effect.
Meta-regression analysis
Based on meta-regression analyses, BCG strain type did not account for the heterogeneity seen within the studies: τ2 values before and after stratification on strain = 0.303 and 0.337, respectively. There was little evidence that BCG vaccination efficacy varied by strain (p-value = 0.614) (Table 7).
| Variable | Number of results | Univariable rate ratios (95% CI) | Univariable model | ||
|---|---|---|---|---|---|
| Ratio of rate ratios (95% CI) | p-value | τ2 | |||
| Null model | 23 | 0.322 | |||
| BCG strain categorya,b | |||||
| DU2-IV | 14 | 0.45 (0.27 to 0.74) | 1.00 (ref.) | ||
| DU2-III | 5 | 0.60 (0.32 to 1.10) | 1.33 (0.61 to 2.91) | ||
| DU1-DU2-IV | 2 | 0.52 (0.20 to 1.31) | 1.15 (0.40 to 3.29) | ||
| Not stated | 2 | 0.72 (0.24 to 2.74) | 1.59 (0.48 to 5.33) | 0.807 | 0.382 |
Scatterplot of vaccine efficacy by bacillus Calmette–Guérin strain type over time since trial started
Figure 12 shows VE for each trial plotted by vaccine strain and year the trial was started. We hypothesised that as the strains evolved over time, at least over the first few decades, the distribution of effect sizes would change over time. Not only was there no noticeable pattern over time, but also results showing trials according to strains used are distributed over a wide range of effect sizes.
FIGURE 12.
Scatterplot of study estimate of BCG vaccine efficacy over time of study start, by BCG strain category. DU2-III, third form of tandem duplication 2; DU2-IV, fourth form of tandem duplication 2; DU1-DU2-IV, tandem duplication 1 and fourth form of tandem duplication 2, according to Brosch et al. 41
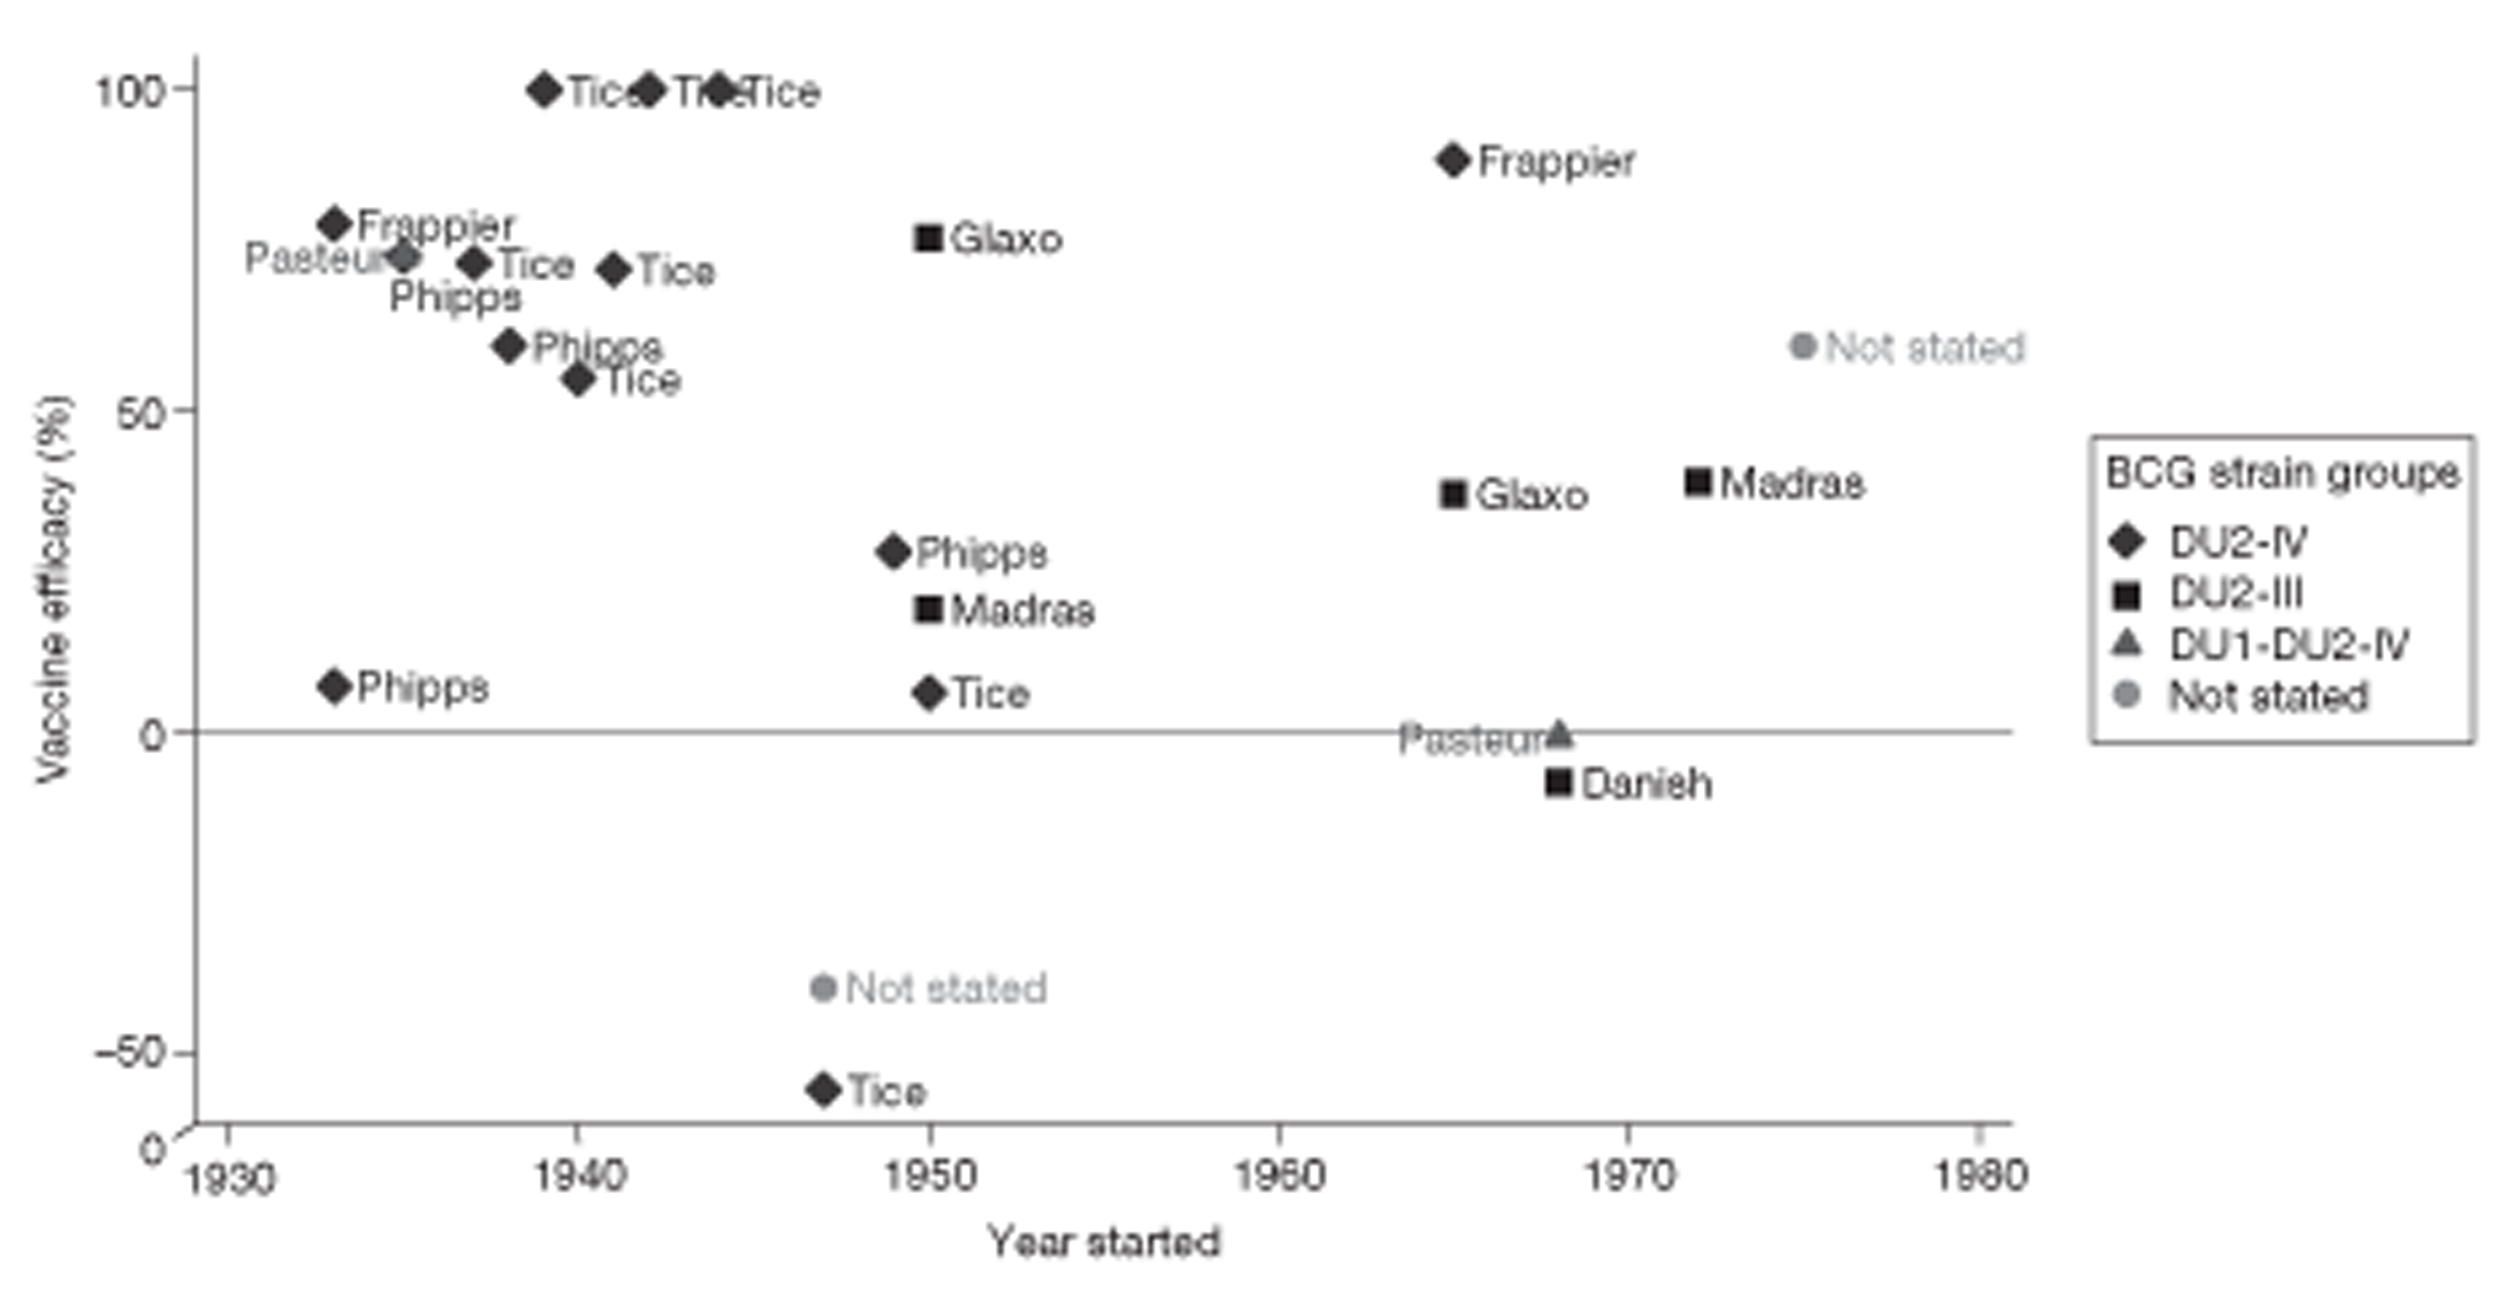
Analysis by bacillus Calmette–Guérin strain
Results from univariable meta-regressions indicate that latitude, age at vaccination/tuberculin testing stringency and risk of diagnostic detection bias explained the largest amount of between-study variation in overall BCG vaccination efficacy with τ2 values of 0.118, 0.080 and 0.233, respectively (baseline τ2 = 0.292). Bivariable analysis showed that models including latitude and the variables age at vaccination/tuberculin testing stringency explained the most between-study heterogeneity, reducing the τ2 from 0.292 (null model) to 0.100. Results from the multivariable regression model including the variables latitude, age at vaccination/tuberculin testing stringency and risk of diagnostic detection bias explained more of the between-study variation observed, decreasing τ2 from 0.292 to 0.037. There was strong evidence (p-value = 0.002), that these variables are associated with increased BCG vaccination efficacy.
Combined meningeal and/or miliary tuberculosis
The following section reports results of RCTs assessing the efficacy of BCG vaccination against meningeal and/or miliary tuberculosis outcomes.
Unstratified analysis ordered by year trial started
The rate ratios and 95% CIs from the six trials assessing the efficacy of BCG vaccination on meningeal and/or miliary tuberculosis are shown in Figure 13. Most studies had very few events in the BCG group. Although there is evidence of variation, all point estimates apart from those of the Puerto Rico and Georgia/Alabama trials15 were consistent with a high protective effect against these severe forms of tuberculosis disease. Two trials (Native American5 and MRC14) provided stronger evidence of a protective effect of BCG vaccination against meningeal and/or miliary tuberculosis.
FIGURE 13.
Rate ratios (with 95% CI) comparing the incidence of meningeal and/or miliary tuberculosis among BCG vaccinated individuals with that in unvaccinated individuals for the longest duration of follow-up (see Table 3) in RCTs, ordered by year of study start. a, The outcome is miliary tuberculosis only. TB HH, tuberculosis households.

Stratified analysis by latitude (10°) group, ordered by year study started
Figure 14 shows the results of trials evaluating the effect of BCG vaccination on meningeal and/or miliary tuberculosis stratified according to 10° latitude groups. With the exception of two trials conducted between 10° and 40° in Puerto Rico15 and Georgia/Alabama,15 all other studies (conducted at higher latitudes) showed evidence of a high and consistent protective effect against meningeal and/or miliary tuberculosis. Studies conducted between 40° and 50° and > 50° latitude had a combined high VE of 90% (95% CI 71% to 97%) and 94% (95% CI 55% to 99%), respectively. Latitude appeared here to explain a substantial amount of the between-study variation in the effect of BCG vaccination, although the results should be interpreted with caution in view of the small number of studies contributing to this analysis.
FIGURE 14.
Rate ratios (with 95% CI) comparing the incidence of meningeal and/or miliary tuberculosis among BCG vaccinated individuals with that in unvaccinated individuals for the longest duration of follow-up (see Table 3) in RCTs, stratified by latitude of study location (10° bands), ordered by year of study start. a, The outcome is miliary tuberculosis only. D + L, DerSimonian and Laird method; M-H, Mantel-Haenszel method; TB HH, tuberculosis households.
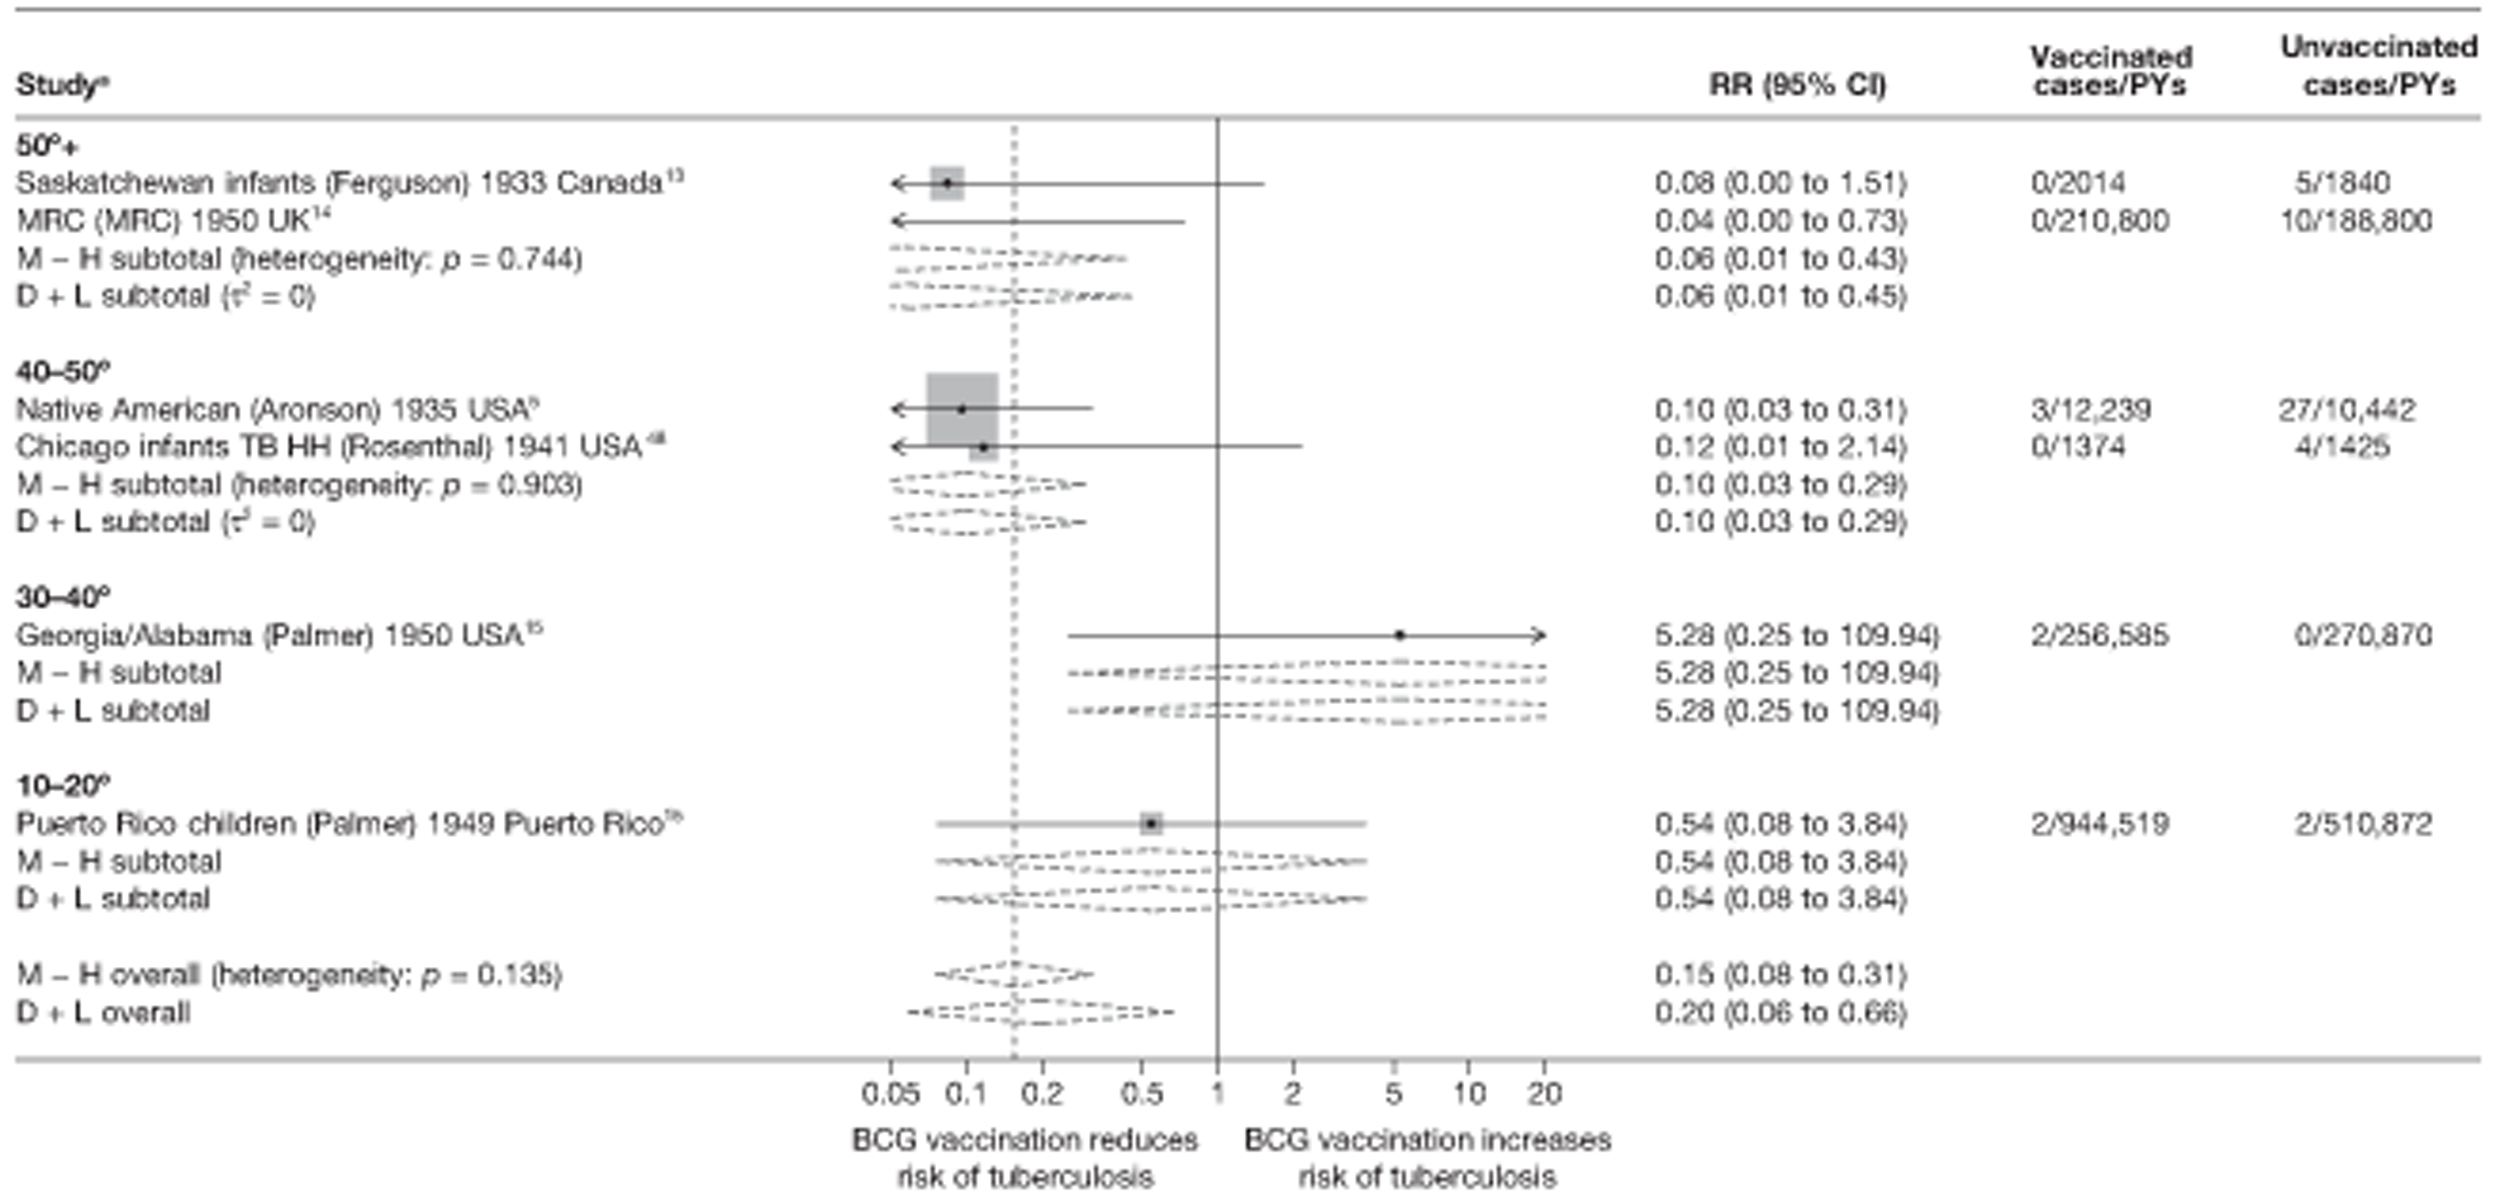
Meta-regression analysis
Stratification on latitude appeared to explain the between-study heterogeneity (τ2 values before and after stratification were 0.767 and 0.000, respectively); however, there were limited data to support the hypothesis that BCG vaccination efficacy varies according to latitude (p-value = 0.141); similarly, studies conducted between 20° and 40° latitude had a RR 60.58 (95% CI 0.34 to 10715.67) times than studies located at latitudes above 40° latitude, but the CIs were wide (Table 9).
| Variable | Number of trials | Univariable rate ratios (95% CI) | Univariable model | ||
|---|---|---|---|---|---|
| Ratio of rate ratios (95% CI) | p-value | τ2 | |||
| Null model | 6 | 0.767 | |||
| Latitude | |||||
| > 40° | 4 | 0.09 (0.01 to 0.73) | 1.00 (ref.) | ||
| 20–40° | 1 | 5.28 (0.01 to 4143) | 60.58 (0.34 to 10,715) | ||
| 0–20° | 1 | 0.54 (0.01 to 39.97) | 6.21 (0.18 to 216.23) | 0.141 | 0.000 |
| Age at vaccination/tuberculin testing combined | |||||
| Neonatal | 2 | 0.10 (0.00 to 60,173) | 1.00 (ref.) | ||
| School age/stringent | 2 | 0.08 (0.00 to 104.89) | 0.86 (0.01 to 143.64) | ||
| School age/non-stringent | 1 | 0.54 (0.00 to 178,373) | 5.52 (0.01to 2819) | ||
| Other age/stringent | 0 | ||||
| Other age/non-stringent | 1 | 5.28 (0.00 to 1.87 × 10⁹) | 55.88 (0.02 to 168,840) | 0.282 | 0.000 |
| Diagnostic quality | |||||
| Lower risk of bias | 4 | 0.09 (0.02 to 0.42) | 1.00 (ref.) | ||
| Higher risk of bias | 2 | 1.06 (0.07 to 15.32) | 12.13 (0.81 to 181.79) | 0.063 | 0.000 |
| Was the allocation sequence adequately generated? | |||||
| Lower risk of bias | 0 | 1.00 (ref.) | |||
| Higher risk of bias | 6 | 0.767 | |||
| Was treatment allocation adequately concealed? | |||||
| Lower risk of bias | 1 | 0.12 (0.00 to 68.45) | 1.00 (ref.) | ||
| Higher risk of bias | 5 | 0.22 (0.02 to 2.58) | 1.89 (0.01 to 739.96) | 0.783 | 1.268 |
| Was knowledge of the allocated intervention prevented during the study? | |||||
| Lower risk of bias | 1 | 0.10 (0.01 to 5.92) | 1.00 (ref.) | ||
| Higher risk of bias | 5 | 0.27 (0.02 to 3.59) | 2.82 (0.04 to 199.08) | 0.536 | 1.178 |
| Are reports of the study free from the suggestion of selective outcome reporting? | |||||
| Lower risk of bias | 6 | 1.00 (ref.) | |||
| Higher risk of bias | 0 | 0.767 | |||
| Was ascertainment of cases complete? | |||||
| Lower risk of bias | 6 | 1.00 (ref.) | |||
| Higher risk of bias | 0 | 0.767 | |||
Stratified analysis by age at vaccination and tuberculin testing stringency, ordered by year study started
Both school-age vaccination with stringent tuberculin testing and neonatal vaccination showed high BCG vaccination efficacy against meningeal and miliary tuberculosis, with the two neonatal vaccination studies showing a pooled rate ratio of 0.10 (95% CI 0.01 to 0.77) corresponding to a high VE of 90% (95% CI 67% to 99%). The two pooled studies of school-age vaccination with stringent tuberculin testing gave a rate ratio of 0.08 (95% CI 0.03 to 0.25) also corresponding to a high VE of 92% (95% CI 75% to 97%). Only one study assessed BCG vaccination15 at other ages with stringent and non-stringent tuberculin testing, respectively, showing little evidence of protection in the case of vaccination in other/all age groups with non-stringent tuberculin testing (Figure 15). Stratification on age at vaccination and tuberculin testing stringency appeared to explain a substantial amount of the between-study variation.
FIGURE 15.
Rate ratios (with 95% CI) comparing the incidence of meningeal and/or miliary tuberculosis among BCG vaccinated individuals with that in unvaccinated individuals for the longest duration of follow-up (see Table 3) in RCTs, stratified by age at vaccination and tuberculin testing stringency, ordered by year of study start. a, The outcome is miliary tuberculosis only. CCH, Cook County Hospital; D + L, DerSimonian and Laird method; M-H, Mantel-Haenszel method; TB HH, tuberculosis households.
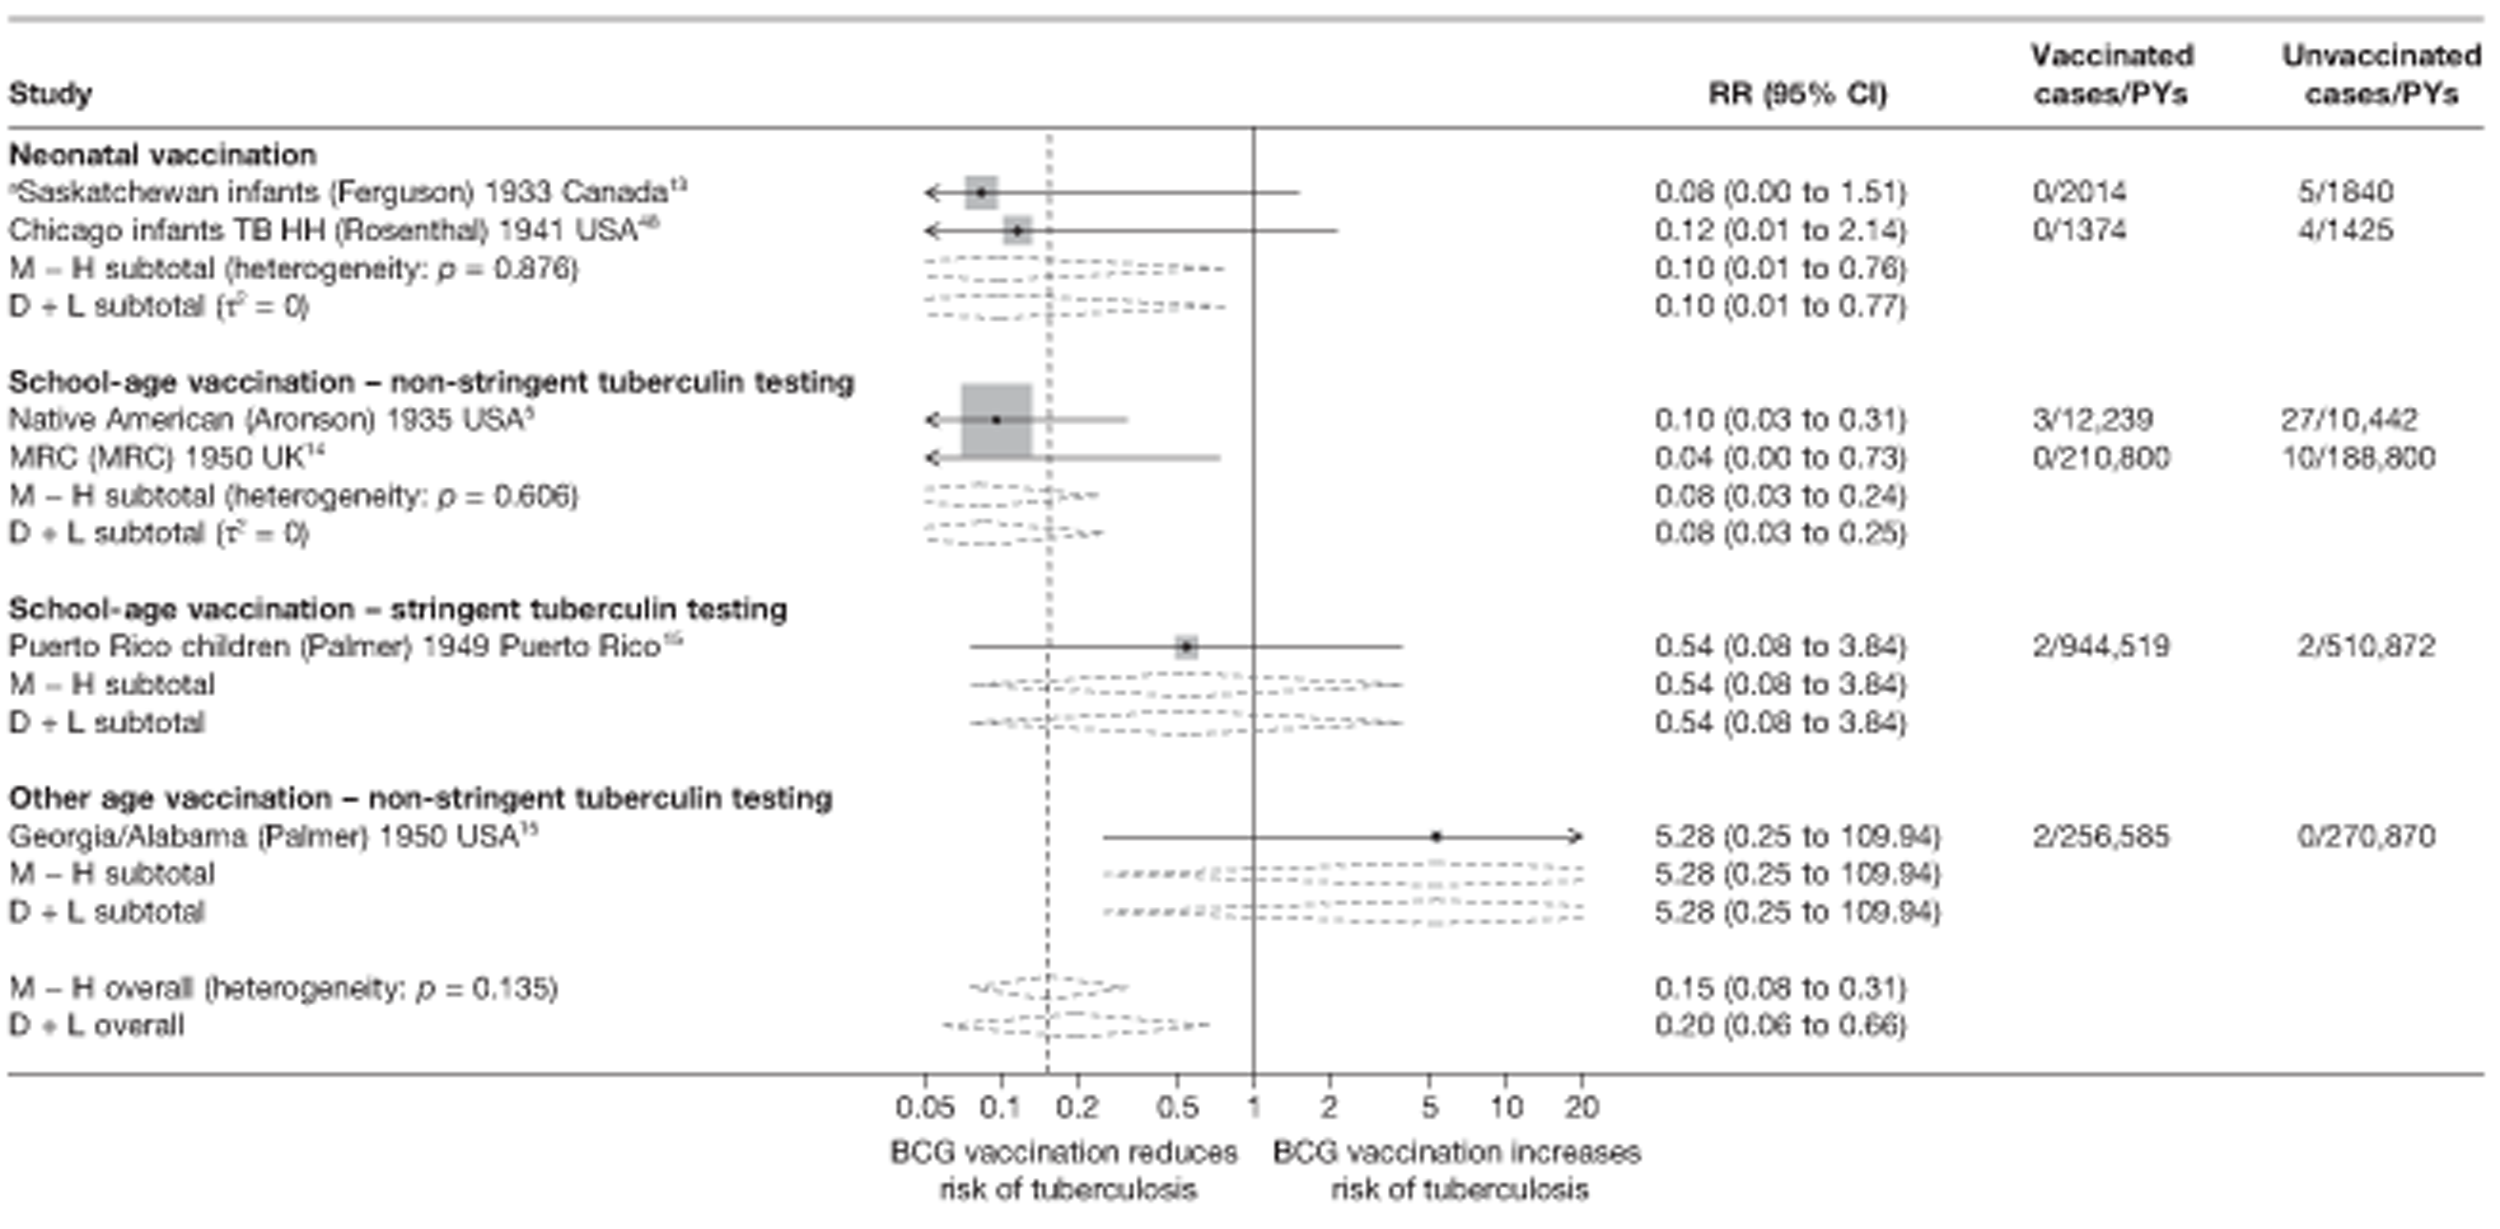
Meta-regression analysis
Based on meta-regression analyses, age at vaccination and stringency of tuberculin testing accounted for a substantial amount of the heterogeneity: τ2 values before and after stratification = 0.767 and 0.000, respectively. However, there was insufficient evidence to test the hypothesis that BCG vaccination efficacy varied by age at vaccination/tuberculin testing stringency (p-value 0.282) (see Table 9).
Stratified analysis by risk of diagnostic detection bias, ordered by year study started
Results from trials were stratified according to risk of diagnostic detection bias (Figure 16). The most consistent protective effect was seen in studies with a lower risk of diagnostic detection bias. The overall rate ratio was 0.09 (95% CI 0.03 to 0.23), consistent with high VE of 91% (95% CI 77% to 97%), with little evidence of within-strata heterogeneity (p-value assuming a fixed-effects model = 0.959), whereas the trials with higher risk of bias showed an overall rate ratio of 1.26 (95% CI 0.14 to 11.27), equivalent to no clinical benefit. Diagnostic detection bias accounted for a substantial amount of the between-study variability.
FIGURE 16.
Rate ratios (with 95% CI) comparing the incidence of meningeal and/or miliary tuberculosis among BCG vaccinated individuals with that in unvaccinated individuals for the longest duration of follow-up (see Table 3) in RCTs, stratified by risk of diagnostic detection bias,b ordered by year of study start. a, Outcome is miliary tuberculosis only; b, Diagnostic detection bias occurs if the assessor of BCG vaccination outcome is not blinded to vaccination status. CCH, Cook County Hospital; D + L, DerSimonian and Laird method; M-H, Mantel-Haenszel method; TB HH, tuberculosis households.
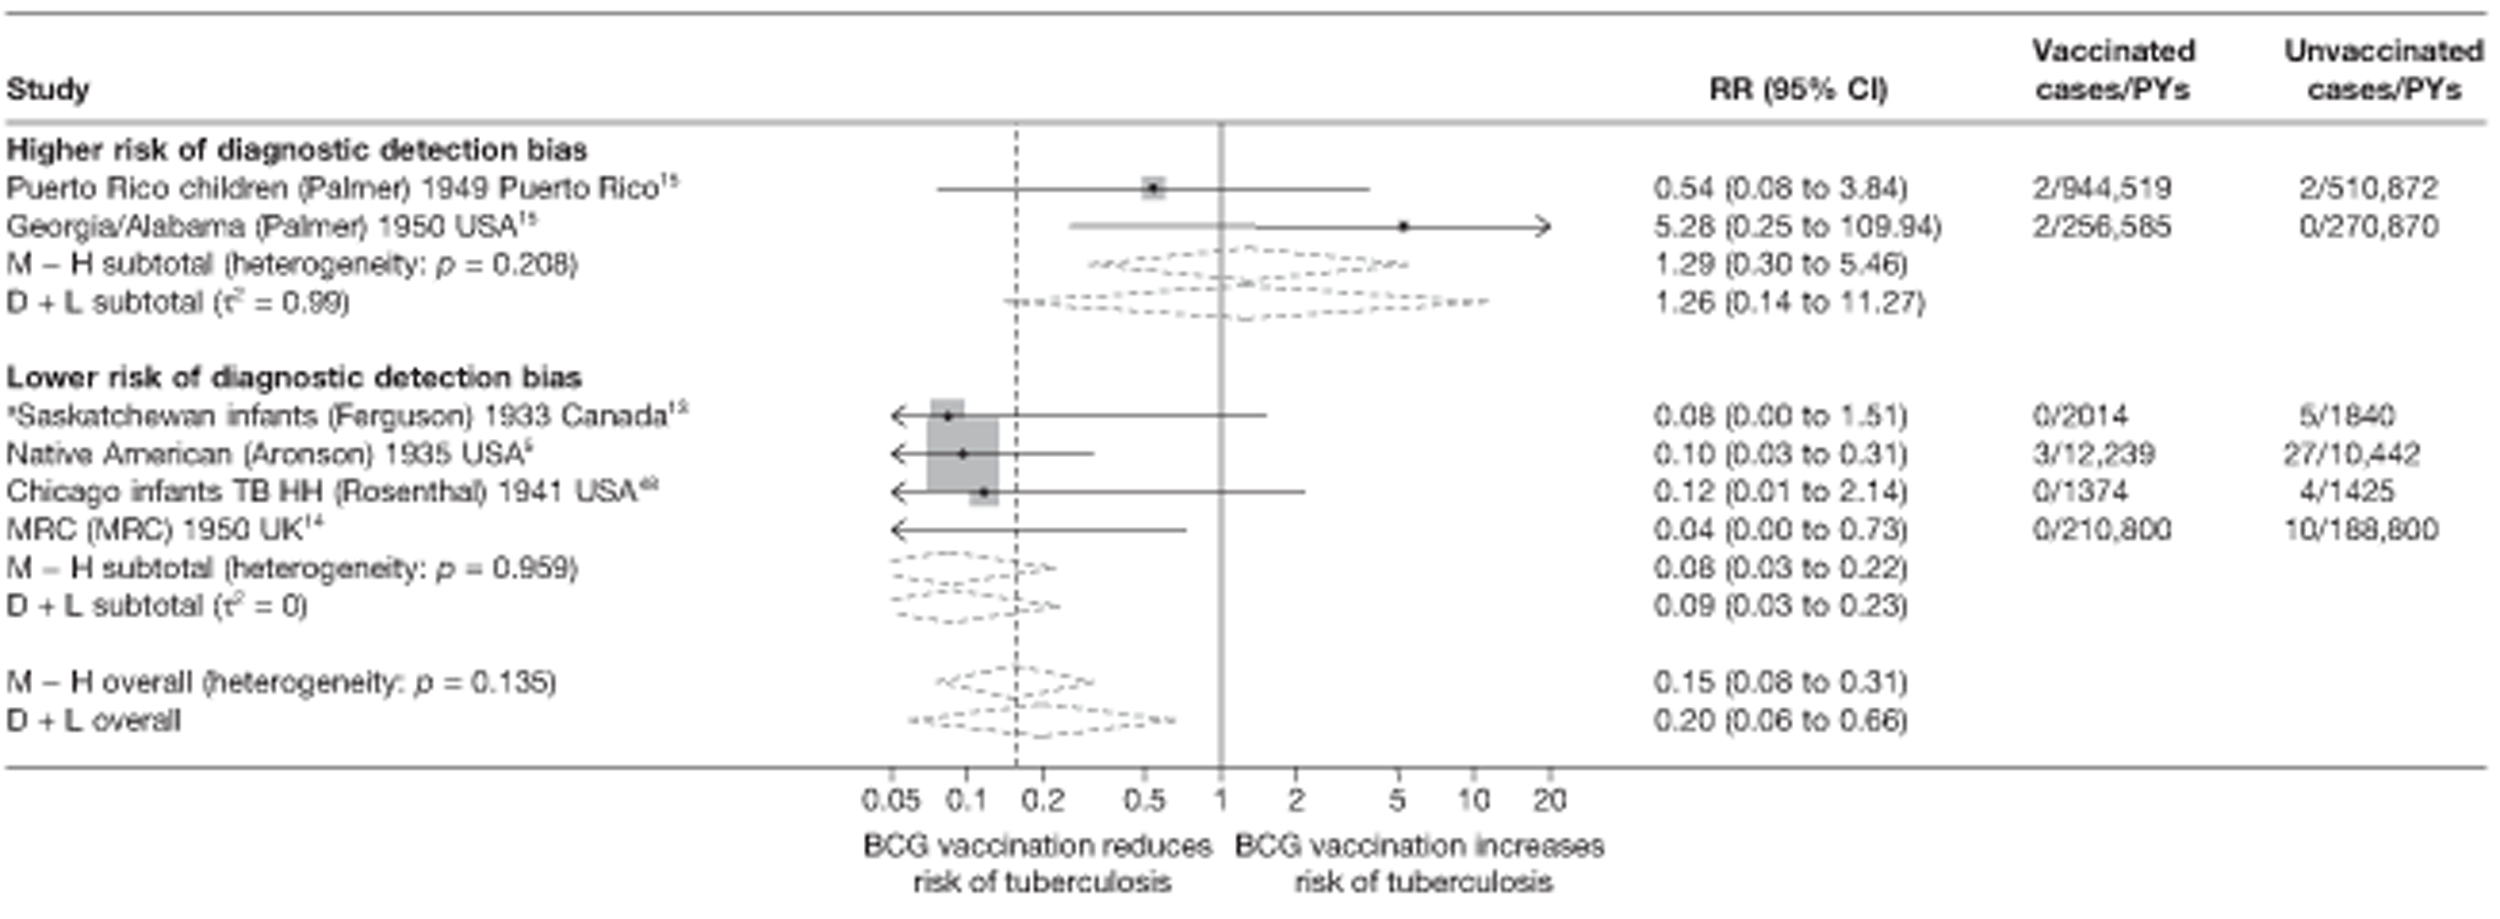
Meta-regression analysis
Stratification on risk of diagnostic detection bias accounted for a very substantial amount of variability (τ2 values before and after stratification = 0.767 and 0.000, respectively) (see Table 9). However, the evidence that BCG vaccination efficacy varied with risk of diagnostic detection bias was weak: studies with a higher risk of diagnostic detection bias had a rate ratio 12.13 (95% CI 0.81 to 181.79) times that of studies with a lower risk of bias, with the VE for studies at higher risk of diagnostic detection bias being correspondingly lower.
Results from univariable meta-regressions suggested that latitude, age at vaccination/tuberculin testing stringency and risk of diagnostic detection bias were closely correlated and could each explain the between-study variation in overall BCG vaccination efficacy against meningeal and/or miliary tuberculosis with a τ2 value of 0.000.
Extrapulmonary tuberculosis
Studies providing data on outcomes of extrapulmonary tuberculosis which were not specified to be tuberculosis meningitis and/or miliary tuberculosis were analysed in the extrapulmonary tuberculosis section below.
Unstratified analysis ordered by year trial started
Figure 17 shows a forest plot for the six trials providing data on the efficacy of the BCG vaccination on any extrapulmonary tuberculosis disease (excluding those referring to miliary tuberculosis or tuberculosis meningitis). There was substantial variation in the protective efficacy of the BCG vaccination against extrapulmonary tuberculosis, ranging from a high protective effect [rate ratio 0.14 (95% CI 0.03 to 0.63)] in Saskatchewan Infants,13 to absence of a clinically important benefit in the Georgia/Alabama trial15 [rate ratio 1.06 (95% CI 0.26 to 4.22)].
FIGURE 17.
Rate ratios (with 95% CI) comparing the incidence of extrapulmonary tuberculosis among BCG vaccinated individuals with that in unvaccinated individuals for the longest duration of follow-up (see Table 3) in RCTs, ordered by year of study start.

Stratified analysis by latitude (10°), ordered by year study started
Figure 18 shows the estimated effect of BCG vaccination from trials with extrapulmonary tuberculosis outcome data excluding tuberculosis meningitis and miliary tuberculosis, stratified by location using 10° bands of latitude of study. Overall, the protective effect of the BCG vaccination was low or absent in studies conducted nearer the equator, whereas there was strong evidence of higher protection observed in studies carried out at latitudes exceeding 40°. The highest protective effect was observed in studies conducted above 50° latitude: rate ratio 0.17 (95% CI 0.11 to 0.29), corresponding to a high VE of 83% (95% CI 71% to 89%). Stratification by latitude appeared to explain a substantial amount of the between-study variation in effect of BCG vaccination.
FIGURE 18.
Rate ratios (with 95% confidence intervals) comparing the incidence of extrapulmonary tuberculosis among BCG vaccinated individuals with that in unvaccinated individuals for the longest duration of follow-up (see Table 3) in RCTs, stratified by latitude of study location (10° bands), ordered by year of study start. D + L, DerSimonian and Laird method; M-H, Mantel-Haenszel method.
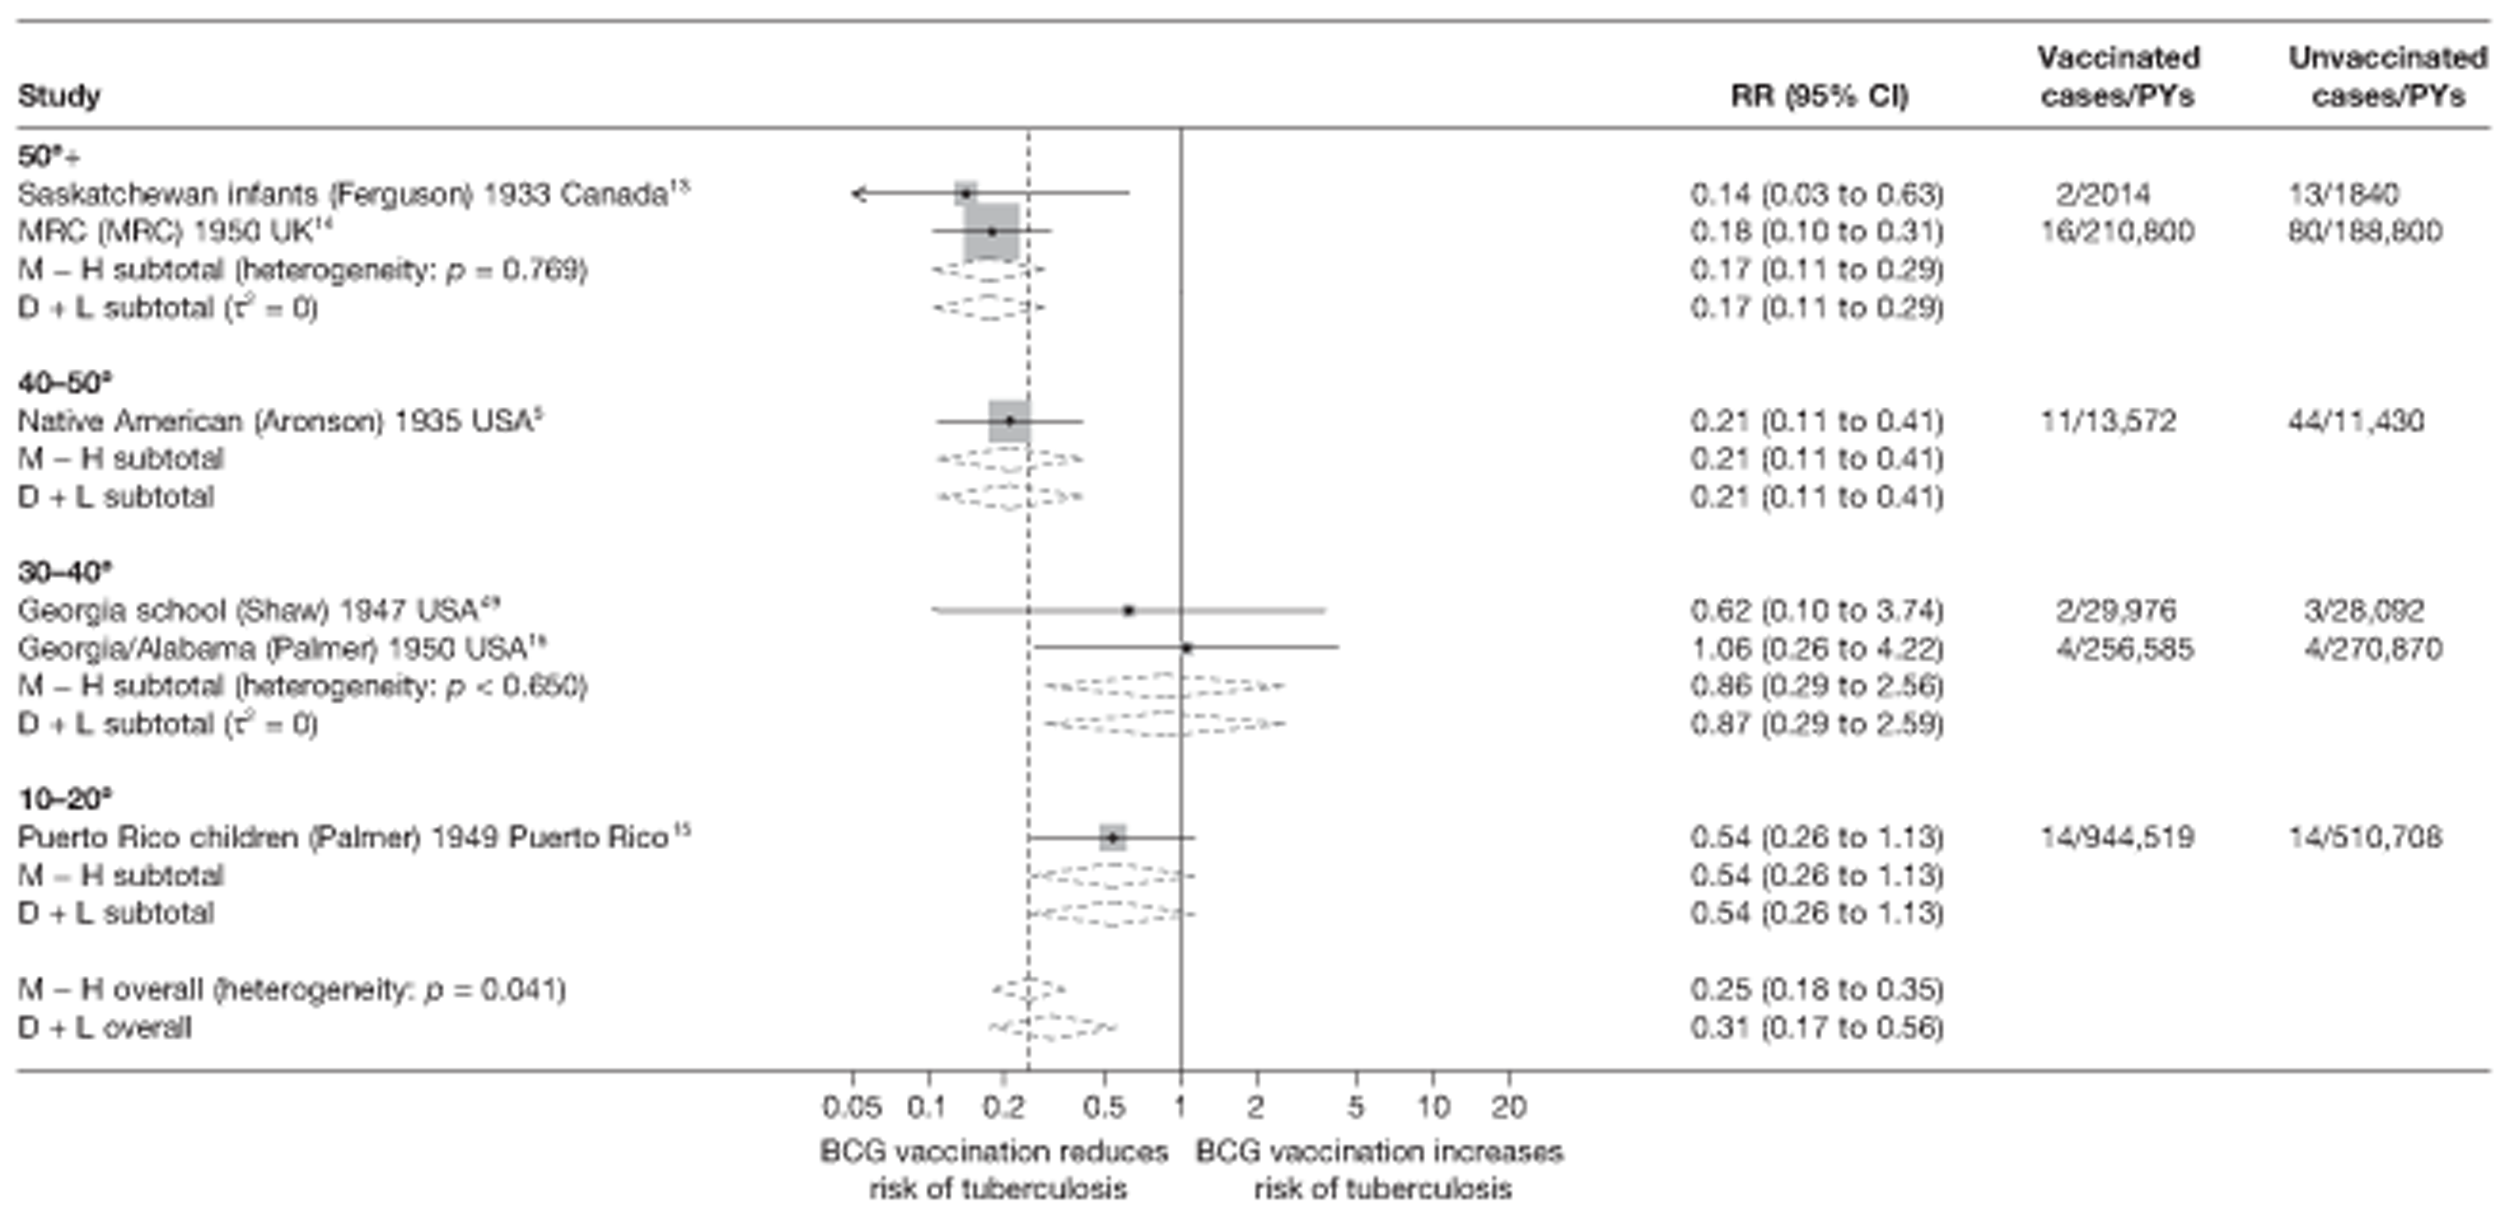
Meta-regression analysis
The between-study variation in estimates was explained by stratification on latitude (τ2 values before and after stratification on 20° latitude were 0.275 and 0.000, respectively) (see Table 9). There was some evidence of protection varying with latitude (p-value = 0.100): the overall rate ratio for the 0–20° latitude strata was 2.89 times (95% CI 0.74 to 11.37) the rate ratio for studies above 40° latitude (thus VE correspondingly lower). Similarly, the overall protective effect for the strata 20–40° was 4.64 (0.70 to 30.87) times lower that of studies above 40° latitude.
Stratified analysis by age at vaccination and tuberculin testing stringency, ordered by year study started
The results of trials with outcome data on extrapulmonary tuberculosis disease (excluding outcomes specified as miliary disease or tuberculosis meningitis) were stratified according to age at vaccination and tuberculin testing stringency (Figure 19). A consistent, high protective effect was seen in studies undertaking stringent tuberculin testing for school-age vaccination [rate ratio 0.20 (95% CI 0.14 to 0.30)] equivalent to a VE of 80% (95% CI 70% to 86%). The one study of BCG vaccination in neonates also showed substantial high protection with rate ratio 0.14 (95% CI 0.03 to 0.63) [VE equivalent to 86% (95% CI 37% to 97%)]. The Georgia/Alabama study15 of vaccination in other age groups provided little evidence of an effect of BCG vaccination. Tis stratification accounted for a substantial amount of heterogeneity.
FIGURE 19.
Rate ratios (with 95% CI) comparing the incidence of extrapulmonary tuberculosis among BCG vaccinated individuals with that in unvaccinated individuals for the longest duration of follow-up (see Table 3) in RCTs, stratified by age at vaccination/tuberculin testing stringency, ordered by year of study start. D + L, DerSimonian and Laird method; M-H, Mantel-Haenszel method.
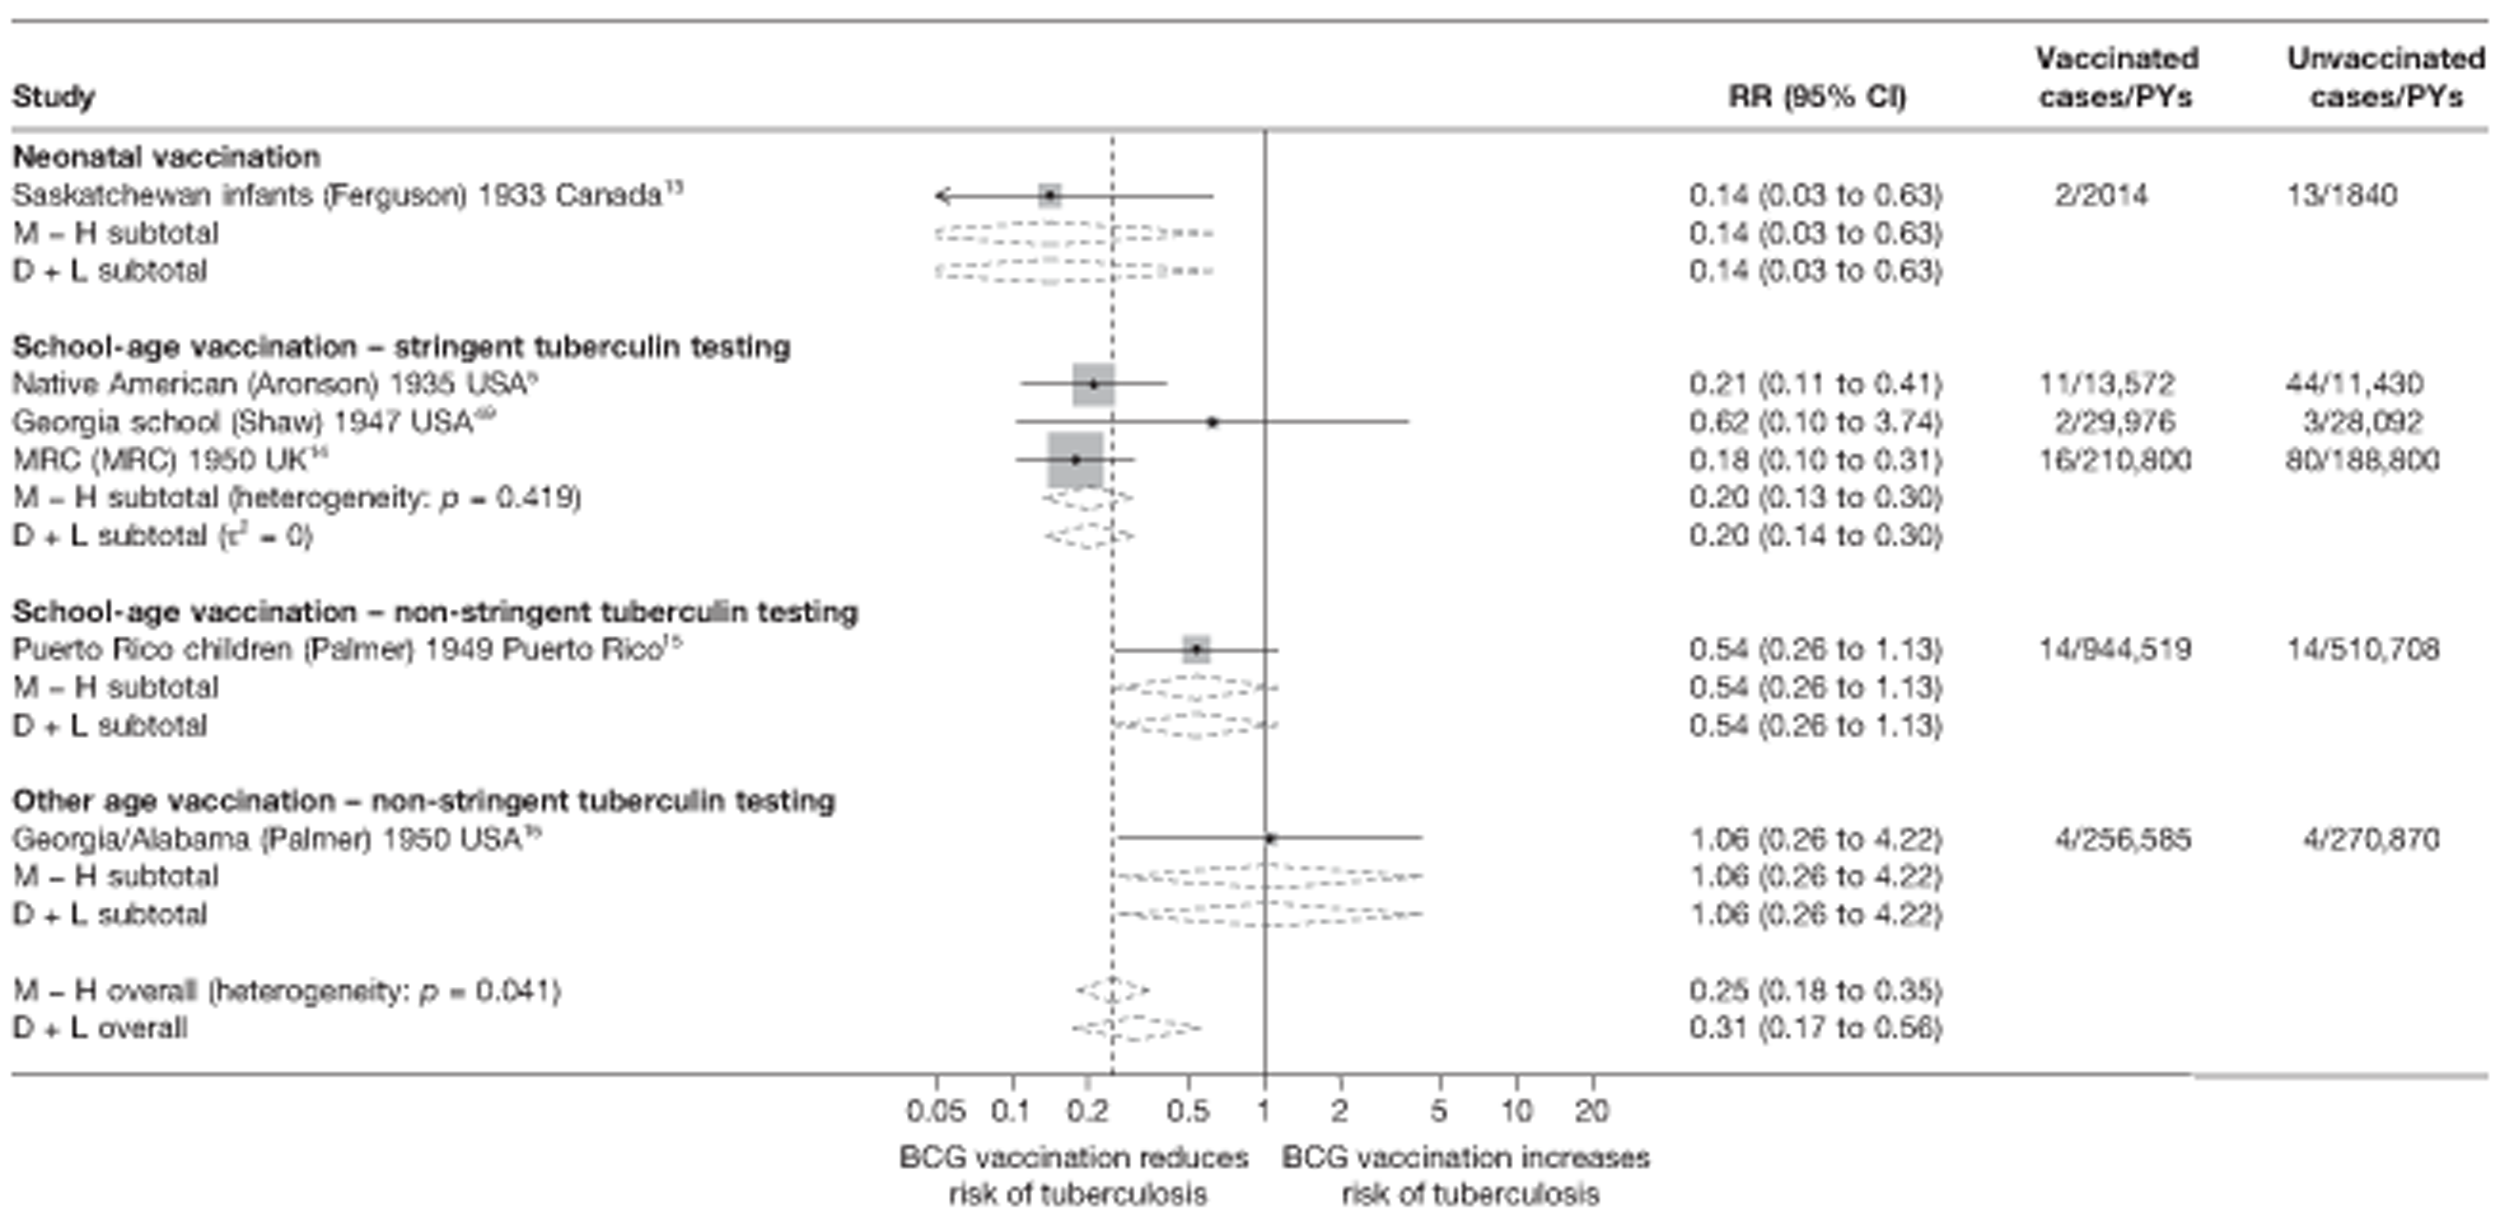
Meta-regression analysis
Based on meta-regression analyses, the between-study variation appeared to be explained by age at vaccination/tuberculin testing (null model τ2 = 0.275, after stratification τ2 = 0.000) (Table 10). There was little evidence, however, that the effect of BCG vaccination on extrapulmonary tuberculosis varied with age at vaccination and tuberculin testing (p-value = 0.245); the overall effect of BCG vaccination in those vaccinated at school-age with stringent tuberculin testing was 1.44 times (95% CI 0.05 to 42.74) that of neonatal vaccination studies.
| Variable | Number of trials | Univariable rate ratios (95% CI) | Univariable model | ||
|---|---|---|---|---|---|
| Ratio of rate ratios (95% CI) | p-value | τ2 | |||
| Null model | 6 | 0.275 | |||
| Latitude | |||||
| > 40° | 3 | 0.19 (0.08 to 0.45) | 1.00 (ref.) | ||
| 20–40° | 2 | 0.87 (0.08 to 9.61) | 4.64 (0.70 to 30.87) | ||
| 0–20° | 1 | 0.54 (0.11 to 2.74) | 2.89 (0.74 to 11.37) | 0.100 | 0.000 |
| Age at vaccination/tuberculin testing combined | |||||
| Neonatal | 1 | 0.14 (0.01 to 2183.96) | 1.00 (ref.) | ||
| School age/stringent | 3 | 0.20 (0.01 to 2.82) | 1.44 (0.05 to 42.74) | ||
| School age/non-stringent | 1 | 0.54 (0.01 to 65.86) | 3.85 (0.10 to 148.06) | ||
| Other age/stringent | 0 | ||||
| Other age/non-stringent | 1 | 1.06 (0.01 to 8423.85) | 7.51 (0.09 to 652.89) | 0.245 | 0.000 |
| Diagnostic quality | |||||
| Lower risk of bias | 3 | 0.19 (0.10 to 0.36) | 1.00 (ref.) | ||
| Higher risk of bias | 3 | 0.63 (0.23 to 1.70) | 3.35 (1.19 to 9.48) | 0.032 | 0.000 |
| Was the allocation sequence adequately generated? | |||||
| Lower risk of bias | 0 | ||||
| Higher risk of bias | 6 | 0.275 | |||
| Was treatment allocation adequately concealed? | |||||
| Lower risk of bias | 0 | ||||
| Higher risk of bias | 6 | 0.275 | |||
| Was knowledge of the allocated intervention prevented during the study? | |||||
| Lower risk of bias | 1 | 0.21 (0.02 to 2.03) | 1.00 (ref.) | ||
| Higher risk of bias | 5 | 0.36 (0.11 to 1.19) | 1.70 (0.18 to 15.90) | 0.547 | 0.475 |
| Are reports of the study free from the suggestion of selective outcome reporting? | |||||
| Lower risk of bias | 6 | ||||
| Higher risk of bias | 0 | 0.275 | |||
| Was ascertainment of cases complete? | |||||
| Lower risk of bias | 6 | ||||
| Higher risk of bias | 0 | 0.275 | |||
Stratified analysis by risk of diagnostic detection bias, ordered by year study started
Figure 20 shows estimated effect of BCG vaccination on extrapulmonary tuberculosis (excluding tuberculosis meningitis and miliary tuberculosis) stratified according to risk of diagnostic detection bias. There was reasonably consistent evidence of higher protection against extrapulmonary tuberculosis observed in pooled results of the three studies with a lower risk of diagnostic detection bias [rate ratio 0.19 (95% CI 0.12 to 0.28)] corresponding to a VE of 81% (95% CI 72% to 88%). By contrast, all three trials that did not adequately mask vaccination status and without active surveillance showed, overall, less effective results. Risk of diagnostic detection bias appears to explain a substantial amount of the between-study variation in the protective effect of BCG vaccination.
FIGURE 20.
Rate ratios (with 95% CI) comparing the incidence of extrapulmonary tuberculosis among BCG vaccinated individuals with that in unvaccinated individuals for the longest duration of follow-up (see Table 3) in RCTs, stratified by risk of diagnostic detection bias,a ordered by year of study start. a, Diagnostic detection bias is said to occur if the assessor of BCG vaccination outcome is not blinded to vaccination status. D + L, DerSimonian and Laird method; M-H, Mantel-Haenszel method.
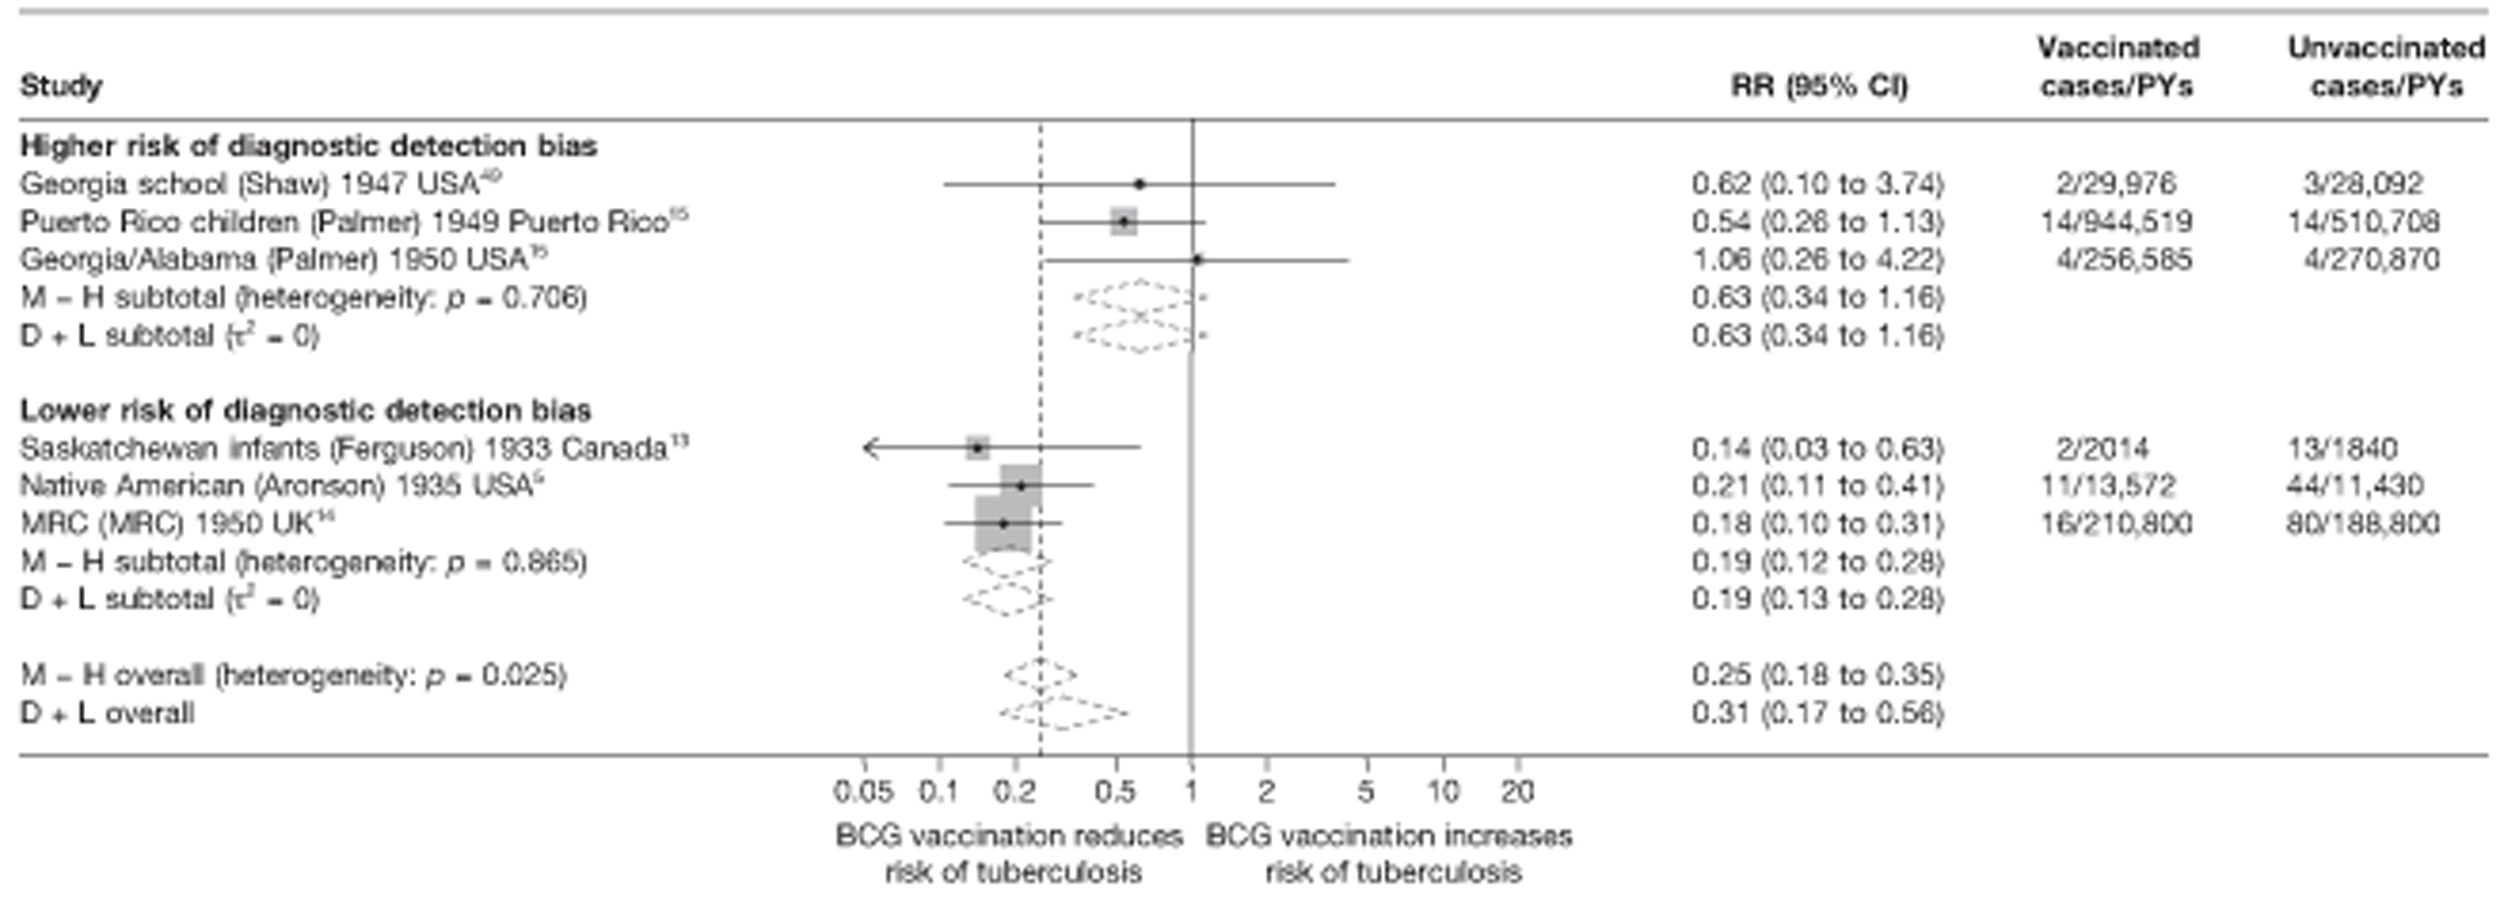
Meta-regression analysis
Stratification on risk of diagnostic detection bias accounted for the between-study variation (τ2 = 0.275 and 0.000, before and after stratification respectively) (see Table 10). There was evidence (p-value = 0.032) that efficacy varied with risk of diagnostic detection bias: overall rate ratios for studies with a higher risk of diagnostic detection bias were 3.35 (95% CI 1.19 to 9.48) times that of studies with a lower risk and hence a lower VE.
Results from univariable meta-regressions indicate that latitude, age at vaccination/tuberculin testing stringency and risk of diagnostic detection bias each explained a large amount of between-study variation in overall BCG vaccination efficacy with a τ2 value of 0.000 for each of these variables, compared with the baseline τ2 value of 0.275. These results should be interpreted with caution in view of the small number of studies contributing to this analysis.
Tuberculosis mortality
Unstratified analysis ordered by year trial started
Only 8 of the 21 trials presented data on the effect of BCG vaccination on mortality from tuberculosis (Figure 21). The Native American trial5 was the only study with a large number of events observed, all other studies having very few events and wide CIs. Two trials (Illinois mentally handicapped50 and Puerto Rico Children15) found a substantially increased risk of death in the vaccinated compared with unvaccinated group.
FIGURE 21.
Rate ratios (with 95% CI) comparing the incidence of tuberculosis mortality among BCG vaccinated individuals with that in unvaccinated individuals for the longest duration of follow-up (see Table 3) in RCTs, ordered by year of study start. CCH, Cook County Hospital; TB HH, tuberculosis households.

Stratified analysis by latitude (10°), ordered by year study started
Figure 22 shows estimated effects of BCG vaccination against tuberculosis mortality, stratified by latitude of study location. In general, the protection afforded by BCG vaccination is low or absent in studies close to the equator, while there was reasonable consistent evidence of higher levels of protection against mortality in studies conducted at latitude exceeding 40°. The overall effect for studies conducted above 50° was rate ratio 0.17 (95% CI 0.11 to 0.29), corresponding to a high protection [VE of 83% (95% CI 71% to 89%)]. Again this should be interpreted with caution in view of the small number of studies contributing to this analysis. A substantial amount of the between-study variation in protective effect of BCG vaccination appeared to be explained in part by latitude, although residual heterogeneity remained between studies conducted in the same latitude bands.
FIGURE 22.
Rate ratios (with 95% CI) comparing the incidence of tuberculosis mortality among BCG vaccinated individuals with that in unvaccinated individuals for the longest duration of follow-up (see Table 3), in RCTs stratified by latitude of study location (10° bands), ordered by year of study start. CCH, Cook County Hospital; D + L, DerSimonian and Laird method; M-H, Mantel-Haenszel method; TB HH, tuberculosis households.
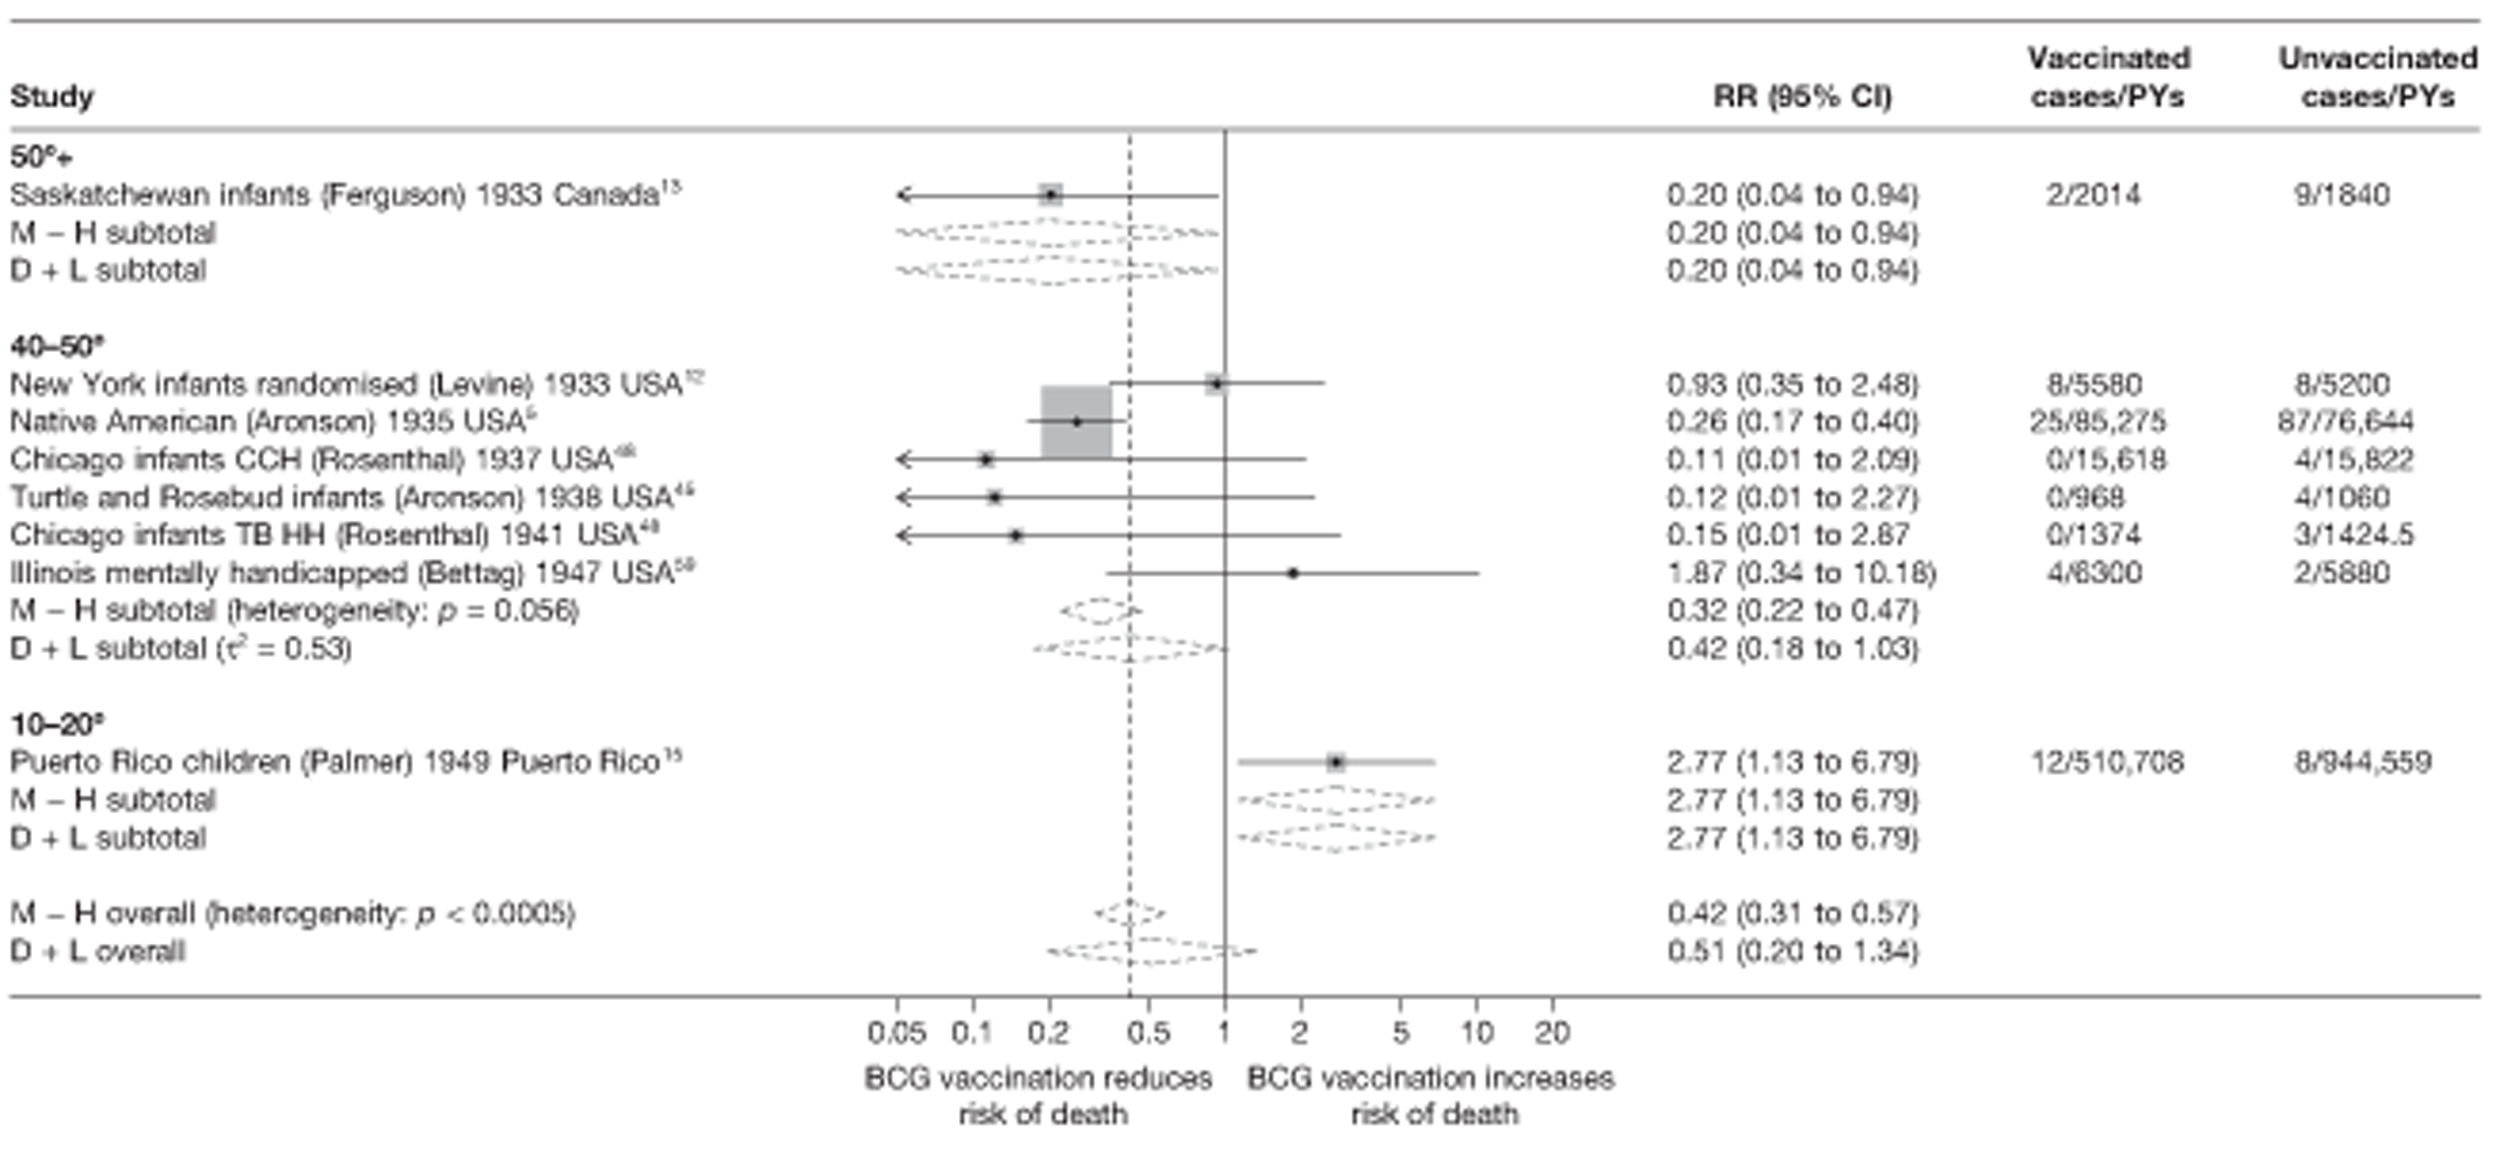
Meta-regression analysis
Stratifying these studies by latitude (20° bands) accounted for 45% of the between-study variation (null model τ2 = 1.067, after stratification τ2 = 0.582) (Table 11). There was, however, insufficient evidence on which to suggest that efficacy varied with latitude (p-value = 0.138). The estimate of the rate ratio for studies at latitudes 0–20° was 5.63 (95% CI 0.48 to 66.58) times that of studies of > 20° latitude, pointing towards a corresponding lower VE.
| Variable | Number of trials | Univariable rate ratios (95% CI) | Univariable model | ||
|---|---|---|---|---|---|
| Ratio of rate ratios (95% CI) | p-value | τ2 | |||
| Null model | 8 | 1.067 | |||
| Latitude | |||||
| > 40° | 7 | 0.49 (0.14 to 1.69) | 1.00 (ref.) | ||
| 20–40° | 0 | ||||
| 0–20° | 1 | 2.77 (0.28 to 27.27) | 5.63 (0.48 to 66.58) | 0.138 | 0.582 |
| Age at vaccination/tuberculin testing stringency | |||||
| Neonatal | 5 | 0.49 (0.04 to 5.37) | 1.00 (ref.) | ||
| School age/stringent | 1 | 0.26 (0.02 to 4.31) | 0.53 (0.02 to 13.26) | ||
| School age/non-stringent | 1 | 2.77 (0.13 to 60.59) | 5.67 (0.19 to 170.89) | ||
| Other age/stringent | 1 | 1.87 (0.04 to 89.71) | 3.81 (0.07 to 202.48) | ||
| Other age/non-stringent | 0 | 0.369 | 0.731 | ||
| Diagnostic detection bias | |||||
| Lower risk of bias | 6 | 0.36 (0.13 to 1.02) | 1.00 (ref.) | ||
| Higher risk of bias | 2 | 2.45 (0.57 to 10.47) | 6.65 (1.22 to 36.09) | 0.034 | 0.260 |
| Was the allocation sequence adequately generated? | |||||
| Lower risk of bias | 0 | ||||
| Higher risk of bias | 8 | 1.067 | |||
| Was treatment allocation adequately concealed? | |||||
| Lower risk of bias | 1 | ||||
| Higher risk of bias | 7 | ||||
| Was knowledge of the allocated intervention prevented during the study? | |||||
| Lower risk of bias | 1 | 0.25 (0.02 to 2.73) | 1.00 (ref.) | ||
| Higher risk of bias | 7 | 1.07 (0.26 to 4.38) | 4.13 (0.30 to 56.56) | 0.232 | 0.790 |
| Are reports of the study free from the suggestion of selective outcome reporting? | |||||
| Lower risk of bias | 8 | ||||
| Higher risk of bias | 0 | 1.067 | |||
| Was ascertainment of cases complete? | |||||
| Lower risk of bias | 8 | ||||
| Higher risk of bias | 0 | 1.067 | |||
Stratified analysis by age at vaccination and tuberculin testing stringency, ordered by year study started
The results in Figure 23 show the effect of BCG vaccination on tuberculosis mortality, stratified by age at which vaccination was administered and stringency of the tuberculin testing method. The most consistent protective effect of BCG vaccination was seen in neonatal vaccination and school-age vaccination with stringent tuberculin testing [overall good protection with rate ratio from five studies of 0.34 (95% CI 0.12 to 0.92) corresponding to a VE of 66% (95% CI 8% to 88%) and rate ratio from one study of 0.26 (95% CI 0.17 to 0.40) corresponding to a VE of 74% (95% CI 60% to 83%), respectively]. There was no evidence of a protective effect of BCG vaccination in the one study each of ‘other’ age groups of vaccination, with stringent or non-stringent tuberculin testing. Stratification by age at vaccination appeared to explain some of the between-study variation observed.
FIGURE 23.
Rate ratios (with 95% CI) comparing the incidence of tuberculosis mortality among BCG vaccinated individuals with that in unvaccinated individuals for the longest duration of follow-up (see Table 3) in RCTs, stratified by age at vaccination/tuberculin testing stringency, ordered by year of study start. CCH, Cook County Hospital; D + L, DerSimonian and Laird method; M-H, Mantel-Haenszel method; TB HH, tuberculosis households.
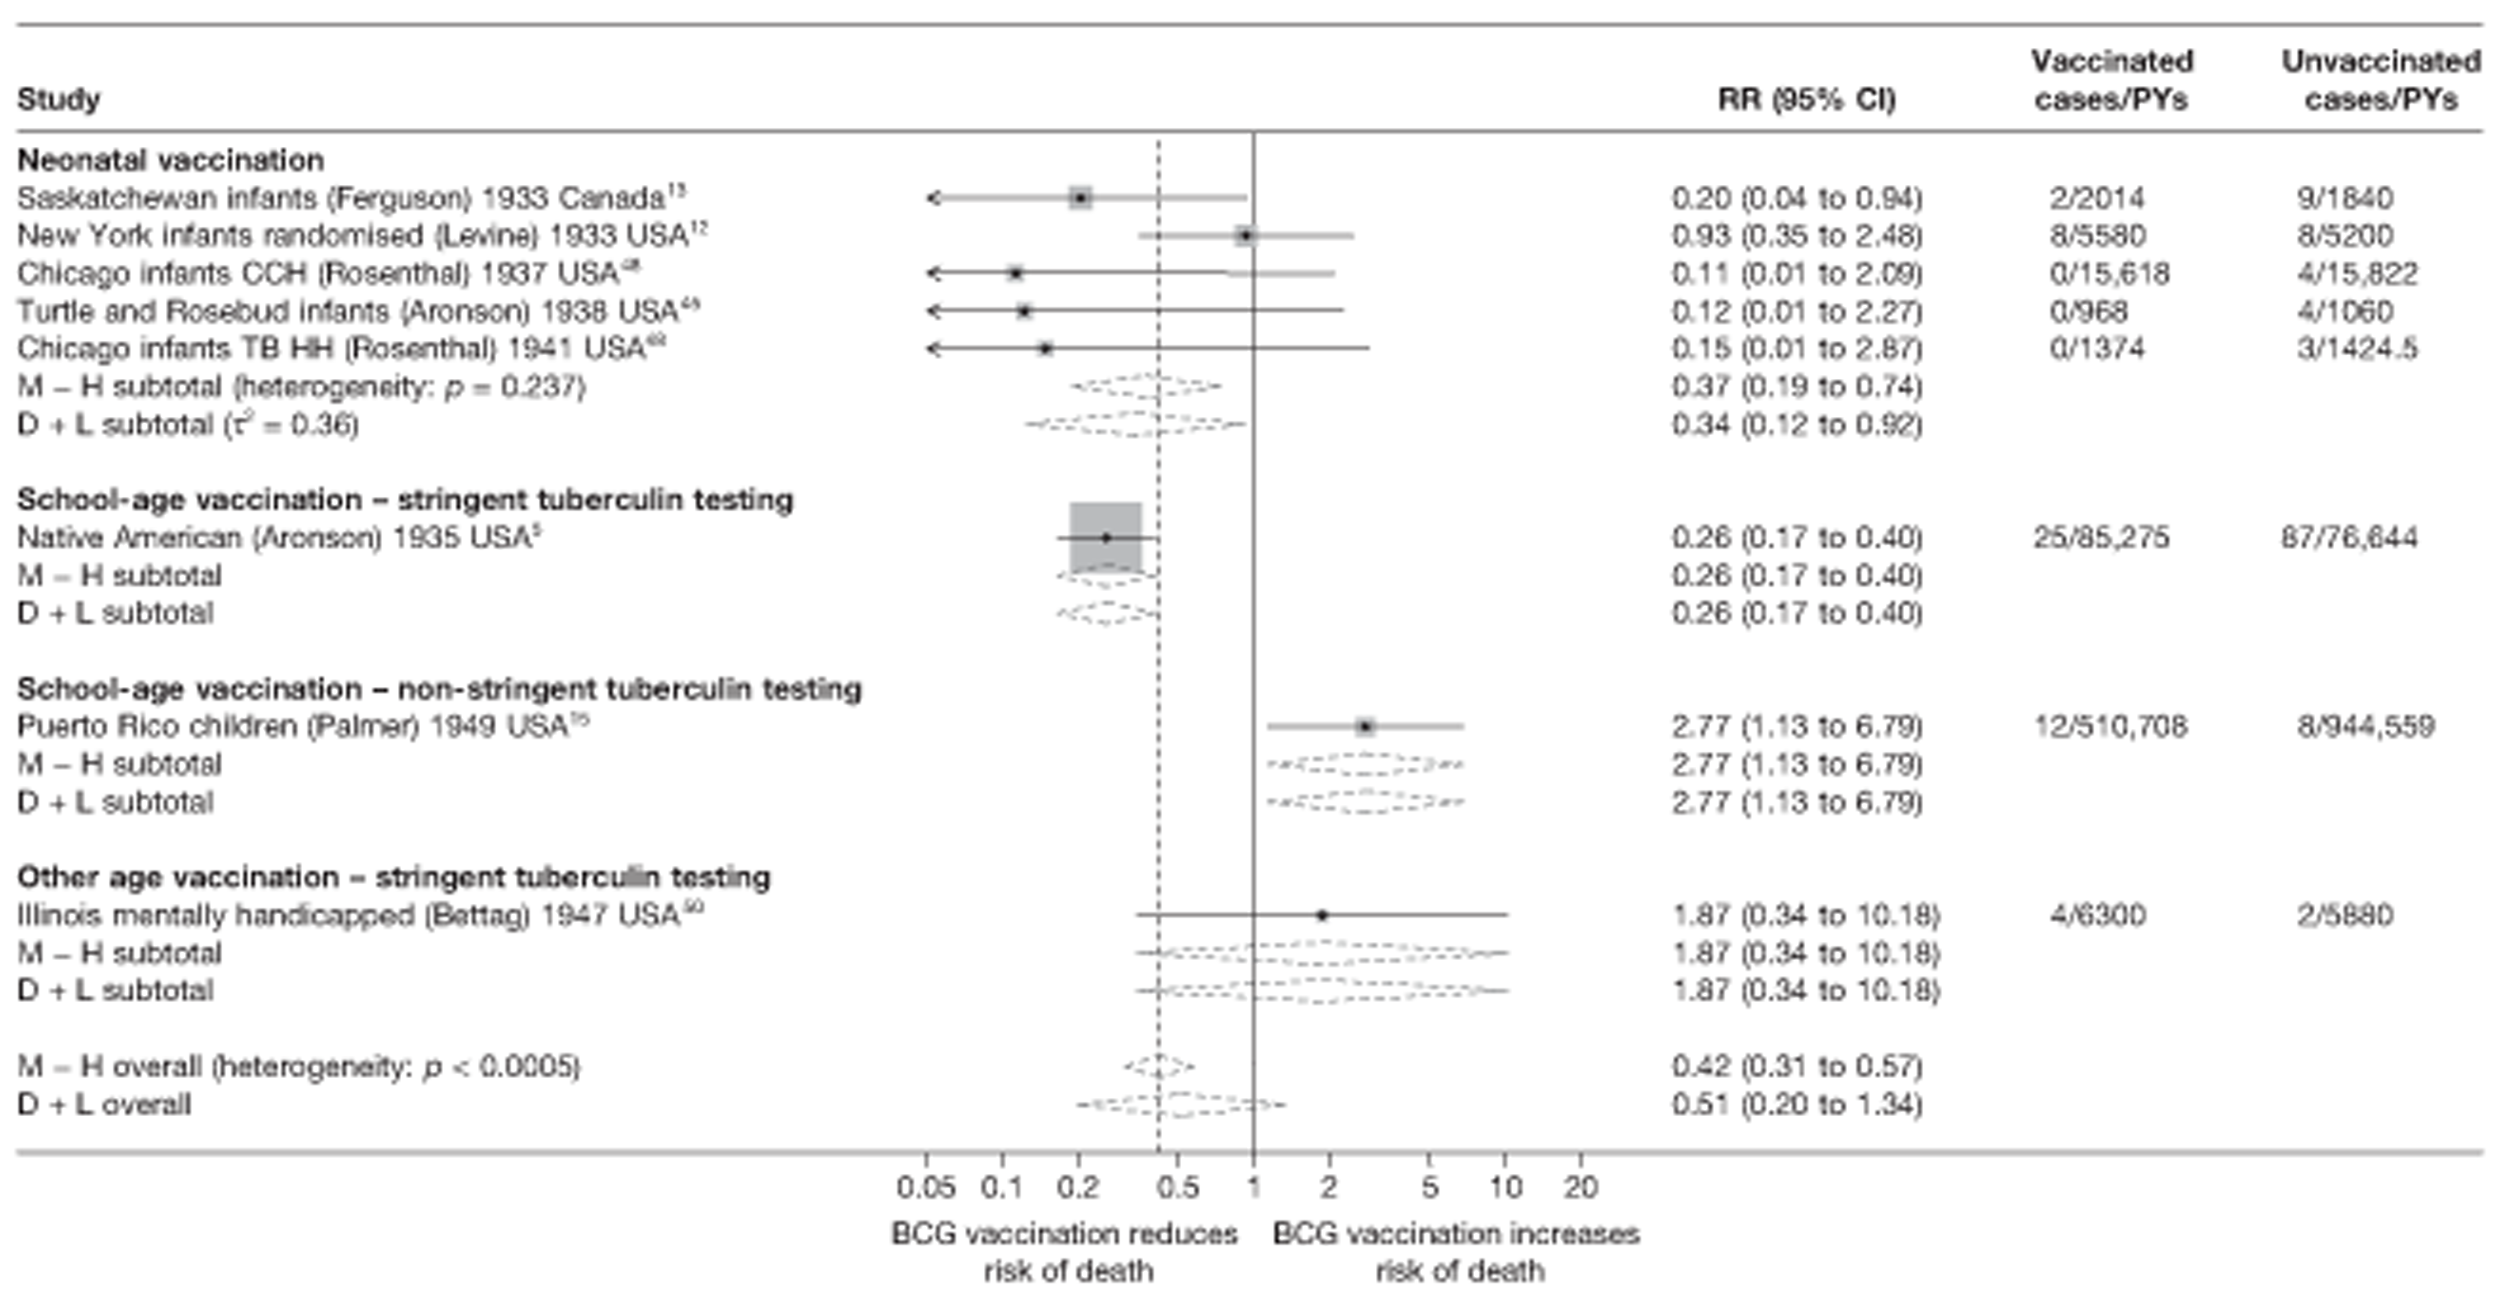
Meta-regression analysis
Based on meta-regression analyses, age at vaccination and tuberculin testing stringency accounted for 31% of the between-study variation observed (null model τ2 = 1.067, after stratification τ2 = 0.731) (see Table 11). There was, however, insufficient evidence (p-value = 0.369) that BCG vaccination efficacy against tuberculosis mortality varied according to age at vaccination/tuberculin testing stringency. The point estimate of effect (rate ratio) for studies of school-age vaccination with stringent tuberculin testing was 0.53 (95% CI 0.02 to 13.26) times that of neonatal vaccination studies, whereas rate ratio for BCG vaccination at other ages with stringent tuberculin testing was 3.81 (95% CI 0.07 to 202.48) times higher and VE correspondingly lower.
Stratified analysis by risk of diagnostic detection bias, ordered by year study started
Figure 24 presents the estimated effects of BCG vaccination on tuberculosis mortality stratified by risk of diagnostic detection bias. The most consistent protective effect was seen in studies assessed as having a lower risk of diagnostic detection bias, with rate ratio 0.32 (95% CI 0.17 to 0.59), corresponding to a good protective effect [VE of 68% (95% CI 41% to 83%)], whereas there was an absence of protective effect of BCG vaccination in two trials with a higher risk of diagnostic detection bias. Stratification on risk of diagnostic detection bias appeared to explain a substantial amount of the between-study variation, although residual heterogeneity remained within strata.
FIGURE 24.
Rate ratios (with 95% CI) comparing the incidence of tuberculosis mortality among BCG vaccinated individuals with that in unvaccinated individuals for the longest duration of follow-up (see Table 3) in RCTs, stratified by risk of diagnostic detection bias,a ordered by year of study start. a, Diagnostic detection bias occurs if the assessor of BCG vaccination outcome is not blinded to vaccination status. CCH, Cook County Hospital; D + L, DerSimonian and Laird method; M-H, Mantel-Haenszel method; TB HH, tuberculosis households.
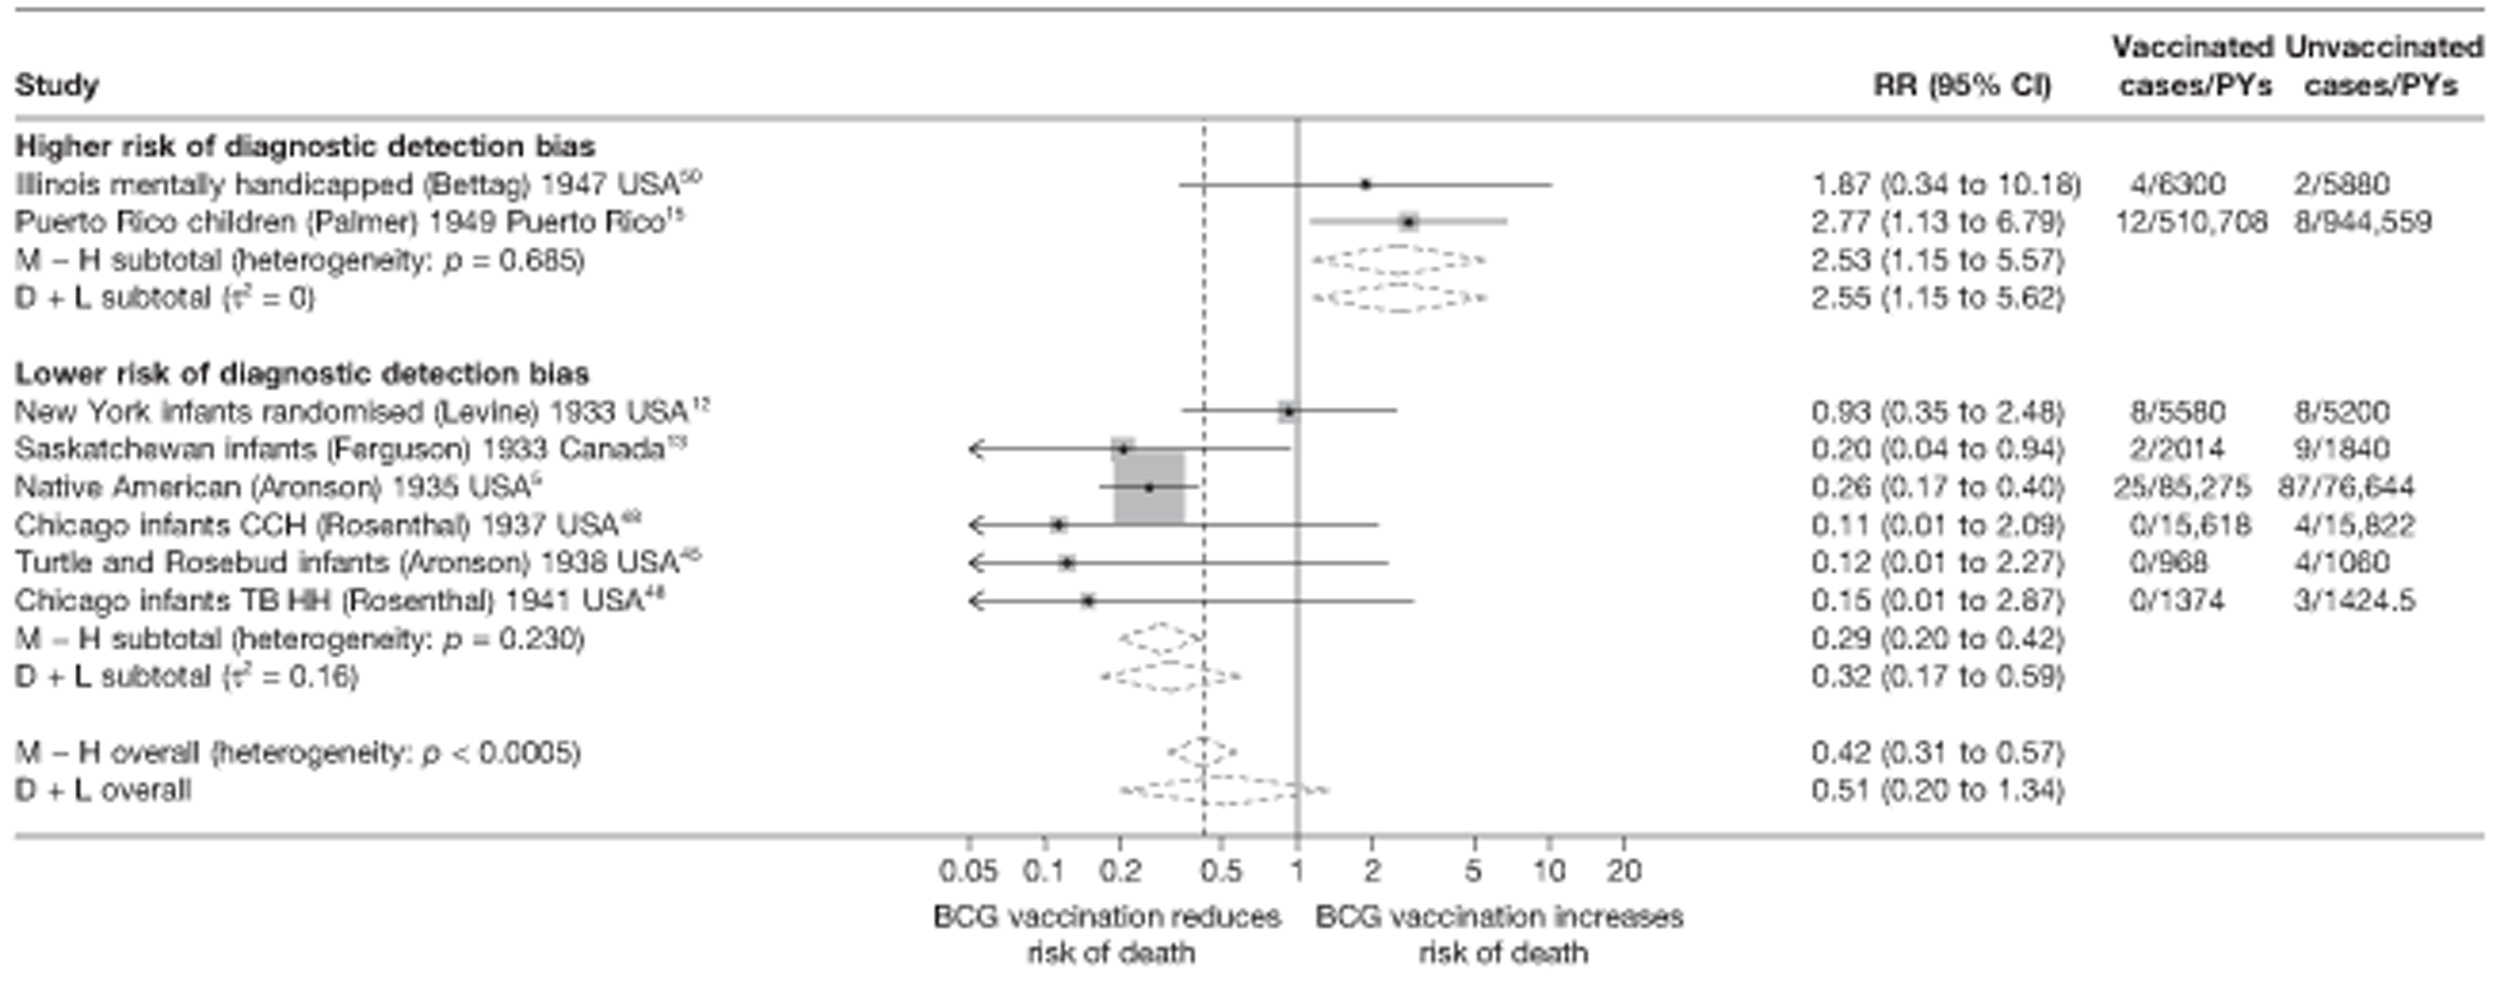
Meta-regression analysis
Stratification on risk of diagnostic detection bias accounted for 76% of the between-study variation (null model τ2 = 1.067, after stratification τ2 = 0.260) (see Table 11). There was more evidence (p-value = 0.034) that efficacy varied with latitude: rate ratio for studies with higher risk of bias was 6.65 (95% CI 1.22 to 36.09) times greater than that of studies with a lower risk of bias.
Results from univariable meta-regressions indicate that latitude, age at vaccination/tuberculin testing stringency and risk of diagnostic detection bias each appeared to explain some of the between-study heterogeneity in overall BCG vaccination efficacy with τ2 values 0.582, 0.731 and 0.260, respectively, compared with the baseline τ2 value (1.067), but only with risk of diagnosis detection bias was there sufficient strong evidence of an effect.
Observational studies
Pulmonary tuberculosis
A variety of observational studies have assessed the effectiveness of BCG vaccination in protecting against pulmonary tuberculosis: eight eligible case–control studies (in which eligibility was that control subjects were selected from the same population from which cases arose), 12 eligible cohort studies (in which the comparison group was tuberculin negative individuals at the start of follow-up), four case population studies (where the rate in BCG vaccinated was compared with rates in the estimated tuberculin negative populations), six cross-sectional studies and three outbreak studies. These studies were conducted in a range of countries between 1936 and 2004. Figures 25–28 present the unstratified results of these observational studies, ordered chronologically by date of study start. While there is some degree of variation in the estimates of effectiveness of BCG vaccination, the majority of studies for each study design showed evidence consistent with a protective effect of BCG vaccination against pulmonary tuberculosis.
FIGURE 25.
Odds ratios (with 95% CI) comparing the BCG vaccination status of pulmonary tuberculosis cases and control subjects in case–control studies, ordered by year of study start. a, Date of study publication was used if study start date was not available.

FIGURE 26.
Rate ratios (with 95% CI) comparing the incidence of pulmonary tuberculosis among BCG vaccinated individuals with that in unvaccinated individuals for the longest duration of follow-up (see Table 4) in cohort studies, ordered by year of study start. a, Date of study publication was used if study start date was not available.

FIGURE 27.
Rate ratios (with 95% CI) comparing the incidence of pulmonary tuberculosis among BCG vaccinated individuals with that in unvaccinated individuals for the longest duration of follow-up (see Table 5) in case population studies, ordered by year of study start.

FIGURE 28.
Risk ratios (with 95% CI) comparing the prevalence of pulmonary tuberculosis among BCG vaccinated individuals with that in unvaccinated individuals in cross-sectional studies, ordered by year of study start. a, Date of study publication was used if study start date was not available.

Estimates of protection by BCG vaccination against pulmonary tuberculosis varied across the eight case–control studies, ranging from a strong protective effect in Tailand65 [OR 0.30 (95% CI 0.24 to 0.38)], to clinical benefit in Bangalore children56 [OR 0.88 (95% 0.53 to 1.17)]. In 11 of the 12 cohorts in Figure 26 there was strong evidence of a protective effect, ranging from rate ratio 0.56 (95% CI 0.39 to 0.81) in the control arm of the Brazil revaccination study6 [equivalent to VE of 44% (95% CI 19% to 61%)] to rate ratio 0.01 (95% CI 0.00 to 0.14) in UK medical students100 [VE 99% (95% CI 86% to 100%)], with one study from Karonga, Malawi24 showing no evidence of clinical benefit. Two of the case population studies, those conducted in Poland160 and Canada (Quebec Pulmonary158), showed evidence of a high level of protection against pulmonary tuberculosis, whereas the other two studies showed some evidence of a protective effect. Four of the six cross-sectional studies found strong evidence of BCG vaccination reducing the risk of pulmonary tuberculosis (see Figure 28), with the Kenyan187 and Lebanese children193 studies suggesting no clinical benefit from BCG vaccination. Two of the three outbreak studies suggested limited clinical benefit from BCG vaccination, whereas the Cork toddler outbreak198 showed evidence of a protective effect [rate ratio 0.09 (95% CI 0.01 to 1.52)].
Unstratified analysis ordered by year study started
Case–control studies
See Figure 25.
Cohort studies
See Figure 26.
Case population studies
See Figure 27.
Cross-sectional studies
See Figure 28.
Outbreak studies
See Figure 29.
FIGURE 29.
Risk ratios (with 95% CI) comparing the incidence of pulmonary tuberculosis among BCG vaccinated individuals with that in unvaccinated individuals in outbreak studies, ordered by year of study start.

Stratified analysis by latitude (10°), ordered by year study started
Forest plots in Figures 30–33 present results from observational studies on the protective effect of BCG vaccination against pulmonary tuberculosis stratified by 10° latitude bands of study location. No case–control studies were identified above 40° of latitude, but there was reasonable evidence of the strongest protective effect in all studies, apart from the cross-sectional ones, at latitudes further from the equator. All outbreak studies were located above 50° latitude.
FIGURE 30.
Odds ratios (with 95% CI) comparing the BCG vaccination status of pulmonary tuberculosis cases and control subjects in case–control studies, stratified by latitude of study location (10° bands), ordered by year of study start. a, Date of study publication was used if study start date was not available. D + L, DerSimonian and Laird method; I – V, inverse variance method.
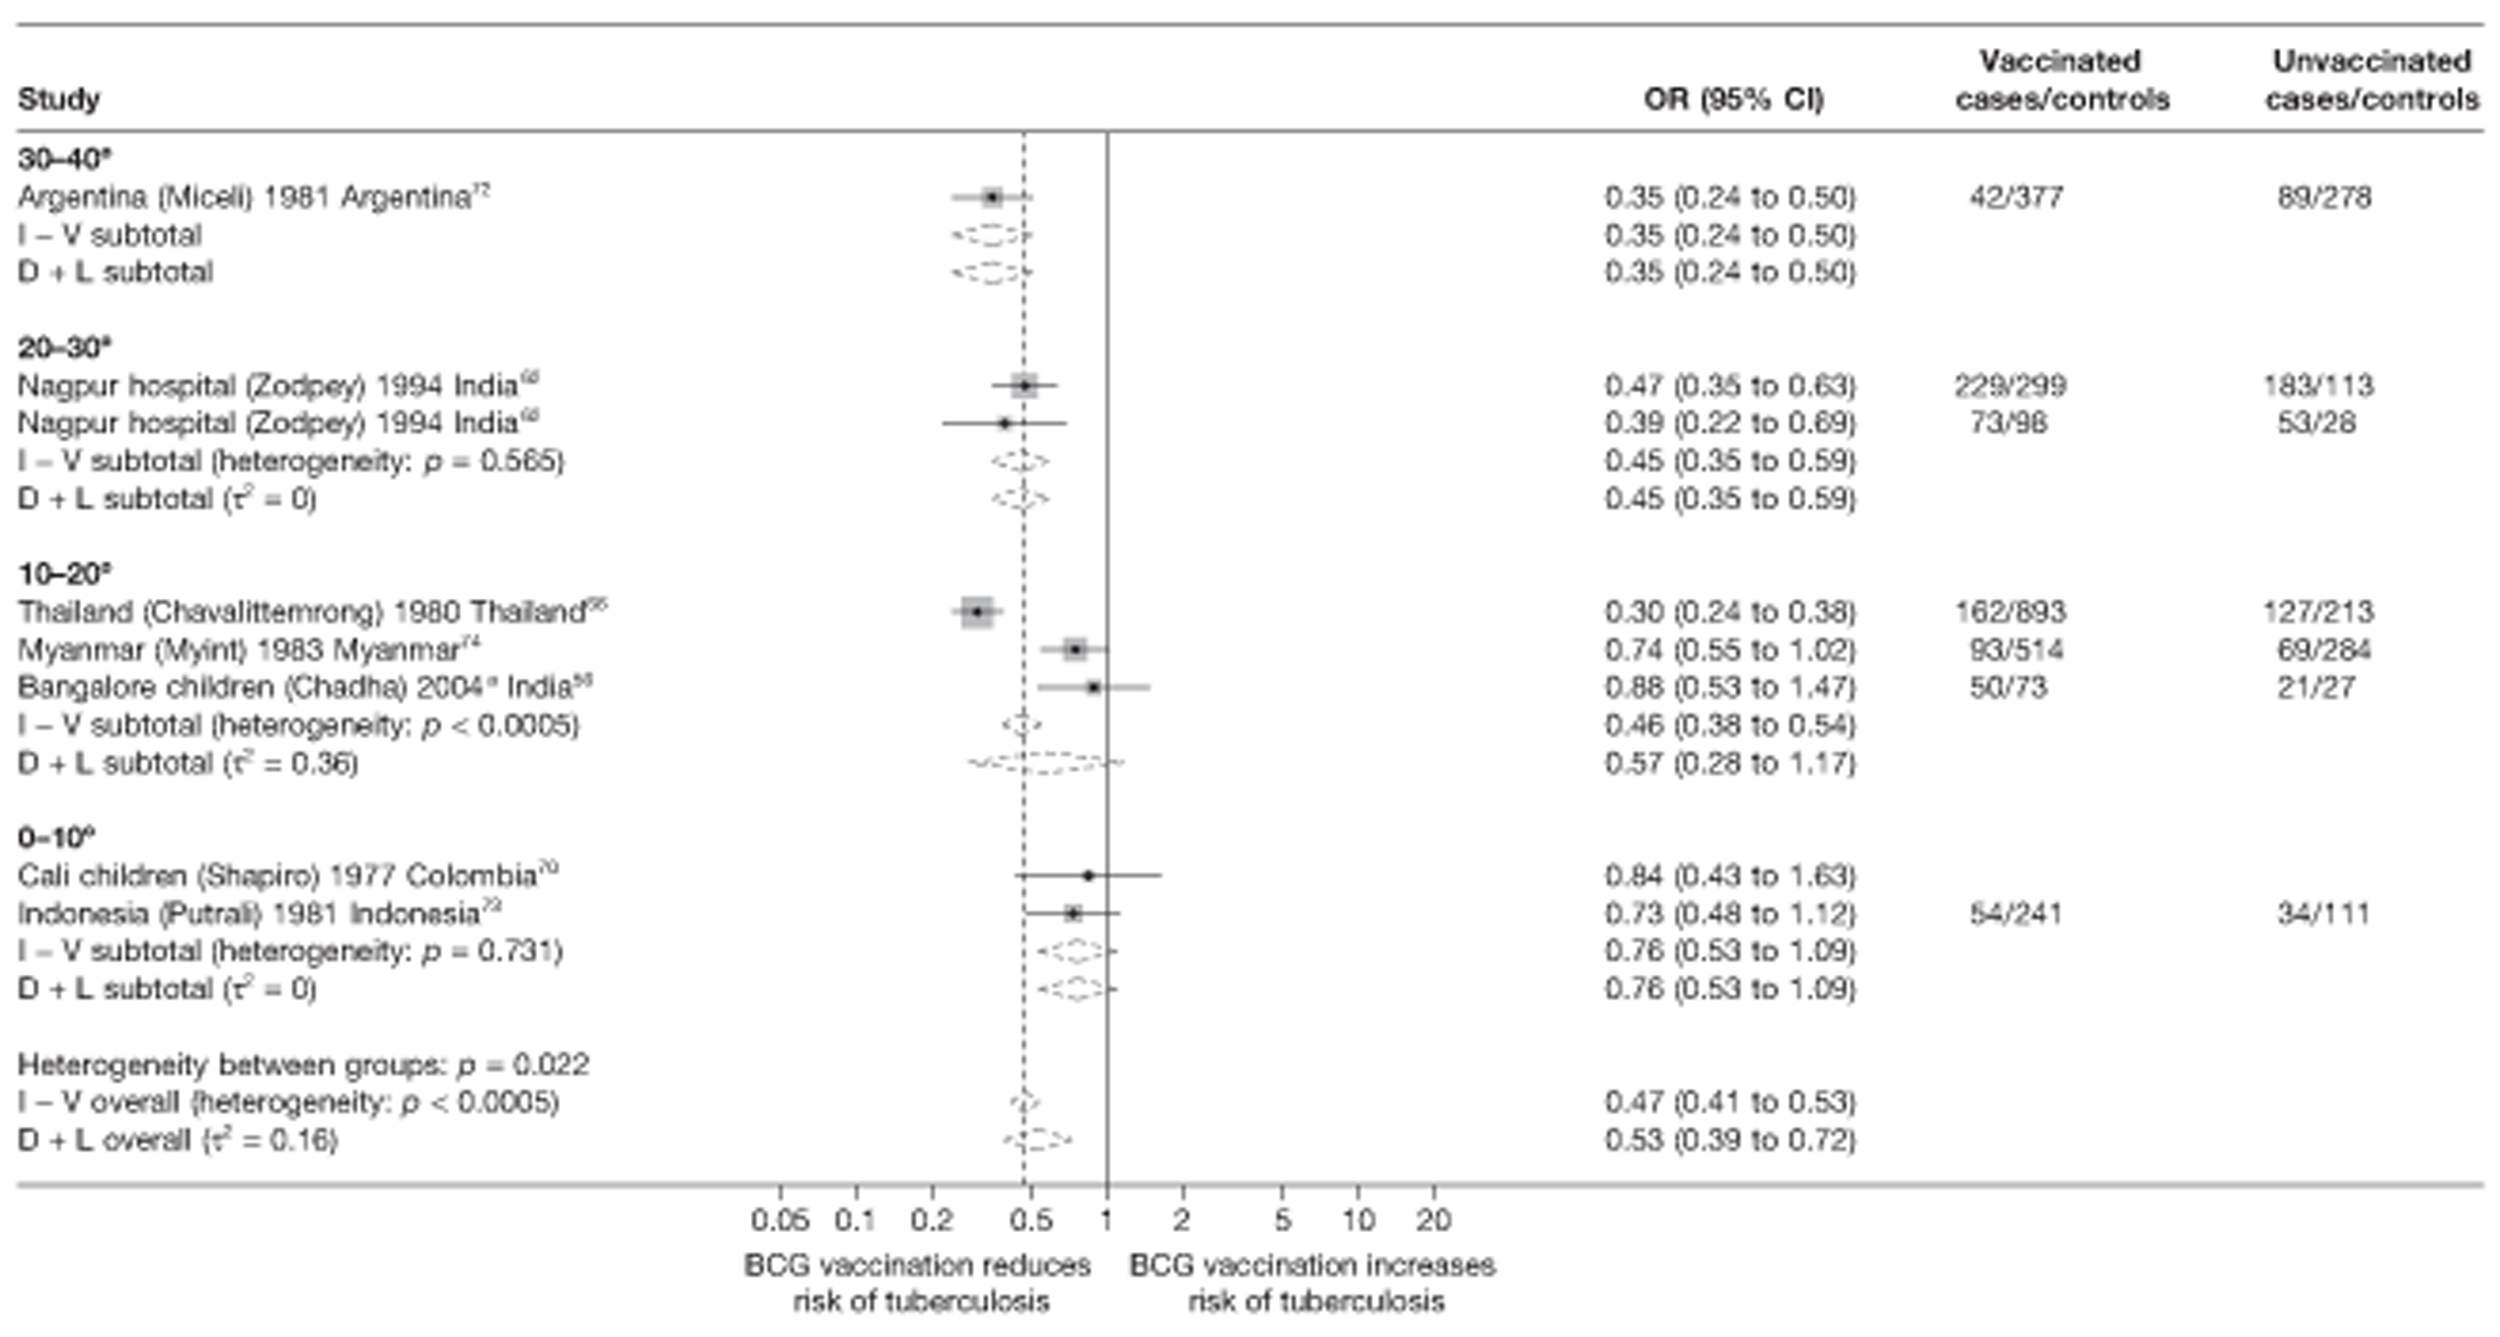
FIGURE 31.
Rate ratios (with 95% CI) comparing the incidence of pulmonary tuberculosis among BCG vaccinated individuals with that in unvaccinated individuals for the longest duration of follow-up (see Table 4) in cohort studies, stratified by latitude of study location (10° bands), ordered by year of study start. a, Date of study publication was used if study start date was not available. D + L, DerSimonian and Laird method; I – V, inverse variance method.
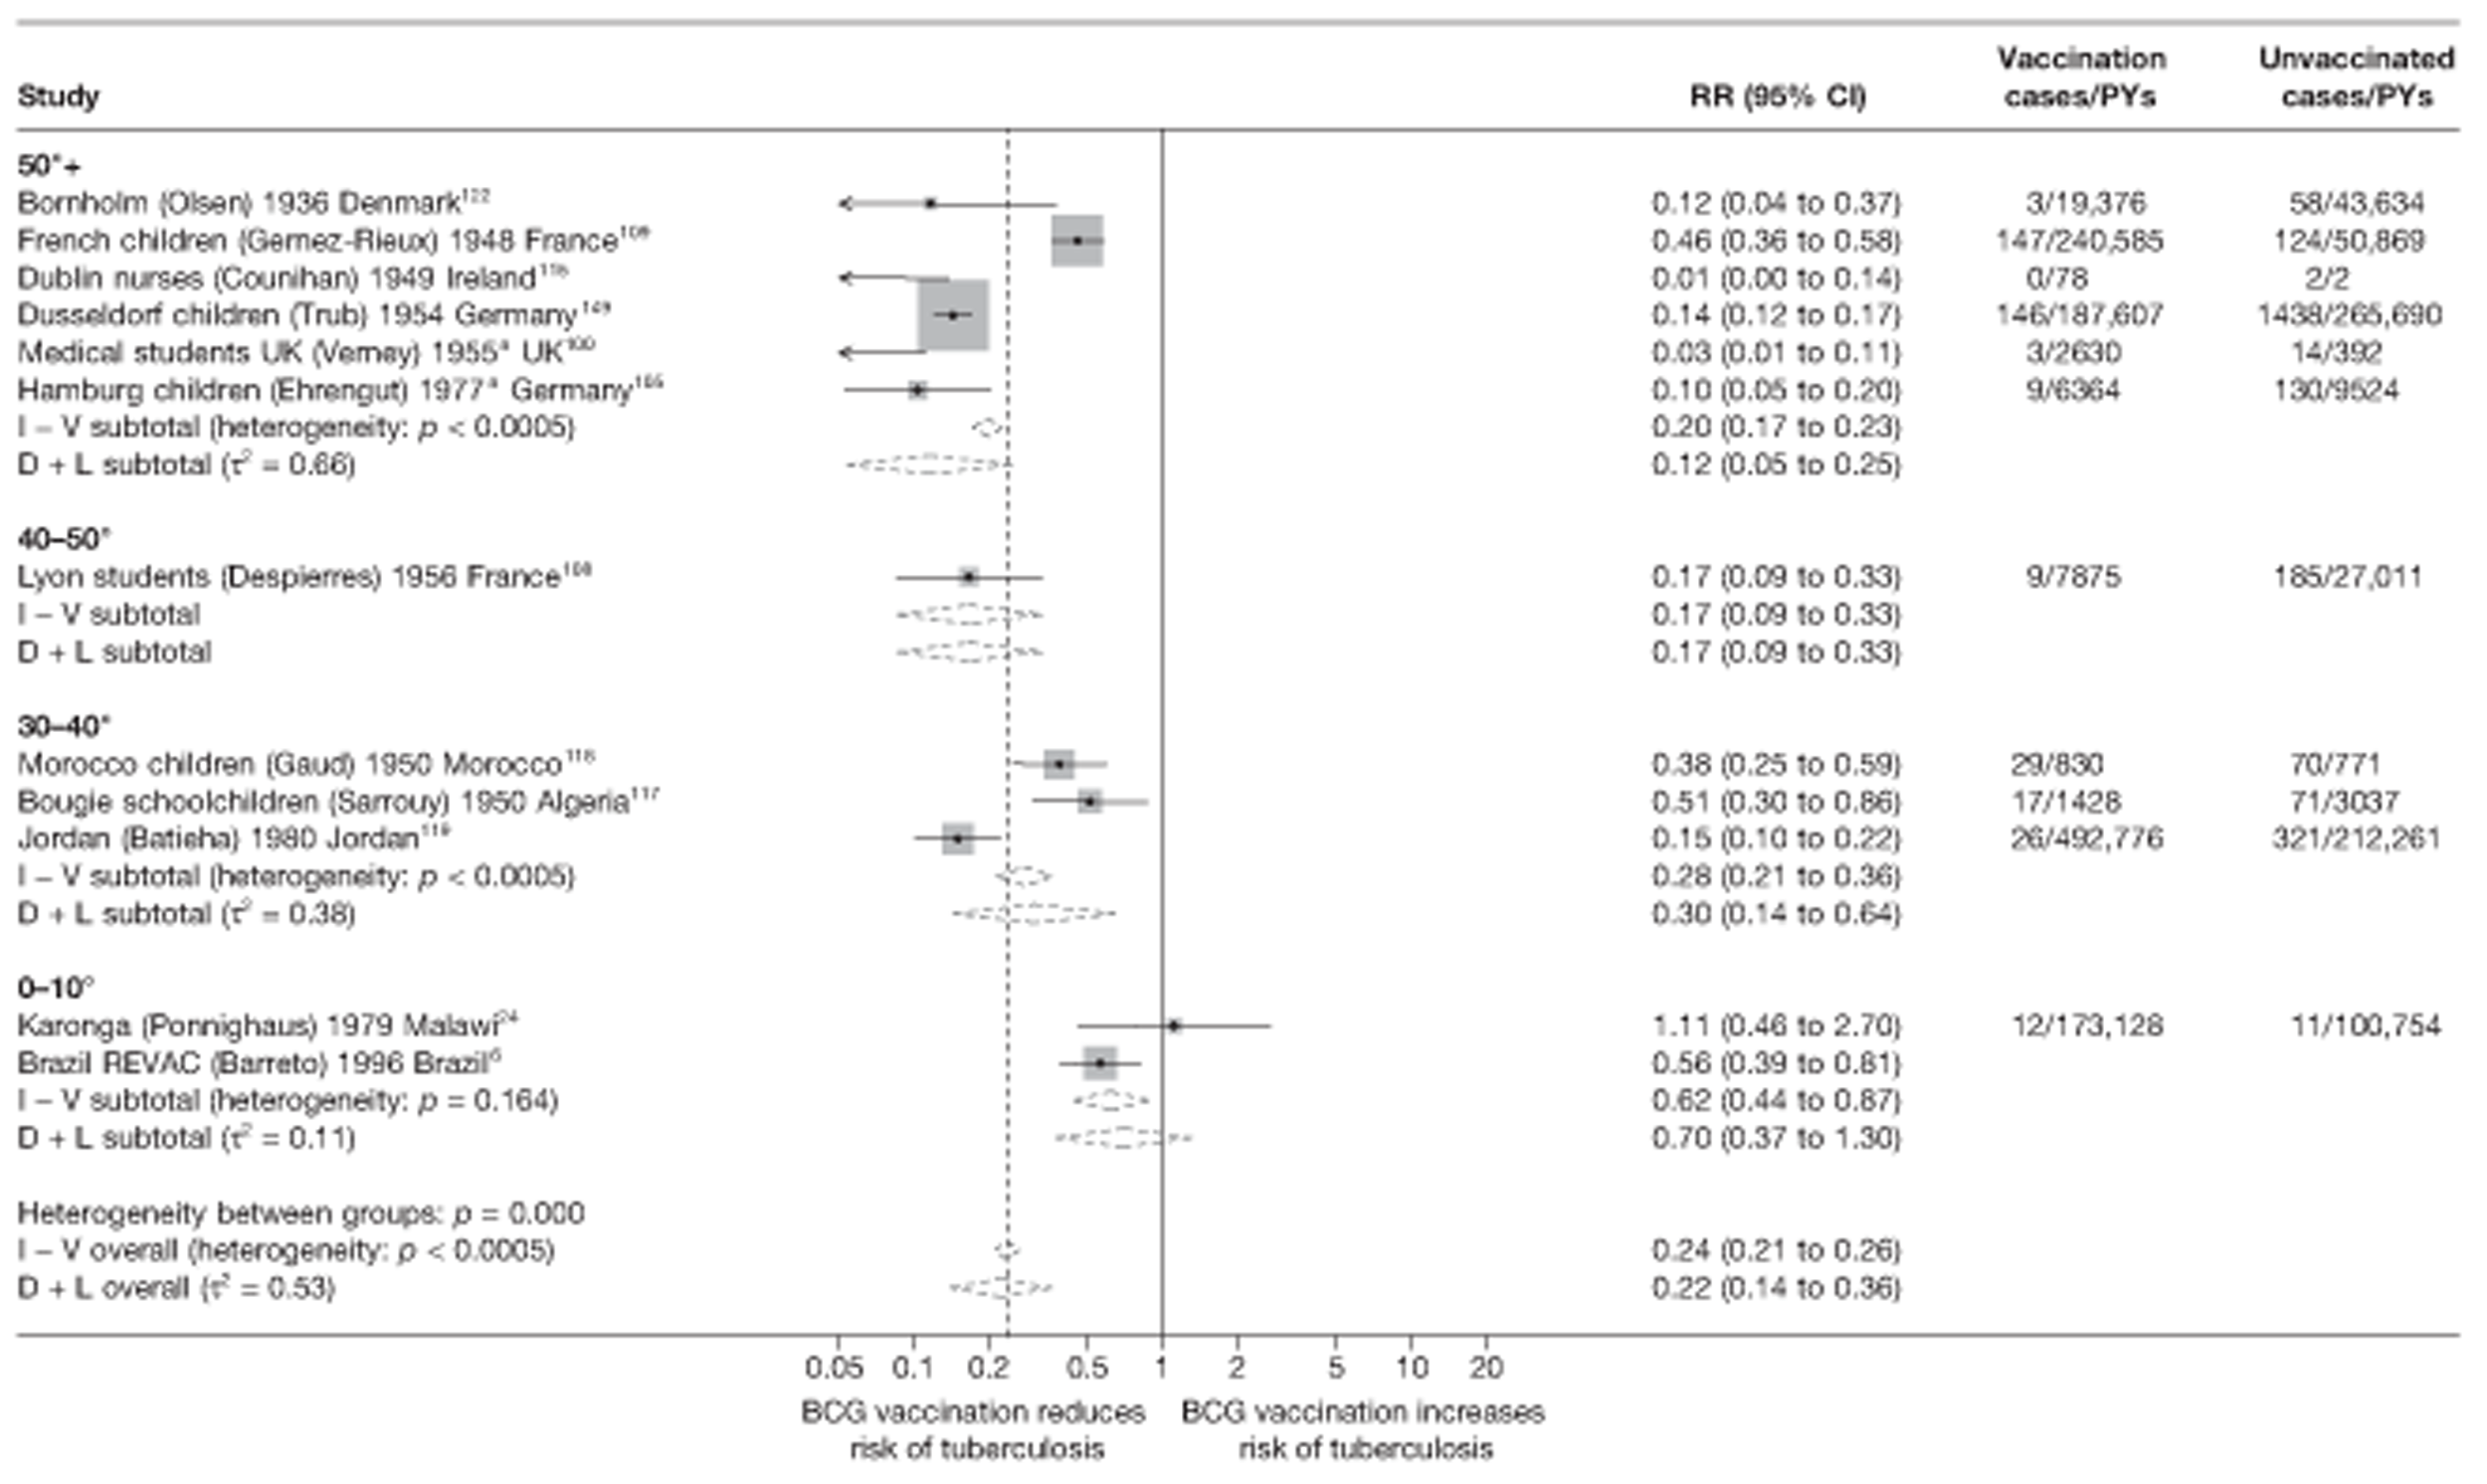
FIGURE 32.
Rate ratios (with 95% CI) comparing the incidence of pulmonary tuberculosis among BCG vaccinated individuals with that in unvaccinated individuals for the longest duration of follow-up (see Table 5) in case population studies, stratified by latitude of study location (10° bands), ordered by year of study start. D + L, DerSimonian and Laird method; I – V, inverse variance method.
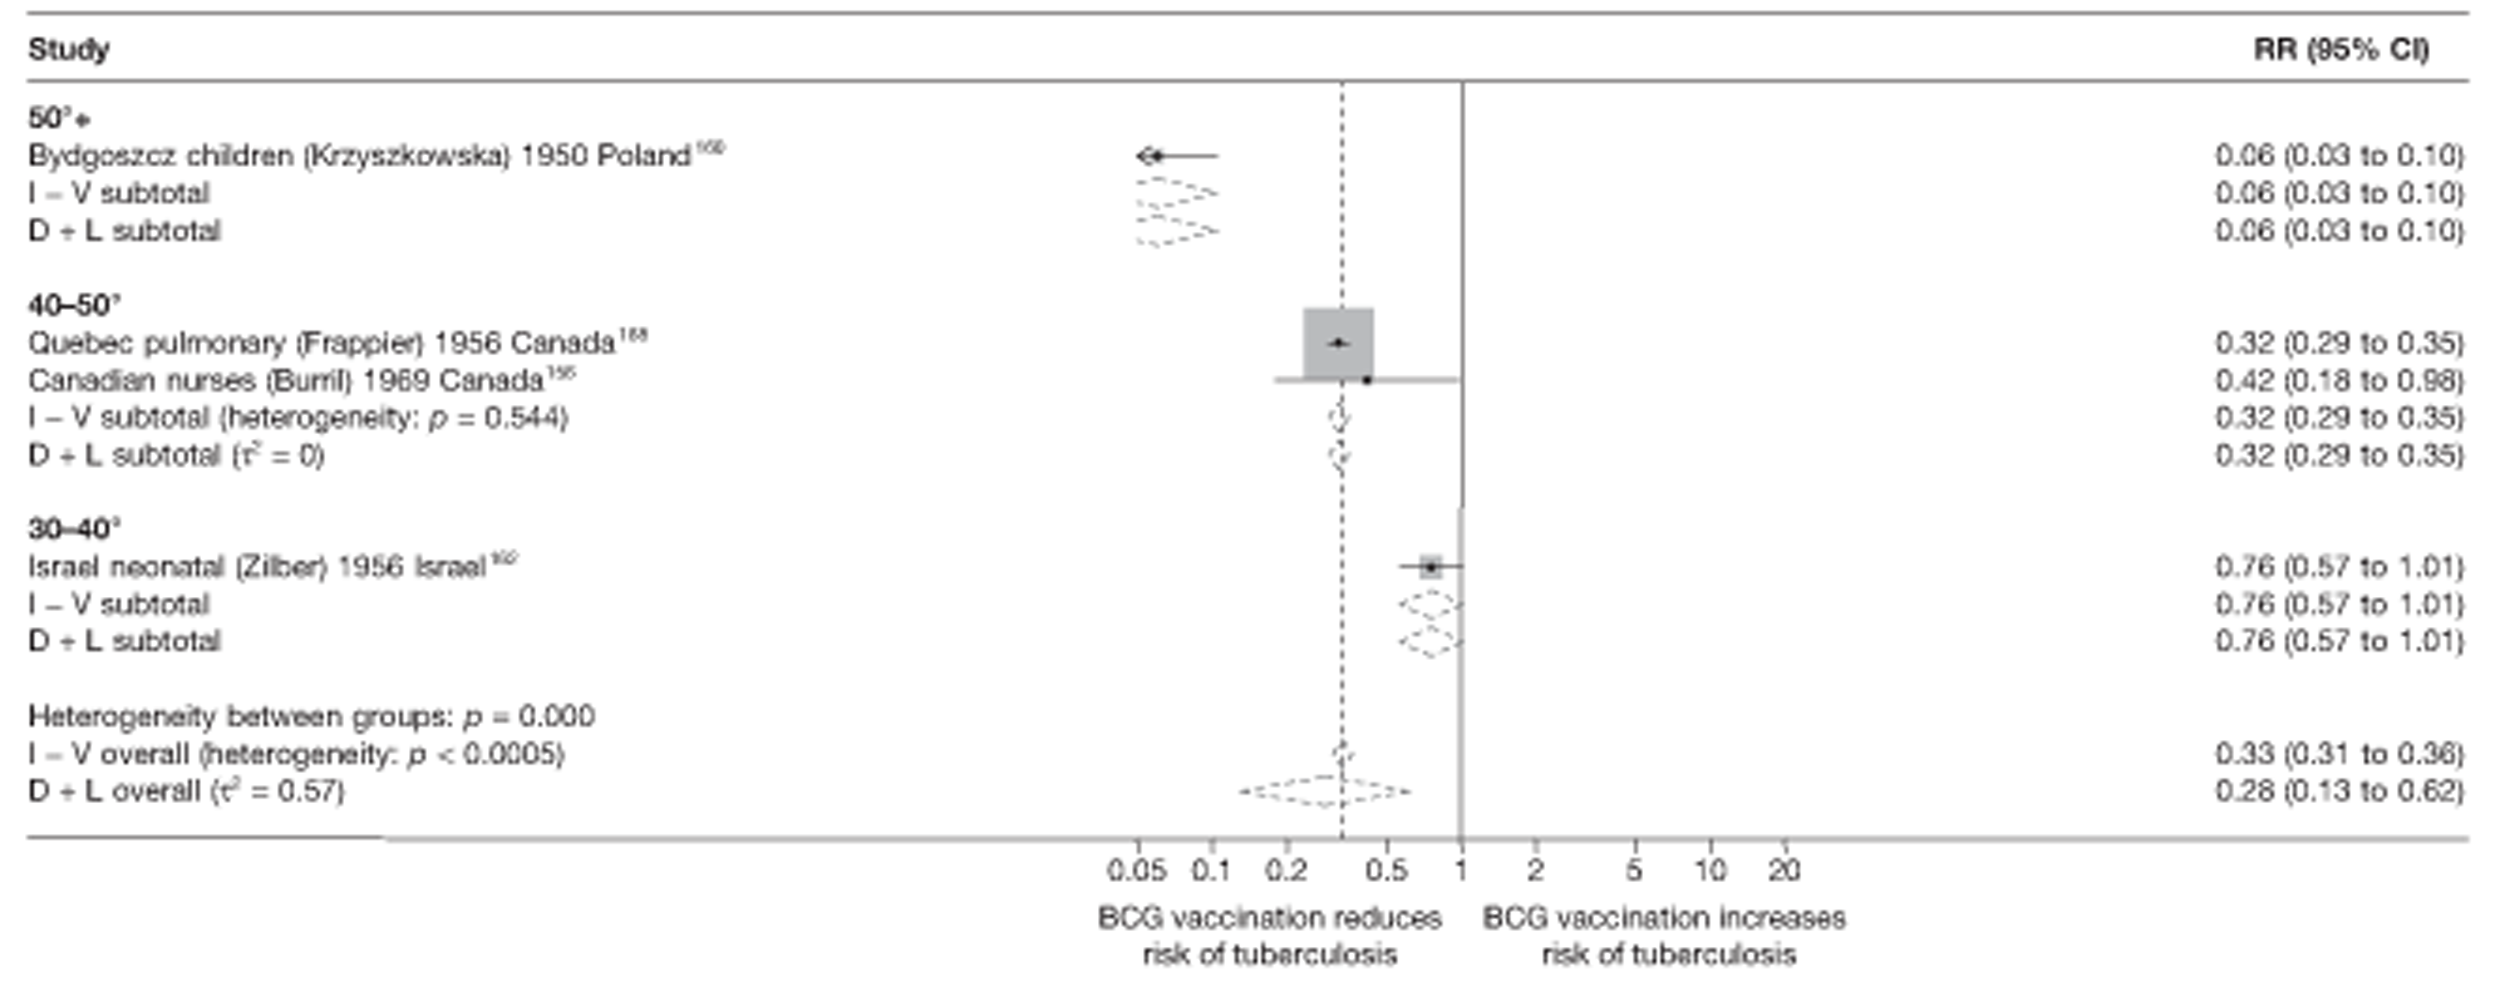
FIGURE 33.
Risk ratios (with 95% CI) comparing the prevalence of pulmonary tuberculosis among BCG vaccinated individuals with that in unvaccinated in cross-sectional studies, stratified by latitude of study location (10° bands), ordered by year of study start. a, Date of study publication was used if study start date was not available. D + L, DerSimonian and Laird method; I – V, inverse variance method.
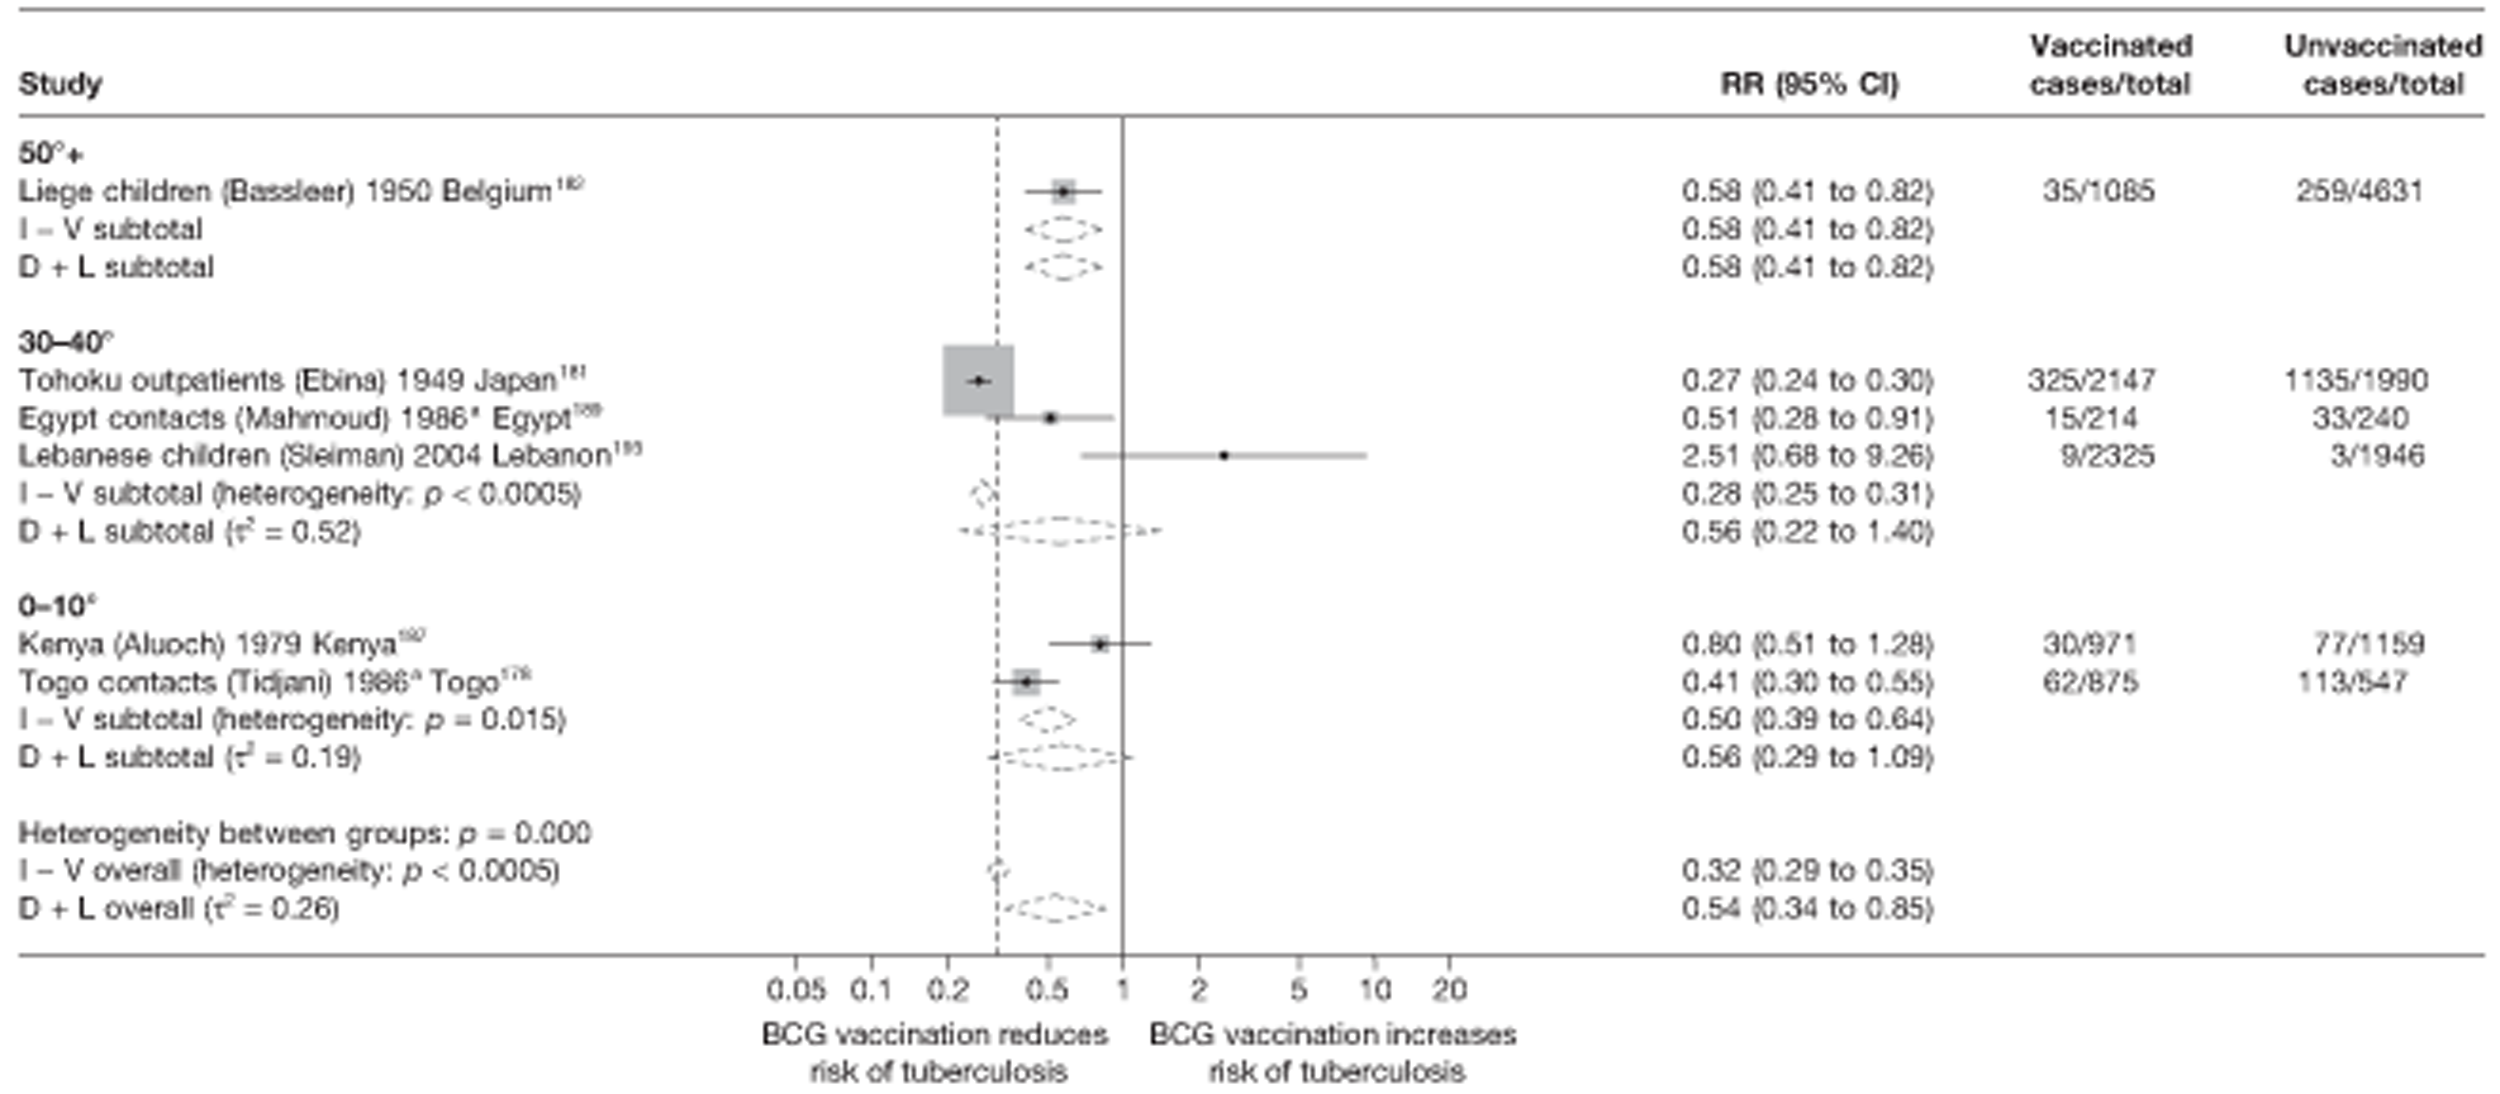
Meta-regression analysis
Using such an analysis, however, indicated that stratification on latitude explained only a small amount (9%) of the between-study heterogeneity within case–control studies (null model τ2 = 0.141, after stratification τ2 = 0.128). There was little evidence to suggest that BCG vaccination effectiveness varies with latitude (p-value = 0.199) in this study type (Table 12). Latitude explained a more substantial amount of heterogeneity (42%) in cohort studies (τ2 values before and after stratification = 0.872 and 0.509, respectively, Table 13), and some evidence (p-value = 0.060) that BCG vaccination effectiveness varies with latitude and with study design (retrospective cohort studies were more likely to show a protective effect than prospective cohort studies). None of the between-study variation seen within cross-sectional studies was found to be associated with latitude (τ2 values before and after stratification = 0.249 and 0.599, respectively (Table 14). There were an insufficient number of case population studies to undertake meta-regression analyses.
| Variable | Number of studies | Univariable ORs (95% CI) | Univariable model | ||
|---|---|---|---|---|---|
| Ratio of ORs (95% CI) | p-value | τ2 | |||
| Null model | 8 | 0.141 | |||
| Latitude | |||||
| 40°+ | 0 | ||||
| 20–40° | 3 | 0.40 (0.22 to 0.74) | 1.00 (ref.) | ||
| 0–20° | 5 | 0.62 (0.39 to 1.01) | 1.55 (0.74 to 3.26) | 0.199 | 0.128 |
| Age at vaccination | |||||
| Neonatal | 7 | 0.50 (0.33 to 0.76) | 1.00 (ref.) | ||
| School age | 0 | ||||
| Other | 1 | 0.84 (0.23 to 3.08) | 1.66 (0.46 to 6.08) | 0.374 | 0.141 |
| Was disease status blinded to BCG assessors? | |||||
| Lower risk of bias | 0 | ||||
| Higher risk of bias | 8 | 0.141 | |||
| Were vaccination definitions the same for cases and control subjects? | |||||
| Lower risk of bias | 6 | 0.57 (0.35 to 0.91) | 1.00 (ref.) | ||
| Higher risk of bias | 2 | 0.43 (0.19 to 1.00) | 0.77 (0.31 to 1.90) | 0.500 | 0.160 |
| Were cases and control subjects determined independently of BCG vaccination status? | |||||
| Lower risk of bias | 5 | 0.52 (0.30 to 0.89) | 1.00 (ref.) | ||
| Higher risk of bias | 3 | 0.55 (0.28 to 1.10) | 1.07 (0.47 to 2.45) | 0.853 | 0.171 |
| Were results adjusted for SES? | |||||
| Yes | 5 | 0.53 (0.31 to 0.90) | 1.00 (ref.) | ||
| No | 3 | 0.53 (0.26 to 1.07) | 1.01 (0.44 to 2.33) | 0.985 | 0.171 |
| If a matched design was used, was a matched analysis performed? | |||||
| Unmatched design | 1 | 0.30 (0.12 to 0.80) | 1.00 (ref.) | ||
| Matched design – matched analysis | 3 | 0.52 (0.27 to 1.00) | 1.69 (0.57 to 5.03) | ||
| Matched design – matched analysis | 4 | 0.63 (0.37 to 1.08) | 2.07 (0.74 to 5.77) | 0.279 | 0.106 |
| Variable | Number of studies | Univariable rate ratios (95% CI) | Univariable model | ||
|---|---|---|---|---|---|
| Ratio of rate ratios (95% CI) | p-value | τ2 | |||
| Null model | 12 | 0.872 | |||
| Latitude | |||||
| > 40° | 7 | 0.12 (0.06 to 0.27) | 1.00 (ref.) | ||
| 20–40° | 3 | 0.31 (0.11 to 0.87) | 2.46 (0.68 to 8.90) | ||
| 0–20° | 2 | 0.75 (0.19 to 2.92) | 6.08 (1.31 to 28.10) | 0.060 | 0.509 |
| Age at vaccination | |||||
| Neonatal | 3 | 0.20 (0.07 to 0.54) | 1.00 (ref.) | ||
| School age | 6 | 0.36 (0.17 to 0.76) | 1.83 (0.53 to 6.37) | ||
| Other | 3 | 0.05 (0.01 to 0.19) | 0.24 (0.04 to 1.32) | 0.049 | 0.546 |
| Was follow-up independent of vaccination status? | |||||
| Lower risk of bias | 6 | 0.25 (0.09 to 0.70) | 1.00 (ref.) | ||
| Higher risk of bias | 6 | 0.17 (0.06 to 0.52) | 0.70 (0.16 to 3.10) | 0.604 | 0.993 |
| Was case ascertainment blinded to vaccination status? | |||||
| Lower risk of bias | 0 | ||||
| Higher risk of bias | 12 | 0.872 | |||
| Were methods of case ascertainment identical for vaccinated and unvaccinated group? | |||||
| Lower risk of bias | 10 | 0.28 (0.14 to 0.54) | 1.00 (ref.) | ||
| Higher risk of bias | 2 | 0.06 (0.01 to 0.28) | 0.22 (0.04 to 1.14) | 0.067 | 0.524 |
| Were losses to follow-up similar in each group? | |||||
| Lower risk of bias | 3 | 0.23 (0.05 to 1.15) | 1.00 (ref.) | ||
| Higher risk of bias | 9 | 0.20 (0.08 to 0.48) | 0.87 (0.14 to 5.27) | 0.869 | 0.982 |
| Was diagnostic detection bias present? | |||||
| Lower risk of bias | 5 | 0.39 (0.16 to 0.95) | 1.00 (ref.) | ||
| Higher risk of bias | 7 | 0.13 (0.06 to 0.30) | 0.33 (0.10 to 1.10) | 0.067 | 0.551 |
| Were results adjusted for SES? | |||||
| Yes | 2 | 0.75 (0.17 to 3.20) | 1.00 (ref.) | ||
| No | 10 | 0.17 (0.09 to 0.33) | 0.22 (0.05 to 1.06) | 0.058 | 0.572 |
| Study type | |||||
| Prospective | 5 | 0.13 (0.07 to 0.26) | 1.00 (ref.) | ||
| Retrospective | 7 | 0.47 (0.22 to 1.04) | 0.27 (0.10 to 0.76) | ||
| Contact | 0 | 0.018 | 0.342 | ||
| Variable | Number of studies | Univariable RRs (95% CI) | RRRs (95% CI) | p-value | τ2 |
|---|---|---|---|---|---|
| Null model | 6 | 0.249 | |||
| Latitude | |||||
| > 40° | 2 | 0.58 (0.01 to 22.59) | 1.00 (ref.) | ||
| 20–40° | 3 | 0.57 (0.06 to 5.61) | 0.99 (0.04 to 24.13) | ||
| 0–20° | 1 | 0.57 (0.04 to 7.72) | 0.99 (0.04 to 27.52) | 0.999 | 0.599 |
| Age at vaccination | |||||
| Neonatal | 1 | 0.41 (0.01 to 12.42) | 1.00 (ref.) | ||
| School age | 2 | 0.68 (0.06 to 7.95) | 1.66 (0.07 to 37.37) | ||
| Other | 3 | 0.55 (0.06 to 4.83) | 1.36 (0.07 to 26.99) | 0.878 | 0.500 |
| Was disease status blinded to BCG assessors? | |||||
| Lower risk of bias | 0 | 1.00 (ref.) | |||
| Higher risk of bias | 6 | 0.249 | |||
| Were vaccination definitions the same for cases and control subjects? | |||||
| Lower risk of bias | 4 | 0.66 (0.23 to 1.88) | 1.00 (ref.) | ||
| Higher risk of bias | 2 | 0.38 (0.11 to 1.38) | 0.58 (0.14 to 2.45) | 0.350 | 0.252 |
| Were cases and control subjects determined independently of BCG vaccination status? | |||||
| Lower risk of bias | 6 | 1.00 (ref.) | |||
| Higher risk of bias | 0 | 0.249 | |||
| Were results adjusted for SES? | |||||
| Yes | 0 | ||||
| No | 6 | 0.249 | |||
| Study type | |||||
| Non-contact | 4 | 0.61 (0.19 to 1.92) | 1.00 (ref.) | ||
| Contact | 2 | 0.45 (0.10 to 2.15) | 1.35 (0.25 to 7.29) | 0.650 | 0.359 |
Case–control studies
See Figure 30.
Cohort studies
See Figure 31.
Case population studies
See Figure 32.
Cross-sectional studies
See Figure 33.
Stratified analysis age at vaccination, ordered by year study started
Estimated effects of BCG vaccination on pulmonary tuberculosis from observational studies were stratified by age at vaccination (Figures 34–37). Only one case–control study of pulmonary tuberculosis did not have neonatal BCG vaccination (Figure 34). This study did not show a protective effect of vaccination, whereas the pooled estimate of neonatal vaccination studies was consistent with a moderate protective effect: OR 0.53 (95% CI 0.39 to 0.72), equivalent to a VE of 47% (95% CI 28% to 61%).
FIGURE 34.
Odds ratios (with 95% CI) comparing the BCG vaccination status of pulmonary tuberculosis cases and control subjects in case–control studies, stratified by age at vaccination, ordered by year of study start. a, Date of study publication was used if study start date was not available. D + L, DerSimonian and Laird method; I – V, inverse variance method.
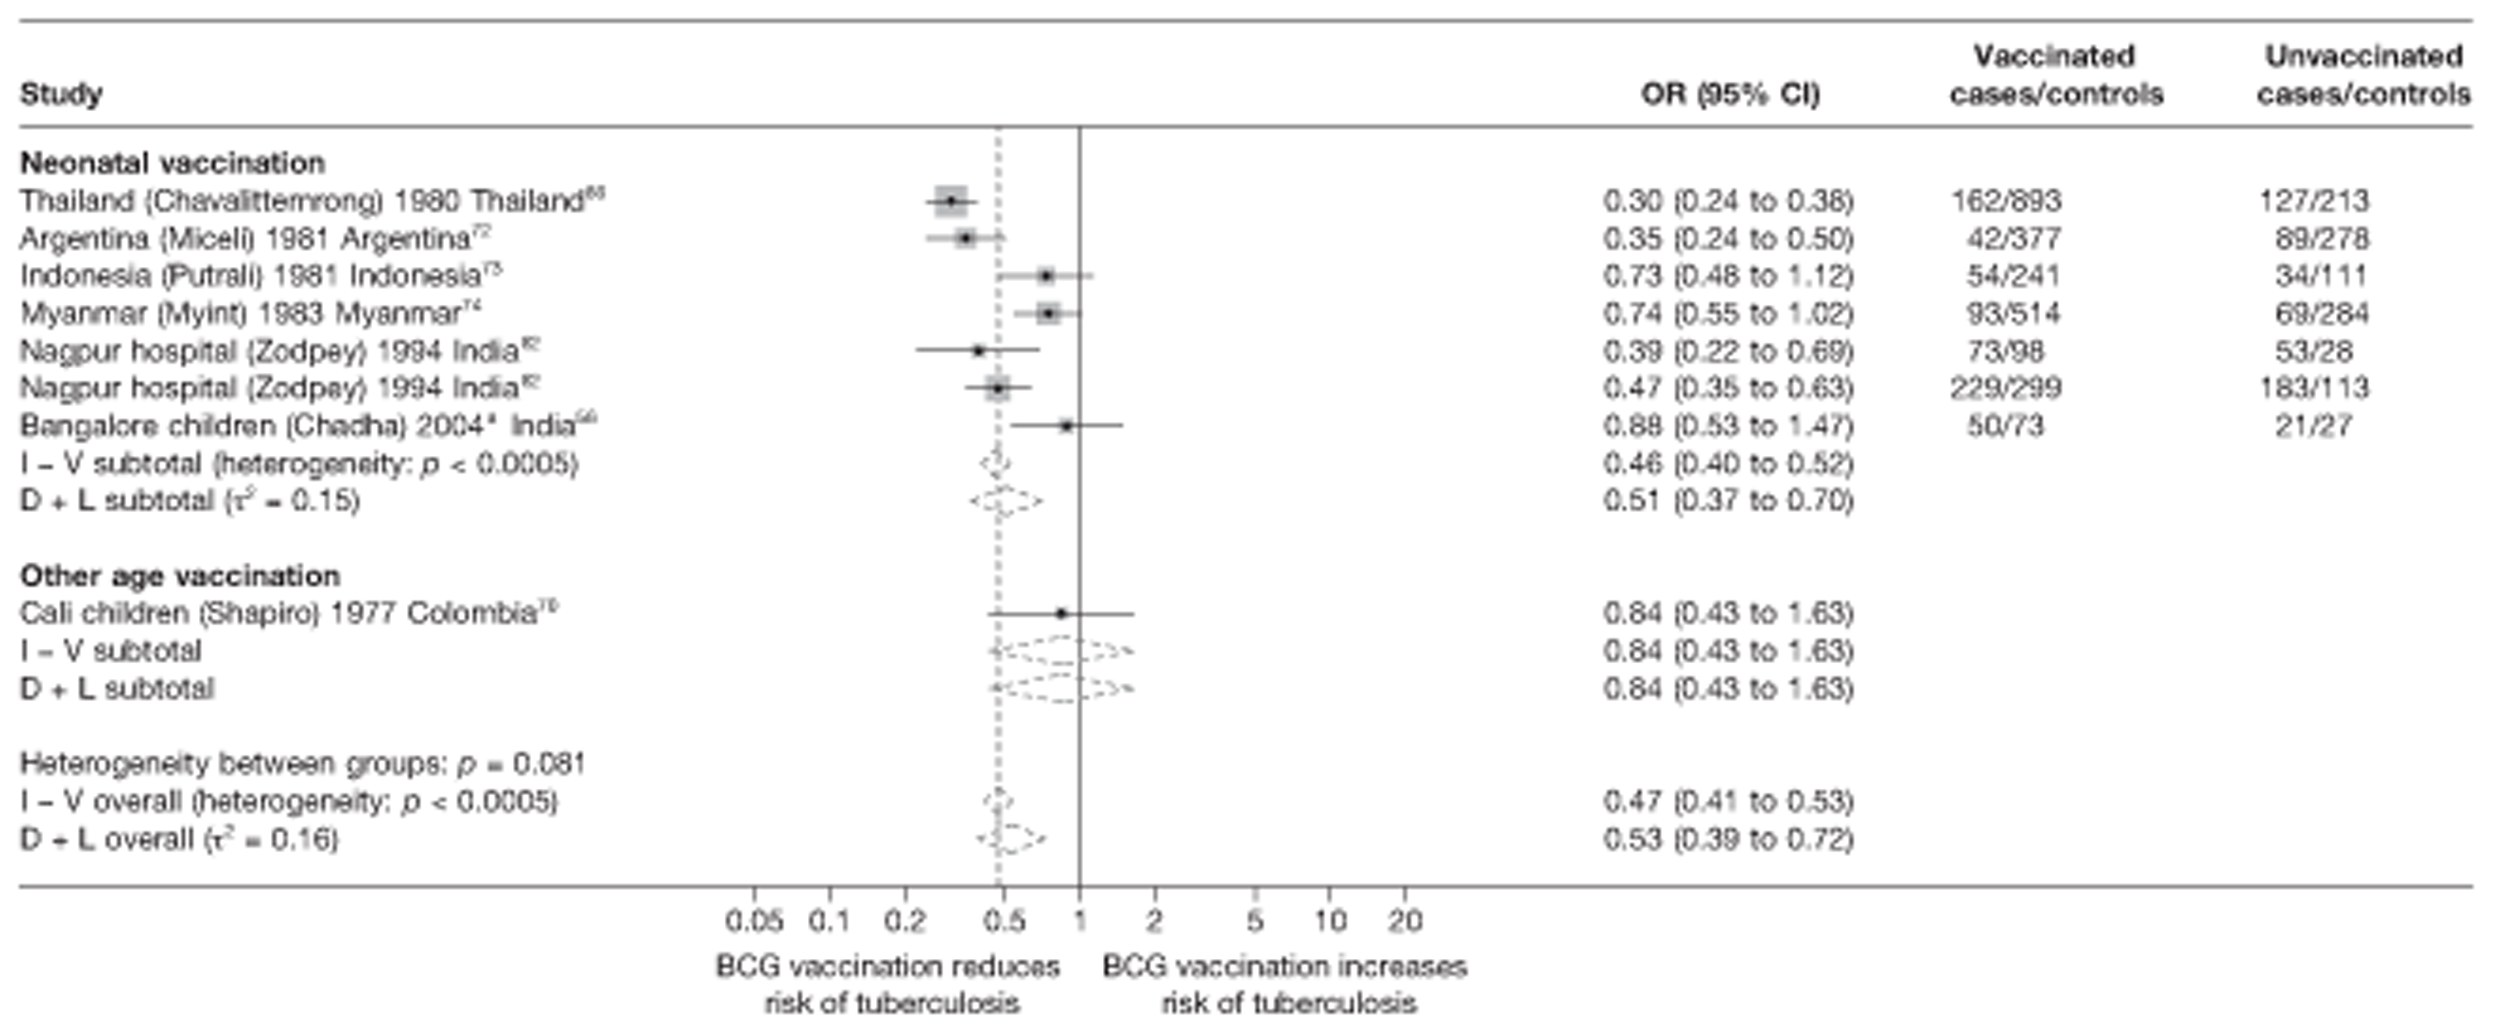
FIGURE 35.
Rate ratios (with 95 CI) comparing the incidence of pulmonary tuberculosis among BCG vaccinated individuals with that in unvaccinated individuals for the longest duration of follow-up (see Table 4) in cohort studies, stratified by age at vaccination, ordered by year of study start. a, Date of study publication was used if study start date was not available. D + L, DerSimonian and Laird method; I – V, inverse variance method.
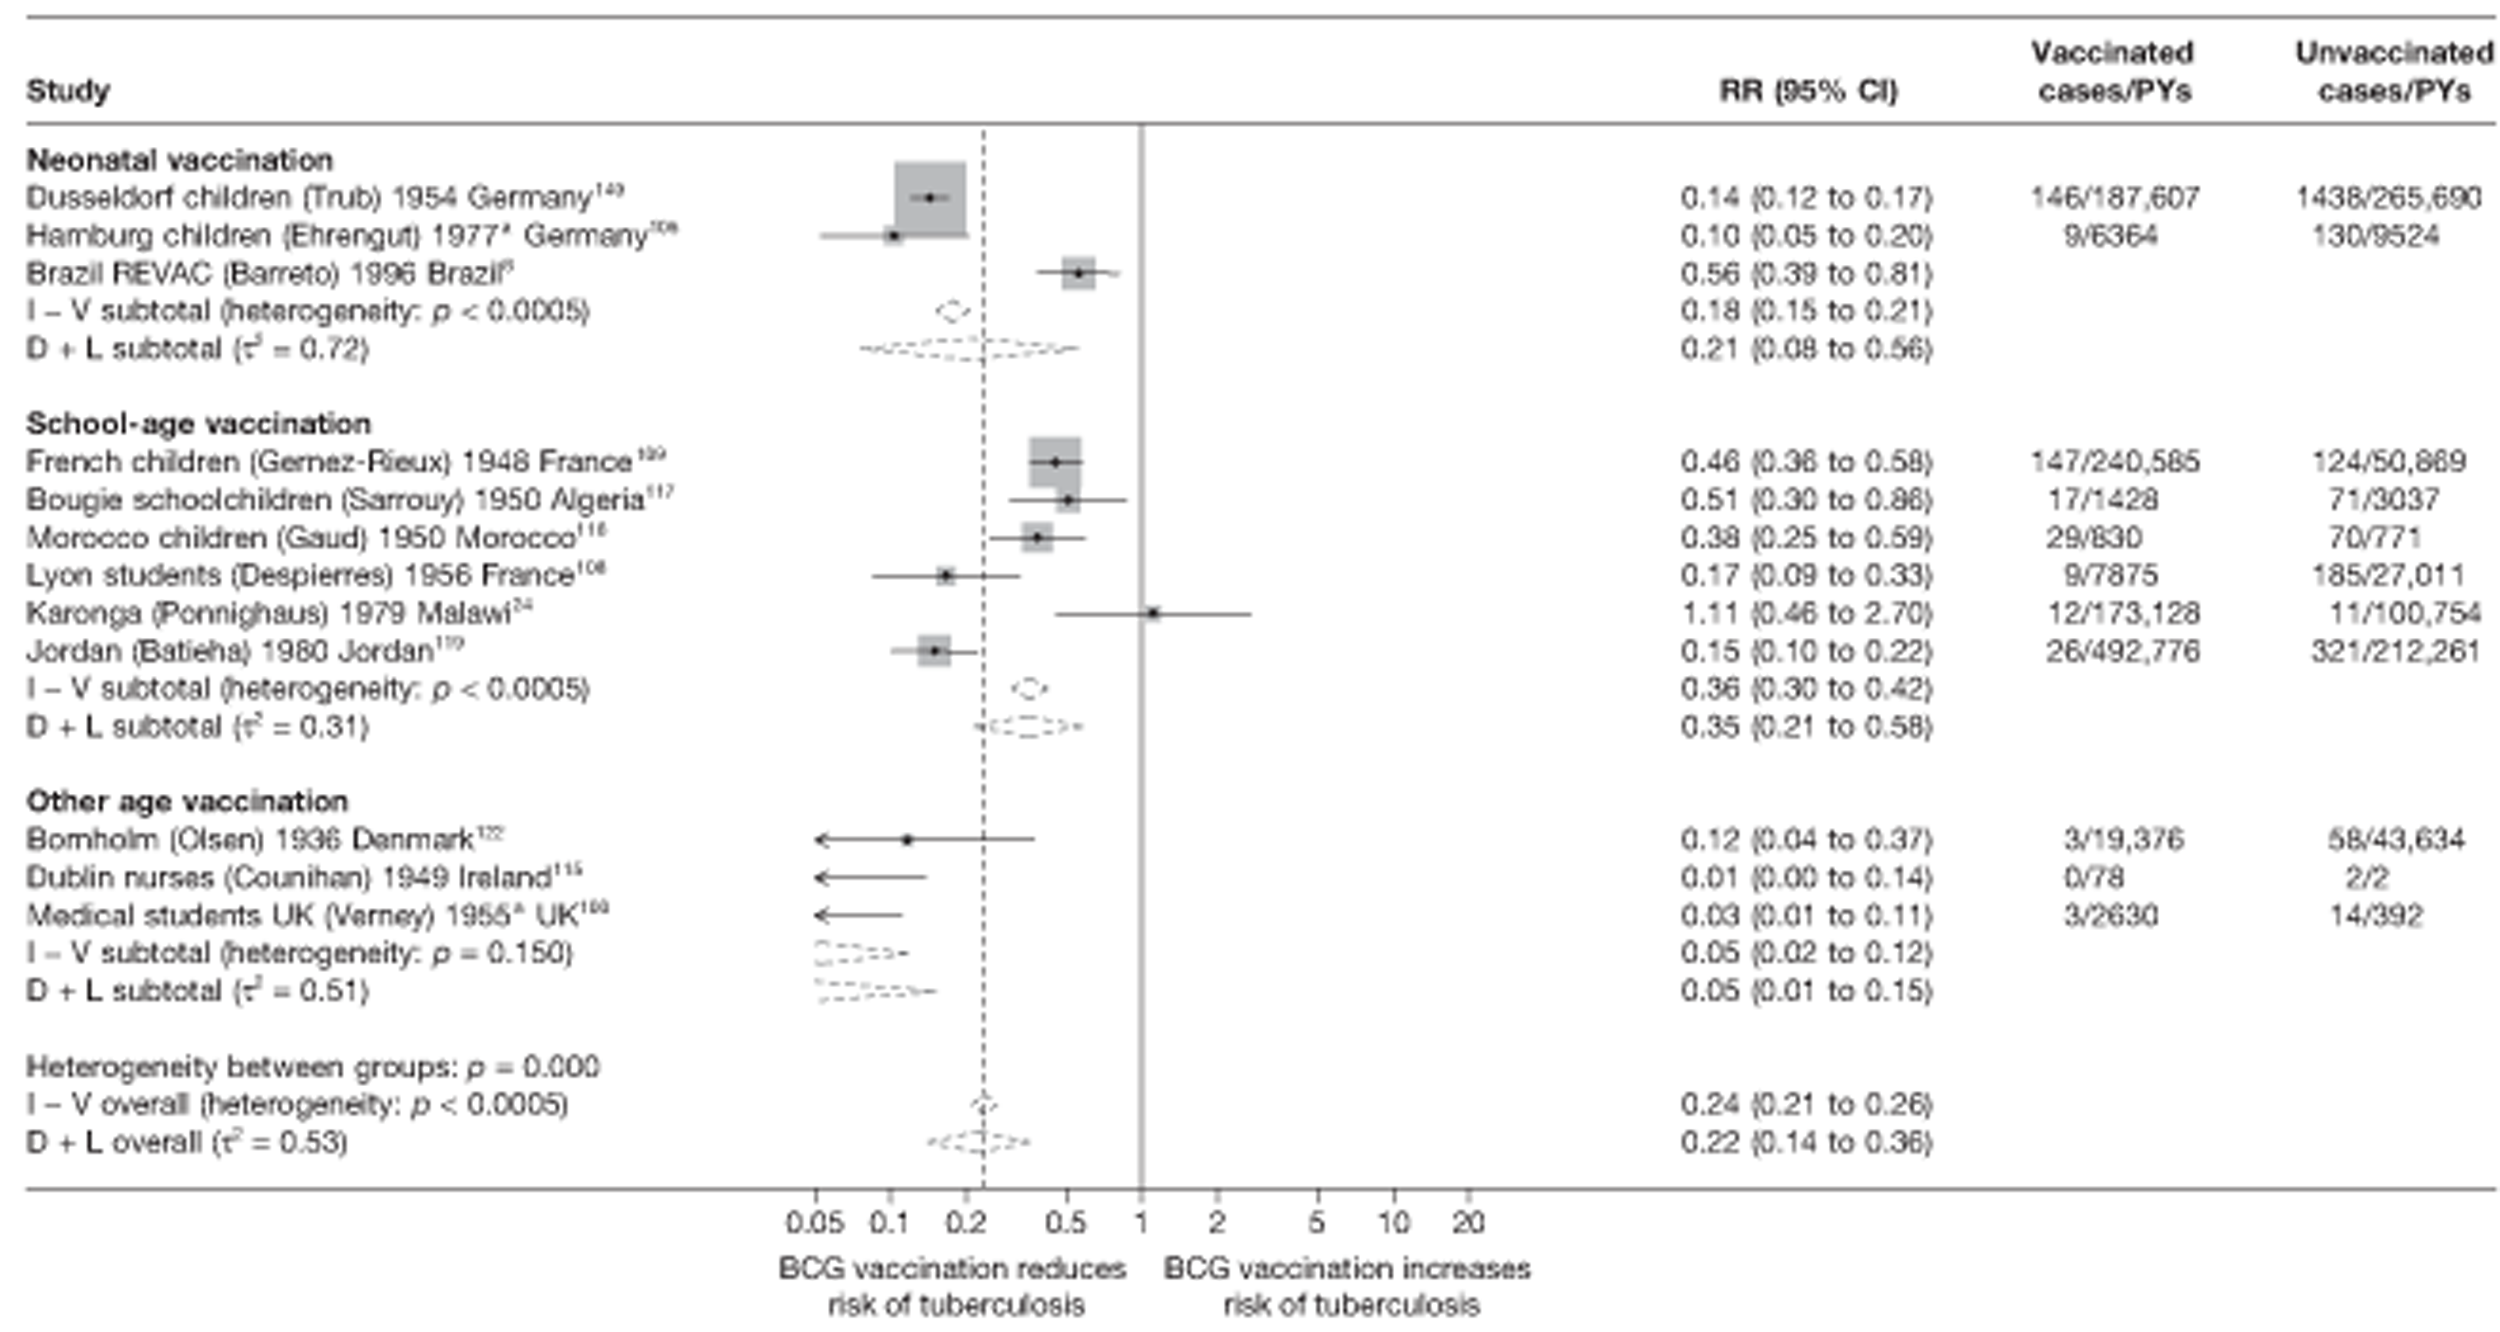
FIGURE 36.
Rate ratios (with 95% CI) comparing the incidence of pulmonary tuberculosis among BCG vaccinated individuals with that in unvaccinated individuals for the longest duration of follow-up (see Table 5) in case population studies, stratified by age at vaccination, ordered by year of study start. D + L, DerSimonian and Laird method; I – V, inverse variance method.
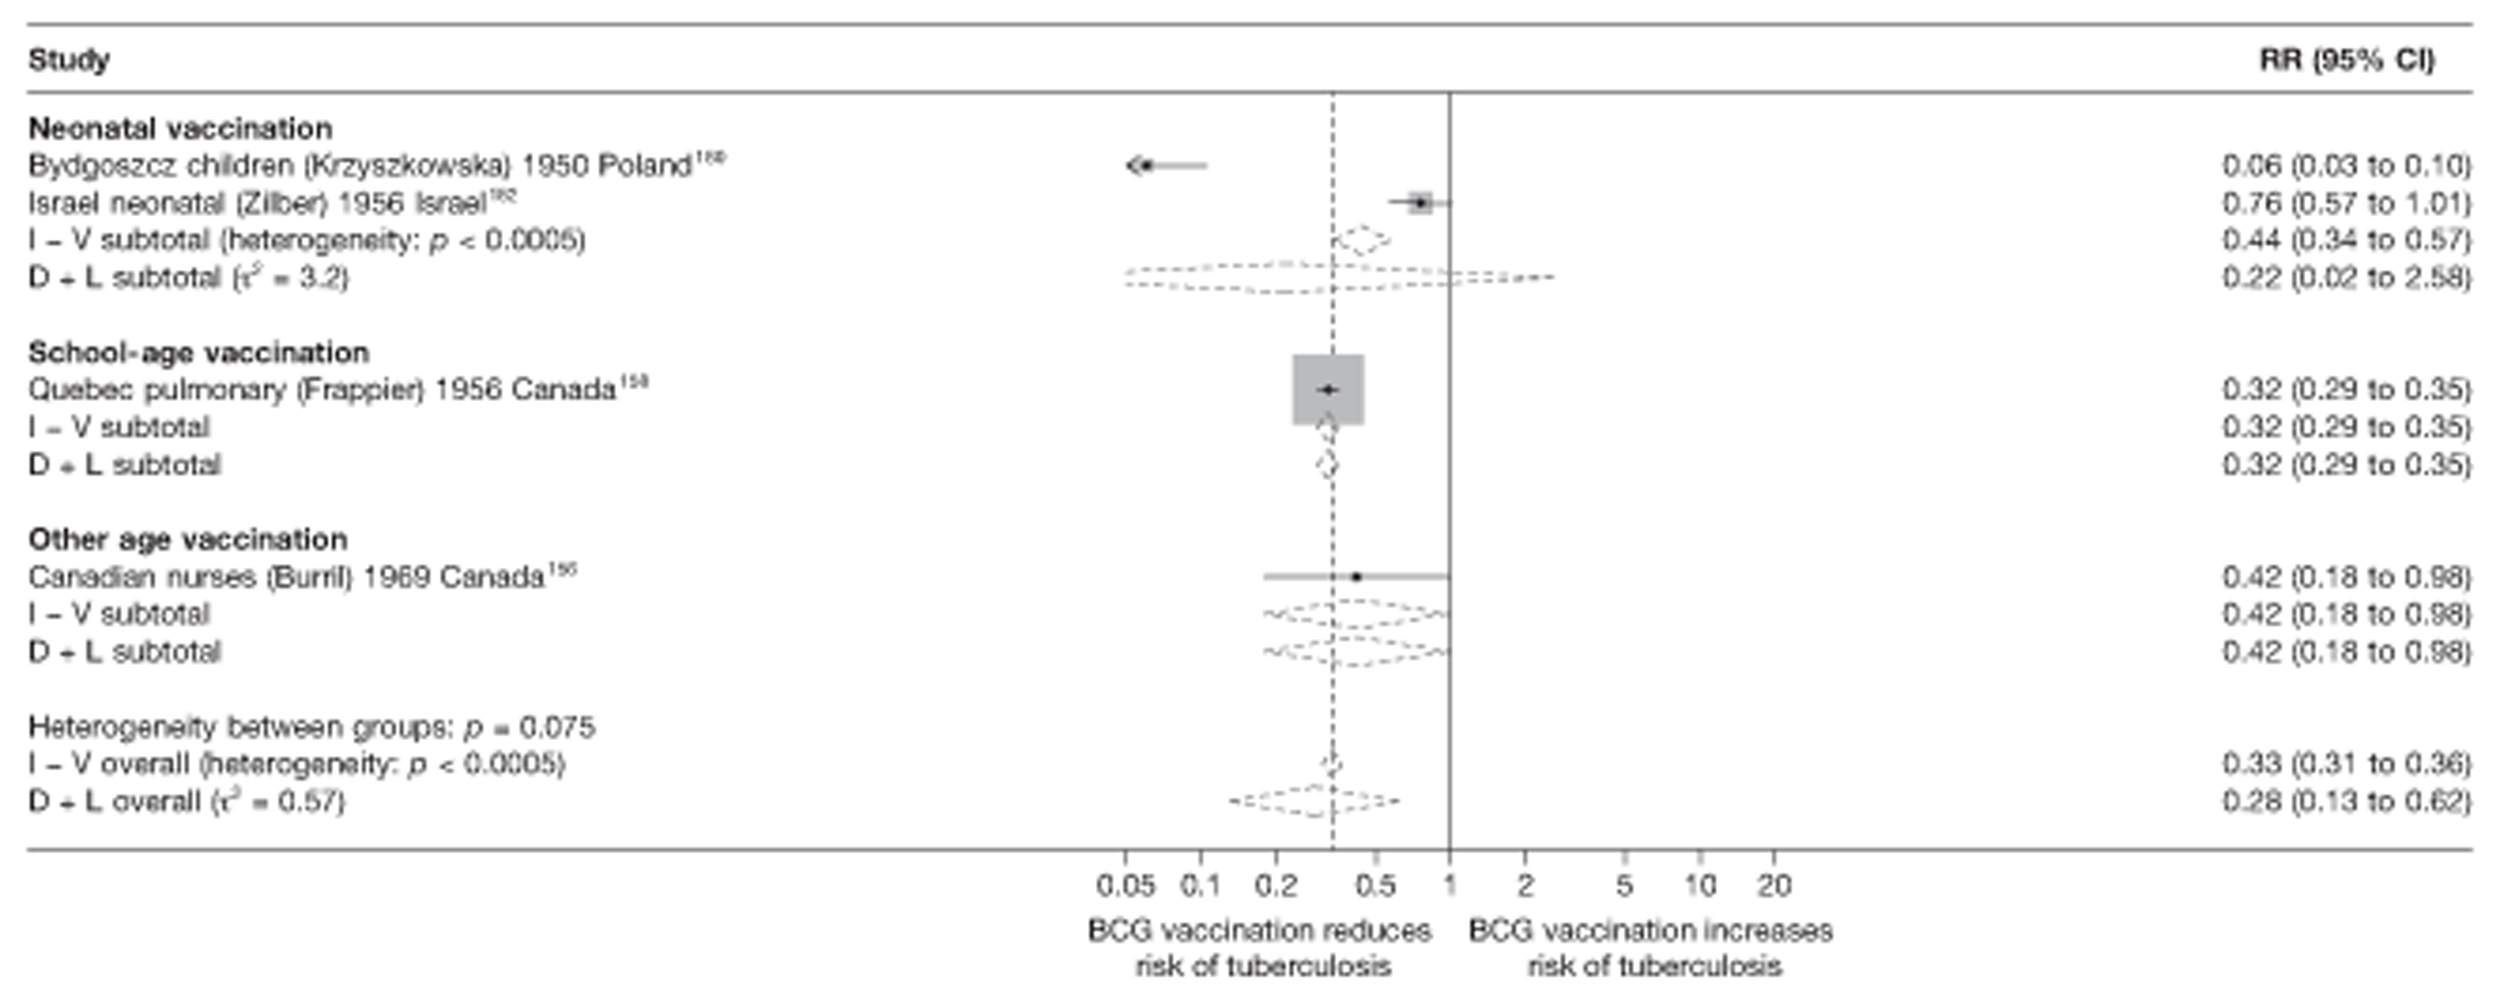
FIGURE 37.
Risk ratios (with 95% CI) comparing the prevalence of pulmonary tuberculosis among BCG vaccinated individuals with that in unvaccinated individuals in cross-sectional studies, stratified by age at vaccination, ordered by year of study start. a, Date of study publication was used if study start date was not available. D + L, DerSimonian and Laird method; I – V, inverse variance method.
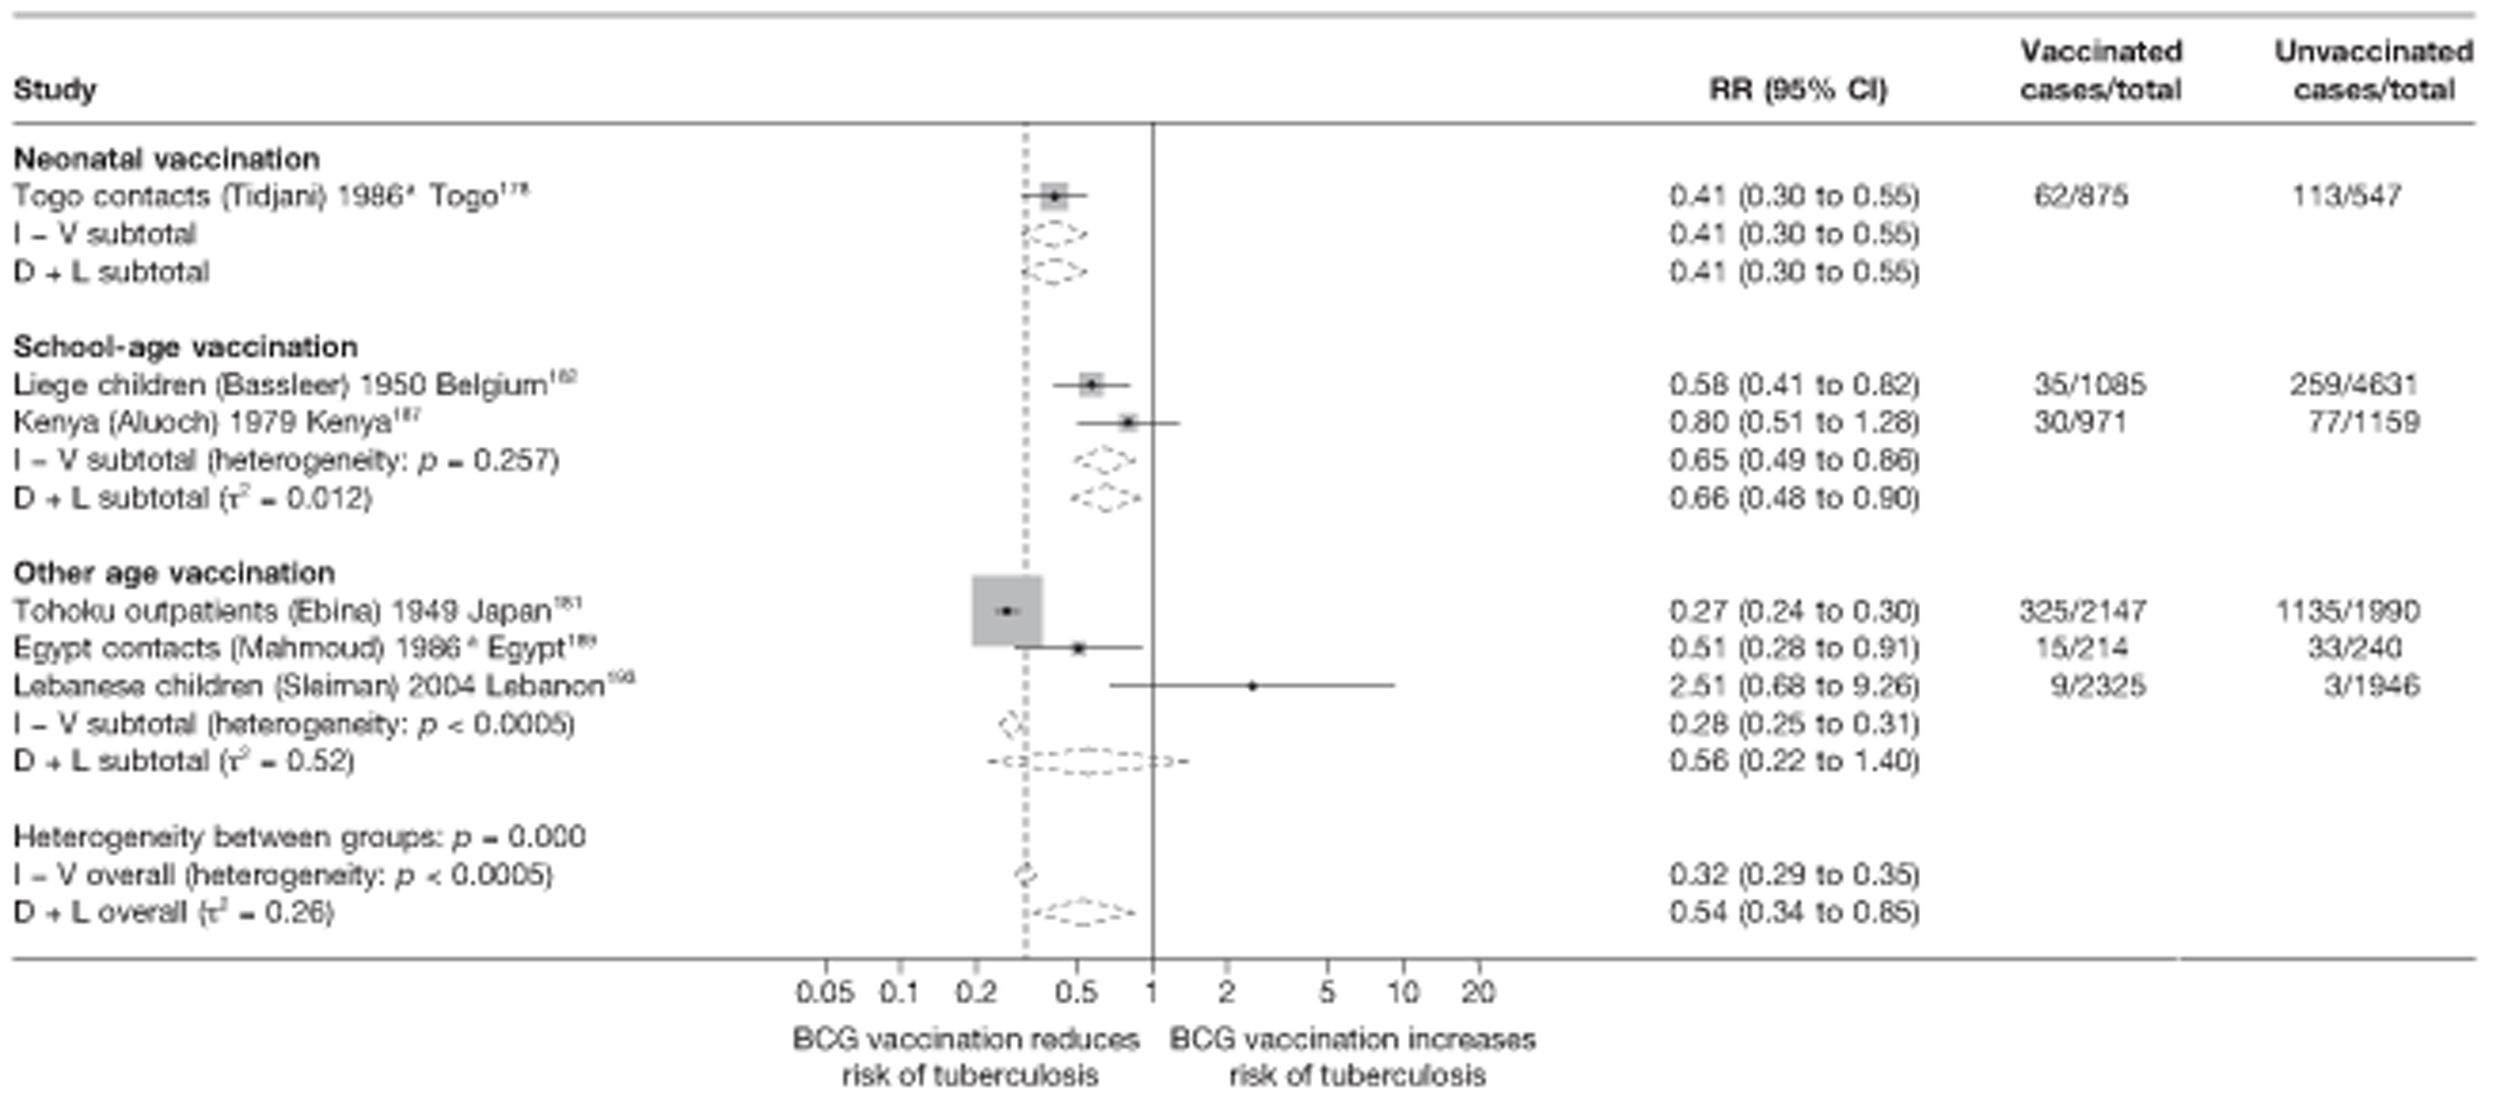
Results from the cohort studies showed some variation with neonatal BCG vaccination appearing to provide a good protective effect [rate ratio 0.21 (95% CI 0.08 to 0.56)], compared with school-age vaccination [rate ratio 0.35 (95% CI 0.21 to 0.58)] (see Figure 35). Results from studies of vaccination in other age groups showed highly protective effect, with the rate ratio ranging from 0.01 (95% CI 0.00 to 0.14) in the Dublin nurses study115 to 0.12 (95% CI 0.04 to 0.37) in the Bornholm study. 122
One of the two case population studies evaluating neonatal BCG vaccination (Bydgoszcz children),160 suggested a very high level of effectiveness, whereas the other (Israel neonatal) study,162 showed very little reduction in the risk of pulmonary tuberculosis, similar to the other two case population studies of school-age and other age vaccination, respectively. Only one of the cross-sectional studies assessed the effect of neonatal vaccination on pulmonary tuberculosis and showed a moderate protective effect, as did the two investigating school-age vaccination. Little protection was noted in those examining vaccinations in other age groups (see Figure 37). Similarly, little protection was noted in the outbreak study in other age groups (Figure 39), whereas overall moderate efcacy was seen in neonatal vaccination outbreak studies.
Meta-regression analysis
Using this method, stratification on age at vaccination accounted for only some of the heterogeneity in cohort studies (τ2 values before and after stratification were 0.872 and 0.546, respectively, see Table 13) and some evidence (p-value = 0.049) that age at vaccination is associated with the size of BCG vaccination protective effect.
Case–control studies
See Figure 34.
Cohort studies
See Figure 35.
Case population studies
See Figure 36.
Cross-sectional studies
See Figure 37.
Outbreak studies
See Figure 38.
FIGURE 38.
Risk ratios (with 95% CI) comparing the prevalence of pulmonary tuberculosis among BCG vaccinated individuals with that in unvaccinated individuals in outbreak studies, stratified by age at vaccination, ordered by year of study start. D + L, DerSimonian and Laird method; I – V, inverse variance method.

Stratified analysis by study design, ordered by year study started
Cohort studies
Figure 39 presents estimated effects of BCG vaccination against pulmonary tuberculosis in cohort studies, stratified by study design. Te strongest protective effect of BCG vaccination was seen in retrospective cohort studies with rate ratio 0.15 (95% CI 0.13 to 0.18), corresponding to a high level of protection with a VE of 85% (95% CI 82% to 87%). Stratification by study design accounted for a substantial amount of heterogeneity, but residual between-study variation remained, particularly in the retrospective cohort study group.
FIGURE 39.
Rate ratios (with 95% CI) comparing the incidence of pulmonary tuberculosis among BCG vaccinated individuals with that in unvaccinated individuals for the longest duration of follow-up (see Table 4) in cohort studies, stratified by cohort study design, ordered by year of study start. a, Date of study publication was used if study start date was not available. D + L, DerSimonian and Laird method; I – V, inverse variance method.
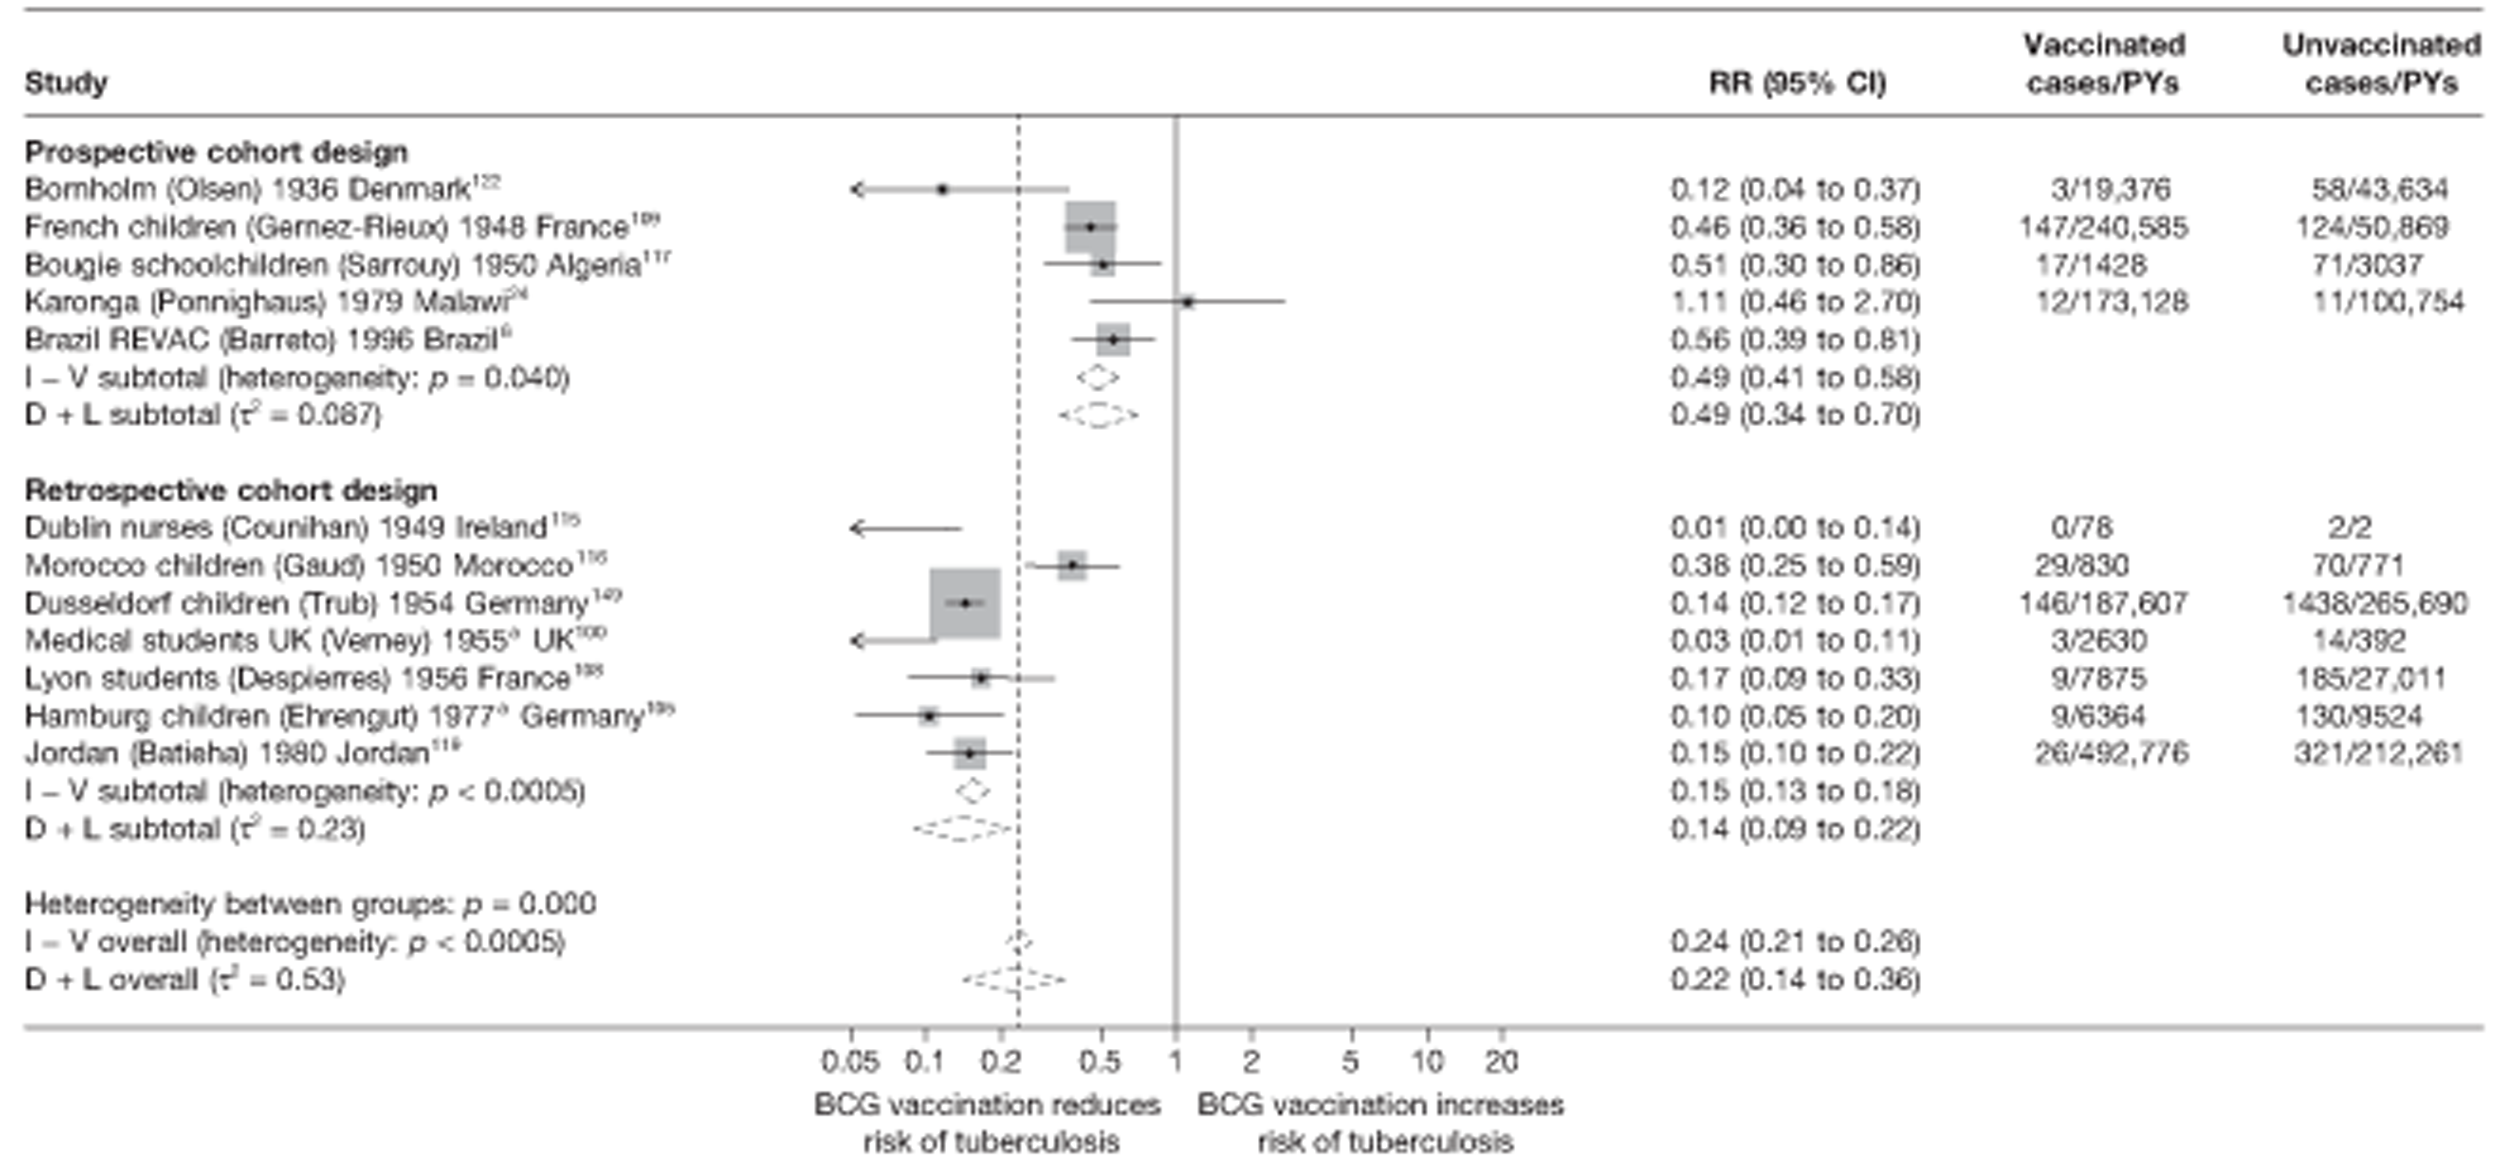
Meta-regression analysis
Stratification on study design for cohorts explained 61% of the between-study variation observed within these studies (τ2 null model = 0.872, τ2 values after stratification on study design = 0.342) (see Table 13). There was evidence that BCG vaccination effectiveness varies depending on cohort study design (p-value = 0.018). Te overall rate ratio for retrospective cohort studies was 0.27 (95% CI 0.10 to 0.76) times the overall rate ratio for prospective studies, corresponding to a protective effect approximately 73% higher in retrospective compared with prospective studies.
Meta-regression analysis
Case–control studies
The small number of studies in each of the observational study design categories precludes any detailed modelling. Univariate meta-regression analysis was used to explore possible reasons for heterogeneity of the findings more formally. For case–control studies (see Table 12), apart from the finding that latitude explained only a small amount of the between-study variation in overall BCG vaccination effectiveness with a τ2 value 0.128 compared with the baseline τ2 value (0.141), there was little evidence that any of other the study level variables were associated with the size of protective effect of BCG vaccination against pulmonary tuberculosis.
Cohort studies
Results from cohort studies univariable meta-regression analysis (see Table 13) indicated that latitude and cohort study type explained the largest amount of between-study variation in overall BCG vaccination effectiveness with a τ2 values of 0.509 and 0.342, respectively, compared with the baseline τ2 value of 0.872. There was some evidence that latitude (p-value = 0.060), age at vaccination (p-value = 0.049), ‘Were methods of case ascertainment identical for vaccinated and unvaccinated group?’ (p-value = 0.067), ‘Was diagnostic detection bias present?’ (p-value = 0.067), ‘Were results adjusted for socioeconomic status?’ (p-value = 0.058) and study type (p-value = 0.018) were also associated with the size of effect of BCG vaccination.
Cross-sectional studies
Results from univariable meta-regression analysis of cross-sectional studies (see Table 14) indicate that no variables explained the between-study variation in overall BCG vaccination effectiveness. There was no evidence that any of these factors were associated with increased BCG vaccination effectiveness.
All tuberculosis morbidity outcomes
Unstratified analysis ordered by year study started
More observational studies assessed the effectiveness of BCG vaccination in preventing all forms of tuberculosis: 16 case–control studies, 32 cohort studies, 12 case population studies, 13 cross-sectional studies and seven outbreak studies (Figures 40–44). All case–control studies showed evidence of protection against all forms of tuberculosis disease (see Figure 40). Similarly, the majority of cohort studies found a protective effect of BCG vaccination on all tuberculosis morbidity outcomes (see Figure 41), with only four showing no evidence of a clinical benefit from BCG vaccination. Te observed effect varied from a high protective effect (rate ratio 0.01; 95% CI 0.00 to 0.05), in the German Siblings cohort,107 to no clinical benefit (rate ratio 6.08; 95% CI 0.00 to 5.97e7) in the Edinburgh study. 96 All case population studies showed evidence of a strong protective effect of BCG vaccination against all tuberculosis morbidity outcomes (see Figure 42) and the majority of cross-sectional studies, except for the Surui Indians180 study, found evidence of substantial protection against tuberculosis (see Figure 43). Te majority of outbreak studies provided evidence of a protective effect against all forms of tuberculosis morbidity (see Figure 43).
FIGURE 40.
Odds ratios (with 95% CI) comparing the BCG vaccination status of all tuberculosis outcome cases and control subjects in case–control studies, ordered by year of study start. a, Date of study publication was used if study start date was not available.
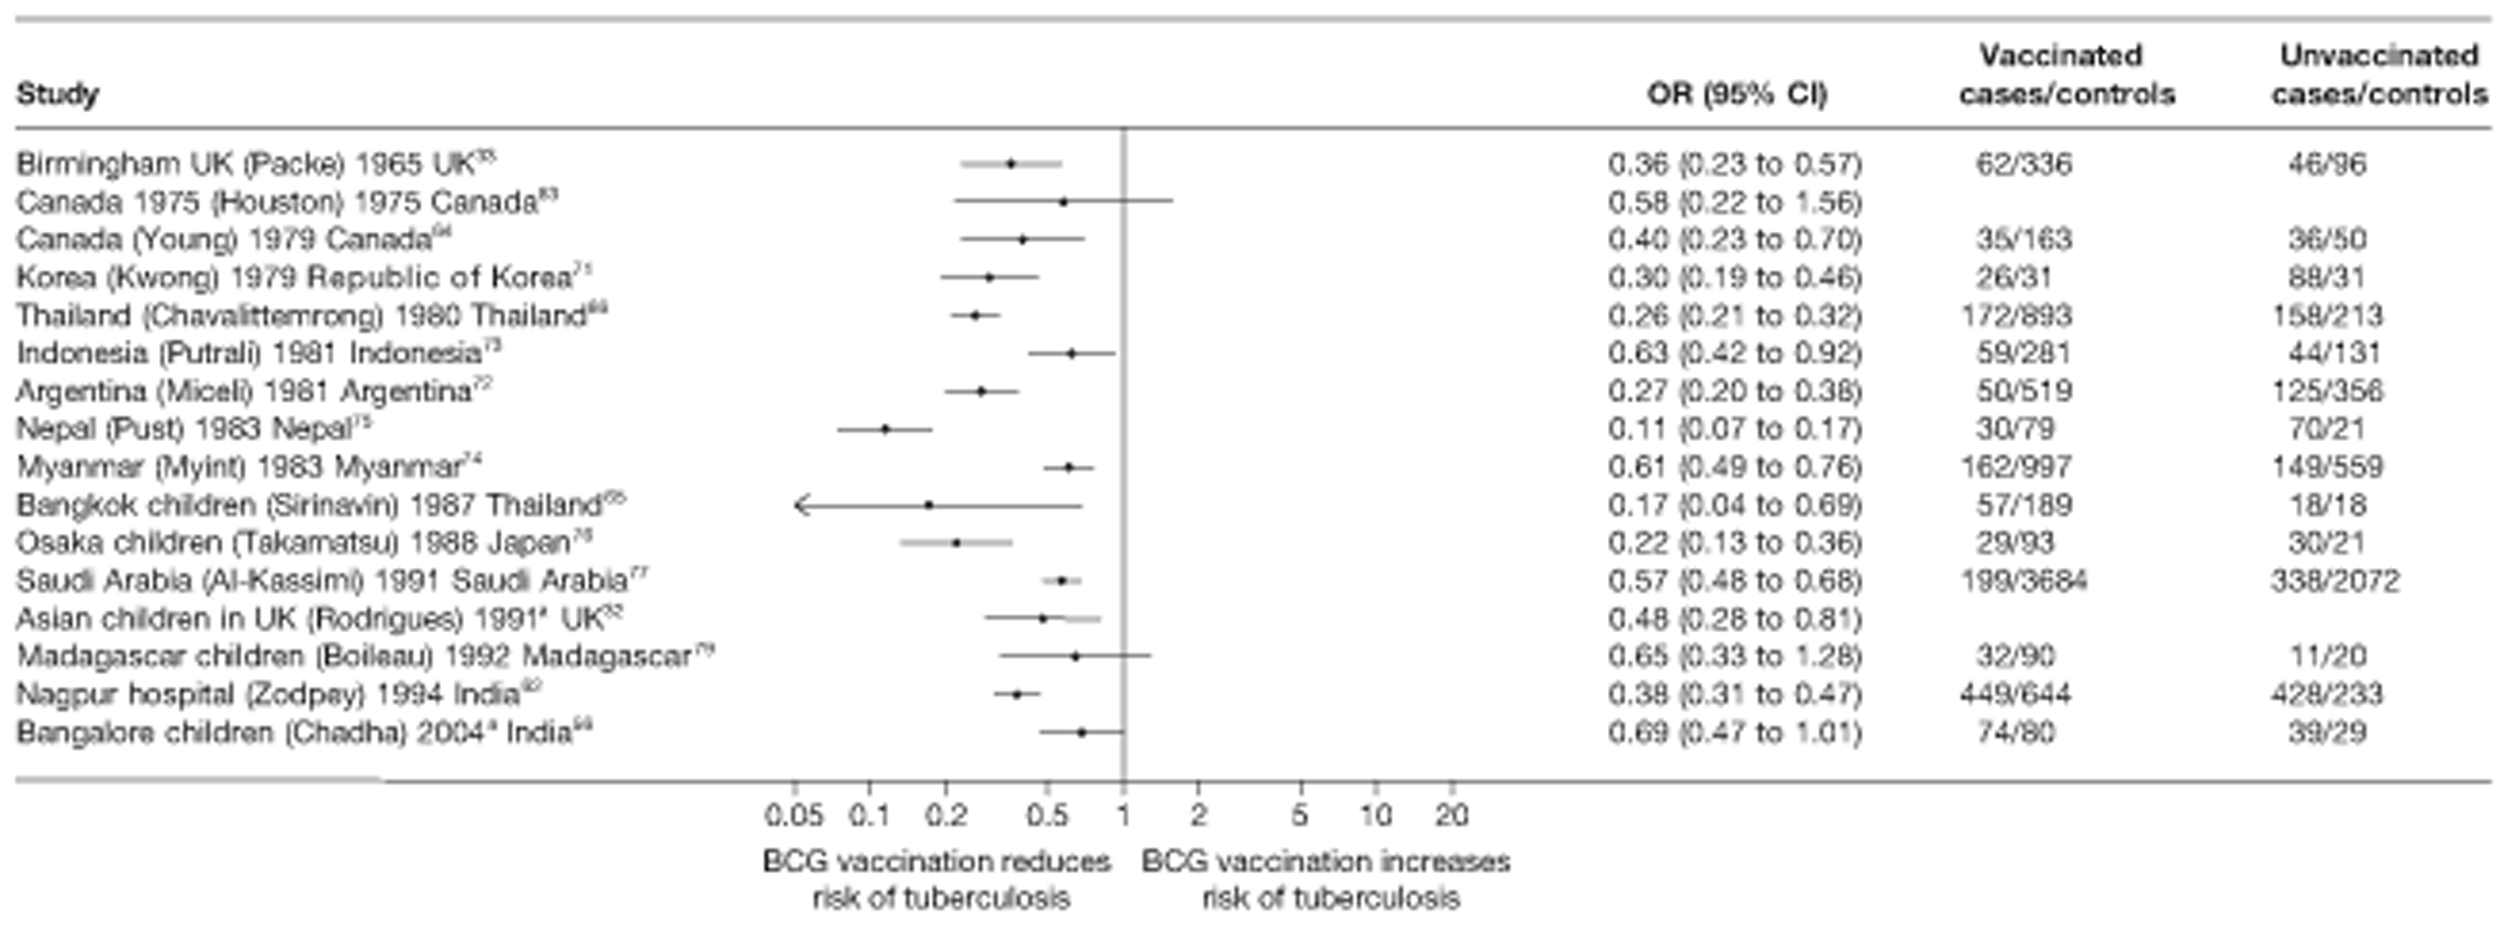
FIGURE 41.
Rate ratios (with 95% CI) comparing the incidence of all tuberculosis morbidity outcomes among BCG vaccinated individuals with that in unvaccinated individuals for the longest duration of follow-up (see Table 4) in cohort studies, ordered by year of study start. a, Date of study publication was used if study start date was not available.
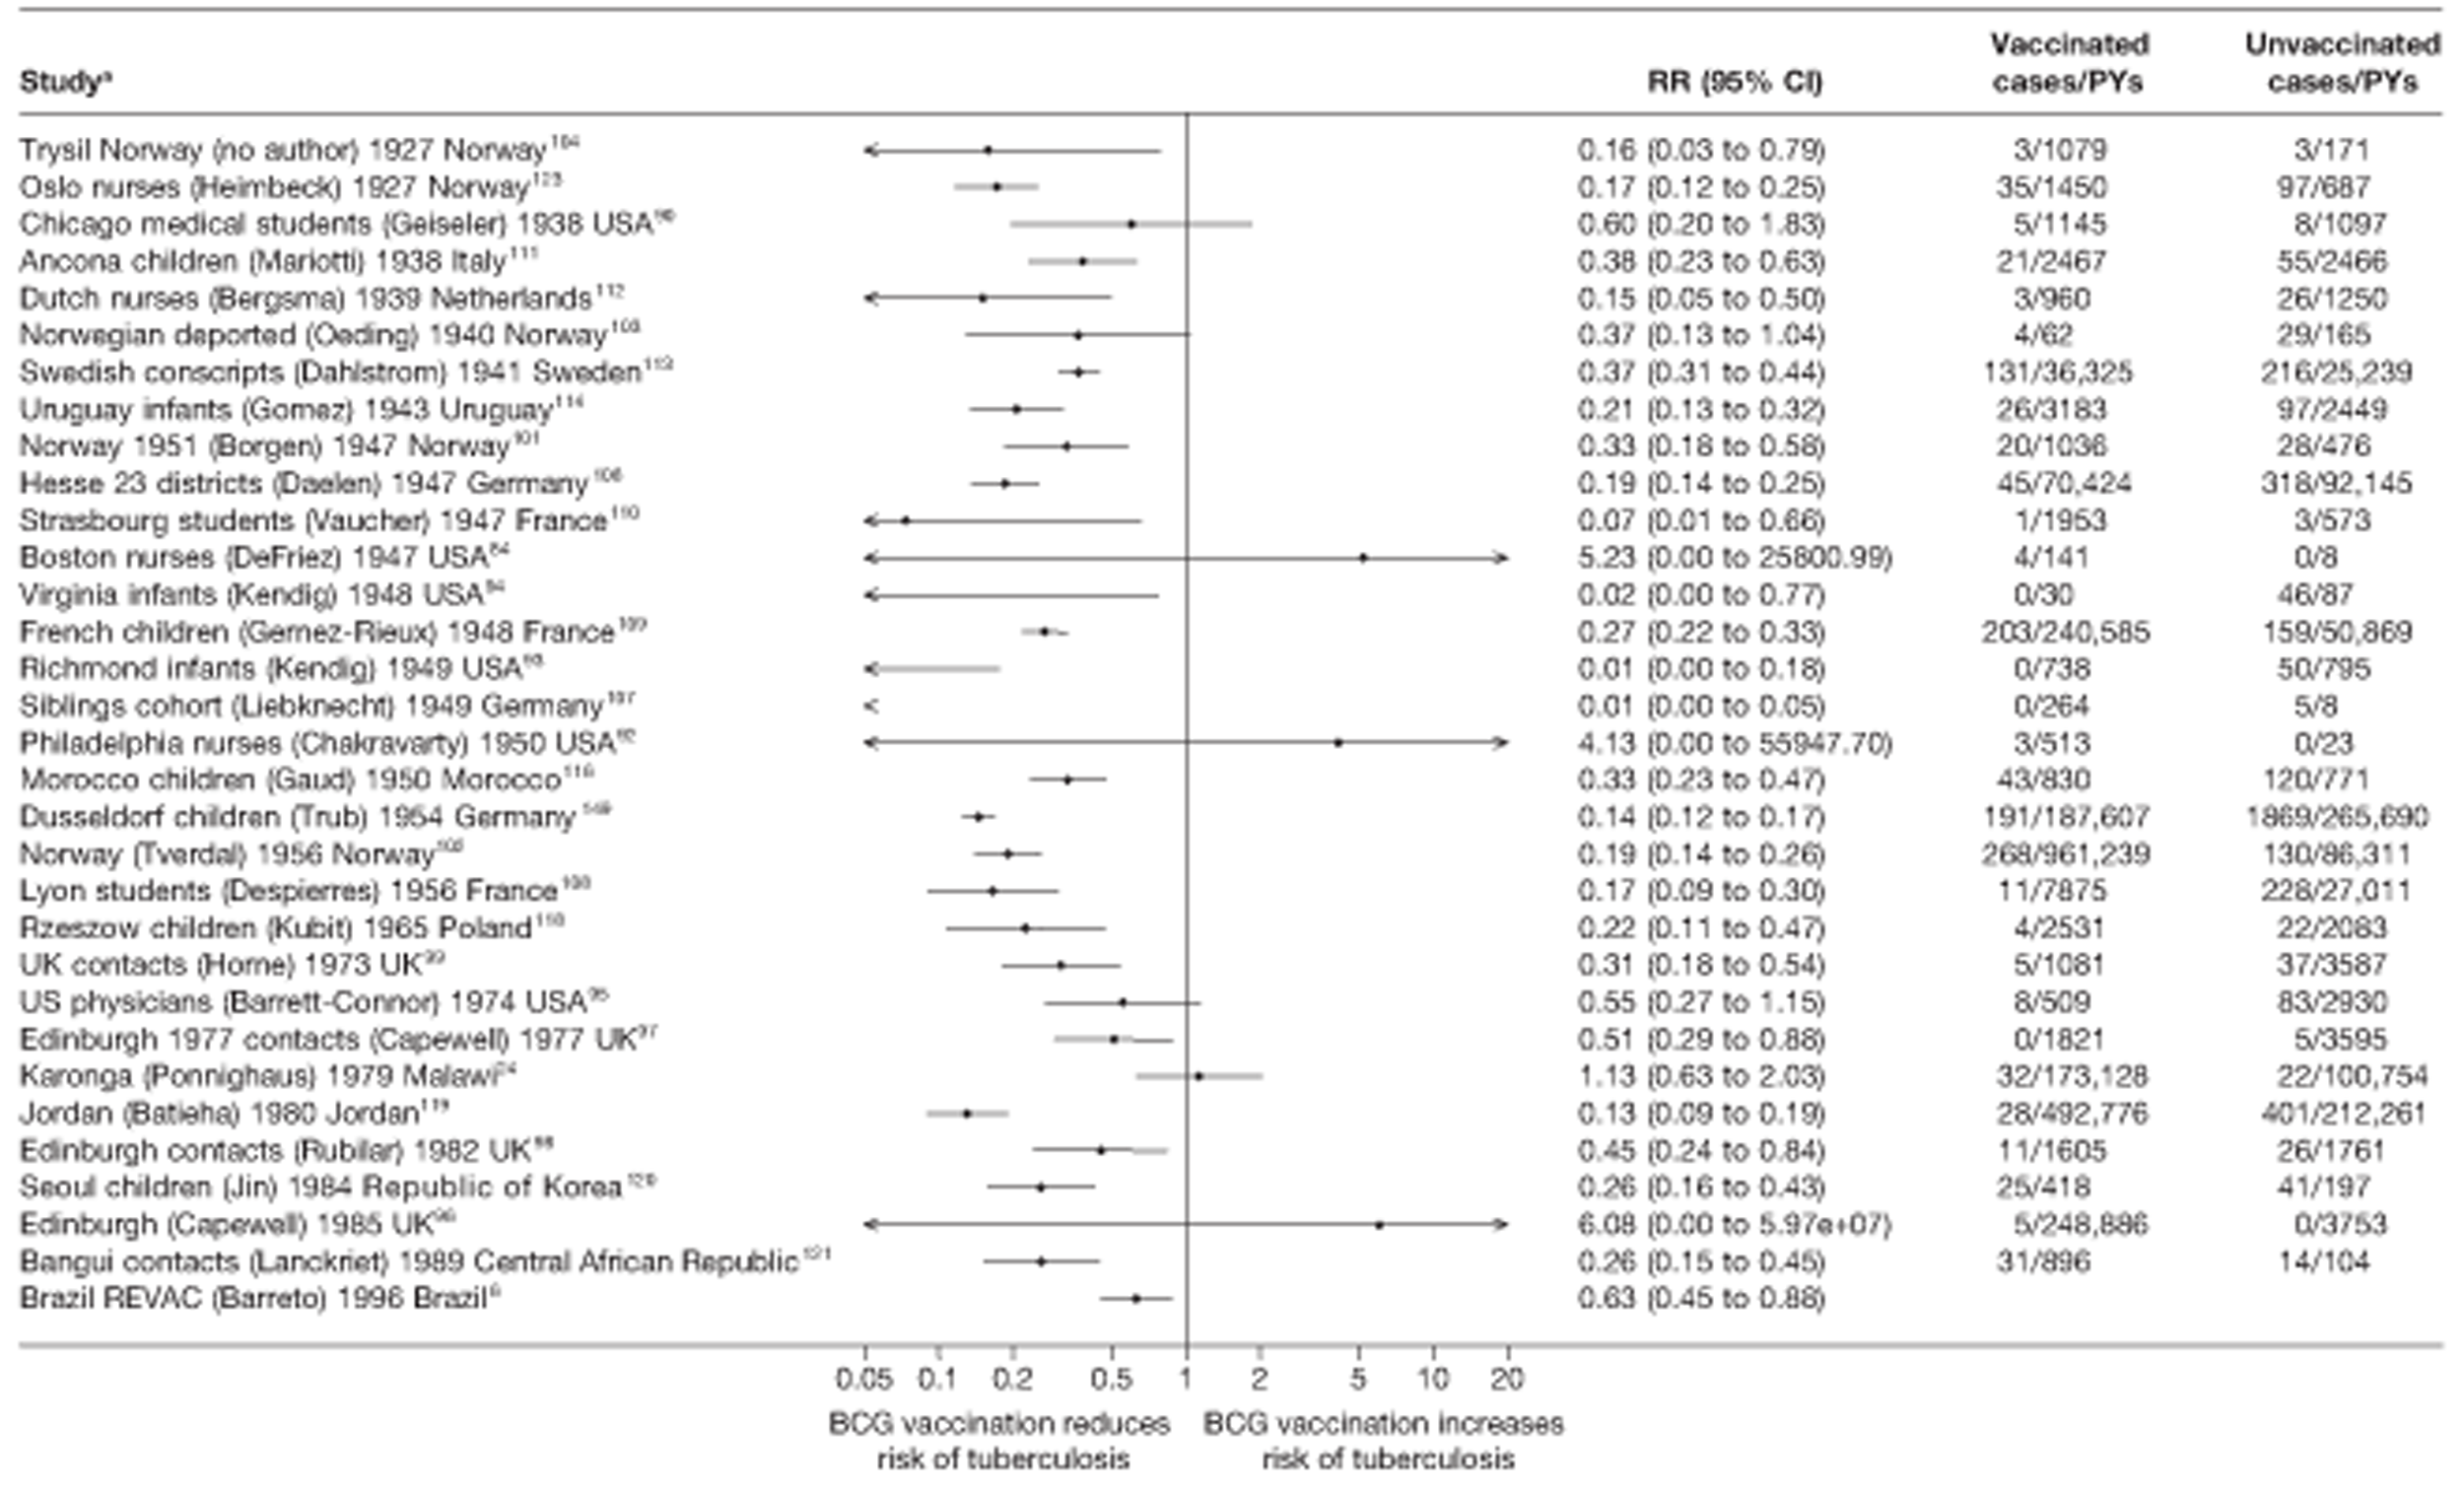
FIGURE 42.
Rate ratios (with 95% CI) comparing the incidence of all tuberculosis morbidity outcomes among BCG vaccinated individuals with that in unvaccinated individuals for the longest duration of follow-up (see Table 5) in case population studies, ordered by year of study start.

FIGURE 43.
Risk ratios (with 95% CI) comparing the prevalence of all tuberculosis morbidity outcomes among BCG vaccinated individuals with that in unvaccinated individuals, in cross-sectional studies ordered by year of study start. a, Date of study publication was used if study start date was not available.

FIGURE 44.
Risk ratios (with 95% CI) comparing the incidence of all tuberculosis morbidity outcomes among BCG vaccinated individuals with that in unvaccinated individuals, in cross-sectional studies ordered by year of study start.

Case–control studies
See Figure 40.
Cohort studies
See Figure 41.
Case population studies
See Figure 42.
Cross-sectional studies
See Figure 43.
Outbreak studies
See Figure 44.
Stratified analysis by latitude (10°), ordered by year study started
Figures 45 and 46 present the estimated effects of case–control and cohort studies against all tuberculosis morbidity outcomes stratified by latitude. Studies on all types of tuberculosis morbidity, unlike pulmonary tuberculosis studies, showed evidence of high effectiveness with no defined pattern of latitude effect on BCG vaccination effectiveness.
FIGURE 45.
Odds ratios (with 95% CI) comparing the BCG vaccination status of all tuberculosis outcome cases and control subjects in case–control studies, stratified by latitude of study location (10° bands), ordered by year of study start. a, Date of study publication was used if study start date was not available. D + L, DerSimonian and Laird method; I – V, inverse variance method.
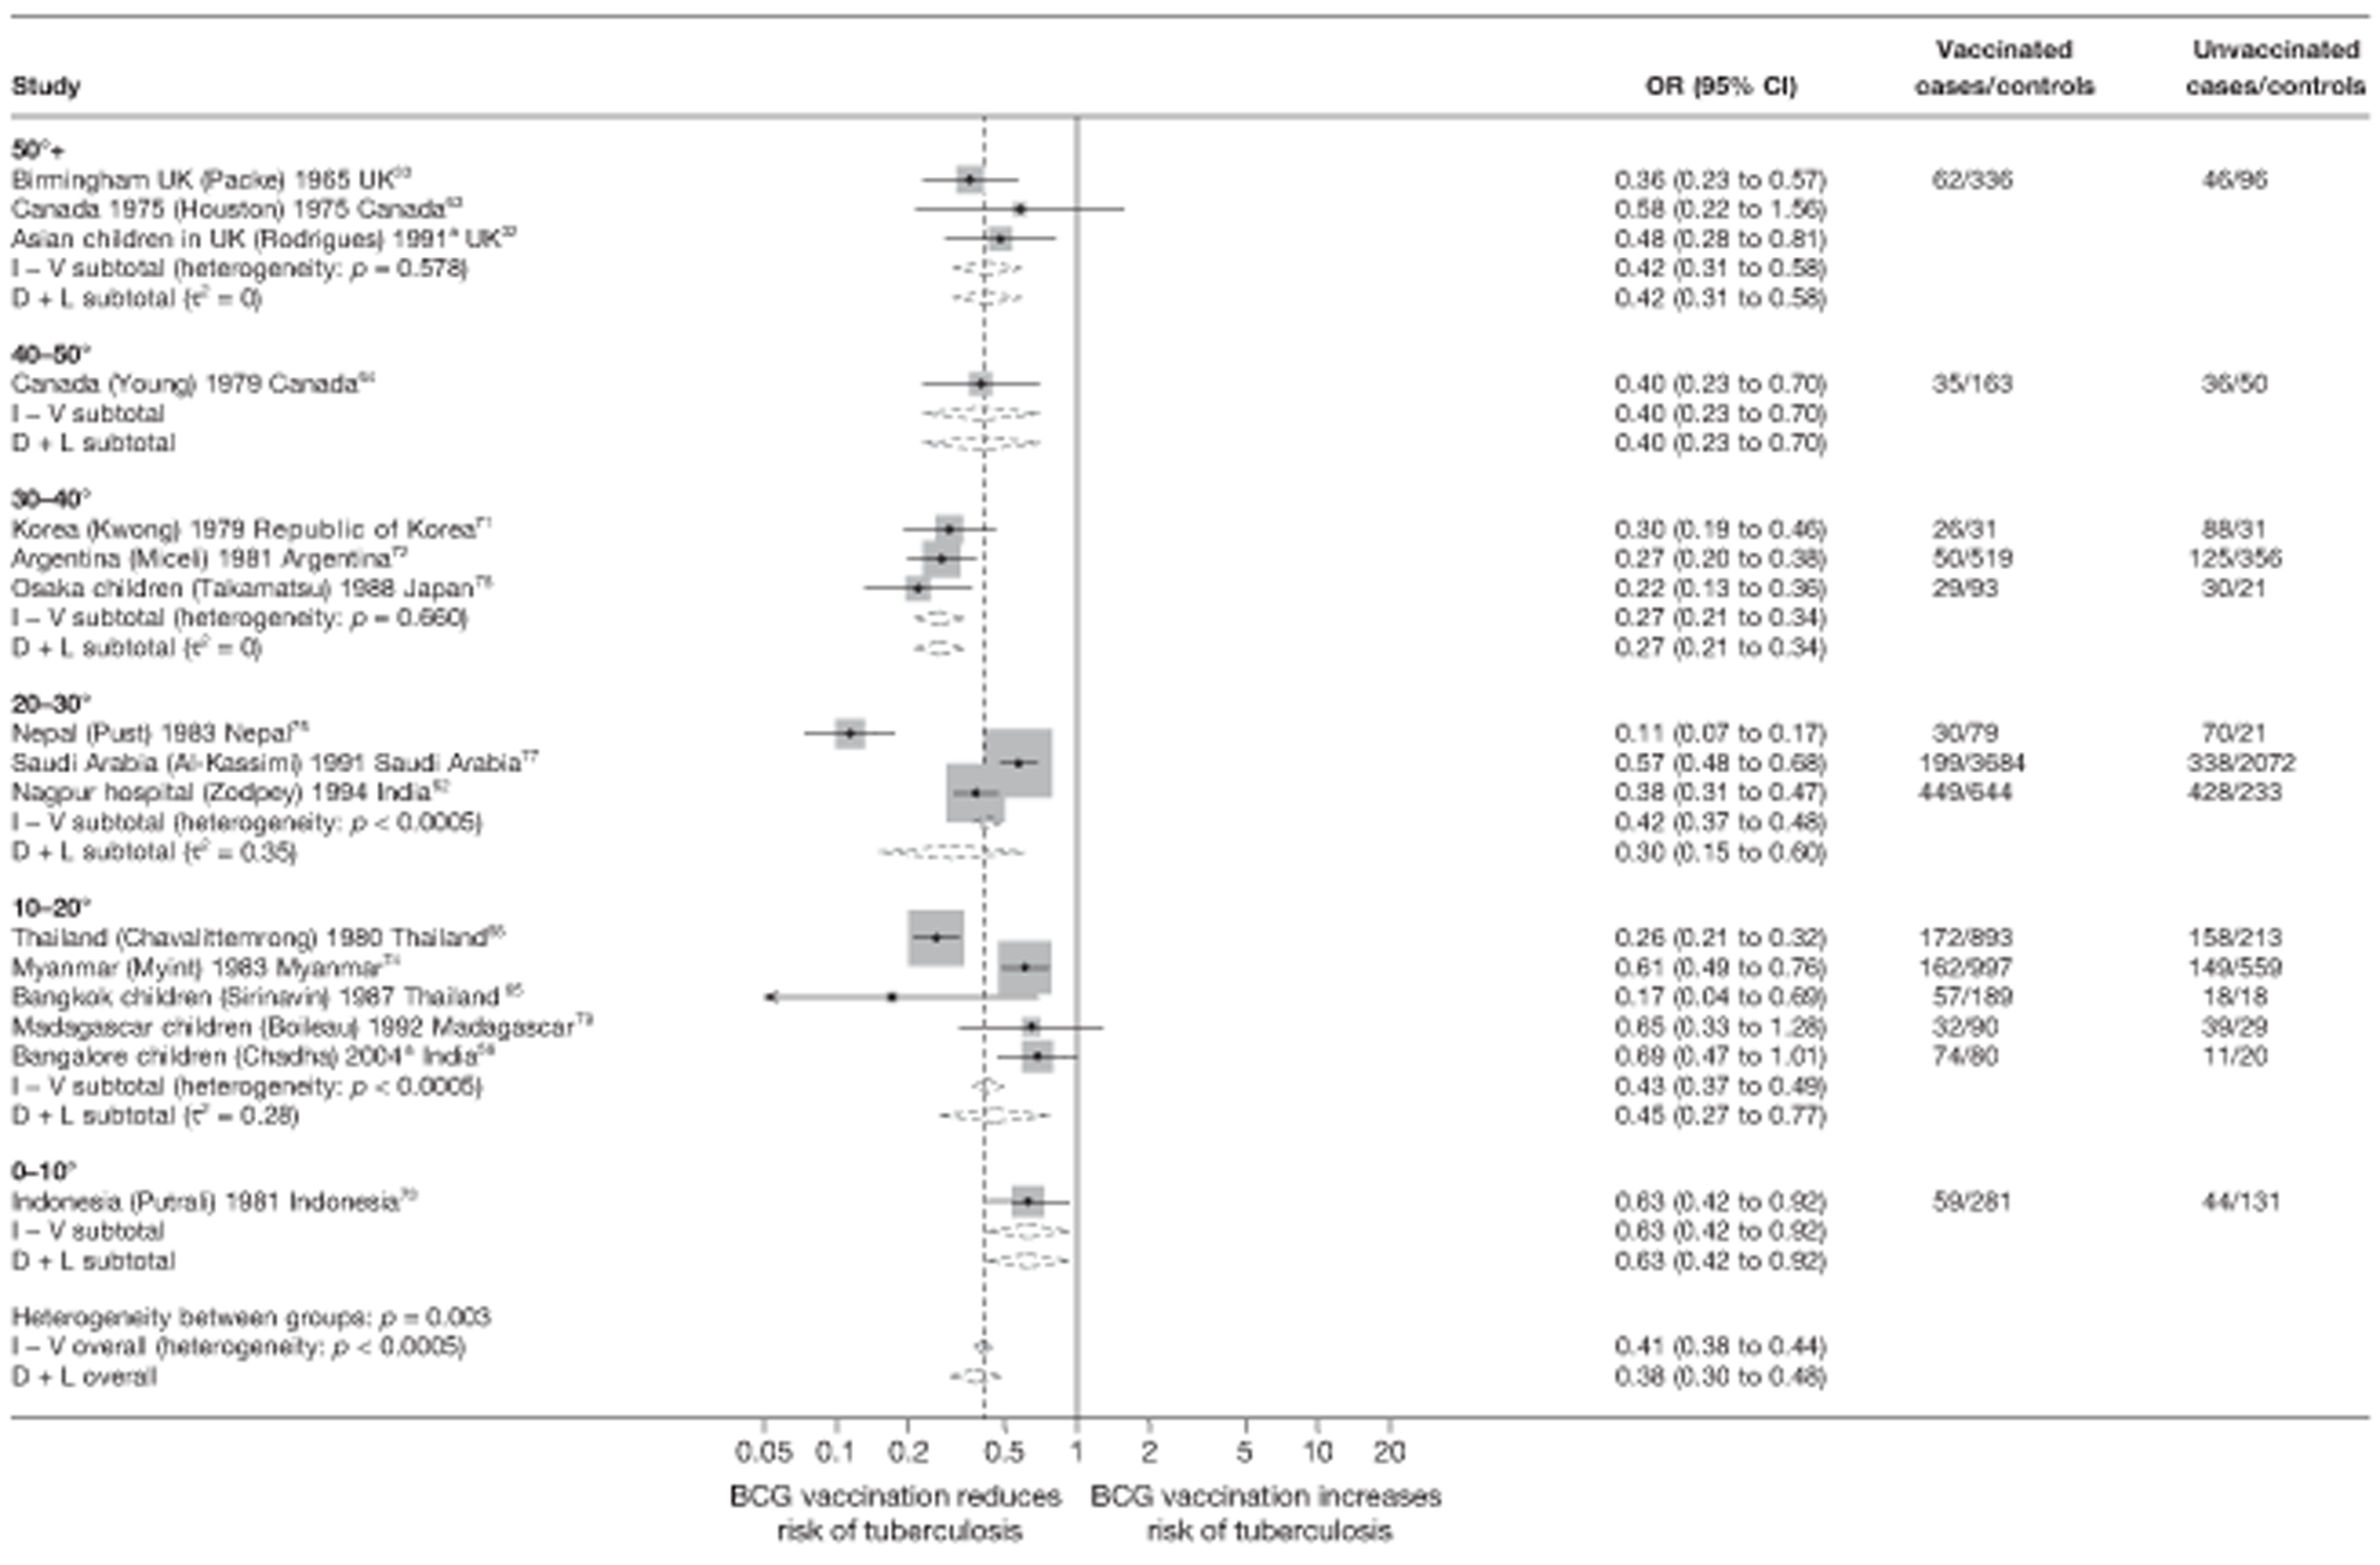
FIGURE 46.
Rate ratios (with 95% CI) comparing the incidence of all tuberculosis morbidity outcomes among BCG vaccinated individuals with that in unvaccinated individuals for the longest duration of follow-up (see Table 4) in cohort studies, stratified by latitude of study location (10° bands), ordered by year of study start. a, Date of study publication was used if study start date was not available. D + L, DerSimonian and Laird method; I – V, inverse variance method.
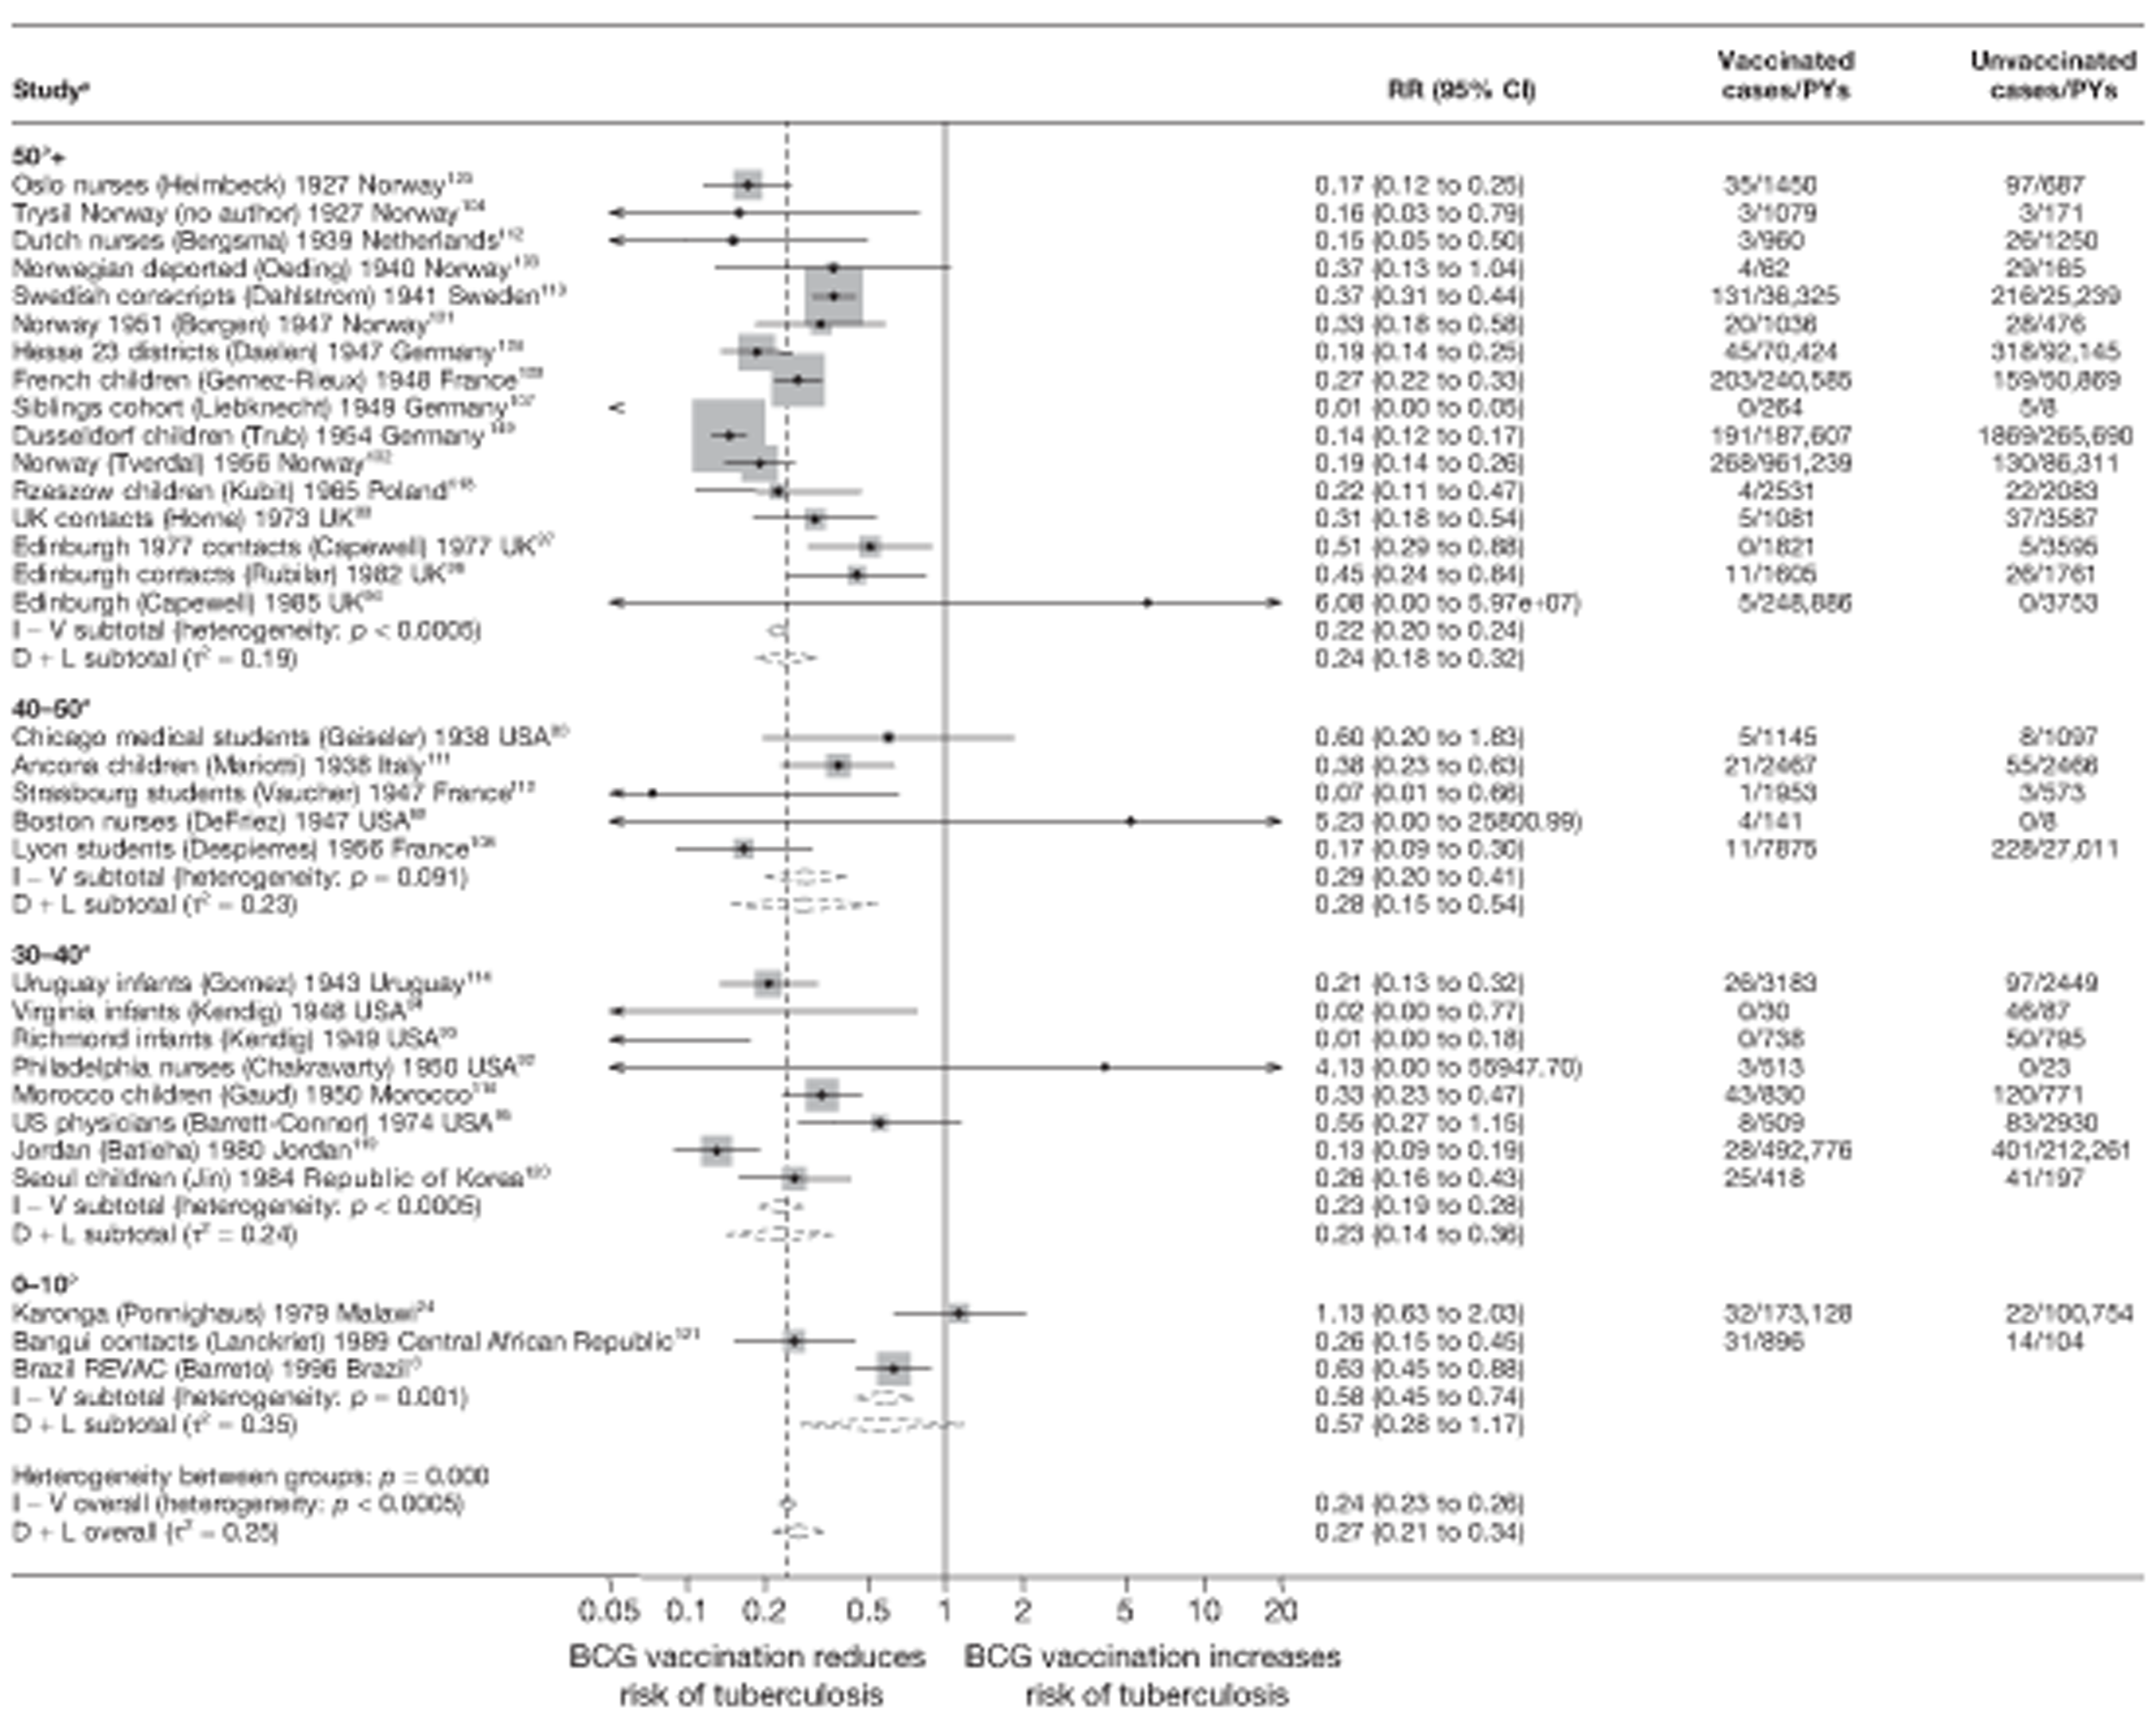
Figures 47 and 48 show forest plots of the results of case population and cross-sectional studies, respectively, stratified by 10° latitude. The majority of case population studies were conducted in sites located above 50° latitude. The small number of case population studies in each stratum other than the above 50° latitude band limits any conclusion, although there was some evidence that the protective effect was strongest in studies conducted at latitudes furthest away from the equator. The majority of cross-sectional studies show a protective effect of BCG vaccination against tuberculosis; however, there was no clear evidence of variation by latitude. Stratification by latitude therefore appeared to explain very little of the heterogeneity in both case population and cross-sectional studies. All outbreak studies were conducted above 50° latitude.
FIGURE 47.
Rate ratios (with 95% CI) comparing the prevalence of all tuberculosis morbidity outcomes among BCG vaccinated individuals with that in unvaccinated individuals for the longest duration of follow-up (see Table 5) in case population studies, stratified by latitude of study location (10° bands), ordered by year of study start. D + L, DerSimonian and Laird method; I – V, inverse variance method.
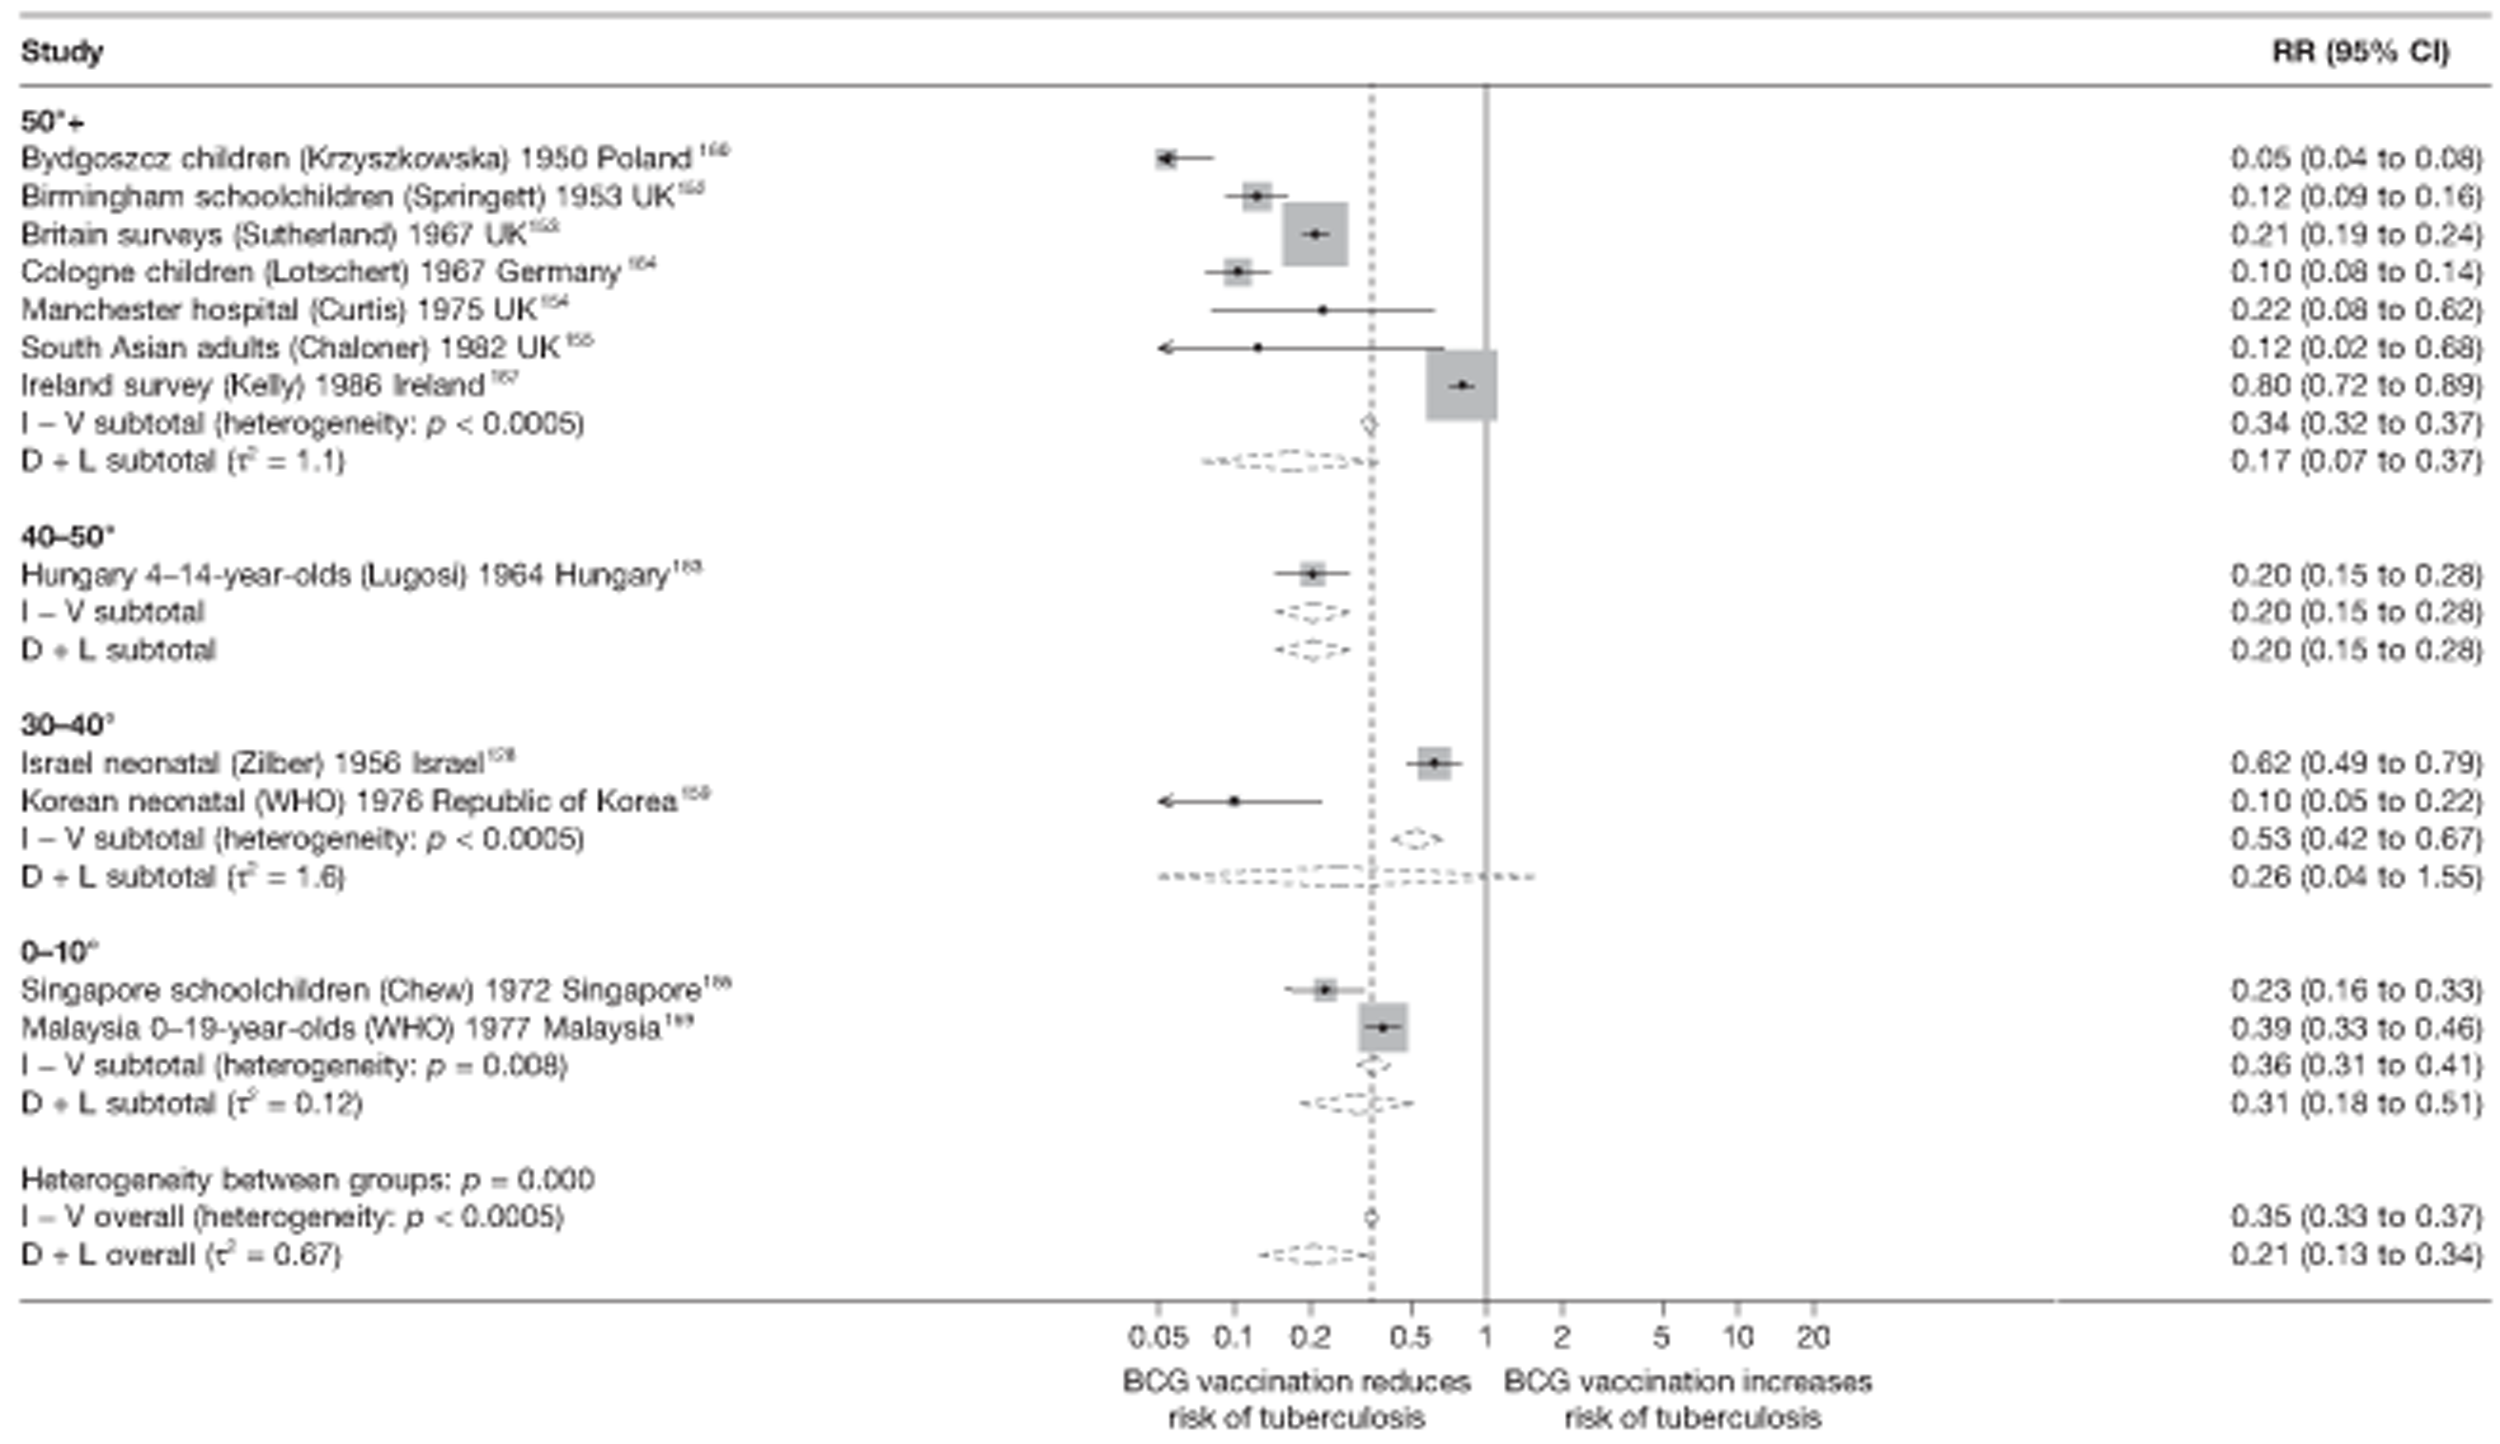
FIGURE 48.
Risk ratios (with 95% CI) comparing the incidence of all tuberculosis morbidity outcomes among BCG vaccinated individuals with that in unvaccinated individuals, in cross-sectional studies stratified by latitude of study location (10° bands), ordered by year of study start. a, Date of study publication was used if study start date was not available. D + L, DerSimonian and Laird method; I – V, inverse variance method.
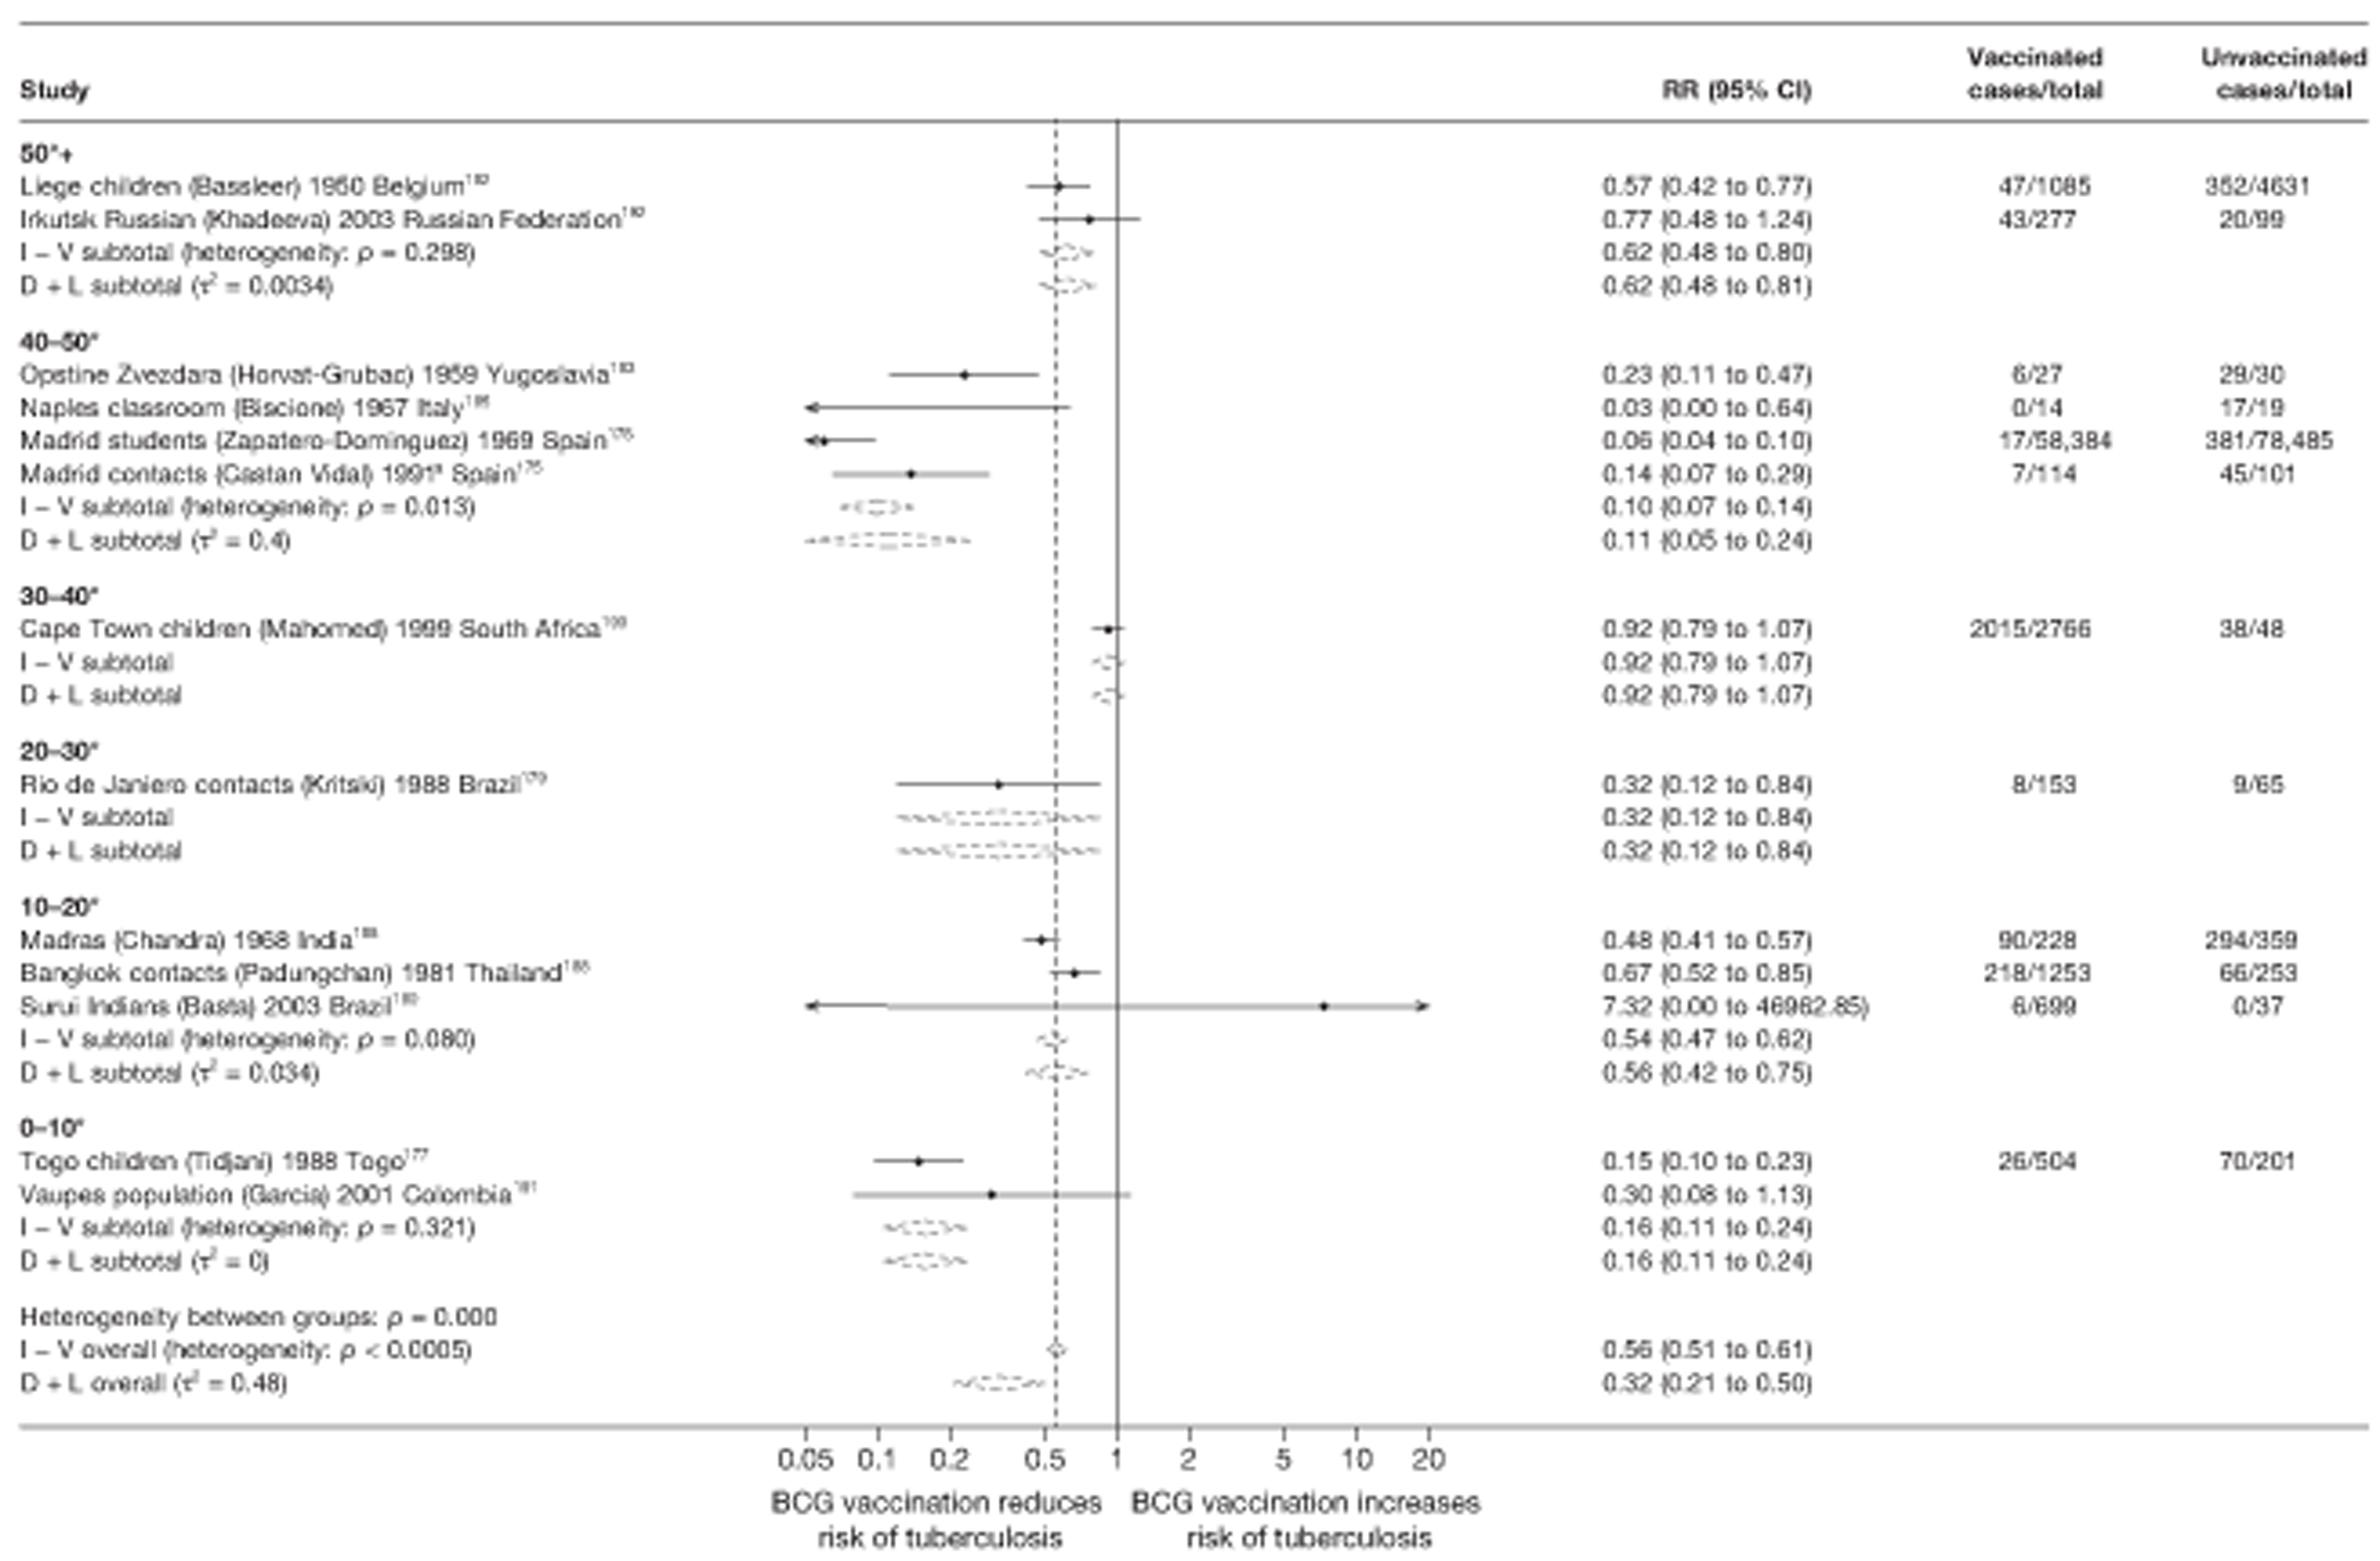
Meta-regression analysis
Meta-regression with stratification on latitude partially explained the heterogeneity between case–control studies (null model τ2 = 0.208; after stratification by 20° latitude group τ2 = 0.180)
(Table 15). Latitude also accounted for a proportion of the heterogeneity between cohort studies (null model τ2 = 0.253; after stratification by 20° latitude group τ2 = 0.185) (Table 16) but there was little evidence (p-value = 0.174) that effectiveness varied by latitude. There was some evidence (p-value = 0.069) that BCG vaccination protection against all tuberculosis varies according to latitude in cohort studies: the overall rate ratios for the 0–20° and 20–40° latitude groups were, respectively, 2.30 (95% CI 1.10 to 4.78) and 0.94 (95% CI 0.53 to 1.68) times the overall rate ratio in the 40° and above group. Based on meta-regression analysis (Table 17), stratification on latitude did not account for any of the between-study variation seen in case population studies (τ2 values before and after stratification by 20° group were 0.619 and 0.683, respectively) or cross-sectional studies (τ2 values before and after stratification by 20° group 0.716 and 0.754, respectively) (Table 18).
| Variable | Number of studies | Univariable ORs (95% CI) | Univariable model | ||
|---|---|---|---|---|---|
| Ratio of ORs (95% CI) | p-value | τ2 | |||
| Null model | 16 | 0.208 | |||
| Latitude | |||||
| > 40° | 4 | 0.43 (0.24 to 0.77) | 1.00 (ref.) | ||
| 20–40° | 6 | 0.29 (0.19 to 0.43) | 0.66 (0.33 to 1.33) | ||
| 0–20° | 6 | 0.49 (0.31 to 0.76) | 1.13 (0.55 to 2.31) | 0.174 | 0.180 |
| Age at vaccination | |||||
| Neonatal | 15 | 0.37 (0.28 to 0.50) | 1.00 (ref.) | ||
| School age | 0 | ||||
| Other | 1 | 0.58 (0.13 to 2.55) | 1.56 (0.35 to 6.96) | 0.537 | 0.215 |
| Was disease status blinded to BCG assessors? | |||||
| Lower risk of bias | 0 | ||||
| Higher risk of bias | 16 | 0.208 | |||
| Were vaccination definitions the same for cases and control subjects? | |||||
| Lower risk of bias | 12 | 0.45 (0.34 to 0.60) | 1.00 (ref.) | ||
| Higher risk of bias | 4 | 0.24 (0.14 to 0.38) | 0.52 (0.31 to 0.89) | 0.021 | 0.139 |
| Were cases and control subjects determined independently of BCG vaccination status? | |||||
| Lower risk of bias | 11 | 0.40 (0.28 to 0.56) | 1.00 (ref.) | ||
| Higher risk of bias | 5 | 0.35 (0.21 to 0.57) | 0.87 (0.48 to 1.60) | 0.640 | 0.221 |
| Were results adjusted for SES? | |||||
| Yes | 8 | 0.40 (0.27 to 0.61) | 1.00 (ref.) | ||
| No | 8 | 0.36 (0.24 to 0.53) | 0.88 (0.50 to 1.56) | 0.650 | 0.221 |
| If a matched design was used, was a matched analysis performed? | |||||
| Unmatched design | 3 | 0.39 (0.20 to 0.76) | 1.00 (ref.) | ||
| Matched design – matched analysis | 5 | 0.39 (0.21 to 0.70) | 1.00 (0.41 to 2.41) | ||
| Matched design – matched analysis | 8 | 0.37 (0.24 to 0.56) | 0.94 (0.43 to 2.06) | 0.981 | 0.248 |
| Variable | Number of studies | Univariable rate ratios (95% CI) | Univariable model | ||
|---|---|---|---|---|---|
| Ratio of rate ratios (95% CI) | p-value | τ2 | |||
| Null model | 32 | 0.253 | |||
| Latitude | |||||
| 40°+ | 21 | 0.25 (0.18 to 0.33) | 1.00 (ref.) | ||
| 20–40° | 8 | 0.23 (0.14 to 0.38) | 0.94 (0.53 to 1.68) | ||
| 0–20° | 3 | 0.57 (0.29 to 1.11) | 2.30 (1.10 to 4.78) | 0.069 | 0.185 |
| Age at vaccination | |||||
| Neonatal | 7 | 0.23 (0.14 to 0.41) | 1.00 (ref.) | ||
| School age | 10 | 0.24 (0.15 to 0.37) | 1.02 (0.51 to 2.04) | ||
| Other | 15 | 0.33 (0.21 to 0.51) | 1.40 (0.69 to 2.84) | 0.487 | 0.268 |
| Was follow-up independent of vaccination status? | |||||
| Lower risk of bias | 23 | 0.31 (0.23 to 0.41) | 1.00 (ref.) | ||
| Higher risk of bias | 9 | 0.16 (0.10 to 0.28) | 0.53 (0.29 to 0.99) | 0.047 | 0.271 |
| Was case ascertainment blinded to vaccination status? | |||||
| Lower risk of bias | 2 | 0.27 (0.11 to 0.66) | 1.00 (ref.) | ||
| Higher risk of bias | 30 | 0.27 (0.20 to 0.36) | 1.01 (0.39 to 2.61) | 0.980 | 0.272 |
| Were methods of case ascertainment identical for vaccinated and unvaccinated group? | |||||
| Lower risk of bias | 30 | 0.27 (0.20 to 0.35) | 1.00 (ref.) | ||
| Higher risk of bias | 2 | 0.28 (0.11 to 0.70) | 1.03 (0.39 to 2.74) | 0.954 | 0.272 |
| Were losses to follow-up similar in each group? | |||||
| Lower risk of bias | 5 | 0.31 (0.17 to 0.55) | 1.00 (ref.) | ||
| Higher risk of bias | 27 | 0.26 (0.19 to 0.35) | 0.85 (0.44 to 1.63) | 0.607 | 0.273 |
| Was diagnostic detection bias present? | |||||
| Lower risk of bias | 13 | 0.28 (0.18 to 0.37) | 1.00 (ref.) | ||
| Higher risk of bias | 19 | 0.26 (0.19 to 0.43) | 0.91 (0.53 to 1.57) | 0.737 | 0.263 |
| Were results adjusted for SES? | |||||
| Yes | 2 | 0.80 (0.39 to 1.64) | 1.00 (ref.) | ||
| No | 30 | 0.25 (0.20 to 0.31) | 0.30 (0.14 to 0.64) | 0.003 | 0.130 |
| Study type | |||||
| Prospective | 10 | 0.31 (0.19 to 0.52) | 1.00 (ref.) | ||
| Retrospective | 17 | 0.23 (0.16 to 0.32) | 0.71 (0.39 to 1.32) | ||
| Contact | 5 | 0.34 (0.19 to 0.60) | 1.08 (0.50 to 2.30) | 0.353 | 0.236 |
| Variable | Number of studies | Univariable rate ratios (95% CI) | Univariable model | ||
|---|---|---|---|---|---|
| Ratio of rate ratios (95% CI) | p-value | τ2 | |||
| Null model | 12 | 0.619 | |||
| Latitude | |||||
| > 40° | 8 | 0.17 (0.08 to 0.35) | 1.00 (ref.) | ||
| 20–40° | 2 | 0.27 (0.07 to 1.13) | 1.58 (0.33 to 7.57) | ||
| 0–20° | 2 | 0.30 (0.07 to 1.17) | 1.74 (0.38 to 7.91) | 0.643 | 0.683 |
| Age at vaccination | |||||
| Neonatal | 8 | 0.22 (0.11 to 0.46) | 1.00 (ref.) | ||
| School age | 3 | 0.18 (0.06 to 0.56) | 0.81 (0.22 to 3.00) | ||
| Other | 1 | 0.12 (0.01 to 2.00) | 0.56 (0.03 to 9.30) | 0.856 | 0.705 |
| Were cases and population the same in terms of time? | |||||
| Lower risk of bias | 12 | ||||
| Higher risk of bias | 0 | 0.619 | |||
| Were cases and population the same in terms of geography? | |||||
| Lower risk of bias | 11 | 0.12 (0.01 to 1.79) | 1.00 (ref.) | ||
| Higher risk of bias | 1 | 0.21 (0.12 to 0.37) | 0.59 (0.04 to 8.68) | 0.671 | 0.643 |
| Were cases and population the same in terms of age? | |||||
| Lower risk of bias | 12 | ||||
| Higher risk of bias | 0 | 0.619 | |||
| Was case ascertainment blinded to vaccination status? | |||||
| Lower risk of bias | 0 | ||||
| Higher risk of bias | 12 | 0.619 | |||
| Was disease status blinded to BCG assessors? | |||||
| Lower risk of bias | 2 | 0.19 (0.10 to 0.34) | 1.00 (ref.) | ||
| Higher risk of bias | 10 | 0.32 (0.09 to 1.15) | 0.59 (0.14 to 2.40) | 0.421 | 0.639 |
| Were methods of case ascertainment same for vaccinated and unvaccinated? | |||||
| Lower risk of bias | 9 | 0.11 (0.04 to 0.28) | 1.00 (ref.) | ||
| Higher risk of bias | 3 | 0.26 (0.15 to 0.47) | 0.41 (0.14 to 1.22) | 0.101 | 0.491 |
| Variable | Number of studies | Univariable RRs (95% CI) | RRRs(95% CI) | p-value | τ2 |
|---|---|---|---|---|---|
| Null model | 13 | 0.716 | |||
| Latitude | |||||
| 40°+ | 6 | 0.22 (0.09 to 0.55) | 1.00 (ref.) | ||
| 20–40° | 2 | 0.58 (0.13 to 2.57) | 2.62 (0.47 to 14.50) | ||
| 0–20° | 5 | 0.37 (0.13 to 1.03) | 1.64 (0.42 to 6.36) | 0.448 | 0.754 |
| Age at vaccination | |||||
| Neonatal | 7 | 0.41 (0.19 to 0.88) | 1.00 (ref.) | ||
| School age | 4 | 0.17 (0.06 to 0.53) | 0.43 (0.11 to 1.63) | ||
| Other | 2 | 0.37 (0.04 to 3.28) | 0.90 (0.09 to 8.88) | 0.398 | 0.736 |
| Was disease status blinded to BCG assessors? | |||||
| Lower risk of bias | 1 | 0.15 (0.02 to 1.04) | 1.00 (ref.) | ||
| Higher risk of bias | 12 | 0.34 (0.18 to 0.64) | 2.29 (0.30 to 17.35) | 0.386 | 0.720 |
| Were vaccination definitions the same for cases and control subjects? | |||||
| Lower risk of bias | 11 | 0.30 (0.15 to 0.60) | 1.00 (ref.) | ||
| Higher risk of bias | 2 | 0.37 (0.09 to 1.62) | 1.24 (0.25 to 6.14) | 0.775 | 0.795 |
| Were cases and control subjects determined independently of BCG vaccination status? | |||||
| Lower risk of bias | 11 | 0.26 (0.14 to 0.50) | 1.00 (ref.) | ||
| Higher risk of bias | 2 | 0.67 (0.19 to 2.38) | 1.54 (0.62 to 10.35) | 0.172 | 0.646 |
| Were results adjusted for SES? | |||||
| Yes | 1 | 0.32 (0.03 to 3.07) | 1.00 (ref.) | ||
| No | 12 | 0.31 (0.16 to 0.60) | 0.98 (0.10 to 9.97) | 0.982 | 0.787 |
| Study type | |||||
| Non-contact | 8 | 0.30 (0.13 to 0.70) | 1.00 (ref.) | ||
| Contact | 5 | 0.33 (0.13 to 0.84) | 0.92 (0.27 to 3.20) | 0.890 | 0.780 |
Case–control studies
See Figure 45.
Cohort studies
See Figure 46.
Case population studies
See Figure 47.
Cross-sectional studies
See Figure 48.
Stratified analysis by age at vaccination, ordered by year study started
Forest plots showing the results of observational studies stratified by the age at which BCG vaccination was given to participants are presented in Figures 49 and 52. All but one case–control study evaluated the effect of neonatal BCG vaccination against all forms of tuberculosis (see Figure 49). This study did not show a protective effect, whereas the estimates of neonatal vaccination studies ranged from substantial protection, as in Nepal75 [OR 0.11 (95% CI 0.07 to 0.17)], to reduced protection [OR 0.69 (95% CI 0.47 to 1.01)], in Madagascar children. 79 Estimates of effect from cohort studies indicated that, in general, the level of protection was similar among studies investigating neonatal BCG vaccination [rate ratio 0.22 (95% CI 0.12 to 0.40)], and school-age vaccination [rate ratio 0.24 (95% CI 0.17 to 0.34)] (the results being based only on tuberculin-negative participants at study start), corresponding to VE of 76% (95% CI 66% to 83%). The Karonga study124 did not show evidence of a protective effect from school-age vaccination, and the majority of studies failed to detect a substantial protective effect from BCG vaccination in other age groups. The majority of case population studies showed strong protective effects of BCG vaccination against all forms of tuberculosis, ranging from rate ratio 0.05 (95% CI 0.04 to 0.08) in the Bydgoszcz children160 neonatal vaccination study to rate ratio of 0.80 (95% CI 0.72 to 0.89) in the Ireland Survey study of school-age BCG vaccination. 167 All cross-sectional studies evaluated either neonatal or school-age vaccination. Both groups were associated with substantial protection against tuberculosis; the highest level was observed in studies evaluating the vaccination of school-age children [RR 0.16 (95% CI 0.04 to 0.65)], equivalent to VE of 84% (95% CI 35% to 96%) (see Figure 52). Age at vaccination appears to explain very little of the heterogeneity seen between case–control studies, whereas evidence of substantial heterogeneity remained after stratification for age at vaccination for all study designs. In outbreak studies, there was little evidence of a clinical benefit from neonatal vaccination, whereas outbreaks in which vaccination was undertaken at school age showed evidence of a high protective effect RR of 0.02 (95% CI 0.01 to 0.07), equivalent to VE of 98% (95% CI 93% to 99%).
FIGURE 49.
Odds ratios (with 95% CI) comparing the BCG vaccination status of all tuberculosis morbidity outcomes cases and control subjects in case–control studies, stratified by age at vaccination, ordered by year of study start. a, Date of study publication was used if study start date was not available. D + L, DerSimonian and Laird method; I – V, inverse variance method.
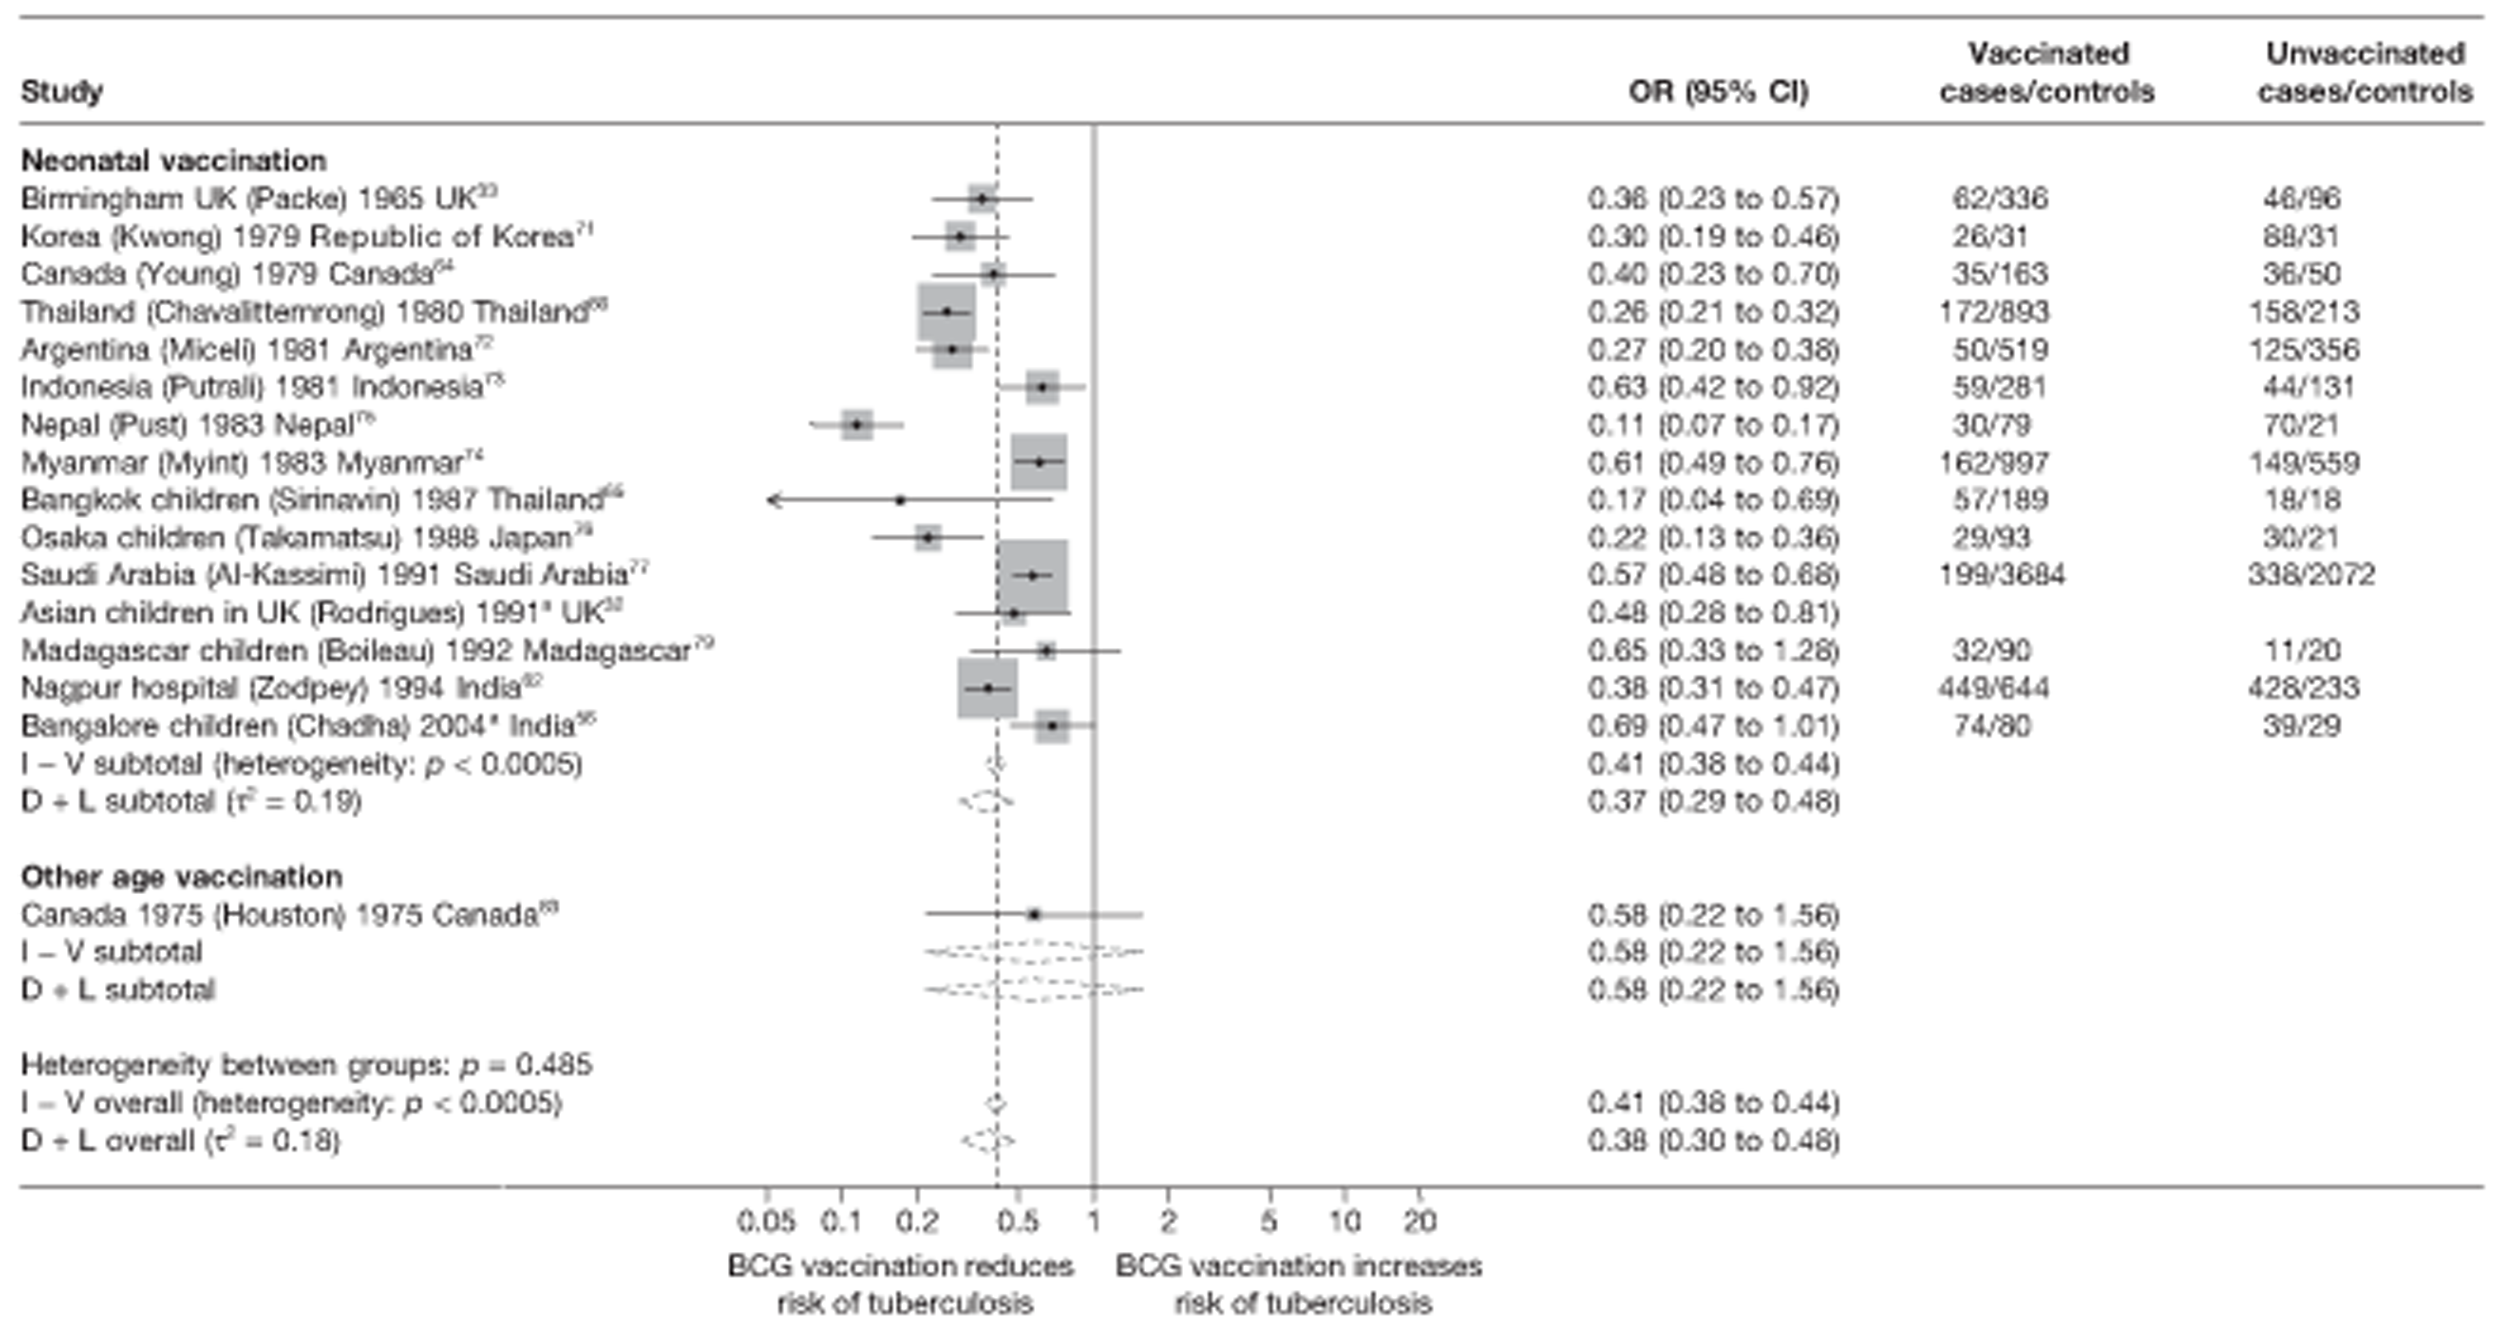
Meta-regression analysis
Stratification of case–control studies on age at vaccination did not explain the between-study variation (τ2 = 0.215 after stratification, compared with τ2 = 0.208 in the null model, as shown in Table 15). Age at vaccination did not explain any of the variation between cohort studies [τ2 values before and after stratification = 0.253 and 0.268, respectively (see Table 16)], case population studies [τ2 values before and after stratification = 0.619 and 0.705, respectively (see Table 17)] or cross-sectional studies [τ2 values before and after stratification = 0.736 and 0.716, respectively (see Table 18)]. There was no evidence that effectiveness of BCG vaccination against all forms of tuberculosis varied by age at vaccination for case–control studies, cohort studies or cross-sectional studies (p-values = 0.537, 0.487 and 0.398, respectively).
Case–control studies
See Figure 49.
Cohort studies
See Figure 50.
FIGURE 50.
Rate ratios (with 95% CI) comparing the incidence of all tuberculosis morbidity outcomes among BCG vaccinated individuals with that in unvaccinated individuals for the longest duration of follow-up (see Table 4) in cohort studies, stratified by age at vaccination, ordered by year of study start. D + L, DerSimonian and Laird method; I – V, inverse variance method.
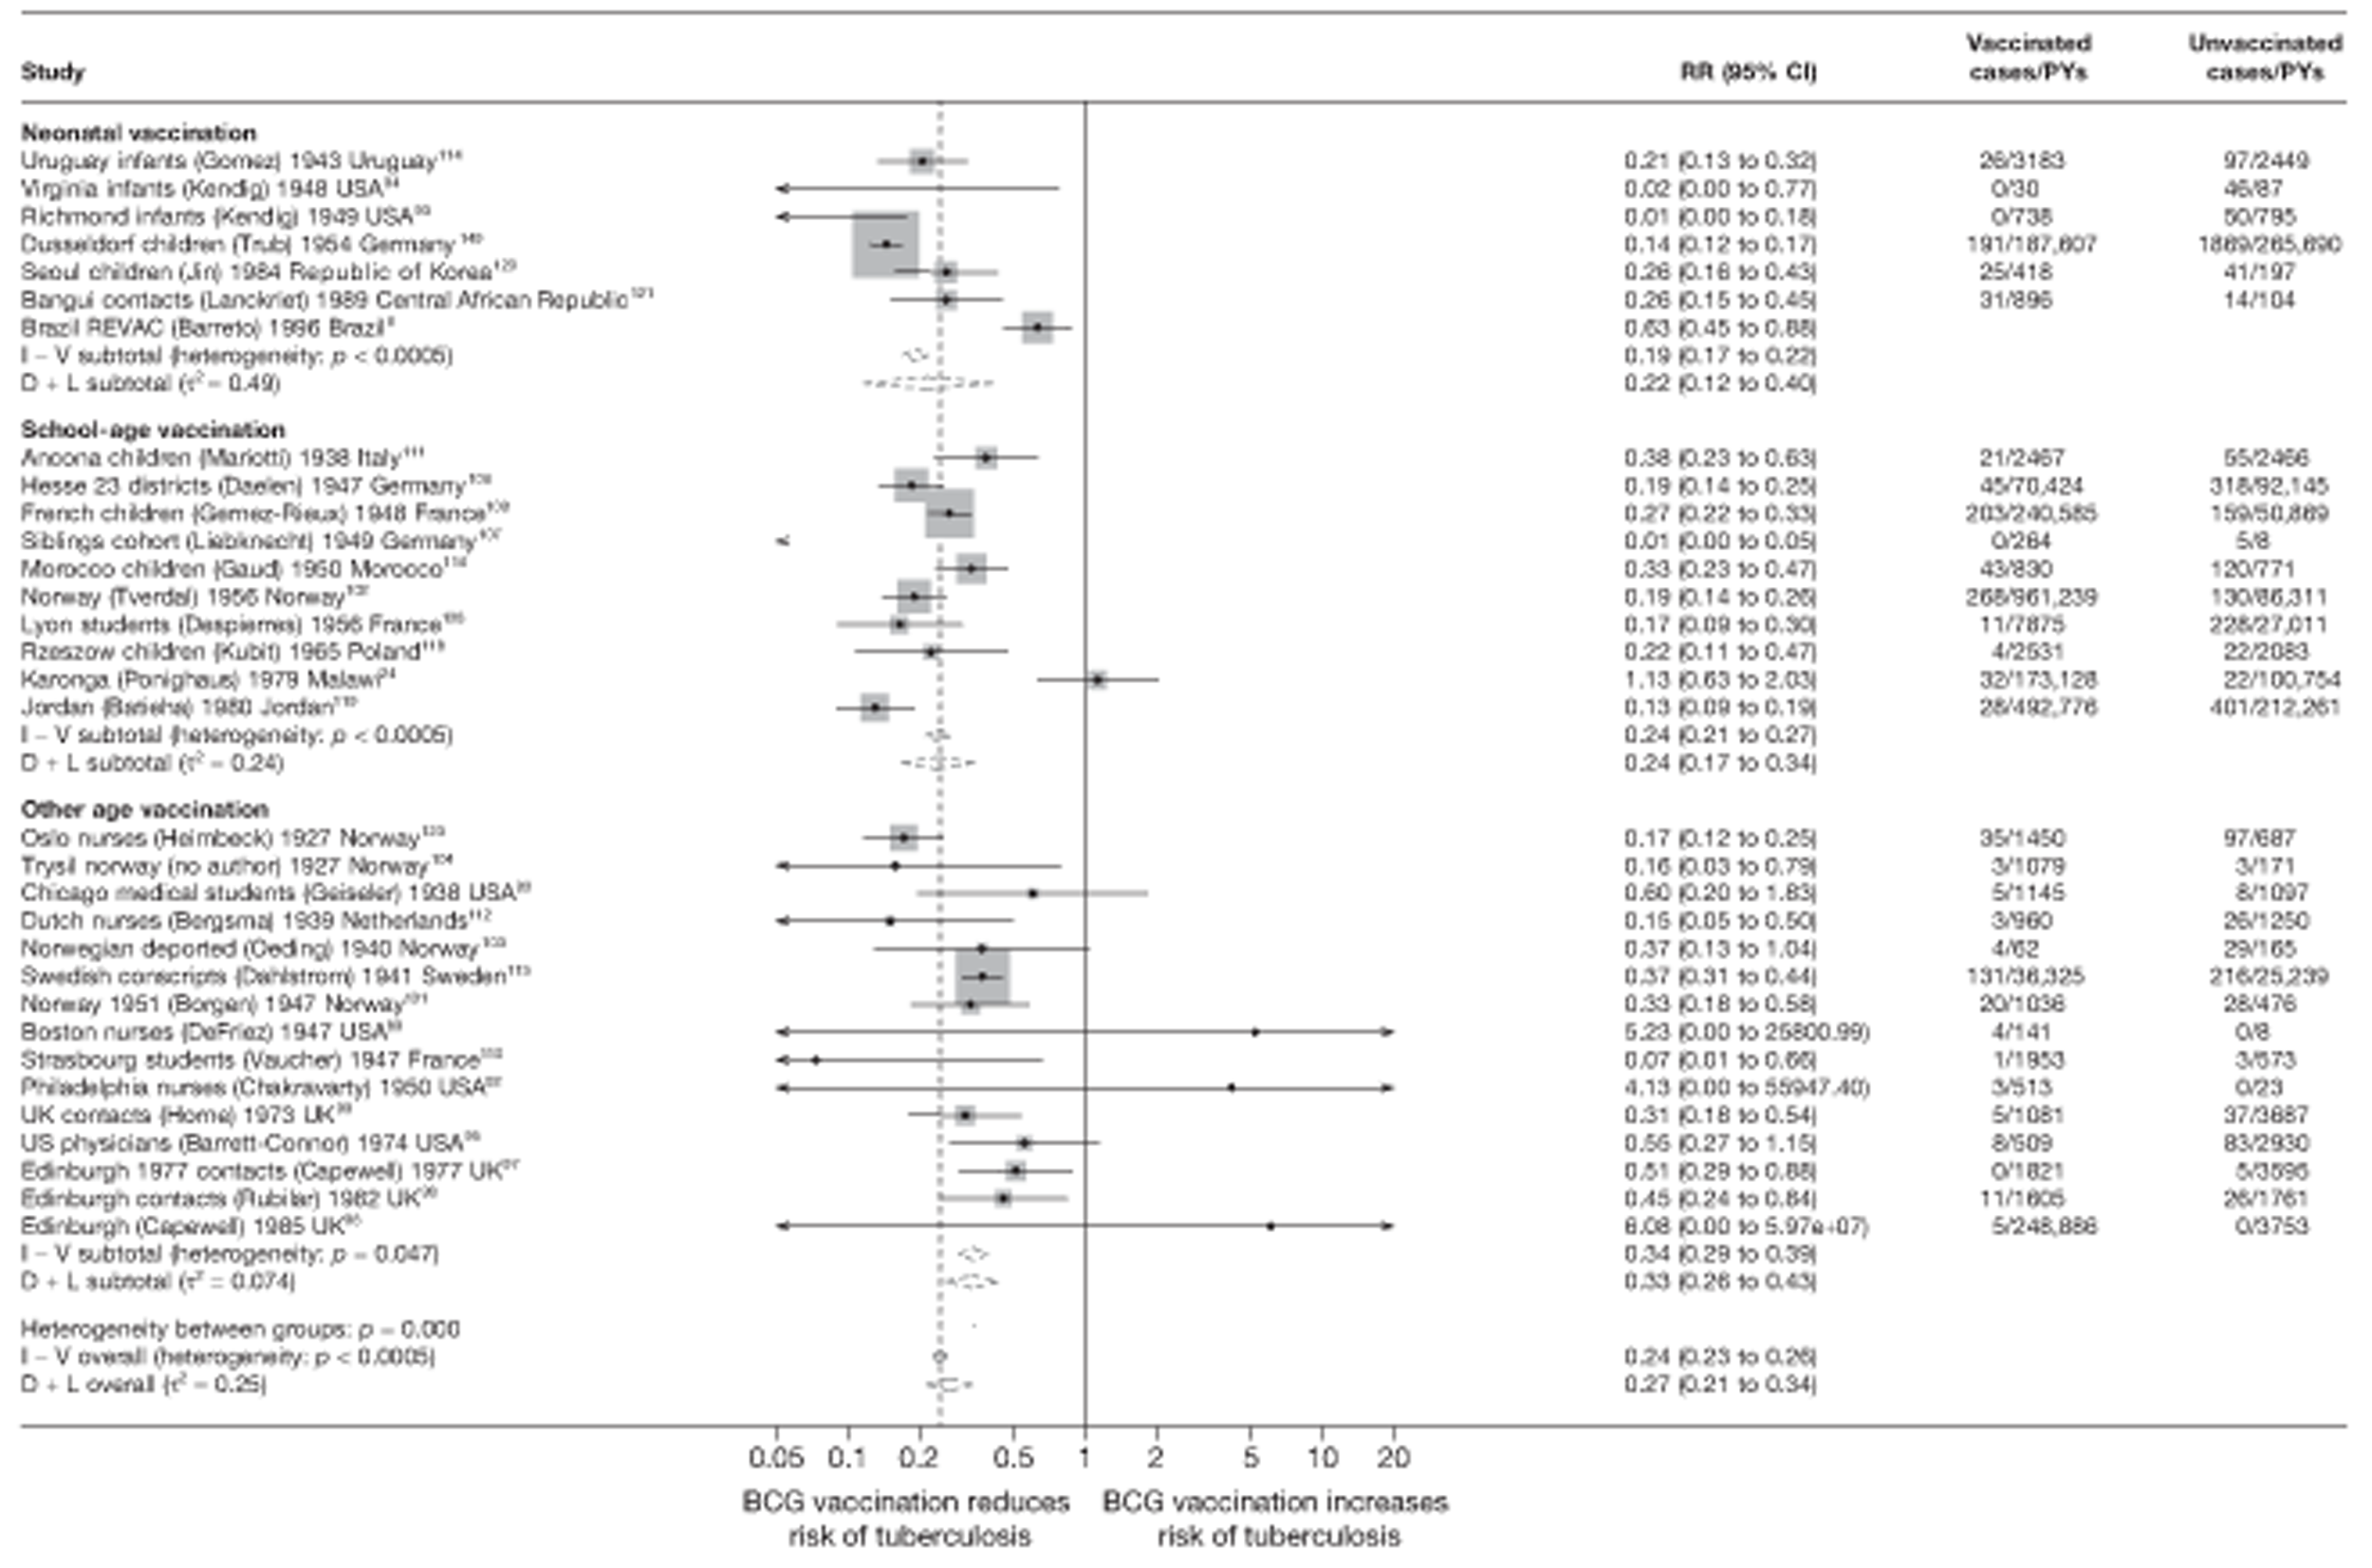
Case population studies
See Figure 51.
FIGURE 51.
Rate ratios (with 95% CI) comparing the incidence of all tuberculosis morbidity outcomes among BCG vaccinated individuals with that in unvaccinated individuals for the longest duration of follow-up (see Table 5) in case population studies, stratified by age at vaccination, ordered by year of study start. D + L, DerSimonian and Laird method; I – V, inverse variance method.
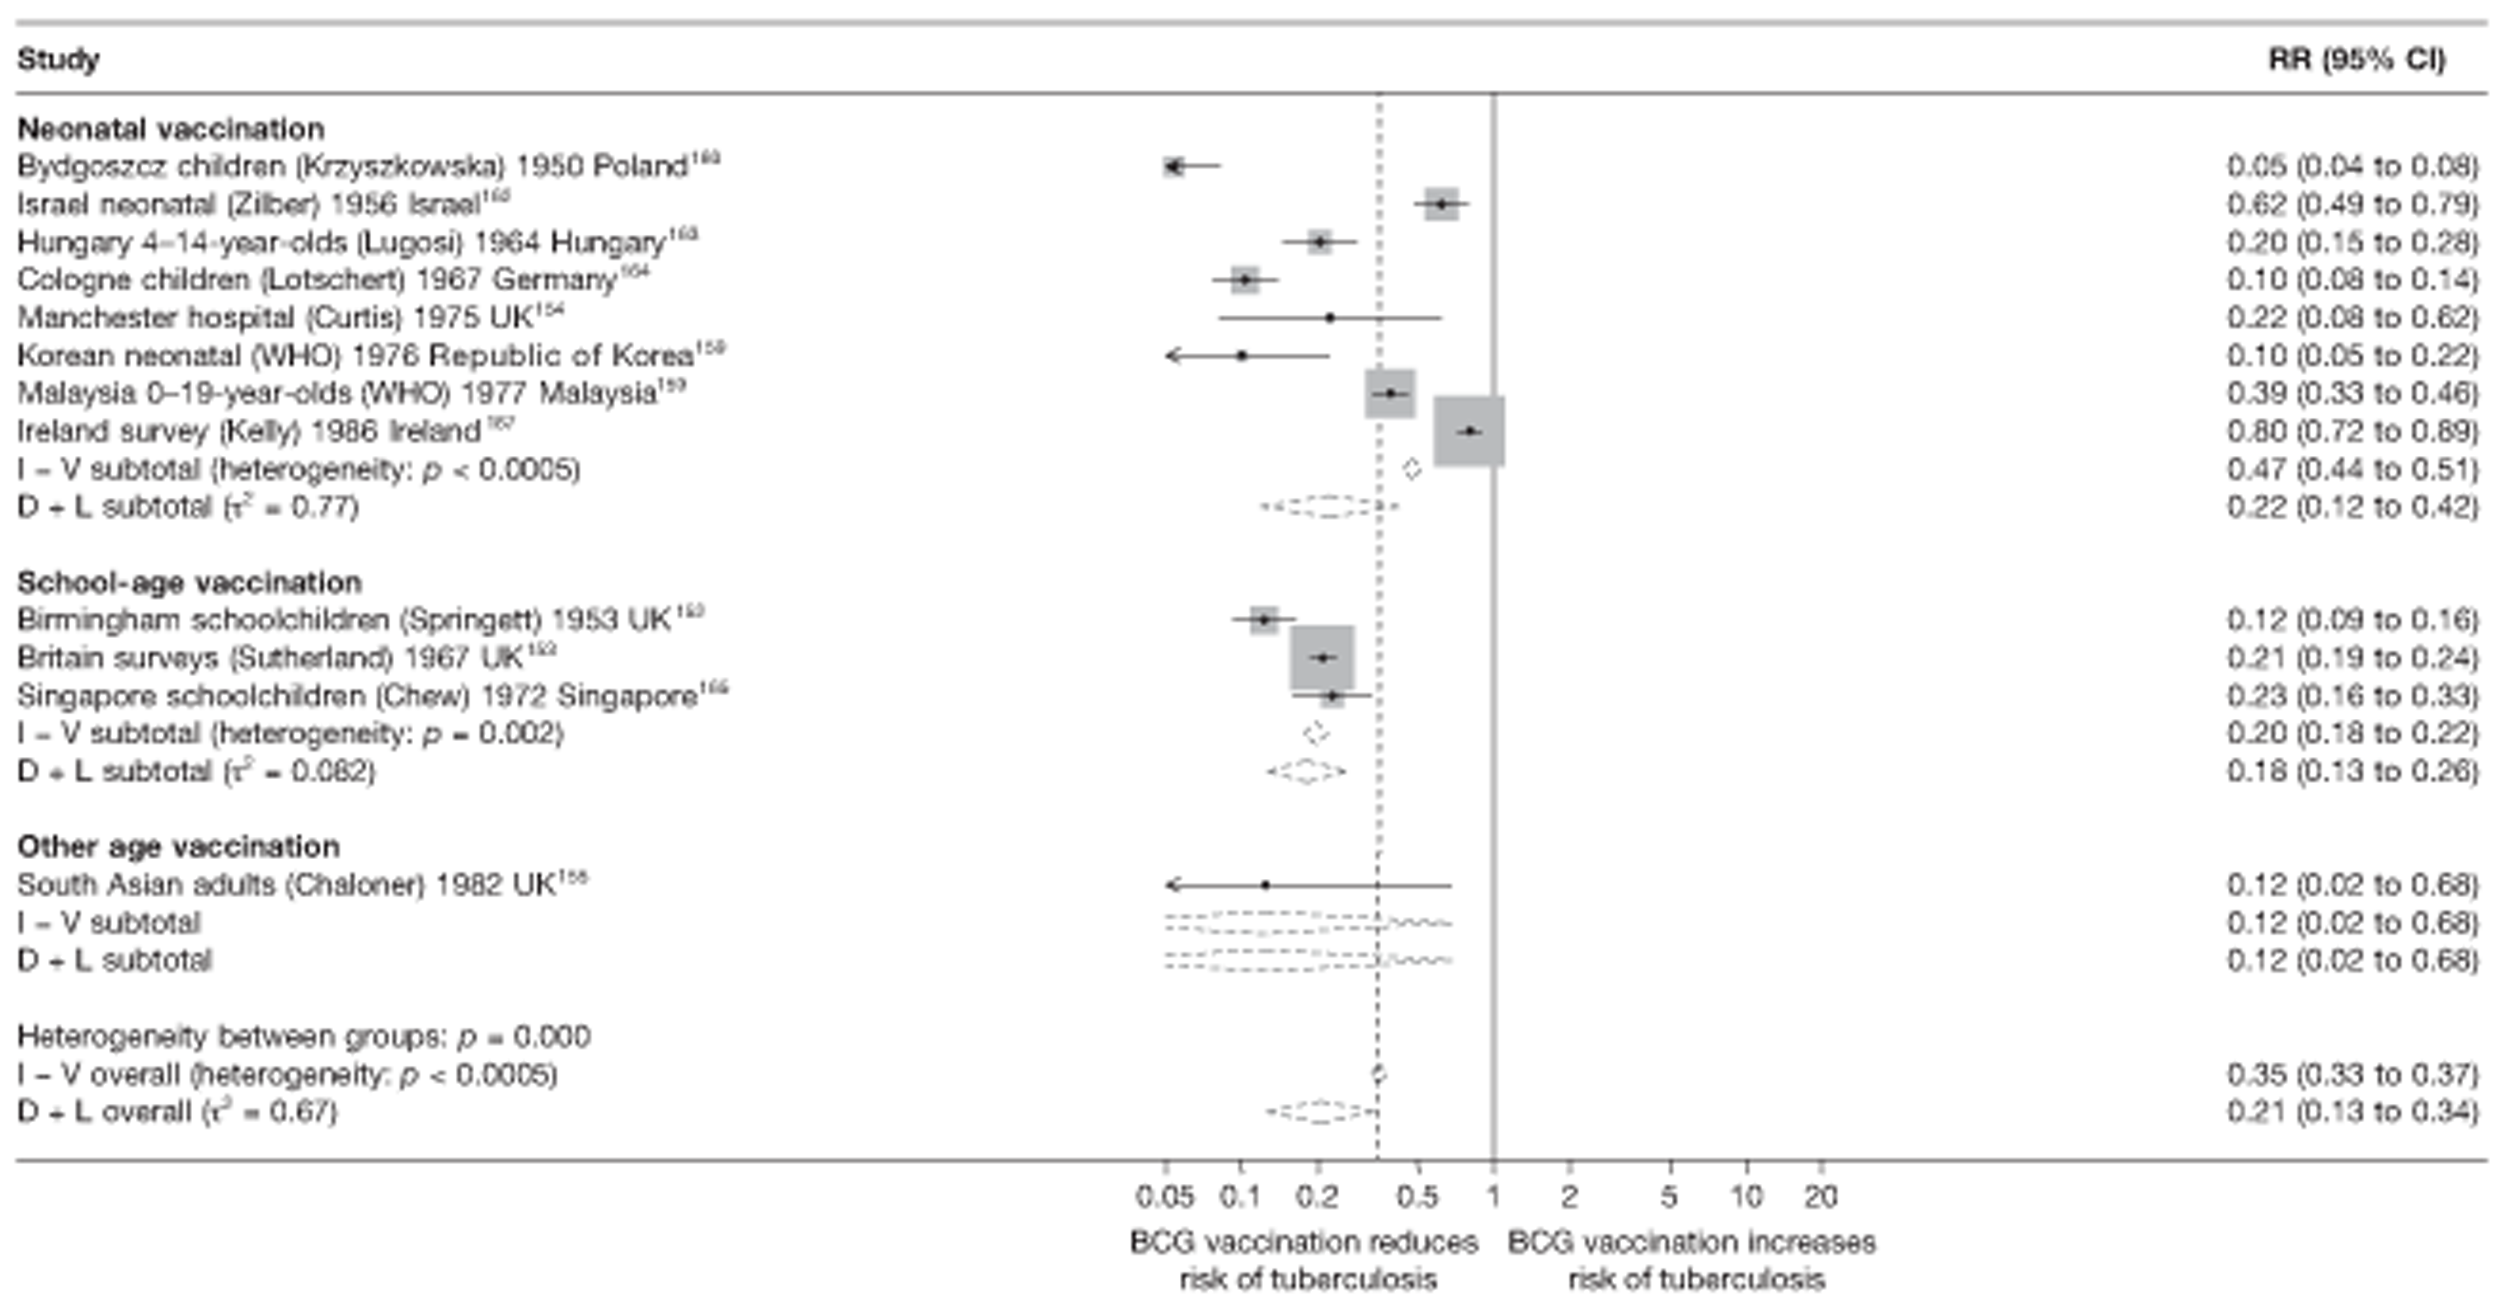
Cross-sectional studies
See Figure 52.
FIGURE 52.
Risk ratios (with 95% CI) comparing the prevalence of all tuberculosis morbidity outcomes among BCG vaccinated individuals with that in unvaccinated individuals in cross-sectional studies, stratified by age at vaccination, ordered by year of study start. a, Date of study publication was used if study start date was not available. D + L, DerSimonian and Laird method; I – V, inverse variance method.
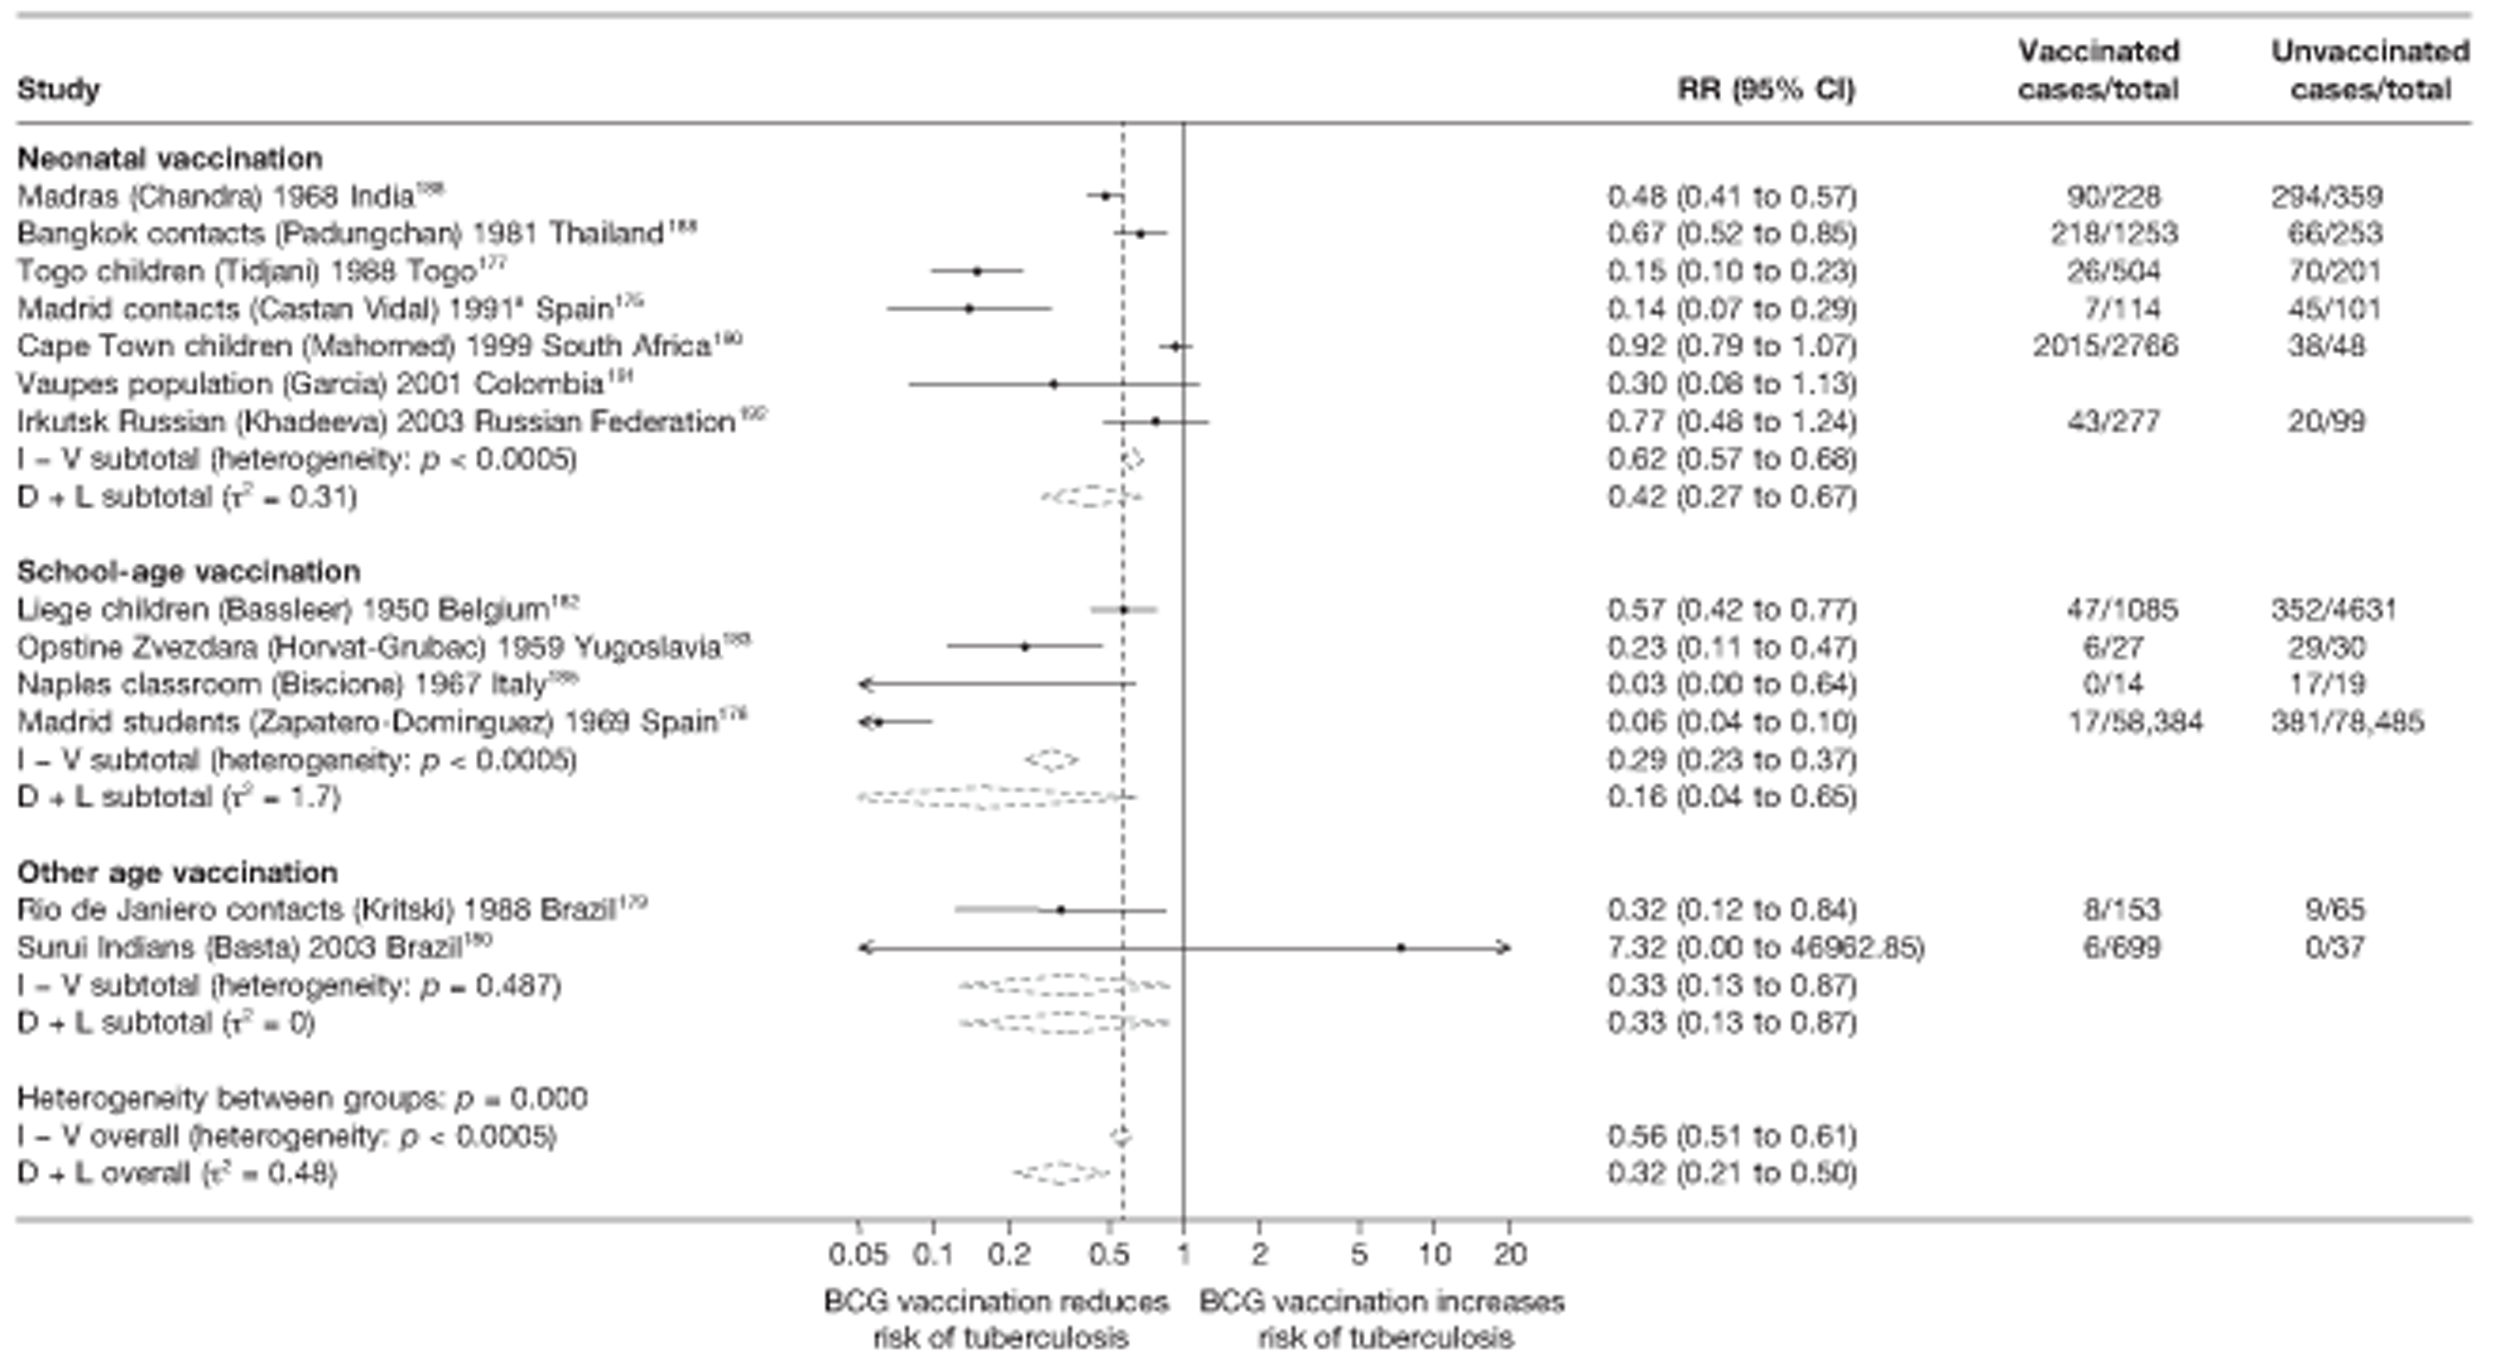
Outbreak studies
See Figure 53.
FIGURE 53.
Risk ratios (with 95% CI) comparing the incidence of all tuberculosis morbidity outcomes among BCG vaccinated individuals with that in unvaccinated individuals in outbreak studies, stratified by age at vaccination, ordered by year of study start. D + L, DerSimonian and Laird method; I – V, inverse variance method.

Stratified analysis by study design, ordered by year study started
Cohort studies
Figure 54 shows the result of cohort studies grouped by retrospective and prospective design and contact studies. As with pulmonary tuberculosis the most consistent protective effect of BCG vaccination against all types of tuberculosis disease was seen in retrospective cohort studies. Stratifying on cohort study design explained a small amount of the heterogeneity seen.
FIGURE 54.
Rate ratios (with 95% CI) comparing the incidence of all tuberculosis morbidity outcomes among BCG vaccinated individuals with that in unvaccinated individuals for the longest duration of follow-up (see Table 4) in cohort studies, stratified by cohort study design, ordered by year of study start. D + L, DerSimonian and Laird method; I – V, inverse variance method.
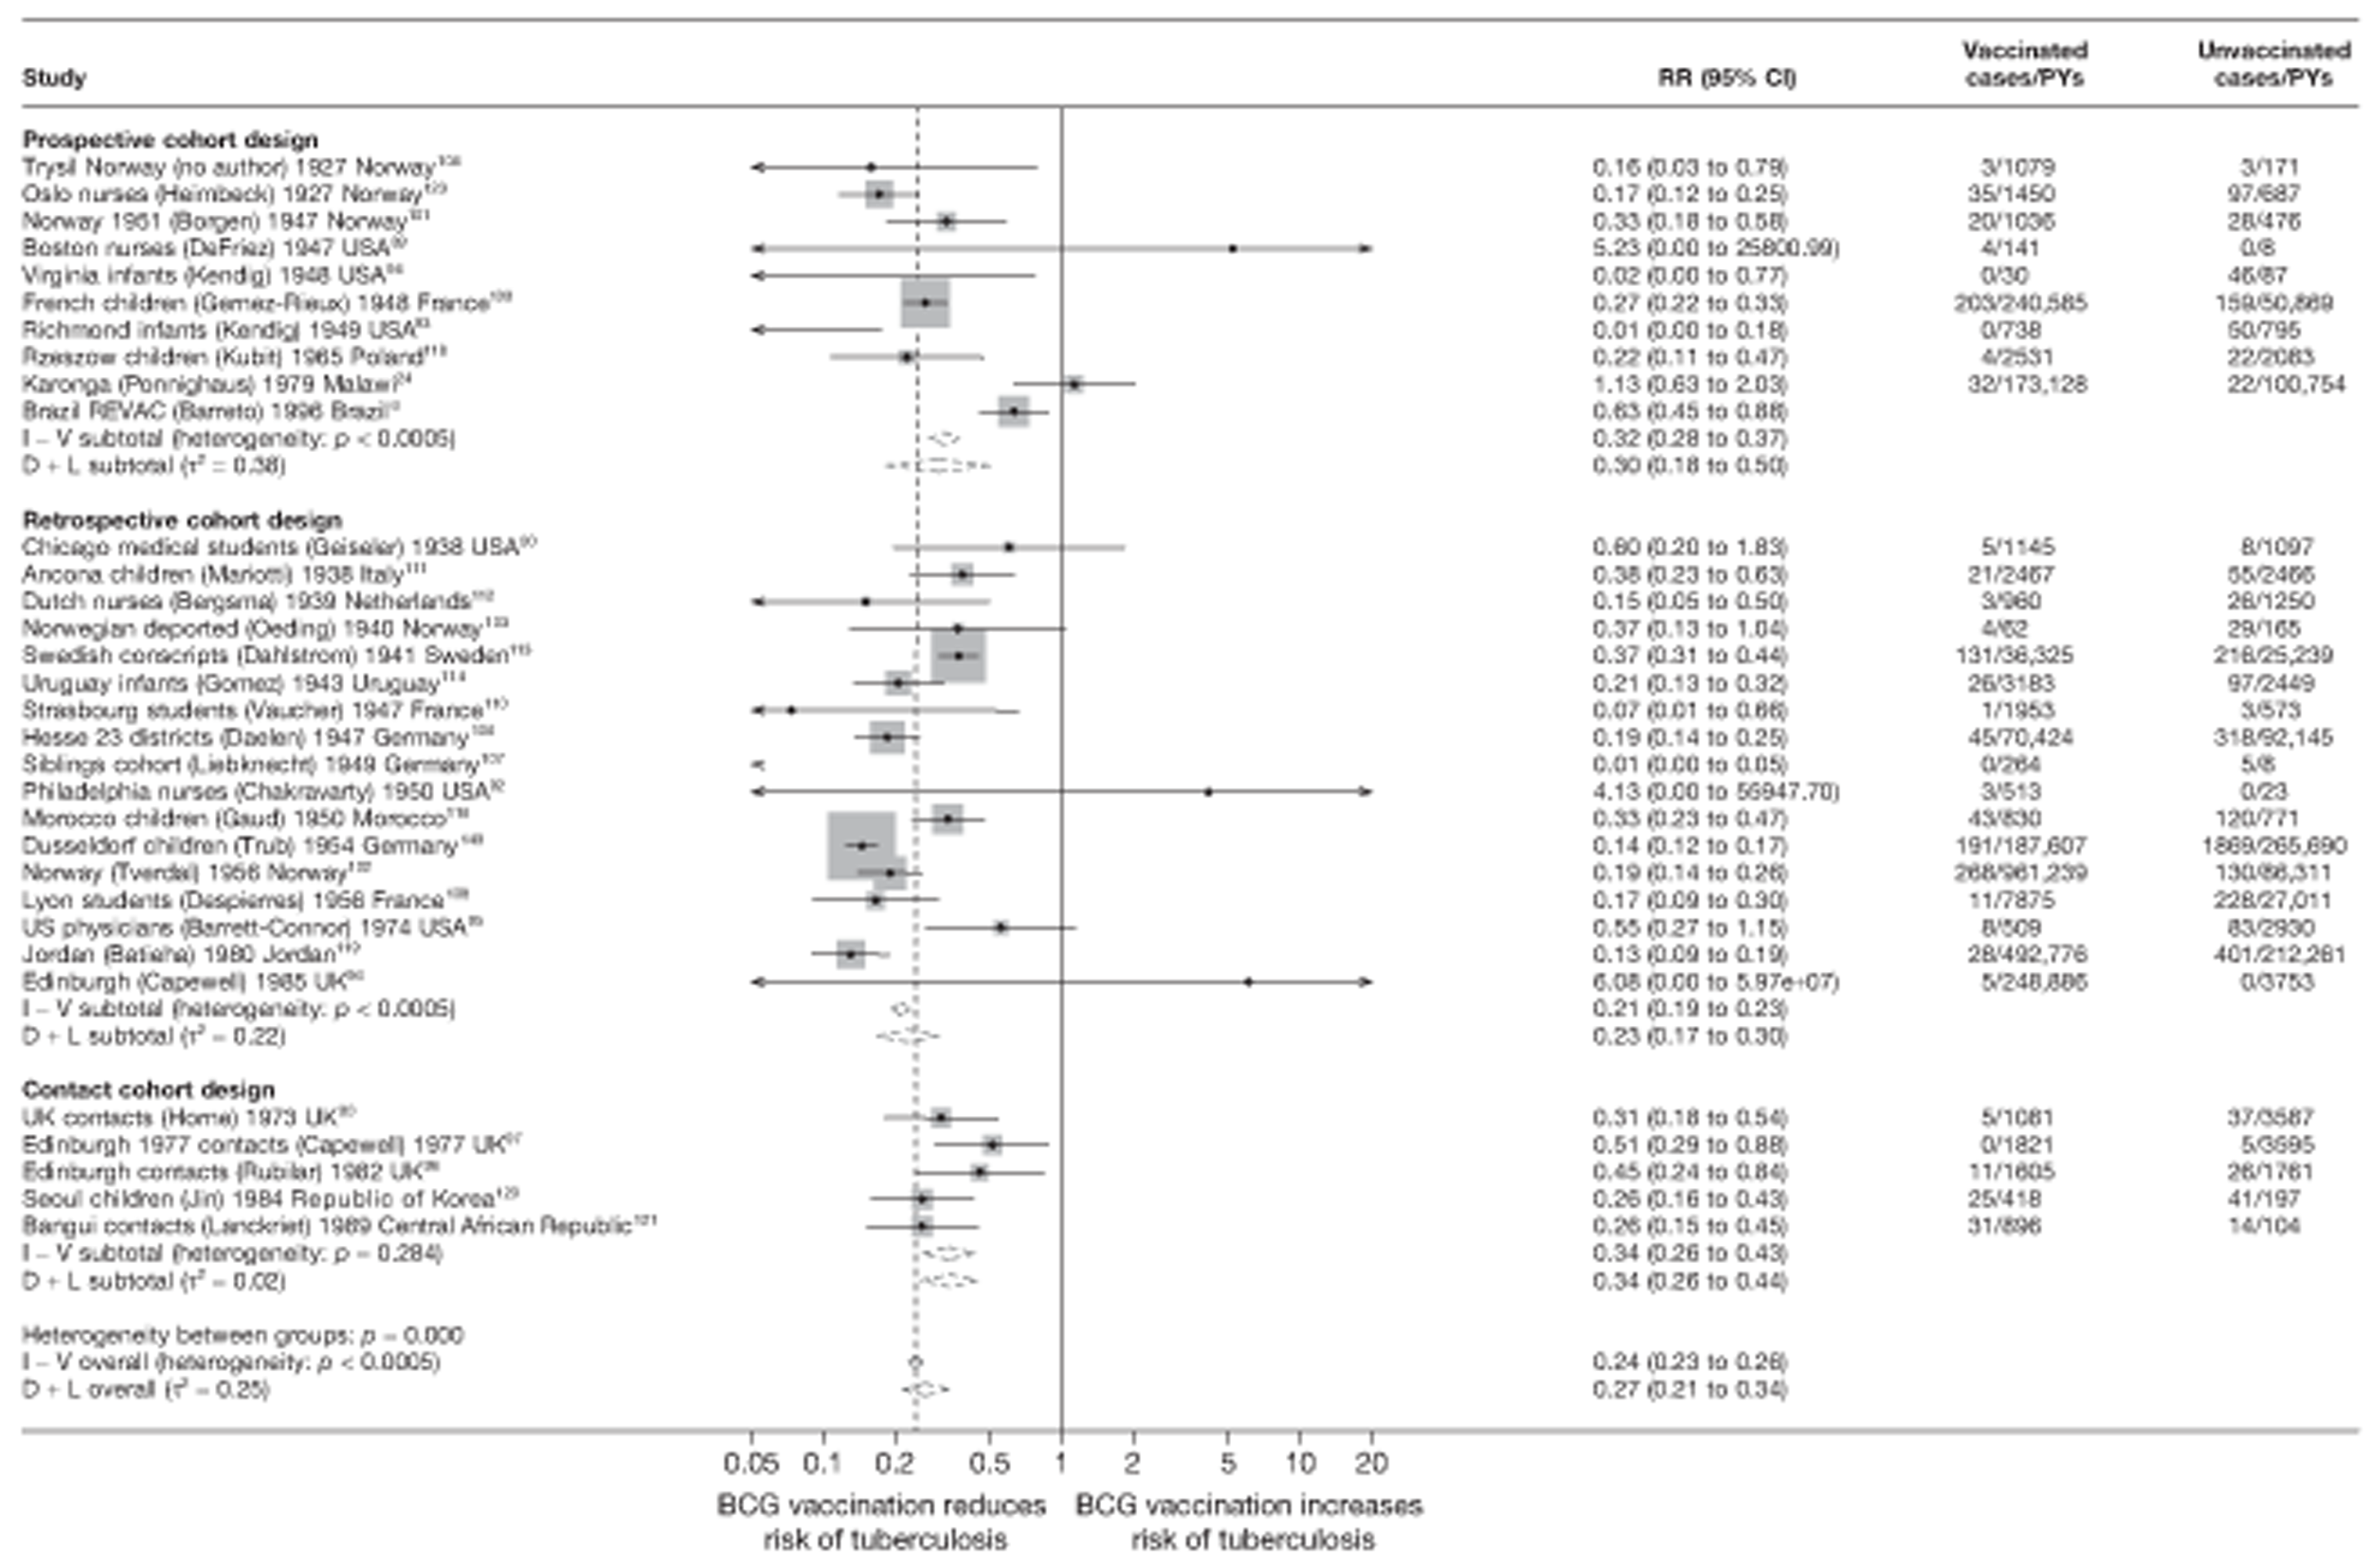
Meta-regression analysis
Based on meta-regression analyses, however, only 7% of the between-study variation was explained by study design [τ2 values before and after stratification were 0.253 and 0.236, respectively (see Table 16)].
Meta-regression analysis
Case–control studies
The univariable meta-regression analysis of case–control studies suggest that latitude and ‘were vaccination definitions the same for cases and controls?’ explained the largest amount of between-study variation in overall BCG vaccination effectiveness against all types of tuberculosis disease with τ2 values of 0.180 and 0.139, respectively, compared with the baseline τ2 value (0.208). There was some evidence (p-value = 0.021) that studies with a high risk of bias, due to vaccination definitions not being the same for cases and control subjects, were associated with BCG vaccination efficacy.
Cohort studies
Results from univariable meta-regressions of cohort studies indicate that latitude and ‘Were results adjusted for socio-economic status?’ each explained the largest amount of between-study variation in overall BCG vaccination effectiveness with τ2 values 0.185 and 0.130, respectively, compared with the baseline τ2 (0.253). There was evidence (p-values = 0.069 and 0.003, respectively) that higher latitude and no adjustment for SES were associated with an increase in BCG vaccination effectiveness.
Case population studies
Results from univariable meta-regressions of case population studies indicate that none of the study level variables explained the between-study variation in overall BCG vaccination effectiveness.
Cross-sectional studies
Only the variable ‘Were cases and controls determined independently of BCG vaccination status?’ explained some of the between-study heterogeneity in cross-sectional studies reducing the τ2 value from 0.716 (null model) to 0.646 but with insufficient data to support the suggestion that knowledge of BCG vaccination status was associated with a reduced effectiveness.
Combined meningeal and/or miliary tuberculosis
Unstratified analysis ordered by year study started
A total of 31 observational studies provided data on the effect of BCG vaccination against miliary tuberculosis and tuberculosis meningitis. The majority of studies assessed this effect on meningeal tuberculosis (14 case–control studies, six cohorts, six case population studies and six cross-sectional studies), seven studies provided data on the combined outcome of both miliary tuberculosis and meningitis, whereas one cohort and one cross-sectional study provided data on miliary tuberculosis only. Figures 55–58 present the unstratified results of these studies. Despite variation in the protective effectiveness of BCG vaccination against meningeal and/or miliary tuberculosis between individual studies, the majority (21) of these showed an overall protective effect.
FIGURE 55.
Odds ratios (with 95% CI) comparing the BCG vaccination status of meningeal and/or miliary tuberculosis cases and control subjects in case–control studies, ordered by year of study start. D + L, DerSimonian and Laird method; I – V, inverse variance method. a, Combined tuberculosis meningitis and miliary tuberculosis outcomes; b, Tuberculosis meningitis outcome only; c, Date of study publication was used if study start date was not available.
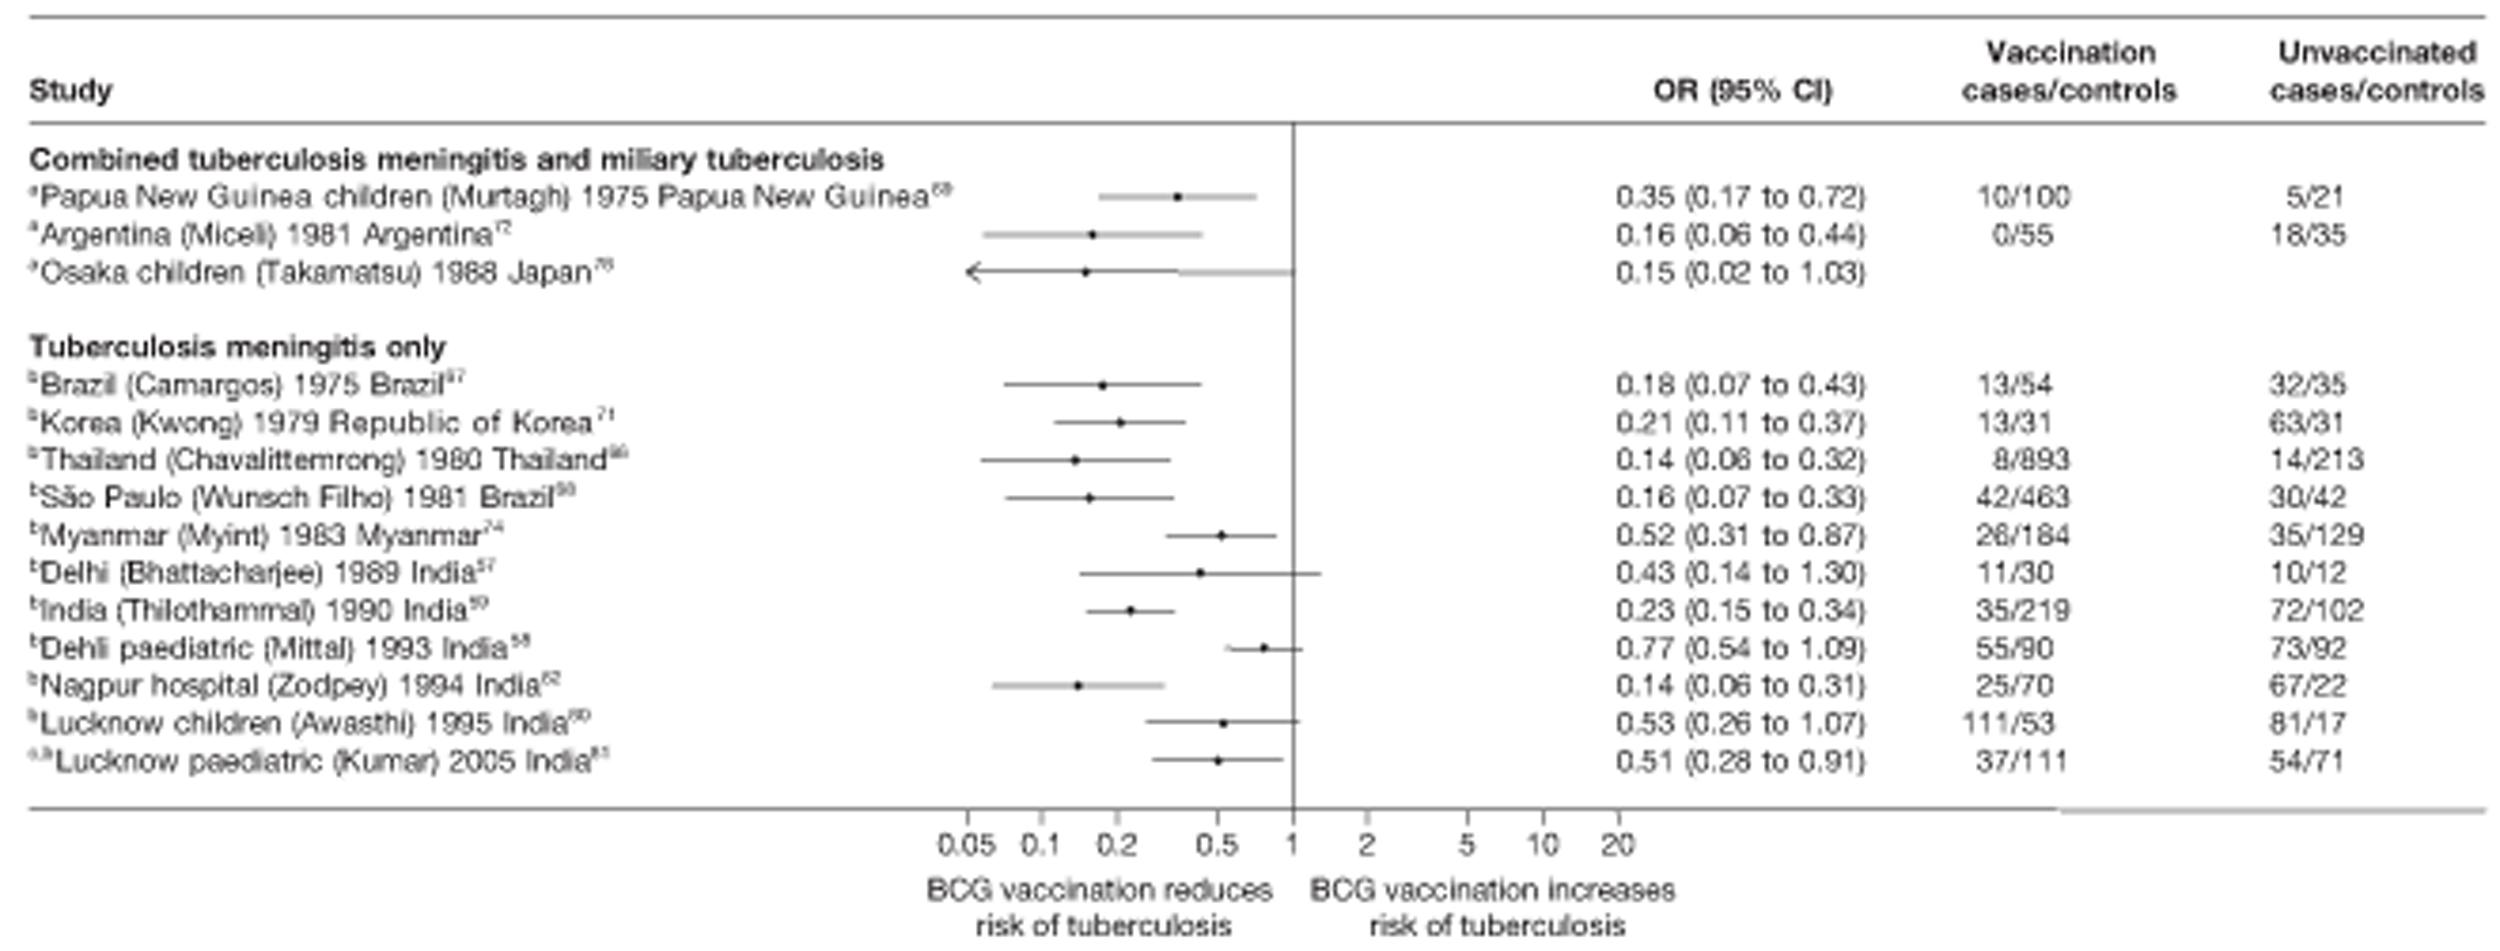
FIGURE 56.
Rate ratios (with 95% CI) comparing the incidence of meningeal and/or miliary tuberculosis among cases with that in control subjects for the longest duration of follow-up (see Table 4) in cohort studies, ordered by year of study start. a, Combined tuberculosis meningitis and miliary tuberculosis outcomes; b, Tuberculosis meningitis outcome only; c, Miliary tubeculosis outcome only. D + L, DerSimonian and Laird method; I – V, inverse variance method.
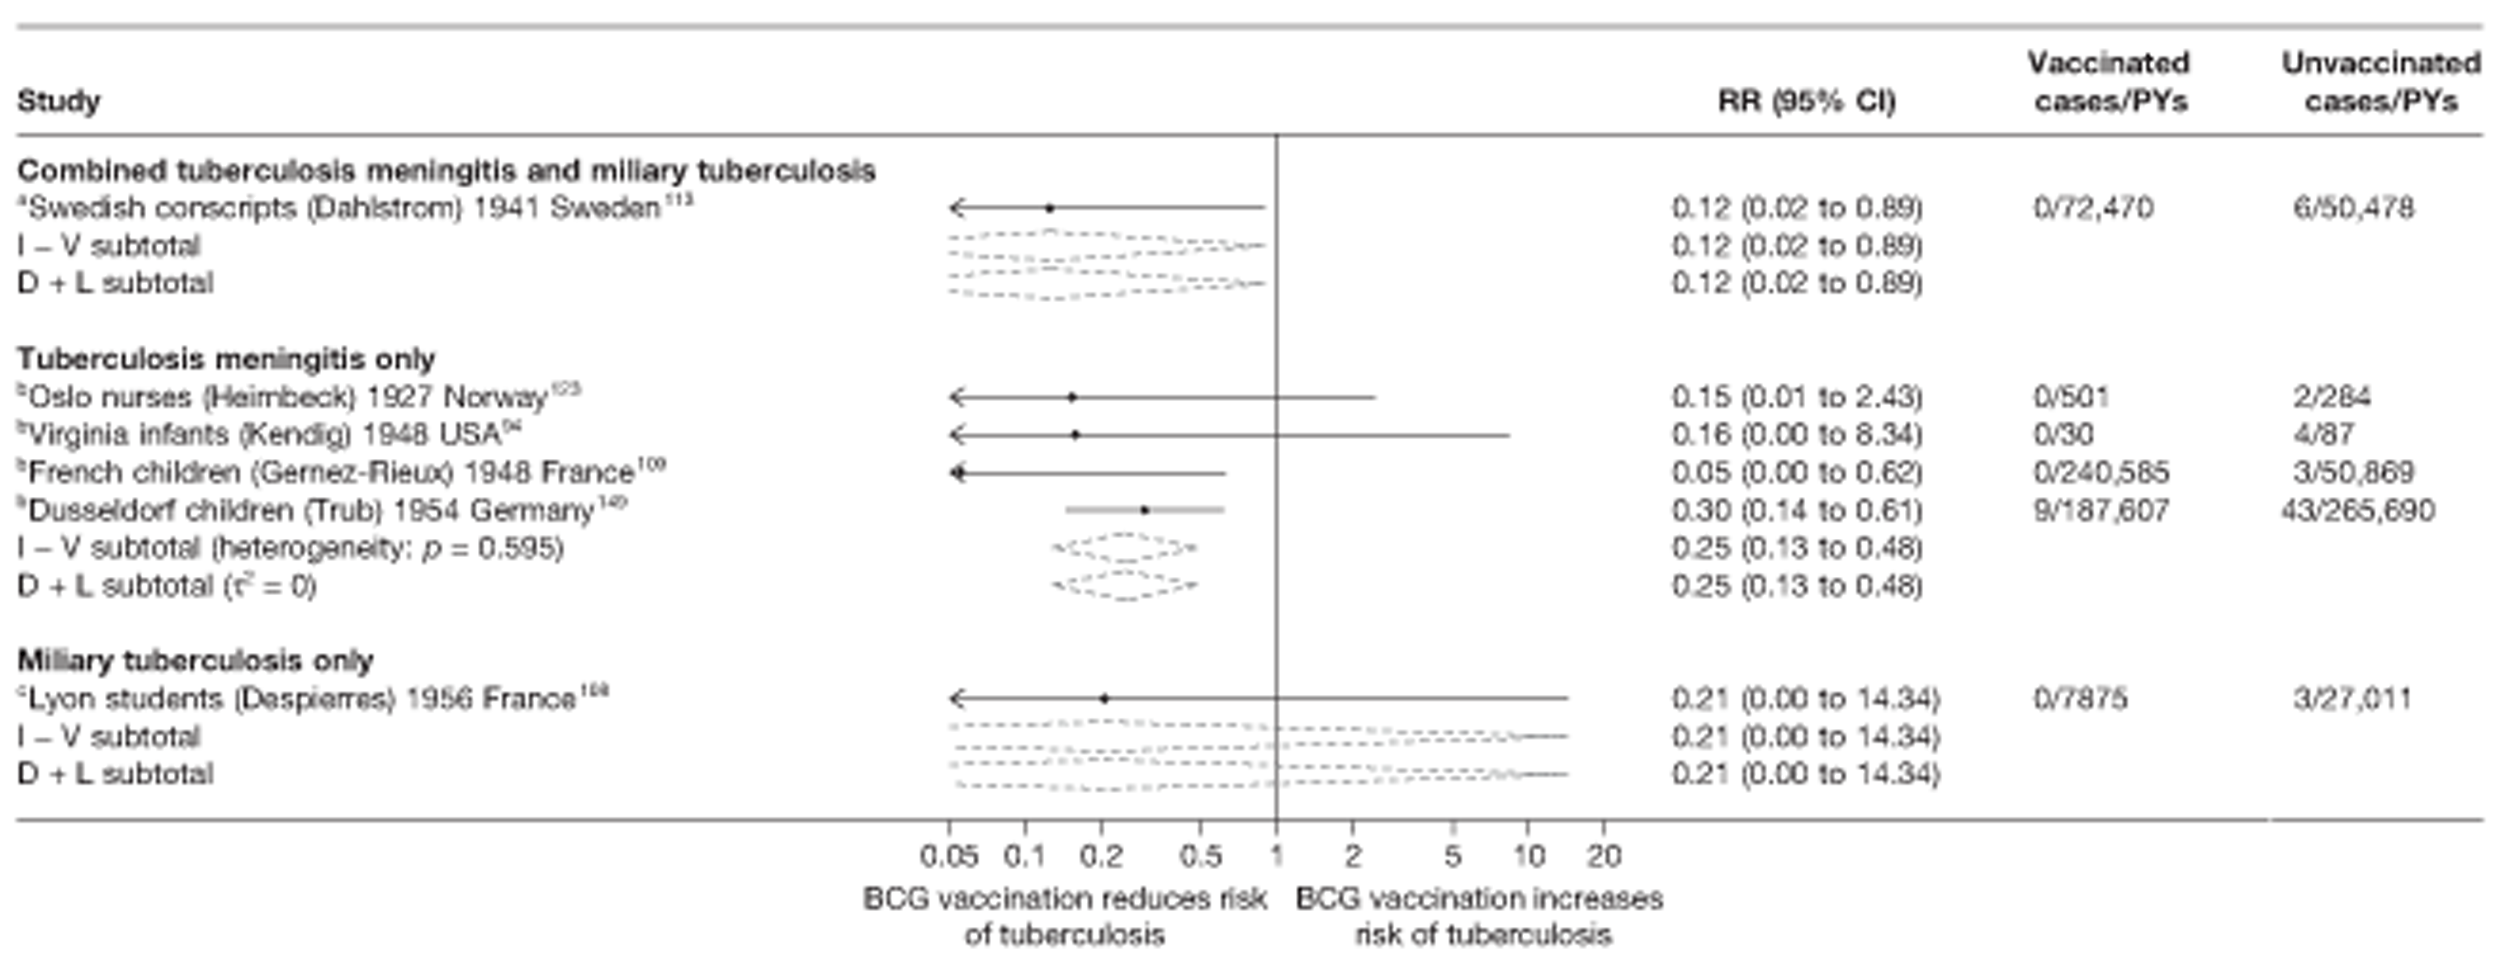
FIGURE 57.
Rate ratios (with 95% CI) comparing the incidence of meningeal and/or miliary tuberculosis among vaccinated individuals with that in unvaccinated individuals for the longest duration of follow-up (see Table 5) in case population studies, ordered by year of study start. a, Tuberculosis meningitis outcome only.

FIGURE 58.
Risk ratios (with 95% CI) comparing the prevalence of meningeal and/or miliary tuberculosis among vaccinated individuals with that in unvaccinated individuals in cross-sectional studies, ordered by year of study start. a, Combined tuberculosis meningitis and miliary tuberculosis outcomes; b, Tuberculosis meningitis outcome only; c, Miliary tuberculosis outcome only. D + L, DerSimonian and Laird metod; I – V, inverse variance method.

All case–control studies showed evidence of a protective effect of BCG vaccination against the combined outcome of meningeal and miliary tuberculosis, and meningeal tuberculosis only (see Figure 55). Similarly, the effect of BCG vaccination observed in cohort studies was protective, although in three of the six studies the sample sizes were small and CI crossed one. All case population studies showed evidence of a strong protection against meningeal tuberculosis. Only one out of the six cross-sectional studies did not find evidence of a clinical benefit (see Figure 58).
Case–control studies
See Figure 55.
Cohort studies
See Figure 56.
Case population studies
See Figure 57.
Cross-sectional studies
See Figure 58.
Stratified analysis by latitude (10°), ordered by year study started
Figures 59–62 show the estimated effects of BCG vaccination against meningeal and miliary tuberculosis, stratified by latitude of study location. All case–control studies were conducted at latitudes of < 40°. The most consistent, protective effect was high, and seen in studies conducted between 30° and 40° with an overall OR of 0.19 (95% CI 0.12 to 0.31), corresponding to a VE of 81% (95% CI 69% to 88%). There was evidence of heterogeneity for studies from locations between 20° and 30°, with some studies showing a protective effect similar to that seen at higher latitudes, whereas in others the protective effect was low. Studies at lower latitudes (0° to 20°) showed evidence of a good protective effect. There was consistent evidence of high protection in cohort studies conducted above 50° latitude [rate ratio 0.23 (95% CI 0.12 to 0.44)] equivalent to a good VE of 77% (95% CI 56% to 88%), whereas only one cohort study each was conducted at 30–40° and 40–50° latitude. Results from observational case population and cross-sectional studies showed no evidence that protection by BCG vaccination against meningeal and miliary tuberculosis varied substantially by latitude.
FIGURE 59.
Odds ratios (with 95% CI) comparing the BCG vaccination status of meningeal and/or miliary tuberculosis cases and control subjects in case–control studies, stratified by latitude (10°), ordered by year of study start. a, Meningitis only; b, Combined meningitis and miliary; c, Date of study publication was used if study start date was not available. D + L, DerSimonian and Laird method; I – V, inverse variance method.
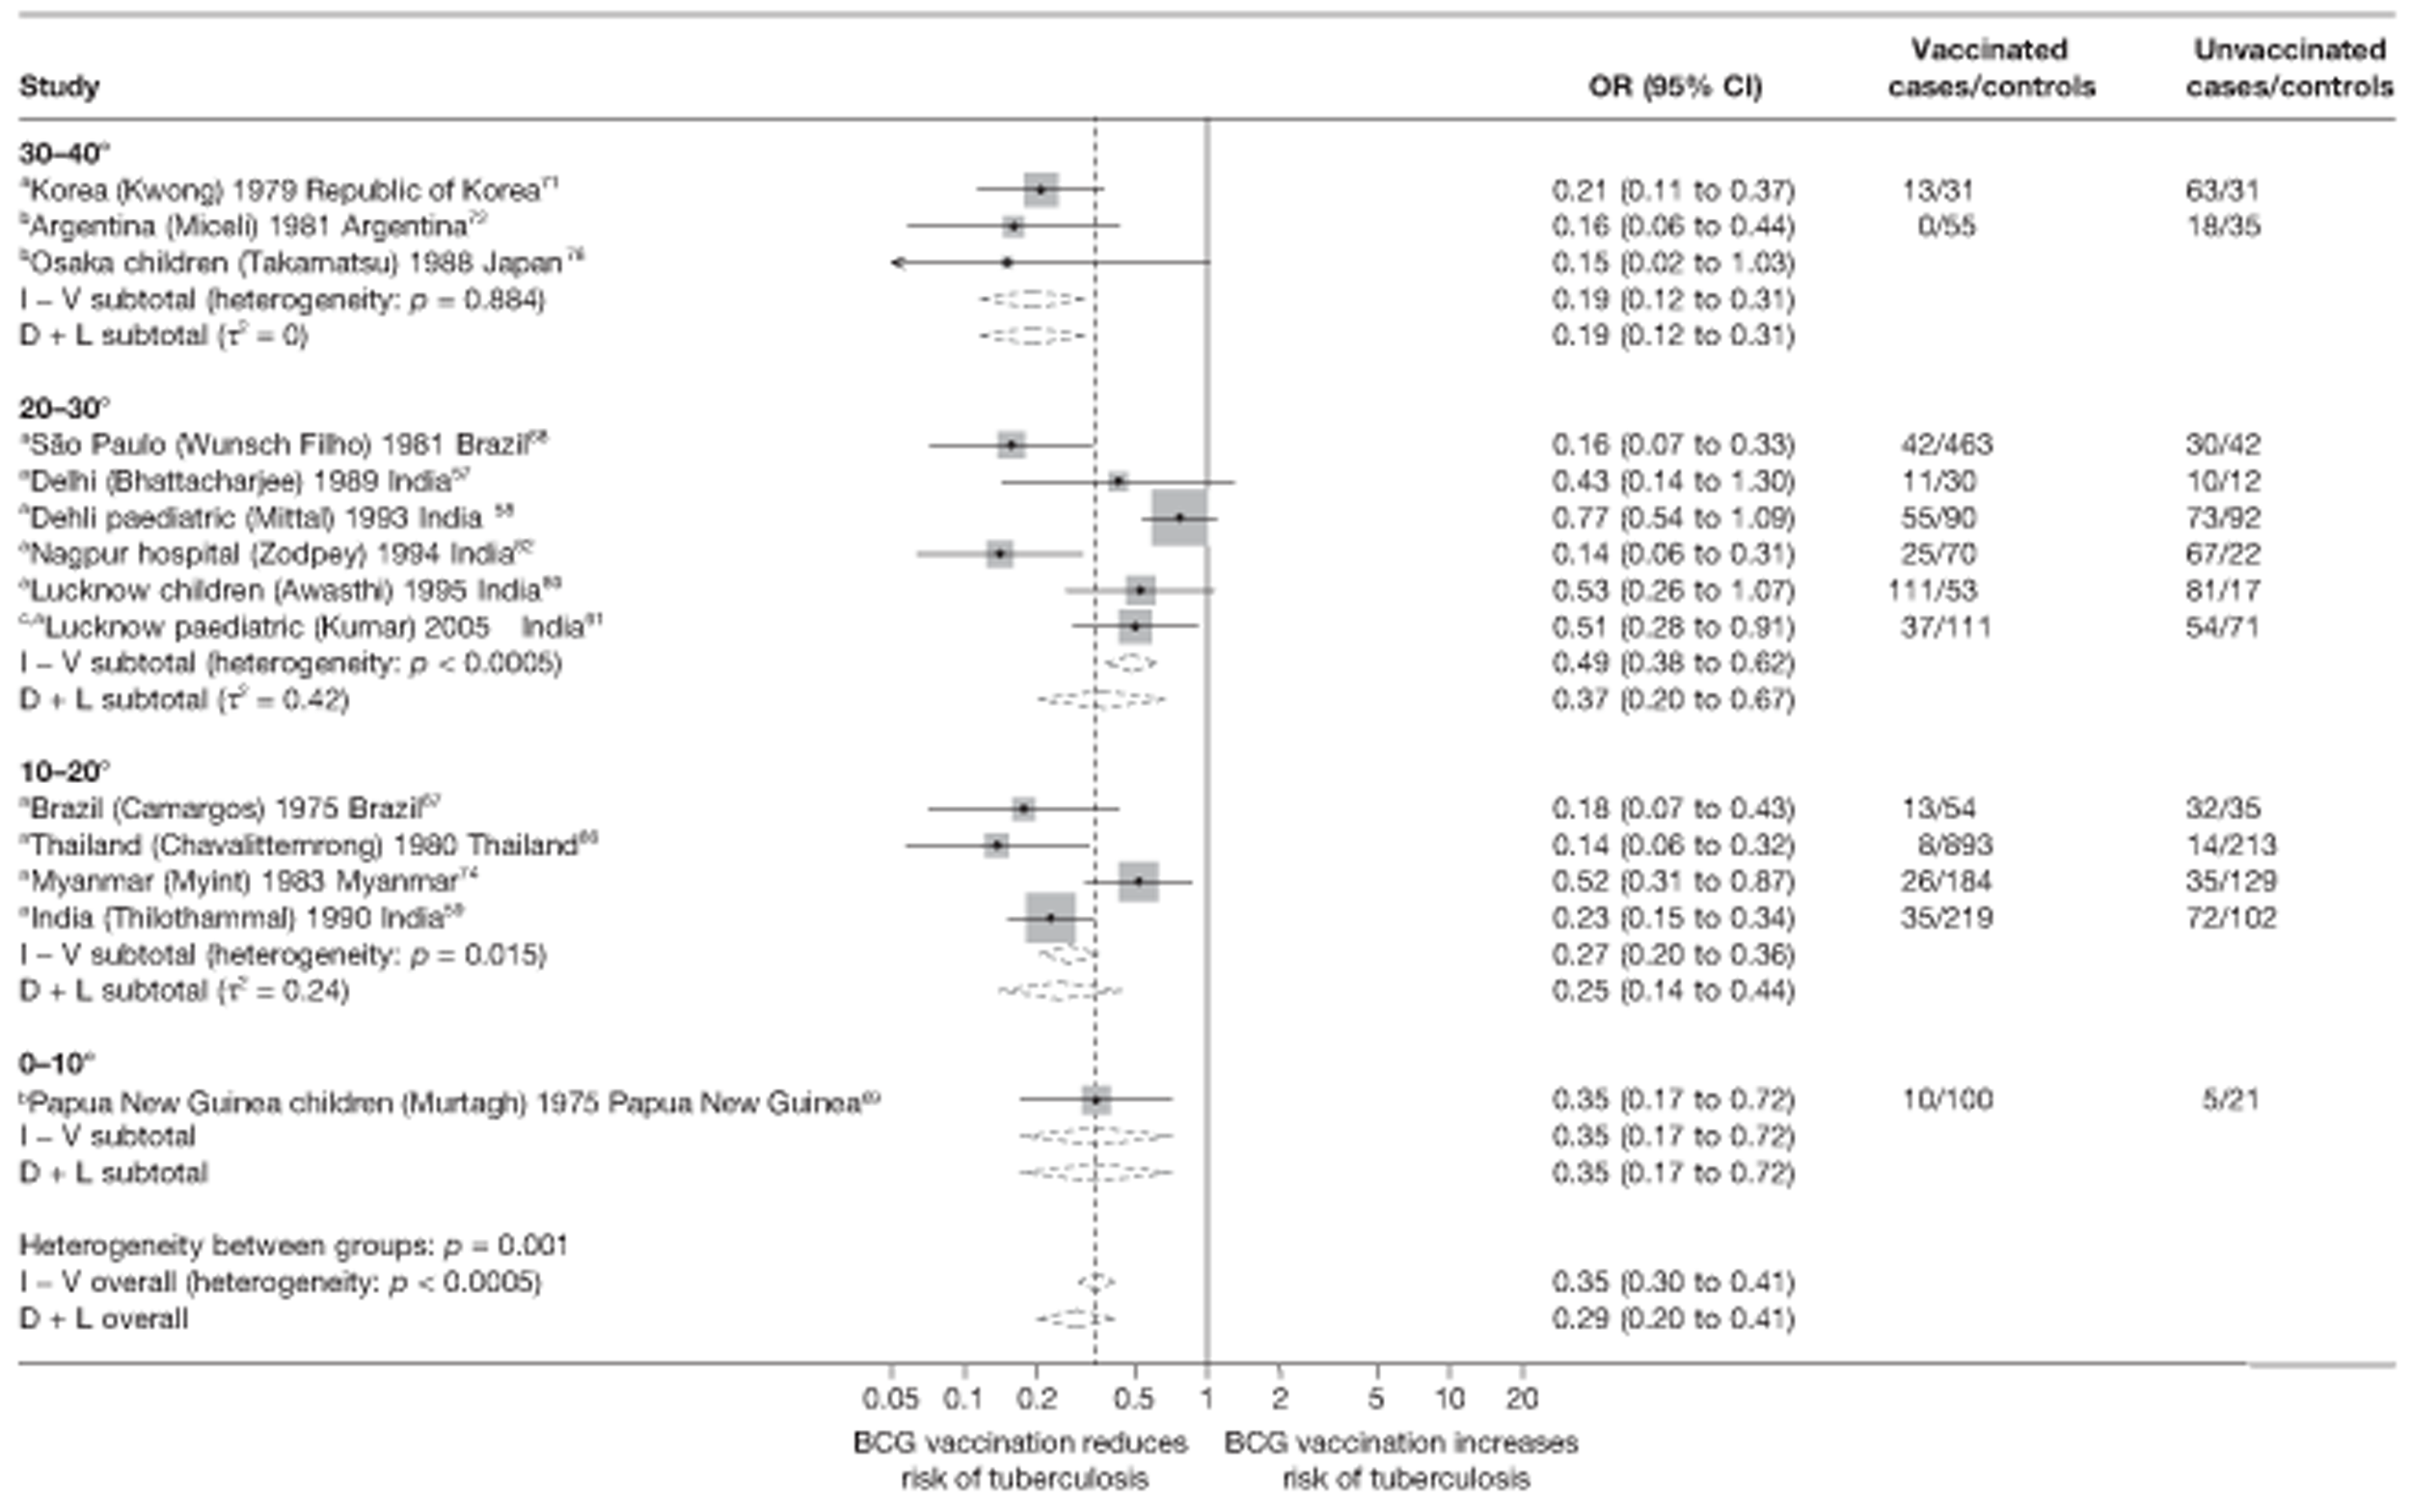
FIGURE 60.
Rate ratios (with 95% CI) comparing the incidence of meningeal and/or miliary tuberculosis among BCG vaccinated individuals with that in unvaccinated individuals for the longest duration of follow-up (see Table 4) in cohort studies, stratified by latitude (10°), ordered by year of study start. a, Date of study publication was used if study start date was not available; b, Combined tuberculosis meningitis and miliary tuberculosis outcomes; c, Tuberculosis meningitis outcome only; d, Miliary tuberculosis outcome only. D + L, DerSimonian and Laird method; I – V, inverse variance method.
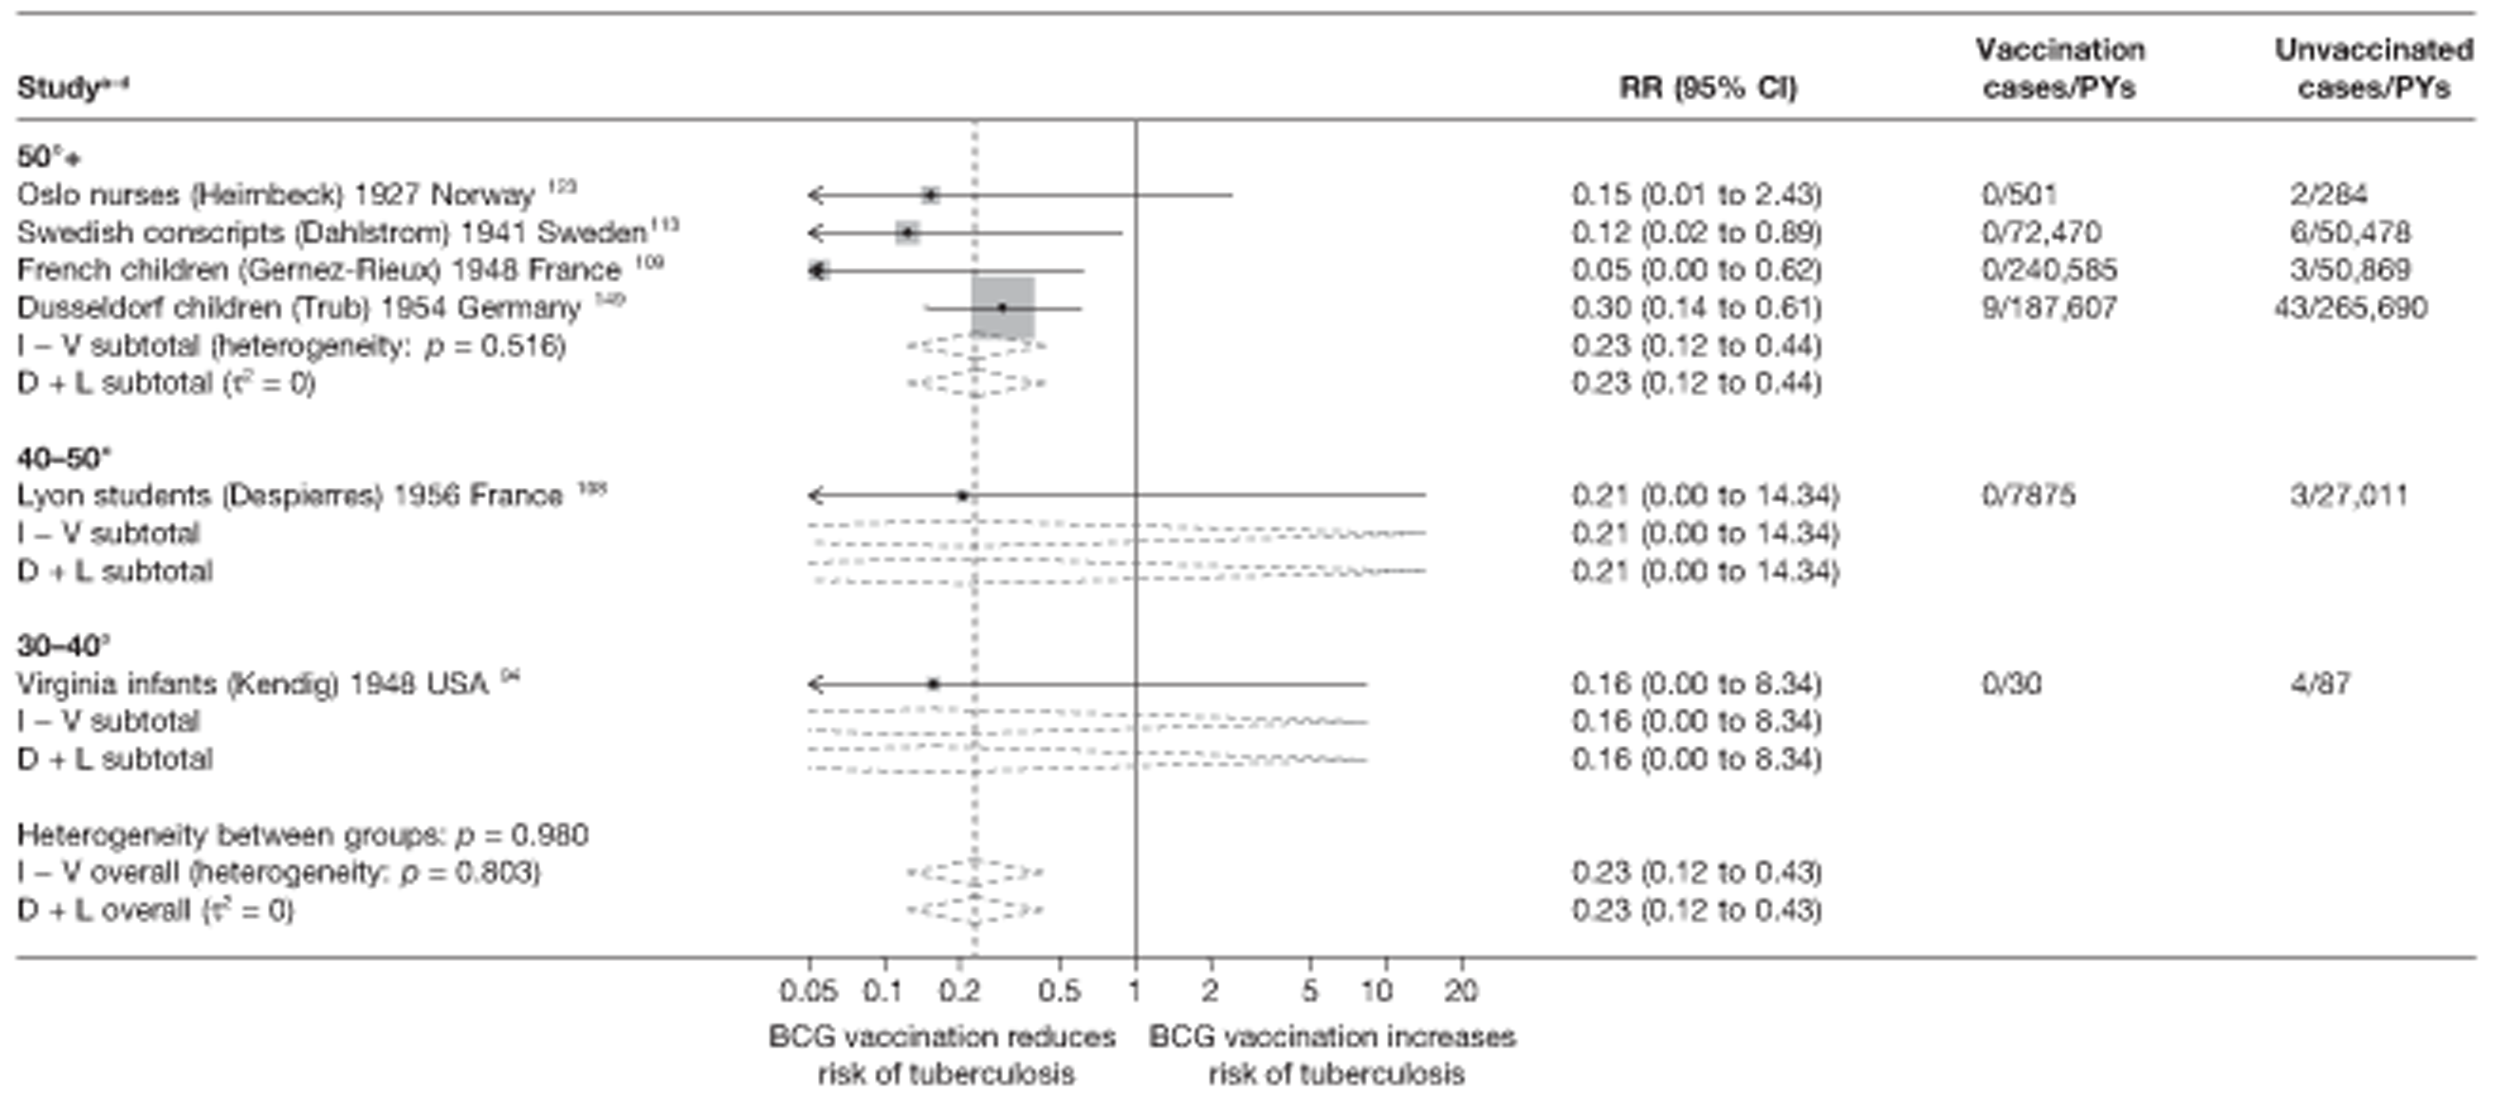
FIGURE 61.
Rate ratios (with 95% CI) comparing the incidence of meningeal and/or miliary tuberculosis among BCG vaccinated individuals with that in unvaccinated individuals for the longest duration of follow-up (see Table 5) in case population studies, stratified by latitude (10°), ordered by year of study start. a, Tuberculosis meningitis outcome only. D + L, DerSimonian and Laird method; I – V, inverse variance method.
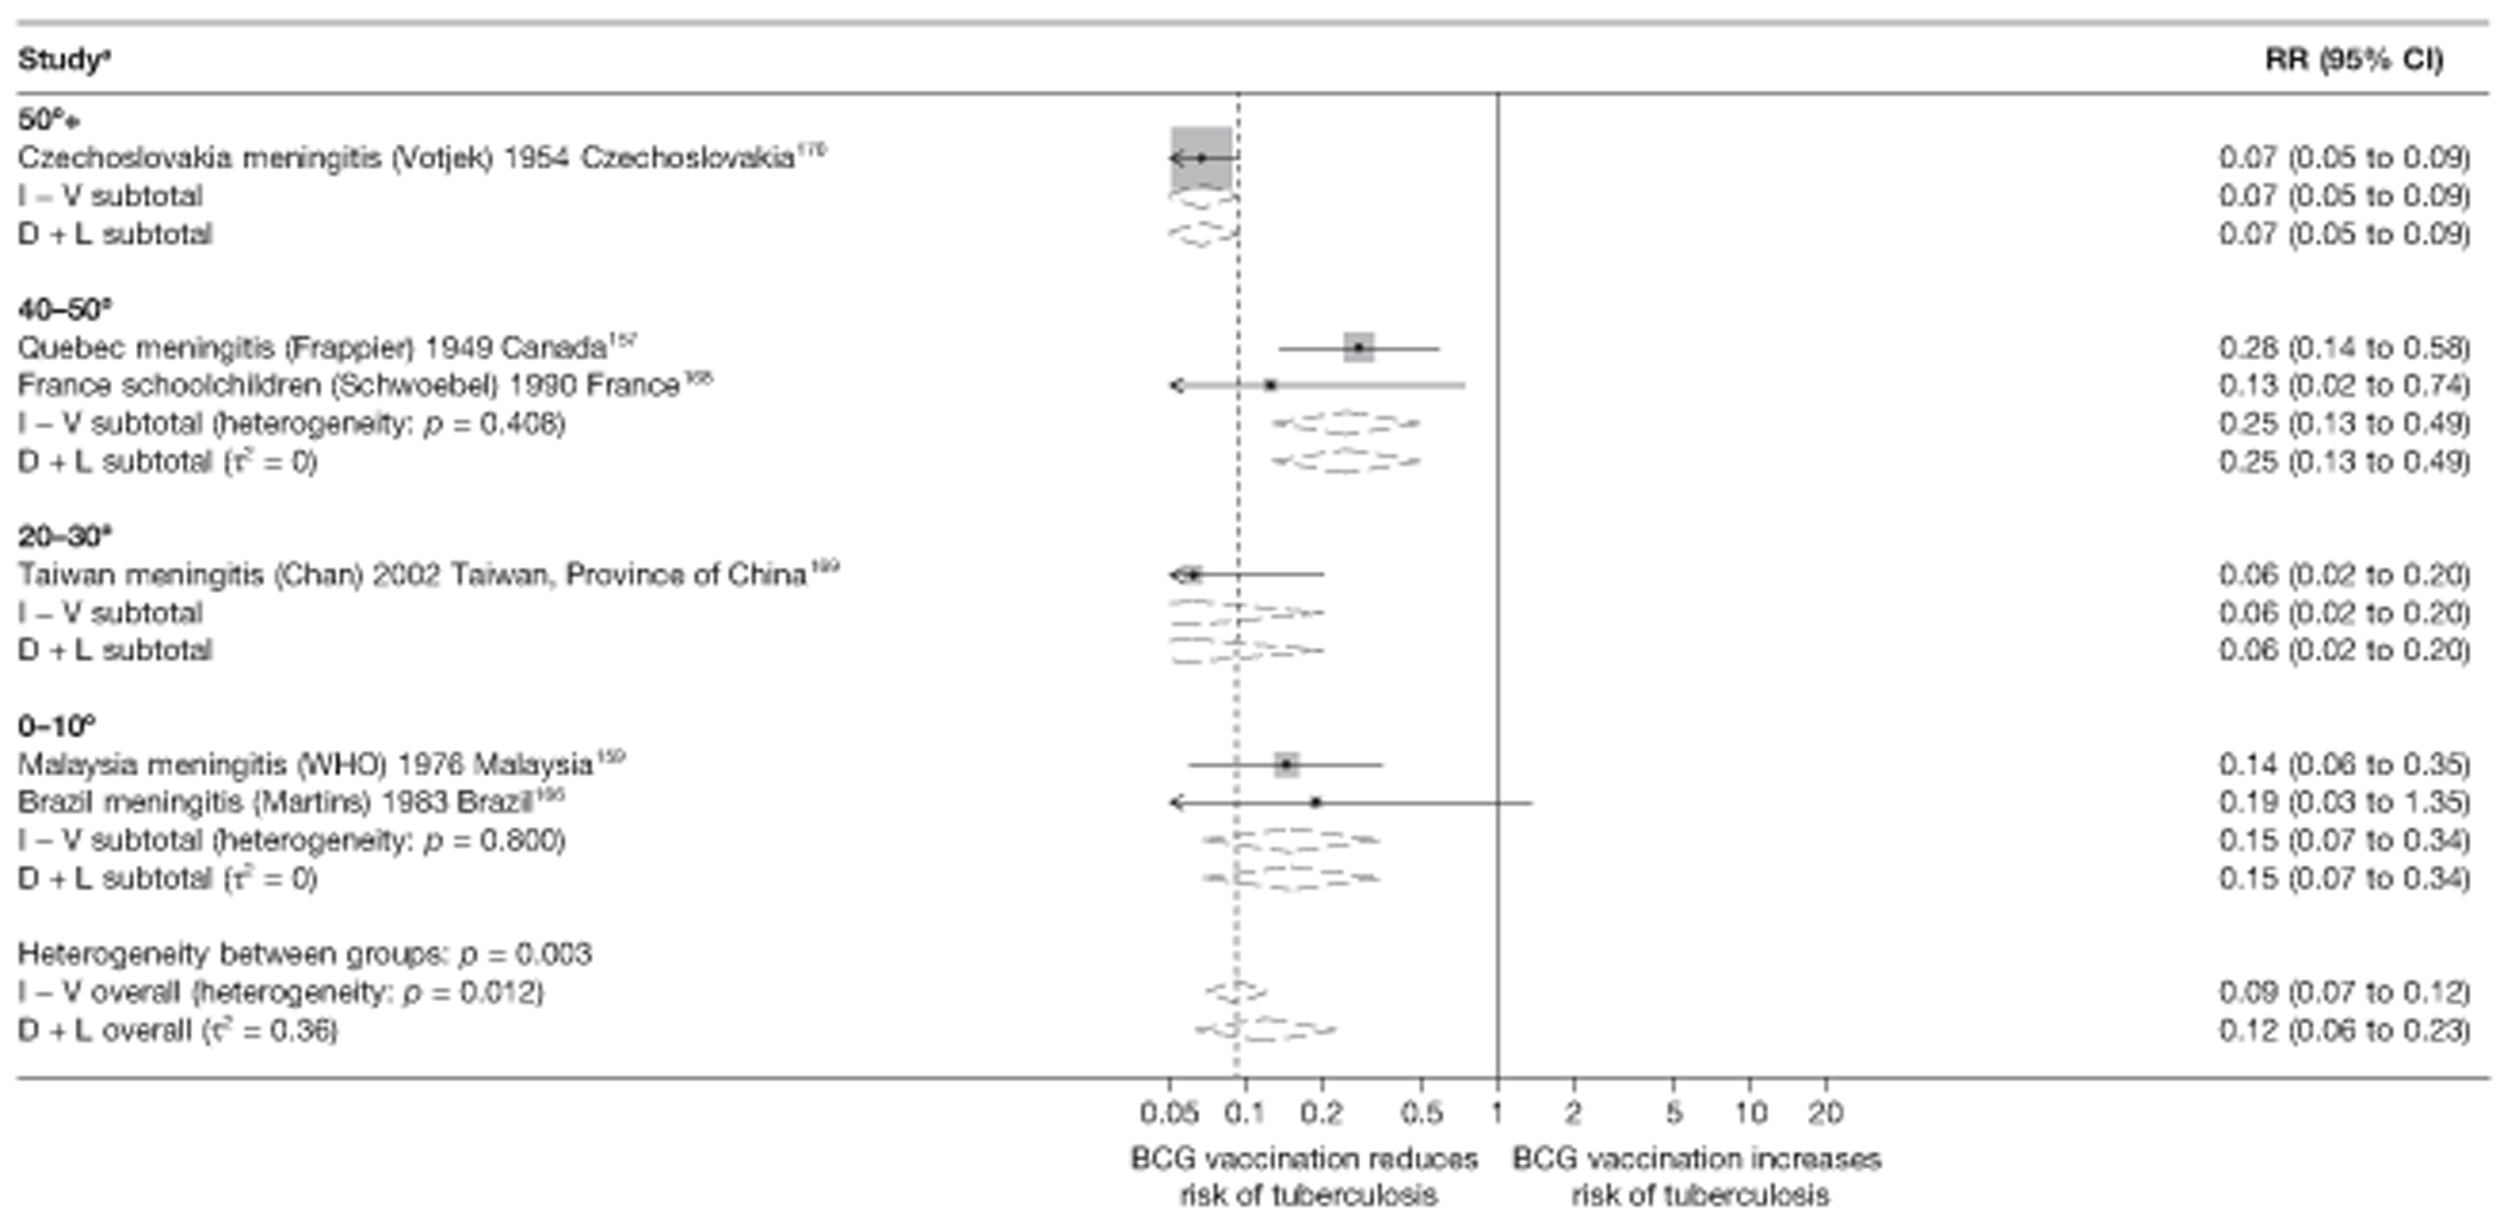
FIGURE 62.
Risk ratios (with 95% CI) comparing the prevalence of meningeal and/or miliary tuberculosis among BCG vaccinated individuals with that in unvaccinated individuals in cross-sectional studies, stratified by latitude (10°), ordered by year of study start. a, Date of study publication was used if study start date was not available; b, Combined tuberculosis meningitis and miliary tuberculosis outcomes; c, Tuberculosis meningitis outcome only; d, Miliary tuberculosis outcome only. D + L, DerSimonian and Laird method; I – V, inverse variance method.
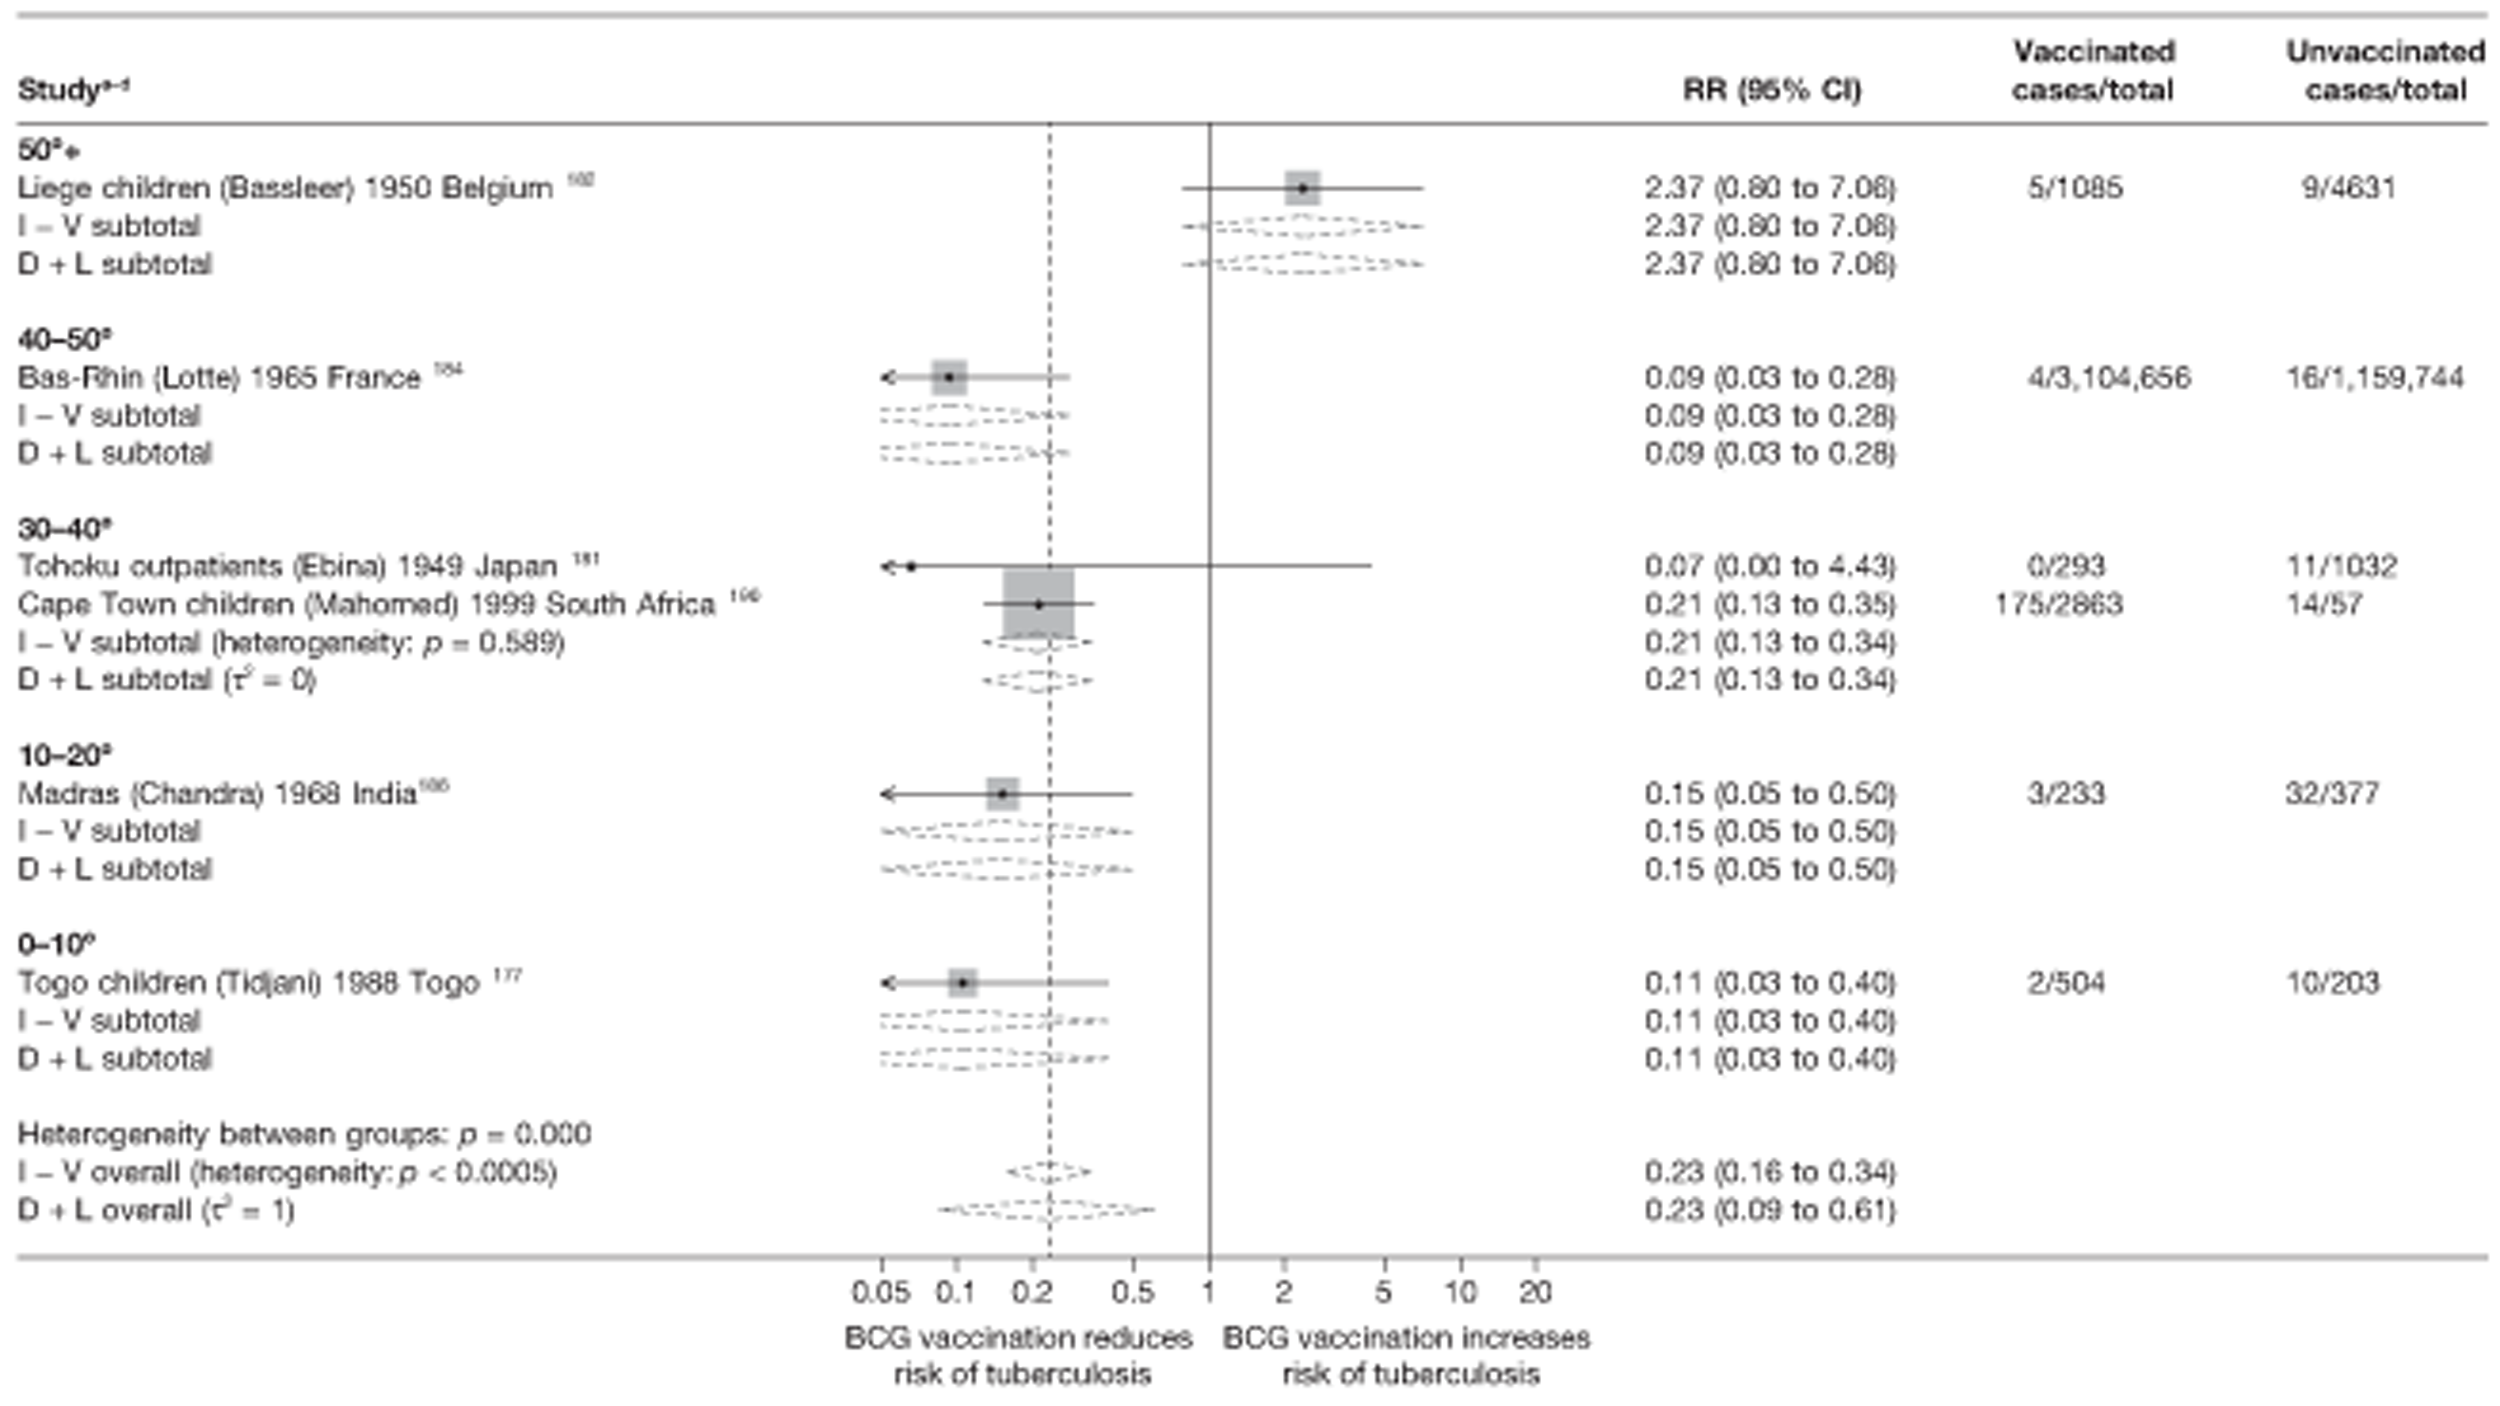
Meta-regression analysis
Stratification by bands of 20° latitude did not explain any of the between-study variance (null model τ2 = 0.275; after stratification band τ2 = 0.291) in case–control studies (Table 19). There was no clear evidence that BCG vaccination effectiveness in case–control studies varied with latitude (p-value = 0.570). The stratification on 20° latitude group for cohort (Table 20) accounted for the between-study heterogeneity (null model τ2 = 0.035; after stratification by 20° band τ2 = 0.000), but did not explain the heterogeneity for case population studies: null model τ2 = 0.292; after stratification by 20° band τ2 = 0.434, respectively) and no evidence (p-value = 0.839 and 0.723, respectively) indicated that BCG vaccination effectiveness differed according to latitude in cohort and case population studies. Similarly, latitude did not account for any of the between-study heterogeneity seen within cross-sectional studies (Table 21), with τ2 value before and after stratification on latitude = 1.433 and 2.140. There was no evidence (p-value = 0.734) that BCG vaccination effectiveness varied with latitude (Table 22).
| Variable | Number of studies | Univariable ORs (95% CI) | Univariable model | ||
|---|---|---|---|---|---|
| Ratio of ORs (95% CI) | p-value | τ2 | |||
| Null model | 14 | 0.275 | |||
| Latitude | |||||
| > 40° | 0 | ||||
| 20–40° | 9 | 0.32 (0.19 to 0.54) | 1.00 | ||
| 0–20° | 5 | 0.26 (0.13 to 0.49) | 0.80 (0.35 to 1.82) | 0.570 | 0.291 |
| Age at vaccination | |||||
| Neonatal | 11 | 0.32 (0.21 to 0.51) | 1.00 (ref.) | ||
| School age | 3 | 0.22 (0.10 to 0.50) | 0.68 (0.27 to 1.71) | ||
| Other | 0 | 0.386 | 0.266 | ||
| Was disease status blinded to BCG assessors? | |||||
| Lower risk of bias | 0 | ||||
| Higher risk of bias | 14 | 0.275 | |||
| Were vaccination definitions the same for cases and control subjects? | |||||
| Lower risk of bias | 11 | 0.33 (0.22 to 0.51) | 1.00 (ref.) | ||
| Higher risk of bias | 3 | 0.17 (0.07 to 0.40) | 0.50 (0.19 to 1.29) | 0.137 | 0.229 |
| Were cases and control subjects determined independently of BCG vaccination status? | |||||
| Lower risk of bias | 10 | 0.34 (0.22 to 0.54) | 1.00 (ref.) | ||
| Higher risk of bias | 4 | 0.21 (0.11 to 0.43) | 0.63 (0.27 to 1.43) | 0.240 | 0.241 |
| Were results adjusted for SES? | |||||
| Yes | 8 | 0.28 (0.16 to 0.50) | 1.00 (ref.) | ||
| No | 6 | 0.31 (0.17 to 0.56) | 1.08 (0.48 to 2.45) | 0.841 | 0.308 |
| If a matched design was used, was a matched analysis performed? | |||||
| Unmatched design | 5 | 0.44 (0.26 to 0.77) | 1.00 (ref.) | ||
| Matched design – matched analysis | 4 | 0.19 (0.10 to 0.37) | 0.42 (0.18 to 1.01) | ||
| Matched design – matched analysis | 5 | 0.27 (0.15 to 0.50) | 0.61 (0.27 to 1.37) | 0.130 | 0.178 |
| Variable | Number of studies | Univariable rate ratios (95% CI) | Univariable model | ||
|---|---|---|---|---|---|
| Ratio of rate ratios (95% CI) | p-value | τ2 | |||
| Null model | 6 | 0.035 | |||
| Latitude | |||||
| > 40° | 5 | 0.24 (0.01 to 0.70) | 1.00 (ref.) | ||
| 20–40° | 1 | 0.16 (0.01 to 99.42) | 0.64 (0.01 to 191.85) | ||
| 0–20° | 0 | 0.839 | 0.000 | ||
| Age at vaccination | |||||
| Neonatal | 2 | 0.29 (0.06 to 1.37) | 1.00 (ref.) | ||
| School age | 2 | 0.08 (0.01 to 7.69) | 0.26 (0.01 to 9.60) | ||
| Other | 2 | 0.16 (0.01 to 12.56) | 0.56 (0.02 to 16.96) | 0.530 | 0.000 |
| Was follow-up independent of vaccination status? | |||||
| Lower risk of bias | 3 | 0.27 (0.09 to 0.83) | 1.00 (ref.) | ||
| Higher risk of bias | 3 | 0.09 (0.01 to 1.82) | 0.32 (0.02 to 5.31) | 0.325 | 0.000 |
| Was case ascertainment blinded to vaccination status? | |||||
| Lower risk of bias | 0 | ||||
| Higher risk of bias | 6 | 0.035 | |||
| Were methods of case ascertainment identical for vaccinated and unvaccinated group? | |||||
| Lower risk of bias | 6 | ||||
| Higher risk of bias | 0 | 0.035 | |||
| Were losses to follow-up similar in each group? | |||||
| Lower risk of bias | 2 | 0.09 (0.01 to 1.77) | 1.00 (ref.) | ||
| Higher risk of bias | 4 | 0.28 (0.09 to 0.83) | 3.13 (0.19 to 50.73) | 0.318 | 0.000 |
| Was diagnostic detection bias present? | |||||
| Lower risk of bias | 2 | 0.08 (0.01 to 2.31) | 1.00 (ref.) | ||
| Higher risk of bias | 4 | 0.27 (0.09 to 0.80) | 3.58 (0.16 to 81.52) | 0.321 | 0.000 |
| Were results adjusted for SES? | |||||
| Yes | 0 | ||||
| No | 6 | ||||
| Study type | |||||
| Prospective | 3 | 0.10 (0.01 to 1.40) | 1.00 (ref.) | ||
| Retrospective | 3 | 0.28 (0.09 to 0.87) | 2.98 (0.24 to 37.84) | ||
| Contact | 0 | 0.298 | 0.000 | ||
| Variable | Number of studies | Univariable rate ratios (95% CI) | Univariable model | ||
|---|---|---|---|---|---|
| Ratio of rate ratios (95% CI) | p-value | τ2 | |||
| Null model | 6 | 0.292 | |||
| Latitude | |||||
| > 40° | 3 | 0.13 (0.02 to 0.92) | 1.00 (ref.) | ||
| 20–40° | 1 | 0.06 (0.01 to 2.91) | 0.49 (0.02 to 12.00) | ||
| 0–20° | 2 | 0.16 (0.01 to 2.73) | 1.24 (0.09 to 16.17) | 0.723 | 0.434 |
| Age at vaccination | |||||
| Neonatal | 5 | 0.12 (0.04 to 0.34) | 1.00 (ref.) | ||
| School age | 1 | 0.13 (0.01 to 3.86) | 1.04 (0.05 to 24.13) | ||
| Other | 0 | 0.969 | 0.340 | ||
| Were cases and population the same in terms of time? | |||||
| Lower risk of bias | 6 | ||||
| Higher risk of bias | 0 | 0.292 | |||
| Were cases and population the same in terms of geography? | |||||
| Lower risk of bias | 6 | ||||
| Higher risk of bias | 0 | 0.292 | |||
| Were cases and population the same in terms of age? | |||||
| Lower risk of bias | 5 | 0.06 (0.01 to 0.88) | 1.00 (ref.) | ||
| Higher risk of bias | 1 | 0.13 (0.05 to 0.40) | 0.46 (0.04 to 5.65) | 0.440 | 0.328 |
| Was case ascertainment blinded to vaccination status? | |||||
| Lower risk of bias | 1 | 1.00 | |||
| Higher risk of bias | 5 | 0.30 (0.07 to 1.21) | 0.075 | 0.063 | |
| Was disease status blinded to BCG assessors? | |||||
| Lower risk of bias | 0 | ||||
| Higher risk of bias | 6 | 0.292 | |||
| Were methods of case ascertainment same for vaccinated and unvaccinated? | |||||
| Lower risk of bias | 1 | 0.19 (0.01 to 7.39) | 1.00 (ref.) | ||
| Higher risk of bias | 6 | 0.12 (0.04 to 0.33) | 1.65 (0.06 to 45.73) | 0.697 | 0.323 |
| Variable | Number of studies | Univariable RRs (95% CI) | RRRs (95% CI) | p-value | τ2 |
|---|---|---|---|---|---|
| Null model | 6 | 1.433 | |||
| Latitude | |||||
| > 40° | 2 | 0.47 (0.01 to 55.16) | 1.00 (ref.) | ||
| 20–40° | 2 | 0.16 (0.00 to 42.04) | 0.34 (0.01 to 76.59) | ||
| 0–20° | 2 | 0.13 (0.00 to 39.65) | 0.27 (0.01 to 67.74) | 0.734 | 2.140 |
| Age at vaccination | |||||
| Neonatal | 3 | 0.16 (0.01 to 8.90) | 1.00 (ref.) | ||
| School age | 2 | 0.47 (0.01 to 38.89) | 2.90 (0.04 to 238.16) | ||
| Other | 1 | 0.07 (0.00 to 3516) | 0.41 (0.01 to 2160) | 0.683 | 1.793 |
| Was disease status blinded to BCG assessors? | |||||
| Lower risk of bias | 1 | 0.11 (0.00 to 39.63) | 1.00 (ref.) | ||
| Higher risk of bias | 5 | 0.27 (0.03 to 2.38) | 2.55 (0.01 to 631.35) | 0.662 | 1.641 |
| Were vaccination definitions the same for cases and control subjects? | |||||
| Lower risk of bias | 4 | 0.16 (0.06 to 0.43) | 1.00 (ref.) | ||
| Higher risk of bias | 2 | 1.82 (0.28 to 11.76) | 11.33(1.79 to 71.53) | 0.022 | 0.061 |
| Were cases and control subjects determined independently of BCG vaccination status? | |||||
| Lower risk of bias | 4 | 0.28 (0.02 to 4.28) | 1.00 (ref.) | ||
| Higher risk of bias | 2 | 0.19 (0.01 to 5.74) | 0.66 (0.01 to 30.55) | 0.783 | 1.839 |
| Were results adjusted for SES? | |||||
| Yes | 0 | ||||
| No | 6 | 1.433 | |||
| Study type | |||||
| Non Contact | 5 | 0.11 (0.00 to 39.63) | 1.00 (ref.) | ||
| Contact | 1 | 0.27 (0.03 to 2.38) | 2.55(0.01 to 631.35) | 0.662 | 1.641 |
Case–control studies
See Figure 59.
Cohort studies
See Figure 60.
Case population studies
See Figure 61.
Cross-sectional studies
See Figure 62.
Stratified analysis by age at vaccination, ordered by year study started
The estimated effects of BCG vaccination against meningeal and miliary tuberculosis from observational studies were stratified by age at vaccination (Figures 63–66). Overall, the protective effect of BCG vaccination from case–control studies of school-age vaccination [OR 0.23 (95% CI 0.16 to 0.33), VE of 77% (95% CI 67% to 84%)] was similarly good, and similar to studies of neonatal vaccination [OR 0.31, 95% CI 0.20 to 0.47, equivalent to VE of 69% (95% CI 53% to 80%)]. The small number of cohort studies in each age at vaccination category makes results difficult to interpret (see Figure 64).
FIGURE 63.
Odds ratios (with 95% CI) comparing the BCG vaccination status of meningeal and/or miliary tuberculosis cases and control subjects, stratified by age at vaccination, ordered by year of study start. a, Date of study publication was used if study start date was not available; b, Combined tuberculosis meningitis and miliary tuberculosis outcomes; c, Tuberculosis meningitis outcome only; d, Miliary tuberculosis outcome only. D + L, DerSimonian and Laird method; I – V, inverse variance method.
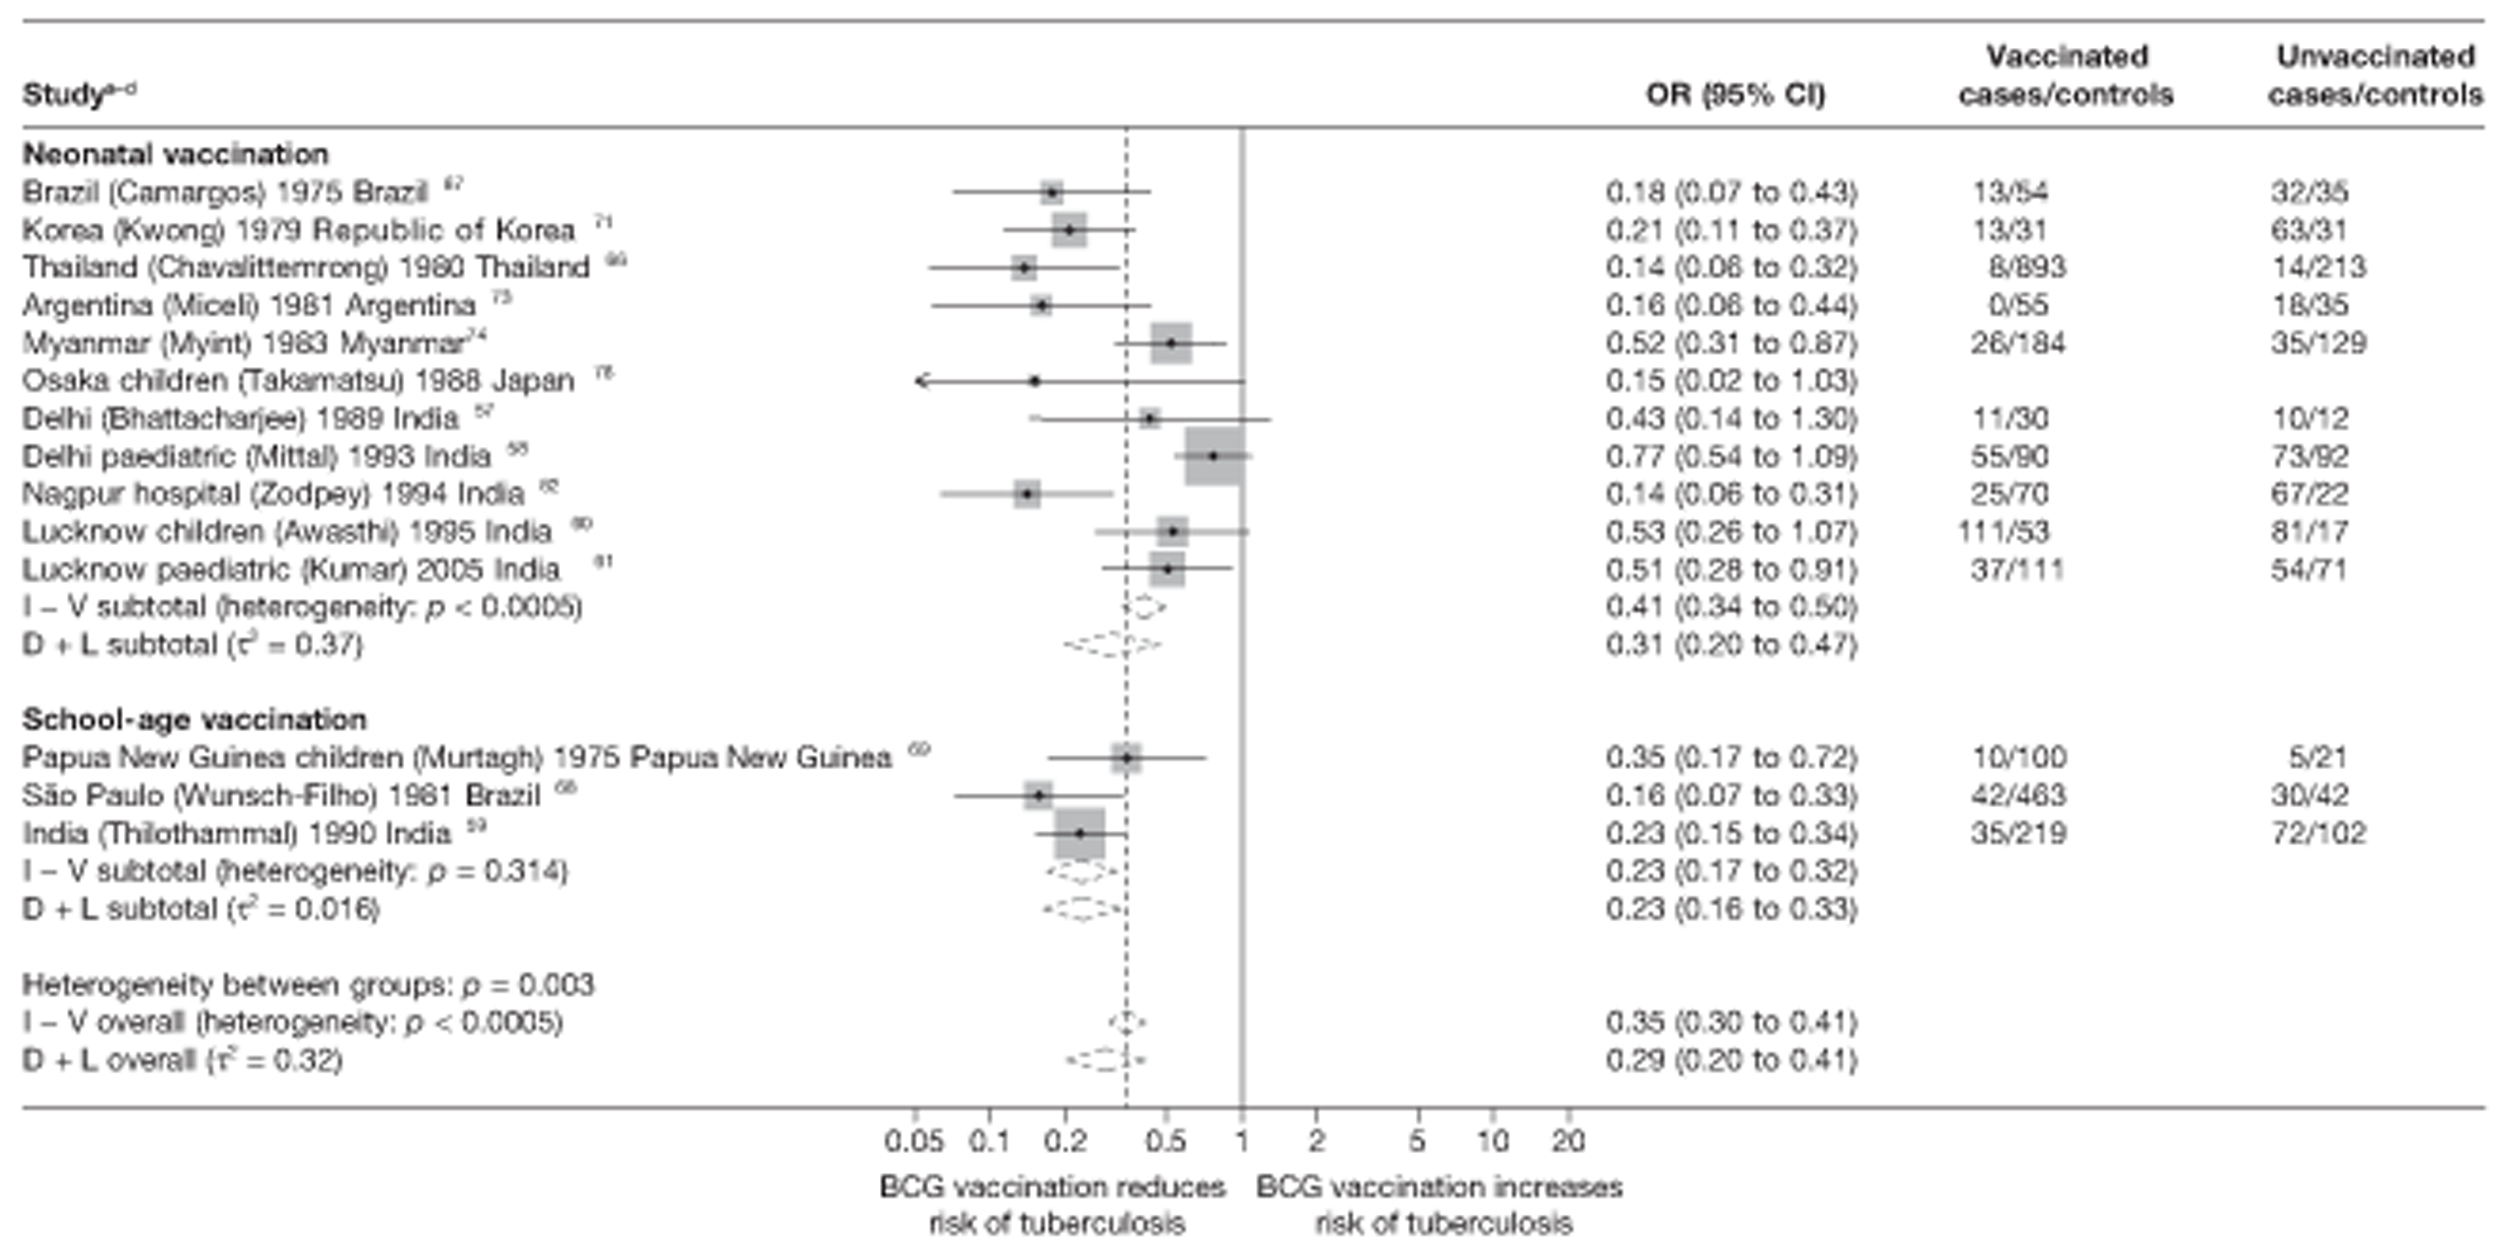
FIGURE 64.
Rate ratios (with 95% CI) comparing the incidence of meningeal and/or miliary tuberculosis among BCG vaccinated individuals with that in unvaccinated individuals for the longest duration of follow-up (see Table 4) in cohort studies, stratified by age at vaccination, ordered by study start. a, Tuberculosis meningitis outcome only; b, Miliary tuberculosis outcome only; c, Combined tuberculosis meningitis and miliary tuberculosis outcomes. D + L, DerSimonian and Laird method; I – V, inverse variance method.
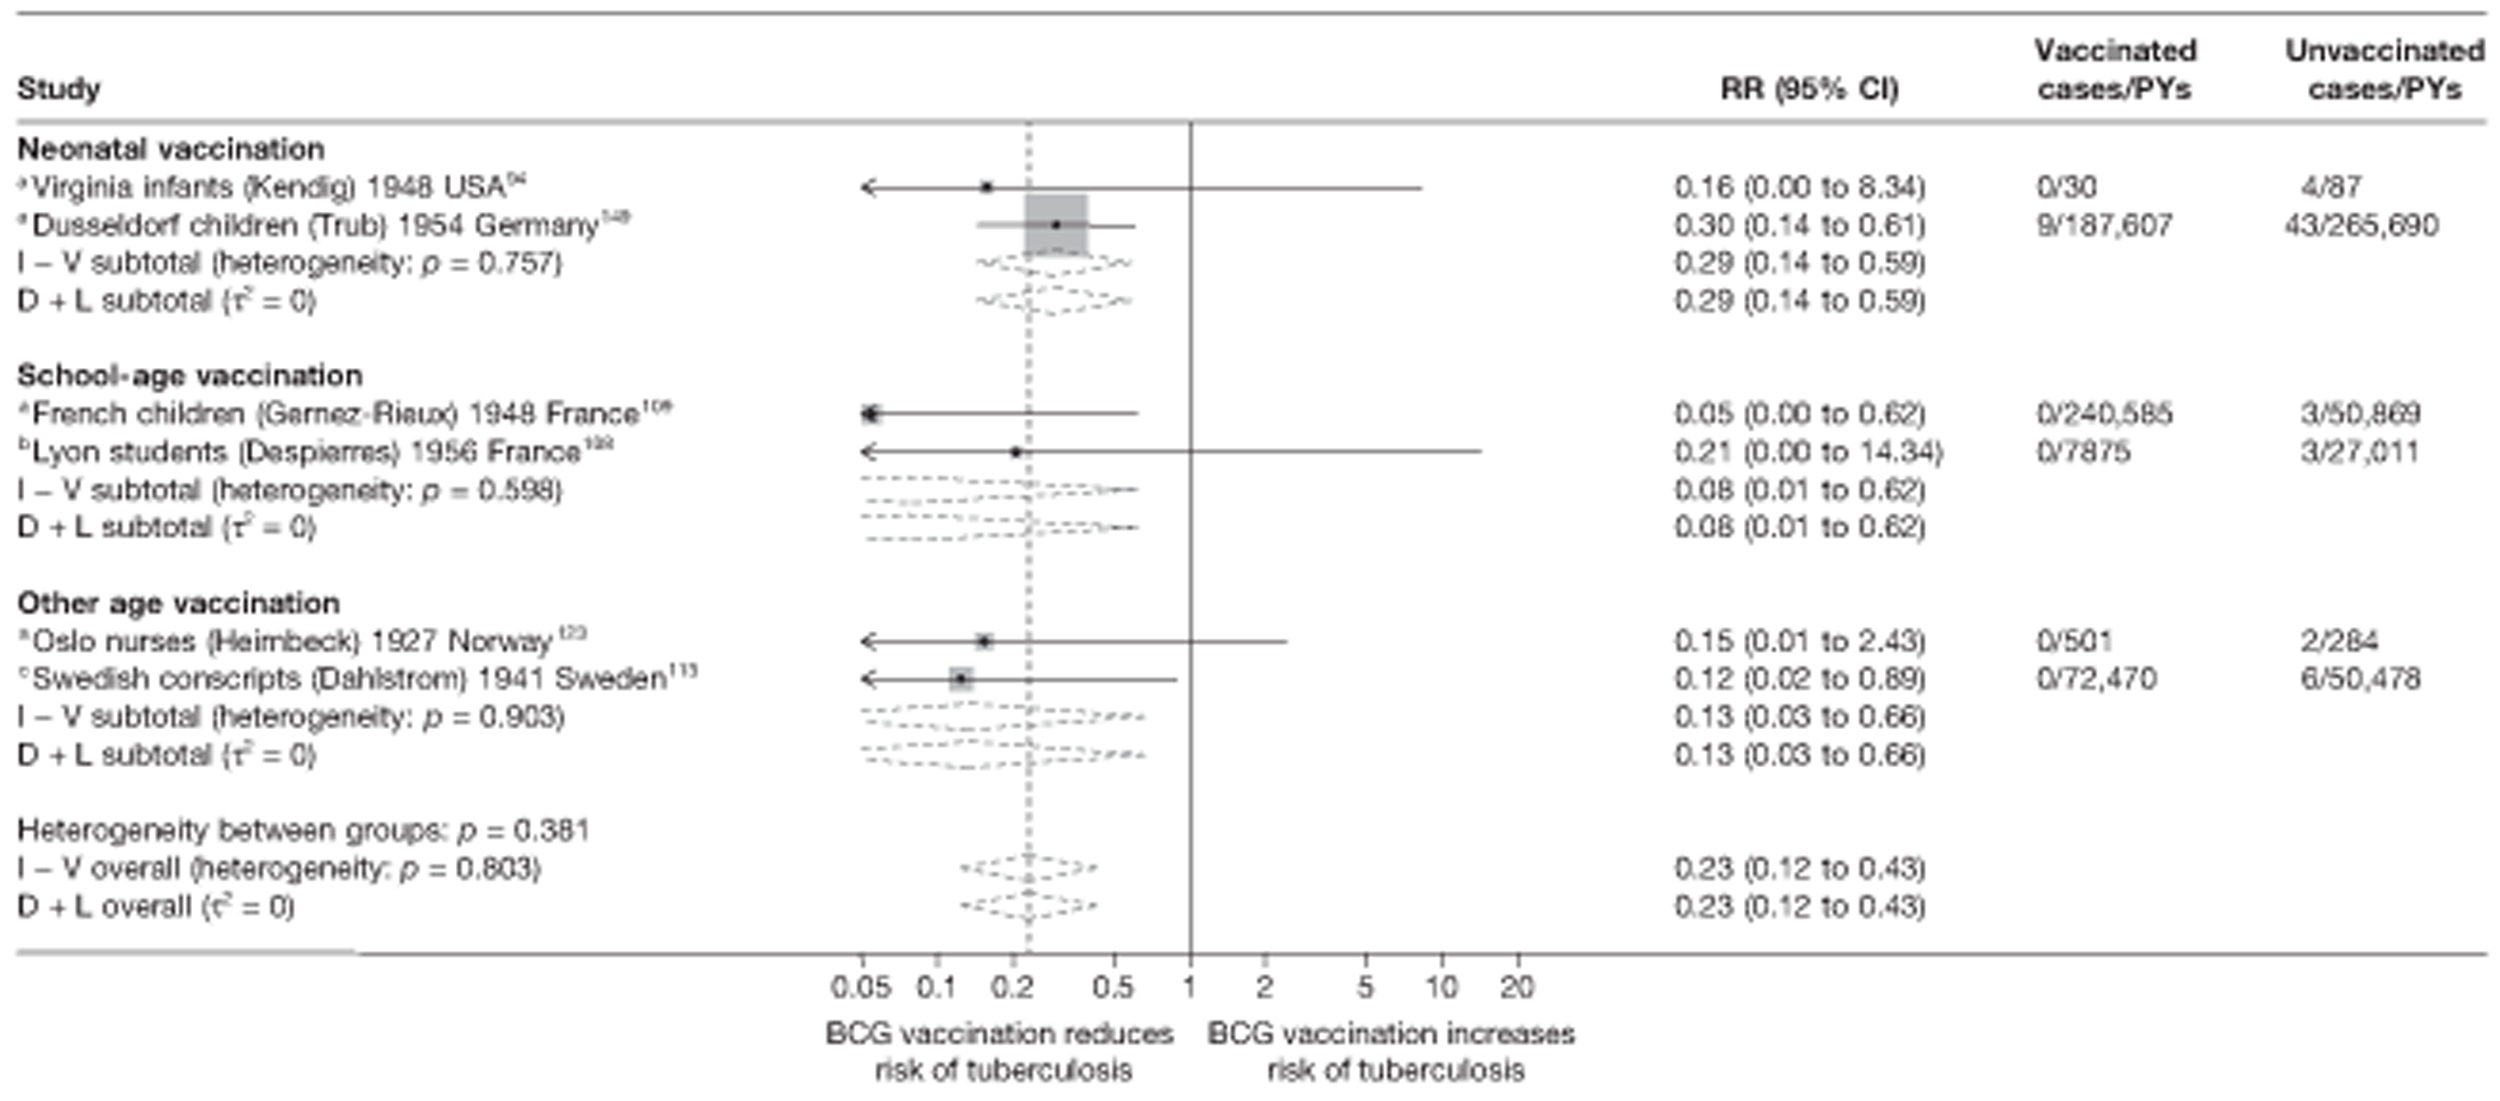
FIGURE 65.
Rate ratios (with 95% CI) comparing the incidence of meningeal and/or miliary tuberculosis among BCG vaccinated individuals with that in unvaccinated individuals for the longest duration of follow-up (see Table 5) in case population studies, stratified by age at vaccination, ordered by year of study start. a, Tuberculosis meningitis outcome only. D + L, DerSimonian and Laird method; I – V, inverse variance method.
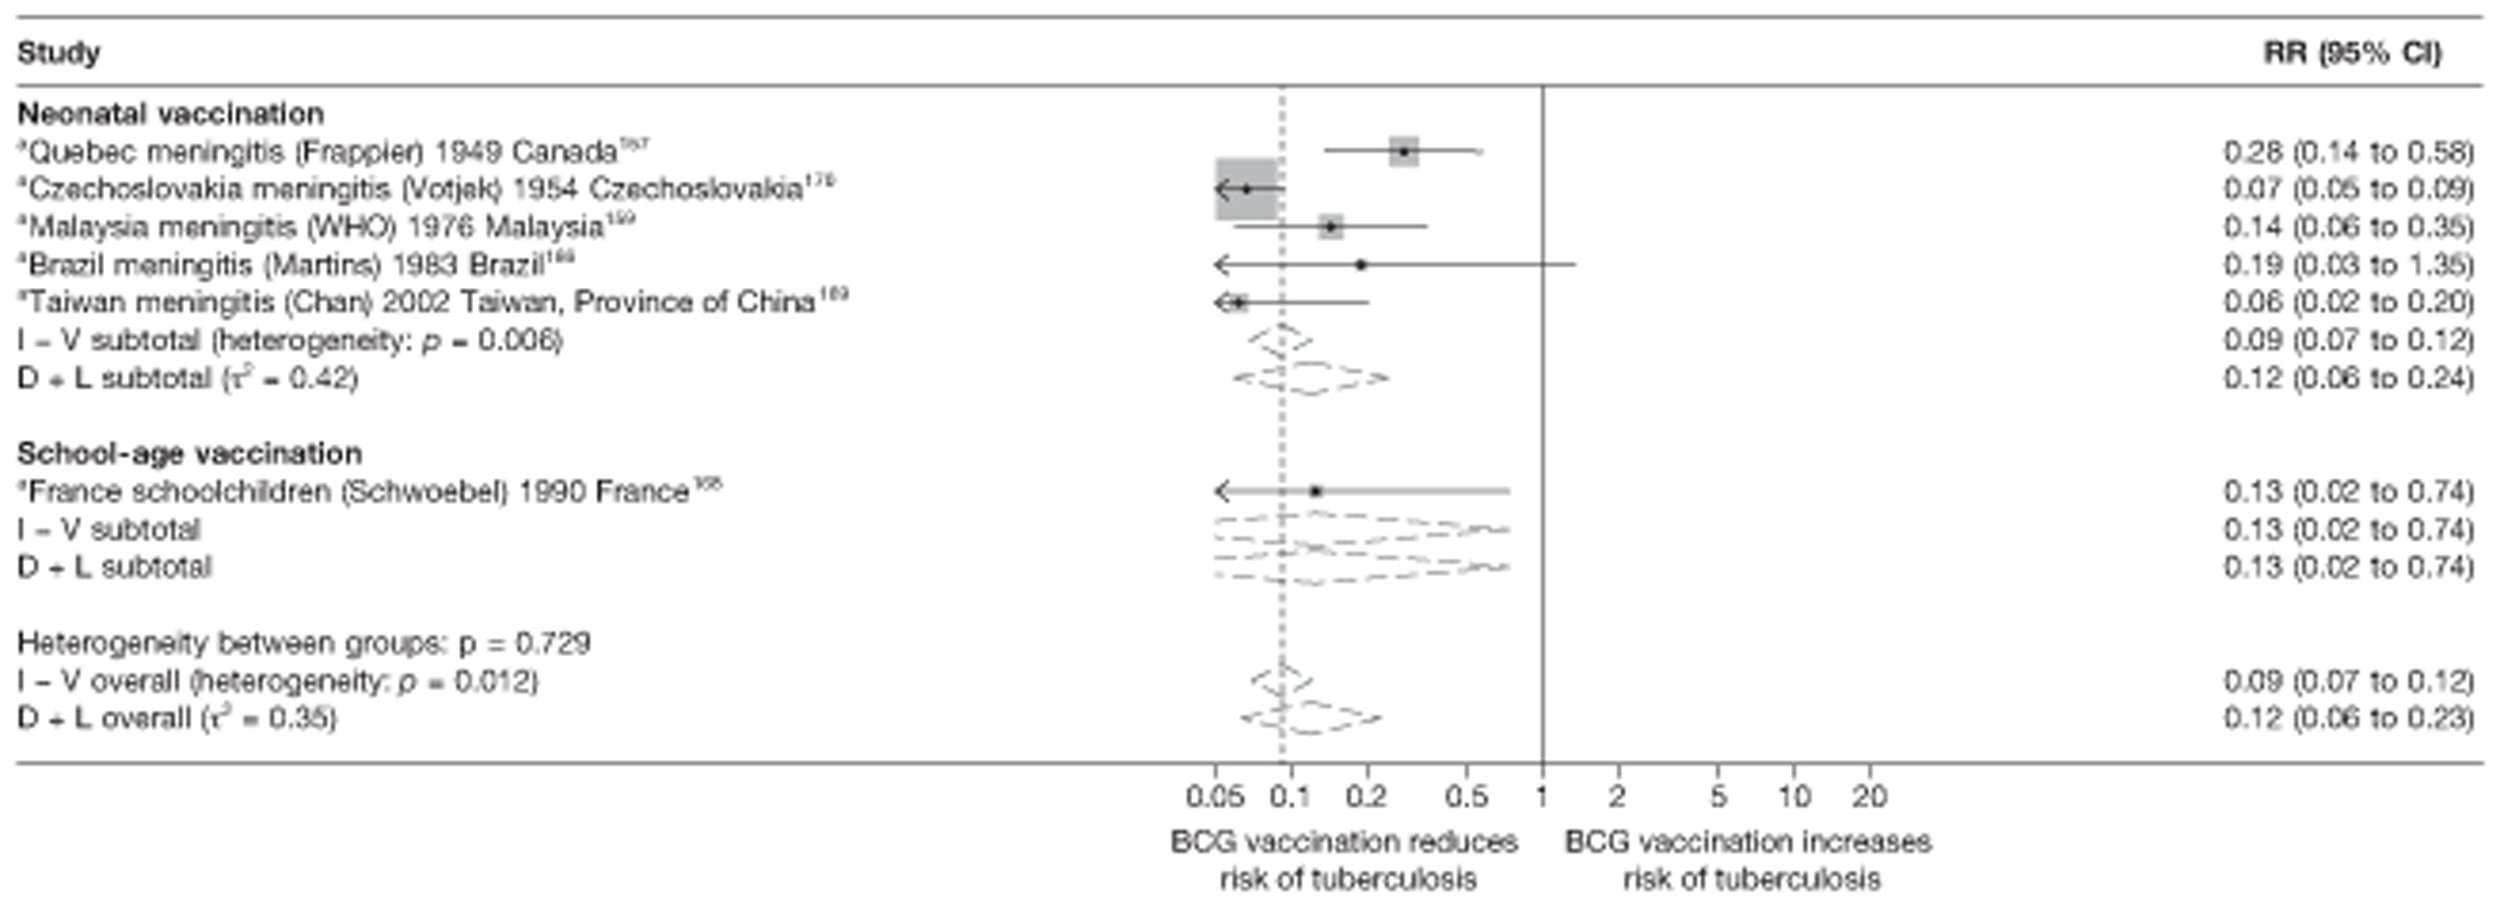
FIGURE 66.
Risk ratios (with 95% CI) comparing the prevalence of meningeal and/or miliary tuberculosis among BCG vaccinated individuals with that in unvaccinated individuals in cross-sectional studies, stratified by age at vaccination, ordered by year of study start. a, Combined tuberculosis meningitis and miliary tuberculosis outcomes; b, Tuberculosis meningitis outcome only; c, Miliary tuberculosis outcome only. D + L, DerSimonian and Laird method; I – V, inverse variance method.
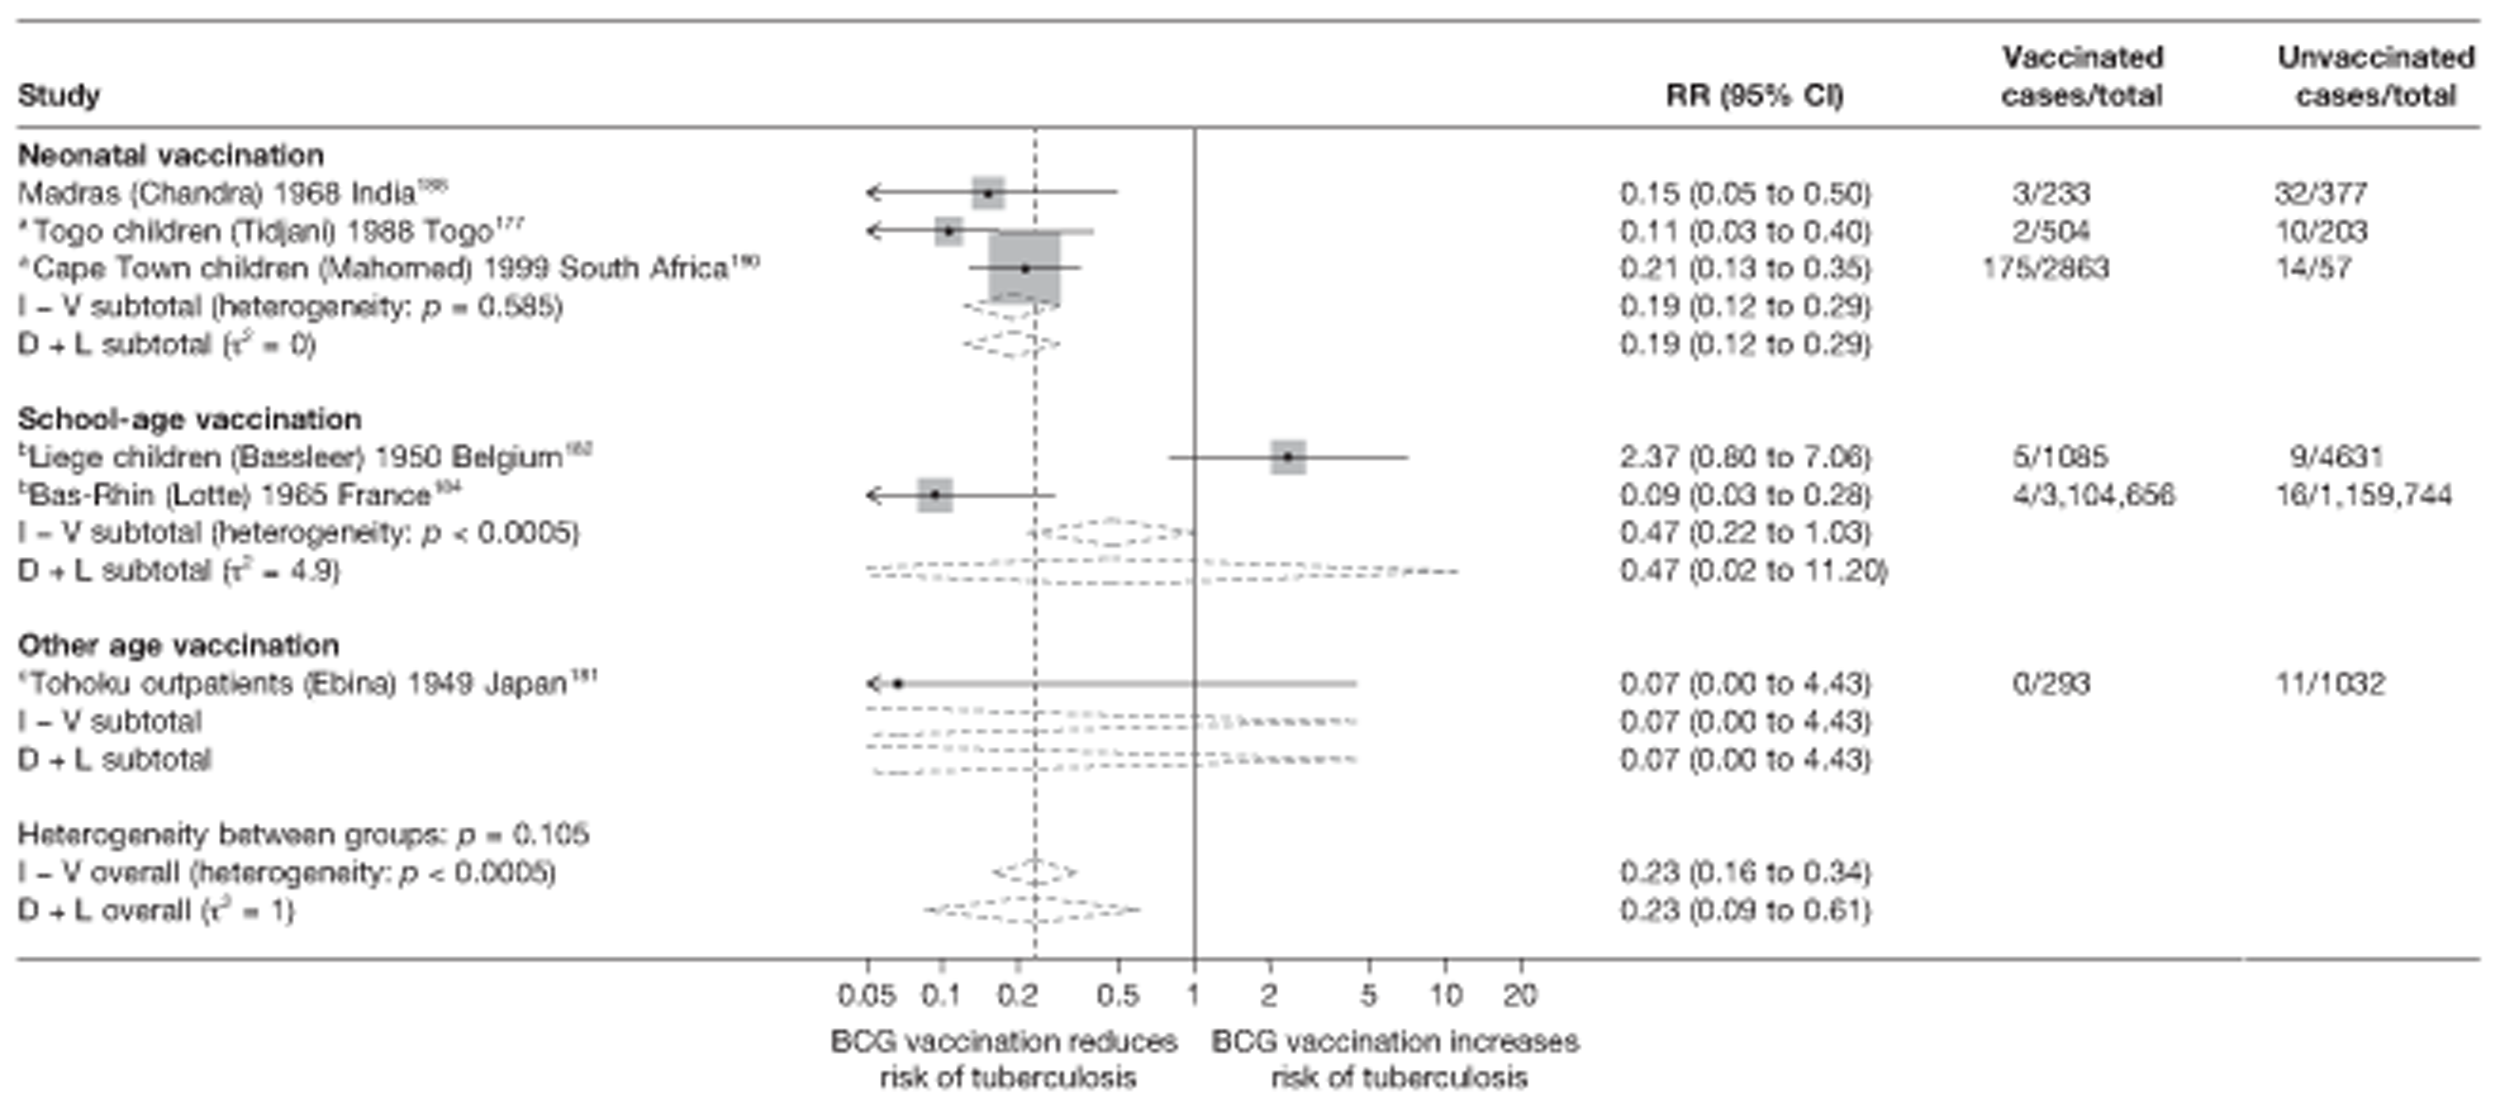
All but one case population study evaluated neonatal vaccination, with high overall levels of effectiveness (see Figure 65). This study of school-age vaccination showed a substantial high protective effect [rate ratio 0.13 (95% CI 0.02 to 0.74)], similar to the overall effect of neonatal vaccination studies [rate ratio 0.12 (95% CI 0.06 to 0.24) equivalent to VE of 88% (95% CI 76% to 94%)]. Results from cross-sectional studies in Figure 66 also showed strong evidence of high protection from vaccination at birth [RR 0.19 (95% CI 0.12 to 0.29, VE of 81% (95% CI 71% to 88%)]. The Tohoku outpatients study,143 which performed vaccination in other age groups, also shows a high estimate of vaccine effectiveness.
Meta-regression analysis
Based on meta-regression analyses, age at vaccination explained very little of the between-study variability (τ2 before and after stratification = 0.275 and 0.266, respectively): see Table 19. Stratification on age at vaccination explained some of between-study heterogeneity within cohorts, in Table 20 (τ2 before and after stratification = 0.035 and 0.000, respectively) although heterogeneity was already low prior to stratification. Table 21 showed that age at vaccination did not account for any of the between-study heterogeneity in case population studies (τ2 before and after stratification = 0.292 and 0.340, respectively). Age at vaccination was not found to account for any of the heterogeneity seen in cross-sectional studies (τ2 before and after stratification = 1.433 and 2.140, respectively), as shown in Table 22. However, there was insufficient evidence that BCG vaccination protection varied according to age at vaccination in case–control, cohort, case population and cross-sectional studies (p = 0.386, 0.475, 0.969, 0.734, respectively).
Case–control studies
See Figure 63.
Cohort studies
See Figure 64.
Case population studies
See Figure 65.
Cross-sectional studies
See Figure 66.
Stratified analysis by study design, ordered by year study started
Cohort studies
Figure 67 shows the forest plot for cohort studies stratified by study design. Contrary to results on protection against pulmonary and all types of tuberculosis disease, prospective studies of BCG vaccination against miliary and or meningeal tuberculosis showed evidence of overall higher protection against tuberculosis meningitis with rate ratio 0.10 (95% CI 0.02 to 0.50), corresponding to VE of 90% (95% CI 50% to 98%), compared with retrospective studies (which include a study with data on miliary tuberculosis only), with an overall good protective effect rate ratio 0.27 (95% CI 0.14 to 0.52) which corresponds to VE of 73% (95% CI 48% to 86%) VE. Cohort study design thus appears to explain a substantial amount of between-study variability.
FIGURE 67.
Rate ratios (with 95% CI) comparing the incidence of meningeal and/or miliary tuberculosis among BCG vaccinated individuals with that in unvaccinated individuals for the longest duration of follow-up (see Table 4) in cohort studies, stratified by cohort study design, ordered by year of study start. a, Tuberculosis meningitis outcome only; b, Combined tuberculosis meningitis and miliary tuberculosis outcomes; c, Miliary tuberculosis outcome only. D + L, DerSimonian and Laird method; I – V, inverse variance method.
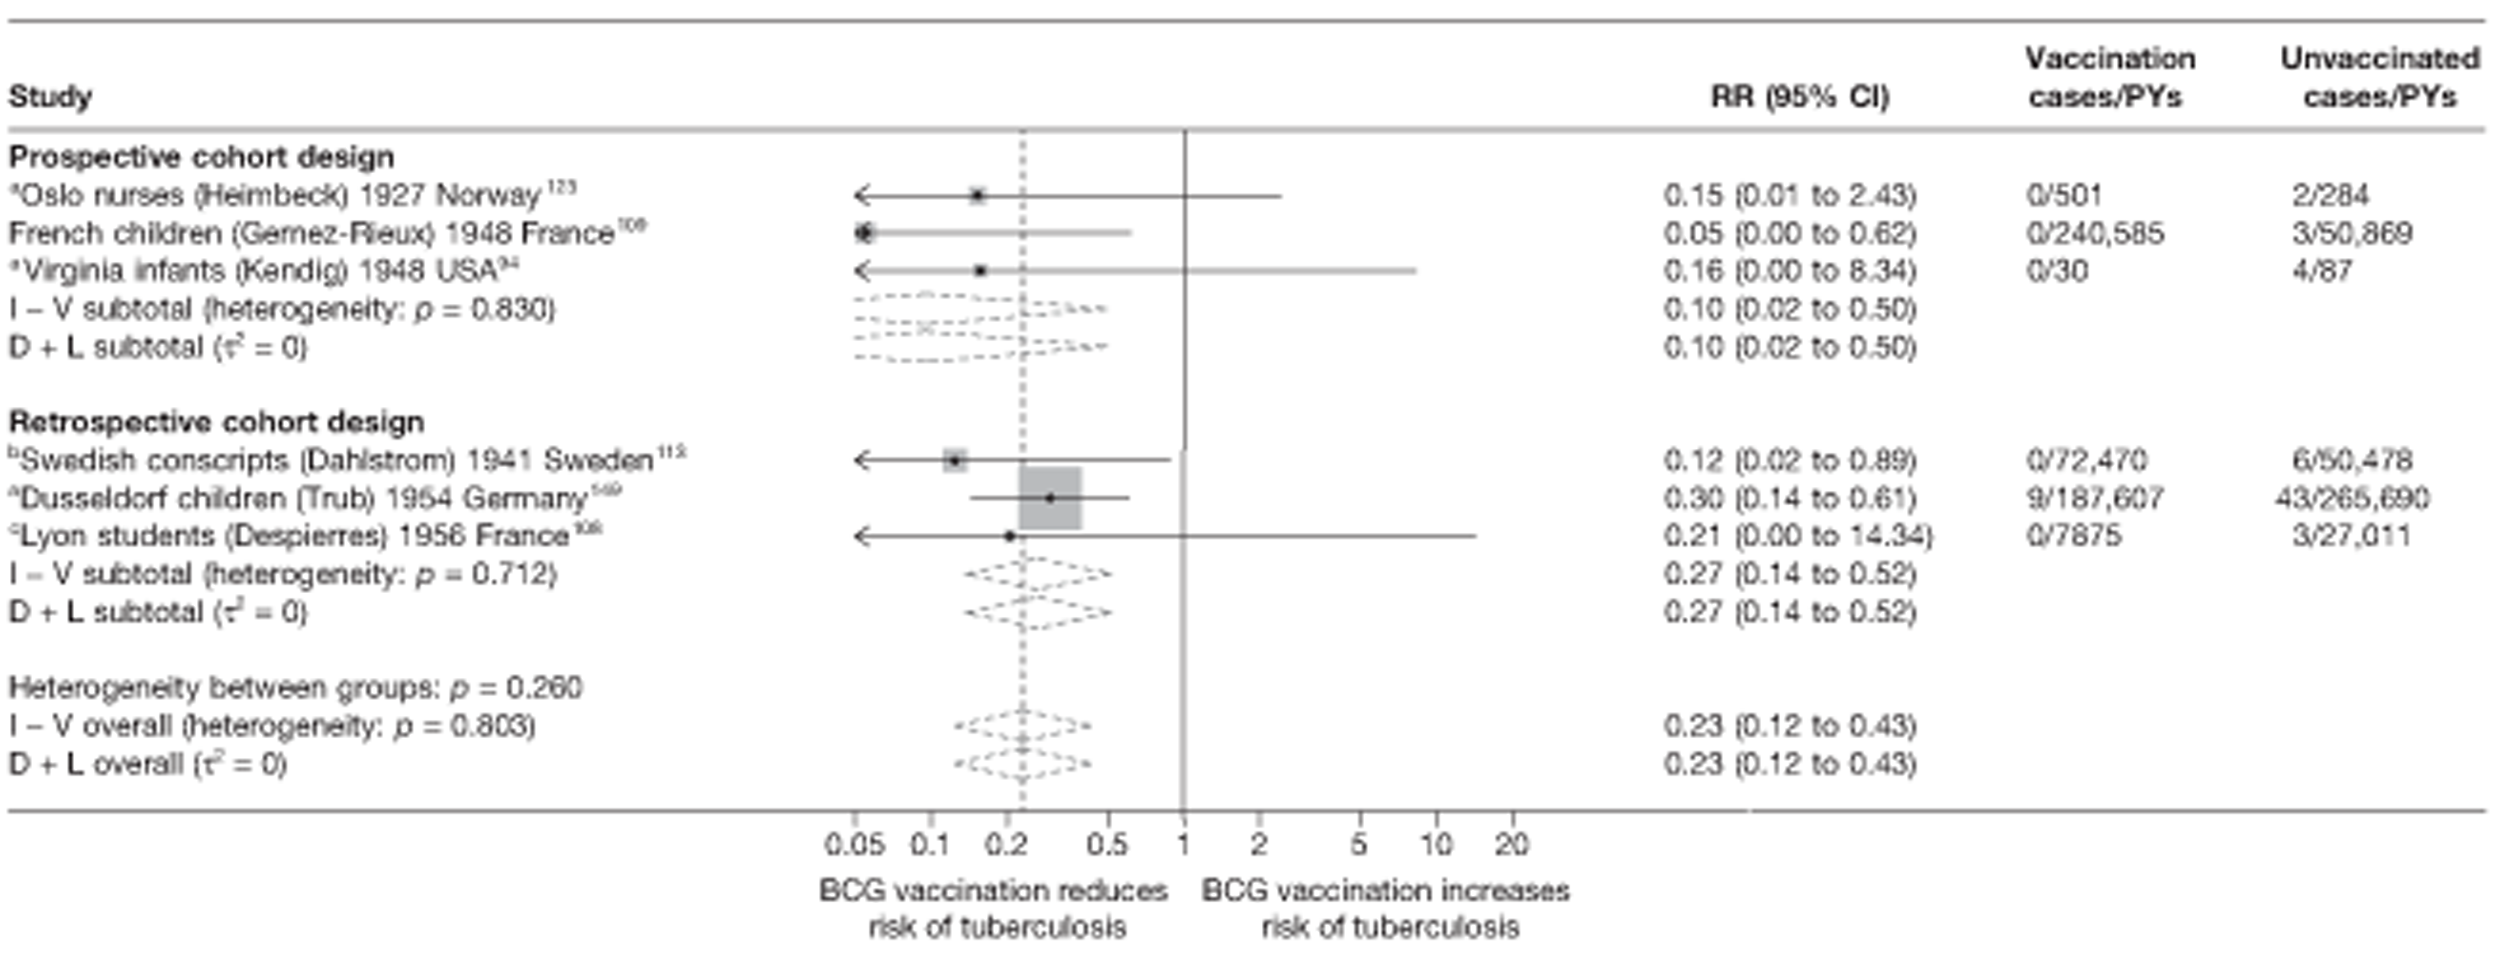
Meta-regression analysis
Stratification of cohort studies by study design accounted for the between-study heterogeneity (τ2 before and after stratification = 0.035 and 0.000) (see Table 20). There was, however, insufficient evidence that BCG vaccination effectiveness varies according to study design in cohort: rate ratio for retrospective cohort studies was 2.79 (95% CI 0.22 to 34.99, p-value = 0.323) times the rate ratio of prospective cohort studies.
Meta-regression analyses
Case–control studies
Results from univariable meta-regressions for all study variables for case–control studies are given in Table 19. Age at vaccination, ‘were vaccination definitions the same for cases and controls?’, ‘were cases and controls determined independently of BCG vaccination status?’ and ‘if the study design was matched, was a matched analysis performed?’ each explained some of the between-study variation in overall BCG vaccination effectiveness with a τ2 value of 0.266, 0.229 and 0.244 and 0.178 respectively, compared with the baseline τ2 (0.275), but there was no evidence consistent with an association between any of the factors and BCG vaccination effectiveness.
Cohort studies
Results from univariable meta-regressions for cohort studies indicate that all variables, apart from ‘Was case ascertainment blinded to vaccination status?’ and ‘were methods of case ascertainment identical for vaccinated and unvaccinated group?’ explained all of the between-study variation in overall BCG vaccination effectiveness reducing the null τ2 (0.035) to 0.000 (see Table 20). There was, however, no evidence of association of these variables with BCG vaccine effectiveness.
Case population studies
For case population studies there was little between-study heterogeneity, with overall clear evidence of effectiveness of BCG vaccination against meningeal and/or miliary forms of tuberculosis.
Cross-sectional studies
The results of the univariate meta-regression for the six cross-sectional studies (see Table 22) examining all study variables indicate that only stratification on the quality assessment criterion ‘Were vaccination definitions the same for cases and controls?’ was associated with a reduction in the heterogeneity seen within these studies (null model τ2 = 1.433 and after stratification by criterion τ2 = 0.061). There was evidence (p-value = 0.022) that this variable was associated with a degree of protection from BCG vaccination against tuberculosis meningitis and/or miliary tuberculosis.
Extrapulmonary tuberculosis
Unstratified analysis ordered by year study started
The results presented in forest plots in Figures 68–71 show estimated effects of BCG vaccination against non-meningeal and non-miliary forms of extrapulmonary tuberculosis from observational studies. Case–control studies showed relatively high protection of BCG vaccination against extrapulmonary tuberculosis, ranging from substantial protection [OR 0.12 (95% CI 0.06 to 0.26)] in Argentina72 to a lower effect [OR 0.63 (95% CI 0.30 to 1.32)] in Bangalore Children. 56 There was more substantial variation in estimates of BCG vaccination effectiveness in cohort studies (see Figure 68), ranging from high levels of protection [rate ratio 0.14 (95% CI 0.10 to 0.19)] in Dusseldorf children,149 to no evidence of clinical benefit in the Lyon students study108 [rate ratio 1.71 (95% CI 0.31 to 9.36)]. High levels of protection against extrapulmonary tuberculosis were seen in all case population (see Figure 70) and cross-sectional studies (see Figure 71).
FIGURE 68.
Odds ratios (with 95% CI) comparing the BCG vaccination status of extrapulmonary tuberculosis cases and control subjects in case–control studies, ordered by year of study start. a, Date of study publication was used if study start date was not available.

FIGURE 69.
Rate ratios (with 95% CI) comparing the incidence of extrapulmonary tuberculosis among BCG vaccinated individuals with that in unvaccinated individuals for the longest duration of follow-up (see Table 4) in cohort studies, ordered by year of study start.

FIGURE 70.
Rate ratios (with 95% CI) comparing the incidence of extrapulmonary tuberculosis among BCG vaccinated individuals with that in unvaccinated individuals for the longest duration of follow-up (see Table 5) in case population studies, ordered by year of study start.

FIGURE 71.
Risk ratios (with 95% CI) comparing the prevalence of extrapulmonary tuberculosis among BCG vaccinated individuals with that in unvaccinated individuals in cross-sectional studies, ordered by year of study start.

Case–control studies
See Figure 68.
Cohort studies
See Figure 69.
Case population studies
See Figure 70.
Cross-sectional studies
See Figure 71.
Stratified analysis by latitude (10°), ordered by year study started
Forest plots showing stratifications of observational studies assessing the protective effect of BCG vaccination on extrapulmonary tuberculosis according to latitude are provided in Figures 72 and 73. Only a few studies fell into each latitude category and the findings should therefore be treated with caution. The overall protective effect of BCG vaccination in case–control studies was lower in the four studies conducted close to the equator, whereas there was reasonably consistent evidence of higher protection observed in three studies conducted at latitudes above 20°. There is also evidence from cohort studies of relatively higher protection observed in studies conducted above 50° with substantial variation between cohort studies conducted at high latitudes. Estimated effects from the one case population study (above 50° latitude) showed a higher protection effect compared with one located between 30° and 40° while there was little variation in the effect of BCG vaccination effectiveness according to latitude in the two cross-sectional studies, one at 30–40° latitude and the other above 50° latitude.
FIGURE 72.
Odds ratios (with 95% CI) comparing the BCG vaccination status of extrapulmonary tuberculosis cases and control subjects in case–control studies, stratified by latitude of study location (10° bands), ordered by year of study start. a, Date of study publication was used if study start date was not available. D + L, DerSimonian and Laird method; I – V, inverse variance method.
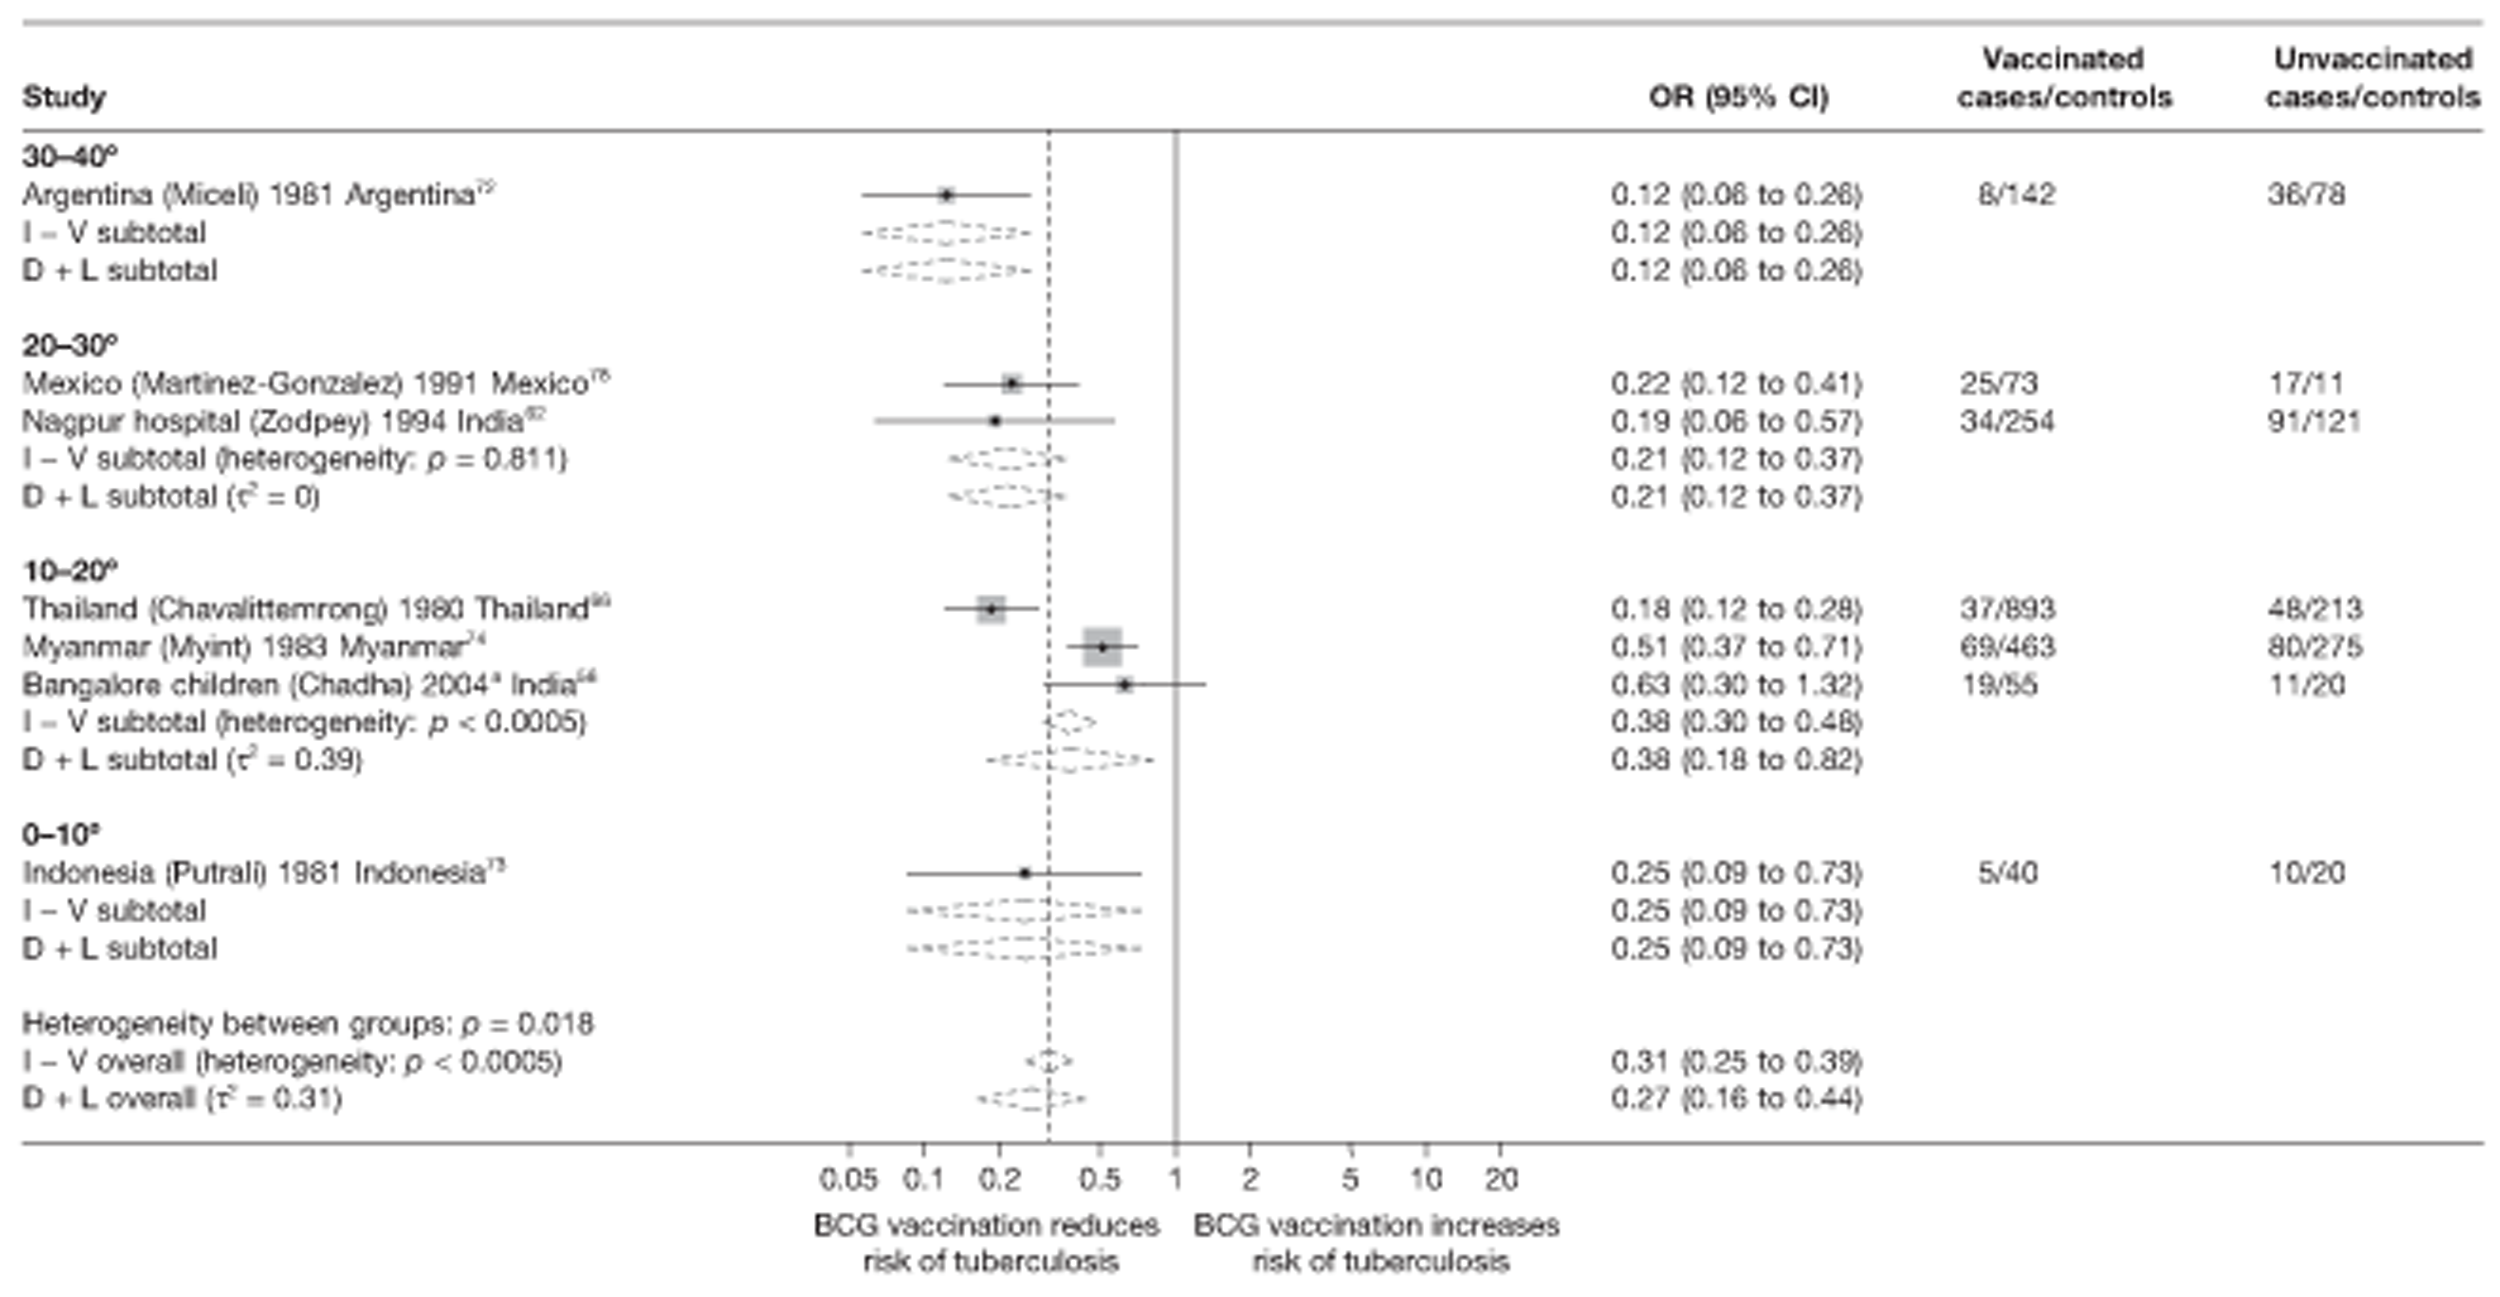
FIGURE 73.
Rate ratios (with 95% CI) comparing the incidence of extrapulmonary tuberculosis among BCG vaccinated individuals with that in unvaccinated individuals for the longest duration of follow-up (see Table 4) in cohort studies, stratified by latitude of study location (10° bands), ordered by year of study start. D + L, DerSimonian and Laird method; I – V, inverse variance method.
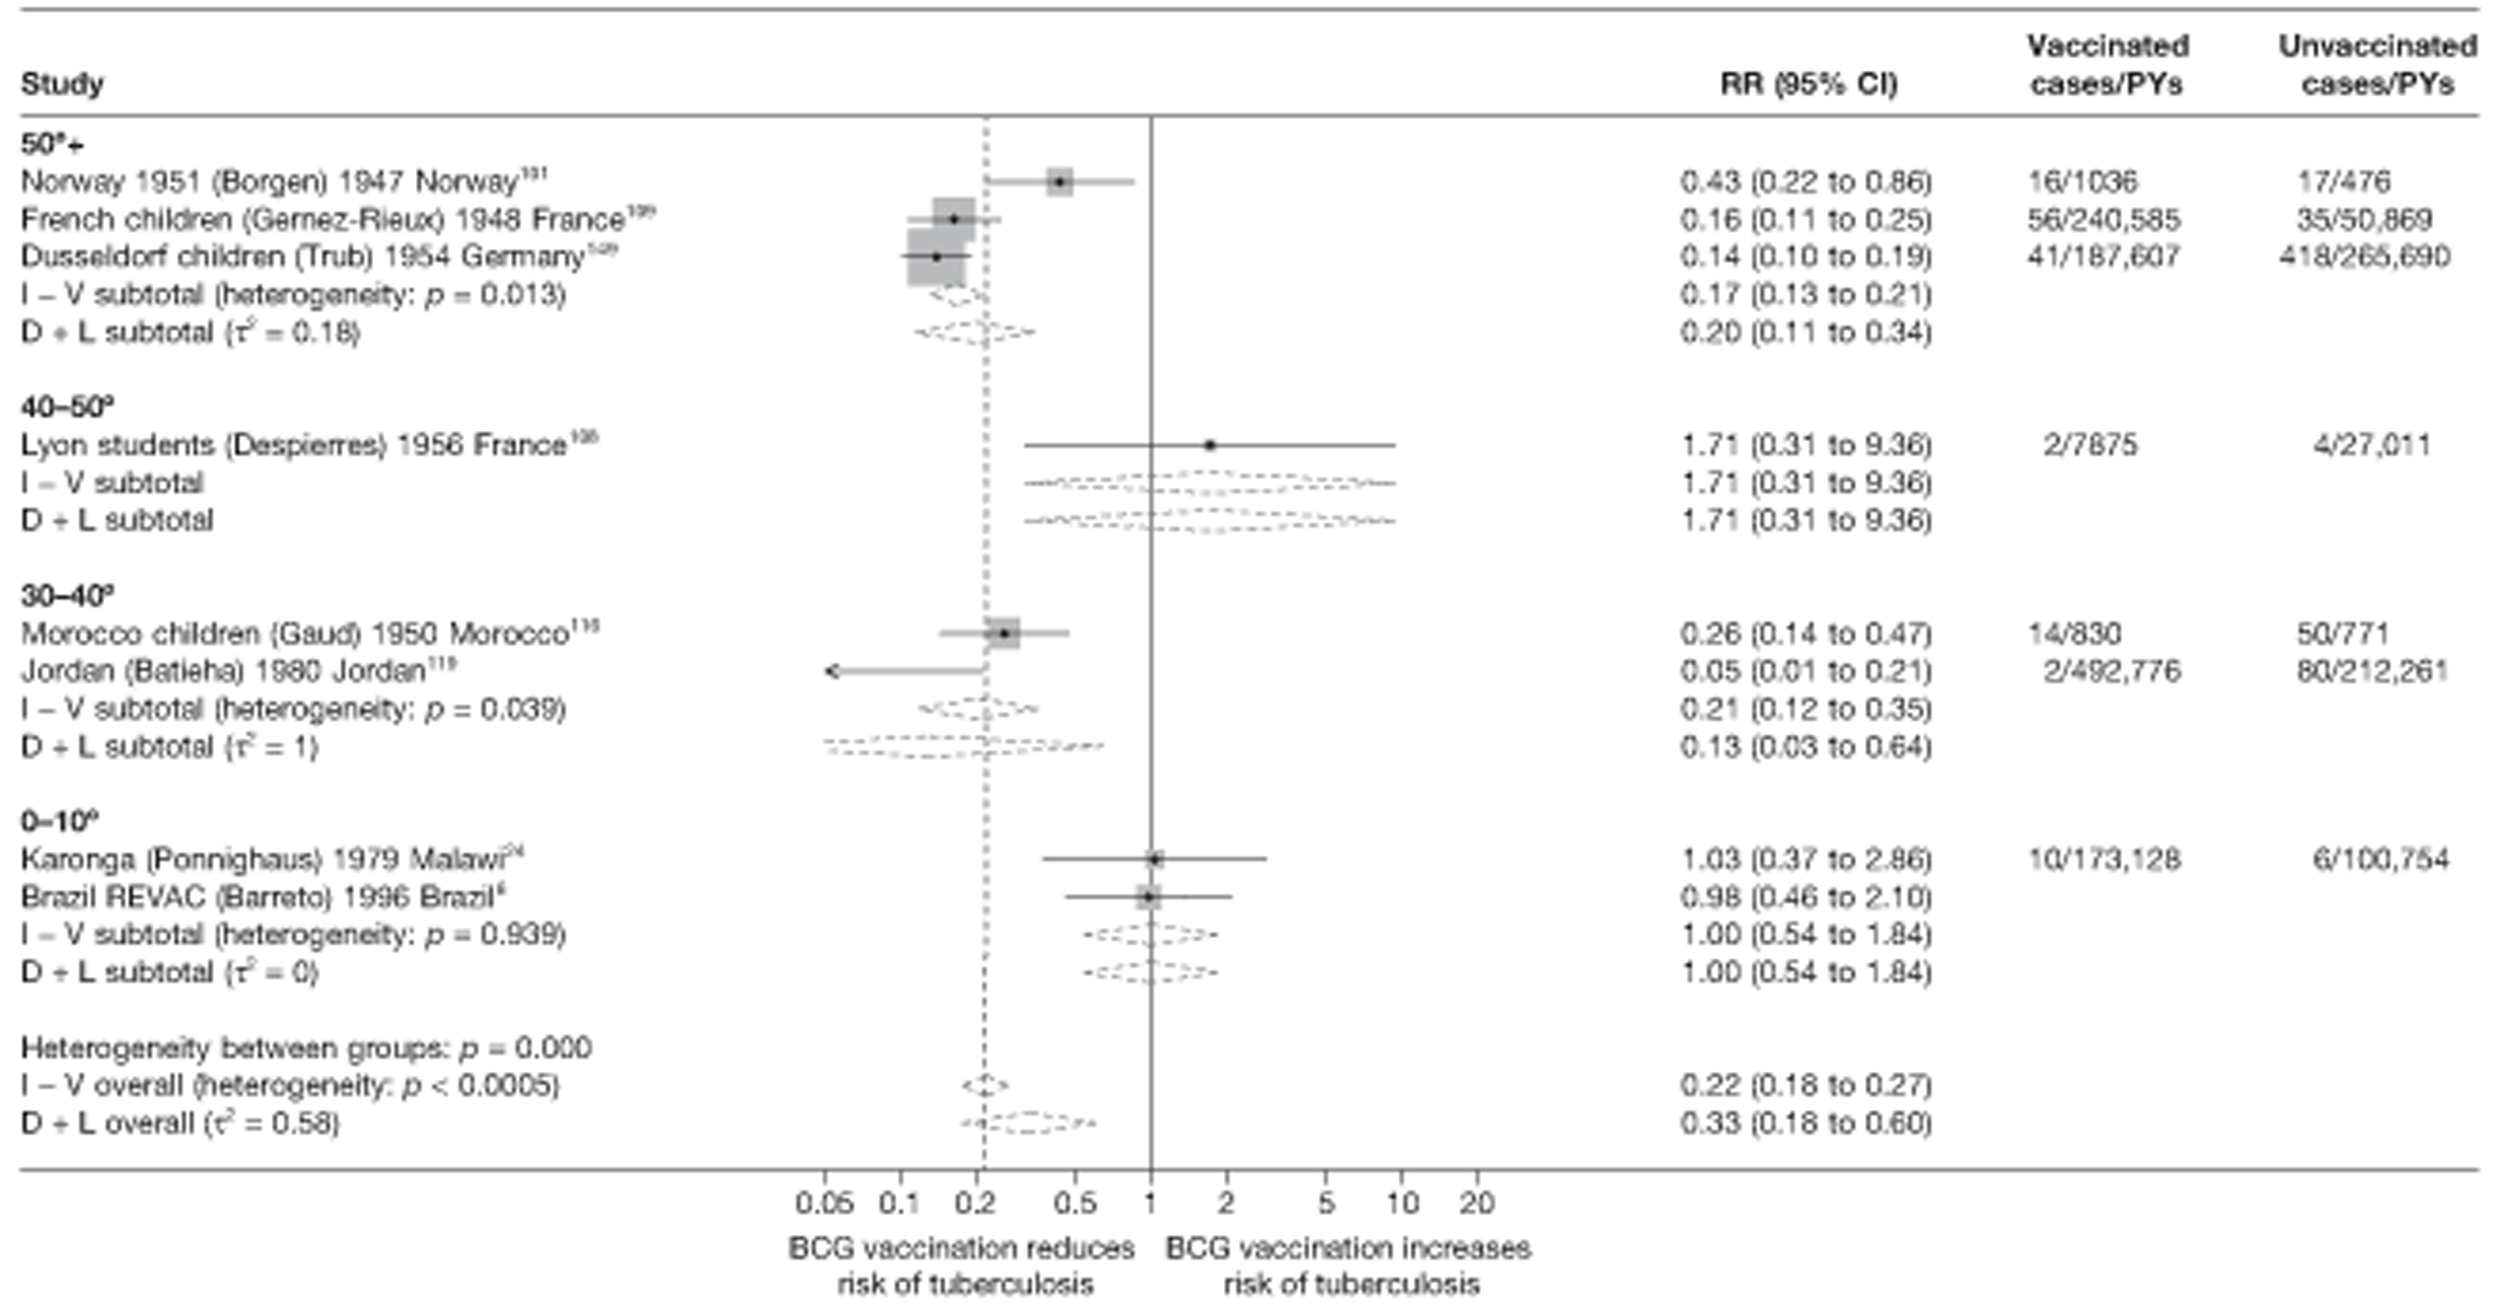
Meta-regression analysis
Only case–control and cohort studies had a sufficient number of studies of the protection by BCG vaccination against extrapulmonary tuberculosis to perform meta-regression analyses. Based on these results, latitude was found to explain respectively 26% and 42% of the between-study variation (τ2 value before and after stratification = 0.262 and 0.193, respectively for case–control studies and τ2 values before and after stratification = 0.895 and 0.520, respectively, for cohort studies, Tables 23 and 24). However, there was insufficient evidence, from either study design, that BCG vaccination effectiveness was higher at higher latitudes (estimates of protective effect from case–control studies conducted between 0° and 20° latitude were 2.04 (95% CI 0.66 to 6.31; p-value = 0.168) times that of studies conducted at higher latitudes (20–40°). Similarly, rate ratios from cohort studies of 0–20° latitudes were 3.65 (95% CI 0.48 to 28.03; p-value = 0.2) times the rate ratio for studies of latitudes > 40°.
| Variable | Number of studies | Univariable ORs (95% CI) | Univariable model | ||
|---|---|---|---|---|---|
| Ratio of ORs (95% CI) | p-value | τ2 | |||
| Null model | 7 | 0.262 | |||
| Latitude | |||||
| 40°+ | 0 | ||||
| 20–40° | 3 | 0.17 (0.07 to 0.46) | 1.00 (ref.) | ||
| 0–20° | 4 | 0.35 (0.17 to 0.75) | 2.04 (0.66 to 6.31) | 0.168 | 0.193 |
| Age at vaccination | |||||
| Neonatal | 7 | ||||
| School age | 0 | ||||
| Other | 0 | 0.262 | |||
| Was disease status blinded to BCG assessors? | |||||
| Lower risk of bias | 0 | ||||
| Higher risk of bias | 7 | 0.262 | |||
| Were vaccination definitions the same for cases and control subjects? | |||||
| Lower risk of bias | 6 | 0.28 (0.13 to 0.57) | 1.00 (ref.) | ||
| Higher risk of bias | 1 | 0.19 (0.02 to 1.66) | 0.69 (0.08 to 5.70) | 0.666 | 0.297 |
| Were cases and control subjects determined independently of BCG vaccination status? | |||||
| Lower risk of bias | 4 | 0.24 (0.10 to 0.63) | 1.00 (ref.) | ||
| Higher risk of bias | 3 | 0.30 (0.10 to 0.91) | 1.22 (0.32 to 4.70) | 0.718 | 0.335 |
| Were results adjusted for SES? | |||||
| Yes | 5 | 0.30 (0.13 to 0.65) | 1.00 (ref.) | ||
| No | 2 | 0.21 (0.06 to 0.73) | 0.69 (0.17 to 2.78) | 0.528 | 0.280 |
| If a matched design was used, was a matched analysis performed? | |||||
| Unmatched design | 1 | 0.18 (0.03 to 1.31) | 1.00 (ref.) | ||
| Matched design – matched analysis | 1 | 0.19 (0.14 to 2.45) | 1.04 (0.06 to 17.19) | ||
| Matched design – matched analysis | 5 | 0.31 (0.12 to 0.80) | 1.66 (0.25 to 11.19) | 0.711 | 0.332 |
| Variable | Number of studies | Univariable rate ratios (95% CI) | Univariable model | ||
|---|---|---|---|---|---|
| Ratio of rate ratios (95% CI) | p-value | τ2 | |||
| Null model | 8 | 0.895 | |||
| Latitude | |||||
| > 40° | 2 | 0.27 (0.08 to 0.94) | 1.00 (ref.) | ||
| 20–40° | 2 | 0.14 (0.02 to 0.93) | 0.52 (0.06 to 4.18) | ||
| 0–20° | 4 | 1.00 (0.16 to 6.18) | 3.65 (0.48 to 28.03) | 0.200 | 0.520 |
| Age at vaccination | |||||
| Neonatal | 2 | 0.35 (0.03 to 4.41) | 1.00 (ref.) | ||
| School age | 5 | 0.31 (0.06 to 1.71) | 0.88 (0.05 to 14.73) | ||
| Other | 1 | 0.43 (0.01 to 15.94) | 1.22 (0.02 to 71.74) | 0.973 | 1.455 |
| Was follow-up independent of vaccination status? | |||||
| Lower risk of bias | 3 | 0.30 (0.08 to 1.16) | 1.00 (ref.) | ||
| Higher risk of bias | 5 | 0.41 (0.07 to 2.51) | 1.40 (0.16 to 12.07) | 0.716 | 1.126 |
| Was case ascertainment blinded to vaccination status? | |||||
| Lower risk of bias | 0 | ||||
| Higher risk of bias | 8 | 0.895 | |||
| Were methods of case ascertainment identical for vaccinated and unvaccinated group? | |||||
| Lower risk of bias | 8 | ||||
| Higher risk of bias | 0 | 0.895 | |||
| Were losses to follow-up similar in each group? | |||||
| Lower risk of bias | 2 | 0.21 (0.03 to 1.47) | 1.00 (ref.) | ||
| Higher risk of bias | 6 | 0.40 (0.12 to 1.39) | 1.96 (0.21 to 17.99) | 0.484 | 0.990 |
| Was diagnostic detection bias present? | |||||
| Lower risk of bias | 3 | 0.44 (0.12 to 1.59) | 1.00 (ref.) | ||
| Higher risk of bias | 5 | 0.20 (0.04 to 1.10) | 0.46 (0.06 to 3.47) | 0.383 | 0.967 |
| Were results adjusted for SES? | |||||
| Yes | 2 | 1.00 (0.21 to 4.71) | 1.00 (ref.) | ||
| No | 6 | 0.22 (0.09 to 0.51) | 0.22 (0.04 to 1.18) | 0.069 | 0.291 |
| Study type | |||||
| Prospective | 4 | 0.49 (0.13 to 1.90) | 1.00 (ref.) | ||
| Retrospective | 4 | 0.21 (0.05 to 0.90) | 0.43 (0.07 to 2.87) | ||
| Contact | 0 | 0.320 | 0.817 | ||
Case–control studies
See Figure 72.
Cohort studies
See Figure 73.
Stratified analysis by age at vaccination, ordered by year study started
There were insufficient data from observational studies to investigate the difference in effectiveness of BCG vaccination protection against extrapulmonary tuberculosis according to age at vaccination. All case–control subjects and case population studies assessed neonatal BCG vaccination, and only one cross-sectional study provided data on school-age vaccination (Liege children182) and on vaccination in an ‘other’ age group (Tohoku Outpatients study181), respectively. Figure 74 shows the estimated effects of BCG vaccination on extrapulmonary tuberculosis from cohorts stratified by age at vaccination. There was substantial variation in estimates of effect for neonatal and school-age vaccination. Stratification did not appear to explain the between-study variation.
FIGURE 74.
Rate ratios (with 95% CI) comparing the incidence of extrapulmonary tuberculosis among BCG vaccinated individuals with that in unvaccinated individuals for the longest duration of follow-up (see Table 4) in cohort studies, stratified by age at vaccination, ordered by year of study start. D + L, DerSimonian and Laird method; I – V, inverse variance method.
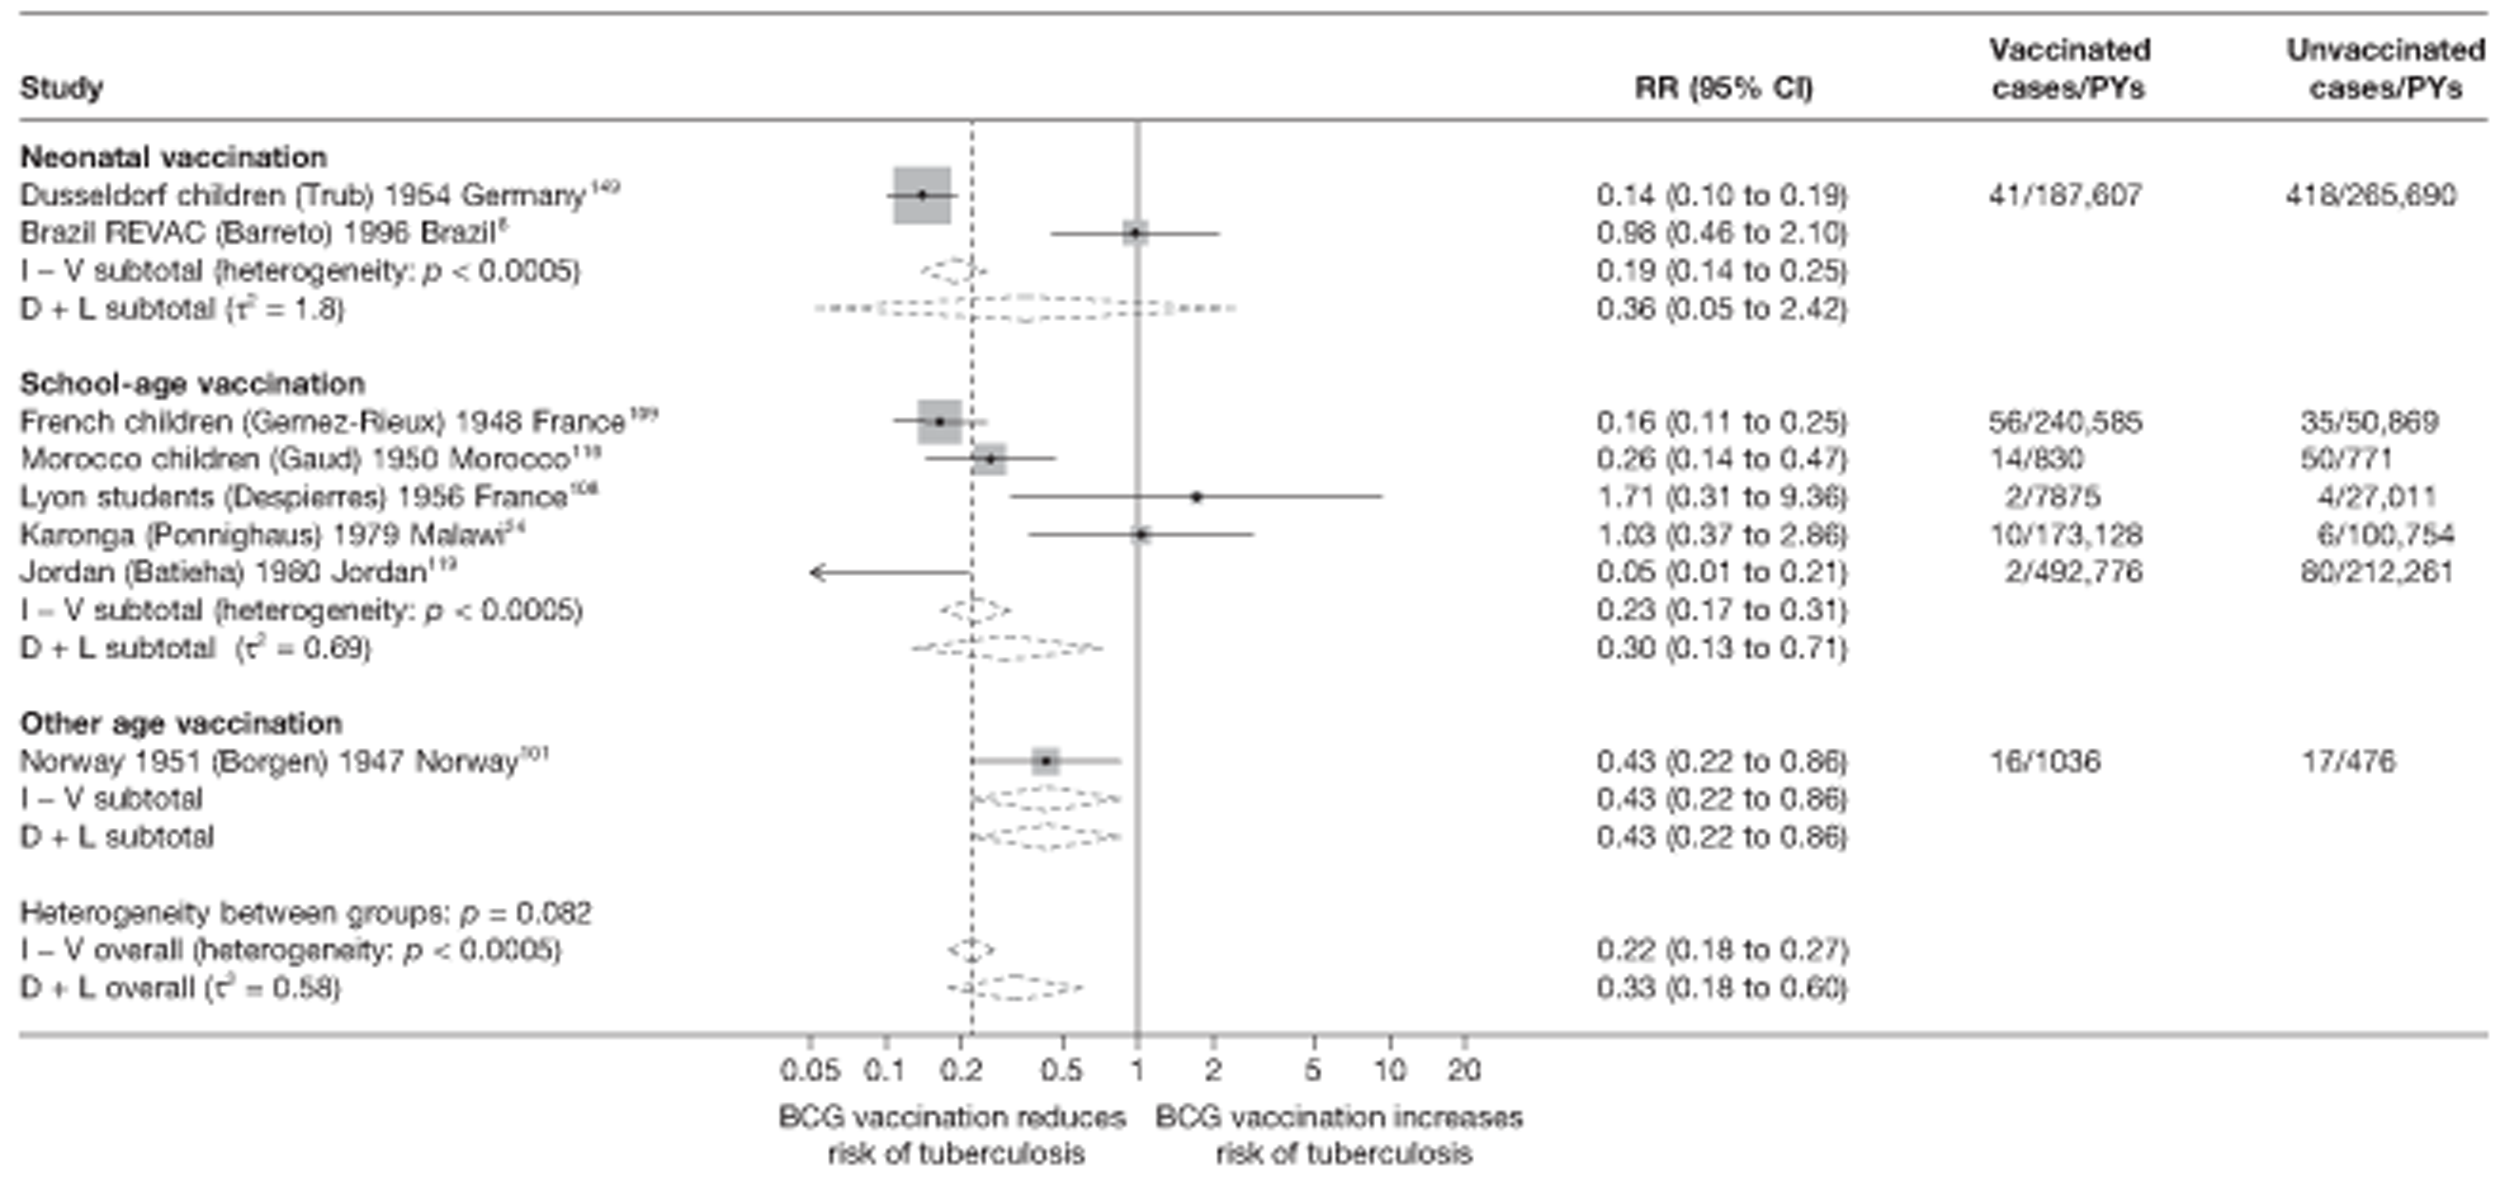
Meta-regression analysis
Based on meta-regression analyses, stratification by age at vaccination does not account for any of the heterogeneity in cohort studies (τ2 before and after stratification, respectively = 0.895 and 1.455). There was therefore no evidence that the effect of BCG vaccination varied according to age at vaccination (p-value = 0.973) (see Table 24).
Cohort studies
Stratified analysis by study design, ordered by year study started
Cohort studies
Figure 75 presents estimated effect of BCG vaccination against extrapulmonary tuberculosis excluding meningeal and miliary tuberculosis, stratified by study design. The highest protective effect of BCG vaccination was seen in the pooled estimate for retrospective study design. Study design appears to explain a small amount of the between-study variation, with a substantial amount of variation remaining after stratification.
FIGURE 75.
Rate ratios (with 95% CI) comparing the incidence of extrapulmonary tuberculosis among BCG vaccinated individuals with that in unvaccinated individuals for the longest duration of follow-up (see Table 4) in cohort studies, stratified by cohort study design, ordered by year of study start. D + L, DerSimonian and Laird method; I – V, inverse variance method.
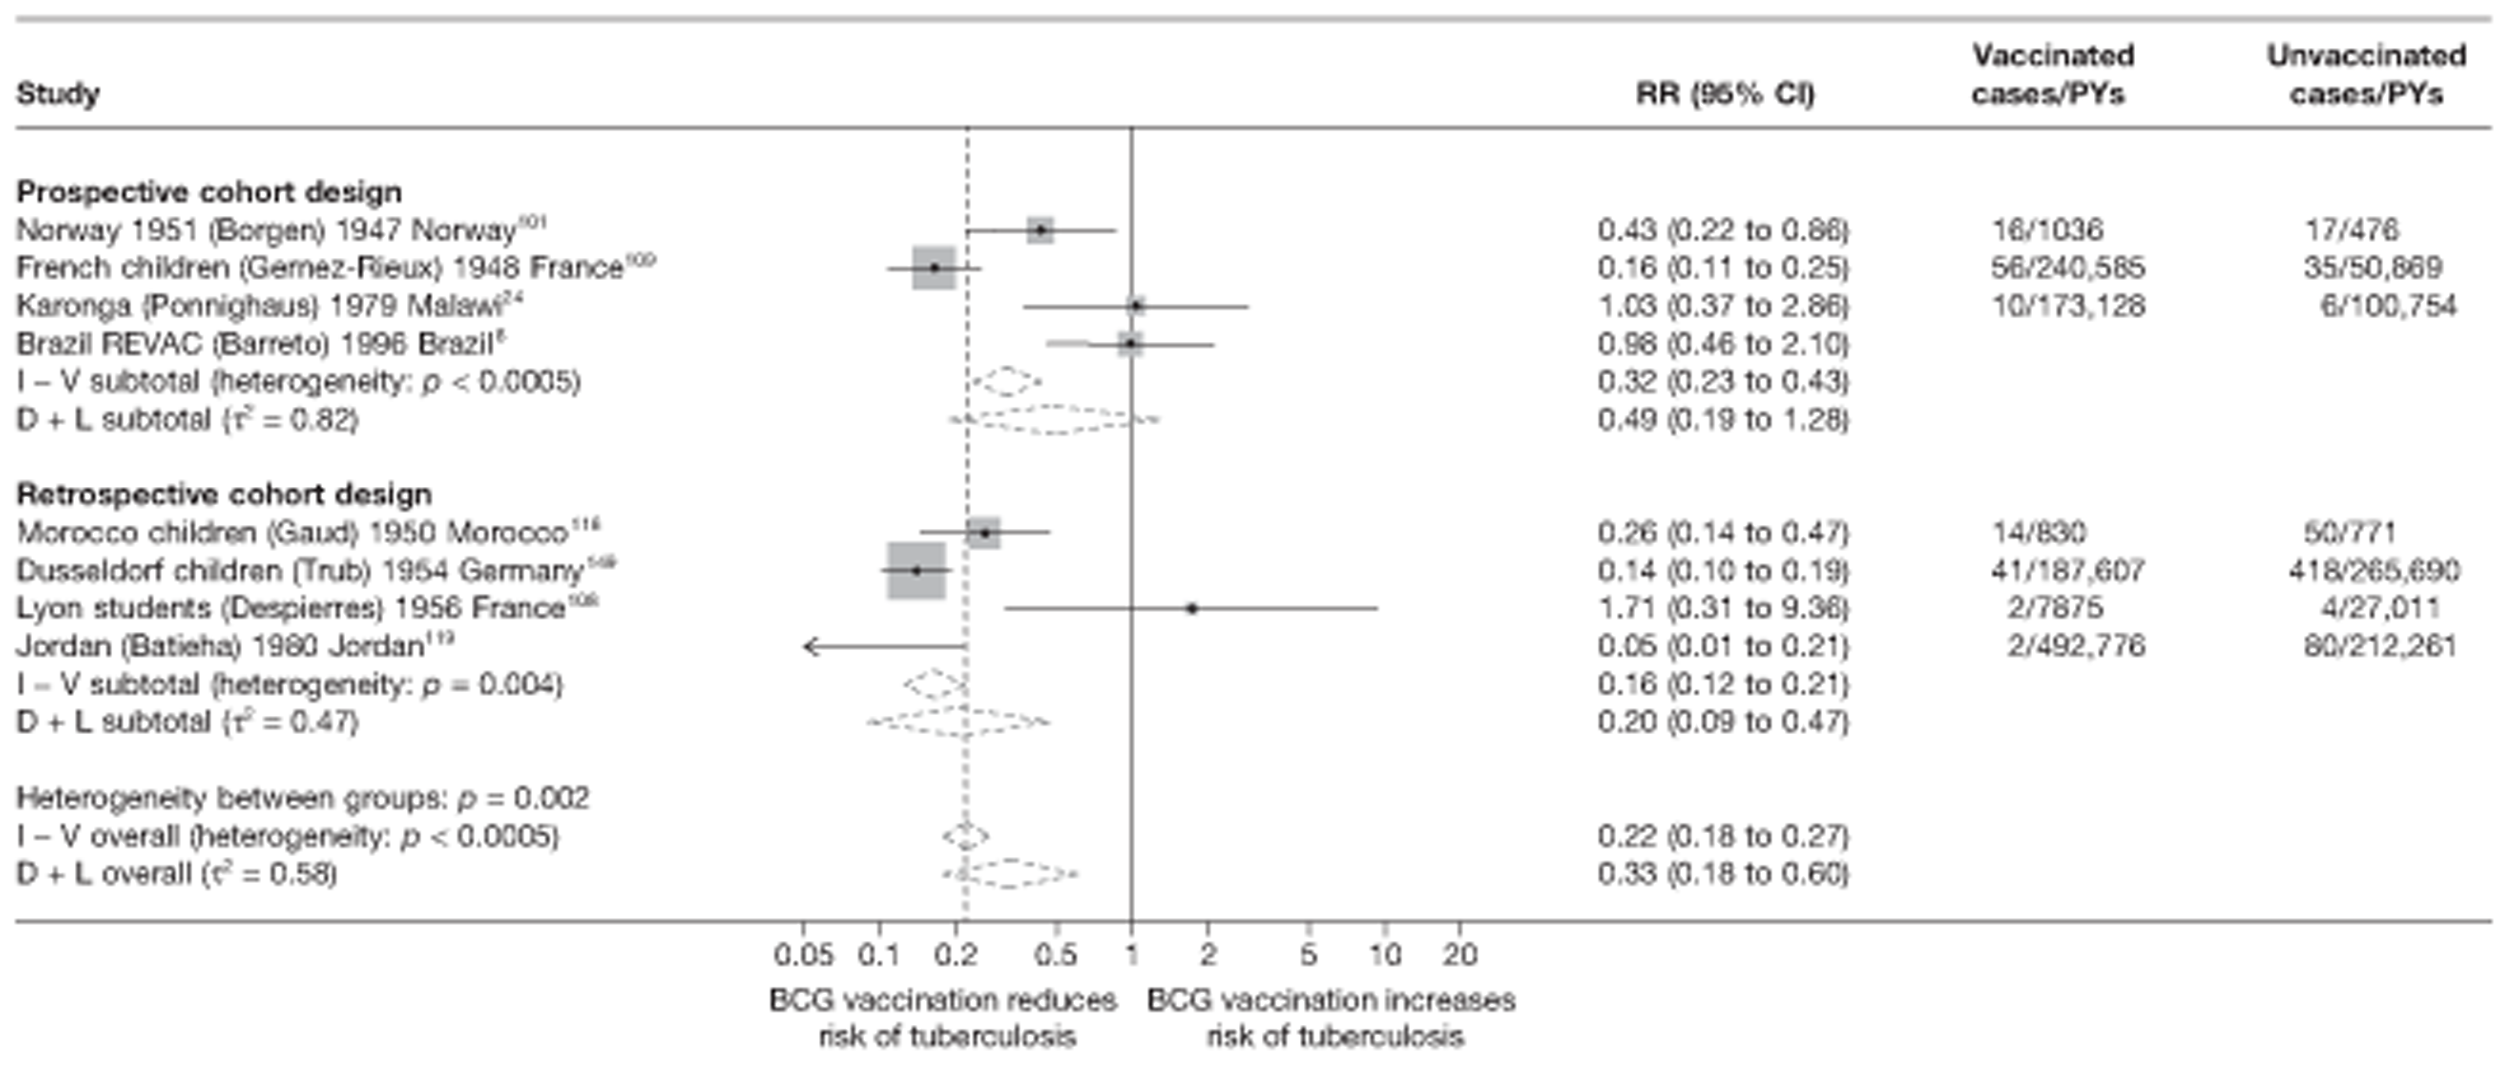
Meta-regression analysis
Stratification on study design accounted for 9% of the heterogeneity: τ2 values = 0.895 and 0.817 before and after stratification, respectively. There was no evidence (p-value = 0.320) that the protective effect of BCG vaccination varied according to cohort study design, as shown in Table 24.
Meta-regression analysis
Case–control studies
Results from univariable meta-regressions for all study variables for case–control studies indicate that latitude explained some of between-study variation in overall BCG vaccination effectiveness with a τ2 value of 0.193, compared with the baseline τ2 (0.262). Nevertheless, there was little evidence (p-value = 0.168) of association between latitude and a degree of protection from BCG.
Cohort studies
For cohort studies, results from univariable meta-regressions indicate that latitude and ‘Were results adjusted for socio-economic status?’ explained some of between-study variation in overall BCG vaccination effectiveness with a τ2 value of 0.520 and 0.291, respectively, compared with the baseline τ2 value (0.895) but little evidence that any factors were associated with the size of the protective effect.
Tuberculosis mortality
Unstratified analysis by year study started
Figures 76 and 77 show the results of cohort and cross-sectional studies, respectively, which presented data on the effect of BCG vaccination on mortality. No case–control or case population studies provided data on tuberculosis mortality.
FIGURE 76.
Rate ratios (with 95% CI) comparing the incidence of tuberculosis mortality among BCG vaccinated individuals with that in unvaccinated individuals for the longest duration of follow-up (see Table 4) in cohort studies, ordered by year of study start.

FIGURE 77.
Risk ratios (with 95% CI) comparing the prevalence of tuberculosis mortality among BCG vaccinated individuals with that in unvaccinated individuals in cross-sectional studies, ordered by year of study start.

Despite the small number of events in each cohort study, all estimates were consistent with a good to high protective effect of BCG vaccination against tuberculosis mortality. Both cross-sectional studies provided strong evidence of high BCG vaccination effectiveness.
Cohort studies
See Figure 76.
Cross-sectional studies
See Figure 77.
Stratified analysis by latitude (10°), ordered by year study started
Figure 78 shows the estimates of effect of BCG vaccination against tuberculosis mortality from all nine cohort studies stratified by 10° bands of latitude. None were conducted close to the equator. The highest pooled estimate of protection was seen in cohort studies conducted between 30° and 40° latitude [rate ratio 0.11 (95% CI 0.05 to 0.24; VE 88%)], while there was reasonably consistent evidence of lower, albeit still good protection from cohort studies at latitudes further from the equator: rate ratio 0.29 (95% CI 0.11 to 0.77; VE 71%) for studies conducted between 40° and 50° latitude, and rate ratio 0.28 (95% CI 0.17 to 0.46; VE 72%) for studies conducted above 50° latitude.
FIGURE 78.
Rate ratios (with 95% CI) comparing the incidence of tuberculosis mortality among BCG vaccinated individuals with that in unvaccinated individuals for the longest duration of follow-up (see Table 6) in cohort studies, stratified by latitude of study location (10° bands), ordered by year of study start. D + L, DerSimonian and Laird method; I – V, inverse variance method.
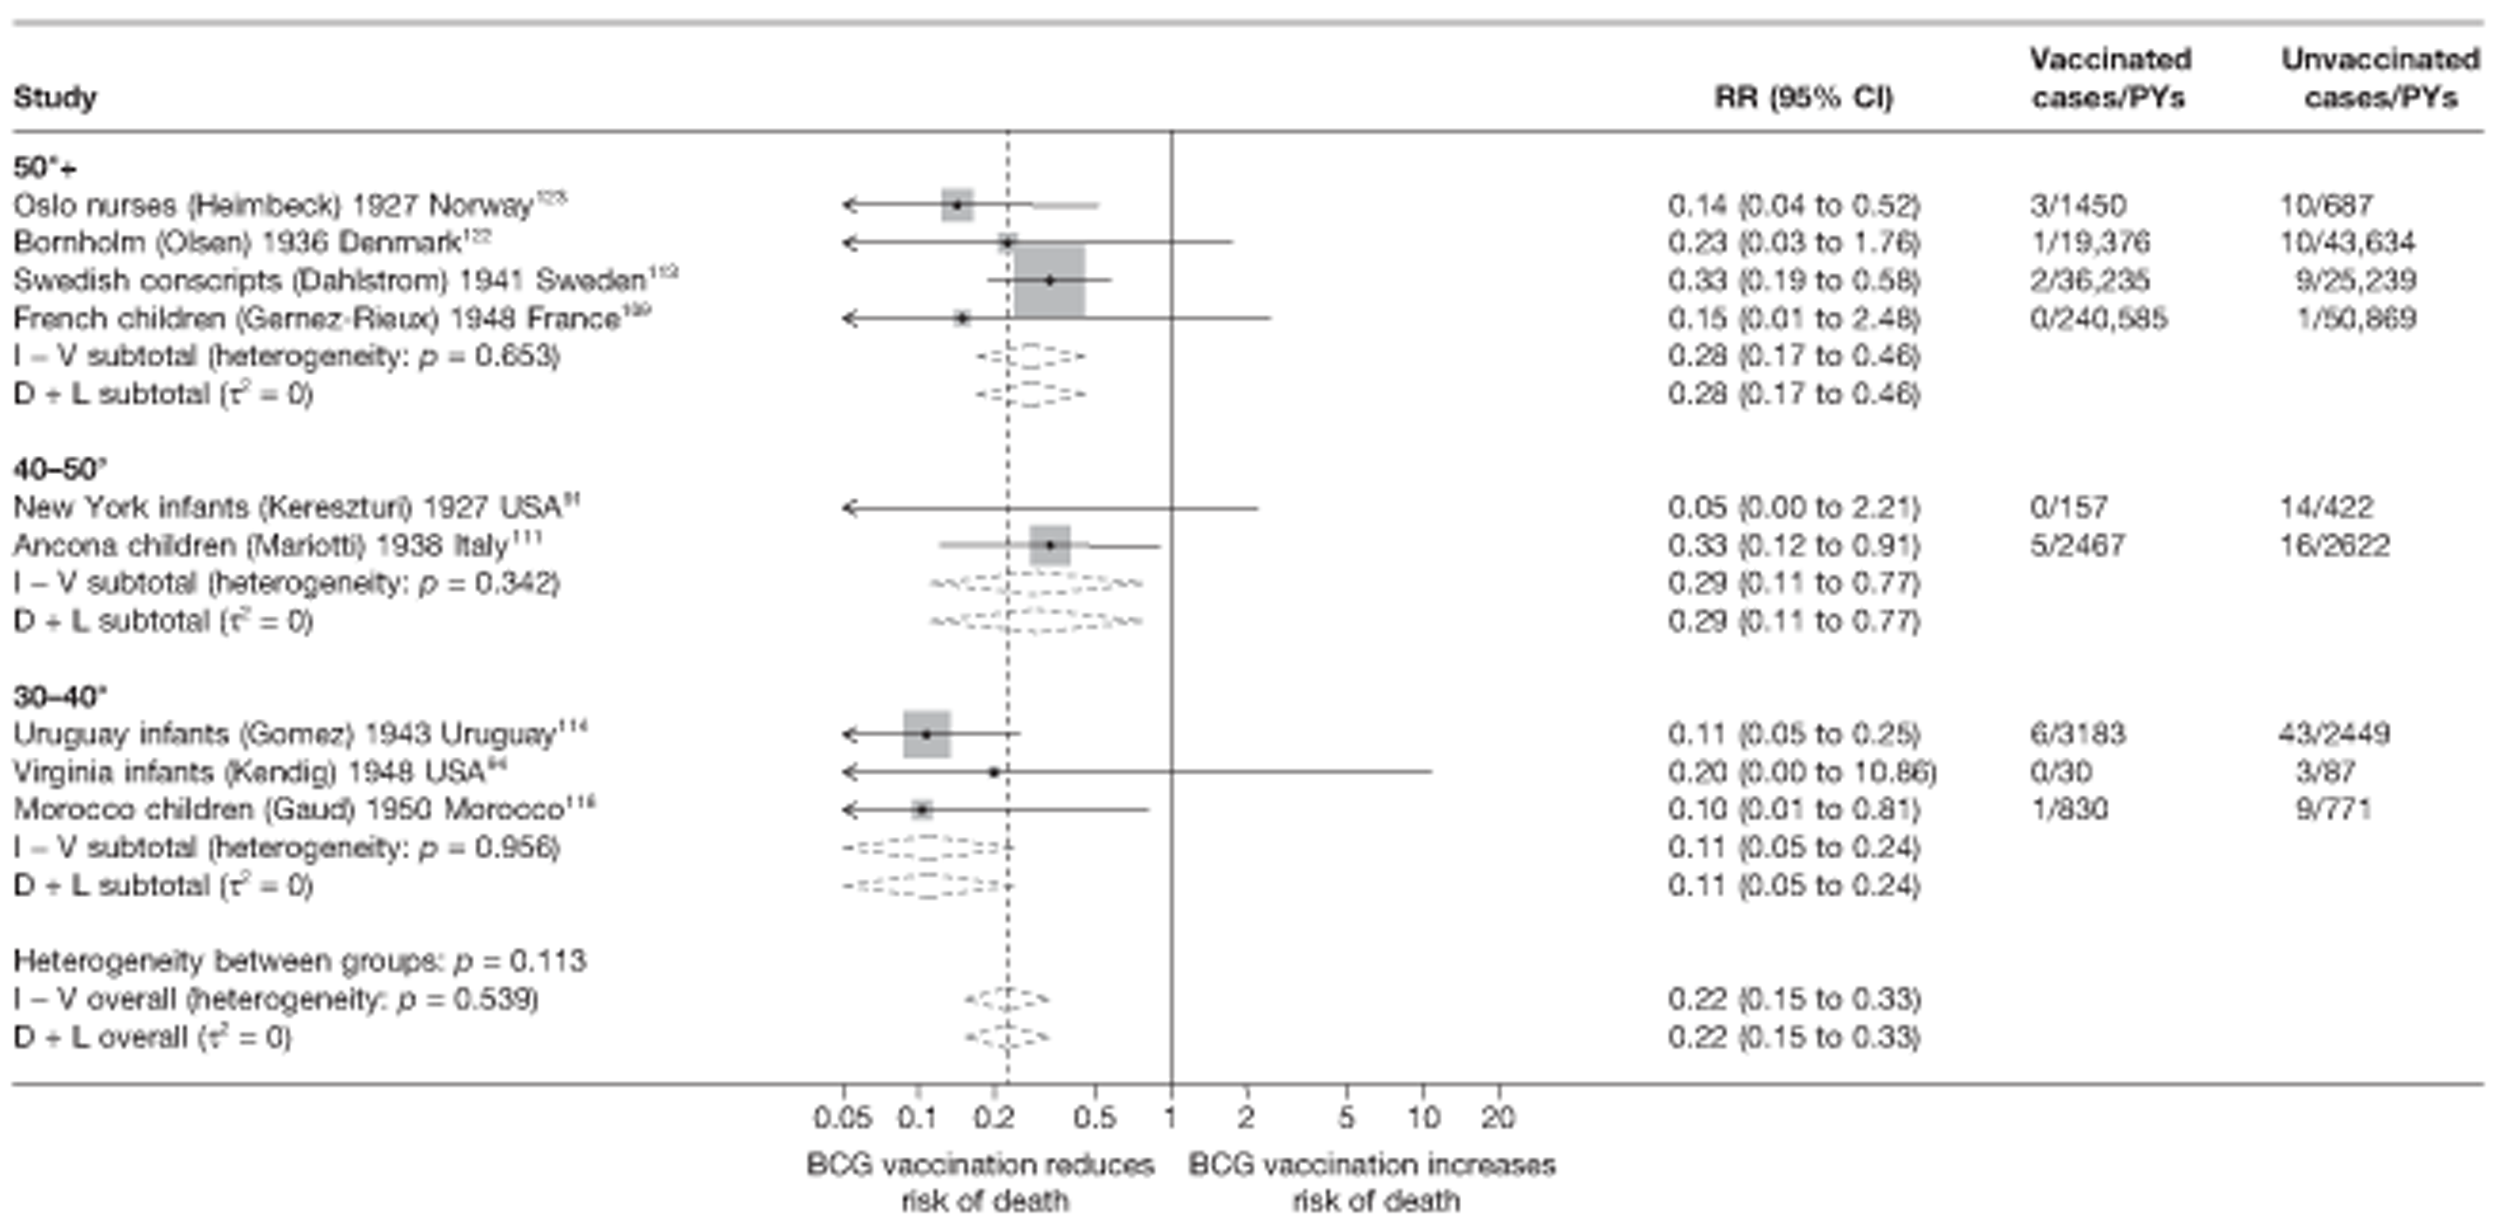
Meta-regression analysis
Stratifying cohort studies by latitude (20° bands) accounted for a very substantial amount of the heterogeneity between-studies (τ2 values before and after stratification 0.128 and 0.000, respectively) (Table 25). There was some evidence (p-value = 0.075) that effectiveness of BCG vaccination against tuberculosis mortality varies with latitude.
| Variable | Number of studies | Univariable rate ratios (95% CI) | Univariable model | ||
|---|---|---|---|---|---|
| Ratio of rate ratios (95% CI) | p-value | τ2 | |||
| Null model | 9 | 0.128 | |||
| Latitude | |||||
| 40°+ | 6 | 0.28 (0.16 to 0.49) | 1.00 (ref.) | ||
| 20–40° | 3 | 0.11 (0.04 to 0.29) | 0.39 (0.13 to 1.13) | ||
| 0–20° | 0 | 0.075 | 0.000 | ||
| Age at vaccination | |||||
| Neonatal | 2 | 0.11 (0.04 to 0.33) | 1.00 (ref.) | ||
| School age | 4 | 0.23 (0.08 to 0.70) | 2.10 (0.47 to 9.30) | ||
| Other | 3 | 0.28 (0.15 to 0.55) | 2.57 (0.75 to 8.76) | 0.248 | 0.003 |
| Was follow-up independent of vaccination status? | |||||
| Lower risk of bias | 5 | 0.28 (0.16 to 0.48) | 1.00 (ref.) | ||
| Higher risk of bias | 4 | 0.12 (0.05 to 0.31) | 0.45 (0.16 to 1.28) | 0.113 | 0.000 |
| Was case ascertainment blinded to vaccination status? | |||||
| Lower risk of bias | 0 | ||||
| Higher risk of bias | 9 | 0.128 | |||
| Were methods of case ascertainment identical for vaccinated and unvaccinated group? | |||||
| Lower risk of bias | 9 | ||||
| Higher risk of bias | 0 | 0.128 | |||
| Were losses to follow-up similar in each group? | |||||
| Lower risk of bias | 3 | 0.28 (0.12 to 0.66) | 1.00 (ref.) | ||
| Higher risk of bias | 6 | 0.17 (0.08 to 0.36) | 0.60 (0.20 to 1.81) | 0.312 | 0.065 |
| Was diagnostic detection bias present? | |||||
| Lower risk of bias | 2 | 0.12 (0.01 to 1.04) | 1.00 (ref.) | ||
| Higher risk of bias | 7 | 0.21 (0.11 to 0.41) | 1.81 (0.20 to 16.32) | 0.544 | 0.128 |
| Were results adjusted for SES? | |||||
| Yes | 0 | ||||
| No | 9 | ||||
| Study type | |||||
| Prospective | 5 | 0.15 (0.04 to 0.56) | 1.00 (ref.) | ||
| Retrospective | 4 | 0.22 (0.11 to 0.46) | 1.47 (0.35 to 6.28) | ||
| Contact | 0 | 0.547 | 0.135 | ||
Cohort studies
See Figure 78.
Stratified analysis by age at vaccination, ordered by year study started
Figure 79 presents the estimated effects of BCG vaccination, stratified by age at vaccination, for cohort studies. Studies of the effect of BCG vaccination given at school and other ages showed slightly lower but still good overall protective effect of BCG vaccination against mortality, compared with neonatal vaccination studies which showed high levels of protection. Age at vaccination appears to explain a substantial amount of between-study variation. Both cross-sectional studies conducted vaccination in neonates.
FIGURE 79.
Rate ratios (with 95% CI) comparing the incidence of tuberculosis mortality among BCG vaccinated individuals with that in unvaccinated individuals for the longest duration of follow-up (see Table 4) in cohort studies, stratified by age at vaccination, ordered by year of study start. D + L, DerSimonian and Laird method; I – V, inverse variance method.
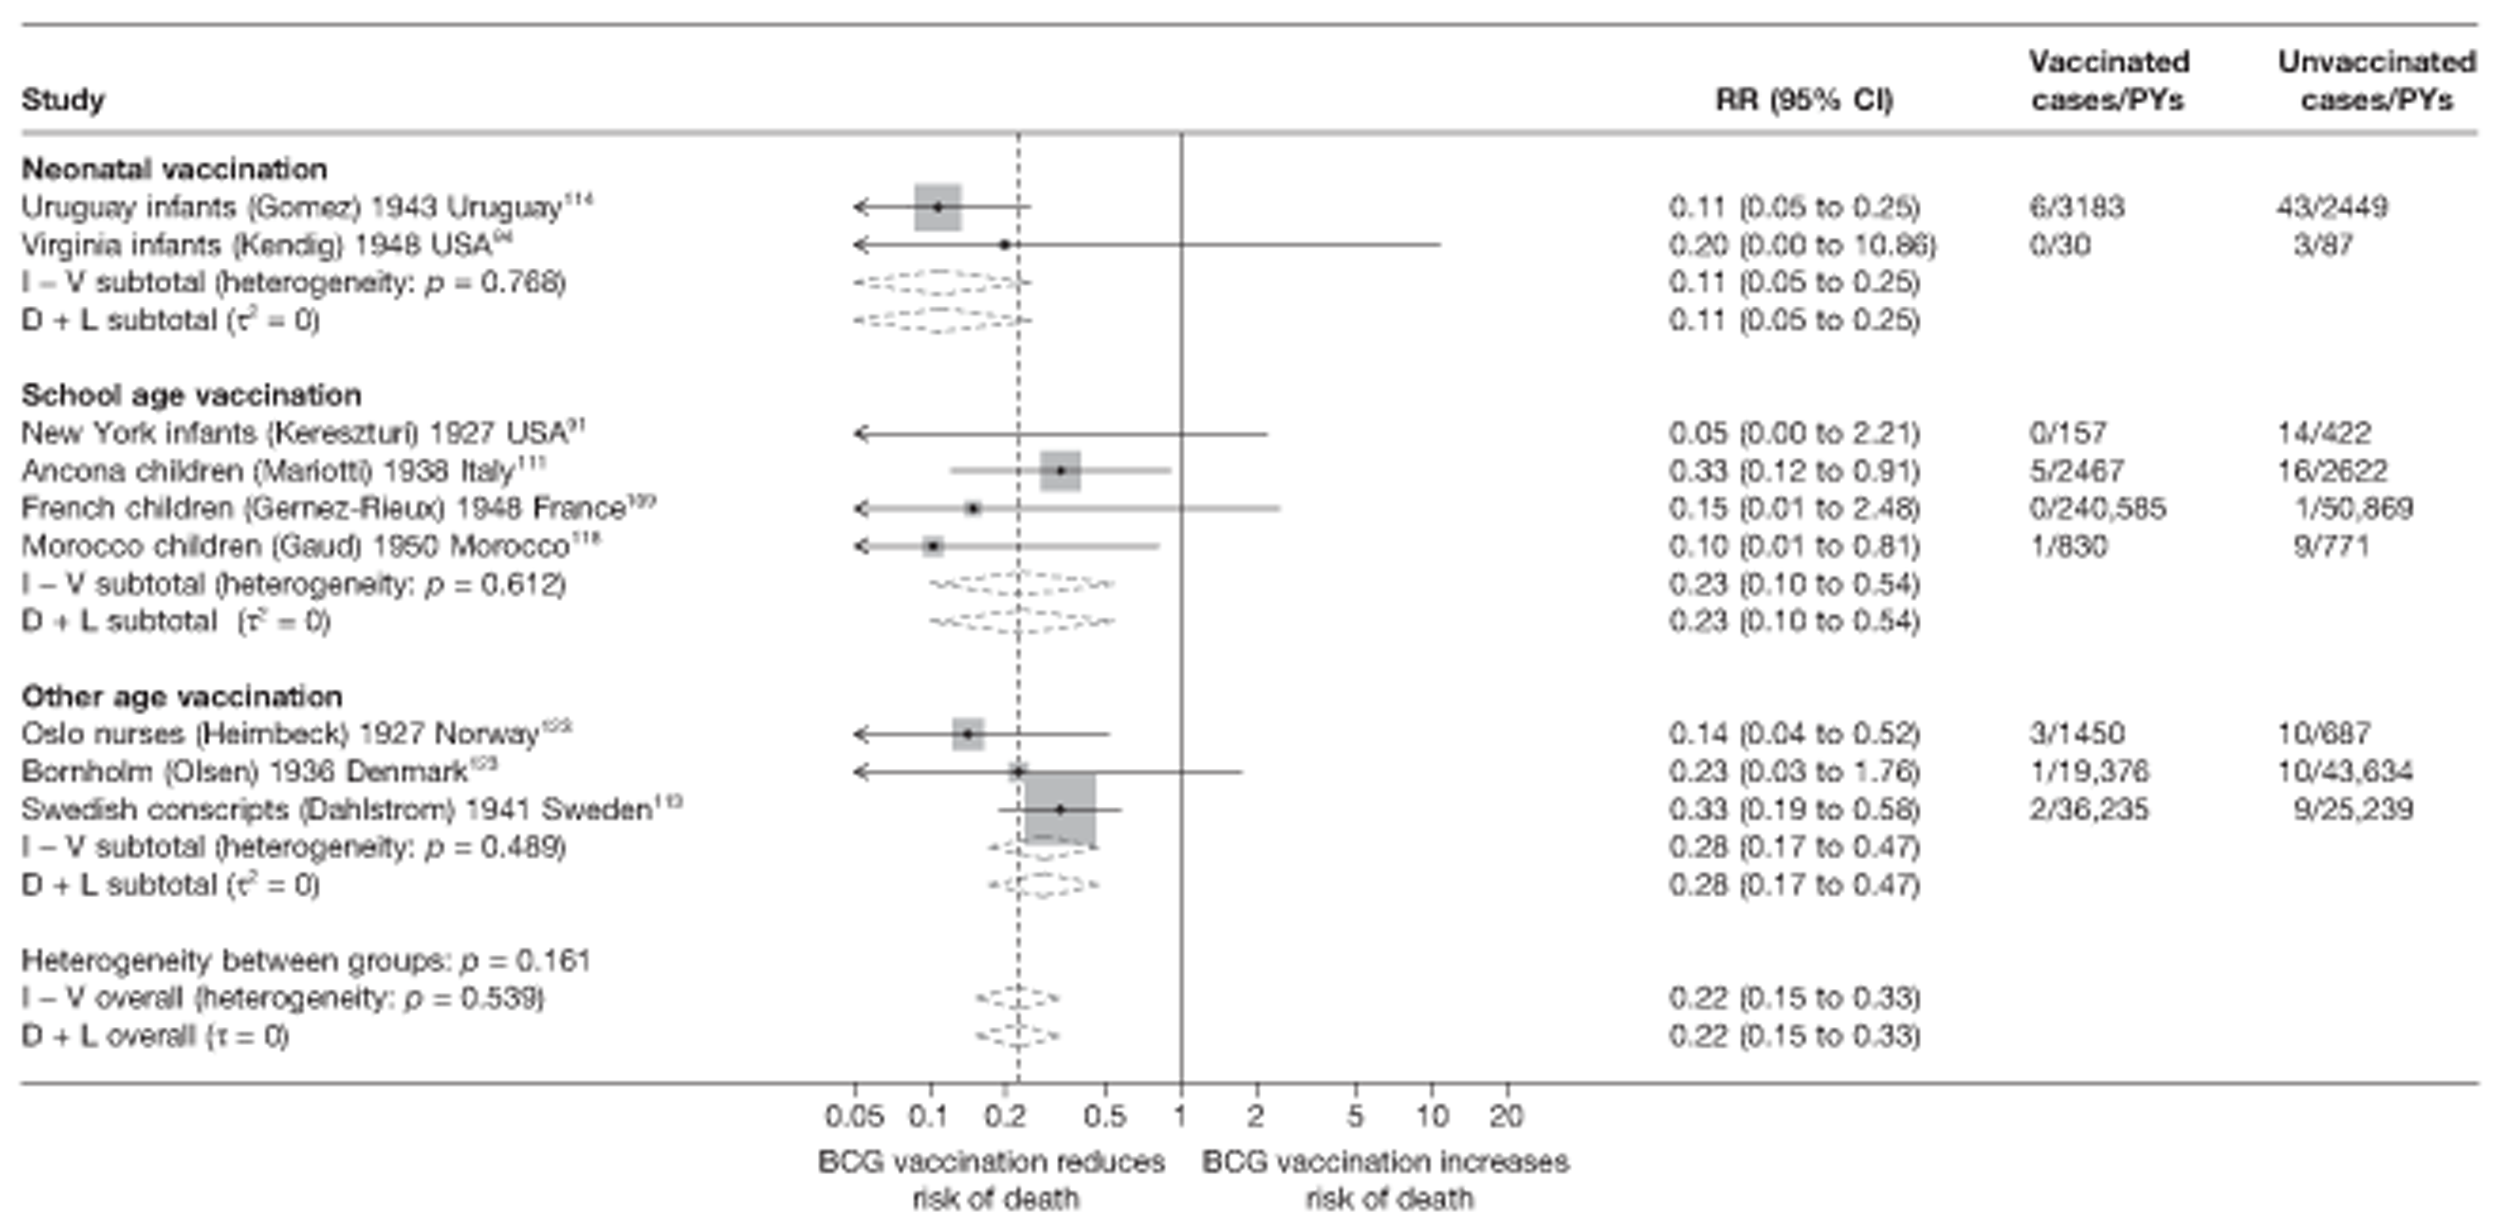
Meta-regression analysis
Among cohort studies, stratification on age at vaccination explained 98% the heterogeneity seen within studies (null model τ2 = 0.128, τ2 value after stratification = 0.003) (see Table 25). However, there was no evidence that BCG vaccination effectiveness varied with age at vaccination (p-value = 0.248).
Cohort studies
Stratified analysis by study design, ordered by year study started
Figure 80 presents the estimated effects of BCG vaccination against tuberculosis mortality, stratified by study design. In general, there was no difference in the effectiveness of BCG vaccination between prospective and retrospective cohort studies. Study design did not explain the between-study heterogeneity of cohorts' estimates of BCG vaccination effectiveness against tuberculosis mortality.
FIGURE 80.
Rate ratios (with 95% CI) comparing the incidence of tuberculosis mortality among BCG vaccinated individuals with that in unvaccinated individuals for the longest duration of follow-up (see Table 4) in cohort studies, stratified by cohort study design, ordered by year of study start. D + L, DerSimonian and Laird method; I – V, inverse variance method.
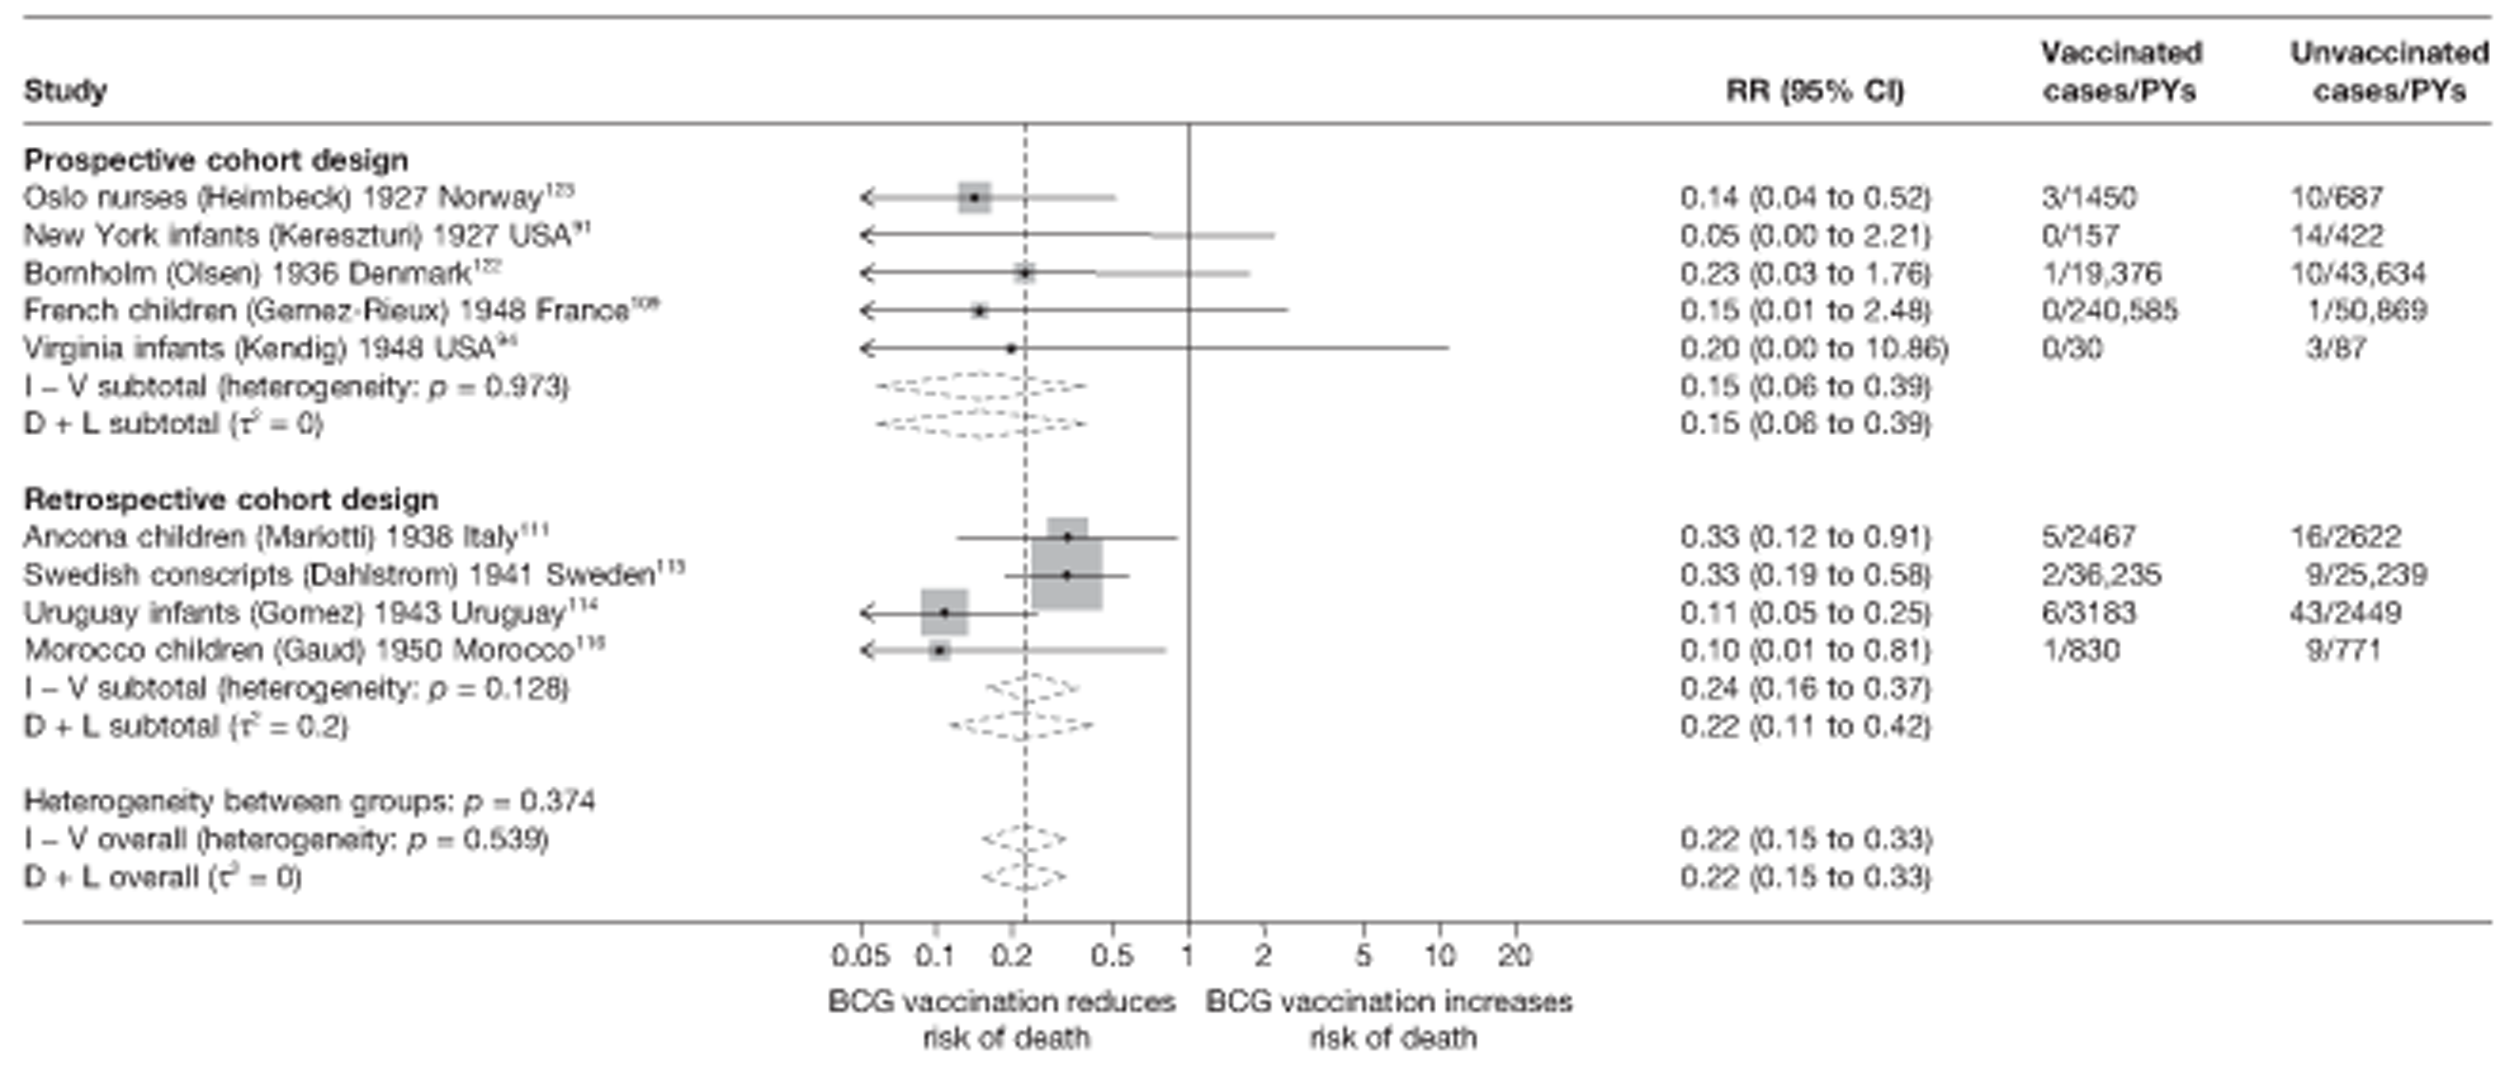
Meta-regression analysis
Stratification by cohort study design did not explain any of the between-study heterogeneity (null model τ2 = 0.128, τ2 value after stratification = 0.135) (see Table 25).
Cohort studies
See Figure 80.
Meta-regression analysis
Cohort studies
The results of univariable meta-regressions for all cohort study variables indicate that latitude, age at vaccination and ‘Was follow-up independent of vaccination status?’ each explained the largest amount of between-study variation in overall BCG vaccination effectiveness with τ2 values of 0.000, 0.003 and 0.000, respectively, compared with the baseline τ2 value (0.128). Only latitude showed some weak evidence (p-value = 0.075) that BCG vaccination effectiveness changed with latitude.
Results by gender for all outcomes
Four trials5,15,28,53 provided data on protective effect of BCG vaccination and gender of participants. Three out of four studies had an estimated ratio of rate ratios indicating that BCG vaccination is more protective in females than in males. Estimates of BCG vaccination effectiveness were presented by gender for six case–control studies, one cohort, one case population and two cross-sectional studies in Appendix 6. There was no evidence of a difference in protective effect in females compared with males: for any tuberculosis outcome, eight estimates of effect were higher in females than in males, whereas seven showed higher effectiveness in males.
Results by human immunodeficiency virus status for all outcomes
No trials reported results by HIV status of participants.
Only one cross-sectional study (Cape Town Children190) commented that the prevalence of HIV+ children in the vaccinated compared with unvaccinated groups was not significantly different. No breakdown of effectiveness by HIV status of the study population was provided. It was not possible to calculate the proportion HIV infected, as not all participants received an HIV test, although it is likely that the BCG group were all HIV tested.
Duration of protection by bacillus Calmette–Guérin vaccination
Randomised controlled trials
Pulmonary tuberculosis
Ten trials provided sufficient data to investigate the duration of protection afforded by BCG vaccination against pulmonary tuberculosis (Figure 81). In the majority of studies there was evidence of protection during the first 5 years of follow-up, while one study (Chingleput28) found an adverse effect of vaccination during this period. In the majority of studies, the protection afforded by BCG vaccination appeared to decline after the first 5 years. The study with the longest follow-up period (Native American trial5) found evidence of protection up to 20 years. By contrast with the trend in the majority of trials, the negative effect of BCG vaccination in the early years of follow-up in the Chingleput study28 was attenuated, with rate ratios close to 1, in subsequent years. Possible explanations for this result are explored further in the discussion (see Chapter 5).
FIGURE 81.
Vaccine efficacy and rate ratios (with 95% CI) comparing the incidence of pulmonary tuberculosis among BCG vaccinated individuals with that in unvaccinated individuals, in RCTs, over time. CCH, Cook County Hospital; TB HH, tuberculosis households.
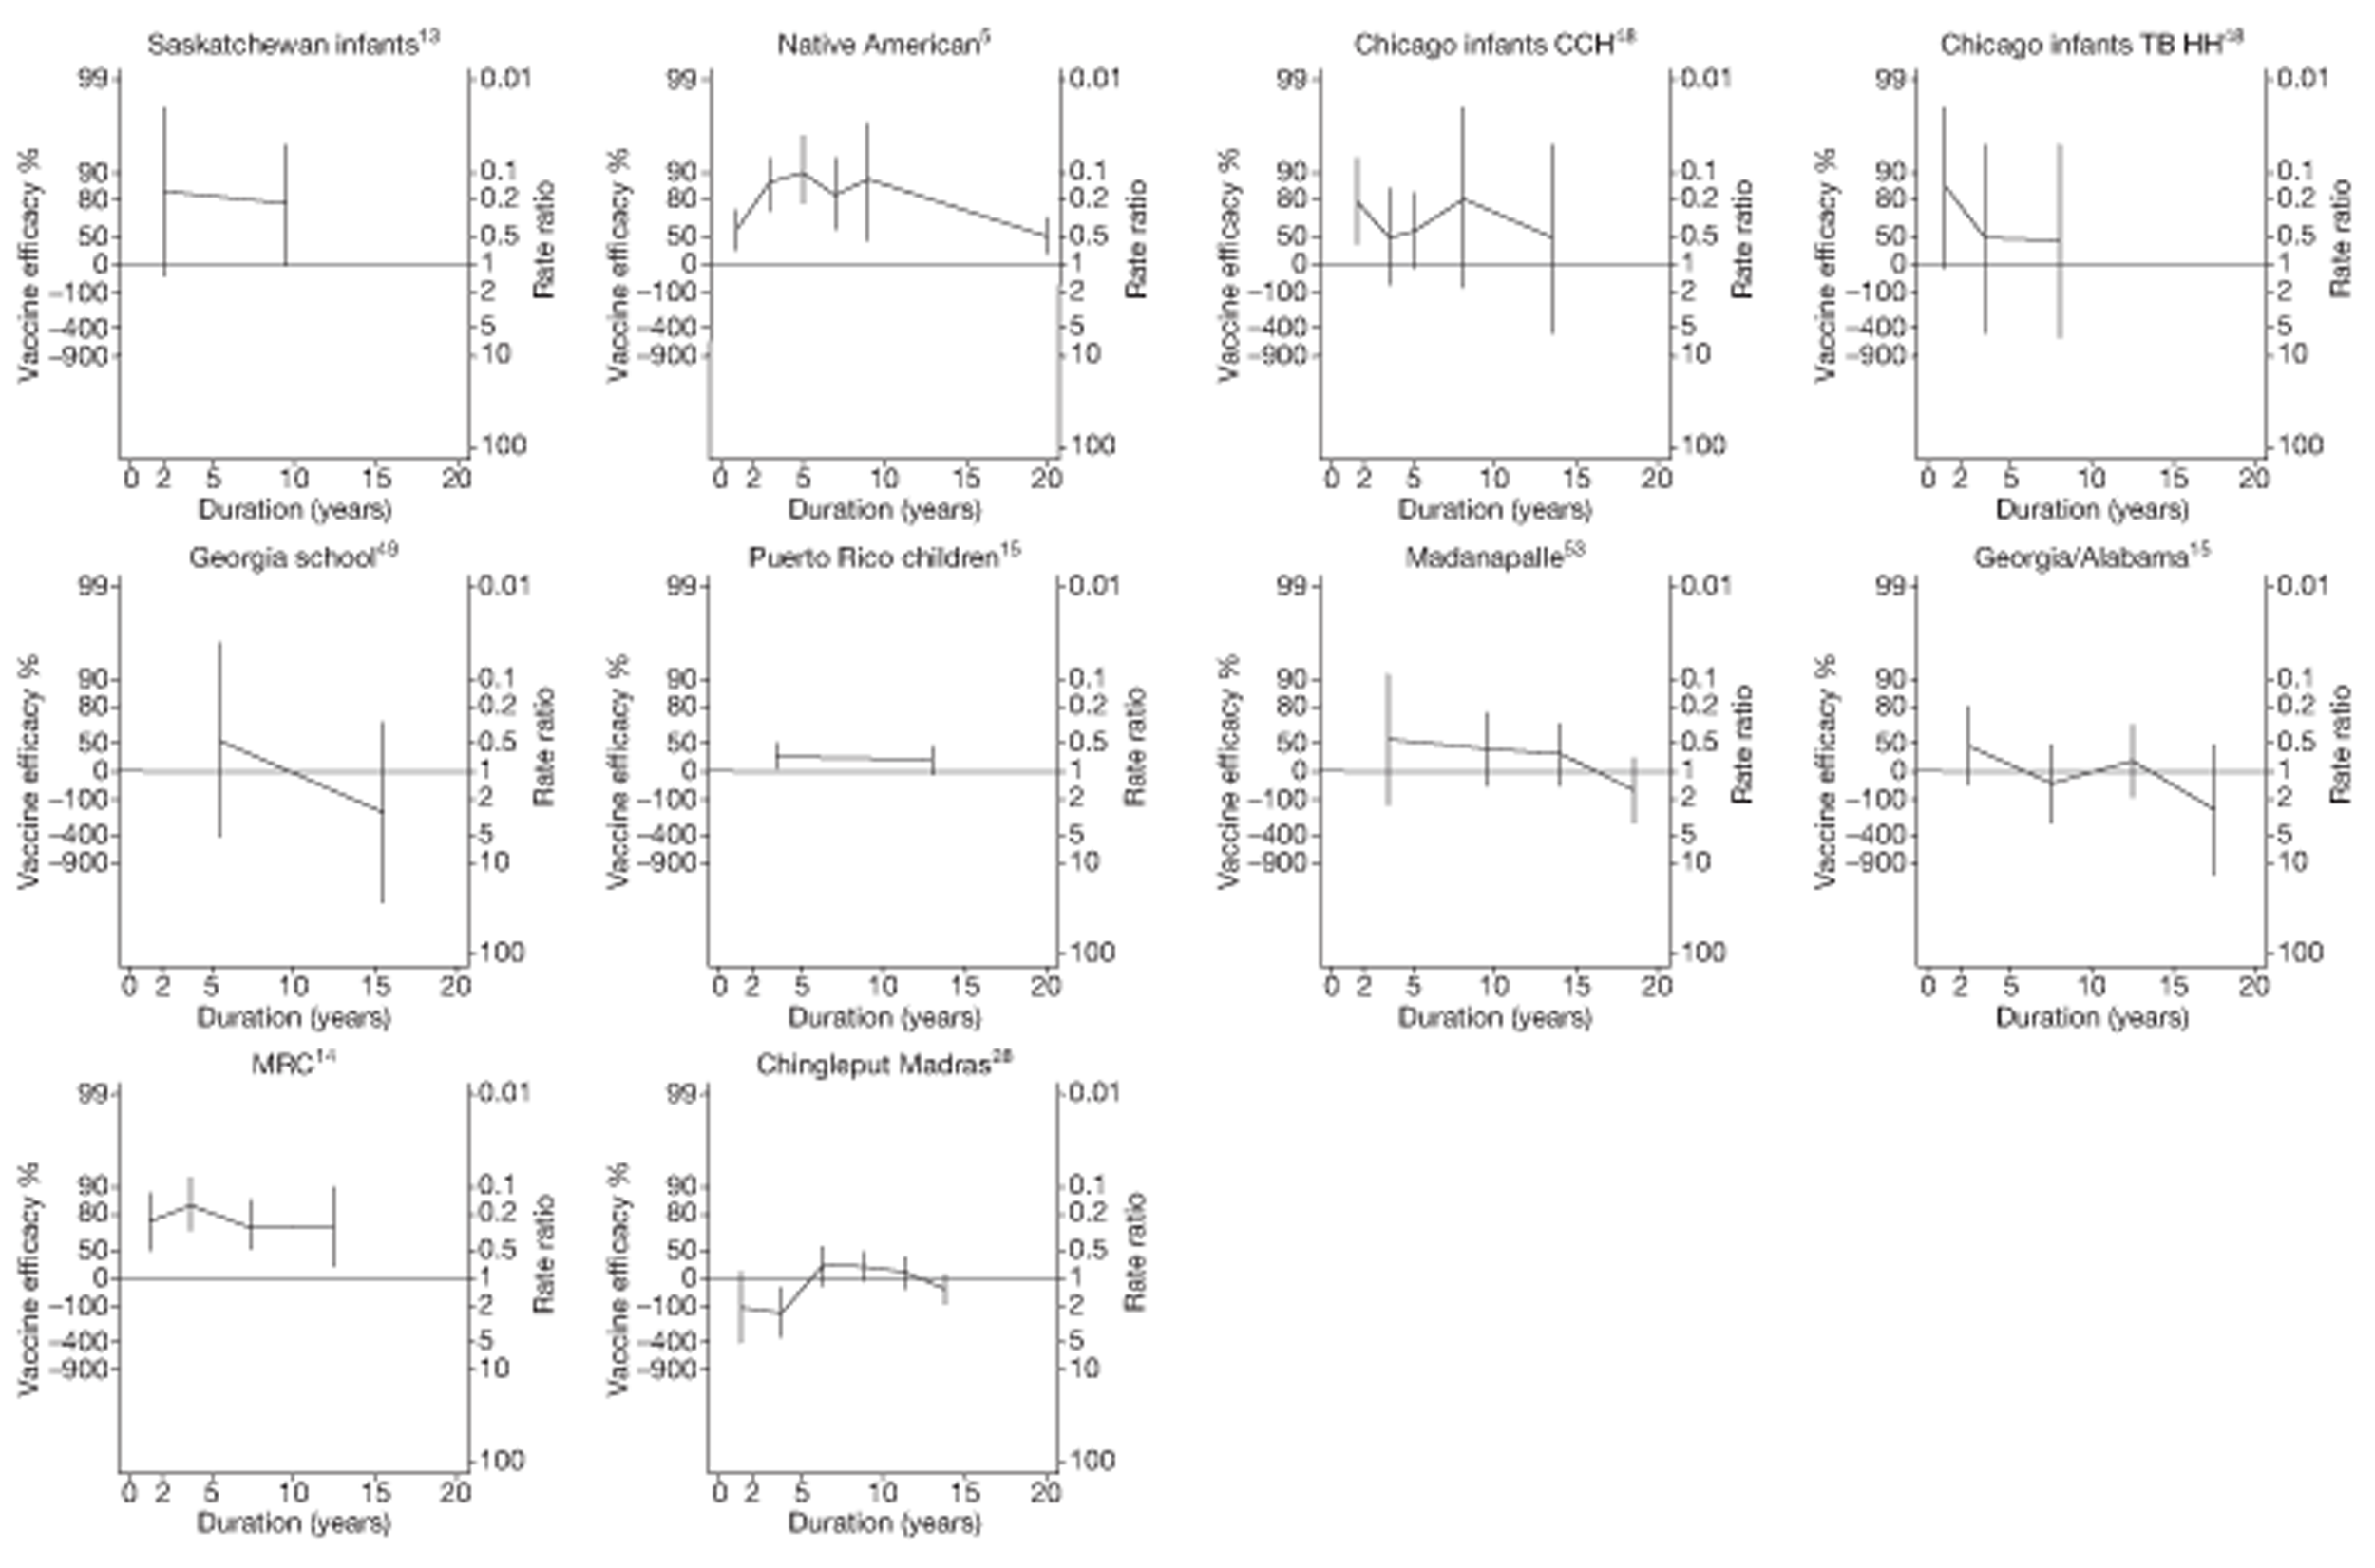
We examined changes in efficacy over time in each study by estimating the ratio of rate ratios per 5 years of follow-up. Such estimates are based on the assumption that, within each study, there is a linear trend in the log-rate ratio over time, and correspond to the assumption of a straight-line relationship for each study in Figure 81. The forest plots in Figures 82 and 83 display these estimated ratios of rate ratios, before and after excluding the first 5 years of follow-up (during which tuberculosis rates may be influenced by prior infection in studies that did not exclude tuberculin skin test positive individuals at enrolment). Figure 82 shows that, on average, the protective effect of BCG vaccination declined over time (summary ratio of rate ratios = 1.14 per 5 years' follow-up; 95% CI 1.03 to 1.27), with little evidence of between-study heterogeneity (τ2 = 0.00). Figure 83 shows that excluding data from the first 5 years of follow-up for each study resulted in a more pronounced decline in the protective effect of BCG vaccination (summary ratio of rate ratios 1.47; 95% CI 1.03 to 1.24), and this effect was also more consistent across studies. Again there was little evidence of between-study heterogeneity (τ2 = 0).
FIGURE 82.
Change per 5 years (with 95% CI) in the rate ratio comparing the incidence of pulmonary tuberculosis among BCG vaccinated individuals with that in unvaccinated individuals in RCTs for the longest follow-up period (see Table 3), including the first 5 years of data for each study. CCH, Cook County Hospital; D + L, DerSimonian and Laird method; I – V, inverse variance method; TB HH, tuberculosis households; TBPT, Tuberculosis Prevention Trial.

FIGURE 83.
Change per 5 years (with 95% CI) in the rate ratio comparing the incidence of pulmonary tuberculosis among BCG vaccinated individuals with that in unvaccinated individuals in RCTs for the longest follow-up period (see Table 3), excluding the first 5 years of data for each study. CCH, Cook County Hospital; D + L, DerSimonian and Laird method; I – V, inverse variance method; TB HH, tuberculosis households; TBPT, Tuberculosis Prevention Trial.

Temporal changes in efficacy
Figures 84 and 85 are scatterplots of the ratio of rate ratios per 5 years of follow-up compared with the overall rate ratio for each study, including and excluding the first 5 years' follow-up. There was little evidence of an association between change in efficacy over time and overall efficacy across studies.
FIGURE 84.
Scatterplot of change per 5 years in rate ratio compared with overall rate ratio, comparing incidence of pulmonary tuberculosis among BCG vaccinated individuals with that in unvaccinated individuals, in RCTs, including the first 5 years of data for each study. The area of the circles is proportional to the inverse of the variance of the log-rate ratio comparing vaccinated with unvaccinated individuals. CCH, Cook County Hospital; TB HH, tuberculosis households.
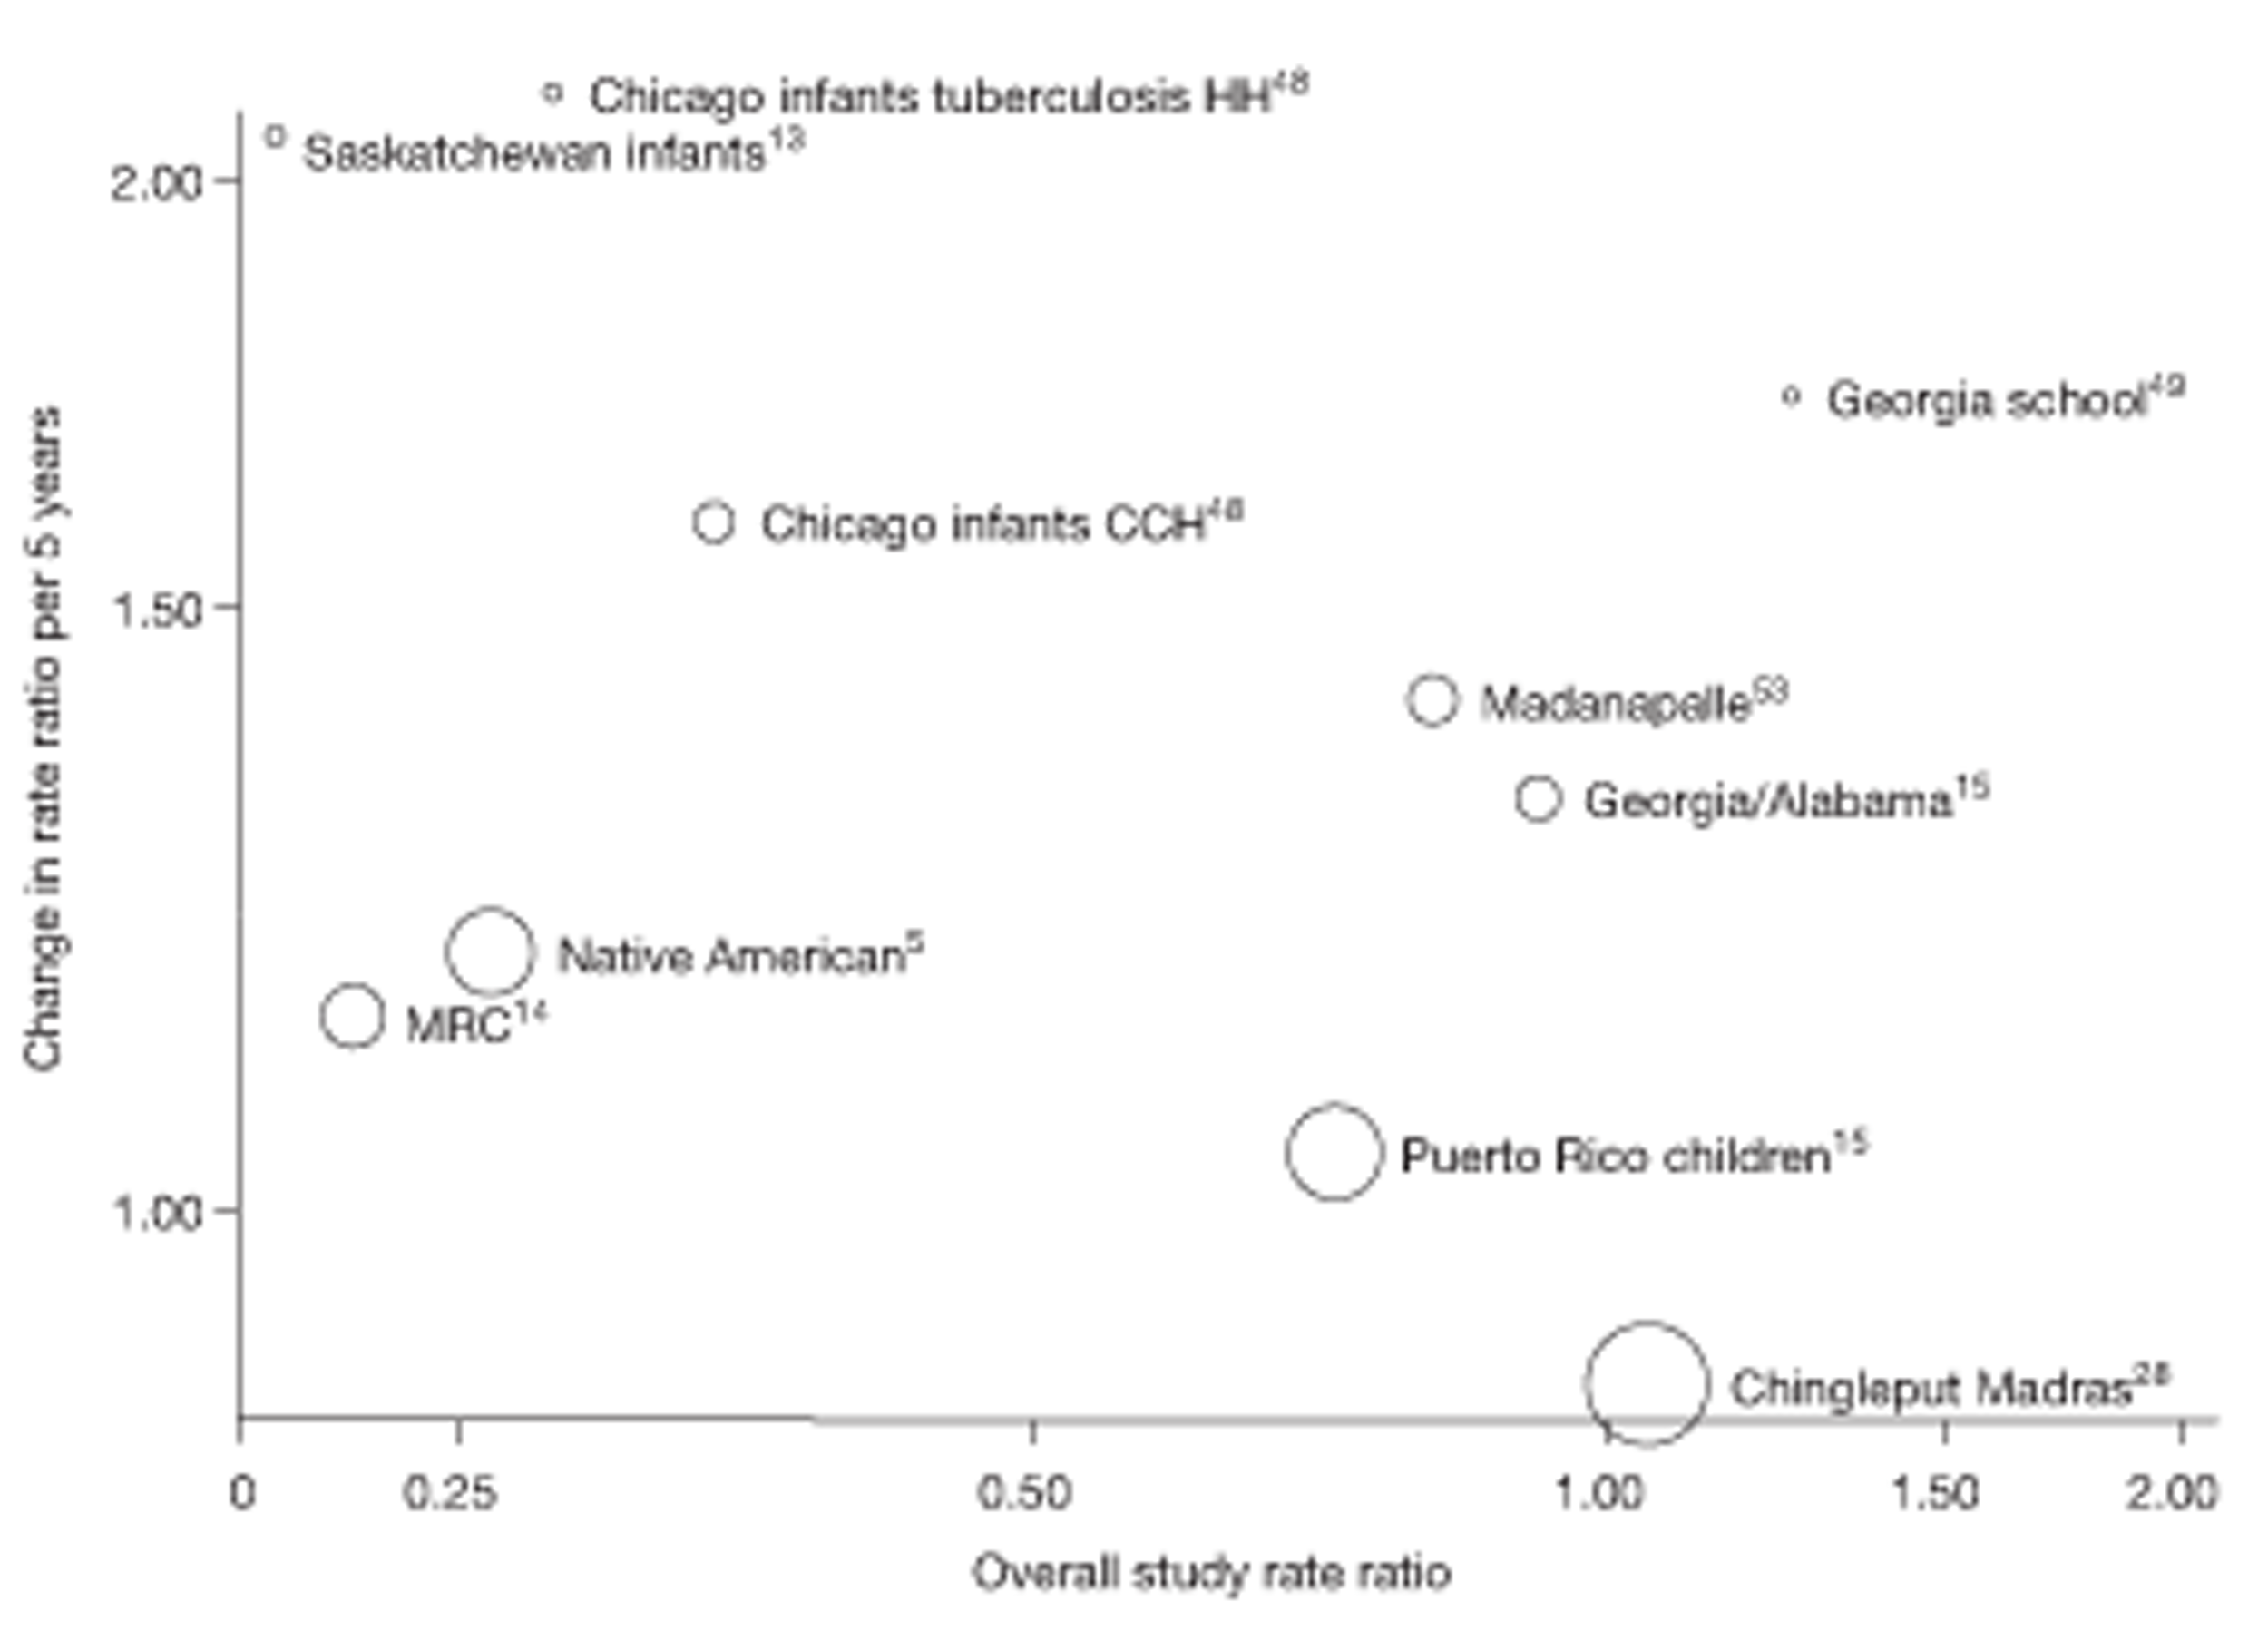
FIGURE 85.
Scatterplot of change per 5 years in rate ratio compared with overall rate ratio, comparing incidence of pulmonary tuberculosis among BCG vaccinated individuals with that in unvaccinated individuals, in RCTs, excluding the first 5 years of data for each study. The area of the circles is proportional to the inverse of the variance of the log-rate ratio comparing vaccinated with unvaccinated individuals. CCH, Cook County Hospital; TB HH, tuberculosis households.
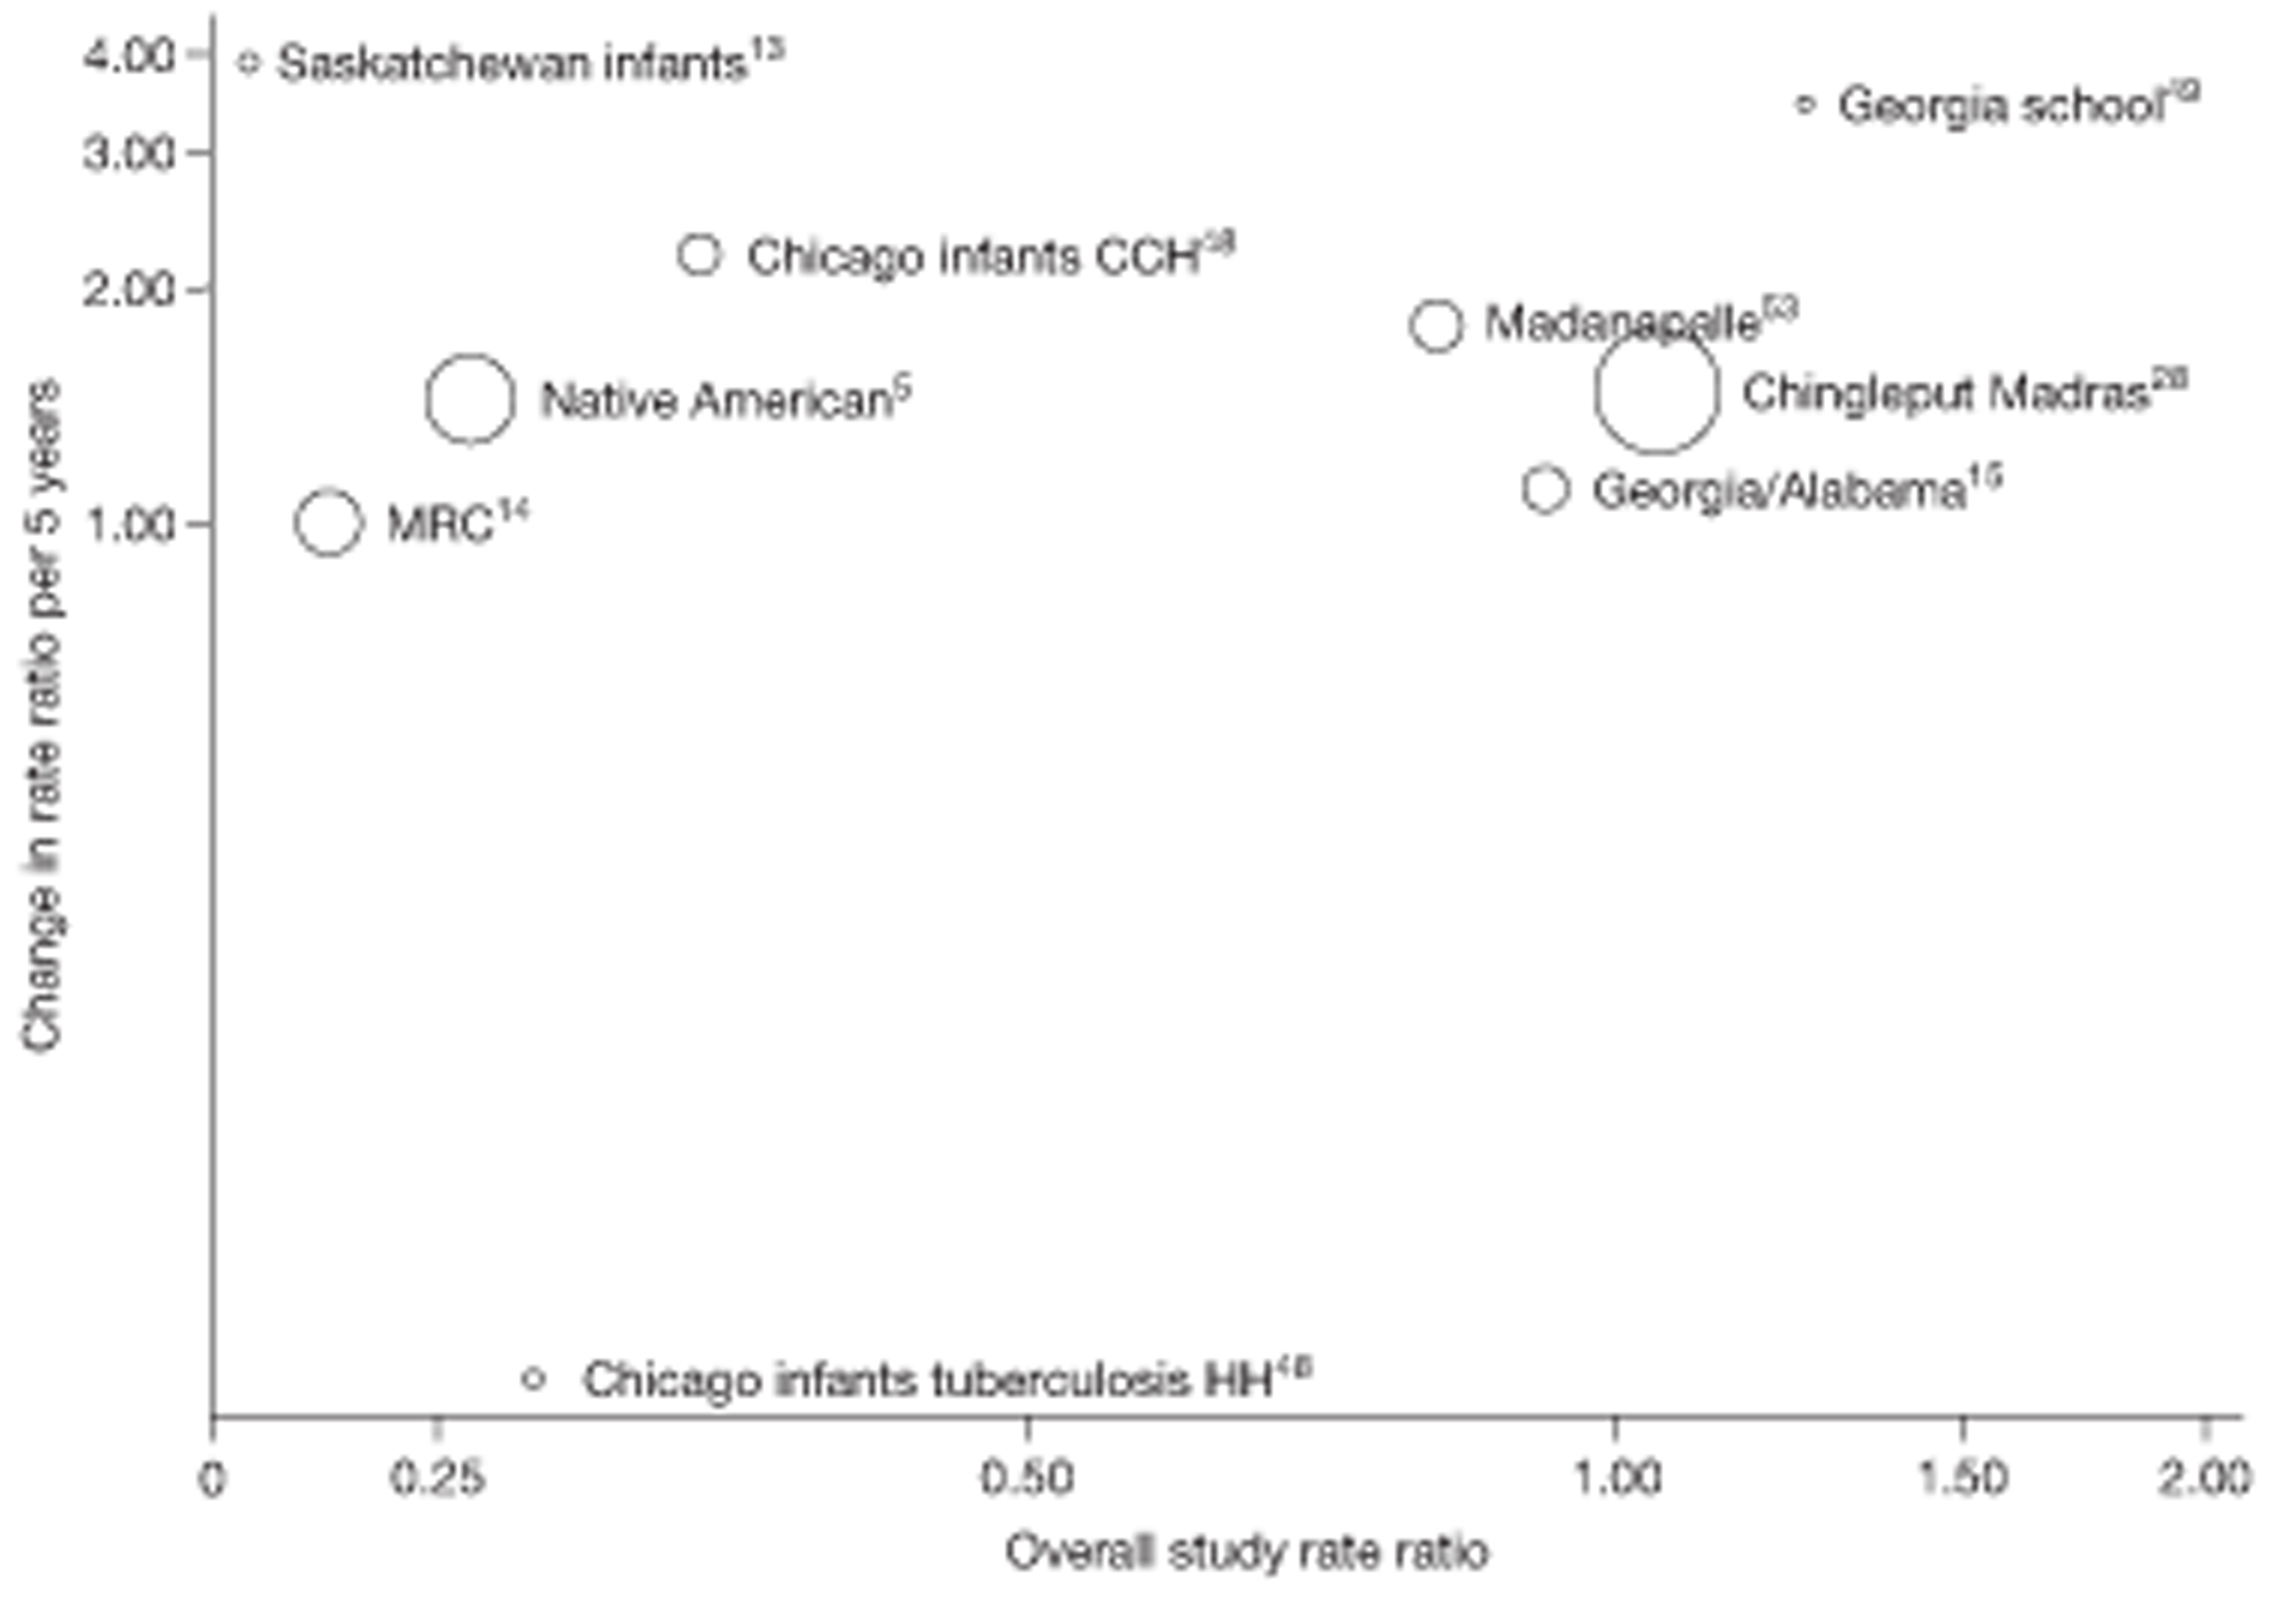
Temporal changes in efficacy in relation to overall efficacy
See Figures 84 and 85.
Study efficacy by follow-up period
Figures 86–89 are forest plots of the effect of BCG vaccination in each trial, within the successive follow-up periods 0–5 years, 5–10 years, 10–15 years and > 15 years after vaccination. During the first 5 years after vaccination (see Figure 86), there was substantial between-study heterogeneity in the effect of BCG vaccination (τ2 = 0.49). Although there was evidence of protection in most studies (ranging from low VE of 31% in the Puerto Rico trial15 to high efficacy of 89% in the Haiti trial55), the Chingleput trial28 found evidence of increased rates of pulmonary tuberculosis in vaccinated individuals (rate ratio 2.07, 95% CI 1.10 to 3.88) (see Chapter 5, Discussion, for explanations).
FIGURE 86.
Rate ratios (with 95% CI) comparing incidence of pulmonary tuberculosis among BCG vaccinated individuals with that in unvaccinated individuals, in RCTs, in the first 5 years of follow-up. a, Date of study publication was used if study start date was not available. CCH, Cook County Hospital; D + L, DerSimonian and Laird method; M-H, Mantel-Haenszel method; TB HH, tuberculosis households; TBPT, Tuberculosis Prevention Trial.
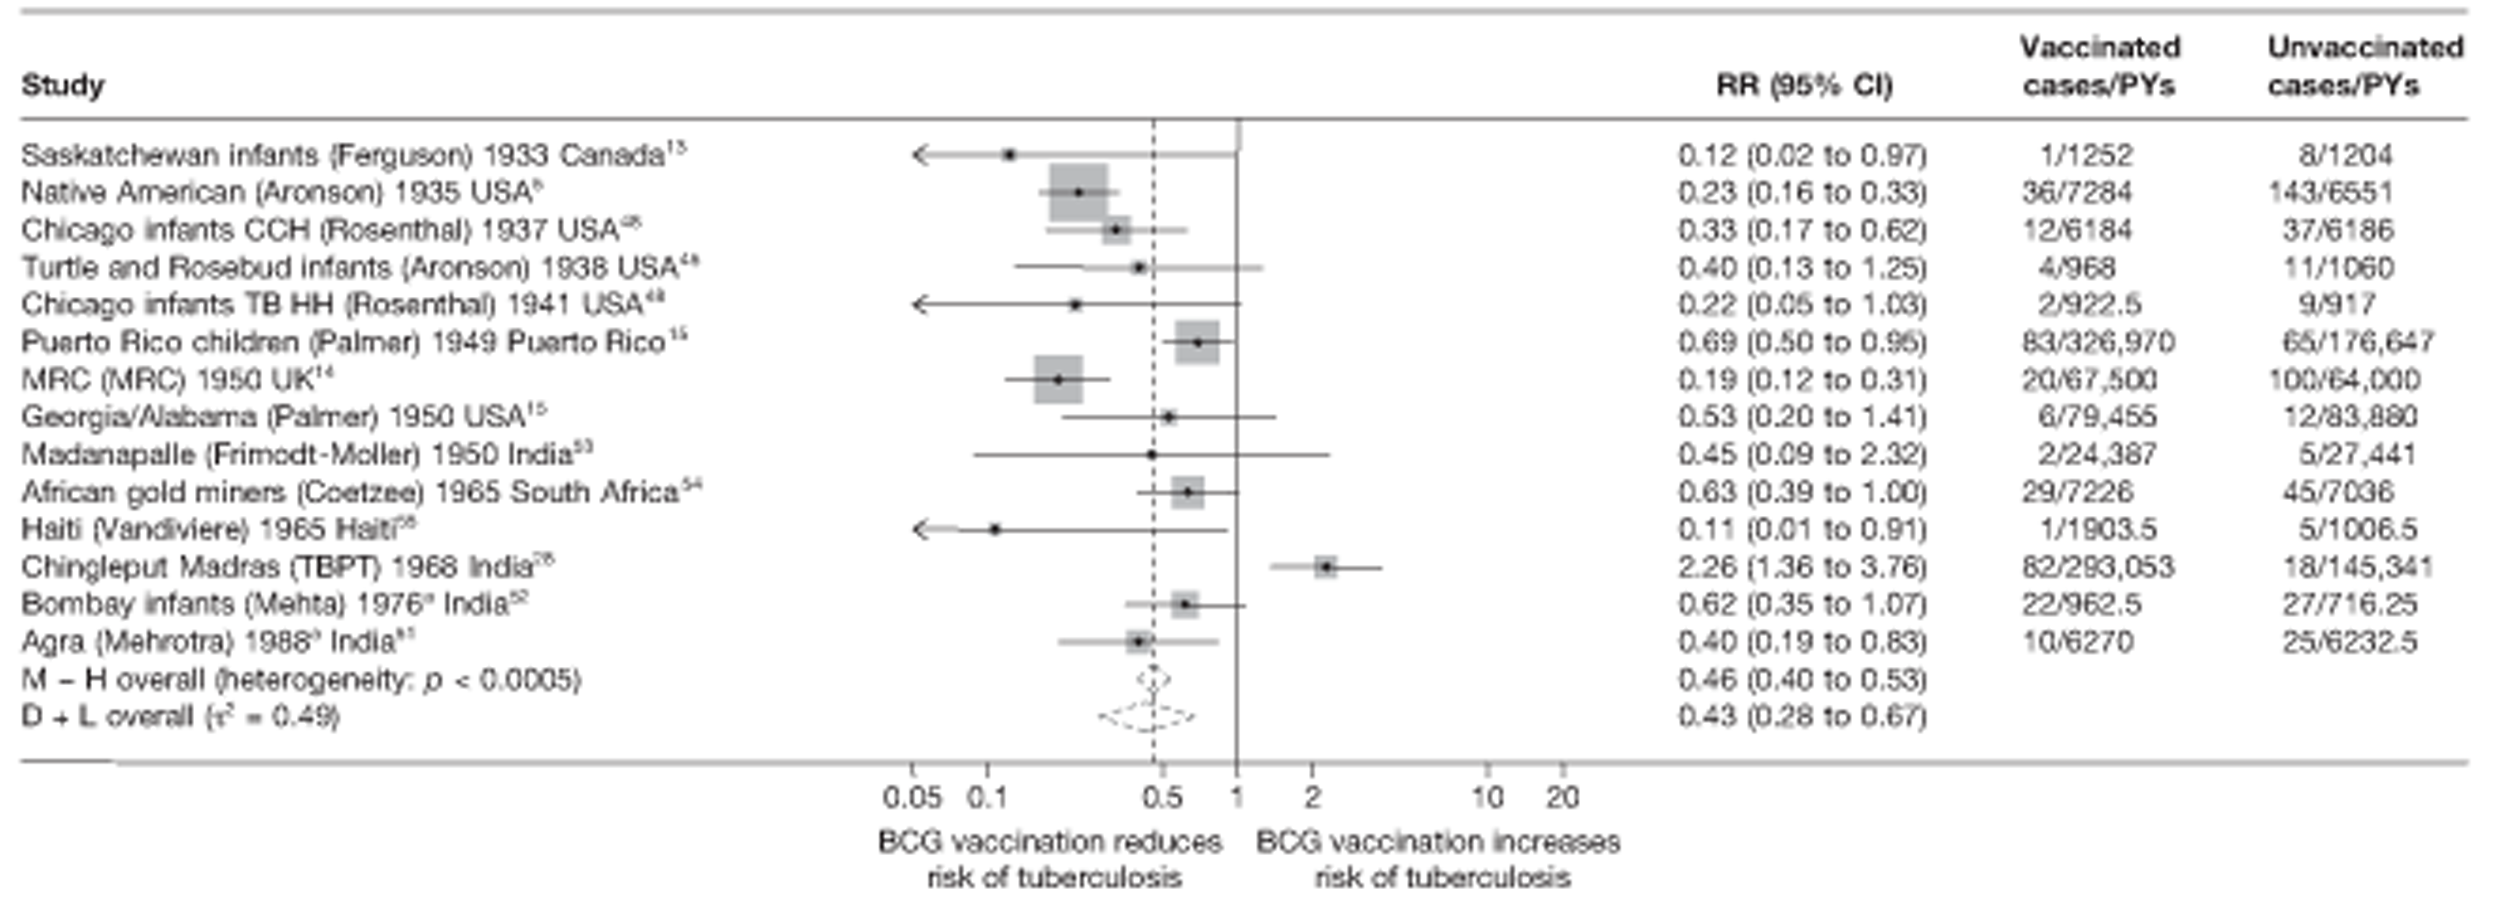
FIGURE 87.
Rate ratios (with 95% CI) comparing incidence of pulmonary tuberculosis among BCG vaccinated individuals with that in unvaccinated individuals, in RCTs, from 5 to 10 years of follow-up. a, Date of study publication was used if study start date was not available. CCH, Cook County Hospital; D + L, DerSimonian and Laird method; M-H, Mantel-Haenszel method; TB HH, tuberculosis households; TBPT, Tuberculosis Prevention Trial.

FIGURE 88.
Rate ratios (with 95% CI) comparing incidence of pulmonary tuberculosis among BCG vaccinated individuals with that in unvaccinated individuals, in RCTs, from 10 to 15 years of follow-up. a, Date of study publication was used if study start date was not available. CCH, Cook County Hospital; D + L, DerSimonian and Laird method; M-H, Mantel-Haenszel method; TBPT, Tuberculosis Prevention Trial.

FIGURE 89.
Rate ratios (with 95% CI) comparing incidence of pulmonary tuberculosis among BCG vaccinated individuals with that in unvaccinated individuals, in RCTs, beyond 15 years of follow-up. a, Date of study publication was used if study start date was not available. This graph contains two additional studies (Puerto Rico Children15 and Chingleput study28) compared with the graphs in Figure 81 with data beyond 15 years. This is because the effects in Figure 81 were averaged over some years. D + L, DerSimonian and Laird method; M-H, Mantel-Haenszel method; TBPT, Tuberculosis Prevention Trial.

Among the seven trials that reported relevant outcome data for the period 5–10 years after vaccination, there was substantial between-study heterogeneity (τ2 = 0.57) (see Figure 87). Although there was little evidence of protection in the Chicago infants,48 Georgia/Alabama15 and Chingleput trials,28 estimated vaccine efficacy was 72% in the MRC trial14 and 86% in the Native American trial. 5
Figure 88 displays results from the seven trials that reported relevant data for the period 10–15 years after vaccination. The number of events in the intervention and control arms of most studies was small. There was clear between-study heterogeneity, but this was less marked than for earlier time periods (τ2 = 0.19).
Relatively few events were reported for the period after 15 years of study follow-up (see Figure 89). Although there was some evidence of between-study heterogeneity, this was less than for earlier time periods (τ2 = 0.13). Only the Native American trial5 found evidence of protection.
Measure of waning efficacy
Table 26 shows rate ratios for the effect of BCG vaccination during the first 10 years and after 10 years, together with the ratio of these rate ratios (i.e. the change in effect of BCG vaccination after compared with before 10 years described here as a ‘measure of waning efficacy’), for the seven trials that reported sufficient data. In general, most cases of tuberculosis were found during the first 10 years' follow-up and so the estimated rate ratios are similar to the overall rate ratios displayed in Figure 3. For each of the seven trials, the effect of BCG vaccination was less after than before 10 years (ratio of rate ratios > 1).
| Trial | Protection in first 10 years of follow-up | Protection post 10 years of follow-up | Waning efficacy measure | ||
|---|---|---|---|---|---|
| Rate ratio (95% CI) for effect of BCG vaccination in the first 10 years | VE (95% CI) for effect of BCG vaccination in the first 10 years | Rate ratio (95% CI) for effect of BCG vaccination after 10 years | VE (95% CI) for the effect of BCG vaccination after 10 years | Effect of BCG vaccination after the first 10 years compared with the first 10 years ratios of the rate (95% CI) | |
| Native American5 | 0.19 (0.14 to 0.26) | 81 (74 to 86) | 0.50 (0.32 to 0.78) | 50 (22 to 68) | 2.62 (1.52 to 4.50) |
| Chicago Infants CCH48 | 0.33 (0.18 to 0.59) | 67 (41 to 82) | 0.51 (0.05 to 5.62) | 49 (−462 to 95) | 1.54 (0.13 to 18.27) |
| Georgia (School)49 | 0.47 (0.04 to 5.17) | 53 (−417 to 96) | 2.81 (0.29 to 27.06) | −181 (−2606 to 71) | 6.01 (0.22 to 162.7) |
| Puerto Rico Children15 | 0.69 (0.50 to 0.95) | 31 (5 to 50) | 0.74 (0.53 to 1.03) | 26 (−3 to 47) | 1.08 (0.68 to 1.71) |
| Georgia/Alabama15 | 0.83 (0.42 to 1.64) | 17 (−64 to 58) | 1.06 (0.49 to 2.28) | −6 (−128 to 51) | 1.27 (0.45 to 3.53) |
| Madanapalle53 | 0.17 (0.04 to 0.77) | 83 (23 to 96) | 1.07 (0.66 to 1.73) | −7 (−73 to 34) | 6.13 (1.28 to 29.34) |
| Chingleput28 | 1.03 (0.8 to 1.32) | −3 (−32 to 20) | 1.06 (0.82 to 1.37) | −6 (−37 to 18) | 1.03 (0.72 to 1.47) |
Meta-regression analysis
Univariable analysis results on the waning efficacy measure (comparing the rate ratio after 10 years of follow-up with the rate ratio in the first 10 years) found little evidence of associations between any of the study characteristics and the measure of waning efficacy. There was considerable between-study heterogeneity (τ2 = 0.182), which appeared to be explained either by latitude or by age at vaccination/tuberculin testing (Table 27).
| Variable | Number of trials | Univariable waning efficacy measure (95% CI) | Univariable model | ||
|---|---|---|---|---|---|
| Ratio of waning efficacy measures (95% CI) | p-value | τ2 | |||
| Null model | 7 | 0.182 | |||
| Latitude | |||||
| > 40° | 2 | 2.55 (0.92 to 7.12) | 1.00 (ref.) | ||
| 20–40° | 2 | 1.45 (0.22 to 9.66) | 0.57 (0.09 to 3.72) | ||
| 0–20° | 3 | 1.11 (0.65 to 1.89) | 0.43 (0.16 to 1.19) | 0.184 | 0.000 |
| Age at vaccination/tuberculin testing combined | |||||
| Neonatal | 1 | 1.54 (0.00 to 1.39 × 10⁷) | 1.00 (ref.) | ||
| School age/stringent | 2 | 2.67 (0.08 to 85.45) | 1.73 (0.01 to 444.78) | ||
| School age/non-stringent | 1 | 1.07 (0.05 to 21.36) | 0.70 (0.01 to 173.17) | ||
| Other age/stringent | 1 | 6.13 (0.01 to 16x105) | 3.97 (0.01 to 2436.92) | ||
| Other age/non-stringent | 2 | 1.06 (0.12 to 9.28) | 0.68 (0.01 to 162.76) | 0.251 | 0.000 |
| Diagnostic quality | |||||
| Lower risk of bias | 4 | 1.89 (0.74 to 4.86) | 1.00 (ref.) | ||
| Higher risk of bias | 3 | 1.25 (0.40 to 3.98) | 0.66 (0.17 to 2.63) | 0.477 | 0.233 |
| Was the allocation sequence adequately generated? | |||||
| Lower risk of bias | 1 | 1.03 (0.27 to 4.03) | 1.00 (ref.) | ||
| Higher risk of bias | 6 | 1.86 (0.82 to 4.22) | 1.80 (0.41 to 7.83) | 0.350 | 0.207 |
| Was treatment allocation adequately concealed? | |||||
| Lower risk of bias | 1 | 1.03 (0.27 to 4.03) | 1.00 (ref.) | ||
| Higher risk of bias | 6 | 1.86 (0.82 to 4.22) | 1.80 (0.41 to 7.83) | 0.350 | 0.207 |
| Was knowledge of the allocated intervention prevented during the study? | |||||
| Lower risk of bias | 2 | 1.60 (0.50 to 5.11) | 1.00 (ref.) | ||
| Higher risk of bias | 5 | 1.67 (0.56 to 4.97) | 1.05 (0.24 to 4.58) | 0.937 | 0.297 |
| Were incomplete outcome data adequately addressed? | |||||
| Lower risk of bias | 3 | 1.13 (0.40 to 3.23) | 1.00 (ref.) | ||
| Higher risk of bias | 4 | 2.05 (0.82 to 5.13) | 1.81 (0.50 to 6.54) | 0.290 | 0.196 |
| Are reports of the study free from the suggestion of selective outcome reporting? | |||||
| Lower risk of bias | 6 | 1.40 (0.75 to 2.63) | 1.00 (ref.) | ||
| Higher risk of bias | 1 | 6.13 (0.54 to 70.08) | 4.36 (0.42 to 44.83) | 0.165 | 0.131 |
| Was ascertainment of cases complete? | |||||
| Lower risk of bias | 6 | 1.40 (0.75 to 2.63) | 1.00 (ref.) | ||
| Higher risk of bias | 1 | 6.13 (0.54 to 70.08) | 4.36 (0.42 to 44.83) | 0.165 | 0.131 |
All tuberculosis disease outcomes
Ten trials provided data to investigate duration of protection by BCG vaccination against all forms of tuberculosis (Figure 90). In the majority of studies, there was evidence of protection during the first 5 years of follow-up except in the Chingleput trial,28 with protective efficacy appearing to decrease over time. Trials including the Saskatchewan infants13 and the two Chicago studies48 showed an initially high protective effect which decreased within 5 to 10 years. The Chingleput trial28 showed BCG vaccination to be potentially harmful in the first 5 years of study, which attenuated to rate ratios close to 1 in subsequent years [further discussion in the Discussion (see Chapter 5) provides an explanation for this observation]. The remaining four studies showed low initial protective effects with a rapid decline in efficacy over the MRC and Native American studies5,14 showed a highly protective effect of BCG vaccination beyond 10 and 15 years, respectively.
FIGURE 90.
Vaccine efficacy and rate ratios (with 95% CI) comparing the incidence of all tuberculosis morbidity outcomes among BCG vaccinated individuals with that in unvaccinated individuals, in RCTs, over time. CCH, Cook County Hospital; TB HH, tuberculosis households.
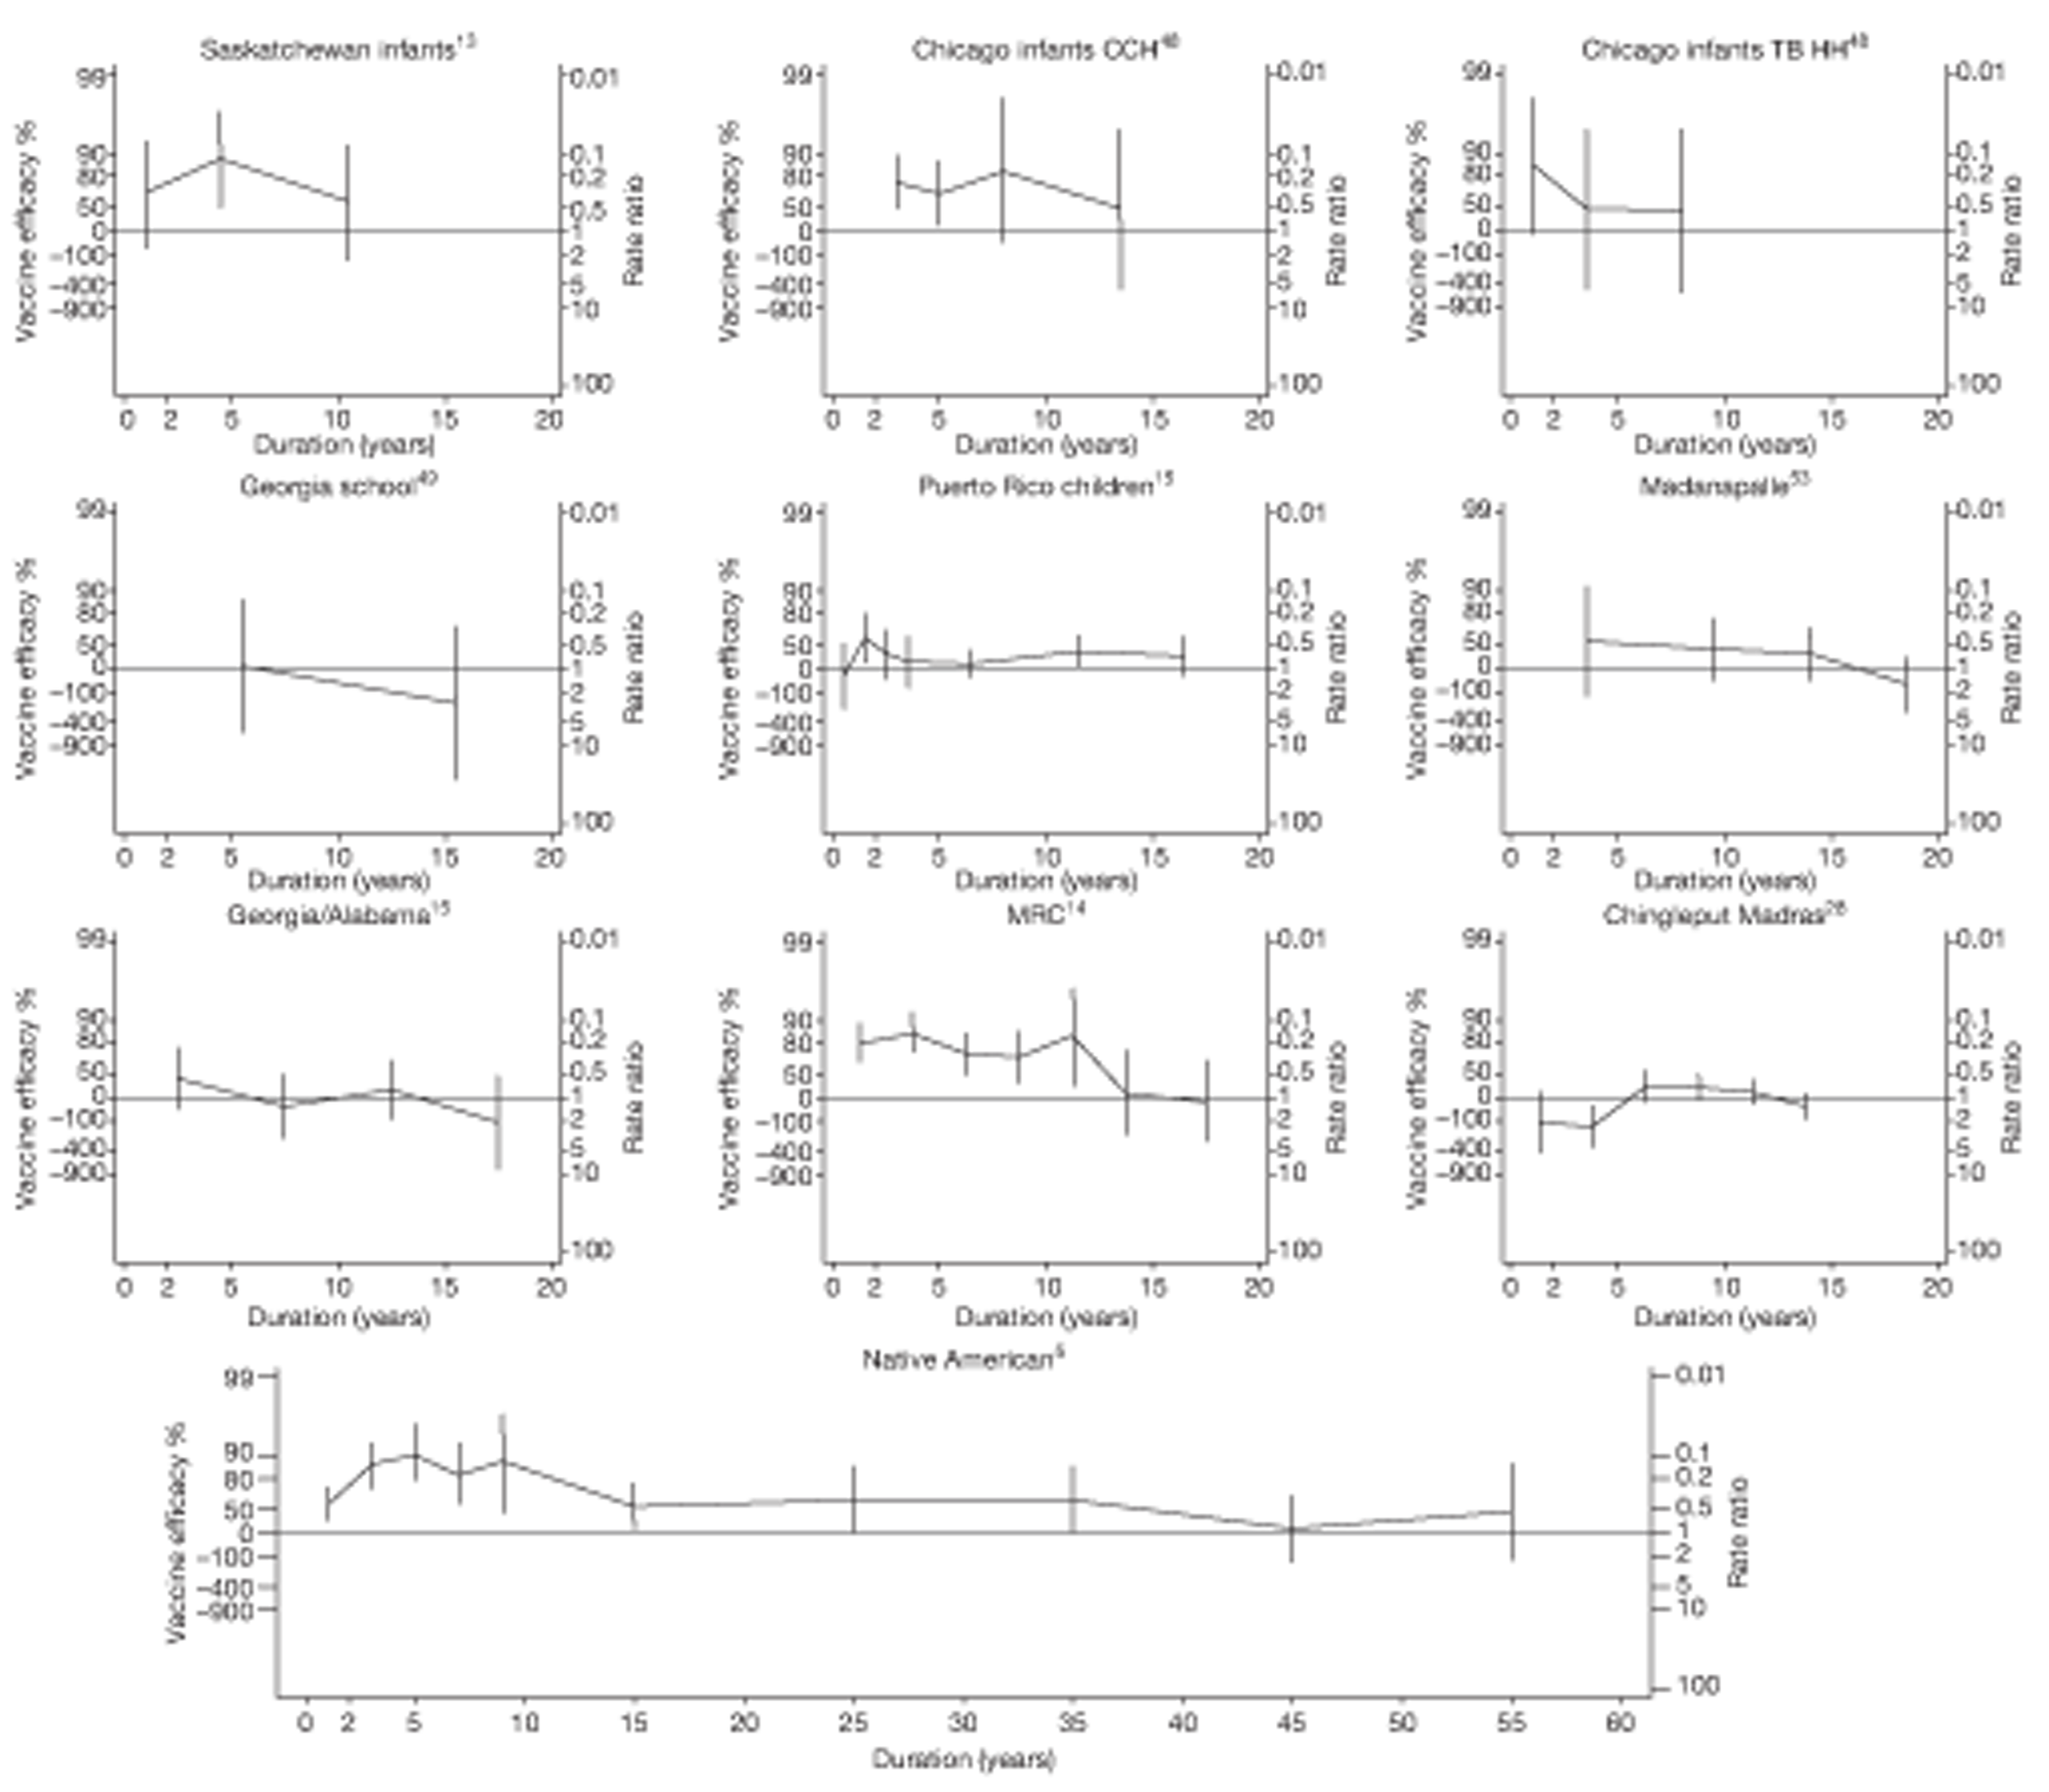
Based on an assumption of a linear trend in log of rate ratio over time, we investigated the change in efficacy over time, by estimating the ratio of rate ratios per 5 years for the whole of the study periods in Figure 91 and excluding the first 5 years of study in Figure 92. Apart from the Chingleput28 and Puerto Rico15 studies, all studies showed an increasing rate ratio (declining protection) for each 5 years of follow-up, with a summary ratio of rate ratios per 5 years of follow-up of 1.16 (95% CI 1.01 to 1.33) and little between-study heterogeneity (τ2 = 0.013) (see Figure 91). Figure 92 shows that if data from the first 5 years of follow-up were excluded, the decline in protective effect was more pronounced [summary ratio of rate ratio 1.32 (95% CI 1.10 to 1.59)]. There was again little between-study heterogeneity (τ2 = 0.02).
FIGURE 91.
Change per 5 years (with 95% CI) in the rate ratio comparing the incidence of all tuberculosis morbidity outcomes among BCG vaccinated individuals with that in unvaccinated individuals in RCTs for the longest follow-up period (see Table 3), including the first 5 years of data for each study. CCH, Cook County Hospital; D + L, DerSimonian and Laird method; I – V, inverse variance method; TB HH, tuberculosis households; TBPT, Tuberculosis Prevention Trial.

FIGURE 92.
Change per 5 years (with 95% CI) in the rate ratio comparing the incidence of all tuberculosis morbidity outcomes among BCG vaccinated individuals with that in unvaccinated individuals in RCTs for the longest follow-up period (see Table 3), excluding the first 5 years of data for each study. CCH, Cook County Hospital; D + L, DerSimonian and Laird method; I – V, inverse variance method; TB HH, tuberculosis households; TBPT, Tuberculosis Prevention Trial.

Temporal changes in efficacy
The scatter plots displayed in Figures 93 and 94 show the change in rate ratio per 5 years' follow-up compared with the overall rate ratio for each study, including and excluding the first 5 years of follow-up. There is little evidence of an association between change in efficacy over time and overall efficacy across studies, similarly to Figures 84 and 85.
FIGURE 93.
Scatterplot of change per 5 years in rate ratio compared with overall rate ratio, comparing incidence of all tuberculosis morbidity outcomes among BCG vaccinated individuals with that in unvaccinated individuals, in RCTs, including the first 5 years of data for each study. The area of the circles is proportional to the inverse of the variance of the log-rate ratio comparing vaccinated with unvaccinated individuals. CCH, Cook County Hospital; TB HH, tuberculosis households.
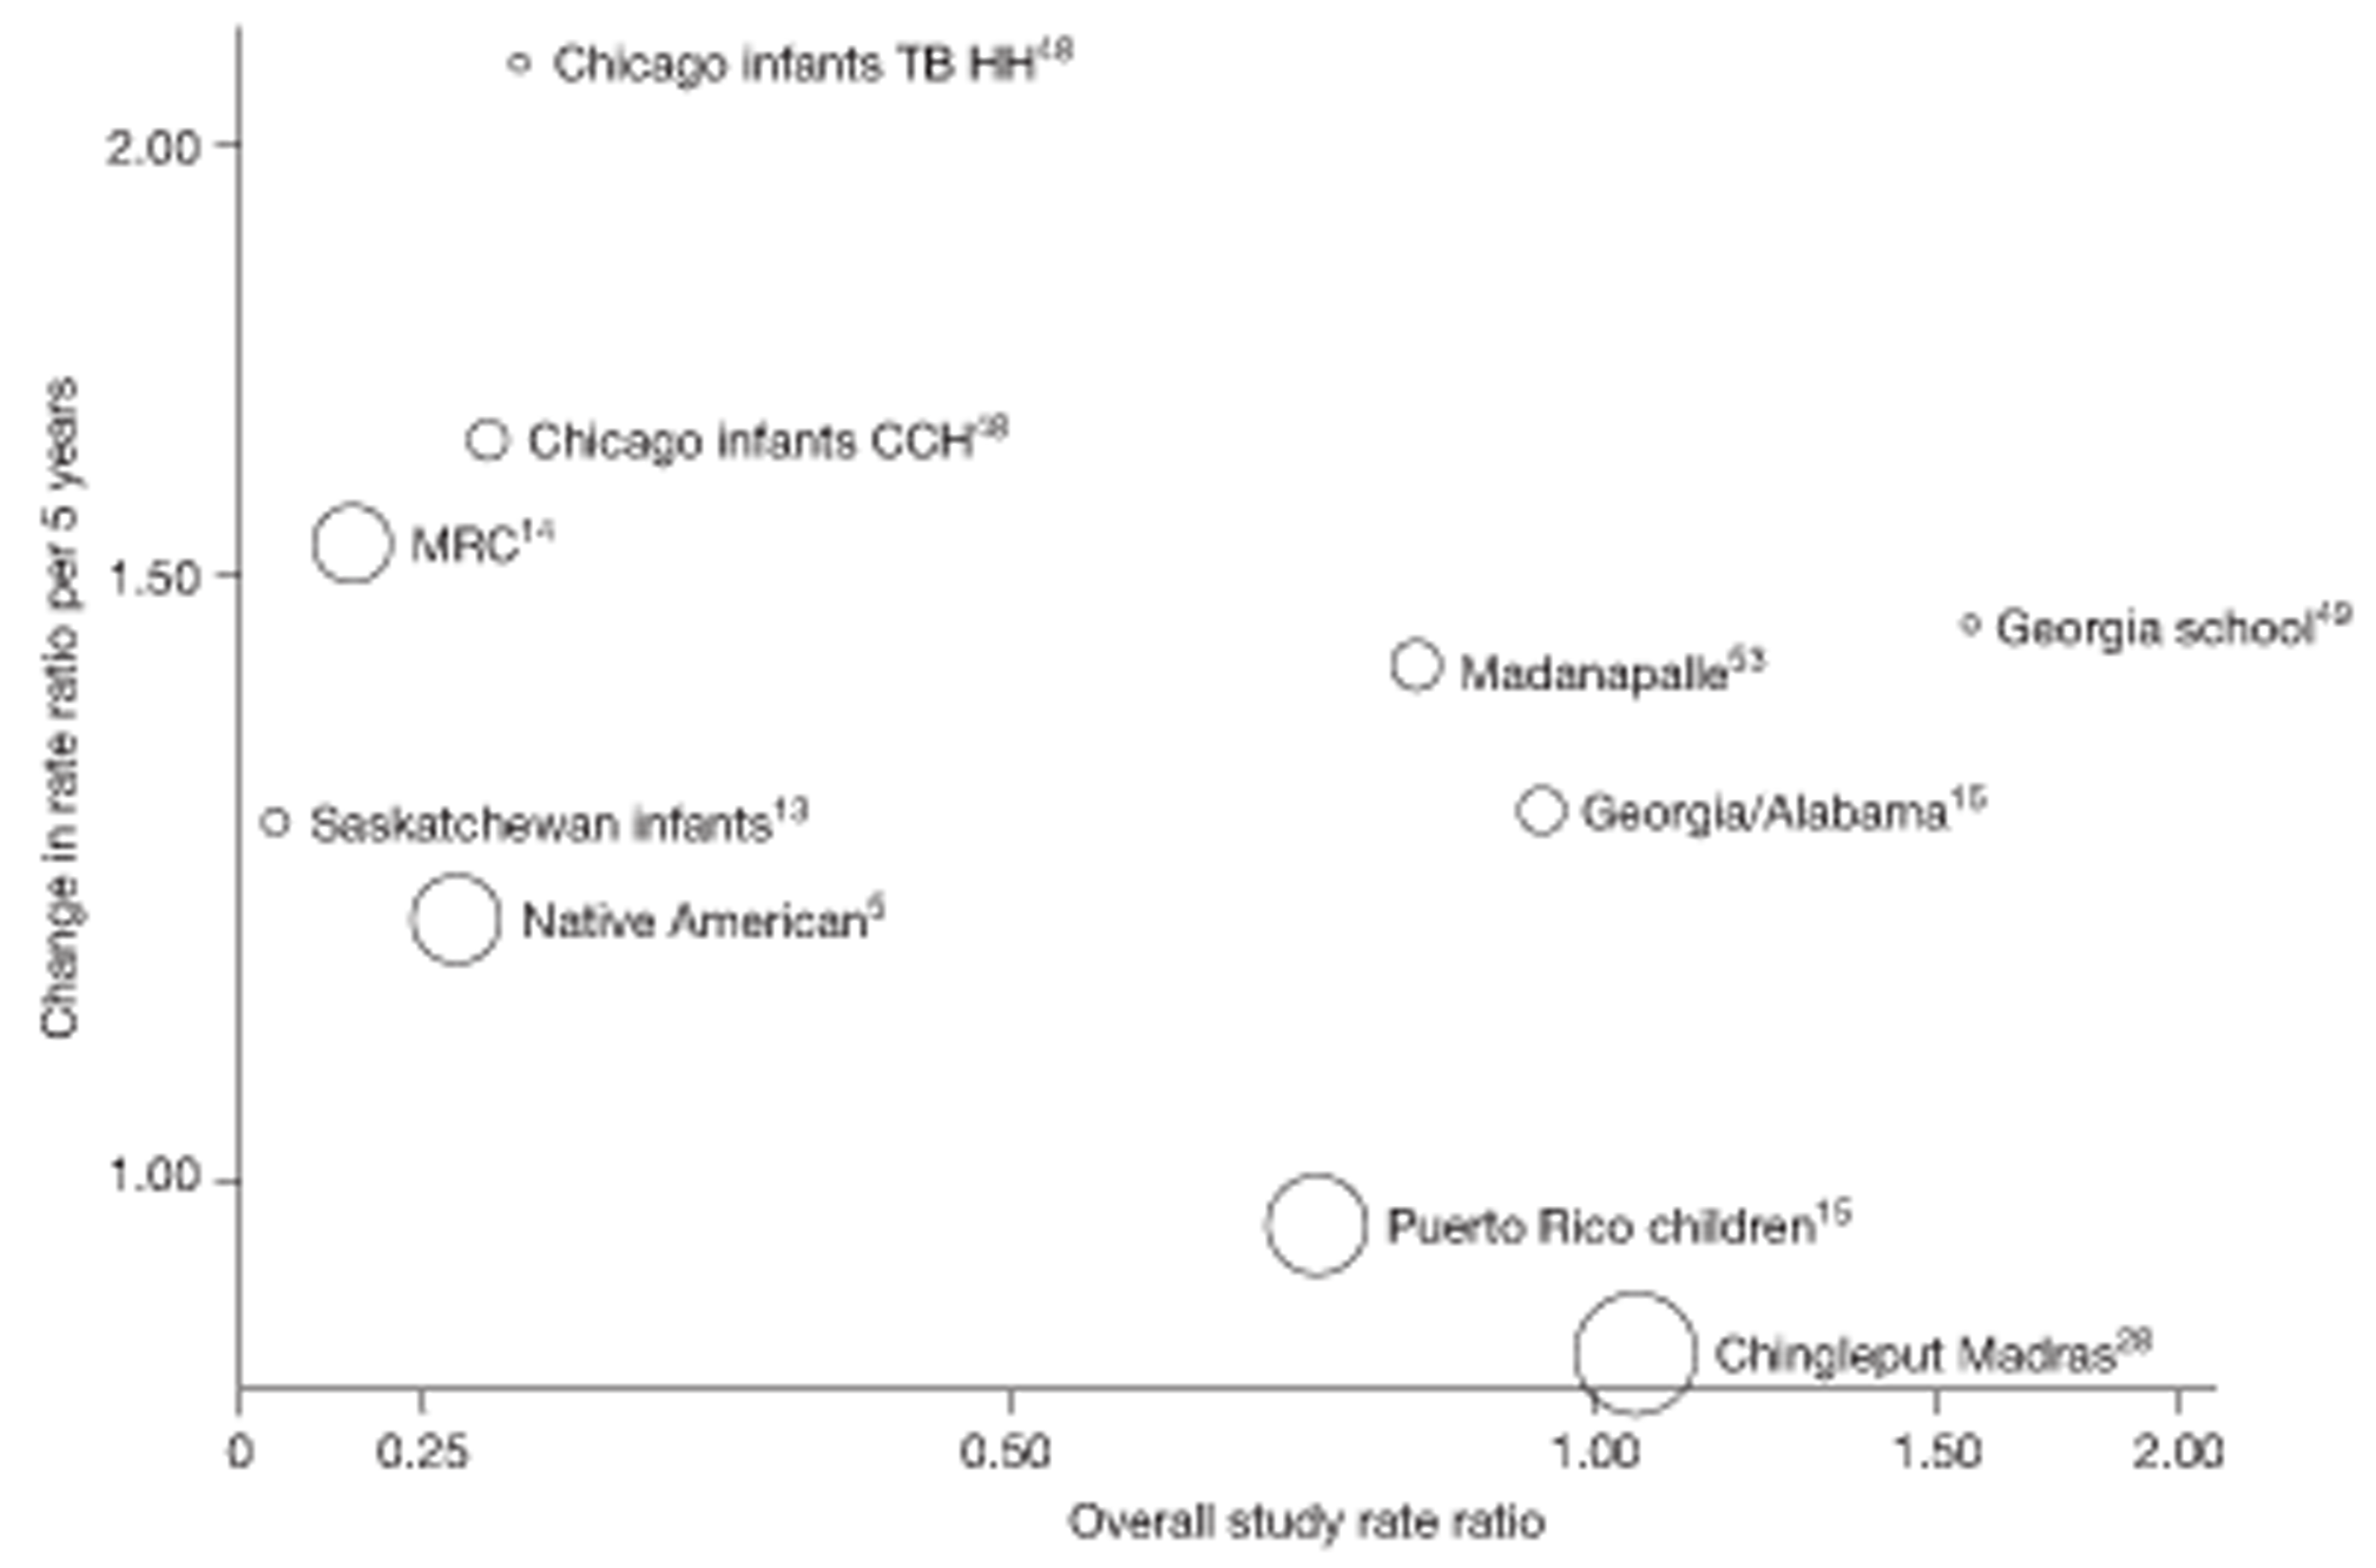
FIGURE 94.
Scatterplot of change per 5 years in rate ratio compared with overall rate ratio, comparing incidence of all tuberculosis outcomes among BCG vaccinated individuals with that in unvaccinated individuals, in RCTs, excluding the first 5 years of data for each study. The area of the circles is proportional to the inverse of the variance of the log-rate ratio comparing vaccinated with unvaccinated individuals. CCH, Cook County Hospital; TB HH, tuberculosis households.
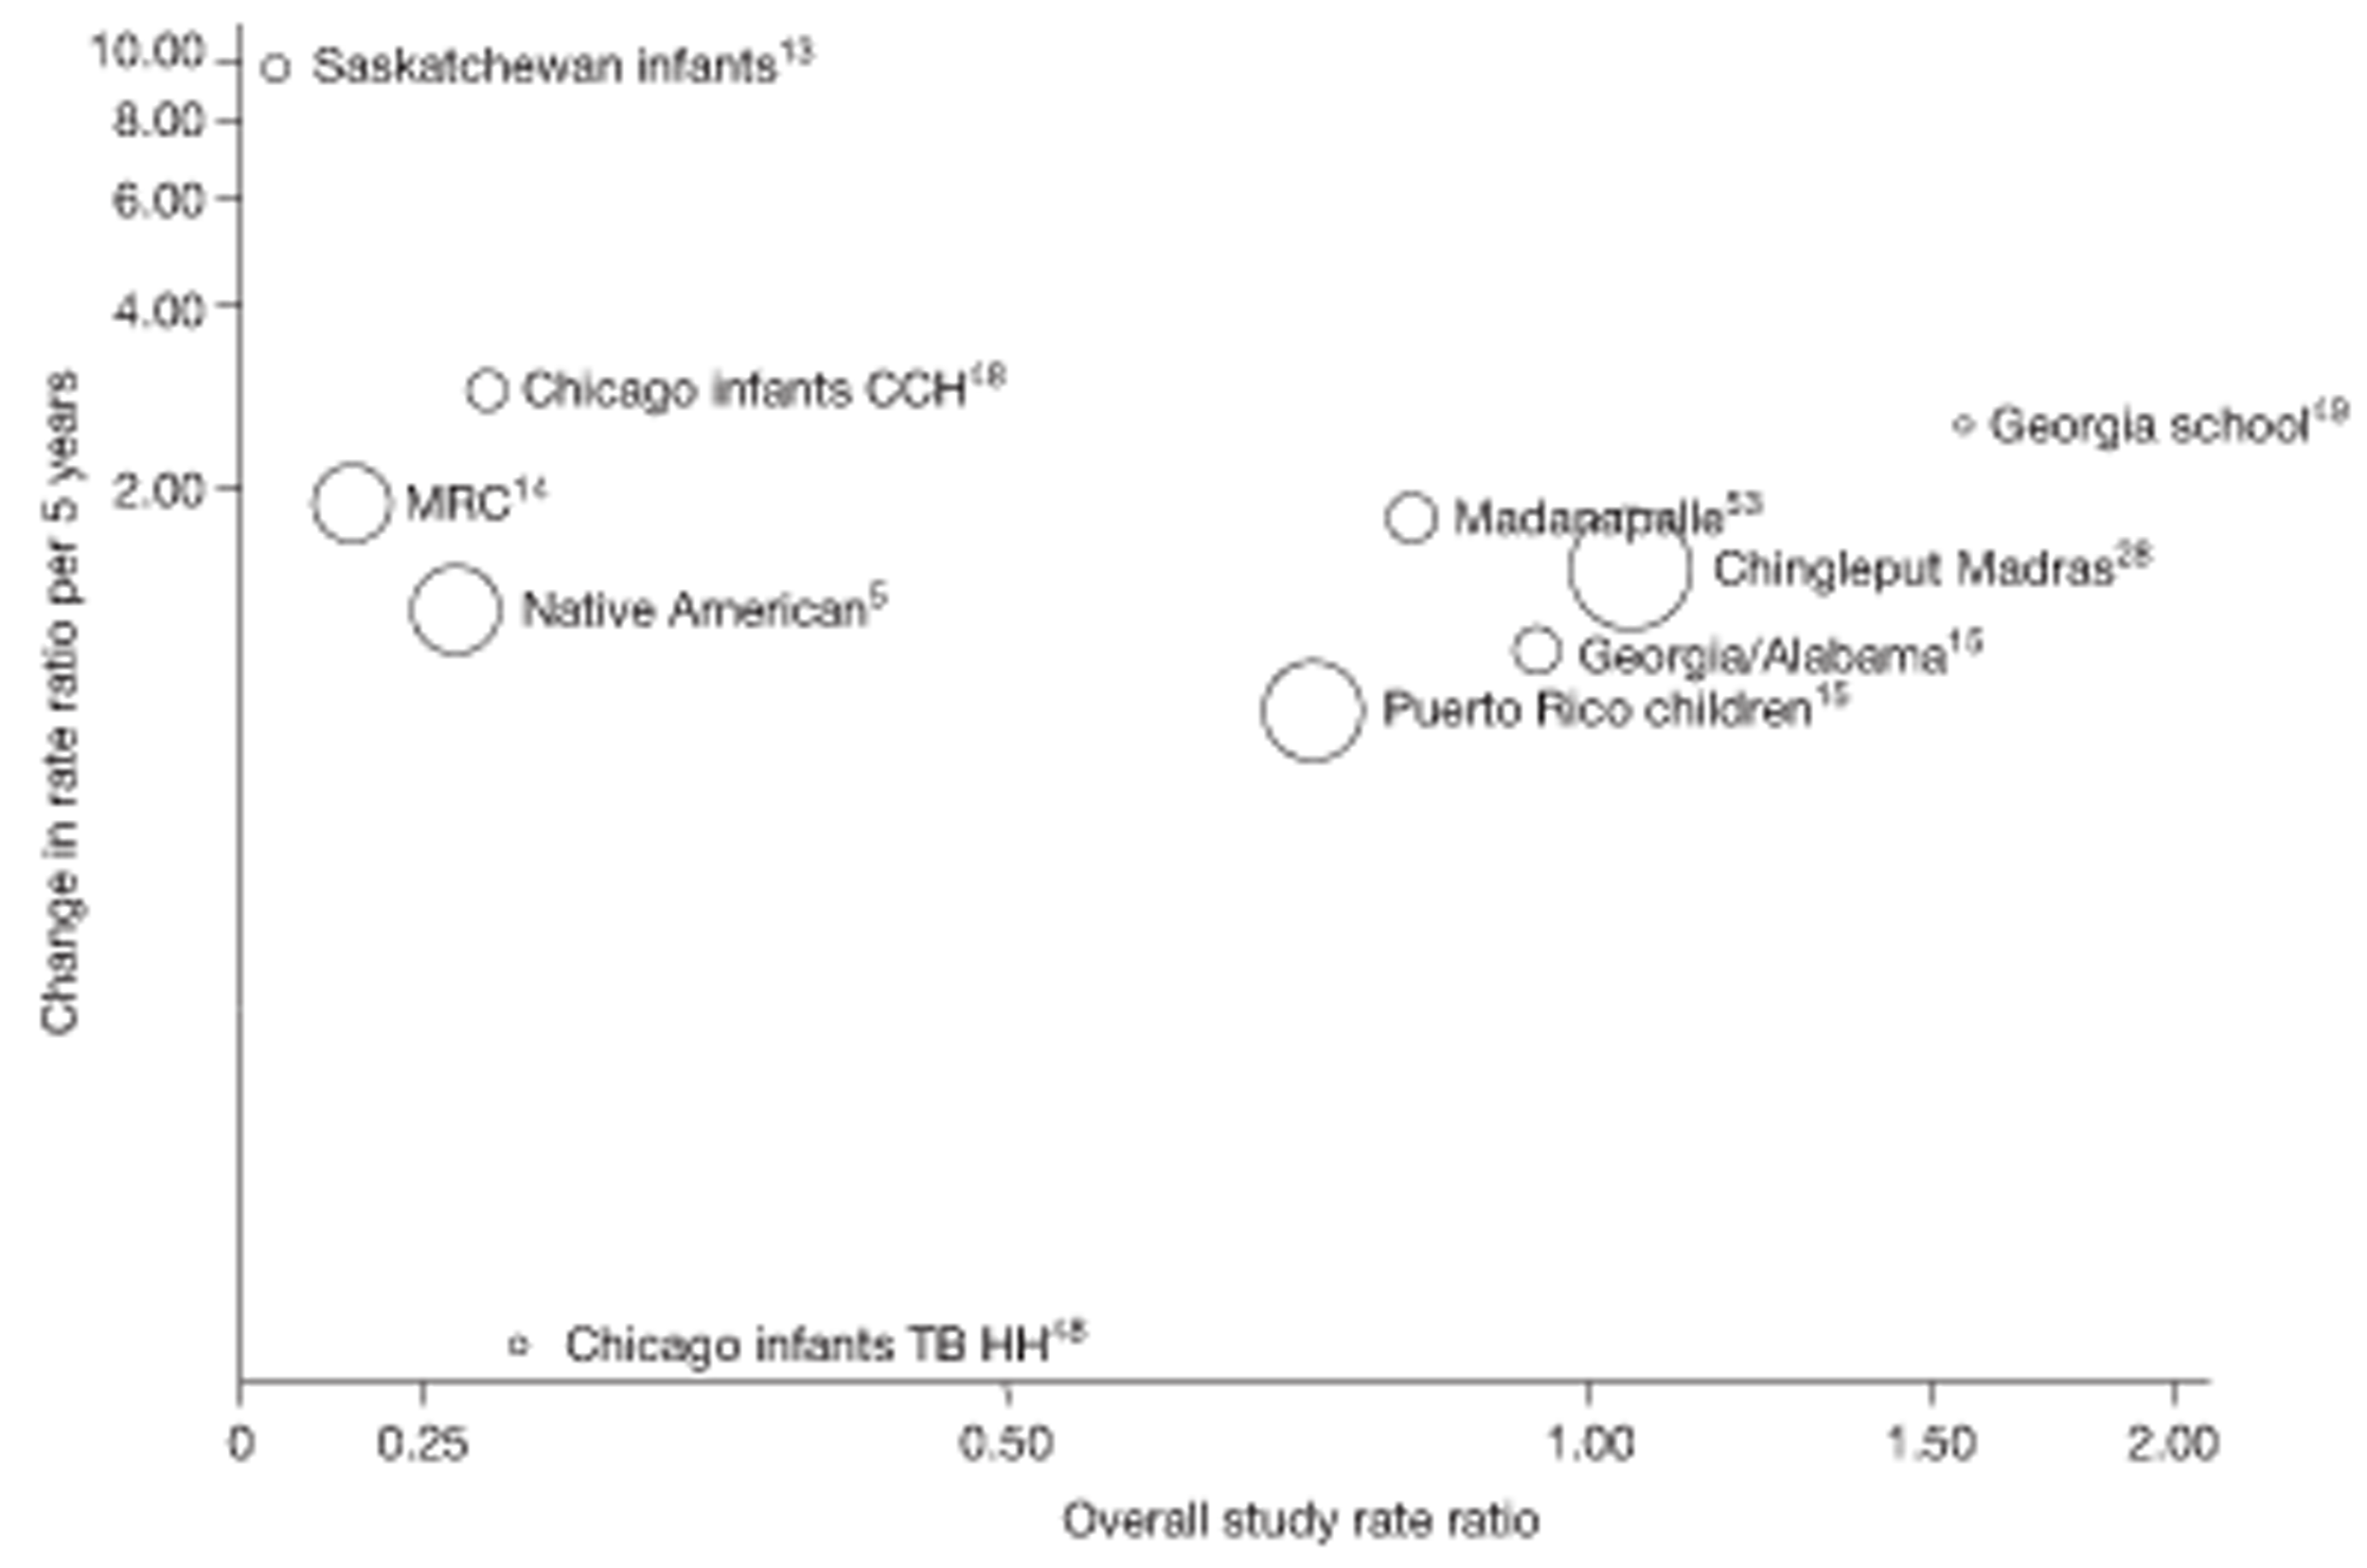
Temporal changes in efficacy in relation to overall efficacyStudy efficacy by follow-up period
The forest plots in Figures 95–98 show the effectiveness of BCG vaccination against all forms of tuberculosis, within the successive follow-up periods 0 to 5 years, 5 to 10 years, 10 to 15 years and > 15 years following vaccination. During the first 5 years, there was substantial heterogeneity in the effect of BCG vaccination (τ2 = 0.56). While there was evidence of a protective effect, ranging from low protection 31% in Puerto Rico children15 to high protection 89% (95% CI 0.09% to 99%) in Haiti,55 the Chingleput Study28 showed a potentially negative effect of BCG vaccination in first 5 years of study [rate ratio 2.26 (95% CI 1.36 to 3.76)] (see Chapter 5 , Discussion, for an explanation).
FIGURE 95.
Rate ratios (with 95% CI) comparing incidence of all tuberculosis morbidity outcomes among BCG vaccinated individuals with that in unvaccinated individuals, in RCTs in the first 5 years of follow-up. a, Date of study publication was used if study start date was not available. CCH, Cook County Hospital; D + L, DerSimonian and Laird method; M-H, Mantel-Haenszel method; TB HH, tuberculosis households; TBPT, Tuberculosis Prevention Trial.
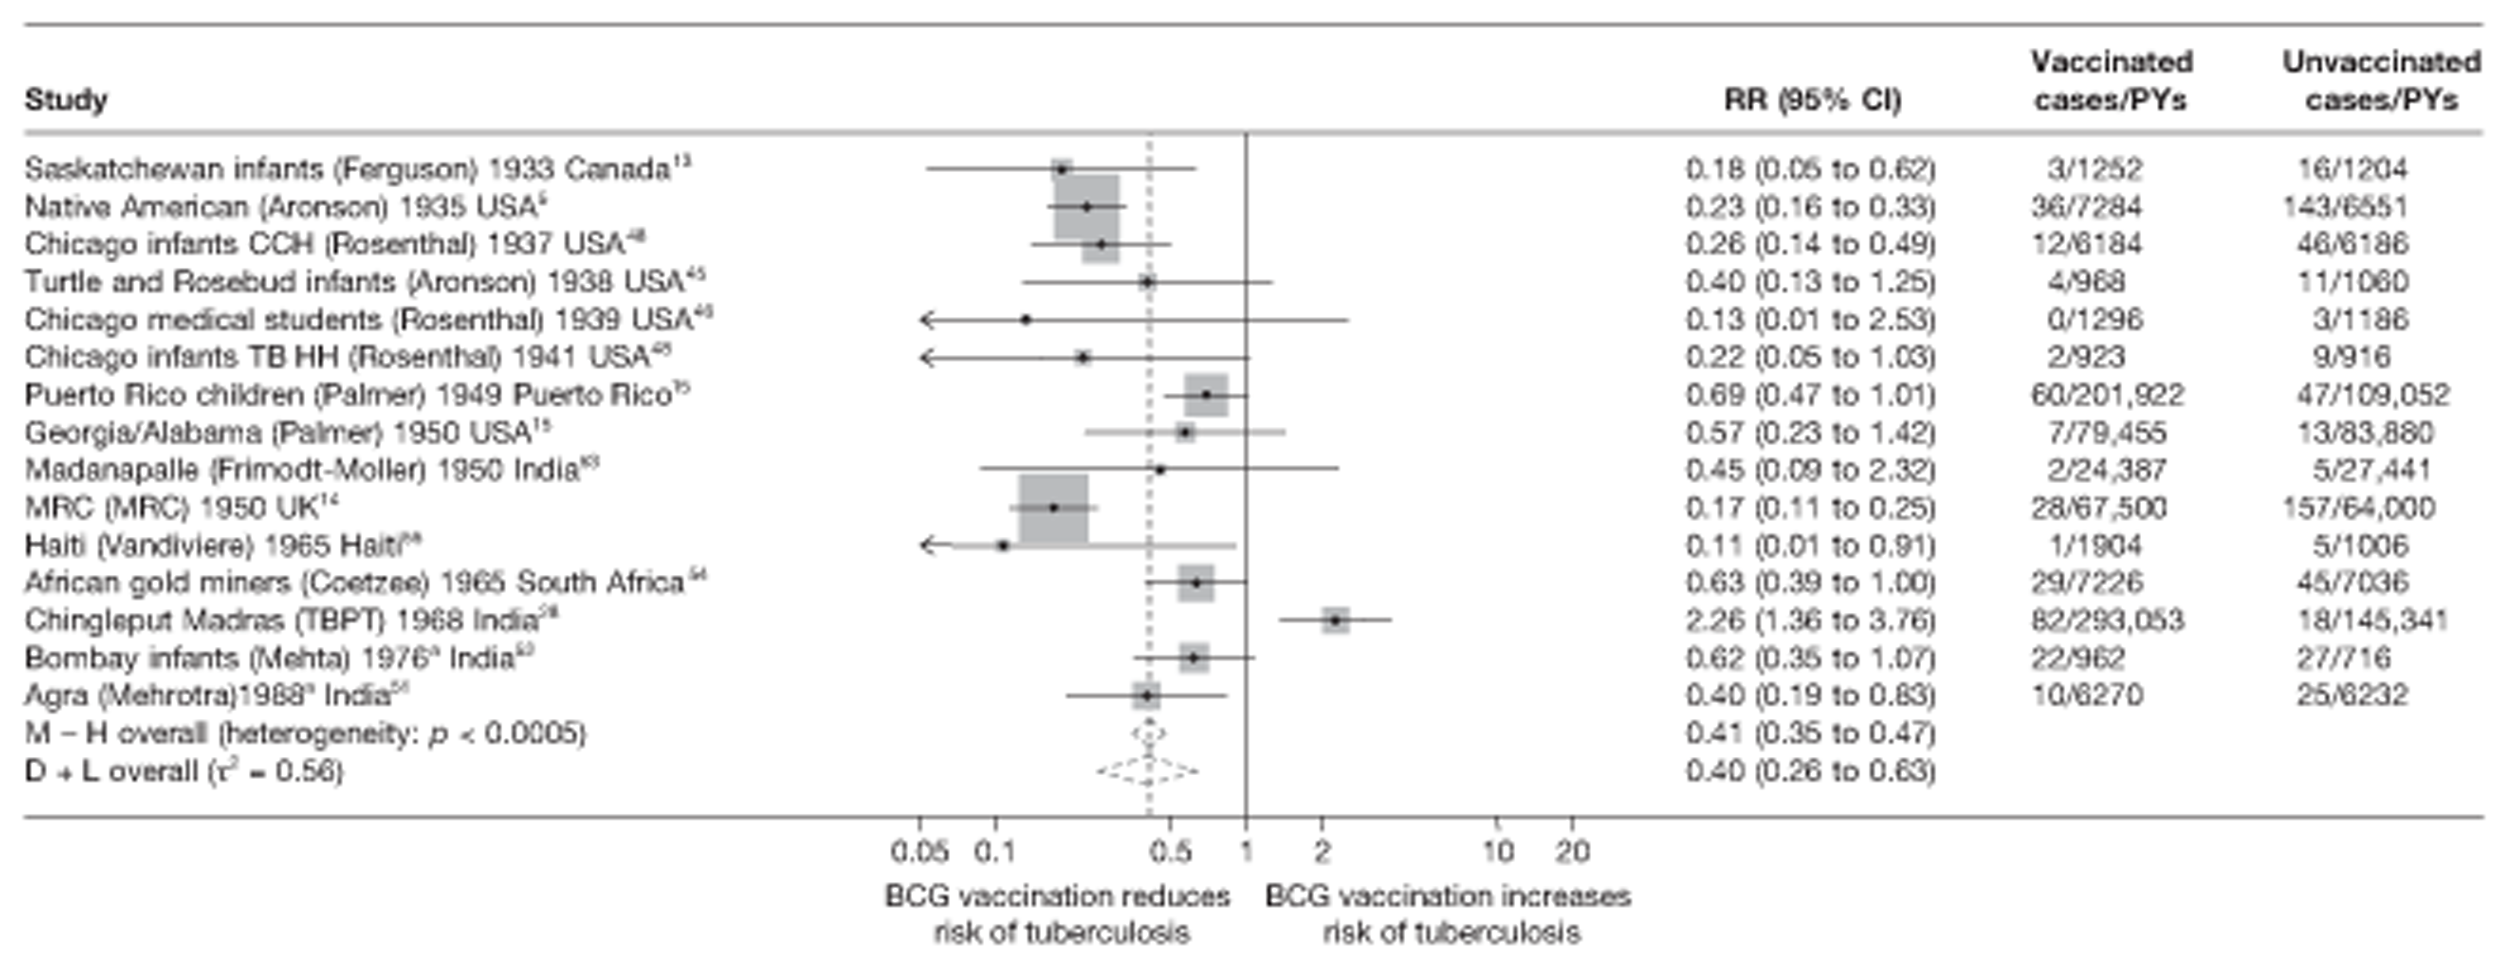
FIGURE 96.
Rate ratios (with 95% CI) comparing incidence of all tuberculosis morbidity outcomes among BCG vaccinated individuals with that in unvaccinated individuals, in RCTs, from 5 to 10 years of follow-up. a, Date of study publication was used if study start date was not available. CCH, Cook County Hospital; D + L, DerSimonian and Laird method; M-H, Mantel-Haenszel method; TB HH, tuberculosis households; TBPT, Tuberculosis Prevention Trial.

FIGURE 97.
Rate ratios (with 95% CI) comparing incidence of all tuberculosis morbidity outcomes among BCG vaccinated individuals with that in unvaccinated individuals, in RCTs, from 10 to 15 years of follow-up. a, Date of study publication was used if study start date was not available. CCH, Cook County Hospital; D + L, DerSimonian and Laird method; M-H, Mantel-Haenszel method; TBPT, Tuberculosis Prevention Trial.

FIGURE 98.
Rate ratios (with 95% CI) comparing incidence of all tuberculosis morbidity outcomes among BCG vaccinated individuals with that in unvaccinated individuals, in RCTs, beyond 15 years of follow-up. a, Date of study publication was used if study start date was not available. This graph contains one additional study (Chingleput study28) compared with the graphs in Figure 90 with data beyond 15 years. This is because the effects in Figure 81 were averaged over some years. D + L, DerSimonian and Laird method; M-H, Mantel-Haenszel method; TBPT, Tuberculosis Prevention Trial.

Among the eight trials5,13–15,28,48 with data on protection between 5 and 10 years after vaccination, there was substantial between-study heterogeneity (τ2 = 0.54) (see Figure 96). Although there was little evidence of protection in the Chicago infants (TB HH),48 Puerto Rico,15 Georgia/Alabama15 and Chingleput trials,28 estimated vaccine efficacy was good, at 73% (95% CI 49% to 85%) in the MRC study14 and high [91% (95% CI 31% to 99%)] in the Saskatchewan trial. 13
Figure 97 shows results from nine trials,5,13–15,28,48,49,53 with relevant data on the protective effect of BCG vaccination between 10 and 15 years after vaccination. The number of events in the vaccinated and unvaccinated arms was small, for most studies; however, data from the MRC14 and Native American trials5 show evidence of substantial protection, with VEs ranging from good [VE 74% (95% CI 49% to 87%)] to high [VE 88% (95% CI 44% to 97%)], respectively. There was evidence of between-study heterogeneity but this was lower than for earlier time periods of follow-up (τ2 = 0.16).
Seven studies5,14,15,28,49,53 provided estimates of BCG vaccination efficacy beyond 15 years after vaccination (see Figure 98). There was evidence of between-study heterogeneity (τ2 = 0.16), although this was less than for periods before 10 years' follow-up. Only the Native American study5 showed evidence of a protective effect beyond 15 years [rate ratio 0.48 (95% CI 0.32 to 0.72)], equivalent to a moderate VE of 52% (95% CI 28% to 68%), whereas the remaining studies showed very little evidence of protection by BCG vaccination beyond 15 years after vaccination.
Measure of waning efficacy
Table 28 shows the rate ratio for the effect of BCG vaccination in the first 10 years and 10 years after vaccination, together with the ratio of these rate ratios (i.e. the change in effect of BCG vaccination before compared with after 10 years) for the eight trials with relevant data. In general, most cases occurred in the first 10 years' follow-up and so the estimated rate ratios are similar to the overall rate ratios displayed in Figure 7. For seven of the eight trials, the effect of BCG vaccination was smaller after 10 years than before 10 years (ratio of rate ratio > 1).
| Trial | Protection in first 10 years of follow-up | Protection post 10 years of follow-up | Waning efficacy measure | ||
|---|---|---|---|---|---|
| Rate ratio (95% CI) for effect of BCG vaccination in the first 10 years | VE (95% CI) for effect of BCG vaccination in the first 10 years | Rate ratio (95% CI) for effect of BCG vaccination after 10 years | VE (95% CI) for the effect of BCG vaccination after 10 years | Effect of BCG vaccination after the first 10 years compared with the first 10 years of ratio of the rate (95% CI) | |
| Native American5 | 0.19 (0.14 to 0.26) | 81 (74 to 86) | 0.48 (0.32 to 0.72) | 52 (28 to 68) | 2.49 (1.49 to 4.16) |
| Chicago Infants CCH48 | 0.27 (0.15 to 0.47) | 73 (53 to 85) | 0.51 (0.05 to 5.62) | 49 (−462 to 95) | 1.91 (0.16 to 22.56) |
| Georgia (School)49 | 0.94 (0.13 to 6.65) | 6 (−565 to 87) | 2.81 (0.29 to 27.06) | −181 (−2606 to 71) | 3.00 (0.15 to 59.95) |
| Puerto Rico Children15 | 0.77 (0.59 to 1.02) | 23 (−2 to 41) | 0.64 (0.45 to 0.92) | 36 (8 to 55) | 0.83 (0.53 to 1.30) |
| Georgia/Alabama15 | 0.85 (0.45 to 1.62) | 15 (−62 to 55) | 1.06 (0.52 to 2.16) | −6 (−116 to 48) | 1.24 (0.47 to 3.23) |
| Madanapalle53 | 0.17 (0.04 to 0.77) | 83 (23 to 96) | 1.07 (0.66 to 1.73) | −7 (−73 to 34) | 6.13 (1.28 to 29.34) |
| MRC14 | 0.20 (0.15 to 0.27) | 80 (73 to 85) | 0.56 (0.28 to 1.12) | 44 (−12 to 72) | 2.78 (1.31 to 5.93) |
| Chingleput28 | 1.03 (0.80 to 1.32) | −3 (−32 to 20) | 1.06 (0.82 to 1.37) | −6 (−37 to 18) | 1.03 (0.72 to 1.47) |
Meta-regression analysis
Univariable analysis of the waning efficacy measure (which compares the rate ratio after 10 years of follow-up with the rate ratio in the first 10 years) of trials for all tuberculosis morbidity outcomes provided some evidence that latitude was associated with the waning efficacy measure (p = 0.058). The between-study variation (null τ2 = 0.249) was accounted for both by stratification on latitude and by stratification on age at vaccination/tuberculin testing stringency (both τ2 = 0.000) (Table 29).
| Variable | Number of trials | Univariable waning efficacy measure (95% CI) | Univariable model | ||
|---|---|---|---|---|---|
| Ratio of waning efficacy measures (95% CI) | p-value | τ2 | |||
| Null model | 8 | 0.249 | |||
| Latitude | |||||
| > 40° | 3 | 2.56 (1.32 to 4.96) | 1.00 (ref.) | ||
| 20–40° | 2 | 1.34 (0.32 to 5.71) | 0.53 (0.12 to 2.30) | ||
| 0–20° | 3 | 1.01 (0.65 to 1.56) | 0.39 (0.19 to 0.82) | 0.058 | 0.000 |
| Age at vaccination/tuberculin testing combined | |||||
| Neonatal | 1 | 1.91 (0.01 to 430.48) | 1.00 (ref.) | ||
| School age/stringent | 3 | 2.59 (1.03 to 6.50) | 1.35 (0.02 to 78.56) | ||
| School age/non-stringent | 1 | 0.83 (0.30 to 2.24) | 0.43 (0.01 to 25.39) | ||
| Other age/stringent | 1 | 6.13 (0.20 to 190.73) | 3.20 (0.03 to 367.95) | ||
| Other age/non-stringent | 2 | 1.06 (0.51 to 2.19) | 0.55 (0.01 to 31.40) | 0.113 | 0.000 |
| Diagnostic quality | |||||
| Lower risk of bias | 5 | 2.03 (0.99 to 4.19) | 1.00 (ref.) | ||
| Higher risk of bias | 3 | 1.03 (0.38 to 2.78) | 0.50 (0.16 to 1.62) | 0.202 | 0.198 |
| Was the allocation sequence adequately generated? | |||||
| Lower risk of bias | 1 | 1.03 (0.24 to 4.36) | 1.00 (ref.) | ||
| Higher risk of bias | 7 | 1.87 (0.89 to 3.91) | 1.80 (0.39 to 8.43) | 0.383 | 0.281 |
| Was treatment allocation adequately concealed? | |||||
| Lower risk of bias | 1 | 1.03 (0.24 to 4.36) | 1.00 (ref.) | ||
| Higher risk of bias | 7 | 1.87 (0.89 to 3.91) | 1.80 (0.39 to 8.43) | 0.383 | 0.281 |
| Was knowledge of the allocated intervention prevented during the study? | |||||
| Lower risk of bias | 2 | 1.57 (0.50 to 4.93) | 1.00 (ref.) | ||
| Higher risk of bias | 6 | 1.75 (0.71 to 4.30) | 1.11 (0.28 to 4.44) | 0.858 | 0.346 |
| Were incomplete outcome data adequately addressed? | |||||
| Lower risk of bias | 3 | 1.16 (0.40 to 3.34) | 1.00 (ref.) | ||
| Higher risk of bias | 5 | 2.01 (0.90 to 4.52) | 1.73 (0.49 to 6.14) | 0.328 | 0.262 |
| Are reports of the study free from the suggestion of selective outcome reporting? | |||||
| Lower risk of bias | 7 | 1.48 (0.80 to 2.71) | 1.00 (ref.) | ||
| Higher risk of bias | 1 | 6.13 (0.58 to 64.89) | 4.15 (0.41 to 42.27) | 0.184 | 0.204 |
| Was ascertainment of cases complete? | |||||
| Lower risk of bias | 7 | 1.48 (0.80 to 2.71) | 1.00 (ref.) | ||
| Higher risk of bias | 1 | 6.13 (0.58 to 64.89) | 4.15 (0.41 to 42.27) | 0.184 | 0.204 |
Combined meningeal/miliary tuberculosis
Only the MRC trial14 had data on combined meningeal/miliary tuberculosis divided by duration, but there were no cases in the BCG vaccination group over the follow-up period so no summary measures could be calculated for changes in the rate ratio over time.
Extrapulmonary tuberculosis
Three studies5,14,15 provided sufficient data to assess the duration of protection of BCG vaccination against extrapulmonary forms of tuberculosis (excluding meningeal or miliary tuberculosis) (Figure 99). Both the Native American5 and MRC trials14 showed consistently high levels of protection, for the whole duration of the trial. The study conducted in Georgia/Alabama15 showed no evidence of protection in the first 10 years following vaccination, with a final estimate of lower protection after 15 years.
FIGURE 99.
Vaccine efficacy and rate ratios (with 95% CI) comparing the incidence of extrapulmonary tuberculosis (non-tuberculosis meningitis or miliary tuberculosis) among BCG vaccinated individuals to that in unvaccinated individuals, in RCTs, over time.
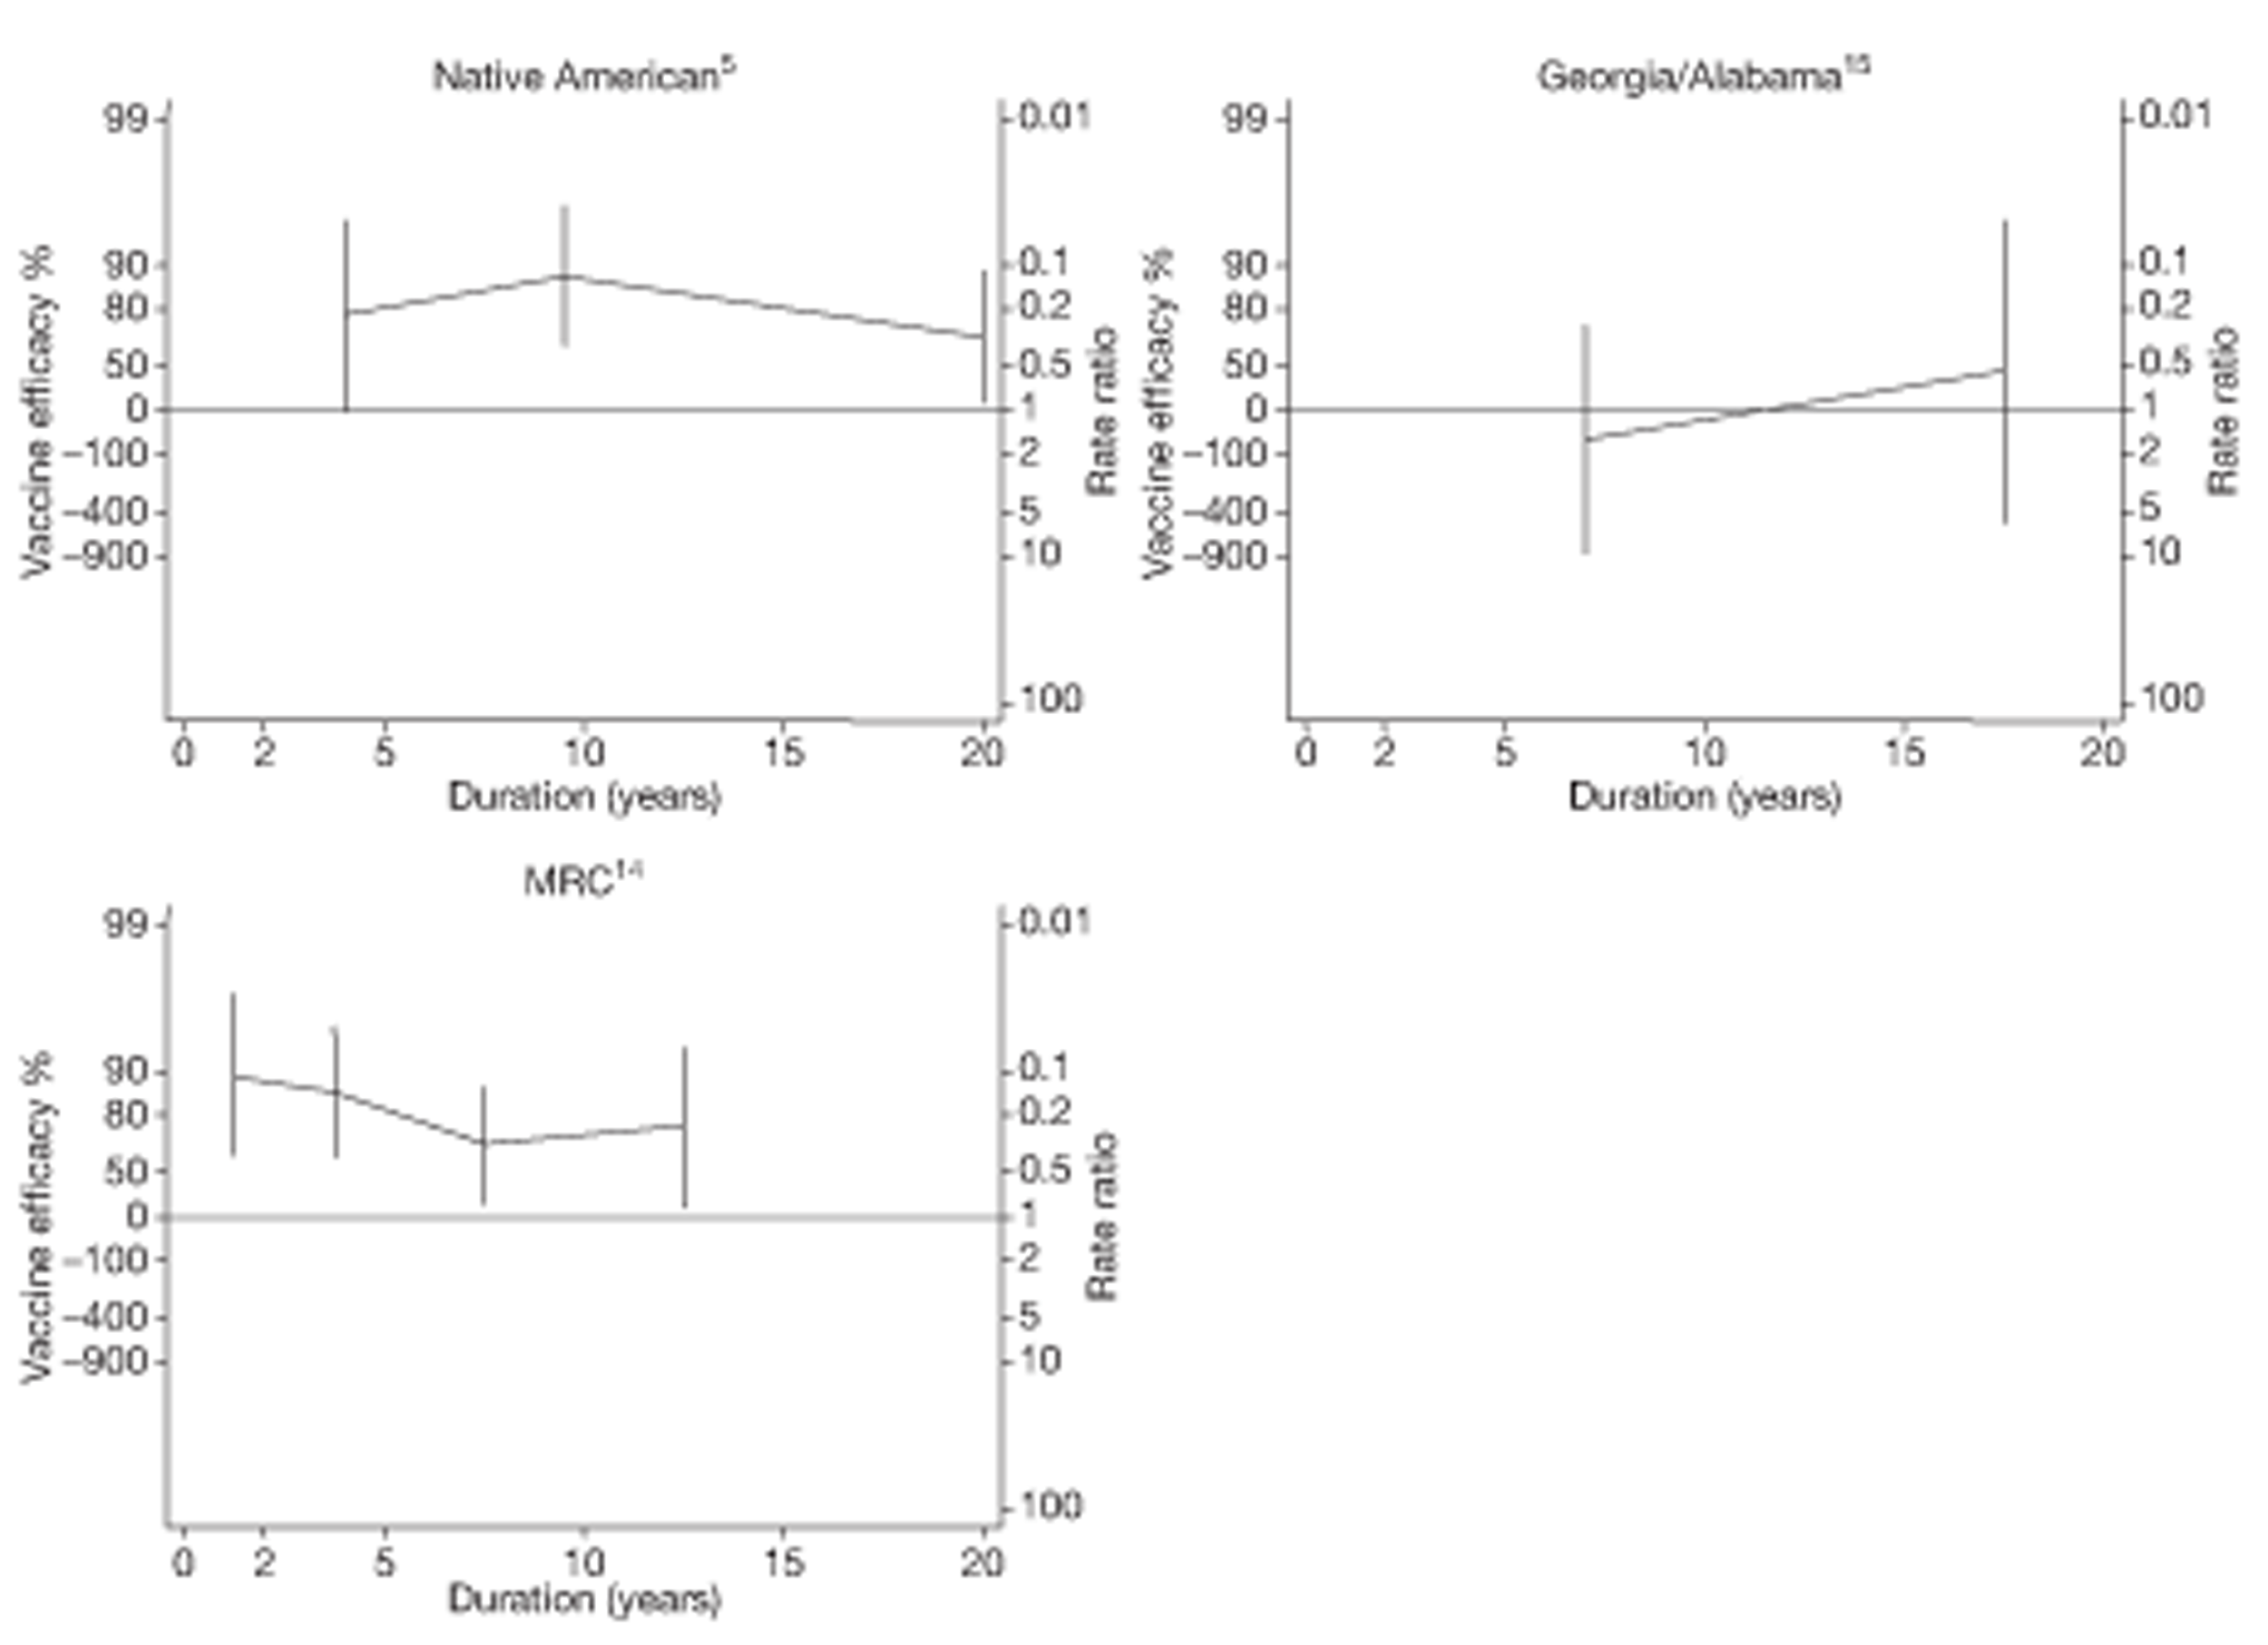
Temporal changes in efficacy
Figures 100 and 101 show the change in rate ratio per 5 years for the three studies with data on extrapulmonary tuberculosis outcomes. These studies demonstrate a decrease in BCG vaccination efficacy over time, with a slightly greater decrease if the first 5 years of data are excluded.
FIGURE 100.
Change per 5 years (with 95% CI) in the rate ratio comparing the incidence of extrapulmonary tuberculosis (excluding meningeal or miliary tuberculosis) among BCG vaccinated individuals with that in unvaccinated individuals in RCTs for the longest follow-up period (see Table 3), including the first 5 years of data for each study. D + L, DerSimonian and Laird method; I – V, inverse variance method.

FIGURE 101.
Change per 5 years (with 95% CI) in the rate ratio comparing the incidence of extrapulmonary tuberculosis (excluding meningeal or miliary tuberculosis) among BCG vaccinated individuals with that in unvaccinated individuals in RCTs for the longest follow-up period (see Table 3), excluding the first 5 years of data for each study. D + L, DerSimonian and Laird method; I – V, inverse variance method.

Study efficacy by follow-up period
The forest plots in Figure 102–105 show the effectiveness of BCG vaccination against extrapulmonary tuberculosis, within the successive follow-up periods 0–5 years, 5–10 years, 10–15 years and > 15 years following vaccination. During the first 5 years, there was substantial heterogeneity in the effect of BCG vaccination (τ2 = 1.1). Two trials showed evidence of a strong protective effect, ranging from good protection 78% (95% CI –2% to 95%) in the Native American5 study to high protection [VE 87% (95% CI 72% to 94%)] in the MRC trial,14 whereas the Georgia/Alabama study15 showed no evidence of clinical benefit (note: very small number of events).
FIGURE 102.
Rate ratios (with 95% CI) comparing incidence of extrapulmonary tuberculosis (excluding meningeal or miliary tuberculosis) among BCG vaccinated individuals with that in unvaccinated individuals, in RCTs, in the first 5 years of follow-up. D + L, DerSimonian and Laird method; M-H, Mantel-Haenszel method.

FIGURE 103.
Rate ratios (with 95% CI) comparing incidence of extrapulmonary tuberculosis (excluding meningeal or miliary tuberculosis) among BCG vaccinated individuals to that in unvaccinated individuals, in RCTs, from 5 to 10 years of follow-up. D + L, DerSimonian and Laird method; M-H, Mantel-Haenszel method.

FIGURE 104.
Rate ratios (with 95% CI) comparing incidence of extrapulmonary tuberculosis (excluding meningeal or miliary tuberculosis) among BCG vaccinated individuals with that in unvaccinated individuals, in RCTs, from 10 to 15 years of follow-up. D + L, DerSimonian and Laird method; M-H, Mantel-Haenszel method.

FIGURE 105.
Rate ratios (with 95% CI) comparing incidence of extrapulmonary tuberculosis (excluding meningeal or miliary tuberculosis) among BCG vaccinated individuals with that in unvaccinated individuals, in RCTs, beyond 15 years of follow-up. D + L, DerSimonian and Laird method; M-H, Mantel-Haenszel method.

Among the three trials13,14,49 with data on protection between 5 and 10 years after vaccination, there was no heterogeneity (τ2 = 0) (see Figure 103), with the protective effect ranging from a rate ratio of 0.14 (95% CI 0.03 to 0.63) to 0.62 (95% CI 0.10 to 3.74), equivalent to a range of vaccine efficacy from 38% (95% CI –274% to 90%) to a high 86% (95% CI 37% to 97%).
Figure 104 shows results from four trials5,14,15 with relevant data on the protective effect of BCG vaccination between 10 and 15 years after vaccination. The number of events in the vaccinated and unvaccinated arms was small for most studies; however, data from the Native American5 and MRC trials14 show evidence of substantial protection beyond 10 years (VE ranging from good protection at 76% to a high protective effect at 87%). There was some evidence of between-study heterogeneity (τ2 = 0.29).
Two studies5,15 provided details on BCG vaccination efficacy beyond 15 years after vaccination (see Figure 105). There was no evidence of between-study heterogeneity (τ2 = 0). Only the Native American5 study showed a protective effect beyond 15 years [rate ratio 0.31 (95% CI 0.11 to 0.88)], equivalent to a good VE of 69% (95% CI 12% to 89%), whereas the Georgia/Alabama trial15 showed only little evidence of protection by BCG vaccination beyond 15 years after vaccination.
Measure of waning efficacy
The rate ratios for the effect of BCG vaccination in the first 10 years after vaccination, and after the first 10 years, along with associated VE and the ratio of these rate ratios (waning efficacy measure) are shown in Table 30. Both the Native American5 and MRC trials14 showed evidence of high protection before 10 years and good protection 10 years after vaccination. The Georgia/Alabama trial15 showed an increase in protection after 10 years to a moderate protective effect, compared with the first 10 years after vaccination.
| Trial | Protection in first 10 years of follow-up | Protection post 10 years of follow-up | Waning efficacy measure | ||
|---|---|---|---|---|---|
| Rate ratio (95% CI) for effect of BCG vaccination in the first 10 years | VE (95% CI) for effect of BCG vaccination in the first 10 years | Rate ratio (95% CI) for effect of BCG vaccination after 10 years | VE (95% CI) for the effect of BCG vaccination after 10 years | Effect of BCG vaccination after the first 10 years compared with the first 10 years of ratio of the rate ratios (95% CI) | |
| Native American5 | 0.16 (0.07 to 0.38) | 84 (62 to 93) | 0.31 (0.11 to 0.88) | 69 (12 to 89) | 1.93 (0.5 to 7.52) |
| Georgia/Alabama15 | 1.58 (0.26 to 9.48) | −58 (−848 to 74) | 0.53 (0.05 to 5.82) | 47 (−482 to 95) | 0.33 (0.02 to 6.65) |
| MRC14 | 0.17 (0.09 to 0.31) | 83 (69 to 91) | 0.24 (0.07 to 0.86) | 76 (14 to 93) | 1.41 (0.34 to 5.75) |
Tuberculosis mortality
Only the Native American trial5 provided data on mortality showing strong evidence that BCG vaccination affords protection against death associated with tuberculosis, for up to 25 years after vaccination (Figure 106). The annual change in rate ratio per 5 years for the Native American5 study was 1.06 (95% CI 1.01 to 1.11). If the first 5 years of data are excluded, the decrease in the rate ratio of effect of BCG vaccination on tuberculosis mortality per 5 years was more pronounced [annual change in rate ratio 1.54 (95% CI 1.10 to 2.14)] (Table 31).
FIGURE 106.
Vaccine efficacy and rate ratios (with 95% CI) comparing the incidence of tuberculosis mortality among vaccinated individuals with that in unvaccinated individuals, in RCTs, over time. 5
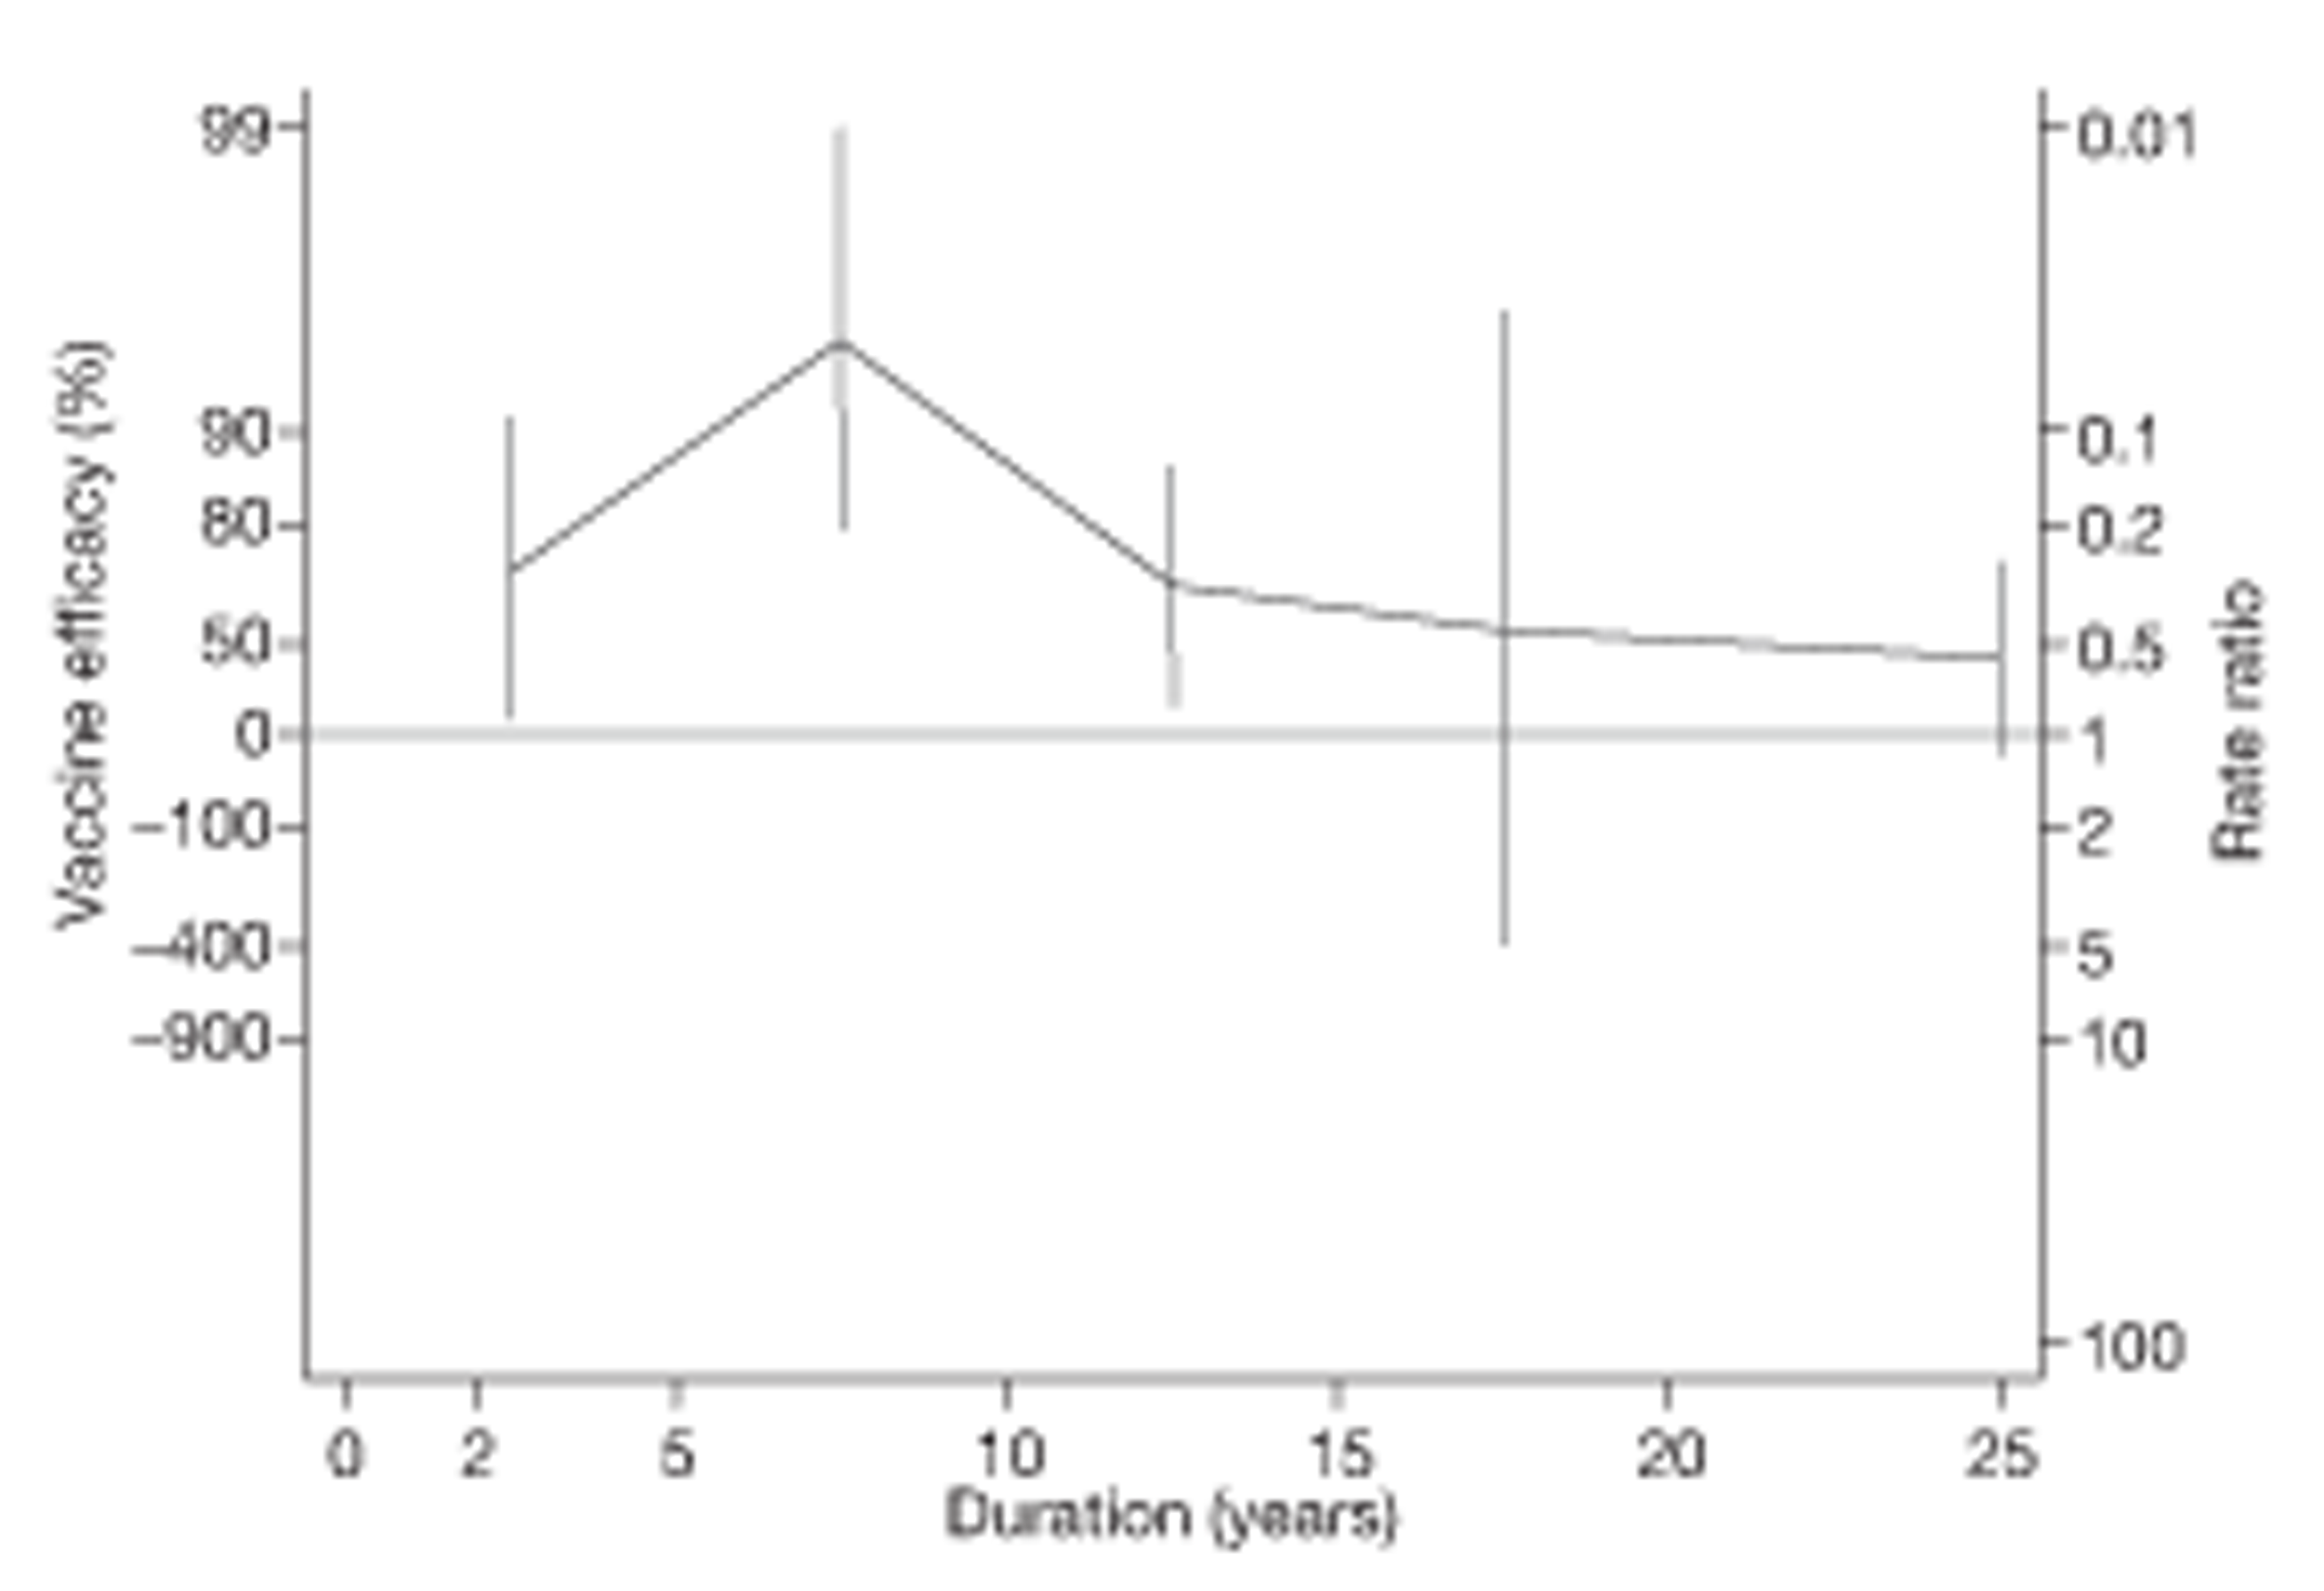
| Trial | Protection in first 10 years of follow-up | Protection post 10 years of follow-up | Waning efficacy measure | ||
|---|---|---|---|---|---|
| Rate ratio (95% CI) for effect of BCG vaccination in the first 10 years | VE (95% CI) for effect of BCG vaccination in the first 10 years | Rate ratio (95% CI) for effect of BCG vaccination after 10 years | VE (95% CI) for the effect of BCG vaccination after 10 years | Effect of BCG vaccination after the first 10 years compared with the first 10 years of ratio of the rate ratios (95% CI) | |
| Native American5 | 0.11 (0.05 to 0.27) | 89 (73 to 95) | 0.45 (0.26 to 0.77) | 55 (23 to 74) | 3.93 (1.43 to 10.80) |
Measure of waning efficacy
Vaccine efficacy against tuberculosis mortality in the Native American trial5 was high for the first 10 years after vaccination, estimated at 89%. This protective effect was found to be almost four times lower after 10 years since vaccination.
Observational studies
Pulmonary tuberculosis
One case–control62 and one cross-sectional study178 provided sufficient data to estimate the duration of protection by BCG vaccination against pulmonary tuberculosis (Figures 107 and 108). No cohort or case population study provided temporal data for this outcome. Both studies showed evidence of protection against pulmonary tuberculosis during the study follow-up periods. The Nagpur hospital case–control study62 showed a consistent level of protection beyond 20 years, whereas the Togo children study177 showed a level of protection varying from high to moderate from 2 to 7 years following vaccination (see Figure 108).
FIGURE 107.
Vaccine effectiveness and ORs (with 95% CI) comparing the BCG vaccination status of pulmonary tuberculosis cases and control subjects over time in a case–control study. 62
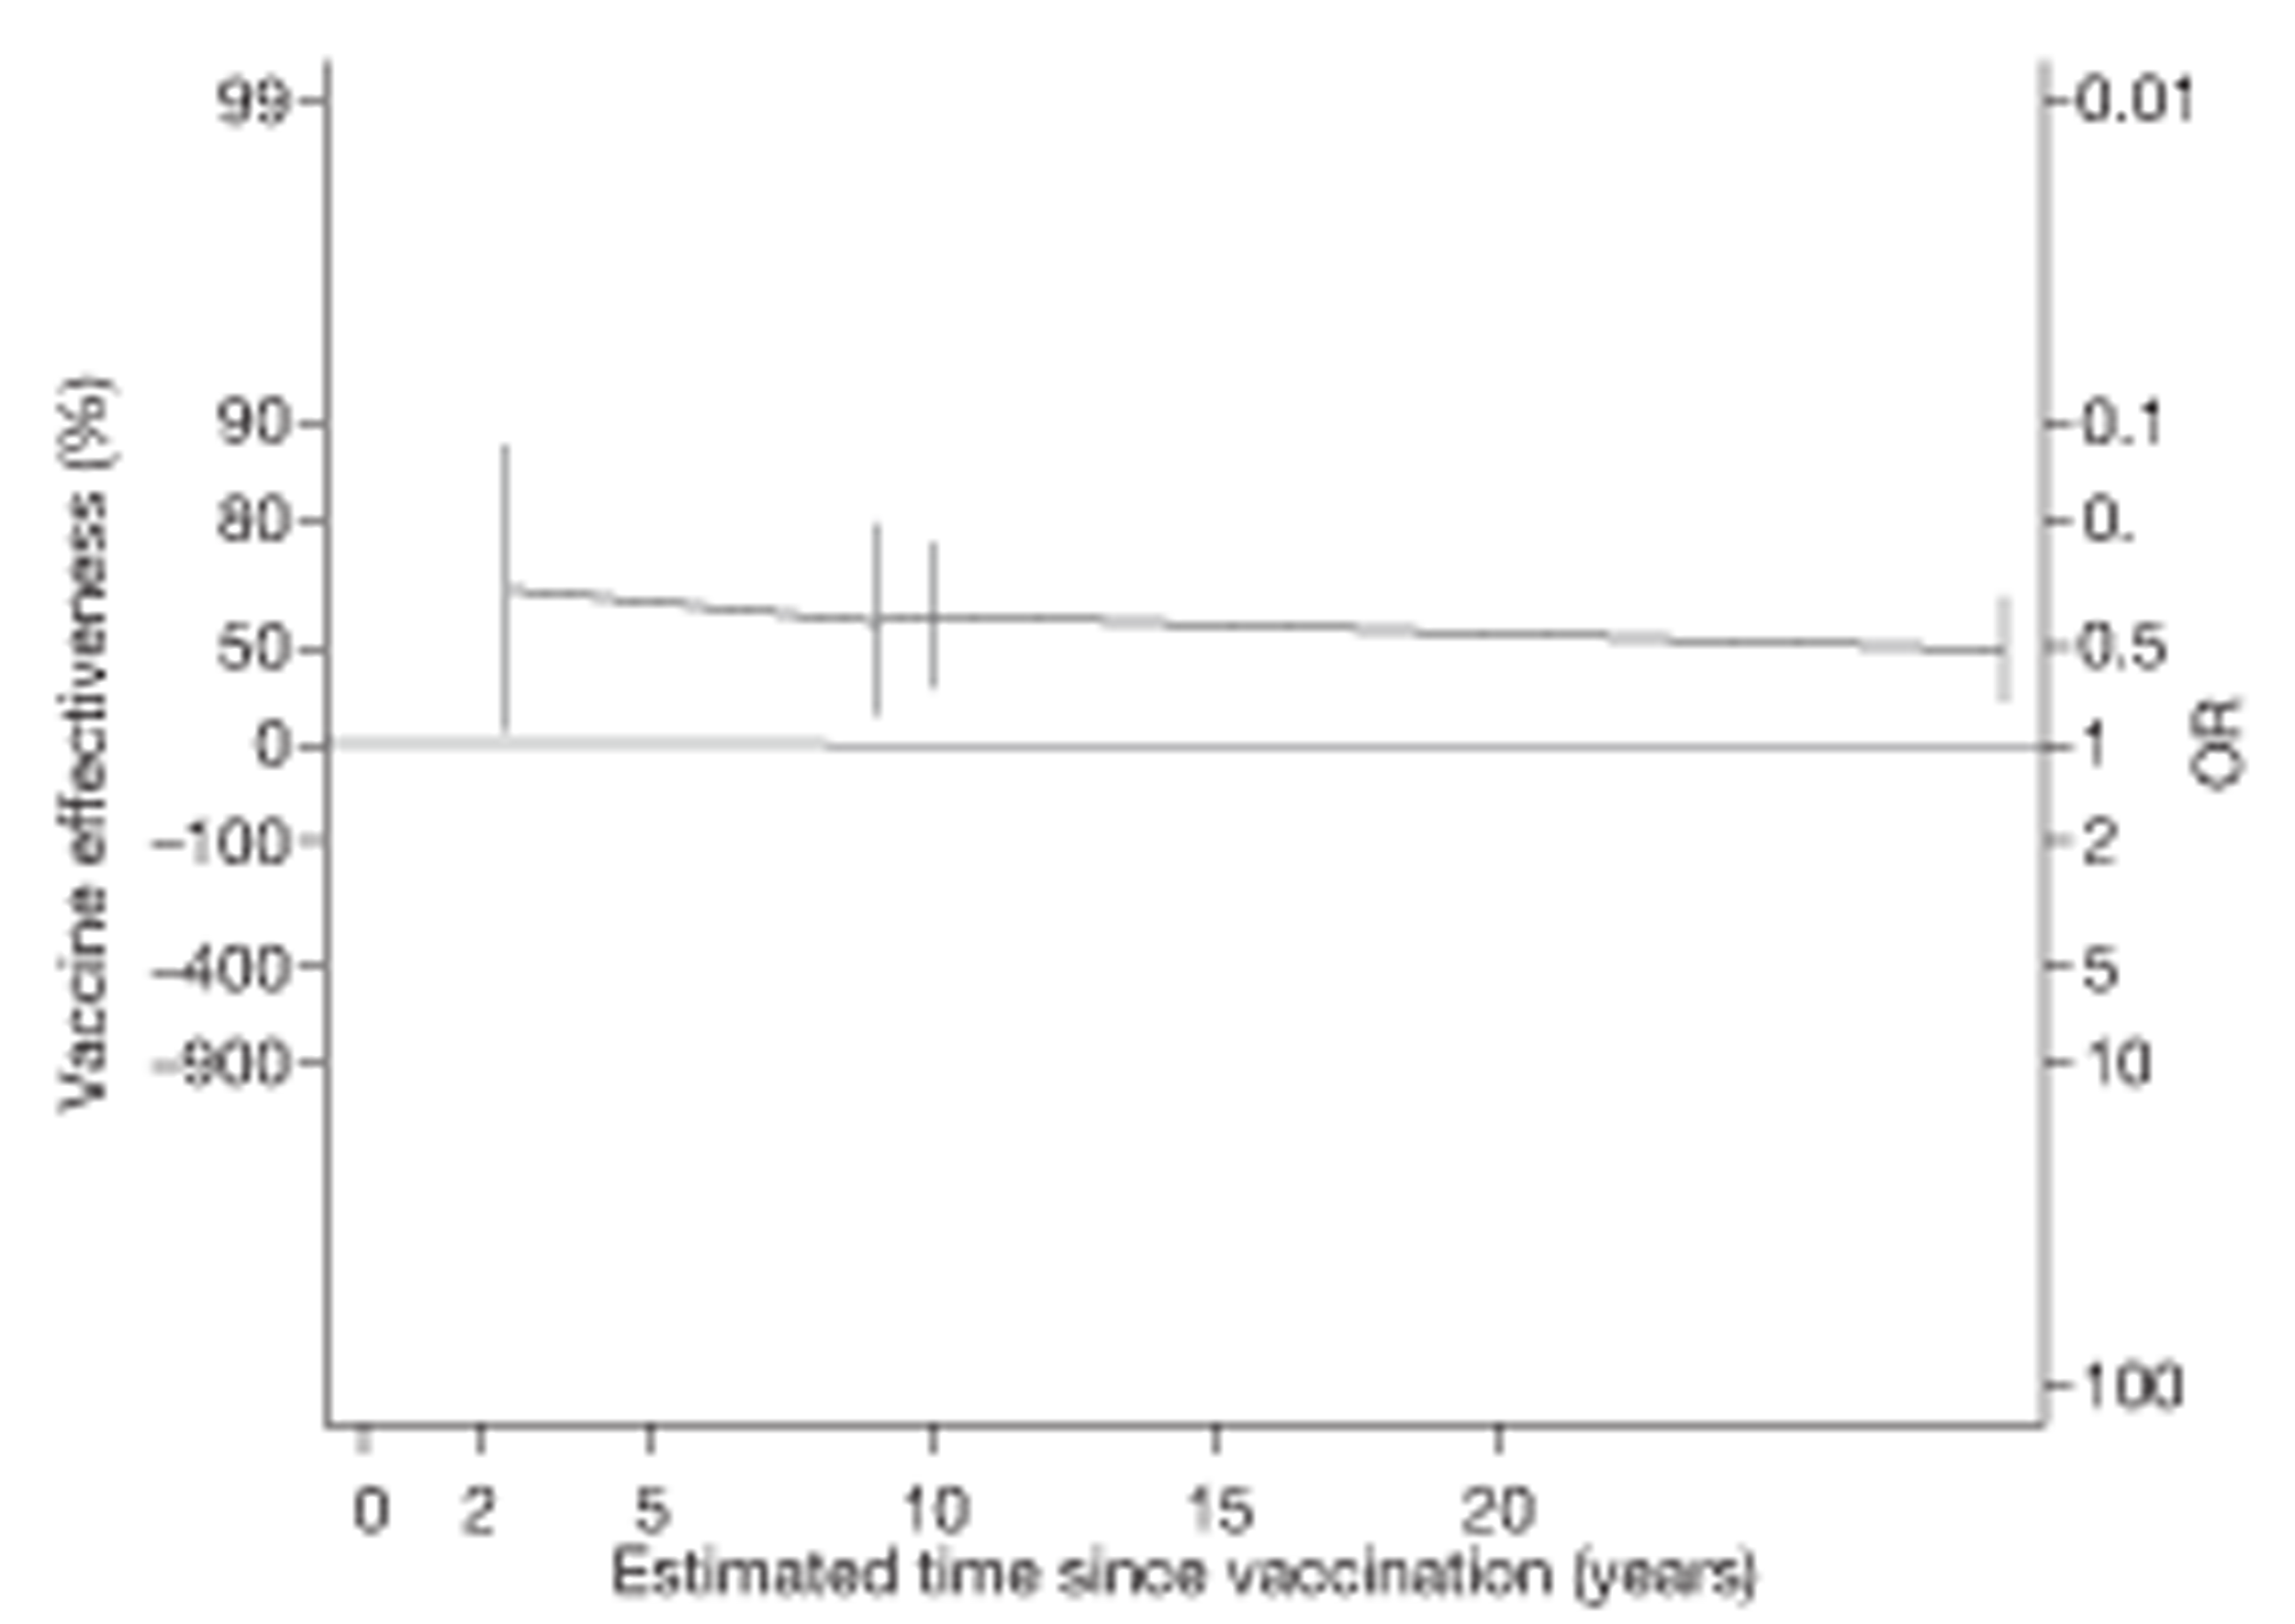
FIGURE 108.
Vaccine effectiveness and RRs (with 95% CI) comparing the prevalence of pulmonary tuberculosis among BCG vaccinated individuals with that in unvaccinated individuals over time in a cross-sectional study. 178
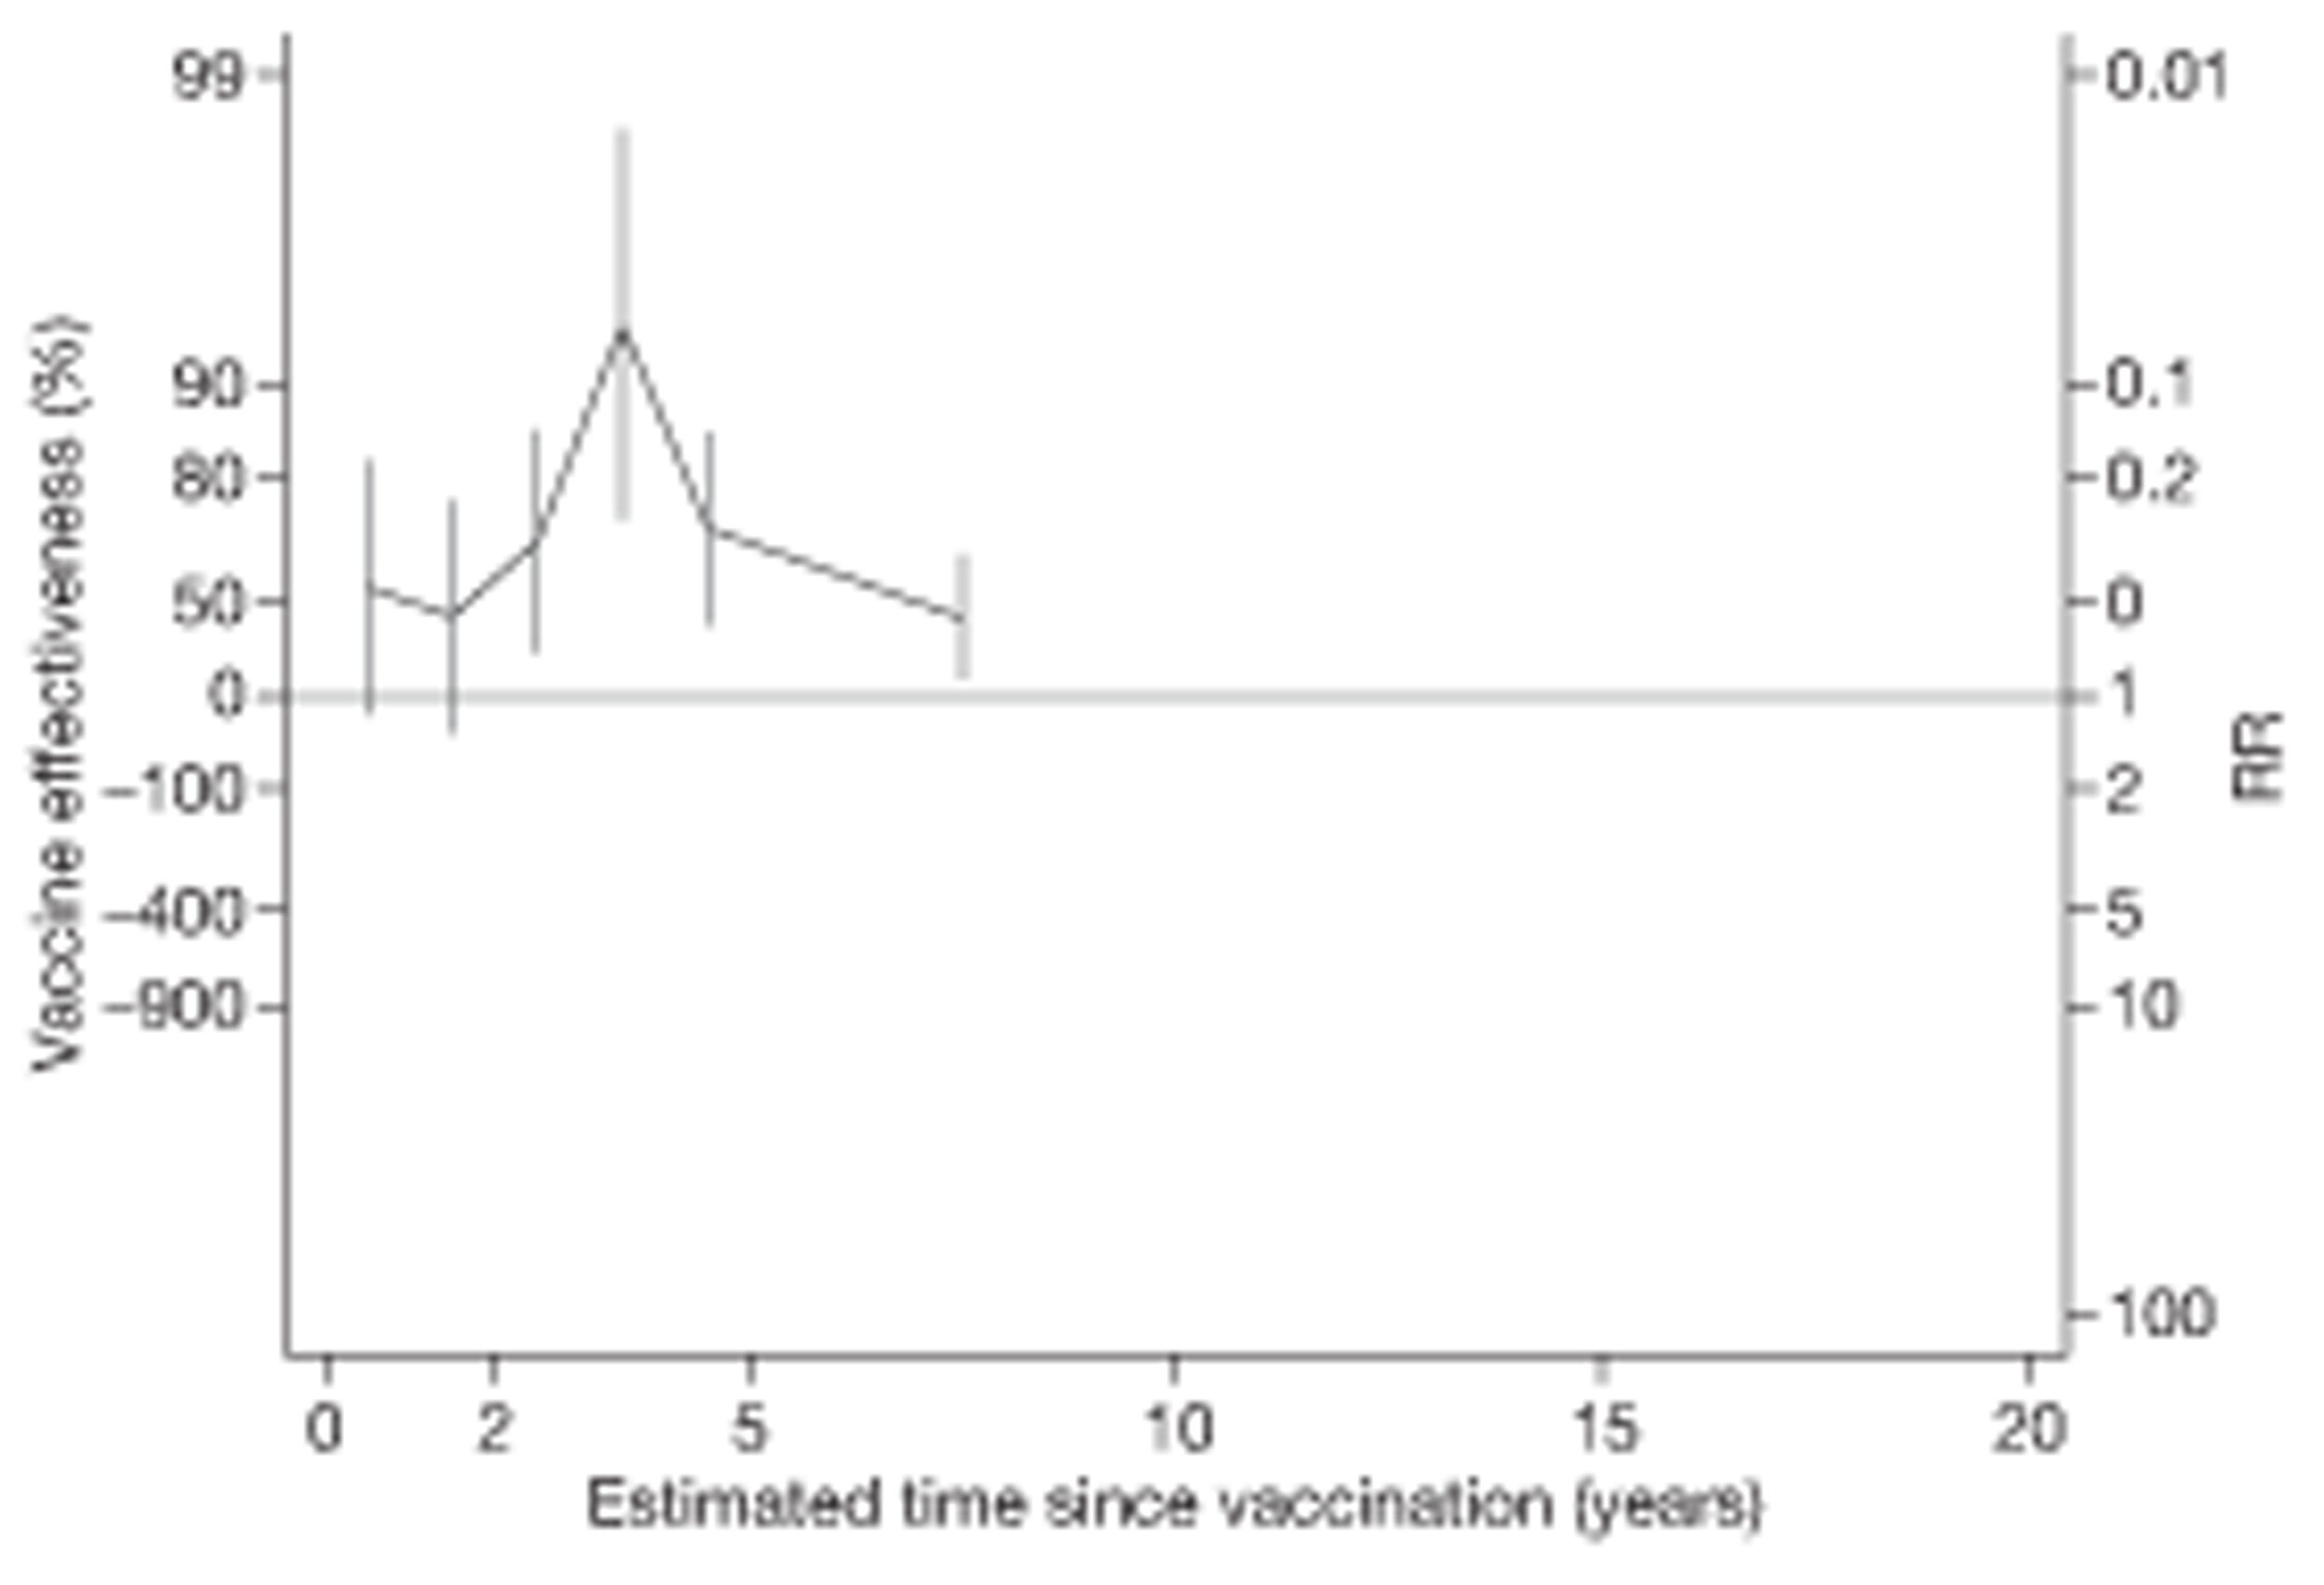
Temporal changes in efficacy
We examined the changes in effectiveness over time by estimating the ratio of ORs and RRs per 5 years of follow-up. The annual change in ORs per 5 years for Nagpur Hospital62 [OR 1.07 (95% CI 0.94 to 1.21)] and in RRs for the Togo children cross-sectional study177 [RR 1.32 (95% CI 0.76 to 2.32)] both suggested a modest evidence of a decline in protection per 5 years.
All tuberculosis disease outcomes
Nine case–control studies,32,33,56,64,65,73,74,76,77 five cohort studies,6,109,120,121,123 five case population studies152,153,163,165,167 and three cross-sectional studies175,186,188 provided sufficient data to investigate the duration of protection afforded by BCG vaccination against all forms of tuberculosis disease (Figures 109–112). In the majority of studies, there was evidence of protection during the first 5 years of follow-up, whereas the Bangalore children56 and Indonesia case–control73 studies showed no evidence of protection at baseline. In most studies, the protection afforded by BCG vaccination appeared to decline after the first 5 years.
FIGURE 109.
Vaccine effectiveness and ORs (with 95% CI) comparing the BCG vaccination status of all tuberculosis morbidity outcomes cases and control subjects over time in case–control studies.
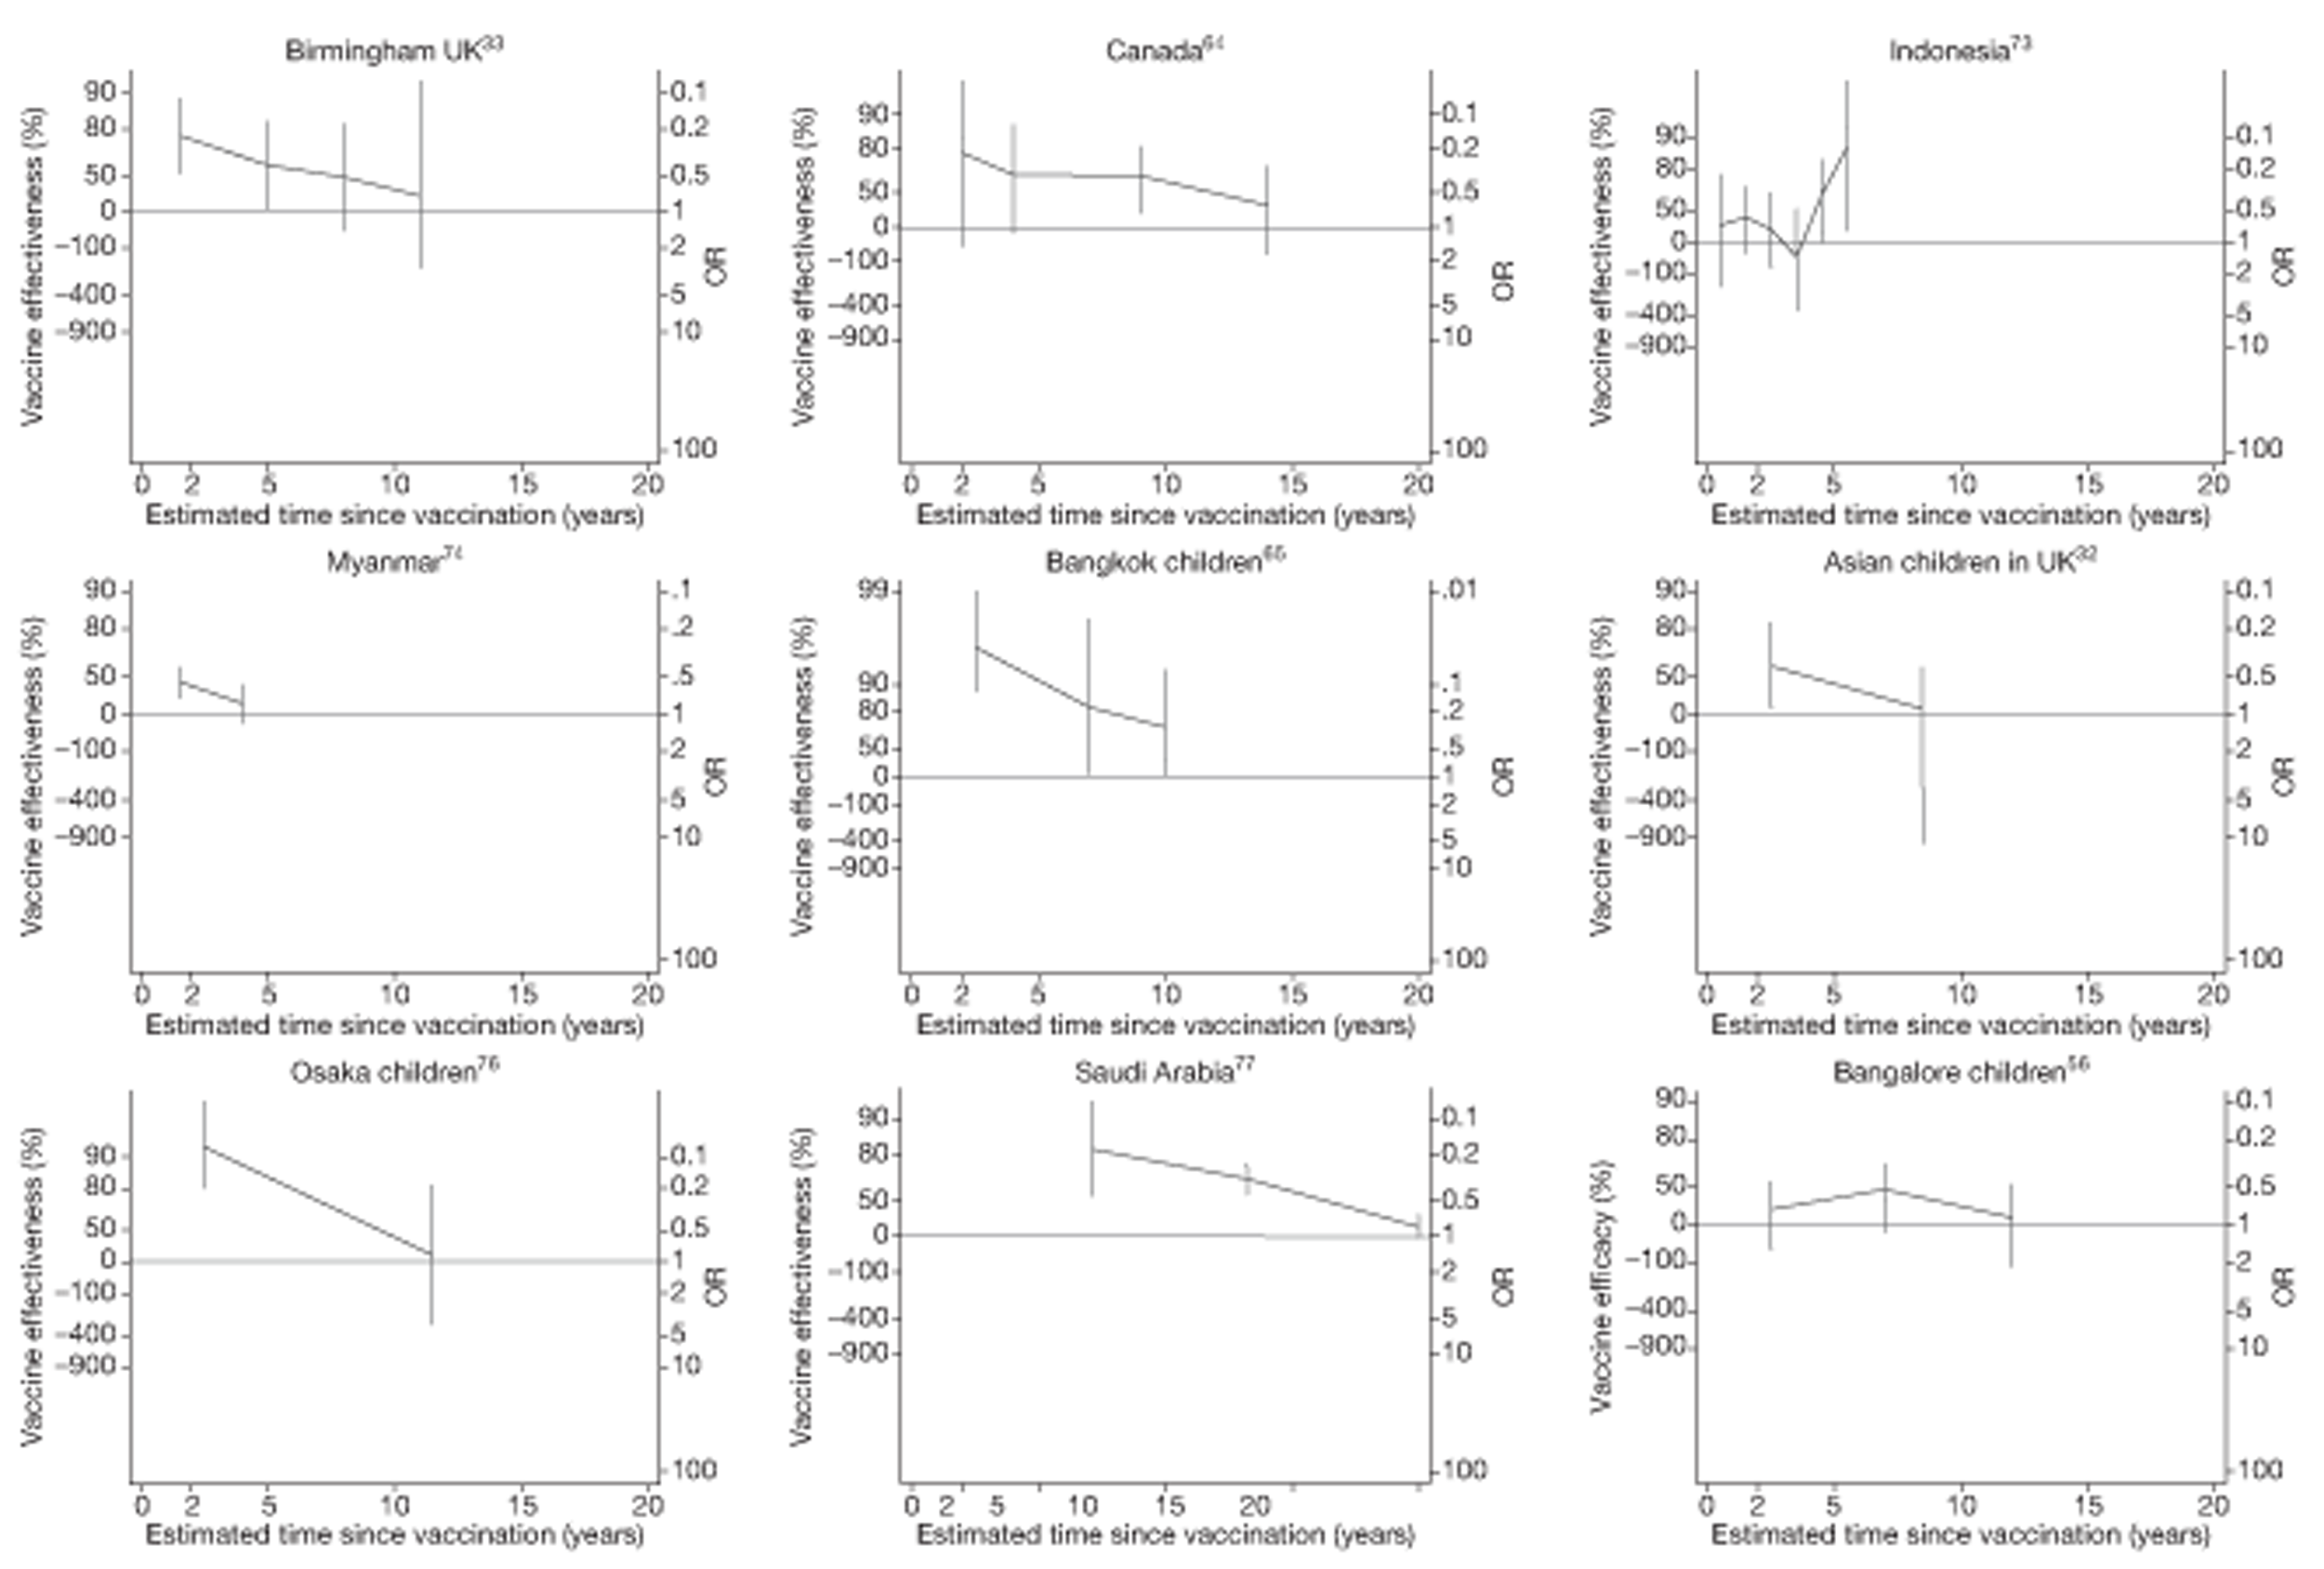
FIGURE 110.
Vaccine effectiveness and rate ratios (with 95% CI) comparing the incidence of all tuberculosis morbidity outcomes among BCG vaccinated individuals with that in unvaccinated individuals over time, in cohort studies.
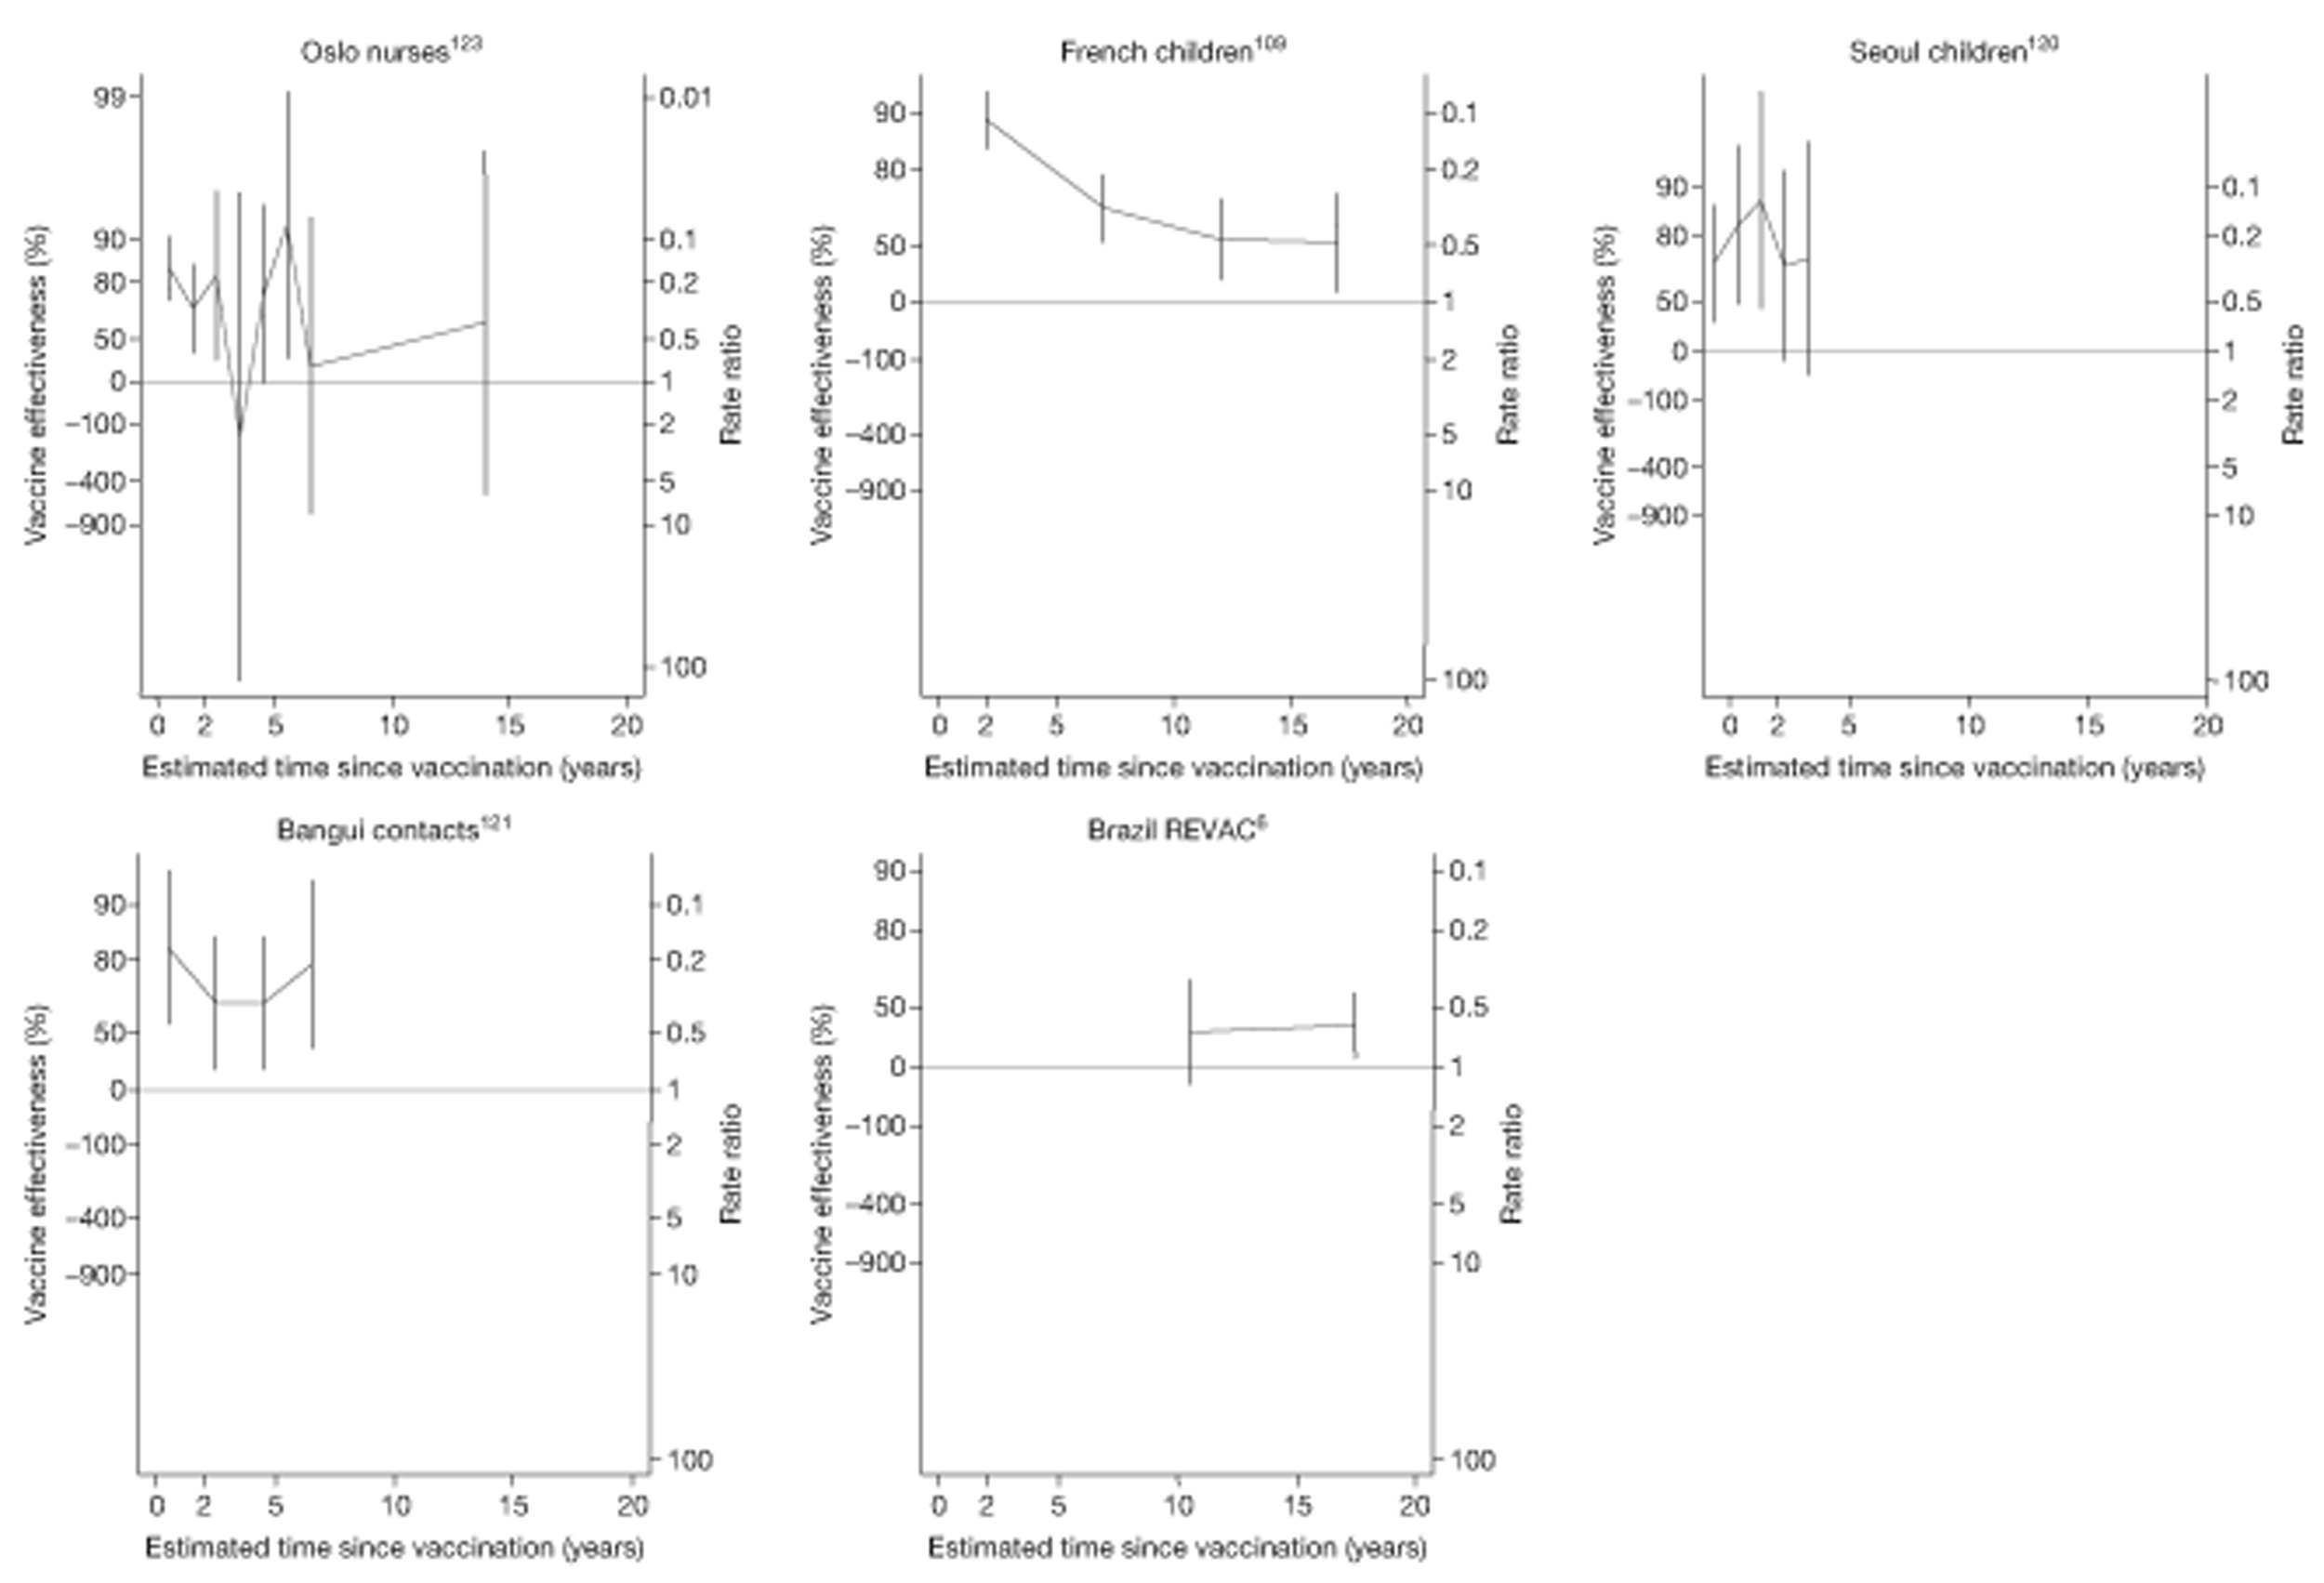
FIGURE 111.
Vaccine effectiveness and rate ratios (with 95% CI) comparing the incidence of all tuberculosis morbidity outcomes among BCG vaccinated individuals with that in unvaccinated individuals over time, in case population studies.
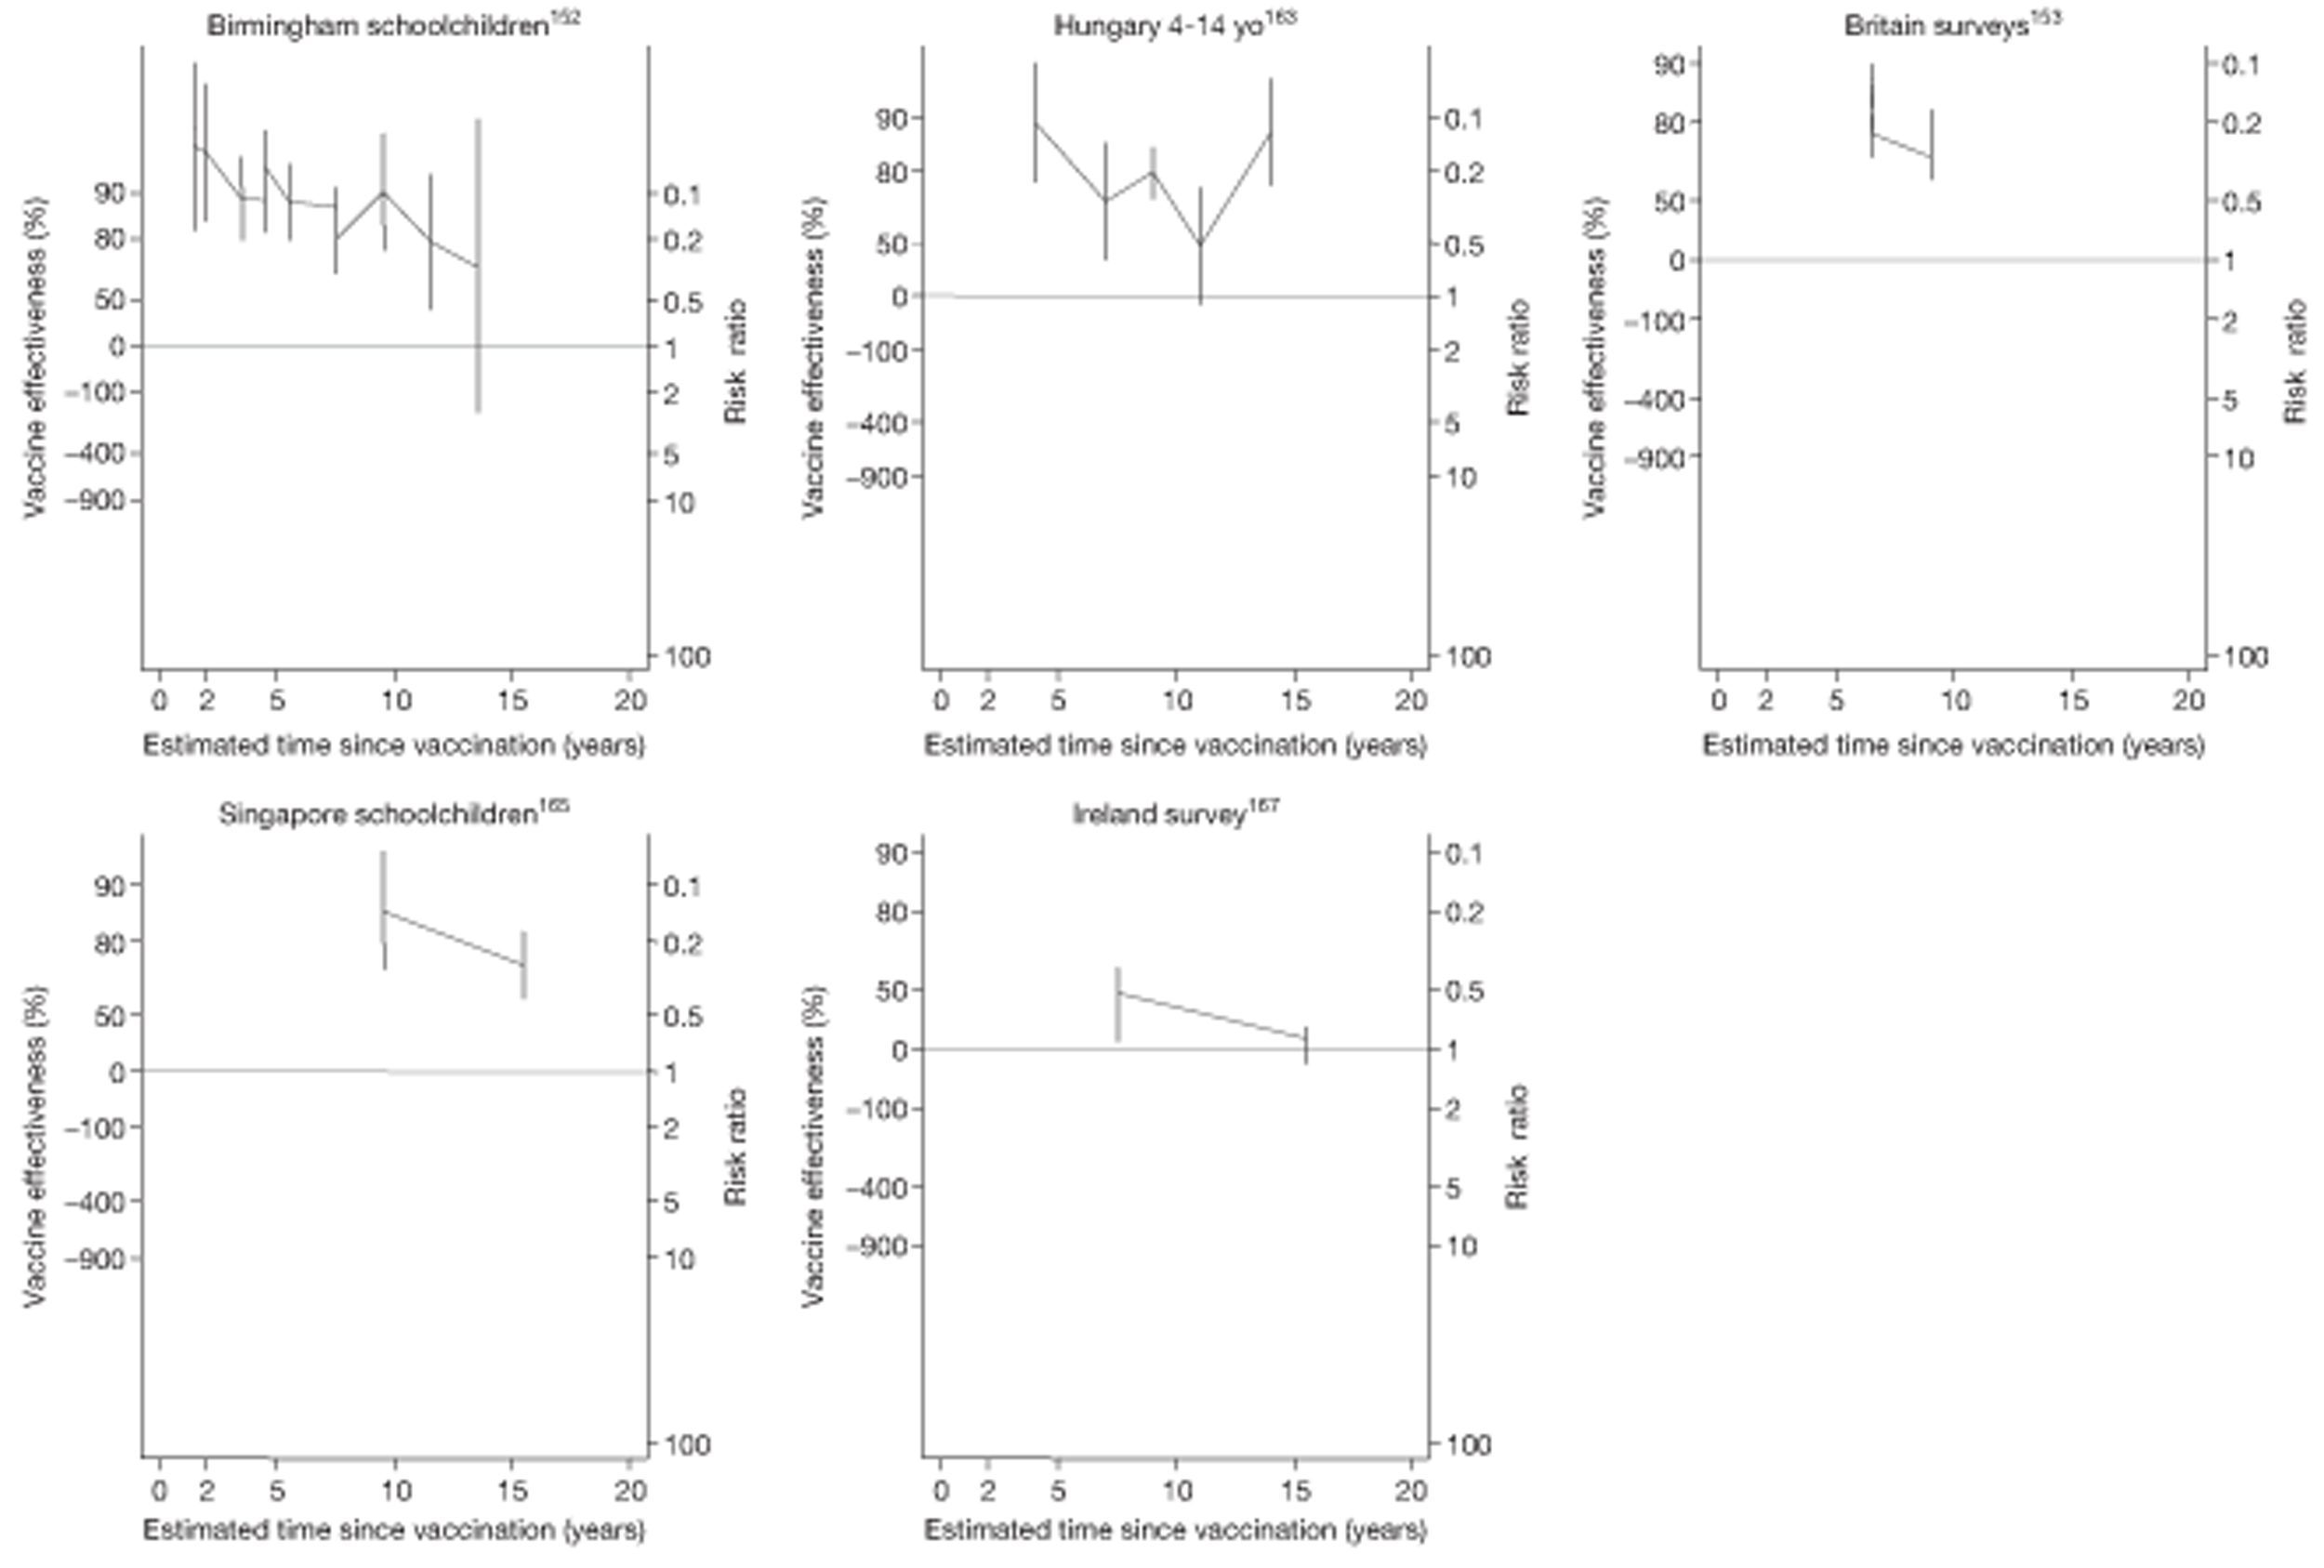
FIGURE 112.
Vaccine effectiveness and RRs (with 95% CI) comparing the prevalence of all tuberculosis morbidity outcomes among BCG vaccinated individuals with that in unvaccinated individuals for over time in cross-sectional studies.
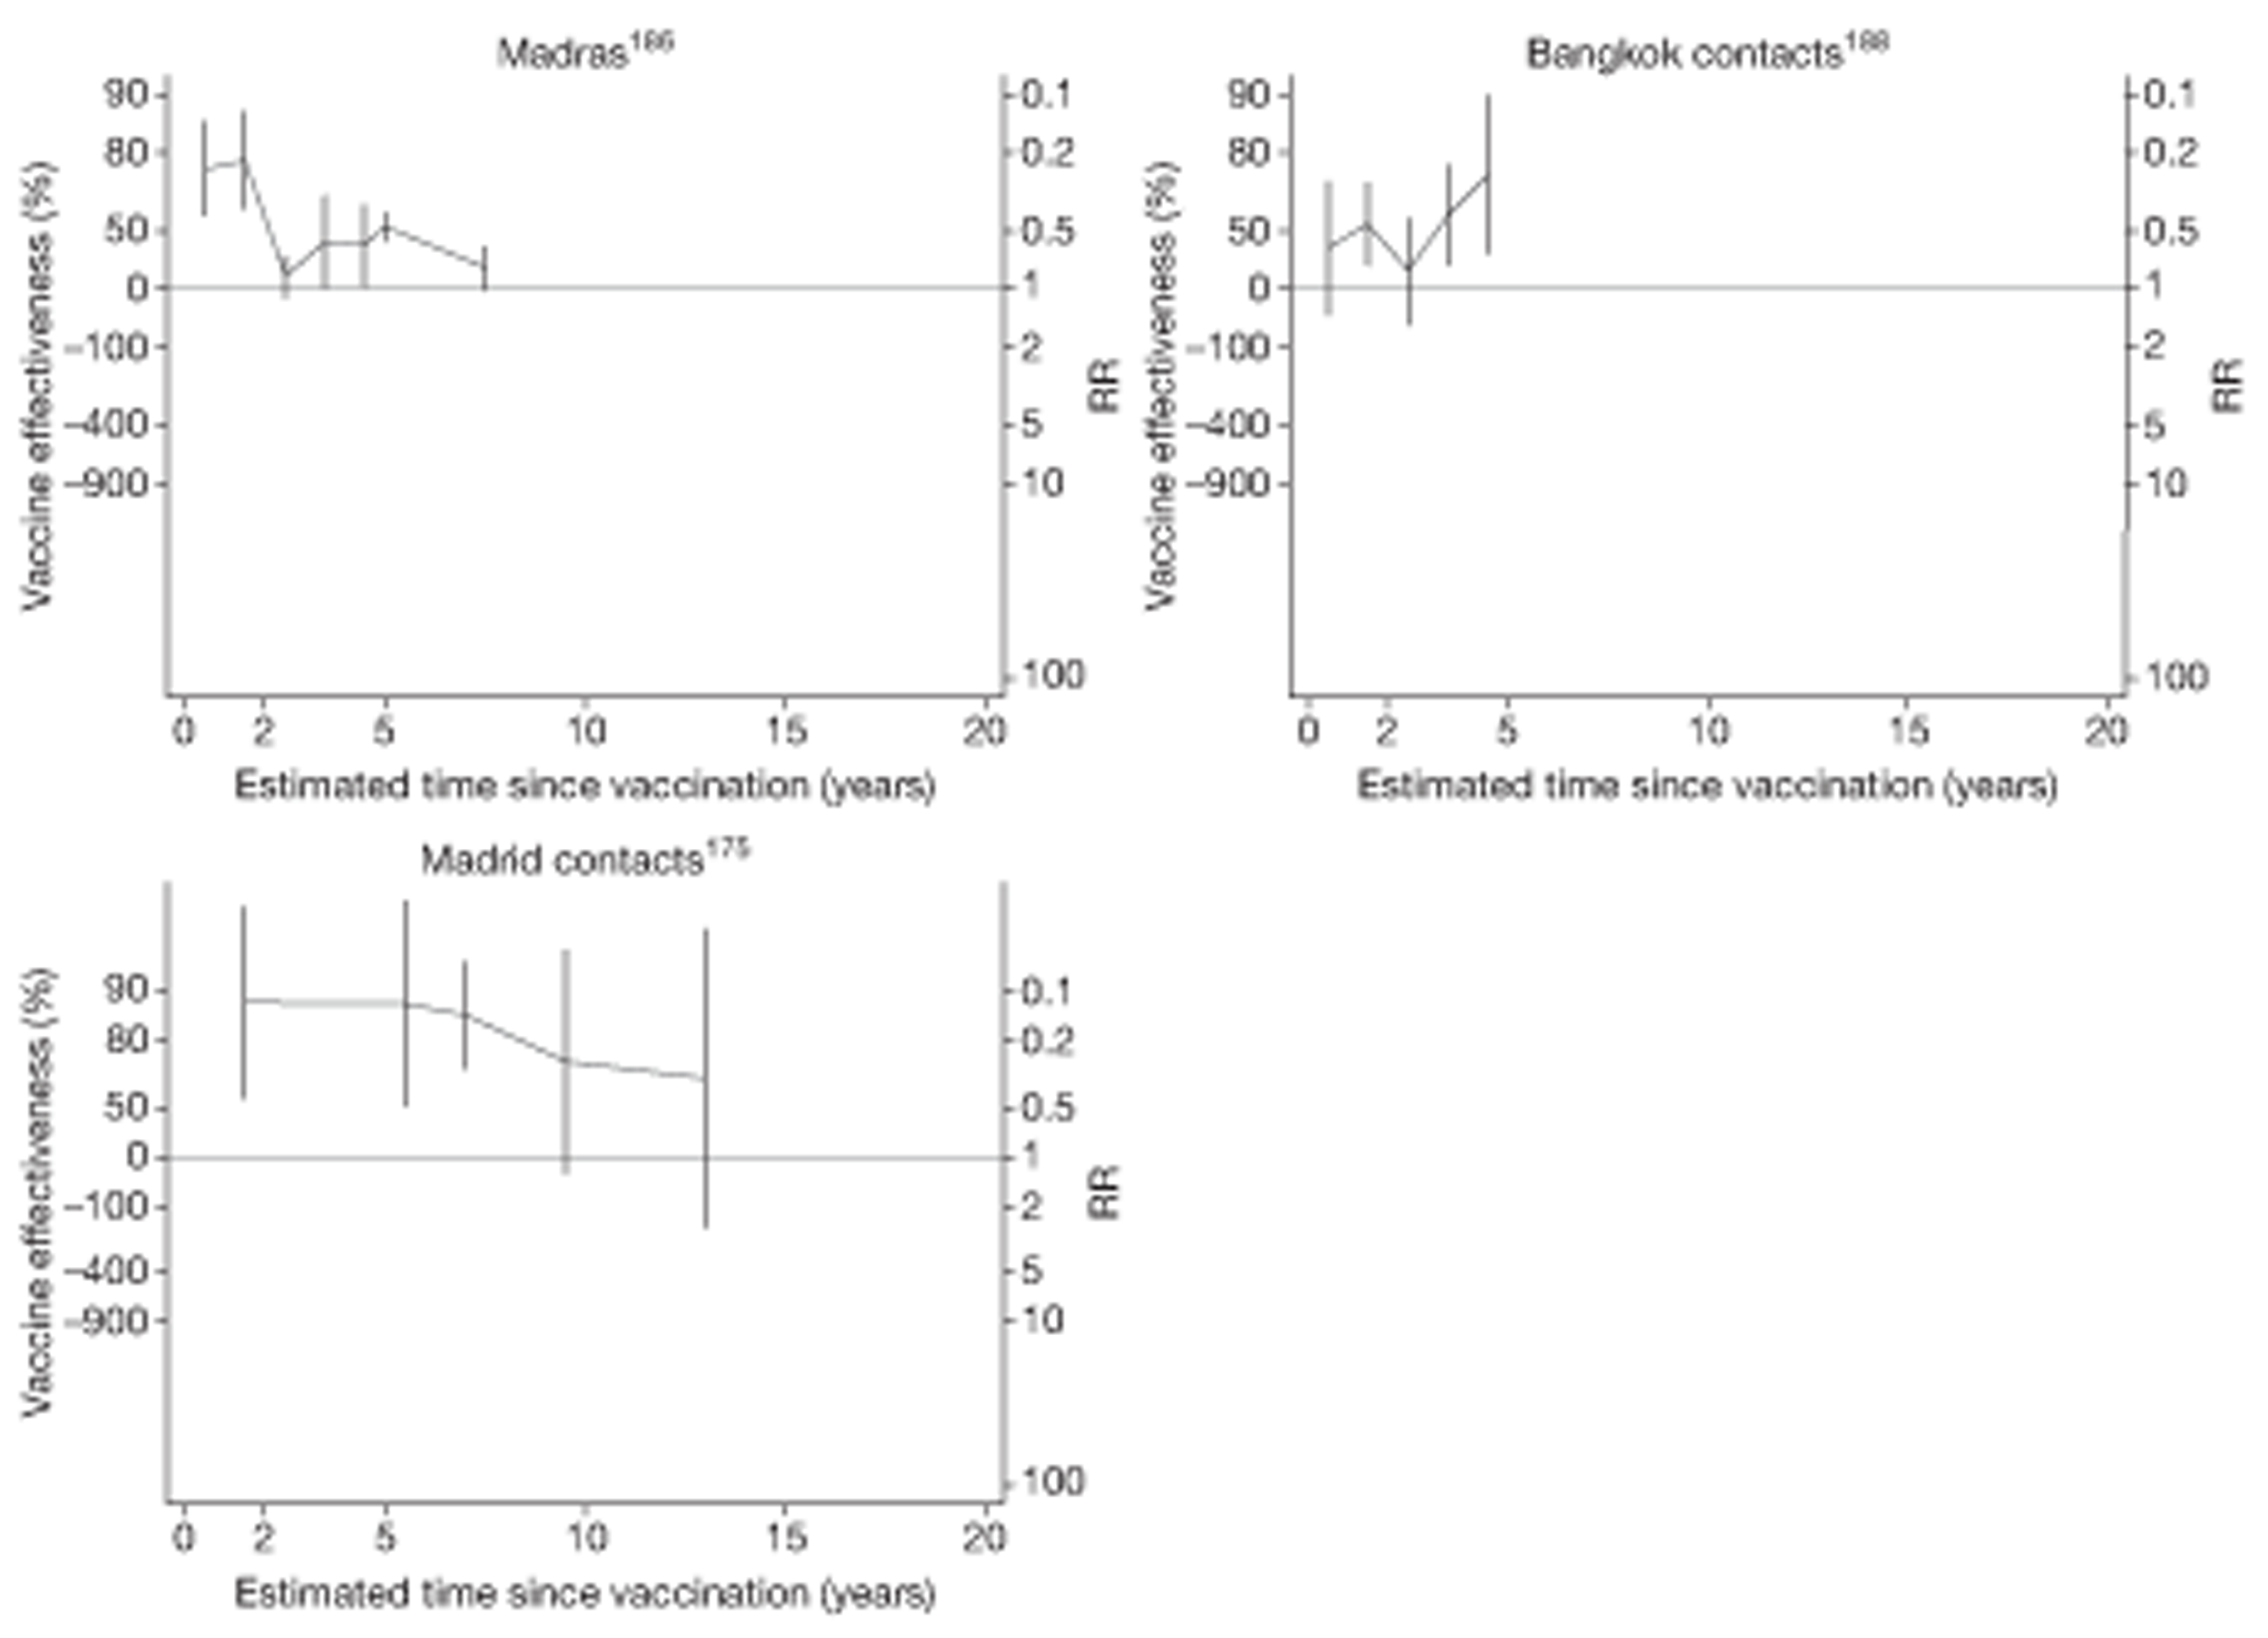
Case–control studies
See Figure 109.
Cohort studies
See Figure 110.
Case population studies
See Figure 111.
Cross-sectional studies
See Figure 112.
Temporal changes in efficacy
Data on the change in effectiveness against all tuberculosis morbidity over time were consistent for all observational study types. Figures 113–116 display these estimated RRRs per 5 years' follow-up (and ORs for case–control studies), showing that on average, the protective effect of BCG vaccination declined over time [summary ratio of ORs for case–control studies 1.59 (95% CI 1.21 to 2.10)], the summary ratio of rate ratios for cohort studies was 1.47 (95% CI 1.10 to 1.98), RRs for case population was 1.59 (95% CI 1.27 to 1.98) and summary RRs for cross-sectional studies [RR 1.29 (95% CI 0.78 to 2.12)].
FIGURE 113.
Change per 5 years (with 95% CI) in the OR comparing the BCG vaccination status of all tuberculosis outcome cases and control subjects in case–control studies. a, Date of study publication was used if study start date was not available. D + L, DerSimonian and Laird method; I – V, inverse variance method.

FIGURE 114.
Change per 5 years (with 95% CI) in the rate ratio comparing the incidence of all tuberculosis morbidity outcomes among BCG vaccinated individuals with that in unvaccinated individuals in cohort studies. D + L, DerSimonian and Laird method; I – V, inverse variance method.

FIGURE 115.
Change per 5 years (with 95% CI) in the rate ratio comparing the incidence of all tuberculosis outcomes among BCG vaccinated individuals with that in unvaccinated individuals in case population studies. D + L, DerSimonian and Laird method; I – V, inverse variance method.

FIGURE 116.
Change per 5 years (with 95% CI) in the RR comparing prevalence of all tuberculosis morbidity outcomes among BCG vaccinated individuals with that in unvaccinated individuals over time in cross-sectional studies. a, Date of study publication was used if study start date was not available. D + L, DerSimonian and Laird method; I – V, inverse variance method.

Case–control studies
See Figure 113.
Cohort studies
See Figure 114.
Case population studies
See Figure 115.
Cross-sectional studies
See Figure 116.
Combined meningeal and/or miliary tuberculosis
Figures 117 and 118 show a summary of the ORs, and rate ratios over time for three case–control studies and one case population study which provided data on the duration of protection by BCG vaccination against tuberculosis meningitis. No case–control or case population study provided data for duration for miliary tuberculosis and no cohort or cross-sectional study provided data for duration for meningeal and/or miliary tuberculosis.
FIGURE 117.
Vaccine effectiveness and ORs (with 95% CI) comparing the BCG vaccination status of tuberculosis meningitis cases and control subjects over time, in case–control studies.
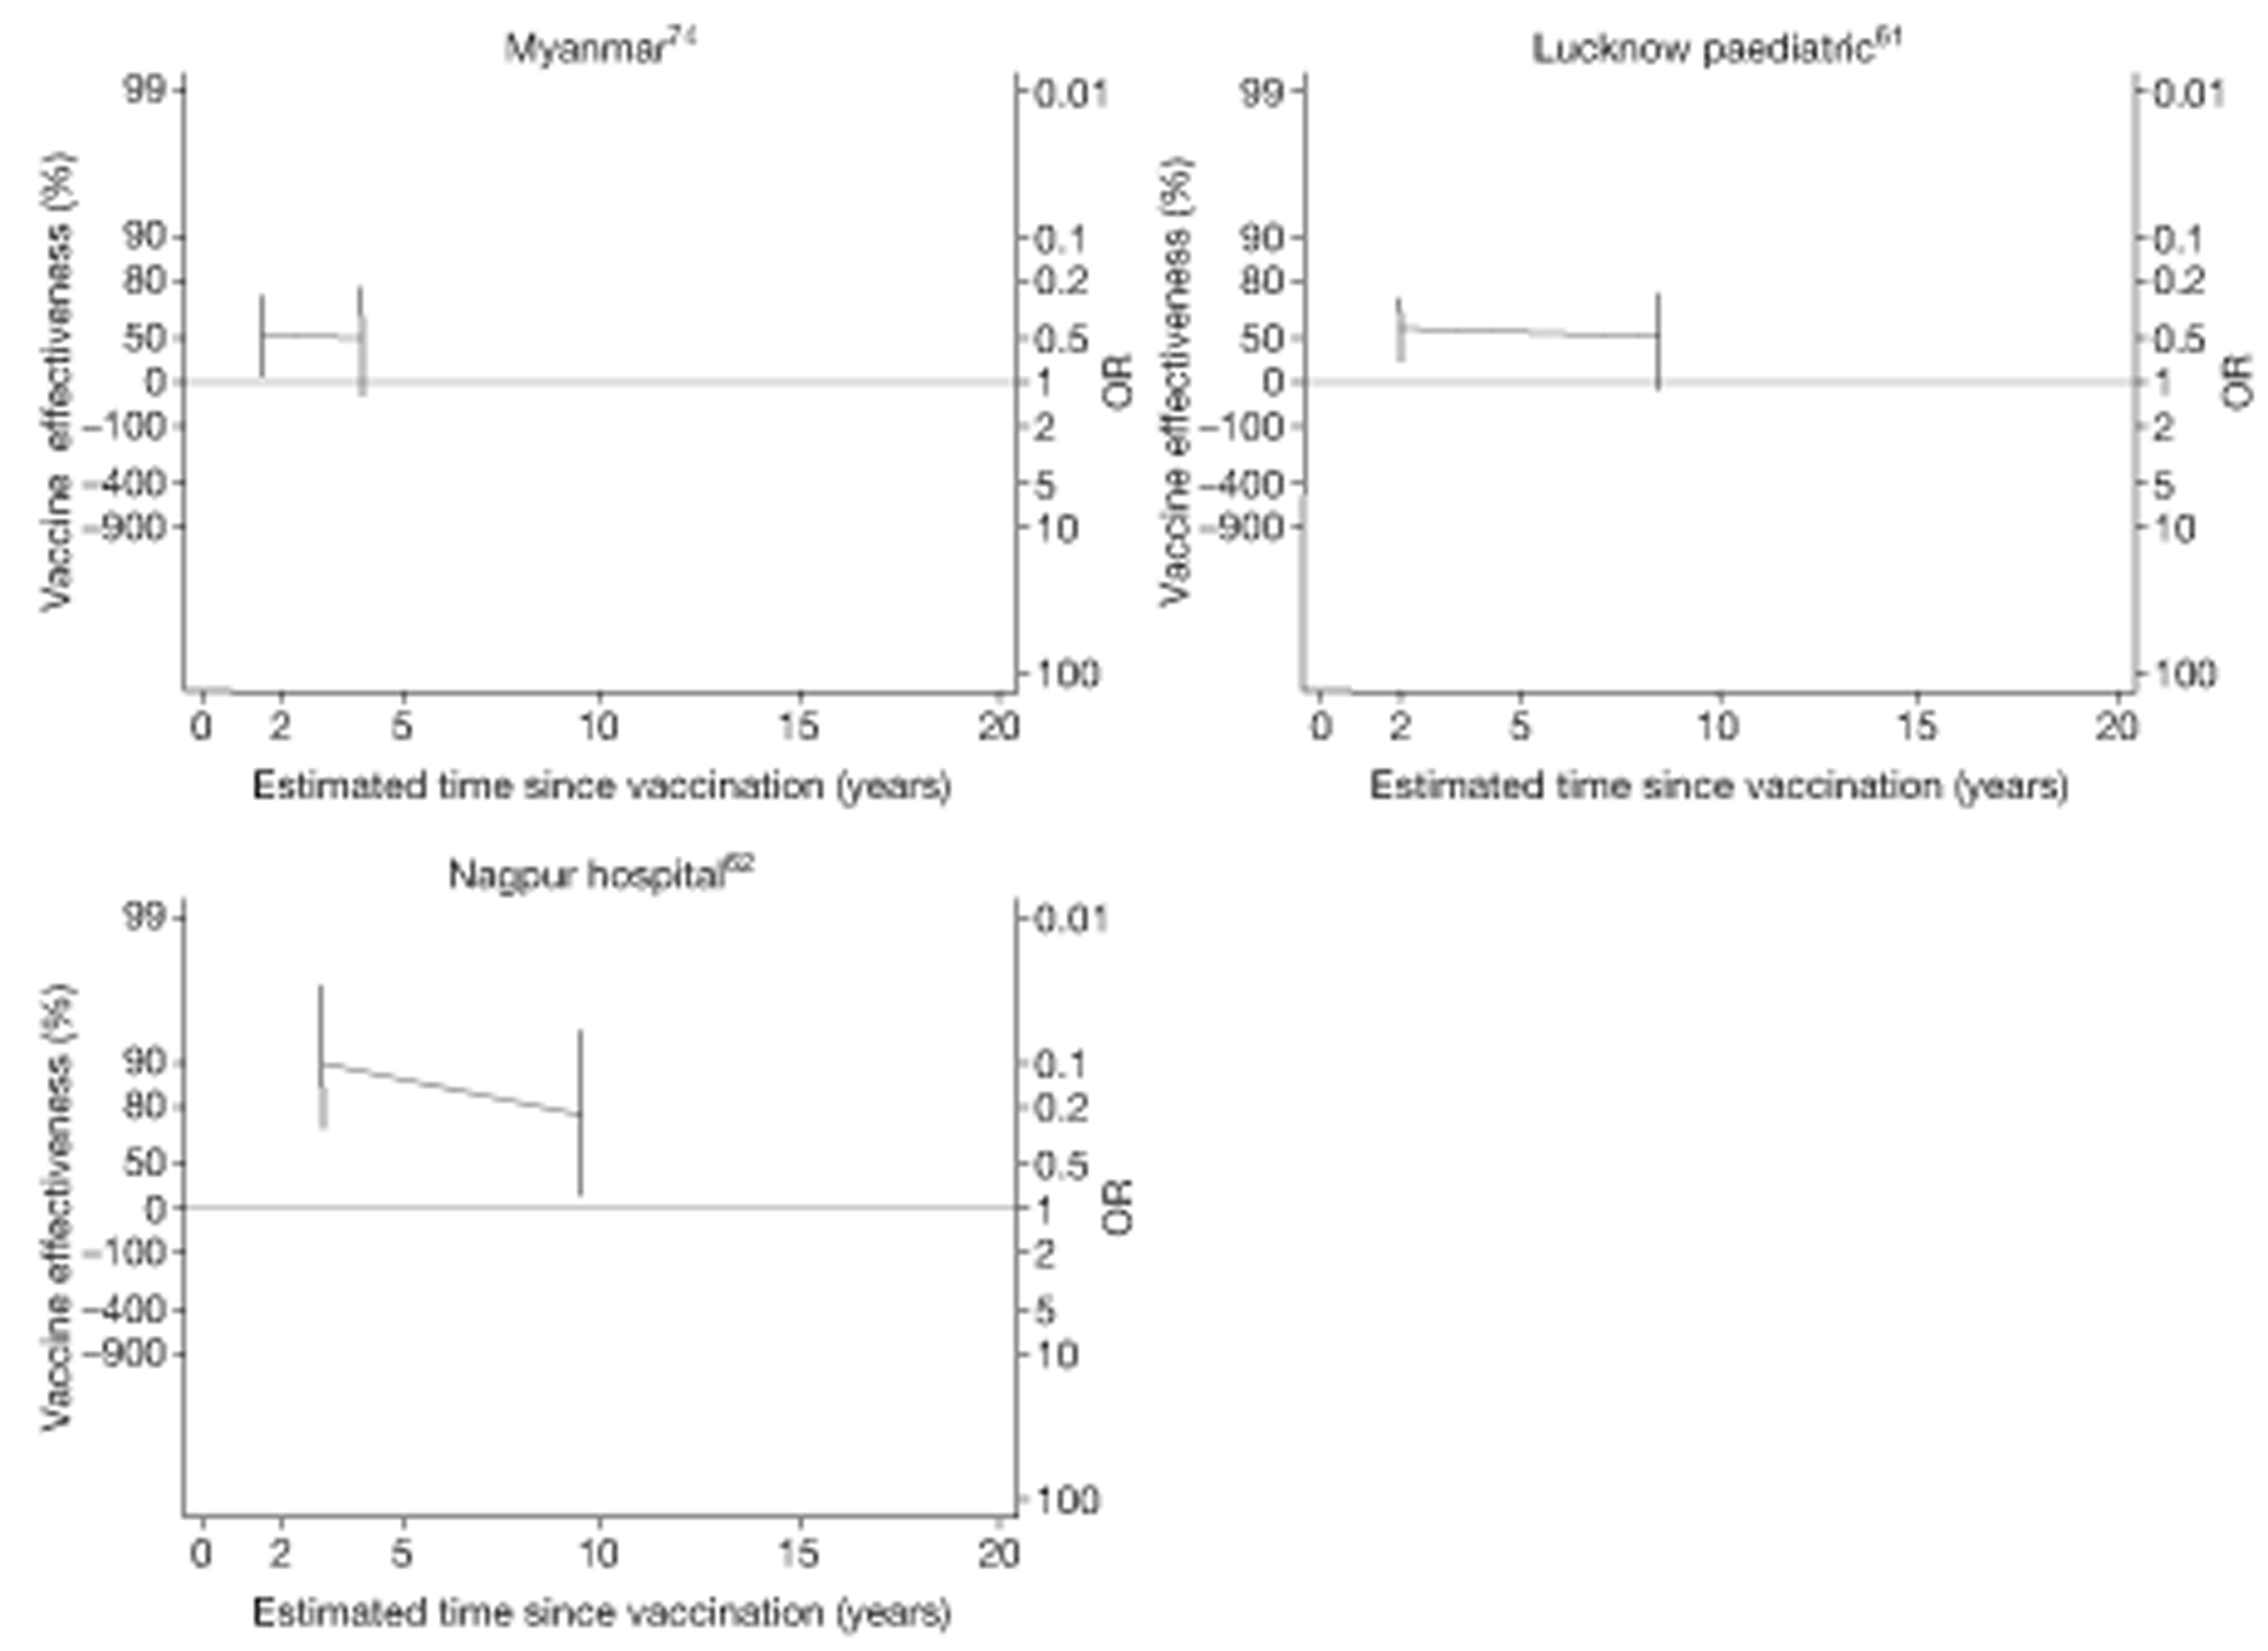
FIGURE 118.
Vaccine effectiveness and rate ratios (with 95% CI) comparing the prevalence of tuberculosis meningitis among BCG vaccinated individuals with that in unvaccinated individuals over time, in a case population study. 170
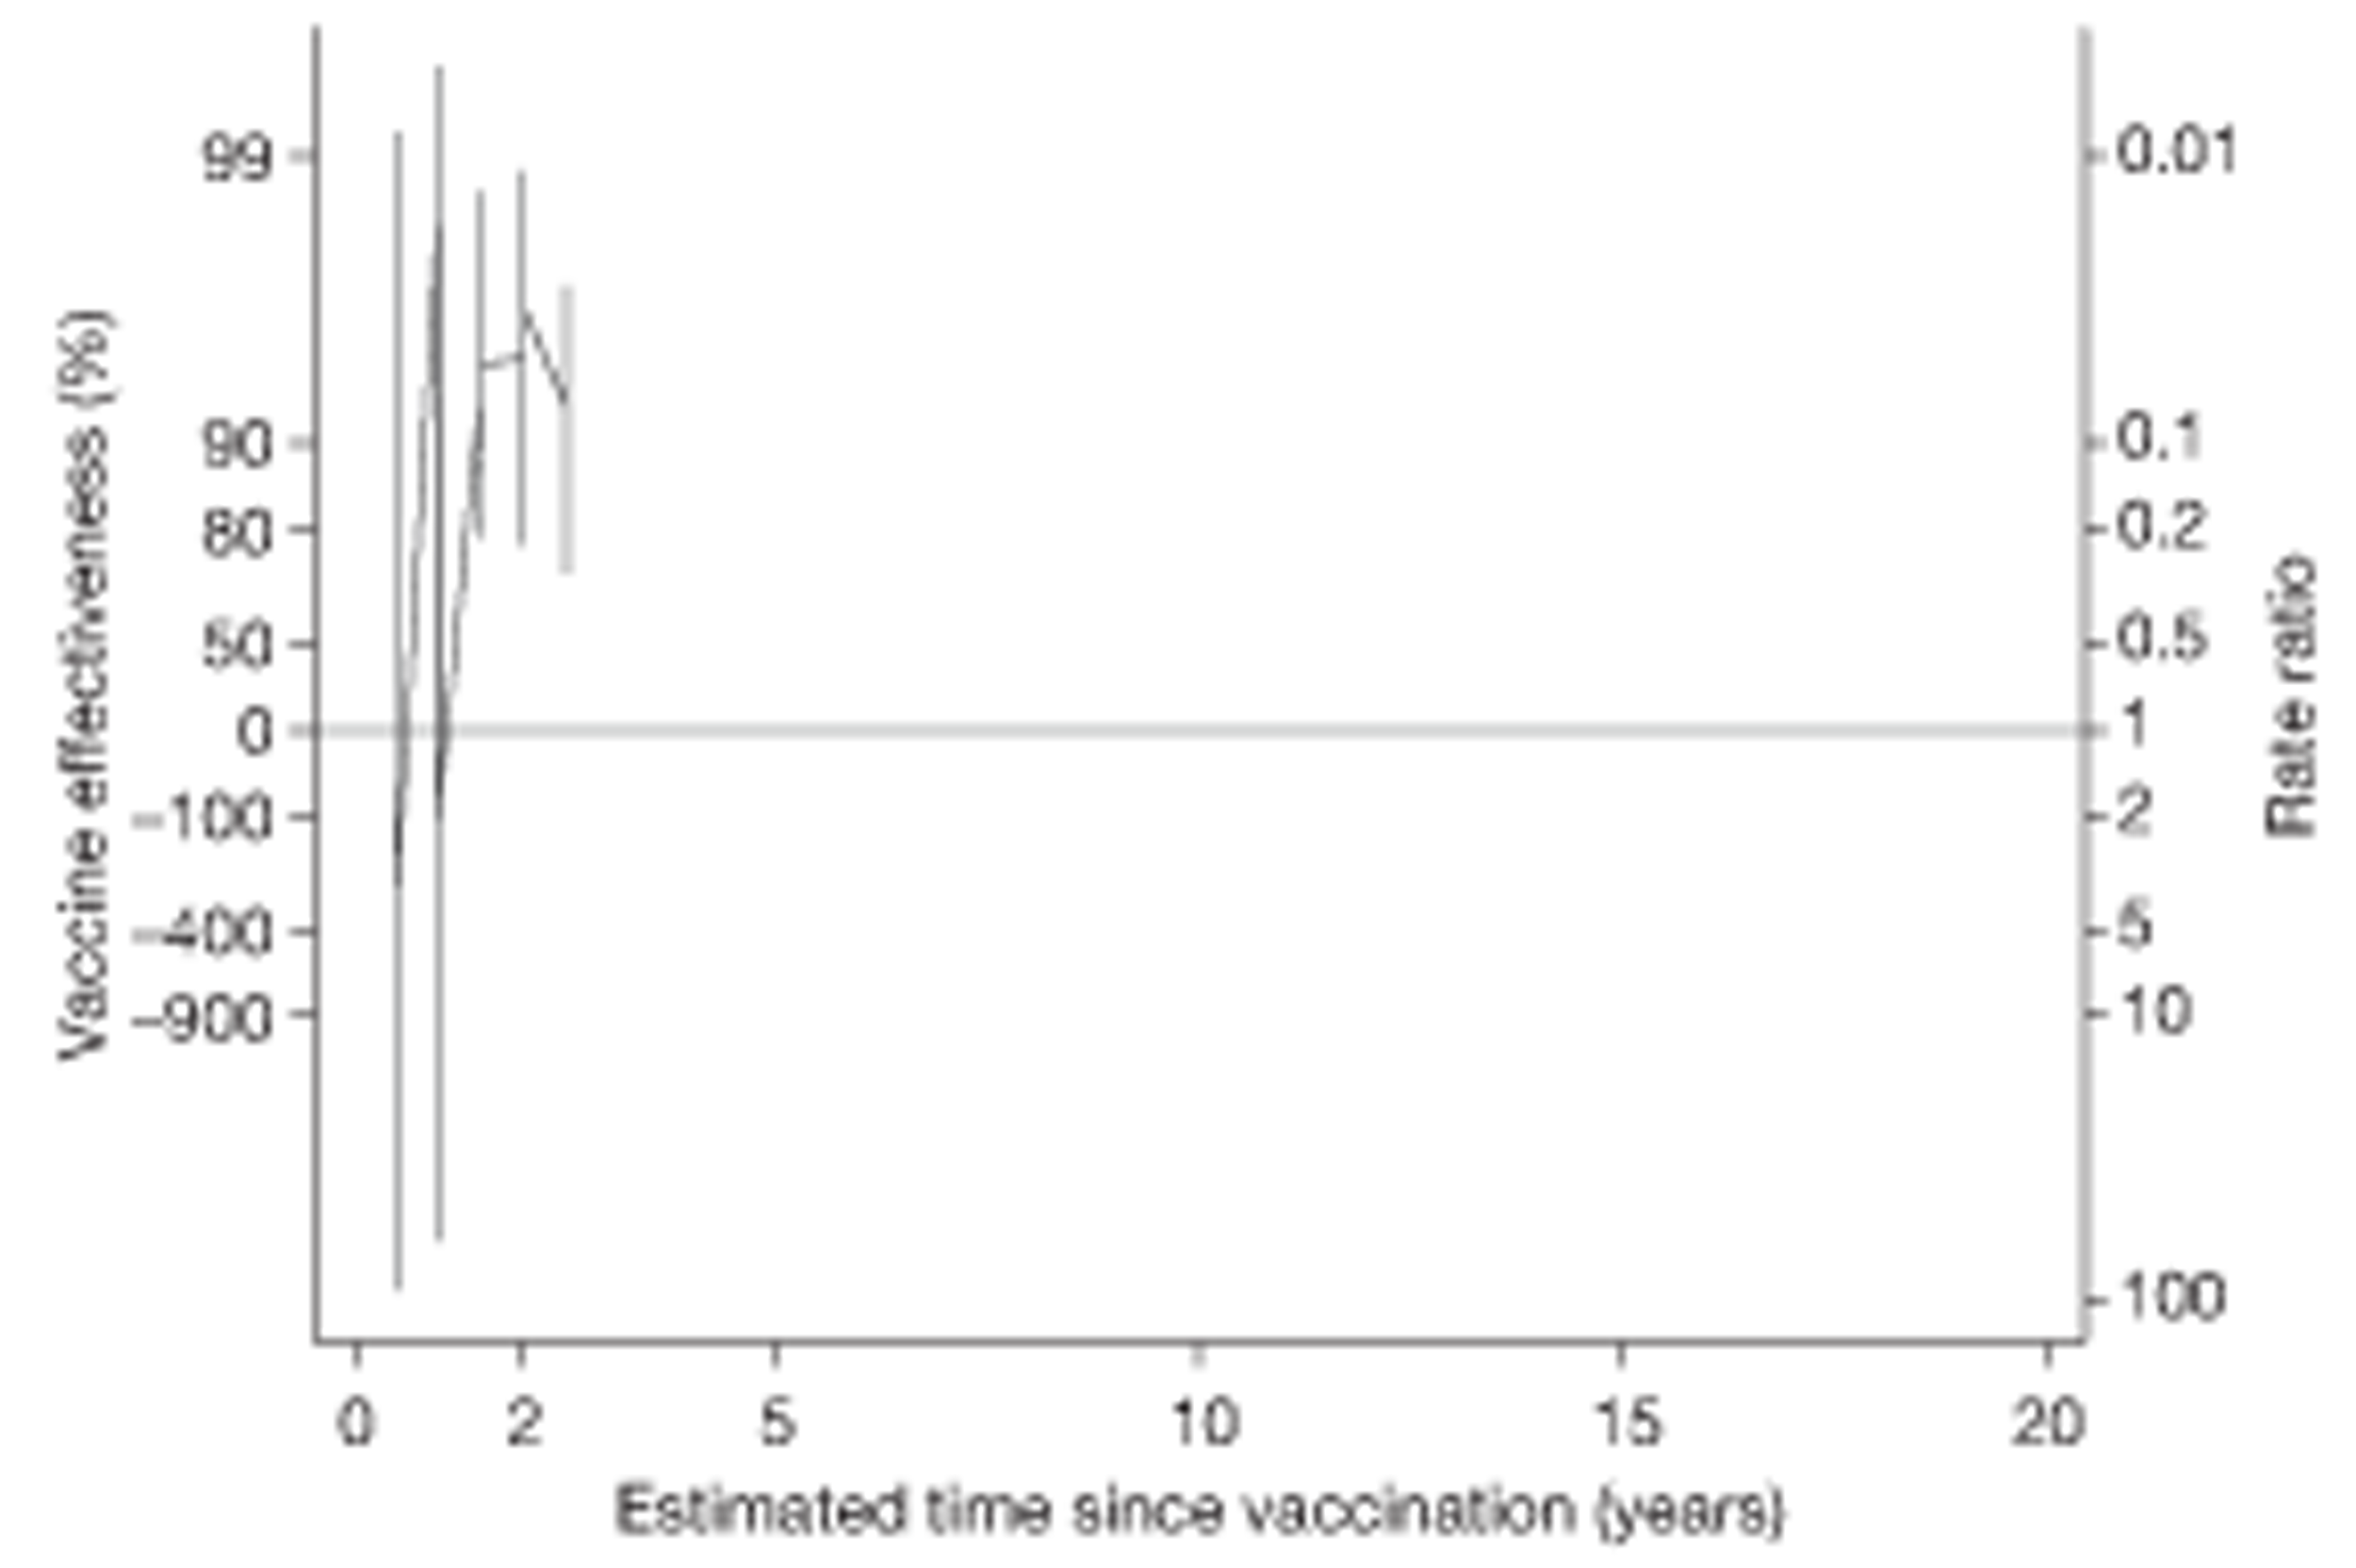
None of the case–control studies provided data to assess duration of protection beyond 10 years. Although all three studies61,62,74 showed evidence of protection against these severe forms of disease at 2 years, only the Nagpur study62 showed a protective effect at 10 years.
Case–control studies
See Figure 117.
Case population studies
See Figure 118.
Figure 119 shows that on average, the protective effect of BCG vaccination against tuberculosis meningitis declines over time, with a summary ratio of ORs per 5 years' follow-up 1.23 (95% CI 0.68 to 2.23) for case–control studies, whereas the annual change in RR in the Czechoslovakia Meningitis case population161 study was found to be 0.78 (95% CI 0.03 to 21.09) per 5 years' follow-up.
FIGURE 119.
Change per 5 years (with 95% CI) in the OR comparing the BCG vaccination status of tuberculosis meningitis cases and control subjects in case–control studies. a, Date of study publication was used if study start date was not available. D + L, DerSimonian and Laird method; I – V, inverse variance method.

Extrapulmonary tuberculosis
Only one case–control study62 provided sufficient data to estimate the duration of protection by BCG vaccination against extrapulmonary tuberculosis (Figure 120). This study showed evidence of protection beyond 20 years after vaccination. The study showed modest evidence of a decline in protection with an annual change in the OR of 1.07 (95% CI 0.83 to 1.37) per 5-year follow-up. No cohort, case population or cross-sectional study provided data for duration for extrapulmonary tuberculosis.
FIGURE 120.
Vaccine effectiveness and ORs (with 95% CI) comparing the BCG vaccination status of extrapulmonary tuberculosis cases and control subjects over time in a case–control study. 62
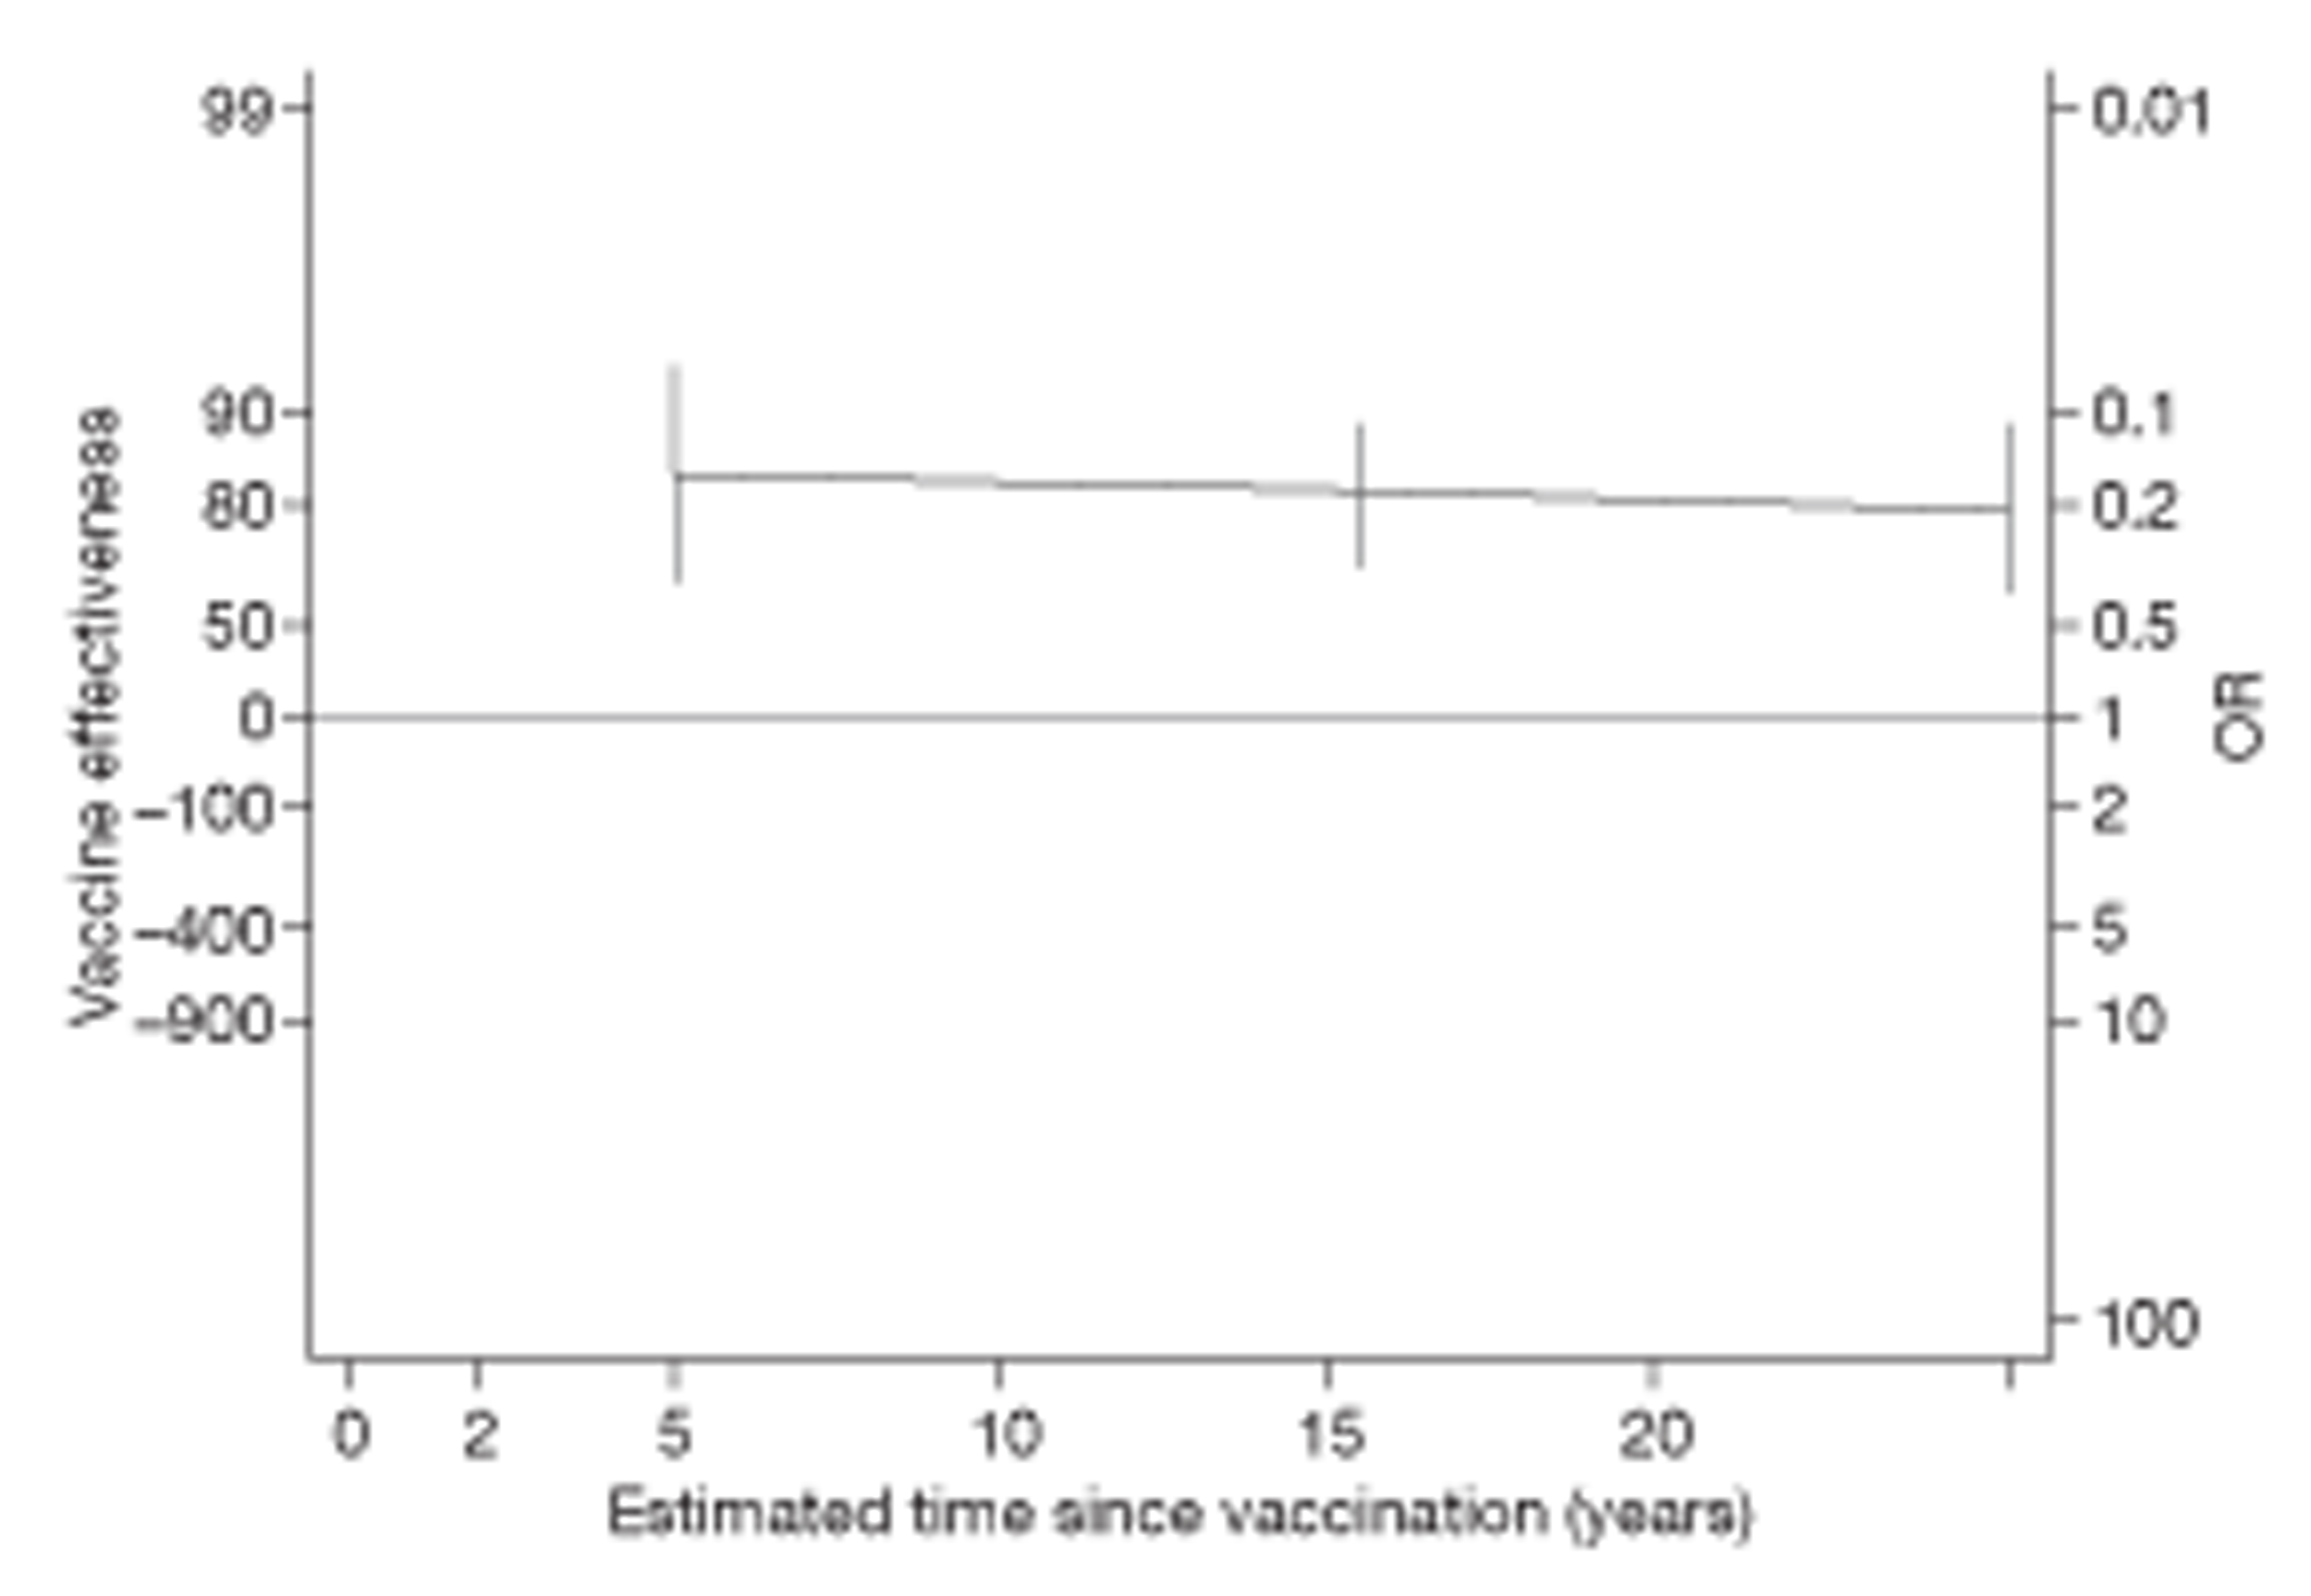
Case–control studies
Tuberculosis mortality
No observational studies provided data on tuberculosis mortality.
Duration of efficacy after 15 years
Randomised controlled trials
Pulmonary tuberculosis
Six studies5,15,28,49,53 (see Figure 89) provide data on the efficacy of BCG vaccination at and beyond 15 years after vaccination. The Native American study,5 with the longest follow-up, showed evidence consistent with a strong protective effect against pulmonary tuberculosis up to 20 years after vaccination. None of the other studies showed evidence of a protective effect beyond 15 years.
All tuberculosis disease outcomes
Seven5,14,15,28,49,53 of the 10 trials5,13–15,28,48,49,53 providing duration data investigated protection beyond 15 years (see Figure 98). The Native American trial,5 which provided data on 60 years of follow-up after vaccination against any tuberculosis morbidity outcome, showed some evidence of protection beyond 15 years, although this declined to low efficacy levels in later years. The Puerto Rico Children15 trial also provided evidence of some low levels of efficacy remaining beyond 15 years post vaccination, whereas the other trials did not show evidence of a protective effect beyond 15 years.
Extrapulmonary tuberculosis
Both the Native American5 and Georgia/Alabama15 trials investigated the protection afforded by BCG vaccination against non-meningeal and/or miliary forms of extrapulmonary tuberculosis, and both indicated that some efficacy remained beyond 15 years of vaccination.
Tuberculosis mortality
Only the Native American study5 showed some evidence of BCG vaccination protective effect against tuberculosis mortality 15 years after vaccination; this protection remained constant up to 25 years of follow-up.
Observational studies
Pulmonary tuberculosis
Only one study, the Nagpur case–control62 study, provided evidence of some protection of BCG vaccination against pulmonary tuberculosis up to and beyond 20 years after vaccination.
All tuberculosis disease outcomes
Of nine case–control studies,32,33,56,64,65,73,74,76,77 only the Saudi Arabian study77 investigated evidence for protection beyond 15 years, indicating some protection which declines beyond 20 years after vaccination. Among five cohort studies, the Brazil REVAC6 and the French children studies109 were the only studies that investigated protection against all tuberculosis disease outcomes, with both studies showing evidence of protection beyond 15 years. The only case population study (Ireland Survey167) investigating the effect of BCG vaccination beyond 15 years did not show a long-term protective effect. No cross-sectional study provided information on duration of BCG vaccination protection beyond 15 years.
None of the observation studies provided data on the duration of protection against meningeal and/or miliary tuberculosis beyond 15 years.
Extrapulmonary tuberculosis
The Nagpur hospital case–control study62 showed some evidence of BCG vaccination protection against non-meningeal and/or miliary forms of extrapulmonary tuberculosis beyond 15 years after vaccination.
Chapter 5 Discussion
Bacillus Calmette–Guérin vaccination is recommended by the WHO for infants at risk of tuberculosis and is one of the more widely used vaccines globally. The rationale for this recommendation is based on systematic reviews showing consistent evidence of protection against primary progressive forms of tuberculosis, such as miliary tuberculosis and tuberculosis meningitis. 3,18 Furthermore, economic analyses suggest that this is a cost-effective intervention, especially in high tuberculosis burden countries. 4
It has long been recognised that the apparent effectiveness of BCG vaccines in protecting against tuberculosis (particularly pulmonary disease) varies considerably between populations, to an extent which cannot be attributed to chance alone. Because of this heterogeneity, single pooled estimates of effect (e.g. Colditz et al. 16) are inappropriate. Several factors have been suggested as contributors to the observed variation in effectiveness. These include causal determinants such as BCG strain,42 genetic differences in immune response, infecting strain of M. tuberculosis, force of infection, sunlight, nutrition, helminths, non-tuberculous mycobacteria23,206 and indicators that have been explored in order to make inferences as to the causal determinants (e.g. age at vaccination or exposure to mycobacteria, latitude,23 tuberculin screening, socioeconomic factors or year of study). The extent to which each of these factors might explain variability in the observed effect of BCG vaccination against tuberculosis has been explored in previous reviews, but questions still remain over the relative contribution of these several factors and how they relate to each other.
As the majority of trials and observational studies assessed in this systematic review do not measure potential causal factors such as human genetics, force of infection, infecting strain of mycobacteria or non-tuberculous mycobacteria exposure, this discussion is focused on indicators. The complex relationship between particular indicators (latitude, age at vaccination) and a potential underlying causative factor (exposure to non-tuberculous mycobacteria) is explored in detail. The potential role of strains of BCG vaccine is also discussed. Further analysis of the potential role of other causative factors have been explored in detail in other reviews207 with the majority of opinion concluding that these factors are not likely explanations for the observed variation in effect.
It is widely assumed that the BCG vaccination does not protect those already infected with M. tuberculosis. Several lines of evidence support this view: (1) if antigens of M. tuberculosis itself are insufficient to induce a protective response in an infected individual, it is unlikely that related antigens (e.g. of BCG) could induce such a response; (2) there is evidence of increased tuberculosis incidence over a short period after vaccination in some studies, in particular the Chingleput trial,28 which has been interpreted as the result of BCG vaccination having been given to individuals already infected with M. tuberculosis; and (3) animal studies found that prior exposure to M. tuberculosis induced an effective resistance against a subsequent challenge with M. tuberculosis. 208
In addition to summarising overall estimates of efficacy/effectiveness and the duration of protection from all published studies, as a function of age, latitude, mycobacterial exposure and BCG strain, this review investigates levels of protection against different clinical forms of tuberculosis (pulmonary, all sites, extrapulmonary, meningeal and miliary tuberculosis).
In addition to summarising overall estimates of efficacy/effectiveness and the duration of protection from all published studies, as a function of age, latitude, mycobacterial exposure and BCG strain, this review investigates levels of protection against different clinical forms of tuberculosis (pulmonary, all sites, extrapulmonary, meningeal and miliary tuberculosis).
Summary of evidence on efficacy of bacillus Calmette–Guérin vaccination
Pulmonary tuberculosis
The results of all trials taken together show that protection against pulmonary tuberculosis is variable and is, in general, correlated with latitude (higher away from the equator). Protection is also higher when the vaccine is given to infants or to school-age children, with stringent exclusion of those with previous sensitisation to PPD (normally assumed to reflect previous tuberculosis infection) but lower when administered at older ages.
Observational studies also contribute evidence on the effect of BCG vaccination against pulmonary tuberculosis. However, owing to poor reporting of site of disease and study limitations, the best evidence is provided by trials. Although few case–control studies were considered suitable for inclusion in this review, their results were consistent with the observation of the effect of latitude and age at vaccination on the protective effect of BCG vaccination as seen in trials. We included only cohort studies that had stringent exclusion of those sensitised to tuberculin. Among all included cohort studies, there was evidence of good protection by BCG vaccination against pulmonary tuberculosis. Greater protection was found at higher latitude, where BCG vaccination was given to infants and in studies that used a retrospective design.
Extrapulmonary (excluding meningeal and miliary tuberculosis)
Although numbers of cases are in general too small to provide strong evidence, the results of trials suggest that BCG vaccination protection against extrapulmonary tuberculosis (excluding meningeal and miliary tuberculosis) was similar to that against pulmonary disease. It also varied by latitude, age at vaccination and stringency of exclusion on the basis of prior tuberculin sensitivity. The results of individual trials suggest that protection has been high when BCG vaccination was given in infancy or to school-age children following stringent exclusion for prior tuberculosis infection.
Meningeal and miliary tuberculosis
Although there were small numbers of cases of meningeal and miliary tuberculosis in trials, all but one trial indicated a protective effect of BCG vaccination against meningeal and miliary tuberculosis. Among case–control studies, good protection was observed against meningeal and miliary tuberculosis with no statistical evidence of variation by latitude or by age at vaccination. Similarly, cohort studies showed evidence of good to high protection, which did not vary by latitude or age at vaccination. Although the level of protection was uniformly high for cohort studies, retrospective studies found a slightly lower, but still good, protective effect.
All tuberculosis morbidity outcomes
Many of the trials and cohort studies reported only overall tuberculosis outcomes and not results for specific sites of disease. As expected, the observed effect of BCG vaccination on all tuberculosis outcomes was consistent with those on pulmonary and extrapulmonary disease.
Mortality
Very few studies assessing the effect of BCG vaccination met our inclusion criteria. Of included studies, moderate-to-good levels of protection against mortality were observed from both trials and observational studies.
Bacillus Calmette–Guérin strain
Our analysis found that the protective effect of BCG vaccination did not differ by the strain of BCG vaccine used in trials. Further details are provided in the section ‘Strain of Mycobacterium bovis bacillus Calmette-Guérin in vaccines’, below.
Summary of evidence on duration of protection
We found good evidence from trials and observational studies that BCG vaccination protects against pulmonary and extrapulmonary tuberculosis for up to 10 years, and in two trials (Puerto Rico15 and Native American trials5) beyond 10 years, with one trial (Native American5) providing evidence for protective efficacy of up to 52% for all tuberculosis outcomes beyond 15 years. The strength of protection appears to decline with time. Most studies either did not follow up participants for long enough to detect change over time or else have very few cases after 15 years. The absence of evidence from the majority of trials can therefore not be taken as an absence of effect. Similarly, just a few observational studies provide evidence of long protection: two case–control studies (Saudi Arabia62 and Nagpur in India77) and two cohort studies (French Children6 and Brazil Revaccination109) found evidence of protection against all tuberculosis disease after 15 years of 20%, 50% and 50%, 40%, respectively. The protective effect found in the observational studies and the North American Indian trial5 requires further confirmation.
There is some variation in the rate of decline with time in trials and observational studies. The number of trials with information to enable investigation of the reason behind the decline was small, but the pattern was similar. The rate of decline was greater in studies further away from the equator, in trials conducted among infants, and with the highest level of stringency in exclusion of tuberculin positives. Too few observational studies reported on duration of protection to contribute to the explanation for the variation in the rate of decline.
Efficacy and duration of protection
In summary, this review found that in situations in which BCG vaccination was given only to either infants or to children after stringent exclusion of tuberculin positives, there was evidence of a good protective effect with limited variation by form of disease (although magnitude of protection appeared to be consistently higher for meningeal and miliary tuberculosis than other forms of disease) or study design. Efficacy also seems to vary by latitude, but there were not enough studies to disentangle the effects of prior tuberculin sensitivity, age at vaccination and latitude. Efficacy declined with time, but in five studies there was measurable protection at beyond 15 years after vaccination. The rate of decline varied between populations and studies, and although these trends failed to reach statistical significance, the pattern of decline was consistent with faster decline in latitudes further from the equator and in situations where BCG vaccination was given only to either infants or to children after strict screening for tuberculin sensitivity.
Interpreting the heterogeneity in protection offered by bacillus Calmette–Guérin vaccination
The heterogeneity in protection by BCG vaccination is too large to be explained by chance, as assessed by the tau-squared statistical measure used in this report. Our review of the global literature shows that three factors were particularly associated with the differences in magnitude of protection: age (higher protection when BCG vaccination given in infancy rather than at older ages); stringency of exclusion criteria based on tuberculin testing (higher protection when the exclusion was stringent); and latitude (higher protection at higher latitudes, i.e. further from the equator). As has been pointed out in the past, each of these observations is consistent with a hypothesis that BCG vaccination is more effective in an immunologically naive individual or population than in individuals or populations sensitised to mycobacterial antigens. Infants are less likely than older individuals to have been exposed to mycobacteria, stringent exclusion of tuberculin-sensitive individuals ensures that participants are immunologically naive, and there is evidence that environmental mycobacteria are less prevalent further away from the equator.
The hypothesis that exposure to non-tuberculous mycobacterial antigens could influence the observed effectiveness of BCG vaccination was first articulated during the 1960s, by Palmer et al. ,209 to explain the striking difference between the low protection observed in trials carried out in southern USA compared with the high protection observed in trials carried out in the UK (it was found that populations in southern USA, where the trials were carried out, have a high prevalence of sensitivity to M. intracellulare and other environmental mycobacteria). The hypothesis has been supported by extensive animal and human population studies over the past 50 years. 23,206,210
We point out below how the observations in this global review are consistent with this hypothesis, and use these data to explore subsidiary mechanistic hypothesis: whether the influence of environmental mycobacteria is mediated through ‘blocking’ the effect of BCG vaccination (i.e. prior sensitivity somehow prevents BCG vaccination from inducing an appropriate immune response) or ‘masking’ the effect of BCG vaccination (i.e. exposure to environmental mycobacteria before or after BCG vaccination induces an immune response similar to that induced by BCG vaccination, and against which BCG vaccination can add little). 211
Why higher protection when bacillus Calmette–Guérin vaccination is given at birth or at school age with stringent sensitivity testing?
Stringent tuberculin sensitivity testing permits the identification of children sensitised by mycobacteria (either tuberculous or non-tuberculous). Children vaccinated in the first year of life are unlikely to have been infected by mycobacteria (either tuberculous or non-tuberculous). Our results appear to suggest that the BCG vaccination will be protective to any child or young adult who is not sensitised (i.e. as long as there is exclusion of tuberculin-sensitive children). Although many trials and cohort studies did undertake tuberculin skin testing, there was considerable variation in the concentration of PPD used and of the cut-off point considered for exclusion. Our criterion of ‘stringent’ testing, which is based on two-stage testing with retesting of initial non-reactors with a stronger dose of tuberculin, should exclude children previously sensitised with M. tuberculosis. It is, nevertheless, possible that the criteria to declare a person previously infected have not always been sensitive enough.
Our stringent criteria should also exclude children previously sensitised with most species of non-tuberculous (sometimes called ‘environmental’ or ‘atypical’) mycobacteria. Evidence from a variety of approaches supports the role of exposure to non-tuberculous mycobacteria in explaining the observed variation in protection. First, animal studies show less protection by BCG vaccination in guinea pigs previously exposed to non-tuberculous mycobacteria. 209 Second, there is likely to be differential exposure to non-tuberculous mycobacteria in different settings, and this would explain the latitude gradient in protection. 23,211,212 Third, follow-up of more than 1 million US naval personnel showed that tuberculosis incidence was lowest in the group who were sensitive to M. intracellulare or M. gaussi antigens, but not to M. tuberculosis antigens. 210 Fourth, several studies have shown a J-shaped relationship between tuberculin reactivity and subsequent risk of tuberculosis, with lowest risk among individuals with low (around 5 mm) levels of tuberculin reactivity, an observation which has been interpreted as evidence that individuals with some non-specific mycobacterial sensitivity are at lowest risk of tuberculosis. Finally, data from randomised controlled studies in the UK and Malawi, comparing the whole-blood PPD and delayed-type hypersensitivity response to PPD before and after BCG vaccination in infants, suggest that differential sensitisation due to exposure to environmental mycobacteria is the most important determinant of the observed differences in immunogenicity213 (although the study did not explore differences on actual protection). It is important to note that the immunological response induced by different mycobacteria is likely to differ. 208
Prior sensitisation to mycobacteria and non-tuberculous mycobacteria provides an explanation for the lack of protective effect observed in the Chingleput study,28 where the majority of cases of active tuberculosis arose among tuberculin-sensitive adults.
This review has found consistent evidence of protection when BCG vaccination is given to infants and to school-age children with stringent sensitivity testing. The issue of infant vaccination overlaps with previous tuberculin sensitivity as, by definition, most infants would not be tuberculin skin test positive. The data were less consistent for the effect of BCG vaccination given at other ages and/or all age groups. Nevertheless, the observation that BCG vaccination, when given in infancy and school age, was protective against pulmonary tuberculosis calls for further research into what is the optimum stringency of tuberculin skin testing to identify adults who will be protected by BCG vaccination in these other age groups.
Taken together, these observations suggest that BCG vaccination works well, even against pulmonary disease, as well as in adolescents, as long as they are not sensitised to mycobacteria (tuberculous or non-tuberculous mycobacteria) prior to BCG vaccination. Prior sensitisation, at least in part, explains the variable reduction in protective efficacy against pulmonary tuberculosis.
Latitude: is this the same effect as that of age and stringency?
The findings of this review confirm that the latitude of the study explains a substantial element of the observed heterogeneity in protection against pulmonary disease irrespective of study type. The observation in this review that studies conducted at latitudes closer to the equator show lower levels of protection than studies conducted at more distant latitudes (mainly northern locations presumably with lower exposure to non-tuberculous mycobacteria) is also consistent with the explanation that exposure to non-tuberculous mycobacteria may explain at least a part of the differences between studies. We did not have a sufficient number of studies to separate the effect of age at vaccination/prior sensitisation from that of study latitude.
Blocking compared with masking
Two non-mutually exclusive hypotheses potentially explain the effect of exposure to tuberculous and non-tuberculous mycobacteria on the observed effect of BCG vaccination. First, previous exposure to mycobacteria might lead to lower efficacy (blocking) because the study population is already sensitised to mycobacteria, and this somehow hampers BCG vaccination from causing immunity. In a sense, this is an extension of the assumption that BCG vaccination does not protect those already infected with M. tuberculosis, but extends it to those already sensitised with either M. tuberculosis or various species of non-tuberculous mycobacteria, and thus there is a need for stringent criteria to define sensitisation. For blocking, exposure to mycobacteria after vaccination is irrelevant. Our data suggest that blocking may be an important determinant behind the variation in protection against pulmonary disease.
The second proposed mechanism, masking, proposes that exposure to mycobacteria provides protection, and continuing exposure following vaccination leads to a gradual reduction in the observed effect of BCG vaccination through increased protection caused by exposure to mycobacteria of unvaccinated participants (masking). The exact mechanism is likely to vary depending on the kind of mycobacteria (and other microbes that share antigens with them) and exposure levels (doses, routes) that all differ greatly between populations. Heterologous exposure/sensitisation is unlikely to be a simple all-or-none affair. An important consideration is whether or not the protection imparted by such heterologous exposure works by similar mechanisms/pathways as BCG vaccination does. 214 We will return to masking when discussing reduction in efficacy with time.
Strain of Mycobacterium bovis bacillus Calmette–Guérin in vaccines
Several previous reports have attributed variation in the results of trials to genetic differences in BCG vaccines. Two studies215,216 reported differences in the effect of two different strains of BCG (Paris and Glaxo vaccines), albeit in different directions. Others have argued that manufacturers may have selected strains over time to lower adverse effects, thereby inadvertently selecting less effective strains, although the latitude of the location of the evaluation studies largely explains the observed differences.
It has long been known that the there are genetic differences between BCG vaccines. 217 Behr and Small43 showed, using restriction fragment length polymorphism typing, that BCG strains have undergone evolution since 1921. For example, the region of difference 2 (RD2) marker is absent in strains derived after 1925 (i.e. in Pasteur-1173 P2, Copenhagen-1331 and Glaxo-1077) and present in derivatives of the earlier Pasteur BCG strains (i.e. Brazilian/Moreau strain, Tokyo-172 and Russian substrains), and all strains of BCG lack region of difference 1 (RD1) genes. However, Kozak and Behr218 have shown, using animal models, that the loss of RD2 in vaccine strains lowered immunogenicity but not protection against pulmonary tuberculosis. Another study compared the whole genomes of 13 BCG strains and found six large sequence polymorphisms affecting genes that encode known virulence factors. 219 More recently, Brosch et al. 41 used genome sequencing to postulate that ‘early’ BCG vaccines (those derived before 1930 or 1940) may be superior to more recent and widely used variants. 41 They identified tandem duplications, known as DU1 and DU2, which differ between BCG strains. Only BCG Pasteur contains a copy of DU1, whereas other strains include variants of DU1, with older strains (e.g. BCG Russia, Moreau and Japan) having DU2-I. Newer strains, such as BCG Danish/Prague and BCG Tice/Phipps, include DU2-III and DU2-IV variants, respectively. The hypothesis proposed is that repeated passage has led to the loss of immunogenicity in the newer strains of BCG. The analysis presented by Brosch et al. 41 supports the view that genetic differences may explain the observed variation in protection, although data were presented only to support differences in gene expression levels and immunogenicity. Furthermore, Brosch et al. 41 postulate that, after 1925, the strain initially distributed (such as BCG Japan) was replaced by another derivative that is possibly less virulent or reactogenic. As none of the trials was conducted with this earlier strain, the variation in protection observed is not related to the original replacement. Indeed, another study, which used a guinea pig model to compare early strain BCG Japanese and evolutionarily late strains, such as those in DU2 group III (BCG Danish and Glaxo) and group IV (BCG Connaught, Pasteur, and Tice), found no significant difference in protection against M. tuberculosis challenge. 220
Our review fails to find evidence that BCG strain is a significant contributor to variation. Furthermore, the distribution of efficacy estimates from trials was not correlated with specific types/groups of vaccines determined using the evolutionary tree postulated by Brosch et al. 41 Our result supports a previous systematic review, which reached the view that strain variation is not behind the variation in protection against pulmonary disease. 17 Further support for our conclusion can be found in the UK MRC trial,14 which found equivalent protection from the Copenhagen strain of BCG and an Mycobacterium microti-derived vaccine (vole bacillus). 21
The Chingleput study
Throughout this report, the results of the Chingleput study28 have stood out in comparison with the other trials. The reasons for the observed increase in tuberculosis among vaccinated compared with unvaccinated individuals during the first few years after vaccination have been explored in detail in previous reports. 22 In brief, the majority of cases during this period occurred in tuberculin-sensitive adults suggesting an abnormal reaction to BCG vaccination. The data from this study suggest a complex interaction of age and time effects. Further analysis of data from the Chingleput study28, restricted to those with a tuberculin skin reaction of < 8 mm, suggested that BCG vaccination did provide protection to children of < 15 years of age, but no protection for subjects ≥ 15 years old, and may even have imparted negative protection among these older individuals. 22,221
Summing up the evidence for variation
It is likely that more than one factor plays a role in explaining the observed differences. Meta-regression analysis indicates that latitude and age at vaccination are the key factors that explain the observed variation in effect between studies. Studies conducted in latitudes further away from the equator and/or where the vaccine was given to naive individuals (either infants or children who had stringent tuberculin sensitivity testing prior to enrolment) were therefore most likely to detect an appreciable protective effect.
Duration
Why lower (or even negative) protection in the first 5 years after bacillus Calmette–Guérin vaccination in some trials?
There is evidence that BCG vaccination is not protective when given to children already infected with M. tuberculosis. Our results suggest that in trials of subjects of all ages, without stringent sensitivity testing, there is an increase in rates of active tuberculosis in the first 5 years, and excluding the first years of each study leads to a greater protective efficacy, which supports this hypothesis. 22 In particular, a review by Fine23 explores the reasons for the harm observed in the first 5 years of the Chingleput study. 28 The majority of cases of active tuberculosis arose among tuberculin-sensitive adults. Indeed, further analysis suggests that BCG vaccination might have been protective in tuberculin skin test-negative children. 22,221
How long can bacillus Calmette–Guérin vaccination protect?
This review provides the most comprehensive analysis to date of studies on the duration of protection by BCG vaccination. This, in part, has informed cost-effectiveness analysis underlying vaccination policy [National Institute for Health and Care Excellence (NICE)].
Previous systematic reviews7,23 have noted the absence of evidence of any protection by BCG vaccination beyond 15 years after vaccination, based on a limited number of studies. The failure to observe longer-term protection in trials may be related to small numbers as the study population ages, including overall small numbers in the intervention and control groups as well as declining number of individuals who might be exposed to tuberculosis; coincidental fall in tuberculosis incidence in many countries, leading to a lower probability of subsequent exposure; or perhaps because protection is mainly against primary progressive disease and not against reactivation at a later age.
As further data accumulate, mainly from observational studies but also from trials, evidence is emerging showing that BCG vaccination protection can last for much longer periods. A question therefore exists about what might be behind the loss of protection with time.
Reasons behind the loss of protection with time
There is consistent evidence of a decline in protection from all study designs examined and across disease outcome types. Decreasing protection with time may reflect true deterioration due to a waning immune memory or it may arise from exposure to mycobacteria giving protection to the unvaccinated subjects such that, with time, the ‘apparent’ protection measured by comparing vaccinated and unvaccinated subjects decreases (‘masking’).
There were too few studies examining duration of protection for the majority of tuberculosis outcomes reviewed here to investigate the factors associated with the apparent variation in effect. Trials examining all tuberculosis outcomes provided the largest group of studies. Meta-regression analysis of the characteristics of these trials suggests that latitude and the composite variable ‘age at vaccination and/or prior tuberculin skin testing’ explained the majority of the observed variation.
The waning in protective effect against pulmonary disease was more marked when BCG vaccination was given to individuals not previously sensitised, which could reflect a progressive erosion of the naiveté of the vaccinated and unvaccinated populations over time due to exposure to mycobacteria. Although not explicitly proven with measurements of tuberculin sensitivity in the studies described in this report, the observed effects of latitude, tuberculin sensitivity screening and age at vaccination on the effectiveness of BCG vaccination leads us to this conclusion. This is consistent with the masking mechanism. The waning was more marked away from the equator, where the prevalence of non-tuberculous mycobacteria is presumed to be lower. However, this is at least in part explained by the lower initial efficacy observed in trials closer to the equator.
Strengths and limitations of the review
Limited number of trials and studies
Although we reviewed 132 studies, and we identified a clear pattern behind the variation in protection against pulmonary disease, we did not have enough studies with sufficient data to explore separately the effect of exclusion of sensitised subjects (by neonatal vaccination or stringent tuberculin sensitivity testing) and the effect of latitude. The small number of studies in each study design limited the usefulness of the evidence they provided.
Comprehensive search but many trials/studies had limited information about sensitivity testing, selection of control subjects and case definition
We undertook a comprehensive search of the literature and screened a large number of papers with no language restrictions, therefore reducing the probability of bias. Nevertheless, it is possible that we have missed some studies. In addition, due to views about the efficacy of BCG vaccination based on the results of trials in the UK, it is possible that studies with a negative effect have had a lower probability of being submitted or published in Europe. In the USA, where BCG vaccination has not been recommended owing to the negative results of trials, there might be a publication bias favouring negative studies. This is unlikely to be a major factor, but we have not formally tested for publication bias.
Although we reviewed a large number of studies, many were quite old and published before a clear understanding of comprehensive reporting or format of reporting were agreed. Many of the studies do not report information now recognised to be important (e.g. concentration of the PPD used, or cut-off point used to define a positive TST) and this limited the usefulness of the data they provided for analysis of the reasons behind variation of protection, or variation in the rate of decline of protection. This was regrettable, as analysis of the trials and observational studies that did provide that information suggests that this alone, or maybe in conjunction with latitude, may explain the majority of the variation of BCG vaccination protection.
For all objectives, insufficient data points limited our ability to undertake important subgroup analyses, for example on protection in HIV-infected populations, which are an increasingly important global concern.
Study design/quality
Owing to the limited number of trials available, we included evidence from observational studies in several areas. This was mainly important for meningeal and miliary tuberculosis, as these outcomes are relatively rare and thus uncommon in trials but were reported in case–control studies. Although we have used meta-regression analysis to attempt to explain the observed variation in the effect of BCG vaccination, it is important to acknowledge that meta-regression, especially of observational studies, is still subject to the underlying biases affecting each study design. Furthermore, meta-regression is akin to an ecological analysis treating each study as the unit of observation. Nevertheless, this approach has allowed us, for the first time, to explore the effects of numerous factors and adjust for the relative effect of other variables in the same model.
Randomised controlled trials provide the best evidence for the effectiveness of any intervention. Unfortunately, data from trials investigating BCG vaccination efficacy are limited largely by the fact that most were conducted decades prior to the development of robust standard methods for RCTs. Therefore, it is not surprising that they are subject to several potential biases, and some failed to report essential information, for example on the strength of PPD used for tuberculin sensitivity testing. Nevertheless, the data reviewed provide good trial-based evidence of efficacy against miliary tuberculosis, tuberculous meningitis, pulmonary tuberculosis and mortality. The data from observational studies are also consistent with a protection by BCG vaccination against forms of disease. Retrospective cohort studies appear to show a greater protective effect than prospective studies for some outcomes (e.g. pulmonary tuberculosis), although both types of studies were associated with a beneficial effect.
A previous appraisal by Clemens et al. 40 provided a framework for our assessment of trial quality. Following careful consideration, we abstracted the quality criteria outlined in this review but a priori selected one criterion – blinding of study staff who assessed outcome on BCG vaccination status or the use of active surveillance – to inform our judgement about quality in the statistical models. Based on these criteria, which we described as diagnostic detection bias, studies with a lower risk of bias had a more significant protective effect compared with those with a higher risk of bias. This is contrary to the usual pattern in which biased studies are generally associated with an exaggeration of effect size.
Although we provided the duration of each trial and how protection varied during the follow-up, in our analysis of the reasons for variation in protective efficacy between studies, we used the average protection over the duration of follow-up and did not include study duration as a covariate. This, inappropriately, averages the effect size over different durations, likely underestimating efficacy as protection declines with time. Nevertheless, the identification of the same covariates as the main drivers of variation in the analysis of protection duration suggests that the analysis of effectiveness is valid.
Our interpretation
From this meta-analysis, of the alternative explanations for variations in BCG vaccination protection, we have concluded that BCG strain is not relevant. We did not, however, explore human genetic differences, genotypic differences between infecting mycobacteria or a variety of other explanations proposed for the variation in protection by latitude, such as differences in exposure to UV light (owing to its mycobacterial killing effect), levels of vitamin D, helminthic infestation and the effect of poor nutrition on immune response. Previous reviews have concluded that these factors are less plausible explanations for the observed variation in protection. 207 Furthermore, although this review did not set out to confirm or refute these potential explanations, our comprehensive search of the literature found no evidence to support any of these, whereas the combination of age at vaccination, stringency of testing and latitude explained a large proportion of the variation. Previous reviews did not explore stringency of tuberculin skin testing in detail.
It is likely that more than one factor plays a role in explaining the observed differences. We carried out meta-regression analysis on the data available, which was limited, from many studies. With all its limitations, the analysis demonstrated that young age at BCG vaccination, with stringent testing and exclusion, provides consistently high protection even for pulmonary disease, and that variations in age at vaccination, stringency of tuberculin skin testing and latitude are the key factors explaining most of the variation in the observed effectiveness of BCG vaccination between studies.
Studies conducted at latitudes closer to the equator and/or those with less stringent tuberculin sensitivity testing prior to enrolment were therefore likely to have failed to detect a significant protective effect due to the effect of prior infection with M. tuberculosis or non-tuberculous mycobacteria. This failure to detect an effect is not necessarily a failure of the study design, as vaccines are known not to provide protection under certain circumstances. Prior infection may block BCG vaccination by the induction of an ineffective immune response that impairs induction of an adequate immune response after subsequent BCG vaccination.
When examining duration of protection we present additional evidence that BCG vaccination can provide longer duration than previously described. While there is clear evidence of variation in the waning in protection, factors that might explain the observed variation in the rate of decline are less clear (there are not enough studies to provide strong evidence but there is some suggestion that waning is faster in studies where initial protection was higher, and that the same factors associated with high protection are associated with fast waning). However, it is worth acknowledging that a decline is more likely where the initial level of protection is high because there is less room for a decline in settings where there is no protection in the first place. The number of studies with sufficient data both on efficacy at different time periods and stringency of testing, however, is limited; thus the evidence is only suggestive.
Chapter 6 Conclusions
Summary
This review extends the evidence from clinical trials and observational studies that BCG vaccines provide protection against tuberculosis. The apparent effectiveness of BCG vaccines in protecting against tuberculosis varies considerably between populations, to an extent that cannot be attributed to chance alone. Latitude, age at which the vaccine was given and pre-vaccination tuberculin sensitivity status were the factors that explained most of the observed variation. There was no evidence that other factors, such as BCG vaccine strain, explain the observed variation. BCG vaccination appears to work best when given to naive individuals, and these individuals are compared with naive unvaccinated individuals.
Our results suggest that there is good evidence that BCG vaccination protects against pulmonary and extrapulmonary tuberculosis for up to 10 years. The strength of protection appears to decline with time. Data on protection beyond 15 years are limited. Most studies either do not follow up participants for long enough, or have very few cases after 10 years. The only trial which has now followed up participants for several decades suggests that BCG vaccination may protect against tuberculosis beyond 15 years. 5 The absence of evidence from the majority of trials should therefore not be taken as an absence of effect.
Recommendations for research
This review provides a comprehensive and up-to-date summary of evidence on the duration of protection by BCG vaccination, and identifies the fundamental dependency of BCG vaccination efficacy on tuberculin sensitivity at vaccination. While this review does not address all pending issues about BCG vaccination, it does permit the rephrasing some of the old controversies regarding why protection from BCG vaccine varies in terms of tuberculin sensitivity status before BCG vaccination, using stringent criteria.
For bacillus Calmette–Guérin research
-
Further research into the duration of protection conferred by BCG vaccination would be useful to inform future vaccination policy. We would recommend a case–control study taking into account PPD status of participants at vaccination, as this approach is likely to be cheaper and provide results in the least amount of time.
-
Further research into the effectiveness of BCG vaccination in those > 35 years of age should be carried out.
-
Studies should investigate the role of stringent tuberculin skin testing in the protective effect of BCG vaccination.
-
The issues of whether BCG vaccination protects individuals from acquiring tuberculosis infection and its role in preventing tuberculosis arising from reactivation and re-infection are also areas where there is a need for further knowledge. Our understanding of BCG vaccines and the global effort to develop new vaccines will be enhanced by greater clarity on these aspects of tuberculosis pathogenesis.
-
Although the effect of repeated BCG vaccination appears to be limited,26,222 given the variation in the effect of the first dose of BCG vaccine, replication of these findings in other settings will be useful. This is supported by the variable results demonstrated in observational studies (albeit of poor quality) from Eastern Europe112,223 and Venezuela,224 as well as data from the effect of BCG revaccination on leprosy. 222 The fact that BCG revaccination did enhance protection against leprosy, although not against tuberculosis, in Malawi indicates that, under some circumstances, a second BCG vaccination can have a beneficial immunological effect, although it may not be sufficient to enhance observable protection against tuberculosis. 24 Ideally, replication of the Brazil REVAC6 study in other settings to see whether similar or different results would be obtained in different environments may also be beneficial.
-
There is some recent evidence, based on a positive interferon-gamma release assay as a proxy for latent tuberculosis infection, that suggests that BCG vaccination may protect against tuberculosis infection. 225–227 One study,228 however, found no protective effect of BCG vaccination against infection in a school outbreak. If further work confirms that BCG vaccination can protect against infection, at least under some circumstances, this may explain the observation in this review that BCG vaccination provides a beneficial effect against both pulmonary and extrapulmonary tuberculosis. This review did not specifically examine the evidence for protection against M. tuberculosis infection.
-
A recent study also suggested that previous BCG vaccination (as determined by a scar) may improve sputum conversion rates after 2 months of treatment. 229 If this is confirmed in subsequent studies, it may imply a form of protective immunity that potentially influences the clinical course, even in those who succumb to tuberculosis disease.
-
Our analysis shows that BCG vaccination given to adults may provide some protection which is important in the era of HIV infection and multidrug resistance; however, data are limited. Further research on this subject, perhaps using occupational health cohorts or a case–control study, may shed more light and inform future policy.
For new vaccines against tuberculosis
-
Given the limited protection conferred by BCG vaccination against post primary adult pulmonary disease, new tuberculosis vaccines against these forms of disease are of high priority.
-
BCG vaccination appears to offer little or no protection to those previously infected with M. tuberculosis. Vaccines that are effective in this group (‘post-exposure vaccines’) should be a priority for research. Among the problems is the appropriateness of animal models for the assessment of vaccine effects against reactivation disease.
-
Future studies need to take into account the observation from this review that prior tuberculin sensitivity is a key determinant of whether a trial shows significant evidence of protection by BCG vaccination. This is particularly pertinent as most trials of new vaccines will be undertaken in high tuberculosis incidence countries that also have a high burden of non-tuberculous mycobacterial infection.
-
Investigating the mechanism behind the failure of BCG vaccination to protect previous sensitised individuals will provide useful information for the development of new vaccines against tuberculosis. This should be assessed for different non-tuberculous mycobacteria, prior BCG vaccination and tuberculosis exposure.
-
Future research should also investigate whether the efficacy of new vaccines differ depending on the predominant strain of M. tuberculosis circulating in the population, as well as the interaction between the predominant circulating strains of M. tuberculosis and human genetic polymorphisms that affect susceptibility to tuberculosis. There is also a need for studies in HIV-infected individuals.
For further research to inform UK vaccination programme
With regard to duration of protection from BCG vaccination, this review confirmed previous observations that BCG vaccination protects against tuberculosis for at least 10 years. There is also some evidence that BCG vaccination might protect beyond 15 years after vaccination. Unfortunately, this was observed in a limited number of studies owing to the lack of long-term follow-up or dwindling of the number of participants, as well as secular downward trends in tuberculosis incidence in the populations where the studies were undertaken. In the UK, a substantial part of the programme is aimed at protecting children against severe (miliary and meningeal) tuberculosis and so infants in high-risk groups are vaccinated. However, most tuberculosis occurs in adults. Further research is therefore needed to update estimates of duration of protection and to inform sensitivity criteria in the cost-effectiveness analysis of BCG vaccination policy.
Questions remain about the effect of BCG vaccination among adults > 35 years of age. Only two trials provide data on the efficacy of BCG vaccination in adults > 35 years of age (Madanapalle53 and Chingleput28), both showing no significant protective effect, in two populations very different from the UK population. This issue is important because national guidelines currently limit the use of BCG vaccination to < 35 years of age, except in certain occupational groups. The limited evidence from this review showing a protective effect against pulmonary tuberculosis, if given to immunologically naive individuals, has implications for the vaccination of older individuals.
The most important consideration internationally is whether BCG vaccination protects against adult pulmonary disease. This review shows evidence of protection against pulmonary tuberculosis under certain conditions, although with considerable variation between different studies and limited data on protection in adults.
Implications for UK vaccination programme and practice
In addition to the research recommendations outlined above, further work is required:
-
The economic analysis to inform the tuberculosis incidence threshold at which universal BCG vaccination becomes cost-effective should be re-examined if further evidence emerges that BCG vaccination protects for longer than 15 years.
-
Outline whether all individuals should be tested to identify those likely to benefit from BCG vaccination, especially with the increased use of interferon-gamma release assays for contact investigation. To date, the rationale for tuberculin sensitivity testing prior to giving BCG vaccinations in the UK has been phrased largely with reference to concerns about increased local reactions when giving BCG vaccinations to already sensitised individuals.
Acknowledgements
We thank Debora Pedrazzoli, Daniela Manno, Michelle Kruijshaar, Lucretius Gram, Tieble Traore, Jolanta Sabbat, Inthira Yamabhai, Aurora Yaacov, Laszlo Harangozo, Chien-Hui Lin, Yasemin Dil, Maria Ramos, Yusuke Shimakawa and Jelena Savovic for their help with the translation, screening and data extraction of non-English papers. We thank Kunju Shaji and Pete Shiarly for their work designing and programming the Microsoft Access database and Catherine Jameson for her help with the data extraction and verification. Thank you to Margaret Burke (MB) and Sheila O'Malley for their help with the literature search and retrieval. We thank Ross Harris for his work on the meta-analysis software and Deborah Curle for her assistance with administrative support.
Contribution of authors
Professor Ibrahim Abubakar (Consultant Epidemiologist and Head of Section) was the principal investigator of the project; he contributed to the design of the project, oversaw publication screening and data extraction, and undertook the write-up of the report.
Ms Laura Pimpin (Scientist, Epidemiology) conducted publication retrieval and screening, data extraction, overseeing of screening and data extraction of non-English publications by translators, write-up of the report and preparation of the report for publication.
Mr Cono Ariti (Lecturer in Medical Statistics) conducted the analysis of all data, and preparation of figures and tables for publication.
Ms Rebecca Beynon (Research Associate) conducted publication retrieval and screening, data extraction and participated in the write-up and review of the report.
Dr Punam Mangtani (Clinical Senior Lecturer in Epidemiology) contributed to the design of the project, oversaw publication screening and data extraction, and participated in the write-up and review of the report.
Professor Jonathan AC Sterne (Professor of Medical Statistics and Epidemiology) contributed to the design of the project, oversaw data analysis, and participated in the write-up and review of the report.
Professor Paul EM Fine (Professor of Communicable Disease Epidemiology) contributed to the design and provided scientific advice on the project and interpretation of the data. He participated in the review of the report.
Professor Peter G Smith (Professor of Tropical Epidemiology) contributed to the design and provided scientific advice on the project and interpretation of the data. He participated in the review of the report.
Dr Marc Lipman (Consultant Physician/Honorary Lecturer) contributed to the design and provided scientific advice on the project and interpretation of the data. He participated in the review of the report.
Dr David Elliman (Consultant in Community Child Health) contributed to the design and provided scientific advice on the project and interpretation of the data. He participated in the review of the report.
Professor John M Watson (Director, Respiratory Diseases Department) contributed to the design and provided scientific advice on the project and interpretation of the data. He participated in the review of the report.
Dr Lydia N Drumright (Scientist, Epidemiology) conducted publication search, retrieval and screening, data extraction and overseeing of screening, and data extraction of non-English publications by translators.
Dr Penny F Whiting (Senior Research Fellow) designed and maintained the publication screening and data extraction databases.
Dr Emilia Vynnycky (Senior Scientist) contributed to the design and provided scientific advice on the project and interpretation of the data. She participated in the review of the report.
Professor Laura C Rodrigues (Professor of Infectious Disease Epidemiology/Head of Department) contributed to the design of the project, provided scientific advice, and participated in the write-up and review of the report.
Disclaimer
This report presents independent research funded by the National Institute for Health Research (NIHR). The views and opinions expressed by authors in this publication are those of the authors and do not necessarily reflect those of the NHS, the NIHR, NETSCC, the HTA programme or the Department of Health. If there are verbatim quotations included in this publication the views and opinions expressed by the interviewees are those of the interviewees and do not necessarily reflect those of the authors, those of the NHS, the NIHR, NETSCC, the HTA programme or the Department of Health.
References
- Crofts JP, Gelb D, Andrews N, Delpech V, Watson JM, Abubakar I. Investigating tuberculosis trends in England. Public Health 2008;122:1302-10.
- Anon . Criteria for discontinuation of vaccination programmes using Bacille Calmette–Guérin (BCG) in countries with a low prevalence of tuberculosis. A statement of the International Union Against Tuberculosis and Lung Disease. Tuber Lung Dis 1994;75:179-80.
- Rodrigues LC, Diwan VK, Wheeler JG. Protective effect of BCG against tuberculous meningitis and miliary tuberculosis: a meta-analysis. Int J Epidemiol 1993;22:1154-8.
- Trunz BB, Fine P, Dye C. Effect of BCG vaccination on childhood tuberculous meningitis and miliary tuberculosis worldwide: a meta-analysis and assessment of cost-effectiveness. Lancet 2006;367:1173-80.
- Aronson NE. Long-term efficacy of BCG vaccine in American Indians and Alaska Natives: a 60-year follow-up study. JAMA 2004;291:17-2091.
- Barreto ML, Rodrigues LC, Cunha SS, Pereira S, Hijjar MA, Ichihara MY, et al. Design of the Brazilian BCG-REVAC trial against tuberculosis: a large, simple randomized community trial to evaluate the impact on tuberculosis of BCG revaccination at school age. Control Clin Trials 2002;23:540-53.
- Sterne JA, Rodrigues LC, Guedes IN. Does the efficacy of BCG decline with time since vaccination?. Int J Tuberc Lung Dis 1998;2:200-7.
- Global tuberculosis control: WHO report 2010. Geneva: WHO; 2010.
- Kruijshaar ME, Watson JM, Drobniewski F, Anderson C, Brown TJ, Magee JG, et al. Increasing antituberculosis drug resistance in the United Kingdom: analysis of national surveillance data. BMJ 2008;336:1231-4.
- Tuberculosis in the UK: annual report on tuberculosis surveillance in the UK, 2010. London: Health Protection Agency; 2010.
- Abubakar I, Laundy MT, French CE, Shingadia D. Epidemiology and treatment outcome of childhood tuberculosis in England and Wales: 1999–2006. Arch Dis Child 2008;93:1017-21.
- Levine MI. Immunization against tuberculosis. A study of the essential factors. Am Rev Tuberc Pulmon Dis 1938;38:632-43.
- Ferguson RG, Simes AB. BCG vaccination of Indian infants in Saskatchewan. Tubercle 1949;30:5-11.
- No authors listed . B.C.G. and vole bacillus vaccines in the prevention of tuberculosis in adolescents; first [progress] report to the Medical Research Council by their Tuberculosis Vaccines Clinical Trials Committee. Br Med J 1956;1:413-27.
- Palmer CE. Community trials of BGG vaccination. Am Rev Tuberc Pulmon Dis 1958;77:6-907.
- Colditz GA, Brewer TF, Berkey CS, Wilson ME, Burdick E, Fineberg HV, et al. Efficacy of BCG vaccine in the prevention of tuberculosis. Meta-analysis of the published literature. JAMA 1994;271:698-702.
- Brewer TF, Colditz GA. Relationship between bacille Calmette–Guérin (BCG) strains and the efficacy of BCG vaccine in the prevention of tuberculosis. Clin Infect Dis 1995;20:126-35.
- Colditz GA, Berkey CS, Mosteller F, Brewer TF, Wilson ME, Burdick E, et al. The efficacy of bacillus Calmette–Guérin vaccination of newborns and infants in the prevention of tuberculosis: meta-analyses of the published literature. Pediatrics 1995;96:29-35.
- No authors listed . Trial of BCG vaccines in south India for tuberculosis prevention: first report. Bull World Health Organ 1979;57:819-27.
- Fine PE. BCG vaccination against tuberculosis and leprosy. Br Med Bull 1988;44:691-703.
- Hart PD, Sutherland I. BCG and vole bacillus vaccines in the prevention of tuberculosis in adolescence and early adult life. Final report to the Medical Research Council. Br Med J 1977;2:293-5.
- Fine PE. BCG: the challenge continues. Scand J Infect Dis 2001;33:243-5.
- Fine PEM. Variation in protection by BCG: implications of and for heterologous immunity. Lancet 1995;346:1339-45.
- Ponnighaus JM, Fine PEM, Sterne JAC, Wilson RJ, Msosa E, Gruer PJK, et al. Efficacy of BCG vaccine against leprosy and tuberculosis in northern Malawi. Lancet 1992;339:636-9.
- Rodrigues LC. BCG revaccination against tuberculosis. Lancet 1996;348.
- Rodrigues LC, Pereira SM, Cunha SS, Genser B, Ichihara MY, de Brito SC, et al. Effect of BCG revaccination on incidence of tuberculosis in school-aged children in Brazil: the BCG–REVAC cluster-randomised trial. Lancet 2005;366:1290-5.
- Mitchison DA. The virulence of tubercle bacilli from patients with pulmonary tuberculosis in India and other countries. Bull Int Union Tuberc 1964;35:287-306.
- Baily GVJ, Narain R, Mayurnath S. Tuberculosis Prevention Trial, Madras. Indian J Med Res 1980;72:1-74.
- Hank JA, Chan JK, Edwards ML, Muller D, Smith DW. Influence of the virulence of Mycobacterium tuberculosis on protection induced by bacille Calmette–Guérin in guinea pigs. J Infect Dis 1981;143:734-8.
- Gardy JL, Johnston JC, Ho Sui SJ, Cook VJ, Shah L, Brodkin E, et al. Whole-genome sequencing and social-network analysis of a tuberculosis outbreak. N Engl J Med 2011;364:730-9.
- Comstock GW. Long-term results of BCG vaccination in the Southern United States. Am Rev Respir Dis 1966;93:2-83.
- Rodrigues LC, Gill ON, Smith PG. BCG vaccination in the first year of life protects children of Indian subcontinent ethnic origin against tuberculosis in England. J Epidemiol Community Health 1991;45:78-80.
- Packe GE, Innes JA. Protective effect of BCG vaccination in infant Asians: a case–control study. Arch Dis Child 1988;63:277-81.
- Kaufmann SH, Hussey G, Lambert PH. New vaccines for tuberculosis. Lancet 2010;375:2110-19.
- Wallis RS, Pai M, Menzies D, Doherty TM, Walzl G, Perkins MD, et al. Biomarkers and diagnostics for tuberculosis: progress, needs, and translation into practice. Lancet 2010;375:1920-37.
- Salisbury D, Ramsey M, Noakes K. Immunisation against infectious diseases – The Green Book. London: Crown Copyright; 2008.
- Zwerling A, Behr MA, Verma A, Brewer TF, Menzies D, Pai M. The BCG World Atlas: a database of global BCG vaccination policies and practices. PLoS Med 2011;8.
- Smith PG. Retrospective assessment of the effectiveness of BCG vaccination against tuberculosis using the case–control method. Tubercle 1982;63:23-35.
- Begaud B. Dictionary of pharmacoepidemiology. Chichester: John Wiley & Sons Ltd; 2000.
- Clemens JD, Chuong JJ, Feinstein AR. The BCG controversy. A methodological and statistical reappraisal. JAMA 1983;249:2362-9.
- Brosch R, Gordon SV, Garnier T, Eiglmeier K, Frigui W, Valenti P, et al. Genome plasticity of BCG and impact on vaccine efficacy. Proc Natl Acad Sci USA 2007;104:5596-601.
- Brewer TF. Preventing tuberculosis with bacillus Calmette–Guérin vaccine: a meta-analysis of the literature. Clin Infect Dis 2000;31:64-7.
- Behr MA, Small PM. A historical and molecular phylogeny of BCG strains. Vaccine 1999;17:915-22.
- Rosenthal SR. BCG Vaccination in all age groups. Methods and results of a strictly controlled study. J Am Med Assoc 1948;136:73-9.
- Aronson JD. Protective vaccination against tuberculosis with special reference to BCG vaccination. Am Rev Tuberc 1948;58:255-81.
- Rosenthal SR. Tuberculin reaction trends and BCG vaccination. Special reference to young adults (medical students). Arch Envir Hlth 1926;11:794-803.
- Rosenthal SR, Afremow ML, Nikurs L, Loewinsohn E, Leppmann M, Katele E, et al. BCG vaccination and tuberculosis in students of nursing. Am J Nurs 1963;63:88-93.
- Rosenthal SR, Blahd M, Leslif EI. Ten years' experience with BCG (experimental and clinical). J Pediatr 1945;26:470-80.
- Shaw LW. Field studies on immunization against tuberculosis. I. Tuberculin allergy following BCG vaccination of school children in Muscogee County, Georgia. Public Health Rep 1951;66:1415-49.
- Bettag OL, Kaluzny AA, Morse D, Radner DB. BCG study at a state school for mentally retarded. Chest 1964;45:503-7.
- Mehrotra AK, Dabral SB, Nandan D, Maheshwari BB, Shrotriya V, Prakash B, et al. Assessment of efficacy of BCG vaccination among slum children of Agra city. Indian J Public Health 1988;32:164-5.
- Mehta KP, Merchant SM, Korde U. Environmental influence on immunity due to B.C.G. vaccination. Indian Pediatr 1976;13:525-32.
- Frimodt-Moller J. A community-wide tuberculosis study in a South Indian rural population, 1950–1955. Bull World Health Organ 1960;22:61-170.
- Coetzee AM, Berjak J. B.C.G. in the prevention of tuberculosis in an adult population. Proc Mine Med Officer Assoc 1968;48:41-53.
- Vandiviere HM, Dworksi M, Melvin IG. Efficacy of bacillus Calmette–Guérin and isoniazid resistant bacillus Calmette Guérin with and without isoiazid chemoprophylaxis from day of vaccination. II. Field trial in man. Am Rev Respir Dis 1973;108:301-13.
- Chadha VK, Suryanarayana L, Suryanarayan HV, Srikantaramu N, Kumar P. Protective effect of BCG among children vaccinated under Universal Immunization Programme. Indian J Pediatr 2004;71:1069-74.
- Bhattacharjee J, Sharma RS, Singh J, Datta KK, Verghese T. Case series evaluation of BCG vaccine efficacy against tubercular meningitis in children in Delhi. J Commun Dis 1993;25:71-4.
- Mittal SK, Aggarwal V, Rastogi A, Saini N. Does B.C.G. vaccination prevent or postpone the occurrence of tuberculous meningitis?. Indian J Pediatr 1996;63:659-64.
- Thilothammal N, Krishnamurthy PV, Runyan DK, Banu K. Does BCG vaccine prevent tuberculous meningitis?. Arch Dis Child 1996;74:144-7.
- Shally A. Effectiveness of BCG vaccination against tuberculous meningitis. Indian Pediatr 1999;36:455-60.
- Kumar P, Kumar R, Srivastava KL, Kumar M. Protective role of BCG vaccination against tuberculous meningitis in Indian children: a reappraisal. Natl Med J India 2005;18:7-11.
- Zodpey SP, Shrikhande SN, Kulkarni SW, Maldhure BR. Scar size and effectiveness of Bacillus Calmette Guérin (BCG) vaccination in the prevention of tuberculosis and leprosy: a case–control study. Indian J Public Health 2007;51:184-9.
- Houston S, Fanning A, Soskolne CL, Fraser N. The effectiveness of bacillus Calmette–Guérin (BCG) vaccination against tuberculosis. A case–control study in Treaty Indians, Alberta, Canada. Am J Epidemiol 1990;131:340-8.
- Young TK, Hershfield ES. A case-control study to evaluate the effectiveness of mass neonatal BCG vaccination among Canadian Indians. Am J Public Health 1986;76:783-6.
- Sirinavin S, Chotpitayasunondh T, Suwanjutha S, Sunakorn P, Chantarojanasiri T. Protective efficacy of neonatal bacillus Calmette–Guérin vaccination against tuberculosis. Pediatr Infect Dis J 1991;10:359-65.
- Chavalittamrong B, Chearskul S, Tuchinda M. Protective value of BCG vaccination in children in Bangkok, Thailand. Pediatr Pulmonol 1986;2:202-5.
- Camargos PAM, Guimaraes MDC, Antunes CMF. Risk assessment for acquiring meningitis tuberculosis among children not vaccinated with BCG: a case–control study. Int J Epidemiol 1988;17:193-7.
- Wunsch Filho V, De Castilho EA, Rodrigues LC, Huttly SRA. Effectiveness of BCG vaccination against tuberculous meningitis: A case–control study in São Paulo, Brazil. Bull World Health Organ 1990;68:69-74.
- Murtagh K. Efficacy of BCG. Lancet 1980;1.
- Shapiro C, Cook N, Evans D. A case–control study of BCG and childhood tuberculosis in Cali, Colombia. Int J Epidemiol 1985;14:441-6.
- Kwong Chan D, Yong C, Ki Sub C. A clinical observation on tuberculous meningitis in childhood. Tuberc Respir Dis 1980;27:9-18.
- Miceli I, Colaiacovo D, Kantor IN, Peluffo G. Evaluation of the effectiveness of BCG vaccination using the case control method. Dev Biol 1986;58:293-6.
- Putrali J, Sutrisna B, Rahayoe N, Gunardi AS. A case–control study of the effectiveness of vaccination in children in Jakarta, Indonesia n.d.:194-200.
- Myint TT, Win H, Aye HH, Kyaw-Mint TO. Case–control study on evaluation of BCG vaccination of newborn in Rangoon, Burma. Ann Trop Paediatr 1987;7:159-66.
- Pust RE. Effectiveness of BCG vaccination in children in the Gorkha District. JNMA 1984;22:3-6.
- Takamatsu I, Kameda M, Inoue T, Toyoshima K. Assessment of effectiveness of BCG vaccination against childhood tuberculosis. Kekkaku 1995;70:561-6.
- Al Kassimi FA, Al Hajjaj MS, Al Orainey IO, Bamgboye EA. Does the protective effect of neonatal BCG correlate with vaccine-induced tuberculin reaction?. Am J Respir Crit Care Med 1995;152:1575-8.
- Martinez-Gonzalez MTG, Vazquez Castellanos JL, Gallardo Meza FA. Effectiveness of the BCG vaccine to prevent severe extrapulmonary tuberculosis in children. Int Pediatr 2002;17:110-14.
- Boileau P, Grill J, Rabarijaona L, Andriamparany M, Guyon P, Auregan G. Tuberculosis in children in Madagascar. 122 cases observed at the Soavinandriana-Antananarivo Hospital Center. Arch Inst Pasteur Madagascar 1995;62:31-6.
- Packe GE, Innes JA. Duration of protection against tuberculosis conferred by BCG vaccination in infancy. Arch Dis Child 1989;64:634-5.
- Zodpey SP. Protective effect of Bacillus Calmette Guérin (BCG) vaccination in prevention of pulmonary tuberculosis. J Commun Dis 2004;36:159-65.
- Zodpey SP. Effectiveness of Bacillus Calmette Guérin (BCG) vaccination in the prevention of childhood pulmonary tuberculosis: a case control study in Nagpur, India. Southeast Asian J Trop Med Public Health 1988;29:2-288.
- Zodpey SP, Shrikhande SN, Maldhure BR, Kulkarni SW. Effectiveness of Bacillus Calmette Guérin (BCG) vaccination in the prevention of tuberculosis of skin: a case control study. Indian J Dermatol 1998;43.
- Zodpey SP, Maldhure BR, Dehankar AG, Shrikhande SN. Effectiveness of Bacillus Calmette Guérin (BCG) vaccination against extra-pulmonary tuberculosis: a case–control study. J Commun Dis 1996;28:77-84.
- Zodpey SP, Maldhure BR, Shrikhande SN, Tiwari RR. Effectiveness of bacillus of Calmette–Guérin (BCG) vaccination against tuberculous meningitis: a case–control study. J Indian Med Assoc 1996;94:338-40.
- Zodpey SP, Shrikhande SN, Maldhure BR, Kulkarni SW. Effectiveness of Bacillus Calmette Guérin (BCG) vaccination against genital tuberculosis: a case–control study. J Commun Dis 1997;29:345-9.
- Murhekar MV, Kulkarni HR, Zodpey SP, Dehankar AG. Effectiveness of mass neonatal BCG vaccination in the prevention of pulmonary tuberculosis: a case–control study in Nagpur, India. Tubercle and Lung Disease 1995;76:545-9.
- Dehankar AG, Maldhure BR, Zodpey SP, Srikhande SN. Effectiveness of bacillus Calmette Guérin (BCG) vaccination against pulmonary tuberculosis: a case control study. Indian J Chest Dis Allied Sci 1995;37.
- Defriez AI. Tuberculosis in BGG-vaccinated nurses. A report of five years' experience at the Boston City Hospital. N Engl J Med 1957;257:4-5.
- Geiseler PJ, Nelson KE, Crispen RG, Moses VK. Tuberculosis in physicians: a continuing problem. Am Rev Respir Dis 1986;133:773-8.
- Kereszturi C. Fate of children of tuberculous families, including those treated and those not treated with BCG. Am J Dis Child 1934;48:507-16.
- Chakravarty S. Effect of BCG (bacillus Calmette–Guérin) vaccination on the occurrence of tuberculosis among student nurses. Calcutta Med J 1958;55:8-64.
- Kendig EL. BCG vaccination in Virginia. J Pediatr 1957;51:54-7.
- Kendig EL. The place of BCG vaccine in the management of infants born of tuberculous mothers. N Eng J Med 1969;281:520-3.
- Barrett-Connor E. The epidemiology of tuberculosis in physicians. JAMA 1979;241:33-8.
- Capewell S. An evaluation of BCG vaccination and tuberculin testing in Edinburgh school children. Health Bull 1997;55:375-85.
- Capewell S, Leitch AG. The value of contact procedures for tuberculosis in Edinburgh. Br J Dis Chest 1984;78:317-29.
- Rubilar M, Brochwicz-Lewinski MJ, Anderson M, Leitch AG. The outcome of contact procedures for tuberculosis in Edinburgh, Scotland 1982–1991. Respir Med 1995;89:113-20.
- Horne . A study of a standardised contact procedure in tuberculosis. Report by the Contact Study Sub-Committee of the Research Committee of the British Thoracic Association. Tubercle 1978;59:245-59.
- Verney RE. Tuberculosis in students and nurses. Br Med J 1955;2:929-34.
- Borgen L, Meyer SN, Refsum E. Mass photofluorography, tuberculin testing, and BCG vaccination in the district of Aker [Norway] 1947–49. Acta Tuberc Scand 1951;25:327-55.
- Tverdal A, Funnemark E. Protective effect of BCG vaccination in Norway 1956–73. Tubercle 1988;69:119-23.
- Oeding P. The frequency of tuberculosis among 291, Norwegian students during 1 1/2 years' imprisonment in Germany. Nordisk Medicin 1946;29:13-8.
- Anon . An experiment with BCG. Lancet 1930;215.
- Ehrengut W, Stellmer H. The influence of BCG-vaccination on the tuberculosis in children [Hamburg 1950–1971]. Immun Infekt 1977;5:35-42.
- Daelen M, Dix E. Protective value of the BCG vaccination of children against tuberculosis. Monatsschr Kinderheilkd 1953;101:517-19.
- Liebknecht WL. Experience with a planned and aimed vaccination for prevention of tuberculosis. Dtsch Med Wochenschr 1957;82:2001-6.
- Despierres G, Riffat G. Statistical data concerning the prevention of tuberculosis by BCG vaccination in students. Rev Tuberc Pneumol 1966;30:314-17.
- Gernez Rieux C, Gervois M. Protection conferred by BCG during the 20 years following vaccination. Bull World Health Org 1973;48:139-54.
- Vaucher E, Oudet P. Vaccination and incidence of tuberculosis in Strasbourg University during the past three school years. Rev Tuberc 1951;15:215-28.
- Mariotti A. Follow-up of 2,500 children 15–17 years after vaccination with Petragnani's anatuberculin. Ann San Pub 1919;17:3-94.
- Bergsma D. Tuberculosis among sanatorium personnel with and without BCG vaccination. Ned Tijdschr Geneeskd 1950;94:1434-45.
- Dahlstrom G. The Efficacy of B.C.G. Vaccination. A study on vaccinated and tuberculin negative non-vaccinated conscripts. Acta Tuberc Scand 1951;25.
- Gomez FD. BCG Vaccination in Uruguay. Hoja Tisiol 1994;14:1-42.
- Counihan HE. BCG vaccination of student nurses. Ir J Med Sci 1956;362:85-7.
- Gaud J. BCG and development of pulmonary tuberculosis in Morocco. Bull Inst Hyg Maroc 1952;12.
- Sarrouy CH, Babeau P. Efficacite de la prophylaxie par BCG. Etude realisee apres la campagne de masse dans un groupe sclaire d’une ville algerienne (Bougie). Algerie Medicale 1957;61:80-4.
- Kubit S, Czajka S, Olakowski T, Piasecki Z. Evaluation of the effectiveness of BCG vaccinations. Pediatr Pol 1983;58:775-81.
- Batieha A, Abo-Khadhra K, Rawashdah M, Jaddou H, Sheyyab M, Abo-Romman K, et al. The effectiveness of BCG vaccination: the Jordanian experience. J Trop Pediatr 1998;44:288-90.
- Jin BW, Hong YP, Kim SJ. A contact study to evaluate the BCG vaccination programme in Seoul. Tubercle 1989;70:241-8.
- Lanckriet C, Levy-Bruhl D, Bingono E, Siopathis RM, Guérin N. Efficacy of BCG vaccination of the newborn: evaluation by a follow-up study of contacts in Bangui. Int J Epidemiol 1995;24:1042-9.
- Olsen HC. Tuberculosis in Bornholm after BCG vaccination. Acta Tuberculosea Scandinavica 1953;28:1-30.
- Heimbeck J. BCG vaccination of nurses. Tubercle 1948;29:84-8.
- Ponnighaus JM, Fine PEM, Bliss L, Gruer PJK, Kapira-Mwamondwe B, Msosa E, et al. The Karonga Prevention Trial: A leprosy and tuberculosis vaccine trial in Northern Malawi – I: Methods of the vaccination phase. Lepr Rev 1993;64:338-56.
- Levine MI. Results of BCG Immunization in New York City. Am Rev Tuberc Pulmon Dis 1946;53:6-32.
- Anon . BCG vaccination of medical students. Lancet 1930;216.
- Heimbeck J. Tuberkuloseschutzmittel BCG, prinzipien und resultate. Schweiz Z Tubcrk 1949;6:209-24.
- Westergaard H. Statistical study of BCG vaccination among female probationers at Ullevaal Hospital, Oslo. Presse Med 1930;38:569-70.
- Heimbeck J. Tuberculosis infection and vaccination. Med Klin 1933;29:1731-4.
- Dips H. Some observations on complications of BCG vaccination, on tuberculosis among the vaccinated, and on the effectiveness of BCG vaccination. Nord Med 1947;33:2-82.
- Heimbeck J. BCG vaccination 1926–1948. Norshe Laegefopening 1948;68.
- Kereszturi C, Park WH, Levine M, Vogel P, Sackett M. Clinical study of BCG vaccination. NY J Med 1933;33:375-81.
- Levine MI. An evaluation of the use of BCG in the prevention of tuberculosis in infants and children. Am J Public Health Nations Health 1947;37:1089-96.
- Levine MI. A critical analysis of BCG in the prevention of tuberculosis. Chest 1949;16:288-300.
- Kereszturi C, Park W. The use of BCG-vaccination against tuberculosis in children, 8 years experience. Am Rev Tuberc 1936;34:437-55.
- Gernez-Rieux C. The long-term results of BCG vaccination with dried and fresh vaccine. Ann Inst Pasteur 1911;5:105-12.
- Gernez-Rieux C. 5 Years of BCG vaccination in the Departement du Nord. Bull Acad Natl Med 1952;136:277-80.
- Gernez-Rieux C, Gervois M, Nistri R, Lebeurre R. Protection conferred against tuberculosis during the 1st 10 years following BCG vaccination by cutaneous scarification. Ann Inst Pasteur Lille 1958;10:97-120.
- Olsen HC. What Protection does BCG vaccination afford?. Ugeskr Laeger 1950;112:688-9.
- Barreto ML, Cunha SS, Pereira SM, Genser B, Hijjar MA, Ichihara MY, et al. Neonatal BCG protection against tuberculosis lasts for 20 years in Brazil. Int J Tuberc Lung Dis 2005;9:1171-3.
- Bergsma D. Further experiences with BCG vaccination. Ned Tijdschar Geneeskd 1954;98:24-6.
- Geiseler PJ, Nelson KE, Crispen RG. BCG vaccine and other measures to prevent tuberculosis in physicians. J Investig Med 1982;30.
- Gomez FD. Evidence of the protective action of BCG administered to the newborn. Hoja Tisiolog 1947;7:1-42.
- Gorlero Bacigalupi R. Comparative study of tuberculosis morbility and mortality in BCG vaccination and a control group. Hoja Tisiol 1952;12:73-6.
- Gorlero Bacigalupi R. Morbidity and mortality from tuberculosis in children vaccinated with BCG and in controls. Hoja Tisiologica 1950;10:4-5.
- Gaud J. BCG vaccination in Morocco. Maroc Medical 1954;33:352-9.
- Dahlstrom G. Tuberculosis in BCG vaccinated and non-vaccinated young adults: a comparative prognostic study. Acta Tuberc Scand Suppl 1953;32:1-138.
- Dahlstrom G. The effect of BCG: vaccination on tuberculous pleurisy. Nord Med 1951;46:36-43.
- Trub CLP. A statistical study of tuberculosis in children vaccinated with BCG at birth and those not vaccinated. Arch Hyg Bak 1970;154:4-402.
- Heimbeck J. BCG vaccination of nurses. Tubercle 1948;29:84-8.
- Olsen HC. Tuberculosis in Bornholm after BCG vaccination. Acta Tuberc Scand 1953;28:1-30.
- Springett VH. BCG vaccination and tuberculosis in Birmingham. A study of notifications related to vaccination of children before leaving school. Tubercle 1959;40:432-42.
- Sutherland I. Effectiveness of BCG vaccination in England and Wales in 1983. Tubercle 1987;68:81-92.
- Curtis HM, Leck I, Bamford FN. Incidence of childhood tuberculosis after neonatal BCG vaccination. Lancet 1984;323:145-8.
- Chaloner JH, Ormerod LP. Assessment of the impact of BCG vaccination on tuberculosis incidence in south Asian adult immigrants. Commun Dis Public Health PHLS 2002;5:338-40.
- Burrill D, Enarson DA, Allen EA, Grzybowski S. Tuberculosis in female nurses in British Columbia: implications for control programs. CMAJ 1985;132:137-40.
- Frappier A, Frappier-Davignon L, Cantin M, St Pierre J. Influence of BCG vaccination on the mortality from meningeal tuberculosis in children from 0 to 10 years of age in the Province of Quebec. CMAJ 1962;19:934-41.
- Frappier A, Cantin M, Davignon L, St Pierre J, Robillard P, Gauthier T. BCG vaccination and pulmonary tuberculosis in Quebec. CMAJ 1971;105:707-10.
- Anon . Evaluation of BCG vaccination programmes. Wkly Epidemiol Rec 1982;57:121-3.
- Krzyszkowska A. Morbidity of tuberculosis in children vaccinated with BCG in Bydgoszcz. Gruzlica 1956;24:197-203.
- Vojtek V. The incidence of tuberculosis meningitis as an indicator of efficacy of BCG vaccination. Tubercle 1960;41:272-5.
- Zilber N, Simchen E, Wartski S. Effect of mass BCG vaccination at birth on the incidence of tuberculosis among Jewish children in Israel. Israel J Med Sci 1984;20:1150-7.
- Lugosi L. Trends in childhood tuberculosis in Hungary 1953–1983: Quantitative methods for evaluation of BCG policy. Int J Epidemiol 1985;14:304-12.
- Lotschert K, Weidtman V. BCG immunization for the newborn. Dtsch Arzteblatt 1983;80:37-9.
- Chew CH, Hu PY. BCG programme in the Republic of Singapore. Singapore Med J 1974;15:241-5.
- Martins TS, Medeiros COD, Gerhardt Filho G. Meningite tuberculosa: resultados de uma pesquisa operacional. J Bras Med 1985;48:34-41.
- Kelly P, McKeown D, Clancy L. Neonatal BCG vaccination in Ireland: evidence of its efficacy in the prevention of childhood tuberculosis. Eur Respir J 1997;10:619-23.
- Schwoebel V. Tuberculous meningitis in France in 1990: characteristics and impact of BCG vaccination. Tuberc Lung Dis 1994;75:44-8.
- Chan PC, Huang LM, Kuo HS. Is neonatal bacillus Calmette–Guérin vaccination protective in Taiwan?. J Formos Med Assoc 2008;107:195-7.
- Vojtek V. The incidence of tuberculosis meningitis as an indicator of efficacy of BCG vaccination. Tubercle 1960;41:272-5.
- Anon . Present effectiveness of BCG vaccination in England and Wales. A report from the Research Committee of the British Thoracic and Tuberculosis Association. Tubercle 1975;56:127-47.
- Angel JH, Springett VH, Pickering CAC, Sutherland I. Effectiveness of BCG vaccination in Great Britain in 1978. A report from the Research Committee of the British Thoracic Association. Br J Dis Chest 1980;74:215-27.
- Schwoebel V, Hubert B, Grosset J. Impact of BCG on tuberculous meningitis in France in 1990. Lancet 1992;340.
- Lugosi L. Quantitative methods in the tuberculosis epidemiology and in the evaluation of the BCG vaccination programs. Dev Biol 1983;58:299-306.
- Castan Vidal ML, Vidal Lopez ML, Cerro Marin MJ, Rey Duran R, Ortega Calderon A, Garcia-Hortelano J. Pediatric contacts of tuberculose patients. An Pediatr 1991;34:129-31.
- Zapatero Dominguez J. Lung tuberculosis in students: Data over 45 yr. of radiologic examination. Protective effect of BCG. An R Acad Nac Med 1984;101:463-84.
- Tidjani O, Grunitzky B, Sadjo H, Guérin N. BCG immunization for the prophylaxis of tuberculosis. A recent study. Anne Pediatr 1992;39:99-105.
- Tidjani O, Amedome A, ten Dam HG. The protective effect of BCG vaccination of the newborn against childhood tuberculosis in an African community. Tubercle 1986;67:269-81.
- Kritski AL, Ozorio Marques MJ, Rabahi MF, Silva Vieira MAM, Werneck-Barroso E, Carvalho CES, et al. Transmission of tuberculosis to close contacts of patients with multidrug-resistant tuberculosis. Am J Respir Crit Care Med 1996;153:331-5.
- Basta PC, Coimbra CEA, Escobar AL, Santos RV, Alves LCC, Fonseca L. Survey for tuberculosis in an indigenous population of Amazonia: the Surui of Rondônia, Brazil. Trans R Soc Trop Med Hyg 2006;100:579-85.
- Ebina T. The protective value of non-lyophilized and lyophilized BGG vaccine against tuberculosis. Acta Tuberc Scand 1959;37:172-4.
- Bassleer J, Lejeune L. BCG and prevention in a population supervised by the antitubercular dispensaries. Acta Tuberc Pneumol Belg 1972;63:5-67.
- Horvat Grubac A, Simovic R, Grulovic G, Simovi’C R, Grulovi’C G. Effectiveness of BCG vaccination in a massive intra-familial tuberculous infection. Tuberkuloza 1963;15:21-3.
- Lotte A, Burghard G, Petitjean R, Perdrizet S, Cooreman J, Lert F, et al. Reduction in the risk of tuberculous meningitis in children in France. Impact of BCG vaccination. Bull Int Union Against Tuberc Dis 1988;63:52-6.
- Biscione C, Fabbrocini V, Natali P. On an episode of tubercular contagion in a school in Naples. Rassegna Internazionale Di Clinica E Terapia 1969;49:268-75.
- Chandra P. Tuberculosis in BCG vaccinated and unvaccinated children. Indian Pediatr 1975;12:424-9.
- Aluoch JA, Swai OB, Edwards EA. Studies of case-finding for pulmonary tuberculosis in outpatients at 4 district hospitals in Kenya. Tubercle 1985;66:237-49.
- Padungchan S, Konjanart S, Kasiratta S. The effectiveness of BCG vaccination of the newborn against childhood tuberculosis in Bangkok. Bull World Health Organ 1986;64:247-58.
- Mahmoud ME, Monhim Attia IA. Evaluation of BCG vaccination in Bab El Shaaria Zone Cairo. Dev Biol 1986;58:249-56.
- Mahomed H, Kibel M, Hawkridge T, Schaaf HS, Hanekom WA, Iloni K, et al. The impact of a change in bacille Calmette–Guérin vaccine policy on tuberculosis incidence in children in Cape Town, South Africa. Pediatr Infect Dis J 2006;25:1167-72.
- Garcia I, De la Hoz F, Reyes Y, Montoya P, Guerrero MI, Leon CI. Respiratory syntomatic prevalence, infection and tuberculosis disease and associated factors: population-based study. Biomedica 2004;24:124-31.
- Khadeeva PV, Morozov IA, Koz’iakova ES. Efficacy of BCG vaccination. Probl Tuberk Bolezn Legk 2003;11:9-11.
- Sleiman R. Interpretation of the tuberculin skin test in bacille Calmette–Guérin vaccinated and nonvaccinated school children. Pediatr Infect Dis J 2007;26:134-8.
- Biscione C, Minicucci E, Fabbrocini V. Observations on the epxperience acquired 14 years of mass x-ray and tuberculin research and of antituberculosis vaccination in the city of Naples. Rass Int Clin Terap 1967;47:367-81.
- Chandra A. B.C.G. vaccination and tuberculosis. J Indian Med Assoc 1973;61:355-8.
- Dominguez JZ, Alvarez JC, Gaviria JZ. The protection provided by the BCG vaccine in university students. Rev Clin Esp 1986;179:131-4.
- Bredin CP, Godfrey M, McKiernan J. A school microepidemic of tuberculosis. Thorax 1991;46:922-3.
- Gaensbauer JT, Vandaleur M, O’Neil M, Altaf A, Chroinin NM. BCG protects toddlers during a tuberculosis outbreak. Arch Dis Child 2009;94:392-3.
- Shannon A, Kelly P, Lucey M, Cooney M, Corcoran P, Clancy L. Isoniazid resistant tuberculosis in a school outbreak: the protective effect of BCG. Eur Respir J 1991;4:778-82.
- Long R, Whittaker D, Russell K, Kuninomoto D, Reid R, Fanning A, et al. Pediatric tuberculosis in Alberta first nations (1991–2000): outbreaks and the protective effect of bacille Calmette–Guérin (BCG) vaccine. CMAJ 2004;95:249-55.
- Bergqvist S. An epidemic of tuberculosis. Nordisk Medicin 1947;36:43-8.
- Hertzberg G. The problem of voluntary or legally compulsory BCG vaccination. Tidsskr Nor Laegeforen 1947;67.
- Hyge TV. The efficacy of BCG-vaccination; tuberculosis epidemic in a state school with an observation period of 12 years. Dan Med Bull 1957;4:13-5.
- Hyge GV. BCG vaccination. Ugeskr Laeger 1953;115:1003-10.
- Hyge TV. The efficacy of BCG vaccination. Nord Med 1949;41:24-60.
- Valadas E. Nontuberculous mycobacteria: clinical importance and relevance to bacille Calmette–Guérin vaccination. Clin Infect Dis 2004;39:457-8.
- Fine PEM, Carneiro IAM, Milstien JB, Clements CJ. Issues relating to the use of BCG in immunization programmes: a discussion document. Geneva: World Health Organization; 1999.
- Collins FM. Immunogenicity of various mycobacteria and the corresponding levels of cross-protection developed between species. Infect Immun 1971;4:688-96.
- Palmer CE, Long MW. Effects of infection with atypical mycobacteria on BCG vaccination and tuberculosis. Am Rev Respir Dis 1966:553-68.
- Edwards LB, Acquaviva FA, Livesay VT, Cross FW, Palmer CE. An atlas of sensitivity to tuberculin, PPD-B, and histoplasmin in the United States. Am Rev Respir Dis 1969;99:1-132.
- Andersen P, Doherty TM. The success and failure of BCG: implications for a novel tuberculosis vaccine. Nat Rev Microbiol 2005;3:656-62.
- Paramasivan CN, Govindan D, Prabhakar R, Somasundaram PR, Subbammal S, Tripathy SP. Species level identification of non-tuberculous mycobacteria from South Indian BCG trial area during 1981. Tubercle 1985;66:9-15.
- Black GF, Weir RE, Floyd S, Bliss L, Warndorff DK, Crampin AC, et al. BCG-induced increase in interferon-gamma response to mycobacterial antigens and efficacy of BCG vaccination in Malawi and the UK: two randomised controlled studies. Lancet 2002;359:1393-401.
- Fine PE, Vynnycky E. The effect of heterologous immunity upon the apparent efficacy of [e.g. BCG] vaccines. Vaccine 1998;16:1923-8.
- Comstock GW. Identification of an effective vaccine against tuberculosis. Am Rev Respir Dis 1988;138:479-80.
- Ten Dam HG, Reichmen LB, Hershfield ES. Tuberculosis: a comprehensive international approach. New York, NY: Marcel Dekker; 1993.
- Walker KB, Brennan MJ, Ho MM, Eskola J, Thiry G, Sadoff J, et al. The second Geneva Consensus: Recommendations for novel live TB vaccines. Vaccine 2010;28:2259-70.
- Kozak R, Behr MA. Divergence of immunologic and protective responses of different BCG strains in a murine model. Vaccine 2011;29:1519-26.
- Leung AS, Tran V, Wu Z, Yu X, Alexander DC, Gao GF, et al. Novel genome polymorphisms in BCG vaccine strains and impact on efficacy. BMC Genomics 2008;9.
- Horwitz MA, Harth G, Dillon BJ, Maslesa-Galic S. Commonly administered BCG strains including an evolutionarily early strain and evolutionarily late strains of disparate genealogy induce comparable protective immunity against tuberculosis. Vaccine 2009;27:441-5.
- Narayanan PR. Fifteen year follow up of trial of BCG vaccines in south India for tuberculosis prevention. Indian J Med Res 1999;110:56-69.
- KPTG . Randomised controlled trial of single BCG, repeated BCG, or combined BCG and killed Mycobacterium leprae vaccine for prevention of leprosy and tuberculosis in Malawi. Lancet 1996;348:17-24.
- Lugosi L. Theoretical and methodological aspects of BCG vaccine from the discovery of Calmette and Guérin to molecular biology. A review. Tuberc Lung Dis 1992;73:252-61.
- Sepulveda RL, Parcha C, Sorensen RU. Case–control study of the efficacy of BCG immunization against pulmonary tuberculosis in young adults in Santiago, Chile. Tuberc Lung Dis 1992;73:372-7.
- Eisenhut M, Paranjothy S, Abubakar I, Bracebridge S, Lilley M, Mulla R, et al. BCG vaccination reduces risk of infection with Mycobacterium tuberculosis as detected by gamma interferon release assay. Vaccine 2009;27:6116-20.
- Eriksen J, Chow JY, Mellis V, Whipp B, Walters S, Abrahamson E, et al. Protective effect of BCG vaccination in a nursery outbreak in 2009: time to reconsider the vaccination threshold?. Thorax 2010;65:1067-71.
- Lalvani A, Bakir M, Millington KA, Dosanjh D, Soysal A. BCG and protection against Mycobacterium tuberculosis infection. Lancet 2006;367:391-2.
- Abubakar I, Matthews T, Harmer D, Okereke E, Crawford K, Hall T, et al. Assessing the effect of foreign travel and protection by BCG vaccination on the spread of tuberculosis in a low incidence country, United Kingdom, October 2008 to December 2009. Euro Surveill 2011;16.
- Jeremiah K, Praygod G, Faurholt-Jepsen D, Range N, Andersen AB, Grewal HM, et al. BCG vaccination status may predict sputum conversion in patients with pulmonary tuberculosis: a new consideration for an old vaccine?. Thorax 2010;65:1072-6.
- Aronson JD. A Twenty-year appraisal of BCG vaccination in the control of tuberculosis. Arch Intern Med 1958;101:5-93.
- Stein SC. The occurrence of pulmonary lesions in BCG-vaccinated and unvaccinated persons. Am Rev Tuberc Pulmon Dis 1953;68:5-712.
- Aronson JD. Appraisal of protective value of BCG vaccine. J Am Med Assoc 1952;149:334-43.
- Aronson JD. Experience with BGG Vaccine in the control of tuberculosis among North American Indians. Public Health Rep 1946;61:802-20.
- Townsend JG, Aronson JD, Saylor R, Parr I. Tuberculosis control among the North American Indians. Am Rev Tuberc 1942;45:41-52.
- Aronson JD. BCG vaccination among American Indians. Ame Rev Tuberc 1948;57:96-9.
- Aronson JD. The correlation of the tuberculin reaction with roentgenographically demonstrable pulmonary lesions in BCG-vaccinated and control persons. Am Rev Tuberc Pulmon Dis 1953;68:5-26.
- Aronson JD. Present status of BCG vaccine in the prevention of tuberculosis. Pennsyl Med J 1948;51:502-7.
- Aronson JD. The evaluation of BCG vaccine in the control of tuberculosis. Trans Stud Coll Physicians Phila 1948;16:1-13.
- Frimodt-Moller J, Acharyulu GS, Parthasarathy R. Observations on the protective effect of BCG vaccination in a South Indian rural population: third report. Indian J Tuberc 1968;15:40-6.
- Frimodt-Moller J, Acharyulu GS, Pillai KK. Observation concerning the protective effect of BCG vaccination in the rural population of South India: report number 4. Bull Int Union Against Tuberc 1973;48:40-52.
- Frimodt-Moller J. Observations on the protective effect of BCG vaccination in a South Indian rural population. Bull World Health Organ 1964;30:4-74.
- Frimodt-Moller J. The protective effect of b.c.g. Vaccination. J Indian Med Assoc 1965;44:577-81.
- Levine MI. Exposure of tuberculin-sensitive children to exogenous infection with human tubercle bacilli. Am J Dis Child 1941;61:6-45.
- Anon . B.C.G. and vole bacillus vaccines in the prevention of tuberculosis in adolescents. second report. Br Med J 1959;2:379-96.
- MRC . B.C.G. and vole bacillus vaccines in the prevention of tuberculosis in adolescence and early adult life. Third Report to the Medical Research Council by their Tuberculosis Vaccines Clinical Trials Committee. Br Med J 1963;1:973-8.
- Anon . BCG and vole bacillus vaccines in the prevention of tuberculosis in adolescence and early adult life. Fourth report to the Medical Research Council by its Tuberculosis Vaccines Clinical Trials Committee. Bull World Health Organ 1972;46:3-85.
- MRC . BCG and vole bacillus vaccines in the prevention of tuberculosis in adolescence and early adult life. Br Med J 1963;1:973-8.
- Hart PD, Sutherland I, Thomas J. The immunity conferred by effective BCG and vole bacillus vaccines, in relation to individual variations in induced tuberculin sensitivity and to technical variations in the vaccines. Tubercle 1967;48:201-10.
- D’Arcy Hart P, Pollock TM, Sutherland I. Assessment of the first results of the Medical Research Council's trial of tuberculosis vaccines in adolescents in Great Britain. Bibli Tuberc 1957;13:171-89.
- Comstock GW, Woolpert SF, Livesay VT. Tuberculosis studies in Muscogee County, Georgia. Twenty year evaluation of a community trial of BCG vaccination. Public Health Rep 1976;91:276-80.
- Comstock GW, Livesay VT, Woolpert SF. Evaluation of BCG vaccination among Puerto Rican children. Am J Public Health 1974;64:283-91.
- Comstock GW. Community research in tuberculosis Muscogee County, Georgia. Public Health Rep 1964;79:12-56.
- Rosenthal SR. Standardization and efficacy of BCG vaccination against tuberculosis; twenty year study: a critical evaluation. J Am Med Assoc 1955;157:801-7.
- Rosenthal SR. The role of BCG vaccination in the prevention of tuberculosis in infancy and childhood. Am Review of Tuberculosis 1956;74:313-18.
- Rosenthal SR. BCG Vaccination in Tuberculous Households. American Rev Respir Dis 1961;84:690-704.
- Rosenthal SR. Immunologic aspects of BCG vaccination. A strictly controlled study in infants from tuberculous households. J Pediatr 1950;36:399-420.
- Neiman IS, Loewinsohn E. Inhibition of primary tuberculosis by BCG. Am Rev Tuberc 1947;56:27-35.
- Rosenthal SR, Loewinsohn E, Graham ML, Liveright D, Thorne MG, Johnson V, et al. BCG vaccination against tuberculosis in Chicago. A twenty-year study statistically analyzed. Pediatrics 1961;28:622-41.
- Andelman SL. Tuberculosis in large urban centers. Am J Public Health 1966;56:9-53.
- Comstock GW. Controlled trial of BCG vaccination in a school population. Tuberculosis studies in Muscogee County, GA. Public Health Rep 1960;75:7-94.
- Comstock GW, Webster RG. Tuberculosis studies in Muscogee County, Georgia. VII. A twenty-year evaluation of BCG vaccination in a school population. Am Rev Respir Dis 1969;100:839-45.
- Tripathy SP. The case for B.C.G. Ann Natl Acad Med Sci 1983;19:11-2.
- Narayanan PR. Influence of sex, age and non-tuberculous infection at intake on the efficacy of BCG: Re-analysis of 15-year data from a double-blind randomized control trial in south India. Indian J Med Res 2006;2:119-24.
- Tripathy SP. Fifteen-year follow-up of the Indian BCG prevention trial. Bull Int Union Against Tuberc Lung Dis 1987;62:69-72.
- Heimbeck J. Tuberculosis in hospital nurses. Tubercle 1936;18:97-9.
Appendix 1 Search strategy
Appendix 2 Data extraction and quality assessment forms
Appendix 3 Included study characteristics
Appendix 4 Quality assessment results
Appendix 5 List of excluded studies
Appendix 6 Results for other tuberculosis outcomes and stratifications
Results for other tuberculosis outcomes and stratifications (PDF download)
Appendix 7 Final research protocol
List of abbreviations
- BCG
- bacillus Calmette–Guérin
- BIOSIS
- Biosciences Information Service
- CABI
- Centre for Agricultural Bioscience International Abstracts
- CCH
- Cook County Hospital
- CDSR
- Cochrane Database of Systematic Reviews
- CENTRAL
- Cochrane Central Register of Controlled Trials
- CI
- confidence interval
- CINAHL
- Cumulative Index to Nursing and Allied Health Literature
- D+L
- DerSimonian and Laird method
- DARE
- Database of Abstracts of Reviews of Effects
- DNA
- deoxyribonucleic acid
- DU1
- tandem duplication 1
- DU2
- tandem duplication 2
- EMBASE
- Excerpta Medica Database
- HIV
- human immunodeficiency virus
- HLA
- human leucocyte antigen
- HTA
- Health Technology Assessment
- I-V
- inverse variance method
- IGRA
- interferon-gamma release assay
- ISI
- Institute for Scientific Information
- IUATLD
- International Union Against Tuberculosis and Lung Disease
- KC50
- Korner Code 50
- LILACS
- Literatura Latino-Americana e do Caribe em Ciências da Saúde (Latin American and Caribbean Health Sciences Literature)
- M-H
- Mantel-Haenszel method
- MRC
- Medical Research Council
- NHS EED
- NHS Economic Evaluation Database
- NICE
- National Institute for Health and Care Excellence
- NIHR
- National Institute of Health Research
- NRAMP
- natural resistance-associated macrophage protein
- OR
- odds ratio
- PCT
- primary care trust
- PPD
- purified protein derivative
- PY
- person-years
- RCT
- randomised controlled trial
- RD1
- region of difference 1
- RD2
- region of difference 2
- ref.
- reference category
- REVAC
- Brazilian revaccination study
- RR
- risk ratio
- RRR
- ratio of risk ratios
- SES
- socioeconomic status
- SIGLE
- System for Information on Grey Literature in Europe
- TBPT
- Tuberculosis Prevention Trial
- VE
- vaccine efficacy
- WHO
- World Health Organization
All abbreviations that have been used in this report are listed here unless the abbreviation is well known (e.g. NHS), or it has been used only once, or it is a non-standard abbreviation used only in figures/tables/appendices, in which case the abbreviation is defined in the figure legend or in the notes at the end of the table.