Notes
Article history
The research reported in this issue of the journal was funded by the HTA programme as project number 98/04/99. The contractual start date was in April 2008. The draft report began editorial review in September 2012 and was accepted for publication in July 2013. The authors have been wholly responsible for all data collection, analysis and interpretation, and for writing up their work. The HTA editors and publisher have tried to ensure the accuracy of the authors' report and would like to thank the reviewers for their constructive comments on the draft document. However, they do not accept liability for damages or losses arising from material published in this report.
Declared competing interests of authors
The ARTISTIC trial extension was funded by the NIHR HTA with co-funding from the NHS Cervical Screening Programme – the grant was paid to the authors’ institutions. HCK is chair of the Advisory Committee in Cervical Screening (ACCS). The views expressed in this report are those of the author(s) and in no way represent views of the ACCS or the Department of Health. MD uses ThinPrep® liquid-based cytology for other laboratory diagnostic work as clinical head of a cytology laboratory. AS received support for travel to meetings from Roche. All authors (except KC) have previously received funding from the HTA to complete the first two rounds of screening in the original ARTISTIC trial. KC is co-principal investigator of a new trial of primary HPV screening in Australia, for which the pilot study is partially supported by Roche Molecular Diagnostics, Pleasanton, CA, USA. Prior development of the model platform used for the economic evaluation was funded by the National Health and Medical Research Council Australia (NHMRC project grants #1007518 and #440200), the Medical Services Advisory Committee Australia, the National Screening Unit in New Zealand, the NHS Cervical Screening Programme in England and Cancer Council, NSW, Australia. KC receives salary support from the NHMRC Australia (CDF1007994). None of the authors has any competing interest with GlaxoSmithKline, manufacturer of Cervarix™.
Permissions
Copyright statement
© Queen’s Printer and Controller of HMSO 2014. This work was produced by Kitchener et al. under the terms of a commissioning contract issued by the Secretary of State for Health. This issue may be freely reproduced for the purposes of private research and study and extracts (or indeed, the full report) may be included in professional journals provided that suitable acknowledgement is made and the reproduction is not associated with any form of advertising. Applications for commercial reproduction should be addressed to: NIHR Journals Library, National Institute for Health Research, Evaluation, Trials and Studies Coordinating Centre, Alpha House, University of Southampton Science Park, Southampton SO16 7NS, UK.
Chapter 1 Introduction
The ARTISTIC (A Randomised Trial In Screening To Improve Cytology) trial was a randomised comparison of human papillomavirus (HPV) testing in combination with liquid-based cytology (LBC) versus LBC alone in primary cervical screening. It was based on outcomes over two rounds of screening and which have been published recently in a Health Technology Assessment (HTA) monograph1 and other peer-reviewed publications,2–6 including analyses of clinical outcomes, psychosocial outcomes, health economics and other HPV typing and testing data.
The following summarises the principal findings of ARTISTIC based on the two screening rounds:
-
Detection of high-grade disease was not significantly increased by LBC combined with HPV testing compared with LBC alone, in either the first round of screening or both rounds combined. 1,2 Other trials of HPV testing, which showed that HPV testing was more sensitive than cytology, used conventional cytology and not LBC. 7–9
-
Prevalence of high-risk (HR) HPV infection [Hybrid Capture 2 (HC2) test] by age: 28% in women aged 25–29 years, falling to 6.5% in women aged 50–64 years. 1,3,4
-
Prevalence of type-specific HPV infection by cytology grade: HPV 16 and/or HPV 18 were detected in 10% of borderline, 22% of mild dyskaryosis and over 50% of moderate/severe dyskaryosis. 1,3
-
The use of HPV testing did not significantly increase psychosocial distress engendered by cervical screening. 5
-
Combined testing (LBC and HPV) was more expensive and, with an incremental cost-effectiveness of £38,771 per additional case of cervical intraepithelial neoplasia (CIN) grade 3 or worse (3+) detected, could not be justified. The mean cost of primary LBC triaged with HPV testing, or primary HPV testing with cytology, was less than the routine NHS Cervical Screening Programme (NHSCSP) protocol of repeat cytology for low-grade abnormalities. 1
-
A HC2 HPV test result cut-off of relative light unit/mean control (RLU/Co) 2 is superior in terms of clinical utility than the manufacturer’s recommended cut-off of RLU/Co 1. 6
Those conclusions will inform future consideration of HPV testing as a primary screening test. ARTISTIC data have also been used in validating models for evaluating the cost-effectiveness of HPV vaccination, which will help inform any decision to implement a national programme. 10 One of the key attributes of HPV testing could be the potential to lengthen screening intervals as suggested by data from other studies. 11
We have extended the follow-up of the trial cohort to October 2009 (up to 8 years after entry) to provide data from a third round of screening. This would offer valuable insight into the predictive ability of HPV testing compared with LBC as negative baseline tests, and for women who tested cytology negative/HPV positive. In the event of considering HPV testing as an initial screen, it would be important to understand what length of protection could be obtained from a negative HPV test and, in the event of a HPV-positive/cytology-negative result, what degree of risk existed over what period of time, and whether or not the type of HPV was important.
With HPV vaccination having been established in the UK in 2008, it would be possible using genotyping data to estimate how much disease would be prevented over a 6-year period by the prevention of HPV infection by the vaccine. We have then undertaken cost-effectiveness analysis of HPV primary screening, triaged with cytology, compared with current screening based on cytology triaged with HPV testing.
Hypotheses
-
1. A negative HPV test at baseline would provide a greater duration of protection against CIN grade 2 or worse (2+) when compared with a negative cytology result, and would allow extended screening intervals.
-
Research questions:
-
– What are the round 3 and cumulative rates of CIN2+ and CIN3+ between the revealed and concealed arms of ARTISTIC after three screening rounds over 6 years?
-
– What is the cumulative incidence of CIN2+ over three screening rounds following negative screening cytology with that following negative baseline HPV?
-
– Could the screening interval be safely extended from 3 to 6 years (continued hypothesis)?
-
-
2. Genotyping HPV to identify certain HR types could be clinically useful in terms of rapid referral to colposcopy following reflex cytology.
-
Research question:
-
– What are the differential rates of disease associated with various HR genotypes?
-
-
3. Increasing the HC2 cut-off from 1RLU/Co to 2RLU/Co could maintain sensitivity and improve specificity of HPV testing.
-
Research question:
-
– What is the effect of HC2 cut-off on the proportion of women with CIN2+?
-
-
4. The impact of the national vaccination programme against HPV types 16/18 will lead to a major reduction in the incidence of CIN2.
-
Research question:
-
– What is the proportion of disease and cytological abnormalities associated with types 16/18?
-
-
5. Conversion from cytology-based screening to HPV-based screening would, through increased ability to predict future risk of CIN2+ and CIN3+, save life-years and by increasing the screening interval, save costs.
-
Research question:
-
– What is the cost-effectiveness of moving from cytology- to HPV-based cervical screening?
-
Aims
The two principal aims of the trial extension were:
-
to determine, over a 6-year period, the predictive significance of a positive or negative HPV test, and specific HPV types with respect to the development of CIN, and to compare this with cytology, in order to determine the impact of HPV testing on cervical screening recall intervals
-
based on the ARTISTIC data, to model cost-effectiveness of changing cervical screening nationally from cytology triaged by HPV testing to HPV testing triaged by cytology.
Other outcomes were:
-
the round 3 and cumulative incidence of CIN2+ and CIN3+ in the original randomised arms of the trial
-
CIN2+ rates in relation to HPV type-specific persistence
-
the predicted impact of prophylactic HPV 16/18 vaccination on cervical screening outcomes in the NHSCSP
-
the potential benefit of using a HC2 cut-off value of 2 rather than 1 RLU in maintaining sensitivity but increasing specificity of HPV testing.
Chapter 2 Methods
ARTISTIC study extension
Study design
The original ARTISTIC study design has been previously described in detail. Briefly, 25,410 women aged 20–64 years undergoing routine cervical cytology screening in Greater Manchester between July 2001 and September 2003 underwent co-testing for HPV. They were randomised 3 : 1 to have the test either revealed and acted upon or concealed so as not to affect management. The intervention in the revealed arm was in those women who were cytology negative but HPV positive. Such women were invited back at 12 months and, if persistently HPV positive, were offered the choice between either colposcopy or a repeat HPV test at 24 months. If still positive at that time, all were offered colposcopy. In the event, two-thirds of those who chose selected colposcopy.
Women who had abnormal cytology at baseline were managed according to national guidance irrespective of HPV status. The hypothesis was that the addition of HPV testing would add sensitivity to detection of high-grade CIN in the first round and result in a reduction of high-grade CIN in round 2. The original primary outcome was therefore the incidence of detected high-grade CIN in round 2.
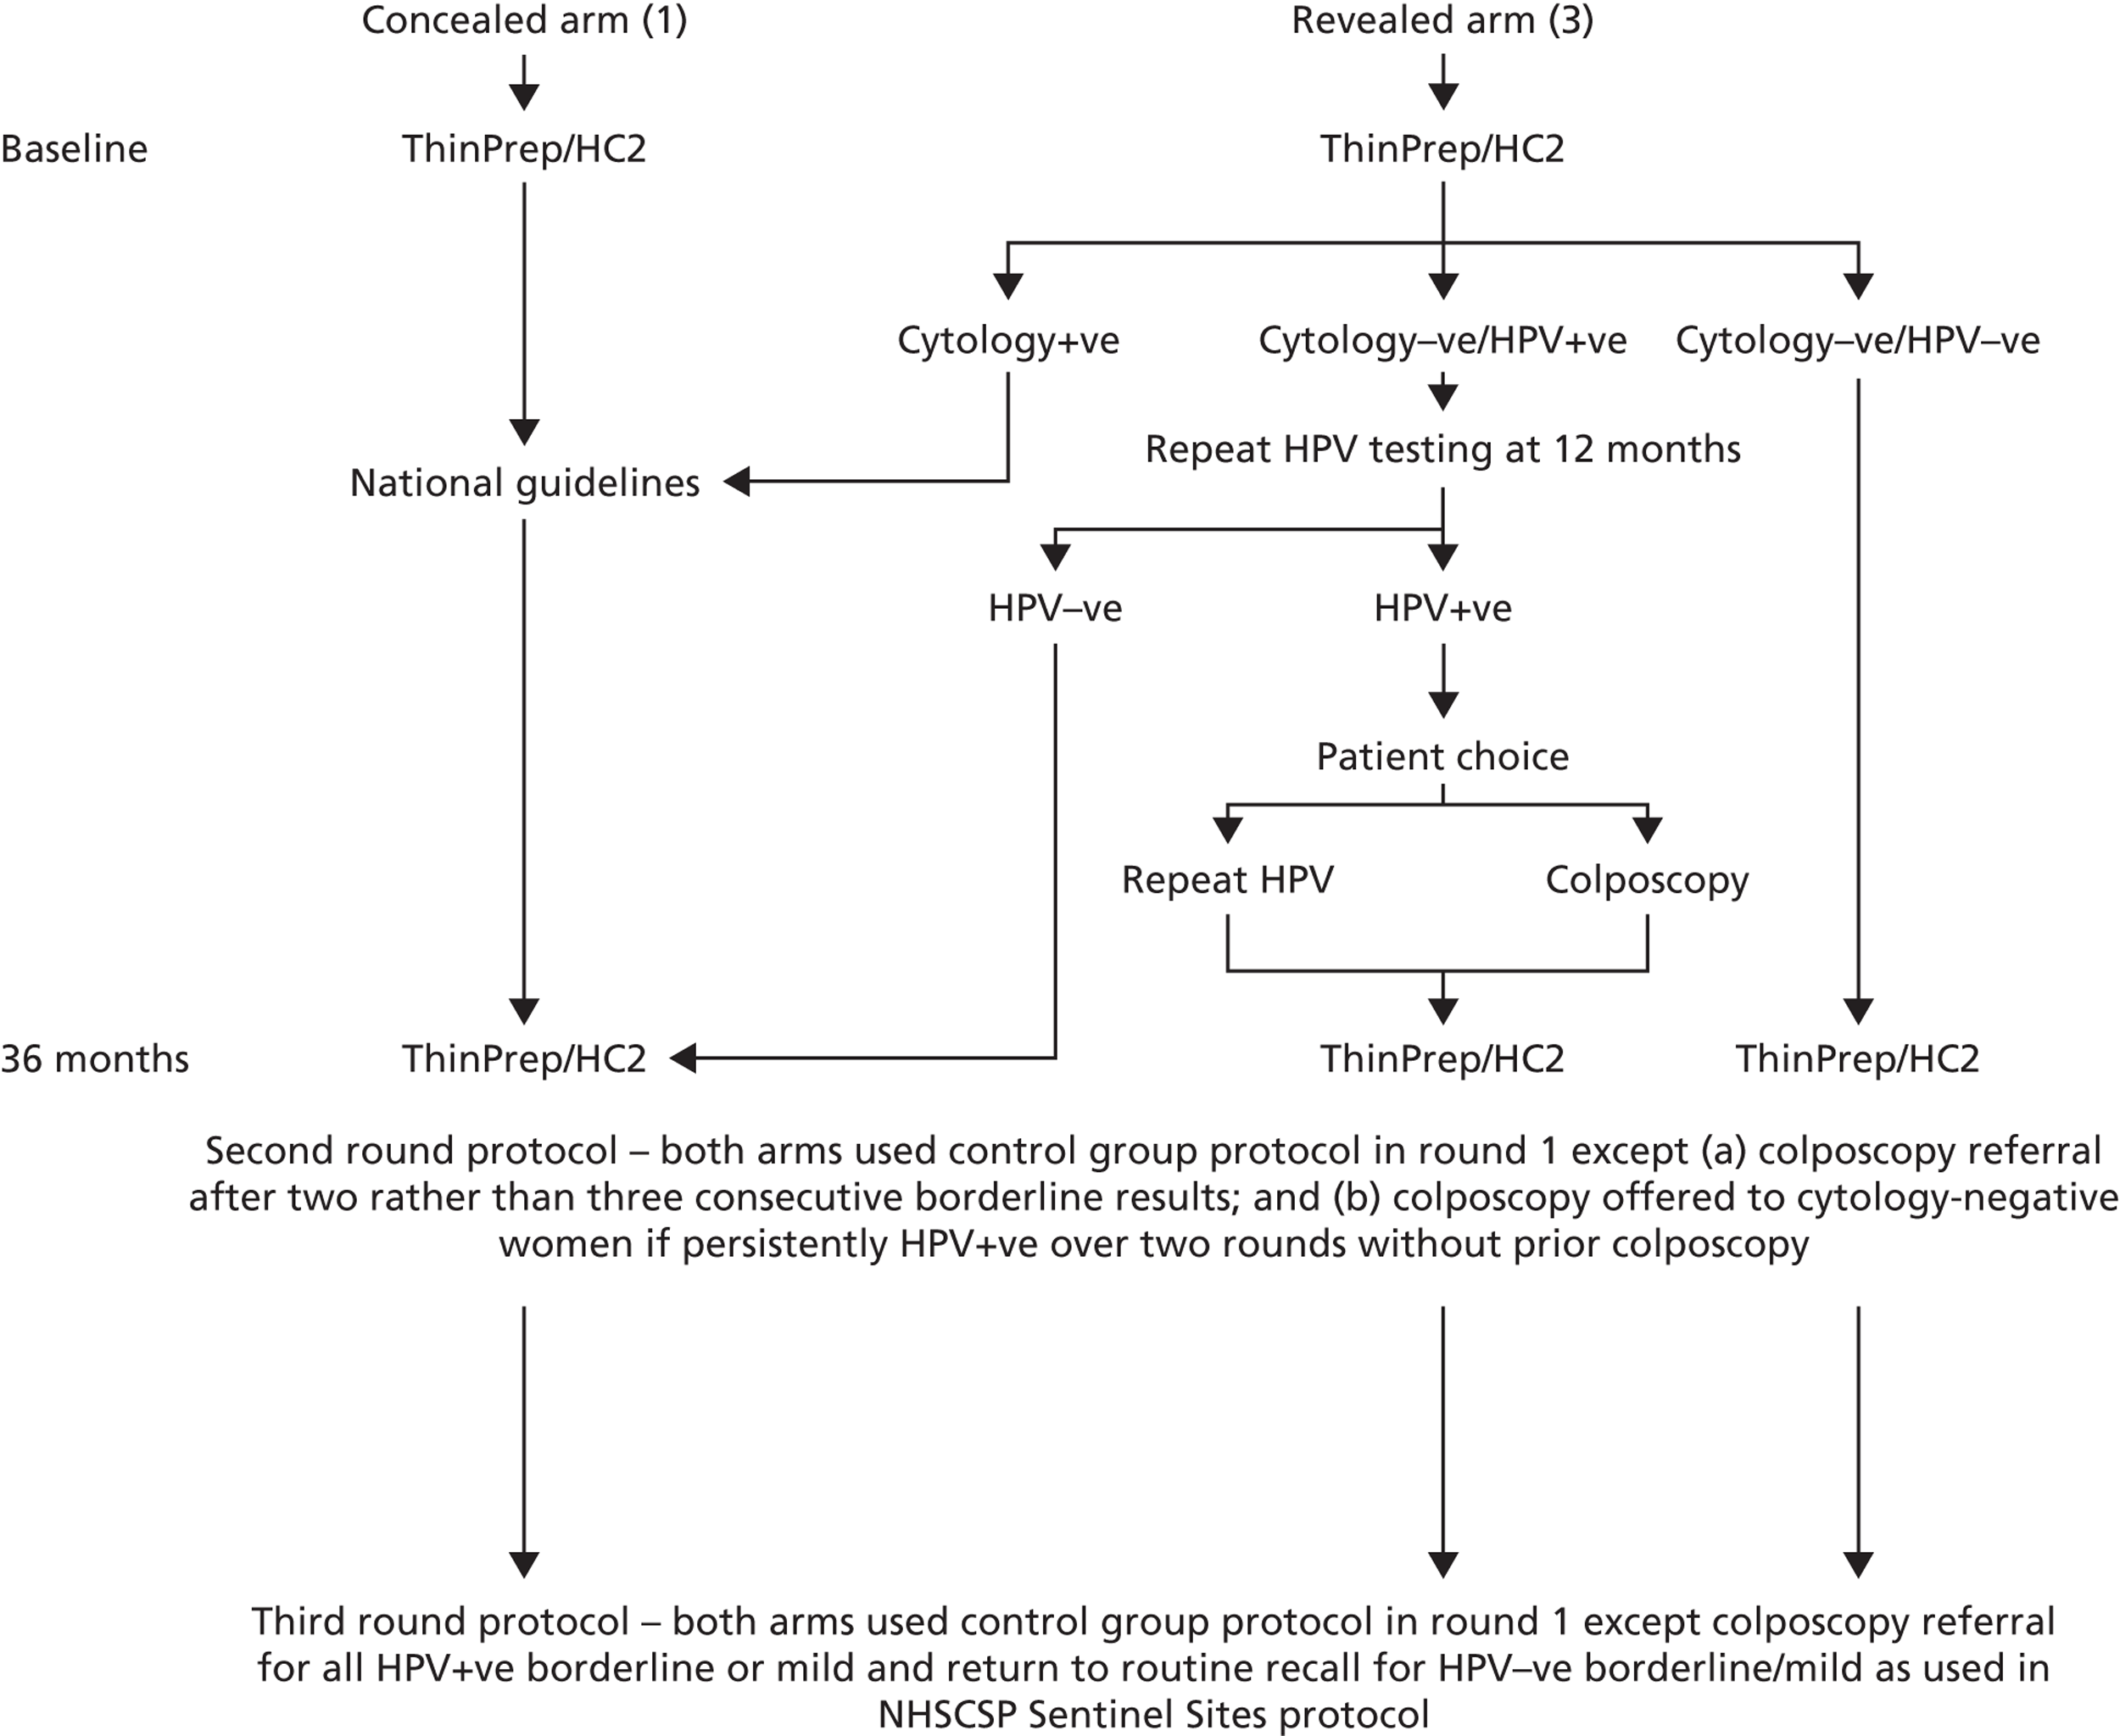
This extension of ARTISTIC involved extending follow-up of the study cohort through a third round of screening (Figure 1). All ARTISTIC women were invited to participate in a third round of screening 3 years following round 2. All women who participated in round 3 had LBC and HPV testing; however, for reasons explained below, a HPV-positive result only affected the management of those women with borderline changes or mild dyskaryosis who were then offered colposcopy, and this applied to both of the original arms. In all other respects routine clinical care applied.
FIGURE 1.
ARTISTIC protocol for rounds 1, 2 and 3.
As was the case throughout the ARTISTIC study, all colposcopy was performed by practitioners accredited in colposcopy through the British Society of Colposcopy and Cervical Pathology. Equally, all cytology procedures were done according to NHSCSP Quality Assurance (QA) standards and HPV testing was performed in a Clinical Pathology Accreditation-approved laboratory.
Setting and ethics committee approval for the extension
The original protocol did not include continued HPV testing after the second screening round. The trial extension with a further (third) round of HPV testing in addition to cytology was initially approved by the North West Multicentre Research Ethics Committee (ref 00/8/30) on the basis that there were no significant changes to the management of women involved in the 6-year follow-up and that all participants were reconsented to the study. It was anticipated by the investigators that this would be difficult to achieve. The patient information leaflets are included in Appendix 5 and Appendix 6 and consent forms are included in Appendix 7.
General practitioner and family planning involvement
The original primary care practices and family planning clinics maintained their involvement in the trial extension. As all clinics had been participating since 2001, and LBC roll-out and update training across the region had been completed, it was deemed unnecessary to hold any information or training sessions. All practices involved were sent information about the trial extension and spare copies of the patient literature to keep in the clinic rooms.
Reconsenting procedures
All previously enrolled women were sent a letter to their last known address, detailing the aims and procedures of the trial extension. The appropriate patient information leaflet and consent form were also included. Women were given stamped addressed envelopes to return the consent form to the trial office. Women who did not wish to continue their participation in the trial were asked to return their consent forms blank with just their unique trial number included to allow identification. Women who withdrew from the extension did not receive any further correspondence from the trial office. Non-responders to the initial information were sent a repeat letter containing the same information to give them an additional opportunity to reconsent.
General practitioners (GPs) and family planning clinics were sent lists of all ARTISTIC women so that they were able to check whether or not the women were still participating when they attended for screening. A reimbursement of £5 was offered to sample-takers to reconsent women at the clinics who had failed to respond to the letters from the trial office. As some women had changed GPs since the first round of screening in the trial began, practices that were not originally part of the trial were sent additional information about the trial and its extension, if they had ARTISTIC women registered with them.
Protocol amendments
Throughout the course of the third round extension, two major protocol amendments were necessary:
-
An amendment was submitted to the ethics committee to seek approval for triaging all ARTISTIC women on the basis of reflex HPV testing for low-grade abnormalities in line with the NHSCSP Sentinel Sites protocol. This amendment was approved on the basis that to deny the women participating in the trial access to the triage would have provided them with inferior management than that received by other women attending for routine screening in the Greater Manchester area.
-
Within 9 months of the process of reconsenting for the third round extension of ARTISTIC, it became clear, as had been anticipated, that this was not viable. Fewer than one-quarter of women had returned consent forms, and not all of these women actually underwent screening. It was obvious that this would result in insufficient data to allow any useful conclusions to be drawn. A substantial amendment was submitted to the ethics committee, who agreed that under the circumstances it was in the public interest for approval to be given to the use of unconsented samples to be tested for HPV and recommended the following:
-
to obtain samples of residual material from routinely performed cytology (ARTISTIC participants)
-
to ensure that the HPV test result would not generate any non-routine clinical action
-
to ensure that data were anonymised by removing the use of the patient NHS number on the study database and instead use the unique study identifier to make it impossible for researchers to link HPV data to named individuals.
-
This amendment meant that colposcopy could not be offered to cytology-negative women who were HPV positive at the third screening round. Consequently, the positive and negative predictive values could be affected by the lack of colposcopy verification in cytology-negative/HPV-positive women. On the other hand, the triage of low-grade abnormalities would have resulted in rapid colposcopic verification of underlying CIN. The impact of the protocol amendments on the management of women in the trial is summarised in Table 1. Round 3 management was based on the post-amendments management recommendations.
| Pre-amendments | Post-amendments |
|---|---|
| Both arms | |
| High-grade cytology – colposcopy | High-grade cytology – colposcopy |
| Low-grade cytology | Low-grade cytology/HPV+ve – colposcopy |
| Mild dyskaryosis – colposcopy | |
| Borderline changes – repeat and refer if abnormal | |
| Negative cytology – colposcopy HPV+ve second and third round (revealed arm only) | Negative cytology – routine recall |
Impact of the NHS Cervical Screening Programme sentinel sites for human papillomavirus triage
On 1 March 2008, the Manchester Cytology Centre became one of six sentinel sites for HPV triage in England. The aim of the sentinel sites project was to evaluate the roll-out of HPV triage of low-grade cytological abnormalities. Women who tested HPV positive were referred to colposcopy, while those who were negative were returned to routine recall. This process expedited the referral to colposcopy for those who were at risk of an underlying abnormality, while women who were negative, and therefore at low risk, were spared repeat cytological testing.
In order to keep the management of the ARTISTIC women in line with local policies as required by the ethics committee, women in both revealed and concealed arms were entered into the triage protocol. 12 Women entered into the triage protocol received both a combined cytology/HPV result letter from the screening agencies as well as a results letter from the trial office. The changes in the HPV testing protocol were explained in the patient information leaflets. Women living in the Stockport area were also sent a leaflet explaining HPV triage, as this would not have been sent to them by their local screening agency.
The trial protocol originally meant that only the HPV result in women with negative cytology influenced management in the revealed arm and differentiated the effect of HPV testing between the two arms. The maintenance of the revealing and concealment of HPV results in round 3 was rendered impossible by the consequences of the ethics committee’s decision.
Clinical samples
All samples were collected as previously described. 1 Samples that were reported as showing low-grade abnormalities were HPV tested as part of the sentinel sites protocol. All HPV triage testing was carried out at the Manchester Virology laboratory alongside the ARTISTIC HPV testing. Samples were reported as positive and acted upon at the recommended cut-off of 1 RLU/Co. During the course of the ARTISTIC study, the following QA measures were followed: retesting of every 50th sample and participation in external QA schemes when they became available. External QA schemes included National External Quality Assessment Service (NEQAS), Quality Control for Molecular Diagnostics (QCMD) and samples sent from the Scottish HPV Reference laboratory.
Reading of cytology slides and samples
All samples were read and reported in line with current laboratory and NHSCSP guidelines as previously reported. 1 Samples were reported blind to both the allocation of the sample within the trial and the HPV test results, with the exception of slides showing low-grade abnormalities which were sent for HPV testing as part of the NHSCSP Sentinel Sites project.
Human papillomavirus testing
Hybrid Capture 2 cut-off values
Unless otherwise stated, HC2 results have been reported using a cut-off RLU/Co of 1 or greater. The alternative cut-off of 2 RLU/Co has been calculated for the purposes of comparison with a cut-off of RLU/Co of 1 or greater and these cut-offs have been clearly identified where relevant.
Changes to human papillomavirus genotyping protocol
Three typing assays for HPV detection were considered during the study to genotype HC2-positive samples. All of the HC2-positive samples accrued during the original trial were genotyped using the prototype Roche Line Blot Assay® (LBA) as previously described. 1
In order to compare typing assays, two-thirds of HC2-positive round 1 archived samples were also tested by the Greiner Bio-One PapilloCheck® assay (Greiner Bio-One GmbH, Frickenhausen, Germany). In round 2, one-third of archived HC2-positive samples were tested by the Roche Linear Array® (LA) (Roche Molecular Diagnostics, Pleasanton, CA, USA). As a result of the prototype LBA being replaced with the commercially available LA assay during the extension period of this study, only 34% of HC2 positive samples in round 3 were actually tested by the LBA. The remainder were tested using PapilloCheck® only (23%), LA only (15%) or both PapilloCheck® and LA (28%). In order to present as many genotyping data as possible, typing results using the PapilloCheck® assay have been included. Any type detected by any of the assays used on a particular sample in all rounds were considered in the analysis.
Human papillomavirus genotyping by the Greiner Bio-One PapilloCheck® test
The PapilloCheck® HPV test is a polymerase chain reaction (PCR)-based assay designed to simultaneously detect and genotype 24 mucogenital HPV types including the 13 HR types targeted by the HC2 test (Qiagen, Gaithersberg, MD, USA). The PapilloCheck® test uses a consensus primer set targeting the E1 region of the HPV genome followed by HPV-type specific product detection using a micro-array hybridisation system.
Deoxyribonucleic acid (DNA) extraction for the PapilloCheck® assay was carried out using the Nuclisens easyMAG automated extraction system (bioMérieux, Inc., Durham, NC, USA). Storage samples (4) were thawed and 50 µl was added to the appropriate well in the easyMAG carrier strip. Twenty-four samples were extracted at a time. The purified total nucleic acid was eluted in 100 µl of extraction buffer, which was transferred to a 2-ml vial for storage at −70 °C prior to amplification.
A 350-bp fragment within the E1 region of the HPV genome was amplified by PCR using a broad-spectrum consensus primer set. In addition, a fragment of the human ADAT1 gene was amplified and fluorescently labelled with Cy5 in the same reaction. This acted as an internal control to assess the quality of DNA. The amplified products were then hybridised to HPV type-specific oligonucleotide probes immobilised onto a DNA chip and were detected by the binding of a Cy5-dUTP labelled oligonucleotide. After hybridisation and subsequent washing, the PapilloCheck® DNA chip was scanned using the CheckScanner apparatus (Greiner Bio-One GmbH, Frickenhausen, Germany) at excitation wavelengths of 532 and 635 nm. Evaluation and analysis of the DNA chip was carried out using the CheckReport analysis software.
Human papillomavirus detection by the M2000 Abbott real-time high-risk human papillomavirus assay
During the course of the ARTISTIC trial the virology laboratory was invited to participate in the Abbott HPV early access evaluation programme. The Abbott test was performed on archived samples for which women had consented to further testing. None of the Abbott results were acted upon clinically.
The recently introduced highly automated Abbott real-time HR HPV assay is a PCR-based real-time assay designed to detect 14 HR HPV genotypes (16, 18, 31, 33, 35, 39, 45, 51, 52, 56, 58, 59, 66 and 68). By the use of different dyes, the assay identified infection with types 16 and 18 singly while the 12 remaining types were detected as a group. Following extraction of DNA from the LBC sample using the Abbott M2000sp extraction robot (Abbott Molecular, Maidenhead, UK), any HR HPV DNA present in the sample was amplified and detected simultaneously using the Abbott M2000rt sequence detection system. The system also co-amplified and detected a portion of human DNA which acted as a sample integrity control.
A 400-µl aliquot of ThinPrep® Medium (Hologic, Inc., Bedford, MA, USA) was added to 100 µl of archived sample prior to DNA extraction using the M2000sp as per the Abbott protocol. Following DNA extraction, any HR HPV DNA was amplified and detected using the M2000rt system as per the recommended protocol.
Statistical analysis
Definitions
Women were eligible if they were aged 20–64 years when they provided a round 1 sample which was defined as the first cytologically adequate sample after randomisation at entry that gave a satisfactory HPV result. Many women attended their next routine screen earlier or later than the scheduled 3-year recall. Originally, ARTISTIC round 2 was defined as 30–48 months after entry. This resulted in CIN2+ lesions being excluded and, in the HTA ARTISTIC report,1 the broader definition of 26–54 months was also used. This latter definition, which was used in the Lancet Oncology manuscript,2 was employed in this current report. Alternative results are shown in Appendix 3 of this report defining round 2 as the first sample 30–48 months after the round 1 entry smear. The round 3 sample was defined as the first cytologically adequate sample at least 54 months after the round 1 smear, and at least 24 months after the round 2 smear (if there was one). Women were classified histologically at round 1, round 2 and round 3 on the basis of the highest grade of histology within 30 months of the round 1, round 2 or round 3 cytology. Women with CIN2 histology or worse (CIN2+) were excluded from subsequent rounds.
Women were followed for cytology until the end of June 2009 and for histology to October 2009. Follow-up was based on cytology and histology reports received by the laboratories in Manchester and Stockport. Cytology and histology taken outside these areas were not available.
Persistent infection at round 2 was defined as detection of one or more of the same HPV types also found at round 1. Persistent infection at round 3 was defined as detection of one or more of the same types also found at round 1 (any round 2 result was ignored for this analysis). Positive HPV results at round 2 or 3 were thus considered to be either ‘new’ or ‘persistent’. Additionally, these HPV positive results were split by HPV type present (according to the previously defined hierarchy and groupings) at round 2 or 3. CIN2+ and CIN3+ rates have been presented for new and persistent infections. HC2-positive results where no HR type was detected have been considered to be ‘new’ infections; hence, no exclusions were made in the analysis.
Data collection
Data were collected as described in the original HTA monograph. 1 For round 3, all patient identifiers, bar the unique trial identifying number, were removed from the database on the advice of the ethics committee.
Data analysis
Human papillomavirus prevalence, cytological abnormality and CIN2+ rates were tabulated by combinations of round, age at round, randomisation arm and HPV status at entry or at round. HPV status was split further by main HPV type identified: (1) HPV 16 or HPV 18, (2) HPV 31, HPV 33, HPV 45, HPV 52 and HPV 58 and (3) other HC2 positive, including HC2-positive samples where none of the 13 types was identified. The rationale behind these groupings was that 16/18 are the types targeted by the Cervarix™ vaccine (GlaxoSmithKline Biologicals, Rixensart, Belgium), which was used in the UK vaccination programme until September 2012, after which it was switched to Gardasil® (Merck Sharp & Dohme Corp., Merck & Co., Inc., Whitehouse Station, NJ, USA). The Cervarix™ vaccine has also been reported to exhibit a degree of cross-protection against types 31/33/45/52/58. According to published efficacy data, Cervarix achieved 98% efficacy against 16/18 related CIN2+, 68% efficacy against 31/33/45/52/58 related to CIN2+ and 70% against CIN2+ of any HR type in females who were HPV naive prior to vaccination. 13
Cumulative CIN2+ and CIN3+ rates were estimated as P = 1 – (1 – P1)(1 – P2)(1 – P3), where Pi denotes the proportion with disease (Di/Ni) in round i. Confidence intervals were calculated from Greenwood’s formula for the standard error: √(1 – P)2Σi{Di/[Ni(Ni – Di)]}14 (suffix numbers refer to screening round). Comparisons using two-sided Fisher’s exact test were also based on these binomial proportions. Between-round differences in rates of abnormal cytology and histology were estimated by unconditional logistic regression adjusted for age and HPV status at round, cytology (for comparing CIN2+ rates) and randomisation. All analyses were programmed in Stata 11 (StataCorp LP, College Station, TX, USA).
Economic analysis
Overview of model platform used for the evaluation
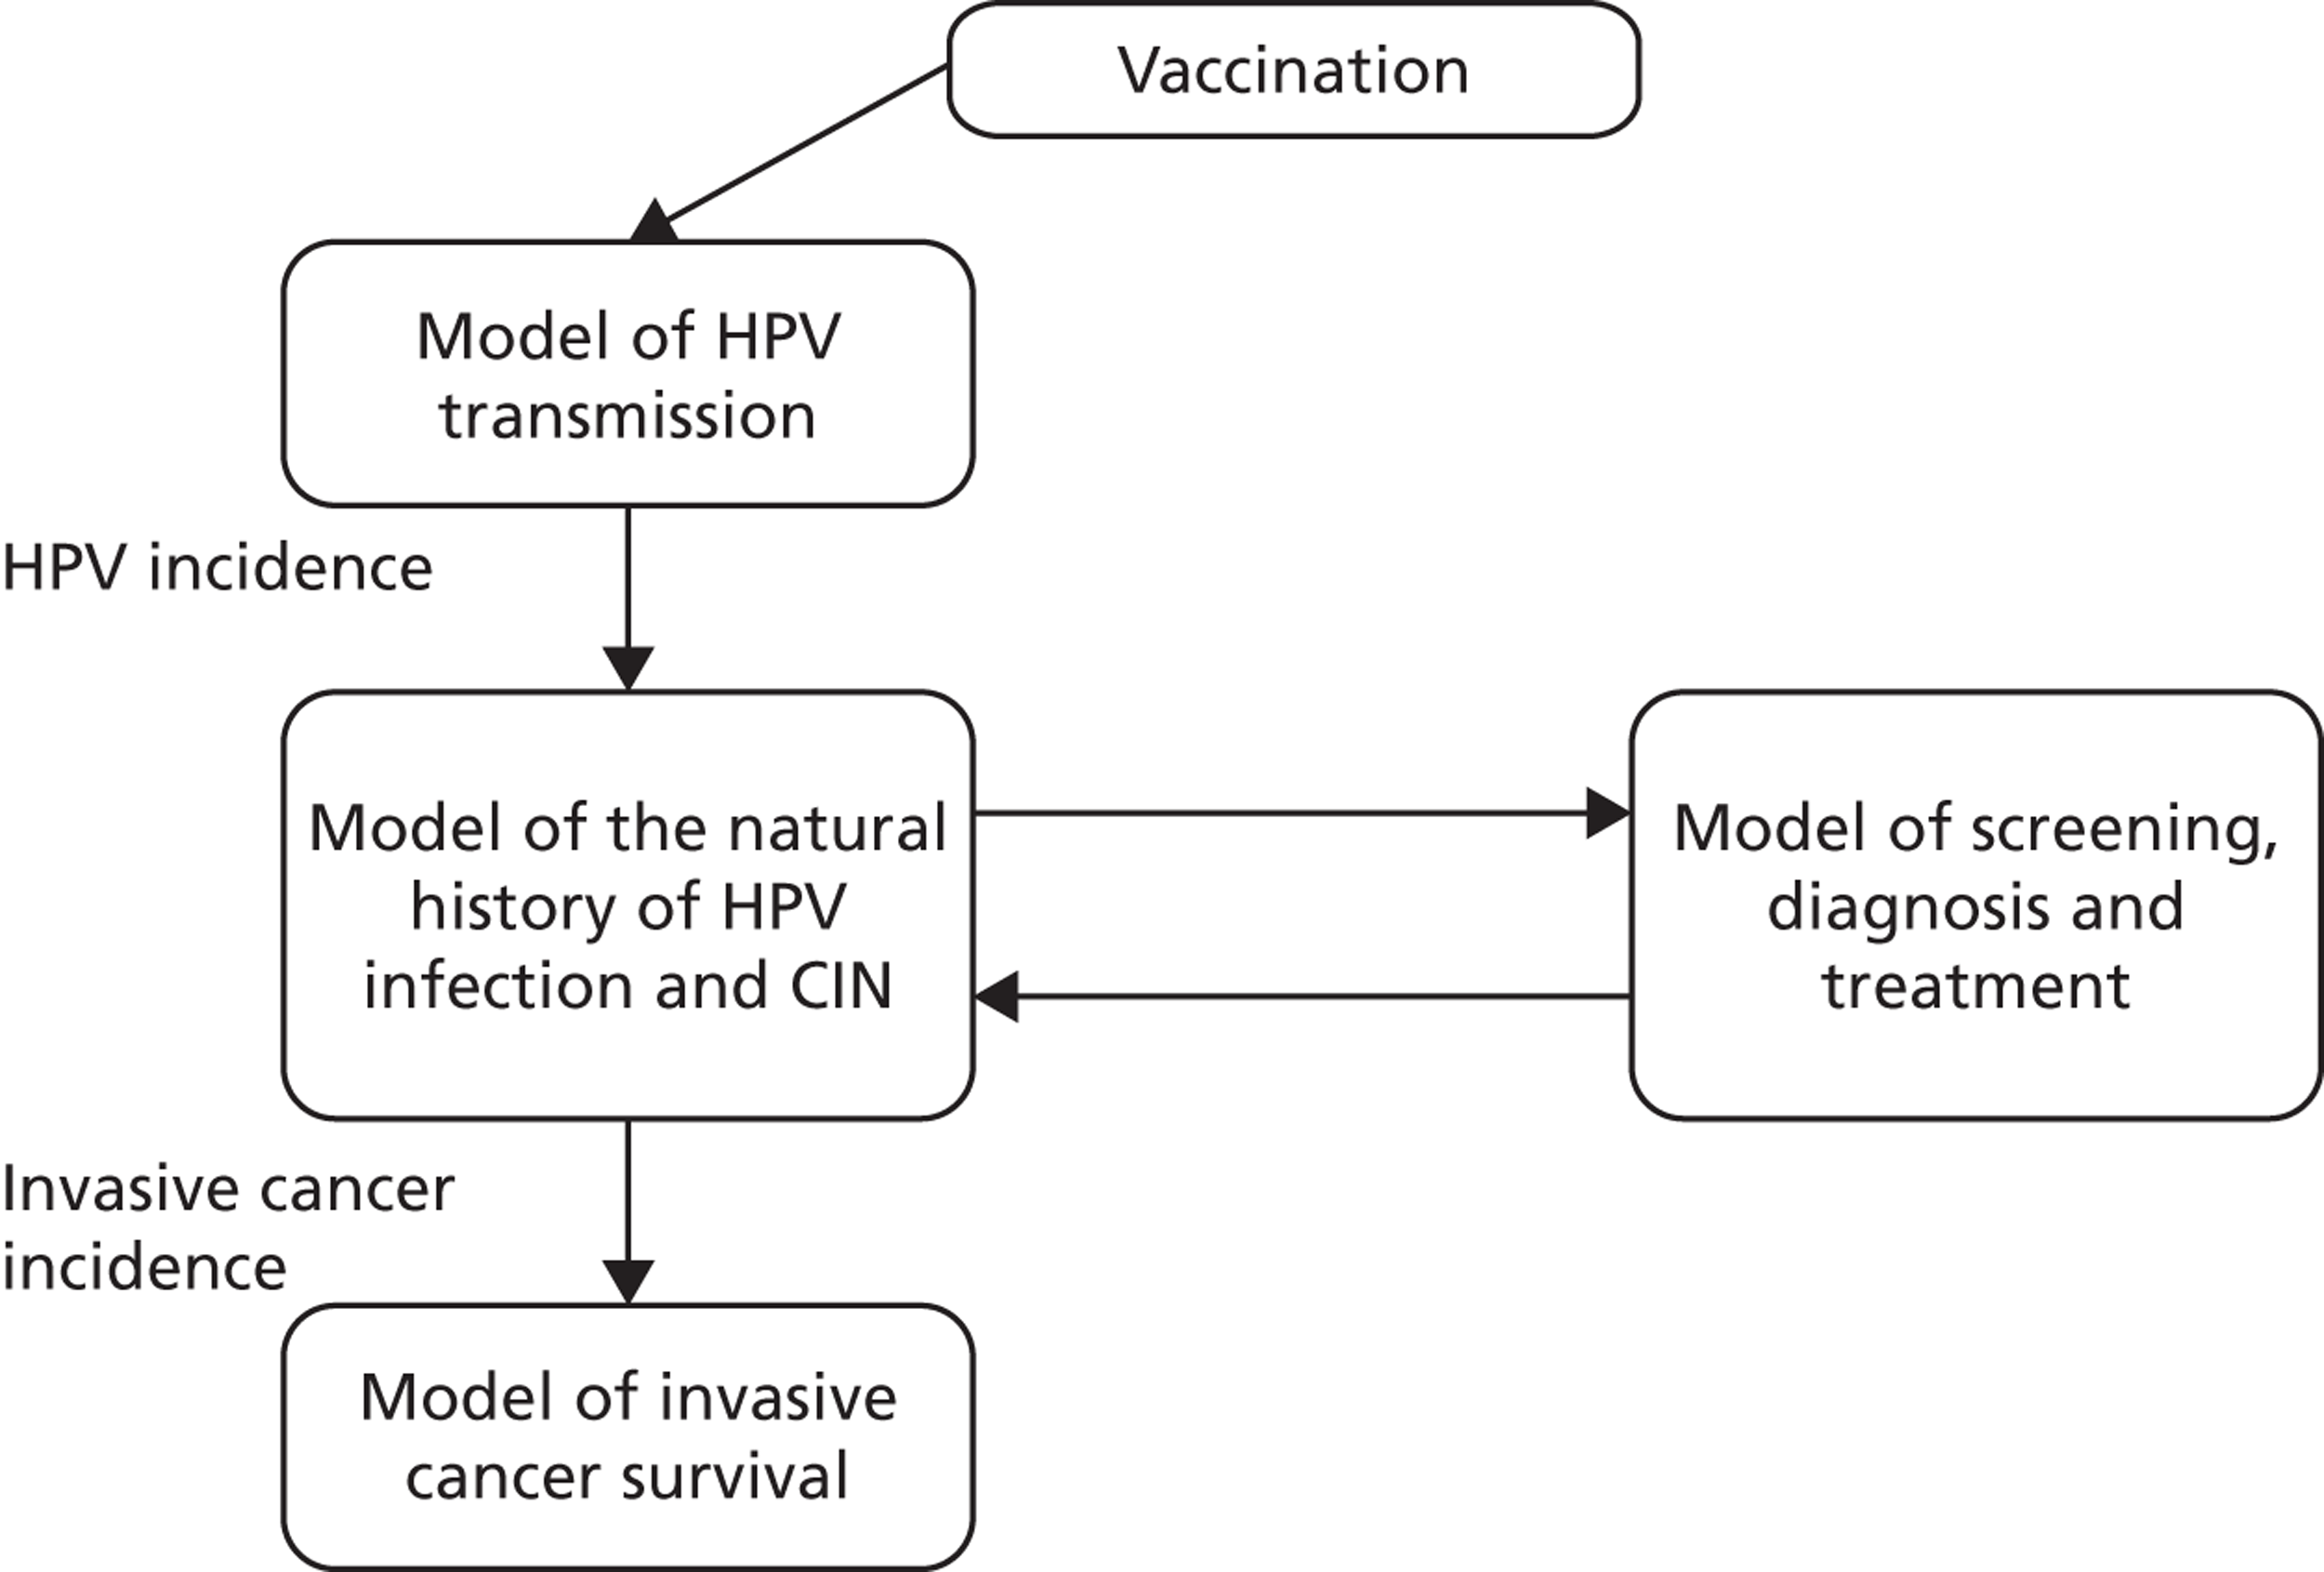
An existing model platform was adapted for the economic analysis, and the components of this platform are summarised in Figure 2. This model platform has been previously used to evaluate changes to the cervical screening interval in Australia and the UK,15,16 the role of alternative technologies for screening in Australia, New Zealand and England,17–19 the role of HPV triage testing for women with low-grade cytology in Australia and New Zealand,20 and the cost-effectiveness of alternative screening strategies, combined screening and vaccination approaches in China. 21,22 The model platform has three main components:
-
A dynamic model of sexual behaviour and HPV transmission (and vaccination as appropriate) in England. This incorporates other data from local sexual behaviour surveys,23 and information on vaccination catch-up and coverage rates in England. 24
-
A multitype Markov cohort model of the natural history of CIN and invasive cervical cancer (referred to as the ‘natural history model’). The natural history model takes into account differing clearance and progression rates associated with HPV 16 and HPV 18, compared with other oncogenic types. The model also explicitly simulates post-treatment recurrence in women previously treated for high-grade lesions.
-
A cohort and multicohort model of screening, diagnosis, treatment and post-treatment management.
FIGURE 2.
Schematic diagram of model platform.
Methods for model validation against ARTISTIC data
Reanalysis of ARTISTIC was used to support validation of the existing model platform. The steps involved in ARTISTIC validation can be summarised as follows:
-
Set up and simulate a ‘virtual’ cohort based on the age distribution and screening behaviour of the ARTISTIC trial cohort.
-
Run a multicohort simulation (i.e. a subsimulation for each age group in the cohort) to predict the number of screen-detected low- and high-grade cervical abnormalities that would be observed in each age group and overall, over the duration of trial follow-up.
-
Validate the predictions obtained from the model with the data from the ARTISTIC trial.
The model platform used for the main evaluation has three main components. These three components consider:
-
HPV transmission and vaccination
-
the natural history of cervical CIN and cancer in HPV-infected women; and
-
cervical screening.
The methods by which the model components two and three above were adapted for modelling the ARTISTIC cohort are described below.
Human papillomavirus transmission and dynamic modelling
Age-specific pre-vaccination HPV incidence was obtained from a dynamic model of HPV transmission. As the model is a dynamic transmission model, the effects of herd immunity are taken into account. Data on sexual behaviour from the UK’s National Survey of Sexual Attitudes and Lifestyles II (NATSAL II)25 (data collected between 2000 and 2001) were incorporated into the model. (See Appendix 16 on sexual behaviour data for the population model for more details on the simulation of sexual behaviour in England.)
Model of the natural history of cervical intraepithelial neoplasia and cancer
The model assumes that once a woman becomes infected with HPV, the virus can be cleared, or can persist and eventually cause CIN or cancer of the cervix. Six different health states in which a woman can exist were considered: well (or uninfected with HPV); HPV; CIN1 (persistent HPV infection); CIN2; CIN3; and cancer. The cancer state was further divided into stages to reflect International Federation of Gynecology and Obstetrics (FIGO) clinical stage at diagnosis and for each stage, diagnosed and undiagnosed cancer. Women who are diagnosed with invasive cervical cancer have an increased, stage-specific rate of death. Women who have survived cervical cancer for over 5 years are considered cancer survivors in the model, and their rate of survival is assumed to be the same as that of the normal population. Women who had HPV, CIN1, CIN2 or CIN3 were further categorised into three pathways associated with HPV 16, 18 or other HR types. The initial prevalence of each HPV type for each CIN state and for each age group was weighted to be consistent with the type-specific prevalence observed at enrolment in the ARTISTIC trial.
The natural history aspect of the model captures the rates at which women in different health states can progress to a more advanced stage (e.g. CIN2 to CIN3), remain in the same health state (e.g. remain in the CIN2 state), or regress (e.g. CIN2 to CIN1). This was captured in a HPV-type-specific matrix of progression, regression and stasis rates between HR HPV infection, CIN1, CIN2, CIN3 and invasive cervical cancer. The model captured the higher rates of disease progression and lower rates of regression in women infected with HPV 16 and 18 compared with other HR HPV types.
The rates of progression, regression and stasis between the different health states have been calibrated and validated previously. However, the ARTISTIC data were used to further validate the natural history model.
Modelling screening
The natural history aspect of the model dealt with modelling the actual underlying health state distribution of women in the population. However, the ARTISTIC trial reported histology results from women who attended screening and were referred for colposcopy and biopsy. Thus, in order to compare the natural history model results with ARTISTIC results, screening behaviour as observed in the trial was simulated. Management of the two different screening arms of the trial were simulated, and the ARTISTIC data were used to determine the rates of non-attendance, early rescreening and late rescreening.
We then compared model predictions for histology detected CIN cases with observed data from the trial.
Fitting test characteristics for cytology and the underlying health state in the ARTISTIC cohort
In order to simulate the ARTISTIC cohort, the actual underlying health states of women entering the trial were estimated. To do this, we also needed to estimate the test characteristics of LBC and HPV testing in the ARTISTIC trial.
The test characteristics for LBC describe the probability of receiving any test result for each possible health state. For each underlying health state (of which there were six: well, HPV, CIN1, CIN2, CIN3 and cancer), there were five possible LBC test results (given an adequate test result): negative, borderline, mild, moderate and severe. The probabilities of receiving each test result for each possible health state form a table called the ‘test probability matrix’, or TPM. The TPM gives complete information on test characteristics and the test parameters for sensitivity, specificity and positive predictive value (PPV). Negative predictive value can be secondarily derived for thresholds at any health state [such as high-grade lesions (CIN2+) or all CIN lesions] and for any testing threshold (such as borderline or mild dyskaryosis for cytology).
A Gibbs sampler was used to simulate the posterior distribution of the health state and LBC test probability parameters using the cytology and HPV data observed at baseline in ARTISTIC. 26 Multiple chains were run and the mixing of the different sequences was monitored. The sampler was stopped when the potential scale reduction was near one for all the estimated parameters. The LBC TPM determined from this sampling procedure was further modified to match histology outputs from the ARTISTIC trial (see Appendix 9 for more information on the Gibbs sampling and fitting procedure).
Construction of the virtual ARTISTIC cohort and validation of model outcomes to ARTISTIC data
The procedure for simulating the ARTISTIC cohort can be summarised in the following steps:
-
A ‘virtual’ ARTISTIC cohort was configured to represent the trial population as at ARTISTIC enrolment. The enrolled virtual cohort represented the actual ARTISTIC cohort in terms of age profile and HPV test positive (type-specific) rates at baseline. We assumed that all women attended their baseline screen at the same time, and so screening events are synchronised (as opposed to simulating the actual date of attendance, in line with the way such trial and cohort data are routinely reported). All women had a baseline cytology and HPV test, with follow-up management dependent upon their trial arm, baseline test results and compliance with guidelines as observed in the ARTISTIC trial. The actual rates of colposcopy referral, delays in colposcopy attendance and screening attendance rates that occurred throughout ARTISTIC were captured in the model.
-
Each woman’s true underlying health state was updated at 6-monthly intervals throughout the simulation according to the parameters from the natural history model and the HPV transmission model. The number of women attending routine screening, follow-up screening or colposcopy was also updated at 6-monthly intervals.
-
For the modelled cohort, for woman with histologically detected CIN2+, any subsequent screening visits were censored, and this group were removed from the simulation. If the histology result was less than CIN2 (‘< CIN2’: CIN1 or histological manifestations of HPV effect), women remained in the simulation.
The simulation predicted the number of histology-detected CIN cases at 6-monthly intervals, and these model predictions were compared with the data from the ARTISTIC trial at 6-monthly intervals. As the natural history simulated in the model captured disease progression and regression at various rates, the actual underlying health states of women throughout the trial changes over time. Thus, the model outputs at later times in the trial give an indication of how well the natural history model captured the rates of disease progression, regression and stasis (after taking into account the ‘overlay’ of screening, i.e. the influence of screening behaviour and test characteristics on the observed outcomes in the trial).
Methods for the evaluation of primary human papillomavirus screening in England
The validated natural history model of CIN and invasive cervical cancer was then used to evaluate health outcomes under different screening strategies on a population basis for England. The cost-effectiveness of various HPV primary screening strategies were evaluated against a comparator of current screening practice, and cross-sectional outcomes, including estimated rates and case numbers of cervical cancer cases and deaths, detected high-grade abnormalities, colposcopies and numbers of screening tests, were predicted after incorporating information on the population age structure. Data from local sexual behaviour surveys, screening compliance information, and information on vaccination catch-up and coverage rates were also incorporated into the England-wide model.
A health-services perspective was used for the collection of costs. The economic evaluation also took a health-services perspective, taking into account the health-services costs associated with population-based screening, management, diagnosis, follow-up, and CIN and cancer treatment. A discount rate of 3.5% was used for costs and effects (the 3.5% discount rate for both costs and effects is recommended by the National Institute for Health and Care Excellence based on the recommendations of the UK Treasury, 2008 guide). 27
Primary human papillomavirus screening strategies considered in the evaluation
A number of potential future primary HPV screening strategies were simulated. These are described and detailed diagrammatically in the following pages. Many of the strategies chosen were thought to represent possible candidates for effective, and cost-effective, strategies in England. Other, more exploratory, strategies (as noted) were included for comparative purposes.
Comparator strategy (current screening practice)
The comparator for the evaluation is current screening practice, with and without the effects of HPV vaccination, and is depicted in Figure 3.
FIGURE 3.
Comparator strategy (current screening practice).
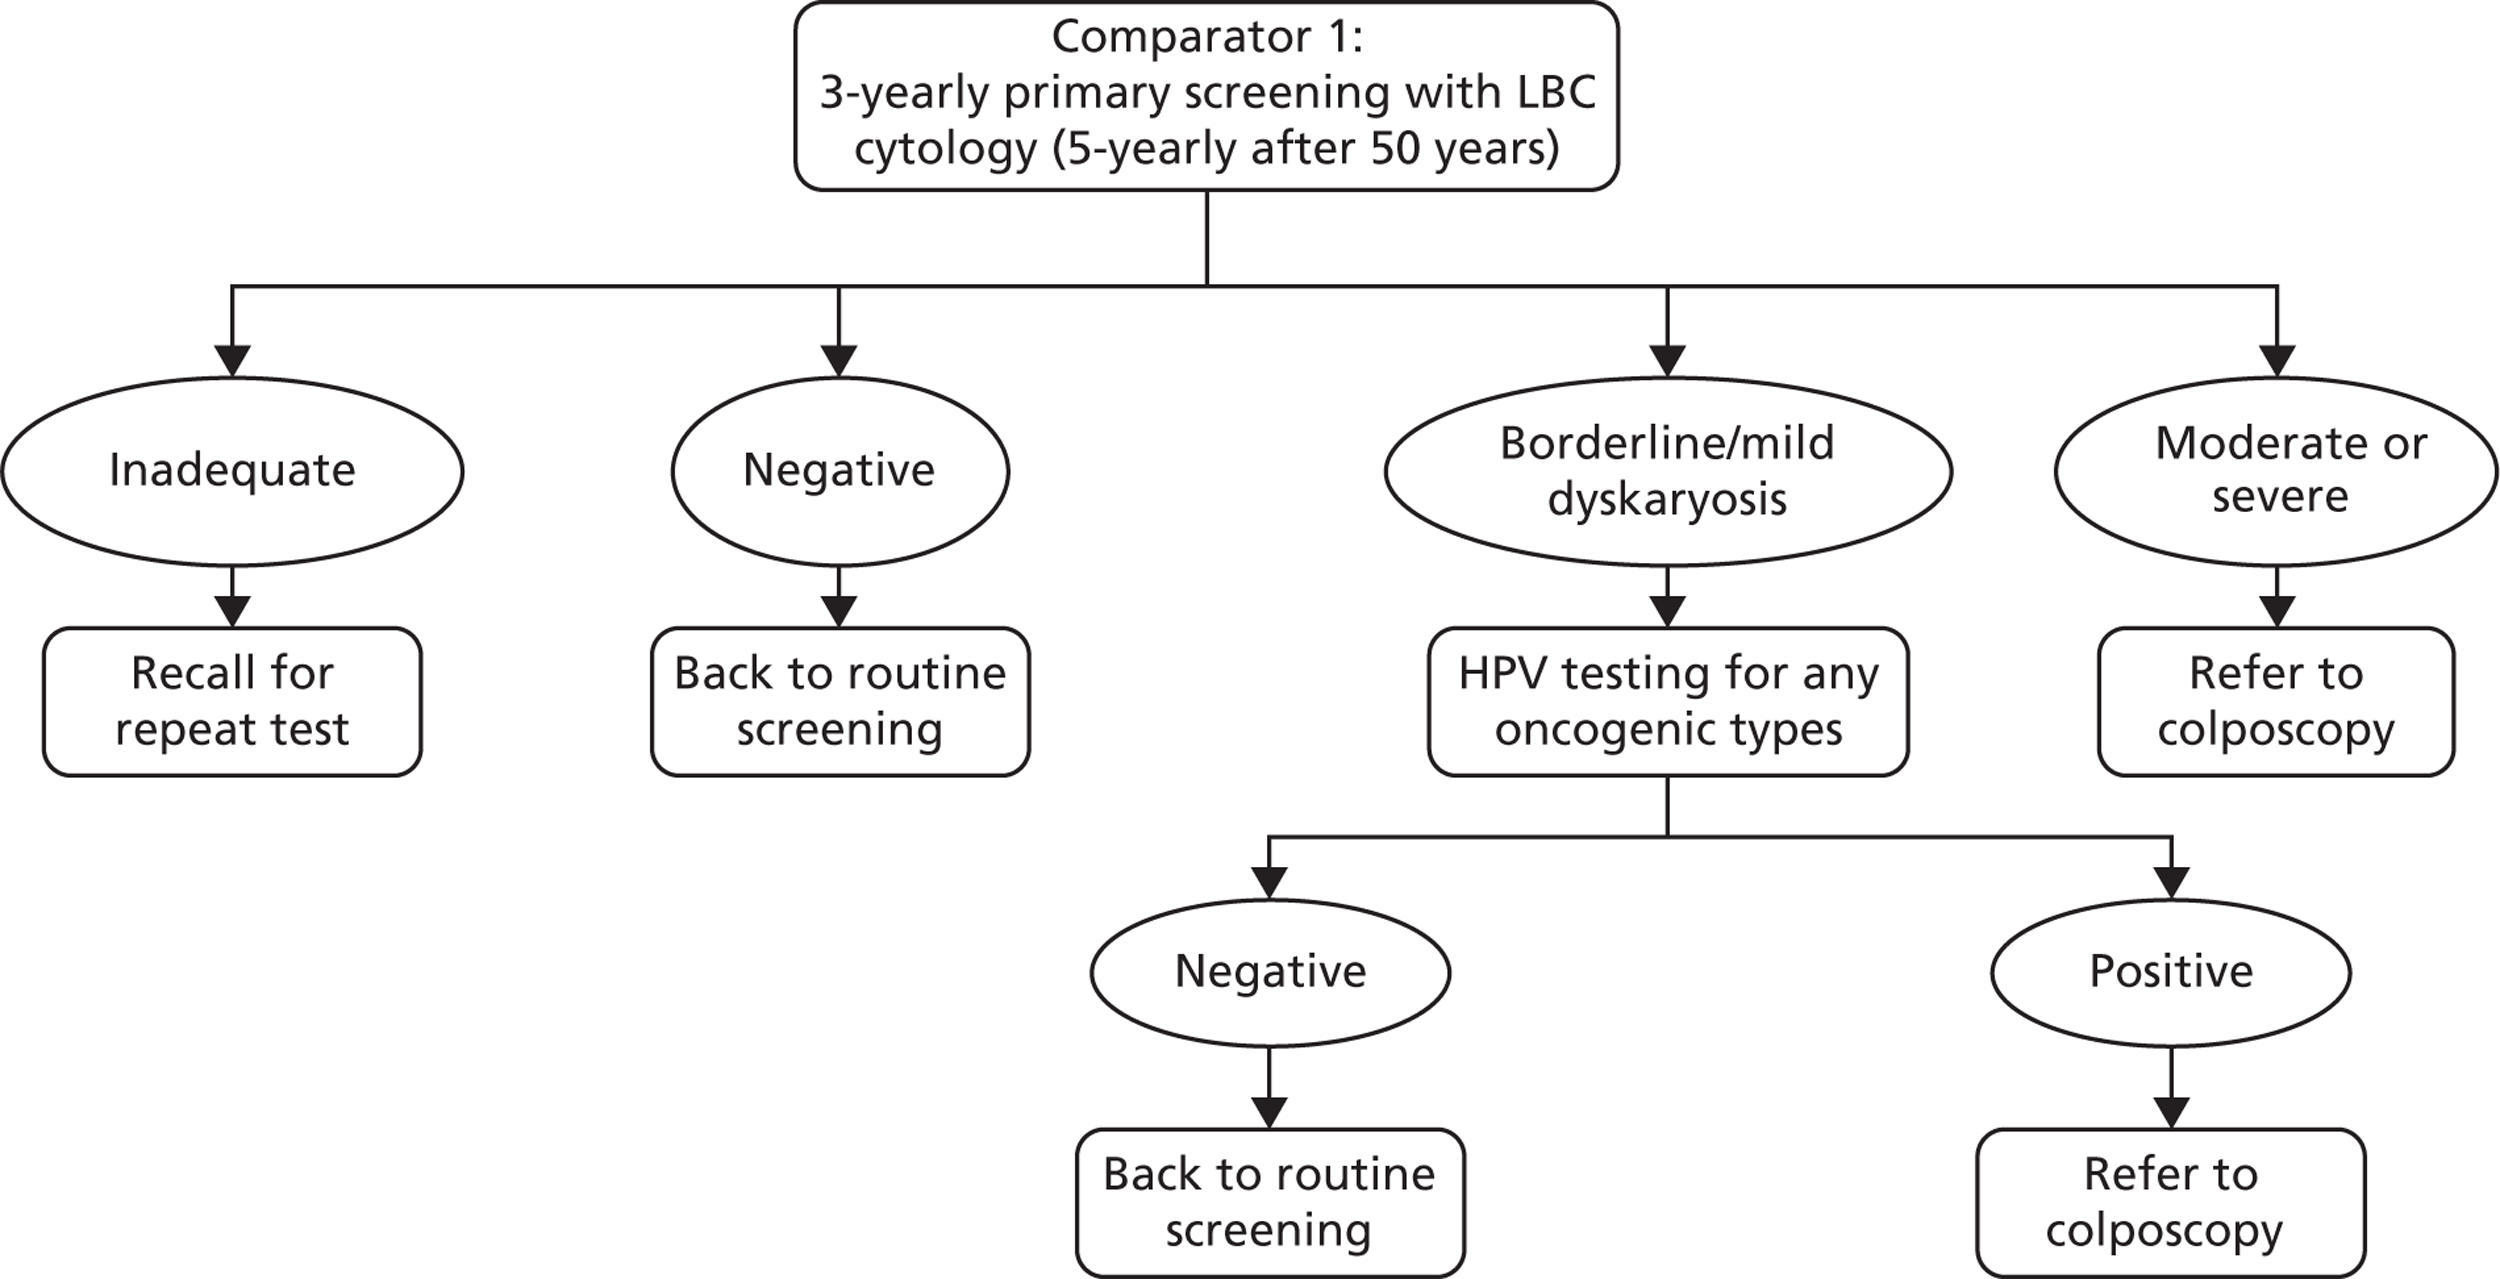
The comparator strategy involves cytology-based screening with LBC and HPV triage testing of low-grade abnormalities (borderline changes and mild dyskaryosis). The recommended screening interval is 3 years for women aged 25–49 years and 5 years for women aged 50–64 years.
Primary human papillomavirus screening strategies
We assumed that strategies two and three are carried out using a HPV test that has the ability to separately output information on HPV 16 and 18, that is to say a ‘partial genotyping’ test [note that one technology also provides information on type 45 but for the purposes of this analysis we did not model differential management based on detection of type 45, assuming that, even if this output was available, women with type 45 were managed as for women with other oncogenic types (not 16/18)].
‘Real-world’ screening compliance was assumed. Screening attendance was informed by a previous analysis performed for the UK,19 and updated to reflect the most recent data on the age-specific percentage of eligible women who attended at least once in a 5-year period in England (2009–10). This analysis allowed the model to take into account non-attendance, early rescreening, late rescreening, and screening in ages outside the target age range for screening. Attendance rates for colposcopy and post treatment were based on those used in a prior model of HPV test-of-cure in England. 28
For all strategies, colposcopy management was assumed to be as detailed later (see Figure 8). Post-treatment management was assumed to use HPV as a test-of-cure as per the protocol used in the NHS Sentinel Sites evaluation. 12
The following primary HPV screening strategies were considered.
Basic strategies
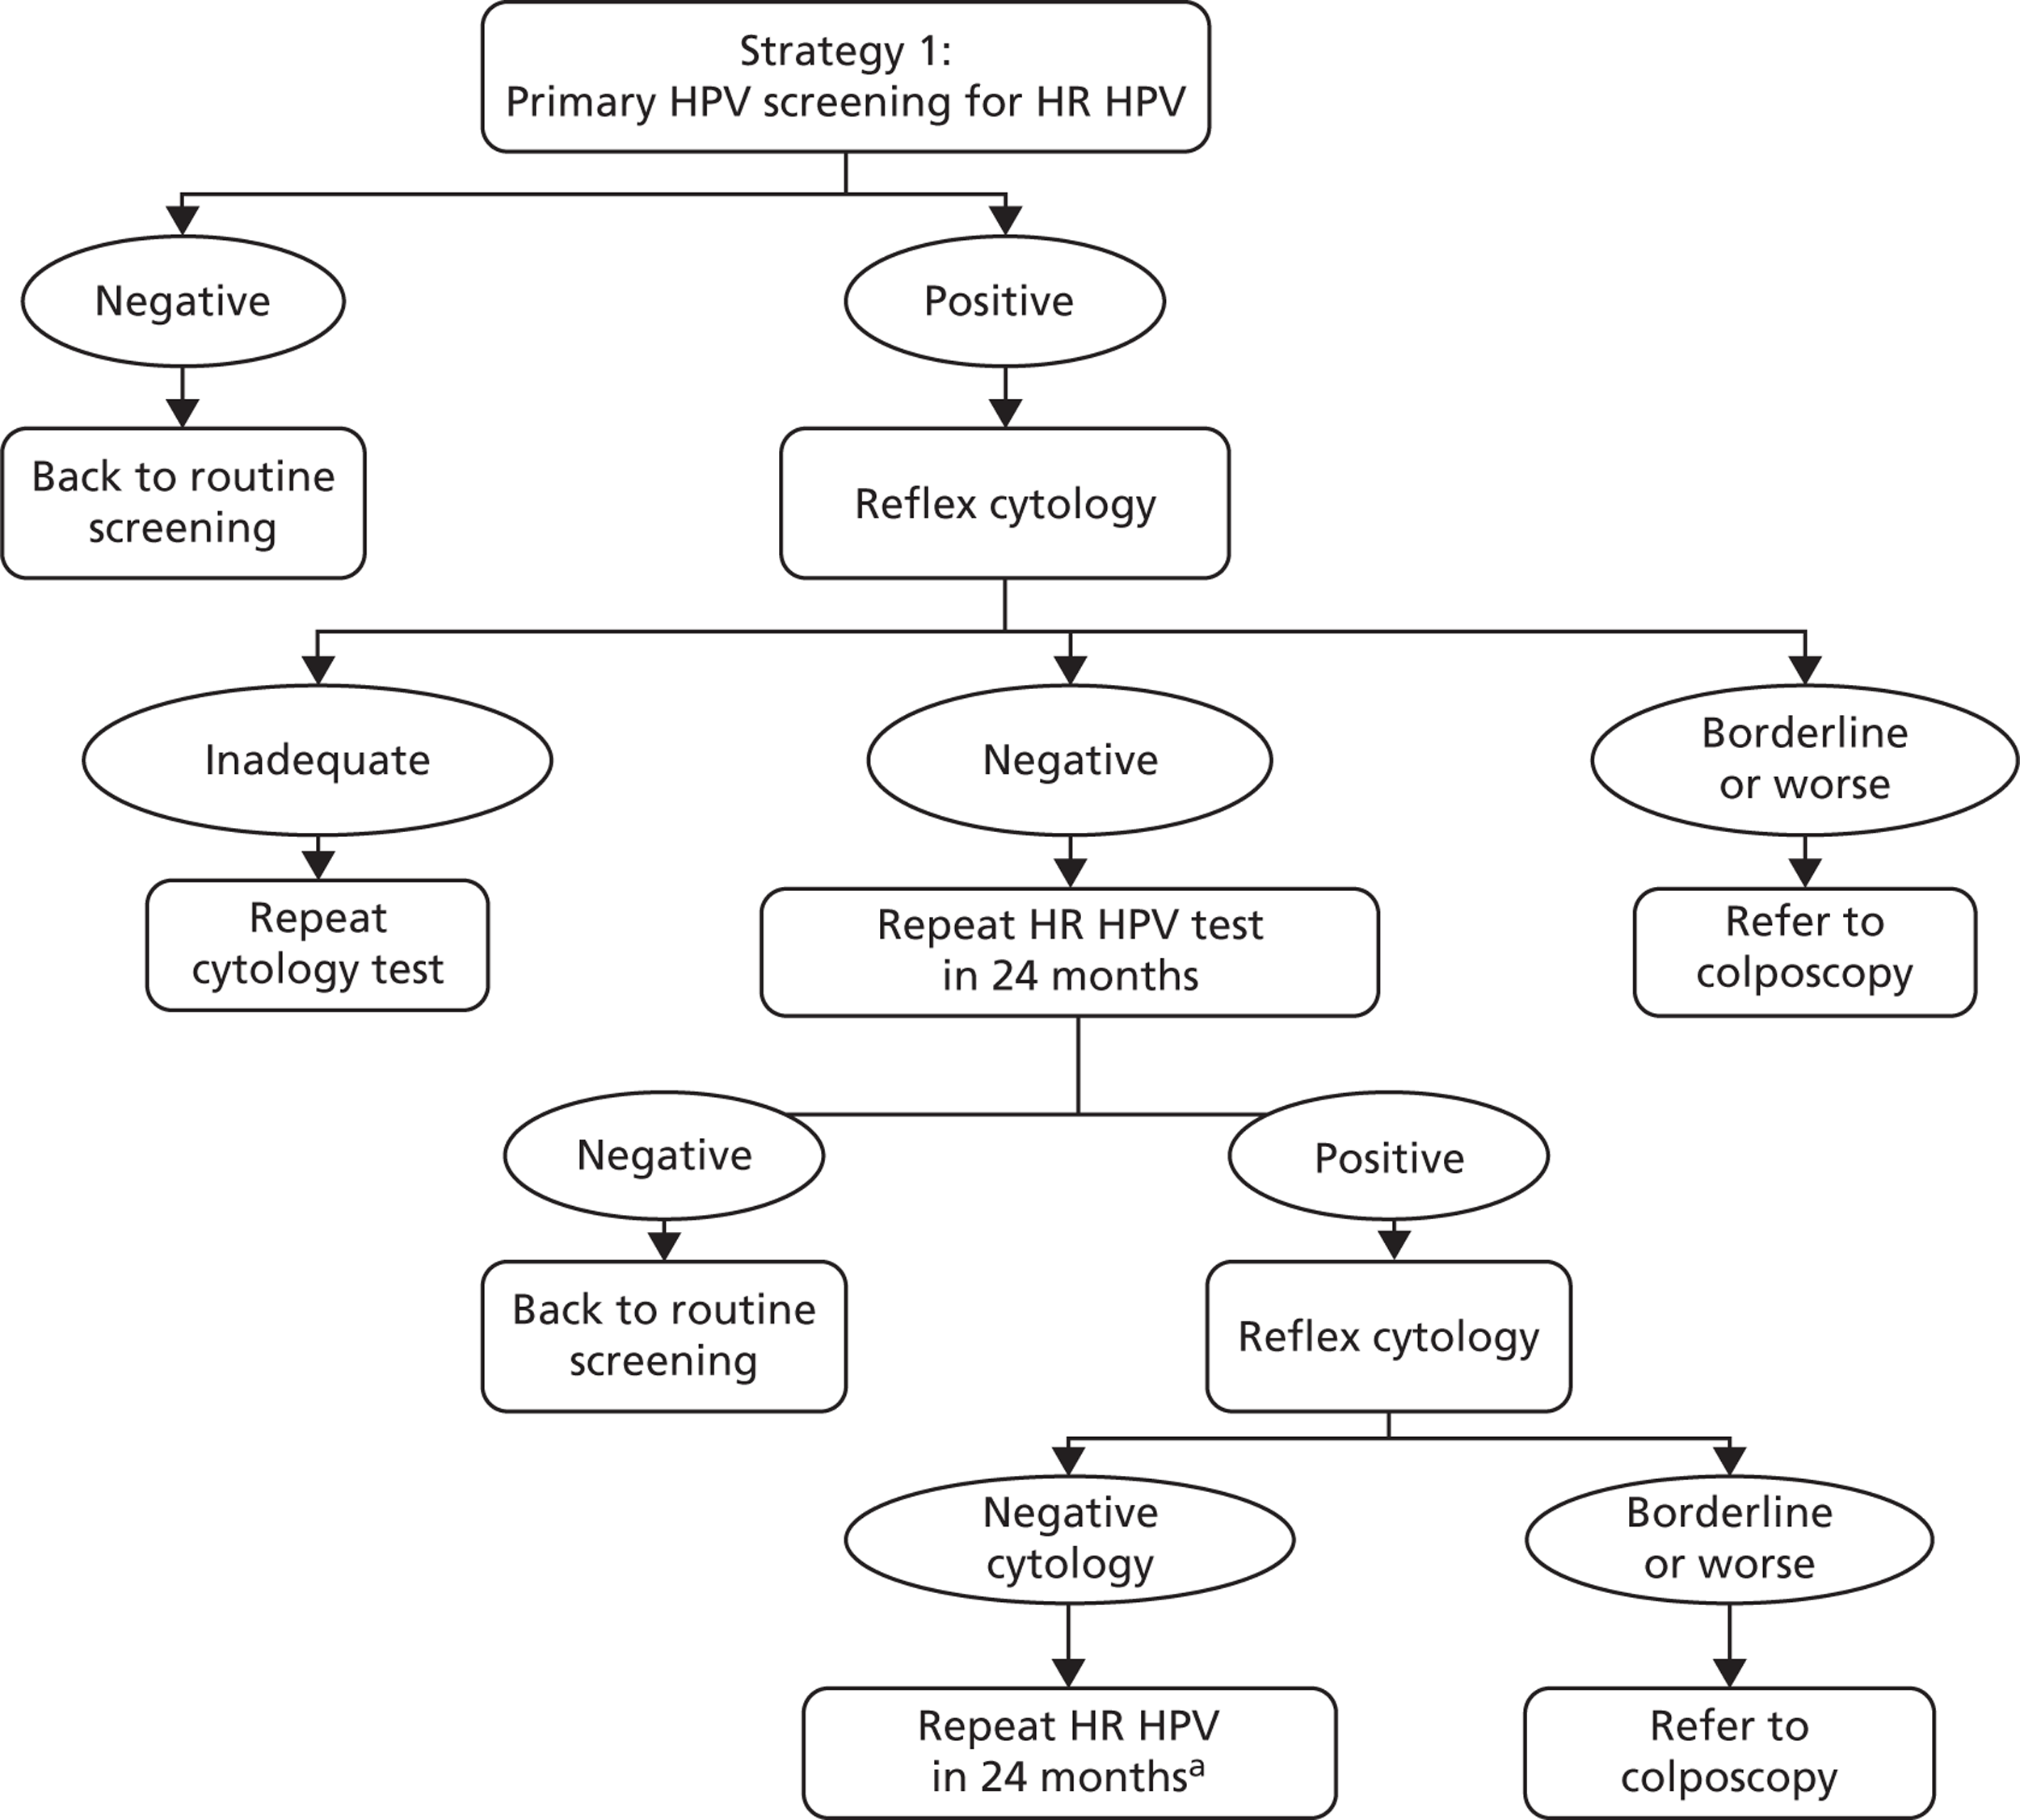
Strategy 1 (Figure 4)
The strategy can be summarised as follows: women positive for any oncogenic infection receive reflex cytology triage testing. Cytology-positive women (borderline dyskaryosis or worse) are referred to colposcopy. Cytology-negative women are sent for repeat HPV testing with cytology triage in 24 months, and any women who are HPV positive and borderline dyskaryosis or worse are referred to colposcopy at that point. HPV-positive, triage-negative women are sent for a repeat HPV testing in another 24 months, and HPV-positive women at that point are referred to colposcopy. HPV-negative women are returned to routine screening at each stage.
FIGURE 4.
Screening and follow-up management of primary HPV screening for strategy 1. a, At the second 24-month follow-up, women negative for HPV are returned to routine screening and HPV-positive women are referred to colposcopy.
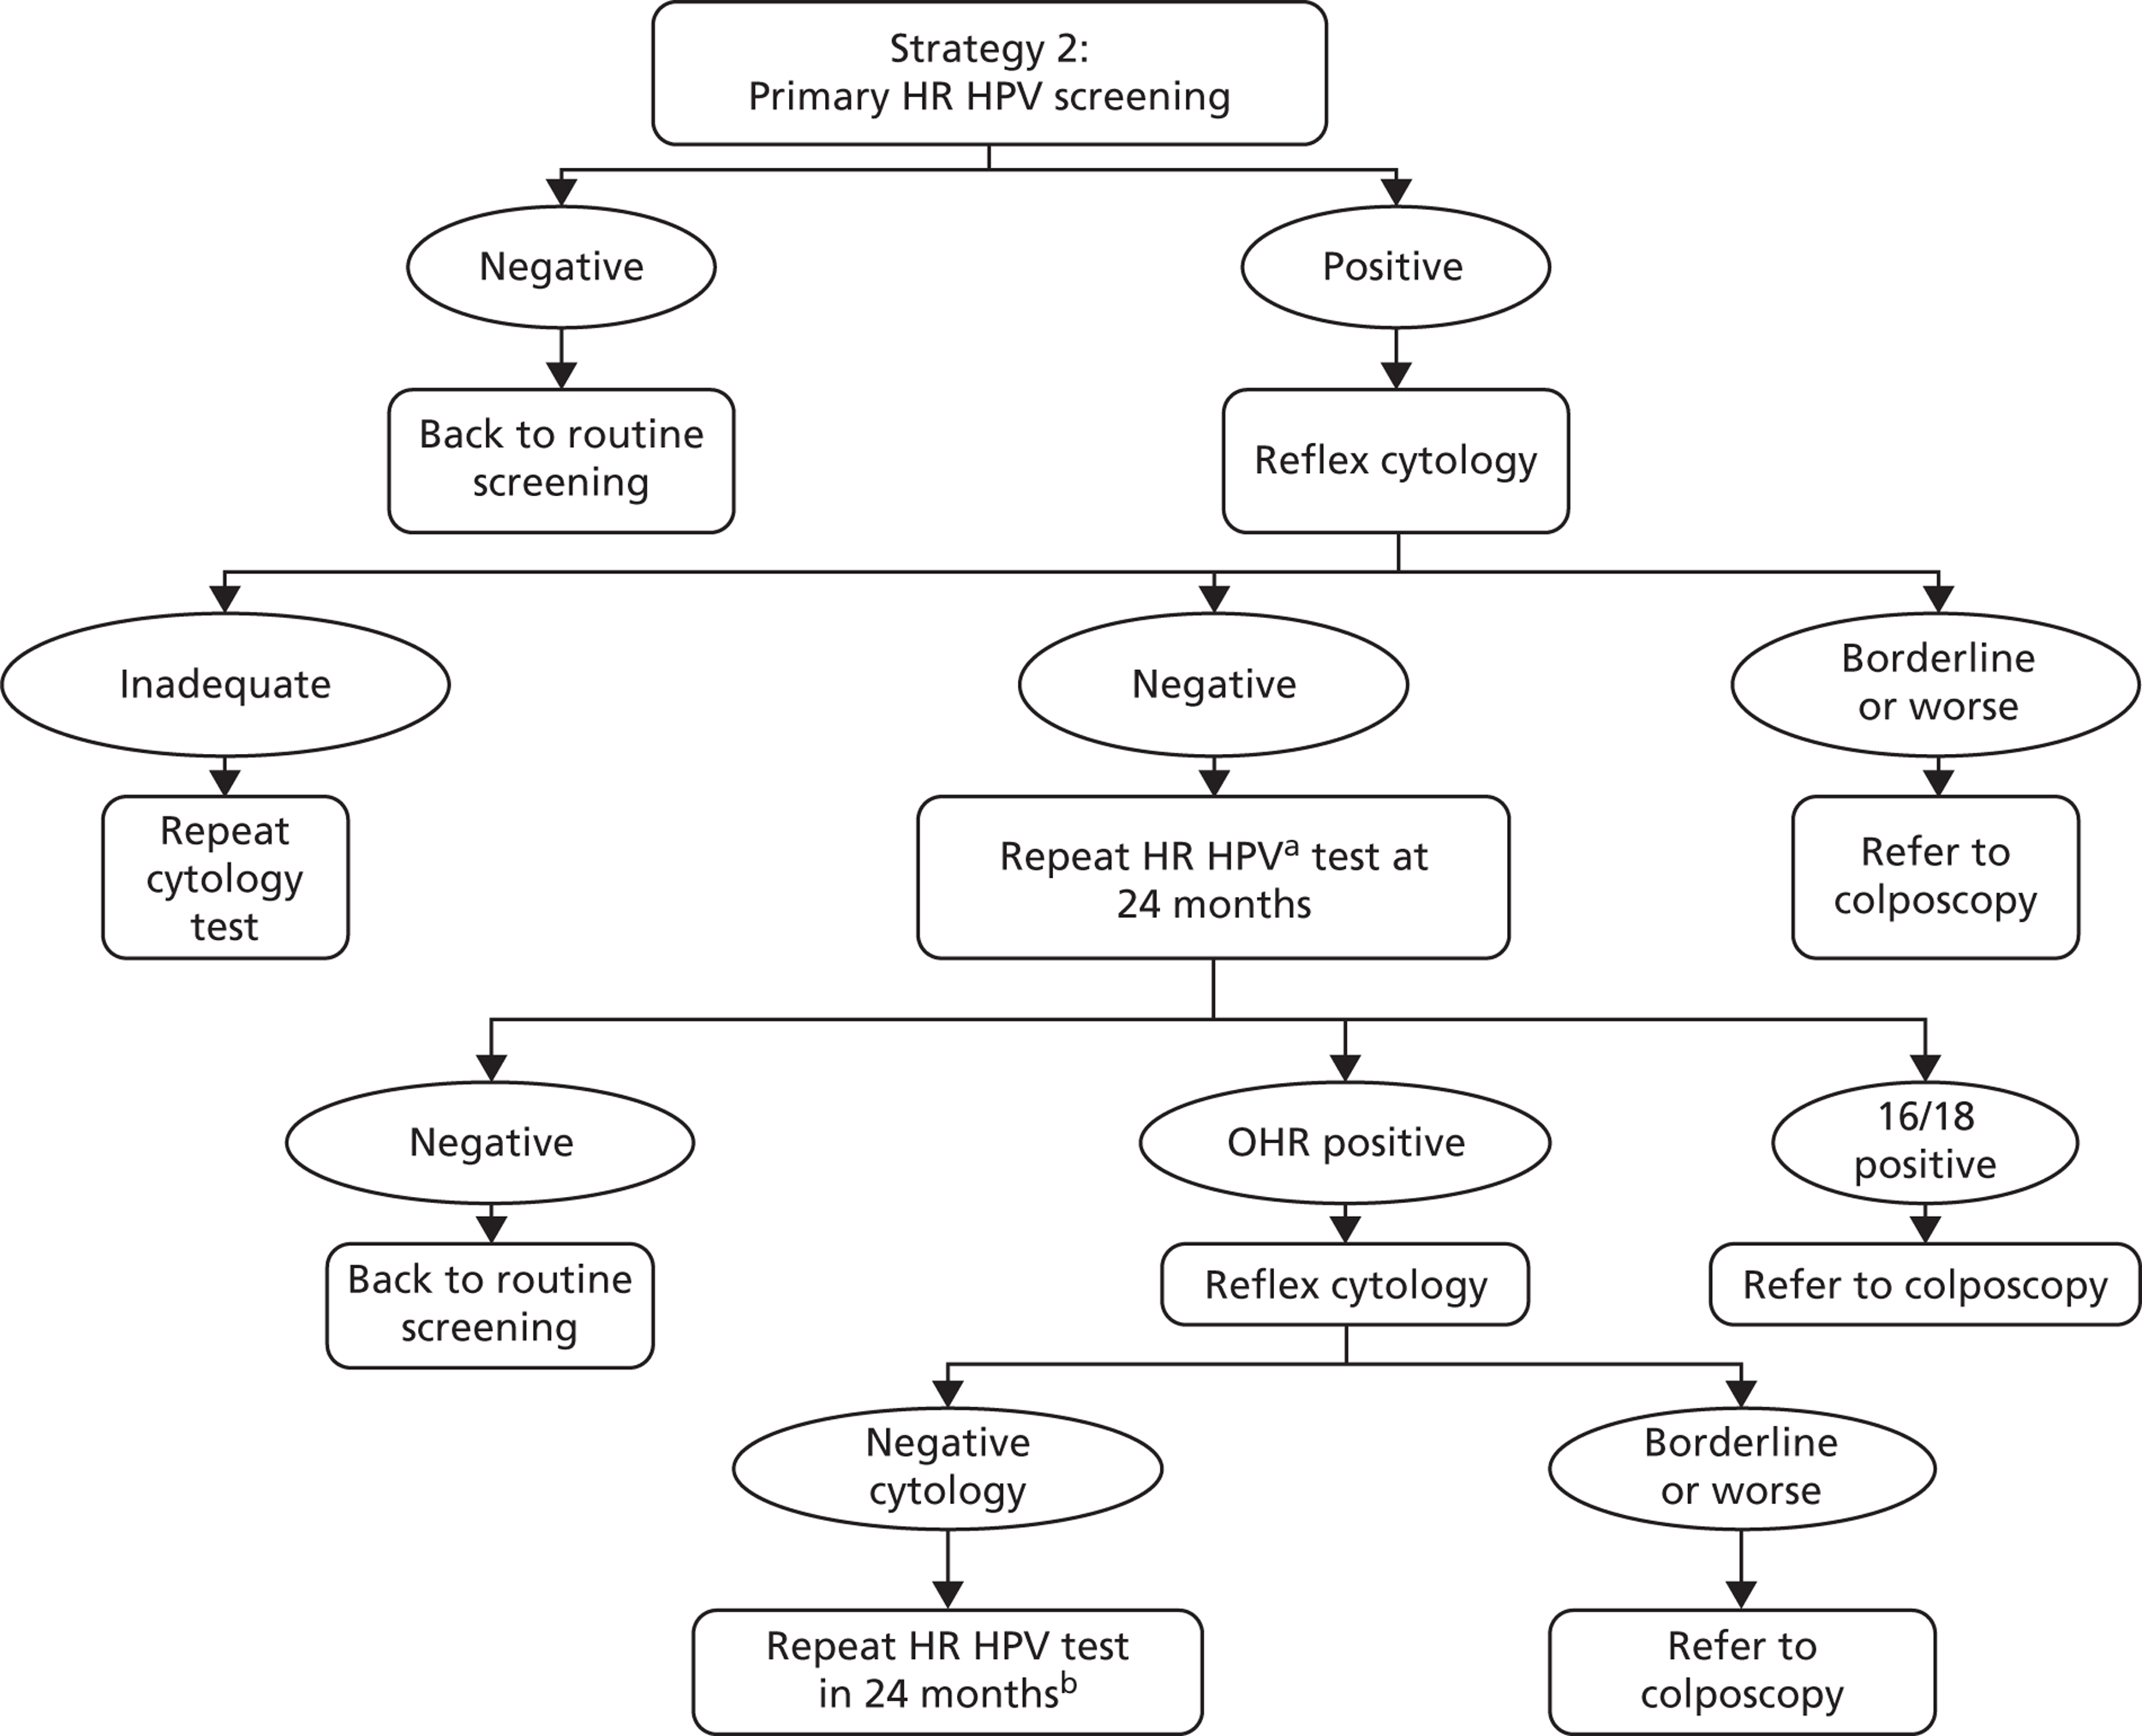
Strategy 2 (Figure 5)
The strategy can be summarised as follows: women with any oncogenic HPV-positive infection have reflex cytology triage. Cytology-positive women (borderline dyskaryosis or worse) are referred to colposcopy. HPV-positive, cytology-negative women have repeat HPV and reflex cytology in 24 months with partial genotyping and any HPV 16/18 positive or borderline dyskaryosis or worse are referred to colposcopy at that point. Cytology-negative women and/or women negative for HPV 16/18 are sent for a repeat HPV test in another 24 months, with any HPV-positive women referred to colposcopy at that point. HPV-negative women are returned to routine screening.
FIGURE 5.
Screening and follow-up management of primary HPV screening for strategy 2. a, Using a HPV test that has HPV 16/18 partial genotyping. b, At the second 24-month follow-up, any oncogenic HPV positive is referred to colposcopy. HPV negatives return to routine screening. OHR, other high risk.
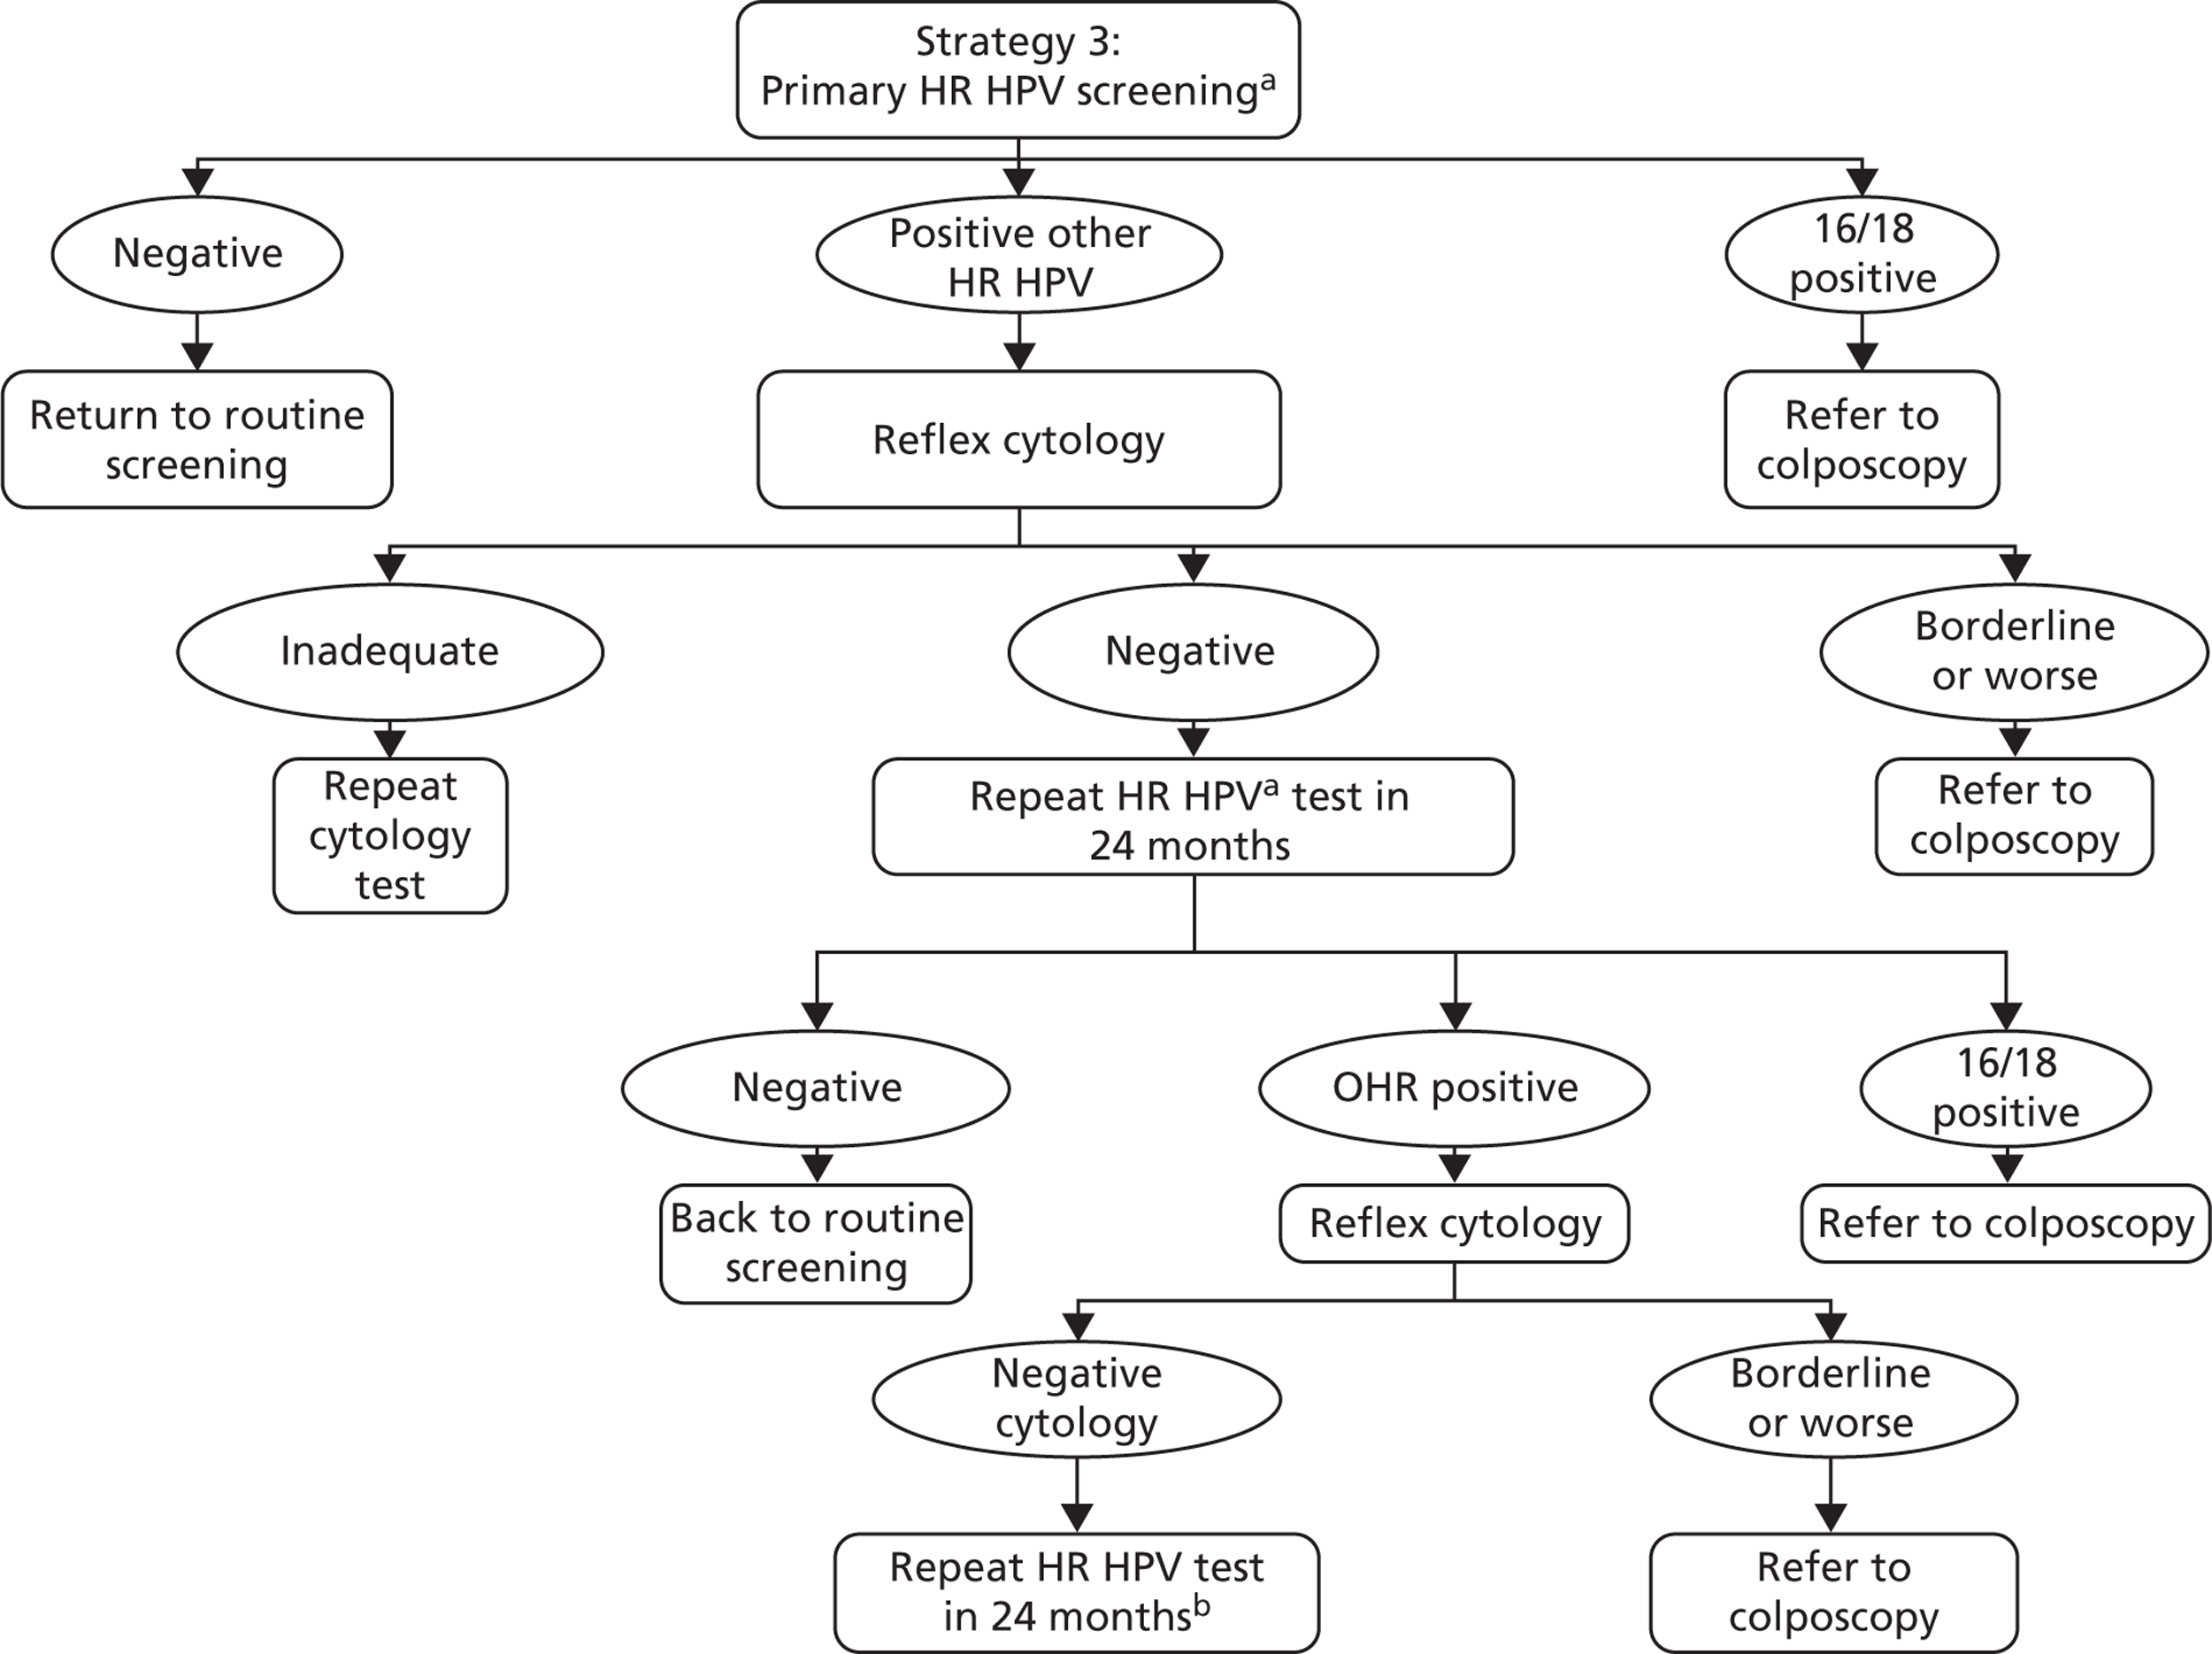
Strategy 3 (exploratory) (Figure 6)
The strategy can be summarised as follows: a primary screening test with partial genotyping is used and women with HPV 16/18 are referred directly to colposcopy. Cytology triage is performed on other oncogenic HPV-positive women, with those cytology-positive (borderline dyskaryosis or worse) referred to colposcopy. Other oncogenic HPV-positive women who are cytology negative are then followed up as in strategy 2.
FIGURE 6.
Screening and follow-up management of primary HPV screening for strategy 3. a, Using a HPV test that has HPV 16/18 partial genotyping. b, At the second 24-month follow-up, any oncogenic HPV positive is referred to colposcopy. HPV negatives return to routine screening. OHR, other high risk.
Strategy 4 (exploratory) (Figure 7)
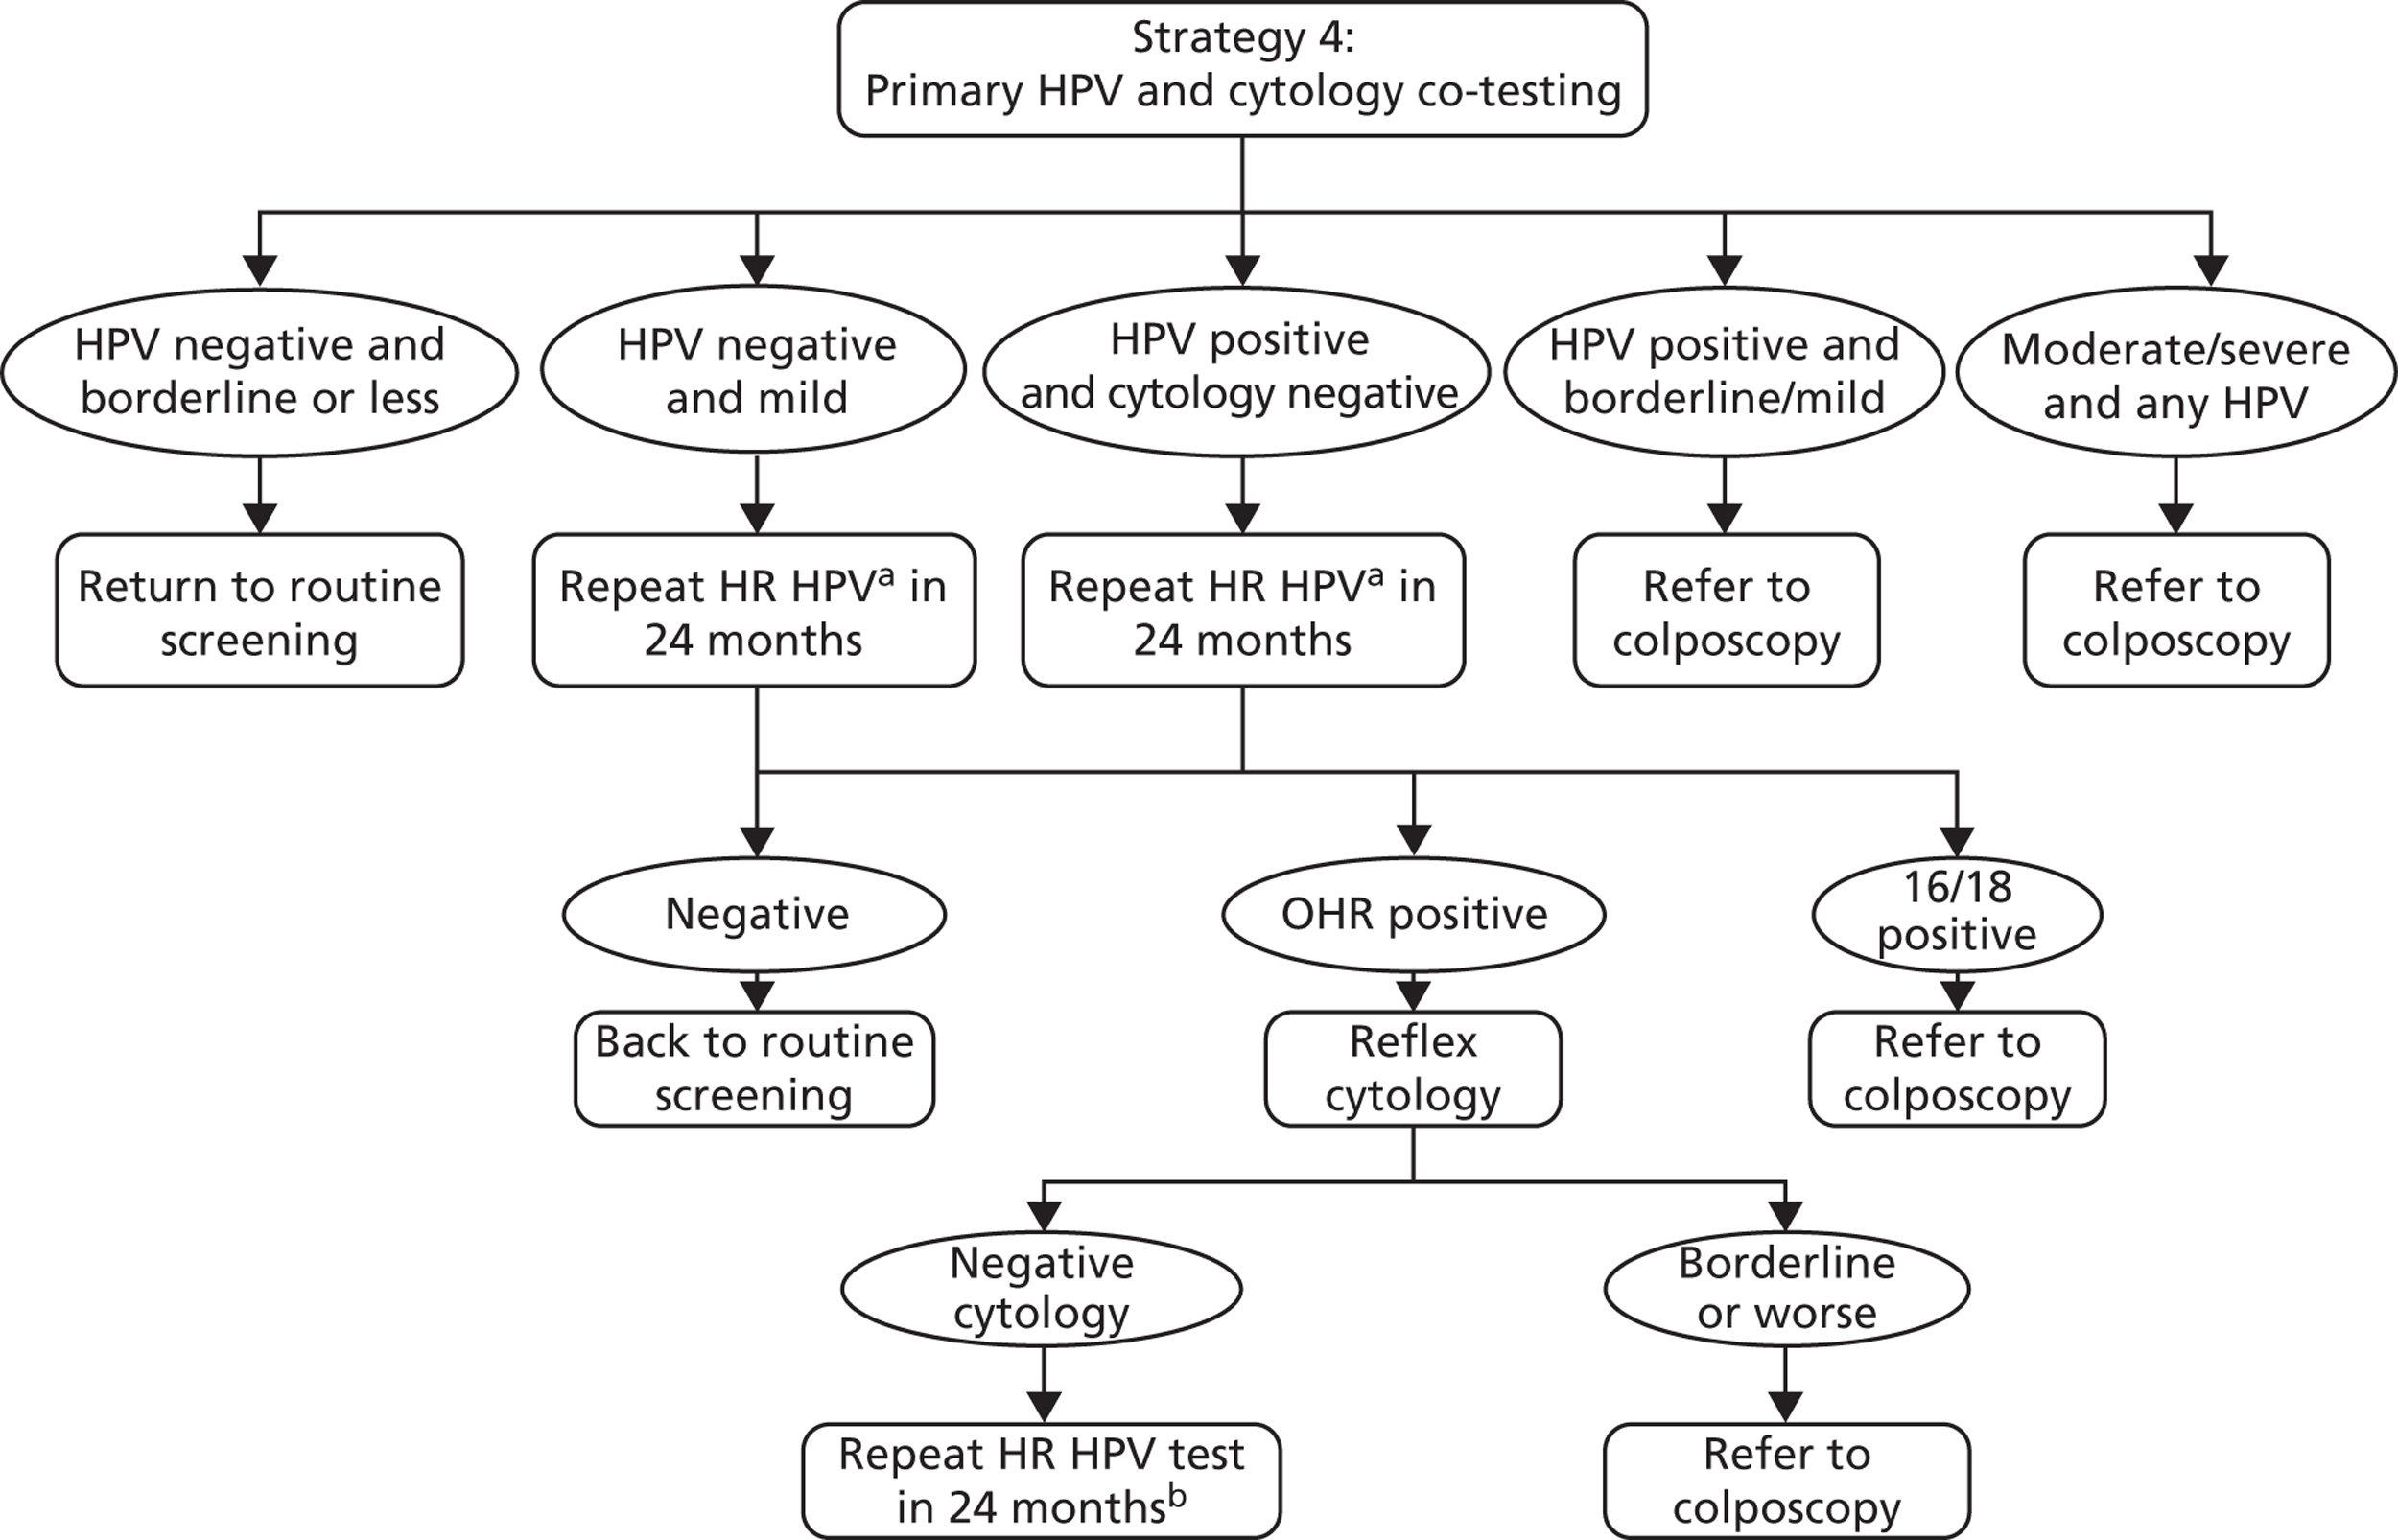
This ‘co-testing’ exploratory strategy can be summarised as follows: women receive HPV and cytology co-testing. Women with moderate or severe dyskaryosis are referred to colposcopy. Women who are HPV positive with a cytology result of borderline or mild dyskaryosis are also referred to colposcopy. Women who are HPV positive with a normal cytology result have repeat testing in 24 months, and are thereafter managed as in strategy 2. Women who are HPV negative with a cytology result of mild dyskaryosis also have repeat testing in 24 months, and are thereafter managed as in strategy 2. Women who are HPV negative with a cytology result of borderline dyskaryosis or normal are returned to routine screening.
FIGURE 7.
Screening and follow-up management of primary HPV screening for strategy 4. a, Using a HPV test that has HPV 16/18 partial genotyping. b, At the second 24-month follow-up, any oncogenic HPV positive is referred to colposcopy and HPV negatives return to routine screening. OHR, other high risk.
Strategy variations
Screening interval
We considered three different screening interval scenarios for each strategy:
-
a 6-yearly screening interval for women aged 25–64 years (used in basic strategies)
-
a 6-yearly screening interval in women aged 25–49 years and a 10-yearly interval in women aged 50–64 years
-
a 5-yearly screening interval for women aged 25–64 years.
Combined primary cytology and primary human papillomavirus strategies (exploratory analysis)
For each of strategies 1 and 2, we also modelled the following combined screening options where cytology was retained as the primary screening test for younger women and then primary HPV screening was used in older women, assuming that:
-
cytology screening according to current recommendations was performed in women 25–29 years, with primary HPV screening in women > 30 years
-
cytology screening according to current recommendations was performed in women 25–34 years, with primary HPV screening in women > 35 years.
For these strategies, we assumed that a woman would ‘switch’ primary screening tests at the first screen attendance after the ‘switching’ age (which may be several years later in the case of underscreened women). We assumed that women who had been screened prior to the ‘switch’, and who were in follow-up management at the time of the switch, completed that cycle of management until discharged back to routine screening. However, it should be noted that detailed recommendations for how underscreened women and women under follow-up management should be handled after the ‘switch’ would require review, and the nature of such recommendations would have the potential to change these findings. Therefore, these strategies should be considered exploratory.
Follow-up of human papillomavirus-positive/cytology-negative women
Each strategy was modelled under alternate assumptions about follow-up for HPV-positive women who were not referred immediately to colposcopy (e.g. because the triage cytology test was negative):
-
Women were assumed to be followed up at 24 months (used in basic strategies).
-
Women were assumed to be followed up at 12 months.
Modelling human papillomavirus vaccination
Each strategy was modelled under alternate assumptions about vaccination status:
-
Women were assumed to be unvaccinated.
-
Women were assumed to be part of a cohort who were offered vaccination as pre-adolescents (12–13 years). The effects of the national HPV vaccination programme were modelled (2010–11 coverage rates24). The vaccination catch-up programme (with appropriate coverage rates obtained from Sheridan and White24) was also simulated, as this would have some effect on the cohorts offered routine vaccination via the effects of herd immunity.
Each cost and effectiveness calculation was performed for the primary HPV screening strategy, compared with current practice, in both vaccinated and unvaccinated cohorts. The effect of vaccination on the incidence of the vaccine-included types was modelled using the dynamic transmission model (which took into account the effects of prior exposure to HPV on vaccine effectiveness and also herd immunity); these differences in HPV incidence were then input to the CIN natural history model and this difference thus impacted the rate of development of HPV 16- and 18-associated CIN and cervical cancer in the model.
We assumed that the HPV 16/18 vaccine was 100% effective in preventing future HPV 16 and HPV 18 infections in HPV-naive women at the time they were vaccinated and who completed all three doses of the vaccine course. This protection was assumed to be life-long. We made these assumptions so that the most generous estimate of vaccine effectiveness can be taken into account when considering new options for cervical screening, when compared with unvaccinated scenarios. No protection was conferred in the model in women with a prevalent infection at the time of vaccination, or who are immune (due to a naturally acquired previous infection) from infection at the time of vaccination. The model assumed that the vaccine conferred no therapeutic effect in women with a prevalent HPV infection, or with pre-existing CIN. In this case, the risk of viral clearance, progression, or regression from CIN in the model remains the same as that in an unvaccinated woman. It was also assumed that an incomplete vaccine course offered no protection; however, the possibility of higher ‘effective’ vaccine coverage in England due to effective two-dose or one-dose vaccination was examined in sensitivity analyses (see Appendix 17).
We did not consider the effects of cross-protection against non-vaccine HPV types, nor, as we were carrying out a cost-effectiveness evaluation of cervical screening (as opposed to vaccination), did we consider the effects of vaccination on anogenital warts. Thus, the results of our analysis are applicable to situations where either bivalent or quadrivalent vaccines have been used.
The screening evaluations in vaccinated women involved a modelled cohort of women born in 1998 who were offered vaccination as 12-year-olds in 2010. Herd immunity effects on the modelled cohort from vaccination delivered to both older birth cohorts (born 1990–7; included in the catch-up programme) and younger birth cohorts (1999 or later) were fully taken into account by the dynamic transmission model. Thus, the effects of the catch-up cohort were included in our analysis through the herd immunity effects they provided to the cohort we investigated for screening. The overall clinical effectiveness of the vaccine administered to the catch-up cohorts was expected to be lower because some of these women will have had prior exposure to HPV; however, for HPV-naive women in the catch-up cohorts, the vaccine is assumed to be clinically effective, and these effects were taken into account in the dynamic transmission model. The outcomes for catch-up cohorts are, therefore, expected to be intermediate to those predicted and presented here for HPV-naive vaccinated cohorts and unvaccinated cohorts.
In the model, we used a hierarchical approach to lesion type-assignment when fitting the model to observed data (fitting HPV 16-positive first, then HPV 18-positive, then other oncogenic types). Because of the potential for multiple infections, this method may result in underestimation in the model of the prevalence of other oncogenic-type infections. However, in our model, women who are vaccinated against HPV types 16 and 18 are available to contract other HR HPV types, partially reducing the effects of this modelling assumption in vaccinated populations.
Diagnosis and treatment procedures
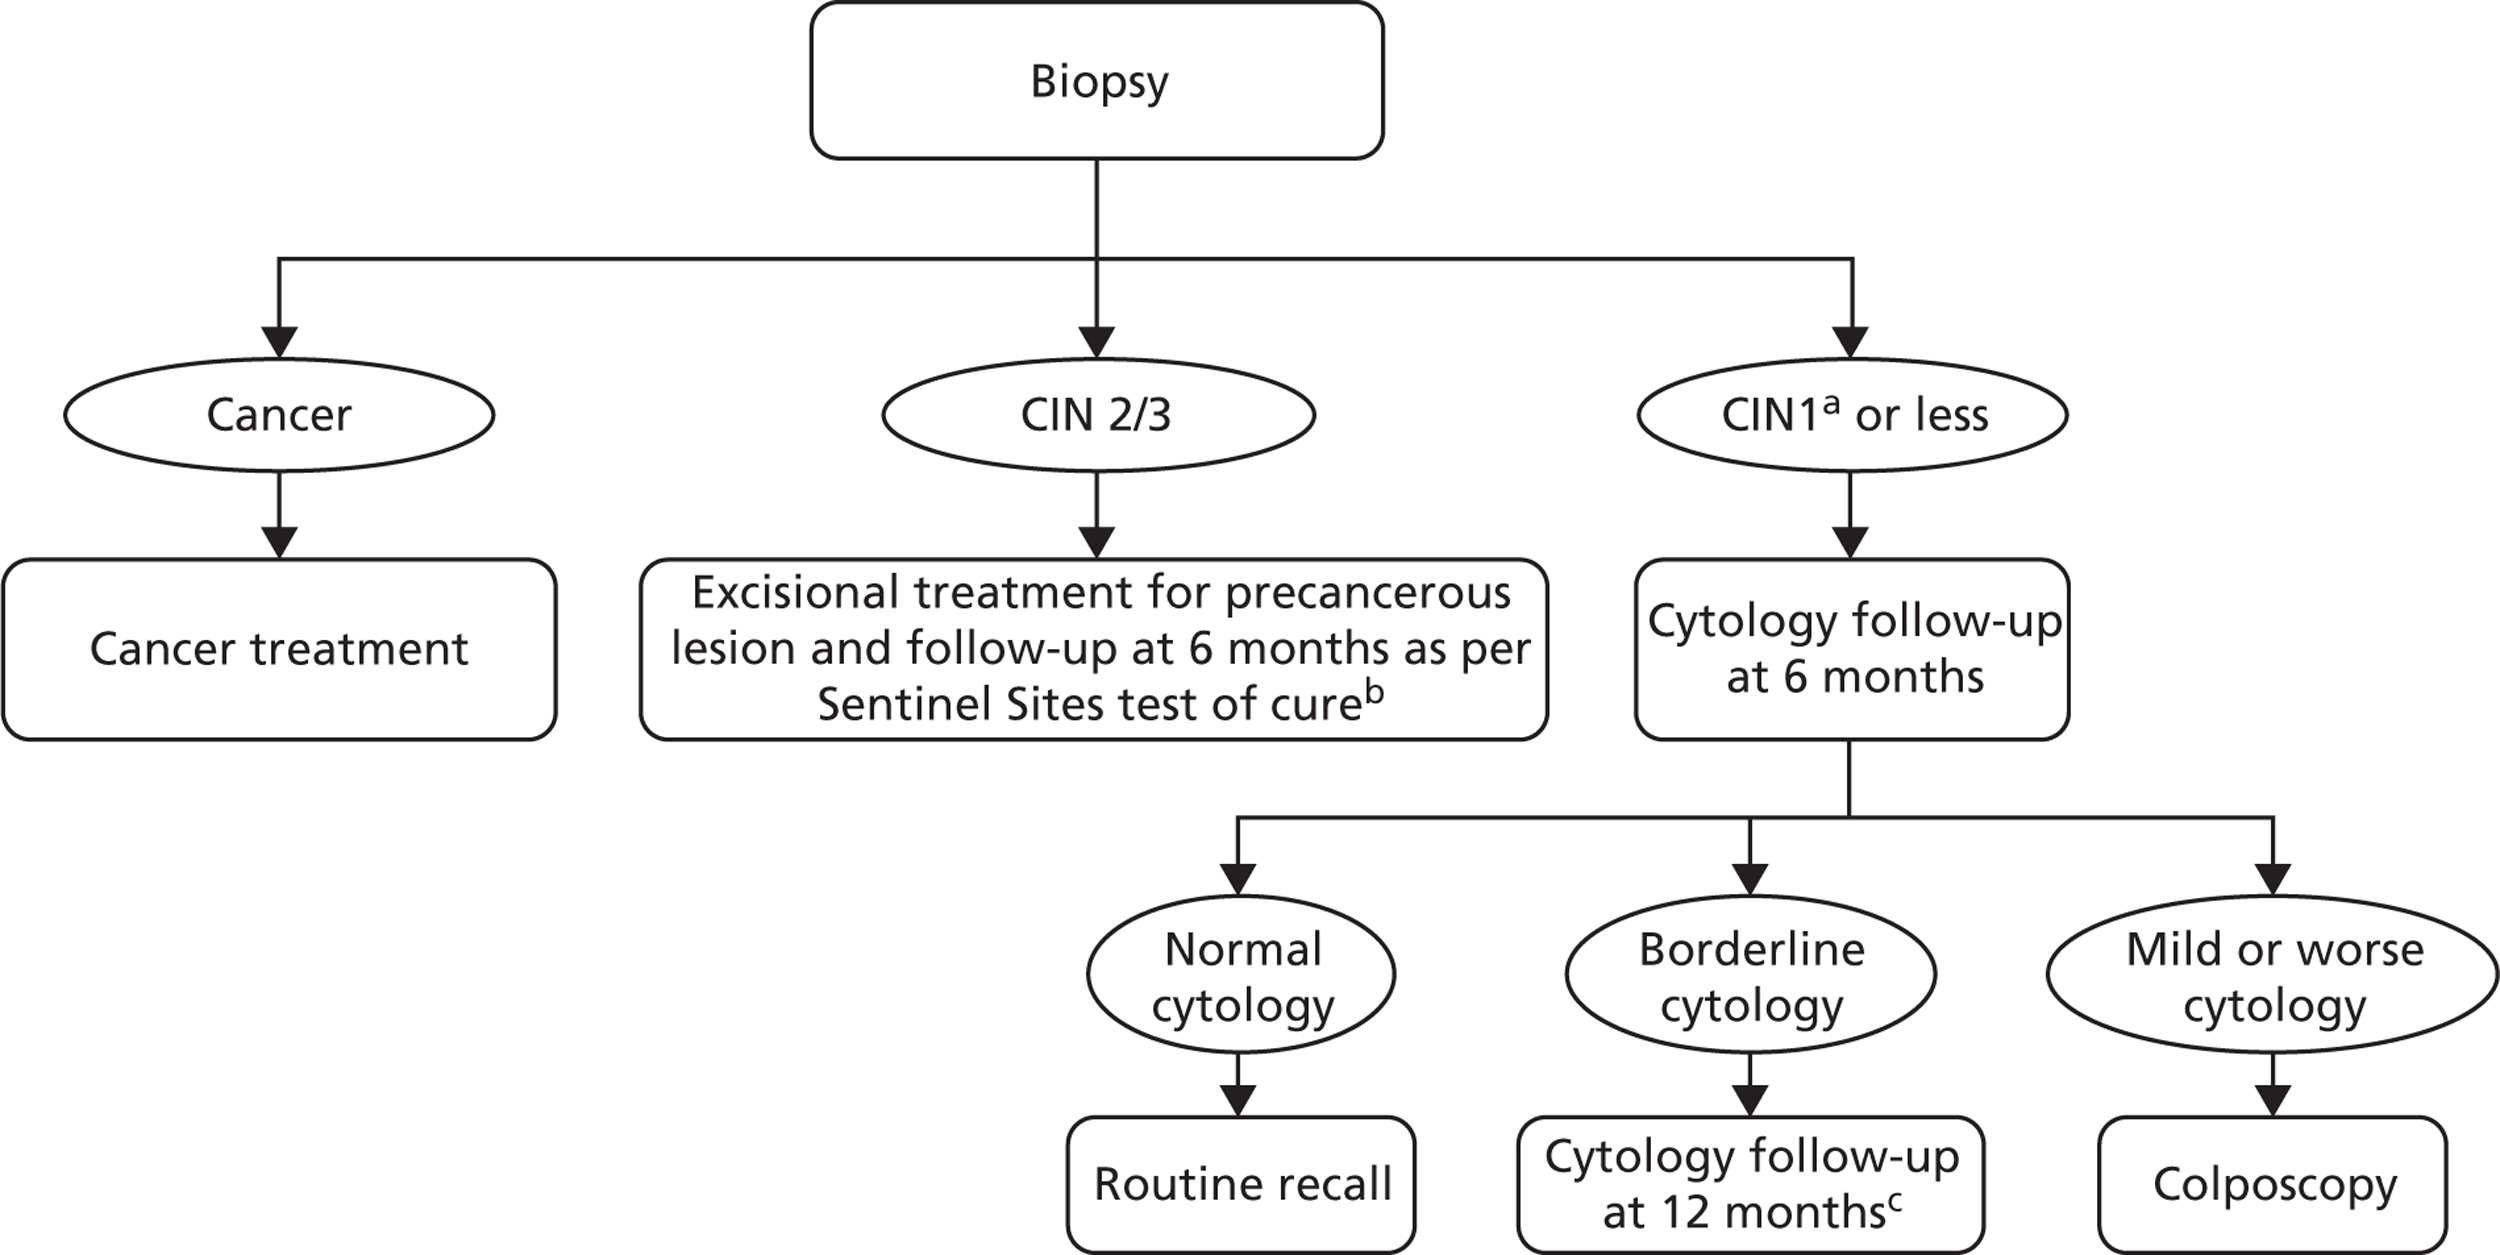
The diagnosis and treatment procedures simulated in the model are detailed in Figures 8–10.
FIGURE 8.
Colposcopy management for women referred with borderline/mild cytology and/or a HPV positive test. a, Women diagnosed with invasive cancer undergo cancer treatment. Women treated for CIN undergo HPV and cytology testing 6 months post treatment. If both cytology and HPV negative, women are returned to routine screening. Women with abnormal cytology or positive HPV result are referred to colposcopy and are subsequently followed up under current practice post-treatment management. b, At the 12-month follow-up, any abnormal cytology result is referred to colposcopy. Women with normal cytology are referred to routine screening.
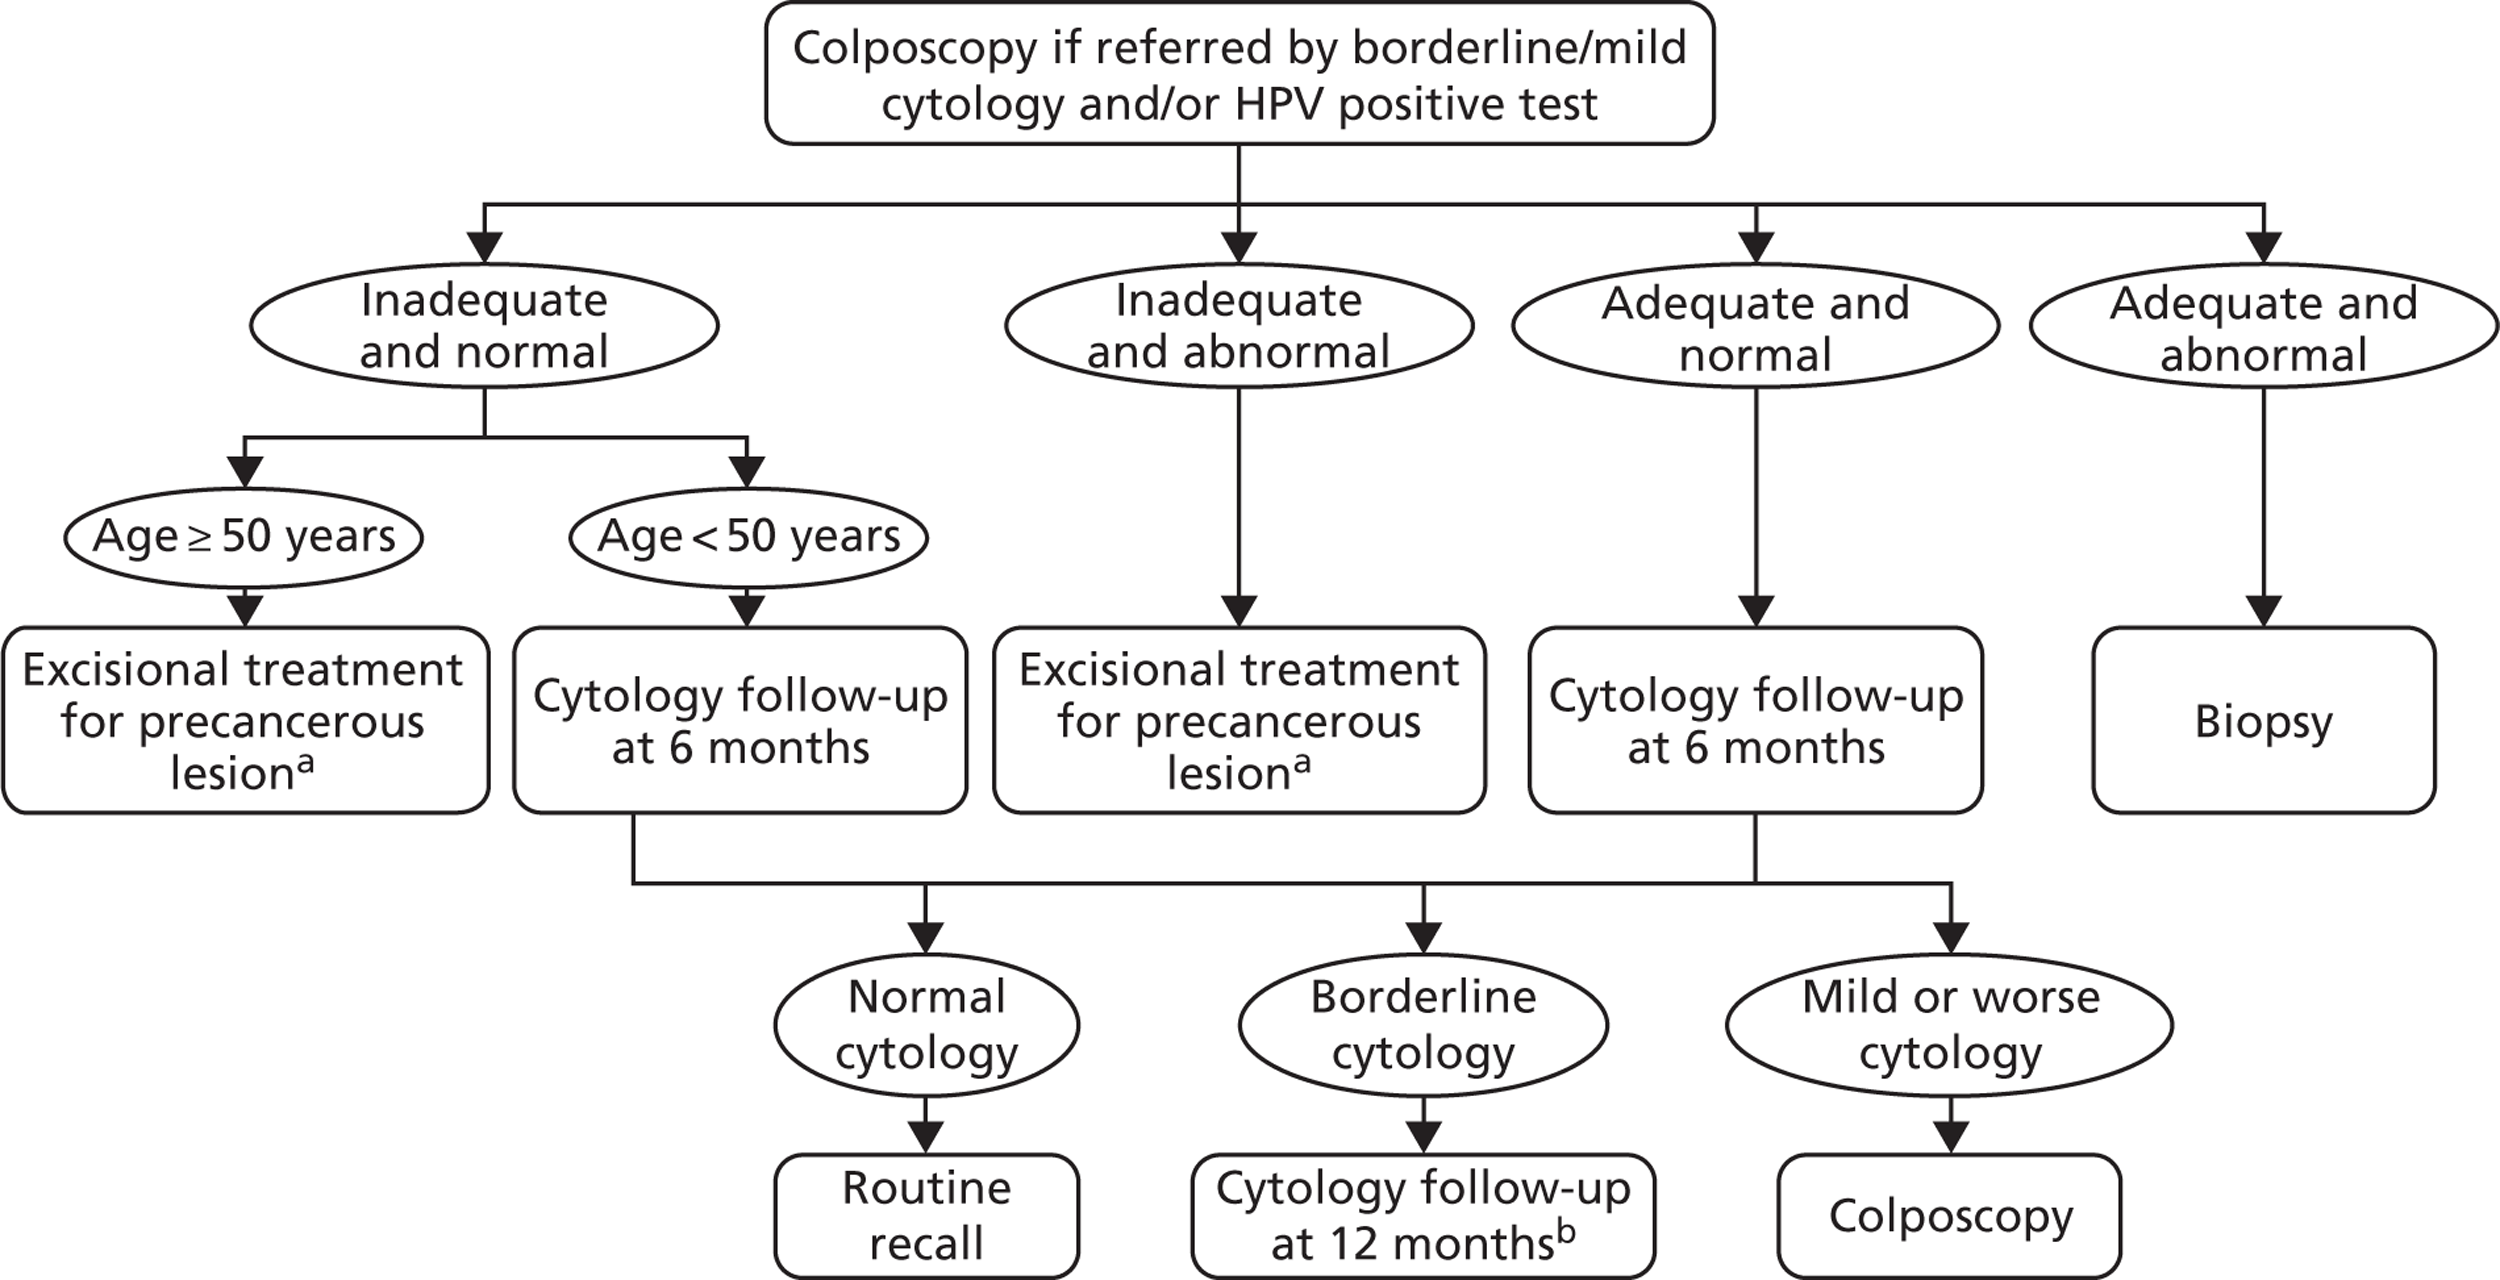
FIGURE 9.
Colposcopy management for women referred with moderate/severe cytology. a, Immediate in women over 50 years; delay 12 months in women younger than 50 years. b, Women diagnosed with invasive cancer undergo cancer treatment. Women treated for CIN undergo HPV and cytology testing 6 months post treatment. If both cytology and HPV negative, women are returned to routine screening. Women with abnormal cytology or positive HPV result are referred to colposcopy and are subsequently followed up under current practice post-treatment management.

FIGURE 10.
Management for women undergoing biopsy. a, A small proportion of CIN1 are assumed to be treated along with CIN2+. b, Women undergo HPV and cytology testing 6 months post treatment. If both cytology and HPV negative, women are returned to routine screening. Women with abnormal cytology or positive HPV result are referred to colposcopy and are subsequently followed up under current practice post-treatment management. c, At the 12-month follow-up, any abnormal cytology result is referred to colposcopy. Normal cytology is referred to routine screening.
Data sources
Screening and diagnostic test characteristics
Liquid-based cytology
With regard to the sensitivity of LBC, in the base case it was assumed that test positivity rates for CIN2+ were equivalent to those from a multicentre screening study conducted in UK (the HART study). 29 ARTISTIC cytology test characteristics were not assumed for the national evaluation [although they were used for the validation exercise reported in Chapter 3 of this report (see Economic analysis validation results)] because ARTISTIC did not recruit nationally, and it is possible that cytology in the baseline round of ARTISTIC was influenced by the retraining associated with the recent introduction of LBC to the NHSCSP at the time of the trial commencement. 2
Although HART was conducted a number of years prior to ARTISTIC, and did not involve LBC, it did recruit across a wider range of centres and thus is more likely to be representative of the performance of cytology across England. The use of HART data to represent LBC test accuracy was considered to be appropriate because the sensitivity of LBC and conventional cytology for detection of CIN2+ have been shown in meta-analysis to be close to equivalent,30 and the inadequate smear rate for LBC (which is known to be lower than the rate for conventional cytology in England) was specifically modelled using other data sources. In the current analysis, the inadequate rate of LBC was assumed to be 3% in the analysis base case. 19
The test positivity rates derived from HART data for cytology for CIN2+ and CIN3+ were 76.7% and 75.9%, respectively, at a borderline dyskaryosis smear threshold; and 70.1% at both CIN2+ and CIN3+, at a mild dyskaryosis smear test threshold. With regard to the specificity of LBC, the positivity rate for CIN1 was assumed to be 37.6% at a borderline dyskaryosis smear threshold and 28.0% at a mild dyskaryosis smear threshold. Alternative sets of test characteristics for LBC, encompassing the test characteristics derived for ARTISTIC, were investigated in the sensitivity analysis (see Appendix 11 for more details).
Human papillomavirus testing
The HPV test positivity rate used in the base-case analysis and its range for sensitivity analysis was informed by a previous meta-analysis of international literature,31 and also findings from the ATHENA trial32 and the HART study. 29 The accuracy of HPV testing was based on extensive data in the literature on HC2 testing, which were used in ARTISTIC and HART. The use of these test characteristics does not necessarily assume that the specific platform was used, but assumes that HC2 or alternative platforms with close-to-equivalent performance were used. For some strategies, the use of new automated test platforms with partial genotyping for HPV 16/18 was assumed (sometimes referred to as ‘genotyping’ here).
With regard to the sensitivity of HPV test, in the base case it was assumed that the test positivity rates for CIN2 and CIN3 were 95.5% and 95.7%, respectively. With regard to specificity, the test positivity rate for CIN1 was assumed to be 84.2% (see Appendix 11 for more details).
The base-case assumptions assumed that the HPV test threshold was such that the test performance was equivalent to HC2 at a 2 pg/ml threshold. However, the sensitivity analysis encompassed the possibility that a test with performance equivalent to that of HC2 with a threshold of 1 pg/ml performance was used.
Colposcopy
The test characteristics and unsatisfactory rate of colposcopy were based on those used in previous modelling work performed in the UK and Australian context. 12,18,20 The test positivity rate for colposcopy was assumed in the base case for CIN1 and CIN2+ to be 79.2% and 90.8%, respectively. Colposcopy was assumed to be capable of detecting abnormalities of the cervix in all women with undiagnosed cervical cancer at the time of examination (see Appendix 11 for more details).
Compliance with screening and management recommendations
For strategies that simulate current practice, we used registry data from Oxfordshire to estimate the cumulative rescreened proportion at various times after a negative smear for women who appeared on the register. 33 We used age-specific data on the percentage of eligible women who attended at least once in a 5-year period in England (2007–8)12,34 to adjust these data and derive age- and interval-specific probabilities of women attending for routine screening. This allows the model to take into account non-attendance, early rescreening, late rescreening, and screening in ages outside the target age range for screening.
For the primary HPV screening strategies involving a recommended 6-yearly interval, the proportion of women rescreened at the sixth year after the last negative test was assumed to be the same as the observed proportion for current practice after the third year following a negative cytology test, or fifth year in women older than 50 years.
Compliance with follow-up recommendations for HPV-positive, cytology-triage-negative women was assumed to be 80% by the recommended follow-up interval (either 24 or 12 months) in the base case. This is higher than the compliance rate observed in the ARTISTIC trial, although ARTISTIC was not nationally representative. Currently, women are either referred for colposcopy (if they have a cytology result of borderline or mild dyskaryosis and a positive HPV test, or if they have moderate or severe dyskaryosis) or referred back to routine screening after their primary screening test. Therefore, there is no directly analogous situation for the NHSCSP from which we can take up-to-date data on compliance for the future scenario in which HPV-positive, triage-negative women are referred for follow-up. However, the NHS Sentinel Site experience has shown that compliance with colposcopy referral in women with a cytology low-grade result who were HPV positive was 90.2% (with a range of 81.4–96.2% depending on the region). Although this relates to colposcopy referral rather than to follow-up compliance, the Sentinel Site experience is more representative nationally than ARTISTIC. The use of two alternate recommended follow-up intervals in this group effectively also assessed the sensitivity of the findings to compliance assumptions (as our modelled simulation of 80% compliance to follow-up at a recommended 24 months is analogous to a situation where the recommended follow-up was 12 months with poor compliance to that interval and in which late attendance between 12 and 24 months occurred in the remaining women).
Compliance to referral for colposcopy and compliance for follow-up at intervals of either 6 months or 12 months in the new strategies were assumed to remain the same as current practice (see Appendix 12 for more details).
Cost and utilities (quality-adjusted life-year weights)
The costs of HPV testing both for general HR types and specifically for genotypes 16/18 were obtained from the manufacturers of four HPV tests: the Abbott® RealTime High Risk HPV test (Abbott Molecular, Maidenhead, UK), the Cobas 4800 HPV test (Roche®), Cervista® HPV HR and Cervista® HPV 16/18 Cervista™ HPV (Hologic®) and the Digene HC HR HPV DNA test and the HPV Genotyping PS test, which can test for HPV 16, 18 and also HPV 45 if required (Qiagen, Gaithersberg, MD, USA). The average cost across the manufacturer-supplied prices was used as the baseline estimate for the unit cost of HPV testing. In the base case, we assumed partial genotyping would be obtained at no extra cost (based on the emergence of systems that provide this information as standard) but the effects of this assumption were assessed in sensitivity analysis.
The cost of LBC was based on reanalysis of the cost data from the MAVARIC study19 and the costs of diagnosis and treatment for CIN and cancer were based on the findings of Martin-Hirsch et al. 35 and Sherlaw-Johnson et al. 36 All costs for the final model inputs were adjusted using the Hospital and Community Health Service (HCHS) pay and price index to the year 201037 (see Appendix 13 for details on the costs used in the model). Probabilistic sensitivity analysis (PSA) was performed to access the robustness of the results to the input costs.
For this evaluation the primary outcome for effectiveness was considered to be life-years saved, because there is a paucity of data to inform the choice of quality-adjusted life-year (QALY) weights (health-state utilities) for HPV testing when it is used as a primary screening test, and for the subsequent referral and management processes. However, as a supplementary analysis and as a secondary outcome of the evaluation, two sets of QALY weights were used to examine the potential impact of considering QALYs, and to assess the sensitivity of the findings to the particular choice of QALY weights. These were as follows.
Quality-adjusted life-year weights set 1
The first set of weights used for the current analysis was from a study recently conducted specifically to assess health-state utilities relevant to primary HPV screening and subsequent triage testing and management. This study was conducted in metropolitan Sydney, NSW, Australia, and measured QALY weights via a two-stage standard gamble. 38 The QALY weights for patients diagnosed with invasive cervical cancer were obtained from published studies. 39,40 Based on the study findings, this set of weights assigned some disutility to the experience of being screened, even if the test result was negative.
Quality-adjusted life-year weight set 2
Previously published weights were used,40,41 although these were not obtained in the context of health-state preference assessment specifically for primary HPV testing. This set of weights did not assign any disutility to the experience of being screened per se.
Details of QALY weight assumptions used in the model are provided in Appendix 14. The impact of the choice of QALY weights was assessed via comparison of the findings using the two different sets of weights.
Human papillomavirus vaccination coverage rates
The screening evaluations in vaccinated women involved a modelled cohort of women born in 1998 and offered vaccination as 12-year-olds in 2010. In the base case it was assumed that the HPV vaccination coverage rate was as reported in 2010–11 by the Department of Health (84.2% three-dose coverage rate in routinely vaccinated 12- to 13-year-old girls). 42 As vaccination is an ongoing activity and it is possible that this level of coverage is not constant over time, and as emerging data on two-dose efficacy suggest the possibility of relatively high effectiveness for two doses (meaning that the ‘effective’ coverage in England may be higher than the reported three-dose coverage), lower and higher coverage rates for vaccination were investigated in sensitivity analysis (see Appendix 15 for details of the age-specific vaccination coverage used in the model).
Demographic data and cancer survival
The rate of death from causes other than cervical cancer was calculated by subtracting the rate of cervical cancer death43 from all-cause mortality rate. 44 The rate of benign hysterectomy was obtained from a published study conducted in England and Wales. 45 The invasive cancer survival rates used in the model were based on the previous work. 19
Sensitivity analysis
Probabilistic sensitivity analyses were performed separately for cost assumptions for selected strategies. Strategies for which full PSAs were performed included all basic strategies and the strategy variants associated with the most favourable outcomes.
One-way sensitivity analyses were also performed to determine how sensitive the outcomes were to various model assumptions. The following assumptions were varied over a feasible range of possible values:
-
screening attendance rate
-
compliance to colposcopy referral
-
test characteristics for HPV testing
-
test characteristics of LBC (accuracy and inadequate rate)
-
test accuracy of colposcopy
-
assumptions regarding CIN progression and regression
-
the proportion of new oncogenic HPV infections attributable to HPV 16/18
-
vaccination coverage.
Chapter 3 Results
ARTISTIC STUDY EXTENSION
Follow-up characteristics and compliance through the three rounds of screening
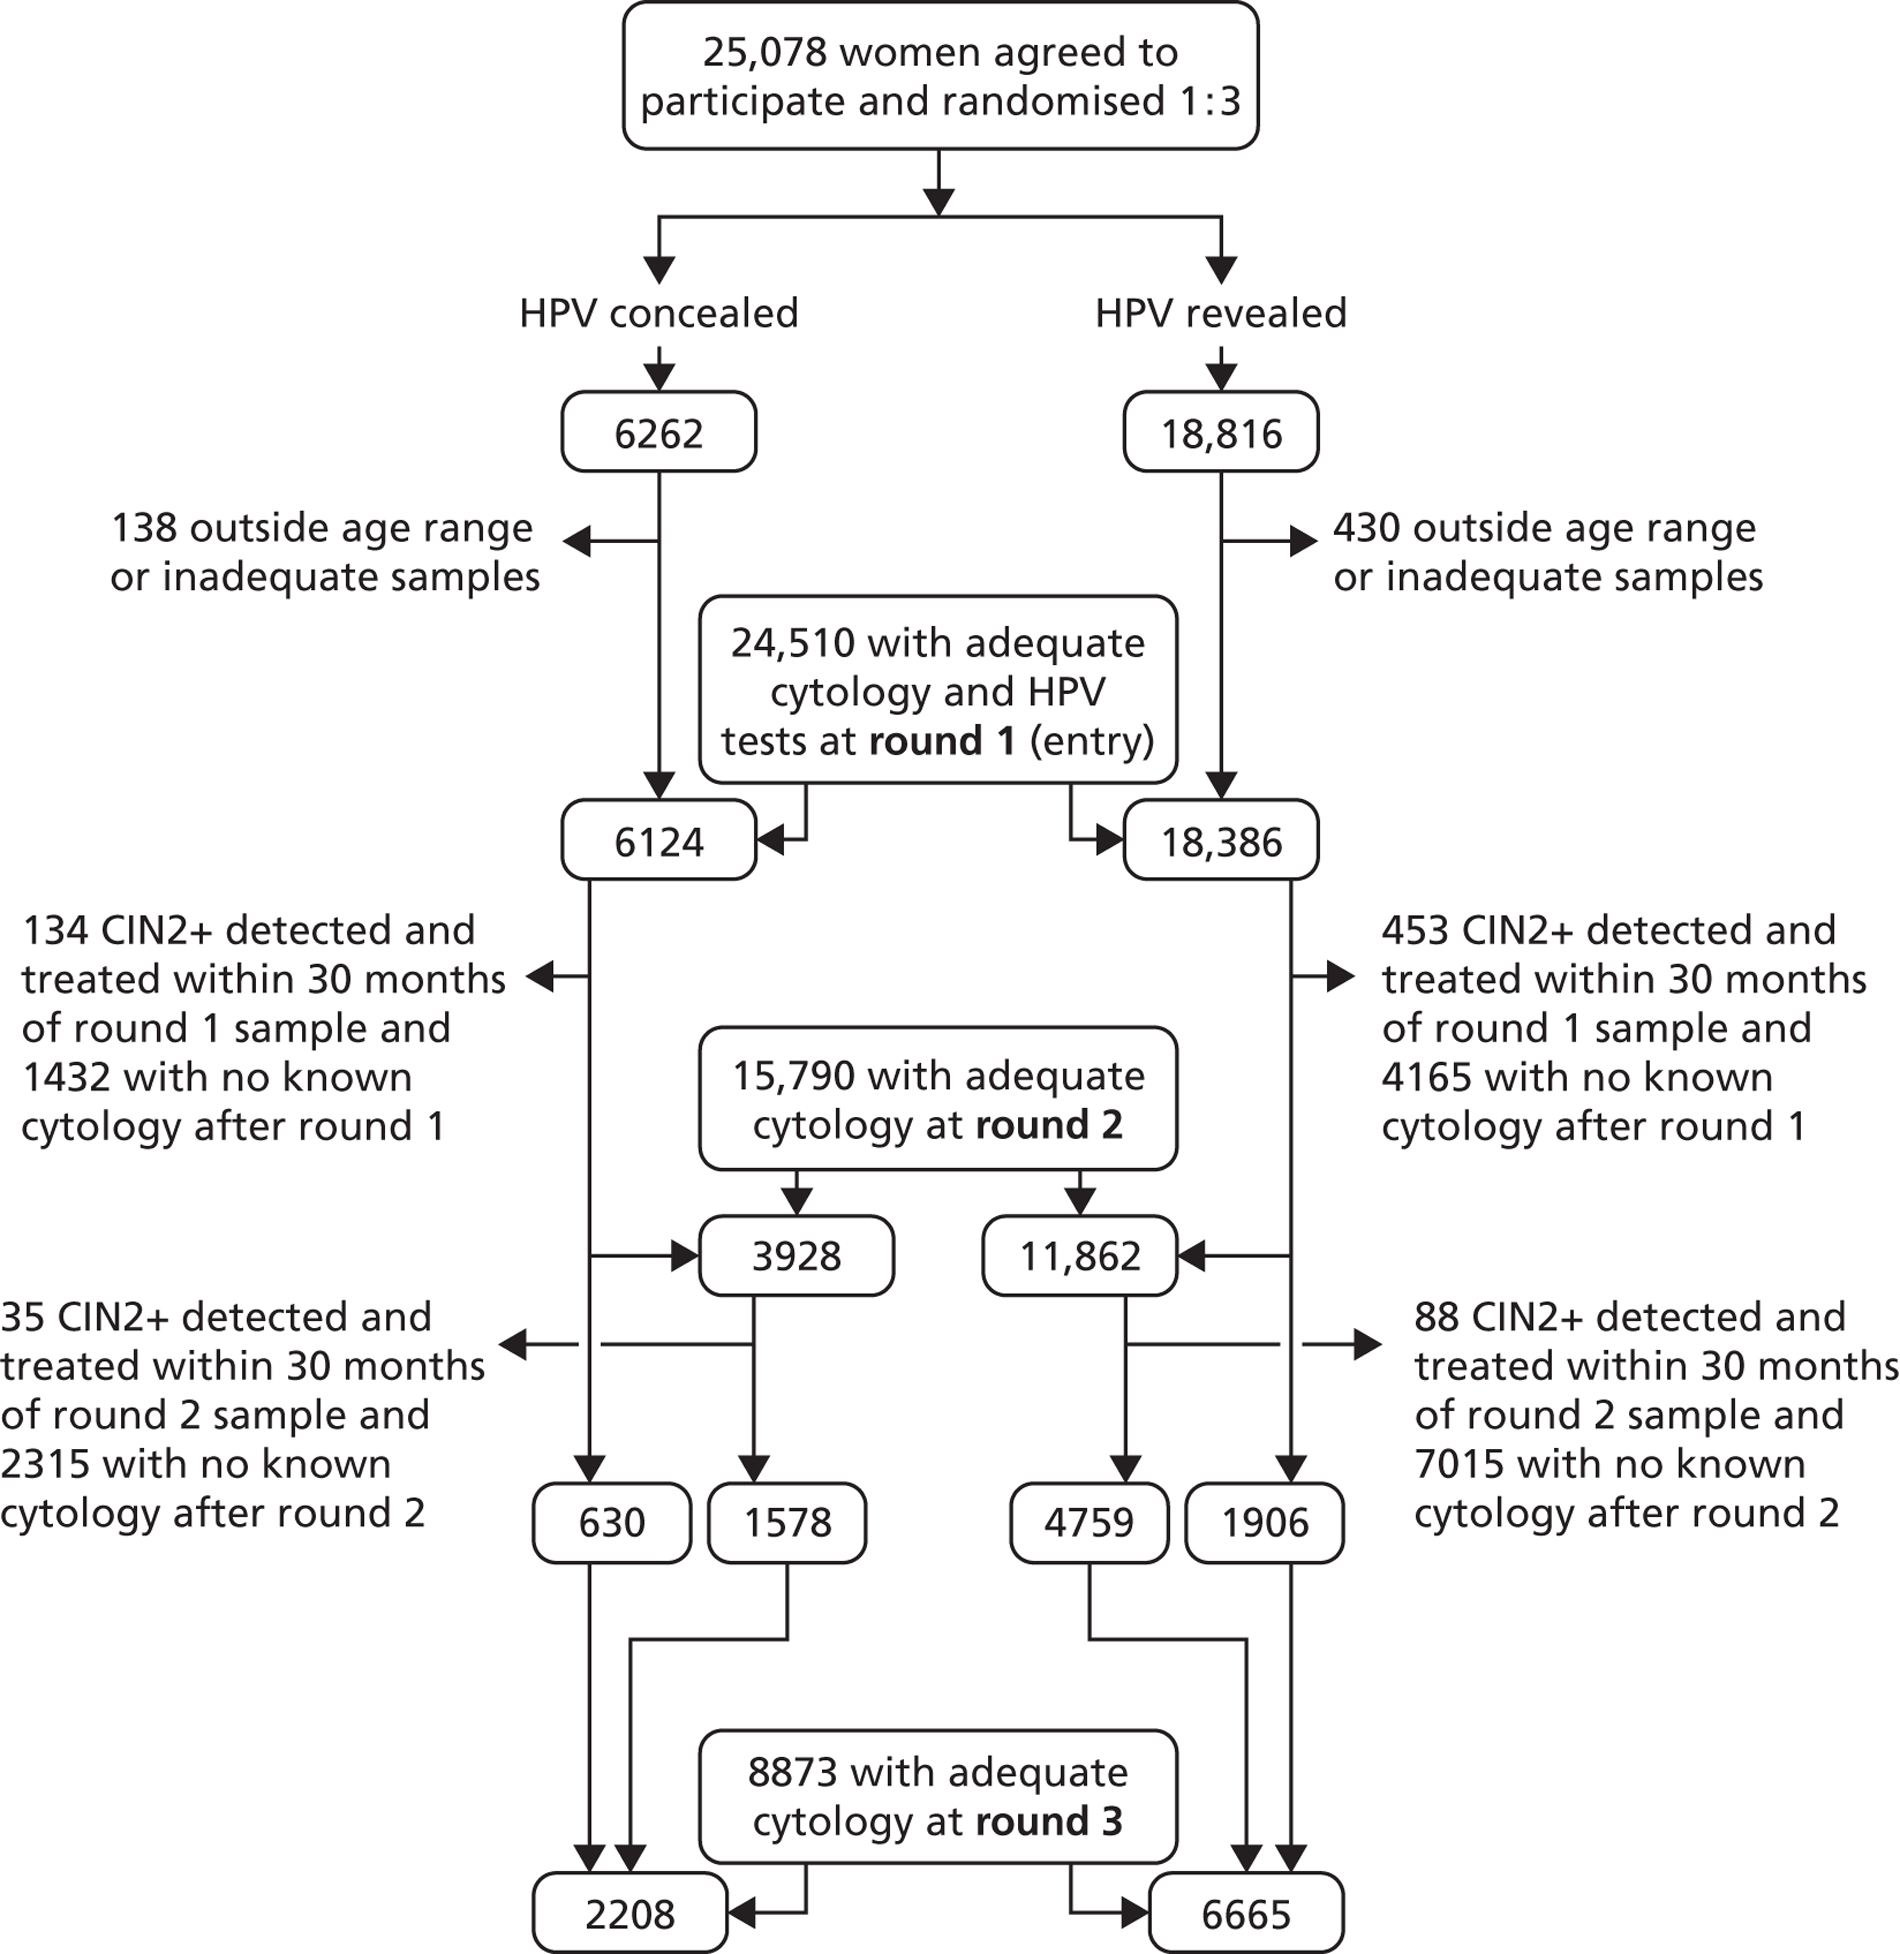
The Consolidated Standards of Reporting Trials (CONSORT) diagram (Figure 11) shows that, of the 24,510 women who entered the trial, 15,790 (64.4%) were screened in round 2 and 8873 (36.2%) were screened in round 3 between January 2006 and June 2009, including 6337 who had also been screened in round 2.
FIGURE 11.
Consolidated Standards of Reporting Trials diagram.
The numbers of women screened, median duration of follow-up and lesions detected in rounds 2 and 3 are shown in Table 2, according to the definitions of rounds 2 and 3 used in this report (definition 1: round 2, 26–54 months; round 3, > 54 months after entry and > 24 months after round 2), and the original definition of round 2 used in the initial ARTISTIC HTA report1 (definition 2: round 2, 30–48 months; round 3, > 48 months after entry and > 24 months after round 2). Whichever definition is used, the numbers of lesions detected in rounds 2 and 3 combined are similar, but definition 1 increases the number of lesions in round 2.
| Round (R) and grades of CIN detected | Definition 1 (this report): R2, 26–54 months after entry; R3, > 54 months after entry and > 24 months after R2 | Definition 2 (previous report): R2, 30–48 months after entry; R3, > 48 months after entry and > 24 months after R2 |
|---|---|---|
| R2 | ||
| n | 15,790 | 14,336 |
| Follow-up (months) | 26–54 (median 36.6) | 30–48 (median 36.6) |
| CIN2 | 70 | 57 |
| CIN3+ | 53 | 45 |
| CIN2+ | 123 | 102 |
| R3 | ||
| n | 8873 | 9781 |
| Follow-up (months) | 54.1–95.3 (median 72.7) | 48.1–95.3 (median 71.8) |
| CIN2 | 35 | 43 |
| CIN3+ | 31 | 39 |
| CIN2+ | 66 | 82 |
| R2 + R3 | ||
| CIN3+ | 84 | 84 |
| CIN2+ | 189 | 184 |
| Excluded CIN2+ by this definition onlya | One CIN3 | Five CIN2, one CIN3 |
Table 3 shows the characteristics at entry of women attending at round 2, rounds 2 and 3, and round 3 but not round 2. Attendance was unrelated to allocated arm, and the apparently lower round 2 attendance rates in women who were HPV-positive or had moderate+ cytology at entry are due to the exclusion of round 1 CIN2+ cases in round 2. Their round 2 attendance rates when these are ignored are 76.1% (102 out of 134) for moderate+ cytology and 63.5% (2070 out of 3262) for HPV positive.
| Characteristics at entry | Round 1, n (%) | Round 2, n (%) | Round 3 and round 2, n (%) | Round 3, no round 2, n (%) |
|---|---|---|---|---|
| Arm | ||||
| Revealed | 6124 (100) | 3928 (64.1) | 1578 (25.8) | 630 (10.3) |
| Concealed | 18,386 (100) | 11,862 (64.5) | 4759 (25.9) | 1906 (10.4) |
| HPV status | ||||
| Negative | 20,697 (100) | 13,720 (66.3) | 5382 (26.0) | 2170 (10.5) |
| Positive | 3813 (100) | 2070 (54.3) | 955 (25.0) | 366 (9.6) |
| Cytology | ||||
| Normal | 21,380 (100) | 13,930 (65.2) | 5450 (25.5) | 2349 (11.0) |
| Mild/borderline | 2667 (100) | 1758 (65.9) | 816 (30.6) | 176 (6.6) |
| Moderate+ | 463 (100) | 102 (22.0) | 71 (15.3) | 11 (2.4) |
| Age at entry (years) | ||||
| 20–24 | 2600 (100) | 1292 (49.7) | 656 (25.2) | 350 (13.5) |
| 25–29 | 2589 (100) | 1349 (52.1) | 729 (28.2) | 342 (13.2) |
| 30–39 | 7633 (100) | 4858 (63.6) | 2698 (35.3) | 893 (11.7) |
| 40–49 | 6096 (100) | 4311 (70.7) | 1890 (31.0) | 557 (9.1) |
| 50–64 | 5592 (100) | 3980 (71.2) | 364 (6.5) | 394 (7.0) |
| All women | 24,510 (100) | 15,790 (64.4) | 6337 (25.9) | 2536 (10.3) |
Cumulative follow-up (Kaplan–Meier analysis of time to next cytology or HPV test) up to 8 years after entry in women with normal cytology at entry was identical in the randomised arms: 79.7% [95% confidence interval (CI) 77.3% to 82.0%] concealed and 79.7% (95% CI 79.0% to 80.5%) revealed. Cytology outside the study area could not be ascertained reliably, so these long-term rates probably underestimate the proportion with any subsequent cytology.
The cumulative follow-up to next cytology or HPV test within 24 months in women who were HPV positive and cytologically normal at each screening round indicates the proportion of women complying with allocated recall. This proportion was 62.4% by 24 months after round 1 and 58.3% by 24 months after round 2 in the revealed arm.
Relationship between age, cytology and human papillomavirus by round of screening
The HPV prevalence by round and age at that round is shown in Table 4, using a RLU/Co of 1. The advancing age of the cohort meant that in round 3 there were HPV data for a small number of women aged 65 years and older. It is interesting to note that the HPV prevalence according to age did not change a great deal between rounds, except that between rounds 1 and 2 there was a fall among women aged over 40 years, and between rounds 2 and 3 there was a rise of similar magnitude. In the previous ARTISTIC HTA report,1 the high population of ‘false positive’ HR results in older women was noted, but this should not change between rounds in similarly aged quinquennia.
| Round 1 | Round 2 | Round 3 | ||
|---|---|---|---|---|
| HPV+/total (%) | HPV+/totala (%) | HPV+/totala (%) | ||
| Age at round (years) | ||||
| 20–24 | 1036/2600 (39.85) | 139/418 (33.25) | 4/14 (28.57) | |
| 25–29 | 717/2589 (27.69) | 246/972 (25.31) | 198/754 (26.26) | |
| 30–39 | 1161/7633 (15.21) | 433/3567 (12.14) | 314/2504 (12.54) | |
| 40–49 | 533/6096 (8.74) | 248/4428 (5.60) | 263/3330 (7.90) | |
| 50–59 | 290/4351 (6.67) | 143/3319 (4.31) | 93/1462 (6.36) | |
| 60–64 | 76/1240 (6.13) | 47/1112 (4.23) | 13/287 (4.53) | |
| 65–70 | N/A (N/A) | 12/416 (2.88) | 6/77 (7.79) | |
| Total | 3813/24,510 (15.56) | 1268/14,232 (8.91) | 891/8428 (10.57) | |
In women aged between 25 and 64 years, the HPV rate did fall from 12.7% in round 1 to 8.3% in round 2 and increased to 10.6% in round 3. This fall is probably explained by treatment of CIN which cleared infection, and also the natural clearing of infection within the ageing cohort. The reason for the small increase in round 3 is unclear but may be due to newly acquired infection in women over 40, among whom the increased rate has occurred. It could be due in part to the higher false-positive rate with HC2 in older women as reported in the original ARTISTIC HTA report. 1 We have looked at the possibility that those attending in round 3 selected, for some reason, women with a higher HPV prevalence in round 1, but this was not the case. The age-standardised HPV prevalence at round 1 for those women who attended in rounds 1, 2 and 3, and rounds 1 and 3 only, were 10.9% and 9.1%, respectively, compared with 10.6% for the entire cohort at round 1.
Whether or not round 3 women were screened in round 2 is shown in Table 5. Twenty-nine per cent of round 3 women had not been screened in round 2, a figure which was similar between the arms. A higher proportion of moderate+ cytology was seen in women who did not attend for an intermediate round of screening (0.9% vs. 0.4%).
| Characteristics at round 3 | With round 2, n (%) | Without round 2, n (%) |
|---|---|---|
| Arm | ||
| Revealed | 4759 (75.1) | 1906 (75.2) |
| Concealed | 1578 (24.9) | 630 (24.8) |
| HPV status | ||
| –ve | 5403 (89.5) | 2134 (89.3) |
| +ve | 635 (10.5) | 256 (10.7) |
| Not done | 299 | 146 |
| Cytology | ||
| Normal | 6056 (95.6) | 2405 (94.8) |
| Mild/borderline | 255 (4.0) | 107 (4.2) |
| Moderate+ | 26 (0.4) | 24 (0.9) |
| Age at round 3 (years) | ||
| 24–29 | 478 (7.6) | 318 (12.5) |
| 30–39 | 1835 (29.0) | 804 (31.7) |
| 40–49 | 2751 (43.4) | 757 (29.9) |
| 50–59 | 1072 (16.9) | 464 (18.3) |
| 60–64 | 155 (2.4) | 154 (6.1) |
| ≥ 65 | 44 (0.7) | 39 (1.5) |
| All women | 6337 (100) | 2536 (100) |
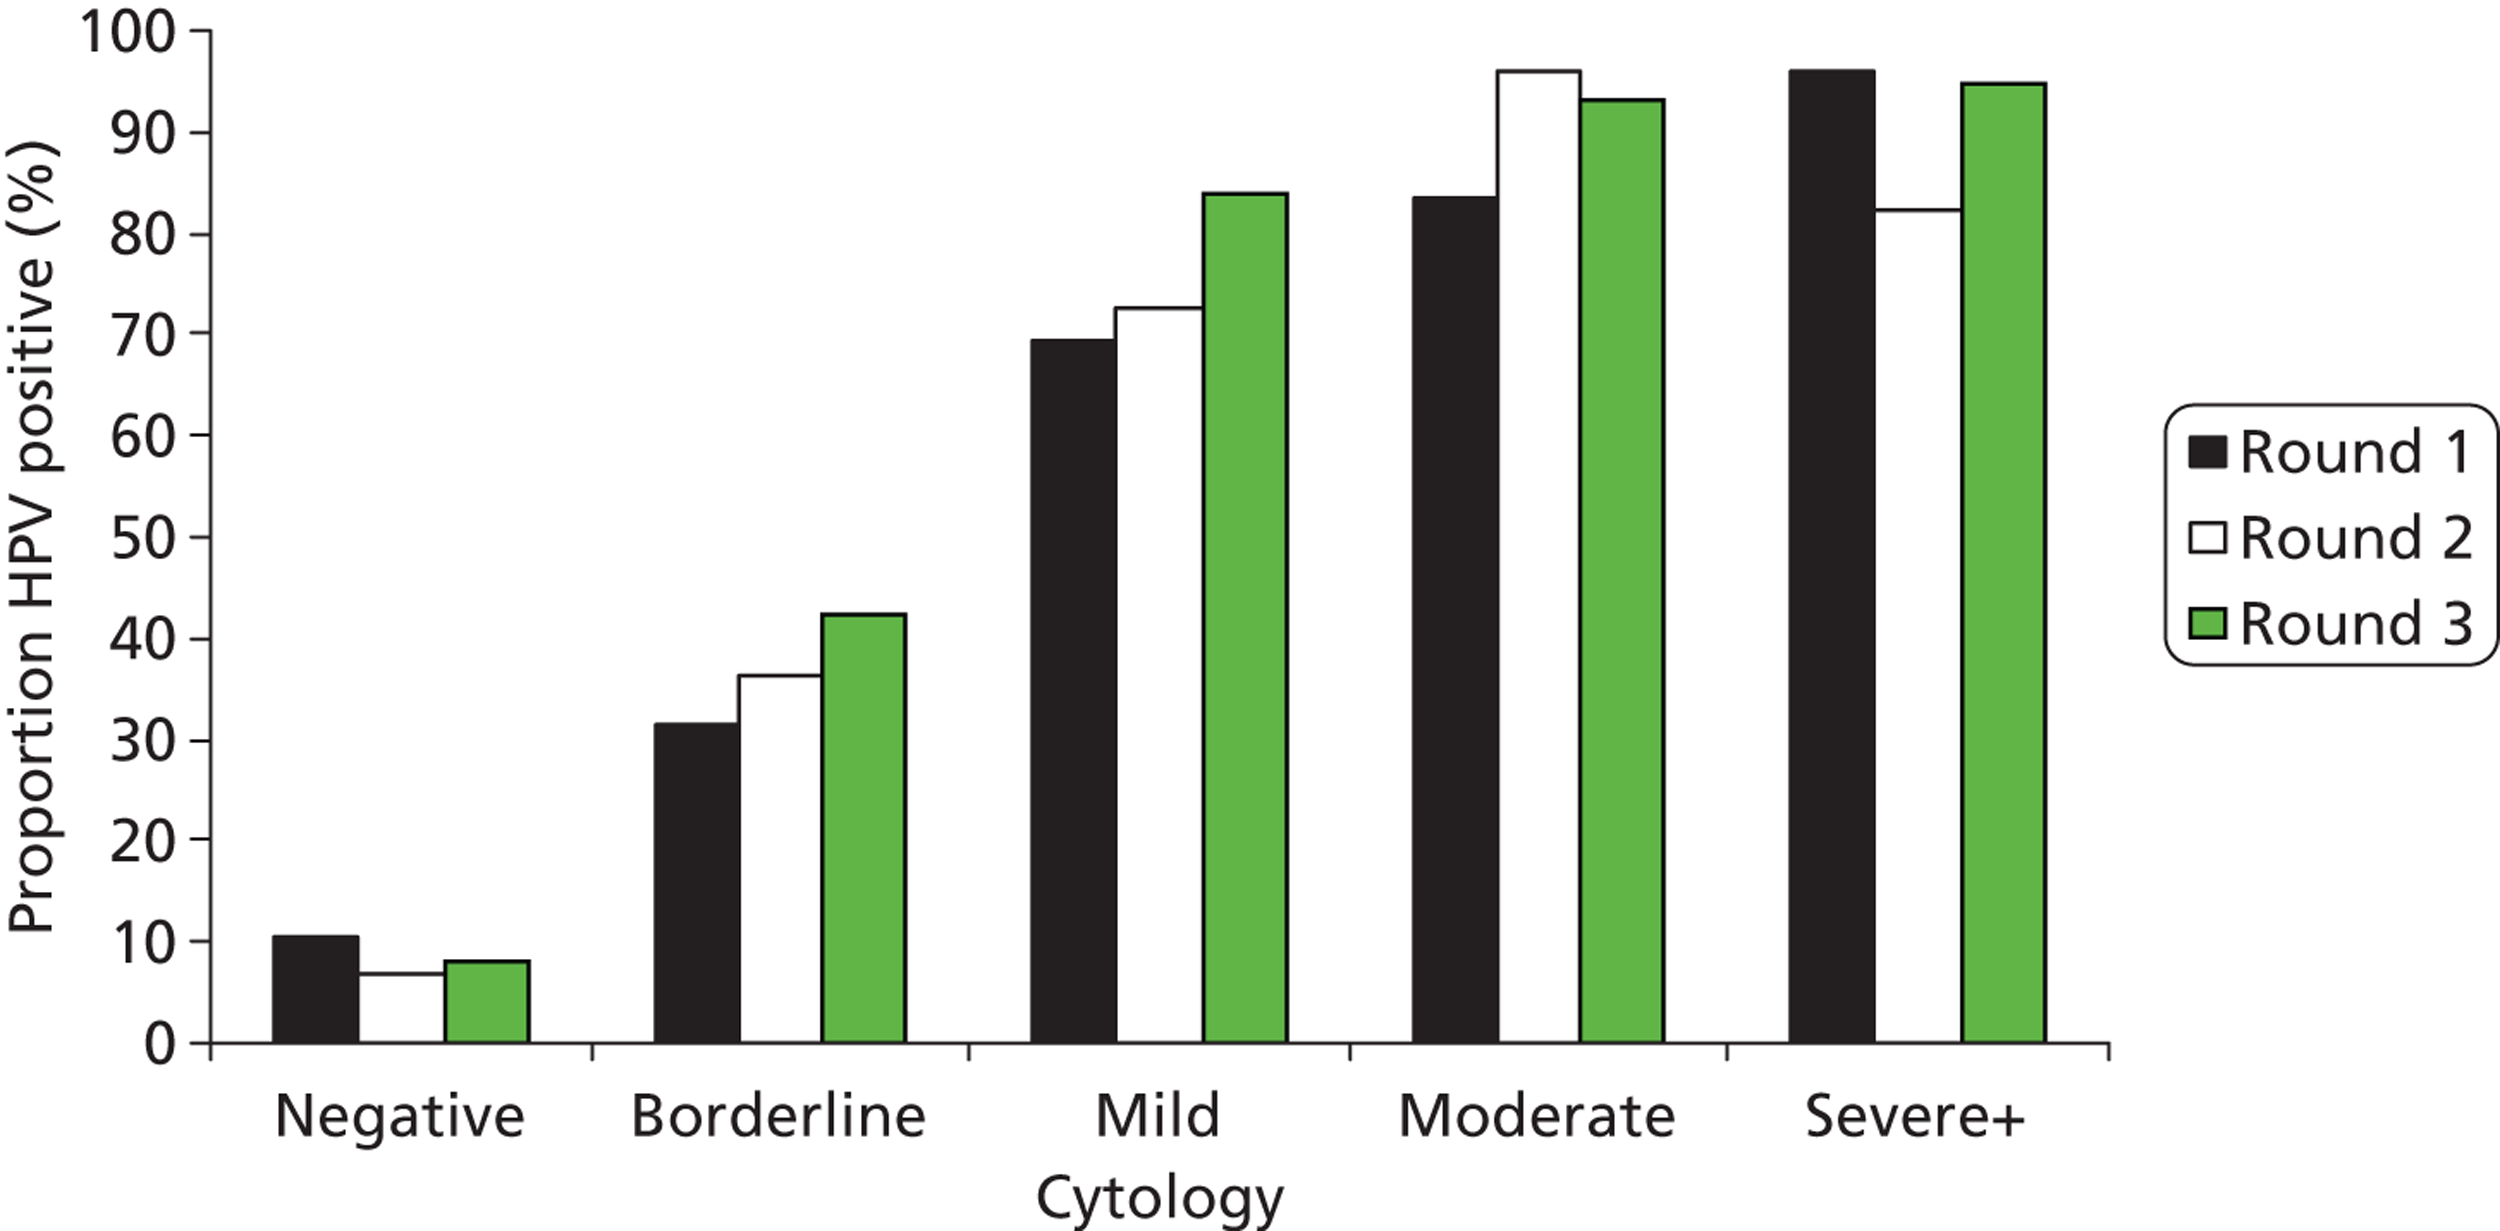
The proportion with abnormal cytology was 12.8%, 5.0% and 4.6% in rounds 1, 2 and 3, respectively (Table 6). Figures 12 and 13 show the proportion of HPV positive results by cytology grade in each of the arms and Table 6 shows the cytology results in rounds 1, 2 and 3, respectively. The proportions of women who were HPV positive remained broadly similar in the two arms of the trial and within each grade of abnormality.
| Cytology | Round 1, n (%) | Round 2, n (%) | Round 3, n (%) | |||
|---|---|---|---|---|---|---|
| Revealed | Concealed | Revealed | Concealed | Revealed | Concealed | |
| Negative | 16,042 (87.3) | 5338 (87.2) | 11,282 (95.1) | 3715 (94.6) | 6355 (95.4) | 2106 (95.4) |
| Borderline | 1343 (7.3) | 446 (7.3) | 350 (3.0) | 138 (3.5) | 150 (2.3) | 51 (2.3) |
| Mild | 643 (3.5) | 235 (3.8) | 183 (1.5) | 59 (1.5) | 115 (1.7) | 37 (1.7) |
| Moderate | 204 (1.1) | 67 (1.1) | 28 (0.2) | 11 (0.3) | 16 (0.2) | 8 (0.4) |
| Severe+ | 154 (0.8) | 38 (0.6) | 19 (0.2) | 5 (0.1) | 20 (0.3) | 6 (0.3) |
| Total | 18,386 | 6124 | 11,862 | 3928 | 6665 | 2208 |
FIGURE 12.
Proportion of HPV-positive results by cytology grade and round in the concealed arm.
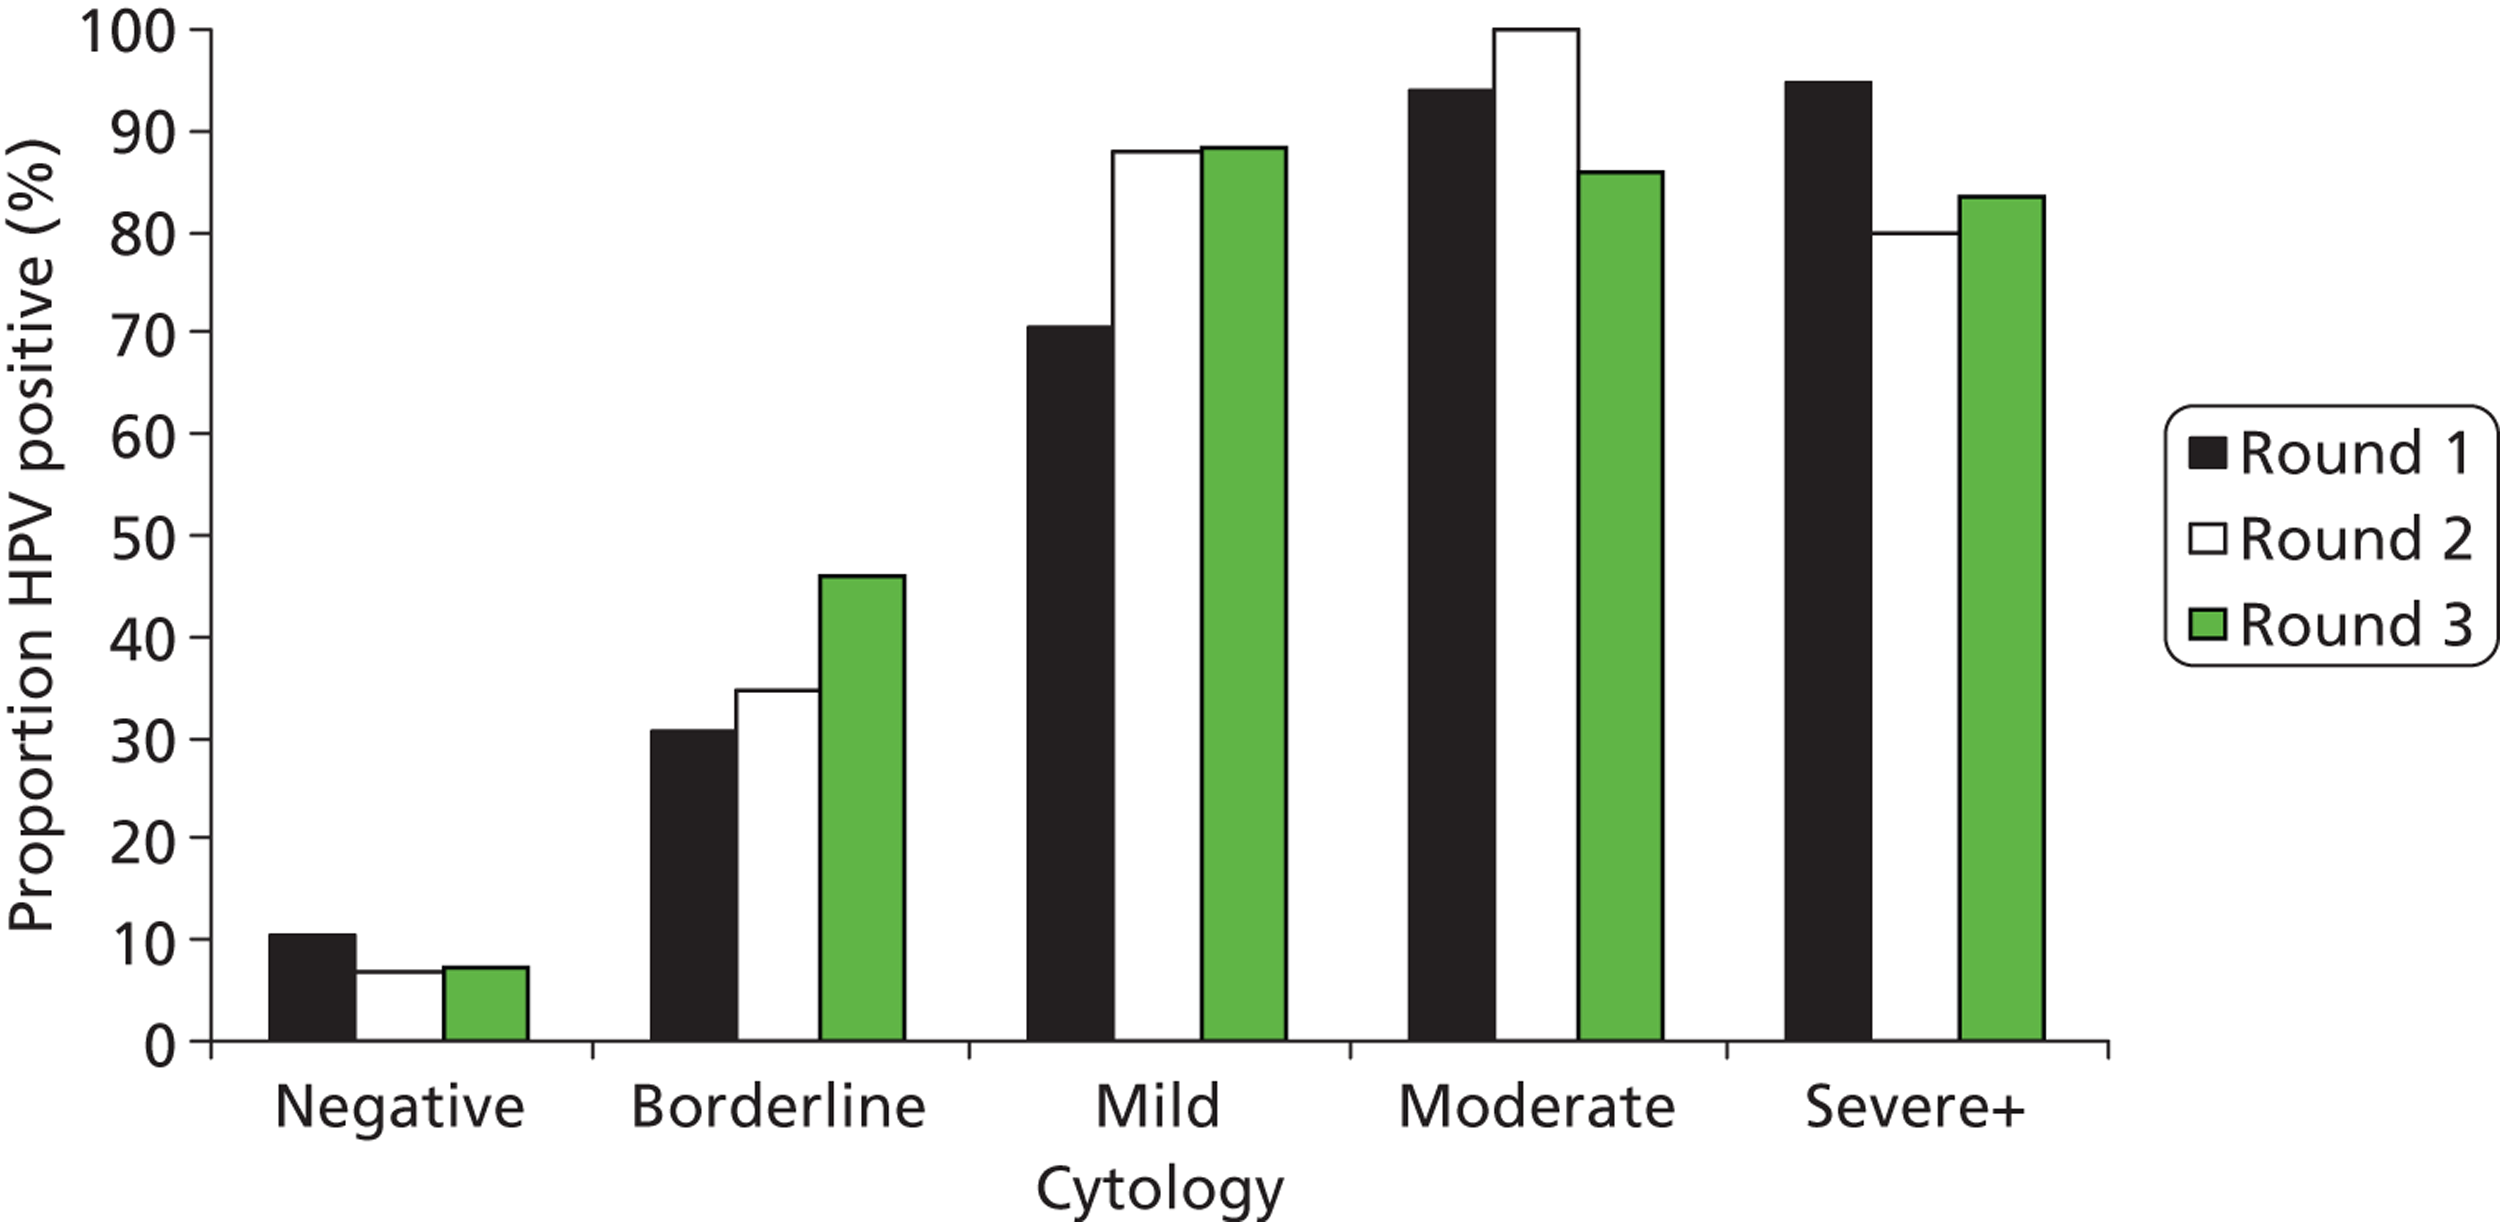
FIGURE 13.
Proportion of HPV-positive results by cytology grade and round in the revealed arm.
Relationship between human papillomavirus, cytology and age over three rounds
Figure 14 depicts the comparable proportion of women who tested cytology negative and HPV positive according to their age at that round, and the proportions of low-grade and high-grade cytology, according to age at round 1, 2 and 3, are shown in Figures 15 and 16, respectively. The numbers of abnormalities in round 3 are small due to the effect of previous screening and the reduced proportion of the original cohort being screened. The number of women under age 25 years fell as the cohort became older, with almost none by round 3. By contrast, the number of women aged over 64 years increased.
FIGURE 14.
Proportion of normal cytology with a positive HPV result according to age at round. R, round.
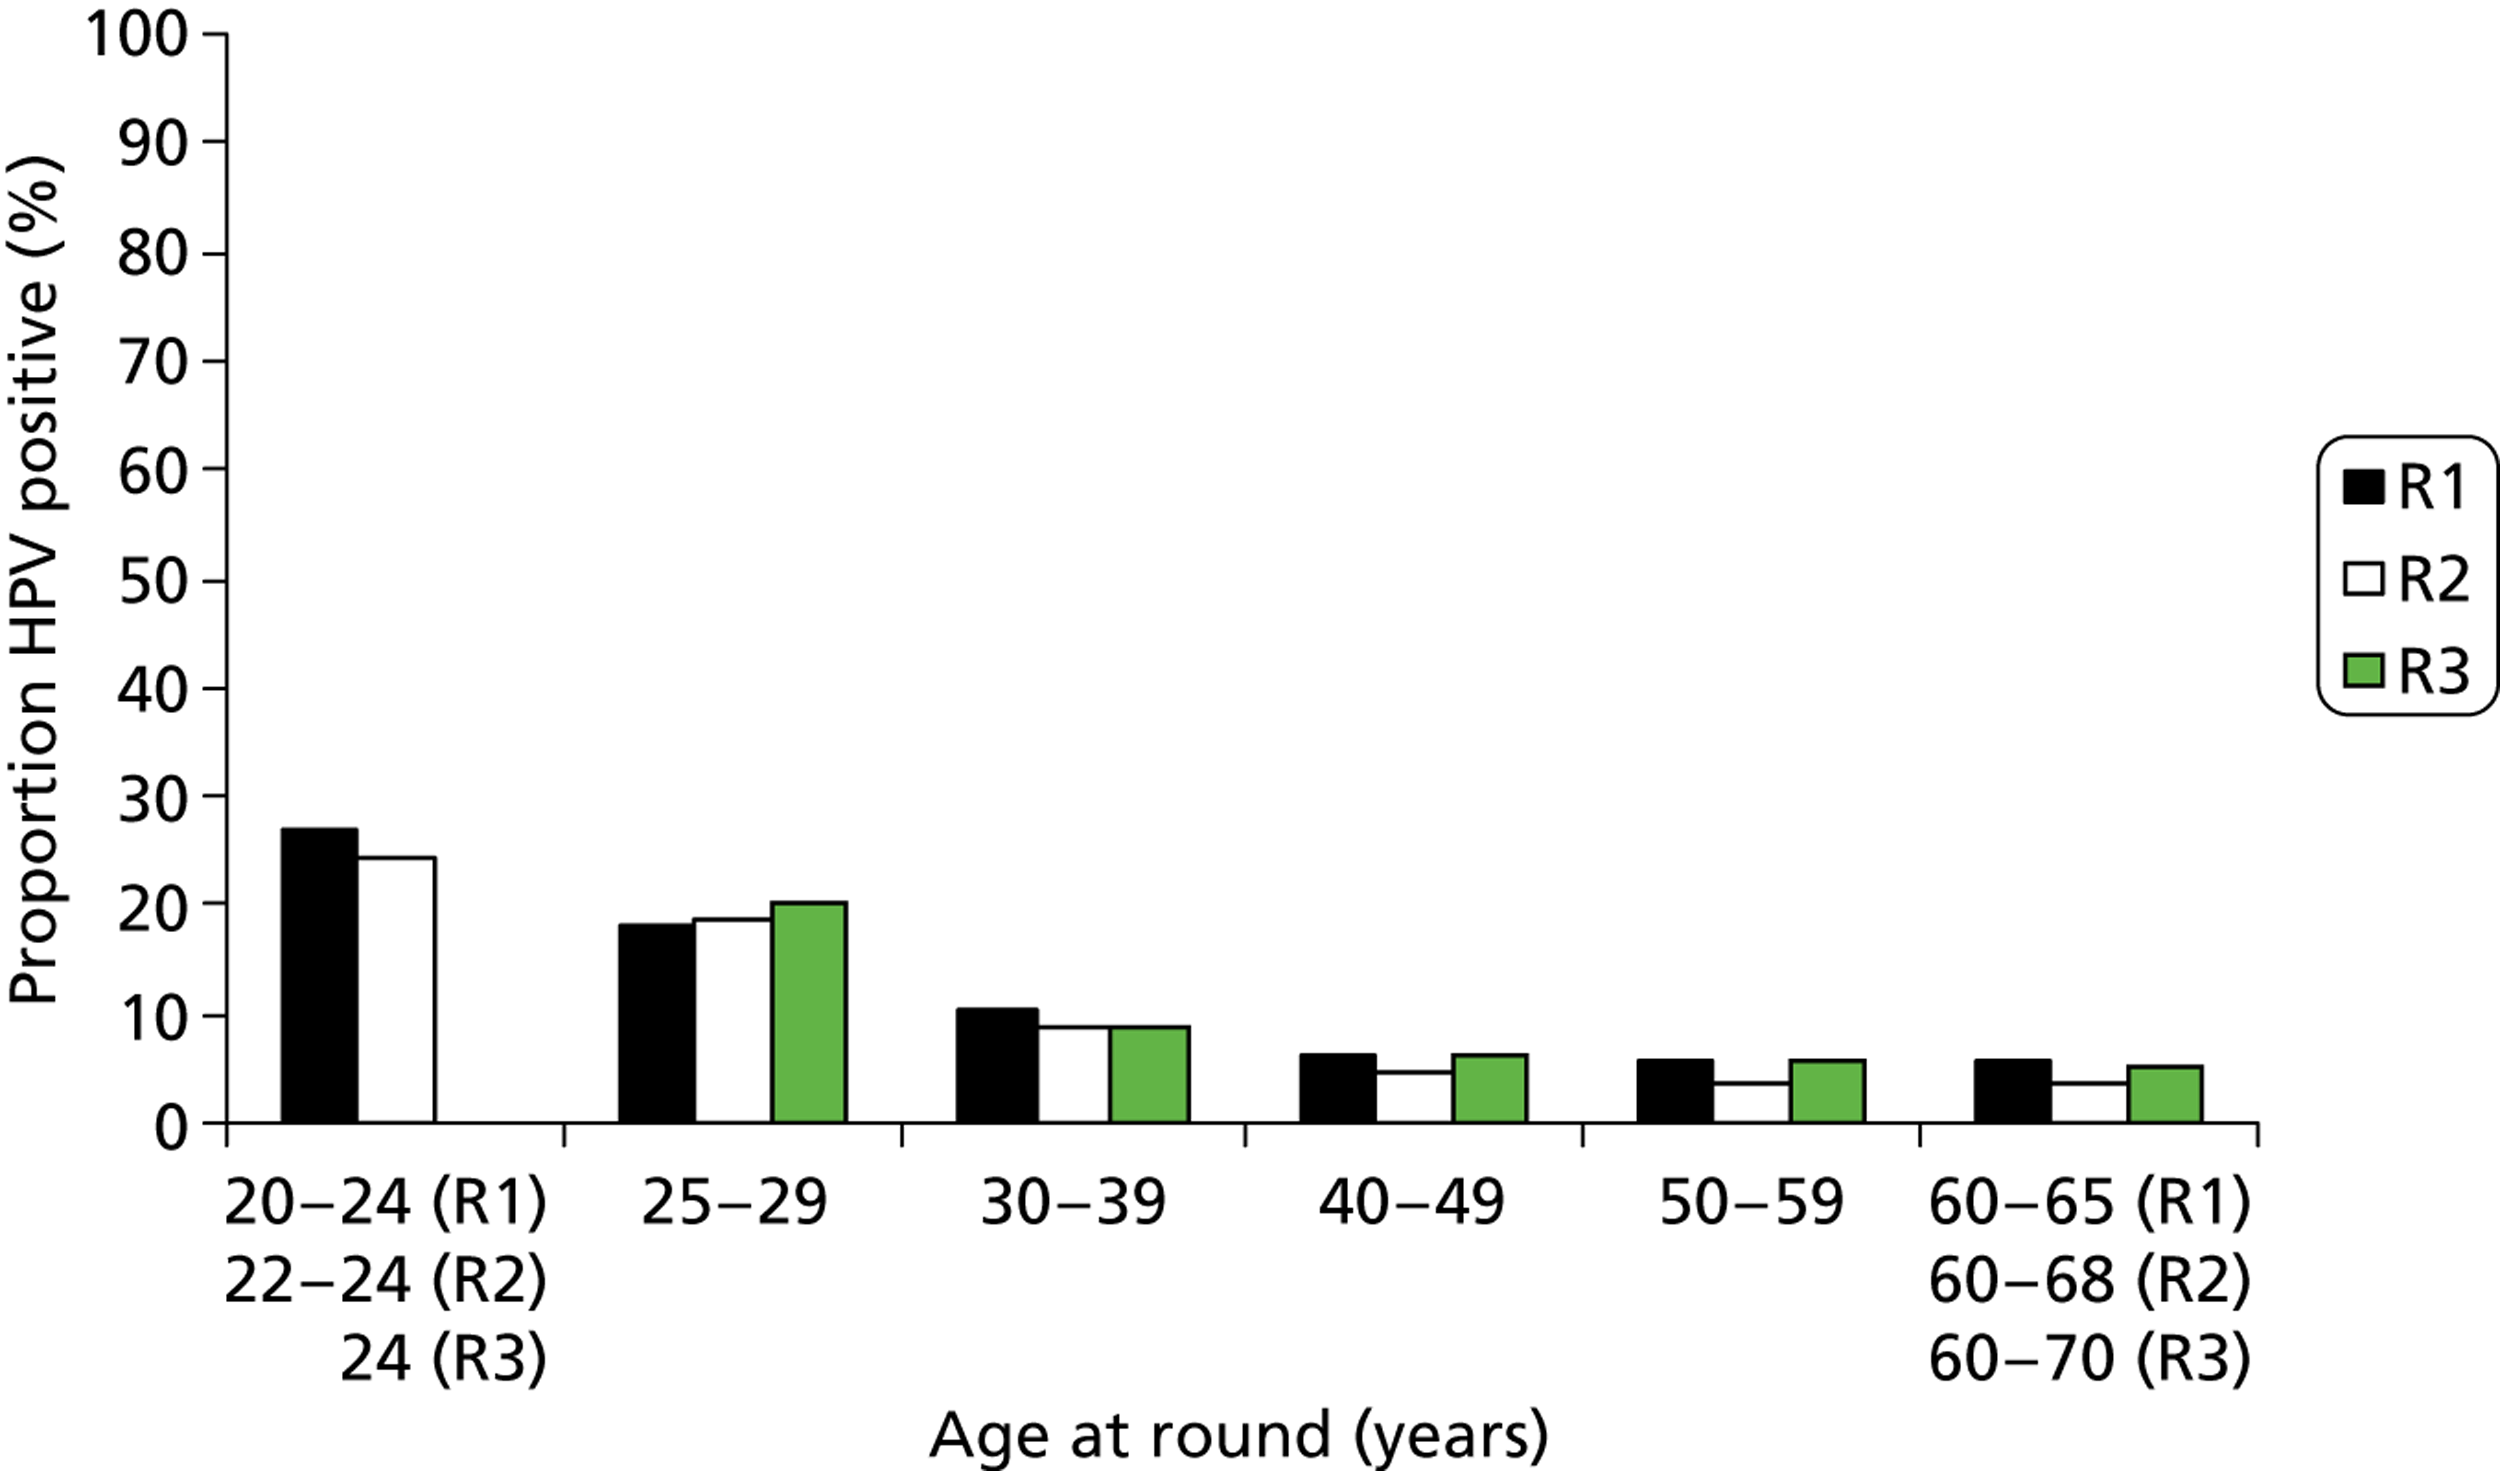
FIGURE 15.
Proportion of borderline/mild cytology with a positive HPV result according to age at round. R, round.
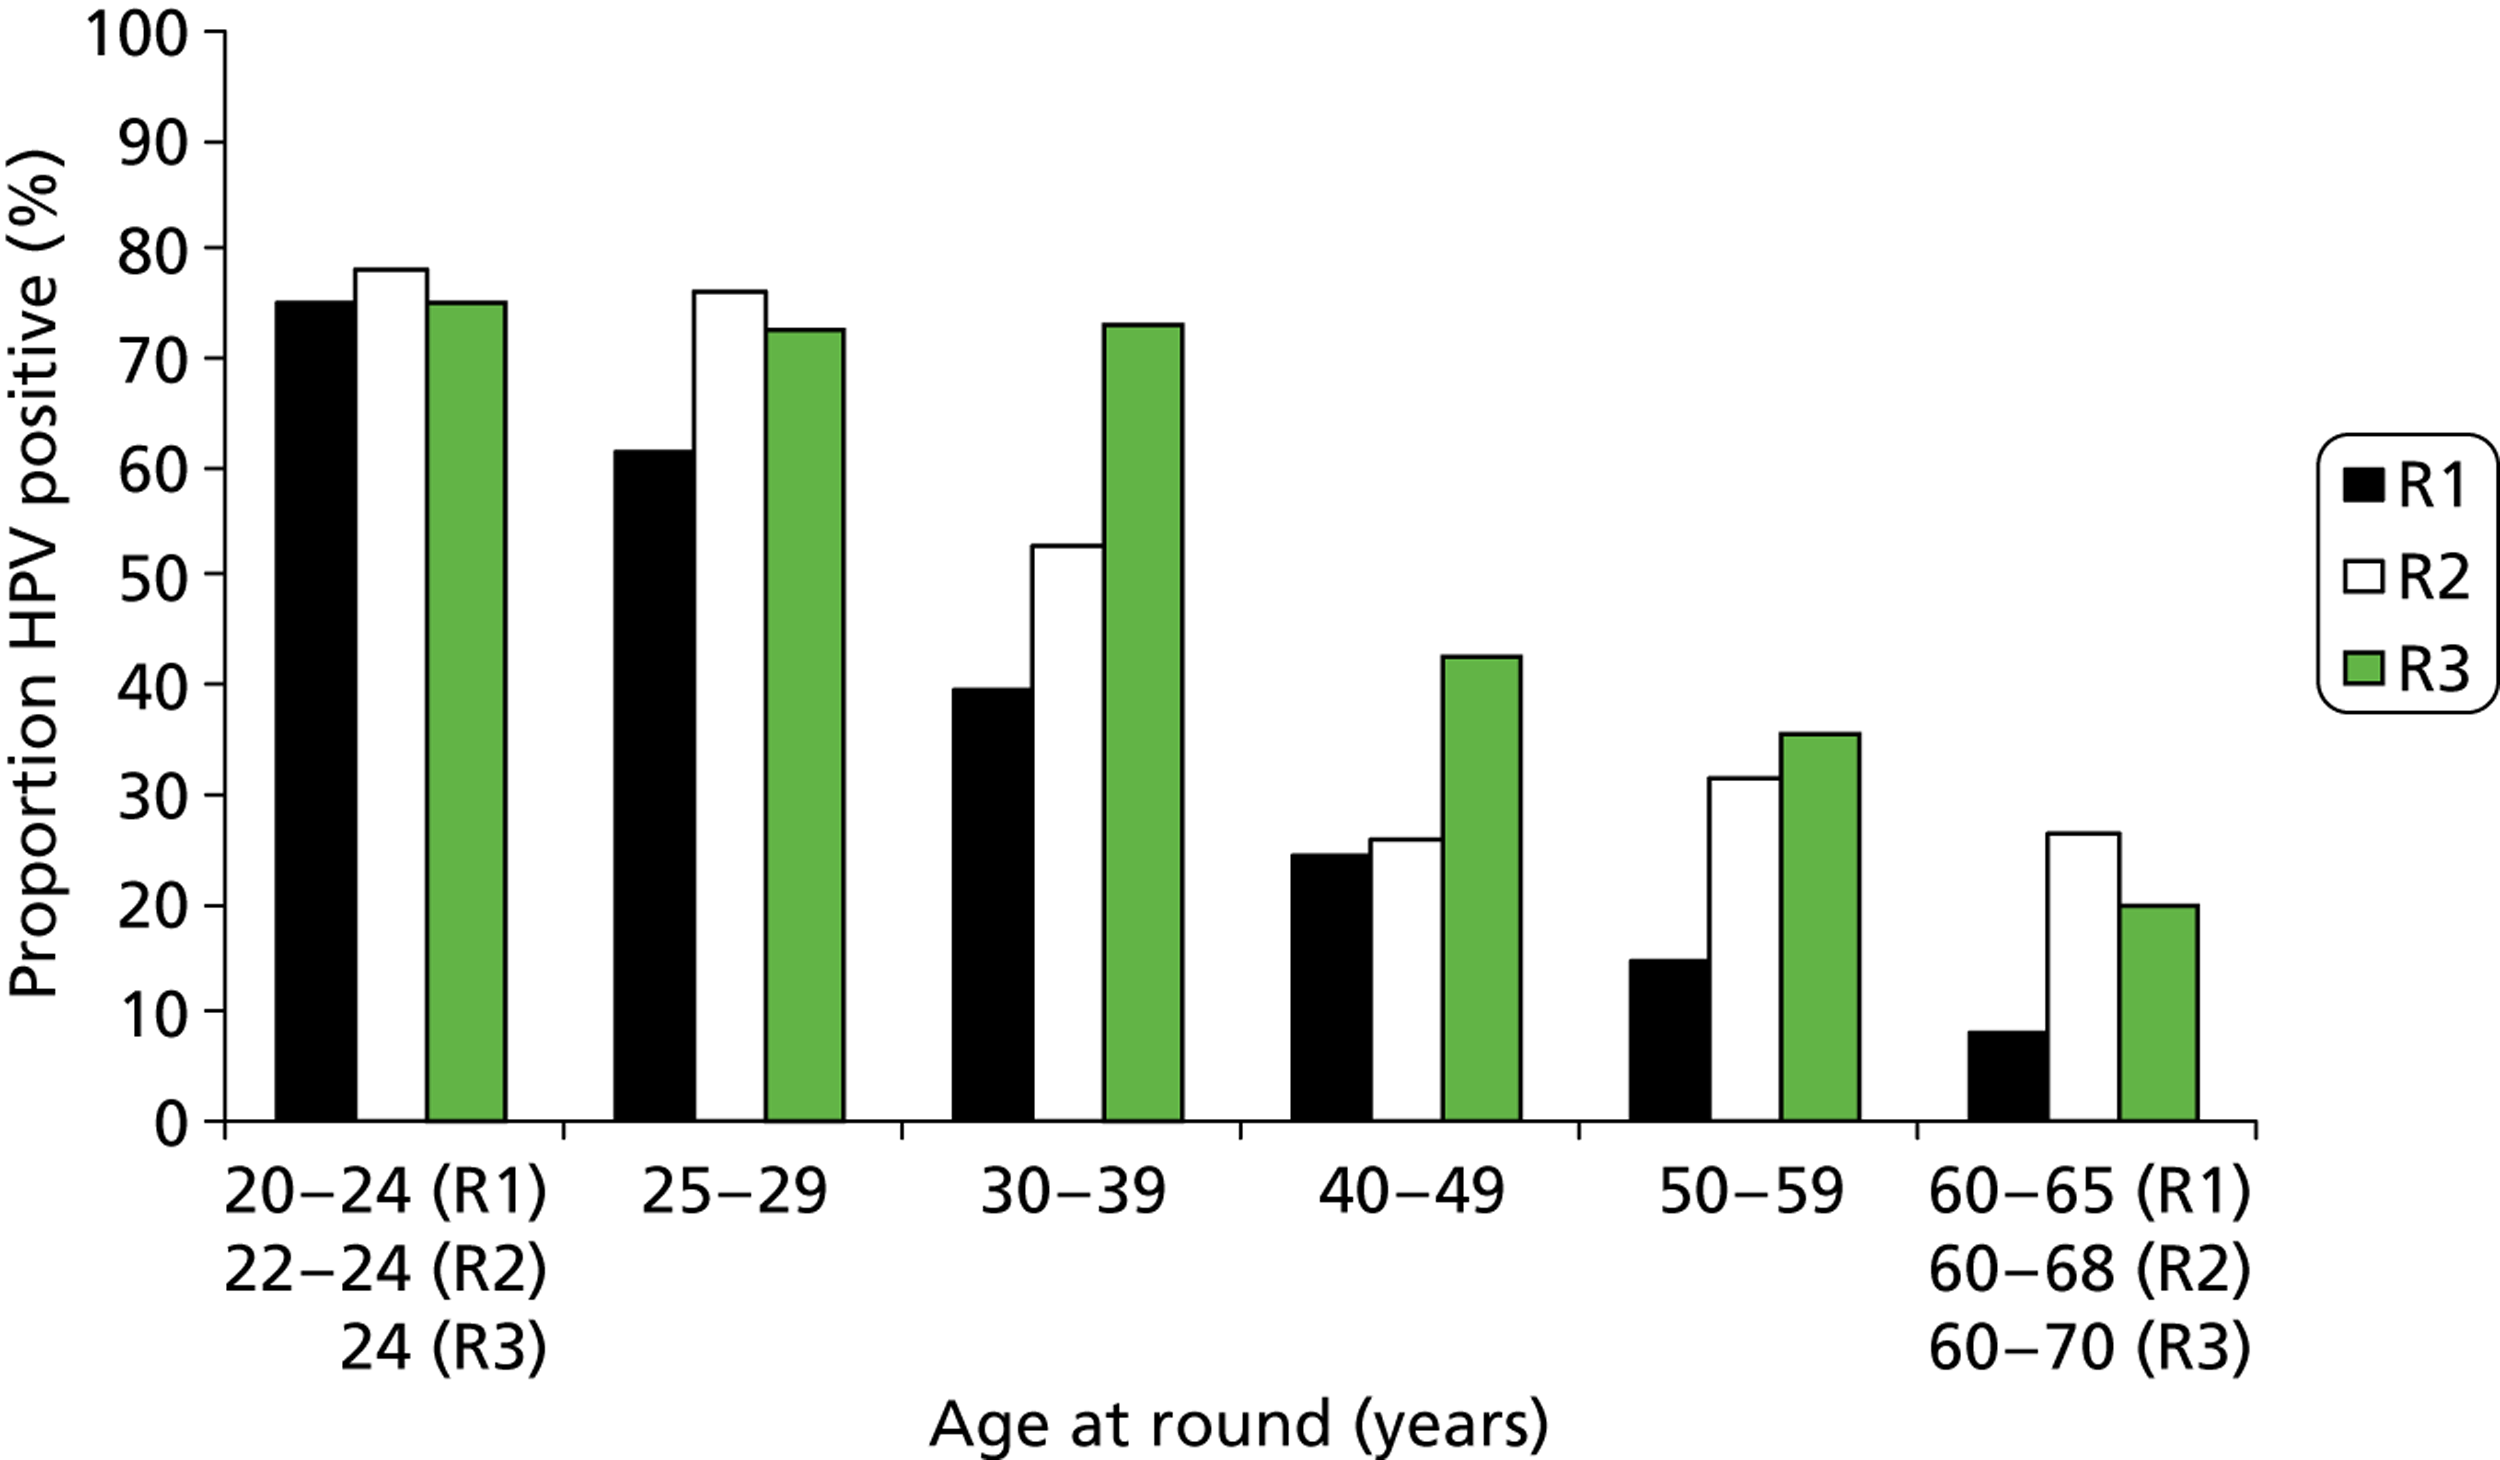
FIGURE 16.
Proportion of moderate+ cytology with a positive HPV result according to age at round. R, round.
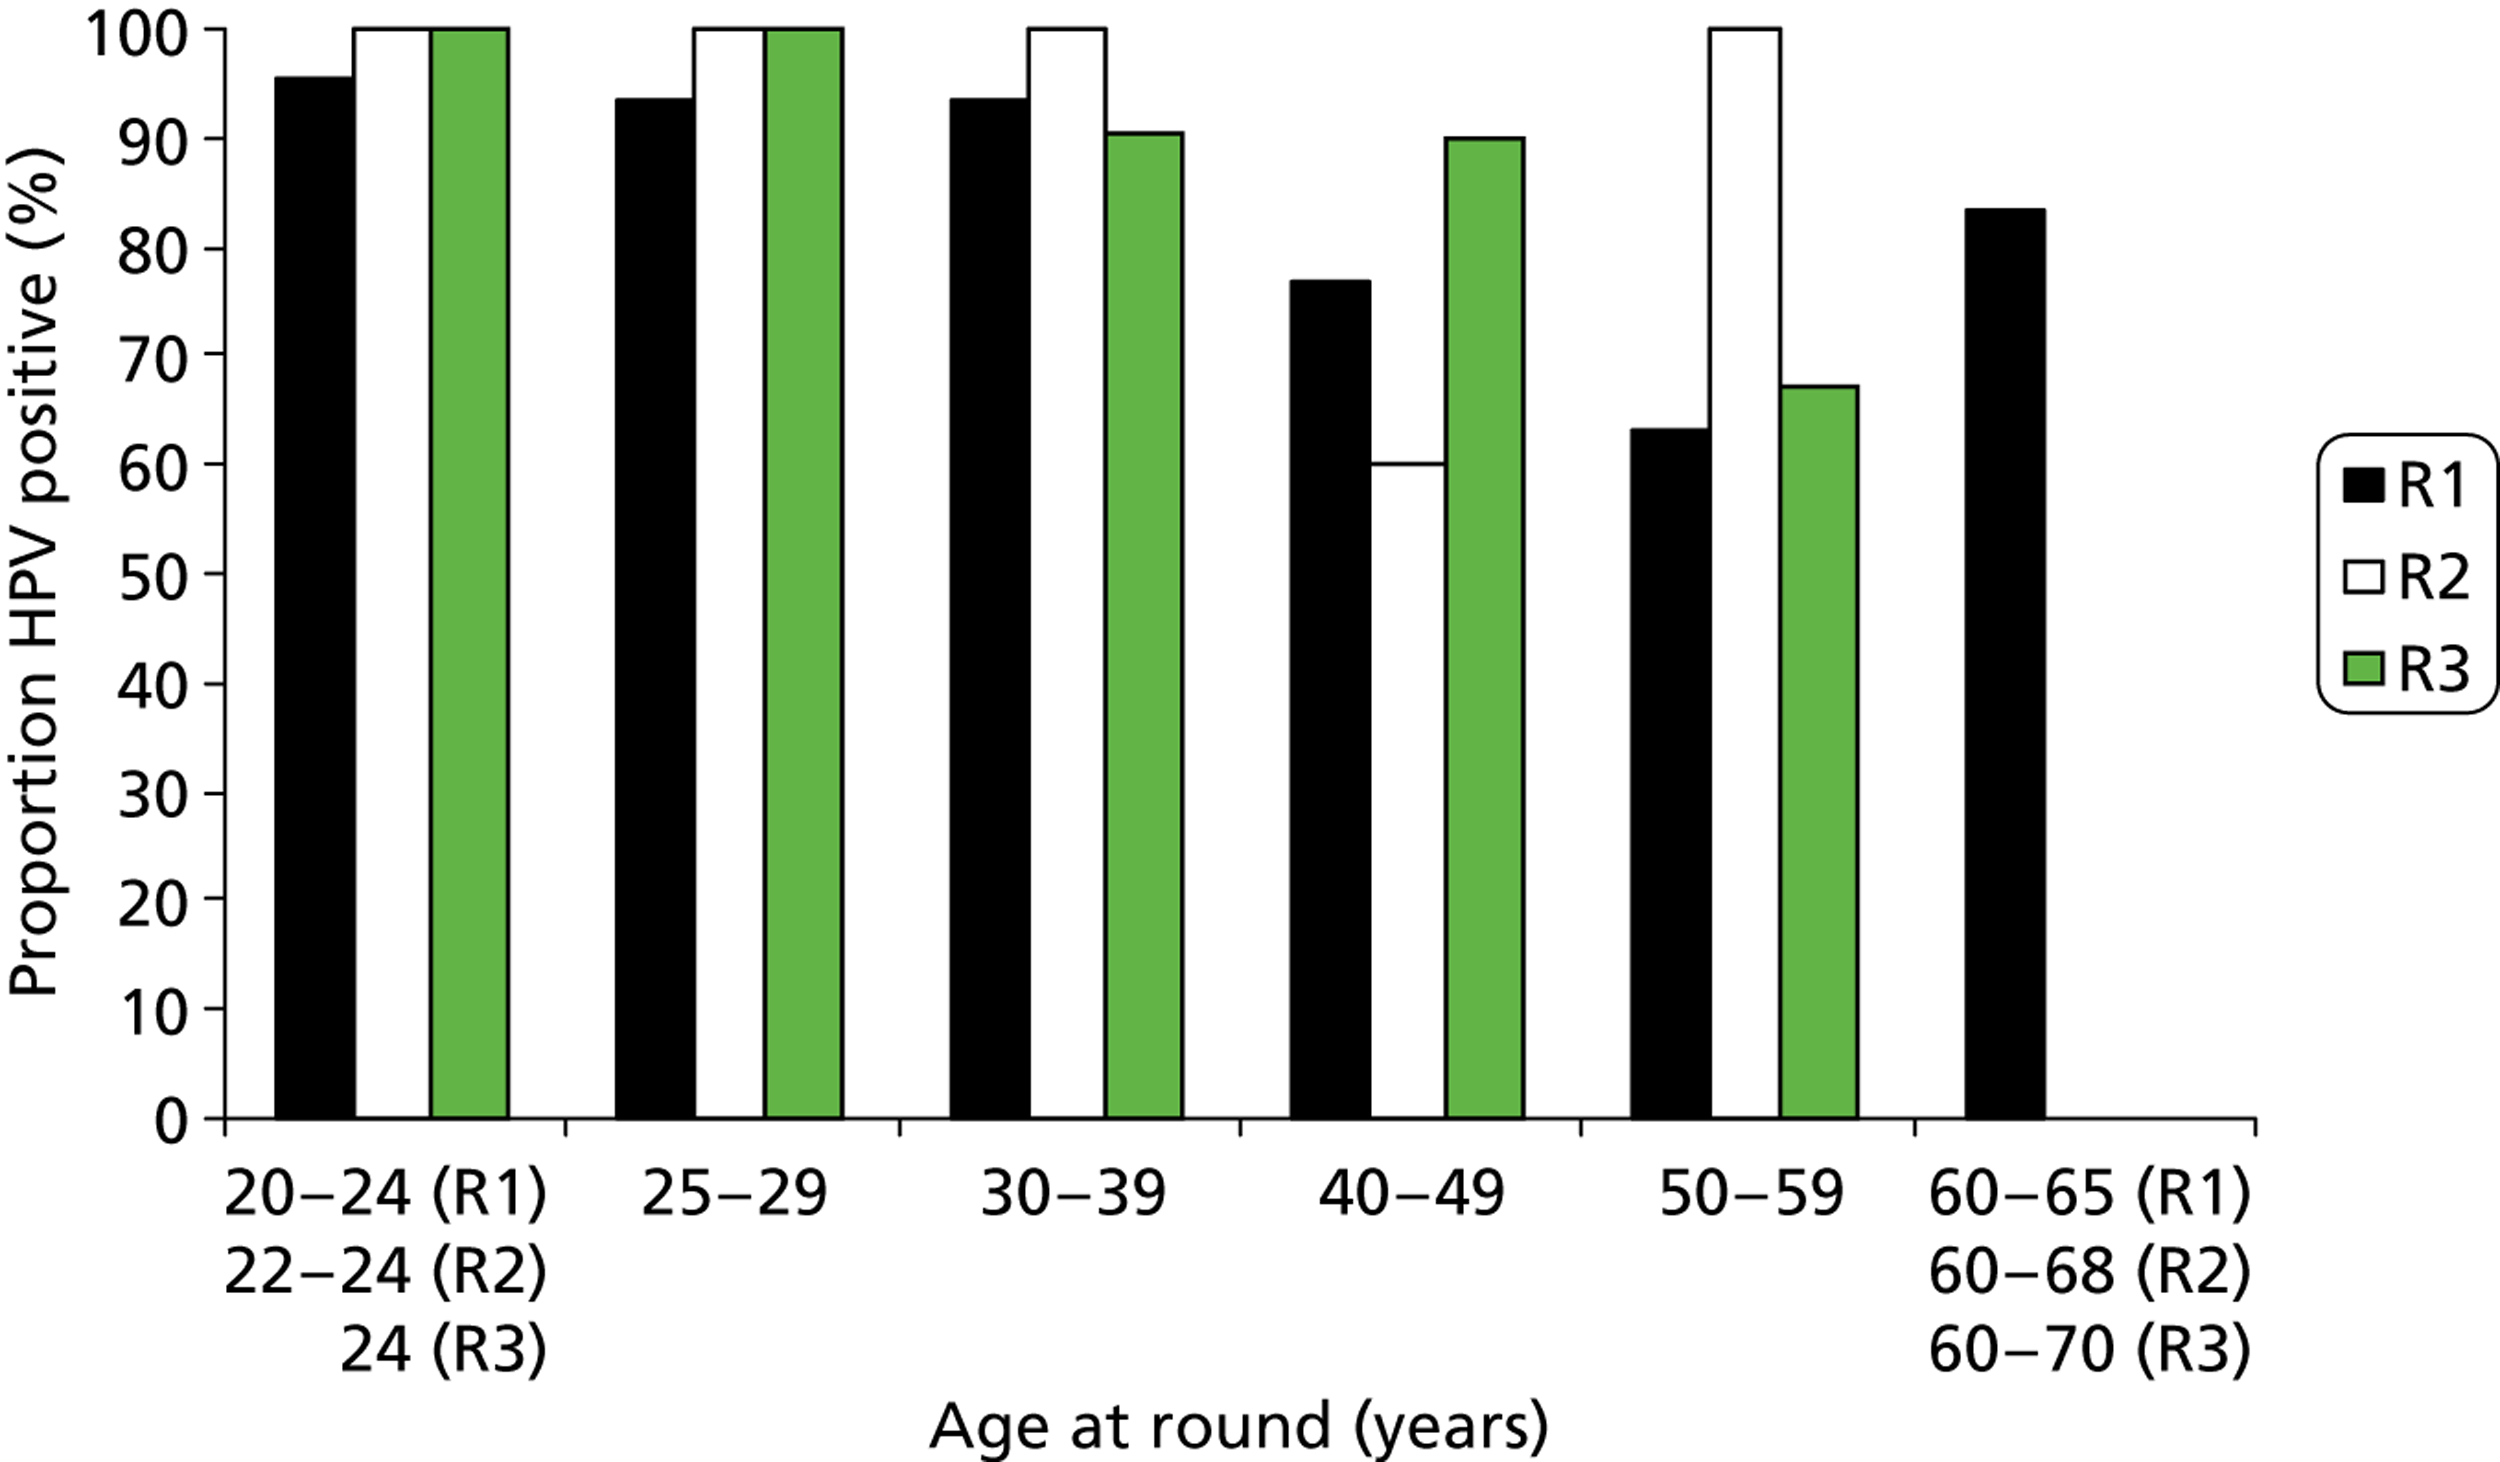
As has been found elsewhere, the proportion of HPV-positive women overall fell rapidly with age. This is most obvious in women with normal cytology, where HPV prevalence decreased from around 25% in those under 25 years to around 5% in those over 50 years; this remained relatively unchanged over the rounds. There was also a marked fall in the HPV positivity rate by age among women with abnormal cytology in round 1. In rounds 2 and 3, the proportion of women with cytological abnormalities was much lower and the data by age became sparse.
The numerical data (see Tables 62–71 in Appendix 8) allow an indication of primary screening with HPV triaged with cytology to be shown over repeated rounds of screening. The round 1 data are broadly representative of what would happen in routine population-based screening, and rounds 2 and 3 reflect the impact of the detection of disease in the first (prevalent) round.
Patterns of any lesion of CIN2+ over three rounds of screening
The impact of screening in the initial (prevalence) round is shown in Table 7, with a marked fall in the proportion of women with CIN2+ between rounds 1 and 2, but not between rounds 2 and 3. The cumulative risk of CIN2+ was 3.9% (95% CI to 3.6% to 4.3%) in the revealed arm and 3.7% (95% CI 3.2% to 4.3%) in the concealed arm. There was no significant difference between the arms [odds ratio (OR) 1.1, 95% CI 0.9 to 1.3; p > 0.1]. The corresponding figures for CIN3+ were 2.1% (95% CI 1.7% to 2.6%) in the revealed arm and 1.9% (95% CI 1.7% to 2.2%) in the concealed arm (OR: 0.9, 95% CI 0.7 to 1.2, p > 0.1).
| Round | Randomisation arm | Total, n (%) | |
|---|---|---|---|
| Concealed, n (%) | Revealed, n (%) | ||
| Round 1 (entry) | |||
| CIN2 | 53 (0.86) | 220 (1.20) | 273 (1.11) |
| CIN3+ | 81 (1.32) | 233 (1.27) | 314 (1.28) |
| CIN2+ | 134 (2.19) | 453 (2.46) | 587 (2.39) |
| Total women | 6124 | 18,386 | 24,510 |
| Round 2 | |||
| CIN2 | 18 (0.46) | 52 (0.44) | 70 (0.44) |
| CIN3+ | 17 (0.43) | 36 (0.30) | 53 (0.34) |
| CIN2+ | 35 (0.89) | 88 (0.74) | 123 (0.78) |
| Total women | 3928 | 11,862 | 15,790 |
| Round 3 | |||
| CIN2 | 7 (0.32) | 28 (0.42) | 35 (0.39) |
| CIN3+ | 8 (0.36) | 23 (0.35) | 31 (0.35) |
| CIN2+ | 15 (0.69) | 51 (0.77) | 66 (0.74) |
| Total women | 2208 | 6665 | 8873 |
| Rounds 1+ 2 | |||
| CIN2 | 71 (1.32) | 272 (1.64) | 343 (1.55) |
| CIN3+ | 98 (1.75) | 269 (1.57) | 367 (1.62) |
| CIN2+ | 169 (3.06) | 541 (3.19) | 710 (3.16) |
| Rounds 1+ 2+ 3 | |||
| CIN2 | 78 (1.64) | 300 (2.06) | 378 (1.94) |
| CIN3+ | 106 (2.11) | 292 (1.92) | 398 (1.97) |
| CIN2+ | 184 (3.72) | 592 (3.93) | 776 (3.88) |
Logistic regression analysis of abnormality rates adjusted for age and randomisation arm for HPV and cytology (also adjusting for HPV) is shown in Table 8. Both HPV and cytology showed a significant decrease between rounds 1 and 2. HPV was significantly more prevalent in round 3 than in round 2.
| Screening round | Adjusteda OR | 95% CIs |
|---|---|---|
| HC2+ve (adjusted for age and arm) | ||
| 1 | 1.00 | |
| 2 | 0.73 | (0.68 to 0.78) |
| 3 | 0.87 | (0.81 to 0.95) |
| Borderline/mild cytologyb (adjusted for age, HPV and arm) | ||
| 1 | 1.00 | |
| 2 | 0.45 | (0.40 to 0.49) |
| 3 | 0.38 | (0.34 to 0.43) |
| Moderate+ cytology (adjusted for age, HPV and arm) | ||
| 1 | 1.00 | |
| 2 | 0.32 | (0.23 to 0.42) |
| 3 | 0.42 | (0.31 to 0.58) |
Those who had negative cytology but were HPV positive at entry continued to develop CIN2+ at a higher rate than the overall proportion of CIN2+ in round 1, and at a higher rate than women with abnormal cytology who were HPV negative (Table 9).
| Cytology | Concealed arm | Revealed arm | ||||
|---|---|---|---|---|---|---|
| HPV–ve | HPV+ve | Subtotal | HPV–ve | HPV+ve | Subtotal | |
| Round 1 | ||||||
| Normal | 0/4787 (–) | 1/551 (0.18) | 1/5338 (0.02) | 0/14,367 (–) | 32/1675 (1.91) | 32/16,042 (0.20) |
| Abnormal | 7/384 (1.82) | 126/402 (31.34) | 133/786 (16.92) | 29/1159 (2.50) | 392/1185 (33.08) | 421/2344 (17.96) |
| Total | 7/5171 (0.14) | 127/953 (13.33) | 134/6124 (2.19) | 29/15,526 (0.19) | 424/2860 (14.83) | 453/18,386 (2.46) |
| Round 2 | ||||||
| Normal | 7/3124 (0.22) | 13/331 (3.93) | 20/3455 (0.58) | 25/9471 (0.26) | 36/1004 (3.59) | 61/10,475 (0.58) |
| Abnormal | 1/284 (0.35) | 14/189 (7.41) | 15/473 (3.17) | 4/841 (0.48) | 23/546 (4.21) | 27/1387 (1.95) |
| Total | 8/3408 (0.23) | 27/520 (5.19) | 35/3928 (0.89) | 29/10,312 (0.28) | 59/1550 (3.81) | 88/11,862 (0.74) |
| Round 3 | ||||||
| Normal | 4/1745 (0.23) | 8/207 (3.86) | 12/1952 (0.61) | 25/5189 (0.48) | 16/660 (2.42) | 41/5847 (0.70) |
| Abnormal | 1/148 (0.68) | 2/108 (1.85) | 3/256 (1.17) | 2/472 (0.42) | 8/346 (2.31) | 10/818 (1.22) |
| Total | 5/1893 (0.26) | 10/315 (3.17) | 15/2208 (0.68) | 27/5659 (0.48) | 24/1006 (2.39) | 51/6665 (0.77) |
CIN2+ detected in rounds 1, 2 and 3 according to HPV status and cytology grade in the corresponding round is shown in Table 9. Although the numbers are smaller, the relationship between HPV, cytology and CIN2+ remain essentially the same when compared with the round 1 data. Around 20–30% of women with abnormal cytology who are HPV positive had CIN2+ detected in each of the rounds.
The abnormality rates in the concealed arm in terms of histopathology, cytology and HPV detection over the three rounds are shown in Table 10. Largely similar falls proportionately were seen with CIN2+ rates and high-grade cytology and low-grade cytology, all of which reflect to some extent treatment of detected disease and the reduced prevalence of disease in serial rounds of screening. The rate of HPV infection also fell reflecting both treatment of CIN and the ageing cohort.
| Round | Histopathology (CIN2+) | Abnormal cytology | HPV+ve rate | |
|---|---|---|---|---|
| High grade | Low grade | |||
| Round 1 | 2.19 | 1.7 | 11.1 | 15.6 |
| Round 2 | 0.89 | 0.4 | 5.0 | 9.0 |
| Round 3 | 0.69 | 0.6 | 4.0 | 10.0 |
The impact of being screened or not in round 2 on round 3 outcomes is shown in Table 11. Among the round 3 women who had not attended in round 2, the overall proportion of women with CIN2+ was 1.11% and 1.42% in the concealed and revealed arms, respectively, compared with 0.5% for both arms in round 3 women who had been screened in round 2. The same effect was seen whether HPV positive or HPV negative at entry to the study. This confirms the protective effect of regular repeated rounds of screening.
| Round 3 cytology | Concealed arm | Revealed arm | ||
|---|---|---|---|---|
| HPV–ve | HPV+ve | HPV–ve | HPV+ve | |
| Normal | ||||
| With round 2 | 2/1230 (0.16) | 5/134 (3.73) | 13/3636 (0.36) | 3/450 (0.67) |
| Without round 2 | 2/515 (0.39) | 3/73 (4.11) | 12/1551 (0.77) | 13/210 (6.19) |
| Abnormal | ||||
| With round 2 | 1/130 (0.77) | 0/84 | 1/386 (0.26) | 7/287 (2.44) |
| Without round 2 | 0/18 | 2/24 (8.33) | 1/86 (1.16) | 1/59 (1.69) |
| Total | ||||
| With round 2 | 3/1360 (0.22) | 5/218 (2.29) | 14/4022 (0.35) | 10/737 (1.36) |
| Without round 2 | 2/533 (0.38) | 5/97 (5.15) | 13/1637 (0.79) | 14/269 (5.20) |
Cumulative detection of any lesion of CIN2+ over three screening rounds according to baseline human papillomavirus test and cytology results
The cumulative risk of being diagnosed with CIN2+ over approximately 6 years is shown in Tables 12–16. The cumulative rate of CIN2+ was 0.67% (95% CI 0.51% to 0.87%) for women who were both cytology negative and HPV negative at baseline compared with 37.4% (95% CI 34.91% to 40.04%) for women who were cytology positive/HPV positive (see Table 14). The cumulative risk in the HPV-positive group [20.12% (95% CI 18.68% to 21.61%)] is identical to that in the abnormal cytology group [20.12% (95% CI 19.04% to 22.08%)]. This reinforces the relative similarity in sensitivity between LBC and HPV testing already reported in the ARTISTIC study. 1 There is, however, a significantly lower cumulative risk (p = 0.0002) of developing a CIN2+ lesion following a negative HPV test [0.87% (95% CI 0.70% to 1.06%)] compared with a negative cytology result [1.41% (95% CI 1.19% to 1.65%)] (see Table 14).
| Cytology | HPV | Round 1, CIN2+/n (%) | Round 2, CIN2+/n (%) | Round 3, CIN2+/n (%) | Cumulative CIN2+ rate,14 % (95% CI) |
|---|---|---|---|---|---|
| Normal | − | 0/19,154 | 32/12,595 (0.25) | 29/6932 (0.42) | 0.67 (0.51 to 0.87) |
| Abnormal | − | 36/1543 | 5/1125 (0.44) | 3/620 (0.48) | 3.24 (2.32 to 4.38) |
| Normal | + | 33/2226 (1.48) | 49/1335 (3.67) | 24/867 (2.77) | 7.73 (6.29 to 9.36) |
| Abnormal | + | 518/1587 (32.64) | 37/735 (5.03) | 10/454 (2.20) | 37.44 (34.91 to 40.04) |
| All women | 587/24,510 (2.39) | 123/15,790 (0.78) | 66/8873 (0.74) | 3.88 (3.59 to 4.17) | |
| Cytology | HPV | Round 1, CIN3+/n (%) | Round 2, CIN3+/n (%) | Round 3, CIN3+/n (%) | Cumulative CIN3+ rate,14 % (95% CI) |
|---|---|---|---|---|---|
| Normal | − | 0/19,154 | 11/12,595 (0.09) | 10/6932 (0.14) | 0.23 (0.14 to 0.36) |
| Abnormal | − | 9/1543 (0.58) | 1/1125 (0.09) | 1/620 (0.16) | 0.83 (0.40 to 1.52) |
| Normal | + | 11/2226 (0.49) | 25/1335 (1.87) | 15/867 (1.73) | 4.05 (2.98 to 5.36) |
| Abnormal | + | 294/1587 (18.53) | 16/735 (2.18) | 5/454 (1.10) | 21.18 (19.03 to 23.45) |
| All women | 314/24,510 (1.28) | 53/15,790 (0.33) | 31/8873 (0.35) | 1.96 (1.76 to 2.17) | |
| Round 1, CIN2+/n (%) | Round 2, CIN2+/n (%) | Round 3, CIN2+/n (%) | Cumulative CIN2+ rate,14 % (95% CI) | |
|---|---|---|---|---|
| Cytology | ||||
| Normal | 33/21,380 (0.15) | 81/13,930 (0.58) | 53/7799 (0.68) | 1.41 (1.19 to 1.65) |
| Abnormal | 554/3130 (17.70) | 42/1860 (2.26) | 13/1074 (1.21) | 20.53 (19.04 to 22.08) |
| HPV | ||||
| − | 36/20,697 (0.17) | 37/13,720 (0.27) | 32/7552 (0.42) | 0.87 (0.70 to 1.06) |
| + | 551/3813 (14.45) | 86/2070 (4.15) | 34/1321 (2.57) | 20.12 (18.68 to 21.61) |
| Round 1, CIN3+/n (%) | Round 2, CIN3+/n (%) | Round 3, CIN3+/n (%) | Cumulative CIN3+ rate,14 % (95% CI) | |
|---|---|---|---|---|
| Cytology | ||||
| Normal | 11/21,380 (0.05) | 36/13,930 (0.26) | 25/7799 (0.32) | 0.63 (0.48 to 0.80) |
| Abnormal | 303/3130 (9.68) | 17/1860 (0.91) | 6/1074 (0.56) | 11.01 (9.87 to 12.23) |
| HPV | ||||
| − | 9/20,697 (0.04) | 12/13,720 (0.09) | 11/7552 (0.15) | 0.28 (0.18 to 0.40) |
| + | 305/3813 (8.00) | 41/2070 (1.98) | 20/1321 (1.51) | 11.19 (10.05 to 12.40) |
| Age group (years) | HPV | Round 1, CIN2+/n (%) | Round 2, CIN2+/n (%) | Round 3, CIN2+/n (%) | Cumulative CIN2+ rate,14 % (95% CI) |
|---|---|---|---|---|---|
| 20–34 | − | 19/6439 (0.30) | 25/3633 (0.69) | 24/2900 (0.83) | 1.80 (1.39 to 2.30) |
| 35–49 | − | 14/9032 (0.16) | 8/6338 (0.13) | 8/3953 (0.20) | 0.48 (0.31 to 0.72) |
| 50–64 | − | 3/5226 (0.06) | 4/3749 (0.11) | 0/699 | 0.16 (0.07 to 0.34) |
| 20–34 | + | 408/2437 (16.74) | 71/1238 (5.74) | 27/872 (3.10) | 23.95 (22.03 to 25.94) |
| 35–49 | + | 127/1010 (12.57) | 14/601 (2.33) | 6/390 (1.54) | 15.92 (13.53 to 18.55) |
| 50–64 | + | 16/366 (4.37) | 1/231 (0.43) | 1/59 (1.69) | 6.40 (3.12 to 11.47) |
An important group is women who were HPV positive/cytology negative at entry. This group had a cumulative CIN2+ rate over 6 years of 7.73% (CI 6.39% to 9.36%), significantly higher than that of those with abnormal cytology/HPV negative at entry at 3.24% (CI 2.32% to 4.38%) and twice that of the screened population overall (3.9%). It is quite clear that the risk to these women persists, presumably due to the proportion who develop long-standing persistent infection.
Table 16 shows cumulative CIN2+ rates over three rounds by both HPV status and age. Within the three age bands of 20–34, 35–49 and 50–64 at entry, there was a 13-, 33- and 40-fold difference, respectively, between women who were HPV positive and those who were HPV negative at entry. Women who were HPV positive and aged between 20–34 years at entry had a cumulative CIN2+ rate of 23.95%, whereas women who were HPV negative and aged 50–64 years at entry had a cumulative rate of only 0.16%.
The impact of human papillomavirus genotyping on screening outcomes
The influence of HPV genotype can also be examined. Tables 17 and 18 show CIN2+ and CIN3+ cumulative rates, respectively, according to the following groupings: HPV 16 alone, HPV 16/18, HPV 31/33/45/52/58 or other HR types. Compared with a baseline HPV-negative test, HPV 16/18, HPV 31/33/45/52/58 and other HR types generated a 44-, 29- and 8-fold rate of CIN2+, respectively, over three rounds. There was a significant difference between 16/18 and 31/33/45/52/58 and both were significantly greater than other HR types (all p < 0.0001). HPV 16/18 was associated with a significantly greater cumulative rate of CIN3+ compared with 31/33/45/52/58 and both groups were significantly greater than other HR types (all p < 0.0001). Compared with HPV negative at baseline the CIN3+ rates over three rounds were 92-, 40- and 10-fold for HPV 16/18, 31/33/45/52/58 and other HR types, respectively.
| HPV type at round 1 | Round 1, CIN2+/n (%) | Round 2, CIN2+/n (%) | Round 3, CIN2+/n (%) | Cumulative CIN2+ rate,14 % (95% CI) |
|---|---|---|---|---|
| Negative | 36/20,697 (0.17) | 37/13,720 (0.27) | 32/7552 (0.42) | 0.87 (0.70 to 1.06) |
| 16 | 287/827 (34.70) | 33/339 (9.73) | 9/213 (4.23) | 43.55 (39.75 to 47.45) |
| 16/18 | 331/1098 (30.15) | 38/487 (7.80) | 14/312 (4.49) | 38.49 (34.25 to 41.81) |
| 31/33/45/52/58 | 152/895 (16.98) | 24/480 (5.00) | 12/338 (3.55) | 23.93 (20.82 to 27.26) |
| Other | 68/1820 (3.74) | 24/1103 (2.18) | 8/671 (1.19) | 6.95 (5.61 to 8.50) |
| HPV at round 1 | Round 1, CIN3+/n (%) | Round 2, CIN3+/n (%) | Round 3, CIN3+/n (%) | Cumulative CIN3+ rate,14 % (95% CI) |
|---|---|---|---|---|
| Negative | 9/20,697 (0.04) | 12/13,720 (0.09) | 11/7552 (0.15) | 0.28 (0.18 to 0.40) |
| 16 | 191/827 (23.10) | 20/339 (5.90) | 8/213 (3.76) | 30.35 (26.70 to 34.24) |
| 16/18 | 213/1098 (19.40) | 23/487 (4.72) | 11/312 (3.53) | 25.91 (22.90 to 29.09) |
| 31/33/45/52/58 | 67/895 (7.49) | 11/480 (2.29) | 4/338 (1.18) | 10.68 (8.46 to 13.23) |
| Other | 25/1820 (1.37) | 7/1103 (0.63) | 5/671 (0.75) | 2.73 (1.86 to 3.85) |
Because of the difficulty in assigning a lesion to a specific HPV genotype in the presence of multiple types, we chose to assign a multiple type lesion to the individual type highest in a hierarchy based on single type associated lesions in round 1. These data are shown in Appendix 8 (see Tables 62–64).
The CIN2+ and CIN3+ rates by HPV results in rounds 2 and 3 are shown in Table 19 in relation to HPV result at entry, thus estimating rates in new and persistent infection. In round 2 there was a greater than threefold difference in CIN2+ rate between those with ‘new’ HPV infection and those with persistent HPV (6.21% vs. 21.01%, respectively). In round 3, this difference was almost twofold (7.91% vs. 14.74%). In both rounds, the CIN2+ rate was similar for women with new HPV infection. There is a similar pattern for CIN3+ rate, although the numbers are small.
| HPV R1 | Round 1 (R1) | Round 2 (R2) | Round 3 (R3) | ||||||||
|---|---|---|---|---|---|---|---|---|---|---|---|
| n | CIN2+ (CIN3+) | % (%) | HPV R2 vs. R1 | n | CIN2+ (CIN3+) | % (%) | HPV R3 vs. R1 | n | CIN2+ (CIN3+) | % (%) | |
| − | 20,697 | 36 (9) | 0.17 (0.04) | ||||||||
| − | 11,770 | 2 (0) | 0.02 | − | 6590 | 4 (0) | 0.06 | ||||
| + | 740 | 30 (10) | 4.05 (1.35) | + | 582 | 27 (10) | 4.64 (1.72) | ||||
| + | 3813 | 551 (305) | 14.45 (8.00) | ||||||||
| − | 1194 | 7 (2) | 0.59 (0.17) | − | 947 | 1 (1) | 0.11 (0.11) | ||||
| + (newa) | 290 | 18 (5) | 6.21 (1.72) | + (newa) | 215 | 17 (11) | 7.91 (5.12) | ||||
| + (persistentb) | 238 | 50 (32) | 21.01 (13.45) | + (persistentb) | 95 | 14 (7) | 14.74 (7.37) | ||||
Tables 20 and 21 indicate the difference in detection of type-specific CIN2+ and CIN3+, respectively, among women who had either a newly acquired HPV infection or persistent HPV infection by genotype. As expected, there is a far higher proportion with disease among women with persistent infection than newly acquired infection. Types 16/18 and 31/33/45/52/58 conferred a higher risk than other HR types grouped together.
| HPV R1 | Round 1 (R1) | Round 2 (R2) | Round 3 (R3) | ||||||||
|---|---|---|---|---|---|---|---|---|---|---|---|
| n | CIN2+ | % | HPV R2 vs. R1 | n | CIN2+ | % | HPV R3 vs. R1 | n | CIN2+ | % | |
| HC2– | 20,697 | 36 | 0.17 | ||||||||
| − | 11,770 | 2 | 0.02 | − | 6590 | 4 | 0.06 | ||||
| + (newa) | 740 | 30 | 4.05 | + (newa) | 582 | 27 | 4.64 | ||||
| 16/18 | 1098 | 331 | 30.15 | ||||||||
| − | 211 | 0 | − | 193 | 0 | ||||||
| + (newa) | 76 | 6 | 7.89 | + (newa) | 58 | 4 | 6.90 | ||||
| + (persistentb) | 108 | 29 | 26.85 | + (persistentb) | 46 | 9 | 19.57 | ||||
| 31/33/45/52/58 | 895 | 152 | 16.98 | ||||||||
| − | 237 | 3 | 1.27 | − | 234 | 0 | |||||
| + (newa) | 66 | 2 | 3.03 | + (newa) | 53 | 6 | 11.32 | ||||
| + (persistentb) | 90 | 15 | 16.67 | + (persistentb) | 37 | 5 | 13.51 | ||||
| Other or no HPV | 1820 | 68 | 3.74 | ||||||||
| − | 746 | 4 | 0.54 | − | 520 | 1 | 0.19 | ||||
| + (newa) | 148 | 10 | 6.76 | + (newa) | 104 | 7 | 6.73 | ||||
| + (persistentb) | 40 | 6 | 15.00 | + (persistentb) | 12 | 0 | |||||
| HPV R1 | Round 1 (R1) | Round 2 (R2) | Round 3 (R3) | ||||||||
|---|---|---|---|---|---|---|---|---|---|---|---|
| n | CIN3+ | % | HPV R2 vs. R1 | n | CIN3+ | % | HPV R3 vs. R1 | n | CIN3+ | % | |
| HC2– | 20,697 | 9 | 0.04 | ||||||||
| − | 11,770 | 0 | − | 6590 | 0 | ||||||
| + (newa) | 740 | 10 | 1.35 | + (newa) | 582 | 10 | 1.72 | ||||
| 16/18 | 1098 | 213 | 19.40 | ||||||||
| − | 211 | 0 | − | 193 | 0 | ||||||
| + (newa) | 76 | 2 | 2.63 | + (newa) | 58 | 3 | 5.17 | ||||
| + (persistentb) | 108 | 20 | 18.52 | + (persistentb) | 46 | 7 | 15.22 | ||||
| 31/33/45/52/58 | 895 | 67 | 7.49 | ||||||||
| − | 237 | 1 | 0.42 | − | 234 | 0 | |||||
| + (newa) | 66 | 0 | + (newa) | 53 | 4 | 7.55 | |||||
| + (persistentb) | 90 | 10 | 11.11 | + (persistentb) | 37 | 0 | |||||
| Other or no HPV | 1820 | 25 | 1.37 | ||||||||
| − | 746 | 1 | 0.13 | − | 520 | 1 | 0.19 | ||||
| + (newa) | 148 | 3 | 2.03 | + (newa) | 104 | 4 | 3.85 | ||||
| + (persistentb) | 40 | 2 | 5.00 | + (persistentb) | 12 | 0 | |||||
If screening were based on HPV testing with cytology triage, those women with negative cytology could be further triaged by HPV genotyping for the purpose of immediate colposcopy referral. The data in Table 20 show that in round 1, the proportion of CIN2+ and CIN3+ associated with types 16/18 are 56% and 68%, respectively. Table 21 shows that among screened women ≥ 25 years, this would require an additional 1.4% (310 out of 21910) of the population to be referred on top of the 4.9% (1074 out of 21910) referred for borderline+ cytology. Referral based on a more inclusive subset of types including 16/18/31/33/45/52/58, for example, could lead to the detection of 82.3% of CIN2+ and 89.2% of CIN3+. This would, however, necessitate a further 1.8% (347 out of 21910) of the screened population to be referred for colposcopy. (See Tables 23 and 24 for corresponding tables for all women in ARTISTIC.)
Influence of different relative light unit/mean control cut-offs in proportions of women with any lesion of CIN2+
Published data from ARTISTIC6 have indicated that a HC2 cut-off of 2 rather than 1 RLU/Co achieves a beneficial balance in clinical utility between achieving sensitivity and reducing referral to colposcopy. The impact of this over three rounds is shown below (Table 22). The projected differential rates of colposcopy referral and resulting PPVs for HC2-positive women referred with reflex cytology showing any abnormalities when different cut-offs of HC2 are shown in Table 22. The cut-off of ≥ 1 RLU/Co represents the manufacturer’s recommendation, and the cut-off of ≥ 2.0 represents a clinically more relevant cut-off based on previously published ARTISTIC data. Essentially, over three rounds there would have been 101 fewer colposcopies (6.2%), with only four (1.5%) fewer CIN3+ and 15 (3.1%) fewer CIN2+ lesions being detected.
| Round | ≥ 1.0 RLU/Co | ≥ 2.0 RLU/Co | ||||
|---|---|---|---|---|---|---|
| Borderline+/no. screened | No. lesions/no. colposcoped (PPV) | Borderline+/no. screened | No. lesions/no. colposcoped (PPV) | |||
| Cytology (%) | CIN3+ (%) | CIN2+ (%) | Cytology (%) | CIN3+ (%) | CIN2+ (%) | |
| Round 1 | 1074/21,910 (4.9) | 217/1074 (20.2) | 374/1074 (34.8) | 1004/21,910 (4.6) | 215/1004 (21.4) | 363/1004 (36.6) |
| Round 2 | 293/13,814 (2.1) | 35/293 (11.9) | 68/293 (23.2) | 277/13,814 (2.0) | 35/277 (12.6) | 67/277 (24.2) |
| Round 3 | 244/8414 (2.9) | 27/244 (11.1) | 54/244 (22.1) | 229/8414 (2.7) | 25/229 (10.9) | 51/229 (22.3) |
| Total | 1611/44,138 (3.6) | 279/1611 (17.3) | 496/1611 (30.8) | 1510/44,138 (3.4) | 275/1510 (18.2) | 485/1510 (32.1) |
Table 23 shows CIN2+ detection respectively by age, cytology and HPV status (RLU/Co ≥ 1 and RLU/Co ≥ 2). Among women with abnormal cytology who were HPV positive, the proportion with CIN2+ was fairly consistent between rounds in each age range. In round 1, 37% of HPV-positive women aged between 25 and 34 years with abnormal cytology had CIN2+ detected, indicating that a policy of restricting colposcopy referral to those women of 35 years or over would not be relevant to our screened population. The data shown in the tables are for both arms of the trial combined; however, in the revealed arm the CIN2+ rate in HPV-positive women with normal cytology was 2.0% (11 out of 564), 1.4% (7 out of 501) and 0.9% (2 out of 217) for age groups 25–34, 35–49 and 50+ years, respectively, in round 1. Table 24 shows similar data for CIN3+.
| Age at round (years) | Normal cytology | Abnormal cytology | ||||||
|---|---|---|---|---|---|---|---|---|
| ≥ 1.0 RLU/Co | ≥ 2.0 RLU/Co | ≥ 1.0 RLU/Co | ≥ 2.0 RLU/Co | |||||
| HPV−ve | HPV+ve | HPV−ve | HPV+ve | HPV−ve | HPV+ve | HPV−ve | HPV+ve | |
| Round 1 | ||||||||
| 25–34 | 0/4481 | 11/747 (1.5) | 0/4616 | 11/612 (1.8) | 11/394 (2.8) | 241/654 (36.9) | 15/423 (3.5) | 237/625 (37.9) |
| 35–49 | 0/8298 | 8/650 (1.2) | 2/8482 (0.02) | 6/466 (1.3) | 14/734 (1.9) | 119/360 (33.1) | 17/768 (2.2) | 116/326 (35.6) |
| ≥ 50 | 0/4951 | 2/306 (0.7) | 1/5078 (0.02) | 1/179 (0.6) | 3/275 (1.1) | 14/60 (23.3) | 3/282 (1.1) | 14/53 (26.4) |
| Round 2 | ||||||||
| 25–34 | 0/1890 | 11/308 (3.6) | 3/1955 (0.2) | 8/243 (3.3) | 2/66 (3.0) | 45/163 (27.6) | 2/75 (2.7) | 45/154 (29.2) |
| 35–49 | 1/5909 (0.02) | 3/355 (0.8) | 2/6002 (0.03) | 2/262 (0.8) | 5/175 (2.9) | 20/101 (19.8) | 5/180 (2.8) | 20/96 (20.8) |
| ≥ 50 | 0/4582 | 1/173 (0.6) | 1/4639 (0.02) | 0/116 | 0/63 | 3/29 (10.3) | 1/65 (1.5) | 2/27 (7.4) |
| Round 3 | ||||||||
| 25–34 | 1/1354 (0.1) | 1/255 (0.4) | 1/1385 (0.1) | 1/194 (0.5) | 0/29 | 28/109 (25.7) | 1/35 (2.9) | 27/103 (26.2) |
| 35–49 | 1/4346 (0.02) | 0/321 | 1/4424 (0.02) | 0/243 | 3/84 (3.6) | 23/120 (19.2) | 5/92 (5.4) | 21/112 (18.8) |
| ≥ 50 | 0/1689 | 1/97 (1.0) | 0/1712 | 1/74 (1.4) | 0/25 | 3/15 (20) | 0/26 | 3/14 (21.4) |
| Age at round (years) | Normal cytology | Abnormal cytology | ||||||
|---|---|---|---|---|---|---|---|---|
| ≥ 1.0 RLU/Co | ≥ 2.0 RLU/Co | ≥ 1.0 RLU/Co | ≥ 2.0 RLU/Co | |||||
| HPV−ve | HPV+ve | HPV−ve | HPV+ve | HPV−ve | HPV+ve | HPV−ve | HPV+ve | |
| Round 1 | ||||||||
| 25–34 | 0/4481 | 2/747 (0.3) | 0/4616 | 2/612 (0.3) | 3/394 (0.8) | 138/654 (21.1) | 5/423 (1.2) | 136/625 (21.8) |
| 35–49 | 0/8298 | 4/650 (0.6) | 0/8482 | 4/466 (0.9) | 4/734 (0.5) | 70/360 (19.4) | 4/768 (0.5) | 70/326 (21.5) |
| ≥ 50 | 0/4951 | 0/306 | 0/5078 | 0/179 | 0/275 | 9/60 (15.0) | 0/282 | 9/53 (17.0) |
| Round 2 | ||||||||
| 25–34 | 0/1890 | 5/308 (1.6) | 2/1955 (0.1) | 3/243 (1.2) | 0/66 | 22/163 (13.5) | 0/75 | 22/154 (14.3) |
| 35–49 | 0/5909 | 1/355 (0.3) | 0/6002 | 1/262 (0.4) | 2/175 (1.1) | 12/101 (11.9) | 2/180 (1.1) | 12/96 (12.5) |
| ≥ 50 | 0/4582 | 0/173 | 0/4639 | 0/116 | 0/63 | 1/29 (3.4) | 0/65 | 1/27 (3.7) |
| Round 3 | ||||||||
| 25–34 | 0/1354 | 0/255 | 0/1385 | 0/194 | 0/29 | 16/109 (14.7) | 0/35 | 16/103 (15.5) |
| 35–49 | 0/4346 | 0/321 | 0/4424 | 0/243 | 1/84 (1.25) | 9/120 (7.5) | 3/92 (3.3) | 7/112 (6.3) |
| ≥ 50 | 0/1689 | 0/97 | 0/1712 | 0/74 | 0/25 | 2/15 (13.3) | 0/26 | 2/14 (14.3) |
What these data do not reflect precisely is what would have happened had these two cut-offs been used prospectively as a triage. A RLU/Co of 1 was used in ARTISTIC round 3 to define HPV positive for the purpose of colposcopy triage. In rounds 1 and 2, colposcopy was offered to women with normal cytology who were persistently HPV positive at 12–24 months. Otherwise, in rounds 1 and 2, HPV status did not affect referral to colposcopy. In round 3, HPV triage was used with a RLU/Co of 1 to refer women with low-grade cytological abnormality to colposcopy. A RLU/Co of 2 was used for women in the NHSCSP Sentinel Sites who were not in the ARTISTIC trial. This threshold of RLU/Co 2 was used based on published ARTISTIC data showing that it provided a beneficial balance between sensitivity and PPV.
The overall HPV-positive proportions for three rounds using RLU/Co 1 and 2 are shown in Table 25, and Table 26 shows the corresponding CIN2+ rates by HPV status. A RLU/Co of 2 would result in an absolute reduction in HPV positive of around 1.5–2.5% per round and a relative reduction in HPV-positive women of 15–20%. The number of HPV-positive CIN2+ cases if the cut-off were increased from 1 to 2 would be reduced by only 2.4% (14 out of 587) in round 1 and 5.3% (9 out of 170) in rounds 2 and 3 combined.
| Round | HPV+ve (RLU/Co ≥ 1) | HPV+ve (RLU/Co ≥ 2) |
|---|---|---|
| Round 1 | 3813/24,510 (15.56) | 3200/24,510 (13.06) |
| Round 2 | 1268/14,232 (8.91) | 1029/14,232 (7.23) |
| Round 3 | 891/8428 (10.57) | 744/8428 (8.83) |
| Round | HPV+ve | HPV−ve |
|---|---|---|
| RLU/Co ≥ 1 | ||
| Round 1 | 551/3813 (14.45) | 36/20,697 (0.17) |
| Round 2 | 98/1268 (7.73) | 9/12,964 (0.07) |
| Round 3 | 58/891 (6.51) | 5/7537 (0.07) |
| RLU/Co ≥ 2 | ||
| Round 1 | 537/3200 (16.78) | 50/21,310 (0.23) |
| Round 2 | 92/1029 (8.94) | 15/13,203 (0.11) |
| Round 3 | 55/744 (7.39) | 8/7684 (0.10) |
The proportion of women with CIN2+ according to HPV RLU/Co is shown in Table 27. It can be seen that a cut-off of 2 in a given round is associated with a slightly higher PPV in all rounds, reflecting a slightly greater specificity and a slightly reduced sensitivity with a cut-off of 2. The balance in terms of clinical utility, however, is considered to be in favour of a cut-off of 2. 6 Across the three consecutive screening rounds, a change of RLU/Co of 2 from 1 would have resulted in 999 out of 5172 (16.6%) fewer HPV-positive results, with only 23 (2.28%) fewer CIN2+ lesions detected. The PPV for HPV-positive tests for detected CIN2+ would increase by around 15% in each round (see Table 26).
| Round | HPV+ve | HPV−ve |
|---|---|---|
| RLU/Co ≥ 1 | ||
| Round 1 | 551/3813 (14.45) | 36/20,697 (0.17) |
| Round 2 | 86/2070 (4.15) | 37/13,720 (0.27) |
| Round 3 | 34/1321 (2.57) | 32/7552 (0.42) |
| RLU/Co ≥ 2 | ||
| Round 1 | 537/3200 (16.78) | 50/21,310 (0.23) |
| Round 2 | 82/1679 (4.88) | 41/1411 (0.29) |
| Round 3 | 33/1114 (2.96) | 33/7759 (0.43) |
Potential impact of the national human papillomavirus vaccination programme on the incidence of disease in women in the screening age range (≥ 25 years)
Tables 28, 29 and 30 show the grades of cytological abnormality in rounds 1, 2 and 3, respectively, by HPV types with 16/18 and 31/33/45/52/58 grouped. The rationale for these groupings was that 16/18 are the HR types used in the Cervarix™ vaccine, which was used in the UK vaccination programme up until September 2012 (at which time it switched to Gardasil®, which also protects against genital warts) and reported cross-protection for Cervarix™ against types 31/33/45/52/58. 46 According to the published data, the degree of protection in women who were HPV naive prior to vaccination with Cervarix™ achieved a 98% efficacy against HPV 16/18-related CIN2+, and 68% efficacy against HPV 31/33/45/52/58-related CIN2+, and 70% against CIN2+ of any HR type. 13 Cross-protection against types 31 and 45 was reported in a recent systematic review47 to be significantly less than for Cervarix but, overall, the two vaccines are likely to provide similar levels of protection. As shown in Table 29, vaccination of young adolescents could be expected to reduce cytology-graded moderate+ by almost 70%, but borderline/mild by less than 25%. The proportion of cytological abnormalities of a given grade is relatively similar within groups of types between rounds 1, 2 and 3; therefore, the degree of protection should be similarly consistent.
| Cytological grade | −ve, n (%) | HPV 16/18, n (%) | HPV 31/33/45/52/58, n (%) | Other HC2+ve, n (%) | Total, N |
|---|---|---|---|---|---|
| Negative | 17,730 (91.2) | 310 (1.6) | 347 (1.8) | 1046 (5.4) | 19,433 |
| Borderline | 1122 (74.7) | 104 (6.9) | 111 (7.4) | 166 (11.0) | 1503 |
| Mild | 240 (38.5% | 102 (16.4) | 95 (15.2) | 186 (29.9) | 623 |
| Moderate | 33 (16.7) | 84 (42.4) | 53 (26.8) | 28 (14.1) | 198 |
| Severe+ | 8 (5.2) | 92 (60.1) | 37 (24.2) | 16 (10.5) | 153 |
| Total | 19,133 (87.3) | 692 (3.2) | 643 (2.9) | 1442 (6.6) | 21,910 |
| Cytological grade | −ve, n (%) | HPV 16/18, n (%) | HPV 31/33/45/52/58, n (%) | Other HC2+ve, n (%) | Total, N |
|---|---|---|---|---|---|
| Negative | 12,381 (93.7) | 146 (1.1) | 180 (1.4) | 510 (3.9) | 13,217 |
| Borderline | 256 (66.7) | 33 (8.6) | 31 (8.1) | 64 (16.7) | 384 |
| Mild | 43 (25.7) | 40 (24.0) | 26 (15.6) | 58 (34.7) | 167 |
| Moderate | 1 (4.0) | 9 (36.0) | 6 (24.0) | 9 (36.0) | 25 |
| Severe+ | 4 (19.0) | 12 (57.1) | 4 (19.0) | 1 (4.8) | 21 |
| Total | 12,685 (91.8) | 240 (1.7) | 247 (1.8) | 642 (4.6) | 13,814 |
| Cytological grade | −ve, n (%) | HPV 16/18, n (%) | HPV 31/33/45/52/58, n (%) | Other HC2+ve, n (%) | Total, N |
|---|---|---|---|---|---|
| Negative | 7389 (92.0) | 109 (1.4) | 109 (1.4) | 425 (5.3) | 8032 |
| Borderline | 113 (56.5) | 14 (7.0) | 22 (11.0) | 51 (25.5) | 200 |
| Mild | 21 (15.4) | 31 (22.8) | 31 (22.8) | 53 (39.0) | 136 |
| Moderate | 2 (9.5) | 9 (42.9) | 7 (33.3) | 3 (14.3) | 21 |
| Severe+ | 2 (8.0) | 10 (40.0) | 6 (24.0) | 7 (28.0) | 25 |
| Total | 7527 (89.5) | 173 (2.1) | 175 (2.1) | 539 (6.4) | 8414 |
ECONOMIC ANALYSIS VALIDATION RESULTS
Validation of detected cervical intraepithelial neoplasia
Interval-specific findings for detected CIN2+
Model outputs for the predicted histology confirmed that cases of CIN over time were compared with observed histology-confirmed CIN cases from the ARTISTIC trial. The model predicted the numbers of histology-confirmed CIN cases at 6-monthly intervals, for both the concealed and the revealed arms of the trial, by 10-year age groups. In this section we produce summarised versions of our results. (For more details of the model predictions by age group see Appendix 18.)
We began by investigating how well the model predicted histology-confirmed CIN2+. We assumed that once women had a histology result of CIN2+ they received treatment, and censored the data thereafter.
Figure 17 shows the cumulative rate of CIN2+ for both the model (solid green diamonds) and the ARTISTIC data (hollow blue squares). These cumulative rates were generated using Kaplan–Meier methods that take into account censoring after the occurrence of histology-confirmed CIN2+ or loss to follow-up. The horizontal axis shows the time since the first screening round in the trial.
FIGURE 17.
Cumulative rate of histology detected CIN2+ by time since enrolment (months), expressed as a percentage for each trial arm and each age group. The model results are shown as the solid green diamonds and the data are shown as the hollow blue squares. 95% CIs are also shown. The value ‘n = ’ in each graph represents the number of women who entered the trial in that age group and trial arm.


Figure 17 indicates that the model-predicted cumulative rate of CIN2+ at 6-monthly intervals compares very well with the ARTISTIC data in both trial arms, with most model predicted cases of cumulative CIN2+ remaining well within, or just outside of, the 95% CI for each 6-monthly observation. For women aged 40–49 years, the predicted cumulative detection of CIN2+ by 6 years is slightly higher than the 95% CI for the revealed arm; however, rates of cumulative detection in this age group for the concealed arm and in both arms for younger and older age groups (50+ years) showed adequate fit to the observed data.
Cumulative rate of CIN2+
Results for histologically confirmed low-grade disease
The model-predicted incidence of histologically confirmed low-grade cervical disease was compared with data from the ARTISTIC trial. In the ARTISTIC trial, women without CIN2+, but who still had a histological abnormality, were said to have a histology result of ‘< CIN2’. Thus, ‘< CIN2’ captured women with detected CIN1, and women with histological evidence of HPV infection. In the model we assumed that all women with a true underlying health state of CIN1 will have a histology result of ‘< CIN2’ if they have a biopsy. As women were not censored from further analysis after a ‘< CIN2’ histology, women can have ‘< CIN2’ results if subsequent biopsies are taken throughout the trial (in fact, the ARTISTIC data show that many women who have detected < CIN2 will have another biopsy within 2 years). By contrast, as mentioned previously, once a woman has a histology result of CIN2+, any subsequent results were censored.
Figure 18 shows the cumulative detected < CIN2 cases for both the model (solid green diamonds) and the ARTISTIC observed data (hollow blue squares). The cases are presented as a percentage of the starting total number of women in the corresponding trial arm and age group. Overall, the model results compared well with the ARTISTIC data throughout the trial and the number of ‘< CIN 2’ cases detected by the model compared well with the number of cases as detected in the trial. In this case, for women aged 40–49 years, the predicted cumulative detection of < CIN2 by 6 years is slightly lower than the 95% CI for the concealed arm; however, rates of cumulative detection in this age group for the revealed arm and in both arms for younger and older age groups (50+ years) showed adequate fit to the observed data.
FIGURE 18.
Cumulative ‘< CIN2’ cases by time since enrolment (months) expressed as a percentage of the total number of women who entered the trial in the corresponding trial arm and age group. The model results are shown as the solid green diamonds and the data are shown as the hollow blue squares. The value ‘n = ‘ in each graph represents the number of women who entered the trial in that age group and trial arm.


Cumulative detected CIN2+ cases
Validation of model outcomes by human papillomavirus type
Cervical intraepithelial neoplasia cases attributed to infection with human papillomavirus 16, 18 and other high-risk types
In the previous sections, model results of CIN cases were reported by aggregating over all HPV types. In this analysis each case of detected CIN was allocated with an HPV type according to HPV status at enrolment, in order to compare HPV type-specific CIN cases with those from the ARTISTIC trial. We consider three different HPV type-groups: 16, 18, and all other oncogenic HPV types. For some of the findings, results were aggregated over both trial arms for simplicity (after taking into account in the modelling the differing screening protocols in each trial arm).
Cumulative outcomes by human papillomavirus type at enrolment (baseline)
For this analysis it was assumed that the underlying HPV type of a CIN diagnosis was the HPV type detected at baseline. For the small number of HPV-negative women at enrolment with a non-negative histology result within 12 months of enrolment, the assumption was made, for the purposes of this exercise, that the baseline HPV status was positive but with a false-negative HPV test.
Summary results for all ages and across each trial arm are presented in Figure 19, which shows the cumulative incidence of CIN2+ by assumed baseline HPV type over 5 years. This representation shows that the model captures the cumulative incidence of CIN2+ by HPV type at baseline over the first 5 years of the ARTISTIC trial.
FIGURE 19.
Cumulative incidence of CIN2+ at 6-monthly intervals by HPV type status at baseline. OHR, other high risk.

Figure 20 shows incident CIN2+ in women who present as negative at baseline or HPV positive for any type. More detailed model outputs on cumulative incidence of CIN2+ by age group is shown in Figure 21, which demonstrates that the model is capturing the incidence of CIN2+ by HPV type for different age groups. The model predicted rate of CIN2+ in HPV negative women is within the 95% CI of the observed data at 5 years.
FIGURE 20.
Overall cumulative incidence of CIN2+ by HPV positivity at baseline.

FIGURE 21.
Cumulative incidence of developing CIN2+ for each age group at 6-monthly intervals by HPV type status at baseline. OHR, other high risk.


Summary of the findings of the ARTISTIC validation procedure
The purpose of simulating the ARTISTIC trial cohort was to determine whether the natural history model or the test probability matrices required recalibration. We found that the model results were in close agreement with ARTISTIC trial results. We concluded that the natural history model was accurately capturing the true underlying rate of disease progression and regression, in time steps of 6-monthly intervals and when considering the underlying HPV type. In conjunction with prior validation exercises for previously reported evaluations, this finding supported the use of the current model platform for use in a national assessment of the role of primary HPV testing in England.
Economic evaluation of primary human papillomavirus screening in England
Calibration and validation of the England-wide model under current screening practice in an unvaccinated cohort
In this section we report on the outcomes of an England-wide evaluation of primary HPV screening. The model used for this evaluation incorporated the natural history model prevalidated in other countries and then validated against the ARTISTIC data. We also modelled sexual behaviour assumptions, which were calibrated to the NATSAL II report25 using a dynamic simulation of sexual behaviour and HPV transmission. We predicted HR HPV prevalence in cytologically normal women by age in England, comparing the results to the prevalence reported in the ARTISTIC trial (in this instance using the ARTISTIC prevalence data as a proxy for all-England prevalence). 3 We also validated the model against England data for age-specific cervical cancer incidence, cervical cancer mortality, and a number of other outcomes.
The England-wide model predicted age-specific and type-specific HPV prevalence rates across the population (including those women subsequently found to have confirmed CIN) similar to those observed in the baseline round of the ARTISTIC trial3 (Figure 22).
FIGURE 22.
Overall HPV prevalence (OHR) by age as predicted by the model (blue dashed curve). We assume an age structure in England as observed in the 2011 census. 48 The HPV prevalence, as observed in ARTISTIC, is also shown with 95% CIs for the estimated prevalence at each age (ARTISTIC prevalence is used as a proxy for England-wide prevalence here). OHR, other high risk.
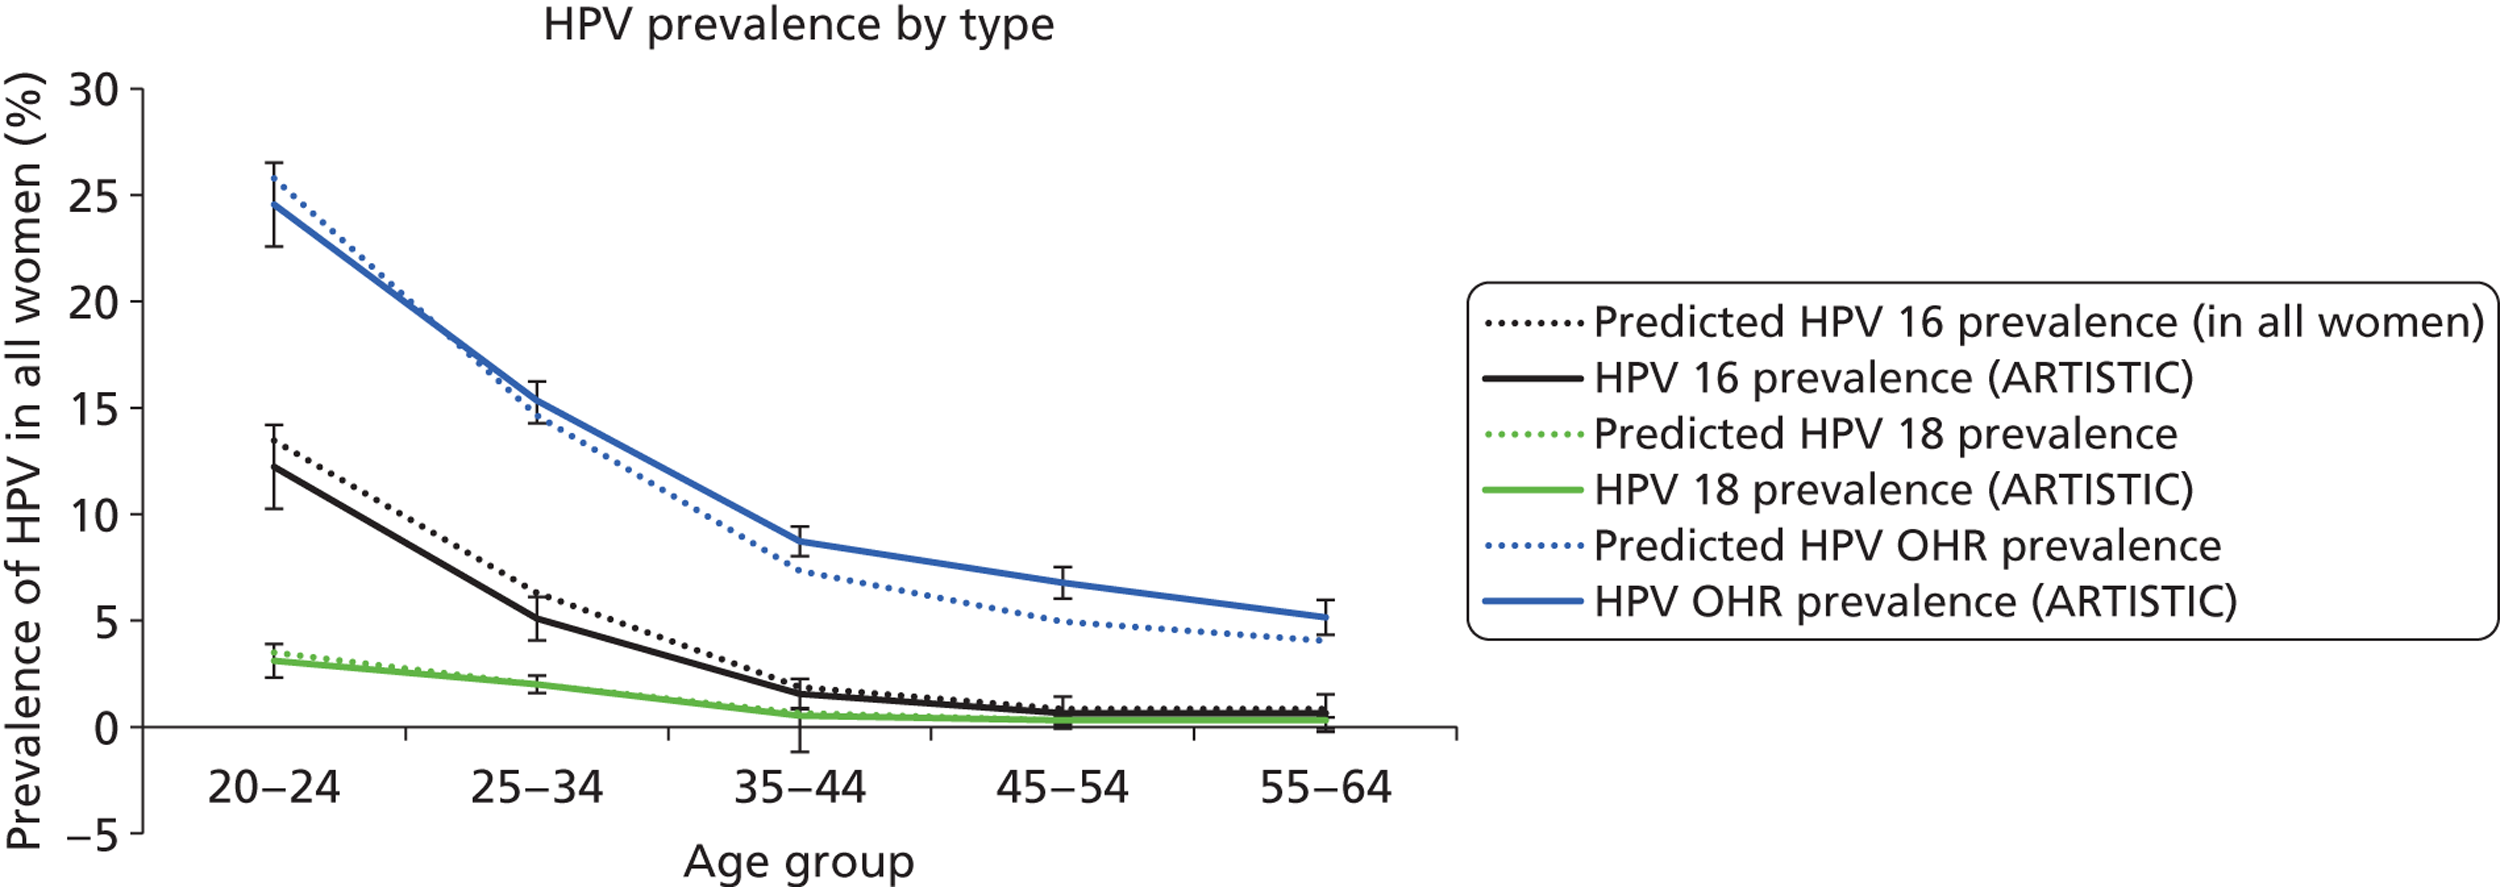
Cervical cancer incidence
The model-predicted cervical cancer incidence compares well with recent national observed cervical cancer, as shown in Figure 23. The data used for comparison are 2010 data from the Office for National Statistics. 49
The predicted age- and type-specific incidence of invasive cervical cancer shown in Table 31 indicates that 52.5% and 13% of cervical cancers are predicted to be attributable to HPV to types 16 and 18, respectively. This compares well with observed international data. 50
| HPV type | Proportion of cancers detected attributable to HPV type (%) | |
|---|---|---|
| Model predicted | Observed | |
| HPV 16 | 52.5 | 55.00 |
| HPV 18 | 12.9 | 13.00 |
| HPV OHR | 34.5 | 32.00 |
The proportion of cancers detected at each of the four FIGO stages is also shown in Figure 24, and this compares well with observed data from the West Midlands. 51
FIGURE 24.
The stage distribution of invasive cervical cancer as predicted by the model is shown as the black bars. We assume an age structure in England as observed in the 2011 census. 49 White bars show observed cancer staging from the West Midlands.
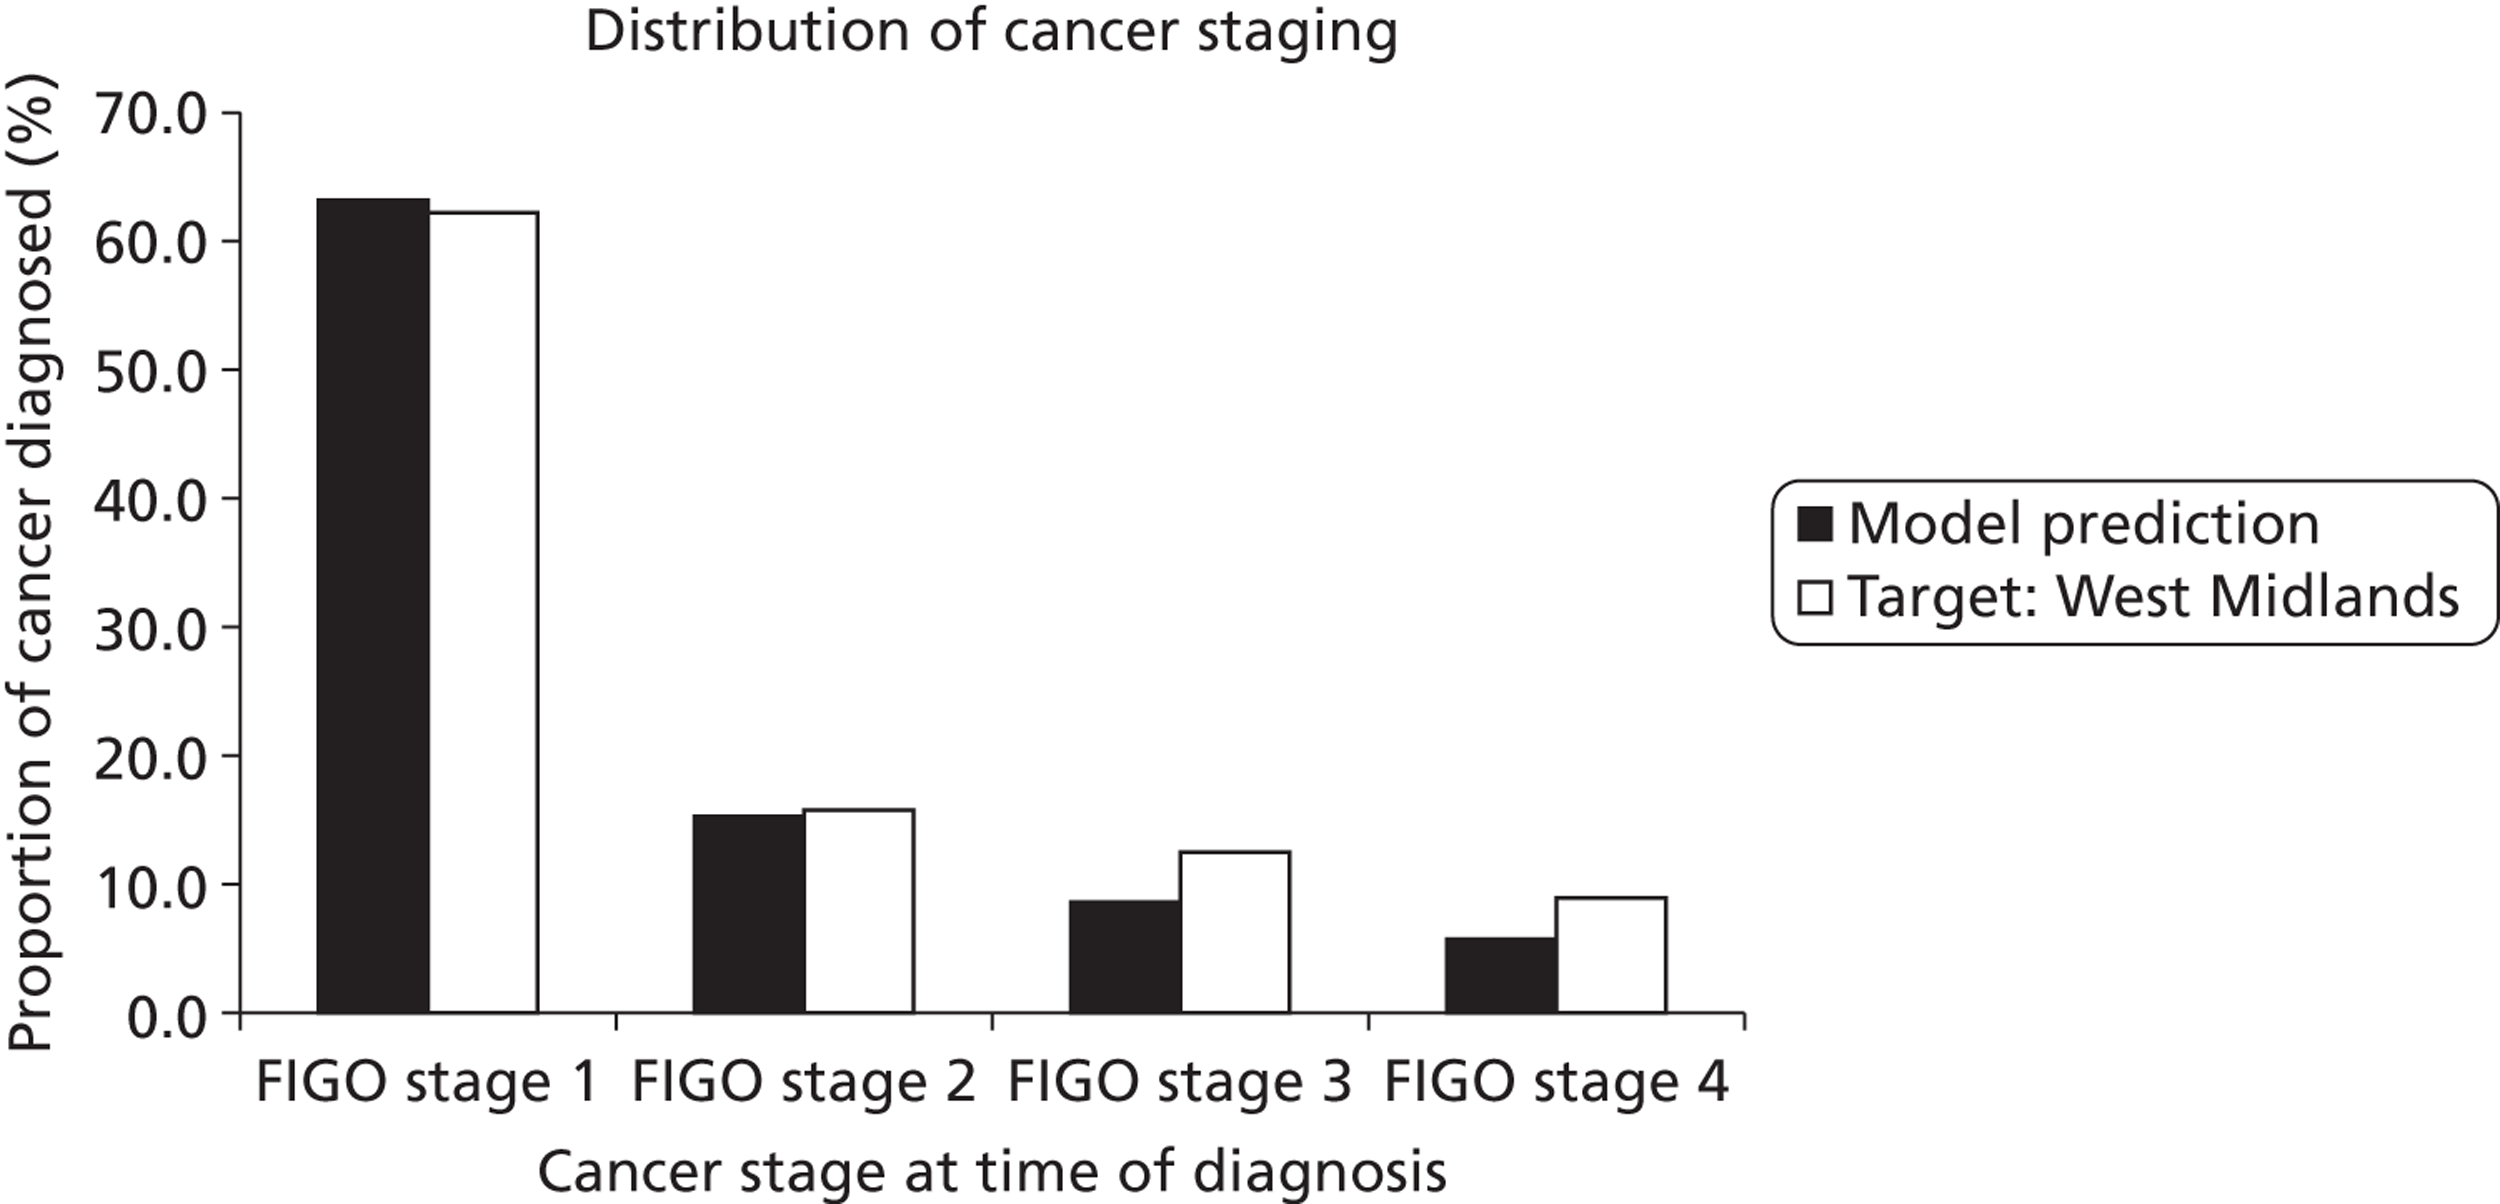
Cervical cancer mortality
Age-specific rates of cancer mortality, as predicted by the model, are shown in Figure 25. The model age-specific predictions compare relatively well with 2008 mortality data (predicted results within the 95% CI of observed data for women aged > 45 years; rates are slightly higher than observed values for younger women).
Predictions of cost, effectiveness and resource utilisation outcomes for current practice
A summary of resource utilisation, cancer incidence and mortality and costs as predicted by the model for current practice is given in Table 32. Note that the life-years presented in the table are a somewhat counterintuitive measure to which discounting has been applied and which reflects the discounted additional number of years a woman is predicted to live given that she has already survived to 10 years of age (the model simulation commences at 10 years of age). Compared with observed data, the model predicts very similar cervical cancer case numbers and cervical cancer deaths overall (although the age-standardised mortality rate is slightly higher than observed).
| Current practice (unvaccinated cohorts) | Predicted outcomes | Target outcomes | Per cent difference between predicted and target outcomes (negative indicates underestimation) |
|---|---|---|---|
| Predicted cost and effectiveness | |||
| Total discounted life-time cost per woman | £159 | – | – |
| Total discounted LYs per woman | 26.2307 | – | – |
| Total discounted QALYs per woman | 26.2098 | – | – |
| Annual screening-associated cost in Englanda | £155,127,987 | – | – |
| Predicted health outcomes in England | |||
| Cervical cancer cases p.a.a | 2521 | 2511 | 0.4% |
| ASR cancer incidence per 100,000 womenb | 8.88 | 8.9 (95% CI 8.7 to 9.1) | −0.2% |
| Cervical cancer deaths p.a.a | 761 | 762 | −0.2% |
| ASR cancer mortality per 100,000 womenb | 2.45 | 2.2 (95% CI 2.1 to 2.3) | 11.4% |
| Cumulative lifetime risk of cervical cancer | 0.74% | – | – |
| Predicted resource utilisation (annually in England)a | |||
| No. of cytology tests (all ages) | 3,703,772 | 3,662,33651 | 1% |
| No. of cytology abnormalities (all ages) | 272,552 | – | – |
| No. of women with an abnormal cytology test | – | 218,000 | – |
| No. of HG cytology testsc | 53,923 | – | – |
| No. of women aged 25–64 with a HG cytology | – | 36,30051 | – |
| No. of HPV tests | 245,330 | – | – |
| No. of women receiving a biopsy | 87,821 | – | – |
| No. of diagnostic biopsies | – | b85,14351 | – |
| No. of first colposcopies after referral | 128,254 | – | |
| No. of women attending colposcopy (first attendance) | – | 137,69351 | – |
| No. of women with histologically confirmed CIN2/3 | 41,309 | b45,00051 | −8% |
The model was also used to calculate the predicted annual number of screening events in England under current practice and the results were compared with values reported in the 2010–11 report of the NHSCSP. Compared with these data, the model predicts very similar numbers of cytology tests overall (within 2%). Other predicted model outcomes, such as the number of colposcopies, biopsies and treatments for CIN, were calculated although it was not always possible to directly compare these with the reported observed data which were often available as a per-woman versus per-test number (as noted in Table 32).
Model predictions for current screening practice in the context of vaccination
Current practice in cervical screening in England was simulated for vaccinated cohorts (i.e. for cohorts offered vaccination after the national vaccination programme commenced, although such cohorts include both vaccinated and unvaccinated individuals). A range of assumptions were considered for vaccine coverage and catch-up coverage rates in sensitivity analysis. For the baseline evaluation we assumed 84% coverage in 12- to 13-year-old girls and catch-up coverage rates as recently reported. Lifetime outcomes for HPV prevalence, cancer incidence and mortality are presented. It should be noted that these are lifetime predictions for the vaccinated cohort but these predictions can also be interpreted as cross-sectional outcomes in the future once all age cohorts have been offered vaccination as pre-adolescents. The assumed age structure in England for the calculation of case numbers was that observed in 2011. 48
Human papillomavirus prevalence
The predicted HPV prevalence for all oncogenic types in a vaccinated cohort (vaccinated as 12- to 13-year-olds) is shown in Figure 26. This indicates that vaccination against 16/18 with current vaccine coverage rates will reduce the overall oncogenic HPV population prevalence in England by about 25% (assuming current generation vaccines do not confer significant long-lasting cross-protection against non-vaccine-included types). This is in accordance with expectations, as HPV 16/18 infections are expected to comprise ∼ 30–40% of all oncogenic type infections in the population, and vaccination coverage in England is approximately 84%.
FIGURE 26.
Predicted overall HPV prevalence for all oncogenic types in England, assuming 84% vaccination coverage (green dashed curve) and HPV prevalence predicted by the model in an unvaccinated setting (black dashed curve).
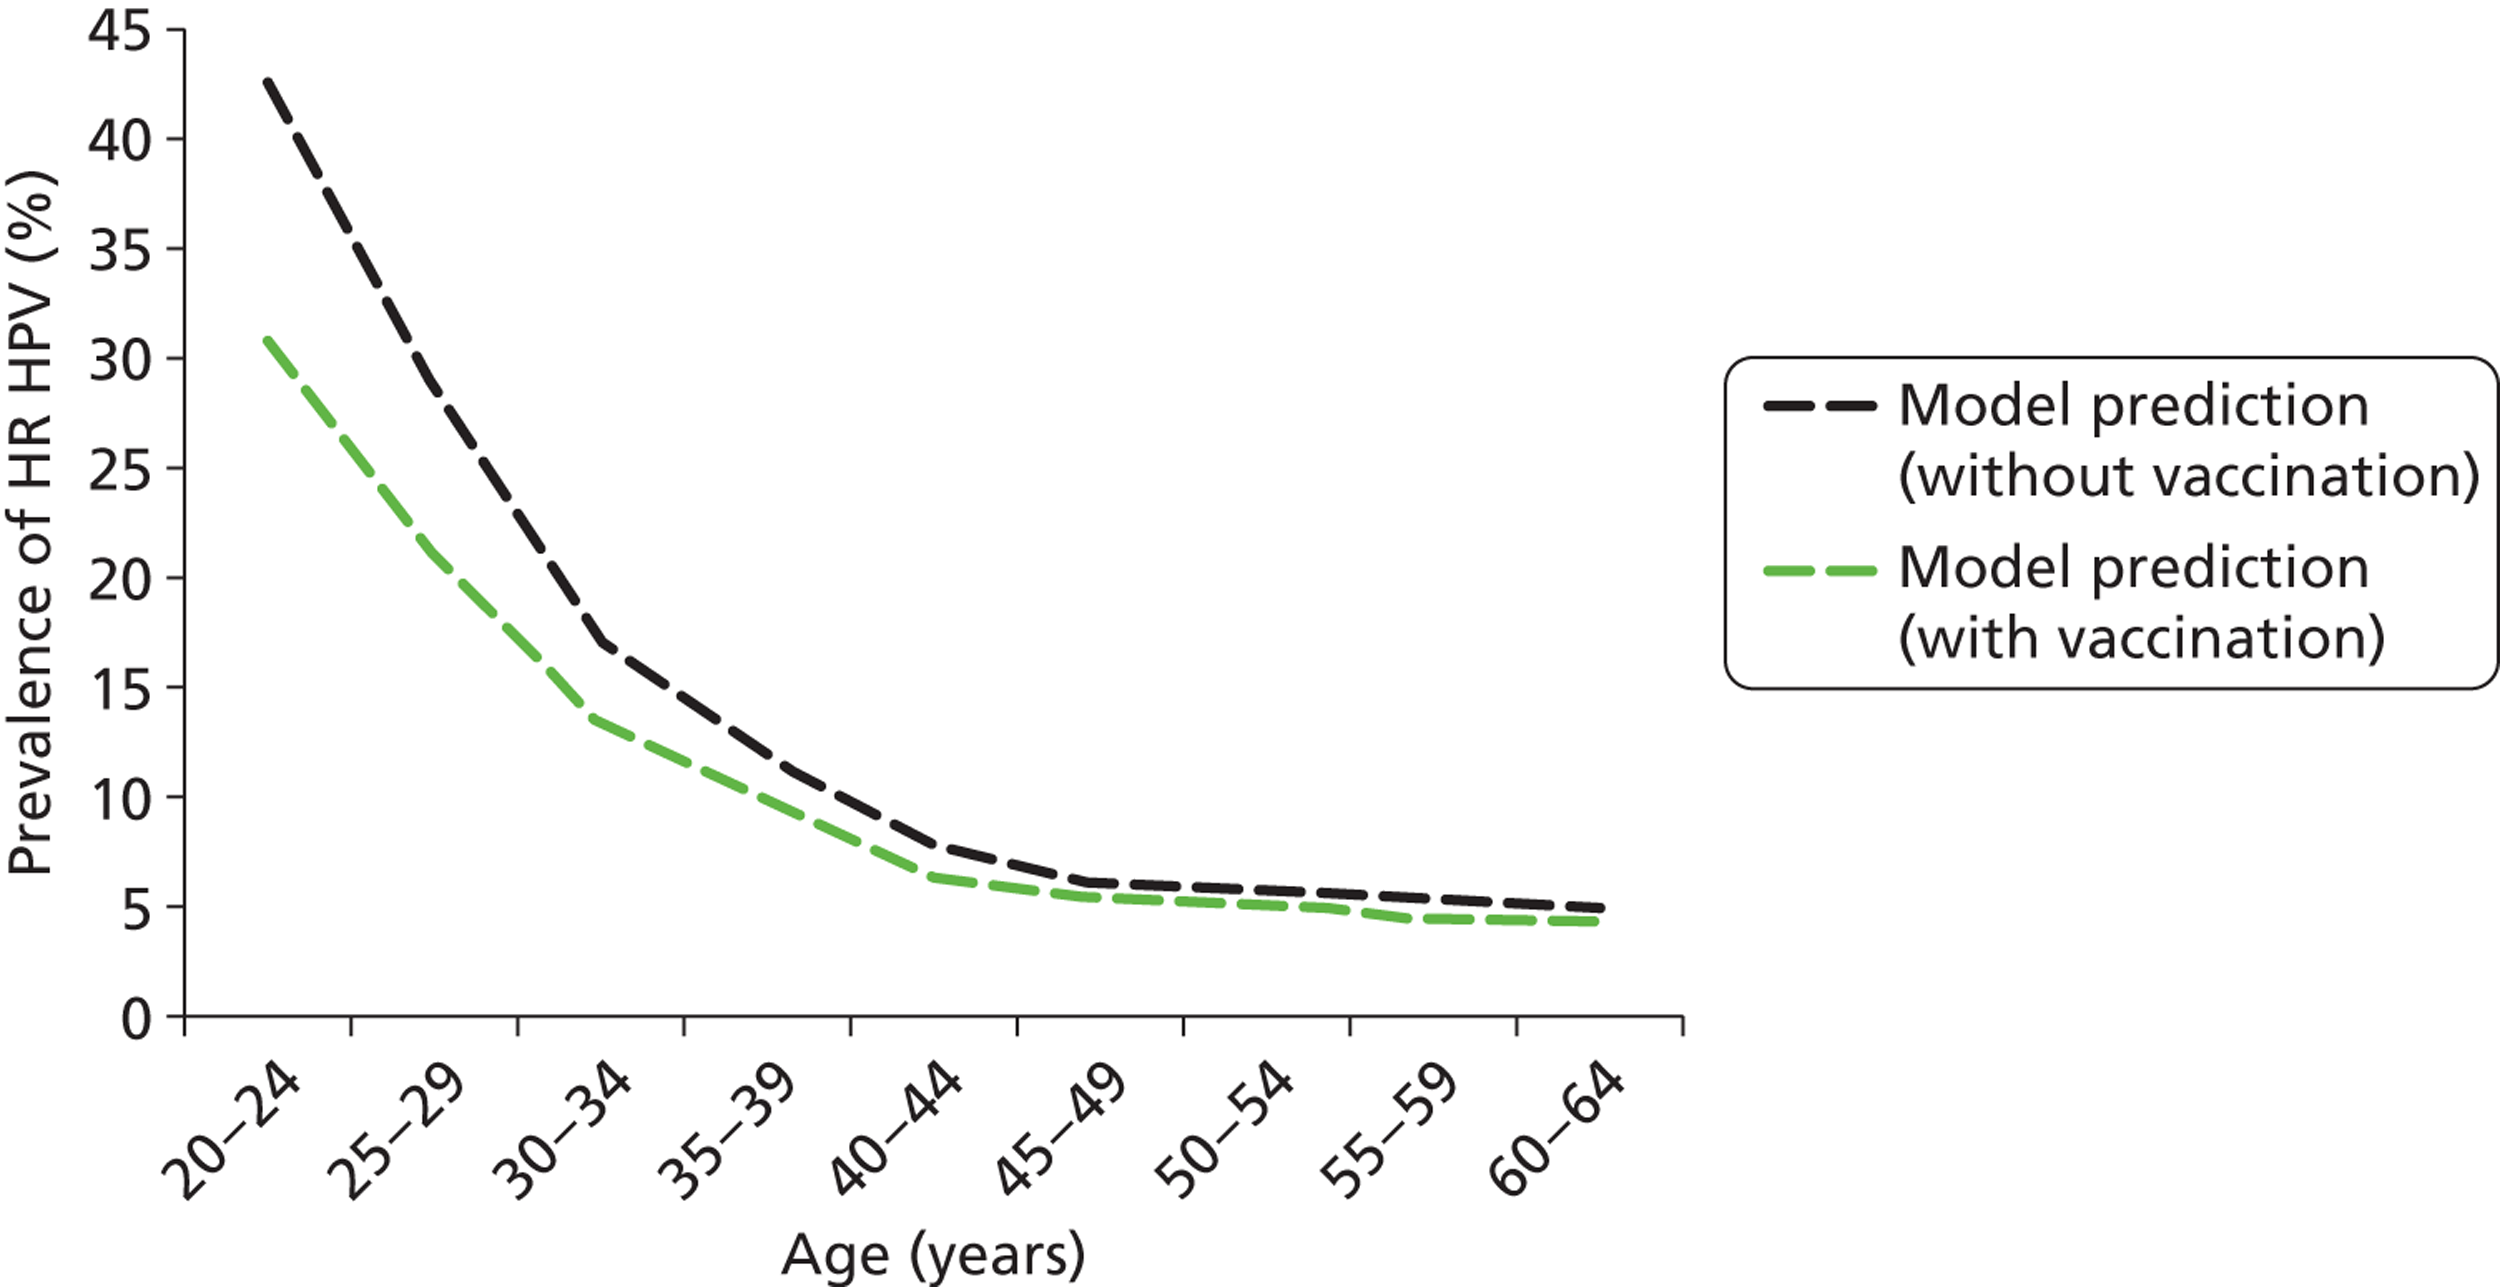
Cervical cancer incidence
The model-predicted cervical cancer incidence in vaccinated cohorts is depicted in Figure 27. Vaccination against HPV 16/18 at the current coverage rate is predicted to reduce the incidence of cervical cancer by close to 56% in women across all ages. This is in accordance with expectations as HPV16/18 infections are implicated in ∼ 65–70% of invasive cervical cancers and vaccination coverage is assumed to be 84% (and there is an additional effect of herd immunity).
FIGURE 27.
Cancer incidence per 100,000 women in a vaccinated cohort in England is shown as the green dashed curve. Model predictions in an unvaccinated setting are shown as the black dashed curve.
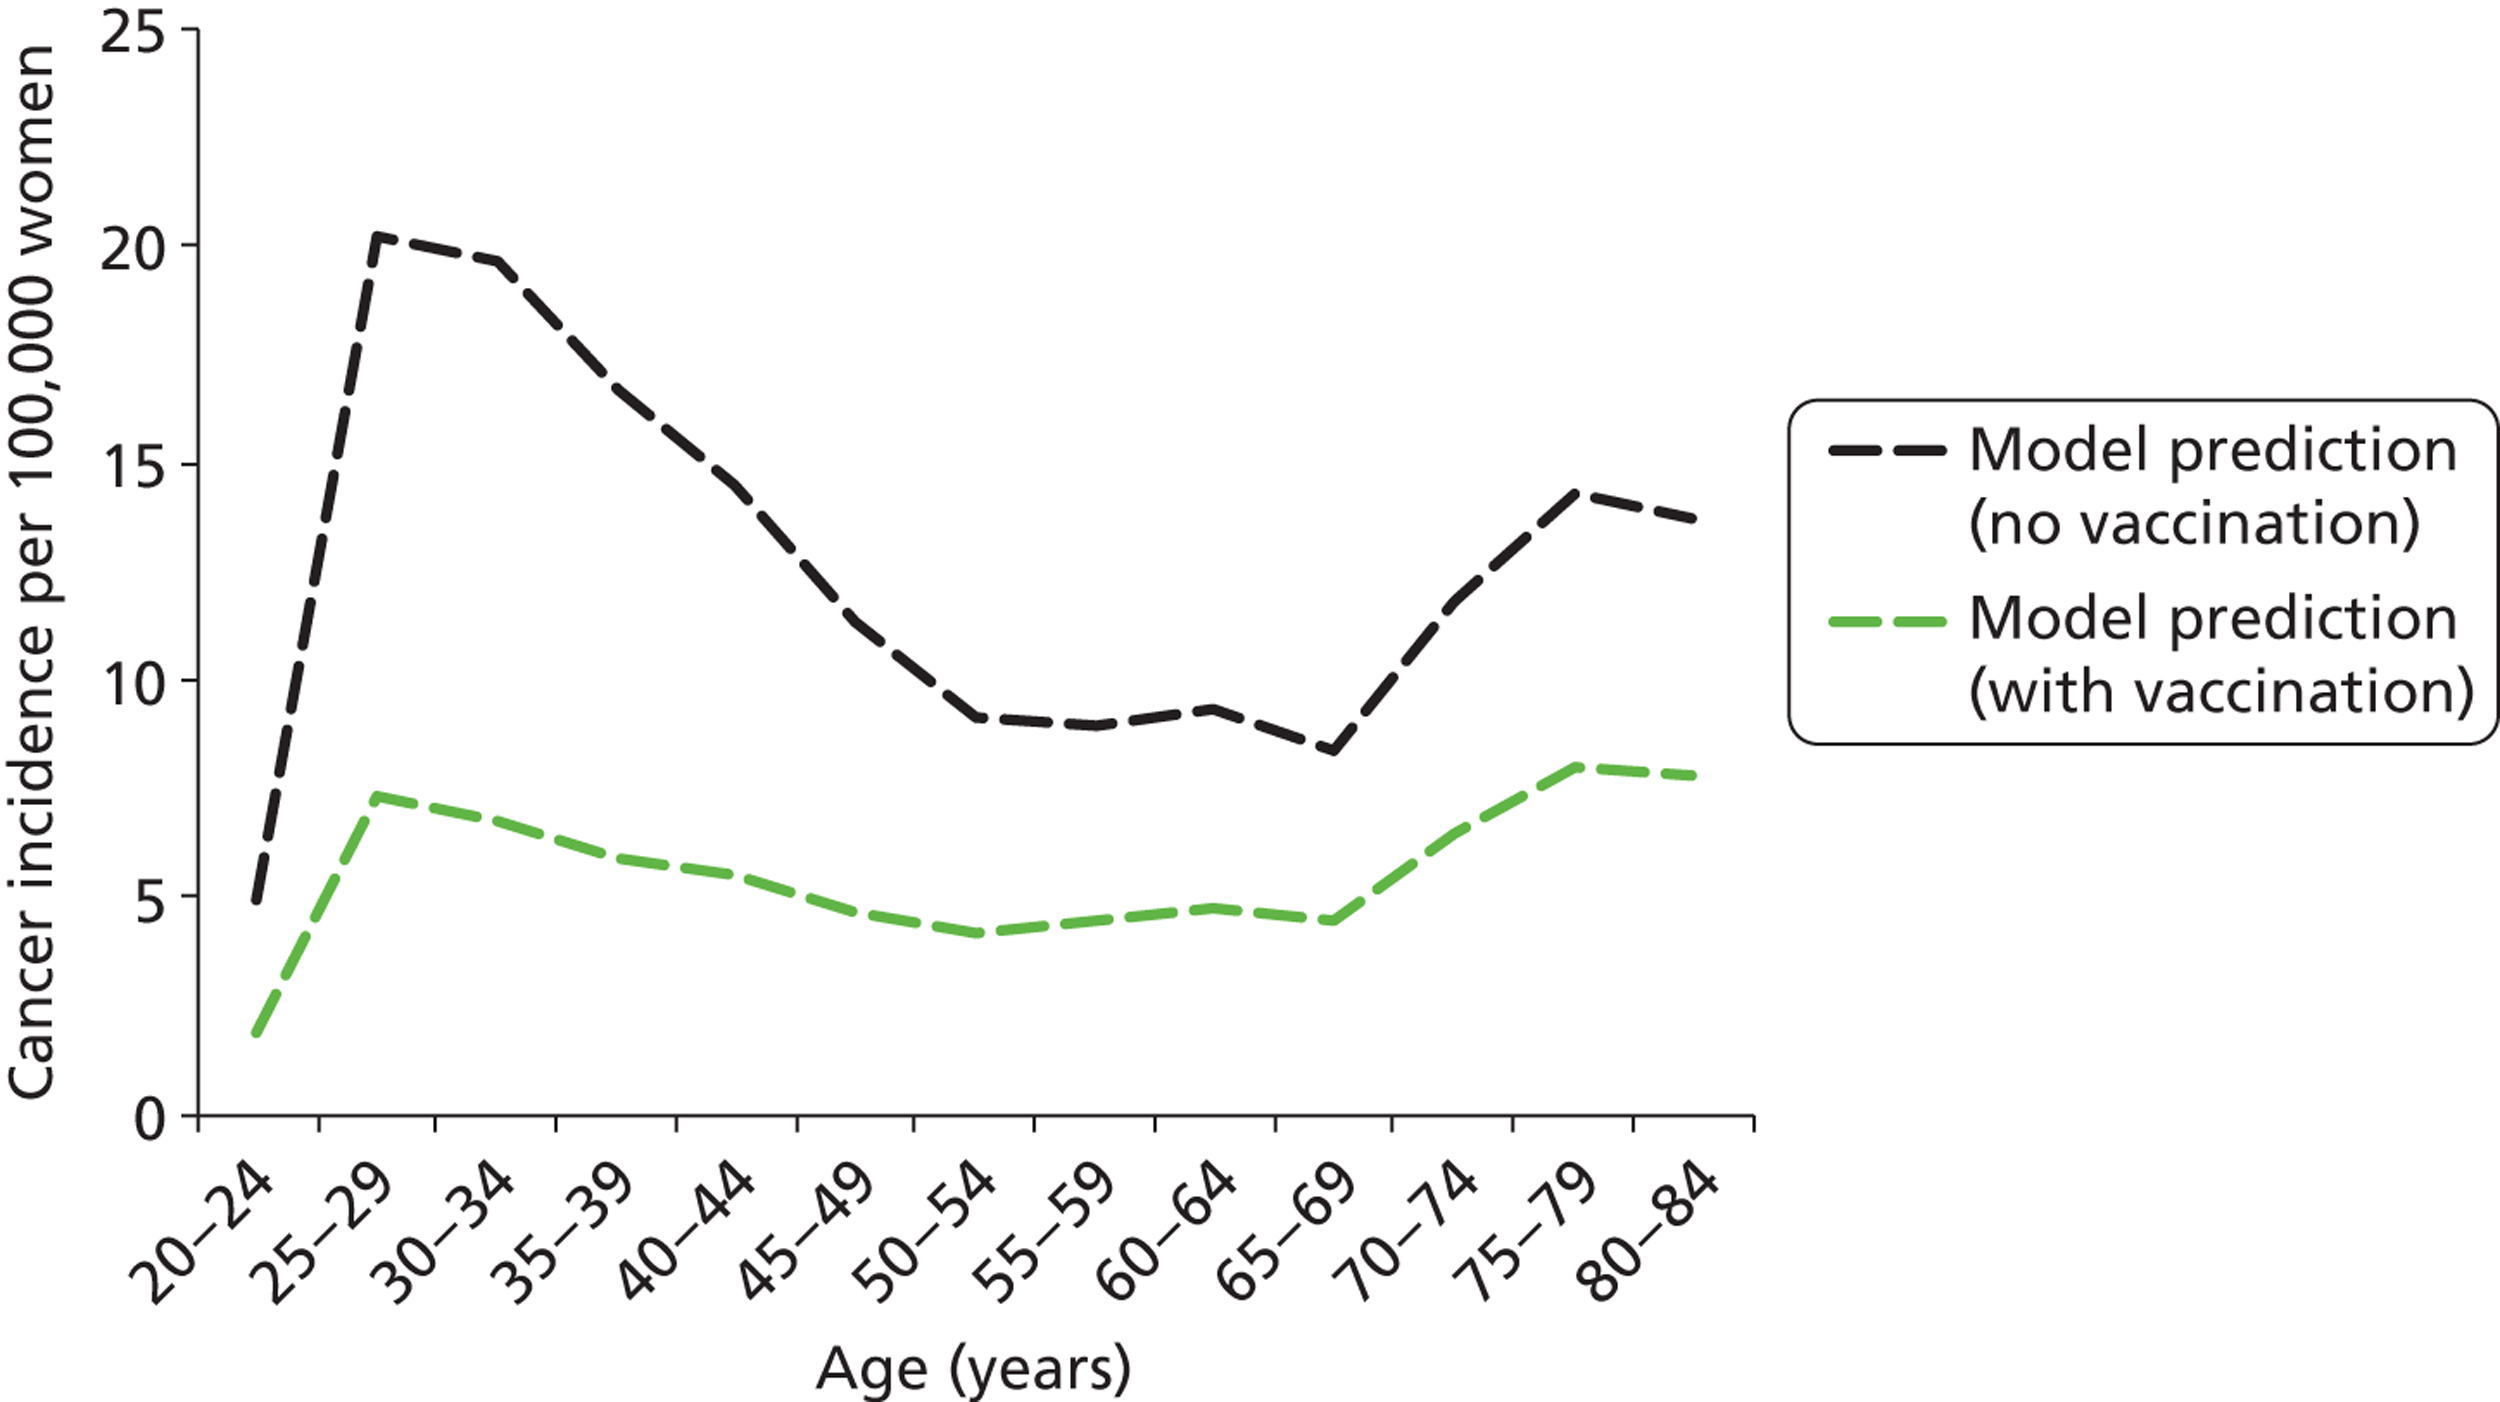
The predicted age- and type-specific incidence of invasive cervical cancer after vaccination is shown in Table 33. This table shows that after vaccination, HPV 16 and 18 associated cancers decrease significantly in relation to the other oncogenic types. Post vaccination, the relative proportions of HPV 16 and HPV 18 in cancer are predicted to be 12% and 3%, respectively.
| HPV type | Proportion of cancers detected attributable to HPV type (%) | |
|---|---|---|
| Vaccinated (84% coverage) | Unvaccinated | |
| HPV 16 | 11.7 | 52.6 |
| HPV 18 | 2.7 | 12.9 |
| HPV OHR | 85.6 | 34.5 |
Cervical cancer mortality
Mortality rates from cervical cancer in the vaccinated cohort are shown in Figure 28. The mortality rate is predicted to decrease by a similar ratio to that for cancer incidence in the vaccinated cohort.
FIGURE 28.
Cervical cancer mortality rates as predicted by the model in cohorts offered vaccination are shown as the green dashed curve. Model predictions in an unvaccinated cohort are shown as the black curve.
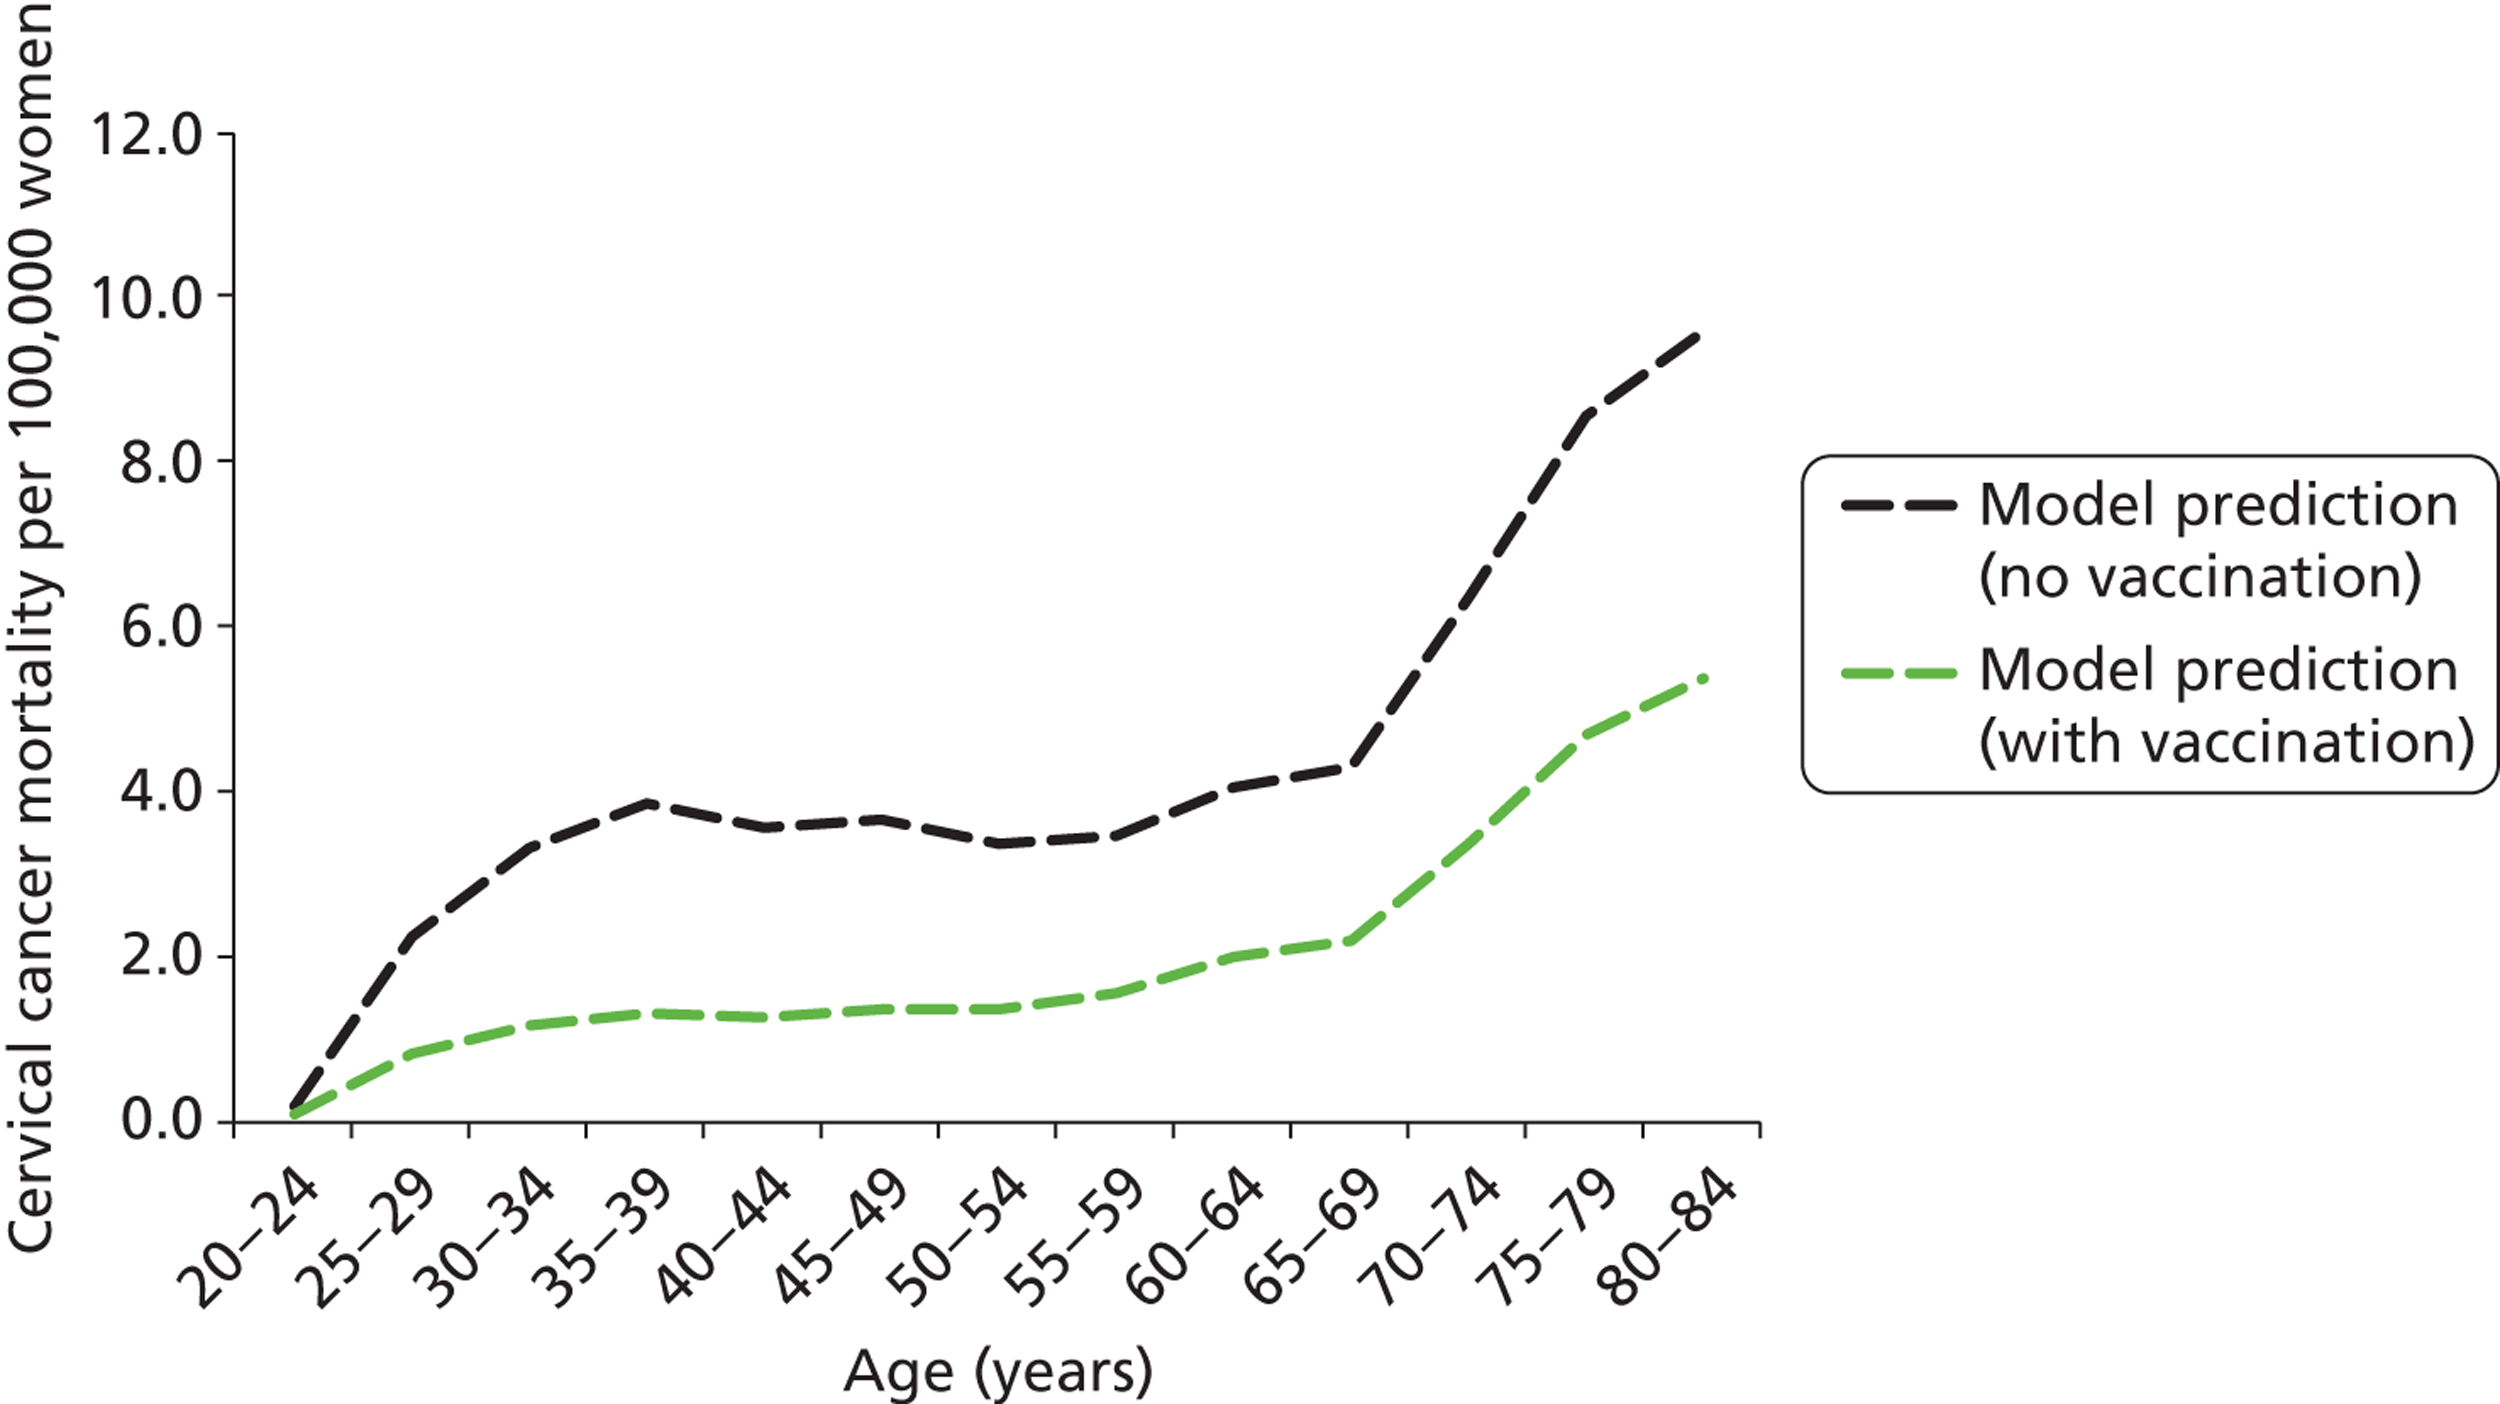
Predicted resource utilisation, cancer incidence and mortality, and costs associated with current screening practice in a vaccinated setting are summarised in Table 34.
| Current practice outcomes | Unvaccinated cohorts | Vaccinated cohorts |
|---|---|---|
| Predicted cost and effectiveness | ||
| Total discounteda lifetime cost per woman | £159 | £129 |
| Total discounteda LYs per woman | 26.2307 | 26.2366 |
| Total discounteda QALYsb per woman | 26.2098 | 26.2187 |
| Annual screening-associated cost in Englandc | £155,127,987 | £128,741,901 |
| Predicted health outcomes in England | ||
| Cervical cancer cases p.a.c | 2521 | 1064 |
| ASR cancer incidence per 100,000 womend | 8.88 | 3.65 |
| Cervical cancer deaths p.a.c | 761 | 338 |
| ASR cancer mortality per 100,000 womend | 2.45 | 1.05 |
| Cumulative lifetime risk of cervical cancer | 0.74% | 0.32% |
| Predicted resource utilisation (annually in England)c | ||
| No. of cytology tests (all ages) | 3,703,772 | 3,663,477 |
| No. of HPV tests | 245,330 | 210,687 |
| No. of women receiving a biopsy | 87,821 | 60,897 |
| No. of women with histologically confirmed CIN2/3 | 41,309 | 24,365 |
| No. of colposcopies (first attendance) | 128,254 | 89,848 |
Table 34 summarises the model-predicted outcomes in the context of current screening practice, with and without the effect of HPV vaccination. The total annual cost of cervical screening, management and diagnosis and cancer treatment under current practice is estimated at £155M per annum; and this would reduce to £129M per annum after vaccination takes effect. This reflects the fact that without a change in screening recommendation, only a modest reduction in the number of cytology and HPV tests are predicted, although vaccination will have a considerable influence on the predicted number of colposcopies, biopsies and treatments for CIN, due to the falling rates of cervical abnormalities in the population.
Cost-effectiveness and resource utilisation for human papillomavirus screening strategies
Each of the four main primary HPV screening strategies were simulated and model outputs were analysed, for both unvaccinated and vaccinated cohorts. We considered a range of variations on the four basic primary HPV strategies and several variations on the basic strategies, as summarised in Table 35.
| Variant 1 | Variant 2 | Variant 3 (exploratory) | Variant 4 (exploratory) | Variant 5 |
|---|---|---|---|---|
| As per the basic strategy, but assuming 10-yearly screening in women aged over 50 years (and 6-yearly screening in younger women) | As per the basic strategy, but assuming two sets of 12-monthly follow-up for intermediate risk women as opposed to two sets of 24-month follow-ups for these women | As per the basic strategy, but assuming current practice management for women under 30 years (only run for strategies 1 and 2) | As per the basic strategy, but assuming current practice management for women under 35 years (only run for strategies 1 and 2) | As per the basic strategy, but assuming 5-yearly screening for women of all ages |
Figure 29 shows the predicted age-specific cervical cancer incidence rate for each of the four basic strategies in unvaccinated cohorts. The predicted age-specific cervical cancer mortality rates are shown in Figure 30. The basic strategies all involve 6-yearly HPV screening with 24-month follow up of HPV-positive, triage-negative women.
FIGURE 29.
Age-specific cancer incidence as predicted by the model for each of the four basic strategies in unvaccinated cohorts. Model outputs for current practice management are also shown for comparison.
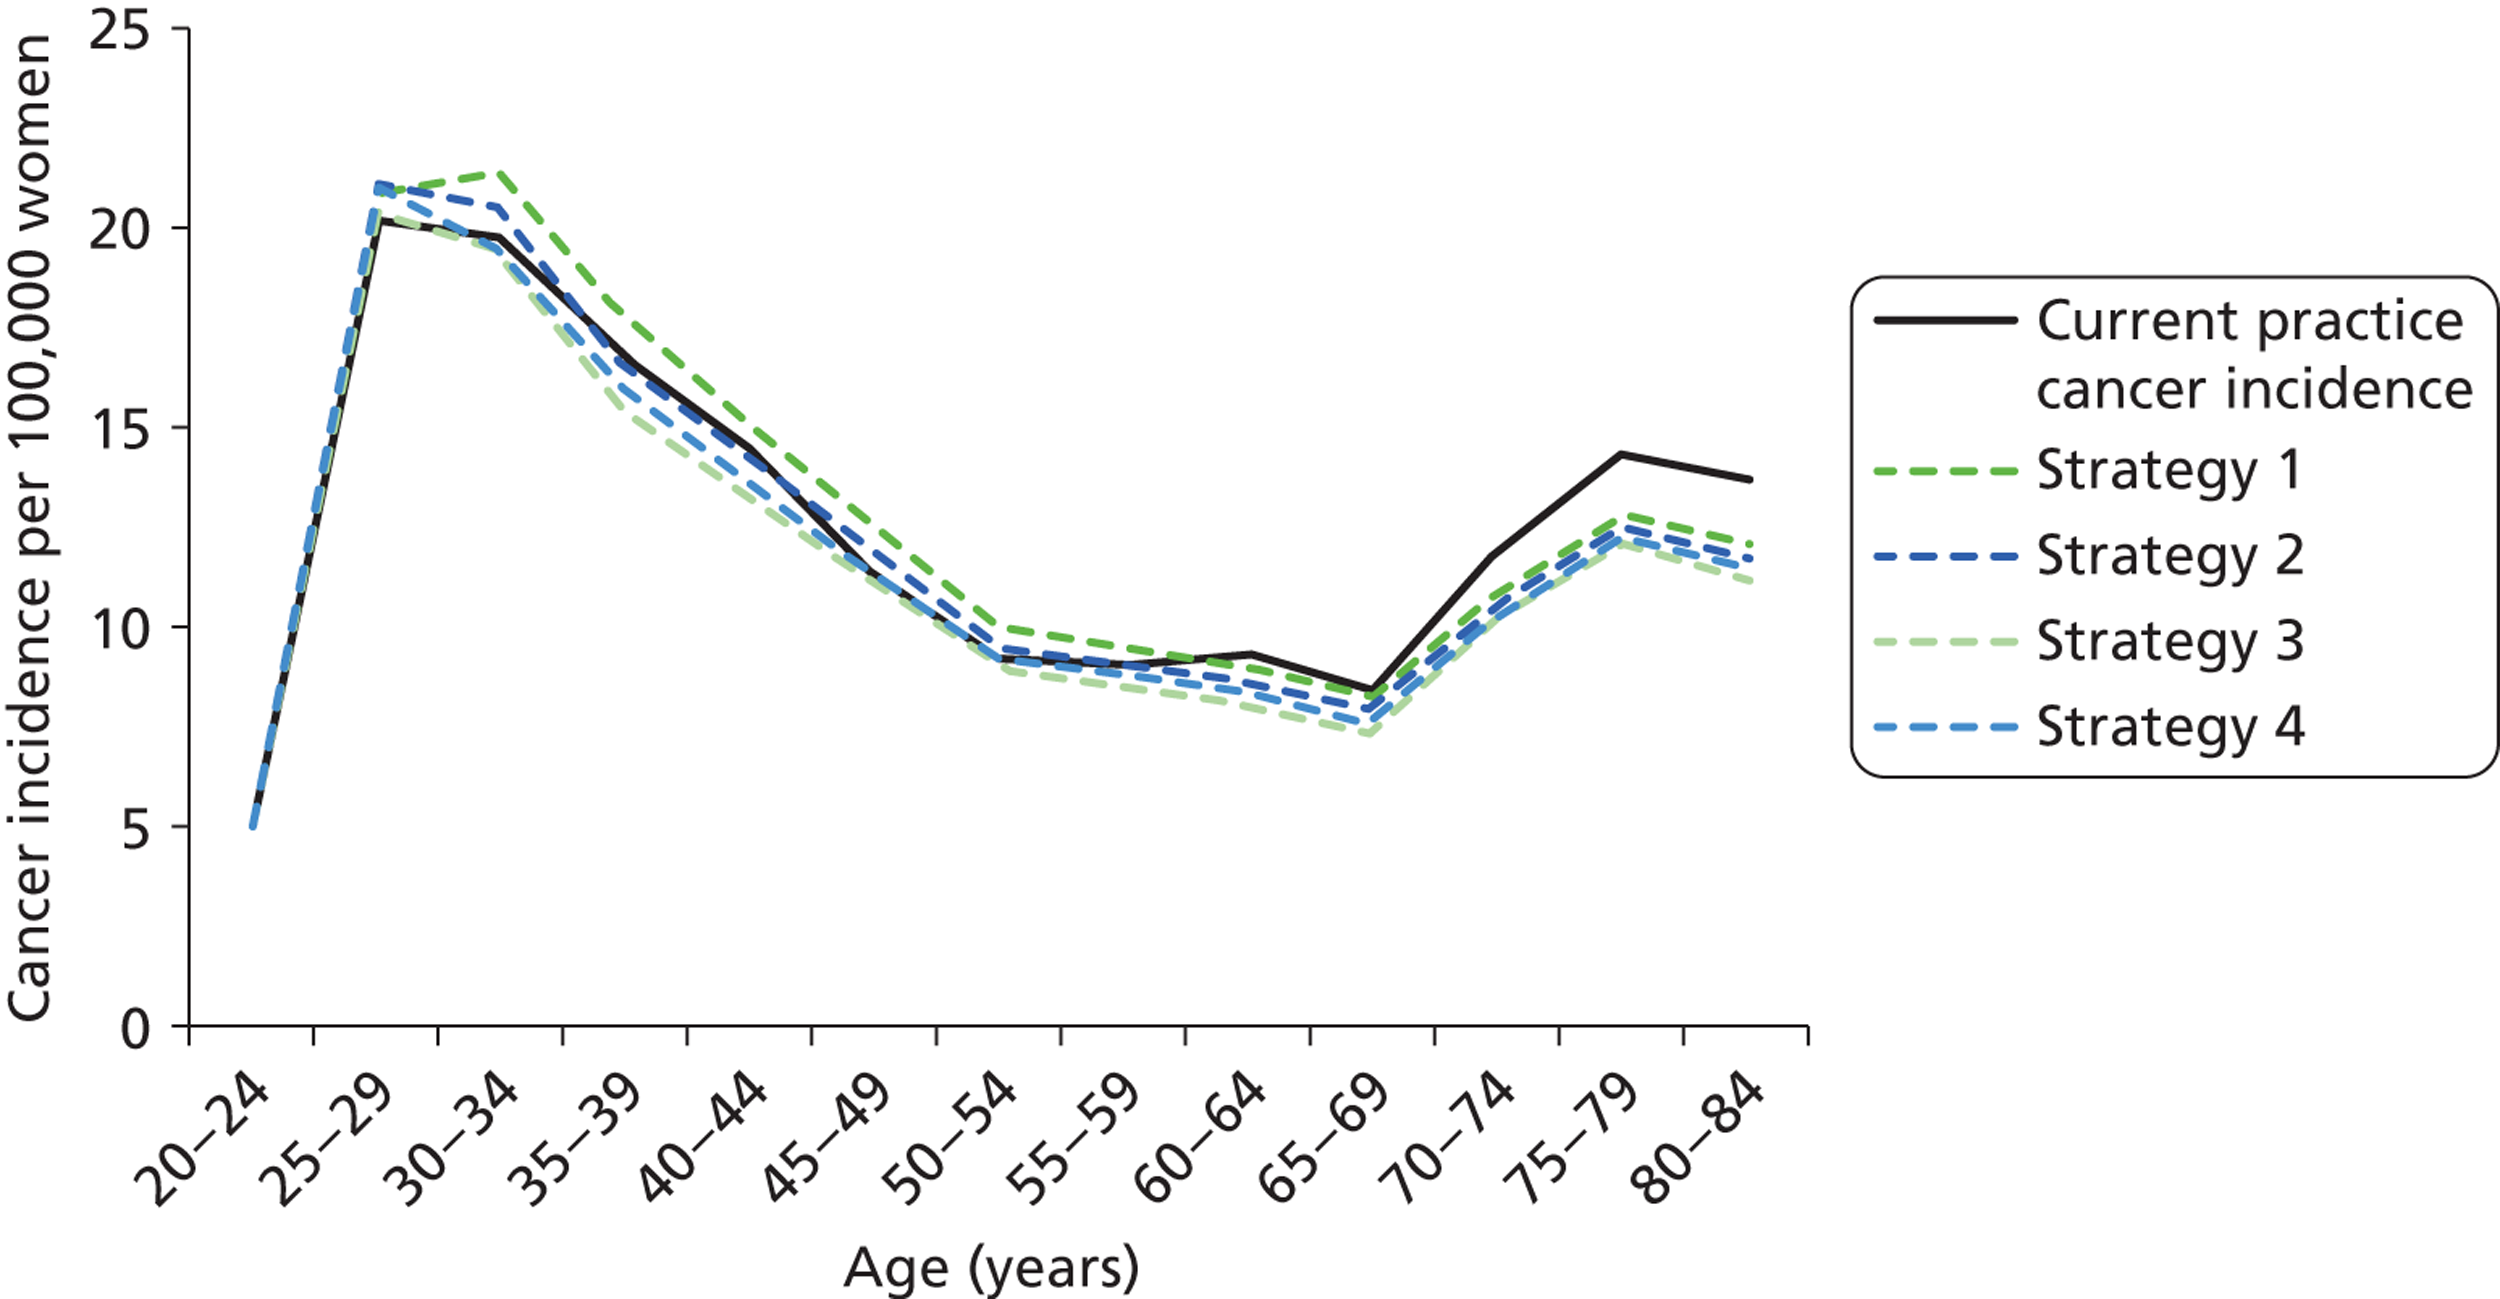
FIGURE 30.
Age-specific cancer mortality as predicted by the model for each of the four basic strategies in unvaccinated cohorts. Model outputs for current practice management are also shown for comparison.
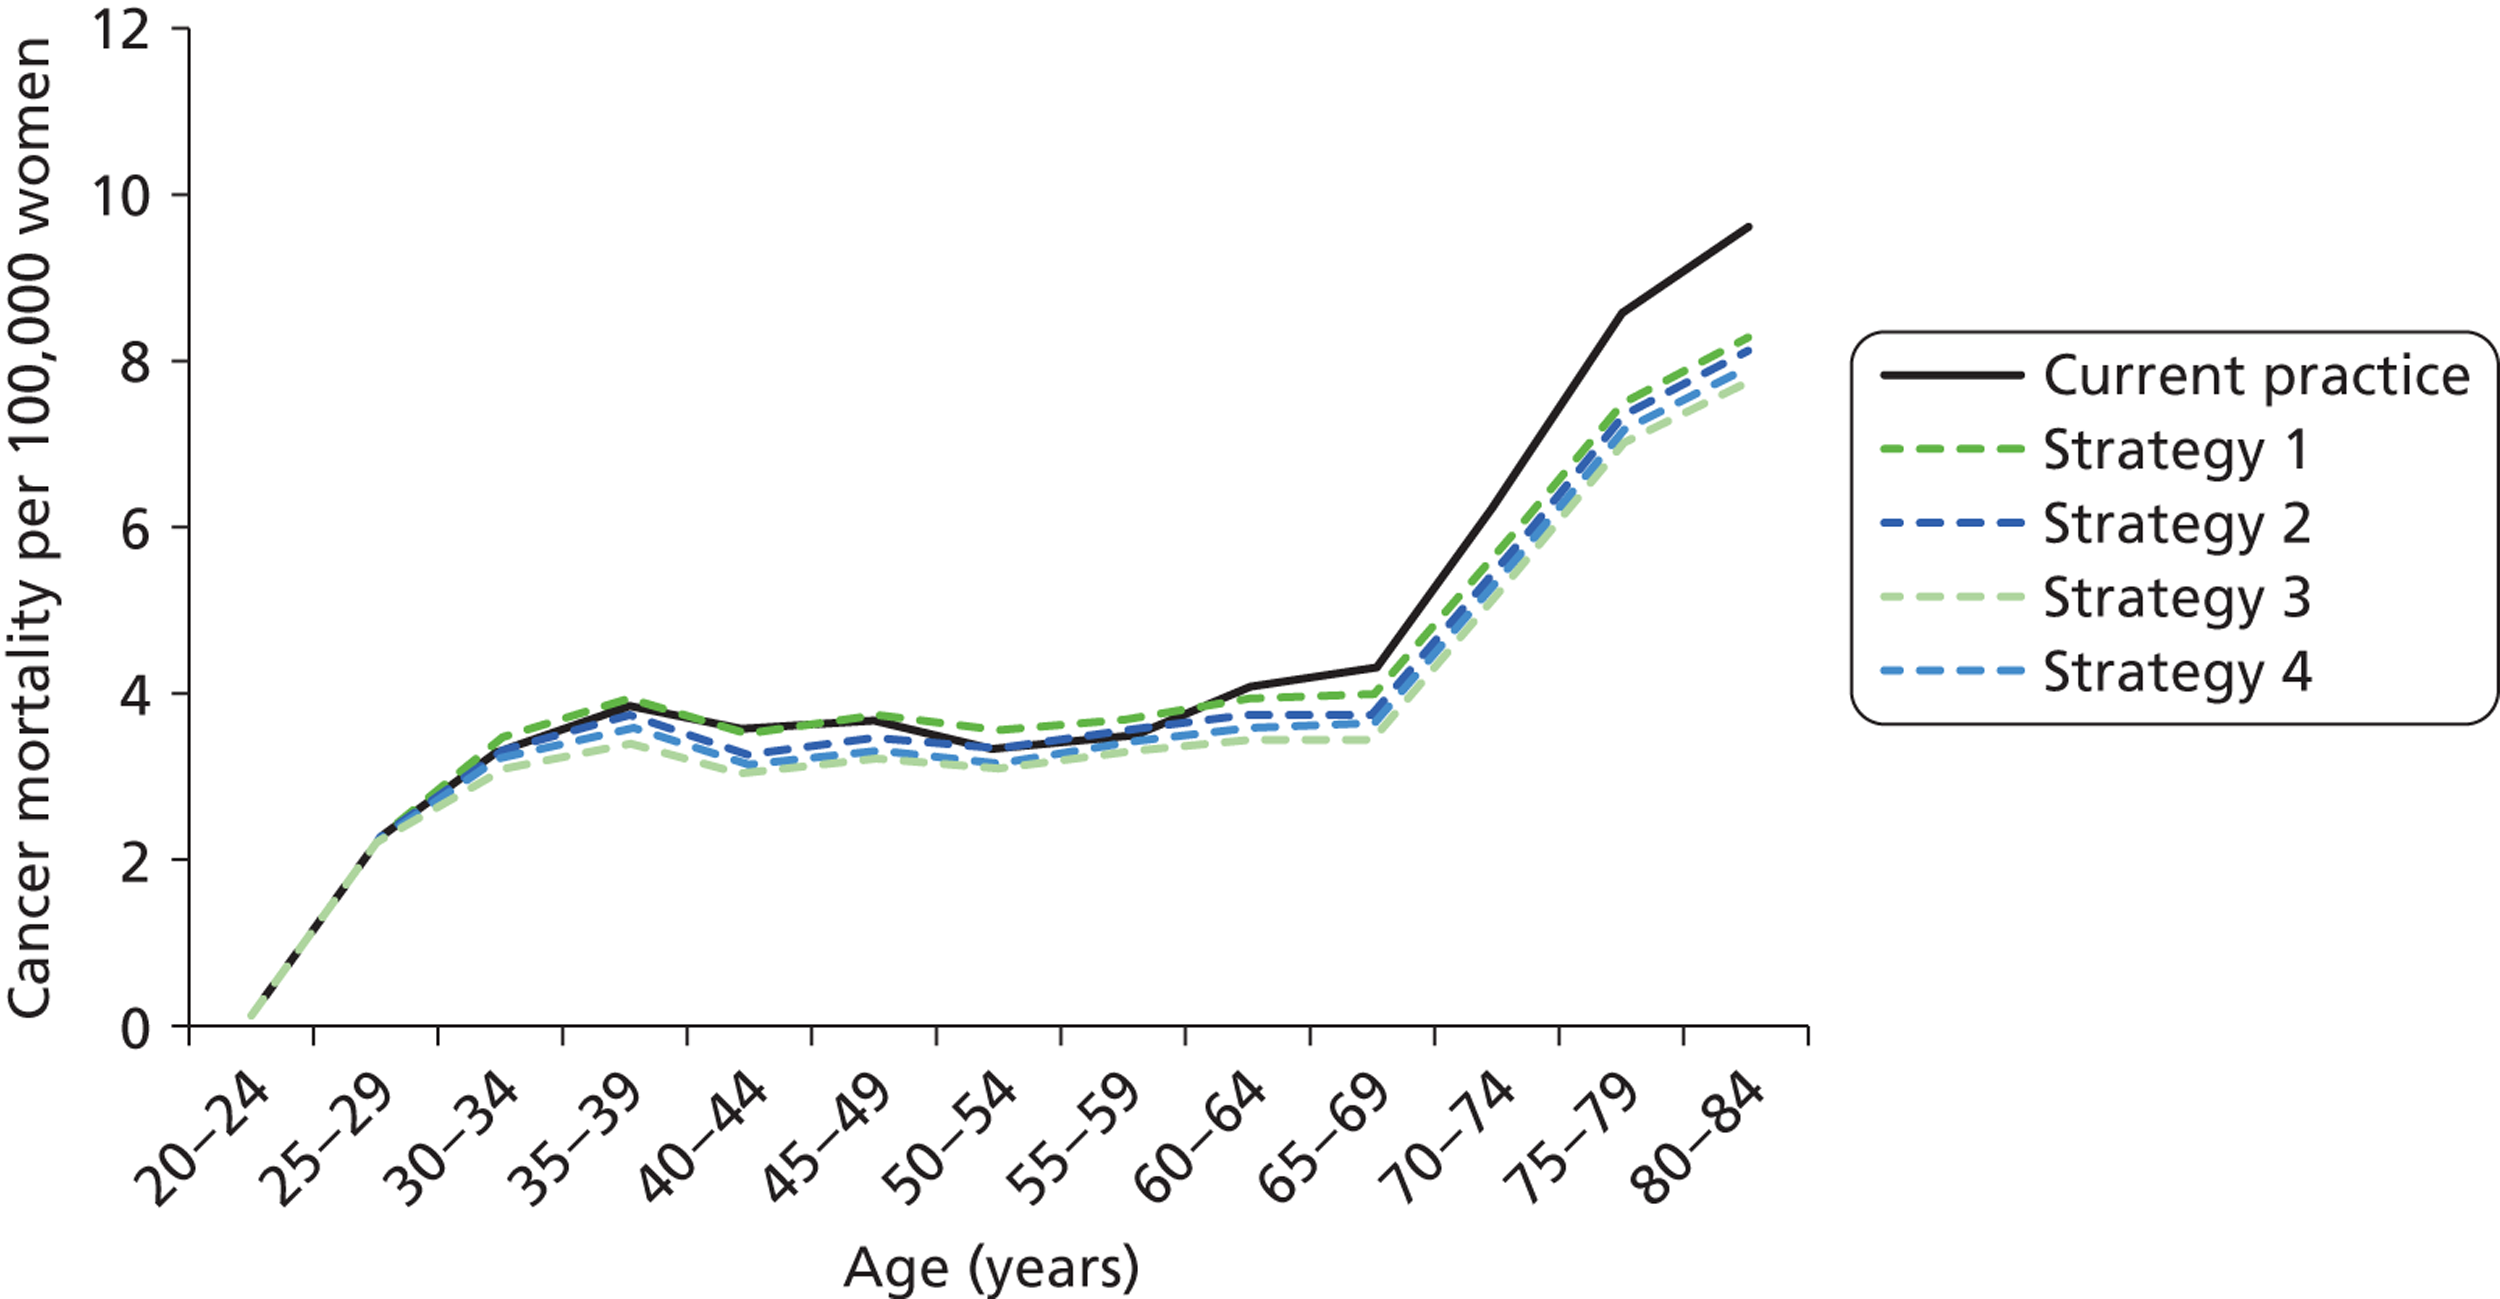
In general terms, a slight increase in cervical cancer incidence is predicted for women less than 50 years when primary HPV screening basic strategy 1 is compared with current practice, but not for the other strategies, and lower incidence rates are predicted for older women (> 60 years) for all primary HPV strategies. The predicted age-specific cervical cancer mortality is lower than that for current practice for all primary HPV basic strategies at most ages, with the exception of strategy 1, which is predicted to have close-to-equivalent age-specific mortality in women less than 50 years of age, compared with current practice.
Table 36 provides a summary of cost, health and resource utilisation outputs for the four basic strategies in an unvaccinated population (all basic strategies involve 6-yearly screening with 24-month follow-up of HPV-positive, triage-negative women).
| Model output | No vaccination | ||||
|---|---|---|---|---|---|
| Current practice | Strategy 1 | Strategy 2 | Strategy 3 | Strategy 4 | |
| Predicted cost and effectiveness | |||||
| Total discounteda lifetime cost per woman | £159 | £132 | £135 | £144 | £149 |
| Total discounteda LYs per woman | 26.2307 | 26.2306 | 26.2310 | 26.2316 | 26.2313 |
| Total discounteda QALYs per woman | 26.2098 | 26.2105 | 26.2111 | 26.2118 | 26.2095 |
| Additional LYs saved per 100,000 women compared with CP (negative indicates fewer LYs) | – | −14.44 | 26.42 | 82.85 | 54.09 |
| Additional QALYs saved per 100,000 women compared with CP (negative indicates fewer QALYs) | – | 73.92 | 126.84 | 201.21 | −27.62 |
| Annual screening-associated cost in Englandb | £155,127,987 | £127,573,498 | £129,905,553 | £136,206,815 | £144,958,217 |
| Annual cost difference compared with CP | – | −£27,554,488 | −£25,222,434 | −£18,921,171 | −£10,169,770 |
| Per cent cost difference compared with CP | – | −18% | −16% | −12% | −7% |
| Predicted health outcomes in England | |||||
| Cervical cancer cases p.a.b | 2521 | 2590 | 2495 | 2366 | 2418 |
| ASR cancer incidence per 100,000 womenc | 8.88 | 9.22 | 8.88 | 8.41 | 8.60 |
| Cumulative lifetime risk of cervical cancer | 0.74% | 0.76% | 0.73% | 0.69% | 0.71% |
| Per cent increase in lifetime risk (compared with CP) | – | 1.9% | −1.7% | −6.8% | −4.7% |
| Cervical cancer deaths p.a.b | 761 | 741 | 708 | 663 | 685 |
| ASR cancer mortality per 100,000 womenc | 2.45 | 2.43 | 2.32 | 2.17 | 2.24 |
| Cumulative lifetime risk of cervical cancer death | 0.24% | 0.23% | 0.22% | 0.21% | 0.21% |
| Per cent increase in lifetime risk of death (compared with CP) | – | −3.6% | −7.7% | −13.4% | −10.6% |
| Predicted resource utilisation (annually in England)b | |||||
| No. of cytology tests (all ages) | 3,703,772 | 636,790 | 636,161 | 564,796 | 2,574,064 |
| No. of HPV tests | 245,330 | 2,255,505 | 2,251,914 | 2,244,887 | 2,269,169 |
| No. of women receiving a biopsy | 87,821 | 75,187 | 84,156 | 106,028 | 87,161 |
| No. of colposcopies (first attendance after referral) | 128,254 | 110,393 | 123,140 | 154,754 | 127,790 |
| No. of women with histologically confirmed CIN2/3 | 41,309 | 39,464 | 39,850 | 40,585 | 40,525 |
Compared with current practice, the four basic strategies result in annual cost reductions of between 7% and 18% (£10M–28M), with strategy 1 associated with the highest cost savings and strategy 4 (co-testing) associated with the least savings.
With respect to effectiveness, the strategies varied in whether they were more or less effective than current screening practice. From the perspective of life-years, strategy 1 was associated with a slightly lower prediction for average life-years in the population compared with current practice, whereas the other strategies were associated with savings in life-years. (Note that strategy 1 has a lower lifetime risk of cervical cancer death, even though it is predicted to have fewer life-years saved compared with current practice. This is due to strategy 1 appearing to be more effective in older, compared with younger, women relative to current screening practice.) As expected, the strategies increased in effectiveness the more aggressively that HPV positive women were managed, with strategy 3 (partial genotyping at the primary screening step with HPV 16/18 referred immediately to colposcopy) being the most effective, followed by strategy 2 (genotyping in follow-up) and then strategy 1 (no genotyping), with strategy 4 (co-testing) having intermediate effectiveness between strategies 2 and 3.
In line with the above findings, strategy 1 was also predicted to be associated with the fewest colposcopies and biopsies, substantially fewer than current practice, whereas strategy 3 was associated with the highest number of colposcopies and biopsies.
Model predictions for the screening strategies in an unvaccinated setting
We considered a range of variations of the four basic primary HPV strategies. Several variations on the basic strategies were considered.
Cost, effectiveness, life-years predictions and quality-adjusted life-years predictions in unvaccinated cohorts
Model predictions for the predicted effectiveness of each of the strategies and their variants are presented in Table 37 and cost and cost-effectiveness outcomes are summarised in Table 38.
| Strategy | Predicted effectiveness | |||||
|---|---|---|---|---|---|---|
| Total discounteda LYs per woman | Total discounteda QALYsb per woman | Additional LYs saved per 100,000 women compared with CPc | Additional QALYsb saved per 100,000 women compared with CPc | Additional LYs saved per 100,000 women for each strategy variant compared with the corresponding basic strategyc | Additional QALYsb saved per 100,000 women for each variant compared with the corresponding basic strategy without the variantc | |
| Current practice | 26.2307 | 26.2098 | – | – | – | – |
| Strategy 1 | 26.2306 | 26.2105 | −14.44 | 73.92 | – | – |
| Strategy 1, 10-yearly screening in 50+ years | 26.2302 | 26.2108 | −56.13 | 95.93 | −41.69 | 22.01 |
| Strategy 1, follow-up in 12 months | 26.2317 | 26.2093 | 98.12 | −45.91 | 112.55 | −119.83 |
| Strategy 1, CP screening in < 30 years | 26.2308 | 26.2108 | 2.82 | 100.33 | 17.26 | 26.41 |
| Strategy 1, CP screening in < 35 years | 26.2308 | 26.2109 | 2.39 | 108.99 | 16.83 | 35.07 |
| Strategy 1, 5-yearly screening in all ages | 26.2310 | 26.2092 | 29.90 | −60.17 | 44.34 | −134.09 |
| Strategy 2 | 26.2310 | 26.2111 | 26.42 | 126.84 | – | – |
| Strategy 2, 10-yearly screening in 50+ years | 26.2306 | 26.2113 | −15.65 | 148.27 | −42.06 | 21.43 |
| Strategy 2, follow-up in 12 months | 26.2320 | 26.2097 | 120.70 | −9.75 | 94.28 | −136.60 |
| Strategy 2, CP screening in < 30 years | 26.2310 | 26.2110 | 21.81 | 117.42 | −4.61 | −9.42 |
| Strategy 2, CP screening in < 35 years | 26.2309 | 26.2110 | 15.25 | 121.81 | −11.17 | −5.04 |
| Strategy 2, 5-yearly screening in all ages | 26.2315 | 26.2097 | 70.95 | −6.77 | 44.53 | −133.62 |
| Strategy 3 | 26.2316 | 26.2118 | 82.85 | 201.21 | – | – |
| Strategy 3, 10-yearly screening in 50+ years | 26.2312 | 26.2120 | 40.70 | 222.25 | −42.15 | 21.04 |
| Strategy 3, follow-up in 12 months | 26.2323 | 26.2102 | 155.66 | 44.69 | 72.81 | −156.52 |
| Strategy 3, 5-yearly screening in all ages | 26.2320 | 26.2104 | 125.25 | 65.27 | 42.40 | −135.94 |
| Strategy 4 | 26.2313 | 26.2095 | 54.09 | −27.62 | – | – |
| Strategy 4, 10-yearly screening in 50+ years | 26.2309 | 26.2099 | 13.13 | 8.27 | −40.95 | 35.88 |
| Strategy 4, follow-up in 12 months | 26.2322 | 26.2080 | 148.96 | −176.72 | 94.87 | −149.10 |
| Strategy 4, 5-yearly screening in all ages | 26.2317 | 26.2079 | 93.76 | −192.72 | 39.68 | −165.10 |
| Strategy | Predicted cost and cost-effectiveness | |||||
|---|---|---|---|---|---|---|
| Total discounteda lifetime cost per woman (£) | Annual screening-associated cost in Englandb (£) | Annual cost difference compared with CPc (£) | Cost difference compared with CP (%) | CERd (£/LY saved) (compared with CP) | CERd (£/QALYe saved) (compared with CP) | |
| Current practice | 159 | 155,127,987 | – | – | – | – |
| Strategy 1 | 132 | 127,573,498 | −27,554,488 | −17.8 | N/A | QALY&cost saving |
| Strategy 1, 10-yearly screening in 50+ years | 128 | 120,739,527 | −34,388,460 | −22.2 | N/A | QALY&cost saving |
| Strategy 1, follow-up in 12 months | 147 | 139,270,789 | −15,857,197 | −10.2 | LY&cost saving | N/A |
| Strategy 1, CP screening in < 30 years | 145 | 137,317,005 | −17,810,982 | −11.5 | LY&cost saving | QALY&cost saving |
| Strategy 1, CP screening in < 35 years | 150 | 141,488,808 | −13,639,179 | −8.8 | LY&cost saving | QALY&cost saving |
| Strategy 1, 5-yearly screening in all ages | 143 | 139,876,367 | −15,251,620 | −9.8 | LY&cost saving | N/A |
| Strategy 2 | 135 | 129,905,553 | −25,222,434 | −16.3 | LY&cost saving | QALY&cost saving |
| Strategy 2, 10-yearly screening in 50+ years | 131 | 122,971,696 | −32,156,291 | −20.7 | N/A | QALY&cost saving |
| Strategy 2, follow-up in 12 months | 152 | 143,380,015 | −11,747,972 | −7.6 | LY&cost saving | N/A |
| Strategy 2, CP screening in < 30 years | 148 | 139,716,017 | −15,411,969 | −9.9 | LY&cost saving | QALY&cost saving |
| Strategy 2, CP screening in < 35 years | 151 | 142,970,793 | −12,157,193 | −7.8 | LY&cost saving | QALY&cost saving |
| Strategy 2, 5-yearly screening in all ages | 146 | 142,417,976 | −12,710,010 | −8.2 | LY&cost saving | N/A |
| Strategy 3 | 144 | 136,206,815 | −18,921,171 | −12.2 | LY&cost saving | QALY&cost saving |
| Strategy 3, 10-yearly screening in 50+ years | 140 | 128,936,551 | −26,191,436 | −16.9 | LY&cost saving | QALY&cost saving |
| Strategy 3, follow-up in 12 months | 161 | 149,483,179 | −5,644,807 | −3.6 | £769 | £2,678 |
| Strategy 3, 5-yearly screening in all ages | 156 | 149,465,888 | −5,662,099 | −3.6 | LY&cost saving | QALY&cost saving |
| Strategy 4 | 149 | 144,958,217 | −10,169,770 | −6.6 | LY&cost saving | N/A |
| Strategy 4, 10-yearly screening in 50+ years | 144 | 136,116,284 | −19,011,702 | −12.3 | LY&cost saving | QALY&cost saving |
| Strategy 4, follow-up in 12 months | 167 | 159,245,777 | 4,117,791 | 2.7 | £5071 | N/A |
| Strategy 4, 5-yearly screening in all ages | 162 | 160,009,060 | 4,881,073 | 3.1 | £2512 | N/A |
These results predict that most of the strategies and the variants considered will be less costly than current practice. Table 37 also shows the difference in effectiveness (in terms of life-years saved) between the variant strategies and the corresponding basic strategy without the variant. For each basic strategy, decreasing the follow-up interval for intermediate risk women from 24 to 12 months was the most effective variant, resulting in 73–113 more life-years per 100,000 women than with the corresponding basic strategy. The next most effective strategy was decreasing the routine screening interval from 6- to 5-yearly, which resulted in 40–45 more life-years per 100,000 women than with the corresponding basic strategy.
These results for cost and life-years saved are also summarised graphically in a cost-effectiveness plane, shown in Figure 31.
FIGURE 31.
Cost-effectiveness plane for unvaccinated women (life-years saved outcome). CP, current practice; FU, follow-up; S, strategy.
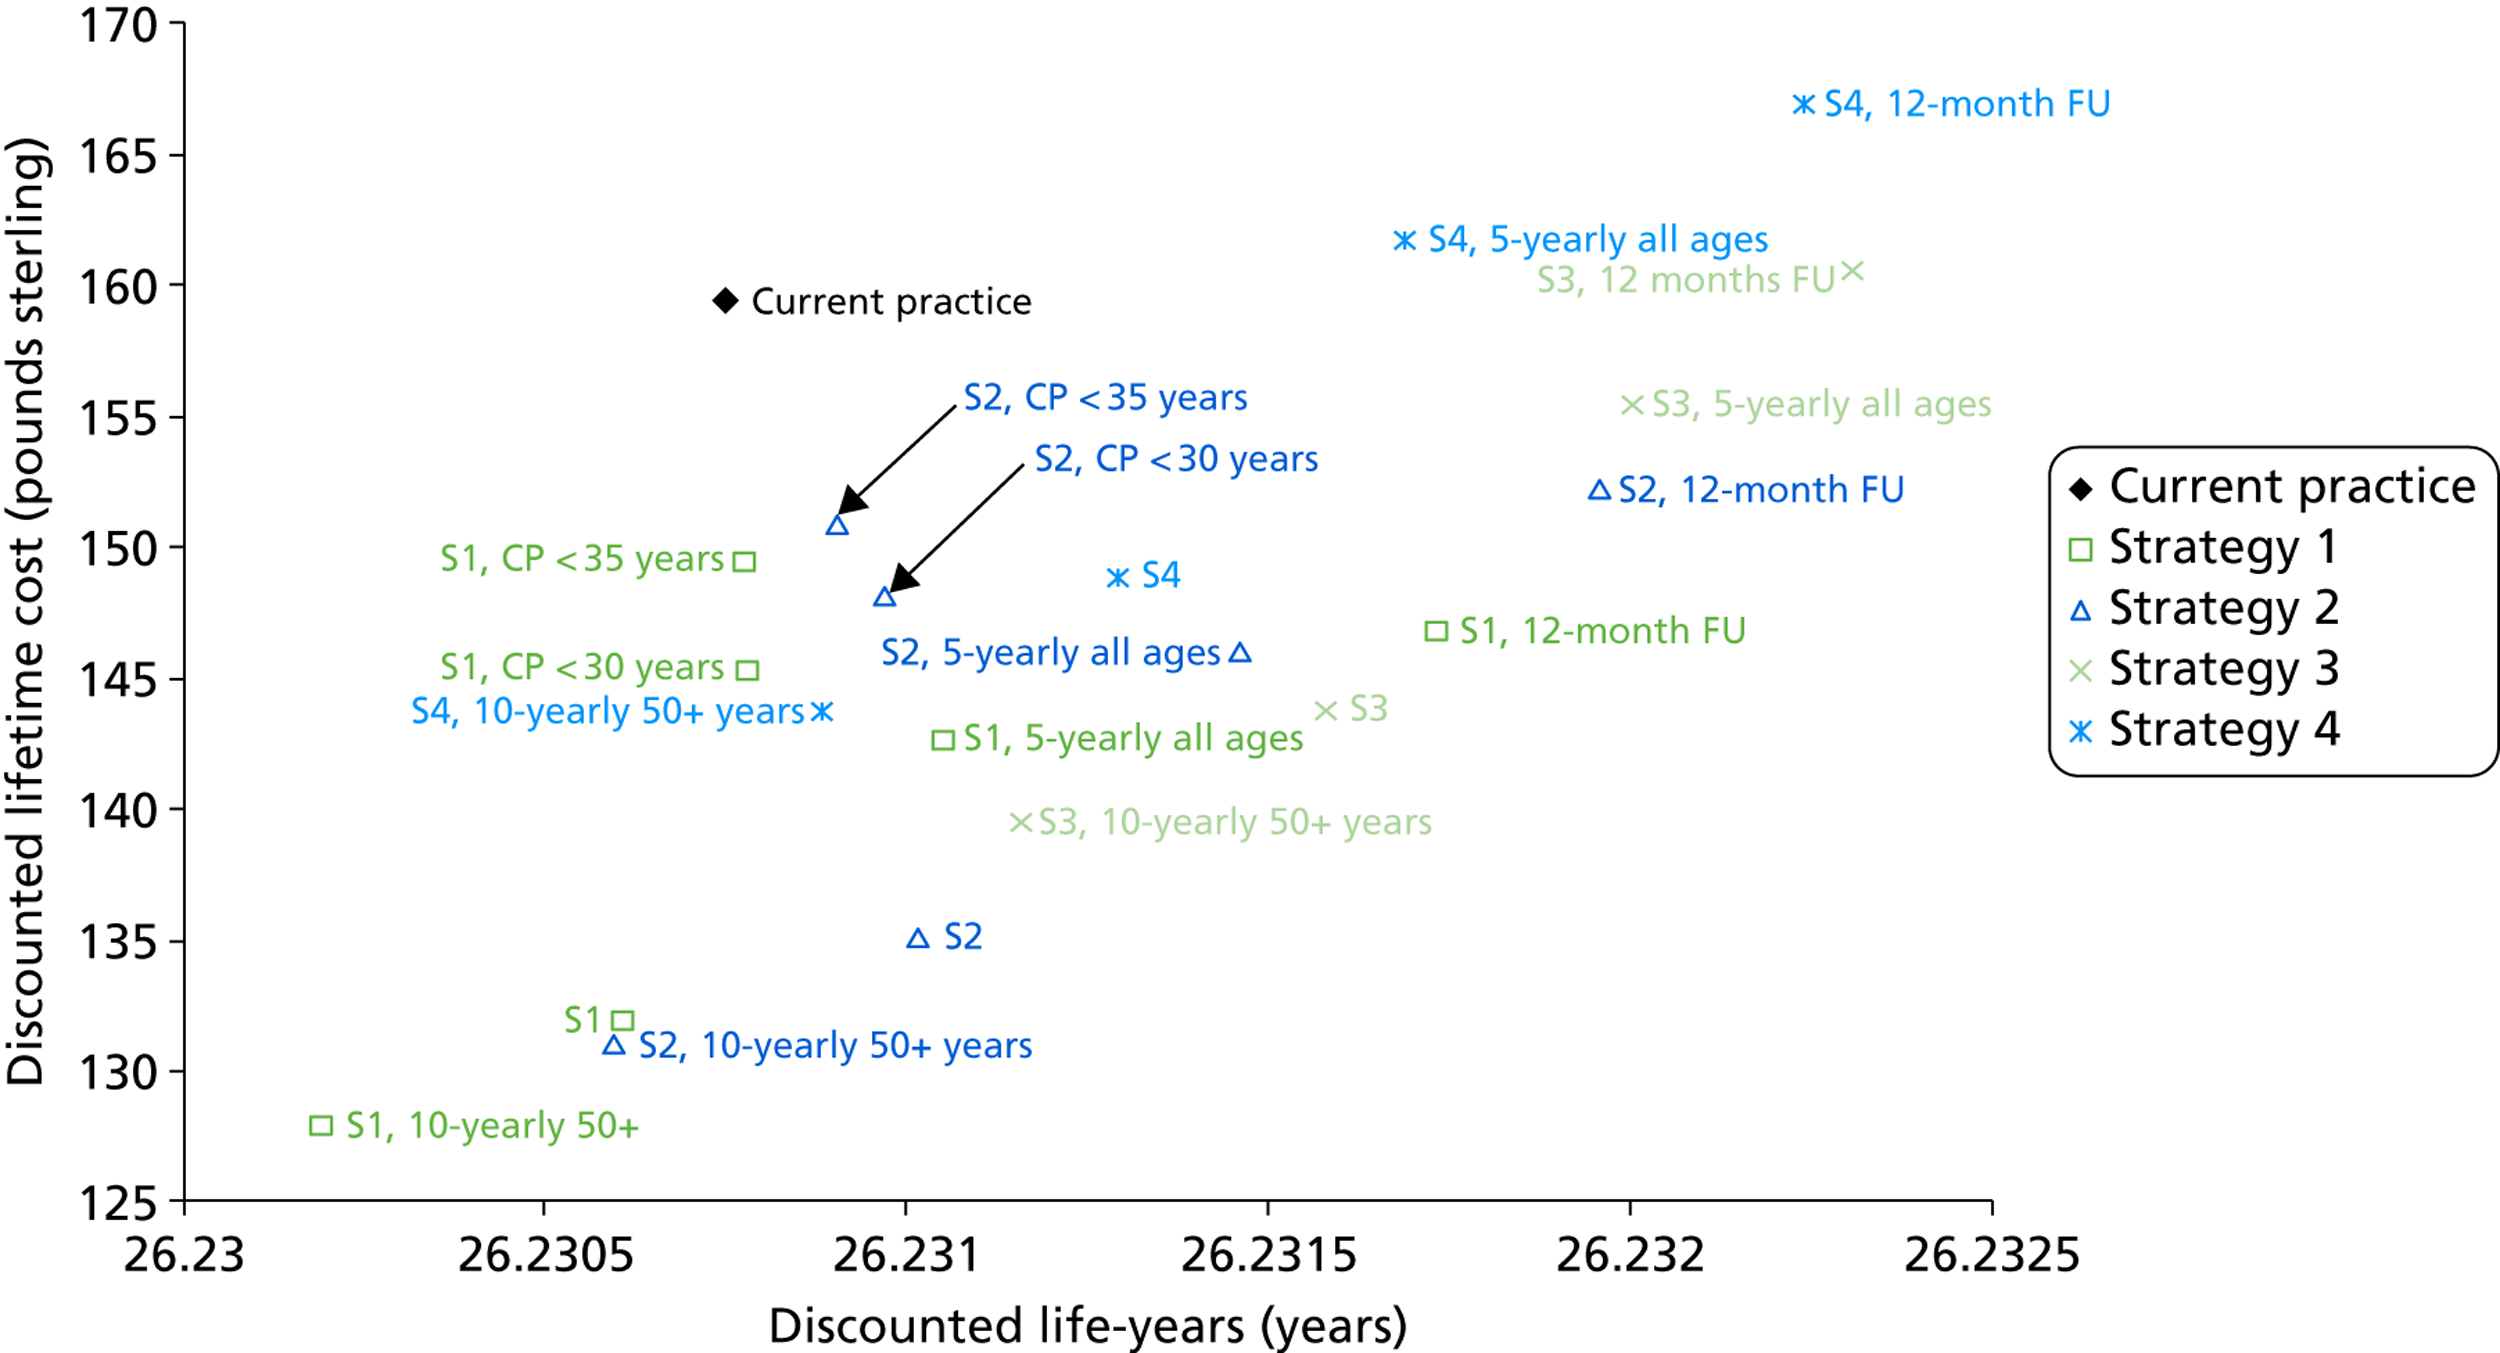
Compared with current practice, and considering the primary effectiveness outcome of life-years saved, almost all primary HPV screening strategies are in either the ‘south-west’ quadrant of the cost-effectiveness plane, (i.e. cost saving but less effective) or the ‘south-east’ quadrant (i.e. cost saving and also more effective). Almost no strategies were predicted to be more costly than current practice, with the notable exceptions of certain variants of co-testing such as 5-yearly screening and 12-month follow-up of intermediate risk women (strategy 4) and strategy 3 (partial genotyping) combined with 12-month follow-up of ‘other oncogenic’ positive women.
It should be noted that the most typical situation for cost-effectiveness analysis is that new strategies are more costly and more effective compared with current practice (i.e. in the ‘north-east’ quadrant of the cost-effectiveness plane). For the current evaluation, in which this generally does not apply, incremental cost-effectiveness ratios are not appropriate or informative53 and, therefore, results for costs, effects and resource utilisation are presented in a disaggregated form.
As discussed in Chapter 2 [see Methods, Cost and utilities (quality-adjusted life-year weights)], we considered two sets of QALY weights for exploratory analysis, and the findings are presented in the cost-effectiveness planes in Figures 32 (QALY weight set 1) and 33 (QALY weight set 2).
FIGURE 32.
Cost-effectiveness plane for unvaccinated women (QALY outcome) using QALY weight set 1. CP, current practice; FU, follow-up; S, strategy.
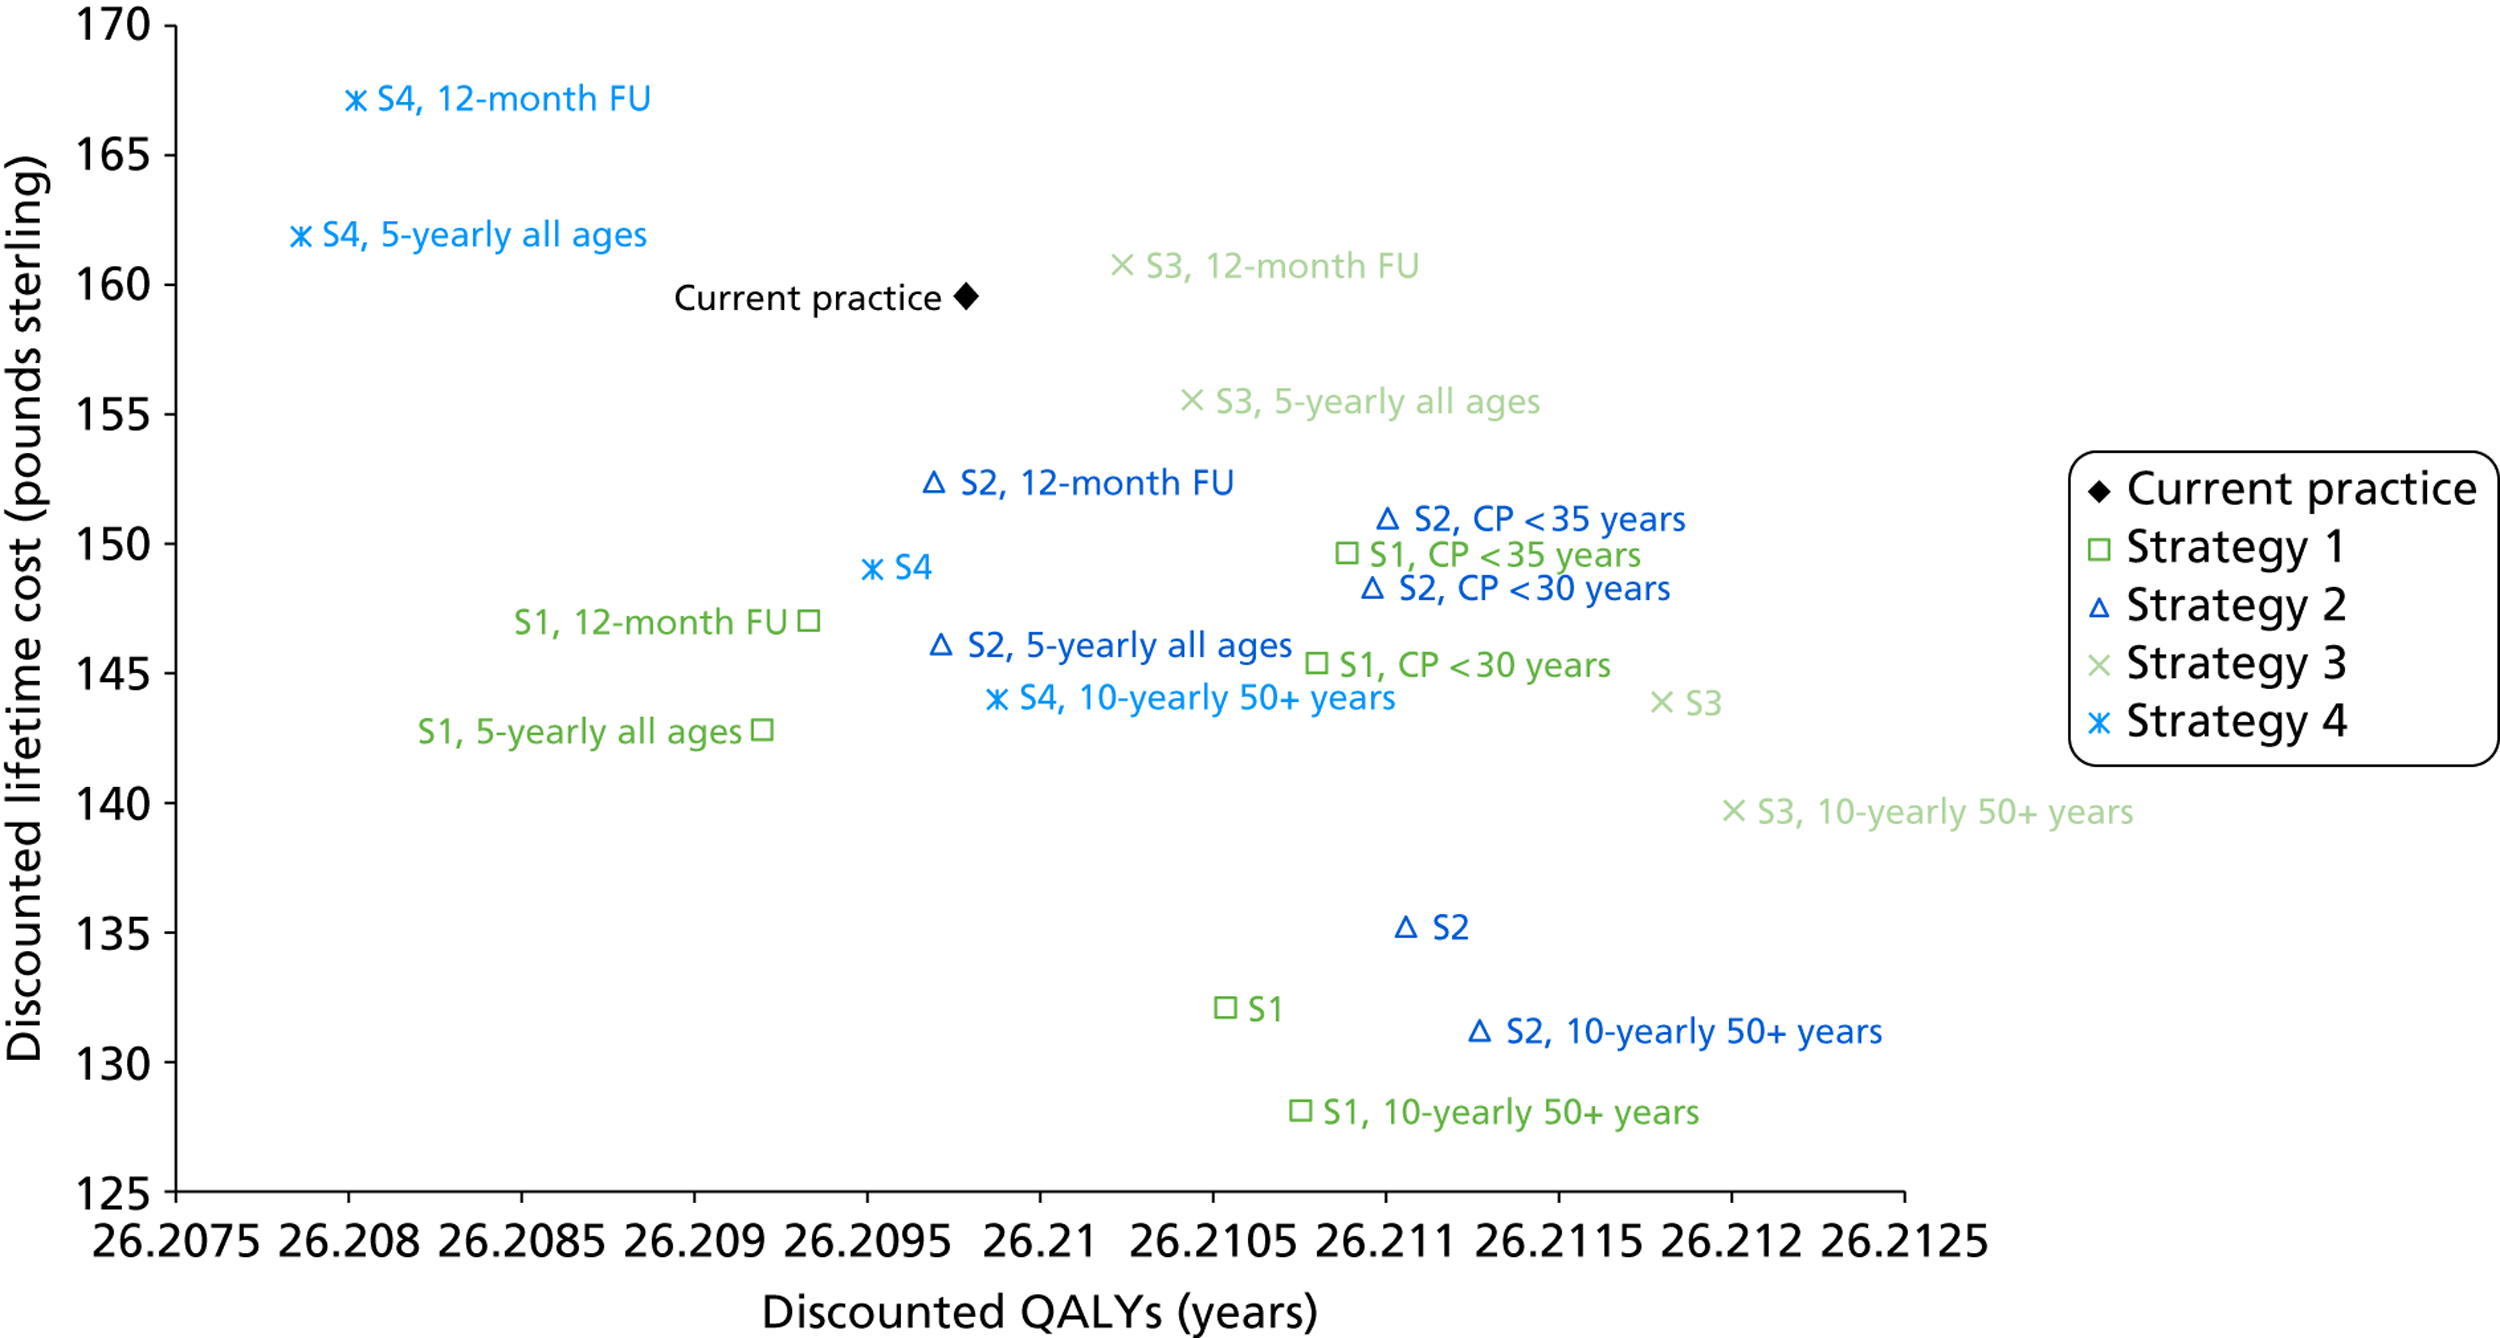
FIGURE 33.
Cost-effectiveness plane for unvaccinated women (QALY outcome) using QALY weight set 2. CP, current practice; FU, follow-up; S, strategy.
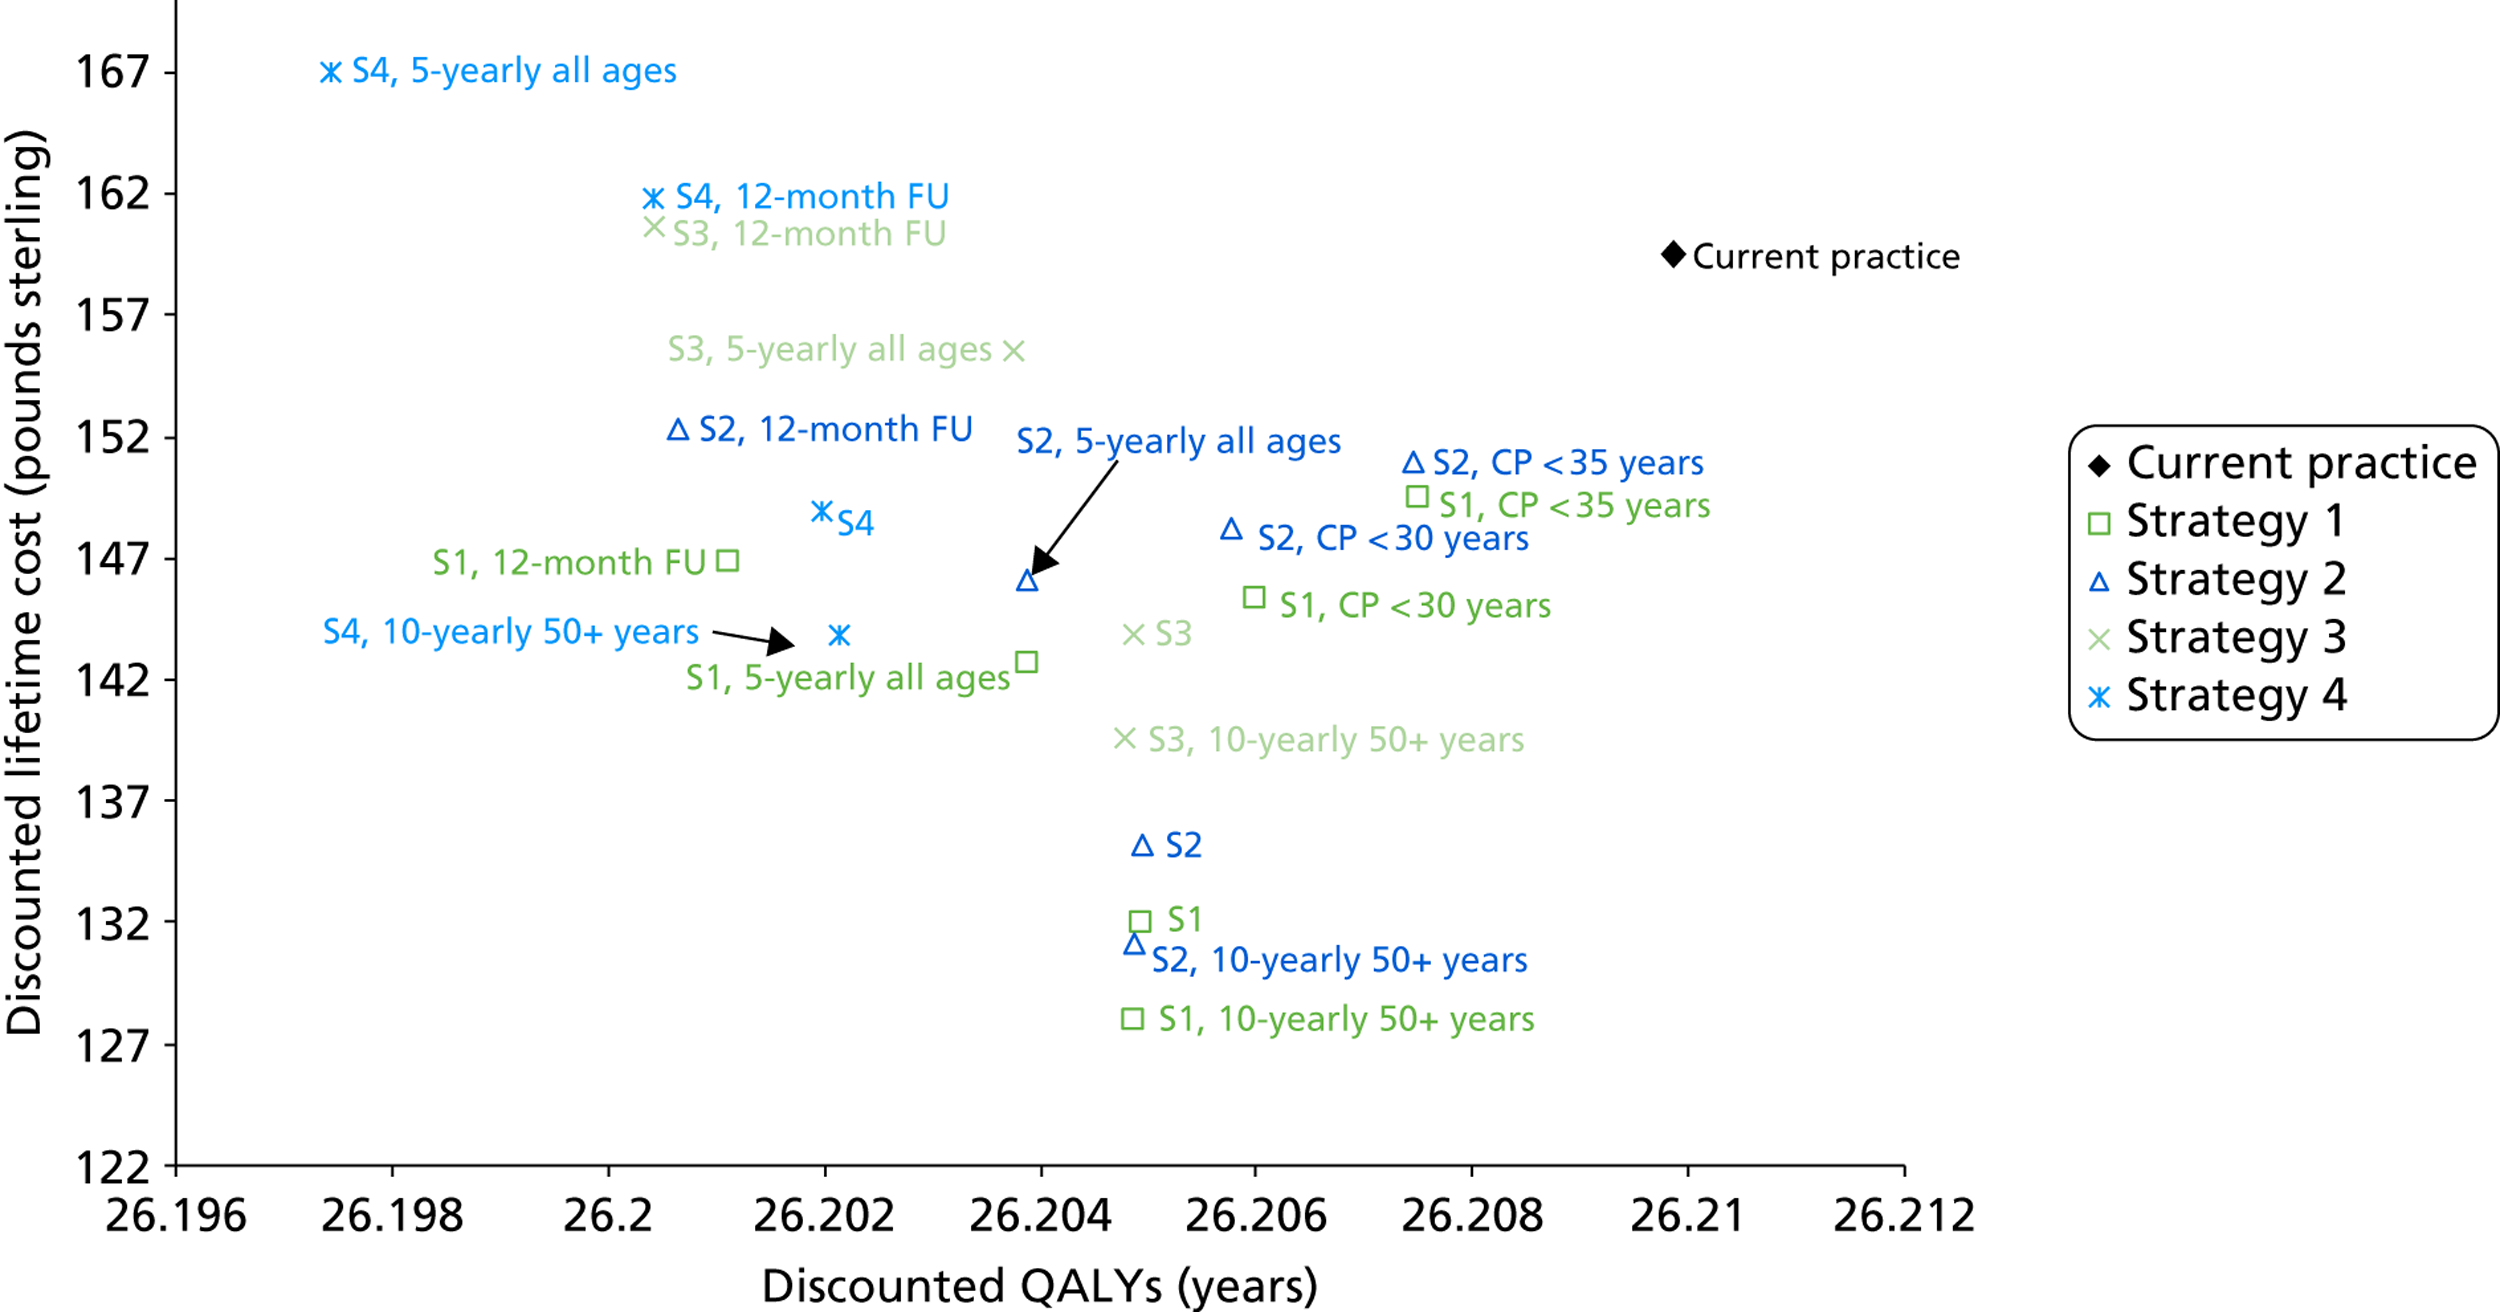
The ranking of strategies when QALYs were considered as the effectiveness outcome differed considerably from the life-years saved outcome (see Figure 31) for both QALY weight sets 1 and 2. QALY weights set one was used to calculate the outcomes depicted in Figure 32, and because this applies a disutility to the experience of being screened, the primary HPV screening strategies involving more screening (i.e. decreased screening interval) or more follow-up resulted in lower effectiveness. When the alternative set of QALY weights two (shown in Figure 33) were used, the position of strategies relative to each other on the cost-effectiveness plane was different again. QALY weight set two does not apply a disutility to being screened; however, this QALY weight set applies a higher disutility to having positive HPV test, and so all of the primary HPV screening strategies appear less effective than current practice. The diversity of the findings when different QALY weights are used emphasises the uncertainty involved in the selection and application of these weightings. Therefore, this report focuses on the life-years saved outcome as the main outcome. This result also highlights a need for further investigation into utilities relevant to primary HPV screening.
When considering the primary outcome of LY saved (see Figure 31), the basic strategies 2 and 3 both involved cost savings in the context of increased life-years saved. In both cases, increasing the frequency of screening to 5-yearly and/or decreasing the follow-up interval in HPV-positive, triage-negative women, improved the effectiveness (and increased costs) of the strategies. Either of these actions applied to strategy 1 also made this strategy both cost and life-year saving. The increased costs were primarily driven by increasing numbers of screening tests (for 5-yearly vs. less frequent screening strategies) or by increasing numbers of diagnostic referrals (for 12-month follow-up of HPV-positive, triage-negative women).
Most of the primary HPV strategies examined were cost saving and many of the strategies also resulted in an increase in predicted life-years saved in the population. The most effective strategy involving HPV as the sole primary screening test incorporated genotyping for HPV 16/18 and direct referral of women positive for these types to colposcopy, but although this is predicted to be cost saving compared with current screening practice, it would substantially increase the number of colposcopy referrals.
In general, strategies for which HPV is used as the sole primary screening test were found to be both cost and life-years saving, if attention was paid to the optimal combination of screening interval (5- or 6-yearly) and follow-up interval (12 or 24 months) for HPV-positive, triage-negative (‘intermediate risk’) women. Decreasing the follow-up interval for intermediate risk women from 24 to 12 months increased the overall effectiveness of primary HPV screening. If 24-month follow-up is retained, the (relative) loss of effectiveness can be partly compensated for by decreasing the screening interval from 6-yearly to 5-yearly, although this was generally a less effective approach than optimising the follow-up of intermediate risk women.
The exploratory strategies for which cytology screening was retained until either age 30 or 35 years, and for which a switch to primary HPV screening was implemented in older women, were predicted to be of somewhat higher costs than those associated with full implementation of primary HPV screening from age 25 years. Findings for this variant of strategy 1 are somewhat difficult to interpret, because the basic version of this strategy was slightly less effective than current practice. However, for strategy 2, the mixed strategy of cytology in younger women switching to HPV screening in older women was found to be of intermediate effectiveness to the related ‘pure’ strategies (i.e. less effective than full implementation of primary HPV screening but more effective than current practice).
Health outcomes, cervical cancer and mortality rates in an unvaccinated setting
Model predictions for health outcomes in an unvaccinated setting (i.e. prior to the impact of vaccination) are summarised in Table 39, and the related data for predicted age-standardised incidence and mortality rates for cervical cancer in England under current practice and for each of the potential primary HPV screening strategies are shown graphically in Figure 34. Each point on the graph represents the predicted incidence and mortality rate associated with a particular strategy (as shown in the figure). In general terms, most of the primary HPV screening strategies resulted in a predicted equivalence (or close-to-equivalence) or improvement in the predicted rates of cervical cancer incidence and mortality, compared with current practice, with the notable exception of strategies involving 10-yearly screening in women over 50 years of age.
| Strategy | Predicted health outcomes in England | ||||
|---|---|---|---|---|---|
| Cervical cancer cases p.a.a | Cumulative lifetime risk of cervical cancer (% increase compared with CP) | ASR cancer incidence per 100,000 womenb | Cervical cancer deaths p.a.a | ASR cancer mortality per 100,000 womenb | |
| Current practice | 2521 | 0.74% (–) | 8.88 | 761 | 2.45 |
| Strategy 1 | 2590 | 0.76% (1.9%) | 9.22 | 741 | 2.43 |
| Strategy 1, 10-yearly screening in 50+ years | 2781 | 0.82% (–) | 9.75 | 850 | 2.71 |
| Strategy 1, follow-up in 12 months | 2329 | 0.68% (−7.8%) | 8.25 | 663 | 2.15 |
| Strategy 1, CP screening in < 30 years | 2544 | 0.74% (–) | 9.02 | 740 | 2.42 |
| Strategy 1, CP screening in < 35 years | 2523 | 0.74% (−0.4%) | 8.95 | 737 | 2.41 |
| Strategy 1, 5-yearly screening in all ages | 2456 | 0.72% (–) | 8.76 | 688 | 2.26 |
| Strategy 2 | 2495 | 0.73% (−1.7%) | 8.88 | 708 | 2.32 |
| Strategy 2, 10-yearly screening in 50+ years | 2689 | 0.8% (–) | 9.41 | 818 | 2.60 |
| Strategy 2, follow-up in 12 months | 2269 | 0.67% (−10.2%) | 8.04 | 644 | 2.09 |
| Strategy 2, CP screening in < 30 years | 2489 | 0.73% (–) | 8.83 | 717 | 2.34 |
| Strategy 2, CP screening in < 35 years | 2481 | 0.73% (−2.2%) | 8.81 | 718 | 2.35 |
| Strategy 2, 5-yearly screening in all ages | 2359 | 0.69% (–) | 8.41 | 655 | 2.15 |
| Strategy 3 | 2366 | 0.69% (−6.8%) | 8.41 | 663 | 2.17 |
| Strategy 3, 10-yearly screening in 50+ years | 2563 | 0.76% (–) | 8.96 | 773 | 2.45 |
| Strategy 3, follow-up in 12 months | 2183 | 0.64% (−13.6%) | 7.73 | 614 | 1.99 |
| Strategy 3, 5-yearly screening in all ages | 2233 | 0.65% (–) | 7.96 | 613 | 2.01 |
| Strategy 4 | 2418 | 0.71% (−4.7%) | 8.60 | 685 | 2.24 |
| Strategy 4, 10-yearly screening in 50+ years | 2609 | 0.77% (–) | 9.12 | 792 | 2.51 |
| Strategy 4, follow-up in 12 months | 2188 | 0.64% (−13.3%) | 7.74 | 620 | 2.01 |
| Strategy 4, 5-yearly screening in all ages | 2294 | 0.67% (–) | 8.18 | 636 | 2.09 |
FIGURE 34.
Age-standardised rate (ASR) (assuming the European Standard Population52) predictions for cancer incidence and mortality are shown for each strategy and the variants as the black circles and green squares, respectively. Current practice (CP) predictions for cancer incidence and mortality are shown as the black and green lines, respectively, for ease of comparison with the other strategies.
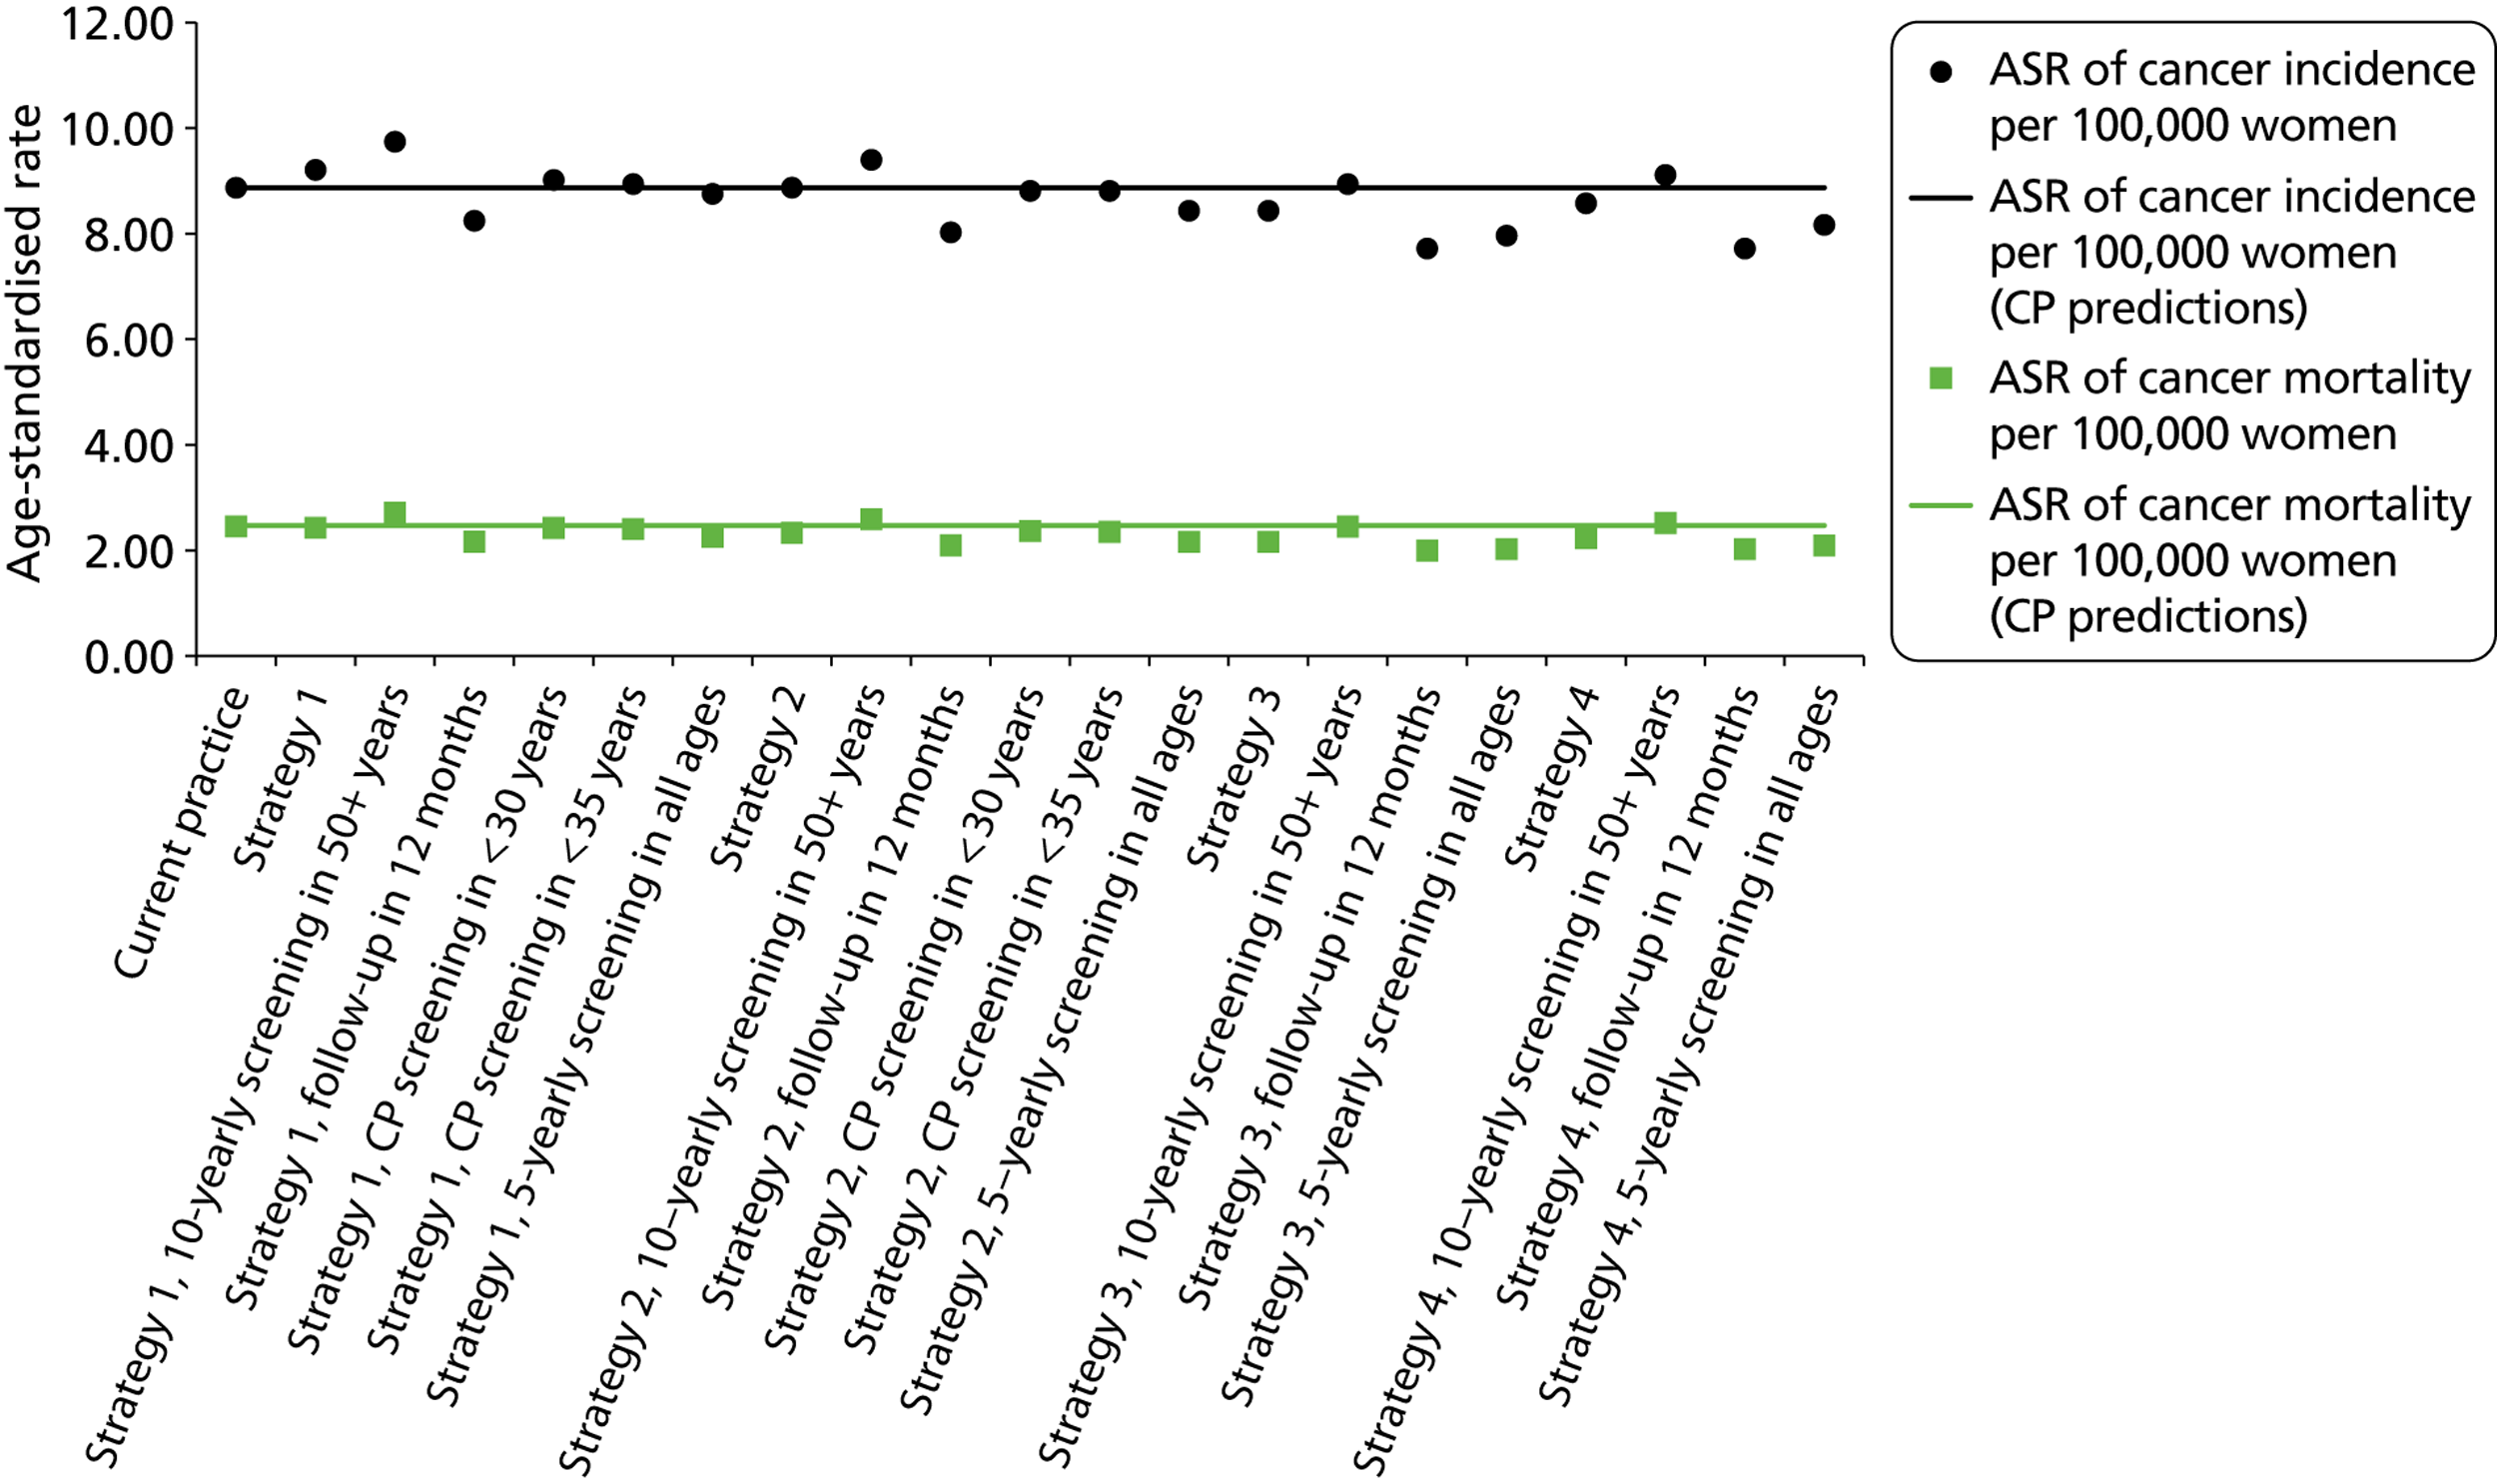
Resource utilisation in an unvaccinated setting
Table 40 shows predicted annual outcomes of resource utilisation in England (assuming an unvaccinated setting, i.e. prior to the impact of vaccination). The annual number of HPV tests and cytology tests are shown graphically in Figure 35. This figure shows that the number of screening tests in the majority of strategies is predicted to be lower than current practice, although in the co-testing strategies (strategy 4 and variants), the number of overall number of HPV and cytology tests is, not unexpectedly, predicted to increase.
| Strategy | Predicted resource utilisation (annually in England)a | ||||
|---|---|---|---|---|---|
| No. of cytology tests (all ages) | No. of HPV tests | No. of colposcopies (first attendance) | No. of women receiving a biopsy | No. of of women with histologically confirmed CIN2/3 | |
| Current practice | 3,703,772 | 245,330 | 128,254 | 87,821 | 41,309 |
| Strategy 1 | 636,790 | 2,255,505 | 110,393 | 75,187 | 39,464 |
| Strategy 1, 10-yearly screening in 50+ years | 604,792 | 2,011,677 | 107,268 | 73,917 | 38,950 |
| Strategy 1, follow-up in 12 months | 728,743 | 2,347,880 | 140,980 | 96,077 | 42,561 |
| Strategy 1, CP screening in < 30 years | 1,065,769 | 1,930,097 | 129,221 | 88,830 | 41,083 |
| Strategy 1, CP screening in < 35 years | 1,448,150 | 1,699,938 | 129,782 | 88,946 | 41,135 |
| Strategy 1, 5-yearly screening in all ages | 699,337 | 2,615,797 | 116,937 | 79,372 | 40,446 |
| Strategy 2 | 636,161 | 2,251,914 | 123,140 | 84,156 | 39,850 |
| Strategy 2, 10-yearly screening in 50+ years | 604,028 | 2,008,407 | 119,677 | 82,751 | 39,339 |
| Strategy 2, follow-up in 12 months | 726,801 | 2,342,664 | 161,880 | 110,858 | 42,721 |
| Strategy 2, CP screening in < 30 years | 1,068,497 | 1,930,624 | 141,238 | 96,997 | 41,125 |
| Strategy 2, CP screening in < 35 years | 1,450,118 | 1,699,988 | 137,213 | 93,733 | 41,143 |
| Strategy 2, 5-yearly screening in all ages | 698,731 | 2,611,853 | 130,579 | 88,926 | 40,829 |
| Strategy 3 | 564,796 | 2,244,887 | 154,754 | 106,028 | 40,585 |
| Strategy 3, 10-yearly screening in 50+ years | 534,236 | 2,002,084 | 150,325 | 104,239 | 40,100 |
| Strategy 3, follow-up in 12 months | 651,412 | 2,334,722 | 192,897 | 132,409 | 43,147 |
| Strategy 3, 5-yearly screening in all ages | 622,891 | 2,604,146 | 165,242 | 112,755 | 41,558 |
| Strategy 4 | 2,574,064 | 2,269,169 | 127,790 | 87,161 | 40,525 |
| Strategy 4, 10-yearly screening in 50+ years | 2,279,088 | 2,024,446 | 124,084 | 85,661 | 40,027 |
| Strategy 4, follow-up in 12 months | 2,704,332 | 2,366,826 | 167,812 | 114,774 | 43,471 |
| Strategy 4, 5-yearly screening in all ages | 2,980,632 | 2,628,841 | 135,479 | 92,060 | 41,433 |
FIGURE 35.
Annual number of cytology and HPV tests performed in England as predicted by the model for each of the strategies and the variants in an unvaccinated setting. CP, current practice; S, strategy.
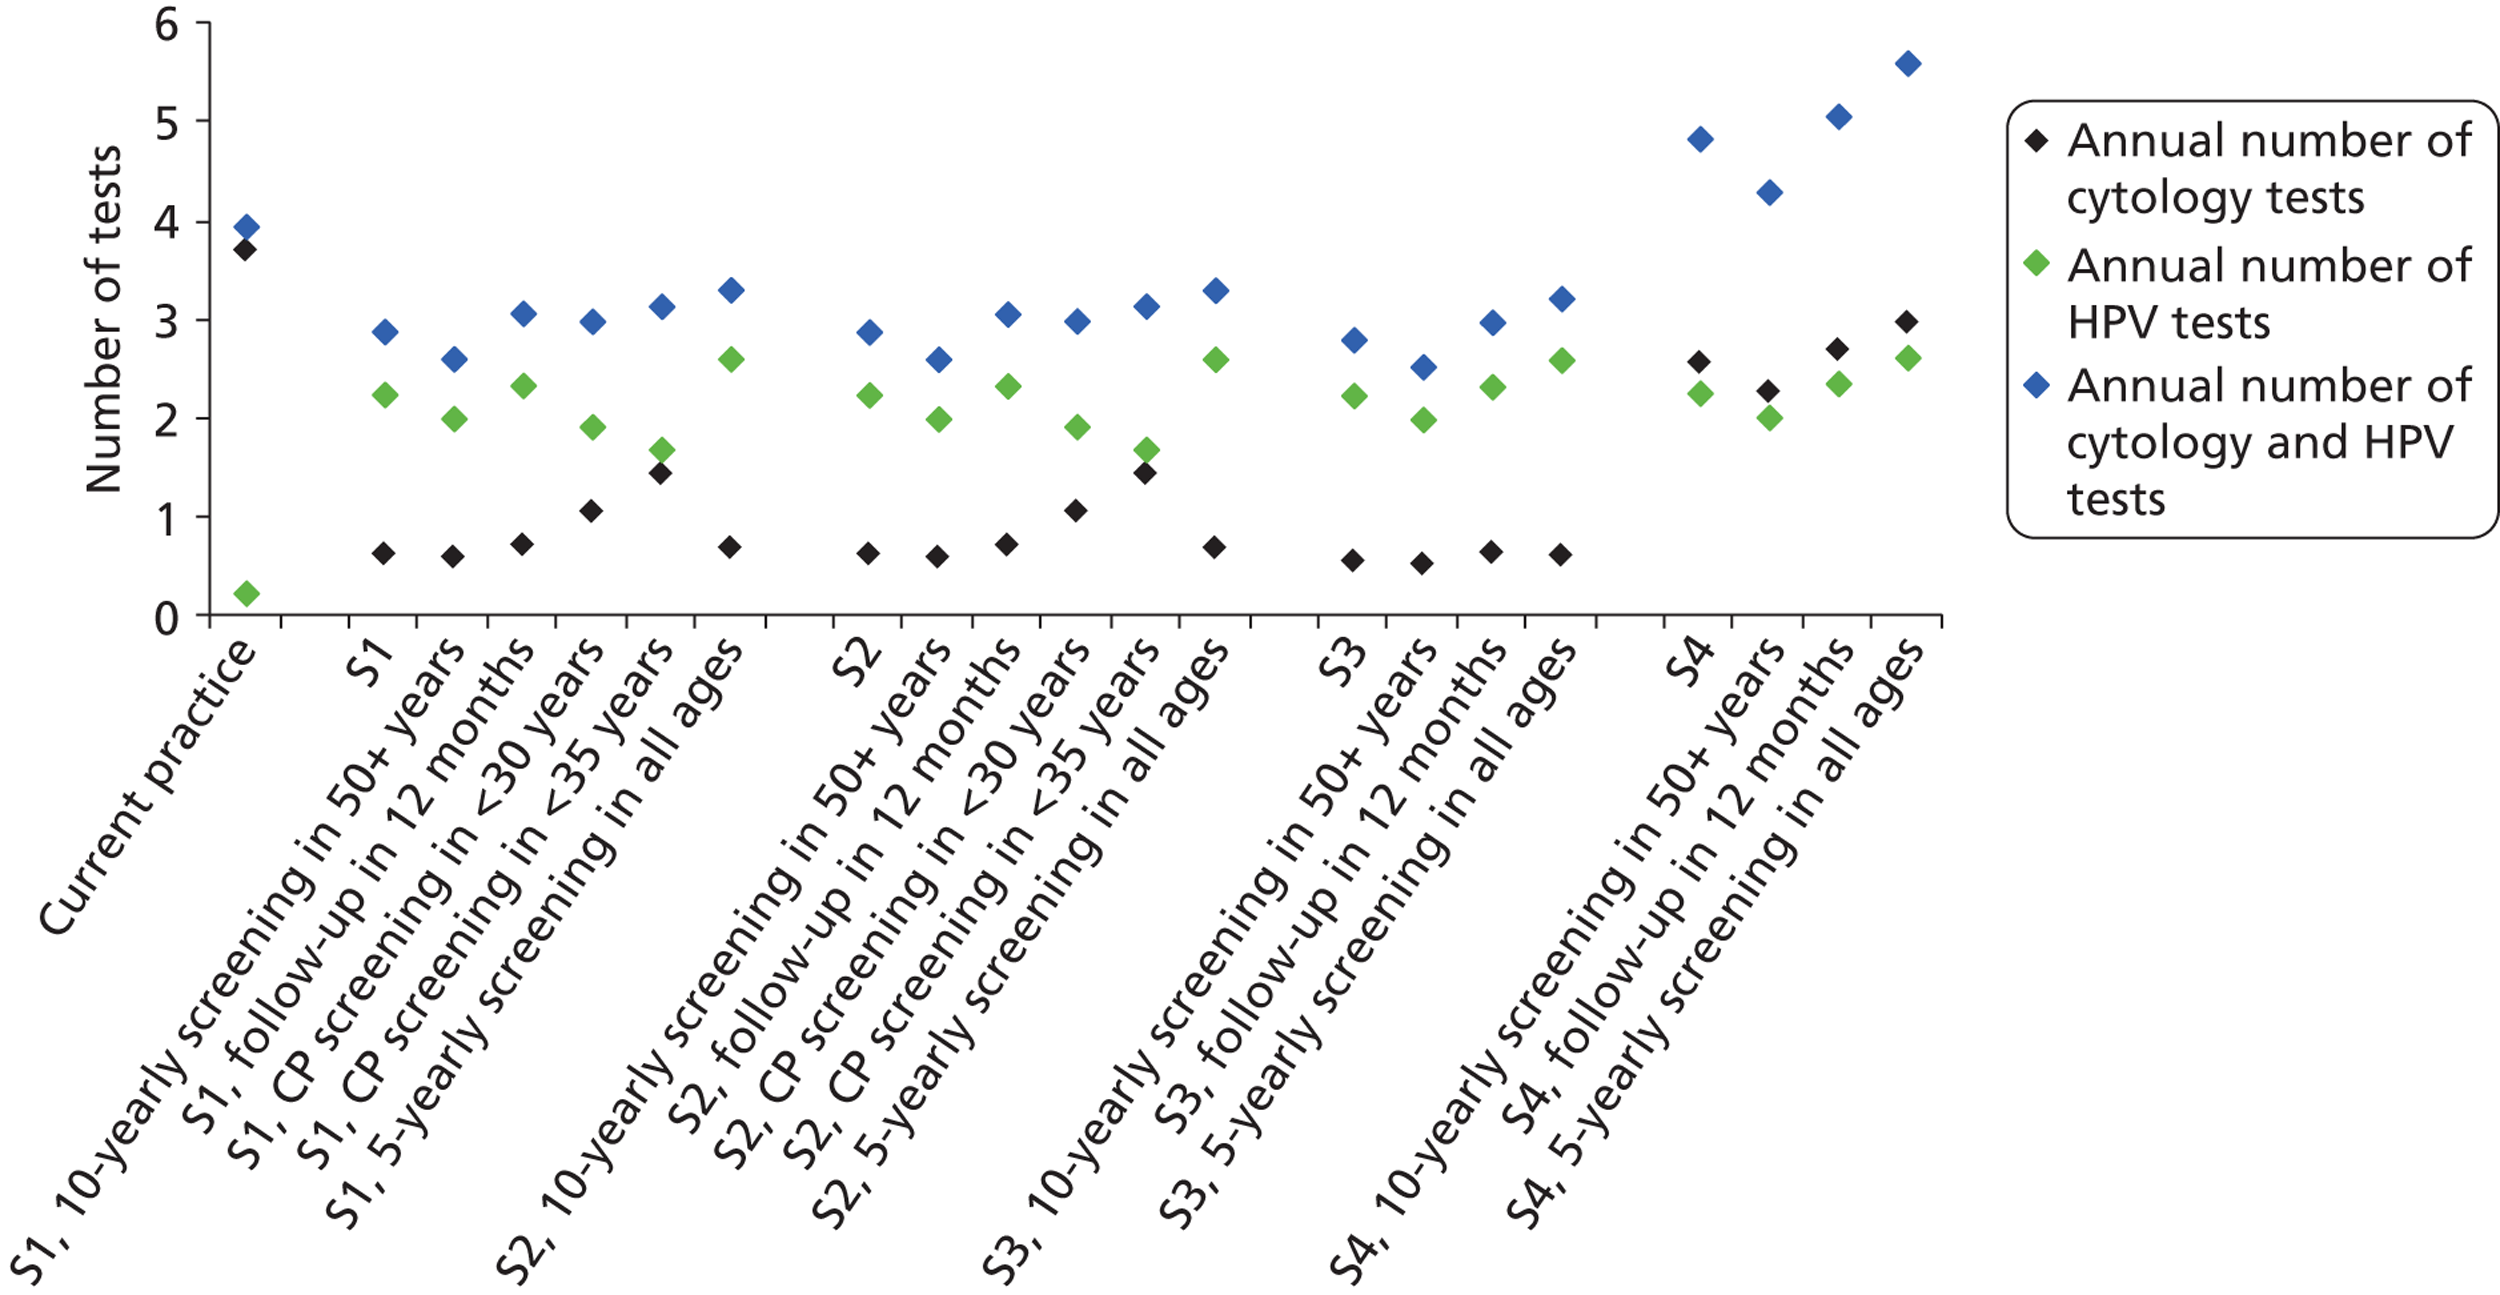
The annual number of colposcopies performed in England is shown in Figure 36. The strategies varied in respect to whether a greater or lower number of colposcopies were predicted in relation to current practice. In general terms, more colposcopies were predicted for strategy 3, which involved genotyping and thus referred HPV 16/18 positive women to colposcopy immediately. In general terms, the number of biopsies was predicted to be proportional to the number of colposcopies performed – the model generally predicts that about 48% of women who attend a colposcopy will have a biopsy taken.
FIGURE 36.
Annual number of colpsocopies performed in England as predicted by the model for each of the strategies and the variants. CP, current practice; S, strategy.
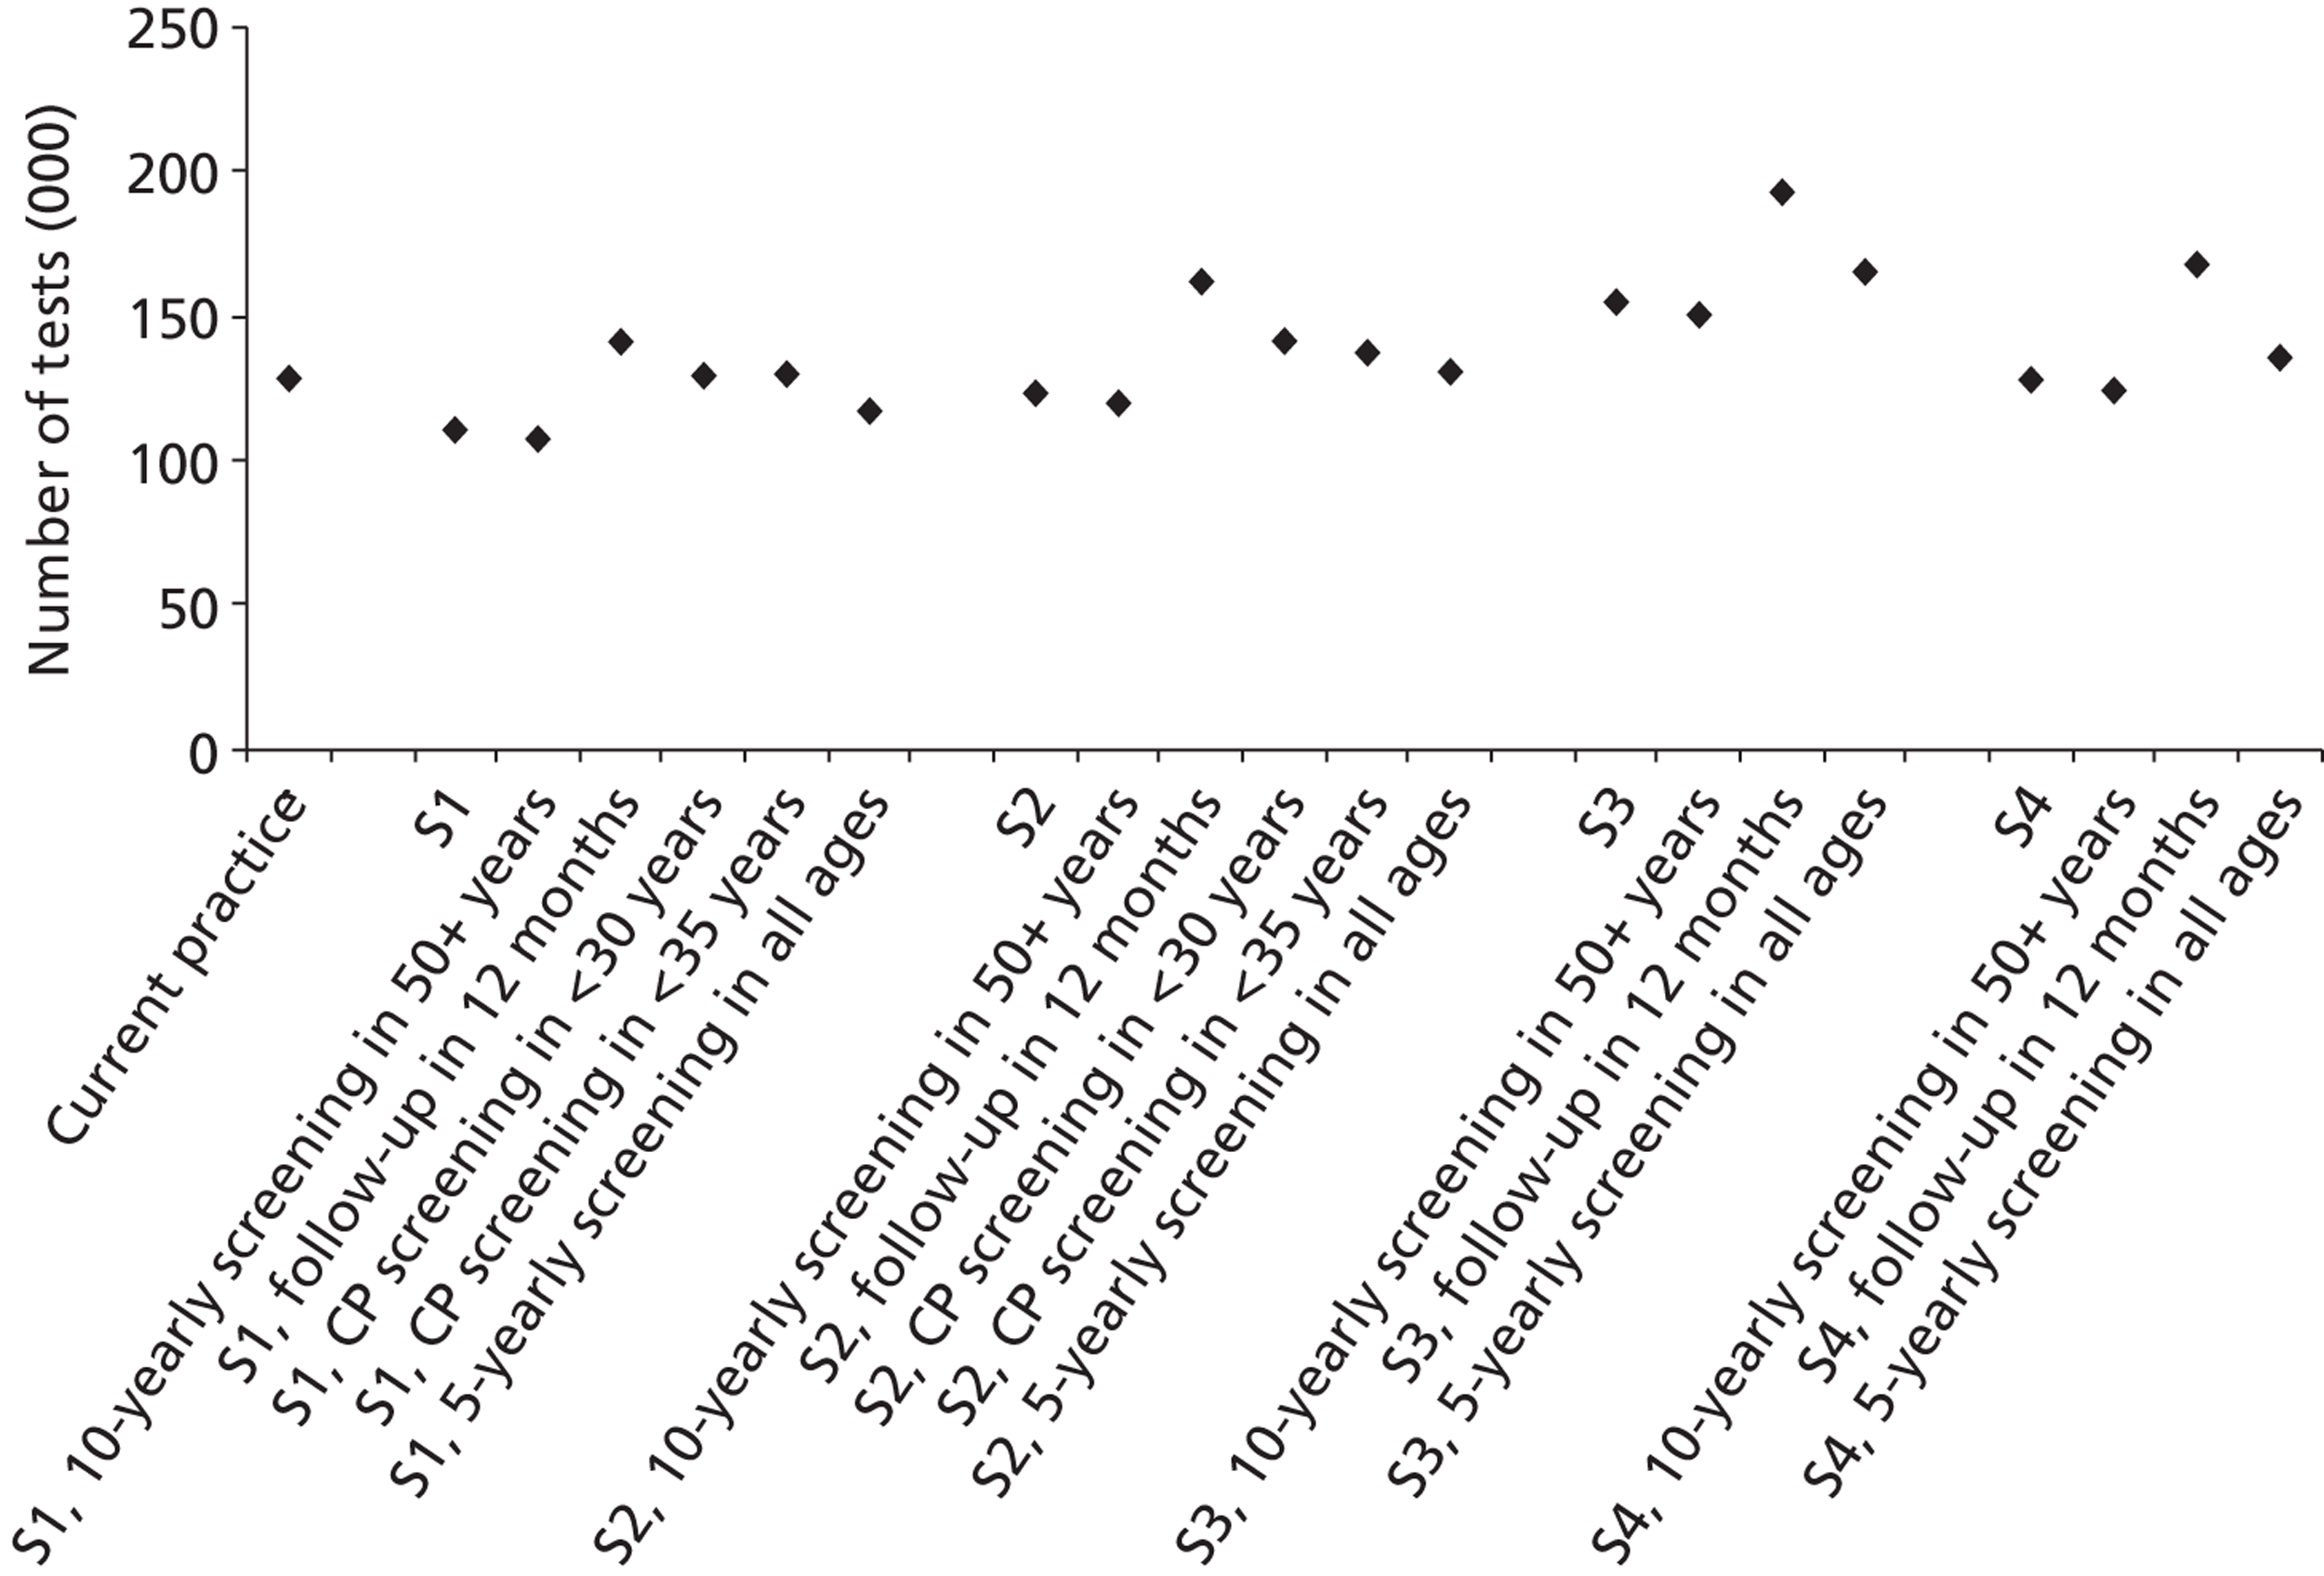
Summary of the effectiveness and costs of the strategies in an unvaccinated cohort
Overall, when considering unvaccinated women, strategies 2 and 3 (and most of their variants) were cost and life-years saving, but strategy 1 could also be tailored to be cost and life-years saving by decreasing the follow-up time for intermediate risk women to 12 months.
Model predictions for the screening strategies in a vaccinated setting
A general summary of resource utilisation, cancer incidence and mortality, and costs as predicted by the model for each of the strategies and the variants in a vaccinated setting is given in this section.
A summary of cost, health and resource utilisation outputs for the four main strategies when considering the effect of vaccination is shown in Table 41.
| Model output | With vaccination | ||||
|---|---|---|---|---|---|
| Current practice | Strategy 1 | Strategy 2 | Strategy 3 | Strategy 4 | |
| Predicted cost and effectiveness | |||||
| Total discounteda lifetime cost per woman (£) | 129 | 101 | 102 | 102 | 116 |
| Total discounteda LYs per woman | 26.2366 | 26.2365 | 26.2365 | 26.2366 | 26.2366 |
| Total discounteda QALYs per woman | 26.2187 | 26.2208 | 26.2208 | 26.2209 | 26.2191 |
| Additional LYs saved per 100,000 women compared with CP (negative indicates fewer LYs) | – | −12.44 | −8.39 | −2.56 | 1.89 |
| Additional QALYs saved per 100,000 women compared with CP (negative indicates fewer QALYs) | – | 206.30 | 211.57 | 219.25 | 34.55 |
| Annual screening-associated cost in Englandb (£) | 128,741,901 | 101,051,532 | 101,259,659 | 101,825,744 | 116,631,025 |
| Annual cost difference compared with CP (£) | – | −27,690,369 | −27,482,242 | −26,916,157 | −12,110,876 |
| Cost difference compared with CP (%) | – | −22 | −21 | −21 | −9 |
| Predicted health outcomes in England | |||||
| Cervical cancer cases p.a.b | 1064 | 1104 | 1096 | 1083 | 1066 |
| ASR cancer incidence per 100,000 womenc | 3.65 | 3.84 | 3.81 | 3.76 | 3.70 |
| Cumulative lifetime risk of cervical cancer (%) | 0.32 | 0.33 | 0.33 | 0.32 | 0.32 |
| Increase in lifetime risk (compared with CP) (%) | – | 2.7 | 1.9 | 0.8 | −0.8 |
| Cervical cancer deaths p.a.b | 338 | 333 | 330 | 326 | 320 |
| ASR cancer mortality per 100,000 womenc | 1.05 | 1.05 | 1.04 | 1.03 | 1.01 |
| Cumulative lifetime risk of cervical cancer death (%) | 0.11 | 0.11 | 0.11 | 0.10 | 0.10 |
| Increase in lifetime risk of death (compared with CP) (%) | – | −2.7 | −3.5 | −4.7 | −6.3 |
| Predicted resource utilisation (annually in England)b | |||||
| No. of cytology tests (all ages) | 3,663,477 | 493,864 | 493,749 | 486,707 | 2,505,463 |
| No. of HPV tests | 210,687 | 2,272,954 | 2,272,615 | 2,271,942 | 2,290,185 |
| No. of women receiving a biopsy | 60,897 | 49,123 | 49,975 | 52,072 | 52,200 |
| No. of colposcopies (first attendance) | 89,848 | 72,943 | 74,112 | 77,048 | 77,660 |
| No. of women with histologically confirmed CIN2/3 | 24,365 | 22,909 | 22,951 | 23,036 | 23,383 |
The cost savings associated with primary HPV screening in a vaccinated cohort range from 9% to 22%. The cost savings are driven both by reduction in the overall number of screening tests and the number of diagnostic referrals. The most effective strategies in a vaccinated cohort are predicted to be strategy 3 (genotyping) and strategy 4 (co-testing).
Model predictions for effectiveness are summarised in Table 42 and model predictions for cost and cost-effectiveness are summarised in Table 43. These results are summarised graphically in a cost-effectiveness plane (i.e. a diagram summarising the cost and effectiveness for each strategy) depicting the relative costs and effects associated with each of the strategies. Figures 37 and 38 provide an alternative representation where variant strategies are grouped graphically by type of variation. These graphics emphasise the importance of the follow-up of intermediate risk women, because strategies involving 12-month follow-up are consistently the most effective (compared with 24-month follow-up with the same strategy) in a vaccinated cohort.
| Strategy | Predicted effectiveness | |||||
|---|---|---|---|---|---|---|
| Total discounteda LYs per woman | Total discounteda QALYsb per woman | Additional LYs saved per 100,000 women compared with CPc | Additional QALYsb saved per 100,000 women compared with CPc | Additional LYs saved per 100,000 women for each variant compared with the corresponding basic strategy without the variantc | Additional QALYsb saved per 100,000 women for each variant compared with the corresponding basic strategy without the variantc | |
| Current practice | 26.2366 | 26.2187 | – | – | – | – |
| Strategy 1 | 26.2365 | 26.2208 | −12.44 | 206.30 | – | – |
| Strategy 1, 10-yearly screening in 50+ years | 26.2362 | 26.2212 | −35.40 | 248.14 | −22.97 | 41.84 |
| Strategy 1, follow-up in 12 months | 26.2369 | 26.2194 | 28.31 | 71.76 | 40.75 | −134.54 |
| Strategy 1, CP screening in < 30 years | 26.2365 | 26.2204 | −5.82 | 167.07 | 6.62 | −39.23 |
| Strategy 1, CP screening in < 35 years | 26.2366 | 26.2201 | −3.24 | 143.27 | 9.20 | −63.02 |
| Strategy 1, 5-yearly screening in all ages | 26.2367 | 26.2192 | 8.04 | 53.49 | 20.47 | −152.80 |
| Strategy 2 | 26.2365 | 26.2208 | −8.39 | 211.57 | – | – |
| Strategy 2, 10-yearly screening in 50+ years | 26.2363 | 26.2212 | −31.37 | 253.38 | −22.99 | 41.81 |
| Strategy 2, follow-up in 12 months | 26.2369 | 26.2195 | 30.54 | 75.33 | 38.93 | −136.24 |
| Strategy 2, CP screening in < 30 years | 26.2365 | 26.2204 | −4.17 | 168.58 | 4.22 | −42.98 |
| Strategy 2, CP screening in < 35 years | 26.2366 | 26.2202 | −2.21 | 144.35 | 6.18 | −67.22 |
| Strategy 2, 5-yearly screening in all ages | 26.2367 | 26.2193 | 12.09 | 58.78 | 20.48 | −152.78 |
| Strategy 3 | 26.2366 | 26.2209 | −2.56 | 219.25 | – | – |
| Strategy 3, 10-yearly screening in 50+ years | 26.2363 | 26.2213 | −25.56 | 261.03 | −23.00 | 41.78 |
| Strategy 3, follow-up in 12 months | 26.2369 | 26.2195 | 34.13 | 80.90 | 36.70 | −138.35 |
| Strategy 3, 5-yearly screening in all ages | 26.2368 | 26.2194 | 17.71 | 66.25 | 20.28 | −153.00 |
| Strategy 4 | 26.2366 | 26.2191 | 1.89 | 34.55 | – | – |
| Strategy 4, 10-yearly screening in 50+ years | 26.2364 | 26.2196 | −20.57 | 90.31 | −22.46 | 55.76 |
| Strategy 4, follow-up in 12 months | 26.2370 | 26.2176 | 41.25 | −111.84 | 39.36 | −146.39 |
| Strategy 4, 5-yearly screening in all ages | 26.2368 | 26.2172 | 20.65 | −147.20 | 18.76 | −181.75 |
| Strategy | Predicted cost and cost-effectiveness | |||||
|---|---|---|---|---|---|---|
| Total discounteda lifetime cost per woman (£) | Annual screening-associated cost in Englandb (£) | Annual cost difference compared with CPc (£) | Per cent cost difference compared with CP | CERd (£/LY saved) (compared with CP) | CERd (£/QALYe saved) (compared with CP) | |
| Current practice | 129 | 128,741,901 | – | – | – | – |
| Strategy 1 | 101 | 101,051,532 | −27,690,369 | −21.5% | N/A | QALY&cost saving |
| Strategy 1, 10-yearly screening in 50+ years | 97 | 93,666,034 | −35,075,867 | −27.2% | N/A | QALY&cost saving |
| Strategy 1, follow-up in 12 months | 112 | 110,012,881 | −18,729,020 | −14.5% | LY&cost saving | QALY&cost saving |
| Strategy 1, CP screening in < 30 years | 113 | 109,810,817 | −18,931,084 | −14.7% | N/A | QALY&cost saving |
| Strategy 1, CP screening in < 35 years | 118 | 114,447,239 | −14,294,662 | −11.1% | N/A | QALY&cost saving |
| Strategy 1, 5-yearly screening in all ages | 112 | 113,332,538 | −15,409,363 | −12.0% | LY&cost saving | QALY&cost saving |
| Strategy 2 | 102 | 101,259,659 | −27,482,242 | −21.3% | N/A | QALY&cost saving |
| Strategy 2, 10-yearly screening in 50+ years | 97 | 93,870,539 | −34,871,362 | −27.1% | N/A | QALY&cost saving |
| Strategy 2, follow-up in 12 months | 113 | 110,387,224 | −18,354,677 | −14.3% | LY&cost saving | QALY&cost saving |
| Strategy 2, CP screening in < 30 years | 114 | 109,990,800 | −18,751,101 | −14.6% | N/A | QALY&cost saving |
| Strategy 2, CP screening in < 35 years | 118 | 114,527,050 | −14,214,851 | −11.0% | N/A | QALY&cost saving |
| Strategy 2, 5-yearly screening in all ages | 112 | 113,556,220 | −15,185,682 | −11.8% | LY&cost saving | QALY&cost saving |
| Strategy 3 | 102 | 101,825,744 | −26,916,157 | −20.9% | N/A | QALY&cost saving |
| Strategy 3, 10-yearly screening in 50+ years | 98 | 94,419,987 | −34,321,914 | −26.7% | N/A | QALY&cost saving |
| Strategy 3, follow-up in 12 months | 113 | 110,938,146 | −17,803,755 | −13.8% | LY&cost saving | QALY&cost saving |
| Strategy 3, 5-yearly screening in all ages | 113 | 114,182,099 | −14,559,802 | −11.3% | LY&cost saving | QALY&cost saving |
| Strategy 4 | 116 | 116,631,025 | −12,110,876 | −9.4% | LY&cost saving | QALY&cost saving |
| Strategy 4, 10-yearly screening in 50+ yrs | 110 | 107,340,135 | −21,401,766 | −16.6% | N/A | QALY&cost saving |
| Strategy 4, follow-up in 12 months | 127 | 126,397,834 | −2,344,067 | −1.8% | LY&cost saving | N/A |
| Strategy 4, 5-yearly screening in all ages | 128 | 131,515,357 | 2,773,456 | 2.2% | LY&cost saving | N/A |
FIGURE 37.
Cost-effectiveness plane in a vaccinated setting (life-years saved outcome). CP, current practice; FU, follow-up; S, strategy.
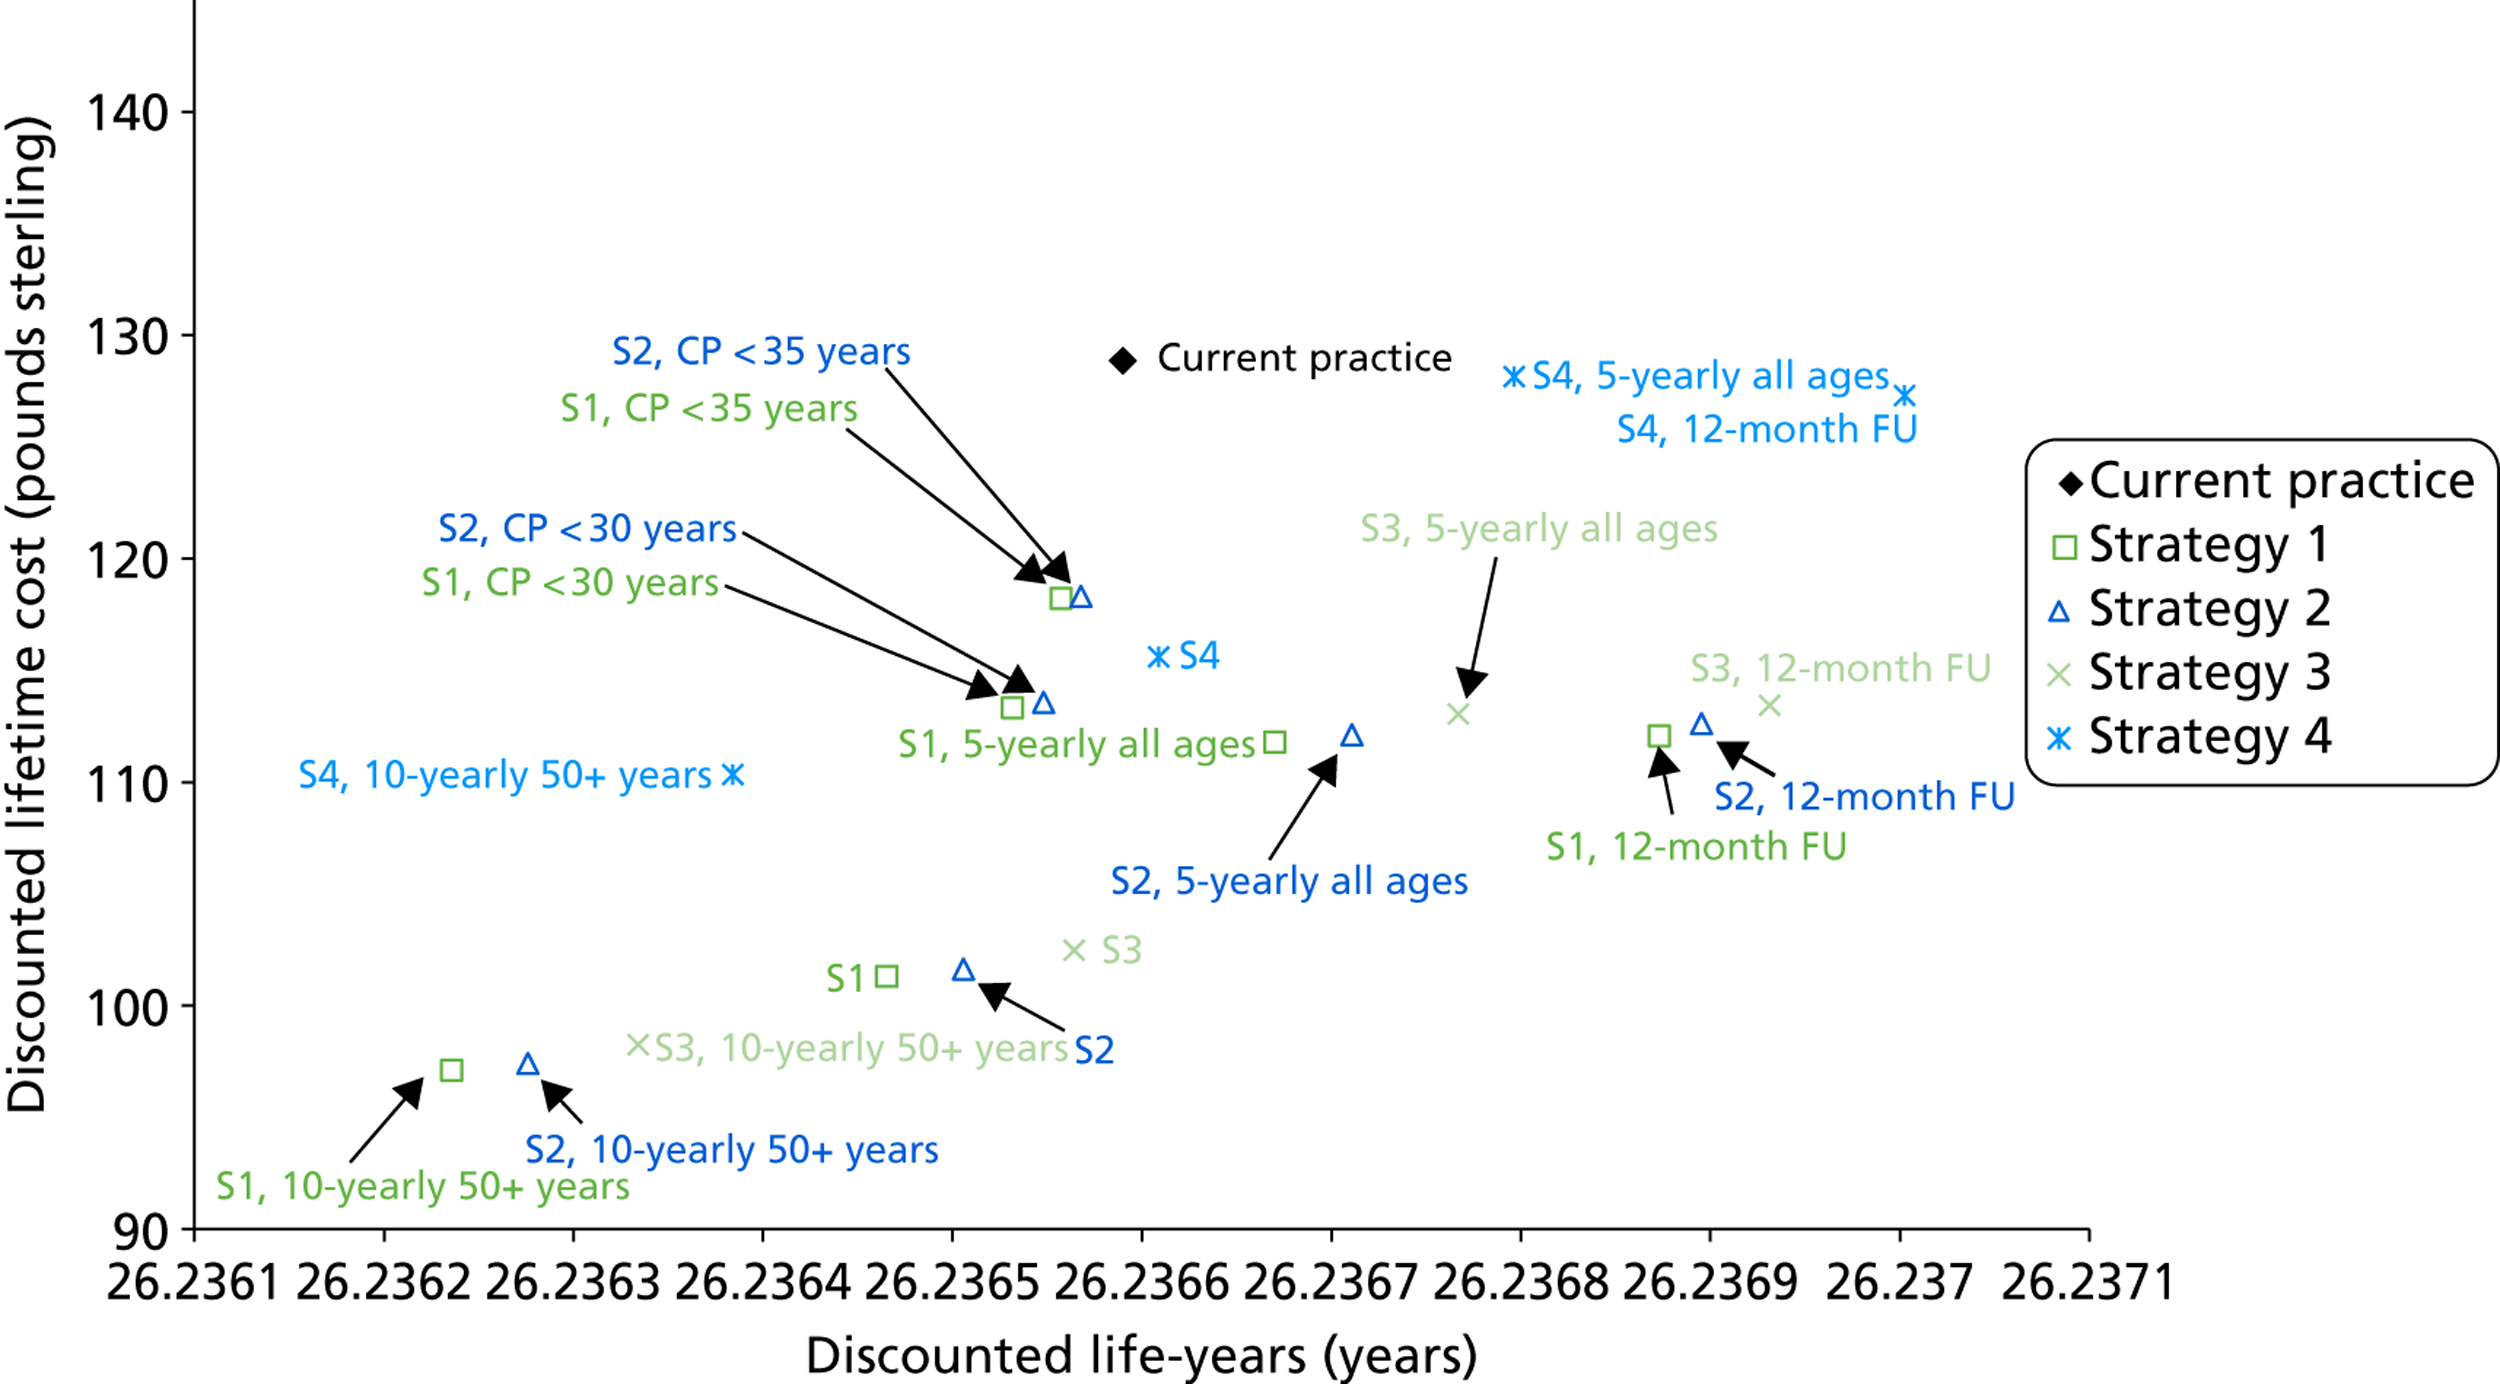
FIGURE 38.
Cost-effectiveness frontier in a vaccinated setting (life-years saved outcome). CP, current practice; S, strategy.
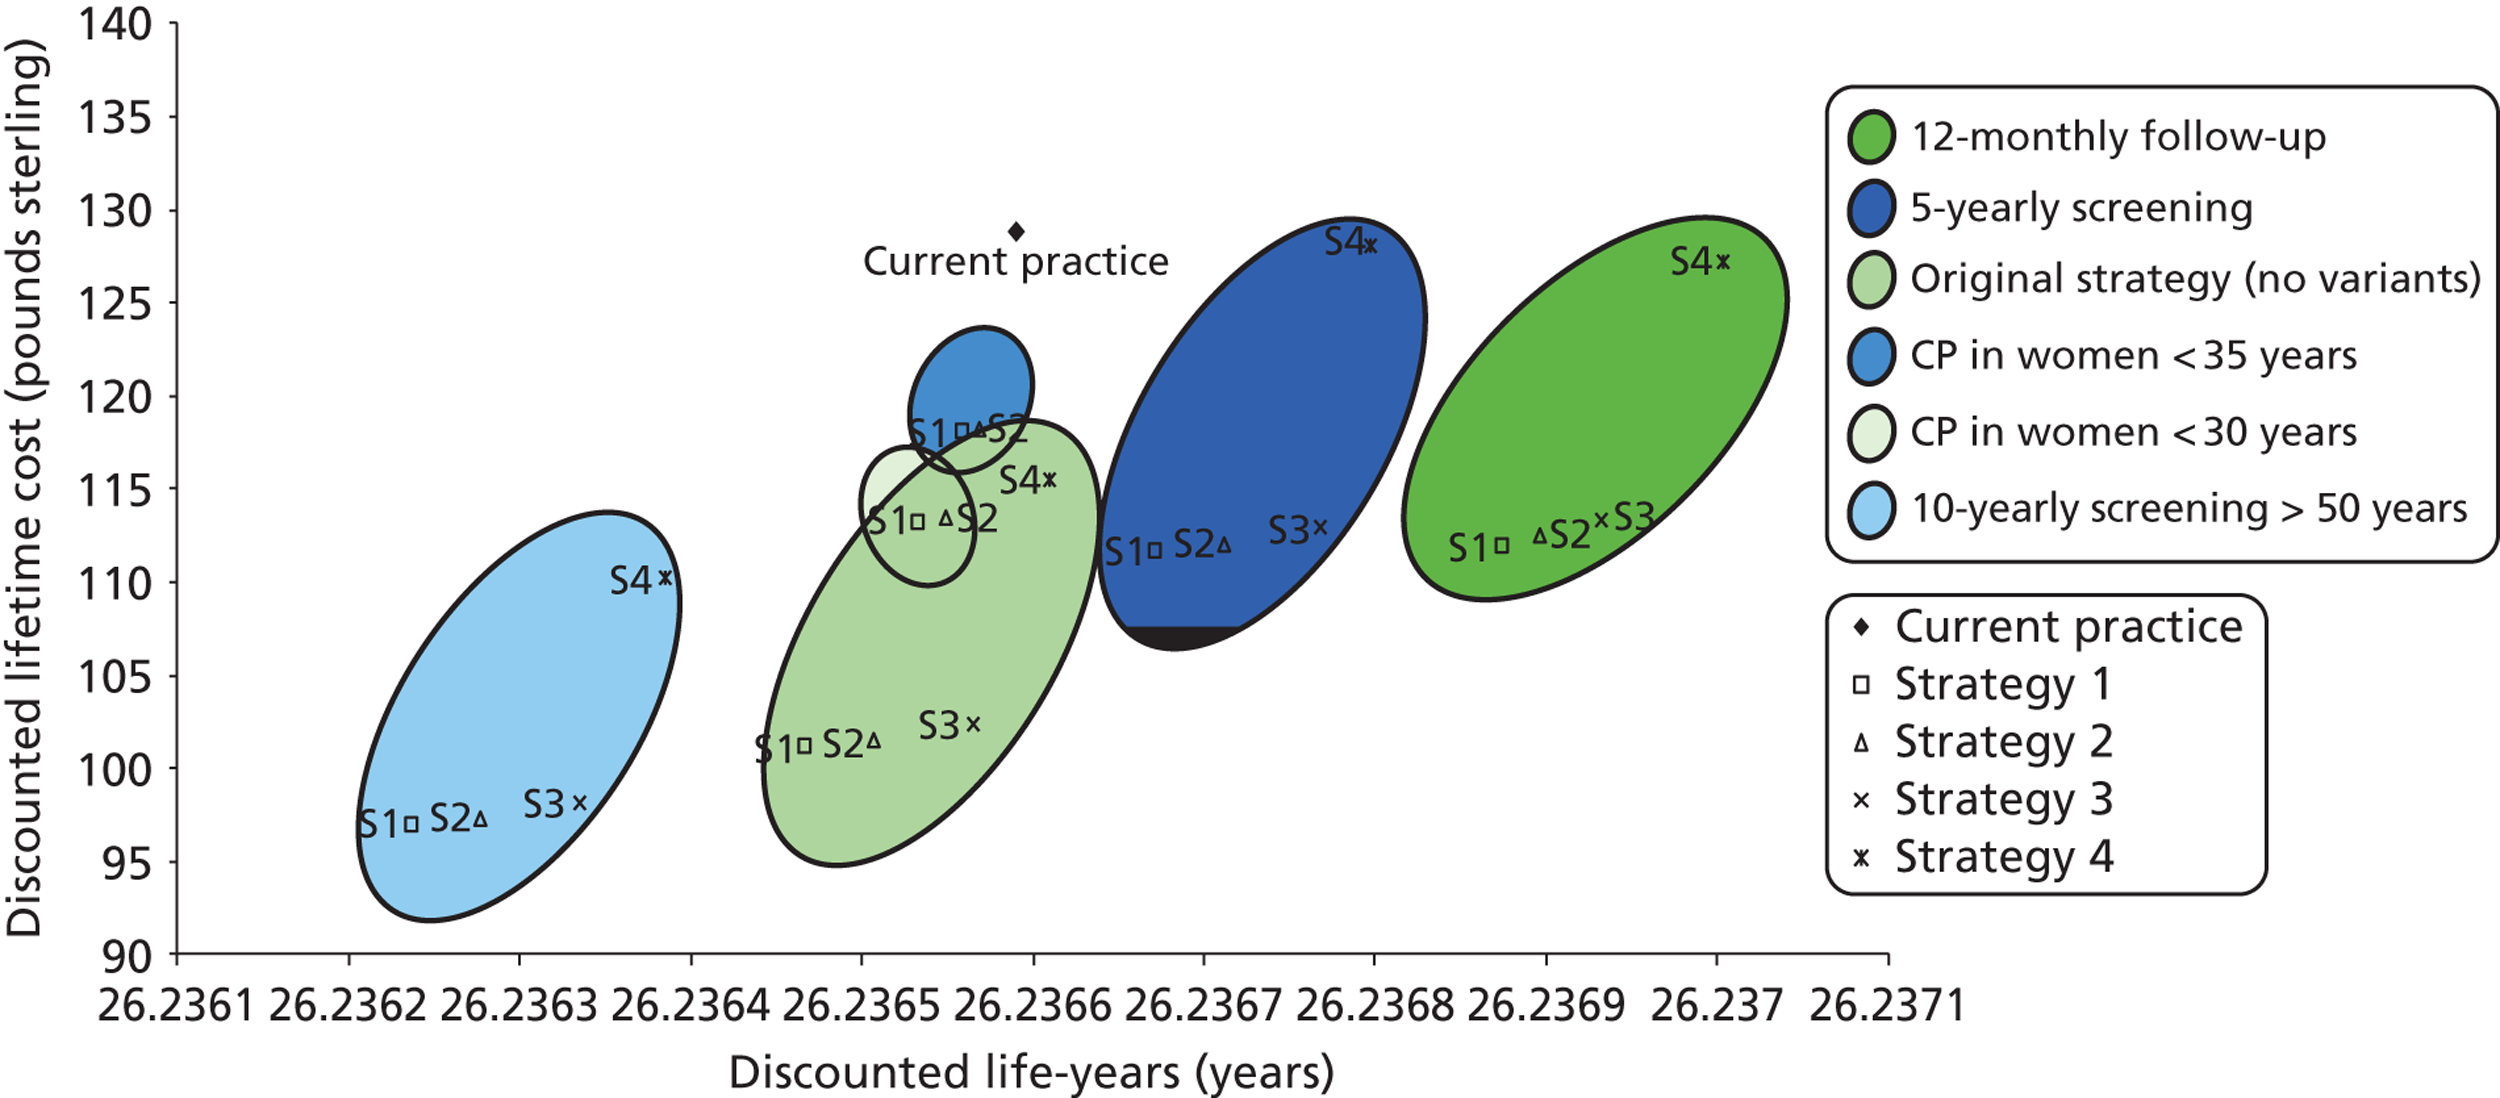
Overall, the findings for costs and effects in a vaccinated cohort follow a similar pattern as for an unvaccinated cohort. Of the basic strategies, the order of strategies in terms of increasing effectiveness is strategy 1, followed by strategy 2, then strategy 3 and, lastly, strategy 4. For all strategies, the most important modification to increase effectiveness was to decrease follow-up time in intermediate risk women to 12 months. If 24 months was retained, it could be partly compensated via decreasing the recommended screening interval to 5-yearly screening. One or both of these modifications was required to bring strategies 1, 2 and 3 into the ‘south-east quadrant’ (i.e. to become both cost and life-year saving), when the effect of vaccination was considered.
Again, supplementary analysis using QALYs as an outcome for effectiveness considerably changed the relative ranking of strategies (Figure 39 for QALY weight set 1 and Figure 40 for QALY weight set 2). In particular, use of QALY weight set 2 resulted in many strategies becoming less effective than current practice, but this was not true for QALY weight set 1, where a different pattern was observed and almost all primary HPV strategies were more effective than current practice. Again, owing to these uncertainties in the application of appropriate weights, this was considered a secondary outcome and more research on the appropriate QALY weights for HPV screening strategies in a vaccinated population is required.
FIGURE 39.
Cost-effectiveness plane for QALYs in a vaccinated setting, using QALY weight set 1. CP, current practice; FU, follow-up; S, strategy.
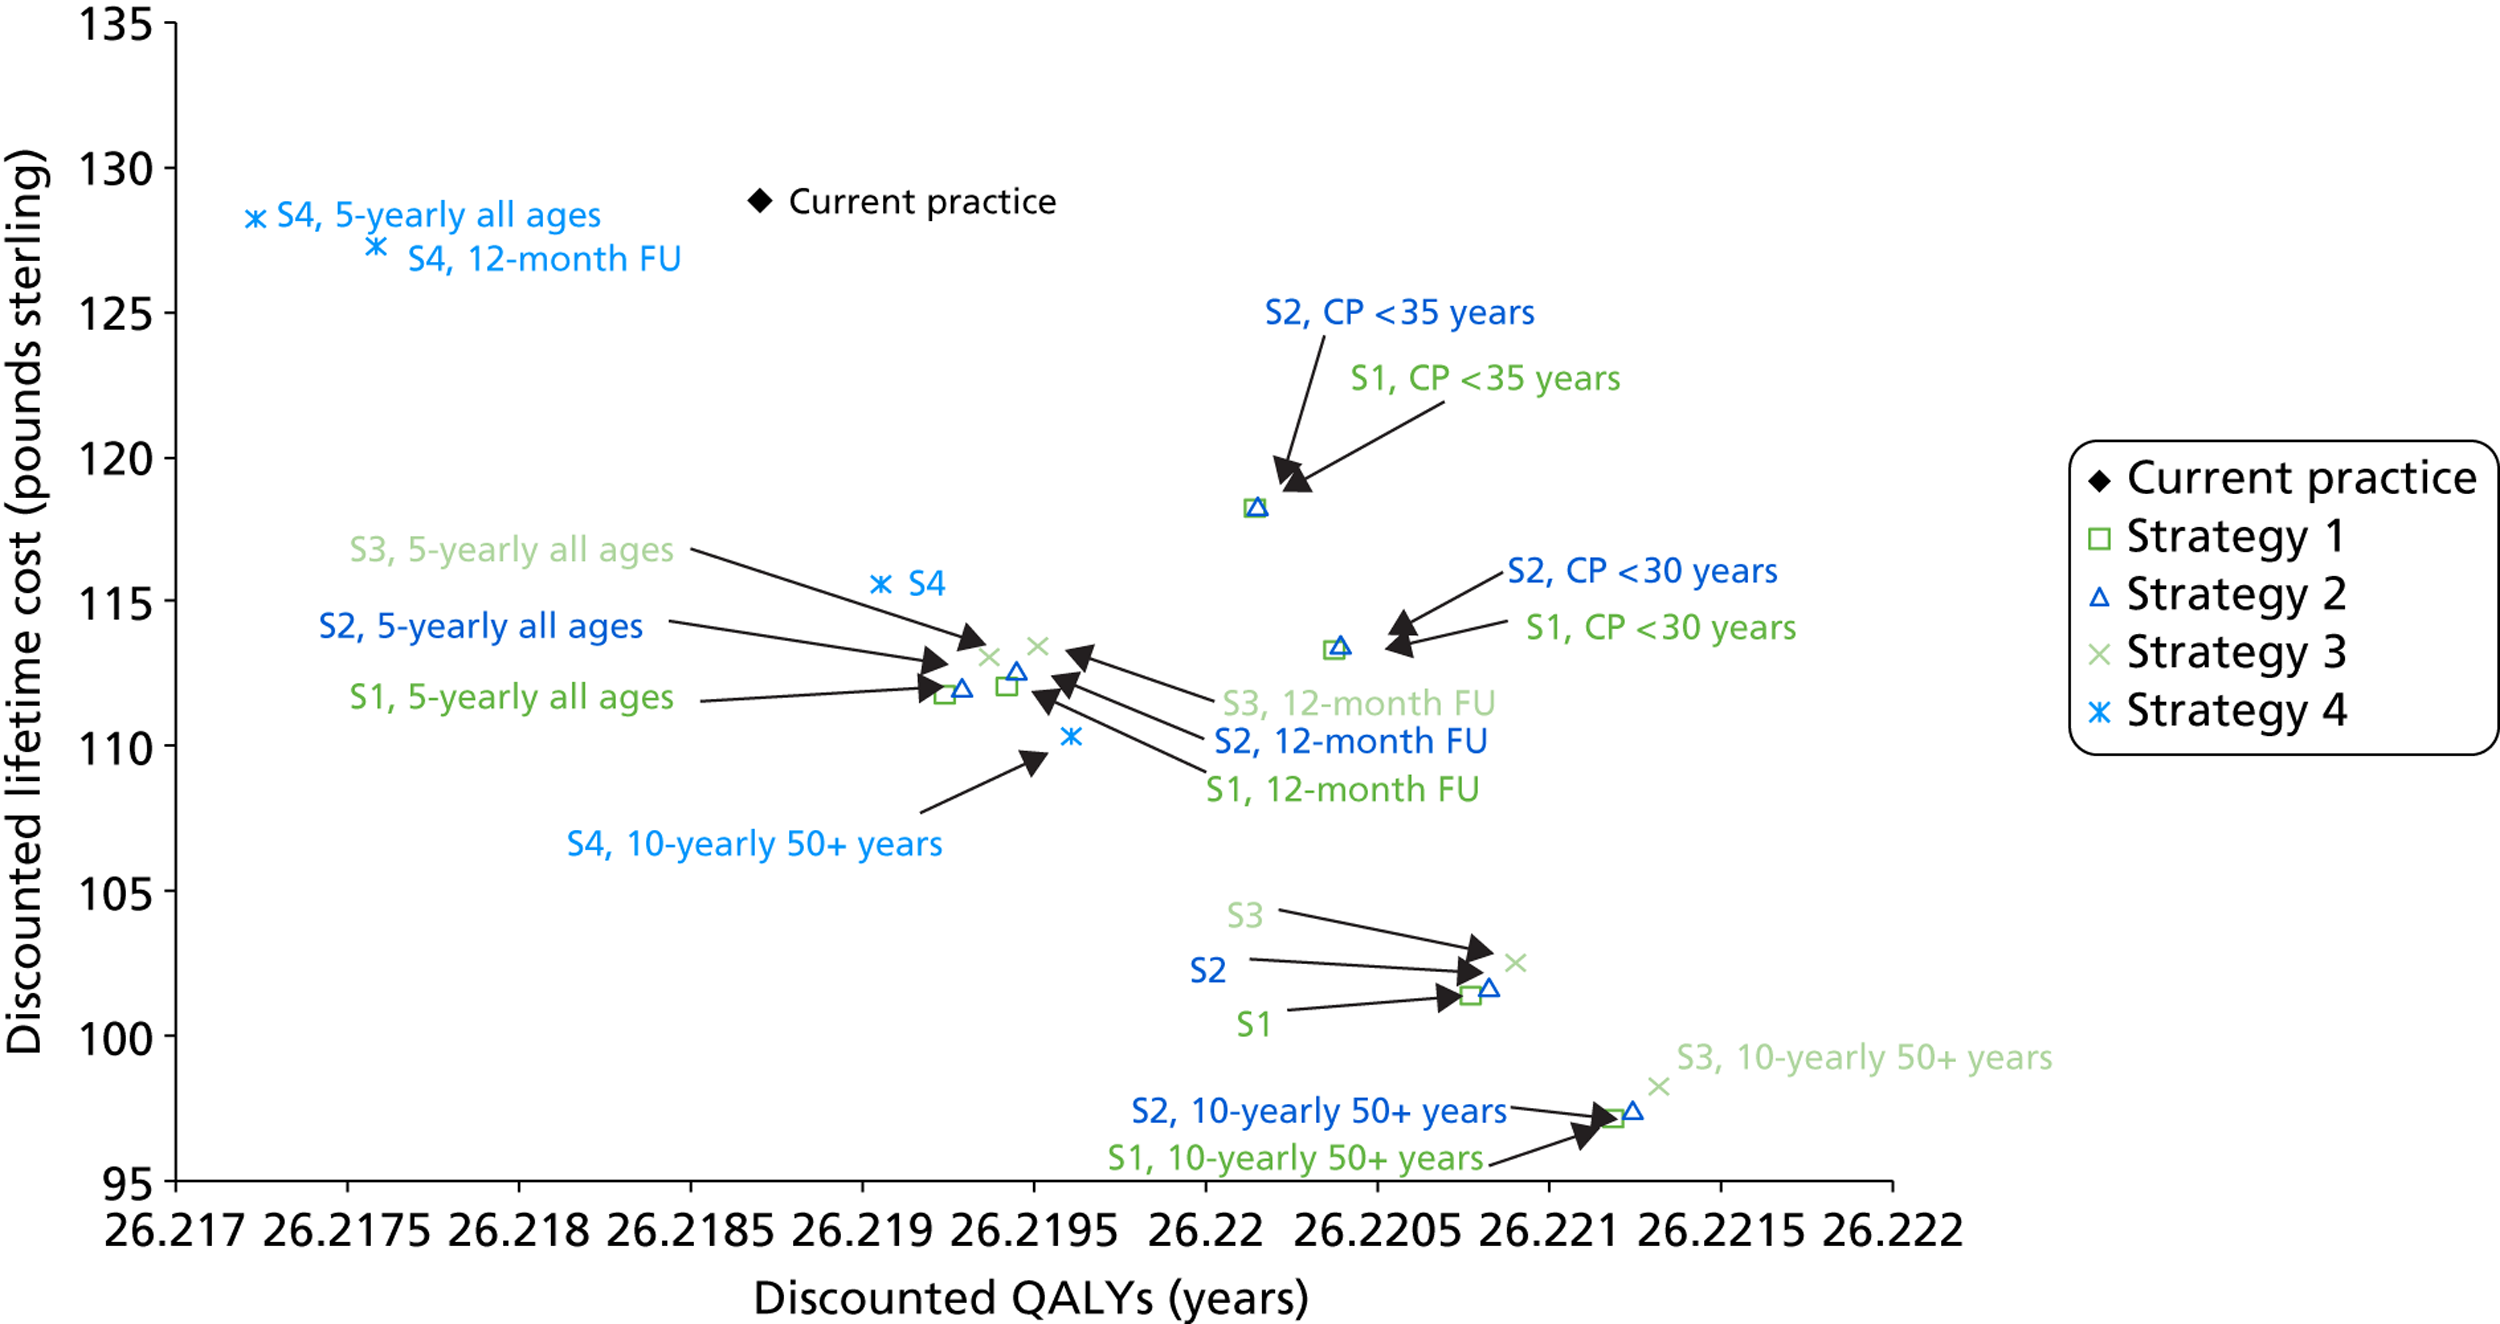
FIGURE 40.
Cost-effectiveness plane for QALYs in a vaccinated setting, using QALY weight set 2. CP, current practice; FU, follow-up; S, strategy.
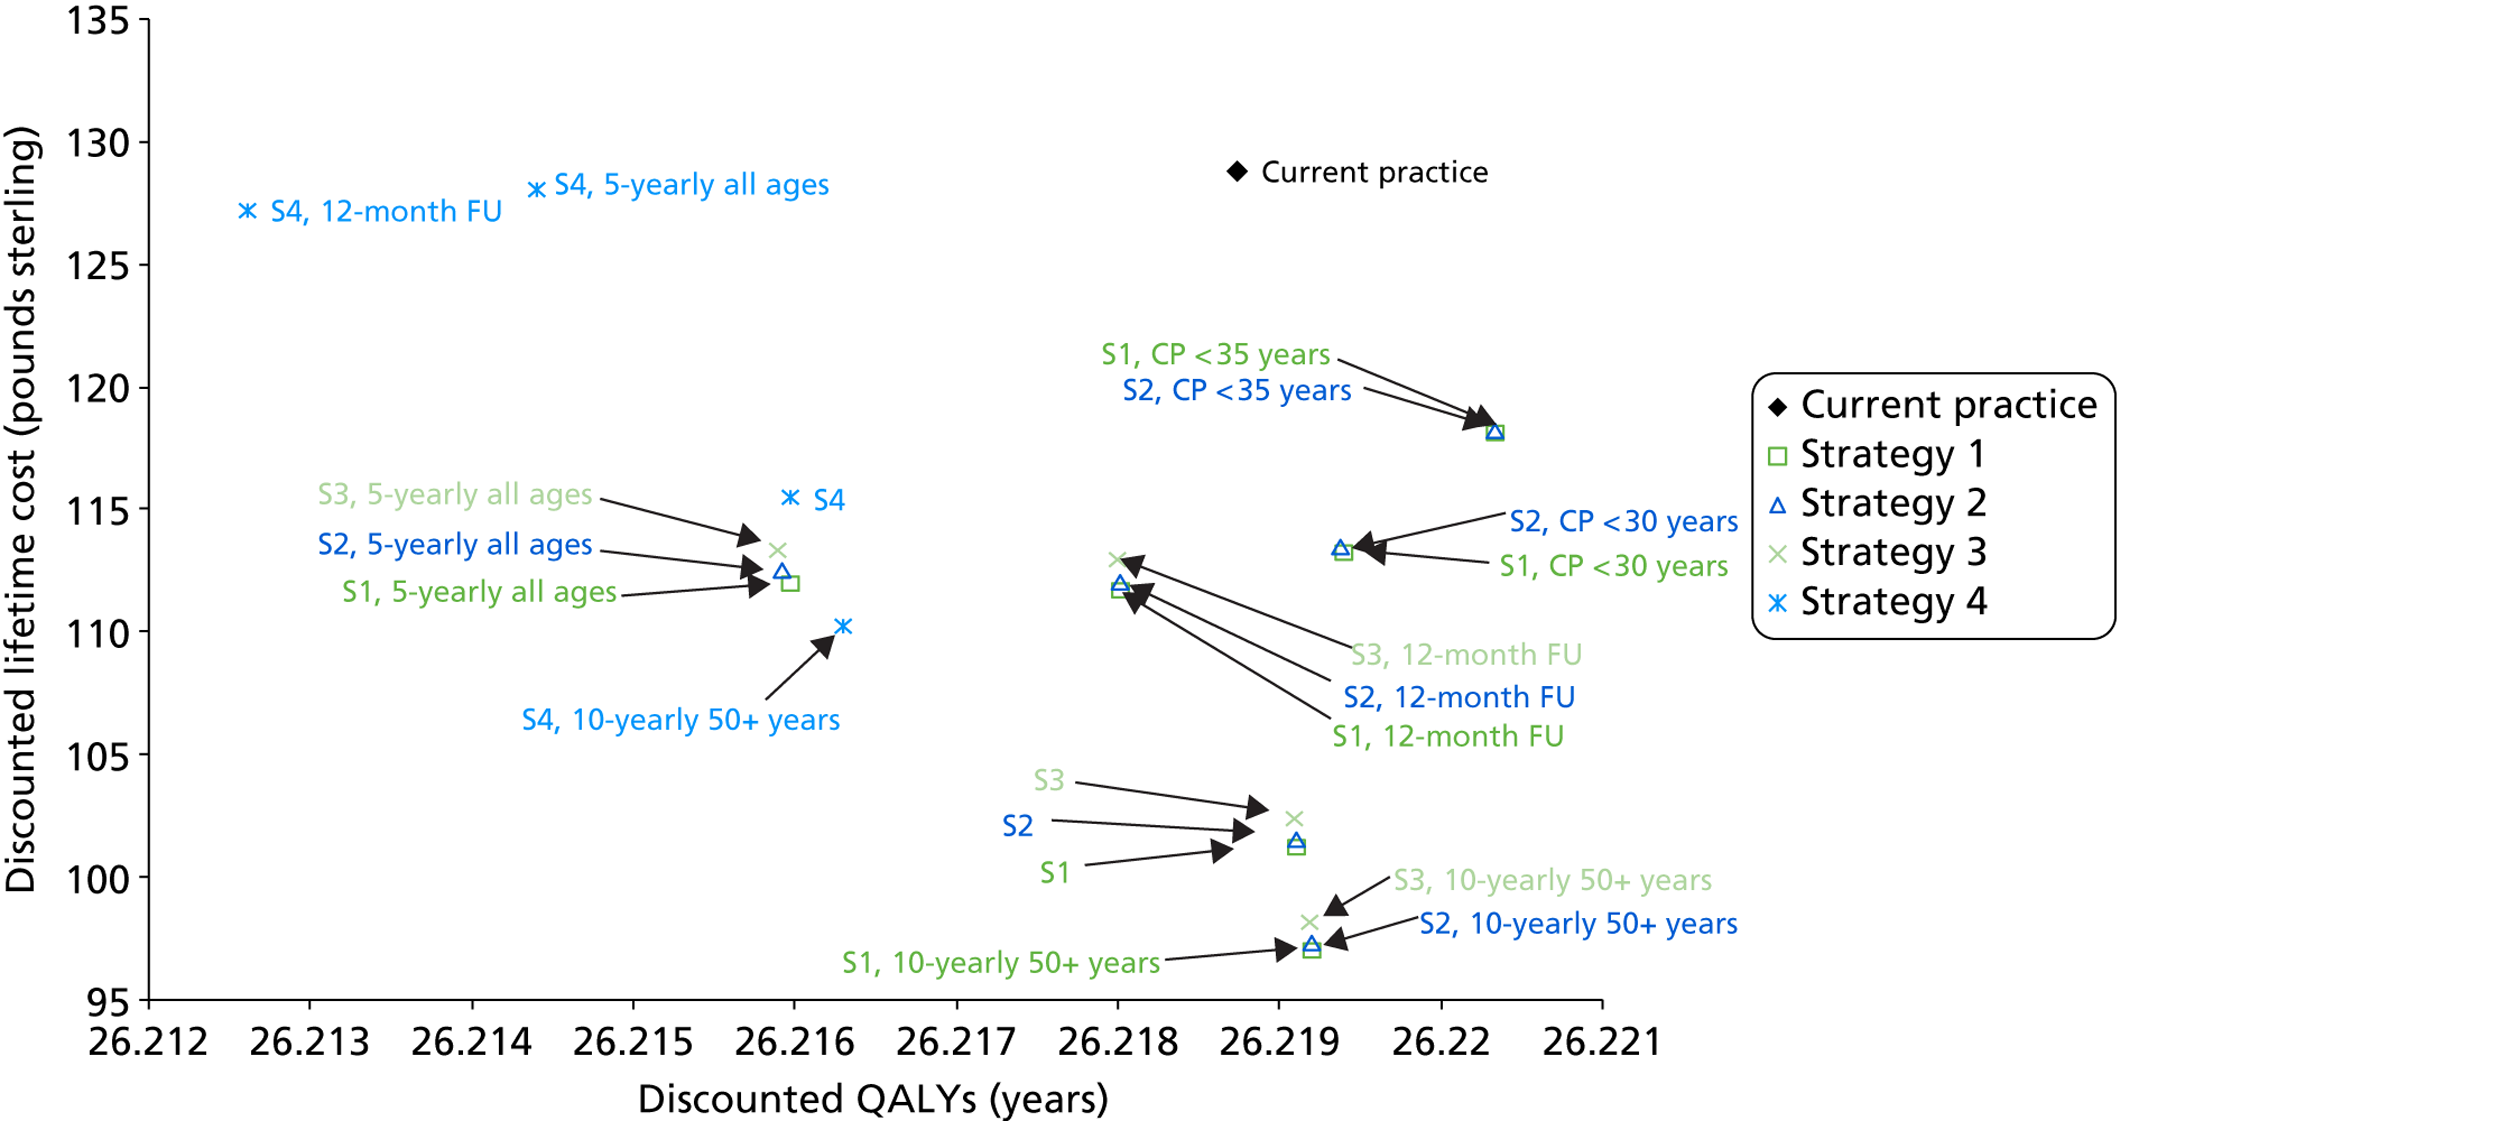
Health outcomes, cervical cancer and mortality rates in a vaccinated setting
Model predictions for health outcomes in a vaccinated setting are summarised in Table 44 and the related data for predicted age-standardised incidence and mortality rates for cervical cancer in England under current practice, and for each for the potential primary HPV screening strategies, are shown graphically in Figure 41. In Figure 34, the predictions for unvaccinated women are also shown for reference. Each point on the graph represents the predicted incidence and mortality rate associated with a particular strategy.
| Strategy | Predicted health outcomes in England | ||||
|---|---|---|---|---|---|
| Cervical cancer cases p.a.a | Cumulative lifetime risk of cervical cancer (% increase compared with CP) | ASR cancer incidence per 100,000 womenb | Cervical cancer deaths p.a.a | ASR cancer mortality per 100,000 womenb | |
| Current practice | 1064 | 0.32 (–) | 3.65 | 338 | 1.05 |
| Strategy 1 | 1104 | 0.33 (2.7%) | 3.84 | 333 | 1.05 |
| Strategy 1, 10-yearly screening in 50+ years | 1210 | 0.37 (–) | 4.13 | 393 | 1.21 |
| Strategy 1, follow-up in 12 months | 1012 | 0.3 (−5.4) | 3.50 | 303 | 0.95 |
| Strategy 1, CP screening in < 30 years | 1092 | 0.33 (–) | 3.78 | 335 | 1.05 |
| Strategy 1, CP screening in < 35 years | 1077 | 0.32 (0.6) | 3.72 | 331 | 1.04 |
| Strategy 1, 5-yearly screening in all ages | 1041 | 0.31 (–) | 3.63 | 307 | 0.97 |
| Strategy 2 | 1096 | 0.33 (1.9) | 3.81 | 330 | 1.04 |
| Strategy 2, 10-yearly screening in 50+ years | 1201 | 0.36 (–) | 4.10 | 390 | 1.20 |
| Strategy 2, follow-up in 12 months | 1006 | 0.3 (−5.8) | 3.48 | 301 | 0.94 |
| Strategy 2, CP screening in < 30 years | 1087 | 0.32 (–) | 3.76 | 333 | 1.05 |
| Strategy 2, CP screening in < 35 years | 1074 | 0.32 (0.3) | 3.71 | 330 | 1.04 |
| Strategy 2, 5-yearly screening in all ages | 1032 | 0.31 (–) | 3.60 | 304 | 0.96 |
| Strategy 3 | 1083 | 0.32 (0.8) | 3.76 | 326 | 1.03 |
| Strategy 3, 10-yearly screening in 50+ years | 1189 | 0.36 (–) | 4.06 | 386 | 1.18 |
| Strategy 3, follow-up in 12 months | 998 | 0.3 (−6.6) | 3.45 | 299 | 0.93 |
| Strategy 3, 5-yearly screening in all ages | 1020 | 0.3 (–) | 3.55 | 300 | 0.95 |
| Strategy 4 | 1066 | 0.32 (−0.8) | 3.70 | 320 | 1.01 |
| Strategy 4, 10-yearly screening in 50+ years | 1170 | 0.35 (–) | 3.99 | 379 | 1.16 |
| Strategy 4, follow-up in 12 months | 974 | 0.29 (−8.8) | 3.36 | 291 | 0.91 |
| Strategy 4, 5-yearly screening in all ages | 1007 | 0.3 (–) | 3.51 | 296 | 0.94 |
FIGURE 41.
Age-standardised rate (ASR) predictions (using the European Standard Population52) in a vaccinated cohort for cancer incidence and mortality are shown for each strategy and the variants as the hollow black circles and green squares, respectively. Current practice (CP) predictions in an unvaccinated cohort are shown as the black and green line respectively, for ease of comparison with the other strategies. The predictions in an unvaccinated cohort are also shown as the solid black and green shapes.
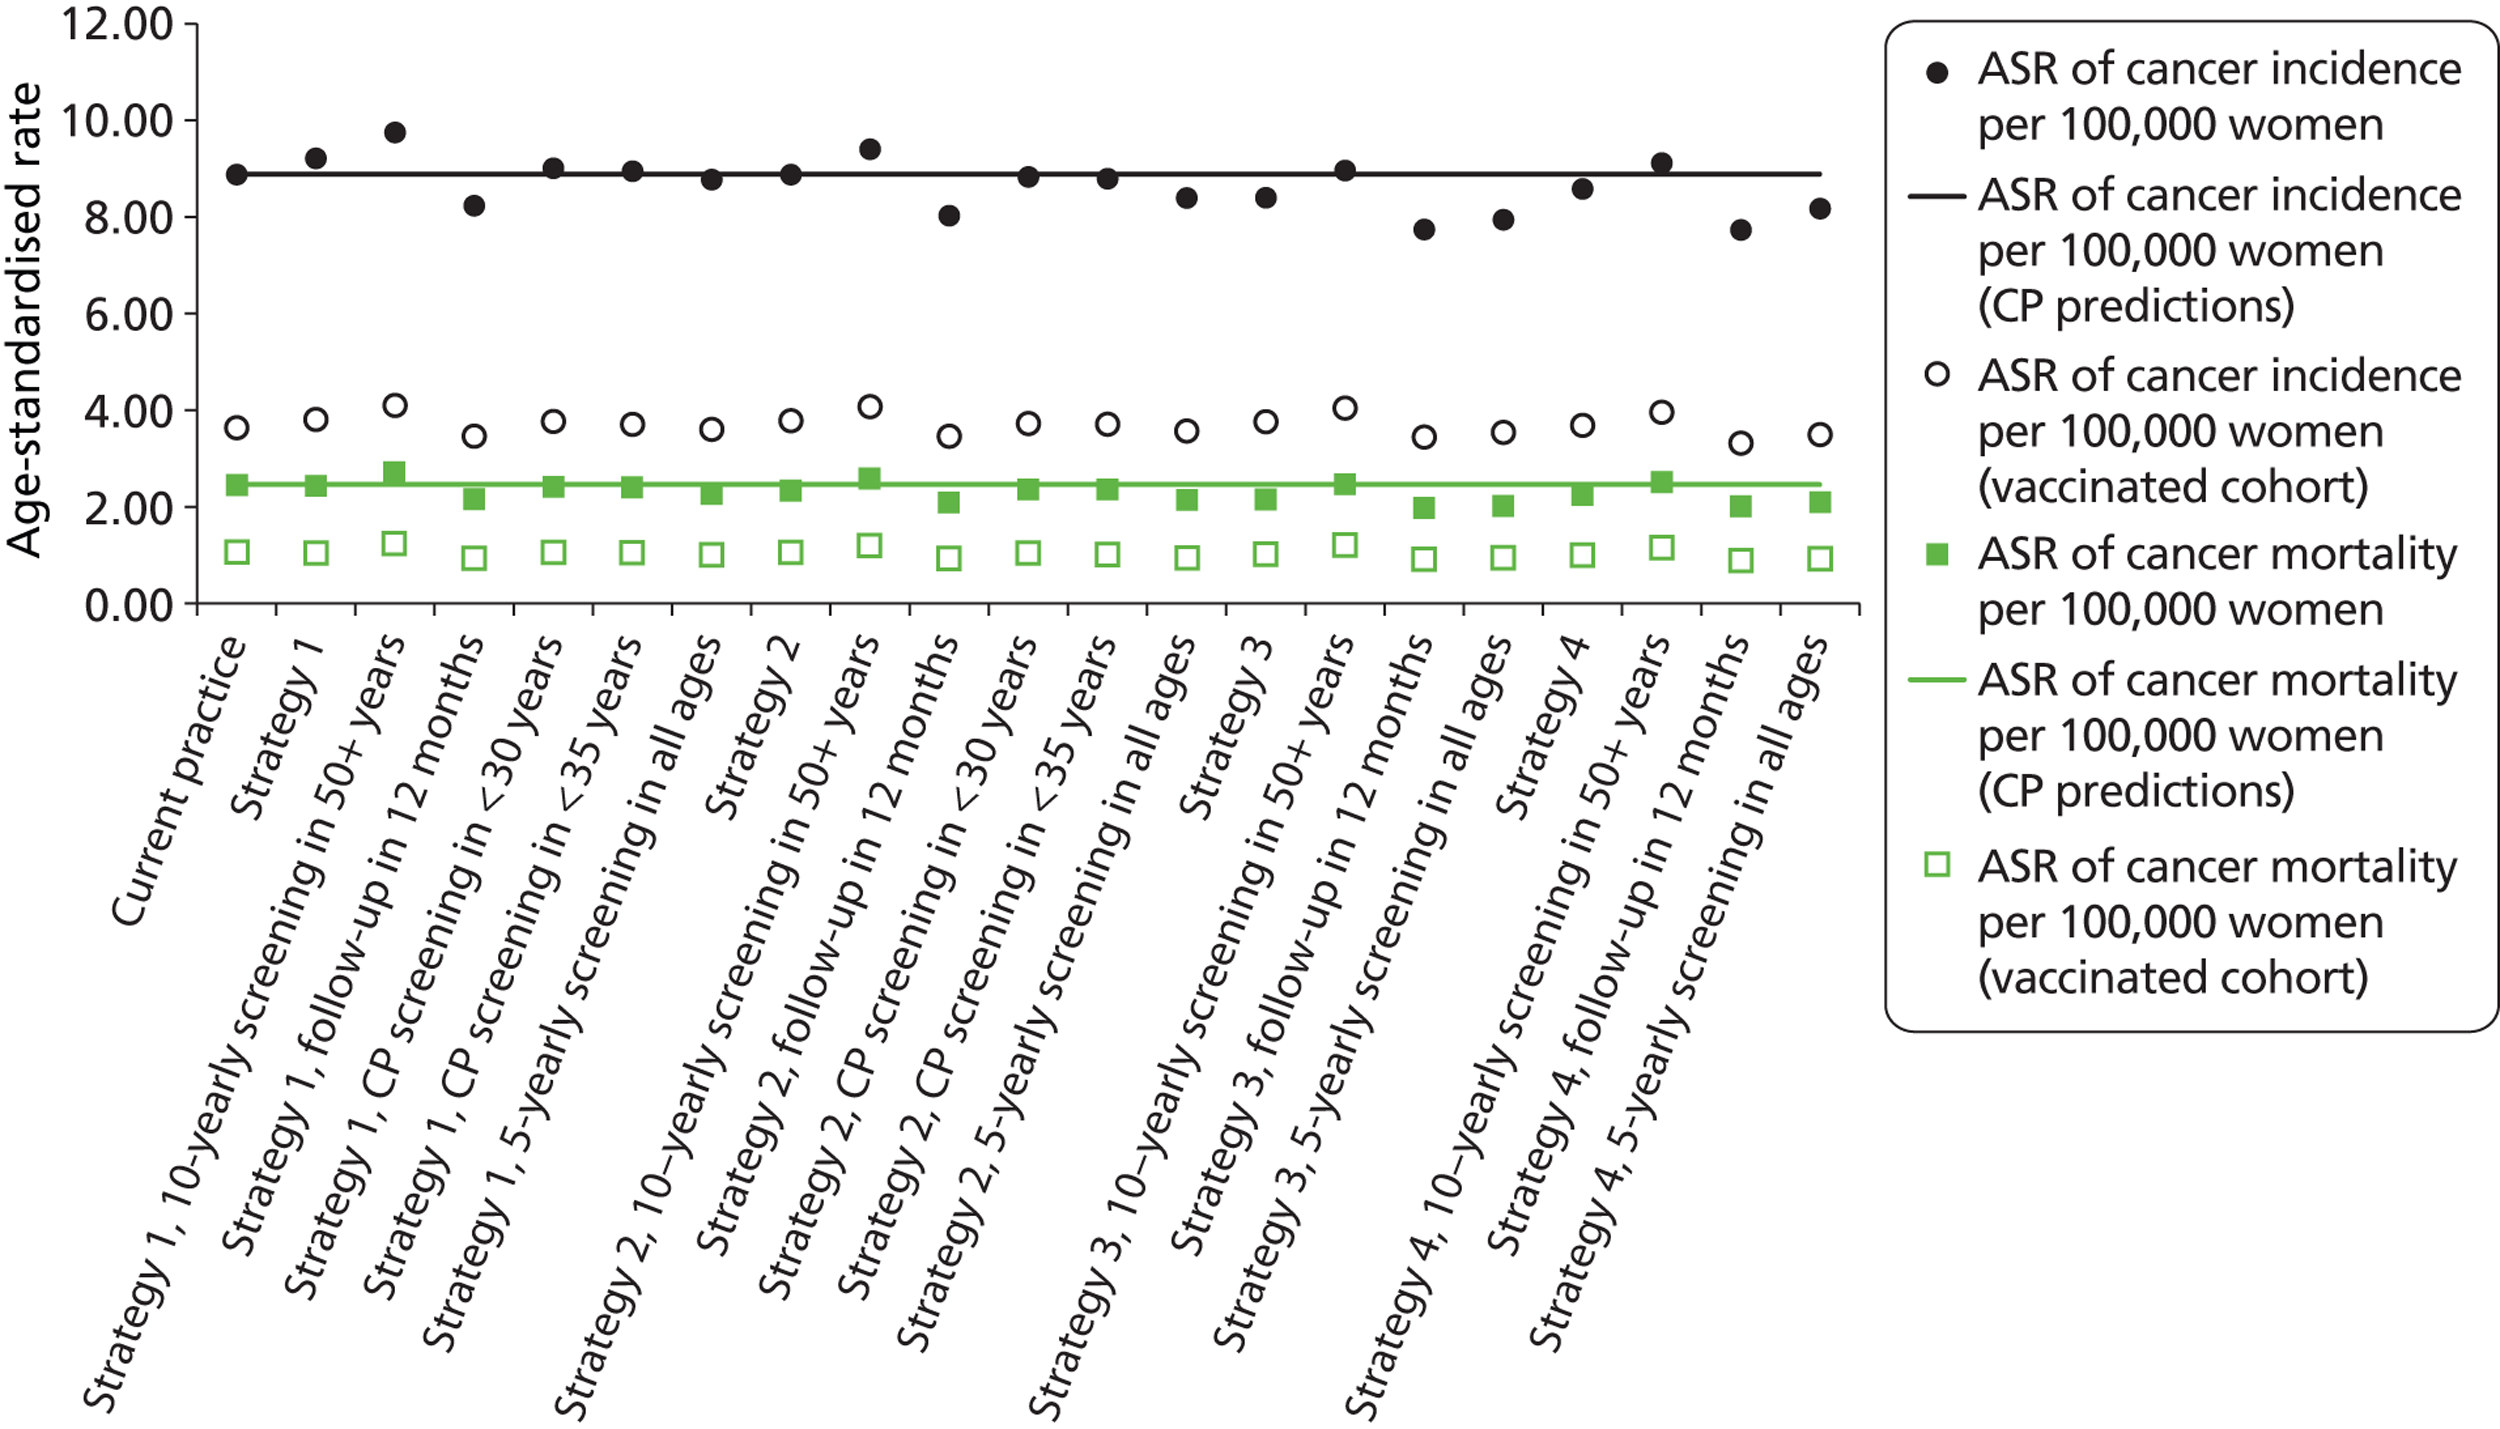
As expected, substantial decreases in cancer incidence and mortality are predicted in the context of vaccination, but in general terms the relative health outcomes of new screening strategies in relation to current screening practice were broadly preserved. As for unvaccinated women, most of the primary HPV screening strategies resulted in a predicted equivalence (or close-to-equivalence) or improvement in the predicted rates of cervical cancer incidence and mortality in a vaccinated setting compared with current practice, with the notable exception of strategies involving 10-yearly screening in women over 50 years of age.
Resource utilisation in a vaccinated setting
Table 45 shows the predicted annual resource utilisation in England in a vaccinated setting. The annual number of HPV tests and cytology tests are shown graphically in Figure 42, with the results for unvaccinated women shown for comparison. The predicted number of screening tests is predicted to be very similar in vaccinated and unvaccinated women (unsurprisingly, as this is driven primarily by screening recommendations and behaviour, not the underlying disease in the population). Again, this figure shows that the number of screening tests in the majority of strategies is predicted to be lower than current practice, although in the co-testing strategies (strategy 4 and variants), the overall number of HPV and cytology tests are, not unexpectedly, predicted to increase.
| Strategy | Predicted resource utilisation (annually in England)a | ||||
|---|---|---|---|---|---|
| No. of cytology tests (all ages) | No. of HPV tests | No. of colposcopies (first attendance) | No. of women receiving a biopsy | No. of women with histologically confirmed CIN2/3 | |
| Current practice | 3,663,477 | 210,687 | 89,848 | 60,897 | 24,365 |
| Strategy 1 | 493,864 | 2,272,954 | 72,943 | 49,123 | 22,909 |
| Strategy 1, 10-yearly screening in 50+ years | 465,212 | 2,017,290 | 70,434 | 48,106 | 22,574 |
| Strategy 1, follow-up in 12 months | 561,572 | 2,344,750 | 94,828 | 63,831 | 24,999 |
| Strategy 1, CP screening in < 30 years | 958,178 | 1,950,267 | 88,034 | 60,040 | 24,170 |
| Strategy 1, CP screening in < 35 years | 1,361,372 | 1,720,782 | 89,517 | 60,867 | 24,249 |
| Strategy 1, 5-yearly screening in all ages | 549,394 | 2,651,382 | 78,199 | 52,450 | 23,594 |
| Strategy 2 | 493,749 | 2,272,615 | 74,112 | 49,975 | 22,951 |
| Strategy 2, 10-yearly screening in 50+ years | 465,094 | 2,016,977 | 71,590 | 48,952 | 22,616 |
| Strategy 2, follow-up in 12 months | 561,335 | 2,344,299 | 96,785 | 65,259 | 25,019 |
| Strategy 2, CP screening in < 30 years | 958,362 | 1,950,325 | 88,967 | 60,694 | 24,175 |
| Strategy 2, CP screening in < 35 years | 1,361,465 | 1,720,785 | 89,957 | 61,159 | 24,251 |
| Strategy 2, 5-yearly screening in all ages | 549,275 | 2,651,009 | 79,436 | 53,349 | 23,636 |
| Strategy 3 | 486,707 | 2,271,942 | 77,048 | 52,072 | 23,036 |
| Strategy 3, 10-yearly screening in 50+ years | 458,145 | 2,016,361 | 74,477 | 51,030 | 22,702 |
| Strategy 3, follow-up in 12 months | 553,961 | 2,343,580 | 99,676 | 67,326 | 25,070 |
| Strategy 3, 5-yearly screening in all ages | 541,841 | 2,650,268 | 82,625 | 55,614 | 23,721 |
| Strategy 4 | 2,505,463 | 2,290,185 | 77,660 | 52,200 | 23,383 |
| Strategy 4, 10-yearly screening in 50+ years | 2,210,414 | 2,033,345 | 74,901 | 51,084 | 23,056 |
| Strategy 4, follow-up in 12 months | 2,606,734 | 2,368,447 | 101,134 | 68,039 | 25,507 |
| Strategy 4, 5-yearly screening in all ages | 2,913,242 | 2,668,517 | 83,278 | 55,734 | 24,028 |
FIGURE 42.
The number of cytology and HPV tests performed in England as predicted by the model in an unvaccinated and a vaccinated setting. Predictions for each of the strategies and the variants are shown.
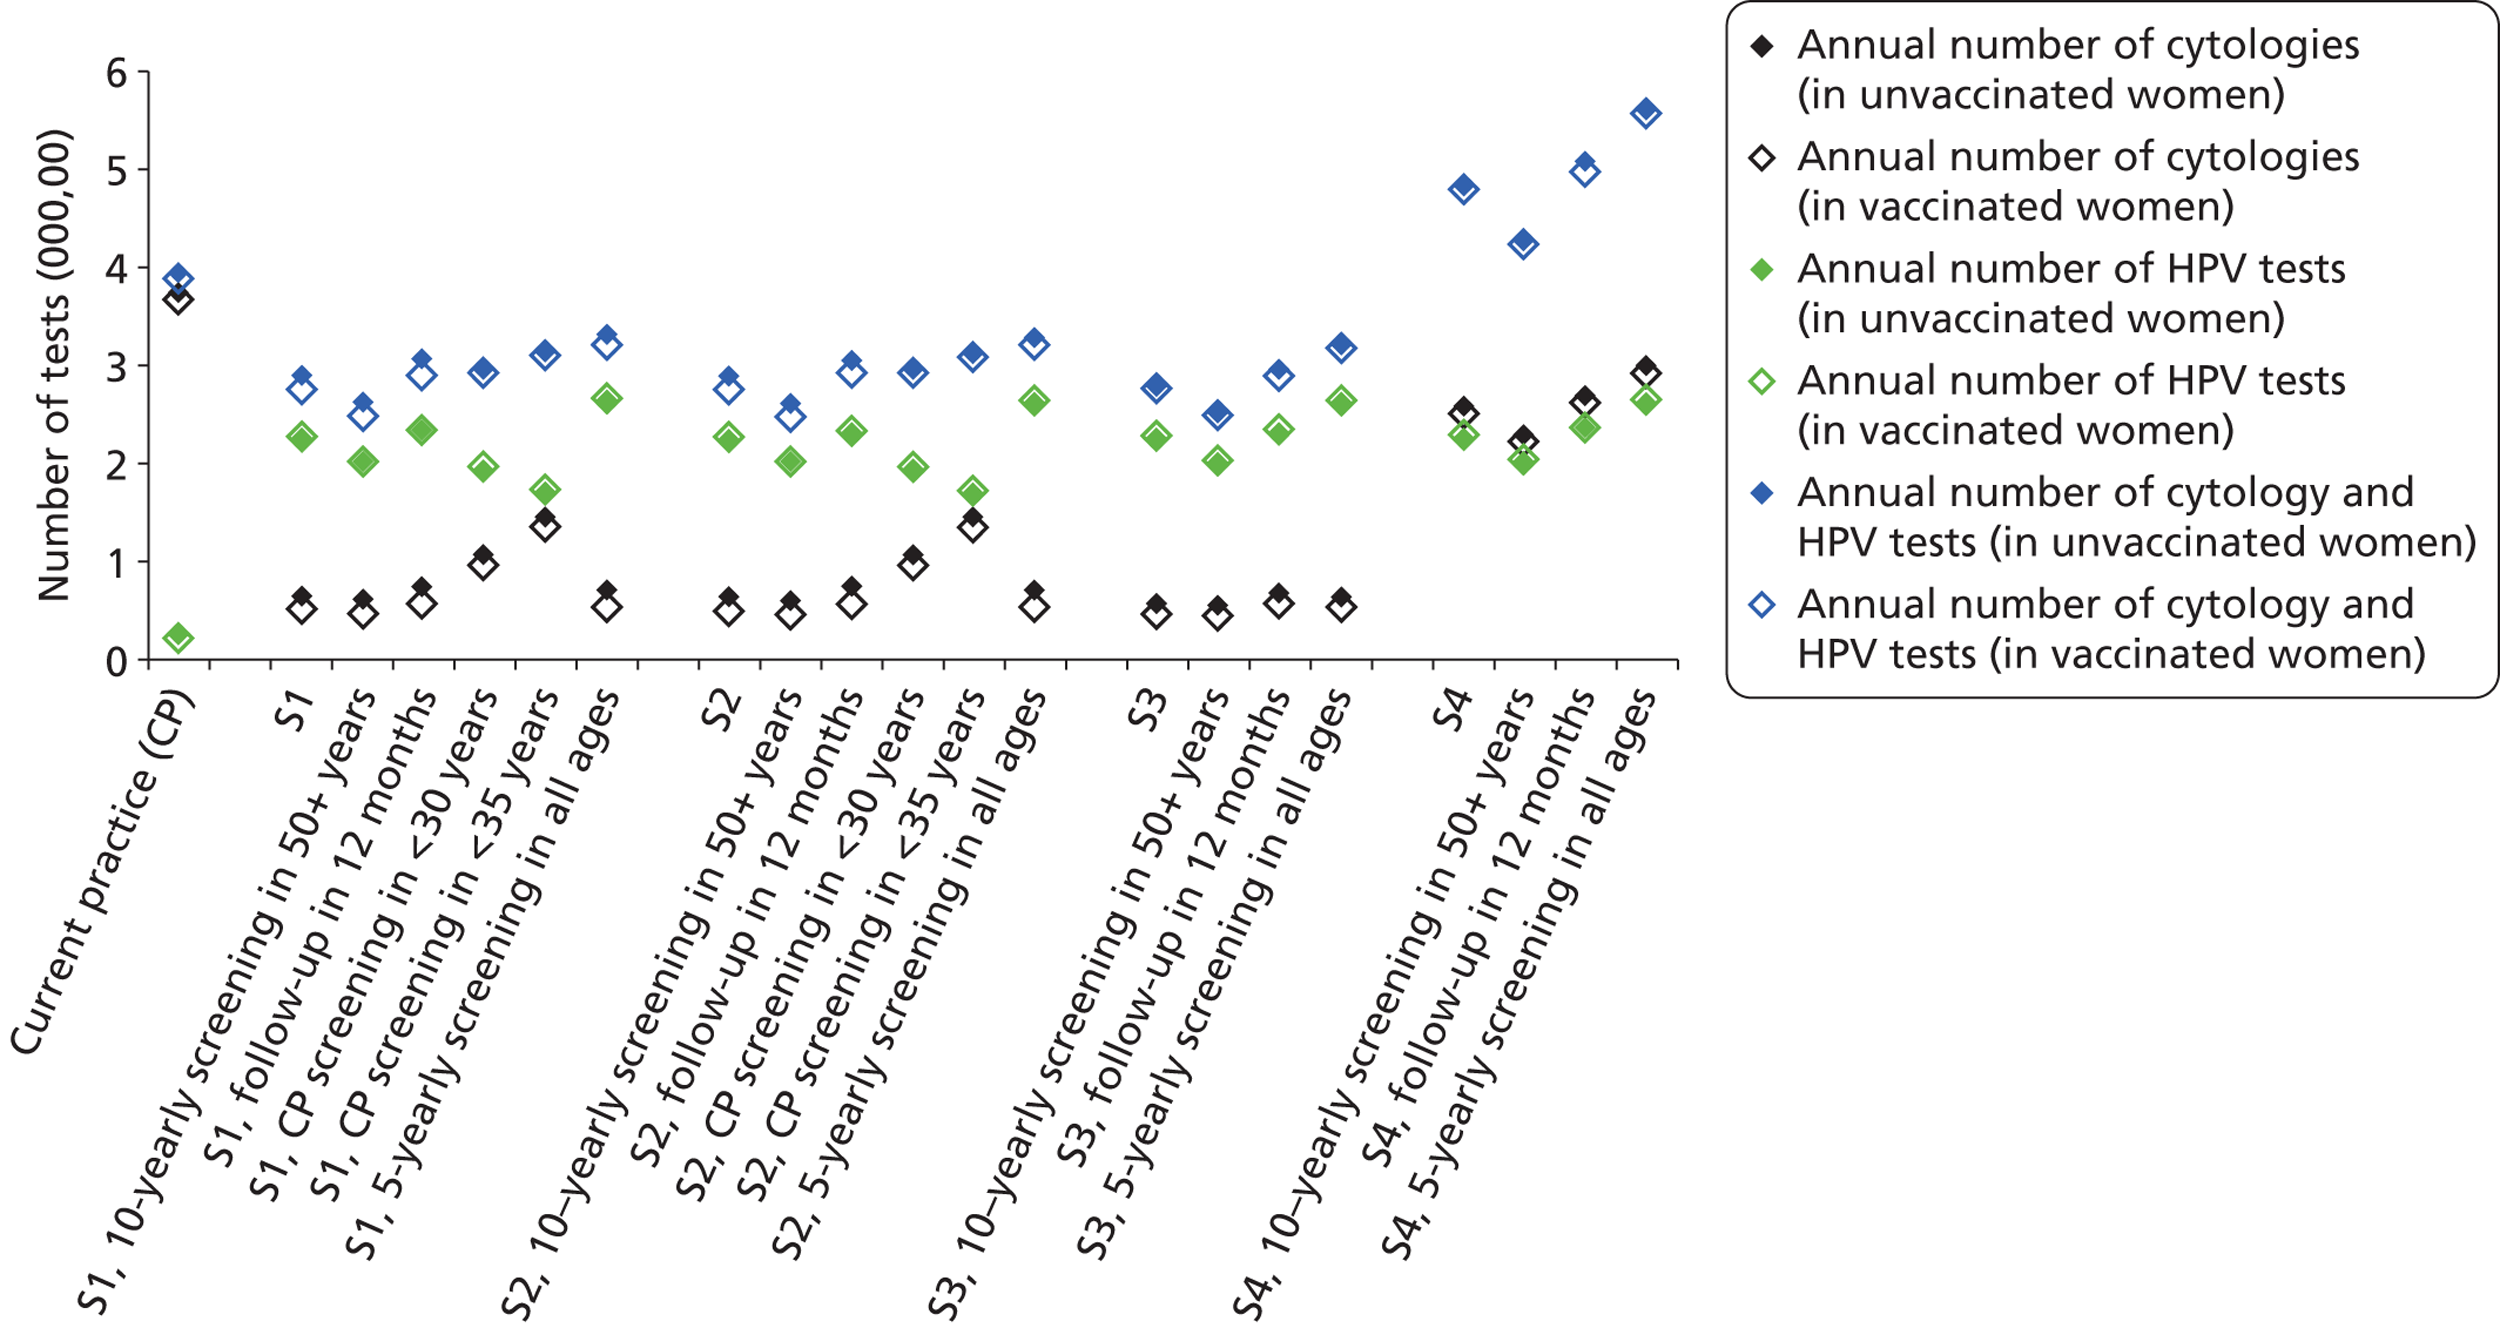
The annual number of (first) colposcopies performed in England in a vaccinated setting is shown in Figure 43, with the findings for an unvaccinated setting shown for comparison. As expected, the number of coloscopies performed was substantially lower in a vaccinated cohort by a factor of about one-third (for strategies 1, 2 and 4) or by about 50% (for strategy 3). Strategy 3 involves direct referral to colposcopy for women positive for HPV types 16/18, and therefore the model predicts a greater drop in the number of colposcopies performed for this strategy in the context of lower prevalence of HPV 16/18 infection and its associated disease. In this sense it can be said that strategy 3 is predicted to become more ‘efficient’ in the context of vaccination, although, as noted earlier, it is cost saving and life-years saving compared with current practice under most conditions. Overall, because of this effect, the primary HPV screening strategies became more similar to each other in terms of the overall number of colposcopies, compared with the findings in an unvaccinated setting. In general terms, more colposcopies were predicted for strategies involving 12-month follow-up of intermediate-risk women, as was the case for the unvaccinated setting.
FIGURE 43.
The number of colposcopies performed in England as predicted by the model for each of the strategies and their variants, in an unvaccinated and vaccinated setting.
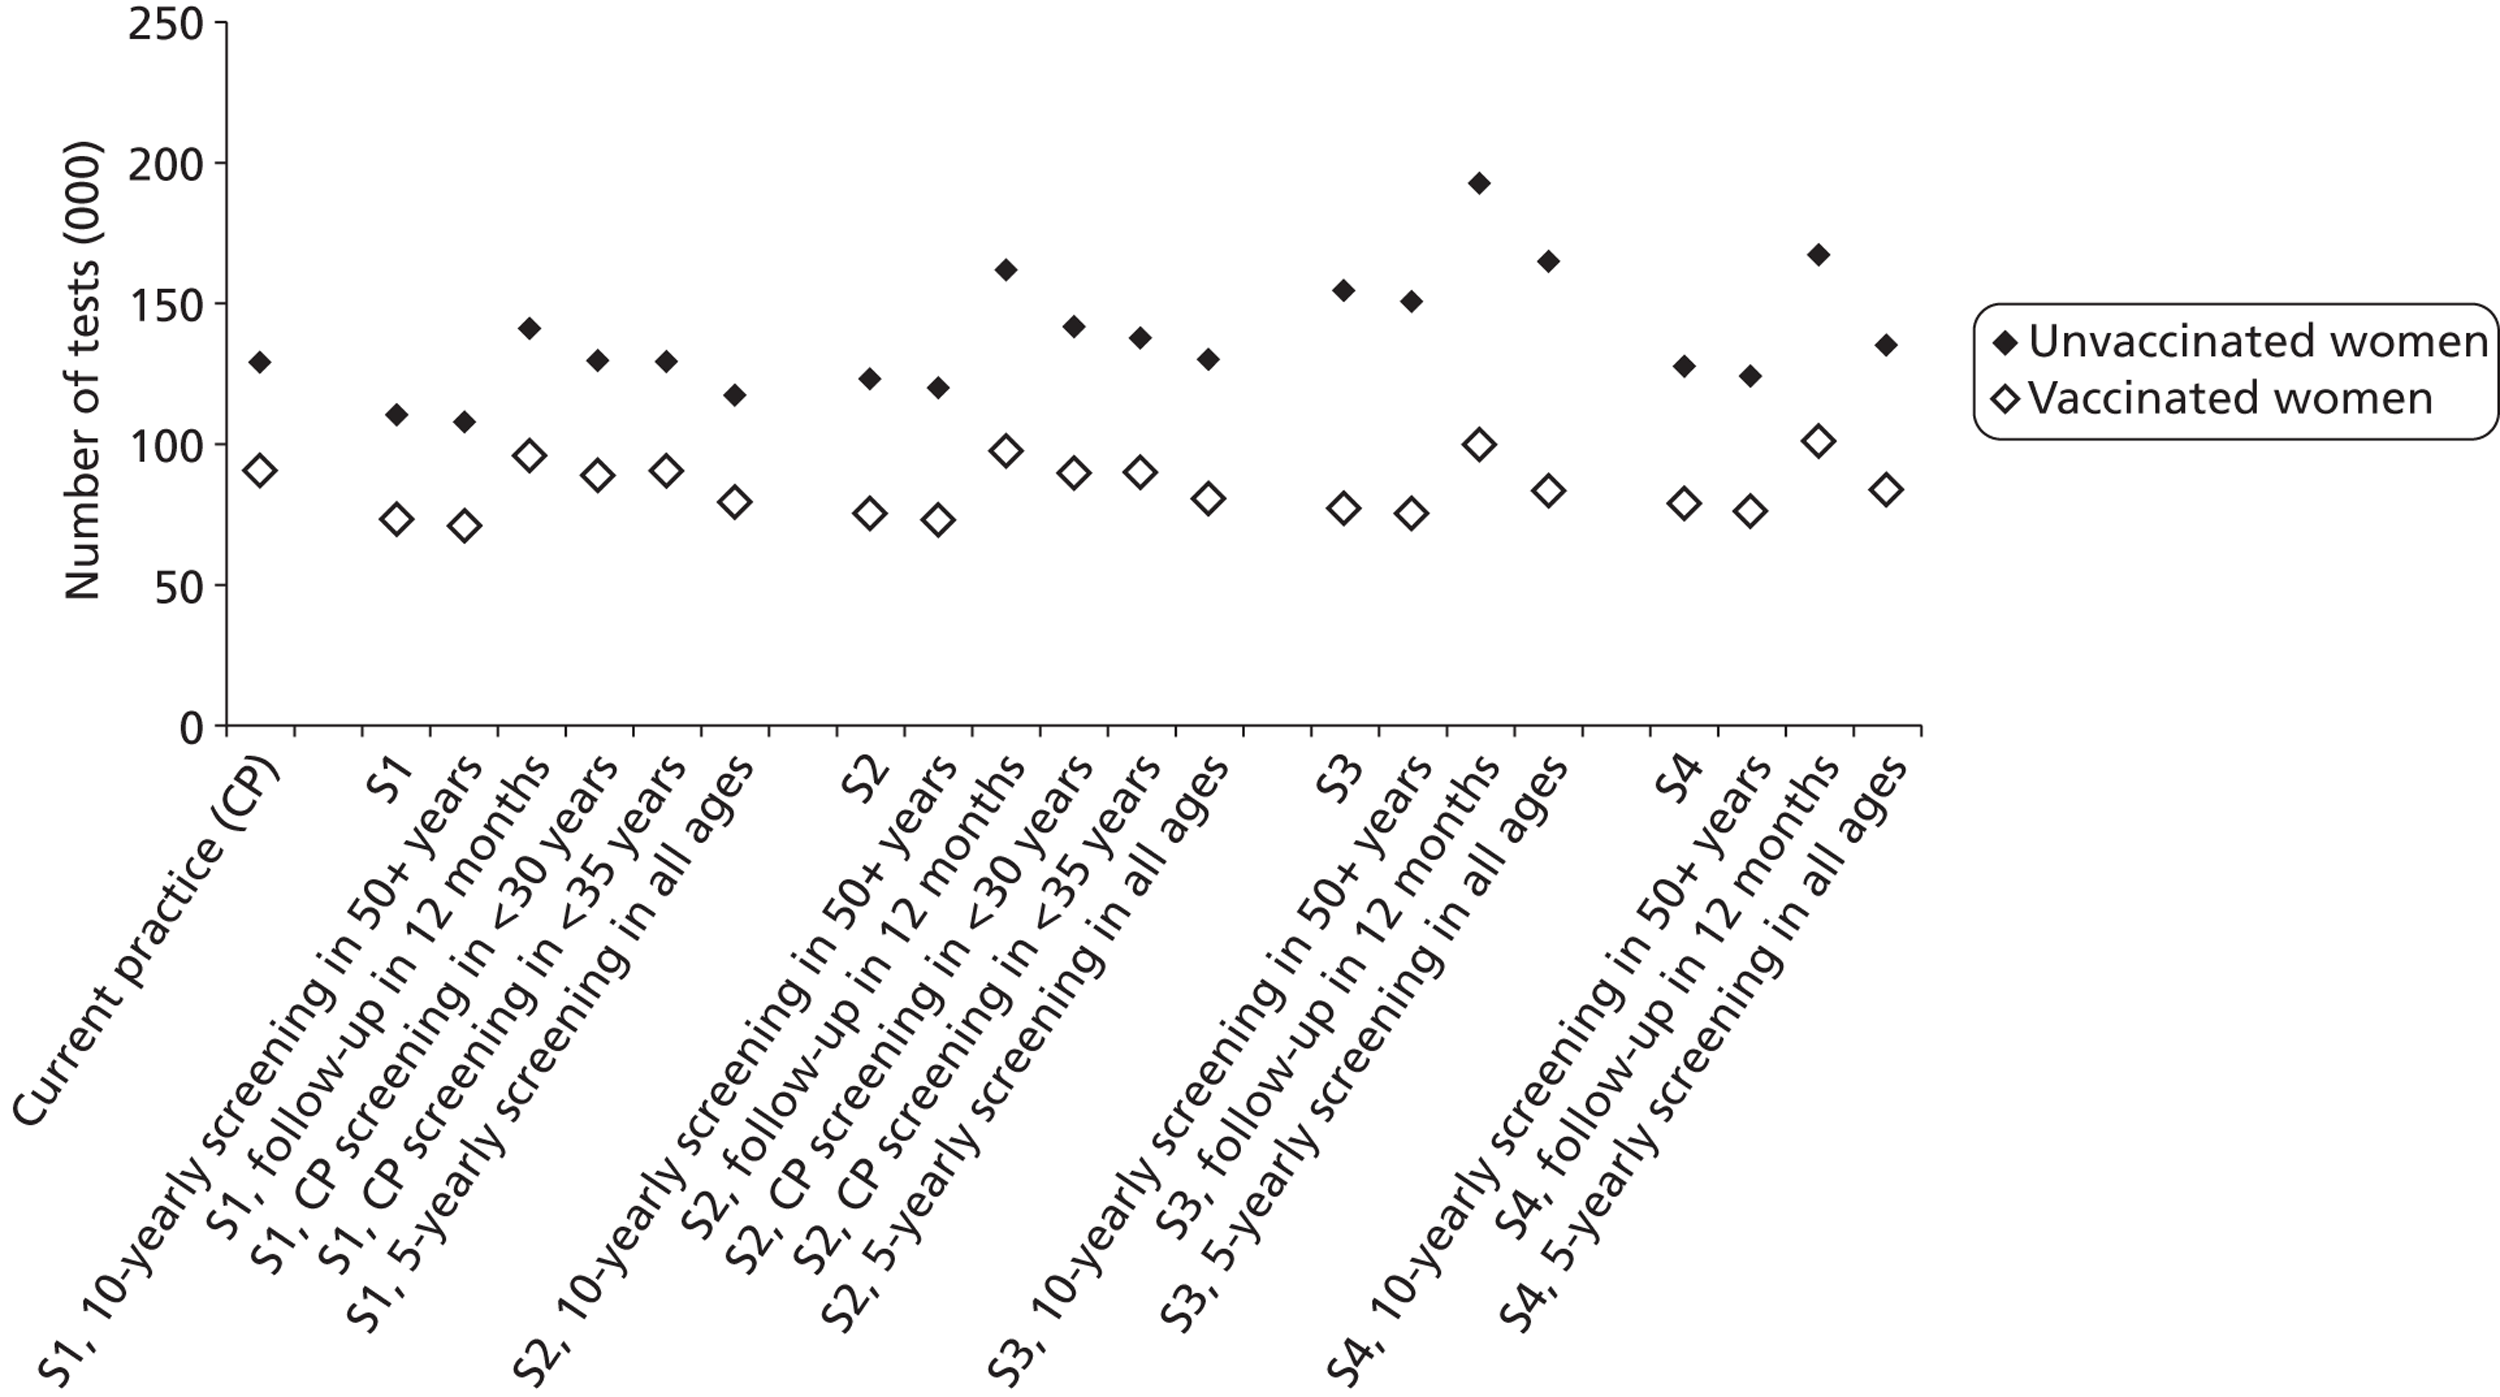
Again, the number of biopsies was predicted to be proportional to the number of colposcopies performed – the model generally predicts that about 68% of women who attend a colposcopy will have a biopsy taken.
Summary of findings from sensitivity analysis
The findings from the sensitivity analysis are provided in Appendix 17. This gives detailed results for one-way sensitivity analysis of the impact of various parameter assumptions on the incremental costs and effectiveness life-years saved of several of the key primary HPV screening strategies in relation to current practice. It also provides the findings from a PSA which varied all costs in the model, and a PSA on sexual behaviour assumptions.
In brief, the findings of the one-way sensitivity analysis consistently identified the relative test characteristics for HPV testing and cytology (summarised as the assumed relative sensitivity and specificity), and the level of compliance to 12-month or 24-month follow-up for intermediate risk women and compliance with colposcopy, as the most important factors in the comparison of the relative costs and effects of primary screening HPV in relation to current practice. With respect to compliance with follow-up, this finding further emphasises the importance of achieving adequate and timely follow-up in the group of women who are HPV positive at screening but who are then found to be reflex cytology negative. Again, the findings of the evaluation suggest that a considerable proportion of the progressive disease in primary HPV strategies originates from this group (as opposed to from the HPV-negative women). These findings are in line with those in the baseline analysis, which found that decreasing the follow-up interval to 12 months (from 24 months) in intermediate risk women has a major positive effect on the overall effectiveness of primary HPV screening.
The findings of the partial PSA for costs were that under all combinations of costs tested, all primary HPV screening strategies considered in the PSA, with the exception of strategy 4 (co-testing), were predicted to be cost saving compared with current practice in vaccinated cohorts; in unvaccinated cohorts with 12 months’ follow-up of HPV-positive, triage-negative women, a very small proportion of scenarios for strategy 2 (0.5%), 29% of scenarios for strategy 3, and 69% of scenarios for strategy 4 were predicted to be more costly than current practice. Overall, this finding provides reassurance that primary HPV screening is likely to be cost saving for a range of possible future screening, diagnostic evaluation and treatment costs for a number of potential strategies in both unvaccinated and vaccinated cohorts.
A PSA was conducted to examine the impact of the detailed sexual behaviour assumptions used by the model. The results indicate that feasible variations in sexual behaviour assumptions do not substantially alter the predicted lifetime cost saved and life-years saved associated with the primary HPV screening strategies, or the relative costs and effects of the main strategies in relation to each other.
Chapter 4 Discussion
The key findings of this extended follow-up of the ARTISTIC trial are summarised as follows: negative HPV testing provides a longer period of protection from CIN2+ than cytology; HPV genotyping can identify subsets of women at greater risk; the HPV vaccination programme is likely to prevent over half of high-grade CIN given current rates of coverage; the cost-effectiveness evaluation has predicted that strategies involving HPV primary screening will save life-years and costs for both unvaccinated and vaccinated cohorts compared with current practice, particularly if screening intervals are 5 years with early recall of HPV-positive/cytology-negative women taking place after 12 months.
The results reported in this extension to the previously published HTA report on ARTISTIC1 are based on up to 8 years of follow-up with HPV testing and cytology (median round 3 follow-up of 72.7 months). The particular value of this extension is the duration of follow-up, rather than the comparison of the original randomised arms of the trial. ARTISTIC now constitutes one of the largest prospective follow-up studies reported over 6 years, and conducted with protocol compliance for recall of HPV-positive women over two rounds of screening and HPV testing over three rounds, and is the largest to have been conducted in the UK. One of the principal strengths of the ARTISTIC study is its relevance to the NHSCSP, particularly in England. ThinPrep® LBC was the standard throughout, and the HC2 HPV test has been used for several years in a process of limited implementation of HPV testing for triage of low-grade cytological abnormalities. Because the ARTISTIC trial and the cost-effectiveness study have been conducted within the framework of the NHSCSP, the findings of this study are likely to be generalisable within the English programme.
Three key strands of the ARTISTIC study 6-year follow-up will provide valuable insight into future considerations of the cervical screening programme: (i) the comparative outcomes following baseline cytology and baseline HPV testing; (ii) estimating the outcome of HPV genotyping in initial screening, followed by reflex cytology for HPV-positive samples; and (iii) estimating the impact of pre-teenage prophylactic vaccination by Cervarix™ on cervical abnormalities. In addition, this follow-up study now includes an economic analysis, which models the long-term cost-effectiveness of HPV primary screening compared with primary cervical cytology.
Cytology, human papillomavirus and cervical intraepithelial neoplasia detection between rounds 1, 2 and 3 of screening
The study cohort decreased in size by about 40% between rounds 1 and 2, and between rounds 2 and 3, which is consistent with the approximate rate of serial coverage of 60% achieved between consecutive 2-year rounds in Greater Manchester. Accrual to the third round was initially hampered by the ethics committee’s requirement to reconsent participants for this extended follow-up with continued HPV testing but, following a number of conditions around anonymity being met, which avoided the need for consent, accrual increased. Because of the reduced accrual and older ages in round 3, as defined by at least 54 months of follow-up, the numbers of lesions detected was just over 50% of that in round 2.
Human papillomavirus prevalence did not change much within age quinquennia, declining by 2–3% at all ages above 25 years from round 2, and increasing by a similar amount from round 2 to round 3 above age 40 years, although not in younger women. The reasons for these changes are not clear. It could be that, above age 40, HPV is less likely to clear, and that following the effect of treatment and natural clearance over the preceding 6 years there was an element of reinfection or possibly latent virus becoming detectable. As previously reported,1,2 there was a marked reduction in abnormal cytology among both HPV-positive and HPV-negative women from round 1 to round 2, particularly for moderate or worse cytology. This was probably due in part to a higher rate of mild abnormalities following the introduction of LBC with a higher colposcopy rate than that seen in routine screening. The impact of LBC on the prevalence round was unique to ARTISTIC, as other international trials used conventional cytology. The relationship between HPV positivity and abnormal cytology remained fairly consistent between rounds 2 and 3, suggesting that HPV-positive status conferred similar risks of abnormal cytology, and confirming the strong relationship between high-grade cytology and the presence of HPV infection.
Women who were cytology negative but HPV positive at entry remained at higher risk in rounds 2 and 3 than the screened cohort overall, which means that in routine screening, where HPV testing was employed as the primary test, there would need to be care taken either to keep such women under surveillance or to further triage them, for example with HPV typing, in order to refer those most at risk to colposcopy. This is reinforced in the cost-effectiveness study. The fact that 28% of women screened in round 3 had not attended for screening in round 2 allows some insight into the effect of missing a round. The proportion of women with CIN2+ detected in round 3 was 0.50% (3 out of 6337) for those screened in all three rounds, whereas, of those who were not screened in round 2, 1.34% (34 out of 2536) had CIN2+ detected. The risk is, of course, very heavily dependent on HPV status. Among those screened in all three rounds, the detection of CIN2+ in round 3 was 1.6% and 0.3% for women who were HPV positive and HPV negative at entry, respectively. Among those who were not screened in round 2, the detection of CIN2+ in round 3 was 5.2% and 0.7% for women who were HPV positive or HPV negative at entry, respectively. The management of HPV-positive/cytology-negative women could be enhanced by further triage using a biomarker of increased risk. So far, no biomarkers offer clear-cut clinical utility, although markers based on p16 and minichromosome maintenance proteins are under investigation.
Influence of human papillomavirus and cytology screening results on cumulative incidence of cervical intraepithelial neoplasia over three rounds
The cumulative incidence of CIN2+ and CIN3+ over three screening rounds (see Table 12) was strongly dependent on baseline screening results, with a greater than 50-fold difference between women who were cytology negative/HPV negative at baseline and those who were cytology positive/HPV positive. If cytology and HPV testing are considered alone (see Table 14), abnormal cytology and testing HPV positive gave similar cumulative CIN2+ and CIN3+ rates over three rounds. Testing HPV negative at baseline was associated with a significantly lower cumulative CIN2+ incidence than negative baseline cytology. It is necessary to consider whether or not ascertainment bias contributed to this result. It is true that, in round 1, women who tested cytology negative/HPV positive were recalled after 1 year and, if still HPV positive, were offered colposcopy, and as a result some CIN2+ was detected. While these lesions may well have been detected as a result of cytology in the next screening round, the revealed arm in which HPV status did not influence referral showed that baseline negative cytology was associated with a higher incidence of CIN2+ in rounds 2 and 3 than negative HPV (0.58% and 0.61%, respectively, vs. 0.23% and 0.26%). This suggests that primary HPV testing would allow longer screening intervals than cytology, which could be highly cost-effective and preferable to women. The reason for the longer duration of protection is that HPV signifies not only a risk of underlying disease but also a risk of developing a lesion. HPV-negative status signifies not only a very low risk of having an underlying lesion, but also a reduced risk of developing one over the next 6 years. In fact, the cost-effectiveness analysis, which takes account of real-life rescreening rates, predicts that a 5-year interval would be a better strategy than 6 years. Indeed, many women recalled after 5 years may take up to 12 months to attend.
The cytology-negative/HPV-positive women represent an important group if screening were based on HPV. The recognition that they remain at risk suggests the need to base management on repeat tests at short-term follow-up. This risks default, but there would be the benefit of allowing HPV infection to clear and regression of minor abnormalities. As shown in the cost-effectiveness analysis, follow-up at 12 months would be more cost-effective than after 24 months. Detection of certain HR types, particularly type 16 which is associated with a higher risk of cumulative disease, can be considered in relation to colposcopy referral. Algorithms which employed novel biomarkers could also be proven in the future to be capable of selecting high-grade CIN without resulting in excessive referral and risk of over treatment.
Human papillomavirus genotyping at baseline confirms that types 16/18 and 31/33/45/52/58 were much more likely to result in detection of CIN2+ and CIN3+ in rounds 1, 2 and 3, either individually or cumulatively; HPV types 16/18/31/33/45/52/58 were detected in over 80% of CIN2+ in round 1 but fewer than half of HC2-positive women, thus conferring greater specificity.
Persistence of human papillomavirus and the incidence of CIN2+
The HPV status of individual women over three rounds allowed estimates of the impact of persistent or fluctuating HPV status. Remaining HPV positive by HC2 between rounds 1 and 2 was associated with a higher risk of CIN2+ than acquiring HPV having screened negative in round 1. True persistence needs to be confirmed by typing and this revealed that among those who remained HPV positive, those who remained positive with the same type (true persistence) had a threefold greater likelihood of having CIN2+ in round 2 than those whose round 2 HPV type(s) were not detected in round 1 (see Table 17). A similar effect was seen in round 3, and the same pattern was seen with CIN3+ between rounds 1 and 2/3 (see Table 18).
The use of human papillomavirus testing followed by cytology to determine colposcopy referral
The data arising from the relationship between age, HPV status, cytology and histology (see Table 23) allow a view of how screening with HPV testing followed by cytology would translate into colposcopy referral and detection of CIN. Had a policy of referral of HPV positive/abnormal cytology been adopted, the round 1 ARTISTIC data suggest an initial referral rate of 5% with a PPV of around 35% for CIN2+. Among women who would have been screened in previous rounds, this would fall to a 2–3% referral rate with a PPV of around 23% for CIN2+.
The major unresolved issue from HPV screening triaged with cytology is the management of women who test HPV positive/cytology negative. Immediate colposcopy for all would result in excessive referral, yet early follow-up with repeat testing to confirm persistent infection would risk significant default. In rounds 1 and 2 of ARTISTIC there was a policy of offering repeat HPV testing at 12 months. Out of 1675 HPV-positive/cytology-negative women at baseline in the revealed arm, only 929 (55%) reported for repeat testing, of whom 393 out of 929 (42%) were still HPV positive. It is likely, therefore, that a policy relying on evidence of persistent HPV to direct referral to colposcopy would result in a proportion of non-attendance. It is likely that nationally, the adherence to early recall for cytology negative/HPV positive would be higher than the Manchester population in a clinical trial. In the original HPV triage studies in England, around 90% of women who were HPV positive with low-grade cytology attended for colposcopy. 34 Although this is not an identical situation, and a new class of ‘abnormality’ in the screening programme, it is reasonable to assume that early recall in real life will achieve high response rates. This will, however, need to be carefully monitored.
The cost-effectiveness analysis predicted that genotyping triage referrals to colposcopy is likely to be beneficial, and if not employed at baseline then at 12 months’ follow-up. If colposcopy were recommended only for women with negative cytology who were very HR-type positive (16/18/31/33/45/52/58), the referral rate would increase to 8% and the PPV would fall to 22%, which could be regarded as acceptable from a clinical perspective. The increased incidence of CIN2+ in women with low-grade cytology/HPV16/18 positive has been well documented in the prospective Portland cohort. 54
Implications for screening intervals
These extended follow-up data strengthen indications from the initial ARTISTIC report1 showing that primary HPV testing would detect similar amounts of CIN2+, and now indicate it could do so with extended screening intervals of 5–6 years. There would be a need to consider how to manage HPV-positive women with negative cytology but typing could have a role in selecting women for colposcopy as opposed to surveillance by repeat cytology or HPV testing. What is not known is how accurate negative cytology would be among a population of HPV-positive women. It is possible that the negative predictive value of negative cytology would be lower than it is for the whole screened population. The typing data have confirmed the massive impact that HPV vaccination can be expected to have on high-grade cervical abnormalities. A move to HPV primary screening with cytology reserved for HPV-positive women would involve considerable shrinkage of the overall amount of cytology, but it would allow cytology, which is of a very high quality in the UK, to continue to play a valuable role in determining referral to colposcopy.
The effect of human papillomavirus vaccination with Cervarix™ on screening abnormalities
The ARTISTIC data confirm how dominant HPV types 16 and 18 are in terms of CIN2+, accounting for well over half of all lesions. Cervarix™ has been reported to prevent 98% of HPV 16/18 associated CIN2+ in women who were HPV DNA negative and HPV sero-negative when they were vaccinated. Additionally, Cervarix™ has been reported to cross-protect in the sense that, among the same vaccinated population, there was vaccine efficacy of almost 70% among a composite of CIN2+ associated with 31/33/45/52/58. 13 Although a recent systematic review47 indicated significantly less cross-protection against types 31 and 45, the overall protective effect of Gardasil will probably not be significantly different. When combined, these efficacies would account for around 65% of CIN2+, according to round 1 ARTISTIC data. With the current vaccine coverage of 80% in 12- to 13-year-old girls, the reduction in the population overall could be 50–55%. These are approximations because of multiple infections but it confirms the predictions from other sources. The effect will begin to become apparent when these vaccinees start screening, as the rates of HPV 16/18 are highest in young women and the rates of HPV positive/abnormal cytology are very high in the 25–29 age group, although the impact on cancer will not be seen for about 20 years. In fact, the earliest signal of the impact of the vaccine will be seen in Scotland and Wales where screening begins at age 20 years, and where late teenagers who were vaccinated in the catch-up campaign began to be screened in 2012. The immediate impact of this will be determined by the rate of vaccine uptake, the attendance for cervical screening by these young women, and the rate of established HPV infection at the time of vaccination.
Effect of Hybrid Capture 2 cut-off
The analysis has shown that using a cut-off of 2 RLU/Co, instead of the manufacturers’ recommended RLU of 1, would provide a useful increase in specificity with an acceptable reduction in sensitivity. A recent study55 comparing new commercially available HPV tests with HC2 at 2 RLU/Co demonstrated that HC2 was generally as specific in the triage setting but within acceptable sensitivity. This means that with HPV primary screening there may be fewer screen positive results, and this is being evaluated as part of the NHSCSP primary screening pilot which has just begun.
Cost-effectiveness evaluation
The results of this evaluation have identified a number of strategies for primary HPV screening which are predicted to be both life-years and cost saving compared with current screening practice with cervical cytology in England for vaccinated and unvaccinated cohorts. The data supporting longer interval HPV-based screening are based, in large part, on consistent information from a number of observational studies and randomised controlled trials which demonstrate that HPV-negative women are at lower subsequent risk of developing the most serious grade of CIN or invasive cancer (CIN3+), compared with HPV-positive women. The international data demonstrate that HPV-negative women are at low risk of developing serious precancerous disease (CIN3+) for 6 years or longer; and these data have (appropriately) underpinned the concept that HPV primary screening can safely be conducted at screening intervals of 5–6 years.
We have, however, in this analysis identified an element important to the practical realisation of primary HPV screening, which needs to be considered to ensure that implementation of primary HPV screening does not result in a loss of screening effectiveness compared with current screening practice. The findings of the current analysis emphasise that in order for primary HPV screening to maintain its effectiveness overall, considerable attention needs to be paid to the optimal management of HPV-positive/cytology-negative women (i.e. an intermediate risk group not immediately referred to colposcopy). This result applies to both vaccinated and unvaccinated cohorts. Because triage testing with cytology has imperfect sensitivity, some women in this group will be at risk of disease progression. If there is delay in follow-up in this group, a higher proportion will develop progressive disease. Furthermore, compliance with follow-up in this group is extremely important. In the base-case analysis, we assumed that 80% of women were followed by the recommended interval. If fewer women were compliant with follow-up, greater rates of disease progression are predicted for both unvaccinated and vaccinated cohorts, as shown in our sensitivity analysis.
From a resource utilisation perspective, although many of the evaluated strategies are predicted to be life-years and cost saving overall, some of the strategies, notably strategy 3 (genotyping and its variants), did result in a higher predicted number of colposcopies, and their downstream sequelae, including a greater number of diagnostic biopsies, in unvaccinated women. This increase in the number of diagnostic evaluations should be considered in terms of a trade-off against the reduced overall costs and greater overall effectiveness (in terms of life-years saved) predicted for these strategies. However, it should be noted that strategy 3 became more ‘efficient’ in a vaccinated setting, where the number of colposcopies, in context of lower prevalence of HPV 16/18 in the population, was comparable with the other primary HPV screening strategies.
We note that the results from this evaluation cannot be directly applied to settings other than England. Other countries may have different screening regimes currently in place, and therefore the results of primary HPV screening strategies would need to be evaluated against a different comparator. In addition, sexual behaviour, vaccination uptake, compliance with routine screening and follow-up management, and costs of screening tests and treatment can vary greatly from setting to setting and, therefore, the results presented in the report should be restricted to England. That said, the promising conclusion that the modelled analysis suggests, that primary HPV screening strategies can be more effective and less costly than current screening practice, should encourage other countries to perform similar evaluations to investigate the potential benefits of changing from primary cytology to primary HPV screening management strategies.
Strengths of the current analysis
The analysis presented in this report used a model with extensive type-specific natural history calibration to ARTISTIC data and shows close duplication of the actual findings in the ARTISTIC trial. The England-wide model, which was used for the overall evaluation of the costs and effects of primary HPV screening in England, incorporated a careful and detailed simulation of sexual behaviour in England, the natural history of type-specific HPV natural history (progression and regression), and a detailed simulation of cervical screening, follow-up and management. This incorporated information on compliance with screening recommendations and also explicit modelling of post-treatment recurrence and test-of-cure management for England. We performed extensive calibration of the England-wide model, including fitting of the sexual behaviour assumptions to national survey data for sexual behaviour (NATSAL II), validation to ensure that the model accurately predicted type-specific HPV infection rates (pre-vaccination) and accurate predictions, under conditions of current screening practice, of age-specific cancer incidence and mortality rates, as well as stage-specific survival. In addition, we validated model predictions for the predicted number of cervical screening tests and other outcomes against current data.
Unlike many previous models of cervical screening, we have also taken into account detailed information on age-specific compliance with cervical screening, incorporating not only overall participation rates, but also the timing of reattendance after a negative screening test.
Other cost-effectiveness evaluations of primary HPV screening has been performed in the Netherlands,56 Germany,57 Norway58 and Canada,59 and each of these analyses concluded in favour of switching to longer-interval HPV-based screening over cytology-based screening. However, our modelled analysis involved a significantly more detailed validation of the modelled natural history assumptions and significantly more detail in terms of the specification of how cervical screening is modelled, as well as a detailed simulation of the effect of vaccination. In addition, we performed extensive analysis of a large number of potential strategies, allowing overall patterns and generalisable model conclusions to be analysed.
Limitations of the current analysis
The main limitations of the current analysis relate to the fact that a number of assumptions about future population behaviour were made, by necessity, and to some extent the conclusions of the current analysis are dependent on whether the assumptions made reflect future screening and vaccination practice.
For example, a key assumption in this modelled analysis was that compliance with follow-up for HPV-positive, triage-negative women will involve approximately 80% of women attending within the recommended follow-up time. However, in sensitivity analysis we demonstrated that the overall outcomes of the analysis are highly dependent on such assumptions, and if actual compliance is less (or more) than 80%, this will have a substantial impact on the findings for the relative costs and effects of primary HPV screening. We also assumed independence of screening and vaccination compliance rates in the population. In the context of high coverage rates for vaccination, as observed in England, heterogeneities between vaccination and screening uptake may not be a major driver of outcomes. There exists high coverage of the vaccine in the school-based system, and there is not strong evidence to suggest that vaccination uptake in individual 12- to 13-year-olds will be correlated with their screening compliance as adults in England. Therefore, we believe this assumption is reasonable at the current time.
Secondly, there are major uncertainties in relation to the costs of primary HPV screening in the future. Although we used the findings of a dedicated costing exercise in relation to current test prices, there has been a general move towards automation of HPV testing (which may drive down test-associated costs) and there is an active competitive environment, with several new HPV test technologies entering the market in recent years. If HPV test costs eventually drop to lower values than those considered here, this will further increase the favourable cost-effectiveness profile of primary HPV testing relative to cytology. In this sense the current evaluation should be considered conservative in relation to the relative costs of primary HPV testing compared to current screening practice. However, we did consider a range of potential future costs in a PSA for costs, and found that HPV screening (if HPV is used as the sole primary test) is predicted to be cost saving under many combinations of projected costs.
Thirdly, the baseline analysis assumed that current levels of HPV vaccination coverage rates will be sustained, and that the vaccine-induced duration of protection will be lifelong. Both of these are likely to be reasonable assumptions given the school-based programme and an absence of evidence that vaccine efficacy substantively decreases over time. We presented our findings for the costs and effects of new potential screening strategies in both unvaccinated and vaccinated cohorts, and it should be noted that both are important in interpretation of the overall results. The results for unvaccinated and vaccinated cohorts (with high coverage rates) should be considered to encompass a range of possibilities with respect to the influence of vaccination coverage on the finding for primary HPV screening. Strategies that were found to have a favourable balance of costs and effects in both situations are likely to also have a favourable balance with respect to intermediate vaccination coverage situations. We also considered vaccination coverage in sensitivity analysis, and found that this factor was not a major influence on the findings for the relative costs and effects of primary HPV screening strategies in relation to current practice.
Fourthly, we made several assumptions about vaccine efficacy. The potential for type-replacement of non-vaccine HPV types has been raised as a concern, although substantive evidence for this phenomenon has not emerged. 60 It is thought to be unlikely as there is little evidence for interaction between HPV types. If substantive evidence type replacement were to be identified then our findings for a vaccinated setting would require re-evaluation. Also, because we used a hierarchical approach to lesion type-assignment when fitting the model to data (HPV 16, then HPV 18, then other oncogenic infections), the rate of other oncogenic type infections may be underestimated, and thus there is potential for HPV 16/18 vaccination to ‘unmask’ underlying co-infections with other oncogenic types. In terms of the effect on the analyses presented here, it is possible that we have somewhat overestimated the efficacy and efficiency (in terms of colposcopy referrals) of partial genotyping strategies in a vaccinated population.
In terms of the partial genotyping strategies considered, we assumed that HPV 16/18 women would be managed in the same way, and did not consider differential management strategies for HPV 16- and HPV 18-positive women. Further work would be needed to assess the potential for strategies involving differential consideration of women according to their infection status with respect to these types or with respect to type 45. In addition, although we did perform initial exploratory analysis of cytology-to-HPV ‘switching’ strategies (where the choice of primary screening test is dependent on a women’s age at the time of screening), the results of such analyses must be considered preliminary as they critically depend on a range of assumptions made about the management of women in follow-up and about the management of underscreened women around the time of the primary test ‘switch’.
In general terms, we have attempted to deal with the uncertainties inherent in modelled analysis via a range of methods. Firstly, we used a modelling platform that was extensively pre-validated against data from several other countries, and was then specifically revalidated against both ARTISTIC data (via a specific simulation of the ARTISTIC cohort) and, for the England-wide model, several observational data sets. Secondly, we have performed extensive sensitivity analysis using a range of techniques including exploring the impact of using different utility weight sets, performing one-way sensitivity analysis of the main results of the analysis, and performing PSA for costs.
The consistency of our findings overall is an important outcome. We found, for a range of strategies, that primary HPV screening is likely to be more effective and less costly than current practice for cervical cytology, provided that attention is paid to the optimal management of HPV-positive, cytology-negative intermediate risk women. Ultimately, the final choice of the particular strategy to be used will consider a trade-off between effectiveness, costs, colposcopy referrals, acceptability to women, and practicalities.
The ARTISTIC protocol originally defined definitions of the duration of time for the second and third screening rounds. This was necessary because women attend following recall for screening over a continuum of time following the invitation. As it turned out, this continuum was of longer duration than anticipated, and it was felt that to avoid lesions being attributed to the wrong screening round, the definitions should be widened. This would of course not affect the combined results for rounds 2 and 3, which is of greatest relevance to this report, and its transfer of some lesions that would have been attributed to round 3, to round 2, is not considered to be of great significance.
Chapter 5 Policy implications
We have identified in this analysis a number of feasible, highly effective and cost-saving strategies for primary HPV screening. The policy decision on which of these strategies to consider for piloting and implementation in England is likely to take into account a range of factors beyond the scope of the current modelled analysis. These might include, for example, factors such as the acceptability to women of the various screening intervals and follow-up and management strategies. Nevertheless, in general terms the current analysis has found that a range of potential primary HPV strategies compared favourably with current screening practice in England.
In terms of the criteria laid down by the National Screening Committee for appraising the effectiveness of a screening programme, the replacement of cytology by HPV as the primary test appears appropriate in the following terms:
-
The test is simple, reliable and less subjective than cytology.
-
Its high negative predictive value and sensitivity compared with cytology will allow extended screening intervals.
-
The modelling suggests that it will be cost effective and cost saving, thus achieving a beneficial balance of expenditure versus health gain.
A less well-understood area relates to the response of women to being told they are HPV positive/cytology negative in terms of understanding the need for follow-up and at the same time avoiding anxiety and uncertainty.
Compliance with surveillance and optimal management of HPV-positive/cytology-negative women after primary HPV screening is of key importance.
Chapter 6 Conclusions
In conclusion, an extended 6-year follow up of the ARTISTIC trial together with an associated cost-effectiveness analysis both support HPV primary screening triaged by cytology in place of cytology triaged by HPV testing. This would apply to both unvaccinated and vaccinated women. Most of the primary HPV strategies examined were not only cost saving but also resulted in an increase in predictive life-years saved in the population. The most feasible and cost-effective strategy in terms of delivery could involve a single policy across the screening age range with 5- or 6-yearly screening intervals and 12-month recall for HPV positive women with negative cytology. High compliance with early recall is predicted to be critical and careful attention should be paid to this aspect. A HC2 cut-off of 2RLU/Co instead of the manufacturers’ recommended cut-off of 1 would be clinically beneficial in terms of an optimal balance between sensitivity and specificity. This study and economic evaluation lend support to convert from cytology to HPV-based screening, piloting of which commenced in the English programme in the second quarter of 2013.
Chapter 7 Research recommendations
-
There needs to be research into the attitudes of women who have been found to be HPV positive/cytology negative, in terms of how to achieve a high level of adherence to follow-up.
-
Other potentially complementary biomarkers should be evaluated in conjunction with HPV testing. Real-time co-testing with such biomarkers could be used to increase the specificity of HPV testing without significant loss of sensitivity. These include p16 and minichromosome maintenance protein which have been incorporated in CINtec™ (Roche Molecular Diagnostics, Pleasanton, CA, USA) and SurePathPlus™ (Becton, Dickenson and Company, Franklin Lakes, NJ, USA), respectively.
-
The ranking of strategies when QALYs were considered as the effectiveness outcome differed considerably from the life-years saved outcome for both QALY weight sets one and two when investigating outcomes for both unvaccinated cohorts and vaccinated cohorts. The diversity of the findings when different QALY weights are used highlights a need for further investigation into utilities relevant to primary HPV screening, in both unvaccinated and vaccinated populations.
Acknowledgements
Contributorship
The ARTISTIC Trial study group
Chief investigators
HC Kitchener (Clinical Principal Investigator; Institute of Cancer Sciences, University of Manchester).
J Peto (Statistics and Epidemiology; London School of Hygiene and Tropical Medicine).
Trial co-ordinators
P Wheeler, round 1 (Institute of Cancer Sciences, University of Manchester).
C Thomson, round 2 (Institute of Cancer Sciences, University of Manchester).
R Albrow, round 3 (Institute of Cancer Sciences, University of Manchester).
Epidemiology/statistics
C Gilham (London School of Hygiene and Tropical Medicine).
M Almonte (Non-Communicable Disease Epidemiology Unit, London School of Hygiene and Tropical Medicine).
C Roberts (Institute of Population Health, University of Manchester).
S Moss (Cancer Screening Evaluation Unit, Institute of Cancer Research).
Cytopathology
M Desai (Manchester Cytology Centre, Central Manchester University Hospital NHS Foundation Trust).
J Mather (Manchester Cytology Centre, Central Manchester University Hospitals NHS Foundation Trust).
Virology
A Sargent (Department of Virology, Central Manchester University Hospitals NHS Foundation Trust).
A Bailey (Department of Virology, Central Manchester University Hospitals NHS Foundation Trust).
A Turner (Department of Virology, Central Manchester University Hospitals NHS Foundation Trust).
Economic modelling
K Canfell (Lowy Cancer Research Centre, University of NSW, Sydney, Australia).*
K Simms (Lowy Cancer Research Centre, University of NSW, Sydney, Australia).*
JB Lew (Lowy Cancer Research Centre, University of NSW, Sydney, Australia).*
M Caruana (Lowy Cancer Research Centre, University of NSW, Sydney, Australia).*
R Walker (Lowy Cancer Research Centre, University of NSW, Sydney, Australia).*
MA Smith (Lowy Cancer Research Centre, University of NSW, Sydney, Australia).*
*Past affiliation: Cancer Research Division, Cancer Council NSW, Australia.
Report production
JB Oughton (Institute of Cancer Sciences, University of Manchester).
B Clarke (Cancer Research Division, Cancer Council NSW, Australia).
Acknowledgement
We thank Dr Rosa Legood of the London School of Hygiene and Tropical Medicine for supplying some of the cost data used in the economic analysis.
Contributions of authors
Professor Henry C Kitchener (Professor of Gynaecological Oncology) was the clinical principal investigator for the study and contributed to the design of the study, the analysis and drafted the report.
Assistant Professor Karen Canfell (Senior Research Fellow) led the modelled analysis of the ARTISTIC cohort and the economic evaluation of primary HPV screening in England.
Clare Gilham (Medical Statistician) carried out the statistical analysis and prepared the results for publication.
Dr Alexandra Sargent (Pre Reg Clinical Scientist) conducted the virology testing for the study, contributed to the interpretation of the virology data and prepared the results for publication.
Professor Chris Roberts (Professor of Biostatistics) made critical comments of the draft report and assisted in preparing the analysis.
Dr Mina Desai (Consultant Cytopathologist) supervised the cytological aspects of the study.
Professor Julian Peto (Cancer Research UK Chair of Epidemiology) contributed to the design of the study, the analysis and made critical comments on the report.
Disclaimers
This report presents independent research funded by the National Institute for Health Research (NIHR). The views and opinions expressed by authors in this publication are those of the authors and do not necessarily reflect those of the NHS, the NIHR, NETSCC, the HTA programme or the Department of Health.
References
- Kitchener HC, Almonte M, Dowie R, Stoykova B, Sargent A, Roberts C, et al. ARTISTIC: a randomised trial of HPV testing in primary cervical screening. Health Technol Assess 2009;13.
- Kitchener HC, Almonte M, Thomson C, Wheeler P, Sargent A, Stoykova B, et al. HPV testing in combination with liquid-based cytology in primary cervical screening (ARTISTIC): a randomised controlled trial. Lancet Oncol 2009;10:672-82. http://dx.doi.org/10.1016/S1470-2045(09)70156-1.
- Kitchener HC, Almonte M, Wheeler P, Desai M, Gilham C, Bailey A, et al. HPV testing in routine cervical screening: cross sectional data from the ARTISTIC trial. Br J Cancer 2006;95:56-61. http://dx.doi.org/10.1038/sj.bjc.6603210.
- Sargent A, Bailey A, Almonte M, Turner A, Thomson C, Peto J, et al. Prevalence of type-specific HPV infection by age and grade of cervical cytology: data from the ARTISTIC trial. Br J Cancer 2008;98:1704-9. http://dx.doi.org/10.1038/sj.bjc.6604324.
- Kitchener HC, Fletcher I, Roberts C, Wheeler P, Almonte M, Maguire P. The psychosocial impact of human papillomavirus testing in primary cervical screening-a study within a randomized trial. Int J Gynecol Cancer 2008;18:743-8.
- Sargent A, Bailey A, Turner A, Almonte M, Gilham C, Baysson H, et al. Optimal threshold for a positive hybrid capture 2 test for detection of human papillomavirus: data from the ARTISTIC trial. J Clin Microbiol 2010;48:554-8. http://dx.doi.org/10.1128/JCM.00896-09.
- Bulkmans NW, Berkhof J, Rozendaal L, van Kemenade FJ, Boeke AJ, Bulk S, et al. Human papillomavirus DNA testing for the detection of cervical intraepithelial neoplasia grade 3 and cancer: 5-year follow-up of a randomised controlled implementation trial. Lancet 2007;370:1764-72. http://dx.doi.org/10.1016/S0140-6736(07)61450-0.
- Naucler P, Ryd W, Tornberg S, Strand A, Wadell G, Elfgren K, et al. Human papillomavirus and Papanicolaou tests to screen for cervical cancer. N Engl J Med 2007;357:1589-97. http://dx.doi.org/10.1056/NEJMoa073204.
- Ronco G, Giorgi-Rossi P, Carozzi F, Confortini M, Dalla Palma P, Del Mistro A, et al. Efficacy of human papillomavirus testing for the detection of invasive cervical cancers and cervical intraepithelial neoplasia: a randomised controlled trial. Lancet Oncol 2010;11:249-57. http://dx.doi.org/10.1016/S1470-2045(09)70360-2.
- Jit M, Choi YH, Edmunds WJ. Economic evaluation of human papillomavirus vaccination in the United Kingdom. BMJ 2008;337. http://dx.doi.org/10.1136/bmj.a769.
- Dillner J, Rebolj M, Birembaut P, Petry KU, Szarewski A, Munk C, et al. Long term predictive values of cytology and human papillomavirus testing in cervical cancer screening: joint European cohort study. BMJ 2008;337. http://dx.doi.org/10.1136/bmj.a1754.
- Moss S, Kelly R, Legood R, Sadique Z, Canfell K, Lew JB, et al. Evaluation of Sentinel Sites for HPV Triage and Test of Cure: Report to NHS Cancer Screening Programmes 2011. www.cancerscreening.nhs.uk/cervical/hpv-sentinel-sites.html (accessed 2 July 2013).
- Paavonen J, Naud P, Salmeron J, Wheeler CM, Chow SN, Apter D, et al. Efficacy of human papillomavirus (HPV)–16/18 AS04-adjuvanted vaccine against cervical infection and precancer caused by oncogenic HPV types (PATRICIA): final analysis of a double-blind, randomised study in young women. Lancet 2009;374. http://dx.doi.org/10.1016/S0140-6736(09)61248-4.
- Rothman KJ. Estimation of confidence limits for the cumulative probability of survival in life table analysis. J Chron Dis 1978;31:557-60. http://dx.doi.org/10.1016/0021-9681(78)90043-7.
- Creighton P, Lew JB, Clements M, Smith M, Howard K, Dyer S, et al. Cervical cancer screening in Australia: modelled evaluation of the impact of changing the recommended interval from two to three years. BMC Public Health 2010;10. http://dx.doi.org/10.1186/1471-2458-10-734.
- Canfell K, Sitas F, Beral V. Cervical cancer in Australia and the United Kingdom: comparison of screening policy and uptake, and cancer incidence and mortality. Med J Aus 2006;185:482-6.
- Canfell K, Barnabas R, Patnick J, Beral V. The predicted effect of changes in cervical screening practice in the UK: results from a modelling study. Br J Cancer 2004;91:530-6. http://dx.doi.org/10.1038/sj.bjc.6602002.
- Automation Assisted and Liquid Based Cytology for Cervical Cancer Screening. Canberra, ACT: Medical Services Advisory Committee; 2009.
- Kitchener HC, Blanks R, Cubie H, Desai M, Dunn G, Legood R, et al. MAVARIC – a comparison of automation-assisted and manual cervical screening: a randomised controlled trial. Health Technol Assess 2011;15.
- Human Papillomavirus Triage Test For Women With Possible or Definite Low-Grade Squamous Intraepithelial Lesions. Canberra, ACT: Medical Services Advisory Committee; 2009.
- Canfell K, Shi JF, Lew JB, Walker R, Zhao FH, Simonella L, et al. Prevention of cervical cancer in rural China: evaluation of HPV vaccination and primary HPV screening strategies. Vaccine 2011;29:2487-94. http://dx.doi.org/10.1016/j.vaccine.2010.12.085.
- Shi JF, Canfell K, Lew JB, Zhao FH, Legood R, Ning Y, et al. Evaluation of primary HPV-DNA testing in relation to visual inspection methods for cervical cancer screening in rural China: an epidemiologic and cost-effectiveness modelling study. BMC Cancer 2011;11. http://dx.doi.org/10.1186/1471-2407-11-239.
- Johnson AM, Mercer CH, Erens B, Copas AJ, McManus S, Wellings K, et al. Sexual behaviour in Britain: partnerships, practices, and HIV risk behaviours. Lancet 2001;358:1835-42. http://dx.doi.org/10.1016/S0140-6736(01)06883-0.
- Sheridan A, White J. Annual HPV vaccine coverage in England in 2009/2010. MMWR Morb Mortal Wkly Rep 2009;59:1018-23.
- Wellings K, Nanchahal K, Macdowall W, McManus S, Erens B, Mercer CH, et al. Sexual behaviour in Britain: early heterosexual experience. Lancet 2001;358:1843-50. http://dx.doi.org/10.1016/S0140-6736(01)06885-4.
- Joseph L. Bayesian Data Analysis. Boca Raton, FL: Chapman & Hall/CRC; 2004.
- National Institute for Health and Care Excellence . Guide to the Methods of Technology Appraisal 2008. www.nice.org.uk/aboutnice/howwework/devnicetech/GuideToMethodsTechnologyAppraisal2008.jsp (accessed 2 July 2013).
- Legood R, Smith M, Lew JB, Walker R, Moss S, Kitchener H, et al. Cost effectiveness of human papillomavirus test of cure after treatment for cervical intraepithelial neoplasia in England: economic analysis from NHS Sentinel Sites Study. BMJ 2012;345. http://dx.doi.org/10.1136/bmj.e7086.
- Cuzick J, Szarewski A, Cubie H, Hulman G, Kitchener H, Luesley D, et al. Management of women who test positive for high-risk types of human papillomavirus: the HART study. Lancet 2003;362:1871-6. http://dx.doi.org/10.1016/S0140-6736(03)14955-0.
- Arbyn M, Bergeron C, Klinkhamer P, Martin-Hirsch P, Siebers AG, Bulten J. Liquid compared with conventional cervical cytology – a systematic review and meta-analysis. Obstet Gynecol 2008;111:167-77. http://dx.doi.org/10.1097/01.AOG.0000296488.85807.b3.
- Cuzick J, Clavel C, Petry KU, Meijer CJ, Hoyer H, Ratnam S, et al. Overview of the European and North American studies on HPV testing in primary cervical cancer screening. Int J Cancer 2006;119:1095-101. http://dx.doi.org/10.1002/ijc.21955.
- Stoler MH, Wright TC, Sharma A, Apple R, Gutekunst K, Wright TL, et al. High-risk human papillomavirus testing in women with ASC-US cytology: results from the ATHENA HPV study. Am J Clin Pathol 2011;135:468-75. http://dx.doi.org/10.1309/AJCPZ5JY6FCVNMOT.
- Cervical Screening Programme England 2007–08 . Data Tables: The Health and Social Care Information Centre 2008. www.cancerscreening.nhs.uk/cervical/hpv-sentinel-sites.html (accessed 2 July 2013).
- Moss S, Gray A, Legood R, Vessey M, Patnick J, Kitchener H, et al. Effect of testing for human papillomavirus as a triage during screening for cervical cancer: observational before and after study. BMJ 2006;332:83-5. http://dx.doi.org/10.1136/bmj.38701.440961.7C.
- Martin-Hirsch P, Rash B, Martin A, Standaert B. Management of women with abnormal cervical cytology: treatment patterns and associated costs in England and Wales. BJOG 2007;114:408-15. http://dx.doi.org/10.1111/j.1471-0528.2007.01261.x.
- Sherlaw-Johnson C, Philips Z. An evaluation of liquid-based cytology and human papillomavirus testing within the UK cervical cancer screening programme. Br J Cancer 2004;91:84-91. http://dx.doi.org/10.1038/sj.bjc.6601884.
- Curtis L. Unit Costs of Health and Social Care 2010 2010.
- Simonella LM. Characterisation and Assessment of Organised Screening, Model Validation, and Health State Preference Scores in Decision Analytic Models of Human Papillomavirus (HPV) Vaccination in Australia and New Zealand 2012.
- Elbasha EH, Dasbach EJ, Insinga RP. Model for assessing human papillomavirus vaccination strategies. Emerg Infect Dis 2007;13:28-41. http://dx.doi.org/10.3201/eid1301.060438.
- Goldie SJ, Kohli M, Grima D, Weinstein MC, Wright TC, Bosch FX, et al. Projected clinical benefits and cost-effectiveness of a human papillomavirus 16/18 vaccine. J Natl Cancer Inst 2004;96:604-15. http://dx.doi.org/10.1093/jnci/djh104.
- Insinga RP, Glass AG, Myers ER, Rush BB. Abnormal outcomes following cervical cancer screening: event duration and health utility loss. Med Decis Making 2007;27:414-22. http://dx.doi.org/10.1177/0272989X07302128.
- Annual HPV Vaccine Coverage in England 2010/2011. London: Department of Health; 2012.
- Cervical Cancer – UK Mortality Statistics. London: Cancer Research UK; n.d.
- Office for National Statistics . Interim Life Tables for England 2005–2007 (Females) 2009. www.statistics.gov.uk/downloads/theme_population/Interim_Life/ILTEng0608Reg.xls (accessed 14 December 2009).
- Redburn JC, Murphy MF. Hysterectomy prevalence and adjusted cervical and uterine cancer rates in England and Wales. BJOG 2001;108:388-95. http://dx.doi.org/10.1016/S0306-5456(00)00098-X.
- Wheeler CM, Castellsague X, Garland SM, Szarewski A, Paavonen J, Naud P, et al. Cross-protective efficacy of HPV-16/18 AS04-adjuvanted vaccine against cervical infection and precancer caused by non-vaccine oncogenic HPV types: 4-year end-of-study analysis of the randomised, double-blind PATRICIA trial. Lancet Oncol 2012;13:100-10. http://dx.doi.org/10.1016/S1470-2045(11)70287-X.
- Malagón T, Drolet M, Boily MC, Franco EL, Jit M, Brisson J, et al. Cross-protective efficacy of two human papillomavirus vaccines: a systematic review and meta-analysis. Lancet Infect Dis 2012;12:781-9.
- 2011 Census – Population and Household Estimates for England and Wales. London: Office for National Statistics; 2011.
- Cancer Registrations in England, 2010 (data table). London: Office for National Statistics; 2010.
- Cancer Incidence in Five Continents. Lyon: International Agency for Research on Cancer; 2007.
- Cervical Cancer Survival Data. Birmingham: West Midlands Cancer Intelligence Unit; 2009.
- Ahmad OB, Boschi-Pinto C, Lopez AD, Murray CJD, Lozano R, Inoue M. Rates: A New WHO Standard 2001. www.who.int/healthinfo/paper31.pdf (accessed 2 July 2013).
- Rudmik L, Drummond M. Health economic evaluation: Important principles and methodology. Laryngoscope 2013;123:1341-7. http://dx.doi.org/10.1002/lary.23943.
- Khan MJ, Castle PE, Lorincz AT, Wacholder S, Sherman M, Scott DR, et al. The elevated 10-year risk of cervical precancer and cancer in women with human papillomavirus (HPV) type 16 or 18 and the possible utility of type-specific HPV testing in clinical practice. J Natl Cancer Inst 2005;97:1072-9. http://dx.doi.org/10.1093/jnci/dji187.
- Moss S, Bailey A, Sargent A, Cubie H, Denton K, Ellis D, et al. Results for the NHSCSP Multiple HPV Testing Study 2012.
- van Rosmalen J, de Kok IM, van Ballegooijen M. Cost-effectiveness of cervical cancer screening: cytology versus human papillomavirus DNA testing. BJOG 2012;119:699-70. http://dx.doi.org/10.1111/j.1471-0528.2011.03228.x.
- Sroczynski G, Schnell-Inderst P, Muhlberger N, Lang K, Aidelsburger P, Wasem J, et al. Cost-effectiveness of primary HPV screening for cervical cancer in Germany--a decision analysis. Eur J Cancer 2011;47:1633-46. http://dx.doi.org/10.1016/j.ejca.2011.03.006.
- Burger EA, Ortendahl JD, Sy S, Kristiansen IS, Kim JJ. Cost-effectiveness of cervical cancer screening with primary human papillomavirus testing in Norway. Br J Cancer 2012;106:1571-8. http://dx.doi.org/10.1038/bjc.2012.94.
- Vijayaraghavan A, Efrusy MB, Mayrand MH, Santas CC, Goggin P. Cost-effectiveness of high-risk human papillomavirus testing for cervical cancer screening in Quebec, Canada. Can J Public Health 2010;101:220-5.
- Franco E. Something to Worry About: Yes or No? 2010.
- Office for National Statistics . Cancer Statistics Registrations, England (Series MB1), No. 32 2001. www.ons.gov.uk/ons/publications/re-reference-tables.html?edition=tcm%3A77–156486 (accessed 14 December 2009).
- Kitchener HC, Gilham C, Sargent A, Bailey A, Albrow R, Roberts C, et al. A comparison of HPV DNA testing and liquid based cytology over three rounds of primary cervical screening: extended follow-up in the ARTISTIC trial. Eur J Cancer 2011;47:864-71. http://dx.doi.org/10.1016/j.ejca.2011.01.008.
- Arbyn M, Sasieni P, Meijer CJ, Clavel C, Koliopoulos G, Dillner J. Chapter 9: Clinical applications of HPV testing: a summary of meta-analyses. Vaccine 2006;24:S78-89. http://dx.doi.org/10.1016/j.vaccine.2006.05.117.
- Kitchener HC, Walker PG, Nelson L, Hadwin R, Patnick J, Anthony GB, et al. HPV testing as an adjunct to cytology in the follow up of women treated for cervical intraepithelial neoplasia. BJOG 2008;115:1001-7. http://dx.doi.org/10.1111/j.1471-0528.2008.01748.x.
- Moss SM, Gray A, Marteau T, Legood R, Henstock E, Maissi E. Evaluation of HPV/LBC Cervical Screening Pilot Studies. Sutton: Institute of Cancer Research; 2004.
- de Kok IM, van Rosmalen J, Dillner J, Arbyn M, Sasieni P, Iftner T, et al. Primary screening for human papillomavirus compared with cytology screening for cervical cancer in European settings: cost effectiveness analysis based on a Dutch microsimulation model. BMJ 2012;344. http://dx.doi.org/10.1136/bmj.e670.
- Choi YH, Jit M, Gay N, Cox A, Garnett GP, Edmunds WJ. Transmission dynamic modelling of the human papillomavirus vaccination in the United Kingdom. Vaccine 2010;28:4091-102. http://dx.doi.org/10.1016/j.vaccine.2009.09.125.
- Caro JJ, Briggs A, Siebert U, Kuntz K. Modelling good research practices – overview: a report of the ISPOR-SMDM Modelling Good Research Practices Task Force-1. Med Decis Making 2012;32:667-77. http://dx.doi.org/10.1177/0272989X12454577.
- Drummond M. Methods for the Economic Evaluation of Health Care Programmes. Oxford: Oxford University Press; 1997.
Appendix 1 Type-specific cumulative incidence supplementary tables
The hierarchy of type-specific cumulative incidence is shown in Tables 46 and 47 (see table footnotes). Type 16 is the most dominant type, with types 31 and 33 some way ahead of the other HR types.
| HPV at round 1a | Round 1, CIN2+/n (%) | Round 2, CIN2+/n (%) | Round 3, CIN2+/n (%) | Cumulative CIN2+ rate,14 % (95% CI) |
|---|---|---|---|---|
| – | 36/20,697 (0.17) | 37/13,720 (0.27) | 32/7552 (0.42) | 0.87 (0.70 to 1.06) |
| 16 | 287/827 (34.70) | 33/339 (9.73) | 9/213 (4.23) | 43.55 (39.75 to 47.45) |
| 33 | 40/166 (24.10) | 6/78 (7.69) | 1/54 (1.85) | 31.23 (23.55% to 39.59) |
| 31 | 70/299 (23.41) | 9/145 (6.21) | 6/109 (5.50) | 32.12 (26.12 to 38.44) |
| 18 | 32/228 (14.04) | 4/128 (3.13) | 5/86 (5.81) | 21.56 (15.53 to 28.74) |
| 45 | 19/137 (13.87) | 5/86 (5.81) | 2/54 (3.70) | 21.88 (14.51 to 30.70) |
| 58 | 17/107 (15.89) | 1/54 (1.85) | 1/35 (2.86) | 19.80 (11.96 to 29.75) |
| 52 | 18/229 (7.86) | 4/137 (2.92) | 2/99 (2.02) | 12.36 (7.91 to 18.11) |
| Other | 68/1820 (3.74) | 24/1103 (2.18) | 8/671 (1.19) | 6.95 (5.61 to 8.50) |
| HPV at round 1a | Round 1, n/CIN3+ (%) | Round 2, CIN3+/n (%) | Round 3, CIN3+/n (%) | Cumulative CIN3+ rate,14 % (95% CI) |
|---|---|---|---|---|
| – | 9/20,697 (0.04) | 12/13,720 (0.09) | 11/7552 (0.15) | 0.28 (0.18 to 0.40) |
| 16 | 191/827 (23.10) | 20/339 (5.90) | 8/213 (3.76) | 30.35 (26.70 to 34.24) |
| 33 | 21/166 (12.65) | 3/78 (3.85) | 1/54 (1.85) | 17.57 (11.37 to 25.43) |
| 31 | 32/299 (10.70) | 5/145 (3.45) | 2/109 (1.83) | 15.36 (10.90 to 20.83) |
| 18 | 16/228 (7.02) | 2/128 (1.56) | 3/86 (3.49) | 11.66 (6.93 to 17.99) |
| 45 | 6/137 (4.38) | 2/86 (2.33) | 0/54 | 6.60 (2.90 to 12.61) |
| 58 | 6/107 (5.61) | 1/54 (1.85) | 0/35 | 7.36 (2.73 to 15.25) |
| 52 | 8/229 (3.49) | 1/137 (0.73) | 1/99 (1.01) | 5.17 (2.39 to 9.59) |
| Other | 25/1820 (1.37) | 7/1103 (0.63) | 5/671 (0.75) | 2.73 (1.86 to 3.85) |
Appendix 2 PapilloCheck® human papillomavirus genotyping
With a number of new HPV test kits becoming available, it was possible to undertake a number of comparisons with new kits. Some of these kits provide genotyping data as their sole read-out, for example PapilloCheck® (Greiner) and Linear Array® (Roche), while others provide a generic HR type read-out, for example Cervista (Hologic). Yet others offer both a generic read-out and limited type-specific data, for example M2000 (Abbott) and Cobas 4800 (Roche).
In one comparative testing exercise, PapilloCheck® and M2000 were compared with HC2 in a subset of samples archived from round 1 with known cytological and histological outcomes. There were 387 cases in which an adequate cytology grade was available and where it was possible to obtain valid HPV results with all three HPV tests. These are tabulated according to grade of cytology with footnotes detailing CIN2+ histology outcomes.
It can be seen from Table 48 that among a group of normal cytology (n = 66), of which 50 were HC2 positive and 16 HC2 negative, there was 46/50 (92%) concordance with HC2 positive and 13/16 (82%) concordance with HC2 negative for the PapilloCheck® and M2000 tests. The results for 212 borderline/mild cytology were similar, with 99/105 (94%) and 99/107 (92.5%) agreement between the PapilloCheck® and M2000 for HC2 positive and HC2 negative, respectively (Table 49). In 109 samples with moderate dyskaryosis or worse, there was 92/96 (95.8%) and 13/13 (100%) for these tests for HC2 positive and HC2 negative, respectively (34 CIN2+ lesions identified among this group: 28 were positive by all three tests, five were negative by all three tests and one was positive by PapilloCheck® only) (Table 50). Taken together, there were 110 underlying CIN2+ lesions, of which 95 were positive by HC2 and M2000 and 93 by PapilloCheck®. In addition, there was one case of invasive carcinoma which was detected by all three assays.
| HC2+ve | HC2−ve | Total | |||
|---|---|---|---|---|---|
| PapilloCheck®+ve | PapilloCheck®−ve | PapilloCheck®+ve | PapilloCheck®−ve | ||
| M2000+ve | 36 (54.5%) | 2 (3.0%) | 1 (1.5%) | 1 (1.5%) | 40 (60.6%) |
| M2000−ve | 2 (3.0%) | 10 (15.2%) | 2 (3.0%) | 12 (18.2%) | 26 (39.4%) |
| Total | 38 (57.6%) | 12 (18.2%) | 3 (4.5%) | 13 (19.7%) | 66a |
| HC2+ve | HC2−ve | Total | |||
|---|---|---|---|---|---|
| PapilloCheck®+ve | PapilloCheck®−ve | PapilloCheck®+ve | PapilloCheck®−ve | ||
| M2000+ve | 94 (44.3%) | 2 (0.9%) | 6 (2.8%) | 2 (0.9%) | 104 (49.1%) |
| M2000−ve | 4 (1.9%) | 5 (2.4%) | 6 (2.8%) | 93 (43.9%) | 108 (50.9%) |
| Total | 98 (46.2%) | 7 (3.3%) | 12 (5.7%) | 95 (44.8%) | 212a |
| HC2+ve | HC2−ve | Total | |||
|---|---|---|---|---|---|
| PapilloCheck®+ve | PapilloCheck®−ve | PapilloCheck®+ve | PapilloCheck®−ve | ||
| M2000+ve | 92 (84.4%) | 4 (3.7%) | 1 (0.9%) | 0 (0%) | 97 (89.0%) |
| M2000−ve | 0 (0%) | 0 (0%) | 0 (0%) | 12 (11.0%) | 12 (11.0%) |
| Total | 92 (84.4%) | 4 (3.7%) | 1 (0.9%) | 12 (11.0%) | 109a |
In a second exercise, 378 HC2-positive samples (300 were prospectively obtained in round 3 and 78 were archived) were co-tested with PapilloCheck® and LA. This was concerned with HPV genotyping. When HR type positivity overall was compared, there was 303/378 (80%) concordance between LA and PapilloCheck®. When types 16/18 detection was compared, this rose to 359/378 (94.9%) concordance. The results for all HR types are shown in Figure 44 with some differences in both directions in some types, 31 and 68 being more obvious among the more HR types.
FIGURE 44.
Linear array vs. PapilloCheck® genotyping results on HC2-positive screening samples (n = 378).
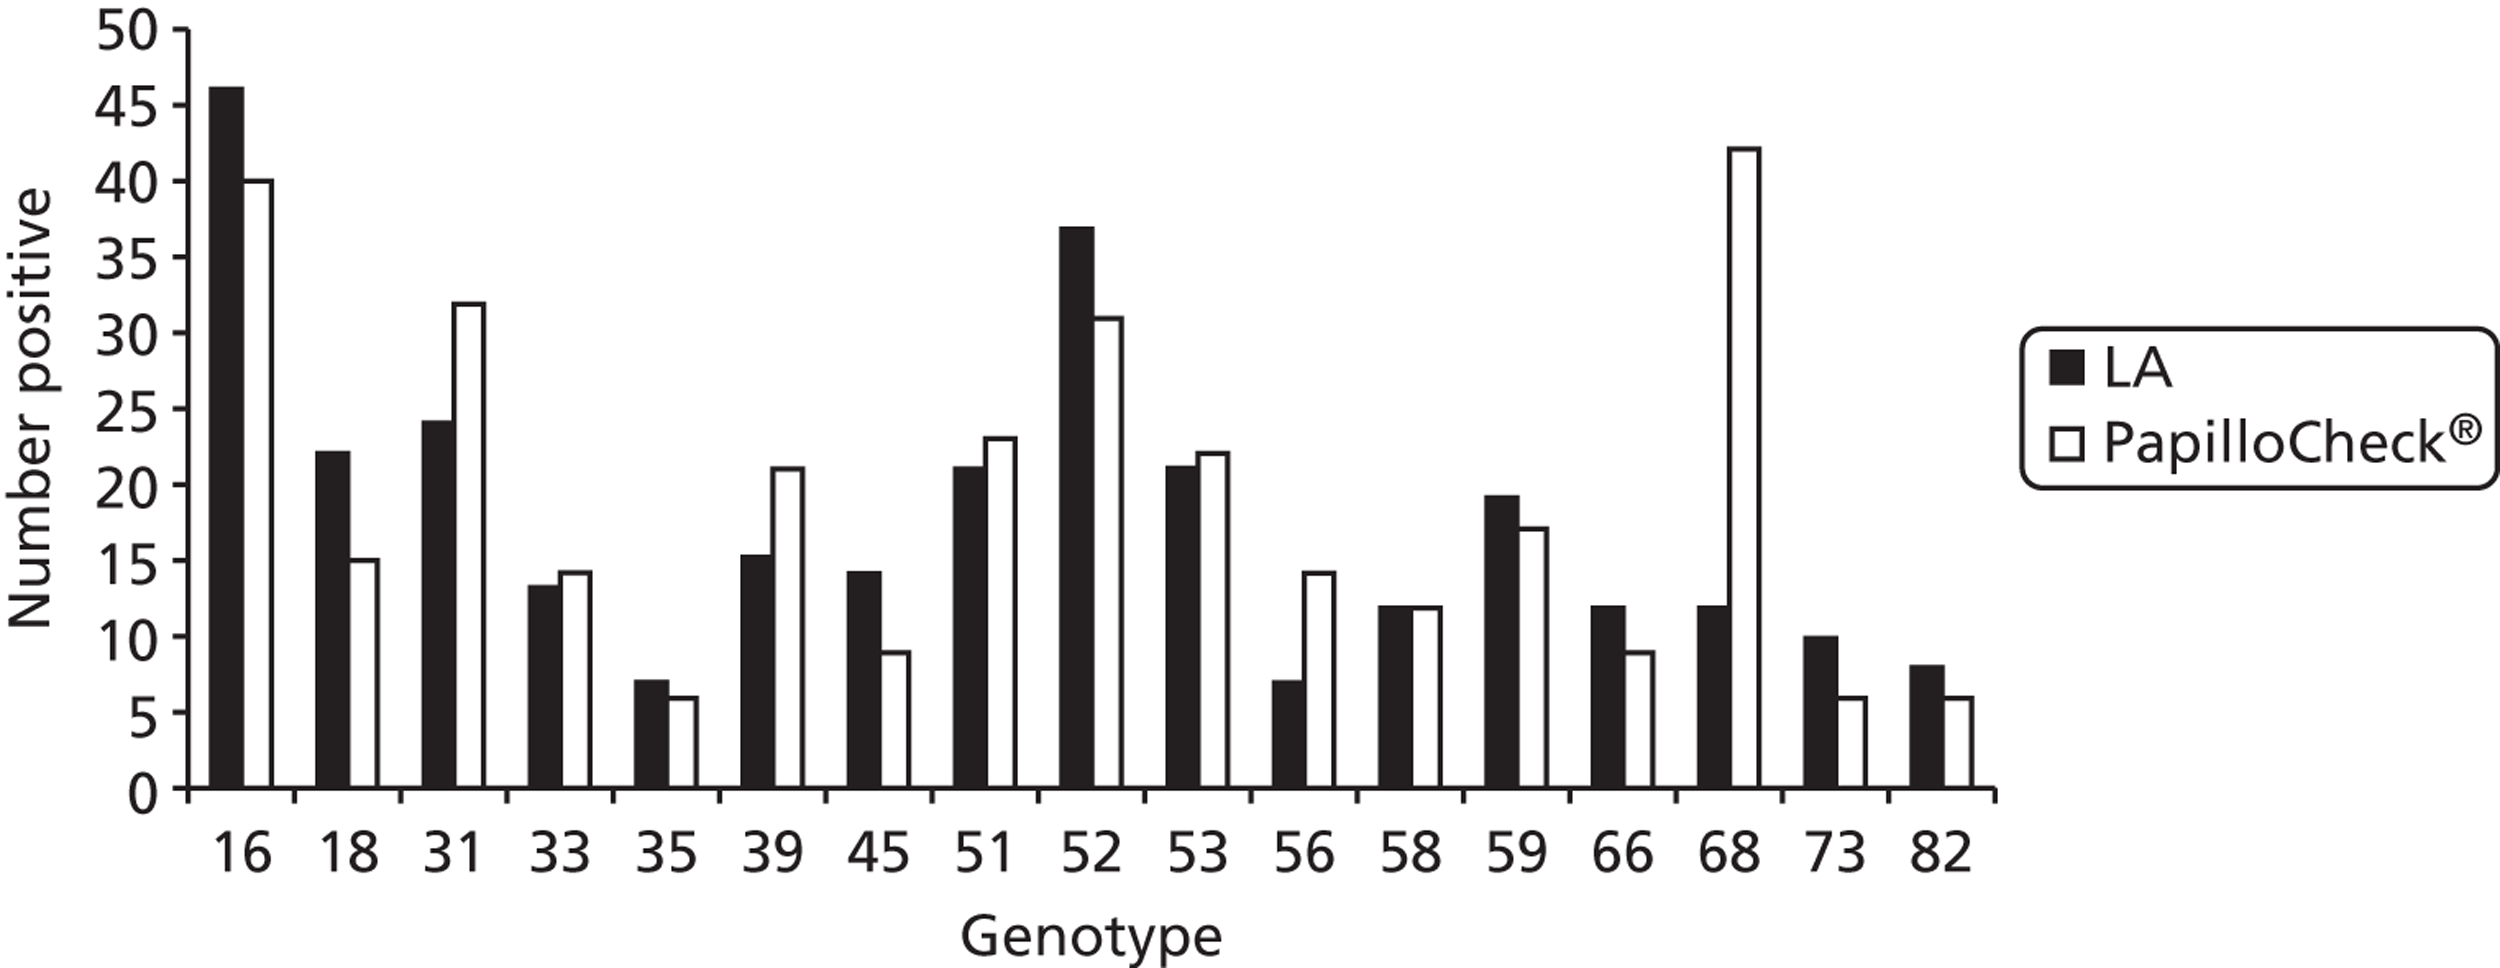
In a third typing exercise, PapilloCheck® was compared with LBA (Roche). Among 2189 archived samples which were cytology negative/HPV positive, the HR types from HC2 were detected by LBA and PapilloCheck® in 63% and 59.8% of cases, respectively (Figure 45). Again, there was some non-concordance between individual types in both directions, but in the case of types 16, 18 and 52 there were quite marked differences. Overall, PapilloCheck® identified fewer types overall (1683) compared with LBA (1835). Among 1279 abnormal cytology/HC2-positive sample, the concordance was higher, as shown in Figure 46, with 1173 types detected using PapilloCheck® and 1117 with LBA.
FIGURE 45.
Confirmation of HC2-positive/cytology-negative samples by LBA and PapilloCheck®. LR, low-risk HPV types.
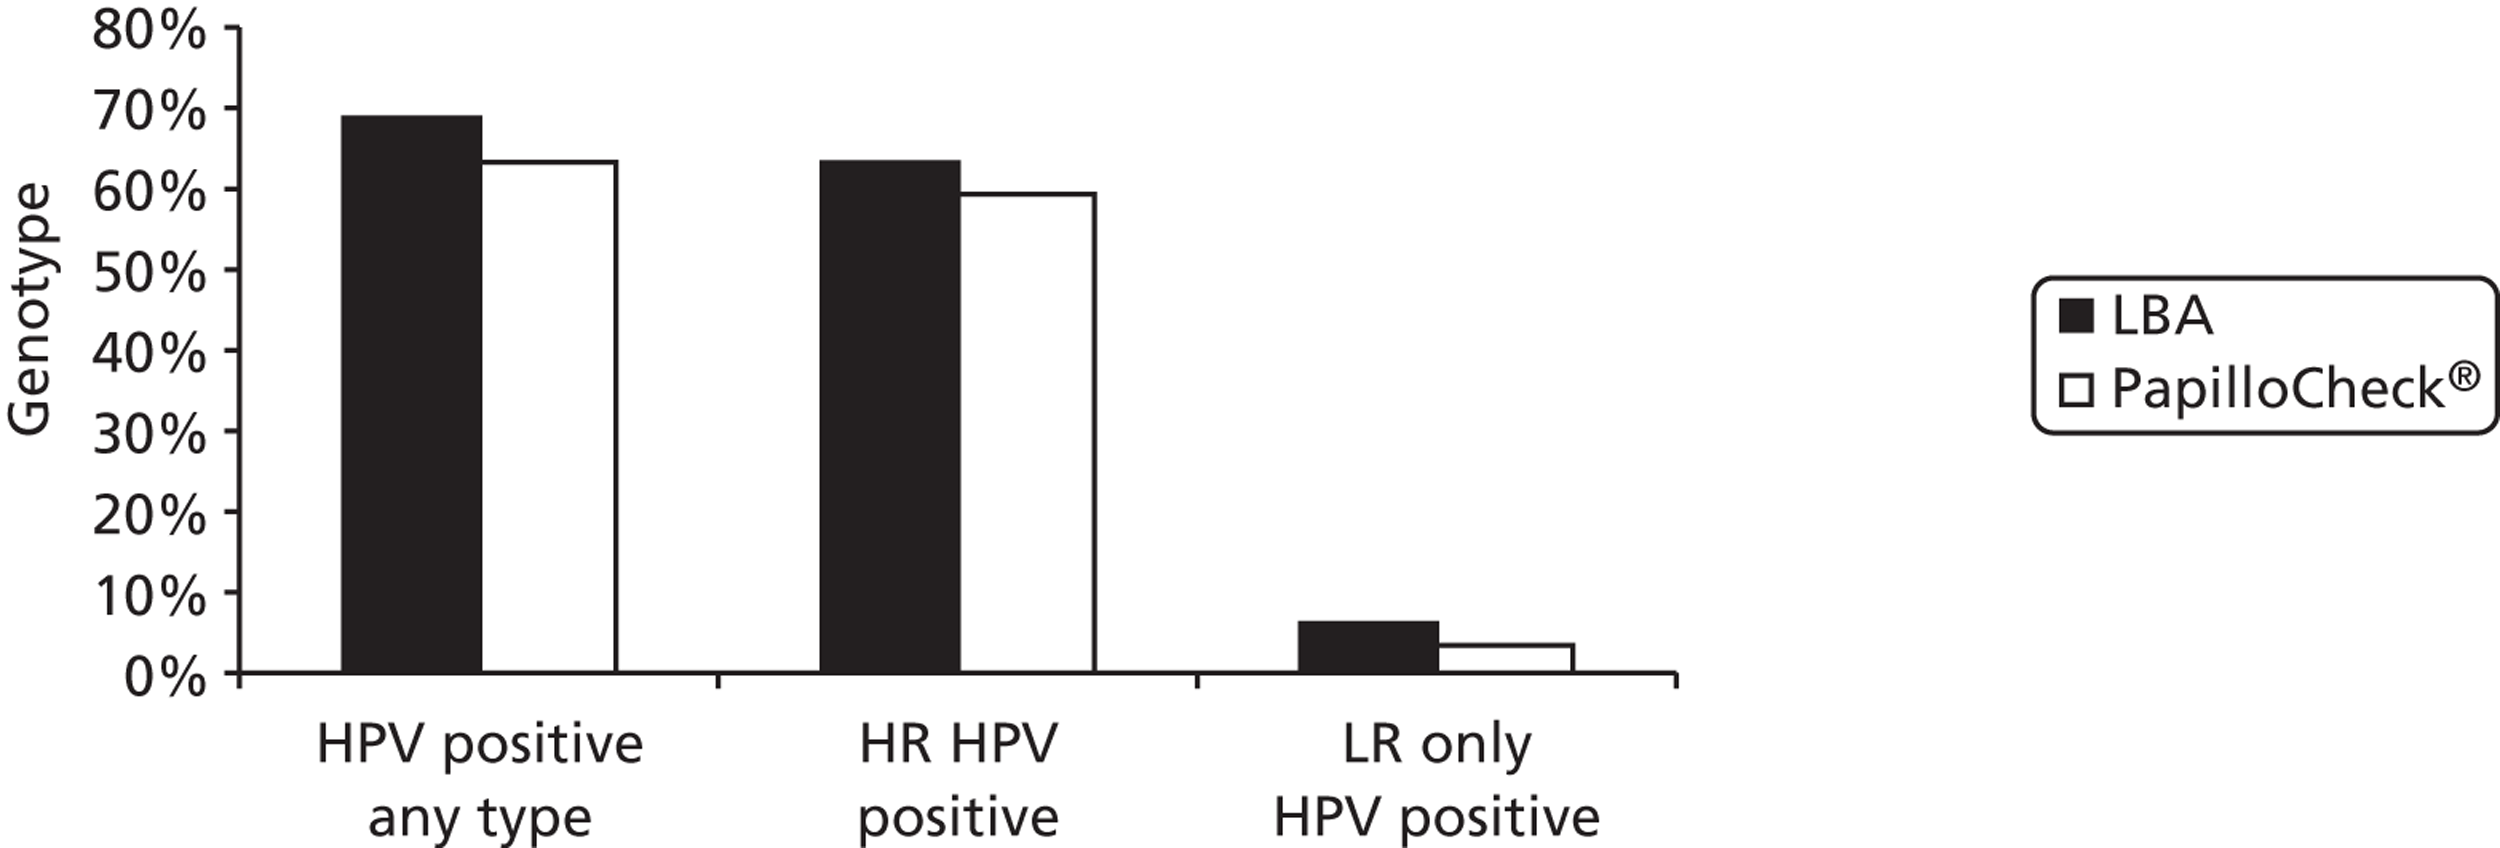
FIGURE 46.
Line blot assay vs. PapilloCheck® on HC2-positive/abnormal cytology samples.
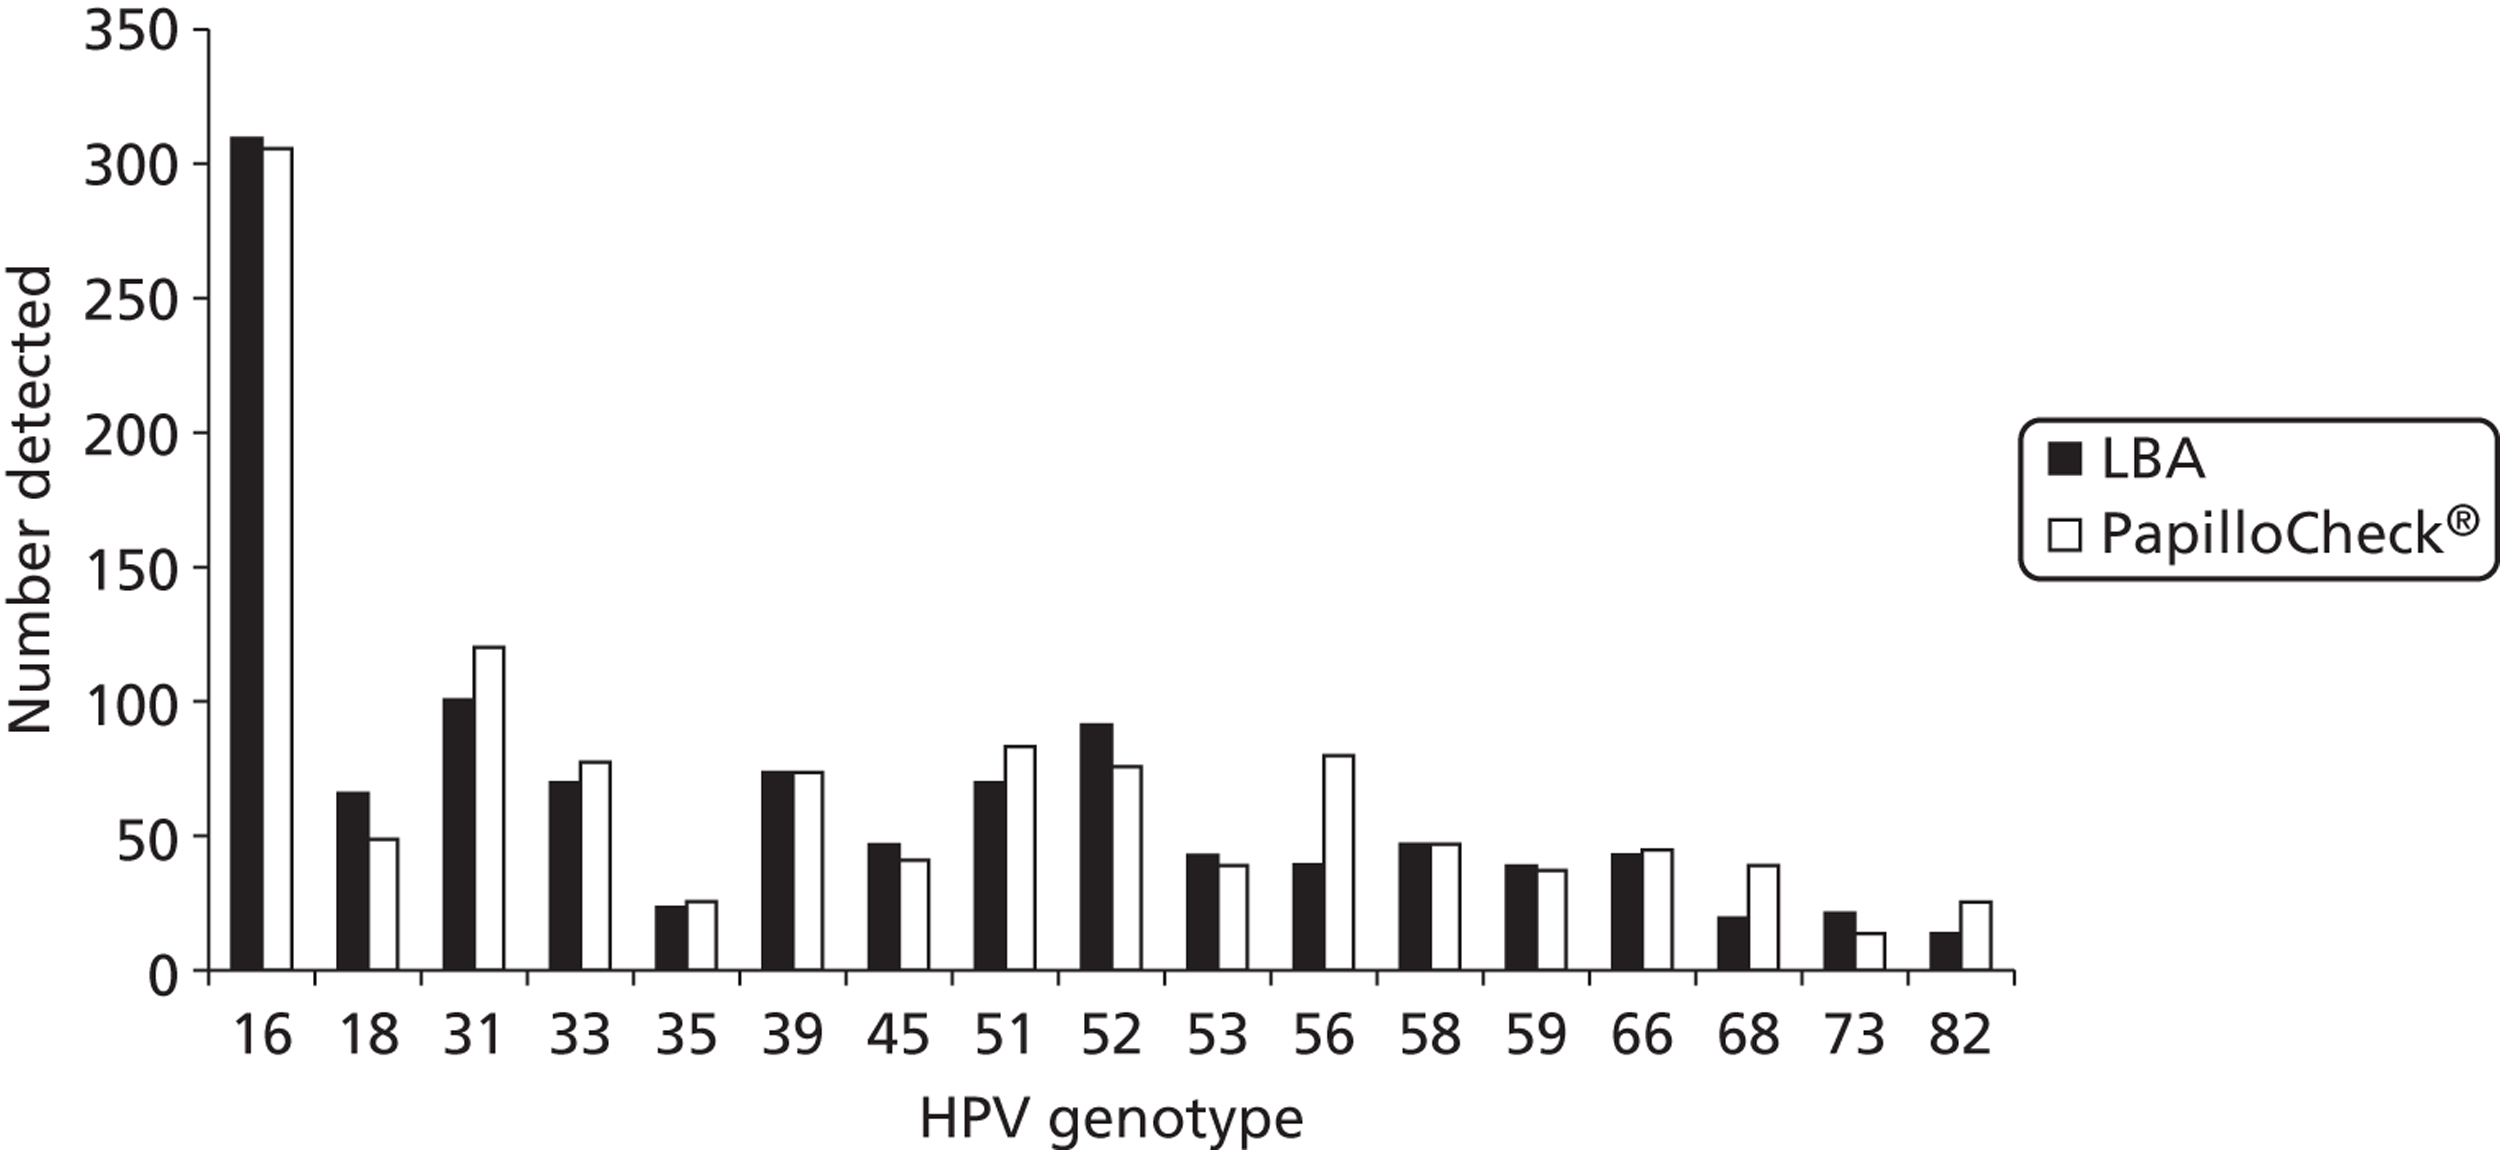
PapilloCheck® was then compared with HC2 in a prospective study of samples received in round 3, against a HC2 cut-off of RLU/Co 1 and 2. Again, the results (Table 51) are similar for both low-grade and high-grade cytology; the concordance within borderline/mild/RLU/Co ≥ 1 and ≥ 2 was 92% and 93.5%, respectively, and for moderate/severe/RLU/Co ≥ 1 and ≥ 2 was 95.5% and 95%, respectively. Among a prospective screened group of 4282 normal and abnormal samples in round 3, HC2 (RLU 1), HC2 (RLU 2) and PapilloCheck® were positive in 16.4%, 13.5% and 11.8%, respectively. It is likely that this reflects greater specificity for HR types with PapilloCheck® and, consequently, slightly reduced sensitivity. These tests appear to perform similarly and, although small differences are found, these are unlikely to be significant from a clinical point of view. They do have different testing characteristics, some more labour intensive than others, and more detailed studies are warranted to address cost-effectiveness taking both costs and clinical utility into account.
| HR PapilloCheck® (%) | HC2/1RLU (%) | HC2/2RLU (%) | |
|---|---|---|---|
| Borderline/mild cytology | 47 | 49 | 45 |
| Moderate/severe cytology | 90 | 93.40 | 92.80 |
Appendix 3 Key tables reproduced using the second definition of round 3
| Age at round (years) | Round 1, HPV+/total (%) | Round 2, HPV+/totala (%) | Round 3, HPV+/totala (%) |
|---|---|---|---|
| 19–24 | 1036/2600 (39.85) | 118/360 (32.78) | 20/57 (35.09) |
| 25–29 | 717/2589 (27.69) | 215/844 (25.47) | 219/859 (25.49) |
| 30–39 | 1161/7633 (15.21) | 372/3251 (11.44) | 354/2739 (12.92) |
| 40–49 | 533/6096 (8.74) | 229/4093 (5.59) | 273/3596 (7.59) |
| 50–59 | 290/4351 (6.67) | 134/3126 (4.29) | 101/1629 (6.20) |
| 60–64 | 76/1240 (6.13) | 45/1075 (4.19) | 15/328 (4.57) |
| 65–70 | 11/401 (2.74) | 6/93 (6.45) | |
| Total | 3813/24,510 (15.56) | 1124/13,150 (8.55) | 988/9301 (10.62) |
| Cytological abnormality | –ve, n (%) | HPV 16/18, n (%) | HPV 31/33/45, n (%) | Other HC2+ve, n (%) | Total, n (%) |
|---|---|---|---|---|---|
| Negative | 11,732 (93.4) | 140 (1.1) | 110 (0.9) | 579 (4.6) | 12,561 (100) |
| Borderline | 246 (64.7) | 39 (10.3) | 19 (5.0) | 76 (20.0) | 380 (100) |
| Mild | 45 (26.3) | 40 (23.4) | 19 (11.1) | 67 (39.2) | 171 (100) |
| Moderate | 0 | 9 (42.9) | 3 (14.3) | 9 (42.9) | 21 (100) |
| Severe+ | 3 (17.6) | 11 (64.7) | 2 (11.8) | 1 (5.9) | 17 (100) |
| Total | 12,026 (91.5) | 239 (1.8) | 153 (1.2) | 732 (5.6) | 13,150 (100) |
| Cytological abnormality | –ve, n (%) | HPV 16/18, n (%) | HPV 31/33/45, n (%) | Other HC2+ve, n (%) | Total, n (%) |
|---|---|---|---|---|---|
| Negative | 8156 (92.0) | 126 (1.4) | 62 (0.7) | 524 (5.9) | 8868 (100) |
| Borderline | 127 (58.5) | 15 (6.9) | 15 (6.9) | 60 (27.6) | 217 (100) |
| Mild | 25 (15.9) | 36 (22.9) | 22 (14.0) | 74 (47.1) | 157 (100) |
| Moderate | 2 (7.1) | 12 (42.9) | 3 (10.7) | 11 (39.3) | 28 (100) |
| Severe+ | 3 (9.7) | 13 (41.9) | 6 (19.4) | 9 (29.0) | 31 (100) |
| Total | 8313 (89.4) | 202 (2.0) | 108 (1.2) | 678 (7.3) | 9301 (100) |
| Concealed, n (%) | Revealed, n (%) | Total, n (%) | |
|---|---|---|---|
| Round 1 (entry) | |||
| CIN2 | 53 | 220 | 273 |
| CIN3 | 81 | 233 | 314 |
| CIN2+ | 134 (2.19) | 453 (2.46) | 587 (2.39) |
| Total women | 6124 | 18,386 | 24,510 |
| Round 2 | |||
| CIN2 | 13 | 44 | 57 |
| CIN3 | 14 | 31 | 45 |
| CIN2+ | 27 (0.76) | 75 (0.69) | 102 (0.71) |
| Total women | 3536 | 10,800 | 14,336 |
| Round 3 | |||
| CIN2 | 9 | 34 | 43 |
| CIN3 | 10 | 29 | 39 |
| CIN2+ | 19 (0.77) | 63 (0.86) | 82 (0.84) |
| Total women | 2460 | 7321 | 9781 |
| Concealed arm | Revealed arm | |||||
|---|---|---|---|---|---|---|
| HPV– | HPV+ | Subtotal | HPV– | HPV+ | Subtotal | |
| Round 2 | ||||||
| Normal | 4/2835 (0.4) | 13/293 (4.4) | 17/3128 (0.5) | 23/8739 (0.3) | 28/891 (3.1) | 51/9630 (0.5) |
| Abnormal | 1/242 (0.4) | 9/166 (5.4) | 10/408 (2.5) | 4/713 (0.6) | 20/457 (4.4) | 24/1170 (2.1) |
| Total | 5/3077 (0.2) | 22/459 (4.8) | 27/3536 (0.8) | 27/9452 (0.3) | 48/1348 (3.6) | 75/10,800 (0.7) |
| Round 3 | ||||||
| Normal | 7/1954 (0.4) | 8/238 (3.4) | 15/2192 (0.7) | 56/5727 (0.5) | 24/735 (3.3) | 50/6462 (0.8) |
| Abnormal | 1/153 (0.7) | 3/115 (2.6) | 4/268 (1.5) | 3/484 (0.6) | 10/375 (2.7) | 13/859 (1.5) |
| Total | 8/2107 (0.4) | 11/353 (3.1) | 19/2460 (0.8) | 15/2192 (0.7) | 4/268 (1.5) | 19/2460 (0.8) |
| Round 3 | Concealed arm | Revealed arm | ||||
|---|---|---|---|---|---|---|
| HPV– | HPV+ | Subtotal | HPV– | HPV+ | Subtotal | |
| With round 2 | ||||||
| Normal | 2/1163 (0.2) | 5/127 (3.9) | 7/1290 (0.5) | 12/3479 (0.3) | 3/419 (0.7) | 15/3898 (0.4) |
| Abnormal | 1/111 (0.9) | 0/73 | 1/184 (0.5) | 0/308 | 4/248 (1.6) | 4/956 (0.7) |
| Total | 3/1274 (0.2) | 5/200 (2.5) | 8/1474 (0.5) | 12/3787 (0.3) | 7/667 (1.0) | 19/4454 (0.4) |
| Without round 2 | ||||||
| Normal | 5/791 (0.6) | 3/111 (2.7) | 8/902 (0.9) | 14/2248 (0.6) | 21/316 (6.6) | 35/2564 (1.4) |
| Abnormal | 0/42 | 3/42 (7.4) | 3/84 (3.6) | 3/176 (1.7) | 6/127 (4.7) | 9/303 (3.0) |
| Total | 5/833 (0.6) | 6/153 (3.9) | 11/986 (1.1) | 17/2424 (0.7) | 27/443 (6.1) | 44/267 (1.5) |
Appendix 4 National Screening Committee’s criteria for appraising the viability, effectiveness and appropriateness of a screening programme
The criteria, which are set out below, are based on the classic criteria first promulgated in a World Health Organization report in 1966 but take into account both the more rigorous standards of evidence required to improve effectiveness and the greater concern about the adverse effects of health care; regrettably, some people who undergo screening will suffer adverse effects without receiving benefit from the programme.
These criteria have been prepared taking into account international work on the appraisal of screening programmes, particularly that in Canada and the USA. It is recognised that not all of the criteria and questions raised in the format will be applicable to every proposed programme, but the more that are answered will obviously assist the NSC to make better evidence-based decisions.
All of the following criteria should be met before screening for a condition is initiated.
The condition
The condition should be an important health problem.
The epidemiology and natural history of the condition, including development from latent to declared disease, should be adequately understood and there should be a detectable risk factor, or disease marker, and a latent period or early symptomatic stage.
All of the cost-effective primary prevention interventions should have been implemented as far as practicable.
The test
There should be a simple, safe, precise and validated screening test.
The distribution of test values in the target population should be known and a suitable cut-off level defined and agreed.
The test should be acceptable to the population.
There should be an agreed policy on the further diagnostic investigation of individuals with a positive test result and on the choices available to those individuals.
The treatment
There should be an effective treatment or intervention for patients identified through early detection, with evidence of early treatment leading to better outcomes than late treatment.
There should be agreed evidence-based policies covering which individuals should be offered treatment and the appropriate treatment to be offered.
Clinical management of the condition and patient outcomes should be optimised by all health-care providers prior to participation in a screening programme.
The screening programme
There must be evidence from high-quality randomised controlled trials that the screening programme is effective in reducing mortality or morbidity. Where screening is aimed solely at providing information to allow the person being screened to make an ‘informed choice’ (e.g. Down’s syndrome or cystic fibrosis carrier screening), there must be evidence from high-quality trials that the test accurately measures risk. The information that is provided about the test and its outcome must be of value and readily understood by the individual being screened.
There should be evidence that the complete screening programme (test, diagnostic procedures, treatment/intervention) is clinically, socially and ethically acceptable to health professionals and the public.
The benefit from the screening programme should outweigh the physical and psychological harm (caused by the test, diagnostic procedures and treatment).
The opportunity cost of the screening programme (including testing, diagnosis, treatment, administration, training and quality assurance) should be economically balanced in relation to expenditure on medical care as a whole (i.e. value for money).
There must be a plan for managing and monitoring the screening programme and an agreed set of quality assurance standards.
Adequate staffing and facilities for testing, diagnosis, treatment and programme management should be made available prior to the commencement of the screening programme.
All other options for managing the condition should have been considered (e.g. improving treatment, providing other services) to ensure that no more cost-effective intervention could be introduced or current interventions increased within the resources available.
Evidence-based information, explaining the consequences of testing, investigation and treatment, should be made available to potential participants to assist them in making an informed choice.
Public pressure for widening the eligibility criteria for reducing the screening interval, and for increasing the sensitivity of the testing process, should be anticipated. Decisions about these parameters should be scientifically justifiable to the public.
Reading list
Department of Health. Screening of Pregnant Women for Hepatitis B and Immunisation of Babies at Risk. London: Department of Health; 1998 (Health Service Circular: HSC 1998/127).
Wilson JMG, Jungner G. Principles and Practice of Screening for Disease. Public Health Paper Number 34. Geneva: WHO; 1968.
Cochrane AL, Holland WW. Validation of screening procedures. Br Med Bull 1971;27:3.
Sackett DL, Holland WW. Controversy in the detection of disease. Lancet 1975;2:357–9.
Wald NJ, editor. Antenatal and Neonatal Screening. Oxford: Oxford University Press; 1984.
Holland WW, Stewart S. Screening in Healthcare. The Nuffield Provincial Hospitals Trust; 1990.
Grey JAM. Dimensions and Definitions of Screening. Milton Keynes: NHS Executive Anglia and Oxford, Research and Development Directorate; 1996.
Appendix 5 Patient information sheet: Manchester, Salford, Trafford and Ashton, Leigh & Wigan primary care trusts
Appendix 6 Patient information sheet: Stockport primary care trust
Appendix 7 Consent form
Appendix 8 Supplementary tables
| Cytological abnormality | Concealed arm, n (%) | Revealed arm, n (%) | ||||
|---|---|---|---|---|---|---|
| HPV– | HPV+ | Subtotal | HPV– | HPV+ | Subtotal | |
| Negative | 4787 (89.7) | 551 (10.3) | 5338 (100) | 14,367 (89.6) | 1675 (10.4) | 16,042 (100) |
| Borderline | 309 (69.3) | 137 (30.7) | 446 (100) | 923 (68.7) | 420 (31.3) | 1343 (100) |
| Mild | 69 (29.4) | 166 (70.6) | 235 (100) | 196 (30.5) | 447 (69.5) | 643 (100) |
| Moderate | 4 (6.0) | 63 (94.0) | 67 (100) | 34 (16.7) | 170 (83.3) | 204 (100) |
| Severe+ | 2 (5.3) | 36 (94.7) | 38 (100) | 6 (3.9) | 148 (96.1) | 154 (100) |
| Total | 5171 (84.4) | 953 (15.6) | 6124 (100) | 15,526 (84.4) | 2860 (15.6) | 18,386 (100) |
| Cytological abnormality | Concealed arm, n (%) | Revealed arm, n (%) | ||||||
|---|---|---|---|---|---|---|---|---|
| HPV– | HPV+ | HPV missing | Subtotal | HPV– | HPV+ | HPV missing | Subtotal | |
| Negative | 3128 (93.3) | 224 (6.7) | 363 | 3715 | 9519 (93.2) | 697 (6.8) | 1066 | 11,282 |
| Borderline | 72 (64.4) | 38 (34.6) | 28 | 138 | 193 (63.9) | 109 (36.1) | 48 | 350 |
| Mild | 6 (12.2) | 43 (87.8) | 10 | 59 | 41 (27.5) | 108 (72.5) | 34 | 183 |
| Moderate | 0 | 8 (100) | 3 | 11 | 1 (4.2) | 23 (95.8) | 4 | 28 |
| Severe+ | 1 (20.0) | 4 (80.0) | 0 | 5 | 3 (17.6) | 14 (82.4) | 2 | 19 |
| Total | 3207 (91.9) | 317 (9.0) | 404 | 3928 | 9757 (91.1) | 951 (8.9) | 1154 | 11,862 |
| Cytological abnormality | Concealed arm, n (%) | Revealed arm, n (%) | ||||||
|---|---|---|---|---|---|---|---|---|
| HPV– | HPV+ | HPV missing | Subtotal | HPV– | HPV+ | HPV missing | Subtotal | |
| Negative | 1855 (92.8) | 145 (7.2) | 106 | 2106 | 5543 (91.8) | 498 (8.2) | 314 | 6355 |
| Borderline | 27 (54.0) | 23 (46.0) | 1 | 51 | 87 (57.6) | 64 (42.4) | 8 | 150 |
| Mild | 4 (11.8) | 30 (88.2) | 3 | 37 | 17 (16.2) | 88 (83.8) | 10 | 115 |
| Moderate | 1 (14.3) | 6 (85.7) | 1 | 8 | 1 (6.72) | 14 (93.3) | 1 | 16 |
| Severe+ | 1 (6.7) | 5 (83.3) | 0 | 6 | 1 (5.3) | 18 (94.7) | 1 | 20 |
| Total | 1888 (90.0) | 209 (10.0) | 111 | 2208 | 5649 (89.2) | 682 (10.8) | 334 | 6665 |
| Concealed arm, n (%) | Revealed arm, n (%) | |||||||
|---|---|---|---|---|---|---|---|---|
| HPV– | HPV+ | HPV missing | Subtotal | HPV– | HPV+ | HPV missing | Subtotal | |
| Round 1 | ||||||||
| Normal | 0/4787 | 1/551 (0.18) | 1/5338 (0.02) | 0/14367 | 32/1675 (1.91) | 32/16,042 (0.20) | ||
| Abnormal | 7/384 (1.82) | 126/402 (31.34) | 133/786 (16.92) | 29/1159 (2.50) | 392/1185 (33.08) | 421/2344 (17.96) | ||
| Total | 7/5171 (0.14) | 127/953 (13.33) | 134/6124 (2.19) | 29/15,526 (0.19) | 424/2860 (14.83) | 453/18,386 (2.46) | ||
| Round 2 | ||||||||
| Normal | 0/3128 | 1/224 (0.45) | 0/363 | 1/3715 (0.03) | 2/9519 (0.02) | 15/697 (2.15) | 3/1066 (0.28) | 20/11,282 (0.18) |
| Abnormal | 2/79 (2.53) | 27/93 (29.03) | 5/41 (12.2) | 34/213 (15.96) | 5/238 (2.10) | 55/254 (21.65) | 8/88 (9.09) | 68/580 (11.72) |
| Total | 2/3207 (0.06) | 28/317 (8.83) | 5/404 (1.24) | 35/3928 (0.89) | 7/9757 (0.07) | 70/951 (7.36) | 11/1154 (0.95) | 88/11,862 (0.74) |
| Round 3 | ||||||||
| Normal | 1/1855 (0.05) | 0/145 | 0/106 | 1/2106 (0.05) | 1/5543 (0.01) | 2/498 (0.40) | 0/314 | 3/6355 (0.05) |
| Abnormal | 0/33 | 13/66 (20.31) | 1/5 (20.0) | 14/102 (13.73) | 3/106 (2.83) | 43/184 (23.37) | 2/20 (10.00) | 48/310 (15.74) |
| Total | 1/1888 (0.05) | 13/209 (6.22) | 1/111 (0.90) | 15/2208 (0.68) | 4/5649 (0.07) | 45/682 (6.60) | 2/334 (0.60) | 51/6665 (0.77) |
| Cytological abnormality | HPV–, n (%) | HPV+, n (%) | HPV missing | Subtotal, n (%) |
|---|---|---|---|---|
| Age 20–24 | ||||
| Negative | 1424 (73.1) | 523 (26.9) | N/A | 1947 (100) |
| Borderline | 110 (38.5) | 176 (61.5) | N/A | 286 (100) |
| Mild | 25 (9.8) | 230 (90.2) | N/A | 255 (100) |
| Moderate+ | 5 (4.5) | 107 (95.5) | N/A | 112 (100) |
| Total | 1564 | 1036 | N/A | 2600 |
| Age 25–29 | ||||
| Negative | 1711 (82.0) | 375 (18.0) | N/A | 2086 (100) |
| Borderline | 126 (52.7) | 113 (47.3) | N/A | 239 (100) |
| Mild | 28 (17.4) | 133 (82.6) | N/A | 161 (100) |
| Moderate+ | 7 (6.8) | 96 (93.2) | N/A | 103 (100) |
| Total | 1872 | 717 | N/A | 2589 |
| Age 30–39 | ||||
| Negative | 5951 (89.9) | 679 (10.2) | N/A | 6630 (100) |
| Borderline | 417 (70.4) | 175 (29.6) | N/A | 592 (100) |
| Mild | 94 (36.6) | 163 (63.4) | N/A | 257 (100) |
| Moderate+ | 10 (6.5) | 144 (93.5) | N/A | 154 (100) |
| Total | 6472 | 1161 | N/A | 7633 |
| Age 40–49 | ||||
| Negative | 5117 (93.7) | 343 (6.3) | N/A | 5460 (100) |
| Borderline | 359 (84.1) | 68 (15.9) | N/A | 427 (100) |
| Mild | 71 (50.7) | 69 (49.3) | N/A | 140 (100) |
| Moderate+ | 16 (23.2) | 53 (76.8) | N/A | 69 (100) |
| Total | 5563 | 533 | N/A | 6096 |
| Age 50–59 | ||||
| Negative | 3822 (94.1) | 238 (5.9) | N/A | 4060 (100) |
| Borderline | 192 (89.3) | 23 (10.7) | N/A | 215 (100) |
| Mild | 40 (70.2) | 17 (29.8) | N/A | 57 (100) |
| Moderate+ | 7 (36.8) | 12 (63.2) | N/A | 19 (100) |
| Total | 4061 | 290 | N/A | 4351 |
| Age 60–65 | ||||
| Negative | 1129 (94.3) | 68 (5.7) | N/A | 1197 (100) |
| Borderline | 28 (93.3) | 2 (6.7) | N/A | 30 (100) |
| Mild | 7 (87.5) | 1 (12.5) | N/A | 8 (100) |
| Moderate+ | 1 (16.7) | 5 (83.3) | N/A | 6 (100) |
| Total | 1165 | 76 | N/A | 1241 |
| Cytological abnormality | HPV–, n (%) | HPV+, n (%) | HPV missing, n | Subtotal, N |
|---|---|---|---|---|
| Age 22–24 | ||||
| Negative | 226 (75.8) | 85 (24.2) | 100 | 451 |
| Borderline | 9 (32.1) | 19 (67.9) | 5 | 33 |
| Mild | 4 (12.9) | 27 (87.1) | 2 | 33 |
| Moderate+ | 0 | 8 (100) | 0 | 8 |
| Total | 279 | 139 | 107 | 525 |
| Age 25–29 | ||||
| Negative | 703 (81.3) | 162 (18.7) | 167 | 1032 |
| Borderline | 18 (34.6) | 34 (65.4) | 18 | 70 |
| Mild | 5 (11.4) | 39 (88.6) | 11 | 55 |
| Moderate+ | 0 | 11 (100) | 2 | 13 |
| Total | 726 | 246 | 198 | 1170 |
| Age 30–39 | ||||
| Negative | 3022 (91.0) | 299 (9.0) | 463 | 3805 |
| Borderline | 88 (61.1) | 56 (38.9) | 24 | 168 |
| Mild | 13 (18.8) | 56 (81.2) | 15 | 84 |
| Moderate+ | 0 | 22 (100) | 4 | 26 |
| Total | 3134 | 433 | 516 | 4083 |
| Age 40–49 | ||||
| Negative | 4063 (95.3) | 202 (4.7) | 384 | 4649 |
| Borderline | 96 (85.0) | 17 (15.0) | 21 | 134 |
| Mild | 17 (42.5) | 23 (57.5) | 14 | 54 |
| Moderate+ | 4 (40.0) | 6 (60.0) | 1 | 11 |
| Total | 4180 | 248 | 420 | 4848 |
| Age 50–59 | ||||
| Negative | 3128 (96.3) | 119 (3.7) | 212 | 3459 |
| Borderline | 41 (71.9) | 16 (28.1) | 7 | 64 |
| Mild | 7 (53.8) | 6 (46.2) | 2 | 15 |
| Moderate+ | 0 | 2 (100) | 1 | 3 |
| Total | 3176 | 143 | 222 | 3541 |
| Age 60–68 | ||||
| Negative | 1454 (96.4) | 54 (3.6) | 93 | 1601 |
| Borderline | 13 (72.2) | 5 (27.8) | 1 | 19 |
| Mild | 1 (100) | 0 | 0 | 1 |
| Moderate+ | 1 (100) | 0 | 1 | 2 |
| Total | 1469 | 59 | 95 | 1623 |
| Cytological abnormality | HPV–, n (%) | HPV+, n (%) | HPV missing, n | Subtotal, N |
|---|---|---|---|---|
| Age 24 | ||||
| Negative | 9 | 0 | 0 | 9 |
| Borderline | 1 | 0 | 0 | 1 |
| Mild | 0 | 3 | 0 | 3 |
| Moderate+ | 0 | 1 | 0 | 1 |
| Total | 10 | 4 | 0 | 14 |
| Age 25–29 | ||||
| Negative | 537 (79.8) | 136 (20.2) | 26 | 699 |
| Borderline | 15 (45.5) | 18 (54.5) | 2 | 35 |
| Mild | 4 (11.1) | 32 (88.9) | 1 | 37 |
| Moderate+ | 0 | 12 (100) | 1 | 13 |
| Total | 556 | 198 | 30 | 784 |
| Age 30–39 | ||||
| Negative | 2156 (91.2) | 207 (8.8) | 128 | 2491 |
| Borderline | 28 (41.2) | 40 (58.8) | 2 | 70 |
| Mild | 4 (7.7) | 48 (92.3) | 5 | 57 |
| Moderate+ | 2 (9.5) | 19 (90.5) | 0 | 21 |
| Total | 2190 | 314 | 135 | 2639 |
| Age 40–49 | ||||
| Negative | 3007 (93.7) | 203 (6.3) | 167 | 3377 |
| Borderline | 47 (67.1) | 23 (32.9) | 3 | 73 |
| Mild | 12 (30.0) | 28 (70.0) | 7 | 47 |
| Moderate+ | 1 (10.0) | 9 (90.0) | 1 | 11 |
| Total | 3067 | 263 | 175 | 3508 |
| Age 50–59 | ||||
| Negative | 1348 (94.5) | 79 (5.5) | 72 | 1499 |
| Borderline | 19 (79.2) | 5 (20.8) | 2 | 26 |
| Mild | 1 (12.5) | 7 (87.5) | 0 | 8 |
| Moderate+ | 1 (33) | 2 (67) | 0 | 3 |
| Total | 1369 | 93 | 74 | 1536 |
| Age 60–70 | ||||
| Negative | 341 (95.0) | 18 (5.0) | 27 | 386 |
| Borderline | 4 (80.0) | 1 (20.0) | 0 | 5 |
| Mild | 0 | 0 | 0 | 0 |
| Moderate+ | 0 | 0 | 1 | 1 |
| Total | 345 | 19 | 28 | 392 |
| Age at round (years) | Cytology at round and HPV status at round, n (%) | |||||
|---|---|---|---|---|---|---|
| Normal cytology | Borderline/mild cytology | Moderate+ cytology | ||||
| HPV– | HPV+ | HPV– | HPV+ | HPV– | HPV+ | |
| Round 1 | ||||||
| 25–34 | 0/4481 | 11/747 (1.5) | 9/385 (2.3) | 90/461 (19.5) | 2/9 (22.2) | 151/193 (78.2) |
| 35–49 | 0/8298 | 8/650 (1.2) | 8/710 (1.1) | 40/260 (15.4) | 6/24 (25.0) | 79/100 (79.0) |
| ≥ 50 | 0/4951 | 2/306 (0.7) | 3/267 (1.1) | 2/43 (4.7) | 0/8 | 12/17 (70.6) |
| Round 2 | ||||||
| 25–34 | 0/1890 | 11/308 (3.6) | 2/66 (3.0) | 26/137 (19.0) | 0/0 | 19/26 (73.1) |
| 35–49 | 1/5909 (0.02) | 3/355 (0.8) | 4/171 (2.3) | 12/88 (13.6) | 1/4 (25.0) | 8/13 (61.5) |
| ≥ 50 | 0/4582 | 1/173 (0.6) | 0/62 | 2/27 (7.4) | 0/1 | 1/2 (50.0) |
| Round 3 | ||||||
| 25–34 | 1/1354 (0.1) | 1/255 (0.4) | 0/29 | 16/89 (18.0) | 0/0 | 12/20 (60.0) |
| 35–49 | 1/4346 (0.02) | 0/321 | 2/81 (2.5) | 14/100 (14.0) | 1/3 (33.3) | 9/20 (45.0) |
| ≥ 50 | 0/1689 | 1/97 (1.0) | 0/24 | 1/13 (7.7) | 0/1 | 2/2 (100) |
| Age at round (years) | Cytology at round and HPV status at round, n (%) | |||||
|---|---|---|---|---|---|---|
| Normal cytology | Borderline/mild cytology | Moderate+ cytology | ||||
| HPV– | HPV+ | HPV– | HPV+ | HPV– | HPV+ | |
| Round 1 | ||||||
| 25–34 | 0/4481 | 2747 (0.3) | 2385 (0.5) | 38/461 (8.2) | 1/9 (11.1) | 100/193 (51.8) |
| 35–49 | 0/8298 | 4650 (0.6) | 2/710 (0.3) | 14/260 (5.4) | 2/24 (8.3) | 56/100 (56.0) |
| ≥ 50 | 0/4951 | 0/306 | 0/267 | 0/43 | 0/8 | 9/17 (52.9) |
| Round 2 | ||||||
| 25–34 | 0/1890 | 5/308 (1.6) | 0/66 | 9/137 (6.6) | 0/0 | 13/26 (50.0) |
| 35–49 | 0/5909 | 1/355 (0.3) | 1/171 (0.6) | 6/88 (6.8) | 1/4 (25.0) | 6/13 (46.2) |
| ≥ 50 | 0/4582 | 0/173 | 0/62 | 1/27 (3.7) | 0/1 | 0/2 |
| Round 3 | ||||||
| 25–34 | 0/1354 | 0/255 | 0/29 | 8/89 (9.0) | 0/0 | 8/20 (40.0) |
| 35–49 | 0/4346 | 0/321 | 1/81 (1.2) | 3/100 (3.0) | 0/3 | 6/20 (30.0) |
| ≥ 50 | 0/1689 | 0/97 | 0/24 | 1/13 (7.7) | 0/1 | 1/2 (50.0) |
| Age at round (years) | Cytology at round and HPV status at round, n (%) | |||||
|---|---|---|---|---|---|---|
| Normal cytology | Borderline/mild cytology | Moderate+ cytology | ||||
| HPV– | HPV+ | HPV– | HPV+ | HPV– | HPV+ | |
| Round 1 | ||||||
| 25–34 | 0/4616 | 11/612 (1.8) | 13/414 (3.1) | 86/432 (19.9) | 2/9 (22.2) | 151/193 (78.2) |
| 35–49 | 2/8482 (0.02) | 6/466 (1.3) | 10/743 (1.3) | 38/227 (16.7) | 7/25 (28.0) | 78/99 (78.8) |
| ≥ 50 | 1/5078 (0.02) | 1/179 (0.6) | 3/274 (1.1) | 2/36 (5.6) | 0/8 | 12/17 (70.6) |
| Round 2 | ||||||
| 25–34 | 3/1955 (0.2) | 8/243 (3.3) | 2/73 (2.7) | 26/130 (20.0) | 0/2 | 19/24 (79.2) |
| 35–49 | 2/6002 (0.03) | 2/262 (0.8) | 4/176 (2.3) | 12/83 (14.5) | 1/4 (25.0) | 8/13 (61.5) |
| ≥ 50 | 1/4639 (0.02) | 0/116 | 1/64 (1.6) | 1/25 (4.0) | 0/1 | 1/2 (50.0) |
| Round 3 | ||||||
| 25–34 | 1/1385 (0.1) | 1/194 (0.5) | 1/34 (2.9) | 15/84 (17.9) | 0/1 | 12/19 (63.2) |
| 35–49 | 1/4424 (0.02) | 0/243 | 3/88 (3.4) | 13/93 (14.0) | 2/4 (50.0) | 8/19 (42.1) |
| ≥ 50 | 0/1712 | 1/74 (1.4) | 0/25 | 1/12 (8.3) | 0/1 | 2/2 (100) |
| Age at round (years) | Cytology at round and HPV status at round, n (%) | |||||
|---|---|---|---|---|---|---|
| Normal cytology | Borderline/mild cytology | Moderate+ cytology | ||||
| HPV– | HPV+ | HPV– | HPV+ | HPV– | HPV+ | |
| Round 1 | ||||||
| 25–34 | 0/4616 | 2/612 (0.3) | 4/414 (1.0) | 36/432 (8.3) | 1/9 (11.1) | 100/193 (51.8) |
| 35–49 | 0/8482 | 4/466 (0.9) | 2/743 (0.3) | 14/227 (6.2) | 2/25 (8.0) | 56/99 (56.6) |
| ≥ 50 | 0/5078 | 0/179 | 0/274 | 0/36 | 0/8 | 9/17 (52.9) |
| Round 2 | ||||||
| 25–34 | 2/1955 (0.1) | 3/243 (1.2) | 0/73 | 9/130 (6.9) | 0/2 | 13/24 (54.2) |
| 35–49 | 0/6002 | 1/262 (0.4) | 1/176 (0.6) | 6/83 (7.2) | 1/4 (25.0) | 6/13 (46.2) |
| ≥ 50 | 0/4639 | 0/116 | 0/64 | 1/25 (4.0) | 0/1 | 0/2 |
| Round 3 | ||||||
| 25–34 | 0/1385 | 0/194 | 0/34 | 8/84 (9.5) | 0/1 | 8/19 (42.1) |
| 35–49 | 0/4424 | 0/243 | 2/88 (2.3) | 2/93 (2.2) | 1/4 (25.0) | 5/19 (26.3) |
| ≥ 50 | 0/1712 | 0/74 | 0/25 | 1/12 (8.3) | 0/1 | 1/2 (50.0) |
| Cytological abnormality | –ve, n (%) | HPV 16/18, n (%) | HPV 31/33/45/52/58, n (%) | Other HC2+ve, n (%) | Total, n (%) |
|---|---|---|---|---|---|
| Negative | 19,154 (89.6) | 473 (2.2) | 476 (2.2) | 1277 (6.0) | 21,380 (100) |
| Borderline | 1232 (68.9) | 179 (10.0) | 160 (8.9) | 218 (12.2) | 1789 (100) |
| Mild | 265 (30.2) | 197 (22.4) | 148 (16.9) | 268 (30.5) | 878 (100) |
| Moderate | 38 (14.0) | 130 (48.0) | 66 (24.4) | 37 (13.7) | 271 (100) |
| Severe+ | 8 (4.2) | 119 (62.0) | 45 (23.4) | 20 (10.4) | 192 (100) |
| Total | 20,697 (84.4) | 1098 (4.5) | 895 (3.7) | 1820 (7.4) | 24,510 (100) |
| Cytological abnormality | –ve, n (%) | HPV 16/18, n (%) | HPV 31/33/45/52/58, n (%) | Other HC2+ve, n (%) | Total, n (%) |
|---|---|---|---|---|---|
| Negative | 12,647 (93.2) | 164 (1.2) | 208 (1.5) | 549 (4.0) | 13,568 (100) |
| Borderline | 265 (64.3) | 43 (10.4) | 33 (8.0) | 71 (17.2) | 412 (100) |
| Mild | 47 (23.7) | 50 (25.3) | 33 (16.7) | 68 (34.3) | 198 (100) |
| Moderate | 1 (3.1) | 14 (43.8) | 8 (25.0) | 9 (28.1) | 32 (100) |
| Severe+ | 4 (18.2) | 13 (59.1) | 4 (18.2) | 1 (4.5) | 22 (100) |
| Total | 12,964 (91.1) | 284 (2.0) | 286 (2.0) | 698 (4.9) | 14,232 (100) |
| Cytological abnormality | –ve, n (%) | HPV 16/18, n (%) | HPV 31/33/45/52/58, n (%) | Other HC2+ve, n (%) | Total, n (%) |
|---|---|---|---|---|---|
| Negative | 7398 (92.0) | 109 (1.4) | 109 (1.4) | 425 (5.3) | 8041 (100) |
| Borderline | 114 (56.7) | 14 (7.0) | 22 (10.9) | 51 (25.4) | 201 (100) |
| Mild | 21 (15.1) | 31 (22.3) | 32 (23.0) | 55 (39.6) | 139 (100) |
| Moderate | 2 (9.1) | 9 (40.9) | 7 (31.8) | 4 (18.2) | 22 (100) |
| Severe+ | 2 (8.0) | 10 (40.0) | 6 (24.0) | 7 (28.0) | 25 (100) |
| Total | 7537 (89.4) | 173 (2.0) | 176 (2.1) | 542 (6.6) | 8428 (100) |
Appendix 9 Determining the test probability matrices for liquid-based cytology in ARTISTIC
The cohort model that is being used to simulate the ARTISTIC trial cohort uses six underlying health states (which we call ‘well’, ‘HPV positive’, ‘CIN1’, ‘CIN2’, ‘CIN3’ and ‘cancer’, which we break into HPV type-specific states after the fitting process is complete). The model also uses a test-specific screening probability matrix (which we call a test probability matrix, or ‘TPM’) to model the outcomes of screening tests in the given population. As a first step in modelling ARTISTIC, we have to decide what reasonable underlying health states to give our model as initial inputs, together with the cytology TPM to be used for the screening rounds. We use a Gibbs sampler to simulate from the posterior distribution of the health state and cytology TPM parameters, using the cytology and HPV data observed at baseline of the ARTISTIC data. The Gibbs sampler technique is described in more detail in Joseph. 26
The Gibbs sampling process requires prior information on the test characteristics for LBC. We use a previously derived TPM for LBC as the prior for the Gibbs sampler. We can also provide prior information about the health state of women entering the trial, because the HPV test results at baseline provide information on the prevalence of HPV infection of women entering the trial. As the combination of health states and test probability matrices can be used to calculate the cytology test results, we use the observed cytology test results observed in ARTISTIC at baseline to inform the sampler on whether the combined health state and test probability matrices are representative of the ARTISTIC cohort.
Let D be a random variable representing the underlying health state of an individual. The health states used in the cohort model are:
-
Well (D = 1)
-
HPV (D = 2)
-
CIN1 (D = 3)
-
CIN2 (D = 4)
-
CIN3 (D = 5)
-
Undetected cancer (D = 6).
As we have age-group specific cytology and HPV data, we let
be the prevalence of health state j in age-group i. The age groups we consider are:
-
20–24 (i = 1)
-
25–29 (i = 2)
-
30–39 (i = 3)
-
40–49 (i = 4)
-
50–64 (i = 5).
Let T be a random variable representing the result of a cytology test. T can take values:
-
negative (T = 1)
-
borderline (T = 2)
-
mild (T = 3)
-
moderate (T = 4)
-
severe (T = 5).
We define
that is to say ηjk is the probability of getting a cytology result k given that the underlying health state is j. This is the TPM entry in row j and column k.
For the undetected cancer parameters, π.6, the reported cervical cancer rates in England in 200161 are used, that is to say we take:
We also assume that the probability of being in the Well health state can be fully obtained from the HPV-negative data in table 7 of Kitchener et al. 1
Our goal is to sample from the posterior distribution of π=(πij) (excluding the Well and Undetected cancer parameters) and η=(ηjk) given the cytology and HPV data,
For each age group i, we use a Dirichlet prior for πi=(πi2,πi3,πi4,πi5), that is
and as we have no specific information on the π’s, we choose α21=…=α51=1 for i = 1,. . .,5. For each row in the TPM, ηj. we also use a Dirichlet prior,
where the αkj are chosen based on previous cytology TPMs used to model screening in both an Australian and a UK context.
At each iteration t of the Gibbs sampler, we first have to draw πt from the conditional distribution,
where ηt−1 is the TPM computed in iteration t – 1. We then have to sample the updated TPM ηt from
Drawing πt from p(π|ηt−1,y) can be simplified by introducing the auxiliary variables zjki which represent the number of women in age group i, whose cytology test is k and underlying health state is j. Before sampling πt we sample z from
From our assumption on the health state Well, we know that for each age group i and cytology result k, z1ki is the number of HPV-negative women in age group i with cytology result k. Using the predictive power of each test result at t – 1,
it follows that
where γ˜. ki=(γ˜2ki,…,γ˜6ki) and γ˜jki=γjki∑j=26γj1i, and nki is the number of HPV-positive women in age group i with cytology result k.
For each age group i, we can sum over k to get the total number of women in each health state,
that is to say xji is the number of women in age group i with underlying health state j. Keeping in mind our assumption on πi1 and πi6, and the Dirichlet priors on π, it follows that
We can then sample from the above to obtain the updated values of π, denoted by πt.
Using the updated values of πt, we now want to sample ηt from
As in the first part of the iteration, we introduce the auxiliary variables zjki, which we again draw from appropriate multinomial distributions. We note that in the calculation of the predictive power of each test result, we use the updated values of π, that is we draw z from
For each cytology test result, we sum over the age groups to get the total number of women in each health state with a particular cytology result, that is
wjk is the number of women with underlying health state j and cytology result k. Combining this information with the Dirichlet priors we assumed for the TPM rows, we can update the ηj. by sampling from
This completes one iteration of the Gibbs sampler.
We run multiple chains and monitor the mixing of the different sequences. We stop the sampler when the potential scale reduction is near one for all the estimated parameters.
The resultant TPM output from the fitting algorithm was further modified to match histology outcomes in ARTISTIC in round 1. The final TPM we use in our ARTISTIC simulation is shown below (this matrix was used to calculate the sensitivity and specificity of LBC testing as reported in the main body of the report).
| Health state | Negative | Borderline | Mild | Moderate | Severe+ |
|---|---|---|---|---|---|
| Well | 93 | 6 | 1 | 0.2 | 0.0 |
| HPV (all HPV types) | 93 | 5 | 1 | 0.3 | 0.1 |
| CIN1 (all HPV types) | 52 | 18 | 23 | 7 | 1 |
| CIN2 (all HPV types) | 15 | 18 | 20 | 46 | 26 |
| CIN3 (all HPV types) | 13 | 11 | 11 | 65 | 47 |
Appendix 10 Screening behaviour of women in the ARTISTIC trial
In order to accurately model women in the ARTISTIC trial (in order to validate model outcomes against ARTISTIC outcomes), we must analyse and then model their screening behaviour. This section summarises this analysis. These screening rates are used in the model to simulate compliance with trial guidelines.
Background on the trial: all women in the trial attended at least one screening event, their first screen, which occurred upon entry into the trial. Women entered the trial between July 2001 and October 2003. 1 Cytology results of all women in the trial were recorded up until July 2009, and histology results were recorded up until October 2009. 62 Thus, women were followed for 6–8 years, depending upon when they entered the trial.
In this section, we explicitly report the times at which women return for screening based on the results of their previous screening event.
The times at which women return to screening after a normal screen
In this section, we will focus on women who have a normal screen at their first screening event, and their rate of return to routine screening.
Table 73 shows the distribution of times a woman returns for a second screen if her first screen was normal (cytologically negative in the concealed arm or both HPV and cytologically negative in the revealed arm).
| Age (years) | 0–12 months (%) | 12–24 months (%) | 24–36 months (%) | 36–48 months (%) | 48–60 months (%) | 60+ months (%) | Never return (%) | Total (n) |
|---|---|---|---|---|---|---|---|---|
| 20–29 | 0 | 1 | 10 | 29 | 10 | 10 | 40 | 3185 |
| 30–39 | 1 | 1 | 17 | 38 | 9 | 8 | 25 | 5701 |
| 40–49 | 0 | 1 | 24 | 40 | 8 | 6 | 21 | 4850 |
| 50–64 | 0 | 1 | 34 | 33 | 6 | 3 | 22 | 4768 |
| Total | 0 | 1 | 22 | 36 | 8 | 6 | 26 | 18,504 |
A proportion of women who had a normal baseline screen did not return during the trial period for another screen (26% across all age groups). The proportion of women who never return was higher in the youngest age group (40%). Of those who did return for a second screen, most return between 36 and 48 months after their first screen event.
The times at which women return to screening after a normal screen: later rounds of the trial
Table 74 shows the distribution of return times for women who had a normal baseline screen and a normal second screen (i.e. compliance with routine screening in later rounds of the trial).
| Age (years) | 0–12 months (%) | 12–24 months (%) | 24–36 months (%) | 36–48 months (%) | 48+ months (%) | Never return (%) | Total (n) |
|---|---|---|---|---|---|---|---|
| 20–29 | 1 | 2 | 11 | 31 | 2 | 52 | 2175 |
| 30–39 | 1 | 1 | 14 | 36 | 2 | 46 | 3790 |
| 40–49 | 1 | 1 | 11 | 31 | 2 | 54 | 2830 |
| 50–64 | 1 | 1 | 2 | 4 | 2 | 90 | 1506 |
| Total | 1 | 1 | 10 | 25 | 2 | 61 | 10,301 |
Table 74 indicates that the proportion of women who return for a third screen after two normal screens is lower than the proportion who returned for a second screen after a baseline normal screen (an average of 61% did not return for a third screen during the trial period, compared with 26% from Table 73). However, as the trial ended in 2009, this table does not capture women who returned late for a third screen, and so it is difficult to compare these rates with those from Table 73. Thus, the rate of ‘non-compliance’ shown in Table 74 is likely to be artificially high. However, for the purposes of modelling the trial experience, this analysis informed the attendance assumptions used. Table 74 also shows that only 10% of women aged 50–64 returned after two consecutive normal screens, which is significantly lower than other age groups. In part, this may be due to women ageing beyond 64 years and no longer taking part in the cervical screening programme.
The compliance with follow-up of cytology-negative and human papillomavirus-positive women in the revealed arm of the trial
Guidelines on cytology-negative/HPV-positive women in the revealed arm of the trial: women who tested cytology negative but HPV positive in the revealed arm of the trial were recommended to attend a HPV-only screen 12 months later. If they were HPV negative at this second screen, they were returned to routine screening. However, women who remained HPV positive at this time could choose to either attend colposcopy or return in another 12 months for a repeat HPV test. If a woman opted to attend for another repeat HPV test, then she was referred to colposcopy if HPV positive. Table 75 shows the distribution of return times in women who were cytologically negative and HPV positive at baseline. In this section, we consider only women in the revealed arm of the trial.
| Age (years) | 6–12 months (%) | 12–18 months (%) | 18–30 months (%) | Cytology (%) | 30+ months (%) | Total (n) |
|---|---|---|---|---|---|---|
| 20–29 | 9 | 31 | 7 | 9 | 44 | 682 |
| 30–39 | 14 | 37 | 6 | 11 | 31 | 506 |
| 40–49 | 20 | 36 | 3 | 11 | 30 | 270 |
| 50–64 | 24 | 43 | 3 | 7 | 22 | 217 |
| Total | 14 | 35 | 6 | 10 | 35 | 1675 |
The compliance with follow-up of cytology-negative and human papillomavirus-positive women in the revealed arm of the trial: later rounds of the trial
Table 76 shows the rate at which women who tested cytology negative and HPV positive returned for screening in the revealed arm. We considered only women who were not already in follow-up, as women being monitored for previous abnormalities may have different management. We determined that a woman was not in follow-up at a screening event if at least 30 months had lapsed since her last screening event, and if she had no known CIN2+ histology results throughout the trial. Table 76 shows the rate of return to screening in women who were not in follow-up and had a cytologically negative and HPV-positive screen.
| Age (years) | 6–12 months (%) | 12–18 months (%) | 18–30 months (%) | Cytology (%) | 30+ months (%) | Total (n) |
|---|---|---|---|---|---|---|
| 20–29 | 7 | 10 | 2 | 17 | 70 | 397 |
| 30–39 | 4 | 15 | 1 | 11 | 69 | 292 |
| 40–49 | 9 | 15 | 1 | 14 | 58 | 170 |
| 50–64 | 6 | 27 | 1 | 9 | 56 | 125 |
| Total | 4 | 15 | 1 | 15 | 66 | 984 |
The compliance with follow-up of borderline and mild cytology test results
We investigated the rate of return to screening in women who had a cytological low-grade abnormality at their baseline screen. The national guidelines (prior to 2003) recommended that women who have a low-grade abnormality return for follow-up cytology 6 months later. The observed distribution of return times in the ARTISTIC trial is shown in Table 77.
Those who tested either borderline or mild at baseline had very similar rates of follow-up, with about 80% returning for cytology screening within 12 months, and about 10% not returning within 24 months for follow-up. Again, we can see that the women in the youngest age group had slightly lower compliance rates than the overall average. A very small proportion of women attended colposcopy after the first low-grade cytology. These women may have already been in follow-up management prior to trial enrolment.
| Age (years) | 0–6 months (%) | 6–12 months (%) | 12–18 months (%) | 18–24 months (%) | 24+ months (%) | Colposcopy (%) | Total (n) |
|---|---|---|---|---|---|---|---|
| Borderline | |||||||
| 20–29 | 21 | 54 | 8 | 4 | 12 | 1 | 519 |
| 30–39 | 25 | 59 | 4 | 3 | 7 | 3 | 588 |
| 40–49 | 24 | 63 | 4 | 2 | 5 | 2 | 425 |
| 50–64 | 29 | 60 | 4 | 2 | 3 | 3 | 213 |
| Total | 24 | 58 | 5 | 3 | 8 | 2 | 1745 |
| Mild | |||||||
| 20–29 | 20 | 51 | 6 | 4 | 13 | 6 | 412 |
| 30–39 | 25 | 52 | 5 | 2 | 8 | 9 | 256 |
| 40–49 | 25 | 61 | 2 | 1 | 5 | 5 | 138 |
| 50–64 | 31 | 62 | 2 | 0 | 4 | 2 | 55 |
| Total | 23 | 53 | 5 | 2 | 10 | 6 | 861 |
The compliance with follow-up of borderline and mild cytology test results later in the trial
After 2003, the national guidelines changed so that women who test mild are referred for colposcopy rather than returning for further follow-up. Thus, the trial guidelines also changed accordingly. We wished to consider the return to screening in women who tested mild or borderline, but we wished to consider only women who are being routinely screened (as opposed to women who are in follow-up for a previous event). As discussed previously, a woman was not in follow-up at a screening event if at least 30 months had lapsed since her last screening event, and if she had no known CIN2+ histology results throughout the trial. Table 78 shows the rate of return to screening in women who tested borderline or mild and were not in follow-up at the time.
| Age (years) | 0–6 months (%) | 6–12 months (%) | 12–18 months (%) | 18–24 months (%) | 24+ months (%) | Colposcopy (%) | Total (n) |
|---|---|---|---|---|---|---|---|
| Borderline | |||||||
| 20–29 | 15 | 46 | 5 | 5 | 21 | 8 | 125 |
| 30–39 | 21 | 51 | 4 | 2 | 15 | 7 | 148 |
| 40–49 | 18 | 47 | 10 | 1 | 13 | 10 | 87 |
| 50–64 | 26 | 43 | 3 | 3 | 17 | 9 | 35 |
| Total | 19 | 48 | 6 | 3 | 17 | 9 | 395 |
| Mild | |||||||
| 20–29 | 8 | 22 | 2 | 0 | 8 | 61 | 93 |
| 30–39 | 8 | 22 | 3 | 0 | 9 | 59 | 73 |
| 40–49 | 22 | 23 | 6 | 0 | 8 | 41 | 31 |
| 50–64 | 43 | 33 | 0 | 0 | 0 | 24 | 6 |
| Total | 11 | 22 | 3 | 0 | 8 | 56 | 203 |
Table 78 shows that about 75% of women who tested borderline returned for a follow-up screen within 24 months, 9% returned for a colposcopy and 17% did not return for any follow-up within 24 months. Compared with those who tested borderline at baseline (see Table 77) there is a slightly lower compliance rate with cytology follow-up and a slightly higher rate of colposcopy attendance, possibly because women were encouraged to go for colposcopy earlier than usual in order to get complete trial data. 1
Table 78 also shows the rate of return to screening in women who tested mild at a routine screen. Only 56% returned for colposcopy, 40% returned for cytology follow-up and 13% did not return for follow-up within 24 months of the mild result.
Appendix 11 Screening and diagnostic test characteristics
Liquid-based cytology parameters
Inadequate sample rates for LBC are based on 2007–8 statistics from the Cervical Screening Programme in England. 33 A range was considered in sensitivity analysis based on the previous work. 12,19
| Parameter | Base-case value (%) | Range for sensitivity analysis (%) |
|---|---|---|
| Inadequate rate of LBC | 3 | 2.6–4.1 |
With regard to the sensitivity of LBC, in the base case it was assumed that test positivity rates for CIN2+ were equivalent to those from a multicentre screening study (HART) conducted in UK. 29 ARTISTIC cytology test characteristics were not assumed for the national evaluation (although they were used for the validation of the model outcomes) because ARTISTIC did not recruit nationally, and it is possible that cytology in the baseline round of ARTISTIC was influenced by the retraining associated with the recent introduction of LBC to the NHS Cervical Screening Programme at the time of the trial commencement. 2
Although HART was conducted a number of years prior to ARTISTIC, and did not involve LBC, it did recruit across a wider range of centres and thus is more likely to be representative of the performance of cytology across England. The use of HART data to represent LBC test accuracy was considered to be appropriate because the sensitivity of LBC and conventional cytology for detection of CIN2+ have been shown in meta-analysis to be close-to-equivalent,30 and the inadequate smear rate for LBC (which is known to be much lower than the rate for conventional cytology in England) was specifically modelled using other data sources, as detailed above.
The test positivity rates derived from HART data for cytology for CIN2+ and CIN3+ were 76.7% and 75.9%, respectively, at a borderline dyskaryosis smear threshold, and 70.1% for both CIN2+ and CIN3+, at a mild dyskaryosis smear test threshold. With regard to the specificity of LBC, the positivity rate for CIN1 was assumed to be 37.6% at a borderline dyskaryosis smear threshold and 28.0% at a mild dyskaryosis smear threshold.
Alternative sets of test characteristics for LBC, encompassing the range used for the ARTISTIC modelling, were investigated in sensitivity analysis.
The least favourable LBC performance considered in the sensitivity analysis assumed that the positivity rate for CIN2+ and CIN 3+ were 53% and 55%, respectively, at a borderline dyskaryosis smear threshold, and 46% and 49%, respectively, at a mild dyskaryosis smear threshold, consistent with the finding of a meta-analysis of international literature. 31 The most favourable LBC performance considered in the sensitivity analysis used the test characteristics of manually read LBC in England in the MAVARIC study. 19
| Histology threshold | Sensitivity analysis value (%) | |||||
|---|---|---|---|---|---|---|
| Base-case value (%) | Least favourable case LBC performance | Most favourable case LBC performance | ||||
| At borderline threshold | At mild threshold | At borderline threshold | At mild threshold | At borderline threshold | At mild threshold | |
| CIN2+ | 76.7 | 70.1 | 53.0 | 45.2 | 79.0 | 67.5 |
| CIN3+ | 75.9 | 70.1 | 55.0 | 49.0 | 87.2 | 77.7 |
Human papillomavirus test parameters
The HPV test positivity rates for histologically verified CIN1 and for histologically confirmed CIN2+ and CIN3+ (and the range for sensitivity analysis) were derived from a number of sources to give a range of assumptions. These included a major meta-analysis of HPV testing,31 the HART study29 and the ATHENA trial. 32 The accuracy of HPV testing was based on extensive data in the literature on HC2 testing, which was used in ARTISTIC and HART. The use of these test characteristics does not necessarily lead to the assumption that the specific platform was used, but that HC2 or alternative platforms with equivalent performance were used. For some strategies the use of new automated test platforms with partial genotyping for HPV 16/18 was assumed (sometimes referred to as ‘genotyping’ here).
For HPV testing, in the base case it was assumed that the test positivity rates for CIN2 and CIN3+ were 95.5% and 95.7%, respectively. With regard to specificity, the test positivity rate for CIN1 was assumed to be 84.2%. In the base case we assumed that the test threshold was such that the test performance was equivalent to HC2 at a 2 pg/ml threshold, as this has been proposed for use in primary screening in England. However, sensitivity analysis encompassed the possibility that a test with performance equivalent to that of HC2 with a threshold of 1 pg/ml performance was used.
| Model health state | Gold standard used | Baseline (%) | Range for sensitivity analysis (%) |
|---|---|---|---|
| Well | PCR testing for HPV | 1.4 | 1.4–4.2 |
| HPV infected (no CIN) | PCR testing for HPV | 82.1 | 49.7–92.5 |
| CIN1 | Histology | 84.15 | 76.3–84.3 |
| CIN2 | Histology | 95.5 | 94.7–97.1 |
| CIN3+ | Histology | 95.7 | 93.6–97.6 |
In the base-case scenario, HPV test was assumed to be associated with no inadequate rate. A 1% inadequate rate was investigated in sensitivity analysis, to encompass the possibility that a technology with an ‘inadequate’ output is used.
| Parameter | Base-case value (%) | Range for sensitivity analysis (%) |
|---|---|---|
| Inadequate rate of HPV test | 0 | 0–1 |
Relative performance of liquid-based cytology and primary human papillomavirus testing
In the base-case scenario, the relative sensitivity of HPV versus cytology for CIN2+ and CIN3+, derived from the above parameters, was equivalent to 1.25 and 1.26, respectively, at a borderline dyskaryosis smear threshold, and 1.36 for both CIN2+ and CIN3+ at a mild dyskaryosis smear threshold, which is consistent with the finding of a meta-analysis of international literature on the test accuracy of HPV test. 63
In sensitivity analysis, in order to assess the most extreme scenarios for the relative performance of LBC and HPV testing, we chose test characteristics for LBC and HPV from the above values such that the relative sensitivity was maximised (‘most favourable’ scenario for primary HPV screening) and also minimised (‘least favourable’ scenario for primary HPV screening) (Table 83).
| Sensitivity | At base case | Best-case scenario assumption | Worse-case scenario assumption | |||
|---|---|---|---|---|---|---|
| CIN2+ | CIN3+ | CIN2+ | CIN3+ | CIN2+ | CIN3+ | |
| HPV+ve/cytology borderline | 1.25 | 1.26 | 1.84 | 1.77 | 1.19 | 1.07 |
| HPV+ve/cytology mild | 1.36 | 1.36 | 2.15 | 1.99 | 1.39 | 1.20 |
Colposcopy parameters
The model assumed an age-specific probability that the colposcopy will be unsatisfactory; data were derived from a large colposcopy dataset collected in Victoria, Australia. 18,20
A TPM was used to specify the relationship between the women’s underlying natural history health state and the colposcopy result. This TPM was used to specify the probability that abnormal result would obtain at colposcopy evaluation according to the women’s underlying health state. The matrix was derived from a large colposcopy data set in Victoria, Australia18,20 and data from the HPV Sentinel Sites study. 12
In the sensitivity analysis, a best-case scenario was evaluated which assumed that colposcopy is capable of detecting cervical abnormalities in all women presenting with CIN2+. The worst-case scenario assumed a lower positivity rate for all health state based on the test characteristic of colposcopy used in prior work. 18,20
| Health state | Probability of having abnormal result at colposcopy evaluation (%) | |
|---|---|---|
| Base case | Range for sensitivity analysis | |
| Normal | 73.8 | 50.2–73.8 |
| HPV | 73.8 | 50.2–73.8 |
| CIN1 | 79.2 | 76.5–79.2 |
| CIN2 | 90.8 | 88.3–100.0 |
| CIN3+ | 90.8 | 88.3–100.0 |
| Cancer | 100.0 | 100.0 |
Appendix 12 Compliance with screening and management recommendations
Routine screening attendance
For strategies that simulate current practice, we used registry data from Oxfordshire to estimate the cumulative rescreened proportion at various times after a negative smear for women who appeared on the register. 33 We used age-specific data on the percentage of eligible women who attended at least once in a 5-year period in England (2007–8)12,34 to adjust these data and derive age- and interval-specific probabilities of women attending for routine screening. This allows the model to take into account non-attendance, early rescreening, late rescreening, and screening in ages outside the target age range for screening.
For the primary screening strategies that simulate 6-yearly and 5-yearly screening, the proportion of women rescreened at the sixth year after the last negative test was assumed to be the same as the observed proportion for current practice after the third year following a negative cytology test, or fifth year in women older than 50 years.
In the sensitivity analysis, we explored a higher compliance scenario for strategies involving HPV as the primary test. We made the assumption that continue to use call-and-recall for 5- and 6-yearly screening intervals, and we did not examine lower screening attendance rates in sensitivity analyses. In this case, we assumed that the cumulative proportion of women rescreened within 6 years (or within 5 years for strategies that simulate 5-yearly screening) was the same as the cumulative proportion currently rescreened within 5 years (Figures 47 and 48).
FIGURE 47.
Modelled cumulative proportion of women with a negative index test reattending for screening (aged younger than 50 years at the time of the index test).
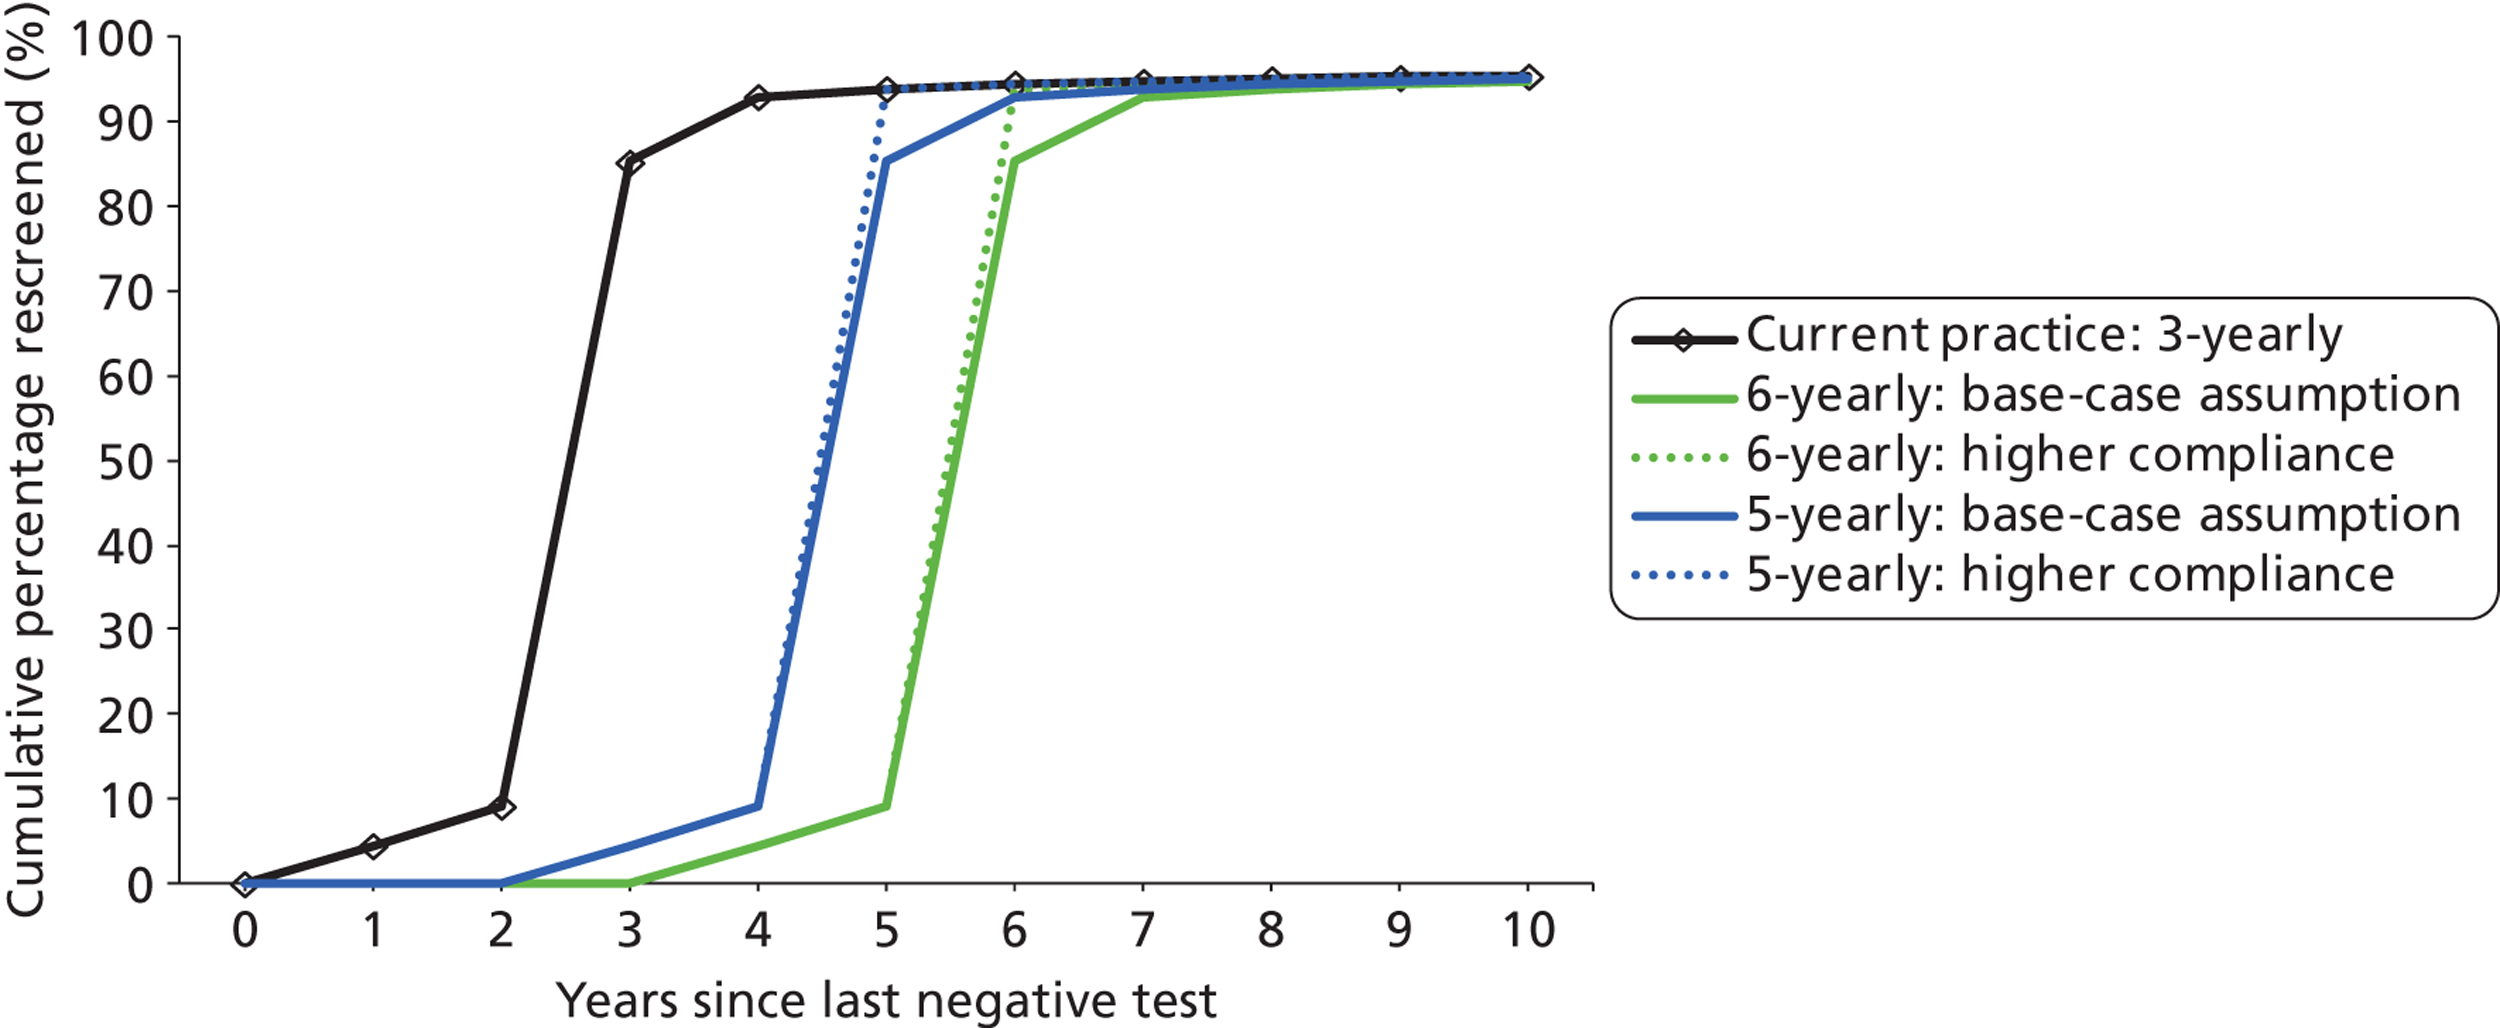
FIGURE 48.
Modelled cumulative proportion of women with a negative index test reattending for screening (aged 50+ years at the time of the index test).
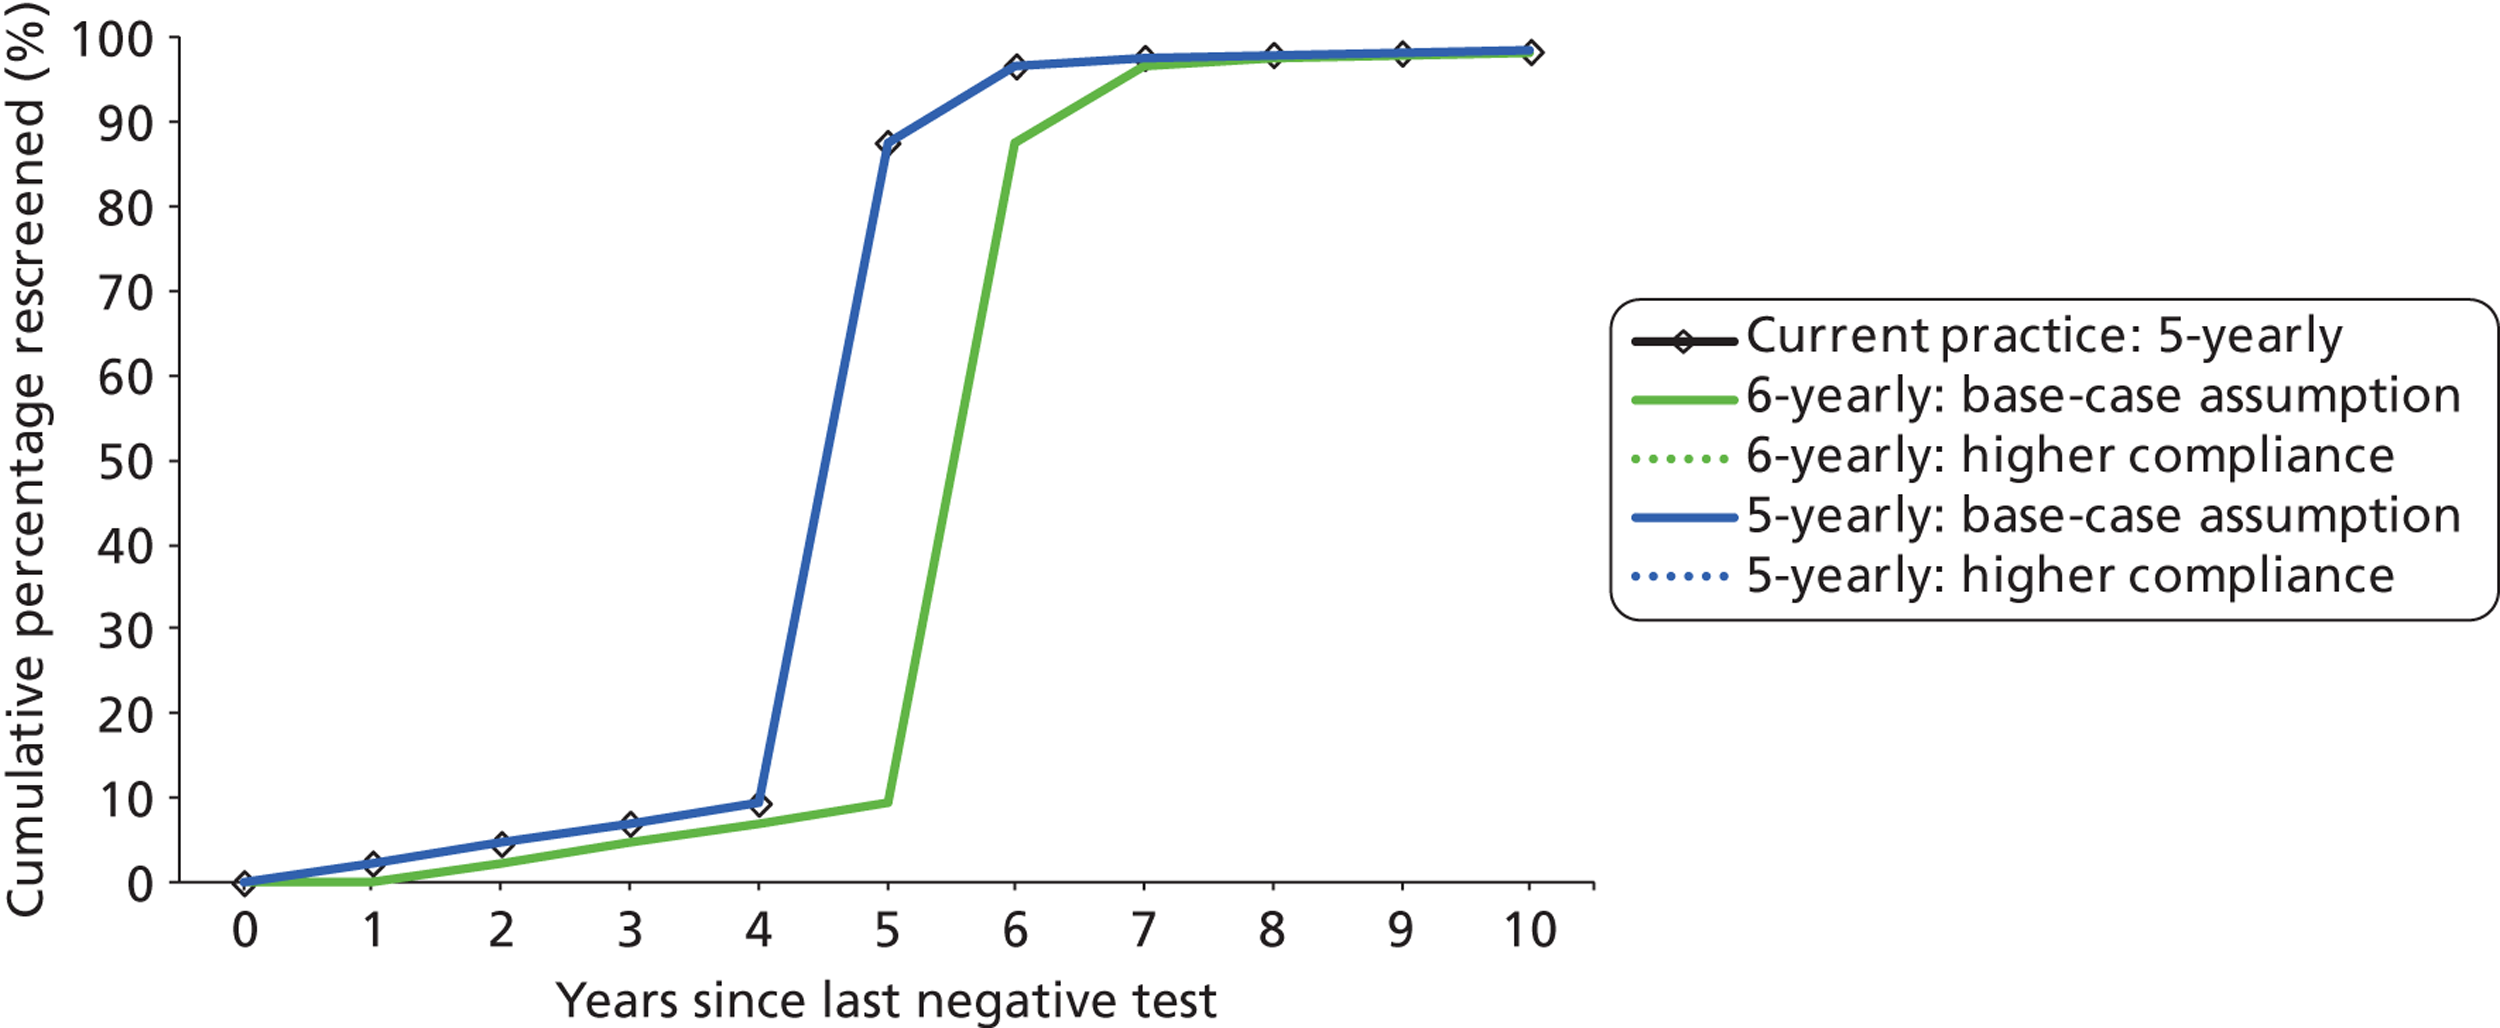
Other compliance assumptions
Attendance rates for women with other types of recall codes were based on earlier studies, including data from the HPV Sentinel Sites,12 and on routinely collected screening data for England (2007–8). 33
In sensitivity analysis, we explored a scenario where all women (other than those recommended to return at the routine interval) attended their appointment for colposcopy or a follow-up test at the recommended time (perfect compliance with follow-up). This allowed an exploration of whether or not any observed differences in strategies may have been influenced by the follow-up management rather than the primary screening recommendations (Table 85).
| Parameter | Base-case value (%) | Range for sensitivity analysis (%) |
|---|---|---|
| Compliance with colposcopy recommendation33 | 84 | 84–100a |
| Compliance with 6-month follow-up visit recommendation64 | 85 | 60–100a |
| Compliance with 12-month follow-up visit recommendation64 | 83 | 60–100a |
| Compliance with 24-month intermediate risk follow-up visit recommendationb | 80a | 60–100a |
| Compliance with 12-month intermediate risk follow-up visit recommendationb | 80a | 60–100a |
Appendix 13 Cost assumptions
All costs used in the model were inflated to the 2010 financial year value using the HCHS pay-and-price index. 37 A NHS perspective was utilised for the costing analysis.
Sample collection
Inflated costs from the HPV pilot study were used. 65 This cost item was applied in the model with each screening episode involving a clinic visit (Table 86).
Human papillomavirus testing
Costs of HPV testing both for general HR types and specifically for genotypes 16/18 were obtained from four manufacturers. Manufacturers were asked to supply information about machine time, staffing requirements, assay capacity, annual capacity of equipment and indicative costs per test. Costs of staff time were based on multiplying the staff time per test by the lowest grade of staff recommended to undertake the activity from the agenda for change costing schedule. Manufacturers were asked to supply indicative costs for conducting both HR testing only (without specific testing for HR) and type 16/18 testing. Indicative costs per test are likely to vary significantly depending on the total volume of tests undertaken. Suppliers were asked to provide indicative prices for two costing scenarios: primary HPV testing and reflex testing of cytology samples on the basis of being awarded a national contract. Costs provided included the service contract for maintenance and rental of equipment based on a 5-year contract. For the purposes of this study it was assumed that equipment was used at maximum capacity. If HPV testing were introduced, it is likely that there would be changes to the configuration of laboratories and transportation system for collecting samples. As a simplification these costs were not included in this analysis. To retain confidentiality between suppliers over indicative contract prices, costs are not presented for individual manufacturers/systems and, instead, a mean and range are presented across the suppliers including both staff and consumable/equipment costs.
An average across manufacturer supplied prices was considered for the unit cost of HPV testing and genotyping in the base case.
The base-case scenarios assumed the HPV test technology used for primary HPV testing would provide the test outcome against HPV 16/18 infections as well as all HR type infections simultaneously. Therefore, HPV 16/18 typing was assumed to incur zero additional cost in the baseline scenario. An additional £5.29 cost for HPV 16/18 was explored in sensitivity analysis.
| Cost item | Value (£) (range for sensitivity analysis)a | Source |
|---|---|---|
| Primary HR HPV testing | 9.38 (4.5–9.38) | Manufacturer average as per value used. Range informed by data from HPV sentinel sites report for full batches (high end) |
| HPV 16/18 test (additional cost) | 0 (0–5.29) | Manufacturer average |
| Reflex HR HPV testing (comparator 1 only) | 12.72 (8.13–21.32) | Manufacturer average. Range informed by data from HPV Sentinel Sites report for smaller batches |
Cytology
The cytology costs were based on the reanalysis of the manual arm of the MAVARIC data. 19 This indicated that the costs of cytology testing differ considerably depending on the final cytology results (Table 88).
| Cost item | Value (£) (range for sensitivity analysis)a | Source |
|---|---|---|
| Negative or inadequate | 5.45 (5.36–5.54) | Cost based on reanalysed cost data collected by MAVARIC study |
| LG cytology | 15.40 (15.13–15.65) | Cost based on reanalysed cost data collected by MAVARIC study |
| HG cytology | 15.56 (14.38–16.74) | Cost based on reanalysed cost data collected by MAVARIC study |
Sample transportation
If primary HPV testing was introduced, it is likely that there would be changes in the sample transport system, and in the volumes of HPV tests performed and transported (Table 89).
| Cost item | Value (£) (range for sensitivity analysis)a | Source |
|---|---|---|
| Transport – sample to lab | 0.45 (0–2.81) | Cost obtained from HPV sentinel sites report (distances up to 50 km). This cost is applied to samples requiring additional triage testing in current practice screening strategy |
| Transport – lab to lab (for HPV triage) | 3.64 (1.06–6.00) | Cost obtained from HPV sentinel sites report. This cost was applied in the comparator to allow for implementation where LBC and HPV testing occur in separate laboratories, following a ‘hub and spoke’ model. Includes staff time required for identifying samples requiring additional triage testing, packing, and reporting |
| Transport – LBC triage in same lab | 1.06 (0.67–3.64) | Cost obtained from HPV sentinel sites report. Administrative costs within the lab relating to identifying samples requiring additional triage testing. This cost is applied to samples requiring cytology triage in strategies 1 and 2, as it is assumed in these scenarios that all labs will perform HPV testing if it is the primary screening test. Range encompasses the costs associated with performing HPV and LBC in different labs |
Diagnostic and treatment for cervical intraepithelial neoplasia
The unit cost for having a colposcopy, biopsy, conisation and large loop excision of the transformation zone (LLETZ) was obtained from Martin-Hirsch35 and Sherlaw-Johnson et al. 36 (Table 90) (inflated to 2010 values). For sensitivity analysis, we used a ± 20% range for each cost.
| Cost item | Value (£) (range for sensitivity analysis)a | Source |
|---|---|---|
| Colposcopy | 146.51 (117.21–175.81) | Martin-Hirsch35 |
| Biopsy | 77.60 (62.08–93.12) | Sherlaw-Johnson36 |
| Conisation | 370.80 (296.64–444.95) | Martin-Hirsch35 |
| LLETZ | 370.80 (296.64–444.95) | Martin-Hirsch35 |
Cancer treatment
The stage-specific cancer treatment cost was obtained from Martin-Hirsch et al. 35 and inflated to the financial year of interest. We used ± 20% of the cancer treatment costs for sensitivity analysis (Table 91).
| Cost item | Value (£) (range for sensitivity analysis)a | Source |
|---|---|---|
| Stage 1 invasive cancer | 3138.76 (2511.01–3766.52) | Martin-Hirsch35 |
| Stage 2 invasive cancer | 5013.00 (4010.4–6015.6) | Martin-Hirsch35 |
| Stage 3 invasive cancer | 14,157.73 (11,326.18–16,989.27) | Martin-Hirsch35 |
| Stage 4 invasive cancer | 14,399.98 (11,519.99–17,279.98) | Martin-Hirsch35 |
Appendix 14 Quality-adjusted life-year weights
The model assumes that healthy women without cervical cancer have a health state utility QALY score of 1. Screening, diagnostic procedures, treatment for precancerous lesions and treatment for cancer are assumed to be associated with a decrease in women’s health state utility (QALY) weight for that year.
The QALY weights used for screening associated health states for QALY set 1 were derived from a study conducted at metropolitan Sydney, NSW, which measured QALY weights via a two-stage standard gamble. 38 A two-stage standard gamble approach was used instead of a time trade-off and was justified in that study on the basis that the standard gamble approach is appropriate for outcomes that involve risk or uncertainty. 38 This set of weights assigned some disutility to the experience of being screened, even if the test result was negative (based on the results of the study).
Quality-adjusted life-year weight set 2 was obtained from previously published weights,40,41 which were not obtained in context of health-state preference assessment specifically for primary HPV testing. This set of weights did not assign any disutility to the experience of being screened per se.
Women with cancer detected in the model were assumed to have a cervical-cancer-stage- and time-since-diagnosis-specific mortality rate for a period of 5 years after the cancer was diagnosed. QALY weights assigned for cancer patients during this period were obtained from published studies by Elbasha et al. 39 and Goldie et al. 40 Women who survive 5 years after cancer diagnosis were assumed to become ‘cancer survivors’. It was further assumed that the quality of life of cancer in this group is the same as in the general population (i.e. QALY weight = 1) (consistent with some other published studies19,66). Table 92 summarises the QALY scores used.
| Health state | Duration (years) | Health-state preference score | Source |
|---|---|---|---|
| Cytology normal and HPV negative/no HPV test (‘experience of being screened even if the result is negative’) | 1 | 0.9967 | Simonella38 |
| Cytology normal and HPV positive | 1 | 0.9733 | Simonella38 |
| Cytology abnormal and HPV negative/no HPV testa | 1 | 0.9735 | Simonella38 |
| Cytology abnormal and HPV positive | 1 | 0.9733 | Simonella38 |
| Colposcopy examination with/without biopsy but do not required treatment for pre-cancerous lesionb | 1 | 0.9724 | Simonella38 |
| Treatment for pre-cancerous lesionc | 1 | 0.9704 | Simonella38 |
| Cancer | |||
| Stage 1 | 5 | 0.76 | Elbasha et al.39 |
| Stage 2 | 5 | 0.67 | Elbasha et al.39 |
| Stage 3 | 5 | 0.56 | Goldie et al.40 |
| Stage 4 | 5 | 0.48 | Goldie et al.40 |
| Cancer survivor | 1 | ||
| Health state | Duration (years) | Health-state preference score | Source |
|---|---|---|---|
| False positive | 1 | 0.92 | Insinga et al.41 |
| CIN1 | 1 | 0.89 | Insinga et al.41 |
| CIN2 | 1 | 0.88 | Insinga et al.41 |
| CIN3 | 1 | 0.89 | Insinga et al.41 |
| Cervical cancer | |||
| Stage 1 | 5 | 0.76 | Elbasha et al.39 |
| Stage 2 | 5 | 0.67 | Elbasha et al.39 |
| Stage 3 | 5 | 0.56 | Goldie et al.40 |
| Stage 4 | 5 | 0.48 | Goldie et al.40 |
| Cancer survivor | 1 | ||
Appendix 15 Vaccination coverage
Annual vaccine coverage in England by age group for the years 2010–11 was obtained from the Department of Health42 and is shown in Table 94. Alternative lower (70%) and higher (95%) vaccination coverage rates in the ongoing vaccination cohort (12- to 13-year-olds) were investigated in sensitivity analysis.
Appendix 16 Sexual behaviour data for the population model
As HPV is a sexually transmitted virus, data on sexual behaviour surveys were used to inform the model of HPV transmission in England. We use a transmission model which simulates heterosexual interaction between men and women in England to inform our natural history model of the rate of HPV transmission in England.
This model was developed for the ARTISTIC project with the aim of generating sexual activity inputs for our HPV transmission model that are compatible with sexual behaviour survey data. This includes, in particular, data presented in terms of fractions of the population age groups who have had specified total lifetime numbers of sexual partners, and percentages who have ever been sexually active by age group. The survey providing the target data for the model in this ARTISTIC context was the UK’s NATSAL II,25 incorporating data collected during 2000 and 2001.
Inputs to the method are probabilities of having different numbers of new sexual partners per year of age, and these are specified as a range of values rather than a single value. The fractions specified for 0 partners in an age year are treated as the fraction of the already sexually active population who have 0 new partners in that year. For higher numbers of partners, they represent the fraction of people remaining, after lower partner numbers are accounted for, who have that number of new partners within a year. For example, suppose that the model has already allocated 70% of people aged 20 years to have either no or one new partner in the year, and that the range of probabilities specified for people aged 20 to have two new partners is from 30% to 50%. The model will randomly generate a probability in this range – for example, 40% – and apply it to the fraction remaining who have not been allocated to a number of partners yet. In this case, of the 100% – 70% = 30% of the 20-year-old population who have two or more new partners, 40% of them – that is to say, 12% of 20-year-olds – will have two new partners.
The model differentiates between people who have not yet had any sexual partners and those who are already sexually active. For these two groups, the probability ranges for having no new partners are specified separately. For the fraction of previously inactive people who will acquire partners within an age year, the same partner number probabilities are applied as for the already active population, scaled to account for the fact that the newly active group will not have partners in the next year.
The input data are divided into processing blocks (e.g. ages 20–24 years and between three and five new partners per year). For each such block, a minimum and maximum probability is specified. When the model is run, a random probability is generated from within this range for each age and number of new partners in the processing block. This probability is then applied as described in the previous paragraphs. Once this has been done for the whole processing block, one or more test statistics are calculated and compared against the specified acceptable ranges. If a fit is obtained, processing moves on to the next block. If not, the block is recalculated up to a specified number of times. If none of these retries succeeds, the entire scenario is regenerated from the beginning. If a set number of restarts is exceeded, processing terminates. Male and female behaviours are calculated independently.
The model provides an option to hold sexual activity proportions equal to those of a lower age group and simply multiply average partner numbers for an activity group by an age-dependent constant (similar to the method used by Choi et al. 67). We used this option for higher age groups (35+ years) for which NATSAL II data are either not available, or not internally consistent when viewed as representing the behaviour of a single age cohort over time.
Once a scenario finishes, the model uses the annual partner number probabilities calculated to determine the proportions of people who fall into specified average partner number per annum ranges for specified age groups. It also calculates the actual average number of partners for people in each such group. These values form the sexual behaviour inputs for the HPV transmission model. The model can be set to generate thousands of such scenarios, in order to produce a spread of acceptable sexual behaviour scenarios that fit the target conditions.
Model sets which fit the NATSAL II data were then used to generate predictions of the age-specific prevalence of oncogenic HPV in cytologically normal women,25 and this was compared with, and fitted to, the corresponding data from ARTISTIC.
Two groups of sets of sexual behaviour inputs were produced for use in sensitivity analysis. Sets in the first group fitted data from NATSAL II on the proportion of individuals ever sexually active, and the age-specific HPV prevalence observed in ARTISTIC. Sets in the second group also fitted additional aspects of NATSAL II (number of partners in the previous 12 months), but fit less well to the HPV prevalence observed in ARTISTIC. This enabled us to explore both uncertainty in the sexual behaviour data, and potential differences between the behaviour of women enrolled in ARTISTIC and in the wider population of England, including cohort effects.
Model fit to the NATSAL II data is shown in Figures 49 and 50. We attempt to reconcile the number of reported sexual partners in a 1-year period for men with the number of reported sexual partners over a 1-year period for women. The model is run under a range of different scenarios. The model results are shown in the graphs as box plots, with the median and interquartile ranges shown across all scenarios tested. The NATSAL II data ranges are shown as the shaded regions underlying the model results for each age group and each number of sexual partners.
FIGURE 49.
The proportion of females who have 0, 1, 2, 3–4 or 5–9 new sexual partners in the last 12 months for each age group. (a) Aged 16–17 years; (b) aged 18–19 years; and (c) aged 20–24 years.
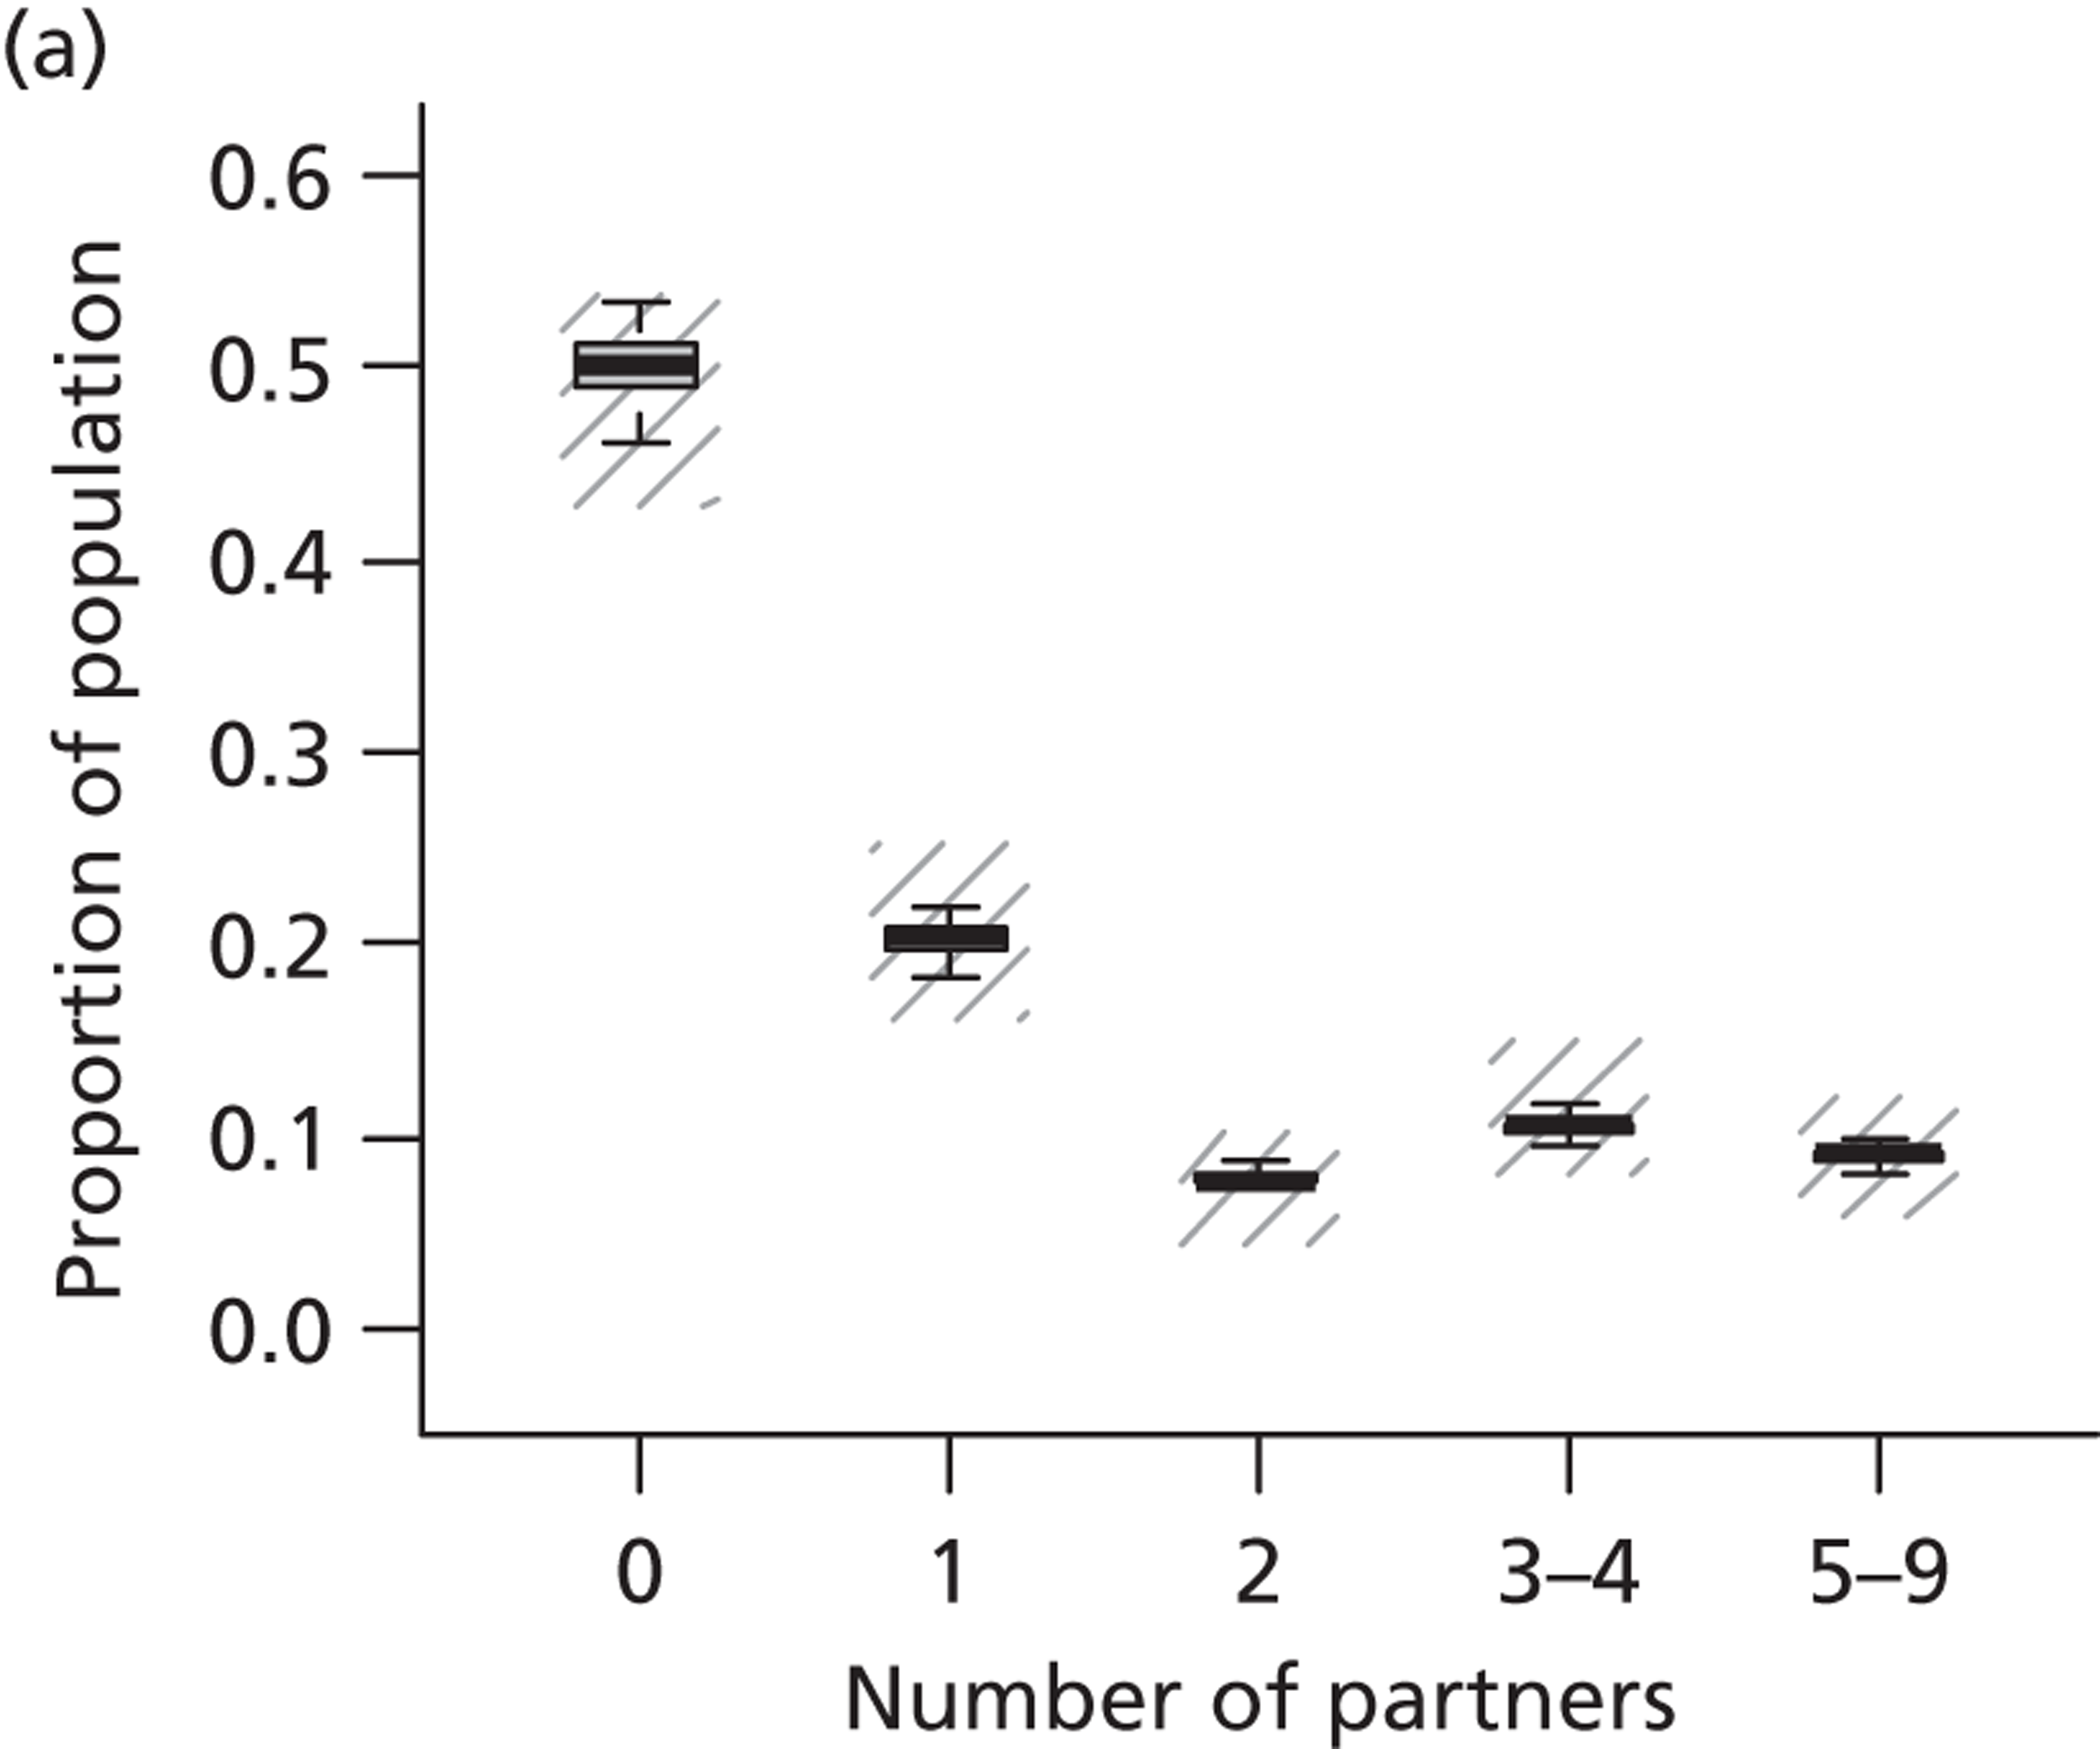
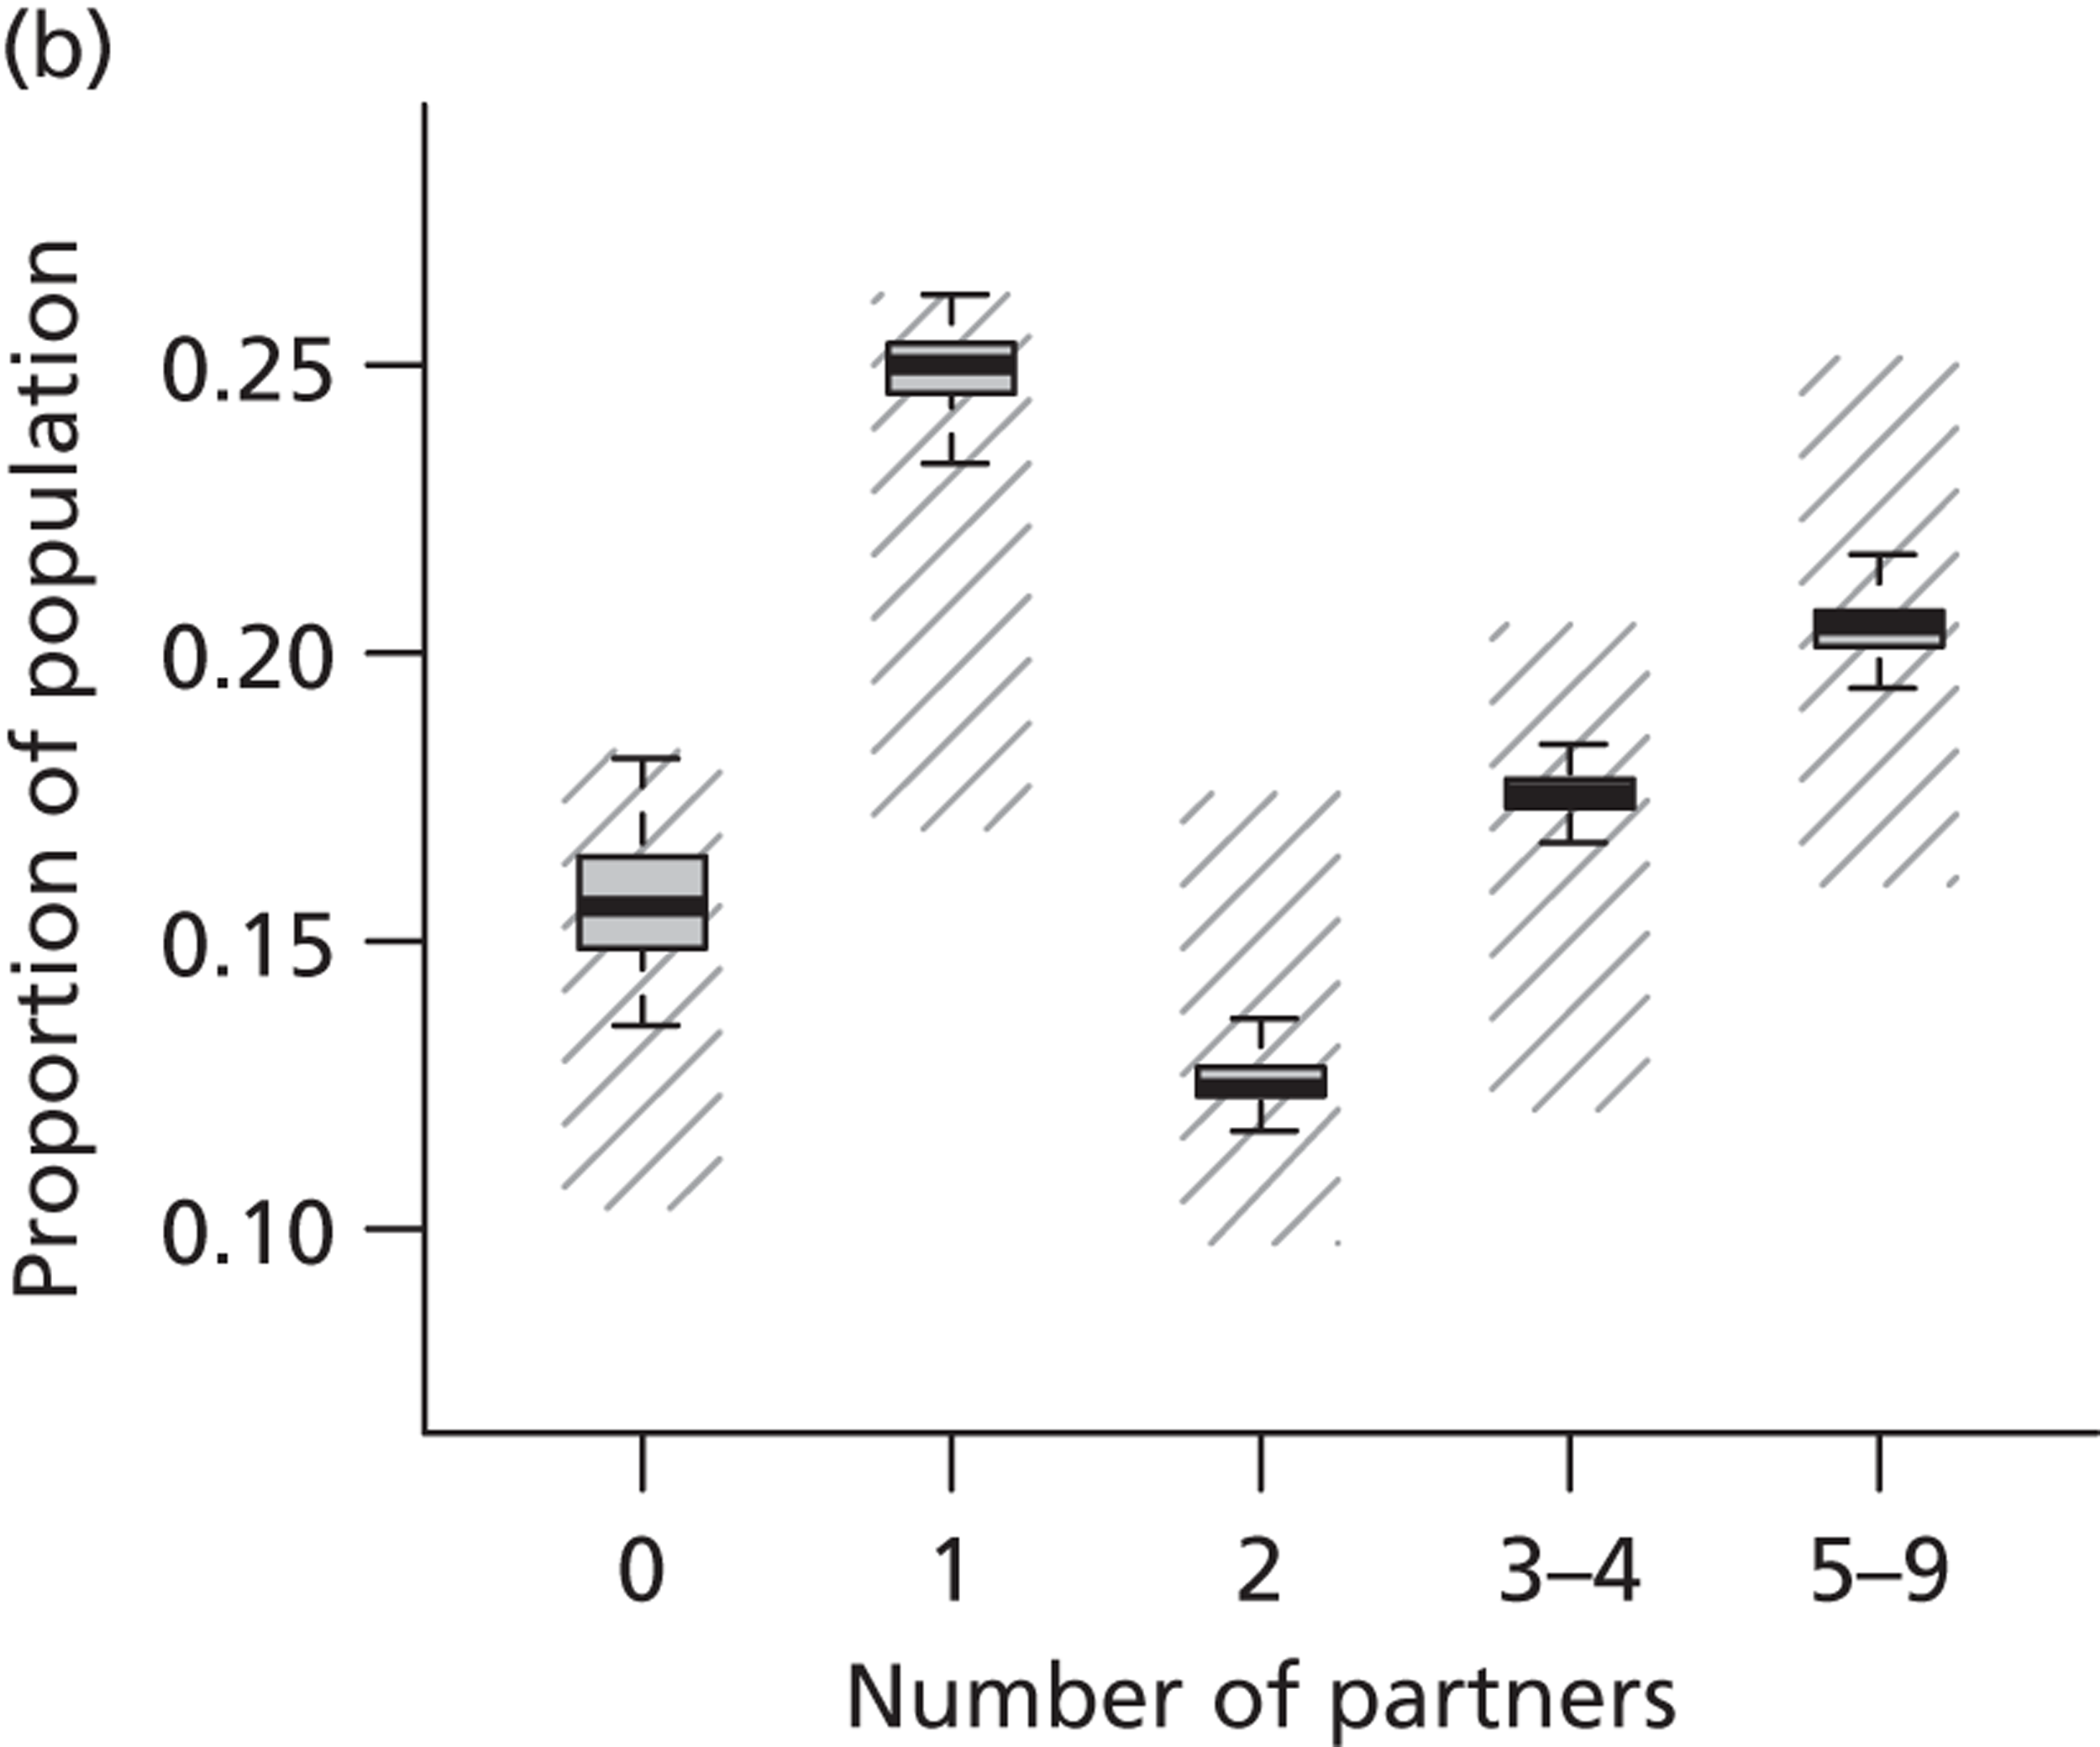
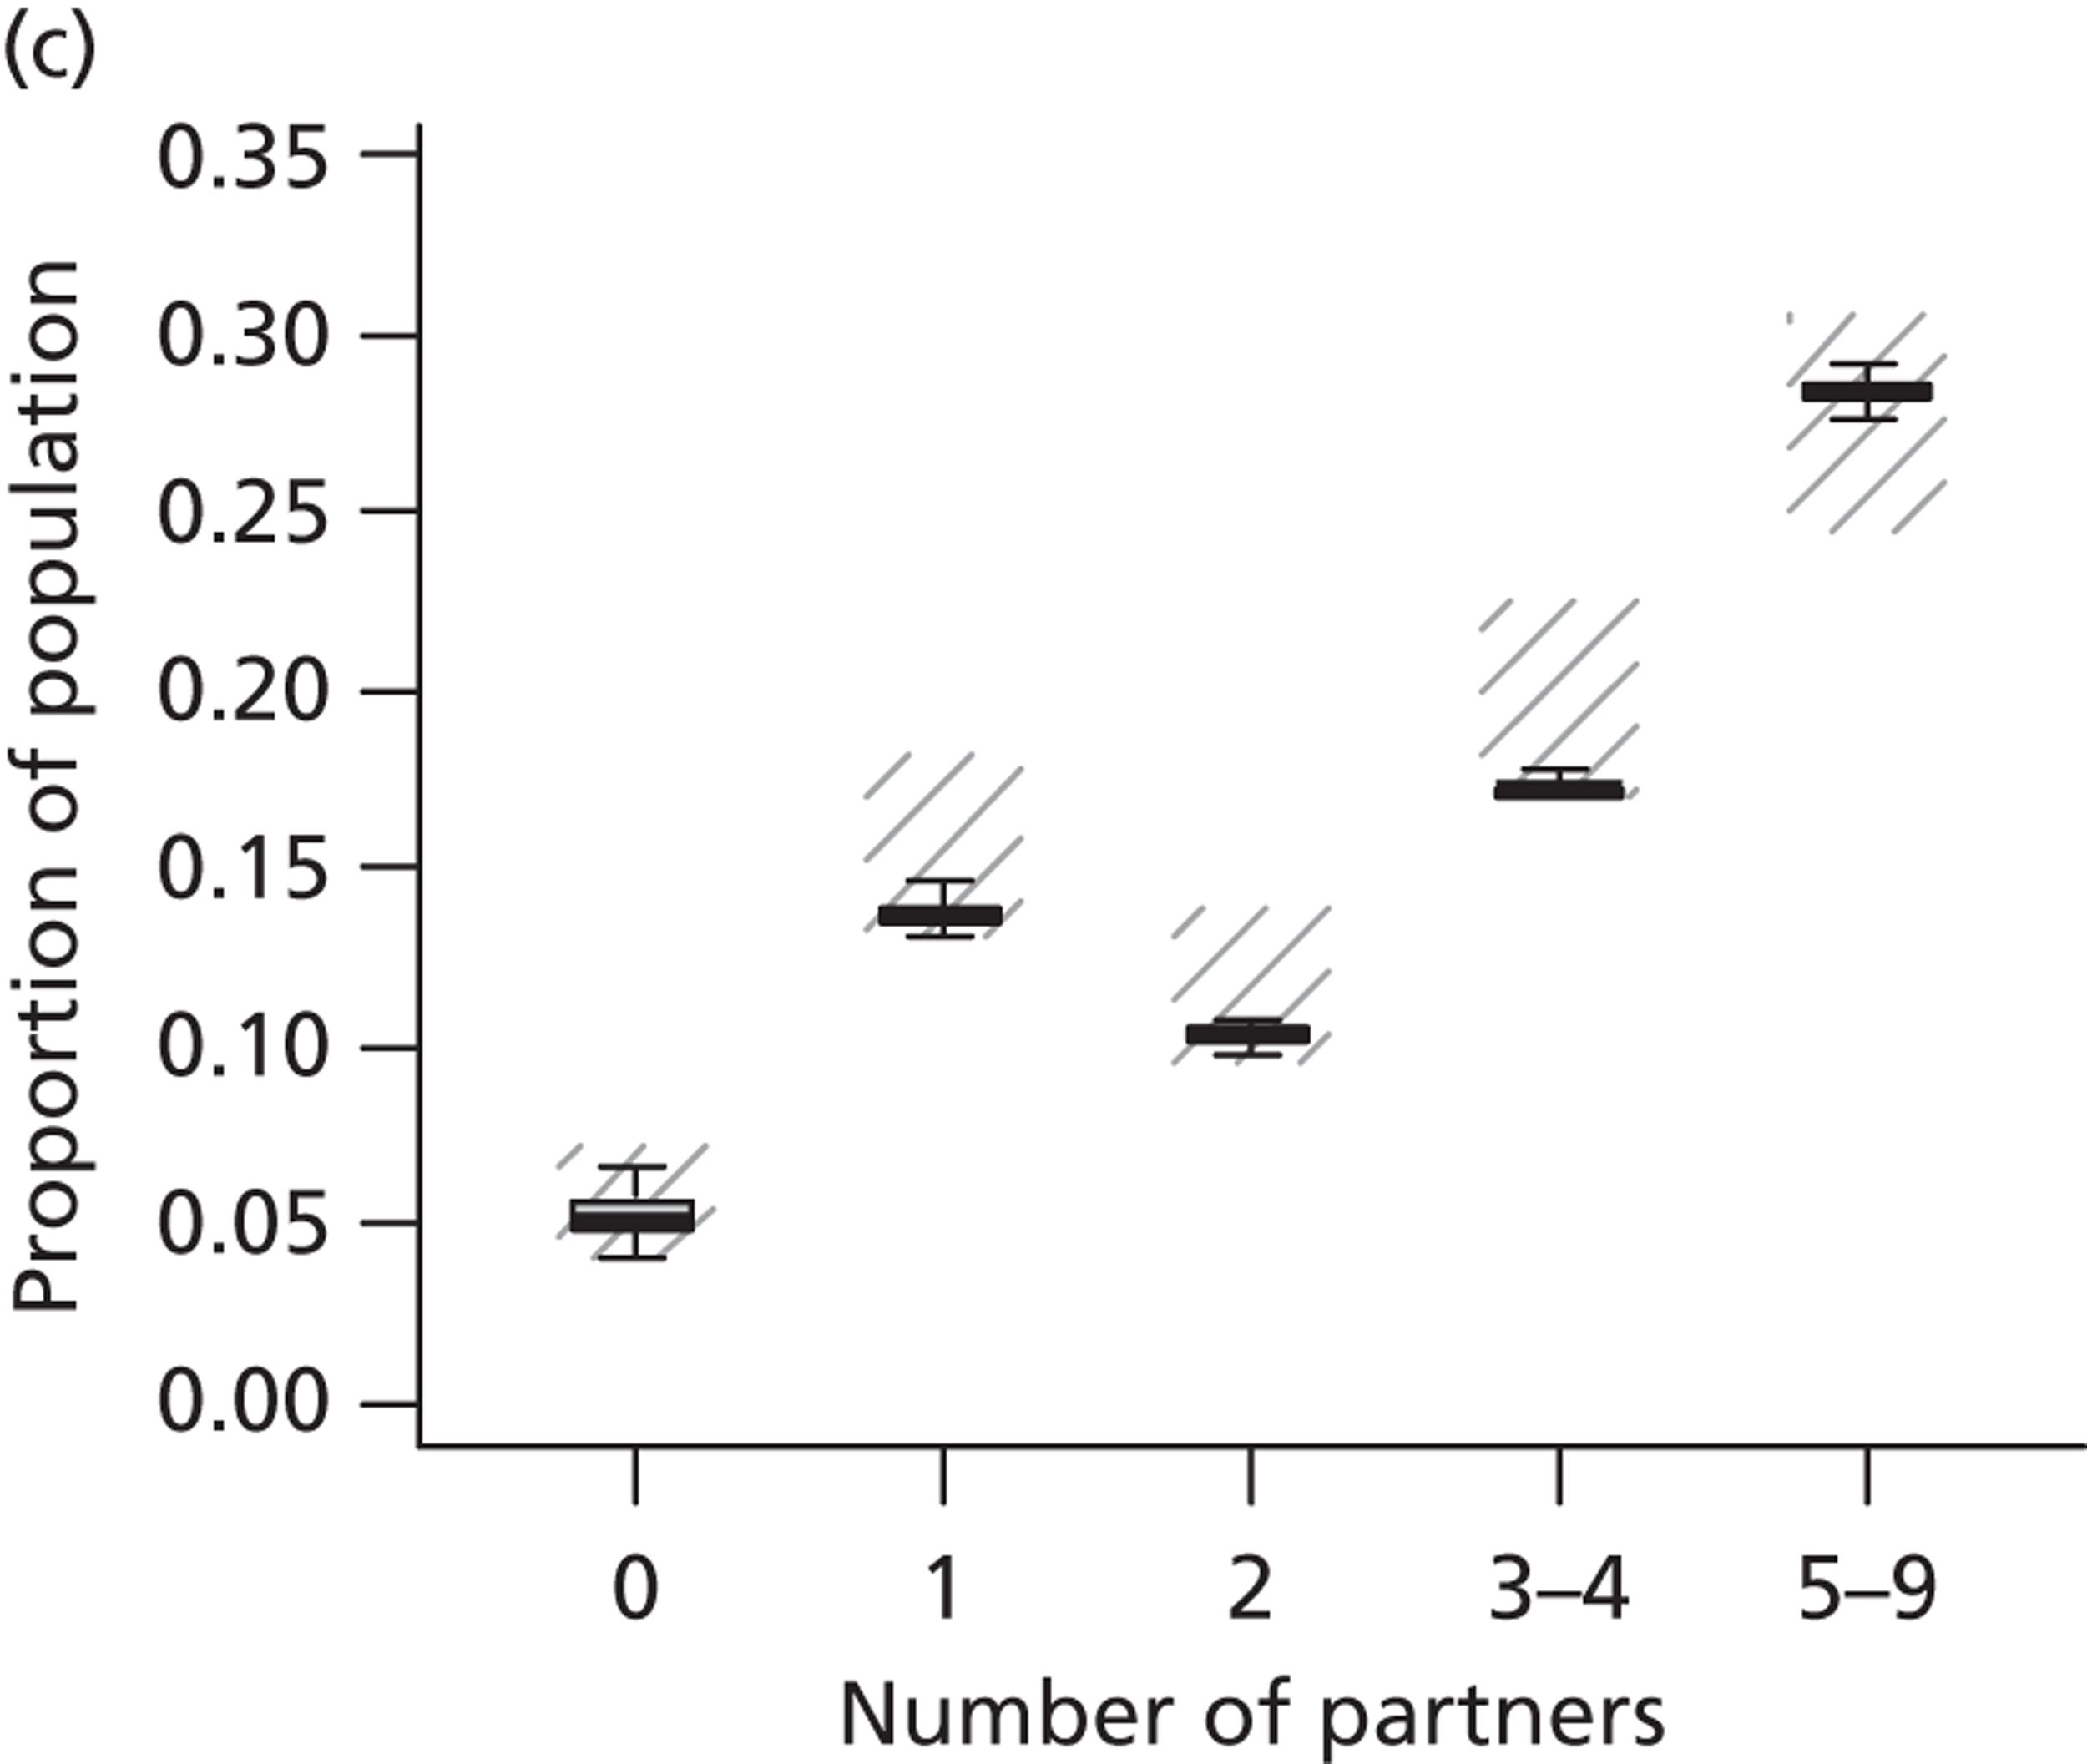
FIGURE 50.
The proportion of males who have 0, 1, 2, 3–4 or 5–9 new sexual partners in the last 12 months for each age group. (a) Aged 16–17 years; (b) aged 18–19 years; and (c) aged 20–24 years.
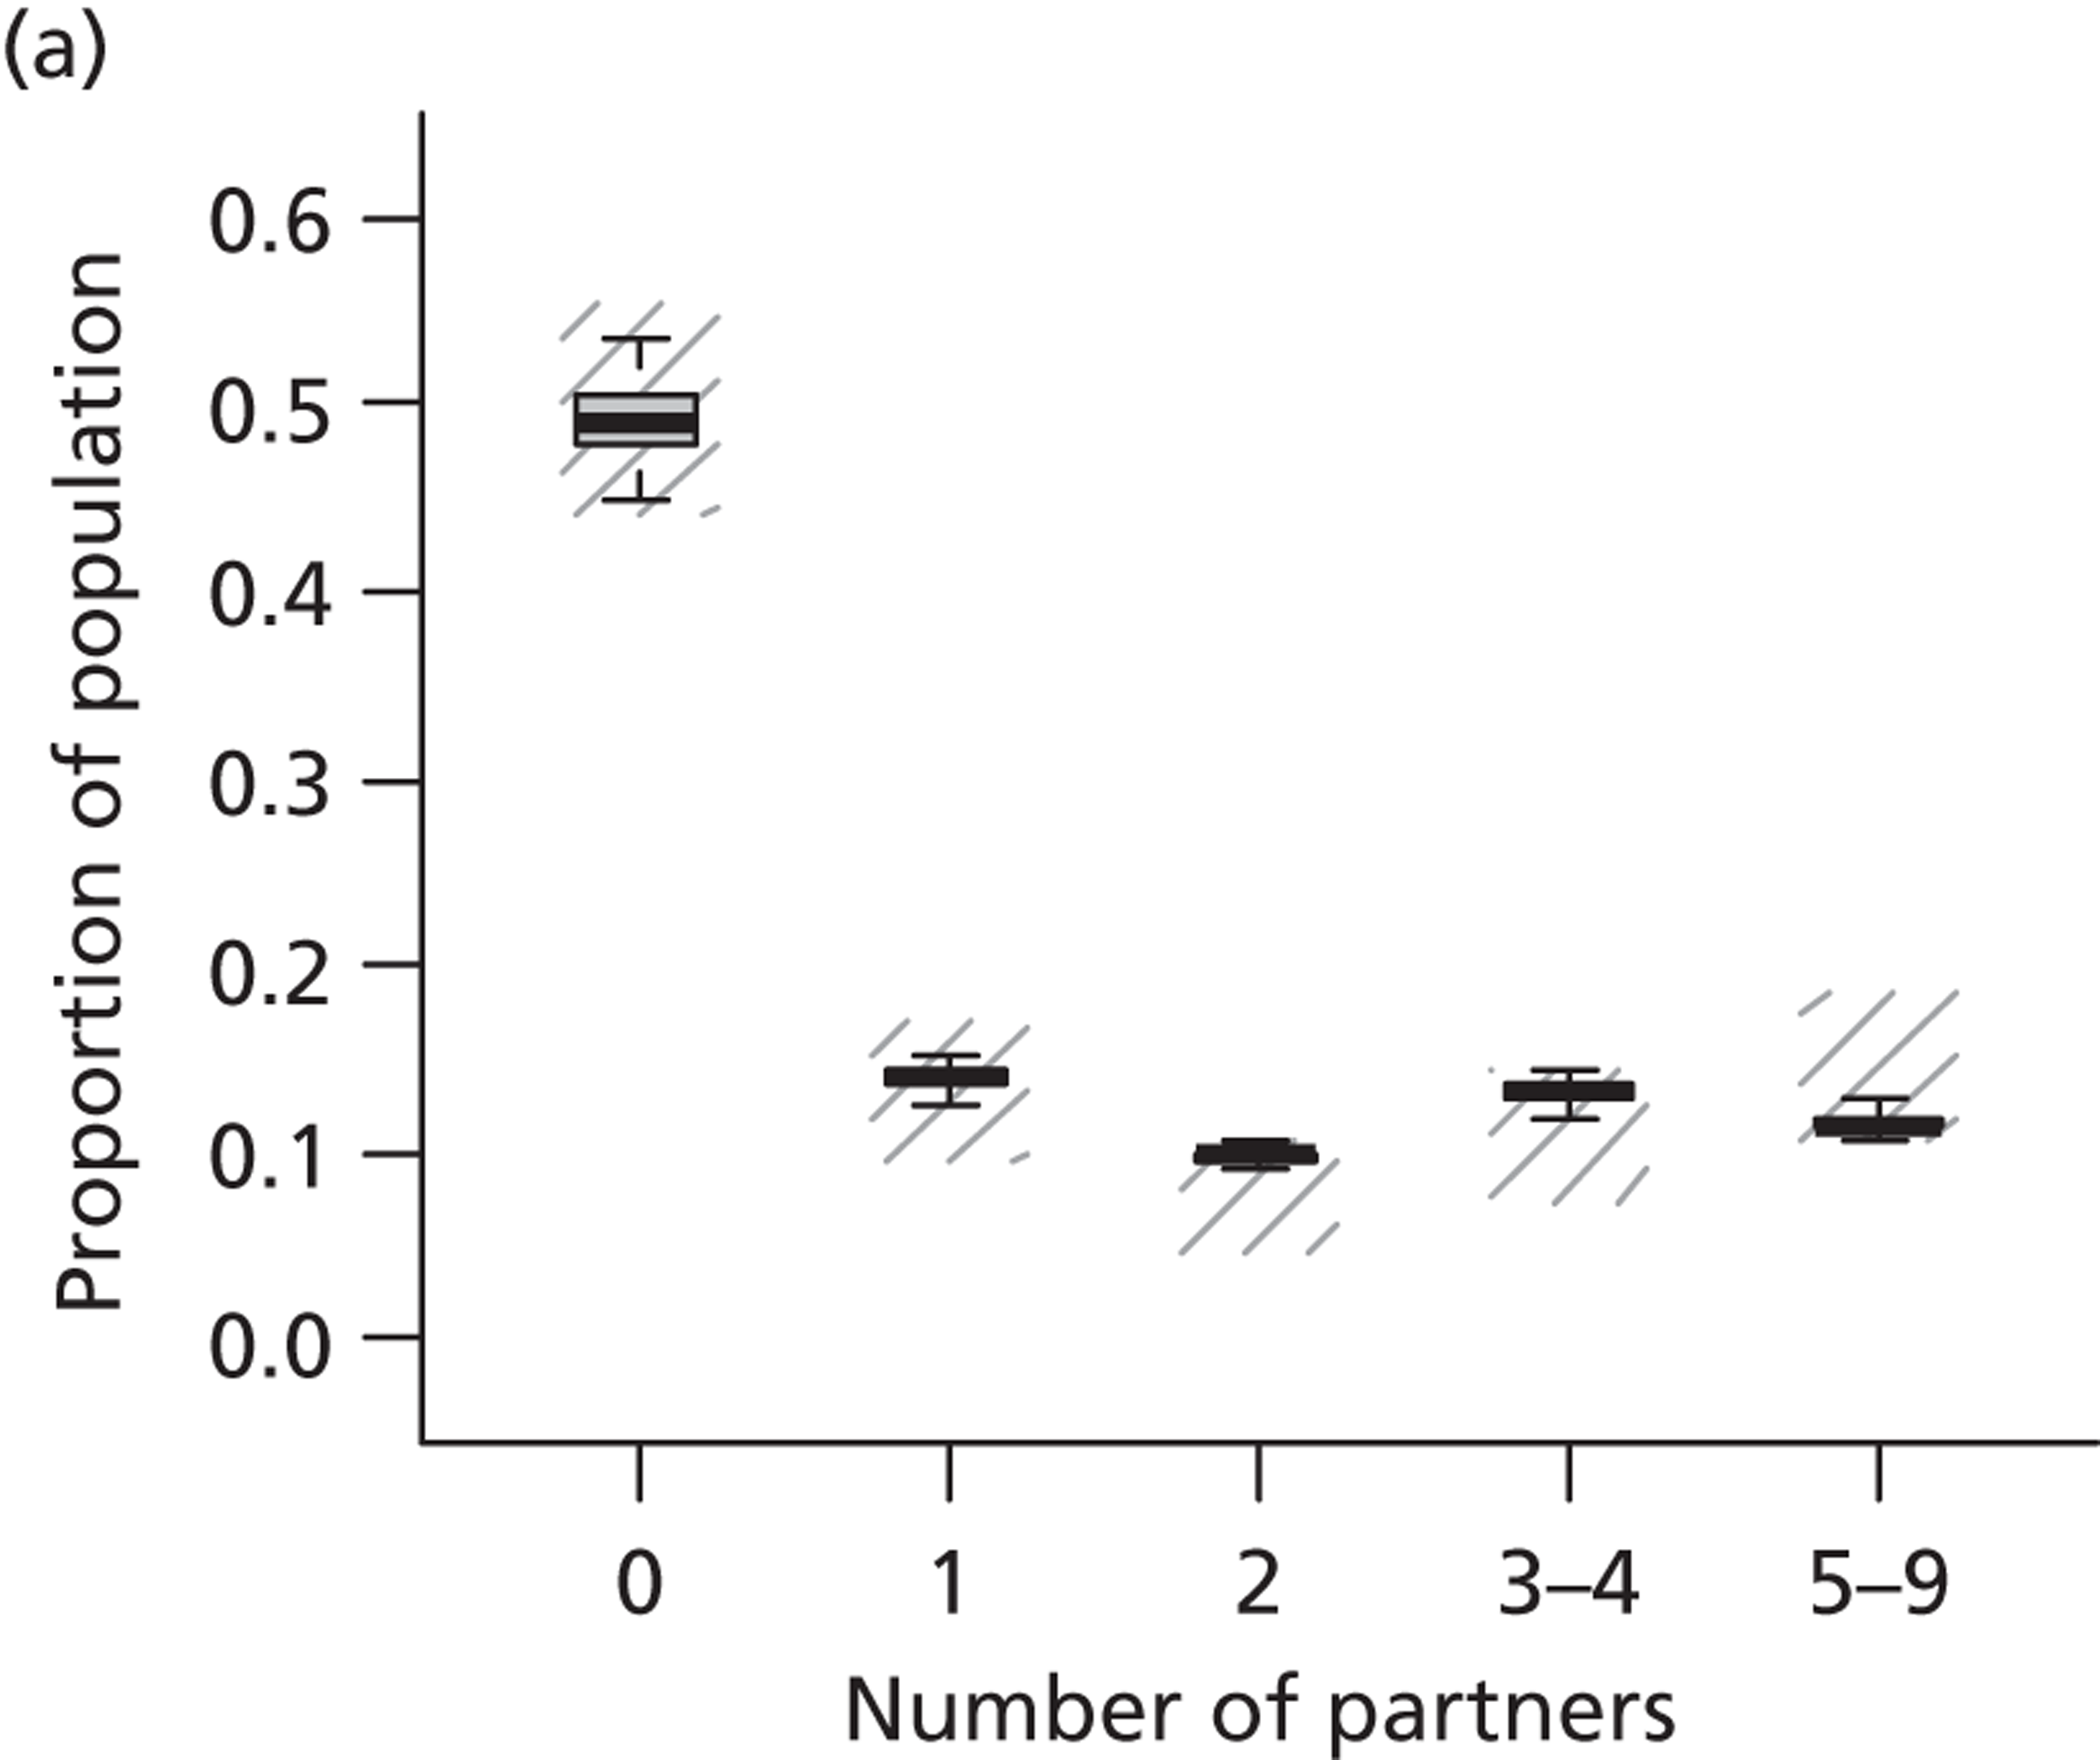
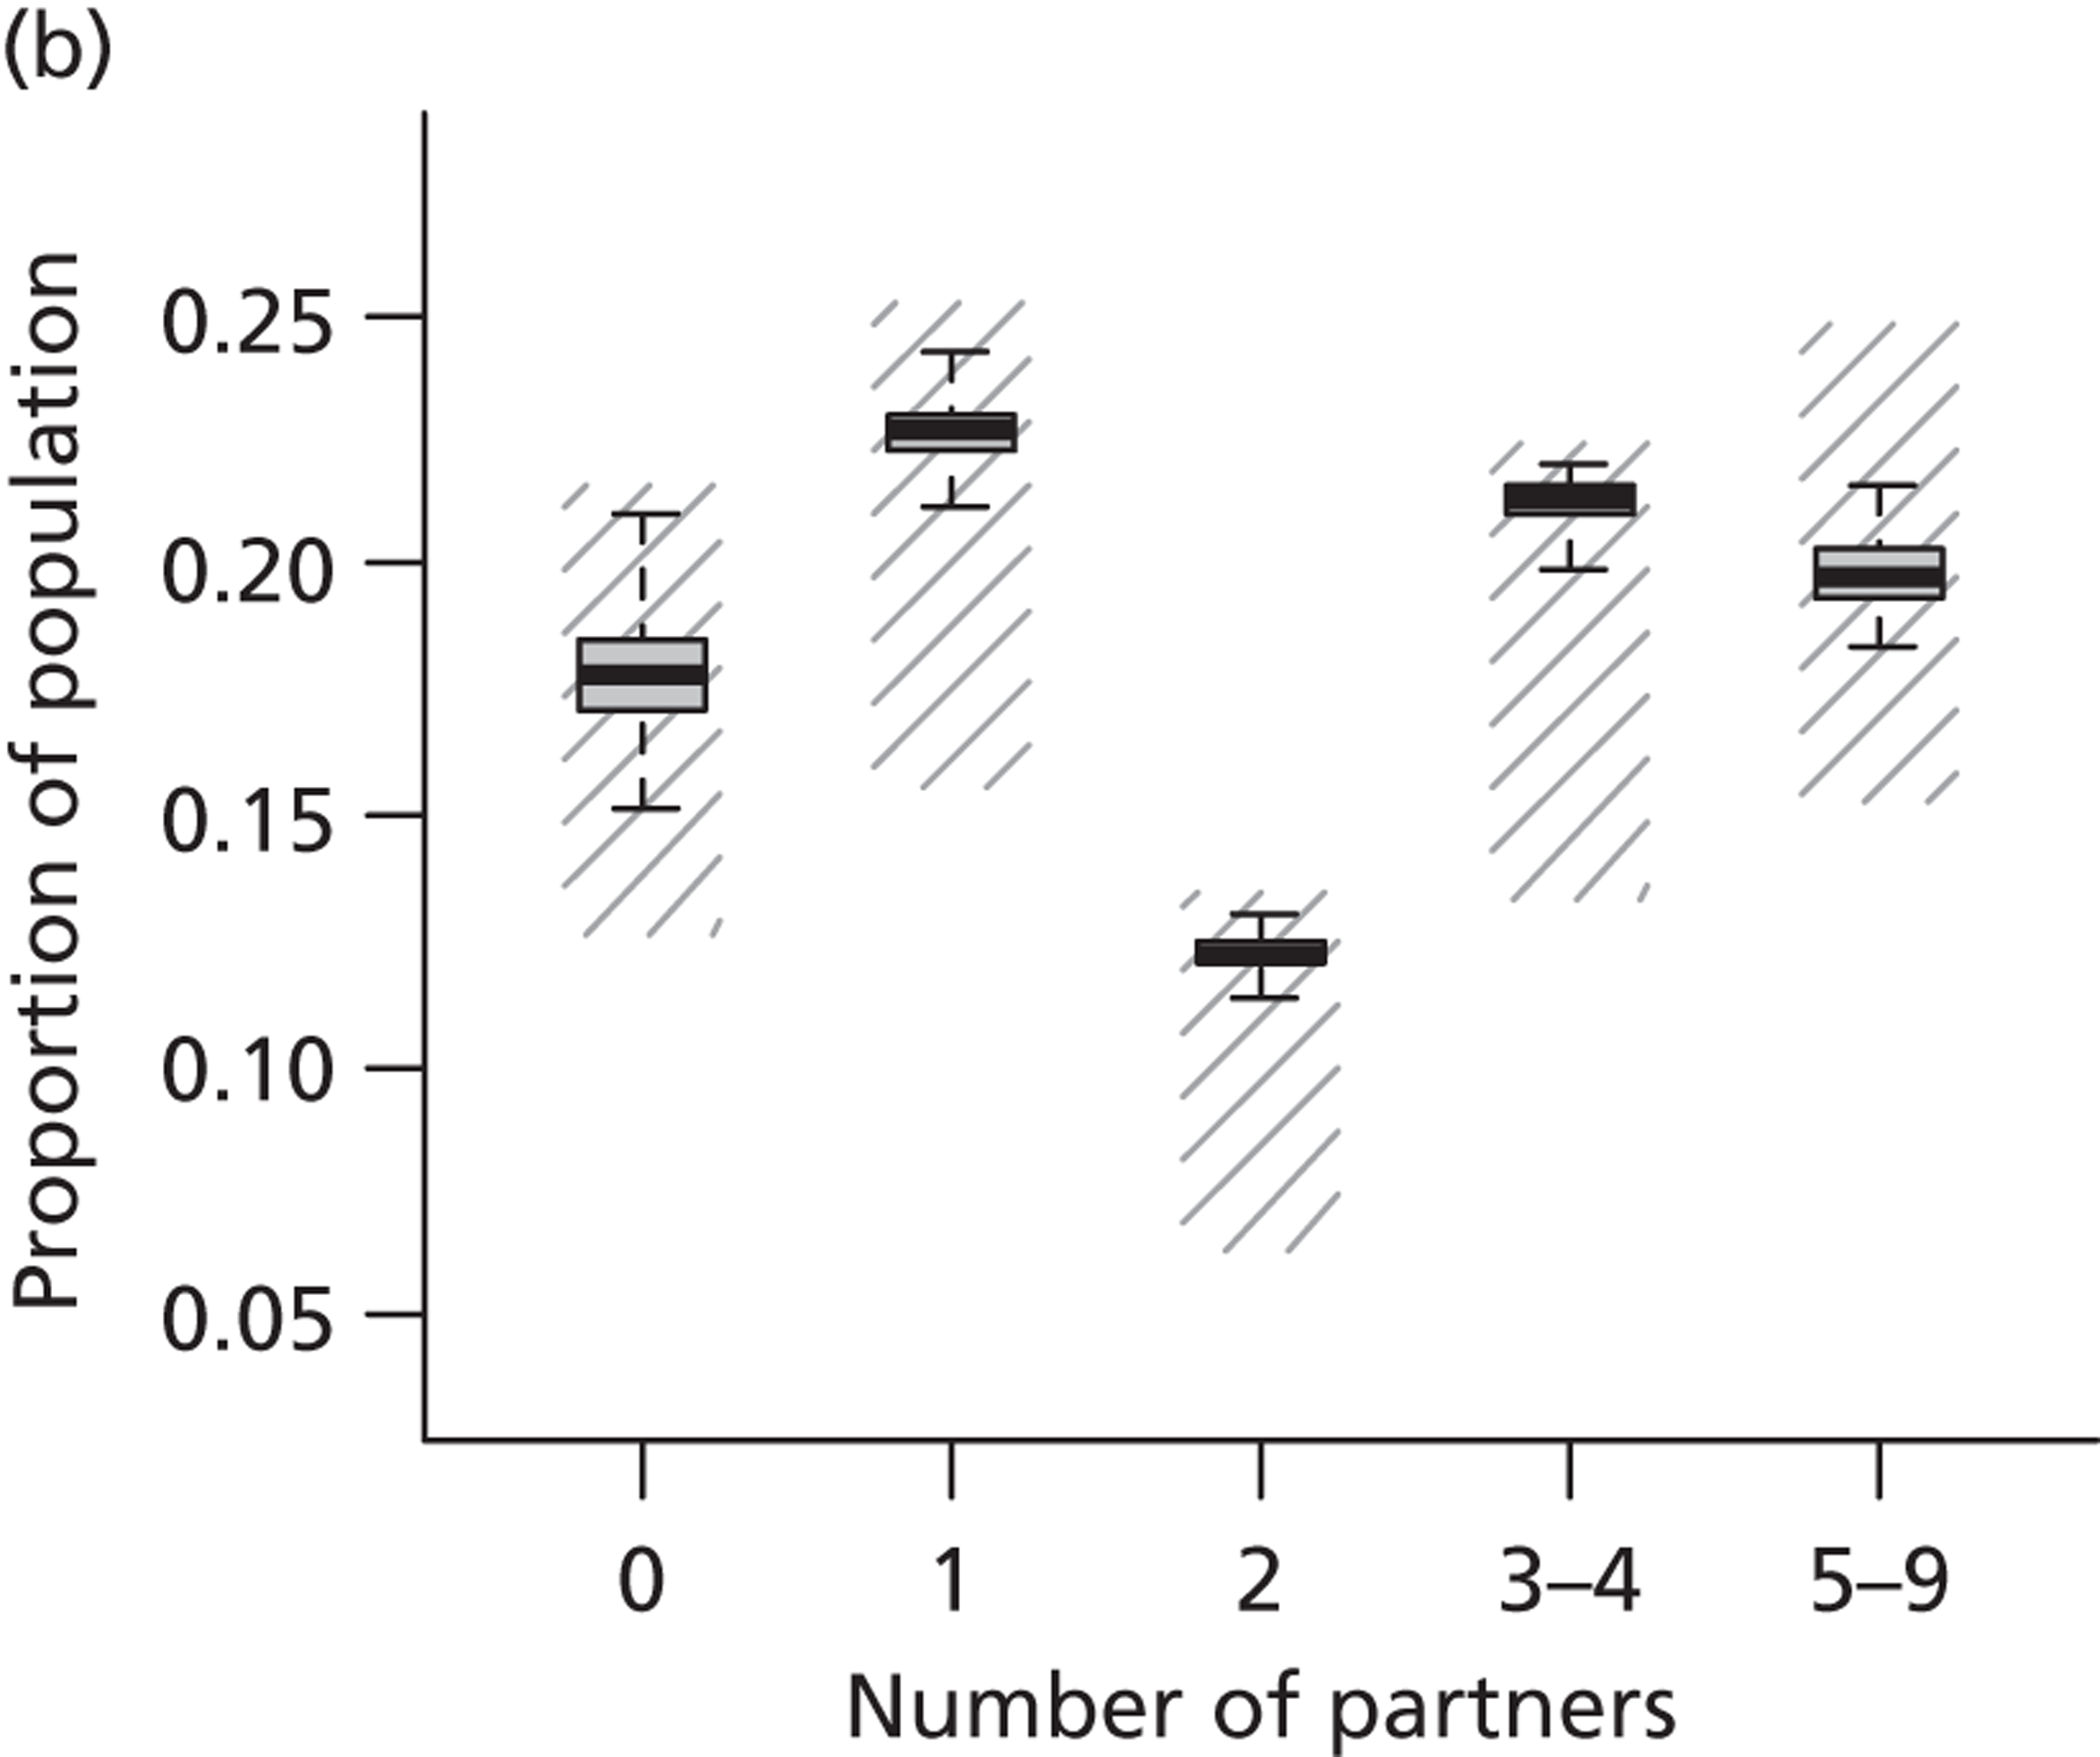
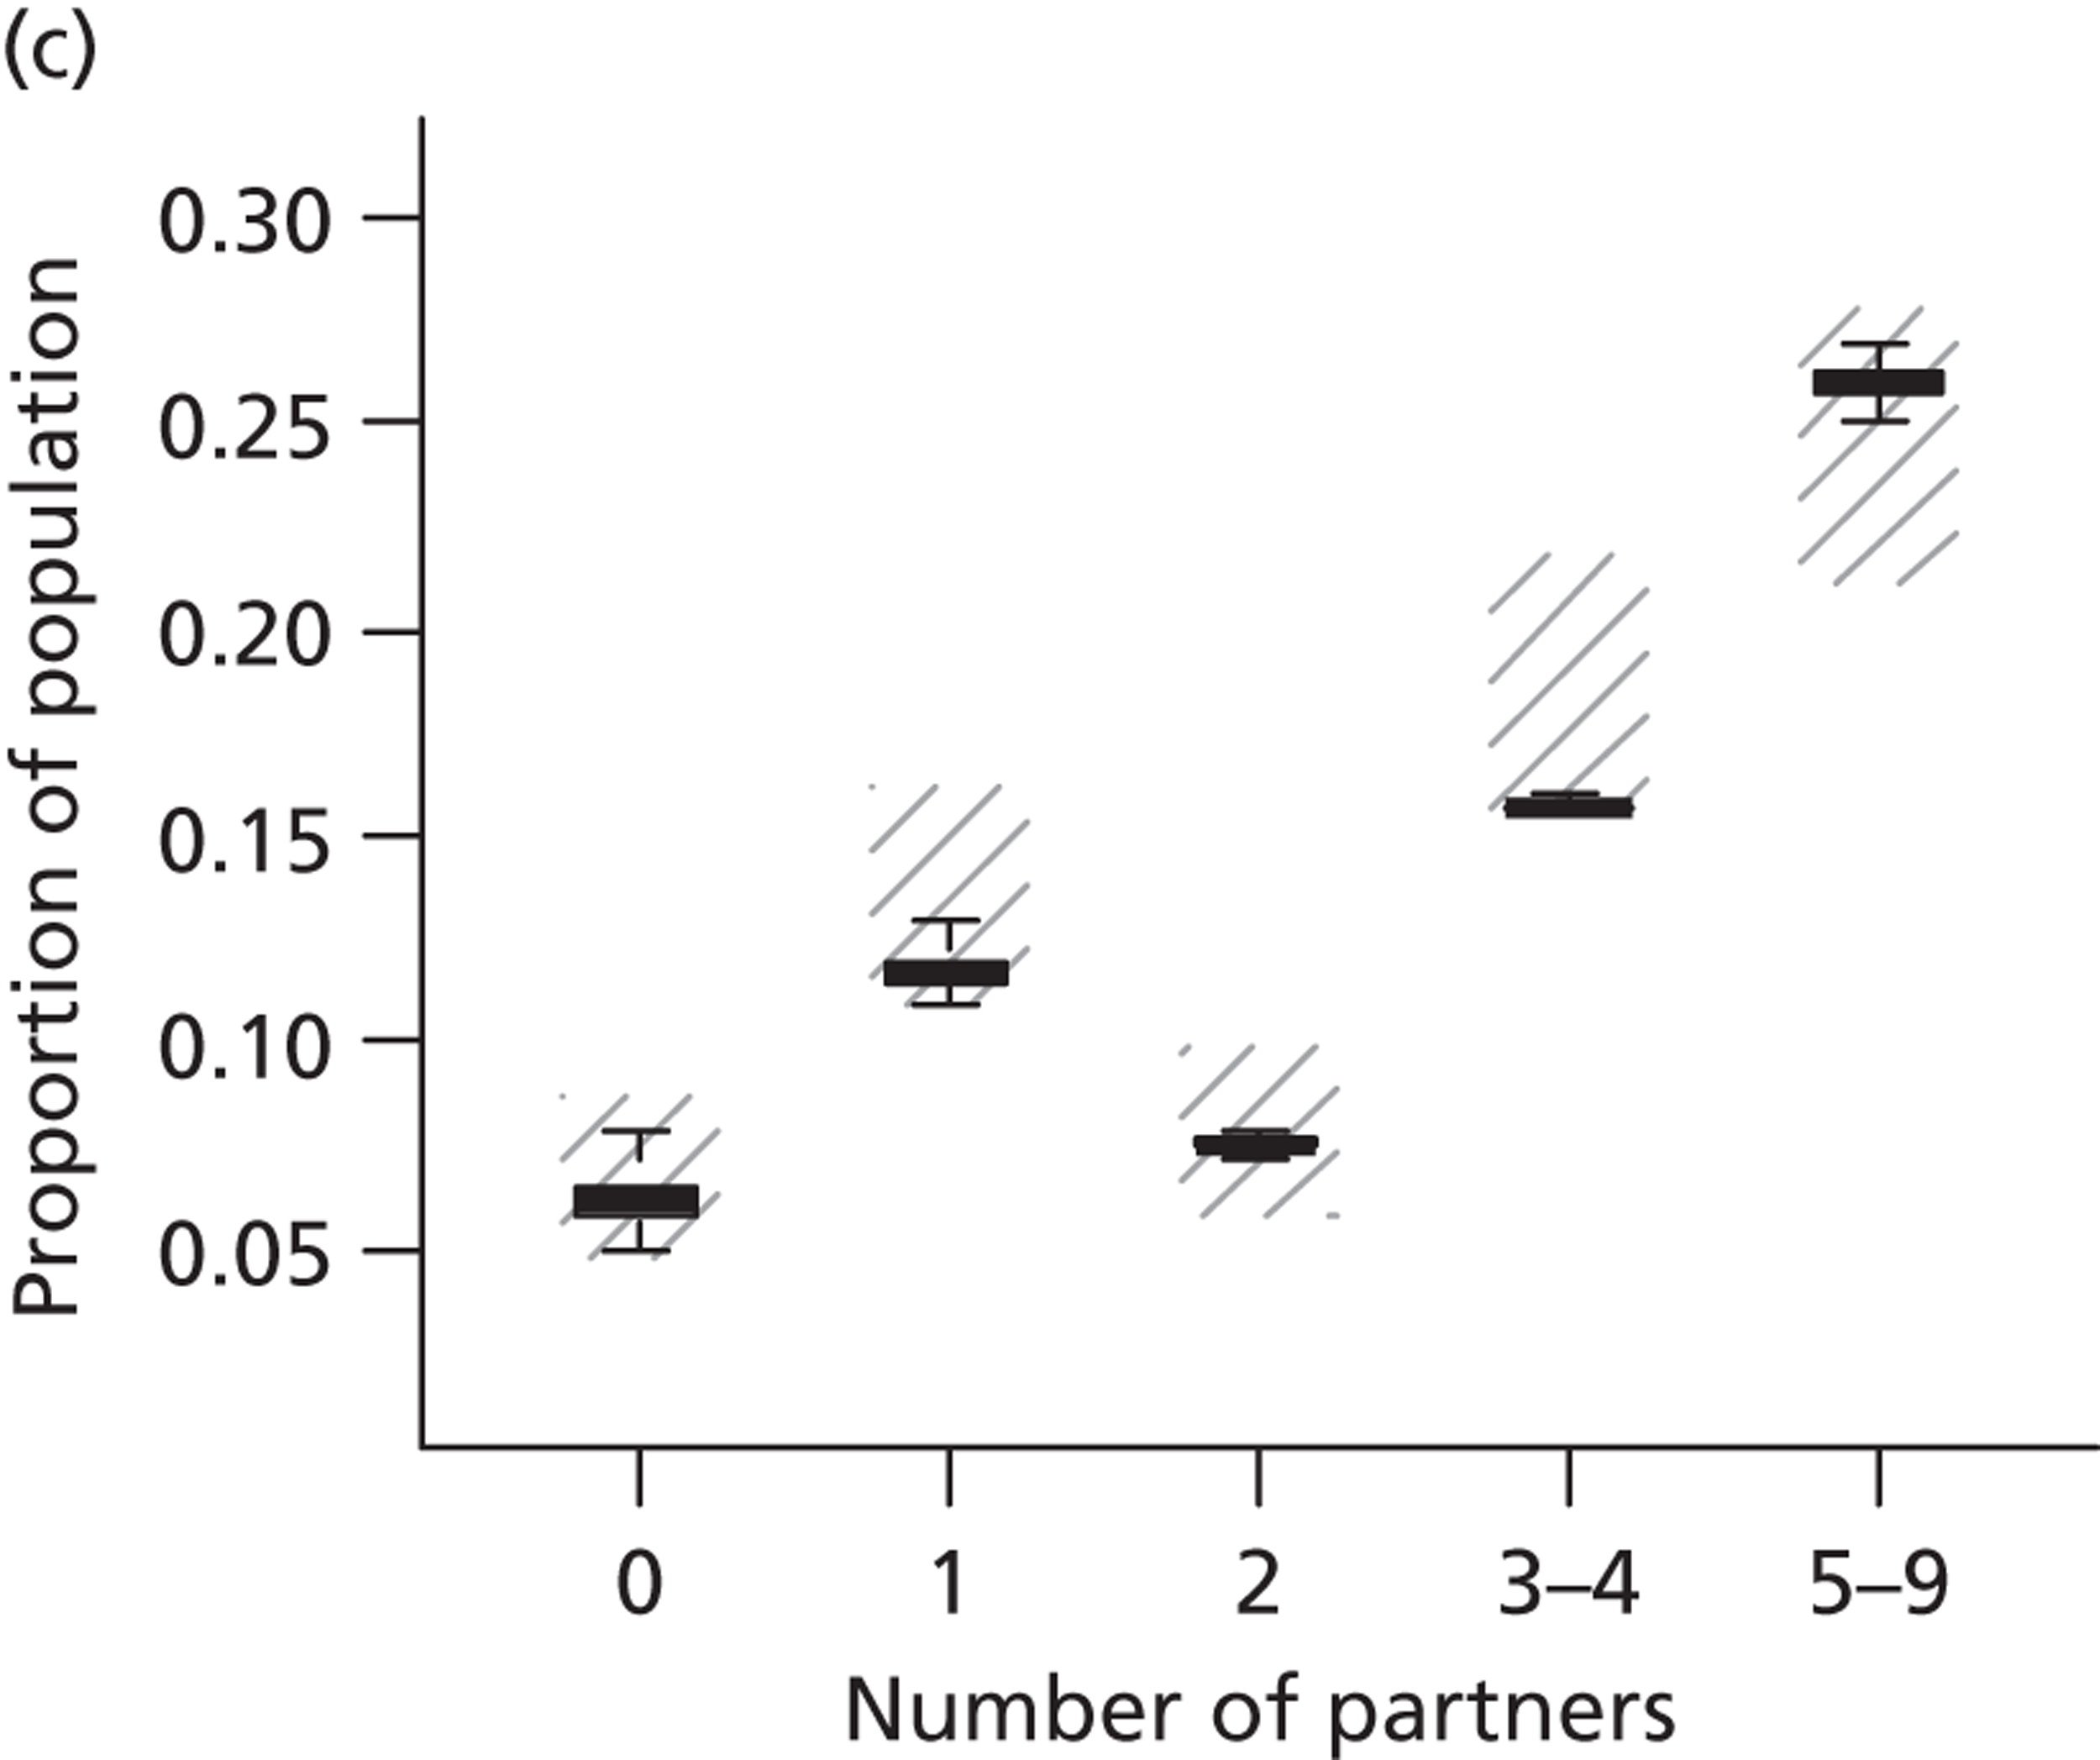
Appendix 17 Sensitivity analysis
The large number of primary HPV screening strategies, including the variants, provides a form of sensitivity analysis for our analysis, as many possible screening and triage options are considered. Additional sensitivity analysis reported here allowed us to determine which parameters are influential in our model.
The input parameters for our model were carefully determined from data on screening attendance rates, and screening management has been determined carefully using national guidelines on screening and colposcopy management in England. Extensive validation of the model has also been performed against England-wide data on cancer rates, HPV prevalence and numbers of screening tests. In addition to these careful choices of model input parameters and model structure, we also perform an extensive sensitivity analysis in this section. In sensitivity analyses, we investigate how varying some parameters in the model changes outputs on costs and effectiveness as predicted by the model. We performed sensitivity analysis on strategies one and two, as well as these strategies with the variants of 12-monthly follow-up intervals and 5-yearly screening for both unvaccinated and vaccinated cohorts. The results are presented in a tornado diagram, showing the relative change in incremental discounted cost of the strategy compared with current practice and also the relative change in the incremental discounted life-years of the strategy compared with current practice under each of the sensitivity analysis assumptions.
One-way sensitivity in unvaccinated cohorts
The tornado diagrams for unvaccinated cohorts are shown in Figures 51 and 52. The tornado diagrams shown in these figures indicate that for each strategy considered, the most influential changes on cost and life-years were changes to cytology and HPV test characteristics, and changes in compliance rates with colposcopy and follow-up rates. Both cost and life-years were most sensitive to changes in the cytology and HPV test characteristics. These results indicate that if cytology testing is substantially more sensitive than assumed in the base case, and/or if HPV testing is substantially less sensitive, then current practice can be more effective than strategies 1 and 2 for the variants considered in this sensitivity analysis. Under these conditions, the primary HPV screening strategies are also less costly than current practice.
FIGURE 51.
Strategy 1: Relative difference in the cost of the strategy compared with current practice for each of the sensitivity analysis assumptions are shown on the left-hand side as the black bars. Relative differences in the life-years are shown on the right hand side as the green bars. a, ‘Worst-case scenario’ (with respect to HPV testing) assumed that cytology had higher sensitivity to CIN2+ (79%) while HPV test has a lower CIN2+ sensitivity (94.2%). The best-case scenario assumed cytology had a lower CIN2+ sensitivity rate (53%) while HPV testing has a higher CIN2+ sensitivity rate (97.4%). b, No further follow-up for women not complying to colposcopy and follow-up referral would result in an increase in the incremental cost but a decrease in incremental life-years saved.
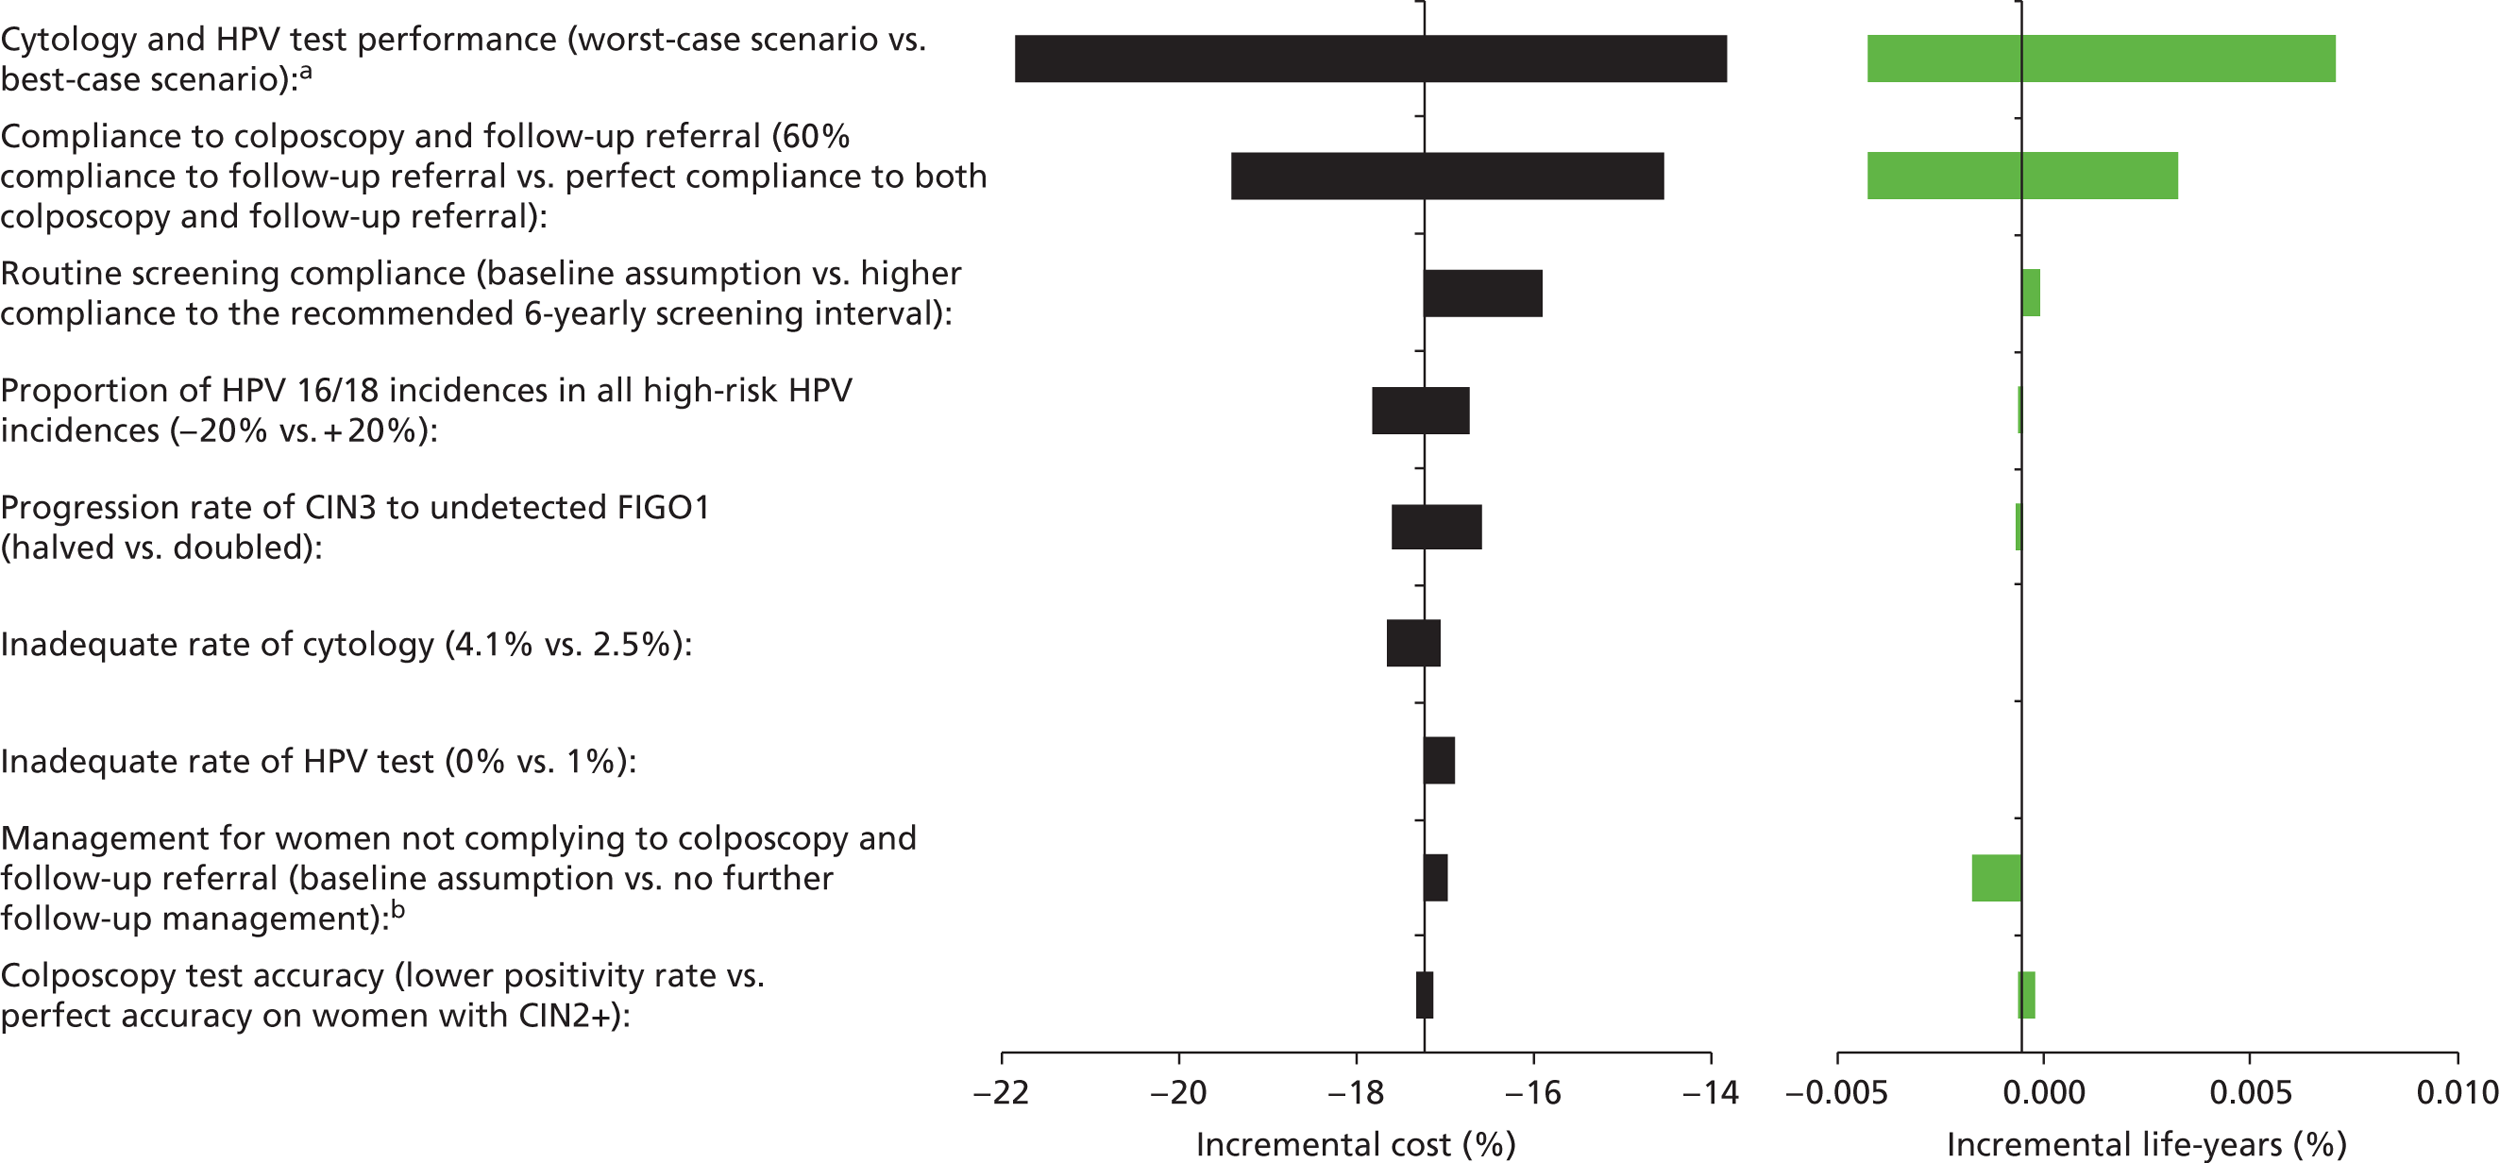
FIGURE 52.
Strategy 1, 12-monthly follow-up: Relative difference in the cost of the strategy compared with current practice for each of the sensitivity analysis assumptions are shown on the left-hand side as the black bars. Relative differences in the life-years are shown on the right-hand side as the green bars. a, ‘Worst-case scenario’ (with respect to HPV testing) assumed that cytology had higher sensitivity to CIN2+ (79%) while HPV test has a lower CIN2+ sensitivity (94.2%). The best-case scenario assumed cytology had a lower CIN2+ sensitivity rate (53%) while HPV testing has a higher CIN2+ sensitivity rate (97.4%). b, Doubling the progression rate from CIN3 to undetected FIGO1 resulted a decrease in the incremental cost but an increase in the incremental life-years saved. Halving the progression rate resulted in a decrease in both incremental cost and incremental life-years saved.
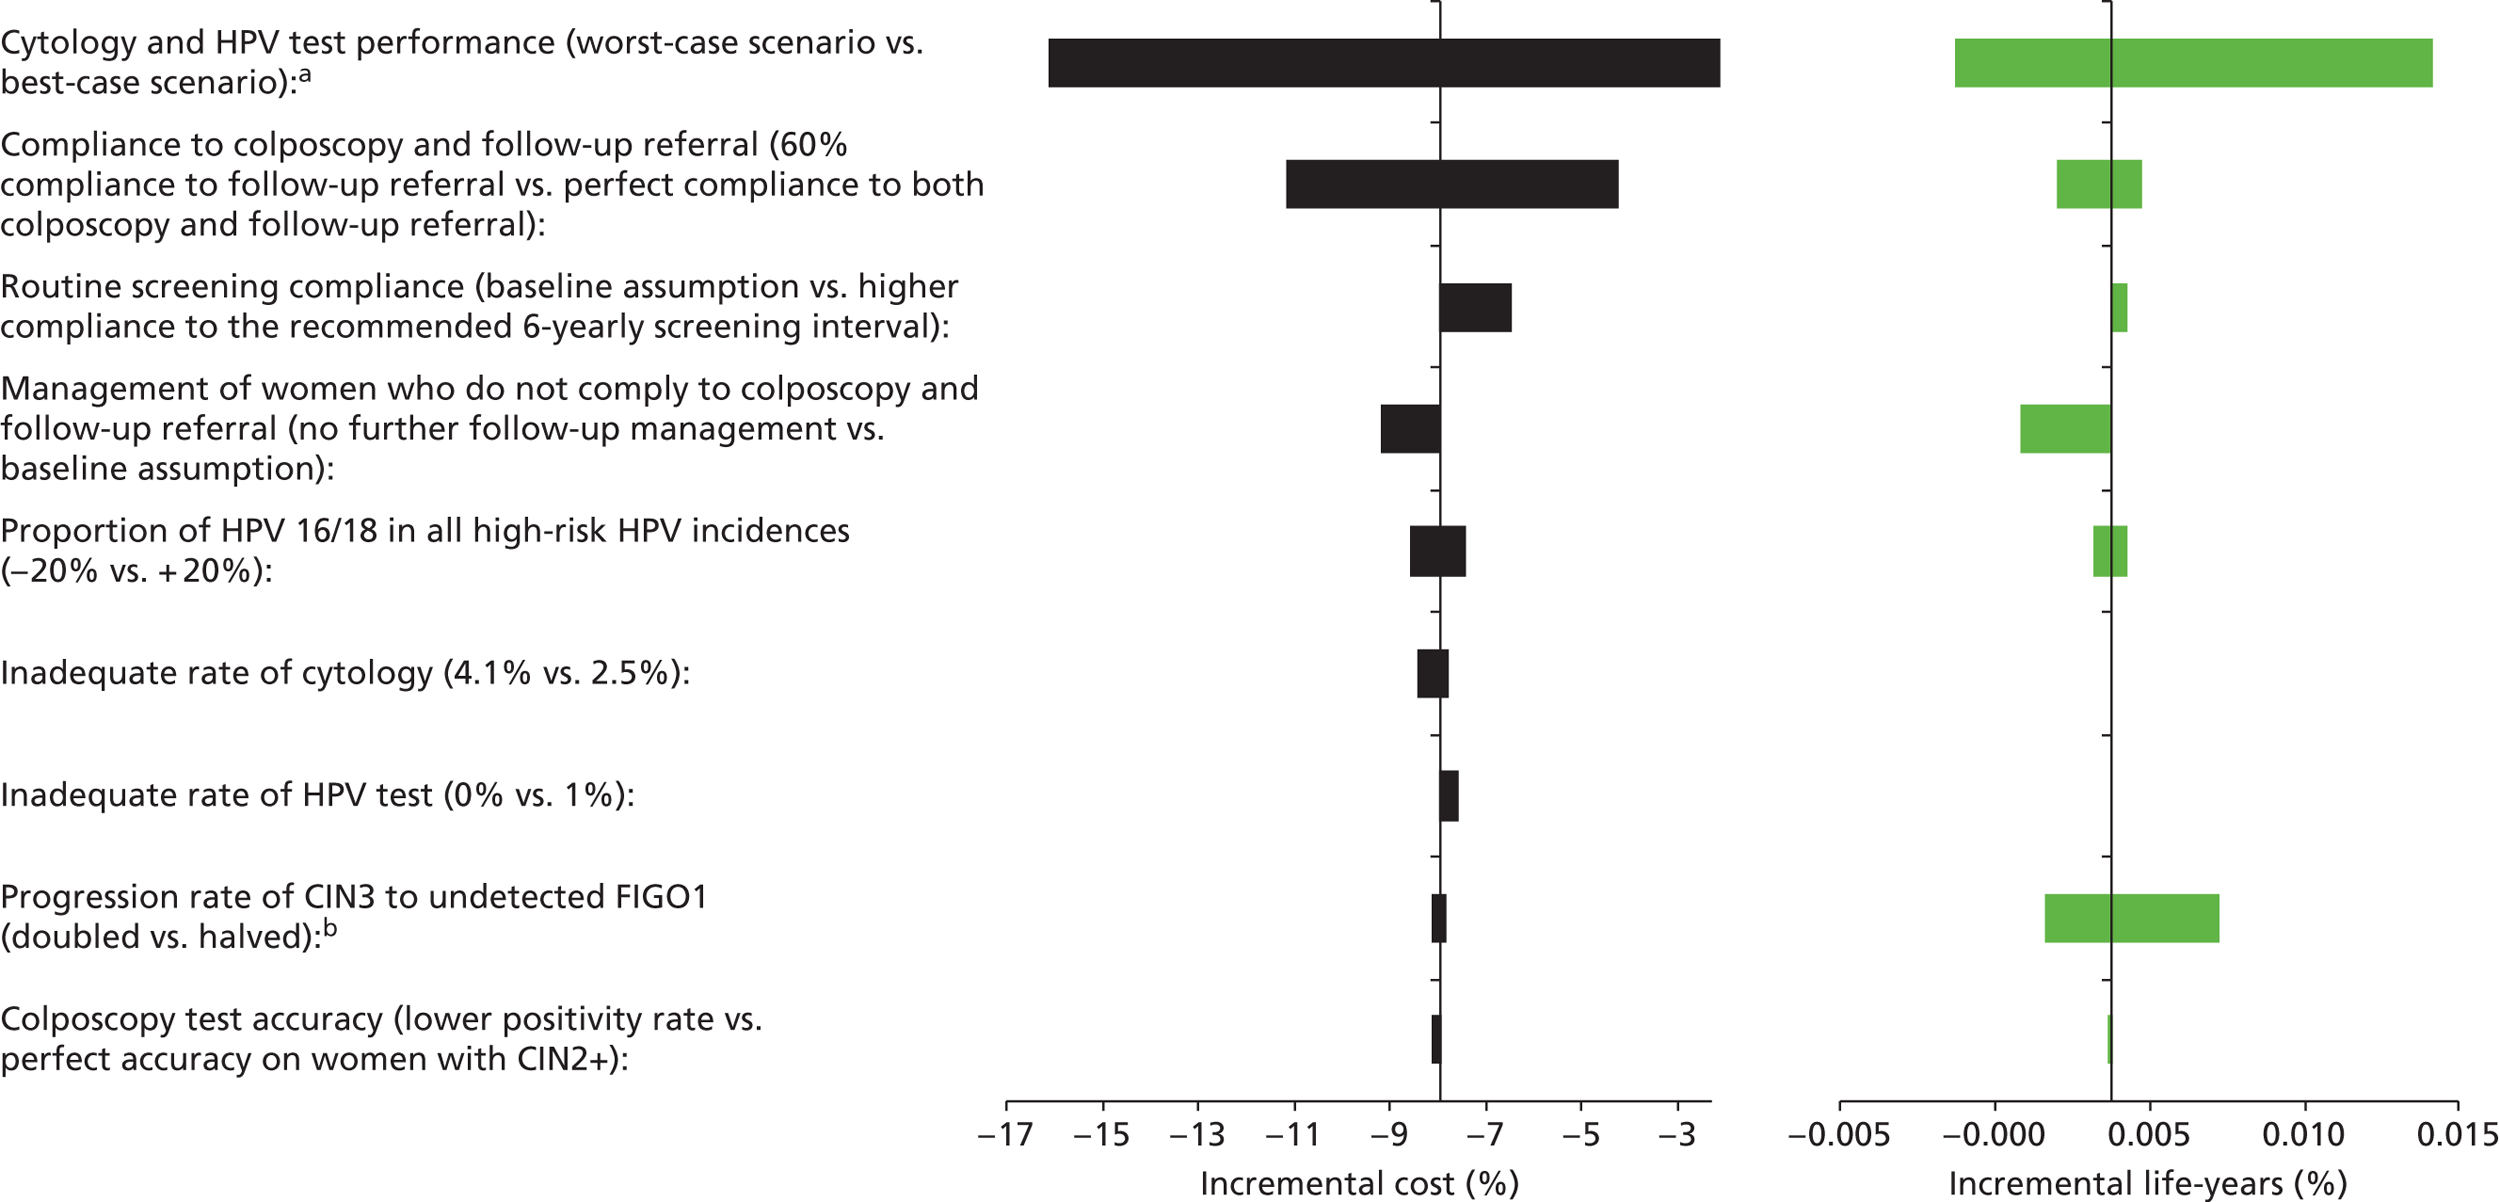
Compliance with colposcopy follow-up also significantly changes the cost and effectiveness of each of the primary HPV screening strategies when compared with current practice. As expected, higher rates of compliance with colposcopy and follow-up improve the effectiveness of primary HPV screening strategies when compared with current practice management. Higher compliance rates also increase the cost of primary HPV screening strategies when compared with current practice.
Increasing the rate at which women in routine screening return for their next 5- or 6-yearly screen increases the costs to some extent; however, it has a smaller effect on the life-years saved when compared with current practice across all strategies considered (current practice did not change the screening rates for routine screeners in this comparison).
Managing women who do not comply with colposcopy referral, or follow-up less aggressively, results in a decrease in effectiveness of HPV screening strategies when compared with current practice in some of the strategies considered. Increasing the rate of progression of CIN3 to cancer had a significant effect on the predicted life-years in many strategies.
Increasing the rate of receiving an inadequate HPV test result increases the cost of primary HPV screening strategies by a small amount compared with current practice. Increasing the rate of an inadequate cytology test decreases the cost of primary HPV screening strategies when compared with current practice.
FIGURE 53.
Strategy 1, 5-yearly screening: Relative difference in the cost of the strategy compared with current practice for each of the sensitivity analysis assumptions are shown on the left-hand side as the black bars. Relative differences in the life-years are shown on the right-hand side as the green bars. a, ‘Worst-case scenario’ (with respect to HPV testing) assumed that cytology had higher sensitivity to CIN2+ (79%) while HPV test has a lower CIN2+ sensitivity (94.2%). The best-case scenario assumed cytology had a lower CIN2+ sensitivity rate (53%) while HPV testing has a higher CIN2+ sensitivity rate (97.4%). b, No further follow-up for women not complying to colposcopy and follow-up referral would result in an increase in the incremental cost but a decrease in the incremental life-years saved.
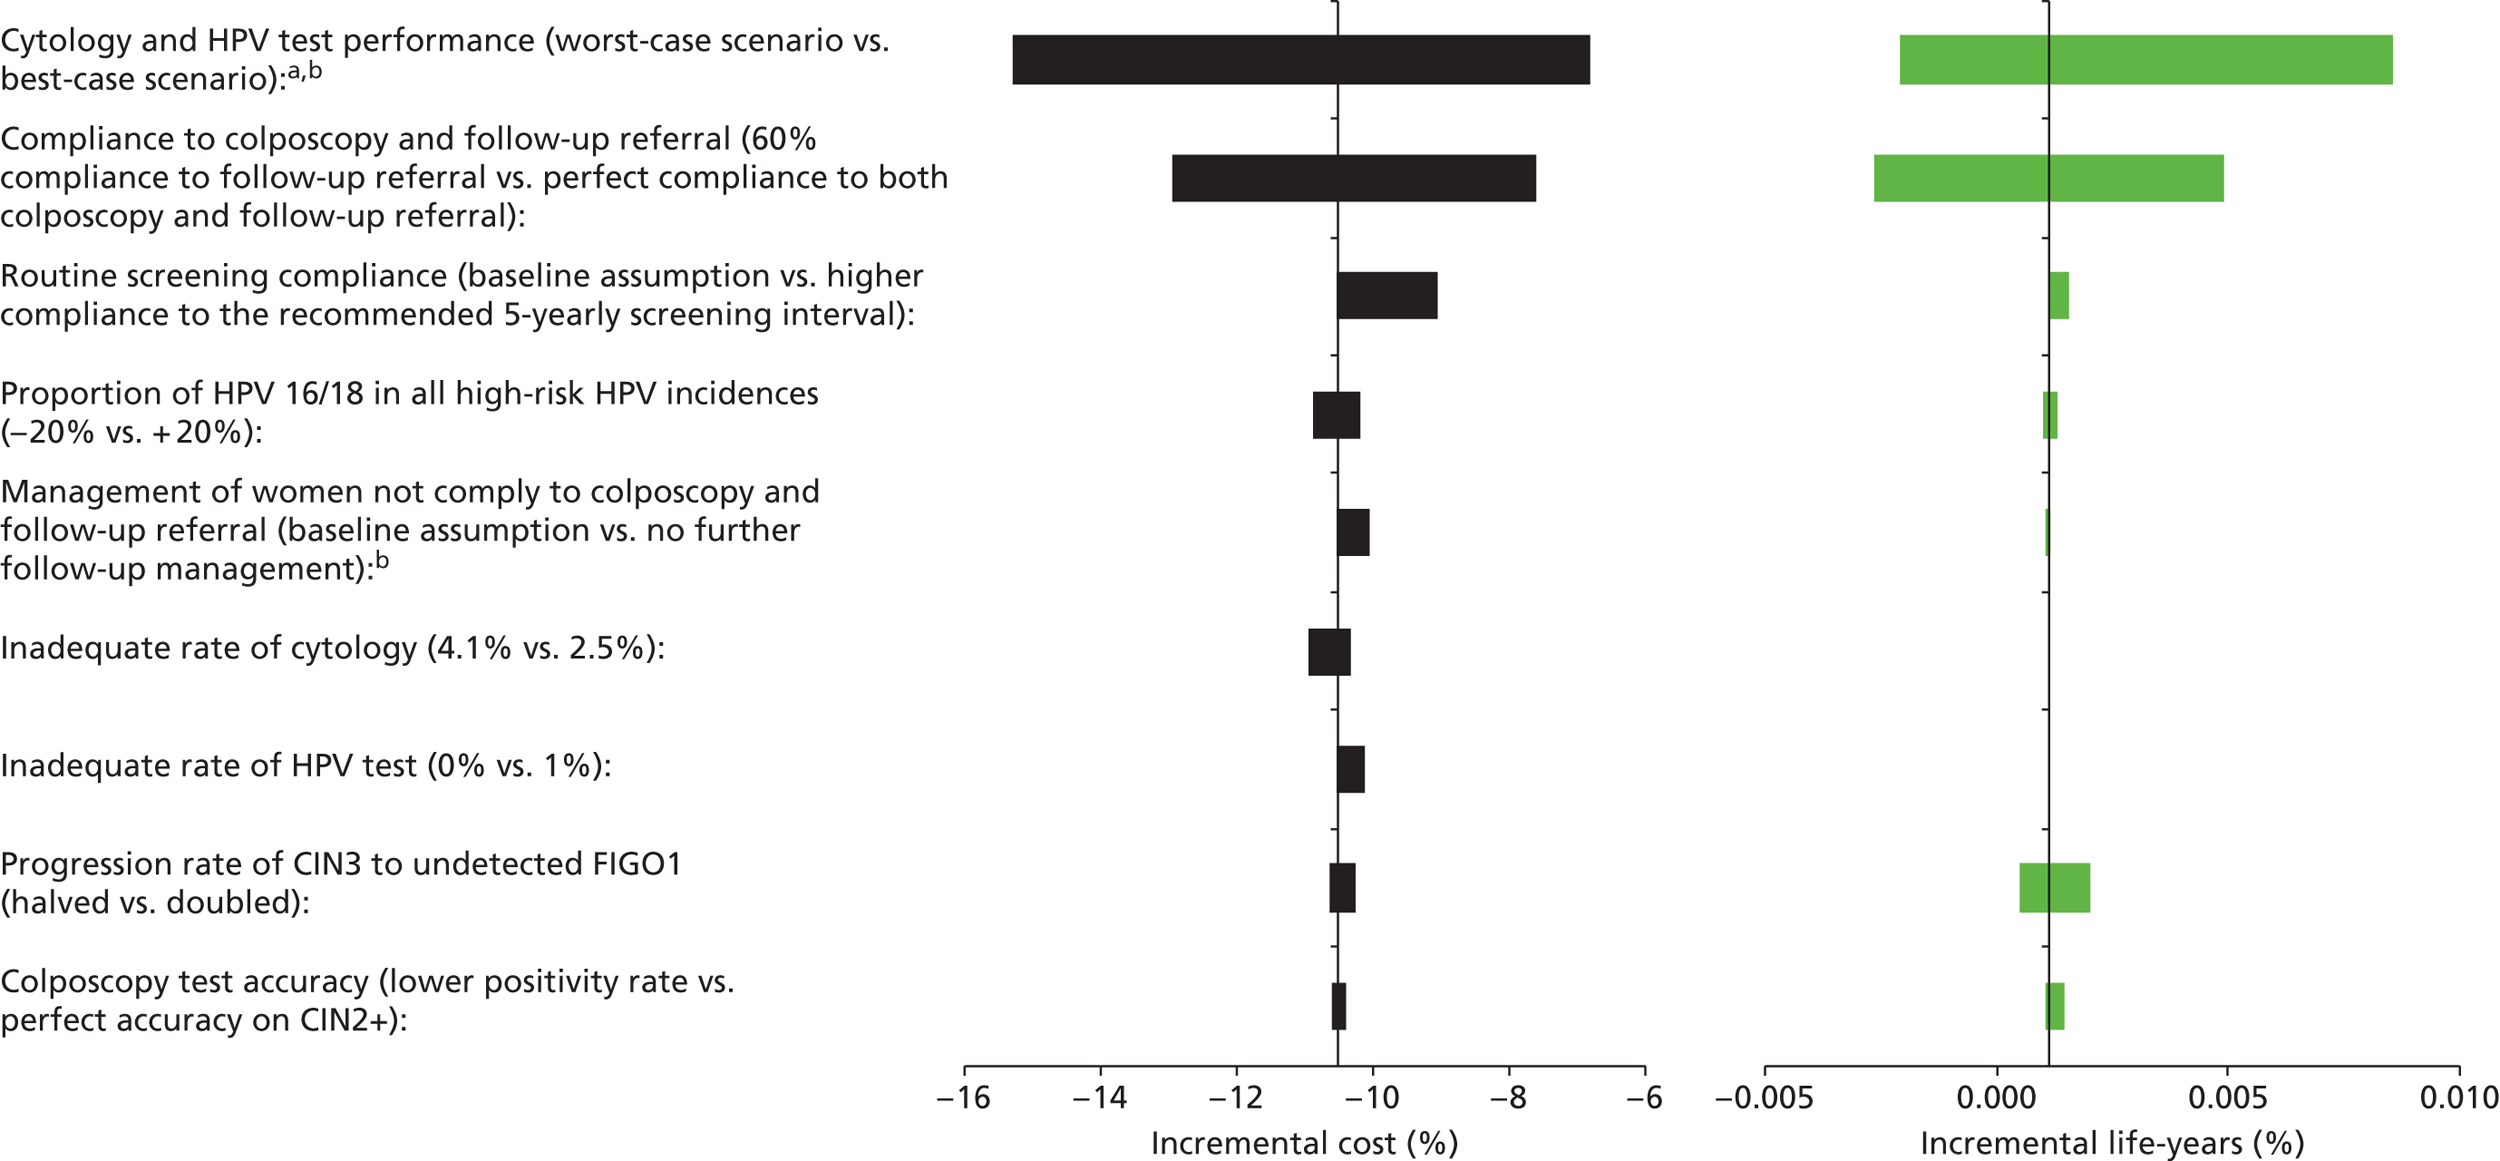
FIGURE 54.
Strategy 2: Relative difference in the cost of the strategy compared with current practice for each of the sensitivity analysis assumptions are shown on the left-hand side as the black bars. Relative differences in the life-years are shown on the right-hand side as the green bars. a, ‘Worst-case scenario’ (with respect to HPV testing) assumed that cytology had higher sensitivity to CIN2+ (79%) while HPV test has a lower CIN2+ sensitivity (94.2%). The best-case scenario assumed cytology had a lower CIN2+ sensitivity rate (53%) while HPV testing has a higher CIN2+ sensitivity rate (97.4%). b, No further follow-up for women not complying to colposcopy and follow-up referral would result in an increase in the incremental cost but a decrease in incremental life-years saved.
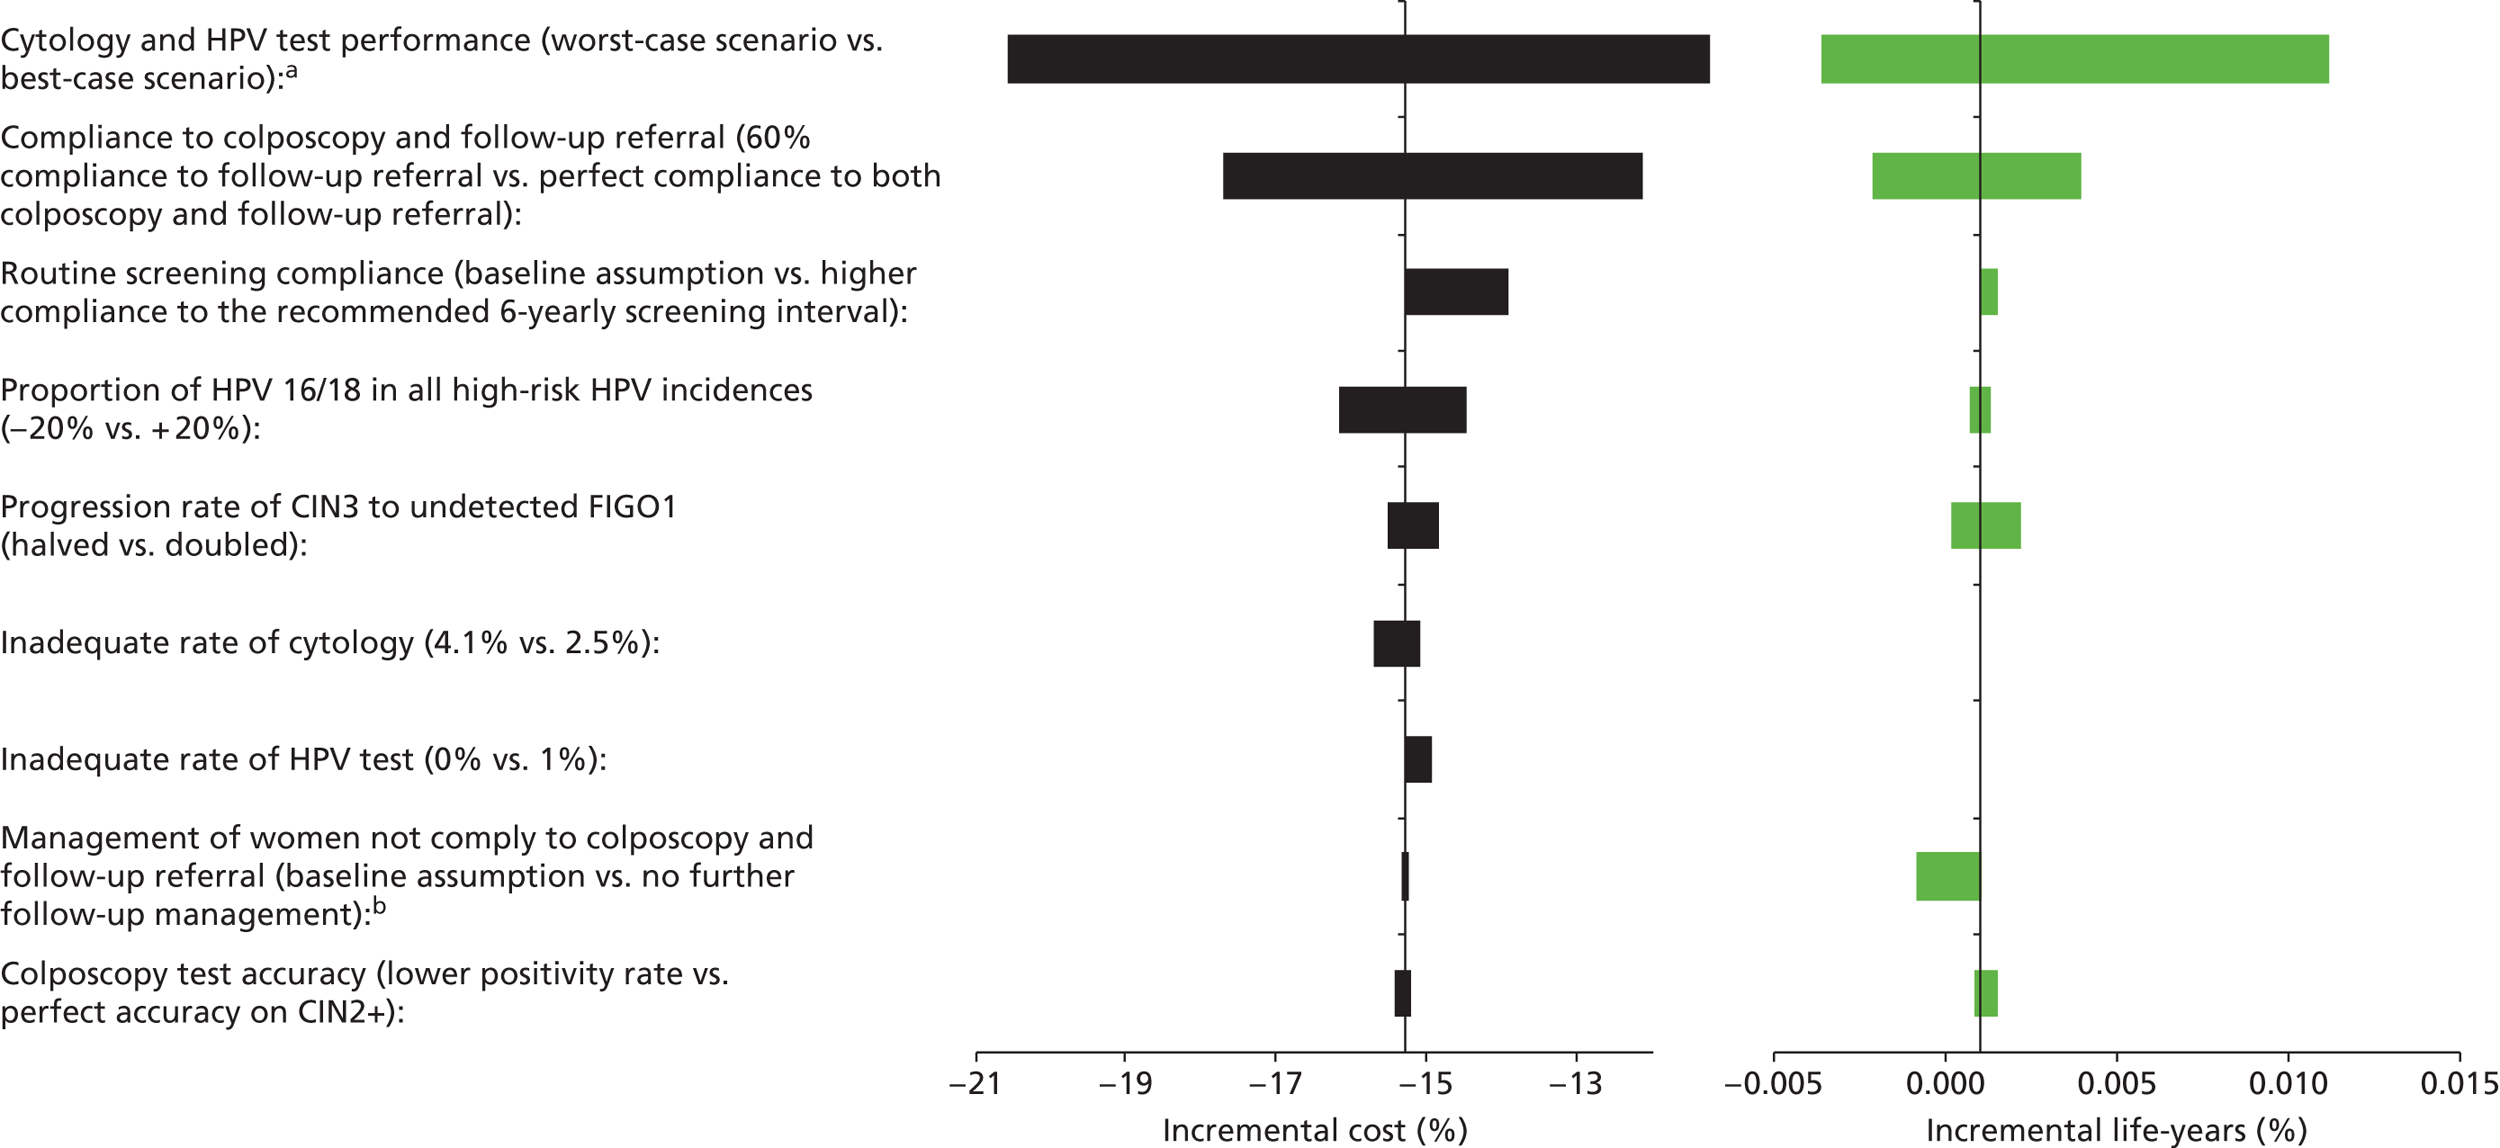
FIGURE 55.
Strategy 2, 12-monthly follow-up: Relative difference in the cost of the strategy compared with current practice for each of the sensitivity analysis assumptions are shown on the left-hand side as the black bars. Relative differences in the life-years are shown on the right-hand side as the green bars. a, ‘Worst-case scenario’ (with respect to HPV testing) assumed that cytology had higher sensitivity to CIN2+ (79%) while HPV test has a lower CIN2+ sensitivity (94.2%). The best-case scenario assumed cytology had a lower CIN2+ sensitivity rate (53%) while HPV testing has a higher CIN2+ sensitivity rate (97.4%). b, Doubling the progression rate from CIN3 to undetected FIGO1 resulted in a decrease in the incremental cost but an increase in the incremental life-years saved.
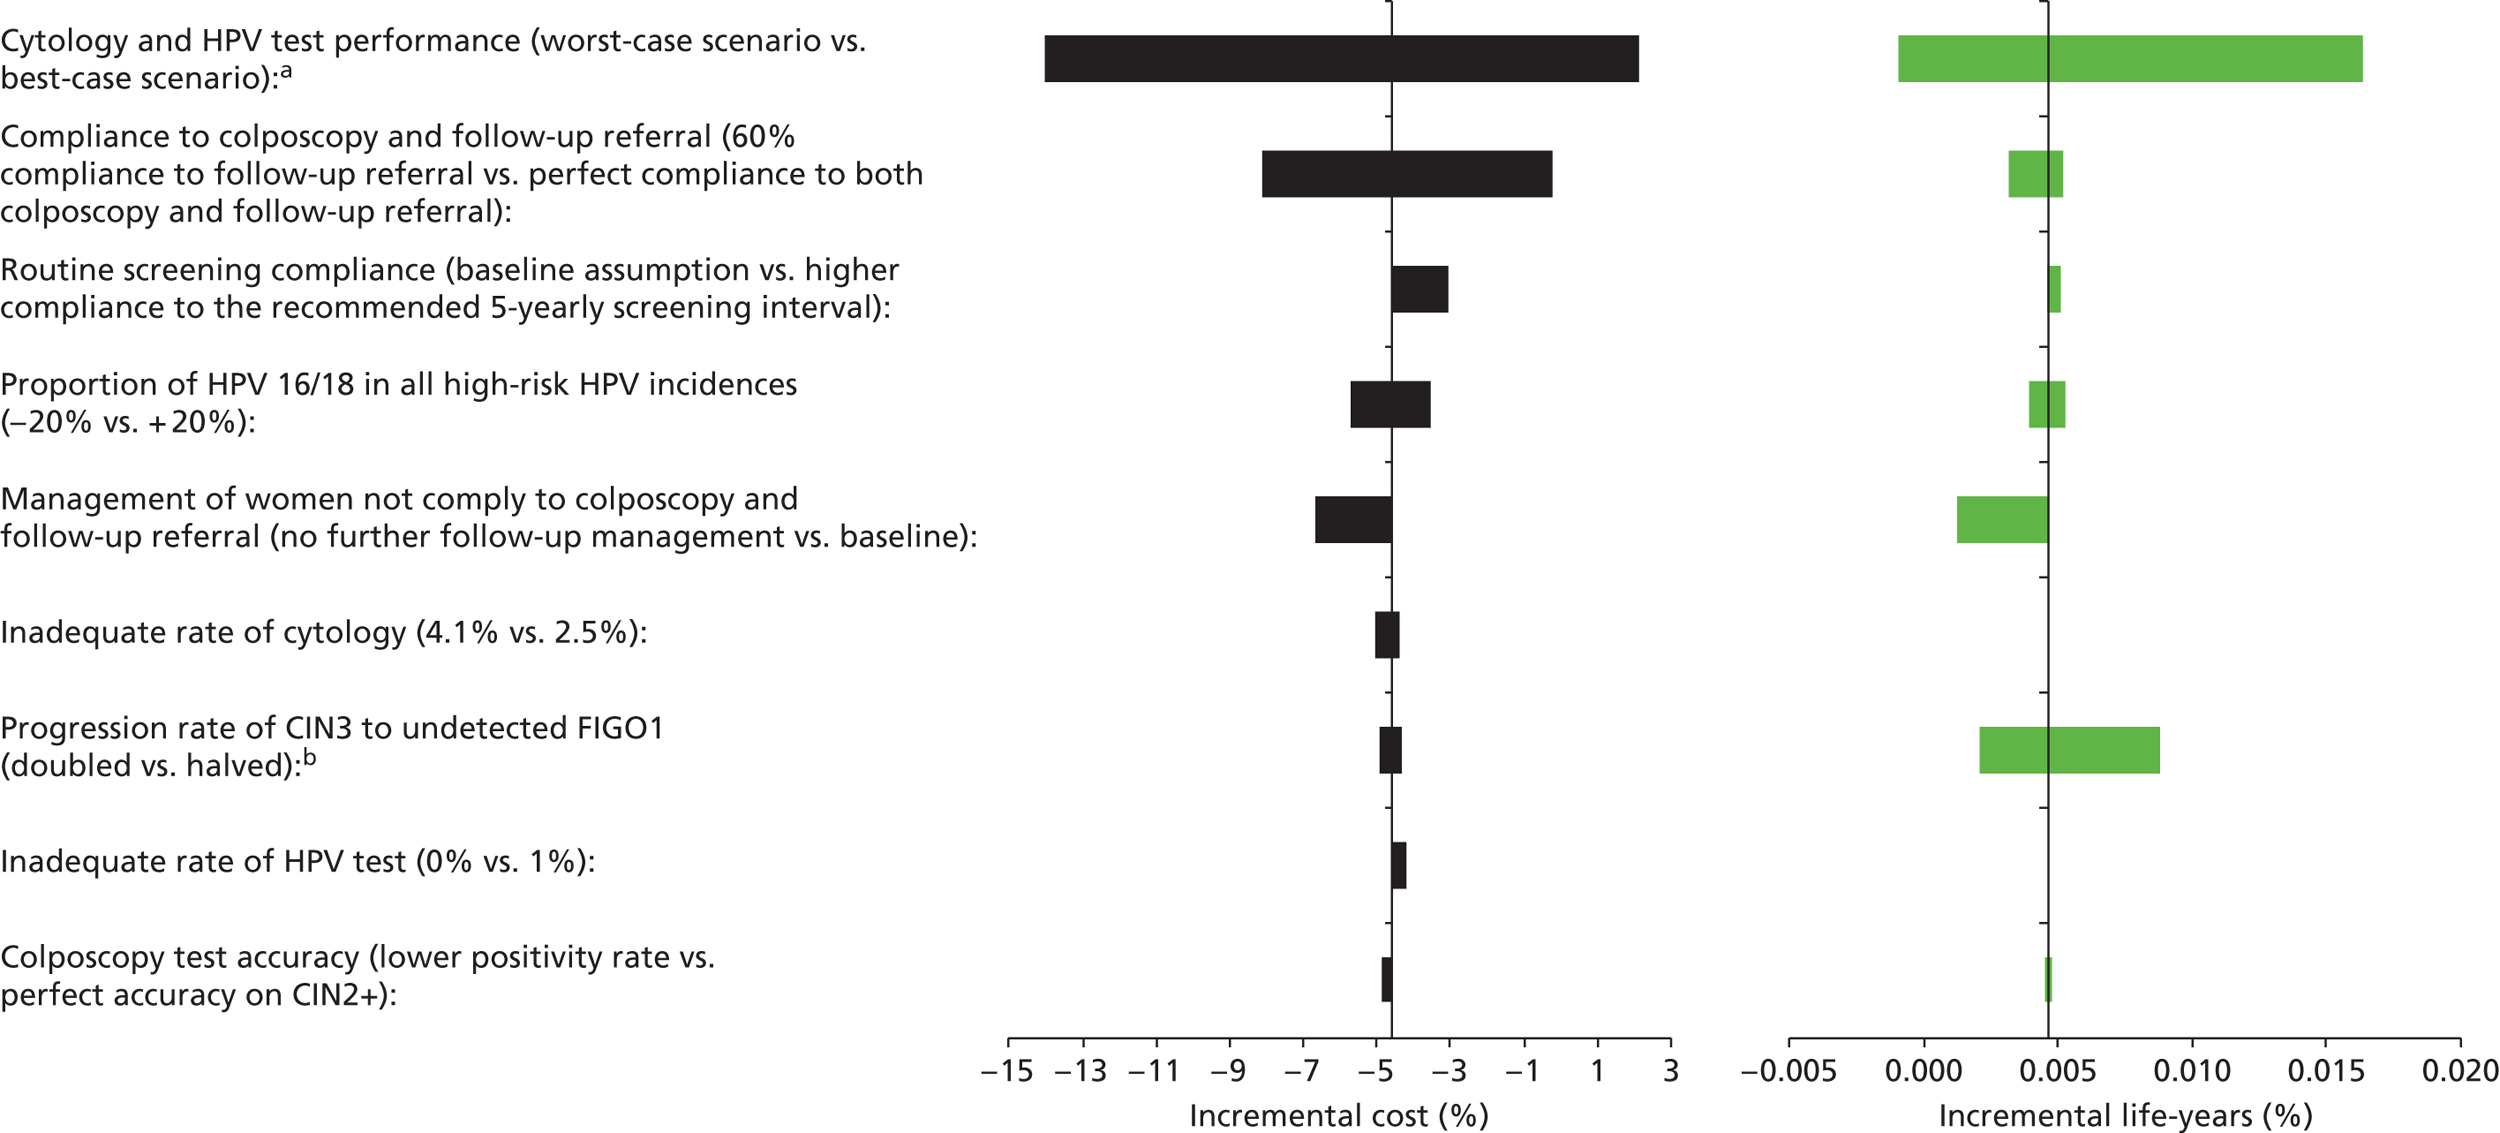
FIGURE 56.
Strategy 2, 5-yearly screening: Relative difference in the cost of the strategy compared with current practice for each of the sensitivity analysis assumptions are shown on the left-hand side as the black bars. Relative differences in the life-years are shown on the right hand side as the green bars. a, ‘Worst-case scenario’ (with respect to HPV testing) assumed that cytology had higher sensitivity to CIN2+ (79%) while HPV test has a lower CIN2+ sensitivity (94.2%). The best-case scenario assumed cytology had a lower CIN2+ sensitivity rate (53%) while HPV testing has a higher CIN2+ sensitivity rate (97.4%). b, No further follow-up for women not complying to colposcopy and follow-up referral would result in an increase in the incremental cost but a decrease in incremental life-years saved. c, Doubling the progression rate from CIN3 to undetected FIGO1 resulted in a decrease in the incremental cost but an increase in the incremental life-years saved.
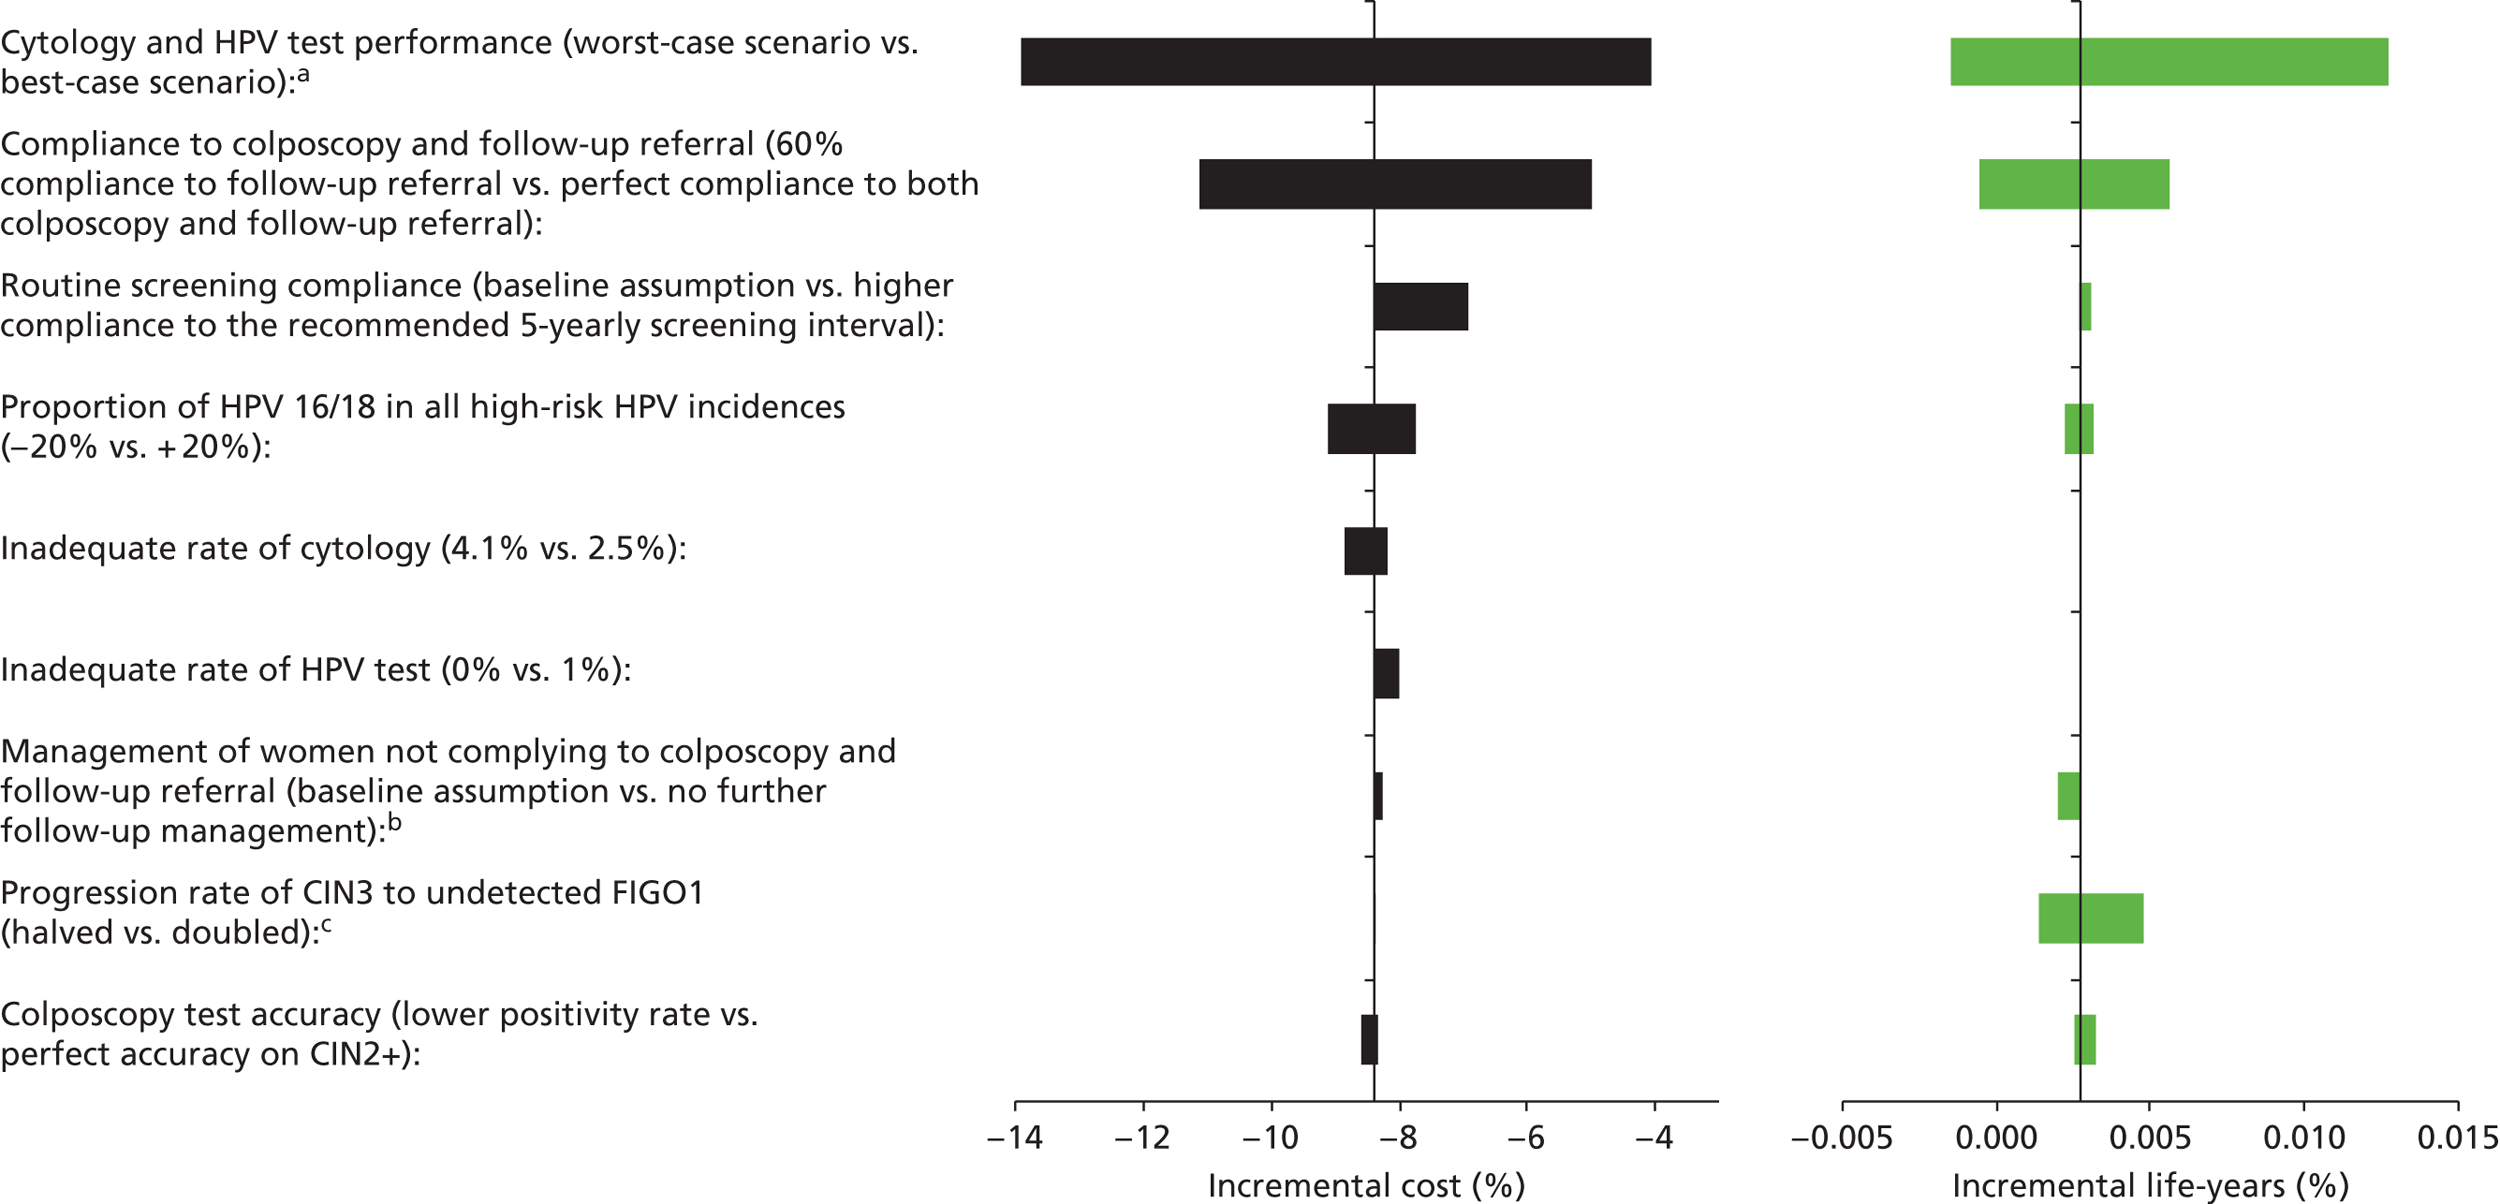
One-way sensitivity in vaccinated cohorts
FIGURE 57.
Strategy 1: Relative difference in the cost of the strategy compared with current practice for each of the sensitivity analysis assumptions are shown on the left-hand side as the black bars. Relative differences in the life-years are shown on the right-hand side as the green bars. a, ‘Worst-case scenario’ (with respect to HPV testing) assumed that cytology had higher sensitivity to CIN2+ (79%) while HPV test has a lower CIN2+ sensitivity (94.2%). The best-case scenario assumed cytology had a lower CIN2+ sensitivity rate (53%) while HPV testing has a higher CIN2+ sensitivity rate (97.4%). b, Note that, although the graph shows no decrease in life-years when cytology test sensitivity is increased and HPV test sensitivity is simultaneously decreased, the strategy is actually less effective than current practice (the strategy is predicted to have 0.001–0.002% fewer life-years than current practice). c, Both doubling and halving the progression rate from CIN3 to undetected FIGO1 resulted in a decrease in the predicted incremental life-years.
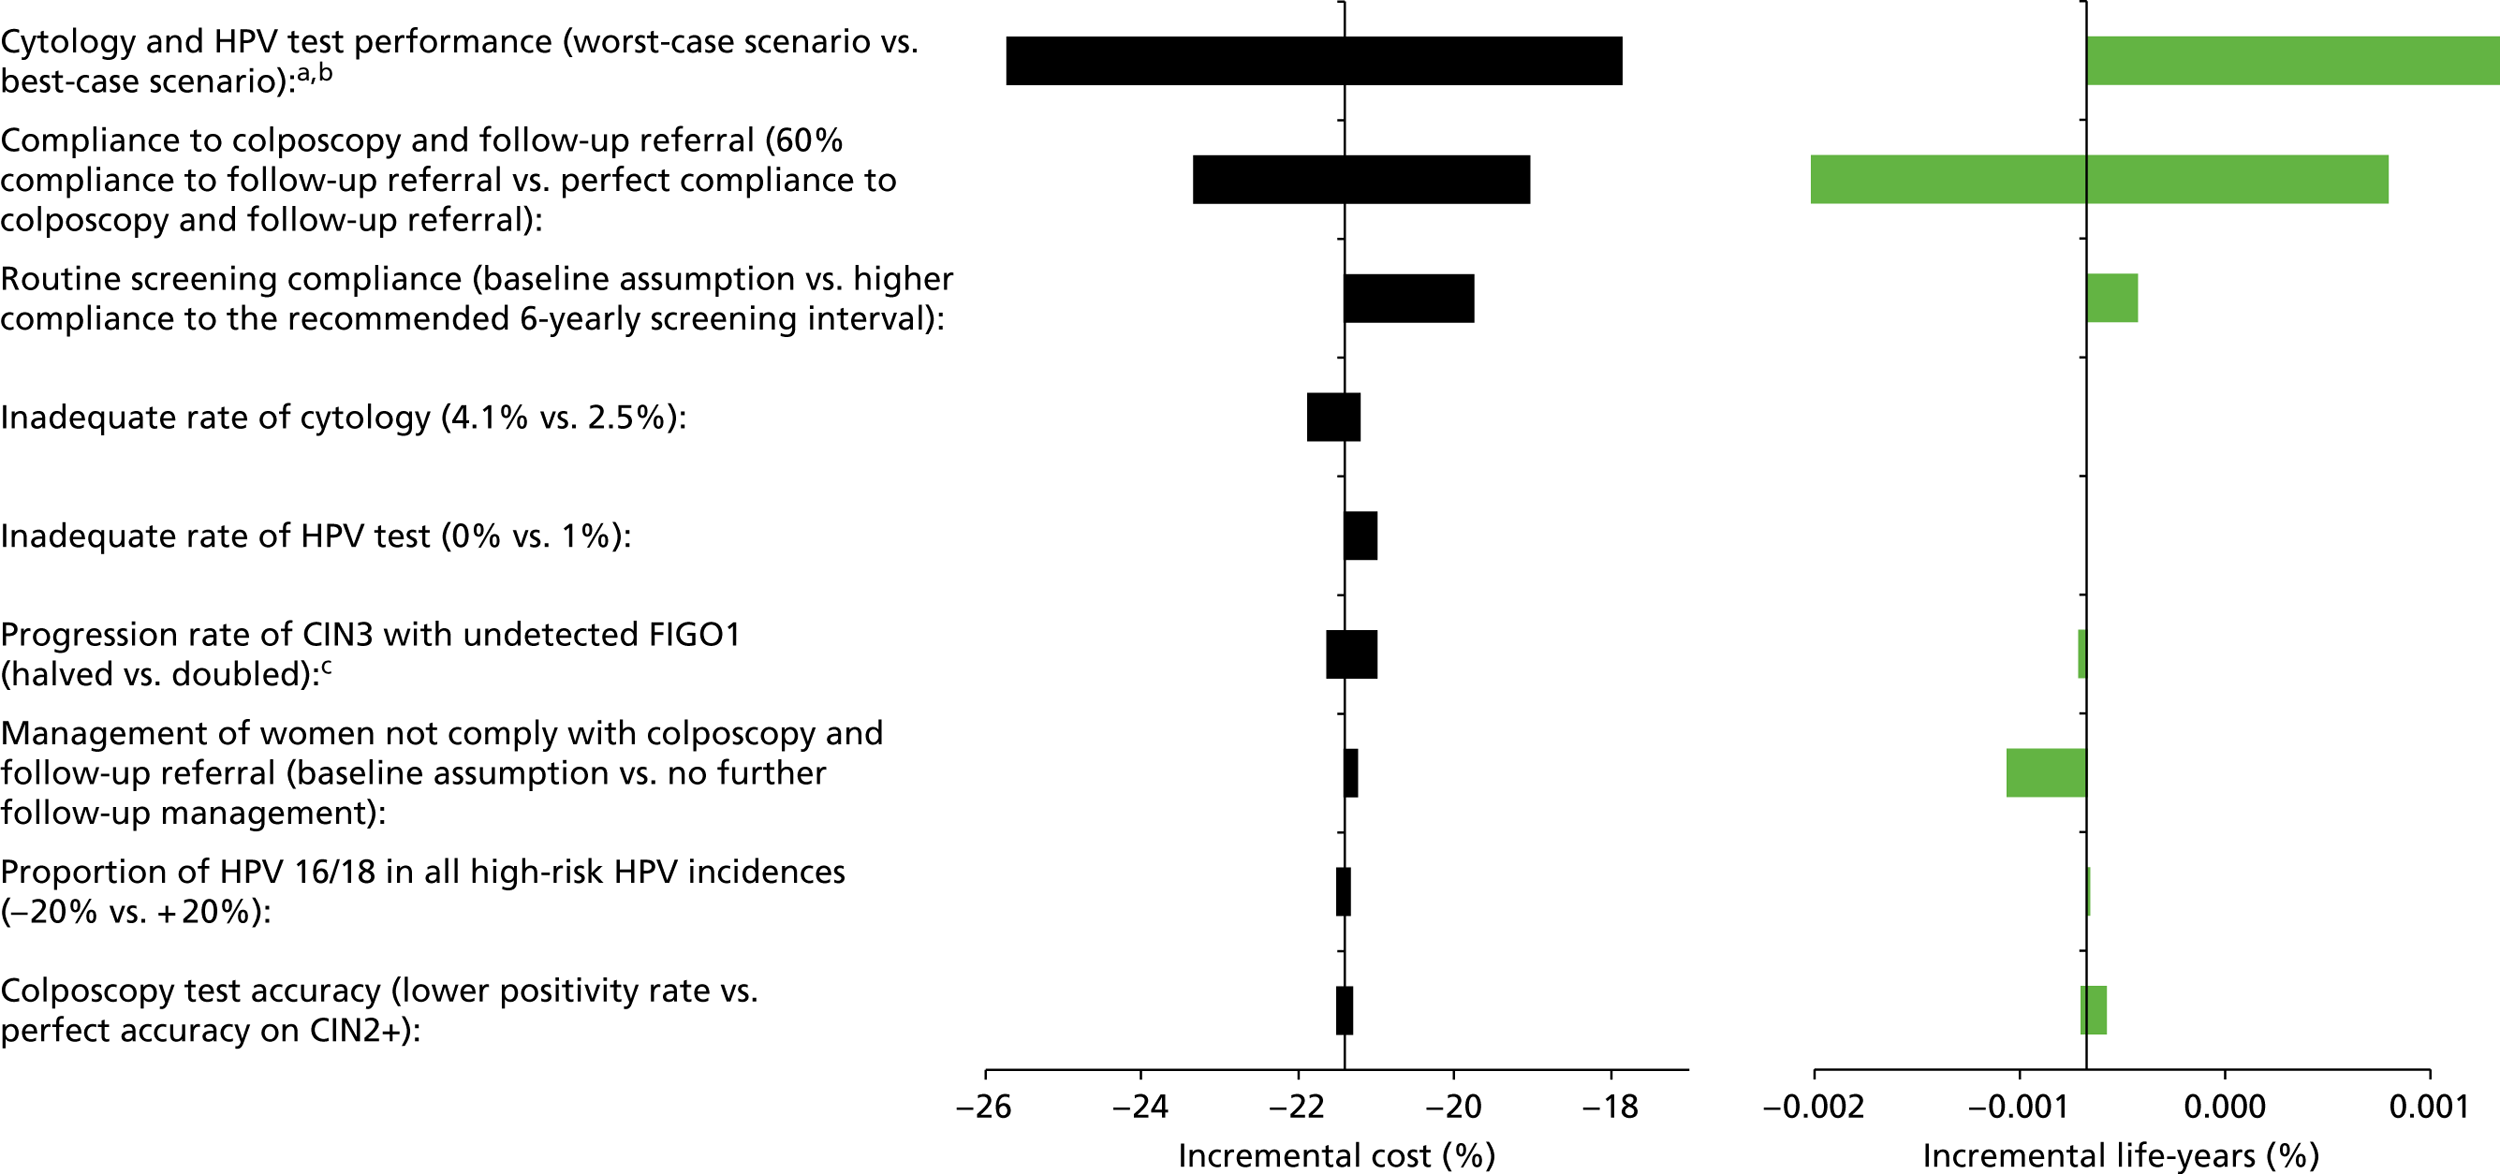
FIGURE 58.
Strategy 1, 12-monthly follow-up: Relative difference in the cost of the strategy compared with current practice for each of the sensitivity analysis assumptions are shown on the left-hand side as the black bars. Relative differences in the life-years are shown on the right-hand side as the green bars. a, ‘Worst-case scenario’ (with respect to HPV testing) assumed that cytology had higher sensitivity to CIN2+ (79%) while HPV test has a lower CIN2+ sensitivity (94.2%). The best case scenario assumed cytology had a lower CIN2+ sensitivity rate (53%) while HPV testing has a higher CIN2+ sensitivity rate (97.4%). b, Note that, although the graph shows no decrease in life-years when cytology test sensitivity is increased and HPV test sensitivity is simultaneously decreased, the strategy is actually less effective than current practice (the strategy is predicted to have 0.001–0.002% fewer life-years than current practice). c, Both lower and higher compliance to colposcopy and follow-up referral increase the predicted incremental screening associated cost and incremental life-years.
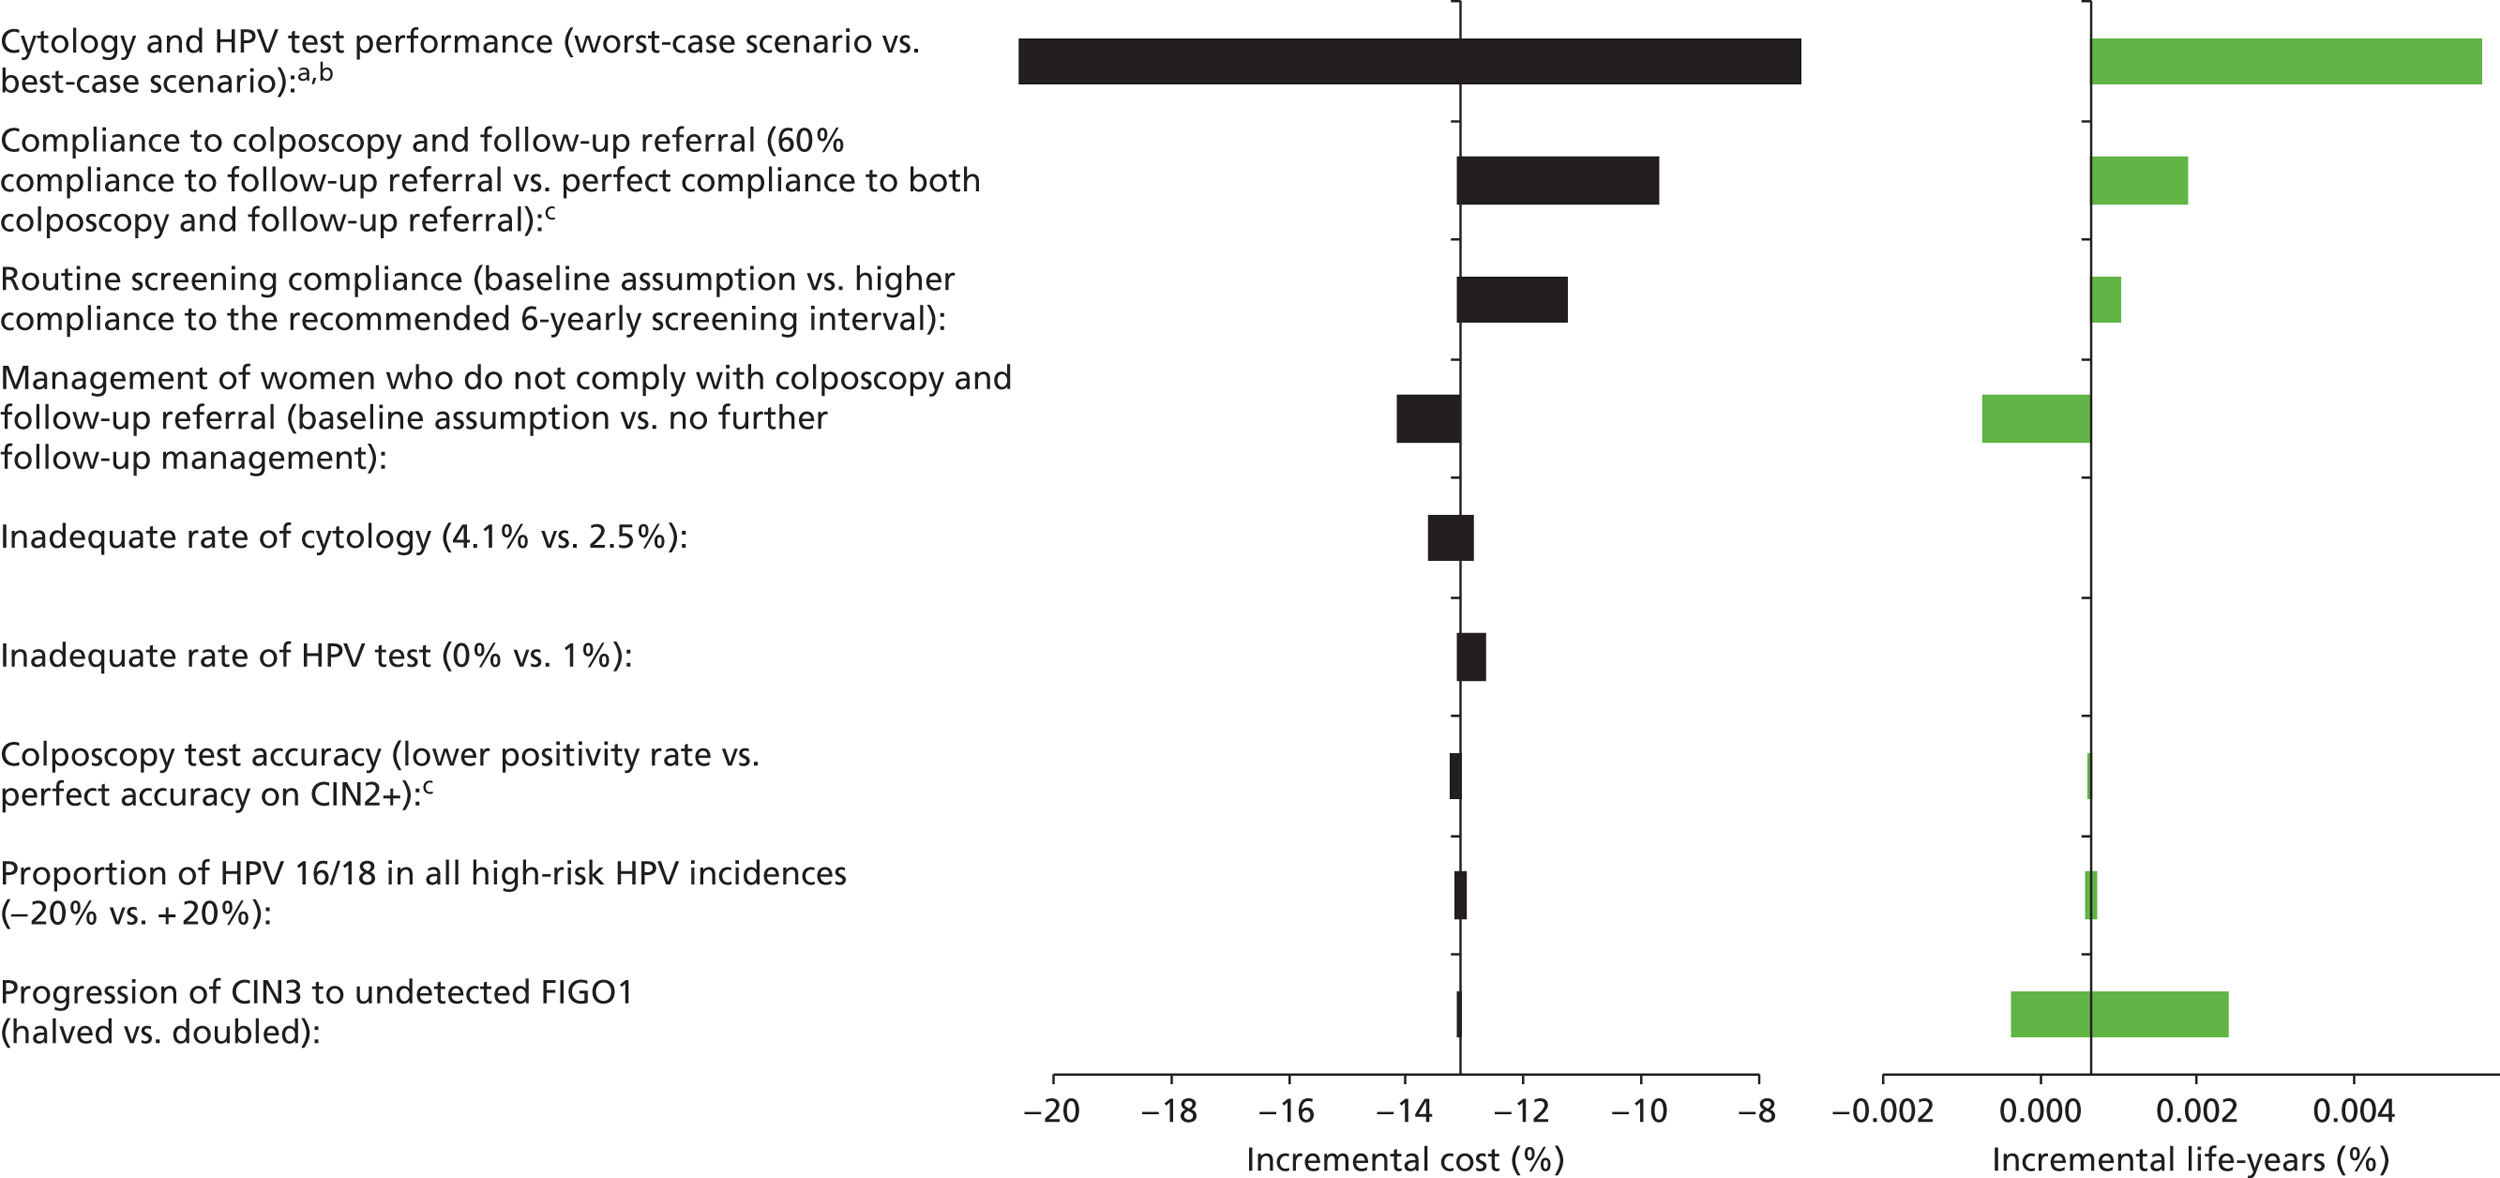
FIGURE 59.
Strategy 1, 5-yearly screening: Relative difference in the cost of the strategy compared with current practice for each of the sensitivity analysis assumptions are shown on the left-hand side as the black bars. Relative differences in the life-years are shown on the right-hand side as the green bars. a, ‘Worst-case scenario’ (with respect to HPV testing) assumed that cytology had higher sensitivity to CIN2+ (79%) while HPV test has a lower CIN2+ sensitivity (94.2%). The best case scenario assumed cytology had a lower CIN2+ sensitivity rate (53%) while HPV testing has a higher CIN2+ sensitivity rate (97.4%). b, Note that, although the graph shows no decrease in life-years when cytology test sensitivity is increased and HPV test sensitivity is simultaneously decreased, the strategy is actually less effective than current practice (the strategy is predicted to have 0.001–0.002% fewer life-years than current practice). c, No further follow-up for women not complying to colposcopy and follow-up referral would result in an increase in the incremental cost but a decrease in incremental life-years saved.
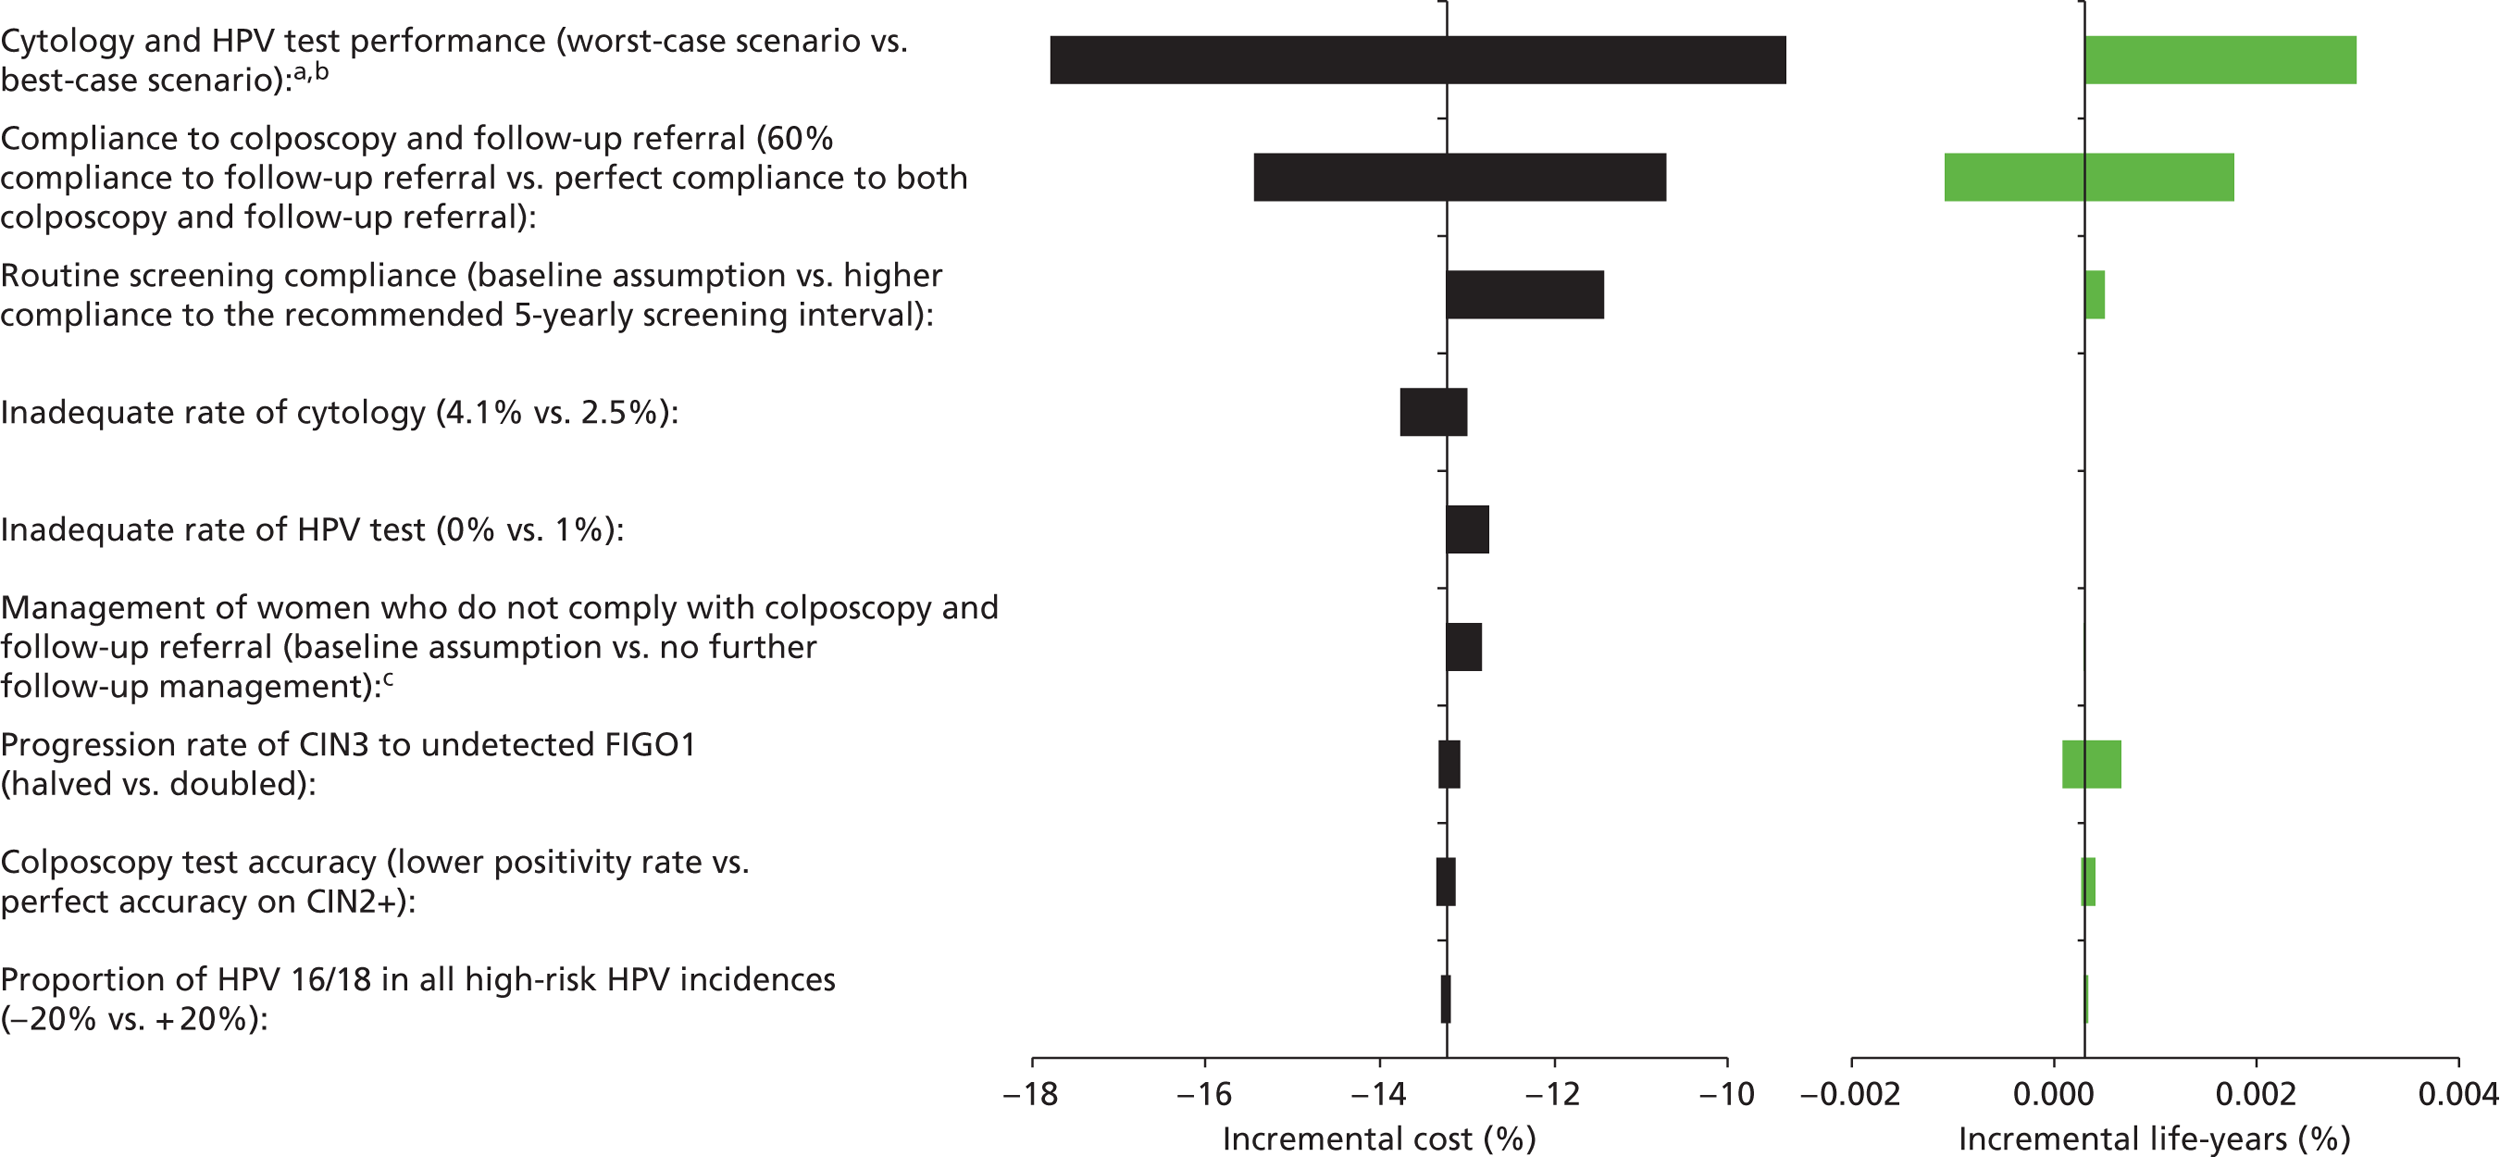
FIGURE 60.
Strategy 2: Relative difference in the cost of the strategy compared with current practice for each of the sensitivity analysis assumptions are shown on the left-hand side as the black bars. Relative differences in the life-years are shown on the right-hand side as the green bars. a, ‘Worst-case scenario’ (with respect to HPV testing) assumed that cytology had higher sensitivity to CIN2+ (79%) while HPV test has a lower CIN2+ sensitivity (94.2%). The best-case scenario assumed cytology had a lower CIN2+ sensitivity rate (53%) while HPV testing has a higher CIN2+ sensitivity rate (97.4%). b, Note that, although the graph shows no decrease in life-years when cytology test sensitivity is increased and HPV test sensitivity is simultaneously decreased, the strategy is actually less effective than current practice (the strategy is predicted to have 0.001–0.002% fewer life-years than current practice). c, No further follow-up for women not complying to colposcopy and follow-up referral would result in an increase in the incremental cost but a decrease in incremental life-years saved.
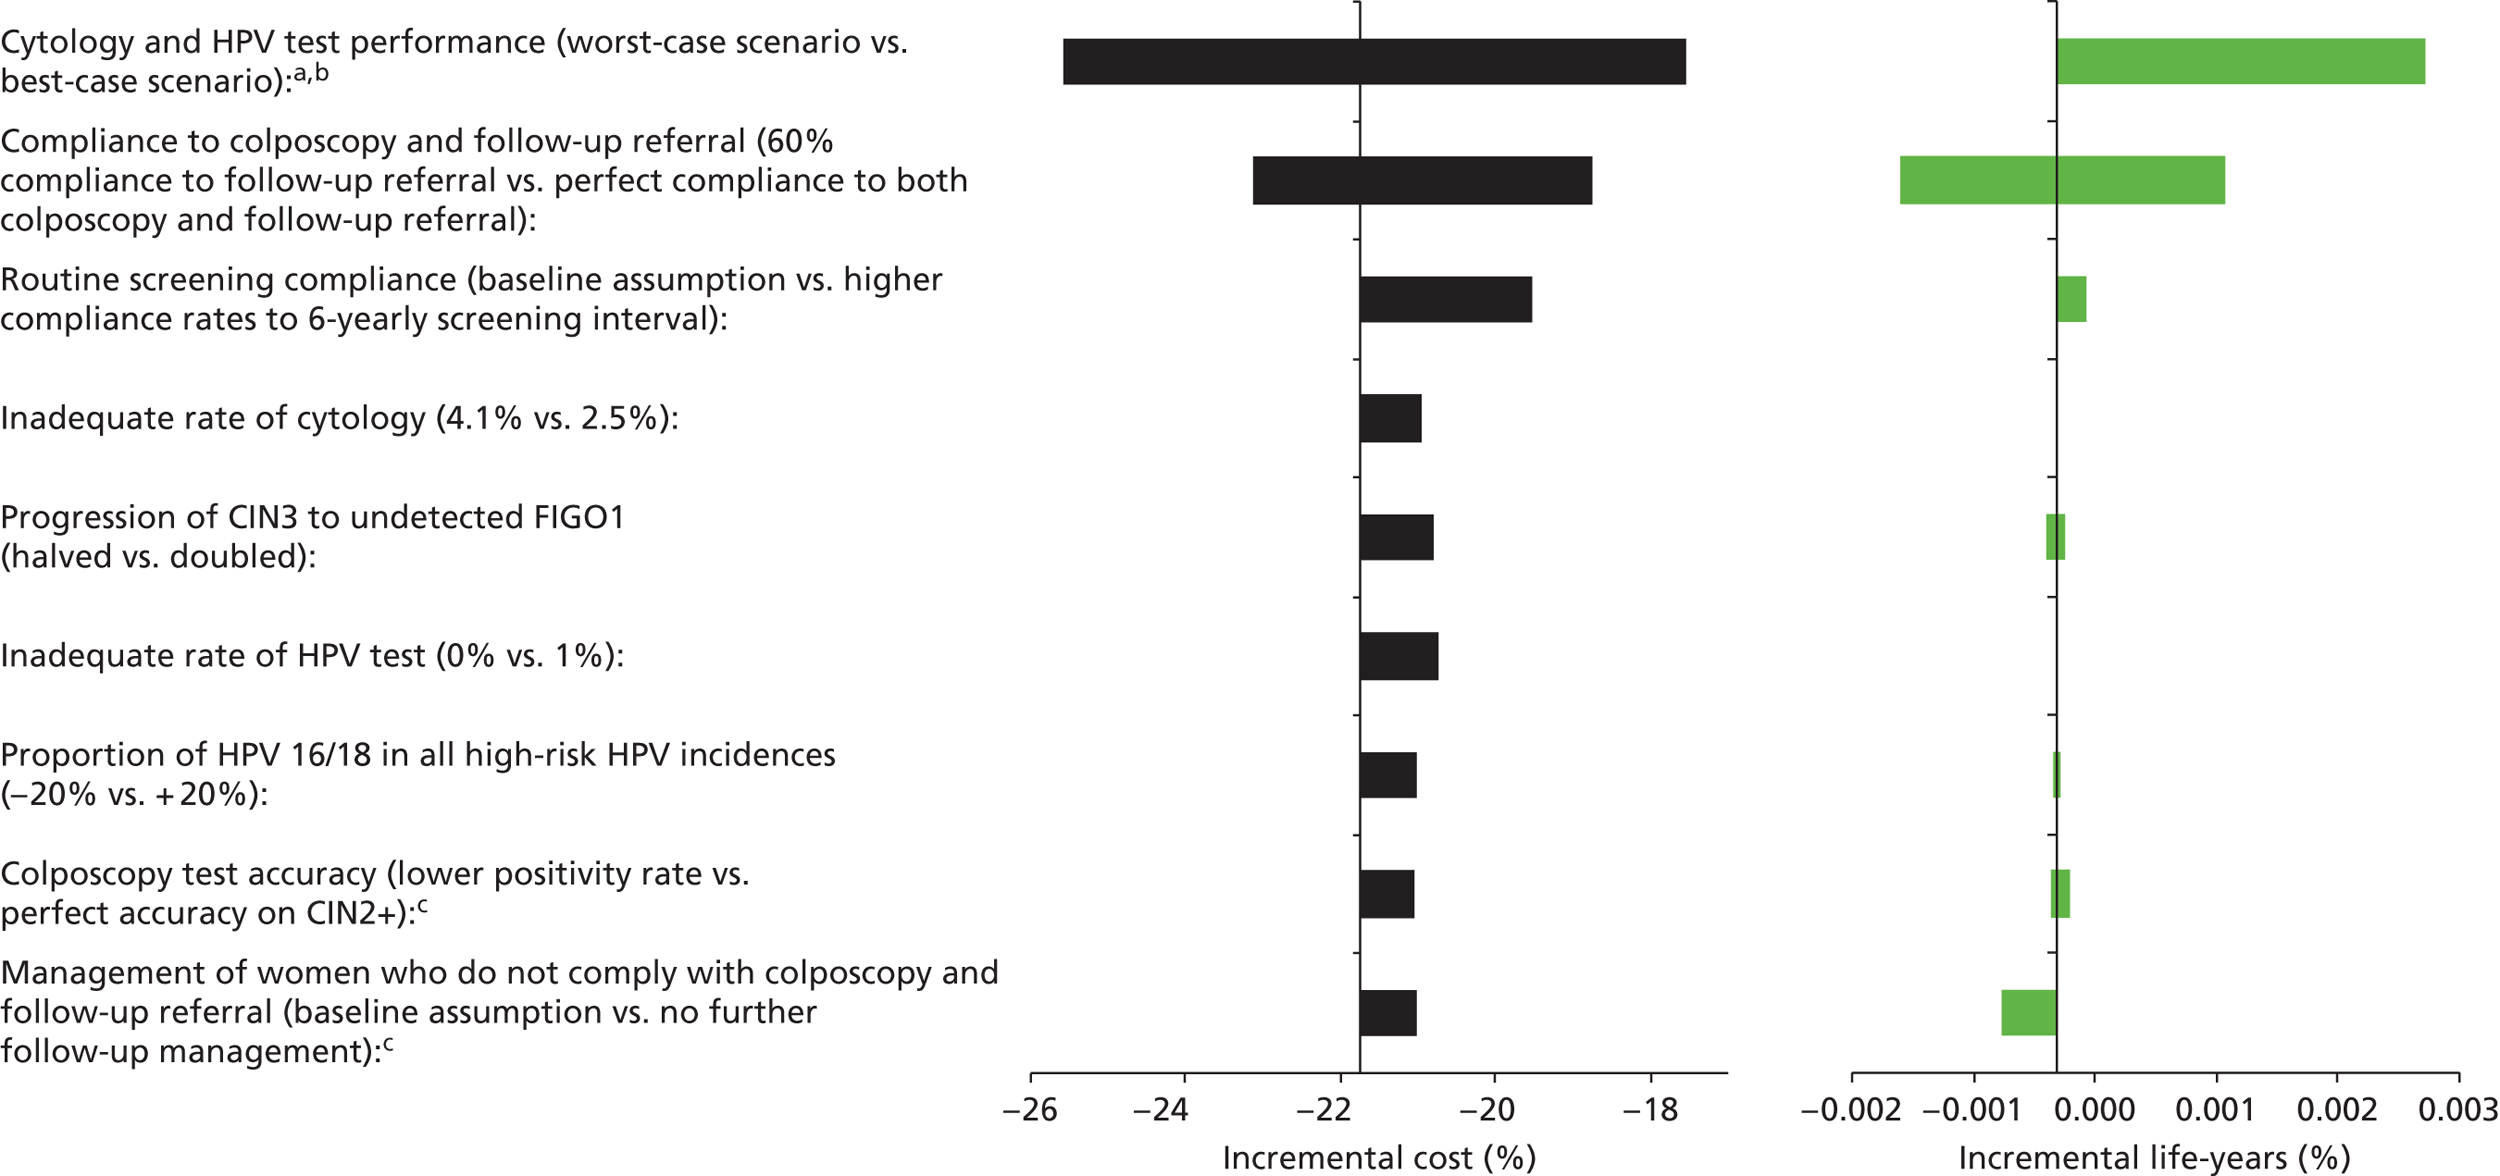
FIGURE 61.
Strategy 2, 12-monthly follow-up: Relative difference in the cost of the strategy compared with current practice for each of the sensitivity analysis assumptions are shown on the left-hand side as the black bars. Relative differences in the life-years are shown on the right-hand side as the green bars. a, ’Worst-case scenario’ (with respect to HPV testing) assumed that cytology had higher sensitivity to CIN2+ (79%) while HPV test has a lower CIN2+ sensitivity (94.2%). The best-case scenario assumed cytology had a lower CIN2+ sensitivity rate (53%) while HPV testing has a higher CIN2+ sensitivity rate (97.4%). b, Note that, although the graph shows no decrease in life-years when cytology test sensitivity is increased and HPV test sensitivity is simultaneously decreased, the strategy is actually less effective than current practice (the strategy is predicted to have 0.001–0.002% fewer life-years than current practice). c, Both lower and higher compliance to colposcopy and follow-up referral increase the incremental cost. d, Doubling the progression rate from CIN3 to undetected FIGO1 resulted in a decrease in the incremental cost but an increase in the incremental life-years saved.
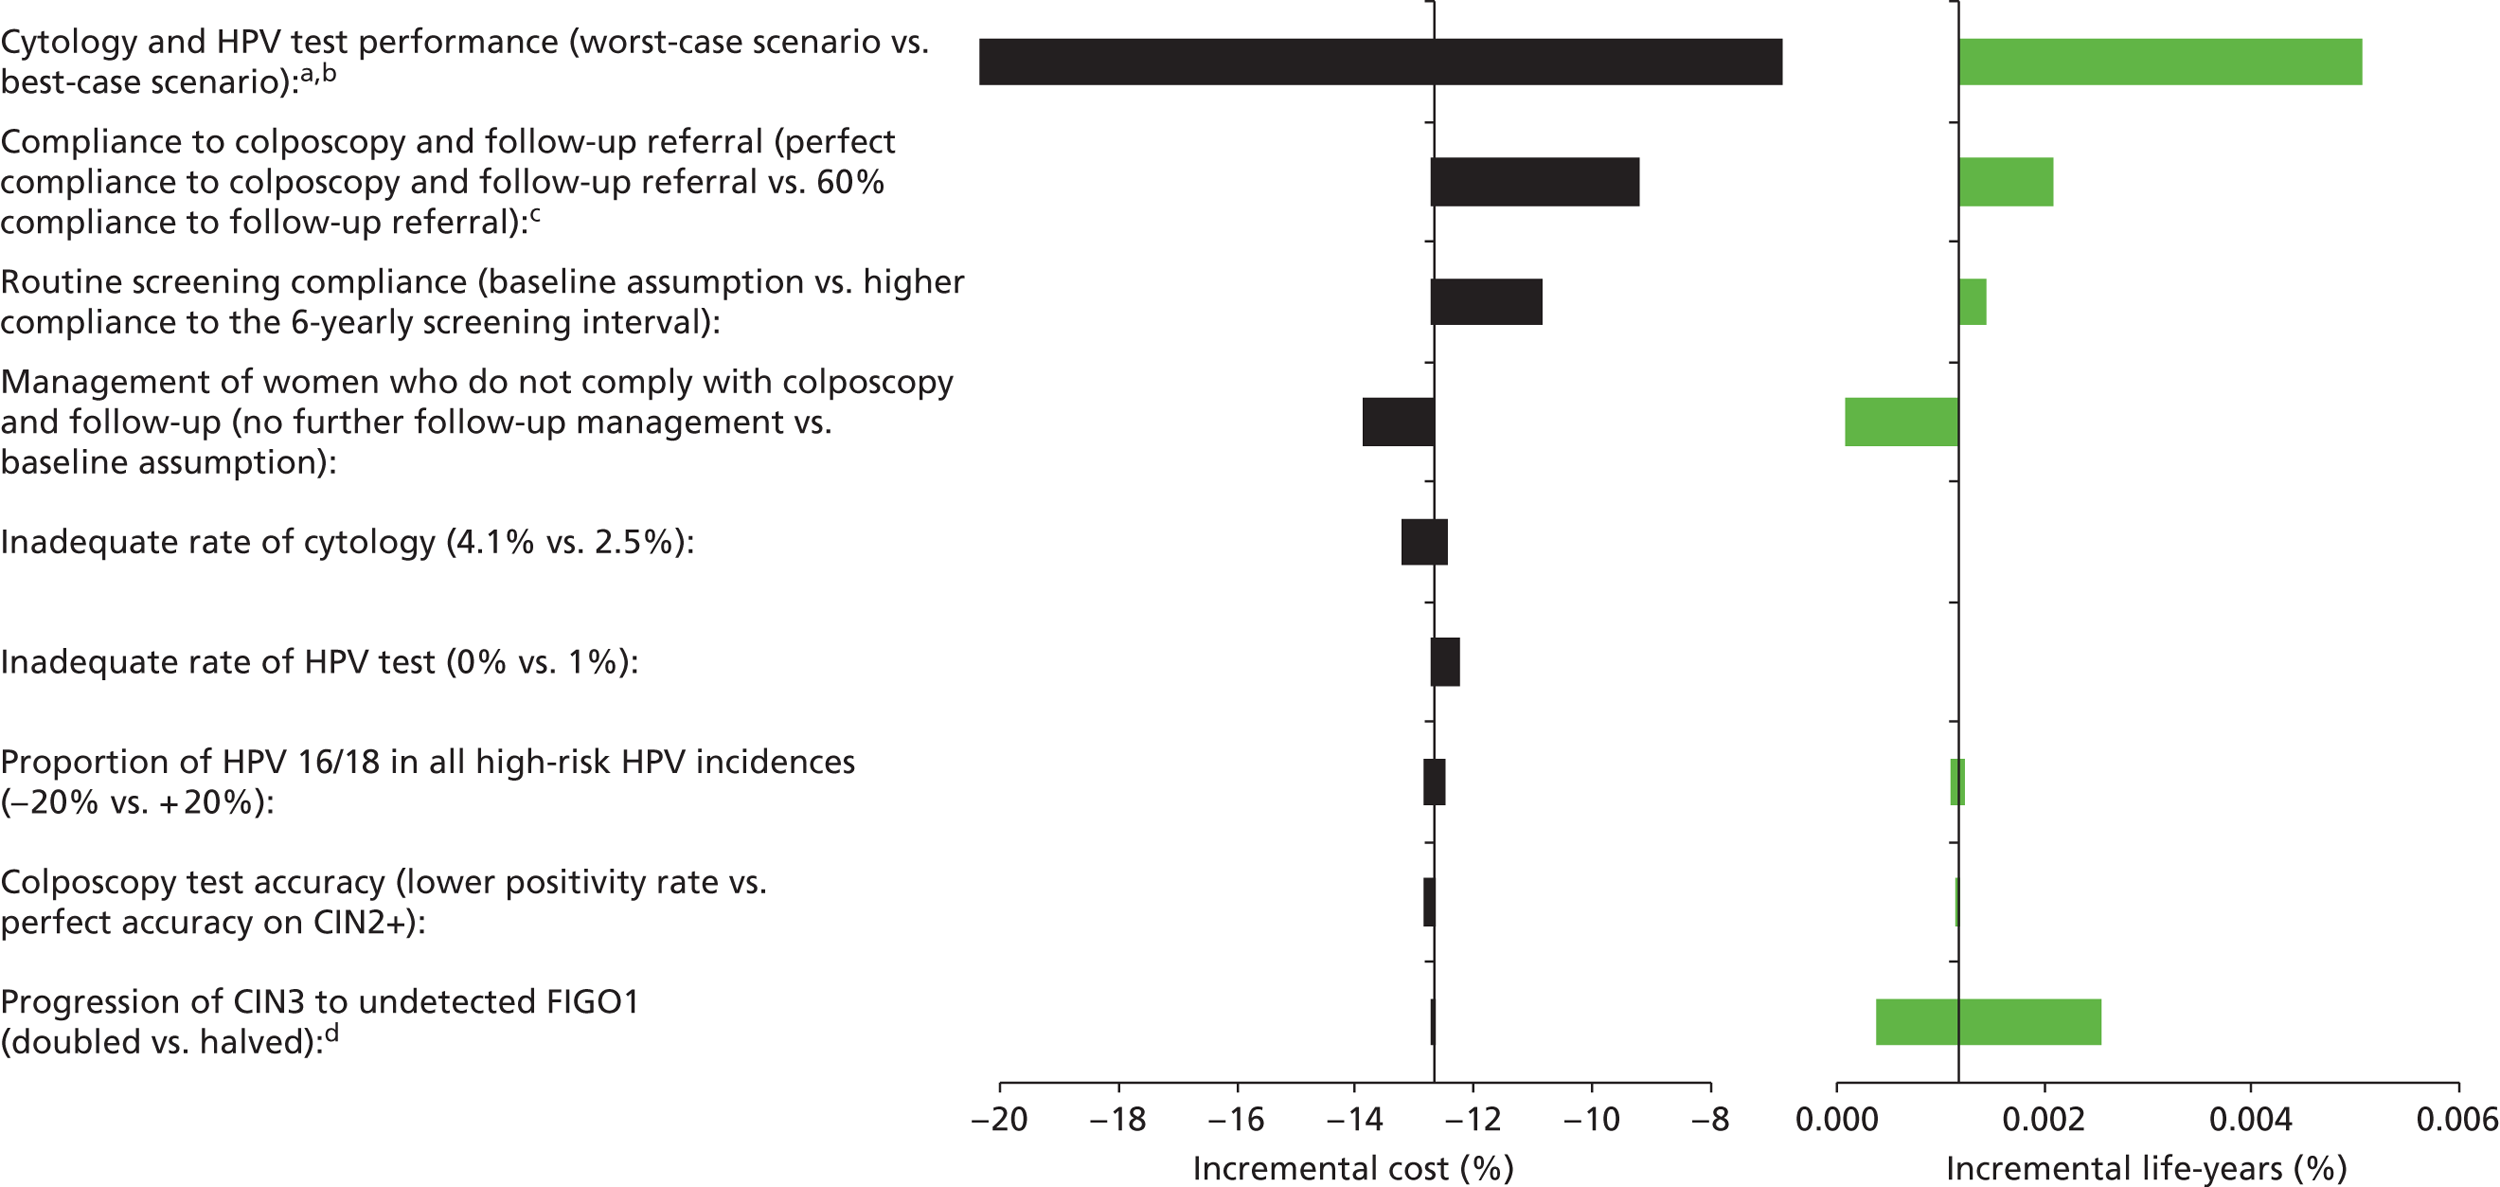
FIGURE 62.
Strategy 2, 5-yearly screening: Relative difference in the cost of the strategy compared with current practice for each of the sensitivity analysis assumptions are shown on the left-hand side as the black bars. Relative differences in the life-years are shown on the right-hand side as the green bars. a, ‘Worst-case scenario’ (with respect to HPV testing) assumed that cytology had higher sensitivity to CIN2+ (79%) while HPV test has a lower CIN2+ sensitivity (94.2%). The best-case scenario assumed cytology had a lower CIN2+ sensitivity rate (53%) while HPV testing has a higher CIN2+ sensitivity rate (97.4%). b, Note that, although the graph shows no decrease in life-years when cytology test sensitivity is increased and HPV test sensitivity is simultaneously decreased, the strategy is actually less effective than current practice (the strategy is predicted to have 0.001–0.002% fewer life-years than current practice). c, No further follow-up for women not complying to colposcopy and follow-up referral would result in an increase in the incremental cost but a decrease in incremental life-years saved.
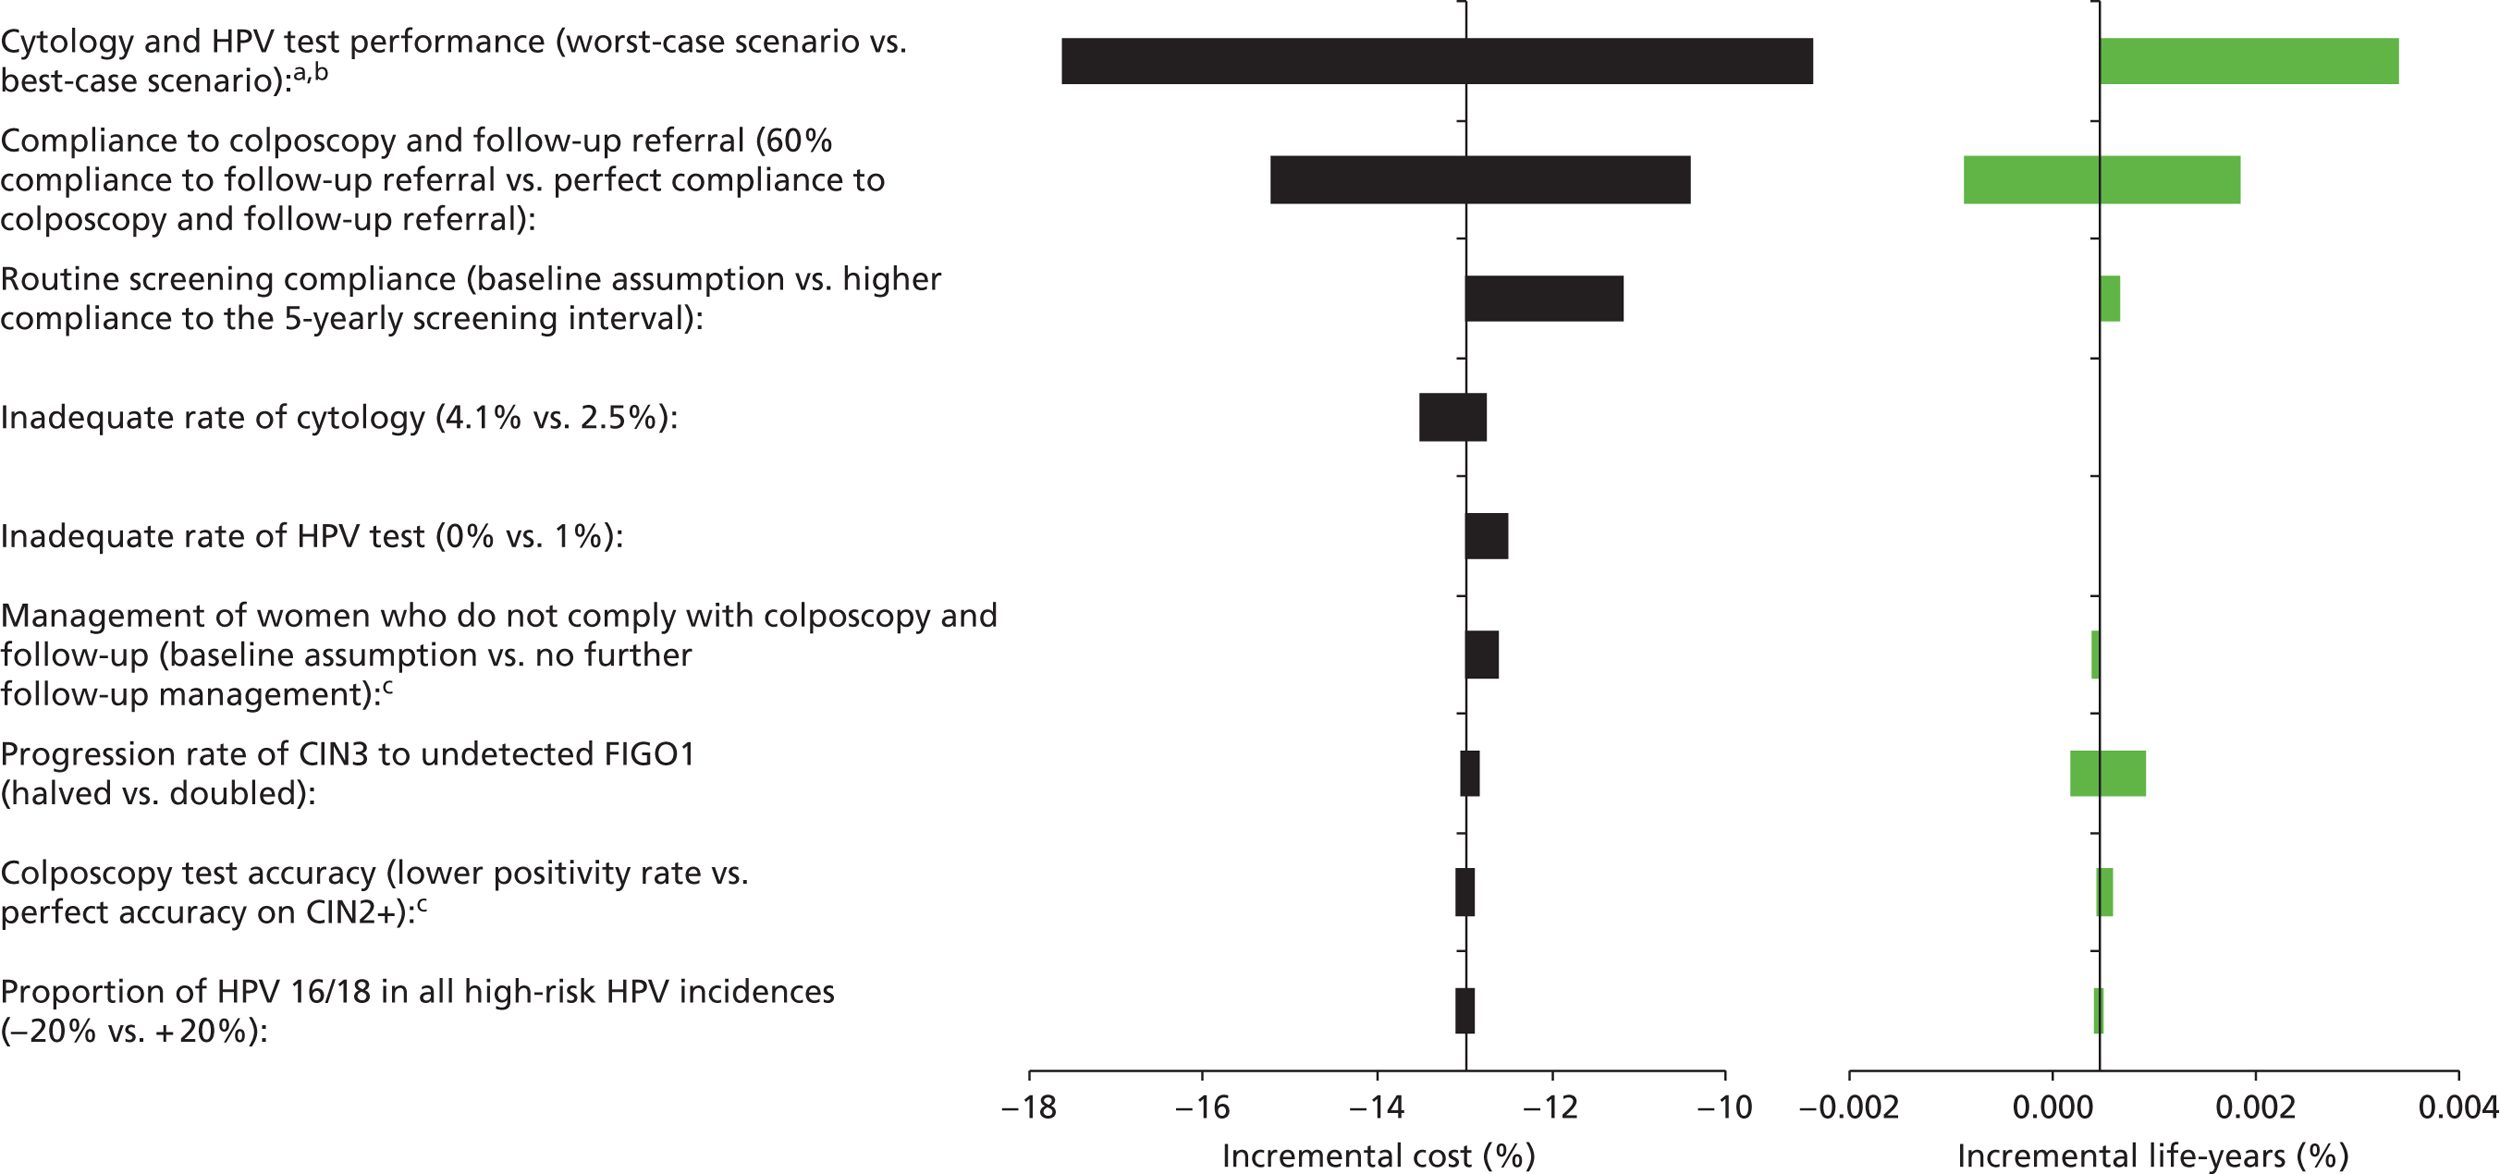
Probabilistic sensitivity analysis for cost assumptions
The PSAs for each of the strategies are shown in Figure 63 for unvaccinated cohorts and Figure 64 for vaccinated cohorts. These results indicate that primary HPV screening strategies are cost saving when compared with current practice for each of the combinations of cost assumptions, except for some of the cost scenarios for strategy 3 and 4 and their variants.
FIGURE 63.
Probabilistic sensitivity analysis on unit cost assumptions in an unvaccinated population. The discounted lifetime cost and life-years associated with current screening practice was used as the comparator. FU, follow-up.
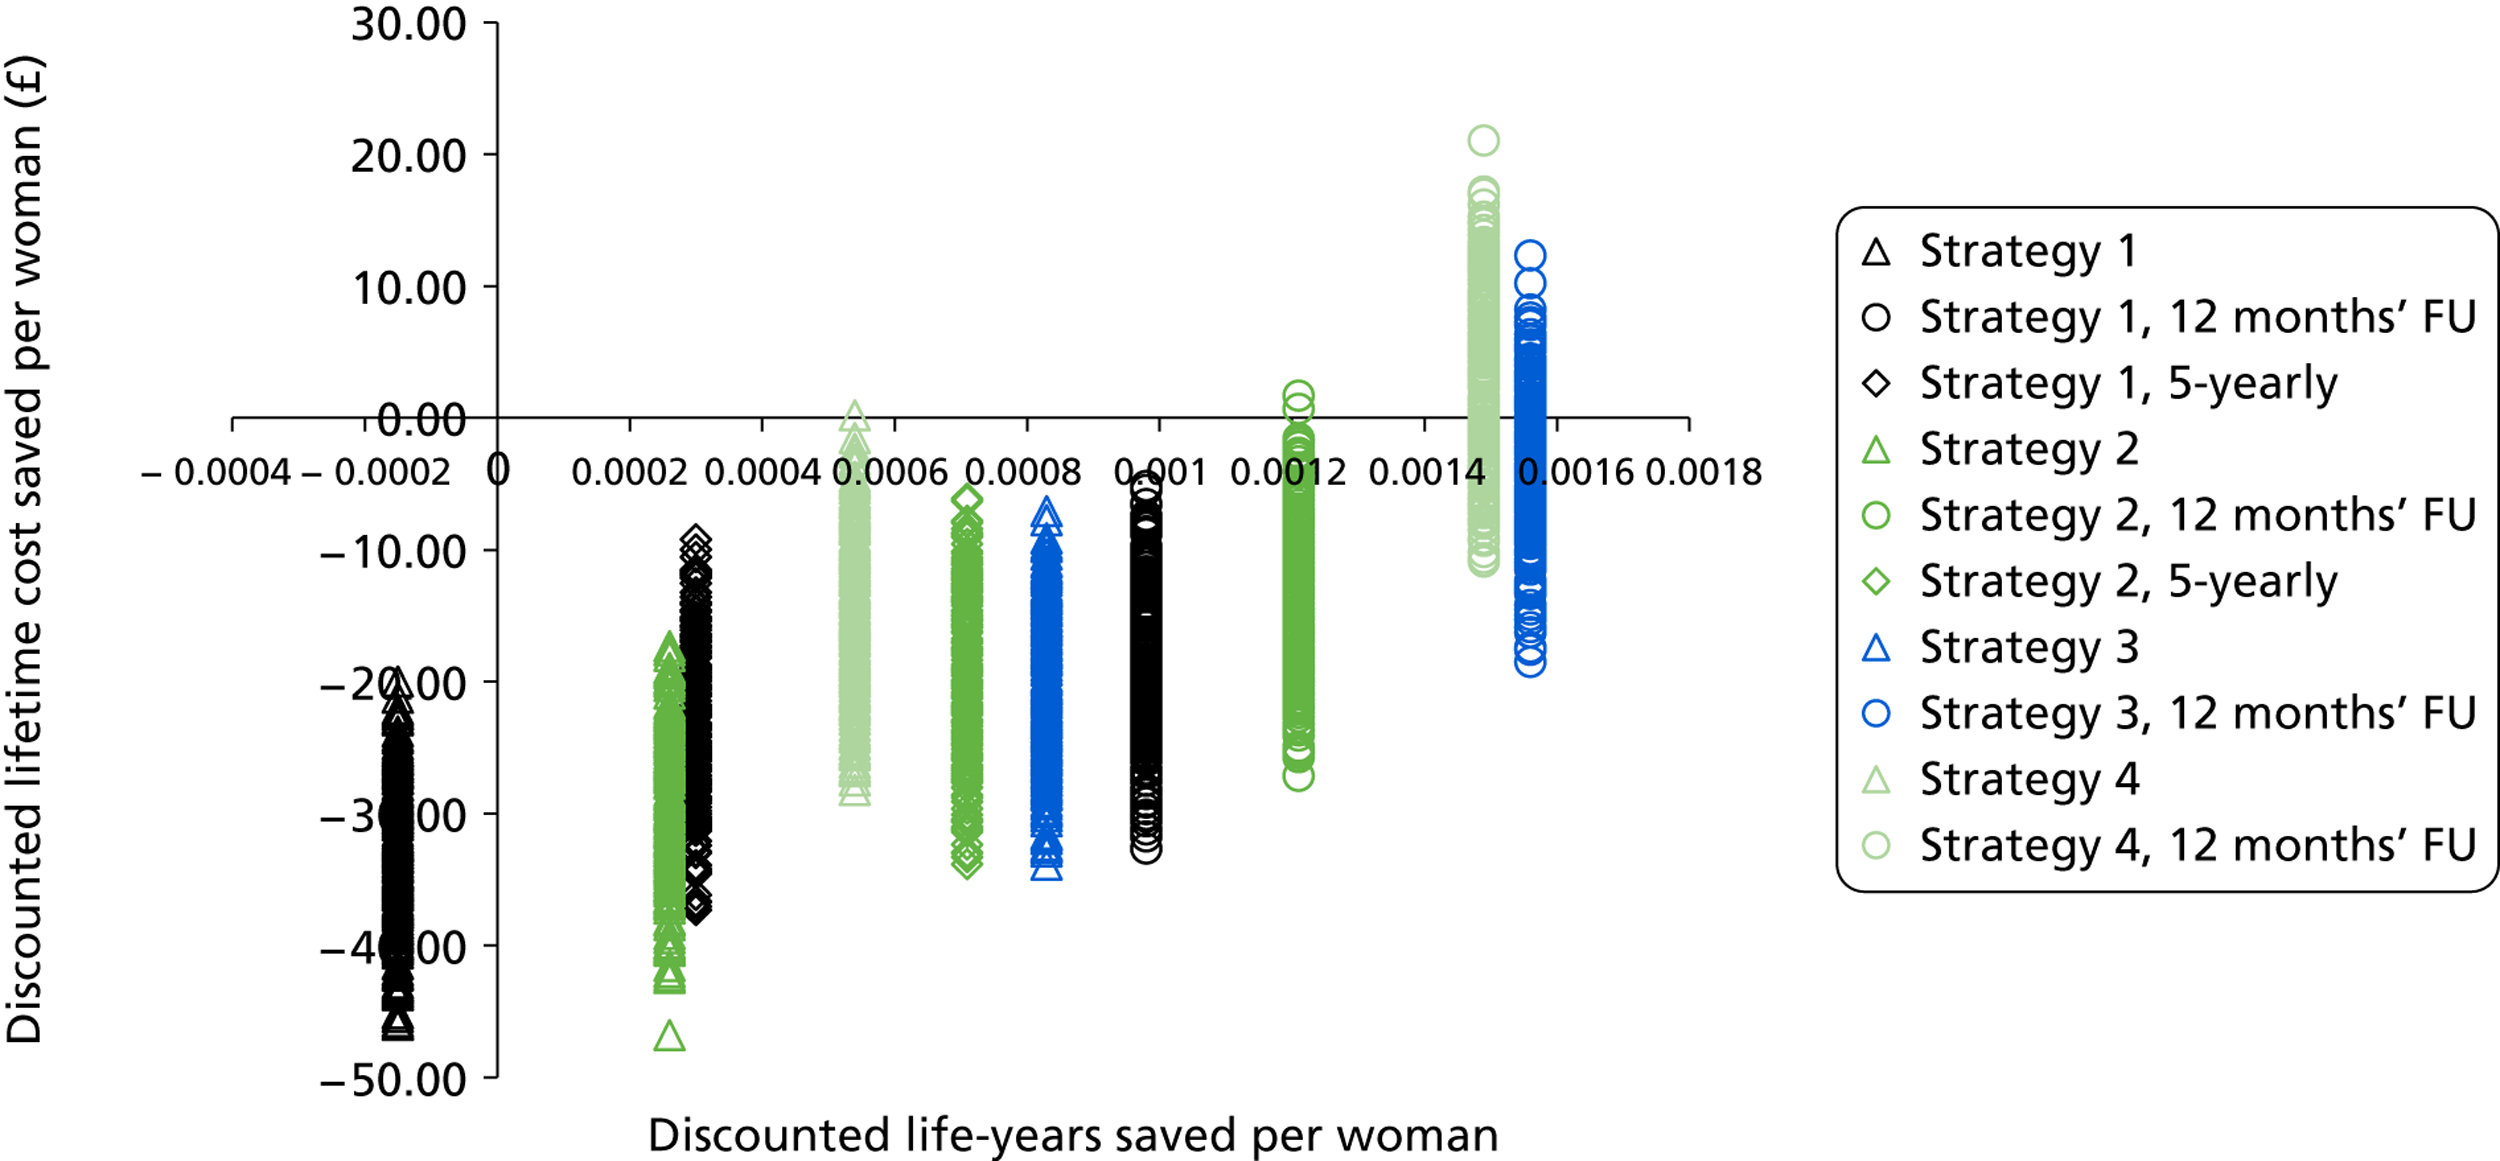
FIGURE 64.
Probabilistic sensitivity analysis on unit cost assumptions on the predicted strategy-specific screening associated lifetime cost in a vaccinated setting. The discounted lifetime cost and life-years associated with current screening practice screening was used as the comparator. FU, follow-up.
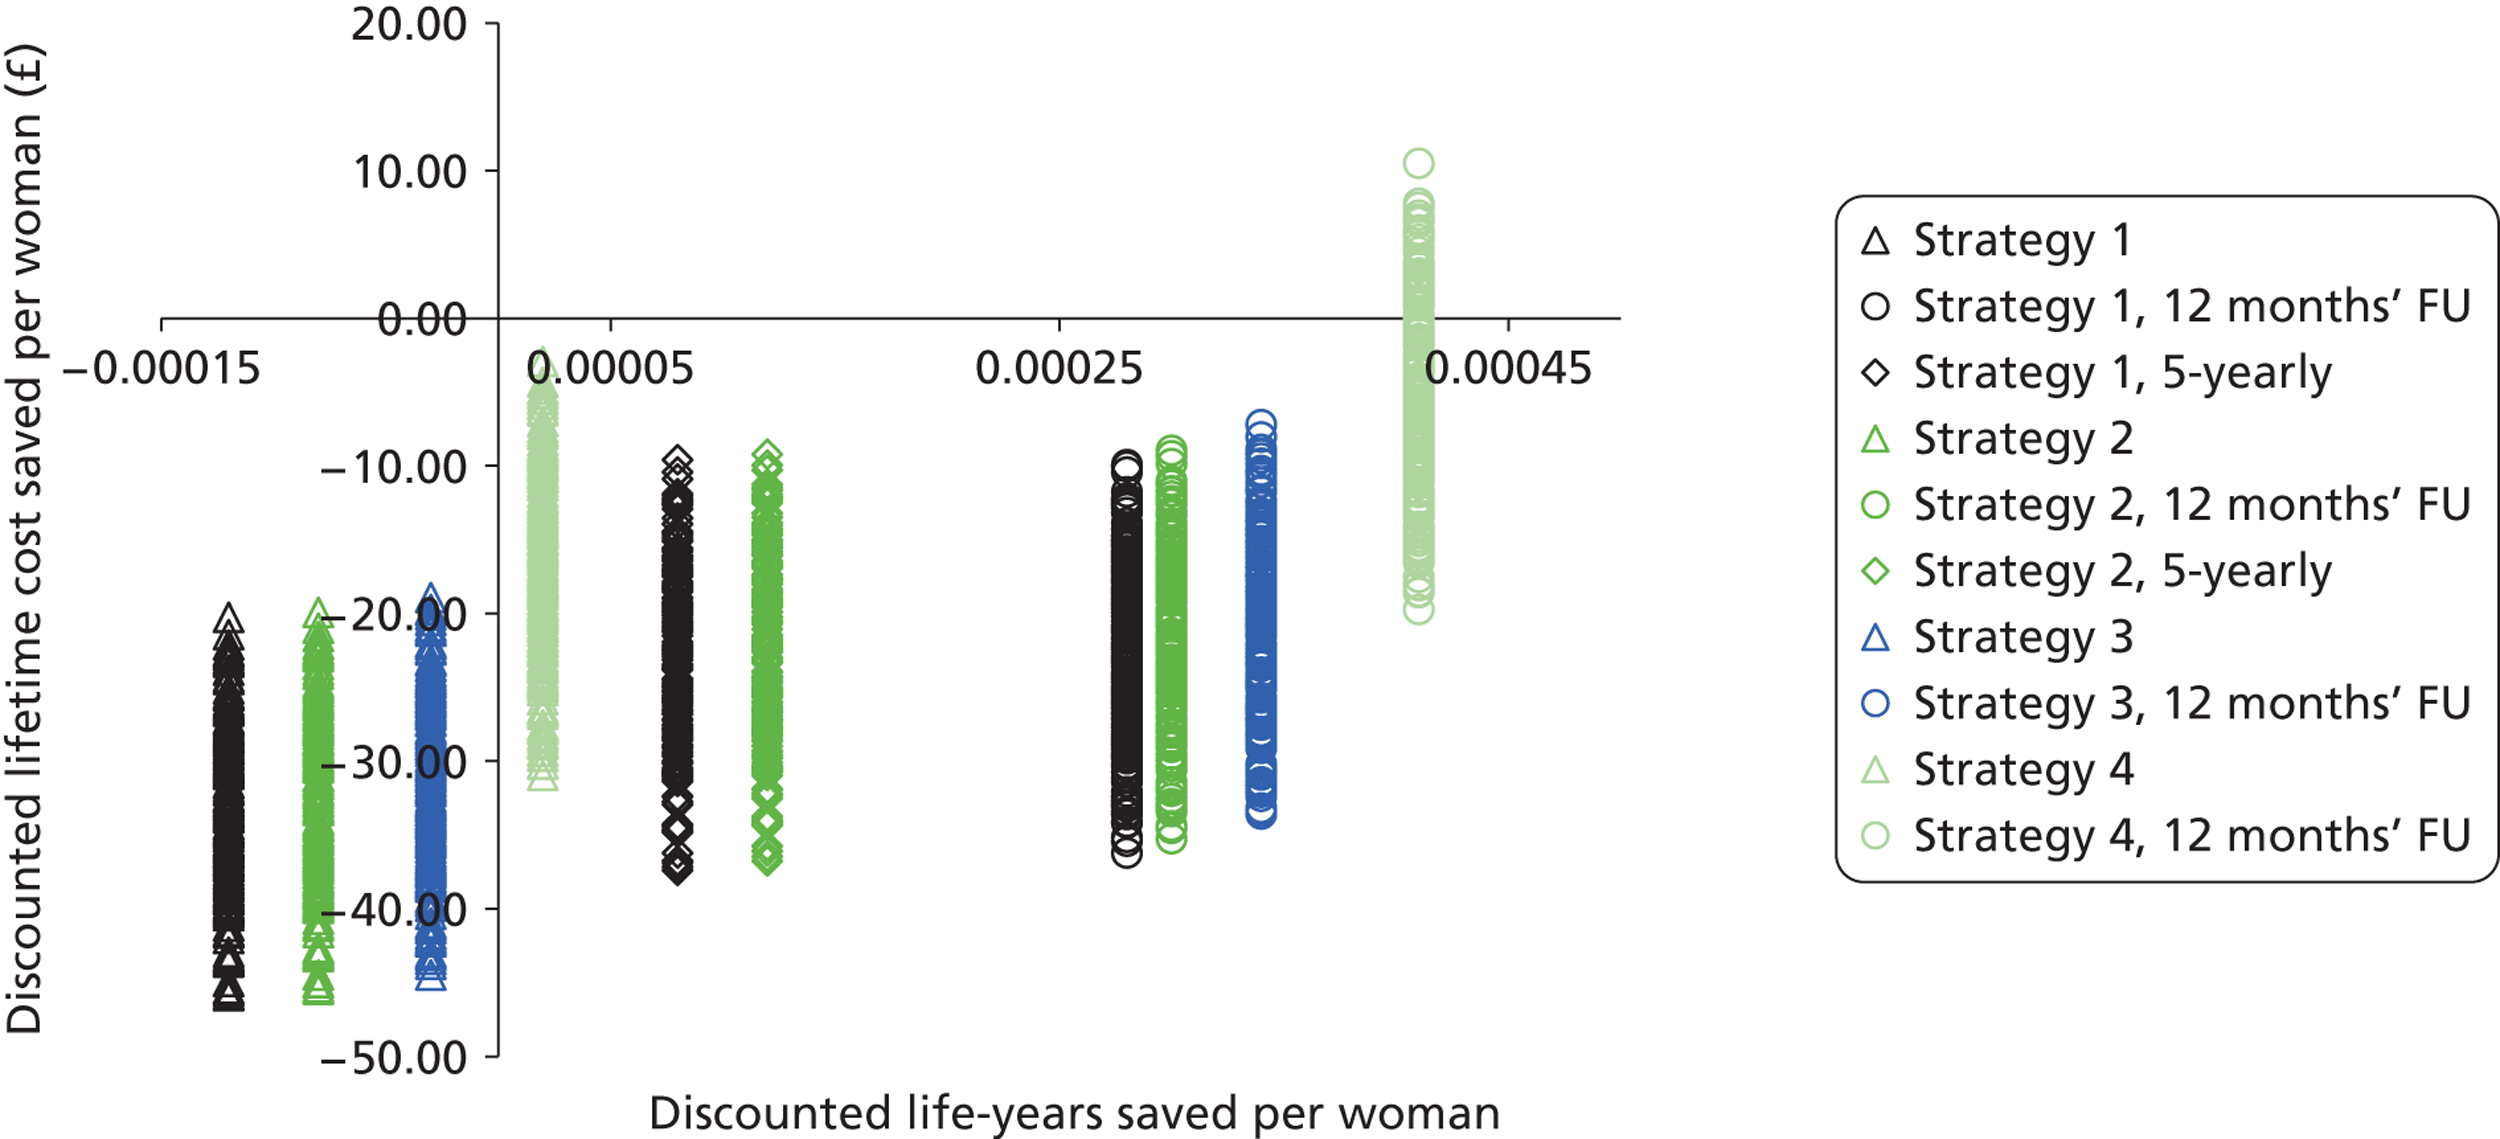
Probabilistic sensitivity analysis for sexual behaviour assumptions
A PSA was conducted to examine the impact of the detailed sexual behaviour assumptions used by the model. This is because, as described in Appendix 16, the NATSAL II data were reported in such a way that there were a range of possible values identified for the parameters directly input to the model. A total of 200 model input parameter sets were identified which fulfilled two criteria: (i) the predicted HPV prevalence was consistent with the prevalence observed in the ARTISTIC trial (i.e. within 95% CI of observed data at most ages), and (ii) the partnership assumptions were consistent with the findings of the NATSAL 2000 survey. These model input sets were included in a PSA for the main strategies S1, S2, S3 and S4 to identify any effect of sexual behaviour assumptions on the main findings of the analysis.
The predicted HPV prevalence for unvaccinated women for the fitted model input sets are shown in Figure 65. The findings of the PSA for each of the strategies are shown in Figure 66 for unvaccinated cohorts. These results indicate that variations in sexual behaviour assumptions do not substantially alter the predicted lifetime cost saved and life-years saved associated with the primary HPV screening strategies, or the relative costs and effects of the main strategies in relation to each other.
FIGURE 65.
Human papillomavirus prevalence predicted by scenario assessed in the PSA on sexual behaviour assumptions.
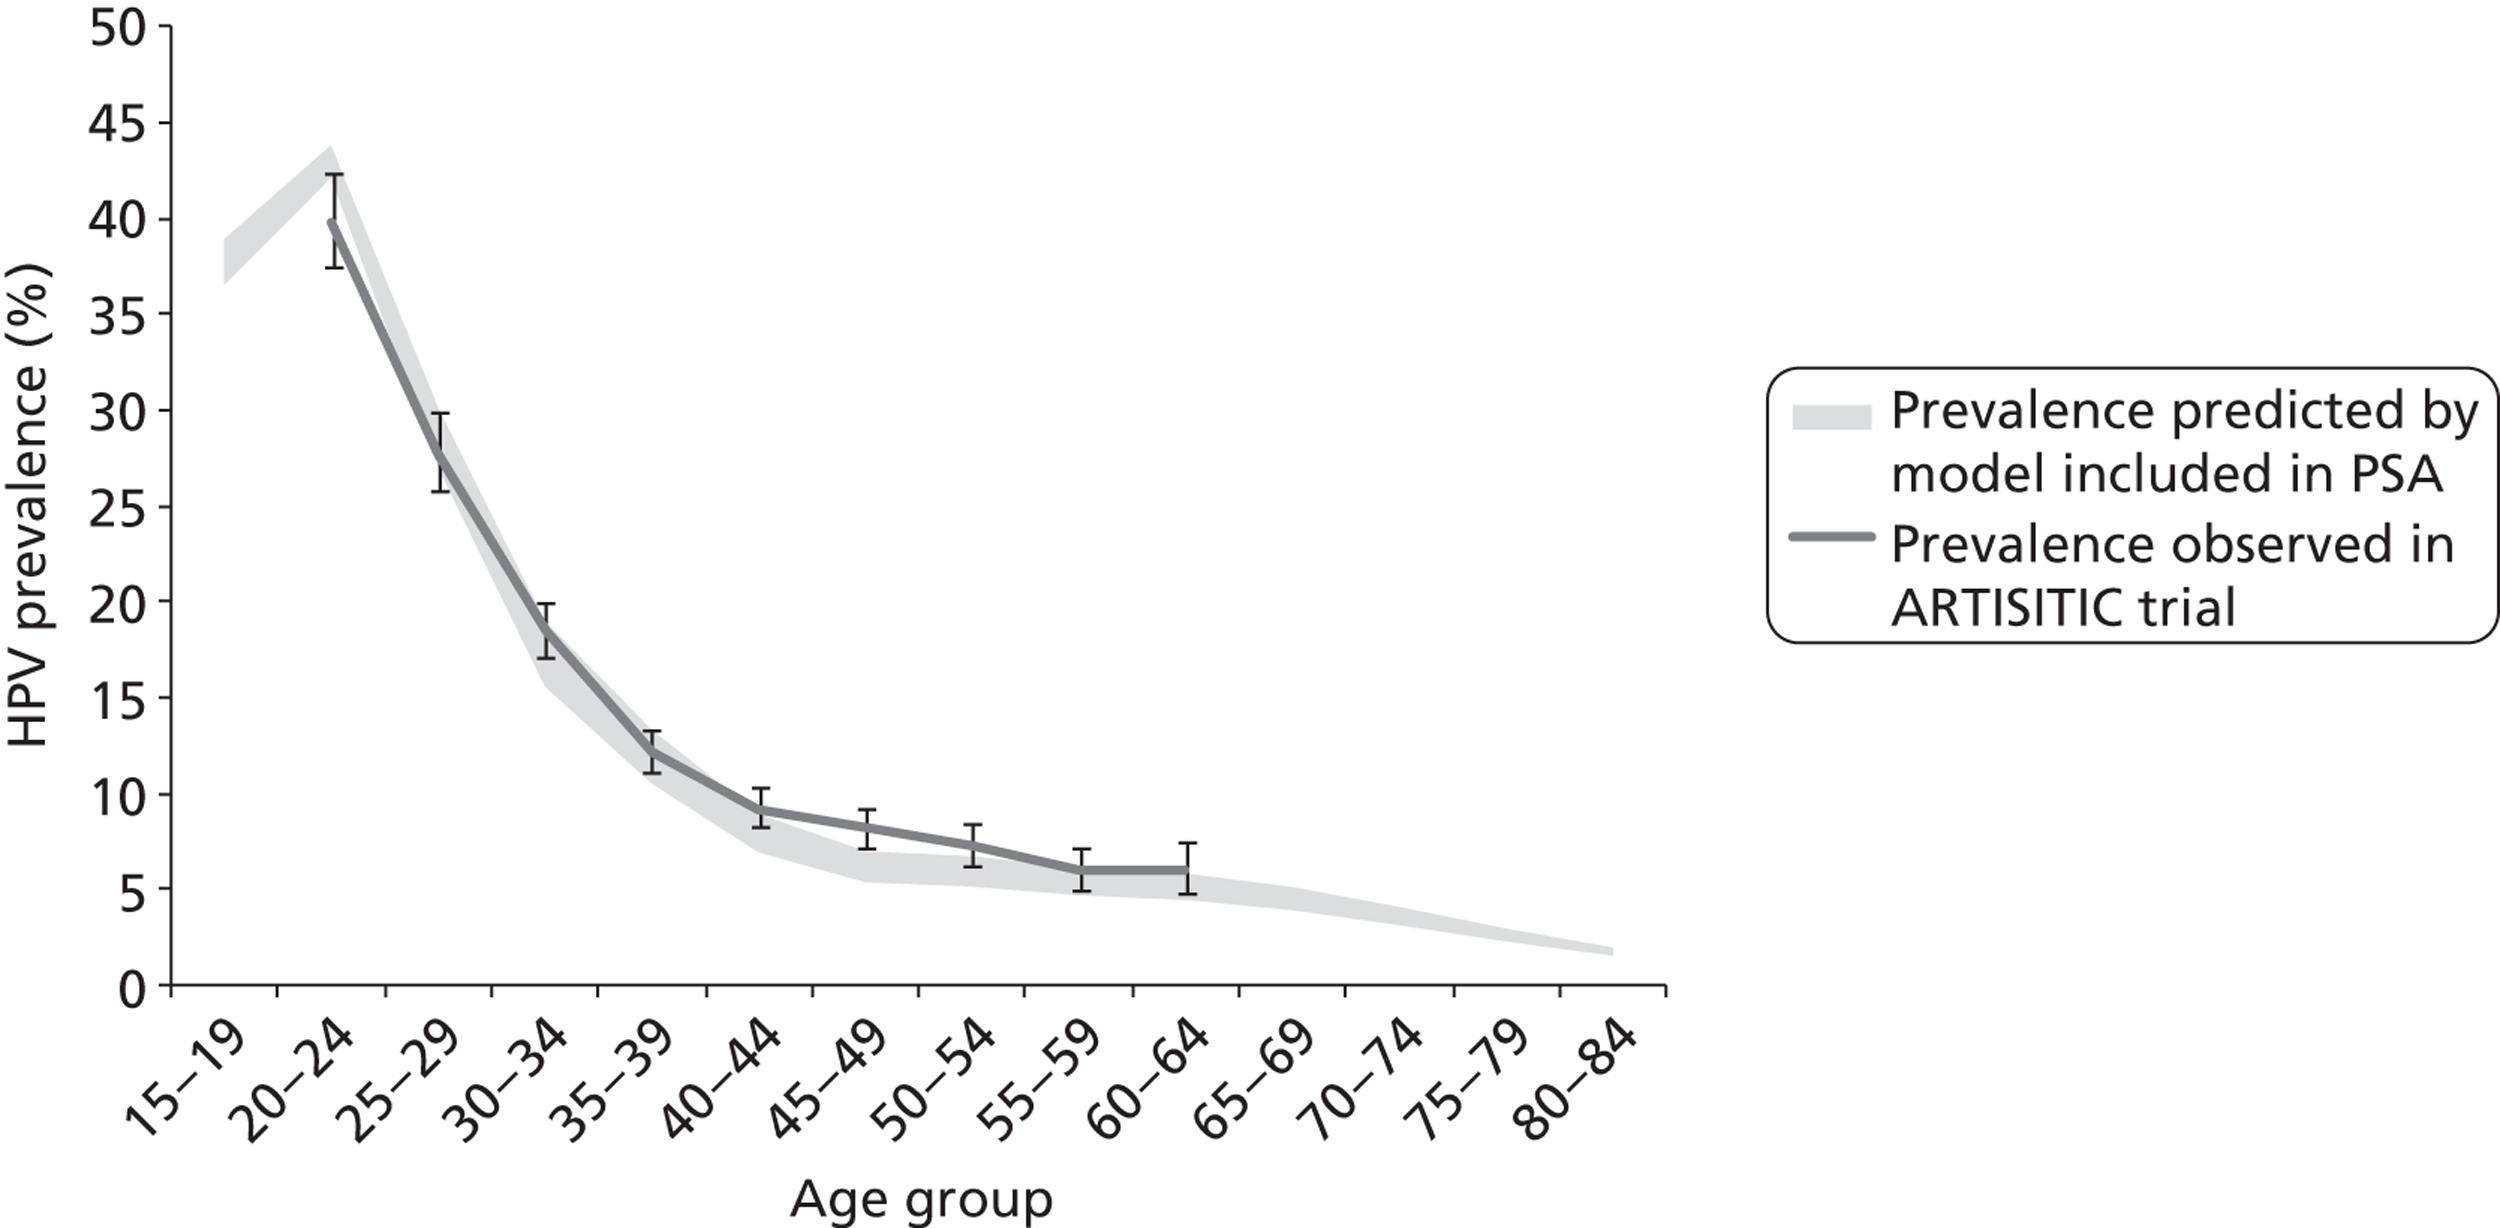
FIGURE 66.
Probabilistic sensitivity analysis on sexual behaviour assumptions in an unvaccinated population. The discounted lifetime cost and life-years associated with current screening practice was used as the comparator.
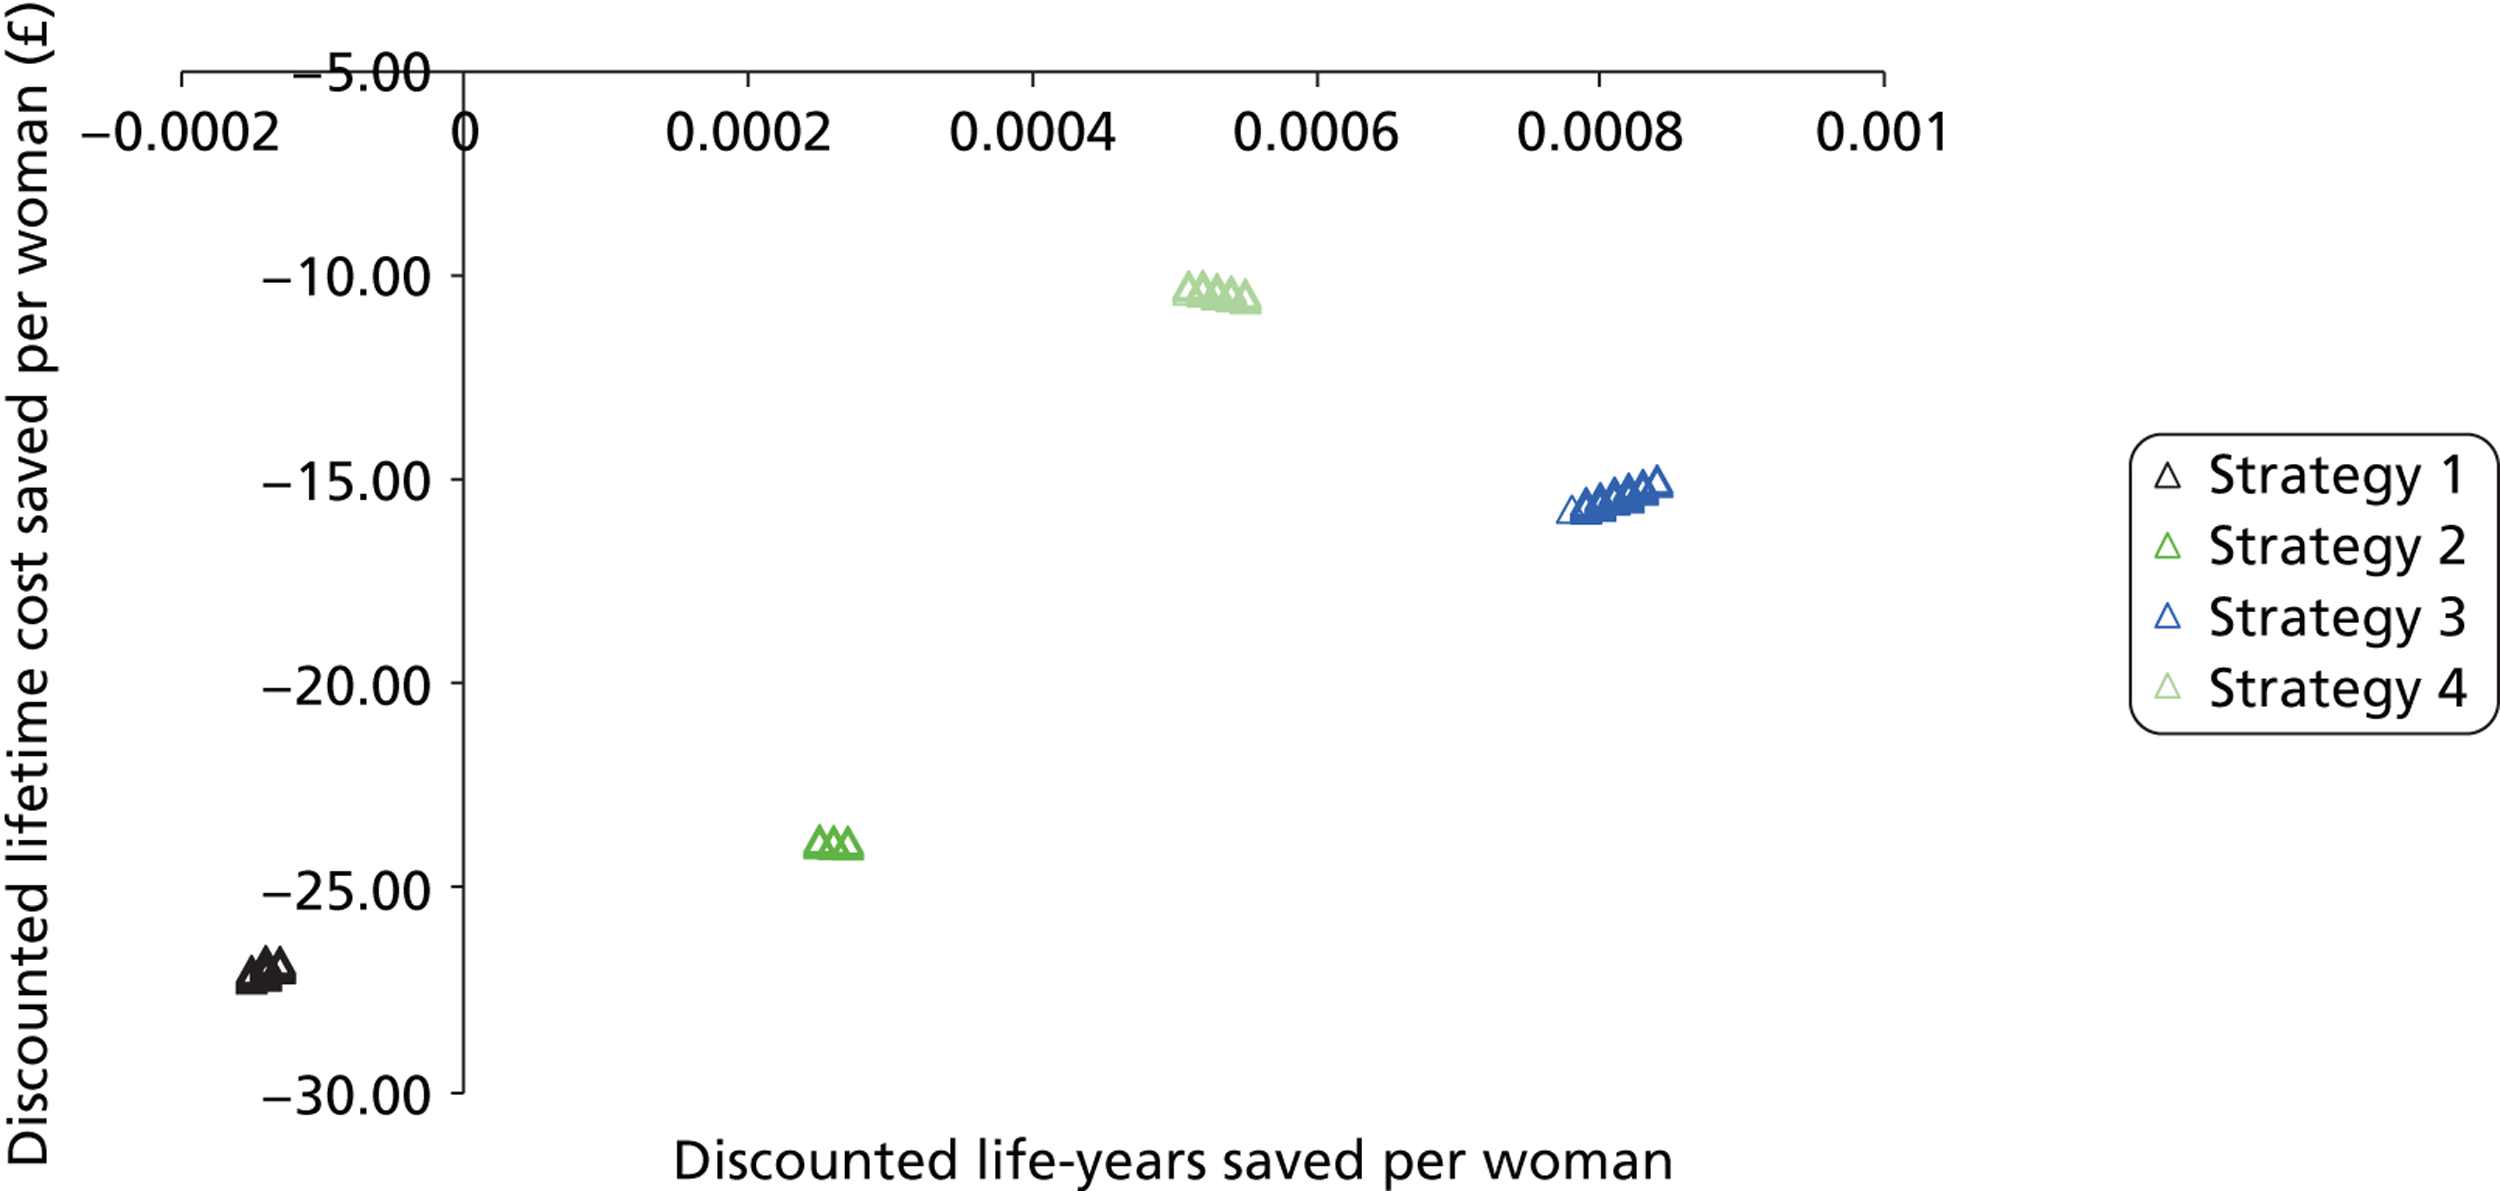
Appendix 18 Model predictions of the ARTISTIC trial
In this appendix, we present model outputs for predictions of the number of CIN cases by age group. Figure 67 shows the number of histology-detected CIN2+ cases for each age group and each trial arm. The results are presented as a percentage of the total number of women who entered the trial in the corresponding age group and trial arm for both the model (solid green diamonds) and the ARTISTIC trial (hollow blue squares). The horizontal axis shows the time since first screen in the trial, so that women are all synchronised at time 0. Across all age groups, we observed that in the first 6 months, there are a large number of histologically detected CIN2+ cases, reflecting the screening and follow-up of the bulk of women. There is a drop in the number of detected CIN2+ cases at 12 months, a second increase at 18 months, and then the observed CIN2+ cases smoothed out as the trial continued. The first spike in CIN2+ cases at 6 months was likely due to the fact that all women who entered the trial attended screening upon entry into the trial (screening is ‘synchronised’ at baseline), and women who have a high grade upon entry will have a colposcopy within 6 months of their first screen. Women who tested mild/borderline are recommended to return for a follow-up test in 6 months. However, many do not return until 12 months, and those who are referred for colposcopy at this time may take another 6 months to attend. Thus, the second ‘spike’ at 18 months likely represents women who were referred for colposcopy at their follow-up screen. The rate at which women attended colposcopy stabilised later during follow-up.
The model results compared well with the ARTISTIC data. Both the model and the data exhibited the same features, with a spike in the number of CIN2+ cases at 6 and 18 months after the initiation of the simulation. The number of observed CIN2+ cases smoothed out and decreased at later times in both the model results and the observed data. It is particularly encouraging because the results were being compared at 6-monthly intervals, indicating that the model is accurately capturing events on relatively small timescales. We also note that the good comparison between the model results and the ARTISTIC data during later times in the trial provides a high level of confidence that the natural history model is capturing the true prevalence of CIN2+ in the population.
FIGURE 67.
CIN2+ cases expressed as a percentage of the total number of women who entered the trial in the corresponding trial arm and age group. The model results are shown as the solid green diamonds and the data are shown as the hollow blue squares. The value ‘n = ‘ in each graph represents the number of women who entered the trial in the respective age group and trial arm.


Histology detected CIN2+ cases: modelled versus observed
CIN2+ cases by rounds
As the model produced outputs in 6-monthly intervals, there was not a direct relationship between the round definitions used in ARTISTIC reports and the model time steps. We therefore processed the model output to produce results on CIN2+ cases by round, in a process analogous to the original analysis of trial data. The output has been processed to best match the definition of a round from the ARTISTIC trial reports.
FIGURE 68.
The number of histologically detected CIN2+ cases by round and by age group for the concealed arm (a) and the revealed arm (b) of the trial. The model output is shown as the solid green diamonds and the ARTISTIC data are presented as the hollow blue diamonds. Lines are drawn through consecutive data points. Bars on the ARTISTIC data points (hollow blue diamonds) represent ± 95% CIs.


FIGURE 69.
The number of ‘< CIN2’ cases expressed as a percentage of the starting number of women in the corresponding age group and trial arm. The model results are shown as the solid green diamonds and the data are shown as the hollow blue squares. Each point represents the number of ‘< CIN2’ histology results that occurred in that 6-monthly interval. The value ‘n = ‘ in each graph represents the number of women who entered the trial in the respective age group and trial arm.


Histology-detected < CIN2 cases
The model results compared reasonably well with the data, implying that the natural history model is capturing the prevalence of low-grade cervical abnormalities. The comparison also indicated that the model is capturing the rate at which women return for follow-up colposcopies after a histology of < CIN2. For each age group and trial arm, there is an initial ‘spike’ in the number of detected cases at 6 months, followed by a drop in the number of detected cases and then another increase at 18 months. These features were observed when we considered the number of CIN2+ cases at 6-monthly intervals in Figure 67. As with the results for the number of CIN2+ cases, the first spike in the number of detected cases likely represents the number of women who tested high grade on their first screen and attended colposcopy within 6 months. The second spike at 18 months captures women who were referred for colposcopy after their follow-up screen. After about 42 months, the rate of women attending colposcopy plateaus, a feature we also observed when considering the number of CIN2+ cases.
Overall, the model results compared well with the ARTISTIC data throughout the trial and the number of ‘< CIN 2’ cases detected by the model compared well with the number of cases as detected in the trial. For older women (ages 40–49 years and 50–64 years), the model underestimated the number of cases detected when compared with the data for the first 36–42 months of the trial (particularly in the concealed arm of the trial), although the model results compared well with the data at later times in the trial.
Appendix 19 Guidelines for the economic analysis
There are several checklists available to ensure that a thorough and accurate economic analysis has been performed. We chose to use the guide on health economic modelling as described in Rudmik and Drummond,53 and also the ISPOR guidelines for modelling as described in Caro et al. 68
Drummond checklist
We have evaluated our work against the Drummond checklist,69 which we provide in Table 95.
| 1. Was a well-defined question posed in answerable form? |
|
|
|
| 2. Was a comprehensive description of the competing alternatives given (i.e. can you tell who did what to whom, where, and how often)? |
|
|
| 3. Was the effectiveness of the programme or services established? |
|
|
All targets related to screening outcomes (e.g. histological-detected disease) would have the potential to show bias if they were treated as natural history states. However, we avoided this problem by explicitly modelling the screening attendance, screening and diagnostic test accuracy and the underlying HPV infections and CIN prevalence (by modelling the sexual behaviour in England and the natural history) |
| 4. Were all the important and relevant costs and consequences for each alternative identified? |
For the comparator and each alternative strategy included in the evaluation, the model predicts the annual cervical screening associated programme cost and resource utilisation in England as well as the discounted cost and effectiveness per woman in England. These findings can inform the policy-maker on the strengths and limitations of the large number of primary HPV screening strategies considered, while taking into account local preferences and limitations |
|
All costs were allocated on a per-woman basis as appropriate to the scope of the evaluation, which was the entire NHS Cervical Screening Programme. For example, the HPV test cost was allocated based on a survey of HPV providers and considered to be the cost of the test provision by the laboratory of the programme. This cost includes components involving capital cost to the laboratory as part of the test cost. Therefore, our approach is appropriate |
| 5. Were costs and consequences measured accurately in appropriate physical units (e.g. hours of nursing time, number of physician visits, lost work-days, gained life years)? |
|
|
| 6. Were the cost and consequences valued credibly? |
|
HPV primary screening tests were evaluated according to manufacturer-obtained costs. All costs were presented in pounds as at financial year 2010 |
|
However, the cost–utility analysis using QALYs was found to be sensitive to the QALY weights assumptions and findings varied greatly when using different QALY weight assumptions. Due to the uncertainties associated with the QALY weights assumptions and because there is a paucity of data to inform the choice of QALY weights (health-state utilities) for HPV testing when it is used as primary screening test and for the subsequent referral and management process, the primary outcome for the study was considered to be life-years saved. This is appropriate to the analysis performed and takes into account the availability of relevant data |
| 7. Were costs and consequences adjusted for differential timing? |
|
|
| 8. Was an incremental analysis of costs and consequences of alternatives performed? |
|
| 9. Was allowance made for uncertainty in the estimates of costs and consequences? |
|
The parameters included in one-way sensitivity analyses were the relative test performance of cytology and HPV, colposcopy test accuracy, inadequate rate of cytology and HPV test, compliance rate to routine screening recommendations, colposcopy referral and follow-up referral, management of women who do not comply with colposcopy referral, proportion of HPV 16/18 infections among all type HPV infections in the population and the aggressiveness of disease natural history assumptions. The range of the cytology and HPV test characteristics were informed by literature review as described in the report. Details of the other parameters included in one-way sensitivity analysis are provided in Appendix 10–12 The model assumptions on the baseline and range for screening associated cost assumptions were based on the findings of LBC/HPV pilot study and MAVARIC study. The unit cost of HPV testing used for primary HPV testing and genotyping were assumed to be the average of four HPV test manufacturers. The baseline and range assumed for the diagnostic, precancerous treatment and cancer treatment cost were obtained from Martin-Hirsch et al.35 and Sherlaw-Johnson et al.36 All cost data were inflated to 2010 financial year value and details are provided in Appendix 13. The range of values used is justified in the report A probabilistic sensitivity analysis was on a range of feasible sexual behaviour assumptions also conducted in this evaluation. We conducted a separate modelling exercise to seek for sexual behaviour model input assumptions that are consistent with the findings of NATSAL II survey and that the predicted HPV prevalence based on that sexual behaviour assumption is consistent with the ARTISTIC trial findings. Thus, the range of assumptions included in the sensitivity analysis was justified. This exercise resulted a set of assumptions fitted with these two targets and were used for the probabilistic analysis. Details of the method used to generate the sexual behaviour model inputs assumptions were described in Appendix 16 |
Excluding strategy 4 (co-testing) and its variants, all primary HPV testing strategies were found to be cost saving compared with current practice under all sets of cost assumptions and strategy variants considered in the vaccinated cohort. In unvaccinated cohorts, S2 and S3 (and S4) with 12 months’ follow-up of HPV-positive, triage-negative women were found to be more costly than current practice under some, but not all, sets of cost assumptions (very few sets of assumptions for S2) Other parameters in the one-way sensitivity analysis, and sexual behaviour assumptions included in the probabilistic sensitivity analysis, were found to have marginal impact on the model predicted outcome within the assumed ranges included for the analyses More details of the sensitivity analyses findings are described in Appendix 17 |
| 10. Did the presentation and discussion of study results
include all issues of concern to users? The presentation and discussion of study results considered a range of issues of concern to users including predicted health outcomes, resource utilisation, life-years and QALYs saved, costs (including overall costs), practicalities and a discussion of the results in both unvaccinated and vaccinated cohorts. Therefore, we believe that the major issues of concern to users were addressed in this extensive report |
The index was interpreted with the presentation of disaggregated results and extensive discussion of the findings relevant to the evaluation. See the scientific summary for an overview |
We were also unable to identify any equivalently detailed evaluations that took into account the effect of HPV vaccination as detailed in this report |
|
|
|
Appendix 20 Standard checklist for reporting studies of diagnostic accuracy
| Section and topic | Item no. | On page no. | |
|---|---|---|---|
| TITLE/ABSTRACT/KEYWORDS | 1 | Identify the article as a study of diagnostic accuracy (recommend MeSH heading ‘sensitivity and specificity’) | vii |
| INTRODUCTION | 2 | State the research questions or study aims, such as estimating diagnostic accuracy or comparing accuracy between tests or across participant groups | 1 |
| METHODS | |||
| Participants | 3 | The study population: the inclusion and exclusion criteria, setting and locations where data were collected | 5 |
| 4 | Participant recruitment: was recruitment based on presenting symptoms, results from previous tests, or the fact that the participants had received the index tests or the reference standard? | 5, 6 | |
| 5 | Participant sampling: was the study population a consecutive series of participants defined by the selection criteria in items 3 and 4? If not, specify how participants were further selected | 5, 6 | |
| 6 | Data collection: was data collection planned before the index test and reference standard were performed (prospective study) or after (retrospective study)? | 10 | |
| Test methods | 7 | The reference standard and its rationale | 5 |
| 8 | Technical specifications of material and methods involved including how and when measurements were taken, and/or cite references for index tests and reference standard | 11, 12 | |
| 9 | Definition of and rationale for the units, cut-offs and/or categories of the results of the index tests and the reference standard | 11, 12 | |
| 10 | The number, training and expertise of the persons executing and reading the index tests and the reference standard | 5, 8 | |
| 11 | Whether or not the readers of the index tests and reference standard were blind (masked) to the results of the other test and describe any other clinical information available to the readers | 8 | |
| Statistical methods | 12 | Methods for calculating or comparing measures of diagnostic accuracy, and the statistical methods used to quantify uncertainty (e.g. 95% confidence intervals) | 10 |
| 13 | Methods for calculating test reproducibility, if done | N/A | |
| RESULTS | |||
| Participants | 14 | When study was performed, including beginning and end dates of recruitment | 25 |
| 15 | Clinical and demographic characteristics of the study population (at least information on age, gender, spectrum of presenting symptoms) | 28 | |
| 16 | The number of participants satisfying the criteria for inclusion who did or did not undergo the index tests and/or the reference standard; describe why participants failed to undergo either test (a flow diagram is strongly recommended) | 28 | |
| Test results | 17 | Time-interval between the index tests and the reference standard, and any treatment administered in between | 28 |
| 18 | Distribution of severity of disease (define criteria) in those with the target condition; other diagnoses in participants without the target condition | 25–30 | |
| 19 | A cross tabulation of the results of the index tests (including indeterminate and missing results) by the results of the reference standard; for continuous results, the distribution of the test results by the results of the reference standard | 25–87 | |
| 20 | Any adverse events from performing the index tests or the reference standard | N/A | |
| Estimates | 21 | Estimates of diagnostic accuracy and measures of statistical uncertainty (e.g. 95% confidence intervals) | 10 |
| 22 | How indeterminate results, missing data and outliers of the index tests were handled | 10 | |
| 23 | Estimates of variability of diagnostic accuracy between subgroups of participants, readers or centres, if done | N/A | |
| 24 | Estimates of test reproducibility, if done | N/A | |
| DISCUSSION | 25 | Discuss the clinical applicability of the study findings | 89–95 |
List of abbreviations
- ARTISTIC
- A Randomised Trial In Screening To Improve Cytology
- CI
- confidence interval
- CIN
- cervical intraepithelial neoplasia
- CIN2+
- (any lesion of) CIN grade 2 or worse
- CIN3+
- (any lesion of) CIN grade 3 or worse
- CONSORT
- Consolidated Standards of Reporting Trials
- DNA
- deoxyribonucleic acid
- FIGO
- International Federation of Gynaecology and Obstetrics
- GP
- general practitioner
- HC2
- Hybrid Capture 2
- HCHS
- Hospital and Community Health Service
- HPV
- human papillomavirus
- HR
- high-risk (HPV type)
- HTA
- Health Technology Assessment
- LA
- Linear Array®
- LBA
- Line Blot Assay®
- LBC
- liquid-based cytology
- LLETZ
- large loop excision of the transformation zone
- NATSAL
- National Survey of Sexual Attitudes and Lifestyles
- NHSCSP
- National Health Service Cervical Screening Programme
- OR
- odds ratio
- PCR
- polymerase chain reaction
- PPV
- positive predictive value
- PSA
- probabilistic sensitivity analysis
- QA
- quality assurance
- QALY
- quality-adjusted life-year
- RLU
- relative light unit
- RLU/Co
- relative light unit/mean control
- TPM
- test probability matrix
