Notes
Article history
The research reported in this issue of the journal was funded by the HTA programme as project number 09/22/46. The contractual start date was in November 2010. The draft report began editorial review in April 2013 and was accepted for publication in February 2014. The authors have been wholly responsible for all data collection, analysis and interpretation, and for writing up their work. The HTA editors and publisher have tried to ensure the accuracy of the authors’ report and would like to thank the reviewers for their constructive comments on the draft document. However, they do not accept liability for damages or losses arising from material published in this report.
Declared competing interests of authors
Simon Gilbody is a member of the HTA CET Commissioning Board.
Notes
The correlation matrix is available following application to the authors. This provides the bivariate correlations for the entire data set.
Permissions
Copyright statement
© Queen’s Printer and Controller of HMSO 2014. This work was produced by Horton et al. under the terms of a commissioning contract issued by the Secretary of State for Health. This issue may be freely reproduced for the purposes of private research and study and extracts (or indeed, the full report) may be included in professional journals provided that suitable acknowledgement is made and the reproduction is not associated with any form of advertising. Applications for commercial reproduction should be addressed to: NIHR Journals Library, National Institute for Health Research, Evaluation, Trials and Studies Coordinating Centre, Alpha House, University of Southampton Science Park, Southampton SO16 7NS, UK.
Chapter 1 Background
Introduction
Self-harm definition
Self-harm is known by many different names and has been defined in a number of different ways. These include the following definitions:
The term self-harm covers a spectrum of behaviour. The most serious forms relate closely to suicide, while behaviours at the milder end of the spectrum merge with other reactions to emotional pain.
Skegg, 20051
. . . the deliberate destruction or alteration of body tissue without conscious suicidal intent.
Favazza, 19892
Self-injury is a behaviour that involves deliberately injuring one’s own body, without suicidal intent and with or without pain.
Duffy, 20063
. . . self-poisoning or self-injury, irrespective of the apparent purpose of the act.
NICE, 20044
From these differing definitions, it is apparent that there is a lack of consistency in how self-harm is defined. This confusion increases with the introduction of the multiple names by which the concept of self-harm is known. The phenomenon of self-harm is also known as self-injury, self-injurious behaviour, self-mutilation, deliberate self-harm, deliberate self-injury, non-suicidal self-injury, self-cutting, self-mutilative behaviour and parasuicide. Some of these names refer to a narrower definition than others, but generally they all refer to the notion of a self-harm event, regardless of the intent and motivation. However, self-harm is also often associated with suicide, and the following names are often used in situations in which the final outcome of death is seen as the primary motivating factor: suicide attempt, suicidal behaviour, suicidal gesture and suicide ideation (parasuicide may also be included in this list).
It has been recognised5 that the terms used to describe self-harm could be harmonised, as the variety of different names and terminology creates confusion regarding which specific construct is under investigation. 6,7 It has also been stated that part of the difficulty in understanding self-harm is the result of the multiple terms used to describe the behaviour,8 and the confusion surrounding whether or not self-harm represents a suicide attempt. 9 Nock and Prinstein10 stated that a broad classification of self-harming behaviours includes actions ranging from stereotypic skin-rubbing to completed suicide. This corresponds with the view of Skegg,1 who contended that the term ‘self-harm’ covers a spectrum of behaviour. It has, however, been suggested that attempted and completed suicides should be treated as aetiologically distinct from self-harm. 11,12 Messer and Fremouw5 have pointed out that the lack of distinction between those who are attempting suicide and those who are mutilating with no intent to die is particularly concerning. It is suggested that differentiating between these two groups is key when examining functions or explanations of the behaviour. This may improve how research is interpreted and prevent confounding results and obscuring relevant findings. 5,7
In contrast to the above perspective, Lohner and Konrad12 reported that some consider both of these phenomena to be on a continuum of lethality, and they consider any differentiation to be irrelevant, confusing and possibly even dangerous. 13,14 Messer and Fremouw5 recognised that matters are further complicated by the findings that self-harmers are at greater risk of attempted suicide and suicidal thoughts and are more likely to have a history of suicide attempts. 8,15 This supports the previous finding that approximately 55–85% of self-mutilators have a history of at least one suicide attempt. 16 A strong statistical connection between self-harm and subsequent suicide has also been reported, and it has been estimated that around one-quarter of suicides are preceded by self-harm in the previous year. 17,18
Although self-harm and suicide attempt may be separated by the motivational intent, this may be irrelevant to the primary care teams and authorities that are charged with dealing with any sort of self-harming behaviour, regardless of the prior motivating factor. This view is supported by Lanes,19 who stated that it is important to note that self-harmers generally distinguish between self-harm and genuine suicidal intent, but this does not qualify as a basis for judging the potential outcome of threatened or enacted self-harm. Despite the motivational and aetiological differences between self-harming and suicide attempts, as the final outcome is likely to be similar in terms of treatment cost and impact, it may make sense, from a public health-care commissioning perspective, to group all self-harm behaviours together, regardless of the intent.
Considering the public health implications that are present in the prison setting of this study, the definition of self-harm provided by the National Institute for Health and Care Excellence (NICE)4 may potentially be the most appropriate; here, it is described as self-poisoning or self-injury, irrespective of the apparent purpose of the act.
This definition is all inclusive and, thus, relates more closely to epidemiological outcome events. However, given the strength of the arguments for separation of the phenomena of self-harm and suicide attempt, research in this area may be problematic, as epidemiological outcome event statistics may not distinguish between the two without a degree of more in-depth information being available.
Self-harm in the community
The best current UK estimate of hospital attendance as a result of self-harm is 400 per 100,000 hospital attendances (0.4% of all hospital attendance). 20 The current incidence of self-harm is estimated at between 300 and 600 cases per 100,000 per year. 21,22 Despite difficulties in diagnostic classification, self-harm is one of the commonest reasons for admission to a medical ward, with around 200,000 hospital attendances per year in the UK, with the majority of these cases (80%) involving self-poisoning. 23 However, it is widely recognised that prevalence rates of self-harm behaviour in the general population are difficult to estimate given that the self-harm may go unreported and not result in a hospital attendance. 17,23,24 Among the general population (who do not routinely present at accident and emergency), physical self-harm is more common, with cutting being the most common form. 25
Prevalence and incidence estimates are likely to be affected by the different classifications and terminology used when quantifying self-harm, along with what is judged to be a meaningful history of self-harm. Depending on classifications, self-harm behaviours may range from lip chewing or lightly biting the inside of the mouth, right through to a genuine suicide attempt. These behaviours are difficult to quantify, and a direct comparison of estimates would also require the definitions of self-harm to be explicitly stated and to remain consistent between studies. With this in mind, the prevalence of reported self-harm is highly variable. Jacobson and Gould26 reviewed eight studies, two involving adults and six involving adolescents (broadly defined as ‘mainly high school students’), and reported varying 12-month prevalence rates of 2.5–12.5% and lifetime prevalence rates of 13.0–23.2%. Muehlenkamp and Gutierrez8 reported that estimates of self-injurious behaviour among adolescents range from 5.1% to over 40%, and Skegg1 stated that 5–9% of adolescents in western countries report having self-harmed within the previous year, with lifetime prevalence ranging from 13% to 30%. It has also been reported27 that self-harm occurs in 4% of the general population28 and 14% of college students. 29 Furthermore, Gratz7 reported that 35% of college students have carried out at least one self-harm behaviour in their lifetime. Along with the issue of differing self-harm definitions, limitations may also be present in these estimates because of sampling biases and interview methods.
Large surveys suggest that 4.6% of the population in the USA and 4.4% in the UK have self-harmed. 23 These results are similar to those of Meltzer et al. ,30 who reported that 14.9% of respondents in a national survey had contemplated suicide at some point in their life and that 4.4% of respondents had actually attempted suicide at some point in their life. In all, 2% of all respondents stated that they had deliberately harmed themselves without suicidal intent. This was a large, national (UK) study involving a representative sample (n = 8450) and should, therefore, provide a fair representation of the adult population (aged 16–74 years). It should be noted, however, that these results are based on a single self-harm question; therefore, an element of subjective judgement may be present, along with the recall bias limitations of retrospective studies.
Characteristics of self-harmers
While self-harm can be found across the entire population, it is more common among those who are socioeconomically disadvantaged and those who have limited social support. 30 Those with mental health disorders are 20 times more likely to report having harmed themselves. 30 Among respondents who had reported a lifetime prevalence of self-harm, 57% were categorised as having a neurotic disorder, 6% as having a psychotic disorder, 24% as alcohol dependent and 16% as drug dependent. 30
Self-harm in prisons
Given the increased prevalence of self-harm in those from socioeconomically disadvantaged areas, and in those with mental health problems, it is not surprising that self-harm presents a significant problem within prisons. 31 Self-harm in prison custody is defined as ‘any act where a prisoner deliberately harms themselves irrespective of the method, intent or severity of any injury’. 32 This definition corresponds to the NICE4 definition mentioned previously. The use of this definition in the prison setting is supported by Lanes. 19 He points out, with reference to the different perspectives on self-harm described above, that in the prison setting the distinction between self-harm and suicide attempt is unlikely to be useful in terms of overall management of the prisoner given that prison authorities are ultimately concerned with preventing both suicides and self-harm events. 33
Within offender populations, certain groups are recognised to be at greater risk of self-harm, including those who are psychiatrically ill, those with long sentences and ‘poor copers’, who are defined as acutely vulnerable prisoners whose major problems are unrelated to psychiatric illness or the nature of their offence. 34 ‘Poor copers’ tend to be young offenders (under 26 years) who have committed acquisitive crimes and have a poor ability to cope with being in prison. 35 Even controlling for the characteristics of a prison sample, rates of self-harm in prisons seem to be much higher than they are in the general population. 36
Self-harm incidence in prisons
There are differing estimates of self-harm incidence within offender populations and corrective institutions. Again, these differing estimates are possibly a result of the different definitions of a ‘self-harm event’. Appelbaum et al. 37 identified that published research has estimated that 30% of prisoners engage in self-harming behaviour. 38 In addition, 50% of female prisoners are stated to have a history of self-harm. 39 The proportion of prisoners engaging in self-harm in American prison systems during 2008 varied from 0.03% to 8.93% across prison systems, with an overall rate of 0.71%. 37 In marked contrast, the prevalence of self-harm behaviour among Greek male prisoners was reported to be 49.4%. 40 Potential reasons for this discrepancy include differing classifications of self-harm, differences in the samples (cultural, diagnostic, offender demographic, etc.) and differing modes of data collection. It may be worth noting that the Greek data40 were derived from face-to-face prisoner interviews, whereas the American prison system data37 were derived from recorded events within prison institutions.
Given this discrepancy in reported prevalence rates, it is important to note how self-harm data are gathered. In the UK, the most complete data are likely to come directly from the offender management statistics. 41 These statistics are published quarterly and are therefore likely to be the most up-to-date estimates that are available. Although there may be some deviation between individual institutions, these statistics relate to actual recorded self-harm events, so the classification of a ‘self-harm event’ is likely to be broadly consistent across all institutions. However, it should be noted that unreported and untreated self-harm events will not be accounted for.
The number of incidents of self-harm in UK prisons rose rapidly between 2003 and 2005. By 2005, there were 23,781 incidents of self-injury in UK prisons, rising from 16,393 incidents in 2003. This rise of 45% was over 11 times the rise in the overall UK prison population for the same period, which was just over 4%. Between 2005 and 2011, the incidence of self-harm in prisons seems to have largely stabilised (Figure 1). This stabilisation could be a result of the prison response to the previously observed rise.
FIGURE 1.
Changes in the overall UK prison population and the number of reported self-harm incidents 2003–11.
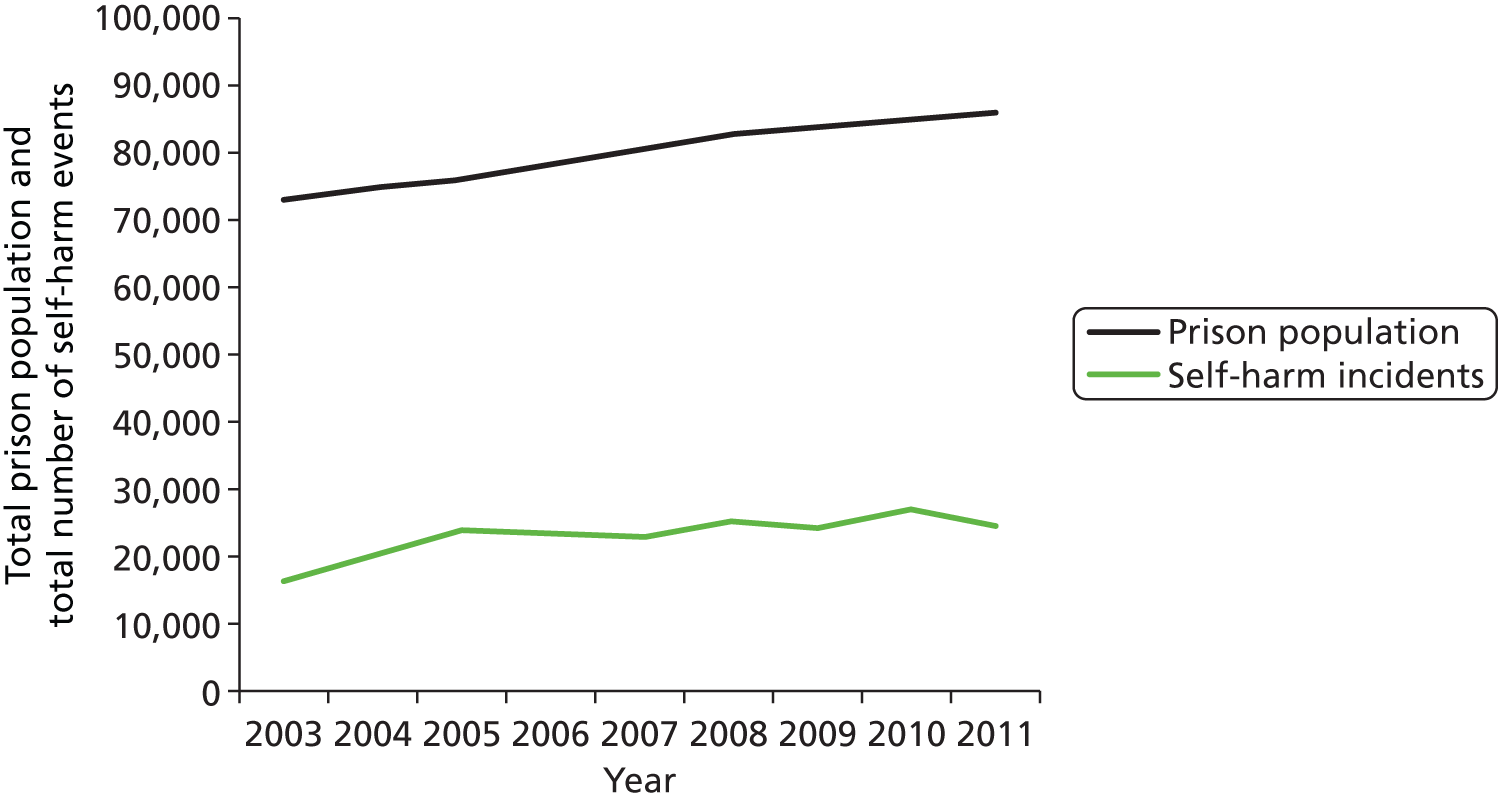
According to the Ministry of Justice,32 there were 24,648 incidents of self-harm reported in 2011, with roughly two-thirds of these attributed to the male inmate population. These self-harm events were carried out by 6854 individuals, with 82% of these being males.
An overall incidence rate cannot be accurately calculated because of the transient nature of prisoners within the system and the lack of statistics regarding the turnover of prisoners. However, using the average number of prisoners within the system in 2011 (85,951), the overall approximate yearly incidence of self-harm within prisons is 8%, with a rate of 6.9% for males and 29.4% for females. This equates to 194 self-harm incidents and 69 self-harming individuals per 1000 male prisoners, and 2104 self-harm incidents and 294 self-harming individuals per 1000 female prisoners. Among the individuals who self-harm, males report an average of 2.8 self-harm incidents per individual and females report an average of 7.1 self-harm incidents. Although prison turnover has not been taken into account, these values are approximately twice those reported in the Corston Report,42 in which it was stated that 16% of women self-harm in prison, compared with 3% of men.
Implications for the prison system
Self-harm can present a major challenge and place considerable demands on prison health-care systems,19 the responsibility for which resides with primary care trusts. In 2007, the prison service introduced a care-planning system called ACCT (Assessment, Care in Custody, and Teamwork)43 to improve care for prisoners at risk of suicide or self-harm. The ACCT process effectively establishes an assessment and care pathway system (CAREMAP) for those deemed to be at risk; however, it does not incorporate a standardised diagnostic test to estimate the risk of future self-harm.
There is some evidence to suggest that screening for psychiatric illness upon entry to prison can help to identify true cases of psychiatric illness. 44 This early indication of psychiatric illness is beneficial to prison staff in terms of prisoner management and, therefore, suggests that a screening process can be useful. However, the evidence to support the routine use of any screening instrument for self-harm in offender populations is limited. A recent review article45 assessed screening tools that have been used to assess the risk of suicide and self-harm in adult offenders. This review identified four screening instruments across five studies. Three of these instruments were specifically aimed at screening for suicide (or suicide risk) rather than self-harm (or risk of self-harm). Furthermore, two of the studies used retrospective methodology, which may result in non-comparable information between study participants. Limited evidence suggests that the Beck Hopelessness Scale (BHS)46 was predictive of self-harm among offenders with mental disorders. 47 Several other scales are available for assessing the risk of self-harm, for example the Self-Harm Inventory (SHI),48 but few have been validated for routine use in offender populations. A newer scale, Suicide Concerns for Offenders in Prison Environment (SCOPE),49 has been specifically developed to assess vulnerability to risk of suicide and non-fatal self-harm behaviour in young adult offenders but, again, has not been tested with regard to routine implementation in prisons, for those of older ages or for prospective predictive validity.
The limited evidence for the use of screening instruments for self-harm in prisons led Perry et al. 45 to conclude that ‘There is a clear need for additional psychometric research on the validity of suicide and self-harm behaviour screening tools in offender populations.’
Chapter 2 Design of the study
In response to the perceived need for screening instruments to identify the risk of self-harm among prisoners, we undertook a multistage prospective study to identify potential instruments and determine their predictive validity. The stages included a scoping exercise to identify candidate instruments, a pilot study to test the feasibility of a protocol to implement these instruments in a prison setting, a prospective cohort study to apply the instruments and identify subsequent self-harm over a specified follow-up period and various psychometric and multivariate analyses to determine the best (if any) predictive instrument, or set of items taken from the instruments.
Scoping exercise
Scoping method
There are many questionnaires available to assess and/or screen for self-harm, some of which relate specifically to self-harm behaviours (e.g. the SHI48) and some of which relate to other underlying correlates of self-harm such as depression [e.g. the Patient Health Questionnaire (PHQ)50]. Perry et al. 45 recognised that there are problems with the transferability of existing screening and assessment instruments to a prisoner population as a result of the unique environment in which prisoners are accommodated. Some instruments, however, have been explicitly designed for, or validated within, specific offender populations. 47–49
The first stage of the project involved a scoping exercise to systematically identify available instruments that could be used to screen for self-harm. A search was carried out with the Scopus database [encompassing MEDLINE, PsycINFO, Cumulative Index to Nursing and Allied Health Literature (CINAHL) and EMBASE], using appropriate search terms such as ‘self-harm’, ‘self-injury’, ‘suicide ideation’, ‘prison’, ‘jail’, ‘risk’, ‘questionnaire’ and ‘screen’. All journal article titles and abstracts were read for any mention of self-harm measurements or scales. This was followed up with a search of the grey literature (e.g. university theses, commissioning reports, etc.) and a related internet search.
Once the instruments were identified, a range of practical inclusion criteria had to be fulfilled prior to assessing the psychometric properties of the applicable scales according to a standardised protocol.
The practical inclusion criteria included the following:
-
The instrument must be able to be administered by generic primary care/prison/research staff who may not have had mental health or clinical training.
-
The instrument must be able to be administered orally by staff rather than self-administered (because of low literacy levels).
-
The instrument must be able to be administered without specialist training specific to the instrument, in line with the circumstances in which it would be administered on prison reception. This is also a practical point with regard to the implementation of the research project.
-
The instrument must not be specifically designed for administration after a self-harm event (people at risk may or may not have actually carried out an act of self-harm).
-
The instrument must comprise closed questions with a discrete response format to allow for objectively measured responses and consistency among respondents. This response format also allows for direct psychometric analysis of individual questions and their corresponding response format.
-
The instrument must be brief, in line with the circumstances in which it would be administered in a prison environment. Any instrument containing more than 50 individual questions was excluded as inappropriate.
-
The instrument must be available for use within the study.
The psychometric criteria that were assessed included:
-
Has the instrument been used to directly screen for self-harm?
-
Is the instrument directly related to self-harm (or a self-harm correlate)?
-
Has the instrument been validated for an offender population?
-
Have the psychometric properties of the instrument been assessed?
Each instrument was rated in terms of its practical application and psychometric properties and then a set of potential instruments was taken forward to an expert panel meeting (consisting of two psychometricians, two prison-based clinicians/researchers, a forensic psychologist, a psychological medicine and health-care researcher, and a service user, all with relevant experience), in order to reach a consensus on the instruments to be used in the pilot study.
Within the expert panel discussions, the same practical and psychometric criteria were applied to the instruments, along with any further practical information relating to prison policy or existing implementation processes. All comparative strengths and weaknesses of the instruments were considered. The aim was to select an array of scales from the potential set that might have moderately different focuses, thus maintaining a range of different screening criteria that could be tested. Where unanimous consensus could not be reached, disagreements were resolved by majority vote among panel members.
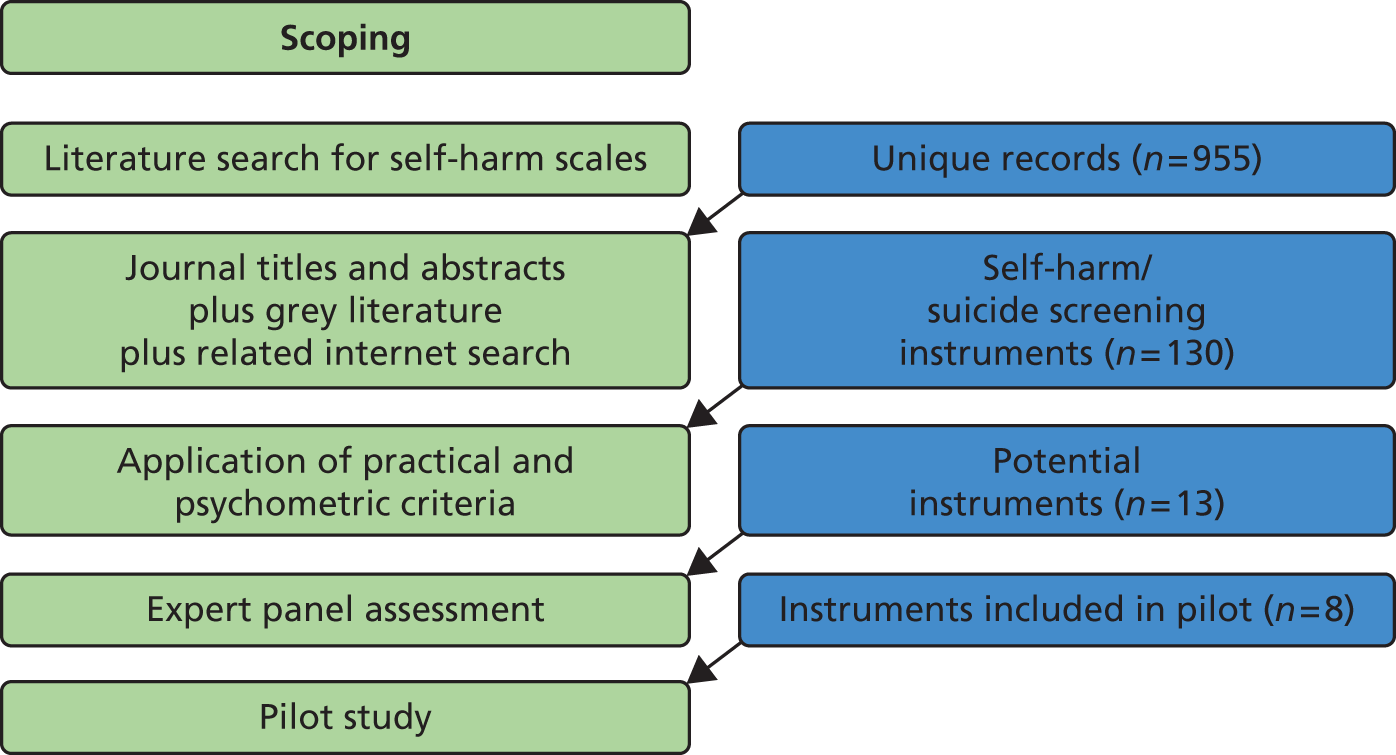
Scoping results
Once duplicates were removed, the initial search yielded 955 unique journal article records. Following the title and abstract screening, along with the grey literature and related internet search, 130 unique potential self-harm or suicide screening measurement instruments remained. Following the application of the practical and psychometric inclusion criteria, 13 potential screening instruments remained. The majority of these potential scales were removed as a result of inappropriate administration constraints (i.e. clinician-rated scales) or inappropriate or unspecific scale content (i.e. a scale specifically focused on anger or suicide rather than self-harm, without any self-harm component). Potential scales were also removed if they were specifically to be administered only after a self-harm event had occurred, if they were deemed to be too long or if no further information could be found on the identified scales.
The initial 13 potential screening instruments were as follows:
-
Prison Screening Questionnaire (PriSnQuest)51
-
SHI48
-
Borderline Symptom List-23 (BSL-23)52
-
SCOPE49
-
BHS46
-
Clinical Outcomes in Routine Evaluation – Outcome Measure (CORE-OM)53
-
Depression Anxiety and Stress Scales (DASS-21)54
-
PHQ-950
-
The Referral Decision Scale (RDS)55
-
Deliberate Self-Harm Inventory (DSHI)7
-
Beck Depression Inventory (BDI)57
-
Hospital Anxiety and Depression Scale (HADS). 58
Following the discussions of the expert panel, eight instruments remained. The instruments removed at this stage were the RDS, the FASM, the DSHI, the BDI and the HADS.
The RDS is primarily a screening tool for mental health disorders, which was developed for use within the US criminal justice system. This was discarded in favour of the PriSnQuest, which was developed to perform a similar role within the UK criminal justice system.
The HADS and BDI are both measures of depression, which is a correlate of self-harm. These measures were left out in favour of the PHQ-9, which contains similar content but is a shorter scale and is already used within UK primary health-care services.
The DSHI and the FASM are both measures relating to previous self-harm behaviours. These were left out in favour of the SHI, which covers similar content but has favourable psychometric properties. 59
The eight remaining instruments (PriSnQuest, SHI, BSL-23, SCOPE, BHS, CORE-OM, DASS-21, PHQ-9) went forward for use in the pilot study. The results of the scoping exercise are summarised in Figure 2.
FIGURE 2.
Summary of scoping process, from initial search to final instrument selection.
Pilot study
Pilot study methods
Following the identification of candidate screening instruments, a pilot study was undertaken in three prisons in northern England which were collaborating with the Prison and Offender Research in Social Care and Health (PORSCH) network: two male institutions (prisons A and C) and one female institution (prison B). The pilot study was undertaken over 6 weeks to determine several operational aspects of the screening process:
-
the operational and safety requirements for introducing a screening procedure, identifying the most appropriate times and locations and the implications for staffing (e.g. prison officers’ time for escorting prisoners)
-
evaluating the face validity and acceptability of the chosen screening instruments to prisoners, to assess for problems in their application
-
discussions with ACCT assessors to see if they foresee and/or have observed any problems in the administration, reliability or validity of the chosen instruments
-
evaluating the time taken to administer the questionnaire packs and gauging the opinion of the respondents regarding the burden of responding.
Furthermore, the pilot study also served the functions of providing:
-
a sample on which to test the follow-up process
-
an estimate of the incidence of self-harm during follow-up for main study power calculations.
The information gained from the pilot study was to have a direct impact on the final set of instruments selected for inclusion in the main study.
To limit the burden of the respondents in the pilot study, a block design was used, meaning that everyone taking part in the study was asked to respond to four scales (Table 1). Everyone responded to the DASS-21 and the PHQ-9, along with two of the other six instruments.
| Pilot | Scale | Total | |||||||
|---|---|---|---|---|---|---|---|---|---|
| CORE-OM | PriSnQuest | BHS | BSL-23 | SHI | SCOPE | PHQ-9 | DASS-21 | ||
| Pattern | 1 | 2 | 3 | 4 | 5 | 6 | 7 | 8 | |
| A | 1 | 2 | 0 | 0 | 0 | 0 | 7 | 8 | 4 |
| B | 0 | 2 | 3 | 0 | 0 | 0 | 7 | 8 | 4 |
| C | 0 | 0 | 3 | 4 | 0 | 0 | 7 | 8 | 4 |
| D | 0 | 0 | 0 | 4 | 5 | 0 | 7 | 8 | 4 |
| E | 0 | 0 | 0 | 0 | 5 | 6 | 7 | 8 | 4 |
| F | 1 | 0 | 0 | 0 | 0 | 6 | 7 | 8 | 4 |
| G | 1 | 0 | 3 | 0 | 0 | 0 | 7 | 8 | 4 |
| H | 0 | 2 | 0 | 4 | 0 | 0 | 7 | 8 | 4 |
| I | 0 | 0 | 3 | 0 | 5 | 0 | 7 | 8 | 4 |
| J | 0 | 0 | 0 | 4 | 0 | 6 | 7 | 8 | 4 |
| K | 1 | 0 | 0 | 0 | 5 | 0 | 7 | 8 | 4 |
| L | 0 | 2 | 0 | 0 | 0 | 6 | 7 | 8 | 4 |
| Total | 4 | 4 | 4 | 4 | 4 | 4 | 12 | 12 | |
Pilot study data collection
Within the prison system, any incidence of self-harm, or cause for concern that a prisoner may be at risk, triggers the opening of an ACCT plan. A unit manager notifies the assessor team and arranges for an assessor to interview the person at risk within 24 hours. This interview identifies the risk and contributes to the first case review. It also presents an opportunity to introduce a diagnostic test for the risk of (further) self-harm. Thus, in the three prisons participating in the study, in all cases in which an ACCT was opened, the prisoner was approached for inclusion in the pilot study, irrespective of their sentencing status (remand prisoners were also included). If the prisoner consented to inclusion in the study, the pilot questionnaire pack was administered within 72 hours of the opening of the ACCT, provided it was safe and sensible to do so. If it was deemed not safe or inappropriate, the prisoner was excluded from the study. The pilot study recruitment was undertaken over 6 weeks. All recruitment and data collection were carried out by an experienced on-site prison researcher in two of the prisons, and by members of prison psychology staff in the third prison.
It is acknowledged that this ACCT-based inception cohort was already a pre-selected group considered to be at risk of self-harm. However, given the overall purpose of identifying suitable predictive screening instruments, rather than undertaking a prevalence study, together with the practicalities of administering a set of questionnaires within a prison institution, it was deemed unfeasible to screen all prisoners within the scope of this study. It should also be noted that recruitment was based only on the index ACCT, and subsequent ACCTs by the same individual were discounted, as they were already within the follow-up cohort.
Pilot study follow-up
Follow-up was carried out after a period of 9 months from the date of questionnaire completion. Follow-up was carried out by checking the prisoner record on the National Offender Management Information System (NOMIS) prison computer record system. The follow-up data that were collected for each study participant included the following:
-
whether or not the participant had self-harmed during the follow-up period
-
the number of self-harm events during the follow-up period
-
dates, descriptions and severity coding of any self-harm events
-
the number of ACCTs opened during the follow-up period
-
the current prison status and location of the participant, along with corresponding dates of transfer or release
-
whether or not the index ACCT event was opened as a result of an actual self-harm event.
Each study participant had a valid follow-up time of 9 months if they were still within the prison system, or up to the point of their release from their index prison stay. Therefore, the valid follow-up time was variable. If a prisoner had been transferred between prisons within the follow-up period, all necessary follow-up data were still accessible via the Global Transfer Report on the NOMIS system.
The information available on the NOMIS system was restricted by the quality of the data that were recorded within the database. The NOMIS system contains data that are entered and updated by prison staff, and the information available from an ACCT record or a ‘self-harm event alert’ is variable, depending on the extent of the information that was entered onto the system.
Pilot study results
Overall, 75 people were recruited to the pilot study: 50 (66.7%) were male, and 22 (29.3%) were female, with data missing for three (4%). Age ranged from 18 to 62 years [interquartile range (IQR) 23–39 years] and the median age was 28 years. Once a routine had been established, there were no problems reported with the process or logistics of running the pilot study.
Cognitive debrief
The mean administration time of the questionnaire packs was 37 minutes [standard deviation (SD) 11 minutes], but the consensus from the respondents was that they did not find the interview process burdensome or onerous. Based on participant feedback and the views of the expert panel, a final set of five instruments (from the original eight) were selected for use in the main study, and the instruments that were eliminated at this point were the BHS, the SCOPE and the DASS. The BHS was removed as the prisoner respondents found some of the questions confusing. It was also thought that many of the questions could be taken out of context when applied within a prison setting. The SCOPE was removed because of a confusing, inconsistent response structure, along with questions that were not applicable to a range of respondents. There were no specific problems found with the DASS, but it was eliminated in favour of the PHQ-9 and the CORE-OM, both of which covered similar content to the DASS, with the PHQ-9 already widely used within UK primary health care.
Follow-up
At follow-up, 25 (33.3%) of the prisoners were still housed in the original prison, 28 (37.3%) had been released, 20 (26.7%) had been transferred and the status of two (2.7%) was not known (Table 2).
| Follow-up status | n (%) |
|---|---|
| Still in original prison | 25 (33.3) |
| Released | 28 (37.3) |
| Transferred | 20 (26.7) |
| Missing status at follow-up | 2 (2.7) |
| Total | 75 (100) |
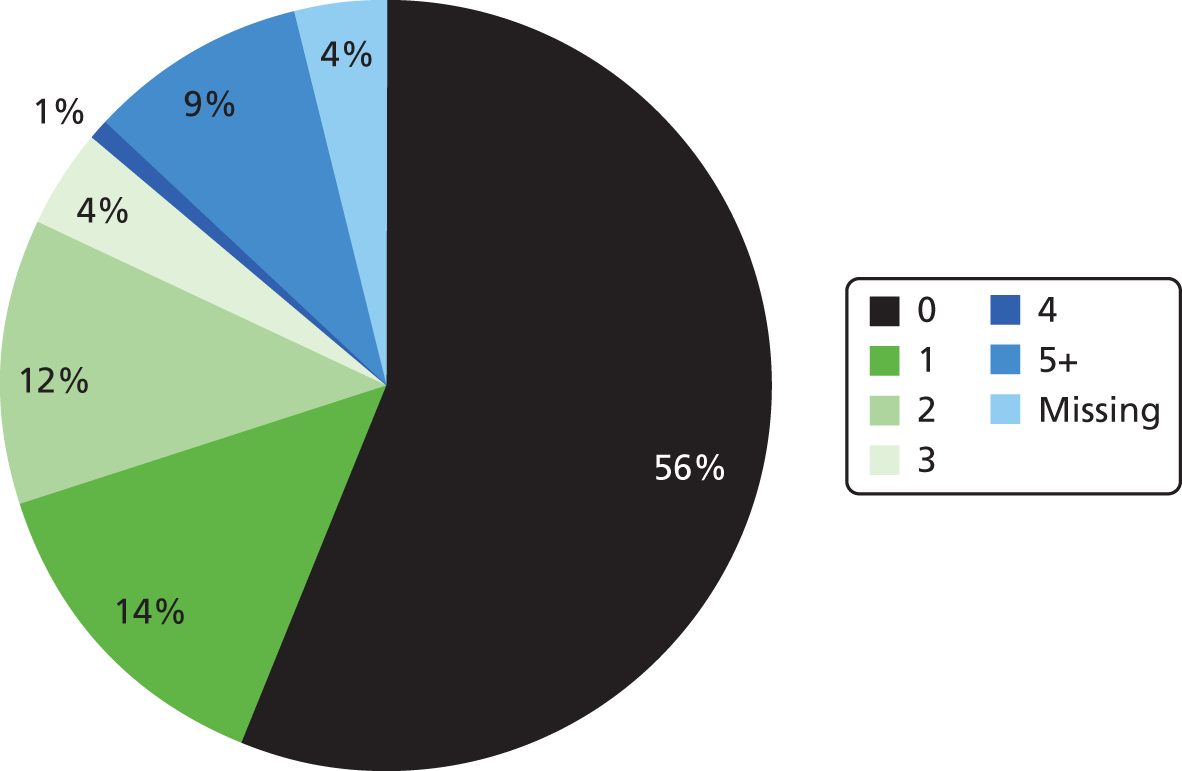
The mean valid follow-up time was 172 days (SD 100 days). During the follow-up period, 30 (40%) prisoners performed a self-harm event (Table 3); however, the rate of self-harm varied by prison (Table 4). The number of self-harm events carried out by each individual during follow-up is shown in Figure 3.
| Statistic | Follow-up time | Time to first self-harm event | |
|---|---|---|---|
| Study population | |||
| Valid, n | 72 | 30 | |
| Missing, n | 3 | 45 | |
| Number of days | |||
| Mean | 171.65 | 64.80 | |
| Median | 216.50 | 45.00 | |
| Range (min.–max.) | 306 (1–307) | 233 (1–234) | |
| Percentile | 25 | 73.25 | 18.75 |
| 50 | 216.50 | 45.00 | |
| 75 | 253.00 | 106.75 | |
| Self-harm | Prison | Total | ||
|---|---|---|---|---|
| A | B | C | ||
| No, n (%) | 10 (47.6) | 8 (34.8) | 24 (77.4) | 42 (56.0) |
| Yes, n (%) | 11 (52.4) | 12 (52.2) | 7 (22.6) | 30 (40.0)a |
| Missing, n (%) | 0 (0.0) | 3 (13.0) | 0 (0.0) | 3 (4.0) |
| Total, n (%) | 21 (100) | 23 (100) | 31 (100) | 75 (100) |
FIGURE 3.
The number of self-harm events carried out by each individual during follow-up, presented as a percentage of the full pilot sample (n = 75).
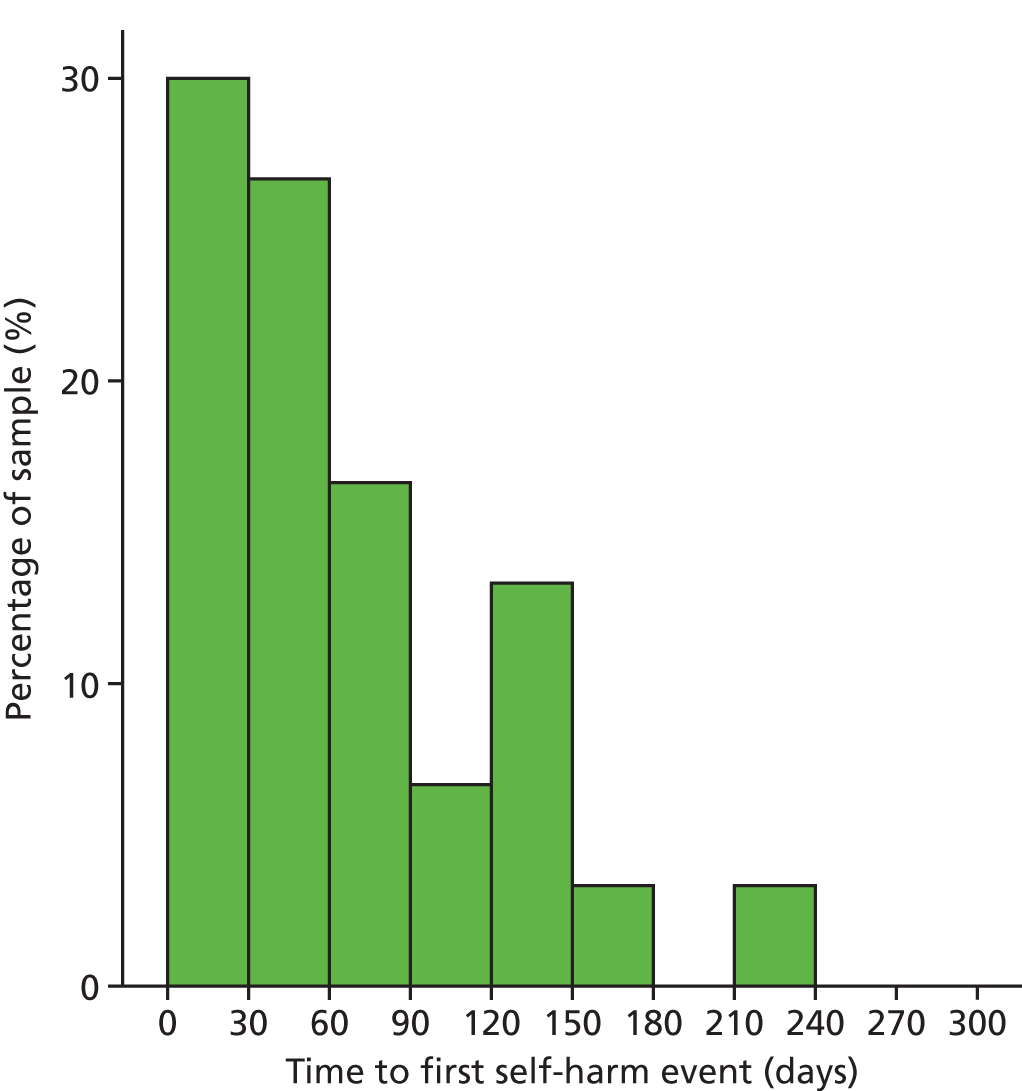
Of those who self-harmed, the median time to the first self-harm event (after the administration of the questionnaires) was 45 days. Importantly, in only one case was the first self-harm event after 6 months (Figure 4) and the rate of self-harm did not increase substantially as the follow-up time increased (Table 5). Table 5 also shows the cumulative self-harm rate and the number of prisoners lost to full follow-up via release and transfer for various follow-up periods. Pilot data suggest a loss to follow-up rate of 18.7% at 6 months (11 transferred without data available after transfer and three missing all follow-up data) and 22.6% at 9 months (14 transferred without data available after transfer and three missing all follow-up data).
FIGURE 4.
Time (in days) to first self-harm event (of those who self-harmed).
| Follow-up period | Self-harm rate, n (%) | Released/transferred with no further follow-up, n (%) | Loss to follow-up: transferred with no further follow-up,a n (%) |
|---|---|---|---|
| 5 months | 28 (37.3) | 28 (37.3) | 13 (17.3) |
| 6 months | 29 (38.7) | 31 (41.3) | 14 (18.7) |
| 7 months | 29 (38.7) | 36 (48.0) | 16 (21.3) |
| 8 months | 30 (40.0) | 39 (52.0) | 17 (22.6) |
| 9 months | 30 (40.0) | 42 (56.0) | 17 (22.6) |
Implications for main study
The pilot study was designed to inform the main study and a number of implications were forthcoming. First, the data collection process and study logistics worked well, so it was agreed that the process would remain largely the same for the main study. However, researchers reported difficulty in trying to conduct all interviews within 72 hours of the index ACCT being opened; therefore, some potential recruits were missed during the pilot study. This was for two reasons, the first of which was the logistics of the researcher actually being able to contact the prisoner within this time frame. The second reason was the unstable, unsafe or vulnerable state of some prisoners within the first 72 hours of the ACCT being opened, which precluded them being approached for inclusion. To address this situation, the time frame was changed from ‘within 72 hours of the ACCT being opened’, to ‘within 2 weeks of a prisoner being on an active ACCT’. This was done in order to maximise study recruitment and it would also allow for the inclusion of people who are on a long-term ACCT (some ACCTs are never closed).
Additionally, because of the results of the time to first self-harm event witnessed in the pilot study, the active follow-up period in the main study was reduced from 9 to 6 months. Decreasing the follow-up time maximised potential recruitment time for the study, while maintaining the opportunity to capture the vast majority of self-harm events [of those who self-harmed within the pilot study, 29 out of 30 (96.7%) self-harmed within 6 months of the interview].
The five scales going forward into the main study were as follows.
Borderline Symptom List-23
(See Appendix 1, Questionnaire 3, for a copy of the complete scale.)
The BSL-2352 is the short-form version of the Borderline Symptom List,60 which was developed to reduce patient burden and assessment time. The original Borderline Symptom List (now known as the BSL-95) was developed as a self-reported instrument to quantify typical borderline symptomatology. The full version of the BSL contains 95 items across seven domains: self-perception, affect regulation, self-destruction, dysphoria, loneliness, intrusions and hostility. The items of the BSL-95 were derived from the criteria of the Diagnostic and Statistical Interview for Borderline Personality Disorder, the opinions of clinical experts and the opinions of borderline patients. The original BSL-95 was developed in Germany among six different samples, and the BSL-23 development was based on a sample of 379 borderline patients, before being further validated in five different samples, including 659 borderline patients. 52 The internal consistency of the BSL-23 was high among all samples, with the Cronbach’s alpha value ranging from 0.935 to 0.969. The test–retest reliability of the BSL-23 (within 1 week) was also reported as being high (r = 0.82; p < 0.0001). 52
The items from the BSL-23 were based on the items from the BSL-95 that had the highest levels of sensitivity to change and the highest ability to discriminate borderline patients from other patient groups. 52,60 It has 23 items, each with five response categories, scored 0–4. However, the original response categories suggested for the scale items did not pass the initial face validity tests for the inclusion of the scales; therefore, the response categories were adapted for use in the current study.
The original response categories suggested by the BSL-23 developers are shown in Table 6.
| Response code | Response wording |
|---|---|
| 0 | Not at all |
| 1 | A little |
| 2 | Rather |
| 3 | Much |
| 4 | Very strong |
As these response categories had limited content validity (possibly because of translation issues), they were amended to those shown in Table 7.
| Response code | Response wording |
|---|---|
| 0 | Not at all |
| 1 | Only occasionally |
| 2 | Sometimes |
| 3 | Often |
| 4 | Most or all the time |
It is acknowledged that these revised response category options may affect the properties of the scale. The revised response options reflect a frequency relating to the BSL statements, whereas the original response options were derived to reflect an intensity rating. In order to differentiate the revised BSL-23 from the original, the revised version will be referred to as the BSL-23-F, with the ‘F’ denoting the frequency element of the response category revision.
The BSL-23 has 23 basic items, with an additional ‘overall personal state’ question, which is rated on a 0% to 100% scale.
It also has supplementary items for behaviour assessment. There are 11 of these on the original form, but three of them were removed for the purposes of the study as they were deemed to be inappropriate for individuals in prison. The three that were removed were as follows:
During the last week:
I got drunk.
I took drugs.
I displayed high-risk behaviour by knowingly driving too fast, running around on the roofs of high buildings, balancing on bridges, etc.
The supplementary behavioural items were scored (for ‘during the last week’) as shown in Table 8.
| Response code | Response wording |
|---|---|
| 0 | Not at all |
| 1 | Once |
| 2 | 2–3 times |
| 3 | 4–6 times |
| 4 | Daily or more often |
Clinical Outcomes in Routine Evaluation – Outcome Measure
(See Appendix 1, Questionnaire 1, for a copy of the complete scale.)
The CORE-OM is a 34-item generic measure of psychological distress with a maximum total score of 136, with each individual item scored 0 to 4 on the same response category structure. 53 The items cover the four domains of subjective well-being (four items), problems/symptoms (12 items), life functioning (12 items) and risk (to self and to others; six items). The CORE-OM was developed in the UK and it has been validated on non-clinical (n = 1106) and clinical (n = 890) samples. The internal consistency (Cronbach’s alpha) ranges from 0.75 to 0.9 among the different domains, and is reported as 0.94 among both clinical and non-clinical samples for the complete item set. Test–retest correlations are reported as 0.9 for the complete item set and 0.87–0.88 among the individual domains, except the risk domain, which delivered a lower correlation value of 0.64. It is, however, argued that this lower correlation is unsurprising given the situational and reactive nature of the items within this domain. 61
Within the analysis, the mean item score was generated where < 10% of items were missing (i.e. at least 31 out of 34 items completed), as per the scale scoring instructions. The CORE-OM comprises four domains, for which the mean item score was generated where there was no more than one item missing within each domain. The non-risk items also form a 28-item subscale, in which the mean item score was generated where < 10% items were missing (i.e. at least 26 out of 28 items completed).
Prison Screening Questionnaire
(See Appendix 1, Questionnaire 2, for a copy of the complete scale.)
The PriSnQuest is an eight-item scale with a maximum total score of 8. 51 The PriSnQuest was developed in the UK, building on the development of the RDS in the USA. It was developed to screen for mental health problems within the UK criminal justice system. To our knowledge, the internal consistency and test–retest reliability of the PriSnQuest have not been reported elsewhere.
Within the analysis, the total score was generated where at least seven out of eight items were completed, and the mean item score was imputed for a missing item.
Patient Health Questionnaire
(See Appendix 1, Questionnaire 5, for a copy of the complete scale.)
The PHQ-9 is a nine-item depression scale with a maximum total score of 27. 50 The items consist of the nine criteria upon which diagnosis of depressive disorders is based, according to the Diagnostic and Statistical Manual of Mental Disorders, 4th Edition (DSM-IV). It was originally developed in the USA for use in primary care, and among this primary care sample (n = 3000) the internal consistency (Cronbach’s alpha) was 0.89, and the test–retest reliability was reported as ‘excellent’ (r = 0.84). 50
Depression severity with the PHQ-9 is graded as 0–4 = none; 5–9 = slim; 10–14 = moderate; 15–19 = moderately severe; and 20–27 = severe.
Within the analysis, a total score was generated where at least eight out of nine items were completed, and the mean item score is imputed for a missing item. In addition, the first two items of the PHQ-9 form an initial assessment, and result in a maximum total score of 6. The total score was generated where a response to both items was available.
The Self-Harm Inventory
(See Appendix 1, Questionnaire 4, for a copy of the complete scale.)
The SHI is a 22-item questionnaire with a maximum total score of 22. 48 The items all relate to previous engagement in different self-harm behaviours, and, therefore, the scale screens for the lifetime prevalence of these behaviours. The scale was initially developed in the USA, among samples taken from mental health and non-mental health settings, as a way of linking self-harm behaviours to a diagnosis of borderline personality disorder. The internal consistency was not reported in the initial development work, but it has subsequently been reported as between 0.8 and 0.9. 62–64 Additionally, the SHI has been shown to satisfy the requirements of Rasch scaling assumptions among a non-clinical sample. 59
For the analysis, a total score was generated where < 10% of items were missing (i.e. at least 20 out of 22 items completed). The SHI has demonstrated accuracy in diagnosis of borderline personality disorder of 84% at a cut-off score of 5. 48
Proposed sample size
The original protocol sample size required approximately 1400 prisoners to be recruited into the study. These would all be administered a small set of questionnaires in an overlapping block design. It was originally anticipated that a total of four screening instruments would be administered, and that each prisoner who consented to take part in the study would respond to only two screening instruments, in order to minimise the responder burden. Therefore, a scale administration block design was used, in which there were six combinations of two scale administrations (Table 9).
| Scale | A | B | C | D |
|---|---|---|---|---|
| A | – | – | – | – |
| B | 1 | – | – | – |
| C | 2 | 4 | – | – |
| D | 3 | 5 | 6 | – |
Initial sample size calculations
The sample size was primarily determined by the need to compare the areas under the curve (AUCs) between each pair of self-harm screening instruments. A secondary requirement was to achieve the relevant degree of precision required by the psychometric analysis (Mokken scale and Rasch analyses) and the Cox proportional hazards regression model.
An audit revealed that approximately 20% of inmates are assigned to an ACCT in any given year. Other work has shown that up to one-quarter of women could self-harm during their current term. 4,65
Thus, assuming a prevalence of self-harm of 20%, it was estimated that a sample of 405 prisoners would be required to achieve 80% power to detect a difference of 0.1 between a diagnostic test with an area under the receiver operating characteristic (ROC) curve of 0.8 and another diagnostic test with an AUC of 0.9 using a two-sided z-test with a 5% significance level. This calculation was based on discrete (rating scale) responses and assumed similar levels of variation for responses in prisoners with and without self-harm for both diagnostic tests, i.e. the ratio of the SD of responses of prisoners with self-harm to those without was 1.0 for both diagnostic tests; and a correlation between the two diagnostic tests for both the prisoners with and without self-harm of 0.6 [PASS 2008 (NCSS, LLC, Kaysville, UT, USA)].
Given that an ACCT is an indicator itself of potential risk of self-harm, it was thought that the prevalence in this group might be substantially higher than the general estimated level of 20%. Thus, the sample size above would have sufficient power to detect smaller differences between the AUC of any two diagnostic tests. Consequently, for the comparison of each pair of scales, a sample size of 405 was required. Given the block design above, a sample of 840 would provide 420 prisoners who could be compared on any pair of screening instruments (Table 10). With a degree of uncertainty surrounding the follow-up rate that would be achieved, a conservative estimate led to deliberate oversampling of approximately 70%, meaning that the initial aim was to assess approximately 1400 prisoners. This would allow for recruitment of 840 subjects with sufficient follow-up information available for a reliable AUC analysis.
| Two-scale combinations | |||
|---|---|---|---|
| Combination | Scale 1 | Scale 2 | n |
| 1 | A | B | 140 |
| 2 | A | C | 140 |
| 3 | A | D | 140 |
| 4 | B | C | 140 |
| 5 | B | D | 140 |
| 6 | C | D | 140 |
| Total | 840 | ||
| Number of scale A tests completed | 420 | ||
| Number of scale B tests completed | 420 | ||
| Number of scale C tests completed | 420 | ||
| Number of scale D tests completed | 420 | ||
For the Rasch analysis, sample size is primarily concerned with the degree of precision of the estimate of items for any given scale. A sample size of 400 respondents for any given screening instrument would estimate the item difficulty within a scale, with significance level of 0.01, to within ± 0.3 logits. This is the minimum practical level of stability expected for most variables. 66
Finally, for the Cox proportional hazards regression analysis it was originally estimated that 400 prisoners would provide > 99% power to detect a hazard ratio for self-harm of 2.72 between two a priori risk groups with a SD of 10.0. This corresponded to an assumption that the risk of self-harm in a prisoner identified as at risk from a diagnostic test was 2.72 times that of a prisoner identified as a non-risk case from the same diagnostic test, and was selected to represent the smallest hazard ratio which could be detected given the available sample size and assumptions. The calculation also assumed a self-harm prevalence of 20%, and was adjusted to account for correlation between the risk factor (identified within a diagnostic test) and other covariates (such as prisoner characteristics) assuming that a multiple regression of the risk factor on the other covariates in the Cox proportional hazards regression model was expected to have an R2 of 0.1 (PASS 2008). It was thought that this would allow for a model using individual scale items should the necessity arise (where there are a minimum of 420 responses on any item in any scale). It was, however, recognised that the estimate of a SD of 10 (given a dichotomous risk factor) and > 99% power was implausible, and the power estimate for the Cox proportional hazards regression analysis was therefore re-estimated at the same time as the re-estimation using the results of the pilot study.
Sample size re-estimates
The pilot study brought about several changes to the protocol, including the estimated sample size required for the study.
As shown in Table 5 and Figure 5, the rate of self-harm did not increase substantially as the follow-up time increased beyond 6 months, suggesting that follow-up time could be restricted to a 6-month period in order to maximise the recruitment period in the main study.
FIGURE 5.
Time to first self-harm event during pilot study follow-up.
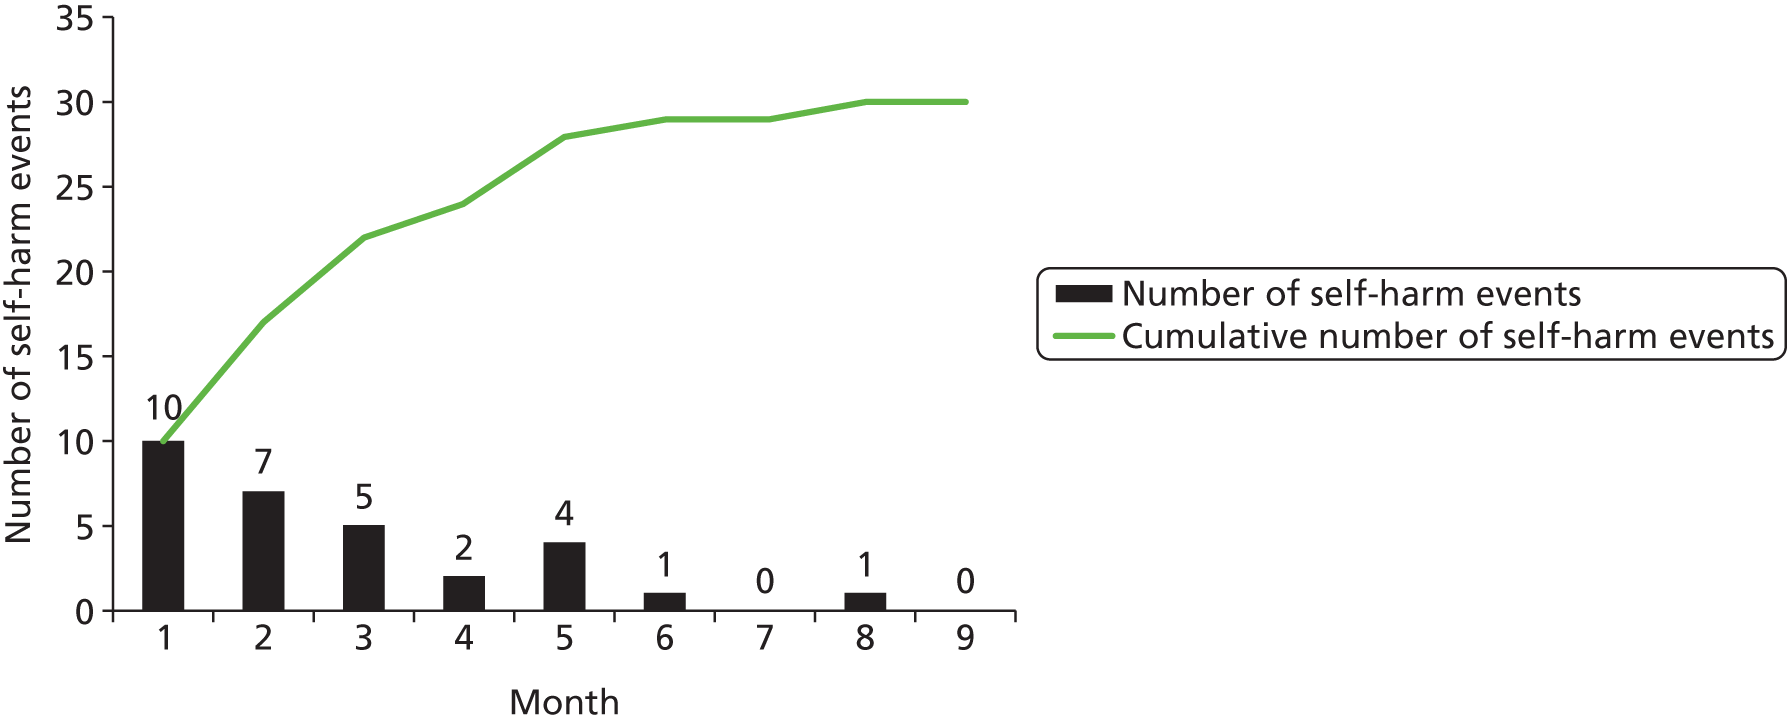
The original sample size was inflated by approximately 80% to allow for a final sample with sufficient follow-up time for a reliable AUC analysis. However, after further consideration, it was agreed that, as the focus of the study was self-harm during the follow-up period post ACCT or the time to release, whichever was sooner, prisoners who were released prior to the end of the follow-up period would not be considered lost to follow-up, assuming that full data would be available for them during their time in prison post ACCT. A prisoner would, therefore, be considered lost to follow-up if he or she were transferred prior to the end of the follow-up period with no available follow-up after their transfer date or if no follow-up data were available at all. Given the loss to follow-up rates observed in the pilot study (see Table 5), in which a loss to follow-up rate of 18.7% was observed at 6 months and of 22.6% at 9 months, it was agreed that a loss to follow-up rate of 20% at 6 months could be assumed for the main study.
The original sample size estimates assumed a self-harm rate of 20%; however, the overall self-harm rate observed during the pilot study was 40%, with an overall 95% confidence interval (CI) of 28.9% to 51.1%. The proportion of prisoners recruited from each prison in the main study was expected to be similar to that in the pilot; however, considerably lower rates were observed in prison C than in prisons A and B. As described above, it was also planned that the follow-up period in the main study would be reduced from 9 to 6 months. Thus, when considering the sample size re-estimates, an expected self-harm rate of ≈ 30% was considered appropriate, based on the lower limit of the 95% CI, in order to limit the deviation from the prior assumption of 20%.
Given the results of the pilot study, the sample size for the AUC analysis and secondary Cox proportional hazards regression analysis were re-estimated assuming a self-harm prevalence rate of 30% and loss to follow-up rate of 20% by 6 months. The power calculations for the Cox proportional hazards regression analysis were also re-estimated for the comparison of a priori risk groups with appropriate estimates of SD.
Given an estimated self-harm prevalence rate of 30% and loss to follow-up rate of 20%, a sample size of 359 prisoners would provide 80% power to detect a difference of 0.1 between the AUC for two diagnostic tests at the 5% significance level. Similarly, 475 prisoners would provide 90% power to detect such a difference (Table 11). As per the original sample size assumptions, it was assumed that the detection of a difference of 0.1 between the AUC for two diagnostic tests would involve one test with an AUC of 0.8 and the other with an AUC of 0.9; similar levels of variation for responses in prisoners with and without self-harm for both diagnostic tests (i.e. the ratio of the SD of responses of prisoners with self-harm to those without was 1.0 for both diagnostic tests); and the correlation between the two diagnostic tests for both the prisoners with and without self-harm being 0.6.
| Specification | Power | |
|---|---|---|
| 80% | 90% | |
| Self-harm prevalence | 0.3 | 0.3 |
| Sample size requirement, n (number expect to self-harm, n) | 287 (86) | 380 (114) |
| Sample size requirement, accounting for loss to follow-up, n (number expected to self-harm, n) | 359 (108) | 475 (143) |
For the Cox proportional hazards analysis, given an estimated self-harm prevalence of 30% and loss to follow-up rate of 20%, Table 12 presents the sample size requirements under different power and hazard ratio requirements. To detect a hazard ratio for self-harm as small as 1.75 between two a priori risk groups with 80% power, 464 prisoners would be required. This corresponds to an assumption that the risk of self-harm in a prisoner identified as at risk from a diagnostic test is 1.75 times that of a prisoner identified as a non-risk case from the same diagnostic test. It was assumed that the proportion of prisoners belonging to a risk group from any diagnostic test would be 0.5, thus yielding a SD of 0.5. As per the original sample size assumption, it was assumed that the correlation between risk group and other covariates (such as prisoner characteristics) would be 0.1. Detection of a hazard ratio smaller than 1.75 would have required substantially more prisoners, and this sample size was considered sufficient given that the Cox proportional hazards analysis forms a secondary analysis. If in fact the hazard ratio for self-harm between two a priori risk groups is larger than 1.75, fewer prisoners are required to yield similar power (see Table 12).
| Specification | Self-harm prevalence | Power (%) | Two-sided significance level (%) | Risk group regression coefficient (hazard ratio), n (%) | Sample size requirement n (number expect to self-harm, n) | Sample size: number who self-harm accounting for loss to follow-up, n (number expected to self-harm, n) |
|---|---|---|---|---|---|---|
| 1 | 0.3 | 90 | 1 | 1.0 (2.72) | 221 (67) | 277 (84) |
| 2 | 0.3 | 80 | 5 | 0.7 (2) | 238 (71.4) | 298 (90) |
| 3 | 0.3 | 80 | 5 | 0.56 (1.75) | 371 (112) | 464 (140) |
Summary of pilot study and implications for main study
The pilot study showed that it was possible to administer a set of screening instruments in a prison setting and that the prisoners themselves were happy to spend time in an interview setting, and were able to answer questions from a broad range of instruments. Just over three in five were still within the prison system at the time of follow-up, and the loss to follow-up rate at 9 months was found to be 22.6%. The self-harm rate was found to be 40%, with the majority of events occurring within 6 months.
Given these findings, the block randomisation of instruments was abandoned, and it was decided that all prisoners would be administered all of the chosen instruments at the same time, combined into a single questionnaire pack (see Appendix 1). Using a conservative rate of 30% for self-harm, and a 6-month follow-up period with a 20% loss to follow-up rate, it was calculated that 359 and 475 cases would be sufficient to give 80% and 90% power, respectively, for the AUC analysis and Cox proportional hazards regression analysis. This sample size would also, as before, be sufficient for the Rasch analysis. The same prisons involved in the pilot study would be used for the main study.
Psychometric analysis
The main study incorporated five standardised questionnaires into a single questionnaire pack, along with other sociodemographic and sentencing information thought relevant to the study. The use of questionnaires or administered standardised assessments in any setting requires that those questionnaires hold certain properties which are consistent with quality measurement. These qualities are generally detailed under the rubric of psychometrics, and the principal textbook in that field has long been Jum Nunnally’s Psychometric Theory. 67 The theory outlines certain desirable properties of questionnaires, such as reliability (measures consistently) and validity (measures what it intends to measure). There are also various assumptions which underpin such assessments, such as unidimensionality (measures just one construct). These various properties can be considered to belong to ‘classical test theory’, some aspects of which can be traced back as far as the work of Thurstone68 in the 1930s. Consequently, all assessments to be administered in the current study must demonstrate acceptable reliability and what may be described as ‘internal construct validity’. In other words, the scale items must work together in an acceptable manner, measuring one construct.
In addition, other qualities have been introduced which can be loosely grouped together under the rubric of ‘modern test theory’. These include aspects of scale performance such as differential item functioning (DIF), whereby, given the same level of the construct being measured, the response to the item will be the same, irrespective of group membership (e.g. gender). DIF may be tested independently (e.g. through logistic regression) or within the framework of item response theory (IRT). IRT offers a sophisticated unified framework for assessing scale construction and, can, under certain circumstances, provide fundamental measurement (like the type associated with height or weight) from questionnaires. Normally, questionnaires provide ordinal-scaled scores, where respondents are ranked by order of magnitude of the construct being measured. However, where data are shown to satisfy the requirements of the Rasch measurement model, these scores can be transformed into interval-scaled measurement where increments in score are of equal units. 69 Determining if this is the case, the process of Rasch analysis tests if data accord with model expectations, and provides further diagnostics as to, for example, whether or not the response categories of polytomous items (where there are more than two response options) are working as intended.
Thus, modern test theory offers detailed diagnostic information on the way that scales work. Consequently, for all candidate screening instruments going forward into the main study, both classical and modern test characteristics are reported. These include unidimensionality through confirmatory factor analysis (CFA); ordinal scaling through Mokken analysis; and interval scaling and other associated properties (e.g. DIF) though Rasch analysis.
Confirmatory factor analysis
A fundamental assumption of test theory is that a set of items should measure just one attribute or dimension; otherwise the score is not interpretable. 68,70 This unidimensionality is an assumption in which a set of items are to be summated to give a total score. CFA makes it possible to test whether or not such a hypothesised factor structure of a questionnaire (based either on empirical data or on theory) is supported by actual data. 71 This may take the form of a single set of items (questions) measuring a single domain, or confirming that a larger set of items map onto many pre-specified domains. Consequently, analysis of the dimensional structure of the candidate screening tools chosen for the current study represents the foundation of the psychometric analysis, as all further stages have the assumption of unidimensionality. CFA is undertaken with the MPlus package (Muthen & Muthen, Los Angeles, CA, USA ) and is based on a polychoric correlation matrix. The polychoric correlation coefficient is a measure of association for ordinal variables which rests upon an assumption of an underlying joint continuous distribution. Although strict CFA interpretation would require uncorrelated errors between indicators (items) of a scale, it is quite common in health-related scales (e.g. depression) to find items which are linked in some fashion such that errors should be correlated. Sometimes these items reflect nuances of the construct that are important for clinical management (e.g. dressing upper body and dressing lower body) and, thus, discarding such items because they breach the assumption of local independence would be inappropriate. Thus, the correlation of errors will be allowed within the CFA.
Several fit statistics will be used to determine if the CFA is satisfactory. The primary measure is the chi-squared statistic, where a non-significant value indicates that the data conform to expectations. 72 Supplementary fit statistics include the root-mean-square error of approximation (RMSEA), where a value of < 0.08 would be considered sufficient. A Tucker–Lewis index (TLI) and comparative fit index (CFI) value of > 0.95 would also support the proposed data structure.
Given these fit parameters, scales can be graded indicating the degree of support for unidimensionality (Table 13).
| Quality of support | Chi-square | RMSEA | TLI | CFI |
|---|---|---|---|---|
| Strong | > 0.05 | < 0.08 | ≥ 0.95 | ≥ 0.95 |
| Medium | > 0.01 | < 0.08 | ≥ 0.90 | ≥ 0.90 |
| Weak | < 0.01 | < 0.08 | ≥ 0.90 | ≥ 0.90 |
Mokken scaling
Mokken scale analysis is used for scaling items and measuring respondents on an ordinal scale. 73,74 It is a non-parametric probabilistic version of Guttman scaling,75 and it is used similarly to other techniques for data reduction that allow for the unidimensional measurement of latent variables. The stochastic cumulative scaling model offered by this approach is ideally suited when the intention is to score an underlying latent trait by simple addition of the item response values. 76 It has been shown to have a number of advantages over some other measurement models; for example, it includes an item parameter that shows how items differ in their distribution, it is probabilistic rather than deterministic and it can be applied in situations in which latent variables must be operationalised with only a small number of indicators. 77
The process has a number of assumptions which are to be found in most non-parametric and parametric (e.g. Rasch model) IRT models. These are unidimensionality, local dependence and monotonicity [the probability of affirming an item increases as the underlying level of the construct (theta) increases]. As with Guttman scaling, model violation is crucial to interpretation, and this revolves around a triple of objects consisting of one subject and two items. The number of model violations in a data set is defined as the number of transitivity relations (e.g. if a > b and b > c, then it always follows that a > c) among all such triples that are violated. 77 Homogeneity, whether of items or subjects, is defined by relating the number of model violations observed to the number of violations that can be expected under the model of stochastic independence. This provides the item coefficient of stability, operationalised as the Loevinger’s H. In practice, this reflects the amount of discrimination of an item where, for example, very low values of H would indicate poor discrimination (a flat item response function). Consequently, many computer programs adopt a minimum requirement of H > 0.3 for item selection. Levels of scaling based on H have been reported as:
Hij < 0.3 indicates poor/no scalability
0.3 ≤ Hij < 0.4 indicates useful but weak scalability
0.4 ≤ Hij < 0.5 indicates medium scalability
Hij ≥ 0.5 indicates good scalability.
The use of Mokken scaling in the current study is designed to provide information to support the summation of a set of items to provide an ordinal scale. Given the double monotone homogeneity of the procedure, which orders both persons and items, it can also be considered a prelude to Rasch analysis. Thus, failure to satisfy Mokken scaling criteria would indicate that a scale would be unlikely to satisfy Rasch model assumptions. Furthermore, given adequate scaling, cut points, which are simply a magnitude on an ordinal scale, would be valid and more than adequate to identify ‘caseness’ (e.g. for depression). Thus, Mokken scaling confirms the validity of cut-point analysis using AUC. As it has the assumption of unidimensionality, this analysis follows the CFA of the candidate scales.
However, some concerns have been expressed about the merits of the Mokken scale. 78 The first concerns monotone homogeneity and sample independence, and the other concerns the meaning and usefulness of the H coefficient. It has been argued that H is not a measure of monotone homogeneity, and that it is not sample independent. In practice, these two aspects are satisfied by only the Rasch model.
Rasch analysis
While Mokken scaling offers a test to see if a set of items forms an ordinal scale, fit of the data to the Rasch measurement model tests to see if the data satisfy the requirements of a quantitative structure, so providing interval scale measurement. 69,79 Briefly, the objective is to determine if data from the scale satisfy a parametric probabilistic version of Guttman scaling. 75 The process involves a number of activities, which include testing to see if the data meet Rasch model expectations; information on the quality of individual items, including individual item fit; testing the assumption of unidimensionality; checking to see if the scale works in the same way across groups (invariance as determined by DIF); and examining the reliability and targeting of the scale to the sample.
The distinct advantage of scales which satisfy Rasch model assumptions is that the items will make a unidimensional scale where, as with the Mokken scale, the raw score is a sufficient statistic (that is that the raw score gives an estimate of the person’s ability at the ordinal level, and does do not require any additional information). 80 Furthermore, the raw score can be transformed to interval scaling such that change scores and other appropriate mathematical calculations can be performed. Given appropriate distributional properties, the transformed score can then be used in parametric statistical procedures. If the distribution of this is non-normal, further transformations could be applied. As items (as well as persons) are calibrated on a metric, the approach lends itself to establishing unidimensional ‘item banks’, where items (questions) from different instruments can be calibrated together on the same metric. Thus, the operational ranges of instruments can be compared and the items can be made available to Computer Adaptive Testing which can minimise respondent burden. 81,82 For the current study, an item bank may offer an alternative source of items for predictive purposes, as opposed to the standardised scales themselves.
In the current study, data are fitted to the Rasch model through the RUMM2030 software (RUMM Laboratory, Perth, WA, Australia). An iterative process tests if polytomous items are properly ordered; if the assumption of local response independence holds;83 if the assumption of unidimensionality holds; if the scales are invariant across key groups such as gender or sentence status; and if the items follow the stochastic ordering as required by the model. For testing the stochastic ordering requirements, a range of fit statistics are available, including chi-squared fit where a non-significant (Bonferroni-adjusted) deviation from model expectation would be required, and where individual item-person residuals would be within standardised range of ± 2.5 (99% CI). 84 In addition, a person separation reliability is reported, consistent with Cronbach’s alpha when persons have a normal distribution, but less so when data are skewed or where there are floor and ceiling effects.
For those scales where there are more than two response options for an item (i.e. polytomous items), it is possible to evaluate whether or not the categories are working as expected [i.e. a monotonic increase in category transition (threshold) across the trait being measured]. Where response options were found to be not working as intended across the whole item set, a generic rescore was considered. This is a post hoc adjustment of the original response categories which treats two (or more) adjacent response categories as equivalent. It is necessary to do this as the disordering of the original response categories implies that the respondents (i.e. the prisoners in this case) do not distinguish between the presented response categories, meaning that the intended discrete, ordered response category structure is not working in the way that it was originally designed. When rescoring, it is logical for this to be guided by the content and wording of each response category. It is often possible to see where the confusion may arise (where response options are similar or overlap) and linking these response options back to the observed threshold patterns helps to inform rescore options.
For DIF, prison, gender, age group (≤ 30 vs. ≥ 30 years), remand status (on remand vs. sentenced), age left full-time education (< 16 vs. 16 + years) and religion (whether or not prisoner stated that he or she practised a religion) were tested for invariance. Where the unidimensionality assumption is questioned by post hoc tests, a bi-factor solution is also available within the approach, where all items are considered to load on one dominant factor, as well as unique factors. 85,86 The amount of unique variance which is removed from the latent estimate to achieve this solution is reported. A post hoc test of unidimensionality is also available, following the recommendations by Smith. 87 Independent sets of items are used to generate two estimates for every individual, which are then compared by a t-test. The lower bound of the binomial CI for proportions should be less than 5% when comparing these estimates, given that the items belong to a unidimensional construct. Further details of the process of Rasch analysis are given elsewhere. 88–90
In the current study, the initial fit statistics for each scale are summarised within corresponding tables. The Rasch analysis was also progressed in alternative ways.
Resolution A
Where misfit anomalies were found, attempts were made to account for the misfit that had been highlighted. In the case of response dependency, where the apparent dependency has a conceptual basis, this can be accounted for by subtesting the related items. This effectively groups the dependent items into one ‘testlet’, meaning that the total raw score derived from the items does not change, but the dependent relationship between the items has been eliminated.
In the case of DIF, an ‘item-split’ can be carried out which effectively creates a new item specific to each selected factor grouping. For example, if an item displays a DIF by gender, then to split this item by gender would result in two new items, one specific to males and one specific to females. Split items remain anchored to the common set of items, but the logit location (item difficulty estimate) will be independent for each split item.
These amendments are post hoc adjustments of the apparent misfit, which will account for the effects of the misfit within the constraints of a particular analysis. Therefore, the person logit estimates will be comparable within this particular analysis while maintaining as many of the original scale items as possible. However, it should be pointed out that these post hoc adjustments do not account for the problems that are inherent to a scale when applied to this particular population.
Resolution A sought to maintain as many original scale items as possible by making the appropriate amendments to account for response dependency and DIF. Where amendments could not be made to account for the source of misfit, individual items were removed from the item set.
Resolution B
A second approach was to remove misfitting items iteratively, to try and obtain a set of items which satisfied all fit parameters. When all individual misfit anomalies had been removed, this provided a pure item set on which to base comparable person estimates. When adequate fit statistics were displayed by the pure item set, the removed items were individually reintroduced back into the pure set to see whether or not the original source of misfit was still apparent. If the source of misfit was still present within the refined item set, then the item would again be removed. If, however, the original source of misfit was no longer apparent, then the item would be marked for reintroduction back into the final item set.
Resolution B sought to find a set of items, free from any form of significant individual or collective misfit, which act together to form a unidimensional scale.
Area under the curve analysis
The accuracy of a predictive test depends on how well the test separates, in this case, the group subsequently self-harming from those who do not. It is measured by the area under the ROC curve. An area of 1 represents a perfect test and an area of 0.5 represents a worthless test. A rule of thumb about the magnitude of the AUC is:
-
0.90–1 = excellent
-
0.80–0.90 = good
-
0.70–0.80 = fair
-
0.60–0.70 = poor
-
0.50–0.60 = fail.
Cox proportional hazards regression modelling
Cox proportional hazards regression modelling analysis was performed using SAS version 9.2 (SAS Institute, Cary, NC, USA). Unless otherwise specified, all hypothesis testing was two-sided and conducted at the 5% significance level.
For this analysis, three populations were defined. The full population consisted of all prisoners who consented to the study and completed their baseline interview. The evaluable population consisted of all prisoners who consented to the study, who completed their baseline interview, and for whom complete follow-up was available. The Rasch score analysis population consisted of all prisoners in the evaluable population who also had a Rasch score available for all questionnaires and subscales investigated within the analysis. Therefore, where a Rasch score could not be generated for any one of the questionnaires and subscales evaluated, the prisoner was excluded from the Rasch score analysis population.
To cope with the variable time to self-harm and follow-up periods (to release or follow-up completion), Cox proportional hazards regression modelling was used to investigate the hazard rates for different a priori determined risk groups while adjusting for important baseline factors. A priori determined risk groups relate to cut points associated with the likelihood of self-harm for each of the questionnaires administered to all prisoners in the main study, and include potential cut points as determined via the AUC analysis and their associated sensitivity and specificity.
Time to self-harm was derived as the number of days between the baseline interview and the date of the first self-harm event (the first self-harm event for prisoners who self-harmed more than once) and estimates presented in months, where 1 month is defined as 30.44 days. Prisoners who were still in prison at their date of follow-up and without evidence of self-harm were censored at their date of follow-up. Prisoners who were released from prison without evidence of self-harm at release were censored at their date of release.
To identify important baseline factors, a univariate analysis was used to determine which baseline factors, pre-specified in the statistical analysis plan, to include in the Cox proportional hazards regression model. Factors significant at the 10% level were then considered for inclusion in the baseline model. Prison was included in the baseline model regardless of significance. This analysis was conducted on the population of prisoners with complete follow-up (the evaluable population). To enable inclusion of all prisoners with complete follow-up in the model, missing baseline factors were imputed to belong to the most frequent level within each baseline factor.
To determine risk groups based on prisoners’ converted Rasch scores, prisoners were grouped according to their response in relation to potential cut points where identified by the AUC analysis. Where cut points were not determined via the AUC analysis, the continuous converted Rasch score was investigated. For each risk group, an overall time to event curve was generated using the Kaplan–Meier method. Multivariate Cox proportional hazards regression modelling was used to test for differences in the time to first self-harm event for risk groups, and continuous scores, adjusting for important baseline factors. Hazard ratios, standard errors, p-values and 95% CIs were calculated for each factor in the model. A statistically significant difference between the risk groups was concluded if the 95% significance interval for the hazard ratio excludes 1.
The proportional hazards assumption was assessed by plotting the hazards over time (i.e. the log-cumulative hazard plot) for each covariate. The ‘ASSESS’ statement in SAS’s PHREG procedure was also be used to check the proportional hazards assumption; this statement uses the methods of Lin et al. 91 to check the adequacy of the Cox proportional hazards regression model.
Ethical arrangements
All prisoners were asked to provide written, informed consent. Although prisoners were recruited in their prison setting, there was, in practice, a variable amount of time available for considering the study information sheet.
Ethical approval was granted by the National Research Ethics Committee and the Ministry of Justice, with local approval from each local NHS research and development office. The University of Leeds was the sponsor for the study. The Project Steering Committee consisted of the chief investigator, an independent chairperson and an independent member. The study management group comprised the chief investigator, coapplicants, research staff and a patient representative.
Unanticipated events
A change to the study follow-up protocol was forcibly introduced following a change to the prison NOMIS computer system. In the time period between the pilot study follow-up being carried out and the main study follow-up being carried out, a nationwide system change of the NOMIS computer system was implemented. A result of this system change was that the Global Transfer Report was no longer available.
During the pilot study follow-up, if a prisoner was still housed within the original institution or had been released, then the required follow-up information was available on the NOMIS system. If a prisoner was still within the prison system but had been transferred to a different establishment, the required follow-up information was available from the Global Transfer Report section of the NOMIS system. As the Global Transfer Report had been removed from the NOMIS system for the main study follow-up, the required follow-up information was no longer directly available for the transferred prisoners.
An amended protocol was, therefore, implemented to obtain the required follow-up information for transferred prisoners. The amended protocol involved identifying the establishment to which the prisoner had been transferred, and then making direct contact with the relevant establishment to obtain the required follow-up information. This approach required the co-operation of the prison governors in the study institutions to provide a letter of reference for the prison-based researchers. It also required the co-operation and goodwill of prison staff within the institutions where transferred study participants were housed at the time of follow-up.
This unforeseen amendment made the follow-up process more difficult and time-consuming, although the relevant follow-up information was still eventually obtained for the vast majority of cases.
Chapter 3 Results
The main stage of the study began recruitment in May 2011, and concluded in May 2012, followed by the 6-month follow-up, which meant that the study data collection lasted from May 2011 until the end of November 2012. Prisoners recruited to the pilot study were not included in the main study sample.
Recruitment
Three prisons were included in the study, two of which were male. A flow chart of the total recruitment is given in Figure 6. During the recruitment period, 590 prisoners were eligible for inclusion, of whom 452 (76.6%) consented (Table 14). Two prisoners subsequently withdrew, making the baseline sample 450. Recruitment rate was similar across prisons, ranging from 70.7% to 79.0%.
FIGURE 6.
Recruitment.
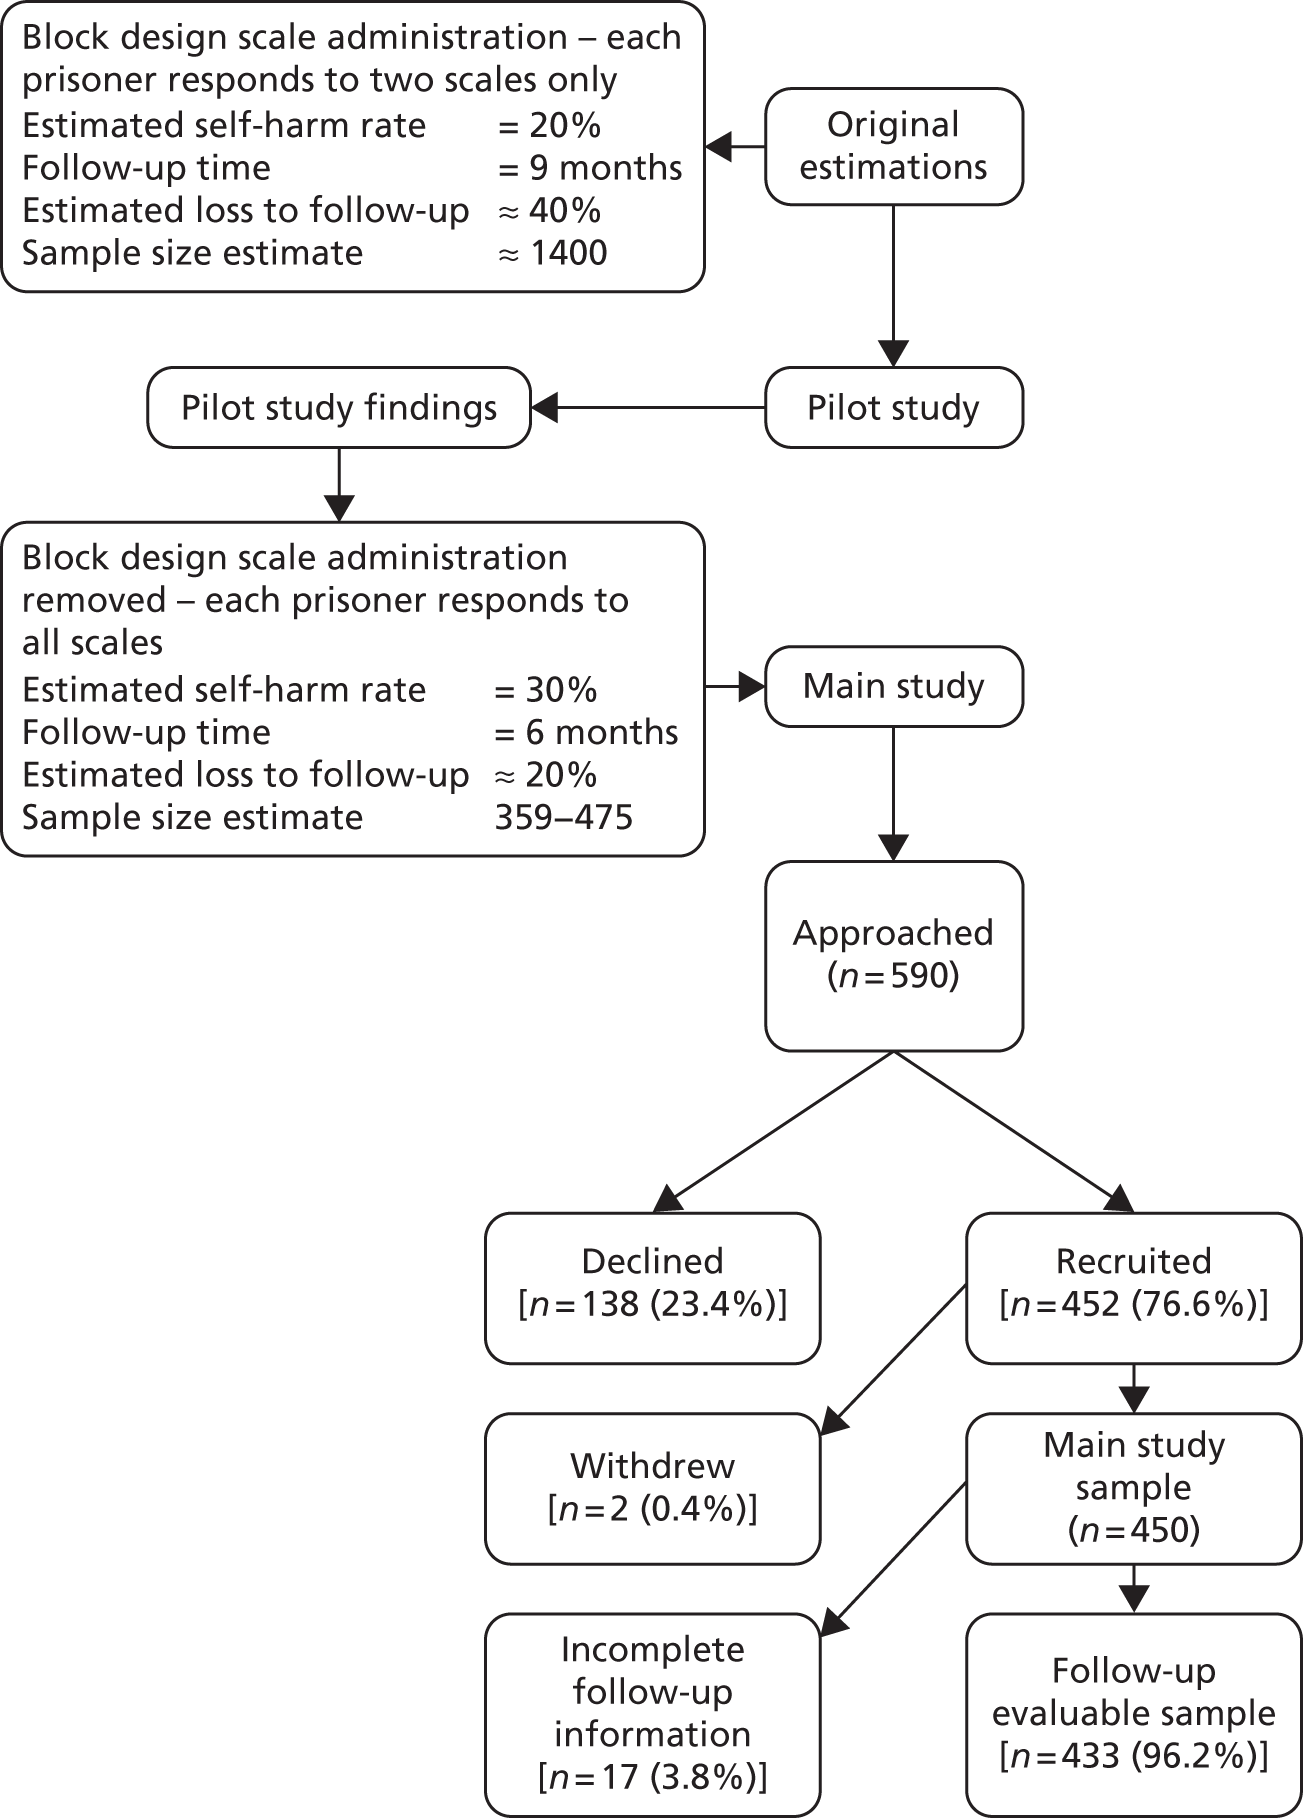
| Prisoners | Prison A | Prison B | Prison C | Total |
|---|---|---|---|---|
| Approached, n | 135 | 164 | 291 | 590 |
| Refused participation, n | 29 | 48 | 61 | 138 |
| Consented, n (%) | 106 (78.5) | 116 (70.7) | 230 (79.0) | 452 (76.6) |
| Withdrew from study, n | 1 | 1 | 0 | 2 |
| Total included, n | 105 | 115 | 230 | 450 |
Characteristics of subjects recruited
The mean age of the 450 subjects consenting to the study was 31.2 years, not varying across the three prisons (Table 15). On average, they left full-time education at 15 years old, with over two-fifths leaving without qualifications of any sort. However, this varied by prison, with twice as many without qualifications in one male prison as in the other. Almost half of subjects (49.4%) had children, but only one in seven (14.3%) reported receiving a visit during the previous 7 days.
| Characteristic | Prison A | Prison B | Prison C | Total | Significancea | n |
|---|---|---|---|---|---|---|
| Mean age (years) | 31.2 | 29.6 | 32.0 | 31.2 | 0.102 | 450 |
| Age (years) at leaving full-time education | 15.3 | 15.5 | 15.3 | 15.3 | 0.896 | 440 |
| Without any qualifications (%) | 26.7 | 36.8 | 55.3 | 43.8 | < 0.001 | 447 |
| Have children (%) | 51.4 | 44.3 | 51.1 | 49.4 | 0.447 | 449 |
| Received visit in previous 7 days (%) | 15.2 | 14.8 | 13.6 | 14.3 | 0.858 | 448 |
| On remand (%) | 56.2 | 22.6 | 52.2 | 45.6 | < 0.001 | 245 |
| Of those sentenced | ||||||
| Tariff (months) | 53.8 | 44.6 | 32.1 | 41.0 | 0.394 | 225 |
| Served (months) | 9.8 | 17.2 | 14.8 | 14.7 | 0.388 | 239 |
| n | 105 | 115 | 230 | 450 | – | – |
The prisons differed in their functions, with the male prisons also being remand facilities. Consequently, the proportions on remand differed considerably, with just over half the subjects on remand in the male prisons, compared with just over one-fifth (22.6%) in the female prison. The average tariff of those sentenced was 41 months, of which 14.7 months had been served.
The median time to interview from initiation of the ACCT was 6 days (Table 16). This differed between the male (A and C) and female (B) prisons, with females being interviewed somewhat later, with a median of 8 days, compared with 5 days in the male prisons.
| Descriptive statistic | Prison A | Prison B | Prison C | Total |
|---|---|---|---|---|
| n | 105 | 115 | 230 | 450 |
| Mean | 6.07 | 8.96 | 4.96 | 6.24 |
| SD | 3.693 | 5.287 | 3.201 | 4.268 |
| Median | 5.00 | 8.00 | 5.00 | 6.00 |
| IQR | 3–9 | 6–12 | 3–7 | 3–8 |
| Minimum | 1 | 0 | 0 | 0 |
| Maximum | 16 | 30 | 18 | 30 |
Follow-up time
The time included in the follow-up period was variable, with the aim being to complete a 6-month follow-up period. In some cases this was not possible as the prisoner had been released, but in some cases the records allowed for a longer follow-up time. Where a longer follow-up was possible, the information for the full follow-up period has been included. However, for the predictive element of the study, the follow-up period was restricted to 198 days (6.5 months). Only one person reported their first self-harm event after this cut-off point. During follow-up, 126 people actually carried out a self-harm event, but only 125 of these were within the valid time frame.
Incidence of self-harm
During the follow-up period, a total of 423 self-harm events were reported, based on 126 individuals followed up for 66,789 prisoner-days. This gives an ‘event incidence’ of 6.33 per 1000 prisoner-days among those who had been placed on an ACCT, or ‘prisoner incidence’ of 1.84 per 1000 days. For example, if 20% of the current prison establishment had previously been on an ACCT, then, in a prison housing 1000 inmates, one self-harm act per day could be expected. However, this is only the average from the current study, and it is notable that this varies considerably by gender (Table 17) and, to a lesser extent, between prisons. Thus, the event incidence in the female prison is much higher, at 15.83 per 1000 prisoner-days, as opposed to the male event average of 4.02 per 1000. Looking at persons, rather than events, there is a clear gradient across prisons, with a low person incidence in the male prison A, rising through 1.79 in the male prison C to the much higher incidence in the female prison B.
| Statistic | Prison A (male) | Prison B (female) | Prison C (male) | Total | Male prisons |
|---|---|---|---|---|---|
| n | 105 | 115 | 230 | 450 | 335 |
| Number with valid follow-up | 102 | 111 | 220 | 433 | 322 |
| Total number of self-harm events reported during follow-up | 50 | 207 | 166 | 423 | 216 |
| Total number of prisoner follow-up days | 13,470 | 13,074 | 40,245 | 66,789 | 53,715 |
| Event incidence per 1000 prisoner-days | 3.71 | 15.83 | 4.12 | 6.33 | 4.02 |
| Total number of people with self-harm events reported during follow-up | 17 | 37 | 72 | 126 | 89 |
| Person self-harm incidence per 1000 prisoner-days | 1.26 | 2.83 | 1.79 | 1.89 | 1.66 |
It becomes obvious that the ratio of persons to events is different across prisons, with the male prisons having a ratio between 2 and 3, whereas the female ratio is above 5. The frequency of events is shown in more detail in Figure 7.
FIGURE 7.
The number of self-harm events carried out by each individual during follow-up, presented as a percentage of the full main study sample (n = 450).
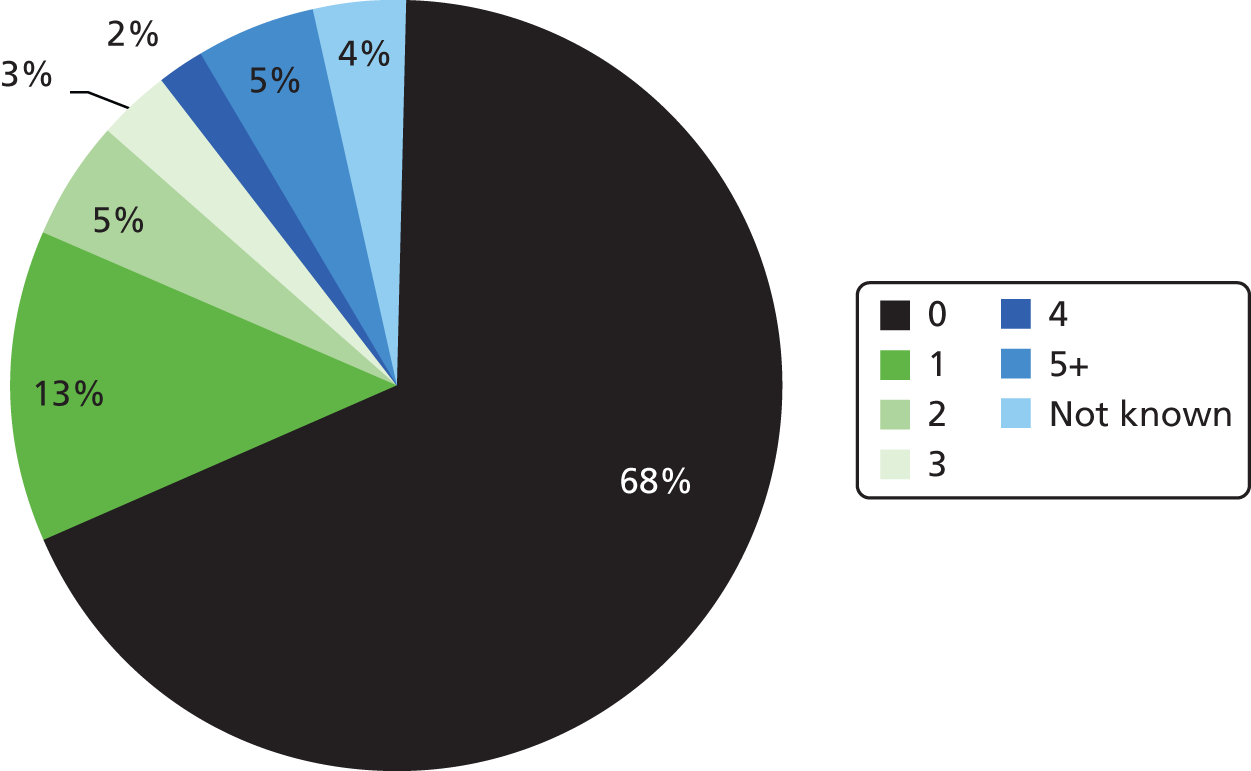
The median time to a first self-harm event during follow-up was 37 days, with a range of 0–190 days (Figure 8). The conditional probability of an ACCT Index self-harm event, given previously reported self-harm, was 0.33; of subsequent self-harm (i.e. during follow-up), given reported previous self-harm, was 0.28; and of subsequent self-harm, given a known self-harm ACCT Index event, was 0.47. See Table 60 for additional detail about the nature of these self-harm events.
FIGURE 8.
Time (in days) to first self-harm event (of those who self-harmed).
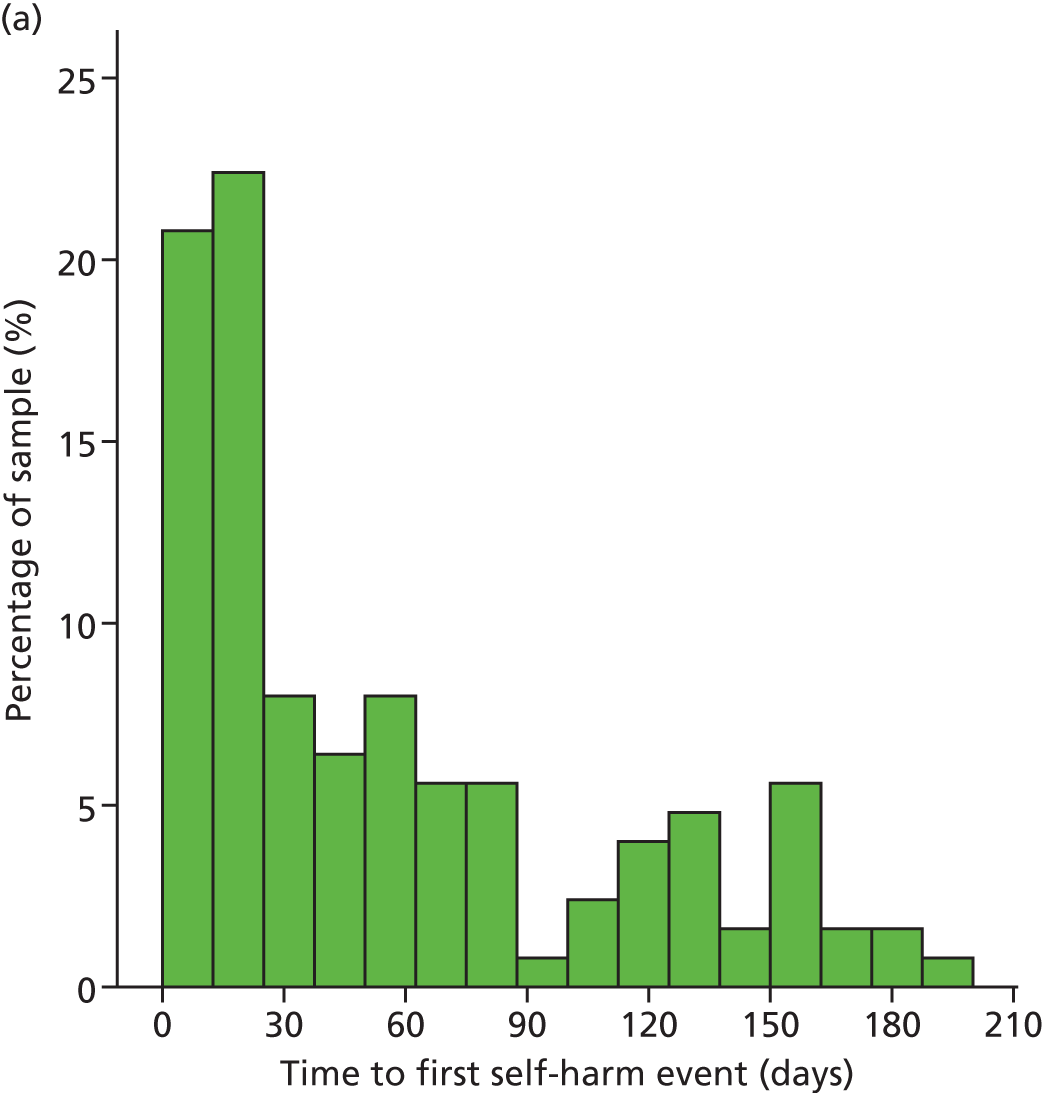
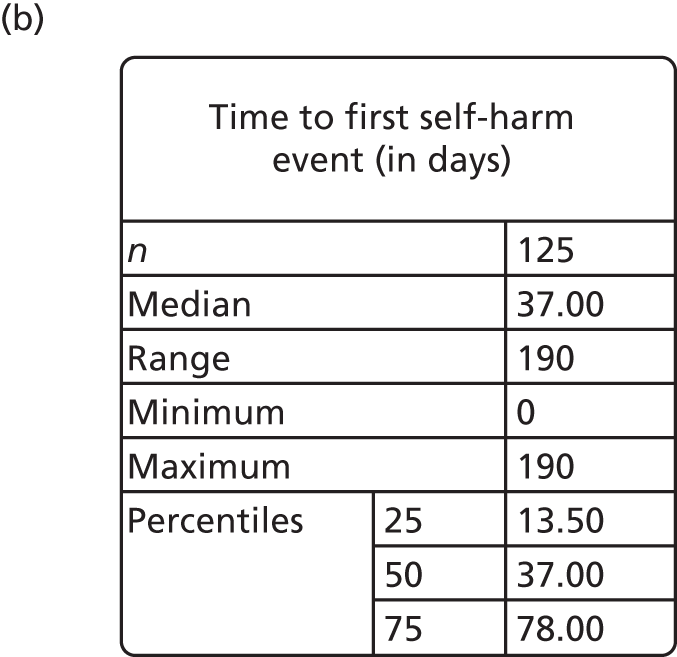
Associations with self-harm
Various characteristics may be considered a potential risk or mediating factor for self-harm. Just over two in five (42.2%) reported that they practised a religion, the rate being much higher in one of the male prisons than elsewhere (Table 18). Over one-third of subjects reported being homeless in the 12 months prior to prison, and almost three in five (57.9%) reported seeing a psychiatrist outside prison. Almost three-quarters (74.4%) reported receiving medication for mental health problems. Almost one-third of the subjects (32.4%) considered themselves to be dependent on alcohol and one-third (33%) considered themselves to be dependent on drugs. Almost four in five (78%) reported that they had self-harmed outside prison and over three in five (61.7%) that they had done so within prison. Females were much more likely to carry out self-harm in prison, but not so outside prison, where one of the male prisons reported a lower rate of self-harm but the other male prison reported a rate equivalent to that reported by females. Just over four in five (82.1%) were recruited from their first ACCT during their current stay in prison, but females were much less likely than males to be on their first ACCT.
| Characteristic | Prison A | Prison B | Prison C | Total | Significancea | n |
|---|---|---|---|---|---|---|
| Practise a religion (%) | 30.5 | 35.7 | 50.9 | 42.2 | 0.001 | 450 |
| Homeless in the 12 months prior to prison (%) | 31.4 | 34.8 | 37.6 | 35.4 | 0.692 | 449 |
| Seen psychiatrist outside prison (%) | 62.5 | 60.0 | 54.8 | 57.9 | 0.369 | 447 |
| Received mental health medication (%) | 68.6 | 81.7 | 73.4 | 74.4 | 0.072 | 449 |
| Dependent upon alcohol (%) | 29.8 | 26.3 | 36.7 | 32.4 | 0.125 | 447 |
| Dependent upon drugs (%) | 29.5 | 31.3 | 35.4 | 33.0 | 0.520 | 449 |
| Self-harmed outside prison (%) | 83.8 | 83.5 | 72.5 | 78.0 | 0.017 | 449 |
| Self-harmed within prison (%) | 59.0 | 78.3 | 54.6 | 61.7 | < 0.001 | 449 |
| First time on ACCT in current tariff (%) | 82.7 | 60.5 | 92.6 | 82.1 | < 0.001 | 447 |
Given that the frequency of reported previous self-harm was so high, it is instructive to examine the behaviours engaged in. Taken from the SHI, given a total history of self-harm (have you ever), behaviours range from ‘tortured self with self-defeating thoughts’, reported by four in five (79.7%) of those who have self-harmed, through to ‘abused laxatives to hurt self’, reported by just 5.2%, mostly female (Table 19). Over three-quarters (77.9%) reported that they had attempted suicide at some time in the past, which showed a significant difference across prisons. One in five reported a suicide attempt within the last week (BSL-23-F supplementary items), but this did not show any difference across prisons. More than half of the behaviours showed a significant difference in reported frequency across prisons, many of which (e.g. engaged in sexually abusive relationships), but not all of which, related to gender differences. On average, subjects who had self-harmed reported nine behaviours, but there were significant differences in the numbers of behaviours reported and the patterns of those behaviours.
| Characteristic | Prison A | Prison B | Prison C | Total | Significancea |
|---|---|---|---|---|---|
| Tortured self with self-defeating thoughts | 68.3 | 76.5 | 86.5 | 79.7 | 0.001 |
| Attempted suicide | 85.1 | 82.6 | 72.1 | 77.9 | 0.012 |
| Overdosed | 71.3 | 85.2 | 65.6 | 72.0 | 0.001 |
| Cut self on purpose | 75.2 | 78.3 | 65.9 | 71.3 | 0.036 |
| Abused alcohol | 68.3 | 68.7 | 65.5 | 67.0 | n.s |
| Banged head on purpose | 67.3 | 59.1 | 50.4 | 56.6 | 0.014 |
| Abused prescription medication | 54.5 | 54.8 | 47.5 | 51.0 | n.s |
| Starved self to hurt self | 38.6 | 53.9 | 43.9 | 45.3 | n.s |
| Made medical situations worse | 27.2 | 36.5 | 55.2 | 44.0 | < 0.001 |
| Hit self | 35.6 | 47.0 | 39.7 | 40.7 | n.s |
| Prevented wounds from healing | 51.5 | 47.0 | 31.2 | 40.0 | 0.001 |
| Engaged in emotionally abusive relationships | 35.6 | 65.2 | 23.2 | 37.2 | < 0.001 |
| Driven recklessly on purpose | 37.6 | 12.2 | 33.5 | 28.9 | < 0.001 |
| Been promiscuous | 37.6 | 24.3 | 27.0 | 28.8 | n.s |
| Scratched self on purpose | 27.7 | 42.6 | 21.0 | 28.2 | < 0.001 |
| Lost job on purpose | 25.7 | 14.8 | 25.1 | 22.6 | n.s |
| Burned self on purpose | 20.8 | 24.3 | 19.2 | 20.9 | n.s |
| Distanced self from God | 15.8 | 12.2 | 22.9 | 18.5 | 0.042 |
| Set relationship to be rejected | 18.8 | 20.9 | 16.3 | 18.1 | n.s |
| Exercised an injury on purpose | 14.9 | 13.9 | 19.0 | 16.7 | n.s |
| Engaged in sexually abusive relationships | 5.9 | 26.1 | 1.9 | 9.3 | < 0.001 |
| Abused laxatives to hurt self | 0.0 | 16.5 | 1.8 | 5.2 | < 0.001 |
A two-step cluster analysis with binary variables revealed four clusters of behaviours, their number being significantly different across clusters (Table 20). Cluster 1 is characterised by an average of 12.5 reported behaviours out of a possible 22 (from the SHI). All behaviours are extremely common, but it is within this cluster that rejected or sexually abusive relationships are to be found. Given that numbers are similar in clusters 1 and 2, the difference is more marked by the absence of certain behaviours in cluster 2. For example, ‘burning self’ and ‘hitting self’ are much less common in cluster 2. ‘Scratching self on purpose’ is almost absent, whereas it is very common in cluster 1. Cluster 3 is characterised by a low average number of behaviours. In practice, there is a significant difference [χ2 = 22.1; degrees of freedom (df) 3; p < 0.001] by gender across cluster membership. Over half of females (50.4%) are to be found in cluster 1, whereas over two in five males (40.1%) are to be found in cluster 2, compared with just over one in five females (20.9%). Proportions of males and females are similar in cluster 3, suggesting that about one in five of each gender who report previous self-harm had engaged in relatively few behaviours. A fourth cluster, identified as an ‘outlying cluster’, consisted of just 32 prisoners and had equal representation across prisons. It had some similarities to cluster 1, with emphasis upon relational matters, but, because of the numerical difference between the two male prisons, prison A had a similar proportion of prisoners in this cluster as did the female prison (prison B), whereas it was less common in prison C.
| Characteristic | Cluster 1 | Cluster 2 | Cluster 3 | Cluster 4 |
|---|---|---|---|---|
| Tortured self with self-defeating thoughts | 127 | 128 | 50 | 26 |
| Attempted suicide | 140 | 123 | 50 | 12 |
| Overdosed | 140 | 110 | 36 | 15 |
| Cut self on purpose | 139 | 99 | 38 | 20 |
| Abused alcohol | 119 | 113 | 32 | 15 |
| Banged head on purpose | 127 | 74 | 15 | 19 |
| Abused prescription medication | 105 | 81 | 15 | 15 |
| Starved self to hurt self | 109 | 41 | 19 | 21 |
| Made medical situations worse | 90 | 76 | 3 | 16 |
| Hit self | 104 | 38 | 8 | 18 |
| Prevented wounds from healing | 96 | 45 | 6 | 19 |
| Engaged in emotionally abusive relationships | 77 | 34 | 26 | 20 |
| Driven recklessly on purpose | 47 | 40 | 18 | 14 |
| Been promiscuous | 50 | 47 | 8 | 17 |
| Scratched self on purpose | 92 | 6 | 10 | 13 |
| Lost job on purpose | 45 | 24 | 10 | 13 |
| Burned self on purpose | 60 | 17 | 2 | 8 |
| Distanced self from God | 26 | 35 | 4 | 11 |
| Set relationship to be rejected | 38 | 18 | 2 | 18 |
| Exercised an injury on purpose | 46 | 12 | 1 | 10 |
| Engaged in sexually abusive relationships | 24 | 2 | 3 | 11 |
| Abused laxatives to hurt self | 16 | 1 | 0 | 6 |
| n | 145 | 146 | 96 | 32 |
| Average number of behaviours | 12.5 | 8.0 | 3.7 | 10.5 |
Characteristics of scales used in main study
Table 21 shows the basic characteristics of the five questionnaires used in the study. Compliance at the scale level was good; the PriSnQuest recorded the lowest proportion of cases with complete data (91.6%). In terms of individual item compliance, this was also good across all items. The mean individual item completion rate was 98.3% (SD 0.91%) across all items. The lowest individual item completion rate was 95.1% (22 non-responses) for item 16 of the SHI (‘engaged in sexually abusive relationships’).
| Statistic | BSL-23-F | CORE-OM | PriSnQuest | PHQ-9 | SHI |
|---|---|---|---|---|---|
| Number of items in scale | 23 | 34 | 8 | 9 | 22 |
| Number of response categories for each item | 5 | 5 | 2 | 4 | 2 |
| Response category scoring for scale items | 0–4 | 0–4 | 0–1 | 0–3 | 0–1 |
| Total scale scoring range | 0–92 | 0–136 | 0–8 | 0–27 | 0–22 |
| Number of cases with missing scale data | 22 | 24 | 38 | 13 | 31 |
| Percentage of cases with complete data (n = 450) | 95.1% | 94.7% | 91.6% | 97.1% | 93.1% |
| Number of cases with missing evaluable scale data | 14 | 6 | 16 | 9 | 12 |
| Percentage of cases with evaluable scores (according to scale instructions) | 96.9% | 98.7% | 96.4% | 98.0% | 97.3% |
| Median | 50 | 77 | 5 | 19 | 9 |
| IQR | 35–65 | 60–90 | 4–6 | 13.5–23 | 6–12 |
| Range | 0–92 | 7–122 | 0–8 | 0–27 | 0–22 |
| Internal consistency reliability α | 0.93 | 0.90 | 0.63 | 0.82 | 0.78 |
The high compliance rate across all scales and individual items would suggest that there is no evidence of responder burnout. Participants were free to stop the questionnaire administration at any point in the process, but very few of them did so, meaning that complete data were present in almost all cases.
The medians and IQR of all of the scales are also reported in Table 22 for the complete sample across all three prisons. These statistics are based on the evaluable scores for each scale, as per the scoring instructions for the individual scales. Note that some scales have low reliability in this setting.
| Prison | Statistic | BSL-23-F | CORE-OM | PriSnQuest | PHQ-9 | SHI |
|---|---|---|---|---|---|---|
| A | Median | 51 | 77 | 5 | 18 | 8 |
| IQR | 34.3–65.0 | 57.0–90.0 | 3–6 | 13–21 | 6.0–11.5 | |
| Range | 0–92 | 12–122 | 0–8 | 0–27 | 0–17 | |
| B | Median | 49 | 74.5 | 5 | 17 | 10 |
| IQR | 34.5–63.0 | 54.8–86.0 | 4–6 | 12–22 | 7–13 | |
| Range | 0–92 | 12–116 | 0–8 | 1–27 | 0–22 | |
| C | Median | 52 | 79 | 5 | 20 | 8 |
| IQR | 36.0–65.0 | 62.9–75.0 | 3.43–6 | 14–24 | 5–11 | |
| Range | 6–92 | 7–118 | 0–8 | 0–27 | 0–20 |
Confirmatory factor analysis of candidate screening instruments
Data from each scale were assessed for unidimensionality with a confirmatory factor analysis (Table 23). As described in the earlier methodology, the majority of scales breached the local independence assumption and required errors to be correlated. Given this, at least weak support for unidimensionality was found for all scales. The CORE-OM subscales, including the Clinical Outcomes in Routine Evaluation – 10 item short-form (CORE-10), showed moderate support, with the well-being subscale showing strong support. Both PriSnQuest and the BSL-23-F supplementary items showed strong support, once errors had been correlated.
| Scale/domain | Number of items | Chi-squared (df) | p-value | RMSEA | CFI | TLI |
|---|---|---|---|---|---|---|
| CORE-OM | ||||||
| Overall structure | 34 | 1854 (521) | < 0.0001 | 0.076 | 0.856 | 0.845 |
| With correlated errors | 34 | 929 (490) | < 0.0001 | 0.045 | 0.952 | 0.946 |
| Well-being | 4 | 1.546 | 0.4617 | 0.000 | 1.0 | 1.0 |
| Problems | 12 | 170 (54) | < 0.0001 | 0.070 | 0.938 | 0.925 |
| With correlated errors | 12 | 76 (48) | 0.0059 | 0.037 | 0.985 | 0.980 |
| Functioning | 12 | 405 (54) | < 0.0001 | 0.122 | 0.831 | 0.794 |
| With correlated errors | 12 | 79 (46) | 0.0019 | 0.040 | 0.984 | 0.977 |
| Risk | 6 | 36 (9) | < 0.0001 | 0.083 | 0.885 | 0.809 |
| With correlated errors | 6 | 16 (8) | 0.0425 | 0.048 | 0.966 | 0.937 |
| CORE-10 | 10 | 122 (35) | < 0.0001 | 0.074 | 0.959 | 0.947 |
| With correlated errors | 10 | 50 (30) | 0.0138 | 0.038 | 0.991 | 0.986 |
| PriSnQuest | 8 | 126 (20) | < 0.0001 | 0.109 | 0.909 | 0.872 |
| With correlated errors | 8 | 26 (17) | 0.0714 | 0.035 | 0.992 | 0.987 |
| BSL-23-F | 23 | 1043 (230) | < 0.0001 | 0.089 | 0.928 | 0.920 |
| With correlated errors | 23 | 400 (205) | < 0.0001 | 0.046 | 0.983 | 0.979 |
| BSL-23-F supplementary items | 8 | 44 (20) | 0.0014 | 0.053 | 0.891 | 0.848 |
| With correlated errors | 8 | 28 (19) | 0.0934 | 0.032 | 0.962 | 0.944 |
| SHI | 22 | 1924 (231) | < 0.0000 | 0.053 | 0.846 | 0.830 |
| With correlated errors | 22 | 277 (198) | 0.0002 | 0.030 | 0.953 | 0.046 |
| PHQ-9 | 9 | 142 (27) | < 0.0001 | 0.098 | 0.941 | 0.921 |
| With correlated errors | 9 | 52 (22) | 0.0003 | 0.056 | 0.984 | 0.974 |
Mokken scale analysis
All but one of the candidate scales (i.e. CORE-OM) satisfied Mokken scaling criteria. For these scales, there is a strong probabilistic relationship between items, with the SHI and the BSL-23-F supplementary items showing very strong scaling characteristics (Table 24). Thus, the four candidate scales satisfying the scaling criteria are ordinal scales in which the raw score is a sufficient statistic, and where cut points (as used in AUC analysis) will be valid. As these four scales also demonstrated some level of unidimensionality, the evidence is that they are robust for use in a prison setting.
| Scale/domain | Number of items | Number of items staying in scale | H-value |
|---|---|---|---|
| CORE-OM well-being | 4 | 3 | 0.42 |
| CORE-OM problems/symptoms | 12 | 10 | 0.42 |
| CORE-OM functioning | 12 | 4 | 0.36 |
| CORE-OM risk | 6 | 5 | 0.50 |
| CORE-10 | 10 | 7 | 0.41 |
| PriSnQuest | 8 | 8 | 0.48 |
| BSL-23-F | 23 | 23 | 0.57 |
| BSL-23-F supplementary items | 8 | 8 | 0.71 |
| SHI | 22 | 22 | 0.91 |
| PHQ-9 | 9 | 9 | 0.66 |
The CORE-OM was more problematic. It appeared to be seriously affected by local dependency when a total score was considered, such that it failed a CFA. The various domains, treated independently, showed moderate support for unidimensionality once errors were correlated. For the Mokken scaling, with minor modifications to the number of items, the well-being, problems/symptoms and risk subscales do show moderate scalability. The functioning subscale is more problematic, splitting into two small scales with weak/moderate scaling. The CORE-10 also failed, requiring removal of three items to satisfy moderate scaling criteria.
Rasch analysis
The highest standard of measurement consistent with a quantitative structure and interval scaling is that associated with the Rasch measurement model. Those scales satisfying the ordinal scale criteria of Mokken scaling will be candidates to satisfy Rasch model requirements. 92 Those that fail the Mokken scaling are unlikely to do so. In the current study, each scale was read into the RUMM2030 Rasch computer software package, where each scale was assessed for various psychometric properties. Rasch analysis provides an integrated framework where many individual item attributes can be explored, along with overall scale attributes. Assuming an underlying unidimensional construct is being measured by a particular scale, a range of fit statistics help to identify anomalies within the observed data.
The Borderline Symptom List-23 (frequency-based responses)
Initial analysis of the BSL-23-F revealed that the items in the scale failed to meet Rasch model expectations (see Table 26). Individual item fit revealed evidence of a number of problematic items displaying fit parameters outside the normally expected and accepted range. Additionally, all items displayed disordered thresholds, meaning that the response categories were not functioning as intended. At this initial stage, only two items displayed DIF at the Bonferroni-adjusted level. Item 13 (‘I suffered from shame’) displayed DIF by age group and item 16 (‘criticism had a devastating effect on me’) displayed DIF by both prison and gender, although the prison DIF is likely to be just an interactive manifestation of the gender DIF that is present.
Rescore
As the response options were not working as intended across the whole item set, and the observed response patterns were similar for most items, a generic rescore was implemented.
The generic rescore of all of the BSL-23-F items was as shown in Table 25.
| Original response code | Response wording | Rescored response code |
|---|---|---|
| 0 | Not at all | 0 |
| 1 | Only occasionally | 1 |
| 2 | Sometimes | 1 |
| 3 | Often | 2 |
| 4 | Most or all the time | 2 |
This rescore also has the follow-on effect of reducing the total scale score. Originally, the scale would be scored 0 to 92, but with the rescore in place the total scale score is contracted to 0–46.
Following the generic recode, all items displayed ordered categories except item 15 (‘I suffered from voices and noises from inside or outside my head’).
The summary fit statistics at this stage are presented in Table 26, along with the plot of relative item threshold difficulties and person abilities (the targeting plot, Figure 9).
| Item location | Person location | Item fit residual | Person fit residual | Chi-squared interaction | PSI | Alpha | Unidimensionality t-tests | |||||||||||
|---|---|---|---|---|---|---|---|---|---|---|---|---|---|---|---|---|---|---|
| Analysis | Mean | SD | Mean | SD | Mean | SD | Mean | SD | Value | df | p | With extremes | Without extremes | Number of significant tests | Total number of tests | % | Lower bound 95% CI | |
| Initial | 0 | 0.39 | 0.15 | 0.9 | 0.77 | 3 | –0.12 | 1.7 | 479 | 138 | 0 | 0.918 | 0.921 | 0.932 | 37 | 436 | 8.49 | 6.40% |
| Rescored | 0 | 0.69 | 0.65 | 1.29 | 0.05 | 2.7 | –0.13 | 1.3 | 416.7 | 138 | 0 | 0.895 | 0.893 | 0.918 | 39 | 431 | 9.05 | 7.00% |
| Resolution A | 0 | 0.77 | 0.56 | 1.19 | 0.25 | 1.3 | –0.18 | 1.1 | 116.9 | 84 | 0.01 | 0.852 | 0.843 | 0.853 | 22 | 424 | 5.19 | 3.10% |
| Resolution B | 0 | 0.73 | 0.9 | 1.38 | 0.33 | 1.4 | –0.18 | 1.1 | 99.07 | 78 | 0.05 | 0.823 | 0.807 | 0.875 | 18 | 414 | 4.35 | – |
| Resolution B2 | 0 | 0.75 | 0.83 | 1.38 | 0.33 | 1.3 | –0.18 | 1.1 | 96.08 | 84 | 0.17 | 0.838 | 0.823 | 0.882 | 19 | 417 | 4.56 | – |
| Supplementary items rescored | 0 | 1.36 | –1.62 | 1.04 | 0.09 | 2.0 | –0.10 | 0.4 | 67.11 | 24 | 0 | 0.018 | –0.27 | 0.486 | 0 | 336 | 0a | – |
FIGURE 9.
Targeting plot for the BSL-23-F following rescoring (n = 443, mean = 0.652, SD = 1.294).
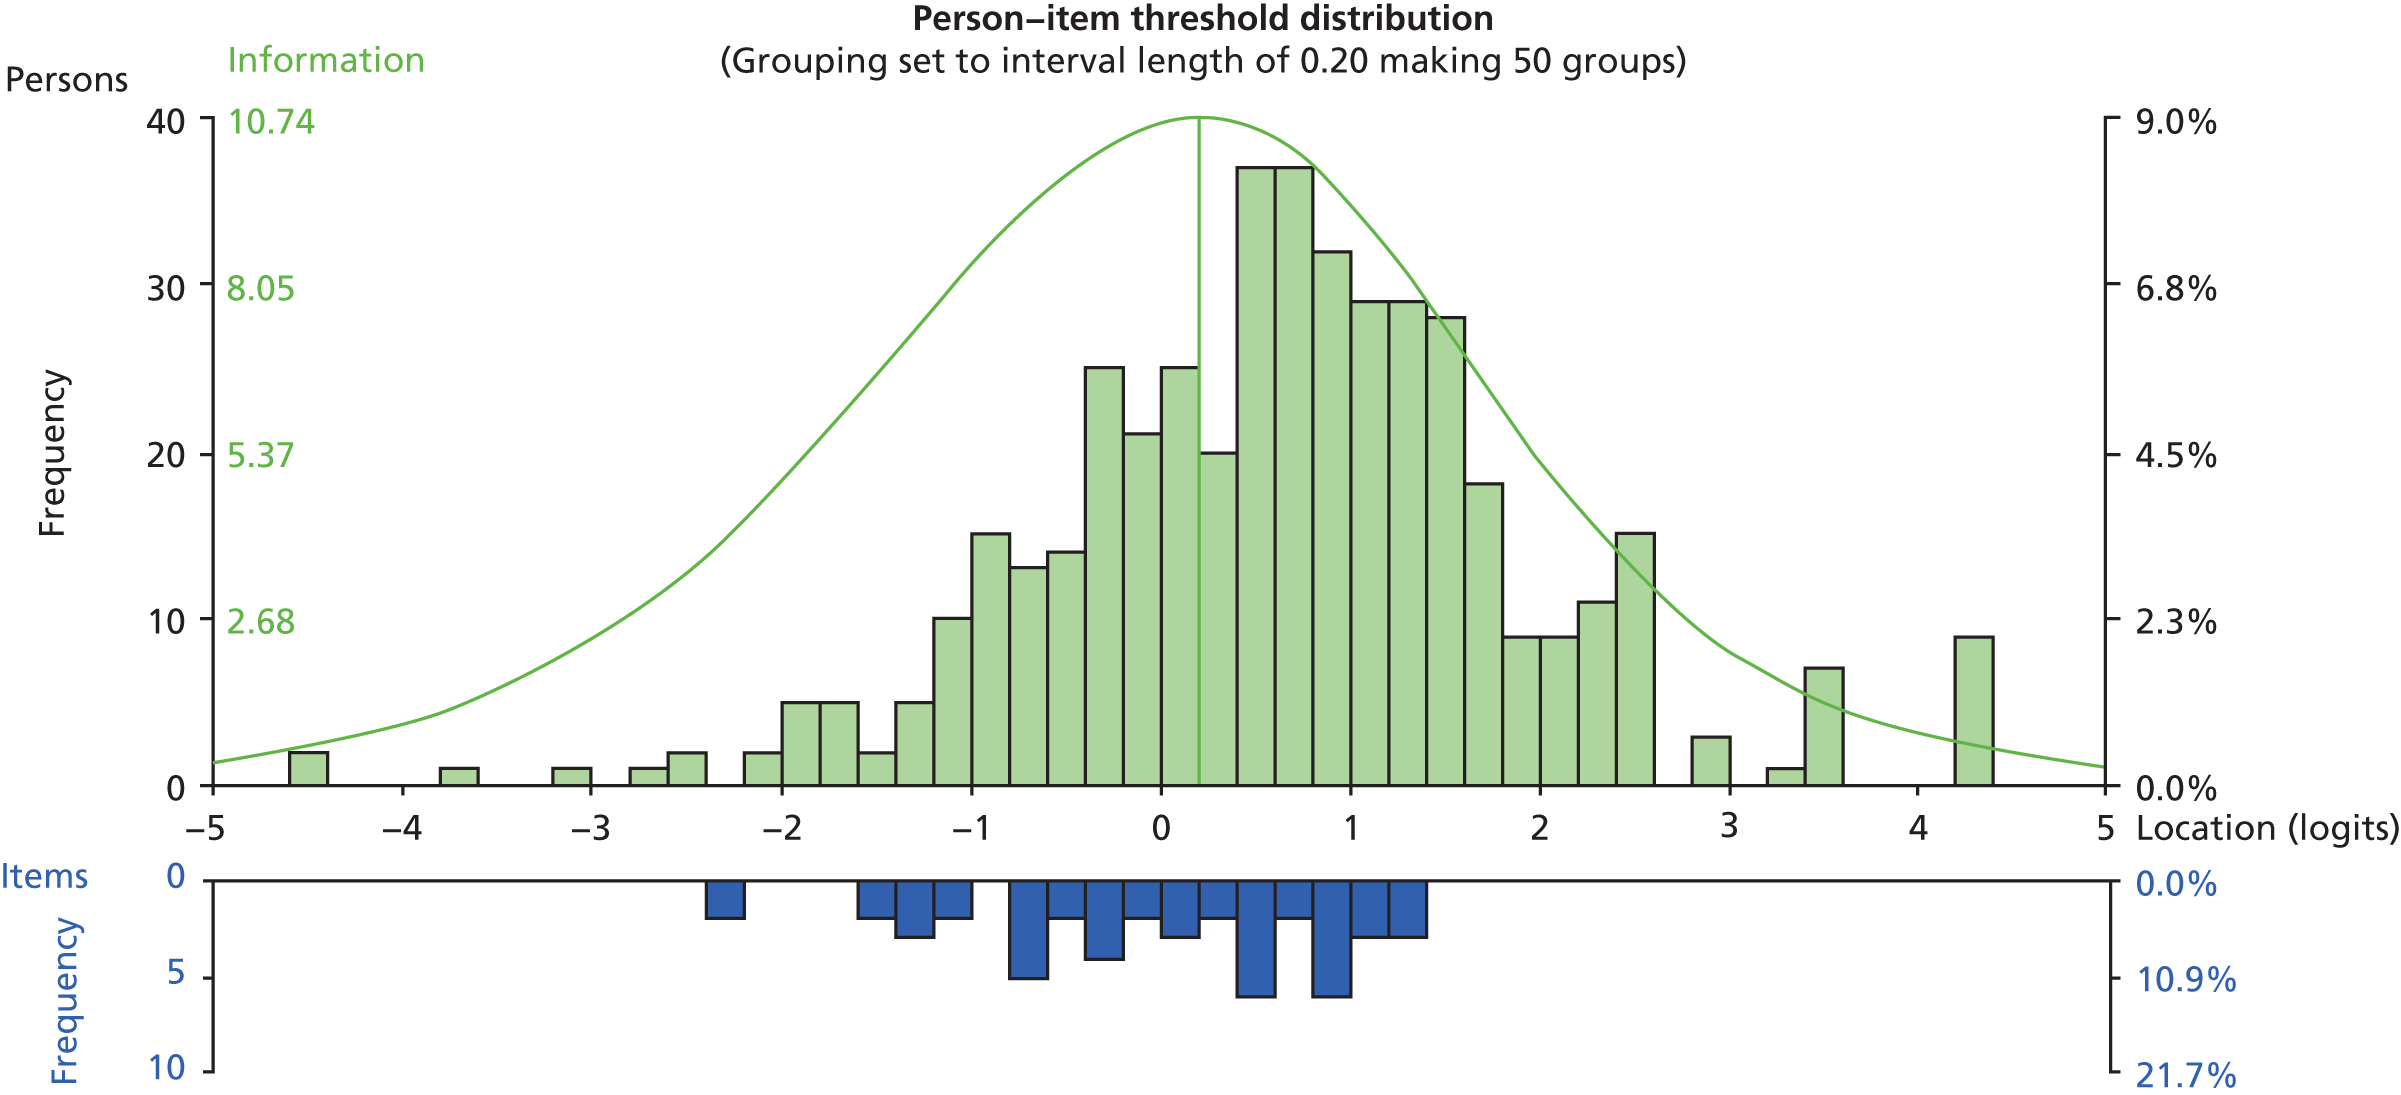
Sources of individual item misfit at this stage are summarised in Table 27.
| Item | Disordered thresholds | Fit residual> 2.5 | Fit residual< –2.5 | Misfitting chi-squared statistic | Misfitting F-statistic | Prison DIF | Gender DIF | Age DIF | Religion DIF | Response dependence (residual correlation > 0.2) |
|---|---|---|---|---|---|---|---|---|---|---|
| 1 | ||||||||||
| 2 | ||||||||||
| 3 | ✗ | ✗ | ✗ | |||||||
| 4 | ✗ | |||||||||
| 5 | ||||||||||
| 6 | ✗ | ✗ | ✗ | |||||||
| 7 | ✗ | |||||||||
| 8 | ||||||||||
| 9 | ||||||||||
| 10 | ||||||||||
| 11 | ✗ | ✗ | ✗ | ✗ | ||||||
| 12 | ✗ | ✗ | ✗ | ✗ | ||||||
| 13 | ✗ | |||||||||
| 14 | ||||||||||
| 15 | ✗ | ✗ | ✗ | ✗ | ||||||
| 16 | ✗ | ✗ | ||||||||
| 17 | ||||||||||
| 18 | ||||||||||
| 19 | ||||||||||
| 20 | ||||||||||
| 21 | ✗ | ✗ | ✗ | ✗ | ||||||
| 22 | ✗ | |||||||||
| 23 | ✗ | ✗ | ✗ | ✗ | ✗ |
Even when item 15 is rescored in an alternative rescore pattern to resolve the disordered thresholds, the reported misfit is still present.
Scale refinement
Resolution A
Following the generic rescore, resolution A was reached following the removal of five items (item 3: ‘I was absent-minded and unable to remember what I was actually doing’; item 6: ‘I didn’t trust other people’; item 15: ‘I suffered from voices and noises from inside or outside my head’; item 22: ‘I felt as if I was far away from myself’; and item 23: ‘I felt worthless’). Additionally, subtests (testlets) were created from items 1 and 2 (‘it was hard for me to concentrate’ and ‘I felt helpless’), items 7, 11 and 12 (‘I didn’t believe in my right to live’, ‘I hated myself’ and ‘I wanted to punish myself’), and items 4, 13 and 21(‘I felt disgust’, ‘I suffered from shame’ and ‘I felt disgusted by myself’). Also, item 16 (‘criticism had a devastating effect on me’) was split for DIF by gender.
The summary fit statistics at this stage are presented in Table 26.
Resolution B
Following the generic rescore, resolution B was reached following the removal of 10 items (item 3: ‘I was absent-minded and unable to remember what I was actually doing’; item 6: ‘I didn’t trust other people’; item 10: ‘I had images that I was very much afraid of’; item 11: ‘I hated myself’; item 12: ‘I wanted to punish myself’; item 15: ‘I suffered from voices and noises from inside or outside my head’; item 16: ‘criticism had a devastating effect on me’; item 18: ‘the idea of death had a certain fascination for me’; item 21: ‘I felt disgusted by myself’; and item 23: ‘I felt worthless’).
The summary fit statistics at this stage are presented in Table 26 (‘resolution B’).
The summary fit statistics are also presented at the stage prior to item 16 (‘criticism had a devastating effect on me’) being removed for DIF by gender. See Table 26 (‘resolution B2’).
Borderline Symptom List-23 (frequency-based responses) supplementary items
The eight items of the supplement were also looked at as a separate scale.
All thresholds were disordered with category probability response patterns tending towards a dichotomous structure. All items were, therefore, dichotomised, which resulted in an extremely low person separation index (0.02), along with other unfavourable fit statistics. See Table 26 for the BSL-23-F supplementary items summary fit statistics at this stage. This analysis was not progressed because of the lack of power in the tests of fit, as indicated by the low person separation index.
The Clinical Outcomes in Routine Evaluation – Outcome Measure
The CORE-OM can be assessed in various different ways. The 34-item scale can be assessed in its entirety, or broken down into its separate domains of well-being (four items), problems/symptoms (12 items), functioning (12 items) and risk (six items). The CORE-OM is also commonly summed with the risk domain excluded (CORE minus risk). Additionally, the short-form 10-item screening tool, the CORE-10, is embedded within the larger 34-item scale.
It is postulated that the four domains all contribute to a higher-order construct, but, prior to this being formed, it holds that each individual domain should function independently. First, the results of the complete CORE-OM will be presented, followed by, second, the independent domains and the CORE-10.
The Clinical Outcomes in Routine Evaluation – Outcome Measure complete scale
Initial analysis of the CORE-OM revealed the scale to be problematic in terms of fit to the Rasch model. The summary fit statistics at this stage are presented in Table 28. Individual item fit revealed evidence of a number of problematic items displaying fit parameters outside the normally expected and accepted range.
| Analysis | Item location | Person location | Item fit residual | Person fit residual | Chi-squared interaction | PSI | Alpha | Unidimensionality t-tests | ||||||||||
|---|---|---|---|---|---|---|---|---|---|---|---|---|---|---|---|---|---|---|
| Mean | SD | Mean | SD | Mean | SD | Mean | SD | Value | df | p-value | With extremes | Without extremes | Number of significant tests | Total number of tests | % | Lower bound 95% CI (%) | ||
| CORE-OM initial | 0 | 0.48 | 0.09 | 0.48 | 0.83 | 3.47 | –0.02 | 1.43 | 1074 | 238 | 0 | 0.9 | 0.9 | 0.9 | 77 | 448 | 17.19 | 15.20 |
| CORE-OM rescored | 0 | 0.84 | 0.34 | 0.83 | 0.38 | 3.26 | –0.07 | 1.23 | 849.7 | 238 | 0 | 0.89 | 0.89 | 0.9 | 59 | 448 | 13.17 | 11.20 |
| Bifactor resolution | 0 | 0.69 | 0.15 | 0.71 | 0.41 | 0.91 | –0.32 | 0.97 | 27.22 | 28 | 0.507 | 0.856 | 0.856 | – | 20 | 445 | 4.49 | – |
| CORE-OM resolution B | 0 | 0.83 | 0.32 | 0.94 | 0.28 | 1.11 | –0.15 | 0.98 | 104.04 | 102 | 0.425 | 0.815 | 0.81 | 0.83 | 25 | 448 | 5.58 | 3.60 |
| Well-being initial | 0 | 0.18 | 0.45 | 0.71 | 0.55 | 1.7 | –0.31 | 1.2 | 80.3 | 28 | 0 | 0.43 | 0.3 | 0.58 | 0 | 448 | 0.00a | – |
| Well-being rescored | 0 | 0.26 | 0.68 | 1.02 | 0.99 | 2.03 | –0.29 | 1.36 | 63.2 | 16 | 0 | 0.26 | 0.03 | 0.54 | 0 | 383 | 0.00a | – |
| Problems/symptoms initial | 0 | 0.33 | 0.37 | 0.76 | 0.82 | 2.64 | –0.17 | 1.36 | 221.8 | 84 | 0 | 0.82 | 0.81 | 0.85 | 26 | 441 | 5.90 | 3.90 |
| Problems/symptoms rescored | 0 | 0.59 | 1.01 | 1.17 | 0.02 | 2.19 | –0.12 | 0.95 | 154.1 | 72 | 0 | 0.75 | 0.73 | 0.83 | 12 | 425 | 2.82 | – |
| Problems/symptoms resolution A | 0 | 0.47 | 0.96 | 1.21 | 0.03 | 1.48 | –0.23 | 1.11 | 44.7 | 32 | 0.067 | 0.686 | 0.64 | 0.8 | 7 | 410 | 1.71a | – |
| Problems/symptoms resolution B | 0 | 0.62 | 1.06 | 1.21 | 0.02 | 1.15 | –0.21 | 1.1 | 43.03 | 24 | 0.0099 | 0.652 | 0.594 | 0.78 | 9 | 407 | 2.21a | – |
| Functioning initial | 0 | 0.38 | 0.07 | 0.5 | 1.05 | 2.59 | –0.08 | 1.34 | 201 | 72 | 0 | 0.75 | 0.74 | 0.74 | 37 | 448 | 8.26 | 6.20 |
| Functioning rescored | 0 | 0.43 | 0.12 | 0.86 | 0.86 | 2.71 | –0.07 | 1.34 | 223.95 | 72 | 0 | 72 | 69 | 0.78 | 36 | 444 | 8.11 | 6.10 |
| Functioning resolution A | 0 | 0.47 | 0.23 | 0.99 | 0.52 | 1.17 | –0.23 | 1.52 | 61.94 | 50 | 0.1198 | 0.72 | 0.671 | 0.74 | 19 | 437 | 4.35 | – |
| Functioning resolution B | 0 | 0.44 | 0.05 | 1.03 | 0.72 | 1.26 | –0.19 | 1.31 | 62.96 | 45 | 0.0396 | 0.708 | 0.638 | 0.74 | 12 | 431 | 2.78a | – |
| Risk 1 initial | 0 | 0.68 | –0.61 | 0.86 | –0.38 | 1.08 | –0.32 | 0.65 | 129.2 | 36 | 0 | 0.65 | 0.6 | 0.73 | 23 | 404 | 5.69a | 3.60 |
| Risk 2 rescored | 0 | 1.34 | –0.7 | 1.38 | –0.4 | 1.11 | –0.34 | 0.69 | 94.8 | 36 | 0 | 0.65 | 0.53 | 0.72 | 27 | 401 | 6.73a | 4.60 |
| CORE-10 initial | 0 | 0.4 | 0.3 | 0.65 | 0.71 | 2.61 | –0.16 | 1.16 | 195.97 | 50 | 0 | 0.764 | 0.751 | 0.79 | 22 | 446 | 4.93 | – |
| CORE-10 rescored | 0 | 0.74 | 0.73 | 1.04 | 0.12 | 2.6 | –0.14 | 0.92 | 170.75 | 60 | 0 | 0.71 | 0.693 | 0.77 | 11 | 442 | 2.49 | – |
| CORE-10 resolution | 0 | 0.83 | 0.78 | 1.1 | 0.11 | 1.24 | –0.18 | 0.85 | 69.2 | 48 | 0.024 | 0.659 | 0.612 | 0.73 | 5 | 434 | 1.15a | – |
Additionally, the observed response patterns for the items were very similar to those observed for the BSL-23-F, as all items displayed disordered thresholds, meaning that the response categories were not functioning as intended.
Rescore
As the response options were not working as intended across the whole item set and the observed response patterns were similar for most items, a generic rescore was implemented, although this rescore was different for regular scored items and reverse scored items.
The generic rescore of all of the CORE items was as in Table 29.
| Original response code | Original reversed response code | Response wording | Rescored response code | Rescored reversed response code |
|---|---|---|---|---|
| 0 | 4 | Not at all | 0 | 2 |
| 1 | 3 | Only occasionally | 1 | 1 |
| 2 | 2 | Sometimes | 1 | 1 |
| 3 | 1 | Often | 2 | 0 |
| 4 | 0 | Most or all the time | 2 | 0 |
This rescore also has the follow-on effect of reducing the total scale score. Originally, the scale would be scored 0 to 136, but with the rescore in place the total scale score is contracted to 0 to 68.
Following the generic recode, 28 items displayed ordered thresholds, but six items still displayed disordered thresholds. Despite the remaining disorder, this response structure was maintained across the item set.
The summary fit statistics at this stage are presented in Table 28, along with the targeting plot (Figure 10).
Sources of individual item misfit at this stage are summarised in Table 30.
FIGURE 10.
Targeting plot for the CORE-OM following rescoring (n = 449, mean = 0.340, SD = 0.829).
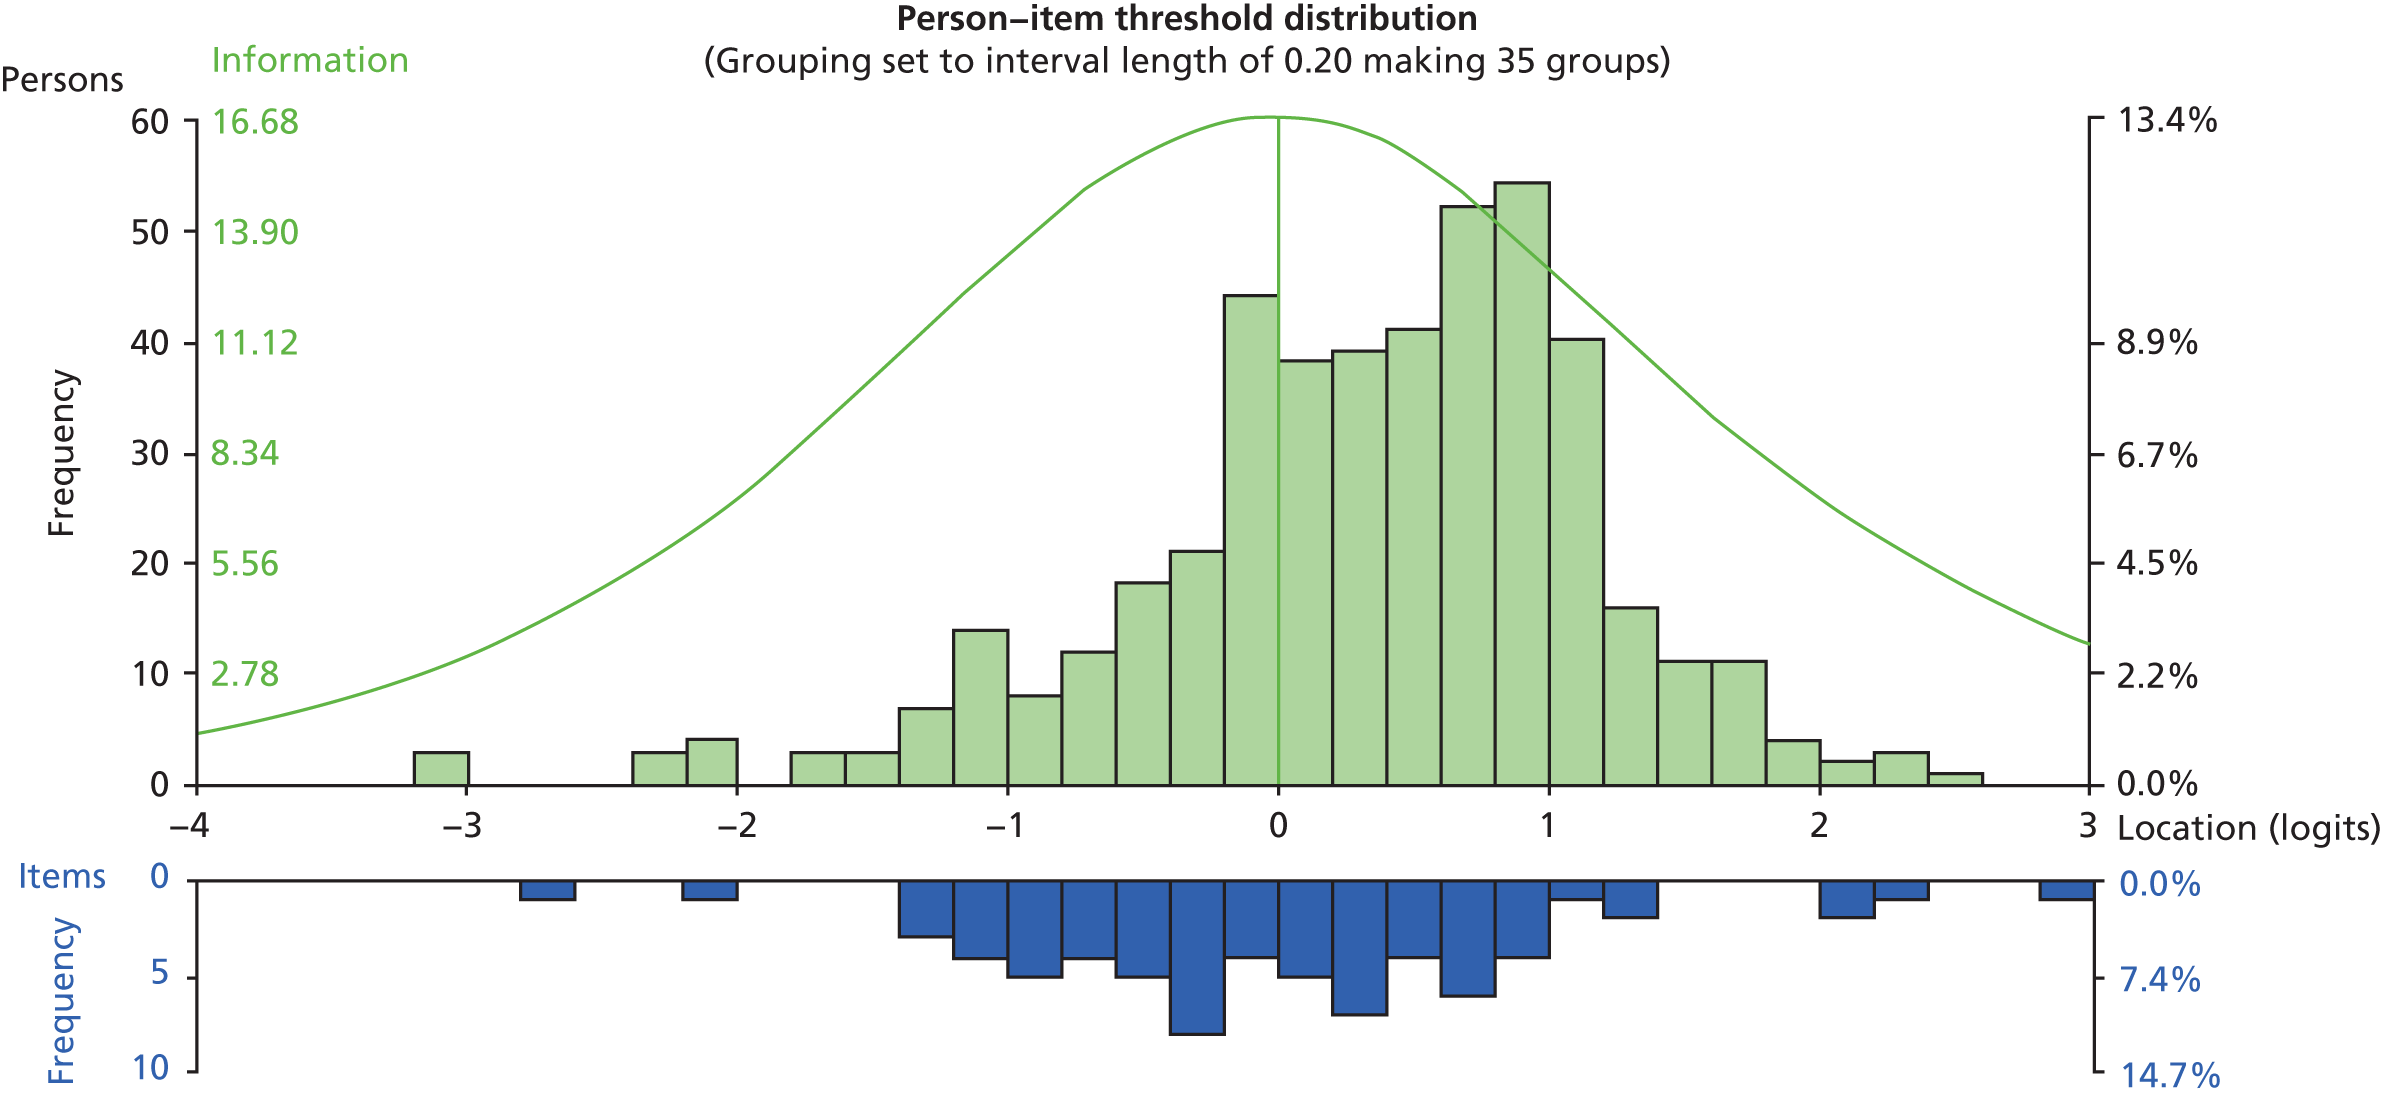
| Item | Disordered thresholds | Fit residual> 2.5 | Fit residual< –2.5 | Misfitting chi-squared statistic | Misfitting F-statistic | Prison DIF | Gender DIF | Age DIF | Religion DIF | Response dependence (residual correlation > 0.2) |
|---|---|---|---|---|---|---|---|---|---|---|
| 1 | ✗ | |||||||||
| 2 | ✗ | ✗ | ||||||||
| 3 | ✗ | ✗ | ✗ | ✗ | ||||||
| 4 | ||||||||||
| 5 | ✗ | |||||||||
| 6 | ✗ | ✗ | ||||||||
| 7 | ||||||||||
| 8 | ✗ | ✗ | ✗ | ✗ | ✗ | |||||
| 9 | ✗ | |||||||||
| 10 | ||||||||||
| 11 | ✗ | |||||||||
| 12 | ✗ | |||||||||
| 13 | ✗ | |||||||||
| 14 | ✗ | |||||||||
| 15 | ✗ | |||||||||
| 16 | ✗ | |||||||||
| 17 | ✗ | ✗ | ✗ | |||||||
| 18 | ✗ | |||||||||
| 19 | ✗ | ✗ | ✗ | ✗ | ✗ | ✗ | ✗ | |||
| 20 | ||||||||||
| 21 | ||||||||||
| 22 | ✗ | ✗ | ||||||||
| 23 | ✗ | ✗ | ✗ | ✗ | ||||||
| 24 | ✗ | ✗ | ✗ | ✗ | ||||||
| 25 | ✗ | |||||||||
| 26 | ||||||||||
| 27 | ✗ | ✗ | ✗ | ✗ | ||||||
| 28 | ✗ | |||||||||
| 29 | ||||||||||
| 30 | ✗ | |||||||||
| 31 | ✗ | ✗ | ✗ | ✗ | ||||||
| 32 | ✗ | |||||||||
| 33 | ✗ | |||||||||
| 34 | ✗ | ✗ | ✗ |
Although the items with disordered thresholds can be recoded in an alternative rescore pattern to resolve the disordered thresholds, the reported misfit is still present.
Scale refinement
Bifactor resolution
As the CORE-OM has four underlying domains, a bifactor resolution was sought. A bifactor analysis treats each independent domain as a testlet item, and the analysis is based on the shared component of the domains, with the unique component excluded.
The items displaying as clear underdiscriminating measurement anomalies within each domain were removed prior to the formation of the domain subtests (testlets). This meant that items 2, 8 and 30 were removed from the problems/symptoms domain, and items 3 and 8 were removed from the functioning domain.
The initial domain grouping revealed various DIF issues. The final bifactor resolution involved splitting the well-being domain for DIF by gender, and splitting the risk and functioning domains for DIF by age group.
The summary fit statistics for the final bifactor resolution are presented in Table 28.
Resolution B
Following the generic rescore, resolution B was reached following the removal of 17 items.
The summary fit statistics at this stage are presented in Table 28.
The removed items, along with the reasons for removal, are summarised in Table 31.
| Misfit parameter | Items removed |
|---|---|
| Underdiscrimination | 3/8/19/21/31/34 |
| Overdiscrimination | 2/9/17/23 |
| Response dependence (residual correlation > 0.2) | 9/22/24/28/32/33/34 |
| Prison DIF | – |
| Gender DIF | 14 |
| Age DIF | 34 |
| Religion DIF | – |
Removed items
An additional analysis was run on the removed items to see if they formed an alternative unidimensional item set. However, this item set displayed a high degree of misfitting parameters, both collectively and on an individual item basis.
Clinical Outcomes in Routine Evaluation domains
The initial summary statistics for each domain can be found in Table 28. All domains displayed the same threshold disordering as was present in the CORE-OM; therefore, the same generic rescoring pattern was applied to each individual domain. The summary statistics for each domain following the generic recode can be found in Table 28, and the sources of individual item misfit at this stage are summarised in Table 32.
| Domain | Item | Disordered thresholds | Fit residual> 2.5 | Fit residual< –2.5 | Misfitting chi-squared statistic | Misfitting F-statistic | Prison DIF | Gender DIF | Age DIF | Religion DIF | Response dependence (residual correlation > 0.2) |
|---|---|---|---|---|---|---|---|---|---|---|---|
| Well-being | 4 | ||||||||||
| 14 | ✗ | ✗ | |||||||||
| 17 | ✗ | ✗ | |||||||||
| 31 | ✗ | ✗ | ✗ | ||||||||
| Problems/symptoms | 2 | ✗ | |||||||||
| 5 | |||||||||||
| 8 | ✗ | ✗ | ✗ | ✗ | |||||||
| 11 | |||||||||||
| 13 | |||||||||||
| 15 | |||||||||||
| 18 | |||||||||||
| 20 | |||||||||||
| 23 | ✗ | ✗ | ✗ | ✗ | |||||||
| 27 | ✗ | ✗ | |||||||||
| 28 | |||||||||||
| 30 | ✗ | ||||||||||
| Functioning | 1 | ✗ | ✗ | ||||||||
| 3 | |||||||||||
| 7 | |||||||||||
| 10 | |||||||||||
| 12 | ✗ | ||||||||||
| 19 | ✗ | ✗ | ✗ | ✗ | ✗ | ✗ | |||||
| 21 | |||||||||||
| 25 | |||||||||||
| 26 | |||||||||||
| 29 | ✗ | ||||||||||
| 32 | |||||||||||
| 33 | ✗ | ||||||||||
| Risk | 6 | ✗ | ✗ | ||||||||
| 9 | ✗ | ✗ | |||||||||
| 16 | ✗ | ✗ | |||||||||
| 22 | ✗ | ✗ | |||||||||
| 24 | ✗ | ||||||||||
| 34 | ✗ |
Well-being and risk domains
Following rescoring, the well-being and risk domains still displayed a large degree of misfit from a number of sources. As there were a limited number of items within these domains, along with the apparent misfit of various forms, neither resolution was reached for either domain. This means that these subscales did not conform to the strict requirements of Rasch scaling, but may still conform to ordinal scale requirements, or have use as a series of single-indicator items. This does not preclude the domains being used as part of a bifactor analysis, but as independent domains these item sets fail to conform to the expectations of Rasch analysis.
Problems/symptoms domain
After the application of the generic recode, resolution A was reached following the removal of items 2, 8 and 20, and subtesting items 23 and 27 to account for the response dependency between the items.
The summary fit statistics at this stage are presented in Table 28.
Following the generic rescore, resolution B was reached following the removal of items 2, 8, 20 and 23. The summary fit statistics at this stage are presented in Table 28.
Functioning domain
After the application of the generic recode, resolution A was reached following the removal of items 3 and 19, and subtesting items 25 and 33 to account for the response dependency between the items. Additionally, item 1 was split for DIF by gender.
The summary fit statistics at this stage are presented in Table 28.
Following the generic rescore, resolution B was reached following the removal of items 1, 3 and 19. The summary fit statistics at this stage are presented in Table 28.
Clinical Outcomes in Routine Evaluation – 10 item
The initial summary statistics for the CORE-10 short form can be found in Table 28. All CORE-10 items displayed the same threshold disordering as was present in the CORE-OM; therefore, the same generic rescoring pattern was applied. The summary statistics for the CORE-10 following the generic recode can be found in Table 28, and the sources of individual item misfit at this stage are summarised in Table 33.
| Item | Disordered thresholds | Fit residual> 2.5 | Fit residual< –2.5 | Misfitting chi-squared statistic | Misfitting F-statistic | Prison DIF | Gender DIF | Age DIF | Religion DIF | Response dependence (residual correlation > 0.2) |
|---|---|---|---|---|---|---|---|---|---|---|
| 2 | ✗ | |||||||||
| 3 | ✗ | ✗ | ✗ | |||||||
| 7 | ||||||||||
| 10 | ||||||||||
| 15 | ||||||||||
| 16 | ||||||||||
| 18 | ||||||||||
| 23 | ✗ | ✗ | ✗ | ✗ | ||||||
| 27 | ✗ | ✗ | ||||||||
| 28 |
After the application of the generic recode, resolutions A and B were reached following the removal of items 3 and 23.
The summary fit statistics at this stage are presented in Table 28 (‘CORE-10 resolution’).
The Prison Screening Questionnaire
Initial analysis of the PriSnQuest showed the scale to be problematic in terms of fit to the Rasch model. The summary fit statistics at this stage are presented in Table 34, along with the initial targeting plot (Figure 11). Individual item fit revealed evidence of some items displaying fit parameters outside the normally expected and accepted range, but the individual item misfit did not suggest the same level of misfit as was found in the overall scale fit statistics.
| Analysis | Item location | Person location | Item fit residual | Person fit residual | Chi-squared interaction | PSI | Alpha | Unidimensionality t-tests | ||||||||||
|---|---|---|---|---|---|---|---|---|---|---|---|---|---|---|---|---|---|---|
| Mean | SD | Mean | SD | Mean | SD | Mean | SD | Value | df | p-value | With extremes | Without extremes | Number of significant tests | Total number of tests | % | Lower bound 95% CI | ||
| PriSnQuest initial | 0 | 0.84 | 0.51 | 1.21 | 0.41 | 1.61 | –0.12 | 0.84 | 82 | 40 | 0 | 0.44 | 0.26 | 0.63 | 8 | 405 | 1.98a | – |
| PriSnQuest subtest | 0 | 0.67 | 0.31 | 1.1 | 0.84 | 1.36 | –0.03 | 0.74 | 70.9 | 35 | 0.0003 | 0.36 | 0.16 | 0.58 | 2 | 404 | 0.5a | – |
| PriSnQuest male | 0 | 0.87 | 0.5 | 1.24 | 0.26 | 1.3 | –0.12 | 0.83 | 54.41 | 32 | 0.008 | 0.45 | 0.28 | 0.65 | 5 | 300 | 1.6%a | – |
| PriSnQuest female | 0 | 0.84 | 0.55 | 1.19 | 0.2 | 0.94 | –0.12 | 0.87 | 21.66 | 16 | 0.155 | 0.43 | 0.23 | 0.6 | 0 | 0a | – | |
FIGURE 11.
Targeting plot for the PriSnQuest (n = 447, mean = 0.512, SD = 1.213).
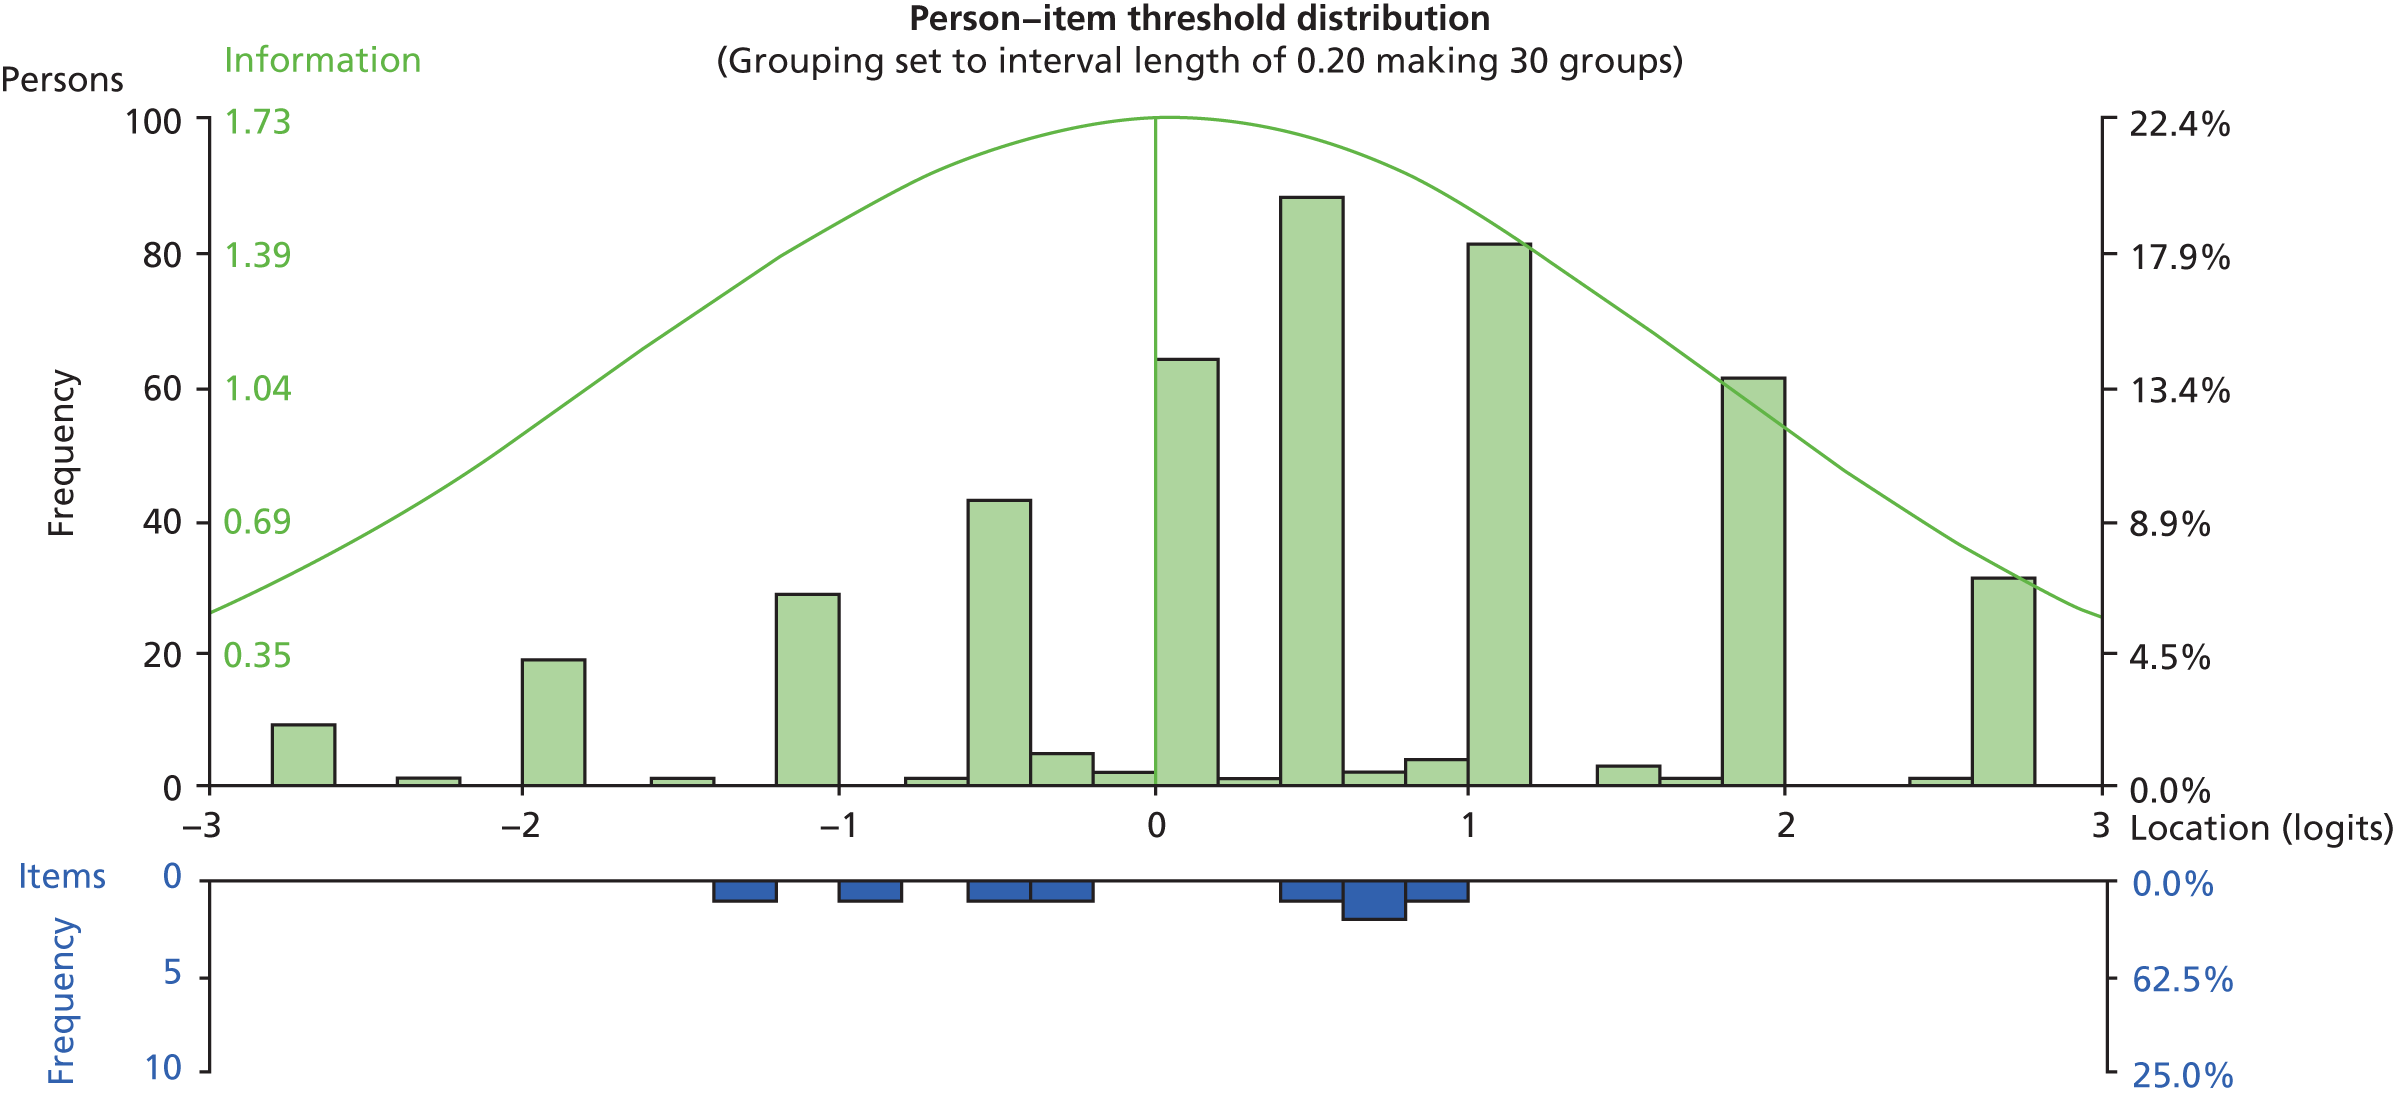
As the PriSnQuest items are all dichotomously scored, there is no opportunity for item thresholds to be disordered, as each item has only a single-measurement threshold. Therefore, no rescoring is necessary, or possible, among the PriSnQuest items. The sources of individual item misfit at this stage are summarised in Table 35.
| Item | Disordered thresholdsa | Fit residual> 2.5 | Fit residual< –2.5 | Misfitting chi-squared statistic | Misfitting F-statistic | Prison DIF | Gender DIF | Age DIF | Religion DIF | Response dependence (residual correlation > 0.2) |
|---|---|---|---|---|---|---|---|---|---|---|
| 1 | – | ✗ | ✗ | ✗ | ||||||
| 2 | – | |||||||||
| 3 | – | |||||||||
| 4 | – | ✗ | ||||||||
| 5 | – | ✗ | ||||||||
| 6 | – | ✗ | ||||||||
| 7 | – | ✗ | ✗ | |||||||
| 8 | – |
At this initial stage, the main anomaly seemed to be the sizeable response dependency that was apparent between item 4 (‘have you recently felt that life isn’t worth living?’) and item 5 (‘have you recently found yourself wishing you were dead and away from it all?’) (residual correlation = 0.505). This apparent dependency was accounted for through subtesting the affected items, and the summary statistics following this amendment are presented in Table 34.
Despite accounting for this item dependency, the PriSnQuest appeared similar to the CORE well-being and risk domains, in that the PriSnQuest has a limited number of items within the scale, and, even after accounting for various forms of apparent misfit, neither resolution A nor resolution B was applicable to this set of items. Again, this means this scale did not conform to the strict requirements of Rasch scaling, but this does not preclude it from conforming to ordinal scale requirements, or having use as a screening tool or a series of single-indicator items. However, this item set fails to conform to the expectations of Rasch analysis, with the main individual item problems highlighted in Table 35.
The PriSnQuest appeared to function differently in male and female populations, suggested by the gender DIF that is apparent in the initial analysis. Consequently, it may be useful to treat the PriSnQuest as a different scale among male and female ACCT populations. The summary statistics of the initial PriSnQuest for the separate male and female samples are presented in Table 34. Although the fit of the scale to the model is weak for males, it does appear that a separate gender-based solution is more appropriate.
The Patient Health Questionnaire-9
Initial analysis of the PHQ-9 showed that the scale failed to satisfy Rasch model expectations. The summary fit statistics at this stage are presented in Table 36. Individual item fit revealed evidence of relatively few problematic items displaying fit parameters outside the normally expected and accepted range.
| Analysis | Item location | Person location | Item fit residual | Person fit residual | Chi-squared interaction | PSI | Alpha | Unidimensionality t-tests | ||||||||||
|---|---|---|---|---|---|---|---|---|---|---|---|---|---|---|---|---|---|---|
| Mean | SD | Mean | SD | Mean | SD | Mean | SD | Value | df | p | With extremes | Without extremes | Number of significant tests | Total number of tests | % | Lower bound 95% CI | ||
| PHQ-9 initial | 0 | 0.44 | 0.6 | 0.96 | 0.28 | 1.4 | –0.2 | 1.15 | 90.2 | 54 | 0.0015 | 0.746 | 0.717 | 0.82 | 14 | 412 | 3.40 | – |
| PHQ-9 rescored | 0 | 0.64 | 0.88 | 1.32 | 0.32 | 1.28 | –0.27 | 1.3 | 70.18 | 45 | 0.0095 | 0.743 | 0.702 | 0.81 | 13 | 412 | 3.16a | – |
| PHQ-9 resolution A | 0 | 0.55 | 0.8 | 1.26 | 0.31 | 1.13 | –0.28 | 1.27 | 46.44 | 40 | 0.224 | 0.732 | 0.69 | 0.79 | 13 | 412 | 3.16a | – |
| PHQ-9 resolution B | 0 | 0.51 | 0.73 | 1.24 | 0.41 | 0.95 | –0.29 | 1.32 | 50.75 | 40 | 0.119 | 0.7 | 0.649 | 0.78 | 8 | 411 | 1.95a | – |
However, all items except one (item 4: ‘feeling tired or having little energy’) displayed disordered thresholds, meaning that the response categories were not functioning as intended.
Rescore
As the response options were not working as intended across almost the whole item set, and the observed response patterns were similar for most items, a generic rescore was implemented.
The generic rescore of all of the PHQ-9 items is shown in Table 37.
| Original response code | Response wording | Rescored response code |
|---|---|---|
| 0 | Not at all | 0 |
| 1 | Several days | 1 |
| 2 | More than half the days | 1 |
| 3 | Nearly every day | 2 |
This rescore also has the follow-on effect of reducing the total scale score. Originally, the scale would be scored 0 to 27, but with the rescore in place the total scale score is contracted to 0 to 18.
Following the generic recode, all items displayed ordered categories.
The summary fit statistics at this stage are presented in Table 36, along with the targeting plot (Figure 12).
Sources of individual item misfit at this stage are summarised in Table 38.
FIGURE 12.
Targeting plot for the PHQ-9 following rescoring (n = 442, mean = 0.878, SD = 1.317).
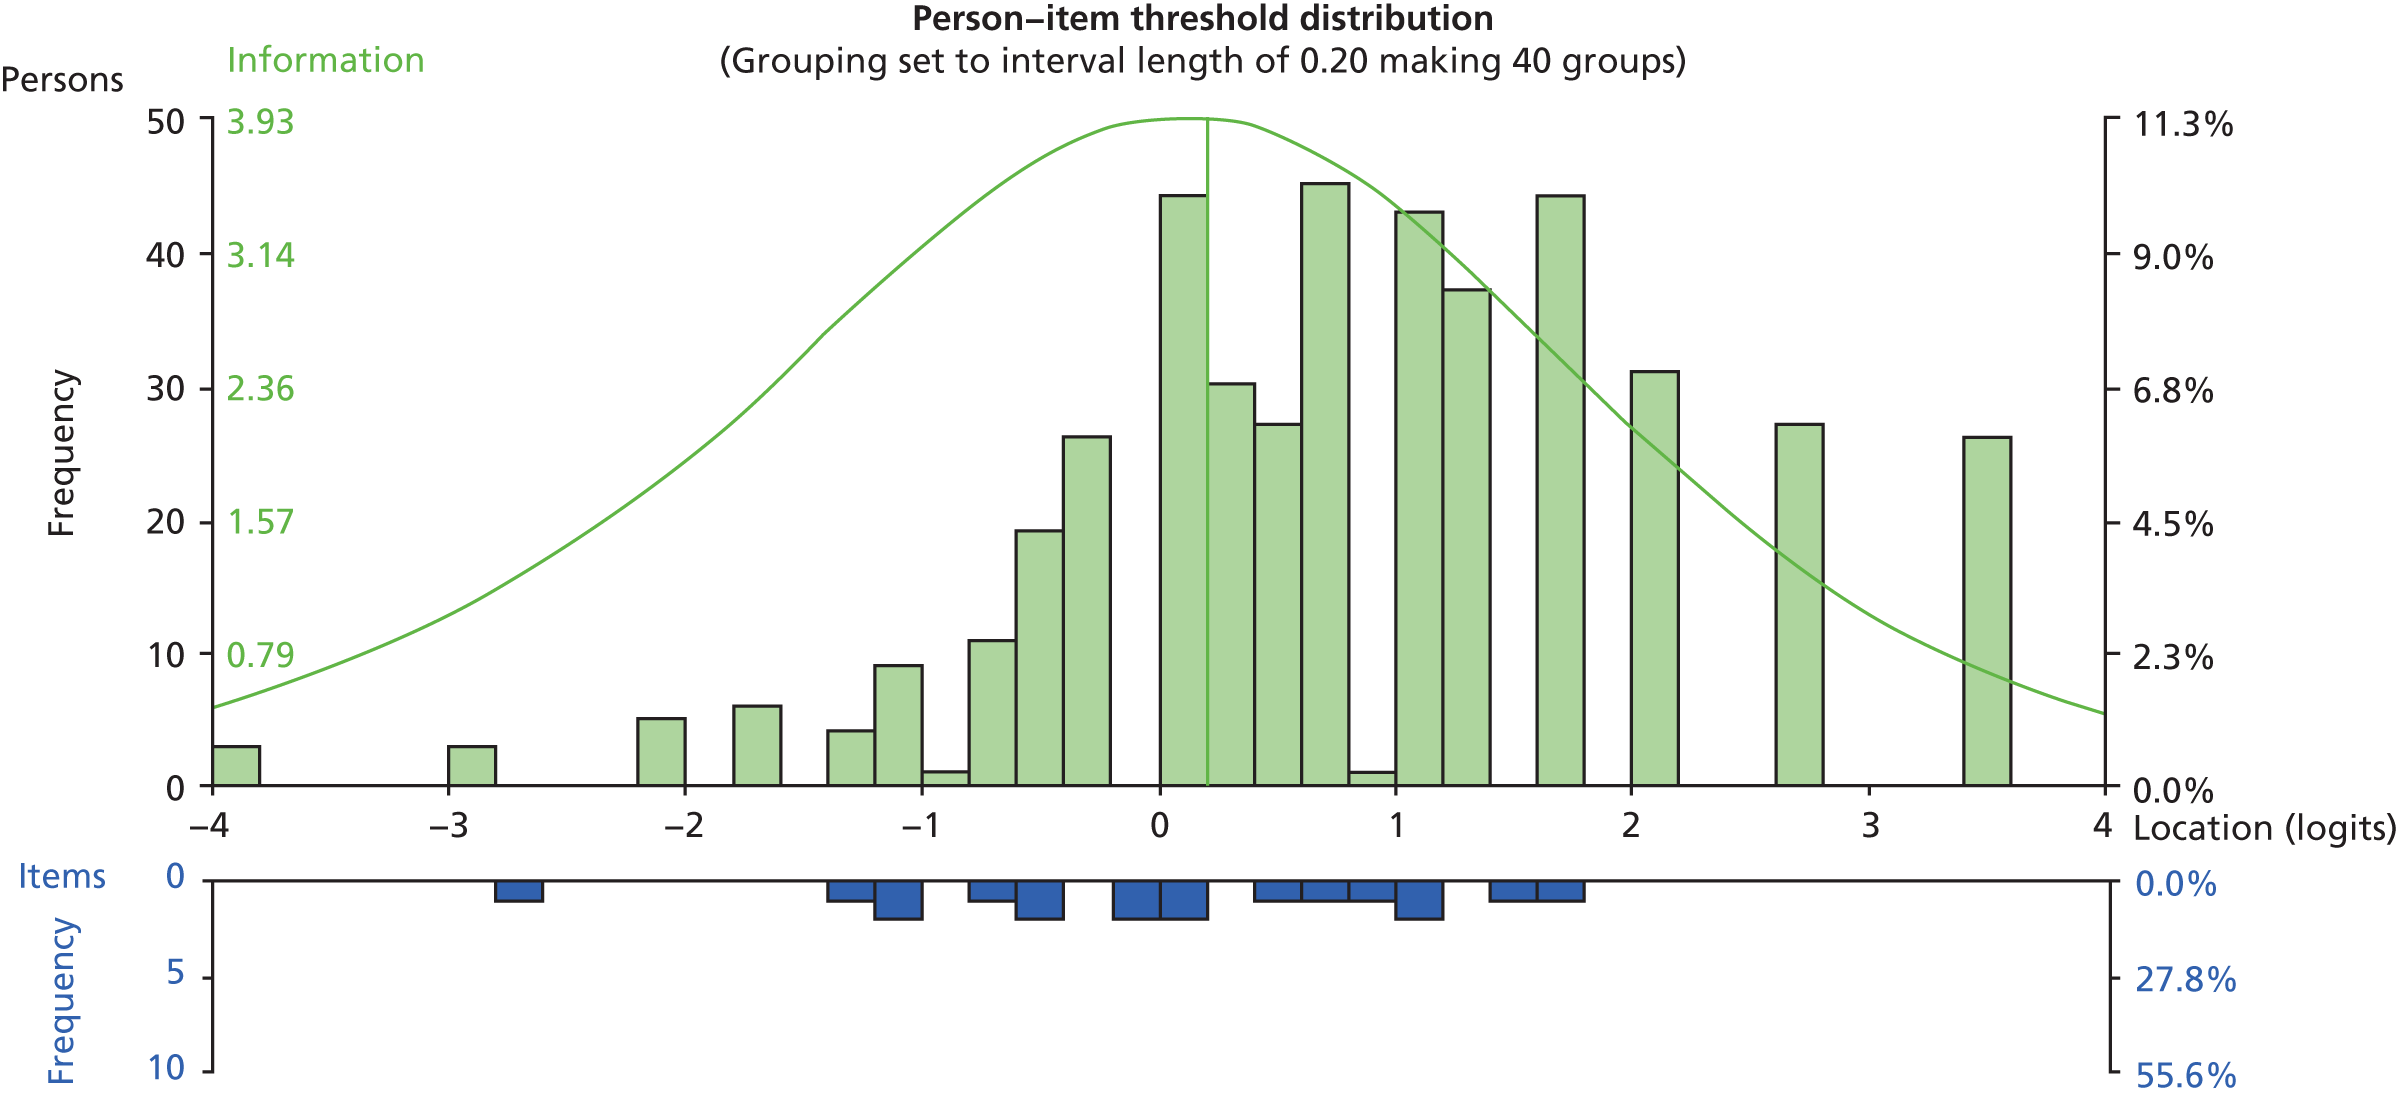
| Item | Disordered thresholds | Fit residual> 2.5 | Fit residual< –2.5 | Misfitting chi-squared statistic | Misfitting F-statistic | Prison DIF | Gender DIF | Age DIF | Religion DIF | Response dependence (residual correlation > 0.2) |
|---|---|---|---|---|---|---|---|---|---|---|
| 1 | ||||||||||
| 2 | ✗ | ✗ | ||||||||
| 3 | ||||||||||
| 4 | ||||||||||
| 5 | ||||||||||
| 6 | ||||||||||
| 7 | ||||||||||
| 8 | ||||||||||
| 9 |
Scale refinement
Resolution A
It can be seen in Table 36 that following the generic rescore there are very few sources of underlying misfit to amend in order to reach resolution A. Despite no response dependency being apparent at a residual correlation of 0.2, a lower level dependency was present between items 1 and 2. This dependency also holds on a conceptual level, as items 1 and 2 are the two ‘summary’ items that make up the PHQ-2 short form.
Resolution A was reached following the subtesting of items 1 and 2 into a testlet to account for underlying conceptual dependency.
The summary fit statistics at this stage are presented in Table 36.
Resolution B
Following the generic rescore, resolution B was reached following the removal of item 2.
The summary fit statistics at this stage are presented in Table 36.
The Self-Harm Inventory
Initial analysis of the SHI revealed a few individual elements of misfit, but the overall scale did not appear to be too problematic in terms of fit to the Rasch model. Individual item analysis, however, revealed evidence of some items displaying fit parameters outside the normally expected and accepted range. The majority of this misfit was attributable to DIF parameters mainly in the form of gender DIF, although prison DIF (unrelated to the gender DIF) was also present.
As the SHI items are all dichotomously scored, there is no opportunity for item thresholds to be disordered, as each item has only a single-measurement threshold. Therefore, no rescoring is necessary, or possible, among the SHI items.
The initial summary statistics for the SHI can be found in Table 39, along with the targeting plot (Figure 13). The sources of individual item misfit at this stage are summarised in Table 40.
| Analysis | Item location | Person location | Item fit residual | Person fit residual | Chi-squared interaction | PSI | Alpha | Unidimensionality t-tests | ||||||||||
|---|---|---|---|---|---|---|---|---|---|---|---|---|---|---|---|---|---|---|
| Mean | SD | Mean | SD | Mean | SD | Mean | SD | Value | df | p | With extremes | Without extremes | Number of significant tests | Total number of tests | % | Lower bound 95% CI (%) | ||
| SHI initial | 0 | 1.32 | –0.61 | 1.16 | –0.1 | 1.25 | –0.19 | 0.86 | 141.5 | 110 | 0.023 | 0.76 | 0.74 | 0.78 | 36 | 435 | 8.28 | 6.20 |
| SHI resolution A | 0 | 1.58 | –0.81 | 1.13 | –0.1 | 1.05 | –0.18 | 0.66 | 160 | 140 | 0.113 | 0.75 | 0.74 | 0.76 | 29 | 435 | 6.67 | 4.60 |
| SHI resolution B | 0 | 1.13 | –0.41 | 1.23 | –0.04 | 1.07 | –0.19 | 0.87 | 67.61 | 65 | 0.3881 | 0.651 | 0.61 | 0.71 | 7 | 427 | 1.64a | – |
| SHI male | 0 | 1.63 | –0.8 | 1.16 | –0.07 | 1.07 | –0.16 | 0.56 | 128.38 | 110 | 0.111 | 0.753 | 0.748 | 0.78 | 16 | 322 | 4.97 | – |
| SHI female | 0 | 1.41 | –0.37 | 1.22 | –0.15 | 0.65 | –0.18 | 0.91 | 17.91 | 22 | 0.7116 | 0.781 | 0.744 | 0.78 | 11 | 113 | 9.73 | 5.70 |
FIGURE 13.
Targeting plot for the SHI (n = 441, mean = −0.610, SD = 1.157).
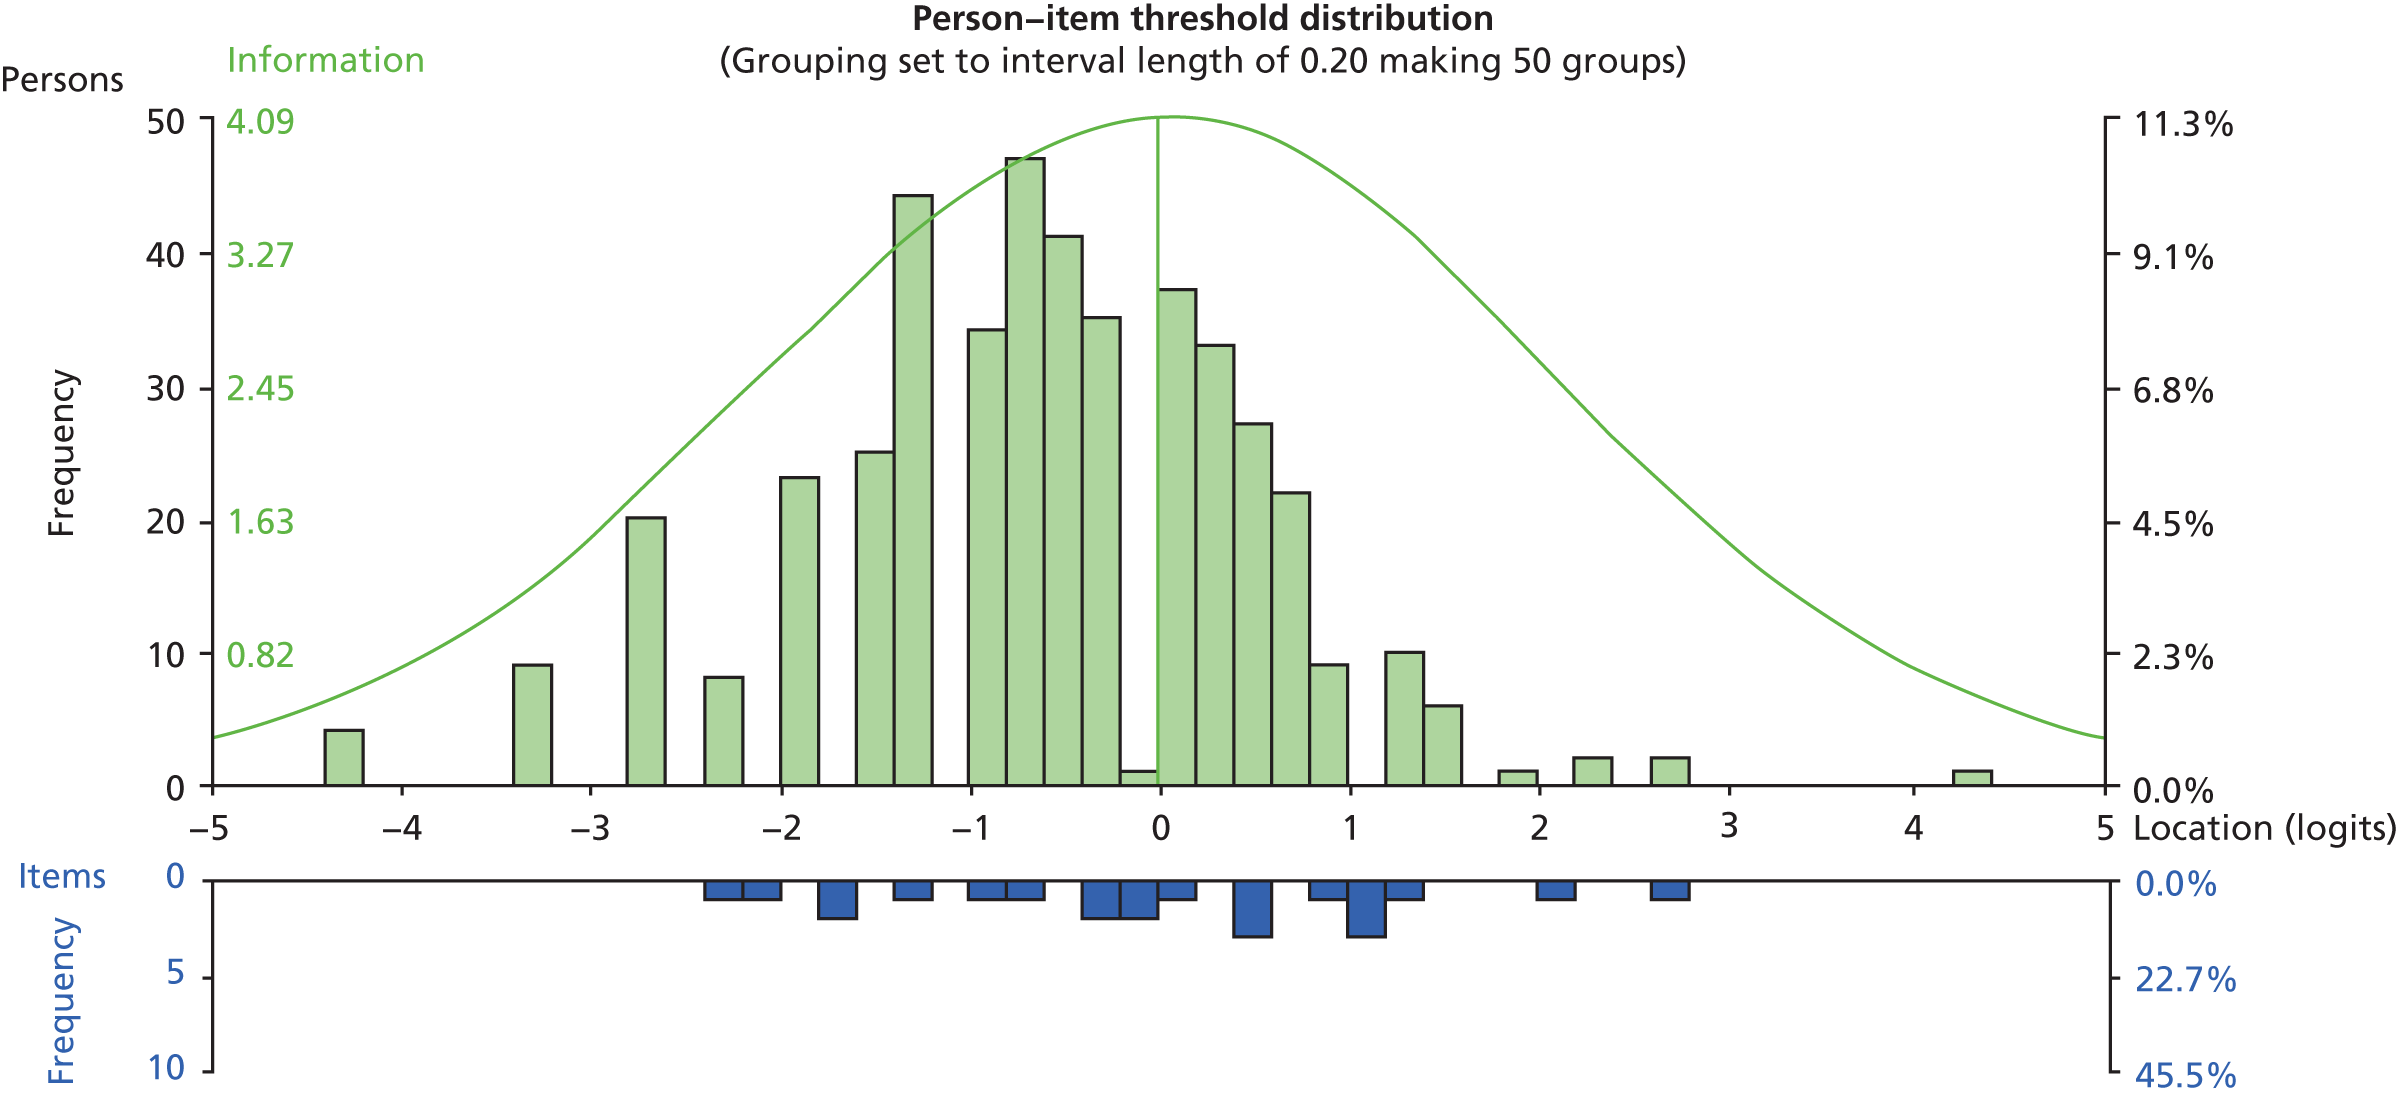
| Item | Disordered thresholdsa | Fit residual> 2.5 | Fit residual< –2.5 | Misfitting chi-squared statistic | Misfitting F-statistic | Prison DIF | Gender DIF | Age DIF | Religion DIF | Response dependence (residual correlation > 0.2) |
|---|---|---|---|---|---|---|---|---|---|---|
| 1 | – | ✗ | ||||||||
| 2 | – | |||||||||
| 3 | – | |||||||||
| 4 | – | |||||||||
| 5 | – | |||||||||
| 6 | – | |||||||||
| 7 | – | ✗ | ✗ | ✗ | ||||||
| 8 | – | |||||||||
| 9 | – | |||||||||
| 10 | – | ✗ | ||||||||
| 11 | – | ✗ | ||||||||
| 12 | – | ✗ | ||||||||
| 13 | – | |||||||||
| 14 | – | ✗ | ||||||||
| 15 | – | ✗ | ✗ | |||||||
| 16 | – | ✗ | ✗ | |||||||
| 17 | – | |||||||||
| 18 | – | ✗ | ||||||||
| 19 | – | |||||||||
| 20 | – | ✗ | ||||||||
| 21 | – | |||||||||
| 22 | – | ✗ | ✗ |
At this initial stage, there was response dependency that was apparent between item 1 (‘overdosed?’) and item 18 (‘attempted suicide?’) (residual correlation = 0.347), along with a lower level dependency apparent between item 11 (‘been promiscuous?’) and item 12 (‘set yourself up in a relationship to be rejected?’).
However, the majority of the misfit was attributable to DIF parameters, mainly in the form of gender DIF, although prison DIF (unrelated to the gender DIF) was also present. Religion DIF was present for item 14 (‘distanced yourself from God as punishment?’). This was the only religion DIF present across any of the scales.
Scale refinement
Resolution A
Resolution A was reached by subtesting items 1 and 18 together, and items 11 and 12 together, in separate testlets, to account for the apparent response dependency. Additionally, a number of items were sequentially split to account for the apparent DIF. Items 7, 8, 15, 16 and 22 were split for DIF by gender, items 10 and 20 were split for DIF by prison, with only prison C separated, and item 14 was split for DIF by gender.
The summary fit statistics at this stage are presented in Table 39.
Resolution B
Resolution B was reached following the sequential removal of nine items, all of which were presenting with some form of DIF. Items 1, 7, 8, 10, 14, 15, 16, 20 and 22 were removed in order to create a set of items which was free from any form of misfit.
The summary fit statistics at this stage are presented in Table 39.
Gender separation
The large amount of gender DIF that is apparent in the initial SHI analysis suggests that the SHI is functioning differently for males and females. It may therefore be beneficial to treat the SHI as a different scale among male and female ACCT populations. The summary statistics of the initial SHI analysis for the separate male and female samples are presented in Table 39. An example of an item displaying a clear gender DIF is presented in Figure 14.
The sources of individual item misfit at this stage are also summarised in Tables 41 and 42.
FIGURE 14.
An example of an item (‘emotionally abusive relationships’) displaying gender DIF, with females obtaining a higher affirmation rate at all levels of the underlying trait. ExpV, expected value.
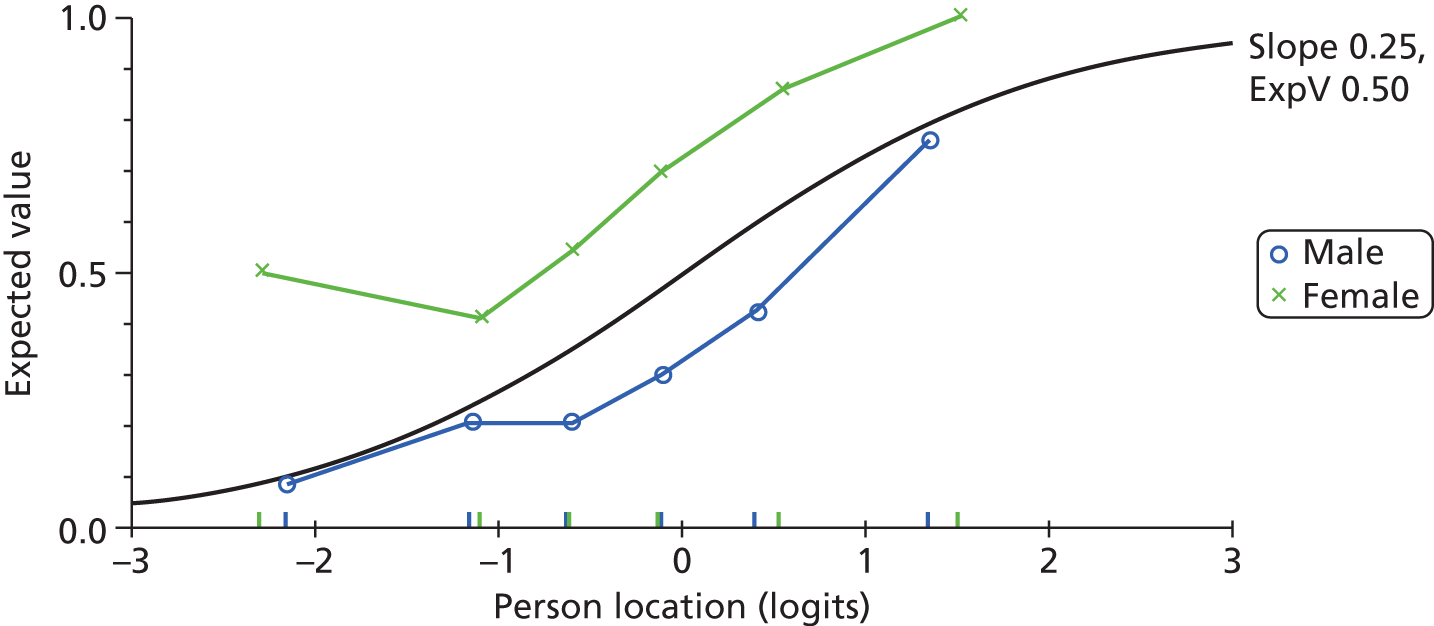
| Item | Disordered thresholdsa | Fit residual> 2.5 | Fit residual< –2.5 | Misfitting chi-squared statistic | Misfitting F-statistic | Prison DIF | Gender DIF | Age DIF | Religion DIF | Response dependence (residual correlation > 0.2) |
|---|---|---|---|---|---|---|---|---|---|---|
| 1 | – | – | ✗ | |||||||
| 2 | – | – | ||||||||
| 3 | – | – | ||||||||
| 4 | – | – | ✗ | |||||||
| 5 | – | – | ✗ | |||||||
| 6 | – | – | ||||||||
| 7 | – | – | ||||||||
| 8 | – | – | ||||||||
| 9 | – | ✗ | – | |||||||
| 10 | – | ✗ | – | |||||||
| 11 | – | – | ✗ | |||||||
| 12 | – | – | ✗ | |||||||
| 13 | – | – | ||||||||
| 14 | – | – | ✗ | |||||||
| 15 | – | – | ||||||||
| 16 | – | – | ||||||||
| 17 | – | – | ||||||||
| 18 | – | – | ✗ | |||||||
| 19 | – | – | ||||||||
| 20 | – | ✗ | – | |||||||
| 21 | – | – | ||||||||
| 22 | – | – |
| Item | Disordered thresholdsa | Fit residual> 2.5 | Fit residual< –2.5 | Misfitting chi-squared statistic | Misfitting F-statistic | Prison DIF | Gender DIF | Age DIF | Religion DIF | Response dependence (residual correlation > 0.2) |
|---|---|---|---|---|---|---|---|---|---|---|
| 1 | – | – | – | ✗ | ||||||
| 2 | – | – | – | |||||||
| 3 | – | – | – | |||||||
| 4 | – | – | – | |||||||
| 5 | – | – | – | |||||||
| 6 | – | – | – | |||||||
| 7 | – | – | – | ✗ | ||||||
| 8 | – | – | – | |||||||
| 9 | – | – | – | |||||||
| 10 | – | – | – | |||||||
| 11 | – | – | – | |||||||
| 12 | – | – | – | |||||||
| 13 | – | – | – | |||||||
| 14 | – | – | – | ✗ | ||||||
| 15 | – | – | – | |||||||
| 16 | – | – | – | |||||||
| 17 | – | – | – | |||||||
| 18 | – | – | – | ✗ | ||||||
| 19 | – | – | – | |||||||
| 20 | – | – | – | |||||||
| 21 | – | – | – | |||||||
| 22 | – | – | – |
Summary of psychometric properties
All of the five candidate instruments showed some level of evidence for the unidimensionality assumption, and all but the CORE-OM and its subscales showed scalability according to Mokken scale criteria. Consequently, with the exception of the CORE-OM, these scales can be used within a prison setting to provide ordinal estimates (magnitude) of their constructs. This analysis is essentially about the internal construct validity of the scales, and does not provide evidence that they measure what they intend, just that they measure something to the level of a good ordinal scale. Previous evidence of external construct validity (see Chapter 2, Implications for main study) supports that they do indeed measure what they intend in a reliable manner.
From the analysis above, it becomes clear that the CORE-OM, in its various subscale forms, will require some modification to support internal construct validity in this setting. None of the CORE-OM scales satisfied ordinal scaling criteria without modification.
The Rasch model is more demanding with regard to its quest for quantitative structure, and this is reflected where data from the instruments are fitted to the model. In their original form, none of the selected instruments completely satisfies all of the requirements of the Rasch model. However, with some refinement, most of the instruments contain a set of items which conform to Rasch model expectations, although the analysis and refinement capabilities are rather limited for the shorter instruments/subscales.
Area under the curve analysis of screening instruments
The Cox proportional hazards regression models will make use of the AUC analysis of individual instruments. The AUC analysis was run on all of the scales (and subscales) to assess the predictive capabilities of each scale, in terms of the final outcome of whether or not a prisoner carried out a self-harm event during the follow-up period.
The AUC results for all scales are summarised in Table 43. An AUC of 1 represents a scale that can discriminate perfectly between prisoners who will and will not self-harm, and an AUC of 0.5 represents a scale giving a 50 : 50 chance of correctly discriminating between prisoners who will and will not self-harm. Where the AUC is significantly different from the null hypothesis assuming an AUC of 0.5, the ROC curves are presented.
| Scale | Area under the curve | |||
|---|---|---|---|---|
| Area | Standard errora | Asymptotic significanceb | Asymptotic 95% CI | |
| CORE well-being | 0.491 | 0.032 | 0.779 | 0.429 to 0.554 |
| Average CORE well-being | 0.492 | 0.031 | 0.802 | 0.431 to 0.554 |
| CORE problems | 0.501 | 0.031 | 0.971 | 0.440 to 0.562 |
| Average CORE problems | 0.501 | 0.031 | 0.967 | 0.441 to 0.562 |
| CORE functioning | 0.517 | 0.031 | 0.583 | 0.457 to 0.578 |
| Average CORE functioning | 0.522 | 0.030 | 0.486 | 0.462 to 0.581 |
| CORE risk | 0.543 | 0.031 | 0.162 | 0.481 to 0.605 |
| Average CORE risk | 0.543 | 0.031 | 0.163 | 0.481 to 0.604 |
| CORE non-risk | 0.504 | 0.032 | 0.890 | 0.442 to 0.567 |
| Average CORE non-risk | 0.508 | 0.031 | 0.796 | 0.447 to 0.569 |
| CORE-10 | 0.496 | 0.030 | 0.889 | 0.436 to 0.555 |
| Average CORE-10 score | 0.491 | 0.030 | 0.773 | 0.432 to 0.550 |
| CORE total OM | 0.520 | 0.032 | 0.525 | 0.458 to 0.583 |
| Average CORE total OM | 0.520 | 0.031 | 0.515 | 0.459 to 0.581 |
| PriSnQuest total score | 0.565 | 0.030 | 0.038c | 0.506 to 0.624 |
| BSL-23-F total score | 0.524 | 0.031 | 0.443 | 0.463 to 0.585 |
| Average BSL-23-F | 0.529 | 0.031 | 0.353c | 0.468 to 0.590 |
| SHI total score | 0.566 | 0.031 | 0.035 | 0.506 to 0.626 |
| PHQ-9 total score | 0.503 | 0.031 | 0.928 | 0.443 to 0.563 |
| PHQ-2 total score | 0.509 | 0.031 | 0.762 | 0.449 to 0.570 |
The only scale scores which offered a significant predictive value were the PriSnQuest and the SHI. The corresponding ROC curves are presented in Figures 15 and 16.
FIGURE 15.
Receiver operating characteristic curve of the PriSnQuest. Diagonal segments were produced by ties.
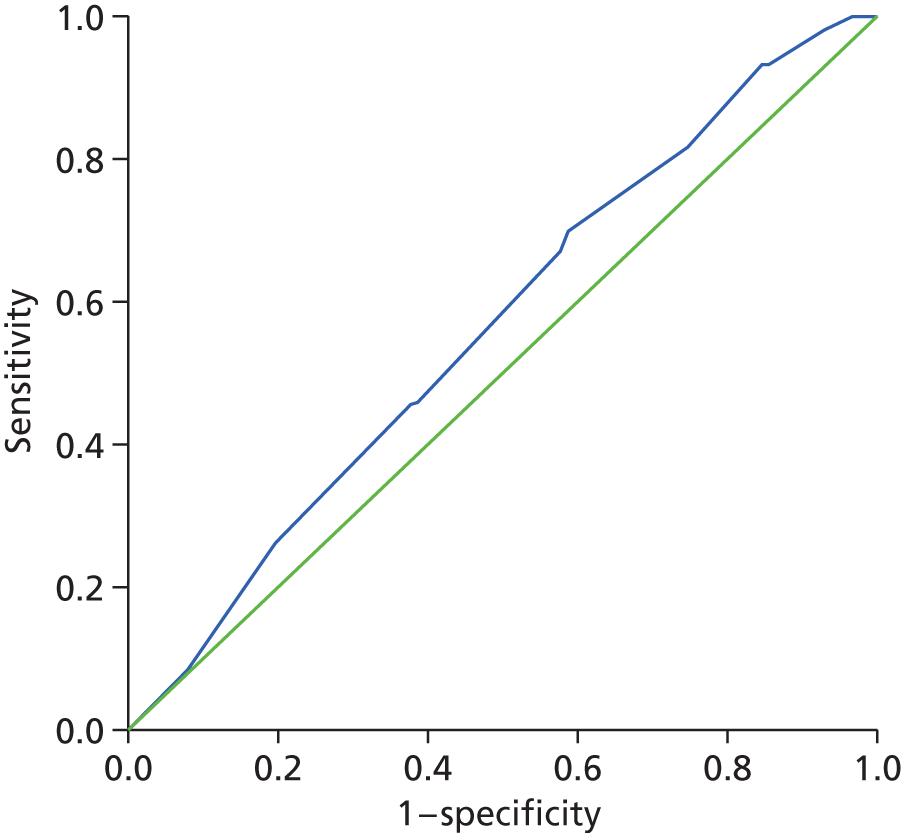
FIGURE 16.
Receiver operating characteristic curve of the Self-Harm Inventory. Diagonal segments were produced by ties.
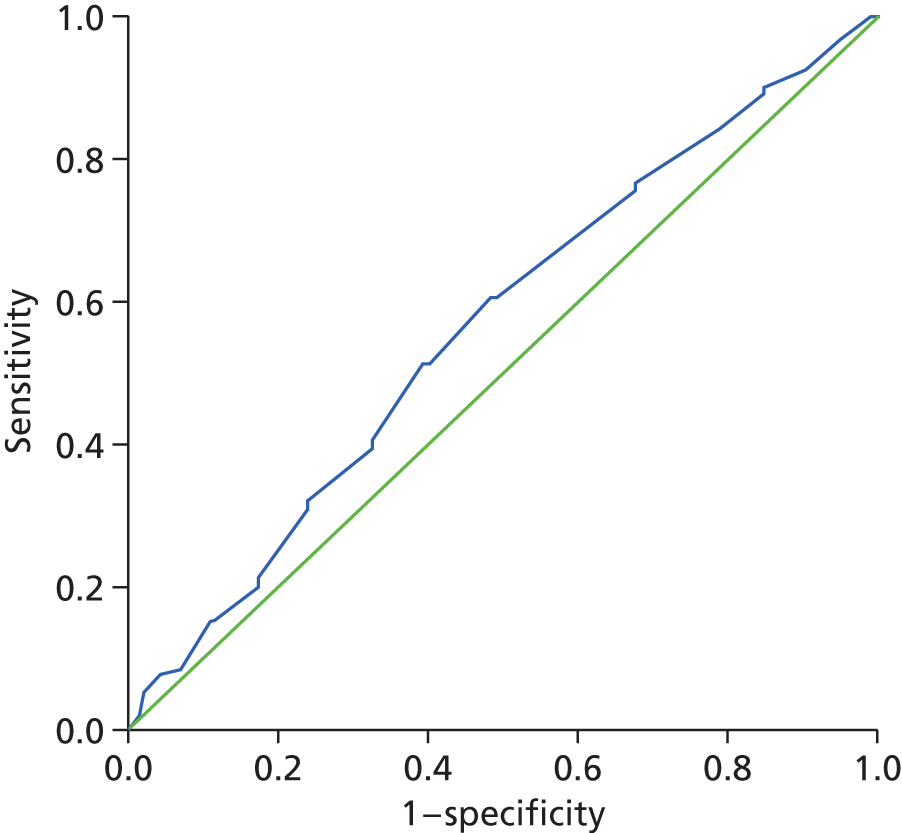
Additionally, the AUC analysis was run for the optimal resolution resulting from the Rasch analysis for each scale and subscale (Table 44). The logit estimates for each person were converted back into an equivalent raw score for the items (and scoring parameters) which constitute the final item set. Resolution B was used in the majority of instances, but, where this was not available, the rescored scale analysis was used. If no rescore was applicable, then the conversion was based on the initial analysis (as per Table 44). The PHQ-9 also offers a resolution A to use, and the PriSnQuest was separated into gender-specific conversions, as suggested within the Rasch analysis.
| Scale | Area under the curve | |||
|---|---|---|---|---|
| Area | Standard errora | Asymptotic significanceb | Asymptotic 95% CI | |
| CORE well-being rescored conversion 0–8 | 0.511 | 0.031 | 0.725 | 0.450 to 0.572 |
| CORE problems resolution B conversion 0–16 | 0.506 | 0.031 | 0.833 | 0.447 to 0.566 |
| CORE functioning resolution B conversion 0–18 | 0.531 | 0.030 | 0.319 | 0.472 to 0.590 |
| CORE risk rescored conversion 0–12 | 0.540 | 0.031 | 0.194 | 0.479 to 0.601 |
| CORE non-risk resolution B conversion 0–30 | 0.525 | 0.031 | 0.412 | 0.465 to 0.585 |
| CORE-10 resolution B conversion 0–16 | 0.493 | 0.030 | 0.814 | 0.434 to 0.551 |
| CORE-OM resolution B conversion 0–34 | 0.527 | 0.031 | 0.387 | 0.466 to 0.587 |
| PriSnQuest initial conversion 0–8 | 0.567 | 0.030 | 0.030c | 0.508 to 0.626 |
| PriSnQuest male subtest conversion 0–8 | 0.580 | 0.036 | 0.028c | 0.510 to 0.650 |
| PriSnQuest female subtest conversion 0–8 | 0.530 | 0.057 | 0.606 | 0.418 to 0.642 |
| BSL-23-F resolution B conversion 0–28 | 0.507 | 0.031 | 0.831 | 0.447 to 0.567 |
| SHI resolution B conversion 0–13 | 0.581 | 0.030 | 0.009c | 0.521 to 0.641 |
| PHQ-9 resolution A conversion 0–18 | 0.508 | 0.031 | 0.809 | 0.447 to 0.568 |
| PHQ-9 resolution B conversion 0–16 | 0.511 | 0.031 | 0.732 | 0.450 to 0.571 |
| PHQ-2 Location conversion 0–6 | 0.511 | 0.031 | 0.719 | 0.451 to 0.572 |
Again, the only scale scores which offered a significant predictive value were the PriSnQuest (initial and male-specific resolutions) and the SHI. The corresponding ROC curves are presented in Figures 17–19.
FIGURE 17.
Receiver operating characteristic curve of the PriSnQuest initial, converted from Rasch estimates. Diagonal segments were produced by ties.
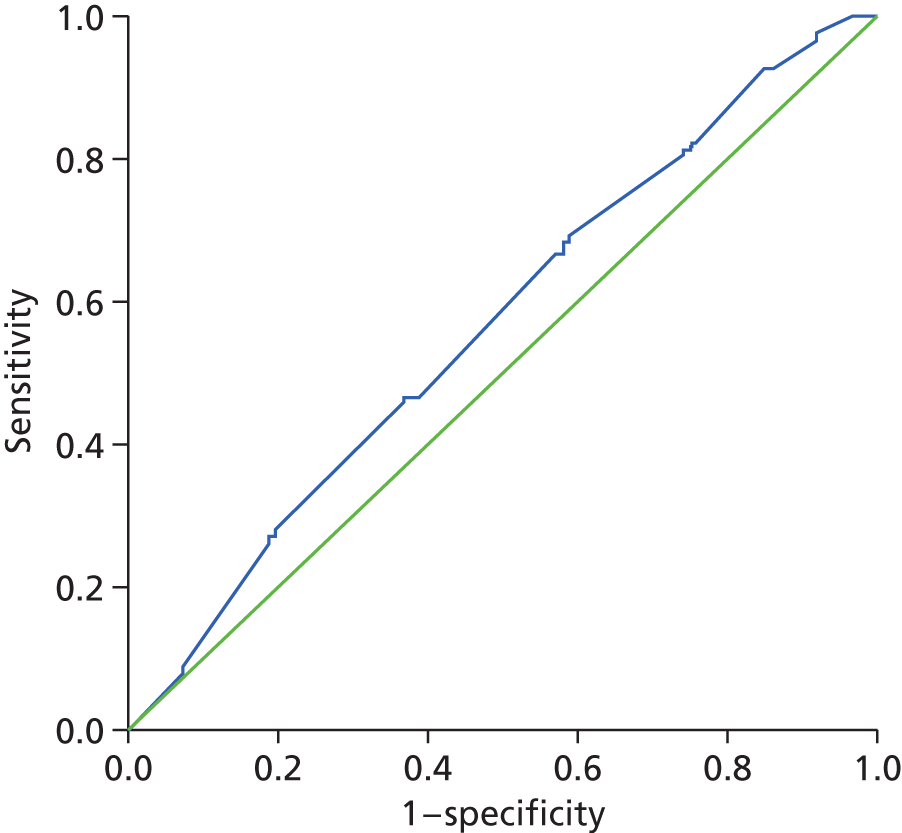
FIGURE 18.
Receiver operating characteristic curve of the PriSnQuest (male-specific), converted from Rasch estimates. Diagonal segments were produced by ties.
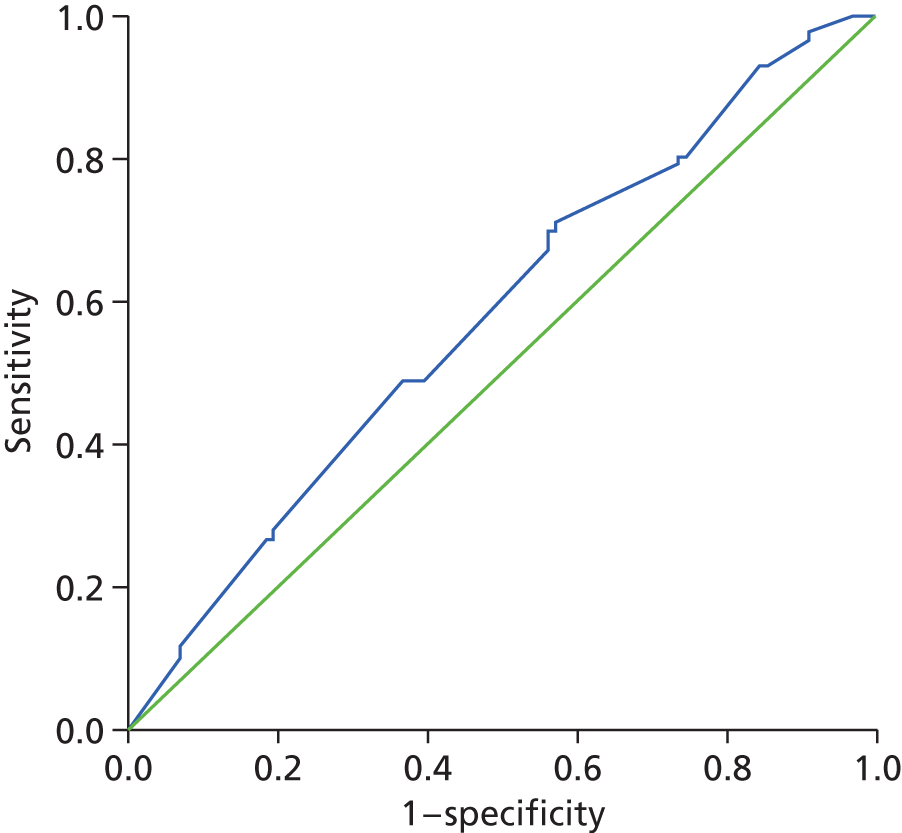
FIGURE 19.
Receiver operating characteristic curve of the SHI, converted from Rasch estimates. Diagonal segments were produced by ties.
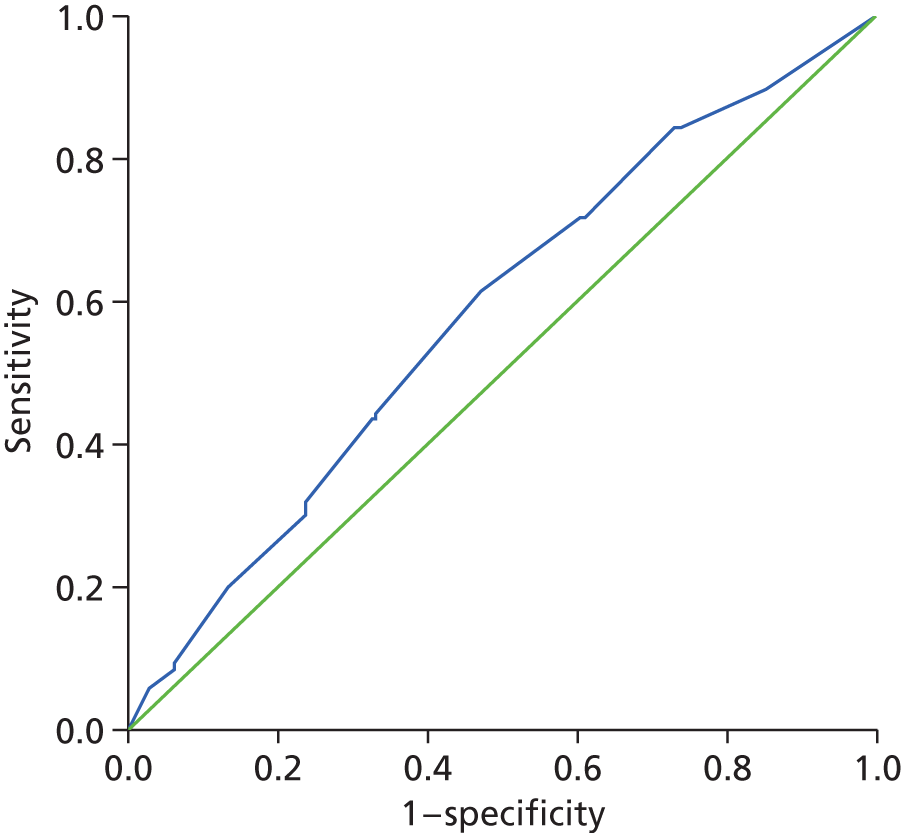
Gender-specific area under the curve
Based on the indications in the literature,42,93 along with the indications provided within the Rasch analysis, the AUC analysis was repeated on a gender-specific basis to assess whether or not results differed from the collated analysis.
The male-specific AUC results for all scales are summarised in Tables 45 and 46.
| Scale | Area under the curve | |||
|---|---|---|---|---|
| Area | Standard errora | Asymptotic significanceb | Asymptotic 95% CI | |
| CORE well-being | 0.486 | 0.038 | 0.711 | 0.413 to 0.560 |
| Average CORE well-being | 0.488 | 0.037 | 0.738 | 0.415 to 0.561 |
| CORE problems | 0.540 | 0.037 | 0.282 | 0.469 to 0.612 |
| Average CORE problems | 0.538 | 0.036 | 0.294 | 0.468 to 0.609 |
| CORE functioning | 0.524 | 0.036 | 0.518 | 0.454 to 0.594 |
| Average CORE functioning | 0.532 | 0.035 | 0.385 | 0.463 to 0.601 |
| CORE risk | 0.560 | 0.037 | 0.098 | 0.488 to 0.633 |
| Average CORE risk | 0.560 | 0.037 | 0.099 | 0.488 to 0.632 |
| CORE non-risk | 0.527 | 0.037 | 0.480 | 0.454 to 0.599 |
| Average CORE non-risk | 0.531 | 0.036 | 0.397 | 0.461 to 0.601 |
| CORE-10 | 0.515 | 0.035 | 0.682 | 0.446 to 0.585 |
| Average CORE-10 score | 0.509 | 0.035 | 0.801 | 0.441 to 0.578 |
| CORE total OM | 0.542 | 0.037 | 0.268 | 0.470 to 0.614 |
| Average CORE total OM | 0.541 | 0.036 | 0.266 | 0.471 to 0.611 |
| PriSnQuest total score | 0.577 | 0.036 | 0.040c | 0.506 to 0.647 |
| BSL-23-F total score | 0.541 | 0.037 | 0.273 | 0.469 to 0.614 |
| Average BSL-23-F | 0.545 | 0.037 | 0.229 | 0.472 to 0.617 |
| SHI total score | 0.517 | 0.038 | 0.656 | 0.443 to 0.590 |
| PHQ-9 total score | 0.543 | 0.036 | 0.243 | 0.473 to 0.614 |
| PHQ-2 total score | 0.536 | 0.036 | 0.330 | 0.465 to 0.607 |
| Scale | Area under the curve | |||
|---|---|---|---|---|
| Area | Standard errora | Asymptotic significanceb | Asymptotic 95% CI | |
| CORE well-being rescored conversion 0–8 | 0.510 | 0.037 | 0.780 | 0.438 to 0.582 |
| CORE problems resolution B conversion 0–16 | 0.529 | 0.035 | 0.418 | 0.460 to 0.599 |
| CORE functioning resolution B conversion 0–18 | 0.547 | 0.034 | 0.194 | 0.480 to 0.615 |
| CORE risk rescored conversion 0–12 | 0.556 | 0.036 | 0.122 | 0.485 to 0.628 |
| CORE non-risk resolution B conversion 0–30 | 0.552 | 0.035 | 0.151 | 0.484 to 0.621 |
| CORE10 resolution B conversion 0–16 | 0.515 | 0.035 | 0.681 | 0.447 to 0.583 |
| CORE-OM resolution B conversion 0–34 | 0.546 | 0.035 | 0.210 | 0.476 to 0.615 |
| PriSnQuest initial conversion 0–8 | 0.579 | 0.036 | 0.031c | 0.509 to 0.648 |
| PriSnQuest male subtest conversion 0–8 | 0.580 | 0.036 | 0.028c | 0.510 to 0.650 |
| BSL-23-F resolution B conversion 0–28 | 0.518 | 0.036 | 0.618 | 0.448 to 0.589 |
| SHI resolution B conversion 0–13 | 0.549 | 0.038 | 0.190 | 0.475 to 0.622 |
| PHQ-9 resolution A conversion 0–18 | 0.545 | 0.036 | 0.225 | 0.474 to 0.616 |
| PHQ-9 resolution B conversion 0–16 | 0.546 | 0.036 | 0.209 | 0.476 to 0.617 |
| PHQ-2 Location conversion 0–6 | 0.538 | 0.036 | 0.307 | 0.466 to 0.609 |
The only scale score which offered a significant predictive value among the male sample was the PriSnQuest. The corresponding ROC curve is presented in Figure 20.
FIGURE 20.
Receiver operating characteristic curve of the PriSnQuest for males. Diagonal segments were produced by ties.
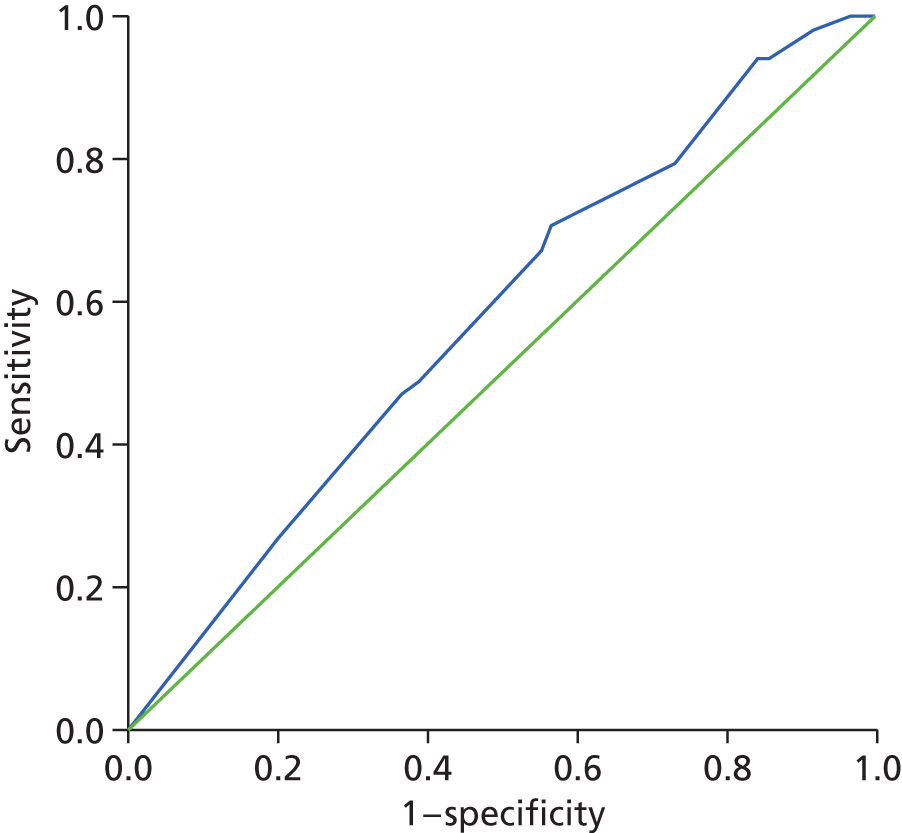
The only scale scores which offered a significant predictive value for males were the two alternative conversions of the PriSnQuest (initial and male-specific resolutions). The corresponding ROC curves are presented in Figures 21 and 22.
FIGURE 21.
Receiver operating characteristic curve of the PriSnQuest initial for males, converted from Rasch estimates. Diagonal segments were produced by ties.
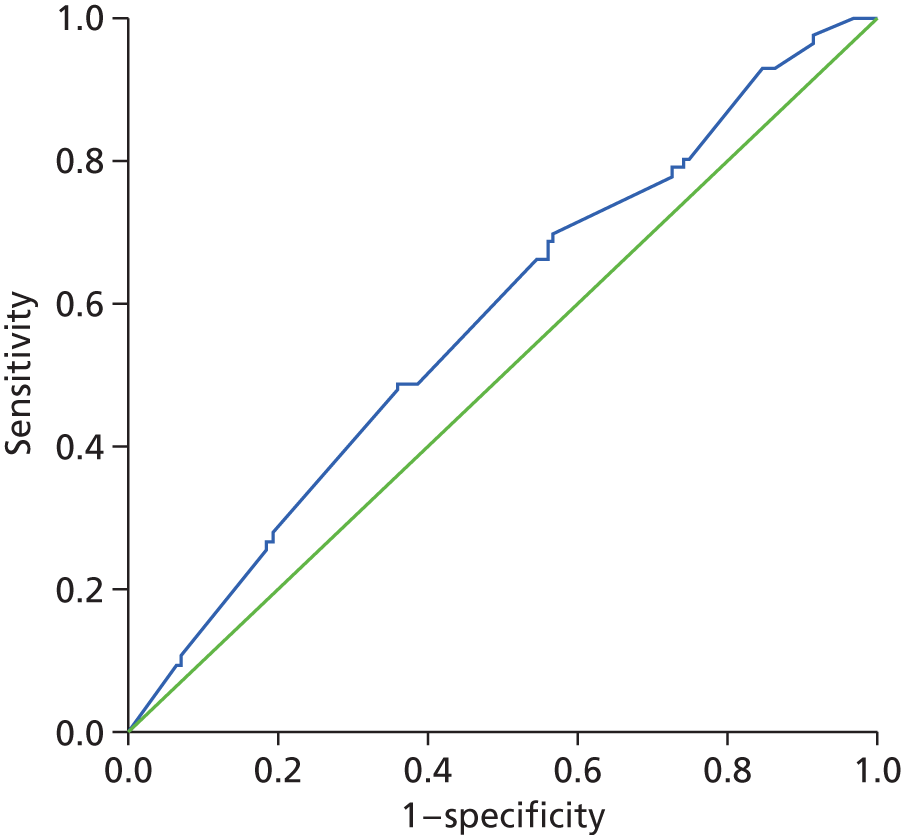
FIGURE 22.
Receiver operating characteristic curve of the PriSnQuest (male-specific conversion) for males, converted from Rasch estimates. Diagonal segments were produced by ties.
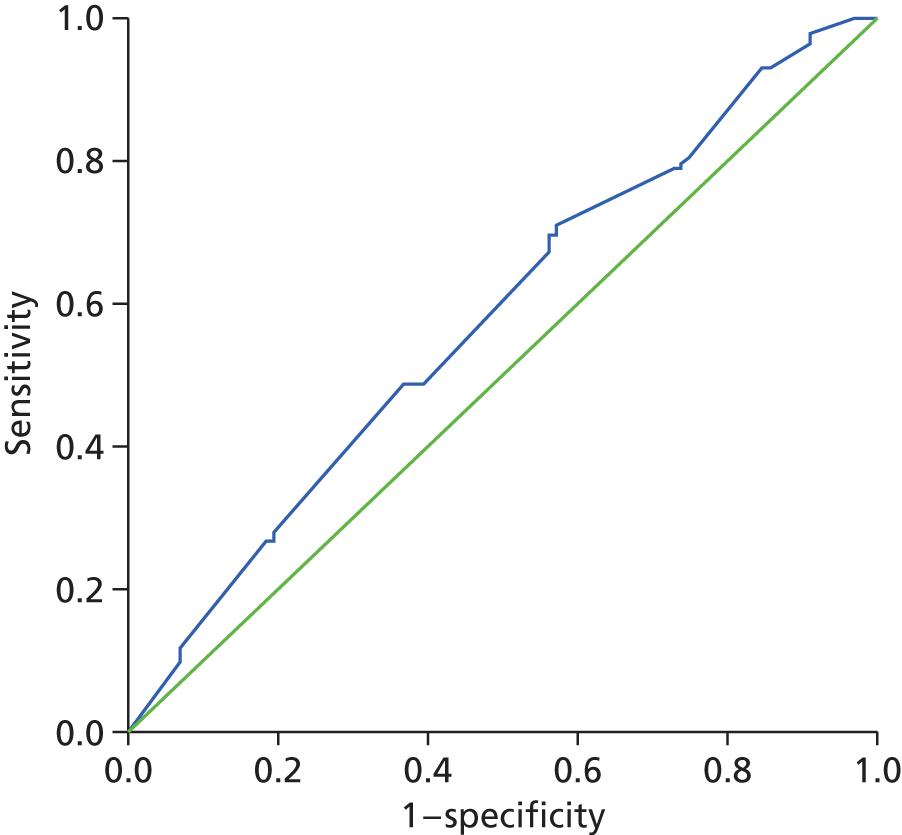
The female-specific AUC results for all scales are summarised in Tables 47 and 48.
| Scale | Area under the curve | |||
|---|---|---|---|---|
| Area | Standard errora | Asymptotic significanceb | Asymptotic 95% CI | |
| CORE well-being | 0.499 | 0.059 | 0.980 | 0.382 to 0.615 |
| Average CORE well-being | 0.499 | 0.059 | 0.980 | 0.382 to 0.615 |
| CORE problems | 0.416 | 0.058 | 0.151 | 0.302 to 0.530 |
| Average CORE problems | 0.416 | 0.058 | 0.151 | 0.302 to 0.530 |
| CORE functioning | 0.504 | 0.060 | 0.947 | 0.386 to 0.622 |
| Average CORE functioning | 0.499 | 0.060 | 0.990 | 0.381 to 0.617 |
| CORE risk | 0.511 | 0.059 | 0.854 | 0.395 to 0.627 |
| Average CORE risk | 0.511 | 0.059 | 0.854 | 0.395 to 0.627 |
| CORE non-risk | 0.458 | 0.061 | 0.471 | 0.337 to 0.578 |
| Average CORE non-risk | 0.456 | 0.061 | 0.455 | 0.336 to 0.577 |
| CORE-10 | 0.456 | 0.058 | 0.457 | 0.343 to 0.570 |
| Average CORE-10 score | 0.453 | 0.058 | 0.418 | 0.339 to 0.566 |
| CORE-Total OM | 0.474 | 0.062 | 0.653 | 0.352 to 0.595 |
| Average CORE-Total OM | 0.473 | 0.062 | 0.641 | 0.351 to 0.594 |
| PriSnQuest total score | 0.530 | 0.057 | 0.606 | 0.418 to 0.642 |
| BSL-23-F total score | 0.483 | 0.058 | 0.773 | 0.369 to 0.597 |
| Average BSL-23-F | 0.494 | 0.058 | 0.920 | 0.381 to 0.607 |
| SHI total score | 0.671 | 0.051 | 0.003c | 0.570 to 0.771 |
| PHQ-9 total score | 0.417 | 0.057 | 0.154 | 0.305 to 0.528 |
| PHQ-2 total score | 0.466 | 0.058 | 0.563 | 0.353 to 0.579 |
| Scale | Area under the curve | |||
|---|---|---|---|---|
| Area | Standard errora | Asymptotic significanceb | Asymptotic 95% CI | |
| CORE well-being rescored conversion 0–8 | 0.511 | 0.059 | 0.856 | 0.394 to 0.627 |
| CORE problems resolution B conversion 0–16 | 0.455 | 0.060 | 0.436 | 0.338 to 0.571 |
| CORE functioning resolution B conversion 0–18 | 0.492 | 0.059 | 0.893 | 0.376 to 0.609 |
| CORE risk rescored conversion 0–12 | 0.514 | 0.059 | 0.805 | 0.399 to 0.630 |
| CORE non-risk resolution B conversion 0–30 | 0.456 | 0.060 | 0.453 | 0.338 to 0.575 |
| CORE10 resolution B conversion 0–16 | 0.446 | 0.059 | 0.359 | 0.331 to 0.562 |
| CORE-OM resolution B conversion 0–34 | 0.476 | 0.061 | 0.687 | 0.356 to 0.597 |
| PriSnQuest initial conversion 0–8 | 0.530 | 0.057 | 0.606 | 0.418 to 0.642 |
| PriSnQuest female subtest conversion 0–8 | 0.530 | 0.057 | 0.606 | 0.418 to 0.642 |
| BSL-23-F resolution B conversion 0–28 | 0.493 | 0.058 | 0.898 | 0.379 to 0.606 |
| SHI resolution B conversion 0–13 | 0.654 | 0.052 | 0.009c | 0.552 to 0.756 |
| PHQ-9 resolution A conversion 0–18 | 0.422 | 0.057 | 0.180 | 0.310 to 0.533 |
| PHQ-9 resolution B conversion 0–16 | 0.427 | 0.057 | 0.210 | 0.314 to 0.539 |
| PHQ-2 Location conversion 0–6 | 0.466 | 0.058 | 0.561 | 0.353 to 0.579 |
The only scale score that offered a significant predictive value among the female sample was the SHI. The corresponding ROC curve is presented in Figure 23.
FIGURE 23.
Receiver operating characteristic curve of the SHI for females. Diagonal segments were produced by ties.
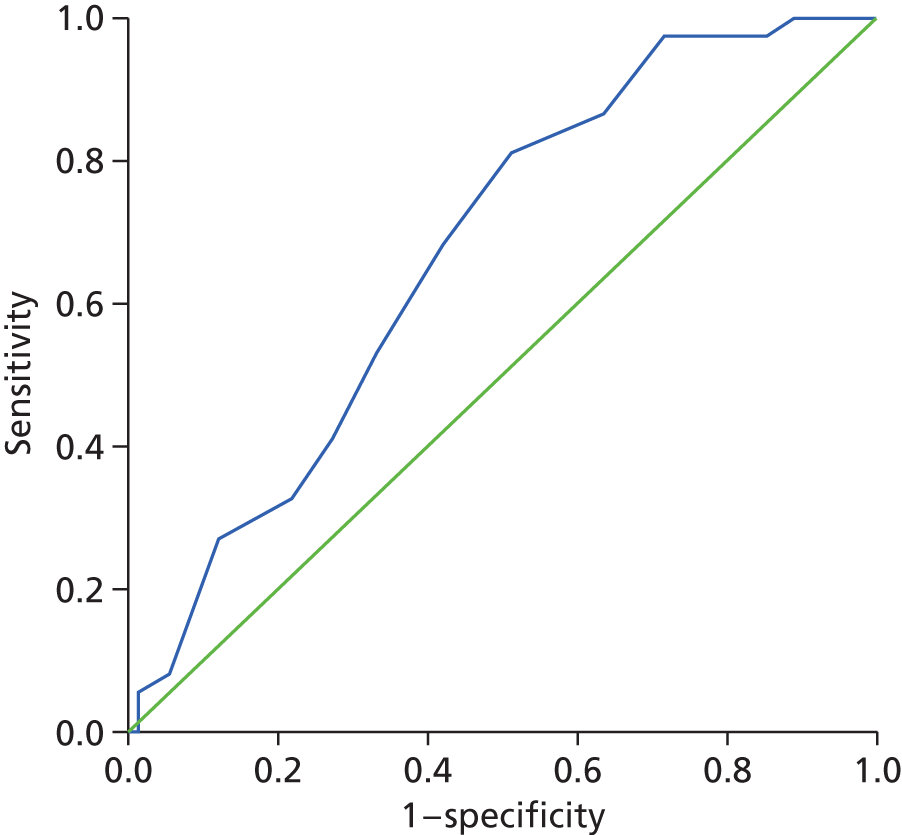
Consequently, the only scale score that offered a significant predictive value for females was the conversion of the SHI resolution B. The corresponding ROC curve is presented in Figure 24.
FIGURE 24.
Receiver operating characteristic curve of the SHI resolution B for females, converted from Rasch estimates.
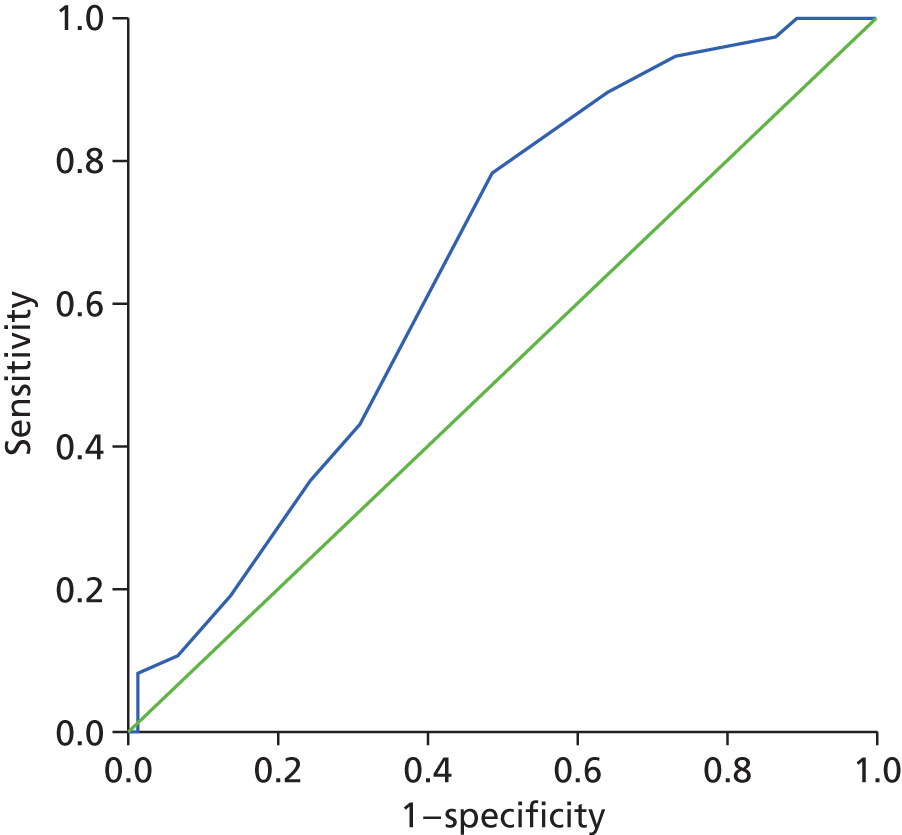
In summary, while two scales demonstrated an AUC significantly different from 0.5, all scales failed to have any meaningful predictive value, with only the SHI showing a ‘poor’ level of discrimination for females. Given this, it is not surprising that there was no significant difference between the AUCs of the various instruments. For example, with a pairwise comparison of ROC curves, the level of significance of the difference between the SHI and PriSnQuest was 0.9761, and between the SHI and PHQ-9 was 0.6253. Thus, from a predictive perspective, all scales were as poor as one another.
Cox proportional hazards regression modelling
Cox proportional hazards regression modelling was used to investigate the hazard rates for different a priori determined risk groups while adjusting for important baseline factors (see Chapter 2, Cox proportional hazards regression modelling).
The populations included in this analysis are described in Chapter 3, Populations.
Chapter 3, Cox proportional hazards regression modelling: baseline model presents the results of the univariate analysis used to determine which baseline factors to include in the Cox proportional hazard regression model; Cox proportional hazards regression modelling: Rasch-scored questionnaires presents the multivariate Cox proportional hazards regression modelling used to test for differences in the time to first self-harm event for risk groups and continuous scores based on prisoners’ converted Rasch scores, adjusting for important baseline factors identified. Rasch-based scores are available for all prisoners with a response to at least one item within each questionnaire or subscale.
Populations
Various analysis populations are considered, and the number of prisoners belonging to each population, and reasons for exclusion from populations, are summarised in Table 49.
| Population | n (%) |
|---|---|
| Full | 450 (100) |
| Evaluable | |
| Yes | 433 (96.2) |
| No | 17 (3.8) |
| Evaluable | |
| Lost to follow-up | 1 (0.2) |
| Records not accessible | 12 (2.7) |
| Full follow-up but records inconclusive | 4 (0.9) |
| Rasch score analysis | |
| Yes | 422 (93.8) |
| No | 28 (6.2) |
| Reasons for exclusion | |
| Incomplete follow-up | 17 (3.8) |
| Missing questionnaire data | 11 (2.4) |
Evaluable population
In total, 17 (3.8%) prisoners were excluded from the evaluable population as a result of incomplete follow-up information. Information for one prisoner was lost to follow-up. Records were attained for four of these prisoners; however, they were inconclusive in determining whether or not prisoners had self-harmed during the follow-up period. Records could not be accessed for the remaining 12 prisoners.
Rasch score analysis population
In total, 28 (6.2%) prisoners were excluded from the Rasch score analysis population as a result of incomplete follow-up information in 17 prisoners (those excluded from the evaluable population) and unobtainable Rasch scores on at least one of the questionnaires and/or subscales evaluated in 11 (2.4%) prisoners.
Tables 50–55 summarise prisoner baseline characteristics by these different populations. It is apparent that baseline characteristics are similar across populations.
| Characteristic | Full population (n = 450) | Evaluable population (n = 433) | Rasch population (n = 422) |
|---|---|---|---|
| Age (years) | |||
| < 30 | 233 (51.8%) | 222 (51.3%) | 218 (51.7%) |
| ≥ 30 | 217 (48.2%) | 211 (48.7%) | 204 (48.3%) |
| Mean (SD) | 31.2 (9.89) | 31.2 (9.96) | 31.1 (9.89) |
| Median | 29.0 | 29.0 | 29.0 |
| IQR | 24–36 | 24–36 | 24–36 |
| Range | 16–80 | 16–80 | 16–80 |
| Prison | |||
| A | 105 (23.3%) | 102 (23.6%) | 98 (23.2%) |
| B | 115 (25.6%) | 111 (25.6%) | 111 (26.3%) |
| C | 230 (51.1%) | 220 (50.8%) | 213 (50.5%) |
| Gender | |||
| Male | 335 (74.4%) | 322 (74.4%) | 311 (73.7%) |
| Female | 115 (25.6%) | 111 (25.6%) | 111 (26.3%) |
| Ethnicity | |||
| White (British/Irish/other) | 407 (90.4%) | 391 (90.3%) | 382 (90.5%) |
| Other ethnic background | 39 (8.7%) | 38 (8.8%) | 36 (8.5%) |
| Missing | 4 (0.9%) | 4 (0.9%) | 4 (0.9%) |
| Total | 450 (100.0%) | 433 (100.0%) | 422 (100.0%) |
| Characteristic | Full population (n = 450) | Evaluable population (n = 433) | Rasch population (n = 422) |
|---|---|---|---|
| Religion | |||
| No | 260 (57.8%) | 254 (58.7%) | 246 (58.3%) |
| Yes | 190 (42.2%) | 179 (41.3%) | 176 (41.7%) |
| Children under 16 years | |||
| No | 227 (50.4%) | 219 (50.6%) | 215 (50.9%) |
| Yes | 222 (49.3%) | 213 (49.2%) | 207 (49.1%) |
| Missing | 1 (0.2%) | 1 (0.2%) | |
| Age when finished full-time education (years) | |||
| Number of prisoners | 440 | 424 | 413 |
| Number of patients with missing data | 10 | 9 | 9 |
| Mean (SD) | 15.3 (3.49) | 15.4 (3.45) | 15.3 (3.19) |
| Median | 15.0 | 15.0 | 15.0 |
| IQR | (14–16) | (14–16) | (14–16) |
| Range | (0–45) | (0–45) | (0–45) |
| Age when finished full-time education (years) | |||
| < 16 | 242 (53.8%) | 232 (53.6%) | 225 (53.3%) |
| ≥ 16 | 208 (46.2%) | 201 (46.4%) | 197 (46.7%) |
| Total | 450 (100.0%) | 433 (100.0%) | 422 (100.0%) |
| Characteristic | Full population (n = 450) | Evaluable population (n = 433) | Rasch population (n = 422) |
|---|---|---|---|
| Education or training received in prison | |||
| No | 204 (45.3%) | 200 (46.2%) | 193 (45.7%) |
| Yes | 245 (54.4%) | 232 (53.6%) | 229 (54.3%) |
| Missing | 1 (0.2%) | 1 (0.2%) | |
| Received a visit in the past 7 days | |||
| No | 382 (84.9%) | 368 (85.0%) | 359 (85.1%) |
| Yes | 64 (14.2%) | 61 (14.1%) | 60 (14.2%) |
| Missing | 4 (0.9%) | 4 (0.9%) | 3 (0.7%) |
| Sentenced | |||
| No | 203 (45.1%) | 198 (45.7%) | 190 (45.0%) |
| Yes | 245 (54.4%) | 233 (53.8%) | 231 (54.7%) |
| Missing | 2 (0.4%) | 2 (0.5%) | 1 (0.2%) |
| Homeless at any point in the 12 months before coming to prison | |||
| No | 289 (64.2%) | 278 (64.2%) | 270 (64.0%) |
| Yes | 159 (35.3%) | 153 (35.3%) | 151 (35.8%) |
| Missing | 2 (0.4%) | 2 (0.5%) | 1 (0.2%) |
| Total | 450 (100.0%) | 433 (100.0%) | 422 (100.0%) |
| Characteristic | Full population (n = 450) | Evaluable population (n = 433) | Rasch population (n = 422) |
|---|---|---|---|
| Seen a psychiatrist outside prison | |||
| No | 188 (41.8%) | 183 (42.3%) | 180 (42.7%) |
| Yes | 259 (57.6%) | 247 (57.0%) | 240 (56.9%) |
| Missing | 3 (0.7%) | 3 (0.7%) | 2 (0.5%) |
| Received medication for mental health problems | |||
| No | 115 (25.6%) | 111 (25.6%) | 108 (25.6%) |
| Yes | 334 (74.2%) | 321 (74.1%) | 314 (74.4%) |
| Missing | 1 (0.2%) | 1 (0.2%) | |
| Ever self-harmed in prison | |||
| No | 172 (38.2%) | 167 (38.6%) | 161 (38.2%) |
| Yes | 277 (61.6%) | 265 (61.2%) | 261 (61.8%) |
| Missing | 1 (0.2%) | 1 (0.2%) | |
| Ever self-harmed outside prison | |||
| No | 99 (22.0%) | 96 (22.2%) | 92 (21.8%) |
| Yes | 350 (77.8%) | 336 (77.6%) | 330 (78.2%) |
| Missing | 1 (0.2%) | 1 (0.2%) | |
| First ACCT | |||
| No | 80 (17.8%) | 77 (17.8%) | 75 (17.8%) |
| Yes | 367 (81.6%) | 353 (81.5%) | 345 (81.8%) |
| Missing | 3 (0.7%) | 3 (0.7%) | 2 (0.5%) |
| Accessed listener services in prison | |||
| No | 316 (70.2%) | 306 (70.7%) | 299 (70.9%) |
| Yes | 133 (29.6%) | 126 (29.1%) | 123 (29.1%) |
| Missing | 1 (0.2%) | 1 (0.2%) | |
| Dependent on alcohol | |||
| No | 302 (67.1%) | 289 (66.7%) | 282 (66.8%) |
| Yes | 145 (32.2%) | 141 (32.6%) | 138 (32.7%) |
| Missing | 3 (0.7%) | 3 (0.7%) | 2 (0.5%) |
| Dependent on drugs | |||
| No | 301 (66.9%) | 290 (67.0%) | 282 (66.8%) |
| Yes | 148 (32.9%) | 142 (32.8%) | 140 (33.2%) |
| Missing | 1 (0.2%) | 1 (0.2%) | |
| Total | 450 (100.0%) | 433 (100.0%) | 422 (100.0%) |
| Sentence Information | Full population (n = 450) | Evaluable population (n = 433) | Rasch population (n = 422) |
|---|---|---|---|
| Length of sentence remaining | |||
| On remand/< 1 year | 312 (69.3%) | 303 (70.0%) | 294 (69.7%) |
| ≥ 1 year | 138 (30.7%) | 130 (30.0%) | 128 (30.3%) |
| Violent or sex-related offence committed | |||
| Violent/sexual offence | 186 (41.3%) | 173 (40.0%) | 169 (40.0%) |
| Other crime | 264 (58.7%) | 260 (60.0%) | 253 (60.0%) |
| Violent or sex- or drug- or theft-related offence committed | |||
| Violent/sexual/drug/burglary offence | 310 (68.9%) | 296 (68.4%) | 291 (69.0%) |
| Other crime | 140 (31.1%) | 137 (31.6%) | 131 (31.0%) |
| Total | 450 (100.0%) | 433 (100.0%) | 422 (100.0%) |
| ACCT Information | Full population (n = 450) | Evaluable population (n = 433) | Rasch population (n = 422) |
|---|---|---|---|
| Index ACCT because of self-harm | |||
| No | 158 (35.1%) | 157 (36.3%) | 152 (36.0%) |
| Yes | 154 (34.2%) | 151 (34.9%) | 147 (34.8%) |
| Not known | 138 (30.7%) | 125 (28.9%) | 123 (29.1%) |
| Days between index ACCT and baseline interview | |||
| Number of prisoners | 450 | 433 | 422 |
| Mean (SD) | 6.2 (4.27) | 6.2 (4.22) | 6.2 (4.24) |
| Median | 6.0 | 6.0 | 6.0 |
| IQR | 3–8 | 3–8 | 3–8 |
| Range | 0–30 | 0–30 | 0–30 |
| Total | 450 (100.0%) | 433 (100.0%) | 422 (100.0%) |
The duration of follow-up for all prisoners is displayed in Table 56, along with the prisoners’ prison status at the time of follow-up. Tables 57 and 58 detail the number of new ACCTs opened and the number of self-harm events during prisoners’ follow-up period. Over one-quarter (27.8%) of the total sample self-harmed during the follow-up period (similar to the anticipated rate of self-harm detailed in Chapter 2, Sample size re-estimates). Where the specific behaviour was recorded, cutting was the most common, employed by just over half of those who self-harmed, followed by self-strangulation and self-poisoning. Table 59 provides further details of self-harm events in those prisoners who did self-harm during follow-up, and Table 60 provides details of the severity and type of first post-baseline interview self-harm event. Follow-up details were similar across populations.
| Follow-up information | Full population (n = 450) | Evaluable population (n = 433) | Rasch population (n = 422) |
|---|---|---|---|
| Prison status at follow-up | |||
| Still in original prison | 120 (26.7%) | 118 (27.3%) | 113 (26.8%) |
| Released | 191 (42.4%) | 189 (43.6%) | 187 (44.3%) |
| Transferred but still in prison | 98 (21.8%) | 86 (19.9%) | 84 (19.9%) |
| Transferred and subsequently released | 16 (3.6%) | 16 (3.7%) | 16 (3.8%) |
| Back in original prison after multiple transfers | 4 (0.9%) | 4 (0.9%) | 3 (0.7%) |
| Back in prison system after release and rearrest | 19 (4.2%) | 19 (4.4%) | 18 (4.3%) |
| Not known | 2 (0.4%) | 1 (0.2%) | 1 (0.2%) |
| Length of follow-up by prison status at follow-up | |||
| Released with < 6 months’ follow-up | 177 (39.3%) | 175 (40.4%) | 174 (41.2%) |
| Released with ≥ 6 months’ follow-up | 49 (10.9%) | 49 (11.3%) | 47 (11.1%) |
| Still in prison with < 6 months’ follow-up | 45 (10.0%) | 41 (9.5%) | 41 (9.7%) |
| Still in prison with ≥ 6 months’ follow-up | 177 (39.3%) | 167 (38.6%) | 159 (37.7%) |
| ≥ 6 months’ follow-up, prison status not known | 1 (0.2%) | 1 (0.2%) | 1 (0.2%) |
| Lost to follow-up | 1 (0.2%) | ||
| Length of follow-up (months) | |||
| Number of prisoners | 449 | 433 | 422 |
| Number of prisoners with missing data | 1 | 0 | 0 |
| Mean (SD) | 5.1 (3.16) | 5.1 (3.14) | 5.0 (3.11) |
| Median | 5.5 | 5.5 | 5.4 |
| IQR | 2.5–6.9 | 2.4–6.8 | 2.3–6.7 |
| Range | 0.0–16.4 | 0.0–16.4 | 0.0–16.4 |
| Total | 450 (100.0%) | 433 (100.0%) | 422 (100.0%) |
| Number of new ACCTs opened during follow-up | Full population (n = 450) | Evaluable population (n = 433) | Rasch population (n = 422) |
|---|---|---|---|
| Number of prisoners | 437 | 433 | 422 |
| Number of prisoners with missing data | 13 | 0 | 0 |
| Mean (SD) | 0.8 (1.37) | 0.8 (1.37) | 0.8 (1.38) |
| Median | 0.0 | 0.0 | 0.0 |
| IQR | 0–1 | 0–1 | 0–1 |
| Range | 0–11 | 0–11 | 0–11 |
| Self-harm information | Full population (n = 450) | Evaluable population (n = 433) | Rasch population (n = 422) |
|---|---|---|---|
| Self-harm events during follow-up | |||
| No | 307 (68.2%) | 307 (70.9%) | 301 (71.3%) |
| Yes | 126 (28.0%) | 126 (29.1%) | 121 (28.7%) |
| Not known | 17 (3.8%) | ||
| Number of self-harm events during follow-up | |||
| Number of prisoners | 433 | 433 | 422 |
| Number of prisoners with missing data | 17 | 0 | 0 |
| Mean (SD) | 1.0 (2.82) | 1.0 (2.82) | 1.0 (2.86) |
| Median | 0.0 | 0.0 | 0.0 |
| IQR | 0–1 | 0–1 | 0–1 |
| Range | 0–26 | 0–26 | 0–26 |
| Total | 450 (100.0%) | 433 (100.0%) | 422 (100.0%) |
| Self-harm details | Full and evaluable population (n = 450 and 433) | Rasch population (n = 422) |
|---|---|---|
| Number of self-harm events during follow-up | ||
| Number of prisoners | 126 | 121 |
| Mean (SD) | 3.4 (4.42) | 3.4 (4.48) |
| Median | 2.0 | 2.0 |
| IQR | 1–4 | 1–4 |
| Range | 1–26 | 1–26 |
| Time to first self-harm event (months)a | ||
| Number of prisoners | 126 | 121 |
| Mean (SD) | 1.9 (1.80) | 1.8 (1.80) |
| Median | 1.2 | 1.1 |
| IQR | 0.5–2.6 | 0.5–2.6 |
| Range | 0.0–8.0 | 0.0–8.0 |
| Total | 126 (100.0%) | 121 (100.0%) |
| Self-harm details | Full (n = 450) and evaluable (n = 433) population | Rasch population (n = 422) |
|---|---|---|
| Severity of first self-harm event | ||
| Self-harm that was near lethal with intent to die | 3 (2.4%) | 3 (2.5%) |
| Self-harm that was near lethal without intent to die | 6 (4.8%) | 6 (5.0%) |
| Major (required medical attention at an off-site hospital) | 3 (2.4%) | 3 (2.5%) |
| Moderate (required medical attention on-site) | 38 (30.2%) | 37 (30.6%) |
| Minor (superficial) | 55 (43.7%) | 52 (43.0%) |
| Not known | 21 (16.7%) | 20 (16.5%) |
| Type of first self-harm event | ||
| Cutting | 64 (50.8%) | 61 (50.4%) |
| Unspecified self-harm | 30 (23.8%) | 29 (24.0%) |
| Attempted hanging/ligatures/self-strangulation | 8 (6.3%) | 8 (6.6%) |
| Self-poisoning | 8 (6.3%) | 7 (5.8%) |
| Scratching | 2 (1.6%) | 2 (1.7%) |
| Self-suffocation | 2 (1.6%) | 2 (1.7%) |
| Hunger strike | 2 (1.6%) | 2 (1.7%) |
| Opening old wounds | 2 (1.6%) | 2 (1.7%) |
| Punching things (wall, door, etc.) | 2 (1.6%) | 2 (1.7%) |
| Swallowing razor blade | 2 (1.6%) | 2 (1.7%) |
| Head banging | 1 (0.8%) | 1 (0.8%) |
| Biting self | 1 (0.8%) | 1 (0.8%) |
| Burning self | 1 (0.8%) | 1 (0.8%) |
| Setting fire to own cell | 1 (0.8%) | 1 (0.8%) |
| Total | 126 (100.0%) | 121 (100.0%) |
Cox proportional hazards regression modelling: baseline model
Categorical baseline factors, as listed in Table 51, were investigated for inclusion in the baseline model, with age dichotomised at the median (forming two groups: < 30 vs. ≥ 30 years). This analysis was conducted on the evaluable population. To enable inclusion of all prisoners with complete follow-up in the model, missing baseline factors were imputed to belong to the most frequent level within each factor. Less than 1% of missing data were present for all baseline factors investigated for inclusion in the model.
Offences were categorised as violent or sex-related offences versus other and violent or sex- or drug- or theft-related offence versus other. A total of 170 (37.8%) prisoners also provided further details of their offence; however, at the time of analysis, these details had not been used to verify the categorical response for offence. Therefore, although investigated, these two factors were not considered for inclusion in the baseline model.
The variable indicating whether or not a prisoner’s index ACCT was as a result of self-harm was not considered for inclusion in the baseline model, as unfortunately this information was not available for 28.9% of the evaluable population. Thus, it was felt that an analysis based on a variable with such a large number of missing data would not provide reliable conclusions.
Univariate analysis
A univariate analysis was conducted in which each baseline factor was included as a single covariate in the Cox proportional hazards regression model. Model fit statistics were compared between each model with and without the factor. A chi-squared test (with df equal to the reduction in the df between each model) was used to test whether or not the reduction in the −2 log-likelihood between each model suggested a significant improvement in model fit.
The results of the Cox proportional hazards regression modelling are displayed in Table 61, with a hazard ratio of > 1.0 indicating an earlier time to self-harm in the variable reference group (those listed after ‘vs.’ in the table). In descending order of significance, the following factors were found to be significant at the 10% level: previous self-harm in prison, first time prisoner has been put on an ACCT, received medication for mental health problems, age group, dependent on alcohol, gender, education or training received in prison, violent or sex-related offence and previous self-harm outside prison.
| Variablea | Parameter estimate | Standard error | Hazard ratio | 95% CI | df | Reduction in –2 log-likelihood from null model | p-value |
|---|---|---|---|---|---|---|---|
| Age group: < 30 vs. ≥ 30 years | –0.44 | 0.18 | 0.65 | 0.45 to 0.92 | 1 | 5.86 | 0.0155b |
| Prison: | 2 | 10.91 | 0.0043b | ||||
| A vs. C | –0.62 | 0.27 | 0.54 | 0.32 to 0.91 | 1 | – | – |
| B vs. C | 0.30 | 0.20 | 1.35 | 0.91 to 2.01 | 1 | – | – |
| Gender: male vs. female | 0.45 | 0.20 | 1.57 | 1.07 to 2.31 | 1 | 4.94 | 0.0263b |
| Religious: no vs. yes | –0.04 | 0.18 | 0.96 | 0.67 to 1.37 | 1 | 0.05 | 0.8196 |
| Ethnicity: white vs. ethnic minority | –0.15 | 0.32 | 0.86 | 0.46 to 1.59 | 1 | 0.24 | 0.6220 |
| Children under 16 years: no vs. yes | –0.20 | 0.18 | 0.82 | 0.58 to 1.16 | 1 | 1.25 | 0.2626 |
| Age finished full-time education: < 16 vs. ≥ 16 years | –0.23 | 0.18 | 0.80 | 0.56 to 1.14 | 1 | 1.58 | 0.2089 |
| Education or training received in prison: no vs. yes | 0.40 | 0.18 | 1.50 | 1.04 to 2.14 | 1 | 4.91 | 0.0266b |
| Visit in the last 7 days: no vs. yes | 0.08 | 0.25 | 1.08 | 0.67 to 1.77 | 1 | 0.10 | 0.7467 |
| Sentenced: no vs. yes | 0.18 | 0.18 | 1.20 | 0.84 to 1.70 | 1 | 1.01 | 0.3153 |
| Violent or sex-related offence: violent/sexual vs. other | 0.37 | 0.19 | 1.45 | 1.01 to 2.09 | 1 | 4.12 | 0.0424b |
| Violent, sex-, drug- or theft-related offence: violent/sexual/drug/burglary vs. other | 0.22 | 0.19 | 1.24 | 0.86 to 1.81 | 1 | 1.26 | 0.2607 |
| Homeless: no vs. yes | –0.06 | 0.19 | 0.94 | 0.65 to 1.37 | 1 | 0.10 | 0.7550 |
| Health psychologist: no vs. yes | 0.25 | 0.18 | 1.28 | 0.89 to 1.83 | 1 | 1.82 | 0.1776 |
| Mental health medications: no vs. yes | 0.53 | 0.23 | 1.70 | 1.08 to 2.67 | 1 | 5.88 | 0.0153b |
| Previous self-harm in prison: no vs. yes | 1.15 | 0.22 | 3.14 | 2.03 to 4.88 | 1 | 31.89 | <0.0001b |
| Previous self-harm outside prison: no vs. yes | 0.39 | 0.23 | 1.48 | 0.93 to 2.34 | 1 | 3.03 | 0.0819 |
| First ACCT: no vs. yes | –0.75 | 0.20 | 0.47 | 0.32 to 0.70 | 1 | 12.71 | 0.0004b |
| Listener services: no vs. yes | 0.22 | 0.19 | 1.25 | 0.87 to 1.81 | 1 | 1.39 | 0.2383 |
| Dependent on alcohol: no vs. yes | –0.49 | 0.21 | 0.61 | 0.41 to 0.93 | 1 | 5.77 | 0.0163b |
| Dependent on drugs: no vs. yes | –0.11 | 0.19 | 0.89 | 0.61 to 1.30 | 1 | 0.35 | 0.5536 |
Model building
A forward selection model-building approach was used to derive the baseline model; stepwise results can be found in Appendix 2, Tables 73–78. Given the hierarchical nature of gender and prison, resulting in there being only one female prison in the study, model fit and parameterisation are equivalent for the model including both gender and prison and the model including prison only. Therefore, gender was not entered into the baseline model; however, the effect of gender can be observed by the effect attributed to prison B. Remaining factors significant at the 10% level were individually added to the baseline model and the reduction in −2 log-likelihood was compared with a chi-squared test with the appropriate number of df to test for effect. The most significant factor was then added to the model, with model building continuing until the reduction in −2 log-likelihood from fitting further factors was not significant at the 10% level.
Baseline model
The results of the Cox proportional hazards final baseline model are displayed in Table 62. Time to self-harm in prison, previous self-harm in prison, alcohol dependence, first ACCT, age group and mental health medications were identified as being significantly associated with self-harm. The following prisoners had an earlier time to self-harm: prisoners in prison C, prisoners who had self-harmed in prison before, prisoners who were not dependent on alcohol, prisoners for whom this was not their first ACCT, prisoners aged less than 30 years and prisoners who had received medication for any mental health problems.
| Variable | Parameter estimate | Standard error | Hazard ratio | 95% CI | Wald test statistic | df | p-value |
|---|---|---|---|---|---|---|---|
| Prison: | 7.95 | 2 | 0.0188 | ||||
| A vs. C | –0.77 | 0.27 | 0.46 | 0.27 to 0.79 | 7.95 | 1 | – |
| B vs. C | –0.17 | 0.22 | 0.85 | 0.55 to 1.31 | 0.58 | 1 | – |
| Previous self-harm in prison: no vs. yes | 1.01 | 0.23 | 2.74 | 1.74 to 4.32 | 18.77 | 1 | < 0.0001 |
| Dependent on alcohol: no vs. yes | –0.54 | 0.22 | 0.58 | 0.38 to 0.89 | 6.27 | 1 | 0.0123 |
| First ACCT: no vs. yes | –0.41 | 0.22 | 0.66 | 0.43 to 1.02 | 3.48 | 1 | 0.0623 |
| Age group: < 30 vs. ≥ 30 years | –0.37 | 0.19 | 0.69 | 0.48 to 0.99 | 4.08 | 1 | 0.0435 |
| Mental health medications: no vs. yes | 0.41 | 0.24 | 1.50 | 0.94 to 2.39 | 2.89 | 1 | 0.0890 |
Kaplan–Meier curves for time to self-harm by baseline factors included in the baseline model are presented in Figures 28–33 in Appendix 2.
The proportional hazards assumptions were assessed for each factor by plotting the hazards over time (i.e. the log-cumulative hazard plot) for each level within a factor. Plots of the observed cumulative martingale residual process and the Kolmogorov-type supremum test91 were used to statistically test the adequacy of the Cox proportional hazards regression model. The results of the Kolmogorov-type supremum test for each factor are displayed in Table 63. The proportional hazards assumption appears to be violated for age group (p = 0.029) and prisoners in prison B compared with those in prison C (p = 0.01, also equivalent to the effect of gender). Plots of the hazards over time and the observed cumulative martingale residual process are presented for these factors in Appendix 2, Figures 34–38. Investigation of the log-cumulative hazard plot for age group suggests a crossover in hazards at around 1 month, with proportionality in hazards after 1 month’s follow-up. Investigation of plots for each prison show that prison B prisoners (females) self-harmed earlier than prisoners in prison C; however, the rate of self-harm is similar after 6 months.
| Variable | Maximum absolute value | p-value |
|---|---|---|
| Prison A | 0.7724 | 0.4810 |
| Prison B | 1.8350 | 0.0010a |
| Previous self-harm in prison: yes | 1.0038 | 0.2160 |
| Dependent on alcohol: yes | 0.5975 | 0.7470 |
| First ACCT: yes | 1.2383 | 0.1210 |
| Age group: ≥ 30 years | 1.4508 | 0.0290a |
| Mental health medications: yes | 0.3102 | 0.9980 |
The proportional hazards assumption was violated within prison because of the earlier time to self-harm in females. To overcome this, it is appropriate to perform a stratified analysis in which the baseline model is stratified by gender to allow for different baseline hazards for males and females while retaining equal parameter coefficients. Graphical and numerical results indicate that the baseline model may also benefit from fitting a piecewise Cox proportional hazards regression model in which the hazards for age group are constrained to be proportional within two intervals, before and after 1 month. However, as age group is not the factor of primary interest and proportionality is achieved after only 1 month, age group remains in the final baseline model.
The results of the baseline Cox proportional hazards regression model stratified by gender are presented in Table 64. There is minimal change to the magnitude of effects for each factor and the direction of effects remains the same as per the unstratified model. The effect of prison B is removed from the model as a result of the stratification by gender, with prison B being the only female prison. The proportional hazards assumptions were reassessed for each factor and the results are presented in Table 65.
| Variable | Parameter estimate | Standard error | Hazard ratio | 95% CI | Wald test statistic | df | p-value |
|---|---|---|---|---|---|---|---|
| Prison: | 8.08 | 1 | 0.0045 | ||||
| A vs. C | –0.78 | 0.27 | 0.46 | 0.27 to 0.79 | 8.08 | 1 | – |
| B vs. C | – | – | – | – | – | – | – |
| Previous self-harm in prison: no vs. yes | 1.02 | 0.23 | 2.77 | 1.75 to 4.37 | 19.16 | 1 | < 0.0001 |
| Dependent on alcohol: no vs. yes | –0.55 | 0.22 | 0.57 | 0.38 to 0.88 | 6.50 | 1 | 0.0108 |
| First ACCT: no vs. yes | –0.42 | 0.22 | 0.66 | 0.43 to 1.02 | 3.57 | 1 | 0.0588 |
| Age group: < 30 vs. ≥ 30 years | –0.38 | 0.19 | 0.68 | 0.47 to 0.98 | 4.28 | 1 | 0.0385 |
| Mental health medications: no vs. yes | 0.43 | 0.24 | 1.54 | 0.96 to 2.45 | 3.26 | 1 | 0.0712 |
| Variable | Maximum absolute value | p-value |
|---|---|---|
| Prison A | 0.9593 | 0.2460 |
| Previous self-harm in prison: yes | 0.7889 | 0.4440 |
| Dependent on alcohol: yes | 0.7817 | 0.4870 |
| First ACCT: yes | 0.8343 | 0.3760 |
| Age group: ≥ 30 years | 1.4369 | 0.0250a |
| Mental health medications: yes | 0.4554 | 0.9590 |
Cox proportional hazards regression modelling: Rasch-scored questionnaires
Cox proportional hazards regression modelling of a priori determined risk groups and questionnaire scores was used to evaluate the questionnaires and subscales according to the Rasch scores displayed in Table 66. Resolution B scores were used where possible. Where resolution B scores did not exist, the rescore Rasch score was used, and where this did not exist, the initial Rasch score was used. To ensure that results could be compared across the questionnaires and subscales evaluated, the analysis was conducted on the Rasch score analysis population, consisting of 422 prisoners.
| Questionnaire/subscale | Rasch score | Conversion range (total scores) |
|---|---|---|
| PriSnQuest | Initial | 0–8 |
| PriSnQuest risk group | Initial | > 4.18 |
| SHI | Resolution B | 0–13 |
| SHI risk group | Resolution B | > 6.17 |
| CORE-OM | Resolution B | 0–34 |
| CORE well-being | Rescore | 0–8 |
| CORE problems | Resolution B | 0–16 |
| CORE functioning | Resolution B | 0–18 |
| CORE risk | Rescore | 0–12 |
| CORE-10 | Resolution B | 0–16 |
| CORE non-risk | Resolution B | 0–30 |
| BSL-23-F | Resolution B | 0–28 |
| PHQ-9 | Resolution B | 0–16 |
| PHQ-2 | Initial | 0–6 |
The results of the AUC analysis identified the PriSnQuest and the SHI as having an AUC statistically significantly > 0.5 (p = 0.03 and p = 0.009, respectively). Using the converted Rasch scores (i.e. those back on the original range), the cut points were derived as those which maximised sensitivity and specificity. The cut point for the PriSnQuest on the converted Rasch score was 4.18 with sensitivity equal to 69.1% and specificity equal to 41.4%, and for the SHI the cut point was 6.17 with sensitivity equal to 61.7% and specificity equal to 52.6%.
The converted Rasch scores (falling within the range outlined in Table 66) were used in the analysis and will be referred to only as the questionnaire score/subscale score throughout Chapter 3, Cox proportional hazards regression modelling: Rasch-scored questionnaires.
Cox proportional hazards regression modelling, adjusting for important baseline factors and stratified by gender, was therefore used to test for differences in the time to first self-harm event for scores for all questionnaires and subscales, and risk groups for the PriSnQuest and SHI.
The baseline Cox proportional hazards regression model derived using the evaluable population was evaluated using the Rasch score analysis population and the results are displayed in Table 67. All factors remained significant at the 10% level. There was a minimal reduction in the effect of prison, alcohol dependence and age group compared with that of the model in the evaluable population, while the effect of first ACCT increased.
| Variable | Parameter estimate | Standard error | Hazard ratio | 95% CI | Wald test statistic | df | p-value |
|---|---|---|---|---|---|---|---|
| Prison: | 7.83 | 1 | 0.0051 | ||||
| A vs. C | –0.81 | 0.29 | 0.45 | 0.25 to 0.79 | 7.83 | 1 | |
| B vs. C | – | – | – | – | – | – | – |
| Previous self-harm in prison: no vs. yes | 1.02 | 0.24 | 2.78 | 1.73 to 4.46 | 17.91 | 1 | < 0.0001 |
| Dependent on alcohol: no vs. yes | –0.49 | 0.22 | 0.62 | 0.40 to 0.95 | 4.92 | 1 | 0.0265 |
| First ACCT: no vs. yes | –0.45 | 0.23 | 0.64 | 0.41 to 0.99 | 4.02 | 1 | 0.0451 |
| Age group: < 30 vs. ≥ 30 years | –0.37 | 0.19 | 0.69 | 0.48 to 1.00 | 3.76 | 1 | 0.0524 |
| Mental health medications: no vs. yes | 0.41 | 0.24 | 1.51 | 0.93 to 2.43 | 2.82 | 1 | 0.0934 |
To test for differences in the time to first self-harm event for risk groups and questionnaires scores, each factor was included as an additional covariate in the baseline Cox proportional hazards regression model stratified by gender. Model fit statistics were compared between the model with and without the additional covariate. A chi-squared test (with df equal to the reduction in the df between each model) was used to test whether or not the reduction in the −2 log-likelihood between each model suggested a significant improvement in model fit, and the results are presented in Table 68. Only the SHI score led to a significant improvement in model fit at the 10% level.
| Additional baseline factor | Reduction in df | –2 log-likelihood | Reduction in –2 log-likelihood | p-value |
|---|---|---|---|---|
| Baseline model | – | 1159.713 | – | – |
| PriSnQuest score | 1 | 1157.229 | 2.485 | 0.1149 |
| PriSnQuest risk group | 1 | 1158.281 | 1.432 | 0.2314 |
| SHI score | 1 | 1156.595 | 3.118 | 0.0774a |
| SHI risk group | 1 | 1157.045 | 2.669 | 0.1023 |
| CORE-OM score | 1 | 1158.373 | 1.340 | 0.2470 |
| CORE well-being score | 1 | 1159.057 | 0.656 | 0.4180 |
| CORE problems score | 1 | 1159.074 | 0.639 | 0.4240 |
| CORE functioning score | 1 | 1159.409 | 0.304 | 0.5814 |
| CORE risk score | 1 | 1159.167 | 0.547 | 0.4597 |
| CORE-10 score | 1 | 1159.692 | 0.021 | 0.8841 |
| CORE non-risk score | 1 | 1158.226 | 1.487 | 0.2227 |
| BSL-23-F score | 1 | 1159.625 | 0.089 | 0.7658 |
| PHQ-9 score | 1 | 1159.039 | 0.674 | 0.4116 |
| PHQ-2 score | 1 | 1159.368 | 0.345 | 0.5569 |
Table 79 in Appendix 3 displays the results of improvement in model fit between the null model with and without (i.e. the model containing no baseline factors) the additional covariate. These results show that the addition of SHI risk group, PriSnQuest (score and risk group), CORE risk, CORE non-risk, CORE-OM and CORE functioning scores also result in a significant improvement in model fit at the 10% level. However, as can be seen in Table 68, these results do not hold in the presence of important baseline factors.
Cox proportional hazards regression model for the Self-Harm Inventory
The Cox proportional hazards regression model, incorporating the SHI score and risk groups, was investigated further.
The psychometric analysis identified that the SHI worked differently for males and females; therefore, an interaction between the SHI score/risk group and gender was investigated. The interaction of scale by gender was the only interaction investigated during this analysis.
The results of the stratified Cox proportional hazards regression model including baseline factors and the SHI score can be found in Appendix 3, Table 80. The addition of the SHI score with gender interaction significantly improved model fit at the 5% level based on the reduction in −2 log-likelihood from the model without interaction (χ2 = 4.86 on 1 df; p = 0.027). The results of the stratified Cox proportional hazards regression model with baseline factors, SHI score and gender interaction are presented in Table 69. The hazard ratio for the SHI score with gender interaction is 1.24 (95% CI 1.02 to 1.50), which is significant at the 5% level and suggests an earlier time to self-harm in females with higher SHI scores.
| Variable | Parameter estimate | Standard error | Hazard ratio | 95% CI | Wald test statistic | df | p-value |
|---|---|---|---|---|---|---|---|
| Prison: | 8.15 | 1 | 0.0043 | ||||
| A vs. C | –0.82 | 0.29 | 0.44 | 0.25 to 0.77 | 8.15 | 1 | – |
| B vs. C | – | – | – | – | – | – | – |
| Previous self-harm in prison: no vs. yes | 0.97 | 0.25 | 2.64 | 1.61 to 4.31 | 14.97 | 1 | 0.0001 |
| Dependent on alcohol: no vs. yes | –0.59 | 0.22 | 0.56 | 0.36 to 0.86 | 6.84 | 1 | 0.0089 |
| First ACCT: no vs. yes | –0.45 | 0.23 | 0.64 | 0.41 to 1.00 | 3.91 | 1 | 0.0481 |
| Age group: < 30 vs. ≥ 30 years | –0.38 | 0.19 | 0.68 | 0.47 to 0.99 | 4.04 | 1 | 0.0444 |
| Mental health medications: no vs. yes | 0.37 | 0.25 | 1.45 | 0.89 to 2.34 | 2.24 | 1 | 0.1343 |
| SHI score | 0.02 | 0.05 | 1.02 | 0.92 to 1.13 | 0.16 | 1 | 0.6861 |
| SHI score × gender interaction | 0.21 | 0.10 | 1.24 | 1.02 to 1.50 | 4.83 | 1 | 0.0279 |
The results of the stratified Cox proportional hazards regression model including baseline factors and the SHI risk group factor can be found in Appendix 3, Table 81; the Kaplan–Meier curve for time to self-harm can also be found in Appendix 3 (see Figure 41). The addition of the SHI risk group with gender interaction significantly improved model fit at the 10% level based on the reduction in −2 log-likelihood from the SHI model without interaction (χ2 = 3.477 on 1 df; p = 0.062), and compared with the stratified baseline model the model including SHI risk group with gender interaction significantly improved model fit at the 5% level (χ2 = 6.145 on 1 df; p = 0.013). The results of the stratified Cox proportional hazards regression model with baseline factors, SHI risk group factor and gender interaction are presented in Table 70. The hazard ratio for the SHI risk group with gender interaction is 0.44 (95% CI 0.18 to 1.08), which suggests a longer time to self-harm in females in the SHI non-risk group and is consistent with the results of the SHI score with gender interaction.
| Variable | Parameter estimate | Standard error | Hazard ratio | 95% CI | Wald test statistic | df | p-value |
|---|---|---|---|---|---|---|---|
| Prison: | 7.92 | 1 | 0.0049 | ||||
| A vs. C | –0.81 | 0.29 | 0.44 | 0.25 to 0.78 | 7.92 | 1 | – |
| B vs. C | – | – | – | – | – | – | – |
| Previous self-harm in prison: no vs. yes | 1.00 | 0.24 | 2.72 | 1.69 to 4.40 | 16.74 | 1 | < 0.0001 |
| Dependent on alcohol: no vs. yes | –0.56 | 0.23 | 0.57 | 0.37 to 0.90 | 5.96 | 1 | 0.0147 |
| First ACCT: no vs. yes | –0.40 | 0.23 | 0.67 | 0.43 to 1.05 | 3.04 | 1 | 0.0813 |
| Age group: < 30 vs. ≥ 30 years | –0.38 | 0.19 | 0.68 | 0.47 to 0.99 | 4.02 | 1 | 0.0450 |
| Mental health medications: no vs. yes | 0.39 | 0.25 | 1.48 | 0.91 to 2.39 | 2.55 | 1 | 0.1105 |
| SHI Rasch score risk group: non-risk group vs. risk group | 0.10 | 0.23 | 1.10 | 0.69 to 1.74 | 0.16 | 1 | 0.6850 |
| SHI risk group × gender interaction: females in non-risk group | –0.82 | 0.46 | 0.44 | 0.18 to 1.08 | 3.22 | 1 | 0.0727 |
A graphical representation of the interaction can be seen in Figure 25; the effect of SHI risk group in relation to self-harm is far larger in females than in males.
FIGURE 25.
Kaplan–Meier plot of time to self-harm by gender and SHI risk group.
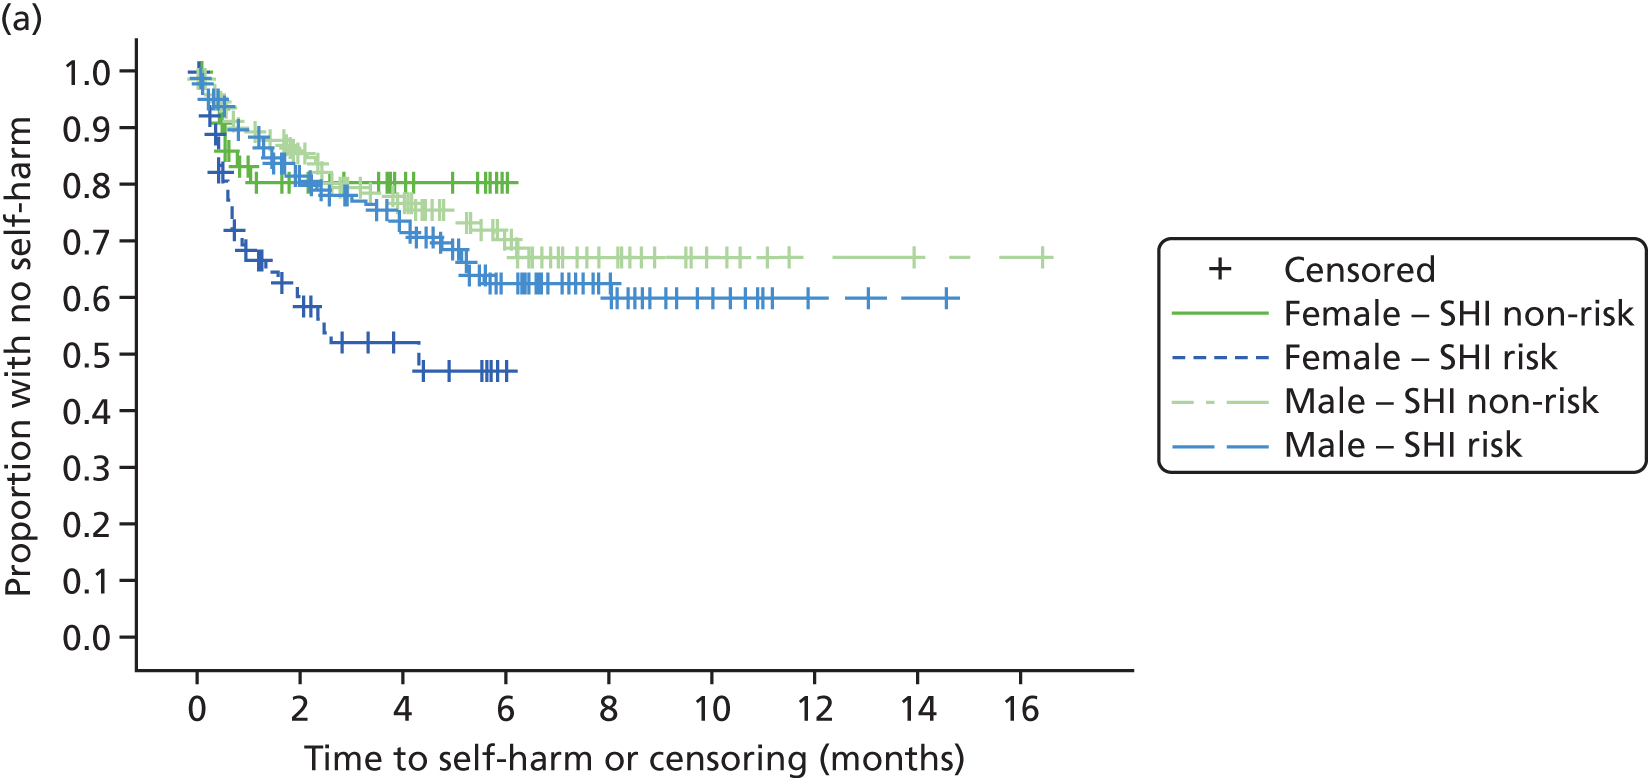

The proportional hazards assumptions for both models were checked using the ASSESS function in SAS’s PHREG procedure and the log-cumulative hazard plot for the SHI risk group and were found to hold. Plots are displayed in Appendix 3, Figures 39, 40 and 42–44, and the results of the Kolmogorov-type supremum tests can be found in Tables 82 and 83 in Appendix 3.
Summary of Cox proportional hazards regression model
The Cox proportional hazards regression modelling of baseline factors identified the following as having a statistically significant effect on time to self-harm:
-
previous self-harm in prison (prisoners who had tried to harm themselves in prison before had an increased risk of self-harm)
-
prison (prisoners from prison C and prison B had an increased risk of self-harm compared with those from prison A)
-
alcohol dependence (prisoners who did not consider themselves to be dependent on alcohol had an increased risk of self-harm)
-
age (younger prisoners, those under 30 years old, had an increased risk of self-harm)
-
first ACCT (prisoners who had already been put on an ACCT had an increased risk of self-harm)
-
mental health medications (prisoners who had received medications for mental health problems had an increased risk of self-harm).
With the exception of the converted SHI Rasch score, after adjusting for important baseline factors, there was no evidence of a significant effect on time to self-harm for questionnaire and subscale scores, or the PriSnQuest and SHI risk groups. A significant interaction was observed between gender and both the SHI Rasch score and SHI risk group (prisoners scoring > 6.17 on the reduced SHI), in which the effect of SHI risk group in relation to self-harm was far larger in females than in males, suggesting that the SHI, in its reduced form (13 items), could be a particularly useful tool in predicting self-harm in the female prison population.
Identifying items predictive of self-harm
The failure of the candidate screening instruments to predict future self-harm, while disappointing, was not entirely unexpected. The scales might contain many items that do not discriminate for self-harm, but they may also contain some that do. For this reason, their total score may be compromised with respect to predicting self-harm, because of the preponderance of non-discriminating items. Consequently, it was always envisaged that it might be necessary to examine the potential of individual items as predictors, and perhaps build a new scale from these items. There are 105 items in the candidate instruments, so forming an item pool of potential risk indicators, together with other sociodemographic and sentencing criteria (e.g. on remand). It is also noted from the psychometric analysis, the Cox proportional hazards regression analysis and the AUC analysis that there was some difference by gender in the ways in which the scales worked, and this may be reflected at the item level.
Table 71 shows those indicators that are associated with future self-harm, giving the odds ratios and sensitivity and specificity of the individual item to a future self-harm event.
| Item/indicator | Sensitivity | Specificity | Predictive power of positive response | Predictive power of negative response | Odds ratio | 95% CI |
|---|---|---|---|---|---|---|
| Males | ||||||
| CORE item 22 | 0.5 | 0.75 | 0.09 | 0.97 | 0.336 | 0.112 to 0.995 |
| PriSnQuest item 1 | 0.55 | 0.57 | 0.32 | 0.79 | 1.706 | 1.040 to 2.799 |
| PriSnQuest item 2 | 0.29 | 0.83 | 0.81 | 0.32 | 1.993 | 1.085 to 3.659 |
| BSL-23-F supplementary item 1 | 0.54 | 0.77 | 0.17 | 0.95 | 3.872 | 1.711 to 8.762 |
| SHI item 2 | 0.84 | 0.36 | 0.31 | 0.87 | 3.033 | 1.587 to 5.798 |
| SHI item 19 | 0.25 | 0.85 | 0.37 | 0.77 | 1.910 | 1.039 to 3.511 |
| No qualifications | 0.59 | 0.58 | 0.33 | 0.80 | 1.967 | 1.198 to 3.230 |
| Alcohol dependency | 0.24 | 0.62 | 0.18 | 0.70 | 0.515 | 0.296 to 0.896 |
| Previous prison self-harm | 0.76 | 0.51 | 0.35 | 0.86 | 3.273 | 1.887 to 5.677 |
| Females | ||||||
| PriSnQuest item 8 | 0.73 | 0.59 | 0.46 | 0.82 | 3.881 | 1.652 to 9.121 |
| BSL-23-F Supplementary item 2 | 0.08 | 1.00 | 1.00 | 0.70 | > 100.0 | not computed |
| SHI item 2 | 0.89 | 0.28 | 0.30 | 0.88 | 4.452 | 1.239 to 16.003 |
| SHI item 21 | 0.40 | 0.77 | 0.68 | 0.53 | 2.309 | 1.017 to 5.238 |
| PHQ9 item 4 | 0.39 | 0.27 | 0.20 | 0.48 | 0.626 | 0.435 to 0.902 |
| First time on ACCT | 0.36 | 0.28 | 0.19 | 0.49 | 0.222 | 0.096 to 0.514 |
It becomes immediately apparent that, as with the analysis presented above, there are different indicators for males and females. From an odds ratio perspective, the strongest indicator for males is BSL-23-F Supplementary item 1 ‘during the last week I have hurt myself by cutting, burning, strangling, head banging, etc.’ (4–6 times or daily or more often) and for females it is SHI-2 ‘cut yourself on purpose’ (have you ever). It should be noted that some indicators reduce the risk of future self-harm. For example, for males reporting alcohol dependency, the risk of future self-harm is reduced by half.
Bringing the indicators together in simple gender-specific summative form weighted by their unadjusted odds ratio gives an AUC of 0.716 for males (Figure 26) and of 0.837 for females (Figure 27). For males, this gives a sensitivity of 68% and a specificity of 64%, predictive power of a positive test of 40% and predictive power of a negative test of 85%. For females, it gives a sensitivity of 76% and a specificity of 83%, predictive power of a positive test of 68% and predictive power of a negative test of 88%.
FIGURE 26.
Area under the curve for risk algorithm: males. Diagonal segments were produced by ties.
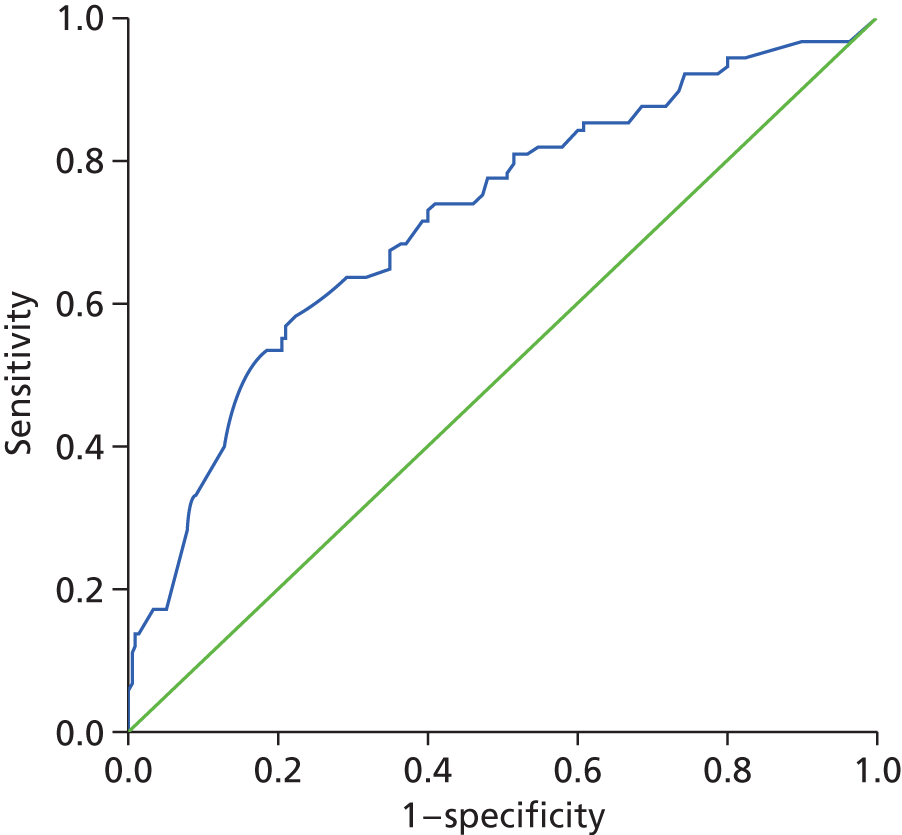
FIGURE 27.
Area under the curve for risk algorithm: females. Diagonal segments were produced by ties.
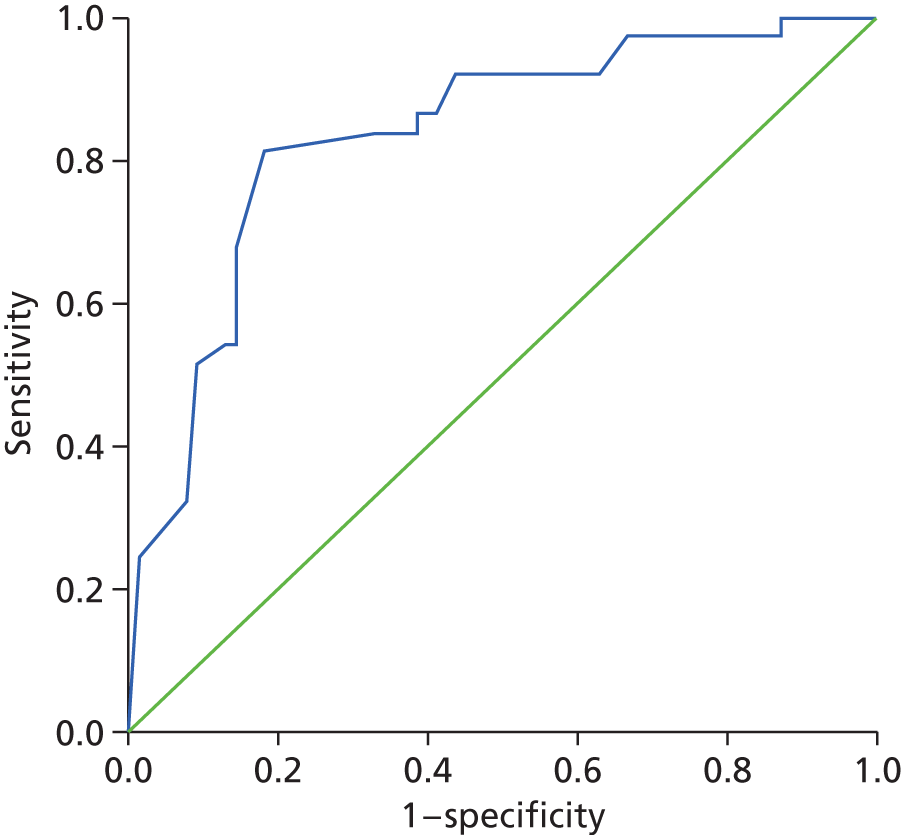
It is also possible to create a low–medium–high risk classification for the risk of self-harm (Table 72). Although the risk of self-harm is relatively low among those of both genders categorised as low risk, it is apparent that the male screening is less efficient than the female screening, where just 56.8% of those classified as high risk subsequently self-harmed, compared with 90% of females. Nevertheless, categorisation by level of risk could contribute to identifying appropriate care pathways and, given the strength of the negative test, support decisions to sign prisoners off from ACCTs. The gender-specific item sets form a single-page questionnaire which can be administered by any staff within a few minutes (see Appendix 4).
| Screening result expressed as level of risk | Males who self-harm (%) | Females who self-harm (%) |
|---|---|---|
| Low | 15.2 | 12.7 |
| Medium | 30.2 | 55.9 |
| High | 56.8 | 90.0 |
Chapter 4 Conclusions
Main findings
There were 450 prisoners with a mean age of 31.2 years (median 29 years) recruited into the study, 26% of whom were female. On average, interviews took place 6.24 days after a prisoner’s ACCT was opened, ranging from the day of the ACCT to 30 days later, with a median time to interview of 6 days. All but one prisoner was followed up (self-harm ascertainment until release or during follow-up period), and the valid follow-up period ranged from 1 to 500 days, with a median of 168 days. This range varied for a number of reasons but primarily because of release. More than four in five of those who entered into the study were doing so through their first ACCT in their current prison episode. The consent rate for interview was similar between prisons, although the time to interview was greater for females. The administered questionnaire pack worked well, and completion rate was high for the scales and their items. Only three prisoners already signed off from their ACCTs were thought to be of further concern during the interviews, and on these occasions the interviewer initiated a further ACCT, as per protocol.
In all, over one-quarter (27.8%) self-harmed during the follow-up period. In addition, just over one-third of ACCTs were initiated because of a known self-harm event and, thus, almost half (46.7%) of those entered into the study were reported to have self-harmed, either from their index ACCT or subsequently. Just over half (55.45%) of those who self-harmed during the follow-up had a reported self-harm event associated with their index ACCT. The most common self-harm behaviour during follow-up was cutting.
Females were more likely to self-harm than males, but the rates of self-harm during follow-up also differed between the male prisons, with the rate in one almost twice that in the other (χ2 = 8.02; p = 0.002). Of those who did self-harm during the follow-up period, a wide range of previous behaviours were reported, with three or four groups emerging, showing significantly different levels of previous behaviour, as well as patterns of those behaviours that were mostly, but not entirely, related to gender.
Four out of five potential screening instruments chosen for the main study were found to have acceptable psychometric properties such that their raw scores were a sufficient statistic as valid ordinal scales, justifying the use of cut points. The fifth instrument, the CORE-OM, would require some modification for use in this setting. However, fitting data to the Rasch model showed up several weaknesses in each scale. Instruments with polytomous items almost always required rescoring, as the categories were not working well in this setting. DIF by age was also widely present, suggesting that the scales worked in different ways by age. This was apparent from the Cox proportional hazards analysis also. Although fit to the Rasch model was resolved in most cases, this often involved item deletion and was thus a far from satisfactory solution.
The Cox proportional hazards regression modelling of baseline factors identified a set of items that had a statistically significant effect on time to self-harm. These included previous self-harm in prison (prisoners who had tried to harm themselves in prison before had an increased risk of self-harm); the prison itself; alcohol dependence; age; a first ACCT (prisoners who had already been put on an ACCT had an increased risk of self-harm); and mental health medications (prisoners who had received medications for mental health problems had an increased risk of self-harm).
The difference in rates of self-harm during follow-up between the male prisons is of interest. One of the predictors for male self-harm was the absence of any qualification, and this differed significantly across the male prisons, with the level of ‘No qualifications’ in prison C twice that in prison A. This may have contributed to the much higher level of self-harm in prison C. Neither prison differed significantly in the proportion of prisoners who had seen a psychiatrist outside prison or who had previously self-harmed inside prison.
The majority of the questionnaires were shown to have internal construct validity in a prison setting and, for example, could be used to screen for depression or borderline symptoms. Although it was disappointing that the scale scores from the various instruments were not good predictors of self-harm, it became obvious that each scale contained many items which did not discriminate and thus potentially masked those that did. The item set consisted of 105 items together with supplementary items associated with sociodemographic and sentencing characteristics. Using evidence both from the Cox proportional hazards analysis and chi-squared significance criteria for individual item association with self-harm, these potential indicators of risk were examined and included in a gender-specific risk index, where each indicator was weighted by its unadjusted odds ratio for self-harm during follow-up. The screening instruments gave reasonable AUC values, particularly so for females. 94 As an index, it was not expected that the items hold a probabilistic relationship to one another or that the risk of future self-harm was a latent construct which determined the responses to the various indicators. The risk algorithm is probably better at screening out risk than screening in risk, given the high predictive values of a negative test. Three levels of risk can be identified, low, medium and high, and each gender has a low frequency of subsequent self-harm when it is categorised as low risk. Males have a 56.8% chance of self-harm when categorised as high risk, compared with 90% for females.
The items incorporated into the screening questionnaire differ to some extent from those that have been recently reported as risk factors for self-harm. For example, one study in offender women reported shame, anger and child abuse as important, although this appears to be a cross-sectional study of associations. 95 Although shame was incorporated as a question in the current study, it did not appear to be predictive of future self-harm. Anger towards others did appear for males, but we did not address the issue of child abuse in the current study. Slade et al. 96 have presented work associated with the ‘cry of pain’ model as a predictor of early self-harm in a male prison population. This was very successful at predicting self-harm (with a rate of 10%), but appeared to require extensive questionnaire data, involving eight separate questionnaires, and therefore may not be suitable for routine everyday use in prison. However, it is possible that such information could be obtained within a more detailed interview situation following an initial screening for risk (e.g. those identified as being at moderate risk, among whom perhaps only half may go on to self-harm). The approach would also need to be validated for those who had been in prison for a longer time and for females. Other research has found that there is no evidence for a universally detrimental impact on mental health in the first 2 months of imprisonment, even among those with pre-existing mental illness. 97
Another study identified several independent predictors for suicide, including previous psychiatric service contact, history of self-harm, single-cell occupation, remand status and non-white ethnicity. 98 In the current study, remand status and non-white ethnicity did not show predictive ability for self-harm, and previous contact with a psychiatrist was predictive only for males; however, previous self-harm was predictive for both genders. We did not determine cell occupancy status. Thus, there appears to be some overlap between predictors for self-harm and suicide, which may lend support to the concept of a continuum, rather than discrete pathologies, whereby harm can range from behaviours without any visible damage, through self-injury with tissue damage, to highly dangerous methods such as overdose and self-strangulation. 99
Consequently, it would appear that different studies highlight different risk factors, but these may be a function not just of gender but also of other factors, such as time in prison. Our study also highlighted the variability of harm rates between the male prisons, suggesting that environmental and contextual factors (e.g. educational levels) may play a part in the incidence of self-harm. This suggests that a simple screening tool, such as the ones proposed in the current study, would be only a starting point for a more in-depth investigation of potential risk. Indeed, further work on examining the potential and role of both actuarial information and structured professional judgement, and their interaction in predicting self-harm, would seem a worthwhile activity.
Clinical and wider prison management implications
Effective risk management in prison involves the care pathways from reception screening to care planning for any immediate risk identified. 100 It has been argued that good practice involves screening each prisoner carefully and comprehensively using both self-report measures and information requested from relevant external agencies. 101 This should give rise to the identification of self-harm/suicide risk, or factors associated with such risk. The identification of self-harm in prison settings fits in well with the principles of screening:102
-
The condition should be an important health problem.
-
There should be a treatment for the condition.
-
Facilities for diagnosis and treatment should be available.
-
There should be a latent stage of the disease.
-
There should be a test or examination for the condition.
-
The test should be acceptable to the population.
-
The natural history of the disease should be adequately understood.
-
There should be an agreed policy on whom to treat.
-
The total cost of finding a case should be economically balanced in relation to medical expenditure as a whole.
-
Case-finding should be a continuous process, not just a ‘once and for all’ project.
Identification of future risk of self-harming behaviour has long been a challenge in prisons, and professionals have often been unfairly criticised for not identifying risk, particularly when a prisoner self-harms following closure of an ACCT. In the case of serious incidents leading to the death of a prisoner, there is a high burden of investigation on prison professionals from their employing organisation, the coroner’s inquest and the Prisons and Probation Ombudsman. The current study has highlighted the challenge in identifying risk, not least as 20% of prisoners will have an ACCT opened and, of those, over 25% will go on to commit an act of self-harm. The negative predictive value of our proposed screening tool is encouraging as it means that, post closure of ACCT, limited clinical resource can be targeted at follow-up for those who require it most.
Our research was not designed to identify optimum times for follow-up screening, although factors linked with early time to self-harm were identified. Until further empirical research is able to identify optimum screening times, for those shown to have a medium or high risk of self-harm repeated short-term screening would seem to be a sensible option. Supportive treatment from mental health services should be considered for those who fail the screening criteria for categorisation as low risk. The regularity of screening could vary in different prisons, as our research has shown that there are significant unexplained differences between prisons in both the rates of and potential risk factors for self-harming behaviour. However, what is clear from our research is that stopping monitoring at the point of ACCT closure will likely lead to missed opportunities to identify and appropriately manage emerging risk of self-harm. Therefore, individual prisons should develop their own specific integrated prison/health-care screening policy relating to the future management of the risk of self-harm for those who have had an ACCT process started. For example, prisons could decide to screen the at-risk population post closure of ACCT on a fortnightly basis (although precise timings could be determined according to local trends). The key clinical governance indicators would then be whether or not screening of all at-risk prisoners was carried out and whether or not ongoing screening and treatment were offered to those identified as at medium or high risk. This would involve a change in emphasis from the current system whereby there is no systematic process of follow-up for individuals post closure of ACCT. Additionally, where self-harm does lead to suicide, professional practice is often criticised through the investigative processes outlined above. We would suggest that legitimate criticism of clinical practice should be limited to circumstances in which either screening of the at-risk population has not taken place or mental health treatment services were not offered to those identified as at medium or high risk.
Strengths and limitations
The main strengths of the current study are the prospective nature of recruitment and the 6-month follow-up period for self-harm, which was shown in the pilot to include the majority of self-harm behaviours in a 9-month period. This also suggests that studies with a follow-up time of less than 6 months risk under-reporting the incidence of self-harm. The majority of those prisoners who consented to the study were also followed up, so there was very little attrition. For example, only marginal numbers were lost to the Cox proportional hazards regression analysis. The identification of the self-harm events came from the formal NOMIS system, which is usually robust with respect to the occurrence of an event, although it may not provide a detailed description. Thus, the figures for primary outcome event can be considered valid, and only 17 cases (3.8%) had to be omitted because of lack of information at follow-up.
The study also incorporated questionnaires consistent with previously reported associations with self-harm, such as self-harm itself, borderline personality disorder and depression. All the questionnaires chosen were exposed to a rigorous psychometric evaluation, and four out of five withstood the test to the level of ordinal scales and valid cut points. Whether or not the failure to fit the Rasch model (over and above Mokken scaling) is important in the current context is debatable. However, if in the future intervention studies wish to track change in any of the traits being measured by these questionnaires, then interval-scaled data would be useful for calculating change scores, as this cannot be done on the ordinal scales.
The main limitations of the study were the absence of historical data about abuse and any independent validation of the self-report questions which formed the greater part of the study. For example, there has been no clinical validation of the cut point for depression based on the PHQ-9. The absence of such criterion validity for scales which can be used in a prison setting is a cause for concern. In addition, we did not systematically collect reported test–retest data on the various instruments and, thus, were limited to the internal consistency reliability and person separation reliability from one interview.
We also failed to record the time taken for consent, so we were not able to fully examine if prisoners were given sufficient time to consider all the information provided. We do know from anecdotal evidence that this was occasionally a challenge as a result of prison operational requirements. Given the relatively high recruitment rate, this did not appear to be a major problem.
A further limitation is that our suggestion of reassessment of risk cannot be further supported by an analysis of risk following second or subsequent ACCTs, as this was not included in the study protocol, therefore, and dates of subsequent ACCTs were not collected during follow-up. Thus, an analysis incorporating a time-dependent covariate for later ACCTs could not be conducted. The risk indexes are also currently limited to the ACCT process itself and it is unknown how they would perform without this process.
The loss of a second female prison as a result of management changes at the outset of the study meant that we were unable to undertake as much gender-specific analysis as we had intended. It may have also limited the variation in the data such that the predictive ability of the potential screening index was better for the more homogenous female group than for the larger, more heterogeneous male group (the results for the male group were, however, perhaps more generalisable).
Consequently, a limitation of the Cox proportional hazards modelling was that the hazard stratification by gender does not allow for covariate effects to differ between males and females. The inclusion of the gender-specific SHI does, however, allow for this for the SHI which is the scale that is of most interest in this study. A further limitation is the pooling of male and female prisoners in this analysis, as these groups could be considered separate subsamples given their differing characteristics. However, pooling males and females allowed a sufficiently large sample to investigate whether or not the addition of a new scale could identify prisoners at increased risk of self-harm, after adjusting for all important baseline factors, which would be more easily available. Conducting the analysis separately for males and females would have been possible for the male sample, as this contained over 335 prisoners, 89 of whom self-harmed during follow-up. However, as there were relatively few events observed within the female sample (115 prisoners, 37 of whom self-harmed during follow-up), it was considered more appropriate to combine the samples to ensure all potential prognostic baseline factors could be examined. An analysis involving the female sample alone would have been restricted in terms of the number of baseline factors included in the model before investigating a new scale; indeed, it would not have been appropriate to include more than three baseline factors.
Future research
Although the resulting gender-specific screening instruments may offer a mechanism for screening (out) for self-harm, the mode of operation in the current study, following an ACCT, limits its generalisation at the present time. It is unknown if the instruments may work just as (less or more) effectively at some other time, for example post reception, pre sentencing, and so on. Also, if it is to be embedded within the ACCT process, it needs further evaluation in that context. Consequently, further work could be undertaken to determine the optimum time(s) for screening and how such an instrument would be used. This would also need to be linked to a portfolio of interventions which may themselves require testing in a randomised controlled trial type of setting.
The priorities for future research are:
-
replication of validity of proposed screening instruments in different offender populations
-
evaluation of efficacy and role of proposed screening instruments at different times (e.g. reception; post ACCT)
-
the use of magnitudes of risk as indicators for care pathways
-
the utility of actuarial information, and structured clinical assessment in predicting the risk of self-harm.
Acknowledgements
With thanks to Tim Allen, Alan Richer and Paul Baker, the governors of the prisons involved, who provided invaluable help and support, particularly during the follow-up period. We would also like to thank Professor Jenny Shaw and Professor Stephen McKenna for their support through the steering group. We also wish to thank Ms Loree Wilson, our user representative, who contributed to our study management group.
Contributions of authors
All the authors were involved in the study management group of the project and collectively took decisions about the direction of the research. All the authors have contributed to the writing and review of this draft final report.
In addition, Jamie Smith and Zanib Mohammed undertook the interviews with prisoners. Mike Horton led the work on the psychometric analysis of scales, supported by Professor Tennant. Alex Wright-Hughes undertook the Cox regression analysis, supported by Professor Farrin. Nat Wright took the lead on the clinical implications of the project and managed the research at one of the male prisons. Wendy Dyer managed the research at the two other prisons.
Mike Horton is a research assistant and doctorial candidate in the Department of Rehabilitation Medicine at the University of Leeds.
Nat Wright is a clinical lead at HMP Leeds and manager of research staff.
Wendy Dyer is a senior lecturer in criminology at the University of Northumbria.
Alex Wright-Hughes is a medical statistician in the Clinical Trials Research Unit at the University of Leeds.
Amanda Farrin is Professor of Clinical Trials at the Clinical Trials Research Unit at the University of Leeds.
Zanib Mohammed is a prison researcher.
Jamie Smith is a prison researcher.
Tom Heyes is a general practitioner with a special interest in prison health.
Simon Gilbody is Professor of Psychological Medicine and Health Services Research at the University of York.
Alan Tennant is Professor of Rehabilitation Studies and Director of the Psychometric Laboratory for Health Sciences at the University of Leeds.
Disclaimers
This report presents independent research funded by the National Institute for Health Research (NIHR). The views and opinions expressed by authors in this publication are those of the authors and do not necessarily reflect those of the NHS, the NIHR, NETSCC, the HTA programme or the Department of Health. If there are verbatim quotations included in this publication the views and opinions expressed by the interviewees are those of the interviewees and do not necessarily reflect those of the authors, those of the NHS, the NIHR, NETSCC, the HTA programme or the Department of Health.
References
- Skegg K. Self-harm. Lancet 2005;366:1471-83. http://dx.doi.org/10.1016/S0140-6736(05)67600-3.
- Favazza AR. Bodies under Siege: Self-Mutilation and Body Modification in Culture and Psychiatry. Baltimore, MD: Johns Hopkins University Press; 1989.
- Duffy DF. Self-injury. Psychiatry 2006;5:263-5. http://dx.doi.org/10.1053/j.mppsy.2006.05.003.
- Self-Harm: The Short-Term Physical and Psychological Management and Secondary Prevention of Self-Harm in Primary and Secondary Care. National Clinical Practice Guideline No. 16. London: NICE; 2004.
- Messer JM, Fremouw WJ. A critical review of explanatory models for self-mutilating behaviors in adolescents. Clin Psychol Rev 2008;28:162-78. http://dx.doi.org/10.1016/j.cpr.2007.04.006.
- Favazza AR. The coming of age of self-mutilation. J Nerv Ment Dis 1998;186:259-68. http://dx.doi.org/10.1097/00005053-199805000-00001.
- Gratz KL. Measurement of deliberate self-harm: preliminary data on the deliberate self-harm inventory. J Psychopathol Behav Assess 2001;23:253-63. http://dx.doi.org/10.1023/A:1012779403943.
- Muehlenkamp JJ, Gutierrez PM. An investigation of differences between self-injurious behavior and suicide attempts in a sample of adolescents. Suicide Life Threat Behav 2004;34:12-23. http://dx.doi.org/10.1521/suli.34.1.12.27769.
- O’Carroll PW, Berman AL, Maris RW, Moscicki EK, Tanney BL, Silverman MM. Beyond the tower of Babel: a nomenclature for suicidology. Suicide Life Threat Behav 1996;26:237-52.
- Nock MK, Prinstein MJ. A functional approach to the assessment of self-mutilative behavior. J Consult Clin Psychol 2004;72:885-90. http://dx.doi.org/10.1037/0022-006X.72.5.885.
- Smith HP, Kaminski RJ. Inmate self-injurious behaviors: distinguishing characteristics within a retrospective study. Crim Justice Behav 2010;37:81-96. http://dx.doi.org/10.1177/0093854809348474.
- Lohner J, Konrad N. Deliberate self-harm and suicide attempt in custody: distinguishing features in male inmates’ self-injurious behavior. Int J Law Psychiatry 2006;29:370-85. http://dx.doi.org/10.1016/j.ijlp.2006.03.004.
- Haycock J. Manipulation and suicide attempts in jails and prisons. Psychiatr Q 1989;60:85-98. http://dx.doi.org/10.1007/BF01064365.
- Verona E, Sachs-Ericsson N, Joiner TE,. Suicide attempts associated with externalizing psychopathology in an epidemiological sample. Am J Psychiatry 2004;161:444-51. http://dx.doi.org/10.1176/appi.ajp.161.3.444.
- Favazza AR, Rosenthal RJ. Diagnostic issues in self-mutilation. Hospital Comm Psychiatry 1993;44:134-40.
- Stanley B, Winchell R, Molcho A, Simeon D, Stanley M. Suicide and the self-harm continuum: phenomenological and biochemical evidence. Int Rev Psychiatry 1992;4:149-55. http://dx.doi.org/10.3109/09540269209066312.
- Owens D, Horrocks J, House A. Fatal and non-fatal repetition of self-harm. Systematic review. Br J Psychiatry 2002;181:193-9. http://dx.doi.org/10.1192/bjp.181.3.193.
- Hawton K, Harriss L, Hall S, Simkin S, Bale E, Bond A. Deliberate self-harm in Oxford, 1990–2000: a time of change in patient characteristics. Psychol Med 2003;33:987-95. http://dx.doi.org/10.1017/S0033291703007943.
- Lanes E. Identification of risk factors for self-injurious behavior in male prisoners. J Forensic Sci 2009;54:692-8. http://dx.doi.org/10.1111/j.1556-4029.2009.01028.x.
- Hawton K, Fagg J, Simkin S, Bale E, Bond A. Trends in deliberate self-harm in Oxford, 1985–1995. Implications for clinical services and the prevention of suicide. Br J Psychiatry 1997;171:556-60. http://dx.doi.org/10.1192/bjp.171.6.556.
- Hawton K, Bergen H, Casey D, Simkin S, Palmer B, Cooper J, et al. Self-harm in England: a tale of three cities. Soc Psychiatry Psychiatr Epidemiol 2007;42:513-21. http://dx.doi.org/10.1007/s00127-007-0199-7.
- Murphy E, Dickson S, Donaldson I, Healey M, Kapur N, Appleby L, et al. The MaSH Project: Self-Harm in Manchester, 1 September 2003 to 31 August 2005. Manchester: Manchester Mental Health and Social Care Trust NHS and The University of Manchester; 2007.
- Kapur N. Self-harm in the general hospital. Psychiatry 2009;8:189-93. http://dx.doi.org/10.1016/j.mppsy.2009.03.005.
- Butler J, Longhitano C. Self-harm. Medicine 2008;36:455-8. http://dx.doi.org/10.1016/j.mpmed.2008.06.008.
- Hawton K, Rodham K, Evans E, Weatherall R. Deliberate self harm in adolescents: self report survey in schools in England. BMJ 2002;325:1207-11. http://dx.doi.org/10.1136/bmj.325.7374.1207.
- Jacobson CM, Gould M. The epidemiology and phenomenology of non-suicidal self-injurious behavior among adolescents: a critical review of the literature. Arch Suicide Res 2007;11:129-47. http://dx.doi.org/10.1080/13811110701247602.
- Klonsky ED, Oltmanns TF, Turkheimer E. Deliberate self-harm in a nonclinical population: prevalence and psychological correlates. Am J Psychiatry 2003;160:1501-8. http://dx.doi.org/10.1176/appi.ajp.160.8.1501.
- Briere J, Gil E. Self-mutilation in clinical and general population samples: prevalence, correlates, and functions. Am J Orthopsychiatry 1998;68:609-20. http://dx.doi.org/10.1037/h0080369.
- Favazza AR, DeRosear L, Conterio K. Self-mutilation and eating disorders. Suicide Life Threat Behav 1989;19:352-61.
- Meltzer H, Lader D, Corbin T, Singleton N, Jenkins R, Brugha T. Non-Fatal Suicide Behaviour among Adults Aged 16–74 in Great Britain. London: The Stationery Office; 2002.
- Singleton N, Meltzer H, Gatward R. Psychiatric Morbidity among Prisoners in England and Wales. London: Office for National Statistics; 1998.
- Safety in Custody Statistics Quarterly Bulletin: January to March 2012, England and Wales. London: Ministry of Justice; 2012.
- Daniel AE. Preventing suicide in prison: a collaborative responsibility of administrative, custodial, and clinical staff. J Am Acad Psychiatry Law 2006;34:165-75.
- Liebling A. Vulnerability and prison suicide. Br J Criminol 1995;35:173-87.
- Powis B. Offenders’ Risk of Serious Harm: A Literature Review. RDS Occasional Paper No. 81 2002.
- Jenkins R, Bhugra D, Meltzer H, Singleton N, Bebbington P, Brugha T, et al. Psychiatric and social aspects of suicidal behaviour in prisons. Psychol Medicine 2005;35:257-69. http://dx.doi.org/10.1017/S0033291704002958.
- Appelbaum KL, Savageau JA, Trestman RL, Metzner JL, Baillargeon J. A national survey of self-injurious behavior in American prisons. Psychiatr Serv 2011;62:285-90. http://dx.doi.org/10.1176/appi.ps.62.3.285.
- Brooker C, Repper J, Beverley C, Ferriter M, Brewer N. Mental Health Services and Prisoners: A Review. Sheffield: University of Sheffield, School of Health and Related Research; 2002.
- Borrill J, Burnett R, Atkins R, Miller S, Briggs D, Weaver T, et al. Patterns of self-harm and attempted suicide among white and black/mixed race female prisoners. Crim Behav Ment Health 2003;13:229-40. http://dx.doi.org/10.1002/cbm.549.
- Sakelliadis EI, Papadodima SA, Sergentanis TN, Giotakos O, Spiliopoulou CA. Self-injurious behavior among Greek male prisoners: prevalence and risk factors. Eur Psychiatry 2010;25:151-8. http://dx.doi.org/10.1016/j.eurpsy.2009.07.014.
- Ministry of Justice . Offender Management Statistics Quarterly n.d. www.justice.gov.uk/statistics/prisons-and-probation/oms-quarterly (accessed October 2012).
- Corston J. Corston Report 2007. www.justice.gov.uk/publications/docs/corston-report-march-2007pdf (accessed March 2013).
- Ministry of Justice . Prison Service Instruction 64 2011: Management of Prisoners at Risk of Harm to Self, to Others and from Others (Safer Custody) 2011.
- Gavin N, Parsons S, Grubin D. Reception screening and mental health needs assessment in a male remand prison. Psychiatr Bull 2003;27:251-3. http://dx.doi.org/10.1192/pb.27.7.251.
- Perry AE, Marandos R, Coulton S, Johnson M. Screening tools assessing risk of suicide and self-harm in adult offenders: a systematic review. Int J Offender Ther Comp Criminol 2010;54:803-28. http://dx.doi.org/10.1177/0306624X09359757.
- Beck AT, Weissman A, Lester D, Trexler L. The measurement of pessimism: the hopelessness scale. J Consult Clin Psychol 1974;42:861-5. http://dx.doi.org/10.1037/h0037562.
- Gray NS, Hill C, McGleish A, Timmons D, MacCulloch MJ, Snowden RJ. Prediction of violence and self-harm in mentally disordered offenders: a prospective study of the efficacy of HCR-20, PCL-R, and psychiatric symptomatology. J Consult Clin Psychol 2003;71:443-51. http://dx.doi.org/10.1037/0022-006X.71.3.443.
- Sansone RA, Wiederman MW, Sansone LA. The Self-Harm Inventory (SHI): development of a scale for identifying self-destructive behaviors and borderline personality disorder. J Clin Psychol 1998;54:973-83. http://dx.doi.org/10.1002/(SICI)1097-4679(199811)54:7<973::AID-JCLP11>3.0.CO;2-H.
- Perry AE, Olason DT. A new psychometric instrument assessing vulnerability to risk of suicide and self-harm behaviour in offenders: Suicide Concerns for Offenders in Prison Environment (SCOPE). Int J Offender Ther Comp Criminol 2009;53:385-400. http://dx.doi.org/10.1177/0306624X08319418.
- Kroenke K, Spitzer RL, Williams JBW. The PHQ-9: validity of a brief depression severity measure. J Gen Int Med 2001;16:606-13. http://dx.doi.org/10.1046/j.1525-1497.2001.016009606.x.
- Shaw JJ, Tomenson B, Creed F. A screening questionnaire for the detection of serious mental illness in the criminal justice system. J Forensic Psychiatr Psychol 2003;14:138-50. http://dx.doi.org/10.1080/1478994031000077943.
- Bohus M, Kleindienst N, Limberger MF, Stieglitz RD, Domsalla M, Chapman AL, et al. The short version of the Borderline Symptom List (BSL-23): development and initial data on psychometric properties. Psychopathology 2009;42:32-9. http://dx.doi.org/10.1159/000173701.
- Evans C, Mellor-Clark J, Margison F, Barkham M, Audin K, Connell J, et al. CORE: Clinical Outcomes in Routine Evaluation. J Ment Health 2000;9:247-55. http://dx.doi.org/10.1080/713680250.
- Lovibond PF, Lovibond SH. The structure of negative emotional states: comparison of the Depression Anxiety Stress Scales (DASS) with the Beck Depression and Anxiety Inventories. Behav Res Therapy 1995;33:335-43. http://dx.doi.org/10.1016/0005-7967(94)00075-U.
- Teplin LA, Swartz J. Screening for severe mental disorder in jails: the development of the Referral Decision Scale. Law Human Behav 1989;13:1-18. http://dx.doi.org/10.1007/BF01056159.
- Lloyd E, Kelley ML, Hope T. Self-Mutilation in a Community Sample of Adolescents: Descriptive Characteristics and Provisional Prevalence Rates n.d.
- Beck AT, Ward CH, Mendelson MM, Mock JJ, Erbaugh JJ. An inventory for measuring depression. Arch Gen Psychiatry 1961;4:561-71. http://dx.doi.org/10.1001/archpsyc.1961.01710120031004.
- Zigmond AS, Snaith RP. The hospital anxiety and depression scale. Acta Psychiatr Scand 1983;67:361-70. http://dx.doi.org/10.1111/j.1600-0447.1983.tb09716.x.
- Latimer S, Covic T, Cumming SR, Tennant A. Psychometric analysis of the Self-Harm Inventory using Rasch modelling. BMC Psychiatry 2009;9. http://dx.doi.org/10.1186/1471-244X-9-53.
- Bohus M, Limberger MF, Frank U, Chapman AL, Kuhler T, Stieglitz RD. Psychometric properties of the Borderline Symptom List (BSL). Psychopathology 2007;40:126-32. http://dx.doi.org/10.1159/000098493.
- Evans C, Connell J, Barkham M, Margison F, McGrath G, Mellor-Clark J, et al. Towards a standardised brief outcome measure: psychometric properties and utility of the CORE-OM. Br J Psychiatry 2002;180:51-60. http://dx.doi.org/10.1192/bjp.180.1.51.
- Sansone RA, Butler M, Dakroub H, Pole M. Borderline personality symptomatology and employment disability: a survey among outpatients in an internal medicine clinic. Prim Care Companion J Clin Psychiatry 2006;8:153-7. http://dx.doi.org/10.4088/PCC.v08n0305.
- Sansone RA, Reddington A, Sky K, Wiederman MW. Borderline personality symptomatology and history of domestic violence among women in an internal medicine setting. Violence Vict 2007;22:120-6. http://dx.doi.org/10.1891/vv-v22i1a008.
- Sansone RA, Songer DA, Sellbom M. The relationship between suicide attempts and low-lethal self-harm behavior among psychiatric inpatients. J Psychiatr Pract 2006;12:148-52. http://dx.doi.org/10.1097/00131746-200605000-00003.
- Meltzer H, Jenkins R, Singleton N, Charlton J, Yar M. Non-fatal Suicidal Behaviour among Prisoners. London: Office for National Statistics; 1999.
- Linacre JM. Sample size and item calibration stability. Rasch Measure Trans 1994;7.
- Nunnally JC. Psychometric Theory. London: McGraw-Hill; 1967.
- Thurstone LL. Measurement of social attitudes. J Abnorm Soc Psychol 1931;26:249-69. http://dx.doi.org/10.1037/h0070363.
- Rasch G. Probabilistic Models for Some Intelligence and Attainment Tests. Copenhagen: Danish Institution for Educational Research; 1960.
- Hattie J, Krakowski K, Rogers HJ, Swaminathan H. An assessment of Stout’s index of essential unidimensionality. Appl Psychol Meas 1996;20:1-14. http://dx.doi.org/10.1177/014662169602000101.
- de Vet HCW, Adèr HJ, Terwee CB, Pouwer F. Are factor analytical techniques used appropriately in the validation of health status questionnaires? A systematic review on the quality of factor analysis of the SF-36. Qual Life Res 2005;14:1203-18. http://dx.doi.org/10.1007/s11136-004-5742-3.
- Kline RB. Principles and Practice of Structural Equation Modelling. New York, NY: Guilford Press; 2011.
- Mokken RJ. The Theory and Procedure of Scale Analysis with Applications in Political Research. New York, NY: Walter de Gruyter; 1971.
- Sijtsma K, Molenaar IW. Introduction to Nonparametric Item Response Modeling. Thousand Oaks, CA: Sage Publications; 2002.
- Guttman L, Stouffer SA, . Measurement and Prediction: The American Soldier Vol. IV. New York, NY: Wiley; 1950.
- Stochl J, Jones PB, Croudace TJ. Mokken scale analysis of mental health and well-being questionnaire item responses: a non-parametric IRT method in empirical research for applied health researchers. BMC Med Res Methodol 2012;12. http://dx.doi.org/10.1186/1471-2288-12-74.
- van Shuur WH. Mokken scale analysis: between the Guttman scale and parametric Item Response Theory. Polit Anal 2003;11:139-63. http://dx.doi.org/10.1093/pan/mpg002.
- Roskam EE, van den Wollenberg AL, Jansen PGW. The Mokken scale: a critical discussion. Appl Psychol Meas 1986;10:265-77. http://dx.doi.org/10.1177/014662168601000305.
- Luce RD, Tukey JW. Simultaneous conjoint measurement. J Math Psychol 1964;1:1-27. http://dx.doi.org/10.1016/0022-2496(64)90015-X.
- Fisher RA. On the mathematical foundations of theoretical statistics. Phil Trans R Soc Lond 1922;A:309-68.
- La Porta F, Caselli S, Susassi S, Cavallini P, Tennant A, Franceschini M. Is the Berg Balance Scale an internally valid and reliable measure of balance across different etiologies in neurorehabilitation? A revisited Rasch analysis study. Arch Phys Med Rehabil 2012;93:1209-16. http://dx.doi.org/10.1016/j.apmr.2012.02.020.
- Elhan AH, Öztuna D, Kutlay S, Küçükdeveci AA, Tennant A. An initial application of computerized adaptive testing (CAT) for measuring disability in patients with low back pain. BMC Musculoskelet Disord 2008;9. http://dx.doi.org/10.1186/1471-2474-9-166.
- Andrich D, Humphry SM, Marais I. Quantifying local, response dependence between two polytomous items using the Rasch model. Appl Psychol Meas 2012;36:309-24. http://dx.doi.org/10.1177/0146621612441858.
- Andrich D. Rasch Models for Measurement. London: Sage Publications; 1988.
- Reise SP, Morizot J, Hays RD. The role of the bifactor model in resolving dimensionality issues in health outcomes measures. Qual Life Res 2007;16:19-31. http://dx.doi.org/10.1007/s11136-007-9183-7.
- Andrich D. Cronbach’s Alpha in the Presence of Subscales n.d.
- Smith EV, Jr. Detecting and evaluating the impact of multidimensionality using item fit statistics and principal component analysis of residuals. J Appl Meas 2002;3:205-31.
- Tennant A, Conaghan PG. The Rasch measurement model in rheumatology: what is it and why use it? When should it be applied, and what should one look for in a Rasch paper?. Arthritis Care Res 2007;57:1358-62. http://dx.doi.org/10.1002/art.23108.
- Pallant JF, Tennant A. An introduction to the Rasch measurement model: an example using the Hospital Anxiety and Depression Scale (HADS). Br J Clin Psychol 2007;46:1-18. http://dx.doi.org/10.1348/014466506X96931.
- Hagquist C, Bruce M, Gustavsson JP. Using the Rasch model in nursing research: an introduction and illustrative example. Int J Nurs Stud 2009;46:380-93. http://dx.doi.org/10.1016/j.ijnurstu.2008.10.007.
- Lin DY, Wei LJ, Ying Z. Checking the Cox model with cumulative sums of martingale-based residuals. Biometrika 1993;80:557-72. http://dx.doi.org/10.1093/biomet/80.3.557.
- Christensen KB, Kreiner S. Monte Carlo tests of the Rasch model based on scalability coefficients. Br J Math Stat Psychol 2010;63:101-11. http://dx.doi.org/10.1348/000711009X424200.
- Ginn S. Women prisoners. BMJ 2013;346. http://dx.doi.org/10.1136/bmj.e8318.
- Fan J, Upadhye S, Worster A. Understanding receiver operating characteristic (ROC) curves. Can J Emerg Med 2006;8:19-20.
- Milligan RJ, Andrews B. Suicidal and other self-harming behaviour in offender women: the role of shame, anger and childhood abuse. Legal Criminol Psychol 2005;10:13-25. http://dx.doi.org/10.1348/135532504X15439.
- Slade K, Edelmann R, Worrall M, Bray D. Applying the Cry of Pain Model as a predictor of deliberate self-harm in an early-stage adult male prison population. Legal Criminol Psychol 2014;19:131-46. http://dx.doi.org/10.1111/j.2044-8333.2012.02065.x.
- Hassan L, Birmingham L, Harty MA, Jarrett M, Jones P, King C, et al. Prospective cohort study of mental health during imprisonment. Br J Psychiatry 2011;198:37-42. http://dx.doi.org/10.1192/bjp.bp.110.080333.
- Humber N, Webb R, Piper M, Appleby L, Shaw J. A national case–control study of risk factors among prisoners in England and Wales. Soc Psychiatry Psychiatr Epidemiol 2013;48:1177-85. http://dx.doi.org/10.1007/s00127-012-0632-4.
- Latimer S, Covic T, Tennant A. Co-calibration of deliberate self harm (DSH) behaviours: towards a common measurement metric. Psychiatry Res 2012;200:26-34. http://dx.doi.org/10.1016/j.psychres.2012.05.019.
- Konrad N, Daigle MS, Daniel AE, Dear GE, Frottier P, Hayes LM, et al. Preventing suicide in prisons, part I: recommendations from the International Association for Suicide Prevention Task Force on Suicide in Prisons. Crisis 2007;28:113-21. http://dx.doi.org/10.1027/0227-5910.28.3.113.
- Humber N, Hayes A, Senior J, Fahy T, Shaw J. Identifying, monitoring and managing prisoners at risk of self-harm/suicide in England and Wales. J Forensic Psychiatry Psychol 2011;22:22-51. http://dx.doi.org/10.1080/14789949.2010.518245.
- Wilson JMG, Jungner G. Principles and Practice of Screening for Disease. Geneva: World Health Organization; 1968.
- CORE ims . English CORE System Forms Download n.d. www.coreims.co.uk/download-pdfs.
- Sanson RA, Sansone LA. Measuring self-harm behaviour with the self-harm inventory. Psychiatry 2010;7:16-20.
Appendix 1 Questionnaires
Background information questionnaire
Questionnaire 1: Clinical Outcomes in Routine Evaluation – Outcome Measure
Reproduced with permission from CORE System Trust. Scale available on application from www.coreims.co.uk/download-pdfs. 103
Questionnaire 1: Clinical Outcomes in Routine Evaluation – Outcome Measures (PDF download)
Questionnaire 2: Prison Screening Questionnaire
Reproduced with permission from Professor Shaw (University of Manchester, 2013, personal communication).
Questionnaire 3: Revised Borderline Symptoms list-23 (frequency-based responses)
Adapted with permission from Professor Bohus and PSM ZI Mannheim. 52
Questionnaire 4: Self-Harm Inventory
Reproduced with permission from Sansone RA, Sansone LA. Measuring self-harm behaviour with the self-harm inventory. Psychiatry 2010;7:16–20. 104
Questionnaire 5: Patient Health Questionnaire-9
Appendix 2 Baseline Cox proportional hazards regression models
Baseline model: model building – tables of sequential chi-squared tests for the reduction in –2 log-likelihood
| Additional baseline factor | Reduction in df | –2 log-likelihood | Reduction in –2 log-likelihood | p-value |
|---|---|---|---|---|
| Model 1 | – | 1410.377 | – | – |
| + Previous self-harm in prison | 1 | 1380.517 | 29.860 | < 0.0001a |
| + First ACCT | 1 | 1399.689 | 10.687 | 0.0011b |
| + Mental health medications | 1 | 1405.832 | 4.545 | 0.0330b |
| + Age group | 1 | 1403.959 | 6.418 | 0.0113b |
| + Dependent on alcohol | 1 | 1404.946 | 5.431 | 0.0198b |
| + Education or training received in prison | 1 | 1406.874 | 3.503 | 0.0612b |
| + Previous self-harm outside prison | 1 | 1407.124 | 3.253 | 0.0713b |
| Additional baseline factor | Reduction in df | –2 log-likelihood | Reduction in –2 log-likelihood | p-value |
|---|---|---|---|---|
| Model 2 | – | 1380.517 | – | – |
| + First ACCT | 1 | 1375.189 | 5.328 | 0.0210a |
| + Mental health medications | 1 | 1377.815 | 2.702 | 0.1002 |
| + Age group | 1 | 1377.823 | 2.694 | 0.1007 |
| + Dependent on alcohol | 1 | 1373.771 | 6.746 | 0.0094b |
| + Education or training received in prison | 1 | 1379.733 | 0.784 | 0.3758 |
| + Previous self-harm outside prison | 1 | 1379.947 | 0.570 | 0.4502 |
| Additional baseline factor | Reduction in df | –2 log-likelihood | Reduction in –2 log-likelihood | p-value |
|---|---|---|---|---|
| Model | – | 1373.771 | – | – |
| + First ACCT | 1 | 1369.744 | 4.027 | 0.0448a |
| + Mental health medications | 1 | 1370.085 | 3.687 | 0.0548b |
| + Age group | 1 | 1370.607 | 3.165 | 0.0752b |
| + Education or training received in prison | 1 | 1373.163 | 0.608 | 0.4356 |
| + Previous self-harm outside prison | 1 | 1372.387 | 1.385 | 0.2393 |
| Additional baseline factor | Reduction in df | –2 log-likelihood | Reduction in –2 log-likelihood | p-value |
|---|---|---|---|---|
| Model 4 | – | 1369.744 | – | – |
| + Mental health medications | 1 | 1367.101 | 2.643 | 0.1040 |
| + Age group | 1 | 1366.060 | 3.685 | 0.0549a |
| + Education or training received in prison | 1 | 1369.504 | 0.240 | 0.6243 |
| + Previous self-harm outside prison | 1 | 1368.645 | 1.099 | 0.2944 |
| Additional baseline factor | Reduction in df | –2 log-likelihood | Reduction in –2 log-likelihood | p-value |
|---|---|---|---|---|
| Model 5 | – | 1366.060 | – | – |
| + Mental health medications | 1 | 1362.953 | 3.106 | 0.0780a |
| + Education or training received in prison | 1 | 1366.006 | 0.053 | 0.8177 |
| + Previous self-harm outside prison | 1 | 1364.812 | 1.247 | 0.2641 |
| Additional baseline factor | Reduction in df | –2 log-likelihood | Reduction in –2 log-likelihood | p-value |
|---|---|---|---|---|
| Model 6 | – | 1362.953 | – | – |
| + Education or training received in prison | 1 | 1362.875 | 0.079 | 0.7788 |
| + Violent or sex-related offence | 1 | 1360.064 | 2.890 | 0.0891a |
| + Previous self-harm outside prison | 1 | 1362.394 | 0.559 | 0.4546 |
Baseline model: Kaplan–Meier plots
FIGURE 28.
Kaplan–Meier plot of events by prison.
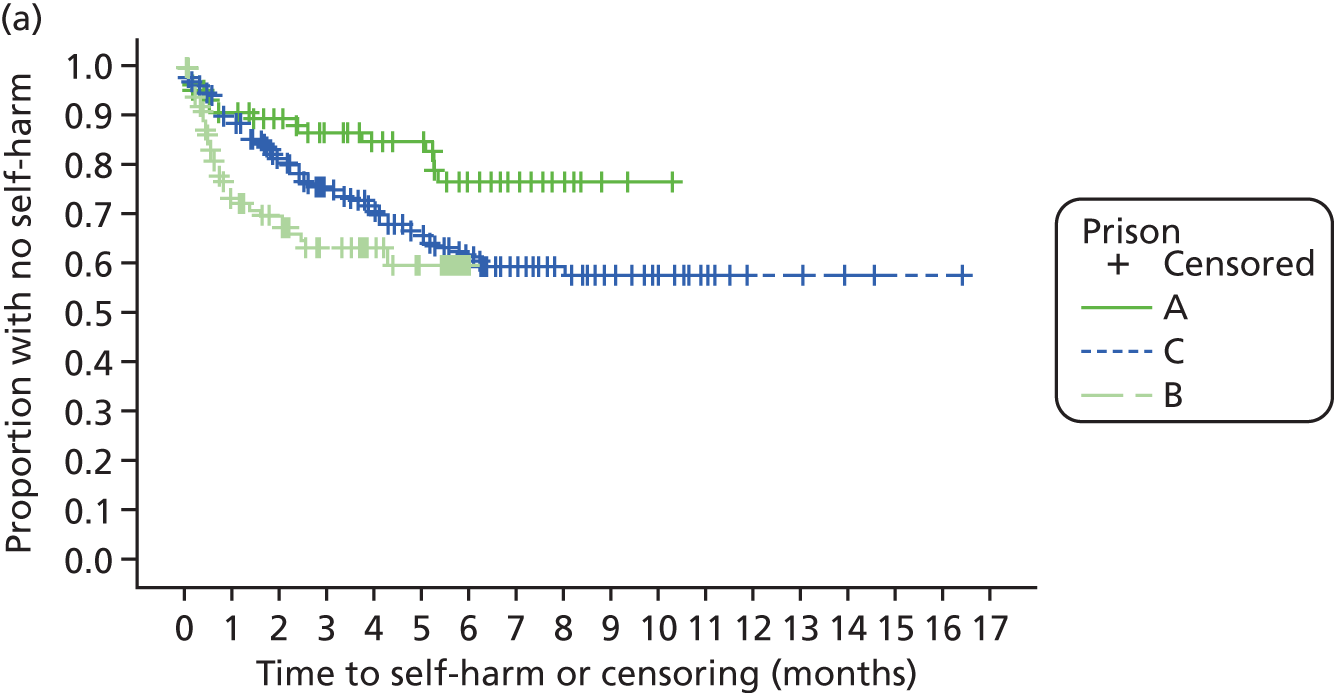

FIGURE 29.
Kaplan–Meier plot of events by previous self-harm in prison.
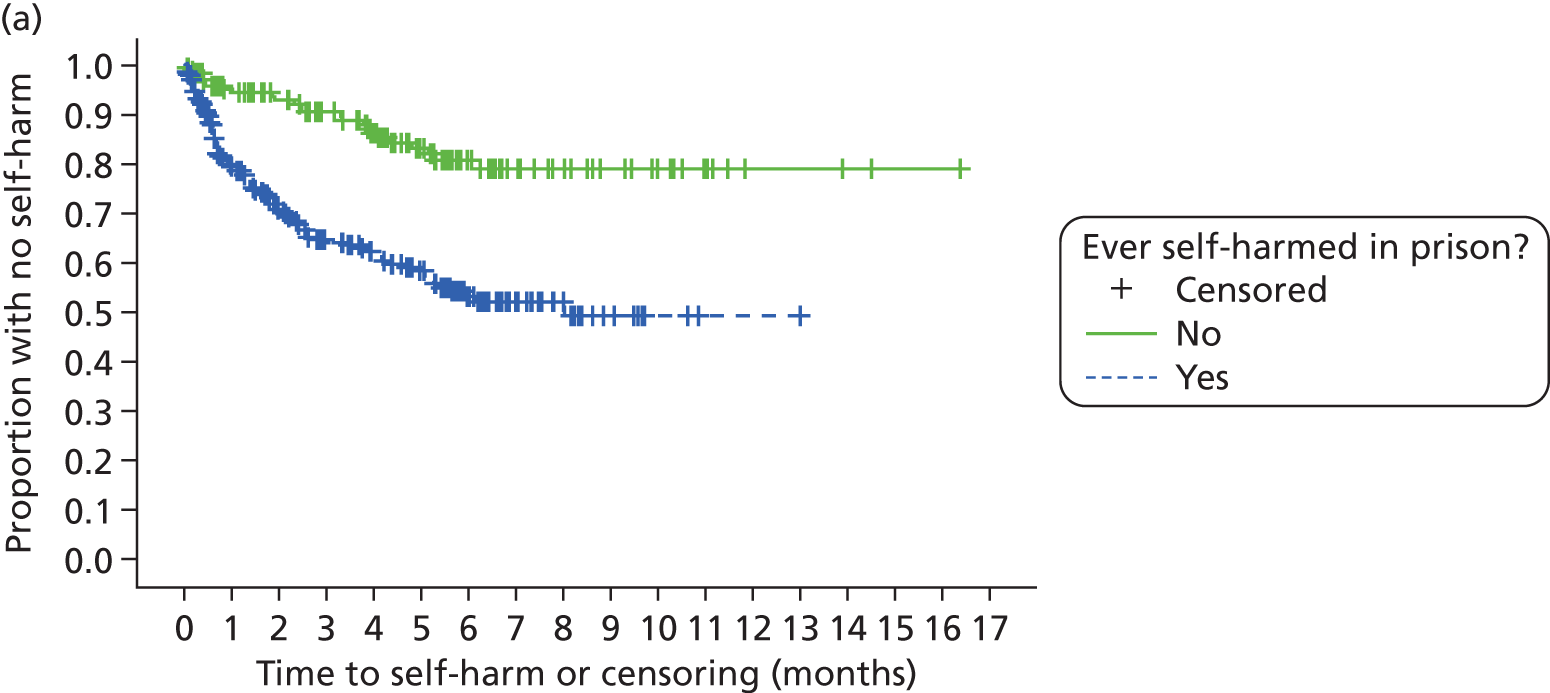

FIGURE 30.
Kaplan–Meier plot of events by dependence on alcohol.
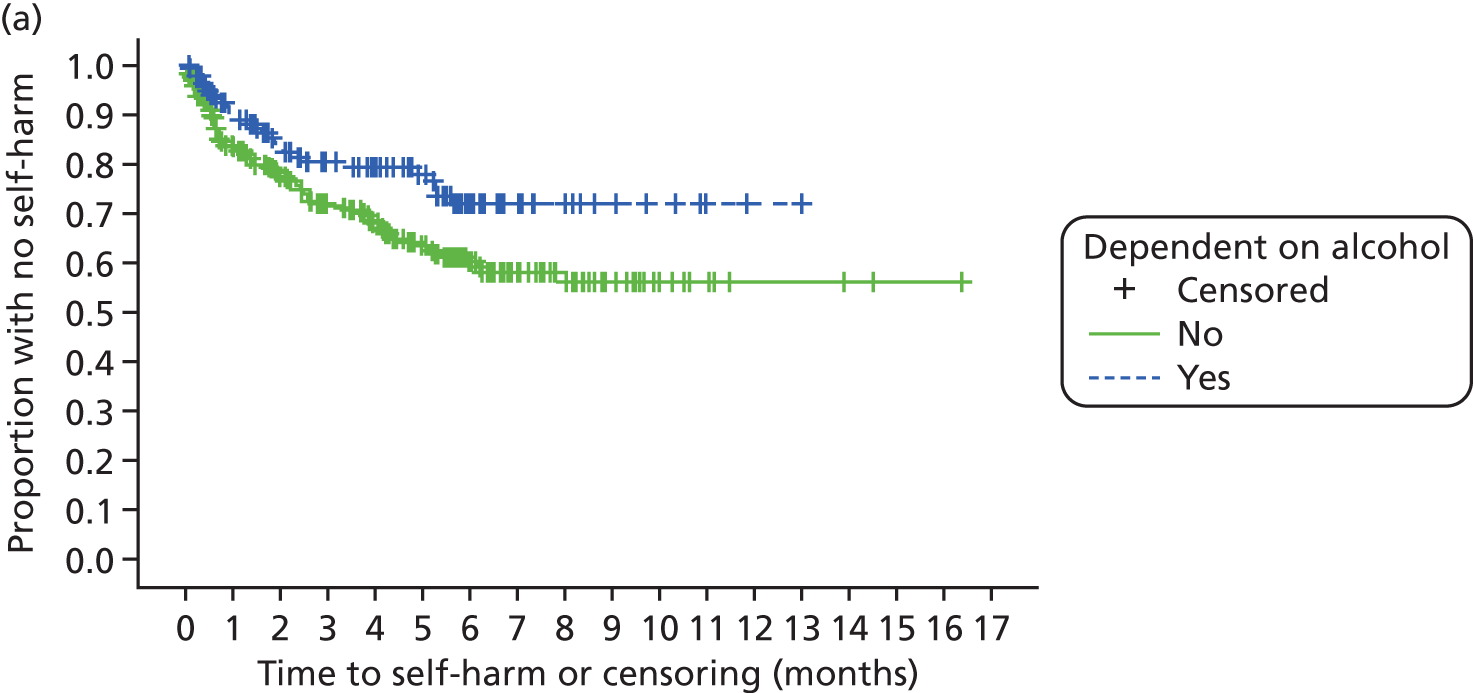

FIGURE 31.
Kaplan–Meier plot of events by first ACCT.
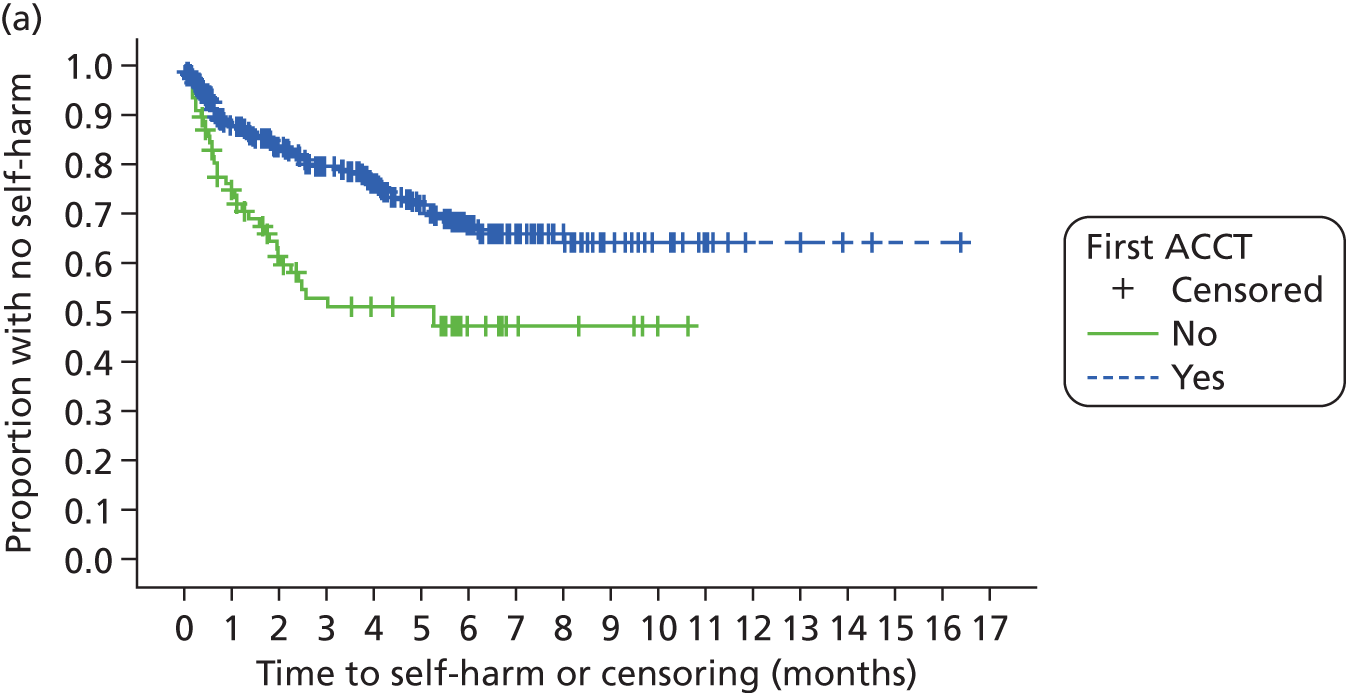

FIGURE 32.
Kaplan–Meier plot of events by age group.
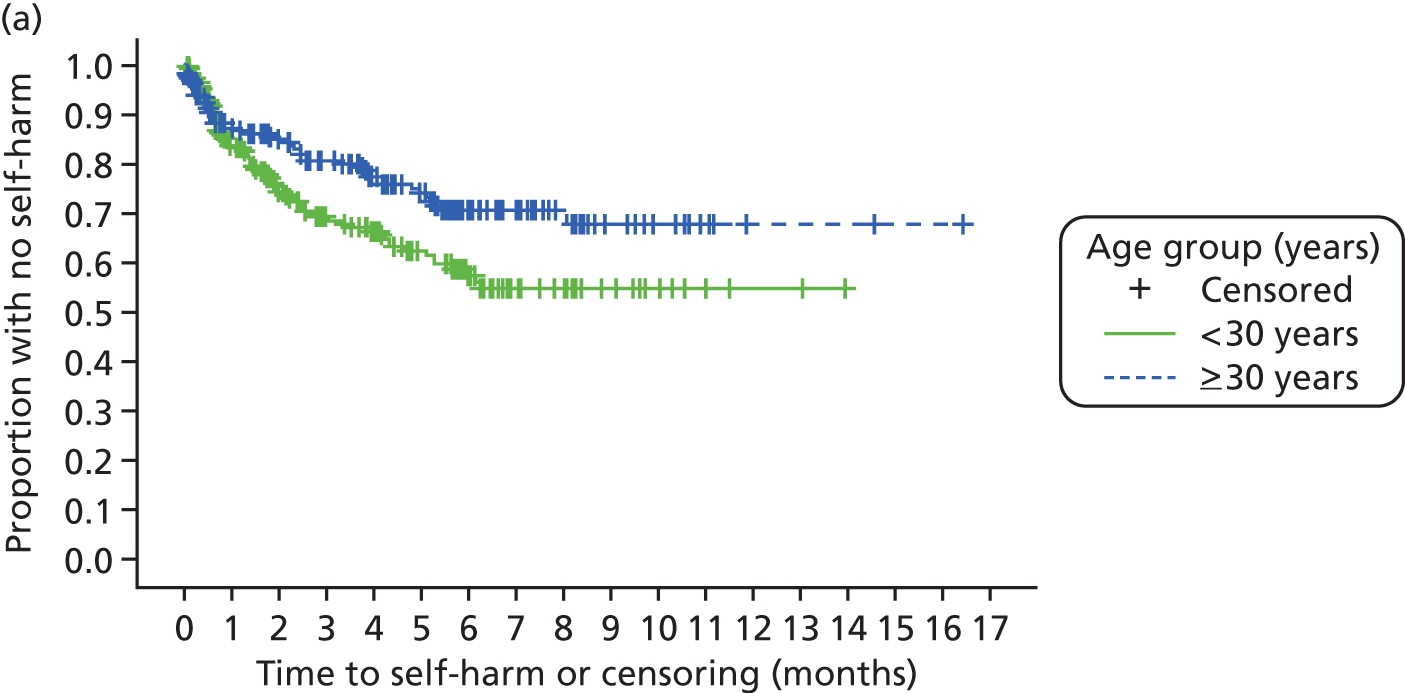

FIGURE 33.
Kaplan–Meier plot of events by mental health medications.
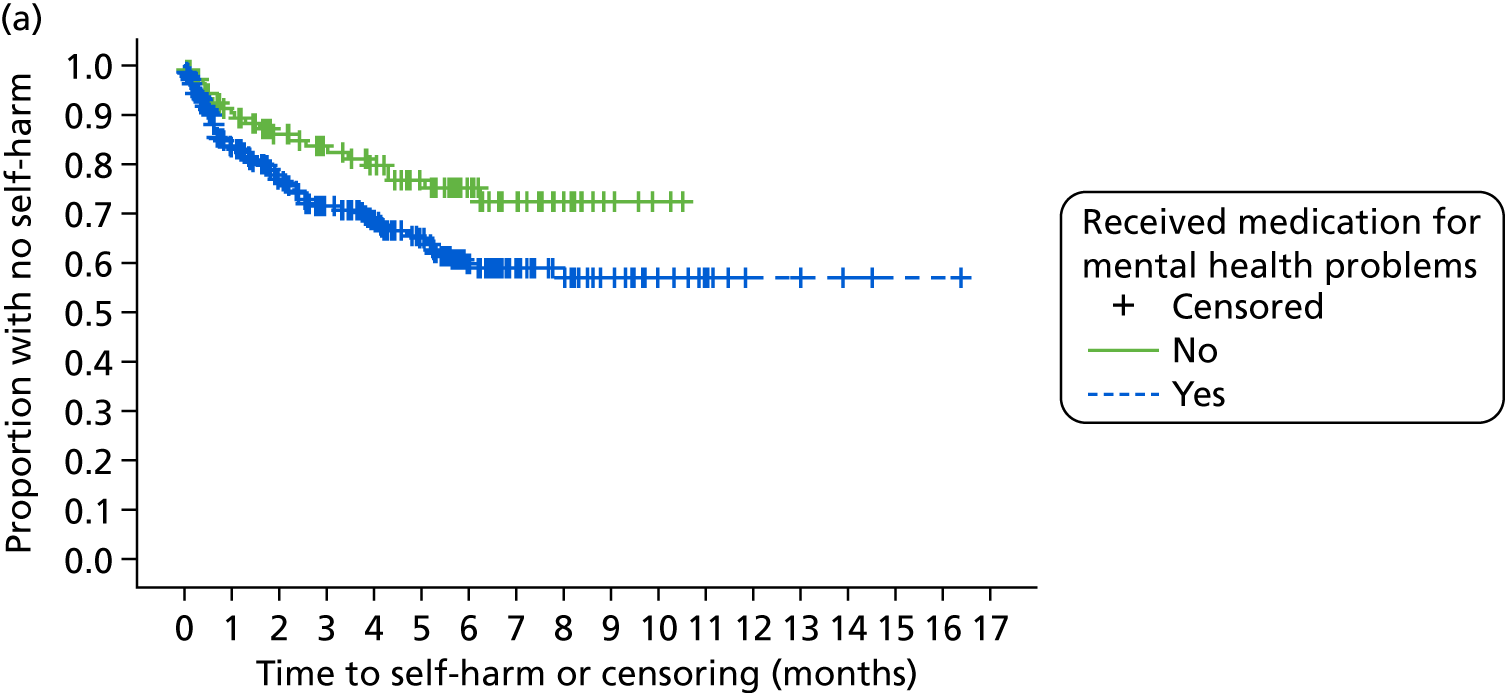

Baseline model: checking the proportional hazards assumption
FIGURE 34.
Log-cumulative hazard plot of events by prison.
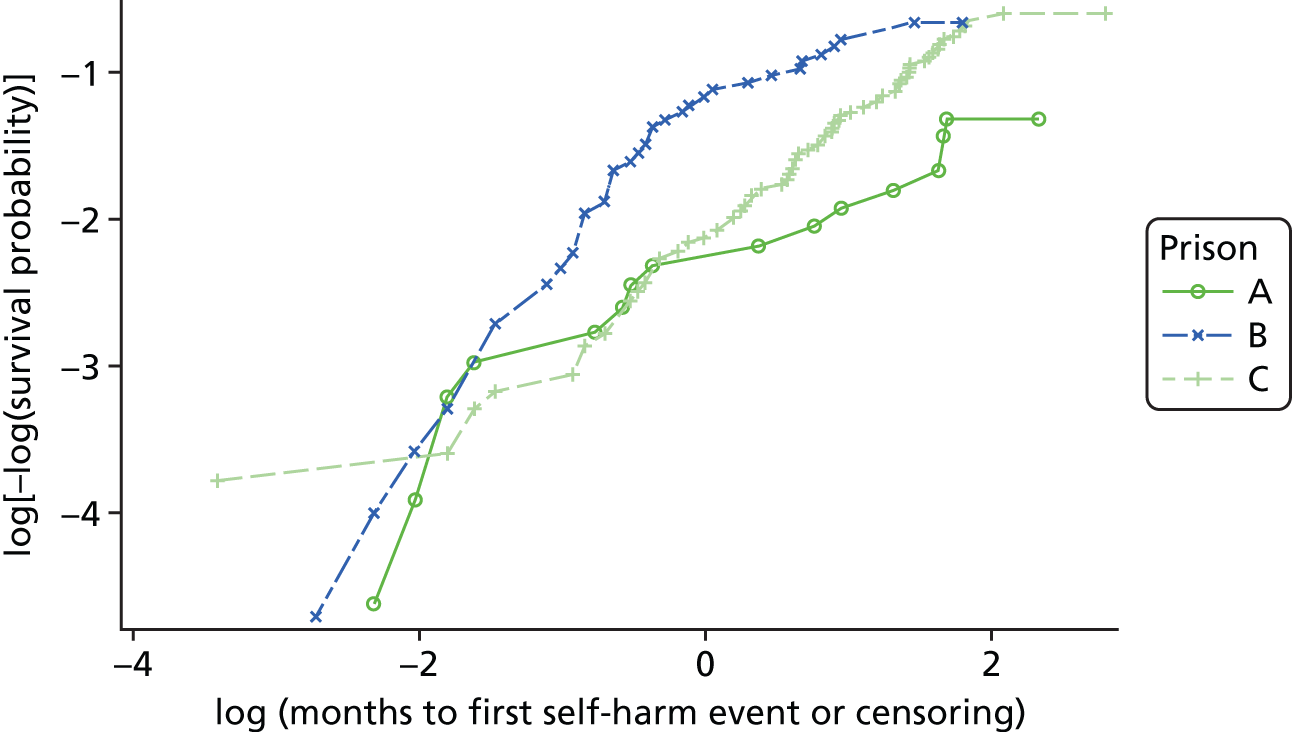
FIGURE 35.
Log-cumulative hazard plot of events by age group.
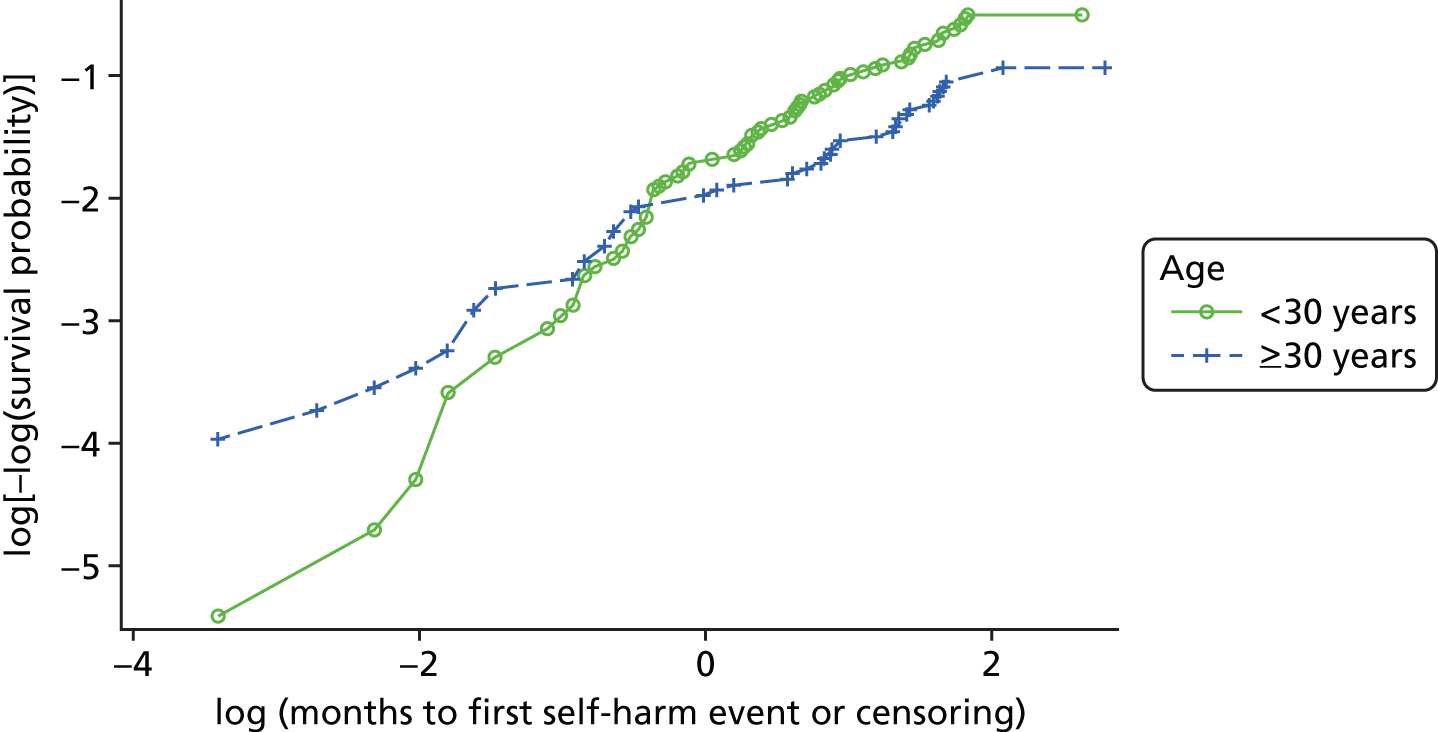
Initial baseline model: checking the proportional hazards assumption
FIGURE 36.
Standardised score process plot for events by prison A. Pr > MaxAbsVal 0.4810 (1000 simulations). Pr > MaxAbsVal represents the proportion of the 1000 simulated processes that yield a maximum score larger than the maximum observed process (supremum test for proportional hazards). It provides a p-value for the null hypothesis that the proportional hazards assumption holds for the variable of interest.
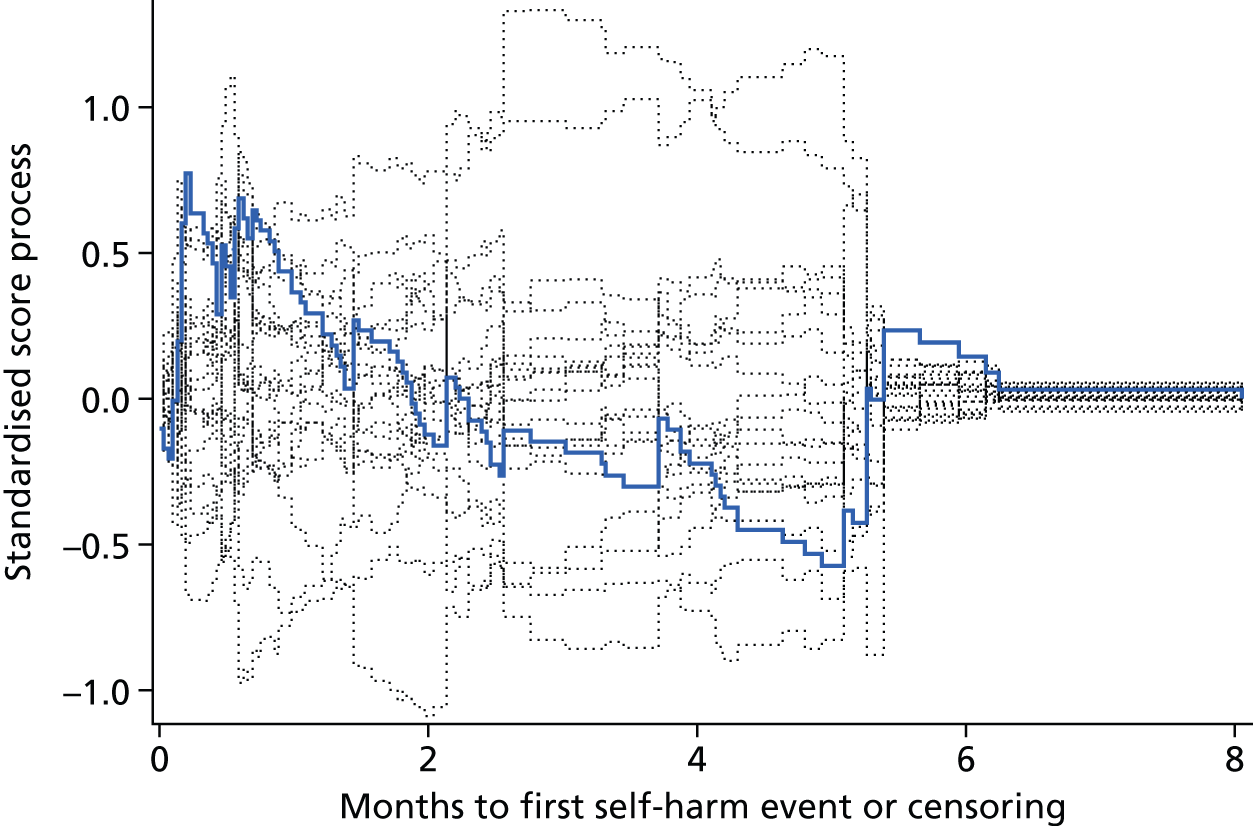
FIGURE 37.
Standardised score process plot for events by prison B. Pr > MaxAbsVal 0.0010 (1000 simulations). Pr > MaxAbsVal represents the proportion of the 1000 simulated processes that yield a maximum score larger than the maximum observed process (supremum test for proportional hazards). It provides a p-value for the null hypothesis that the proportional hazards assumption holds for the variable of interest.
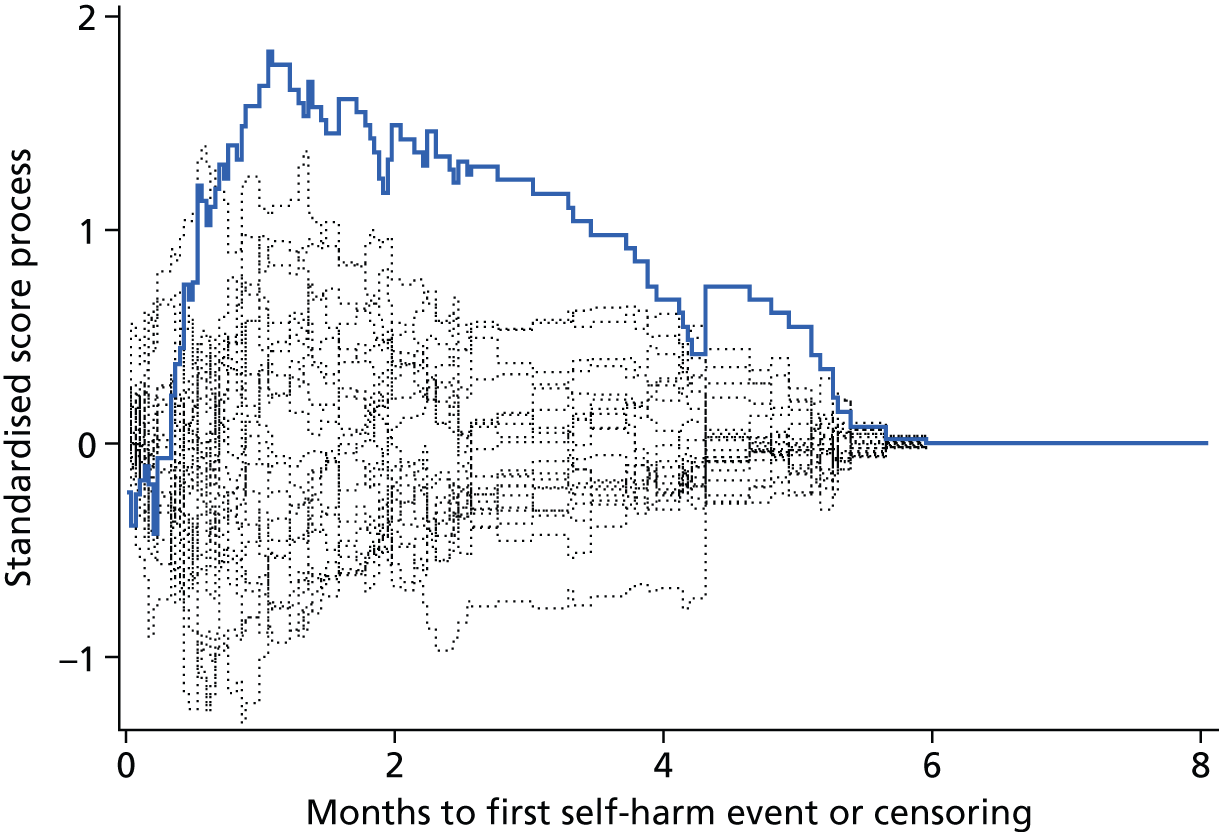
FIGURE 38.
Standardised score process plot for events by age group. Pr > MaxAbsVal 0.0290 (1000 simulations). Pr > MaxAbsVal represents the proportion of the 1000 simulated processes that yield a maximum score larger than the maximum observed process (supremum test for proportional hazards). It provides a p-value for the null hypothesis that the proportional hazards assumption holds for the variable of interest.
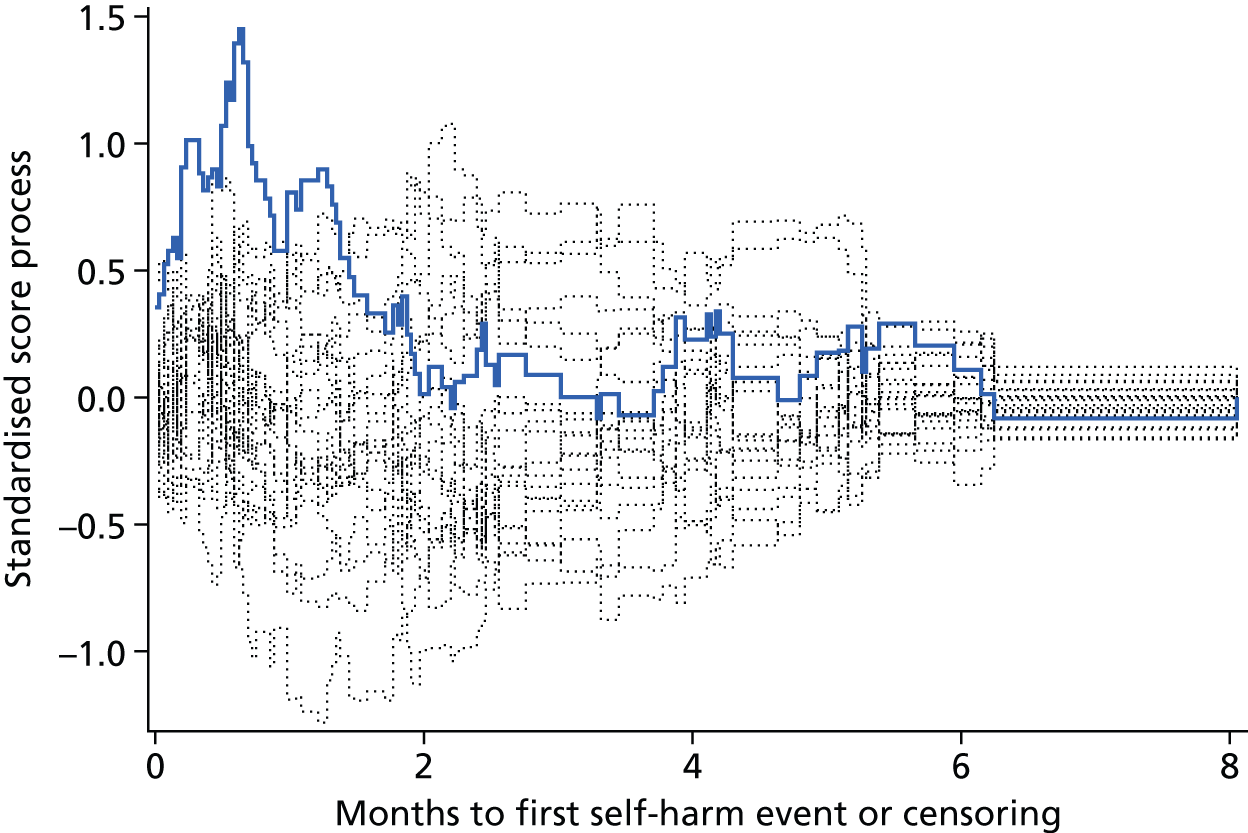
Appendix 3 Cox proportional hazards regression modelling of the questionnaires using Rasch scores
| Additional baseline factor | Reduction in df | –2 log-likelihood | Reduction in –2 log-likelihood | p-value |
|---|---|---|---|---|
| – | 1211.636 | – | – | |
| + PriSnQuest Rasch score | 1 | 1203.030 | 8.607 | 0.0033a |
| + PriSnQuest Rasch score risk group | 1 | 1207.350 | 4.286 | 0.0384a |
| + SHI Rasch score | 1 | 1204.060 | 7.576 | 0.0059a |
| + SHI Rasch score risk group | 1 | 1206.307 | 5.330 | 0.0210a |
| + CORE-OM Rasch score | 1 | 1207.892 | 3.744 | 0.0530a |
| + CORE well-being Rasch score | 1 | 1211.411 | 0.226 | 0.6348 |
| + CORE problems Rasch score | 1 | 1210.356 | 1.281 | 0.2578 |
| + CORE functioning Rasch score | 1 | 1208.320 | 3.317 | 0.0686a |
| + CORE risk Rasch score | 1 | 1207.030 | 4.607 | 0.0318a |
| + CORE-10 Rasch score | 1 | 1211.075 | 0.562 | 0.4536 |
| + CORE non-risk Rasch score | 1 | 1207.635 | 4.001 | 0.0455a |
| + BSL-23-F Rasch score | 1 | 1210.911 | 0.726 | 0.3943 |
| + PHQ-9 Rasch score | 1 | 1210.430 | 1.207 | 0.2720 |
| + PHQ-2 Rasch score | 1 | 1211.031 | 0.606 | 0.4365 |
| Parameter estimate | Standard error | Hazard ratio | 95% CI | Wald test statistic | df | p-value | |
|---|---|---|---|---|---|---|---|
| Prison: | – | – | – | – | 8.51 | 1 | 0.0035 |
| A vs. C | –0.84 | 0.29 | 0.43 | 0.24 to 0.76 | 8.51 | 1 | – |
| B vs. C | – | – | – | – | – | – | – |
| Previous self-harm in prison: no vs. yes | 0.92 | 0.25 | 2.50 | 1.54 to 4.06 | 13.71 | 1 | 0.0002 |
| Dependent on alcohol: no vs. yes | –0.58 | 0.23 | 0.56 | 0.36 to 0.87 | 6.64 | 1 | 0.0100 |
| First ACCT: no vs. yes | –0.43 | 0.23 | 0.65 | 0.42 to 1.01 | 3.60 | 1 | 0.0576 |
| Age group: < 30 vs. ≥ 30 years | –0.38 | 0.19 | 0.69 | 0.47 to 1.00 | 3.91 | 1 | 0.0480 |
| Mental health medications: no vs. yes | 0.39 | 0.24 | 1.48 | 0.91 to 2.38 | 2.54 | 1 | 0.1110 |
| SHI Rasch score | 0.08 | 0.05 | 1.08 | 0.99 to 1.18 | 3.12 | 1 | 0.0773 |
| Parameter estimate | Standard error | Hazard ratio | 95% CI | Wald test statistic | df | p-value | |
|---|---|---|---|---|---|---|---|
| Prison: | – | – | – | – | 8.32 | 1 | 0.0039 |
| A vs. C | –0.83 | 0.29 | 0.43 | 0.25 to 0.77 | 8.32 | 1 | |
| B vs. C | – | – | – | – | – | – | |
| Previous self-harm in prison: no vs. yes | 0.96 | 0.24 | 2.61 | 1.62 to 4.21 | 15.54 | 1 | < .0001 |
| Dependent on alcohol: no vs. yes | –0.59 | 0.23 | 0.55 | 0.35 to 0.87 | 6.68 | 1 | 0.0097 |
| First ACCT: no vs. yes | –0.41 | 0.23 | 0.66 | 0.43 to 1.04 | 3.25 | 1 | 0.0714 |
| Age group: < 30 vs. ≥ 30 years | –0.39 | 0.19 | 0.68 | 0.47 to 0.98 | 4.16 | 1 | 0.0414 |
| Mental health medications: no vs. yes | 0.39 | 0.24 | 1.48 | 0.92 to 2.40 | 2.58 | 1 | 0.1079 |
| SHI Rasch score risk group: non-risk group vs. risk group | 0.32 | 0.20 | 1.38 | 0.93 to 2.05 | 2.62 | 1 | 0.1053 |
Cox proportional hazards regression model with Self-Harm Inventory continuous score and gender interaction
FIGURE 39.
Standardised score process plot for events by SHI continuous score. Pr > MaxAbsVal 0.7150 (1000 simulations).
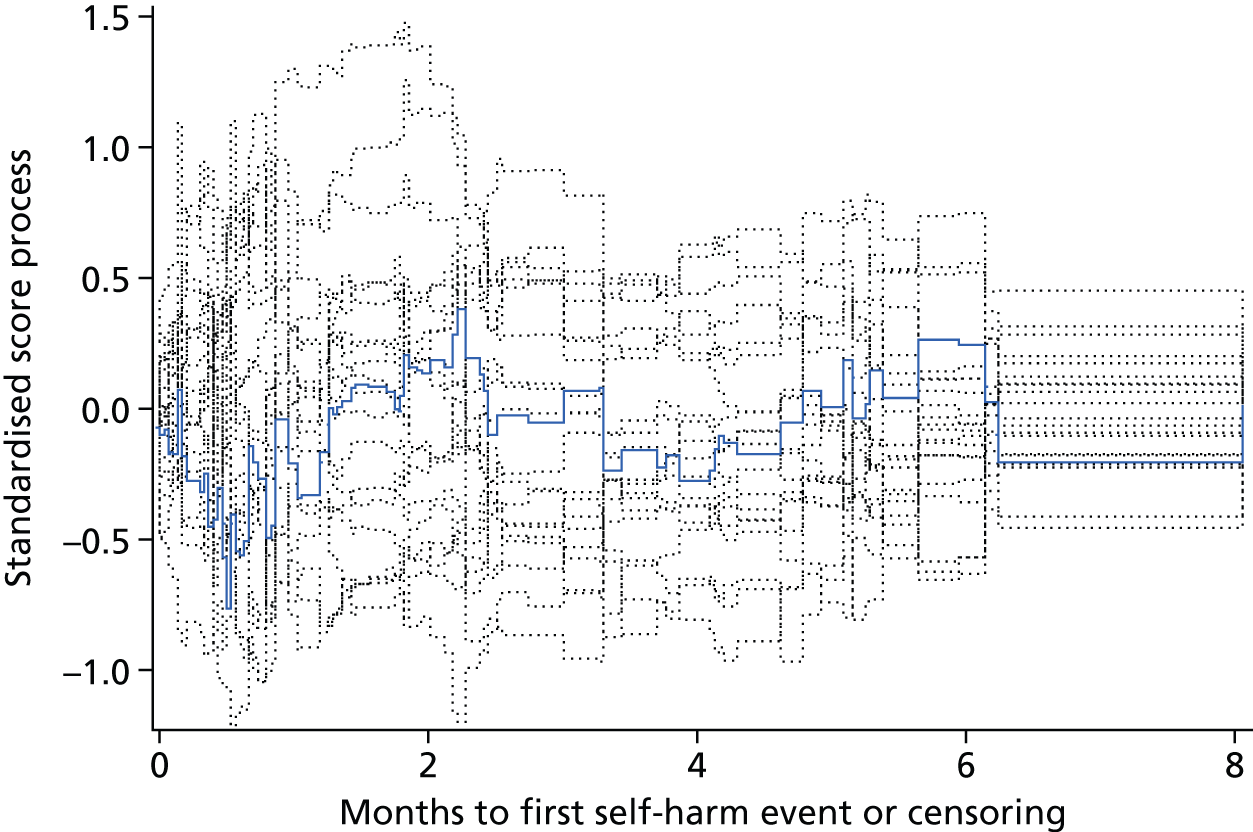
FIGURE 40.
Standardised score process plot for events by SHI continuous score × gender interaction. Pr > MaxAbsVal 0.4450 (1000 simulations).
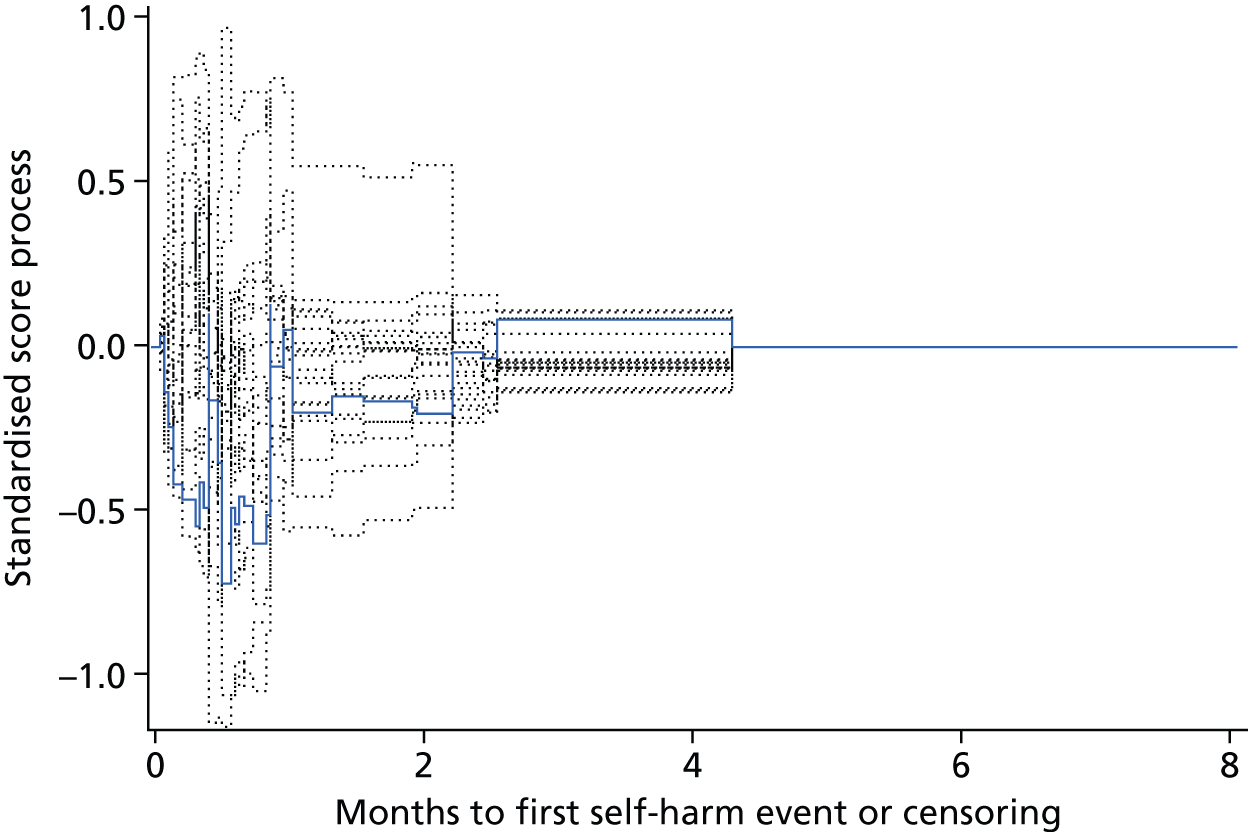
| Variable | Maximum absolute value | Pr > MaxAbsVal |
|---|---|---|
| Prison A | 1.1499 | 0.1050 |
| Previous self-harm in prison: yes | 0.8263 | 0.4210 |
| Dependent on alcohol: yes | 0.6320 | 0.7130 |
| First ACCT: yes | 0.9761 | 0.2220 |
| Age group: ≥ 30 years | 1.3691 | 0.0320 |
| Mental health medications: yes | 0.5861 | 0.7890 |
| SHI: Rasch score | 0.7621 | 0.7150 |
| SHI Rasch score × gender interaction | 0.7201 | 0.4450 |
Cox proportional hazards regression model with Self-Harm Inventory risk group and gender interaction
FIGURE 41.
Kaplan–Meier plot of events by SHI risk group.
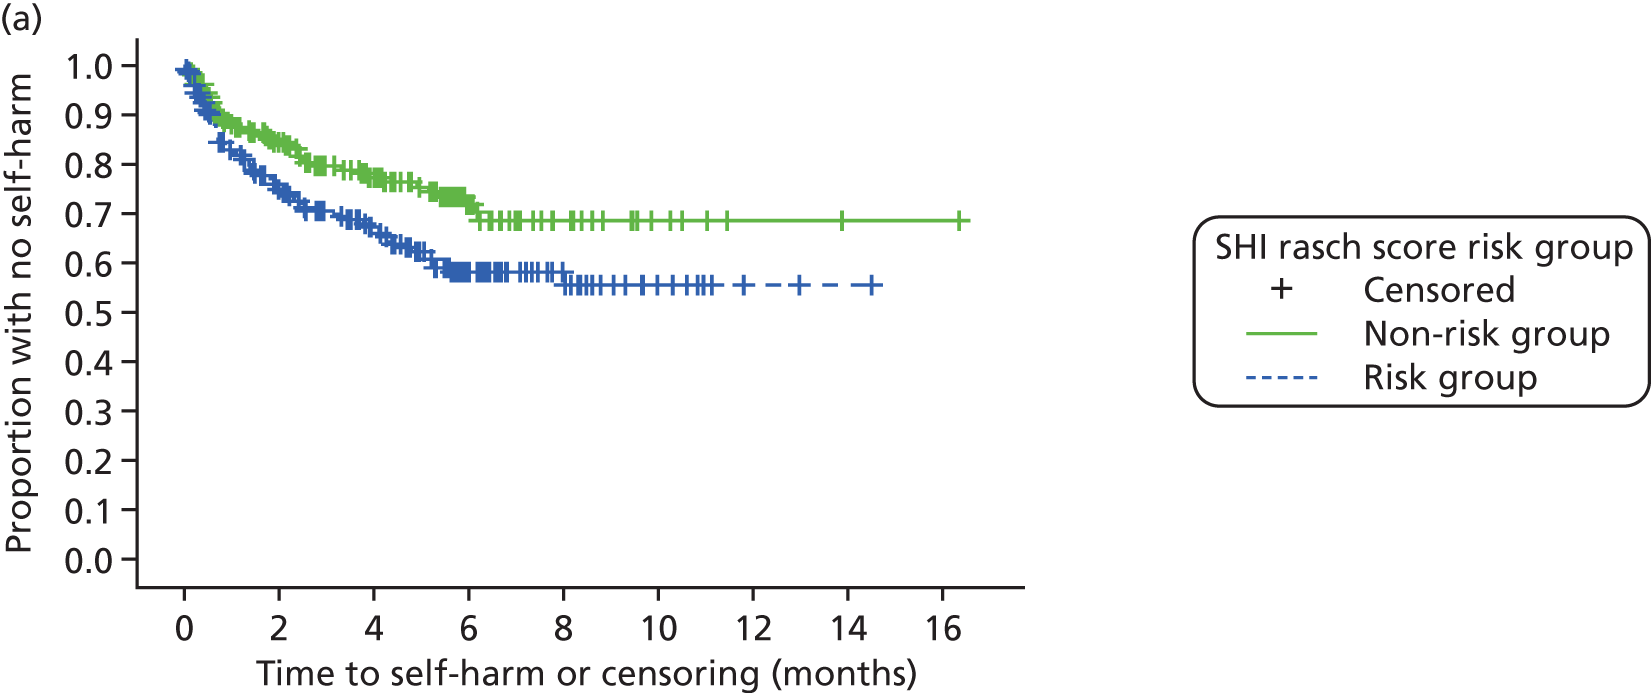

FIGURE 42.
Log-cumulative hazard plot of events by SHI risk group.
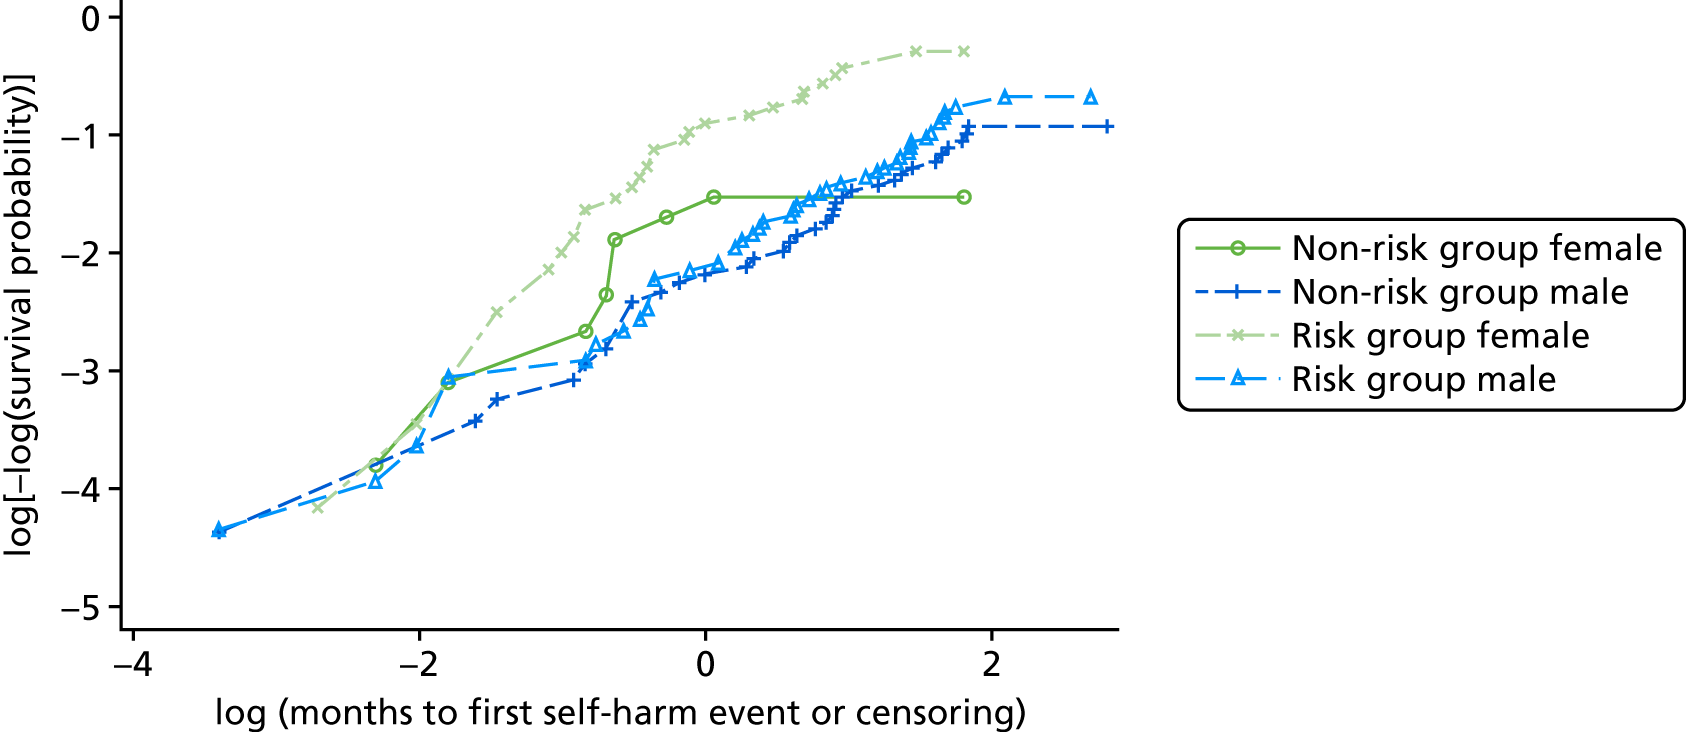
FIGURE 43.
Standardised score process plot for events by SHI risk group. Pr > MaxAbsVal 0.2900 (1000 simulations). Pr > MaxAbsVal represents the proportion of the 1000 simulated processes that yield a maximum score larger than the maximum observed process (supremum test for proportional hazards). It provides a p-value for the null hypothesis that the proportional hazards assumption holds for the variable of interest.
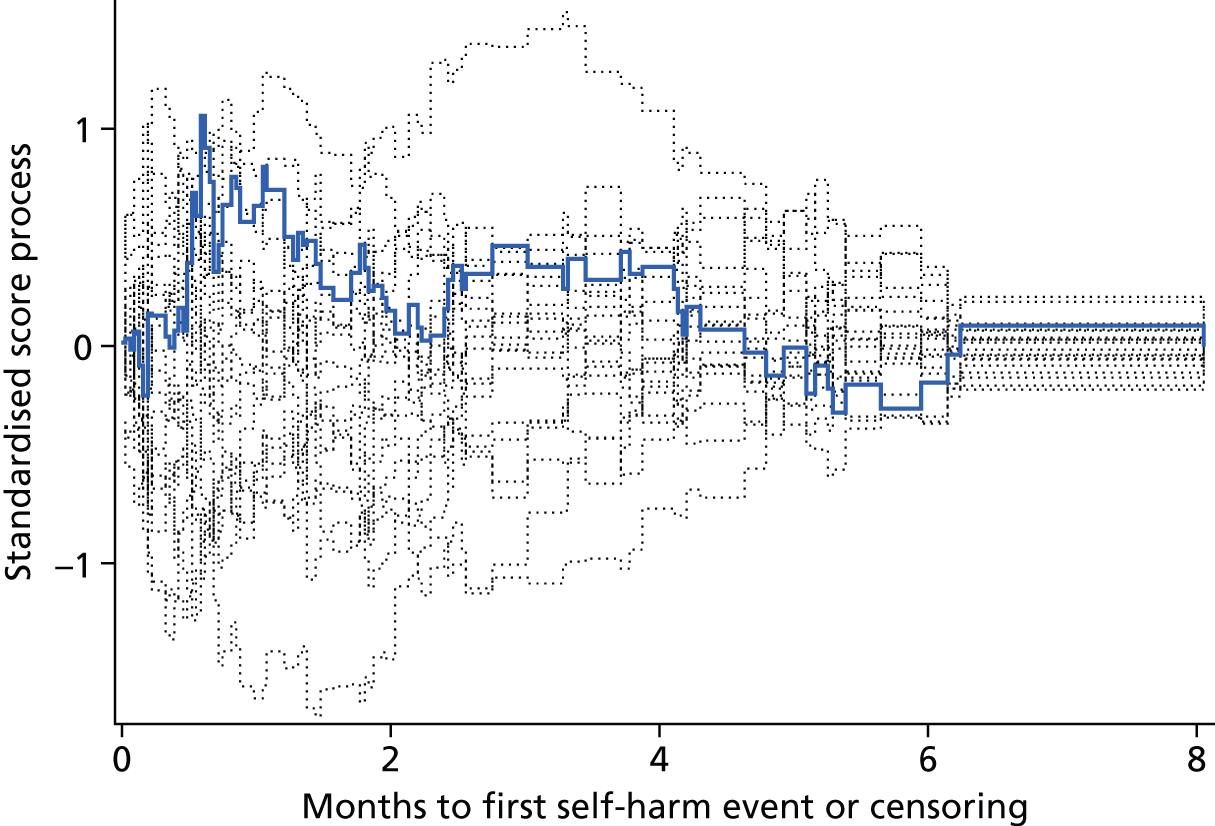
FIGURE 44.
Standardised score process plot for events by SHI continuous score. Pr > MaxAbsVal 0.2200 (1000 simulations). Pr > MaxAbsVal represents the proportion of the 1000 simulated processes that yield a maximum score larger than the maximum observed process (supremum test for proportional hazards). It provides a p-value for the null hypothesis that the proportional hazards assumption holds for the variable of interest.
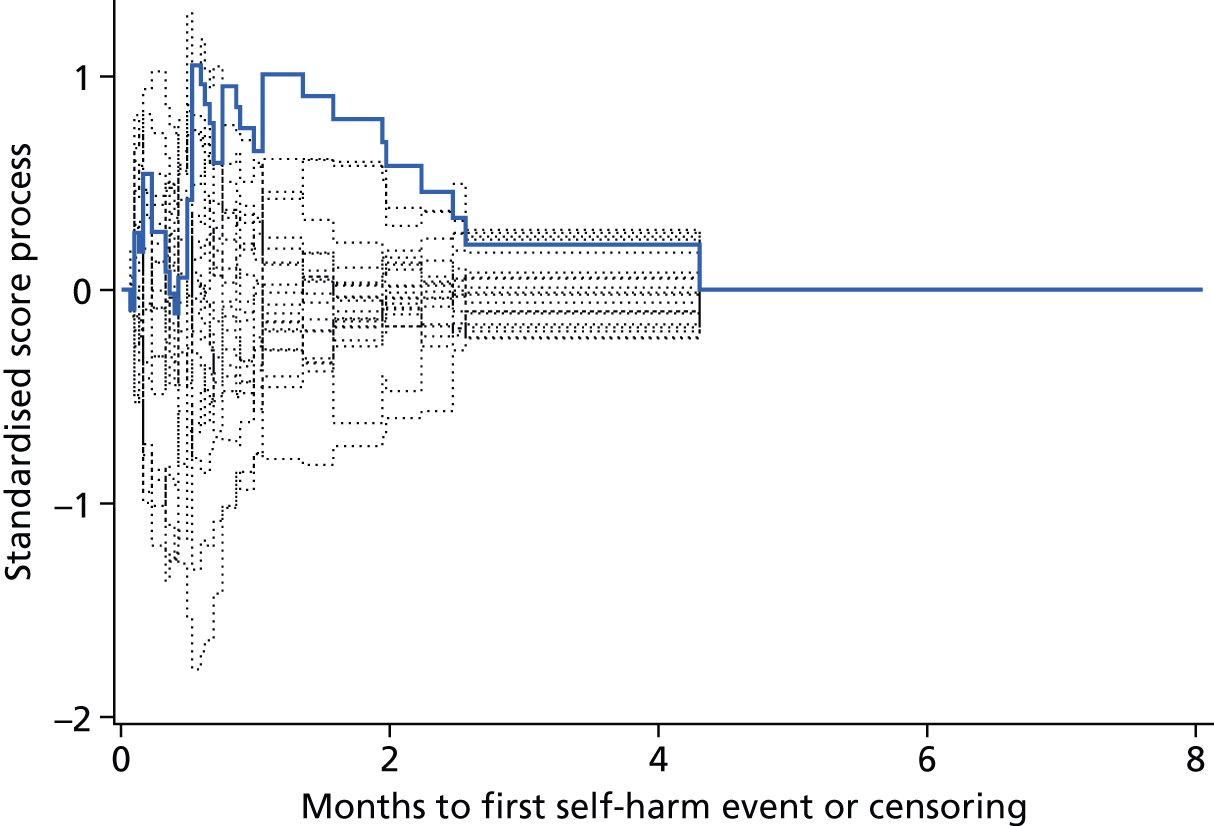
| Variable | Maximum absolute value | Pr > MaxAbsVal |
|---|---|---|
| Prison A | 1.1515 | 0.1020 |
| Previous self-harm in prison: yes | 0.8267 | 0.3910 |
| Dependent on alcohol: yes | 0.6890 | 0.6270 |
| First ACCT: yes | 0.9562 | 0.2530 |
| Age group: ≥ 30 years | 1.3605 | 0.0350 |
| Mental health medications: yes | 0.5662 | 0.8180 |
| SHI: risk group | 1.0628 | 0.2900 |
| SHI × gender interaction | 1.0516 | 0.2200 |
Appendix 4 Gender-specific screening indexes
List of abbreviations
- ACCT
- Assessment, Care in Custody, and Teamwork
- AUC
- area under the curve
- BDI
- Beck Depression Inventory
- BHS
- Beck Hopelessness Scale
- BSL-23
- Borderline Symptom List-23
- BSL-23-F
- Revised Borderline Symptom List-23 (frequency-based responses)
- CFA
- confirmatory factor analysis
- CFI
- comparative fit index
- CI
- confidence interval
- CORE-10
- Clinical Outcomes in Routine Evaluation – 10 item short-form
- CORE-OM
- Clinical Outcomes in Routine Evaluation – Outcome Measure
- DASS-21
- Depression Anxiety and Stress Scales
- df
- degrees of freedom
- DIF
- differential item functioning
- DSHI
- Deliberate Self-Harm Inventory
- FASM
- Functional Assessment of Self-Mutilation
- HADS
- Hospital Anxiety and Depression Scale
- IQR
- interquartile range
- IRT
- item response theory
- NICE
- National Institute for Health and Care Excellence
- NOMIS
- National Offender Management Information System
- PHQ
- Patient Health Questionnaire
- PORSCH
- Prison and Offender Research in Social Care and Health
- PriSnQuest
- Prison Screening Questionnaire
- RDS
- Referral Decision Scale
- RMSEA
- root-mean-square error of approximation
- ROC
- receiver operating characteristic
- SCOPE
- Suicide Concerns for Offenders in Prison Environment
- SD
- standard deviation
- SHI
- Self-Harm Inventory
- TLI
- Tucker–Lewis index