Notes
Article history
The research reported in this issue of the journal was funded by the HTA programme as project number 10/65/02. The contractual start date was in September 2012. The draft report began editorial review in September 2016 and was accepted for publication in March 2017. The authors have been wholly responsible for all data collection, analysis and interpretation, and for writing up their work. The HTA editors and publisher have tried to ensure the accuracy of the authors’ report and would like to thank the reviewers for their constructive comments on the draft document. However, they do not accept liability for damages or losses arising from material published in this report.
Declared competing interests of authors
Edward Lamb reports that he was a member of the development groups for both the National Institute for Health and Care Excellence chronic kidney disease and Kidney Disease Improving Global Outcomes clinical guidelines, which have considered the relative accuracies of proteinuria and albuminuria testing.
Permissions
Copyright statement
© Queen’s Printer and Controller of HMSO 2017. This work was produced by Waugh et al. under the terms of a commissioning contract issued by the Secretary of State for Health. This issue may be freely reproduced for the purposes of private research and study and extracts (or indeed, the full report) may be included in professional journals provided that suitable acknowledgement is made and the reproduction is not associated with any form of advertising. Applications for commercial reproduction should be addressed to: NIHR Journals Library, National Institute for Health Research, Evaluation, Trials and Studies Coordinating Centre, Alpha House, University of Southampton Science Park, Southampton SO16 7NS, UK.
2017 Queen’s Printer and Controller of HMSO
Chapter 1 Introduction
Clinical background
Pre-eclampsia (PE) is a multisystem disorder of pregnancy associated with raised blood pressure (BP) and proteinuria. 1 Hypertensive disorders in pregnancy (HDP) remain the second leading cause of direct maternal deaths in the UK and account for 20% of all stillbirths. 2,3 One in five women with hypertension is diagnosed with PE, resulting in complex treatment and substantial health-care costs. 1 Women with the severest forms of PE require high-dependency care,1 although definitions of severe disease are not consistent. PE is also responsible for significant infant morbidity related to fetal growth restriction and prematurity resulting in prolonged neonatal intensive care treatment and lifelong handicaps; the additional NHS costs to care for a preterm baby born before 33 and 28 weeks’ gestation are £61,509 and £94,190, respectively. 1 Extra costs of £939M for the care of preterm babies per year in the NHS are linked to neonatal care. 1
Proteinuria measurement has been a key component of the screening and diagnostic strategies for modern antenatal care. Normal ranges have been defined,4 but the optimal method of detection remains uncertain. 5,6 Furthermore, the diagnosis of PE does not always imply that serious maternal or perinatal morbidity will occur. None of the diagnostic features of PE is predictive of severe adverse outcome. 7
The potential impact of early and accurate assessment of PE is enormous. The reliable diagnosis of significant proteinuria is critical in women with hypertension in pregnancy because it distinguishes those with PE from those with isolated hypertension; this distinction determines future monitoring and management. 1 Furthermore, the determination of the most appropriate threshold for abnormal proteinuria that predicts clinical outcome helps to better focus resource on high-risk women and reduce unnecessary intervention. Currently, women with suspected PE undergo 24-hour proteinuria testing, mainly as inpatients, to evaluate the severity of the condition. The cost associated with 24-hour protein measurement and additional testing needs to be evaluated against identifying women with PE and avoiding the mortality, morbidity and costs associated with undiagnosed PE.
The National Institute for Health and Care Excellence (NICE) acknowledges the paucity of evidence relating to the diagnosis of significant proteinuria and the unclear prognostic value of various urinary protein thresholds. 1 They have highlighted the need for ‘large, high-quality prospective studies comparing the various methods of measuring proteinuria (automated reagent-strip reading devices, urinary protein–creatinine ratio, urinary albumin–creatinine ratio, and 24-hour urine collection) in women with new-onset hypertensive disorders during pregnancy’. 1
Our proposed study aims to address this shortfall in evidence by determining which method of measurement is most accurate in predicting not only PE but, more importantly, clinically significant outcomes. This will help to inform decisions regarding clinical management of gestational hypertensive disorders during pregnancy.
Description of technology
Comparative test
Measurement of 24-hour urine protein is currently the gold standard for the assessment of proteinuria in pregnancy. However, this test is associated with significant costs related to hospital admission, as often women are admitted as an inpatient for up to 48 hours until the results become available. Furthermore, the measurement is subject to errors (in as many as 20% of patients) as a result of incomplete collection. Diagnosis of proteinuria in HDP also varies with the type of laboratory assay used. These errors are compounded for other point-of-care (POC) technologies. 8
Index tests
Proteinuria estimation by a urinary spot protein–creatinine ratio (SPCR) test or a urinary spot albumin–creatinine ratio (SACR) test in women with suspected PE is available as a laboratory test performed on a random ‘spot’ sample of urine.
A reliable, accurate and cost-effective SPCR or SACR test, that is equivalent or better than 24-hour protein estimation at predicting adverse maternal and fetal outcomes, could be employed as the primary test in the assessment of women with suspected PE. Furthermore, given the rising costs of inpatient care, the use of a SPCR test or a SACR test has the potential to deliver significant cost improvements. A clearer understanding of the threshold of proteinuria (by any measurement) that predicts increased risks of adverse maternal and fetal outcomes will allow the concentration of scarce NHS resource onto the more intensive monitoring of fewer women.
Summary of current evidence
Current recommendations for assessment of proteinuria vary. Recently published NICE guidelines1 in the UK suggest the use of an automated reagent strip reading device to detect proteinuria. In women with a result of 1+ or more, the use of SPCR or 24-hour urine collection is recommended to quantify proteinuria. Significant proteinuria is defined as a SPCR greater than 30 mg/mmol or a validated 24-hour urine collection of > 300 mg/24 hours. When 24-hour urine collection is used to quantify proteinuria, a recognised method of evaluating completeness of the sample is recommended. 1 The Society of Obstetricians and Gynaecologists of Canada9 suggests using urinary dipstick testing to screen for proteinuria, with the definition of significant proteinuria similar to the NICE guidelines. The American College of Obstetricians and Gynecologists10 consider 24-hour urine protein estimation of > 300 mg as significant proteinuria for a diagnosis of PE.
Work leading to the trial
Diagnostic accuracy of spot protein–creatinine ratio/spot albumin–creatinine ratio in assessing proteinuria in women with hypertensive disorders in pregnancy
Price et al. ,11 in 2005, and Cote et al. ,12 in 2008, performed systematic reviews of 1214 women with gestational hypertension. The SPCR test, with a cut-off point of 30 mg/mmol, had a pooled sensitivity of 83.6% [95% confidence interval (CI) 77.5% to 89.7%], a specificity of 76.3% (95% CI 72.6% to 80.0%), a positive likelihood ratio (LR+) of 3.53 (95% CI 2.83 to 4.49) and a negative likelihood ratio (LR–) of 0.21 (95% CI 0.13 to 0.31). Both groups of authors concluded that the SPCR test was a reasonable ‘rule-out’ test for proteinuria of ≥ 300 mg/day in HDP. However, laboratory assays in the primary studies were not well described. This led to the recommendation for future studies on using the SACR test to predict significant proteinuria and clinical outcomes.
Evaluation of proteinuria thresholds and assays in predicting adverse clinical outcomes
The authors have assessed the use of different laboratory assays to measure 24-hour proteinuria in pregnancy. 13 The prevalence of proteinuria of > 300 mg/24 hours and, hence, the prevalence of PE differed between the two assays studied [24.9% for the Bradford assay and 70.1% for the benzethonium chloride (BZC) assay]. The threshold of 300 mg/24 hours performed poorly as a predictor of adverse outcomes. 13 At the threshold of 500 mg/24 hours, the BZC assay predicted severe hypertension with a LR+ of 1.51 (95% CI 0.99 to 2.28) and small for gestational age with a LR+ of 1.72 (95% CI 1.11 to 2.66). However, at the threshold of 500 mg/24 hours, the LR+ for the Bradford assay for severe hypertension was 2.15 (95% CI 1.07 to 4.34), for birthweight of less than the 10th centile was 2.79 (95% CI 1.40 to 5.54) and for biochemical disease was 2.47 (95% CI 1.22 to 5.01). These data support the recommendation from NICE1 for prospective studies to explore the relationship between individual assays for proteinuria and clinical outcome.
Point-of-care measurement of proteinuria
The authors have also investigated POC testing for proteinuria and albuminuria in pregnancy and PE. 14–16 The SACR dipstick test and the fully quantitative SACR test were compared with 24-hour proteinuria. The SACR dipstick testing did not improve detection rates whether automated or visual. Fully quantitative measurement of SACR was a better predictor than any dipstick technique (LR+ 14.60, 95% CI 6.74 to 31.80; LR– 0.069, 95% CI 0.030 to 0.160). 16
In a systematic review of six studies of visual dipstick analysis, Waugh et al. 17 reported a pooled LR+ of 3.48 (95% CI 1.66 to 7.27) and a pooled LR– of 0.60 (95% CI 0.45 to 0.80) for predicting proteinuria at a level of 300 mg/24 hours at the 1+ or greater threshold. They concluded that the accuracy of dipstick urinalysis with a 1+ threshold in the prediction of significant proteinuria is poor and, therefore, of limited clinical value.
Our study comparing semiquantitative and fully quantitative POC tests for albuminuria and proteinuria found automated dipstick urinalysis to have better predictive values for significant proteinuria (LR+ 4.27, 95% CI 2.78 to 6.56; LR– 0.225, 95% CI 0.14 to 0.37) compared with conventional visual dipstick urinalysis (LR+ 2.27, 95% CI 1.47 to 3.51; LR– 0.635, 95% CI 0.49 to 0.82). Dipstick microalbumin–creatinine ratio testing did not improve overall detection rates with automated or visual testing. The fully quantitative POC test of SACR was better than any dipstick technique (LR+ 14.6, 95% CI 6.74 to 31.8; LR– 0.069, 95% CI 0.030 to 0.16). 16 These studies have informed the development of NICE clinical guideline (CG) number 107. 1
Systematic review of tests that predict onset of pre-eclampsia
The authors have evaluated the accuracy of tests in predicting the onset of PE by a systematic review of the literature. 18 This study concluded that no current tests employed in screening for PE were sufficiently accurate or effective to become part of routine care. One of the recommendations from that project was to evaluate prognostic or predictive features, such as proteinuria, that are associated with maternal and fetal complications once PE has started.
Systematic reviews on the accuracy of tests to predict complications in pre-eclampsia: TIPPS study
We have conducted systematic literature reviews to assess the predictive value of five of the commonly performed tests in PE. We analysed more than 25,000 citations and reviewed 60 relevant studies. Although we conducted good-quality reviews, including one on proteinuria, it was hard to provide recommendations on the value of tests because of the deficiencies in the primary studies. However, the data collated give face validity of the choice of tests that have been chosen for use in the study. 19
Development and validation of the PREP study
We have recently been funded by the Health Technology Assessment (HTA) programme to undertake the first prognostic study to develop a prediction rule for adverse outcomes in early-onset PE that will provide personalised estimates of maternal and fetal risks. The Prediction model for Risk of complications in Early-onset Pre-eclampsia (PREP) study will achieve this by validating the model in two prospective external data sets in the Netherlands and Canada. The data from the PREP study will complement the current project in evaluating the association between proteinuria and adverse outcomes. Furthermore, the study will also provide valuable data on outcomes of women with severe PE to further populate the decision-analytic model for an economic evaluation.
Chapter 2 Methods and design
Aims and objectives
The aim of this study was to evaluate the measurement of proteinuria in women with suspected PE. This includes women with new hypertension of ≥ 140/90 mmHg and a trace or greater of proteinuria using an automated dipstick analysis. By determining the most appropriate method and threshold for measuring proteinuria that predicts PE and its severity, it may be possible to reduce unnecessary intervention in women without PE.
Primary objective
To evaluate the accuracy of quantitative assessments of SPCR and SACR at different thresholds in predicting severe PE compared with a 24-hour urine protein measurement in pregnant women with hypertension and suspected proteinuria.
Secondary objectives
The secondary objectives of this study were to:
-
assess the accuracy of POC assessments of SPCR and SACR at different thresholds in diagnosing PE compared with a 24-hour urine protein measurement
-
identify the laboratory assay method of 24-hour proteinuria that is most accurate in the assessment of PE
-
estimate the accuracy of quantitative assessments of SPCR and SACR at different thresholds in predicting adverse fetal outcomes
-
estimate the diagnostic utility of a SPCR test or a SACR test as a potential replacement for 24-hour protein estimation by developing a decision-analytic model
-
assess the cost-effectiveness using incremental cost per quality-adjusted life-year (QALY) gained by the mother and baby in each test compared with standard practice.
For the statistical analysis plan, these have been amended to:
-
evaluate the accuracy of POC assessments of SPCR and SACR at different thresholds in predicting severe PE compared with a 24-hour urine protein measurement
-
investigate differences between laboratory assay methods for 24-hour proteinuria
-
evaluate the accuracy of both quantitative and POC assessments of SPCR and SACR at different thresholds in predicting adverse perinatal outcomes.
Study design
This was a prospective cohort study to evaluate diagnostic accuracy, which also undertook a decision-analytic modelling and cost-effectiveness analysis. The study was open to recruitment for a total of 33 months. Research Ethics Service Committee A favourable opinion from the Research Ethics Committee was sought and granted for the original study (reference number 12/NE/0301) from the National Research Ethics Service Committee North East – County Durham & Tees Valley. This became the National Research Ethics Service Committee North East – Newcastle and North Tyneside 2 for subsequent amendments.
Setting
The study was conducted in a total of 36 obstetric units in England. The last day of study recruitment was on 30 November 2015. Data were collected prospectively; participants were sampled consecutively until the target sample size was reached.
Inclusion criteria
Pregnant women aged ≥ 16 years who were at > 20 weeks’ gestation with confirmed gestational hypertension (systolic BP of ≥ 140 mmHg and/or diastolic BP of ≥ 90 mmHg) and trace or greater of proteinuria on an automated dipstick urinalysis, who are able to given written informed consent.
Exclusion criteria
Women aged < 16 years or women with new hypertension but no proteinuria on automated dipstick urinalysis, proteinuria before 20 weeks’ gestation, pre-existing renal disease, pre-gestational diabetes and chronic hypertension. Women who were unable to provide written informed consent could not take part.
Identification and screening
Potential participants were identified from women during admission to the hospital in the maternity assessment unit, delivery suite or outpatient department, subject to meeting the study inclusion and exclusion criteria.
All eligible women were given a patient information sheet at their time of booking for antenatal care to read and consider. The information sheets were made available in Urdu and Polish, as these were two of the most commonly spoken languages in the participating sites.
During pregnancy, as part of routine care, women have their BP monitored and midwives checked protein in collected urine samples using a urine dipstick. Women with high BP and trace proteinuria (who had suspected PE) were referred to a day assessment unit for regular check-ups. During a regular check-up, BP was measured and urine protein was assessed from another urine sample (POC sample) using a dipstick and an automated urinalysis machine. Women with confirmed hypertension and a trace or more of protein in this sample were eligible for the study and invited to participate by a research midwife.
Recruitment and consent
All women had the opportunity to ask questions about the study. Study discussions were undertaken by the research midwives or research nurses as per the site delegation log. If willing, written informed consent was obtained from the woman by a delegation member of the study team. The original signed consent form was held in the investigator site file, with a copy of it placed in the medical notes and a copy given to the participant.
It was clearly stated that the woman had the right to withdraw her participation at any point in the study without having to give a reason.
Reference standards and other outcomes
Severe pre-eclampsia (National Institute for Health and Care Excellence definition)
Following the 2010 NICE definition,1 severe PE was defined as either (1) severe hypertension (systolic BP of ≥ 160 mmHg or diastolic BP of ≥ 110 mmHg) and proteinuria (see Proteinuria), or (2) mild or moderate hypertension (systolic BP of ≥ 140 mmHg and/or diastolic BP of ≥ 90 mmHg) and proteinuria with one or more of the following: severe headache, visual disturbances, problems with vision, severe pain just below the ribs or vomiting, papilloedema, signs of clonus (three or more beats), liver tenderness, HELLP (Haemolysis, Elevated Liver enzymes, Low Platelets) syndrome, platelet levels below 100 × 109/l or abnormal liver enzyme levels [alanine aminotransferase (ALT) or aspartate aminotransferase (AST) levels of > 70 U/l].
Proteinuria
Proteinuria was defined as ≥ 300 mg of protein from a 24-hour urine collection using the central laboratory’s (Kent) BZC assay.
Severe pre-eclampsia (clinician diagnosis)
A clinician diagnosis of severe PE was defined as when a woman was treated with magnesium sulphate or put on a severe PE protocol.
Adverse perinatal outcome
A composite adverse perinatal outcome was identified by a Delphi survey of clinicians. This comprises one or more of the following: perinatal or infant mortality, bronchopulmonary dysplasia, necrotising enterocolitis or grade III or IV intraventricular haemorrhage. The definition used for bronchopulmonary dysplasia was oxygen dependence at 36 weeks’ postmenstrual age (gestational age at delivery plus chronological age of baby).
Sample size
The sample size for the study was chosen to allow for a demonstration that a quantitative assessment of SPCR or SACR at a given cut-off point could safely rule out the possibility of severe PE. In diagnostic testing terms, this means a test with a LR– of ≤ 0.1 and a sensitivity of at least 90% with high specificity. Previous studies have suggested that SPCR or SACR testing (when fully quantitative) may achieve this. 16
To demonstrate with 80% power that sensitivity is at least 90% within 95% confidence limits, assuming that sensitivity is actually 95%, requires 240 women with severe PE, as determined using the power one proportion command in Stata version 13 (Stata Corporation, College Station, TX, USA). The original sample size calculation assumed that 5% of recruited women would develop severe PE, with a negligible number of missing outcome data, and the recruitment target was, therefore, set at 3000 women with new hypertension and suspected PE.
Following indications in interim reports that the prevalence of PE may be higher than expected, the Trial Steering Committee recommended that the proportion of women with severe PE should be estimated from the first 500 participants to be recruited and that the target sample size should be re-estimated on this basis. Because the laboratory assessments needed to determine severe PE, as defined in the protocol, were not available for all participants (namely liver function results and platelet counts), it was necessary to use a surrogate definition of PE that was agreed with the Trial Steering Committee. In total, 419 participants out of the first 500 women had sufficient data to determine this surrogate outcome, and prevalence was estimated to be 78 out of 500 (15.6%). With the additional assumption that 14% of participants would have missing data on the primary outcome in the final analysis (also based on an interim analysis), the recruitment target was revised to 1790 women with new hypertension and suspected PE.
Data collection
Urine samples
A small amount of urine (five 1-ml aliquots) was taken from each participant’s POC sample, frozen and stored at –80 °C for secondary analysis. The remainder of the POC sample was sent to the local laboratory to obtain quantitative assessments of SPCR.
Participants were then asked to collect urine for 24 hours in a collection container provided by the research midwife. The research midwife gave detailed instructions on when the collection should start and finish. The start of 24-hour urine collection could be up to 24 hours after the POC test. When a woman returned her 24-hour urine sample, a small amount (five 1-ml aliquots) was frozen and stored at –80 °C. If clinically indicated from the initial recruitment urine sample, the remainder of the 24-hour urine sample was sent to the local biochemical laboratory to determine the 24-hour measurement of proteinuria.
Participants were asked for a third, and final, urine sample immediately before delivery and, again, five 1-ml aliquots were stored at –80 °C (delivery urine).
The aliquots of urine were sent from each of the participating sites to a central laboratory, East Kent Hospitals Trust, for analysis using standardised methods. All data were entered into a clinical data management software package supplied by MedSciNet (Stockholm, Sweden) that was configured to allow web-based entry from each of the 36 clinical sites as well as the Kent laboratory.
Clinical information and POC test results were not available to the central laboratory that conducted assessments of 24-hour proteinuria.
Medical notes
Demographic characteristics, medical history and other characteristics measured at baseline (including referral to the day assessment unit) were obtained from participants’ medical notes.
Information, other than proteinuria, that was needed to determine a diagnosis of severe PE was obtained from participants’ medical notes.
Information to determine adverse perinatal outcome was collected at birth and discharge from hospital from the hospital case notes. Neonatal outcome data for the small number of babies admitted to the neonatal unit were obtained by the midwives employed in each unit. When a mother or baby was transferred to another neonatal unit, data were collected (when possible) from all the hospitals that provided their care.
Primary analysis
Using quantitative assessments of SPCR and SACR as index tests and the NICE definition of severe PE as the reference standard, non-parametric receiver operating characteristic (ROC) curves were plotted, showing diagnostic performance at different cut-off points. 20
This primary analysis used the central laboratory’s (Kent) BZC total protein assay from the 24-hour urine sample to determine PE, and was conducted for each of the following assays using the spot urine sample at recruitment:
-
a SPCR test from a local laboratory
-
a SPCR test using the BZC assay at a central laboratory (Kent)
-
a SPCR test using the pyrogallol red (PGR) assay at a central laboratory (Kent)
-
a SACR test from a central laboratory (Kent).
Diagnostic accuracy was summarised using the area under the ROC curve, as well as sensitivity, specificity, positive predictive value, negative predictive value, and LR+ and LR– at prespecified cut-off points (30 mg/mmol for SPCR12 and 2 mg/mmol for SACR). 16
Areas under the ROC curves for the quantitative SPCR and SACR assays were compared using the non-parametric method of DeLong et al. 21 to give a CI and significance test for the difference in area, with SPCR testing from a local laboratory as the comparator. Sensitivity and specificity at the prespecified cut-off points were compared using McNemar tests for paired proportions.
These analyses were restricted to the subsample for which the 24-hour urine sample result and the four assays were all non-missing.
Secondary analyses
Point-of-care dipstick test
The POC test using the urine dipstick proteinuria result at recruitment was analysed to determine its diagnostic performance, using the same methods and reference standard as the primary analysis (restricted to the subsample for which the 24-hour urine sample result and dipstick test result were both non-missing), and using the standard threshold of 1+. 16
Proteinuria as reference standard
The primary analysis was repeated using proteinuria [≥ 300 mg/24 hours using the central laboratory’s (Kent) BZC assay] as the reference standard in place of severe PE (NICE definition). 1
Severe pre-eclampsia (clinician diagnosis) as reference standard
The primary analysis was repeated using clinician diagnosis of severe PE [magnesium sulphate or severe pre-eclamptic toxaemia (PET) protocol] as the reference standard in place of the NICE definition. The central laboratory’s BZC and PGR assays using the 24-hour urine sample were also included as index tests in this analysis, as they were not part of the definition of the reference standard.
The two definitions of severe PE (clinician diagnosis and NICE definition) were cross-tabulated.
Prediction of adverse perinatal outcome
The four assays of the urine sample at recruitment and two assays of the 24-hour urine sample were analysed to see how well they predicted adverse perinatal outcomes, using the same methods as the primary analysis.
Receiver operating characteristic curves were plotted separately for the following as predictors of adverse perinatal outcomes:
-
change in SPCR from recruitment to delivery spot urine samples assessed using the BZC assay at the central laboratory (Kent)
-
maximum SPCR from recruitment and delivery spot urine samples assessed using the BZC assay at the central laboratory (Kent).
These ROC curves were compared with the ROC curve for the central laboratory’s BZC assay of the recruitment sample.
No cut-off points were specified a priori for the last two, and these analyses were considered exploratory.
Subgroup analysis
The primary analysis was repeated on the subgroup of women with 1+ or higher on the POC dipstick test, that is excluding those with a ‘trace’ result only. This is the population of women who would currently be referred for further testing.
Laboratory assay method for 24-hour proteinuria
The primary analysis was repeated using the central laboratory’s (Kent) PGR assay instead of the assay in the NICE definition of severe PE.
The two definitions of severe PE (using the BZC and PGR assays) were cross-tabulated. Exploratory investigation of the agreement between the central laboratory’s (Kent) BZC and PGR assays of total protein from the 24-hour urine sample was undertaken using a Bland–Altman plot. 22
Changes to the protocol
Owing to the availability of POC testing in the UK and the availability and cost of the equipment needed, the SPCR and fully quantitative SACR POC tests that were stated in the original study protocol were not undertaken. This change was covered in substantial amendment 2 , which was added in version 2.0 of the protocol, dated 7 April 2015. It is hoped that this can be completed as a separate piece of work in the future.
Chapter 3 Results
For the DAPPA (spot protein–creatinine ratio and spot albumin–creatinine ratio in the assessment of pre-eclampsia: a diagnostic accuracy study with decision-analytic model-based economic evaluation and acceptability analysis) trial timeline and key milestones see Appendix 1.
Participant flow
The number of eligible participants consented and recruited was 1823. In total, 165 women had to be withdrawn because they withdrew consent, refused or were unable to collect any samples after recruitment, or the samples were collected but not frozen.
There were 1658 women who had completed patient records for inclusion in the final database. However, the central laboratory’s test results for urinary protein in the 24-hour urine sample were not available for 212 women, leaving 1446 women for whom the primary outcome of severe PE could be determined (Figure 1). The prevalence of severe PE in these women was 44% (638/1446). Note that even assuming that none of the 212 women with missing test results developed severe PE, the prevalence of severe PE in the 1658 eligible and consented women would still have been 38% (638/1658).
FIGURE 1.
Participant flow chart showing the number of eligible and consented women, the number for whom a diagnosis of severe PE using the NICE definition could be determined, the number included in the primary analysis and the number with severe PE. a, > 20 weeks’ gestation with confirmed gestational hypertension (systolic BP of ≥ 140 mmHg or diastolic BP of ≥ 90 mmHg) and trace or more proteinuria on automated dipstick analysis; b, 24-hour urine sample (the central laboratory’s BZC assay) total protein concentration of ≥ 300 mg; c, severe – systolic BP of ≥ 160 mmHg or diastolic BP of ≥ 110 mmHg, mild/moderate – systolic BP of ≥ 160 mmHg or diastolic BP of ≥ 110 mmHg; d, severe headache, visual disturbances, problems with vision, severe pain just below the ribs or vomiting, papilloedema, signs of clonus (three or more beats), liver tenderness, HELLP syndrome, platelet levels below 100 × 109/l, abnormal liver enzyme levels (ALT or AST level of > 70 U/l); e, either (1) severe hypertension and proteinuria or (2) mild/moderate hypertension and proteinuria with one or more symptoms.
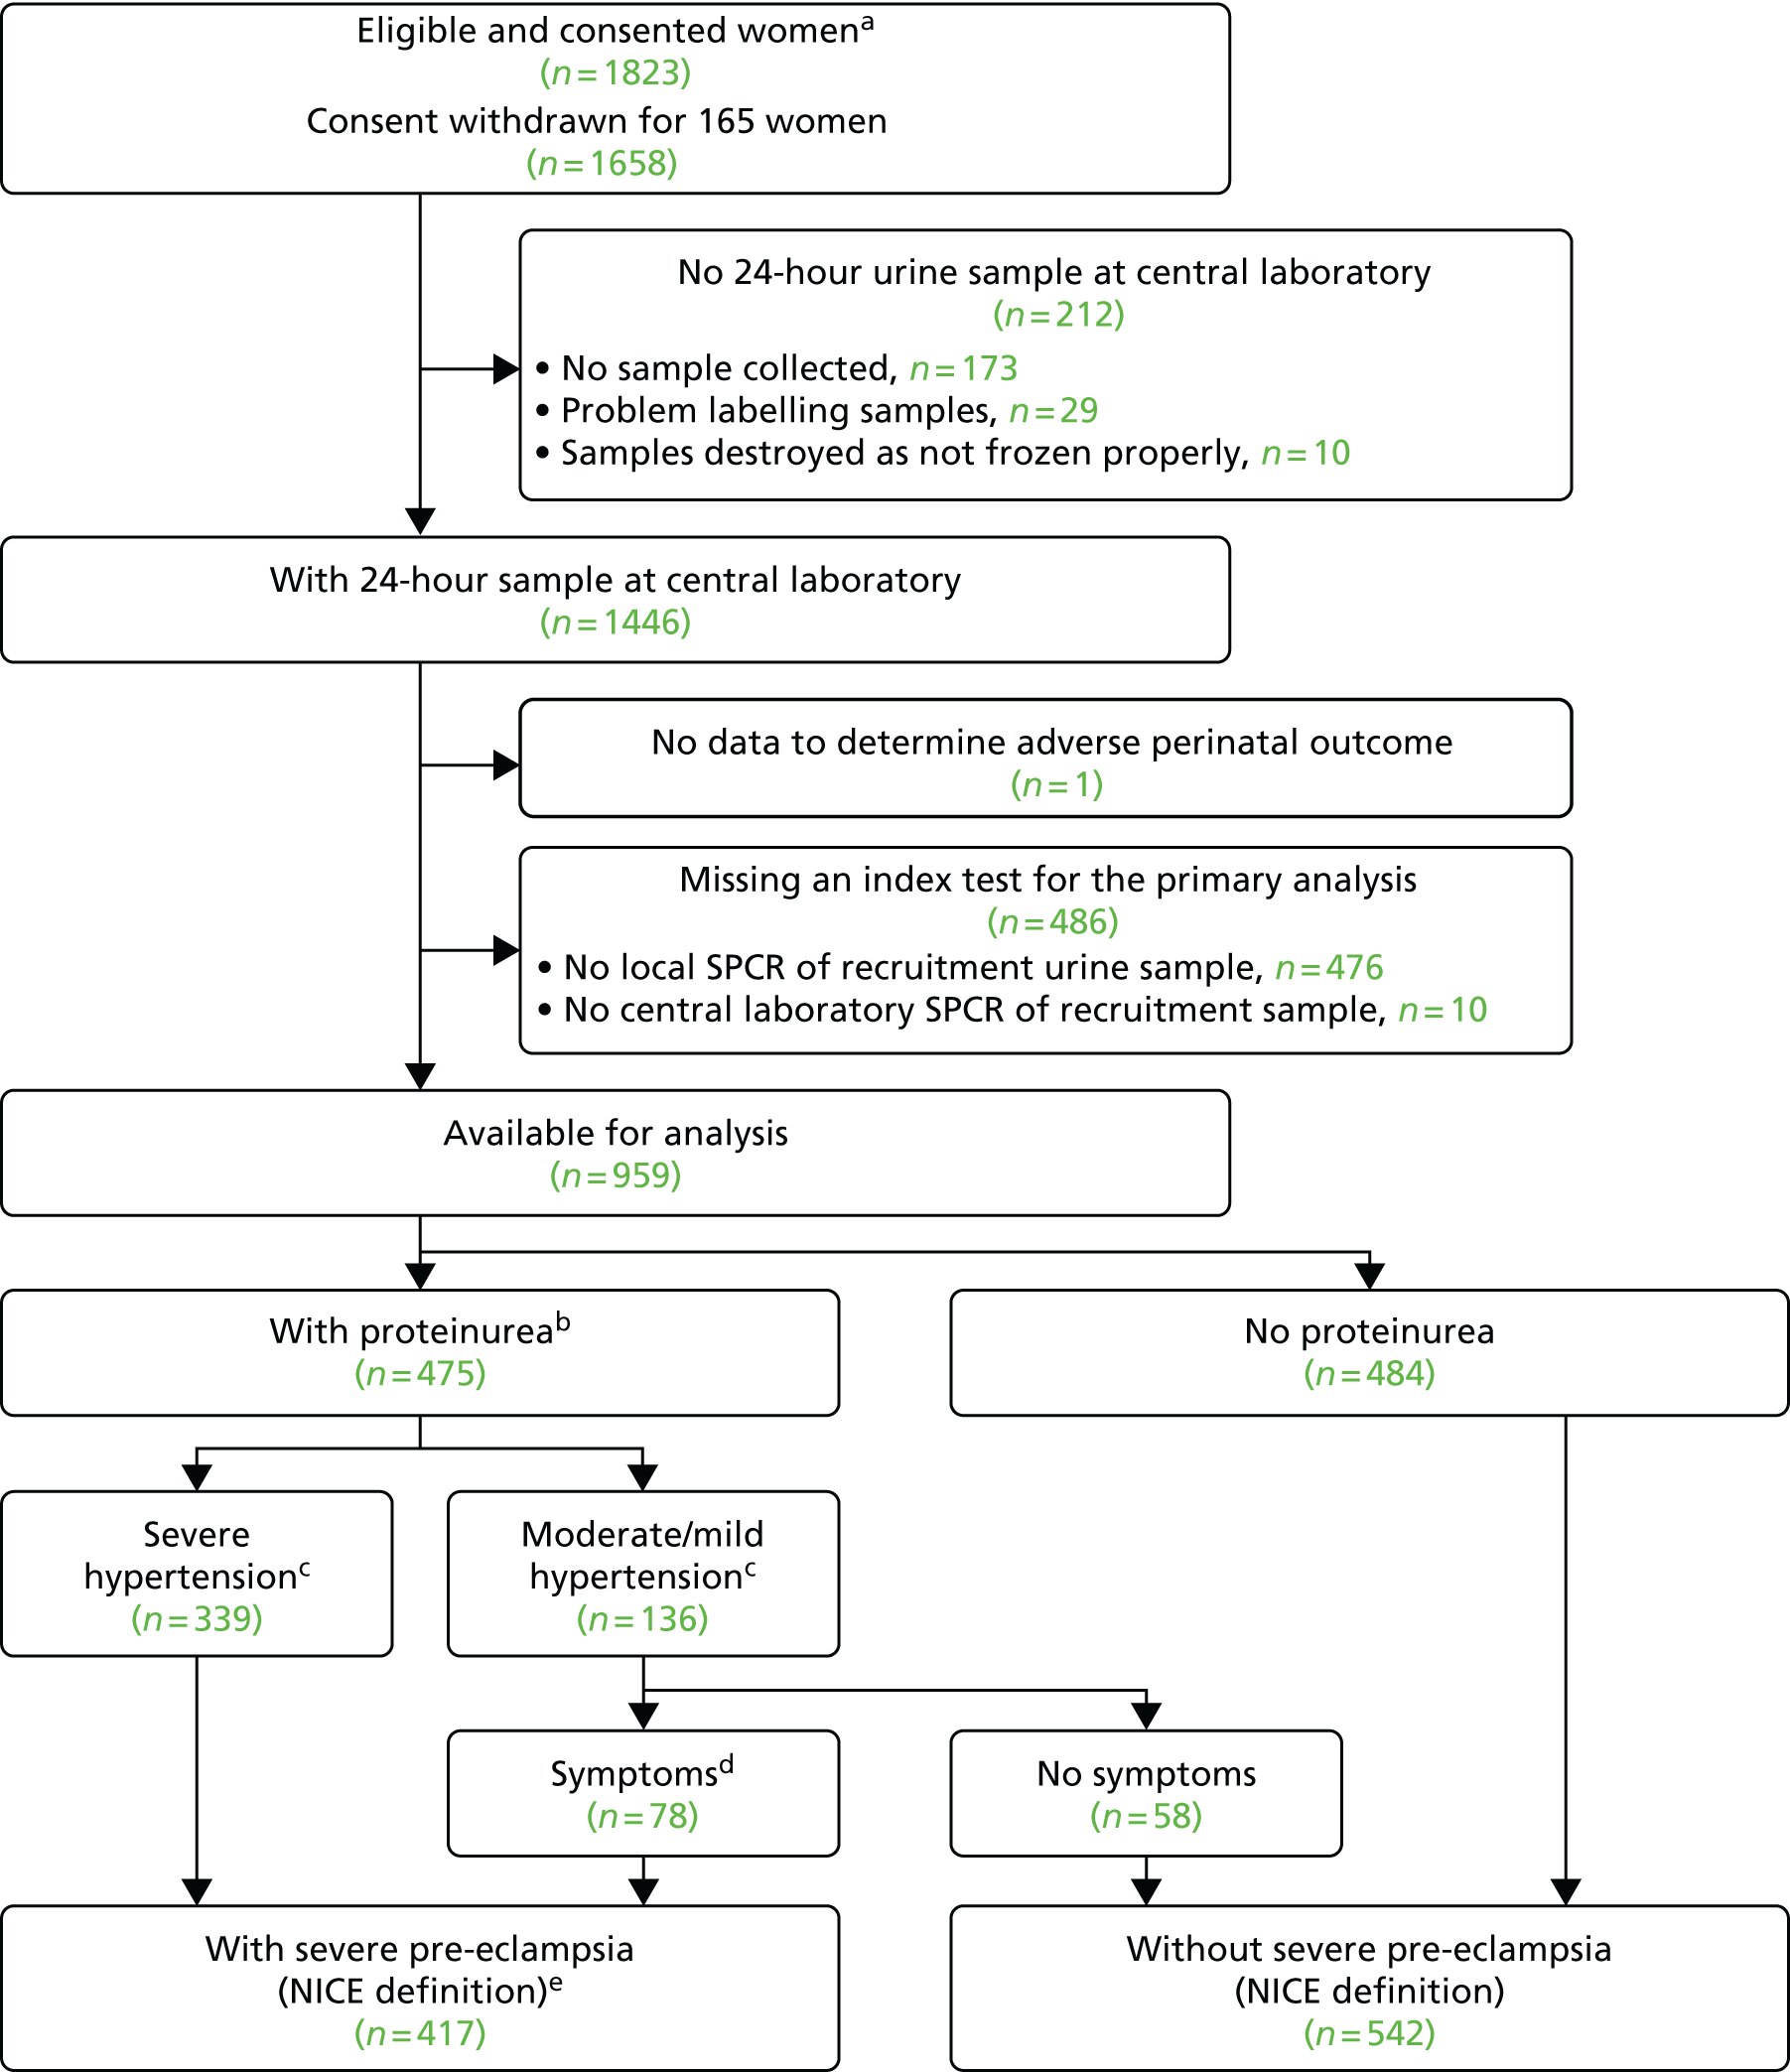
Unfortunately, local laboratory SPCR testing of the recruitment urine sample was not available for 476 women, and a further 10 women had missing central laboratory SPCR test data for the recruitment urine sample (see Figure 1). To compare the diagnostic accuracy of the four assays (three central laboratory and one local laboratory) on the recruitment urine sample, the analysis was restricted to those women with data for all four assays, and excluded one other woman with missing adverse perinatal outcome (n = 959). The prevalence of severe PE in this subsample was 43% (417/959), similar to the prevalence in the 1446 women with 24-hour urine protein sample data.
Characteristics of participants
The number of women by centre is shown in Table 1, for eligible and consented women, for women for whom a diagnosis of severe PE using the NICE definition could be determined, and for women included in the primary analysis. Baseline characteristics, including demographics, concurrent medication, medical history and family history, are summarised in Table 2. BP at recruitment and spot urine protein, creatinine and SPCR at recruitment are summarised in Table 3.
| Centre | Trust | Number (%) of women | ||
|---|---|---|---|---|
| Eligible and consented (N = 1658) | Diagnosis of severe PE could be determined (N = 1446) | Included in the primary analysis (N = 959) | ||
| Royal Victoria Infirmary | The Newcastle upon Tyne Hospitals NHS Foundation Trust | 218 (13) | 175 (12) | 170 (18) |
| Whipps Cross, Newham and The Royal London | Barts Health NHS Trust | 131 (8) | 116 (8) | 103 (11) |
| St Thomas’ Hospital | Guy’s and St Thomas’ NHS Foundation Trust | 128 (8) | 120 (8) | 84 (9) |
| James Cook University Hospital | South Tees Hospitals NHS Foundation Trust | 87 (5) | 70 (5) | 42 (4) |
| North Tyneside General Hospital | Northumbria Healthcare NHS Foundation Trust | 86 (5) | 61 (4) | 42 (4) |
| Sunderland Royal Hospital | City Hosptials Sunderland NHS Foundation Trust | 77 (5) | 72 (5) | 67 (7) |
| John Radcliffe Hospital | Oxford University Hospitals NHS Foundation Trust | 61 (4) | 60 (4) | 1 (< 1) |
| Warrington Hospital | Warrington and Halton Hospital NHS Foundation Trust | 61 (4) | 51 (4) | 23 (2) |
| Royal Shrewsbury Hospital | Shrewsbury and Telford Hospital NHS Trust | 58 (4) | 58 (4) | 28 (3) |
| St George’s Hospital | St George's University Hospital NHS Foundation Trust | 50 (3) | 42 (3) | 26 (3) |
| Queen’s Hospital | Burton Hospitals NHS Foundation Trust | 49 (3) | 49 (3) | 25 (3) |
| Milton Keynes Hospital | Milton Keynes University Hospital NHS Foundation Trust | 45 (3) | 40 (3) | 27 (3) |
| Royal Cornwall Hospital | Royal Cornwall Hospital NHS Trust | 44 (3) | 42 (3) | 36 (4) |
| St James’s University Hospital | The Leeds Teaching Hospitals NHS Trust | 41 (2) | 41 (3) | 21 (2) |
| Queen Alexandra Hospital | Portsmouth Hospitals NHS Trust | 41 (2) | 29 (2) | 26 (3) |
| Queen Elizabeth Hospital | Gateshead Health NHS Foundation Trust | 37 (2) | 28 (2) | 20 (2) |
| Leicester Royal Infirmary | University Hospitals of Leicester NHS Trust | 35 (2) | 23 (2) | 22 (2) |
| St Mary’s Hospital | Central Manchester University Hospitals NHS Foundation Trust | 32 (2) | 32 (2) | 32 (3) |
| Southport and Ormskirk Hospital | Southport and Ormskirk Hospital NHS Trust | 31 (2) | 30 (2) | 27 (3) |
| University Hospital of North Tees | North Tees and Hospital NHS Foundation Trust | 30 (2) | 30 (2) | 15 (2) |
| Queen's Medical Centre | Nottingham University Hospitals NHS Trust | 28 (2) | 26 (2) | 10 (1) |
| St Michael’s Hospital | University Hospital Bristol NHS Foundation Trust | 27 (2) | 24 (2) | 21 (2) |
| North Manchester Hospital | The Pennine Acute Hospitals NHS Trust | 27 (2) | 24 (2) | 0 (0) |
| Royal Derby Hospital | Derby Teaching Hospitals NHS Foundation Trust | 25 (2) | 24 (2) | 15 (2) |
| Norfolk and Norwich University Hospital | Norfolk and Norwich University Hospitals NHS Foundation Trust | 25 (2) | 20 (1) | 3 (< 1) |
| Queen Charlotte and Chelsea Hospital | Imperial College Healthcare NHS Trust | 24 (1) | 17 (1) | 12 (1) |
| South Tyneside District Hospital | South Tyneside NHS Foundation Trust | 23 (1) | 20 (1) | 9 (1) |
| Royal Blackburn Hospital and Burnley General Hospital | East Lancashire Hospitals NHS Trust | 21 (1) | 16 (1) | 11 (1) |
| Colchester General Hospital | Colchester Hospital University NHS Foundation Trust | 19 (1) | 18 (1) | 16 (2) |
| Derriford Hospital | Plymouth Hospitals NHS Trust | 18 (1) | 17 (1) | 0 (0) |
| Arrow Park Hospital | Wirral University Teaching Hospital NHS Foundation Trust | 15 (1) | 12 (1) | 8 (1) |
| Nottingham City Hospital | Nottingham University Hospitals NHS Trust | 14 (1) | 13 (1) | 1 (< 1) |
| Worcestershire Royal Hospital | Worcestershire Acute Hospitals NHS Trust | 13 (1) | 10 (1) | 9 (1) |
| Cumberland Infirmary | North Cumbria University Hospitals NHS Trust | 12 (1) | 12 (1) | 0 (0) |
| University Hospital of North Durham | County Durham & Darlington NHS Foundation Trust | 11 (1) | 11 (1) | 5 (1) |
| Stafford Hospital | University Hospitals of North Midlands NHS Trust (previously Mid Staffordshire) | 8 (< 1) | 8 (1) | 2 (< 1) |
| Peterborough City Hospital | North West Anglia NHS Foundation Trust | 6 (< 1) | 5 (< 1) | 0 (0) |
| Demographic criteria | Eligible, consented (not withdrawn) (N = 1658) | Diagnosis of severe PE (NICE definition) could be determined (N = 1446) | Included in primary analysis (N = 959) |
|---|---|---|---|
| Age (years) | |||
| Median (quartiles) | 30 (25, 34) | 30 (25, 34) | 30 (26, 34) |
| Weight (kg) | |||
| Median (quartiles) | 76 (65, 91) | 76 (65, 91) | 76 (64, 90) |
| Height (cm) | |||
| Median (quartiles) | 164 (160, 168) | 164 (160, 168) | 164 (160, 168) |
| Body mass index (kg/m2) | |||
| Median (quartiles) | 28 (24, 34) | 28 (24, 34) | 28 (24, 33) |
| Country of origin, n (%) | |||
| UK | 1219 (74) | 1059 (73) | 706 (74) |
| Africa | 93 (6) | 88 (6) | 59 (6) |
| Eastern European | 82 (5) | 71 (5) | 38 (4) |
| Other | 59 (4) | 52 (4) | 31 (3) |
| Western European | 44 (3) | 36 (2) | 19 (2) |
| Pakistan | 37 (2) | 34 (2) | 29 (3) |
| India | 36 (2) | 31 (2) | 22 (2) |
| Bangladesh | 32 (2) | 28 (2) | 20 (2) |
| Caribbean | 28 (2) | 22 (2) | 17 (2) |
| South East Asia | 14 (1) | 11 (1) | 8 (1) |
| Middle East | 8 (< 1) | 8 (1) | 6 (1) |
| China | 6 (< 1) | 6 (< 1) | 4 (< 1) |
| Family history, n (%) | |||
| PE | 266 (16) | 237 (16) | 166 (17) |
| Hypertension/cardiovascular disease | 692 (42) | 609 (42) | 408 (43) |
| Diabetes mellitus | 569 (34) | 500 (35) | 328 (34) |
| Renal disease | 37 (2) | 32 (2) | 24 (2) |
| Taking aspirin | 373 (22) | 336 (23) | 213 (22) |
| Number of previous pregnancies beyond 20 weeks’ gestation, n (%) | |||
| 0 | 1066 (64) | 937 (65) | 616 (64) |
| 1 | 344 (21) | 300 (21) | 203 (21) |
| 2 | 151 (9) | 131 (9) | 85 (9) |
| 3 | 48 (3) | 38 (3) | 29 (3) |
| 4 | 29 (2) | 26 (2) | 19 (2) |
| 5 | 10 (1) | 8 (1) | 4 (< 1) |
| ≥ 6 | 10 (1) | 6 (< 1) | 3 (< 1) |
| Number of previous pregnancies of 20 weeks’ gestation or less (including terminations), n (%) | |||
| 0 | 1163 (70) | 1002 (69) | 664 (69) |
| 1 | 337 (20) | 308 (21) | 209 (22) |
| 2 | 85 (5) | 71 (5) | 45 (5) |
| 3 | 43 (3) | 38 (3) | 24 (2) |
| 4 | 16 (1) | 13 (1) | 5 (1) |
| ≥ 5 | 14 (1) | 14 (1) | 12 (1) |
| Previous hypertension in pregnancy | 298 (18) | 264 (18) | 183 (19) |
| Symptoms at recruitment, n (%) | |||
| Headache | 666 (40) | 572 (40) | 381 (40) |
| Nausea | 222 (13) | 189 (13) | 137 (14) |
| Vomiting | 81 (5) | 71 (5) | 53 (6) |
| Epigastric pain | 176 (11) | 148 (10) | 97 (10) |
| Visual disturbance | 294 (18) | 251 (17) | 175 (18) |
| Reduced fetal movements | 123 (7) | 106 (7) | 74 (8) |
| Measurement | Median (quartiles) | ||
|---|---|---|---|
| Eligible and consented (n = 1658) | Diagnosis of severe PE could be determined (n = 1446) | Included in primary analysis (n = 959) | |
| Systolic BP (mmHg) | 145 (140, 152) | 145 (140, 152) | 145 (140, 152) |
| Diastolic BP (mmHg) | 94 (90, 99) | 94 (90, 99) | 94 (90, 100) |
| Urine protein concentration (mg/l)a | 510 (250, 1420) | 520 (250, 1405) | 520 (250, 1360) |
| Urine creatinine concentration (mmol/l)a | 12 (7, 18) | 12 (7, 18) | 12 (7, 18) |
| Urine protein–creatinine ratio (mg/mmol)a | 46 (22, 132) | 46 (22, 131) | 46 (22, 129) |
Reference standards and other outcomes
Reference standards and perinatal outcomes are summarised in Table 4 for women included in the primary analysis.
| Standard and outcome | Number of women (%) (n = 959) |
|---|---|
| Severe PE (the NICE definition) | 417 (43) |
| Proteinuria | 475 (50) |
| Severe PE (the clinician diagnosis) | 193 (20) |
| Eclampsia | 30 (3) |
| Gestational age < 36 weeks | 223 (23) |
| Median (weeks) | 37 |
| Interquartile range (weeks) | 36–39 |
| Range (weeks) | 23–43 |
| Multiple birthsa | 53 (6) |
| Adverse perinatal outcome | 62 (6) |
| Perinatal/neonatal mortality | 18 (2) |
| Bronchopulmonary dysplasia | 27 (3) |
| Necrotising enterocolitis | 7 (1) |
| Intraventricular haemorrhage | 16 (2) |
Only 32% (134/417) of the women who met the NICE definition of severe PE had a clinician diagnosis of severe PE, and, in addition, 11% (59/542) of women who did not meet the NICE definition had a clinician diagnosis (Table 5).
| Clinical diagnoses, number of women | NICE definition, number of women | ||
|---|---|---|---|
| Without severe PE | With severe PE | Total | |
| Without severe PEa | 483 | 283 | 766 |
| With severe PEa | 59 | 134 | 193 |
| Total | 542 | 417 | 959 |
The majority (149/193, 77%) of those with a clinician diagnosis of severe PE had both magnesium sulphate treatment and followed a severe PE protocol (Table 6).
| PET protocol, number of women | Treatment, number of women | ||
|---|---|---|---|
| Without magnesium sulphate | With magnesium sulphate | Total | |
| Without severe | 766 | 13 | 779 |
| With severe | 31 | 149 | 180 |
| Total | 797 | 162 | 959 |
Of the 417 women with severe PE according to the NICE definition, 8% had an adverse perinatal outcome compared with 5% of women without severe PE (p = 0.033) (Table 7). Of the 193 women with a clinician diagnosis of severe PE, 15% had an adverse perinatal outcome, compared with 4% of women without a clinician diagnosis of severe PE (p < 0.001) (Table 8).
| NICE definition, number of women | Perinatal outcome, number of women | ||
|---|---|---|---|
| Without adverse | With adverse | Total | |
| Without severe PE | 515 | 27 | 542 |
| With severe PE | 382 | 35 | 417 |
| Total | 897 | 62 | 959 |
| Clinician diagnosed, number of women | Perinatal outcome, number of women | ||
|---|---|---|---|
| Without adverse | With adverse | Total | |
| Without severe PEa | 732 | 34 | 766 |
| With severe PEa | 165 | 28 | 193 |
| Total | 897 | 62 | 959 |
Table 9 shows the prevalence of severe PE (according to both definitions) and adverse perinatal outcomes separately for women aged < 35 years and for women aged ≥ 35 years, and also separately for women aged < 40 years and for women aged ≥ 40 years.
| Women affected by | Age (years), n (%) | |||
|---|---|---|---|---|
| < 35 (N = 729) | ≥ 35 (N = 230) | < 40 (N = 907) | ≥ 40 (N = 52) | |
| Severe PE (NICE definition) | 329 (45) | 88 (38) | 399 (44) | 18 (35) |
| Severe PE (clinician diagnosis) | 147 (20) | 46 (20) | 186 (21) | 7 (13) |
| Adverse perinatal outcome | 51 (7) | 11 (5) | 62 (7) | 0 (0) |
Primary analysis
The diagnostic accuracy of the four assays using the spot urine sample at recruitment was compared using prespecified thresholds of 30 mg/mmol for SPCR and 2 mg/mmol for SACR. Tables 10–13 show index test results cross-tabulated against the reference standard (severe PE, NICE definition). Sensitivities, specificities, LR+s and LR–s are shown in Table 14. The three SPCR tests all had sensitivity in excess of 90% at the prespecified thresholds but with poor specificity. The central laboratory’s SACR test had significantly higher sensitivity (99%, 95% CI 98% to 100%) than the local laboratory’s SPCR test, but its specificity (23%, 95% CI 20% to 27%) was significantly lower. The high sensitivities and LR–s of ≤ 0.1 suggest that all of the tests could be used as rule-out tests for severe PE (NICE definition). From Tables 10–13 the negative predictive values of each of the three SPCR tests was 92–93% (98% for the SACR test), so a negative result from one of these tests brings the risk of developing severe PE down to 7–8% (2% for the SACR test), compared with the pre-test risk of 43%.
| Threshold (mg/mmol) | Number of women | ||
|---|---|---|---|
| Without severe PE | With severe PE | Total | |
| < 30 | 309 | 27 | 336 |
| ≥ 30 | 233 | 390 | 623 |
| Total | 542 | 417 | 959 |
| Threshold (mg/mmol) | Number of women | ||
|---|---|---|---|
| Without severe PE | With severe PE | Total | |
| < 30 | 333 | 29 | 362 |
| ≥ 30 | 209 | 388 | 597 |
| Total | 542 | 417 | 959 |
| Threshold (mg/mmol) | Number of women | ||
|---|---|---|---|
| Without severe PE | With severe PE | Total | |
| < 30 | 302 | 22 | 324 |
| ≥ 30 | 240 | 395 | 635 |
| Total | 542 | 417 | 959 |
| Threshold (mg/mmol) | Number of women | ||
|---|---|---|---|
| Without severe PE | With severe PE | Total | |
| < 2 | 126 | 3 | 129 |
| ≥ 2 | 416 | 414 | 830 |
| Total | 542 | 417 | 959 |
| Assay | Threshold | Sensitivity (%) (95% CI) | Specificity (%) (95% CI) | Likelihood ratios (95% CI) | p-value for comparison with the local laboratory’s SPCRa | ||
|---|---|---|---|---|---|---|---|
| LR+ | LR– | Sensitivity | Specificity | ||||
| Local laboratory – SPCR | 30 mg/mmol | 94 (91 to 96) | 57 (53 to 61) | 2.18 (1.96 to 2.39) | 0.11 (0.07 to 0.16) | – | – |
| Central laboratoryb – SPCR via the BZC assay | 30 mg/mmol | 93 (90 to 95) | 61 (57 to 66) | 2.41 (2.15 to 2.68) | 0.11 (0.07 to 0.15) | 0.68 | 0.012 |
| Central laboratoryb – SPCR via the PGR assay | 30 mg/mmol | 95 (92 to 97) | 56 (51 to 60) | 2.14 (1.93 to 2.35) | 0.09 (0.06 to 0.13) | 0.30 | 0.47 |
| Central laboratoryb – SACR | 2 mg/mmol | 99 (98 to 100) | 23 (20 to 27) | 1.29 (1.23 to 1.35) | 0.03 (0.00 to 0.07) | < 0.0001 | < 0.0001 |
| POC – proteinuria dipstick test | 1+ | 98 (96 to 99) | 20 (17 to 24) | 1.22 (1.17 to 1.28) | 0.11 (0.04 to 0.18) | 0.001 | < 0.0001 |
Because we used a cut-off point for SACR of 2 mg/mmol based on published work in pregnancy,16 and we note that this is different from the cut-off point chosen in other clinical contexts, we performed a further analysis to examine whether or not a different cut-off point for SACR would have calibrated better with a cut-off point of 30 mg/mmol for SPCR, and to show how an alternative choice of cut-off point for the SPCR test would have affected sensitivity and specificity of these assays. Exploratory analyses are presented in Tables 15 and 16 for different cut-off points. These analyses suggest that a cut-off point of 8 mg/mmol for SACR achieves comparable diagnostic accuracy to a cut-off point of 30 mg/mmol for SPCR. Note that a cut-off point of 3.5 mg/mmol has been suggested in other contexts. 23
| Threshold (mg/mmol) | Assay and sample (SPCR) | |||||
|---|---|---|---|---|---|---|
| Local laboratory | Central laboratorya via the BZC assay | Central laboratorya via the PGR assay | ||||
| Sensitivity (%) (95% CI) | Specificity (%) (95% CI) | Sensitivity (%) (95% CI) | Specificity (%) (95% CI) | Sensitivity (%) (95% CI) | Specificity (%) (95% CI) | |
| 10 | 100 (99 to 100) | 5 (3 to 7) | 100 (99 to 100) | 9 (7 to 12) | 100 (99 to 100) | 9 (6 to 11) |
| 20 | 97 (96 to 99) | 37 (32 to 41) | 98 (96 to 99) | 42 (38 to 46) | 99 (97 to 100) | 36 (32 to 40) |
| 30 | 94 (91 to 96) | 57 (53 to 61) | 93 (91 to 95) | 61 (57 to 66) | 95 (93 to 97) | 56 (52 to 60) |
| 40 | 88 (85 to 91) | 73 (69 to 77) | 88 (85 to 91) | 73 (69 to 77) | 90 (87 to 93) | 67 (63 to 71) |
| 50 | 82 (78 to 85) | 80 (76 to 83) | 82 (78 to 85) | 80 (76 to 83) | 85 (81 to 88) | 75 (71 to 79) |
| 60 | 77 (73 to 81) | 83 (79 to 86) | 77 (73 to 81) | 84 (81 to 87) | 79 (75 to 83) | 79 (76 to 83) |
| Threshold (mg/mmol) | Sensitivity (%) (95% CI) | Specificity (%) (95% CI) |
|---|---|---|
| 1 | 100 (99 to 100) | 7 (5 to 9) |
| 2 | 99 (98 to 100) | 23 (20 to 27) |
| 3.5 | 99 (98 to 100) | 35 (31 to 39) |
| 8 | 96 (94 to 98) | 57 (53 to 61) |
| 16 | 89 (86 to 92) | 73 (69 to 76) |
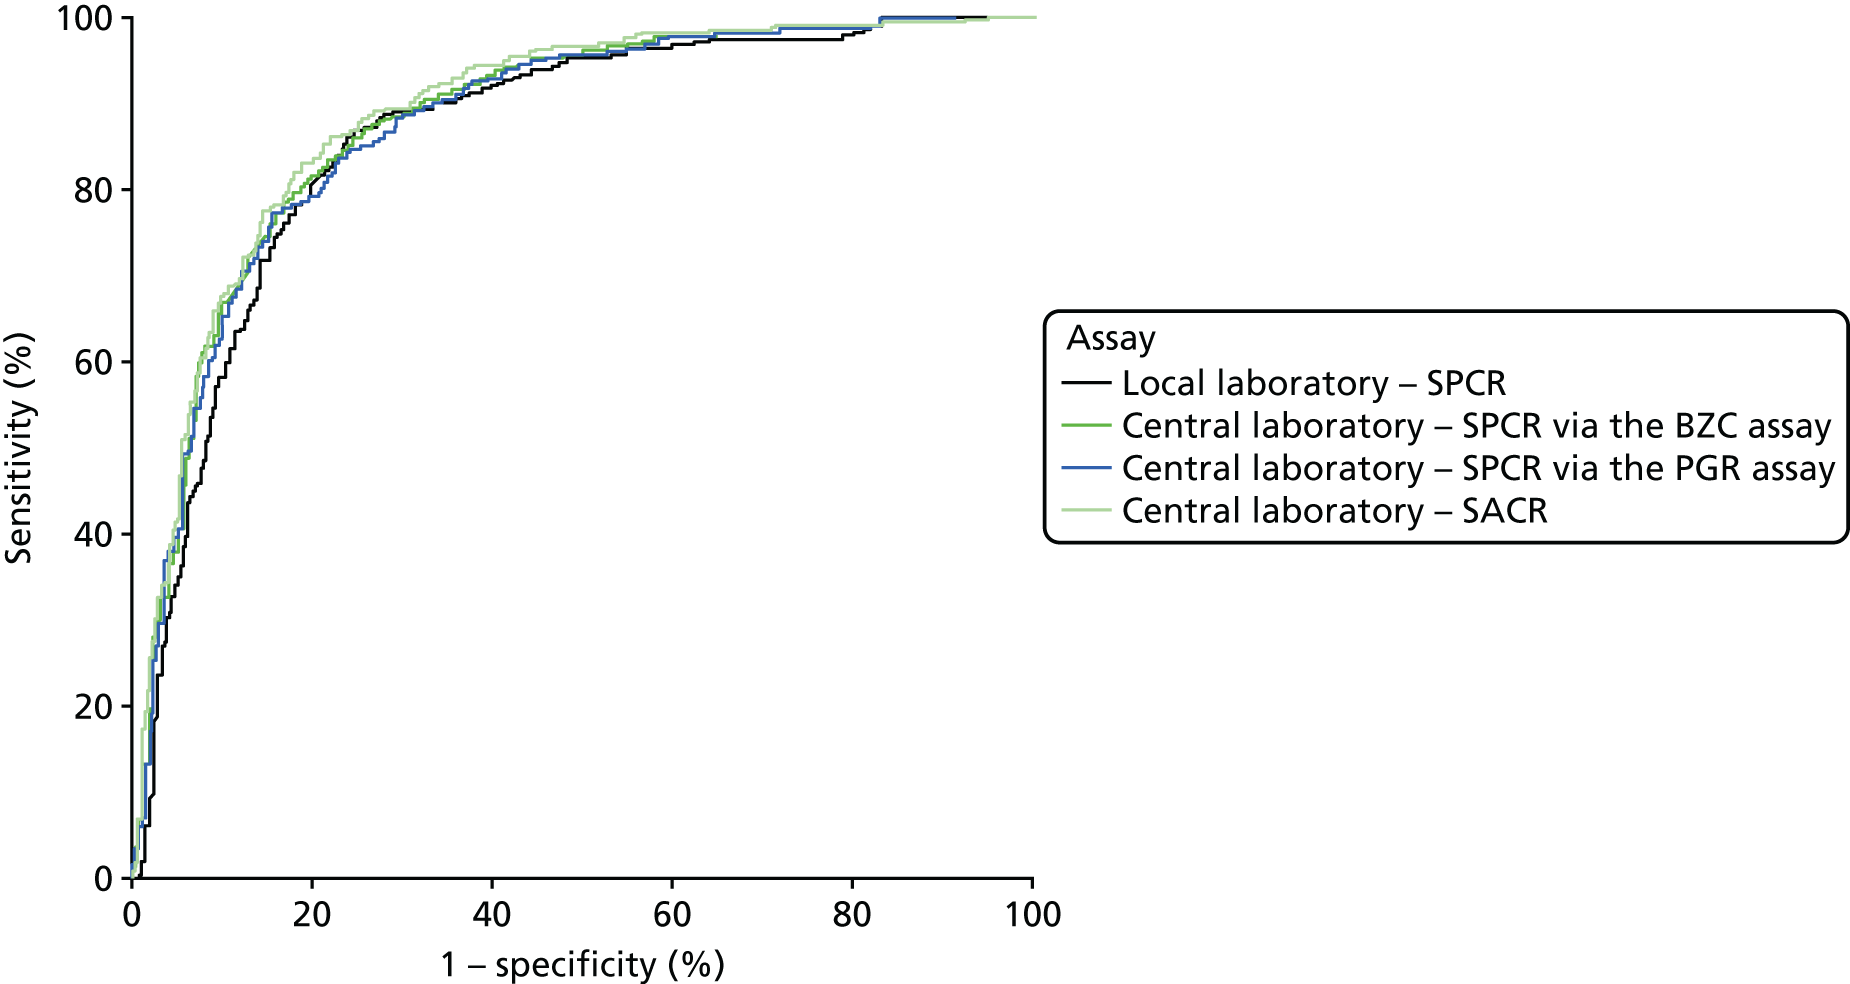
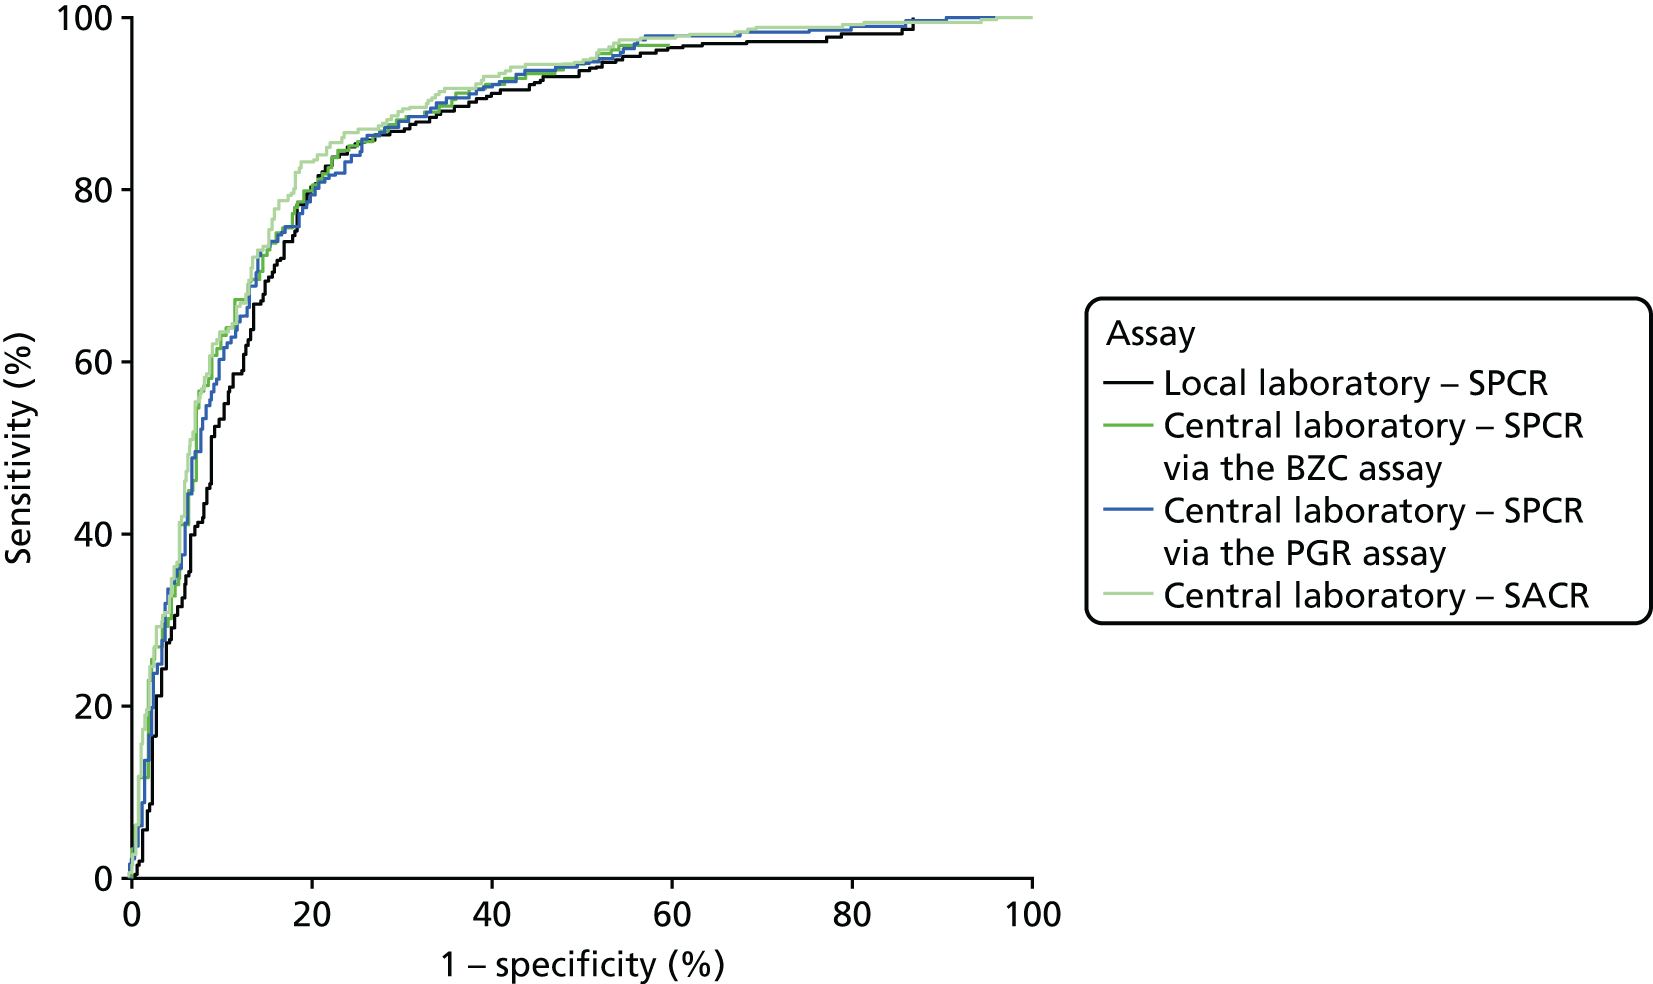
When overlain the ROC curves for the four assays were similar (Figure 2). The area under the central laboratory’s SACR assay curve was significantly greater than that for the local laboratory’s SPCR test, although the difference may not be of practical importance (0.02, 95% CI 0.01 to 0.04; p = 0.004) (Table 17).
FIGURE 2.
Receiver operating characteristic curves for the four assays of the recruitment urine sample used to diagnose severe PE (NICE definition).
| Assay | Area under ROC curve (95% CI) | Comparison with the local laboratory’s SPCR | |
|---|---|---|---|
| Difference (95% CI) | p-valuea | ||
| Local laboratory – SPCR | 0.87 (0.84 to 0.89) | – | – |
| Central laboratoryb – SPCR via the BZC assay | 0.88 (0.86 to 0.90) | 0.02 (0.00 to 0.03) | 0.057 |
| Central laboratoryb – SPCR via the PGR assay | 0.88 (0.85 to 0.90) | 0.01 (0.00 to 0.03) | 0.17 |
| Central laboratoryb – SACR | 0.89 (0.87 to 0.91) | 0.02 (0.01 to 0.04) | 0.004 |
Secondary analyses
Point-of-care dipstick test
The diagnostic accuracy of the POC urine proteinuria dipstick test at recruitment was investigated using a prespecified threshold of 1+. Table 18 shows this index test result cross-tabulated against the reference standard (NICE definition of severe PE). Sensitivity, specificity, LR+s and LR–s are shown in Table 14. As expected, the urine proteinuria dipstick at this threshold had high sensitivity (98%, 95% CI 96% to 99%) but low specificity (20%, 95% CI 17% to 24%).
| Threshold | Number of women | ||
|---|---|---|---|
| Without severe PE | With severe PE | Total | |
| Trace | 108 | 9 | 117 |
| 1+ or higher | 434 | 408 | 842 |
| Total | 542 | 417 | 959 |
Proteinuria as reference standard
The diagnostic accuracy of the four assays using the spot urine sample at recruitment were compared using prespecified thresholds of 30 mg/mmol for SPCR and 2 mg/mmol for SACR. Tables 19–22 show index test results cross-tabulated against the reference standard (proteinuria). Sensitivities, specificities, LR+s and LR–s are shown in Table 23. The three SPCR tests all had sensitivity in excess of 90% at the prespecified thresholds. The central laboratory’s SACR test had significantly higher sensitivity (99%, 95% CI 98% to 100%) than the local laboratory’s SPCR test, but its specificity (26%, 95% CI 22% to 30%) was significantly lower. The high sensitivities and LR–s of ≤ 0.1 suggest that all of the tests could be used as rule-out tests for proteinuria.
| Threshold (mg/mmol) | Number of women | ||
|---|---|---|---|
| Without proteinuria | With proteinuriaa | Total | |
| < 30 | 302 | 34 | 336 |
| ≥ 30 | 182 | 441 | 623 |
| Total | 484 | 475 | 959 |
| Threshold (mg/mmol) | Number of women | ||
|---|---|---|---|
| Without proteinuria | With proteinuriaa | Total | |
| < 30 | 328 | 34 | 362 |
| ≥ 30 | 156 | 441 | 597 |
| Total | 484 | 475 | 959 |
| Threshold (mg/mmol) | Number of women | ||
|---|---|---|---|
| Without proteinuria | With proteinuriaa | Total | |
| < 30 | 300 | 24 | 324 |
| ≥ 30 | 184 | 451 | 635 |
| Total | 484 | 475 | 959 |
| Threshold (mg/mmol) | Number of women | ||
|---|---|---|---|
| Without proteinuria | With proteinuriaa | Total | |
| < 2 | 125 | 4 | 129 |
| ≥ 2 | 359 | 471 | 830 |
| Total | 484 | 475 | 959 |
| Assay | Threshold (mg/mmol) | Sensitivity (%) (95% CI) | Specificity (%) (95% CI) | Likelihood ratios (95% CI) | p-value for the comparison with the local laboratory’s SPCRa | ||
|---|---|---|---|---|---|---|---|
| LR+ | LR– | Sensitivity | Specificity | ||||
| Local laboratory – SPCR | 30 | 93 (90 to 95) | 62 (58 to 67) | 2.47 (2.18 to 2.76) | 0.11 (0.08 to 0.15) | – | – |
| Central laboratoryb – SPCR via the BZC assay | 30 | 93 (90 to 95) | 68 (63 to 72) | 2.88 (2.50 to 3.26) | 0.11 (0.07 to 0.14) | 1.00 | 0.006 |
| Central laboratoryb – SPCR via the PGR assay | 30 | 95 (92 to 97) | 56 (51 to 60) | 2.14 (1.93 to 2.35) | 0.09 (0.06 to 0.13) | 0.068 | 0.83 |
| Central laboratoryb – SACR | 2 | 99 (98 to 100) | 23 (20 to 27) | 1.29 (1.23 to 1.35) | 0.03 (0.00 to 0.07) | < 0.0001 | < 0.0001 |
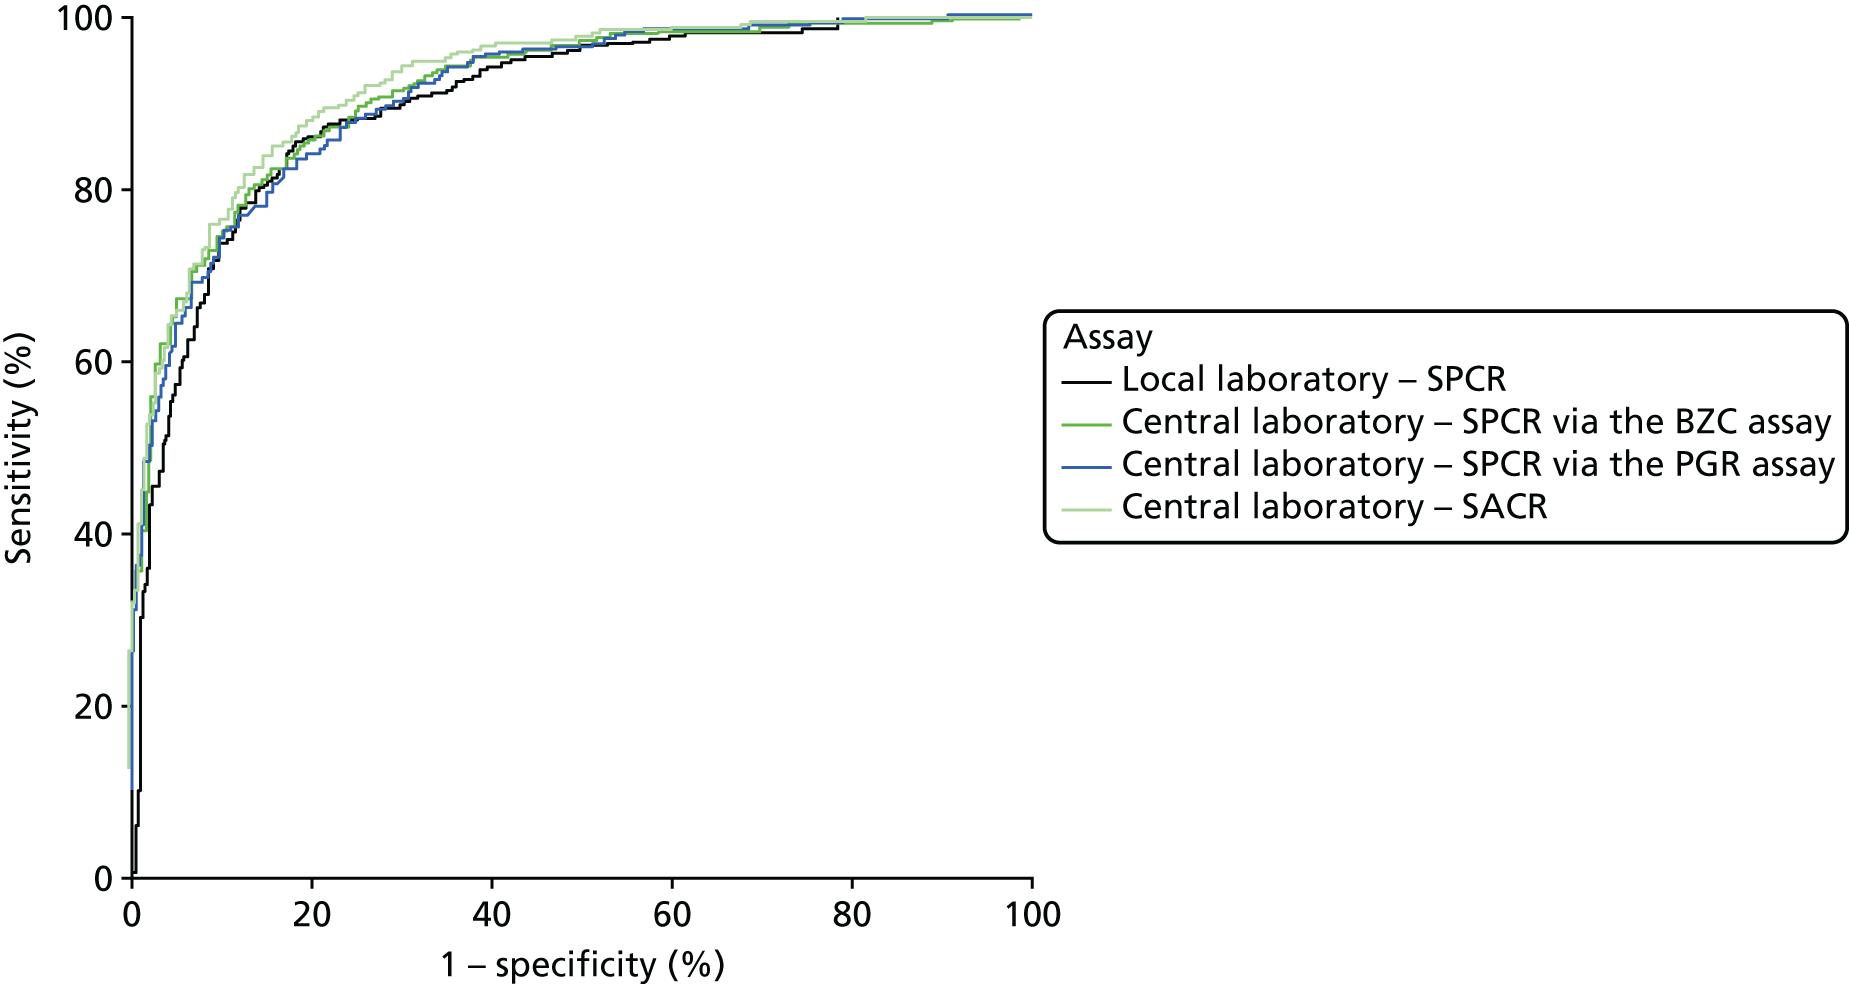
When overlain the ROC curves for the four assays were, again, similar (Figure 3). The areas under the central laboratory’s SACR curve and the central laboratory’s SPCR BZC assay curve were both significantly greater than that for the local laboratory’s SPCR curve, although the differences may not be of practical importance (Table 24).
FIGURE 3.
Receiver operating characteristic curves for the four assays of the recruitment urine sample used to diagnose proteinuria.
| Assay | Area under ROC curve (95% CI) | Comparison with the local laboratory’s SPCR | |
|---|---|---|---|
| Difference (95% CI) | p-valuea | ||
| Local laboratory – SPCR | 0.90 (0.88 to 0.92) | – | – |
| Central laboratoryb – SPCR via the BZC assay | 0.91 (0.90 to 0.93) | 0.02 (0.00 to 0.03) | 0.047 |
| Central laboratoryb – SPCR via the PGR assay | 0.91 (0.89 to 0.93) | 0.01 (0.00 to 0.03) | 0.17 |
| Central laboratoryb – SACR | 0.92 (0.91 to 0.94) | 0.02 (0.01 to 0.04) | 0.002 |
Severe pre-eclampsia (clinician diagnosis) as the reference standard
The diagnostic accuracy of the four assays using the spot urine sample at recruitment, and two assays using the 24-hour urine sample, were compared using prespecified thresholds of 30 mg/mmol for SPCR and 2 mg/mmol for SACR. Tables 25–30 show index test results cross-tabulated against the reference standard (clinician diagnosis of severe PE). Sensitivities, specificities, and LR+s and LR–s are shown in Table 31. The three SPCR tests and two SPCR tests all had sensitivity below 90% at the prespecified thresholds. The central laboratory’s SACR test from the recruitment sample had a significantly higher sensitivity (97%, 95% CI 93% to 99%) than the local laboratory’s SPCR test from the recruitment sample, but its specificity (16%, 95% CI 14% to 19%) was significantly lower.
| Threshold (mg/mmol) | Number of women | ||
|---|---|---|---|
| Without severe PE | With severe PEa | Total | |
| < 30 | 308 | 28 | 336 |
| ≥ 30 | 458 | 165 | 623 |
| Total | 766 | 193 | 959 |
| Threshold (mg/mmol) | Number of women | ||
|---|---|---|---|
| Without severe PE | With severe PEa | Total | |
| < 30 | 331 | 31 | 362 |
| ≥ 30 | 435 | 162 | 597 |
| Total | 766 | 193 | 959 |
| Threshold (mg/mmol) | Number of women | ||
|---|---|---|---|
| Without severe PE | With severe PEa | Total | |
| < 30 | 296 | 28 | 324 |
| ≥ 30 | 470 | 165 | 635 |
| Total | 766 | 193 | 959 |
| Threshold (mg/mmol) | Number of women | ||
|---|---|---|---|
| Without severe PE | With severe PEa | Total | |
| < 2 | 123 | 6 | 129 |
| ≥ 2 | 643 | 187 | 830 |
| Total | 766 | 193 | 959 |
| Threshold (mg/mmol) | Number of women | ||
|---|---|---|---|
| Without severe PE | With severe PEa | Total | |
| < 30 | 338 | 32 | 370 |
| ≥ 30 | 428 | 161 | 589 |
| Total | 766 | 193 | 959 |
| Threshold (mg/mmol) | Number of women | ||
|---|---|---|---|
| Without severe PE | With severe PEa | Total | |
| < 30 | 300 | 31 | 331 |
| ≥ 30 | 466 | 162 | 628 |
| Total | 766 | 193 | 959 |
| Assay and sample | Threshold | Sensitivity (%) (95% CI) | Specificity (%) (95% CI) | Likelihood ratios (95% CI) | p-value for comparison with the local laboratory’s SPCRa | ||
|---|---|---|---|---|---|---|---|
| LR+ | LR– | Sensitivity | Specificity | ||||
| Recruitment sample | |||||||
| Local laboratory – SPCR | 30 mg/mmol | 85 (80 to 90) | 40 (37 to 44) | 1.43 (1.31 to 1.55) | 0.36 (0.23 to 0.49) | – | – |
| Central laboratoryb – SPCR via the BZC assay | 30 mg/mmol | 84 (78 to 89) | 43 (40 to 47) | 1.48 (1.35 to 1.61) | 0.37 (0.25 to 0.50) | 0.44 | 0.022 |
| Central laboratoryb – SPCR via the PGR assay | 30 mg/mmol | 85 (80 to 90) | 39 (35 to 42) | 1.39 (1.28 to 1.51) | 0.38 (0.24 to 0.51) | 1.00 | 0.23 |
| Central laboratoryb – SACR | 2 mg/mmol | 97 (93 to 99) | 16 (14 to 19) | 1.15 (1.11 to 1.20) | 0.19 (0.04 to 0.35) | < 0.0001 | < 0.0001 |
| 24-hour sample | |||||||
| Central laboratoryb – SPCR via the BZC assay | 30 mg/mmol | 83 (77 to 88) | 44 (41 to 48) | 1.49 (1.36 to 1.63) | 0.38 (0.25 to 0.50) | 0.37 | 0.010 |
| Central laboratoryb – SPCR via the PGR assay | 30 mg/mmol | 84 (78 to 89) | 39 (36 to 43) | 1.38 (1.26 to 1.50) | 0.41 (0.27 to 0.55) | 0.47 | 0.48 |
| POC – proteinuria dipstick test | 1+ | 92 (88 to 96) | 13 (11 to 16) | 1.06 (1.01 to 1.12) | 0.58 (0.28 to 0.89) | 0.012 | < 0.0001 |
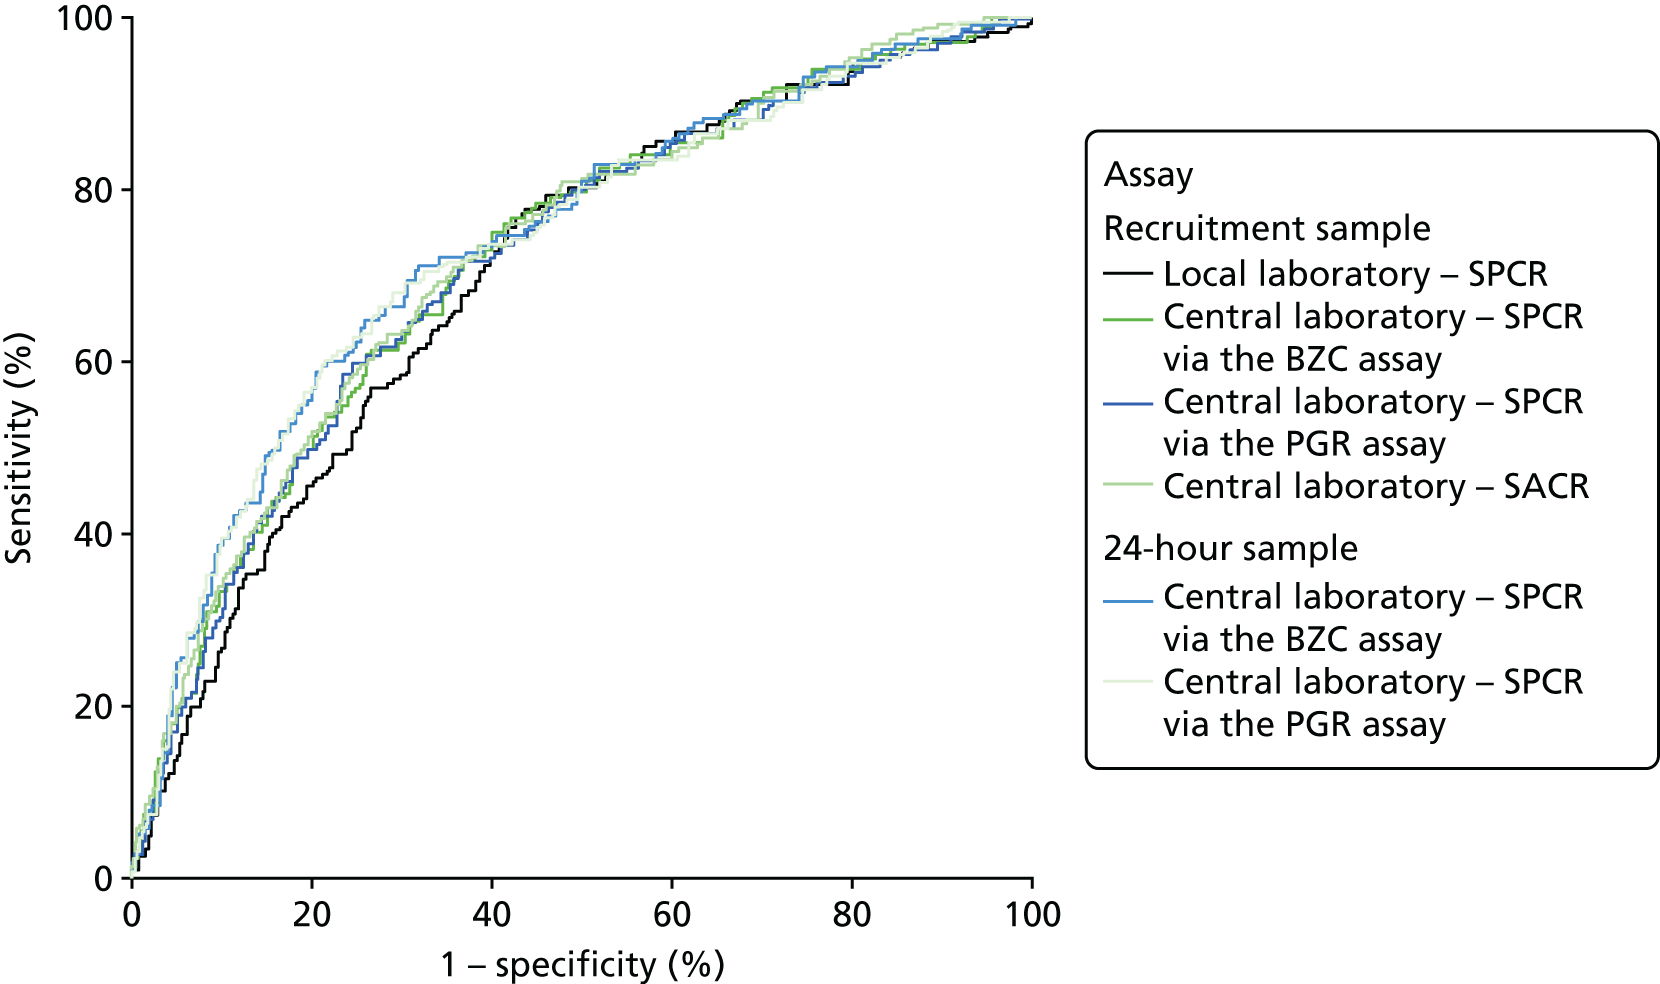
When overlain the ROC curves for the six assays were similar and demonstrated a much poorer diagnostic accuracy compared with the NICE definition of PE as the reference standard (Figure 4). The areas under the central laboratory’s SACR (recruitment sample) curve, the central laboratory’s SPCR via the BZC assay (24-hour sample) curve and the central laboratory’s SPCR via the PGR assay (24-hour) curve were all significantly greater than that for the local laboratory’s SPCR curve, although the differences may not be of practical importance (Table 32).
FIGURE 4.
Receiver operating characteristic curves for the four assays of the recruitment urine sample and the two assays of the 24-hour urine sample used to predict severe PE (clinician diagnosis).
| Assay and sample | Area under ROC curve (95% CI) | Comparison with the local laboratory’s SPCR | ||
|---|---|---|---|---|
| Difference (95% CI) | p-valuea | |||
| Recruitment sample | ||||
| Local laboratory – SPCR | 0.70 (0.66 to 0.74) | – | – | |
| Central laboratoryb – SPCR via the BZC assay | 0.72 (0.68 to 0.76) | 0.02 (0.00 to 0.04) | 0.11 | |
| Central laboratoryb – SPCR via the PGR assay | 0.71 (0.67 to 0.75) | 0.01 (–0.01 to 0.03) | 0.25 | |
| Central laboratoryb – SACR | 0.72 (0.68 to 0.76) | 0.02 (0.00 to 0.04) | 0.028 | |
| 24-hour sample | ||||
| Central laboratoryb – SPCR via the BZC assay | 0.74 (0.70 to 0.78) | 0.03 (0.01 to 0.06) | 0.006 | |
| Central laboratoryb – SPCR via the PGR assay | 0.73 (0.69 to 0.77) | 0.03 (0.01 to 0.05) | 0.012 | |
The diagnostic accuracy of the POC urine proteinuria dipstick test at recruitment was also investigated using a prespecified threshold of 1+. Table 33 shows this index test result cross-tabulated against the reference standard (severe PE, clinician diagnosis). Sensitivity, specificity, LR+s and LR–s are shown in Table 31. As expected, the urine proteinuria dipstick at this threshold had high sensitivity (92%, 95% CI 88% to 96%) but low specificity (13%, 95% CI 11% to 16%).
Prediction of adverse perinatal outcomes
The accuracy of the four assays using the spot urine sample at recruitment and the two assays using the 24-hour urine sample in predicting adverse perinatal outcomes were compared using prespecified thresholds of 30 mg/mmol for SPCR and 2 mg/mmol for SACR. Tables 34–39 show index test results cross-tabulated against adverse perinatal outcome. Sensitivities, specificities, LR+s and LR–s are shown in Table 40. The three SPCR tests and two SPCR tests all had sensitivity below 80% at the prespecified thresholds. The central laboratory’s SACR test from the recruitment sample had significantly higher sensitivity (94%, 95% CI 84% to 98%) than the local laboratory’s SPCR test from the recruitment sample, but its specificity (14%, 95% CI 12% to 16%) was significantly lower. The central laboratory’s SPCR test via the PGR assay also had significantly higher sensitivity (79%, 95% CI 67% to 88%) than the local laboratory’s SPCR test.
| Threshold (mg/mmol) | Number of women | ||
|---|---|---|---|
| Without adverse perinatal outcome | With adverse perinatal outcome | Total | |
| < 30 | 317 | 19 | 336 |
| ≥ 30 | 580 | 43 | 623 |
| Total | 897 | 62 | 959 |
| Threshold (mg/mmol) | Number of women | ||
|---|---|---|---|
| Without adverse perinatal outcome | With adverse perinatal outcome | Total | |
| < 30 | 348 | 14 | 362 |
| ≥ 30 | 549 | 48 | 597 |
| Total | 897 | 62 | 959 |
| Threshold (mg/mmol) | Number of women | ||
|---|---|---|---|
| Without adverse perinatal outcome | With adverse perinatal outcome | Total | |
| < 30 | 311 | 13 | 324 |
| ≥ 30 | 586 | 49 | 635 |
| Total | 897 | 62 | 959 |
| Threshold (mg/mmol) | Number of women | ||
|---|---|---|---|
| Without adverse perinatal outcome | With adverse perinatal outcome | Total | |
| < 2 | 125 | 4 | 129 |
| ≥ 2 | 772 | 58 | 830 |
| Total | 897 | 62 | 959 |
| Threshold (mg/mmol) | Number of women | ||
|---|---|---|---|
| Without adverse perinatal outcome | With adverse perinatal outcome | Total | |
| < 30 | 350 | 20 | 370 |
| ≥ 30 | 547 | 42 | 589 |
| Total | 897 | 62 | 959 |
| Threshold (mg/mmol) | Number of women | ||
|---|---|---|---|
| Without adverse perinatal outcome | With adverse perinatal outcome | Total | |
| < 30 | 313 | 18 | 331 |
| ≥ 30 | 584 | 44 | 628 |
| Total | 897 | 62 | 959 |
| Assay and sample | Threshold (mg/mmol) | Sensitivity (%) (95% CI) | Specificity (%) (95% CI) | Likelihood ratios (95% CI) | p-value for comparison with the local laboratory’s SPCRa | ||
|---|---|---|---|---|---|---|---|
| LR+ | LR– | Sensitivity | Specificity | ||||
| Recruitment sample | |||||||
| Local laboratory – SPCR | 30 | 69 (56 to 80) | 35 (32 to 39) | 1.07 (0.89 to 1.26) | 0.87 (0.53 to 1.20) | – | – |
| Central laboratoryb – SPCR via the BZC assay | 30 | 77 (65 to 87) | 39 (36 to 42) | 1.26 (1.08 to 1.45) | 0.58 (0.31 to 0.85) | 0.059 | 0.003 |
| Central laboratoryb – SPCR via the PGR assay | 30 | 79 (67 to 88) | 35 (32 to 38) | 1.21 (1.04 to 1.38) | 0.60 (0.31 to 0.90) | 0.034 | 0.56 |
| Central laboratoryb – SACR | 2 | 94 (84 to 98) | 14 (12 to 16) | 1.09 (1.01 to 1.16) | 0.46 (0.02 to 0.91) | < 0.0001 | < 0.0001 |
| 24-hour sample | |||||||
| Central laboratoryb – SPCR via the BZC assay | 30 | 68 (55 to 79) | 39 (36 to 42) | 1.11 (0.91 to 1.31) | 0.83 (0.52 to 1.13) | 0.74 | 0.006 |
| Central laboratoryb – SPCR via the PGR assay | 30 | 71 (58 to 82) | 35 (32 to 38) | 1.09 (0.91 to 1.27) | 0.83 (0.50 to 1.16) | 0.74 | 0.73 |
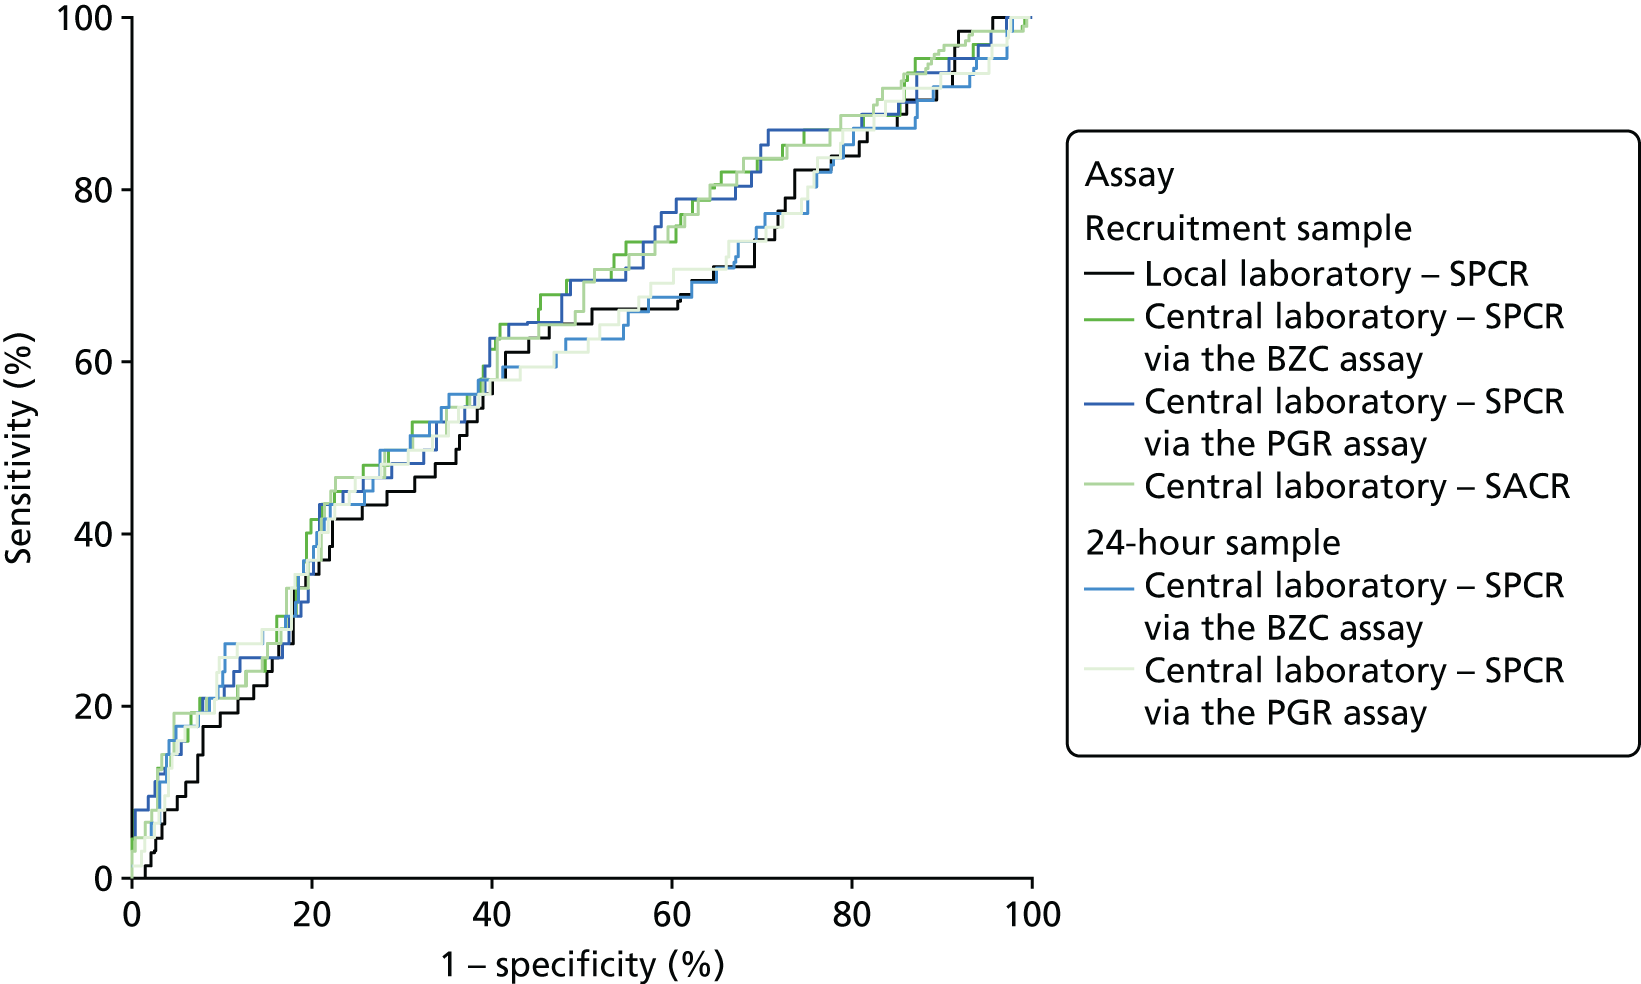
The ROC curves for all six assays demonstrated poor diagnostic accuracy (Figure 5), although the areas under the central laboratory’s SPCR via the BZC assay (recruitment sample) curve, the central laboratory’s SPCR via the PGR assay (recruitment sample) curve and the central laboratory’s SACR (recruitment sample) curve were all significantly greater than that for the local laboratory’s SPCR (recruitment sample) curve (Table 41).
FIGURE 5.
Receiver operating characteristic curves for the four assays of the recruitment urine sample and the two assays of the 24-hour urine sample used to predict adverse perinatal outcome.
| Assay and sample | Area under ROC curve (95% CI) | Comparison with the local laboratory’s SPCR | |
|---|---|---|---|
| Difference (95% CI) | p-valuea | ||
| Recruitment sample | |||
| Local laboratory – SPCR | 0.59 (0.51 to 0.67) | – | – |
| Central laboratoryb – SPCR via the BZC assay | 0.64 (0.56 to 0.71) | 0.05 (0.01 to 0.08) | 0.025 |
| Central laboratoryb – SPCR via the PGR assay | 0.63 (0.56 to 0.70) | 0.04 (0.00 to 0.08) | 0.047 |
| Central laboratoryb – SACR | 0.63 (0.56 to 0.71) | 0.04 (0.00 to 0.04) | 0.039 |
| 24-hour sample | |||
| Central laboratoryb – SPCR via the BZC assay | 0.60 (0.52 to 0.68) | 0.01 (–0.03 to 0.06) | 0.64 |
| Central laboratoryb – SPCR via the PGR assay | 0.60 (0.52 to 0.68) | 0.03 (–0.03 to 0.06) | 0.58 |
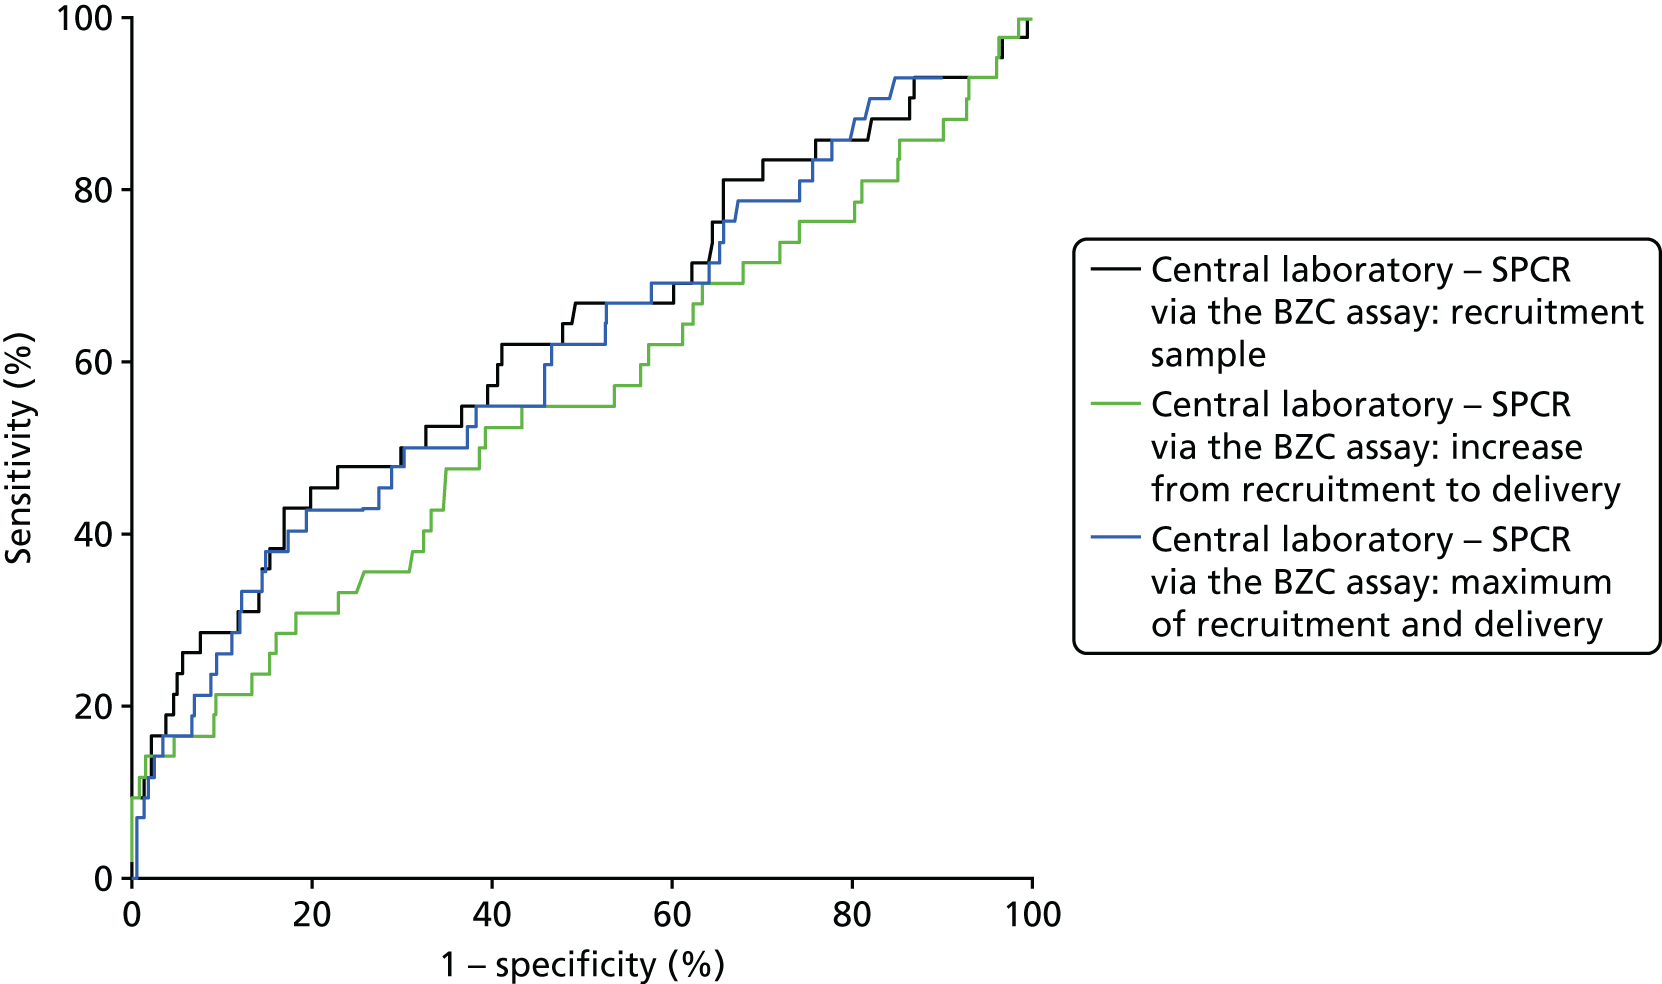
Because of missing data, only 530 women could be included in the analyses involving the central laboratory’s BZC assay of the delivery spot urine samples (i.e. the increase from recruitment to delivery and the maximum of the recruitment and delivery laboratory BZC SPCR assay). ROC curves for the prediction of adverse perinatal outcomes are shown in Figure 6, alongside that for the recruitment sample central laboratory’s SPCR test via the BZC assay for comparison. Neither the increase nor the maximum offered any improvement over the original recruitment sample in the prediction of adverse perinatal outcomes (Table 42).
FIGURE 6.
Receiver operating characteristic curves for the increase from recruitment to delivery for the BZC SPCR assay, and maximum of recruitment and delivery BZC SPCR assay, in the prediction of adverse perinatal outcome.
| Assay | Area under ROC curve (95% CI) | Comparison with the recruitment sample of the central laboratory’s SPCR test via the BZC assay | |
|---|---|---|---|
| Difference (95% CI) | p-valuea | ||
| Recruitment sampleb | 0.64 (0.53 to 0.75) | – | – |
| Increase from recruitment to delivery sampleb | 0.53 (0.41 to 0.66) | –0.11 (–0.27 to 0.05) | 0.19 |
| Maximum of recruitment and delivery sampleb | 0.63 (0.52 to 0.74) | –0.01 (–0.06 to 0.04) | 0.71 |
Subgroup analysis
The primary analysis was repeated in the subset of women with 1+ or higher on the POC dipstick test. Tables 43–46 show index test results cross-tabulated against the reference standard (NICE definition of severe PE). Sensitivities, specificities, LR+s and LR–s are shown in Table 47. The three SPCR tests all had sensitivity in excess of 90% at the prespecified thresholds, but with poor specificity. The central laboratory’s SACR test had significantly higher sensitivity (99%, 95% CI 98% to 100%) than the local laboratory’s SPCR test, but its specificity (20%, 95% CI 16% to 24%) was significantly lower. The high sensitivities and LR–s of ≤ 0.1 suggest that all of the tests could be used as rule-out tests for severe PE (NICE definition) in the subgroup with 1+ or higher on the POC dipstick test.
| Threshold (mg/mmol) | Number of women | ||
|---|---|---|---|
| Without severe PE | With severe PE | Total | |
| < 30 | 228 | 24 | 252 |
| ≥ 30 | 206 | 384 | 590 |
| Total | 434 | 408 | 842 |
| Threshold (mg/mmol) | Number of women | ||
|---|---|---|---|
| Without severe PE | With severe PE | Total | |
| < 30 | 253 | 26 | 279 |
| ≥ 30 | 181 | 382 | 563 |
| Total | 434 | 408 | 842 |
| Threshold (mg/mmol) | Number of women | ||
|---|---|---|---|
| Without severe PE | With severe PE | Total | |
| < 30 | 219 | 20 | 239 |
| ≥ 30 | 215 | 388 | 603 |
| Total | 434 | 408 | 842 |
| Threshold (mg/mmol) | Number of women | ||
|---|---|---|---|
| Without severe PE | With severe PE | Total | |
| < 2 | 86 | 3 | 89 |
| ≥ 2 | 348 | 405 | 753 |
| Total | 434 | 408 | 842 |
| Assay | Threshold (mg/mmol) | Sensitivity (%) (95% CI) | Specificity (%) (95% CI) | Likelihood ratios (95% CI) | p-value for the comparison with the local laboratory’s SPCRa | ||
|---|---|---|---|---|---|---|---|
| LR+ | LR– | Sensitivity | Specificity | ||||
| Local laboratory – SPCR | 30 | 94 (91 to 96) | 53 (48 to 57) | 1.98 (1.78 to 2.19) | 0.11 (0.07 to 0.16) | – | – |
| Central laboratoryb – SPCR via the BZC assay | 30 | 94 (91 to 96) | 58 (54 to 63) | 2.25 (1.99 to 2.50) | 0.11 (0.07 to 0.15) | 0.67 | 0.003 |
| Central laboratoryb – SPCR via the PGR assay | 30 | 95 (93 to 97) | 50 (46 to 55) | 1.92 (1.73 to 2.11) | 0.10 (0.05 to 0.14) | 0.39 | 0.31 |
| Central laboratoryb – SACR | 2 | 99 (98 to 100) | 20 (16 to 24) | 1.24 (1.18 to 1.30) | 0.04 (–0.01 to 0.08) | < 0.0001 | < 0.0001 |
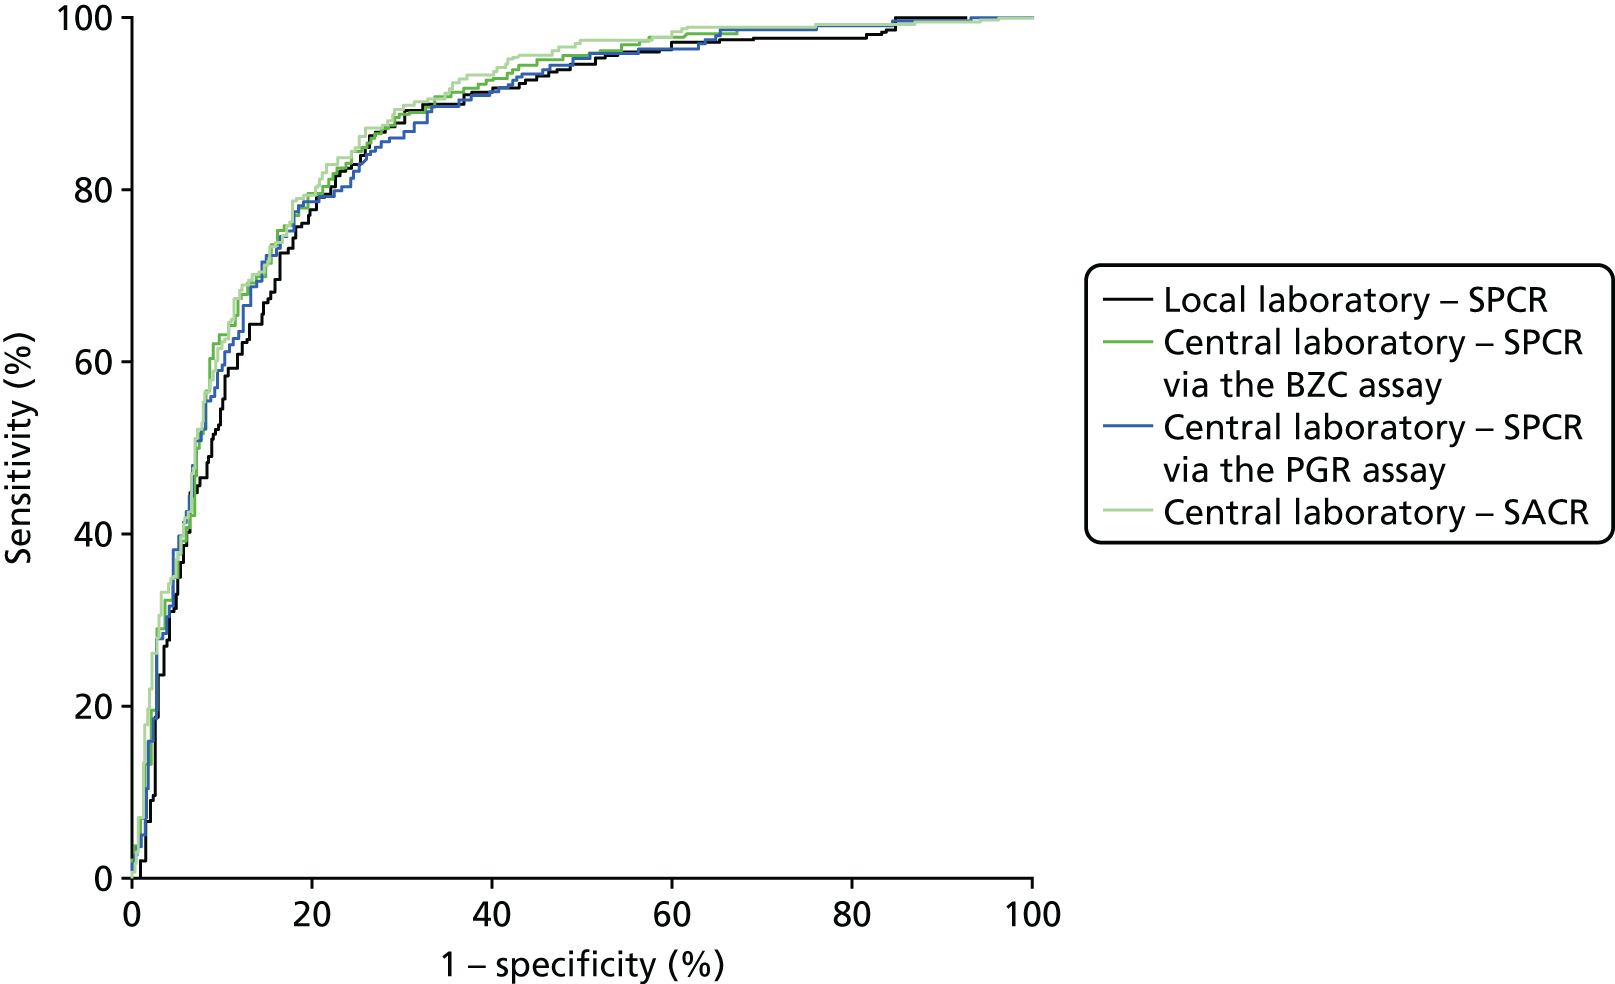
When overlain the ROC curves for the four assays were similar (Figure 7). The area under the central laboratory’s SACR curve was significantly greater than that for the local laboratory’s SPCR curve, although the difference (0.02, 95% CI 0.00 to 0.04; p = 0.012) may not be of practical importance (Table 48).
FIGURE 7.
Receiver operating characteristic curves for the four assays of the recruitment urine sample used to diagnose severe PE (NICE definition), in the subgroup with 1+ or higher on the POC dipstick test.
| Assay | Area under ROC curve (95% CI) | Comparison with the local laboratory’s SPCR | |
|---|---|---|---|
| Difference (95% CI) | p-valuea | ||
| Local laboratory – SPCR | 0.85 (0.83 to 0.88) | – | – |
| Central laboratoryb – SPCR via the BZC assay | 0.87 (0.85 to 0.89) | 0.02 (0.00 to 0.03) | 0.074 |
| Central laboratoryb – SPCR via the PGR assay | 0.86 (0.84 to 0.89) | 0.01 (–0.01 to 0.03) | 0.31 |
| Central laboratoryb – SACR | 0.88 (0.85 to 0.90) | 0.03 (0.00 to 0.04) | 0.012 |
The same subgroup analysis (1+ or higher on the POC dipstick test) was repeated using clinician diagnosis of severe PE as the reference standard and including the two assays of the 24-hour urine sample as index tests. Tables 49–54 show index test results cross-tabulated against the reference standard. Sensitivities, specificities, LR+s and LR–s are shown in Table 55. The three SPCR tests from the recruitment urine sample and two SPCR tests from the 24-hour sample had sensitivity in excess of 80% but below 90% at the prespecified thresholds, and with poor specificity. The central laboratory’s SACR test had significantly higher sensitivity (97%, 95% CI 94% to 99%) than the local laboratory’s SPCR test, but its specificity (13%, 95% CI 10% to 15%) was significantly lower.
| Threshold (mg/mmol) | Number of women | ||
|---|---|---|---|
| Without severe PE | With severe PEa | Total | |
| < 30 | 232 | 20 | 252 |
| ≥ 30 | 432 | 158 | 590 |
| Total | 664 | 178 | 842 |
| Threshold (mg/mmol) | Number of women | ||
|---|---|---|---|
| Without severe PE | With severe PEa | Total | |
| < 30 | 254 | 25 | 279 |
| ≥ 30 | 410 | 153 | 563 |
| Total | 434 | 178 | 842 |
| Threshold (mg/mmol) | Number of women | ||
|---|---|---|---|
| Without severe PE | With severe PEa | Total | |
| < 30 | 216 | 23 | 239 |
| ≥ 30 | 448 | 155 | 603 |
| Total | 664 | 178 | 842 |
| Threshold (mg/mmol) | Number of women | ||
|---|---|---|---|
| Without severe PE | With severe PEa | Total | |
| < 2 | 84 | 5 | 89 |
| ≥ 2 | 580 | 173 | 753 |
| Total | 664 | 178 | 842 |
| Threshold (mg/mmol) | Number of women | ||
|---|---|---|---|
| Without severe PE | With severe PEa | Total | |
| < 30 | 257 | 26 | 283 |
| ≥ 30 | 407 | 152 | 559 |
| Total | 664 | 178 | 842 |
| Threshold (mg/mmol) | Number of women | ||
|---|---|---|---|
| Without severe PE | With severe PEa | Total | |
| < 30 | 219 | 26 | 245 |
| ≥ 30 | 445 | 152 | 597 |
| Total | 664 | 178 | 842 |
| Assay and sample | Threshold (mg/mmol) | Sensitivity (%) (95% CI) | Specificity (%)(95% CI) | Likelihood ratios (95% CI) | p-value for the comparison with local laboratory’s SPCRa | ||
|---|---|---|---|---|---|---|---|
| LR+ | LR– | Sensitivity | Specificity | ||||
| Recruitment sample | |||||||
| Local laboratory – SPCR | 30 | 89 (83 to 93) | 35 (31 to 39) | 1.36 (1.26 to 1.47) | 0.32 (0.18 to 0.46) | – | – |
| Central laboratoryb – SPCR via the BZC assay | 30 | 86 (80 to 91) | 38 (35 to 42) | 1.39 (1.27 to 1.51) | 0.37 (0.23 to 0.51) | 0.13 | 0.016 |
| Central laboratoryb – SPCR via the PGR assay | 30 | 87 (81 to 92) | 33 (29 to 36) | 1.29 (1.19 to 1.39) | 0.40 (0.24 to 0.56) | 0.37 | 0.090 |
| Central laboratoryb – SACR | 2 | 97 (94 to 99) | 13 (10 to 15) | 1.11 (1.07 to 1.16) | 0.22 (0.02 to 0.42) | 0.0003 | < 0.0001 |
| 24-hour sample | |||||||
| Central laboratoryb – SPCR via the BZC assay | 30 | 85 (79 to 90) | 39 (35 to 43) | 1.39 (1.27 to 1.51) | 0.38 (0.24 to 1.52) | 0.16 | 0.024 |
| Central laboratoryb – SPCR via the PGR assay | 30 | 85 (79 to 90) | 33 (29 to 37) | 1.27 (1.17 to 1.38) | 0.44 (0.28 to 1.61) | 0.11 | 0.22 |
The ROC curves for all six assays demonstrated poor diagnostic accuracy (Figure 8), although the areas under the central laboratory’s SACR (recruitment sample) curve and the central laboratory’s SPCR test via the BZC assay (24-hour sample) curve (Figure 9) curve were both significantly greater than that for the local laboratory’s SPCR (recruitment sample) curve (Table 56).
FIGURE 8.
Receiver operating characteristic curves for the four assays of the recruitment urine sample and the two assays of the 24-hour sample used to diagnose severe PE (clinician diagnosis), in the subgroup with 1+ or higher on POC dipstick test.
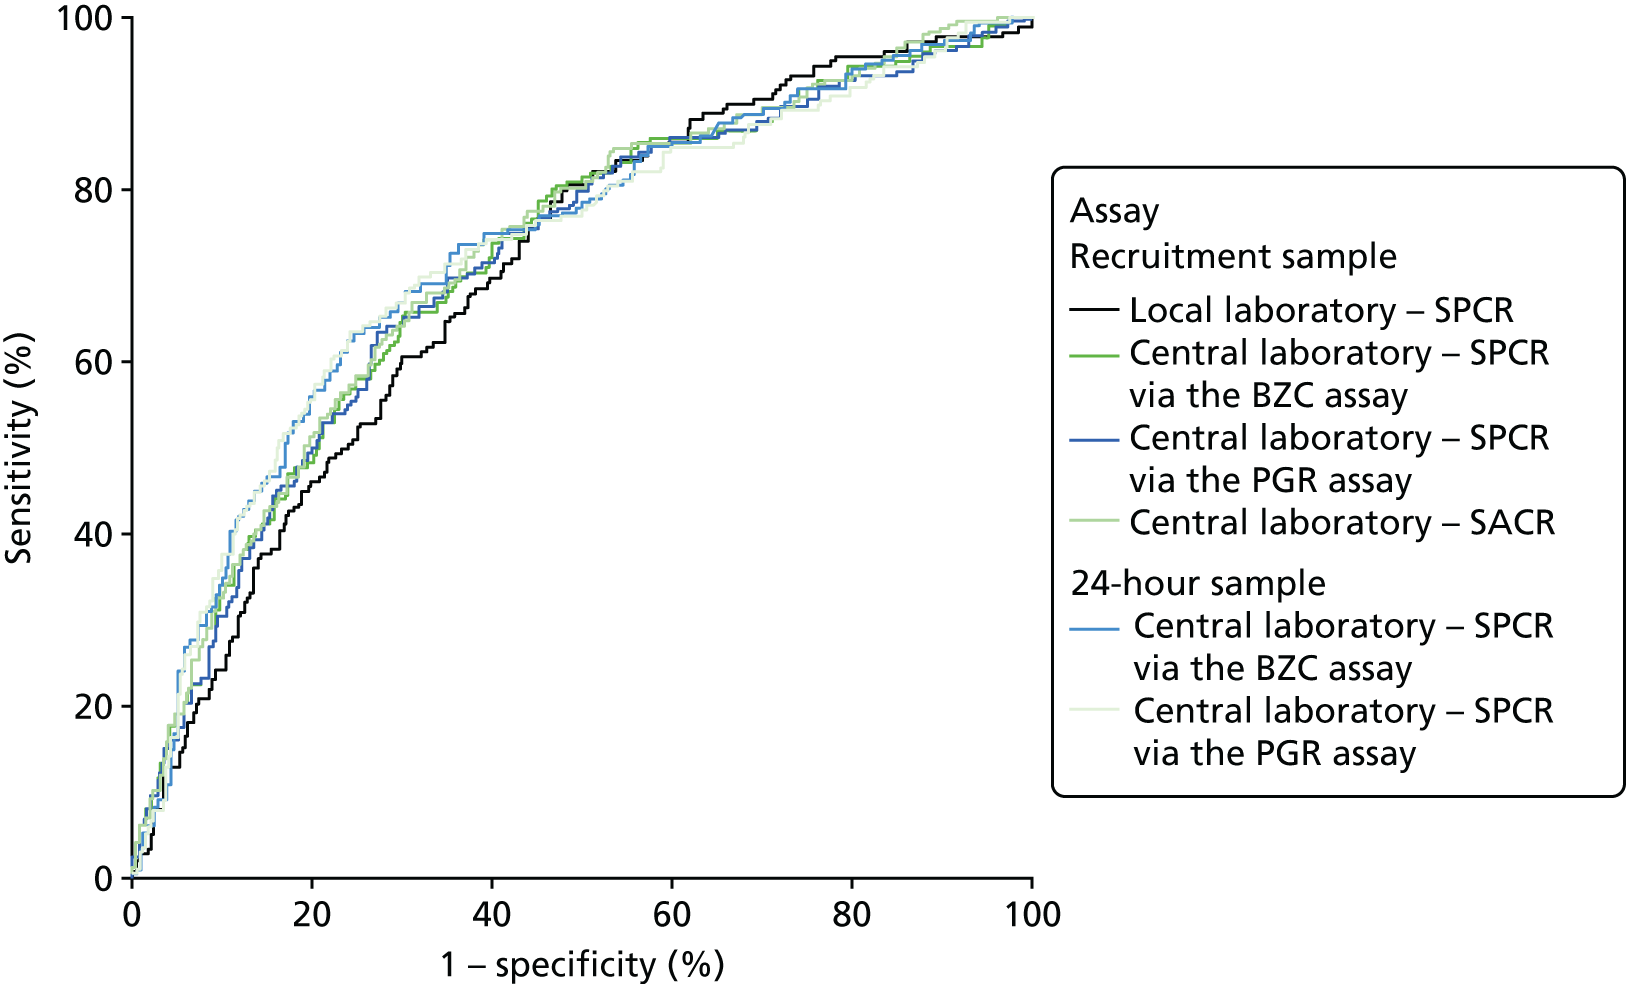
FIGURE 9.
Receiver operating characteristic curves for the four assays of the recruitment urine sample used to diagnose severe PE (NICE definition, using the PGR assay).
| Assay and sample | Area under ROC curve (95% CI) | Comparison with the local laboratory’s SPCR | |
|---|---|---|---|
| Difference (95% CI) | p-valuea | ||
| Recruitment sample | |||
| Local laboratory – SPCR | 0.70 (0.66 to 0.74) | – | – |
| Central laboratoryb – SPCR via the BZC assay | 0.71 (0.67 to 0.76) | 0.01 (–0.01 to 0.03) | 0.19 |
| Central laboratoryb – SPCR via the PGR assay | 0.71 (0.67 to 0.75) | 0.01 (–0.01 to 0.03) | 0.40 |
| Central laboratoryb – SACR | 0.72 (0.68 to 0.76) | 0.02 (0.00 to 0.04) | 0.042 |
| 24-hour sample | |||
| Central laboratoryb – SPCR via the BZC assay | 0.73 (0.68 to 0.77) | 0.03 (0.00 to 0.05) | 0.040 |
| Central laboratoryb – SPCR via the PGR assay | 0.72 (0.68 to 0.77) | 0.02 (0.00 to 0.05) | 0.083 |
Laboratory assay method for 24-hour proteinuria
The percentage of women with proteinuria (≥ 300 mg/24 hours) defined using the central laboratory’s (Kent) PGR assay (55%) was greater than the percentage defined using the BZC assay (50%) (Table 57). Consequently, the percentage of women categorised as having severe PE according to the NICE definition was greater using the alternative PGR assay (48%) than using the BZC assay (43%) (Table 58).
| Threshold (mg/mmol) | Number of women | ||
|---|---|---|---|
| PGR threshold (mg/l) | Total | ||
| < 300 | ≥ 300 | – | |
| < 300 | 425 | 59 | 484 |
| ≥ 300 | 2 | 473 | 475 |
| Total | 427 | 532 | 959 |
| Severe PE defined using the BZC assaya | Severe PE defined using the PGR assay,a number of women | ||
|---|---|---|---|
| Without severe PE | With severe PE | Total | |
| Without severe PE | 493 | 49 | 542 |
| With severe PE | 2 | 415 | 417 |
| Total | 495 | 464 | 959 |
The diagnostic accuracy of the four assays using the spot urine sample at recruitment were compared using prespecified thresholds of 30 mg/mmol for SPCR and 2 mg/mmol for SACR, but using the PGR assay instead of the BZC assay in the NICE definition of severe PE. Tables 59–62 show index test results cross-tabulated against this alternative reference standard. Sensitivities, specificities, LR+s and LR–s are shown in Table 63. The three SPCR tests all had sensitivity in excess of 90% at the prespecified thresholds but with poor specificity. The central laboratory’s SACR test had significantly higher sensitivity (99%, 95% CI 97% to 100%) than the local laboratory’s SPCR test, but its specificity (25%, 95% CI 21% to 29%) was significantly lower. LR–s were slightly higher than those found using the BZC assay in the proteinuria component of the definition.
| Threshold (mg/mmol) | Number of women | ||
|---|---|---|---|
| Without severe PE | With severe PE | Total | |
| < 30 | 296 | 40 | 336 |
| ≥ 30 | 199 | 424 | 623 |
| Total | 495 | 464 | 959 |
| Threshold (mg/mmol) | Number of women | ||
|---|---|---|---|
| Without severe PE | With severe PE | Total | |
| < 30 | 319 | 43 | 362 |
| ≥ 30 | 176 | 421 | 597 |
| Total | 495 | 464 | 959 |
| Threshold (mg/mmol) | Number of women | ||
|---|---|---|---|
| Without severe PE | With severe PE | Total | |
| < 30 | 290 | 34 | 324 |
| ≥ 30 | 205 | 430 | 635 |
| Total | 495 | 464 | 959 |
| Threshold (mg/mmol) | Number of women | ||
|---|---|---|---|
| Without severe PE | With severe PE | Total | |
| < 2 | 124 | 5 | 129 |
| ≥ 2 | 371 | 459 | 830 |
| Total | 495 | 464 | 959 |
| Assay | Threshold (mg/mmol) | Sensitivity (%) (95% CI) | Specificity (%) (95% CI) | Likelihood ratios (95% CI) | p-value for the comparison with the local laboratory’s SPCRa | ||
|---|---|---|---|---|---|---|---|
| LR+ | LR– | Sensitivity | Specificity | ||||
| Local laboratory – SPCR | 30 | 91 (88 to 94) | 60 (55 to 64) | 2.27 (2.02 to 2.53) | 0.14 (0.07 to 0.16) | – | – |
| Central laboratoryb – SPCR via the BZC assay | 30 | 91 (88 to 93) | 64 (60 to 69) | 2.55 (2.24 to 2.86) | 0.14 (0.07 to 0.15) | 0.59 | 0.013 |
| Central laboratoryb – SPCR via the PGR assay | 30 | 93 (90 to 95) | 59 (54 to 63) | 2.24 (2.00 to 2.48) | 0.13 (0.08 to 0.17) | 0.27 | 0.52 |
| Central laboratoryb – SACR | 2 | 99 (97 to 100) | 25 (21 to 29) | 1.32 (1.25 to 1.39) | 0.04 (0.00 to 0.08) | < 0.0001 | < 0.0001 |
When overlain, the ROC curves for the four assays were similar (see Figure 9). The areas under the curve for all three laboratory assays were significantly greater than that for the local laboratory’s SPCR curve, although the differences may not be of practical importance (Table 64).
| Assay | Area under ROC curve (95% CI) | Comparison with the local laboratory’s SPCR | |
|---|---|---|---|
| Difference (95% CI) | p-valuea | ||
| Local laboratory – SPCR | 0.85 (0.82 to 0.87) | – | – |
| Central laboratoryb – SPCR via the BZC assay | 0.87 (0.85 to 0.89) | 0.02 (0.00 to 0.04) | 0.033 |
| Central laboratoryb – SPCR via the PGR assay | 0.87 (0.84 to 0.89) | 0.02 (0.00 to 0.03) | 0.050 |
| Central laboratoryb – SACR | 0.88 (0.85 to 0.90) | 0.03 (0.01 to 0.04) | 0.002 |
Further investigation of the agreement between the central laboratory’s (Kent) BZC and PGR assays of total protein from the 24-hour urine sample was conducted for 1446 women with data from both assays. The minimum protein concentration was 68 mg/l for the BZC assay and 26 mg/l for the PGR assay. Maximum values were of the order of 45,000 mg/l for both assays. Figure 10 shows a Bland–Altman plot for the two assays (for the difference between the BZC assay and the PGR assay plotted against the average of the two). There was a distinctly non-linear relationship between the two. As the clinical decision point in relation to diagnosing severe PE is 300 mg/l, we have shown this relationship over a limited range of values for the average between 0 mg/l and 2000 mg/l. Up to values of around 1200 mg/l the PGR assay value is typically higher than the BZC assay value (at 600 mg/l the difference averages around 100 mg/l), and at values from 1200 to 2000 mg/l the PGR assay value is typically smaller.
FIGURE 10.
Bland–Altman plot of the central laboratory’s BZC and PGR assay protein concentrations.
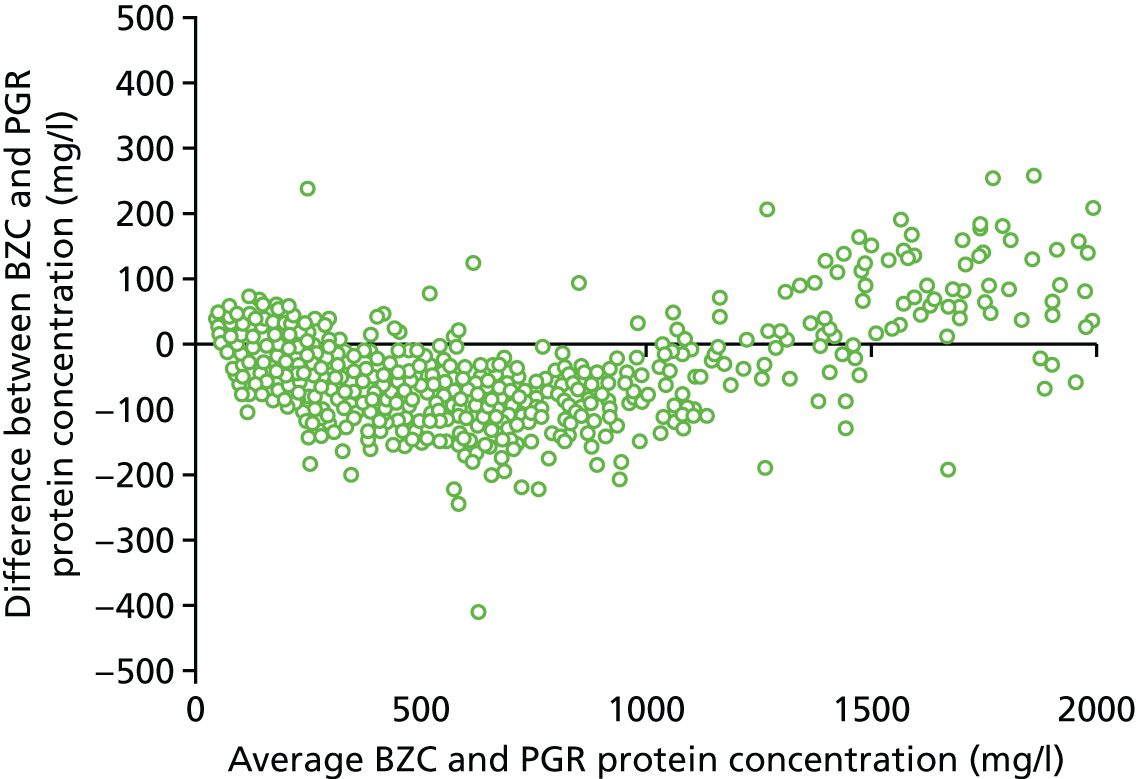
Chapter 4 Health economics
Methods of economic evaluation
Aim of economic evaluation
The aim of the economic evaluation was to estimate the cost-effectiveness of six laboratory tests compared with the local laboratory’s SPCR test for the diagnosis of severe PE in pregnant women treated in obstetric units.
Design of economic evaluation
Comparators
The analysis estimated the economic consequences of the following tests:
-
local laboratory’s SPCR test
-
central laboratory’s (Kent) SPCR test using the BZC assay
-
central laboratory’s (Kent) SPCR test using the PGR assay
-
central laboratory’s (Kent) SACR test
-
central laboratory’s (Kent) 24-hour urine protein concentration using the BZC assay
-
central laboratory’s (Kent) 24-hour urine protein concentration using the PGR assay
-
dipstick test only.
Population
The economic evaluation incorporated the results of the clinical study, which included women aged ≥ 16 years who were at > 20 weeks’ gestation with confirmed new hypertension (systolic BP of ≥ 140 mmHg and/or diastolic BP of ≥ 90 mmHg) and trace or greater of proteinuria on automated dipstick urinalysis.
Perspective
The economic evaluation assumed a NHS cost perspective.
Time horizon
Relevant costs and outcomes of each comparator were examined over a lifetime horizon.
Discounting of costs and outcomes
All costs and outcomes accumulated in future years in the analysis were discounted at an annual rate of 3.5%, as recommended by Her Majesty’s Treasury. 24
Model structure
A decision-analytic decision tree model was used to carry out a cost-effectiveness analysis of each test compared with the baseline test (local laboratory SPCR). It combined information collected during the clinical study with external sources for resource use, unit costs and utility parameters to quantify the economic consequences of each test for both the mother and baby.
The analysis built on the hypertension in pregnancy models published in NICE’s CG107. 1 Specifically, the current study updated the model pathway for hypertension in pregnancy (listed in appendix I of the NICE guideline1) and PE (in appendix J of the NICE guideline1). A focused search of the literature was conducted to update key transition probabilities with evidence published since 2011 (the publication year of the NICE guideline). All model costs were updated to 2014/15 year using published UK unit costs.
Model components
The decision-analytic model combined the following elements:
-
A decision-tree model incorporated the outcome of each proposed test: true positive, false negative, true negative and false positive. The diagnostic accuracy of each test was estimated from data collected prospectively during the study period.
-
Each branch corresponding to the outcome of the test leads to a decision tree for the management of the mother and baby in the antenatal and postnatal period.
-
Patients in the true-negative branch enter a pathway adapted from appendix I of the NICE guideline. 1 False positives follow through the same pathway, with the exception of an additional day of hospital stay for additional tests to establish the case as a negative.
-
True positives enter a pathway of treatment for severe PE (adapted from appendix J of the NICE guideline). 1
-
False negatives were assumed to be treated as true negatives, apart from the following changes as per the methods used in the NICE model:1 90% in emergency caesarean section, 5% assisted birth and 5% normal birth. The probability of intensive care for PE is 5%. The effect of delayed diagnosis of severe PE is a higher probability of adverse outcome during delivery and the need for intensive treatment for the mother. The probability of neonatal high-dependency/intensive care is assumed to be unchanged compared with true negatives.
-
-
The therapeutic pathway simulated the lifetime progression of the mother and baby until death, which determined the QALY outcome.
Model states
The initial part of the model defined the diagnostic accuracy of each test and contained the following nodes: negative, positive, true positive, true negative, false positive and false negative. This was followed by the therapeutic pathway that contained the following nodes: spontaneous onset of birth, induced onset of birth and planned caesarean. Spontaneous and induction onset had identical pathways, with the only difference in the distribution of the type of birth: normal vaginal birth, assisted vaginal birth and emergency caesarean. This was followed by hospital admission for complications for the mother: severe PE, no severe PE, maternal high-dependency unit (HDU), maternal intensive care unit (ICU) and maternal ward. This was followed by hospital admission for complications for the baby: neonatal normal care, neonatal HDU, neonatal ICU, neonatal intensive care unit (NICU) or no admission for complications. All pathways led to the mortality nodes, death of the mother and/or baby, which determined the QALY outcomes.
Model diagram
The structure of the first part of the model (diagnostic pathway) is illustrated in Figure 11 and the second part of the model (therapeutic pathway) in Figure 12.
FIGURE 11.
Structure of diagnostic pathway in the decision-analytic model.
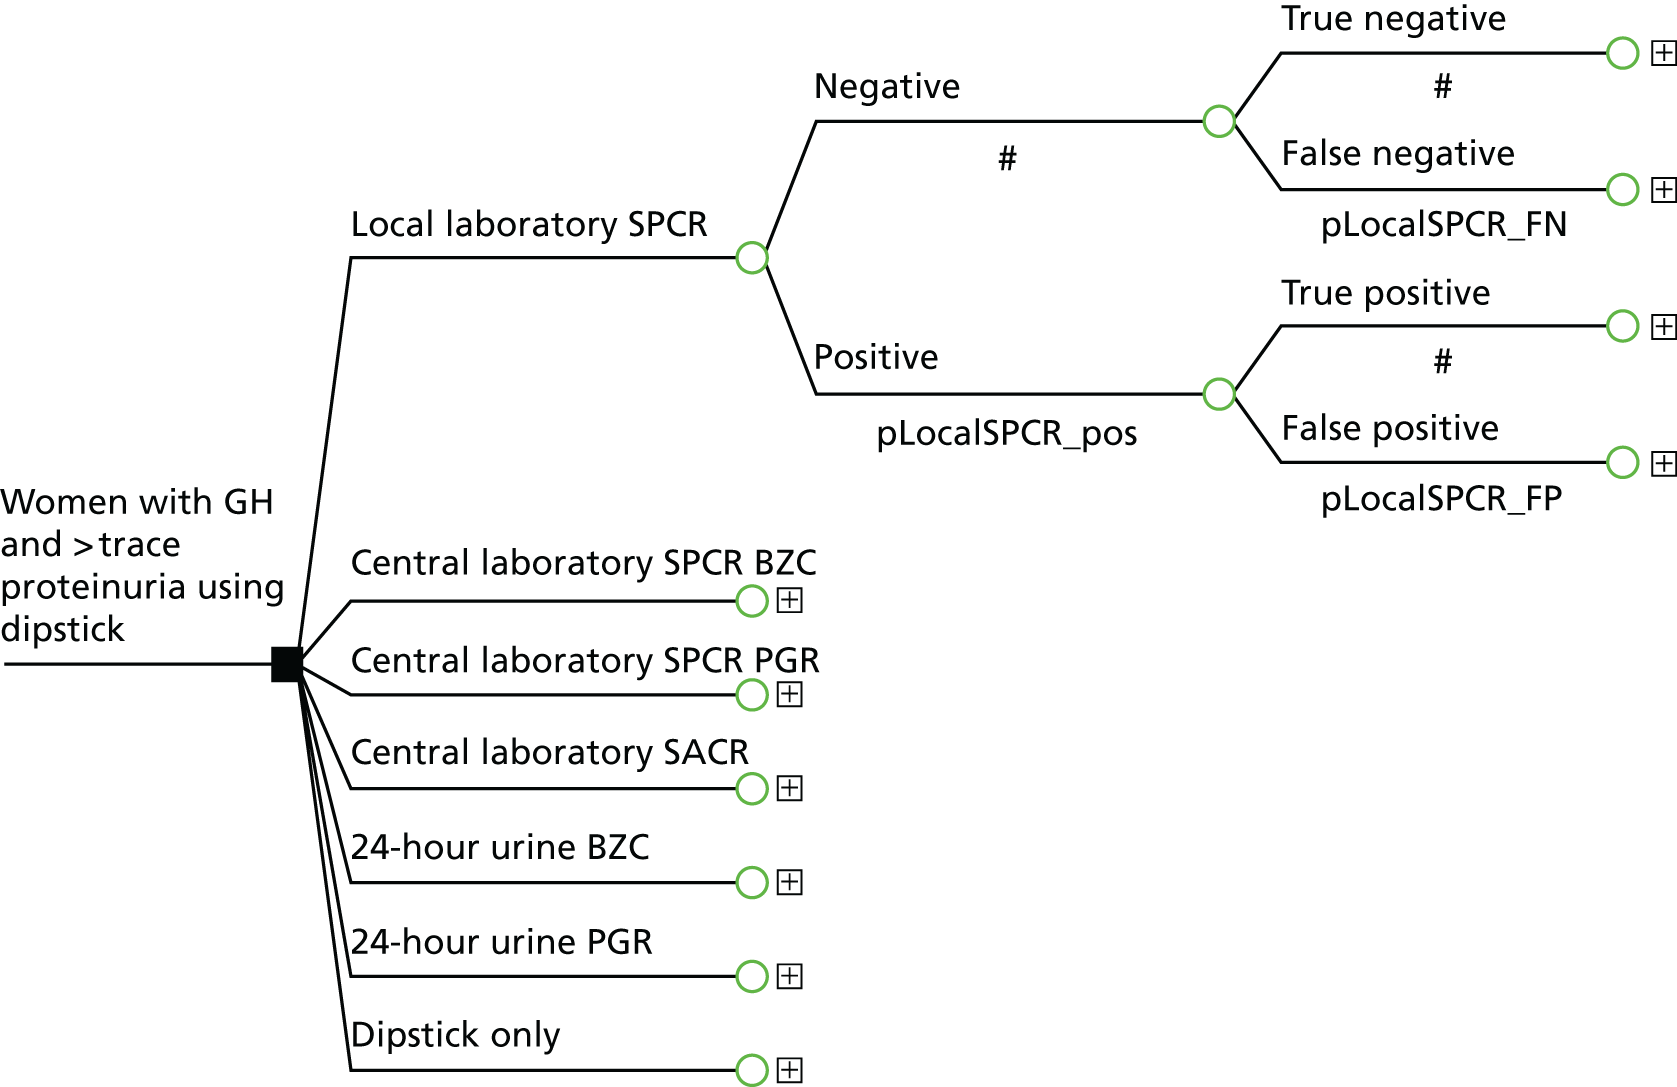
FIGURE 12.
Structure of therapeutic pathway in the decision-analytic model.
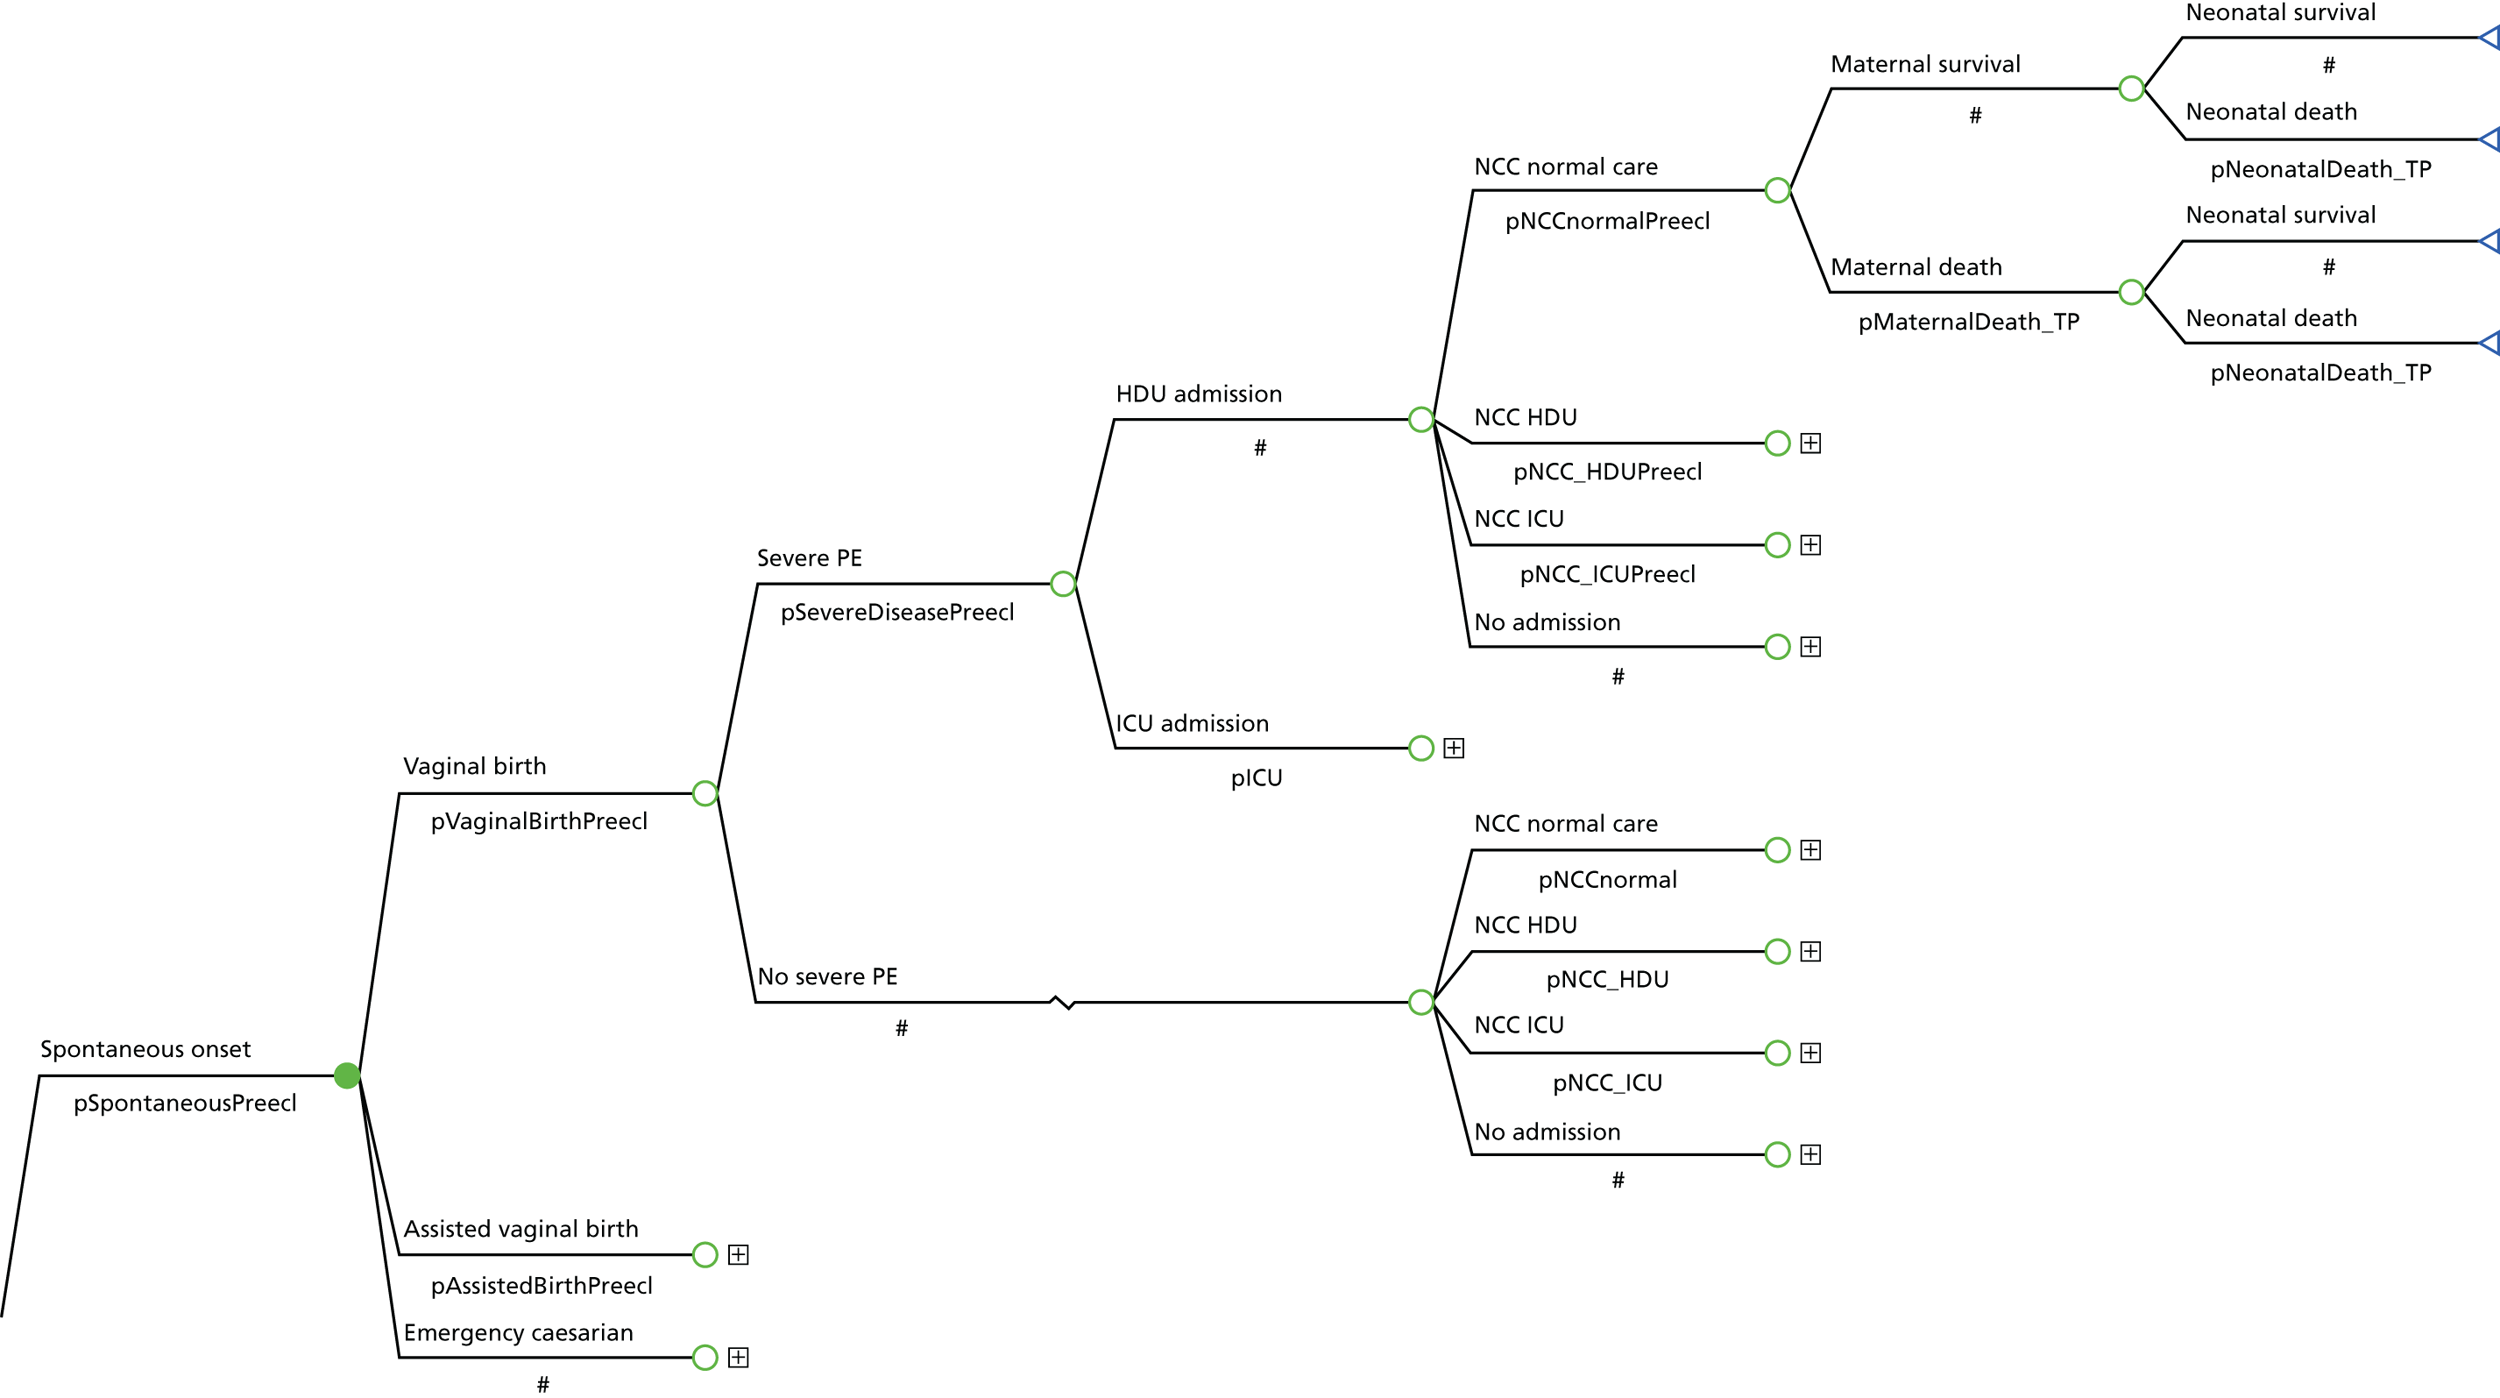
Figure 11 demonstrates the pathway in the diagnostic part of the model. All patients begin at the initial node (pregnant with hypertension and trace/dipstick +1 urine protein). The model then assigns patients to one of the comparator tests. The presence or absence of severe PE will determine the subsequent progression of patients to the therapeutic pathway in Figure 12. Patients transition into pathways according to the outcome of testing: severe PE (true positive, false negative) or normal care in gestational hypertension/PE (true negative, false positive). The pathway in Figure 11 is demonstrated for the local laboratory’s SPCR test and is identical for all tests. Differences in pathways will be determined by the diagnostic accuracy (sensitivity and specificity) collected in the clinical study.
Figure 12 demonstrates the pathway in the therapeutic part of the model. All patients begin at the initial node, according to the consequences of tests in Figure 11 (severe PE, moderate PE or gestational hypertension). Subsequent progression determines the type of birth, maternal HDU/ICU admission as a result of PE and neonatal HDU/ICU. Transition probabilities are derived from the NICE hypertension in pregnancy guideline model. 1 Patients accumulate cost of treatment up to the end of the pathway (discharge from maternal ward/HDU/ICU/death). The mean cost per patient is added to the intervention cost and QALYs estimated based on maternal and neonatal mortality rates in PE or gestational hypertension.
Sources of model inputs
Effectiveness of interventions
Transition probabilities for the initial part of the model were derived from the results of the statistical analysis of the diagnostic accuracy of each comparator test in relation to the clinician diagnosis of severe PE, which was determined by the presence of severe PET protocol and/or magnesium sulphate treatment. The distribution of patients across diagnostic categories is summarised in Table 65.
| Comparator | Women included in analysis, n | Cases | Non-cases | TP | FP | TN | FN | Sensitivity | Specificity |
|---|---|---|---|---|---|---|---|---|---|
| Local laboratory – SPCR | 959 | 193 | 766 | 165 | 458 | 308 | 28 | 0.8549 | 0.4021 |
| Central laboratorya – SPCR via the BZC assay | 959 | 193 | 766 | 162 | 435 | 331 | 31 | 0.8394 | 0.4321 |
| Central laboratorya – SPCR via the PGR assay | 959 | 193 | 766 | 165 | 470 | 296 | 28 | 0.8549 | 0.3864 |
| Central laboratorya – SACR | 959 | 193 | 766 | 187 | 643 | 123 | 6 | 0.9689 | 0.1606 |
| Central laboratorya – 24-hour urine protein measured using the BZC assay | 959 | 193 | 766 | 161 | 428 | 338 | 32 | 0.8342 | 0.4413 |
| Central laboratorya – 24-hour urine protein measured using the PGR assay | 959 | 193 | 766 | 162 | 466 | 300 | 31 | 0.8394 | 0.3916 |
| Dipstick test alone | 959 | 193 | 766 | 178 | 664 | 102 | 15 | 0.9223 | 0.1332 |
Transition probabilities
Transition probabilities for the model were derived from three sources:
-
Transition probabilities in the first part of the model (outcomes of tests) were informed by data on diagnostic accuracy of each test prospectively collected from patients.
-
The consequences of hypertension in pregnancy and PE on maternal and neonatal outcomes were modelled using transition probabilities obtained from the adapted NICE hypertension in pregnancy models (reported in appendix I and appendix J of the NICE guideline1).
-
Probability of death was derived from mortality figures based on the confidential enquiry into maternal and child health25 and Douglas and Redman,26 used in the NHS model and reported in NICE’s CG107, in appendix K. 1
A summary of transition probabilities used in the model is included in Table 66.
| Transition | Value | Range | Source |
|---|---|---|---|
| Clinician diagnosis | |||
| Probability of severe PE | 0.2013 | 0.1765–0.2272 | Clinical study |
| Diagnostic accuracy | |||
| Local laboratory – SPCR | |||
| Sensitivity | 0.8549 | 0.8020–0.9009 | Clinical study |
| Specificity | 0.4021 | 0.3676–0.4370 | Clinical study |
| Dipstick only | |||
| Sensitivity | 0.9223 | 0.8807–0.9556 | Clinical study |
| Specificity | 0.1332 | 0.1100–0.1581 | Clinical study |
| Central laboratorya – SPCR via the BZC assay | |||
| Sensitivity | 0.8394 | 0.7845–0.8876 | Clinical study |
| Specificity | 0.4321 | 0.3972–0.4673 | Clinical study |
| Central laboratorya – SPCR via the PGR assay | |||
| Sensitivity | 0.8549 | 0.8020–0.9009 | Clinical study |
| Specificity | 0.3864 | 0.3523–0.4212 | Clinical study |
| Central laboratorya – SACR | |||
| Sensitivity | 0.9689 | 0.9403–0.9884 | Clinical study |
| Specificity | 0.1606 | 0.1354–0.1874 | Clinical study |
| Central laboratorya – 24-hour urine protein measured via the BZC assay | |||
| Sensitivity | 0.8342 | 0.7787–0.8831 | Clinical study |
| Specificity | 0.4413 | 0.4063–0.4765 | Clinical study |
| Central laboratorya – 24-hour urine protein measured via the PGR assay | |||
| Sensitivity | 0.8394 | 0.7845–0.8876 | Clinical study |
| Specificity | 0.3916 | 0.3574–0.4264 | Clinical study |
| Type of onset | |||
| TP and FN | |||
| Spontaneous onset | 0 | Not reported | NICE CG107, table J.11 |
| Induction onset | 0.95 | Not reported | NICE CG107, table J.11 |
| Planned caesarean | 0.05 | N/A | NICE CG107, table J.11 |
| FP and TN | |||
| Spontaneous onset | 0.027 | 0.013–0.045 | NICE CG107, table I.1a1 |
| Induction onset | 0.97 | 0.952–0.985 | NICE CG107, table I.1a1 |
| Planned caesarean | 0.003 | N/A | NICE CG107, table I.1a1 |
| Type of birth | |||
| TN/FP, spontaneous/induction onset | |||
| Vaginal birth | 0.727 | 0.678–0.768 | NICE CG107, table I.1a1 |
| Assisted birth | 0.133 | 0.1–0.169 | NICE CG107, table I.1a1 |
| Emergency caesarean | 0.14 | N/A | NICE CG107, table I.1a1 |
| TP, spontaneous/induction onset | |||
| Vaginal birth | 0.75 | Not reported | NICE CG107, table J.11 |
| Assisted birth | 0.15 | Not reported | NICE CG107, table J.11 |
| Emergency caesarean | 0.10 | N/A | NICE CG107, table J.11 |
| FN, spontaneous/induction onset | |||
| Vaginal birth | 0.05 | Not reported | NICE CG107, table K.41 |
| Assisted birth | 0.05 | Not reported | NICE CG107, table K.41 |
| Emergency caesarean | 0.90 | Not reported | NICE CG107, table K.41 |
| Maternal admission | |||
| TN/FP, vaginal/assisted/emergency or planned caesarean | |||
| Severe PE | 0 | N/A | Assumption |
| No severe PE | 1 | N/A | Assumption |
| TP/FN, vaginal/assisted/emergency or planned caesarean | |||
| Severe PE | 1 | N/A | Assumption |
| No severe PE | 0 | N/A | Assumption |
| TP/FP/TN, severe PE | |||
| HDU | 0.99 | N/A | NICE CG107, table I.1a1 |
| ICU | 0.01 | 0.003–0.023 | NICE CG107, table I.1a1 |
| FN, severe PE | |||
| HDU | 0.95 | N/A | NICE CG107, table K.41 |
| ICU | 0.05 | Not reported | NICE CG107, table K.41 |
| Neonatal admission | |||
| TP/FN, HDU/ICU | |||
| Neonatal special care | 0.4286 | N/A | NICE CG107, table J.11 |
| Neonatal HDU | 0.2857 | 0.138–0.463 | NICE CG107, table J.11 |
| NICU | 0.2857 | 0.138–0.463 | NICE CG107, table J.11 |
| No neonatal admission | 0 | N/A | Assumption |
| FP/TN, HDU/ICU/no severe PE | |||
| NSC | 0.18 | 0.143–0.221 | NICE CG107, table I.1a1 |
| NHDU | 0.03 | 0.017–0.052 | NICE CG107, table I.1a1 |
| NICU | 0.03 | 0.013–0.045 | NICE CG107, table I.1a1 |
| No neonatal admission | 0.76 | N/A | NICE CG107, table I.1a1 |
| Mortality | |||
| Probability of maternal death | |||
| TP | 0.0079 | Not reported | NICE CG107, table K.51 |
| FN | 0.009 | Not reported | NICE CG107, table K.51 |
| TN and FP | 0 | N/A | Assumption |
| Probability of neonatal death | |||
| TP | 0.0056 | 0.00015–0.02224 | NICE CG107, table K.5,1 the confidential enquiry into maternal and child health25 |
| FN | 0.056 | 0.036–0.083 | NICE CG107, table K.5,1 Douglas and Redman26 |
| TN and FP | 0 | N/A | Assumption |
Resource use and cost
Resource use assumptions used in the model were derived from multiple sources:
-
Intervention cost for each comparator test were communicated by the study laboratory.
-
Resource use assumptions for the mother and baby in the relevant prenatal and postnatal period were derived from the models used in NICE’s CG107. 1
-
Assumptions regarding length of stay (LOS) in maternal and neonatal intensive care were obtained from data collected from patients in the clinical study.
Intervention cost
The cost of delivering each test was obtained from the laboratory used to conduct the primary analysis in the clinical study. Unit costs for each test are summarised in Table 67.
| Assay | Unit cost (£) |
|---|---|
| Local laboratory – SPCR | 0.70 |
| Central laboratorya – SPCR via the BZC assay | 0.70 |
| Central laboratorya – SPCR via the PGR assay | 0.70 |
| Central laboratorya – SACR | 2.71 |
| Central laboratorya – 24-hour urine protein measured via the BZC assay | 1.19 |
| Central laboratorya – 24-hour urine protein measured via the PGR assay | 1.19 |
| Dipstick test only | 0.00 |
Treatment cost
The analysis incorporated the impact of each strategy on the use of NHS services by the mother and baby during the neonatal and postnatal period. This included time spent in the maternal ward, ICU and HDU by the mother and neonatal ICU and HDU by the baby. The analysis took into account different intensity of care involved in a normal birth, assisted delivery, and planned and emergency caesarean. In addition, the analysis included the use of medications such as oxytocin and magnesium sulphate during delivery and labetalol in PE and hypertension in pregnancy. Resource use assumptions in each pathway were derived from an existing model of care for hypertension without proteinuria and PE developed by NICE. 1
The resource use assumptions from the NICE model1 were combined with information prospectively collected for the study participants. This included the following:
-
admissions to the hospital for labour and/or complications
-
admissions to neonatal intensive care, HDUs and special baby units.
Estimates of LOS derived from prospectively collected data are summarised in Table 68.
| Type of care | Variable name | Number of observations | Mean LOS, days (standard error) | Description |
|---|---|---|---|---|
| HDU | OUT1_Days_HDU, OUT1_Days_HDUobstetric | 95 | 2.33 (0.19) | Calculated in a subset with diagnosed severe PE |
| ICU | OUT1_Days_ITU | 5 | 2.20 (0.73) | Calculated in a subset with diagnosed severe PE |
| Maternal unit | OUT2_Tot_PNdays_inpatient | 765 | 3.21 (0.08) | Calculated in a subset with no severe PE diagnosis |
| Neonatal special care | OUT3_1_days_SCBU, OUT3_1_days_Ventilated | PE: 64; no PE: 95 | PE: 18.55 (1.55); no PE: 12.78 (1.27) | Calculated separately for subsets with and with no severe PE diagnosis |
| Neonatal HDU and ICU | OUT3_1_days_SCBU, OUT3_1_days_Ventilated | PE: 64; no PE: 28 | PE: 8.27 (1.81); no PE: 5.14 (1.77) | Calculated separately for subsets with and with no severe PE diagnosis |
Data collected alongside the clinical study included the number of inpatient days spent in different hospital units, which included HDU, ICU, regular postnatal hospital admission for the mother and time spent in special care baby unit (SCBU) for the baby. Table 68 summarises the data obtained on hospital stays; the column entitled ‘Variable name’ contains the name of the variable, which was used in the LOS calculation. The column entitled ‘Description’ outlines the subset of the population that was used to calculate the LOS estimate. Different subsets defined within the data were used: patients with a clinician diagnosis of severe PE were used to determine the mean LOS in maternal HDU and ICU. Mean LOS in neonatal units was estimated separately in patients with and without severe PE, as the presence of severe disease may have affected the intensity and cost of neonatal care.
It was assumed that neonates who required ventilation were admitted to neonatal HDU or ICU and the length of time in ventilation (reported in variable OUT3_1_days_Ventilated) was assumed to be the LOS in HDU or ICU. The data set did not make a distinction between neonatal HDU and ICU. The mean LOS was assumed to the same in neonatal HDU and ICU, which is consistent with the assumptions made in the NICE hypertension in pregnancy economic model. 1 The LOS in neonatal special care was estimated as the time spent in ventilation (HDU/ICU based on above assumption) subtracted from the total time spent in SCBU. The excess LOS in a regular maternal unit was assumed to be 2 days, which is the same as in the NICE model. Based on data from the current study, the average LOS was 3.21 days compared with a national average of 1.24 days reported in NHS Reference Costs 2014/1527 for Healthcare Resource Group (HRG) NZ30C.
Unit costs
Unit costs were derived from up-to-date routine sources, such as the NHS Reference Costs 2014/15 for secondary care27 and the British National Formulary for medications. 28 A list of cost items used in the model are included in Table 69.
| Category | Episode cost (£) | Range (£) | Details | Source of resource use assumption | Source of unit cost |
|---|---|---|---|---|---|
| Laboratory tests | |||||
| Local laboratory – SPCR | 0.70 | – | – | Study laboratory | Personal communicationa |
| Central laboratoryb – SPCR via the BZC assay | 0.70 | – | – | Study laboratory | Personal communicationa |
| Central laboratoryb – SPCR via the PGR assay | 0.70 | – | – | Study laboratory | Personal communicationa |
| Central laboratoryb – SACR | 2.71 | – | – | Study laboratory | Personal communicationa |
| Central laboratoryb – 24-hour urine protein using the BZC assay | 1.19 | – | – | Study laboratory | Personal communicationa |
| Central laboratoryb – 24-hour urine protein using the PGR assay | 1.19 | – | – | Study laboratory | Personal communicationa |
| Type of delivery | |||||
| Unassisted | 1513.06 | 693.36–1790.25 | HRG NZ30C | Update of NICE model | NHS Reference Costs 2014/15 27 |
| Assisted | 1887.17 | 1469.65–1887.17 | HRG NZ31C | Update of NICE model | NHS Reference Costs 2014/15 27 |
| Planned caesarean | 3106.32 | 2516.77–3506.77 | HRG NZ50C | Update of NICE model | NHS Reference Costs 2014/15 27 |
| Emergency caesarean | 3894.84 | 3095.07–4699.48 | HRG NZ51C | Update of NICE model | NHS Reference Costs 2014/15 27 |
| Hospital admission | |||||
| Maternal ward | 820.56 | 329.56–861.68 | HRG NZ30C, based on a LOS of 2 days | Update of NICE model | NHS Reference Costs 2014/15 27 |
| Maternal ward excess day | 410.28 | 164.78–430.84 | HRG NZ30C | Update of NICE model | NHS Reference Costs 2014/15 27 |
| HDU | 1973.43 | 1669.78–2364.82 | HRG XC04Z, based on a LOS of 2 days | Update of NICE model | NHS Reference Costs 2014/15 27 |
| ICU | 3145.34 | 2664.34–3581.30 | HRG XC06Z, based on a LOS of 2 days | Update of NICE model | NHS Reference Costs 2014/15 27 |
| Neonatal care | |||||
| Neonatal special care | 1598.85 | 1292.37–1913.31 | HRG XA03Z, based on a LOS of 3 days | Update of NICE model | NHS Reference Costs 2014/15 27 |
| Neonatal special care in PE | 2611.46 | 2110.87–3125.07 | HRG XA03Z, based on a LOS 4.9 days | Update of NICE model | NHS Reference Costs 2014/15 27 |
| Neonatal HDU | 2541.04 | 2128.59–2921.01 | HRG XA01Z, based on a LOS of 3 days | Update of NICE model | NHS Reference Costs 2014/15 27 |
| Neonatal HDU in PE | 4151.04 | 3476.70–4770.98 | HRG XA01Z, based on a LOS of 4.9 days | Update of NICE model | NHS Reference Costs 2014/15 27 |
| Neonatal ICU | 3529.41 | 2620.53–4223.67 | HRG XA02Z, based on a LOS of 3 days | Update of NICE model | NHS Reference Costs 2014/15 27 |
| Neonatal ICU in PE | 5764.70 | 4280.20–6898.66 | HRG XA02Z, based on a LOS of 4.9 days | Update of NICE model | NHS Reference Costs 2014/15 27 |
| Medications | |||||
| Dinoprostone | 26.56 | – | Two doses of 3-mg tablets | Update of NICE model | BNF28 |
| Dexamethasone | 74.88 | – | Four intramuscular doses of 12 mg | Update of NICE model | BNF28 |
| Labetalol | 7.37 | – | Intravenous | Update of NICE model | BNF28 |
| Magnesium sulphate | 38.55 | – | One dose of 4 mg + 24 intravenous doses of 2 mg | Update of NICE model | BNF28 |
| Oxytocin | 15.50 | – | 5 ml of oxytocin, staff cost (£20) and disposables (£7), used in 40% of cases | Update of NICE model | BNF28 |
Summary of state costs
A summary of state costs (resource use assumptions combined with unit costs) are summarised in Table 69.
Outcomes
Quality-adjusted life-year calculations
The modelling analysis estimated outcomes of treatment in terms of QALYs gained over a lifetime horizon in both the mother and baby. It employed the same assumptions regarding QALY generation in hypertension without proteinuria and PE as the NICE models included in NICE’s CG107,1 as described in Model structure. The following assumptions were made, which were tested in the sensitivity analyses:
-
The time interval of the impact of PE is brief, with surviving mothers returning to full health following treatment. Therefore, this short period was not assumed to impact on the number of QALYs generated in the different arms of the model.
-
Severe PE was assumed to impact on the mean QALYs gained over a lifetime through increased maternal and neonatal mortality. This information was derived from the confidential enquiry into maternal and child health25 and Douglas and Redman. 26
-
A neonatal death was assumed to be a loss of 27.7 discounted (3.5% per annum) QALYs, based on calculations in the NICE hypertension in pregnancy model which assumed a life expectancy of 80 years.
-
A maternal death was assumed to be a loss of 24.8 discounted QALYs, based on mean age at birth of 29 years and a remaining life expectancy of 53 years.
Analysis methods
Descriptive statistics
The mean cost and QALY gained per patient were presented using arithmetic means. In probabilistic analyses, comparisons of costs, QALYs and incremental cost-effectiveness ratios (ICERs) across alternative strategies were made using arithmetic means and 95% CIs of the mean computed using standard errors.
Base-case cost-effectiveness analysis
Cost-effectiveness of each test was presented using ICERs, which estimate incremental cost per unit of outcome gained over a baseline comparator. This was done using pairwise comparisons of each test compared with the baseline comparator (the local laboratory’s SPCR test). The ICER was explicitly examined only if it was positive (either both cost and outcome is higher, or both are lower compared with standard care). In the case of a negative ICER, the corresponding comparator was defined as either dominant (in case of incremental QALY gain) or dominated (in case of incremental QALY loss).
Deterministic sensitivity analysis
The robustness of the results of the cost-effectiveness analysis was examined in one-way sensitivity analyses by changing the assumed values of model inputs. Defensible ranges for model parameters were obtained from clinical experts and literature. The following model parameters will be tested.
Transition probabilities
-
Probability of severe PE.
-
Sensitivity and specificity of each test.
-
Probability of different modes of induction (spontaneous, induced, caesarean section) in hypertension without proteinuria and PE.
-
Probability of different types of birth (normal, assisted, emergency caesarean).
-
Probability of admission to maternal HDU/ICU in PE.
-
Probability of neonatal admission to HDU/ICU.
-
Maternal and neonatal mortality in severe PE.
Resource use and cost
-
LOS (days) in maternal/neonatal HDU/ICU.
-
Unit costs of hospital admission to maternal ward/HDU/ICU.
-
Unit costs of hospital admission to NICU/SCBU/HDU/ICU.
-
Unit costs of different types of delivery.
Probabilistic sensitivity analysis
A probabilistic sensitivity analysis (PSA) was conducted in order to examine the combined uncertainty of all parameters used in the model on the model results. Distributional assumptions were made in case of each model parameter based on their expected value and CI derived from literature or expert opinion (distribution parameters are listed in Table 70). Cost parameters and lifetime QALY gains were assumed to approximate a gamma distribution as they are strictly non-negative, contain a large proportion of zero values (non-users for cost estimates and patients who have died for QALY estimates) and a positive skew because of outliers. Beta distribution was assumed for transition probabilities which are bounded between 0 and 1. Parameter values were repeatedly sampled over 5000 iterations in order to construct a 95% CI for the ICER. The results of each iteration were mapped on an incremental cost-effectiveness plane to illustrate the uncertainty in the ICER estimate. Decision uncertainty was illustrated using a cost-effectiveness acceptability curve to map the probability of cost-effectiveness of each comparator over a range of ceiling willingness-to-pay (WTP) values per QALY gain by NICE (£0–100,000).
| Parameter | Analysis | Source | |||
|---|---|---|---|---|---|
| Deterministic sensitivity | PSA | ||||
| Minimum value | Maximum value | Distribution type | Distribution parameters | ||
| Probability of severe PE | 0.1765 | 0.2272 | Beta | α = 193, β = 766 | 95% CI of beta distribution |
| Local laboratory | |||||
| SPCR test | |||||
| Sensitivity | 0.8020 | 0.9009 | Beta | α = 165, β = 28 | 95% CI of beta distribution |
| Specificity | 0.3676 | 0.4370 | α = 308, β = 458 | ||
| Dipstick test only | |||||
| Sensitivity | 0.8807 | 0.9556 | Beta | α = 178, β = 15 | 95% CI of beta distribution |
| Specificity | 0.1100 | 0.1581 | α = 102, β = 664 | ||
| Central laboratory | |||||
| SPCR test | |||||
| BZC assay | |||||
| Sensitivity | 0.7845 | 0.8876 | Beta | α = 162, β = 31 | 95% CI of beta distribution |
| Specificity | 0.3972 | 0.4673 | α = 331, β = 435 | ||
| PGR assay | |||||
| Sensitivity | 0.8020 | 0.9009 | Beta | α = 165, β = 28 | 95% CI of beta distribution |
| Specificity | 0.3523 | 0.4212 | α = 296, β = 470 | ||
| SACR test | |||||
| Sensitivity | 0.9403 | 0.9884 | Beta | α = 643, β = 6 | 95% CI of beta distribution |
| Specificity | 0.1354 | 0.1874 | α = 123, β = 664 | ||
| 24-hour urine test | |||||
| BZC assay | |||||
| Sensitivity | 0.7787 | 0.8831 | Beta | α = 161, β = 32 | 95% CI of beta distribution |
| Specificity | 0.4063 | 0.4765 | α = 338, β = 428 | ||
| PGR assay | |||||
| Sensitivity | 0.7845 | 0.8876 | Beta | α = 162, β = 31 | 95% CI of beta distribution |
| Specificity | 0.3574 | 0.4264 | α = 300, β = 466 | ||
| FP and TN | |||||
| Spontaneous onset | 0.013 | 0.045 | α = 10, β = 367 | NICE’s CG107 (appendices I and J)1 | |
| Induction onset | 0.952 | 0.985 | α = 366, β = 11 | ||
| TN/FP | |||||
| Spontaneous/induction onset | |||||
| Vaginal birth | 0.678 | 0.768 | α = 273, β = 104 | NICE’s CG107 (appendices I and J)1 | |
| Assisted birth | 0.100 | 0.169 | α = 50, β = 327 | ||
| TP/FP/TN | |||||
| Severe PE | |||||
| ICU | 0.003 | 0.023 | α = 4, β = 373 | NICE’s CG107 (appendices I and J)1 | |
| TP/FN | |||||
| HDU/ICU | |||||
| NHDU | 0.138 | 0.463 | α = 8, β = 20 | NICE’s CG107 (appendices I and J)1 | |
| NICU | 0.138 | 0.463 | α = 8, β = 20 | ||
| FP/TN | |||||
| HDU/ICU/no severe PE | |||||
| NSC | 0.143 | 0.221 | α = 68, β = 309 | NICE’s CG107 (appendices I and J)1 | |
| NHDU | 0.017 | 0.052 | α = 12, β = 365 | ||
| NICU | 0.013 | 0.045 | α = 10, β = 367 | ||
| Probability of maternal death | |||||
| TP | 0.00395 | 0.01185 | Beta | Not reported | Not reported in NICE report1 assumed range 50–150% of base case |
| FN | 0.0045 | 0.0135 | Not reported | ||
| TP | 0.00015 | 0.02224 | α = 1, β = 164 | The confidential enquiry into maternal and child health25 | |
| FN | 0.036 | 0.083 | α = 22, β = 361 | Douglas and Redman26 | |
| Maternal | |||||
| Unit | 1.816 | 2.130 | Gamma | κ = 606.39, θ = 0.0032 | 95% CI from study data |
| HDU | 1.972 | 2.717 | κ = 150.39, θ = 0.0155 | ||
| ICU | 1.010 | 3.845 | κ = 9.082, θ = 0.242 | ||
| Neonatal | |||||
| Special care | |||||
| No PE | 10.412 | 15.387 | Gamma | κ = 101.264, θ = 0.126 | 95% CI from study data |
| PE | 15.637 | 21.709 | κ = 143.227, θ = 0.1295 | ||
| HDU/ICU | |||||
| No PE | 2.278 | 9.146 | Gamma | κ = 8.433, θ = 0.61 | 95% CI from study data |
| PE | 5.111 | 12.177 | κ = 20.876, θ = 0.396 | ||
| Delivery | |||||
| Normal | 693.36 | 1790.25 | Gamma | κ = 24.68, θ = 61.31 | 25th and 75th percentile from NHS Reference Costs 2014/1527 |
| Assisted | 1469.65 | 1887.17 | κ = 499.11, θ = 3.781 | ||
| Caesarean | |||||
| Planned | 2516.77 | 3506.32 | Gamma | κ = 150.88, θ = 20.59 | 25th and 75th percentile from NHS Reference Costs 2014/1527 |
| Emergency | 3095.07 | 4699.48 | κ = 90.36, θ = 43.1 | ||
| Maternal | |||||
| Ward | 164.78 | 430.84 | Gamma | κ = 32.65, θ = 12.565 | 25th and 75th percentile from NHS Reference Costs 2014/1527 |
| HDU | 834.89 | 1182.41 | κ = 123.67, θ = 7.98 | ||
| ICU | 1332.17 | 1790.65 | κ = 180.89, θ = 8.71 | ||
| Neonatal | |||||
| ICU | 873.51 | 1407.89 | Gamma | κ = 74.14, θ = 15.87 | 25th and 75th percentile from NHS Reference Costs 2014/1527 |
| HDU | 709.53 | 973.67 | κ = 157.84, θ = 5.37 | ||
| Special care | 430.79 | 637.77 | κ = 101.69, θ = 5.24 | ||
Results
Base-case analysis
The mean cost and QALYs of each strategy are summarised in Table 71. The central laboratory’s SACR test was the most effective strategy, generating 52.42 QALYs. The least costly strategy was 24-hour urine collection using the BZC assay (£6615.46), which was £72 lower than the most costly strategy, dipstick only (£6687.35).
| Strategy | Mean cost (£) | Mean QALY gain |
|---|---|---|
| Local laboratory – SPCR | 6621.27 | 52.39 |
| Central laboratorya – SACR | 6666.34 | 52.42 |
| Dipstick test only | 6687.35 | 52.41 |
| Central laboratorya – SPCR via the PGR assay | 6626.41 | 52.39 |
| Central laboratorya – 24-hour urine protein measured via the BZC assay | 6615.46 | 52.38 |
| Central laboratorya – SPCR via the BZC assay | 6616.34 | 52.38 |
| Central laboratorya – 24-hour urine protein measured via the PGR assay | 6630.11 | 52.38 |
A cost-effectiveness frontier was constructed to determine which options are dominated (Figure 13). The 24-hour urine test (PGR assay), central laboratory’s SPCR test (PGR assay) and dipstick test only were absolutely dominated as there was at least one other strategy which was both more effective and less costly. Non-dominated strategies positioned along the cost-effectiveness frontier were 24-hour urine test (BZC assay), central laboratory’s SPCR test (BZC assay), local laboratory’s SPCR test and central laboratory’s SACR test.
FIGURE 13.
Mean cost and QALYs of each strategy.
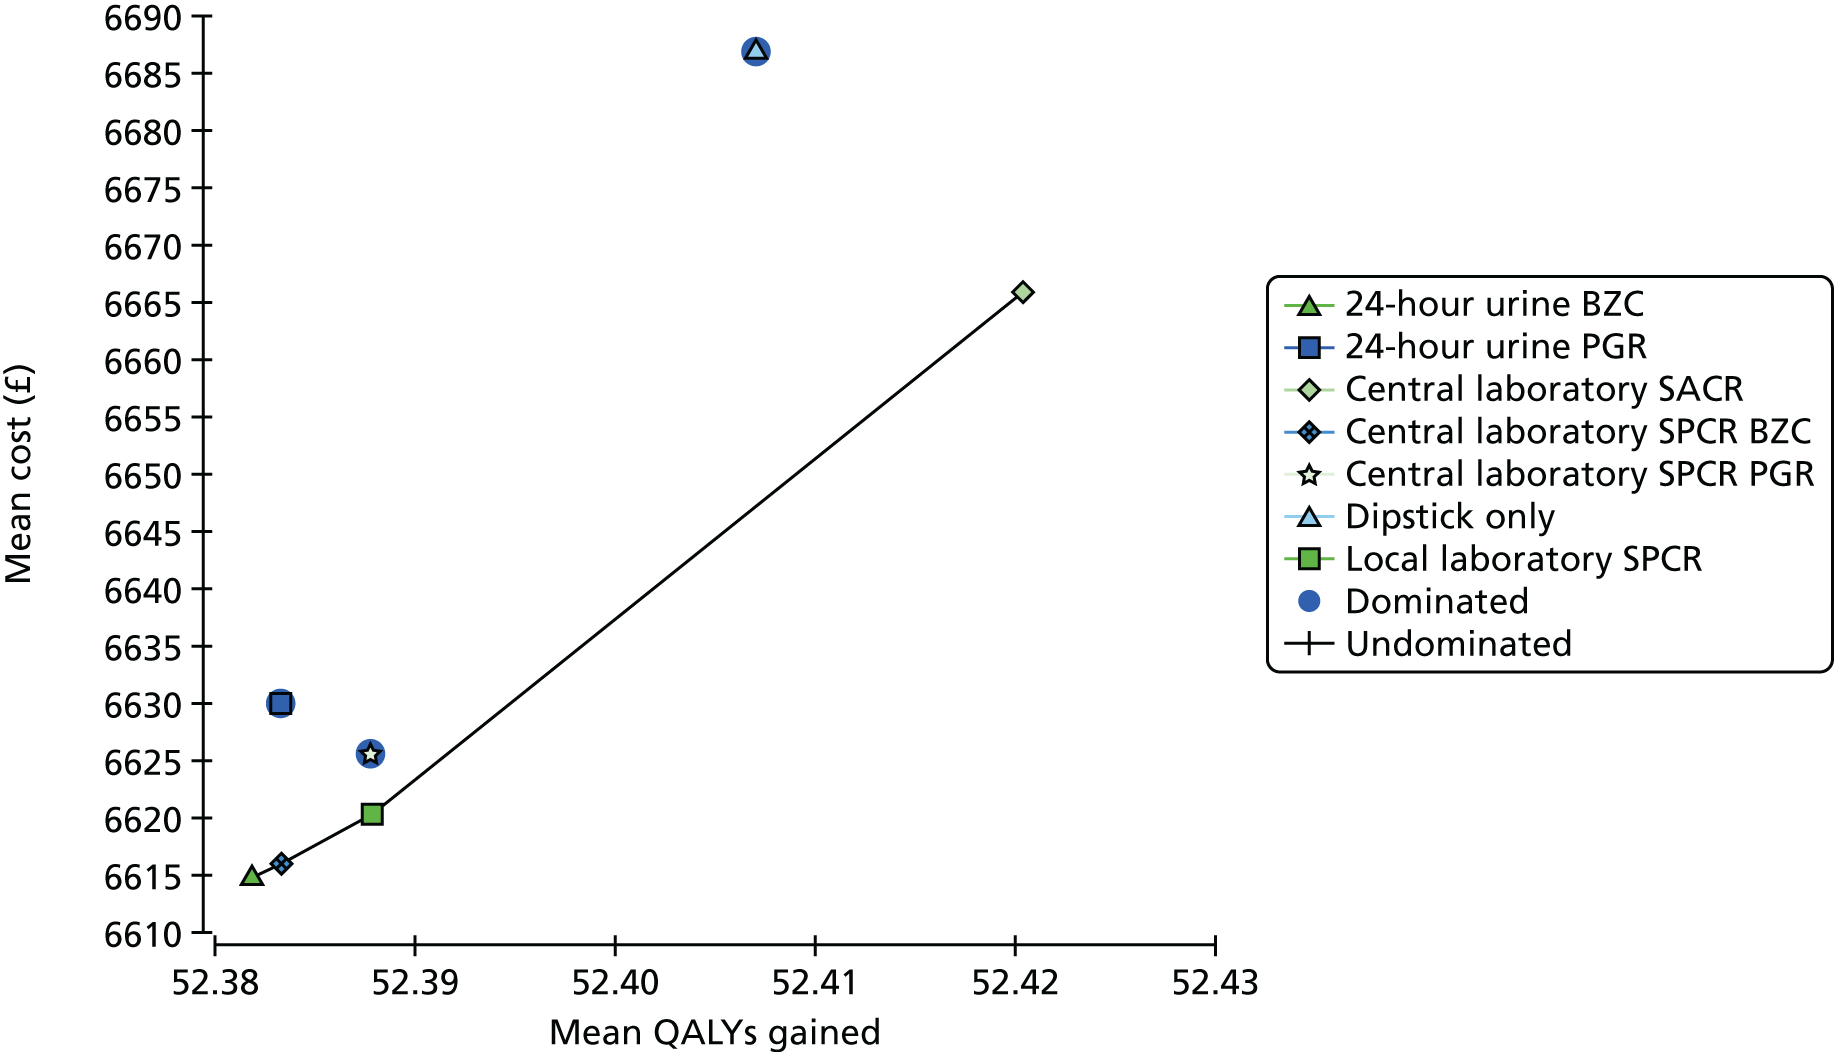
Analysis of incremental cost-effectiveness
The incremental cost-effectiveness of each option compared with the local laboratory’s SPCR test (the baseline comparator) is represented in Table 72. ICERs were calculated according to the methods outlined in Analysis methods. The effectiveness of all seven comparators was very similar: the difference between the least and most effective strategy was 0.04 QALYs, which corresponds to 14.6 days in full health. Differences in mean cost were more substantial: the most costly strategy (dipstick only) was £66 higher than the local laboratory’s SPCR test. The least costly (24-hour urine test using the BZC assay) was £6 lower than the baseline comparator. Two strategies were dominated compared with the baseline comparator: the central laboratory’s SPCR test, which was equally effective and more costly, and the 24-hour urine collection using the PGR assay, which was both more costly and less effective.
| Strategy | Incremental cost (£) vs. local laboratory SPCR test | Incremental QALYs vs. local laboratory SPCR test | ICER (£/QALY) |
|---|---|---|---|
| Central laboratorya – SACR | 45.07 | 0.03 | 1502 |
| Dipstick test only | 66.08 | 0.02 | 3304 |
| Central laboratorya – SPCR via the PGR assay | 5.14 | 0 | Dominated |
| Central laboratorya – 24-hour urine protein measured via the BZC assay | –5.81 | –0.01 | 581 |
| Central laboratorya – SPCR via the BZC assay | –4.93 | –0.01 | 493 |
| Central laboratorya – 24-hour urine protein measured via the PGR assay | 8.84 | –0.01 | Dominated |
Deterministic sensitivity analysis
The differences in cost and QALYs generated across strategies were small, meaning that small changes in the values of input parameters could impact on the cost-effectiveness ranking of the comparators. To identify the main sources of uncertainty in the model, tornado diagrams (Figure 14) were constructed to assess the effect of varying model inputs on the net monetary benefit (NMB) assuming a WTP of £20,000 per QALY.
FIGURE 14.
Diagnostic accuracy parameters. EV, expected value.
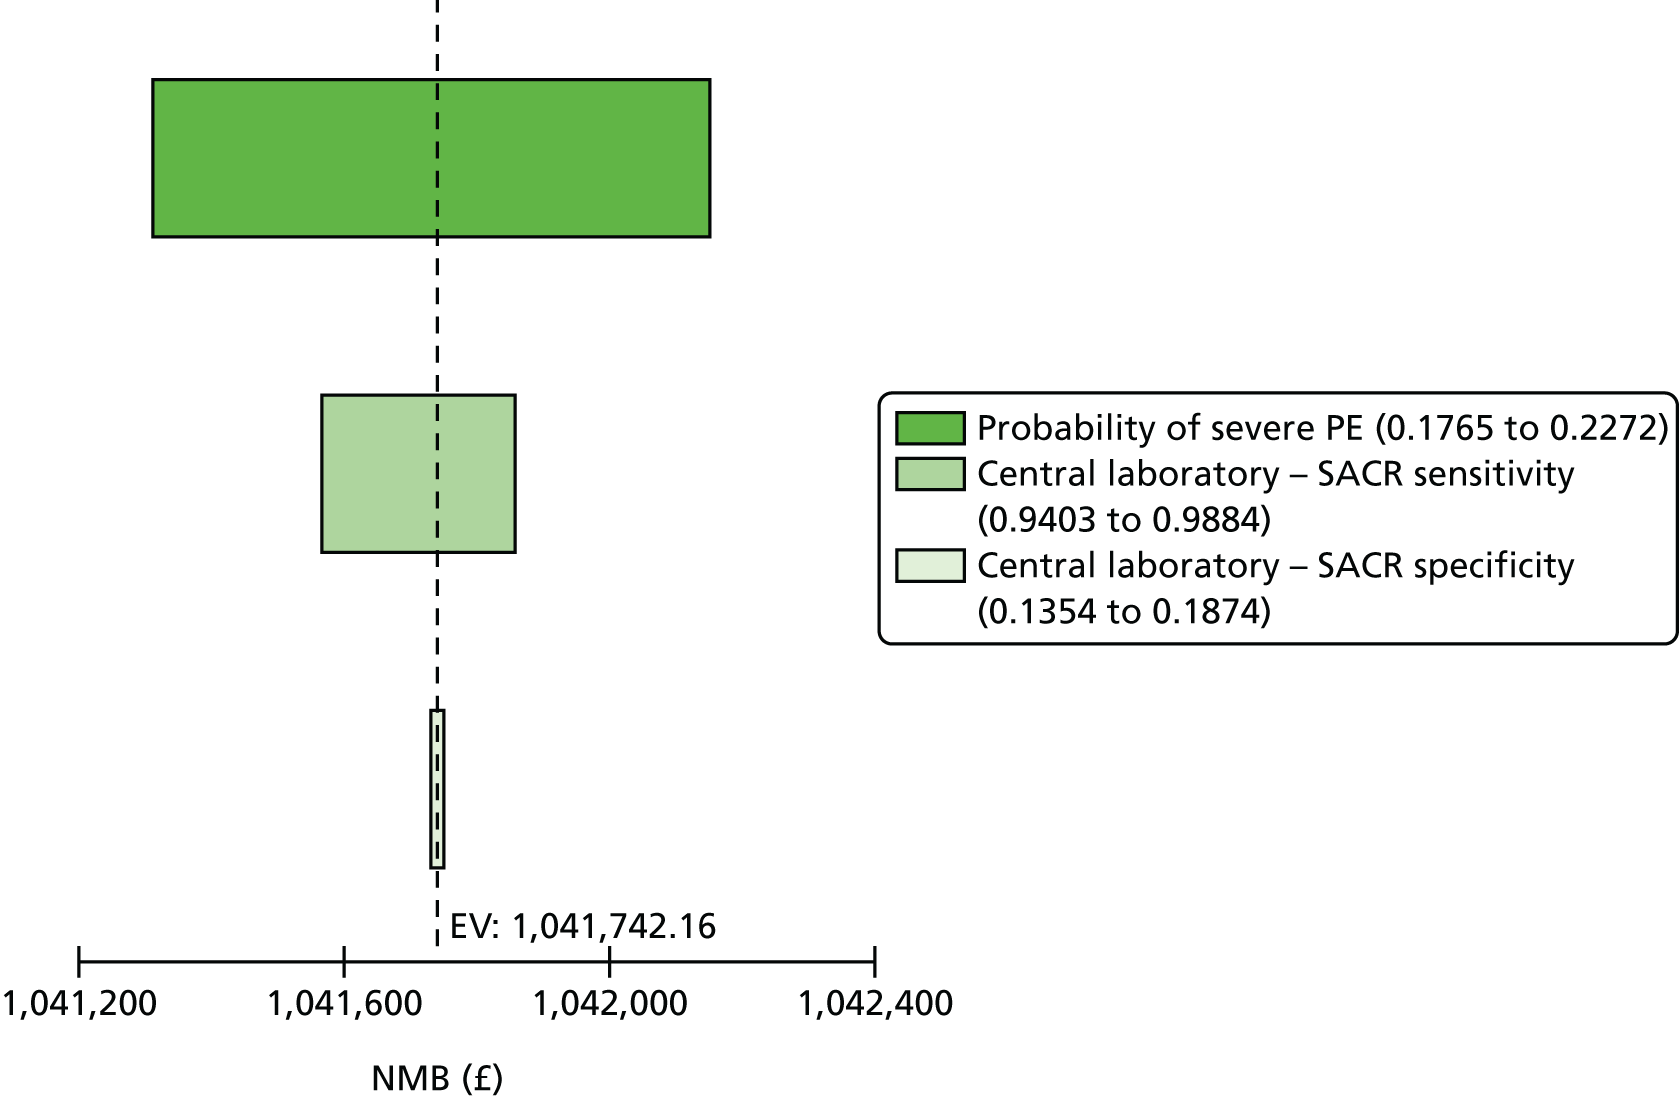
Diagnostic accuracy parameters
The probability of severe PE and sensitivity of the central laboratory’s SACR test were the largest sources of uncertainty. However, varying the values of these parameters over their pre-assigned range did not result in a change of optimal strategy, as shown in the one-way sensitivity analysis in Figure 15 and the tornado analysis in Figure 16.
FIGURE 15.
Marginal effect of varying probability in severe PE.
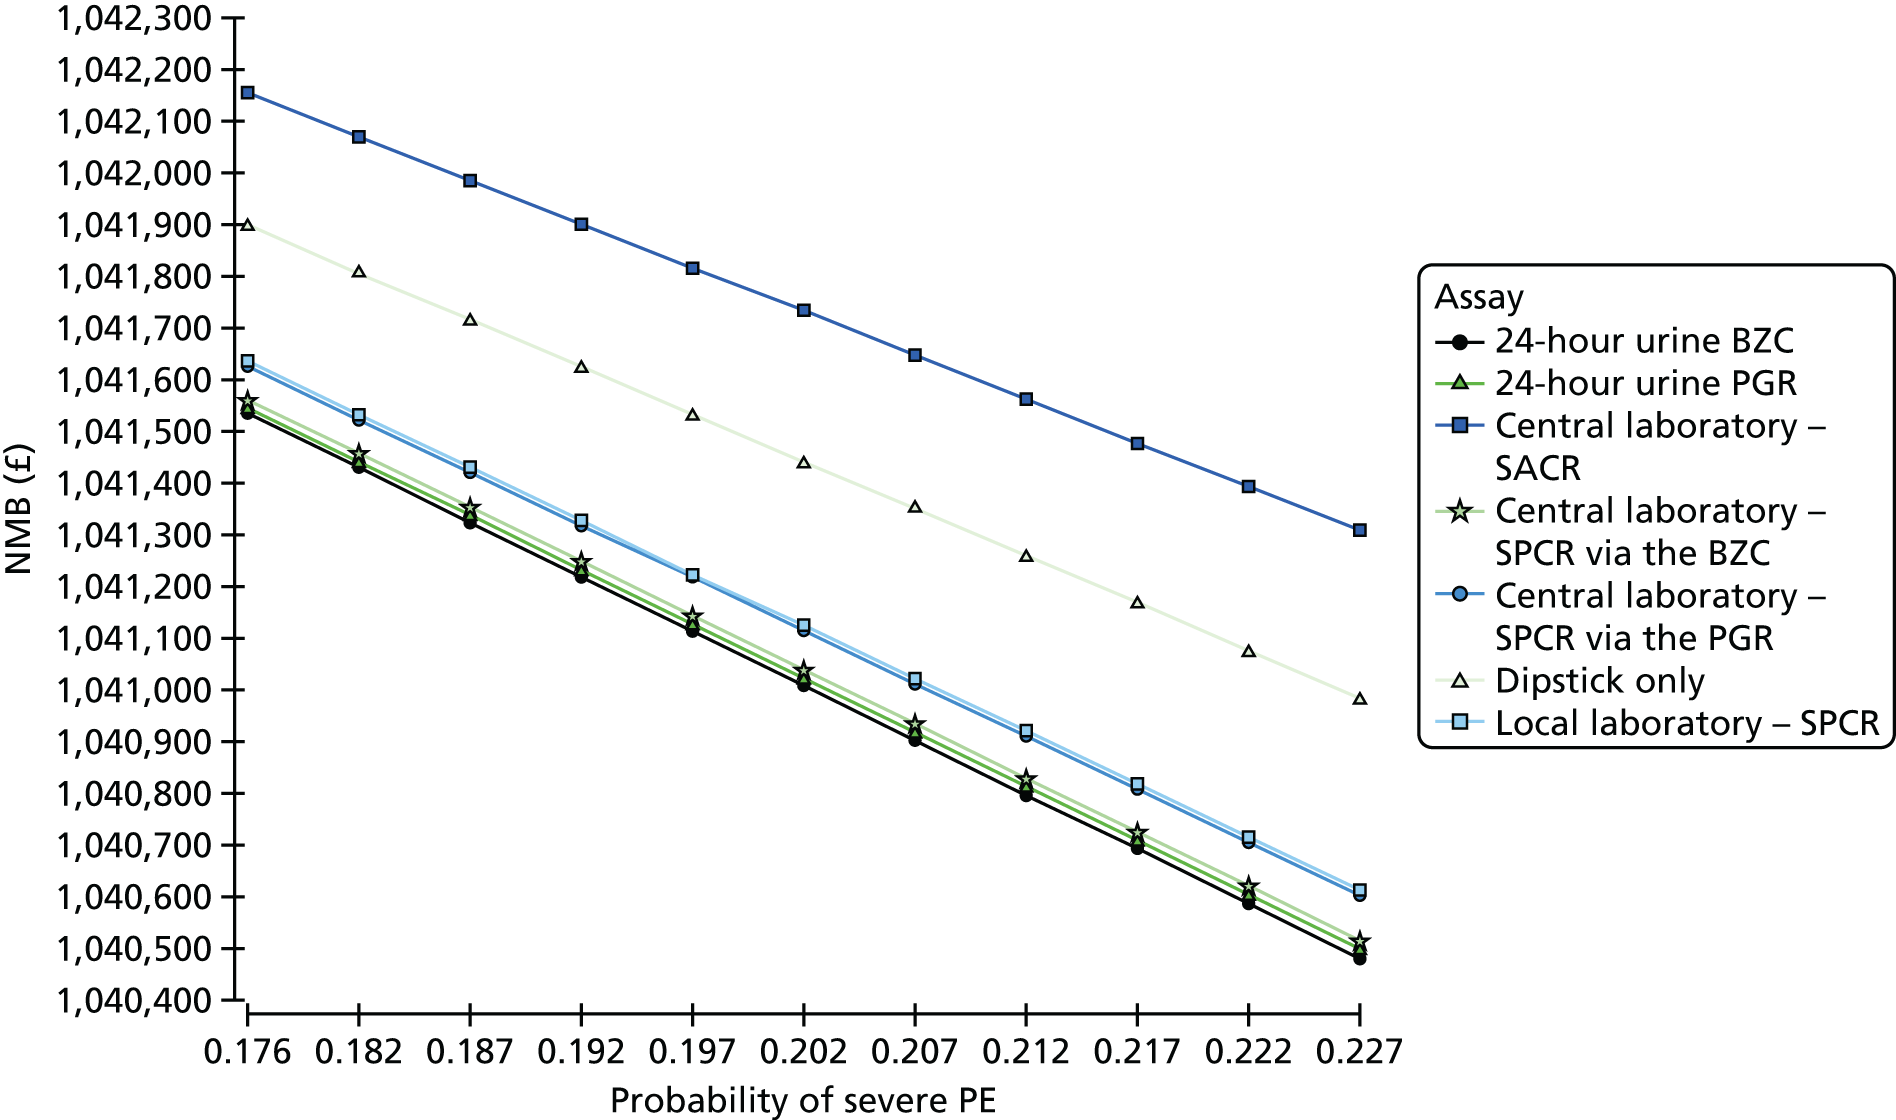
FIGURE 16.
Tornado analysis, pathway probabilites. EV, expected value.
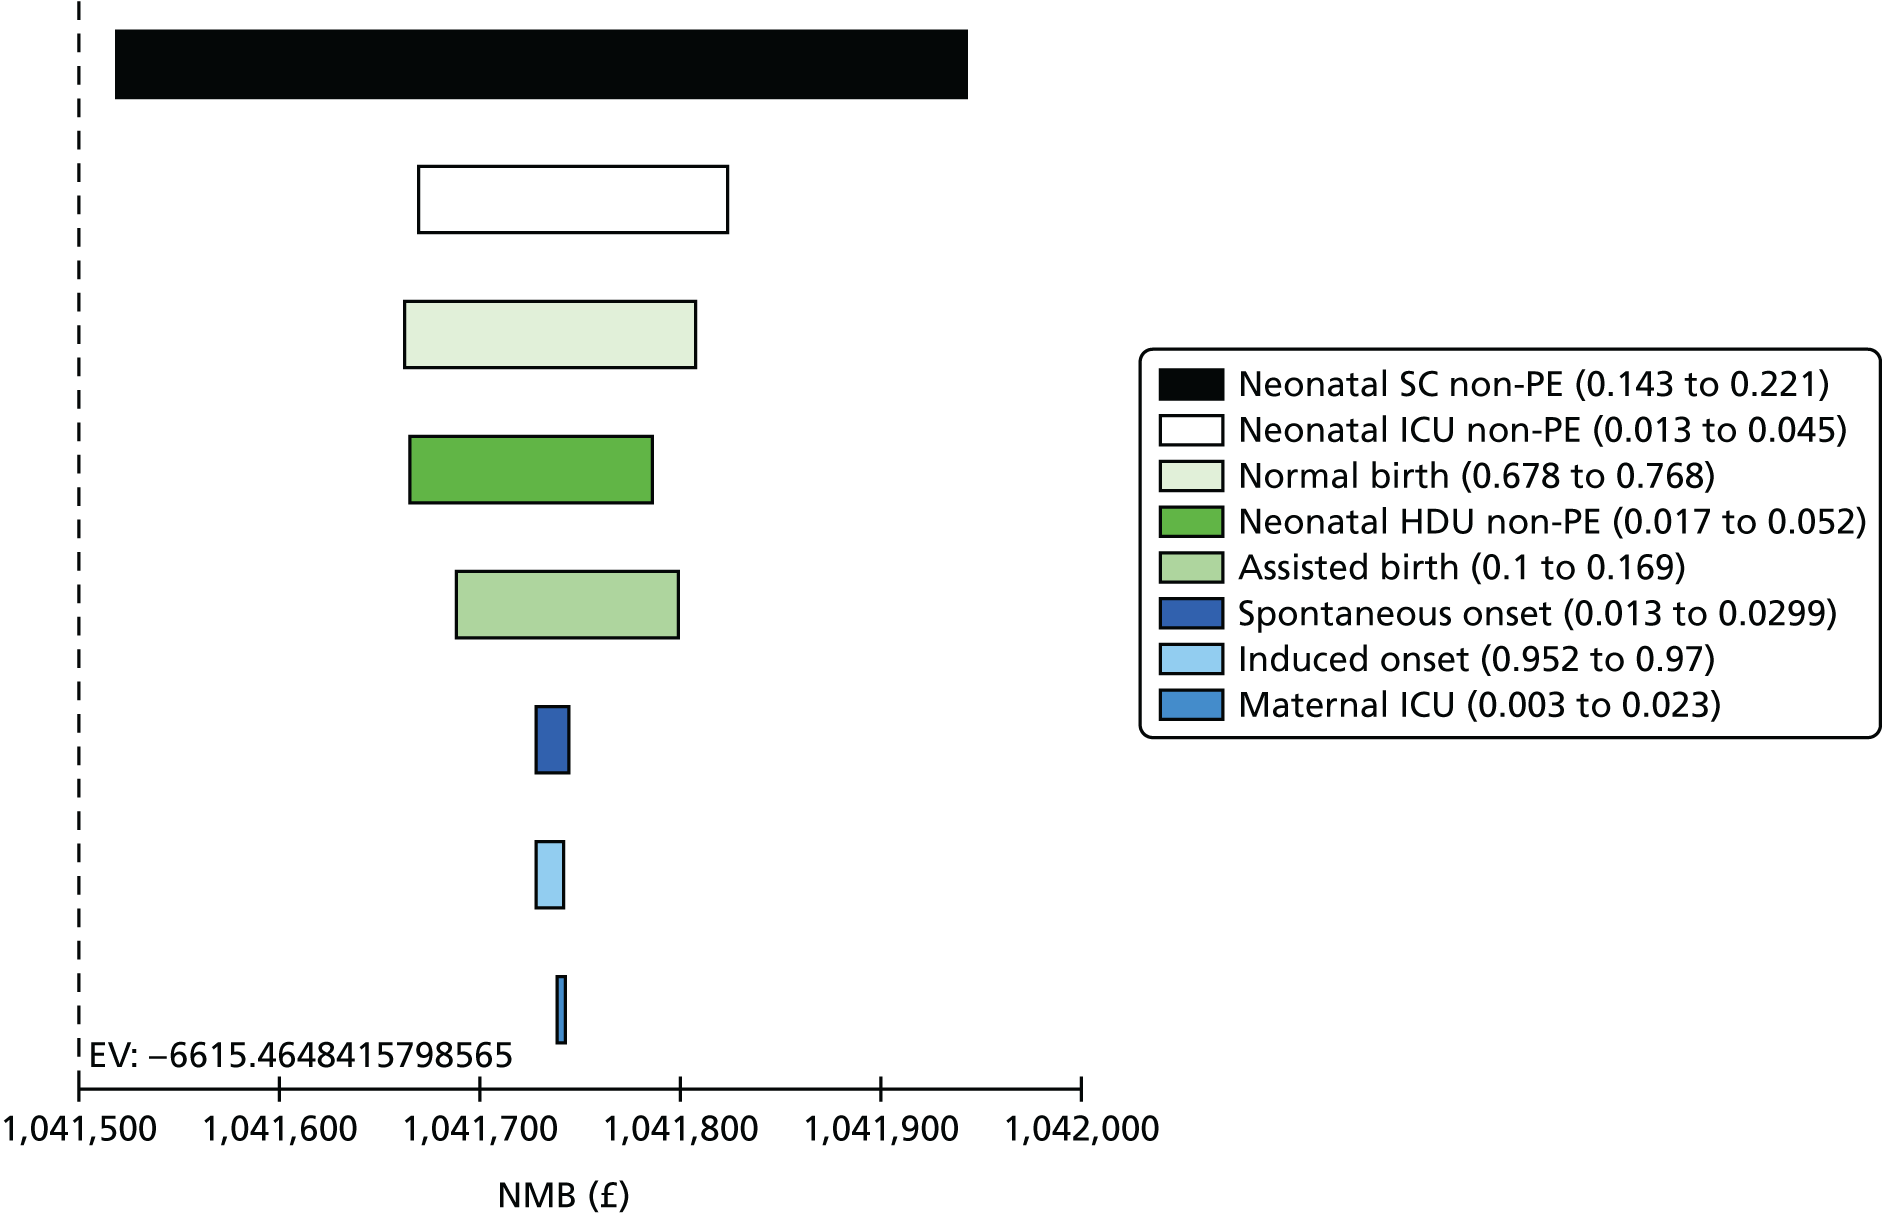
Transition probabilities in the treatment pathway
The most significant source of uncertainty was the probability of neonatal special care admission in patients with no PE. This was investigated in a one-way sensitivity analysis in Figure 17 and tornado analysis in Figure 18. Changing the probability did not affect the cost-effectiveness ranking.
FIGURE 17.
Marginal effect of varying the probability of neonatal SCBU admission.
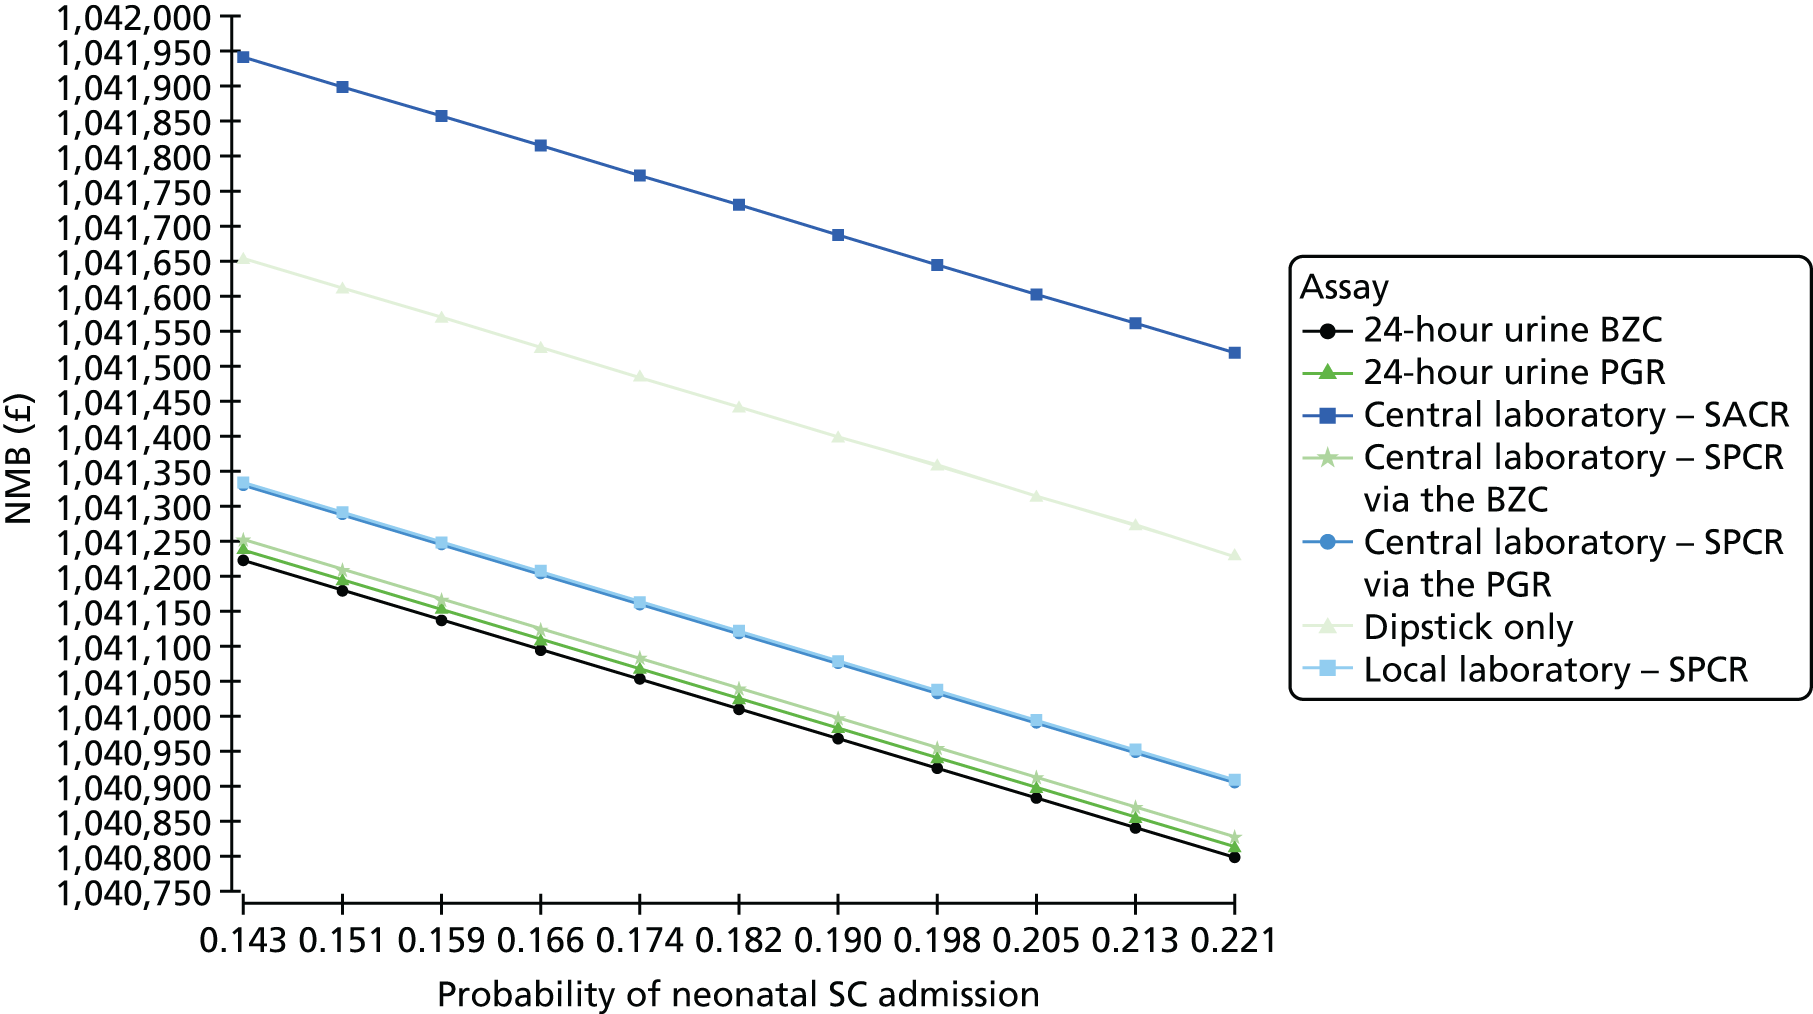
FIGURE 18.
Tornado analysis, probability of death. EV, expected value.
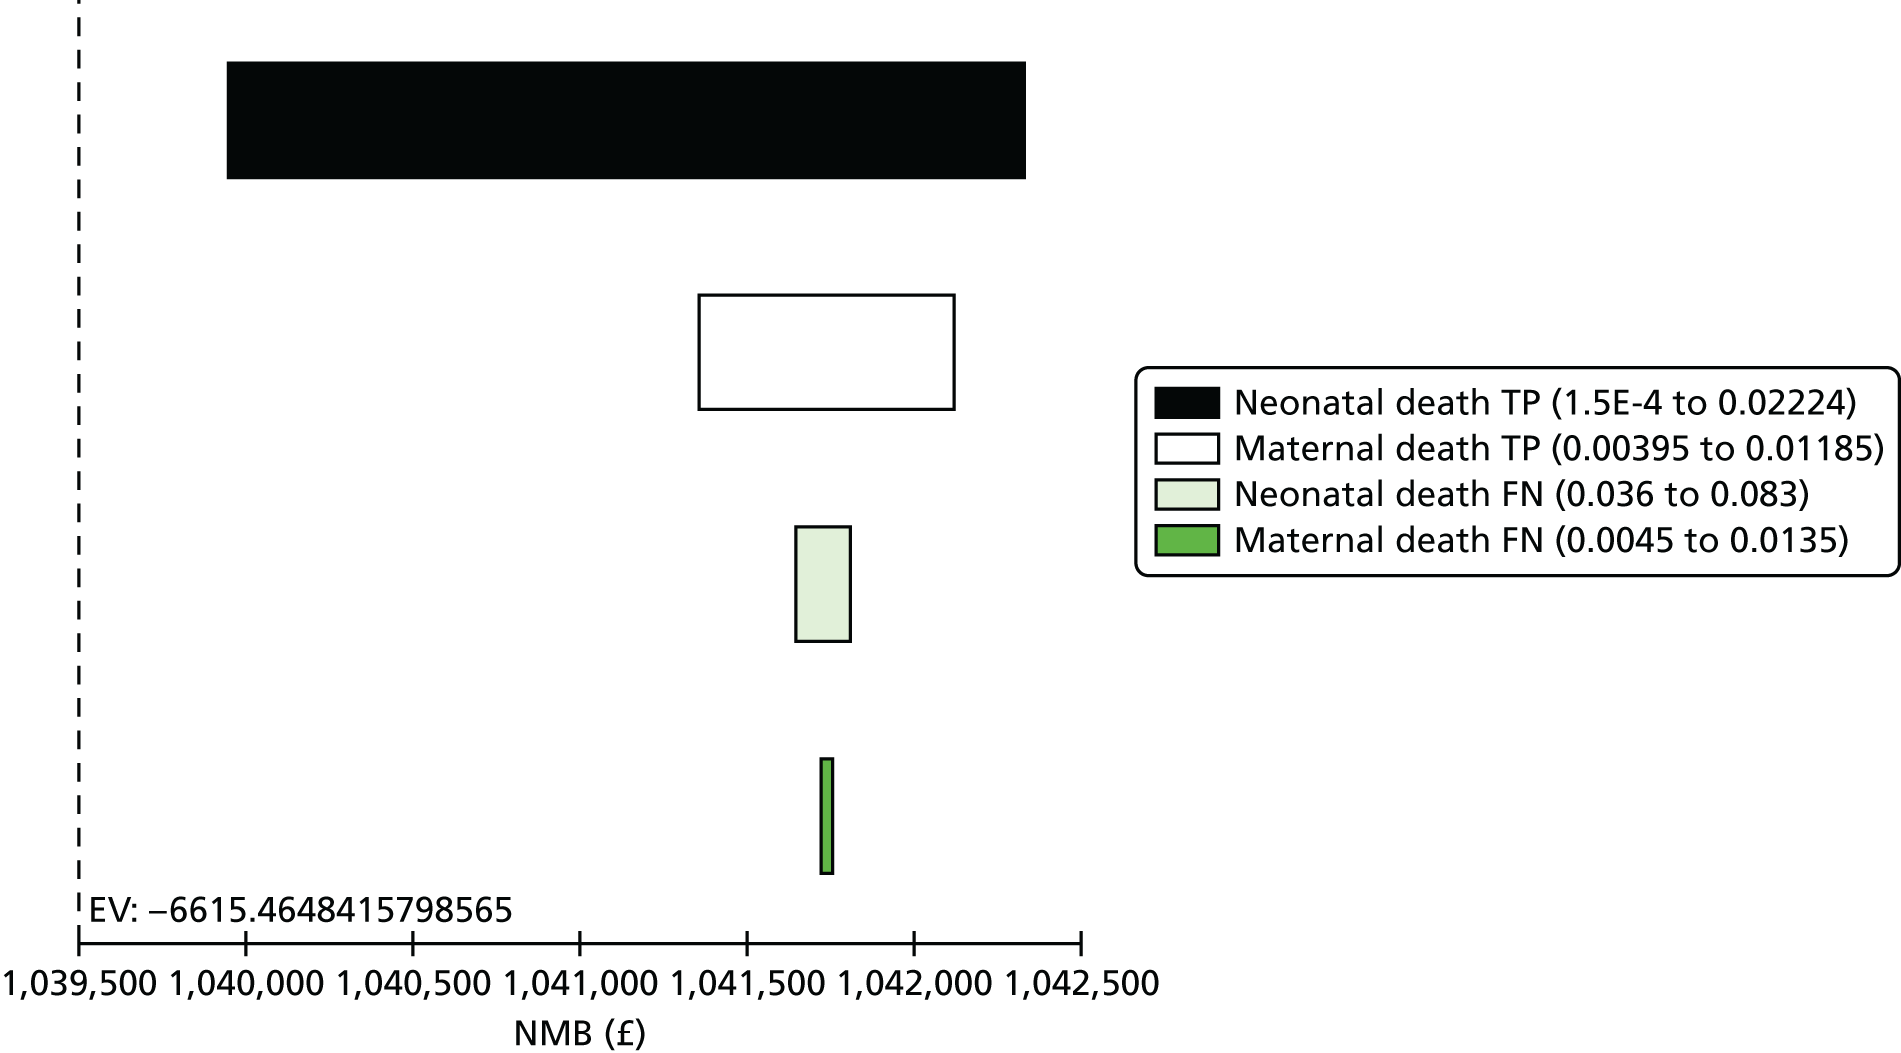
Probability of death
The probability of neonatal death in true positives was the largest source of uncertainty. This was explored in a one-way sensitivity analysis in Figure 19 and tornado analysis in Figure 20. Varying the value of the parameter did not affect the cost-effectiveness ranking.
FIGURE 19.
Marginal effect of changing the probability of neonatal death in true positives.
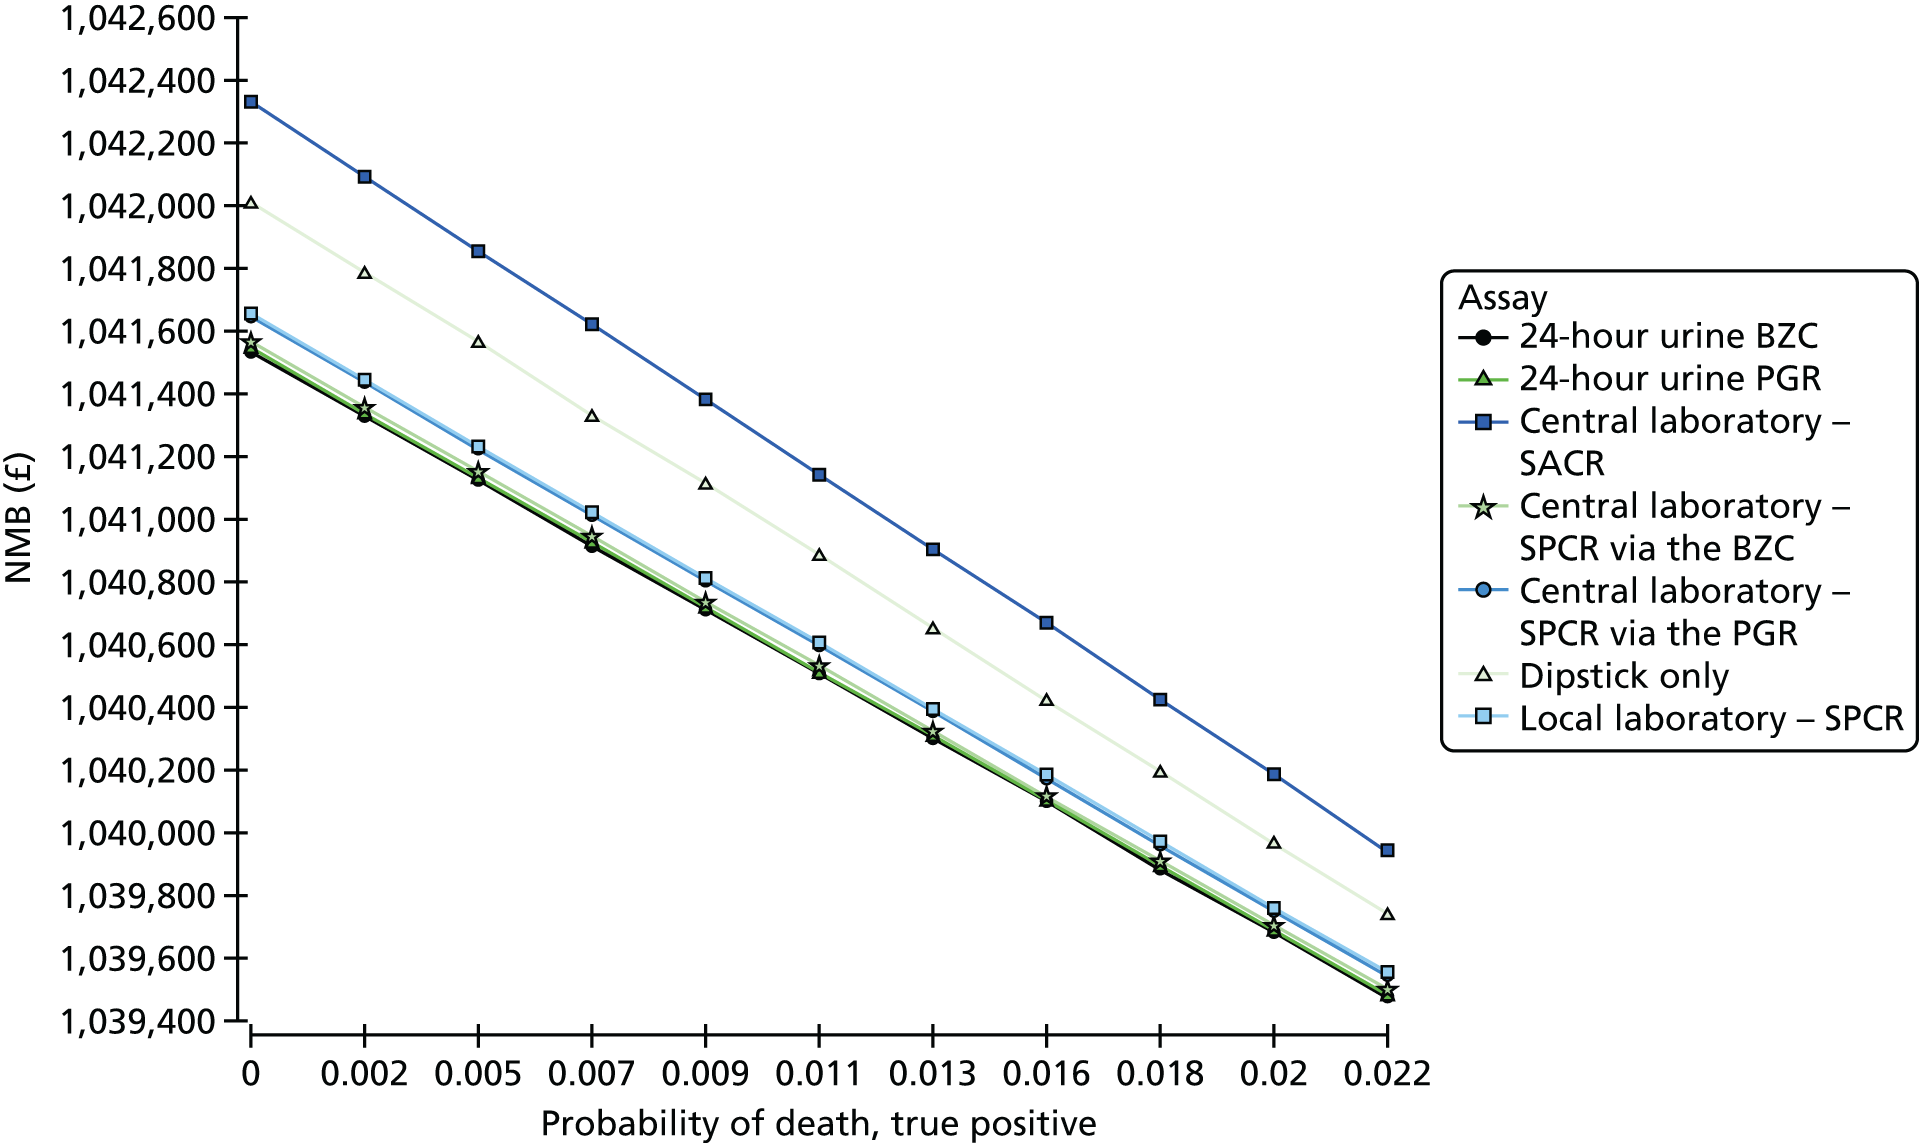
FIGURE 20.
Tornado analysis, LOS. EV, expected value.
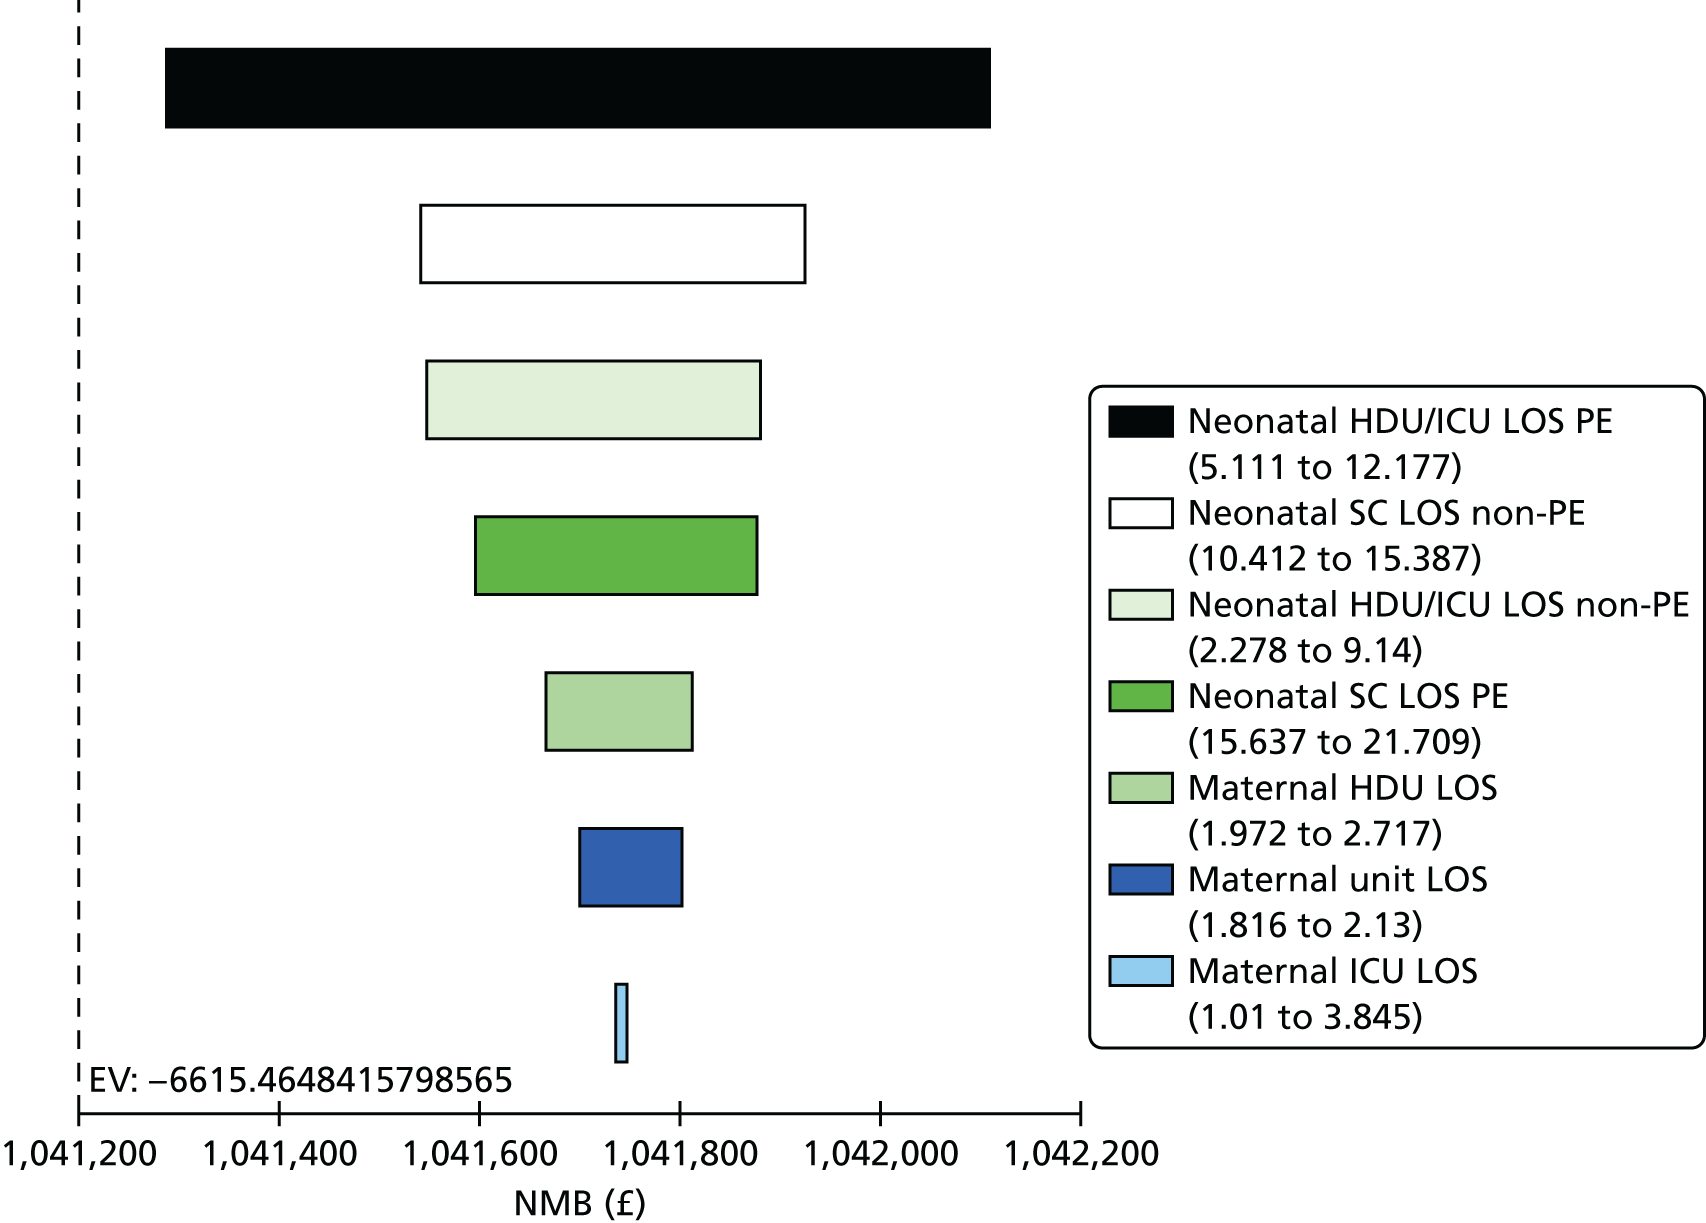
Length of stay in maternal and neonatal units
Length of stay in neonatal HDU and ICU in patients with PE was the largest source of uncertainty. This was explored in a one-way sensitivity analysis in Figure 21 and the tornado analysis in Figure 22. There was no effect on the ranking of comparators.
FIGURE 21.
Marginal effect or neonatal HDU/ICU LOS.
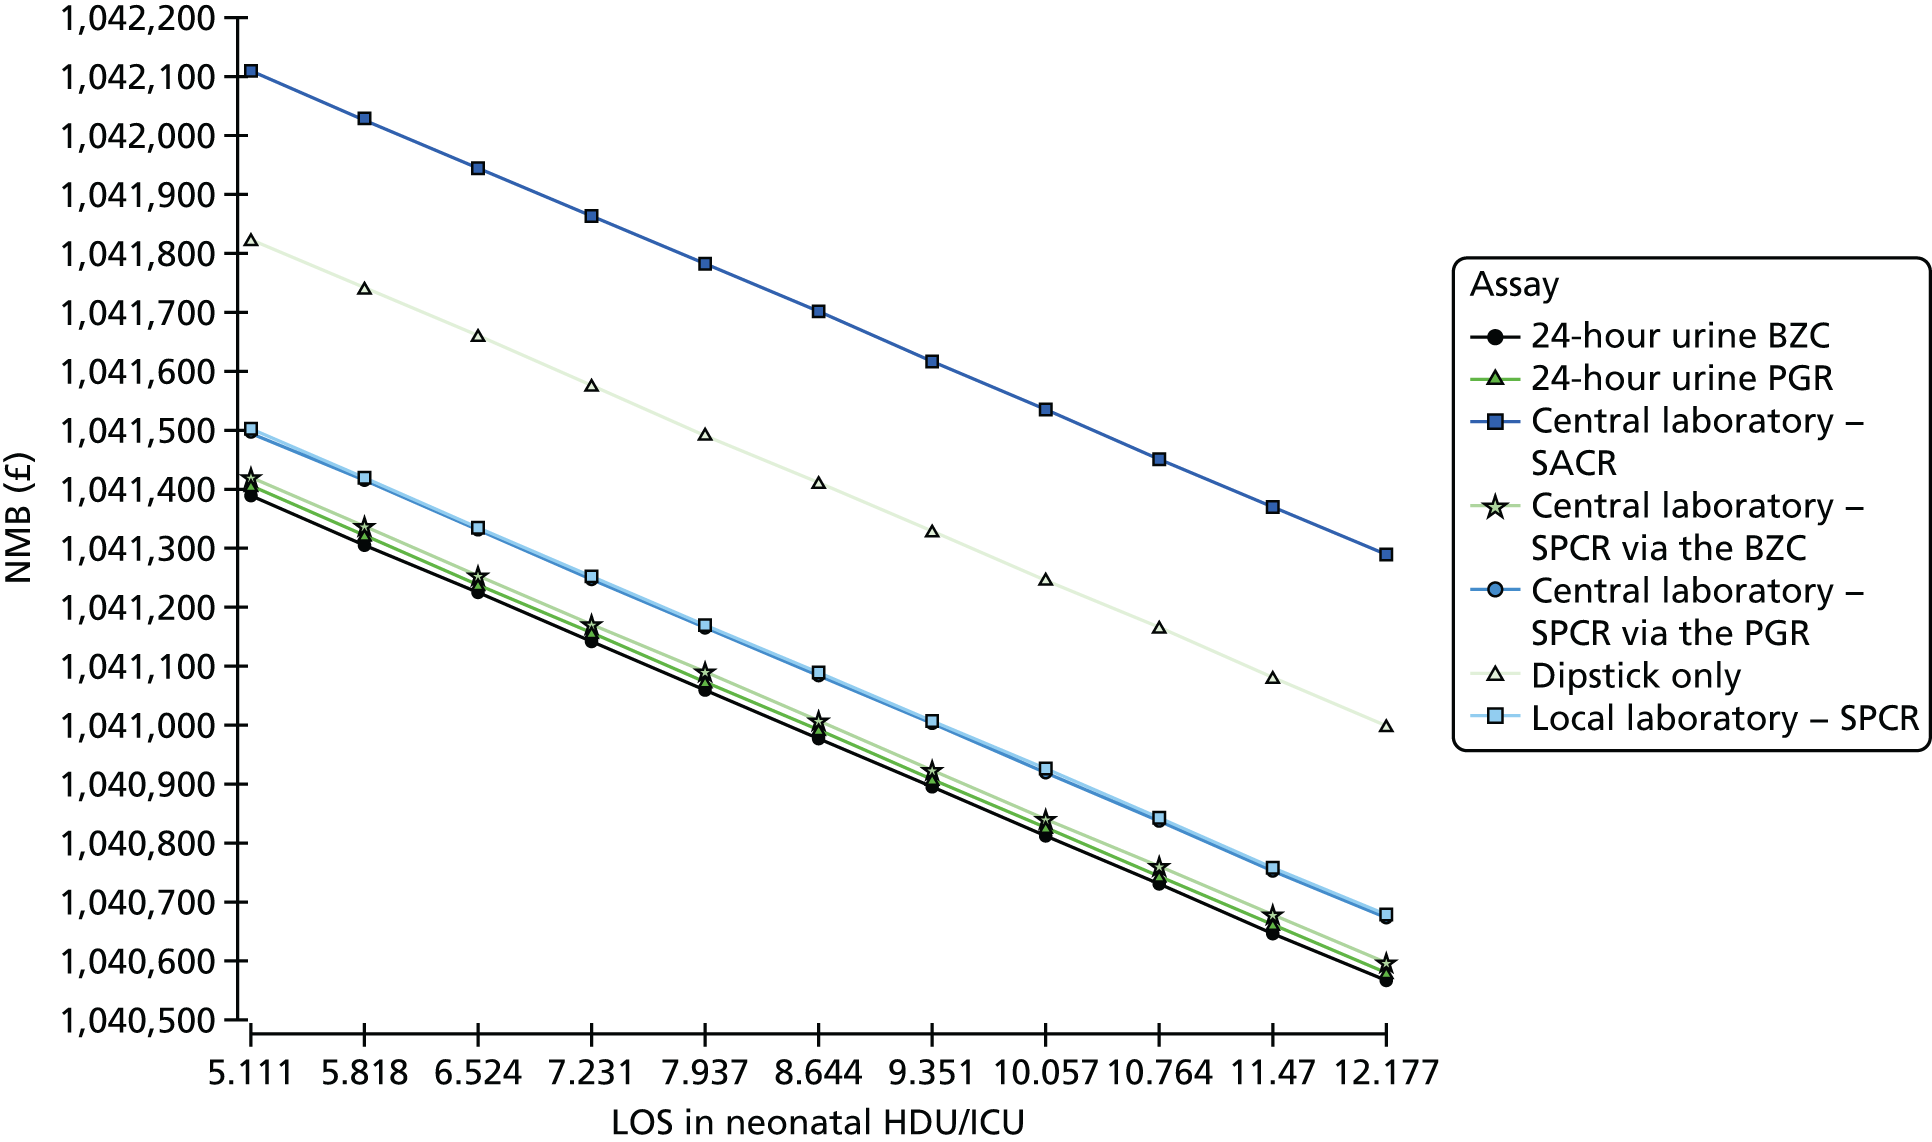
FIGURE 22.
Tornado analysis (NMB) unit costs. EV, expected value.
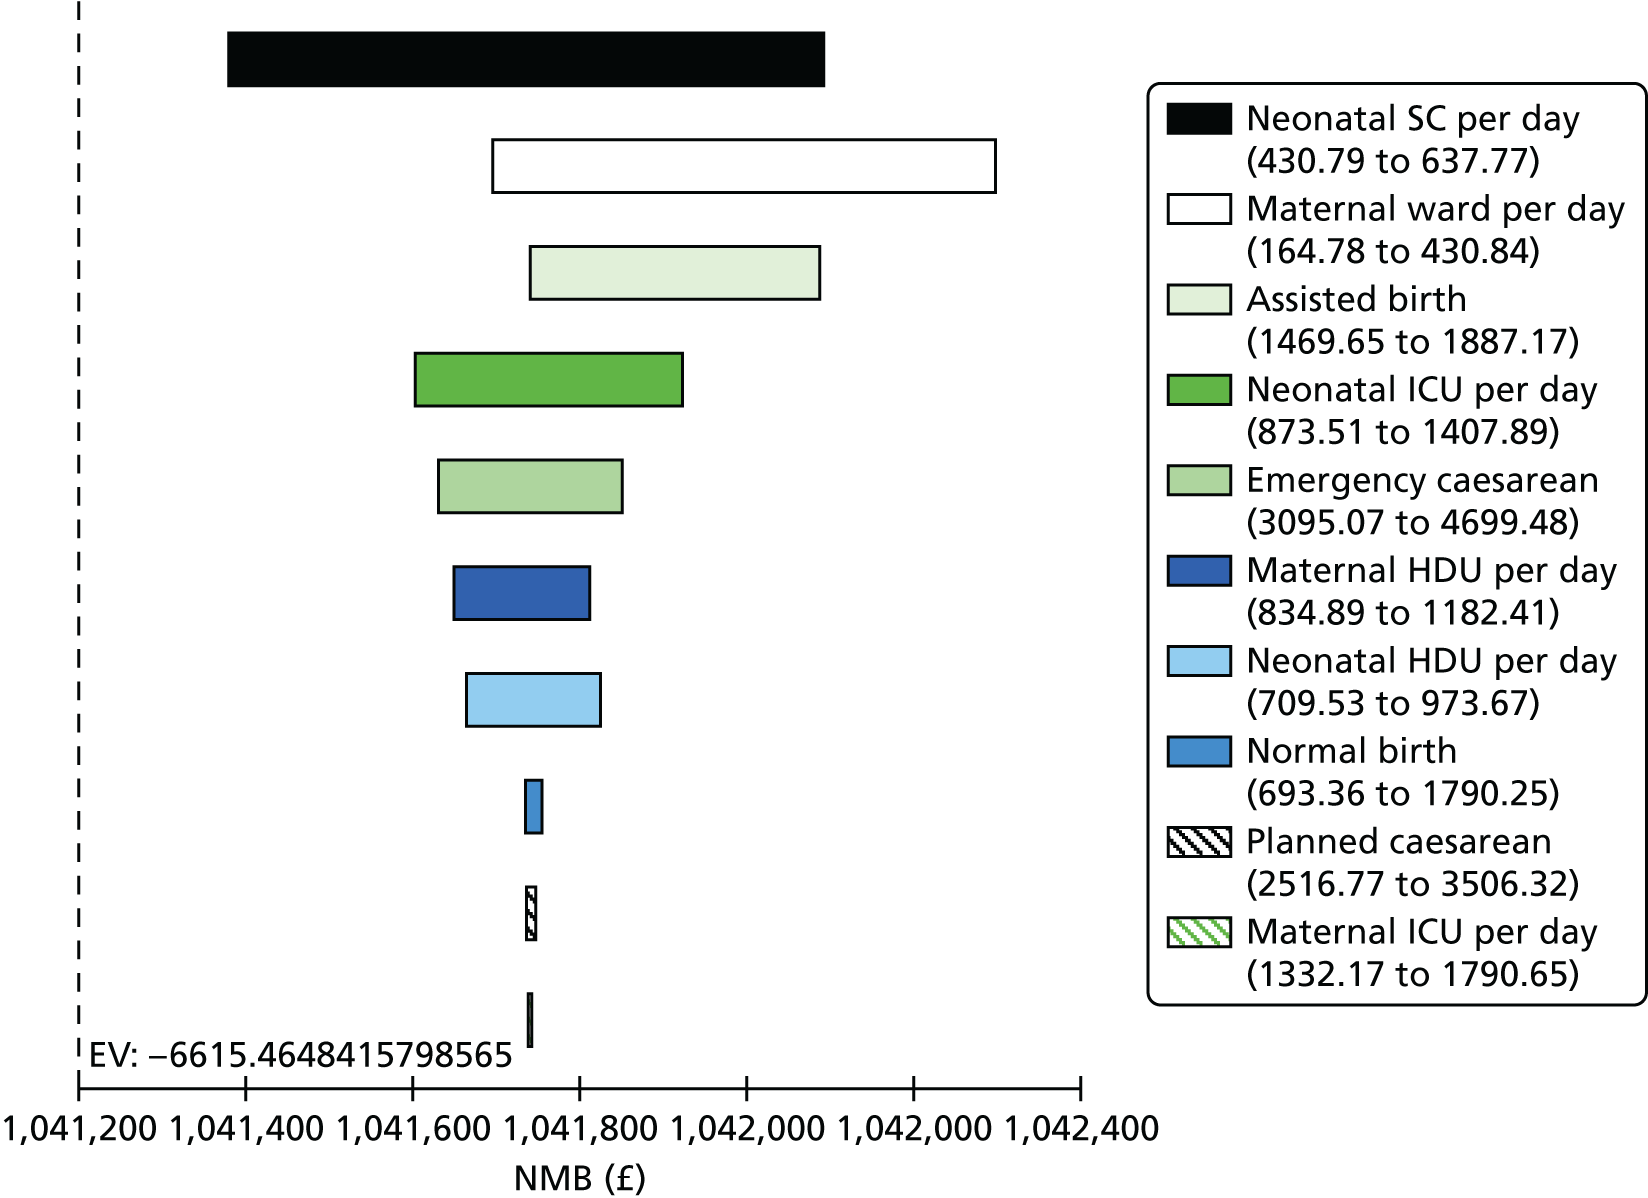
Unit costs
The largest contributors to uncertainty in cost parameters were neonatal SCBU and maternal ward daily costs. These were explored in one-way analyses represented in Figures 23 and 24. There was no effect on cost-effectiveness rankings.
FIGURE 23.
Marginal effect of cost of neonatal special care.
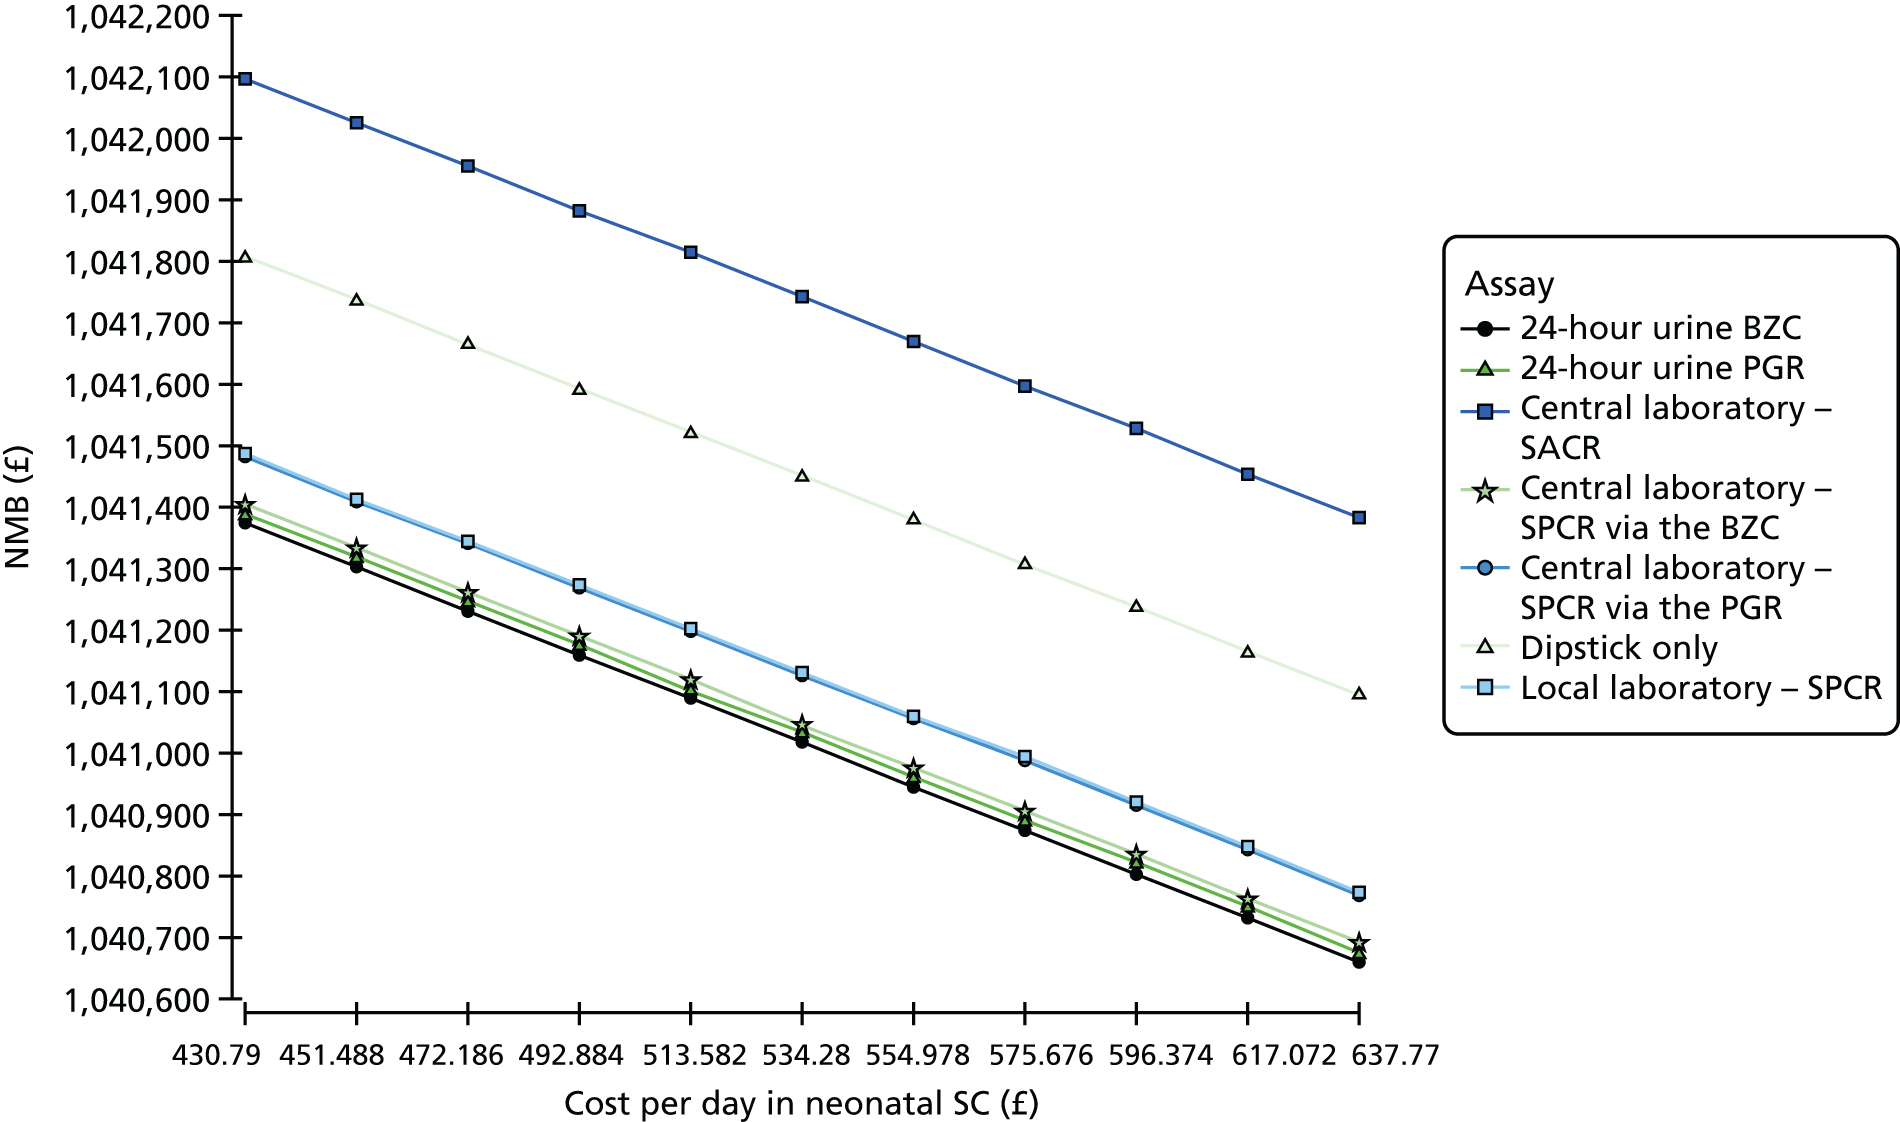
FIGURE 24.
Marginal effect of cost in maternal ward.
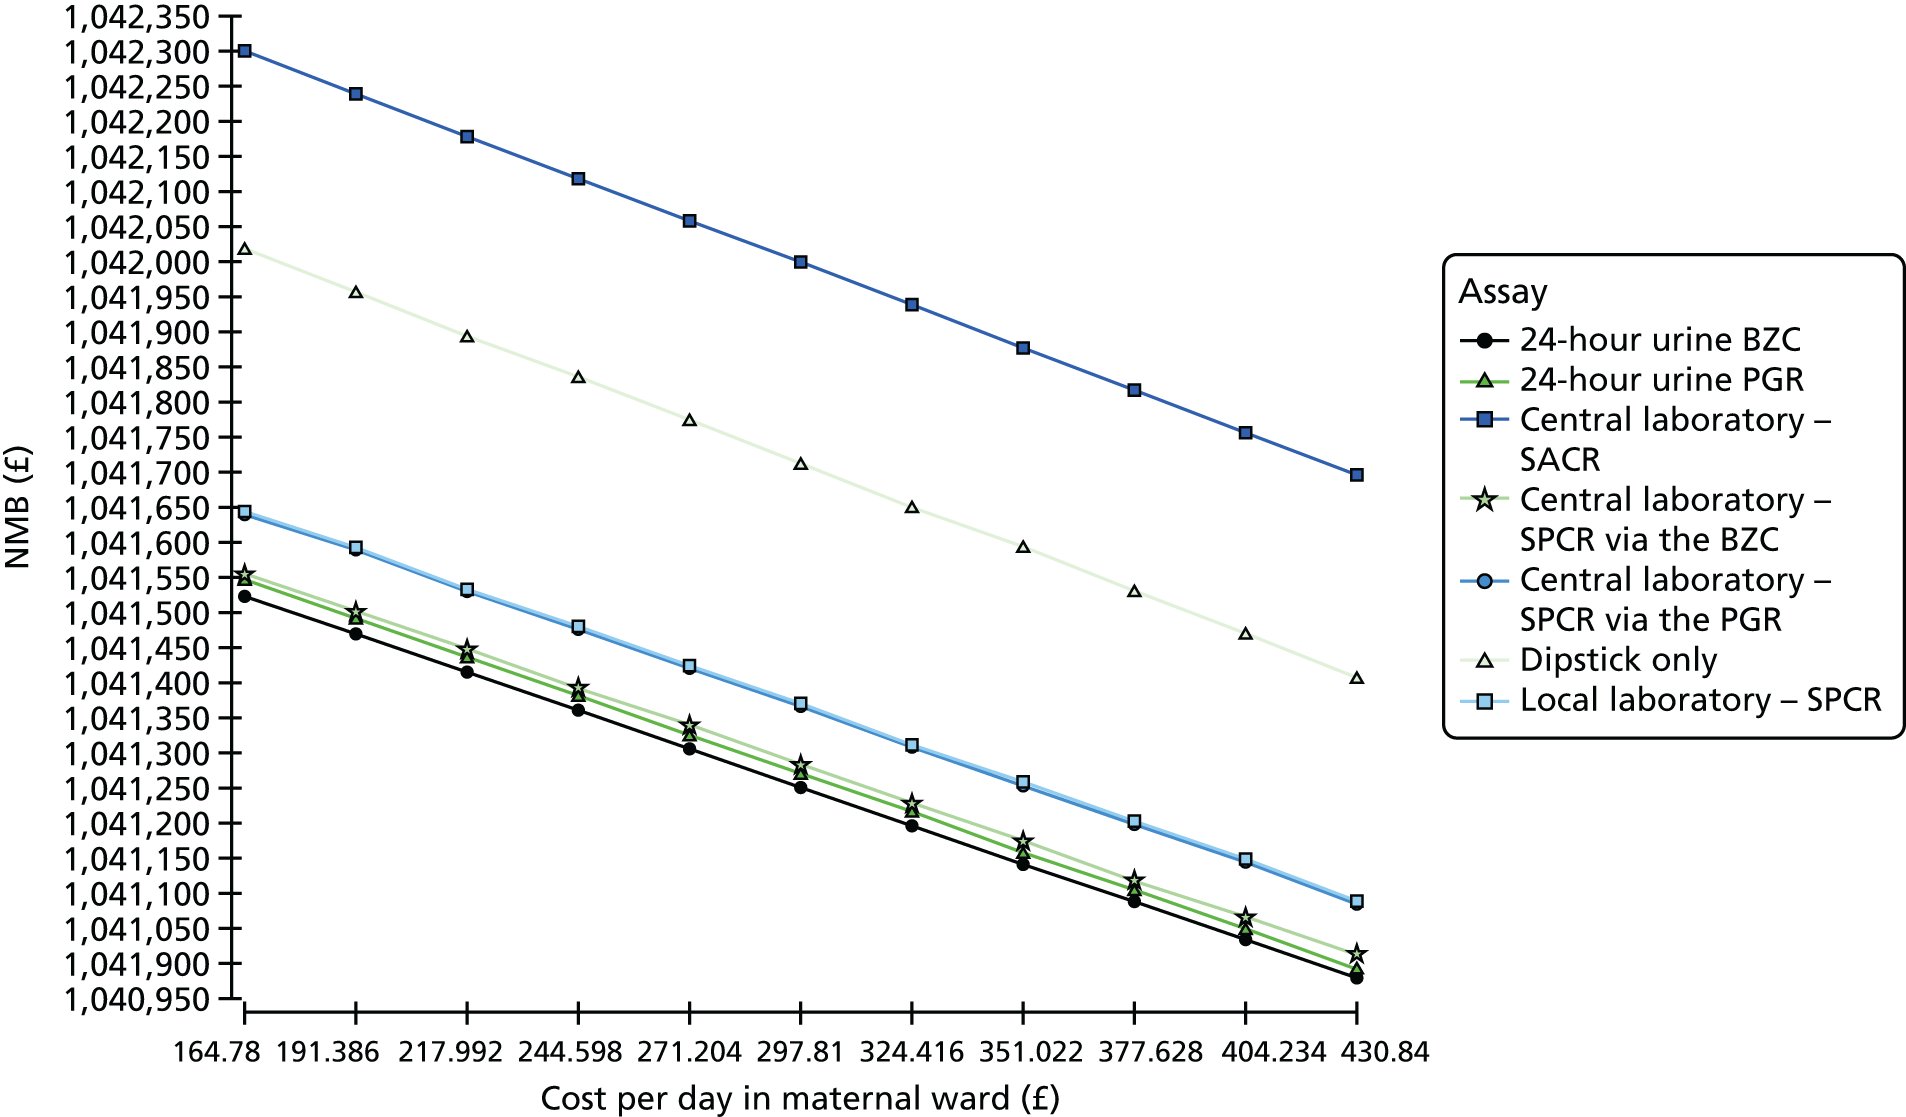
Probabilistic sensitivity analysis
Summary of probabilistic sensitivity analysis results
Tables 73 and 74 demonstrate the mean and incremental values of cost, QALYs gained and ICER for each comparator test based on the PSA with 95% CIs. The differences in cost and QALYs were small, resulting in wide CIs for the ICER estimates. The most cost-effective test was the central laboratory’s SACR test, which had an ICER of £1255 compared with the local laboratory’s SPCR test, although the 95% CI crossed zero (–£6124 to £8635). Despite the wide range, the upper bound of the CI was below the NICE threshold for acceptability of new health-care technology of £20,000 per QALY gained.
| Strategy | Mean (95% CI) | |
|---|---|---|
| Cost (£) | QALY gain | |
| Local laboratory SPCR test | 6504.11 (5682.16 to 7326.06) | 52.38 (52.32 to 52.44) |
| Central laboratorya – SACR | 6544.25 (5716.62 to 7371.88) | 52.42 (52.36 to 52.48) |
| Dipstick test only | 6570.77 (5740.36 to 7401.18) | 52.40 (52.34 to 52.46) |
| Central laboratorya – SPCR via the PGR assay | 6509.36 (5686.14 to 7332.58) | 52.38 (52.32 to 52.44) |
| Central laboratorya – 24-hour urine protein measured via the BZC assay | 6498.29 (5677.05 to 7319.53) | 52.38 (52.32 to 52.44) |
| Central laboratorya – SPCR via the BZC assay | 6499.11 (5678.07 to 7320.15) | 52.38 (52.32 to 52.44) |
| Central laboratorya – 24-hour urine protein measured via the PGR assay | 6513.01 (5689.95 to 7336.07) | 52.38 (52.32 to 52.44) |
| Strategy | Incremental cost (£) vs. local laboratory SPCR test (95% CI) | Incremental QALYs vs. local laboratory SPCR test (95% CI) | ICER (£/QALY) (95% CI) |
|---|---|---|---|
| Central laboratorya – SACR | 40.14 (0.39 to 79.89) | 0.04 (0.02 to 0.06) | 1255.27 (–6124.03 to 8634.57) |
| Dipstick test only | 66.66 (26.19 to 107.13) | 0.02 (0 to 0.04) | 5077.07 (–87,873.40 to 98,027.50) |
| Central laboratorya – SPCR via the PGR assay | 5.26 (–22.77 to 33.29) | 0 (–0.02 to 0.02) | Dominated (–73,092.20 to 71,792.53) |
| Central laboratorya – 24-hour urine protein measured via the BZC assay | –5.82 (–34.79 to 23.15) | –0.01 (–0.03 to 0.01) | Dominated (–84,381.80 to 83,366.32) |
| Central laboratorya – SPCR via the BZC assay | –5.00 (–33.60 to 23.60) | –0.01 (–0.03 to 0.01) | 674.44 (–119,920.09 to 121,268.97) |
| Central laboratorya – 24-hour urine protein measured via the PGR assay | 8.91 (–19.43 to 37.25) | –0.01 (–0.03 to 0.01) | Dominated (–162,414.22 to 157,255.86) |
Because the CI for the ICER crossed zero in every comparison, 2 × 2 tables representing the distribution of the ICER estimates in the PSA across the four quadrants of the cost-effectiveness plane (Tables 75–80) were used in combination with graphical representation of the PSA output using cost-effectiveness planes (Figures 25–30) to interpret the uncertainty around the ICER estimate. The ICER of central laboratory SACR test is distributed across the north-east (97.7% of points) and south-east (2.3%) quadrants, meaning that the negative range of the ICER represents cost savings, which supports the argument that the central laboratory’s SACR test was likely to be cost-effective compared with the local laboratory’s SPCR test. The dipstick-only strategy was the second most likely to be cost-effective, with 98.4% of points representing higher cost and higher outcome, although it was dominated in 1.5% of cases. The other four strategies (central laboratory’s SPCR test and the 24-hour urine test for both the PGR and BZC assays) had a significant probability of being either dominant or dominated, which is explained by small differences and significant uncertainty in cost and outcome per patient.
| Negative incremental effect (%) | Positive incremental outcome (%) | |
|---|---|---|
| Positive incremental cost (%) | 0 | 97.7 |
| Negative incremental outcome (%) | 0 | 2.3 |
| Negative incremental effect (%) | Positive incremental outcome (%) | |
|---|---|---|
| Positive incremental cost (%) | 1.5 | 98.4 |
| Negative incremental outcome (%) | 0 | 0.1 |
| Negative incremental effect (%) | Positive incremental outcome (%) | |
|---|---|---|
| Positive incremental cost (%) | 45.1 | 18.4 |
| Negative incremental outcome (%) | 4.3 | 32.2 |
| Negative incremental effect (%) | Positive incremental outcome (%) | |
|---|---|---|
| Positive incremental cost (%) | 33.6 | 0.6 |
| Negative incremental outcome (%) | 39.1 | 26.6 |
| Negative incremental effect (%) | Positive incremental outcome (%) | |
|---|---|---|
| Positive incremental cost (%) | 34.9 | 1.3 |
| Negative incremental outcome (%) | 32.0 | 31.9 |
| Negative incremental effect (%) | Positive incremental outcome (%) | |
|---|---|---|
| Positive incremental cost (%) | 60.6 | 12.8 |
| Negative incremental outcome (%) | 5.7 | 20.9 |
FIGURE 25.
Incremental cost-effectiveness plane: the central laboratory’s SACR test vs. the local laboratory’s SPCR test. The line represents the standard ceiling WTP per QALY recommended by NICE.
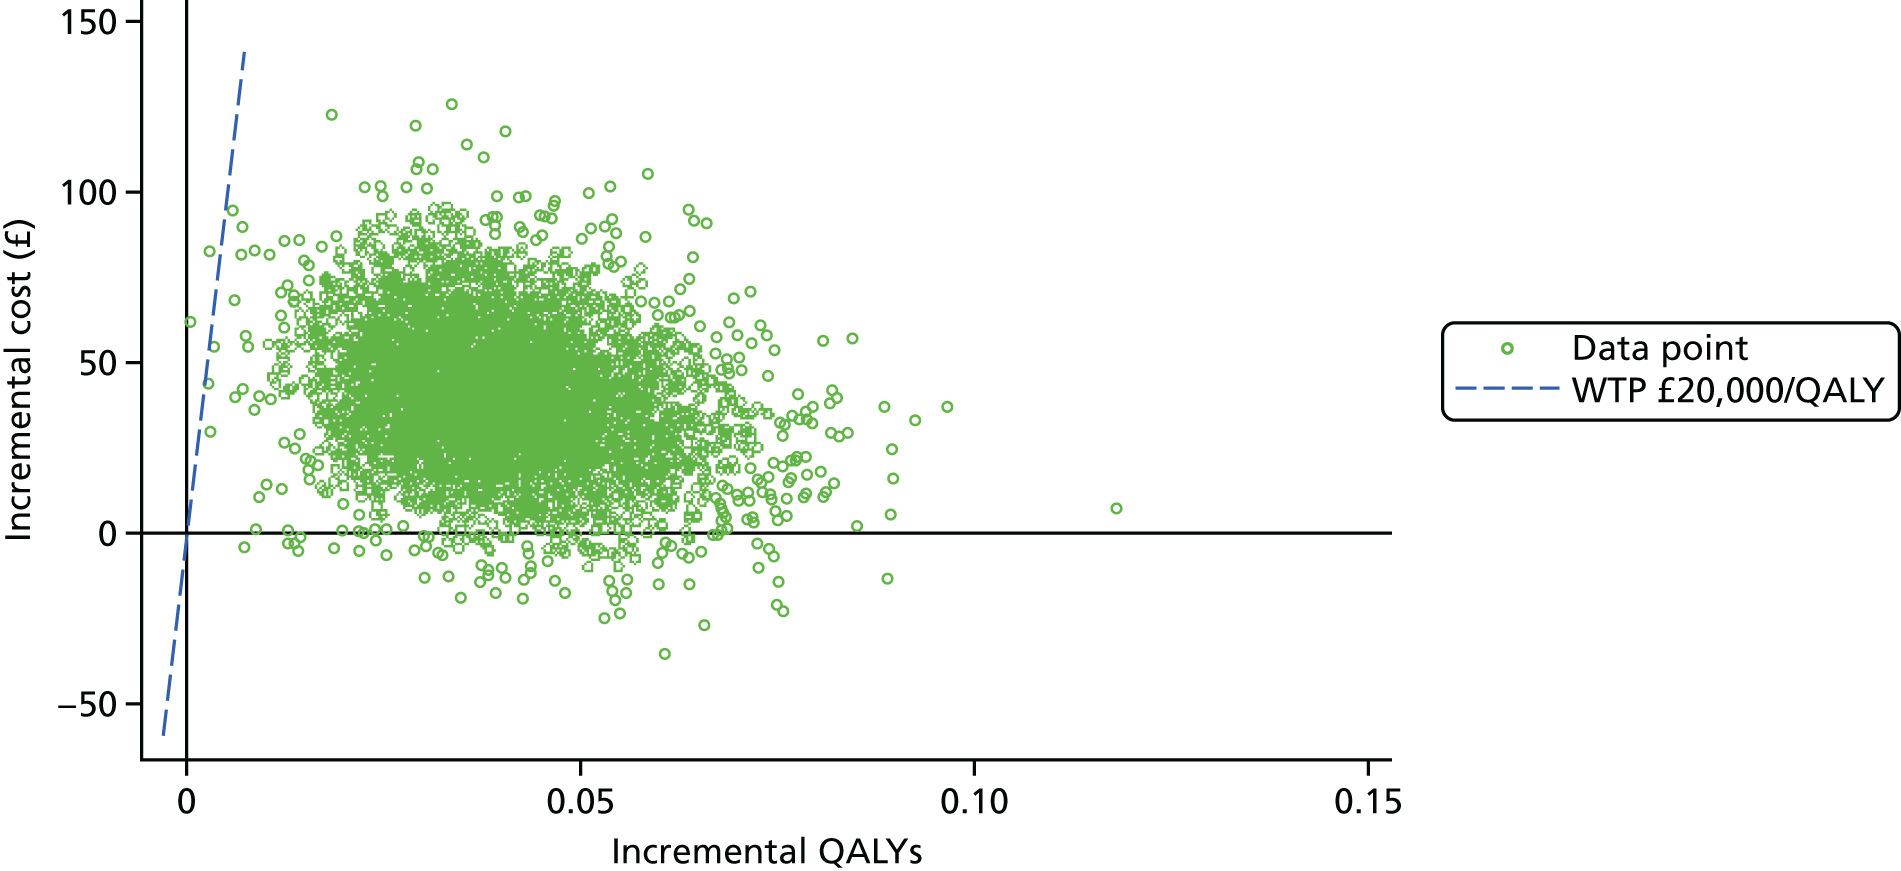
FIGURE 26.
Incremental cost-effectiveness plane: dipstick test only vs. the local laboratory’s SPCR test. The line represents the standard ceiling WTP per QALY recommended by NICE.
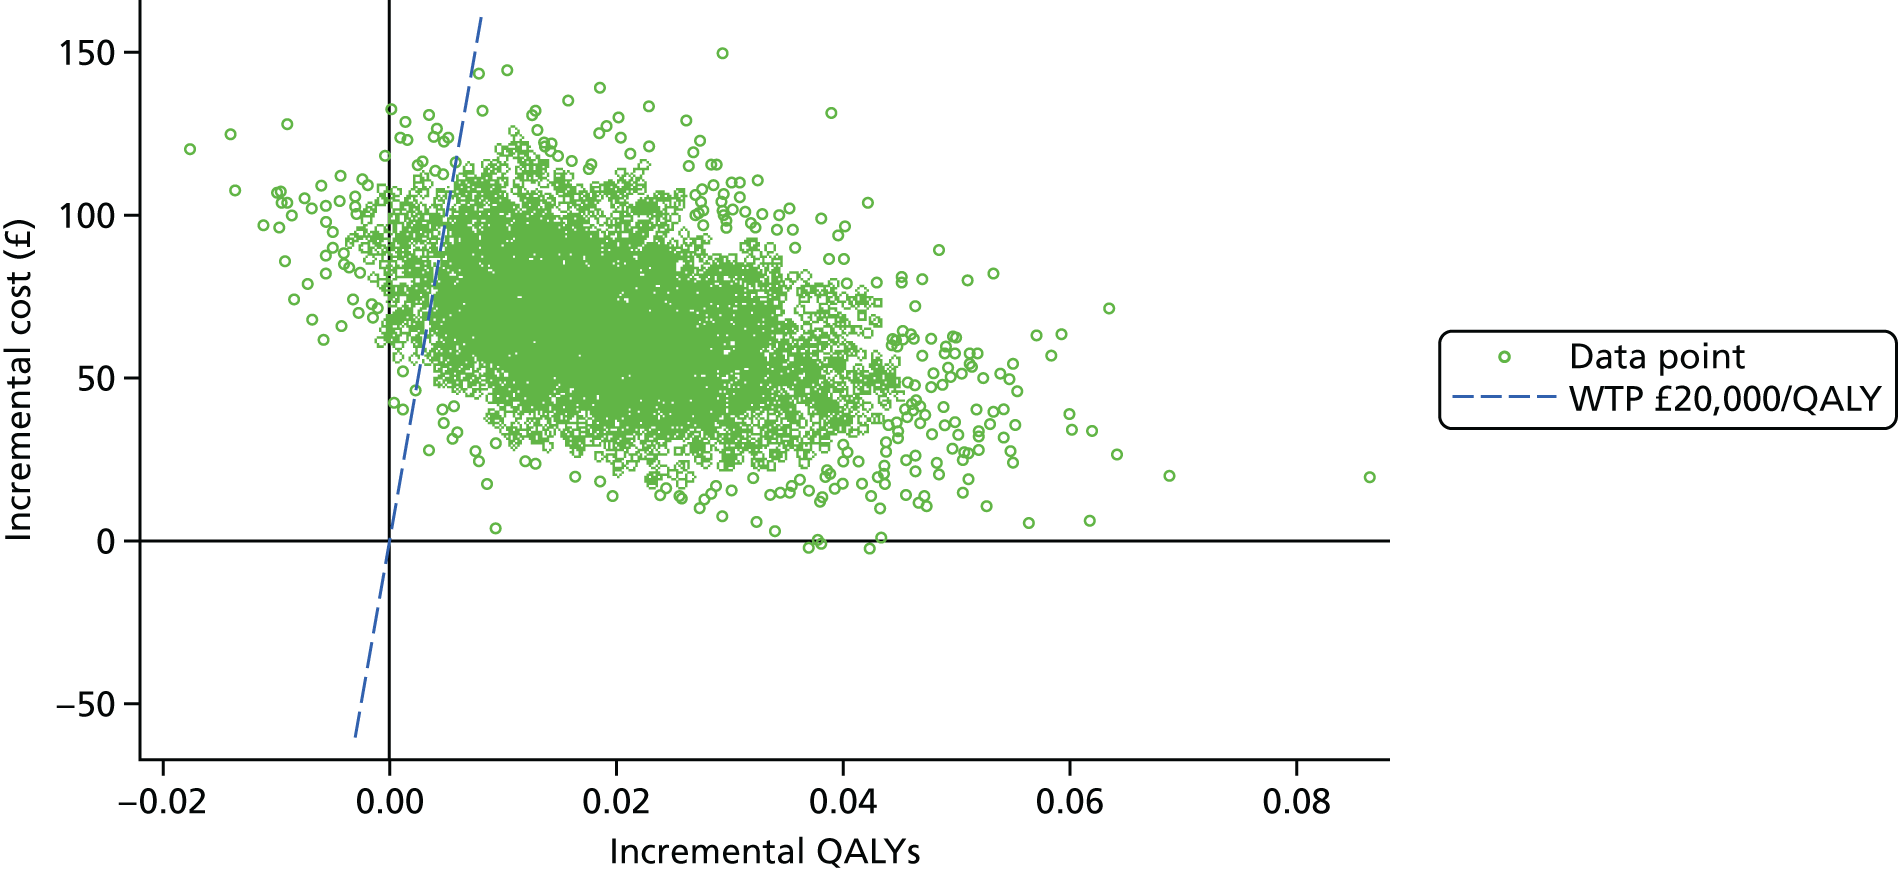
FIGURE 27.
Incremental cost-effectiveness plane: the central laboratory’s SPCR test (measured via the PGR assay) vs. the local laboratory’s SPCR test. The line represents the standard ceiling WTP per QALY recommended by NICE.
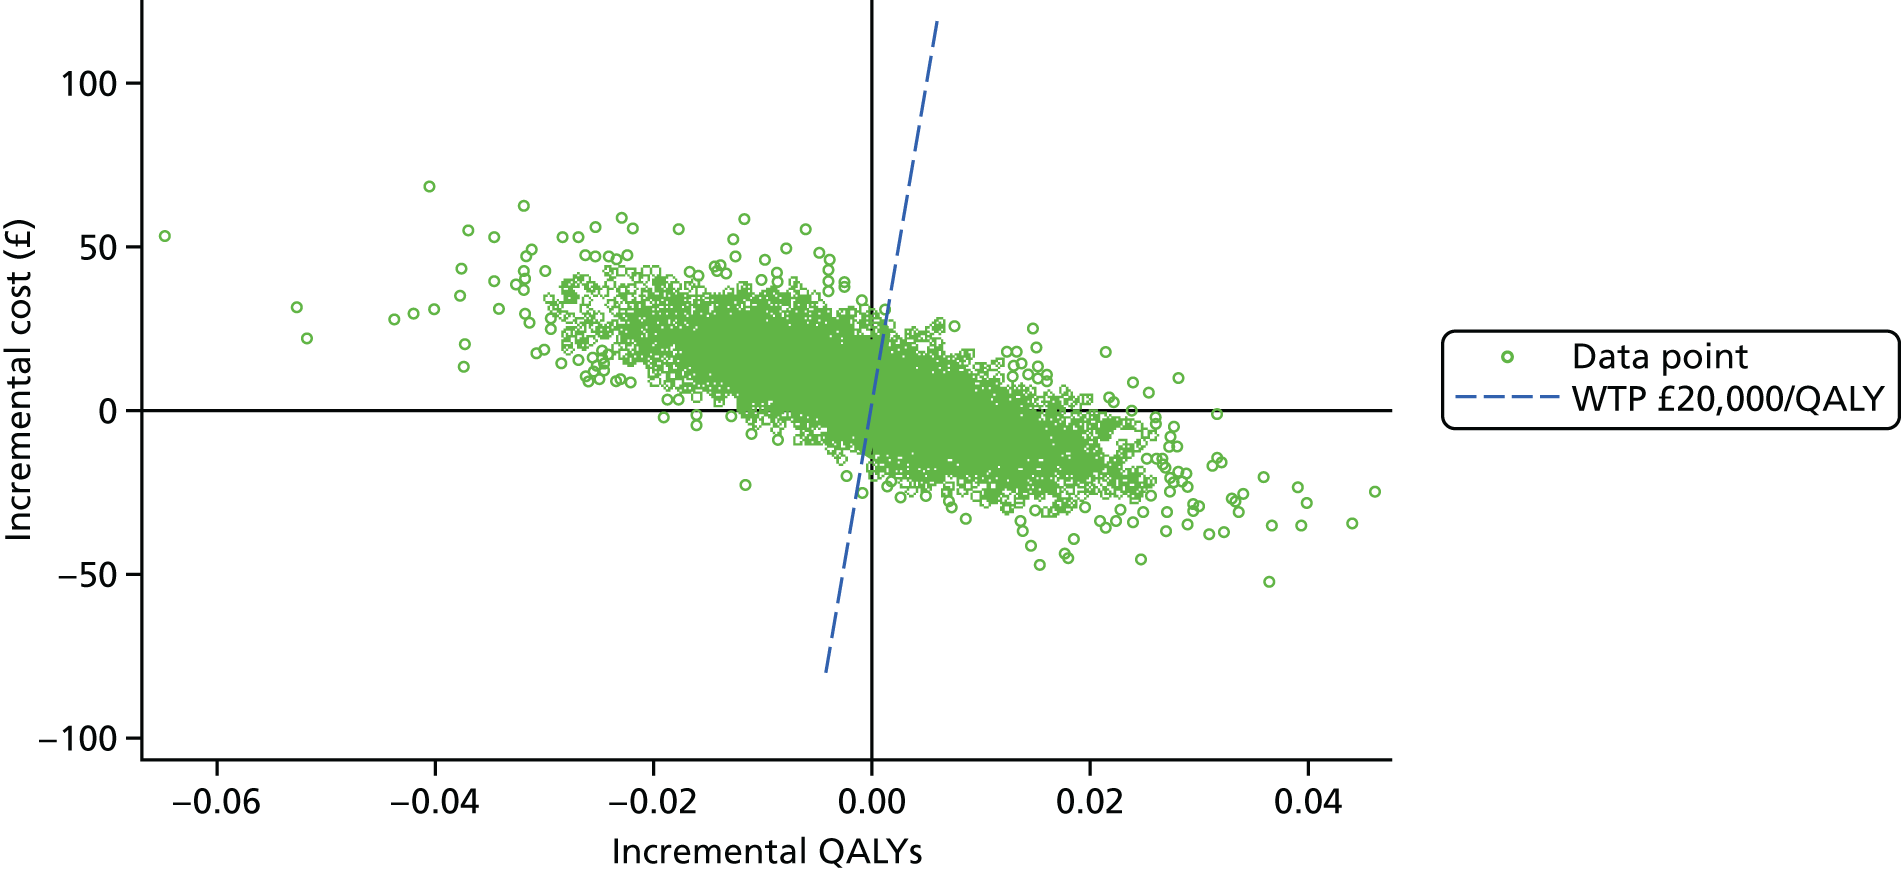
FIGURE 28.
Incremental cost-effectiveness plane: the 24-hour urine test (measured via the BZC assay) vs. the local laboratory’s SPCR test. The line represents the standard ceiling WTP per QALY recommended by NICE.
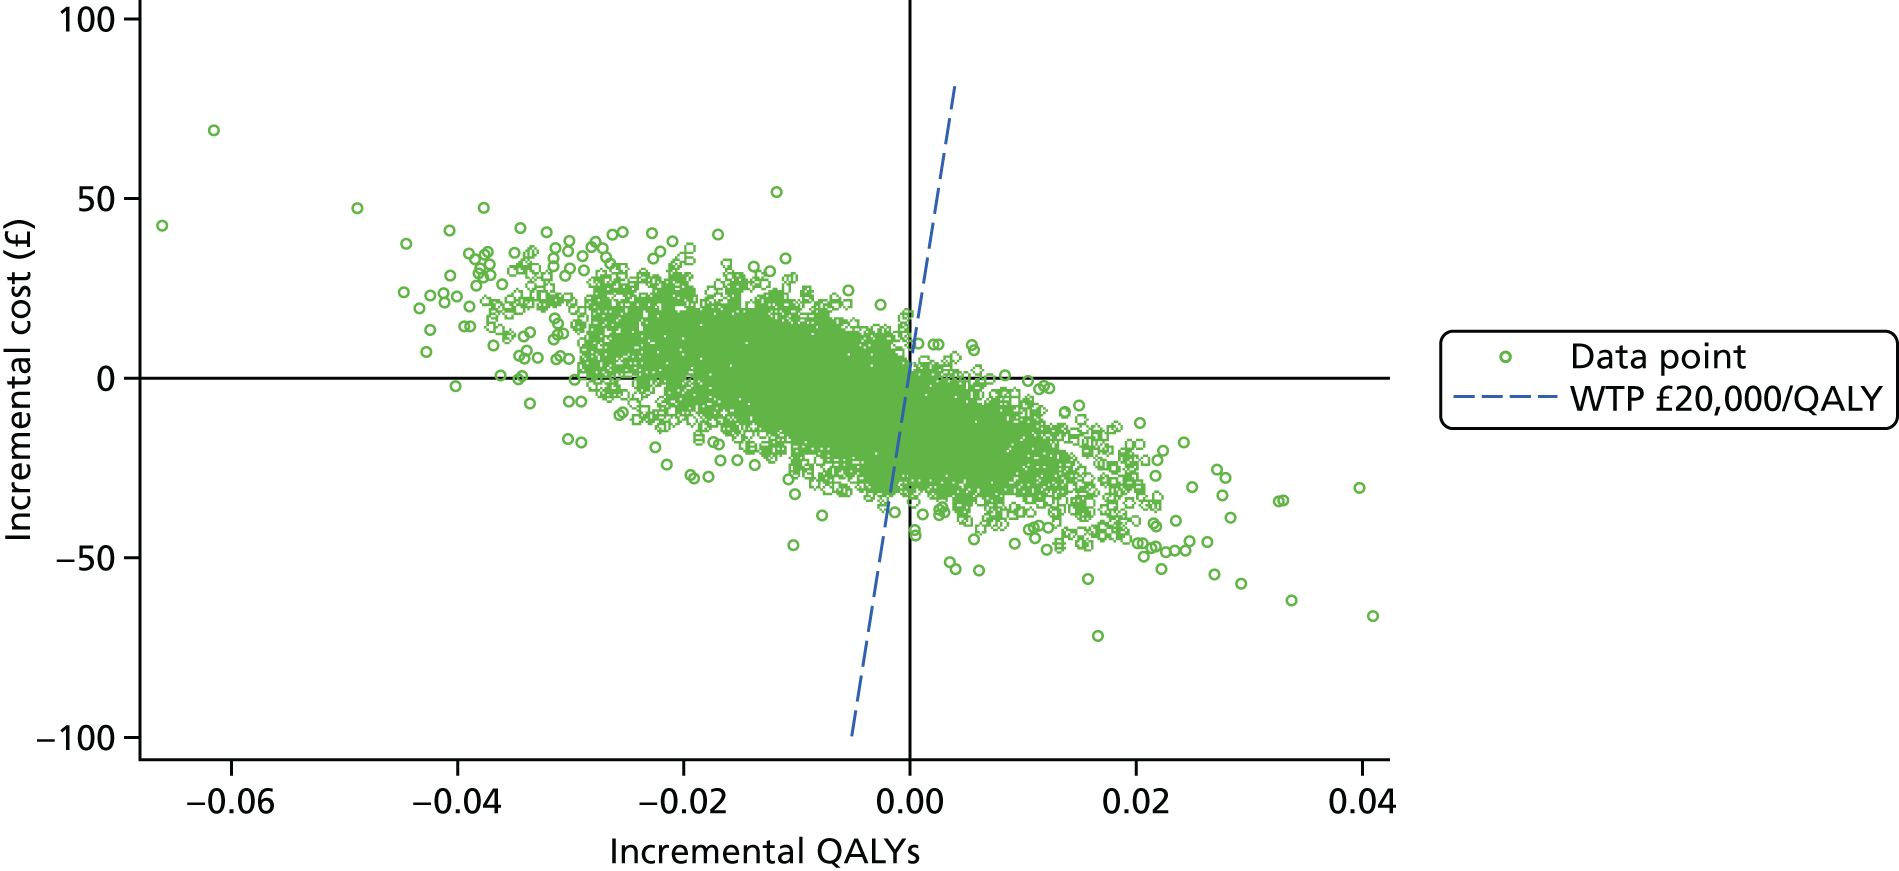
FIGURE 29.
Incremental cost-effectiveness plane: the central laboratory’s SPCR test (measured via the BZC assay) vs. the local laboratory’s SPCR test. The line represents the standard ceiling WTP per QALY recommended by NICE.
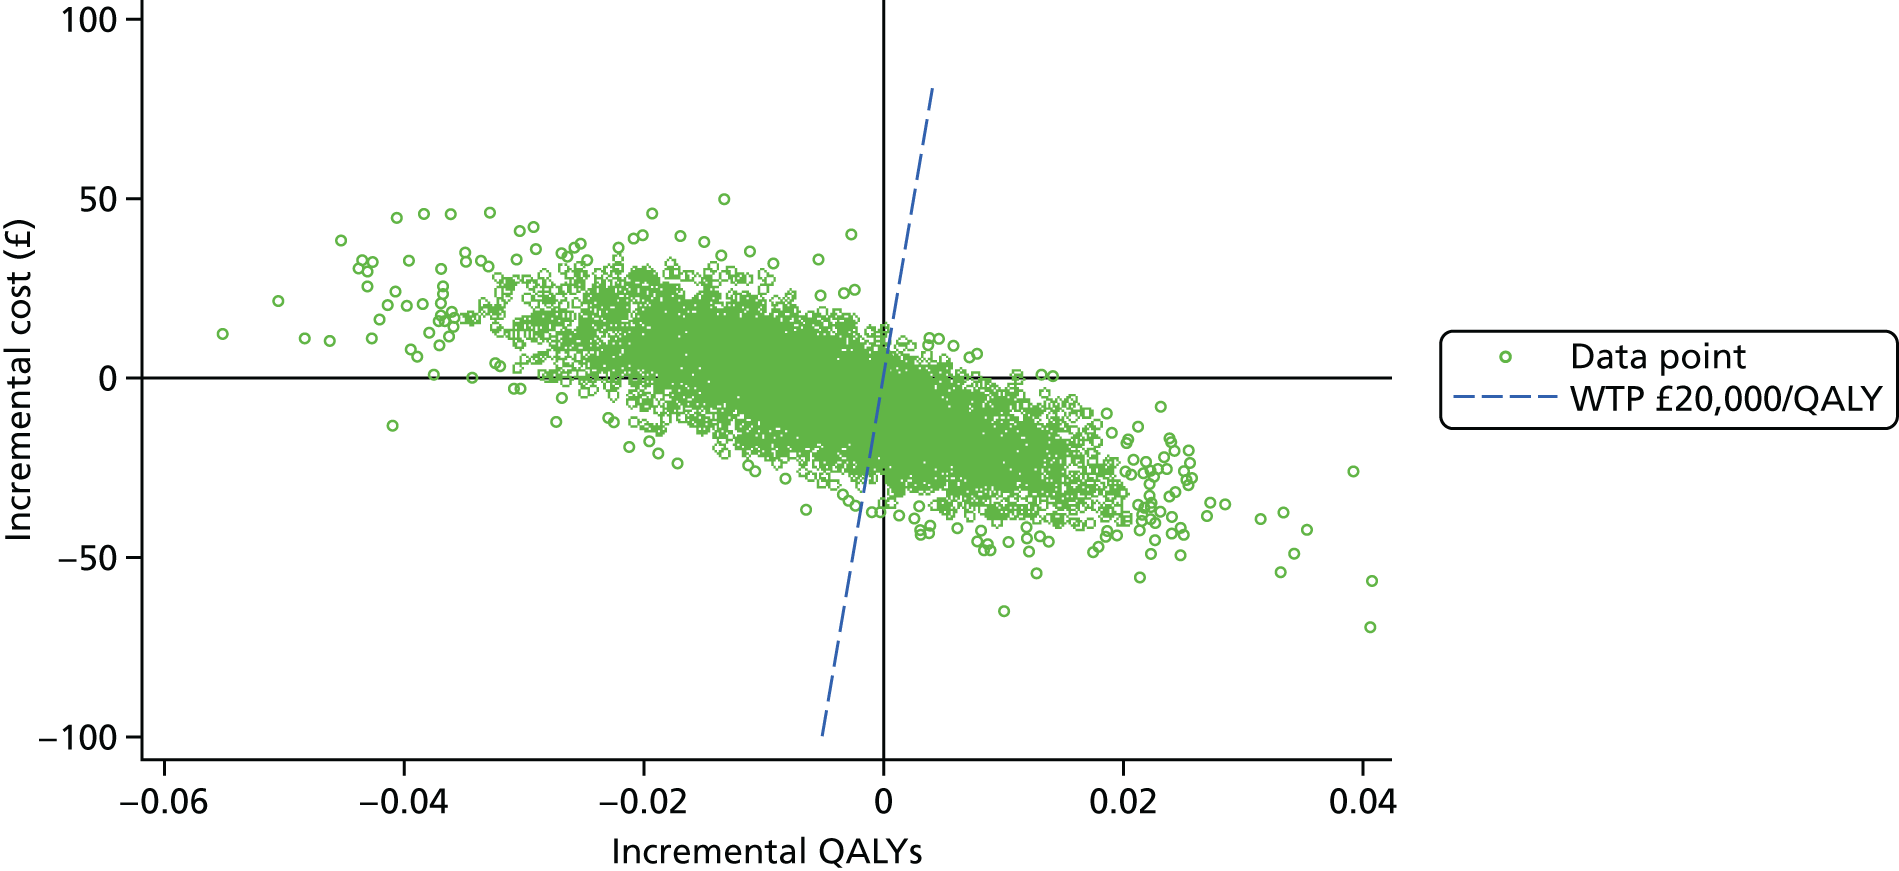
FIGURE 30.
Incremental cost-effectiveness plane: the 24-hour urine test (measured via the PGR assay) vs. the local laboratory’s SPCR test. The line represents the standard ceiling WTP per QALY recommended by NICE.
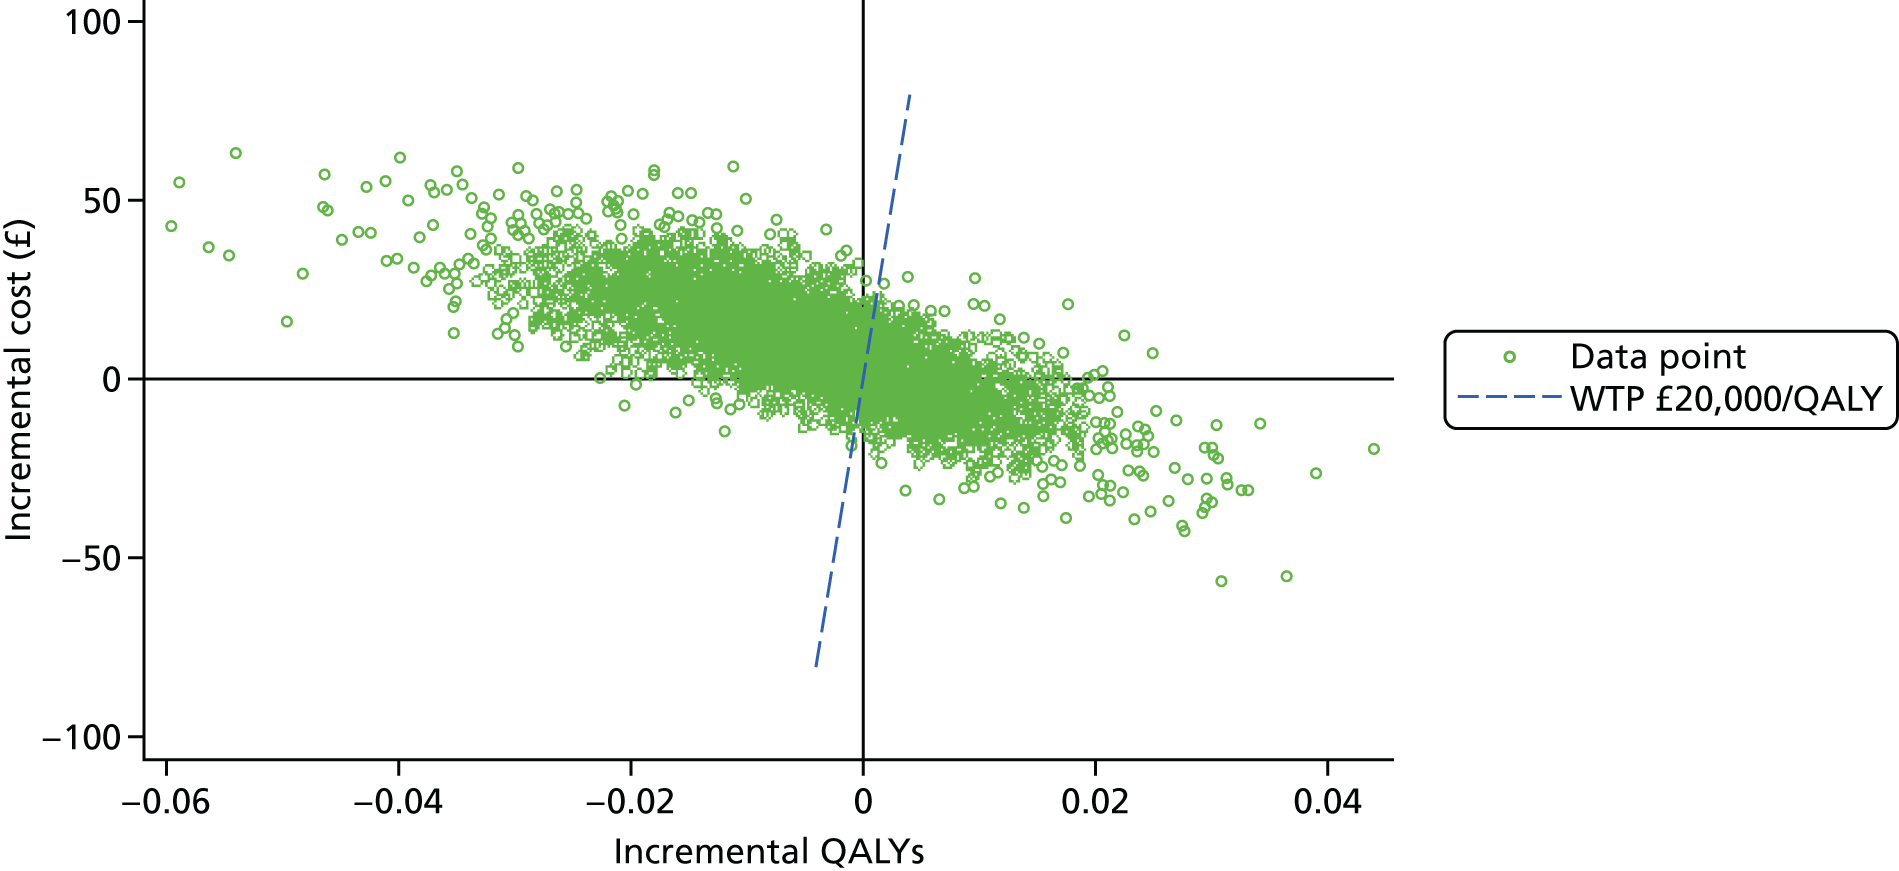
Incremental cost-effectiveness planes
Figures 25–30 represent incremental cost-effectiveness planes for each test versus the baseline comparator (the local laboratory’s SPCR test), which plot each combination of incremental cost and effect generated in the PSA. A line representing the standard ceiling WTP per QALY recommended by NICE is overlaid for reference.
Cost-effectiveness acceptability curve
Figure 31 plots the probability of cost-effectiveness of each comparator against ceiling WTP levels ranging from £0 to £30,000 per QALY. The central laboratory’s SACR test was deemed to have a 100% probability of being the most cost-effective option at the standard WTP threshold of £20,000–30,000 per QALY recommended by NICE.
FIGURE 31.
Cost-effectiveness acceptability curve.
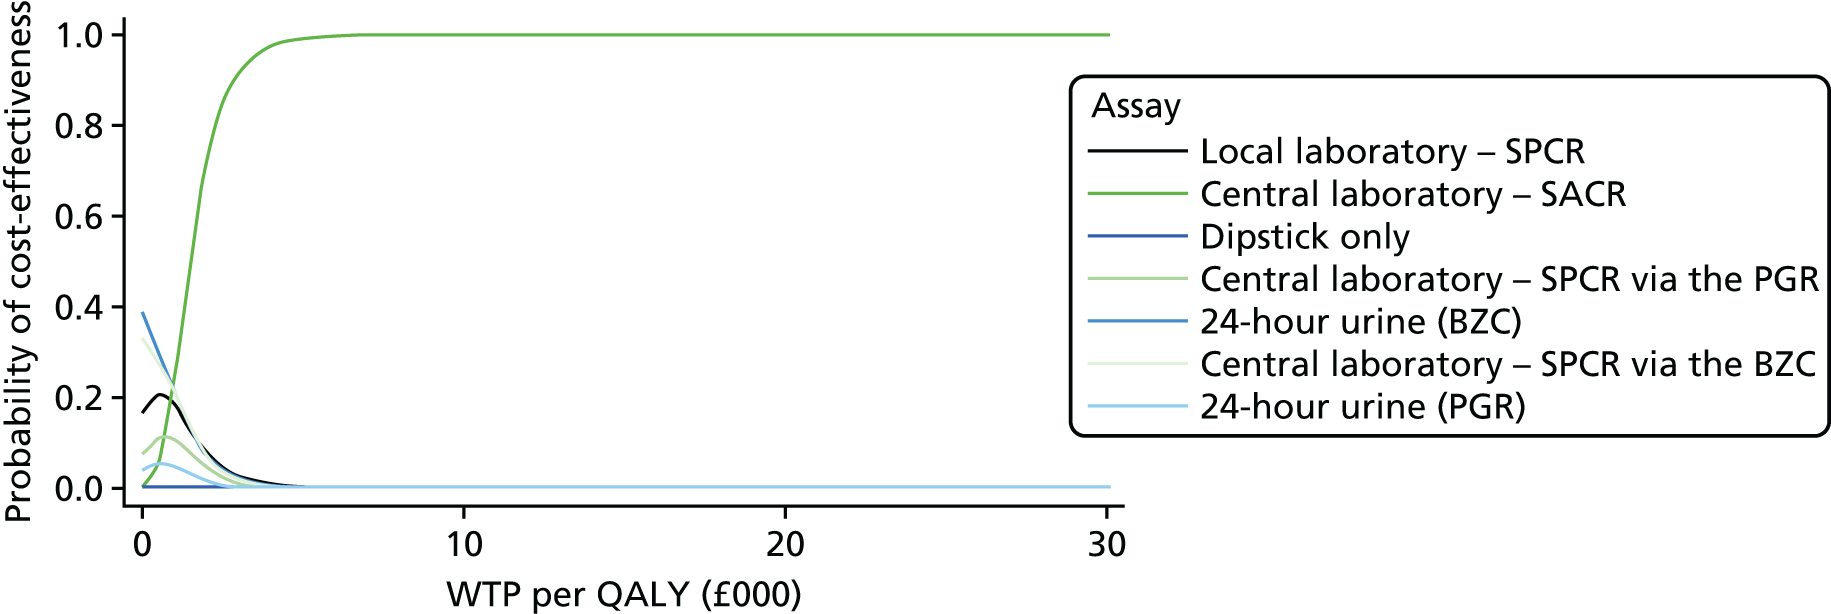
Chapter 5 Discussion and conclusions
Study design, progress and prosecution
This study was designed to explore the challenges of measuring proteinuria in the management of PE and to determine the most reliable method of measurement for future management algorithms within the UK’s NHS. We also set out to determine whether or not there was a level of proteinuria that best predicted (or excluded) severe maternal and perinatal morbidity.
The trial was conducted within the UK and in this clinical setting the management of HDP is heavily influenced by guidance published by NICE in 20101 (and not due for review until September 2016).
When NICE published in 2010, it reviewed all of the evidence regarding proteinuria measurement and made several clinical and research recommendations. Its clinical recommendations for the measurement of proteinuria were:
1.3.1.1 Use an automated reagent-strip reading device or a spot urinary protein : creatinine ratio for estimating proteinuria in a secondary care setting.
1.3.1.2 If an automated reagent-strip reading device is used to detect proteinuria and a result of 1+ or more is obtained, use a spot urinary protein : creatinine ratio or 24-hour urine collection to quantify proteinuria.
1.3.1.3 Diagnose significant proteinuria if the urinary protein : creatinine ratio is greater than 30 mg/mmol or a validated 24-hour urine collection result shows greater than 300 mg protein.
1.3.1.4 Where 24-hour urine collection is used to quantify proteinuria, there should be a recognised method of evaluating completeness of the sample.
National Institute for Health and Clinical Excellence (2010) Hypertension in Pregnancy: The Management of Hypertensive Disorders during Pregnancy. Available from: www.nice.org.uk/guidance/cg107. 1 NICE guidance is prepared for the National Health Service in England, and is subject to regular review and may be updated or withdrawn. NICE has not checked the use of its content in this article to confirm that it accurately reflects the NICE publication from which it is taken. Copyright © 2017 National Institute for Health and Care Excellence. All rights reserved.
Its research recommendations were:
Most adverse outcomes in new-onset hypertensive disorders during pregnancy arise in women with proteinuria. However, the quality of evidence for the diagnosis of significant proteinuria is poor and the prognostic value of different quantities of urinary protein is unclear. There is a need for large, high-quality prospective studies comparing the various methods of measuring proteinuria (automated reagent-strip reading devices, urinary protein : creatinine ratio, urinary albumin : creatinine ratio, and 24-hour urine collection) in women with new-onset hypertensive disorders during pregnancy. The studies should aim to determine which method of measurement, and which diagnostic thresholds, are most accurate in predicting clinically important outcomes. Such studies would inform decisions regarding clinical management of new-onset hypertensive disorders during pregnancy. If predictive parameters were identified then interventions based on these and aimed at improving outcomes could be evaluated in randomised clinical trials.
National Institute for Health and Clinical Excellence (2010) Hypertension in Pregnancy: The Management of Hypertensive Disorders during Pregnancy. Available from: www.nice.org.uk/guidance/cg107. 1 NICE guidance is prepared for the National Health Service in England, and is subject to regular review and may be updated or withdrawn. NICE has not checked the use of its content in this article to confirm that it accurately reflects the NICE publication from which it is taken. Copyright © 2017 National Institute for Health and Care Excellence. All rights reserved.
For centres to participate in the trial, compliance with NICE’s CG107 was mandatory, and we utilised NICE’s definitions of PE and severe PE to create as homogeneous a participant group as possible.
It is accepted that PE is associated with severe maternal and perinatal morbidity and so we wanted to determine whether or not proteinuria could be used as a meaningful predictor of these more clinically important end points. For maternal outcomes, we chose the use of the severe PE management algorithm and magnesium sulphate for eclampsia prophylaxis. This is the treatment pathway that clinicians reserve for those women who (1) fulfil a definition of severe PE and (2) are of most clinical concern to the team providing the medical care. We refer to this group as severe PE clinician diagnosis. For perinatal outcomes, we chose a composite including stillbirth and neonatal death along with the major complications of preterm delivery that may have long-term health implications to a surviving infant (Table 13).
Our initial calculations of disease prevalence meant that we realistically expected to complete the trial in three Clinical Research Networks regions and it became clear within months that more centres would be required to maintain recruitment. This unexpected shortfall was explored through the recruitment logs from recruiting centres and it was noted that the number of eligible women was below expected and that many women had a management plan that included an offer of immediate delivery (either induction of labour or caesarean birth) and, hence, they were not offered participation in this trial, as they would not have had time to collect a 24-hour urine sample.
The CG107 published by NICE does make recommendations regarding timing of delivery in women who have hypertension without proteinuria as well as PE. These recommendations are listed below for gestational hypertension 1.4.2.1–1.4.2.3 and for PE 1.5.2.5–1.5.2.7:
1.4.2.1 Do not offer birth before 37 weeks to women with gestational hypertension whose blood pressure is lower than 160/110 mmHg, with or without antihypertensive treatment.
1.4.2.2 For women with gestational hypertension whose blood pressure is lower than 160/110 mmHg after 37 weeks, with or without antihypertensive treatment, timing of birth, and maternal and fetal indications for birth should be agreed between the woman and the senior obstetrician.
1.4.2.3 Offer birth to women with refractory severe gestational hypertension after a course of corticosteroids (if required) has been completed.
1.5.2.5 Recommend birth for women who have pre-eclampsia with severe hypertension after 34 weeks when their blood pressure has been controlled and a course of corticosteroids has been completed (if appropriate).
1.5.2.6 Offer birth to women who have pre-eclampsia with mild or moderate hypertension at 34+0 to 36+6 weeks depending on maternal and fetal condition, risk factors and availability of neonatal intensive care.
1.5.2.7 Recommend birth within 24–48 hours for women who have pre-eclampsia with mild or moderate hypertension after 37+0 weeks.
National Institute for Health and Clinical Excellence (2010) Hypertension in Pregnancy: The Management of Hypertensive Disorders during Pregnancy. Available from: www.nice.org.uk/guidance/cg107. 1 NICE guidance is prepared for the National Health Service in England, and is subject to regular review and may be updated or withdrawn. NICE has not checked the use of its content in this article to confirm that it accurately reflects the NICE publication from which it is taken. Copyright © 2017 National Institute for Health and Care Excellence. All rights reserved.
These recommendations have clearly been widely implemented and resulted in most women with either gestational hypertension or PE being delivered either at 37 completed weeks of gestation or immediately on diagnosis if diagnosed after 37 weeks’ gestation.
To our knowledge, this is the first major trial that has captured this change in practice, and there are significant implications if all women with this diagnosis are delivered before spontaneous labour occurs. It is not clear, and we are unable to determine, whether the decision to deliver the baby is shared between the clinician and patient, is recommended by clinicians and women agree or is requested by women and clinicians agree.
This change in practice highlights the potential benefit of a ‘rule-out’ test that may allow a woman to be reassured that severe morbidity will not occur, that her pregnancy can, therefore, continue and that medical intervention may be minimised.
We also noted that as we expanded the trial to recruit in 36 centres that the practice of using a 24-hour urine collection as part of routine clinical care has dramatically reduced in favour of a SPCR test. As such, although most centres did still employ the test occasionally, the majority of the 24-hour urine samples collected for this study was primarily for the trial. Having to collect this additional sample, which was seen as cumbersome and not part of the unit’s CGs, was the other major reason for women refusing to participate and recruitment taking longer to complete.
Diagnosis of severe pre-eclampsia
When NICE’s CG107 definition1 of severe PE is assessed it is striking that the prevalence was 44% in the recruited population and 43% in the population used for the primary analysis (with all completed samples). This is considerably higher than expected and is in stark contrast to the number of women who had a clinician diagnosis of severe PE (20%). However, we had expected (at study design) a prevalence of 5% and, hence, the number needed to be recruited was revised after the interim analysis of outcomes.
This finding has not been reported before in such a large study. Demographically, the population of women recruited was predominantly low risk with a median age of 30 years, body mass index of 28 kg/m2 and 64% were nulliparous. There were 53 (6%) multiple pregnancies. In total, 19% had previous hypertension in pregnancy, which is just over half of the multiparous women recruited, and 22% of the women were taking aspirin during their pregnancy for PE prevention.
Defining severe PE has always been challenging when the syndrome can be so varied. However, all definitions include the use of severe hypertension (systolic BP of > 160 mmHg and/or diastolic BP of > 110 mmHg) as one key feature of the typical phenotype. In this study, we have noted a very high prevalence of severe hypertension (88%) and this is likely to account for the very high prevalence of severe PE recorded. We chose to apply NICE’s definition of severe disease but the prevalence would have been the same if we had used the American College of Obstetricians and Gynecologists’10 definition or the Society of Obstetric Medicine of Australia and New Zealand or the Canadian Society’s definitions. 9
We also noted significant perinatal morbidity in the cohort, with 23% of women delivered prior to 36 completed weeks of gestation (preterm), and 6% of babies had severe perinatal morbidity. There were no maternal deaths in this group, but there were still 30 cases of eclampsia.
In the HYPITAT (induction of labour versus expectant monitoring for gestational hypertension or mild pre-eclampsia after 36 weeks’ gestation) I trial,29 women with PE (33%) and gestational hypertension (66%) were randomised to delivery or conservative care after 37 weeks’ gestation. In the expectant management group, 67% of women laboured spontaneously. In the study, the primary outcome was defined as a composite measure of poor maternal outcome consisting of several conditions. Of women who were randomised, 117 (31%) allocated to induction of labour developed poor maternal outcome compared with 166 (44%) allocated to expectant monitoring [relative risk (RR) 0.71, 95% CI 0.59 to 0.86; p < 0.0001]. No cases of maternal or neonatal death or eclampsia were recorded. They decided to include progression to severe hypertension (systolic BP of > 170 mmHg or diastolic BP of > 110 mmHg on one occasion) in their composite outcome because this disease is associated with severe maternal morbidity (such as eclampsia, pulmonary oedema, cerebral encephalopathy or haemorrhage) and this was their predominant component of the composite outcome. When the results of this trial are explored, the RR of the composite adverse outcome for women with gestational hypertension (no proteinuria) is 31% [induction of labour (IOL)] vs. 38% (expectant); RR 0.81, 95% CI 0.63 to 1.03), suggesting that immediate delivery does not confer significant clinical benefit when proteinuria is not present. For the PE group, it was 33% (IOL) versus 54% (expectant) (RR 0.61, 95% CI 0.45 to 0.82). This supports the view that a good ‘rule-out’ test for proteinuria can identify a group of women with hypertension in pregnancy who can be offered conservative management after 37 weeks of gestation with a high probability of spontaneous labour. An interventional approach after 37 weeks of gestation (as advocated by current NICE guidelines) has not been reported to significantly increase or decrease caesarean section rates. 29
Our study highlights major variations in clinical management of severe PE in the UK. Only 32% of women who met the NICE criteria for severe disease were managed in accordance with NICE’s ‘severe PE’ guidelines, and 11% of women were managed by clinicians as having severe disease when they did not met the NICE definition. Within the group managed for severe PE by clinicians, 31 women (16%) did not receive magnesium sulphate prophylaxis. Furthermore, 13 women (7%) received magnesium sulphate prophylaxis but no other aspect of a severe PE management algorithm. No woman received magnesium sulphate for fetal neuroprotection alone; therefore, this does not account for its use in isolation. The NICE CG1071 states that the clinician should give magnesium sulphate if a women ‘has or previously had an eclamptic fit’ and consider it if birth is planned within 24 hours and for other reasons. This is presumably why 16% of women with severe PE (clinician diagnosis) did not receive it as prophylaxis.
The prevalence of adverse perinatal outcome was significantly more likely if severe PE was present. However, it was not confined to those with severe disease. For those with severe disease, according to NICE, the prevalence of adverse perinatal outcome was 8% versus 5% in those with non-severe disease (p = 0.033) and for those whom the clinicians treated as having severe disease the prevalence of adverse perinatal outcome was 15% versus 4% of those with non-severe disease (p ≤ 0.001). This almost certainly reflects the clinician’s appreciation of the fetus’ condition as part of their assessment of severity, whereas the NICE definition does not. In the HYPITAT I trial,29 in which a similar composite neonatal outcome was reported, recruitment was restricted to > 36 weeks of pregnancy and their overall rate of occurrence was 7%, and this was not influenced by immediate delivery or conservative care (6% vs. 8%).
It is clear that the definition of severe PE in NICE’s CG1071 is very broad and includes the presence of symptoms with only moderate hypertension and proteinuria. It states:
If considering magnesium sulphate* treatment, use the following as features of severe PE:
severe hypertension and proteinuria or
mild or moderate hypertension and proteinuria with one or more of the following:
symptoms of severe headache
problems with vision, such as blurring or flashing before the eyes
severe pain just below the ribs or vomiting
papilloedema
signs of clonus (≥ 3 beats)
liver tenderness
HELLP syndrome
platelet count falling to below 100 × 109 per litre
abnormal liver enzymes (ALT or AST rising to above 70 iu/litre).
National Institute for Health and Clinical Excellence (2010) Hypertension in Pregnancy: The Management of Hypertensive Disorders during Pregnancy. Available from: www.nice.org.uk/guidance/cg107. 1 NICE guidance is prepared for the National Health Service in England, and is subject to regular review and may be updated or withdrawn. NICE has not checked the use of its content in this article to confirm that it accurately reflects the NICE publication from which it is taken. Copyright © 2017 National Institute for Health and Care Excellence. All rights reserved.
From the study population, we found that 339 out of 417 women (81%) with severe PE (NICE definition) had severe hypertension; therefore, the relatively common reporting of symptoms that can be difficult to quantify did not really cause the high prevalence of severe PE. Severe hypertension at recruitment was rare. This is likely to account for the high prevalence of severe disease according to this definition. Management guidelines and algorithms mandate for senior multidisciplinary staff to be consulted regarding further management of these women and it is possible that this seniority (and presumably experience) results in fewer women being managed using severe PE care pathways.
In the HYPITAT I trial,29 when they changed the definition of severe hypertension from a BP of > 170/110 mmHg on one occasion to a BP of > 170/110 mmHg on two occasions 6 hours apart, the prevalence dropped from 38% to 19%. When severe disease is defined by an isolated recording of BP above a certain threshold, prevalence will be significantly affected by the choice of threshold and be much higher with definitions such as that of NICE, in which the threshold is 160 mmHg systolic and 110 mmHg diastolic.
In the HYPITAT II trial,30 the progression to severe PE was defined as diastolic BP of ≥ 110 mmHg despite medication or systolic BP of ≥ 170 mmHg despite medication. Despite the study population being between 34 and 37 weeks’ gestation [a period during which PE is generally held to be higher risk or more severe than at > 37 weeks’ gestation (HYPITAT I)] the trial found that the composite adverse maternal outcome occurred in only 4 out of 352 women (1.1%) allocated to immediate delivery, compared with 11 out of 351 women (3.1%) allocated to expectant monitoring (RR 0.36, 95% CI 0.12 to 1.11; p = 0.069). This non-significant result could well have been because of their stricter definition of severe hypertension and hence lower adverse outcome rate. They also found that respiratory distress syndrome was diagnosed in 20 out of 352 neonates (5.7%) in the immediate delivery group, compared with 6 out of 351 (1.7%) neonates in the expectant monitoring group (RR 3.3, 95% CI 1.4 to 8.2; p = 0.005). The authors conclude that, for women with non-severe hypertensive disorders at 34–37 weeks’ gestation, immediate delivery significantly increases the risk of neonatal respiratory distress syndrome; therefore, routine immediate delivery does not seem justified and a strategy of expectant monitoring until the clinical situation deteriorates can be considered.
The majority of adverse perinatal outcomes (34/62, 55%) occurred in women who clinicians had decided did not require severe PE management. Whether or not the more liberal use of management algorithms and magnesium sulphate could reduce this is addressed in Recommendations for future research.
We have found that when the definition of severe hypertension is ‘less strict’ the prevalence of either severe PE or a composite adverse maternal outcome will be high and others have also reported this. Our data strongly suggest that clinicians will interpret clinical data and trial results based on experience and that recommendations to change practice to minimise less clinically relevant end points may not be implemented universally. We believe that this finding should be explored further in a formal qualitative study.
Urine testing: spot protein–creatinine ratio and spot albumin–creatinine ratio
We set out to assess the diagnostic or predictive accuracy of the SPCR and SACR tests. The SPCR test was performed both locally (in the recruiting hospital) and then, to minimise laboratory variation, all samples were retested in a central ‘reference’ laboratory using two different assays for urine protein, BZC (the most commonly employed assay) and PGR assays.
From ROC curve comparison there is minimal difference between assays tested and, although the SACR test had a statistically significantly higher area under ROC, it is not likely that the small improvement offers significant clinical benefits. When tested at prespecified cut-off points, all tests have very high sensitivities but poor specificities. However, as ‘rule-out’ tests, the high sensitivities and low LR–s (≤ 0.1) mean that they are of diagnostic value (Table 14).
The thresholds that we prespecified in the trial protocol were based on NICE’s CG1071 proteinuria thresholds for proteinuria and the thresholds from Waugh et al. 16 for albuminuria in previous work.
In non-obstetric practice, in which albuminuria is routinely utilised, a threshold of 3.5 mg/mmol is used to delineate a positive result. 23
Spot protein–creatinine ratio testing at different thresholds did not demonstrate a more discriminatory threshold to predict severe PE than that recommended in NICE’s CG1071 of 30 mg/mmol.
Different thresholds for SACR suggest that diagnostic performance equivalent to 30 mg/mmol of SPCR is achieved with a cut-off point level of 8 mg/mmol. This observation is further discussed in recommendations for future research.
Other groups have suggested that SPCR testing offers improvement over conventional urine dipstick testing for proteinuria alone. 31 We tested the accuracy of the recruitment dipstick (read on an automated reader). The accuracy of the urine dipstick is worse with a significantly lower specificity (20% vs. 57%; p < 0.0001). The comparative performances are illustrated in Table 14. Waugh et al. 16 has previously shown that automated dipstick readers are significantly more predictive than the visual interpretation of the same dipsticks. These results therefore suggest that visually read urine dipsticks should not be advocated for proteinuria screening in pregnancy.
Previous individual studies that have subsequently been subject to meta-analysis have compared the accuracy of urine dipsticks, SPCR and SACR in the prediction of significant proteinuria measured by a 24-hour urine protein. 16,31–33
We again observed that all SPCR assays and SACR perform similarly, with the reference laboratory testing for SACR offering significant differences compared with the SPCR but with very poor specificity (23%). ROC curve areas summarised in Table 24 confirm the tests are all very similar in terms of performance.
When the tests (SPCR and SACR) are utilised to predict the reference standard of clinician diagnosis of severe PE (see Table 31), sensitivity falls for all SPCR tests from 93–95% to 84–85%. Sensitivity for SACR is maintained but specificity is very low at 16%.
There is no improvement seen in using 24-hour urine samples and SPCR testing, and dipstick testing alone had the lowest specificity of any test at 13% (see Table 31).
Receiver operating characteristic curves, when overlain, demonstrated that diagnostic accuracy was much poorer than for the NICE definition of PE as a reference standard. Again, the areas under the reference laboratory assay tests were significantly greater than the local laboratory assay but the differences, while statistically significant, are unlikely to be of clinical utility and may just demonstrate the small effect of interlaboratory assay error.
Very similar results were found when the prediction of adverse perinatal outcome was tested. Sensitivities were generally poor (69–79%), but the SACR test at the prespecified threshold of 2 mg/mmol was the exception at 94%. Although better than the SPCR tests for sensitivity, it also had a lower specificity (14% vs. 35–39%).
We also analysed the spot urine samples collected immediately prior to delivery to allow for secondary analysis of both the incremental increase in proteinuria between recruitment and delivery and the maximum level of proteinuria achieved prior to delivery. Even acknowledging that these samples proved difficult to collect with the unplanned onset of labour, 530 samples could be included in an analysable data set. Neither the incremental increase nor the maximum proteinuria level offered any improvement over the original recruitment sample in the prediction of adverse perinatal outcomes.
When all of these analyses were repeated on a subgroup of women who all had 1+ proteinuria on recruitment dipstick assessment, there was no change in the diagnostic accuracy of the tests.
We found, as have previous authors, a difference between the two protein assays compared during this study. The proportion of women with > 300 mg/24 hours was higher using the PGR (55%) than the BZC (50%) assay. Consequently, severe PE was diagnosed 5% more often. If this assay was used as the reference standard to diagnose PE and the analysis was repeated, the results were again very similar with all three SPCR assays having high sensitivities but much lower specificities and SACR being statistically better but with only marginal differences to confer any clinical advantage. It appears, from this study, that differences do exist between proteinuria assays and, as such, they by definition can influence the prevalence of PE (when used in the definition) by a small amount (5% in this study and up to 45% in previous studies). 8,34 There does not seem to be any difference in diagnostic accuracy related to the prediction of adverse maternal or perinatal outcomes. This is again mentioned in recommendations for future research.
When the two assays are compared using a Bland–Altman plot there is clearly a non-linear relationship. Pragmatically, given that the threshold for diagnosing PE is 300 mg/l and most samples will fall between 0 and 2000 g/l, we have shown that up to approximately 1200 g/l the PGR assay is generally higher than the BZC assay (up to 100 mg/l) and hence PE is diagnosed more frequently and potentially ‘overdiagnosed’. Above 1200 mg/l, the PGR assay value is typically smaller but clearly PE will be diagnosed anyway as the differences are small.
Economic evaluation
The economic evaluation was designed to compare the cost-effectiveness of six alternative tests used to identify severe PE in pregnant women with gestational hypertension: the central laboratory’s SACR test, the central laboratory’s SPCR test (using the BZC or PGR assays), 24-hour urine collection (using the BZC or PGR assays) and dipstick test only against the local laboratory’s SPCR test, which was considered as the standard care comparator. A modelling approach was undertaken by the authors to estimate the incremental cost (from the perspective of the NHS) per QALY gained of each comparator test. The model combined information on the diagnostic accuracy (i.e. sensitivity and specificity) of each test collected as part of the clinical study with therapeutic pathways based on previously developed economic models published by NICE in their hypertension in pregnancy CG1071 in 2010. These pathways were used to model the effect of diagnostic errors (false positives and negatives) on the cost of neonatal and maternal care, as well as QALY losses resulting from premature death of the mother or baby, or both.
The base-case analysis demonstrated that the local laboratory’s SPCR test generated 52.39 maternal and neonatal QALYs over a lifetime at cost of £6621. Four strategies [central laboratory’s SACR test, dipstick test only, 24-hour urine collection (as measured via the BZC assay) and central laboratory’s SPCR test (as measured via the BZC assay)] were non-dominated compared with the baseline comparator (did not have a lower effectiveness and higher cost), although the dipstick test only was dominated by at least one other strategy. The differences in cost and QALYs across alternative tests were small, which is a reflection of the small differences in the accuracy of each test reported in the statistical analysis. When an incremental cost-effectiveness analysis was performed, it confirmed that the effectiveness of all the comparators was very similar, with only 0.04 QALYs between the best- and worst-performing tests. Cost differences were greater, with dipstick alone costing £66 more than the local laboratory’s SPCR test. Although this result may suggest that the SPCR test could be used alone, it must be remembered that only women with trace or greater of proteinuria on the dipstick have been included in this study and the impact of reverting to a SPCR-only strategy cannot be assessed, as women with ‘no proteinuria’ on dipstick have not been included.
The central laboratory’s SACR test was the most effective strategy (52.42 QALYs gained) with an ICER of £1502 per QALY in the base-case scenario and £1255 per QALY in the PSA, although the 95% CI crossed zero (–£6124 to £8635) as a result of significant uncertainty and a small difference in incremental cost and QALYs. Despite this wide range, however, the upper bound of the CI was below the NICE threshold for acceptability of new health-care technology, meaning that the central laboratory’s SACR test was likely to be a cost-effective choice. A deterministic analysis designed to test the effect of changes in model inputs on NMB, assuming a WTP of £20,000 per QALY, showed that the central laboratory’s SACR test remained the optimal strategy when model parameters were varied over pre-assigned ranges. A cost-effectiveness acceptability curve constructed using the PSA output demonstrated that the central laboratory’s SACR test had a 100% probability of being the most cost-effective option at the standard range of WTP of £20,000–30,000 per QALY recommended by NICE.
This cost-effectiveness study employed a modelling approach to complement within-study data collection, which did not observe the cost and QALY outcomes of each test because of its prospective cohort design. The authors adapted a previously validated model pathway designed by NICE that used evidence from previous studies of maternal and neonatal care in gestational hypertension and PE in combination with expert opinion. As such, the therapeutic pathways that were used to determine cost and QALY outcomes in the model accurately reflect current practice in maternal and neonatal care in the presence of these conditions. Information on LOS in maternal and neonatal units collected prospectively during the study contributed to accurate estimates of the cost of intensive care in severe PE that were representative of the study population.
The modelling analysis was restricted to the perinatal period and did not include the effect of PE on resource use and quality of life in later years of life. The cost estimates produced in the model were potentially insensitive to long-term cost effects of diagnostic errors, which is a limitation of the model. QALY estimates were based on life-years lost as a result of premature maternal or neonatal death, which is a simplification that may have underestimated the true impact of false negatives on patient utility.
The results of the economic analysis indicate the potential superior cost-effectiveness of the SACR test over other tests as a tool to diagnose severe PE in women with gestational hypertension. This study contributed to the evidence base on the relative value of alternative diagnostic tests for PE in antenatal care. Given the high cost of maternal and neonatal intensive care, the use of cost-effective diagnostic tools is required for timely identification of severe PE, prevention of unnecessary hospital admission and premature deaths. An economic evaluation alongside a randomised study is necessary in order to produce conclusive estimates of the relative cost-effectiveness of alternative testing methods for severe PE.
Conclusions
From the results of this study we can draw the following conclusions:
-
The SACR test has marginally better diagnostic accuracy characteristics than the SPCR test when predicting severe PE according to NICE’s CG1071 definitions.
-
All four tests could be used as rule-out tests for the NICE definition of severe PE, in that if there is a negative test result, the odds of severe PE are considerably reduced (tenfold or more) compared with the odds in the target population as a whole before the test is performed.
-
The collection of a 24-hour urine sample confers no additional value over a spot urine sample to quantify proteinuria in women with hypertension in pregnancy.
-
The threshold level of SPCR that performs best for the prediction of severe PE is the current threshold of 30 mg/mmol.
-
The threshold level of SACR that is equivalent to this, in terms of clinical accuracy, is 8 mg/mmol.
-
Urine dipstick testing without laboratory testing of SPCR or SACR performs poorly as a predictive strategy for either severe PE or adverse perinatal outcomes.
-
The measurement of ‘maximum proteinuria’ or a ‘rise in proteinuria’ confers no advantage in the prediction of severe PE or adverse perinatal outcomes in hypertensive pregnancies.
-
Biochemical assays for proteinuria are not universal and as such some assays (e.g. PGR) will overdiagnose PE compared with the BZC assay by at least 5%.
-
The SACR test was deemed to have a 100% probability of being the most cost-effective option at the standard WTP threshold of £20,000–30,000 per QALY as recommended by NICE.
-
Clinicians continue to plan care (and interpret results) in an inconsistent manner when caring for women with severe PE.
-
The non-uniform application of NICE’s CG1071 severe PE management algorithms and definitions by clinicians does not confer any additional benefits in reducing the number of women who will have adverse perinatal outcomes.
Implications for clinical practice
-
Evidence would suggest that all proteinuria assessments should be performed by an initial dipstick screening test read on an automated dipstick reader, and for all non-negative tests a SACR test should be considered. In the absence of SACR being available, SPCR could be used as an alternative.
-
Given the intermethod/laboratory variability of protein assays demonstrated, all ‘protein’ tests should be viewed with extreme caution and consideration should be given to a urine albumin assay being employed for future definitions.
-
Clinically significant proteinuria should remain defined at a level of 8 mg/mmol measured by the SACR test or 30 mg/mmol measured by the SPCR test.
-
The evidence from this clinical study does not support the recommendation of 24-hour urine sample collection in hypertensive pregnant women.
-
Once the SPCR test is confirmed to be > 30 mg/mmol, no further proteinuria measurements are required during hypertensive pregnancy.
-
Whenever possible, proteinuria measurements should be by a single (accepted as standard) assay. When this is not a BZC assay, clinicians should be aware that some assays can overdiagnose proteinuria and, hence, PE.
-
In the presence of hypertension in pregnancy without proteinuria, the progression to severe maternal disease is unlikely (7% for SPCR and 2% for SACR). Adverse maternal and perinatal outcomes do occur and all women with gestational hypertension should be closely monitored.
Recommendations for future research
-
Spot albumin–creatinine ratio at a threshold of 8 mg/mmol should be studied as a ‘rule-out’ test of proteinuria and for the prediction of severe PE.
-
The reasons for the wide variation in clinician management of severe PE despite NICE guidelines should be explored through a qualitative study. This would have implications for the wider medical community.
Acknowledgements
Professor Khalid Khan (National Institute Health Research Senior Investigator, Clinical Director of Research and Development, The Blizard Institute, London, UK) advised on the study design and grant application.
Professor Elaine McColl (Professor of Health Service Research, Institute of Health and Society) advised on the management of the trial.
Contributions of authors
Jason Waugh (Chief Investigator) trial design and management and report authorship and editing.
Richard Hooper (Co-applicant, Statistician) trial design and data analysis and report authorship and editing.
Edmund Lamb (Co-applicant) trial design and sample laboratory analysis and report authorship and editing.
Stephen Robson (Co-applicant) trial design and management and report authorship and editing.
Andrew Shennan (Co-applicant) trial design and management and report authorship and editing.
Fiona Milne (Co-applicant, Lay Representative) trial design and management and report authorship and editing.
Christopher Price (Co-applicant) trial design and management and report authorship and editing.
Shakila Thangaratinam (Co-applicant) trial design and management and report authorship and editing.
Vladislav Berdunov (Co-applicant, Health Economist) trial design and management and report authorship and editing.
Jenn Bingham (Trial Manager) report authorship and editing.
Data sharing statement
All available data can be obtained by contacting the corresponding author.
Disclaimers
This report presents independent research funded by the National Institute for Health Research (NIHR). The views and opinions expressed by authors in this publication are those of the authors and do not necessarily reflect those of the NHS, the NIHR, NETSCC, the HTA programme or the Department of Health. If there are verbatim quotations included in this publication the views and opinions expressed by the interviewees are those of the interviewees and do not necessarily reflect those of the authors, those of the NHS, the NIHR, NETSCC, the HTA programme or the Department of Health.
References
- Hypertension in Pregnancy: The Management of Hypertensive Disorders During Pregnancy. London: NICE; 2010.
- Centre for Maternal and Child Enquiries . Saving Mothers Lives: reviewing maternal deaths to make motherhood safer: 2006–08. The eighth report on confidential enquiries into maternal deaths in the United Kingdom. BJOG 2011;118:1-203.
- Perinatal Mortality 2008: United Kingdom. London: Centre for Maternal and Child Enquiries; 2010.
- Kuo VS, Koumantakis G, Gallery ED. Proteinuria and its assessment in normal and hypertensive pregnancy. Am J Obstet Gynecol 1992;167:723-8. https://doi.org/10.1016/S0002-9378(11)91578-6.
- Chappell LC, Shennan AH. Assessment of proteinuria in pregnancy. BMJ 2008;336:968-9. https://doi.org/10.1136/bmj.39540.657928.BE.
- Halligan AW, Bell SC, Taylor DJ. Dipstick proteinuria: caveat emptor. Br J Obstet Gynaecol 1999;106:1113-15. https://doi.org/10.1111/j.1471-0528.1999.tb08133.x.
- Menzies J, Magee LA, Macnab YC, Ansermino JM, Douglas MJ, Gruslin A, et al. Current CHS and NHBPEP criteria for severe preeclampsia do not uniformly predict adverse maternal or perinatal outcomes. Hypertens Pregnancy 2007;26:447-62. https://doi.org/10.1080/10641950701521742.
- Waugh J, Bell SC, Kilby M, Lambert P, Shennan A, Halligan A. Effect of concentration and biochemical assay on the accuracy of urine dipsticks in hypertensive pregnancies. Hypertens Pregnancy 2001;20:205-17. https://doi.org/10.1081/PRG-100106970.
- Helewa ME, Burrows RF, Smith J, Williams K, Brain P, Rabkin SW. Report of the Canadian Hypertension Society Consensus Conference: 1. Definitions, evaluation and classification of hypertensive disorders in pregnancy. CAMJ 1997;157:715-25.
- Hypertension in Pregnancy. Washington, DC: American College of Obstetricians and Gynecologists; 1996.
- Price CP, Newall RG, Boyd JC. Use of protein : creatinine ratio measurements on random urine samples for prediction of significant proteinuria: a systematic review. Clin Chem 2005;51:1577-86. https://doi.org/10.1373/clinchem.2005.049742.
- Cote AM, Brown MA, Lam E, von Dadelszen P, Liston RM, Magee LA. Diagnostic accuracy of urinary spot protein: creatinine ratio for proteinuria in hypertensive pregnant women: systematic review. BMJ 2008;336:1003-6. https://doi.org/10.1136/bmj.39532.543947.BE.
- Waugh J, Bell SC, Kilby MD, Lambert PC, Shennan AH, Halligan AWF. Urine protein estimation in hypertensive pregnancy: which thresholds and laboratory assay best predict clinical outcome?. Hypertens Pregnancy 2005;24:291-302. https://doi.org/10.1080/10641950500281019.
- Waugh J, Kilby M, Lambert P, Bell SC, Blackwell CN, Shennan A, et al. Validation of the DCA 2000 microalbumin : creatinine ratio urinanalyzer for its use in pregnancy and preeclampsia. Hypertens Pregnancy 2003;22:77-92. https://doi.org/10.1081/PRG-120017006.
- Waugh J, Bell SC, Kilby MD, Lambert PC, Blackwell CN, Shennan AH, et al. Urinary microalbumin/creatinine ratios: reference range in uncomplicated pregnancy. Clin Sci (Lond) 2003;104:103-7. https://doi.org/10.1042/cs1040103.
- Waugh JJ, Bell SC, Kilby MD, Blackwell CN, Seed P, Shennan AH, et al. Optimal bedside urinalysis for the detection of proteinuria in hypertensive pregnancy: a study of diagnostic accuracy. BJOG 2005;112:412-17. https://doi.org/10.1111/j.1471-0528.2004.00455.x.
- Waugh JJ, Clark TJ, Divakaran TG, Khan KS, Kilby MD. Accuracy of urinalysis dipstick techniques in predicting significant proteinuria in pregnancy. Obstet Gynecol 2004;103:769-77. https://doi.org/10.1097/01.AOG.0000118311.18958.63.
- Meads CA, Cnossen JS, Meher S, Juarez-Garcia A, ter Riet G, . Methods of prediction and prevention of pre-eclampsia: systematic reviews of accuracy and effectiveness literature with economic modelling. Health Technol Assess 2008;12. https://doi.org/10.3310/hta12060.
- Thangaratinam S, Coomarasamy A, O’Mahony F, Sharp S, Zamora J, Khan KS, et al. Estimation of proteinuria as a predictor of complications of pre-eclampsia: a systematic review. BMC Med 2009;7. https://doi.org/10.1186/1741-7015-7-10.
- Altman DG, Bland JM. Diagnostic tests 3: receiver operating characteristic plots. BMJ 1994;309. https://doi.org/10.1136/bmj.309.6948.188.
- DeLong ER, DeLong DM, Clarke-Pearson DL. Comparing the areas under two or more correlated receiver operating characteristic curves: a nonparametric approach. Biometrics 1988;44:837-45. https://doi.org/10.2307/2531595.
- Bland JM, Altman DG. Statistical methods for assessing agreement between two methods of clinical measurement. Lancet 1986;1:307-10. https://doi.org/10.1016/S0140-6736(86)90837-8.
- Kidney Disease: Improving Global Outcomes (KDIGO) CKD Work Group . KDIGO 2012 Clinical Practice Guideline for the evaluation and management of chronic kidney disease. Kidney Int 2013;3:28-9.
- The Green Book: Appraisal and Evaluation in Central Government. London: The Stationery Office; 2011.
- Weindling AM. The confidential enquiry into maternal and child health (CEMACH). Arch Dis Child 2003;88:1034-7. https://doi.org/10.1136/adc.88.12.1034.
- Douglas KA, Redman CW. Eclampsia in the United Kingdom. BMJ 1994;309:1395-400. https://doi.org/10.1136/bmj.309.6966.1395.
- NHS Reference Costs 2014/15. London: Department of Health; 2015.
- British National Formulary. London: BMJ Group and Pharmaceutical Press; 2015.
- Koopmans CM, Bijlenga D, Groen H, Vijgen SM, Aarnoudse JG, Bekedam DJ, et al. Induction of labour versus expectant monitoring for gestational hypertension or mild pre-eclampsia after 36 weeks’ gestation (HYPITAT): a multicentre, open-label randomised controlled trial. Lancet 2009;374:979-88. https://doi.org/10.1016/S0140-6736(09)60736-4.
- Broekhuijsen K, van Baaren GJ, van Pampus MG, Ganzevoort Wsikkema JM, Woiski MD, . Immediate delivery versus expectant monitoring for hypertensive disorders of pregnancy between 34 and 37 weeks of gestation (HYPITAT-II): an open-label, randomised controlled trial. Lancet 2015;385:2498-501. https://doi.org/10.1016/S0140-6736(14)61998-X.
- Brown MA, Buddle ML. Inadequacy of dipstick proteinuria in hypertensive pregnancy. Aust N Z J Obstet Gynaecol 1995;35:366-9. https://doi.org/10.1111/j.1479-828X.1995.tb02143.x.
- Saudan PJ, Brown MA, Farrell T, Shaw L. Improved methods of assessing proteinuria in hypertensive pregnancy. Br J Obstet Gynaecol 1997;104:1159-64. https://doi.org/10.1111/j.1471-0528.1997.tb10940.x.
- Morris RK, Riley RD, Doug M, Deeks JJ, Kilby MD. Diagnostic accuracy of spot urinary protein and albumin to creatinine ratios for the detection of significant proteinuria or adverse pregnancy outcome in patients with suspected pre-eclampsia: systematic review and meta-analysis. BMJ 2012;345. https://doi.org/10.1136/bmj.e4342.
- McElderry LA, Tarbit IF, Cassells-Smith AJ. Six methods for urinary protein compared. Clin Chem 1982;28:356-60.
Appendix 1 The DAPPA trial timeline and key milestones
| Date | Milestone |
|---|---|
| 4 December 2012 | Research and development approval granted by Newcastle upon Tyne Hospitals (sponsor) |
| 5 December 2012 | Minor amendment 1 (addition of three new sites, change of database to MedSciNet and other minor clarifications) |
| 26 February 2013 | Minor amendment 2 (change of principal investigator at St Bartholomew's Hospital site) |
| March 2013 | One patient recruited at Royal Victoria Infirmary, Newcastle upon Tyne |
| 1–7 July 2013 | Substantial amendment (creation of study poster for maternity units) |
| 6 September 2013 | Trial Steering Committee meeting |
| 11 September 2013 | Research Ethics Committee annual progress report submitted |
| 2 October 2013 | Monitoring Project review meeting, HTA, London |
| 1 April 2014 | Minor amendment 3 (amendment to general practitioner letter) |
| 7 April 2014 | Trial Steering Committee meeting |
| 30 June 2014 | Trial Steering Committee meeting |
| 3 September 2014 | Monitoring project review meeting, HTA, London |
| September 2014 | Change of trial manager following resignation |
| 1 October 2014 | Trial Steering Committee meeting |
| 8 January 2015 | Minor amendment 4 (translation of documents into Urdu and Polish) |
| 3 February 2015 | Research Ethics Committee annual progress report submitted |
| 19 June 2015 | Substantial amendment 2 (8-month extension, reduce recruitment target, increase funding, change staffing, central monitoring, change to laboratory testing and updates to protocol) |
| 16 October 2015 | Trial Steering Committee meeting |
| 3 November 2015 | Research Ethics Committee annual progress report submitted |
| 30 November 2015 | End of patient recruitment |
| 5 January 2016 | All samples shipped from sites to Kent laboratory |
| 18 May 2016 | Kent laboratory analysis complete, data entered |
| 25 May 2016 | Research Ethics Committee end of study report submitted and acknowledged |
| 26 May 2016 | MedSciNet database closed to data entry and passed to statisticians |
| 2 June 2016 | MedSciNet database sent for archiving |
| 11 September 2016 | HTA final report submitted |
| March 2013, September 2013, March 2014, July 2014, August 2014, March 2015, September 2015 and April 2016 | HTA progress reports submitted |
List of abbreviations
- ALT
- alanine aminotransferase
- AST
- aspartate aminotransferase
- BP
- blood pressure
- BZC
- benzethonium chloride
- CG
- clinical guideline
- CI
- confidence interval
- DAPPA
- spot protein–creatinine ratio and spot albumin–creatinine ratio in the assessment of pre-eclampsia: a diagnostic accuracy study with decision-analytic model-based economic evaluation and acceptability analysis
- HDP
- hypertensive disorders in pregnancy
- HDU
- high-dependency unit
- HELLP
- Haemolysis, Elevated Liver enzymes, Low Platelets
- HRG
- Healthcare Resource Group
- HTA
- Health Technology Assessment
- HYPITAT
- Induction of labour versus expectant monitoring for gestational hypertension or mild pre-eclampsia after 36 weeks' gestation
- ICER
- incremental cost-effectiveness ratio
- ICU
- intensive care unit
- IOL
- induction of labour
- LOS
- length of stay
- LR–
- negative likelihood ratio
- LR+
- positive likelihood ratio
- NICE
- National Institute for Health and Care Excellence
- NICU
- neonatal intensive care unit
- NMB
- net monetary benefit
- PE
- pre-eclampsia
- PET
- pre-eclamptic toxaemia
- PGR
- pyrogallol red
- POC
- point of care
- PREP
- Prediction model for Risk of complications in Early-onset Pre-eclampsia
- PSA
- probabilistic sensitivity analysis
- QALY
- quality-adjusted life-year
- ROC
- receiver operating characteristic
- RR
- relative risk
- SACR
- spot albumin–creatinine ratio
- SCBU
- special care baby unit
- SPCR
- spot protein–creatinine ratio
- WTP
- willingness to pay
