Notes
Article history
The research reported in this issue of the journal was funded by the HTA programme as project number 11/129/245. The contractual start date was in December 2013. The draft report began editorial review in June 2017 and was accepted for publication in October 2017. The authors have been wholly responsible for all data collection, analysis and interpretation, and for writing up their work. The HTA editors and publisher have tried to ensure the accuracy of the authors’ report and would like to thank the reviewers for their constructive comments on the draft document. However, they do not accept liability for damages or losses arising from material published in this report.
Declared competing interests of authors
David Garway-Heath has received consulting fees from Aerie Pharmaceuticals Inc., Alcon, Alimera Sciences, Inc., Allergan, CenterVue Inc., Pfizer Inc., Quark Pharmaceuticals, Quethera Ltd, F Hoffman-La Roche Ltd, Santen Pharmaceutical Co., Ltd, Santhera Pharmaceuticals and Sensimed AG, a grant from Pfizer Inc. and lecture fees from Heidelberg Engineering Ltd, Santen Pharmaceutical Co., Ltd and Topcon Corporation and his institution has received equipment loans from Carl Zeiss Meditec AG, Heidelberg Engineering Ltd and Optovue, Inc. He is also a member of the HTA Clinical Evalution and Trials Board. David P Crabb has received lecture fees from Allergan, F Hoffman-La Roche Ltd and Santen Pharmaceutical Co., Ltd and consulting fees from Allergan and his institution has received unrestricted research funds from Allergan, CenterVue Inc., Novartis UK, F Hoffman-La Roche Ltd and Santen Pharmaceutical Co., Ltd. He has also provided expert testimony for the Driving and Vehicle Licensing Agency. Tuan-Anh Ho has received salary from the National Institute for Health Research (NIHR) Biomedical Research Centre at Moorfields Eye Hospital and UCL Institute of Ophthalmology and consultancy fees from Allergan. David Garway-Heath, David P Crabb, Qian Cheng and Haogang Zhu have a patent application filed for ANSWERS (a method of data analysis evaluated in this work).
Permissions
Copyright statement
© Queen’s Printer and Controller of HMSO 2018. This work was produced by Garway-Heath et al. under the terms of a commissioning contract issued by the Secretary of State for Health. This issue may be freely reproduced for the purposes of private research and study and extracts (or indeed, the full report) may be included in professional journals provided that suitable acknowledgement is made and the reproduction is not associated with any form of advertising. Applications for commercial reproduction should be addressed to: NIHR Journals Library, National Institute for Health Research, Evaluation, Trials and Studies Coordinating Centre, Alpha House, University of Southampton Science Park, Southampton SO16 7NS, UK.
2018 Queen’s Printer and Controller of HMSO
Chapter 1 Background
Glaucoma is the leading cause of irreversible blindness worldwide1 and remains the second leading cause of blind registrations in the UK. 2 Open-angle glaucoma (OAG) affects > 2% of those aged > 49 years and at least 5% of those aged > 80 years; its prevalence can be as high as 13% in black adults aged > 80 years. 3 OAG affects approximately 500,000 people in England and Wales. 4 At the end of life, around 6% of those with glaucoma are blind in both eyes as a consequence of the disease and a further 8% are blind as a result of comorbidity. 5 The disease prevalence is rising with an ageing population and it is estimated that glaucoma will affect nearly 80 million people worldwide by 2020. 6
The term ‘glaucoma’ represents a family of chronic, progressive optic neuropathies, characterised by distinctive structural changes to the optic nerve head (ONH) and retinal nerve fibre layer (RNFL) that lead to loss of visual function. Progression of the disease can vary widely between patients: some may not experience any substantial sight loss over the course of their lifetime, whereas others may deteriorate very quickly. The only known modifiable risk factor is the level of intraocular pressure (IOP). Early detection is important for blindness prevention and regular monitoring for deterioration in vision (‘progression’) is a fundamental aspect of glaucoma management.
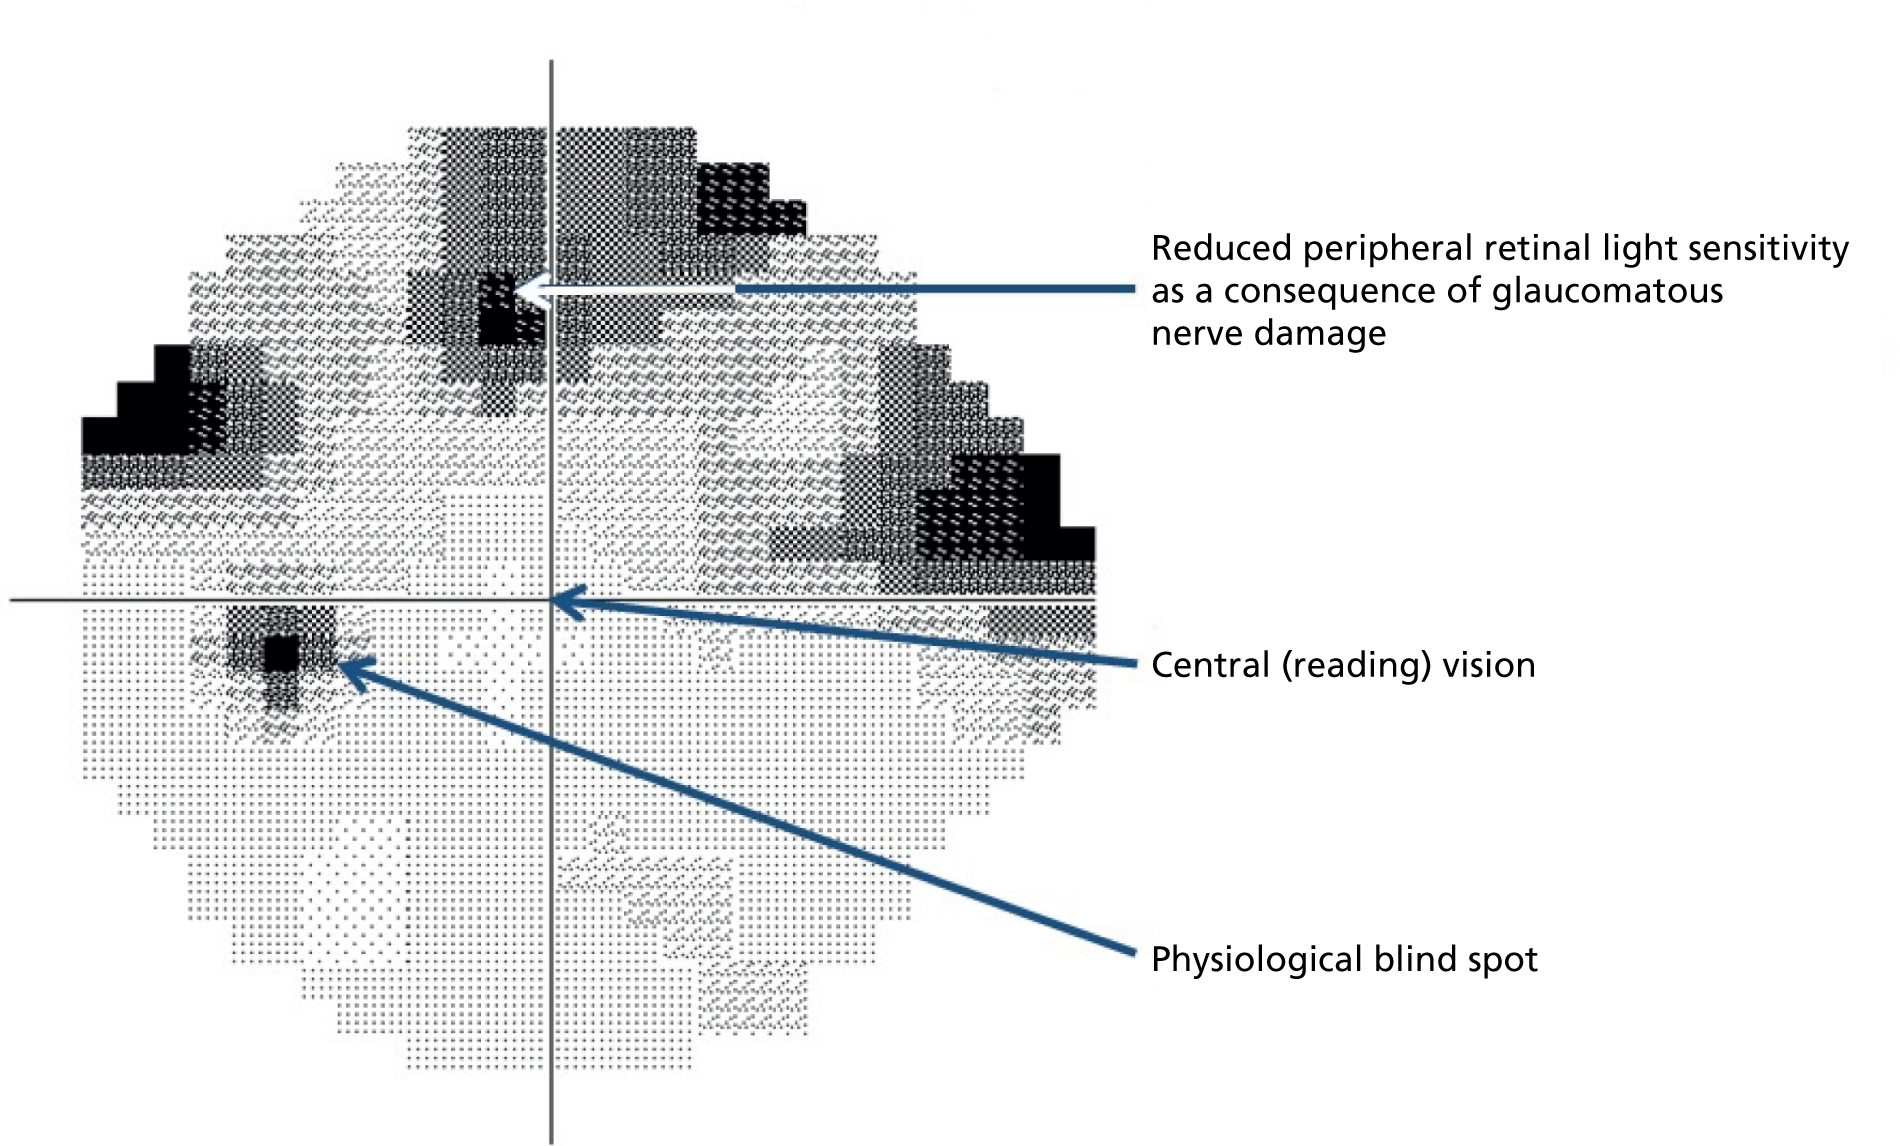
Glaucoma management, by lowering IOP, aims to preserve the patient’s vision. Therefore, tests of vision are of considerable clinical importance. The principal vision function test in glaucoma management is the visual field (VF) test (also known as perimetry); this aims to locate damaged areas in a patient’s field of vision using an automated instrument that systematically measures the eye’s sensitivity to detect dim spots of light at various locations across the VF (Figure 1). The interpretation of VF test results, however, poses a major challenge because VF measurements are very variable and the variability becomes greater as VF sensitivity deteriorates. 7–9 Mitigation of the effects of variability, to accurately detect true disease deterioration, requires frequent VF testing and/or a long period of time. 10,11 The requirement for frequent VF tests over extended periods of time results in delayed identification of vision loss and is a burden to patients and the NHS. 12
FIGURE 1.
Greyscale representation of the VF. Glaucomatous VF showing loss of retinal light sensitivity in the upper part of the peripheral VF. The central vision is mediated by the fovea (see Figure 2). The physiological blind spot is the location of the ONH.
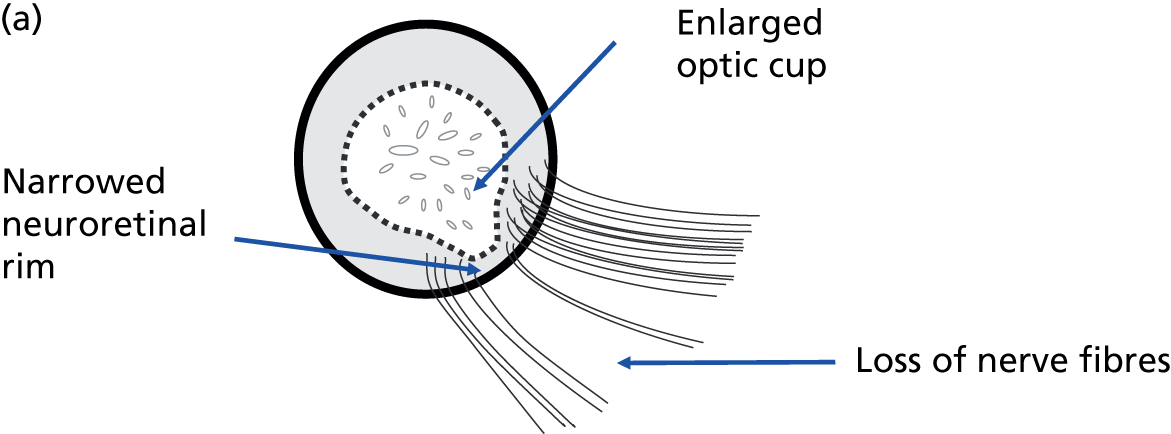
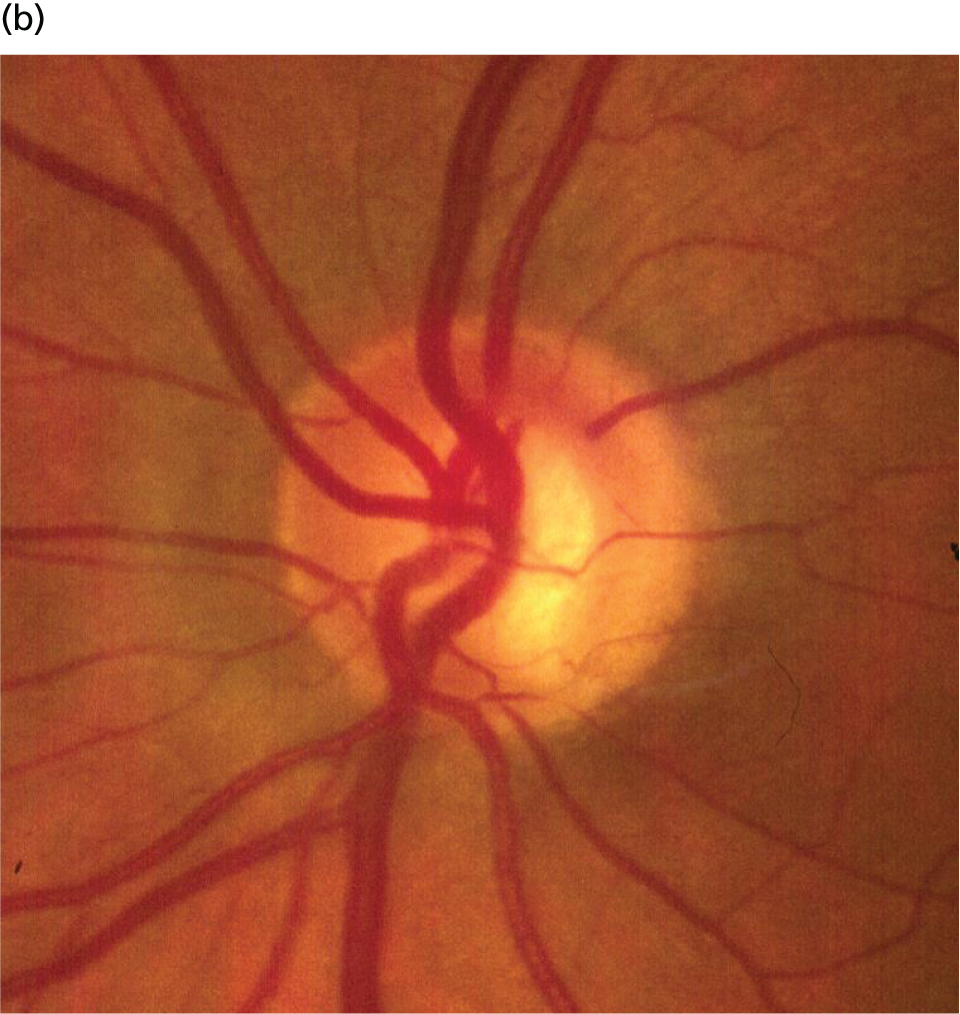
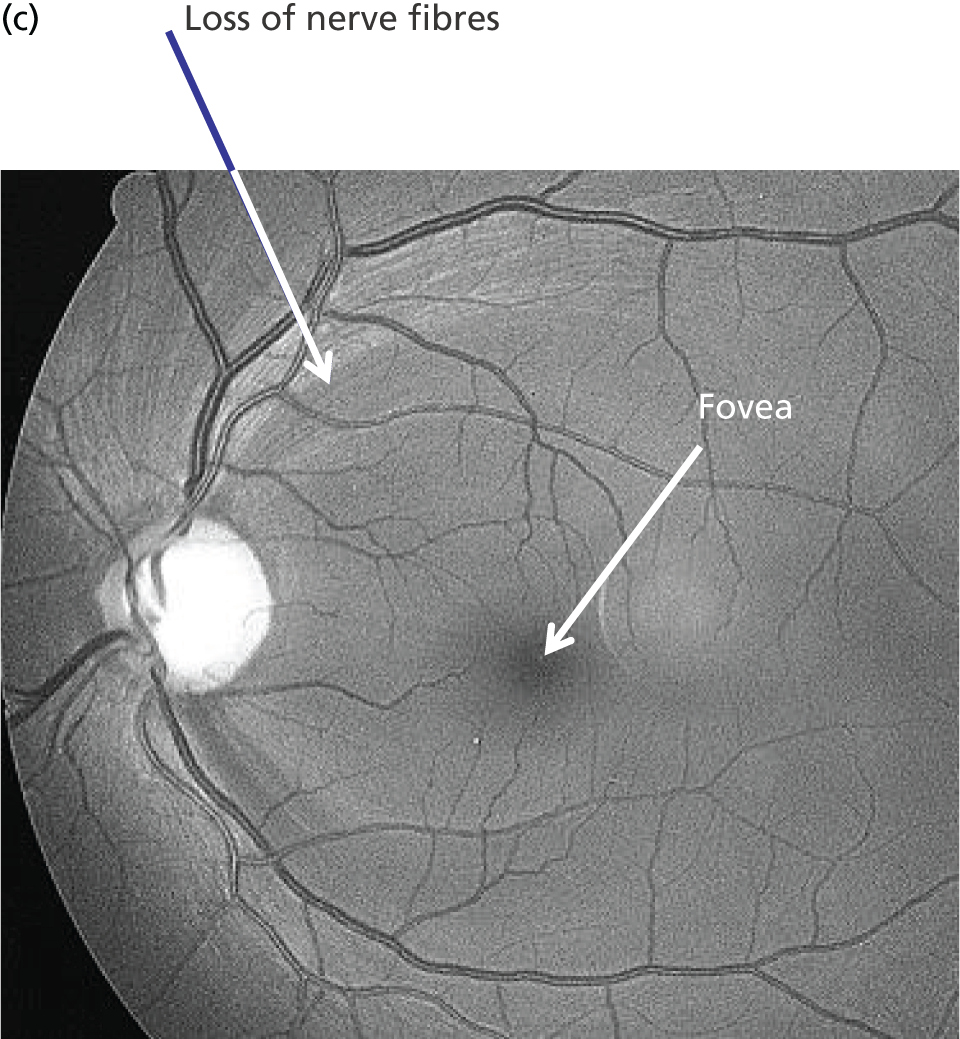
The vision loss in glaucoma is a consequence of structural damage to the ONH. 13 Nerve cells in the retina (retinal ganglion cells) transmit light sensitivity information to the brain through fibres that form a layer on the retinal surface, known as the RNFL. These fibres collect together at the ONH, forming the neural rim of the ONH (Figure 2). It is these nerve cells and fibres that are damaged in glaucoma. 14–16 The optic nerve and neural rim can be examined with imaging technology to quantify the degree of structural damage; the association between image-based measurements of neural rim and RNFL loss and VF damage is well recognised17–21 and the spatial relationship between the structural damage and VF loss has been established. 13,22 Imaging-based quantitative measurements have diagnostic utility23–29 and numerous publications support the ability of imaging-based measurements to identify glaucoma deterioration. 30–40 Progressive structural change has been shown to be useful as a predictor of subsequent VF loss. 41,42
FIGURE 2.
Anatomy of the ONH and RNFL. (a) Schematic of a glaucomatous ONH illustrating a section of nerve fibre bundles entering the ONH to form the neuroretinal rim. Loss of nerve fibre bundles results in narrowing of the neuroretinal rim and enlargement of the optic cup in the centre of the ONH. (b) Colour photograph of a glaucomatous ONH with a narrow inferior neuroretinal rim. (c) Red-free photograph of the RNFL. Loss of nerve fibre bundles results in dark, wedge-shaped defects leading to the margin of the ONH. The fovea mediates central (reading) vision.
The ability of imaging to detect deterioration has been compared with that of VF testing, controlling for the false-positive rate of the chosen progression criteria. 33,34 Strouthidis et al. 33 studied trend-based change over time of ONH neuroretinal rim measurements made with the Heidelberg Retina Tomograph (Heidelberg Engineering, GmbH, Heidelberg, Germany) and location-wise trend-based change in the VF; Leung et al. 34 compared trend-based analysis of RNFL measurements obtained with time-domain optical coherence tomography (TD OCT) with a trend analysis of a VF summary measure [the VF index (VFI)]. With the imaging and VF progression criteria matched for specificity, both studies found similar detection sensitivity for imaging compared with VF testing.
Various imaging technologies have been applied to glaucoma diagnostics and monitoring. OCT has become most widespread. It is a three-dimensional imaging technology with ultrahigh spatial resolution. It is similar to ultrasound but typically uses 820- or 1050-nm wavelength light, instead of sound, to image tissue. A beam of this light is directed into tissue and reflections coming from different layers of the tissue are received by a detector. The tissue layers are differentiated by variances in reflectivity; device software identifies borders between areas of differing reflectivity to segment the image into various tissue layers. The RNFL is more highly reflecting than adjacent layers and is the innermost layer, lying on the retinal surface. Thickness measurements are made of the segmented retinal layers so that OCT provides quantitative measurements of both the ONH and the RNFL (Figure 3).
FIGURE 3.
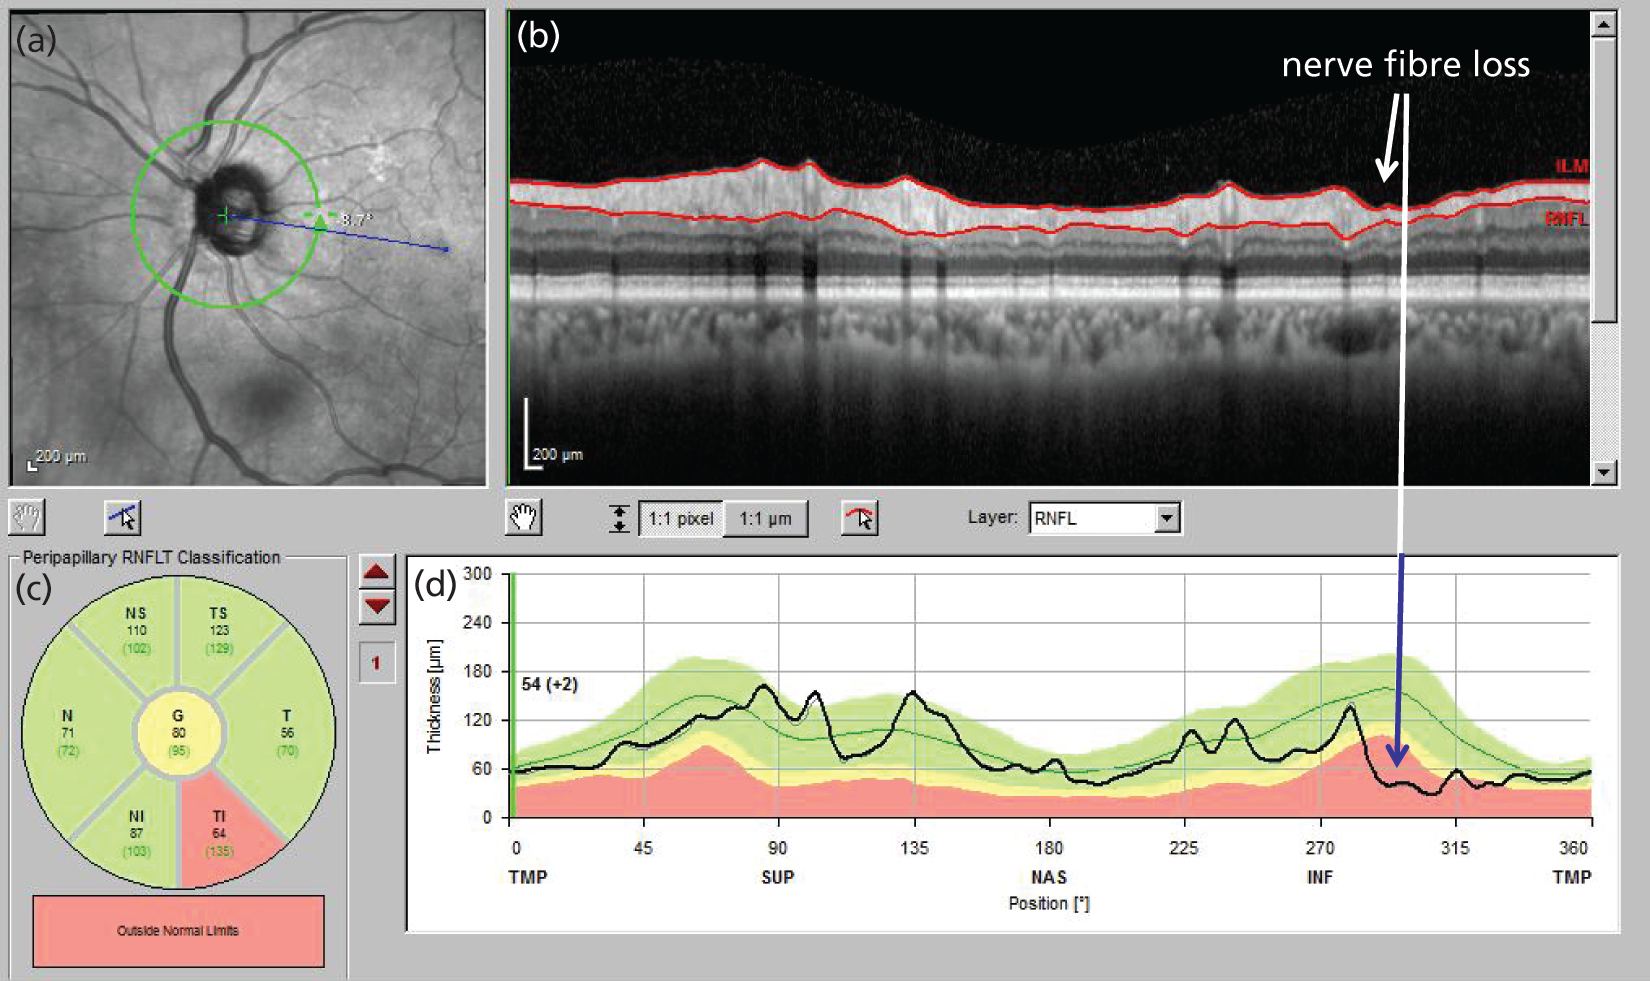
Optical coherence tomograph scan of the RNFL. (a) En face view of the ONH, position of the scan circle (green circle) and fovea (blue line extending between the ONH and the fovea); (b) retinal image cross-section around the ONH (the red lines delimit the RNFL on the retinal surface; glaucomatous thinning is indicated); (c) classification of the RNFL thickness in sectors around the ONH (the inferotemporal sector is outside normal limits); and (d) segmented RNFL thickness (black line) in relation to population normal ranges (green 5–95%, yellow 1% to > 5%, red < 1%) with glaucomatous thinning indicated.
As with VF testing, quantitative measurements of the RNFL by OCT are imprecise. A discernible change in RNFL thickness can be described by ‘tolerance limits’ for test–retest variability [1.645 × √2 × test–retest standard deviation (SD)]. 43 For a widely used commercial spectral-domain OCT (SD OCT) device, the Cirrus™ OCT (Carl Zeiss Meditec Inc., Dublin, CA, USA), the tolerance limit for average RNFL thickness measurement is 3.9 µm. The dynamic range of RNFL thickness measurements varies between commercial devices; for the Cirrus OCT, a value of 35.5 µm has been reported. 44 The number of steps of discernible change across the dynamic range is therefore about 9. Measurement imprecision is greater for the older TD OCT technology, with tolerance limits reported of between 6.4 and 8 µm. 45
The sources of measurement variability for VF tests include neural noise, variation in cognitive function (such as fatigue) and in decision criteria, learning effects, distractions in the test environment and the effect of technician instructions to patients. 8,46–50 The sources of measurement variability in OCT imaging include media opacity and other causes of poor signal strength,51–53 eye movement, scan misalignment (particularly for TD OCT) and software errors in image segmentation. 54,55
When a cohort is followed with VF testing and imaging, agreement on the eyes demonstrating glaucomatous progression is poor (for the most part, different eyes are identified as progressing by structure and function). 33,34 Modelling studies of rates of deterioration and measurement variability have shown that the poor agreement may be explained by measurement variability that is uncorrelated between the VF and imaging measurement techniques, which prevents deterioration from being identified in a proportion of eyes. 56,57 Because the source of measurement variability is different in VF testing and imaging, the eyes in which deterioration is missed are different for the two techniques. In addition, as the false-positive rate in these studies33,34 was fixed at a low value (and matched between techniques), the findings indicate that imaging and VF testing are providing ‘additive’ information. It makes sense, therefore, to use imaging data to compensate for the failure of VF testing to identify some of the deteriorating eyes. The statistical ‘addition’ of VF and imaging data might mitigate the variability and thereby increase the signal-to-noise ratio of combined measurements. An improved signal-to-noise ratio would facilitate the identification of true disease deterioration, enabling more rapid detection of disease worsening.
At present, regulatory authorities recognise VF test outcomes for clinical trials evaluating therapeutic interventions for glaucoma, but not yet structural outcomes based on imaging. 58,59
The United Kingdom Glaucoma Treatment Study (UKGTS) was designed to enable the evaluation of ONH and RNFL imaging measurements as potential clinical trial outcomes,60 using imaging devices available at the initiation of the trial: scanning laser ophthalmoscopy,33,61 scanning laser polarimetry62 and TD OCT. 63 There has been much interest in the possibility of replacing VF testing with imaging outcomes in clinical trials, or of using joint VF and imaging outcomes, based on a perception of more precise measurements in imaging data. Alternative outcomes, such as structural measurements based on imaging, need to be correlated with the clinically relevant outcome, in this case VF loss, and capture the effect of a treatment intervention on that clinically relevant outcome. 64,65 The correlation between structural and VF measurements has been established20,21,41,42 and the potential for scanning laser ophthalmoscopy measurements of the ONH to capture treatment effects has been demonstrated;66 however, clinical trial data demonstrating that structural outcomes capture treatments effects on the VF have yet to be published.
The potential benefits to patients and the NHS of combining VF and OCT data could be more sensitive (and therefore more rapid) identification of glaucoma deterioration and more accurate assessment of rates of deterioration, with consequently improved clinical outcomes, and a reduced frequency of patient visits and testing. This approach may also enable a reduction in study population size and study duration in clinical trials, thus allowing a greater number of new treatments to be assessed and brought to patients more rapidly.
Chapter 2 Objectives
The primary objective of this work was to establish whether combining VF and OCT data results in more sensitive identification of glaucoma deterioration and more accurate assessment of rates of deterioration than using VF data alone. More sensitive and accurate identification of deterioration may enable a reduction in study population size and/or study duration in clinical trials and so an additional objective was to compare sample size estimates for clinical trials based on techniques combining VF and OCT data and techniques using VF data alone.
Chapter 3 Methods
Study design
Overview
Evaluation of ONH and RNFL imaging measurements as potential clinical trial outcomes was a secondary objective of the UKGTS. 60 The trial protocol for data collection was established before the index and reference standard tests were performed.
This work draws together a number of different statistical strands to establish statistical tools to analyse glaucomatous disease deterioration. The main emphasis was to investigate ‘trend’ analyses, which use several observations taken over a period of time to estimate a rate of change in the outcome over that time period. A related secondary set of methods that were investigated were ‘event’-based analyses, in which patients are declared to have experienced an event if they have deteriorated by a certain amount compared with their baseline measurements. With the reference method (see below), an event is identified when follow-up measurements differ by a certain amount from the baseline measurements. With the index methods, the event is based on the ‘trend’ analysis, so that the event is the point in time at which a trend becomes statistically significant.
Before evaluating methods that combine the VF and OCT measurements, we evaluated some data attributes required to assess the suitability of the imaging outcome as an alternative or additional outcome to VF testing. To do this we compared the distribution of individual rates of change in VF mean sensitivity and OCT mean RNFL thickness between treatment arms of the UKGTS. Potential surrogate outcomes also need to be shown to capture the effect of a treatment intervention on the clinically relevant outcome. 64,65 We therefore assessed the association of the rate of RNFL loss in individual participants with the time to VF event in a Cox proportional hazards model.
The reference method to identify VF deterioration, for comparison with the index methods, was the event-based method available in the VF testing instrument [Humphrey Field Analyzer™ (HFA) II-i Guided Progression Analysis™ (GPA) software (Carl Zeiss Meditec Inc., Dublin, CA, USA)] with the criterion for deterioration that was applied in the UKGTS. 60,67 The GPA method compares each follow-up VF with the baseline pair of VFs and ‘flags’ deterioration when the follow-up measurement at a VF location has a sensitivity that is lower than the 5% limit predicted from population test–retest data. Criteria for deterioration are based on various combinations of the number of flagged location and the number of consecutive times that the location is flagged. 68
Two types of index analysis methods were considered: those that analyse VF measurements alone (‘VF-only index methods’) and those that analyse both VF and OCT outcomes (‘VF + OCT index methods’). These methods were compared against the reference method.
Analysis methods were compared as detailed in the following sections.
‘Hit rate’ and specificity
There is no ‘gold standard’ reference for glaucoma deterioration and so the sensitivity (true-positive rate) of a method cannot be calculated directly. The approach adopted in this work was to evaluate criterion specificity (true-negative frequency) in a ‘stable’ data set of glaucomatous subjects and to select a criterion for deterioration providing a type 1 error (false-positive frequency) of 5% (assuming that none of the stable subjects was actually deteriorating). Criteria to identify deterioration were then applied to the UKGTS data set. 67 For a constant type 1 error, the ‘hit rate’ is a monotonically increasing function of the sensitivity and, under a certain assumption, methods with a higher hit rate have a higher sensitivity. The assumption is that the specificity of the methods is the same, or that the specificity of each method is different by the same amount, in the stable and UKGTS cohorts. If the specificity changes differentially for the methods evaluated, then the comparison of hit rate will not be a surrogate for sensitivity (as the type 1 errors will no longer be comparable). However, in the absence of a gold standard test, assessment of hit rate is a pragmatic alternative to comparing method sensitivities. Therefore, the method with the criterion identifying most trial patients as deteriorating was assumed to be the most sensitive technique. The stable data set consisted of treated glaucoma patients tested on 10 occasions within a 3-month period. The assumption was that no measurable deterioration occurs in such a short period of time in treated patients.
Prediction accuracy
Similarly, as there is no gold standard reference for glaucoma deterioration, a surrogate method to evaluate the accuracy of the determination of the rate of deterioration was used. Accuracy was assessed by using the rate of deterioration to predict future VF states from initial measurements and comparing the prediction with the observed measurement. In individual UKGTS participants, initial tests were used to predict a VF test result towards the end of the trial. This analysis assumes that VF deterioration is linear. This assumption has been shown to be reasonable in manifest glaucoma, at least over observation periods of a few years. 69,70 The method with the lowest prediction error was presumed to be the most accurate for measuring the rate of deterioration.
Discrimination between trial treatment arms
Analysis methods that best capture glaucoma deterioration should discriminate well between clinical trial treatment arms if one treatment slows the rate of deterioration compared with the other. The treatment effect may be measured either by comparing the average rate of change in the outcome measure in each group or by comparing the time-to-progression events in each group. Both approaches were adopted.
Review of models to identify visual field deterioration and incorporate imaging outcomes
Testing of the VF, using instruments such as the HFA, has been used as both a diagnostic tool and an outcome measure in randomised clinical trials (RCTs) in glaucoma for many years. Bosworth et al. 71 reviewed current VF testing practice. There has been much research into the characteristics of VF measurements from the 24-2 pattern acquired with the Swedish interactive thresholding algorithm (SITA) of the HFA. 72 Many papers have described the large variability in VF measurements and the increasing variability as sensitivity declines. 7–9 Gardiner et al. 73 found that sensitivity values below a cut-off value of between 15 and 19 dB are particularly unreliable and that values at these levels of sensitivity agree poorly with estimates obtained from ‘frequency of seeing’ curves. Gardiner et al. 73 also discussed the concept that sensitivity values may not be truly defined at such low levels, as the retinal ganglion cells remaining cannot be stimulated sufficiently to produce a 50% response rate to stimuli, regardless of the intensity of the presentation. Gardiner et al. 74 found that the proportion of eyes identified as deteriorating was not decreased by truncating sensitivities at 10 dB (i.e. setting all sensitivities below 10 dB equal to 10 dB) in the two cohorts studied. Furthermore, in one of the cohorts, no reduction in the proportion deteriorating was observed when truncating at 15 dB; in the other, only a small reduction was observed.
In addressing the increased variability in sensitivity estimates with declining sensitivity, Ibáñez and Simó75 used geostatistical methods to model the spatiotemporal characteristics of VF data taken from healthy eyes. They noted the relationship between variability, mean sensitivity and distance from the centre of the VF and considered the use of a Box–Cox transformation to adjust for the heteroskedasticity of the data.
Bryan et al. 76 compared pointwise simple linear regression (SLR) with exponential regression, censored regression and median-based regression to describe VF deterioration. They found that all models performed similarly, with SLR performing slightly better in terms of prediction errors and model fit, but that all models gave large prediction errors. However, the authors noted a need for more complex models that explore the spatiotemporal relationships of VF data to improve predictions further. For the main part of their paper, Bryan et al. 76 considered censored regression models (also known as Tobit models) with censoring at 0 dB, which is the limit of the VF machine’s dynamic range. In the discussion section, the authors briefly mention also considering censoring at 10 dB, but that SLR still performed better in terms of model fit and prediction errors. The authors acknowledged the difficulties of using prediction errors as a metric to compare models given the high level of variability in VF measurements, particularly at low dB values.
Bryan et al. 77 explored the use of mixed-effects models in a Bayesian framework in the context of analysis of glaucoma data. In their model they included levels for person, eye and hemi-field within eye. In such a model, the VF locations are assumed to have an exchangeable correlation structure within the hemi-field. The authors also included a ‘global visit effect’ in their model (to account for visit-by-visit differences in performance) and allowed the log of the SD in their model to vary linearly with the sensitivity. Bryan et al. 77 used a two-stage Bayesian Monte Carlo procedure to obtain estimates from such a model. They found that by taking into account the global visit effect and including the relationship between variability and sensitivity, the model fit improved, as well as future VF prediction accuracy.
Acknowledging the heteroskedastic nature of VF variability, O’Leary et al. 78 considered the use of permutation methods. They used SLR to obtain a p-value at each VF location. They then used a generalisation of Fisher’s method to combine the p-values into a summary statistic, which they permuted. With this method, which they named permutation analyses of pointwise linear regression (PoPLR), they obtained a superior ‘hit rate’, with specificity held at 5%, to the previously described pointwise linear regression. 79 A particular advantage of this method over the GPA facility in the HFA is that the statistical significance of the slope of change is estimated from the patient’s own data rather than from population statistics.
Zhu et al. 80 proposed an approach to identify deterioration that formally modelled the variability characteristics at each level of VF sensitivity; this was termed ‘Analysis with Non-Stationary Weibull Error Regression and Spatial enhancement’ (ANSWERS). The methodology was developed from a data set that included 12 VF tests on each of 30 subjects. 81 To develop their methodology, Zhu et al. 80 formed the 1980 (30 × 12 × 11/2) pairs of VFs and treated these as independent representations of within-subject variability. However, these pairs were not truly independent as they came from only 30 subjects; it is not clear to what extent this non-independence may impact on the validity of the method, but the sensitivity-determined variability characteristics of the model were consistent with previous publications. 7,8 The ‘hit rate’ and prediction accuracy of ANSWERS was compared with the SLR of a VF summary measure [mean deviation (MD)] and with PoPLR. The hit rate was significantly better than the SLR of the MD and PoPLR, especially in short time series. The prediction accuracy of ANSWERS was also better than that of PoPLR, particularly in shorter series; 75% of VF series were better predicted by ANSWERS than by PoPLR and the average prediction error of ANSWERS was 15% lower than that of PoPLR. 82
Medeiros et al. 83 proposed a Bayesian framework to integrate event-based (GPA) and trend-based (SLR of VFI) analyses. The results from the event-based analysis were incorporated into the prior for the trend-based analysis. Although this approach identified more subjects as deteriorating than the GPA alone, at the same level of estimated specificity, the approach appears to use the same data twice, which may lead to incorrect estimates of variability when making inferences.
Recognising the potential of structural measures to support VF testing, several groups have proposed methods to combine VF and imaging data for glaucoma diagnosis and disease staging84–86 that are reported to perform better than the separate structure or function tests. Medeiros et al. 87 applied their approach to identify glaucoma deterioration. The analysis is effectively SLR on combined summary measures of glaucoma damage and does not address the heteroskedasticity in the VF data. Analysis of the combined data provided a better hit rate than the VF and structure data alone, for the same level of specificity. This relatively simple methodology could be more statistically efficient than more complex approaches; however, it is probably more appropriate to exploit the multivariate nature of the repeated measures of the imaging outcome together with the data from all locations in the VF.
Two further studies by Medeiros et al. 62,88 used a Bayesian approach to combine structural and functional information. In the first study,62 a Bayesian hierarchical model was used to integrate information from the longitudinal VF (VFI) and structure (RNFL thickness estimated with the scanning laser polarimeter) measurements to classify individual eyes as progressing or not. The output was compared with SLR of the component VF and structural data; more eyes were identified as deteriorating with the Bayesian approach. ‘Specificity’ was estimated from healthy eyes. In the second study,88 a Bayesian joint regression model was used to integrate structural (rim area measurements from a scanning laser tomograph) and functional (VF MD) information. Compared with SLR on either the structural or the functional components alone, the deterioration slopes were less variable and prediction accuracy was better. Both approaches use a summary VF outcome measure (VFI or MD) and neither formally addresses heteroskedasticity in the data. Furthermore, the use of healthy eyes to evaluate criterion specificity is not appropriate because the range of sensitivity values and associated variability differs.
Russell et al. 89 proposed a Bayesian framework in which the rate of neural rim change measured by scanning laser tomography formed the prior for SLR of a VF summary measure (mean sensitivity). The Bayesian approach incorporating the structural data resulted in significantly better predictions of future VF mean sensitivity than SLR of mean sensitivity alone. As with other published methods, this approach used a summary VF outcome measure and did not addresses heteroskedasticity in the VF data. However, this, and the other approaches, demonstrate the potential benefit of including structure outcomes in the analysis of serial VF data to identify deterioration.
Developing analysis approaches for the visual field and imaging outcomes
In this project we made use of a variety of techniques that are used in mainstream medical statistics in many disease areas, as well as building on some methods that have also been used in a glaucoma setting; these are detailed in Chapter 6 (see Index methods: newly developed). For example, we considered a variety of transformations, including those from the two-parameter Box–Cox family of transformations,90 to investigate whether or not one could be found under which the transformed VF values would follow an approximate normal distribution. Ibáñez and Simó75 considered the use of Box–Cox transformations and transformations more generally have been used in a wide variety of settings to allow normality assumptions to be made.
We considered the use of censored regression models (also known as Tobit models) in this project, using a cut-off value of 15 dB. This relates to work by Bryan et al. ,76 among others, who considered regression models that assume censoring below 0 dB. We considered a higher cut-off value, as described in Chapter 6 (see Censored regression), which has the dual advantage of allowing normality and homoskedasticity assumptions to be made and avoids the need to account for zero weighting caused by the truncation at 0 dB. The recent study by Gardiner et al. 74 considered ‘censoring’ at a cut-off value above 0 dB, although in their work they simply truncated at the cut-off value and replaced all values below the cut-off value with the cut-off value, instead of using a censored regression model as proposed.
Another method we have made use of is the permutation test. These tests are commonly used in many areas of statistics to compute p-values when comparing levels of a particular outcome variable between two groups when there are concerns over the assumptions made by a test such as a t-test. 91 Such permutation tests have been utilised for the analysis of serial VF data to identify deterioration. 78
Multiple imputation, and specifically the use of chained equations,92 is frequently used to handle missing data in a principled way in many disease areas. A similar approach to the model that we propose in Chapter 6 (see Multiple imputation) has been previously used to analyse longitudinal dietary data. 93
Linear mixed-effects models (also known as hierarchical models or mixed models) are commonly used in other disease areas to analyse longitudinal and/or hierarchical data. 94 They have also been applied to glaucoma data by Bryan et al. 77 in a Bayesian framework. The specific use of a Kronecker product to specify the residual error structure is described by O’Brien et al. 95 Generalised estimating equations (GEEs) are also a standard methodology that is frequently used in other disease areas. 94
We also make use of the known spatial relationship between regions of the VF and RNFL sectors around the ONH. 22
Setting
The data analysis methods were applied to two data sets, RCT data from the UKGTS and test–retest data from the RAPID trial. The methods applied to the UKGTS data were used to determine method ‘hit rate’ (approximating sensitivity); method specificity was determined from the RAPID data set.
The UKGTS design, participant characteristics and main outcomes are described in detail elsewhere. 60,67,96 The UKGTS was a multicentre RCT conducted at 10 centres across the UK. Centres were district general hospitals, teaching hospitals and tertiary referral centres. Consecutive participants consenting for the study were recruited between 1 December 2006 and 16 March 2010.
The RAPID data set was acquired from patients attending the glaucoma clinics at Moorfields Eye Hospital NHS Foundation Trust, which functions as a district general and teaching hospital and a tertiary referral centre; VF testing and imaging was undertaken in the National Institute for Health Research (NIHR) Clinical Research Facility.
While the RAPID data set was being collected, statistical methods were evaluated in a second test–retest data set, termed here the ‘Halifax’ data set. 81 This data set was acquired from patients attending the glaucoma clinics at Dalhousie University Department of Ophthalmology and Visual Sciences in Halifax, NS, Canada.
Participants and data sources
United Kingdom Glaucoma Treatment Study
The UKGTS was a RCT that compared the effects of latanoprost, a topical treatment to lower IOP, with those of placebo on survival from VF deterioration. In total, 516 patients with newly diagnosed OAG were enrolled, with 777 eyes eligible for entry into the study; details of the eligibility criteria and baseline characteristics have been published elsewhere. 60,96 The study was undertaken in accordance with good clinical practice guidelines97 and adhered to the Declaration of Helsinki. 98 The trial was approved by the Moorfields and Whittington Research Ethics Committee on 1 June 2006 (reference 09/H0721/56). All patients provided written informed consent before the screening investigations were carried out. An independent Data and Safety Monitoring Committee (DSMC) was appointed by the Trial Steering Committee. The trial manager monitored adverse events, which were reported immediately to the operational DSMC at Moorfields Eye Hospital. Serious adverse events were reported to the Medicines and Healthcare products Regulatory Agency. The trial is registered as ISRCTN96423140.
The principal baseline characteristics of the participants are presented in Table 1.
| Characteristic | Placebo (n = 258 participants, 393 eyes) | Latanoprost (n = 258 participants, 384 eyes) | ||
|---|---|---|---|---|
| Median | 5th to 95th percentile | Median | 5th to 95th percentile | |
| Age (years) | 66.5 | 47.5 to 80.7 | 66.2 | 44.8 to 79.9 |
| IOP (mmHg) | 19.0 | 12.0 to 28.0 | 19.0 | 12.5 to 28.7 |
| SAP MD (dB) | –2.62 | –9.89 to 0.00 | –2.66 | –9.95 to 0.00 |
| Visual acuity (Snellen) | 6/6 | 6/5 to 6/9 | 6/6 | 6/5 to 6/9 |
| Refractive error (D) | 0.00 | –6.9 to 2.8 | –0.1 | –6.1 to 2.6 |
| Number | % | Number | % | |
| Sex (female) | 125 | 48 | 118 | 46 |
| Ethnic origin | ||||
| White | 230 | 89 | 235 | 91 |
| Black | 17 | 7 | 10 | 4 |
| Indian subcontinent | 7 | 3 | 9 | 3 |
| Other/unknown | 4 | 2 | 4 | 2 |
Participants were followed up every 2–3 months after eye drop therapy was initiated, for up to 11 scheduled visits (see Appendix 1). Participants attended for additional visits if VF deterioration was identified according to certain preset criteria, at which VF testing and imaging were repeated. The baseline visit was the first visit, 6 weeks after randomised therapy (drops) was started. Visual function was monitored by VF testing (see Data types, Visual field measurements) and ONH structure was monitored with the Heidelberg Retina Tomograph at all study sites and with TD Stratus OCT™ (Carl Zeiss Meditec Inc., Dublin, CA, USA) (software version 5.0; see Data types, Optical coherence tomography measurements) and GDxECC Nerve Fiber Analyzer (Carl Zeiss Meditec Inc., Dublin, CA, USA) at study sites with those devices. The sample size in the UKGTS was determined for a two-sided error at a significance level (α) of 0.05 to detect the difference between 24% and 11% incident deterioration over a 24-month follow-up at 90% power and assuming a 25% attrition rate. The subset of UKGTS participants with both VF testing and OCT imaging was used in this work.
The primary outcome for the trial was glaucomatous VF progression (deterioration) within 24 months. Details of the method for determining progression in the VFs (see Chapter 3, Visual field measurements) have been published previously. 60,67 If tentative deterioration was identified, participants returned for confirmation tests within 1 month. At this confirmation visit, two VF tests were performed; if the deterioration was confirmed, then participants were considered to have progressed. Participants who were deemed to have progressed left the trial and treatment was adjusted as appropriate. Participants leaving the trial were invited to an ‘exit visit’ before treatment adjustment. Participants found to not be progressing at the confirmation visit were returned to the standard visit schedule.
The primary outcome was analysed as survival in a Cox model, which found an adjusted treatment hazard ratio (HR) of 0.44 [95% confidence interval (CI) 0.28 to 0.69, p < 0.001]. Details of the covariates used in the outcome model have been published previously. 67
RAPID study
Eighty-two glaucoma patients under standard treatment were recruited to a test–retest study. Seventy-seven (148 eyes) of the patients recruited attended for up to 10 visits within a 3-month period, totalling 1256 patient-eye visits. This data set was taken to represent a ‘stable glaucoma’ cohort; assumptions made include that, over such a short length of time, no clinically meaningful changes in the VF or RNFL structure would occur and that the variability in characteristics of the VF and RNFL measurements are similar to those seen in clinical practice over longer periods of time.
The study was undertaken in accordance with good clinical practice guidelines97 and adhered to the Declaration of Helsinki. 98 The study was approved by the North of Scotland National Research Ethics Service committee on 27 September 2013 (reference 13/NS/0132) and NHS Permissions for Research was granted by the Joint Research Office at University College London Hospitals NHS Foundation Trust on 3 December 2013. All patients provided written informed consent before the screening investigations were carried out.
Recruitment criteria were based on those for the UKGTS. 60 Patients were required to have reproducible VF loss with corresponding damage to the ONH and no other condition that could lead to VF loss, be aged > 18 years and have a visual acuity of ≥ 6/12, a refractive error within ±8 dioptres and an IOP of ≤ 30 mmHg. The VF MD had to be better than –16 dB in the worse eye and better than –12 dB in the better eye. VF loss was defined as a reduction in sensitivity at two or more contiguous locations with p < 0.01 loss or more, three or more contiguous locations with p < 0.05 loss or more, or a 10-dB difference across the nasal horizontal midline at two or more adjacent locations in the total deviation plot.
Participants attended approximately once a week for 10 visits, with VF testing and OCT imaging carried out twice at the first visit and once at each subsequent visit. The mean time between visits was 8.2 days (range 3–63 days). VF testing was undertaken with the HFA, as detailed below, and OCT imaging was carried out using TD Stratus OCT and Spectralis® SD OCT (Heidelberg Engineering, Heidelberg, Germany); we present the TD OCT results in this report because this was the form of OCT imaging used in the UKGTS.
Halifax study
Initial statistical modelling was undertaken while the RAPID study was still in the data collection phase. Therefore, we made use of a similar test–retest data set. 81 This consisted of 30 glaucoma patients who took 12 VF tests over a 3-month period, approximately once a week, in the Department of Ophthalmology, Dalhousie University, Halifax, NS, Canada. In accordance with the Declaration of Helsinki,98 the institutional research ethics board approved the protocol and all patients gave written informed consent.
Data types
Visual field measurements
In a VF test, a patient fixates with the eye to be tested (one at a time) on a central (‘fixation’) point and is then presented with flashes of light of varying intensity at locations at various distances (eccentricity) from the fixation point. The patient is provided with a button and instructed to click this when he or she can see a flash of light. In the standard 24-2 VF pattern, 54 locations in a regular grid 6° apart are tested and a sensitivity level is recorded for each. The locations above and below the physiological blind spot (see Figure 1) are discarded so that 52 locations are analysed. At a sensitive retinal location a dim flash can be seen and at a location with poor sensitivity only bright flashes can be seen. The unit of sensitivity measurement (decibel) is 10 times the log of the reciprocal of the dimmest intensity seen, so that a sensitive location has a high decibel value. A sensitivity of < 0 dB implies that the patient has been unable to see the brightest light that the machine can produce. Thus, the measurements are bounded at 0 dB. They are also heteroskedastic (the variability associated with the measurement depends on the mean level of the measurement), so that the variability of the VF sensitivities increases as sight deteriorates (at low decibel values).
All VF tests were performed with the HFA II (or II-i) and the SITA standard 24-2 program. A reliable VF was one with a false-positive rate of < 15% and < 20% fixation losses (for fixation losses of > 20%, reliability was based on the subjective judgement of the technician supervising the test and the clinician reading the test, including an assessment of the eye tracker trace). Unreliable tests were repeated, either on the same day (with a break of at least 30 minutes) or on a subsequent occasion.
The reference standard analysis for VF deterioration was that used for the outcome of the UKGTS and was undertaken with the HFA II-i GPA software (version 5.1.1). The criterion for tentative deterioration (progression) was three locations worse than baseline in two consecutive VFs (three half-shaded or full-shaded locations). Definite deterioration was identified if the same criterion of three half-shaded or full-shaded locations was satisfied in the next two VF tests. 60,67
Optical coherence tomography measurements
During OCT image acquisition, a patient sits in front of the image device, which is aligned to the patient’s pupil. The patient views a fixation light and the instrument scans the retina, acquiring reflectivity measurements around a circle centred on the ONH. OCT imaging was performed with the TD Stratus OCT. Images were acquired through dilated pupils with the fast RNFL thickness (3.4) scanning protocol and using the landmark function. With this scanning protocol, three images are acquired in quick succession. The OCT instrument software averages the measurements from these three images. A signal strength of ≥ 7 was required; images were retaken if necessary to acquire adequate-quality images. Images of lower quality, or those with a software alert, were not included in the analyses.
Retinal nerve fibre layer measurements are provided as means (average RNFL around the ONH) and in clock-hour sectors.
Structure/function mapping
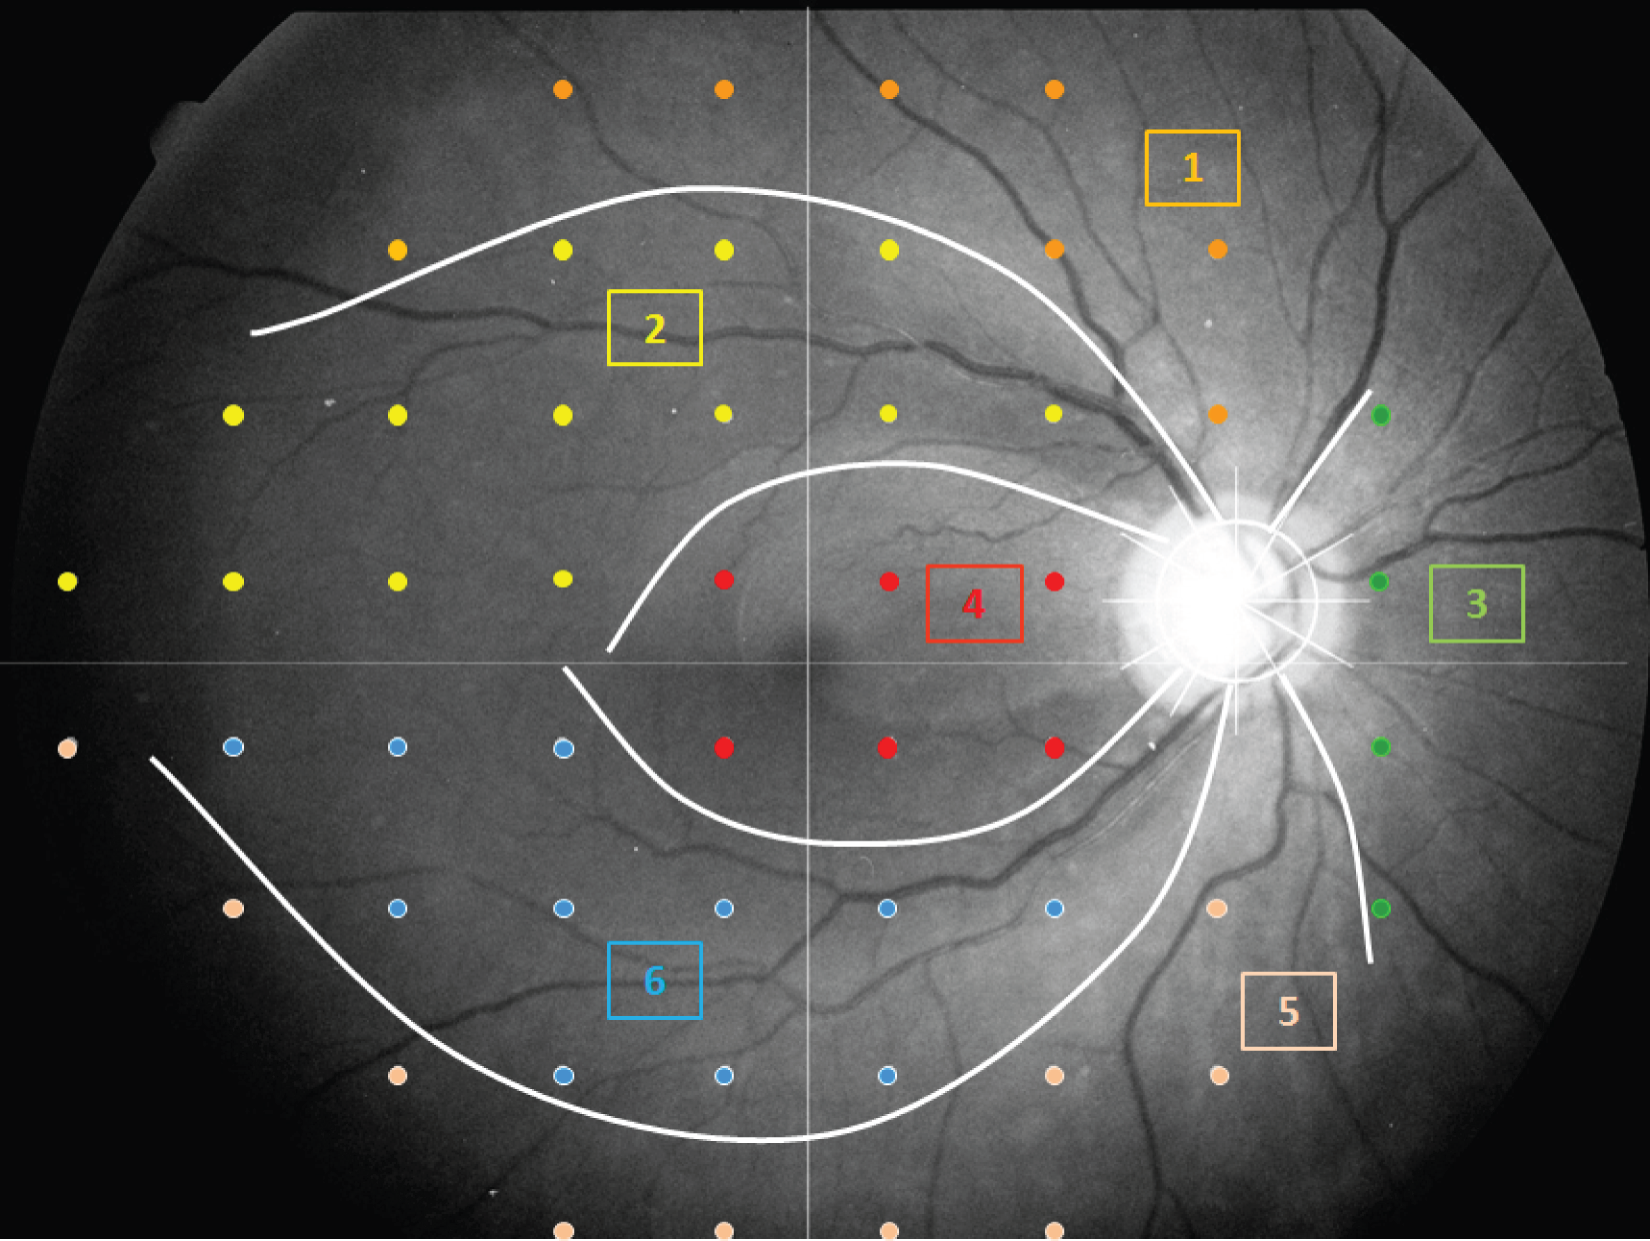
There is an established anatomical correspondence between regions of the VF and sectors of the ONH (Figure 4). 22 In some analyses we make use of this mapping, so that either regions of the VF or individual VF locations are associated with corresponding RNFL measurements.
FIGURE 4.
Relationship between VF regions and RNFL sectors around the ONH. The optics of the eye result in inversion of the VF compared with the anatomy. The VF test locations are shown in ‘retinal view’ (the VF has been inverted, so that inferior locations are shown at the top of the image, to allow direct correspondence between the anatomy and the VF). The RNFL sectors are numbered as follows: (1) superior 30° sector corresponding to the inferior VF, (2) superotemporal 30° sector corresponding to the inferior arcuate VF region, (3) nasal 120° sector corresponding to the temporal VF, (4) temporal 120° sector corresponding to the central VF, (5) inferior 30° sector corresponding to the superior VF and (6) inferotemporal 30° sector corresponding to the superior arcuate VF region.
Main outcome measures
The following outcomes were assessed:
-
the difference between UKGTS treatment arms in the
-
distribution of individual rates of VF sensitivity change
-
distribution of individual rates of OCT mean RNFL change
-
-
the association of the rate of RNFL change with time to VF progression
-
the ‘hit rate’ and specificity of the reference method
-
the ‘hit rate’ and specificity of the index methods
-
the accuracy of the prediction of future VF states
-
the discrimination between treatment arms
-
based on the rate of VF change (new index method)
-
based on the time to event (comparing the reference and index methods)
-
-
sample size calculations for the reference and index methods.
Interventions
The analyses were performed on existing clinical trial data comparing treatment and placebo arms. 67 The treatment arm was given IOP-lowering drops intended to slow the rate of VF sensitivity deterioration.
Chapter 4 Statistical methodology
Existing reference and index data analysis methods (or modifications of them), and the methods for assessing them, are described in Methods of evaluation of reference and previously described index methods and new approaches developed in this work are described in Index methods: newly developed. The existing reference and index data analysis and the new approaches used slightly differing subsets of the UKGTS and RAPID data; details of the data used in Methods of evaluation of reference and previously described index methods are provided in Visual field and imaging outcomes in the United Kingdom Glaucoma Treatment Study; details of the data used in Index methods: newly developed are provided in that section.
Progression detection in clinical practice and clinical trials
Event-based methods to identify progression are suitable for both clinical practice and clinical trials, whereas methods evaluating the behaviour of groups of patients are suitable only for clinical trials.
In the latter setting there are often hundreds of patients, with a proportion on the investigational treatment and the remainder (‘control group’) on a placebo or alternative treatment. In the context of glaucoma, the aim would be to detect whether the investigational treatment is preventing the patients in the active group from deteriorating as quickly as patients in the control group. This aim can be achieved by defining a binary progression event that can be analysed alongside the time until that event (for those with an event) or the time until the end of follow-up (for those without an event) in a survival analysis. Alternatively, a multilevel modelling approach can be used, in which average slopes over time are estimated separately in the investigational and control groups by using a time-by-treatment interaction. The treatment effect of interest would then be the difference between those slopes.
Until now, imaging outcomes collected during the course of RCTs of glaucoma have been analysed as secondary outcomes. However, if imaging and VF outcomes could be analysed together, then this may allow treatment effects to be detected more accurately and after a shorter length of time. This could allow smaller and shorter RCTs to be conducted.
The methodological approach for the clinical trials setting requires models that appropriately specify the complex covariance structure of the repeated measures available (between subject, within subject between occasion and within subject within occasion, such as the covariance between different VF locations).
The clinical practice setting is very different. The data available are often limited to only a handful of visits for a single patient. To manage his or her treatment effectively, it is important to monitor him or her to identify any deterioration in his or her condition. Because the data are much more limited, the approaches here are simpler, but nonetheless must take appropriate account of the characteristics of VF data (particularly the non-normality and heteroskedasticity of such data). Given these characteristics, non-parametric approaches, such as permutation tests, are particularly attractive.
Visual field and imaging outcomes in the United Kingdom Glaucoma Treatment Study
Data
A subset of 528 eyes of 361 UKGTS participants had OCT imaging of adequate quality acquired during the follow-up, 178 participants in the placebo group and 183 participants in the latanoprost group. The principal characteristics of these participants (Table 2) were very similar to those of the complete UKGTS cohort (see Table 1).
| Characteristics | Placebo (n = 178 participants, 264 eyes) | Latanoprost (n = 183 participants, 264 eyes) | ||
|---|---|---|---|---|
| Median | 5th to 95th percentile | Median | 5th to 95th percentile | |
| Age (years) | 66.3 | 47.3 to 81.1 | 65.7 | 44.7 to 79.6 |
| IOP (mmHg) | 19.0 | 12.0 to 28.0 | 19.0 | 12.5 to 27.0 |
| SAP MD (dB) | –2.73 | –10.60 to –0.17 | –2.57 | –10.98 to –0.02 |
| RNFL thickness (µm) | 75.3 | 48.2 to 106.6 | 77.2 | 56.1 to 101.3 |
| Visual acuity (Snellen) | 6/6 | 6/5 to 6/9 | 6/6 | 6/5 to 6/12 |
| Refractive error (dioptre) | 0.00 | –6.85 to 3.13 | –0.13 | –6.13 to 2.29 |
| Number | % | Number | % | |
| Sex (female) | 86 | 48 | 79 | 43 |
| Ethnic origin | ||||
| White | 153 | 86 | 165 | 90 |
| Black | 15 | 8 | 8 | 4 |
| Indian subcontinent | 4 | 2 | 8 | 4 |
| Other/unknown | 6 | 3 | 2 | 1 |
Figure 5 shows the process for identifying subjects with VF and OCT image data of adequate quality. Confirmation and exit visits were included in the analyses provided that they occurred within 2 years of the baseline visit.
FIGURE 5.
Flow chart illustrating the process for identifying patients with both VF and OCT data of adequate quality.
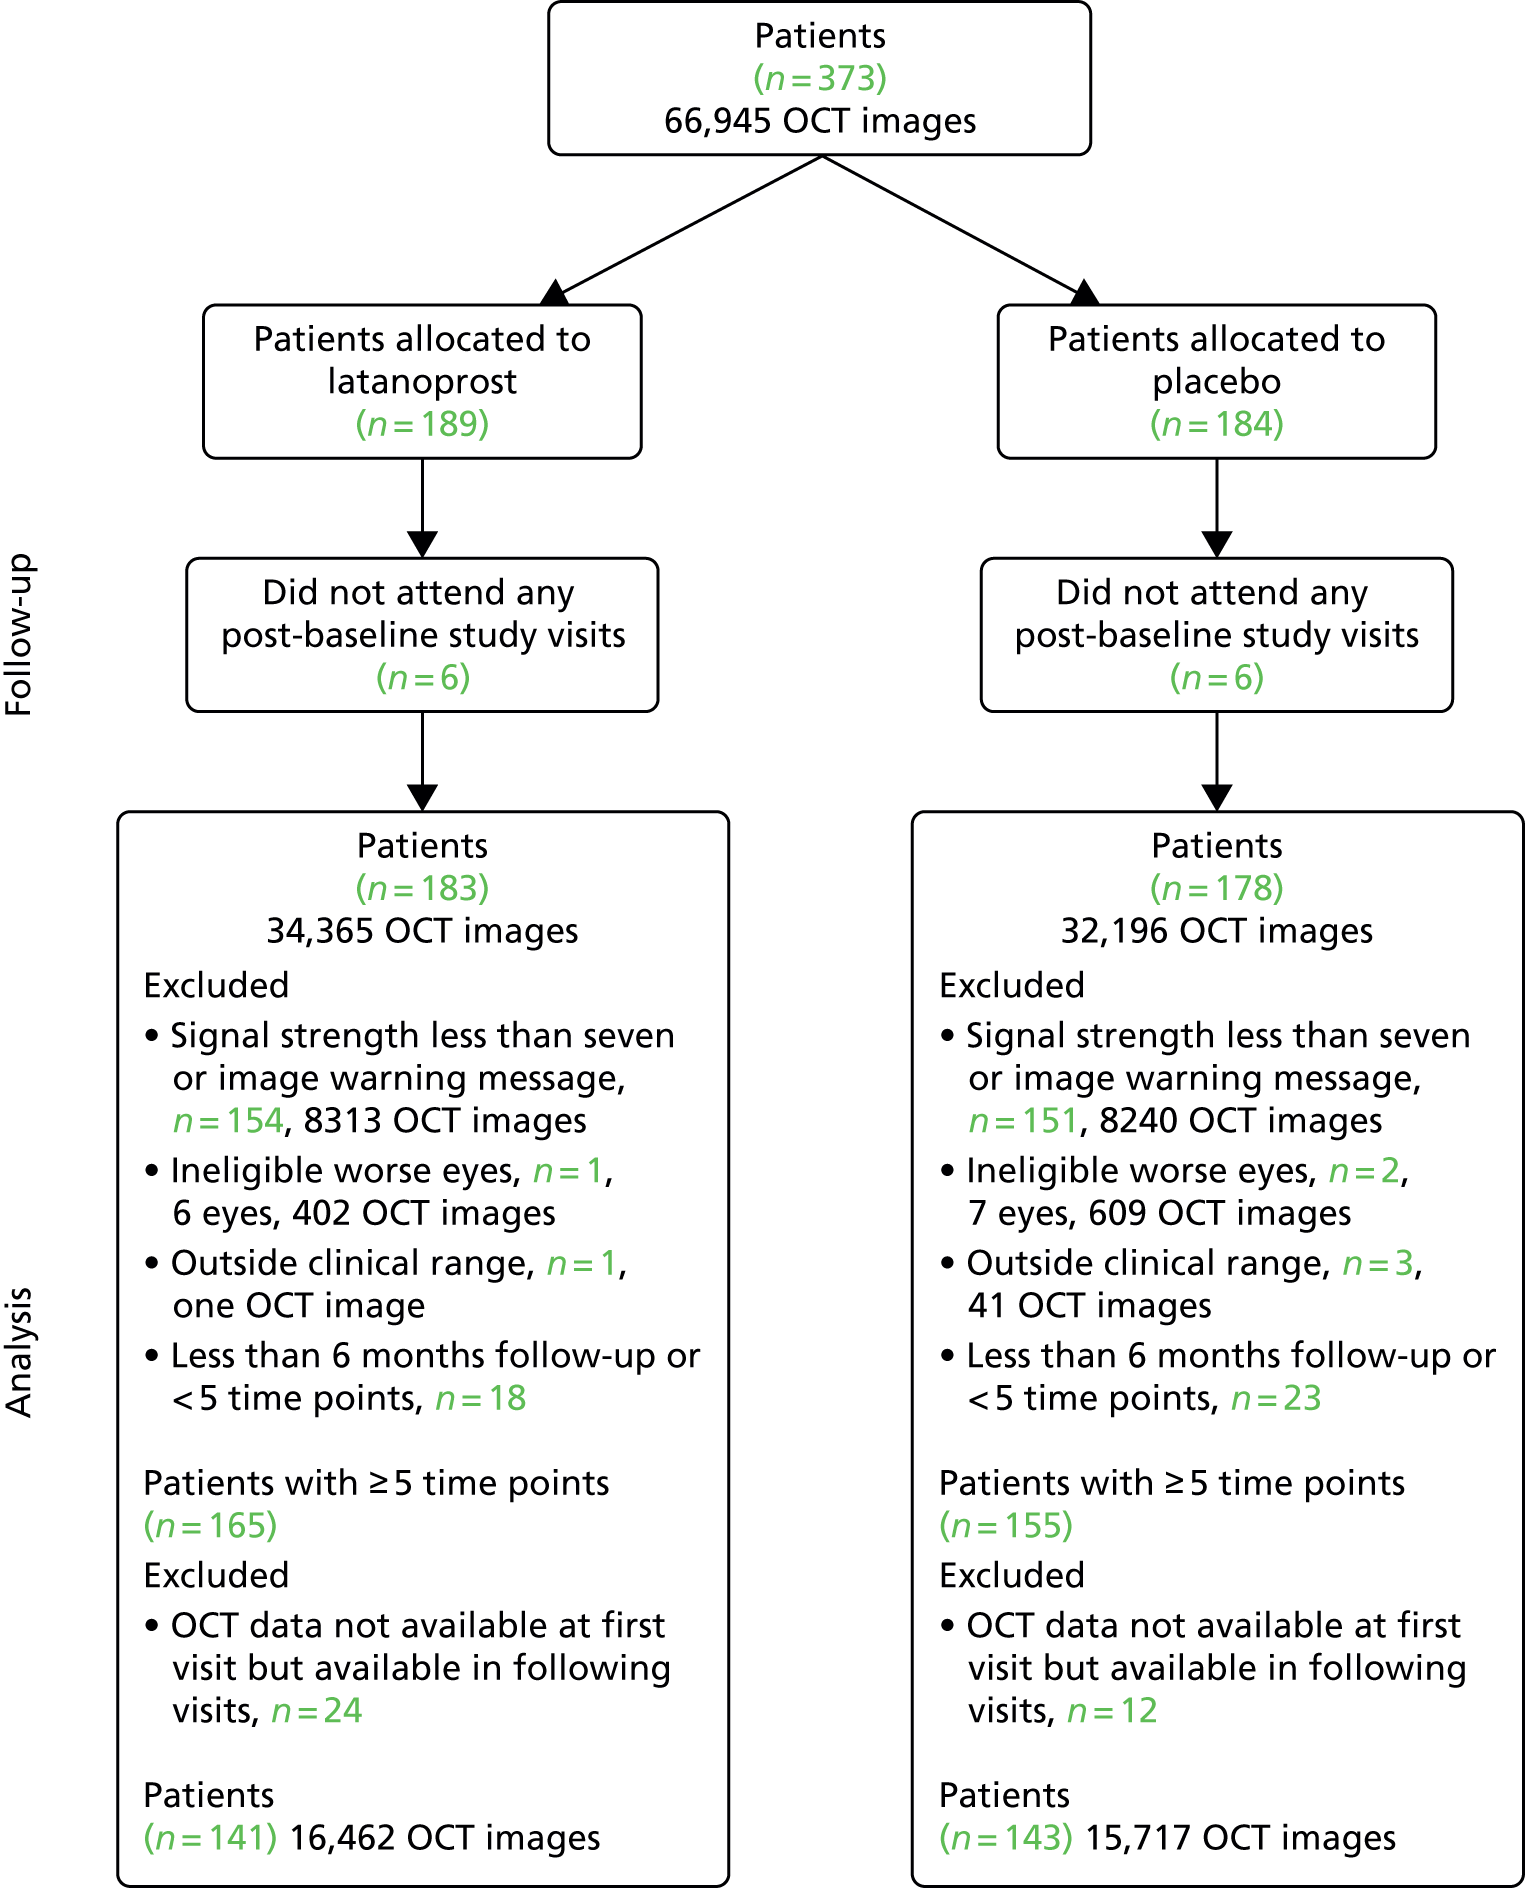
Data for the analyses in the following two sections came from the 284 UKGTS participants (141 in the latanoprost arm and 143 in the placebo arm; see Figure 5) with adequate-quality VF and OCT data, with > 6 months of follow-up, who underwent five or more visits and with data for both VFs and OCT at the baseline visit.
Rate of change of visual field mean sensitivity and mean retinal nerve fibre layer thickness
The rate of change of VF mean sensitivity (mean of the 52 locations) and mean RNFL thickness were calculated by SLR and the individual rates of change were compared between treatment arms using a Mann–Whitney two-tailed test.
Association of retinal nerve fibre layer thickness change with time to visual field progression
To identify whether the rate of change in OCT RNFL thickness was associated with VF progression (reference analysis), a Cox proportional hazards model was fitted to the data for factors potentially associated with survival failure (treatment allocation, age, baseline IOP, baseline VF MD and occurrence of a disc haemorrhage in either eye during follow-up)99 and the slope of change in OCT RNFL thickness. Calculations were performed using MedCalc Statistical Software version 17.1 [MedCalc Software bvba, Ostend, Belgium; see www.medcalc.org (accessed 7 November 2017)].
Methods of evaluation of reference and previously described index methods
This section describes the methods of evaluation of the reference and previously described index methods to identify VF progression and the modifications made to them to allow the inclusion of OCT RNFL measurements.
The reference method is the GPA detailed in Chapter 3 (see Visual field measurements). The index methods explored in this section were (1) ANSWERS,80,82 (2) PoPLR78 and (3) a modification of ANSWERS to incorporate the RNFL tickness slope as a prior (structure-guided ANSWERS or sANSWERS).
Data
United Kingdom Glaucoma Treatment Study
Data used in the analyses described in this section are detailed in Visual field and imaging outcomes in the United Kingdom Glaucoma Treatment Study, Data.
RAPID study
Seventy patients with VFs matching the eligibility criteria for the UKGTS had a data series that was sufficiently long (six VFs) to apply the reference (GPA) analysis for deterioration. The mean (SD) number of test results for each participant was 11 (0.7).
The principal characteristics of the RAPID participants at baseline are presented in Table 3. The data are similar to those for the UKGTS participants (see Table 2); RAPID participants have slightly more advanced glaucoma (VF MD –4.17 vs. –2.65 dB) and lower IOP (14.0 vs. 19.0 mmHg) and there was a lower proportion of white participants in the RAPID study (67% vs. 88%).
| Characteristics | RAPID cohort (n = 70 participants, 114 eyes) | |
|---|---|---|
| Median | 5th to 95th percentile | |
| Age (years) | 70.3 | 50.0 to 85.6 |
| IOP (mmHg) | 14.0 | 8.0 to 21.0 |
| SAP MD (dB) | –4.17 | –14.22 to 0.88 |
| RNFL thickness (µ) | 69.0 | 45.1 to 95.6 |
| Visual acuity (Snellen) | 6/6 | 6/4 to 6/12 |
| Refractive error (dioptres) | –0.13 | –7.48 to 2.95 |
| Number | % | |
| Sex (female) | 42 | 58 |
| Ethnic origin | ||
| White | 48 | 67 |
| Black | 16 | 22 |
| Indian subcontinent | 4 | 6 |
| Other/unknown | 4 | 6 |
Reference analysis
Progression was defined according to the reference GPA (detailed in Chapter 3, Visual field measurements). Progression-free VF survival for the treatment and placebo arms was assessed using Kaplan–Meier survival analysis in two subsets: the 284 UKGTS participants in Visual field and imaging outcomes in the United Kingdom Glaucoma Treatment Study and the 320 participants in Index analyses. Calculations were performed with MedCalc Statistical Software version 17.1.
The specificity of the reference analysis was evaluated in the RAPID study participants; the first two VFs formed the baseline and each subsequent VF test was compared with the baseline pair. The RAPID data were not permuted for this analysis because this is not possible using the HFA II-i GPA software. Estimates of criterion specificity took into account the manner in which tests for progression are applied in clinical practice and in clinical trials. Tests for progression are applied each time a patient has a new VF or OCT test and so there is an opportunity for false-positive identification of progression. Therefore, in every generated series, the ‘progression test’ is applied at each time point and a series is flagged as progressing if the progression criterion is met at any time point.
Index analyses
ANSWERS
This method is a linear regression technique applied to each VF location that formally takes into account the increasing variability of VF sensitivity estimates as sensitivity declines. It also takes into account the spatial correlation between sensitivity values at each location within a VF. Application of SLR makes the assumption that the residuals from the regression are normally distributed. In reality, there is heteroskedasticity, with more dispersed residuals as sensitivity declines. ANSWERS models this heteroskedasticity with a mixture of Weibull distributions. Spatial correlation of measurements is also included in the model using a Bayesian framework. We have previously shown that this technique is more sensitive at identifying VF progression and provides more accurate predictions of future VF states than SLR of VF MD over time and PoPLR. 82
Permutation analyses of pointwise linear regression
Permutation analyses of pointwise linear regression is a non-parametric approach based on randomly permuting the observed VF series to identify whether or not negative change identified in the observed (unpermuted) series is significant, based on the distribution of change identified in the permuted series. The slope of VF sensitivity change is determined by SLR and the statistical significance (p-value) from each location across the VF is combined into a statistic S by using the truncated product method. The statistical significance of S in the observed series is calculated by comparing it with a null distribution of S, derived from permuted sequences of the series.
Structure-guided ANSWERS
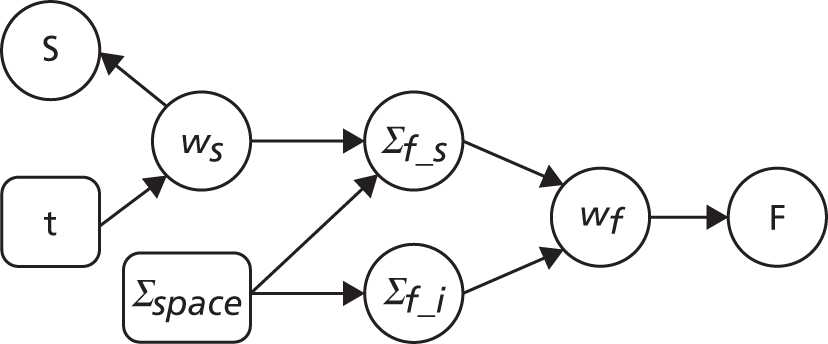
Structure-guided ANSWERS is a modification of ANSWERS in which there is a two-layered hierarchical Bayesian model (Bayesian belief network); the prior distribution of the VF progression rate at each VF location is set by the slopes and variance of the rate of change of RNFL thickness measurements (Figure 6). This is similar to the approach described previously to incorporate scanning laser ophthalmoscope rim area measurement slopes into VF progression analysis. 89
FIGURE 6.
Structure of sANSWERS: the structure measure S and function measure F are dependent when the function progression parameter wf is not conditioned on, but become independent only when wf is observed (conditioned). F, function measure; wf, the prior distribution of the slopes and intercepts of VF progression rate; ∑f_s, The prior distribution of the slopes of the VF progression rate; ∑f_i, The prior distribution of the intercepts of the VF progression rate; ws, The distribution of the rate of change of RNFL thickness measurements; ∑space, The spatial correlation between each location and all other locations in the visual field; S, structure measure.
As the spatial correspondence of peripapillary circle sectors and VF locations is known,22 each VF location was mapped to one of 12 peripapillary RNFL sector measurements (see Figure 4); the slope and variance of RNFL thickness over time formed the Bayesian prior for the VF slope.
Assessment
‘Hit rate’ compared with specificity
The specificity of index method criteria to identify deterioration was evaluated in the RAPID test–retest data set and the ‘hit rate’ (a surrogate for criterion ‘sensitivity’ that includes true change and the false-positive change allowed by the criterion specificity) was determined from the UKGTS data set (introduced in Chapter 3, ‘Hit rate’ and specificity) in the 320 participants who had five or more time points with both VF tests and OCT images available (see Figure 5).
In the RAPID data, the modelling assumed that the number of tests performed at each visit and the interval between visits were the same as specified in the UKGTS schedule of visits (see Appendix 1). The RAPID data series included series lengths of between 10 and 14 tests. The 18- and 22-month time points required 12 and 14 tests, respectively, to have equivalence to UKGTS analyses. Therefore, for modelled observation periods of ≥ 18 months (see Chapter 5, ‘Hit rate’ compared with specificity), the RAPID data for a subject were randomly resampled if necessary to make up the number of tests required for analyses at 18 and 22 months. Criterion specificity was determined for follow-up periods of up to 7, 13, 18 and 22 months and included multiple testing in time (the criterion for progression is applied to every VF test in sequence), as is the case when applying a progression criterion in a trial or in clinical practice. To evaluate test criterion specificity for ANSWERS, PoPLR and sANSWERS, 100 permutations of the RAPID data series (10–14 tests) were performed for each eye across time points. When data were permuted, the VF tests and OCT images for the same day were tied (permuted together); when there was no OCT image associated with a VF test, the VF was permuted alone.
Prediction of future visual field state
The purpose of this analysis was to evaluate how well the analysis methods model the true rate of VF loss (introduced in Chapter 3, Prediction accuracy). As there is no gold standard for the true rate, a surrogate indicator was investigated. This surrogate is the accuracy of predicting the final VF (sensitivity at each location) in a series based on the initial five visits in the series and the rate of loss estimated by the analysis method.
This analysis was performed on 372 eyes of 257 participants in the data set with both VF tests and OCT images. A trend line was fitted to the tests for the first five visits using the index methods and was projected to the time point of the last VF test in the series. The per-subject prediction error for a method is the average absolute difference between the measured sensitivity and the predicted sensitivity across the 52 non-blind-spot locations in the last VF. The absolute difference is the square root of the squared error.
Survival analyses
Each data analysis method, with the progression criterion giving 95% specificity in the RAPID data set, was applied to the UKGTS subset of 320 subjects to establish time to progression in the two treatment arms. As for the analysis of the reference method, treatment arms were compared using a Kaplan–Meier survival analysis. The HRs and event rates were used in sample size calculations to establish the number of participants required for each of the analysis methods to distinguish treatment effects. Calculations were performed using MedCalc Statistical Software version 17.1.
Index methods: newly developed
This section describes the development and application of new methods: Permutation Test (newly developed methods) (PERM), multivariate hierarchical models with multiple imputation for censored values (MaHMIC) and multivariate generalised estimating equations with multiple imputation for censored values (MaGIC).
Data
United Kingdom Glaucoma Treatment Study
A subsample of 361 participants with 528 UKGTS-eligible eyes was used in this modelling. In total, 2960 patient-eye visits with both VF and OCT tests meeting the quality criteria were retained in the subsample [false positive < 15% for VF: 31 (0.4%) VF tests excluded, nine (0.2%) patient-eye visits excluded; signal strength ≥ 7 for OCT, 10,633 (21.3%) OCT scans excluded, 632 (13.4%) patient-eye visits excluded]. Of the 361 participants, 167 contributed data from two eyes to the data set and 194 contributed data from only one eye. The mean number of visits per eye was 5.6 (range 1–11) and the mean time between visits was 97.4 (range 35–602) days.
Only paired VF and OCT data were used because we wanted our assessment of the benefit of adding imaging data to VF data not to be diluted by the presence of missing data at the visit level. In addition, on occasions when more than five OCT scan triplets were taken, only the first five were included in the data set. Confirmation visits were discarded as they were scheduled based on suspected deterioration in visual function and so could bias the results; if one treatment was more effective than the other it could result in there being more confirmation visits, and hence more data, in one arm than in the other in a way that would not necessarily be the case were another methodological approach to be used. Exit visits (see Chapter 3, United Kingdom Glaucoma Treatment Study) were also discarded as they were not used to determine the primary outcome in the UKGTS.
All participants in this subset with four or more visits were used for PERM. Participants with three or fewer visits were not included. As explained in Permutation Test, this is because permutations of only three objects cannot produce statistical significance at the 5% level. In total, 386 eyes from 270 participants were included in the PERM analyses.
RAPID study
All patients in the RAPID data set with four or more visits were analysed, with the same scan quality criteria as for the UKGTS data. In total, 135 eyes from 72 participants were included in this analysis. Sixty-three of the 72 participants contributed data from two eyes to the data set and nine contributed data from only one eye. The mean number of visits per eye was 9.1 (range 4–10) and the mean time between visits was 8.1 (range 3–50) days.
Methods and assessment
Visual field test and transformations
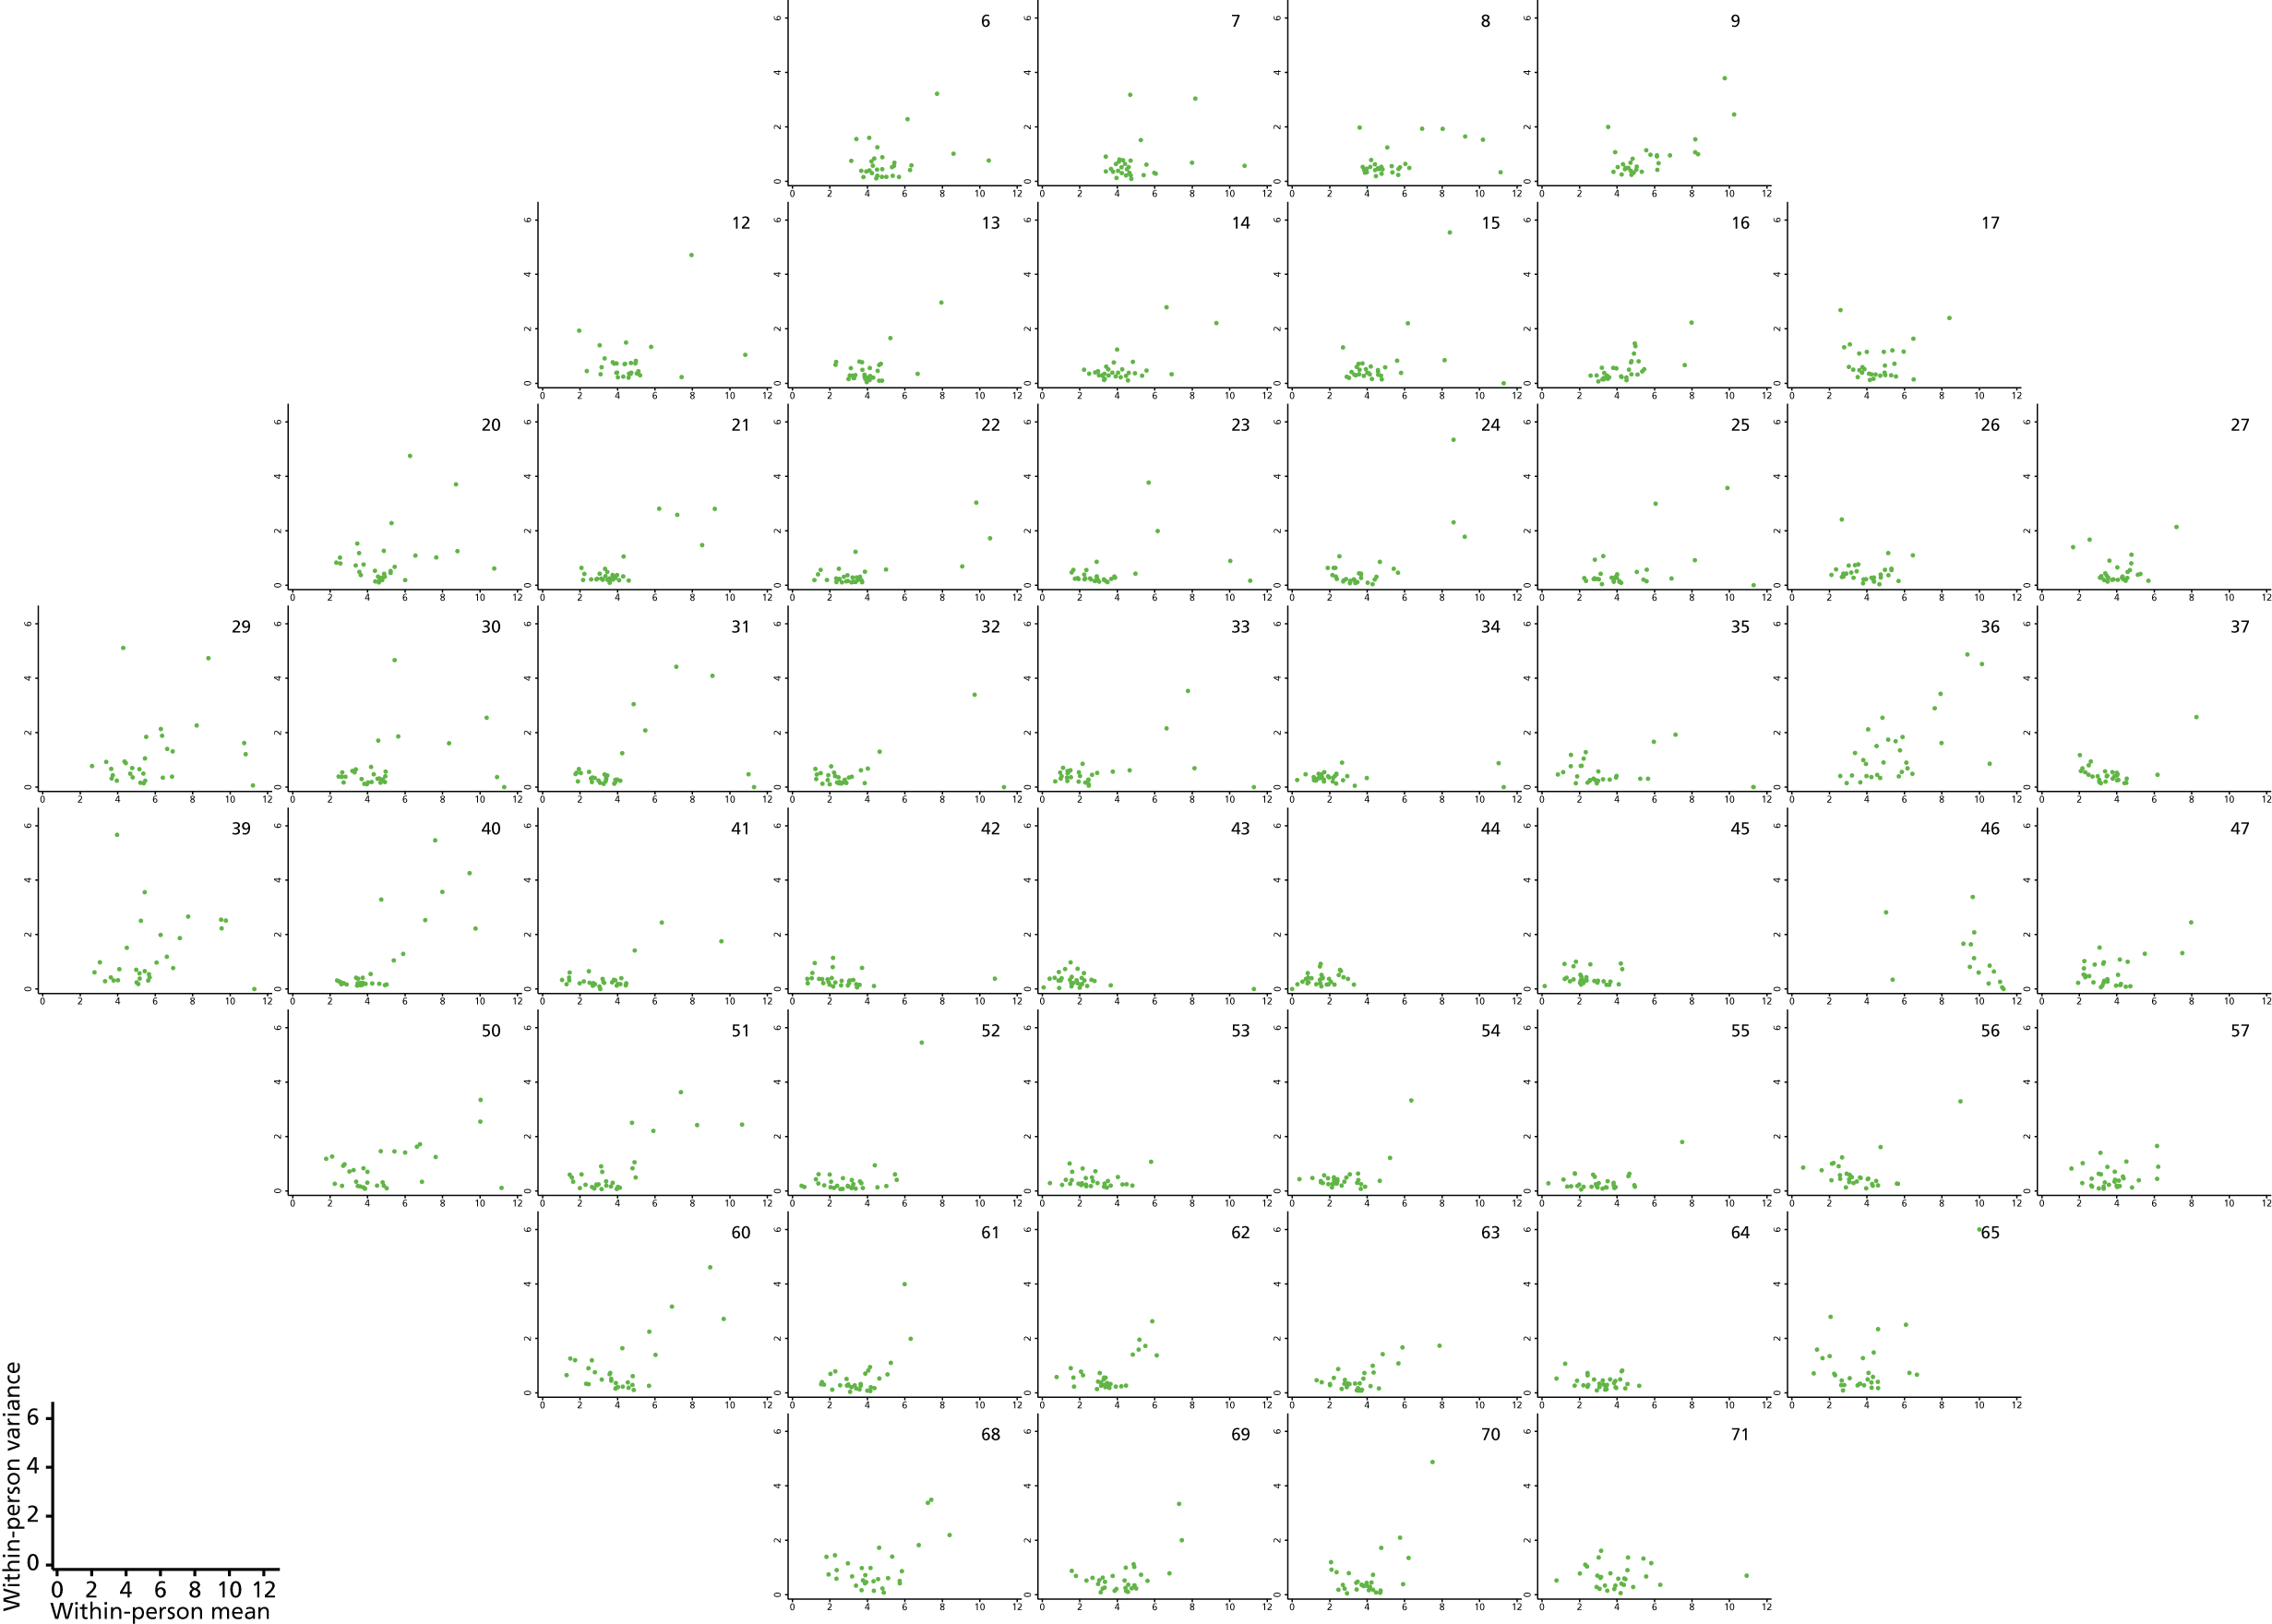
As can be seen in Figures 7 and 8, which display data from the Halifax study,81 VF measures are highly non-normal. They are truncated at zero and are heteroskedastic, with greater variation as vision deteriorates (i.e. as VF values decrease). Figure 9 illustrates the complex spatial correlation structure of VF measures. Mixed-effects models, also known as hierarchical models, are commonly used in other disease areas to analyse multivariate, hierarchical data and can handle complex correlation structures such as those observed in VF data. However, they are easiest to implement when outcomes approximately follow a normal distribution. We therefore explored a variety of transformations, including those from the two-parameter Box–Cox family of transformations, to investigate whether one could be found under which the transformed values would follow an approximate normal distribution. 90 Examples of the transformations that we considered can be found in Figures 10–13. None of the transformations that we considered appeared to stabilise the variance sufficiently for the transformed values to be reliably modelled under a normality assumption.
FIGURE 7.
Visual field sensitivity values at each test location from 30 glaucoma patients from the Halifax study. There is one plot for each of the 54 VF test locations tested in a 24-2 pattern (two of the locations are adjacent to the physiological blind spot). Each line on the location-specific plots represents the trajectory of a single patient across 12 repeated visits. Differential light sensitivity (DLS) measured in decibels is plotted against visit number.
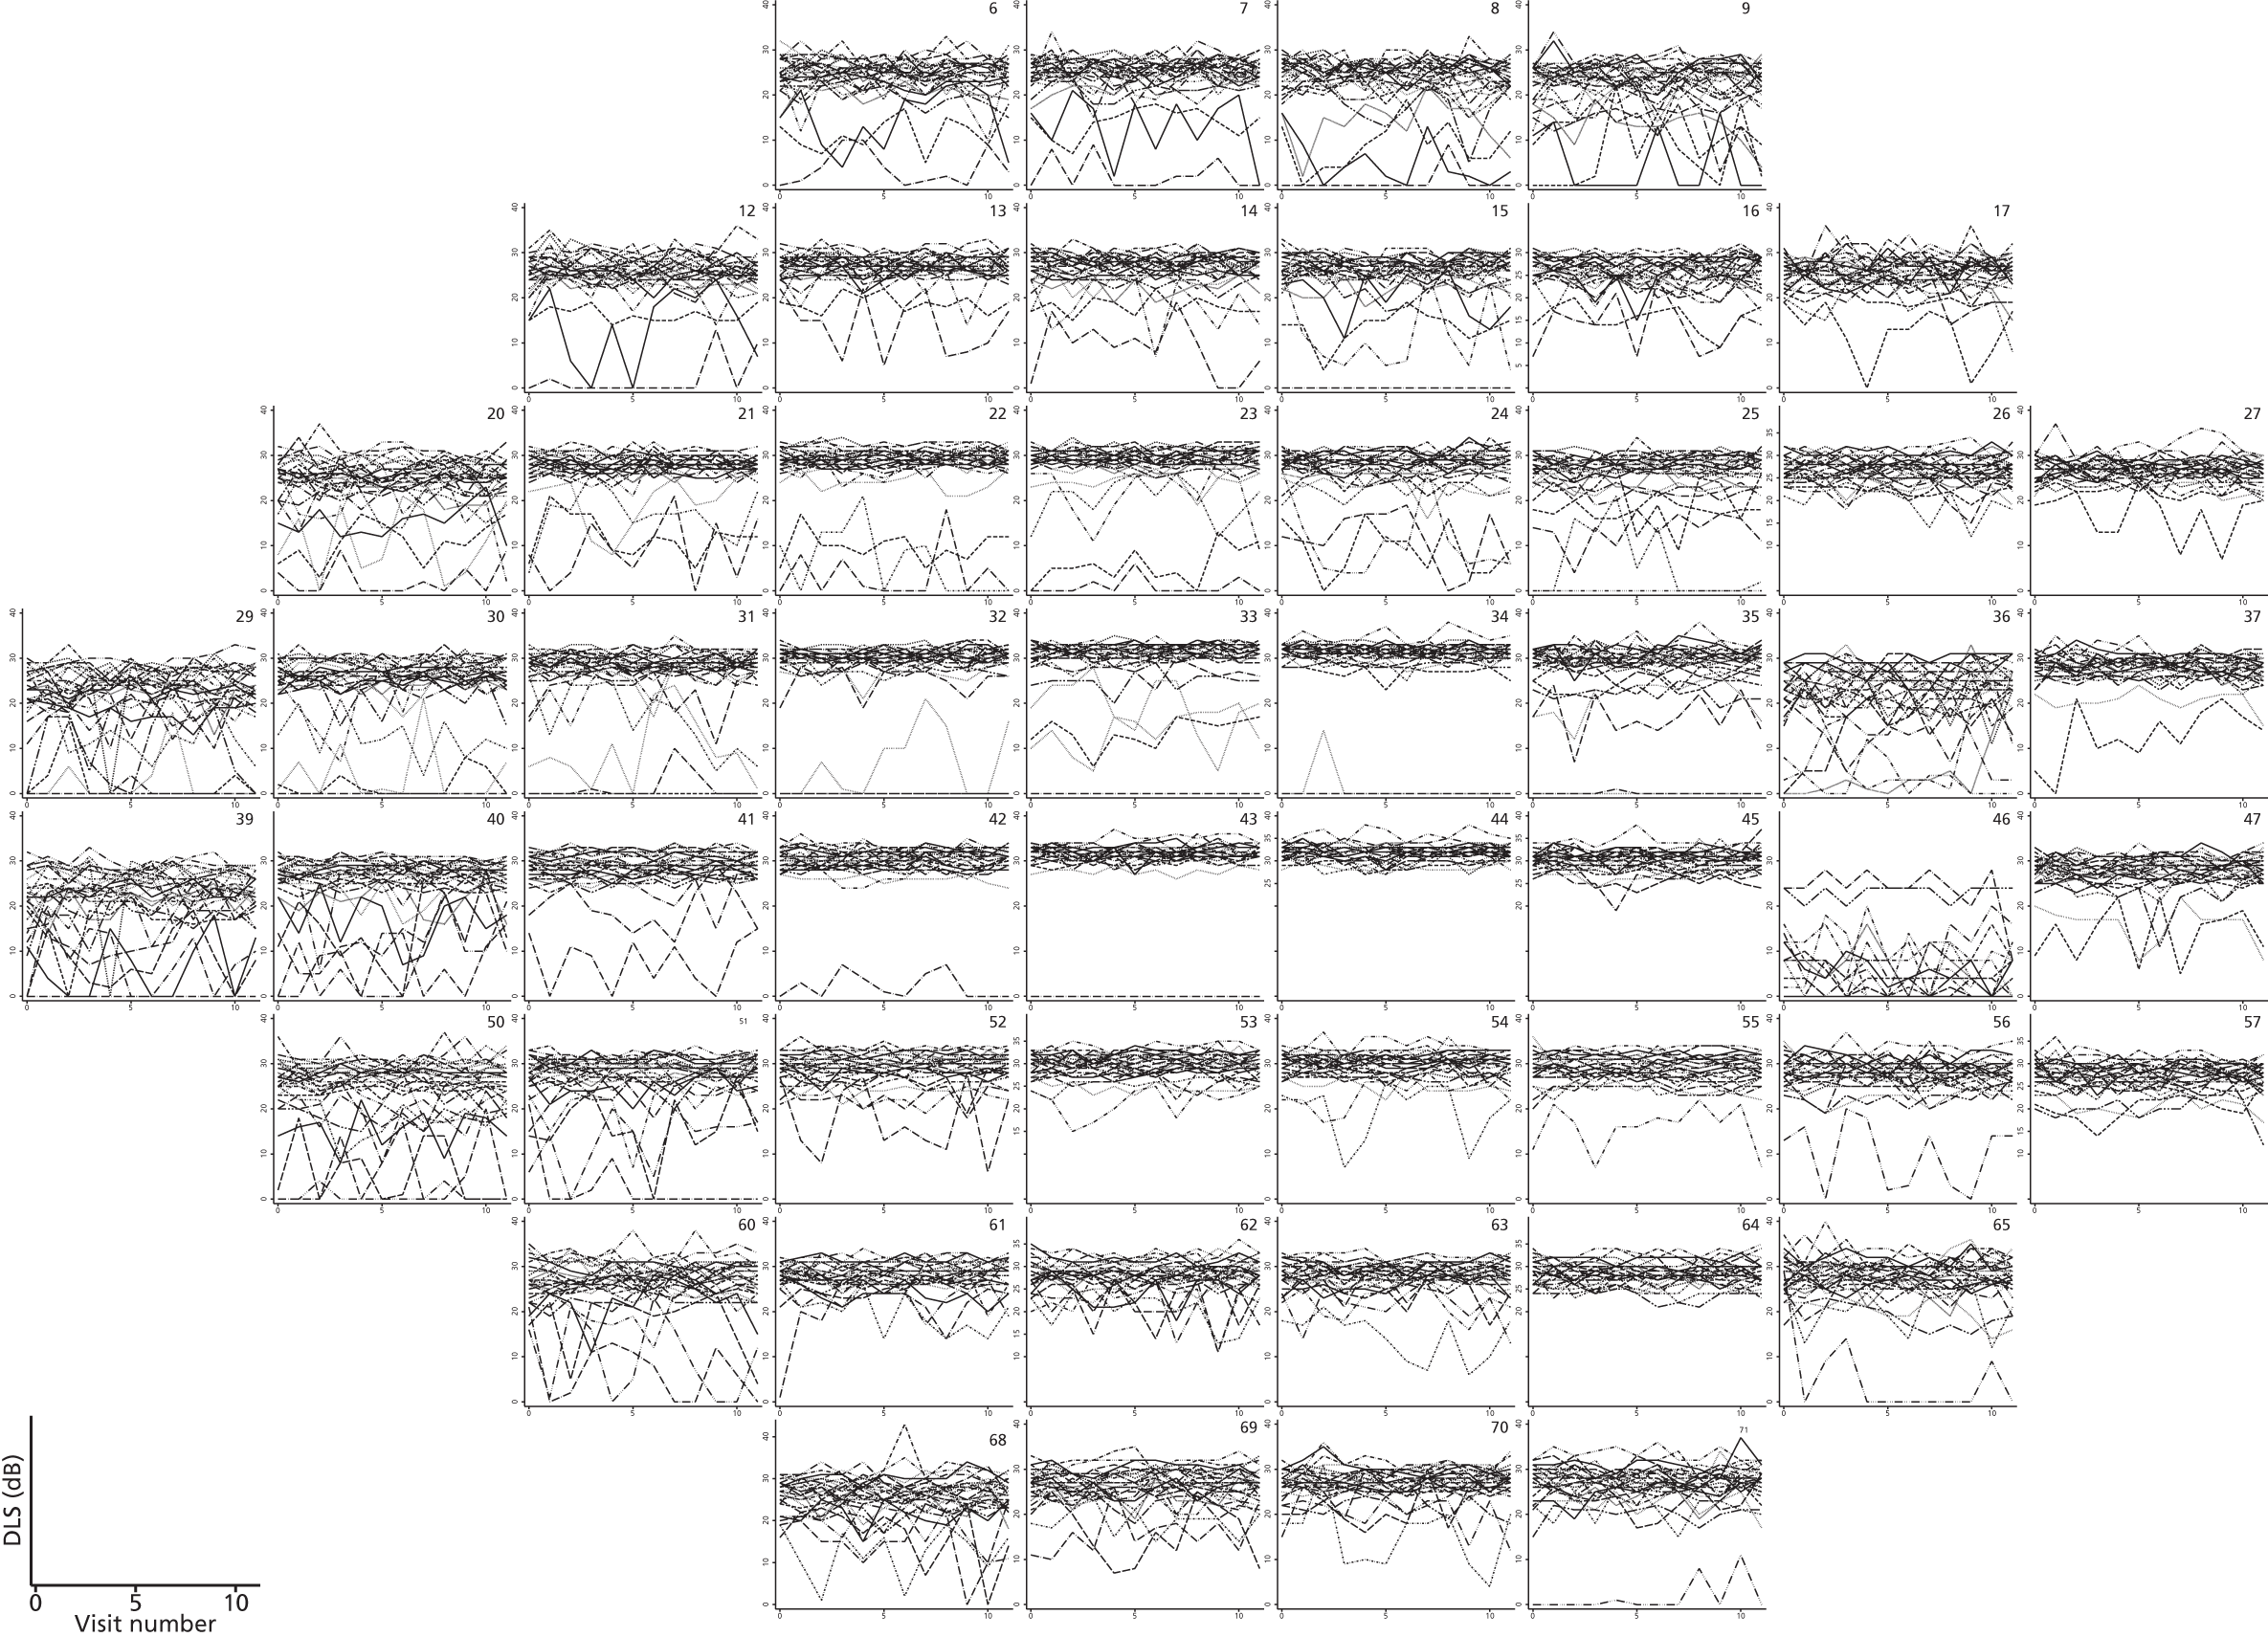
FIGURE 8.
Plots of within-person variance vs. within-person mean at each VF location for the 30 patients from the Halifax study.
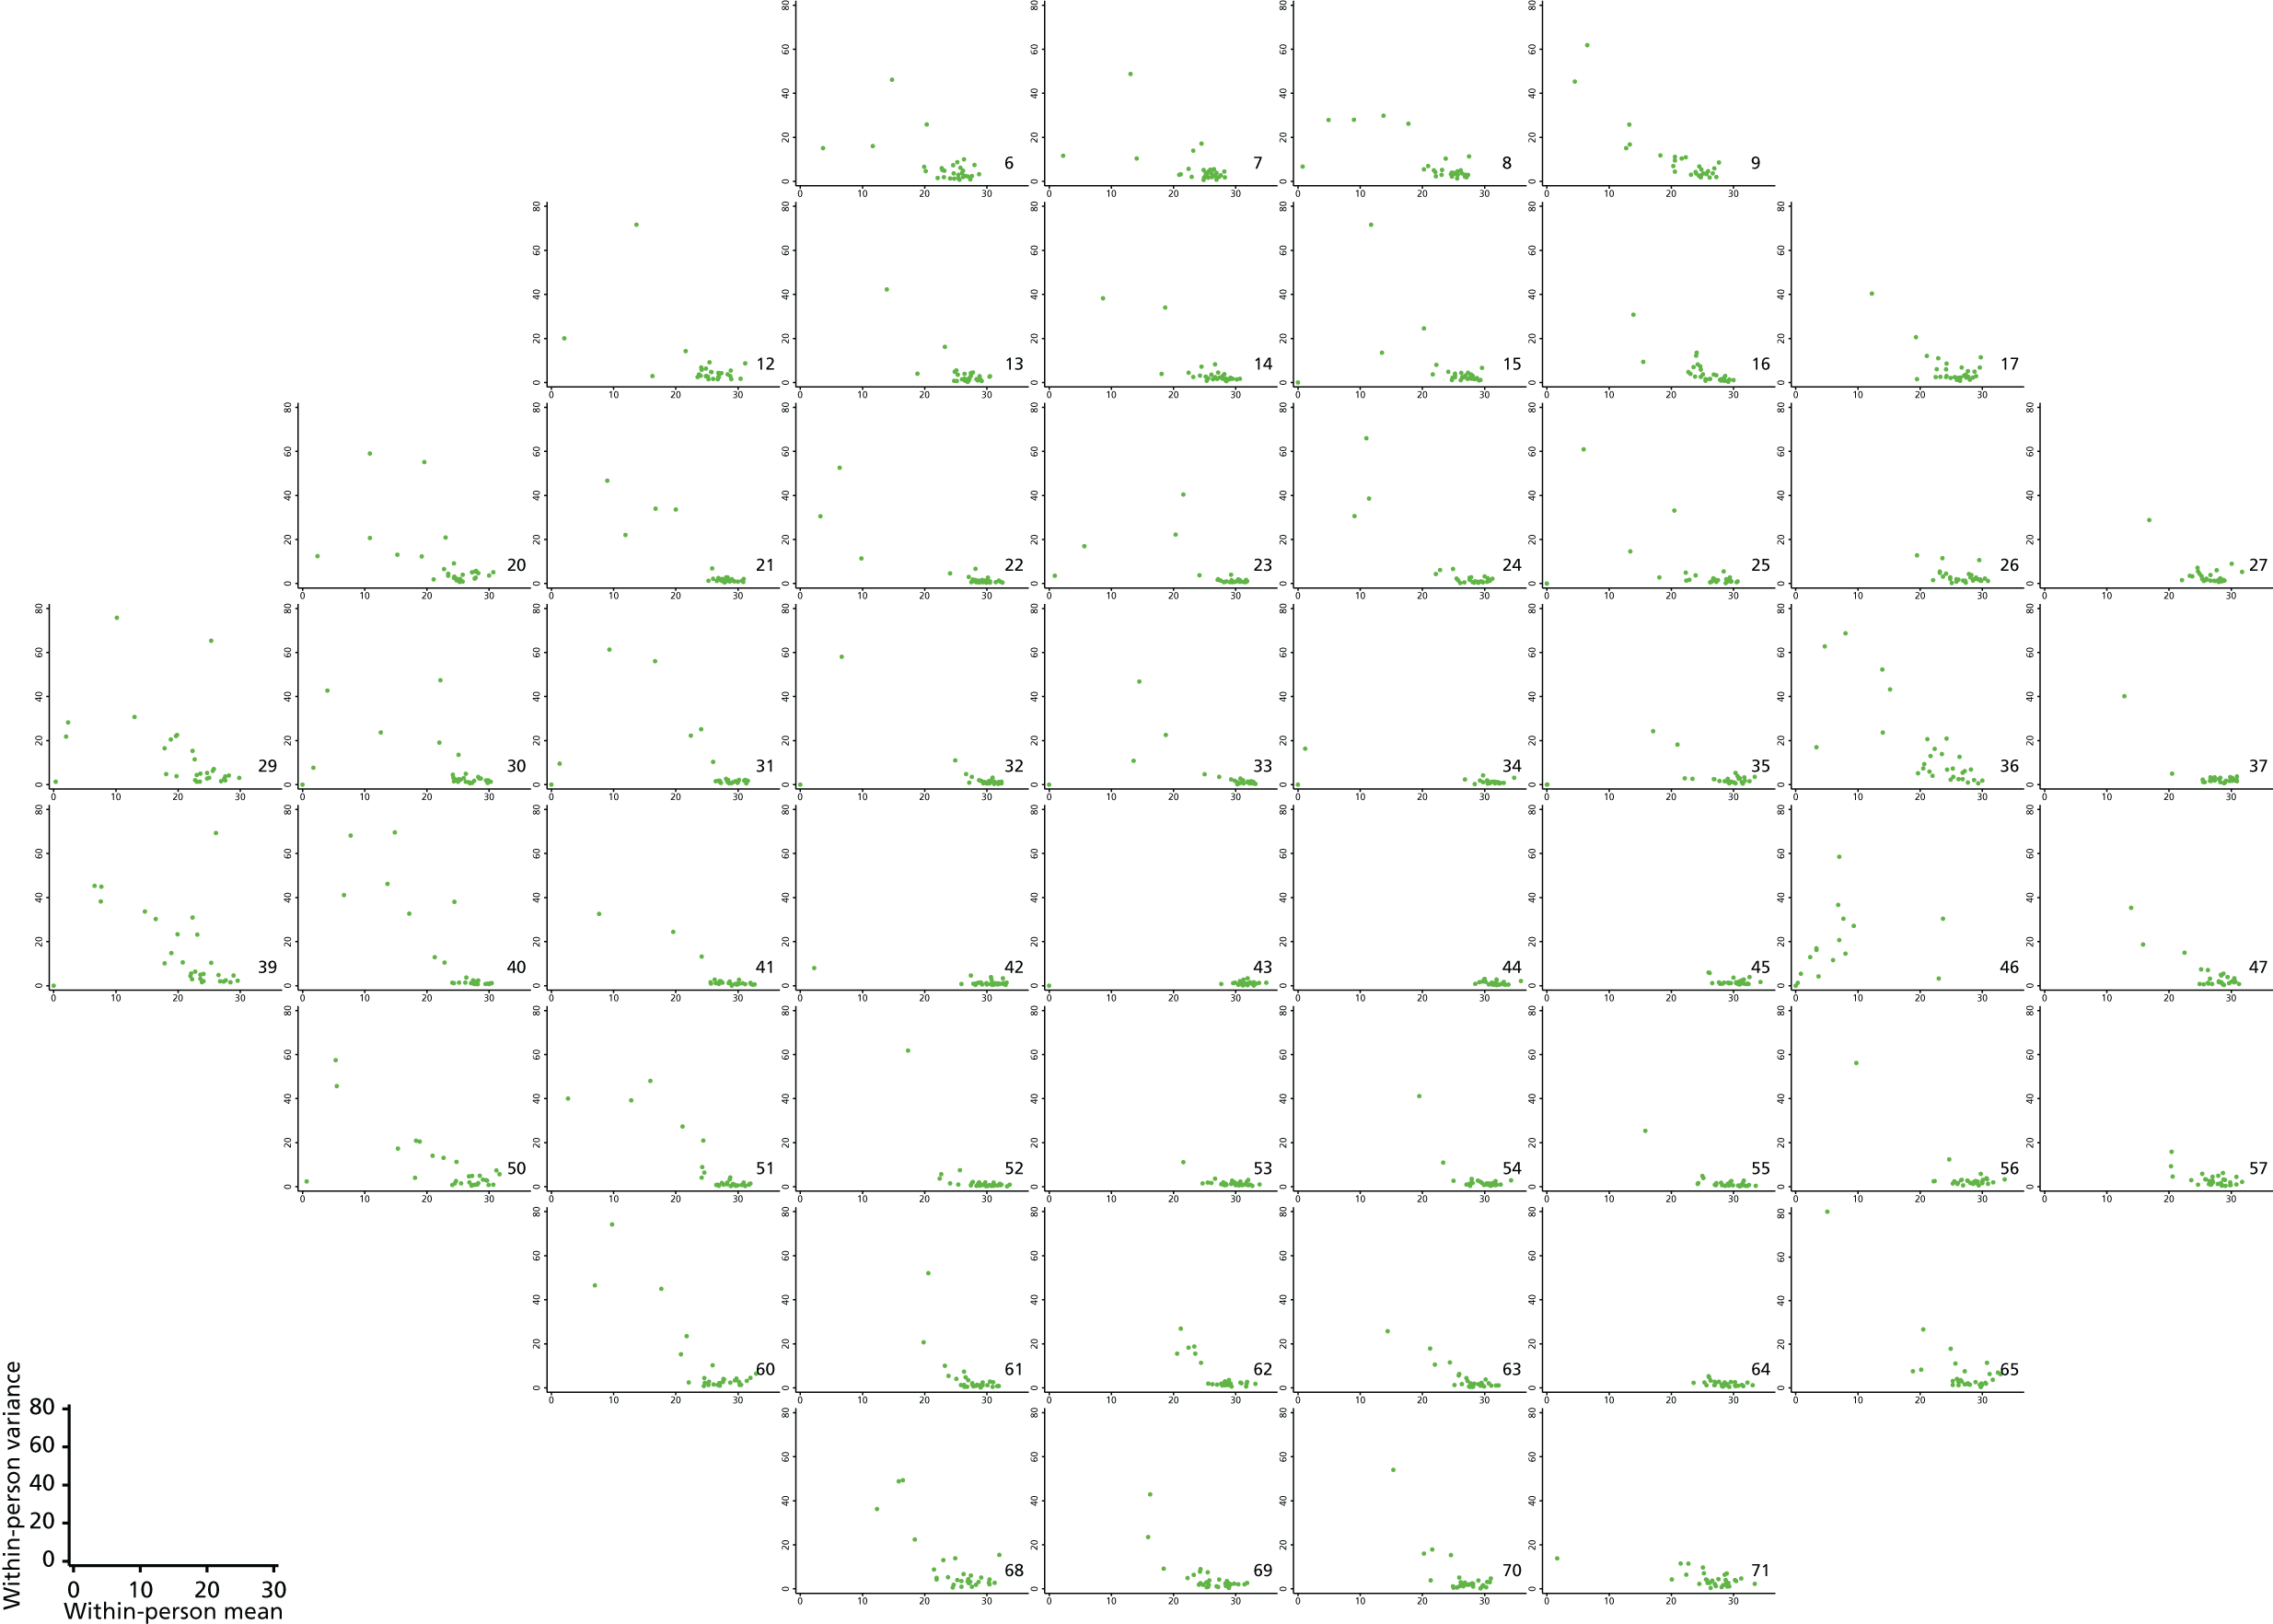
FIGURE 9.
Correlations between mean light sensitivity values across all VF test locations. This figure shows the correlations between test locations (the mean of the 12 repeat VF measurements at each location) in the 30 patients from the Halifax study. Each plot represents one VF location, which is highlighted in dark blue. The other pixels represent the strength of the correlations with other locations, with darker colours indicating larger correlations. The lightest green shading represents correlations of between –0.6 and 0.4, the mid-green shading indicates correlations between 0.4 and 0.6, the dark green shading indicated correlation between 0.6 and 0.8 and the darkest green represents correlations between 0.8 and 1.
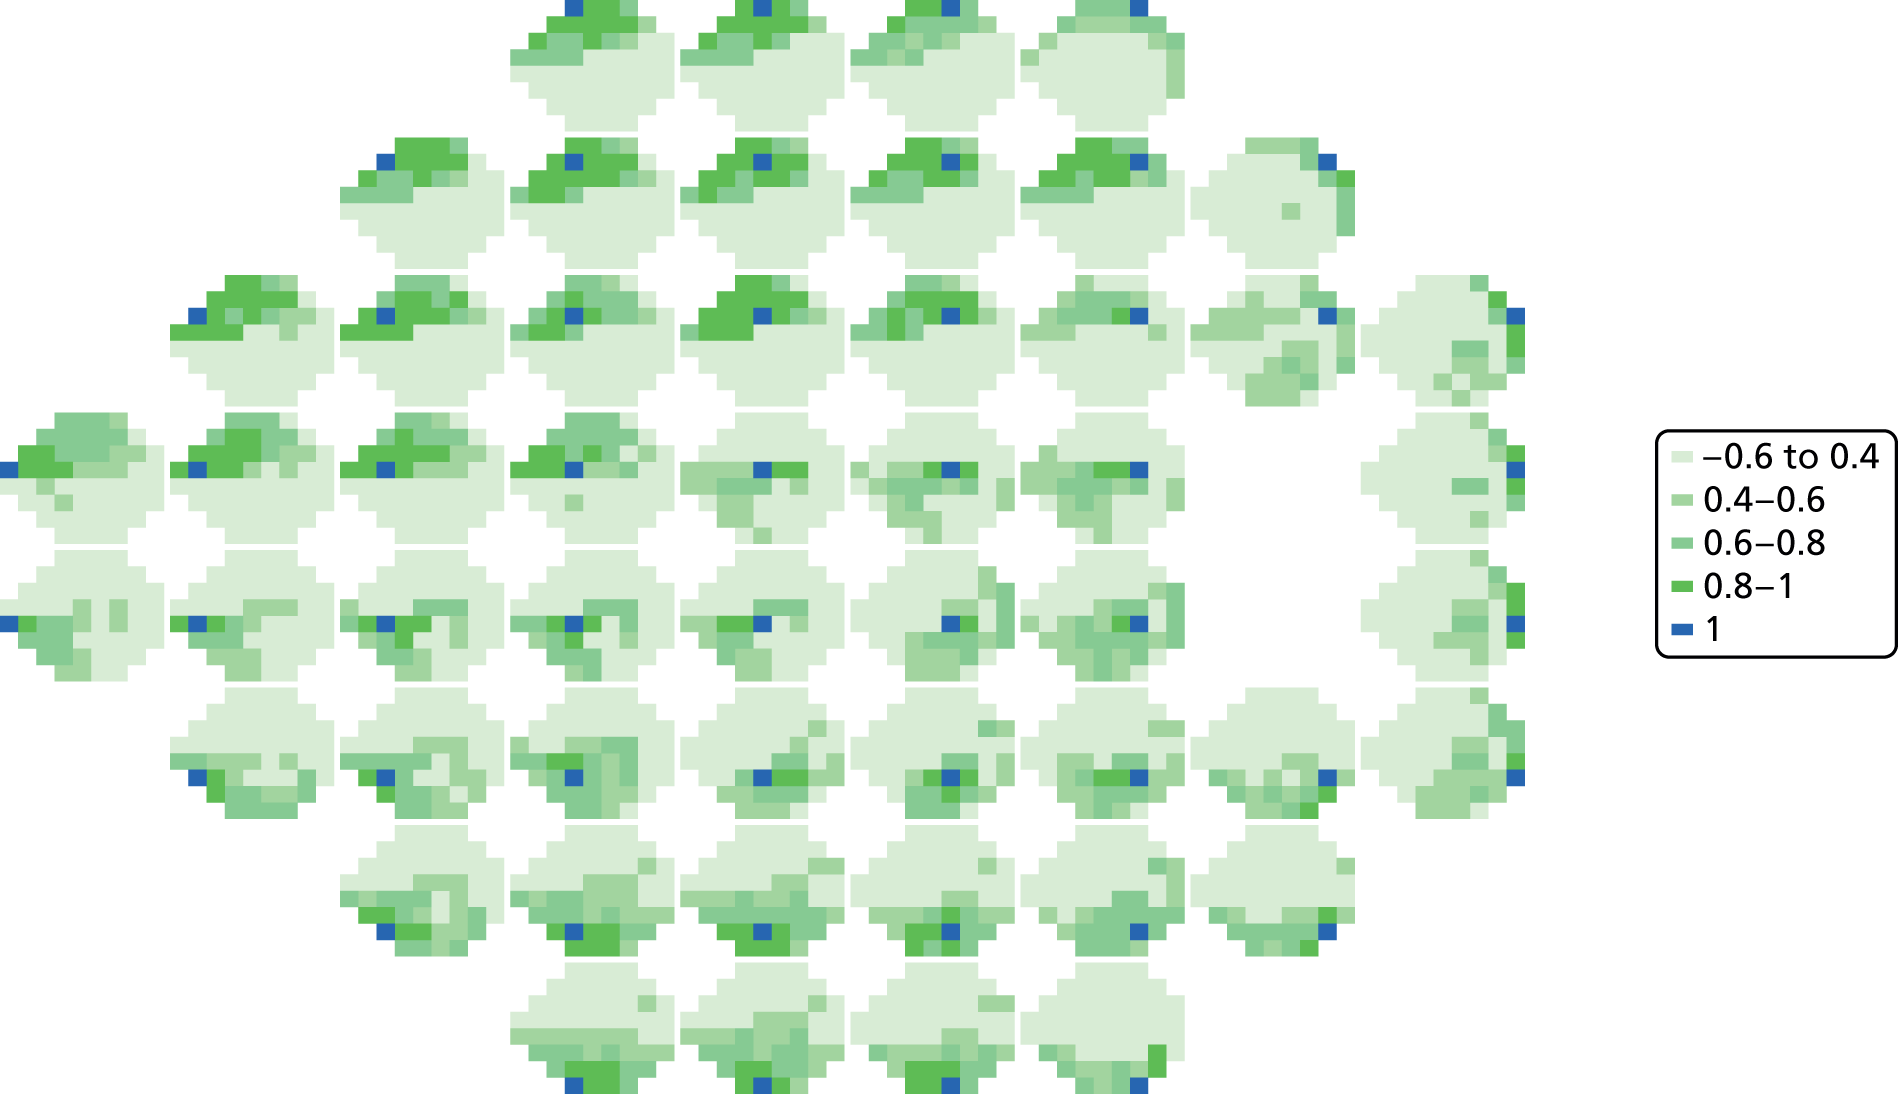
FIGURE 10.
Plots of trajectories over time for log(45 – DLS)-transformed Halifax study data. Log(45 – DLS) are plotted against visit number.
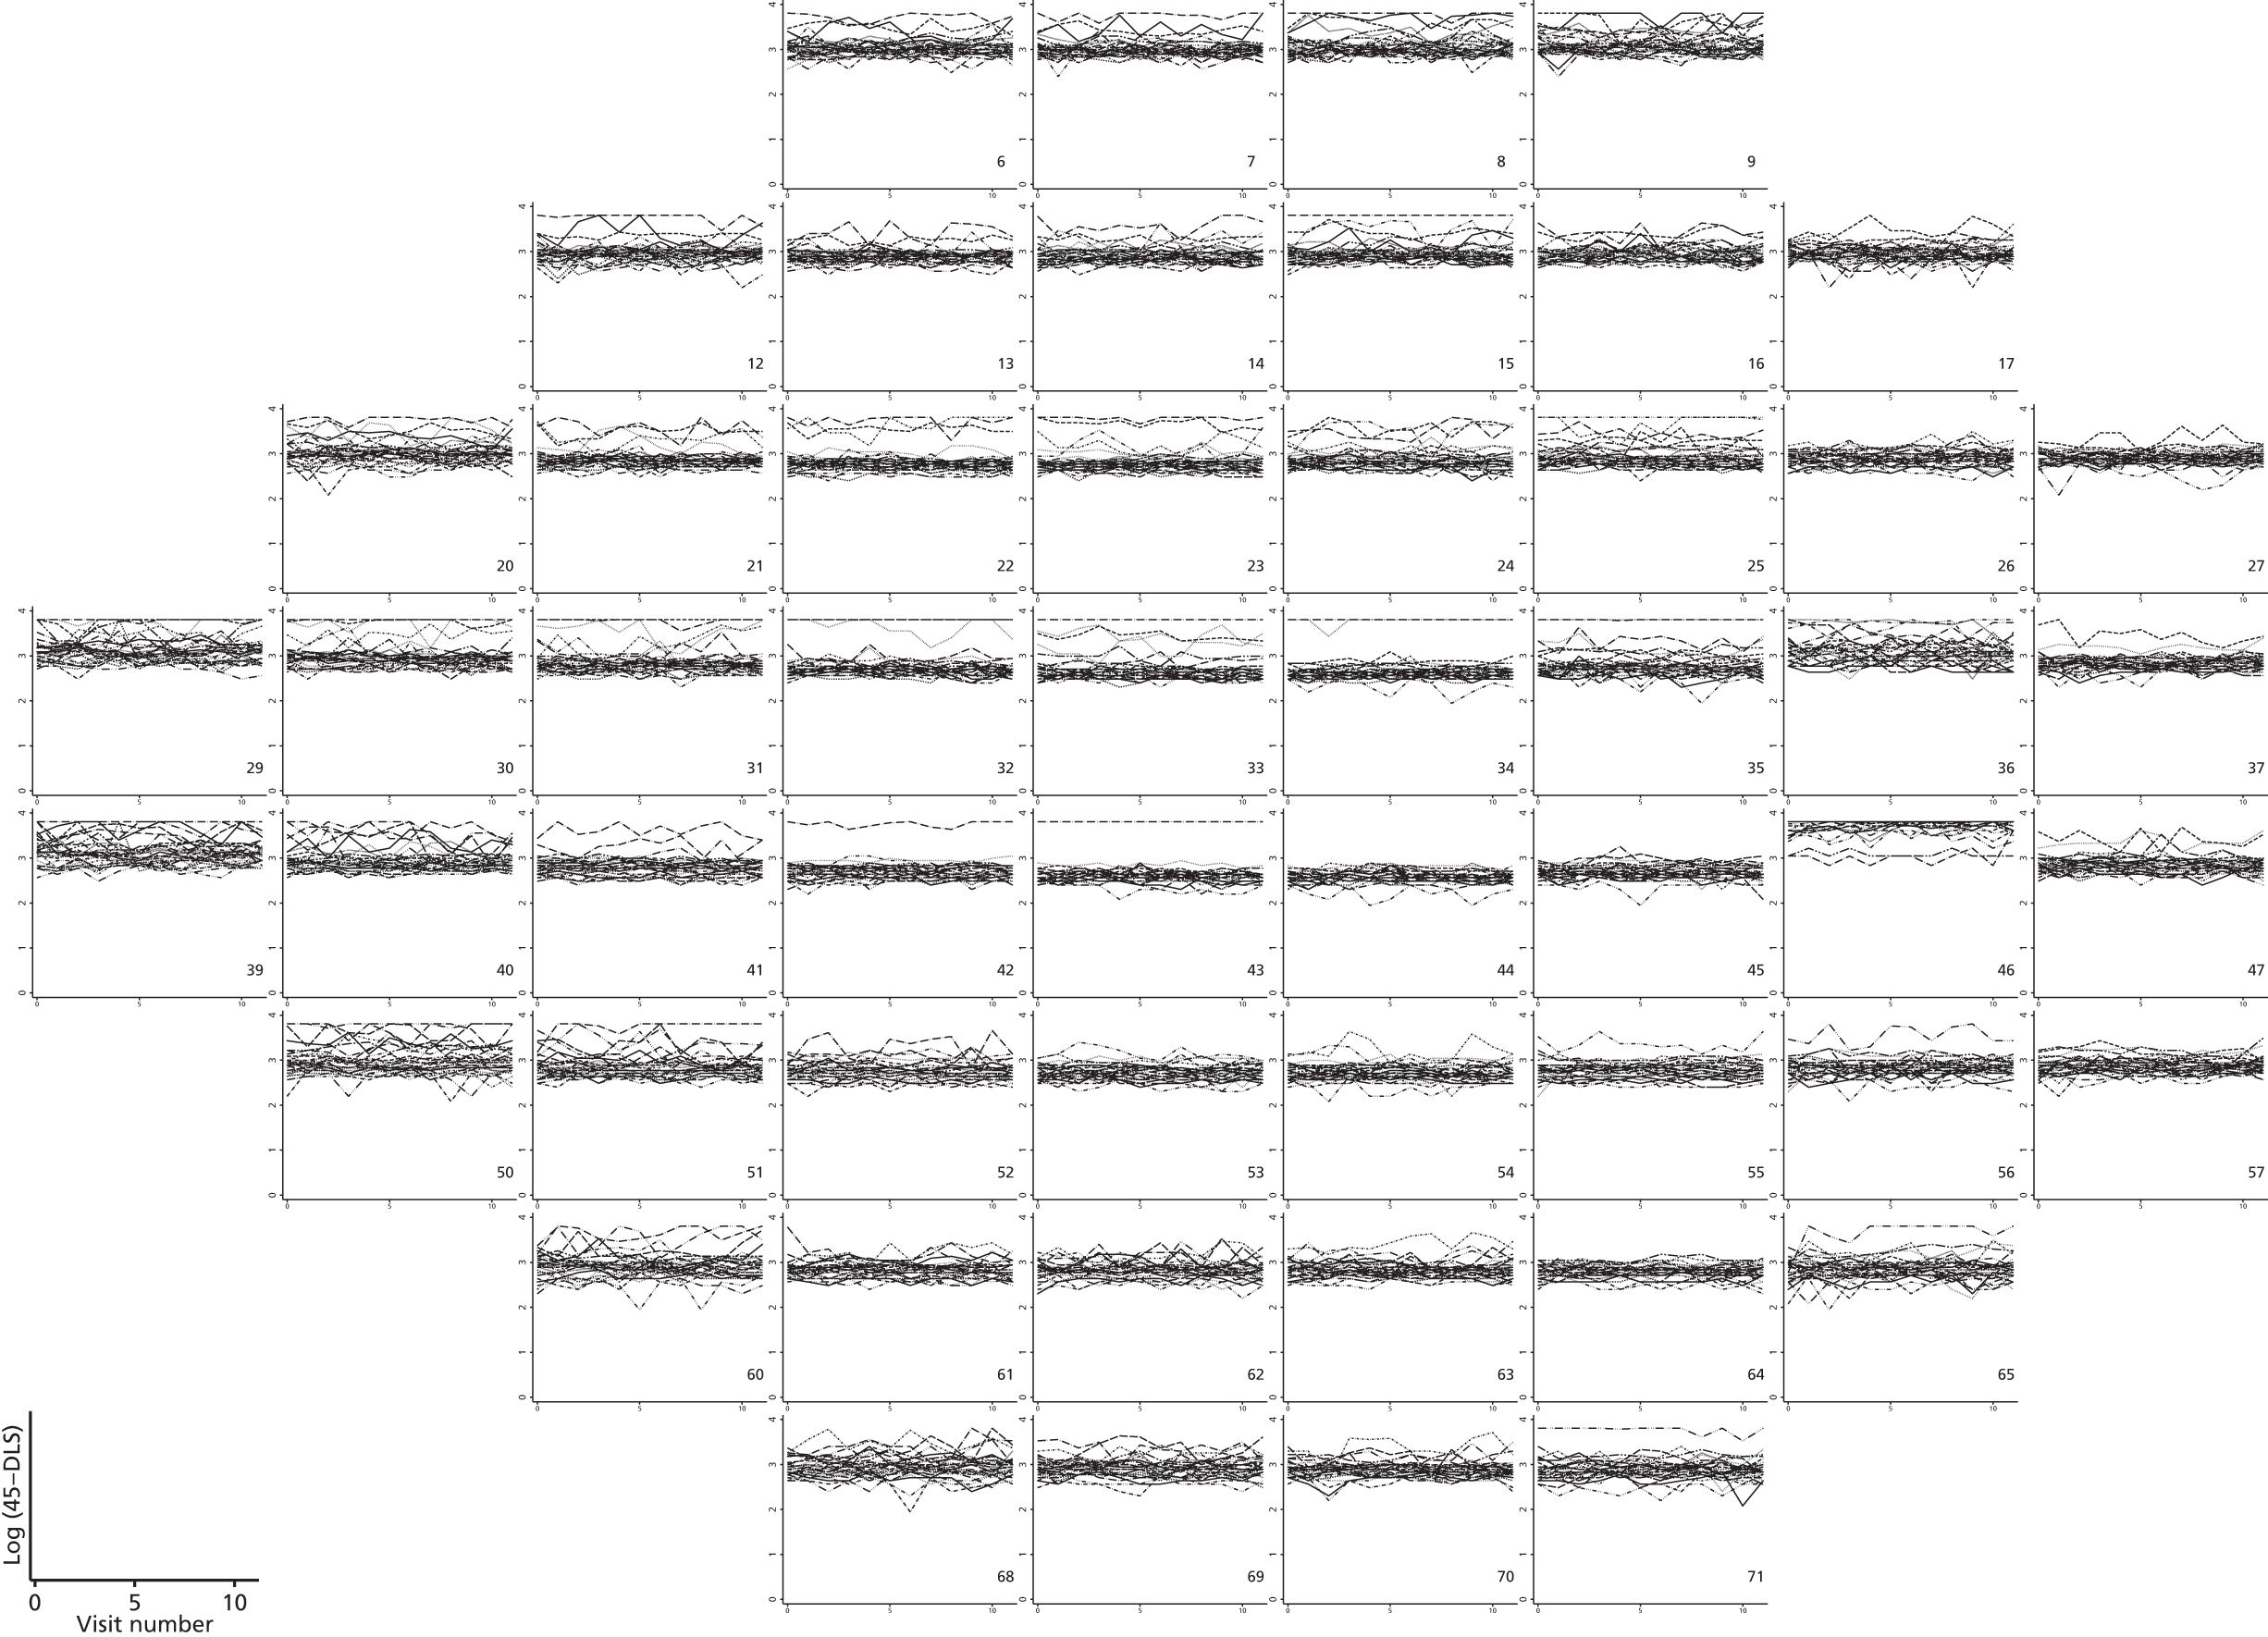
FIGURE 11.
Plots of within-person variance vs. within-person mean for log(45 – DLS) using transformed Halifax study data.
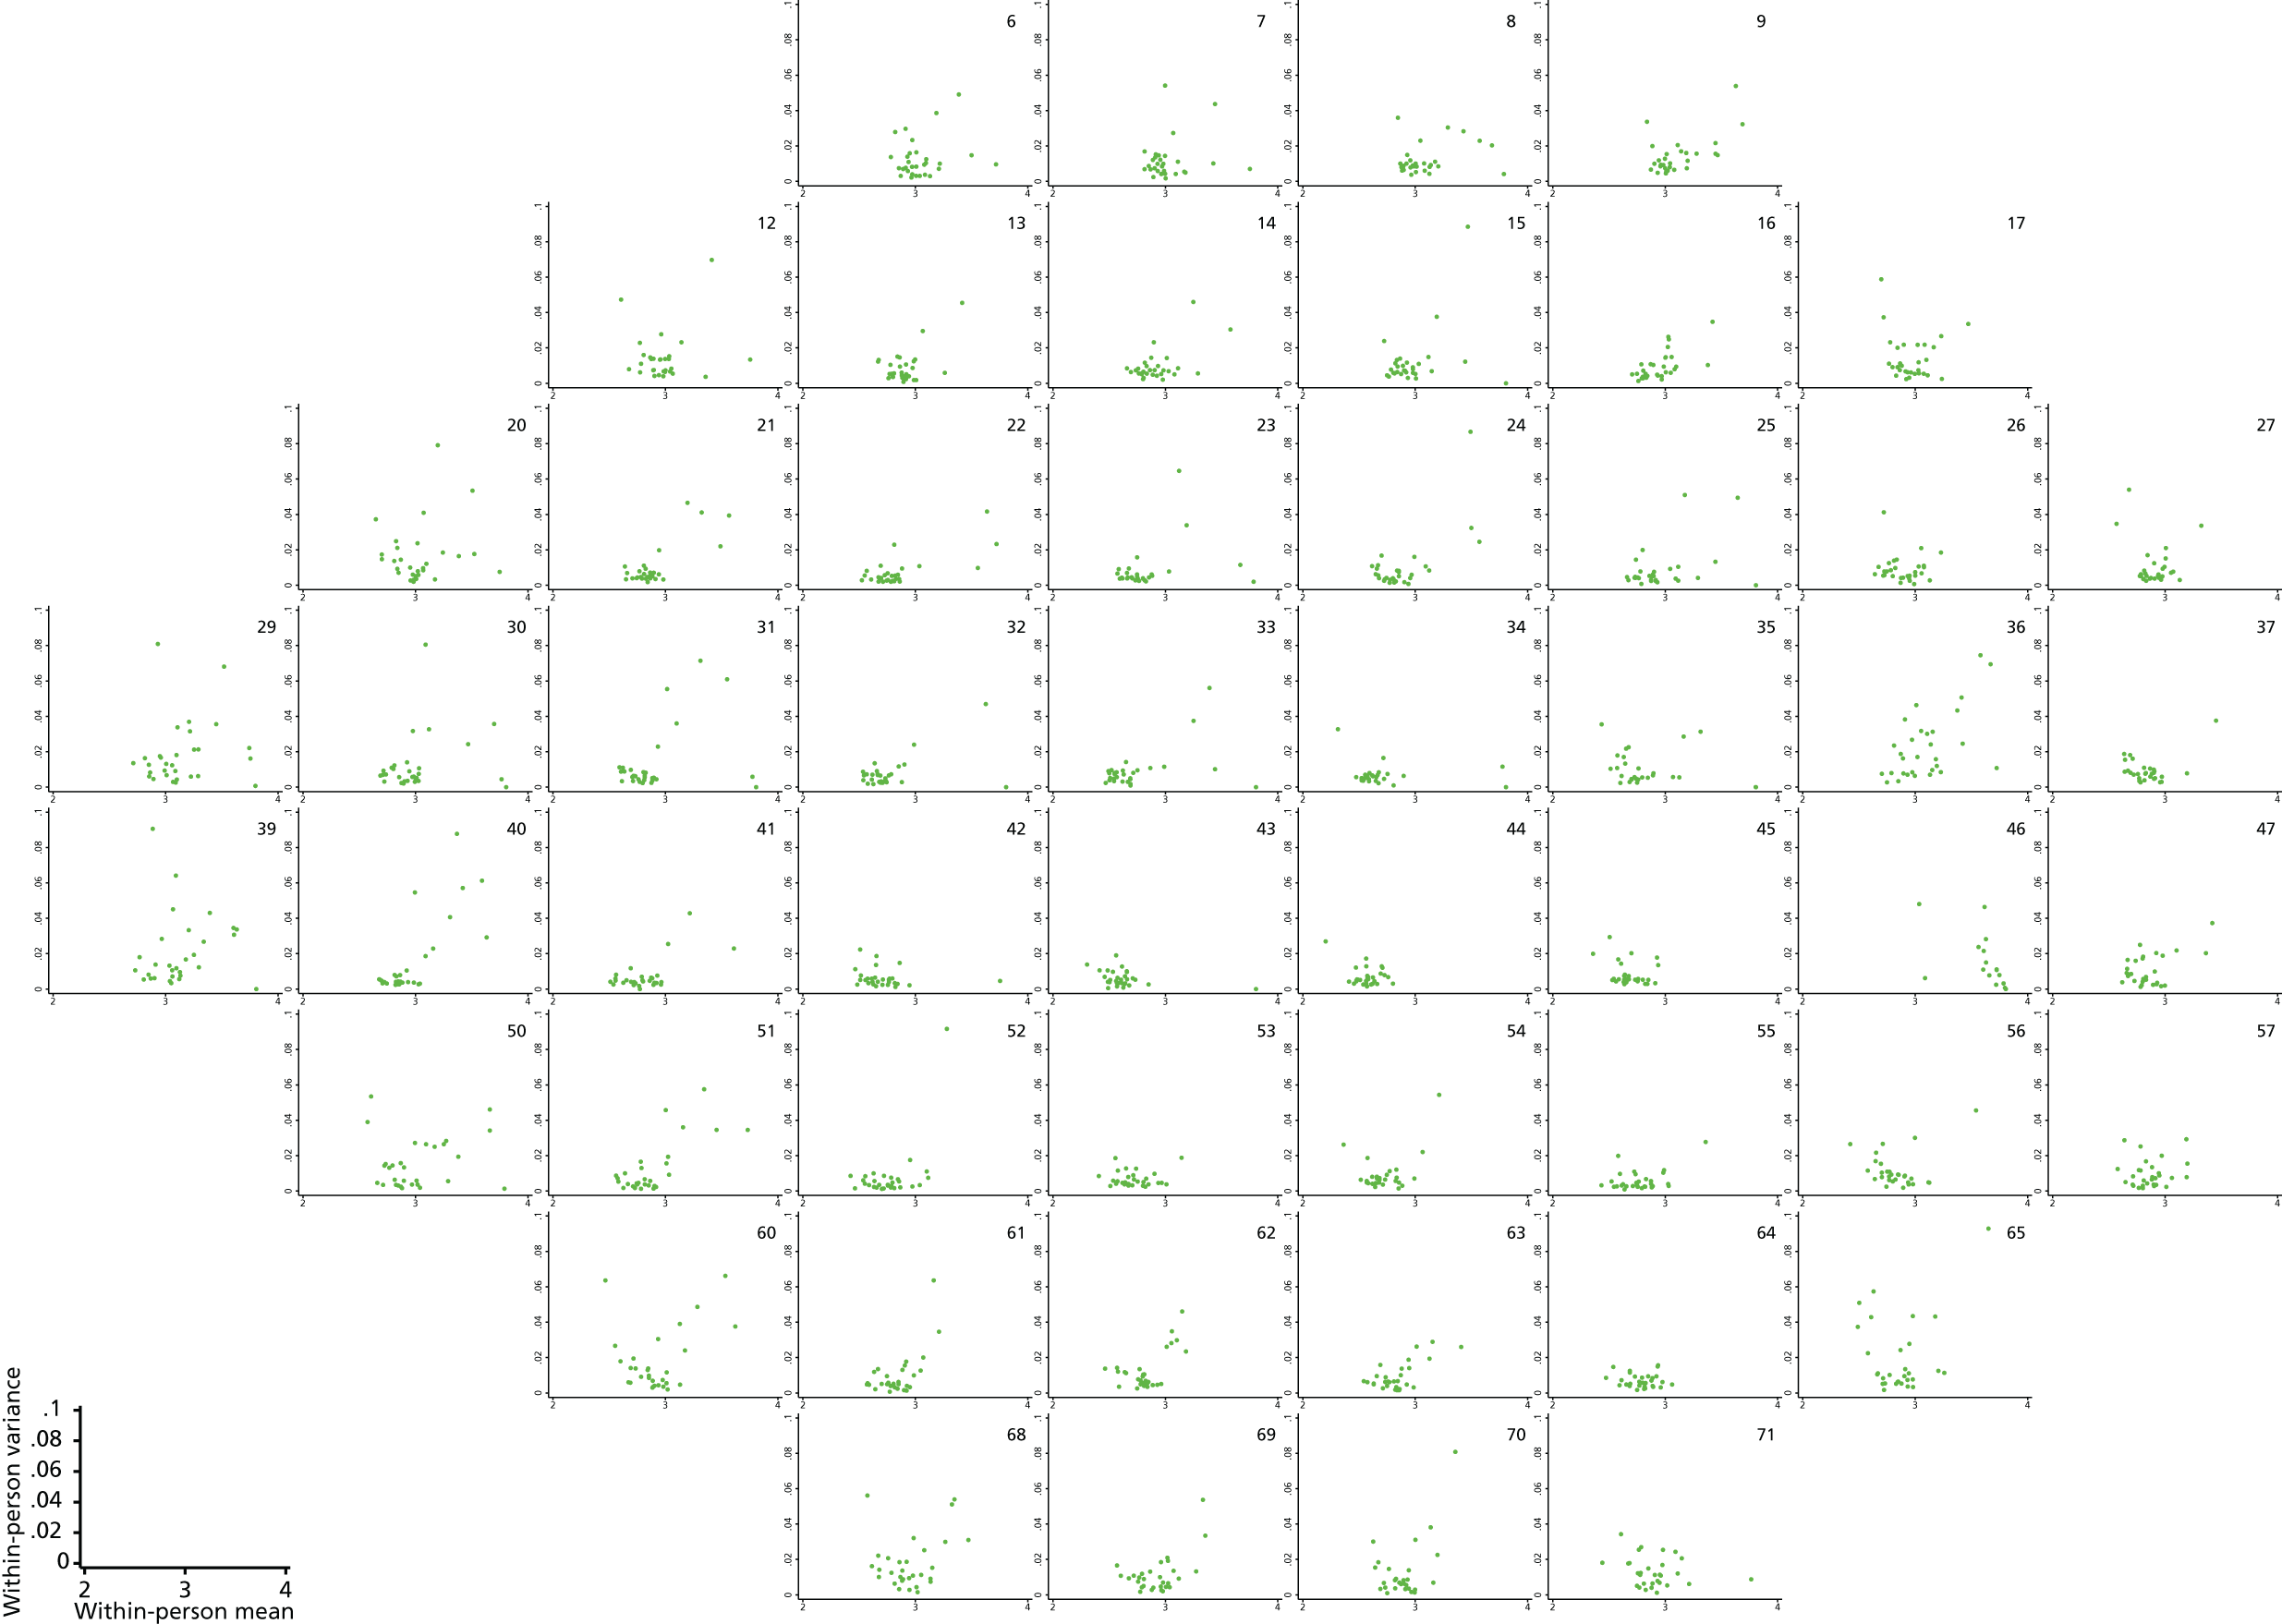
FIGURE 12.
Plots of trajectories over time for Halifax study data with a two-parameter Box–Cox transformation: [(35 – DLS)0.56 – 1]/0.56. The transformed data are plotted against visit number.
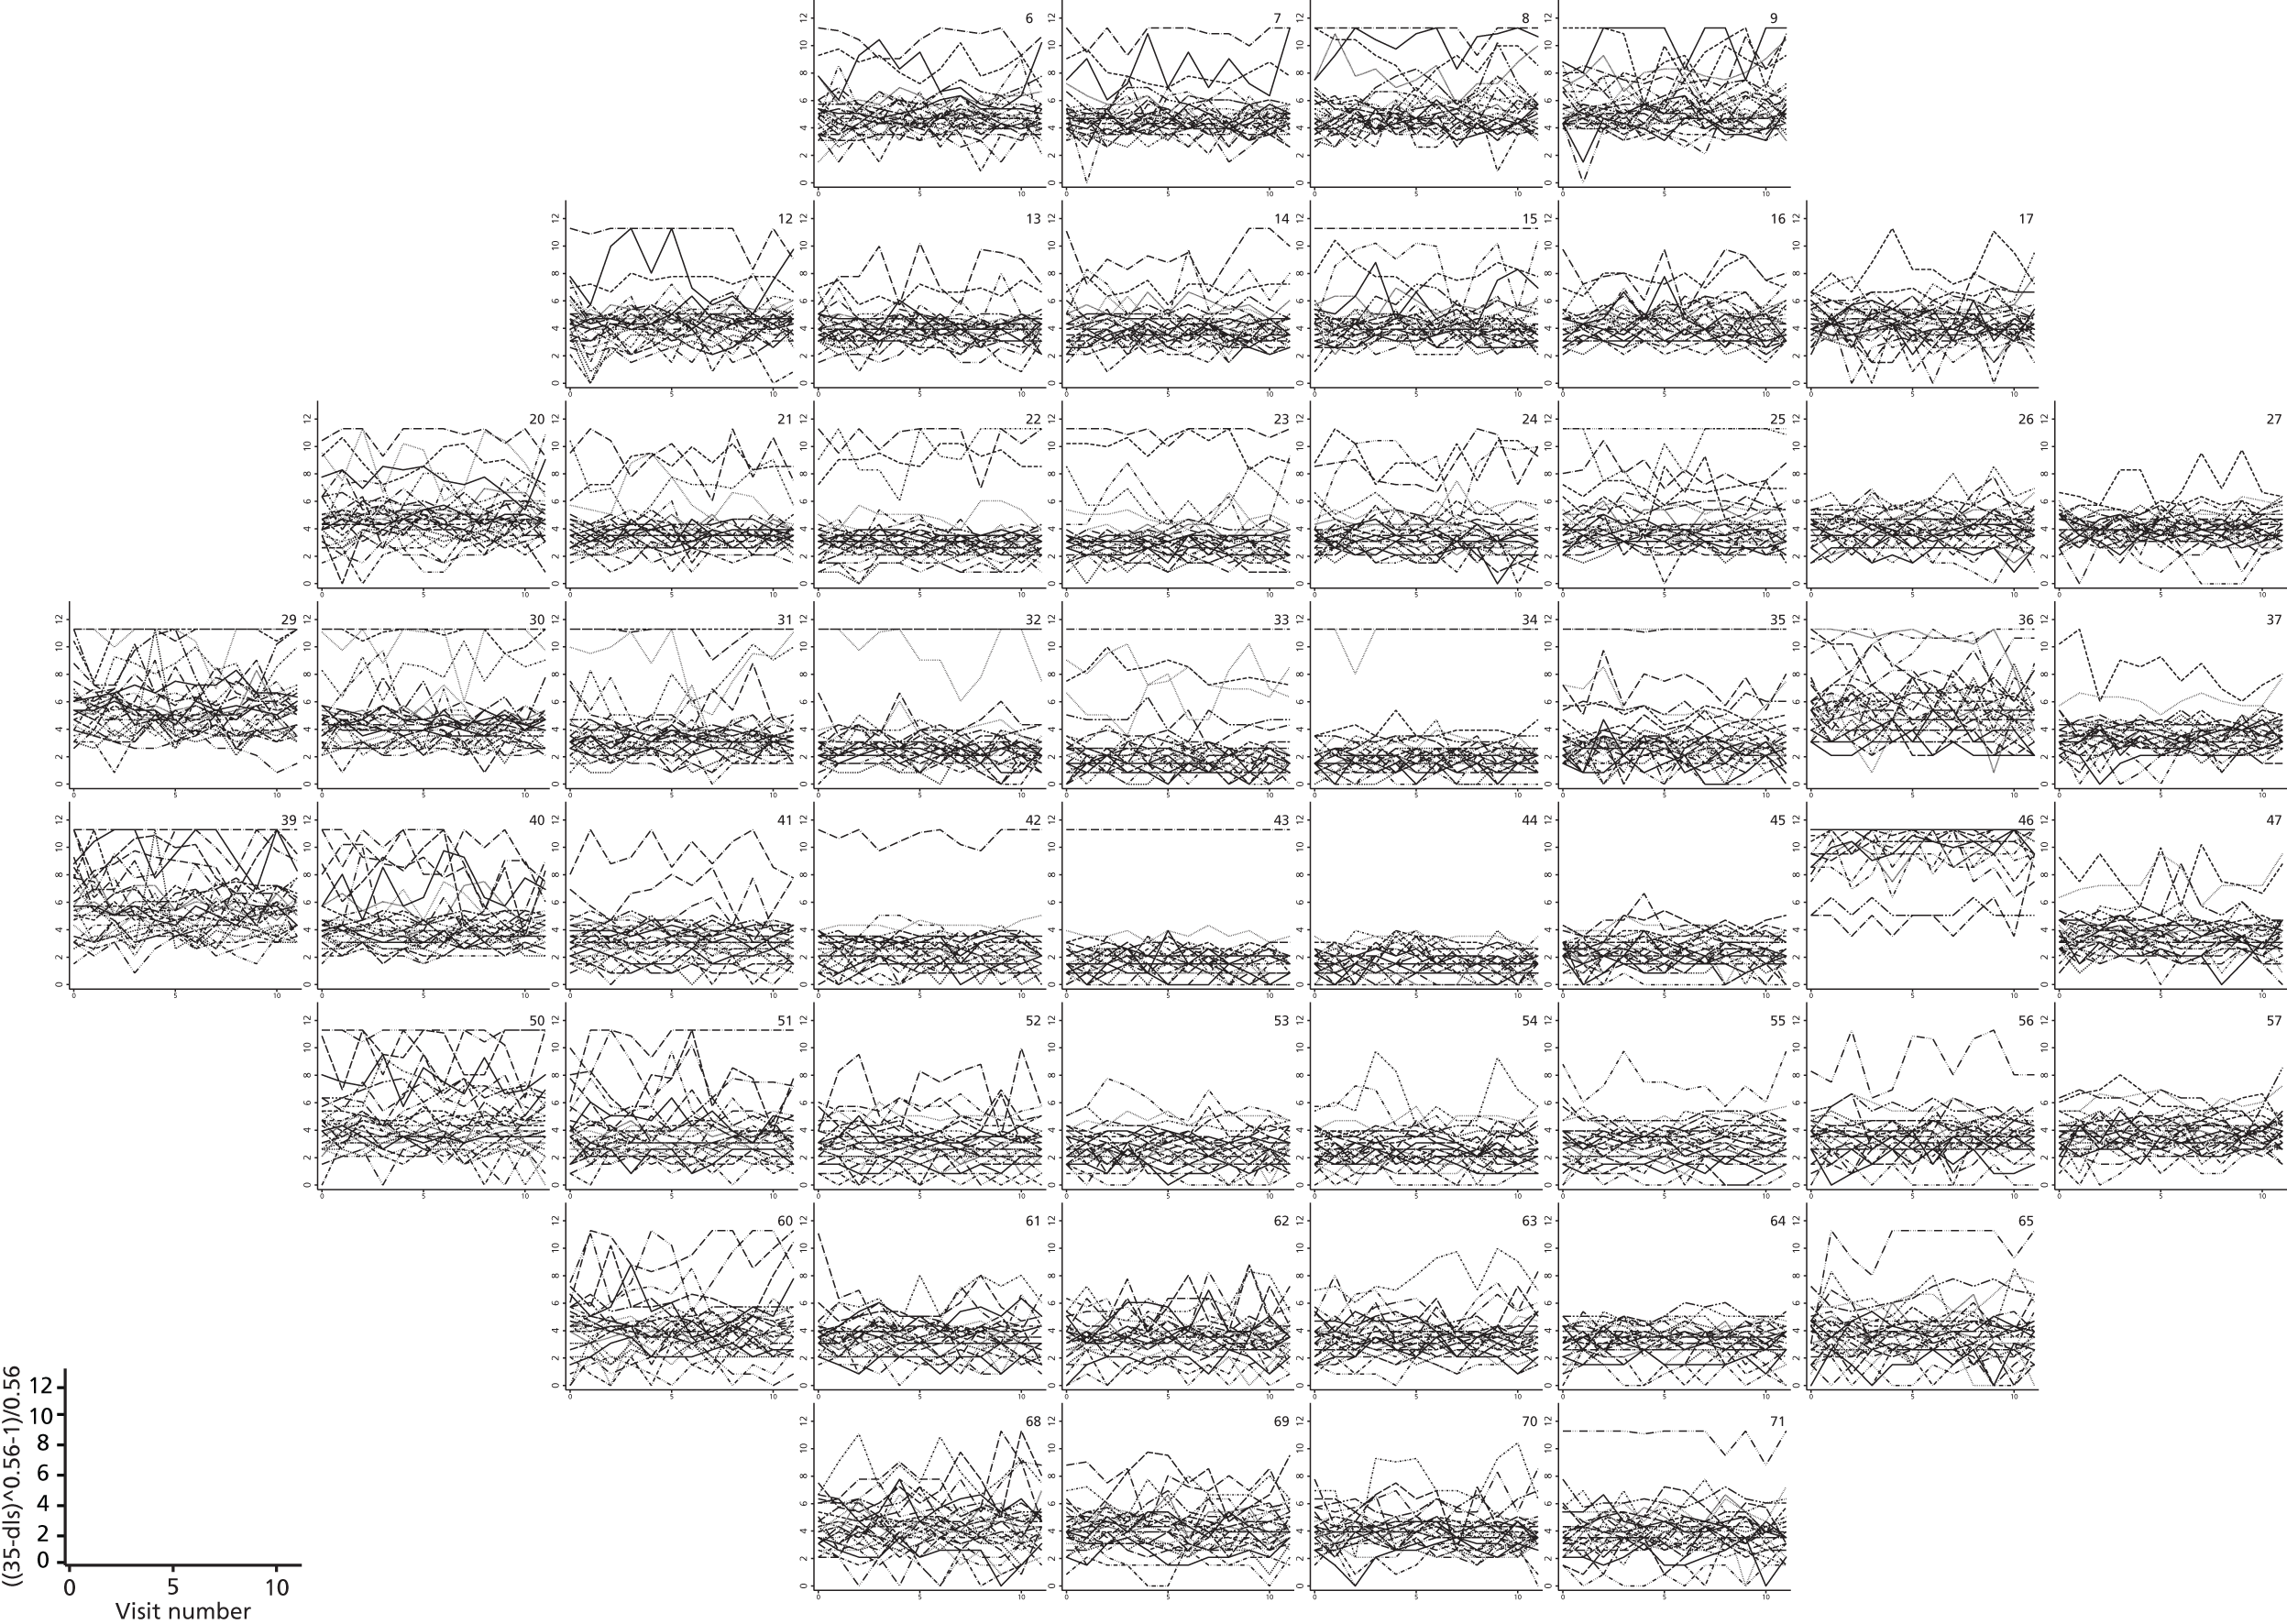
FIGURE 13.
Plots of within-person variance vs. within-person mean for Halifax study data with a two-parameter Box–Cox transformation: [(35 – DLS)0.56 – 1]/0.56.
Censored regression
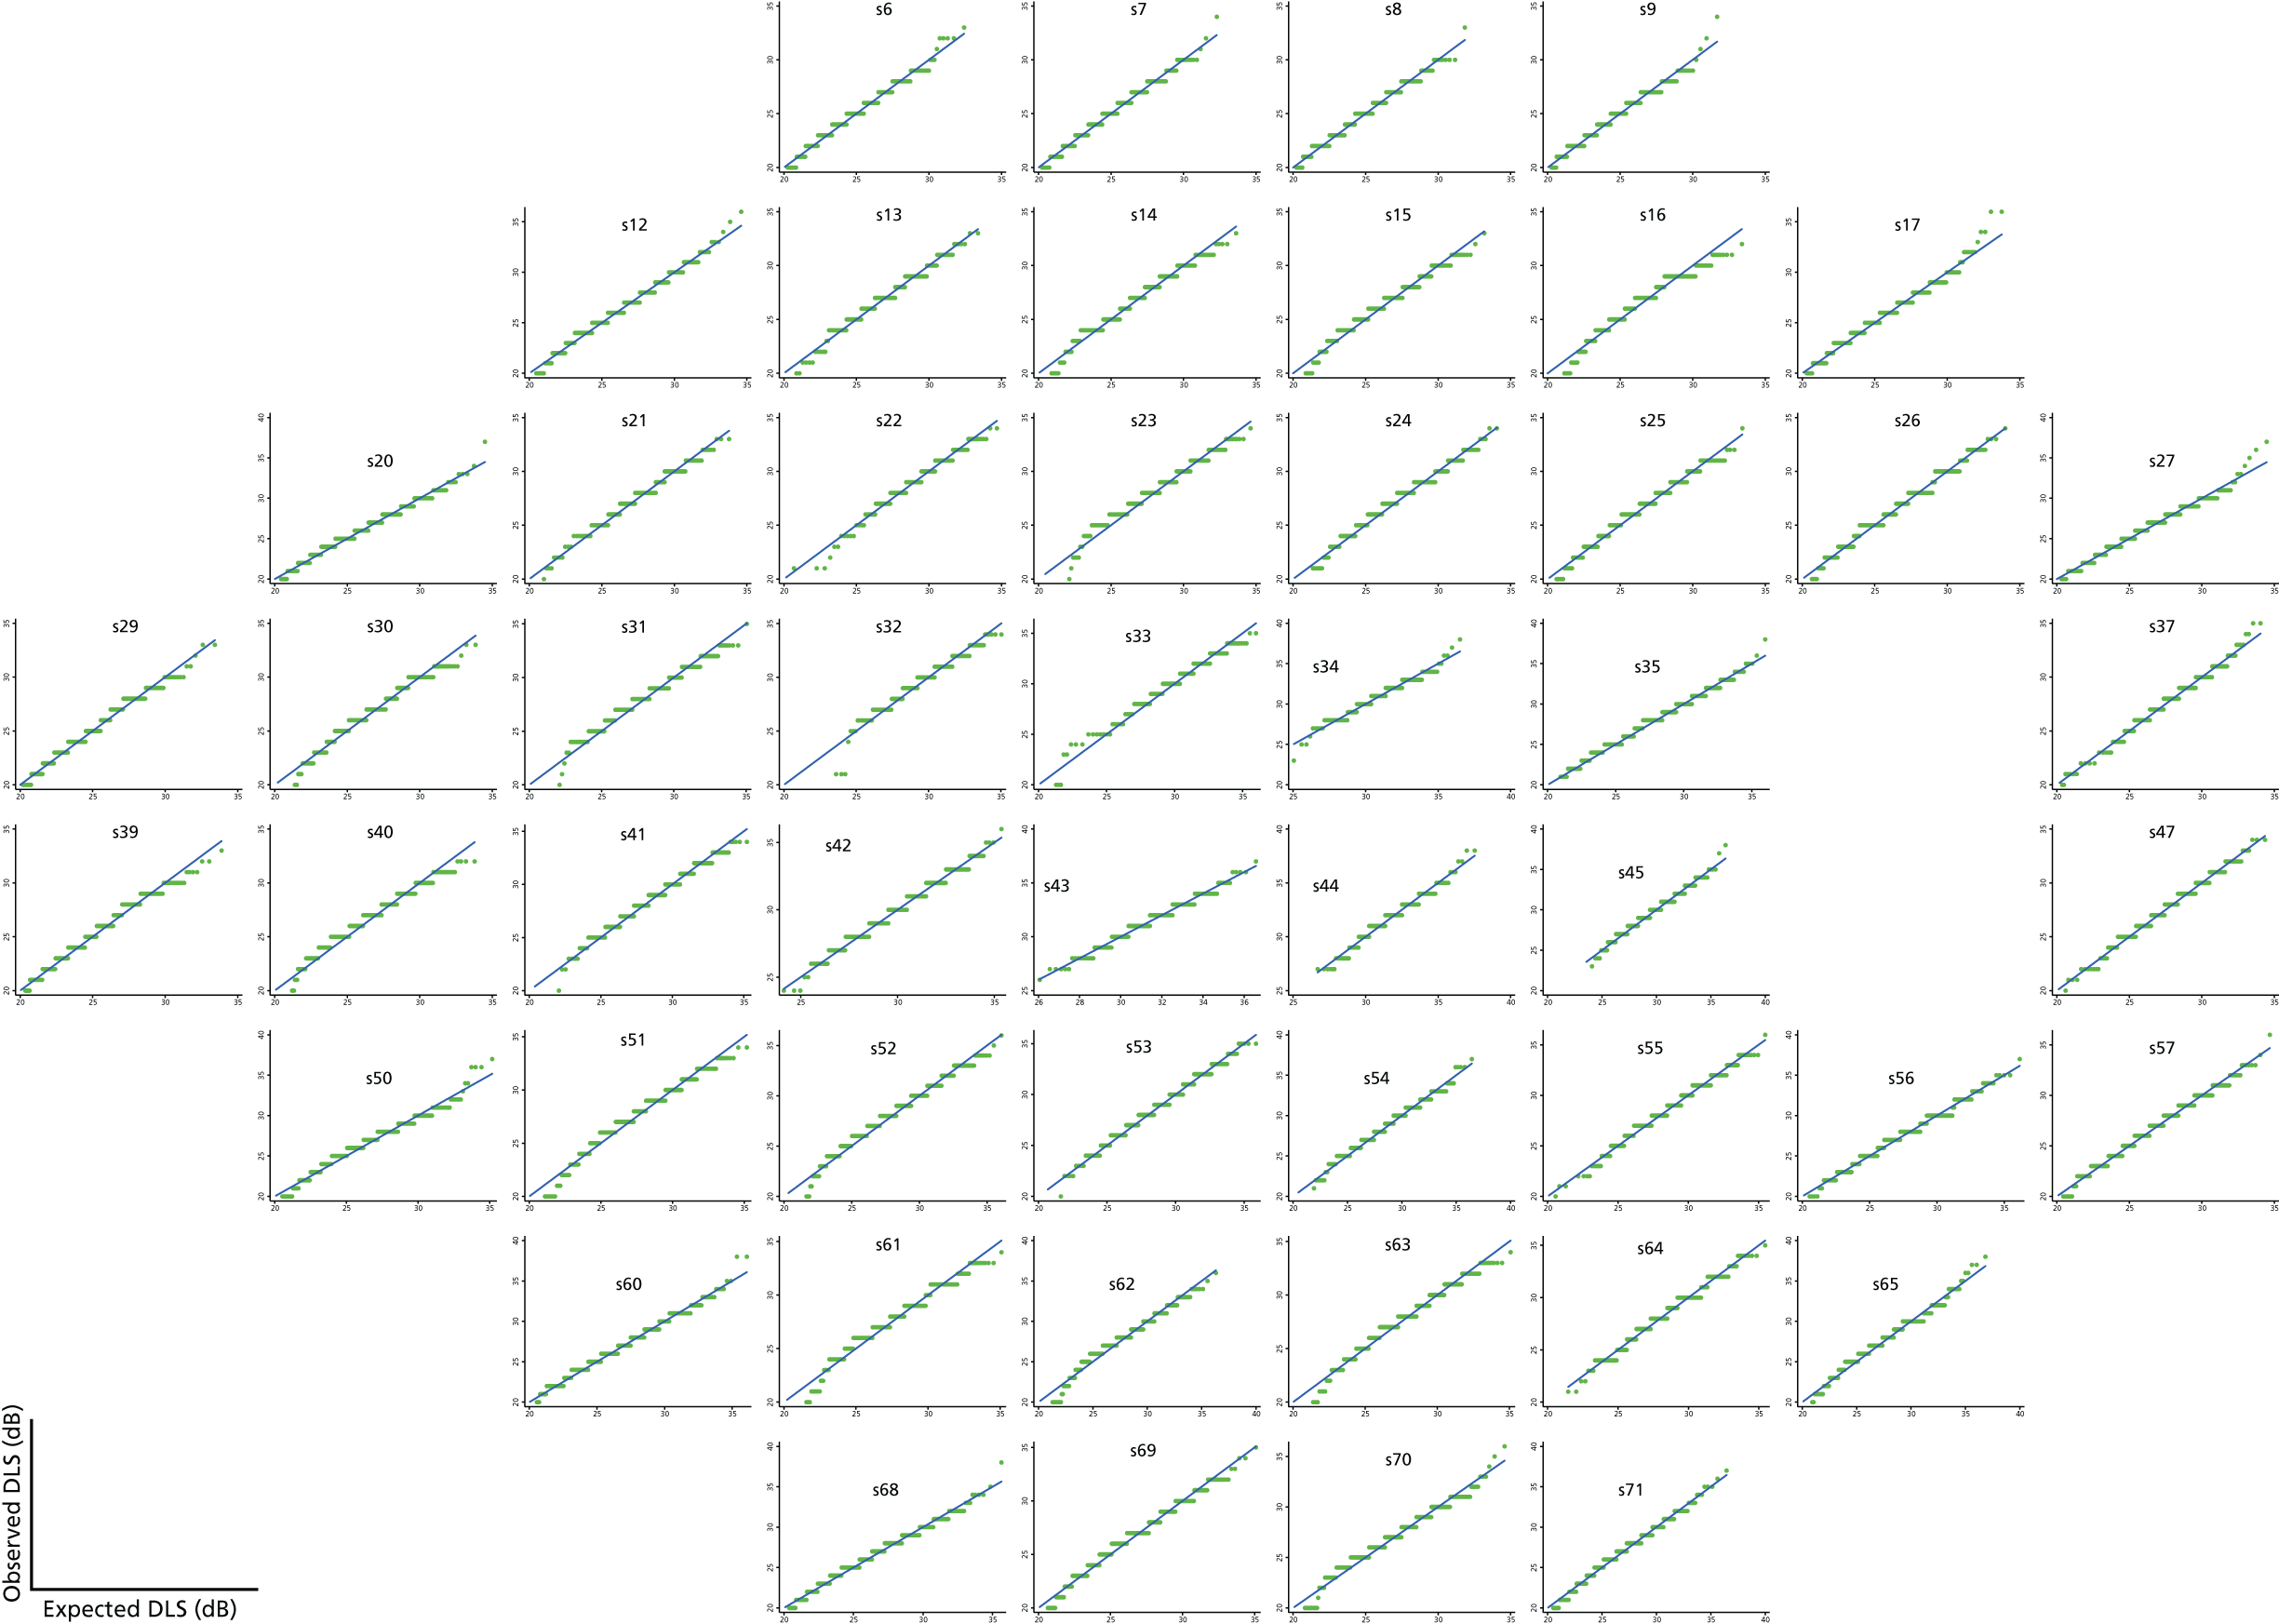
An alternative to the transformations is to evaluate the normality of the test–retest distributions over part of the sensitivity range. To do this we utilised a variation of a quantile–quantile plot in which values are plotted against the values that would be expected under a normal distribution given their rank. Such a standard quantile–quantile plot would generally be used for a variable with independent values, for example with each value obtained from a different person. However, in this setting we have multiple values obtained over time, and from several locations across the eye, for each person. Each person and location has values distributed around their own mean level. To avoid the complexity of multiple locations we plotted each separately. To account for every person having their own mean we used the following variation of a quantile–quantile plot:
-
For each location separately, a censored regression model was fitted to the 12 repeat measurements for the 30 subjects. This model allowed a different mean for each subject, with values of < 15 considered as censored and a common within-subject variance. As a separate model was fitted for each location, the variance was free to vary between different spatial locations across the eye.
-
12 values were drawn for each patient from a normal distribution centred on the patient’s mean and using the common variance from the censored regression model.
-
These were ordered according to their size.
-
The previous two steps were repeated 500 times.
-
An average was taken across each of these repeats to obtain an accurate estimate of the expected value for each rank.
-
The average, or expected, value for each rank was plotted against the actual value.
If the values are in fact normally distributed, or close to normally distributed, then they would be expected to fall close to the line of equality. As can be seen in Figure 14, the VF data appear to be reasonably well described by a mixture of normal distributions above 15 dB, although at a few locations there is some minor departure from normality in the tail of the distribution. Such departures were appreciably more marked using a cut-off value of 10 dB (Figure 15) and not completely eliminated using a cut-off value of 20 dB (Figure 16), providing some justification for our choice of a 15-dB cut-off value. In addition, using a higher cut-off value such as 20 dB results in a higher proportion of censored observations and might lead to a loss of important information.
FIGURE 14.
Joint quantile–quantile plots with a cut-off value of 15 dB for the Halifax study data set.
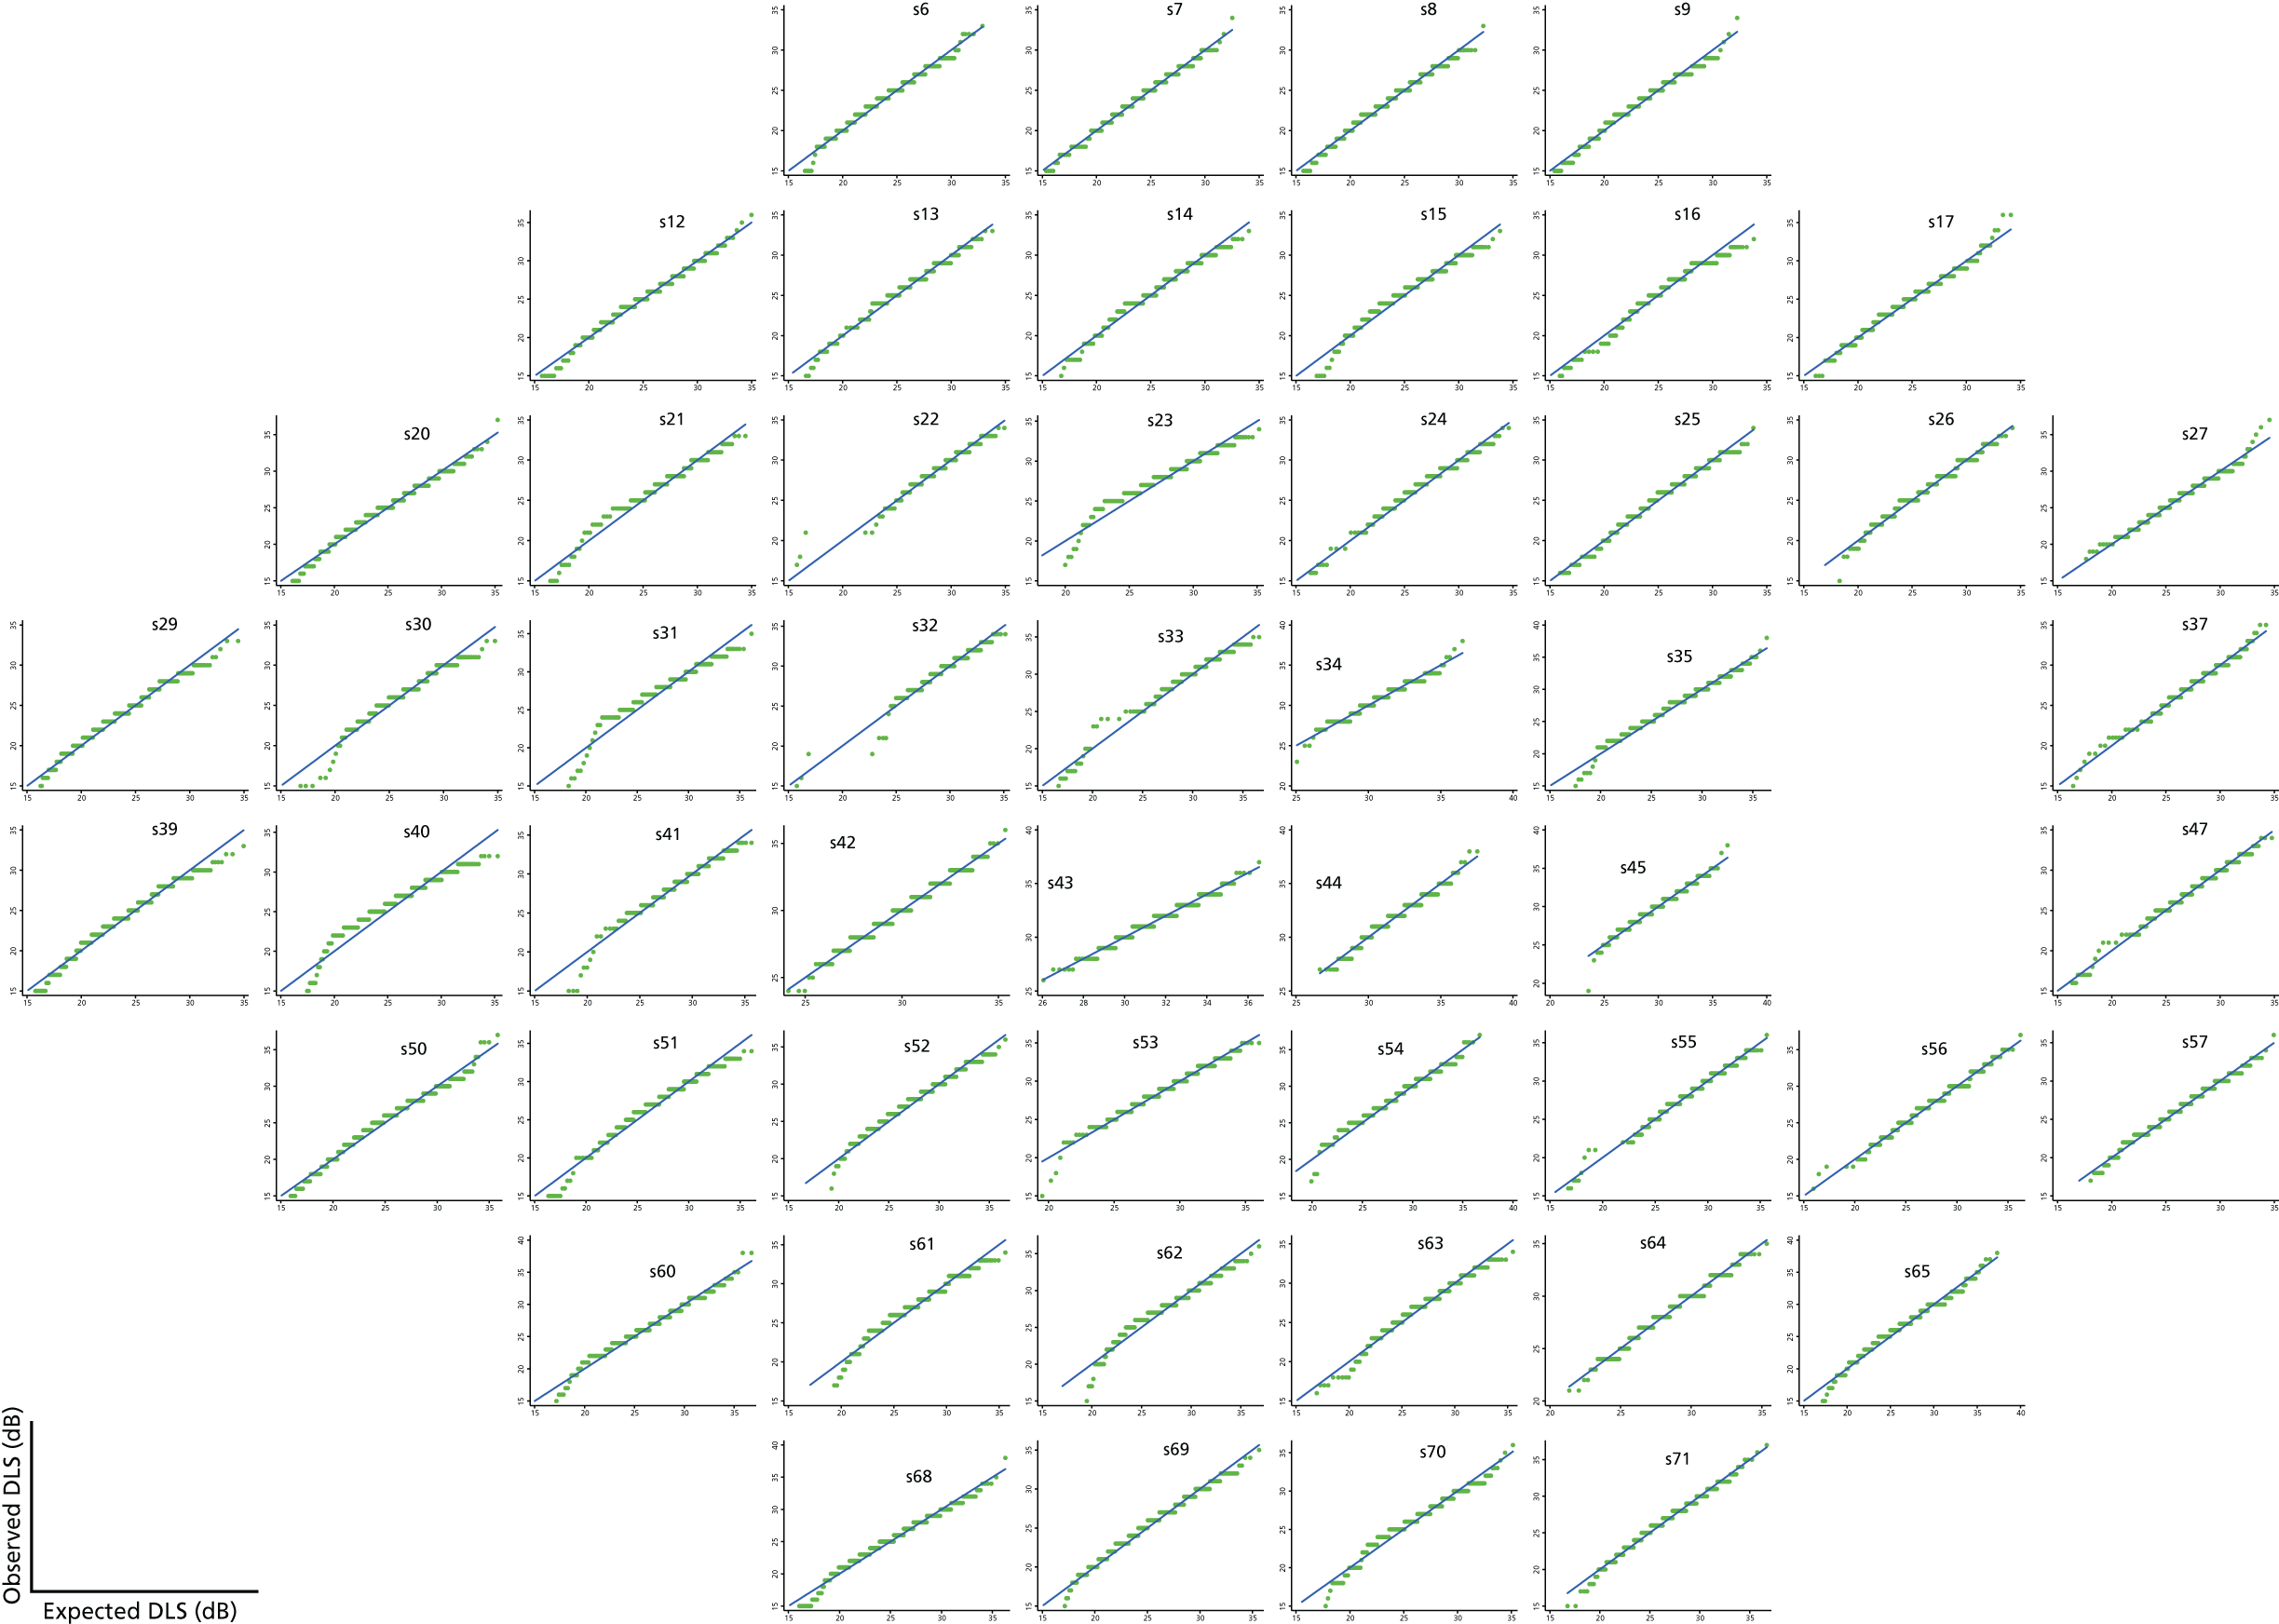
FIGURE 15.
Joint quantile–quantile plots using a cut-off value of 10 dB for the Halifax study data set.
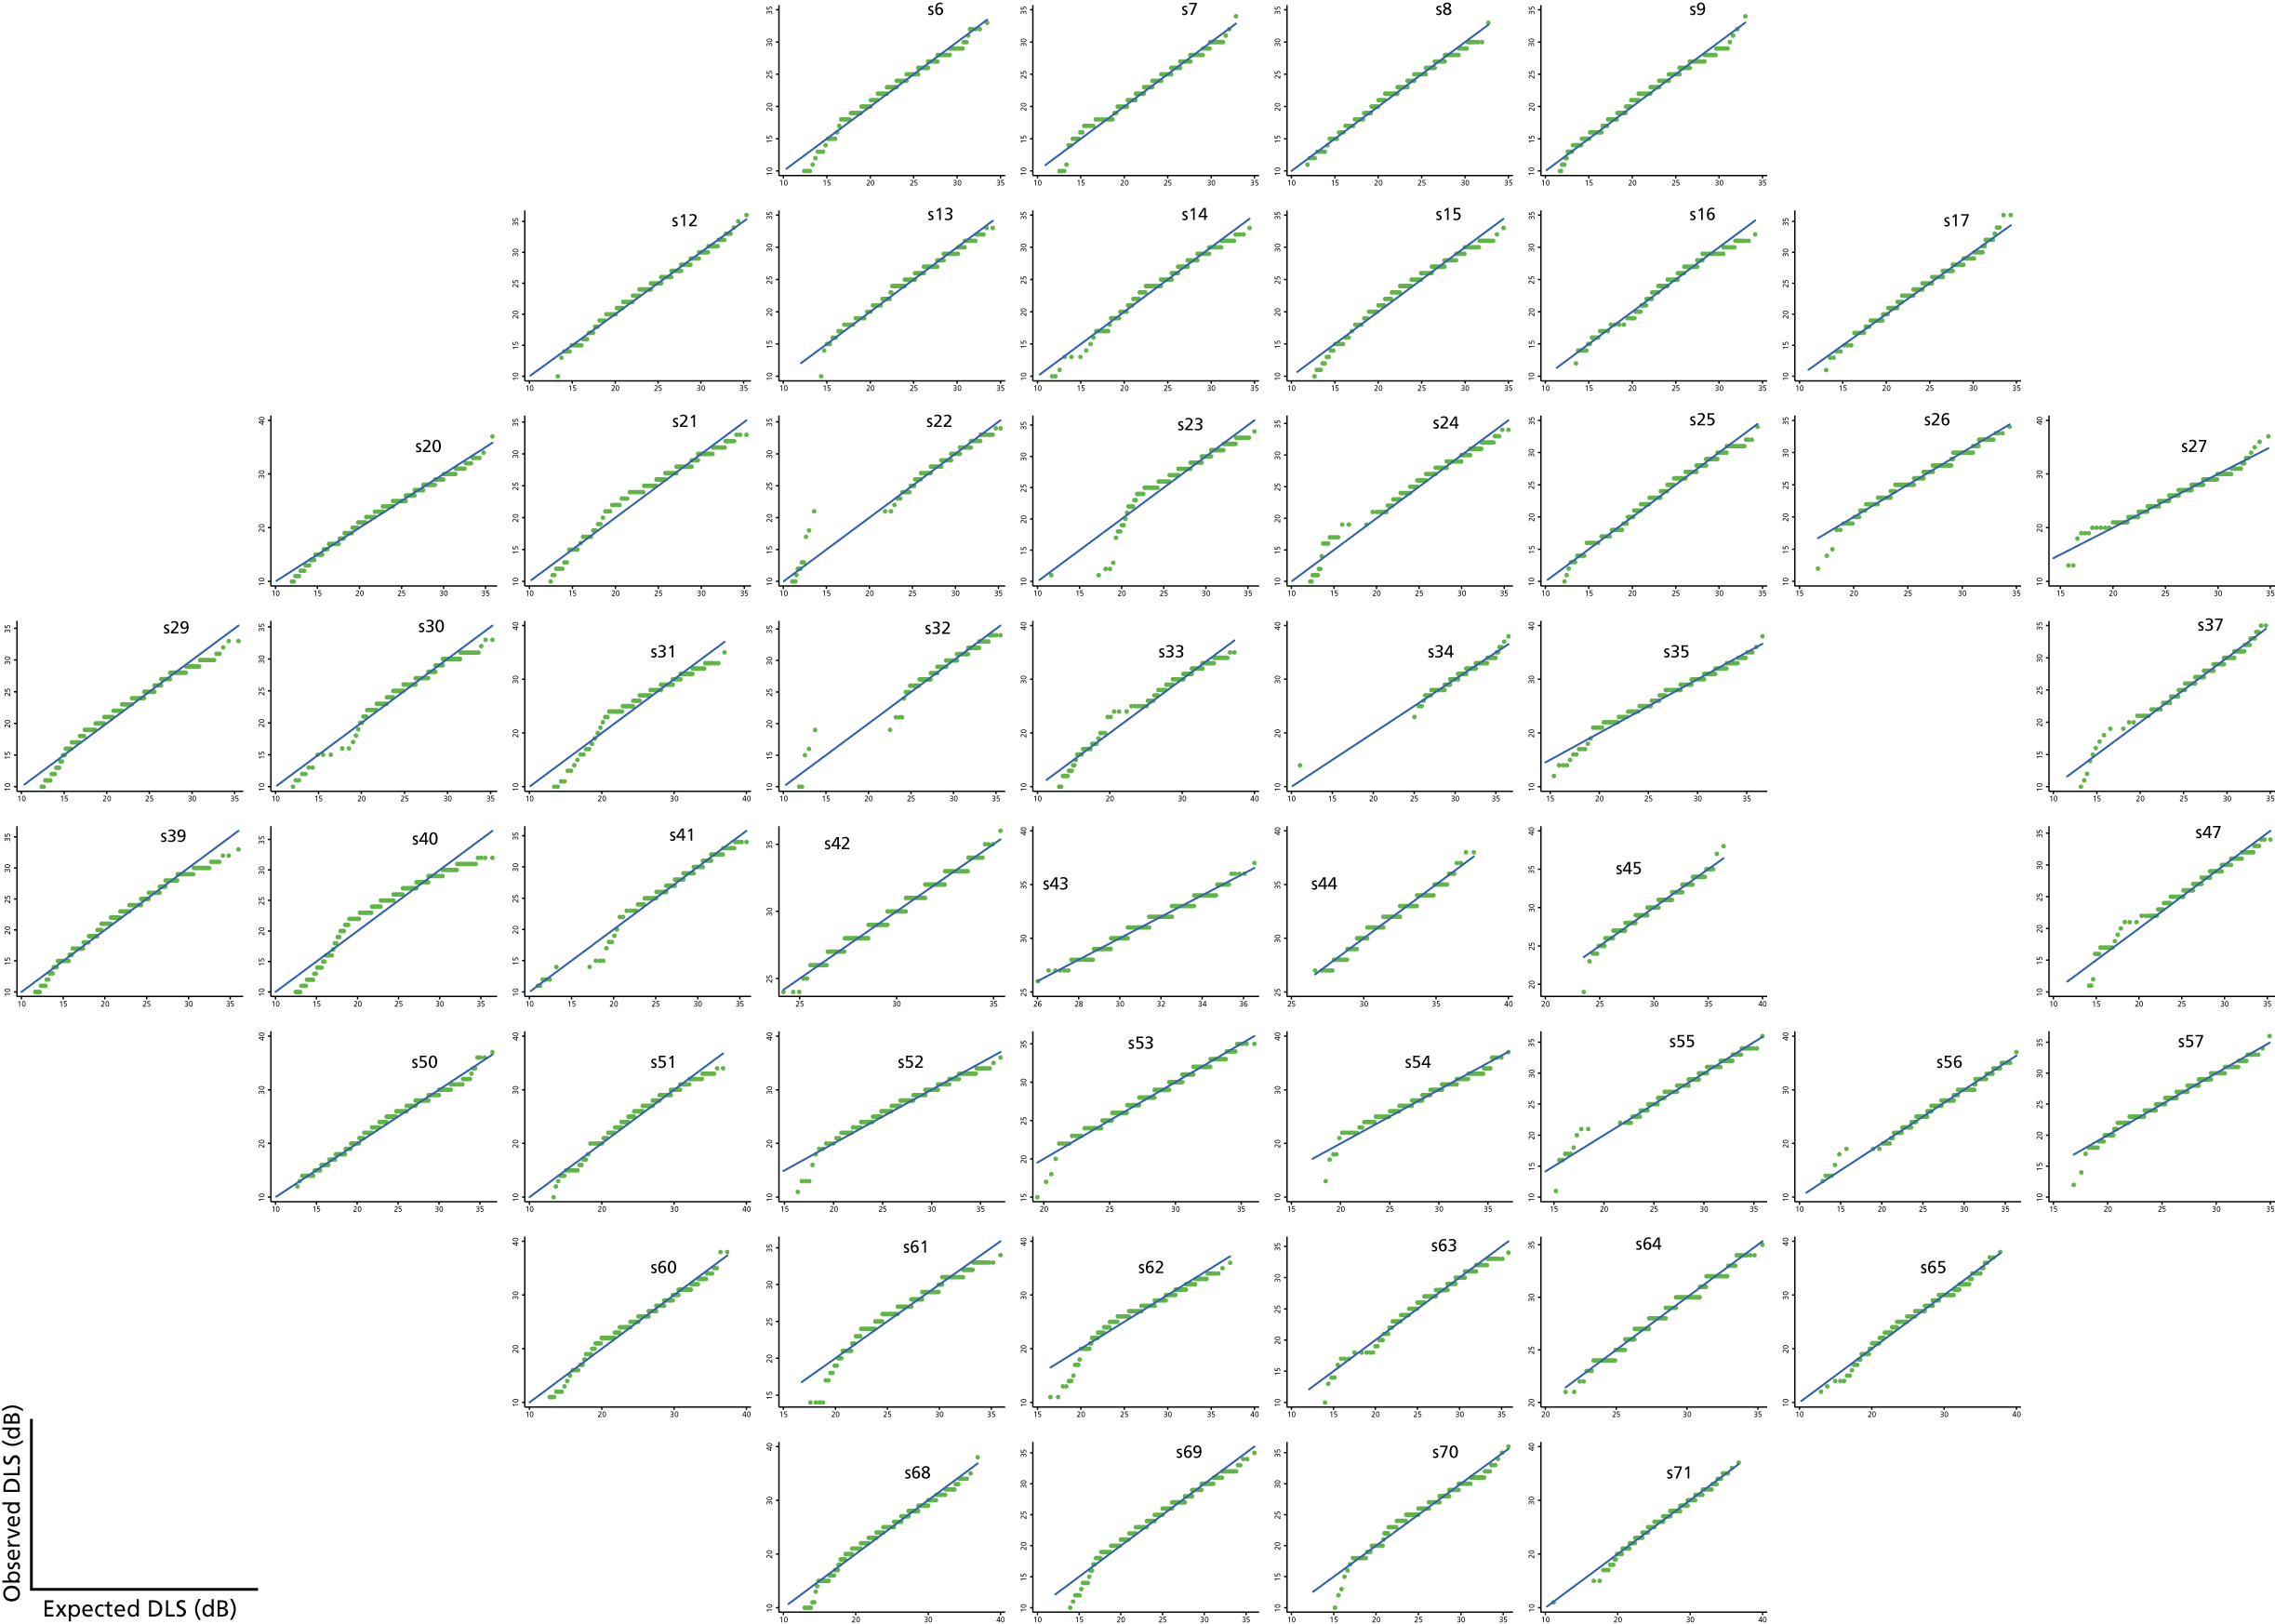
FIGURE 16.
Joint quantile–quantile plots using a cut-off value of 20 dB for the Halifax test-retest data set.
Permutation Test
Permutation tests are commonly used in statistics to compute p-values when comparing levels of a particular outcome variable between two groups when there are concerns over the assumptions made by a test such as a t-test. 91 Some measure of difference between the groups, such as the difference in the means or the difference in the medians or a test statistic such as that from a t-test, is first computed. The variable defining group membership is then permuted many times and the measure of difference recomputed for each permutation. The p-value is simply the proportion of the permutations that give a measure of difference as large as or larger than that observed in the actual data. If the number of objects to be permuted is small, all permutations can be performed; if the number of objects to be permuted is not small then a random sample of all possible permutations of the grouping variable is taken.
Permutation tests can also be used to compute p-values from linear regression models and there is general agreement concerning an appropriate method of permutation for exact tests of hypotheses in SLR (though not for multiple regression). 100 In SLR one simply permutes the ordering of the predictor variable (here, visit number or calendar time), so, for example, with four time points there are 24 permutations (4 × 3 × 2) and with five time points there are 120 permutations (5 × 4 × 3 × 2).
In our multivariate setting, in which patients have multiple measures at each time point, entire visits are permuted together. For example, if visits 2 and 3 are to be permuted, then both VF and OCT measurements at visit 2 are swapped with those at visit 3.
O’Leary et al. 78 used SLR to obtain a p-value at each VF location, which they combined into a summary statistic and then permuted. By contrast, in our method, we are using censored regression rather than SLR and we are permuting slopes or test statistics rather than a summary statistic derived from the p-values.
Multiple imputation
As discussed, the VF measurements are highly non-normal but an assumption of normality and constant variance above 15 dB does not appear to be unreasonable. We would therefore have liked to fit a multivariate hierarchical censored regression. However, this is computationally intractable. As an alternative approach we used a first stage of multiply imputing for any values that are censored (< 15 dB). Using the imputed data, which will be approximately normally distributed, we then used a multivariate hierarchical model without censoring.
There were too many outcome measures (52 VF locations plus imaging outcomes for each eye at each visit) to impute all outcomes together in a joint model. Therefore, a chained equations approach was used. 92 This method uses a set of univariate models, one for each outcome to be imputed, and cycles through them many times before taking imputed values. Theoretically, this cycling process should allow the Monte Carlo process to converge and hence not to depend on the starting values for the process. The initial convergence period is referred to as the burn-in and the number of iterations spent on this stage can be chosen by the analyst.
In this setting, each univariate model for the VF outcomes will include a small number of neighbouring VF points and neighbours in time (e.g. the value at the same VF location at the visit before and the visit after the one to be imputed). The chained equations therefore iterate through time and across spatial locations. A similar chained equations approach has been used to impute for missing values in longitudinal dietary data. 93
Note that in this setting we have a mixture of censored observations, defined as those that lie below 15 dB, and missing visits (because of using a subsample of the UKGTS data set or because a patient left the trial, e.g. as a result of progression or of dropping out of the study). We proposed to impute both types of ‘missing’ data. In the imputed data sets, therefore, all patients have data (imputed or otherwise) for 11 visits. Imputed values for censored observations all lie below 15 dB, whereas observations from missing visits are not restricted in this way.
The number of censored observations by visit number is given in Table 4. These numbers are pooled across VF location, but the amount of censoring varies substantially according to the location. For example, at the top left VF location there were 54 (13.1%) censored observations at the first visit, whereas for a location just to the bottom right of the fovea there was only one censored observation at this visit.
| Visit number | Number (%) of missing eye visits | Number (%) of censored VF observations across 52 locations for non-missing visits |
|---|---|---|
| 1 | 117 (22.2) | 1416 (6.6) |
| 2 | 147 (27.8) | 1241 (6.3) |
| 3 | 167 (31.6) | 1176 (6.3) |
| 4 | 192 (36.4) | 1117 (6.4) |
| 5 | 229 (43.4) | 932 (6.0) |
| 6 | 247 (46.8) | 941 (6.4) |
| 7 | 285 (54.0) | 857 (6.8) |
| 8 | 340 (64.4) | 516 (5.3) |
| 9 | 364 (68.9) | 369 (4.3) |
| 10 | 382 (72.3) | 320 (4.2) |
| 11 | 378 (71.6) | 442 (5.7) |
Kronecker model
Linear mixed-effects models (also known as hierarchical models or mixed models) are commonly used in other disease areas to analyse longitudinal and/or hierarchical data. 94 They can account for complex correlation structures such as those observed in the VF data. However, such models are most easily fitted if the data are approximately normally distributed. Such an assumption does not seem unreasonable for the imaging outcome, but the VF data are far from being normally distributed. As described earlier, we tried a variety of transformations but did not find one that was sufficient to reliably model the transformed VF data under normality assumptions. Therefore, we proceeded to the censoring approach described in Censored regression and to use the multiple imputation process outlined in Multiple imputation. Once we obtained some imputed data sets, we modelled the now approximately normally distributed VF values in a mixed-effects model jointly with the imaging outcome. This model includes random intercepts and slopes for person and eye.
Instead of assuming an independent residual error structure, we used a Kronecker product to model the residual correlations. Using the Kronecker product offers a parsimonious way to model the remaining spatial and temporal correlations in a separable way. 95
Based on initial investigations using the Halifax data set, we chose to model the temporal correlations under an exchangeability assumption. For the spatial correlations, we used a model of exponential decay with correlations decreasing as the distance between the VF locations increased and also as the angle at which the nerve fibres running through the location enter the ONH increases. 22 In addition, the locations in separate hemi-fields of the VF were assumed to not be correlated. Such a model for the correlation structure between VF locations was proposed in the paper on ANSWERS by Zhu et al. 80 No correlation is modelled in the spatial matrix between the VF outcomes and imaging outcome, but correlations between these measures are induced through the person and eye random effects.
Two sets of the following fixed effects were included in the model, one set each for the VF and imaging outcomes: a constant term, a slope over time and a time-by-treatment interaction. The per-protocol visit time in years since starting treatment was used as the timescale for this model. We defined this scale as in Table 5.
| Visit | Per-protocol visit time in months | Per-protocol visit time in years (per-protocol time in months/12) |
|---|---|---|
| 1 | 1.5 | 0.125 |
| 2 | 3.5 | 0.292 |
| 3 | 5.5 | 0.458 |
| 4 | 8.5 | 0.708 |
| 5 | 11.5 | 0.958 |
| 6 | 14.5 | 1.208 |
| 7 | 17.5 | 1.458 |
| 8 | 19.5 | 1.625 |
| 9 | 21.5 | 1.792 |
| 10 | 23.5 | 1.958 |
| 11 | 25.5 | 2.125 |
Using the per-protocol visit time was a pragmatic decision based on computation time, as the Kronecker model is computationally much quicker to run on balanced data, in which every person has visits at the same time point.
Note that when using such a timescale in an individually randomised trial setting, under which there will be no systematic differences between treatment groups at the point of randomisation (assuming randomisation has been implemented appropriately), it is not efficient to include a main effect for treatment in a mixed-effects model. 101
The algebraic form of the Kronecker model is:
where i = person, j = eye, k = VF location or imaging, k = 1. . . , 53, that is, 52 VF locations and one imaging outcome, l = visit number, IVF,Ilm are indicators for VF locations or imaging respectively, ti is the time of visit l, trti is the treatment group for person i and α, β, γ are fixed effects – a constant, a slope over time and a time-by-treatment interaction respectively – with one of each for VF and imaging. In a clinical trials setting the parameters of interest are γVF and γlm, along with their joint test of significance, as these represent the difference in slope between the treated group and the placebo group. p0i, p1i are random intercepts and slopes for person and e0i, e1i are random intercepts and slopes for eye. They are distributed as:
and
The residual error ϵijkl is distributed as:
where Σ = τ⊗λ takes a Kronecker product structure, with:
an exchangeable covariance matrix for time (with a variance of 1 to avoid overparameterisation), and λ is the covariance matrix for VF locations and imaging:
where σVF2 is the variance for VF locations, σIm2 is the variance for imaging, σVF2e−(dDkk′+aAkk′) is the correlation between locations k and k′, with the correlation depending on a matrix containing the distances between the VF locations D_ and a matrix containing the difference between the angle of entry into the ONH for the VF locations A_ (as previously determined22). Distances between locations in different hemi-fields were set to be very large in the matrix D, such that the correlations between hemi-fields were effectively zero.
Although there is no explicit correlation between the VF locations and the imaging outcome in the matrix λ, a correlation between the outcomes is induced by the random effects for person and eye. The variances and covariances implied by this model are given in Appendix 2.
For comparison, we also consider a model with VF measurements only (no imaging outcomes). The algebraic form of this model is:
with k now running from 1 to 52 and the covariance matrix λ becoming:
As it is not possible to implement such a model in standard statistical software packages, we wrote a function in R (version 3.3.0, The R Foundation for Statistical Computing, Vienna, Austria) to calculate the log-likelihood for the model. We then used the ‘optim’ function in R to maximise the log-likelihood. The optim function was used repeatedly, each time starting from the last set of parameter estimates from the previous optim call, until the log-likelihood increased by < 0.1 compared with the previous optim call. If the optim function failed, for example if a region of parameter space was reached in which the log-likelihood could not be calculated, the optim function was used again using the same fixed effects but returning to the starting values for the variance parameters. Once the final parameter estimates at the maximum log-likelihood were reached, the standard errors (SEs) for the fixed effects were obtained by finding the numerical derivatives at that point. Only SEs for the fixed effects were calculated, as inversion of the variance–covariance matrix for all parameters was found to fail often in simulations. Inverting the smaller variance–covariance matrix for just the fixed effects was more stable.
The Kronecker model was applied to each of the imputed data sets in turn and the parameter estimates from each were combined using Rubin’s rules. 102
Generalised estimating equations
Linear mixed models make strong distributional assumptions and theoretically these assumptions need to hold for inferences to be valid. 94 An alternative approach requiring fewer assumptions utilises GEEs. 103 In this approach a repeated-measures model with an assumed (usually simple) ‘working’ correlation structure is fitted to the data for estimation of parameters. To correct for the fact that the assumed correlation structure is likely to be incorrect, robust SEs are used to construct CIs and to perform hypothesis tests. 104,105
The mean model for the GEEs used in this study takes the same form as the fixed effects of the Kronecker models outlined in the previous section:
This mean model is used with an exchangeable working correlation matrix at the level of person. Robust SEs are used.
For comparison, we also considered a GEE applied to the VF data only. This has a mean model of the form:
Again, an exchangeable working correlation matrix and robust SEs are used.
Chapter 5 Results
Rates of visual field and retinal nerve fibre layer thickness change
The analysis was applied to the 284 subjects with both VF and OCT measurements available at baseline and with ≥ 6 months of follow-up (see Figure 5).
Visual field
The distribution of the rate of VF mean sensitivity change is shown in Figure 17. The rate of loss was taken from the eye with the worse baseline MD or the eye demonstrating incident VF loss. It can be seen clearly in the histogram that the placebo group has faster rates of deterioration than the latanoprost group (data shifted to the left). The mean (SD) rates of change were –0.36 (2.20) dB per year in the placebo group and –0.02 (0.96) dB per year in the latanoprost group. The d’Agostino–Pearson test for normal distribution of individual rates of change rejected normality (p < 0.0001). The median rate of change was –0.21 (5th to 95th percentile –2.84 to +1.40) dB per year in the placebo group and +0.12 (5th to 95th percentile –1.95 to +1.39) dB per year in the latanoprost group. A Mann–Whitney two-tailed test (independent samples) identified that the distribution of slopes was significantly different (p = 0.0034).
FIGURE 17.
Distribution of the rate of VF mean sensitivity (MS) change in decibels per year for the subset of UKGTS participants with OCT images (placebo, n = 143 participants; latanoprost, n = 141 participants).
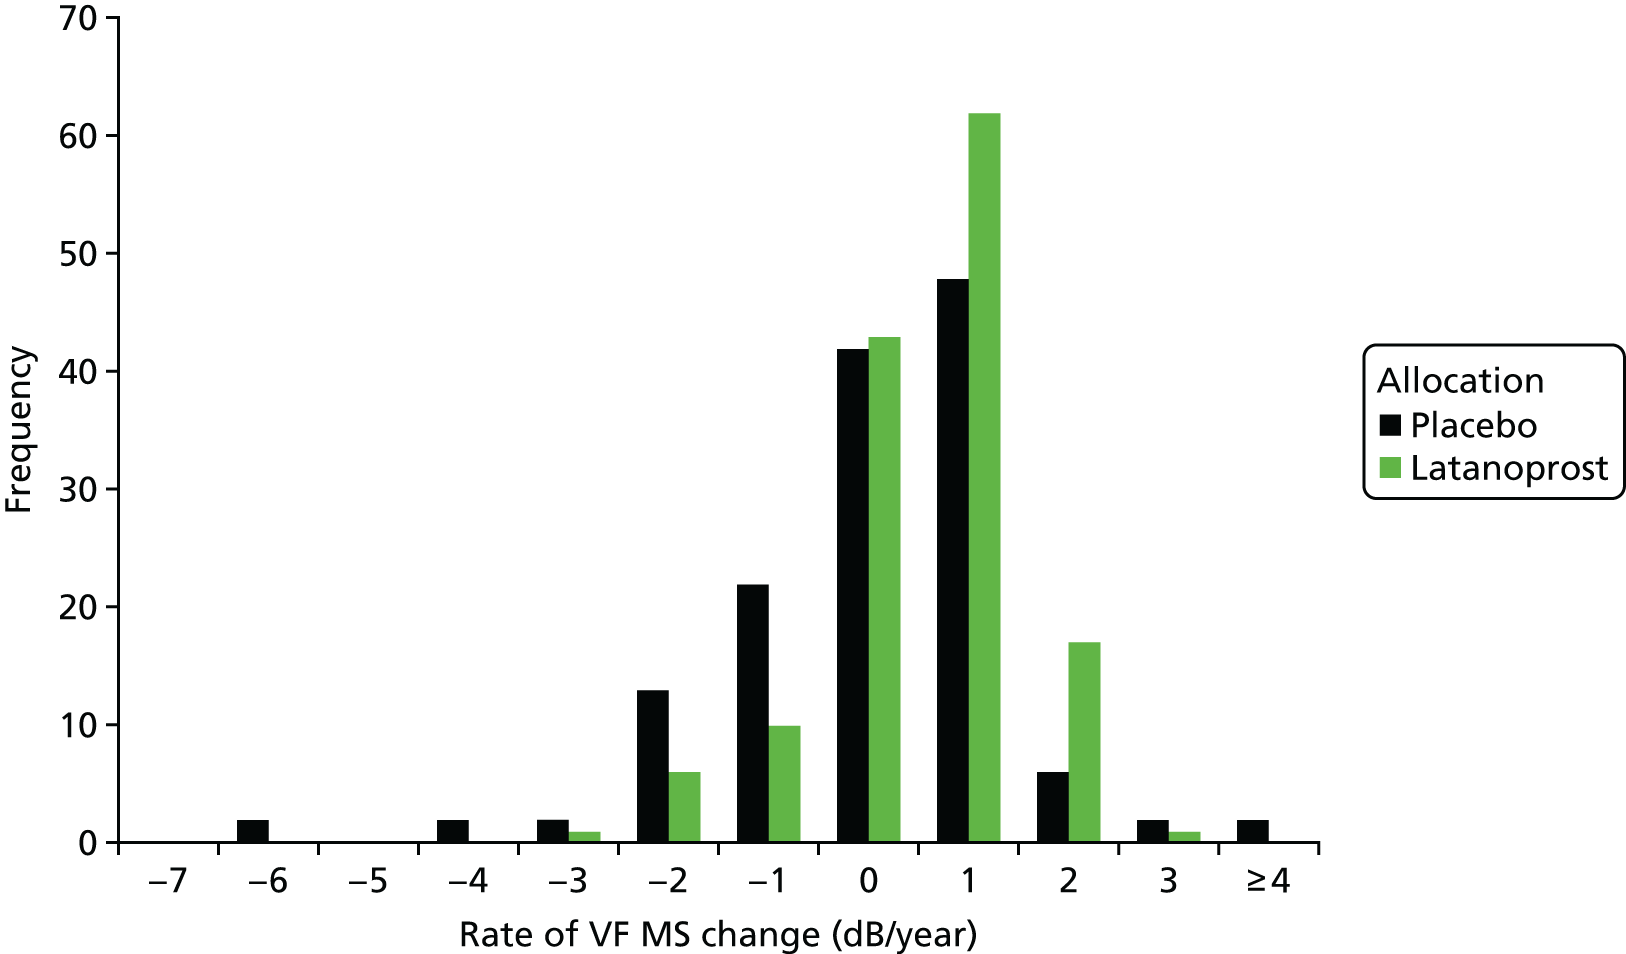
Retinal nerve fibre layer thickness
The distribution of rate of RNFL thickness change is shown in Figure 18. The rate of loss was taken from the eye with the worse baseline MD or the eye demonstrating incident VF loss. Similarly to the VF data, the placebo group had faster rates of deterioration than the latanoprost group (data shifted to the left). The d’Agostino–Pearson test for normal distribution rejected normality (p = 0.0026). The median rate of change was –1.56 (5th to 95th percentile –9.17 to +6.16) µm per year in the placebo group and –1.05 (5th to 95th percentile –8.05 to +3.89) µm per year in the latanoprost group. The difference in distribution of slopes was not statistically significant (Mann–Whitney two-tailed test, p = 0.18).
FIGURE 18.
Distribution of the rate of OCT RNFL thickness change for the subset of UKGTS participants with OCT images (placebo, n = 143 participants; latanoprost, n = 141 participants).
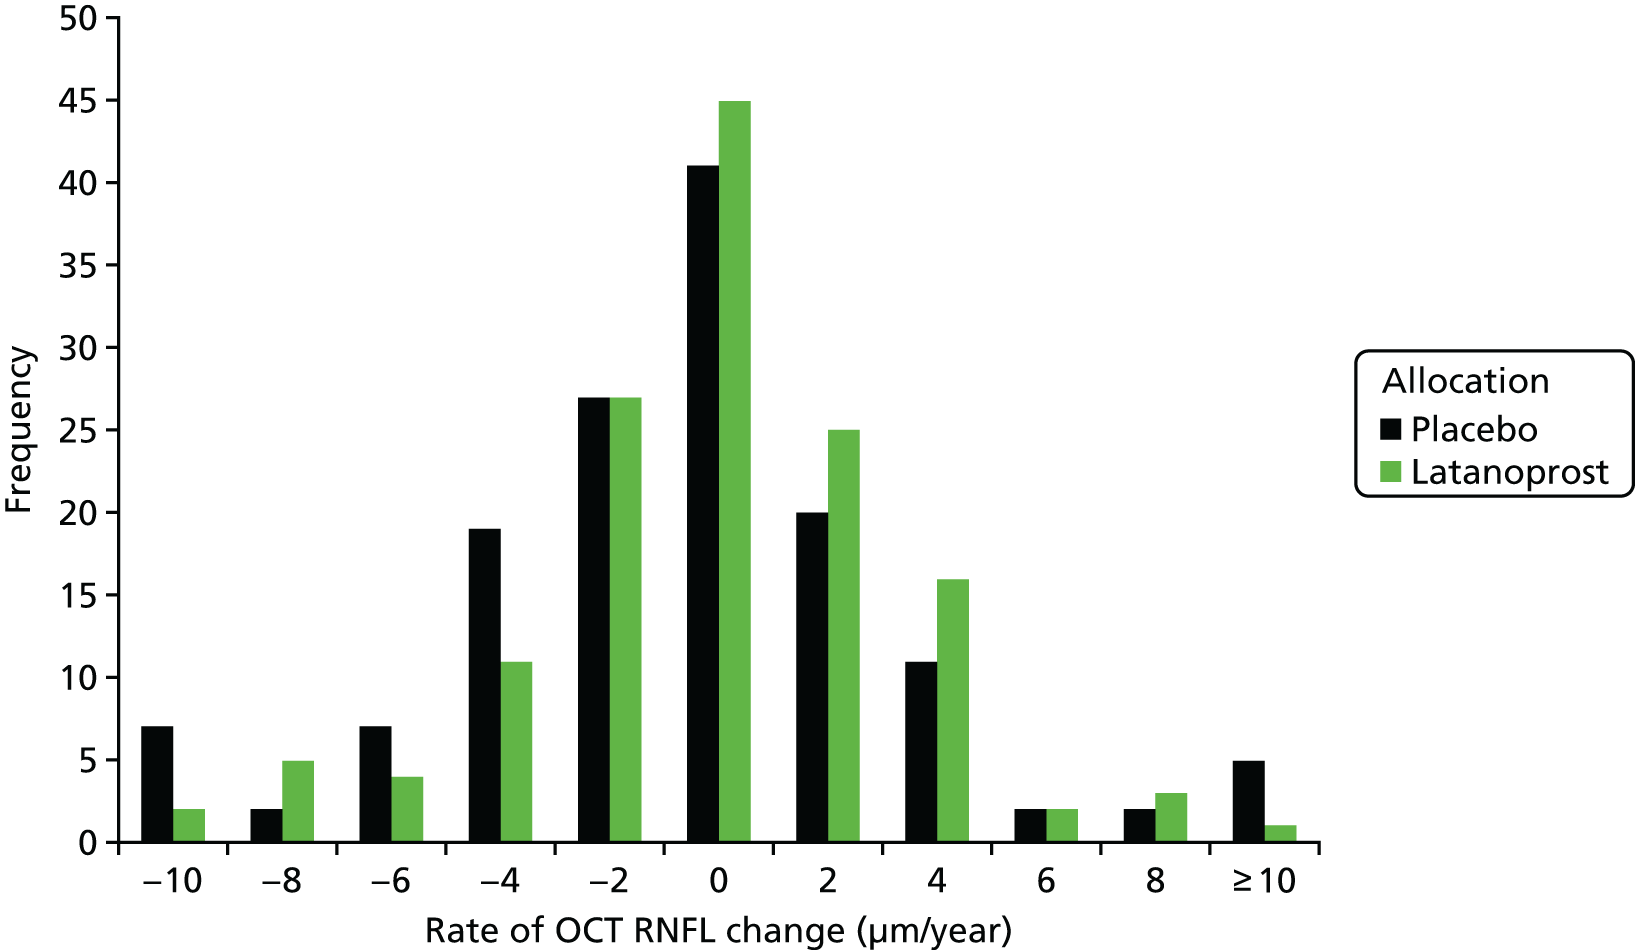
Association of the rate of retinal nerve fibre layer thickness change with visual field progression
A Cox proportional hazards model was fitted to the time to VF progression data for the 284 UKGTS participants with OCT RNFL thickness change data, OCT images at baseline and ≥ 6 months of follow-up. The significance of the association of various factors with time to incident progression (survival) is given in Table 6. Treatment allocation, the occurrence of a disc haemorrhage during follow-up (either eye) and the rate of OCT RNFL change were significantly associated with survival (p = 0.042–0.007) and baseline (pretreatment) IOP and baseline (visit 1) VF MD approached statistical significance (p between 0.077 and 0.085); the overall model fit was significant (p = 0.0007). The median rate of RNFL thickness change was –2.26 (5th to 95th percentile –9.82 to +5.17) µm per year in eyes with incident VF loss and –1.15 (5th to 95th percentile –7.20 to +5.10) µm per year in eyes without incident VF loss; the difference was statistically significant (Mann–Whitney test, p = 0.019).
| Covariate | b | SE | Wald | p | Exp(b) | 95% CI of Exp(b) |
|---|---|---|---|---|---|---|
| Age | 0.018 | 0.014 | 1.748 | 0.186 | 1.018 | 0.991 to 1.045 |
| Allocation | –0.770 | 0.287 | 7.226 | 0.007 | 0.463 | 0.264 to 0.812 |
| Baseline IOP | 0.050 | 0.029 | 2.972 | 0.085 | 1.051 | 0.993 to 1.113 |
| Baseline VF MD | 0.086 | 0.048 | 3.123 | 0.077 | 1.089 | 0.991 to 1.198 |
| OCT RNFL slope | –0.086 | 0.041 | 4.430 | 0.035 | 0.917 | 0.846 to 0.994 |
| Disc haemorrhage | 0.576 | 0.283 | 4.143 | 0.042 | 1.779 | 1.022 to 3.099 |
Reference method: Guided Progression Analysis
The reference method was time to VF progression based on the GPA criterion applied in the UKGTS. The progression criterion was applied sequentially to each VF test during follow-up of the 284 subjects with both VF and OCT measurements available at baseline and with ≥ 6 months of follow-up (see Figure 5). Survival was determined at the patient level, with the first UKGTS-eligible eye showing progression classifying the patient as ‘progressed’. Figure 19 illustrates the survival curves.
FIGURE 19.
Survival analysis for the 284 UKGTS participants with VFs and OCT images available at baseline and with ≥ 6 months of follow-up.
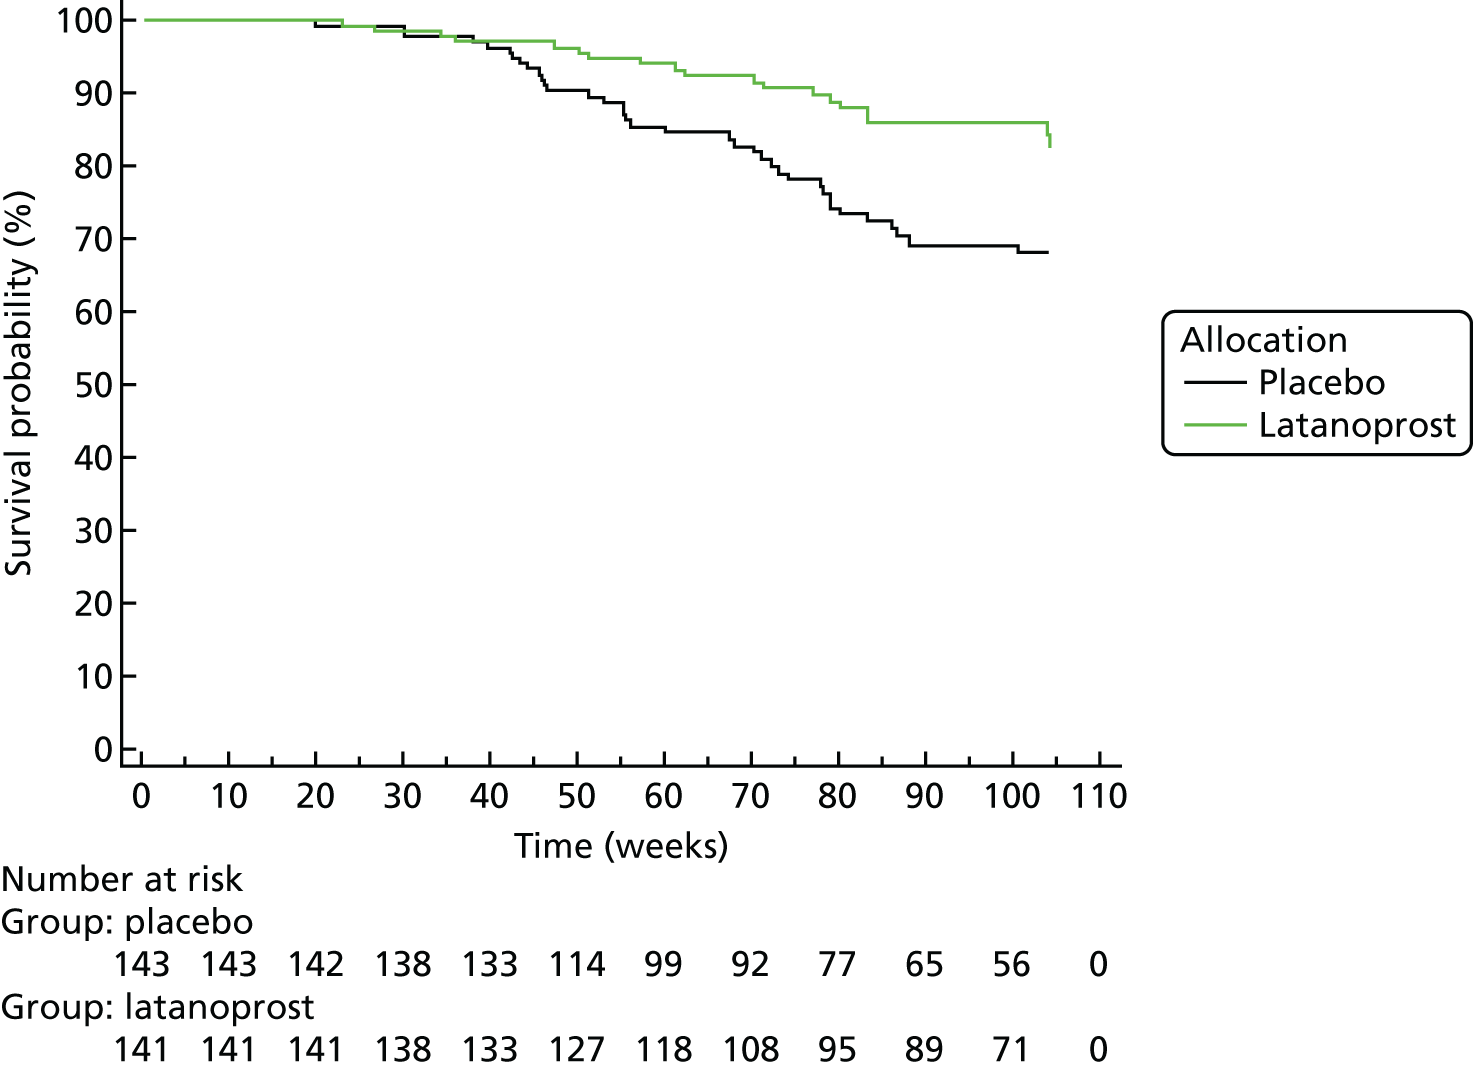
The log-rank test comparison of the survival curves was statistically significant (p = 0.0036); the HR was 0.45 (95% CI 0.27 to 0.76).
Criterion specificity was evaluated in the RAPID data set. Survival was determined at the patient level, with the first eye (with VF loss eligible for the UKGTS) showing progression classifying the patient as ‘progressed’. Four of 70 participants in the RAPID data set demonstrated progression according to the reference (GPA) criterion. Therefore, the false-positive estimate for the VF series (when this criterion is applied to each VF test in the series) in the RAPID data was 4/70 = 5.7% (95% CI 1.6% to 14.6%; specificity 94.3%, 95% CI 85.4% to 98.4%).
Evaluation of the ANSWERS, PoPLR and sANSWERS index methods
‘Hit rate’ compared with specificity
Figure 20 illustrates the proportion of eyes of the 320 UKGTS participants with five or more time points with both VF tests and OCT images available that were identified as progressing (the ‘hit rate’, equivalent to the true positives plus the false positives) plotted against the false-positive frequency (proportion of eyes of RAPID subjects identified as deteriorating) as the criterion for flagging an eye as deteriorating is varied. This is a larger subset than other analyses because baseline OCT images were not required (see Figure 5).
FIGURE 20.
The proportion of participants in the UKGTS identified as progressing (hit rate) plotted against the false-positive frequency as the criterion for progression is varied. The ‘hit rate’ is the proportion of eyes of UKGTS participants identified as deteriorating at criterion false-positive rates between 0% and 15%. Analyses are shown for the ANSWERS, PoPLR and sANSWERS models. Data are shown for series intervals (baseline to final observation) of up to (a) 7 months (404 eyes), (b) 13 months (378 eyes), (c) 18 months (286 eyes) and (d) 22 months (230 eyes). The shorter series are subsets of the longer series so that an eye identified as ‘progressed’ earlier in the series is carried forward as ‘progressed’ in the later series. Data are shown for 404 eyes of 320 participants.
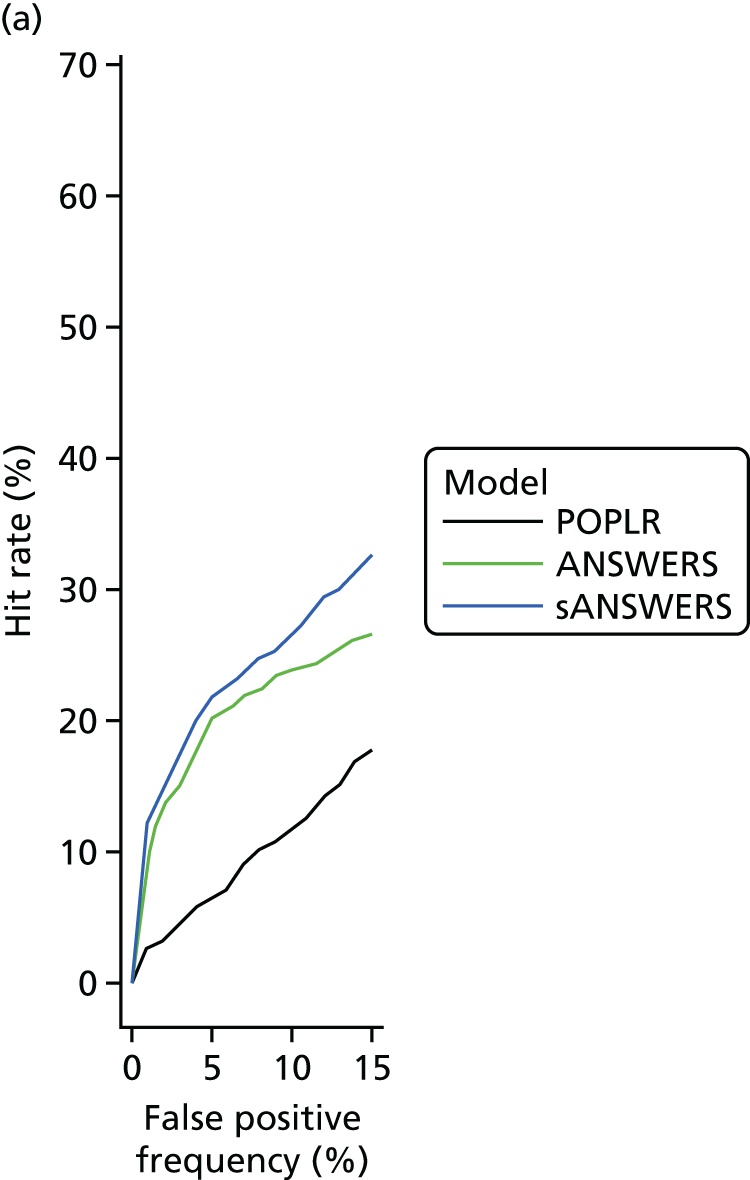
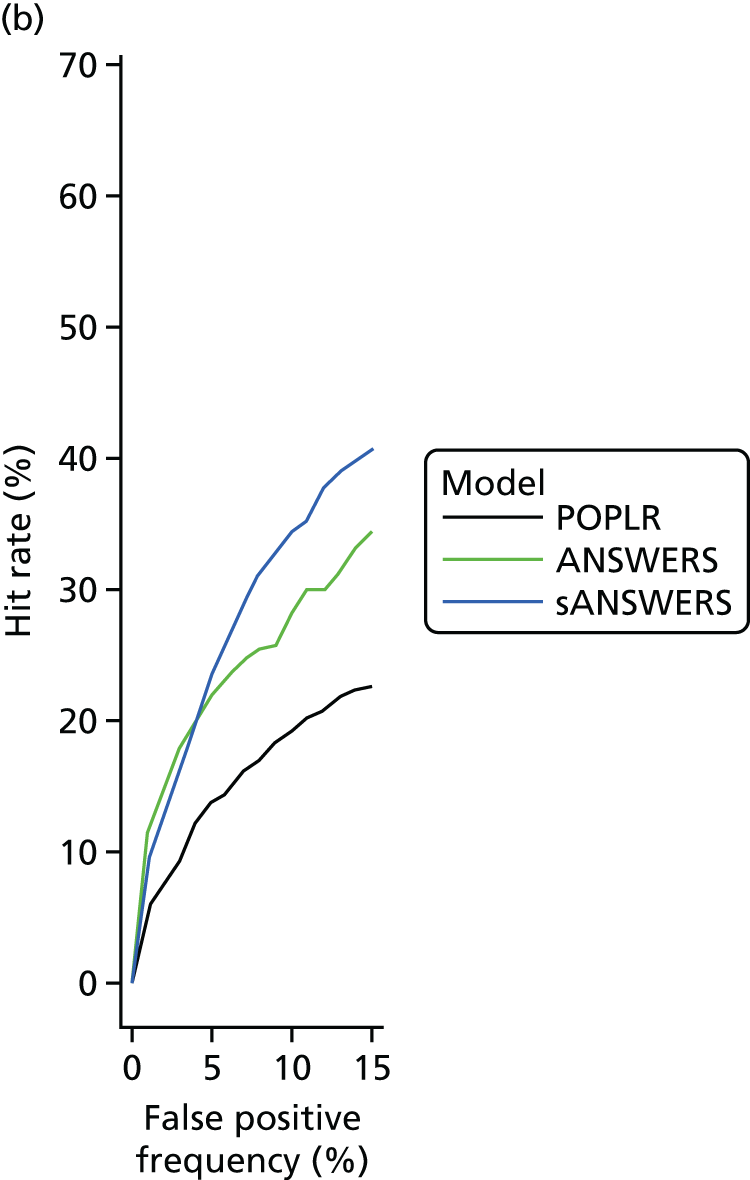
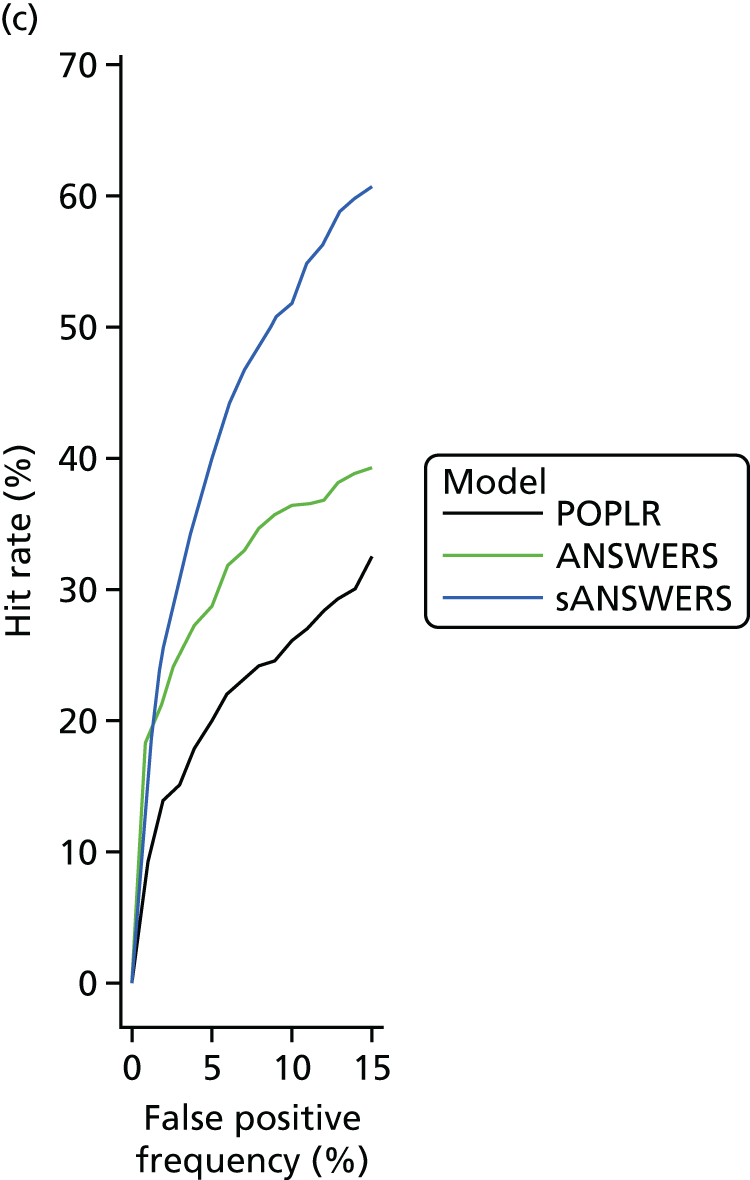
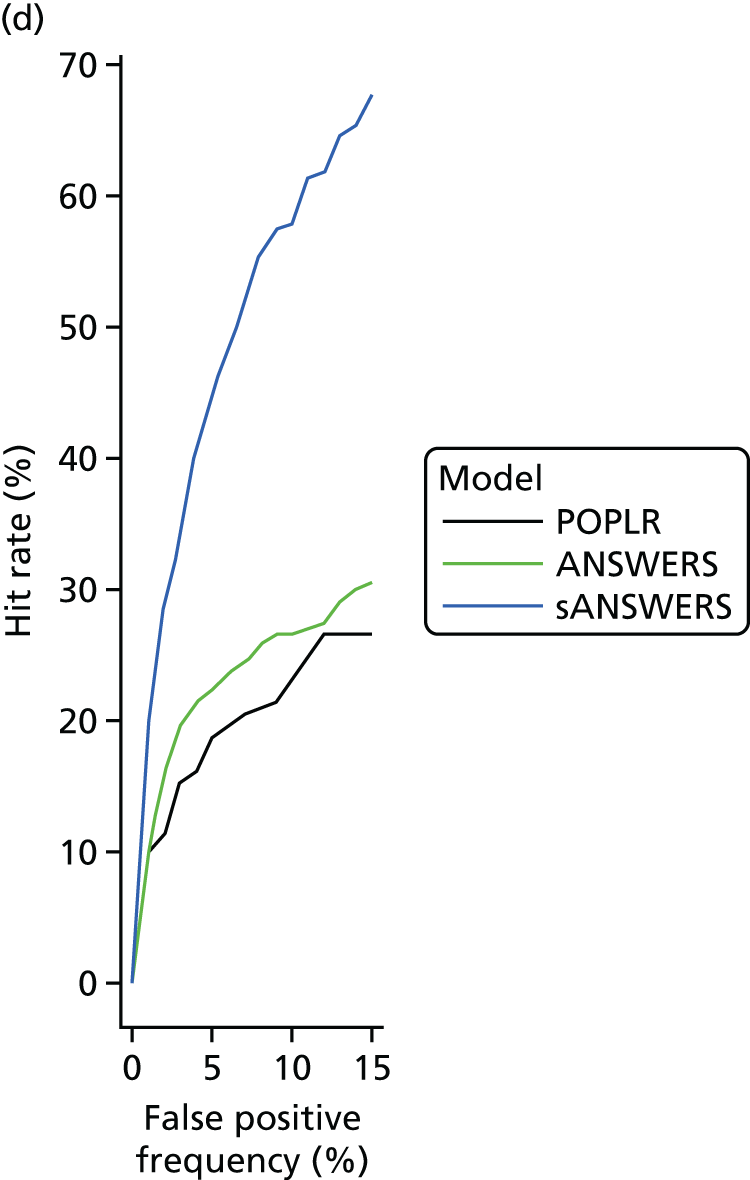
At a 5% false-positive frequency and after 22 months’ observation, the hit rate for the ANSWERS and PoPLR methods was similar, at around 20%. For comparison, the hit rate with the GPA criterion applied in the UKGTS in this subset of eyes with OCT data was 87/394 eligible eyes (22%). The hit rate for the sANSWERS method was considerably greater, at > 40%, suggesting that, for the same false-positive frequency, sANSWERS is much more sensitive at identifying a progressing eye. A similar pattern was seen for shorter follow-up durations, but with the ANSWERS method showing greater sensitivity than the PoPLR method for short follow-up durations.
Prediction of future visual field state
The sensitivity at each location in the last VF in a UKGTS participant’s series was predicted by projecting the trend for sensitivity change observed over the first five visits to the time of the last VF. The period over which the initial trend line was fitted was a mean (SD) of 42.4 (6.2) weeks and the mean (SD) interval from the initial period to the predicted VF was 49.2 (19.8) weeks.
The mean prediction errors (average error across the 52 locations in the VF) across subjects were not normally distributed (D’Agostino–Pearson test, p < 0.0001). The median mean prediction error across subjects was 3.8 (5th to 95th centile 1.7 to 7.6) dB for SLR, 3.0 (5th to 95th centile 1.5 to 5.7) dB for ANSWERS and 2.3 (5th to 95th centile 1.3 to 4.5) dB for sANSWERS. The difference between methods was evaluated with the Wilcoxon signed-rank test; all pairs of comparisons were significantly different at the p < 0.0001 level.
Survival analyses
The following survival analyses were conducted on data from the 320 subjects who had five or more time points with both VF tests and OCT images available (see Figure 5) (in contrast to Reference method: Guided Progression Analysis, which describes the analysis of patients with only OCT data at the baseline visit). Survival was determined at the patient level, with the first UKGTS-eligible eye showing progression classifying the patient as ‘progressed’.
Guided Progression Analysis (reference test)
The survival analysis employing the GPA progression criterion applied in the UKGTS is shown in Figure 21. The number of participants with incident progression was 42 (27.1%) in the placebo group, 29 (17.6%) in the latanoprost group and 71 (22.2%, 95% CI 17.8% to 27.2%) overall. The overall mean survival time was 93.6 weeks (95% CI 91.3 to 96.0 weeks). The HR was 0.566 (95% CI 0.354 to 0.903) and the log-rank test to compare the survival curves was significant at p = 0.016.
FIGURE 21.
Kaplan–Meier survival curves for the subset of UKGTS participants with OCT images applying the GPA criterion for progression.
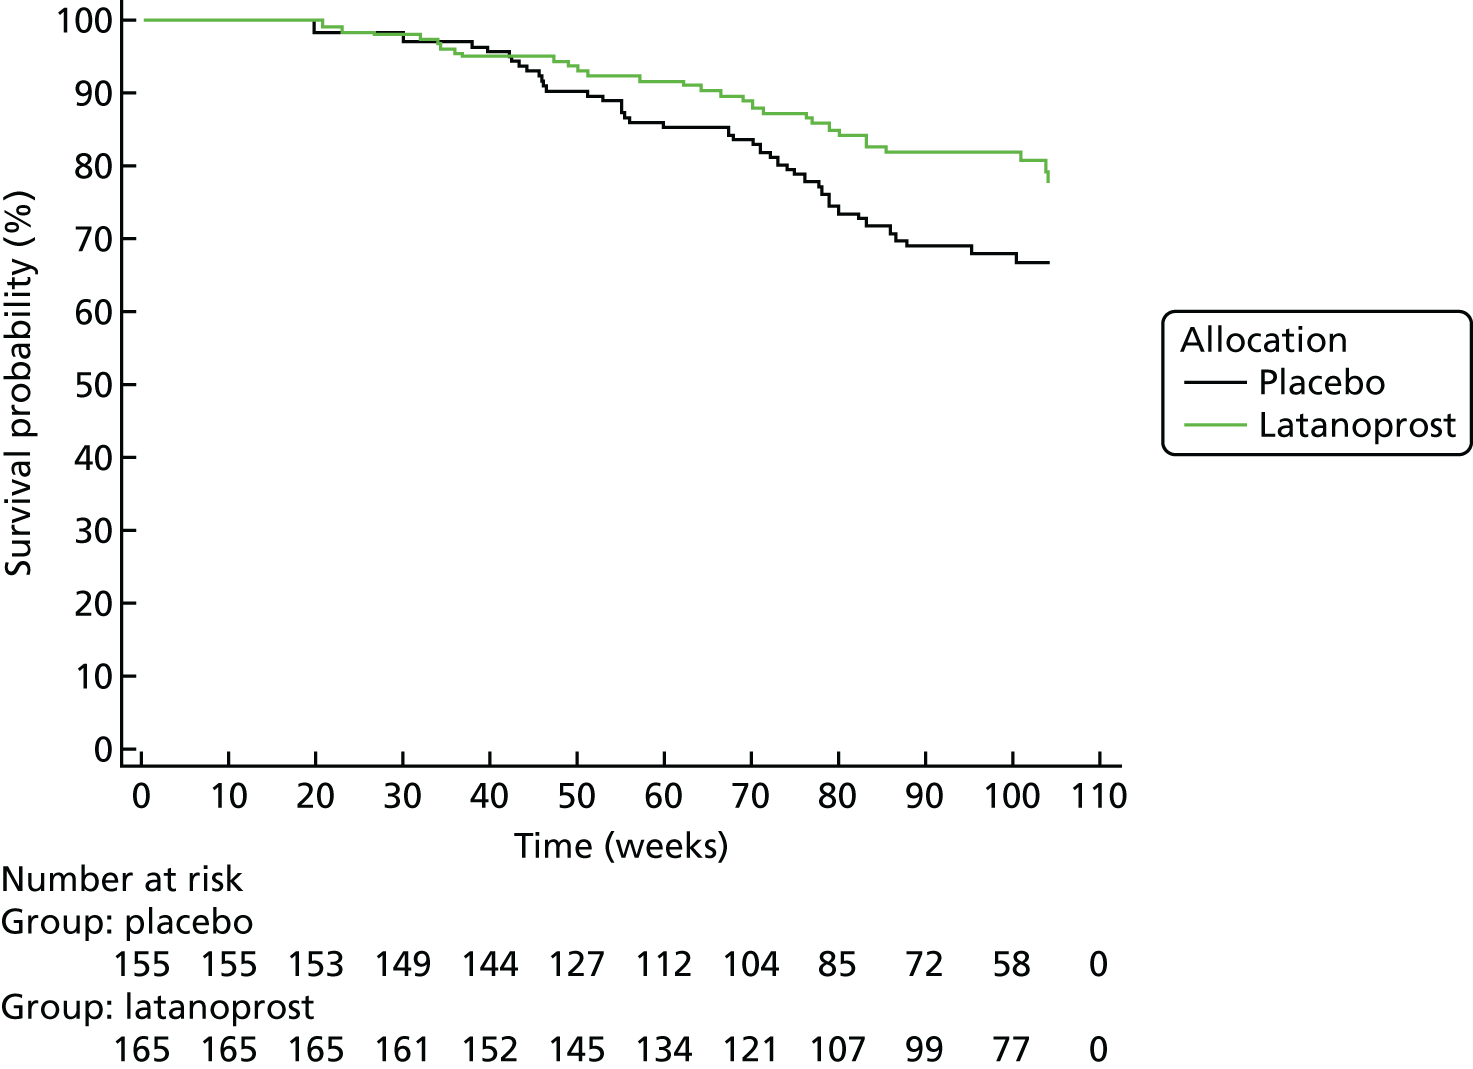
ANSWERS
The survival analysis employing the ANSWERS survival criterion giving a 5% false-positive rate when applied sequentially to each VF in a participant’s VF series in the RAPID data set is shown in Figure 22. The number of participants with incident progression was 90 (58.0%) in the placebo group, 82 (49.7%) in the latanoprost group and 172 (53.8%, 95% CI 48.1% to 59.3%) overall. The proportion identified as progressing was statistically significantly greater than that identified with the GPA criterion (McNemar test, p < 0.0001). The overall mean survival time was 72.0 weeks (95% CI 68.6 to 75.5 weeks). The HR was 0.758 (95% CI 0.561 to 1.023) and the log-rank test to compare the survival curves was borderline statistically significant at p = 0.065.
FIGURE 22.
Kaplan–Meier survival curves for the subset of UKGTS participants with OCT images applying the ANSWERS criterion for progression.
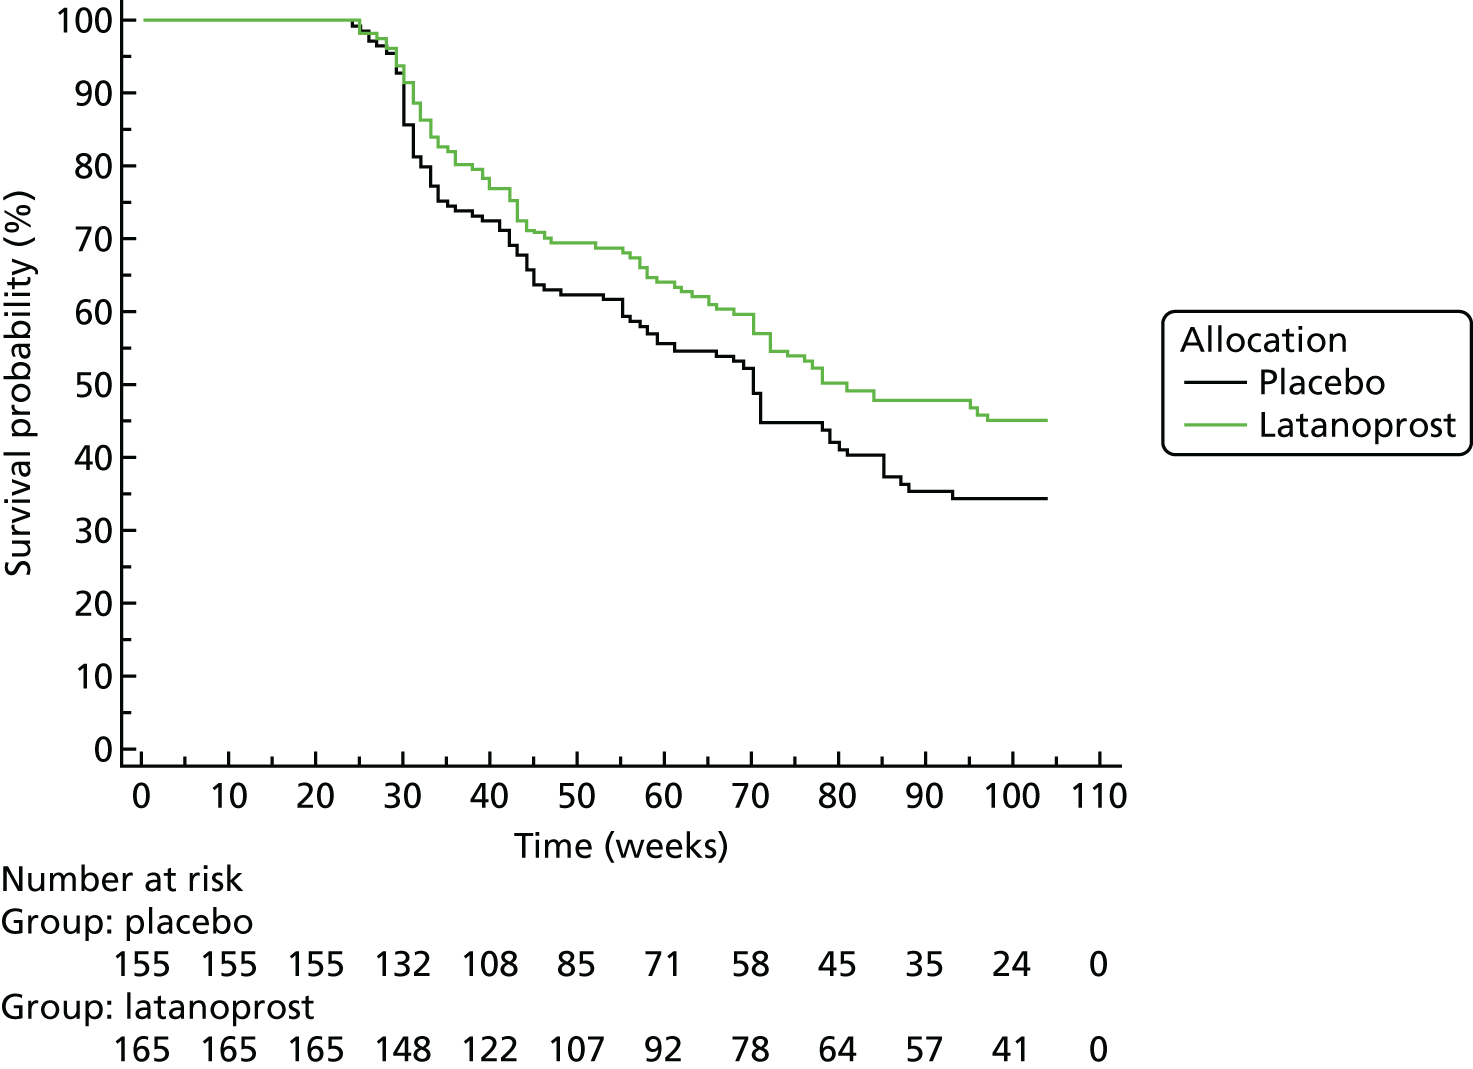
Permutation analyses of pointwise linear regression
The survival analysis employing the PoPLR survival criterion, giving a 5% false-positive rate when applied sequentially to each VF in a participant’s VF series in the RAPID data set, is shown in Figure 23. The number of participants with incident progression was 76 (49.0%) in the placebo group, 57 (34.6%) in the latanoprost group and 133 (41.6%, 95% CI 36.1% to 47.2%) overall. The proportion identified as progressing was statistically significantly greater than that identified with the GPA criterion (McNemar test, p < 0.0001), but statistically significantly less than that identified with the ANSWERS criterion (McNemar test, p < 0.0001). The overall mean survival time was 82.5 weeks (95% CI 79.5 to 85.5 weeks). The HR was 0.590 (95% CI 0.419 to 0.831) and the log-rank test to compare the survival curves was significant at p = 0.002.
FIGURE 23.
Kaplan–Meier survival curves for the subset of UKGTS participants with OCT images applying the PoPLR criterion for progression.
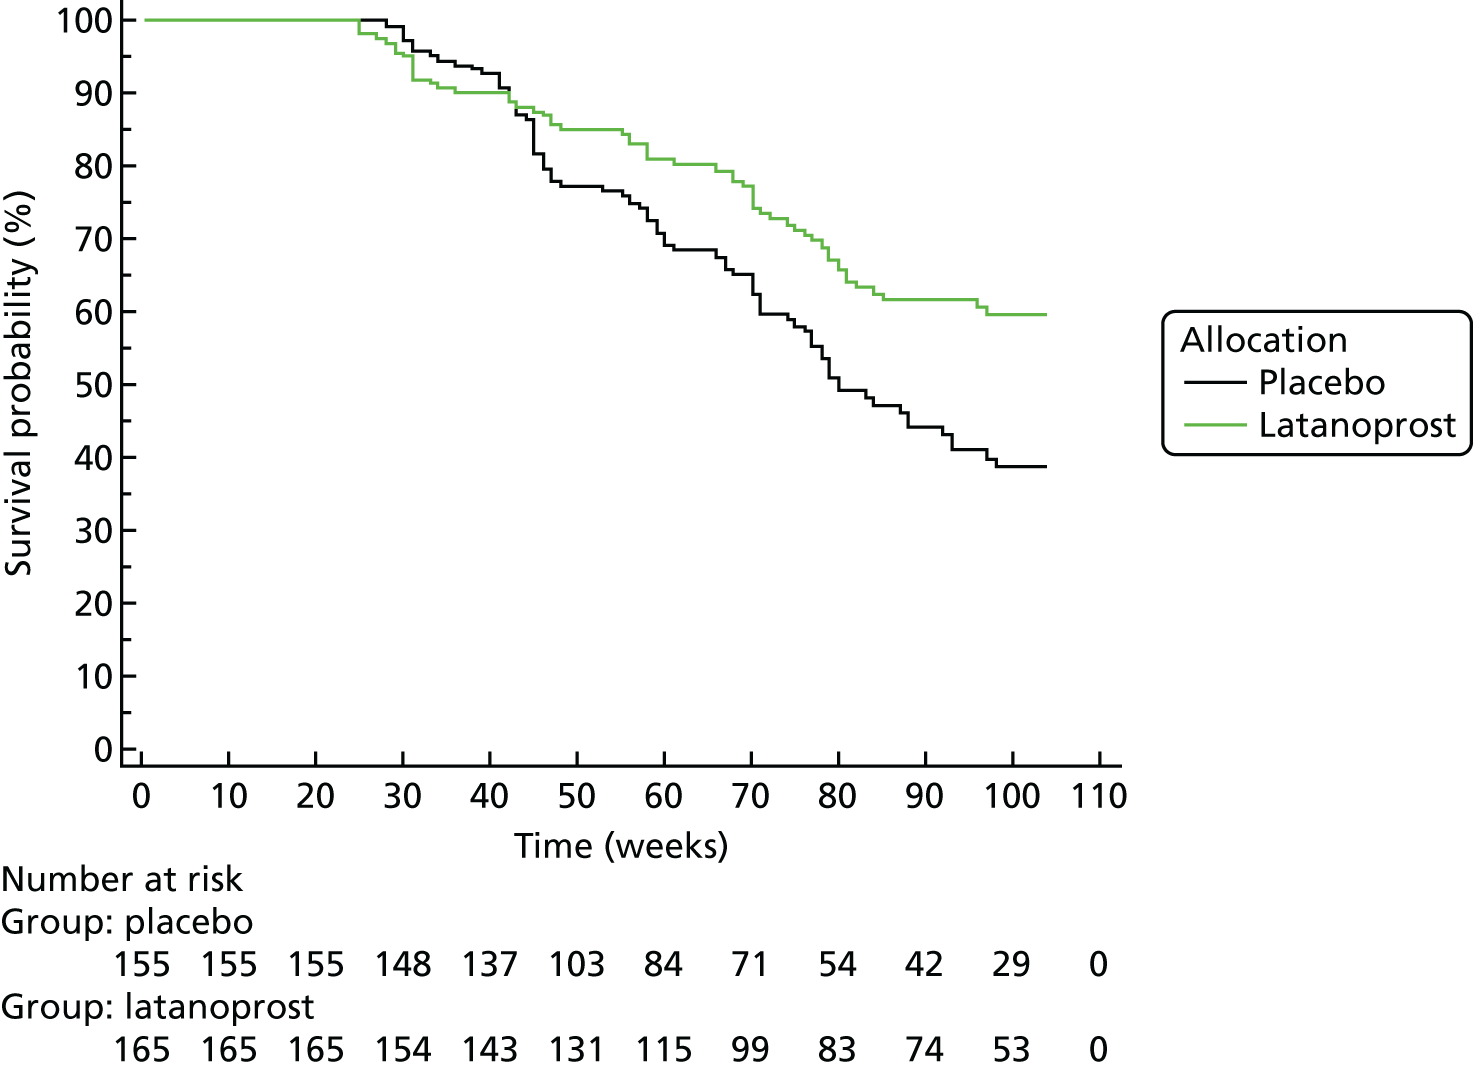
Structure-guided ANSWERS
The survival analysis employing the sANSWERS survival criterion, giving a 5% false-positive rate when applied sequentially to each VF in a participant’s VF series in the RAPID data set, is shown in Figure 24. The number of participants with incident progression was 103 (66.5%) in the placebo group, 93 (56.4%) in the latanoprost group and 196 (61.3%, 95% CI 55.7% to 66.6%) overall. The proportion identified as progressing was statistically significantly greater than that identified with the GPA and PoPLR criteria (McNemar test, p < 0.0001) and statistically significantly greater than that identified with the ANSWERS criterion (McNemar test, p = 0.042). The overall mean survival time was 69.1 weeks (95% CI 65.7 to 72.4 weeks). The HR was 0.704 (95% CI 0.531 to 0.933) and the log-rank test to compare the survival curves was significant at p = 0.012.
FIGURE 24.
Kaplan–Meier survival curves for the subset of UKGTS participants with OCT images applying the sANSWERS criterion for progression.
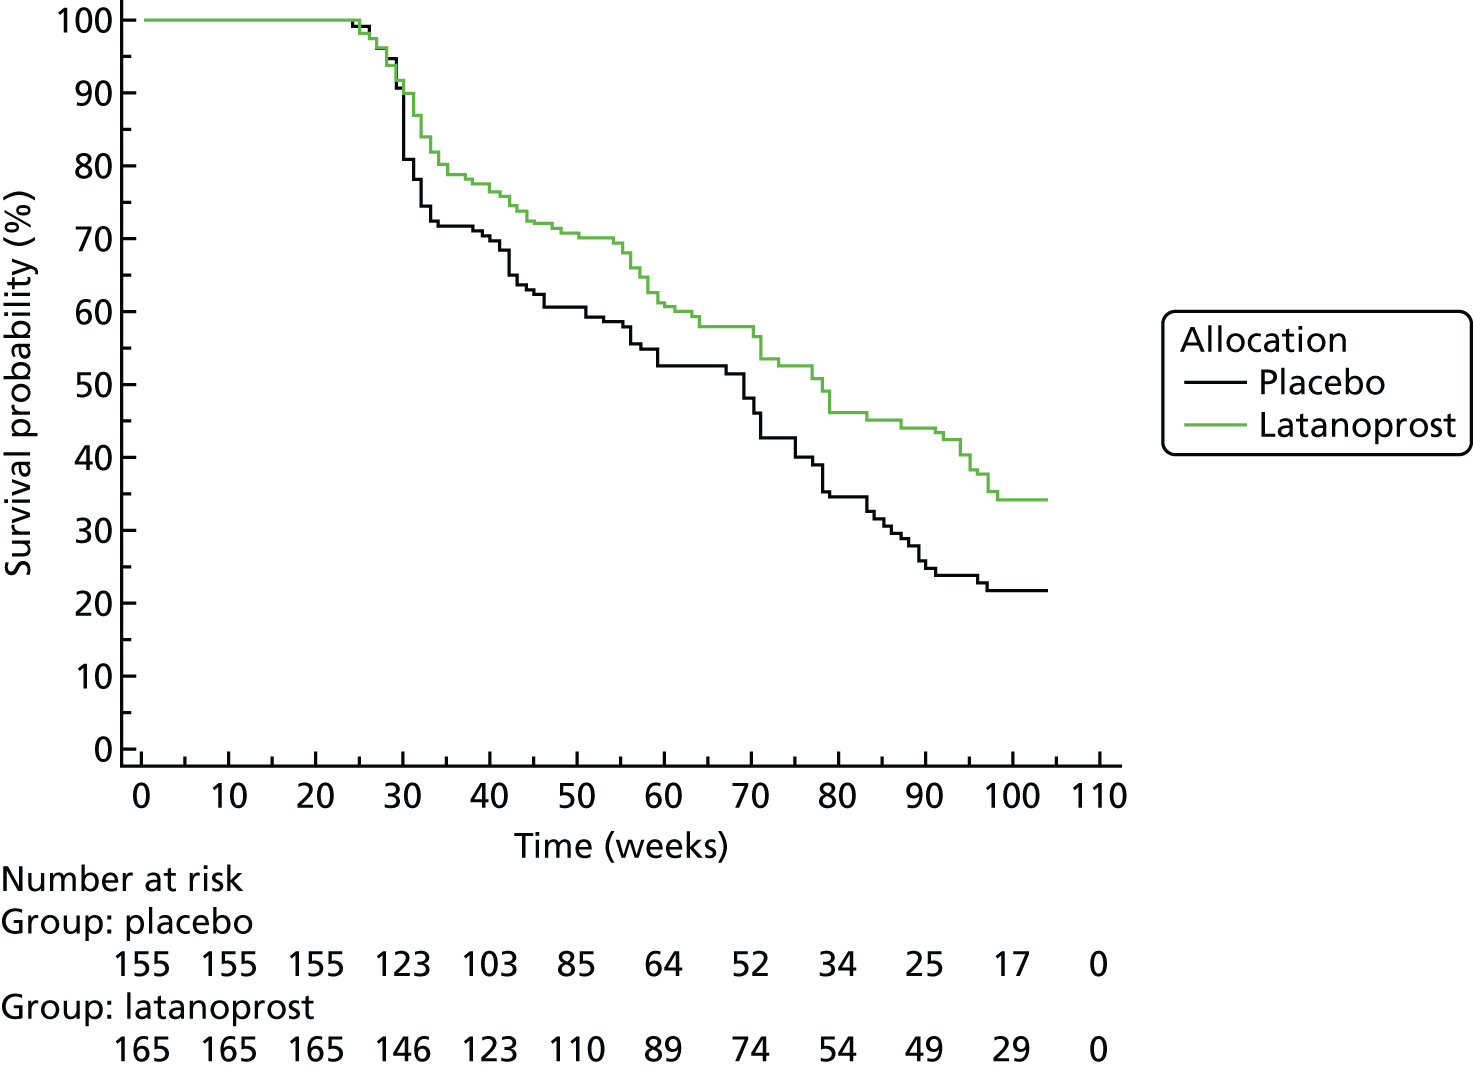
Post hoc survival analyses
Application of the progression criterion for ANSWERS and sANSWERS resulted in the identification of 53.8% and 61.3%, respectively, of UKGTS participants as progressing, substantially more than the 22.2% identified as progressing with the reference standard GPA criterion. The HRs resulting from application of the ANSWERS and sANSWERS criteria (0.758 and 0.704, respectively) suggested a smaller treatment effect than the HR resulting from application of the GPA criterion (0.566). A possible explanation for this finding is that the treatment is more effective in more rapidly progressing eyes. To test this hypothesis, in a post hoc analysis, to label an eye as progressing, an additional ‘rate of change’ in MD criterion was added to the requirement for a negative slope, with statistical significance sufficient for 95% specificity. For sANSWERS, a rate of change cut-off value at approximately the 50th centile of significantly progressing participants was selected; the rate of change in MD at this cut-off value was –0.35 dB per year. Residual life expectancy at diagnosis for glaucoma patients is a median of about 16 years. 106 For a patient presenting with relatively early VF loss in the better eye of MD –4 dB, –0.35 dB per year would result in a MD of nearly –10 dB; this change in MD would alter the probability of failing the vision requirements for driving from about 24% to about 70%. 107 An MD change of –0.35 dB per year is therefore clinically meaningful.
The rates of change estimated by sANSWERS were more accurate than those estimated by SLR or ANSWERS (see Prediction of future visual field state). Therefore, for comparison with sANSWERS, we selected a rate of change criterion for ANSWERS that identified the same number of subjects as progressing as the sANSWERS criterion; this was a MD change of –1.05 dB per year. Survival analyses for ANSWERS and sANSWERS with the additional rate criterion were calculated.
ANSWERS
The survival analysis employing the ANSWERS survival criterion including the rate of change is shown in Figure 25. The number of participants with incident progression was 60 (38.7%) in the placebo group, 44 (26.7%) in the latanoprost group and 104 (32.5%, 95% CI 27.5% to 38.0%) overall. The proportion identified as progressing was statistically significantly greater than that identified with the GPA criterion (McNemar test, p < 0.005). The overall mean survival time was 85.0 weeks (95% CI 81.2 to 88.1 weeks). The HR was 0.593 (95% CI 0.403 to 0.873) and the log-rank test to compare the survival curves was borderline statistically significant at p = 0.0075.
FIGURE 25.
Kaplan–Meier survival curves for the subset of UKGTS participants with OCT images applying the criterion for progression for ANSWERS including a MD rate of progression of > –1.05 dB per year.
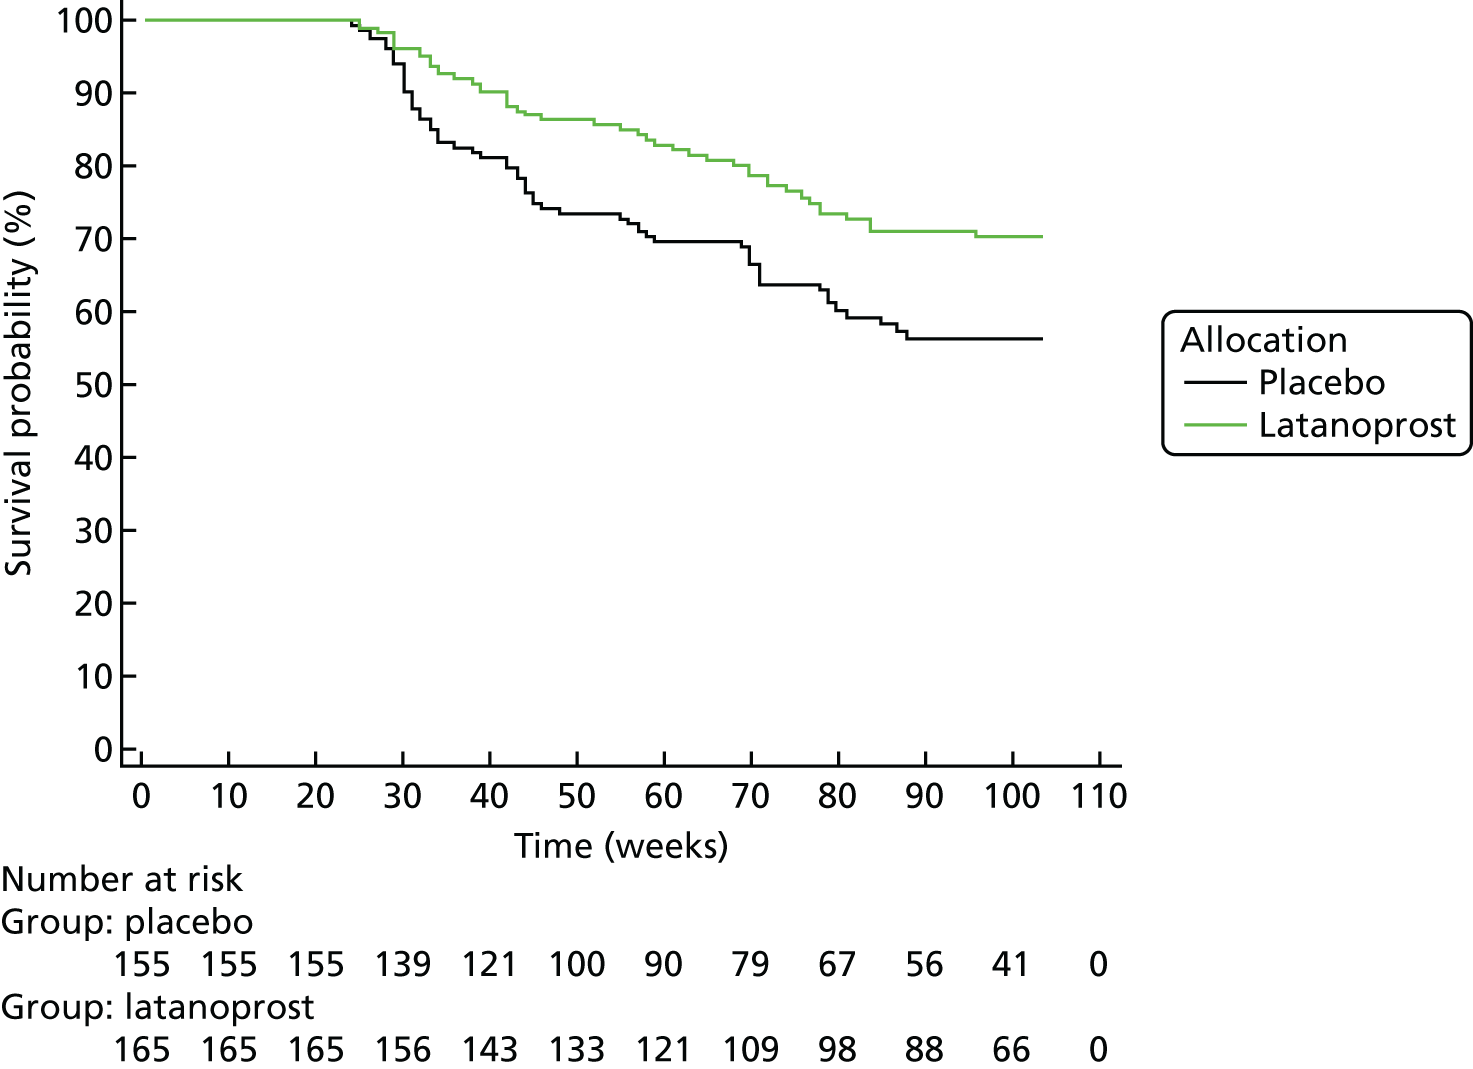
Structure-guided ANSWERS
The survival analysis employing the sANSWERS survival criterion including the rate of change is shown in Figure 26. The number of participants with incident progression was 63 (40.7%) in the placebo group, 41 (24.9%) in the latanoprost group and 104 (32.5%, 95% CI 27.5% to 38.0%) overall. The proportion identified as progressing was statistically significantly greater than that identified with the GPA criterion (McNemar test, p < 0.005). The overall mean survival time was 83.7 weeks (95% CI 80.3 to 87.0 weeks). The HR was 0.573 (95% CI 0.390 to 0.843) and the log-rank test to compare the survival curves was borderline statistically significant at p = 0.0047.
FIGURE 26.
Kaplan–Meier survival curves for the subset of UKGTS participants with OCT images applying the criterion for progression for sANSWERS including a MD rate of progression of > –0.35 dB per year.
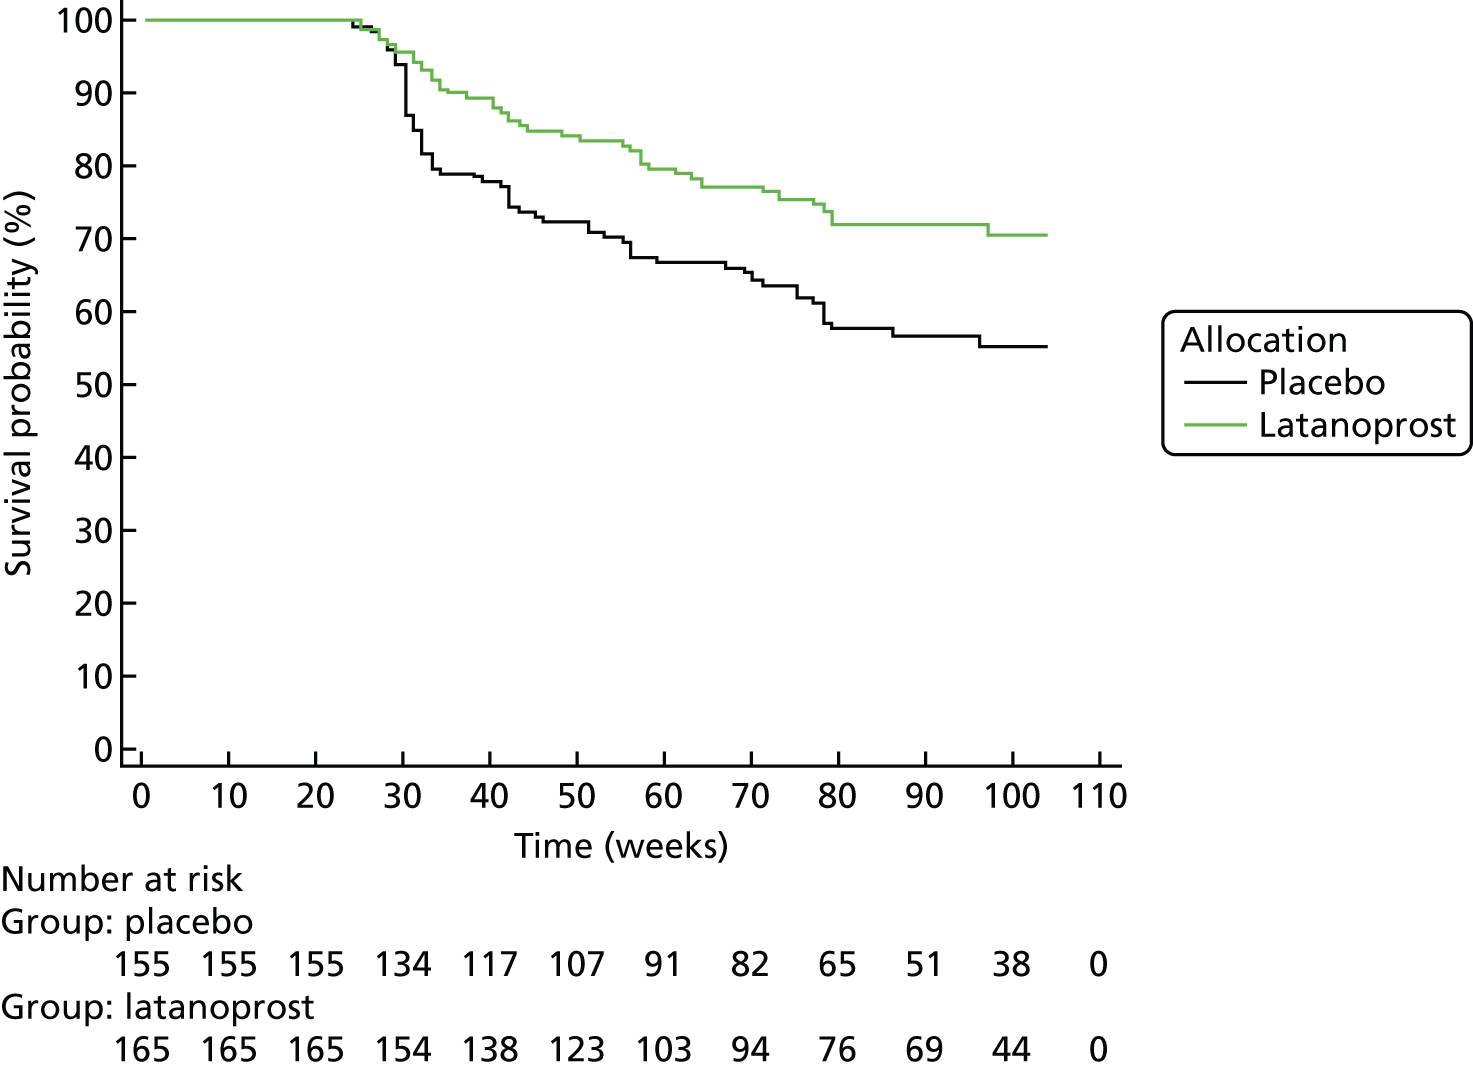
Sample size calculations
The purpose of the sample size calculations was to estimate, for each analysis method and the HR estimated for the analysis method (see Survival analyses), the sample size required for a clinical trial of a treatment with the same effect size as latanoprost in the UKGTS and for an observation period of 18 months per participant. A second set of sample size calculations was carried out to assess a HR of 0.6, based on the GPA [see Guided Progression Analysis (reference test)] and PoPLR (section 7.4.3.3) criteria and the ANSWERS and sANSWERS post hoc criteria (see Post hoc survival analyses).
The sample size calculations were based on the survival curves in the preceding section. The number of events required was determined from the observed HR for each method and a HR of 0.60, a type 1 error of 5%, a type 2 error of 10% and equal allocation between treatment groups. In the UKGTS, progression (deterioration) events were observed from 4.5 months onwards (once sufficient data had been collected to enable application of the GPA criterion).The sample size was estimated for an 18-month (4.5 plus 13.5 month) trial from the number of events required, the observed event rate in the placebo group for each method and the censoring rate observed in the UKGTS. Event rates were calculated over the 13.5-month interval, after the initial 4.5 months, for an 18-month trial. The loss to follow-up (censoring) rate was about 10% per year in the UKGTS.
The sample size calculations were made with an online calculator. 108,109
Sample size calculations for the observed hazard ratio
Guided Progression Analysis (reference test)
-
HR = 0.566, event rate = 20% per year, loss to follow-up = 10% per year.
-
Number of events required = 130.
-
Sample size = 427 per arm = 854 total.
ANSWERS
-
HR = 0.758, event rate = 40% per year, loss to follow-up = 10% per year.
-
Number of events required = 547.
-
Sample size = 884 per arm = 1768 total.
Permutation analyses of pointwise linear regression
-
HR = 0.590, event rate = 38% per year, loss to follow-up = 10% per year.
-
Number of events required = 151.
-
Sample size = 279 per arm = 558 total.
Structure-guided ANSWERS
-
HR = 0.704, event rate = 48% per year, loss to follow-up = 10% per year.
-
Number of events required = 341.
-
Sample size = 489 per arm = 978 total.
Sample size calculations for a hazard ratio of 0.6
Guided Progression Analysis (reference test)
-
HR = 0.60, event rate = 20% per year, loss to follow-up = 10% per year.
-
Number of events required = 161.
-
Sample size = 519 per arm = 1038 total.
ANSWERS
-
HR = 0.60, event rate = 32% per year, loss to follow-up = 10% per year.
-
Number of events required = 161.
-
Sample size = 342 per arm = 684 total.
Permutation analyses of pointwise linear regression
-
HR = 0.60, event rate = 38% per year, loss to follow-up = 10% per year.
-
Number of events required = 161.
-
Sample size = 296 per arm = 592 total.
Structure-guided ANSWERS
-
HR = 0.60, event rate = 36% per year, loss to follow-up = 10% per year.
-
Number of events required = 161.
-
Sample size = 309 per arm = 618 total.
Evaluation of newly developed methods
Analyses
The analysis methods applied were as follows:
-
PERM:
-
with the timescale as either visit number or time since baseline
-
using individual VF location sensitivity or VF region mean sensitivity
-
when more than one VF test was taken at a visit, taking either the mean values or the values in the initial test at the visit
-
-
MaHMIC
-
MaGIC.
All analyses were performed using Stata® software (version 14; StataCorp LP, College Station, TX, USA) or R.
Permutation test
Participants with three or fewer visits were not included in the permutation analyses as there are only six permutations of three objects and this is not sufficient to produce significance at the 5% level (there is a lack of power – even if the original ordering of the visits is such that the slope is the most extreme that it could be, the one-sided p-value would still be only 1/6 = 0.167). With four visits, if the observed data give a test statistic that is more extreme than those from all other permutations, the one-sided p-value is 1/24 = 0.042, which is just statistically significant using a conventional cut-off value of 5% (although not if corrections for multiple testing are carried out). For four visits, all 23 permutations plus the original ordering of visits were used; for five visits, all 119 permutations plus the original were used; for six visits, all 719 permutations plus the original were used; and, for seven or more visits, 719 permutations were selected at random for use in the PERM in addition to the original ordering of visits.
Visual field sensitivity at each location (or region mean) and the average RNFL thickness from OCT were regressed against time (visit number or time from baseline) using interval-censored regression with VF sensitivities censored at 15 dB (note that imaging outcomes were not censored). Locations with one or fewer uncensored observations were not included in the regression model; the rationale for this is that these locations contain very little information on whether the patient is progressing or not, but will add uncertainty to the model estimates. When more than one VF test was taken at the same visit, either the mean value at each location was used (see RAPID data set, Permutation with visit number as the timescale and Permutation with time since baseline as the timescale, and United Kingdom Glaucoma Treatment Study, Permutation with visit number as the timescale and Permutation with time since baseline as the timescale) or only the first VF of the visit was used (see RAPID data set, Permutations using one visual field per visit, and United Kingdom Glaucoma Treatment Study, Permutations using one visual field per visit).
The regression model included both individual means and slopes over time for each VF location and for the imaging outcome. The model also allowed heterogeneity of the residual variance according to measurement type (separate variances were estimated for the VF and OCT measurements). The regression model was applied to the original ordering of the visits and to each of the (up to 719) permutations described above.
After each model was run, the following parameters were stored:
-
Simple average of the slopes from the individual slopes from the VF locations. Note that this is the average of 52 slopes for people with no locations that have one or fewer uncensored observations (i.e. two or more values of ≥ 15 dB at that location). For people with locations that have one or fewer uncensored values, the average will be taken across fewer than 52 slopes.
-
Chi-squared test statistic for the simple average of the VF slopes.
-
Slope of the imaging outcome.
-
Chi-squared test statistic for the imaging outcome slope.
-
Chi-squared test statistic for a joint test of all of the individual VF slopes.
-
Chi-squared test statistic for a joint test of all of the individual VF slopes and the imaging outcome slope. This test statistic is used in two different ways:
-
requiring the mean VF slope to be negative
-
requiring both the mean VF slope and the imaging slope to be negative.
-
-
Chi-squared test statistic for a joint test of the simple average of the VF slopes and the imaging slope. This test statistic is used in two different ways:
-
requiring the mean VF slope to be negative
-
requiring both the mean VF slope and the imaging slope to be negative.
-
-
Mean slopes within the six sectors defined in the structure/function map (see Figure 4). 22
PERM was then applied to each of these parameters in turn to give a p-value. Progressing eyes were then defined in the following way:
-
For the simple average of VF slopes, the imaging slope and the test statistics for both, a one-sided p-value at the 5% significance level was used so that all progressors have a negative slope over time. A one-sided test was used, as clinically a decision to intensify treatment will be made on the basis of deteriorating VF and imaging values, not improvement.
-
For the other test statistics, a two-sided p-value was used as it is not clear from a chi-squared test statistic which tail the statistic belongs to. However, to declare progression a negative mean VF slope or both a negative mean VF slope and a negative imaging slope was required. The significance level was set such that a type 1 error of close to 5% was achieved in the RAPID data.
-
The mean from each sector was permuted separately and then progressing eyes were defined as those with at least one sector-specific p-value below a critical value. A Bonferroni correction was used to account for multiple testing (described in Mean slopes within visual field sector). Given that such a correction is likely to be overly conservative, other corrections were also considered.
In computing hit rates and specificities using data that accumulate over time, there are two possible approaches. One is to compute the hit rate and specificity at a single visit, using data from that visit and earlier ones to assess trends. The second is to compute the hit rate and specificity cumulatively so that they represent the probability of a positive result at the current and previous visits combined.
There are advantages and disadvantages of both approaches. Using the former approach it is possible to constrain the specificity to take a particular value (such as 95%) at each visit, whereas using the latter approach the specificity will inevitably increase with an increasing number of visits. The latter approach might be preferable if one was considering a particular trial design in which every patient has a fixed maximum number of (say) six visits, whereas the former is arguably preferable for continuous monitoring when there is no upper limit to the number of visits. In this section we have opted for the former approach because we are focusing on the context of a single patient being seen repeatedly in clinical practice.
RAPID data set
In the following sections we consider whether the number of eyes identified as progressing is consistent with a false-positive error (type 1 error) of 5%. This is equivalent to considering whether the specificity, or true negative rate, is consistent with 95%.
Permutation with visit number as the timescale
Visual field sensitivity at each location
In this analysis the VF sensitivity at each location and the average RNFL thickness from OCT were regressed against visit number (numbering all visits in the data set from 1 up to a maximum of 10) using interval-censored regression.
The results for the nine different tests are presented in Table 7. All PERM variants resulted in approximately 5% (range 4.4–5.9%) of the 135 eyes from the RAPID data set with four or more visits being identified as progressing. None of the tests resulted in a 95% CI that did not cover 5%. However, the number of eyes in this data set, although large for a test–retest data set, is still relatively small for determining the type 1 error with any great precision, as demonstrated by the wide CIs.
| Parameter to be permuted | Number of progressing eyes; % progressing eyes (95% CI) | Mean (range) VF slope in progressing eyes (dB/visit) | Mean (range) imaging slope in progressing eyes (µm/visit) | Mean (range) VF slope in non-progressing eyes (dB/visit) | Mean (range) imaging slope in non-progressing eyes (µm/visit) |
|---|---|---|---|---|---|
| Mean of VF slopesa | 7; 5.2 (2.1 to 10.4) | –0.46 (–1.85 to –0.10) | –0.18 (–0.49 to 0.88) | 0.06 (–0.29 to 1.88) | 0.02 (–8.26 to 2.04) |
| Test statistic for mean of VF slopesa | 6; 4.4 (1.6 to 9.4) | –0.53 (–1.85 to –0.14) | –0.17 (–0.49 to 0.88) | 0.06 (–0.29 to 1.88) | 0.02 (–8.26 to 2.04) |
| Imaging slopea | 7; 5.2 (2.1 to 10.4) | 0.09 (0.01 to 0.19) | –1.68 (–8.26 to –0.45) | 0.03 (–1.85 to 1.88) | 0.10 (–2.16 to 2.04) |
| Test statistic for imaging slopea | 7; 5.2 (2.1 to 10.4) | 0.09 (0.01 to 0.19) | –1.68 (–8.26 to –0.45) | 0.03 (–1.85 to 1.88) | 0.10 (–2.16 to 2.04) |
| Test statistic for joint test of all VF slopesb | 8; 5.9 (2.6 to 11.3) | –0.41 (–1.85 to –0.05) | –0.06 (–0.49 to 0.88) | 0.06 (–0.29 to 1.88) | 0.01 (–8.26 to 2.04) |
| Test statistic for joint test of all VF and imaging slopes (mean VF slope < 0)b | 7; 5.2 (2.1 to 10.4) | –0.46 (–1.85 to –0.05) | –0.09 (–0.49 to 0.88) | 0.06 (–0.29 to 1.88) | 0.01 (–8.26 to 2.04) |
| Test statistic for joint test of all VF and imaging slopes (mean VF and imaging slopes < 0)c | 8; 5.9 (2.6 to 11.3) | –0.35 (–1.85 to –0.01) | –0.37 (–0.49 to –0.22) | 0.06 (–0.55 to 1.88) | 0.03 (–8.26 to 2.04) |
| Test statistic for joint test of mean VF and imaging slopes (mean VF slope < 0)b | 6; 4.4 (1.6 to 9.4) | –0.53 (–1.85 to –0.14) | –0.17 (–0.49 to 0.88) | 0.06 (–0.29 to 1.88) | 0.02 (–8.26 to 2.04) |
| Test statistic for joint test of mean VF and imaging slopes (mean VF and imaging slopes < 0)d | 7; 5.2 (2.1 to 10.4) | –0.42 (–1.85 to –0.10) | –0.35 (–0.49 to –0.22) | 0.06 (–0.55 to 1.88) | 0.03 (–8.26 to 2.04) |
The critical p-values for the permutation of the joint tests were set at 0.1 (for the joint test of the location-specific VF slopes and the joint test of the mean VF slope and imaging slope when requiring only a negative mean VF slope), 0.15 (for the joint test of the mean VF slope and imaging slope when requiring both a negative mean VF slope and a negative imaging slope) and 0.2 (for the joint test of the location-specific VF slopes and the imaging slope). These values were chosen as they give a type 1 error of approximately 5% in the RAPID (‘stable glaucoma’) cohort.
Confidence intervals for the percentage of progressing eyes were calculated without taking clustering of eyes within people into account. Ignoring this clustering results in CIs that are too narrow but, as we are using this technique to assess whether the specificity is consistent with 5%, this results in a conservative approach, assuming a positive correlation between eyes within the same person. The approach is conservative because CIs calculated ignoring the clustering will, in expectation, be narrower than if the clustering was taken into account, so if the narrower CI still covers a type 1 error of 5% then it would also be covered by a CI that was adjusted for clustering. We therefore chose not to adjust for clustering as doing so would necessitate the use of normal approximations instead of the exact binomial CI and this is likely to be inappropriate given the small sample size.
Mean slopes within visual field sector
In this analysis we used the mean slope within the VF regions described previously (see Figure 4),22 with the mean slope being the average of the location-specific slopes each obtained from regressions of VF sensitivity against visit number.
The numbers of eyes progressing in RAPID subjects, considering each region-specific mean separately, are presented in Table 8.
| Region | Number of VF locations in region | Number of progressing eyes |
|---|---|---|
| 1 | 8 | 7 |
| 2 | 13 | 8 |
| 3 | 4 | 5 |
| 4 | 6 | 7 |
| 5 | 10 | 10 |
| 6 | 12 | 4 |
Considering all of the VF region means together, and requiring at least one of the region means to be progressing to declare an eye as progressing, results in 26 eyes being flagged as progressing. This equates to 19.3% (95% CI 12.6% to 25.9%) of the sample, indicating that ignoring the multiple testing results in an unacceptably high type 1 error rate. We therefore implemented a Bonferroni correction, under which the p-value required to declare progression is reduced by a factor equal to the number of tests carried out. In this case, as we are testing six different sectors, the p-value is required to be < 0.05/6 = 0.0083. Using this correction, requiring at least one sector to be progressing identifies six eyes as progressing, which equates to a percentage of 4.4% (95% CI 1.6% to 9.4%), which is not inconsistent with a type 1 error of 5%.
A Bonferroni correction may be too conservative in this setting given that the sector means will be correlated and hence the tests will not be independent. If instead a critical p-value of 0.05/5 is used, eight eyes (5.9%, 95% CI 2.6% to 11.3%) are identified as progressing, which is still consistent with a 5% type 1 error rate. Using a still less-conservative cut-off value of 0.05/4 also identifies eight eyes as progressing. Using 0.05/3 as the critical p-value identifies 11 eyes as progressing. This corresponds to 8.1% (95% CI 4.1% to 14.1%) of eyes, which again is still just consistent with a 5% false-positive rate.
Permutation with time since baseline as the timescale
Instead of using visit number, in this analysis PERM variants were based on regressions on time since first visit.
The results from the PERM variants, presented in Table 9, are very similar to those obtained from regressions on visit number. A few more eyes were identified as progressing by some tests but all percentages of progressing eyes were still consistent with a type 1 error of 5% (range 4.4–6.7%).
| Parameter to be permuted | Number of progressing eyes; % progressing eyes (95% CI) | Mean (range) VF slope in progressing eyes (dB/year) | Mean (range) imaging slope in progressing eyes (µm/year) | Mean (range) VF slope in non-progressing eyes (dB/year) | Mean (range) imaging slope in non-progressing eyes (µm/year) |
|---|---|---|---|---|---|
| Mean of VF slopesa | 8; 5.9 (2.6 to 11.3) | –13.7 (–42.4 to –5.4) | –7.7 (–21.4 to 19.3) | 2.8 (–11.8 to 68.1) | –1.5 (–433.6 to 61.9) |
| Test statistic for mean of VF slopesa | 9; 6.7 (3.1 to 12.3) | –13.1 (–42.4 to –5.4) | –8.1 (–21.4 to 19.3) | 2.9 (–11.8 to 68.1) | –1.5 (–433.6 to 61.9) |
| Imaging slopea | 8; 5.9 (2.6 to 11.3) | 5.5 (1.4 to 10.3) | –75.3 (–433.6 to –13.9) | 1.6 (–42.4 to 68.1) | 2.7 (–111.1 to 61.9) |
| Test statistic for imaging slopea | 8; 5.9 (2.6 to 11.3) | 5.5 (1.4 to 10.3) | –75.3 (–433.6 to –13.9) | 1.6 (–42.4 to 68.1) | 2.7 (–111.1 to 61.9) |
| Test statistic for joint test of all VF slopesb | 8; 5.9 (2.6 to 11.3) | –13.2 (–42.4 to –2.6) | –4.6 (–21.4 to 19.3) | 2.8 (–11.8 to 68.1) | –1.7 (–433.6 to 61.9) |
| Test statistic for joint test of all VF and imaging slopes (mean VF slope < 0)b | 7; 5.2 (2.1 to 10.4) | –14.4 (–42.4 to –2.6) | –3.9 (–21.4 to 19.3) | 2.7 (–11.8 to 68.1) | –1.8 (–433.6 to 61.9) |
| Test statistic for joint test of all VF and imaging slopes (mean VF and imaging slopes < 0)c | 7; 5.2 (2.1 to 10.4) | –11.8 (–42.4 to –2.0) | –15.1 (–21.4 to –9.1) | 2.6 (–14.6 to 68.1) | –1.2 (–433.6 to 61.9) |
| Test statistic for joint test of mean VF and imaging slopes (mean VF slope < 0)b | 6; 4.4 (1.6 to 9.4) | –16.3 (–42.4 to –6.2) | –5.7 (–21.4 to 19.3) | 2.7 (–11.8 to 68.1) | –1.7 (–433.6 to 61.9) |
| Test statistic for joint test of mean VF and imaging slopes (mean VF and imaging slopes < 0)d | 7; 5.2 (2.1 to 10.4) | –12.8 (–42.4 to –5.4) | –14.1 (–21.4 to –11.2) | 2.6 (–14.6 to 68.1) | –1.2 (–433.6 to 61.9) |
Permutations using one visual field only per visit
Previous analyses have used the average of all VF tests from a particular visit. However, in clinical practice usually only one VF test is carried out per visit. We therefore repeated the analyses using the first VF test only for any given visit. OCT is relatively easy to perform, taking much less time to complete a scan, and so we continued using the average of all of the OCT repeat tests for a visit.
The results, presented in Table 10, again show a very similar pattern to that seen in the previous analyses, with the number of eyes identified as progressing consistent with a type 1 error of 5% (range 4.4–7.4%).
| Parameter to be permuted | Number of progressing eyes; % progressing eyes (95% CI) | Mean (range) VF slope in progressing eyes (dB/visit) | Mean (range) imaging slope in progressing eyes (µm/visit) | Mean (range) VF slope in non-progressing eyes (dB/visit) | Mean (range) imaging slope in non-progressing eyes (µm/visit) |
|---|---|---|---|---|---|
| Mean of VF slopesa | 6; 4.4 (1.6 to 9.4) | –0.52 (–1.86 to –0.13) | –0.2 (–0.5 to 0.9) | 0.05 (–0.29 to 1.19) | 0.02 (–8.3 to 2.0) |
| Test statistic for mean of VF slopesa | 7; 5.2 (2.1 to 10.4) | –0.48 (–1.86 to –0.13) | –0.2 (–0.5 to 0.9) | 0.05 (–0.29 to 1.19) | 0.02 (–8.3 to 2.0) |
| Imaging slopea | 7; 5.2 (2.1 to 10.4) | 0.07 (–0.14 to 0.22) | –1.7 (–8.3 to –0.4) | 0.02 (–1.86 to 1.19) | 0.1 (–2.2 to 2.0) |
| Test statistic for imaging slopea | 7; 5.2 (2.1 to 10.4) | 0.07 (–0.14 to 0.22) | –1.7 (–8.3 to –0.4) | 0.02 (–1.86 to 1.19) | 0.1 (–2.2 to 2.0) |
| Test statistic for joint test of all VF slopesb | 7; 5.2 (2.1 to 10.4) | –0.43 (–1.86 to –0.01) | –0.1 (–0.5 to 0.9) | 0.05 (–0.29 to 1.19) | 0.01 (–8.3 to 2.0) |
| Test statistic for joint test of all VF and imaging slopes (mean VF slope < 0)b | 8; 5.9 (2.6 to 11.3) | –0.39 (–1.86 to –0.01) | –0.18 (–0.67 to 0.88) | 0.05 (–0.29 to 1.19) | 0.02 (–8.26 to 2.04) |
| Test statistic for joint test of all VF and imaging slopes (mean VF and imaging slopes < 0)c | 10; 7.4 (3.6 to 13.2) | –0.28 (–1.86 to –0.00) | –0.41 (–0.67 to –0.22) | 0.05 (–0.50 to 1.19) | 0.04 (–8.26 to 2.04) |
| Test statistic for joint test of mean VF and imaging slopes (mean VF slope < 0)b | 6; 4.4 (1.6 to 9.4) | –0.52 (–1.86 to –0.13) | –0.17 (–0.49 to 0.88) | 0.05 (–0.29 to 1.19) | 0.02 (–8.26 to 2.04) |
| Test statistic for joint test of mean VF and imaging slopes (mean VF and imaging slopes < 0)d | 9; 6.7 (3.1 to 12.3) | –0.35 (–1.86 to –0.10) | –0.38 (–0.67 to –0.22) | 0.05 (–0.50 to 1.19) | 0.03 (–8.26 to 2.04) |
United Kingdom Glaucoma Treatment Study data set
Permutation with visit number as the time scale
Visual field sensitivity at each location
Permuting the mean of the VF slopes from each location resulted in 32 out of 386 eyes being identified as progressing (Table 11). Permutation of the test statistic for the mean of VF slopes gave very similar results, with 34 eyes flagged as progressing. Of the 32 progressing eyes identified by the permutation of the mean of VF slopes, 31 were also identified as progressing by the chi-squared test statistic for the mean VF slope. The hit rate varied between 8.3% and 17.1% across the different permutation methods.
| Parameter to be permuted | Number of progressing eyes; % progressing eyes (95% CI) | Mean (range) VF slope in progressing eyes (dB/visit) | Mean (range) imaging slope in progressing eyes (µm/visit) | Mean (range) VF slope in non-progressing eyes (dB/visit) | Mean (range) imaging slope in non-progressing eyes (µm/visit) |
|---|---|---|---|---|---|
| Mean of VF slopesa | 32; 8.3 (5.7 to 11.5) | –0.38 (–0.82 to –0.13) | –0.50 (–2.95 to 4.15) | 0.02 (–3.03 to 1.10) | –0.36 (–5.19 to 3.80) |
| Test statistic for mean of VF slopesa | 34; 8.8 (6.2 to 12.1) | –0.36 (–0.82 to –0.13) | –0.58 (–2.95 to 4.15) | 0.02 (–3.03 to 1.10) | –0.35 (–5.19 to 3.80) |
| Imaging slopea | 66; 17.1 (13.5 to 21.2) | –0.02 (–0.67 to 0.68) | –1.38 (–5.13 to –0.44) | –0.01 (–3.03 to 1.10) | –0.16 (–5.19 to 4.15) |
| Test statistic for imaging slopea | 66; 17.1 (13.5 to 21.2) | –0.02 (–0.67 to 0.68) | –1.38 (–5.13 to –0.44) | –0.01 (–3.03 to 1.10) | –0.16 (–5.19 to 4.15) |
| Test statistic for joint test of all VF slopesb | 39; 10.1 (7.3 to 13.6) | –0.31 (–0.82 to –0.02) | –0.52 (–2.95 to 4.15) | 0.03 (–3.03 to 1.10) | –0.35 (–5.19 to 3.80) |
| Test statistic for joint test of all VF and imaging slopes (mean VF slope < 0)b | 42; 10.9 (8.0 to 14.4) | –0.28 (–0.75 to –0.02) | –0.53 (–2.75 to 4.15) | 0.02 (–3.03 to 1.10) | –0.35 (–5.19 to 3.80) |
| Test statistic for joint test of all VF and imaging slopes (mean VF and imaging slopes < 0)c | 45; 11.7 (8.6 to 15.3) | –0.26 (–0.82 to –0.01) | –1.04 (–2.95 to –0.02) | 0.02 (–3.03 to 1.10) | –0.28 (–5.19 to 4.15) |
| Test statistic for joint test of mean VF and imaging slopes (mean VF slope < 0)b | 39; 10.1 (7.3 to 13.6) | –0.31 (–0.75 to –0.03) | –0.66 (–2.75 to 4.15) | 0.02 (–3.03 to 1.10) | –0.34 (–5.19 to 3.80) |
| Test statistic for joint test of mean VF and imaging slopes (mean VF and imaging slopes < 0)d | 38; 9.8 (7.1 to 13.3) | –0.27 (–0.75 to –0.03) | –0.99 (–2.75 to –0.02) | 0.02 (–3.03 to 1.10) | –0.30 (–5.19 to 4.15) |
Sixty-six eyes (17.1%, 95% CI 13.5% to 21.2%) were identified as progressing by permuting the imaging slope or its test statistic. Both PERM variants gave identical results. There was little overlap between the eyes identified as progressing by permuting the mean VF slope and the eyes identified as progressing by using the imaging slope: only eight eyes were flagged as progressing by both tests.
Permuting the joint test statistic for all location-specific VF slopes flagged slightly more eyes as progressing than using the mean VF slope: 39 compared with 32. Of these, 27 eyes were identified as progressing by both tests.
Using the joint test statistic for all VF and imaging slopes identified a few more eyes, with 42 identified as progressing when requiring only the mean VF slope to be negative and a p-value of < 0.1 and 45 identified as progressing when requiring that both the mean VF and the imaging slopes are negative and that the p-value is < 0.2.
Permuting the joint test statistic for the mean VF and imaging slopes also identified slightly more progressing eyes than using the mean VF slope alone: 39 eyes were identified when requiring only the mean VF slope to be negative and a p-value of < 0.1 and 38 eyes were identified when requiring that both the mean VF and the imaging slopes are negative and that the p-value is < 0.15.
As expected, there was a large overlap between the eyes identified as progressing by use of the joint test statistic for all VF slopes and the imaging slope and the joint test statistic for the mean VF slope and imaging slope: 36 eyes were flagged by both tests.
For the non-progressing eye in Table 11 with a mean VF slope of –3.03 dB per visit, there are only four visits available in this data set. PERM is therefore based on only 24 permutations and in fact the permutation p-value is 0.08, suggesting that progression might be identified at the next visit.
In Table 11 we report the exact binomial CIs for the percentage of progressing eyes. As discussed earlier, when assessing specificity, ignoring clustering of eyes within patients results in a conservative approach. However, when investigating the hit rate in UKGTS participants, this is no longer true. Ignoring clustering will lead to narrower CIs, assuming a positive correlation between eyes within the same patient, which is anti-conservative. However, it is not possible to adjust for clustering when using an exact CI. It is possible to adjust for clustering when using a normal approximation for the CI, however. For permutation of the mean VF slope this gives a 95% CI of 5.2% to 11.4%, compared with 5.5% to 11.1% for the exact CI. Alternatively, a 95% CI could be calculated using a normal approximation on the logistic scale and then back-transformed to provide a CI for the proportion. Using this approach gives a 95% CI of 5.7% to 11.9%. All three approaches give very similar results and so we provide only the exact CIs for the other tests presented in the tables.
The pairwise comparison of the progressing eyes identified by the joint test statistic for all VF slopes (fifth row of Table 11; 39 eyes) and those flagged by the joint test statistic for all VF slopes and the imaging slope requiring both the mean VF slope and the imaging slope to be negative (seventh row of Table 11; 45 eyes) is provided in Table 12. McNemar’s exact binomial test of the agreement between these approaches gives a two-sided p-value of 0.33. McNemar’s exact binomial test conditions on the total number of discordant pairs (eyes detected as progressing by one method but not by the other) and compares the number of discordant pairs of both types (detected by method 1 but missed by method 2 and vice versa). Under the null hypothesis the distribution of the number of discordant pairs of one type conditional on the total number of such pairs follows a binomial distribution with an expectation of 0.5; hence, an exact binomial test can be used to give a p-value. Note that as the exact CI is very similar to the CI adjusting for clustering (see above), we used the exact binomial test here without adjustment for clustering.
| Number of non-progressing eyes classified by the joint test statistic for all VF slopes and the imaging slope | Number of progressing eyes classified by the joint test statistic for all VF slopes and the imaging slope | Total | |
|---|---|---|---|
| Number of non-progressing eyes classified by the mean VF slope test statistic | 331 | 16 | 347 |
| Number of progressing eyes classified by the mean VF slope test statistic | 10 | 29 | 39 |
| Total | 341 | 45 | 386 |
A pairwise comparison of the progressing eyes identified by the imaging slope (third row of Table 11; 66 eyes) and those identified by the joint test statistic for all VF slopes and the imaging slope requiring both the mean VF slope and the imaging slope to be negative (seventh row of Table 11; 45 eyes) is provided in Table 13. McNemar’s exact binomial test of the agreement between these approaches gave a two-sided p-value of 0.02.
| Number of non-progressing eyes classified by the joint test statistic for all VF slopes and the imaging slope | Number of progressing eyes classified by the joint test statistic for all VF slopes and the imaging slope | Total | |
|---|---|---|---|
| Number of non-progressing eyes classified by the imaging slope | 295 | 25 | 320 |
| Number of progressing eyes classified by the imaging slope | 46 | 20 | 66 |
| Total | 341 | 45 | 386 |
Table 14 shows the number of progressing eyes identified by the nine variants of PERM by treatment group in the UKGTS. Although most of the tests involving VF data do identify a statistically significant effect of latanoprost, permutation of the imaging slope alone or its test statistic does not. For the same reasons as for using McNemar’s exact binomial test earlier, we used Fisher’s exact test to compare the proportions, without adjusting for clustering of eyes within person.
| Parameter to be permuted | Number of progressing eyes in the placebo group (n = 189) | Number of progressing eyes in the latanoprost group (n = 197) | p-value for the difference in proportions between treatment groups |
|---|---|---|---|
| Mean of VF slopesa | 22 | 10 | 0.03 |
| Test statistic for mean of VF slopesa | 23 | 11 | 0.03 |
| Imaging slopea | 36 | 30 | 0.35 |
| Test statistic for imaging slopea | 36 | 30 | 0.35 |
| Test statistic for joint test of all VF slopesb | 27 | 12 | 0.01 |
| Test statistic for joint test of all VF and imaging slopes (mean VF slope < 0)b | 29 | 13 | 0.008 |
| Test statistic for joint test of all VF and imaging slopes (mean VF and imaging slopes < 0)c | 31 | 14 | 0.007 |
| Test statistic for joint test of mean VF and imaging slopes (mean VF slope < 0)b | 23 | 16 | 0.24 |
| Test statistic for joint test of mean VF and imaging slopes (mean VF and imaging slopes < 0)d | 27 | 11 | 0.006 |
In total, 109 eyes were identified as progressing on at least one of the PERM variants. The distribution of number of visits per eye for these 109 progressing eyes is shown in Table 15.
| Number of visits per eye | Number of progressing eyes | Number of non-progressing eyes |
|---|---|---|
| 4 | 9 | 47 |
| 5 | 15 | 52 |
| 6 | 18 | 46 |
| 7 | 17 | 34 |
| 8 | 18 | 38 |
| 9 | 13 | 31 |
| 10 | 12 | 20 |
| 11 | 7 | 9 |
Mean visual field sector sensitivity
In this analysis we used the mean VF sensitivity within the VF regions previously described (see Figure 4),22 regressed against visit number.
The number of eyes identified as progressing for each VF region considered separately is displayed in Table 16.
| Region | Number of VF locations in region | Number of progressing eyes |
|---|---|---|
| 1 | 8 | 27 |
| 2 | 13 | 33 |
| 3 | 4 | 23 |
| 4 | 6 | 24 |
| 5 | 10 | 21 |
| 6 | 12 | 32 |
Considering all of the VF region means together and using a Bonferroni correction identified 27 eyes as progressing, which equates to a percentage of 7.0% (95% CI 4.7% to 10.0%). Using a less conservative correction, with a critical p-value of 0.05/5, identified 36 progressing eyes (9.3%, 95% CI 6.6% to 12.7%). Relaxing the multiple testing correction even further to a p-value of < 0.05/4 identified 38 progressing eyes (9.8%, 95% CI 7.1% to 13.3%), whereas using a p-value of < 0.05/3 identified 41 eyes as progressing (10.6%, 95% CI 7.7% to 14.1%).
Fourteen of the 27 progressing eyes identified by the VF region mean approach were also identified by the permutation of the mean VF slope. The overlap with permutation of the imaging slope was much lower, with only seven progressing eyes identified by both approaches. Sixteen eyes were identified as progressing by both the region mean approach and the test statistic for a joint test of all location-specific VF slopes.
Permutation with time since baseline as the timescale
The results presented in Table 17 show a very similar pattern to those obtained from regressions on visit number, with slightly more eyes identified for permutations involving VF slopes. For example, 49 eyes were identified as progressing from the joint test statistic for all VF slopes and the imaging slope and requiring both the mean VF slope and the imaging slope to be negative compared with 45 when using regression on visit number. Across the different methods, hit rates varied from 9.1% to 17.1%.
| Parameter to be permuted | Number of progressing eyes; % progressing eyes (95% CI) | Mean (range) VF slope in progressing eyes (dB/year) | Mean (range) imaging slope in progressing eyes (µm/year) | Mean (range) VF slope in non-progressing eyes (dB/year) | Mean (range) imaging slope in non-progressing eyes (µm/year) |
|---|---|---|---|---|---|
| Mean of VF slopesa | 35; 9.1 (6.4 to 12.4) | –1.4 (–4.2 to –0.5) | –2.4 (–13.1 to 10.3) | 0.03 (–17.6 to 3.8) | –1.2 (–31.9 to 21.4) |
| Test statistic for mean of VF slopesa | 35; 9.1 (6.4 to 12.4) | –1.4 (–4.2 to –0.6) | –2.6 (–13.1 to 10.3) | 0.04 (–17.6 to 3.8) | –1.2 (–31.9 to 21.4) |
| Imaging slopea | 65; 16.8 (13.2 to 21.0) | –0.2 (–2.9 to 2.1) | –5.5 (–17.3 to –1.6) | –0.1 (–17.6 to 3.8) | –0.5 (–31.9 to 21.4) |
| Test statistic for imaging slopea | 66; 17.1 (13.5 to 21.2) | –0.2 (–2.9 to 2.1) | –5.5 (–17.3 to –1.6) | –0.1 (–17.6 to 3.8) | –0.5 (–31.9 to 21.4) |
| Test statistic for joint test of all VF slopesb | 41; 10.6 (7.7 to 14.1) | –1.7 (–17.6 to –0.1) | –1.6 (–13.1 to 10.8) | 0.1 (–9.4 to 3.8) | –1.3 (–31.9 to 21.4) |
| Test statistic for joint test of all VF and imaging slopes (mean VF slope < 0)b | 44; 11.4 (8.4 to 15.0) | –1.6 (–17.6 to –0.1) | –2.4 (–13.1 to 10.8) | 0.1 (–9.4 to 3.8) | –1.2 (–31.9 to 21.4) |
| Test statistic for joint test of all VF and imaging slopes (mean VF and imaging slopes < 0)c | 49; 12.7 (9.5 to 16.4) | –1.1 (–4.2 to –0.0) | –4.5 (–13.7 to –0.1) | 0.05 (–17.6 to 3.8) | –0.9 (–31.9 to 21.4) |
| Test statistic for joint test of mean VF and imaging slopes (mean VF slope < 0)b | 47; 12.2 (9.1 to 15.9) | –1.6 (–17.6 to –0.1) | –3.0 (–13.1 to 10.8) | 0.1 (–9.4 to 3.8) | –1.1 (–31.9 to 21.4) |
| Test statistic for joint test of mean VF and imaging slopes (mean VF and imaging slopes < 0)d | 44; 11.4 (8.4 to 15.0) | –1.1 (–4.2 to –0.1) | –4.5 (–13.1 to –0.2) | 0.04 (–17.6 to 3.8) | –0.9 (–31.9 to 21.4) |
Thirty-three of the 35 progressing eyes identified by permuting the mean VF slope were also identified by using the test statistic for the mean VF slope. Use of the imaging slope and its test statistic now give very slightly different results, although the overlap between the progressing eyes is very large, with 65 eyes identified by both tests.
In total, 111 eyes were identified as progressing by one or more of the PERM variants.
Permutations using one visual field only per visit
The above analyses used the average of all VF tests on a particular date, if more than one test was carried out. However, in clinical practice usually only one VF test is carried out per visit. We therefore repeated the analyses using the first VF test only at any given visit. OCT is relatively easy to perform, taking much less time to complete a scan, and so we continued using an average of all OCT repeat tests for a visit. This also allowed a more direct comparison with the RAPID data set, in which multiple VF repeat tests were generally not available at later visits.
The results in Table 18 show a very similar pattern to the previous results, with hit rates varying between 9.6% and 17.4%. Slightly more eyes were identified as progressing when the permuted parameter involved the VF slopes. Overall, 118 eyes were identified as progressing according to one or more of the PERM variants.
| Parameter to be permuted | Number of progressing eyes; % progressing eyes (95% CI) | Mean (range) VF slope in progressing eyes (dB/visit) | Mean (range) imaging slope in progressing eyes (µm/visit) | Mean (range) VF slope in non-progressing eyes (dB/visit) | Mean (range) imaging slope in non-progressing eyes (µm/visit) |
|---|---|---|---|---|---|
| Mean of VF slopesa | 42; 10.9 (8.0 to 14.4) | –0.41 (–1.1 to –0.14) | –0.57 (–2.95 to 1.38) | 0.03 (–2.90 to 0.99) | –0.35 (–5.19 to 4.15) |
| Test statistic for mean of VF slopesa | 37; 9.6 (6.8 to 13.0) | –0.40 (–1.11 to –0.14) | –0.67 (–2.95 to 1.38) | 0.02 (–2.90 to 0.99) | –0.34 (–5.19 to 4.15) |
| Imaging slopea | 67; 17.4 (13.7 to 21.5) | –0.02 (–0.46 to 0.58) | –1.41 (–5.13 to –0.44) | –0.02 (–2.90 to 0.99) | –0.15 (–5.19 to 4.15) |
| Test statistic for imaging slopea | 67; 17.4 (13.7 to 21.5) | –0.02 (–0.46 to 0.58) | –1.41 (–5.13 to –0.44) | –0.02 (–2.90 to 0.99) | –0.15 (–5.19 to 4.15) |
| Test statistic for joint test of all VF slopesb | 47; 12.2 (9.1 to 15.9) | –0.31 (–1.11 to –0.03) | –0.51 (–2.95 to 4.15) | 0.02 (–2.90 to 0.99) | –0.35 (–5.19 to 3.80) |
| Test statistic for joint test of all VF and imaging slopes (mean VF slope < 0)b | 50; 13.0 (9.8 to 16.7) | –0.29 (–0.76 to –0.00) | –0.55 (–2.75 to 4.15) | 0.02 (–2.90 to 0.99) | –0.34 (–5.19 to 3.80) |
| Test statistic for joint test of all VF and imaging slopes (mean VF and imaging slopes < 0)c | 57; 14.8 (11.4 to 18.7) | –0.26 (–1.11 to –0.00) | –0.95 (–2.95 to –0.02) | 0.03 (–2.90 to 0.99) | –0.27 (–5.19 to 4.15) |
| Test statistic for joint test of mean VF and imaging slopes (mean VF slope < 0)b | 42; 10.9 (8.0 to 14.4) | –0.33 (–0.76 to –0.00) | –0.80 (–2.75 to 4.15) | 0.02 (–2.90 to 0.99) | –0.32 (–5.19 to 3.80) |
| Test statistic for joint test of mean VF and imaging slopes (mean VF and imaging slopes < 0)d | 44; 11.4 (8.4 to 15.0) | –0.31 (–0.76 to –0.00) | –0.95 (–2.75 to –0.02) | 0.02 (–2.90 to 0.99) | –0.29 (–5.19 to 4.15) |
Time to identified progression
The 100 UKGTS eyes that were identified as progressing using at least one of the PERM variants and for which there were data from at least five visits were used to explore when progression would first be identified in clinical practice. For each eye the PERM variants were applied to the first four visits. For eyes with more than five visits, the PERM variants were also applied to the first five visits and then the first six visits, etc., up to the maximum number of visits available for that eye. The first visit at which progression was identified was recorded, with the results tabulated in Table 19.
| Number of visits per eye | Number of eyes | PERM | Number of eyes progressing at the final visit | Mean (range) first visit with identified progression |
|---|---|---|---|---|
| 5 | 15 | Mean VF slope | 5 | 4.4 (4–5) |
| Test statistic for mean VF slope | 4 | 4.5 (4–5) | ||
| Imaging slope | 6 | 4.7 (4–5) | ||
| Test statistic for imaging slope | 6 | 4.7 (4–5) | ||
| Test statistic for all VF slopes | 8 | 4.8 (4–5) | ||
| Test statistic for all VF and imaging slopes (mean VF slope < 0) | 8 | 4.8 (4–5) | ||
| Test statistic for all VF and imaging slopes (mean VF and imaging slopes < 0) | 9 | 4.7 (4–5) | ||
| Test statistic for mean VF and imaging slopes (mean VF slope < 0) | 7 | 4.7 (4–5) | ||
| Test statistic for mean VF and imaging slopes (mean VF and imaging slopes < 0) | 6 | 4.7 (4–5) | ||
| 6 | 18 | Mean VF slope | 10 | 5.4 (4–6) |
| Test statistic for mean VF slope | 9 | 5.3 (4–6) | ||
| Imaging slope | 10 | 5.5 (4–6) | ||
| Test statistic for imaging slope | 10 | 5.5 (4–6) | ||
| Test statistic for all VF slopes | 7 | 5.3 (4–6) | ||
| Test statistic for all VF and imaging slopes (mean VF slope < 0) | 9 | 5.1 (4–6) | ||
| Test statistic for all VF and imaging slopes (mean VF and imaging slopes < 0) | 12 | 5.5 (4–6) | ||
| Test statistic for mean VF and imaging slopes (mean VF slope < 0) | 10 | 5.2 (4–6) | ||
| Test statistic for mean VF and imaging slopes (mean VF and imaging slopes < 0) | 10 | 5.5 (4–6) | ||
| 7 | 17 | Mean VF slope | 4 | 6.8 (6–7) |
| Test statistic for mean VF slope | 5 | 6.8 (6–7) | ||
| Imaging slope | 12 | 5.9 (4–7) | ||
| Test statistic for imaging slope | 12 | 5.9 (4–7) | ||
| Test statistic for all VF slopes | 5 | 6.6 (6–7) | ||
| Test statistic for all VF and imaging slopes (mean VF slope < 0) | 6 | 6.5 (6–7) | ||
| Test statistic for all VF and imaging slopes (mean VF and imaging slopes < 0) | 6 | 6 (5–7) | ||
| Test statistic for mean VF and imaging slopes (mean VF slope < 0) | 6 | 6 (5–7) | ||
| Test statistic for mean VF and imaging slopes (mean VF and imaging slopes < 0) | 7 | 5.7 (5–7) | ||
| 8 | 18 | Mean VF slope | 5 | 6.6 (4–8) |
| Test statistic for mean VF slope | 6 | 6.7 (5–8) | ||
| Imaging slope | 12 | 6.2 (4–8) | ||
| Test statistic for imaging slope | 12 | 6.2 (4–8) | ||
| Test statistic for all VF slopes | 7 | 6.6 (6–8) | ||
| Test statistic for all VF and imaging slopes (mean VF slope < 0) | 7 | 6.3 (4–8) | ||
| Test statistic for all VF and imaging slopes (mean VF and imaging slopes < 0) | 6 | 6.8 (4–8) | ||
| Test statistic for mean VF and imaging slopes (mean VF slope < 0) | 7 | 6.7 (4–8) | ||
| Test statistic for mean VF and imaging slopes (mean VF and imaging slopes < 0) | 6 | 6.7 (4–8) | ||
| 9 | 13 | Mean VF slope | 4 | 7.8 (7–9) |
| Test statistic for mean VF slope | 5 | 7.6 (6–9) | ||
| Imaging slope | 9 | 5.3 (4–7) | ||
| Test statistic for imaging slope | 9 | 5.3 (4–7) | ||
| Test statistic for all VF slopes | 4 | 7.8 (6–9) | ||
| Test statistic for all VF and imaging slopes (mean VF slope < 0) | 6 | 8.7 (7–9) | ||
| Test statistic for all VF and imaging slopes (mean VF and imaging slopes < 0) | 7 | 7.4 (4–9) | ||
| Test statistic for mean VF and imaging slopes (mean VF slope < 0) | 7 | 7.7 (6–9) | ||
| Test statistic for mean VF and imaging slopes (mean VF and imaging slopes < 0) | 7 | 7.1 (6–9) | ||
| 10 | 12 | Mean VF slope | 5 | 9.2 (7–10) |
| Test statistic for mean VF slope | 5 | 8.6 (6–10) | ||
| Imaging slope | 8 | 7.6 (4–10) | ||
| Test statistic for imaging slope | 8 | 7.6 (4–10) | ||
| Test statistic for all VF slopes | 6 | 8.7 (6–10) | ||
| Test statistic for all VF and imaging slopes (mean VF slope < 0) | 6 | 8.7 (6–10) | ||
| Test statistic for all VF and imaging slopes (mean VF and imaging slopes < 0) | 8 | 8.3 (6–10) | ||
| Test statistic for mean VF and imaging slopes (mean VF slope < 0) | 4 | 8 (6–9) | ||
| Test statistic for mean VF and imaging slopes (mean VF and imaging slopes < 0) | 5 | 8.4 (6–10) | ||
| 11 | 7 | Mean VF slope | 2 | 8.5 (6–11) |
| Test statistic for mean VF slope | 2 | 8.5 (6–11) | ||
| Imaging slope | 6 | 7 (4–11) | ||
| Test statistic for imaging slope | 6 | 7 (4–11) | ||
| Test statistic for all VF slopes | 2 | 9 (7–11) | ||
| Test statistic for all VF and imaging slopes (mean VF slope < 0) | 2 | 9 (7–11) | ||
| Test statistic for all VF and imaging slopes (mean VF and imaging slopes < 0) | 2 | 8.5 (7–10) | ||
| Test statistic for mean VF and imaging slopes (mean VF slope < 0) | 2 | 8.5 (7–10) | ||
| Test statistic for mean VF and imaging slopes (mean VF and imaging slopes < 0) | 2 | 8 (6–10) |
The mean first visit with identified progression in those eyes with six visits was less than one visit before the maximum number of visits. For those eyes with nine visits, the mean first visit with identified progression was closer to two visits before the maximum number of visits. However, the number of eyes progressing in any one category of PERM and the number of visits per eye were small, and so there was little power to determine trends.
Multiple imputation
Simulations
When developing the multiple imputation model used to impute the censored and missing values in the VF data, we ran a range of small simulation studies. In this section we present some of the results, based on simulated data from six time points and nine locations arranged in a 3 × 3 grid as follows:
The data were simulated using the following approach:
-
A person mean, pi, with i indexing person, was drawn from a 25−3χ12 distribution.
-
Four person-specific area effects were then drawn, one each for locations 1, 2, 4 and 5 (ai1), 2, 3, 5 and 6 (ai2), 4, 5, 7 and 8 (ai3) and 5, 6, 8 and 9 (ai4), from a normal distribution with a mean of 0 and a SD of 4.
-
A person-specific location effect, lij, was then drawn from N(0,σloc) where σloc = 1 for locations 1, 3, 7 and 9, σloc = 0.5 for locations 2, 4, 6 and 8 and σloc = 0.1 for location 5. σloc was varied in this way to allow for the greater variation at some locations because of having multiple area means.
-
The person, area and location means were then combined, along with a fixed time effect if the simulation scenario required one, and with a random error term:
Any observations below 15 dB were then imputed using chained equations and generating 10 imputations for each simulated data set. The imputed data from location y1 and y5 were analysed using a mixed-effects model with a fixed effect for time and a random intercept for person and using restricted maximum likelihood. The results from the different imputations were combined using Rubin’s rules. 102
The results of applying a multiple imputation model that uses all other spatial predictors and the nearest time neighbours as predictors for nine locations, six time points, 300 people, a true effect over time of –0.5 dB per unit time and 100 simulated data sets are provided in Table 20. The averages of the slopes over time obtained from the mixed-effects model applied to the imputed data are provided, along with the SD of the slopes across the 100 estimates. In addition, the same model was applied to the true underlying values and the slope estimates are also summarised in Table 20.
| VF location | Length of burn-in period (iterations) | Mean (SD) of slopes over time after imputation | (Mean of slope variances)0.5 | Mean (SD) of slopes over time before imputation | (Mean of slope variances)0.5 |
|---|---|---|---|---|---|
| y 1 | 5 | –0.489 (0.014) | 0.018 | –0.499 (0.013) | 0.014 |
| 10 | –0.488 (0.015) | 0.018 | –0.498 (0.014) | 0.014 | |
| 20 | –0.490 (0.016) | 0.018 | –0.500 (0.016) | 0.014 | |
| y 5 | 5 | –0.501 (0.020) | 0.026 | –0.501 (0.012) | 0.014 |
| 10 | –0.505 (0.019) | 0.026 | –0.501 (0.012) | 0.014 | |
| 20 | –0.504 (0.022) | 0.026 | –0.501 (0.015) | 0.014 |
There was some slight suggestion of bias towards the null in the slope estimates for y1, but this was very small and was not seen in the estimates for y5. Increasing the burn-in period from five up to 20 did not appear to alter the estimates substantially.
We also ran simulations using a variety of other models. One of the other main findings was that not including any time predictors leads to substantial bias. This might be caused by the failure of the multiple imputation process to converge – when checking the chain convergence over 100 iterations of the burn-in period it was found that this model did not converge.
Multiple imputation models applied to United Kingdom Glaucoma Treatment Study data
Based on the results of the simulation study, we started by applying a multiple imputation model with three spatial neighbours at the same time point, within the same VF region,22 and the nearest time neighbours at the same location as predictors in the model. Instead of adding an extra level of hierarchy into an already complex mixed-effects model, which may have led to problems with convergence in the mixed-effects model, we chose to average across repeated measures recorded at the same visit. However, we found that using such a method resulted in lack of convergence for the multiple imputation process. This behaviour can be seen in the chain plots in Figure 27. This figure shows the burn-in chains for the imputed variables at the first time point for the first 100 iterations, with one plot for each VF location. To produce such a plot, the mean and SD of the imputed values for each variable are calculated after each iteration during the burn-in period. If the multiple imputation process were converging, then one would expect an initial move away from any effect of the starting values and for the chains to then not exhibit a trend as the number of iterations increases. However, there are clear trends observable at some locations in Figure 27, with means tending to decrease over time and SDs correspondingly increasing.
FIGURE 27.
Chains for the means (a) and SDs (b) of the imputed VF variables at time point 1, using the average across VF repeats.
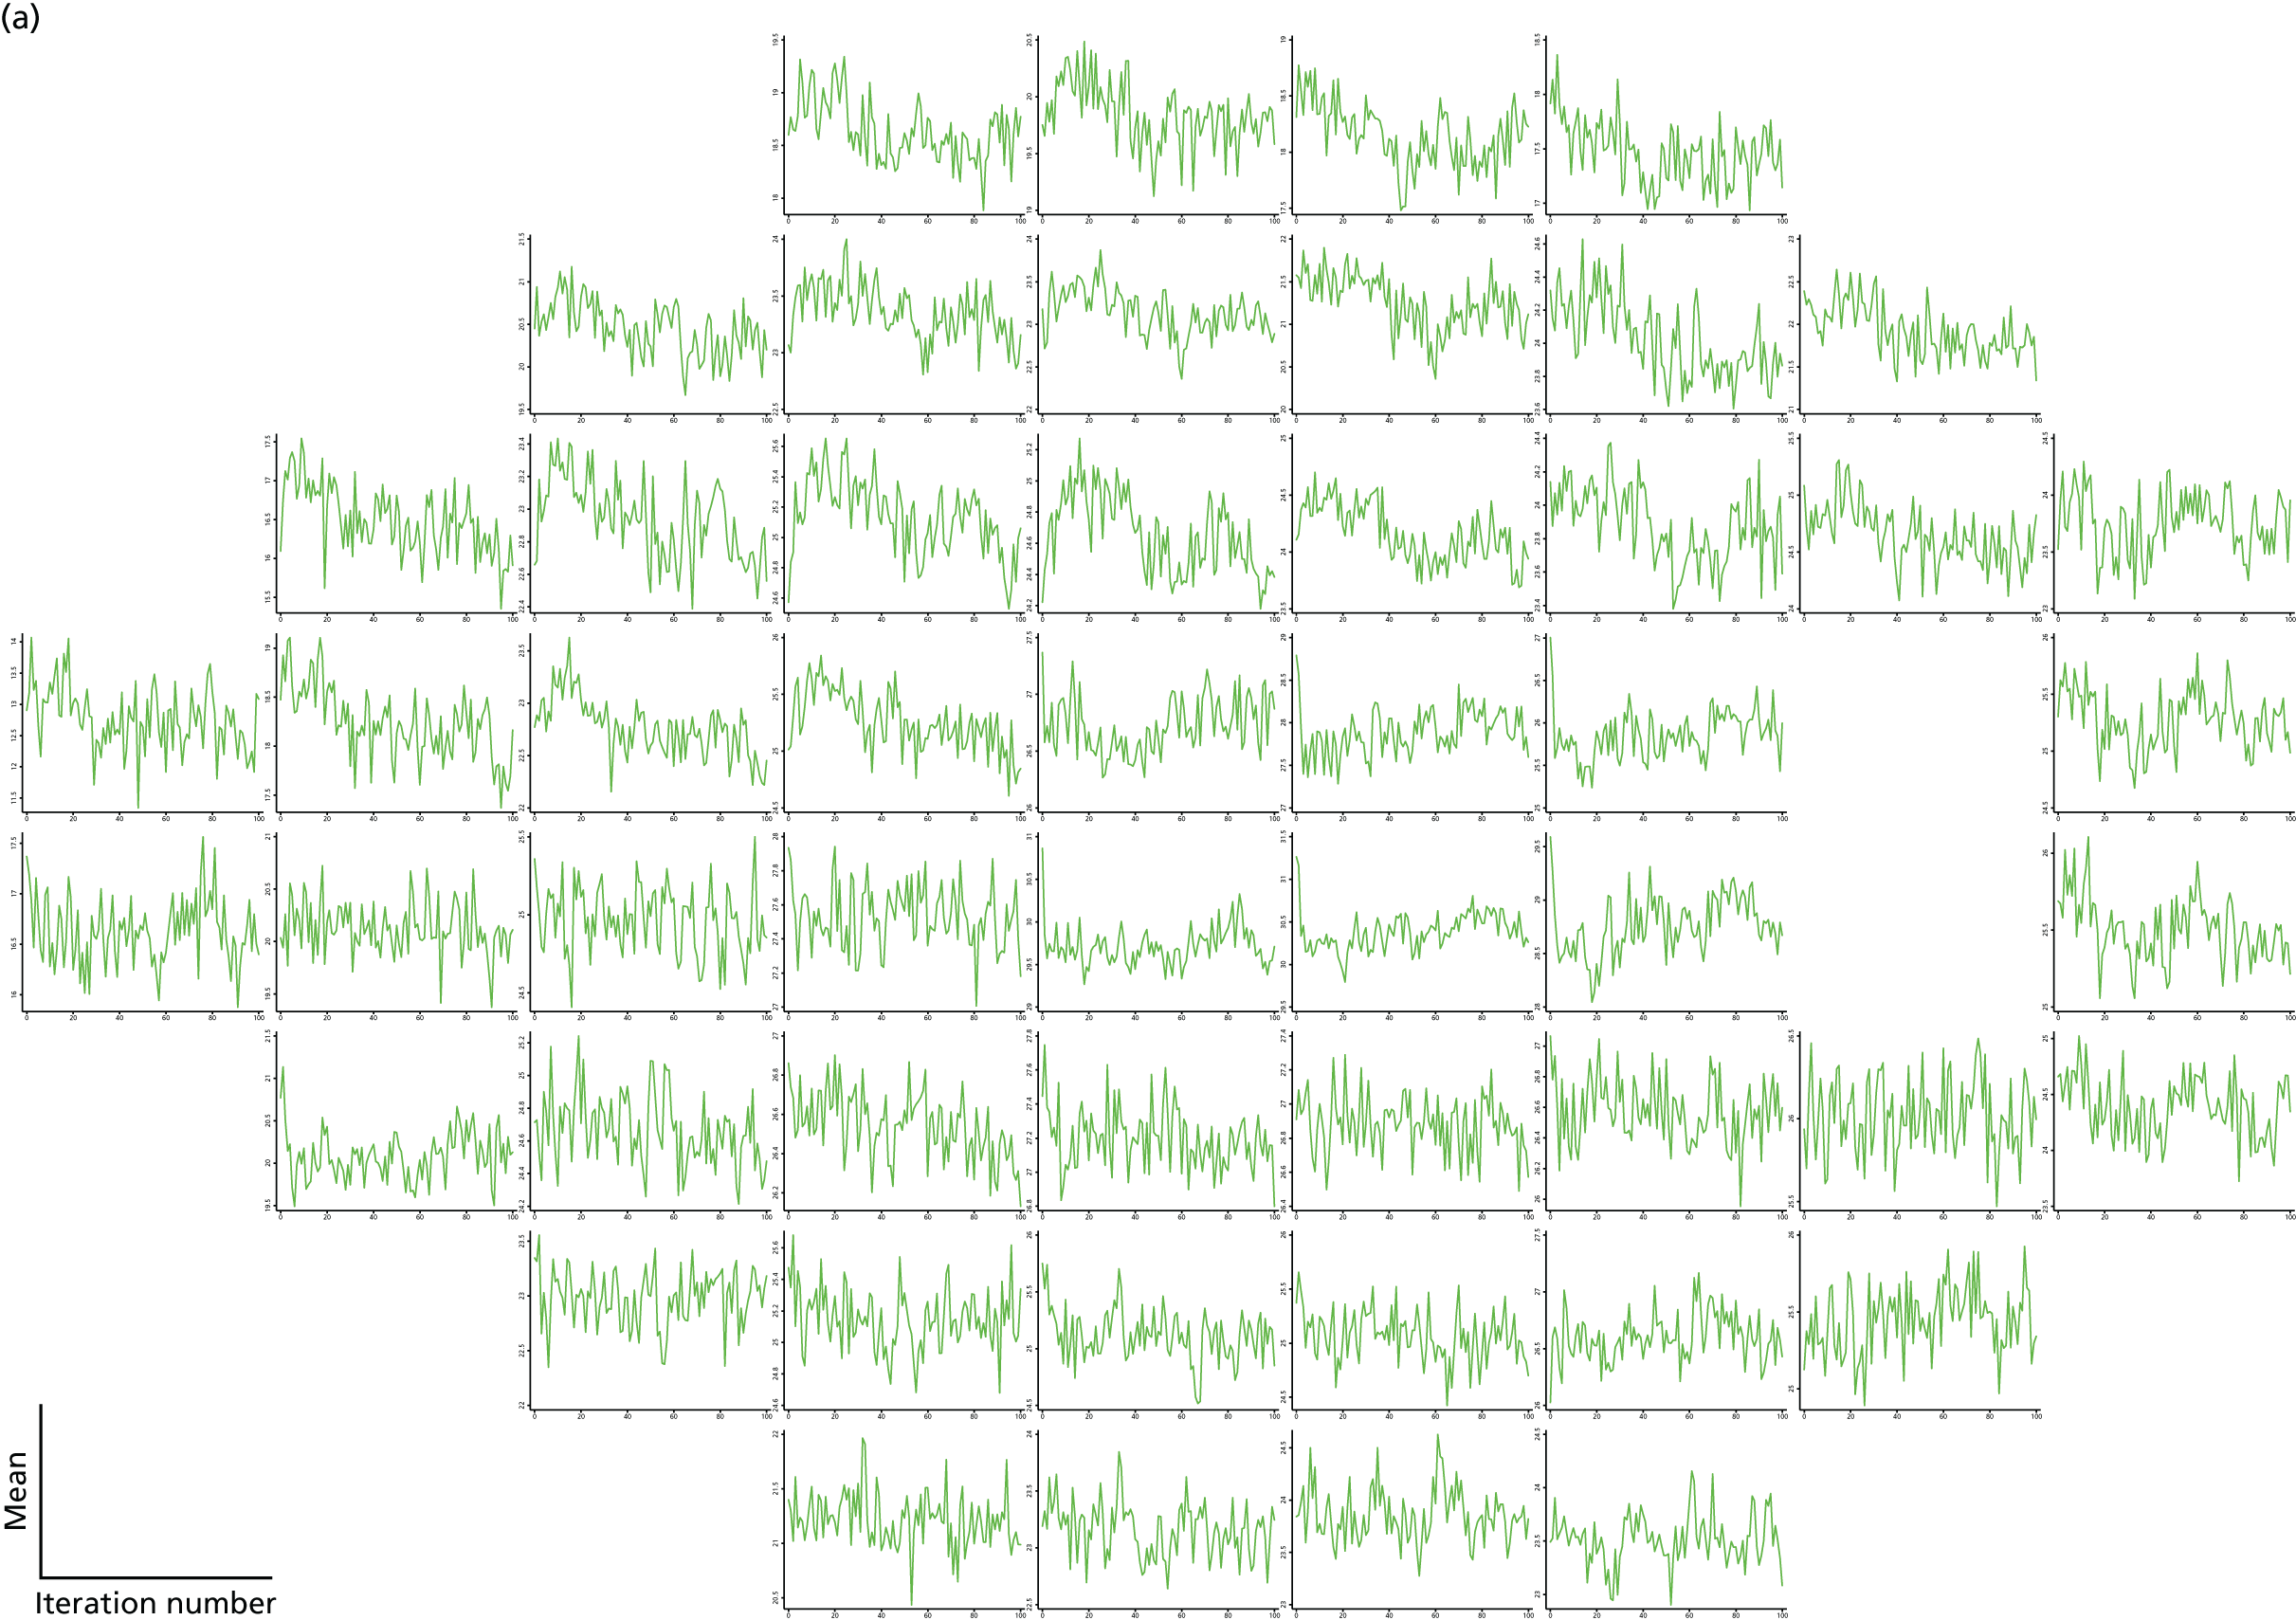
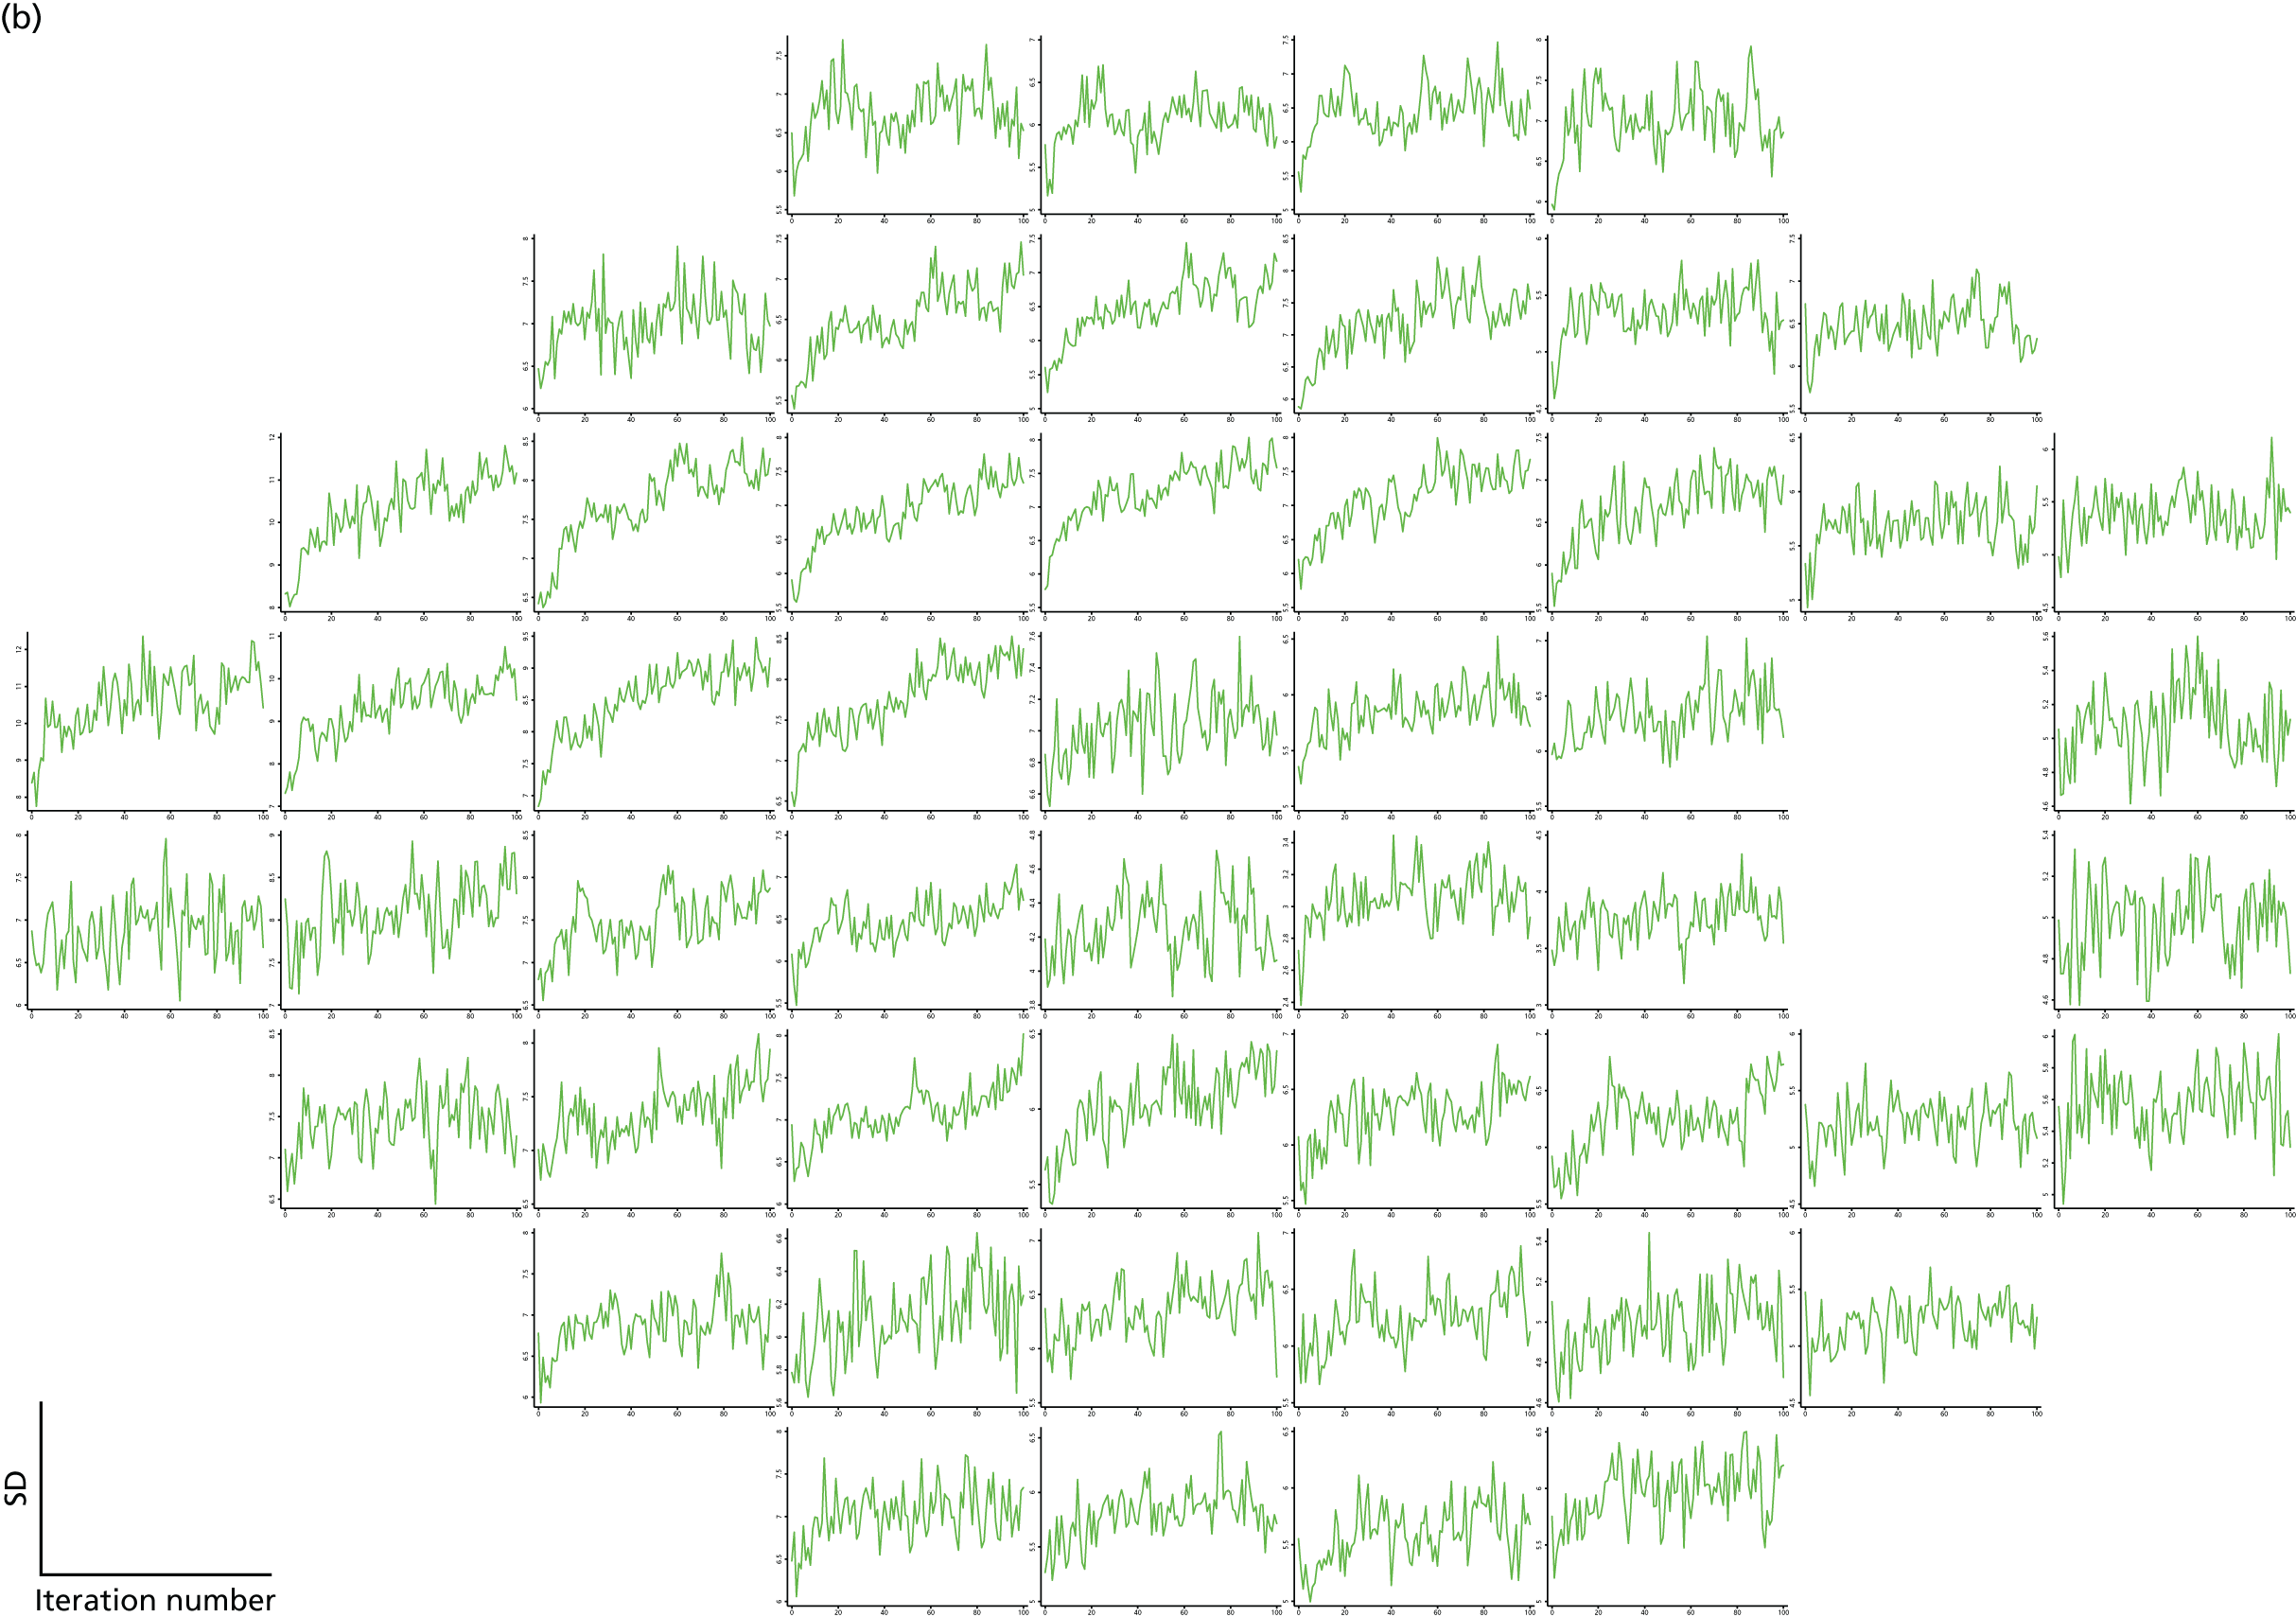
To improve the convergence of these chains, we therefore moved to using models in which a single VF repeat is used, instead of the average across VF repeats. An example of the improved convergence for such a model is shown in Figure 28. This model also uses three spatial neighbours at the same time point and the nearest time neighbours at the same location as predictors. One possible explanation of the improved convergence behaviour in the model using a single VF scan is that it makes full use of the spatial correlations to predict the imputed values. In contrast, by averaging across VF repeats, some of that local correlation structure is being lost or ‘smoothed out’.
FIGURE 28.
Chains for the means (a) and SDs (b) of the imputed VF variables at time point 1, using a single VF repeat.
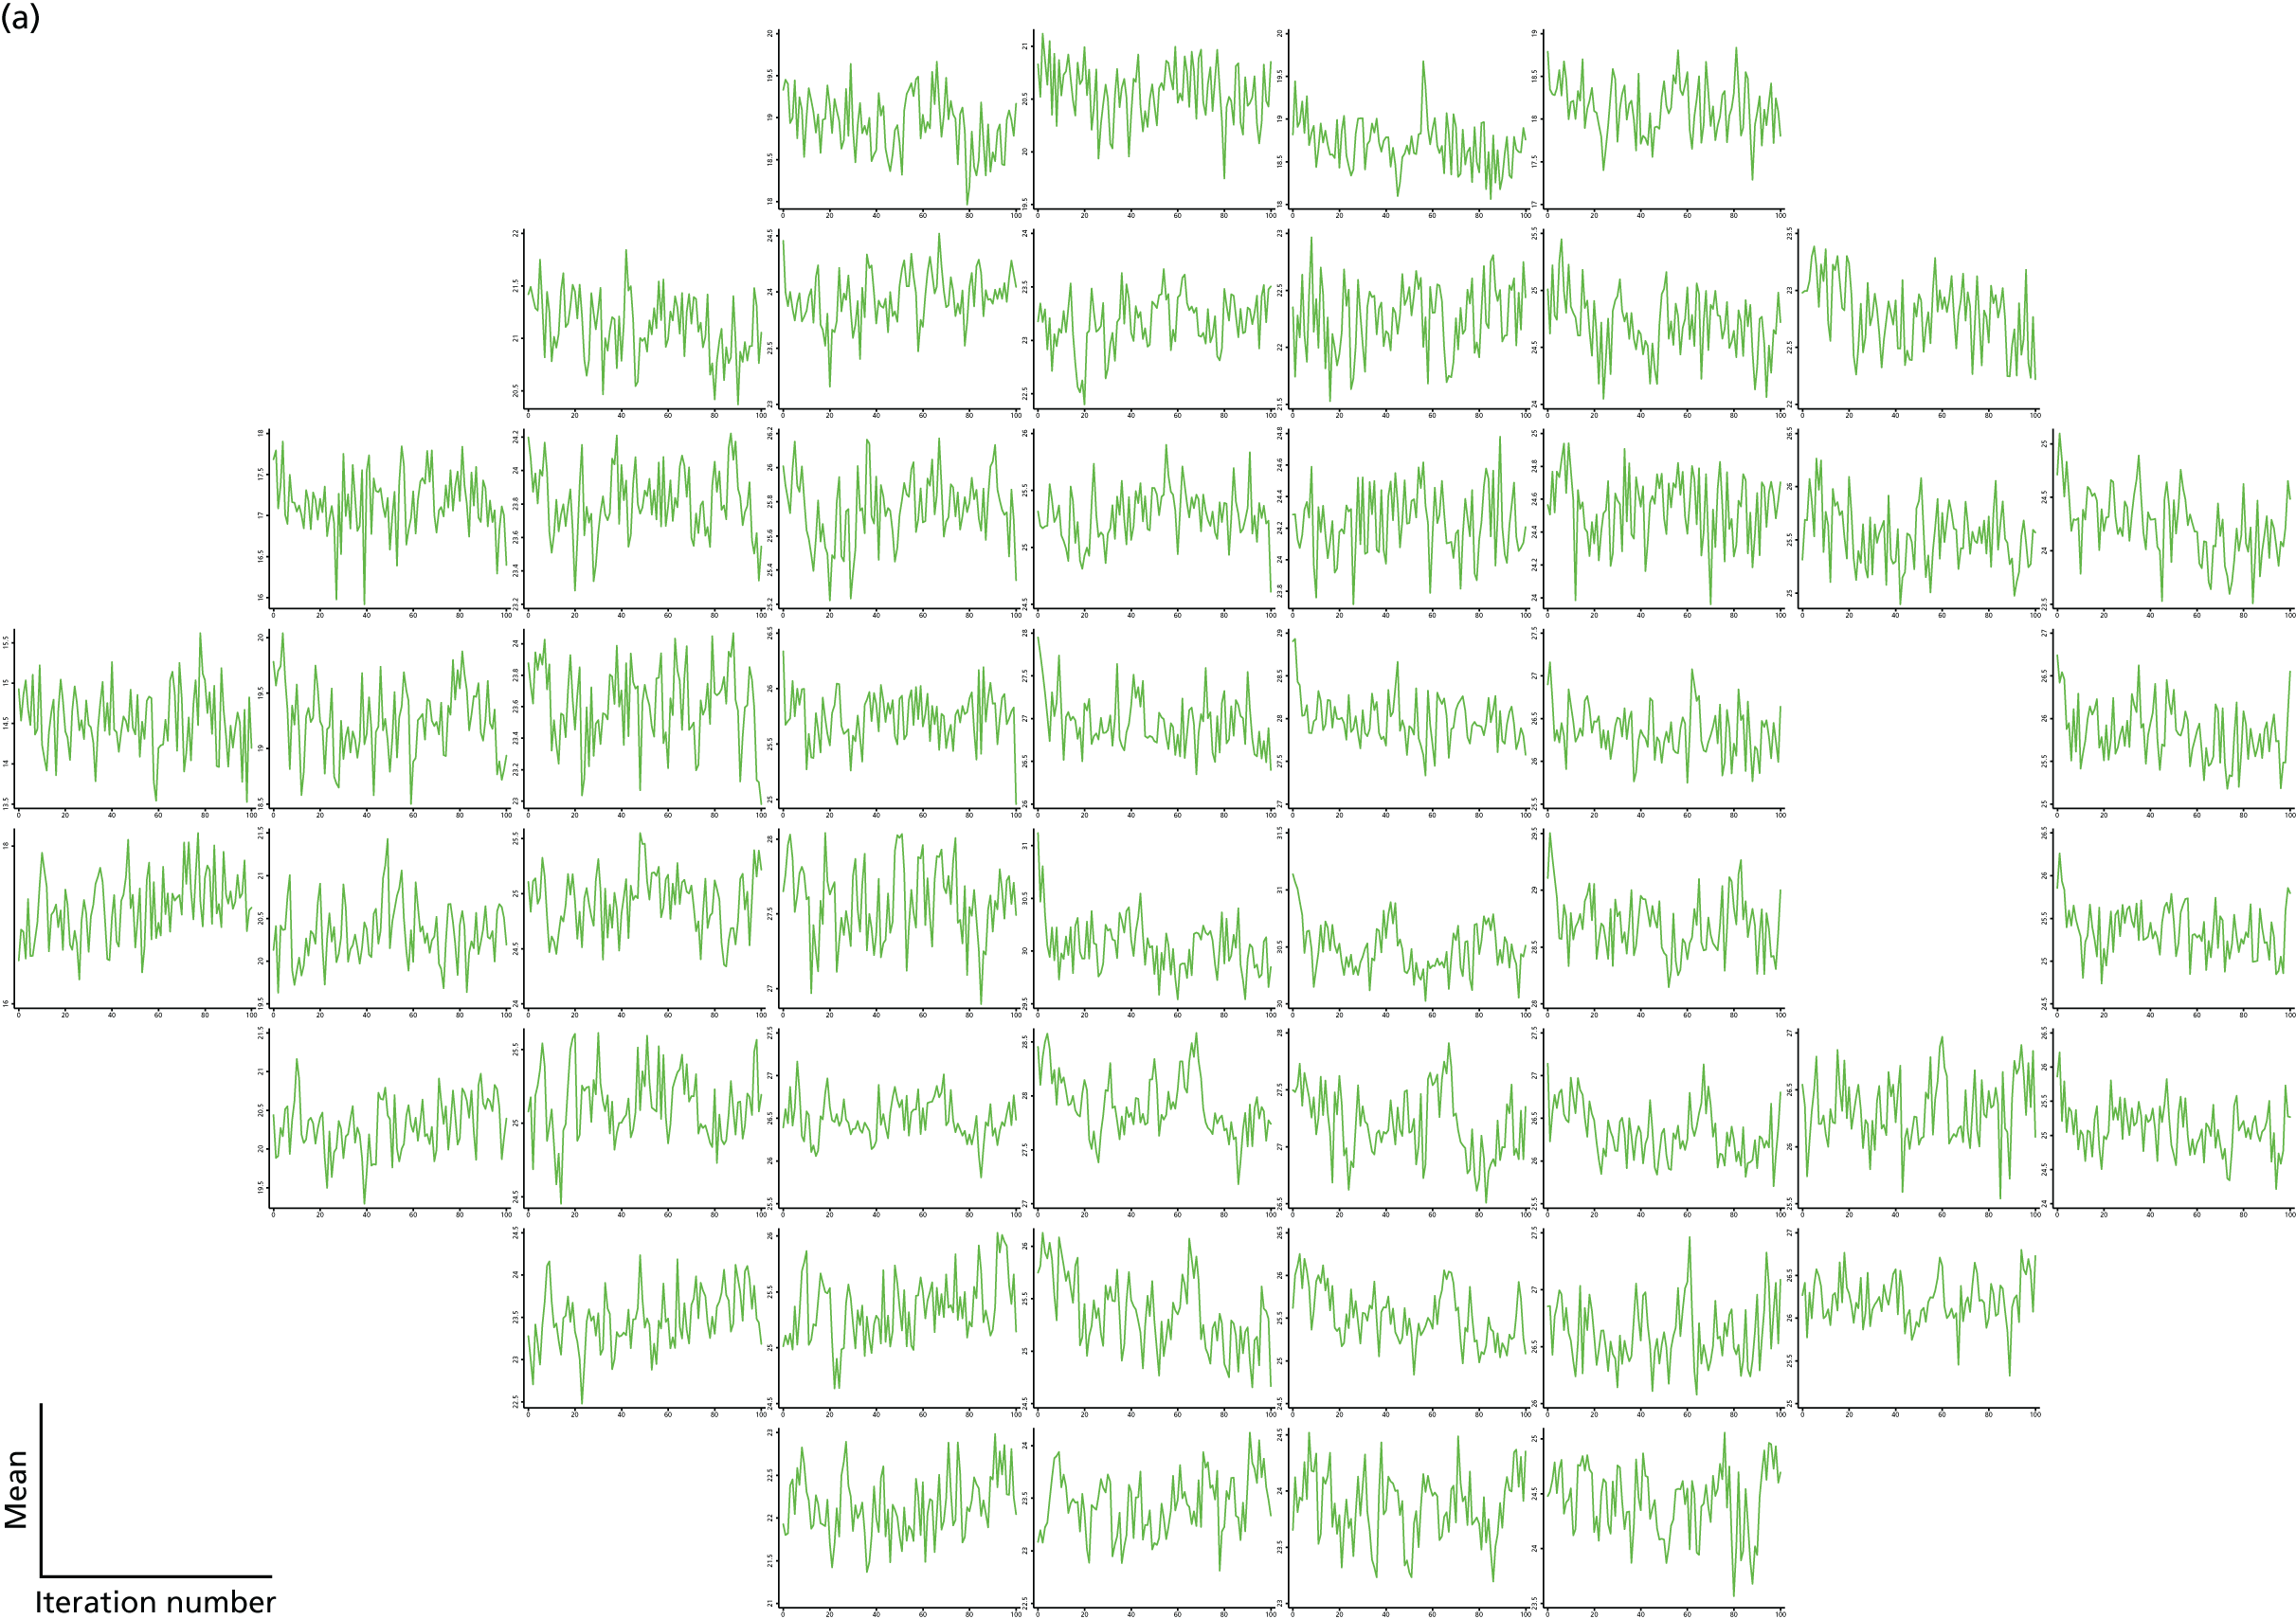
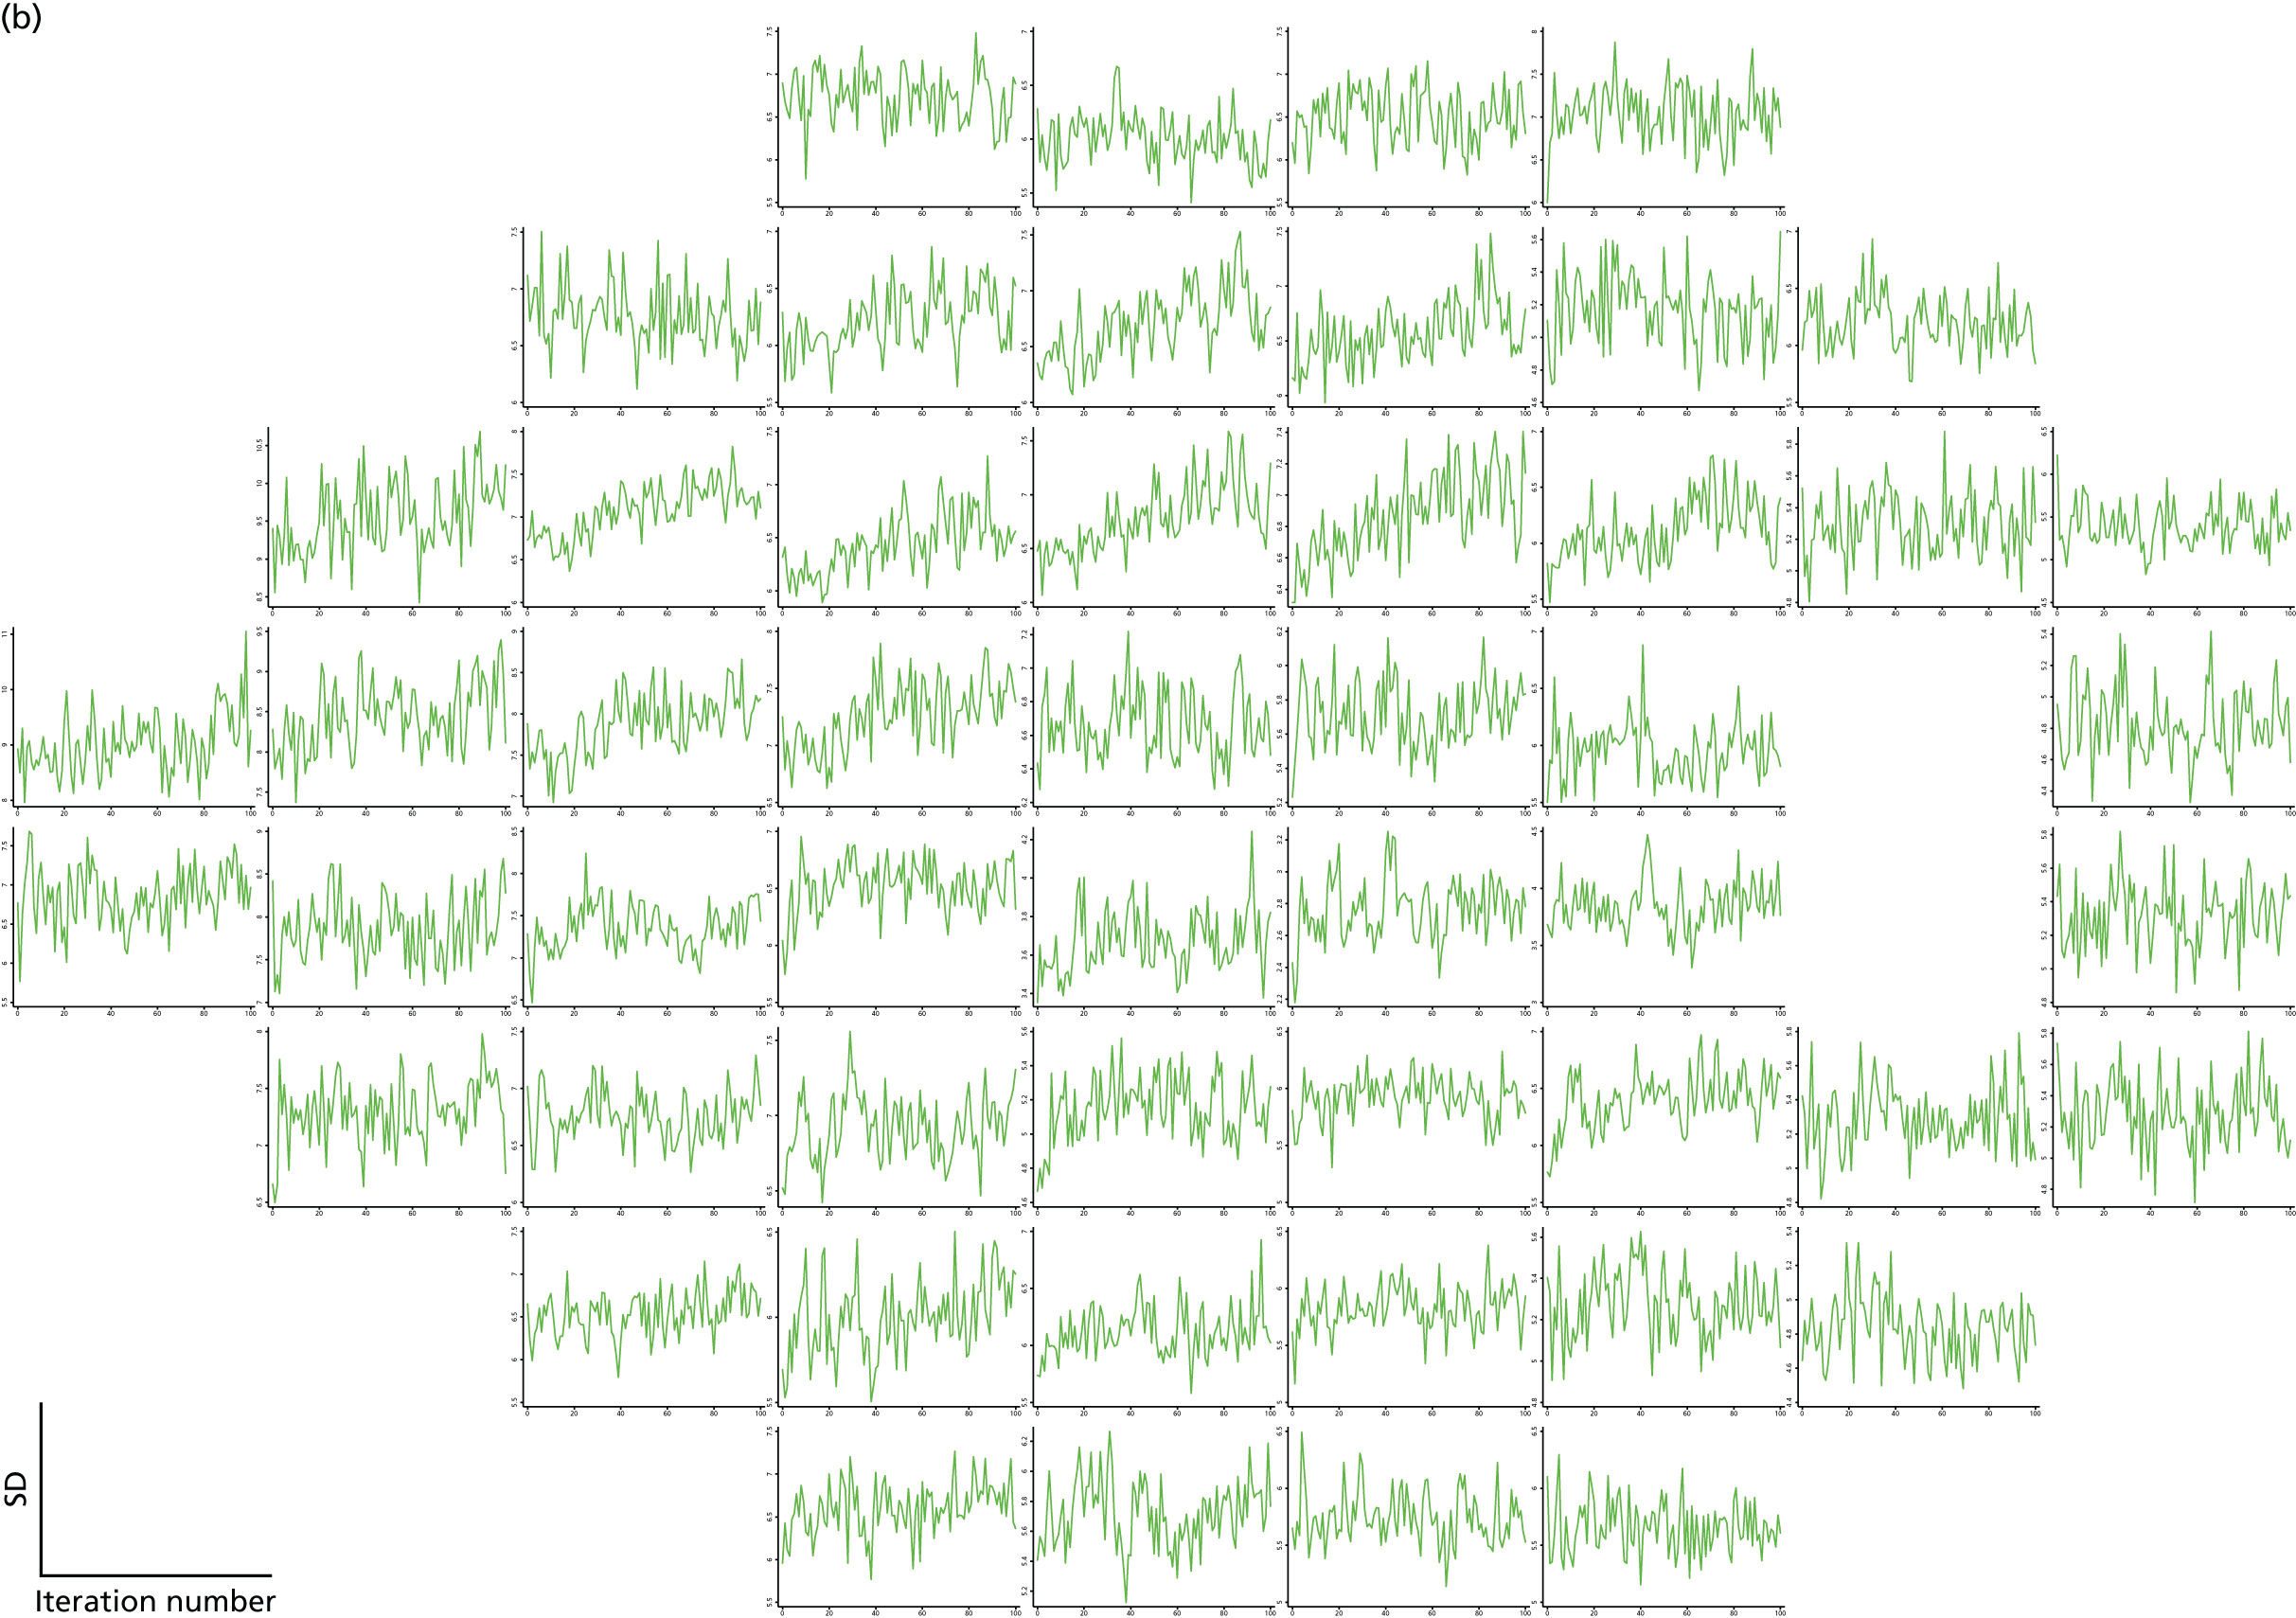
In addition, we also considered a model that uses a three-stage approach to imputing the data. The data that are imputed in this data set are a mixture of values that are censored (i.e. that lie below 15 dB) and values that are missing (i.e. visits that do not appear in the data set, e.g. because a patient had left the study or did not attend the visit or because the visit did not have both a VF and an OCT measurement). In the first model discussed, we imputed both the censored and the missing data in the same process. In the three-stage approach, we first imputed the censored values only using a constant model (i.e. no predictors were used). This step is performed to obtain some values that are approximately normally distributed before moving on to the second stage, which is to impute the missing visit values using the imputed values from the first stage. SLR models are used for this second step, with three spatial neighbours in the same sector and the nearest time neighbours as predictors. In the third stage, all values that are < 15 dB were imputed using censored regressions, again with three spatial neighbours in the same sector and the nearest time neighbours as predictors.
We used a burn-in period of 50 iterations for the first multiple imputation model and a burn-in of 20 iterations for the third stage of the second model. Ten imputations for each model were produced. Burn-in chains for the imputed data sets at time point 1 are provided in Figures 29 and 30.
FIGURE 29.
Chains for the means (a) and SDs (b) over a burn-in of 50 iterations for the 10 imputations produced by the first model that uses a single VF repeat, three spatial neighbours within a sector and the nearest time neighbours as predictors.
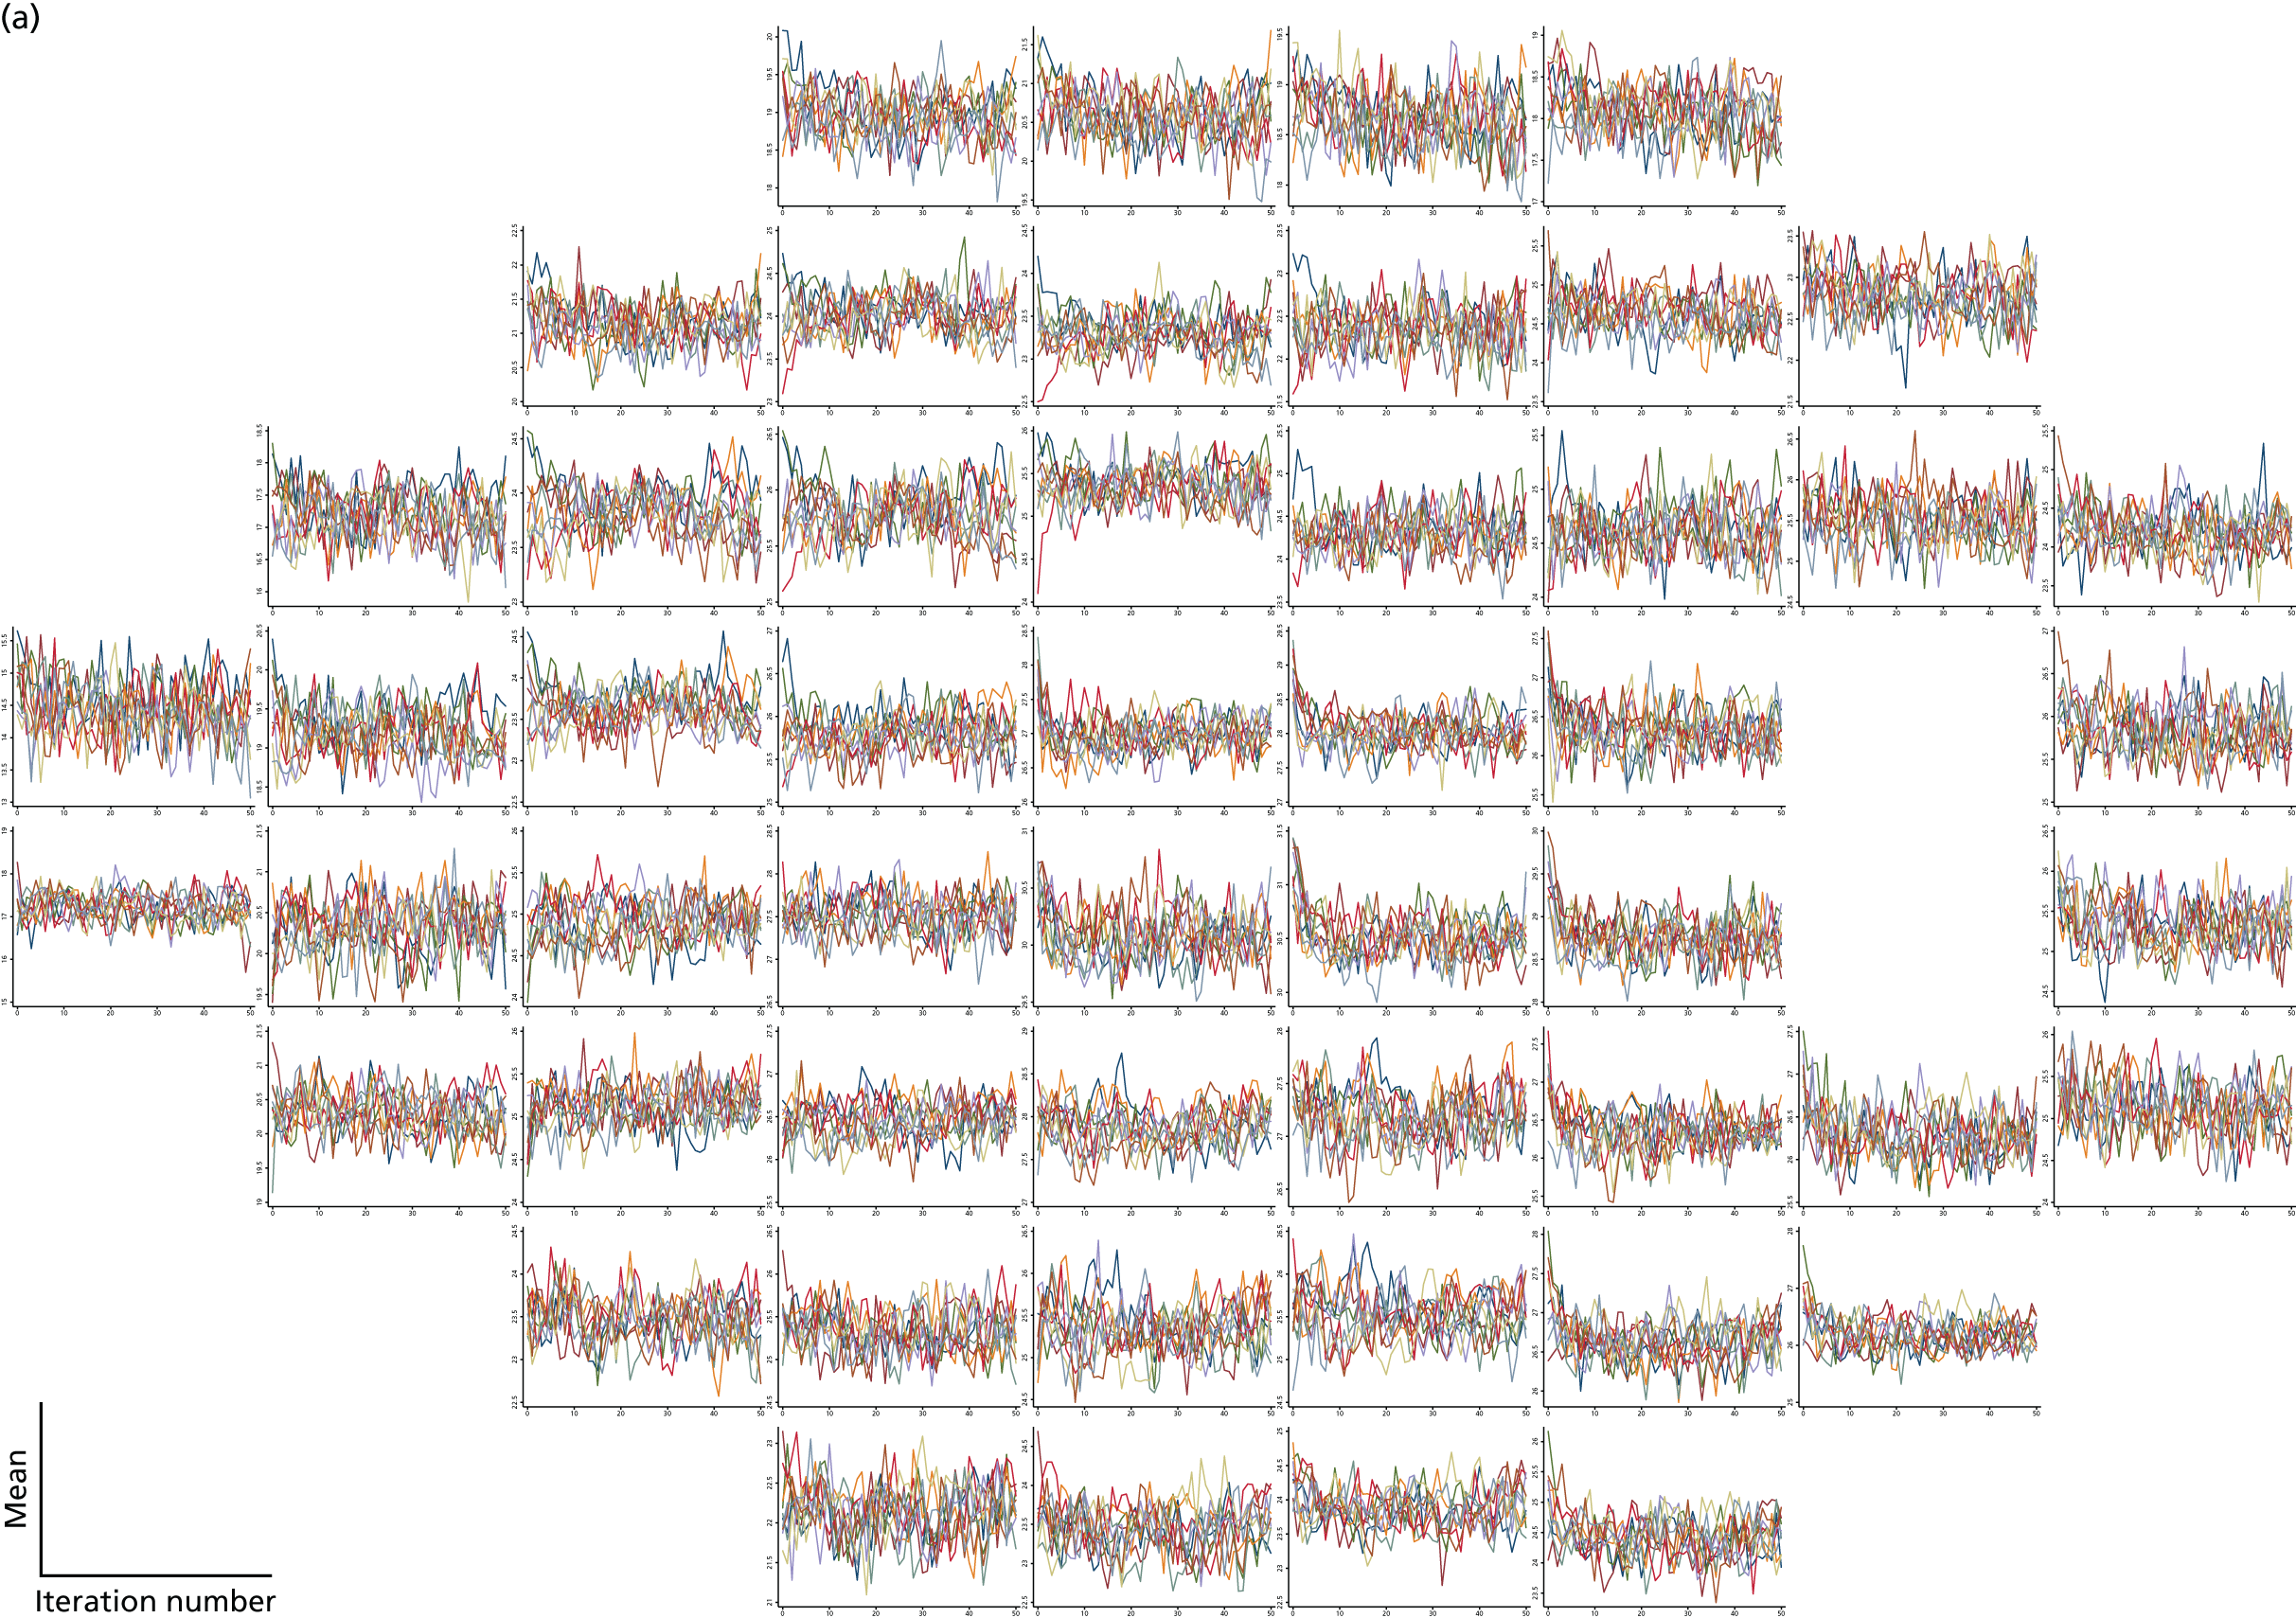
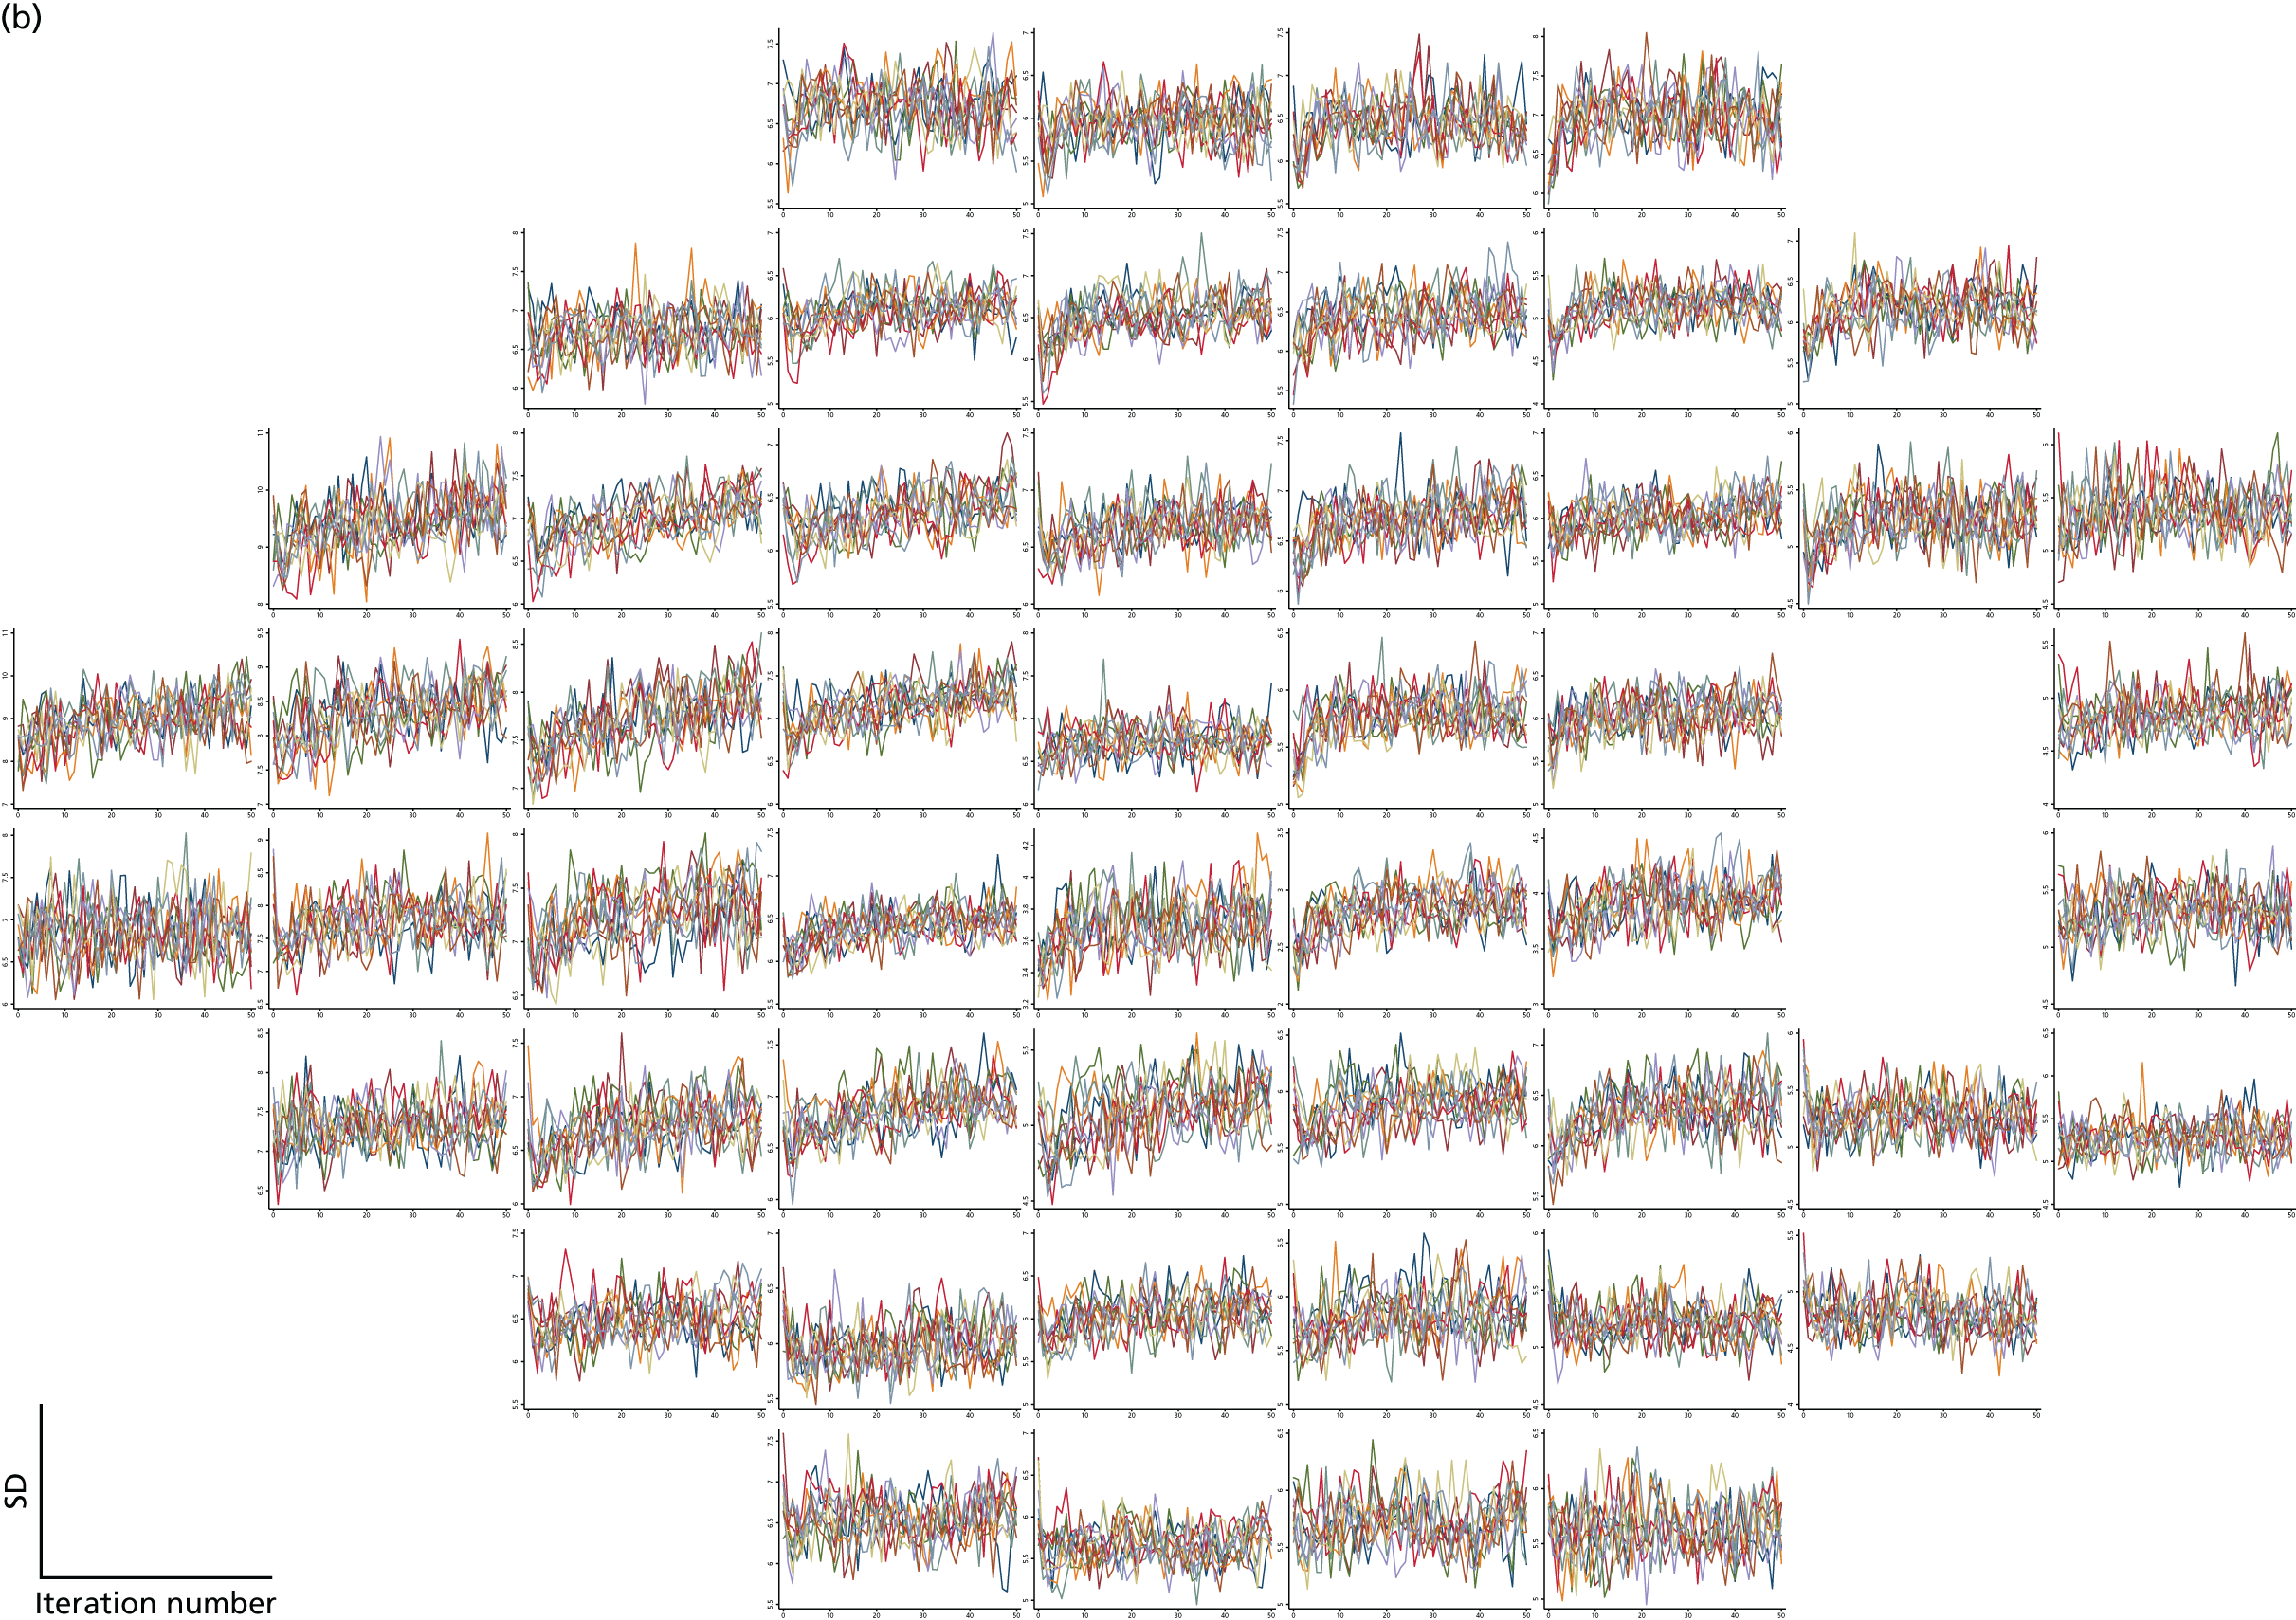
FIGURE 30.
Chains for the means (a) and SDs (b) over a burn-in of 20 iterations for the 10 imputations produced by the second model that uses a single VF repeat and a three-stage approach. The burn-in chains are for the third stage.
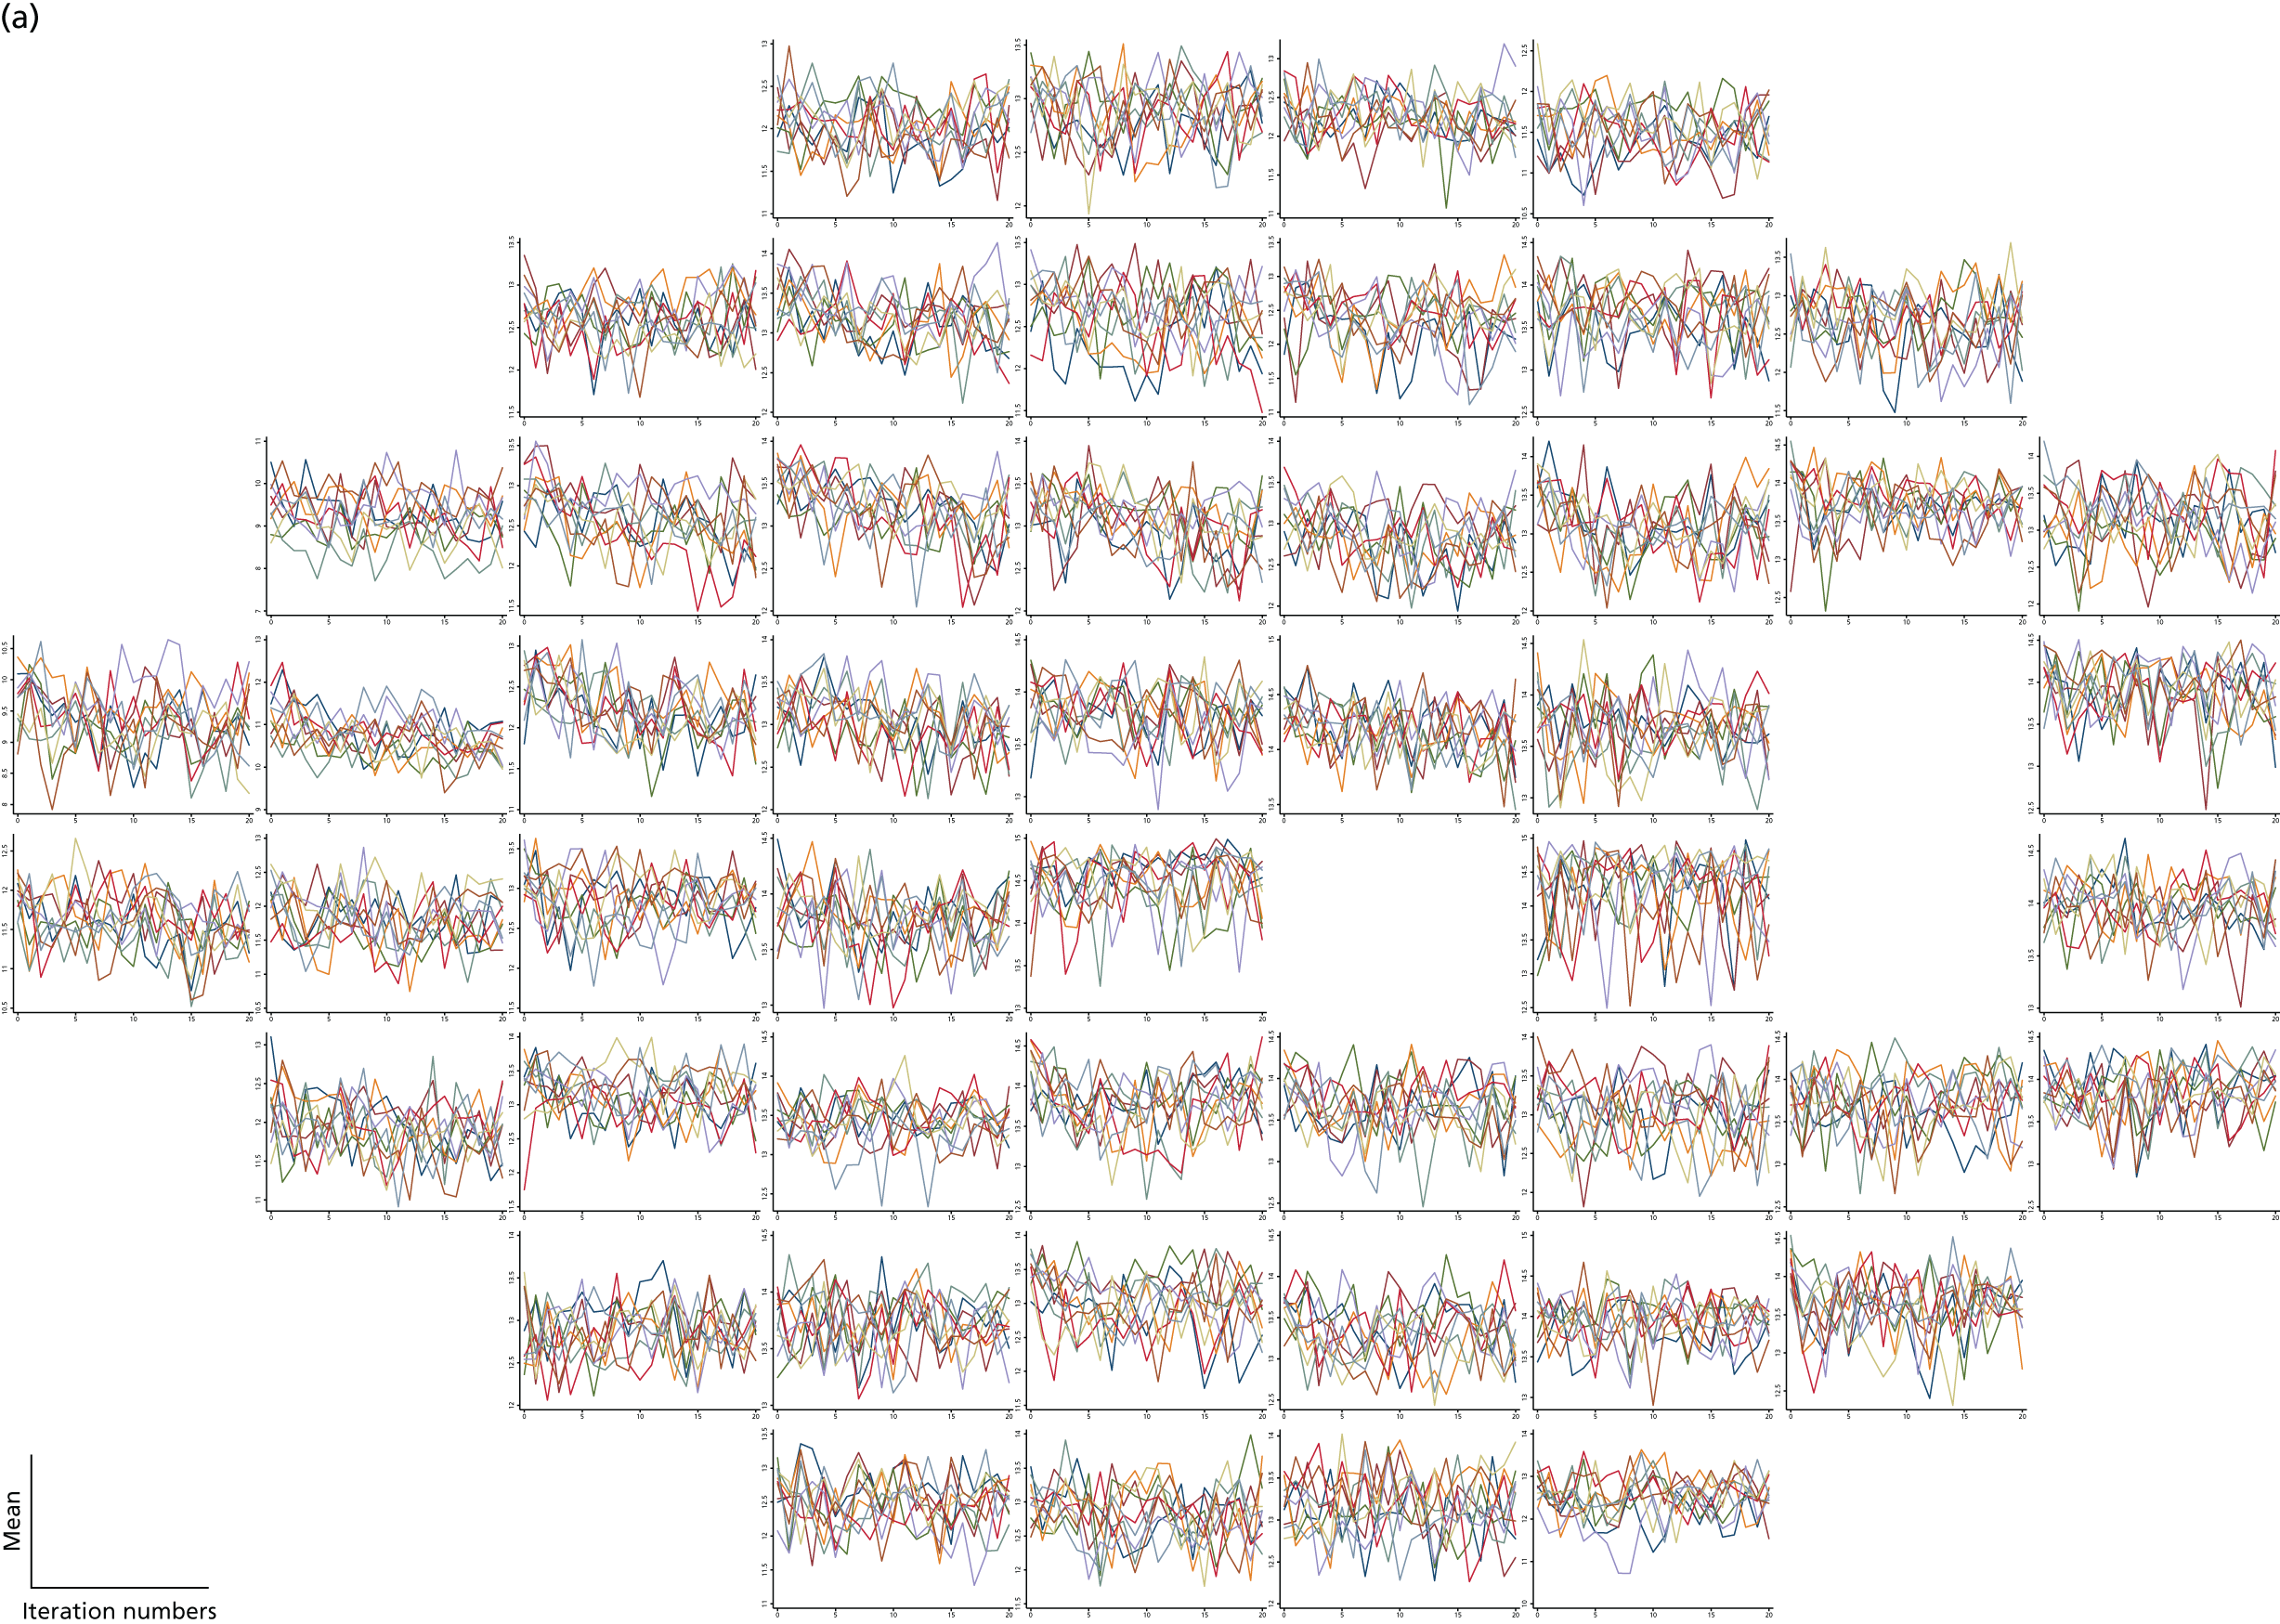
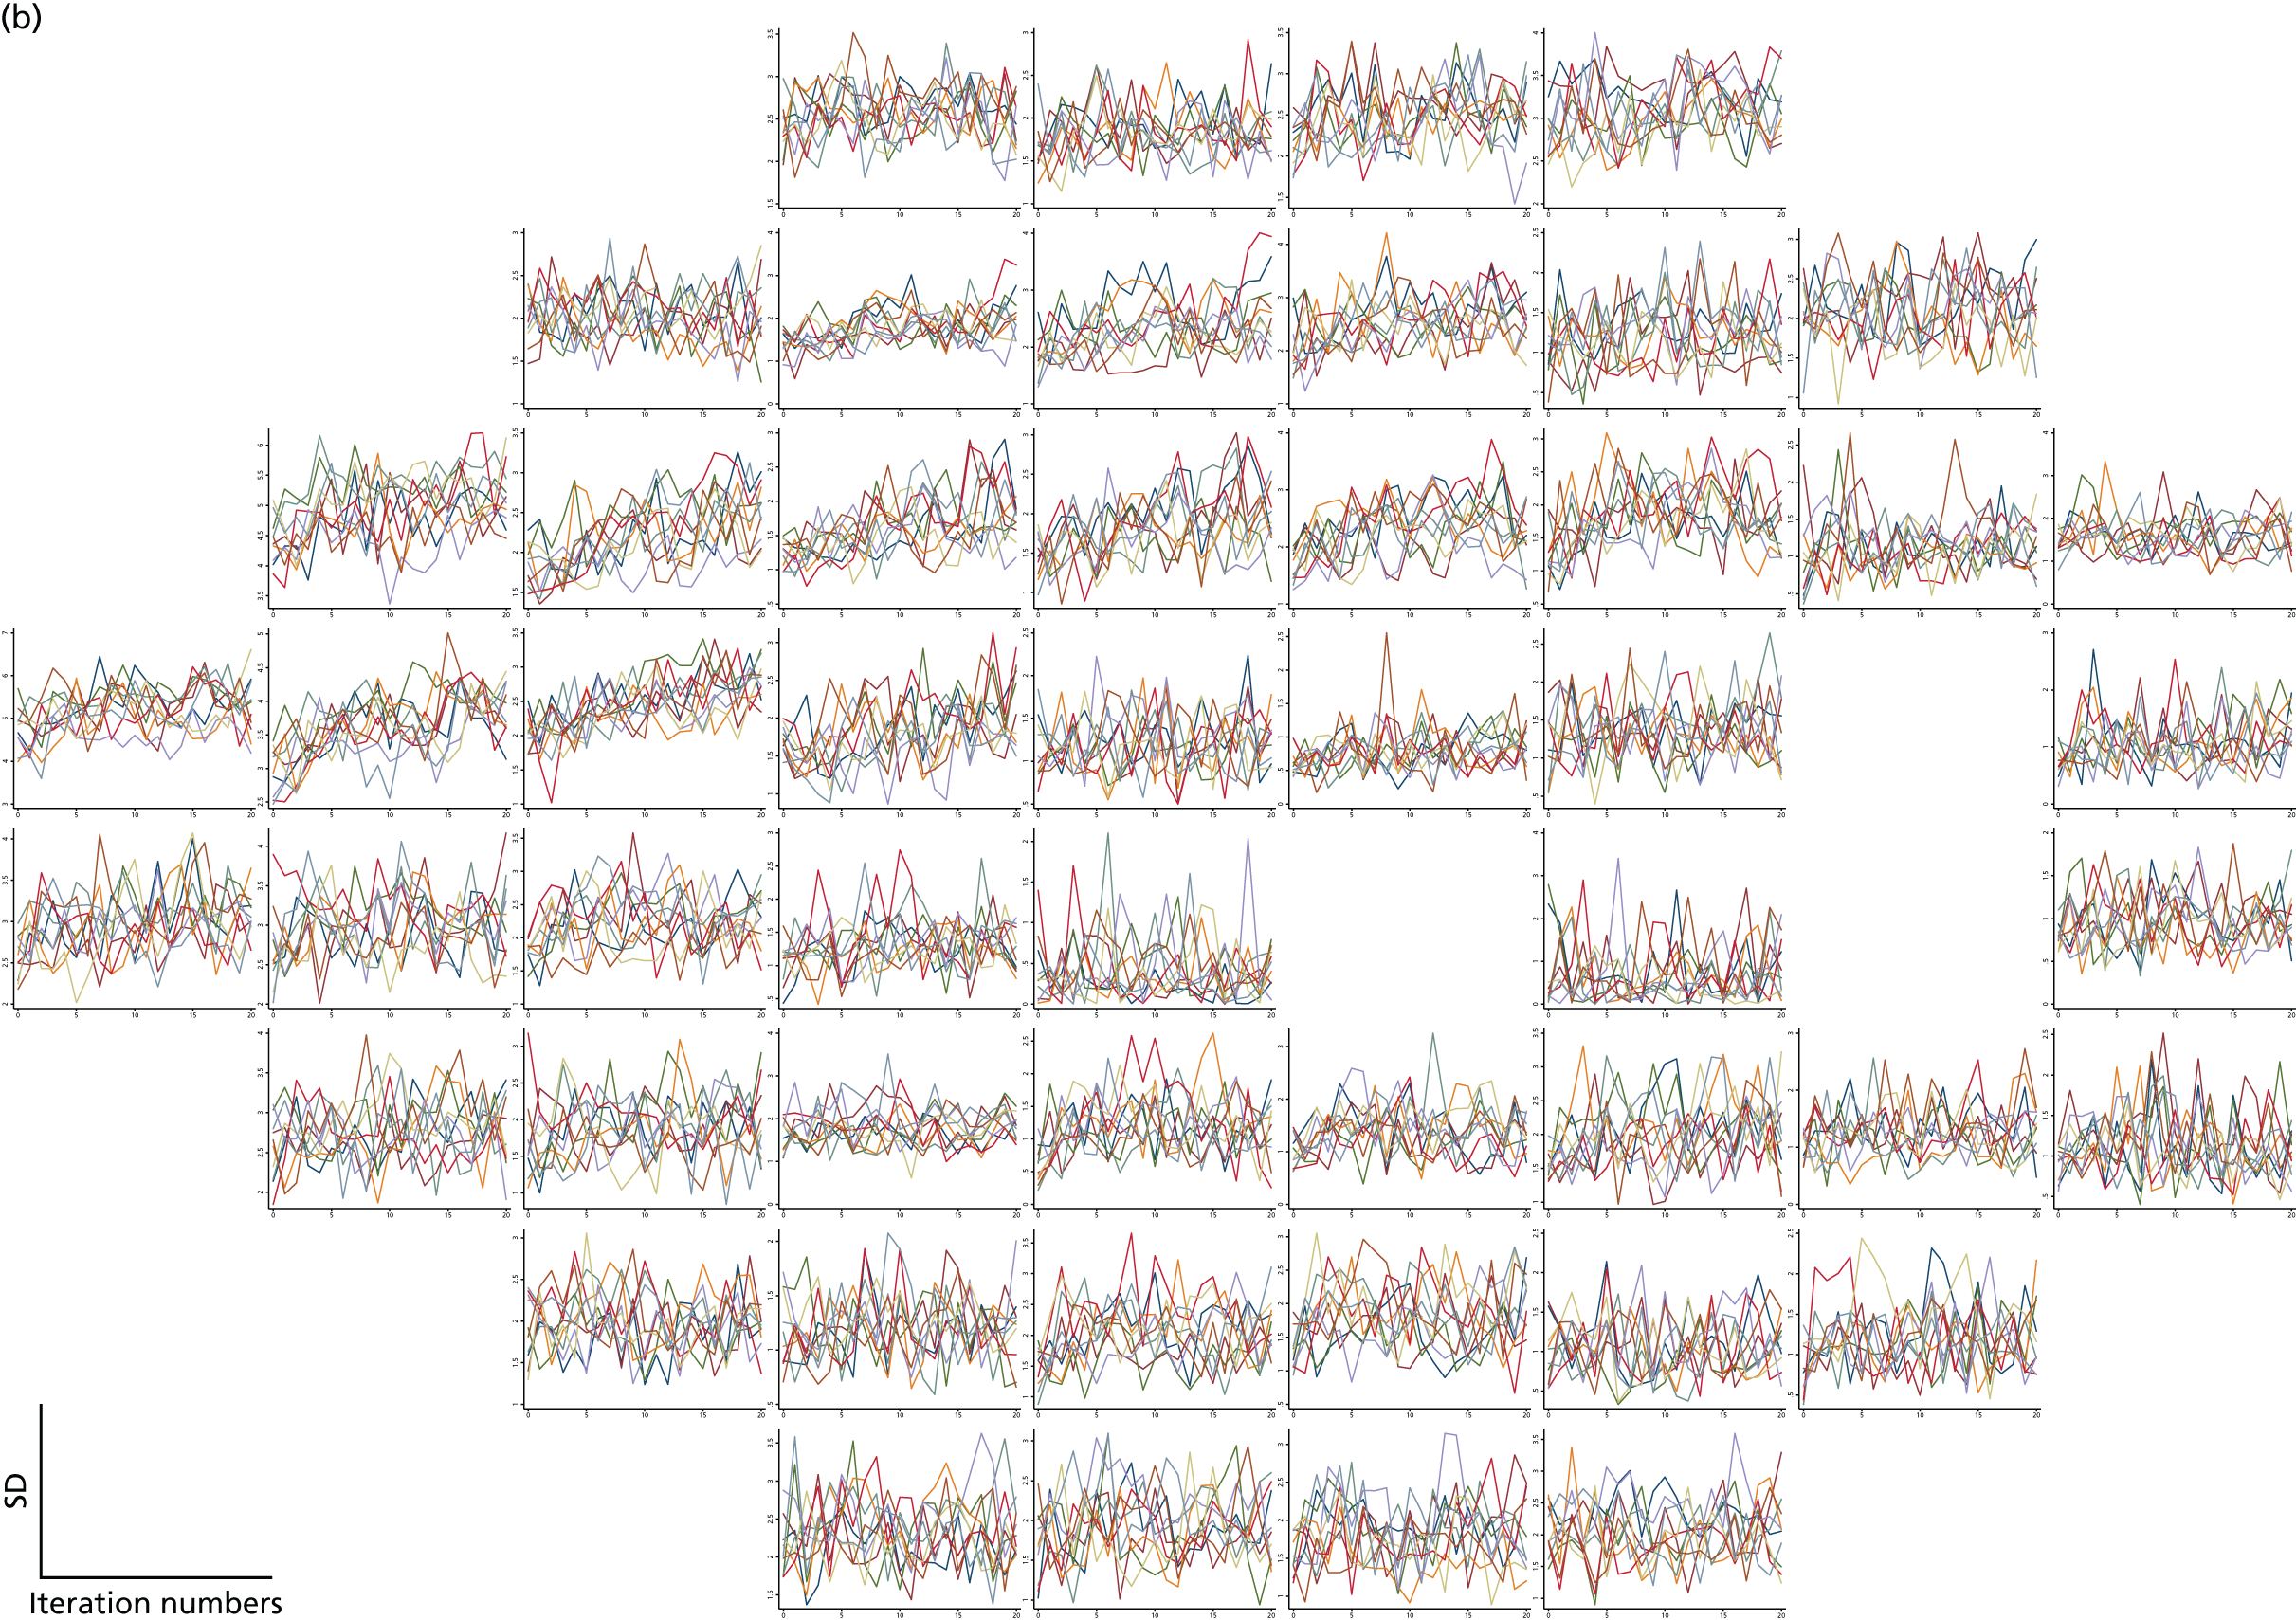
Kronecker hierarchical models
The Kronecker hierarchical models, which form part of the MaHMIC method, were performed in R software.
Simulations
As for the development of the multiple imputation model, we ran small simulation studies to assist with the development of the Kronecker models. An example of the results obtained from a relatively simple Kronecker model and 100 simulated data sets is provided in Table 21.
| Parameter | Mean (SD) | (Mean of model variances)^0.5a | True value |
|---|---|---|---|
| Intercept | 24.99 (0.27) | 0.26 | 25 |
| Treatment-by-time interaction | 2.01 (0.14) | 0.14 | 2 |
| Time | –3.02 (0.10) | 0.10 | –3 |
Simulated data for 300 people (i) at nine locations (k) and six time points (l) were generated from the following model:
where tl denotes the visit number, trti is an indicator for treatment group, the random person effects and residual errors are distributed as follows:
with:
and τikl = N[0,αik⊗ϕil], where αik has a compound symmetrical structure with variance 25 and covariance 20 and ϕik has a compound symmetrical structure with a variance of 1 and a covariance of 0.5.
The results for the fixed-effect parameters obtained from the Kronecker model agree well with the values used to simulate the data.
Standard deviations of variance parameters and the mean of the model variances are taken on the log(SD) scale. For correlations they are taken on the Fisher transform scale (person correlation) or the logit scale (Kronecker product correlations).
MaHMIC model applied to United Kingdom Glaucoma Treatment Study visual field and imaging data
The results for the fixed effects from the model outlined in Chapter 4 (see Index methods: newly developed, Kronecker model) are provided in Table 22 for the first set of 10 imputations described in Chapter 4 (see Index methods: newly developed, Multiple imputation). These imputations are from the one-stage imputation model that uses the nearest time neighbour and three spatial neighbours in the same sector as predictors in the model. The results from the individual imputations were combined using Rubin’s rules. 102
| Parameter | Estimate (95% CI) | p-value for the null hypothesis that parameter is zero |
|---|---|---|
| Constant for VF (dB) | 26.1 (25.8 to 26.4) | |
| Slope over time for VF in placebo group (dB/year) | 0.08 (–0.06 to 0.22) | 0.24 |
| Time-by-treatment interaction for VF (dB/year) | 0.13 (–0.02 to 0.29) | 0.10 |
| Constant for imaging (µm) | 77.2 (76.5 to 77.9) | |
| Slope over time for imaging in placebo group (µm/year) | –1.36 (–1.94 to –0.78) | < 0.001 |
| Time-by-treatment interaction for imaging (µm/year) | 0.21 (–0.33 to 0.76) | 0.44 |
The slope over time for the imaging outcome was estimated as negative and was statistically significant at the 5% level. However, the slope over time for the VF outcomes was not statistically significant and the point estimate was actually positive. This could be because of learning effects (patients can become more adept at taking the VF test over time), but it could also be because of an inability of the multiple imputation process to account for the selectively missing data. In the original UKGTS, patients were monitored for progression on the basis of their VF values and patients with confirmed progression were removed from the study. Subsequent data are therefore not observed. In a cohort with positive and negative slopes, removing subjects with negative slopes over time will cause a shift to a more positive average for the slopes over time. In a missing at random (MAR) setting, in which all information needed to predict the missing values is present in the observed data set, and with a correctly specified model, it would be possible to adjust for this artefactual positive slope. However, in this setting, with the restricted data set, it is possible that there is a missing not at random (MNAR) scenario. Alternatively, a MAR mechanism may be involved but the proposed multiple imputation model is not using all of the relevant information.
Neither of the time-by-treatment interactions is statistically significant, although both are in the direction of benefit for the trial drug, latanoprost. The VF time-by-treatment interaction also has a lower confidence limit that is not far from zero. The joint test of the time-by-treatment interactions for VF and imaging is not statistically significant (p = 0.24).
The results for the second set of 10 imputations are provided in Table 23. These imputations are from the multiple imputation described in Chapter 4 (see Index methods: newly developed, Multiple imputation), a three-stage approach that first imputes the censored observations from a constant model, then imputes the missing visits using regression models with the nearest time neighbour and three spatial locations within the same sector and finally re-imputes all censored observations using the same predictors.
| Parameter | Estimate (95% CI) | p-value for the null hypothesis that parameter is zero |
|---|---|---|
| Constant for VF (dB) | 26.1 (25.8 to 26.3) | |
| Slope over time for VF in placebo group (dB/year) | 0.23 (0.07 to 0.39) | 0.005 |
| Time-by-treatment interaction for VF (dB/year) | 0.07 (–0.10 to 0.23) | 0.44 |
| Constant for imaging (µm) | 77.2 (76.5 to 77.9) | |
| Slope over time for imaging in placebo group (µm/year) | –1.41 (–2.07 to –0.76) | < 0.001 |
| Time-by-treatment interaction for imaging (µm/year) | 0.29 (–0.30 to 0.87) | 0.34 |
Using these imputations, the slope over time for VF is again positive. In this case the effect appears more extreme, with a statistically significant positive slope. Again, both time-by-treatment interactions directionally favour the latanoprost group, but neither is statistically significant. In these imputations neither treatment effect is close to being statistically significant. The joint test of the time-by-treatment interactions for VF and imaging is again not statistically significant (p = 0.54).
MaHMIC model applied to United Kingdom Glaucoma Treatment Study visual field data only
In this section we provide the results for the MaHMIC model applied to data sets containing only the VF data, without the addition of imaging data. The model for VF data only is outlined in Chapter 4 (see Index methods: newly developed, Kronecker model).
The results for the first set of imputations are provided in Table 24 and for the second set of imputations are provided in Table 25. Both sets of results have been combined using Rubin’s rules.
| Parameter | Estimate (95% CI) | p-value for the null hypothesis that parameter is zero |
|---|---|---|
| Constant for VF (dB) | 26.1 (25.8 to 26.4) | |
| Slope over time for VF in placebo group (dB/year) | 0.08 (–0.06 to 0.23) | 0.26 |
| Time-by-treatment interaction for VF (dB/year) | 0.13 (–0.03 to 0.30) | 0.11 |
| Parameter | Estimate (95% CI) | p-value for the null hypothesis that parameter is zero |
|---|---|---|
| Constant for VF (dB) | 26.0 (25.7 to 26.3) | |
| Slope over time for VF in placebo group (dB/year) | 0.24 (0.07 to 0.41) | 0.006 |
| Time-by-treatment interaction for VF (dB/year) | 0.06 (–0.11 to 0.23) | 0.47 |
The results obtained from the VF-only models are very similar to those obtained from the joint VF and imaging models.
MaGIC model applied to United Kingdom Glaucoma Treatment Study visual field and imaging data
In this section we provide the results for the MaGIC model, described in Chapter 4 (see Index methods: newly developed, Generalised estimating equations), applied to the imputed data sets using Stata software. As for the MaHMIC models, the results from each imputation were combined using Rubin’s rules. The results from the first and second sets of imputations are provided in Tables 26 and 27 respectively.
| Parameter | Estimate (95% CI) | p-value for the null hypothesis that parameter is zero |
|---|---|---|
| Constant for VF (dB) | 26.3 (26.0 to 26.6) | |
| Slope over time for VF in placebo group (dB/year) | 0.09 (–0.06 to 0.24) | 0.25 |
| Time-by-treatment interaction for VF (dB/year) | 0.07 (–0.12 to 0.26) | 0.47 |
| Constant for imaging (µm) | 77.2 (75.6 to 78.8) | |
| Slope over time for imaging in placebo group (µm/year) | –1.19 (–2.31 to –0.07) | 0.04 |
| Time-by-treatment interaction for imaging (µm/year) | –0.09 (–2.08 to 1.91) | 0.93 |
| Parameter | Estimate (95% CI) | p-value for the null hypothesis that parameter is zero |
|---|---|---|
| Constant for VF (dB) | 26.3 (26.0 to 26.6) | |
| Slope over time for VF in placebo group (dB/year) | 0.27 (0.08 to 0.45) | 0.004 |
| Time-by-treatment interaction for VF (dB/year) | –0.05 (–0.28 to 0.18) | 0.65 |
| Constant for imaging (µm) | 77.2 (75.6 to 78.8) | |
| Slope over time for imaging in placebo group (µm/year) | –1.18 (–2.32 to –0.04) | 0.04 |
| Time-by-treatment interaction for imaging (µm/year) | –0.14 (–2.14 to 1.85) | 0.89 |
The parameter estimates obtained from the MaGIC models were quite similar to those obtained from the MaHMIC models, although the CIs were generally slightly wider. There was a slight discrepancy in the imaging time-by-treatment interaction estimates, with the MaGIC model giving small negative estimates and the MaHMIC model producing positive estimates. However, given the wide CIs for the MaGIC estimates, these estimates are still broadly in agreement. In both models, the imaging time-by-treatment interaction was not statistically significant. Similarly, the VF time-by-treatment interaction estimated in the second set of imputations differed in sign to that estimated by the MaHMIC model, although in both models this term was not statistically significant.
As for the MaHMIC models, the joint test of the time-by-treatment interaction for VF and imaging was not statistically significant in either set of imputations (p = 0.76 for the first set of imputations and p = 0.88 for second set of imputations).
We also applied the first imputation model to the two treatment groups separately and combined the imputed data sets for analysis (as opposed to applying the imputation model to both treatment groups combined). When analysing the imputations from the two treatment groups with the MaGIC model, substantively similar results to those presented in Table 26 were obtained.
MaGIC model applied to United Kingdom Glaucoma Treatment Study visual field data only
In this section we present the results of the MaGIC model applied to data sets containing only the VF data, without the addition of imaging data. The model for VF data only is outlined in Chapter 4 (see Index methods: newly developed, Generalised estimating equations). The results are presented in Tables 28 and 29 for the two sets of imputations respectively.
| Parameter | Estimate (95% CI) | p-value for the null hypothesis that parameter is zero |
|---|---|---|
| Constant for VF (dB) | 26.3 (26.0 to 26.6) | |
| Slope over time for VF in placebo group (dB/year) | 0.09 (–0.06 to 0.24) | 0.23 |
| Time-by-treatment interaction for VF (dB/year) | 0.06 (–0.12 to 0.25) | 0.51 |
| Parameter | Estimate (95% CI) | p-value for the null hypothesis that parameter is zero |
|---|---|---|
| Constant for VF (dB) | 26.3 (26.0 to 26.6) | |
| Slope over time for VF in placebo group (dB/year) | 0.27 (0.09 to 0.45) | 0.003 |
| Time-by-treatment interaction for VF (dB/year) | –0.06 (–0.29 to 0.16) | 0.58 |
As for the joint model, these results broadly agreed with the estimates produced by the MaHMIC models. The VF-only model also provided similar results to the joint VF and imaging models.
Chapter 6 Discussion
In clinical trials with a vision function outcome, VF variability results in the requirement for large numbers of patients observed over long intervals. This causes a delay in bringing new beneficial treatments to patients, and trials become more costly with a consequence that potentially beneficial treatments may not be evaluated. It has been established for decades that imaging measurements of structural damage to the ONH are associated with VF loss in glaucoma. Imaging measurements are often considered more precise than VF measurements, making them attractive as potential surrogate outcomes for clinical trials and clinical practice. However, for imaging measurements to be established as appropriate alternative or supplementary outcomes for VF testing, the measurements need to capture the treatment effect of an intervention on the outcome of interest (the VF test). Furthermore, analyses that include imaging outcomes also need to be more sensitive, more accurate and/or distinguish treatment arms in a clinical trial better than analyses based on the VF alone.
The results of this work provide some evidence that imaging measurements do capture the treatment effect of latanoprost on the VF. Although the rate of TD OCT-measured RNFL loss was faster in the placebo-treated eyes than in the latanoprost-treated eyes, the difference did not reach statistical significance (see Chapter 5, Rates of visual field and retinal nerve fibre layer thickness change). However, the rate of RNFL thickness change was statistically significantly faster in eyes with incident VF loss and the rate of RNFL thickness change was a statistically significant predictor of incident VF loss (see Chapter 5, Association of the rate of retinal nerve fibre layer thickness change with visual field progression), establishing that VF progression is more likely in eyes with faster rates of RNFL loss. Furthermore, adding the rate of RNFL change as a Bayesian prior in a model of VF progression (sANSWERS) improved the progression detection hit rate of the model considerably, for the same false-positive rate (see Chapter 5, Evaluation of ANSWERS, PoPLR and sANSWERS index methods, ‘Hit rate’ compared with specificity), and was more accurate in modelling the rate of progression (see Chapter 5, Evaluation of ANSWERS, PoPLR and sANSWERS index methods, Prediction of future visual field state) than analysis methods using VF data alone. However, although faster OCT RNFL thinning was associated with incident VF deterioration, the OCT data explained little of the incident VF deterioration. Possible explanations for this are that the structural data behave differently under treatment from the VF data and/or the measurement imprecision in the OCT data obscures the underlying association. Despite inclusion of OCT RNFL change as a Bayesian prior in the analysis of VF change resulting in more identified progression and more accurate estimates of rates of progression, adding the imaging data to the vision function data from VF testing did not provide a greater separation between the treatment groups in the UKGTS (see Chapter 5, Evaluation of ANSWERS, PoPLR and sANSWERS index methods, Survival analyses).
Methods to combine imaging and VF data are emerging in the literature. 62,85,86,89,110 However, currently, glaucoma is identified and monitored in the clinic using either imaging (structural) or VF change, with integration of information gained from either being carried out subjectively by the clinician. 32,33,36,111 The results of the work presented here add weight to the evidence on the benefit of combining imaging and VF data quantitatively.
Imaging outcomes in the United Kingdom Glaucoma Treatment Study
From Figures 17 and 18, it is obvious that the signal compared with the ‘noise’ (variability) is lower in the OCT data than in the VF data. A Mann–Whitney test identified that the distribution of RNFL slopes was not statistically significantly different in the placebo and latanoprost treatment arms (p = 0.18); however, this analysis does not take account of all measurements, only the ‘summary’ individual slope estimates. It may be that non-parametric multilevel models may better detect the signal in the data. 112 That said, the principal problem is that the signal-to-noise ratio in the TD OCT data is low relative to that in the VF data. The variability characteristics of measurements from SD OCT images are much better, with the variability of SD OCT RNFL measurements being about half that of the TD OCT measurements. 113
The Cox proportional hazards analysis, with the OCT RNFL rate of change as a predictor variable, demonstrated that the rate of RNFL thickness change was a significant predictor of incident VF loss (p = 0.035). Thus, the data in this study are in support of the treatment effect on RNFL measurements being in the same direction as the treatment effect on VF measurements and the imaging outcomes being associated with VF loss. However, the signal-to-noise ratio of the TD OCT measurements is insufficient for these measurements to have much utility in improving study power; SD OCT, because of its better signal-to-noise characteristics, may be more useful.
Evaluation of the reference and ANSWERS, PoPLR and sANSWERS index tests
With the criterion false-positive rate held at about 5%, the ANSWERS analysis technique was more sensitive than the PoPLR technique, especially over shorter follow-up intervals (see Chapter 5, Evaluation of ANSWERS, PoPLR and sANSWERS index methods, ‘Hit rate’ compared with specificity). When the RNFL rate of change is included as a Bayesian prior in the ANSWERS technique (sANSWERS), the sensitivity to identify progression increases markedly, especially for the ‘longer’ follow-up intervals (up to 22 months). The benefit of adding imaging data is also seen when the accuracy of the estimated rate of progression is considered. When evaluated by projecting the estimated rate of progression at each VF location to predict future VF states, the prediction error for sANSWERS was significantly smaller than that for ANSWERS (without the structural prior) and the PoPLR technique. This implies that the RNFL data contain information relevant to VF loss.
The optimal outcome measure for a clinical trial should distinguish the treatment groups (the HR should indicate a large difference) and be sensitive to change in clinical status, so that the proportion of participants with an outcome is high. These attributes reduce the number of participants required for a trial and/or the duration of observation required. The GPA criterion applied in the UKGTS was designed to have greater sensitivity in the 24-2 VF test than the conventional GPA criterion (three locations different from baseline at the 5% level on three consecutive occasions). The latter was designed for the 30-2 VF test used in the Early Manifest Glaucoma Trial (EMGT). 114 The 30-2 VF test has 40% more test locations than the 24-2 VF test and so the opportunity to detect progression is greater for a 30-2 VF test than a 24-2 VF test. The number of locations tested in the VF (24-2 vs. 30-2 test) influences both the sensitivity and the false-positive frequency. The false-positive frequency is also affected by the number of times that the criterion is applied over a test series. In clinical trials and clinical practice, the criterion is applied every time the patient undergoes a new test. Thus, over time, the false-positive frequency increases. The false-positive frequency for the EMGT GPA criterion has been estimated as 11% in the 30-2 VF test over the course of an average 25 (range 14–36) VF tests115 and as 2.6% in the 24-2 VF test over the course of 12 VF tests. 81 This compares with an estimated false-positive frequency of 5.7% (95% CI 1.6% to 14.6%) over the course of 11 VF tests for the UKGTS GPA criterion in the 24-2 VF test in the RAPID data set.
The UKGTS GPA criterion distinguished well between the treatment groups. The HR in the subset of 284 UKGTS participants with baseline OCT images and ≥ 6 months’ follow-up was 0.45 (95% CI 0.27 to 0.76; p = 0.0036). In the larger subset of 320 UKGTS participants with any OCT images, the HR was 0.57 (95% CI 0.35 to 0.90; p = 0.016) and in the full data set of 461 UKGTS participants with follow-up data the HR was 0.44 (95% CI 0.28 to 0.69). 67 The difference in the point estimate of the HR in the various subsets illustrates the sensitivity of the HR to variations in the samples tested.
The PoPLR technique distinguished between the treatment groups similarly well in the subset of 320 UKGTS participants, with a HR of 0.59 (95% CI 0.42 to 0.83; p = 0.002) and with a greater number of events than the GPA criterion (see Figure 23). This is a positive attribute, adding power to a trial. In this subset the ANSWERS technique did less well, producing a HR of 0.76 (95% CI 0.56 to 1.03; p = 0.065), but with a greater number of events still. The sANSWERS technique, incorporating the imaging data, did better, with a HR of 0.71 (95% CI 0.53 to 0.93) and had the highest number of events. The criterion for progression in these analyses had been adjusted to give a false-positive frequency of about 5% over the course of 11 VF tests in the RAPID data set.
The sANSWERS technique, as shown by the estimate of sensitivity at a 5% false-positive rate (see Figure 20), was considerably more sensitive than the other techniques. However, the difference between treatment groups was less than in the other analyses. One possible explanation is that the greater sensitivity of the test allowed detection of very small amounts of progression that may be less related to the level of IOP and therefore less amenable to modulation with treatment. The post hoc analysis in Chapter 5, adding a rate of deterioration criterion, supports the hypothesis that treatment was more effective in eyes that were progressing more quickly. Having a ‘rate of change’ criterion also makes sense for clinical practice in that very slow rates of progression are unlikely to result in symptomatic VF loss over a patient’s lifetime. However, there is no single rate of change that is clinically meaningful for all patients. A relatively slow rate of change in a young patient with advanced VF loss at baseline may impact on vision-related quality of life, whereas a relatively fast rate in an elderly patient with early VF damage at baseline may have no consequence on vision-related quality of life. Another explanation for the limited impact on the sample size calculation of adding OCT imaging data is that the progressive structural changes may not respond to treatment in an identical way to the visual function changes.
Newly developed methods: permutation tests, MaHMIC and MAGIC
In this work we have considered two approaches to the simultaneous analysis of longitudinal VF and imaging data, one approach geared to the analysis of data from RCTs and the other geared to the analysis of data from a single patient in a clinical practice setting. The methods were assessed using a subset of data from the UKGTS. It should be recognised that the data analysed, and therefore the results produced, are not directly comparable to those reported in the main outcome paper. 67 One reason for this is that we wanted to explore the potential of adding an imaging variable to VF data and, to assess this, we included data only from visits when both VF and imaging data were collected. This meant including only follow-up visits when both VF and OCT measures were available.
Given the non-normality and heteroskedastic nature of VF data and the fact that the data are multivariate with a complex covariance structure, realistic models for the clinical setting would have to include more parameters than could be reliably estimated using the data available from a single subject. Our approach of using a censored normal regression model for the repeated measures at each location coupled with permutation tests to assess trends over time deals with the non-normality and heteroskedasticity and avoids the need to model the covariance structure. As such, it is an attractive option for modelling data from a single subject.
A number of outcomes could be considered for PERM in the clinic setting. These could be parameters estimated from the model (such as the imaging outcome slope or the mean of the VF slopes) or test statistics derived from these parameter estimates. Test statistics are an attractive option when the aim is to simultaneously assess changes in multiple parameters. These test statistics are derived assuming independence across locations, but p-values calculated from these are valid because they are calculated using permutations.
For simple outcomes, such as a slope or a mean slope or a test statistic with a single degree of freedom, it is natural to use a one-sided p-value of 0.05 as a cut-off value. This is equivalent to using a two-sided p-value of 0.1, coupled with observed deterioration. By definition, this will be associated with a specificity of 95%. Analysis of the RAPID data supported this, with 95% CIs for the specificity always spanning 95% for this type of outcome. Choosing a p-value cut-off value for a one-sided test for an outcome that is a joint test statistic is not so straightforward. Our approach required a directional estimate of deterioration (as opposed to an improvement) for both imaging and/or mean VF parameters, as well as the p-value being below a cut-off value. The additional requirement of deterioration means that choosing a cut-off value of p = 0.1 (two-sided) will result in a specificity of > 95%. Accordingly, in this situation we used the RAPID data to help choose a p-value cut-off value higher than 0.1 that gave a specificity close to 95%; a limitation of this approach is that the size of the RAPID data set precludes accurate estimation of specificity.
The relatively small size of the RAPID data set also affected our assessment of the potential of outcome measures utilising rates of change in VF regions. It is clear that ignoring the multiplicity problem introduced by simultaneous consideration of multiple outcomes (the six VF regions) gives specificities that are statistically significantly lower than 95%. Using a Bonferroni correction gave a specificity that was consistent with 95%, but in theory a Bonferroni correction should be too stringent. Even though the RAPID data set is more than twice the size of the largest similar published data set,81 had the data set been larger, empirical cut-off values could have been estimated more precisely.
Subject to the caveats over cut-off values mentioned above, PERM based on the imaging parameter alone had the highest hit rate, with 66 eyes being identified as progressing in the UKGTS, which was statistically significantly higher (p < 0.05) than the value obtained from the mean of the VF slopes at each location or the best of the test statistics based on the combination of VF and imaging parameters. However, the number of participants identified as progressing using this approach was similar in the two arms of the trial (36 vs. 30).
A number of different outcomes combining the imaging and VF data were considered, with the best of these giving rise to a hit rate that was not statistically significantly better than that from the best of the outcomes utilising the VF measures alone when using regressions on visit number. When using visit date or one VF per visit only, the best combination of imaging and VF parameters also gave a hit rate that was not statistically significantly better than the best VF-only measure. The difference between the numbers of participants identified as progressing in the two arms of the UKGTS was most statistically significant using this outcome, although gains over the best VF-only measure were small. A number of the combined outcomes gave very similar hit rates and, given the relatively small numbers identified as progressing, it is not possible to draw definitive conclusions about which approach is best. Likewise, for all outcomes, analysis assuming equally spaced visits and analysis using actual visit times gave very similar results. We would anticipate that use of the actual visit times should be more efficient if rates of decline are linear, but in practice, at least with the data here, gains seem small.
For the clinical trials setting, to take account of the imprecision in VF measures below 15 dB, we explored the use of censored regression models, utilising a multiple imputation model to fit these. These censored models assume that when a measurement is < 15 dB then there is a true underlying measure but that the observed measurement is a poor guide to its actual value. In addition to censoring, our models allow for spatial and temporal correlations through the use of a mixed-effects model with a Kronecker product error structure. We also used a GEE approach to estimate effects, relaxing assumptions about the covariance structure within subjects.
When applying the multiple imputation process to the VF data, we experienced some problems with convergence, possibly because of the loss of information from the spatial correlations caused by averaging across repeated VF tests at the same visit; when using a single VF repeat, the convergence properties appeared to be better.
In this setting, the proposed multiple imputation models may not be able to completely correct for any selection effects of progressing patients leaving the UKGTS. The lack of data from patients who are progressing can lead to an appearance of VF outcomes improving over time when considering only available visit data. If the missingness mechanism were MAR, we would expect an appropriate model to be able to correct for this effect. However, as the subset analysed in this study did not contain all of the information according to which participants were judged to have progressed (as we analysed a restricted data set compared with the full UKGTS data set) it is possible that the missing data scenario is MNAR in this case, which would explain why the upwards trend in VF measures has not been eliminated. Alternatively, the missing data mechanism could be MAR but our models may be missing important predictors of missingness. Further work could include investigating other potential multiple imputation models using different combinations of predictors, including more locations within the VF to impute and including variables such as age and imaging outcomes. An alternative explanation for the observed positive slopes over time is that there are learning effects – patients becoming more proficient at taking the VF tests over time.
Despite not completely correcting for the potentially artefactual positive VF slope, the time-by-treatment interactions for VF estimated by the models usually favoured latanoprost over placebo; however, this was not statistically significant. The VF-only and VF plus imaging joint models appeared to give similar results.
The results obtained from the MaHMIC and MaGIC models appeared to be consistent with each other, with parameter estimates usually agreeing quite closely. The imaging time-by-treatment interaction obtained from the MaGIC models was in favour of placebo but the CIs were wide. The lack of statistical significance for the imaging time-by-treatment interaction is consistent with the results from the PERM variants, in which the number of eyes identified as progressing in both treatment arms was similar.
We restricted our data set to visits at which we could identify the availability of both outcome measures, which will have reduced the power of the models that we used. There may therefore be insufficient power to distinguish between the different models in terms of their performance. However, in future work different correlation structures in the Kronecker hierarchical model could be examined, which may lead to an improvement in the size of the SEs.
It was our intention to assess the ability of our methodology to predict future measurements in a series over time, as specified in the protocol. Accuracy of prediction was to have been compared using a sum of squares approach to give a prediction error, weighted to account for the heteroskedastic nature of VF measurements. Our decision to treat VF measurements below 15 dB as being censored renders this problematic, however. The models used to carry out the PERM and MaHMIC methods could be used to predict future measurements [those from the MaHMIC models being best linear unbiased predictions (BLUPs)], but in both cases the prediction will include a probability that the next measurement will be censored, making it impossible to compare observed and predicted results using a simple sum of squares approach. A direct comparison of the predicted and observed values, ignoring whether they lie above or below 15 dB, would be inappropriate, as the censored regression approaches are modelling the measurement error-free latent VF values that are postulated to underlie the observed values.
Future work could include examination of the use of other cut-off values. However, reducing the censoring point from 15 dB to 10 dB might be problematic given the observed non-normality. Increasing the cut-off value to, say, 20 dB would increase the number of data that need to be imputed, which may lead to convergence problems in the multiple imputation model.
Sample size estimates
The sample size estimates show that a placebo-controlled trial of an intervention as effective as latanoprost can be undertaken with an observation period of only 18 months and as few participants as 558 (applying the PoPLR criterion). In fact, a smaller sample size is probably required because the GPA criterion applied to the sample of 320 UKGTS participants identified a smaller difference between treatment groups than when applied to the smaller subset of 284 participants analysed in this study and the total sample reported originally.
Naturally, these sample size estimates relate to cohorts that are similar to the UKGTS cohort, that is, newly diagnosed subjects with early glaucoma and a relatively low IOP. Including newly diagnosed patients has advantages and disadvantages. An important advantage is that such patients have not received any previous disease-modifying treatment, so the placebo arm fairly reflects the natural history of untreated glaucoma and the treatment arm provides information on the disease-modifying effect of a single intervention. However, even though the UKGTS protocol included steps to minimise the inclusion of subjects still learning the VF test,60 the median MD slope in the treatment arm was slightly positive (0.12 dB per year), despite approximately 15% of latanoprost-treated subjects being identified as having VF deterioration. This net slight improvement in VF MD suggests either that treatment induces VF improvement in a proportion of patients or that VF learning effects are causing progressively more positive MD measurements over time. The former hypothesis was tested recently in the EMGT data and found not to be the case. 116 If the latter hypothesis is true, then the measured rates of VF loss likely underestimate the true rate of glaucoma-related VF loss. Thus, the –0.21dB per year median rate of MD loss in the placebo-treated arm may be an underestimate. Although the average IOP in the UKGTS cohort, at approximately 20 mmHg,67 was < 1 mmHg lower than the average IOP in the EMGT cohort, the rate of MD loss in the untreated arm was half that in the untreated arm in the EMGT cohort (median –0.21 dB per year in this UKGTS subset and median –0.48 dB per year in the EMGT cohort,117 later revised to –0.40 dB per year over a longer observation period118). The rate of VF loss was measured over a longer period in the EMGT cohort so the impact of VF learning (if occurring mostly over the initial part of the observation period) may be less than in the UKGTS data.
Quigley119 evaluated samples sizes for trials in glaucoma based on assumed rates of MD deterioration. The rates considered for the (treated) control group were all > 50% greater than the observed mean rate in untreated patients in the UKGTS. Thus, the sample size calculations may be overoptimistic, although the caveats stated above apply. In addition, Quigley’s model assessed the mean and SDs of rates of change, whereas it is known that rate-of-change VF data are not normally distributed. 118 His sample size estimate for a treatment reducing the rate of progression by 50% over that of a treated control group was 294 (323 adding a 10% initial loss to follow-up), although type 1 and 2 error rates were not stated and the duration of observation was not defined. This is a much smaller sample size estimate than that estimated for a placebo-controlled trial in this work, in which the number of events should be greater because the reference arm is untreated (compared with a treated reference arm in Quigley’s calculation).
Because the IOP level was not a recruitment criterion, the UKGTS cohort is probably fairly representative of an unselected clinical glaucoma population and the results of the trial can, therefore, be generalised to patients in the clinic. A caveat is that no data were obtained on the IOP and degree of VF loss of subjects declining to participate in the UKGTS. If there had been a tendency for individuals with a higher IOP and greater degrees of VF loss to decline participation, then the UKGTS cohort may have ‘milder’ disease than the unselected clinical glaucoma population. Study power is strongly influenced by the event rate (in this case, VF deterioration) and therefore study power may be increased (and the required sample size and observation duration may be reduced) by enriching the study population with patients more likely to achieve a deterioration event. This can be achieved by selecting patients on the basis of risk factors for deterioration, such as higher IOP or the presence of optic disc haemorrhages. Although doing this may reduce the required sample size or observation duration, there are potential disadvantages. The outcomes of such studies can be generalised only to similar patients and there is a risk that a treatment effect may be incorrectly estimated if the treatment is more, or less, effective in the trial cohort than in the target clinic population. Disc haemorrhages, for example, are well known to be a risk factor for glaucoma deterioration99,120 and, although IOP lowering may be beneficial in these eyes,121 the incidence of disc haemorrhages does not seem to be affected by IOP-lowering treatment. 122 If disc haemorrhages represent, at least in part, a non-IOP-related risk, then enriching a population with patients with a history of disc haemorrhages in a study assessing the effect of IOP lowering may not increase study power and may, in fact, have the opposite effect.
Limitations and further work
A limitation of these data is the imaging technology that was available at the time that the data were obtained. At the time that the UKGTS was designed and run, the most sophisticated ocular imaging technique available was TD OCT. Imaging technology has been developing rapidly and SD OCT has significantly better resolution and measurement precision than TD OCT. The finding of little benefit to trial power of adding TD OCT RNFL measurements to VF measurements may relate to the low signal-to-noise ratio of the TD OCT RNFL measurements compared with the VF measurements. Future trials assessing the potential of SD OCT are warranted.
The ANSWERS, PoPLR and sANSWERS progression criteria were adjusted to account for the impact of multiple testing in time on the false-positive rate. The PoPLR criteria distinguished the treatment groups well and better than the ANSWERS and sANSWERS criteria, both of which, being more sensitive, identified more UKGTS participants as progressing. Further work will explore how adjusting the criterion for significant change affects criterion on the separation between treatment groups and the proportion of subjects identified as progressing. An additional ‘rate of change’ threshold criterion may also be beneficial.
Approaches in this work aimed to reduce the heteroskedasticity in the data so that statistical methods requiring a normal distribution could be applied. Further work will explore non-parametric approaches to the analysis of repeated measures over time. 112 Permutation approaches, which do not require normal data distribution, proved helpful. Although the correlation between imaging measures of structural damage to the ONH and VF measures is established and imaging measures are sensitive to progressive damage in glaucoma, imaging outcomes are not yet recognised by regulatory authorities. 58 The finding in the permutation analysis, that the imaging outcome was more sensitive than VF measurements but did not distinguish the treatment arms in the trial, may suggest that imaging measures an aspect of disease deterioration that is less responsive to treatment than the VF outcome or that has a different time course. The signal-to-noise ratio in these data is too poor to draw many conclusions and therefore further evidence is needed that imaging outcomes capture the effect of treatment on the VF outcome. The data in this work provide some support that they do. Other approaches, such as the joint modelling of incident VF loss with the rate of change in structural measurements, as suggested by Medeiros et al. ,66 and multivariate non-linear mixed-effect methods, with credible intervals for progression in individual patients, may be helpful to provide additional evidence, and non-parametric approaches need to be explored in detail. 123,124
A limitation that is hard to address when evaluating alternative progression criteria in real-world trial data is that the data are censored as a consequence of the progression criterion that were applied in the trial – once a participant is identified as progressing, he or she exits the study and the data series is curtailed. If an alternative progression criterion fails to identify progression in a censored series, it is not possible to know whether that criterion may have identified progression in that participant had the data not been censored. The only way around this problem is to build virtual models of progressing patients; such models would need to capture all aspects of VF and imaging variability.
The estimates of specificity for the ANSWERS, PoPLR and sANSWERS analysis methods were made in 70 RAPID study participants so they are fairly imprecise, particularly so for the GPA criterion for which permutation of the data was not possible. Permuting the VF series from these 70 participants may increase the precision. It is presently not possible to permute VF data and analyse GPA progression with the GPA software, so new software applications need to be developed to enable this. Additionally, given the practical difficulties in obtaining many repeat tests in a short period of time in a large number of patients, virtual models of stable patients would be particularly helpful; as mentioned, such models would need to capture all aspects of VF and imaging variability.
The newly developed analysis methods were tested on a data set that included only paired VF/imaging data and only one VF at each visit (if more than one VF was available, either the first VF or an average was used); additional trial visits to confirm possible VF progression were also excluded. Therefore, a comparison of the number of eyes identified as progressing by the PERM variants with the number identified as progressing in the UKGTS could not be made as the trial definition of progression used visits that were not included in our data set. Progression in the UKGTS therefore used more information than was available in the subset of data used for the newly developed analysis methods.
Chapter 7 Conclusions/recommendations
The rate of RNFL change was significantly faster in eyes with incident VF loss and the rate of RNFL change was a significant predictor of the VF outcome (see Table 6). When TD OCT RNFL data were included as prior information in the ANSWERS analysis (sANSWERS), the analysis was much more sensitive at identifying progression (for the same false-positive rate) than the same analysis without the imaging prior (see Figure 20). Furthermore, the accuracy of the estimated rate of VF change in the sANSWERS analysis was greater than that in the analyses using methods without imaging outcome data (see Chapter 5, Evaluation of ANSWERS, PoPLR and sANSWERS index methods, Prediction of future visual field state). However, the sANSWERS analysis did not distinguish between treatment groups as well as the VF-alone analyses and therefore did not reduce the estimated sample sizes or the observation periods for future trials.
For the PERM methods, we computed hit rates and specificities that related to the use of tests at a specific visit, including data from that visit and all previous visits to assess trends up to that time point. Specificities obtained by applying the PERM methods to the RAPID data were all consistent with 95%. Hit rates were between 8.3% and 17.4% when using the PERM methods to analyse UKGTS data. Analysing VF and imaging data with the PERM methods did not significantly increase the hit rate compared with using VF data alone. Although applying PERM methods to imaging data identified only a larger number of progressing eyes, a comparison of the proportion progressing in the two arms of the UKGTS did not result in a statistically significant treatment difference. Using MaHMIC and MaGIC, treatment effects were non-significant and their statistical significance was little altered by incorporating imaging. This may be because multiple imputation is not able to account sufficiently for the complex missing data mechanism in this setting, in which progressors are removed from the data set over time.
Although there was no evidence that the imaging technology assessed in this work, as well as the analysis methods applied, would result in more rapid or smaller clinical trials, there was evidence that imaging outcomes are associated with VF loss and that, when combined with VF data, they enable faster, more sensitive detection of progression and more accurate estimates of the rate of VF loss. Therefore, imaging has a place in clinical practice. Validated software tools are required to enable clinicians to combine imaging and VF data and interpret the outcomes. Once such tools are available, studies should be undertaken to evaluate patient experience and the clinical effectiveness and cost-effectiveness of including imaging outcomes with VF testing in managing patients with glaucoma.
It is recommended that current or future generations of imaging technology are included in future clinical trials to evaluate whether their greater resolution and measurement precision improves the potential of imaging to reduce trial duration and sample sizes.
Recommendations for future research
-
Further refine statistical methods to combine imaging and VF data.
-
Evaluation of current or future generations of imaging technology in clinical trials to establish the extent to which imaging outcomes capture treatment effects on the VF.
-
Evaluation of patient experience and the clinical effectiveness and cost-effectiveness of including imaging outcomes with VF testing in managing patients with glaucoma.
Chapter 8 Public and patient involvement
The research was motivated by patients’ views on the frequency of VF testing for the follow-up of their condition, explored as part of the NIHR HSR grant, ‘Frequency of visual field testing when monitoring patients newly diagnosed with glaucoma’. 12 Patient focus groups indicated that, although patients do not like VF testing, they accept it as a critical part of their care. This research explored the ‘diagnostic gain’ from including imaging data. Indirectly, the results may inform the extent to which VF testing frequency may be reduced while still monitoring glaucoma effectively. The information may improve the glaucoma care process, especially as research suggests that imaging tests are generally preferred by patients to VF tests.
Co-applicant Dr Agiomyrgiannakis is a glaucoma patient. He attended investigator meetings and provided invaluable input on how best to communicate the research and the statistical approaches implemented to patients.
Acknowledgements
The authors would like to thank Professor Andrew McNaught, Professor Paul Artes and Russell Young for their contributions through the Trial Steering Committee; Professor Paul Artes for providing the Halifax data set for initial modelling; Professor Mike Kenward for advice and help in developing the PERM, MaHMIC and MaGIC methodologies; and NIHR Clinical Research Facility staff: Lauren Leitch-Devlin and Francesca Amalfitano (Study Coordination), Edward White (Chief Technician), Emerson Tingco (Study Technician) and Ana Quartilho and Philip Prah (Statisticians).
Contributions of authors
David F Garway-Heath (Professor of Ophthalmology) was involved in the study design, data analysis and interpretation and writing the report; he was not involved in the development and assessment of the methods described in Index methods: newly developed (see Chapter 6), Evaluation of newly developed methods (see Chapter 7) and Newly developed methods: permutation tests, MaHMIC and MaGIC (see Chapter 8).
Haogang Zhu (Associate Professor, Computer Science) was involved in the design of the analysis methods described in ANSWERS and Structure-guided ANSWERS (see Chapter 6), data analysis in Evaluation of the ANSWERS, PoPLR and sANSWERS index methods (see Chapter 7) and interpretation of the data; he was not involved in the development and assessment of the methods described in Index methods: newly developed (see Chapter 6), Evaluation of newly developed methods (see Chapter 7) and Newly developed methods: permutation tests, MaHMIC and MaGIC (see Chapter 8).
Qian Cheng (PhD Student, Computer Science) was involved in the data analysis in Evaluation of the ANSWERS, PoPLR and sANSWERS index methods (see Chapter 7); he was not involved in the development and assessment of the methods described in Index methods: newly developed (see Chapter 6), Evaluation of newly developed methods (see Chapter 7) and Newly developed methods: permutation tests, MaHMIC and MaGIC (see Chapter 8).
Katy Morgan (Research Fellow, Medical Statistics) wrote the first draft of Review of models to identify visual field deterioration and incorporate imaging outcomes and Developing analysis approaches for the visual field and imaging outcomes (see Chapter 3), Index methods: newly developed (see Chapter 6), Evaluation of newly developed methods (see Chapter 7) and Newly developed methods: PERM, MaHMIC and MaGIC (see Chapter 8), developed (with CF) the PERM, MaHMIC and MaGIC methodologies and carried out and interpreted all data analysis using these methodologies. She was not involved with the development or assessment of the other methods.
Chris Frost (Professor of Medical Statistics) developed (with KM) the PERM, MaHMIC and MaGIC methodologies, interpreted the results and contributed critical revision of the manuscript sections pertaining to these methodologies. He was not involved with the development or assessment of the other methods.
David P Crabb (Professor of Statistics and Vision Research) was involved in the study design; he was not involved in the development and assessment of the methods described in Index methods: newly developed (see Chapter 6), Evaluation of newly developed methods (see Chapter 7) and Newly developed methods: permutation tests, MaHMIC and MaGIC (see Chapter 8).
Tuan-Anh Ho (Postdoctoral Scientist and Publications Manager) provided administrative support and was involved in writing of the report; he was not involved in the development and assessment of the methods described in Index methods: newly developed (see Chapter 6), Evaluation of newly developed methods (see Chapter 7) and Newly developed methods: permutation tests, MaHMIC and MaGIC (see Chapter 8).
Yannis Agiomyrgiannakis (Postdoctoral Scientist and Patient Representative) provided a patient perspective with regard to the design and conduct of the study; he was not involved in the development and assessment of the methods described in Index methods: newly developed (see Chapter 6), Evaluation of newly developed methods (see Chapter 7) and Newly developed methods: permutation tests, MaHMIC and MaGIC (see Chapter 8).
Publications
Zhu H, Russell RA, Saunders LJ, Ceccon S, Garway-Heath DF, Crabb DP. Detecting changes in retinal function: Analysis with Non-Stationary Weibull Error Regression and Spatial enhancement (ANSWERS). PLOS ONE 2014;9:e85654.
Garway-Heath DF, Quartilho A, Prah P, Crabb DP, Cheng Q, Zhu H. Evaluation of visual field and imaging outcomes for glaucoma clinical trials (an American Ophthalomological Society thesis). Trans Am Ophthalmol Soc 2017;115:T4.
Data sharing statement
We shall make data available to the scientific community with as few restrictions as feasible while retaining exclusive use until the publication of major outputs. Anonymised data can be obtained by contacting the corresponding author.
Disclaimers
This report presents independent research funded by the National Institute for Health Research (NIHR). The views and opinions expressed by authors in this publication are those of the authors and do not necessarily reflect those of the NHS, the NIHR, NETSCC, the HTA programme or the Department of Health. If there are verbatim quotations included in this publication the views and opinions expressed by the interviewees are those of the interviewees and do not necessarily reflect those of the authors, those of the NHS, the NIHR, NETSCC, the HTA programme or the Department of Health.
References
- Kingman S. Glaucoma is second leading cause of blindness globally. Bull World Health Organ 2004;82:887-8.
- Quartilho A, Simkiss P, Zekite A, Xing W, Wormald R, Bunce C. Leading causes of certifiable visual loss in England and Wales during the year ending 31 March 2013. Eye 2016;30:602-7. https://doi.org/10.1038/eye.2015.288.
- Quigley HA, Vitale S. Models of open-angle glaucoma prevalence and incidence in the United States. Invest Ophthalmol Vis Sci 1997;38:83-91.
- Burr JM, Mowatt G, Hernandez R, Siddiqui MA, Cook J, Lourenco T, et al. The clinical effectiveness and cost-effectiveness of screening for open angle glaucoma: a systematic review and economic evaluation. Health Technol Assess 2007;11. https://doi.org/10.3310/hta11410.
- Forsman E, Kivelä T, Vesti E. Lifetime visual disability in open-angle glaucoma and ocular hypertension. J Glaucoma 2007;16:313-19. https://doi.org/10.1097/IJG.0b013e318033500f.
- Quigley HA, Broman AT. The number of people with glaucoma worldwide in 2010 and 2020. Br J Ophthalmol 2006;90:262-7. https://doi.org/10.1136/bjo.2005.081224.
- Henson DB, Chaudry S, Artes PH, Faragher EB, Ansons A. Response variability in the visual field: comparison of optic neuritis, glaucoma, ocular hypertension, and normal eyes. Invest Ophthalmol Vis Sci 2000;41:417-21.
- Artes PH, Iwase A, Ohno Y, Kitazawa Y, Chauhan BC. Properties of perimetric threshold estimates from Full Threshold, SITA Standard, and SITA Fast strategies. Invest Ophthalmol Vis Sci 2002;43:2654-9.
- Russell RA, Crabb DP, Malik R, Garway-Heath DF. The relationship between variability and sensitivity in large-scale longitudinal visual field data. Invest Ophthalmol Vis Sci 2012;53:5985-90. https://doi.org/10.1167/iovs.12-10428.
- Chauhan BC, Garway-Heath DF, Goni FJ, Rossetti L, Bengtsson B, Viswanathan AC, et al. Practical recommendations for measuring rates of visual field change in glaucoma. Br J Ophthalmol 2008;92:569-73. https://doi.org/10.1136/bjo.2007.135012.
- Jansonius NM. On the accuracy of measuring rates of visual field change in glaucoma. Br J Ophthalmol 2010;94:1404-5. https://doi.org/10.1136/bjo.2009.164897.
- Crabb DP, Russell RA, Malik R, Anand N, Baker H, Boodhna T, et al. Frequency of visual field testing when monitoring patients newly diagnosed with glaucoma: mixed methods and modelling. Health Serv Deliv Res 2014;2.
- Read RM, Spaeth GL. The practical clinical appraisal of the optic disc in glaucoma: the natural history of cup progression and some specific disc-field correlations. Trans Am Acad Ophthalmol Otolaryngol 1974;78:OP255-74.
- Hoyt WF, Newman NM. The earliest observable defect in glaucoma?. Lancet 1972;1:692-3. https://doi.org/10.1016/S0140-6736(72)90500-4.
- Hoyt WF, Frisén L, Newman NM. Fundoscopy of nerve fiber layer defects in glaucoma. Invest Ophthalmol 1973;12:814-29.
- Quigley HA, Katz J, Derick RJ, Gilbert D, Sommer A. An evaluation of optic disc and nerve fiber layer examinations in monitoring progression of early glaucoma damage. Ophthalmology 1992;99:19-28. https://doi.org/10.1016/S0161-6420(92)32018-4.
- Airaksinen PJ, Drance SM, Douglas GR, Schulzer M. Neuroretinal rim areas and visual field indices in glaucoma. Am J Ophthalmol 1985;99:107-10. https://doi.org/10.1016/0002-9394(85)90216-8.
- Jonas JB, Gründler AE. Correlation between mean visual field loss and morphometric optic disk variables in the open-angle glaucomas. Am J Ophthalmol 1997;124:488-97. https://doi.org/10.1016/S0002-9394(14)70864-5.
- Bartz-Schmidt KU, Thumann G, Jonescu-Cuypers CP, Krieglstein GK. Quantitative morphologic and functional evaluation of the optic nerve head in chronic open-angle glaucoma. Surv Ophthalmol 1999;44:S41-53. https://doi.org/10.1016/S0039-6257(99)00076-4.
- Garway-Heath DF, Holder GE, Fitzke FW, Hitchings RA. Relationship between electrophysiological, psychophysical, and anatomical measurements in glaucoma. Invest Ophthalmol Vis Sci 2002;43:2213-20.
- Ajtony C, Balla Z, Somoskeoy S, Kovacs B. Relationship between visual field sensitivity and retinal nerve fiber layer thickness as measured by optical coherence tomography. Invest Ophthalmol Vis Sci 2007;48:258-63. https://doi.org/10.1167/iovs.06-0410.
- Garway-Heath DF, Poinoosawmy D, Fitzke FW, Hitchings RA. Mapping the visual field to the optic disc in normal tension glaucoma eyes. Ophthalmology 2000;107:1809-15. https://doi.org/10.1016/S0161-6420(00)00284-0.
- Garway-Heath DF, Hitchings RA. Quantitative evaluation of the optic nerve head in early glaucoma. Br J Ophthalmol 1998;82:352-61. https://doi.org/10.1136/bjo.82.4.352.
- Wollstein G, Garway-Heath DF, Hitchings RA. Identification of early glaucoma cases with the scanning laser ophthalmoscope. Ophthalmology 1998;105:1557-63. https://doi.org/10.1016/S0161-6420(98)98047-2.
- Deleon-Ortega JE, Arthur SN, McGwin G, Xie A, Monheit BE, Girkin CA. Discrimination between glaucomatous and nonglaucomatous eyes using quantitative imaging devices and subjective optic nerve head assessment. Invest Ophthalmol Vis Sci 2006;47:3374-80. https://doi.org/10.1167/iovs.05-1239.
- Izatt JA, Hee MR, Swanson EA, Lin CP, Huang D, Schuman JS, et al. Micrometer-scale resolution imaging of the anterior eye in vivo with optical coherence tomography. Arch Ophthalmol 1994;112:1584-9. https://doi.org/10.1001/archopht.1994.01090240090031.
- Schuman JS, Hee MR, Puliafito CA, Wong C, Pedut-Kloizman T, Lin CP, et al. Quantification of nerve fiber layer thickness in normal and glaucomatous eyes using optical coherence tomography. Arch Ophthalmol 1995;113:586-96. https://doi.org/10.1001/archopht.1995.01100050054031.
- Schuman JS, Hee MR, Arya AV, Pedut-Kloizman T, Puliafito CA, Fujimoto JG, et al. Optical coherence tomography: a new tool for glaucoma diagnosis. Curr Opin Ophthalmol 1995;6:89-95. https://doi.org/10.1097/00055735-199504000-00014.
- Akashi A, Kanamori A, Nakamura M, Fujihara M, Yamada Y, Negi A. Comparative assessment for the ability of Cirrus, RTVue, and 3D-OCT to diagnose glaucoma. Invest Ophthalmol Vis Sci 2013;54:4478-84. https://doi.org/10.1167/iovs.12-11268.
- Chauhan BC, McCormick TA, Nicolela MT, LeBlanc RP. Optic disc and visual field changes in a prospective longitudinal study of patients with glaucoma: comparison of scanning laser tomography with conventional perimetry and optic disc photography. Arch Ophthalmol 2001;119:1492-9. https://doi.org/10.1001/archopht.119.10.1492.
- Wollstein G, Schuman JS, Price LL, Aydin A, Stark PC, Hertzmark E, et al. Optical coherence tomography longitudinal evaluation of retinal nerve fiber layer thickness in glaucoma. Arch Ophthalmol 2005;123:464-70. https://doi.org/10.1001/archopht.123.4.464.
- Artes PH, Chauhan BC. Longitudinal changes in the visual field and optic disc in glaucoma. Prog Retin Eye Res 2005;24:333-54. https://doi.org/10.1016/j.preteyeres.2004.10.002.
- Strouthidis NG, Scott A, Peter NM, Garway-Heath DF. Optic disc and visual field progression in ocular hypertensive subjects: detection rates, specificity, and agreement. Invest Ophthalmol Vis Sci 2006;47:2904-10. https://doi.org/10.1167/iovs.05-1584.
- Leung CK, Cheung CY, Weinreb RN, Qiu K, Liu S, Li H, et al. Evaluation of retinal nerve fiber layer progression in glaucoma: a study on optical coherence tomography guided progression analysis. Invest Ophthalmol Vis Sci 2010;51:217-22. https://doi.org/10.1167/iovs.09-3468.
- Mansouri K, Leite MT, Medeiros FA, Leung CK, Weinreb RN. Assessment of rates of structural change in glaucoma using imaging technologies. Eye 2011;25:269-77. https://doi.org/10.1038/eye.2010.202.
- Xin D, Greenstein VC, Ritch R, Liebmann JM, De Moraes CG, Hood DC. A comparison of functional and structural measures for identifying progression of glaucoma. Invest Ophthalmol Vis Sci 2011;52:519-26. https://doi.org/10.1167/iovs.10-5174.
- Leung CK, Yu M, Weinreb RN, Lai G, Xu G, Lam DS. Retinal nerve fiber layer imaging with spectral-domain optical coherence tomography: patterns of retinal nerve fiber layer progression. Ophthalmology 2012;119:1858-66. https://doi.org/10.1016/j.ophtha.2012.03.044.
- Leung CK, Ye C, Weinreb RN, Yu M, Lai G, Lam DS. Impact of age-related change of retinal nerve fiber layer and macular thicknesses on evaluation of glaucoma progression. Ophthalmology 2013;120:2485-92. https://doi.org/10.1016/j.ophtha.2013.07.021.
- Leung CK. Diagnosing glaucoma progression with optical coherence tomography. Curr Opin Ophthalmol 2014;25:104-11. https://doi.org/10.1097/ICU.0000000000000024.
- Abe RY, Diniz-Filho A, Zangwill LM, Gracitelli CP, Marvasti AH, Weinreb RN, et al. The relative odds of progressing by structural and functional tests in glaucoma. Invest Ophthalmol Vis Sci 2016;57:OCT421-8. https://doi.org/10.1167/iovs.15–18940.
- Chauhan BC, Nicolela MT, Artes PH. Incidence and rates of visual field progression after longitudinally measured optic disc change in glaucoma. Ophthalmology 2009;116:2110-18. https://doi.org/10.1016/j.ophtha.2009.04.031.
- Medeiros FA, Alencar LM, Zangwill LM, Bowd C, Sample PA, Weinreb RN. Prediction of functional loss in glaucoma from progressive optic disc damage. Arch Ophthalmol 2009;127:1250-6. https://doi.org/10.1001/archophthalmol.2009.276.
- Mwanza JC, Chang RT, Budenz DL, Durbin MK, Gendy MG, Shi W, et al. Reproducibility of peripapillary retinal nerve fiber layer thickness and optic nerve head parameters measured with cirrus HD-OCT in glaucomatous eyes. Invest Ophthalmol Vis Sci 2010;51:5724-30. https://doi.org/10.1167/iovs.10-5222.
- Mwanza JC, Budenz DL, Warren JL, Webel AD, Reynolds CE, Barbosa DT, et al. Retinal nerve fibre layer thickness floor and corresponding functional loss in glaucoma. Br J Ophthalmol 2015;99:732-7. https://doi.org/10.1136/bjophthalmol-2014-305745.
- Kotowski J, Wollstein G, Folio LS, Ishikawa H, Schuman JS. Clinical use of OCT in assessing glaucoma progression. Ophthalmic Surg Lasers Imaging 2011;42:S6-14. https://doi.org/10.3928/15428877-20110627-01.
- Heijl A, Lindgren G, Olsson J. The effect of perimetric experience in normal subjects. Arch Ophthalmol 1989;107:81-6. https://doi.org/10.1001/archopht.1989.01070010083032.
- Zeyen TG, Zulauf M, Caprioli J. Priority of test locations for automated perimetry in glaucoma. Ophthalmology 1993;100:518-22. https://doi.org/10.1016/S0161-6420(93)31612-X.
- Heijl A, Bengtsson B. The effect of perimetric experience in patients with glaucoma. Arch Ophthalmol 1996;114:19-22. https://doi.org/10.1001/archopht.1996.01100130017003.
- Kutzko KE, Brito CF, Wall M. Effect of instructions on conventional automated perimetry. Invest Ophthalmol Vis Sci 2000;41:2006-13.
- Spry PG, Johnson CA. Identification of progressive glaucomatous visual field loss. Surv Ophthalmol 2002;47:158-73. https://doi.org/10.1016/S0039-6257(01)00299-5.
- DeLeon Ortega JE, Sakata LM, Kakati B, McGwin G, Monheit BE, Arthur SN, et al. Effect of glaucomatous damage on repeatability of confocal scanning laser ophthalmoscope, scanning laser polarimetry, and optical coherence tomography. Invest Ophthalmol Vis Sci 2007;48:1156-63. https://doi.org/10.1167/iovs.06-0921.
- Budenz DL, Fredette MJ, Feuer WJ, Anderson DR. Reproducibility of peripapillary retinal nerve fiber thickness measurements with stratus OCT in glaucomatous eyes. Ophthalmology 2008;115:661-6.e4. https://doi.org/10.1016/j.ophtha.2007.05.035.
- Leung CK, Cheung CY, Lin D, Pang CP, Lam DS, Weinreb RN. Longitudinal variability of optic disc and retinal nerve fiber layer measurements. Invest Ophthalmol Vis Sci 2008;49:4886-92. https://doi.org/10.1167/iovs.07-1187.
- Wu Z, Vazeen M, Varma R, Chopra V, Walsh AC, LaBree LD, et al. Factors associated with variability in retinal nerve fiber layer thickness measurements obtained by optical coherence tomography. Ophthalmology 2007;114:1505-12. https://doi.org/10.1016/j.ophtha.2006.10.061.
- Chong GT, Lee RK. Glaucoma versus red disease: imaging and glaucoma diagnosis. Curr Opin Ophthalmol 2012;23:79-88. https://doi.org/10.1097/ICU.0b013e32834ff431.
- Gardiner SK, Johnson CA, Demirel S. The effect of test variability on the structure–function relationship in early glaucoma. Graefes Arch Clin Exp Ophthalmol 2012;250:1851-61. https://doi.org/10.1007/s00417-012-2005-9.
- Crabb DP, Owen VMF, Garway-Heath DF. Poor agreement between current tests of structural and functional progression in glaucoma can be explained by measurement noise. Invest Ophthalmol Vis Sci 2007;48.
- Weinreb RN, Kaufman PL. The glaucoma research community and FDA look to the future: a report from the NEI/FDA CDER Glaucoma Clinical Trial Design and Endpoints Symposium. Invest Ophthalmol Vis Sci 2009;50:1497-505. https://doi.org/10.1167/iovs.08-2843.
- Weinreb RN, Kaufman PL. Glaucoma research community and FDA look to the future, II: NEI/FDA Glaucoma Clinical Trial Design and Endpoints Symposium: measures of structural change and visual function. Invest Ophthalmol Vis Sci 2011;52:7842-51. https://doi.org/10.1167/iovs.11-7895.
- Garway-Heath DF, Lascaratos G, Bunce C, Crabb DP, Russell RA, Shah A. The United Kingdom Glaucoma Treatment Study: a multicenter, randomized, placebo-controlled clinical trial: design and methodology. Ophthalmology 2013;120:68-76. https://doi.org/10.1016/j.ophtha.2012.07.028.
- Poli A, Strouthidis NG, Ho TA, Garway-Heath DF. Analysis of HRT images: comparison of reference planes. Invest Ophthalmol Vis Sci 2008;49:3970-5. https://doi.org/10.1167/iovs.08-1764 10.1167/iovs.08-1764.
- Medeiros FA, Leite MT, Zangwill LM, Weinreb RN. Combining structural and functional measurements to improve detection of glaucoma progression using Bayesian hierarchical models. Invest Ophthalmol Vis Sci 2011;52:5794-803. https://doi.org/10.1167/iovs.10-7111.
- Leung CK, Chiu V, Weinreb RN, Liu S, Ye C, Yu M, et al. Evaluation of retinal nerve fiber layer progression in glaucoma: a comparison between spectral-domain and time-domain optical coherence tomography. Ophthalmology 2011;118:1558-62. https://doi.org/10.1016/j.ophtha.2011.01.026.
- Prentice RL. Surrogate endpoints in clinical trials: definition and operational criteria. Stat Med 1989;8:431-40. https://doi.org/10.1002/sim.4780080407.
- Medeiros FA. Biomarkers and surrogate endpoints in glaucoma clinical trials. Br J Ophthalmol 2015;99:599-603. https://doi.org/10.1136/bjophthalmol-2014-305550.
- Medeiros FA, Lisboa R, Zangwill LM, Liebmann JM, Girkin CA, Bowd C, et al. Evaluation of progressive neuroretinal rim loss as a surrogate end point for development of visual field loss in glaucoma. Ophthalmology 2014;121:100-9. https://doi.org/10.1016/j.ophtha.2013.06.026.
- Garway-Heath DF, Crabb DP, Bunce C, Lascaratos G, Amalfitano F, Anand N, et al. Latanoprost for open-angle glaucoma (UKGTS): a randomised, multicentre, placebo-controlled trial. Lancet 2015;385:1295-304. https://doi.org/10.1016/S0140-6736(14)62111-5.
- Bengtsson B, Heijl A. Inter-subject variability and normal limits of the SITA Standard, SITA Fast, and the Humphrey Full Threshold computerized perimetry strategies, SITA STATPAC. Acta Ophthalmol Scand 1999;77:125-9. https://doi.org/10.1034/j.1600-0420.1999.770201.x.
- McNaught AI, Crabb DP, Fitzke FW, Hitchings RA. Modelling series of visual fields to detect progression in normal-tension glaucoma. Graefes Arch Clin Exp Ophthalmol 1995;233:750-5. https://doi.org/10.1007/BF00184085.
- Bengtsson B, Patella VM, Heijl A. Prediction of glaucomatous visual field loss by extrapolation of linear trends. Arch Ophthalmol 2009;127:1610-15. https://doi.org/10.1001/archophthalmol.2009.297.
- Bosworth CF, Sample PA, Johnson CA, Weinreb RN. Current practice with standard automated perimetry. Semin Ophthalmol 2000;15:172-81. https://doi.org/10.3109/08820530009037869.
- Bengtsson B, Olsson J, Heijl A, Rootzén H. A new generation of algorithms for computerized threshold perimetry, SITA. Acta Ophthalmol Scand 1997;75:368-75. https://doi.org/10.1111/j.1600-0420.1997.tb00392.x.
- Gardiner SK, Swanson WH, Goren D, Mansberger SL, Demirel S. Assessment of the reliability of standard automated perimetry in regions of glaucomatous damage. Ophthalmology 2014;121:1359-69. https://doi.org/10.1016/j.ophtha.2014.01.020.
- Gardiner SK, Swanson WH, Demirel S. The effect of limiting the range of perimetric sensitivities on pointwise assessment of visual field progression in glaucoma. Invest Ophthalmol Vis Sci 2016;57:288-94. https://doi.org/10.1167/iovs.15-18000.
- Ibáñez MV, Simó A. Spatio-temporal modeling of perimetric test data. Stat Methods Med Res 2007;16:497-522. https://doi.org/10.1177/0962280206071845.
- Bryan SR, Vermeer KA, Eilers PH, Lemij HG, Lesaffre EM. Robust and censored modeling and prediction of progression in glaucomatous visual fields. Invest Ophthalmol Vis Sci 2013;54:6694-700. https://doi.org/10.1167/iovs.12-11185.
- Bryan SR, Eilers PHC, Li B, Rizopoulos D, Vermeer KA, Lemij HG, et al. Bayesian hierarchical modeling of longitudinal glaucomatous visual fields using a two-stage approach. ArXiv 2015.
- O’Leary N, Chauhan BC, Artes PH. Visual field progression in glaucoma: estimating the overall significance of deterioration with permutation analyses of pointwise linear regression (PoPLR). Invest Ophthalmol Vis Sci 2012;53:6776-84. https://doi.org/10.1167/iovs.12-10049.
- McNaught AI, Crabb DP, Fitzke FW, Hitchings RA. Visual field progression: comparison of Humphrey Statpac2 and pointwise linear regression analysis. Graefes Arch Clin Exp Ophthalmol 1996;234:411-18. https://doi.org/10.1007/BF02539406.
- Zhu H, Russell RA, Saunders LJ, Ceccon S, Garway-Heath DF, Crabb DP. Detecting changes in retinal function: Analysis with Non-Stationary Weibull Error Regression and Spatial enhancement (ANSWERS). PLOS ONE 2014;9. https://doi.org/10.1371/journal.pone.0085654.
- Artes PH, O’Leary N, Nicolela MT, Chauhan BC, Crabb DP. Visual field progression in glaucoma: what is the specificity of the Guided Progression Analysis?. Ophthalmology 2014;121:2023-7. https://doi.org/10.1016/j.ophtha.2014.04.015.
- Zhu H, Crabb DP, Ho T, Garway-Heath DF. More accurate modeling of visual field progression in glaucoma: ANSWERS. Invest Ophthalmol Vis Sci 2015;56:6077-83. https://doi.org/10.1167/iovs.15-16957.
- Medeiros FA, Weinreb RN, Moore G, Liebmann JM, Girkin CA, Zangwill LM. Integrating event- and trend-based analyses to improve detection of glaucomatous visual field progression. Ophthalmology 2012;119:458-67. https://doi.org/10.1016/j.ophtha.2011.10.003.
- Medeiros FA, Lisboa R, Weinreb RN, Girkin CA, Liebmann JM, Zangwill LM. A combined index of structure and function for staging glaucomatous damage. Arch Ophthalmol 2012;130:1107-16. https://doi.org/10.1001/archophthalmol.2012.827.
- Bizios D, Heijl A, Bengtsson B. Integration and fusion of standard automated perimetry and optical coherence tomography data for improved automated glaucoma diagnostics. BMC Ophthalmol 2011;11. https://doi.org/10.1186/1471-2415-11-20.
- Raza AS, Zhang X, De Moraes CG, Reisman CA, Liebmann JM, Ritch R, et al. Improving glaucoma detection using spatially correspondent clusters of damage and by combining standard automated perimetry and optical coherence tomography. Invest Ophthalmol Vis Sci 2014;55:612-24. https://doi.org/10.1167/iovs.13-12351.
- Medeiros FA, Zangwill LM, Anderson DR, Liebmann JM, Girkin CA, Harwerth RS, et al. Estimating the rate of retinal ganglion cell loss in glaucoma. Am J Ophthalmol 2012;154:814-24. https://doi.org/10.1016/j.ajo.2012.04.022.
- Medeiros FA, Zangwill LM, Weinreb RN. Improved prediction of rates of visual field loss in glaucoma using empirical Bayes estimates of slopes of change. J Glaucoma 2012;21:147-54. https://doi.org/10.1097/IJG.0b013e31820bd1fd.
- Russell RA, Malik R, Chauhan BC, Crabb DP, Garway-Heath DF. Improved estimates of visual field progression using Bayesian linear regression to integrate structural information in patients with ocular hypertension. Invest Ophthalmol Vis Sci 2012;53:2760-9. https://doi.org/10.1167/iovs.11-7976.
- Box GEP, Cox DR. An analysis of transformations. J R Stat Soc Ser B Methodol 1964;2:211-52.
- Pitman EJG. Significance tests which may be applied to samples from any populations. Suppl J R Statist Soc 1937;4:119-30. https://doi.org/10.2307/2984124.
- van Buuren S. Multiple imputation of discrete and continuous data by fully conditional specification. Stat Methods Med Res 2007;16:219-42. https://doi.org/10.1177/0962280206074463.
- Nevalainen J, Kenward MG, Virtanen SM. Missing values in longitudinal dietary data: a multiple imputation approach based on a fully conditional specification. Stat Med 2009;28:3657-69. https://doi.org/10.1002/sim.3731.
- Verbeke G, Molenberghs G. Linear Mixed Models for Longitudinal Data. New York: Springer-Verlag; 2000.
- O’Brien LM, Fitzmaurice GM. Regression models for the analysis of longitudinal Gaussian data from multiple sources. Stat Med 2005;24:1725-44. https://doi.org/10.1002/sim.2056.
- Lascaratos G, Garway-Heath DF, Burton R, Bunce C, Xing W, Crabb DP, et al. The United Kingdom Glaucoma Treatment Study: a multicenter, randomized, double-masked, placebo-controlled trial: baseline characteristics. Ophthalmology 2013;120:2540-5. https://doi.org/10.1016/j.ophtha.2013.07.054.
- Good Clinical Practice (GCP) Reference Guide. Leeds: NIHR Clinical Research Network Coordinating Centre; 2016.
- World Medical Association . Declaration of Helsinki n.d. www.wma.net/what-we-do/medical-ethics/declaration-of-helsinki/ (accessed 14 November 2017).
- Leske MC, Heijl A, Hussein M, Bengtsson B, Hyman L, Komaroff E. Early Manifest Glaucoma Trial Group . Factors for glaucoma progression and the effect of treatment: the Early Manifest Glaucoma Trial. Arch Ophthalmol 2003;121:48-56. https://doi.org/10.1001/archopht.121.1.48.
- Anderson MJ, Robinson J. Permutation tests for linear models. Aust NZ J Stat 2001;43:75-88. https://doi.org/10.1111/1467-842X.00156.
- Frost C, Kenward MG, Fox NC. Optimizing the design of clinical trials where the outcome is a rate. Can estimating a baseline rate in a run-in period increase efficiency?. Stat Med 2008;27:3717-31. https://doi.org/10.1002/sim.3280.
- Rubin DB. Multiple Imputation for Nonresponse in Surveys. New York: Wiley; 1987.
- Liang KY, Zeger SL. Longitudinal data analysis using generalized linear models. Biometrika 1986;73:13-22. https://doi.org/10.1093/biomet/73.1.13.
- Huber PJ. The Behavior of Maximum Likelihood Estimates Under Nonstandard Conditions 1967:221-33.
- White H. A heteroskedasticity-consistent covariance matrix estimator and a direct test for heteroskedasticity. Econometrica 1980;48:817-30. https://doi.org/10.2307/1912934.
- Saunders LJ, Russell RA, Kirwan JF, McNaught AI, Crabb DP. Examining visual field loss in patients in glaucoma clinics during their predicted remaining lifetime. Invest Ophthalmol Vis Sci 2014;55:102-9. https://doi.org/10.1167/iovs.13-13006.
- Saunders LJ, Russell RA, Crabb DP. Practical landmarks for visual field disability in glaucoma. Br J Ophthalmol 2012;96:1185-9. https://doi.org/10.1136/bjophthalmol-2012-301827.
- Kohn MA, Jarrett MS, Senyak J. Sample Size Calculators 2016. www.sample-size.net/sample-size-survival-analysis/ (accessed 4 February 2017).
- Schoenfeld DA. Sample-size formula for the proportional-hazards regression model. Biometrics 1983;39:499-503. https://doi.org/10.2307/2531021.
- Tatham AJ, Weinreb RN, Medeiros FA. Strategies for improving early detection of glaucoma: the combined structure-function index. Clin Ophthalmol 2014;8:611-21. https://doi.org/10.2147/OPTH.S44586.
- Hood DC, Raza AS. On improving the use of OCT imaging for detecting glaucomatous damage. Br J Ophthalmol 2014;98:ii1-9. https://doi.org/10.1136/bjophthalmol-2014-305156.
- Rights JD, Sterba SK. The relationship between multilevel models and non-parametric multilevel mixture models: discrete approximation of intraclass correlation, random coefficient distributions, and residual heteroscedasticity. Br J Math Stat Psychol 2016;69:316-43. https://doi.org/10.1111/bmsp.12073.
- Leung CK, Cheung CY, Weinreb RN, Qiu Q, Liu S, Li H, et al. Retinal nerve fiber layer imaging with spectral-domain optical coherence tomography: a variability and diagnostic performance study. Ophthalmology 2009;116:1257-63. https://doi.org/10.1016/j.ophtha.2009.04.013.
- Leske MC, Heijl A, Hyman L, Bengtsson B. Early Manifest Glaucoma Trial: design and baseline data. Ophthalmology 1999;106:2144-53. https://doi.org/10.1016/S0161-6420(99)90497-9.
- Heijl A, Bengtsson B, Chauhan BC, Lieberman MF, Cunliffe I, Hyman L, et al. A comparison of visual field progression criteria of 3 major glaucoma trials in Early Manifest Glaucoma Trial patients. Ophthalmology 2008;115:1557-65. https://doi.org/10.1016/j.ophtha.2008.02.005.
- Bengtsson B, Heijl A. Lack of visual field improvement after initiation of intraocular pressure reducing treatment in the Early Manifest Glaucoma Trial. Invest Ophthalmol Vis Sci 2016;57:5611-15. https://doi.org/10.1167/iovs.16-19389.
- Heijl A, Leske MC, Bengtsson B, Hyman L, Bengtsson B, Hussein M. Early Manifest Glaucoma Trial Group . Reduction of intraocular pressure and glaucoma progression: results from the Early Manifest Glaucoma Trial. Arch Ophthalmol 2002;120:1268-79. https://doi.org/10.1001/archopht.120.10.1268.
- Heijl A, Bengtsson B, Hyman L, Leske MC. Early Manifest Glaucoma Trial Group . Natural history of open-angle glaucoma. Ophthalmology 2009;116:2271-6. https://doi.org/10.1016/j.ophtha.2009.06.042.
- Quigley HA. Clinical trials for glaucoma neuroprotection are not impossible. Curr Opin Ophthalmol 2012;23:144-54. https://doi.org/10.1097/ICU.0b013e32834ff490.
- Budenz DL, Anderson DR, Feuer WJ, Beiser JA, Schiffman J, Parrish RK II, et al. Detection and prognostic significance of optic disc hemorrhages during the Ocular Hypertension Treatment Study. Ophthalmology 2006;113:2137-43. https://doi.org/10.1016/j.ophtha.2006.06.022.
- Medeiros FA, Alencar LM, Sample PA, Zangwill LM, Susanna R, Weinreb RN. The relationship between intraocular pressure reduction and rates of progressive visual field loss in eyes with optic disc hemorrhage. Ophthalmology 2010;117:2061-6. https://doi.org/10.1016/j.ophtha.2010.02.015.
- Bengtsson B, Leske MC, Yang Z, Heijl A. EMGT Group . Disc hemorrhages and treatment in the Early Manifest Glaucoma Trial. Ophthalmology 2008;115:2044-8. https://doi.org/10.1016/j.ophtha.2008.05.031.
- Ding J, Wang JL. Modeling longitudinal data with nonparametric multiplicative random effects jointly with survival data. Biometrics 2008;64:546-56. https://doi.org/10.1111/j.1541-0420.2007.00896.x.
- Song X, Davidian M, Tsiatis AA. A semiparametric likelihood approach to joint modeling of longitudinal and time-to-event data. Biometrics 2002;58:742-53. https://doi.org/10.1111/j.0006-341X.2002.00742.x.
Appendix 1 Schedule of examinations in the United Kingdom Glaucoma Treatment Study
| Examination | Number of tests/images at each visit | ||||||||||
|---|---|---|---|---|---|---|---|---|---|---|---|
| Visit 1 (month 0) | Visit 2 (month 2) | Visit 3 (month 4) | Visit 4 (month 7) | Visit 5 (month 10) | Visit 6 (month 13) | Visit 7 (month 16) | Visit 8 (month 18) | Visit 9 (month 20) | Visit 10 (month 22) | Visit 11 (month 24) | |
| VFs | 2 | 2 | 1 | 1 | 1 | 1 | 2 | 2 | 1 | 1 | 2 |
| HRT | 3 | 2 | 1 | 1 | 1 | 1 | 2 | 3 | 1 | 1 | 1 |
| Optic disc photography | 1 | 1 | 1 | 1 | 1 | 1 | 1 | 1 | 1 | 1 | 1 |
| GDxVCC | 3 | 2 | 1 | 1 | 1 | 1 | 2 | 3 | 1 | 1 | 1 |
| OCT | 5 | 3 | 3 | 3 | 3 | 3 | 3 | 5 | 3 | 3 | 5 |
Appendix 2 Variances and covariances implied by the Kronecker model
The notation used in this appendix is defined in Chapter 4 (see Index methods: newly developed, Methods and assessment, Kronecker model).
Variance of a visual field location
Variance of an imaging outcome
Covariance of the same visual field location at different times tl and tl′
Covariance of imaging outcomes at different times tl and tl′
Covariance between two visual field locations, k and k′, at the same time
Covariance between two visual field locations at different times
Covariance between imaging and a visual field location at the same time
Covariance between imaging and a visual field location at different times
List of abbreviations
- ANSWERS
- Analysis with Non-Stationary Weibull Error Regression and Spatial enhancement
- CI
- confidence interval
- DLS
- differential light sensitivity
- DSMC
- Data and Safety Monitoring Committee
- EMGT
- Early Manifest Glaucoma Trial
- GEE
- generalised estimating equation
- GPA
- Guided Progression Analysis
- HFA
- Humphrey Field Analyzer
- HR
- hazard ratio
- IOP
- intraocular pressure
- MaGIC
- multivariate generalised estimating equations with multiple imputation for censored values
- MaHMIC
- multivariate hierarchical models with multiple imputation for censored values
- MAR
- missing at random
- MD
- mean deviation
- MNAR
- missing not at random
- NIHR
- National Institute for Health Research
- OAG
- open-angle glaucoma
- OCT
- optical coherence tomography
- ONH
- optic nerve head
- PERM
- Permutation Test (newly developed methods)
- PoPLR
- permutation analyses of pointwise linear regression
- RCT
- randomised clinical trial
- RNFL
- retinal nerve fibre layer
- sANSWERS
- structure-guided Analysis with Non-Stationary Weibull Error Regression and Spatial enhancement
- SD
- standard deviation
- SD OCT
- spectral-domain optical coherence tomography
- SE
- standard error
- SITA
- Swedish interactive thresholding algorithm
- SLR
- simple linear regression
- TD OCT
- time-domain optical coherence tomography
- UKGTS
- United Kingdom Glaucoma Treatment Study
- VF
- visual field
- VFI
- visual field index
