Notes
Article history
The research reported in this issue of the journal was funded by the HTA programme as project number 11/01/26. The contractual start date was in March 2013. The draft report began editorial review in October 2017 and was accepted for publication in April 2018. The authors have been wholly responsible for all data collection, analysis and interpretation, and for writing up their work. The HTA editors and publisher have tried to ensure the accuracy of the authors’ report and would like to thank the reviewers for their constructive comments on the draft document. However, they do not accept liability for damages or losses arising from material published in this report.
Declared competing interests of authors
Christopher C Butler is a National Institute for Health Research (NIHR) senior investigator. Kerenza Hood and Amanda Roberts are members of the NIHR Health Technology Assessment General Board. Kerenza Hood is a member of the NIHR Clinical Trials Unit Standing Committee.
Permissions
Copyright statement
© Queen’s Printer and Controller of HMSO 2018. This work was produced by Francis et al. under the terms of a commissioning contract issued by the Secretary of State for Health and Social Care. This issue may be freely reproduced for the purposes of private research and study and extracts (or indeed, the full report) may be included in professional journals provided that suitable acknowledgement is made and the reproduction is not associated with any form of advertising. Applications for commercial reproduction should be addressed to: NIHR Journals Library, National Institute for Health Research, Evaluation, Trials and Studies Coordinating Centre, Alpha House, University of Southampton Science Park, Southampton SO16 7NS, UK.
2018 Queen’s Printer and Controller of HMSO
Chapter 1 Introduction
Importance of the problem
Otitis media with effusion (OME) is the commonest cause of hearing loss in children in the UK, and up to 80% of children are affected by OME by 4 years of age. 1 Overall, the prognosis for OME is good, with over 50% of OME episodes resolving spontaneously within 3 months and 95% resolving within 1 year. However, 30–40% of children have recurrent OME episodes, and 5% of preschool children (aged < 5 years) have persistent (> 3 months) bilateral hearing loss associated with OME. 2
Hearing loss from OME can have an important impact on children’s mood, communication, concentration, learning, socialisation and language development. This may affect other family members and family function. OME in early childhood can affect intelligence quotient (IQ), behaviour and reading into teenage years. 3
The UK’s National Institute for Health and Care Excellence (NICE) 2008 guideline for OME management recommends a ‘watchful waiting’ period of 3 months, with referral to an ear, nose and throat (ENT) department if hearing is significantly affected, if OME persists for > 3 months or if there is suspected language or developmental delay. 4 Similar recommendations come from the American Academy of Pediatrics and the American Academy of Otolaryngology–Head and Neck Surgery. 5,6 Treatment options for these children are limited to hearing aids or surgical insertion of ventilation tubes (grommets or tympanostomy tubes) through the tympanic membrane. Hearing aids are an effective treatment, but this intervention is not problem free; children often find them uncomfortable, may feel self-conscious and may become a target for bullying. 7
Although the diagnosis of OME in primary care has increased over the last decade, the number of grommet operations performed in England fell from 43,300 in 1994–95 to 25,442 in 2009–10, primarily as a result of the watchful waiting strategy. 8 However, OME remains the commonest reason for childhood surgery in the UK and comprises a considerable workload for hospital ENT departments. Furthermore, there is wide variation in the rate of grommet surgery between regions that is unlikely to be explained by variation in disease. In Wales, there is sixfold variation in the European age-standardised rates of grommet surgery between the highest and the lowest local authorities. 9
Both hearing aids and surgery require referral to secondary care with risks and major cost consequences. The Department of Health and Social Care-commissioned ‘McKinsey’ report10 stated that the NHS could save £21M per year by reducing grommet insertion, a procedure that was assessed as being ‘relatively ineffective’, by a further 90%. This position has been challenged. Deafness Research UK11 and ENT UK’s 2009 OME (Glue Ear) Adenoid and Grommet Position Paper12 conclude that reducing access to grommets will disadvantage thousands of children who are in genuine need of treatment.
Rationale for the current trial
Antibiotics, topical intranasal steroids, decongestants, antihistamines and mucolytics are all ineffective treatments for OME. 13–15 A rigorous evaluation of anti-inflammatory treatment for OME has been a priority for many years. 16 Cochrane systematic reviews have found insufficient evidence for the effectiveness of both oral steroids and autoinflation (AI) devices in resolving OME in children to recommend implementation, but sufficient evidence to recommend further research. 14
A recent trial of an AI device in children aged 4–11 years with OME has found a modest effect for some children. 17 However, 80% of children are affected by OME before the age of 4 years, at a time when language development is most rapid and hearing loss has its greatest effect on language development. 3 Alternative management options to hearing aids or surgery for children aged < 4 years (who are unable to use an AI device) are required.
Williamson et al. 18 evaluated topical intranasal steroids for children with OME in general practice and found that they are unlikely to be clinically effective for OME. This may be because topical steroids applied through the nose are unlikely to reach the middle ear. However, systemic steroids do reach the middle ear epithelium and modulate OME in animal models. 19
The evidence from in vitro and animal models suggests that steroids reduce middle ear effusions and middle ear pressure. 20–23 Various mechanisms have been proposed for a role for steroids in resolving middle ear effusions, including (1) reducing arachidonic acid and associated inflammatory mediators, (2) shrinking perieustachian tube lymphoid tissue, (3) enhancing secretion of eustachian tube surfactant with a resultant improvement in tubal function and (4) reducing middle ear fluid viscosity by its action on mucoproteins. 24
The latest update of the Cochrane review on oral or topical steroids for OME (last search conducted in August 2010) found no benefit from intranasal steroids. 14 However, the review did identify evidence of a statistically significant benefit from oral steroids plus antibiotics versus antibiotics alone for OME (five studies, 409 participants; 23% in the intervention group and 47% in the control group with persistent OME at follow-up) and a trend toward a significant benefit for oral steroids versus placebo in the short term (three studies, 108 participants). Oral antibiotics alone are not effective. The only study to assess the effect of oral steroids on hearing as an outcome was underpowered.
Studies included in the systematic review were short term, underpowered, often had poorly described inclusion criteria and/or did not assess hearing at the time of inclusion, used ears rather than children as the unit of analysis and used intermediate outcome measures, such as tympanometry results, rather than improved hearing. No cost-effectiveness studies of oral steroids for OME were found. Therefore, there is insufficient evidence to recommend oral steroids as a treatment for persistent OME because of inadequate evidence about the short-term effects on hearing and cost-effectiveness, and the absence of evidence about the longer-term effects.
Potential harms from oral steroids
No significant adverse effects from steroids were reported by the studies included in the Cochrane review. However, the numbers of participants were too small to rule out that possibility. Short courses of prednisolone are widely used in treating children with acute asthma and adverse events are extremely rare; when adverse events do occur, they are largely limited to behavioural disturbances and dyspepsia and resolve on withdrawal of the steroid drug. The safety of multiple short courses of oral steroid therapy has been evaluated. 25 Short courses of oral steroids, such as prednisolone, do not have lasting negative effects on bone metabolism, bone density, adrenal gland function, or weight or height, even if used on several occasions over the course of 1 year. 26
Summary
There is an important evidence gap regarding the clinical effectiveness and cost-effectiveness of short courses of oral steroid treatment for OME. Identifying an effective, safe, cost-effective, acceptable non-surgical intervention for OME in children (including those in the first 4 years of life) for use in primary care remains an important research priority.
The Oral STeroids for the Resolution of otitis media with effusion In CHildren (OSTRICH) trial aimed to determine the clinical effectiveness and cost-effectiveness of a 7-day course of oral prednisolone (steroid) in improving hearing over the short term in children with bilateral OME, as diagnosed at an ENT outpatient or paediatric audiology/audiovestibular medicine (AVM) clinic, who have had symptoms attributable to OME present for at least 3 months and currently have significant hearing loss (as demonstrated by audiometry). 27
Chapter 2 Methods
Summary of the trial design
The OSTRICH trial was a double-blind, individually randomised, placebo-controlled trial involving children with persistent OME and significant hearing loss, which aimed to determine the clinical effectiveness and cost-effectiveness of a 7-day course of oral steroids in improving hearing in children with bilateral OME. The trial was based in secondary care, primarily in ENT outpatient clinics, but also included paediatric audiology and AVM clinics. Participating sites were asked to identify children (aged between 2 and 8 years) with persistent bilateral OME and significant hearing loss. Eligible, consented children were randomly assigned to one of the two treatment groups: oral steroids or matched oral placebo.
At the baseline visit, participants’ hearing was assessed and parents reported on quality of life (QoL), the impact of OME on the family and health status, using established assessment tools. Children aged > 5 years were also asked about their QoL. Parents were asked to complete a diary for the first 5 weeks following enrolment to record daily symptom severity, use of medication and health-care consultations. Participants were followed up at 5 weeks, 6 months and 12 months after the day of randomisation.
The main analysis compared hearing resolution at week 5 in the active treatment group (oral steroids) and the placebo group.
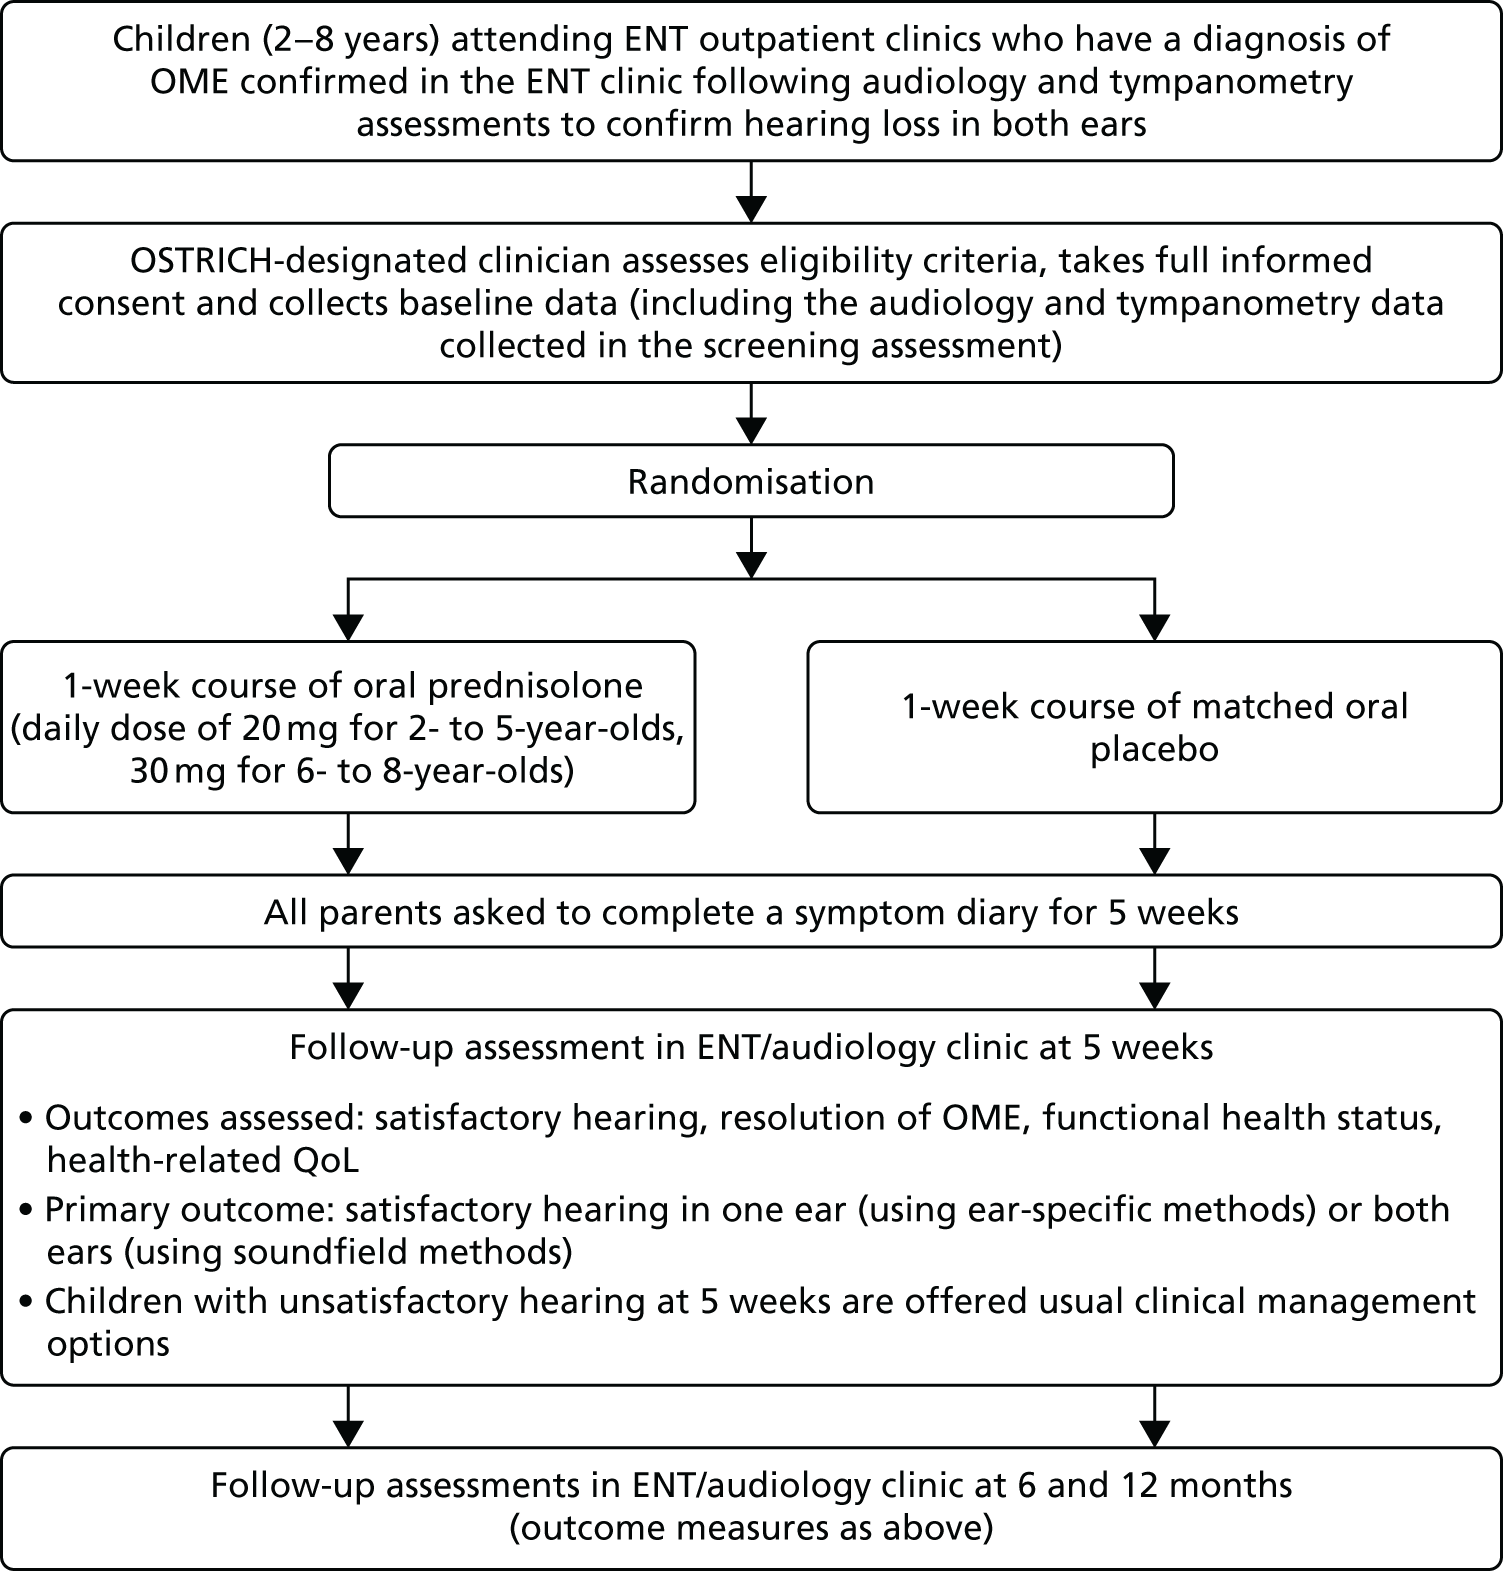
The schedule of events and participant flow for the trial is summarised in Figure 1.
FIGURE 1.
Trial schema and participant flow.
Clinical effectiveness objectives
Primary objective
The primary objective was to determine the clinical effectiveness of a 7-day course of oral steroids in improving hearing at 5 weeks from randomisation in children with bilateral OME, who have had symptoms attributable to OME present for at least 3 months, and currently have significant hearing loss (as demonstrated by audiometry). Oral steroids are likely to take effect within the first few weeks, and most of the existing evidence is for an effect at 4–6 weeks. This is, therefore, the time point at which the maximum effect is expected.
Secondary objectives
To assess the longer-term (up to 12 months) effect of the intervention on:
-
hearing
-
resolution of OME
-
insertion of ventilation tubes (grommet surgery) rates
-
symptoms
-
adverse effects
-
functional health status
-
QoL.
Setting
Participants were recruited from ENT outpatient or paediatric audiology and AVM clinics across Wales and England.
Site recruitment
The trial was open to participant recruitment from 19 March 2014 until 31 March 2016. A principal investigator led each site.
Ear, nose and throat outpatient clinics and paediatric audiology/AVM clinics were considered to be sites for the purpose of the trial. The Clinical Research Network (CRN) in England and the Health and Care Research Wales Workforce in Wales supported site recruitment.
Clinics were invited to take part in the trial by e-mail or newsletter from the CRN. Interested practices were initially contacted by e-mail and asked to provide further information about their feasibility for conducting the trial. This was followed up by telephone from the trial team to discuss the trial in more detail.
Each site involved had a research nurse/co-ordinator and a local site pharmacy.
Participant selection
Children were eligible to join the trial if they attended a participating NHS site for their routine care, met the following inclusion criteria and did not meet any of the exclusion criteria.
Inclusion criteria
-
Aged 2–8 years (e.g. reached second birthday and not yet reached ninth birthday).
-
Symptoms of hearing loss attributable to OME for at least 3 months (or had audiometry-proven hearing loss for at least 3 months).
-
Diagnosis of bilateral OME made in an ENT or paediatric audiology and AVM clinic on the day of recruitment or during the preceding week.
-
Audiometry-confirmed hearing loss of > 20 decibels hearing level (dBHL) averaged within the frequencies of 0.5, 1, 2 and 4 kHz in both ears by pure-tone audiometry (PTA) ear-specific insert, visual reinforcement audiometry (VRA) or ear-specific play audiometry, or hearing loss of > 25 dBHL averaged within the frequencies of 0.5, 1, 2 and 4 kHz by soundfield VRA or soundfield performance/play audiometry in the better-hearing ear, on the day of recruitment or within the preceding 14 days.
-
First time in the OSTRICH trial.
-
Parent/legal guardian able to understand and give full informed consent.
Exclusion criteria
Children who met one or more of the following criteria were not eligible for inclusion:
-
was currently involved in another clinical trial of an investigational medicinal product (CTIMP) or participated in a CTIMP during the last 4 months
-
had a current systemic infection or ear infection
-
had a cleft palate, Down syndrome, diabetes mellitus, Kartagener syndrome or primary ciliary dyskinesia, renal failure, hypertension or congestive heart failure
-
had confirmed, major developmental difficulties (e.g. was tube fed, had chromosomal abnormalities)
-
existing known sensory hearing loss
-
had taken oral steroids in the preceding 4 weeks
-
had a live vaccine in the preceding 4 weeks if aged < 3 years
-
had a condition that increases the risk of adverse effects from oral steroids (i.e. on treatment likely to modify the immune system or be immunocompromised, for example undergoing cancer treatment)
-
had been in close contact with someone known or suspected to have varicella (chickenpox) or active herpes zoster (shingles) during the 3 weeks prior to recruitment and had no prior history of varicella infection or immunisation
-
already had ventilation tubes (grommets)
-
was on a waiting list for grommet surgery and anticipated having surgery within 5 weeks, and was unwilling to delay it.
Participant recruitment
Participating clinicians (in ENT or paediatric audiology/AVM) were asked to identify eligible patients with bilateral hearing loss and a diagnosis of OME during routine outpatient consultations, from current grommet surgery waiting lists or hearing aid review lists. In addition, potentially eligible children were identified in audiology, AVM, paediatric audiology and community audiology clinics and interested parents/legal guardians were directed to the participating OSTRICH trial clinician.
Informing parents of potentially eligible children about the trial
Participating sites were asked to identify all children between the ages of 2 and 8 years who had been referred to the ENT clinic for probable OME and to write to their parent/legal guardian(s) (hereafter referred to as parent) to inform them about the trial.
Identification of potentially eligible children
Participating clinicians identified potentially eligible children who were attending routine clinics with bilateral hearing loss or a diagnosis of OME. Parents of children were approached about the trial by an ENT/audiovestibular clinician (doctor, nurse or audiologist). Each child had an audiometry assessment and a clinical assessment (both routine procedures for those attending these clinics) before they were assessed for eligibility to enter the trial.
The participating clinician assessed eligibility and interested parents of eligible children were invited to speak with a designated clinical member of the OSTRICH trial team. This individual explained the trial to the child’s parent and provided them with a written patient information sheet (PIS). If the parent had already received the PIS with their clinic invitation, then the designated individual went through this with the parent. Age-appropriate pictorial information sheets were also provided for children who were old enough to use them.
Informed consent
Parents were asked to provide informed consent. The clinician taking consent also assessed the child’s capacity to understand the nature of the trial and, when appropriate, the views of children capable of expressing an opinion were taken into account; children deemed to have sufficient understanding were asked to sign an age-appropriate assent form.
Parents were informed that they had the right to withdraw consent from participation in the OSTRICH trial at any time and that the clinical care of their child would not be affected by declining to participate or withdrawing from the trial.
All participating sites were asked to keep an anonymous screening log of all ineligible and eligible but not consented/not approached patients. This was used to assess potential selection bias.
Randomisation, blinding and unblinding
Randomisation
Randomisation was co-ordinated centrally by the South East Wales Trials Unit, Centre for Trials Research. The randomisation schedule was prepared by the trial statistician (TS) and comprised random permuted blocks that were stratified by site and child’s age. The investigational medicinal product (IMP) manufacturer (Piramal Healthcare UK Limited, Grangemouth, UK) was provided with a list of random allocation numbers linking to either the oral steroid or the placebo. Whether the allocations related to the oral steroid or placebo was determined by an independent statistician to ensure that the TS remained blinded. The allocation numbers were used to label the trial medication packs. Each trial medication pack had a unique identification number (trial pack number).
As children were recruited, they were assigned the next vacant participant identification number. Trial medication packs were released only once informed consent had been obtained and a consent form was signed. Participants were randomised to receive either the oral steroid or the matching placebo by receiving the next sequentially numbered trial pack allocated to the participant by the site pharmacy. A designated member of the OSTRICH trial site team (when possible), or the participant’s parent, collected the pack from the pharmacy on behalf of the participant. Participant randomisation was considered to have occurred once a consent form was signed and the trial pack was received. The trial pack number was then entered onto the participant’s case report form (CRF) by the research nurse.
Blinding
The placebo was matched for consistency, colour and solubility, as well as visually, in identical packaging to the active treatment. Participants, parents, all clinic staff and members of the OSTRICH trial team remained blinded to treatment allocation.
Unblinding
The active treatment used in this trial was a licensed product (or placebo) used outside its licensed indication. Parents were provided with information about the medication that their child was prescribed, which included instructions for use and information on unblinding.
Withdrawal and loss to follow-up
Parents were informed that they had the right to withdraw consent for their child’s participation in any aspect of the trial at any time. If a parent indicated that they wished to withdraw their child from the trial they were asked to give a reason for withdrawal.
Parents who wished to withdraw their child from the trial were asked to decide if they wished to withdraw their child from:
-
further treatment, but allow the child to participate in all further data collection
-
active follow-up, but allow existing data and their child’s medical records to be used
-
all aspects of the trial, as well as requiring all data collected to date to be excluded from the analysis.
To minimise loss to follow-up, parents who had given permission to be contacted by short message service (SMS) text messaging were sent a reminder of their scheduled appointment, when possible, a few days before the appointment.
Trial interventions
Participants were randomised to the active treatment group [oral soluble prednisolone (oral steroid)] or control group (matched oral soluble placebo). Clinicians were blinded to allocation and so prescribed the trial intervention (either prednisolone or placebo); this was dispensed by the site pharmacy.
Oral soluble prednisolone (oral steroid)
Participants in the active treatment group received a 7-day course of oral soluble prednisolone. The soluble prednisolone tablets (5 mg) used in this trial were manufactured by Waymade PLC trading as Sovereign Medical (Basildon, Essex, UK). The marketing authorisation is PL06464/0914.
Piramal Healthcare UK Limited, which has a Medicines and Healthcare products Regulatory Agency (MHRA) manufacturing authorisation (MIA IMP 29595), repackaged and supplied the soluble prednisolone tablets.
Placebo
The placebo used in this trial was matched for consistency, colour and solubility, as well as visually and in its packaging. The placebo was manufactured, packaged and supplied by Piramal Healthcare UK Limited.
Dosage
Oral steroid or placebo
-
For children aged 2–5 years: a single daily dose of four tablets (20 mg of prednisolone) for 7 days.
-
For children aged > 5 years: a single daily dose of six tablets (30 mg of prednisolone) for 7 days.
The daily dose stated was the most commonly used dose in previous studies of OME, and is similar to the standard dose for the treatment of other conditions with inflammatory components (such as asthma).
All IMP products were manufactured and reconciled into sealed and labelled ‘trial packs’ by Piramal Healthcare UK Limited in accordance with good manufacturing practice and in compliance with clinical trial regulations. 28 Trial materials were stored under the conditions specified by the manufacturer (or in the summary of product characteristics) and stored in designated temperature-monitored areas at site pharmacies.
Trial procedures
Training
All staff involved in the trial, including clinicians, research nurses/co-ordinators and pharmacists at sites were provided with written standard operating procedures and received trial-specific training in trial procedures and good clinical practice prior to commencing the trial.
Data collection
The schedules for timing, frequency and method of collection of all trial data are summarised in Table 1. Assessments were performed as close as possible to the required time point (e.g. 5 weeks’ follow-up at 4 weeks post intervention treatment, with a window of + 2 weeks, and 6 and 12 months follow-up with a window of ± 2 weeks).
| Data type | Time point | |||
|---|---|---|---|---|
| Baseline evaluation | Follow-up period | |||
| 5 weeks | 6 months | 12 months | ||
| Clinic visit | Clinic visit/parent diary | Clinic visit/questionnaire | Clinic visit/questionnaire | |
| 1. Demographics | ✗ | |||
| 2. Medical history | ✗ | |||
| 3. Audiometry | ✗ | ✗ | ✗ | ✗ |
| 4. Tympanometry | ✗ | ✗ | ✗ | ✗ |
| 5. Otoscopy | ✗ | ✗ | ✗ | ✗ |
| 6. Medication use | ✗ | |||
| 7. Insertion of ventilation tubes | ✗ | ✗ | ✗ | |
| 8. Daily symptoms | ✗ | |||
| 9. Adverse effects | ✗ | |||
| 10. Resource use | ✗ | ✗ | ✗ | |
| 11. Functional health status (OM8-3029) | ✗ | ✗ | ✗ | ✗ |
| 12. HRQoL (HUI330 and PedsQL31) | ✗ | ✗ | ✗ | ✗ |
| 13. SAEs | |↔| | |||
| 14. Withdrawals | |↔| | |||
Baseline assessments
Once informed consent had been obtained, the OSTRICH trial nurse:
-
registered the participant and their parent to the trial (this included collecting the names and addresses of the participants and their parents)
-
completed the medical history and baseline CRFs (which included recording audiology, tympanometry and otoscopy assessments)
-
provided the parent with the trial medication (when possible) or the prescription for the parent to take to the pharmacy, and provided the medication guidance and instructions-for-use leaflet of the trial medication
-
provided the questionnaire booklet to the parent and completed this with the participant (if appropriate)
-
gave the parent a 5-week symptom diary and provided them with instructions on diary completion
-
arranged the next clinic appointment (at week 5) for the participant to attend with their parent (and instructed them to bring any unused medication with them).
Follow-up assessments
Follow-up assessments for all participants were conducted at week 5 (4 weeks post intervention treatment, + 2-week window) and at 6 and 12 months (± 2-week window). At the 5-week follow-up appointment, any unused trial medication was collected and returned to the pharmacy for disposal.
Diary
Parents were asked to complete a diary for the first 5 weeks. In week 1, this was completed daily to record treatment adherence. Thereafter, it was completed weekly for 4 weeks to record symptoms, adverse events, health-care consultations, additional medication taken, time off school/nursery and parental time off work.
Clinical assessments
The hearing assessments described in Table 2 were measured at 5 weeks post randomisation (4 weeks post treatment) and at 6 and 12 months.
| Measurement | Outcome |
|---|---|
| Audiometry | Hearing in each ear assessed by PTA, ear-specific insert VRA or ear-specific play audiometry, or in both ears together by soundfield VRA or soundfield performance/play audiometry |
| Tympanometry (using calibrated standardised tympanometers and modified Jerger classification types B and C were considered abnormal)32 | Presence of middle ear effusion in each ear |
| Otoscopy | Appearance of tympanic membrane |
In current practice, the recommended standard methods to assess hearing thresholds are ear-specific PTA at 0.5, 1, 2 and 4 kHz in children aged ≥ 3 years and soundfield VRA in children aged < 3 years. However, equally, those under 3 years of age may comply with PTA. Therefore, it was recommended that the audiologist or clinician use their judgement on the most appropriate method of assessment for the child and, when possible, maintain that method for the subsequent follow-ups.
Ear-specific VRA through the use of insert earphones is considered the ‘gold standard’ practice, but it was believed that soundfield VRA provided a reasonable assessment of the child’s level of hearing and ensured the feasibility of the trial in a range of research sites.
Although the follow-up of participants was continued for 12 months, after the 5-week assessment, all participants resumed to ‘usual care’ and all treatment decisions were made by their parents in consultation with their clinician.
Functional health status and quality of life
Functional health status [assessed via the OM8-30 (Otitis Media Questionnaire)]29 and health-related quality of life (HRQoL) [assessed via the Paediatric Quality of Life Inventory (PedsQL)31 and the Health Utilities Index, version 3 (HUI3)]30 were assessed at the end of week 5 and at 6 and 12 months, through parent-completed questionnaires. Additional questionnaires comprising the child version of the PedsQL were given to children aged ≥ 5 years. There were two age-specific versions for children aged 5–7 years and for those aged ≥ 8 years. Scoring for the three and nine OM8-30 facets was provided by Professor Mark Haggard. A further description of how these measures were used and interpreted within the economic analysis is provided in Chapter 4, Outcomes used in the economic analysis.
Safety monitoring
Parents were asked to record non-serious adverse reactions or events or possible side effects and rate their severity in the parent diary up to the end of the fifth week of trial participation.
Data management and monitoring
Data quality
Data monitoring was conducted throughout the trial across all of the recruiting sites; this included a 10% quality control of all data sets. Further monitoring was triggered if an error rate of > 1% was detected.
Data cleaning
The OSTRICH trial database was built with internal validations and ranges; queries arising during data entry were referred back to the site research nurses. When data collected on paper CRFs conflicted with those collected via the web-based database, the value on the paper CRF was deemed to be the true value, unless the paper CRF had already been appropriately annotated with a correction. Self-evident correction rules were developed during the course of the trial, in response to common errors of CRF completion.
Research governance
This trial had clinical trial authorisation from the UK Competent Authority (MHRA reference number 21323/0039/001-0001) and was reviewed as risk category type B. Ethics approval was granted from the NHS Research Ethics Committee (REC), recognised by the United Kingdom Ethics Committee Authority. The initial approval was granted by the National Research Ethics Service REC for Wales on 28 February 2013 (reference number 13/WA/0004). NHS research and development (R&D) approval was sought from the respective NHS-relevant organisations in Wales and England.
The trial was assigned a European Union Drug Regulating Authorities Clinical Trials (EudraCT) number (2012-005123-32) and an International Standard Randomised Controlled Trial Number (ISRCTN 49798431; registered on 7 December 2012).
Patient and public involvement
The study had a patient and public involvement (PPI) representative who has a child who had long-standing OME. She joined the trial as a member of the trial management group. Our Trial Steering Committee (TSC) and Independent Data Monitoring Committee (IDMC) also had PPI representatives who had personal experience of children with OME. Our PPI representatives made important contributions to reviewing parent and child information sheets, providing feedback on the trial protocol and providing guidance on strategies for successful recruitment. One of our PPI representatives was also interviewed for a case study on the BBC (British Broadcasting Corporation) Wales News. 33 The trial has also benefited from our PPI representatives’ contribution during the analysis and dissemination of study results and they will continue to contribute to dissemination activities.
Outcome measures
Primary outcome measure
The primary outcome was an assessment of acceptable hearing at 5 weeks from randomisation (4 weeks after conclusion of treatment), whereby acceptable hearing is defined as ≤ 20 dBHL averaged within the frequencies of 0.5, 1, 2 and 4 kHz in at least one ear in children assessed by PTA, ear-specific insert VRA or ear-specific play audiometry, and ≤ 25 dBHL averaged within the frequencies of 0.5, 1, 2 and 4 kHz in children assessed by soundfield VRA or soundfield performance/play audiometry. These thresholds are based on national guidelines. 34
Secondary outcome measures
The secondary outcomes assessed the longer-term (up to 12 months) effects of the intervention on:
-
acceptable hearing at 6 and 12 months (as defined in Primary outcome measure)
-
tympanometry (using calibrated standardised tympanometers and modified Jerger classification types A, B and C)32
-
otoscopic findings
-
health-care consultations related to OME and other resource use
-
insertion of ventilation tubes (grommet surgery) at 6 and 12 months
-
adverse effects
-
symptoms (reported by parent and child, if appropriate)
-
functional health status
-
HRQoL.
Clinical effectiveness statistical considerations
Sample size calculation
The sample size calculation was based on demonstrating a change in the rate of resolution of hearing loss at 5 weeks post randomisation (i.e. 4 weeks post completion of treatment), from 20% in the control group to 35% in the intervention group. OME resolves spontaneously in a high proportion of children, and some studies have found a significantly higher rate of spontaneous resolution. For example, Williamson et al. 18 found a resolution rate in their control group of 47%. However, we anticipated a lower spontaneous rate of resolution both because we only included children who had been symptomatic for at least 3 months and because we were recruiting children in a secondary care setting, in which a more severe spectrum of illness was anticipated. The Cochrane review of oral steroids for OME reported a ratio of proportions for resolution of OME at 2 weeks of 3.80 [95% confidence interval (CI) 0.93 to 15.52]. 14 In the five studies in the Cochrane review of oral steroids versus placebo, overall there was a 23% recovery rate in the placebo plus antibiotic group and a 47% recovery rate in the oral steroid plus antibiotic group, with a 24% difference (antibiotics on their own are ineffective). 14 The OSTRICH study selected a conservative estimate of 1.75 for its effect size (ratio of proportions) because it was believed that a 15% absolute increase in the rate of resolution at 5 weeks would represent a clinically meaningful benefit that could result in a meaningful reduction in unnecessary operations and a related saving in costs for the NHS. In order to demonstrate a difference between 20% and 35% with an alpha of 0.05 and 80% power, the study needed 302 participants (nQuery software version 4.0; Statistical Solutions Ltd, Cork, Ireland). The study sample size was 380 to allow for a 20% loss to follow-up at 12 months. Although the primary outcome data were gathered at 5 weeks, it was believed that it was important to be able to assess long-term outcomes and, therefore, the study wanted to ensure that it would have sufficient power for longer-term follow-up assessments.
Statistical analysis
A detailed statistical analysis plan (SAP) was developed and signed off by the chief investigators and the TS, and approved by the IDMC, before the study trial database was locked and any data were examined. Data analysis was conducted in IBM SPSS Statistics version 20.0 (IBM Corporation, Armonk, NY, USA) and Stata® version 13.1 (StataCorp LP, College Station, TX, USA).
Definitions of populations
Screened population
The screened population comprises all children assessed for eligibility at the initial appointment.
Intention-to-treat population
The intention-to-treat (ITT) population comprises all randomised children and was analysed in the groups to which the children were randomised (regardless of the treatment they received and compliance with the treatment).
Per-protocol population
The per-protocol (PP) population comprises those children randomised who satisfied the study eligibility criteria, received and adhered to their allocated intervention for the 7 days and did not receive any surgery for grommets 5 weeks from randomisation. Children who presented > 14 days before or after the scheduled 5-week visit date were considered not to have complied with the trial protocol and were excluded from the PP population.
Analysis
All of the clinical effectiveness analyses were by ITT without imputation, with outcome values compared between groups using mixed-effect two-level regression models to adjust for site and age of child (2–5 years and 6–8 years) as stratification variables.
Primary analyses
The primary analyses employed a logistic regression model to investigate differences in the proportion of children with acceptable hearing at the 5-week post-randomisation follow-up appointment between the two treatment groups. In addition to age and site, models were adjusted for days from randomisation to the 5-week follow up. Results are presented as the absolute difference in proportions, the adjusted odds ratio (OR) (comparing the odds of an event in the oral steroid group with the placebo group), 95% CI and p-value. For comparison with other studies, the relative risk (RR) was also presented. Sensitivity analyses were performed using the PP population and using allocation-respecting methods, such as complier average causal effect (CACE) modelling to investigate the effect of adherence to treatment using instrumental variable regression. This was carried out by fitting a structural mean model (i.e. White;35 White et al. 36). Adherence was defined as taking all 7 days of oral steroids versus partial adherence (taking < 7 days of oral steroids and taking some/none over the 7 days). Imputation was not necessary because of the low numbers of children missing primary outcome data.
Two effect modifiers were originally identified as a basis for subgroup analyses: age of child and history of atopy (presence of eczema, asthma or hay fever). The following further-identified confounders were defined in advance of any analysis based on best available evidence:
-
the season the child was randomised
-
whether or not the child received antibiotics for an ear infection in the last month
-
number of previous episodes
-
duration of ear symptoms
-
number of previous OME episodes (first vs. more than one)
-
household smoke present
-
deprivation score
-
previous tonsillectomy or adenoidectomy.
Relevant interaction terms were entered into the primary regression analyses for each of the outcomes in order to conduct prespecified subgroup analyses. As the trial was powered to detect overall differences between the groups rather than interactions of this kind, the results of these exploratory analyses are presented using CIs as well as p-values.
One secondary analysis of the primary outcome was proposed using weighted (to account for the number of frequencies recorded) average decibel at the 5-week follow-up as a continuous outcome. As the majority of children had their ears tested at all four frequencies, the weighted results were very similar to the unweighted results, so these were dropped from the analysis. This outcome was modelled in two ways:
-
as a child-level analysis, to explore using the average, best or worst hearing levels from children assessed via PTA, ear-specific insert VRA or ear-specific play audiometry
-
as an ear-level analysis to account for both ears being tested using the ear-specific VRA.
Both approaches used multilevel linear regression modelling [(1) child nested within site and (2) ears nested within child nested within site] adjusting for baseline decibel, child’s age at recruitment and time of the 5-week follow-up (in days). Results were presented as the difference in adjusted means (oral steroid minus placebo), alongside 95% CIs and p-values.
Secondary outcomes
Secondary outcomes with a binary outcome (present/absent), such as satisfactory hearing (as assessed by audiology/tympanometry), otoscopy outcomes (presence of perforation, effusion, bubbles) and insertion of ventilation tubes, were analysed using repeated measures logistic regression to investigate the differences between the treatment groups and time (at 5 weeks’ and at 6 and 12 months’ follow-up). Time was nested within participants nested within site and included an interaction term for time and treatment group to investigate any divergent or convergent pattern in outcomes. The global interaction effect was tested. In addition to the aforementioned covariates, baseline measures of outcome were also adjusted for when possible.
An adjusted multilevel Cox (shared frailty) regression model examined the time (days) since recruitment to insertion of ventilation tubes between treatment groups, the effect was reported as an adjusted hazard ratio (HR) alongside 95% CIs.
For continuous secondary outcomes, such as the HUI3, PedsQL (overall and five domains) and OM8-30 scores (total and the three facets), repeated measures linear regression models were used to investigate differences between the treatment groups and over time (5 weeks and 6 and 12 months), adjusting for baseline scores. Transformations (squared and cubed) to the raw scores were performed, as necessary, to improve residuals and model fit. If no transformations were suitable, the raw scores were dichotomised and a repeated measures logistic regression model was used. The use and interpretation of these measures for the economic analysis are described in Chapter 4, Health outcome measures.
A number of outcomes were calculated from the parents’ diary for the first 5 weeks, such as parent-reported symptoms, total days off school/nursery and work for ear and non-ear problems, and the number of OME-related health-care consultations. Weekly scores were reported on the child’s symptoms on a scale of 0 to 6 (not present to as bad as it could be) for eight symptoms (any problems with hearing, ear pain, speech, energy levels, sleep, attention span, balance, being generally unwell). The protocol stated that the duration between the start and the resolution of symptoms would be examined and modelled using a Cox regression model. Given the limited number of weeks of follow-up, this analysis was not possible and the following analysis proposal was written into the SAP and signed off in advance of the sight of any data.
The correlation between symptom scores in the symptom diary was examined via Cronbach’s alpha and a factor analysis was used to determine whether or not the eight symptoms could be combined in an overall score. This was carried out for symptoms at each week to demonstrate the validity of using the total symptom score to measure child illness. For the overall score, a multilevel linear repeated measures model (adjusting for age of child and site) was used. Changes in nausea and in behaviour and mood over time were examined separately. The effect of oral steroids is reported as the adjusted difference in means score alongside 95% CIs.
For days off school/nursery and work, and OME-related health-care consultations, these were analysed first using a Poisson multilevel model; however, a negative binomial model was found to be a better-fitting model, according to the Akaike information criterion (AIC). The results were presented as the adjusted incidence rate ratio (IRR) (in the oral steroid group compared with the placebo group) alongside 95% CIs.
Changes to statistical methods from the protocol
The following changes were added to the SAP following publication of the protocol paper and approved by the IDMC:
-
For the primary outcome, in addition to adjusting for child’s age at recruitment, site and time to follow-up were also deemed to be important to adjust for.
-
A negative binomial model was used instead of the intended Poisson model, as a result of overdispersion.
-
For the symptoms scores, a component was added to combine each individual symptom score into an overall score so that the issue of multiple outcomes was overcome.
The following changes were omitted from the SAP following publication of the protocol paper:
-
Given the limited number of weeks of follow-up, the duration between the start and resolution of symptoms was not examined and modelled using a time-to-event (Cox regression) model. Instead, the analysis proposed in point 3 above was included.
Additional exploratory analysis
Additional exploratory analysis was conducted as part of a student research project assessing the association between baseline hearing threshold and HRQoL (including both overall HRQoL and scores for each domain). Pearson’s correlation coefficient (assuming that the distributions were sufficiently normally distributed) was used and 95% CIs and p-values were presented. Pearson’s correlation coefficient (r) was used to investigate the strength of any correlations.
Decisions about exploratory health economic analyses would be assessed following a review of the subgroup analyses, as described in Primary analyses.
Summary of changes to the trial
The main changes to the protocol that occurred during the conduct of the trial are summarised below.
A number of changes were made to the protocol to make it easier for sites to recruit children and schedule the follow-up appointments. For example, the study extended the site coverage into England, the eligibility criteria for audiometry-confirmed hearing loss was extended to 14 days preceding recruitment, follow-up visits were conducted in ENT or audiology outpatient clinics, and the time-frame windows for follow-up were extended to + 2 weeks for the 5-week follow-up and ± 2 weeks for the 6- and 12-month follow-ups. Paediatric audiology and AVM clinics were included as sites, and audiovestibular physicians were included as designated OSTRICH trial clinicians.
Additions were made to the exclusion criteria, such as ear infections, Kartagener syndrome or primary ciliary dyskinesia, existing known sensory hearing loss, undergoing cancer treatment, on a waiting list for grommet surgery and anticipated to have surgery within 5 weeks and unwilling to delay it, and live vaccines 4 weeks prior to recruitment if aged < 3 years.
A number of changes to the planned trial procedures were made because of time constraints resulting from the longer than anticipated recruitment period; for example, the removal of medical notes search and data linkage used to identify health-care consultations during the 12-month follow-up period in primary and secondary care. As a result of this, a specific assessment of resource use at baseline could not be collected.
Finally, a number of further amendments were made to the protocol, such as sending reminders for follow-up appointments, contacting parents regarding missed appointments and exploratory analysis to assess the association between baseline hearing threshold and QoL. In addition, the study undertook a qualitative substudy to explore parents’ understanding of the treatment options available to them, their views on shared decision-making in the context of managing glue ear (OME) and their views on the use of oral steroids for glue ear (OME). Further changes were made to the proposed longer-term modelling to be conducted as part of the health economic analysis as a result of the trial results, which are explained in detail in Appendix 1.
Chapter 3 Results
Site recruitment
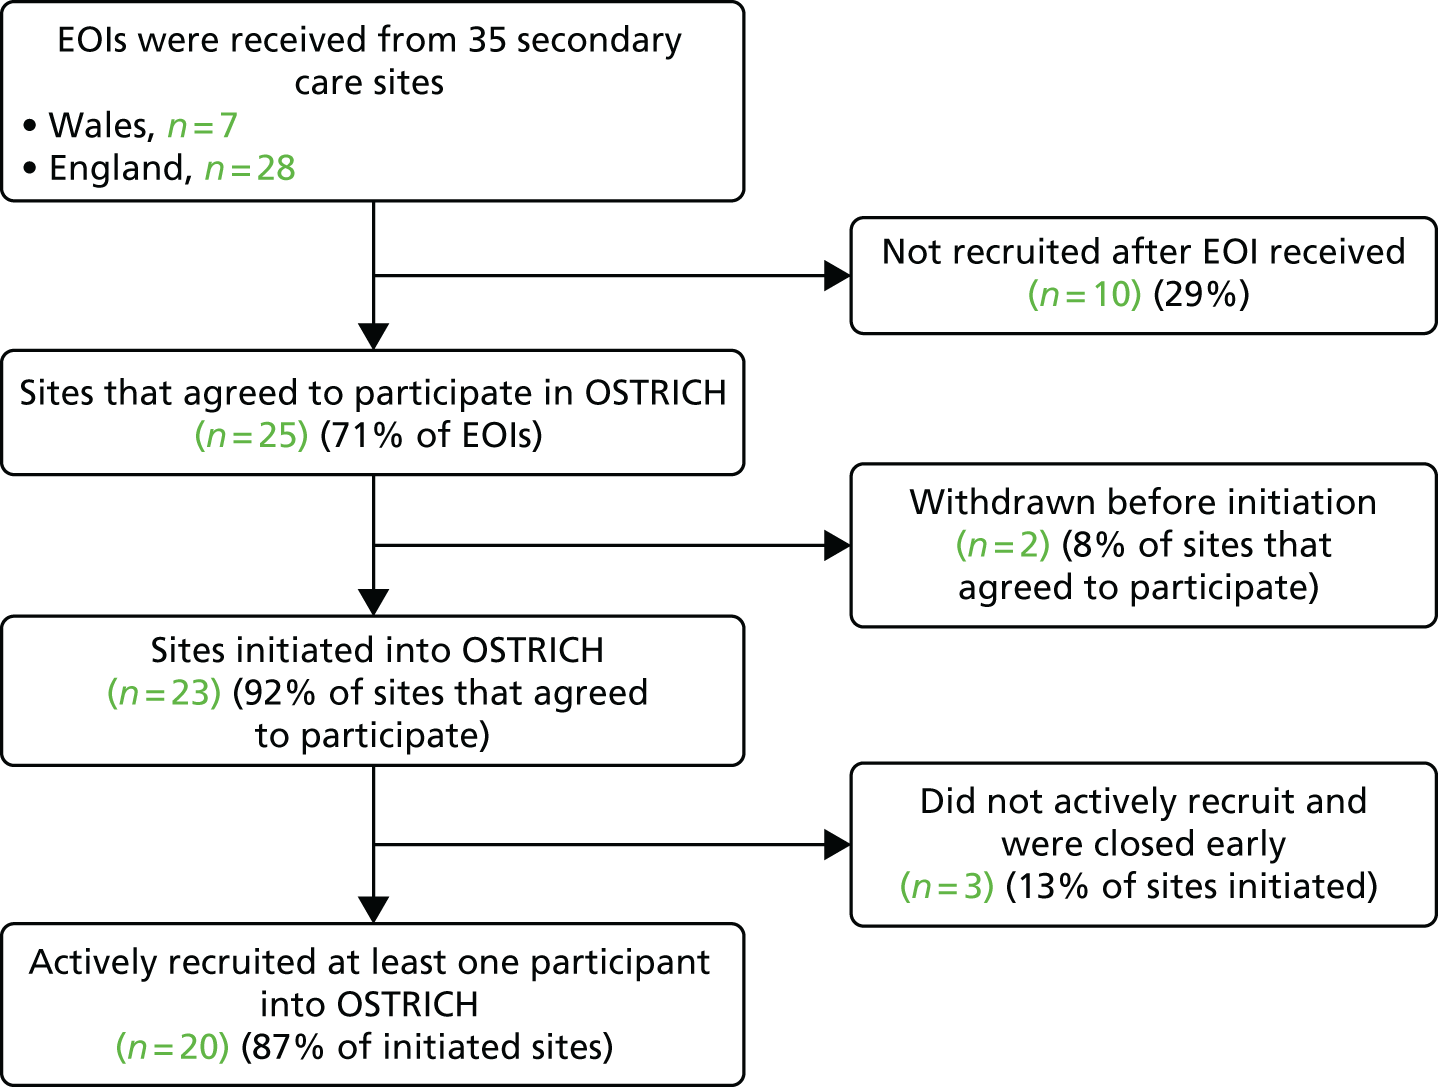
The study initially planned to recruit participants from seven secondary care sites in Wales; however, it became apparent that it would not be possible to recruit all 380 children in the allotted time from Wales only, recruitment was therefore extended to sites in England. In total, 35 expressions of interest were received; 13 were from enquiries made by Comprehensive Local Research Network research leads and a further 15 resulted from a call from the Medicines for Children CRN and National Institute for Health Research (NIHR) ENT Specialty Group. Ten sites did not progress any further, as they felt unable to commit to the recruitment target or were no longer looking to take on new studies. The process of obtaining local R&D approval was started for two sites but was not progressed, as a result of the lengthy time taken for initial discussions and approvals. A breakdown of the number of sites that expressed an interest in participating, agreed to participate and were actively recruited is presented in Figure 2.
FIGURE 2.
Site recruitment flow. EOI, expression of interest.
Participant recruitment and trial flow profile
The first child was randomised on 20 March 2014 and the last on 5 April 2016. The flow of children through the trial is represented in the Consolidated Standards of Reporting Trials (CONSORT) trial profile diagram in Figure 3.
FIGURE 3.
The main trial CONSORT flow diagram. ITT, intention to treat.
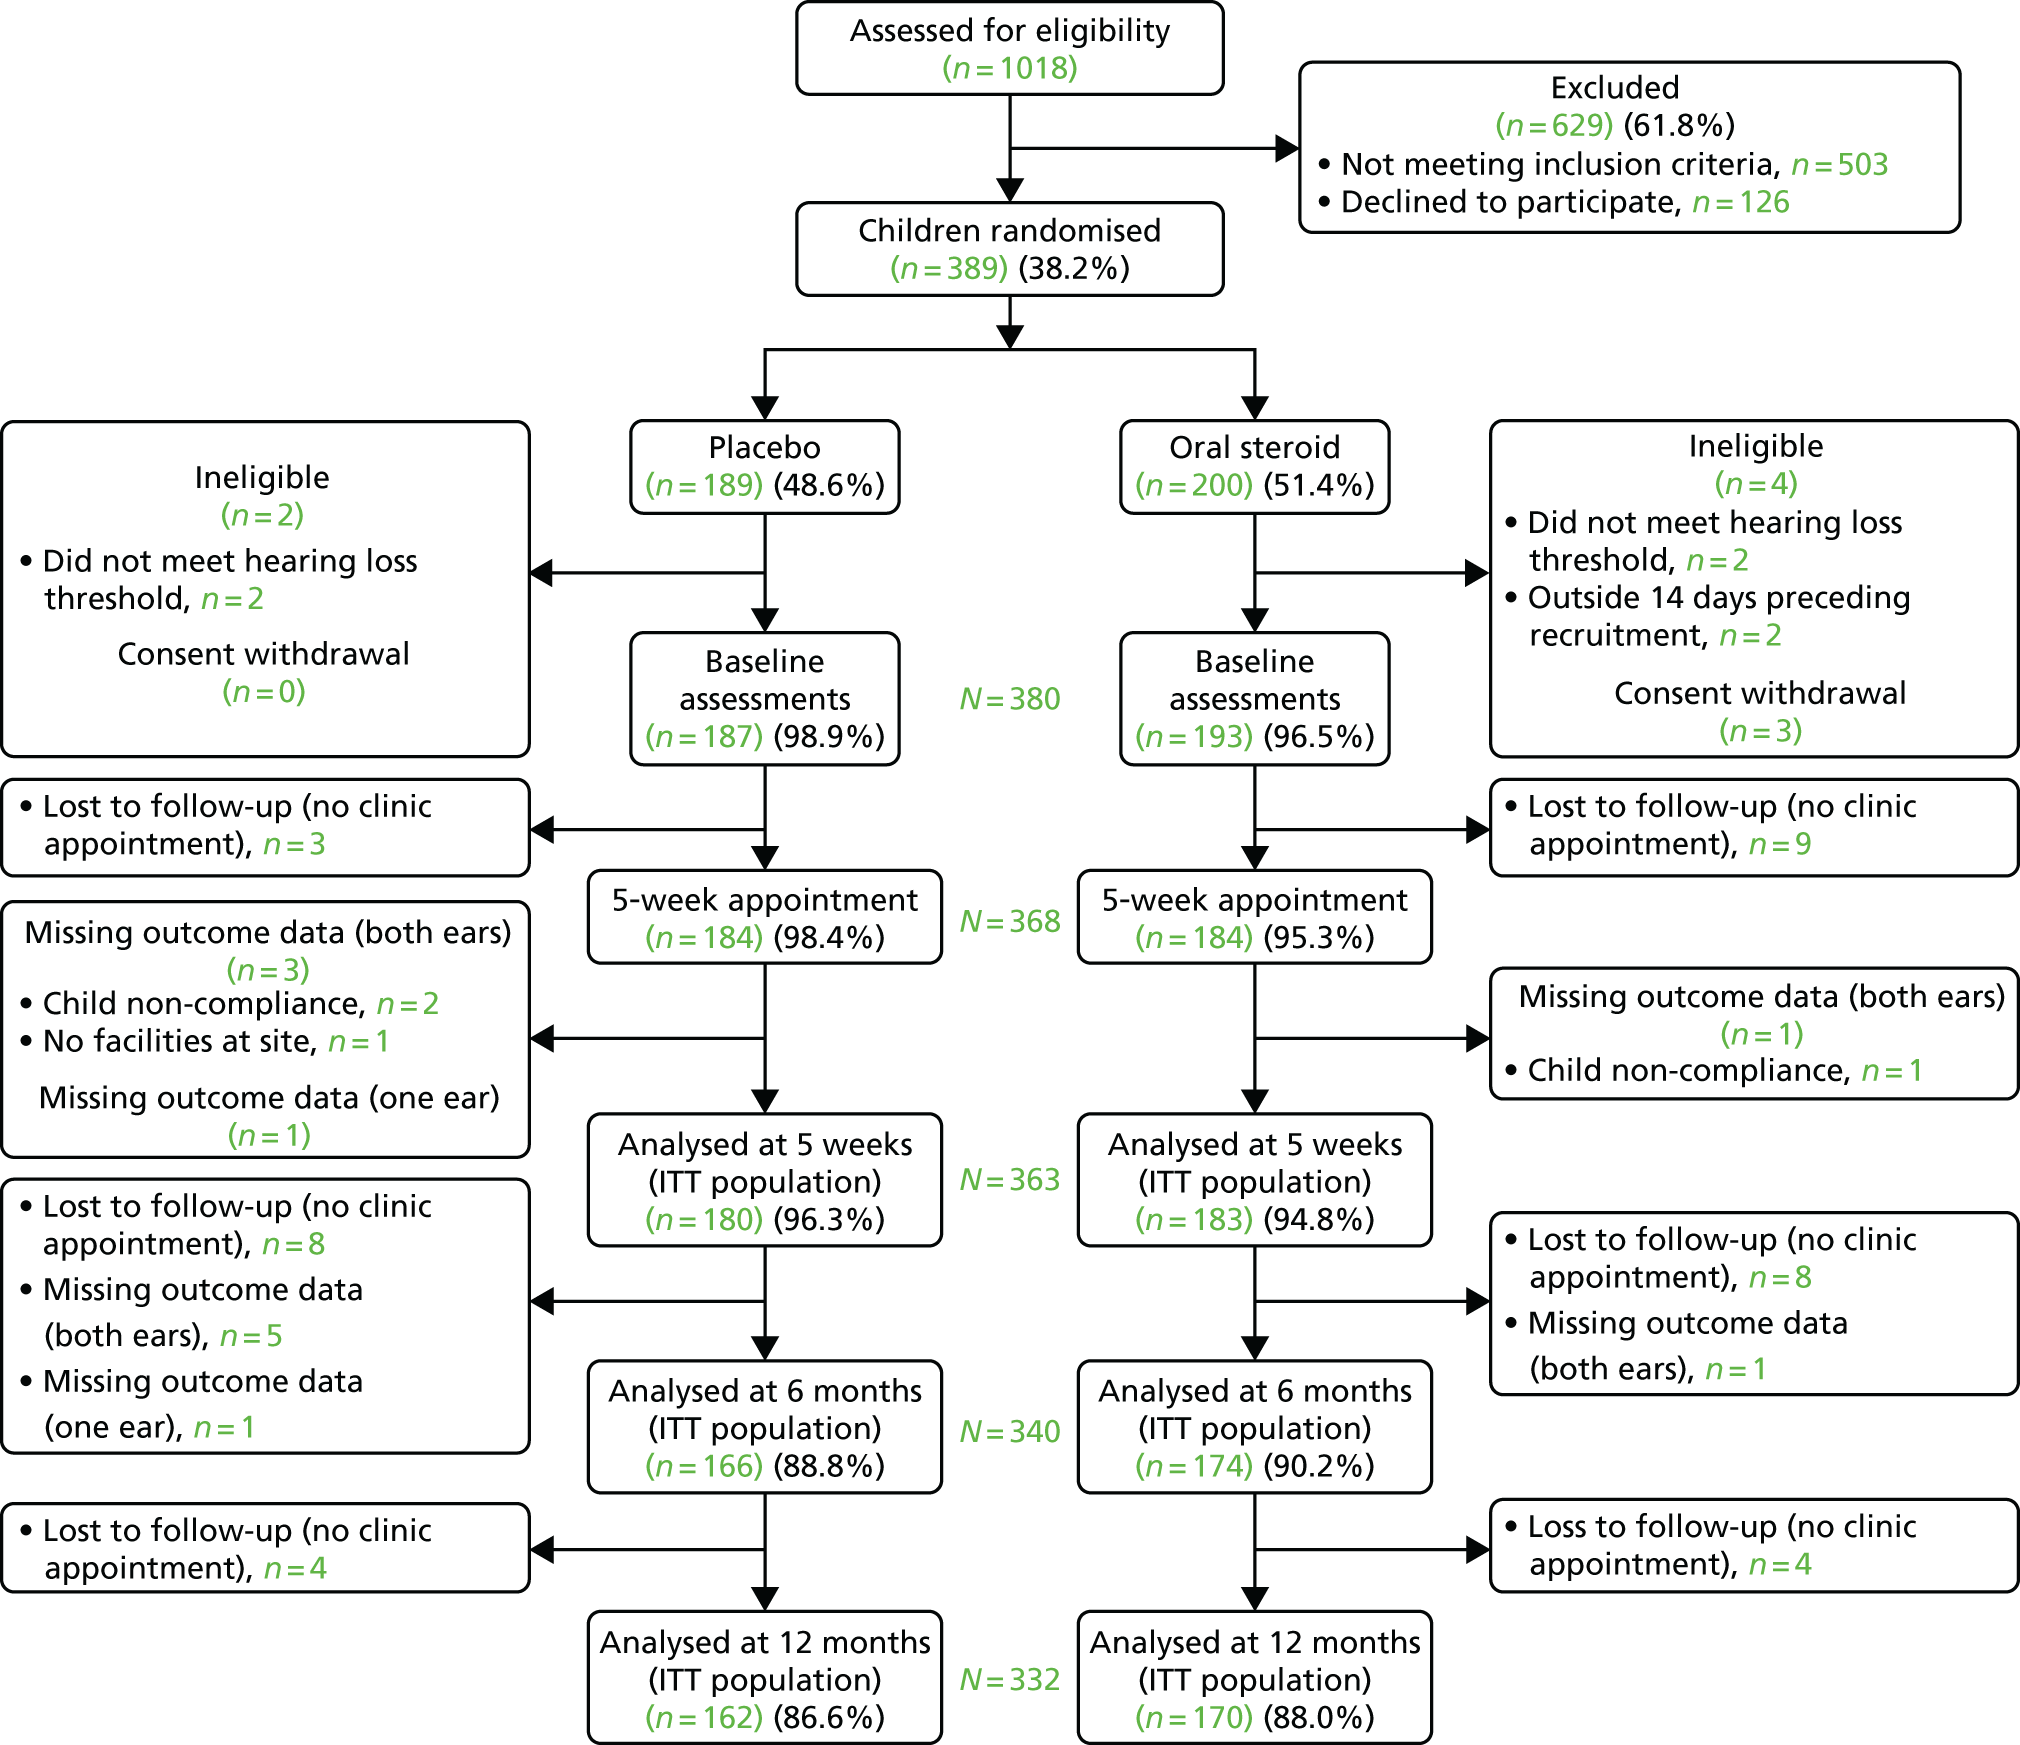
A total of 1018 children were assessed for eligibility, with 389 children (38%) randomised into the trial over a period of 25 months. A total of 535 reasons for exclusion were given for 503 children. The main reasons for exclusion were insufficient hearing loss (49.3%) and having no diagnosis of OME on the day of recruitment or the preceding week (16.1%). The parents of 126 children (12.3%) declined participation, and a small number were unable to be consented at site. The majority (50%) gave no reason for declining. The most common reasons given were ‘having grommets fitted’ (12%) and ‘carer not wishing the child to have steroids’ (9%). After randomisation, a further six children were found to be ineligible and three withdrew from the trial (and declined the use of their data), leaving 380 children (193 in the oral steroid group and 187 in the placebo group). There was slight differential loss to follow-up for the 5-week clinic appointment (nine in the oral steroid group vs. three in the placebo group), but over 95% of the population were retained for the analysis of the primary outcome at 5 weeks.
Randomisation was remote and online, and was stratified by site and age of the child at recruitment (2–5 years and 6–8 years). For the majority of the recruiting sites and children aged 2–5 years, treatment allocation was well balanced (Table 3). There was, however, a slight imbalance of treatment allocation in the 6- to 8-years stratum and in a few sites. The explanation for this imbalance is that there were 53 incomplete blocks of allocations (29 in age stratum 2–5 years and 24 in age stratum 6–8 years). In one site, allocations were stopped mid-block as a result of the IMP expiring and requiring disposal or the study recruitment period ending mid-block.
| Site identifier | Number of participants randomised | Treatment group (number of participants) | |
|---|---|---|---|
| Placebo | Oral steroid | ||
| 1 | 76 | 38 | 38 |
| 2 | 28 | 12 | 16 |
| 3 | 7 | 3 | 4 |
| 4 | 41 | 20 | 21 |
| 5 | 7 | 4 | 3 |
| 6 | 13 | 7 | 6 |
| 7 | 3 | 1 | 2 |
| 8 | 64 | 30 | 34 |
| 9 | 26 | 14 | 12 |
| 10 | 30 | 14 | 16 |
| 11 | 18 | 9 | 9 |
| 12 | 3 | 1 | 2 |
| 13 | 22 | 12 | 10 |
| 14 | 6 | 2 | 4 |
| 15 | 5 | 0 | 5 |
| 16 | 1 | 1 | 0 |
| 17 | 13 | 7 | 6 |
| 18 | 14 | 7 | 7 |
| 19 | 8 | 5 | 3 |
| 20 | 4 | 2 | 2 |
| Age category, n (%) | |||
| 2- to 5-year-olds | 270 | 134 (49.6) | 136 (50.4) |
| 6- to 8-year-olds | 119 | 55 (46.2) | 64 (53.8) |
| Total | 389 | 189 (48.6) | 200 (51.4) |
Baseline characteristics
The baseline demographics of the randomised children were similar in the two groups (Table 4). Slightly more boys were randomised, and the majority were from a white ethnic background. Over 60% of children were randomised in the winter or spring. For over two-thirds of children, this was their first episode of OME, although around 10% in each group had had six or more episodes. Over 60% of children had had their current problem for > 12 months (see Table 4). Comparable numbers of children had previously had a tonsillectomy/adenoidectomy, and a marginally higher proportion in the placebo group had received surgery for the insertion of ventilation tubes or had been fitted with a hearing aid. Just under 30% of children were on a waiting list for ventilation tubes. Of those with a sibling, one-quarter either currently had or previously had OME. Around 65–70% of children did not have asthma, eczema, or hay fever and 15% were on long-term medications. Fewer than 10% in each treatment group had received antibiotics for an ear infection in the past month.
| Variables | Treatment group | |
|---|---|---|
| Placebo (N = 187) | Oral steroid (N = 193) | |
| Child demographics | ||
| Age (years) at recruitment, mean (SD) | 5.08 (1.60) | 5.30 (1.60) |
| 2–5 years, n (%) | 133 (71.1) | 131 (67.9) |
| 6–8 years, n (%) | 54 (28.9) | 62 (32.1) |
| Male gender, n (%) | 102 (54.5) | 109 (56.5) |
| Townsend deprivation quintile, n (%) | ||
| 1 – least deprived | 32 (17.1) | 25 (13.0) |
| 2 | 16 (8.6) | 23 (11.9) |
| 3 | 48 (25.7) | 45 (23.3) |
| 4 | 46 (24.6) | 48 (24.9) |
| 5 – most deprived | 45 (24.1) | 52 (26.9) |
| Ethnicity, n (%) | ||
| White | 134 (82.7) | 143 (82.2) |
| Mixed/multiple ethnic | 10 (6.2) | 10 (5.2) |
| Asian/Asian British | 13 (8.0) | 18 (10.3) |
| Black/African/Caribbean/black British | 3 (1.9) | 3 (1.7) |
| Other ethnic | 2 (1.2) | 0 (0.0) |
| Missing | 25 (0.0) | 19 (0.0) |
| Season randomised, n (%) | ||
| Spring (March–May) | 64 (34.2) | 70 (36.3) |
| Summer (June–August) | 32 (17.1) | 33 (17.1) |
| Autumn (September–November) | 31 (16.6) | 34 (17.6) |
| Winter (December–February) | 60 (32.1) | 56 (29.0) |
| Height measured, n (%) | 62 (33.2) | 74 (38.3) |
| Height (cm), mean (SD) | 112.22 (11.34) | 115.08 (10.59) |
| Weight measured, n (%) | 70 (37.4) | 75 (38.9) |
| Weight (kg), mean (SD) | 20.24 (5.49) | 21.77 (5.95) |
| Body mass index (kg/m2) | ||
| Centile, n (%) | 60 (32.1) | 69 (35.8) |
| Median (25th–75th centiles) | 18.5 (16.4 to 23.1) | 21.0 (18.7 to 24.6) |
| Relation of carer to child, n (%) | ||
| Mother | 159 (85.5) | 171 (88.6) |
| Father | 24 (12.9) | 20 (10.4) |
| Other | 3 (1.6) | 2 (1.0) |
| Missing | 1 (0.0) | 0 (0.0) |
| Medical history of children | ||
| First episode of OME, n (% yes) | 135 (72.2) | 128 (66.3) |
| Length of time had problems attributable to this episode of OME, n (%) | ||
| < 6 months | 26 (13.9) | 19 (9.9) |
| 6 to < 9 months | 28 (15.0) | 22 (11.5) |
| 9 to < 12 months | 18 (9.6) | 20 (10.4) |
| ≥ 12 months | 115 (61.5) | 131 (68.2) |
| Missing | 0 (0.0) | 1 (0.0) |
| Previous ventilation tubes (grommet surgery), n (% yes) | 19 (10.2) | 14 (7.3) |
| On waiting list for ventilation tubes, n (% yes) | 52 (27.8) | 55 (28.6) |
| Fitted with hearing aids, n (% yes) | 31 (16.6) | 27 (14.0) |
| If yes, frequency of use | ||
| Not at all | 5 (16.1) | 2 (7.4) |
| Occasionally | 2 (6.5) | 2 (7.4) |
| Most of the time | 8 (25.8) | 15 (55.6) |
| All of the time | 16 (51.6) | 8 (29.6) |
| Previous tonsillectomy, n (% yes) | 8 (4.3) | 9 (4.7) |
| Previous adenoidectomy, n (% yes) | 8 (4.3) | 8 (4.1) |
| Family history of OME | ||
| Has a brother or sister?, n (% yes) | 147 (78.6) | 156 (80.8) |
| If yes, at least one currently has or has had OME | 34 (23.3) | 44 (28.4) |
| Missing | 1 (0.0) | 1 (0.0) |
| Atopy, n (%) | ||
| None | 131 (70.1) | 125 (64.8) |
| At least one | 56 (29.9) | 68 (35.2) |
| Asthma | 22 (11.9) | 21 (11.2) |
| Eczema | 41 (22.2) | 41 (21.6) |
| Hay fever | 16 (8.7) | 21 (11.1) |
| Missing | 0 (0.0) | 3 (0.0) |
| Medications | ||
| Presently using medication regularly for longer than 1 week, n (% yes) | 25 (13.4) | 32 (16.7) |
| Asthma (β-agonist or corticosteroid inhaler, corticosteroid inhaler in combination) | 20 | 23 |
| Leukotriene receptor antagonists | 1 | 2 |
| Antihistamine | 4 | 2 |
| Nasal steroids | 3 | 1 |
| Antibiotics | 0 | 0 |
| Pain relief (ibuprofen, paracetamol) | 2 | 2 |
| Other | 8 | 17 |
| Antibiotics for an ear infection in the last month, n (% yes) | 13 (7.0) | 19 (9.9) |
| Missing | 0 (0.0) | 1 (0.0) |
| Smoking in house (> 5 hours a week), n (% yes) | 56 (29.9) | 51 (26.4) |
Ear-specific PTA was the favoured hearing assessment in the older age group (i.e. 6–8 years) and is the recommended standard method in children aged 3 years or older. The remainder of 6- to 8-year-olds had ear-specific VRA or play audiometry. Soundfield VRA or soundfield performance/play audiometry was used in only 19.3% of children aged 2–5 years. The method of audiometry was balanced across treatment groups (Table 5). Over 85% of ears were tested using ear-specific methods over all four frequencies (0.5, 1, 2 and 4 kHz), with slightly lower numbers (around 80%) using the soundfield VRA or soundfield performance/play audiometry. Hearing loss was slightly worse in the oral steroid group, with most children having mild to moderate hearing loss. Tympanometry and otoscopy were performed in almost all children, with the majority having type B tympanograms, and a small proportion having type C tympanograms. The tympanic membrane could be visualised in most ears and the appearance suggested the presence of middle ear infusion. QoL was high and comparable between treatment groups (Table 6).
| Hearing assessment | Treatment group | |
|---|---|---|
| Placebo (N = 187) | Oral steroid (N = 193) | |
| Audiometry | ||
| Method of audiometry, n (%) | ||
| PTA | 94 (50.3) | 108 (56.0) |
| Ear-specific VRA | 3 (1.6) | 2 (1.0) |
| Ear-specific play audiometry | 61 (32.6) | 61 (31.6) |
| Soundfield VRA | 17 (9.1) | 16 (8.3) |
| Soundfield performance/play audiometry | 12 (6.4) | 6 (3.1) |
| Average decibel (dBHL) that is audible, mean (SD) | ||
| PTA, ear-specific VRA/play audiometry | (N = 158) | (N = 171) |
| Right ear | 37.07 (7.49) | 35.94 (8.59) |
| Left ear | 37.39 (8.00) | 35.89 (8.83) |
| Best-hearing ear | 34.24 (7.21) | 32.69 (8.21) |
| Worst-hearing ear | 40.22 (7.10) | 39.25 (7.94) |
| Average of the two ears | 37.23 (6.53) | 35.97 (7.51) |
| Soundfield average decibel (dBHL) | (N = 29) | (N = 22) |
| Mean (SD) | 41.13 (8.12) | 38.35 (9.30) |
| Overall, n (%) | ||
| Average of the two ears and soundfield | 37.83 (6.93) | 36.25 (7.74) |
| Degree of hearing loss (dBHL range), n (%) (based on overall dBHL) | ||
| Slight (16–25) | 8 (4.3) | 13 (6.7) |
| Mild (26–40) | 116 (62.0) | 134 (69.4) |
| Moderate (41–55) | 63 (33.7) | 44 (22.8) |
| Moderately severe (56–70) | 0 (0.0) | 2 (1.0) |
| Severe (71–90) | 0 (0.0) | 0 (0.0) |
| Profound (> 90) | 0 (0.0) | 0 (0.0) |
| Tympanometry | ||
| Tympanometry performed, n (% yes) | 187 (100.0) | 192 (99.5) |
| Type: right ear, n (% yes) | ||
| B (flat) | 181 (96.8) | 184 (96.8) |
| C (retracted/negative) | 6 (3.2) | 6 (3.2) |
| Missing | 0 (0.0) | 3 (0.0) |
| Type: left ear, n (% yes) | ||
| B (flat) | 181 (97.8) | 182 (95.8) |
| C (retracted/negative) | 4 (2.2) | 8 (4.2) |
| Missing | 1 (0.0) | 1 (0.0) |
| No type B ears | 1 (0.5) | 3 (1.6) |
| One type B ear | 8 (4.3) | 10 (5.2) |
| Two type B ears | 177 (95.2) | 178 (93.2) |
| Otoscopy | ||
| Visualise the tympanic membrane, n (%) | ||
| Right ear | 180 (96.3) | 192 (99.5) |
| If yes | ||
| Perforation present | 0 (0.0) | 0 (0.0) |
| Appearance suggests presence of middle ear effusion | 180 (100.0) | 190 (99.0) |
| Bubbles behind the ear drum | 20 (11.1) | 22 (11.6) |
| Visualise the tympanic membrane, n (%) | ||
| Left ear | 178 (95.2) | 189 (97.9) |
| If yes | ||
| Perforation present | 2 (1.1) | 2 (1.1) |
| Appearance suggests presence of middle ear effusion | 177 (99.4) | 187 (98.9) |
| Bubbles behind the ear drum | 20 (11.2) | 19 (10.1) |
| Measure | Treatment group | |
|---|---|---|
| Placebo (N = 187) | Oral steroid (N = 193) | |
| HUI3,a median score (25th–75th centiles) | 0.80 (0.63–0.93) | 0.79 (0.66–0.92) |
| Range (min. to max.) | –0.16 to 1.00 | 0.10 to 1.00 |
| Missing | 28.0 | 29.0 |
| PedsQL,b median score (25th–75th centiles) | 187.0 | 189.0 |
| Physical functioning | 90.6 (78.1–100.0) | 90.6 (79.7–98.4) |
| Emotional functioning | 70.0 (60.0–85.0) | 75.0 (55.0–85.0) |
| Social functioning | 90.0 (75.0–100.0) | 90.0 (72.5–100.0) |
| Psychosocial health summary | 78.8 (63.54–87.5) | 78.3 (63.4–87.1) |
| Total summary | 82.1 (69.0–90.5) | 82.6 (68.0–90.7) |
| Missing | 0.0 | 4.0 |
| School functioning | 75.0 (58.3–90.0) | 70.0 (58.3–85.0) |
| Missing | 8.0 | 10.0 |
| OM8-30,c mean score (SD) | 187 | 190 |
| Infection-related physical health factor | –0.31 (1.03) | –0.17 (0.99) |
| General development impact factor | 0.52 (1.24) | 0.48 (1.20) |
| Reported hearing difficulties factor | 0.74 (0.78) | 0.87 (0.82) |
| Total summary score | 0.47 (1.04) | 0.60 (1.03) |
| Parent-reported overall child’s health, n (%) | ||
| Poor | 4 (2.2) | 6 (3.2) |
| Fair | 28 (15.1) | 29 (15.5) |
| Good | 61 (33.0) | 54 (28.9) |
| Very good | 56 (30.3) | 55 (29.4) |
| Excellent | 36 (19.5) | 43 (23.0) |
| Missing | 2 (0.0) | 6 (0.0) |
Time of follow-up assessments
Follow-up assessments were scheduled at 5 weeks (35 days), 6 months (182 days) and 12 months (365 days) after randomisation. Parents were encouraged to return for assessment as close as possible to the scheduled date. Table 7 shows that the range of timings for the follow-up assessments were comparable between treatment groups. A total of 316 children attended all three assessments, 14 attended the 5-week follow-up assessment only, four attended only the 6- and 12-month follow-up assessments, 38 attended two of the three and four children missed their 5-week assessment, but returned for the 6- and 12-month assessments. The proportion of responders attending the clinic within the specified window (± 14 days) was high at 5 weeks (≈90% in each group) but then decreased over the next two time points. A greater proportion of children randomised to receive oral steroids attended their appointments within the window (71% in the placebo group vs. 79% in the oral steroid group at 6 months, and 65% vs. 75%, respectively, at 12 months).
| Treatment group | Follow-up time point | Number of participants | Attending within window (± 14 days), n (%) | Days between recruitment and clinic assessment | |||
|---|---|---|---|---|---|---|---|
| Mean (SD) | Median (25th–75th centile) | Min. | Max. | ||||
| Placebo | 5 weeks | 184 | 165 (89.7) | 40.46 (9.14) | 37.5 (35.0–42.0) | 28 | 96 |
| 6 months | 172 | 133 (71.0) | 187.72 (21.49) | 183.0 (178.25–194.0) | 96 | 275 | |
| 12 months | 162 | 115 (64.8) | 371.38 (25.55) | 364.0 (357.0–374.75) | 310 | 512 | |
| Oral steroid | 5 weeks | 184 | 171 (92.9) | 39.52 (6.63) | 37.0 (35.0–42.0) | 27 | 71 |
| 6 months | 175 | 139 (79.4) | 187.37 (20.73) | 183.0 (179.0–193.0) | 119 | 276 | |
| 12 months | 170 | 127 (74.7) | 371.06 (30.93) | 366.0 (358.75–373.0) | 294 | 665 | |
Medication adherence
A 7-day course of oral steroids or matched placebo was given as a single daily dose of 20 mg for children aged 2–5 years or 30 mg for 6- to 8-year-olds. Over 90% of diaries were returned, in which over 98% of responders reported that they started medication and, hence, initiated treatment (Table 8). In total, 31 diaries were not returned, but all medication had been received according to pharmacy records and 79% had reported taking all medication for 7 days. One participant had not completed the adherence data, but had provided dates to enable a verification that medication had been taken for the 7 days. Of those initiating treatment, the majority initiated treatment the day after recruitment as instructed. More parents reported that the child did not find the oral steroid as palatable (did not like the taste or spat it out) as the placebo (21 vs. 10 children). Minimal numbers of children vomited after medication.
| Medication adherence outcome | Treatment group | |
|---|---|---|
| Placebo (N = 187) | Oral steroid (N = 193) | |
| Medication received, n (%) | 187 (100.0) | 193 (100.0) |
| Diary returned, n (%) | 170 (90.1) | 179 (92.7) |
| Initiated treatment, n (%) | 167 (98.2) | 176 (98.3) |
| Implementation in those who initiated, n (%) | ||
| Fully compliant for 7 days (all taken for 7 consecutive days) | 134 (80.7) | 138 (78.4) |
| Partial compliance | 32 (19.1) | 38 (21.6) |
| Compliance unknown | 1 (0.6) | 0 (0.0) |
| All 7 days taken (all/some medication reported) | 147 (88.0) | 157 (89.2) |
| < 7 days taken (1–6 days) | 19 (11.3) | 19 (10.8) |
| Persistence, n (%) | ||
| Medication reported as not stopped | 147 (88.0) | 157 (89.2) |
| Medication stopped at days 5–7 | 8 (5.4) | 10 (5.7) |
| Medication stopped at days 1–4 | 11 (6.6) | 9 (5.2) |
| Days between recruitment and treatment start | ||
| 0 (same day as recruitment), n (%) | 4 (2.4) | 6 (3.4) |
| 1 (day after recruitment as instructed), n (%) | 134 (80.7) | 148 (85.1) |
| ≥ 2, n (%) | 28 (16.9) | 20 (11.5) |
| Median (min., max.) (days) | 1 (0, 20) | 1 (0, 14) |
Main trial results
Primary outcome
Proportion of children with acceptable hearing between trial groups at 5 weeks post randomisation
The ITT population (i.e. children analysed as randomised with primary outcome data) comprised 363 children (placebo group, n = 180; oral steroid group, n = 183). Of these, 59 children (33%) in the placebo group and 73 children (40%) in the oral steroid group had acceptable hearing at 5 weeks, resulting in a 7.1% (95% CI –2.8% to 16.8%) difference between treatment groups and a number needed to treat to benefit of 14.1 [95% CI number needed to treat to harm of 35.7 to ∞ to number needed to treat to benefit of 6.0 (Table 9)].
| Type of analysis | Treatment group, n (%) | Adjusteda OR (95% CI) | p-value | |
|---|---|---|---|---|
| Placebo | Oral steroid | |||
| ITT population | (N = 187) | (N = 193) | ||
| Acceptable hearing | ||||
| No | 121 (67.2) | 110 (60.1) | Reference | |
| Yes | 59 (32.8) | 73 (39.9) | 1.36 (0.88 to 2.11) | 0.164 |
| PP population | (N = 116) | (N = 127) | ||
| Acceptable hearing | ||||
| No | 76 (65.5) | 75 (59.1) | Reference | |
| Yes | 40 (34.5) | 52 (40.9) | 1.27 (0.75 to 2.17) | 0.378 |
| CACE | ||||
| Primary analysis | 0.07b (–0.02 to 0.16) | 0.109 | ||
| Full adherence to oral steroid (vs. none/some) | 0.08b (–0.03 to 0.20) | 0.103 | ||
The point estimate for the treatment effect suggests that the odds of having acceptable hearing at 5 weeks were 36% higher for children randomised to receive oral steroids than children randomised to receive a placebo (see Table 9). However, this difference is not statistically significant. There was a small effect of clustering of outcome within site (intracluster correlation coefficient 0.02, 95% CI 0.003 to 0.20). The adjusted RR drew a similar conclusion of no significant treatment effect at 1.21 (95% CI 0.92 to 1.60; p = 0.169).
The sensitivity analyses showed similar results and no significant difference between treatment groups in both the PP population and when adjusting for adherence in a CACE analysis. The latter showed a small increase of 1% in acceptable hearing for children whose parents stated that they had fully adhered for all 7 days of the oral steroid course (see Table 9). Multiple imputation (MI) was also prespecified in the SAP, but as the proportion missing the primary outcome in each treatment group was minimal [only 17 (5%) of all children], imputation was not carried out and a complete-case analysis was appropriate.
Subgroup analyses
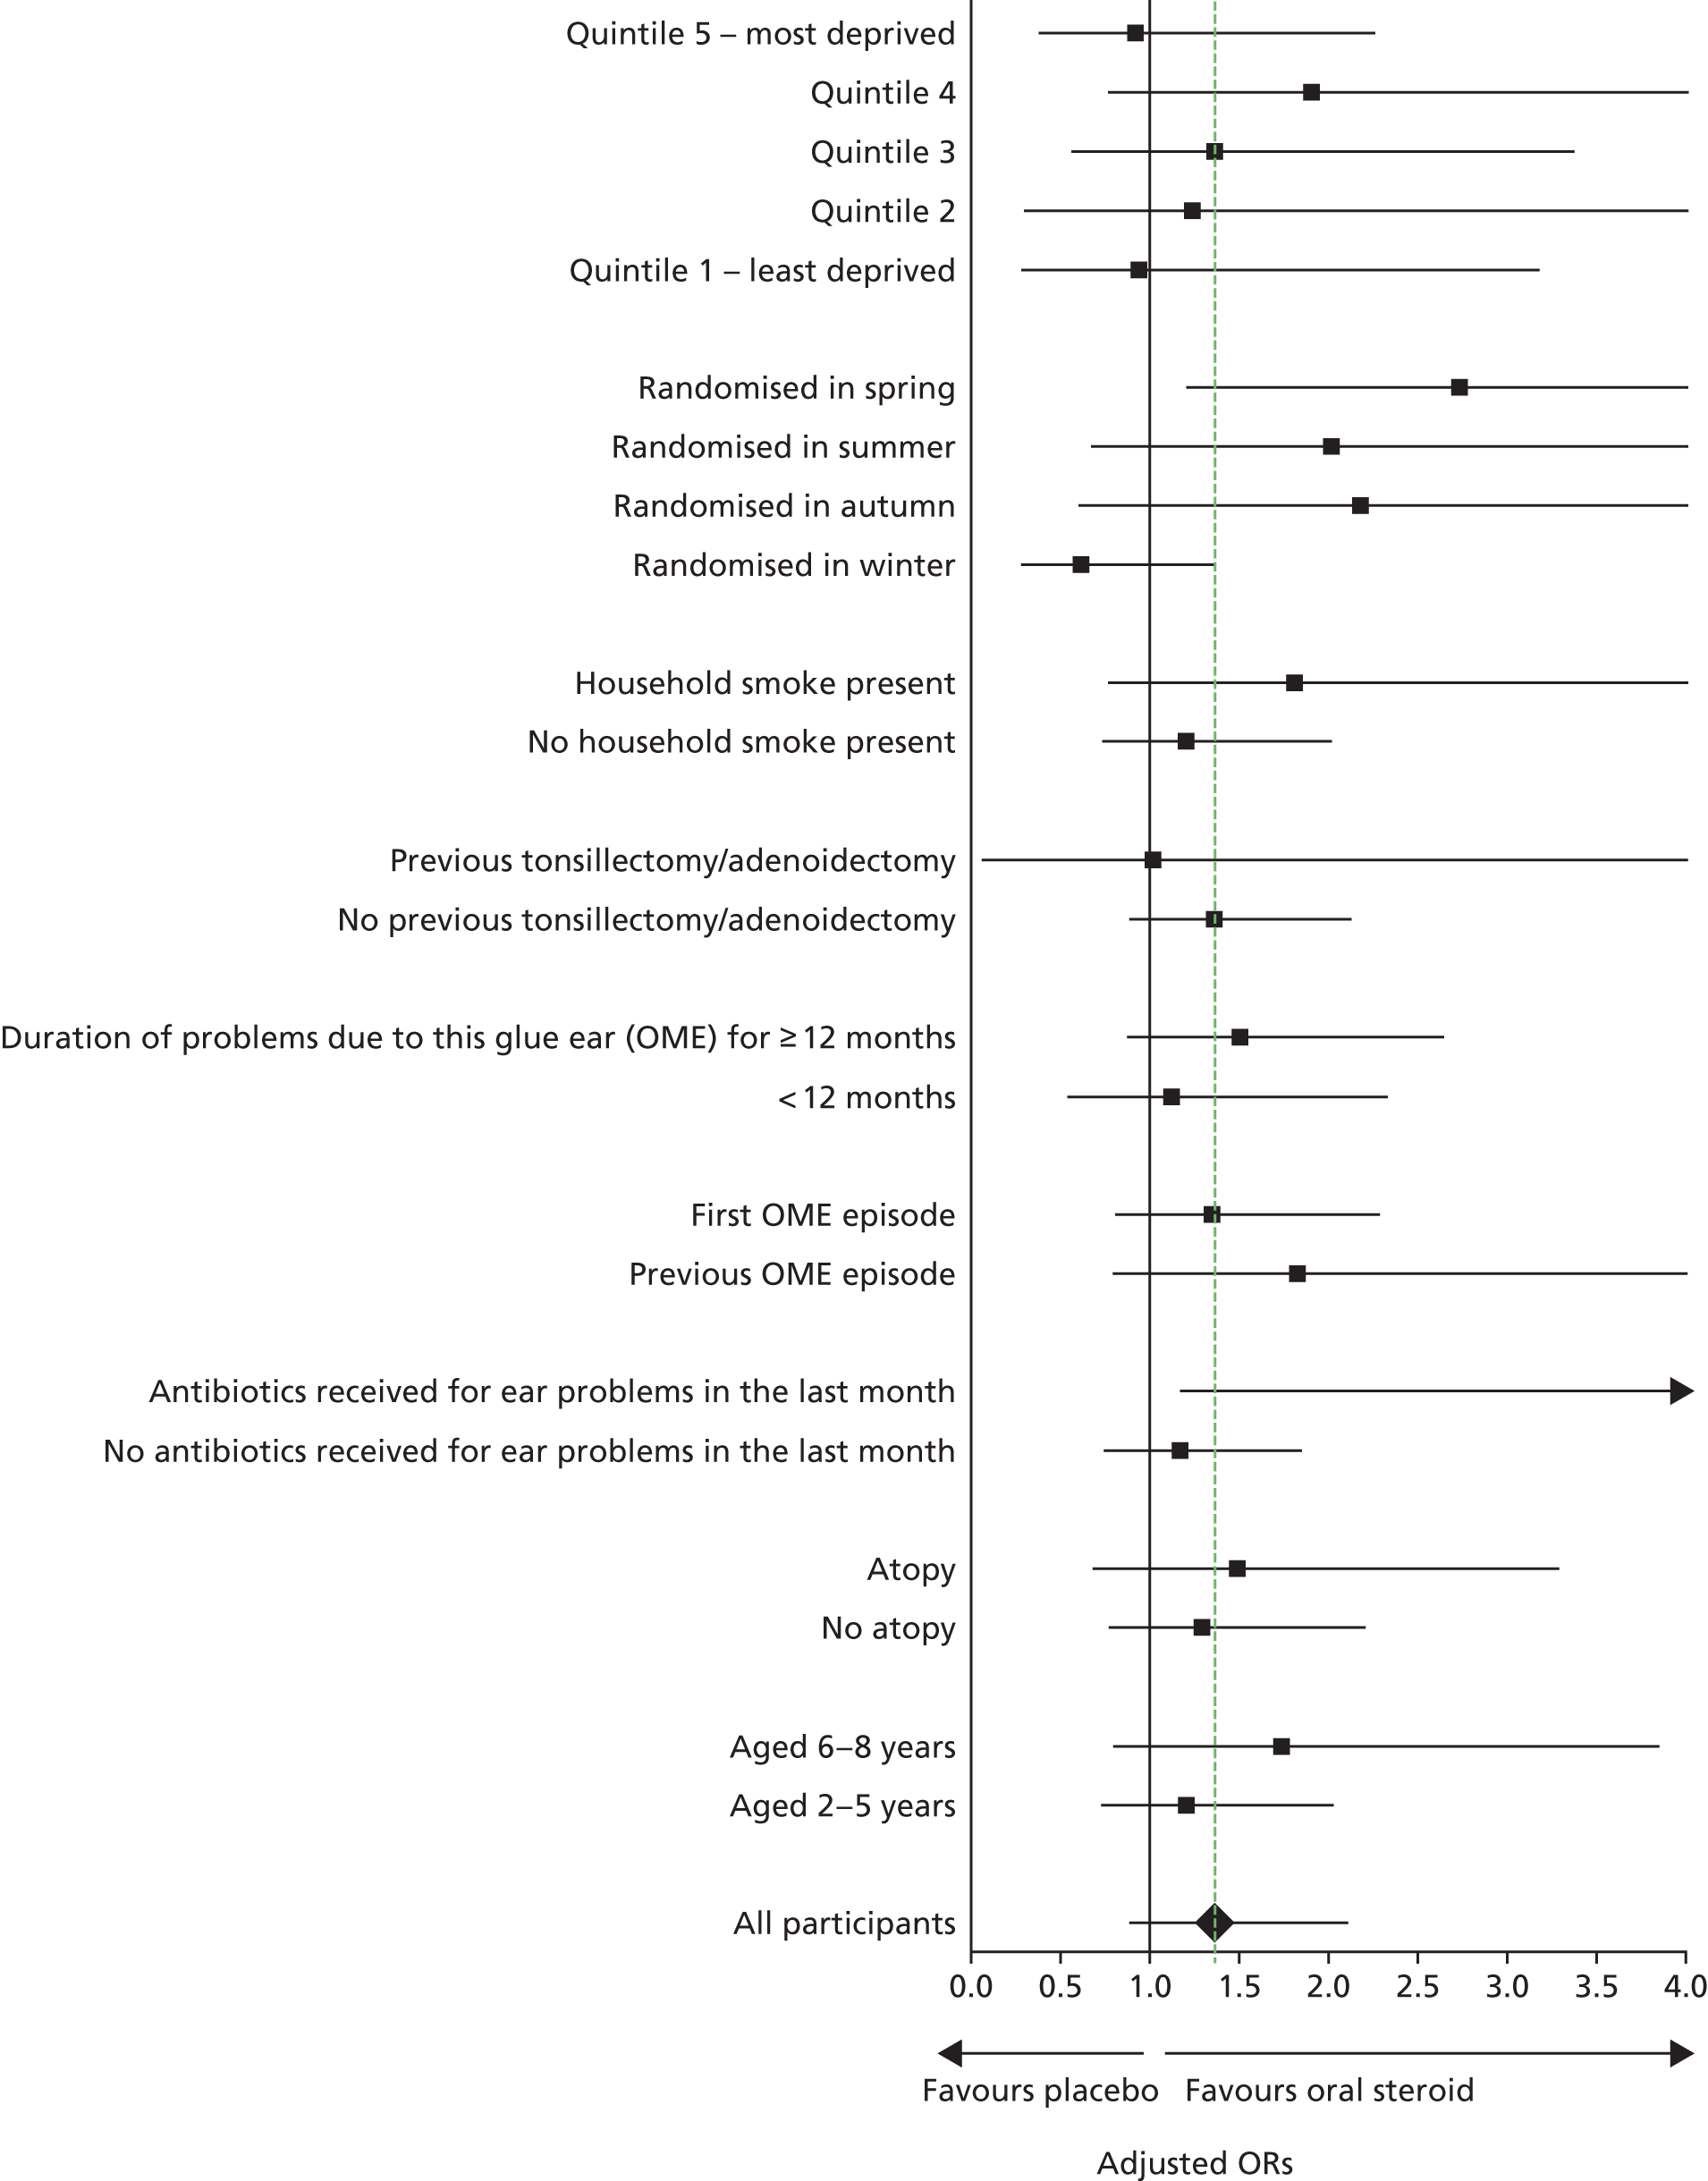
No differences in treatment effects between subgroups were found (Figure 4), and the p-values for the interaction term (treatment group by subgroup) in the model ranged from 0.04 to 0.74 (see Appendix 2).
FIGURE 4.
Forest plot of subgroup analyses.
Secondary analysis of the primary outcome
Two secondary analyses of the primary outcome were proposed in the SAP at 5 weeks, using the outcome as a continuous measure. This enabled an examination of any improvements or deterioration in dBHL over time. This outcome was modelled in two ways:
-
as a child-level analysis using the average, best or worst hearing levels from children assessed via PTA (whereby two ears were assessed) and the only assessment of hearing in those using ear-specific insert VRA or ear-specific play audiometry
-
as an ear-level analysis to account for both ears being tested using the ear-specific VRA.
For the child-level analysis, both treatment groups observed a similar decrease over the 5 weeks of, on average, around 7 dBHL, whichever assessment of both ears was taken [average of both, best ear, worse ear (Table 10)]. A weighted average decibel at baseline and 5 weeks was calculated to account for the number of frequencies recorded per ear/child, but as most children had their ears tested at all four frequencies, the results were very similar (see Table 10). There was no evidence of a difference between treatment groups with similar results (< 1-dBHL between-group difference). An analysis of each ear was separately conducted, and the results were similar to the main per-child analyses.
| Average, best or worse ear | Treatment group | Time point | Change (5 weeks – baseline), mean (SD) | Difference in adjusteda means (95% CI) | |||
|---|---|---|---|---|---|---|---|
| Baseline | 5 weeks | ||||||
| N | Mean (SD), weighted mean (SD) | N | Mean (SD), weighted mean (SD) | ||||
| Child-level analysis | |||||||
| Average hearing level | Placebo | 181 |
37.79 (6.92) 37.68 (6.93) |
181 |
30.99 (11.00) 30.84 (10.95) |
–6.80 (10.67) | –0.56 (–2.56 to 1.44) |
| Oral steroid | 183 |
36.25 (7.72) 36.18 (7.67) |
183 |
29.32 (10.38) 29.22 (10.34) |
–6.93 (9.57) | ||
| Best hearing level | Placebo | 181 |
35.24 (7.74) 35.17 (7.74) |
181 |
28.02 (11.55) 27.82 (11.46) |
–7.23 (11.59) | –0.96 (–3.07 to 1.16) |
| Oral steroid | 183 |
33.30 (8.46) 33.24 (8.43) |
183 |
25.82 (10.80) 25.71 (10.74) |
–7.48 (10.57) | ||
| Worst hearing level | Placebo | 181 |
40.33 (7.26) 40.20 (7.26) |
181 |
33.96 (11.33) 33.85 (11.29) |
–6.37 (11.12) | –0.37 (–2.52 to 1.78) |
| Oral steroid | 183 |
39.19 (8.11) 39.12 (8.03) |
183 |
32.82 (11.37) 32.72 (11.36) |
–6.37 (10.52) | ||
| Ear-level analysis | |||||||
| Placebo | 361 | 37.81 (7.91) | 361 | 31.01 (11.82) | –6.80 (11.79) | –0.78b (–2.79 to 1.23) | |
| Oral steroid | 364 | 36.20 (8.79) | 364 | 29.38 (11.54) | –6.82 (10.98) | ||
Secondary outcomes
Audiometry
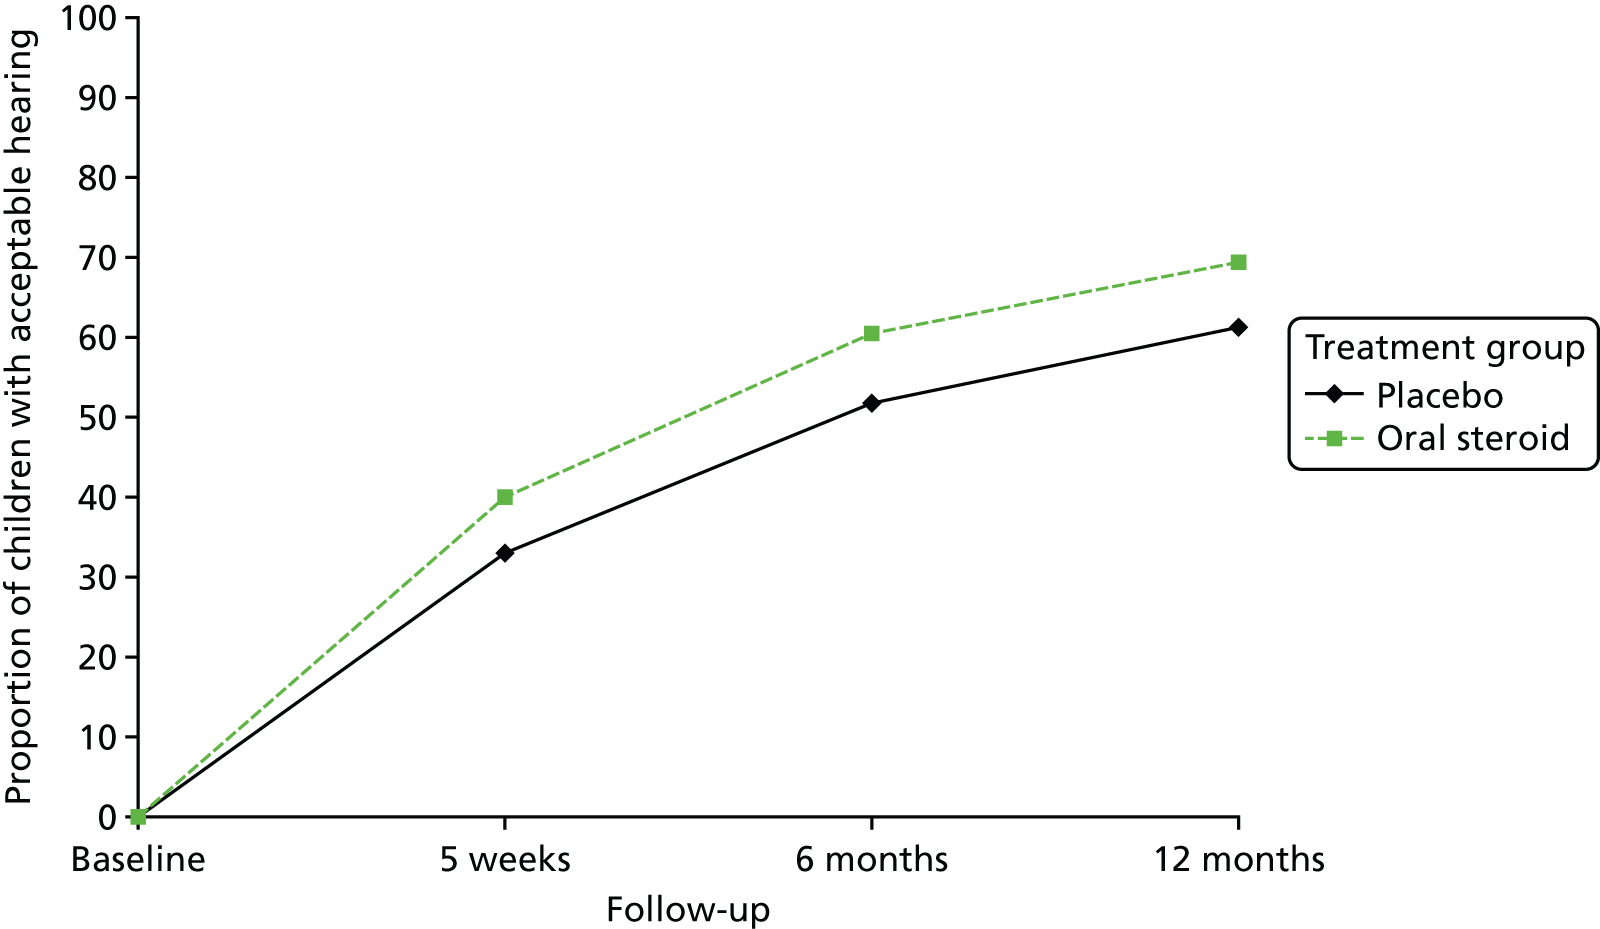
The proportion of children who attended clinic for a hearing assessment was over 95% at 5 weeks, reducing to around 86% by 12 months. Acceptable hearing using audiometry was described by examining the proportion of children with acceptable hearing between treatment groups at 5 weeks and 6 and 12 months. A total of 306 children had audiology assessments at all three time points; 19 had no follow-up at 6 months and 26 had no follow-up at 12 months. Of the 306 children, 62 had acceptable hearing at each time point [placebo group 25 (13.4%) vs. oral steroid group 37 (19.2%)]. A repeated measures multilevel logistic regression model (adjusting for site and age of child) showed that there was a significant increase in acceptable hearing from 5 weeks to the 6 and 12 months’ time points, with a constant 7–8% difference between treatment groups (Table 11 and Figure 5). There was no overall difference in acceptable hearing between groups (oral steroids compared with placebo averaged across all follow-up time points) and no differential effect of treatment over time.
| Outcome | Treatment group, n/N (%) | Effect | Treatment × time effect (p-value) | ||||
|---|---|---|---|---|---|---|---|
| Time | Treatmenta | ||||||
| Placebo | Oral steroid | Adjustedb OR (95% CI) | p-value | Adjustedb OR (95% CI) | p-value | ||
| Acceptable hearing at audiometry | |||||||
| 5 weeks | 59/180 (32.8) | 73/183 (39.9) | Reference | 1.42 (0.91 to 2.21) | 0.121 | 0.975 | |
| 6 months | 86/166 (51.8) | 105/174 (60.3) | 2.30 (1.47 to 3.60) | < 0.001 | |||
| 12 months | 99/162 (61.1) | 118/170 (69.4) | 3.46 (2.19 to 5.46) | < 0.001 | |||
| Tympanometric resolution of OME | |||||||
| 5 weeks | 13/178 (7.3) | 7/182 (3.8) | Reference | 0.51 (0.20 to 1.30) | 0.159 | 0.007 | |
| 6 months | 17/147 (11.6) | 26/152 (17.1) | 1.69 (0.79 to 3.61) | 0.179 | |||
| 12 months | 9/144 (6.3) | 31/159 (19.5) | 0.85 (0.35 to 2.06) | 0.724 | |||
FIGURE 5.
Proportion of children with audiometric-acceptable hearing over time, by treatment group.
Tympanometric resolution of otitis media with effusion over time
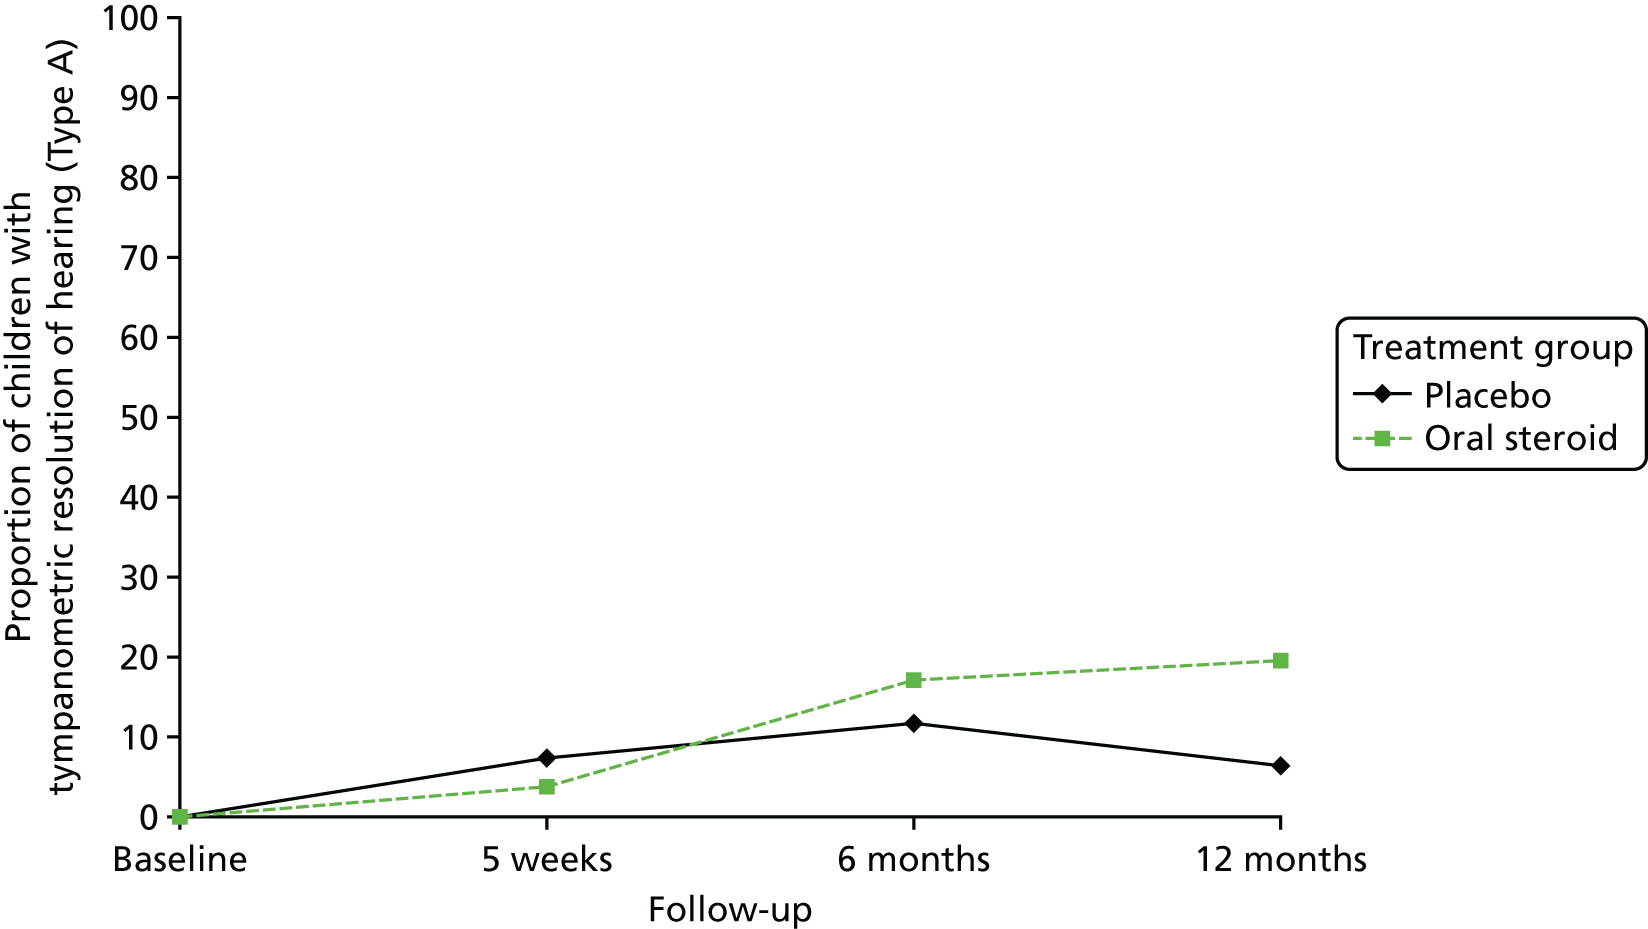
Of those children who attended a clinic, tympanometry was performed in over 98% of children at 5 weeks, a slight decrease at 6 months to 81% and increasing to 90% at 12 months. The main reason that tympanometry was not performed was that the child had ventilation tubes in situ or was about to have surgery to place them. Evidence of tympanometric resolution of OME is defined as moving from a type B or C tympanogram at baseline to a type A tympanogram in at least one ear at the 5-week follow-up. Of the children who had tympanometry performed, a small proportion had evidence of resolution in at least one ear at 5 weeks, 6 months and 12 months (see Table 11). Although there was no overall effect between treatment groups or over time, the rate of resolution in the oral steroid and placebo groups had a different trajectory (Figure 6).
FIGURE 6.
Proportion of children with tympanometric resolution (type A) of hearing over time, by treatment group.
Otoscopy
Otoscopy was performed in over 96% of children over the three follow-up time points, and the tympanic membrane was visible for the majority of these children. Very few children had a perforation present in at least one ear with no significant difference by treatment group, but an increase was detected at 6 and 12 months when compared with perforations at 5 weeks (Table 12). There was a decrease over time in the proportion of children in whom the appearance of the tympanic membrane suggested the presence of a middle ear effusion, but there was no difference between treatment groups. There was no evidence of a difference between treatment groups in the proportion of children with bubbles present behind the ear drum, but there were significantly fewer children with bubbles present at 12 months than at 5 weeks. There was no differential effect between treatment groups in bubbles present behind the ear drum over time.
| Outcome | Treatment group, n/N (%) | Effect | Treatment × time effect (p-value) | ||||
|---|---|---|---|---|---|---|---|
| Placebo | Oral steroid | Time | Treatmenta | ||||
| Adjustedb OR (95% CI) | p-value | Adjustedb OR (95% CI) | p-value | ||||
| Perforation present in at least one ear | |||||||
| Baseline | 2/184 (1.1) | 2/192 (1.0) | 0.78 (0.37 to 1.66) | 0.520 | 0.623 | ||
| 5 weeks | 2/169 (1.2) | 0/171 (0.0) | Reference | ||||
| 6 months | 9/152 (5.9) | 6/155 (3.9) | 12.43 (2.77 to 55.76) | 0.001 | |||
| 12 months | 7/134 (5.2) | 6/151(4.0) | 9.21 (2.00 to 42.98) | 0.004 | |||
| Presence of a middle ear effusion in at least one ear | |||||||
| Baseline | 183/184 (99.4) | 192/192 (100.0) | 0.70c (0.35 to 1.39) | 0.312 | 0.950 | ||
| 5 weeks | 152/168 (90.5) | 150/172 (87.2) | Reference | ||||
| 6 months | 96/151 (63.6) | 90/154 (58.4) | 0.18 (0.10 to 0.33) | < 0.001 | |||
| 12 months | 80/138 (58.0) | 80/151 (53.0) | 0.14 (0.08 to 0.26) | < 0.001 | |||
| Bubbles present behind the ear drum in at least one ear | |||||||
| Baseline | 23/183 (12.6) | 25/190 (13.2) | 1.57 (0.76 to 3.26) | 0.222 | 0.165 | ||
| 5 weeks | 15/164 (9.1) | 23/169 (13.6) | Reference | ||||
| 6 months | 19/147 (12.9) | 13/152 (8.6) | 1.54 (0.73 to 3.25) | 0.260 | |||
| 12 months | 4/135 (3.0) | 8/149 (5.4) | 0.30 (0.10 to 0.96) | 0.042 | |||
Insertion of ventilation tubes (grommet surgery)
Around one-fifth of children had ventilation tubes inserted between 5 weeks and 6 months (Table 13). Between 6 and 12 months, < 15% of children had new operations for ventilation tubes. There was no evidence of an overall difference between treatment group and a differential treatment effect over time. The mean time to surgery was 165.5 days (SD 104.5 days) in the placebo group and 168.0 days (SD 96.1 days) in the oral steroid group. When examined in a time-to-event model, there was no difference in the risk of operations for ventilation tubes between treatment groups (adjusted HR 0.98, 95% CI 0.69 to 1.41).
| Follow-up time point | Treatment group, n/N (%) | Effect | Treatment × time effect (p-value) | ||||
|---|---|---|---|---|---|---|---|
| Placebo | Oral steroid | Time | Treatmenta | ||||
| Adjustedb OR (95% CI) | p-value | Adjustedb OR (95% CI) | p-value | ||||
| 5 weeks | c | c | |||||
| 6 months | 38/170 (22.4) | 39/173 (22.5) | Reference | Reference | |||
| 12 months | 23/162 (14.2) | 23/172 (13.4) | 0.54 (0.30 to 0.98) | 0.042 | 1.10 (0.64 to 1.89) | 0.728 | 0.762 |
Health-care consultations related to otitis media with effusion and other resource use
From the 349 diaries that were returned by parents (placebo group, n = 179; oral steroid group, n = 170), the total number of health-care consultations relating to OME over the 5-week period was examined. Very few children consulted with any health-care setting over the 5 weeks post randomisation (Table 14), with no difference between treatment groups. Similar conclusions were made for time taken off school/nursery or days off work for family members, for ear problems and other illnesses.
| Outcome | Treatment group | Adjusteda IRRb (95% CI) | p-value | |
|---|---|---|---|---|
| Placebo (N = 170) | Oral steroid (N = 179) | |||
| Health-care consultations relating to OME | ||||
| No consultations, n (%) | 146 (85.9) | 162 (90.5) | Reference | |
| At least one consultation, n (%) | 24 (14.1) | 17 (9.5) | 0.64c (0.33 to 1.25) | 0.188 |
| One consultation | 16 (9.4) | 13 (7.3) | ||
| Two consultations | 5 (2.9) | 2 (1.1) | ||
| Three consultations | 3 (1.8) | 2 (1.1) | ||
| Time off school/nursery/work for ear problems | Adjusteda OR (95% CI) | p-value | ||
| No time off taken, n (%) | 162 (95.3) | 173 (96.6) | Reference | |
| Time off taken, n (%) | 8 (4.7) | 6 (3.4) | 0.71 (0.14 to 4.08) | 0.697 |
| Min. to max. (days) | 0.1 to 6.0 | 0.1 to 7.0 | ||
| Time off school/nursery/work for non-ear problems | ||||
| No time off taken, n (%) | 155 (91.2) | 171 (95.5) | Reference | |
| Time off taken, n (%) | 15 (8.8) | 8 (4.5) | 0.49 (0.14 to 1.66) | 0.249 |
| Min. to max. (days) | 0.3 to 8.0 | 1.0 to 7.0 | ||
Main clinical diary symptoms
For the 5 weeks post randomisation, the weekly scores were reported by parents on 10 symptoms on a scale of 0 (problem not present at all) to 6 (problem is as bad as it could be). Most symptoms were not present at all (see Figures 20–27, Appendix 3). The following eight problems were combined into a single symptom scale to avoid multiple outcomes: hearing, ear pain, speech, energy levels, sleep, attention span, balance, and being generally unwell. At 1 week post randomisation, Cronbach’s alpha for the eight symptom scores was 0.77 at week 1, indicating good reliability between the eight symptoms, suggesting that they could be combined into a single symptom score ranging from 0 (problems not present at all) to 48 (all problems are as bad as possible). The factor analysis also suggested that these symptoms could form a single scale. Cronbach’s alpha for the subsequent 4 weeks was > 0.80 for all symptom scores, suggesting a relatively high internal consistency over time. The distributions of the weekly overall symptom score was positively skewed, indicating no problems (Figure 7). The highest median scores were at the end of week 1 (7 in the placebo group and 6 in the oral steroid group), indicating that these symptoms were not a problem. When the scores were changed into binary outcomes (no symptoms vs. some symptoms), there was no difference between treatment groups over time (Table 15). Two categories of symptoms (nausea, vomiting or indigestion, and changes in behaviour and mood over time) were examined separately; a high proportion of children had resolution of symptoms over time, with no difference between treatment groups and over time (see Table 15).
FIGURE 7.
Box plot of weekly overall symptom score, by treatment group.
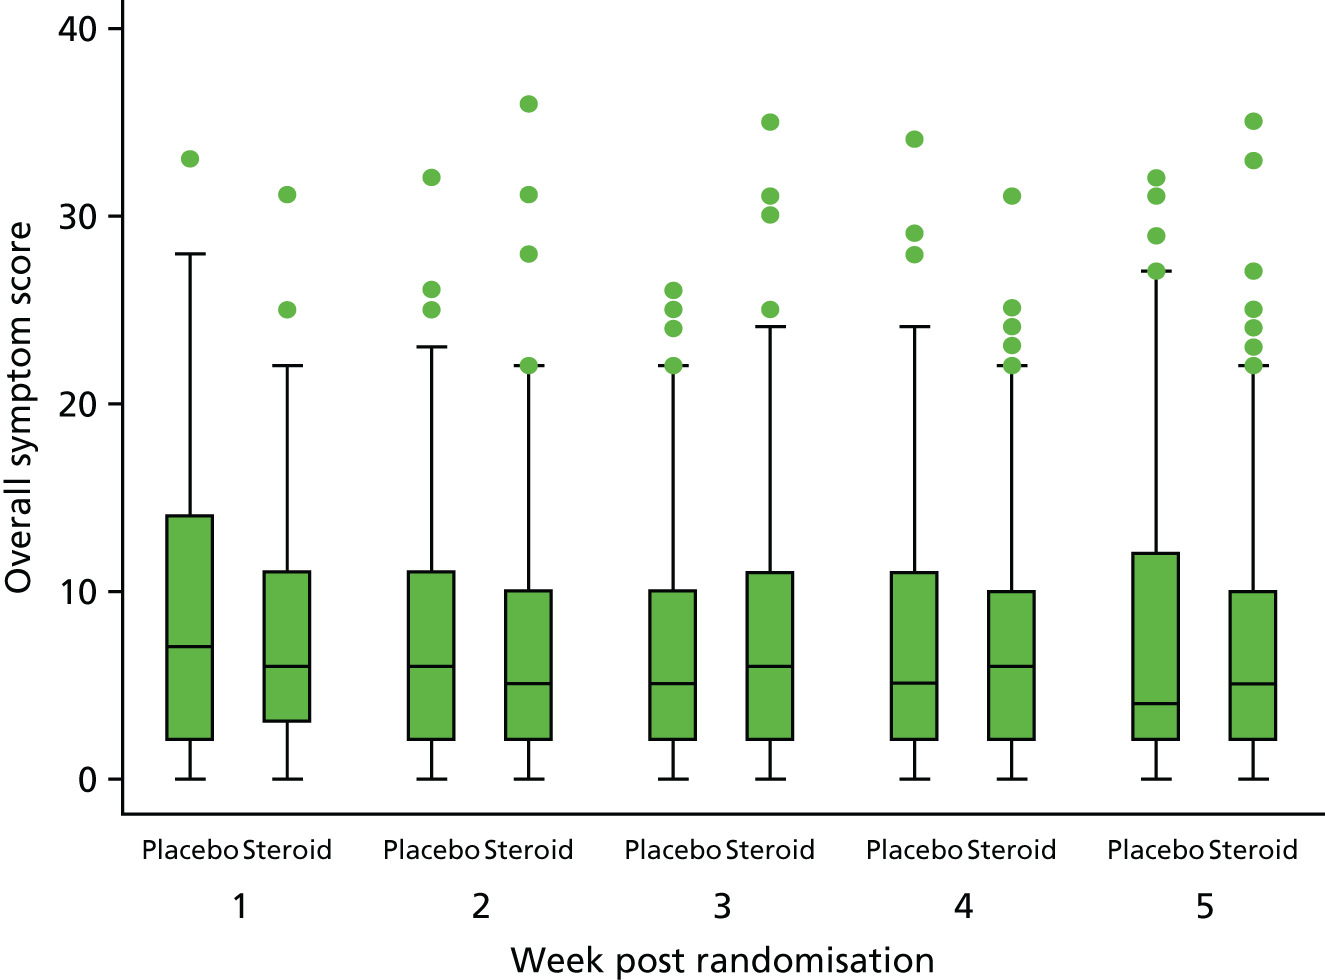
| Week | Treatment group, n/N (%) | Effect | Treatment × time effect (p-value) | ||||
|---|---|---|---|---|---|---|---|
| Placebo | Oral steroid | Time | Treatmenta | ||||
| Adjustedb OR (95% CI) | p-value | Adjustedb OR (95% CI) | p-value | ||||
| No problem with any symptomc (score of 0) | |||||||
| 1 | 19 (13.6) | 13 (8.7) | Reference | 0.59 (0.28 to 1.27) | 0.178 | 0.801 | |
| 2 | 20 (13.4) | 18 (11.6) | 1.00 (0.50 to 1.99) | 0.990 | |||
| 3 | 22 (14.7) | 19 (12.3) | 1.09 (0.55 to 2.15) | 0.807 | |||
| 4 | 17 (11.4) | 21 (13.2) | 0.83 (0.40 to 1.69) | 0.600 | |||
| 5 | 21 (14.7) | 22 (13.8) | 1.10 (0.55 to 2.19) | 0.789 | |||
| No symptoms of nausea, vomiting or indigestion | |||||||
| 1 | 132 (79.5) | 124 (72.5) | Reference | 0.67 (0.40 to 1.11) | 0.116 | 0.806 | |
| 2 | 136 (83.4) | 138 (81.2) | 1.30 (0.74 to 2.28) | 0.355 | |||
| 3 | 145 (87.3) | 142 (83.5) | 1.78 (0.98 to 3.23) | 0.057 | |||
| 4 | 138 (84.1) | 144 (84.7) | 1.37 (0.78 to 2.41) | 0.278 | |||
| 5 | 136 (85.0) | 143 (84.6) | 1.46 (0.82 to 2.59) | 0.201 | |||
| No symptoms of changes in behaviour and mood | |||||||
| 1 | 96 (58.2) | 90 (52.9) | Reference | 0.76 (0.49 to 1.19) | 0.231 | 0.779 | |
| 2 | 97 (59.9) | 105 (61.4) | 1.09 (0.69 to 1.70) | 0.723 | |||
| 3 | 102 (62.6) | 113 (66.9) | 1.20 (0.76 to 1.89) | 0.425 | |||
| 4 | 105 (65.2) | 111 (66.1) | 1.35 (0.85 to 2.13) | 0.201 | |||
| 5 | 106 (67.1) | 113 (67.7) | 1.47 (0.92 to 2.34) | 0.104 | |||
Additional symptoms
Additional parent-reported symptoms from the free-text box in the diary were examined. The number of children reporting any other symptoms was balanced over time (Table 16). A list of the symptoms for week 1 is provided in Appendix 4.
| Week | Treatment group, n (%) | |
|---|---|---|
| Placebo (N = 170) | Oral steroid (N = 179) | |
| 1 (administration of medication) | 22 (11.8) | 25 (14.0) |
| 2 (1 week post medication) | 15 (8.8) | 15 (8.4) |
| 3 (2 weeks post medication) | 16 (9.4) | 16 (8.9) |
| 4 (3 weeks post medication) | 15 (8.8) | 17 (9.5) |
| 5 (4 weeks post medication) | 12 (7.1) | 14 (7.8) |
Adverse events
Only one adverse event/serious adverse event was reported during the trial in the placebo group, in which the child had an asthma attack. No between-group comparison was made.
Functional health status: Otitis Media Questionnaire
The OM8-30 assesses the child’s functional health status as the overall score and three facets: infection-related physical health, general developmental impact and reported hearing difficulties. A low (more negative) score indicates a better QoL. Table 17 shows that the total OM8-30 score decreases over time. This decrease in score was also reflected in the three facets, but there were no discernible differences in trends over time by treatment group.
| OM8-30 facet | Treatment group | Effect | Treatment × time effect (p-value) | ||||||
|---|---|---|---|---|---|---|---|---|---|
| Placebo | Oral steroid | Time | Treatmentb | ||||||
| N | Mean (SD) | N | Mean (SD) | Adjustedc mean difference (95% CI) | p-value | Adjustedc mean difference (95% CI) | p-value | ||
| Total OM8-30 score | |||||||||
| Baseline | 187 | 0.47 (1.04) | 190 | 0.60 (1.03) | 0.05 (–0.12 to 0.22) | 0.539 | 0.301 | ||
| 5 weeks | 177 | 0.33 (1.08) | 182 | 0.49 (1.11) | Reference | ||||
| 6 months | 158 | –0.13 (1.13) | 163 | –0.14 (1.19) | –0.44 (–0.62 to –0.27) | < 0.001 | |||
| 12 months | 150 | –0.29 (1.20) | 154 | –0.22 (1.18) | –0.56 (–0.74 to –0.38) | < 0.001 | |||
| Infection-related physical health facet | |||||||||
| Baseline | 187 | –0.31 (1.03) | 190 | –0.17 (0.99) | 0.04 (–0.12 to 0.20) | 0.666 | 0.591 | ||
| 5 weeks | 177 | –0.44 (0.98) | 182 | –0.30 (1.00) | Reference | ||||
| 6 months | 158 | –0.67 (0.90) | 163 | –0.68 (0.95) | –0.25 (–0.42 to –0.09) | 0.003 | |||
| 12 months | 150 | –0.69 (0.90) | 154 | –0.57 (1.04) | –0.25 (–0.41 to –0.08) | 0.004 | |||
| General development impact facet | |||||||||
| Baseline | 187 | 0.52 (1.24) | 190 | 0.48 (1.20) | 0.08 (–0.07 to 0.23) | 0.314 | 0.292 | ||
| 5 weeks | 177 | 0.54 (1.24) | 182 | 0.58 (1.18) | Reference | ||||
| 6 months | 158 | 0.44 (1.19) | 163 | 0.43 (1.18) | –0.04 (–0.20 to 0.12) | 0.630 | |||
| 12 months | 150 | 0.29 (1.19) | 154 | 0.25 (1.16) | –0.18 (–0.34 to –0.02) | 0.024 | |||
| Reported hearing difficulties facet | |||||||||
| Baseline | 187 | 0.74 (0.78) | 190 | 0.87 (0.82) | 0.03 (–0.13 to 0.20) | 0.692 | 0.866 | ||
| 5 weeks | 177 | 0.58 (0.88) | 182 | 0.67 (0.87) | Reference | ||||
| 6 months | 158 | 0.04 (0.88) | 163 | 0.06 (0.99) | –0.54 (–0.72 to –0.37) | < 0.001 | |||
| 12 months | 150 | –0.05 (0.91) | 154 | –0.04 (0.99) | –0.63 (–0.81 to –0.45) | < 0.001 | |||
Health-related quality of life: Paediatric Quality of Life Inventory and Health Utilities Index, version 3
Table 18 displays the summary statistics for baseline and follow-up (5 weeks, 6 months and 12 months) for the total PedsQL scores and by each of the five domains. Higher scores indicate better QoL. For all domains, the QoL was high and increased over time with a negatively skewed distribution, with a high proportion of parents reporting higher QoL for their children. For all PedsQL outcomes, there were no differences between groups nor significant trends over time.
| PedsQL domain | Treatment group | Effect | Treatment × time effect (p-value) | ||||||
|---|---|---|---|---|---|---|---|---|---|
| Placebo | Oral steroid | Time | Treatmentb | ||||||
| N | Median (25th–75th centile) | N | Median (25th–75th centile) | Adjustedc estimate (95% CI) | p-value | Adjustedc estimate (95% CI) | p-value | ||
| Total PedsQL score | |||||||||
| Baseline | 187 | 82.1 (69.0 to 90.5) | 189 | 84.8 (73.8 to 92.7) | –85.11d (–420.65 to 250.44) | 0.619 | 0.475 | ||
| 5 weeks | 176 | 84.8 (73.8 to 92.7) | 182 | 84.5 (72.4 to 91.7) | Reference | ||||
| 6 months | 158 | 84.5 (75.0 to 90.7) | 162 | 82.6 (72.6 to 94.6) | –32.11d (–378.89 to 314.67) | 0.856 | |||
| 12 months | 149 | 85.7 (77.7 to 92.9) | 154 | 86.9 (75.0 to 95.2) | 146.53d (–205.89 to 498.94) | 0.415 | |||
| Physical health | |||||||||
| Baseline | 187 | 90.6 (78.1 to 100.0) | 189 | 90.6 (79.7 to 98.4) | 0.84e (0.51 to 1.37) | 0.480 | 0.554 | ||
| 5 weeks | 176 | 90.6 (81.3 to 100.0) | 182 | 90.6 (80.5 to 100.0) | Reference | ||||
| 6 months | 158 | 93.8 (81.3 to 100.0) | 162 | 93.8 (77.3 to 100.0) | 0.90e (0.54 to 1.49) | 0.675 | |||
| 12 months | 149 | 93.8 (85.0 to 100.0) | 154 | 93.8 (84.4 to 100.0) | 1.39e (0.85 to 2.28) | 0.195 | |||
| Emotional functioning | |||||||||
| Baseline | 187 | 70.0 (60.0 to 85.0) | 189 | 75.0 (55.0 to 85.0) | 2.02f (–1.85 to 5.89) | 0.306 | 0.778 | ||
| 5 weeks | 175 | 75.0 (60.0 to 90.0) | 182 | 75.0 (60.0 to 90.0) | Reference | ||||
| 6 months | 158 | 70.0 (55.0 to 85.0) | 162 | 75.0 (60.0 to 95.0) | 1.17f (–4.46 to 6.79) | 0.684 | |||
| 12 months | 149 | 75.0 (60.0 to 90.0) | 154 | 80.0 (65.0 to 100.0) | 2.05f (–3.67 to 7.77) | 0.482 | |||
| Social functioning | |||||||||
| Baseline | 187 | 90.0 (75 to 100) | 189 | 90.0 (72.5 to 100.0) | 1.20e (0.75 to 1.92) | 0.436 | 0.854 | ||
| 5 weeks | 175 | 90.0 (80.0 to 100.0) | 182 | 90.0 (73.8 to 100.0) | Reference | ||||
| 6 months | 158 | 90.0 (80.0 to 100.0) | 162 | 90.0 (70.0 to 100.0) | 0.81e (0.50 to 1.32) | 0.403 | |||
| 12 months | 148 | 95.0 (80.0 to 100.0) | 154 | 95.0 (78.8 to 100.0) | 1.10e (0.67 to 1.79) | 0.717 | |||
| School functioning | |||||||||
| Baseline | 179 | 75.0 (58.3 to 90.0) | 183 | 70.0 (58.3 to 85.0) | –240.53d (–718.72 to 237.65) | 0.324 | 0.916 | ||
| 5 weeks | 172 | 80.0 (65.0 to 91.7) | 176 | 77.5 (60.0 to 90.0) | Reference | ||||
| 6 months | 154 | 83.3 (66.3 to 95.0) | 156 | 80.0 (66.67 to 90.0) | 184.37d (–308.02 to 676.76) | 0.463 | |||
| 12 months | 143 | 83.3 (66.67 to 91.7) | 147 | 80.0 (60.0 to 95.0) | 217.95d (–286.59 to 722.49) | 0.397 | |||
| Psychosocial | |||||||||
| Baseline | 187 | 78.8 (63.5 to 87.5) | 189 | 78.3 (63.4 to 87.1) | |||||
| 5 weeks | 175 | 81.7 (69.2 to 90.0) | 182 | 81.2 (67.3 to 90.0) | Reference | 0.71e (0.26 to 2.00) | 0.509 | 0.577 | |
| 6 months | 158 | 80.0 (70.0 to 90.0) | 162 | 79.0 (67.5 to 93.3) | 1.57e (0.64 to 3.90) | 0.327 | |||
| 12 months | 149 | 82.7 (71.4 to 91.7) | 154 | 84.0 (69.8 to 93.6) | 1.45e (0.57 to 3.66) | 0.433 | |||
The HUI3 comprises a family of multiattribute preference-based utility measures, in which scores can range from –0.36 to 1.00, whereby higher scores indicate better HRQoL. At all follow-up time points, the HUI3 distribution was negatively skewed, with a high proportion of parents reporting a higher QoL for their children (Figure 8 and Table 19). The decision was taken to recode the score as a binary variable based on the maximum score of 1 (healthy) versus scores of < 1 (Table 20). There was an increase in the proportion over time but no evidence of a difference between treatment groups and no discernible difference between treatment groups over time.
FIGURE 8.
Box plot of HUI3 score by time and treatment group.
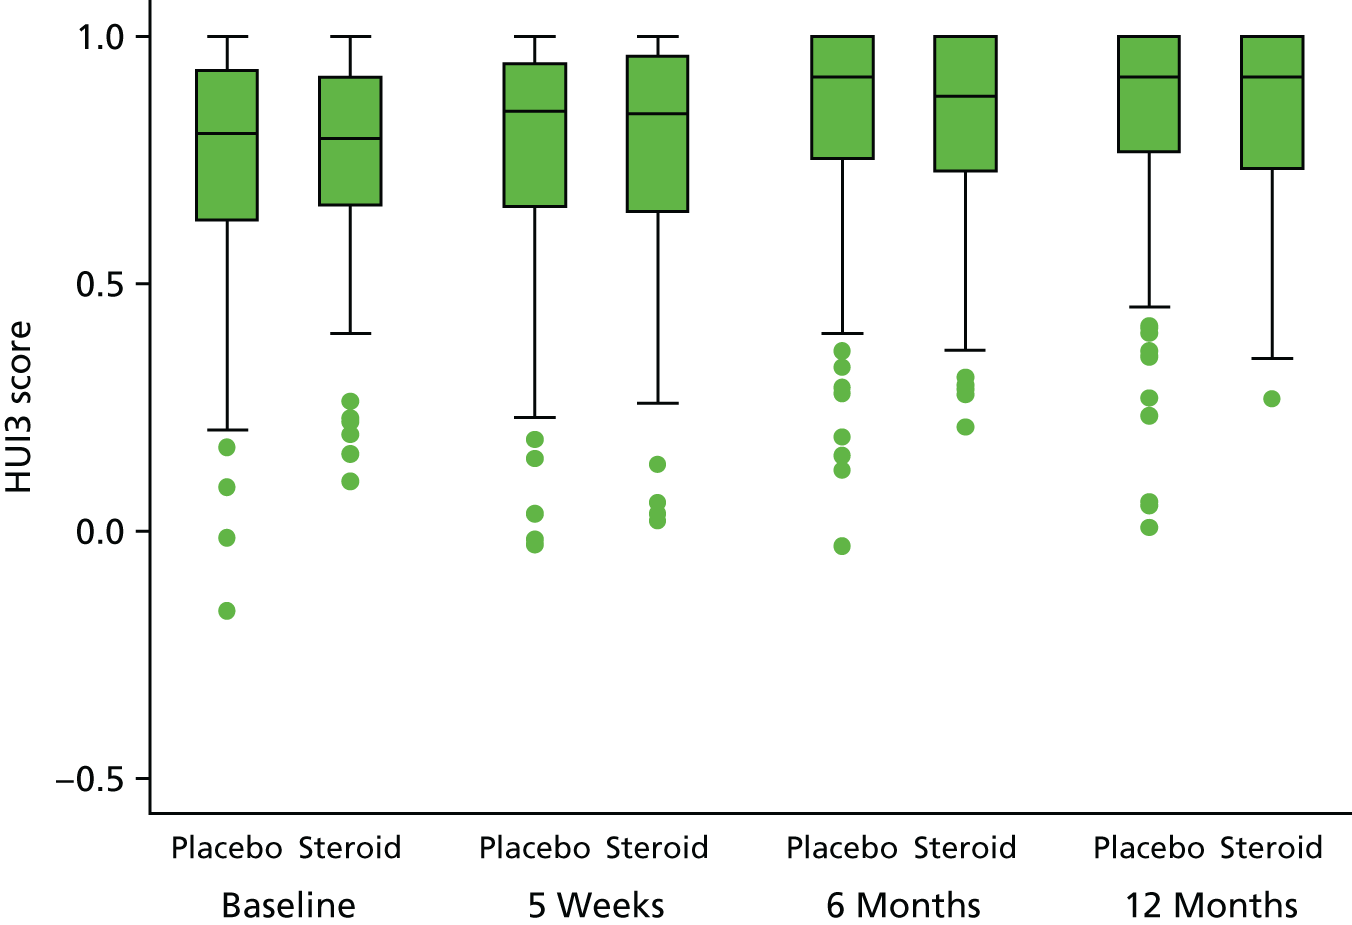
| N | 159 | 164 | 155 | 164 | 152 | 155 | 142 | 150 |
|---|---|---|---|---|---|---|---|---|
| Median (25th–75th centile) | 0.80 (0.63 to 0.93) | 0.79 (0.66 to 0.92) | 0.85 (0.66 to 0.95) | 0.84 (0.64 to 0.97) | 0.92 (0.75 to 1.00) | 0.88 (0.73 to 1.00) | 0.92 (0.77 to 1.00) | 0.92 (0.73 to 1.00) |
| Time point | Treatment group, n (%) | Effect | Treatment × time effect (p-value) | ||||
|---|---|---|---|---|---|---|---|
| Placebo | Oral steroid | Time | Treatmentb | ||||
| Adjustedc OR (95% CI) | p-value | Adjustedc OR (95% CI) | p-value | ||||
| N (%) perfect health score = 1 | |||||||
| Baseline | 22 (13.8) | 22 (13.4) | 1.23 (0.66 to 2.27) | 0.511 | 0.790 | ||
| 5 weeks | 33 (21.3) | 37 (22.6) | Reference | ||||
| 6 months | 49 (32.2) | 52 (33.5) | 2.36 (1.31 to 4.26) | 0.004 | |||
| 12 months | 44 (31.0) | 51 (34.0) | 1.99 (1.09 to 3.65) | 0.025 | |||
Chapter 4 Economic evaluation
This chapter describes the objectives, methods, results and conclusions of the embedded health economic evaluation.
Objectives
The objectives of the economic evaluation were to:
-
estimate the costs associated with a 7-day course of oral steroids at 12 months
-
assess the cost-effectiveness of a 7-day course of oral steroids to improve hearing over the short term (5 weeks) in children with bilateral OME
-
assess the cost-effectiveness of a 7-day course of oral steroids to improve hearing over 12 months
-
explore the longer-term cost-effectiveness of oral steroid treatment.
The objectives were designed to estimate the likely economic impact of treating OME in the target population. The maximum clinical effect for oral steroid use was expected to occur within 4–6 weeks. This could result in short-term relief of symptoms and subsequent reduction in costs as a result of reduced health care resource use. Over the longer term, these could translate into reduced morbidity as a result of OME and a positive impact on HRQoL, and could allow children to possibly avoid further treatment (e.g. surgical intervention). The protocol set out an original time horizon of 12 months, with the plan to undertake a model-based analysis to estimate potential longer-term cost-effectiveness beyond the trial period. In light of the clinical results presented in the preceding chapter, the revision to this objective is explained, with the modelling plans summarised in Appendix 1.
Methods
Resource usage
Health and personal social care resource usage was collected for participants at the end of week 5 and at 6 and 12 months following randomisation. Parents were asked to report health-care resource use relating to ear problems and relating to any other illnesses (not specified) as separate categories. Health-care resource use categories included general practitioner (GP) and practice nurse consultations, other community services (e.g. health visitor, community audiologist) and prescriptions, alongside any other NHS services, such as NHS direct. Hospital admissions, outpatient consultations and accident and emergency (A&E) attendances were also captured, as well as other resource components associated with the management of OME and hearing loss (e.g. surgical interventions). Parents had the option to tick a range of boxes (0, 1 or 2 and 3+) and a box to input the exact number if known. When individuals ticked a range box without an exact figure, an average (rounded up to the next whole number) was calculated using the reported resource value from the appropriate range group. All zero (0) options were recorded as above to indicate no resource use; for the other options, an average number was recorded. When no information was available against a resource item, the assumption was made that no resource use had been incurred and it was recorded as zero (0). Baseline resource use was not collected.
For medications, parents were asked to provide the name, dosage, duration of treatment and whether or not this was prescribed. For non-prescribed medications, parents were asked to provide a cost of the medication. When information was missing (e.g. a medication had been listed but dosage and/or duration was not recorded), a cost was estimated based on recommended prescribing indications. 37 When a general medication name (e.g. paracetamol) or abbreviated names were given, the lowest-priced generic medication was used.
Parents were asked to record any over-the-counter (OTC) medications used to treat ear-related problems (e.g. analgesia). Travel expenses associated with health-care consultations and the costs of additional child care and time off work were also recorded. Parents were prompted to provide an approximate cost in pounds sterling.
The economic analysis was conducted from the perspective of the UK NHS and Personal Social Services, and also considered a limited societal perspective, encompassing the impact on patients and their families. The economic analysis set out to include a within-trial analysis and comprised a series of cost-effectiveness analyses (based on the primary trial outcome and secondary outcome; PedsQL) and cost–utility analyses (based on the HUI3 for the primary analysis and mapping of the OM8-30 to the HUI3 for the secondary analysis). If feasible, a longer-term time horizon was proposed, based on decision-analytic modelling and populated from parameter estimates derived from the trial and from information from literature sources relating to the long-term effects of hearing difficulties in children. A health economics plan was included within the SAP. Data analysis was conducted in Stata (version 13.1). For the within-trial analysis, no discounting was done, as the trial duration was 12 months. A summary of the terms used within the economic analysis is presented below.
Terms of interest
-
Base case:38 the main analysis, with no deviations to assumptions.
-
Primary analysis: the HUI3 analysis from which the sensitivity analysis was undertaken.
-
Secondary analysis: the analysis using PedsQL for the cost-effectiveness analysis (CEA) and mapping the HUI3 from the OM8-30.
-
Preliminary analysis: early analysis that informs approach, but in which outcomes are not reported.
-
Available data: uses all data regardless of missing components.
-
Complete case: limits inclusion into the analysis to those individuals who reported figures for all components.
-
Multiple imputation:39 the missing data technique that estimates additional sets of data based on selected predictive variables.
Costs
Resource use and associated costs were calculated across the following broad categories:
-
the acquisition costs of oral steroids (intervention cost)
-
health and personal social care resource use at 5 weeks, 6 months and 12 months following randomisation
-
other resource use incurred by the family related to direct costs (e.g. OTC medications) and indirect costs (time off work and other duties to care for the child as a result of ear problems) at 5 weeks, 6 months and 12 months following randomisation.
The resource use and associated costs were first examined in disaggregated categories (e.g. medications, community/primary care contacts) based on all available cases.
Intervention costs
Drug acquisition costs were based on the unit cost of a prescription of a 7-day course of oral soluble prednisolone (5 mg), based on the age-specific trial dosage, and weighted for the number of children in each of the age groups (2–5 years and 6–8 years). As the oral steroid was prescribed during a scheduled outpatient appointment, this appointment was not included.
Individual patient-level resource use and associated costs
For NHS resource use, national average unit costs were applied from published sources, including the unit costs of health and social care,40 NHS reference costs41 and the British National Formulary. 37 A summary of the unit costs is provided in Appendix 5. As GP visits were recorded separately, to avoid potential double-counting, we took a bottom-up costing approach to calculated prescription costs in primary care, using the cost of the medication prescribed and the pharmacist’s time to dispense the medication. Based on an estimated assumption agreed with the trial team that each prescription item would take approximately 5 minutes, we used the Personal Social Services Research Unit (PSSRU) hourly rate for a pharmacist to calculate an average dispensing cost.
All costs were recorded in 2015–16 prices in pounds sterling. When a relevant unit cost could not be obtained, other published sources were consulted (e.g. previous unit cost manuals, papers or NICE costing information obtained from previous economic analyses to inform national guidelines on OME were used, with adjustment for inflation). 42,43
When parents had indicated OTC medication use but had not provided a cost, the mean cost was calculated based on an average price listed by a national pharmacy [Boots (Boots UK Ltd, Nottingham, UK) online (URL: www.boots.com; accessed 31 May 2017)] and three national supermarkets [Asda (Asda Stores Ltd, Leeds, UK; URL: www.asda.com; accessed 31 May 2017), Sainsbury’s (J Sainsbury plc, London, UK; URL: www.sainsburys.co.uk; accessed 31 May 2017) and Tesco (Tesco plc, Welwyn Garden City; URL: www.tesco.com; accessed 31 May 2017)], when available. When time taken off work was indicated, but no pay loss was given, a national median daily wage of £70.07 was used (methodology taken from Manning et al. 44); when pay loss was specified, this figure was used irrespective of the reported number of days taken off work. Missed school days were described but not costed separately to the costing of days off work and additional child-care costs. When distance travelled was indicated, the cost was calculated using the HM Revenue and Customs (HMRC) rate of £0.45 per mile. 45 All sources of unit costs used to inform the calculation of family costs are reproduced in Appendix 5.
Outcomes used in the economic analysis
Trial outcomes use
The primary trial outcome measure (acceptable hearing achieved at 5 weeks, as defined within the OSTRICH trial protocol) was used to calculate the cost-effectiveness of the intervention. To examine the longer-term cost-effectiveness, an additional analysis of the incremental cost of achieving a successful hearing resolution was also conducted at 12 months.
Health outcome measures
Health Utilities Index, version 3
The parent-completed data from the HUI330,46 collected at baseline, 5 weeks and 6 and 12 months were used as the primary source of preference-based utility weights to generate quality-adjusted life-years (QALYs) for the primary cost–utility analysis (CUA). The HUI3 is a well-established preference-based measure of HRQoL in childhood health conditions, covering eight dimensions (vision, hearing, speech, ambulation, dexterity, emotion, cognition and pain). Standard procedures recommended by the HUI3 developers were used to construct a multiattribute utility score.
Otitis Media Questionnaire
Previous researchers have mapped OM8-30 scores to utility values on the HUI3 scale and have found reasonably small mean absolute errors. 47 As this trial measured both OM8-30 scores and HUI3 scores, it provided the opportunity to evaluate the generalisability of the existing mapping. This was done by correlating the mapped utility values on the HUI3 scale (obtained via the mapping formula from the OM8-30 facet scores) with the newly acquired HUI3 scores (all measures obtained by parent proxy).
Mappings are applicable in future studies of all types that may not have the resources of a centrally funded trial to acquire generic measures, and to also bring past studies into systematic review on a universal metric. It was anticipated that this work would contribute to the development and validation of a short form of the OM8-30 (the Q-14), which is likely to become a widespread standard in ENT and paediatrics.
Paediatric Quality of Life Inventory
As the PedsQL was collected as one of the secondary outcome measures, the original protocol set out to compute utilities from the PedsQL. 31 Although the PedsQL is a well-established measure of HRQoL, at present it cannot be used to calculate QALYs, as it is not a preference-based measure. To overcome this challenge, several studies have produced mapping algorithms to estimate health utilities such as the EuroQol-5 Dimensions, youth (EQ-5D-Y)48 questionnaire and Child Health Utility 9D. 49 The analysis was planned to be based on the mapping algorithm described by Khan et al. 48 However, this would depend on the feasibility of using a subset of OSTRICH trial participants who were eligible to be mapped against the age range of the EQ-5D-Y population (minimum age of 8 years). Given the small number of children in the trial population in this age group, the PedsQL data were not mapped, but were used directly to provide a secondary CEA based on the incremental cost per point difference in the PedsQL score at 12 months, in order to capture parent-reported HRQoL changes in their child.
Analysis of costs
The costs for each participant were calculated by multiplying their use of each resource item by the relevant unit cost. As no baseline costs were collected, the impact of baseline imbalance could not be considered (i.e. costs were assumed to be the same for each group at baseline). The costs were summated for each assessment point and then compiled to provide an aggregated cost per group across the trial duration. A total mean cost per participant was computed for each group, with differences assessed using a linear regression model approach to identify whether or not the intervention was a significant predictor of cost. The mean difference in cost is reported by the coefficient estimate of the binary treatment group covariate, with 95% CIs reported.
Analysis of the health economic outcomes
The output from the analysis of the primary outcome measure was used within the CEA. To maintain consistency with the statistical analysis, non-imputed data were used for the base case, with multiple imputed data used within the sensitivity analysis. Given the impact of missing data during follow-up, MI was used for the base case of all subsequent secondary cost-effectiveness analyses and CUAs. The secondary analysis using the PedsQL data was again adjusted for the same covariates used in the clinical effectiveness analysis, with the base case based on multiple imputed data. For the CUA, QALYs were derived from the utility values reported from the HUI3. As the preliminary analysis highlighted small differences in baseline utility, utility scores were also adjusted by baseline utility and used within the base-case CUA.
Utilities from the HUI3 were calculated for each participant at each assessment point. Utilities were then converted into QALYs for each participant using the area under the curve (AUC) method, which assumes linear interpolation between each time point. The differences in QALYs from baseline to 12 months were summarised as the total mean QALY gain between the placebo group and the oral steroid group and the 95% CIs were reported, with linear regression used to test for the differences between groups. A similar approach was used to derive QALYs from the mapped utilities derived from the OM8-30 to the HUI3.
Missing data
Considerable effort was devoted to minimising missing data. Research nurses were trained in data collection and the questionnaires filled out by them were designed to minimise the amount of missing information.
The general problems associated with missing data are particularly relevant to health economic analysis, especially in a within-trial analysis in which costs and QALYs are based on cumulative measures collected over the trial duration. Missing items relating to health-care service usage may undervalue the total cost, whereas missing outcome data may bias effects, as those individuals without information may be systematically different from those for whom all information is observed.
The use of a complete-case analysis provides a useful first exploratory stage of an economic evaluation. However, according to recommended good practice,37,40 it is not sufficient for a robust base-case analysis in which missing data are identified. The health economic analysis plan took this into consideration and proposed MI as an additional approach to support the complete-case analysis. 50 Measures that include multiple components over time are particularly susceptible to missing data issues; for these outcomes, MI analysis will be the central approach.
The decision (and appropriate method) for missing data imputation was informed by conducting a descriptive analysis of resource use and outcome data by group at each assessment point. The pattern of missing data was examined to ascertain whether or not the missing data could be considered to be missing at random in order to employ suitable MI methods. The complete-case analysis and available analysis were conducted as additional sensitivity analyses to explore the impact of different imputation methods on the base-case findings.
The ‘MI’ command in Stata was used to impute missing data from the total costs and from the HUI3 data measures at baseline, 5 weeks, 6 months and 12 months. Age, gender and site, as explained in Chapter 2, were included as covariates in the imputation models for the CUAs. Costs and utilities were imputed using predictive mean matching, as this allows sampling within the observed values and is less dependent on the assumptions of normality. Fifteen data sets were created, based on the number of missing data. These imputed data sets were used to produce a summary statistic (i.e. mean cost and utility).
To ensure consistency across the statistical and economic analysis, a complete-case analysis was used to inform the base-case analysis for both the primary CEA and the secondary CEA of hearing resolution. The CUA, which includes the HUI3 and PedsQL, utilises the MI approach in the base-case analysis.
Incremental cost-effectiveness analysis
Two main incremental analyses were undertaken. The first comprised a CEA to calculate the incremental cost of achieving an acceptable level of hearing in one or both ears at 5 weeks, with an additional analysis undertaken to assess cost-effectiveness at 12 months. A secondary CEA investigated the incremental cost per improvement in the PedsQL score. The second incremental analysis was a CUA to assess the incremental cost per QALY, using the HUI3 to derive utilities gained as a result of oral steroid treatment at 12 months, with a secondary CUA conducted to assess the incremental QALY gained as a result of oral steroid treatment at 12 months based on utilities derived from mapping the OM8-30 to the HUI3.
The results of the comparative analyses of incremental costs and effects were expressed as incremental cost-effectiveness ratios (ICERs).
An ICER is calculated as:
C1 and E1 represent the costs and effects of the intervention group and C0 and E0 represent the costs and effects of the usual care group, with ΔC and ΔE being the incremental costs and effects of the intervention compared with usual care.
This results in four potential scenarios, which can be illustrated by the cost-effectiveness plane (Figure 9).
FIGURE 9.
Illustration of the cost-effectiveness plane.
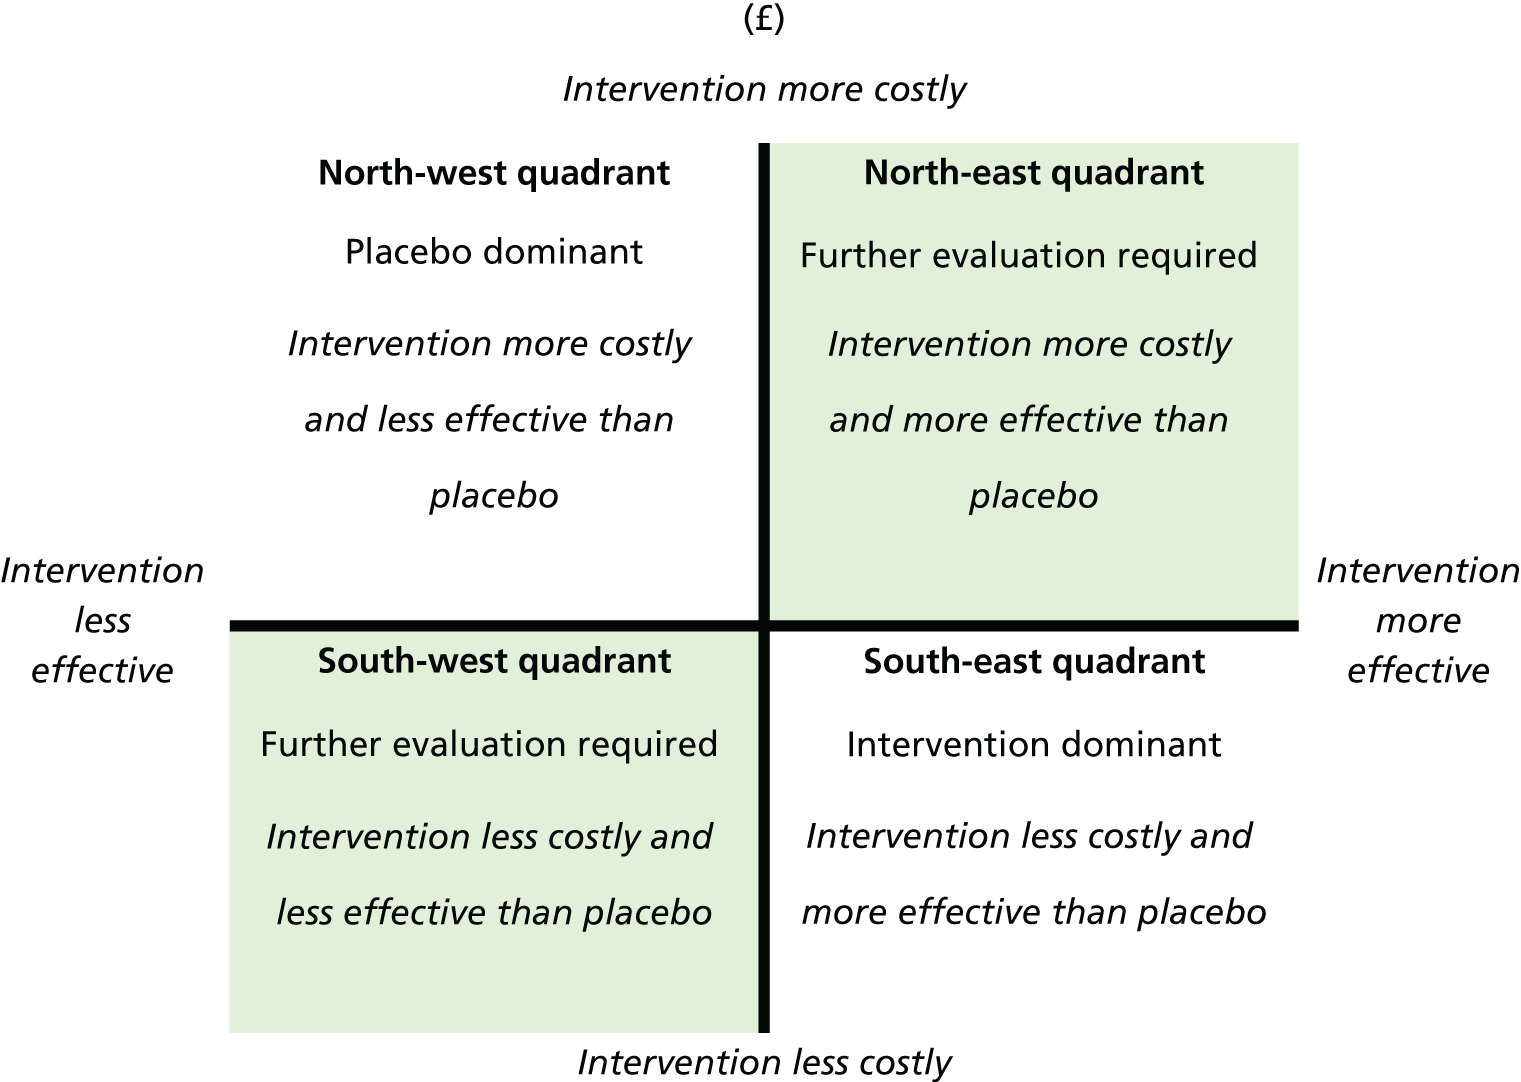
If the intervention is less costly (negative incremental costs) and produces more effect (i.e. positive incremental QALY gain), then the intervention is considered to be dominant to placebo and thus cost-effective (the results would be located in the south-east quadrant). Conversely, if the intervention is more costly (positive incremental cost) and produces less effect (negative incremental QALY gain), the intervention can be considered to be dominated by the placebo and is thus not cost-effective (results would be located in the north-west quadrant). In these scenarios, no ICER is reported.
In the third possible scenario, the intervention is more expensive (positive incremental cost) but produces more effect (positive incremental QALY gain, result located in the north-east quadrant). In the fourth scenario, the intervention would be less costly but would produce less effect (negative incremental QALY gain, result located in the south-west quadrant). In these last scenarios, the ICER is computed to assess whether or not the net incremental health gain (or loss) is worth the incremental cost (or cost-saving). For the CUA, NICE guidelines regarding the societal willingness-to-pay (WTP) threshold were used. 51 Generally, an ICER below £20,000 per QALY is considered to be cost-effective.
For the ICER produced by the CEA, descriptions of the probability (%) of being within notional WTP thresholds of £1000, £2500 and £5000 per acceptable hearing resolution achieved were used.
Health economic sensitivity analyses
Deterministic sensitivity analyses were undertaken on the CEA and CUA to assess the extent to which changes made to different parameter values and assumptions affect the results. The one-way sensitivity analyses undertaken are summarised below:
-
CEA (cost per hearing resolution at 5 weeks and cost per improvement in PedsQL score at 12 months):
-
available and MI (for cost per hearing resolution at 5 weeks) or complete cases (cost per improvement in PedsQL score) in the analysis of costs and outcomes
-
adjustment of costs and outcomes by upper- and lower-bound values (based on 95% CIs) for net costs and benefits.
-
-
CUA (cost per QALY gain at 12 months):
-
use of available and complete cases in the analysis of costs and outcomes
-
adjustments of costs and outcomes (base-case results) by upper- and lower-bound values (based on 95% CIs) for net costs and benefits
-
utilities derived from mapping the OM8-30 to the HUI3.
-
A probabilistic sensitivity analysis was undertaken to investigate the combined effect of uncertainties associated with the differences between costs and outcomes on the results of the economic evaluation for the primary CEA (at both 5 weeks and 12 months) and the CUA (cost per QALY gain at 12 months using the HUI3 utilities). Bootstrapping simulations, based on 5000 resamples, were used to characterise the joint distribution of costs and outcomes, illustrated using cost-effectiveness planes for the primary CEA and CUA. Cost-effectiveness acceptability curves (CEACs) were produced to express the probability that the intervention is cost-effective at different WTP thresholds, as explained above.
Results
Costs
The cost of a 7-day course of oral soluble prednisolone, weighted for the different prescription dosage based on age, was estimated to be £59 (this figure rises to £62 when taking into account the prescription dispensing cost).
The frequency and cost of health-care service use at 5 weeks and then over 12 months for the placebo and oral steroid groups are reported in Tables 21 and 22. Overall, no significant differences in resource use or costs were found for any of the categories of health service usage between the placebo and oral steroid groups. The inclusion of resource use and costs to the family did not change these results.
| Component | Unit costs (£) |
|---|---|
| Soluble prednisolone tablets | |
| Ages 2–5 years, 20 mg daily | 50.76 |
| Ages 6–8 years, 30 mg daily | 76.14 |
| GP | |
| Normal hours | 46.00 |
| Out of hours | 68.65 |
| Home visit | 75.40 |
| Telephone call | 11.25 |
| Medication | |
| Prescription dispensing cost | 3.50 |
| Nurse | |
| Practice nurse | 22.50 |
| Community nurse | 39.00 |
| A&E | 136.00 |
| Outpatient hospital clinic | 146.01 |
| Inpatient hospital stay | 2385.27 |
| NHS speech and language therapy | |
| Community based | 89.00 |
| Hospital clinic | 67.00 |
| NHS Direct | 7.90 |
| Interventions | |
| Ventilation tubes | 944.00 |
| Tonsillectomy | 1326.00 |
| Adenoidectomy | 1238.00 |
| Auto-inflation device | 5.88 |
| Hearing aid | 132.20 |
| Social costs | |
| Mileage costs (per mile) | 0.45 |
| Missed work cost | 70.07 |
| Time point | Treatment group, cost (£) | Difference in costa (£) (95% CI) | p-value | |
|---|---|---|---|---|
| Placebo | Oral steroid | |||
| 5 weeks (health-care costs) | ||||
| Complete cases | 36 | 78 | 49 (6 to 71) | 0.020 |
| Multiple imputed | 35 | 80 | 42 (11 to 74) | 0.009 |
| 12 months (health-care costs) | ||||
| Complete cases | 775 | 935 | 177 (–132 to 487) | 0.261 |
| Multiple imputed | 794 | 934 | 145 (–136 to 426) | 0.309 |
| 5 weeks (societal costs) | ||||
| Complete cases | 46 | 84 | 35 (1 to 69) | 0.043 |
| Multiple imputed | 44 | 86 | 40 (9 to 71) | 0.012 |
| 12 months (societal costs) | ||||
| Complete cases | 851 | 998 | 160 (–181 to 500) | 0.356 |
| Multiple imputed | 867 | 987 | 114 (–178 to 406) | 0.442 |
Table 22 provides a summary of the total NHS costs for the placebo and oral steroid groups at 5 weeks and 12 months, using non-imputed data, complete case for the base case and MI presented for use in the sensitivity analysis. At 5 weeks, the oral steroid group was found to have a significantly higher health-care cost than the placebo group for the base case, with a similar picture seen when MI data were considered. At 12 months, the costs were higher in the steroid group than in the placebo group across both imputation approaches, but these did not reach statistical significance. Similar results (i.e. the oral steroid group incurred higher costs than the placebo group, which were statistically significant at 5 weeks but not at 12 months) were obtained when costs to the family were included (see Table 22). When differences in mean costs per patient were compared, costs in the oral steroids group were consistently more expensive than in the placebo group.
Outcomes
Hearing resolution at 5 weeks and 12 months
The values for the clinical outcome used in the base case were the 7.1% difference in acceptable hearing loss between the oral steroid and placebo groups at 5 weeks and the 5.8% difference at 12 months.
Paediatric Quality of Life Inventory
The mean score in PedsQL between the placebo and oral steroid groups over 12 months is shown in Table 23, based on the MI data. At 12 months, the mean difference in improved PedsQL between the oral steroid and placebo groups (when baseline is controlled for) showed a small, non-statistically significant gain in favour of oral steroids. The results based on a complete-case analysis for the PedsQL score are summarised in Appendix 6.
| Time point | Treatment group, mean PedsQL score | Mean differencea (95% CI) | p-value | |
|---|---|---|---|---|
| Placebo | Oral steroid | |||
| Baseline | 79.2 | 78.8 | –0.20 (–3.25 to 2.86) | 0.899 |
| Week 5 | 80.3 | 79.9 | –0.20 (–3.68 to 3.28) | 0.909 |
| 6 months | 79.8 | 79.8 | 0.67 (–3.02 to 4.36) | 0.722 |
| 12 months | 82.2 | 83.1 | 1.18 (–2.27 to 4.62) | 0.502 |
| PedsQL score over 12 months | 80.5 | 80.6 | 0.66 (–1.37 to 2.69) | 0.522 |
Quality-adjusted life-years
Table 24 reports the HUI3 utilities and QALY gains by group over 12 months, based on the MI approach, with baseline adjustment used for the base case. The HUI3 reports better health as higher values. Were the oral steroid group participants to experience increased QoL following the intervention, the net benefit would be a positive QALY figure, and vice versa. Overall, there were small numerical differences in QALY gain in favour of placebo compared with oral steroids for both unadjusted and adjusted outcomes. In all instances, the difference in utilities at each assessment point and subsequent QALY gains at 12 months between the placebo and oral steroid groups are not statistically significant. The results based on different data approaches are presented in Appendix 7.
| Utilities and QALYs | Treatment group | Mean difference (95% CI) | p-value | |
|---|---|---|---|---|
| Placebo | Oral steroid | |||
| HUI3 utilities | ||||
| Baseline | 0.743 | 0.760 | 0.013 (–0.033 to 0.060) | 0.568 |
| Week 5 | 0.771 | 0.763 | –0.006 (0.053 to 0.041) | 0.792 |
| 6 months | 0.833 | 0.822 | –0.010 (–0.053 to 0.033) | 0.640 |
| 12 months | 0.835 | 0.851 | 0.016 (–0.026 to 0.057) | 0.453 |
| QALYs | ||||
| Unadjusted QALYs | 0.814 | 0.811 | –0.008 (–0.036 to 0.021) | 0.592 |
| Baseline-adjusted QALYa | 0.070 | 0.051 | –0.015 (–0.054 to 0.023) | 0.448 |
Quality-adjusted life-years generated from mapping the Otitis Media Questionnaire to the Health Utilities Index, version 3
Table 25 presents the mapped OM8-30 to the HUI3 figures across each of the collection time points and the resulting unadjusted and adjusted AUC results. The HUI3 averages report that the cohort, both the placebo group and the intervention group, was of broadly good health. The high HUI3 figures represent a ceiling effect, which diminishes the scope for improvements. The baseline figure reported for the oral steroid group is lower than that for the placebo group. Both groups showed improvement over time; the unadjusted QALY scores suggested that the placebo group had better health at the 12-month mark. Accounting for the disparity at baseline offered an insignificant incremental improvement in QALYs for the oral steroid group (0.004).
| Utilities and QALYs | Treatment group | Mean difference (95% CI) | p-value | |
|---|---|---|---|---|
| Placebo | Oral steroid | |||
| HUI3-mapped utilities | ||||
| Baseline | 0.964 | 0.956 | –0.008 (–0.016 to –0.001) | 0.034 |
| Week 5 | 0.969 | 0.965 | –0.005 (–0.013 to 0.004) | 0.279 |
| 6 months | 0.994 | 0.991 | –0.003 (–0.012 to 0.006) | 0.553 |
| 12 months | 0.994 | 0.990 | –0.005 (–0.014 to 0.004) | 0.286 |
| QALYs | ||||
| Unadjusted QALYs | 0.986 | 0.983 | –0.004 (–0.011 to 0.003) | 0.258 |
| Adjusted QALYa | 0.023 | 0.026 | 0.004 (–0.002 to 0.011) | 0.199 |
The impact of using a complete-case analysis is summarised in Appendix 8.
Incremental cost-effectiveness analysis
Table 26 presents the incremental CEA at 5 weeks. The base-case analysis showed an incremental cost of £546 to achieve an additional hearing resolution. This additional hearing resolution finding is the result of statistically significant differences in costs and statistically and clinically insignificant differences in hearing resolution in oral steroids compared with the placebo outcome and, as such, the ICER should be interpreted within this context. In the sensitivity analysis, oral steroids were dominated by placebo (i.e. oral steroids had a higher cost and lower net benefit) in two of the four scenarios (when costs or outcomes were at the lower-bound 95% CI); this suggests that the findings were not robust to changes in these parameters.
| Parameter | Incremental | ICER [cost (£) per additional resolution] | |
|---|---|---|---|
| Cost (£) | Effect | ||
| Base case | 39 | 7.1% | £546 per additional hearing resolution |
| Upper 95% bounda of net cost and upper 95% bounda of % successful hearing resolution | 71 | 16.4% | £432 per additional hearing resolution |
| Upper 95% bounda of net cost and lower 95% bounda of % successful hearing resolution | 71 | –0.0% | Oral steroid dominated by placebo |
| Lower 95% bounda of net cost and upper 95% bounda of % successful hearing resolution | 6 | 16.4% | £37 per additional hearing resolution |
| Lower 95% bounda of net cost and upper 95% bounda of % successful hearing resolution | 6 | –0.0% | Oral steroid dominated by placebo |
The results on the bootstrapped replications are presented in the cost-effectiveness plane (Figure 10). Although point estimates are displayed in all four quadrants of the cost-effectiveness plane, the greatest density of the point estimates reflects the scenarios in which oral steroids could be considered to be cost-effective (i.e. the north-east quadrant) on the cost-effectiveness plane or oral steroid is dominated by placebo (i.e. higher costs and less effect, as represented by the north-west quadrant).
FIGURE 10.
Cost-effectiveness plane of incremental costs per acceptable hearing resolution at 5 weeks.
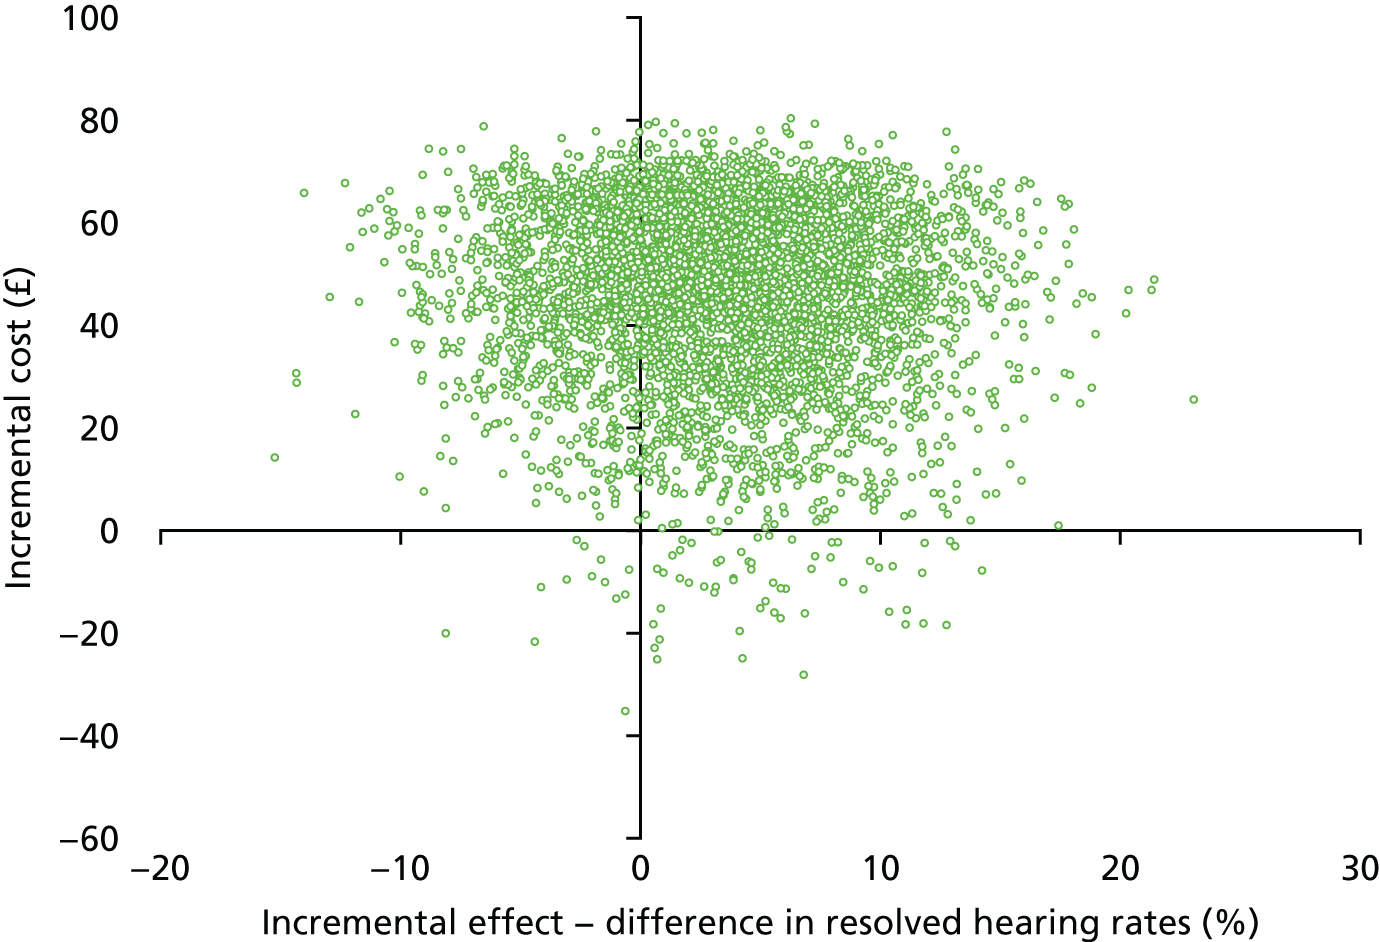
The CEAC is presented in Figure 11. This showed that, at a WTP threshold of £1000, £2500 and £5000 per acceptable hearing resolution achieved, the probability of oral steroids being a cost-effective option at 5 weeks was 41%, 60% and 65%, respectively.
FIGURE 11.
Cost-effectiveness acceptability curve of incremental cost per acceptable hearing resolution achieved at 5 weeks.
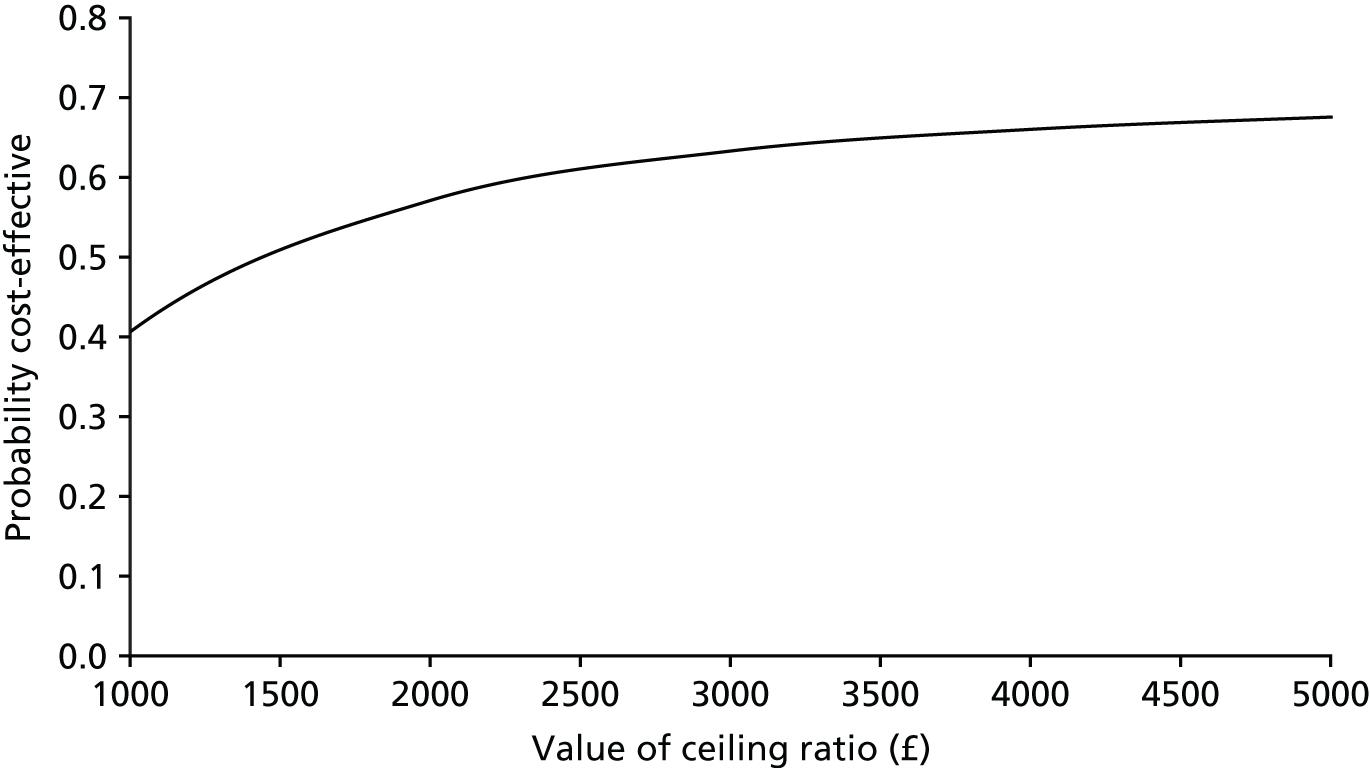
Table 27 shows the results at 12 months. The base-case analysis indicates that the incremental cost of every additional hearing resolution was £3052 after 12 months. When costs and outcomes are varied, uncertainty again arises in the results, as a result of the statistically non-significant differences in costs and treatment benefit with wide CIs.
| Parameter | Incremental | ICER [cost (£) per additional hearing resolution] | |
|---|---|---|---|
| Cost (£) | Effect | ||
| Base case | 177 | 5.8% | £3052 per additional hearing resolution |
| Upper 95% bounda of net cost and upper 95% bounda of % successful hearing resolution | 487 | 17.2% | £2831 per additional hearing resolution |
| Upper 95% bounda of net cost and lower 95% bounda of % successful hearing resolution | 487 | –5.5% | Oral steroid dominated by placebo |
| Lower 95% bounda of net cost and upper 95% bounda of % successful hearing resolution | –132 | 17.2% | Oral steroid dominates placebo |
| Lower 95% bounda of net cost and lower 95% bounda of % successful hearing resolution | –132 | –5.5% | £2400 saved per reduction in adequate hearing |
Figures 12 and 13 present the cost-effectiveness plane and the CEAC to illustrate the incremental cost of achieving an acceptable hearing resolution at 12 months. Similar to the 5-week results, the results are spread across all four quadrants. There is a 12%, 46% and 70% probability of oral steroids being a cost-effective option at WTP thresholds of £1000, £2500 and £5000, respectively.
FIGURE 12.
Cost-effectiveness plane of incremental cost per acceptable hearing resolution at 12 months.
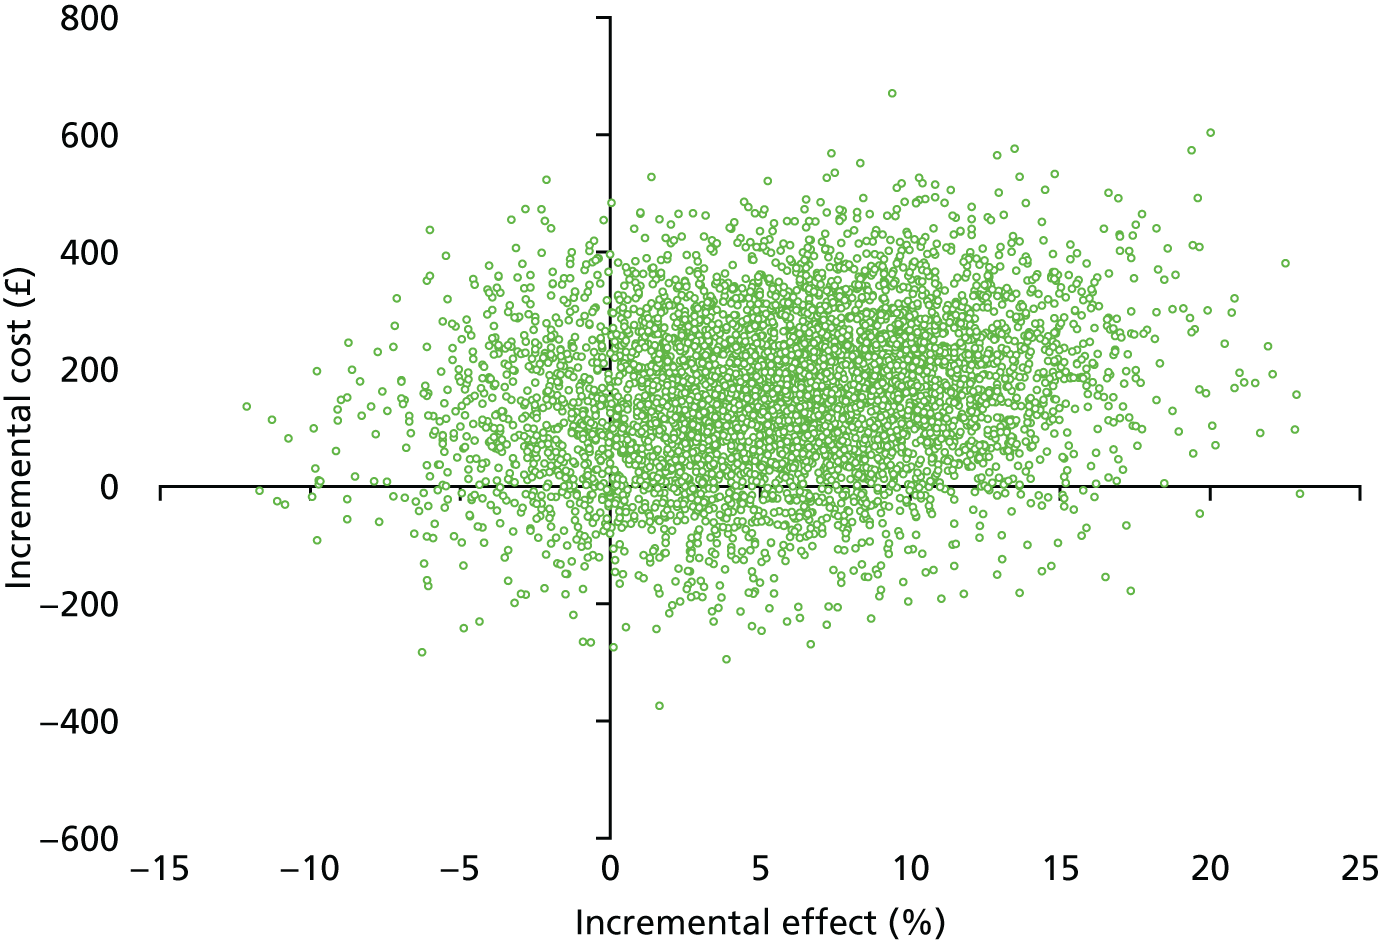
FIGURE 13.
Cost-effectiveness acceptability curve of incremental cost per acceptable hearing resolution achieved at 12 months.
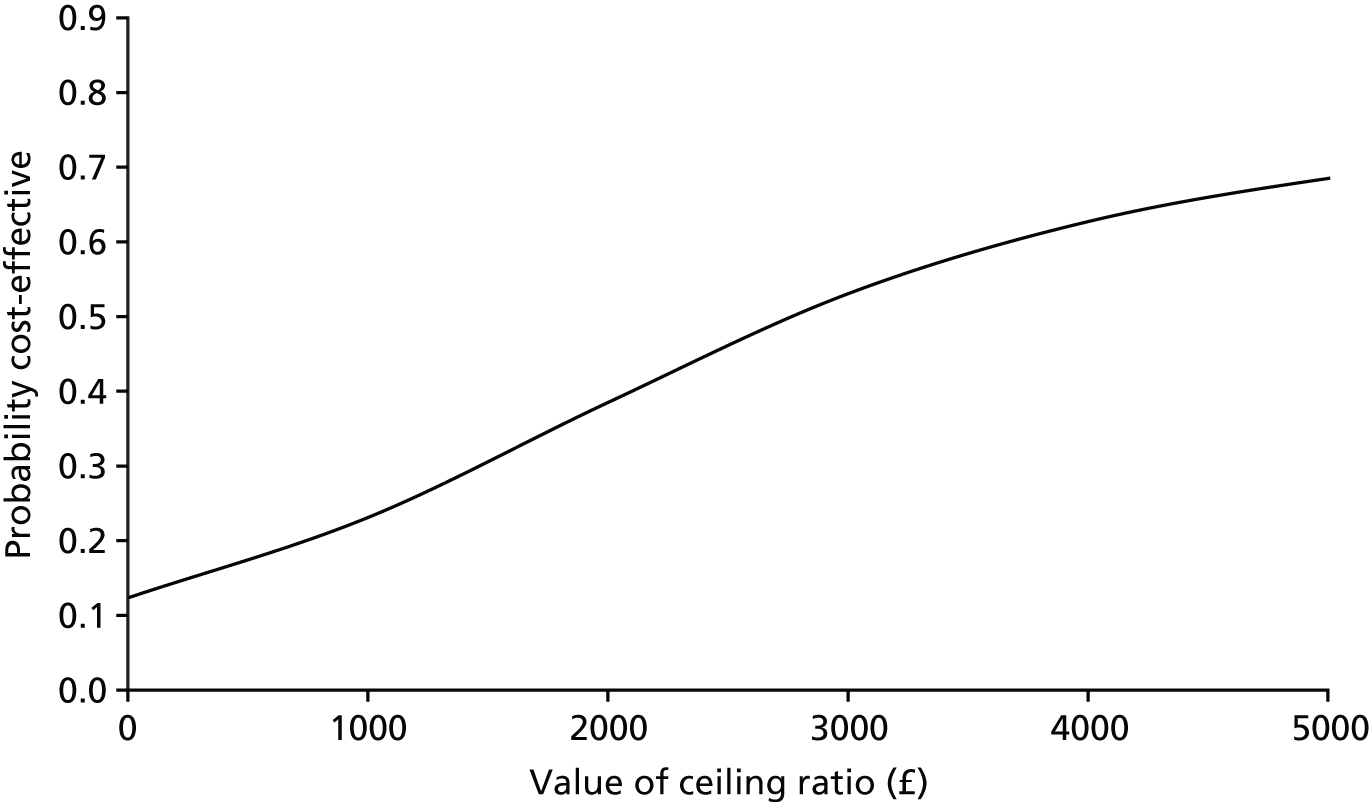
When the analysis was extended to reflect a limited societal perspective, the results remained consistent with the analysis based on a NHS perspective (see Appendix 9).
Cost–utility analysis
Table 28 presents the findings from the primary CUA. The base-case analysis shows that oral steroid treatment was dominated by placebo, with oral steroids costing an additional £145, with a net loss of 0.015 QALYs per child treated. As shown earlier in Tables 22 and 24, neither the differences in costs nor QALYs were statistically significant, with only small, numerical differences in both measures. The uncertainty surrounding these findings is emphasised by the results of the sensitivity analyses undertaken. The complete-case analysis suggests that oral steroid treatment yields an ICER of £22,882. Varying the parameters for both costs and outcomes further highlights the variability in the results.
| Parameter | Incremental | ICER | |
|---|---|---|---|
| Cost (£) | Effect | ||
| Base case (values using multiple imputed costs and QALYs) | 145 | –0.015 | Oral steroid treatment dominated by placebo |
| Complete cases | 389 | 0.017 | £22,882 |
| Upper 95% bound of net costa and upper 95% bound of QALY gaina | 426 | 0.024 | £17,750 |
| Upper 95% bound of net costa and lower 95% bound of QALY gaina | 426 | –0.054 | Oral steroid treatment dominated by placebo |
| Lower 95% bound of net costa and upper 95% bound QALY gaina | –136 | 0.024 | Oral steroid treatment dominates placebo |
| Lower 95% bound of net costa | –136 | –0.054 | £2518 saved per QALY lost |
Based on the bootstrapped replications, this uncertainty is clearly illustrated in the cost-effectiveness plane (see Figure 14). The distribution of results across all four quadrants is evident, with the greatest density reflecting the scenarios in which oral steroids are dominated by placebo (i.e. less effect and higher costs, as represented by the north-west quadrant).
FIGURE 14.
Cost-effectiveness plane of incremental cost per QALY gain at 12 months, based on values imputed from MI.
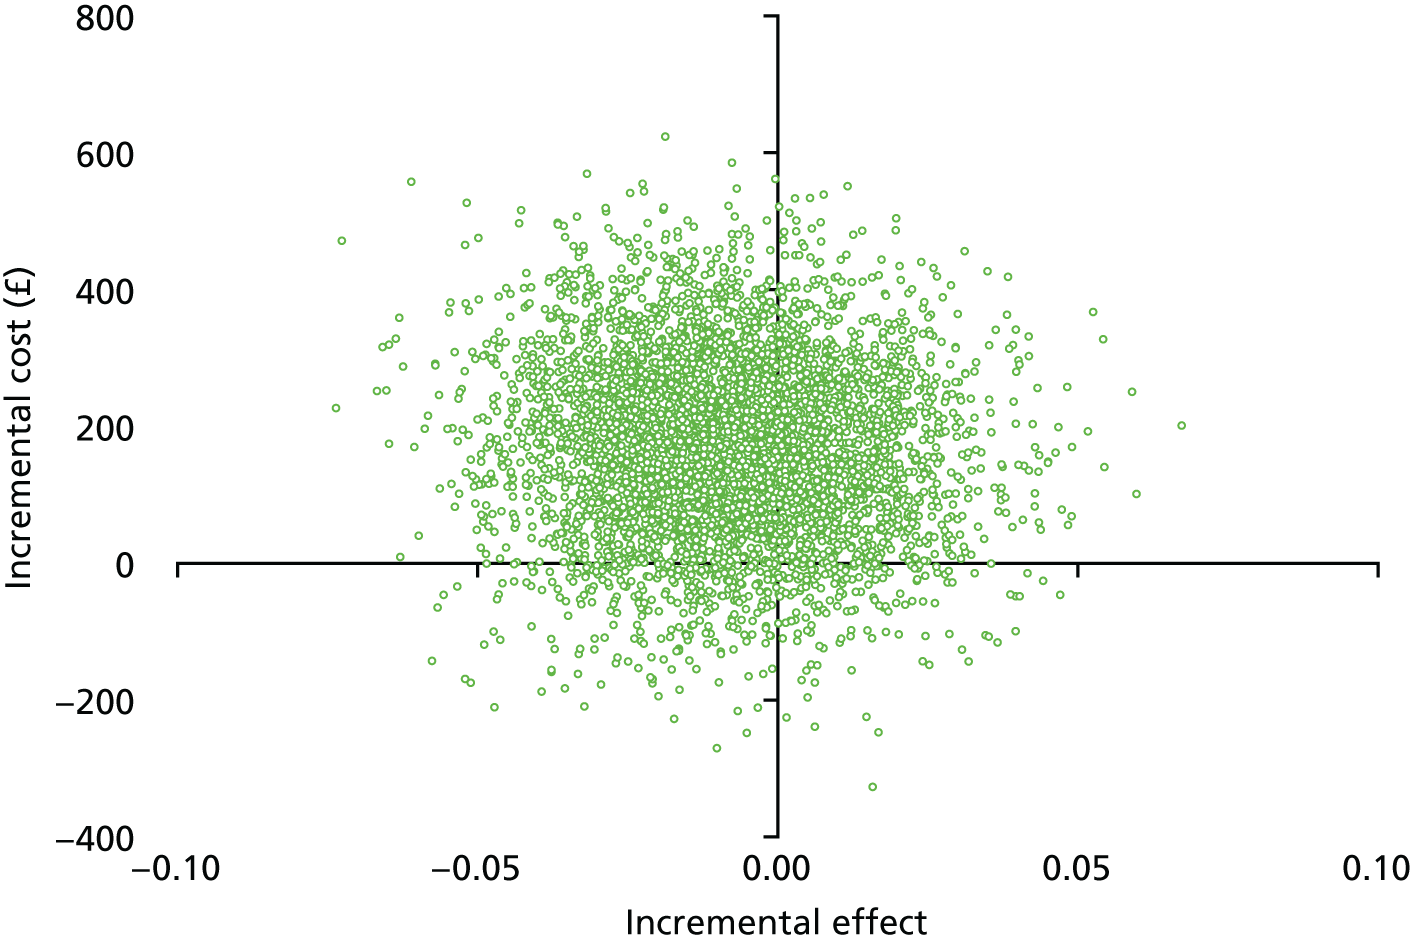
The CEAC is depicted in Figure 15. The probability of oral steroid treatment being cost-effective when compared with placebo at a £20,000-per-QALY threshold is 17%, increasing slightly to 22% at a £30,000-per-QALY threshold.
FIGURE 15.
Cost-effectiveness acceptability curve of incremental cost per QALY gain at 12 months.
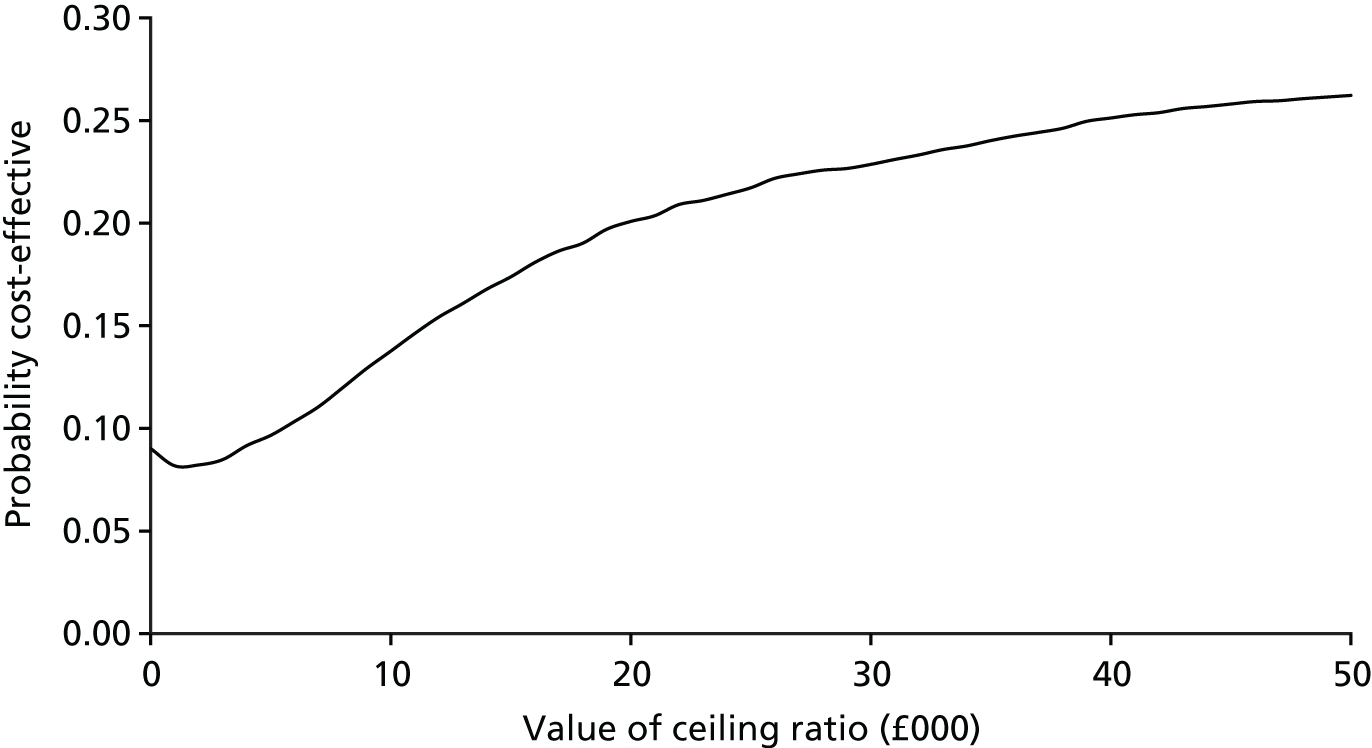
When the analysis was extended to reflect a limited societal perspective, the results remained consistent with the primary analysis (see Appendix 10).
Subgroup analysis
As there was no evidence of a significant treatment effect in the subgroup analysis undertaken, this was not further considered within the economic analysis.
Secondary cost-effectiveness analysis: incremental cost per improvement in the Paediatric Quality of Life Inventory at 12 months
Table 29 shows the 12-month CEA. The incremental cost of achieving a point improvement in the PedsQL score at 12 months was £220 for the base case, and this remained consistent when complete cases were examined. Again, these results were sensitive to changes in varying the costs and outcomes.
| Parameter | Incremental | ICER [cost (£) per point improvement] | |
|---|---|---|---|
| Cost (£) | Effect | ||
| Base case (values using multiple imputed costs and effects)27 | 145 | 0.66 | £220 |
| Complete cases | 145 | 0.58 | £250 |
| Upper 95% bounda of net cost and upper 95% bounda of point improvement in PedsQL score | 426 | 2.69 | £158 per point increase in PedsQL |
| Upper 95% bounda of net cost and lower 95% bounda of point improvement in PedsQL score | 426 | –1.37 | Oral steroid dominated by placebo |
| Lower 95% bounda of net cost and upper 95% bounda of point improvement in PedsQL score | –136 | 2.69 | Oral steroids dominates placebo |
| Lower 95% bounda of net cost and lower 95% bound of point improvement in PedsQL score | –136 | –1.37 | £99 saved per point reduction in PedsQL |
Figures 16 and 17 display the cost-effectiveness plane and the CEAC curve. Again, these showed that point estimates were spread across all four quadrants. The probability of oral steroids being cost-effective based on notional WTP thresholds of £1000, £2000 and £5000 per point improvement in PedsQL score at 12 months was 50%, 51% and 51%, respectively.
FIGURE 16.
Cost-effectiveness plane of incremental cost per point improvement in PedsQL score at 12 months.
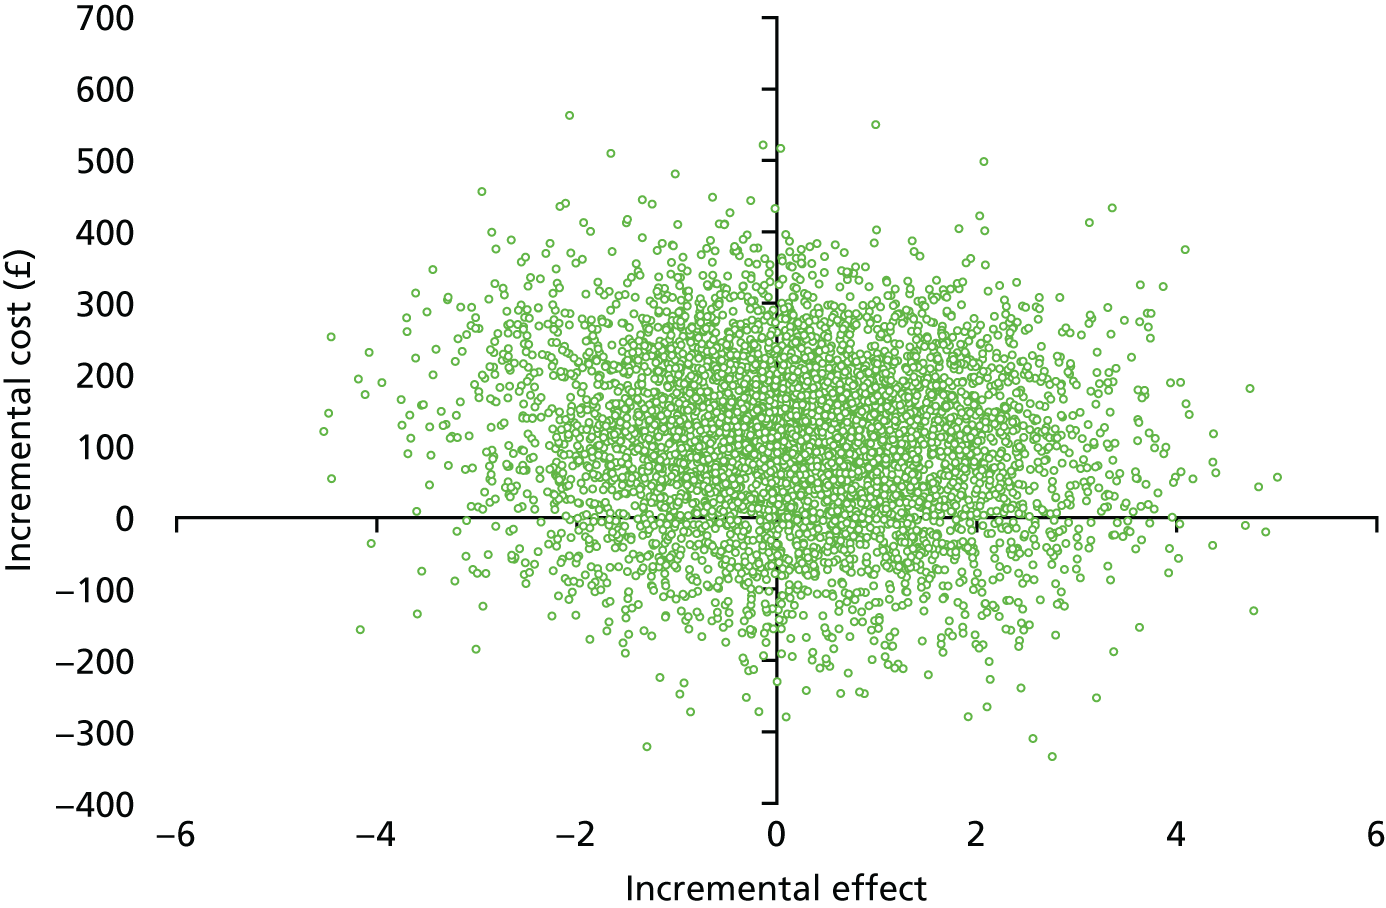
FIGURE 17.
Cost-effectiveness acceptability curve of incremental cost per point improvement in PedsQL score at 12 months.
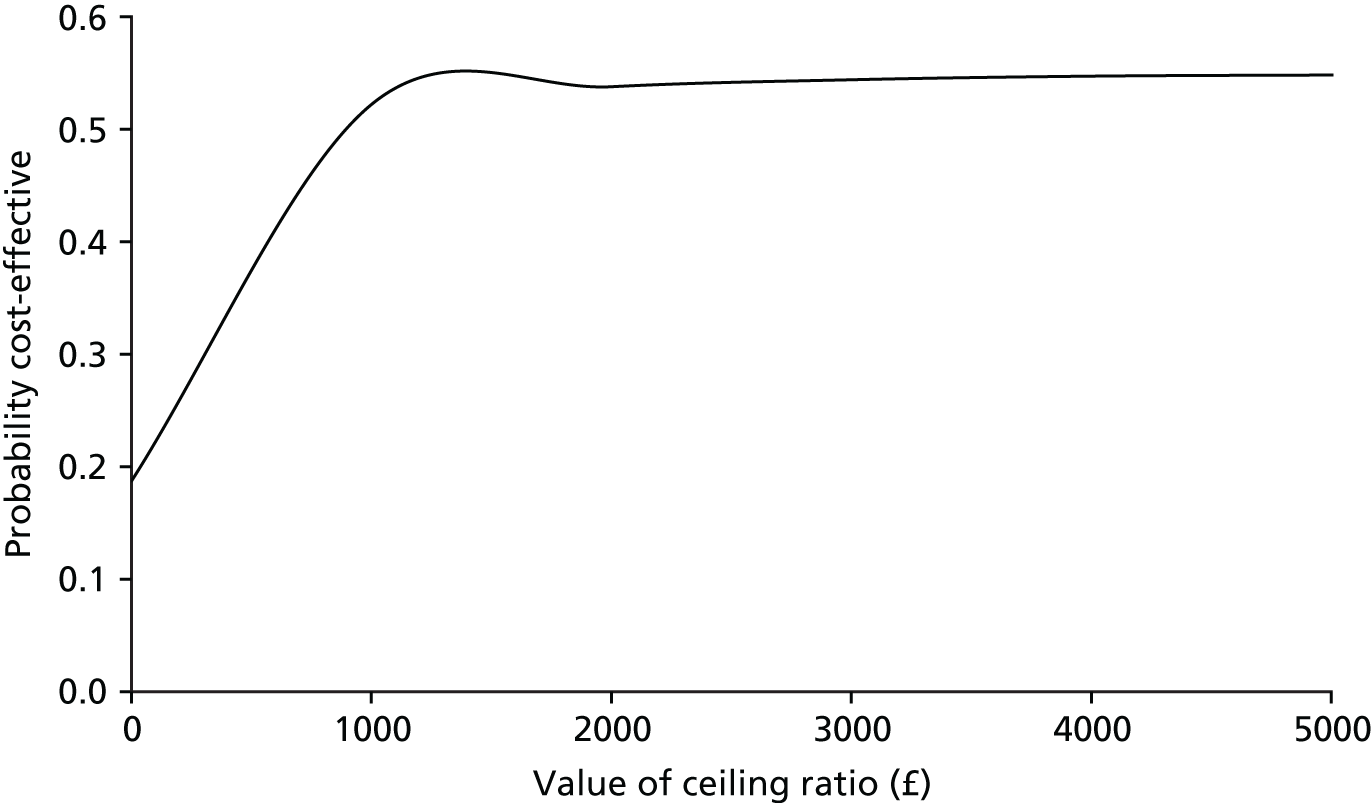
Secondary cost–utility analysis: incremental cost per quality-adjusted life-year gain (based on utilities estimated from mapping the Otitis Media Questionnaire to the Health Utilities Index, version 3)
Table 30 shows the sensitivity analysis for the mapped OM8-30 to HUI3 scores for the MI approach and the figures from the complete-case analysis. The base-case approach found that there were insignificant differences between groups for both the incremental costs and effects. The base-case ICER of £26,750 should be viewed in the context of the sensitivity analysis, which finds estimates in each of the four cost-effectiveness quadrants.
| Parameter | Incremental | ICER | |
|---|---|---|---|
| Cost (£) | Effect | ||
| Base case (values using multiple imputed costs and QALYs) | 107 | 0.004 | £26,750 per QALY gain |
| Complete cases | 121 | 0.002 | £60,500 per increase in QALY |
| Upper 95% bound of net costa and upper 95% bound of QALY gaina | 362 | 0.011 | £32,909 per QALY gain |
| Upper 95% bound of net costa and lower 95% bound of QALY gaina | 362 | –0.002 | Oral steroid treatment dominated by placebo |
| Lower 95% bound of net costa and upper 95% bound QALY gaina | –148 | 0.011 | Oral steroid treatment dominates placebo |
| Lower 95% bound of net costa and upper 95% bound of QALY gaina | –148 | –0.002 | £74,000 saved per QALY loss |
Exploration of the longer-term cost-effectiveness of the intervention
The original protocol set out a third objective to explore the long-term cost-effectiveness of a 7-day course of soluble oral prednisolone as a treatment for bilateral OME in children. The health economics plan contains a summary of the analysis proposed. If feasible and indicated by the initial trial results, a decision-analytic model would be developed to assess the longer-term cost-effectiveness of the intervention. Prior to this, and on receipt of the initial analysis of the clinical effectiveness results, a feasibility check of undertaking the modelling would be discussed with the OSTRICH trial team based on the following parameters:
-
the intervention shows sufficient evidence of clinical effectiveness during the trial
-
the trial results (and supporting literature) provide a sufficiently robust source for the estimation of all data inputs attributed to the intervention compared with placebo
-
the model can be realistically expected to produce plausible estimates of the longer-term costs and outcomes associated with the intervention.
Preparatory work was undertaken, including a rapid review of the economic literature and spot searches to identify suitable data inputs supplementary to the trial results, to inform the model and a detailed modelling plan (see Appendix 1). Published model-based analyses of comparable interventions faced considerable challenges regarding outcome differences and available input data. 52 Similarly, the OSTRICH trial found no evidence of a statistically significant treatment effect or impact on health outcomes at 12 months. In addition, considering the paucity of evidence available within the literature on the longer-term impact of OME and its management, the time horizon would be severely constrained to 2 years. Even within this shorter duration, no reliable means for estimating the likely persistence of the small and statistically non-significant clinical and health outcome (QALY) effects beyond 12 months could be found.
The feasibility of modelling was fully discussed with the OSTRICH trial team and members of the TSC, in light of the presentation of the initial clinical effectiveness and cost-effectiveness findings. The consensus was that conducting the model-based analysis at this point was not feasible, but this could be revisited in the future, based on extending the meta-analysis reported in the Cochrane review14 to include the OSTRICH trial findings. On the basis of this further meta-analysis (i.e. whether or not there is stronger evidence of a significant treatment effect resulting from the use of oral steroids on OME), this would provide more robust and reliable data to inform a model-based analysis.
Conclusions
The economic evaluation found that oral steroids at 5 weeks cost more than a placebo, and there was no significant treatment effect. Interpreting the results of the CEA in light of the clinical findings is crucial, particularly as the findings failed to demonstrate a statistically or clinically significant treatment effect. The base-case CEA suggests that it would cost £546 to achieve an additional hearing resolution at 5 weeks, with uncertainty demonstrated in the sensitivity analysis; however, this finding should be fully considered within the context that there was no statistically significant difference in hearing resolution between the two groups.
The base-case incremental cost per QALY at 12 months estimated that oral steroids were dominated by placebo and oral steroids would not be considered to be a cost-effective option. However, there was again considerable uncertainty seen in the sensitivity analyses. The impact of the joint uncertainty in cost and outcomes is illustrated by the CEA curve estimating a 17% and 22% probability of oral steroids being considered to be cost-effective based on a societal WTP threshold of £20,000 and £30,000 per QALY gain, respectively.
Chapter 5 Discussion and conclusions
Summary of the main results
A short course of oral steroids in children with symptoms of OME for at least 3 months, and proven significant bilateral hearing loss, was neither clinically effective nor cost-effective. A greater proportion of children in the group randomised to oral steroids, than those in the placebo group, had achieved satisfactory hearing at 5 weeks [39.9% vs. 32.8%, absolute difference of 7.1%, 95% CI –2.8% to 16.8%, number needed to treat (NNT) = 14]. However, this difference was not statistically significant. The secondary outcomes were consistent with the picture of a small or no benefit, and we found no subgroups that achieved a meaningful benefit from oral steroids. There was no significant increase in adverse events in the intervention group and we found no evidence to suggest important harms from taking oral steroids.
The results of the primary CEA suggest that the incremental cost of achieving an additional hearing resolution at 5 weeks as a result of oral steroid treatment was £690; this increased to £3052 at 12 months. However, the overall health economic analysis is more complex, with differences in costs and outcomes at 12 months being small and not statistically significant, and the CUA (incremental cost per QALY gain at 12 months) suggesting that oral steroids are dominated by placebo (i.e. they are less effective and more expensive).
The study did, however, identify a resolution of hearing in nearly one-third of those allocated to the placebo group by 5 weeks, more than half at 6 months and more than 60% at 12 months. These high rates of resolution may be useful in shared decision-making approaches to discussions concerning treatment options, including watchful waiting, with the carers of children who have OME.
Strengths and limitations
The OSTRICH trial is the first randomised controlled trial of oral steroids for OME, and one of only a few OME trials that used audiology-assessed resolution of hearing as the primary outcome. We found that the oral steroid and placebo groups had different trajectories in tympanometry resolution over time, but there was no difference in functional health status or hearing, underlining the importance of functional and patient-reported outcomes in addition to proxy measures. The hearing tests the study used are relatively objective, related to the resolution of the underlying pathology and to functional status and deemed to be a key outcome by the study’s PPI representatives. Clinicians, participants, parents, audiologists and members of the research team were all blind to the intervention allocation, and the study used matched placebos to help to maintain blinding. The study used remote, independent randomisation, and there was no indication of breaches in allocation concealment. Participants were recruited from a range of different hospital and audiology settings across the UK; all of these participants met strict inclusion criteria, including having symptoms for at least 3 months and audiology-confirmed significant hearing loss. Poor soundproofing of audiology testing rooms could affect the quality of audiology data. However, all sites received extensive training and monitoring, and over 60% of patients were recruited in university/teaching hospital sites, so it was believed that this was unlikely to be a problem in this study. The study measured many important secondary outcomes, including insertion of ventilation tubes and effect on QoL and functional health status, using well-validated instruments.
The trial was adequately powered to detect a 15% difference in recovery at 5 weeks, and is the largest trial of oral steroids for OME that has ever been conducted. However, more children than anticipated recovered by 5 weeks spontaneously (20% were used in the sample size calculation, but the actual rate in the placebo group was 32.8%), leading to the possibility of a type II error. The study was able to follow participants for up to 12 months and achieved high follow-up rates (over 90% at 5 weeks and 6 months, and close to 90% at 12 months). Reported adherence to trial medication was also high, suggesting that lack of effect was not caused by poor adherence to treatment.
The resource use questionnaire allowed participants to provide either a precise figure or a range, which resulted in some analytical challenges, and there were some differences in the way that resource use data were recorded at 5 weeks and at 6 and 12 months. Slower than anticipated recruitment resulted in the need to take a pragmatic decision to not collect routine health record data. As a result, the study was not able to validate self-reported health-care consultation data or collect baseline resource use data. This lack of baseline resource use data made it impossible for the study to assess any potential baseline imbalance in resource use and take this into account in the base-case and sensitivity analyses.
The study used a robust preference-based HRQoL measure (the HUI3) and the additional exploration of the impact of using alternative approaches (mapping of the OM8-30 ), which has already been investigated in detail within a comparable patient population. 47 Although there is evidence that the HUI3 can be used to collect self-reported HRQoL directly from children aged ≥ 5 years,46 the majority of children were too young to provide direct child-based HRQoL and, therefore, the study had to rely on parent proxy reporting, which has its own biases. 53
Generalisability
Participants were recruited from 23 hospitals and audiology clinics in Wales and England. Sites included large teaching hospitals, children’s hospitals and smaller general hospitals. Although only 38% of those participants assessed for eligibility were included in the trial, the main reason for not being included was not meeting the trial inclusion/exclusion criteria (in particular, not having bad enough, objectively measured hearing loss). Therefore, the study’s results are likely to be generalisable to the population meeting the inclusion criteria for this trial (i.e. symptoms of OME for at least 3 months and clinically important bilateral hearing loss). Most children included in the trial were ethnically white, and so the study’s results may not be generalisable to all ethnic groups.
The majority of children included in the trial (63% of 2- to 5-year-olds and 69% of 6- to 8-year-olds) had mild hearing loss (26–40 dBHL) and, therefore, our results may not be generalisable to children with more moderate hearing loss, although the study did not see any evidence of a beneficial effect in the subgroup with more moderate hearing loss. Furthermore, it is possible that children who did not meet the study inclusion criteria (those with Down syndrome or unilateral hearing loss, for example) may have responded differently.
The study recruited from secondary care sites (hospitals and audiology clinics) and, therefore, there needs to be caution when generalising these findings to a primary care setting. However, there is no reason to believe that the results are likely to be very different for children who meet the same criteria (including symptoms for at least 3 months and demonstrable hearing loss) but who are identified in primary care, especially as the majority of children in the trial had mild hearing loss.
Interpretation
The point estimate for the measure of effect suggests a small benefit from oral steroids in terms of resolution of hearing at 5 weeks. However, the CI crosses the null and, therefore, no effect or even a harmful effect cannot be excluded. Although no formal threshold exists for the WTP for an additional hearing resolution achieved, Williamson et al. 18 used a notional WTP threshold of £1000 per OME cured. 18 Using a similar notional value, oral steroids would have an 85% and 62% probability to be cost-effective at 5 weeks and 12 months, respectively.
The latest update of the Cochrane review on oral or topical steroids for OME (last search in August 2010) identified three trials (108 participants) of oral steroids versus placebo, which suggested a benefit from oral steroids, but did not demonstrate a statistically significant finding. 14 The review also identified five trials (409 participants) comparing oral steroids plus antibiotics with antibiotics alone, and found that the inclusion of oral steroids with antibiotics resulted in a statistically significant benefit in terms of resolution of OME. Studies included in the systematic review were short term, underpowered, often had poorly described inclusion criteria and/or did not assess hearing at the time of inclusion, used ears rather than children as the unit of analysis, and used intermediate outcome measures, such as tympanometry results, rather than improved hearing. No other cost-effectiveness studies of oral steroids for OME were identified. However, despite the poor quality of the prior evidence, the results of the OSTRICH trial are similar and suggestive of a small benefit from oral steroids. Whether or not such a small benefit is clinically important is another question. The study’s point estimate suggests a NNT of 14, which is not dissimilar to other medical interventions (e.g. a NNT of 15 for nicotine replacement therapy for smoking cessation54) and could justify the use of a low-cost and safe intervention to reduce the burden of an important problem, such as significant hearing loss. The study found little evidence to support the belief that a short course of oral corticosteroid therapy is associated with significant risks, either from the review of the literature or from the adverse effect and safety data from the current study. A subsequent trial found that oral steroids and oral steroids followed by intranasal steroids resolved OME more than watchful waiting at 6 weeks, but by 3 months this advantage disappeared. 55 The American Academy of Otolaryngology–Head and Neck Surgery Foundation and the American Academy of Pediatrics, informed by the flawed studies in the review, recommended against oral steroids for OME. 56 Despite this, adults diagnosed with OME are more likely to be prescribed oral steroids than those without. 57
A review of surgical treatments of OME found that ventilation tubes improved hearing and time to resolution of OME, but did not improve speech, language or other functional outcomes compared with watchful waiting or myringotomy, and that tubes increased the rate of otorrhoea and tympanosclerosis. 58
An overview of studies found that OME diagnosed by tympanometry of unknown duration had 28% spontaneous resolution by 3 months (95% CI 14% to 41%), rising to 42% by 6 months (95% CI 35% to 49%). 5 In the OSTRICH trial, higher rates of hearing resolution associated with OME were found.
Conclusions
Implications for health care
Otitis media with effusion is a common cause of hearing loss in children, which results in a significant burden on children and their families and accounts for a considerable workload for primary care and ENT clinicians. It continues to be the most common reason for childhood surgery, despite reported reductions in the number of ventilation operations. 8 The OSTRICH trial has produced unique data about the generally favourable natural history of problems associated with OME that have lasted ≥ 3 months in children who have proven bilateral hearing loss, and these data will be of great use to clinicians and parents in making decisions about treatment options. The Department of Health and Social Care-commissioned ‘McKinsey’ report10 concluded that ventilation tube surgery was relatively ineffective and recommended reductions in the use of this procedure. The report suggested that the NHS could save £21M per year by reducing grommet insertion by a further 90%. 10
Evidence supporting the use of oral corticosteroids for OME remains unclear. Updating the meta-analysis of evidence on oral steroids for OME with the results of the OSTRICH trial may help to reduce uncertainty further. However, the findings suggest that any benefits from oral steroids are likely to be small and of questionable clinical significance, and given the evidence of no beneficial effect on functional health status and HRQoL, their routine use cannot be recommended based on these findings. The data reported in this trial are the best available data on the effects of oral steroids in children with OME and can be used to help inform discussions between parents and clinicians about the possible use of oral steroids for OME. In addition, the information on the natural course of the condition provided by OSTRICH could help to inform decisions about which treatment options, including watchful waiting, parents might prefer.
Recommendations for research
We do not feel that further empirical studies addressing the same question are warranted. However, although the study did not find any evidence of benefit among subgroups, the study was not powered for these analyses, and meta-analysis and further studies could help to identify whether or not oral steroids are likely to be effective in certain subgroups.
Our trial has provided key data that can help to inform a shared decision-making approach in the management of OME. Studies exploring the optimal ways of sharing natural history and intervention effect data with parents, as well as further evaluations of alternative pathways, will help to improve the management of this common and important problem.
Acknowledgements
Independent members of the Trial Steering Committee and Independent Data Monitoring Committee
We would like to thank our TSC and IDMC for their continued support.
Trial Steering Committee members
Dr Ian Williamson (TSC chairperson, University of Southampton), Professor Alastair Sutcliffe (Great Ormond Street Hospital), Ms Claire Hopkins (Guy’s and St Thomas’ Hospital) and Ros Cox (PPI Representative).
Independent Data Monitoring Committee members
Professor Rafael Perera (IDMC Chairperson, Professor of Statistics, University of Oxford), Lt Colonel Nnaemeka Okpala (Frimley Park Hospital) and Ms Shanaz Dorkenoo (PPI Representative).
Research networks
We also wish to thank the research nurses, clinical study officers and administrators who supported the study at each site. This includes staff at the Health and Care Research Wales Workforce (South East, South West and North Wales regions) and the local NIHR CRNs (West Midlands, Yorkshire and Humber).
Recruitment sites
We would like to thank all of the staff involved at our participating sites, including the principal investigators, ENT consultants and specialist registrars, audiologists, clinic staff, research nurses, research co-ordinators and administrators from the following sites:
-
NHS health boards in Wales:
-
Cardiff and Vale University Health Board
-
Aneurin Bevan University Health Board
-
Cwm Taf Health Board
-
Abertawe Bro Morgannwg University Health Board
-
Hywel Dda University Health Board
-
Betsi Cadwaladr University Health Board.
-
-
NHS trusts in England:
-
Royal Wolverhampton NHS Trust
-
Newcastle Upon Tyne NHS Foundation Trust
-
Bradford Teaching Hospitals NHS Foundation Trust
-
London North West Healthcare NHS Trust
-
Maidstone and Tunbridge Wells NHS Trust
-
Royal Free London NHS Foundation Trust
-
University College London Hospitals NHS Foundation Trust
-
University Hospitals of North Midlands NHS Trust
-
Isle of Wight NHS Trust
-
Sheffield Children’s NHS Foundation Trust
-
Central Manchester University Hospitals NHS Foundation Trust
-
Brighton and Sussex University Hospitals NHS Trust
-
Surrey and Sussex Healthcare NHS Trust
-
Blackpool Teaching Hospitals NHS Foundation Trust
-
Walsall Healthcare NHS Trust
-
Worcestershire Acute Hospitals NHS Trust.
-
Finally, we would like to thank the children and families who participated in the trial, without whom this trial would not have been possible.
Contributions of authors
Nick A Francis (GP and Clinical Reader, Primary Care and Public Health) was the lead applicant and a co-chief investigator for the OSTRICH trial. He had overall responsibility for the study design and implementation, and the writing of the background, methods, results and discussion sections of the report, with final approval of the report submission.
Cherry-Ann Waldron (Research Associate) was the trial manager, contributing to the trial design and implementation, and writing the methods section of the report. She also co-ordinated the compilation, formatting, proofreading and final approval of the report.
Rebecca Cannings-John (Research Fellow) was a co-investigator. She contributed to the trial design, conducted the statistical data analysis, cowrote the methods and results sections and gave final approval of the report.
Emma Thomas-Jones (Research Fellow) was a co-investigator and the lead for trial management. She contributed to the overall trial design and implementation, proofreading and final approval of the report.
Thomas Winfield (Health Economist) conducted the health economic analysis, co-writing the health economic evaluation section and gave final approval of the report.
Victoria Shepherd (Research Associate) was the research nurse for the trial, recruiting participants and providing research nurse guidance. She contributed to the trial management, design, implementation and final approval of the report.
Debbie Harris (Research Assistant) was the data manager, contributing to the design of the CRFs and to the data management of the trial. She also contributed to the methods and results sections and final approval of the report.
Kerenza Hood (Professor in Statistics and Director of Centre for Trials Research) was a co-investigator and contributed to the overall trial design and implementation, supervised the statistical analysis and gave final approval of the report.
Deborah Fitzsimmons (Professor of Health Outcomes Research and Academic Director, Swansea Centre for Health Economics) was a co-investigator and contributed to the overall trial design and implementation, supervised the health economic analyses, co-wrote the health economic evaluation section and gave final approval of the report.
Amanda Roberts (Paediatric Audiologist) was a co-investigator contributing to the overall trial design and implementation. She provided expert advice on paediatric audiology and final approval of the report.
Colin VE Powell (Paediatrician) was a co-investigator contributing to the overall trial design and implementation. He provided expert paediatric advice and final approval of the report.
Micaela Gal was a co-investigator and contributed to the overall trial design and implementation and final approval of the report.
Sarah Jones (Patient and Public Representative) contributed to the study design, study implementation in terms of PPI and final approval of the report.
Christopher C Butler (Professor of Primary Care) was the co-chief investigator of the trial. He contributed to the overall trial design and implementation, interpretation of the findings and final approval of the report.
Other members of the trial team
We would like to thank and acknowledge the input from Professor Ceri Philips (Health Economist), Dr Mathew Smith (Pharmacist) and Mr Alun Tomkinson (Consultant ENT Surgeon), who contributed to the trial design, and from Professor Mark Haggard and Ms Helen Spencer in respect of help with the OM8-30 mapping.
We would also like to thank Katy Addison (Trial Manager), Judith Evans (Research Administrator), Vincent Poile (Database Developer), Dr Jane Davies (Research Nurse), Hayley Prout (Research Nurse), Vasileios Gkiousias (intercalated BSc student) and Ellen Smith (MSc student) for their contribution to the trial implementation and management.
Publications
Waldron CA, Thomas-Jones E, Harris D, Shepherd V, Cannings-John R, Hood K, et al. Recruitment to oral steroids for the resolution of otitis media with effusion in children (OSTRICH) study: challenges of a randomised controlled trial in secondary care sites across Wales and England. Trials 2015;16(Suppl. 2):P119.
Waldron CA, Thomas-Jones E, Cannings-John R, Hood K, Powell C, Roberts A, et al. Study protocol: oral steroids for the resolution of otitis media with effusion (OME) in children (OSTRICH): a randomised double-blind placebo controlled clinical trial. Trials 2015;17:115.
Gkiousias V, Butler CC, Shepherd V, Kilgour J, Waldron CA, Thomas-Jones E, Francis N. Parental perceptions and understanding of information provision, management options and factors influencing the decision-making process in the treatment of children with glue ear. Int J Paediatr Otorhinolaryngol 2016;89:6–12.
Francis NA, Cannings-John R, Waldron CA, Thomas-Jones E, Winfield T, Shepherd V, et al. Oral steroids for resolution of otitis media with effusion in children (OSTRICH): a double-blinded, placebo-controlled randomised trial. Lancet 2018;392:557–568.
Data-sharing statement
All data requests should be submitted to the corresponding author for consideration. Access to anonymised data may be granted following review.
Patient data
This work uses data provided by patients and collected by the NHS as part of their care and support. Using patient data is vital to improve health and care for everyone. There is huge potential to make better use of information from people’s patient records, to understand more about disease, develop new treatments, monitor safety, and plan NHS services. Patient data should be kept safe and secure, to protect everyone’s privacy, and it’s important that there are safeguards to make sure that it is stored and used responsibly. Everyone should be able to find out about how patient data are used. #datasaveslives You can find out more about the background to this citation here: https://understandingpatientdata.org.uk/data-citation.
Disclaimers
This report presents independent research funded by the National Institute for Health Research (NIHR). The views and opinions expressed by authors in this publication are those of the authors and do not necessarily reflect those of the NHS, the NIHR, NETSCC, the HTA programme or the Department of Health and Social Care. If there are verbatim quotations included in this publication the views and opinions expressed by the interviewees are those of the interviewees and do not necessarily reflect those of the authors, those of the NHS, the NIHR, NETSCC, the HTA programme or the Department of Health and Social Care.
References
- Casselbrant ML, Brostoff LM, Cantekin EI, Flaherty MR, Doyle WJ, Bluestone CD, et al. Otitis media with effusion in preschool children. Laryngoscope 1985;95:428-36. https://doi.org/10.1288/00005537-198504000-00011.
- Zielhuis GA, Rach GH, van den Broek P. Screening for otitis media with effusion in preschool children. Lancet 1989;1:311-14. https://doi.org/10.1016/S0140-6736(89)91317-2.
- Bennett KE, Haggard MP, Silva PA, Stewart IA. Behaviour and developmental effects of otitis media with effusion into the teens. Arch Dis Child 2001;85:91-5. https://doi.org/10.1136/adc.85.2.91.
- Clinical Guidance Surgical Management of Otitis Media with Effusion in Children. London: NICE; 2008.
- Rosenfeld RM, Schwartz SR, Pynnonen MA, Tunkel DE, Hussey HM, Fichera JS, et al. Clinical practice guideline: tympanostomy tubes in children – executive summary. Otolaryngol Head Neck Surg 2013;149:8-16. https://doi.org/10.1177/0194599813490141.
- American Academy of Pediatrics Subcommittee on Otitis Media With Effusion . Otitis media with effusion. Pediatrics 2004;113. https://doi.org/10.1542/peds.113.5.1412.
- Dengerink J, Porter J. Children’s attitudes toward peers wearing hearing aids. Lang Speech Hear Serv Sch 1984;15:205-9. https://doi.org/10.1044/0161-1461.1503.205.
- Hospital Episode Statistics. Grommets. London: Department of Health and Social Care; 2004.
- Variation in Elective Surgical Procedures Across Wales. Cardiff: Public Health Wales; 2010.
- Achieving World Class Productivity in the NHS 2009/10 – 2013/14: Detailing the Size of the Opportunity. London: Department of Health and Social Care; 2009.
- Deafness Research UK. Grommet Treatment for Glue Ear: A Sticking point?. London: Deafness Research UK; 2010.
- OME (Glue Ear) Adenoid and Grommet Position Paper. London: ENT UK; 2009.
- Griffin G, Flynn CA. Antihistamines and/or decongestants for otitis media with effusion (OME) in children. Cochrane Database Syst Rev 2011;9. https://doi.org/10.1002/14651858.CD003423.pub3.
- Simpson SA, Lewis R, van der Voort J, Butler CC. Oral or topical nasal steroids for hearing loss associated with otitis media with effusion in children. Cochrane Database Syst Rev 2011;5. https://doi.org/10.1002/14651858.CD001935.pub3.
- Williamson I. Otitis media with effusion in children. BMJ Clin Evid 2011;2011.
- Butler CC, Rollnick S, Kinnersley P, Jones A, Stott N. Reducing antibiotics for respiratory tract symptoms in primary care: consolidating ‘why’ and considering ‘how’. Br J Gen Pract 1998;48:1865-70.
- Williamson I, Vennik J, Harnden A, Voysey M, Perera R, Kelly S, et al. Effect of nasal balloon autoinflation in children with otitis media with effusion in primary care: an open randomized controlled trial. CMAJ 2015;187:961-9. https://doi.org/10.1503/cmaj.141608.
- Williamson I, Benge S, Barton S, Petrou S, Letley L, Fasey N, et al. Topical intranasal corticosteroids in 4–11 year old children with persistent bilateral otitis media with effusion in primary care: double blind randomised placebo controlled trial. BMJ 2009;339. https://doi.org/10.1136/bmj.b4984.
- MacArthur CJ, DeGagne JM, Kempton JB, Trune DR. Steroid control of acute middle ear inflammation in a mouse model. Arch Otolaryngol Head Neck Surg 2009;135:453-7. https://doi.org/10.1001/archoto.2009.23.
- Baggett HC, Prazma J, Rose AS, Lane AP, Pillsbury HC. The role of glucocorticoids in endotoxin-mediated otitis media with effusion. Arch Otolaryngol Head Neck Surg 1997;123:41-6. https://doi.org/10.1001/archotol.1997.01900010049006.
- Tan CT, Escoubet B, Van den Abbeele T, Friedlander G, Tran Ba Huy P, Herman P. Modulation of middle ear epithelial function by steroids: clinical relevance. Acta Otolaryngol 1997;117:284-8. https://doi.org/10.3109/00016489709117788.
- Haddad J. Lipoperoxidation as a measure of free radical injury in otitis media. Laryngoscope 1998;108:524-30. https://doi.org/10.1097/00005537-199804000-00012.
- Yaman H, Ozturk K, Uyar Y, Gurbilek M. Effectiveness of corticosteroids in otitis media with effusion: an experimental study. J Laryngol Otol 2008;122:25-30. https://doi.org/10.1017/S0022215107007724.
- Rosenfeld RM, Mandel EM, Bluestone CD. Systemic steroids for otitis media with effusion in children. Arch Otolaryngol Head Neck Surg 1991;117:984-9. https://doi.org/10.1001/archotol.1991.01870210056008.
- Rieder MJ. The child with multiple short courses of steroid therapy. Paediatr Child Health 2003;8. https://doi.org/10.1093/pch/8.4.226.
- Ducharme FM, Chabot G, Polychronakos C, Glorieux F, Mazer B. Safety profile of frequent short courses of oral glucocorticoids in acute pediatric asthma: impact on bone metabolism, bone density, and adrenal function. Pediatrics 2003;111:376-83. https://doi.org/10.1542/peds.111.2.376.
- Waldron CA, Thomas-Jones E, Cannings-John R, Hood K, Powell C, Roberts A, et al. Oral steroids for the resolution of otitis media with effusion (OME) in children (OSTRICH): study protocol for a randomised controlled trial. Trials 2016;17. https://doi.org/10.1186/s13063-016-1236-1.
- The Medicines for Human Use (Clinical Trials) Regulations. London: The Stationery Office; 2004.
- Timmerman AA, Meesters CM, Anteunis LJ, Chenault MN, Haggard MP. Psychometric evaluation of the OM8-30 questionnaire in Dutch children with otitis media. Eur Arch Otorhinolaryngol 2008;265:1047-56. https://doi.org/10.1007/s00405-008-0591-2.
- Feeny D, Furlong W, Boyle M, Torrance GW. Multi-attribute health status classification systems. Health Utilities Index. PharmacoEconomics 1995;7:490-502. https://doi.org/10.2165/00019053-199507060-00004.
- Varni JW, Seid M, Rode CA. The PedsQL: measurement model for the pediatric quality of life inventory. Med Care 1999;37:126-39. https://doi.org/10.1097/00005650-199902000-00003.
- Jerger J. Clinical experience with impedance audiometry. Arch Otolaryngol 1970;92:311-24. https://doi.org/10.1001/archotol.1970.04310040005002.
- BBC News . ‘Glue Ear’ Drugs Trial at University 2013. www.bbc.co.uk/news/uk-wales-21663787 (accessed 30 August 2018).
- Visual Reinforcement Audiometry Testing of Infants; A Recommended Test Protocol. Reading: British Society of Audiology; 2008.
- White IR. Uses and limitations of randomization-based efficacy estimators. Stat Methods Med Res 2005;14:327-47. https://doi.org/10.1191/0962280205sm406oa.
- White IR, Kalaitzaki E, Thompson SG. Allowing for missing outcome data and incomplete uptake of randomised interventions, with application to an internet-based alcohol trial. Stat Med 2011;30:3192-207. https://doi.org/10.1002/sim.4360.
- British National Formulary. London: BMJ Group and Pharmaceutical Press; n.d.
- Base Case Analysis. York: York Health Economics Consortium; 2016.
- Glick HA, Doshi JA, Sonnad SS, Polsky D. Economic Evaluation in Clinical Trials. Oxford: Oxford University Press; 2014.
- Curtis L, Burns A. Unit Costs of Health and Social Care. Canterbury: PSSRU, University of Kent; 2016.
- NHS Reference Costs 2015 to 2016. London: Department of Health and Social Care; 2016.
- Otitis Media with Effusion in Under 12s: Surgery. London: NICE; 2008.
- Bank of England . Inflation Calculator n.d. www.bankofengland.co.uk/education/Pages/resources/inflationtools/calculator/default.aspx (accessed 26 July 2017).
- Manning VL, Kaambwa B, Ratcliffe J, Scott DL, Choy E, Hurley MV, et al. Economic evaluation of a brief education, self-management and upper limb exercise training in people with rheumatoid arthritis (EXTRA) programme: a trial-based analysis. Rheumatology 2015;54:302-9. https://doi.org/10.1093/rheumatology/keu319.
- UK Government . Expenses and Benefits: Business Travel Mileage for Employees’ Own Vehicles n.d. www.gov.uk/expenses-and-benefits-business-travel-mileage/rules-for-tax (accessed 26 July 2017).
- Horsman J, Furlong W, Feeny D, Torrance G. The Health Utilities Index (HUI): concepts, measurement properties and applications. Health Qual Life Outcomes 2003;1. https://doi.org/10.1186/1477-7525-1-54.
- Dakin H, Petrou S, Haggard M, Benge S, Williamson I. Mapping analyses to estimate health utilities based on responses to the OM8-30 Otitis Media Questionnaire. Qual Life Res 2010;19:65-80. https://doi.org/10.1007/s11136-009-9558-z.
- Khan KA, Petrou S, Rivero-Arias O, Walters SJ, Boyle SE. Mapping EQ-5D utility scores from the PedsQL™ generic core scales. PharmacoEconomics 2014;32:693-706. https://doi.org/10.1007/s40273-014-0153-y.
- Mpundu-Kaambwa C, Chen G, Russo R, Stevens K, Petersen KD, Ratcliffe J. Mapping CHU9D Utility Scores from the PedsQLTM 4.0 SF-15. PharmacoEconomics 2017;35:453-67. https://doi.org/10.1007/s40273-016-0476-y.
- Rubin DB. Multiple Imputation for Nonresponse in Surveys. Hoboken, NJ: John Wiley & Sons; 2004.
- Guide to the Methods of Technology Appraisal 2013. London: NICE; 2013.
- Williamson I, Benge S, Barton S, Petrou S, Letley L, Fasey N, et al. A double-blind randomised placebo-controlled trial of topical intranasal corticosteroids in 4- to 11-year-old children with persistent bilateral otitis media with effusion in primary care. Health Technol Assess 2009;13. https://doi.org/10.3310/hta13370.
- Eiser C, Morse R. Can parents rate their child’s health-related quality of life? Results of a systematic review. Quality Life Res 2001;10:347-57. https://doi.org/10.1023/A:1012253723272.
- Stead LF, Perera R, Bullen C, Mant D, Hartmann-Boyce J, Cahill K, et al. Nicotine replacement therapy for smoking cessation. Cochrane Database Syst Rev 2012;11. https://doi.org/10.1002/14651858.CD000146.pub4.
- Hussein A, Fathy H, Amin SM, Elsisy N. Oral steroids alone or followed by intranasal steroids versus watchful waiting in the management of otitis media with effusion. J Laryngol Otol 2017;131:907-13. https://doi.org/10.1017/S0022215117001700.
- Rosenfeld RM, Shin JJ, Schwartz SR, Coggins R, Gagnon L, Hackell JM, et al. Clinical practice guideline: otitis media with effusion (update). Otolaryngol Head Neck Surg 2016;154:1-41. https://doi.org/10.1177/0194599815623467.
- Bellmunt AM, Vila PM, Chen JX, Rosenfeld RM, Hackell JM, Shin JJ. Oral steroid usage for otitis media with effusion, eustachian tube dysfunction, and tympanic membrane retraction. Otolaryngol Head Neck Surg 2016;155:139-46. https://doi.org/10.1177/0194599816637845.
- Wallace IF, Berkman ND, Lohr KN, Harrison MF, Kimple AJ, Steiner MJ. Surgical treatments for otitis media with effusion: a systematic review. Pediatrics 2014;133:296-311. https://doi.org/10.1542/peds.2013-3228.
- Mohiuddin S, Schilder A, Bruce I. Economic evaluation of surgical insertion of ventilation tubes for the management of persistent bilateral otitis media with effusion in children. BMC Health Serv Res 2014;14. https://doi.org/10.1186/1472-6963-14-253.
- Mohiuddin S, Payne K, Fenwick E, O’Brien K, Bruce I. A model-based cost-effectiveness analysis of a grommets-led care pathway for children with cleft palate affected by otitis media with effusion. Eur J Health Econ 2015;16:573-87. https://doi.org/10.1007/s10198-014-0610-8.
- Petrou S, Dakin H, Abangma G, Benge S, Williamson I. Cost–utility analysis of topical intranasal steroids for otitis media with effusion based on evidence from the GNOME trial. Value Health 2010;13:543-51. https://doi.org/10.1111/j.1524-4733.2010.00711.x.
- Venekamp RP, Burton MJ, van Dongen TM, van der Heijden GJ, van Zon A, Schilder AG. Antibiotics for otitis media with effusion in children. Cochrane Database Syst Rev 2016;6. https://doi.org/10.1002/14651858.CD009163.pub3.
- Curtis L. Unit Costs of Health and Social Care 2014. Canterbury: PSSRU, University of Kent; 2014.
- Otovent Nasal Balloon for Otitis Media with Effusion. London: NICE; 2016.
- Morris AE, Lutman ME, Cook AJ, Turner D. An economic evaluation of screening 60- to 70-year-old adults for hearing loss. J Public Health 2013;35:139-46. https://doi.org/10.1093/pubmed/fds058.
Appendix 1 Proposed modelling plan
Aim of analysis
To estimate the cost-effectiveness of oral steroids and current standard practice versus standard practice in the treatment of persistent bilateral OME in children.
Population
Eligible children aged 2–8 years with symptoms of hearing loss for at least 3 months, attributable to OME, referred to NHS secondary care (ENT outpatient or paediatric AVM clinics). Entry criteria for the model would reflect the OSTRICH trial inclusion criteria.
Subgroups
No subgroups are considered in the health economic analysis.
Interventions
Short course of oral steroids as per the OSTRICH protocol.
Comparator
No treatment or other technologies.
Outcomes
Successful hearing resolution, treatment-related morbidity and HRQoL.
Time horizon
The time horizon was 24 months. Owing to the lack of literature available on the longer-term outcomes associated with OME and its treatment, this time horizon was agreed as the most plausible that could be considered within the model.
Analysis plan
A decision tree model will be constructed in Microsoft Excel® (Microsoft Corporation, Redmond, WA, USA) using visual basic application. A decision tree was chosen as the most appropriate model structure to reflect the clinical pathway, based on discussion with the OSTRICH trial team and following a review of similar model-based analyses within a comparable population (i.e. Williamson et al. 52 and Mohiuddin et al. 59), with the latter model being used as the basis for adaption to the OSTRICH trial population. A schematic of the proposed model is set out in Figure 18.
FIGURE 18.
Schematic of the OSTRICH trial model.
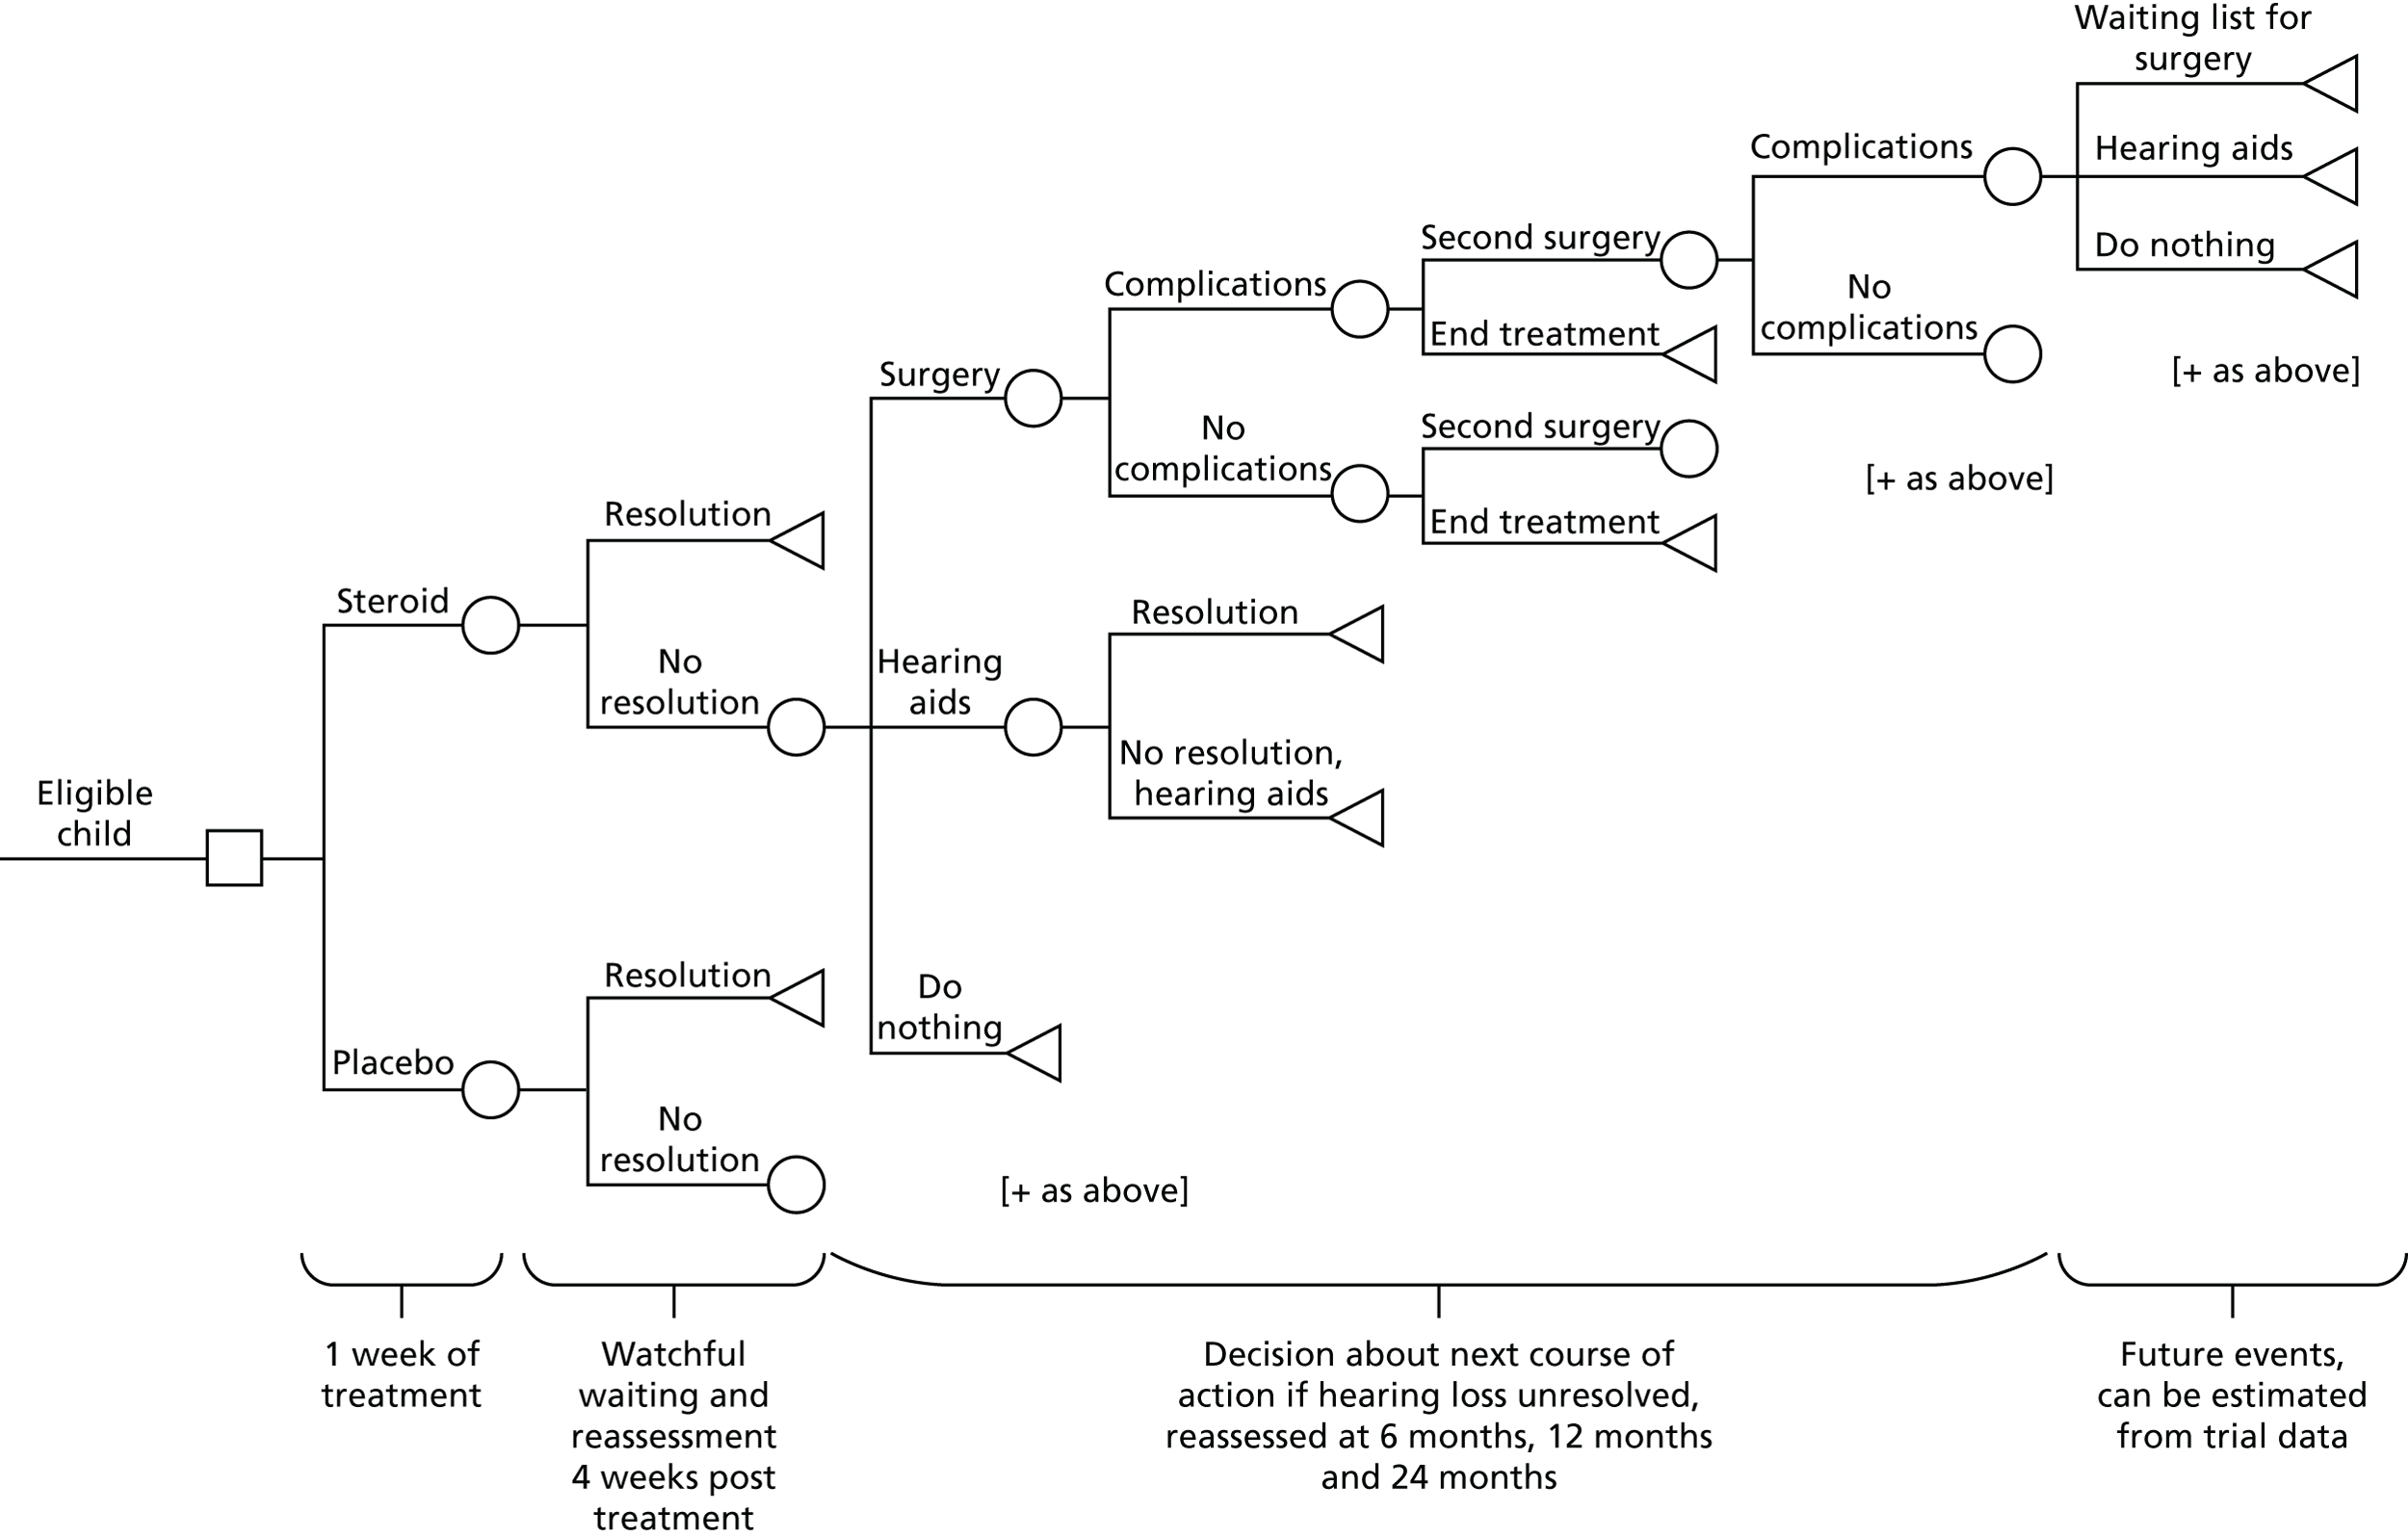
Pathway assumptions
An eligible child will be assigned to receive either the steroid or the placebo for 1 week on model entry. After 4 weeks, the child will be reassessed to quantify the change in hearing loss and to determine whether or not hearing resolution was achieved. If hearing is not resolved, the next possible options are surgery, hearing aids or watchful waiting (as hearing loss in children with OME can spontaneously resolve within 2 years). Surgery carries the risk of complications, which can have a detrimental effect to patient QoL and cause costs to the NHS and society. Repeat surgery may be required if hearing resolution is not achieved or grommets fall out too early. Any treatment can be stopped at any time.
Although the NICE guidelines42 recommend a third surgery option, this cannot be modelled using the available trial data, as patients retrospectively reported data at three individual time points (5 weeks, 6 months and 12 months), and follow-up is not long enough to record third surgeries. It might be possible to obtain information regarding waiting list entries for third surgery at the third data capture point. In addition, having already had two surgical interventions, it can be assumed that this surgery would take place in the future, but there is no way of gauging the outcome of this procedure. In addition, the study cannot predict what will happen while the patients are waiting for this third surgery, whether or not they will experience some hearing resolution while being monitored or whether or not their hearing will deteriorate. Therefore, the study will not speculate about the outcomes at this stage, but it will include surgery within an upper-bound value of final costs for a sensitivity analysis.
Data inputs and sources
In the first instance, the transition probabilities, appropriate costs and outcomes (including HRQoL and OME resolution) will be obtained from the OSTRICH trial data. Costs and outcomes will be accumulated over the model horizon of 24 months. The cost-effectiveness of the steroid treatment will be calculated after 5 weeks, 6 months, 12 months and 24 months.
Discounting will be applied in the base-case analysis at 3.5%, with sensitivity analysis using a discount of 1.5% per annum for costs and outcomes, commensurate with the NICE reference case51 for cost-effectiveness at 24 months.
Analysis
In accordance with the within-trial OSTRICH economic analysis, two sets of base-case analyses will be undertaken:
-
incremental cost per successful hearing resolution achieved at 24 months
-
incremental cost per QALY gained at 24 months.
Sensitivity analysis
One-way sensitivity analyses will be undertaken to assess the effect of changing key parameters (e.g. utility values from the OSTRICH trial compared with literature-based inputs) on the base-case results. A probabilistic sensitivity analysis will be conducted to characterise the joint uncertainty in parameter estimates. CEACs will be generated to depict the probability of the intervention being cost-effective at different WTP thresholds.
Literature sources
A rapid review of the evidence was undertaken to gather suitable information to inform the data inputs required for the model pathways and the sensitivity analyses (e.g. by considering different parameter variations reported in the literature compared with the OSTRICH trial results).
Summary of rapid review
The objectives of the rapid review were to:
-
review the evidence of the cost-effectiveness of oral steroids in the management of bilateral OME
-
identify potential sources of information to inform a subsequent model-based analysis.
A population, intervention, comparison, outcome (PICO) was constructed based on the OSTRICH trial population and intervention. The study did not restrict for comparators in order to consider the full extent of the evidence (e.g. if oral steroids had been compared with another technology, such as intranasal steroids). Both primary and secondary care settings were considered in the study. For outcomes, we considered all full economic evaluations (cost-effectiveness, cost–utility, cost–benefit, cost-minimisation) and a cost–consequences analysis. Partial economic evaluations (e.g. in which only costs were presented) were excluded from objective 1, but considered for informing objective 2, if relevant.
A search strategy was developed (available from the authors). Searches were undertaken using the following electronic databases:
-
PubMed [via the National Centre for Biotechnology Information (NCBI)]
-
Web of Science (via Clarivate™ Analytics)
-
Scopus (via Elsevier)
-
The Cochrane Library (via Wiley Online Library), which includes the Cochrane Database of Systematic Reviews, the Database of Abstracts of Reviews of Effects, the Cochrane Central Register of Controlled Trials and the Cochrane Methodology Register
-
Cumulative Index to Nursing and Allied Health Literature [(CINAHL) via EBSCOhost].
In addition, reference lists were scanned and spot searches were undertaken to locate suitable evidence. No date or language limits were applied (Figure 19).
FIGURE 19.
Flow chart of rapid review search results.
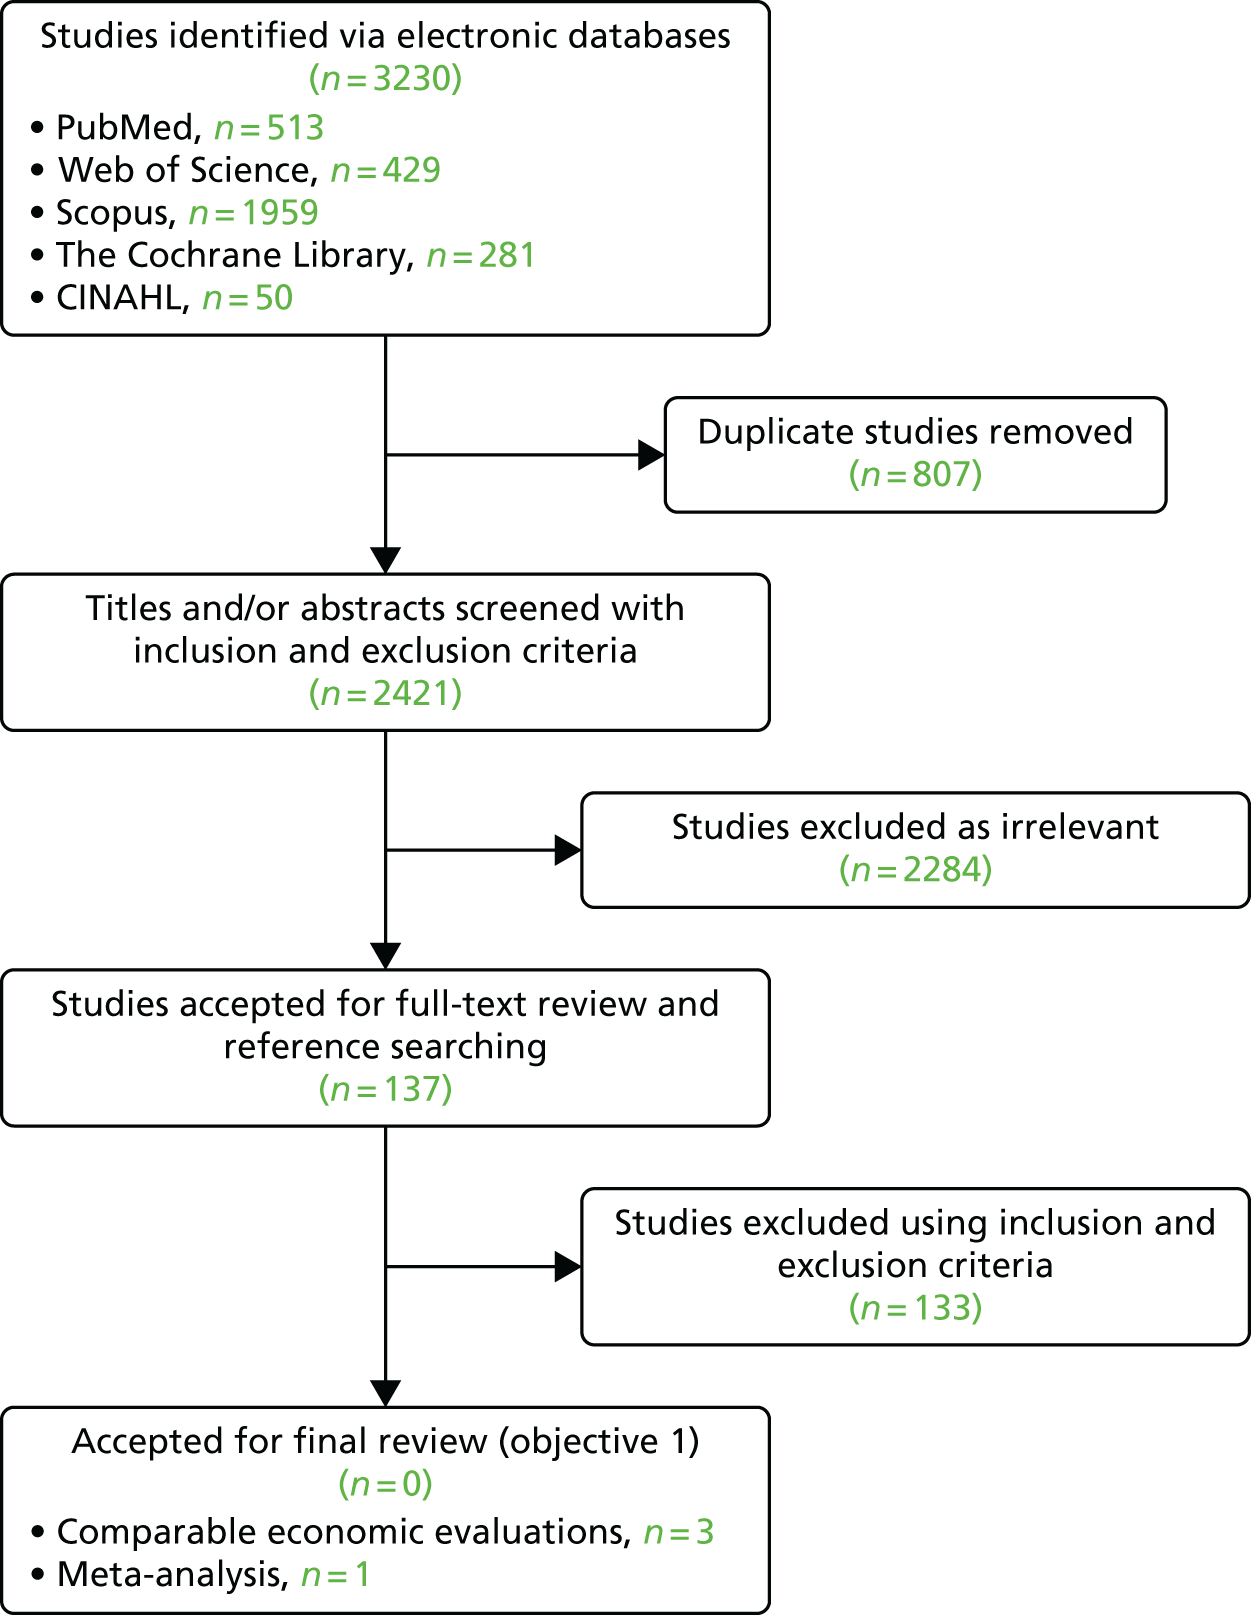
For objective 1, no papers were identified.
For objective 2, we identified three full economic evaluations that could provide suitable inputs for the OSTRICH model (i.e. Williamson et al. ,52 Mohiuddin et al. 59 and Mohiuddin et al. 60), alongside the NICE clinical guidance (CG60)42 for the surgical management of OME in children aged < 12 years. Another study (i.e. Petrou et al. 61) reported the economic evaluation within the Williamson et al. 52 report. The study will use the Williamson et al. 52 report as the main source, because of the completeness of reporting.
One Cochrane review (i.e. Venekamp et al. 62) was identified as a key source for potential clinical inputs from the literature. No suitable papers were identified to provide longer-term data inputs on HRQoL/utilities.
All parameters will be extracted from the relevant papers. None of the studies selected for objective 2 met the full PICO criteria for the OSTRICH trial (i.e. different age population, setting or intervention). Therefore, a decision was made that estimation of additional inputs (such utilities beyond 12 months) would have to be obtained and validated from additional spot searches and clinical opinion. When applicable, sensitivity analysis would be used to take into account any parameter variation that could have an impact on the health economic results. A comprehensive table would be included in a final report of the model-based analysis, which would document all parameters used in the model and their source.
Appendix 2 Subgroup analyses
All analyses were adjusted for site, child’s age group at recruitment (2–5 and 6–8 years), and time since recruitment of the 5-week assessment (in days).
Primary outcome by age group
| Treatment group | Age (years) | |||
|---|---|---|---|---|
| 2–5 | 6–8 | |||
| No resolution | Resolution | No resolution | Resolution | |
| Placebo, n (%) | 85 (66.4) | 43 (33.6) | 36 (69.2) | 16 (30.8) |
| Oral steroids, n (%) | 78 (62.4) | 47 (37.6) | 32 (55.2) | 26 (44.8) |
| Adjusted OR (95% CI) | 1.21 (0.72 to 2.03) | 1.74 (0.79 to 3.85) | ||
Primary outcome by atopy
| Treatment group | Atopy status | |||
|---|---|---|---|---|
| No atopy | Atopy | |||
| No resolution | Resolution | No resolution | Resolution | |
| Placebo, n (%) | 84 (66.1) | 43 (33.9) | 37 (69.8) | 16 (30.19) |
| Oral steroids, n (%) | 70 (60.3) | 46 (39.7) | 40 (59.7) | 27 (40.30) |
| Adjusted OR (95% CI) | 1.30 (0.77 to 2.21) | 1.49 (0.68 to 3.29) | ||
Primary outcome by antibiotics received for ear problems in the last month
| Treatment group | Antibiotics received | |||
|---|---|---|---|---|
| No antibiotics | Antibiotics | |||
| No resolution | Resolution | No resolution | Resolution | |
| Placebo, n (%) | 109 (65.3) | 58 (34.7) | 12 (92.3) | 1 (7.7) |
| Oral steroids, n (%) | 101 (61.2) | 64 (38.8) | 8 (47.1) | 9 (52.9) |
| Adjusted OR (95% CI) | 1.17 (0.74 to 1.85) | 11.80 (1.18 to 117.80) | ||
Primary outcome by number of previous episodes of otitis media with effusion
| Treatment group | Episodes of OME | |||
|---|---|---|---|---|
| Previous OME episode | First OME episode | |||
| No resolution | Resolution | No resolution | Resolution | |
| Placebo, n (%) | 36 (72.0) | 14 (28.0) | 85 (65.4) | 45 (34.6) |
| Oral steroids, n (%) | 39 (61.9) | 24 (38.1) | 71 (59.2) | 49 (40.8) |
| Adjusted OR (95% CI) | 1.83 (0.79 to 4.21) | 1.35 (0.80 to 2.29) | ||
Primary outcome by duration of problems attributable to this episode of otitis media with effusion
| Treatment group | Duration | |||
|---|---|---|---|---|
| < 12 months | ≥ 12 months | |||
| No resolution | Resolution | No resolution | Resolution | |
| Placebo, n (%) | 44 (63.8) | 25 (36.2) | 77 (69.4) | 34 (30.6) |
| Oral steroids, n (%) | 35 (60.3) | 23 (39.7) | 75 (60.5) | 49 (39.5) |
| Adjusted OR (95% CI) | 1.13 (0.54 to 2.33) | 1.51 (0.87 to 2.64) | ||
Primary outcome by previous tonsillectomy or adenoidectomy
| Treatment group | Tonsillectomy/adenoidectomy status | |||
|---|---|---|---|---|
| No previous | Previous | |||
| No resolution | Resolution | No resolution | Resolution | |
| Placebo, n (%) | 115 (67.3) | 56 (32.7) | 6 (66.7) | 3 (33.3) |
| Oral steroids, n (%) | 102 (60.0) | 68 (40.0) | 8 (61.5) | 5 (38.5) |
| Adjusted OR (95% CI) | 1.37 (0.88 to 2.13) | 1.02 (0.06 to 17.33) | ||
Primary outcome by household smoke present (> 5 hours a week)
| Treatment group | Smoking status | |||
|---|---|---|---|---|
| No smoke present in the home | Smoke present in the home | |||
| No resolution | Resolution | No resolution | Resolution | |
| Placebo, n (%) | 81 (64.3) | 45 (35.7) | 40 (74.1) | 14 (25.9) |
| Oral steroids, n (%) | 81 (59.6) | 55 (40.4) | 29 (61.7) | 18 (38.3) |
| Adjusted OR (95% CI) | 1.21 (0.73 to 2.02) | 1.81 (0.77 to 4.24) | ||
Primary outcome by season of recruitment
| Treatment group | Season | |||||||
|---|---|---|---|---|---|---|---|---|
| Spring | Summer | Autumn | Winter | |||||
| No resolution | Resolution | No resolution | Resolution | No resolution | Resolution | No resolution | Resolution | |
| Placebo, n (%) | 44 (71.0) | 18 (29.0) | 17 (58.6) | 12 (41.4) | 24 (80.0) | 6 (20.0) | 36 (61.0) | 23 (39.0) |
| Oral steroids, n (%) | 34 (51.5) | 32 (48.5) | 14 (46.7) | 16 (53.3) | 22 (68.8) | 10 (31.2) | 40 (72.7) | 15 (27.3) |
| Adjusted OR (95% CI) | 2.74 (1.20 to 6.23) | 2.02 (0.67 to 6.03) | 2.19 (0.60 to 7.99) | 0.62 (0.28 to 1.37) | ||||
Primary outcome by deprivation quintile
| Treatment group | Quintile | |||||||||
|---|---|---|---|---|---|---|---|---|---|---|
| 1 | 2 | 3 | 4 | 5 | ||||||
| No resolution | Resolution | No resolution | Resolution | No resolution | Resolution | No resolution | Resolution | No resolution | Resolution | |
| Placebo, n (%) | 20 (66.7) | 10 (33.3) | 121 (67.2) | 59 (32.8) | 33 (71.7) | 13 (28.3) | 32 (72.7) | 12 (27.3) | 28 (63.6) | 16 (36.4) |
| Oral steroids, n (%) | 15 (65.2) | 8 (35.8) | 110 (60.1) | 73 (39.9) | 28 (63.6) | 16 (36.4) | 26 (56.5) | 20 (43.5) | 32 (66.7) | 16 (33.3) |
| Adjusted OR (95% CI) | 0.94 (0.28 to 3.18) | 1.25 (0.30 to 5.25) | 1.37 (0.56 to 3.37) | 1.91 (0.77 to 4.73) | 0.92 (0.38 to 2.26) | |||||
Appendix 3 Symptom score histograms by week (post randomisation)
Symptom scores from 0 to 6, that is, from ‘symptom not present at all’ to ‘symptom is as bad as it could be’; 7 = do not know.
FIGURE 20.
Hearing. (a) Week 1; (b) week 2; (c) week 3; (d) week 4; and (e) week 5.

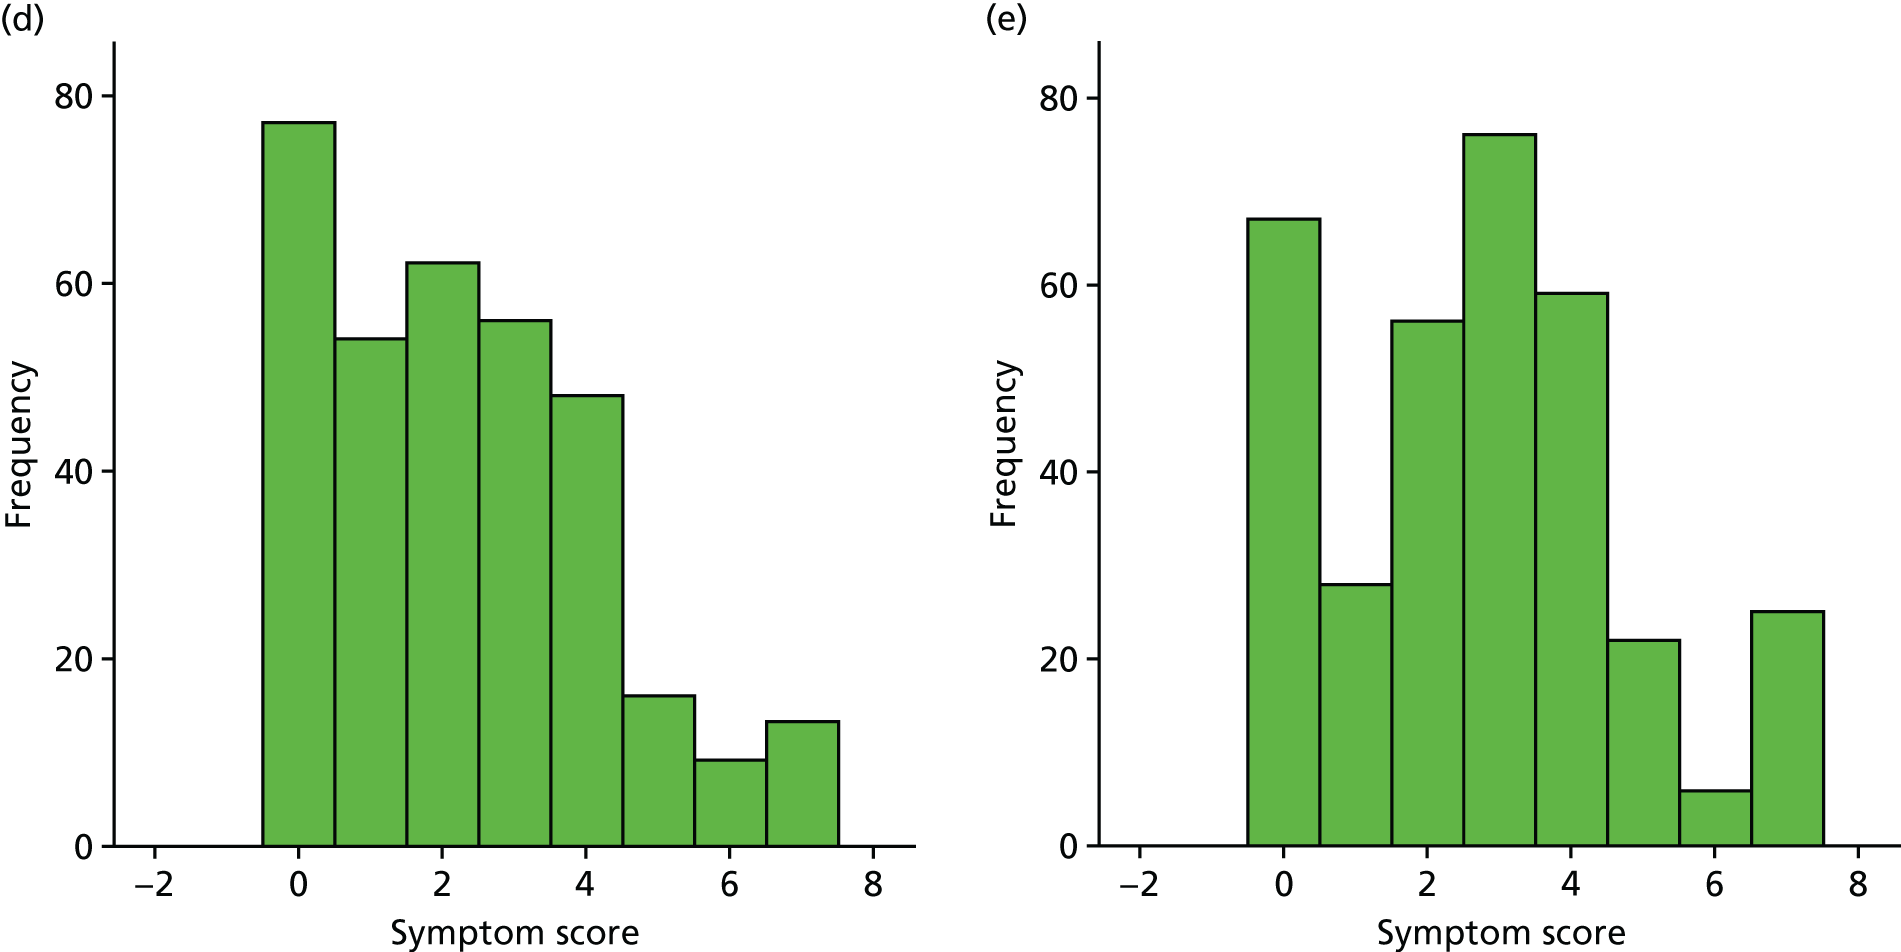
FIGURE 21.
Ear pain. (a) Week 1; (b) week 2; (c) week 3; (d) week 4; and (e) week 5.

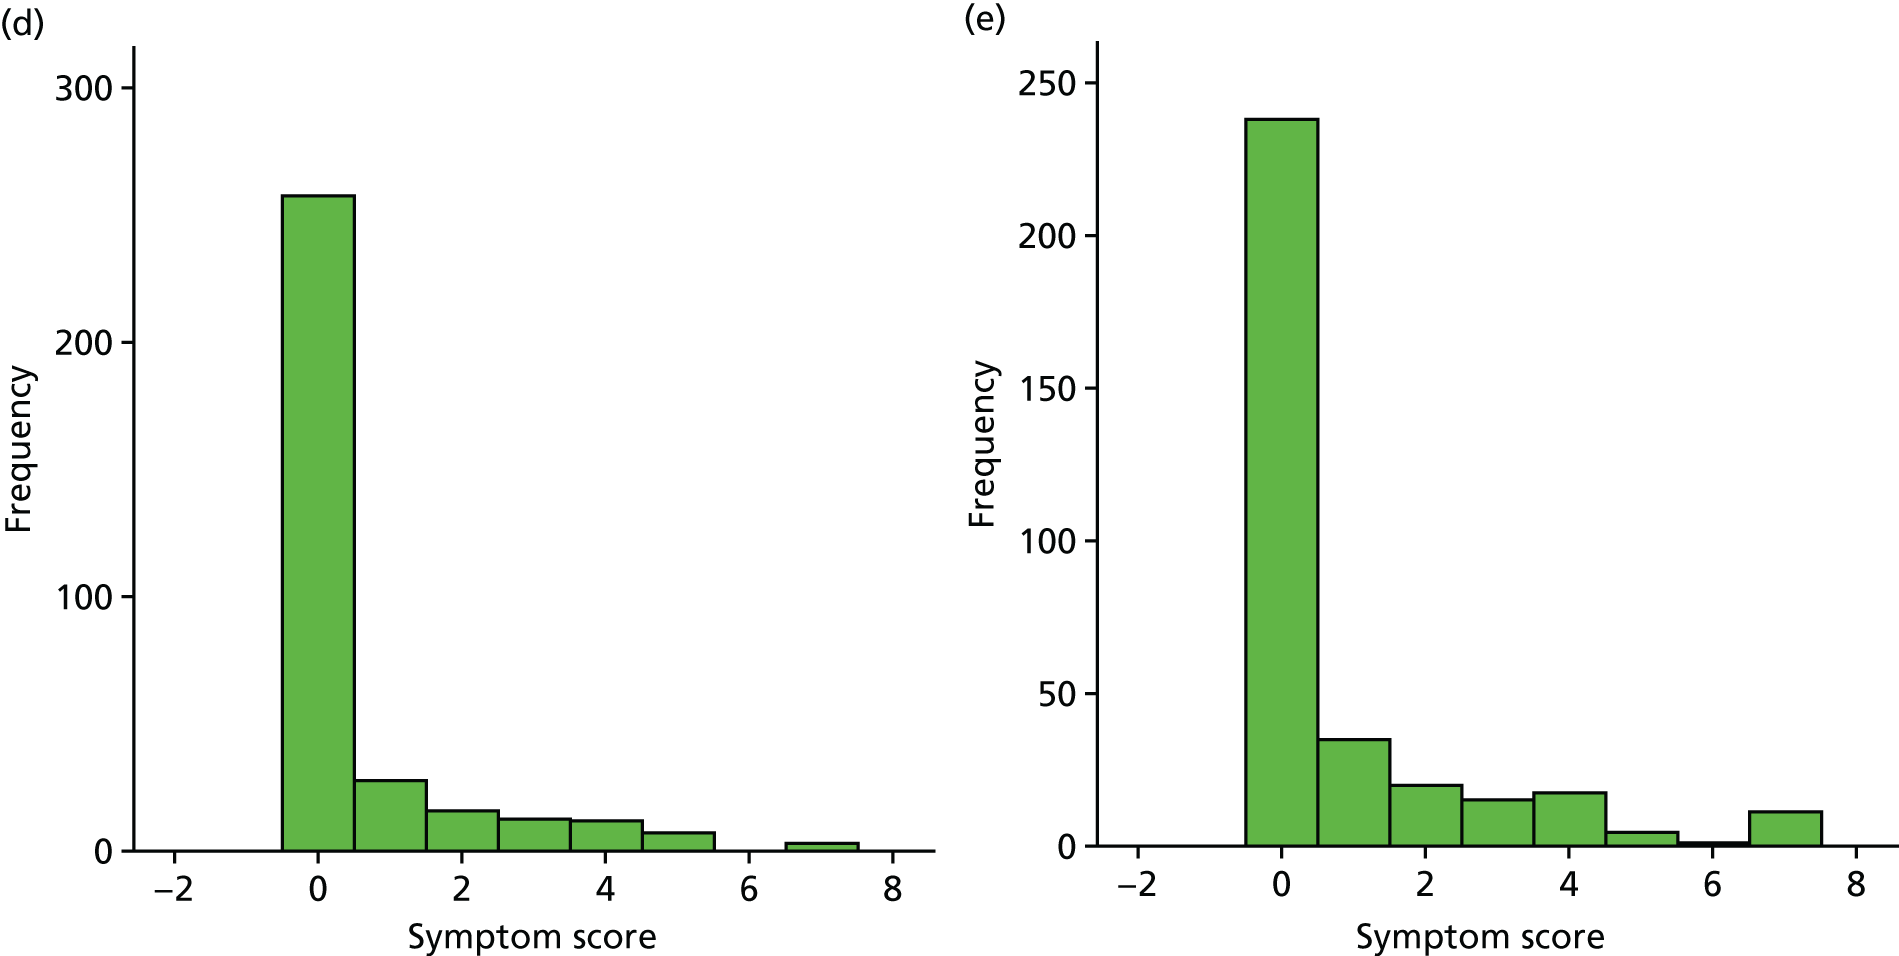
FIGURE 22.
Speech. (a) Week 1; (b) week 2; (c) week 3; (d) week 4; and (e) week 5.
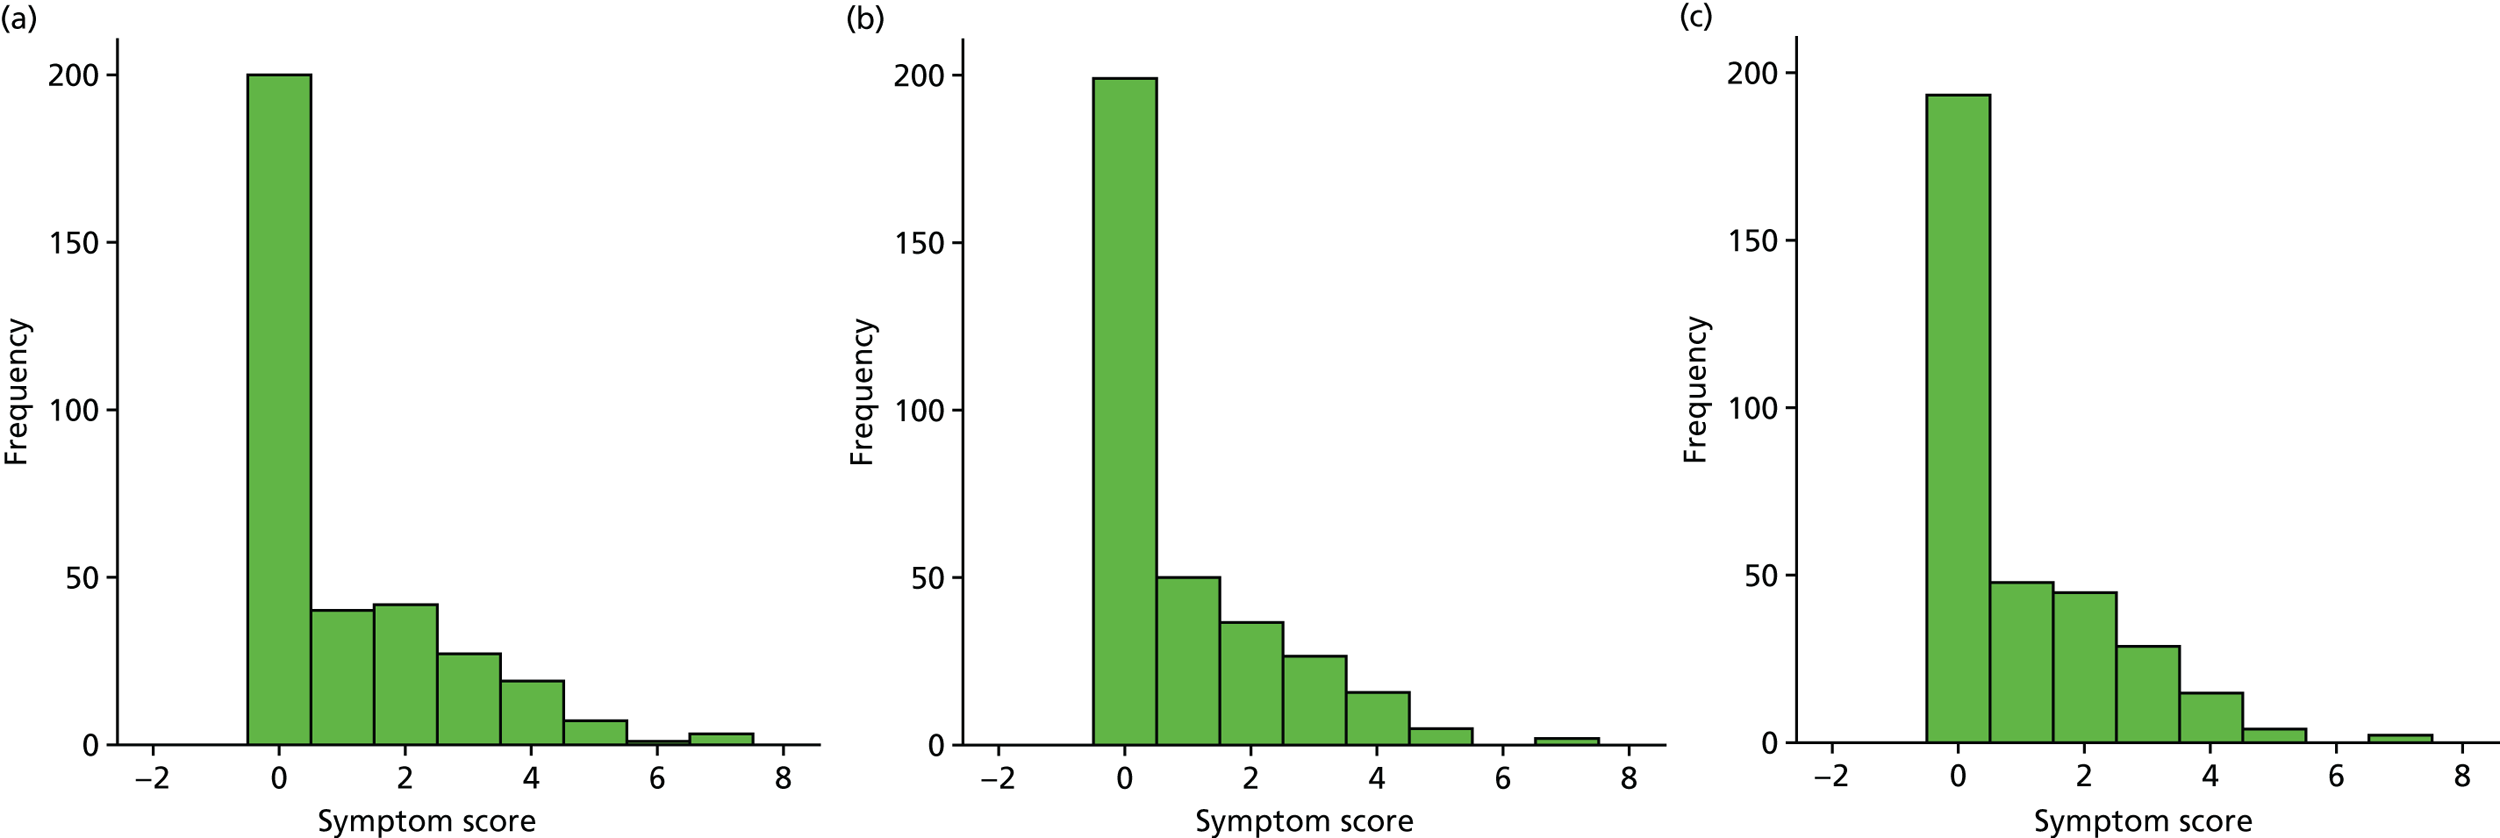
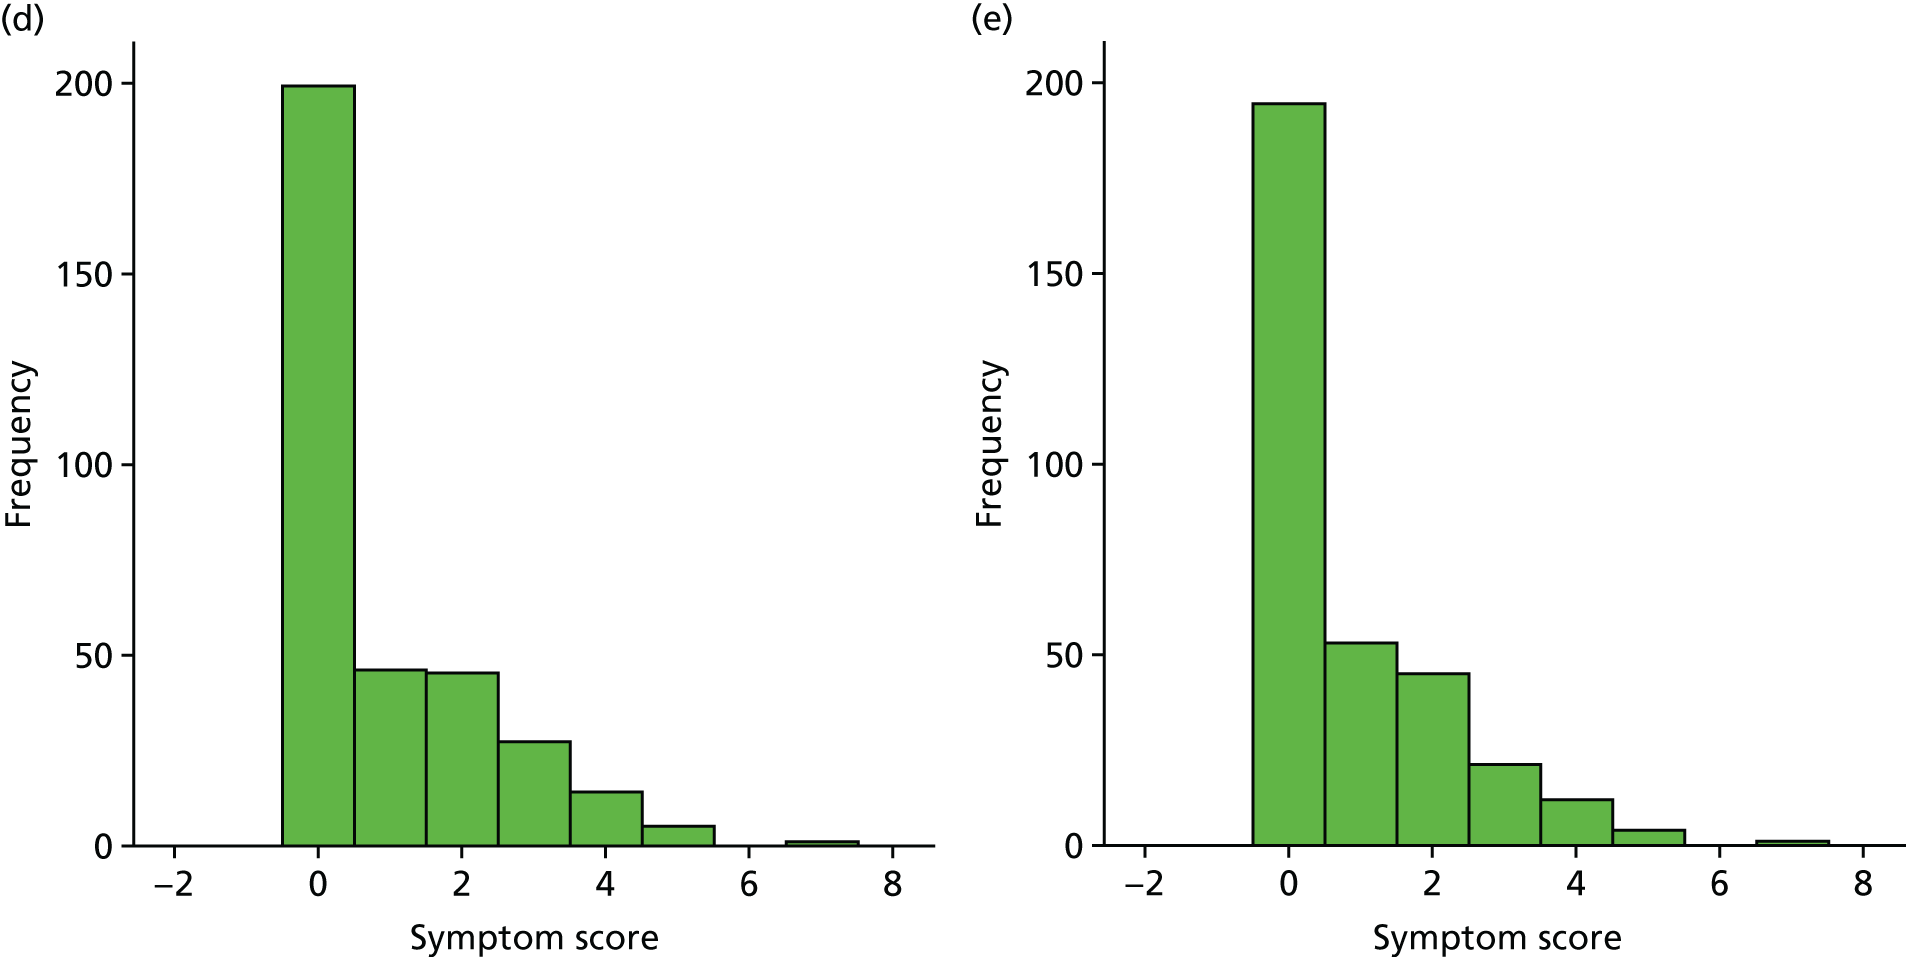
FIGURE 23.
Energy levels. (a) Week 1; (b) week 2; (c) week 3; (d) week 4; and (e) week 5.
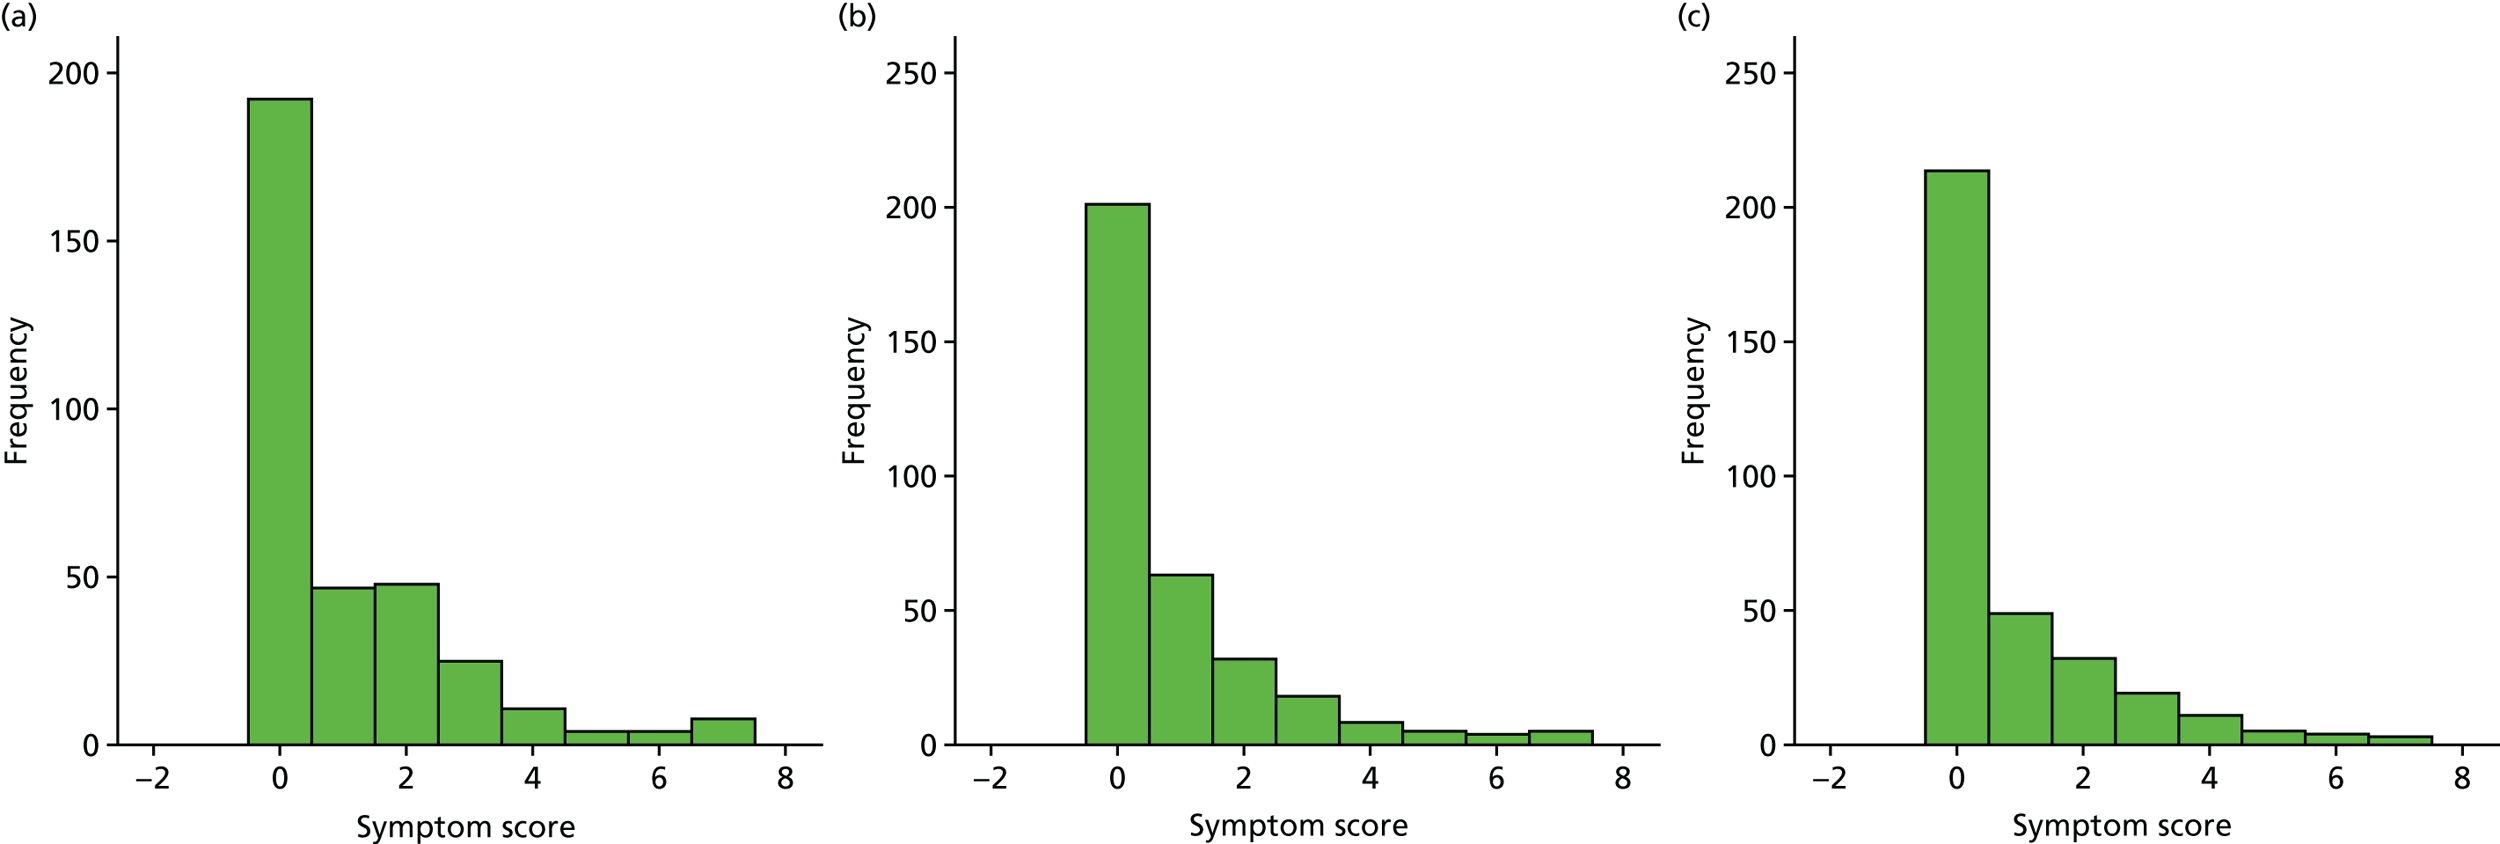
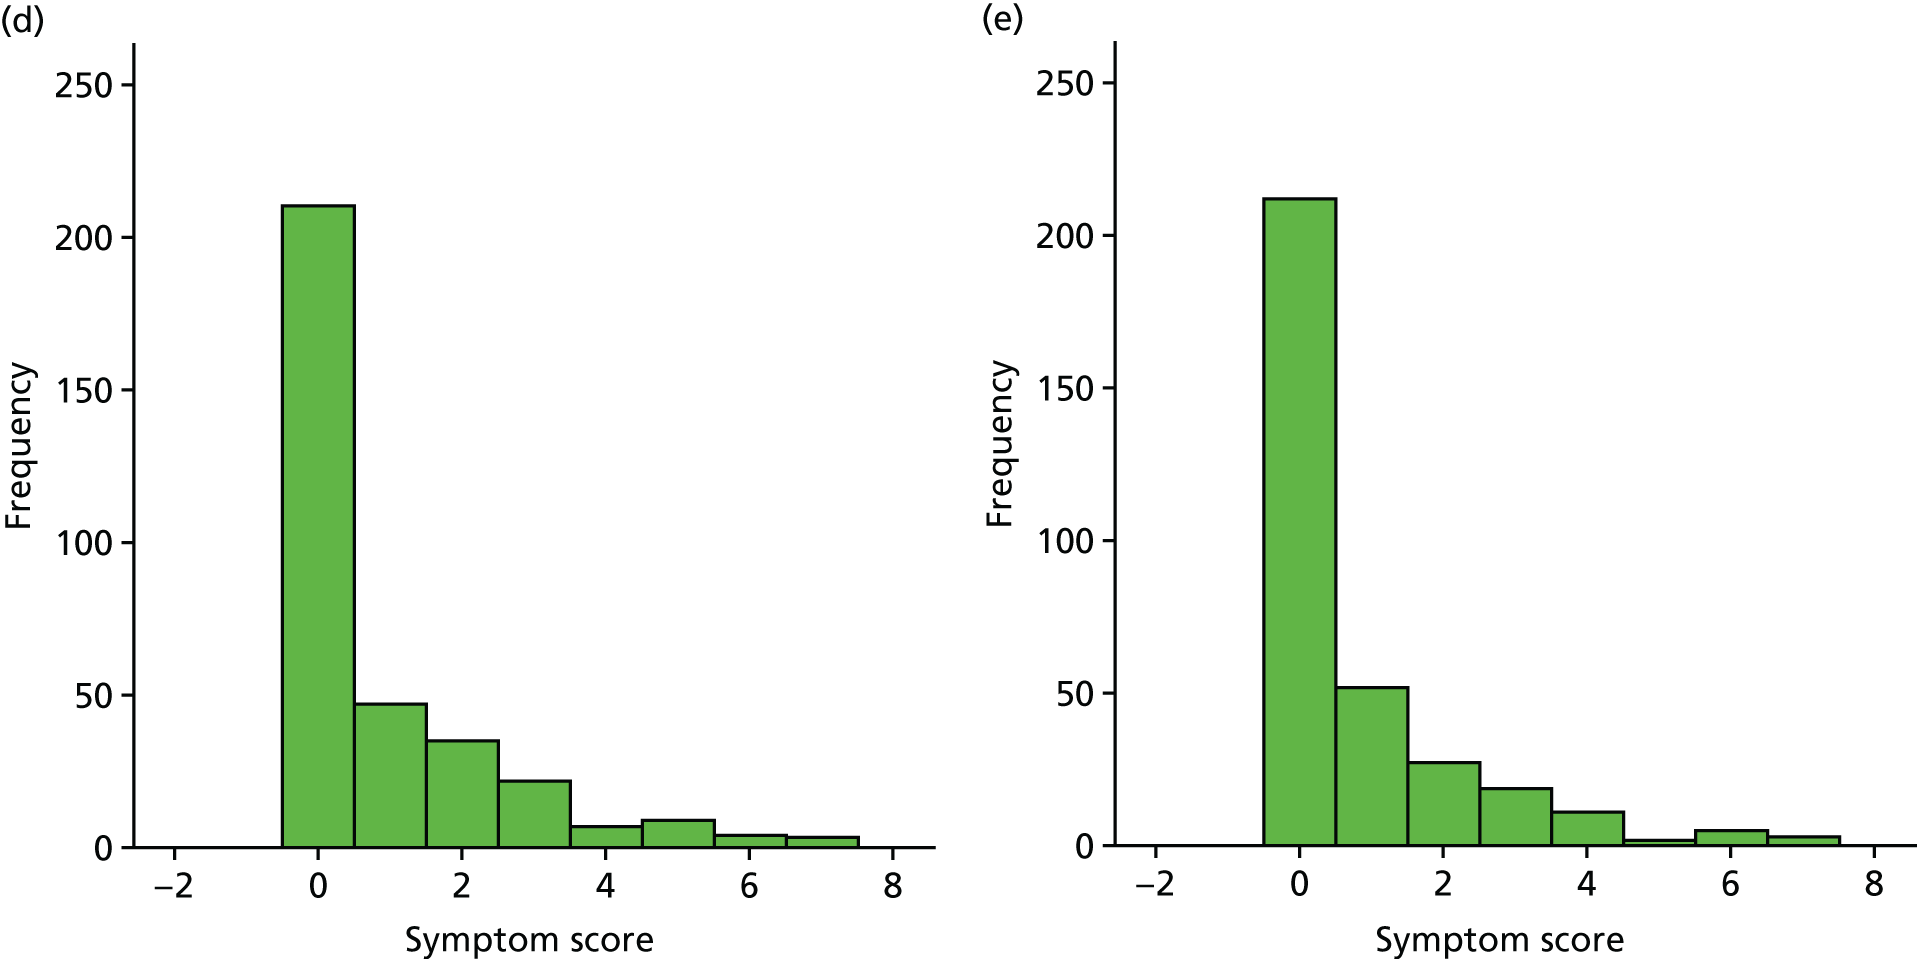
FIGURE 24.
Sleep. (a) Week 1; (b) week 2; (c) week 3; (d) week 4; and (e) week 5.
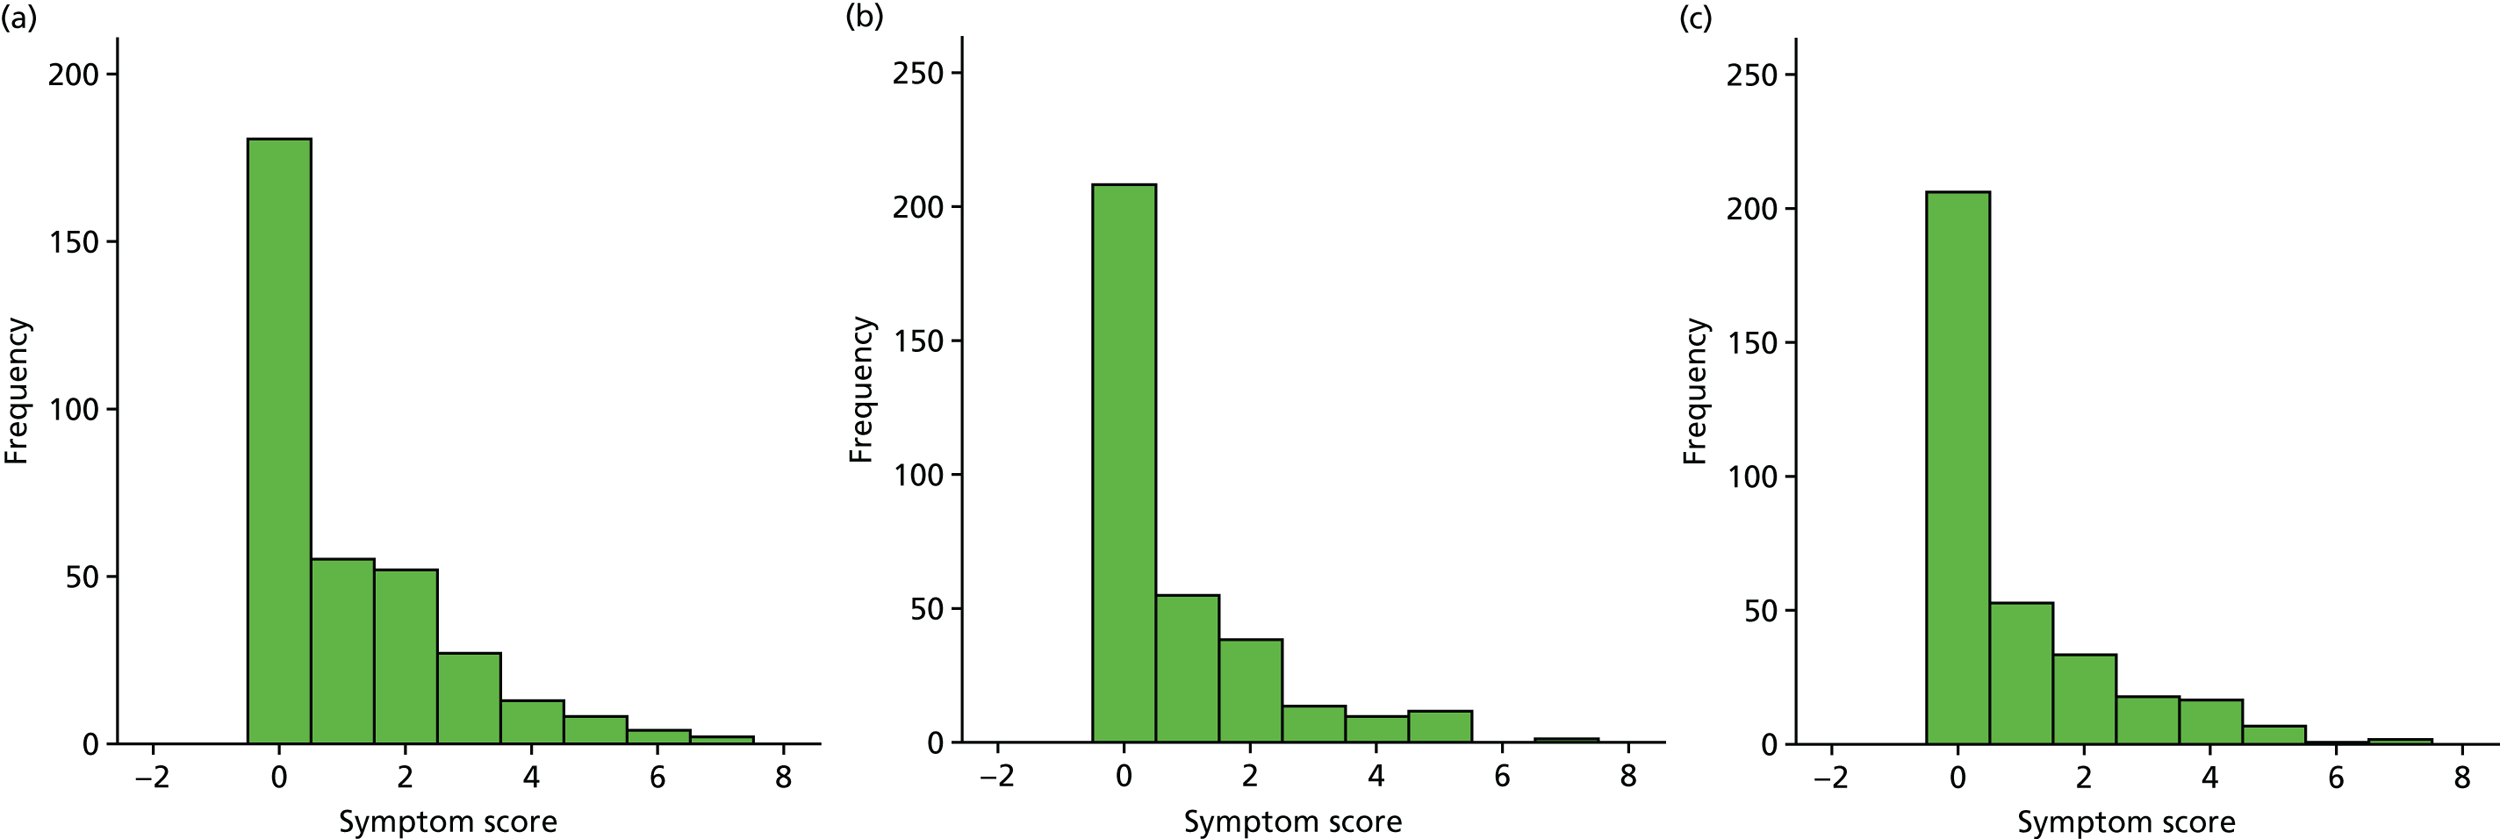
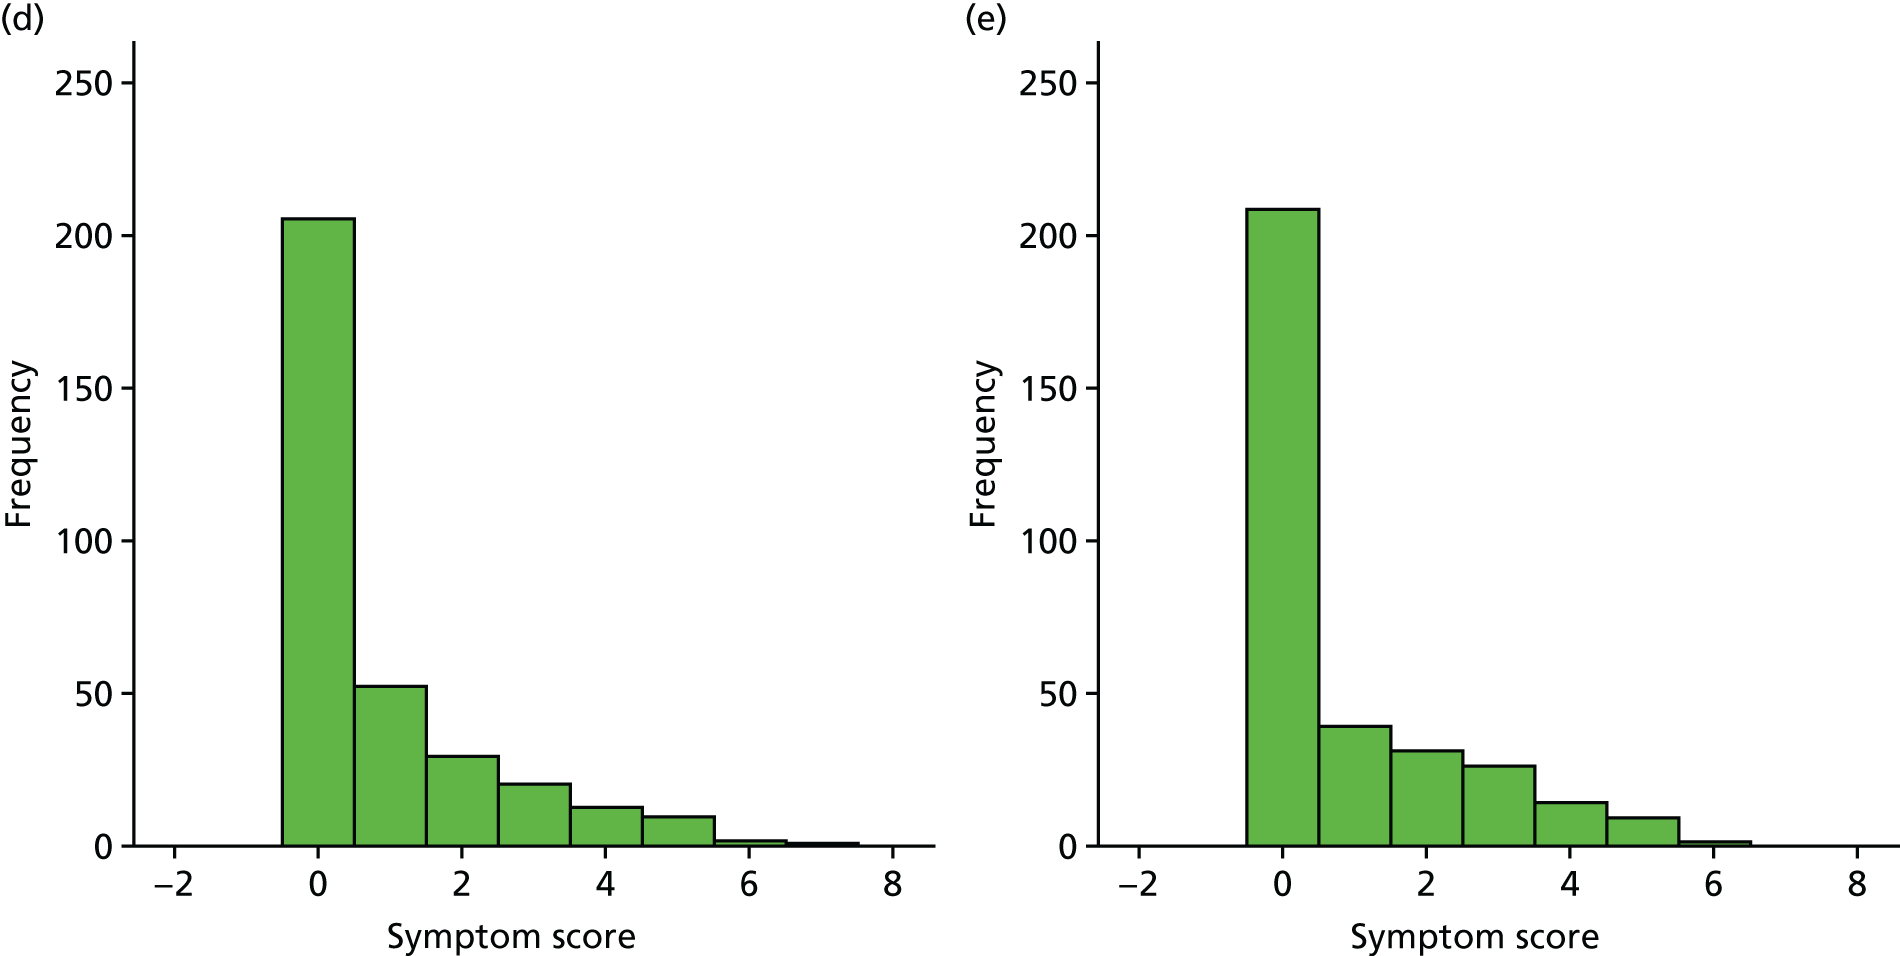
FIGURE 25.
Attention span. (a) Week 1; (b) week 2; (c) week 3; (d) week 4; and (e) week 5.
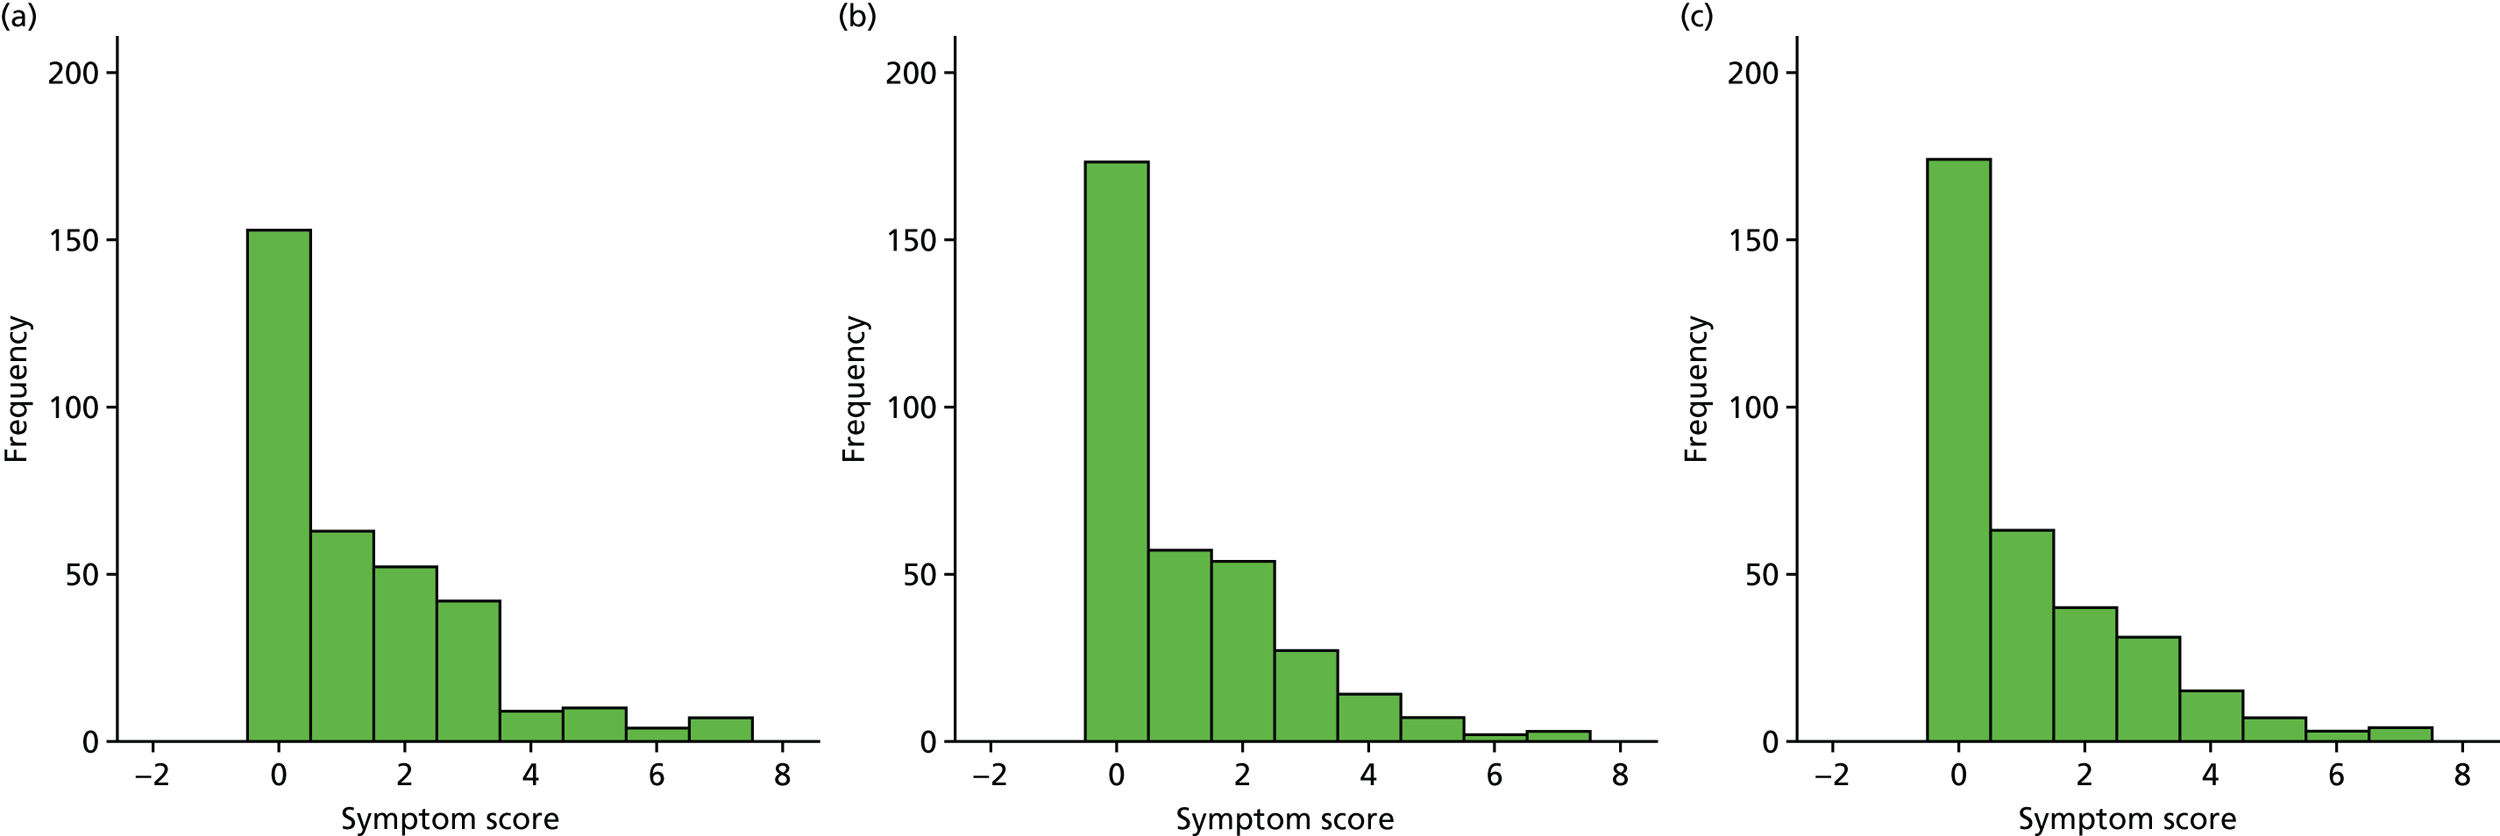
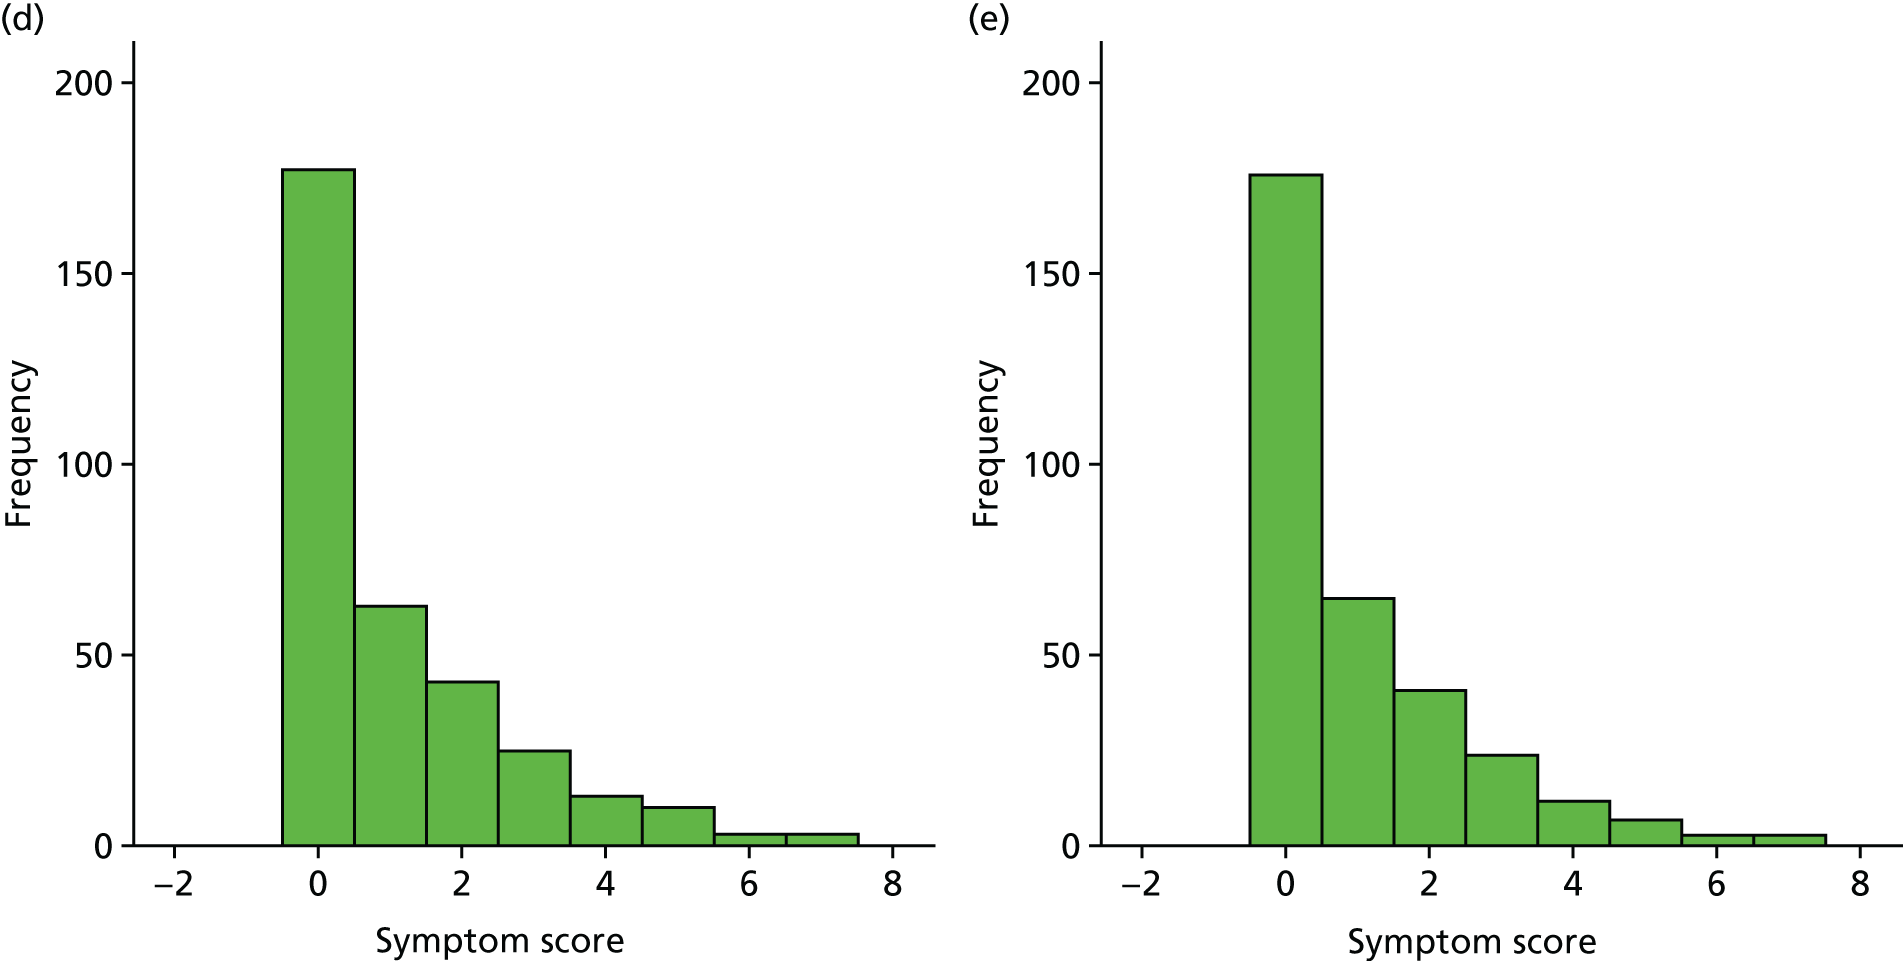
FIGURE 26.
Balance. (a) Week 1; (b) week 2; (c) week 3; (d) week 4; and (e) week 5.
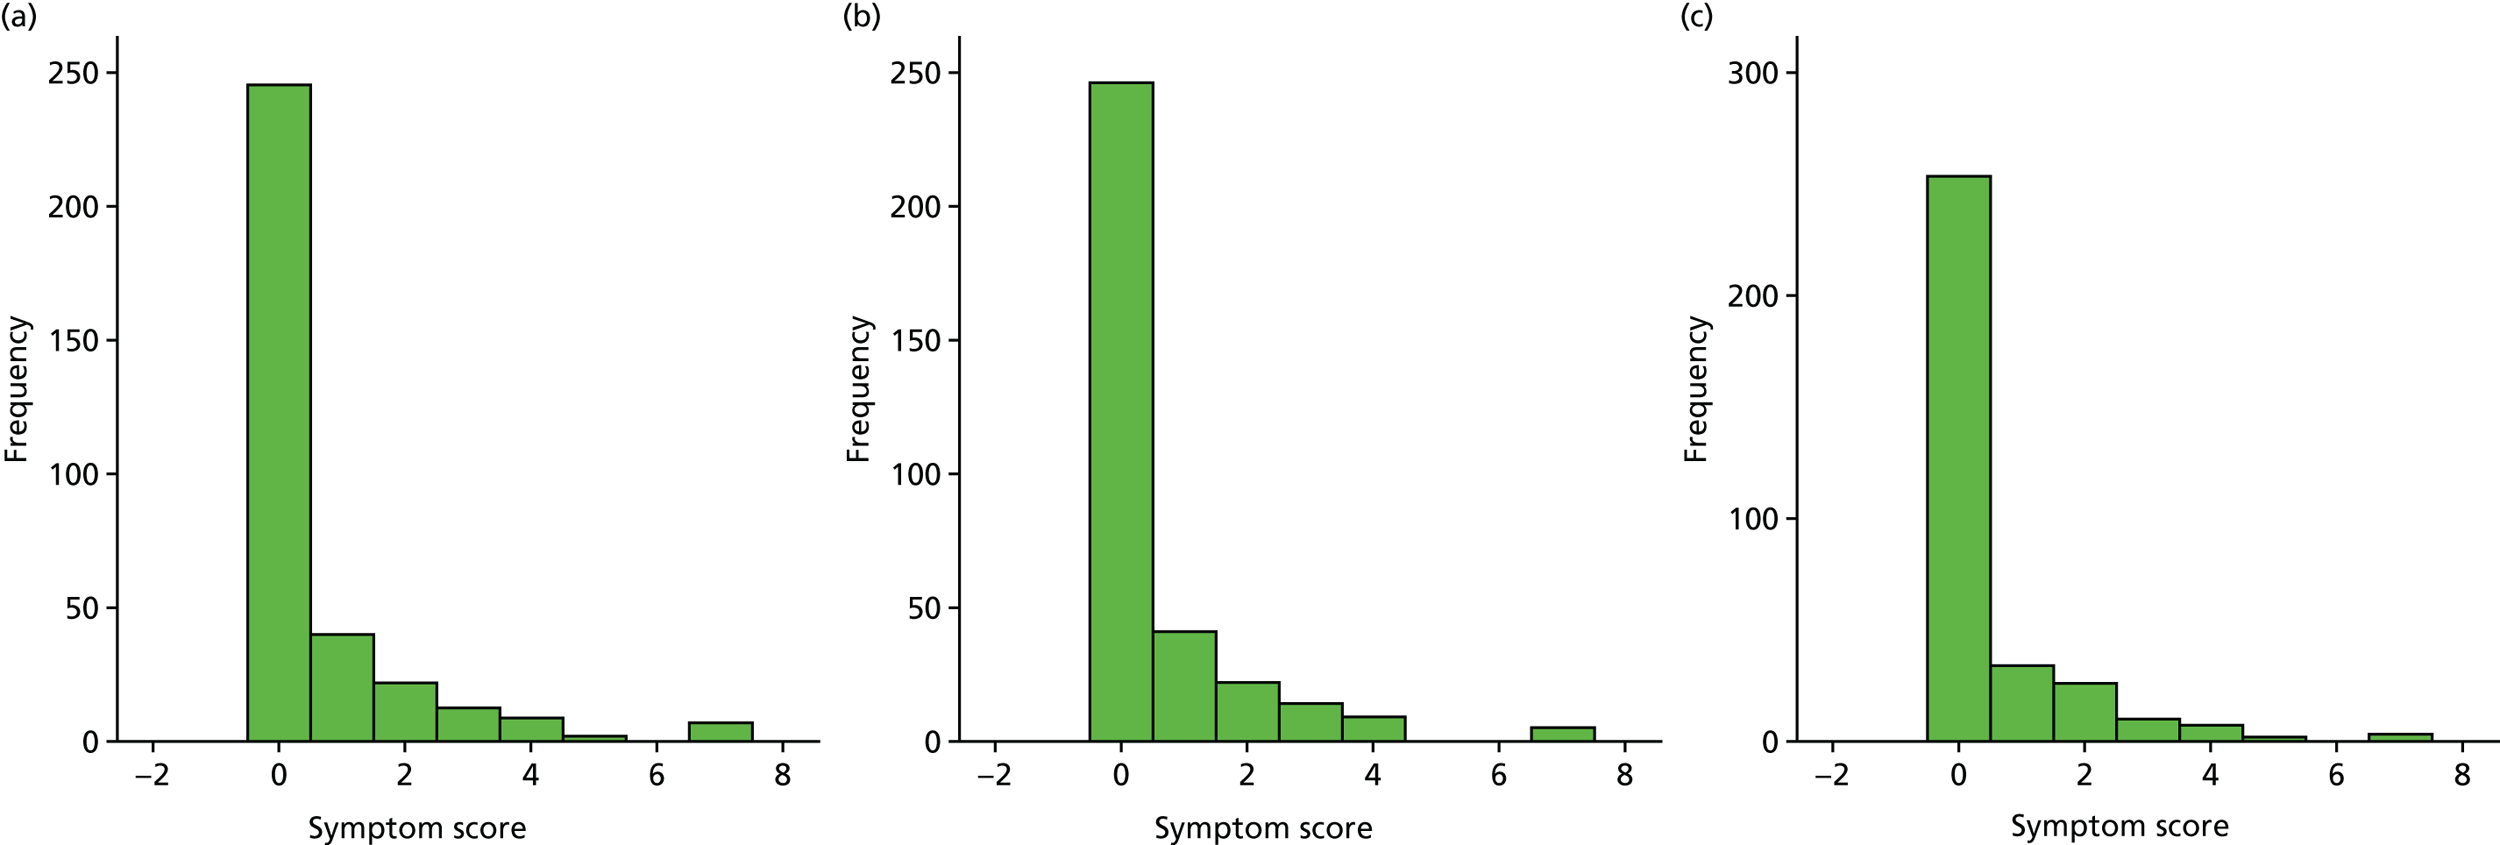
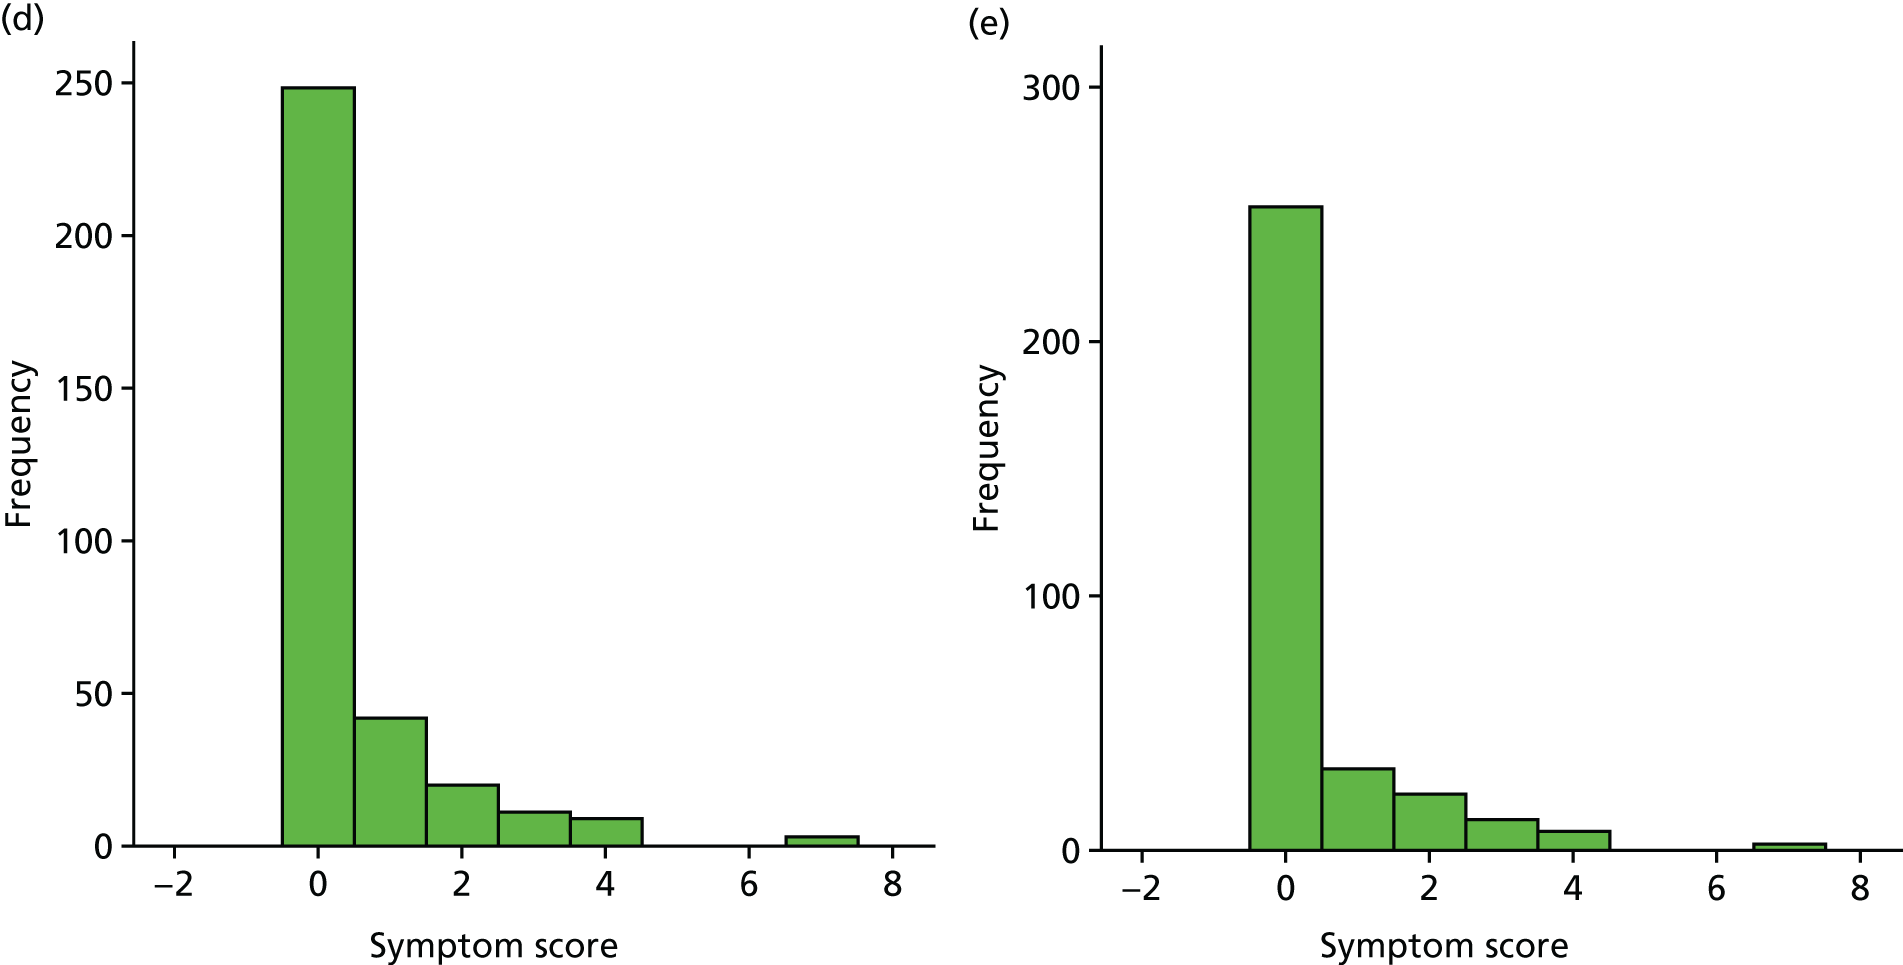
FIGURE 27.
Generally unwell. (a) Week 1; (b) week 2; (c) week 3; (d) week 4; and (e) week 5.
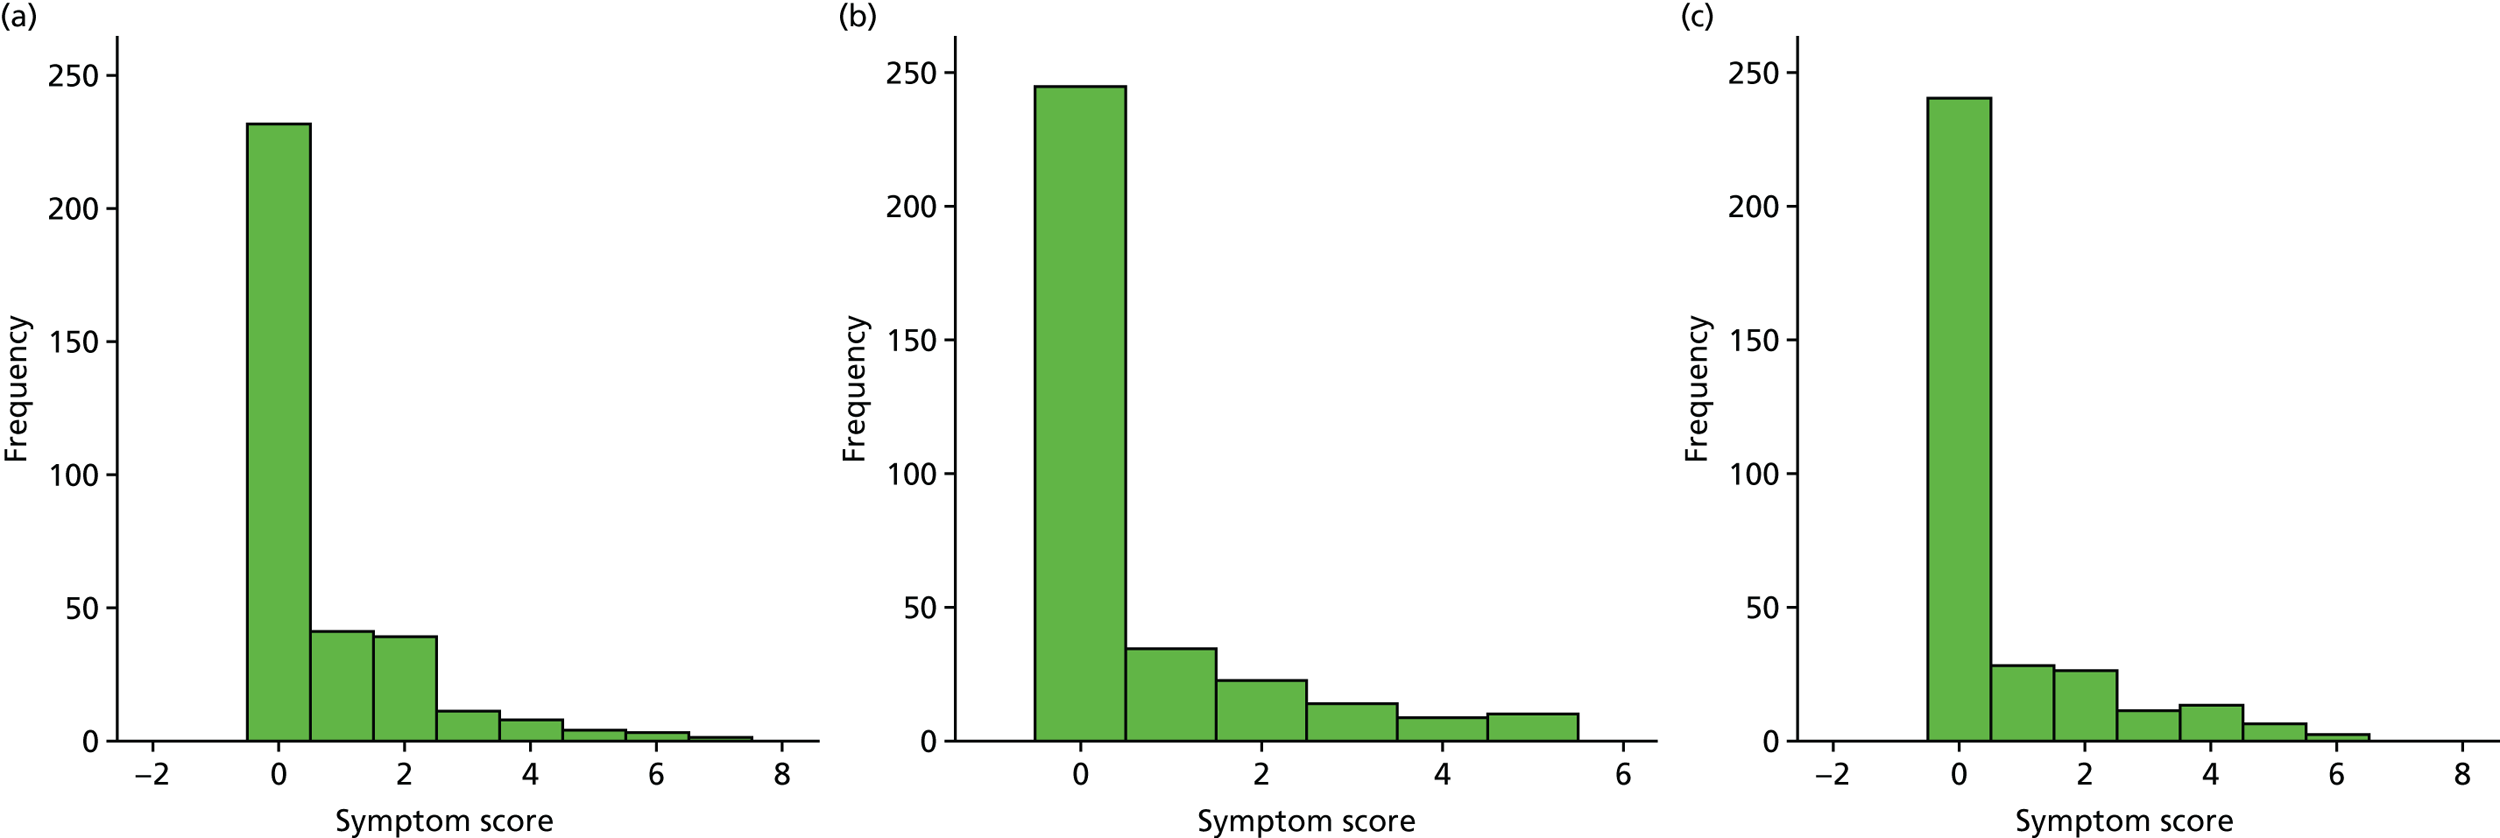
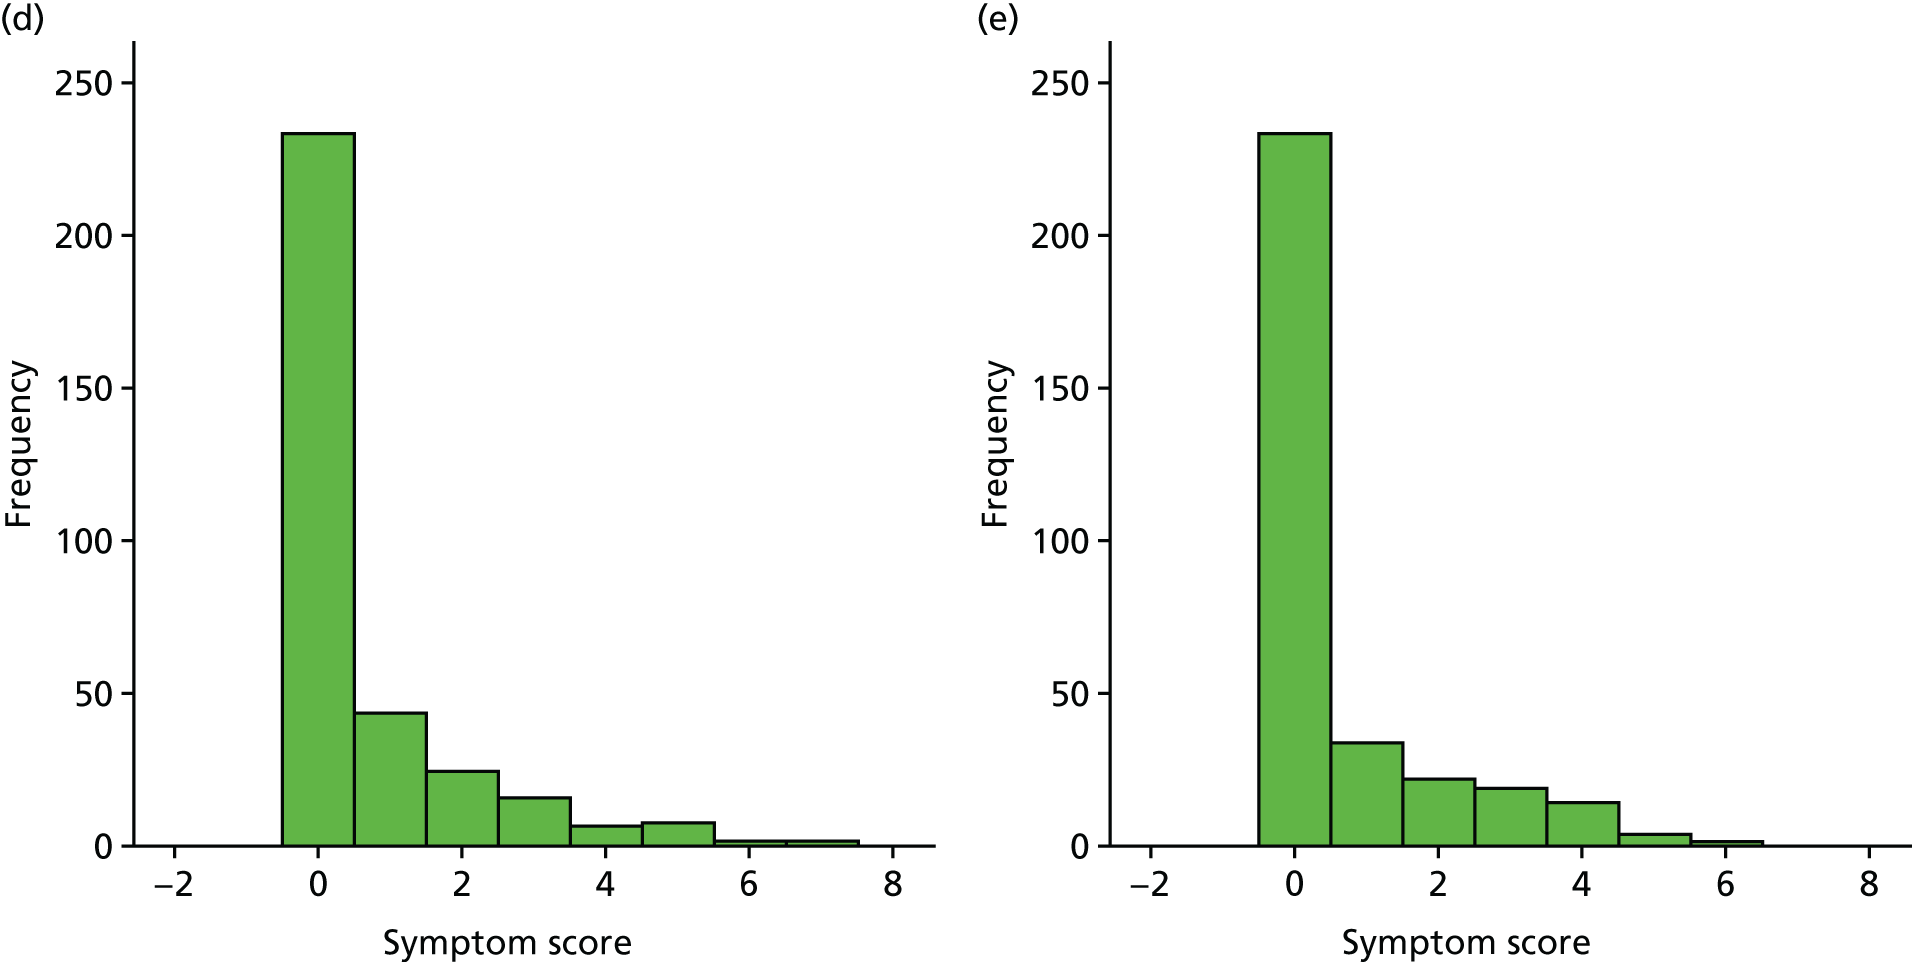
Appendix 4 Parent-reported adverse events from diaries at 1 week post medication
| Adverse events | Treatment group, n (% total children) | |
|---|---|---|
| Placebo (N = 170) | Oral steroid (N = 179) | |
| Number of problems reported | 148 (87.1) | 154 (86.0) |
| Children reported with having at least one problem | 22 (12.9) | 25 (14.0) |
| Total number of problems | 24 | 27 |
| Respiratory tract infection | ||
| Phlegmy cough/cold/sneezing/temperature/nosebleed/conjunctivitis/itchy eyes/generally unwell | 2 | 7 |
| Headache | 3 | 4 |
| Parotitis | 1 | 0 |
| Ear pain on touch/earache | 1 | 1 |
| Rash/pox/scarlet fever | 2 | 0 |
| Flushed cheeks | 0 | 1 |
| Digestion | ||
| Increased appetite | 4 | 3 |
| Low appetite | 2 | 0 |
| Diarrhoea | 2 | 2 |
| Constipation | 1 | 1 |
| Nausea | 0 | 1 |
| Behaviour | ||
| Hyperactive | 1 | 3 |
| Tired | 1 | 1 |
| Frustration | 1 | 0 |
| Change in behaviour | 0 | 2 |
| Parent states child not hearing | 1 | 0 |
| Sleep walking | 0 | 1 |
| Other | ||
| Finger infection | 1 | 0 |
| Knee pain | 1 | 0 |
Appendix 5 Summary of unit costs
| Component | Unit costs (£) | References |
|---|---|---|
| Soluble prednisolone tablets | ||
| Aged 2–5 years, 20 mg daily | 50.76 | BNF (2015)37 – 28 tablets |
| Aged 6–8 years, 30 mg daily | 76.14 | BNF (2015)37 – 42 tablets |
| GP | ||
| Normal hours | 46.00 | PSSRU (2016)40 |
| Out of hours | 68.65 | PSSRU (2014)63 – cost £68.30; inflated to January 2016 using inflation rate of 1.005% |
| Home visit | 75.40 | PSSRU (2016)40 – £46.00 for GP contact plus £29.40 (12-minute travel time at £147 per hour) |
| Telephone call | 11.25 | PSSRU (2016)40 – average of £7.90 (nurse) and £11.25 (GP) |
| Medication | ||
| Prescription dispensing cost | 3.50 | |
| Nurse | ||
| Practice nurse | 22.50 | PSSRU (2014)63 – 60 contacts per week; PSSRU (2016)40 weekly cost of £1350 |
| Community nurse | 39.00 | PSSRU (2016)40 |
| A&E | 136.00 | NHS Reference Costs 2015 to 2016 41 |
| Outpatient hospital clinic | 146.01 | NHS Reference Costs 2015 to 2016 41 |
| Inpatient hospital stay | 2385.27 | NHS Reference Costs 2015 to 201641 – average length of stay of 1.2 days, excess day cost of £371.96 |
| NHS speech and language therapy | ||
| Community based | 89.00 | PSSRU (2016)40 |
| Hospital clinic | 67.00 | PSSRU (2014)63 |
| NHS Direct | 7.90 | PSSRU (2016)40 |
| Interventions | ||
| Ventilation tubes | 944.00 | NHS Reference Costs 2015 to 2016 41 |
| Tonsillectomy | 1326.00 | NHS Reference Costs 2015 to 2016 41 |
| Adenoidectomy | 1238.00 | NHS Reference Costs 2015 to 2016 41 |
| AI device | 5.88 | NICE guideline64 |
| Hearing aid | 132.20 | Morris et al.65 |
| Social costs | ||
| Mileage costs (per mile) | 0.45 | HMRC rate45 |
| Missed work costs | 70.07 | Manning et al.44 |
Appendix 6 Paediatric Quality of Life Inventory scores over 12 months by group using complete cases
| Time point | Treatment group | Mean difference (95% CI) | p-value | |
|---|---|---|---|---|
| Placebo | Oral steroid | |||
| PedsQL score | ||||
| Baseline | 80.2 | 78.7 | –2.19 (–5.77 to 1.40) | 0.231 |
| Week 5 | 81.5 | 79.9 | –2.17 (–6.34 to 2.00) | 0.306 |
| 6 months | 80.7 | 80.1 | –0.45 (–4.75 to 3.84) | 0.835 |
| 12 months | 82.5 | 82.7 | 0.26 (–3.77 to 4.30) | 0.898 |
| PedsQL score over 12 months | 81.4 | 80.6 | 0.58 (–1.84 to 3.00) | 0.635 |
Appendix 7 Utilities and quality-adjusted life-year gains at 12 months using complete cases
| Utilities and QALYs | Treatment group | Mean difference (95% CI) | p-value | |
|---|---|---|---|---|
| Placebo | Oral steroid | |||
| HUI3 utilities | ||||
| Baseline | 0.778 | 0.756 | –0.023 (–0.081 to 0.035) | 0.436 |
| Week 5 | 0.780 | 0.793 | 0.009 (–0.058 to 0.075) | 0.799 |
| 6 months | 0.841 | 0.822 | –0.016 (–0.076 to 0.043) | 0.587 |
| 12 months | 0.852 | 0.851 | 0.000 (0.053 to 0.054) | 0.991 |
| QALYs | ||||
| Unadjusted QALYs | 0.826 | 0.819 | –0.006 (–0.056 to 0.043) | 0.801 |
| Baseline-adjusted QALYa | 0.048 | 0.063 | 0.017 (–0.033 to 0.066) | 0.503 |
Appendix 8 Utilities and quality-adjusted life-year gains at 12 months, including values imputed from mapping Otitis Media Questionnaire data to Health Utilities Index, version 3 utilities: complete cases
| Utilities and QALYs | Treatment group | Mean difference (95% CI) | p-value | |
|---|---|---|---|---|
| Placebo | Oral steroid | |||
| HUI3-mapped utilities | ||||
| Baseline | 0.965 | 0.956 | –0.009 (–0.019 to 0.000) | 0.053 |
| Week 5 | 0.971 | 0.964 | –0.008 (–0.019 to 0.002) | 0.126 |
| 6 months | 0.996 | 0.988 | –0.006 (–0.017 to 0.005) | 0.261 |
| 12 months | 0.997 | 0.989 | –0.008 (–0.019 to 0.002) | 0.122 |
| QALYs | ||||
| Unadjusted QALYs | 0.988 | 0.981 | –0.002 (–0.019 to 0.002) | 0.563 |
| Adjusted QALYa | 0.023 | 0.025 | 0.002 (–0.008 to 0.005) | 0.594 |
Appendix 9 Base-case and sensitivity analysis for the primary cost-effectiveness analysis (incremental cost per acceptable hearing resolution at 12 months): limited societal costs
| Parameter | Incremental | ICER [cost (£) per additional hearing resolution] | |
|---|---|---|---|
| Cost (£) | Effect | ||
| Base case | 160 | 5.8% | £2759 per additional hearing resolution |
| Upper 95% bound of net cost and upper 95% bounda of % successful hearing resolution | 500 | 17.2% | £2907 cost per additional hearing resolution |
| Upper 95% bounda of net cost and lower 95% bounda of % successful hearing resolution | 500 | –5.5% | Oral steroid dominated by placebo |
| Lower 95% bounda of net cost and upper 95% bounda of % successful hearing resolution | –181 | 17.2% | Oral steroid dominates placebo |
| Lower 95% bounda of net cost and lower 95% bounda of % successful hearing resolution | –181 | –5.5% | £3291 saved per reduction in adequate hearing |
Appendix 10 Results from the base-case and sensitivity analysis for the primary cost–utility analysis (incremental cost per quality-adjusted life-year gain at 12 months): limited societal costs
| Parameter | Incremental | ICER [cost (£) per quality-adjusted life-year gain] | |
|---|---|---|---|
| Cost (£) | Effect | ||
| Base case (values using multiple imputed costs and QALYs) | 114 | –0.015 | Oral steroid treatment dominated by placebo |
| Upper 95% bound of net cost and upper 95% bound of QALY gain | 406 | 0.024 | £16,917 |
| Upper 95% bound of net cost and lower 95% bound of QALY gain | 406 | –0.054 | Oral steroid treatment dominated by placebo |
| Lower 95% bound of net cost and upper 95% bound QALY gain | –178 | 0.024 | Oral steroid treatment dominates placebo |
| Lower 95% bound of net cost | –178 | –0.054 | £3296 saved per QALY lost |
List of abbreviations
- A&E
- accident and emergency
- AI
- autoinflation
- AIC
- Akaike information criterion
- AUC
- area under the curve
- AVM
- audiovestibular medicine
- CACE
- complier average causal effect
- CEA
- cost-effectiveness analysis
- CEAC
- cost-effectiveness acceptability curve
- CI
- confidence interval
- CONSORT
- Consolidated Standards of Reporting Trials
- CRF
- case report form
- CRN
- Clinical Research Network
- CTIMP
- clinical trial of an investigational medicinal product
- CUA
- cost–utility analysis
- dBHL
- decibels hearing level
- ENT
- ear, nose and throat
- EQ-5D-Y
- EuroQol-5 Dimensions, youth
- GP
- general practitioner
- HMRC
- HM Revenue and Customs
- HR
- hazard ratio
- HRQoL
- health-related quality of life
- HUI3
- Health Utilities Index, version 3
- ICER
- incremental cost-effectiveness ratio
- IDMC
- Independent Data Monitoring Committee
- IMP
- investigational medicinal product
- IRR
- incidence rate ratio
- ITT
- intention to treat
- MHRA
- Medicines and Healthcare products Regulatory Agency
- MI
- multiple imputation
- NICE
- National Institute for Health and Care Excellence
- NIHR
- National Institute for Health Research
- NNT
- number needed to treat
- OM8-30
- Otitis Media Questionnaire
- OME
- otitis media with effusion
- OR
- odds ratio
- OSTRICH
- Oral STeroids for the Resolution of otitis media with effusion In CHildren
- OTC
- over the counter
- PedsQL
- Paediatric Quality of Life Inventory
- PICO
- population, intervention, comparison, outcome
- PIS
- patient information sheet
- PP
- per protocol
- PPI
- patient and public involvement
- PSSRU
- Personal Social Services Research Unit
- PTA
- pure-tone audiometry
- QALY
- quality-adjusted life-year
- QoL
- quality of life
- R&D
- research and development
- REC
- Research Ethics Committee
- RR
- relative risk
- SAP
- statistical analysis plan
- SD
- standard deviation
- TS
- trial statistician
- TSC
- Trial Steering Committee
- VRA
- visual reinforcement audiometry
- WTP
- willingness to pay
