Notes
Article history
The research reported in this issue of the journal was funded by the HTA programme as project number 15/80/30. The contractual start date was in November 2016. The draft report began editorial review in July 2018 and was accepted for publication in February 2019. The authors have been wholly responsible for all data collection, analysis and interpretation, and for writing up their work. The HTA editors and publisher have tried to ensure the accuracy of the authors’ report and would like to thank the reviewers for their constructive comments on the draft document. However, they do not accept liability for damages or losses arising from material published in this report.
Declared competing interests of authors
Rod S Taylor is currently co-chief investigator on a National Institute for Health Research (NIHR)-funded programme grant designing and evaluating the clinical effectiveness and cost-effectiveness of a home-based cardiac rehabilitation intervention for patients who have experienced heart failure (RP-PG-1210-12004). He is also a member of the NIHR Priority Research Advisory Methodology Group (August 2015–present). Previous roles include the NIHR South West Research for Patient Benefit Committee South West (2010–14); core group of methodological experts for the NIHR Programme Grants for Applied Research programme (2013–October 2017); NIHR Health Technology Assessment (HTA) Themed Call Board (2012–14); NIHR HTA General Board (2014–June 2017); and chairperson of the NIHR Health Services and Delivery Research Researcher-led Panel (March 2014–February 2018).
Permissions
Copyright statement
© Queen’s Printer and Controller of HMSO 2019. This work was produced by Taylor et al. under the terms of a commissioning contract issued by the Secretary of State for Health and Social Care. This issue may be freely reproduced for the purposes of private research and study and extracts (or indeed, the full report) may be included in professional journals provided that suitable acknowledgement is made and the reproduction is not associated with any form of advertising. Applications for commercial reproduction should be addressed to: NIHR Journals Library, National Institute for Health Research, Evaluation, Trials and Studies Coordinating Centre, Alpha House, University of Southampton Science Park, Southampton SO16 7NS, UK.
2019 Queen’s Printer and Controller of HMSO
Chapter 1 Background
Chronic heart failure (HF) is a burgeoning global health challenge that affects 1–2% of adults in the Western world. 1 Although survival after HF diagnosis has improved, prognosis is poor, with 30–40% of patients dying within a year of diagnosis. 2 Patients with HF experience limitations to their exercise capacity and activities of daily living, reduced health-related quality of life (HRQoL), and an increased risk of hospital admission rate and all-cause mortality. 3,4
The cost of management of HF to the UK NHS was reported to be approximately £1B in 2010. 5 According to the Office for National Statistics, the proportion of the UK population aged ≥ 85 years is projected to double between 2016 and 2041. 6 Owing to increases in both the incidence and the prevalence in HF with increasing age,7 more demands will be placed on the NHS in this time frame. An increase in the prevalence of comorbidities in an older population will lead to a greater number of hospitalisations in HF patients. 8
With increasing numbers of people living longer with symptomatic HF, the effectiveness and accessibility of health services for HF patients have never been more important. Exercise-based cardiac rehabilitation (ExCR) is recognised as being integral to the comprehensive care of HF patients. Cardiac rehabilitation is a process by which patients, in partnership with health professionals, are encouraged and supported to achieve and maintain optimal physical health. 9 Although exercise training is at the centre of cardiac rehabilitation, it is accepted that programmes should be comprehensive in nature and include education and psychological input, focusing on health and lifestyle behaviour change and psychosocial well-being. 2–4,9
Previous systematic reviews and meta-analyses have shown exercise-based rehabilitation offers important health benefits for patients. 9–12 Including 33 trials across 4740 HF patients, the 2014 Cochrane review10 shows no difference in pooled all-cause mortality with ExCR [relative risk 0.93, 95% confidence interval (CI) 0.69 to 1.27]; reduced risk of overall hospitalisation (relative risk 0.75, 95% CI 0.62 to 0.92) and HF-specific hospitalisation (relative risk 0.61, 95% CI 0.46 to 0.80); and a clinically important improvement in disease-specific HRQoL on the Minnesota Living with Heart Failure Questionnaire (MLHFQ) (mean difference –5.8 points, 95% CI –9.2 to –2.4 points). ExCR for HF is therefore recommended by the National Institute for Health and Care Excellence3 and is a class I recommendation of the joint American College of Cardiology Foundation and the American Heart Association guidelines and the European Society of Cardiology guidelines. 13–15 These guidelines do not differentiate by patient subgroup but, rather, recommend cardiac rehabilitation to all HF patients ‘who are able to participate to improve functional status’. 13
Despite this evidence and recommendation by clinical guidelines, the uptake of ExCR for HF remains poor. Only 16% of UK cardiac rehabilitation centres have a specific rehabilitation programme for HF. 16 The recent ExtraHF Survey reported that only 40% of centres from across 42 European countries implemented an exercise programme for HF. 17 Cardiac rehabilitation centres report a lack of resources as the major barrier to providing rehabilitation services for HF (i.e. lack of finances, staff and equipment). 16,17 A key potential solution (if supported by evidence) could be targeting exercise-based rehabilitation services to those HF patients who might experience the greatest benefit in outcomes. Such a differential effect of treatment across HF patients could improve the overall clinical effectiveness and cost-effectiveness of rehabilitation for HF and drive improvements in patient uptake of rehabilitation.
Although meta-analyses demonstrate important health benefits with ExCR, there is uncertainty as to whether or not there are differential effects across HF patient subgroups. Three data sources currently provide evidence on this issue, but all have weaknesses. First, in 2004, the Exercise Training Meta-Analysis of Trials for Chronic Heart Failure (ExTraMATCH/ExTraMATCH II) Collaborative Group published an individual participant data (IPD) meta-analysis based on nine randomised trials of 801 HF patients, which showed ExCR to reduce all-cause mortality [hazard ratio (HR) 0.65, 95% CI 0.46 to 0.92], and no subgroup [age, sex, HF aetiology, New York Heart Association (NYHA) class, ejection fraction or exercise capacity] effects. 18 Given the small number of trials, patients and events (193 deaths), these subgroup analyses are likely to be underpowered. Furthermore, a number of trials have been published since, including Heart Failure: A Controlled Trial Investigating Outcomes of exercise Training (HF-ACTION), a large US National Institutes of Health (NIH)-funded randomised trial (2331 HF patients across 82 centres). 19 Second, the original analysis of HF-ACTION found no interactions between treatment allocation (ExCR or no exercise control) and patient characteristics (age, sex, HF aetiology, NYHA class, ejection fraction or depression score) for the composite outcome of mortality or hospital admission. 19 Although the largest ExCR trial to date, to our knowledge, the power of this study to detect small subgroup effects remains limited. Finally, meta-regression analysis in the 2014 Cochrane review found no association between trial-level patient characteristics (age, sex, ejection fraction) and the impact of ExCR. 10 However, such analysis is highly prone to study-level confounding (ecological fallacy) and should be interpreted with great caution. The methodology of IPD meta-analysis allows more robust analysis of treatment effects in subgroups and consistent analysis of outcome data across trials, such as enabling time-to-event data analyses adjusted for baseline covariates.
Chapter 2 Aims and objectives
The ExTraMATCH II project aimed to determine which HF patient subgroups benefit most from ExCR using IPD meta-analysis.
The project objectives were to:
-
obtain definitive estimates of the impact of ExCR interventions compared with no exercise intervention (control) on all-cause mortality, hospitalisation, HRQoL and exercise capacity in HF patients
-
determine the differential (subgroup) effects of exercise-based interventions in HF patients according to their:
-
age
-
sex
-
left ventricular ejection fraction
-
HF aetiology
-
NYHA class
-
baseline exercise capacity
-
-
assess whether or not the change in patient exercise capacity mediates and acts as a surrogate end point for the impact of the ExCR on all-cause mortality, all-cause hospitalisation and disease-specific HRQoL.
The information gained from the ExTraMATCH II project will inform future national and international clinical and policy decision-making on the use of ExCR in HF.
Chapter 3 Methods
This project was undertaken and reported according to current reporting guidelines for IPD meta-analyses20–22 and was registered with PROSPERO (CRD42014007170). 23 The project management committees are listed in Appendix 1.
Identification of trials for inclusion
Trials were identified from the ExTraMATCH IPD meta-analysis and the 2014 Cochrane systematic review of ExCR for HF. 10,18 The Cochrane review searched (to January 2013) the following electronic databases: Cochrane Central Register of Controlled Trials in The Cochrane Library, EMBASE, MEDLINE, Cumulative Index to Nursing and Allied Health Literature (CINAHL), PsycINFO and the NHS Centre for Reviews and Dissemination (see Appendix 2 for the search strategy). Conference proceedings were searched on Web of Science. Trial registers (controlled-trials.com and ClinicalTrials.gov) and reference lists of all eligible trials and identified systematic reviews were also checked. No language limitations were imposed. Details of the search strategy used are reported elsewhere23 and are included in Appendix 2.
Trials were included if they met the following criteria.
Study design
Randomised controlled trials (RCTs) with a follow-up period of ≥ 6 months (in accordance with the 2014 Cochrane review10).
Target population
Adult patients, aged ≥ 18 years, with a diagnosis of heart failure with reduced ejection fraction (HFrEF) or heart failure with preserved ejection fraction (HFpEF), based on an objective assessment of the left ventricular ejection fraction and on clinical findings.
Setting/context
Patients managed in any setting (i.e. hospital, community facility or patient’s home).
ExCR intervention
An ExCR intervention that included at least an aerobic exercise training component performed by the lower limbs, lasting a minimum of 3 weeks,24 either alone or as part of a comprehensive cardiac rehabilitation programme, which may also include health education and/or a psychological intervention.
Comparator
A non-exercise group receiving standard medical care or an attention placebo.
Sample size
A sample size of > 50 patients to ensure that the logistical effort in obtaining, cleaning and organising the data were commensurate with the contribution of the data set to the analysis. 25,26
Identified RCTs meeting the inclusion criteria are shown in Appendix 3. Study selection for the 2014 Cochrane review and ExTraMATCH IPD meta-analysis was performed by the original research teams that performed these studies. 10,18 For the purposes of this project, a single researcher (RST) compared the included studies from these two previous studies and applied the above inclusion criteria.
Investigator requests
The principal investigators of eligible studies were invited (collaboration invitation) to participate in this IPD meta-analysis and share their anonymised trial data. The list of variables that principal investigators were asked to provide was reported in the study protocol27 (see Appendix 4).
Exclusion of trials from individual participant data analysis
Trials were excluded if:
-
authors did not respond to the invitation to provide IPD for the ExTraMATCH II analysis in spite of repeated contact attempts being made
-
authors were unable to provide IPD, because the data had been either lost or destroyed
-
patients were included in the trial who may also have appeared in another IPD data set.
Ethics approval
The ethics of obtaining data were carefully considered and advice was sought from NHS Digital in April 2016. The original trials had each obtained ethics/institutional review board committee approval and obtained individual patient consent. Given the fully anonymised nature of all the trial data sets (i.e. no inclusion of data, such as patient name or date of birth, that would allow individual patients to be identified), NHS Digital confirmed that there was no further legal/ethics or contractual requirements for use of these data for the purpose of this project. A revision of the HF-ACTION19 data was obtained via the NIH data portal, which required that we obtain a letter of approval from the University of Exeter Medical School Research Ethics Committee. A letter was received on 13 November 2017.
Data management
Data files were received in a variety of formats depending on the security concerns of the host institutions. In most cases, data transfer was by e-mail of a password-protected file, with a separate e-mail containing the password. Each raw data file was saved in its original format on receipt and then converted to a Stata® file (version 14.2, StataCorp LP, College Station, TX, USA). Data cleaning was carried out in each pseudonymised data set prior to being combined in a master data set. Within the individual data sets, data for each variable (at the patient level) was checked for accuracy in range, extreme values, internal consistency, missing values and consistency with published reports. Data discrepancies or missing information were discussed with trial investigators and corrected, if appropriate.
All data files were stored on a secure password-protected computer server managed in accordance with the data management standard operating procedures of the UK Clinical Research Collaboration-registered Exeter Clinical Trials Unit. Access to data at all stages of cleaning and analysis was restricted to core members of the research team (OC, RST, FW and SW).
Patient and public involvement
As part of the National Institute for Health Research (NIHR) Programme Grants for Applied Research report [Rehabilitation EnAblement in CHronic Heart Failure (REACH-HF), reference number RP-PG-1210-12004; www.journalslibrary.nihr.ac.uk/programmes/pgfar/RP-PG-1210-12004/#/ (accessed 1 January 2019)], a patient and public involvement (PPI) group was established in 2009, which consisted of eight active members (five with lived experience of HF and three patient caregivers). The PPI group are familiar with the ongoing portfolio of Cochrane systematic reviews in cardiac rehabilitation.
This IPD meta-analysis was proposed to the PPI group meeting in Truro on 1 November 2015, in which views were sought on the proposed research questions. Following receipt of funding from NIHR, the ExTraMATCH II project was presented to the PPI group at a further meeting (held in March 2017). Members of the group gave views on how the results could be best presented and disseminated to patients, caregivers and clinicians to have an impact on clinical practice and patient understanding of HF. Kevin Paul (PPI group chairperson) was a co-applicant for the REACH-HF study and was also a member of the REACH-HF Programme Steering Committee. Kevin is a core colleague and valued member of our team and agreed to act as conduit between the Project Advisory Group for ExTraMATCH II and the established PPI group. The PPI group was asked to contribute to, and give views on, (1) the ExTraMATCH II protocol (e.g. whether or not the most appropriate outcomes were prioritised), (2) lay summaries of the ExTraMATCH II project, (3) the implications for clinical practice and future research and (4) the planned dissemination strategy.
Kevin commented on the plain English summary of the original application and also offered advice on the plain English summary of the final report. Based on the INVOLVE guidelines,28 we paid expenses that included the cost of his time to attend Project Advisory Group meetings, plus travel costs.
Statistical analysis
All analyses were carried out in accordance with the principle of intention to treat (i.e. patients were analysed according to randomised treatment assignment for which complete data was available at follow-up). When missing data were noted within an individual trial, contact with the author was attempted and data added if available. Given the relatively small levels of missing outcome and covariate data within trials, we did not undertake data imputation. When possible, all one- and two-stage analyses used random-effects models, as the overall data set is likely to include a high degree of clinical heterogeneity across the individual studies (differences in population, ExCR intervention and comparator). 29 All analyses were undertaken using Stata.
Main outcomes
In accordance with the study research objectives, it was sought, from eligible trials, IPD for the following outcomes:
-
Mortality – incidence and time-to-event data for all deaths (we also sought to obtain data on the cause of death).
-
Hospital admission – incidence, time to event and duration of hospitalisation (we also sought to obtain data on the cause of the hospitalisation).
-
Disease-specific HRQoL (as assessed by the MLHFQ and other validated HRQoL outcomes) – value at baseline (pre randomisation) and at 6, 12, 24 and > 24 months post randomisation.
-
Exercise capacity [as assessed by peak oxygen uptake (VO2peak) and other validated exercise capacity measures] – as measured at baseline and at 6, 12, 24 and > 24 months post randomisation.
Patient subgroups
We also requested individual patient demographic and clinical data, including age, sex, ejection fraction, NYHA class, HF aetiology (ischaemic vs. non-ischaemic), race/ethnicity and exercise capacity at baseline. Details of exercise training prescription (i.e. session frequency, duration, intensity and overall programme duration) was collected as part of the 2014 Cochrane review. 10
Statistical analysis plans
A detailed statistical analysis plan was produced for each of the three analyses described below:
-
the impact of ExCR on mortality and hospitalisation outcomes
-
the impact of ExCR on HRQoL and exercise capacity outcomes
-
the validation of exercise capacity as a surrogate outcome.
Descriptive statistics
For each analysis, patient-level characteristics were compared for those patients in the ExCR and control groups of the included studies. Descriptives of trial-level characteristics by group are also reported.
Assessment of study quality and risk of bias
We checked for potential small-study bias by visually assessing funnel plot asymmetry and using Egger’s test. 30 Study quality and risk of bias was assessed using the Tool for the assEssment of Study qualiTy and reporting in EXercise (TESTEX). 31 Statistical heterogeneity was assessed using the I2-statistic. 29
Impact of ExCR on mortality and hospitalisation
Inclusion of trials
Trials were included in the mortality and hospitalisation analyses if IPD was provided for the one or more of the outcomes of interest detailed below.
Outcomes of interest
The final patient-relevant outcomes of interest in this study were time to event to:
-
all-cause mortality
-
HF-related mortality
-
all-cause hospital admission
-
HF-related hospital admission.
Owing to the inconsistency of reporting in IPD sets, we were able to consider only time-to-event outcomes and not incidence or duration of events. Insufficient data were made available to allow analyses on ‘sudden death’ to be carried out.
Each of the outcomes described above was analysed separately. Each trial contributed to between one and four analyses.
Primary analysis
In the primary analysis, a two-stage IPD meta-analysis approach was taken. A Cox regression model was performed on the data from each trial individually and the resulting HRs used in a random-effects meta-analysis. For the meta-analysis of treatment–covariate interactions, the same approach was used, with a Cox regression model applied to the data from each trial and the resulting HR for the interaction effect used to inform the meta-analysis. A random-effects model was used to account for the high degree of clinical heterogeneity across the individual studies due to differences in population, ExCR intervention and comparator. 29 An overall estimate of the effect of ExCR for each outcome, both by trial and as a pooled estimate, was presented as a HR and 95% CI. Additionally, the and I2 and τ2 statistics were reported alongside the associated p-value for the results of the main analyses. 29,32 The Cochrane handbook advises that using specific threshold values for the interpretation of the I2-statistic can be misleading. 33
Secondary analysis
The secondary analysis used a one-stage IPD meta-analysis Cox regression model, stratified by trial. Stratification allowed the baseline hazard to vary between studies, rather than forcing the hazard in individual studies to be proportionate to each other. 34 No distributional assumptions about this baseline hazard were made. Owing to failure of convergence in the one-stage random-effect models, probably due to the low level of heterogeneity between studies, a fixed-effect approach was used.
The within-trials interaction term used here identifies any patient characteristics that influence the effectiveness of ExCR on an individual level, necessary for making inferences for stratified medicine, as recommended by Riley et al. 35 The within-trial interaction effect is fixed across trials. Continuous covariates were centred on the mean value within each trial; binary covariates were centred on the proportion within each trial.
Sensitivity analyses
To test the robustness of the primary and secondary analyses, we undertook a number of prespecified sensitivity analyses: we excluded the largest trial (HF-ACTION19); truncated outcomes at 1, 2 and 5 years’ follow-up; and included trial-level outcome data for studies that could not provide IPD. 26
Impact of ExCR on health-related quality of life and exercise capacity
Inclusion of trials
Trials were included in the HRQoL and exercise capacity analyses if IPD was provided for the one or more of the outcomes of interest detailed below.
Outcomes of interest
The final patient-relevant outcomes of interest in this study were:
-
HRQoL measured using the MLHFQ score
-
HRQoL measured through any validated scale
-
exercise capacity measured using VO2peak (ml/kg/minute)
-
exercise capacity measured using the 6-minute walk test (6MWT) (m)
-
exercise capacity measured using a standardised exercise capacity score calculated from any of the four validated exercise capacity measures [i.e. VO2peak, 6MWT, incremental shuttle walk test (ISWT) and workload on cycle ergometer].
Health-related quality of life: scales of measurement
Health-related quality of life measured using one of the following three validated measures was included in this analysis:
-
the MLHFQ36
-
the Kansas City Cardiomyopathy Questionnaire37
-
the Guyatt et al. 38 Chronic Heart Failure Questionnaire scale.
The first HRQoL analysis was carried out for trials providing the MLHFQ data; the second analysis used a standardised score calculated from any of the three measures above.
Exercise capacity: scales of measurement
Exercise capacity measured using one of four validated measures was included in this analysis:
-
VO2peak (ml/kg/minute)
-
distance (m) walked on the 6MWT
-
distance (m) walked in an ISWT
-
workload on cycle ergometer (watts).
Exercise capacity analysis was carried out for:
-
trials providing VO2peak
-
trials providing the 6MWT
-
a standardised exercise capacity score, calculated from any of the validated exercise capacity measures listed above.
One study, HF-ACTION,19 provided data on both VO2peak and the 6MWT, and was included in all analyses, with the VO2peak measure taking precedence for the standardised exercise capacity analysis.
Primary analysis
The primary analyses included one- and two-stage IPD meta-analyses carried out at 6 and 12 months. At each time point, we used the observation closest to and prior to the time point. All one-stage IPD models used a hierarchical random-effects regression model, adjusted for the baseline value of the outcome measure. All two-stage models used random treatment effects. We performed a series of models to estimate the overall treatment effect and to investigate potential interactions between ExCR and predefined patient subgroups (i.e. age, sex, left ventricular ejection fraction, HF aetiology, NYHA class and baseline exercise capacity23,27). Each model investigated one interaction effect only. The I2 and τ2 statistics were reported alongside the associated p-value for the results of the main analyses. 29,32
Secondary analysis
The secondary analyses used a random-effects hierarchical model for repeated measures at multiple time points. These models utilised HRQoL and exercise capacity outcome data at all available time points. Adjustments for baseline values of the outcome measure were made; no other covariates were included in the model. This model included a time-by-treatment interaction term.
Sensitivity analyses
To test the robustness of the primary analyses, prespecified sensitivity analyses were carried out:
-
the primary analysis was repeated after exclusion of the largest trial (HF-ACTION19)
-
data was added from studies that did not provide IPD.
Surrogate analyses
Inclusion of trials
All studies in the ExTraMATCH II meta-analysis were eligible for inclusion in the surrogate analyses, dependent on the availability of data on exercise capacity and final patient-relevant outcomes, as explained below.
Outcomes of interest
The final patient-relevant outcomes of interest in this validation study were:
-
HRQoL measured by MLHFQ score
-
HRQoL measured through any validated scale
-
time to all-cause mortality
-
time to all-cause hospital admission.
For this study, three approaches to exercise capacity definition were used:
-
direct assessed VO2peak
-
6MWT
-
direct and indirect VO2peak (conversion from the 6MWT and the ISWT; no conversion was possible for watts as it is dependent on the body weight of individual patients).
Distances recorded as either 6MWT or ISWT at baseline were converted to VO2peak using previously reported methods. 39–43 Details can be found in Appendix 5.
Follow-up time considerations
The following outcome follow-up times were considered: ≤ 6 months for exercise capacity outcomes, ≤ 12 months for HRQoL outcomes and all available follow-up time for mortality and hospitalisation. This approach was consistent with the assumption of temporal antecedence for a causal relationship between the surrogate end point and the final outcomes.
Mediation analysis
Mediation is known as the phenomenon whereby a cause affects an intermediate variable (also called mediator), and the change in the intermediate variable goes on to affect the outcome. 44,45 The effect of the cause on the outcome that operates through the intermediate of interest is sometimes referred to as an indirect or mediated effect. Mediation analysis usually refers to the set of techniques by which a researcher assesses the relative magnitude of these direct and indirect effects. The product method specification of this approach was used to determine whether or not a change in VO2peak (ΔVO2peak) or a change in the 6MWT result (Δ6MWT) mediate the relationship between treatment assignment (i.e. ExCR vs. no ExCR), and each of the final outcomes of interest. Linear or Cox regression analyses were conducted to evaluate the following four hypotheses:
-
Treatment assignment (i.e. ExCR vs. control) has a significant effect on ΔVO2peak or Δ6MWT from baseline to 6 months’ follow-up.
-
ΔVO2peak or Δ6MWT have a significant effect on ΔMLHFQ or ΔHRQoL, or on the hazards of developing a clinical event.
-
Treatment assignment (i.e. ExCR vs. control) has a significant effect on ΔMLHFQ or ΔHRQoL, or on the hazards of developing a clinical event.
-
The effect of treatment assignment (i.e. ExCR vs. control) on ΔMLHFQ or ΔHRQoL, or on the hazards of developing a clinical event, is attenuated when ΔVO2peak or Δ6MWT is added to the model.
All regression models took into account the clustering within trials to allow for study-level differences in treatment effect and unstructured covariance between random intercept and random slope. Regression models were adjusted for baseline of either exercise capacity values or baseline HRQoL values. No other adjustments were made, because patients were randomly assigned to intervention or control arm. In testing hypothesis (2), no adjustment is made for potential confounding variables.
It was assumed necessary to reject the null for at least the first of these hypotheses (i.e. the treatment assignment is associated with the mediator), to support the validation of ΔVO2peak or Δ6MWT as mediator end points and proceed further with the estimation of proportion explained or proportion mediated.
Meta-analytic approach: R2 and surrogate threshold effect
Although mediation analysis considers pathways by which treatment effects may arise, surrogacy principally concerns whether or not we are able to predict the effect of treatment on the final end point by using the effect of treatment on the surrogate.
Given the issues described with the proportion explained and indirect effects approaches in identifying consistent surrogates, the meta-analytic approach may offer the most promise for assessing surrogate outcomes and for making policy and treatment decisions. 46,47 This approach requires multiple studies, or at least multiple subgroups (e.g. centres within a trial), which we have through the ExTraMATCH II IPD meta-analysis. As a true and strong association between the treatment effect on the final end point and the treatment effect on the surrogate is considered to be the hallmark of surrogacy,47 this approach proceeds as follows. Let ϕj denote the estimate of the effect of treatment on the final outcome in the jth study, let θj denote the estimate of the effect of treatment on the surrogate outcome in the jth study, both derived from RCTs. For a good surrogate, a monotonic relationship would exist between ϕj and θj and, in a regression of ϕj on θj, there would be limited variability around the regression line. If the relationship between ϕj and θj is approximately linear, a reasonable measure of surrogacy is the R2trial of the regression of ϕj on θj. Another intuitive measure recommended as a surrogacy metric is the surrogate threshold effect (STE), which takes into account the variability around the regression line and represents the intercept of the prediction band of the regression line with the zero effect line on the final outcome. 46 For each trial, we estimated study-level treatment effects by conducting linear regression or Cox proportional hazards regression models. Adjustment was made for baseline exercise capacity or HRQoL values. Then we conducted linear meta-regressions to relate estimated difference in exercise capacity to the estimated effect on change in HRQoL: log(HR) of all-cause mortality or log(HR) of all-cause hospitalisation events. The square of the inverse standard error was used as a weight to account for uncertainty in the estimated patient-relevant outcomes effect. We calculated commonly reported indicators of surrogate validation. 48 The correlation coefficient (p-value) and the R2 for the relationship between treatment effect difference on exercise capacity and each of the final outcomes was estimated individually using weighting by the inverse of the variance (for the treatment effect on final outcomes). In order to estimate STE, prediction bands were calculated based on approximate prediction intervals. 48,49
Chapter 4 Characteristics and quality of included studies
Identification of trials for inclusion in the ExTraMATCH II master data set
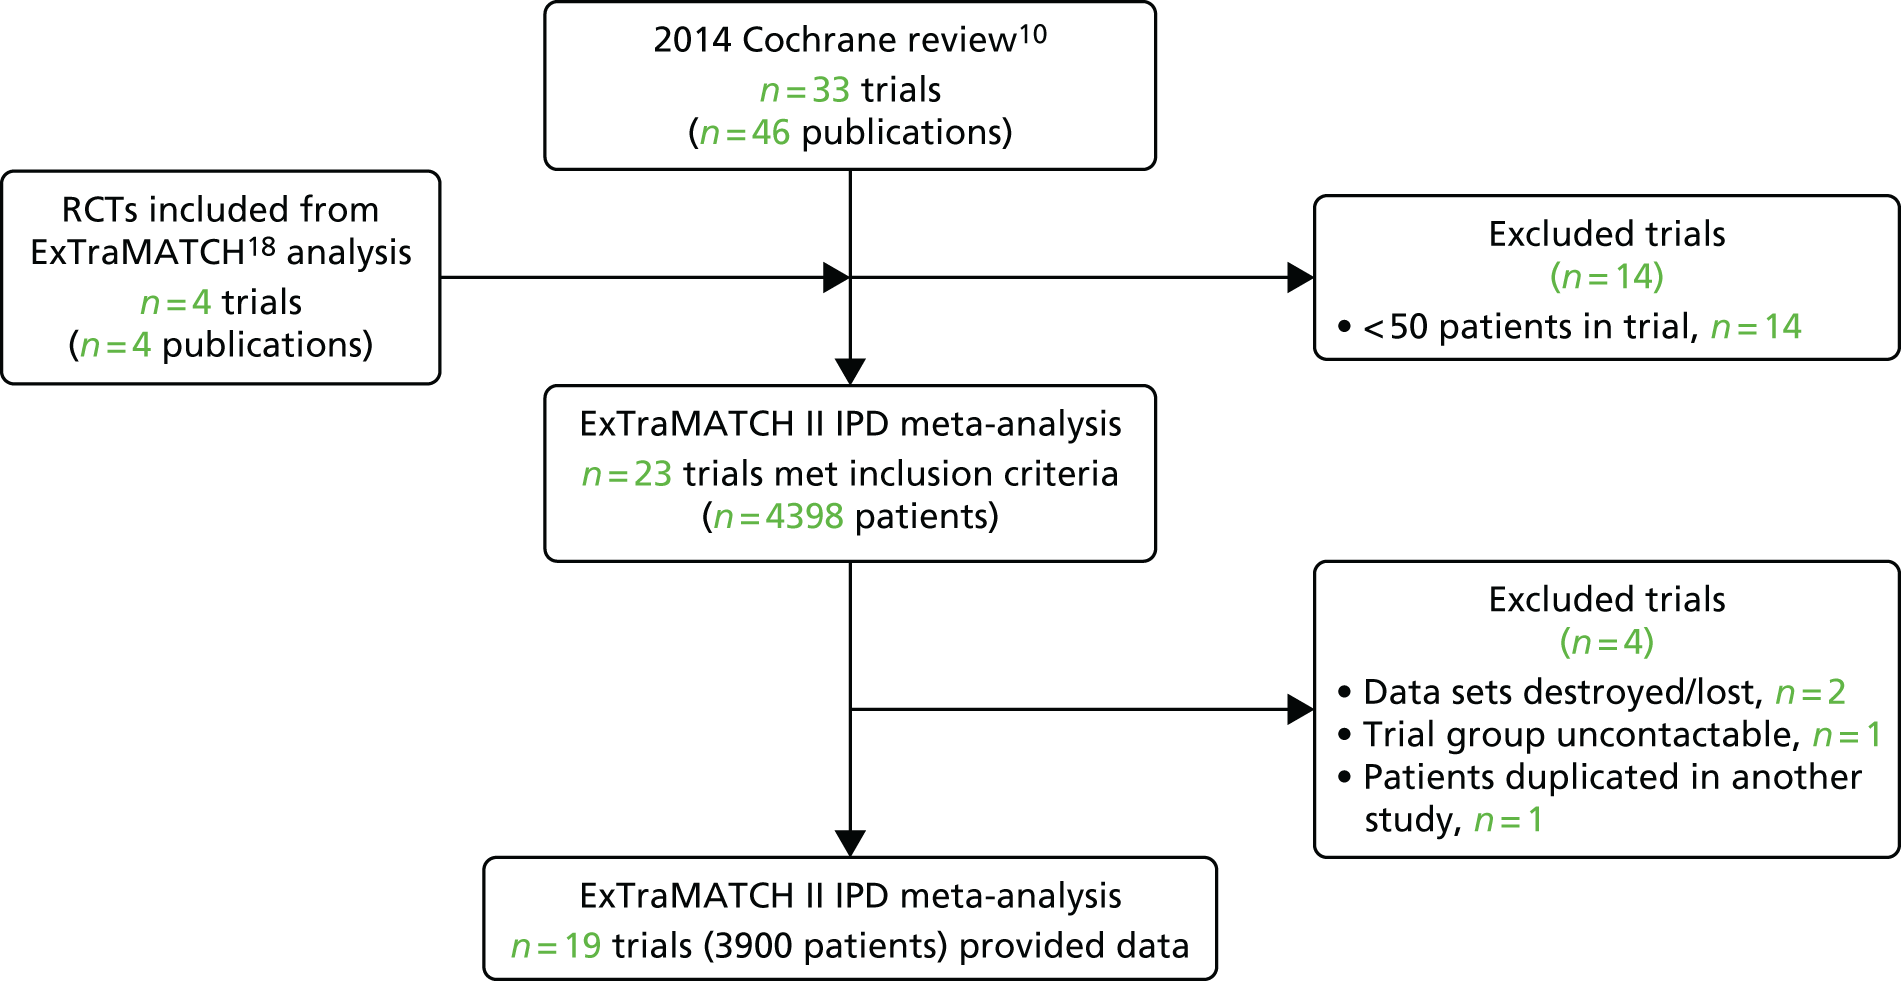
A total of 23 trials were deemed eligible for the ExTraMATCH II IPD meta-analysis. Data from six trials had been analysed previously and were available from the ExTraMATCH database. 50–55 Fourteen investigators responded positively and shared their de-identified trial data directly. 19,56–68
Exclusion of eligible trials from the ExTraMATCH II master data set
We were unable to include data from three trials (355 patients): for two trials data were no longer available69,70 and the investigators of the other trial could not be contacted. 71 After obtaining IPD, a further trial72 was excluded, as it was determined that it included patient data that overlapped with another trial. 62 We therefore had a total of 19 trials in the ExTraMATCH II study,19,50–67 with a total of 3900 patients. A Preferred Reporting Items for Systematic Reviews and Meta-Analyses (PRISMA)22 flow diagram to show inclusion and exclusion of trials in the ExTraMATCH II study is shown in Figure 1. Further flow diagrams to show inclusion and exclusion of trials and participants within individual analyses are given in the appropriate results sections.
FIGURE 1.
The PRISMA flow diagram summarising the selection of studies for the ExTraMATCH II study.
Characteristics of included patients
Patient characteristics at baseline were well balanced between ExCR and control patients. The majority of patients were male (74%), with a mean age of 61 years [standard deviation (SD) 13 years]. The mean baseline left ventricular ejection fraction was 26.7% (SD 8.1%), and most patients were in NYHA functional class II (59%) or III (37%) (Table 1). No included trials recruited patients with HFpEF (i.e. an ejection fraction of > 45%).
| Characteristic | ExCR (N = 1986) | Control (N = 2003) | All (N = 3989) |
|---|---|---|---|
| Age (years), mean (SD) | 61.4 (12.8) | 61.5 (13.1) | 61.4 (13.0) |
| Gender, n (%) | |||
| Male | 1455 (73.3) | 1511 (75.4) | 2966 (74.4) |
| Female | 531 (26.7) | 492 (24.6) | 1023 (25.7) |
| Baseline ejection fraction (%); mean (SD) | 27.2 (8.8) | 26.9 (8.7) | 26.9 (8.7) |
| NYHA status, n (%) | |||
| Class I | 25 (1.3) | 29 (1.5) | 54 (1.4) |
| Class II | 1124 (58.6) | 1148 (59.5) | 2272 (59.0) |
| Class III | 721 (37.6) | 728 (37.7) | 1449 (37.7) |
| Class IV | 47 (2.5) | 26 (1.4) | 73 (1.9) |
| Aetiology, n (%) | |||
| Ischaemic | 1067 (57.3) | 1055 (56.1) | 2122 (56.7) |
| Non-ischaemic | 796 (42.7) | 826 (43.9) | 1622 (43.3) |
| Ethnicity, n (%) | |||
| White | 1130 (70.2) | 1163 (71.8) | 2293 (71.0) |
| Non-white | 480 (29.8) | 458 (28.3) | 938 (29.0) |
| VO2peak (ml/kg/minute), mean (SD) | 14.9 (4.3) | 15.0 (4.6) | 15.0 (4.4) |
Characteristics of included trials
Trials were from Europe and North America and were published between 1990 and 2012. Sample size ranged from 50 to 2130 patients. All trials evaluated an aerobic exercise intervention, which was most commonly delivered in either an exclusively centre-based setting or a centre-based setting in combination with some home exercise sessions. The dose of exercise training ranged widely across trials. ExCR was delivered over a period of 12–90 weeks, with between two and seven sessions per week (median session duration was between 15 and 120 minutes, including warm-up and cool-down). The intensity of exercise ranged between 50% and 85% VO2peak (Table 2).
| Study characteristic | n (%), unless otherwise stated |
|---|---|
| Publication year | |
| 1990–99 | 2 (10.5) |
| 2000–9 | 12 (63.2) |
| 2010–12 | 4 (21.0) |
| Unpublished | 1 (5.3) |
| Main study location | |
| Europe | 14 (73.7) |
| North Americaa | 5 (26.3) |
| Study centre | |
| Single | 13 (68.4) |
| Multiple | 5 (26.3) |
| Not reported | 1 (5.3) |
| Sample size | |
| 0–99 | 11 (57.9) |
| 100–999 | 7 (36.8) |
| ≥ 1000 | 1 (5.3) |
| Duration of follow-up in data set (months), median (interquartile range) | |
| Mortality | 29 (24–40) |
| Intervention characteristic | |
| Intervention type | |
| Exercise-only programmes | 13 (68.4) |
| Comprehensive programmes | 5 (26.3) |
| Not reported | 1 (5.3) |
| Type of exercise | |
| Aerobic exercise only | 12 (63.2) |
| Aerobic plus resistance training | 6 (31.6) |
| Not reported | 1 (5.3) |
| Dose of intervention | |
| Duration of intervention (weeks), median (range) | 30 (15–90) |
| Frequency (sessions/week), median (range) | 2.5 (2–6.5) |
| Length of exercise session (minutes), median (range) | 24 (4–120) |
| Exercise intensity (range) | 50–85% VO2peak |
| 11–15 Borg rating | |
| Setting | |
| Centre based | 14 (73.7) |
| Home based | 4 (21.1) |
| Not reported | 1 (5.3) |
Assessment of study quality and risk of bias in included trials
The overall quality of included trials was judged to be moderate to good, with a median TESTEX score of 11 (range 9–14) out of a maximum score of 15 (Table 3).
| First author/study (year) | Eligibility criteria specified | Randomisation specified | Allocation concealed | Groups similar at baseline | Blinding of assessors | Outcome measures in > 85% of participantsa | Intention-to-treat analysisb | Between-group statistical comparisons reportedc | Point measures and measures of variability reported | Activity monitoring in control group | Relative exercise intensity reviewed | Exercise volume and energy expended | Overall TESTEX score (maximum score of 15) |
|---|---|---|---|---|---|---|---|---|---|---|---|---|---|
| Belardinelli et al. (1999)50 | 1 | 0 | 0 | 1 | 0 | 3 | 1 | 1 | 1 | 0 | 0 | 1 | 9 |
| Belardinelli et al. (2012)56 | 1 | 0 | 0 | 1 | 0 | 3 | 1 | 1 | 1 | 0 | 0 | 1 | 9 |
| DANREHAB (2008)57 | 1 | 1 | 0 | 1 | 1 | 3 | 1 | 2 | 1 | 0 | 0 | 0 | 11 |
| Dracup et al. (2007)58 | 1 | 0 | 0 | 1 | 0 | 3 | 1 | 2 | 1 | 1 | 1 | 1 | 10 |
| Gary et al. (2010)59 | 1 | 1 | 0 | 1 | 1 | 3 | 1 | 2 | 1 | 0 | 0 | 0 | 11 |
| Giannuzzi et al. (2003)60 | 1 | 0 | 0 | 1 | 0 | 2 | 1 | 2 | 1 | 0 | 1 | 1 | 10 |
| Hambrecht et al. (2000)51 | 1 | 1 | 0 | 1 | 0 | 3 | 0 | 2 | 1 | 0 | 1 | 1 | 11 |
| HF-ACTION (2009)19 | 1 | 1 | 1 | 1 | 1 | 3 | 1 | 2 | 1 | 1 | 0 | 1 | 14 |
| Jolly et al. (2009)61 | 1 | 1 | 1 | 1 | 0 | 2 | 1 | 2 | 1 | 0 | 1 | 1 | 12 |
| McKelvie et al. (2002)52 | 1 | 1 | 1 | 1 | 1 | 2 | 1 | 1 | 1 | 0 | 1 | 1 | 12 |
| Mueller et al. (2007)62 | 1 | 0 | 0 | 1 | 0 | 2 | 1 | 2 | 1 | 0 | 1 | 1 | 10 |
| Nilsson et al. (2008)63 | 1 | 1 | 0 | 1 | 1 | 2 | 1 | 2 | 1 | 0 | 0 | 1 | 11 |
| Passino et al. (2006)67 | 1 | 0 | 0 | 1 | 0 | 2 | 1 | 2 | 1 | 0 | 1 | 1 | 10 |
| Wielenga et al. (1999)53 | 1 | 0 | 0 | 1 | 0 | 2 | 1 | 2 | 1 | 0 | 0 | 1 | 9 |
| Willenheimer et al. (2001)54 | 1 | 0 | 0 | 1 | 1 | 2 | 1 | 2 | 1 | 0 | 0 | 1 | 9 |
| Witham et al. (2005)64 | 1 | 1 | 0 | 1 | 1 | 3 | 1 | 2 | 1 | 0 | 1 | 0 | 12 |
| Witham et al. (2012)65 | 1 | 1 | 0 | 1 | 1 | 3 | 1 | 2 | 1 | 0 | 1 | 0 | 12 |
| Yeh et al. (2011)66 | 1 | 1 | 0 | 1 | 1 | 3 | 1 | 2 | 1 | 1 | 0 | 0 | 12 |
| Zanelli et al. (1997)55 | No scored | ||||||||||||
Chapter 5 Impact of exercise-based cardiac rehabilitation on mortality and hospitalisation
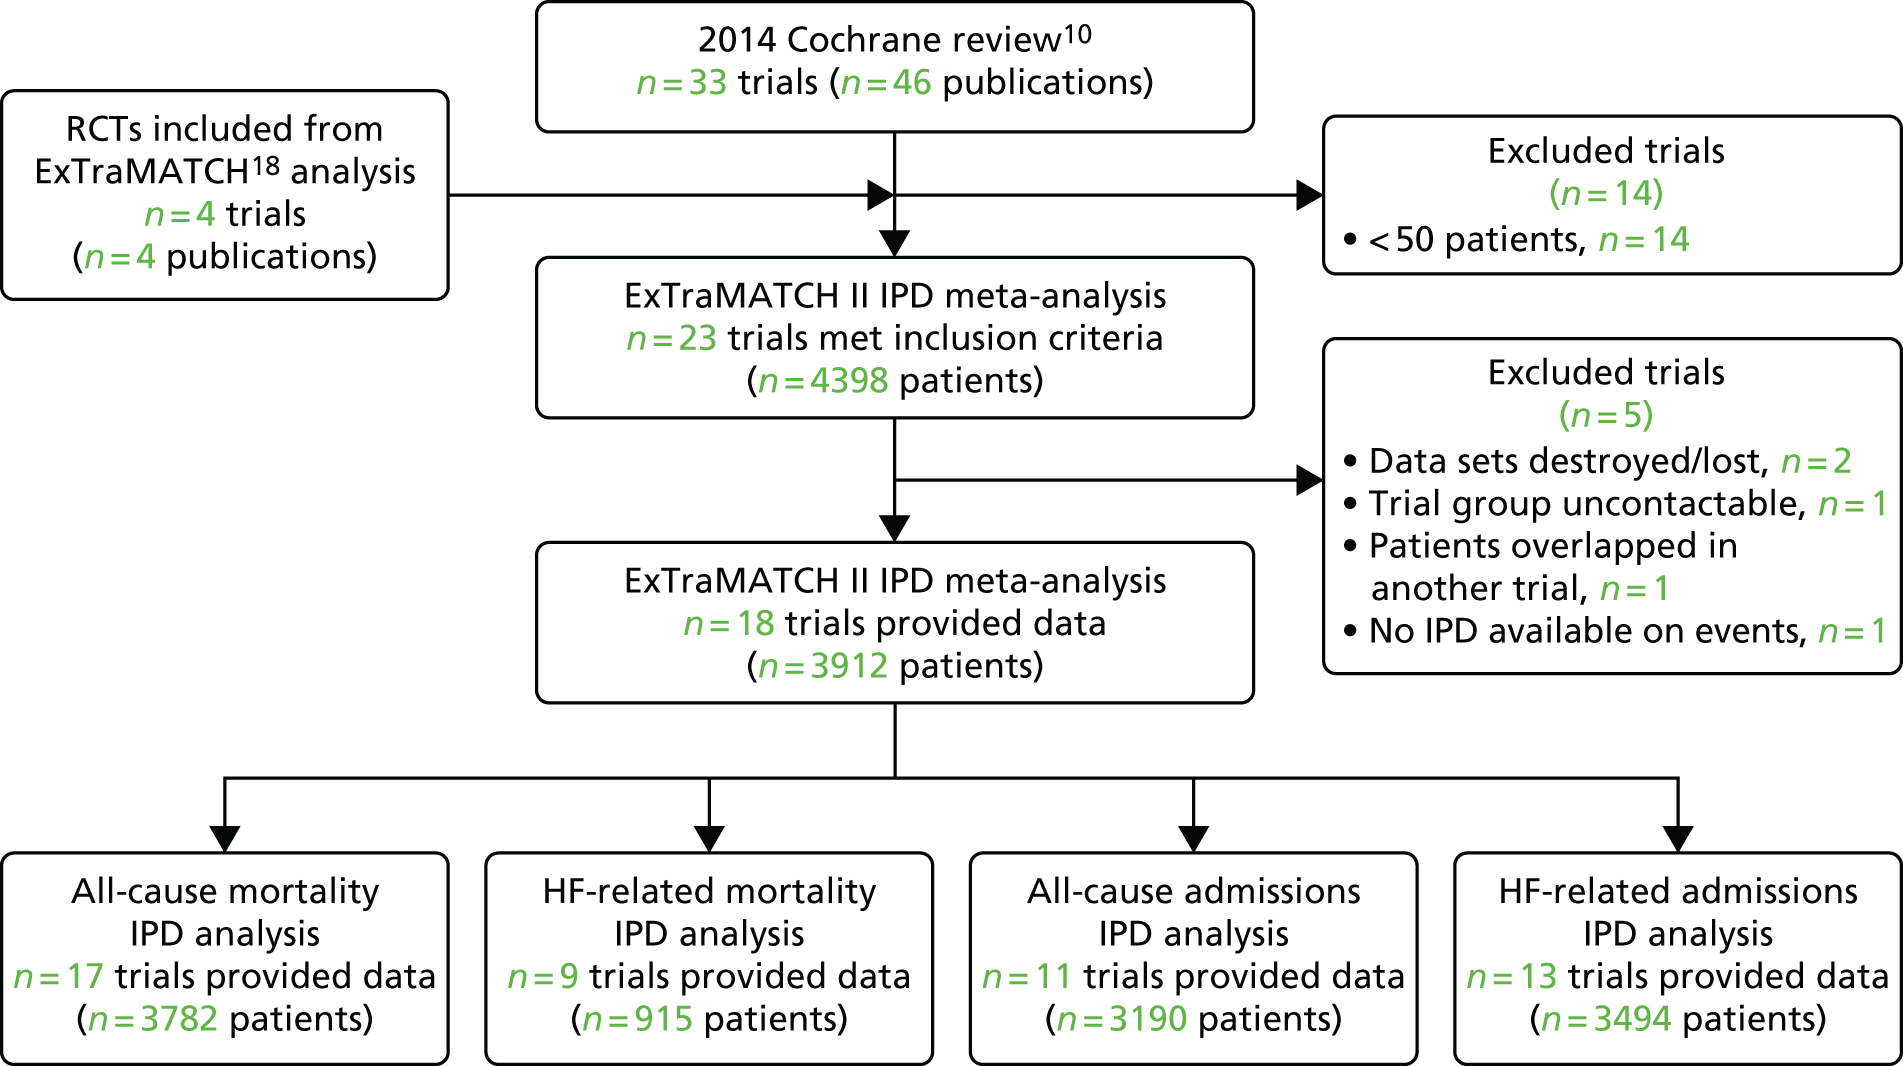
One trial that provided IPD was not included in the mortality and hospitalisation analyses, as no data were provided to allow calculation of survival time or time to hospitalisation. 59 This resulted in the inclusion of 18 trials,19,50,51,53–58,60–67,73 comprising 3912 patients (1948 ExCR patients and 1964 control patients), with a median follow-up of 19 months for mortality outcomes and 11 months for hospitalisation outcomes. Figure 2 summarises the study selection process for the mortality and hospitalisation analyses.
FIGURE 2.
The PRISMA flow diagram summarising the selection of studies for mortality and hospitalisation analyses.
Characteristics of included patients and trials
Patient baseline characteristics were well balanced between ExCR patients and control patients (Table 4). The majority of patients were male (75%), with a mean age of 61 years (SD 13 years). The mean baseline left ventricular ejection fraction was 27% (SD 8.1%), no included studies recruited patients with HFpEF (i.e. an ejection fraction of > 45%), and most patients were in NYHA functional class II (59%) or III (37%). Studies were published between 1999 and 2012 across a number of countries (see Table 2). Sample size ranged from 50 to 2130 patients. All trials evaluated an aerobic exercise intervention; six also included resistance training. 52,57,58,61,64,65 Exercise training was most commonly delivered in either an exclusively centre-based setting or a centre-based setting in combination with some home exercise sessions (Table 5). Three trials were conducted in an exclusively home-based setting. 52,54,58 The dose of exercise training ranged widely across studies, with an average session duration of 15–120 minutes (including warm-up and cool-down), two to seven sessions per week, of exercise intensity equivalent of 50–85% VO2peak and delivery duration of 12–90 weeks.
| Characteristic | ExCR (N = 1948) | Control (N = 1964) | All (N = 3912) |
|---|---|---|---|
| Age (years), mean (SD) | 61.3 (12.7) | 61.4 (13.2) | 61.3 (13.0) |
| Gender, n (%) | |||
| Male | 1442 (74) | 1489 (76) | 2931 (75) |
| Female | 506 (26) | 475 (24) | 981 (25) |
| Baseline ejection fraction (%), mean (SD) | 26.8 (8.2) | 26.7 (8.1) | 26.7 (8.1) |
| NYHA status, n (%) | |||
| Class I | 25 (1) | 28 (1) | 53 (1) |
| Class II | 1107 (59) | 1130 (60) | 2237 (59) |
| Class III | 700 (37) | 708 (37) | 1408 (37) |
| Class IV | 47 (3) | 26 (1) | 73 (2) |
| Aetiology, n (%) | |||
| Ischaemic | 1094 (57) | 1080 (56) | 2174 (57) |
| Non-ischaemic | 809 (43) | 838 (44) | 1647 (43) |
| Ethnicity, n (%) | |||
| White | 1100 (70) | 1140 (72) | 2240 (71) |
| Non-white | 472 (30) | 445 (28) | 917 (29) |
| VO2peak (ml/kg/minute), mean (SD) | 14.9 (4.4) | 15.0 (4.6) | 14.9 (4.5) |
| Study characteristic | n (%), unless otherwise stated |
|---|---|
| Publication year | |
| 1990–9 | 2 (11) |
| 2000–9 | 12 (67) |
| 2010–12 | 3 (17) |
| Unpublished | 1 (6) |
| Main study location | |
| Europe | 14 (78) |
| North Americaa | 4 (22) |
| Study centre | |
| Single | 12 (67) |
| Multiple | 5 (28) |
| Not reported | 1 (6) |
| Sample size | |
| 0–99 | 10 (56) |
| 100–999 | 7 (39) |
| ≥ 1000 | 1 (6) |
| Duration of follow-up in data set (months), median (range) | |
| Mortality | 18.6 (11.8–419) |
| Hospitalisation | 11.2 (2.6–98) |
| Intervention characteristic | |
| Intervention type | |
| Exercise-only programmes | 5 (28) |
| Comprehensive programmes | 12 (67) |
| Not reported | 1 (6) |
| Type of exercise | |
| Aerobic exercise only | 12 (67) |
| Aerobic plus resistance training | 6 (33) |
| Dose of intervention | |
| Duration of intervention (weeks), median (range) | 30 (12–90) |
| Frequency (sessions/week), median (range) | 2.8 (2–7) |
| Length of exercise session (minutes), median (range) | 24 (15–120) |
| Exercise intensity (range) | 40–80% maximum heart rate |
| 50–85% VO2peak | |
| 12–18 Borg rating | |
| Setting | |
| Centre based | 6 (33) |
| Home based | 3 (17) |
| Centre and home based | 8 (44) |
| Not reported | 1 (6) |
Assessment of study quality and risk of bias
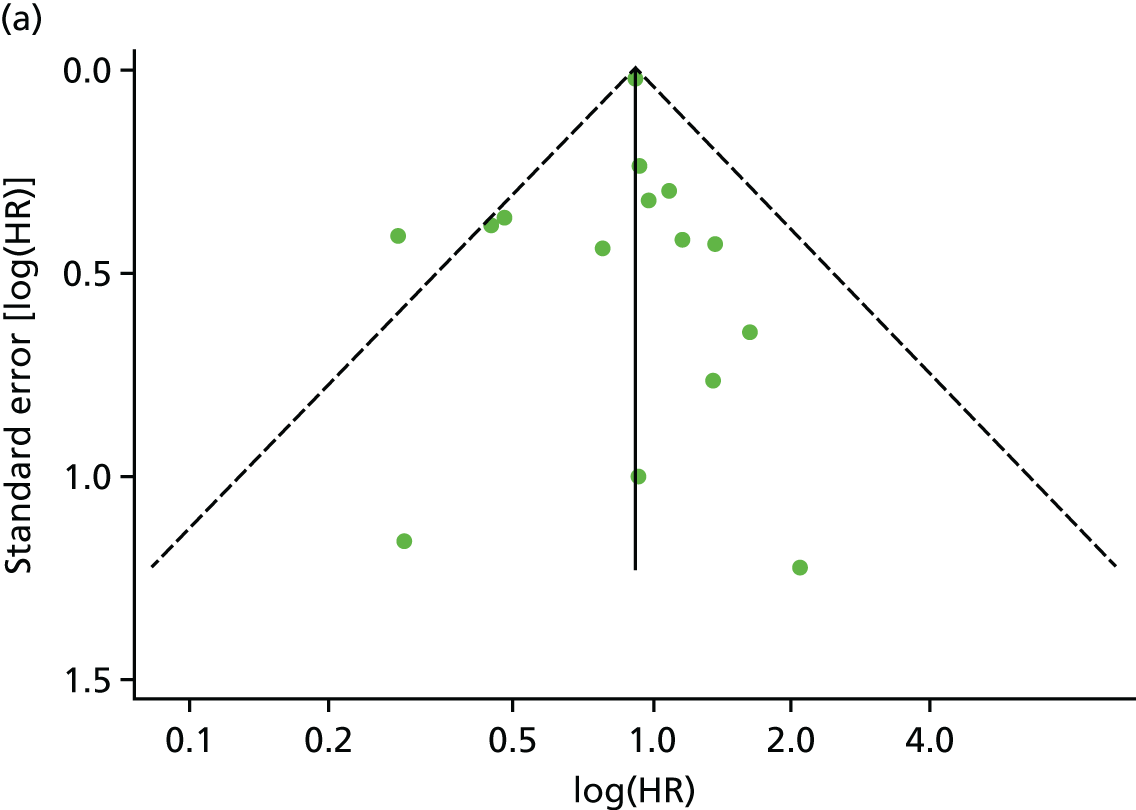
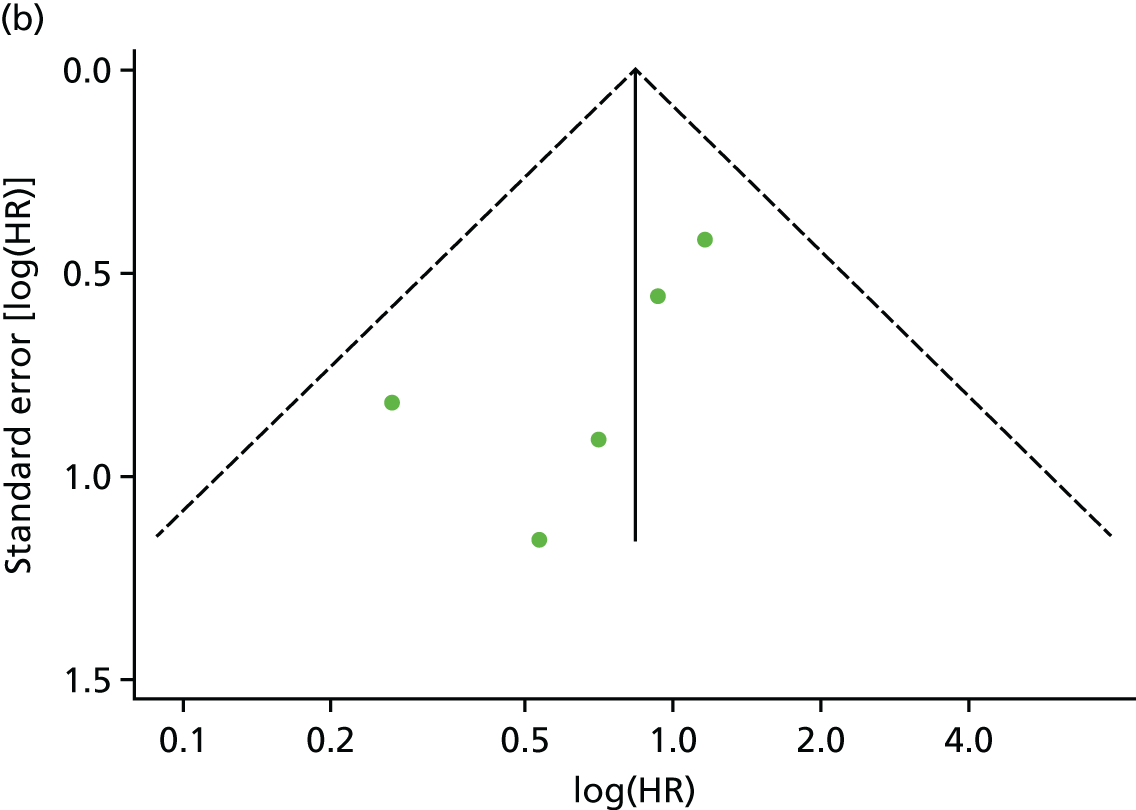
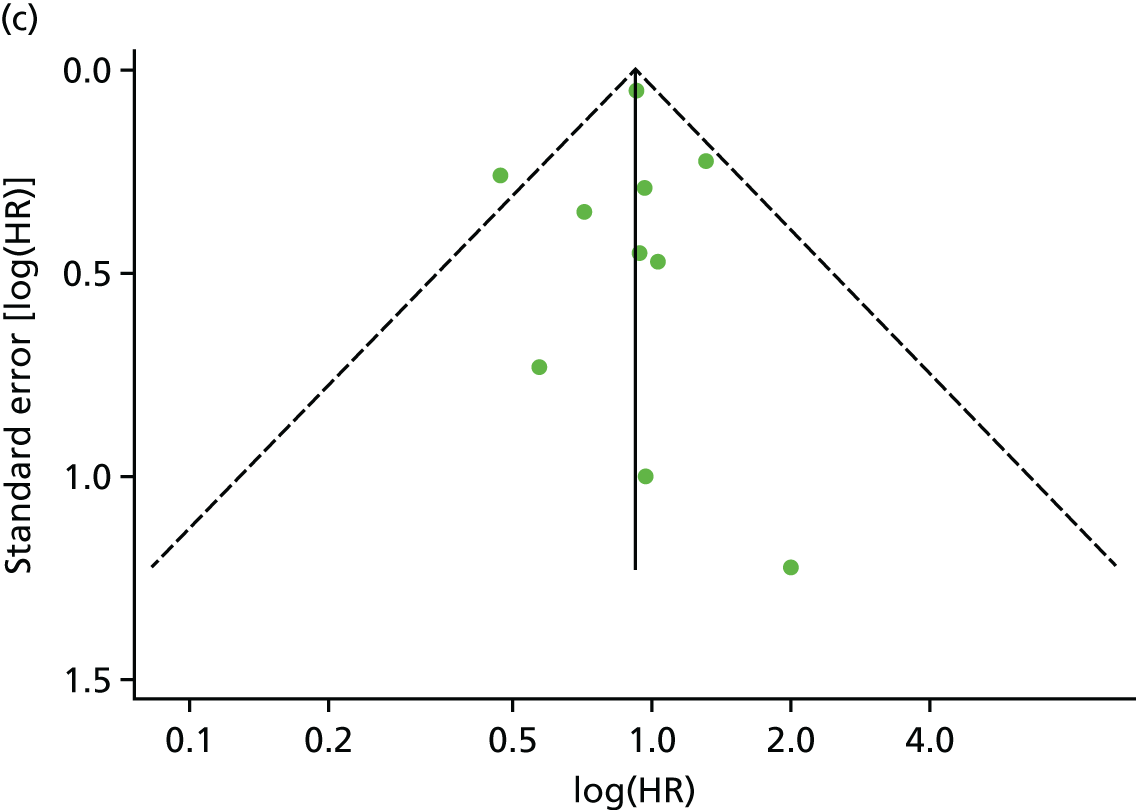
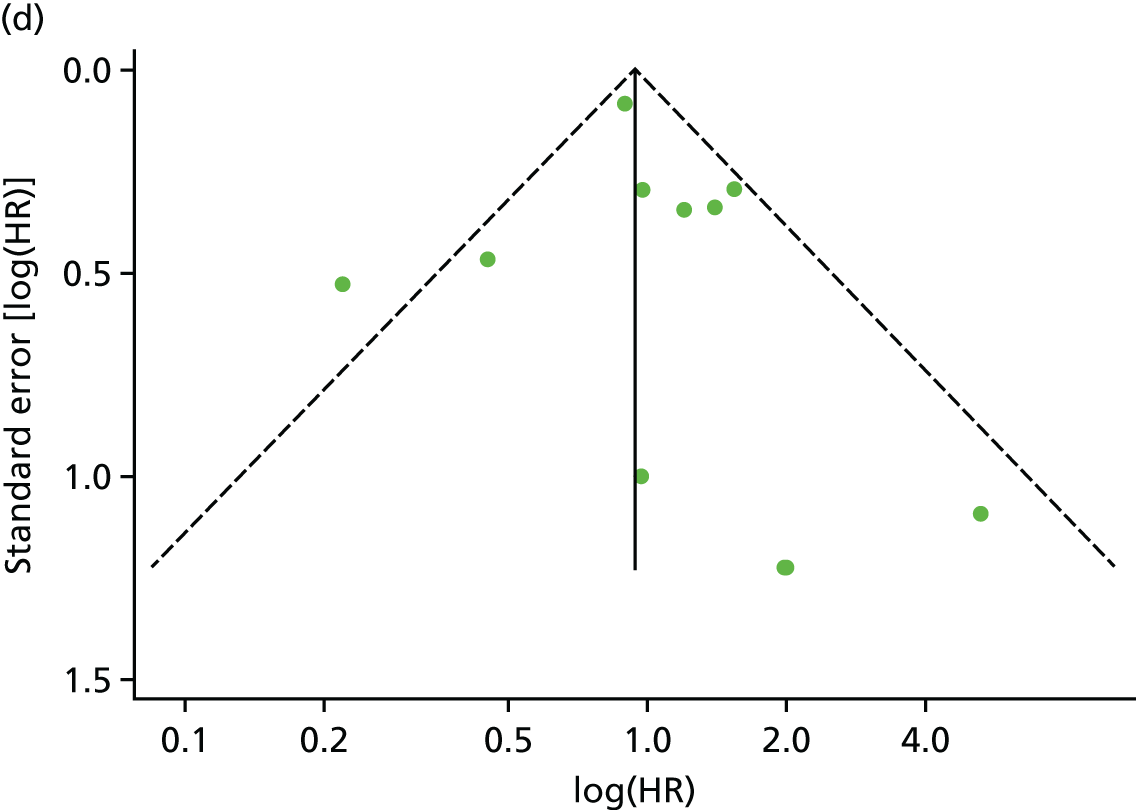
There was no evidence of significant small-study bias for the four outcomes (Figure 3). The overall quality of included trials was judged to be moderate to good, with a median TESTEX31 score of 11 (range 9–14) out of a maximum score of 15 (Table 6). The criteria of allocation concealment and physical activity monitoring in the control groups were met in only three studies;19,58,66 the other TESTEX criteria were met in ≥ 50% of the trials.
FIGURE 3.
Funnel plots for mortality and hospitalisation analyses. (a) All-cause mortality, Egger’s test –0.26, p = 0.458; (b) HF-specific mortality, Egger’s test –1.60, p = 0.147; (c) all-cause hospitalisation, Egger’s test 0.16, p = 0.739; and (d) HF-specific hospitalisation, Egger’s test 0.32, p = 0.610.
| First author/study (year) | Eligibility criteria specified | Randomisation specified | Allocation concealed | Groups similar at baseline | Blinding of assessors | Outcome measures in > 85% of participantsa | Intention-to-treat analysisb | Between-group statistical comparisons reportedc | Point measures and measures of variability reported | Activity monitoring in control group | Relative exercise intensity reviewed | Exercise volume and energy expended | Overall TESTEX score (maximum score of 15) |
|---|---|---|---|---|---|---|---|---|---|---|---|---|---|
| Belardinelli et al. (1999)50 | 1 | 0 | 0 | 1 | 0 | 3 | 1 | 1 | 1 | 0 | 0 | 1 | 9 |
| Belardinelli et al. (2012)56 | 1 | 0 | 0 | 1 | 0 | 3 | 1 | 1 | 1 | 0 | 0 | 1 | 9 |
| DANREHAB (2008)57 | 1 | 1 | 1 | 1 | 1 | 3 | 1 | 2 | 1 | 0 | 0 | 0 | 12 |
| Dracup et al. (2007)58 | 1 | 0 | 0 | 1 | 0 | 3 | 1 | 2 | 1 | 1 | 1 | 1 | 10 |
| Giannuzzi et al. (2003)60 | 1 | 0 | 0 | 1 | 0 | 2 | 1 | 2 | 1 | 0 | 1 | 1 | 10 |
| Hambrecht et al. (2000)51 | 1 | 1 | 0 | 1 | 0 | 3 | 0 | 2 | 1 | 0 | 1 | 1 | 11 |
| HF-ACTION (2009)19 | 1 | 1 | 1 | 1 | 1 | 3 | 1 | 2 | 1 | 1 | 0 | 1 | 14 |
| Jolly et al. (2009)61 | 1 | 1 | 1 | 1 | 0 | 2 | 1 | 2 | 1 | 0 | 1 | 1 | 12 |
| McKelvie et al. (2002)52 | 1 | 1 | 1 | 1 | 1 | 2 | 1 | 1 | 1 | 0 | 1 | 1 | 12 |
| Mueller et al. (2007)62 | 1 | 0 | 0 | 1 | 0 | 2 | 1 | 2 | 1 | 0 | 1 | 1 | 10 |
| Nilsson et al. (2008)63 | 1 | 1 | 0 | 1 | 1 | 2 | 1 | 2 | 1 | 0 | 0 | 1 | 11 |
| Passino et al. (2006)67 | 1 | 0 | 0 | 1 | 0 | 2 | 1 | 2 | 1 | 0 | 1 | 1 | 10 |
| Wielenga et al. (1999)53 | 1 | 0 | 0 | 1 | 0 | 2 | 1 | 2 | 1 | 0 | 0 | 1 | 9 |
| Willenheimer et al. (2001)54 | 1 | 0 | 0 | 1 | 1 | 2 | 1 | 2 | 1 | 0 | 0 | 1 | 9 |
| Witham et al. (2005)64 | 1 | 1 | 0 | 1 | 1 | 3 | 1 | 2 | 1 | 0 | 1 | 0 | 12 |
| Witham et al. (2012)65 | 1 | 1 | 0 | 1 | 1 | 3 | 1 | 2 | 1 | 0 | 1 | 0 | 12 |
| Yeh et al. (2011)66 | 1 | 1 | 0 | 1 | 1 | 3 | 1 | 2 | 1 | 1 | 0 | 0 | 12 |
| Zanelli et al. (1997)55 | No scored | ||||||||||||
Findings
Primary analysis
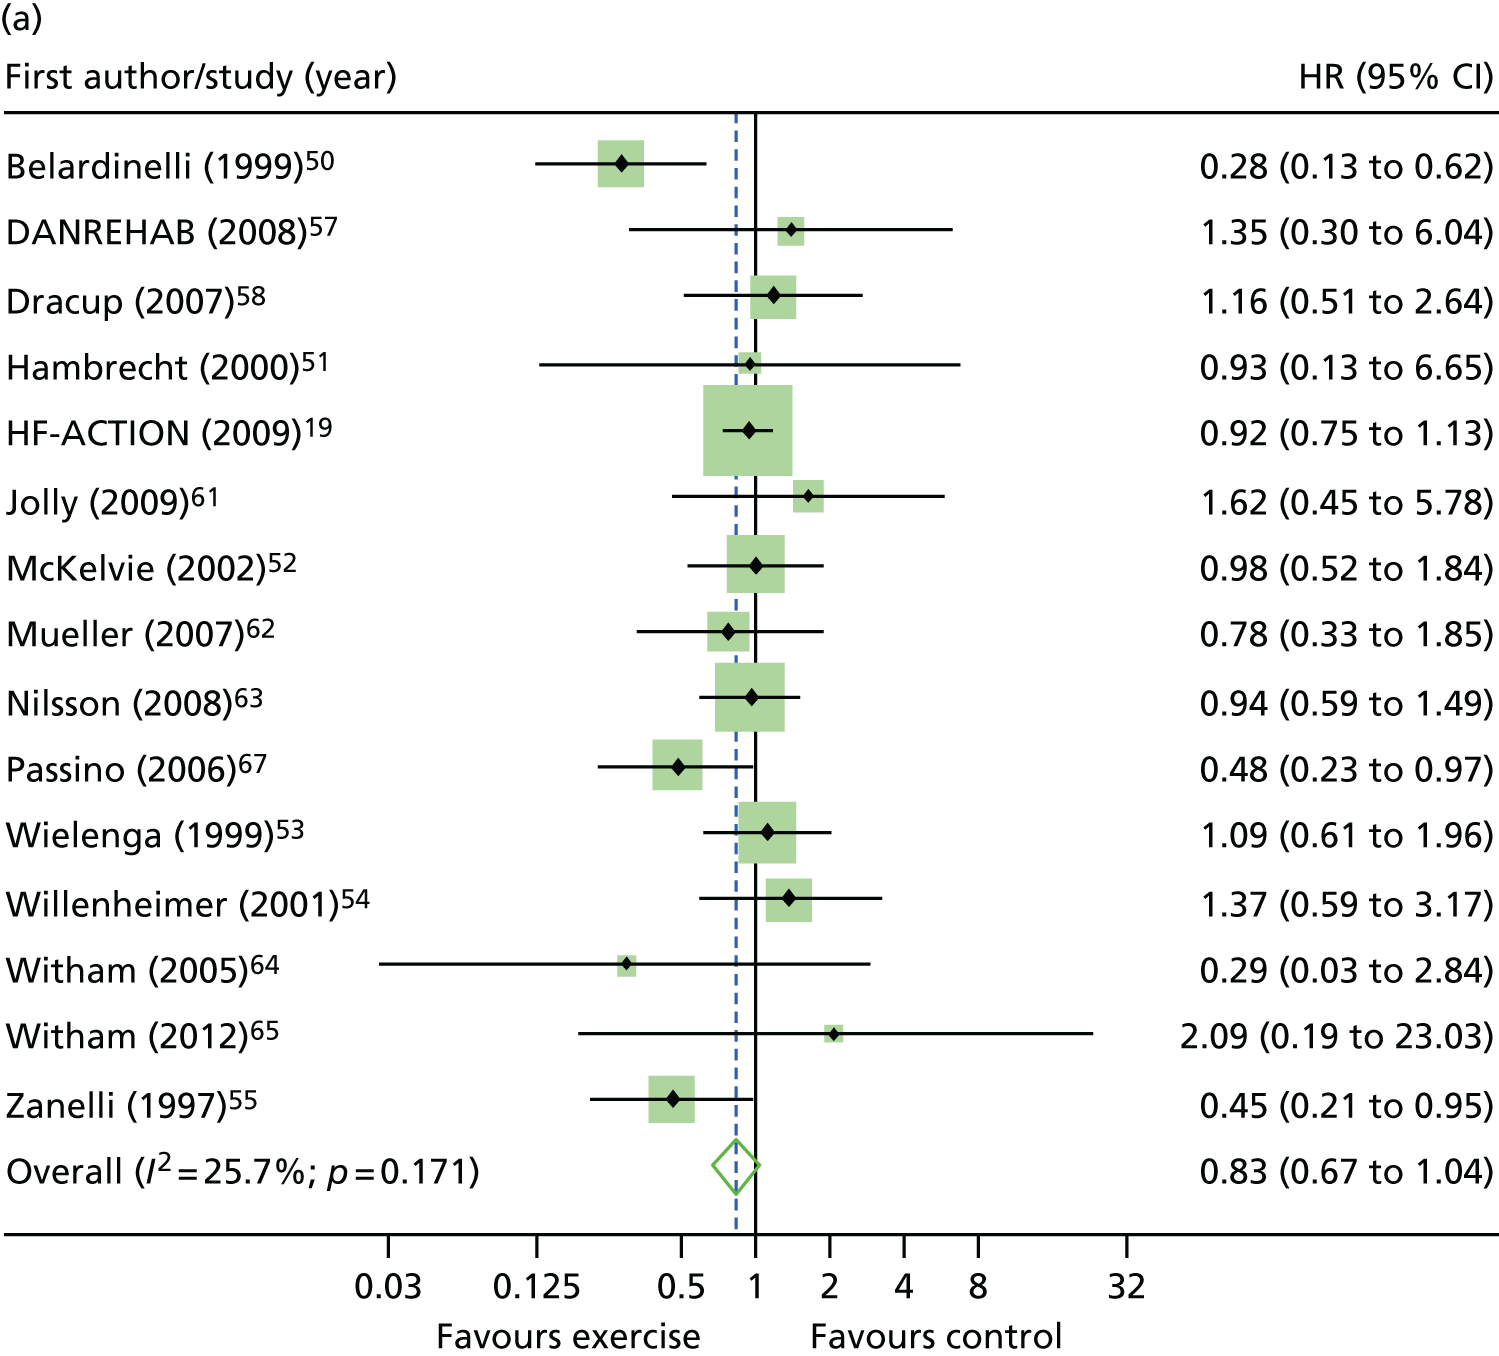
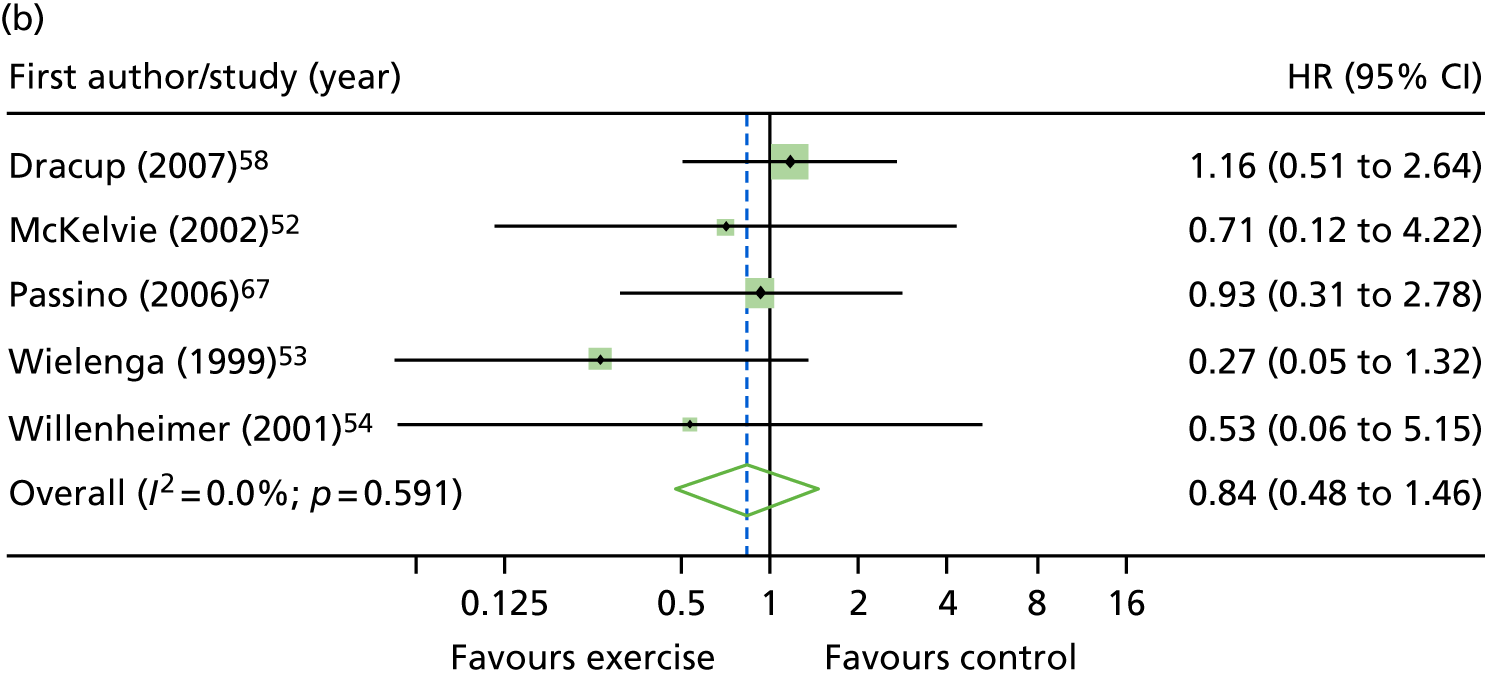
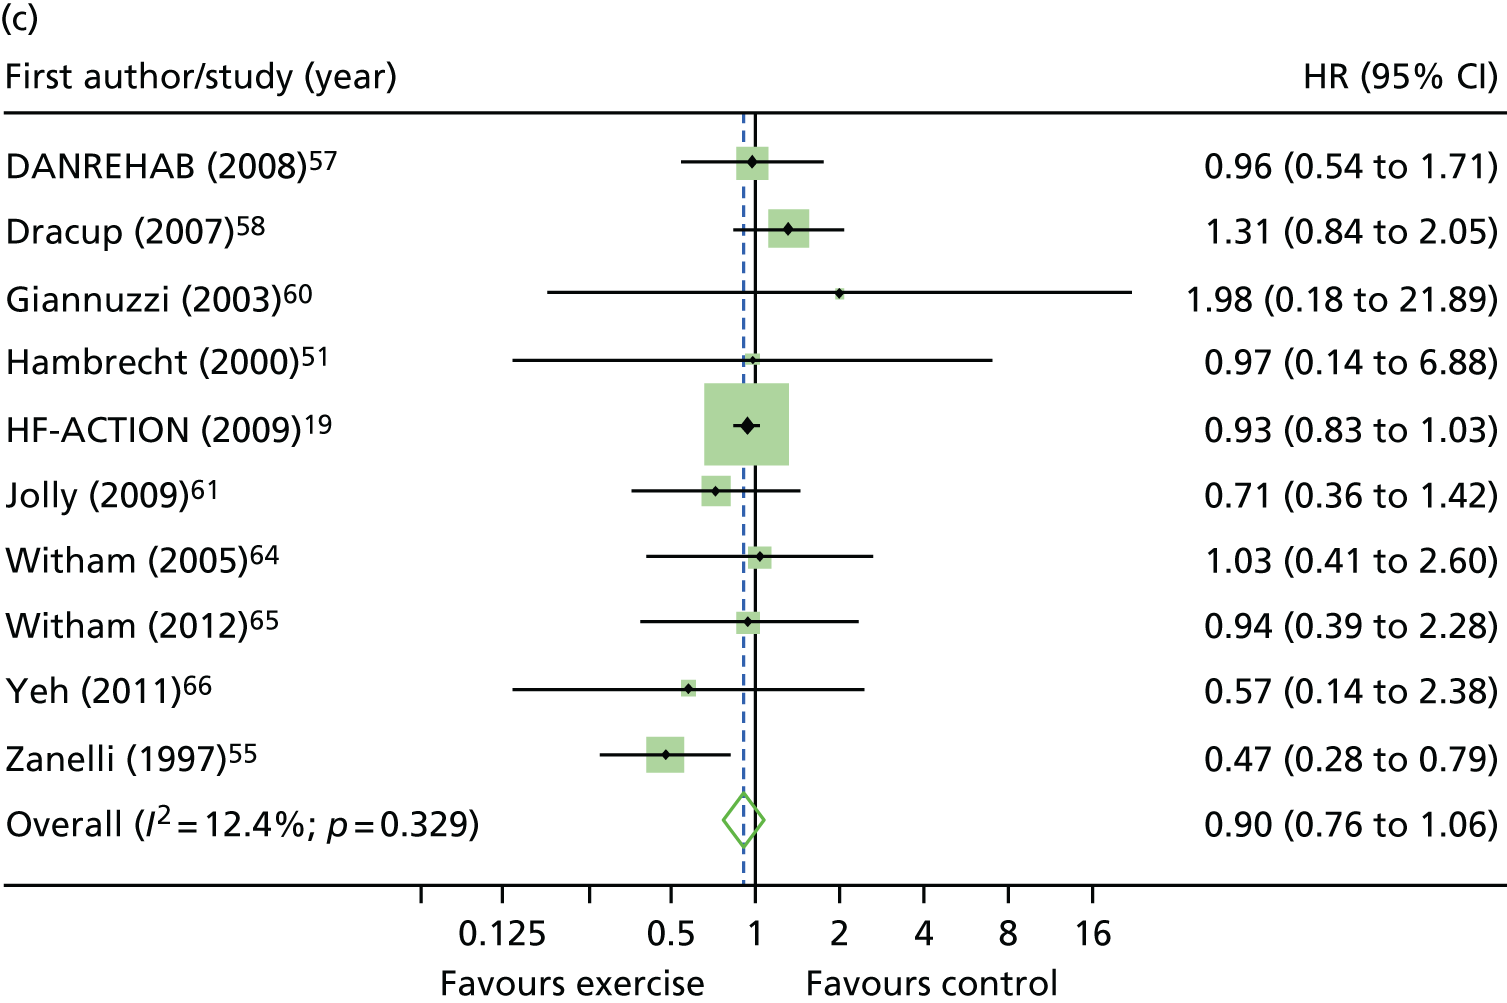
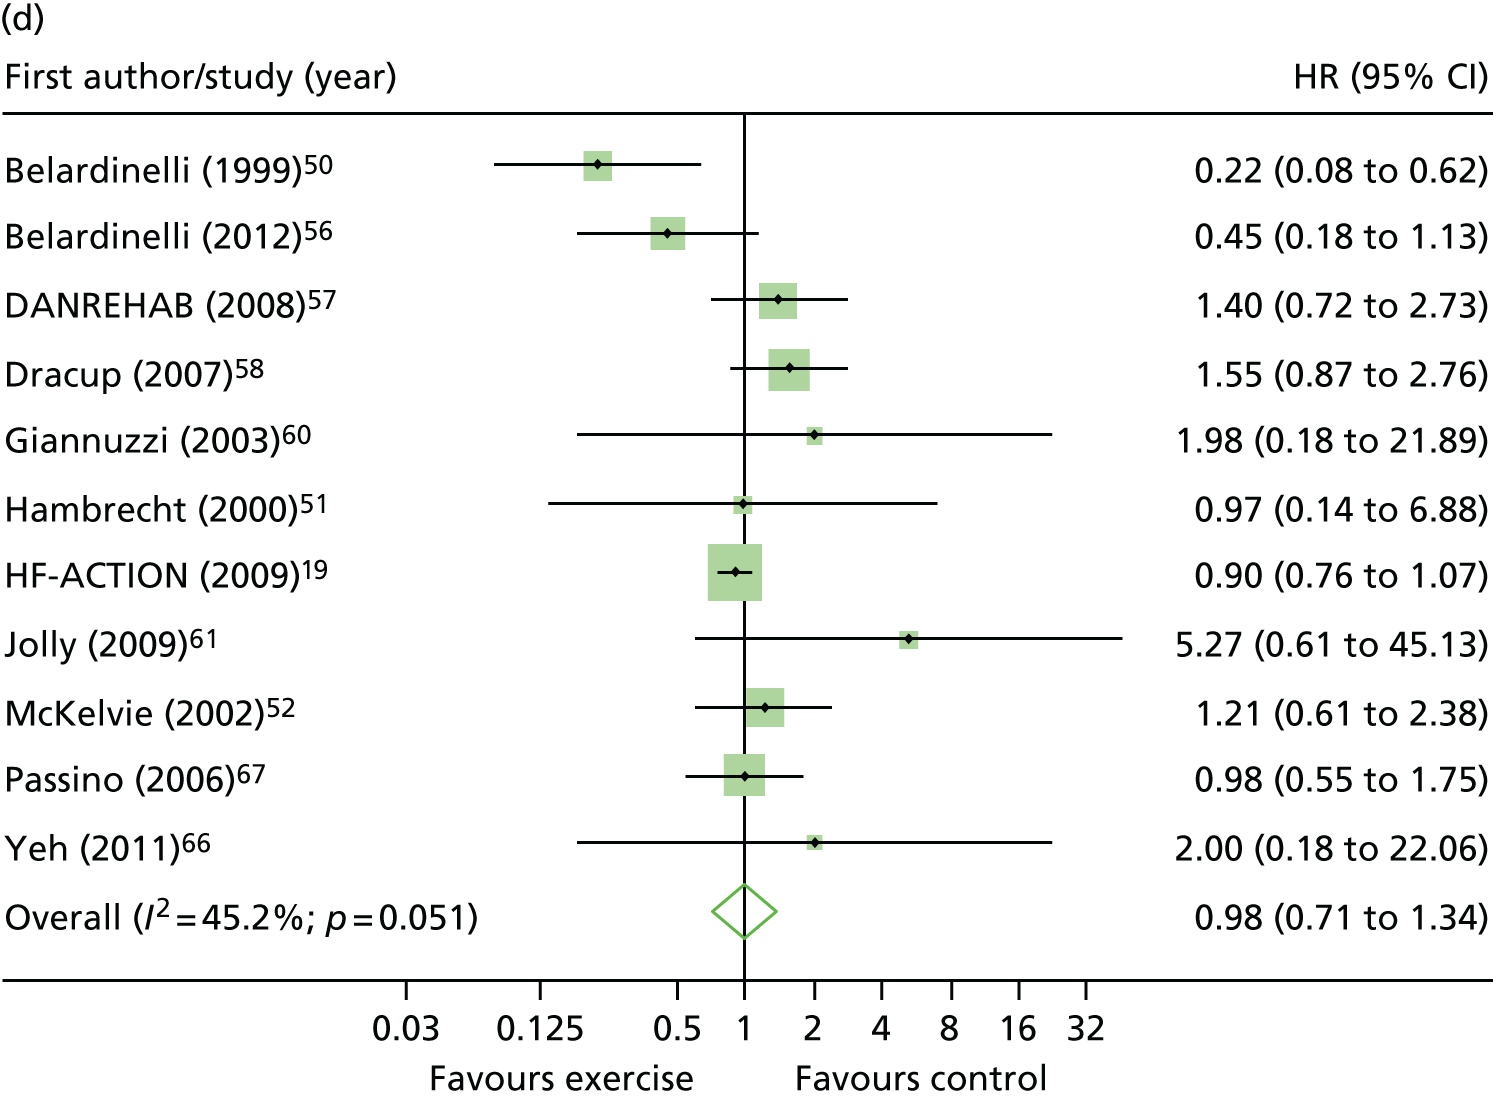
Compared with control, all time-to-event mean treatment effects from the two-stage random-effects IPD meta-analysis were in favour of ExCR, but had wide CIs and were not statistically significant [all-cause mortality: HR 0.83 (95% CI 0.67 to 1.04; p = 0.107, 17 studies,19,50–55,57,58,60–67 3782 patients, τ2 = 0.04, I2 = 26%); HF-specific mortality: HR 0.84 (95% CI 0.48 to 1.46; p = 0.527, 9 studies,51–54,58,60,64,65,67 915 patients, τ2 = 0.00, I2 = 0%); all-cause hospitalisation: HR 0.90 (95% CI 0.76 to 1.06; p = 0.210, 11 studies,19,51,54,55,57,58,60,61,64–66 3190 patients, τ2 = 0.01, I2 = 12.4%); and HF-specific hospitalisation: HR 0.98 (95% CI 0.72 to 1.35; p = 0.902, 13 studies,19,50,51,52,56–58,60,61,64–67 3494 patients, τ2 = 0.10, I2 = 45%)] (Figure 4 and Tables 7–10).
FIGURE 4.
Effect of ExCR on mortality and hospitalisation across patient subgroups: two-stage IPD meta-analysis. (a) All-cause mortality; (b) HF-specific mortality; (c) all-cause hospitalisation; and (d) HF-specific hospitalisation. DANREHAB, DANish Cardiac ReHABilitation trial.
| Baseline variable | Primary analysis, HR (95% CI); p-value | Secondary analysis, HR (95% CI); p-value | Sensitivity analyses, HR (95% CI); p-value | ||||
|---|---|---|---|---|---|---|---|
| Two-stage model, random effects | One-stage Cox model, stratified by study with fixed treatment effect | Two-stage model, random effects excluding HF-ACTION19 | One-stage Cox model, stratified by study with fixed effect excluding HF-ACTION19 | Two-stage model, random effects 1-year truncation | Two-stage model, random effects 2-year truncation | Two-stage model, random effects 5-year truncation | |
| Overall effect | 0.83 (0.67 to 1.04); 0.107 | 0.85 (0.73 to 0.99); 0.034 | 0.81 (0.61 to 1.06); 0.129 | 0.79 (0.64 to 0.97); 0.027 | 0.87 (0.58 to 1.31); 0.507 | 0.86 (0.67 to 1.10); 0.217 | 0.84 (0.66 to 1.06); 0.140 |
| Interaction term | |||||||
| Age (years) | 0.99 (0.98 to 1.00); 0.165 | 0.99 (0.98 to 1.01); 0.254 | 0.98 (0.96 to 1.01); 0.144 | 0.99 (0.96 to 1.01); 0.228 | 0.98 (0.95 to 1.00); 0.077 | 0.98 (0.96 to 1.00); 0.034 | 0.99 (0.97 to 1.00); 0.097 |
| Gender (male vs. female) | 1.10 (0.73 to 1.66); 0.660 | 1.06 (0.70 to 1.60); 0.783 | 0.71 (0.35 to 1.43); 0.341 | 0.70 (0.36 to 1.36); 0.300 | 0.76 (0.34 to 1.68); 0.490 | 0.96 (0.55 to 1.67); 0.872 | 1.17 (0.75 to 1.82); 0.481 |
| Ejection fraction (%) | 0.99 (0.97 to 1.01); 0.250 | 0.99 (0.97 to 1.01); 0.332 | 0.98 (0.95 to 1.01); 0.124 | 0.98 (0.96 to 1.01); 0.201 | 1.04 (1.00 to 1.08); 0.055 | 0.99 (0.97 to 1.02); 0.688 | 0.99 (0.97 to 1.01); 0.506 |
| NYHA class (NYHA class I/II vs. NYHA class III/IV) | 0.80 (0.58 to 1.11); 0.182 | 0.79 (0.57 to 1.08); 0.134 | 0.82 (0.49 to 1.38); 0.459 | 0.75 (0.46 to 1.22); 0.244 | 0.50 (0.23 to 1.07); 0.073 | 0.84 (0.54 to 1.30); 0.431 | 0.83 (0.59 to 1.18); 0.297 |
| HF aetiology (ischaemic vs. non-ischaemic) | 0.73 (0.38 to 1.39); 0.335 | 1.19 (0.86 to 1.64); 0.297 | 0.69 (0.36 to 1.31); 0.255 | 0.87 (0.54 to 1.41); 0.575 | 0.69 (0.19 to 2.54); 0.574 | 0.79 (0.38 to 1.67); 0.542 | 0.70 (0.33 to 1.47); 0.345 |
| Ethnic group (white vs. non-white) | 1.12 (0.74 to 1.69); 0.593 | 1.11 (0.74 to 1.68); 0.604 | a | 1.05 (0.25 to 4.31); 0.949 | 0.72 (0.34 to 1.53); 0.396 | 0.83 (0.50 to 1.38); 0.468 | 1.12 (0.74 to 1.69); 0.593 |
| Exercise capacity | |||||||
| Baseline VO2peak directly measured | 1.00 (0.95 to 1.05); 0.937 | 0.99 (0.95 to 1.04); 0.783 | 0.98 (0.90 to 1.08); 0.712 | 0.99 (0.91 to 1.07); 0.777 | 0.97 (0.88 to 1.06); 0.456 | 0.99 (0.93 to 1.05); 0.780 | 0.98 (0.91 to 1.06); 0.630 |
| Baseline VO2peak directly measured and predicted | 1.00 (0.95 to 1.06); 0.903 | 1.00 (0.96 to 1.04); 0.954 | 1.00 (0.91 to 1.08); 0.923 | 1.00 (0.93 to 1.07); 0.984 | 0.99 (0.90 to 1.08); 0.734 | 1.00 (0.94 to 1.06); 0.961 | 1.00 (0.93 to 1.07); 0.924 |
| Standardised scores using baseline VO2peak, 6MWT, ISWT units and watts score | 1.03 (0.83 to 1.27); 0.802 | 1.02 (0.85 to 1.22); 0.851 | 0.99 (0.71 to 1.39); 0.955 | 1.01 (0.75 to 1.35); 0.967 | 0.97 (0.66 to 1.41); 0.858 | 1.00 (0.78 to 1.30); 0.972 | 1.01 (0.76 to 1.35); 0.938 |
| Baseline variable | Primary analysis, HR (95% CI); p-value | Secondary analysis, HR (95% CI); p-value | Sensitivity analyses, HR (95% CI); p-value | ||
|---|---|---|---|---|---|
| Two-stage model, random effects | One-stage Cox model, stratified by study with fixed treatment effect | Two-stage model, random effects 1-year truncation | Two-stage model, random effects 2-year truncation | Two-stage model, random effects 5-year truncation | |
| Overall effect | 0.84 (0.48 to 1.46); 0.527 | 0.75 (0.44 to 1.28); 0.294 | a | 1.30 (0.59 to 2.87); 0.515 | 0.84 (0.49 to 1.53); 0.575 |
| Interaction term | |||||
| Age (years) | 0.96 (0.91 to 1.02); 0.206 | 0.96 (0.92 to 1.01); 0.162 | a | 0.91 (0.84 to 0.98); 0.017 | 0.95 (0.90 to 1.00); 0.066 |
| Gender (male vs. female) | 0.53 (0.08 to 3.73); 0.524 | 0.61 (0.11 to 3.49); 0.583 | a | b | b |
| Ejection fraction (%) | 0.95 (0.89 to 1.02); 0.159 | 0.96 (0.90 to 1.02); 0.179 | a | 1.01 (0.82 to 1.24); 0.912 | 0.96 (0.89 to 1.04); 0.309 |
| NYHA class (NYHA class I/II vs. NYHA class III/IV) | 0.54 (0.07 to 4.28); 0.562 | 0.78 (0.23 to 26.65); 0.691 | a | b | 0.54 (0.07 to 4.28); 0.562 |
| HF aetiology (ischaemic vs. non-ischaemic) | Data only available for one study | 3.30 (1.02 to 10.7); 0.047 | a | b | b |
| Ethnic group (white vs. non-white) | b | b | a | b | b |
| Exercise capacity | |||||
| Baseline VO2peak directly measured | 0.90 (0.76 to 1.07); 0.232 | 0.93 (0.78 to 1.09); 0.362 | a | 0.98 (0.73 to 1.31); 0.893 | 0.86 (0.69 to 1.06); 0.146 |
| Baseline VO2peak directly measured and predicted | 0.91 (0.77 to 1.07); 0.263 | 0.94 (0.80 to 1.10); 0.423 | a | 0.98 (0.76 to 1.26); 0.854 | 0.88 (0.72 to 1.06); 0.184 |
| Standardised scores using baseline VO2peak, 6MWT, ISWT units and watts score | 0.69 (0.35 to 1.35); 0.276 | 0.82 (0.43 to 1.56); 0.545 | a | 0.86 (0.31 to 2.37); 0.773 | 0.61 (0.28 to 1.32); 0.210 |
| Baseline variable | Primary analysis, HR (95% CI); p-value | Secondary analysis, HR (95% CI); p-value | Sensitivity analyses, HR (95% CI); p-value | ||||
|---|---|---|---|---|---|---|---|
| Two-stage model, random effects | One-stage Cox model, stratified by study with fixed treatment effect | Two-stage model, random effects excluding HF-ACTION19 | One-stage Cox model, stratified by study with fixed treatment effect excluding HF-ACTION19 | Two-stage model, random effects 1-year truncation | Two-stage model, random effects 2-year truncation | Two-stage model, random effects 5-year truncation | |
| Overall effect | 0.90 (0.76 to 1.06); 0.210 | 0.91 (0.83 to 1.01); 0.072 | 0.86 (0.64 to 1.14); 0.293 | 0.85 (0.68 to 1.09); 0.210 | 0.94 (0.75 to 1.18); 0.583 | 0.91 (0.74 to 1.11); 0.330 | 0.90 (0.76 to 1.06); 0.210 |
| Interaction term | |||||||
| Age (years) | 1.00 (0.99 to 1.01); 0.794 | 1.00 (0.99 to 1.01); 0.854 | 1.00 (0.98 to 1.03); 0.808 | 1.00 (0.98 to 1.02); –0.969 | 1.00 (0.99 to 1.01); 0.636 | 1.00 (0.99 to 1.01); 0.798 | 1.00 (0.99 to 1.01); 0.794 |
| Gender (male vs. female) | 1.09 (0.87 to 1.36); 0.454 | 1.09 (0.88 to 1.36); 0.424 | 0.66 (0.38 to 1.14); 0.136 | 0.68 (0.39 to 1.16); 0.158 | 1.05 (0.80 to 1.37); 0.745 | 1.15 (0.91 to 1.46); 0.239 | 1.09 (0.87 to 1.35); 0.454 |
| Ejection fraction (%) | 1.00 (0.98 to 1.01); 0.629 | 1.00 (0.98 to 1.01); 0.646 | 1.00 (0.96 to 1.04); 0.857 | 1.00 (0.96 to 1.05); 0.831 | 1.00 (0.98 to 1.01); 0.632 | 0.99 (0.98 to 1.01); 0.343 | 1.00 (0.98 to 1.01); 0.629 |
| NYHA class (NYHA class I/II vs. NYHA class III/IV) | 0.91 (0.74 to 1.12); 0.370 | 0.90 (0.73 to 1.10); 0.308 | 0.89 (0.43 to 1.87); 0.763 | 0.79 (0.39 to 1.60); 0.508 | 0.81 (0.63 to 1.05); 0.110 | 0.87 (0.70 to 1.09); 0.235 | 0.91 (0.74 to 1.12); 0.355 |
| HF aetiology (ischaemic vs. non-ischaemic) | 0.96 (0.71 to 1.31); 0.810 | 1.00 (0.82 to 1.22); 0.988 | 0.73 (0.39 to 1.39); 0.340 | 0.73 (0.40 to 1.31); 0.284 | 1.08 (0.84 to 1.38); 0.562 | 1.04 (0.84 to 1.29); 0.723 | 1.01 (0.83 to 1.24); 0.910 |
| Ethnic group (white vs. non-white) | 1.02 (0.83 to 1.26); 0.860 | 1.02 (0.83 to 1.26); 0.852 | 1.02 (0.47 to 2.21); 0.959 | 1.06 (0.49 to 2.32); 0.879 | 1.14 (0.88 to 1.48); 0.322 | 1.06 (0.85 to 1.33); 0.607 | 1.02 (0.83 to 1.26); 0.860 |
| Exercise capacity | |||||||
| Baseline VO2peak directly measured | 1.01 (0.99 to 1.04); 0.259 | 1.02 (0.99 to 1.04); 0.234 | 1.05 (0.95 to 1.16); 0.352 | 1.06 (0.96 to 1.17); 0.262 | 1.03 (0.99 to 1.06); 0.124 | 1.02 (0.99 to 1.04); 0.243 | 1.01 (0.99 to 1.04); 0.259 |
| Baseline VO2peak directly measured and predicted | 1.02 (0.99 to 1.04); 0.153 | 1.02 (0.99 to 1.04); 0.134 | 1.07 (0.98 to 1.17); 0.125 | 1.08 (0.99 to 1.17); 0.078 | 1.03 (1.00 to 1.06); 0.057 | 1.02 (0.99 to 1.05); 0.129 | 1.02 (0.99 to 1.04); 0.153 |
| Standardised scores using baseline VO2peak, 6MWT, ISWT units and watts score | 1.09 (0.98 to 1.22); 0.095 | 1.10 (0.99 to 1.22); 0.088 | 1.30 (0.93 to 1.83); 0.120 | 1.32 (0.95 to 1.82); 0.097 | 1.16 (1.02 to 1.33); 0.027 | 1.11 (0.99 to 1.24); 0.077 | 1.09 (0.98 to 1.22); 0.095 |
| Baseline variable | Primary analysis, HR (95% CI); p-value | Secondary analysis, HR (95% CI); p-value | Sensitivity analyses, HR (95% CI); p-value | ||||
|---|---|---|---|---|---|---|---|
| Two-stage model, random effects | One-stage Cox model, stratified by study with fixed treatment effect | Two-stage model, random effects excluding HF-ACTION19 | One-stage Cox model, stratified by study with fixed treatment effect excluding HF-ACTION19 | Two-stage model, random effects 1-year truncation | Two-stage model, random effects 2 year truncation | Two-stage model, random effects 5 year truncation | |
| Overall effect | 0.98 (0.72 to 1.35); 0.902 | 0.94 (0.81 to 1.08); 0.368 | 1.00 (0.65 to 1.54); 0.999 | 1.03 (0.79 to 1.35); 0.829 | 1.08 (0.88 to 1.33); 0.470 | 1.06 (0.83 to 1.34); 0.658 | 0.97 (0.70 to 1.34); 0.855 |
| Interaction term | |||||||
| Age (years) | 1.00 (0.99 to 1.02); 0.603 | 1.00 (0.99 to 1.02); 0.632 | 1.00 (0.98 to 1.03); 0.958 | 1.00 (0.97 to 1.02); 0.906 | 1.00 (0.99 to 1.02); 0.640 | 1.00 (0.99 to 1.02); 0.611 | 1.00 (0.99 to 1.02); 0.580 |
| Gender (male vs. female) | 1.03 (0.73 to 1.46); 0.865 | 0.99 (0.71 to 1.39); 0.949 | 0.70 (0.32 to 1.53); 0.372 | 0.65 (0.33 to 1.29); 0.215 | 0.76 (0.46 to 1.24); 0.274 | 1.06 (0.68 to 1.66); 0.803 | 0.93 (0.49 to 1.75); 0.815 |
| Ejection fraction (%) | 0.51 (0.14 to 1.79); 0.291 | 0.99 (0.97 to 1.01); 0.325 | 0.99 (0.96 to 1.03); 0.540 | 0.99 (0.97 to 1.01); 0.350 | 0.99 (0.97 to 1.02); 0.569 | 0.99 (0.97 to 1.01); 0.350 | 0.99 (0.97 to 1.02); 0.569 |
| NYHA class (NYHA class I/II vs. NYHA class III/IV) | 1.55 (0.79 to 3.02); 0.200 | 1.14 (0.84 to 1.54); 0.399 | 2.05 (0.86 to 4.92); 0.107 | 1.74 (0.92 to 3.29); 0.089 | 0.81 (0.51 to 1.29); 0.375 | 1.17 (0.68 to 2.03); 0.573 | 1.21 (0.72 to 2.04); 0.475 |
| HF aetiology (ischaemic vs. non-ischaemic) | 1.20 (0.64 to 2.25); 0.577 | 1.28 (0.94 to 1.74); 0.111 | 0.95 (0.31 to 2.95); 0.928 | 1.10 (0.57 to 2.16); 0.771 | 1.47 (0.94 to 2.29); 0.128 | 1.28 (0.90 to 1.84); 0.172 | 1.29 (0.79 to 2.12); 0.309 |
| Ethnic group (white vs. non-white) | 1.18 (0.85 to 1.65); 0.318 | 1.19 (0.86 to 1.66); 0.291 | a | 1.79 (0.60 to 5.37); 0.301 | 1.25 (0.79 to 1.98); 0.334 | 1.20 (0.83 to 1.74); 0.327 | 1.18 (0.85 to 1.65); 0.318 |
| Exercise capacity | |||||||
| Baseline VO2peak directly measured | 0.97 (0.88 to 1.07); 0.538 | 0.97 (0.93 to 1.01); 0.149 | 0.94 (0.80 to 1.11); 0.467 | 0.98 (0.90 to 1.07); 0.658 | 0.99 (0.90 to 1.10); 0.882 | 0.99 (0.93 to 1.06); 0.769 | 0.98 (0.89 to 1.08); 0.685 |
| Baseline VO2peak directly measured and predicted | 0.97 (0.89 to 1.07); 0.539 | 0.97 (0.93 to 1.01); 0.116 | 0.95 (0.82 to 1.10); 0.483 | 0.97 (0.89 to 1.05); 0.424 | 0.98 (0.92 to 1.05); 0.610 | 0.99 (0.94 to 1.03); 0.535 | 0.98 (0.90 to 1.07); 0.670 |
| Standardised scores using baseline VO2peak, 6MWT, ISWT units and watts score | 0.88 (0.62 to 1.26); 0.483 | 0.86 (0.72 to 1.03); 0.093 | 0.83 (0.46 to 1.49); 0.527 | 0.81 (0.56 to 1.16); 0.246 | 0.92 (0.69 to 1.23); 0.576 | 0.93 (0.75 to 1.16); 0.517 | 0.91 (0.69 to 1.20); 0.505 |
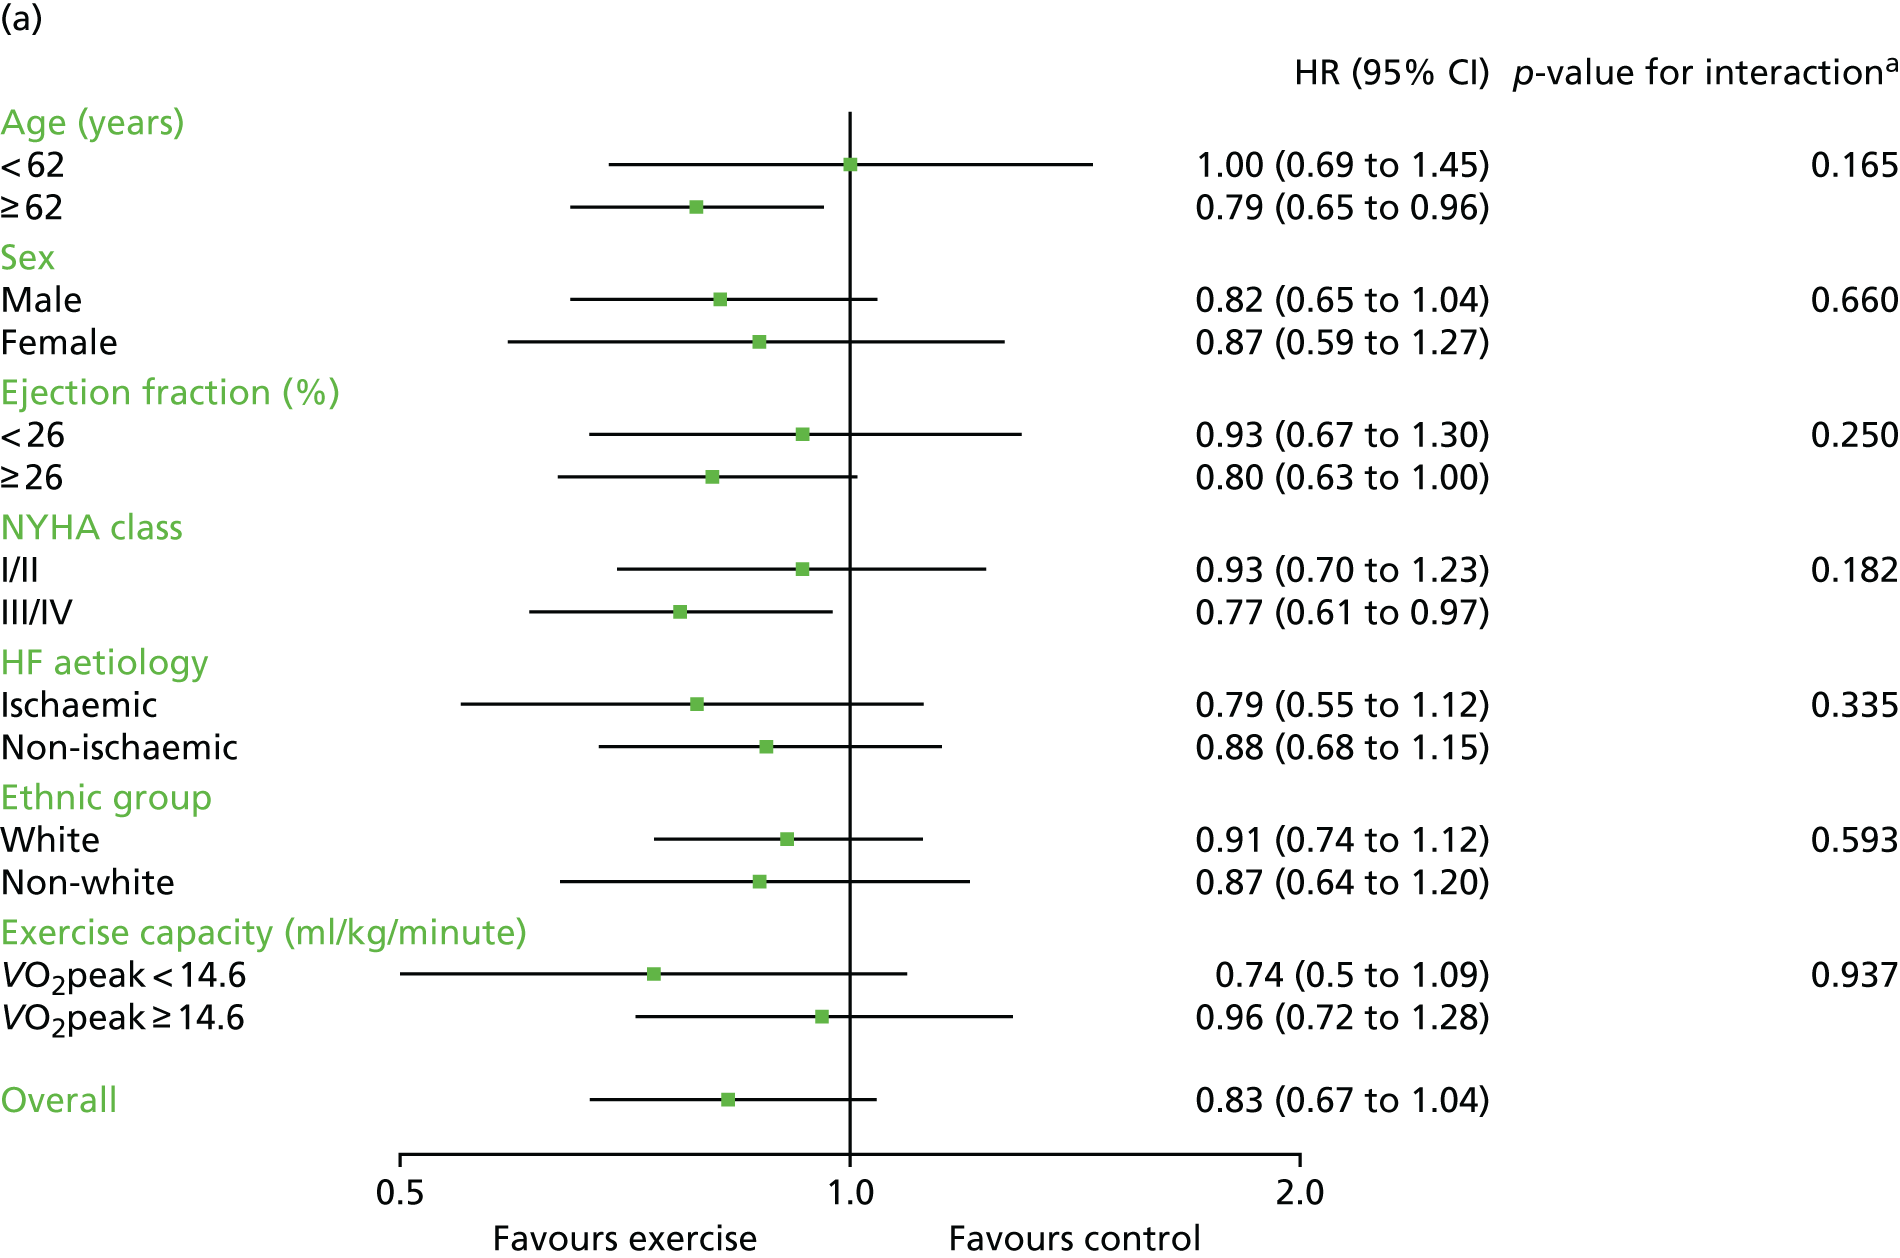
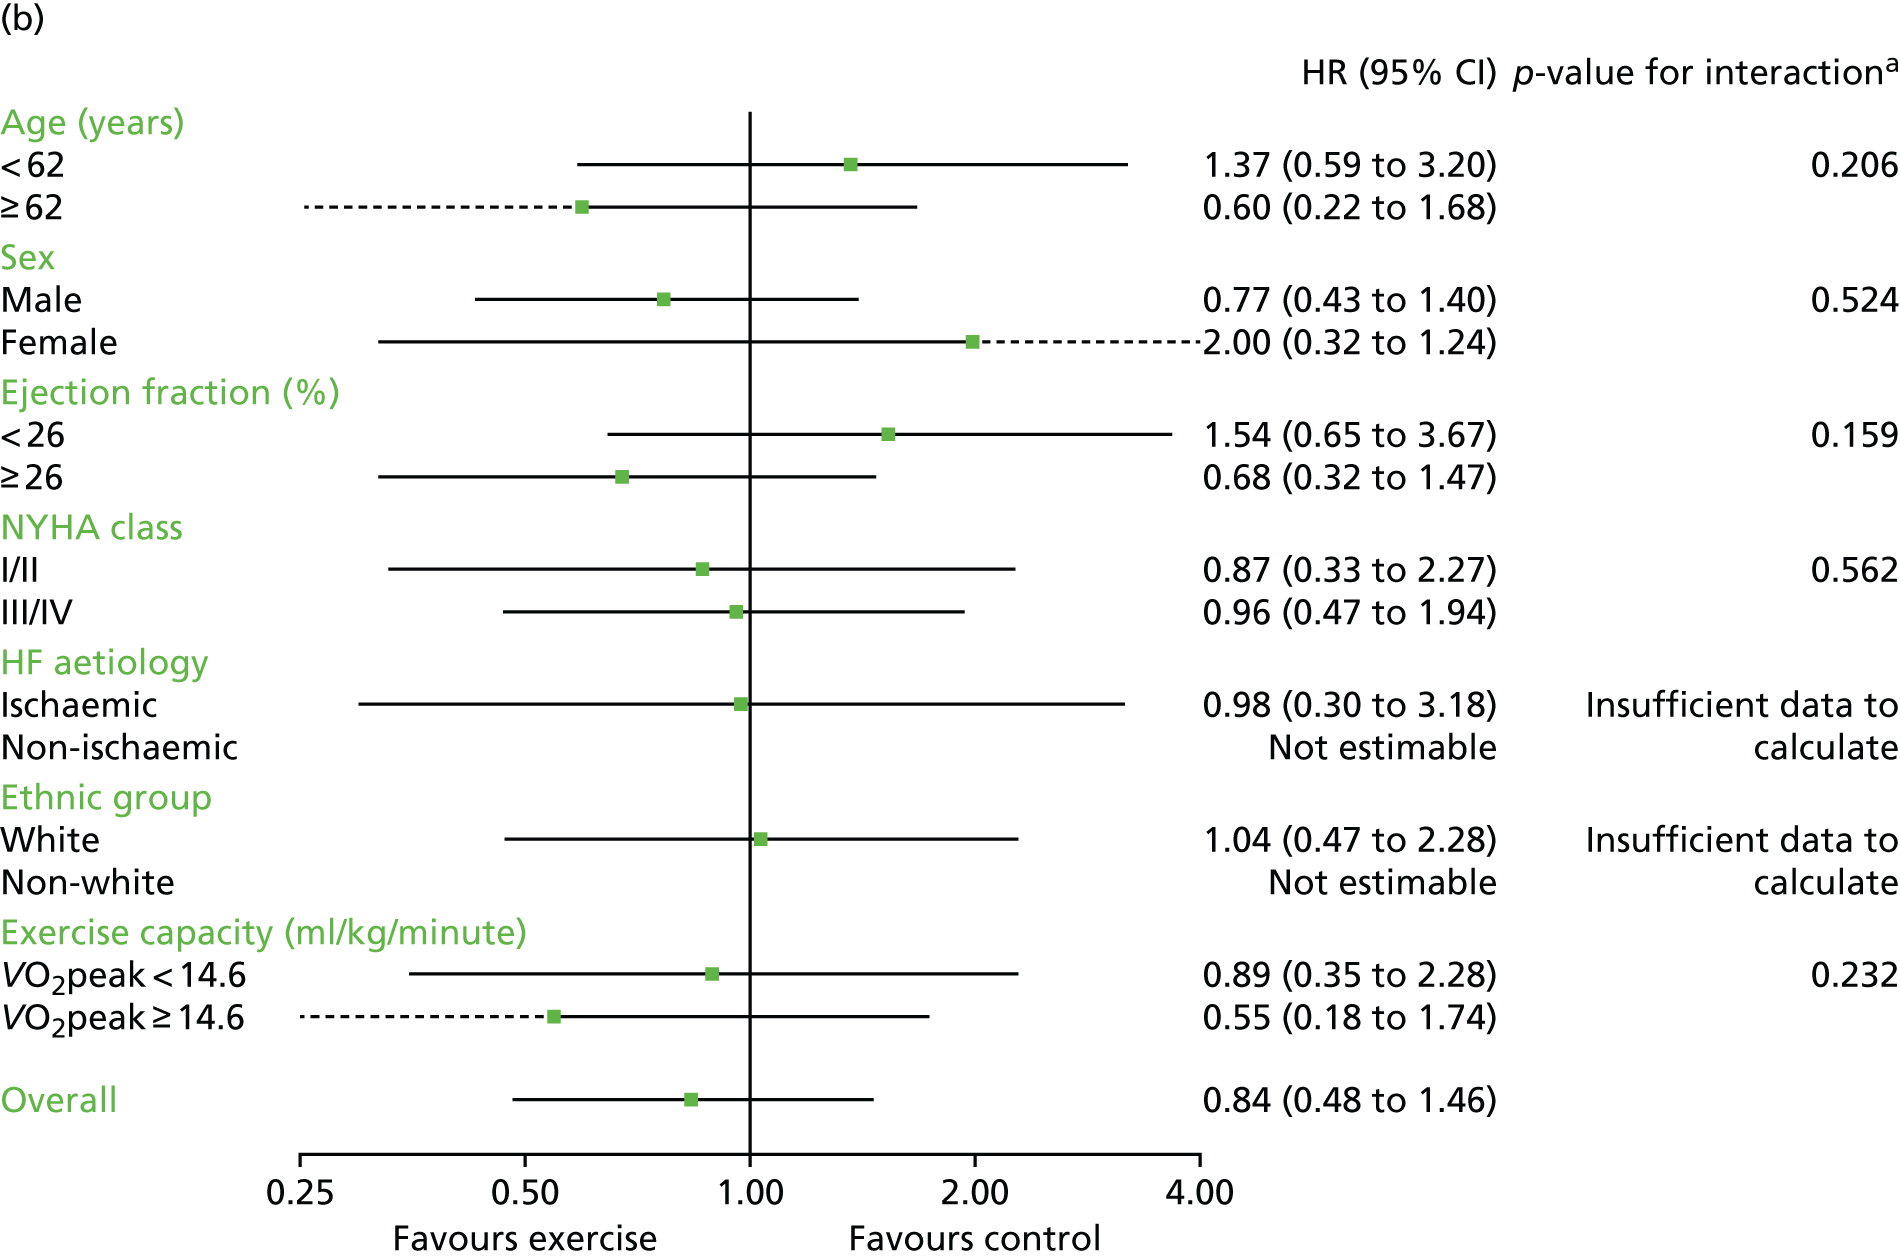
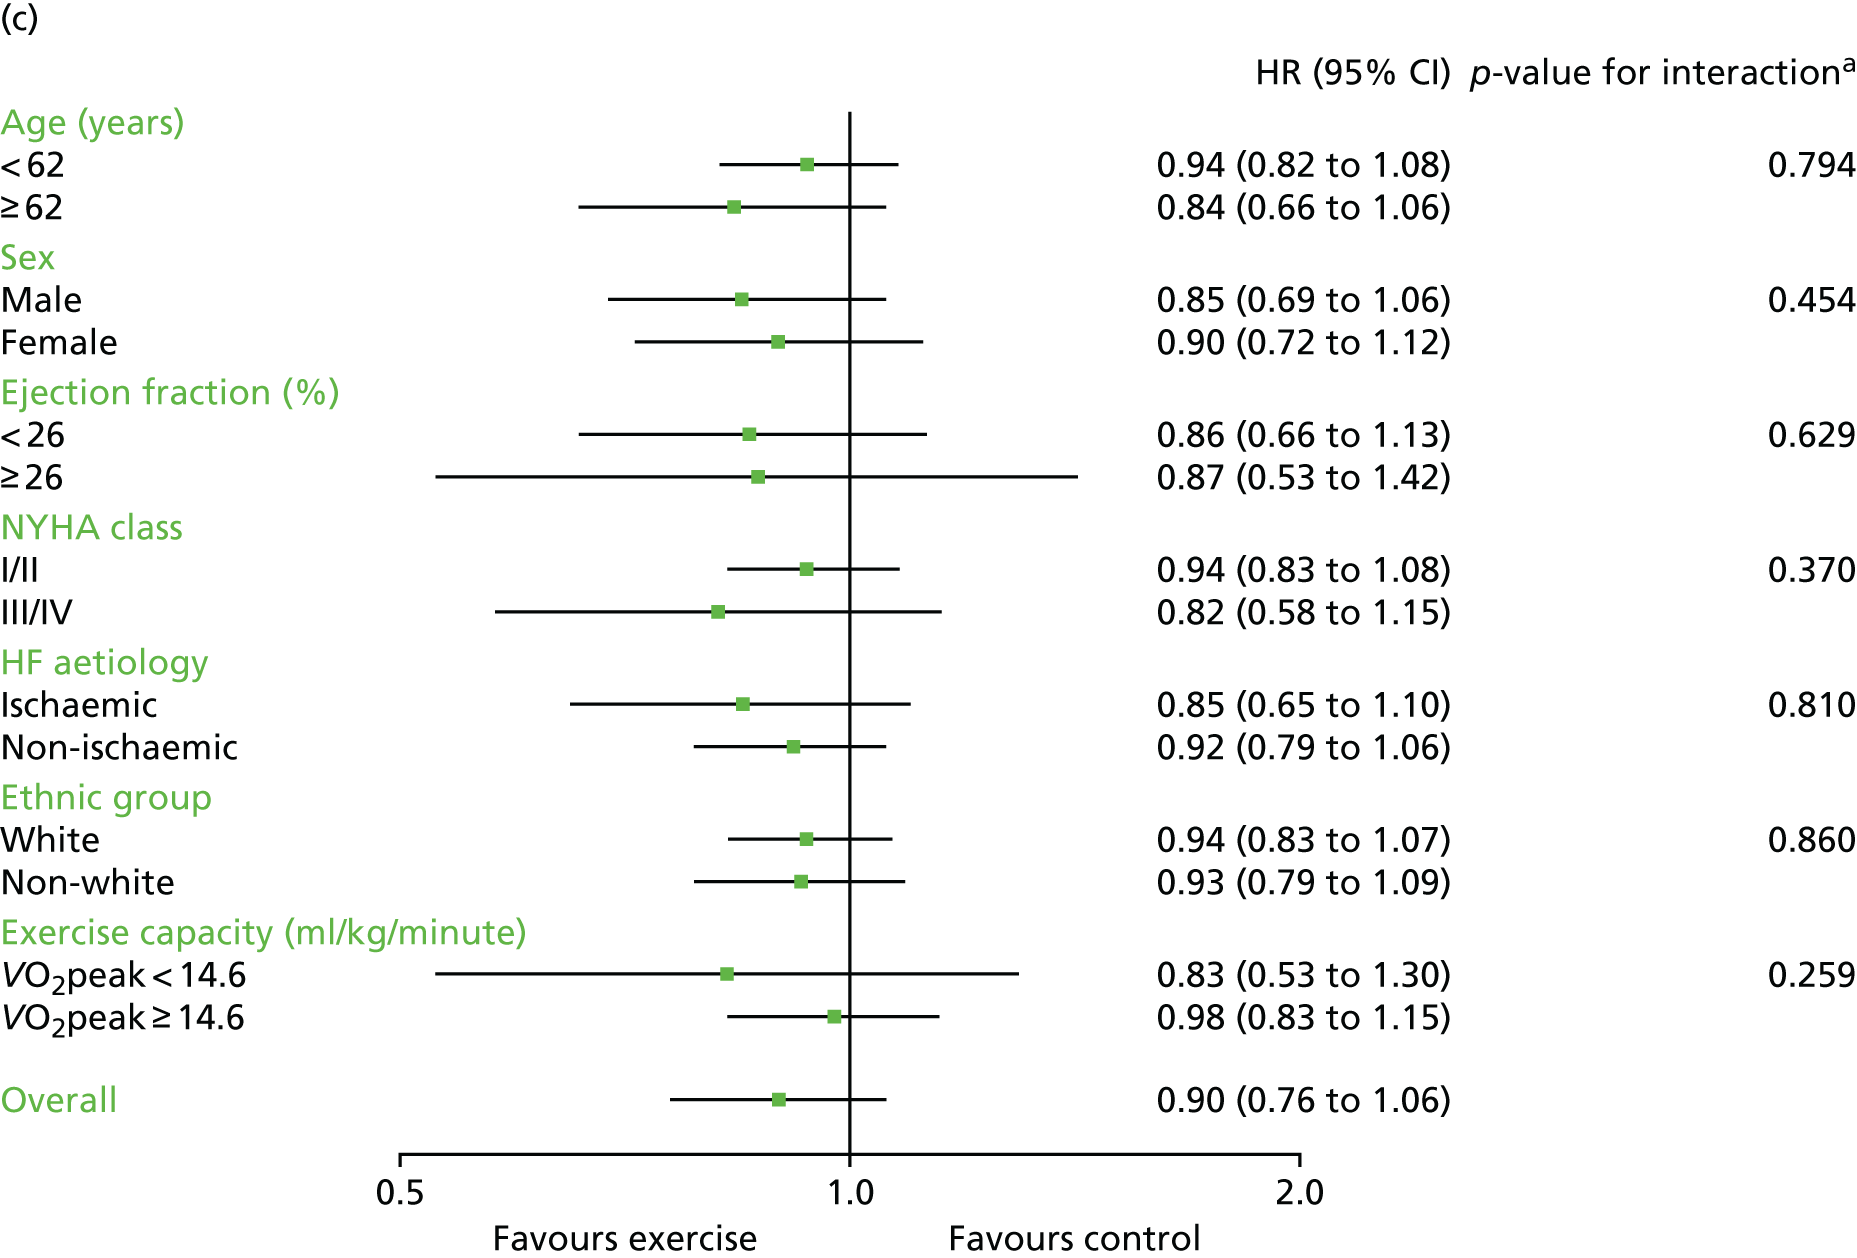
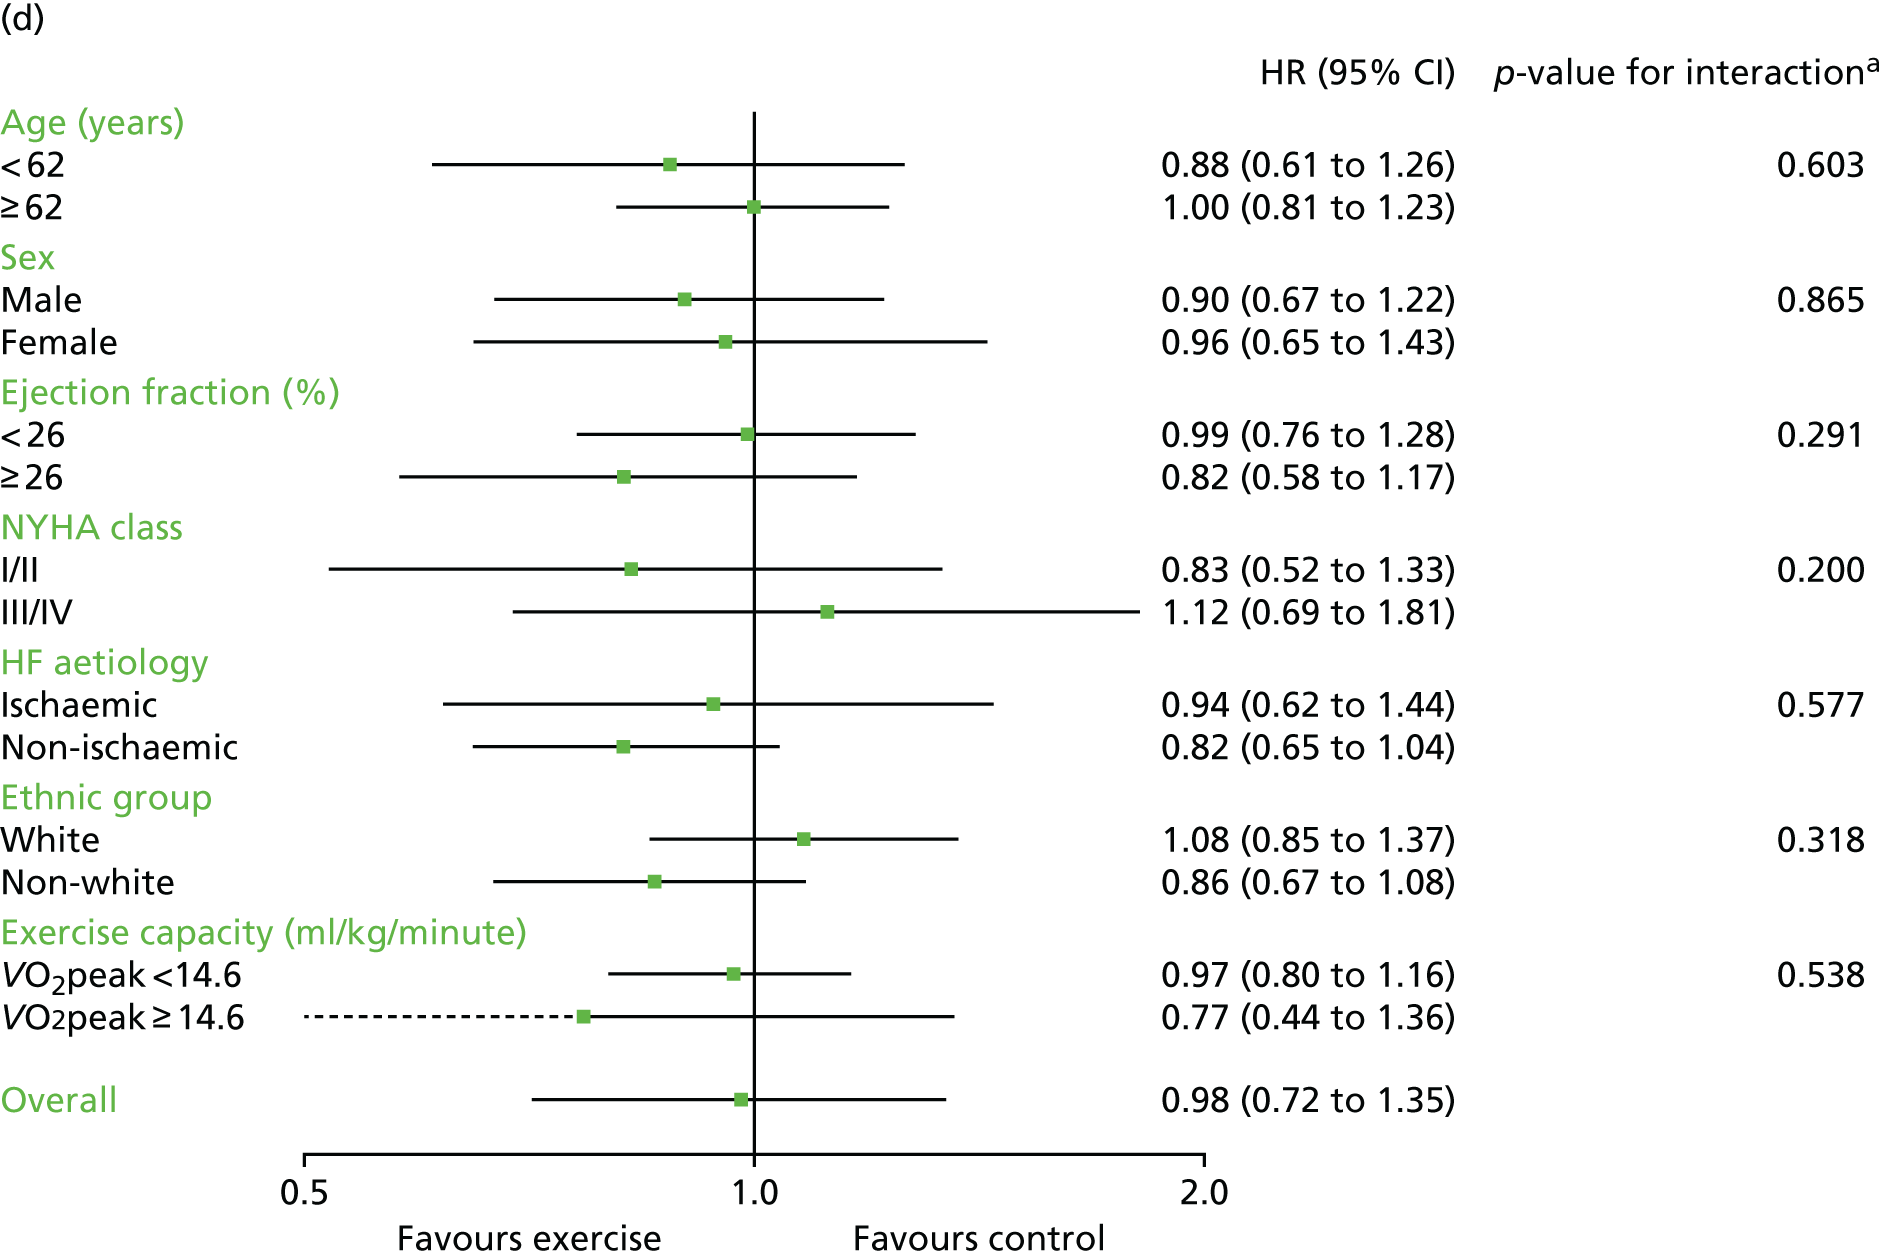
Interaction analyses for the two-stage model revealed no consistent interaction between the effect of ExCR and any of the predefined subgroups (age, sex, ejection fraction, NYHA class, HF aetiology, ethnicity or baseline exercise capacity) for all-cause mortality, HF-related mortality, all-cause hospitalisation or HF-related hospitalisation (see Tables 7–10). In order to make further comparisons of mortality and hospitalisation rates within each subgroup, the HR and associated 95% CI from individual subgroup one-stage IPD meta-analyses are shown in Figure 5. The p-values from the interaction test in the two-stage IPD meta-analyses are presented alongside these estimates.
FIGURE 5.
Effect of ExCR on mortality and hospitalisation across patient subgroups: individual subgroup one-stage IPD meta-analyses. (a) All-cause mortality; (b) HF-related mortality; (c) all-cause hospitalisation; and (d) HF-related hospitalisation. a, Although stratified meta-analyses are shown, the interaction p-values are calculated based on continuous distribution of age, ejection fraction and baseline exercise capacity.
Secondary analyses
These primary analysis results were broadly consistent across secondary analyses.
Sensitivity analyses
In sensitivity analyses, four weak interaction effects (p < 0.05) were seen:
-
Age compared with all-cause mortality (p = 0.034) in the two-stage 2-year truncation model (i.e. larger reduction in all-cause mortality with ExCR in older patients).
-
Age compared with HF-related mortality (p = 0.017) in the two-stage 2-year truncation model (i.e. larger reduction in HF-related mortality with ExCR in older patients).
-
Ischaemic status compared with HF-related mortality (p = 0.047) in the one-stage model (i.e. larger reduction in HF-related mortality with ExCR in ischaemic patients).
-
Standardised baseline exercise capacity compared with all-cause hospitalisation (p = 0.027) in the two-stage 1-year truncation model (i.e. larger reduction in all-cause hospitalisation with ExCR in patients with lower than average baseline exercise capacity) (see Tables 7–10).
Inferences did not change following the addition of trial-level data from trials that met the study inclusion criteria but did not contribute IPD (data are not shown here, but are available from the authors of this report).
Chapter 6 Impact of exercise-based cardiac rehabilitation on health-related quality of life and exercise capacity
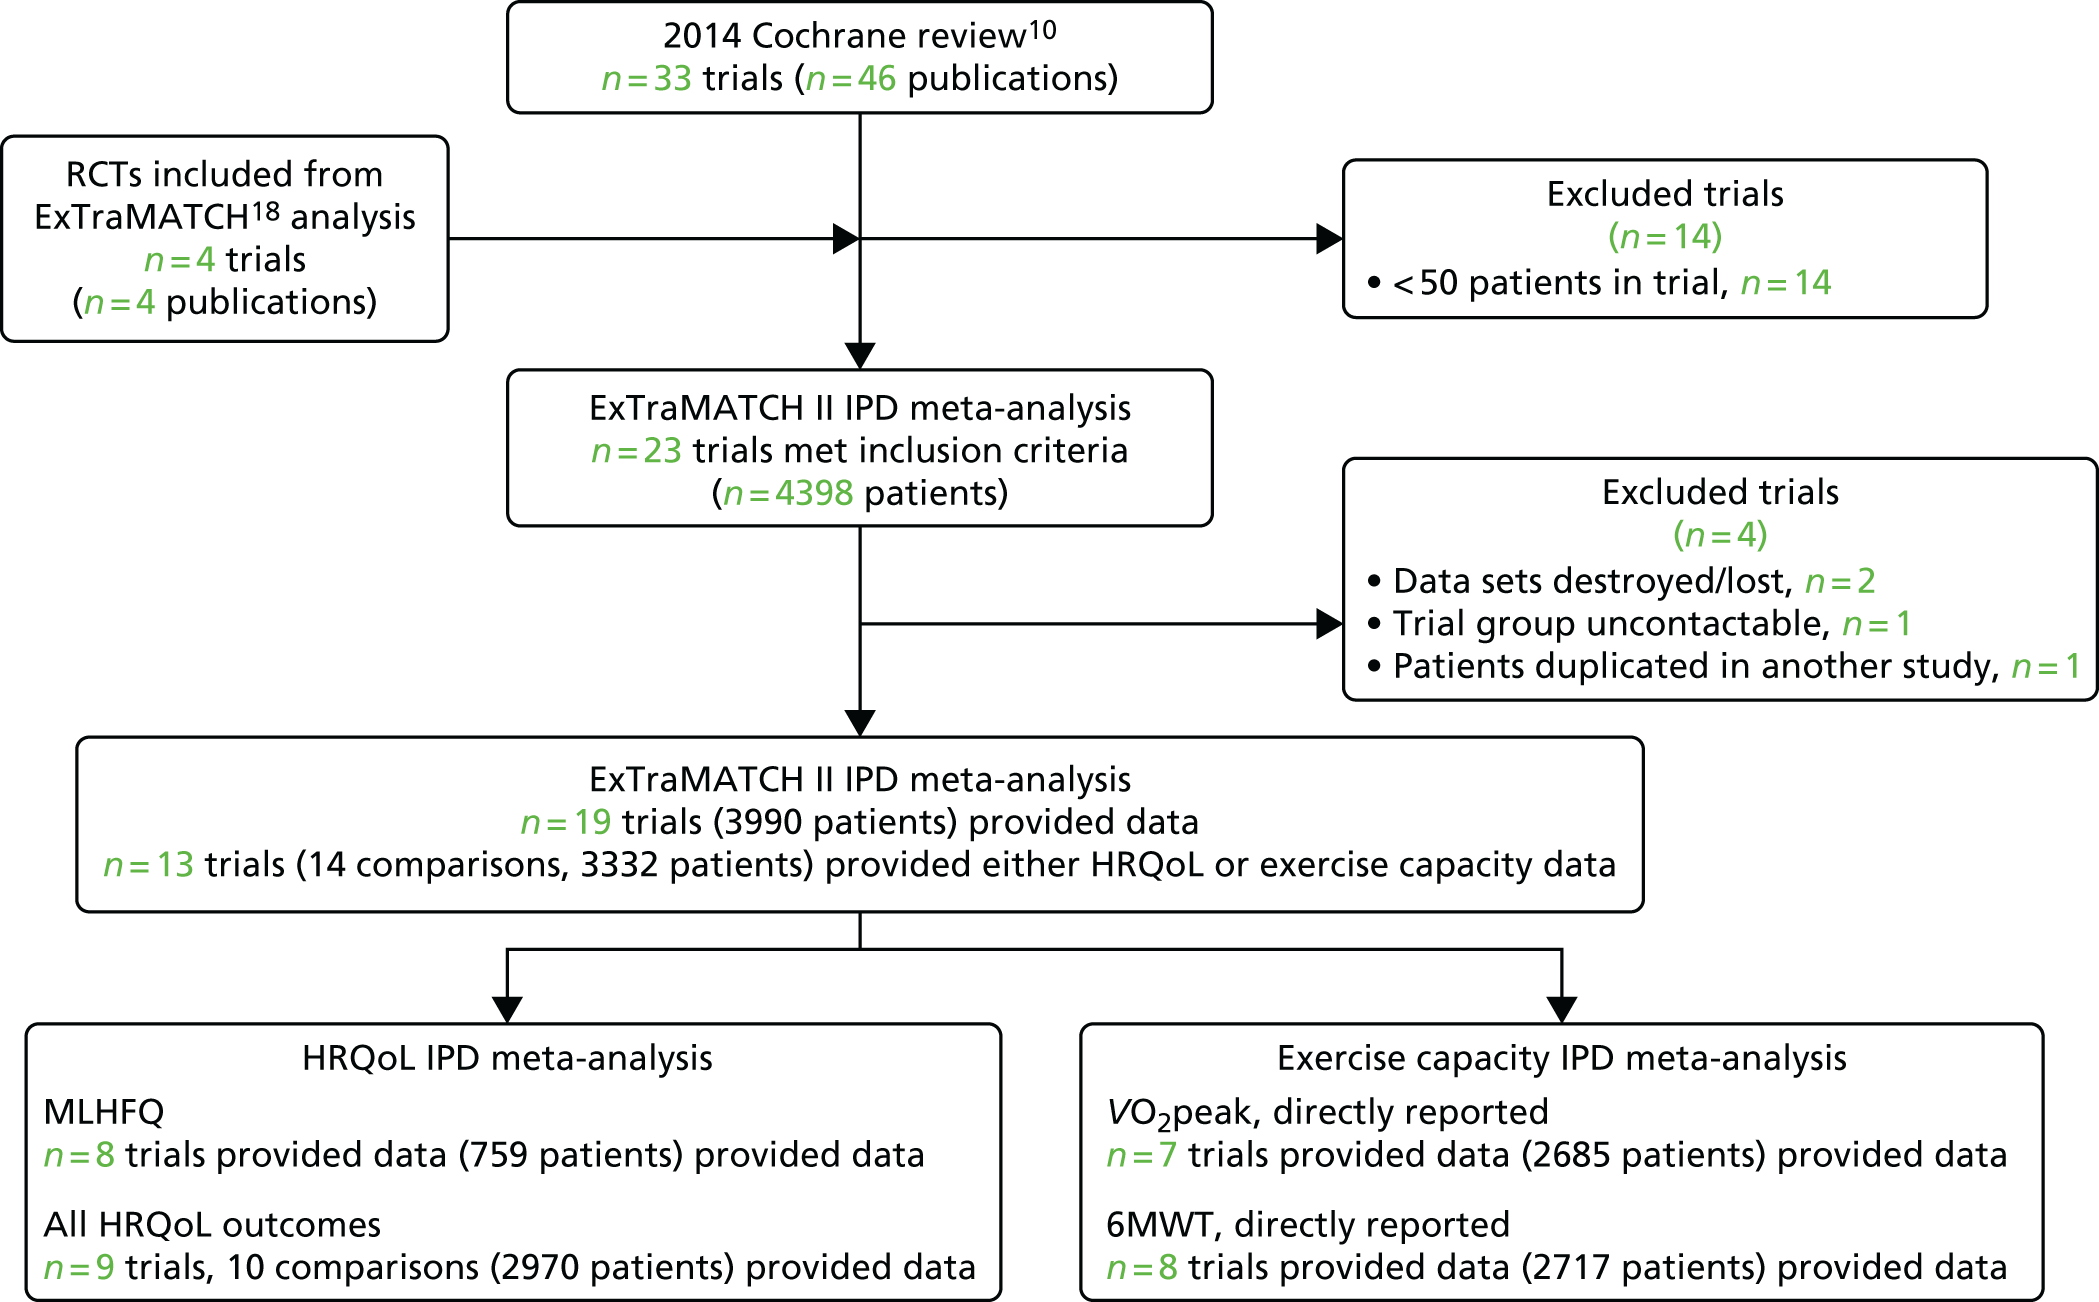
Six trials that provided IPD but had no data on HRQoL or exercise capacity were excluded from analyses in this section. 50,52,54,55,57,73 In addition to comparing usual care with an intervention arm of usual care plus ExCR, Gary et al. 59 also compared the effects of cognitive–behavioural therapy to cognitive–behavioural therapy plus ExCR. For the purpose of analysis from this point forward, this will be described as one trial providing two comparisons. For analysis, the data set was split into two and analysed as if the data were provided by two separate trials. For the HRQoL analysis, nine trials19,58,59,61,63–67 (10 comparisons) provided data for 3000 patients (1496 ExCR patients and 1504 control patients), with a median follow-up of 33 weeks. For the exercise capacity analysis, 13 trials19,51,56,58–67 (14 comparisons) provided data for 3332 patients (1662 ExCR patients and 1670 control patients), with a median follow-up of 26 weeks. Figure 6 summarises the study selection process.
FIGURE 6.
The PRISMA flow diagram summarising the selection of studies for HRQoL and exercise capacity analyses.
Characteristics of included patients and trials
Patient baseline characteristics were well balanced between ExCR patients and control patients (Table 11). The majority of patients were male (73%), with a mean age of 61 years. The mean baseline left ventricular ejection fraction was 27%, < 5% of included patients had a HFpEF (defined as an ejection fraction of > 45%), and most patients were in NYHA functional class II (62%) or III (36%). Studies were published between 2000 and 2012 across a number of countries (Table 12). Sample size ranged from 50 to 2130 patients. All trials evaluated an aerobic exercise intervention; four also included resistance training. 58,61,64,65 Exercise training was most commonly delivered in an exclusively centre-based setting. Four trials were conducted in an exclusively home-based setting. 58,59,61,67 The dose of exercise training ranged across studies, with an average session duration of 15–60 minutes (including warm-up and cool-down), of two to seven sessions per week, exercise intensity equivalent of 40–70% VO2peak and delivery duration of 4–120 weeks.
| Characteristic | Intervention | All (N = 3332) | |
|---|---|---|---|
| ExCR (N = 1662) | Control (N = 1670) | ||
| Age (years), mean (SD) | 60.9 (13.2) | 61.2 (13.5) | 61.1 (13.4) |
| Gender, n (%) | |||
| Male | 1187 (71.4) | 1237 (74.1) | 2424 (72.8) |
| Female | 475 (28.6) | 433 (25.9) | 908 (27.3) |
| Baseline ejection fraction (%), mean (SD) | 27.0 (8.8) | 26.9 (8.7) | 26.9 (8.8) |
| Baseline ejection fraction, n (%) | |||
| HFrEF (< 45%) | 1721 (96.8) | 1744 (97.5) | 3465 (97.1) |
| HFpEF (≥ 45%) | 57 (3.2) | 45 (2.5) | 102 (2.9) |
| NYHA status, n (%) | |||
| Class I | 20 (1.2) | 25 (1.5) | 45 (1.4) |
| Class II | 1002 (61) | 1032 (63) | 2034 (62.0) |
| Class III | 597 (36) | 569 (35) | 1166 (35.5) |
| Class IV | 19 (1.2) | 18 (1.1) | 37 (1.1) |
| Aetiology, n (%) | |||
| Ischaemic | 892 (54.9) | 884 (54.1) | 1776 (54.5) |
| Non-ischaemic | 732 (45.1) | 750 (45.9) | 1482 (45.5) |
| Ethnicity, n (%) | |||
| White | 1085 (69.3) | 1117 (70.9) | 2202 (70.1) |
| Non-white | 480 (30.7) | 458 (29.1) | 938 (30.0) |
| VO2peak (ml/kg/minute), mean (SD) | 15.0 (4.5) | 15.1 (4.7) | 15.0 (4.6) |
| 6MWT (m), mean (SD) | 362.6 (109.3) | 362.5 (112.1) | 362.6 (110.7) |
| Study characteristic | n (%), unless otherwise stated |
|---|---|
| Publication year | |
| 1990–9 | 0 (0) |
| 2000–9 | 9 (64) |
| 2010–12 | 5 (36) |
| Unpublished | 0 (0) |
| Main study location | |
| Europe | 9 (64) |
| North Americaa | 5 (36) |
| Study centre | |
| Single | 10 (71.4) |
| Multiple | 4 (28.6) |
| Not reported | 0 (0) |
| Sample size | |
| 0–99 | 8 (57) |
| 100–999 | 5 (36) |
| ≥ 1000 | 1 (7) |
| Duration of latest follow-up (weeks), median (range) | |
| HRQoL outcomes | 33 (26–104) |
| Exercise capacity outcomes | 26 (9–520) |
| Intervention characteristic | |
| Intervention type | |
| Exercise-only programmes | 9 (64.3) |
| Comprehensive programmes | 5 (35.7) |
| Type of exercise | |
| Aerobic exercise only | 10 (71.4) |
| Aerobic plus resistance training | 4 (28.6) |
| Dose of intervention | |
| Duration of intervention (weeks), median (range) | 24 (4–120) |
| Frequency (sessions/week), median (range) | 3 (2–6.5) |
| Length of exercise session (minutes), median (range) | 30 (15–60) |
| Exercise intensity (range) | 40–70% VO2peak |
| 11–15 Borg rating | |
| Setting | |
| Centre based | 9 (64.3) |
| Home based | 5 (35.7) |
Assessment of study quality and risk of bias
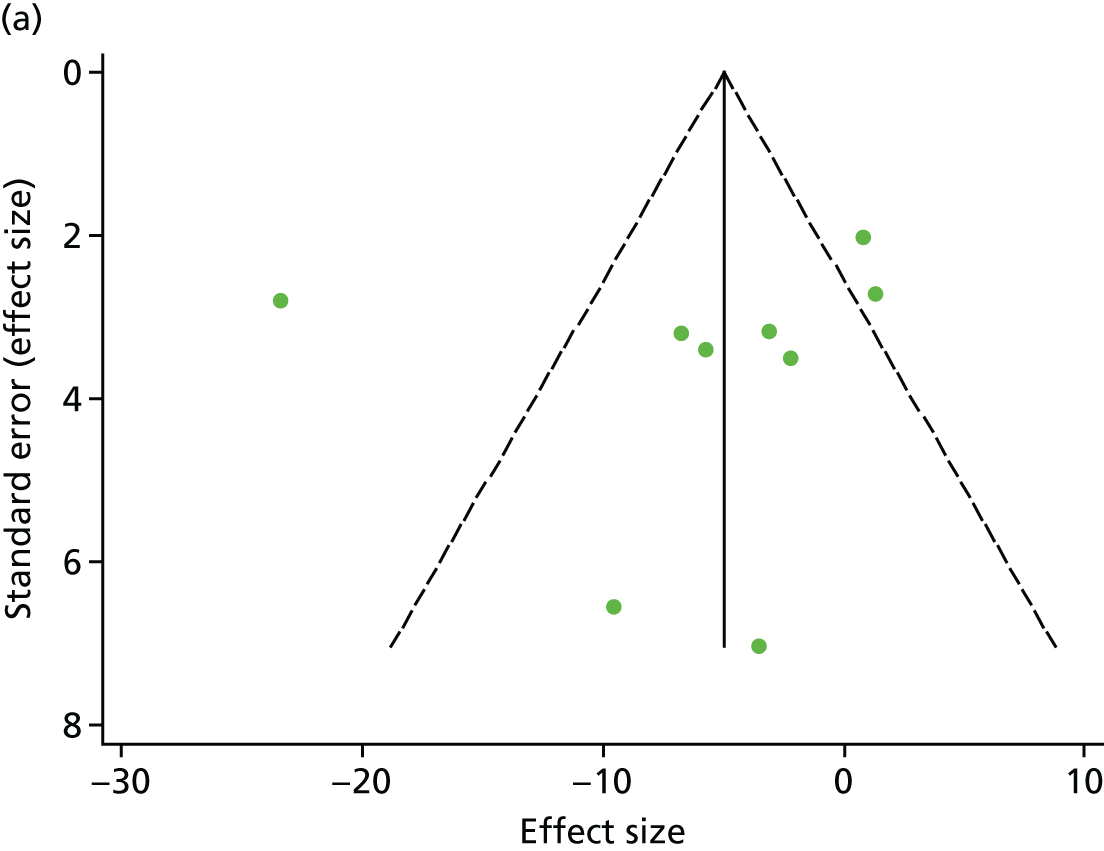
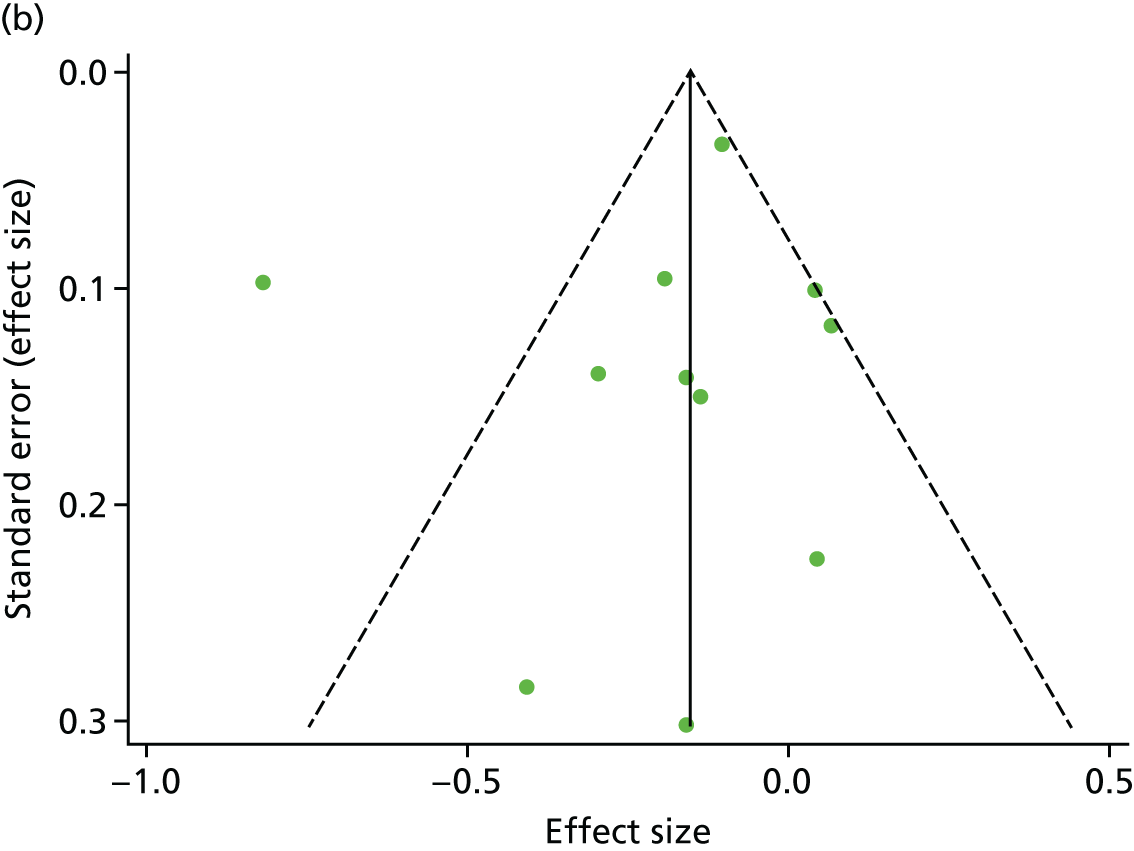
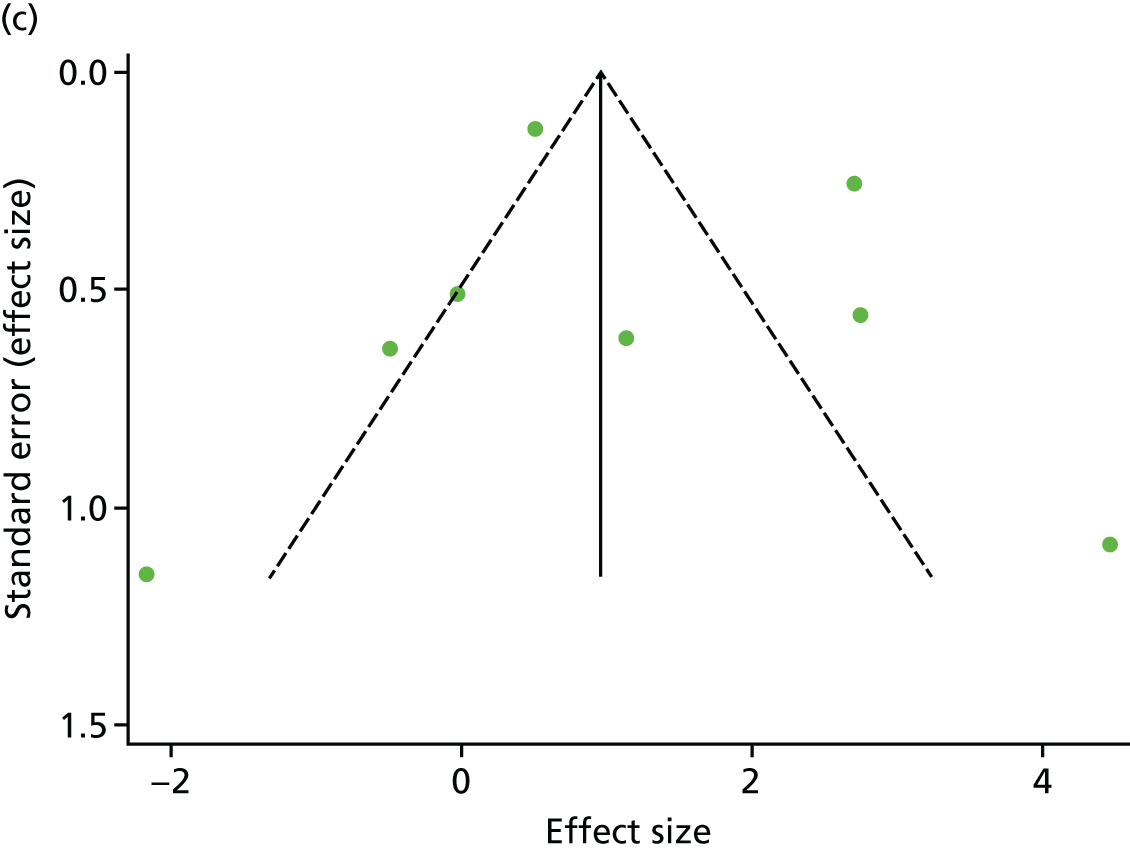
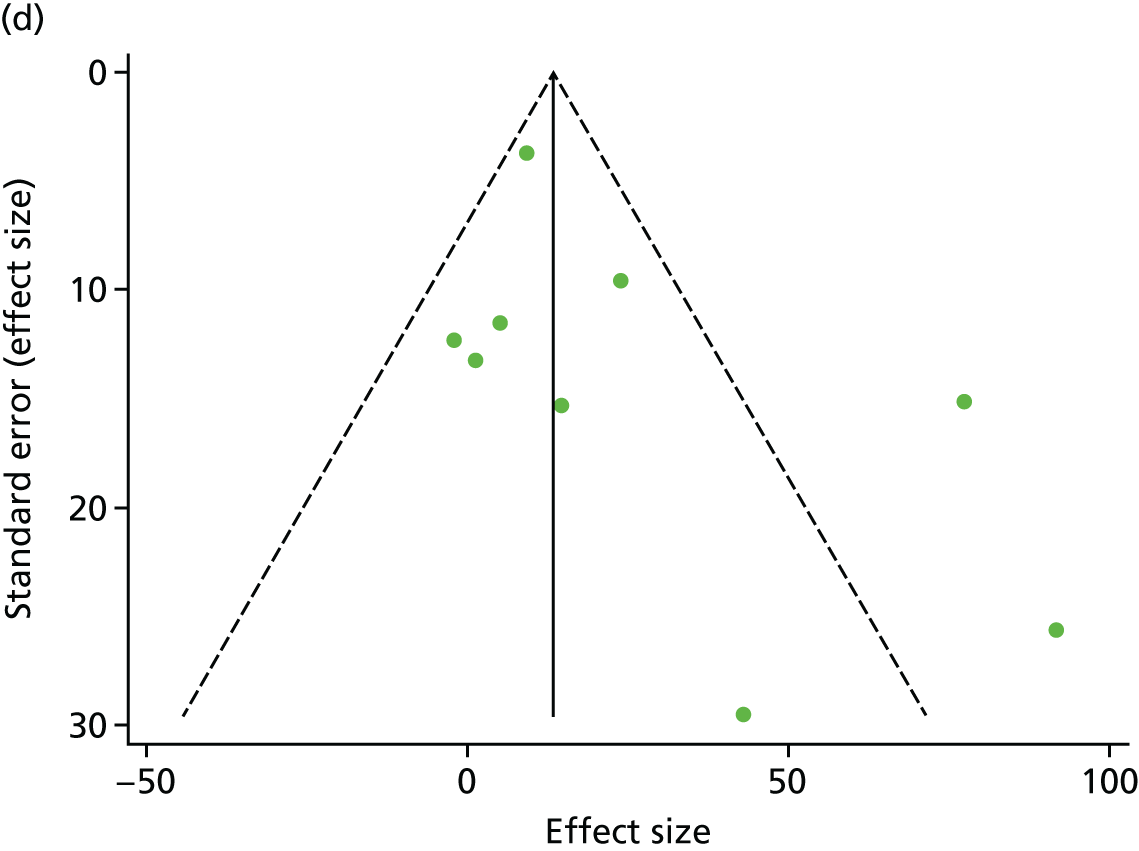
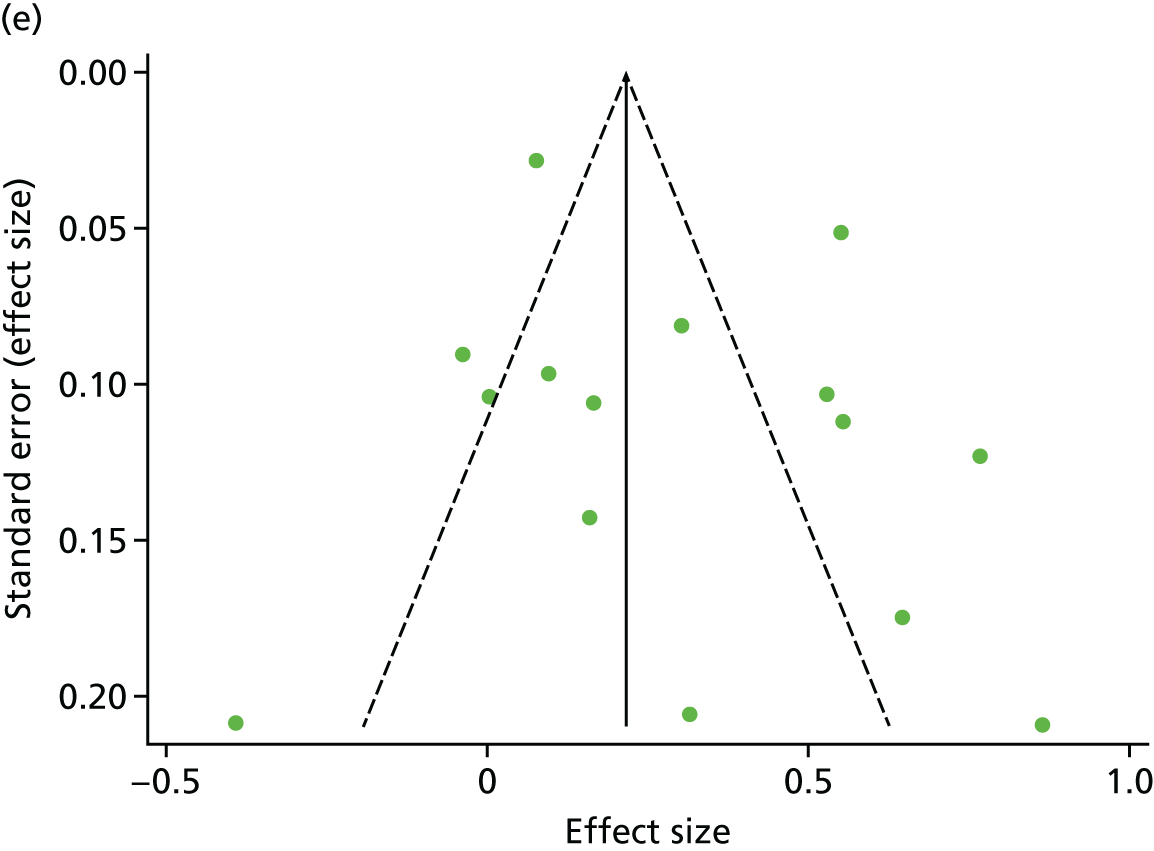
There was no evidence of significant small-study bias for the five outcomes studied (Figure 7). The overall quality of included trials was judged to be moderate to good, with a median TESTEX31 score of 11 (range 9–14) out of a maximum score of 15 (Table 13). The criteria of allocation concealment and physical activity monitoring in the control groups were met in only two19,61 and three studies,19,58,66 respectively. The other TESTEX criteria were each met in ≥ 50% of trials.
FIGURE 7.
Funnel plots for HRQoL and exercise capacity analyses. (a) MLHFQ score (points ) (at 12 months), Egger’s test –1.40, p = 0.656; (b) all HRQoL measures (at 12 months), Egger’s test –0.72, p = 0.577; (c) VO2peak directly reported (at 12 months), Egger’s test 0.99, p = 0.665; (d) 6MWT directly reported (at 12 months), Egger’s test 1.71, p = 0.150; and (e) all exercise capacity measures (at 12 months), Egger’s test 1.85, p = 0.214.
| First author/study (year) | Eligibility criteria specified | Randomisation specified | Allocation concealed | Groups similar at baseline | Blinding of assessors | Outcome measures in > 85% of participantsa | Intention-to-treat analysisb | Between-group statistical comparisons reported | Point measures and measures of variability reported | Activity monitoring in control group | Relative Exercise intensity reviewed | Exercise volume and energy expended | Overall TESTEX score (maximum score of 15) |
|---|---|---|---|---|---|---|---|---|---|---|---|---|---|
| Belardinelli et al. (2012)56 | 1 | 0 | 0 | 1 | 0 | 3 | 1 | 1 | 1 | 0 | 0 | 1 | 9 |
| Dracup et al. (2007)58 | 1 | 0 | 0 | 1 | 0 | 3 | 1 | 2 | 1 | 1 | 1 | 1 | 10 |
| Gary et al. (2010)59 | 1 | 1 | 0 | 1 | 1 | 3 | 1 | 2 | 1 | 0 | 0 | 0 | 11 |
| Giannuzzi et al. (2003)60 | 1 | 0 | 0 | 1 | 0 | 2 | 1 | 2 | 1 | 0 | 1 | 1 | 10 |
| Hambrecht et al. (2000)51 | 1 | 1 | 0 | 1 | 0 | 3 | 0 | 2 | 1 | 0 | 1 | 1 | 11 |
| HF-ACTION (2009)19 | 1 | 1 | 1 | 1 | 1 | 3 | 1 | 2 | 1 | 1 | 0 | 1 | 14 |
| Jolly et al. (2009)61 | 1 | 1 | 1 | 1 | 0 | 2 | 1 | 2 | 1 | 0 | 1 | 1 | 12 |
| Mueller et al. (2007)62 | 1 | 0 | 0 | 1 | 0 | 2 | 1 | 2 | 1 | 0 | 1 | 1 | 10 |
| Nilsson et al. (2008)63 | 1 | 1 | 0 | 1 | 1 | 2 | 1 | 2 | 1 | 0 | 0 | 1 | 11 |
| Passino et al. (2006)67 | 1 | 0 | 0 | 1 | 0 | 2 | 1 | 2 | 1 | 0 | 1 | 1 | 10 |
| Witham et al. (2005)64 | 1 | 1 | 0 | 1 | 1 | 3 | 1 | 2 | 1 | 0 | 1 | 0 | 12 |
| Witham et al. (2012)65 | 1 | 1 | 0 | 1 | 1 | 3 | 1 | 2 | 1 | 0 | 1 | 0 | 12 |
| Yeh et al. (2011)66 | 1 | 1 | 0 | 1 | 1 | 3 | 1 | 2 | 1 | 1 | 0 | 0 | 12 |
Findings
Primary analysis
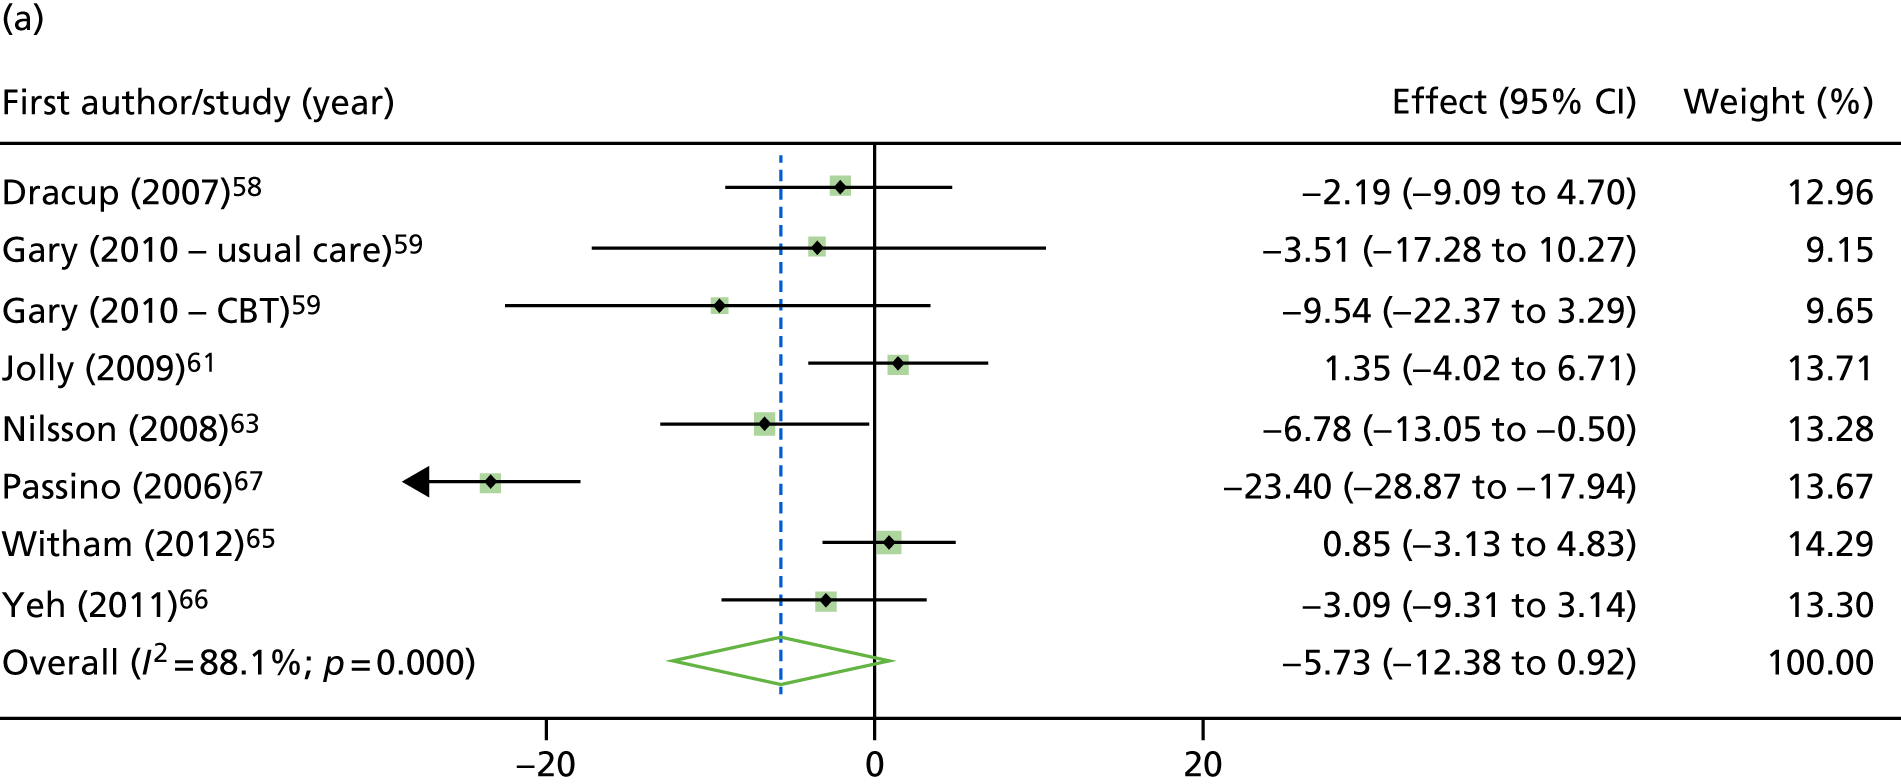
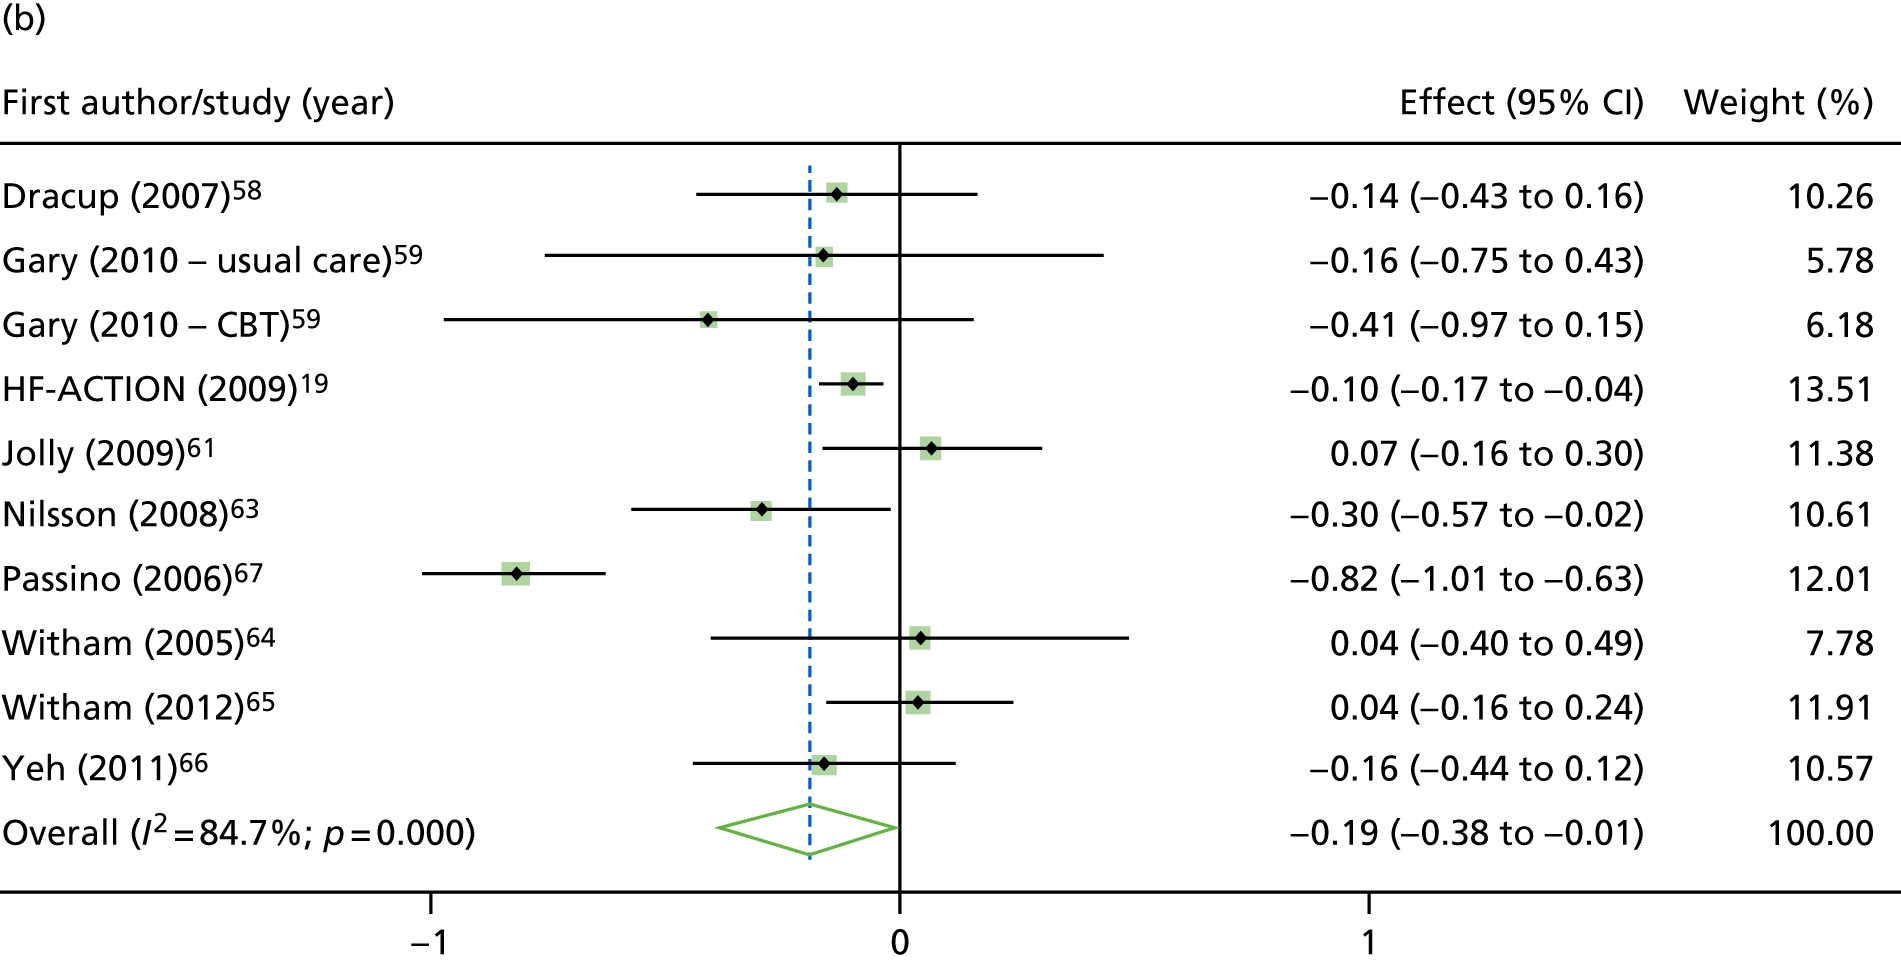
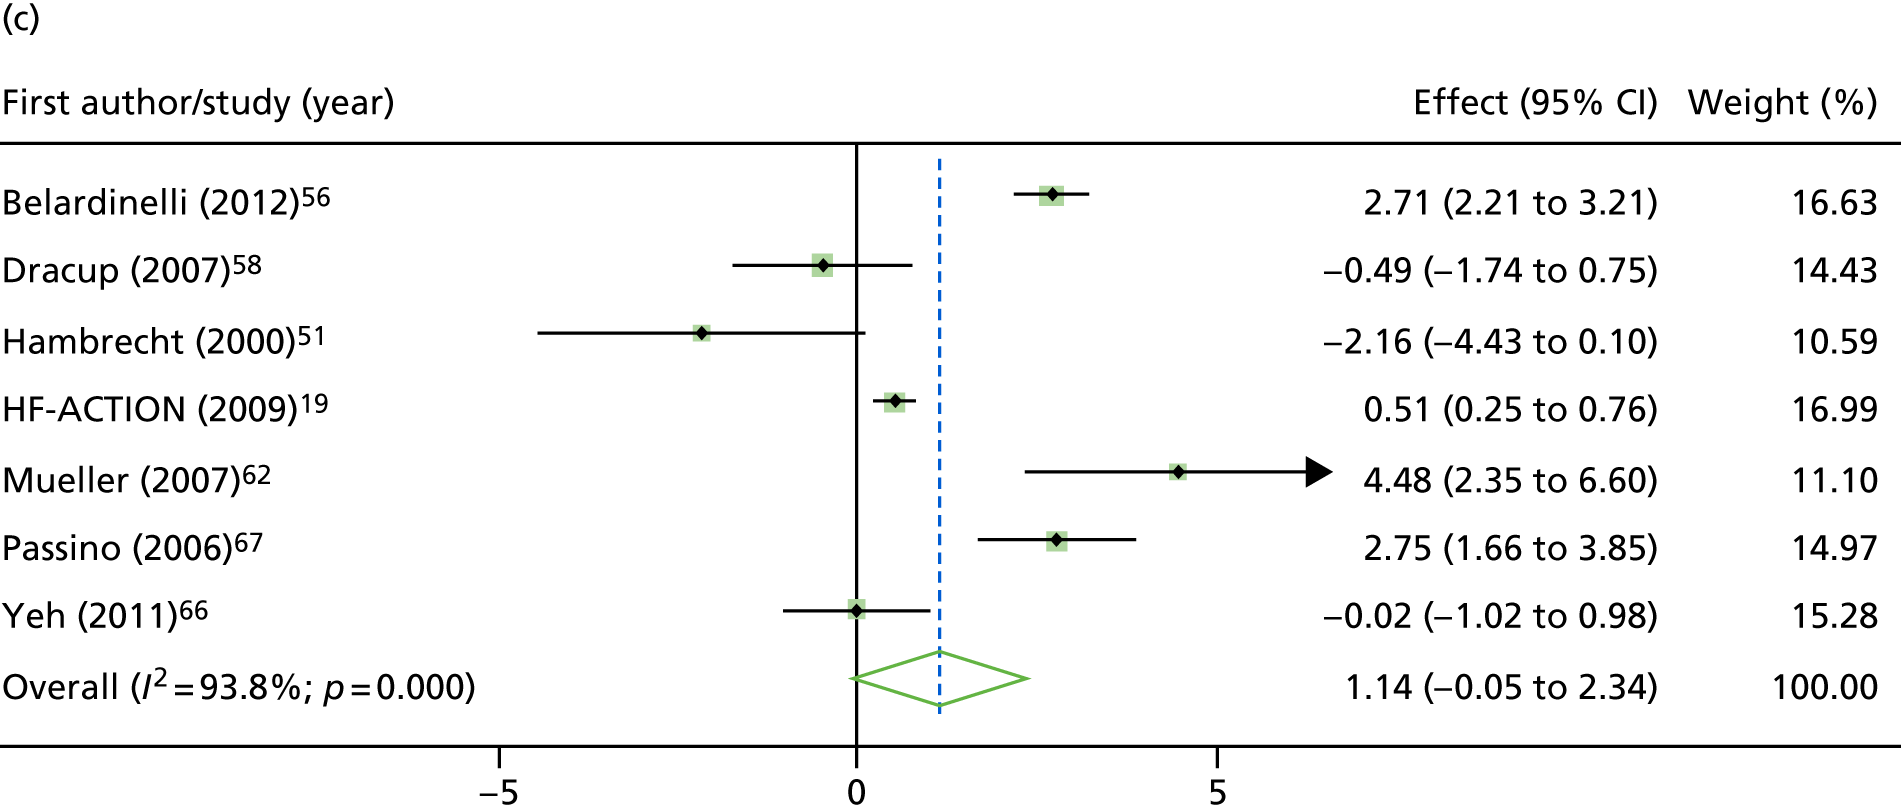
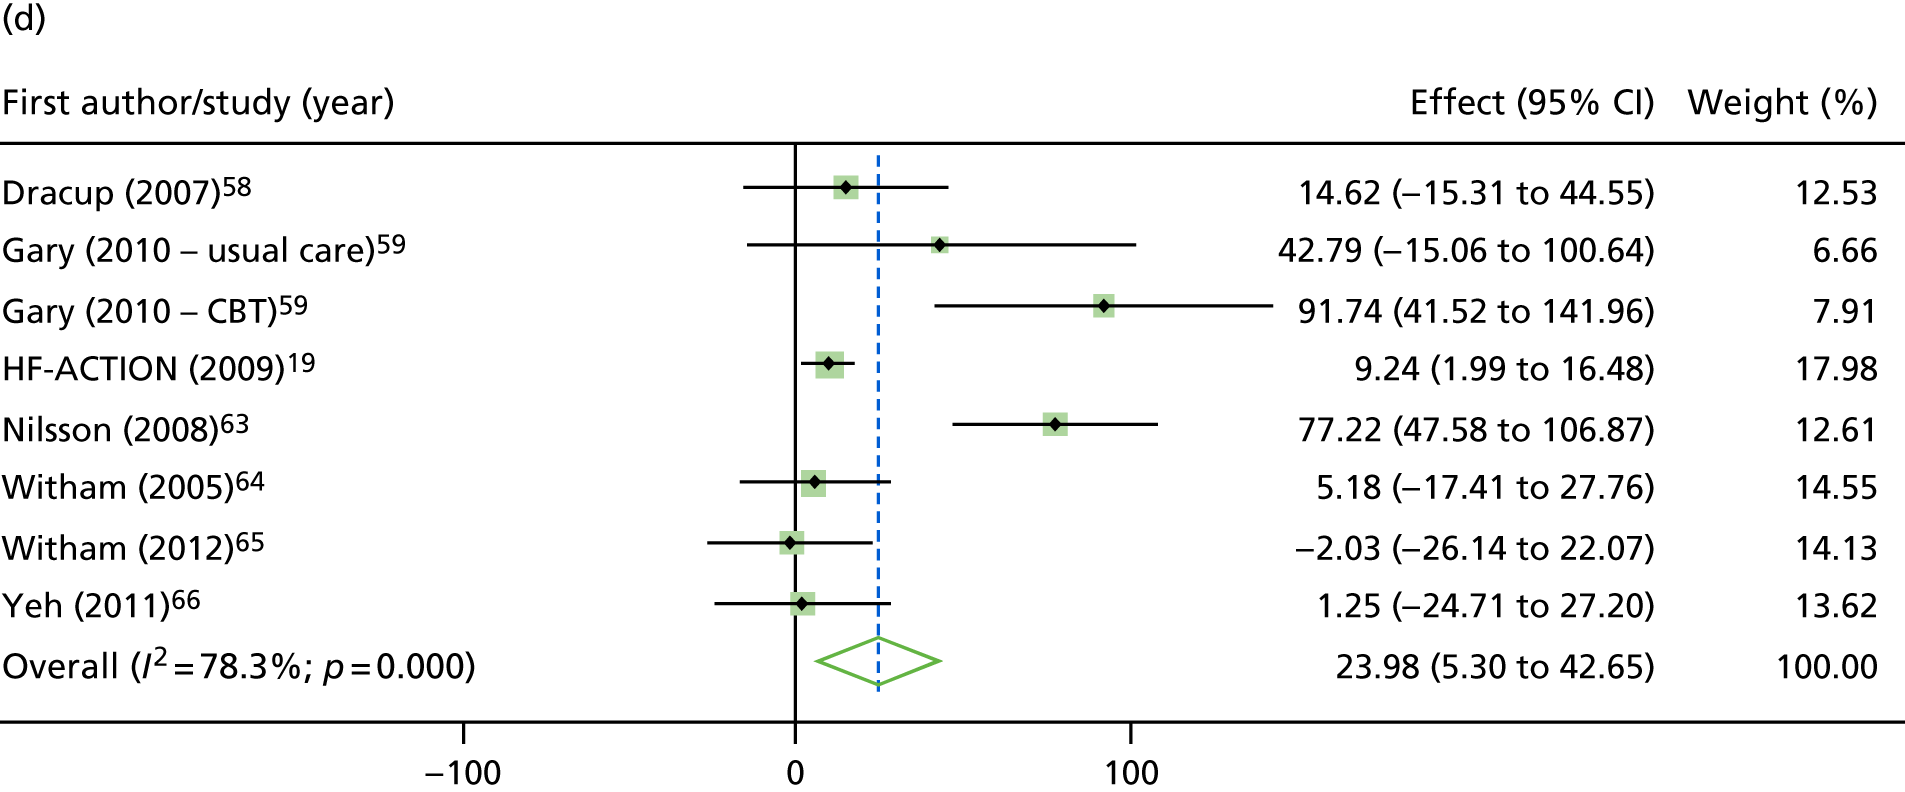
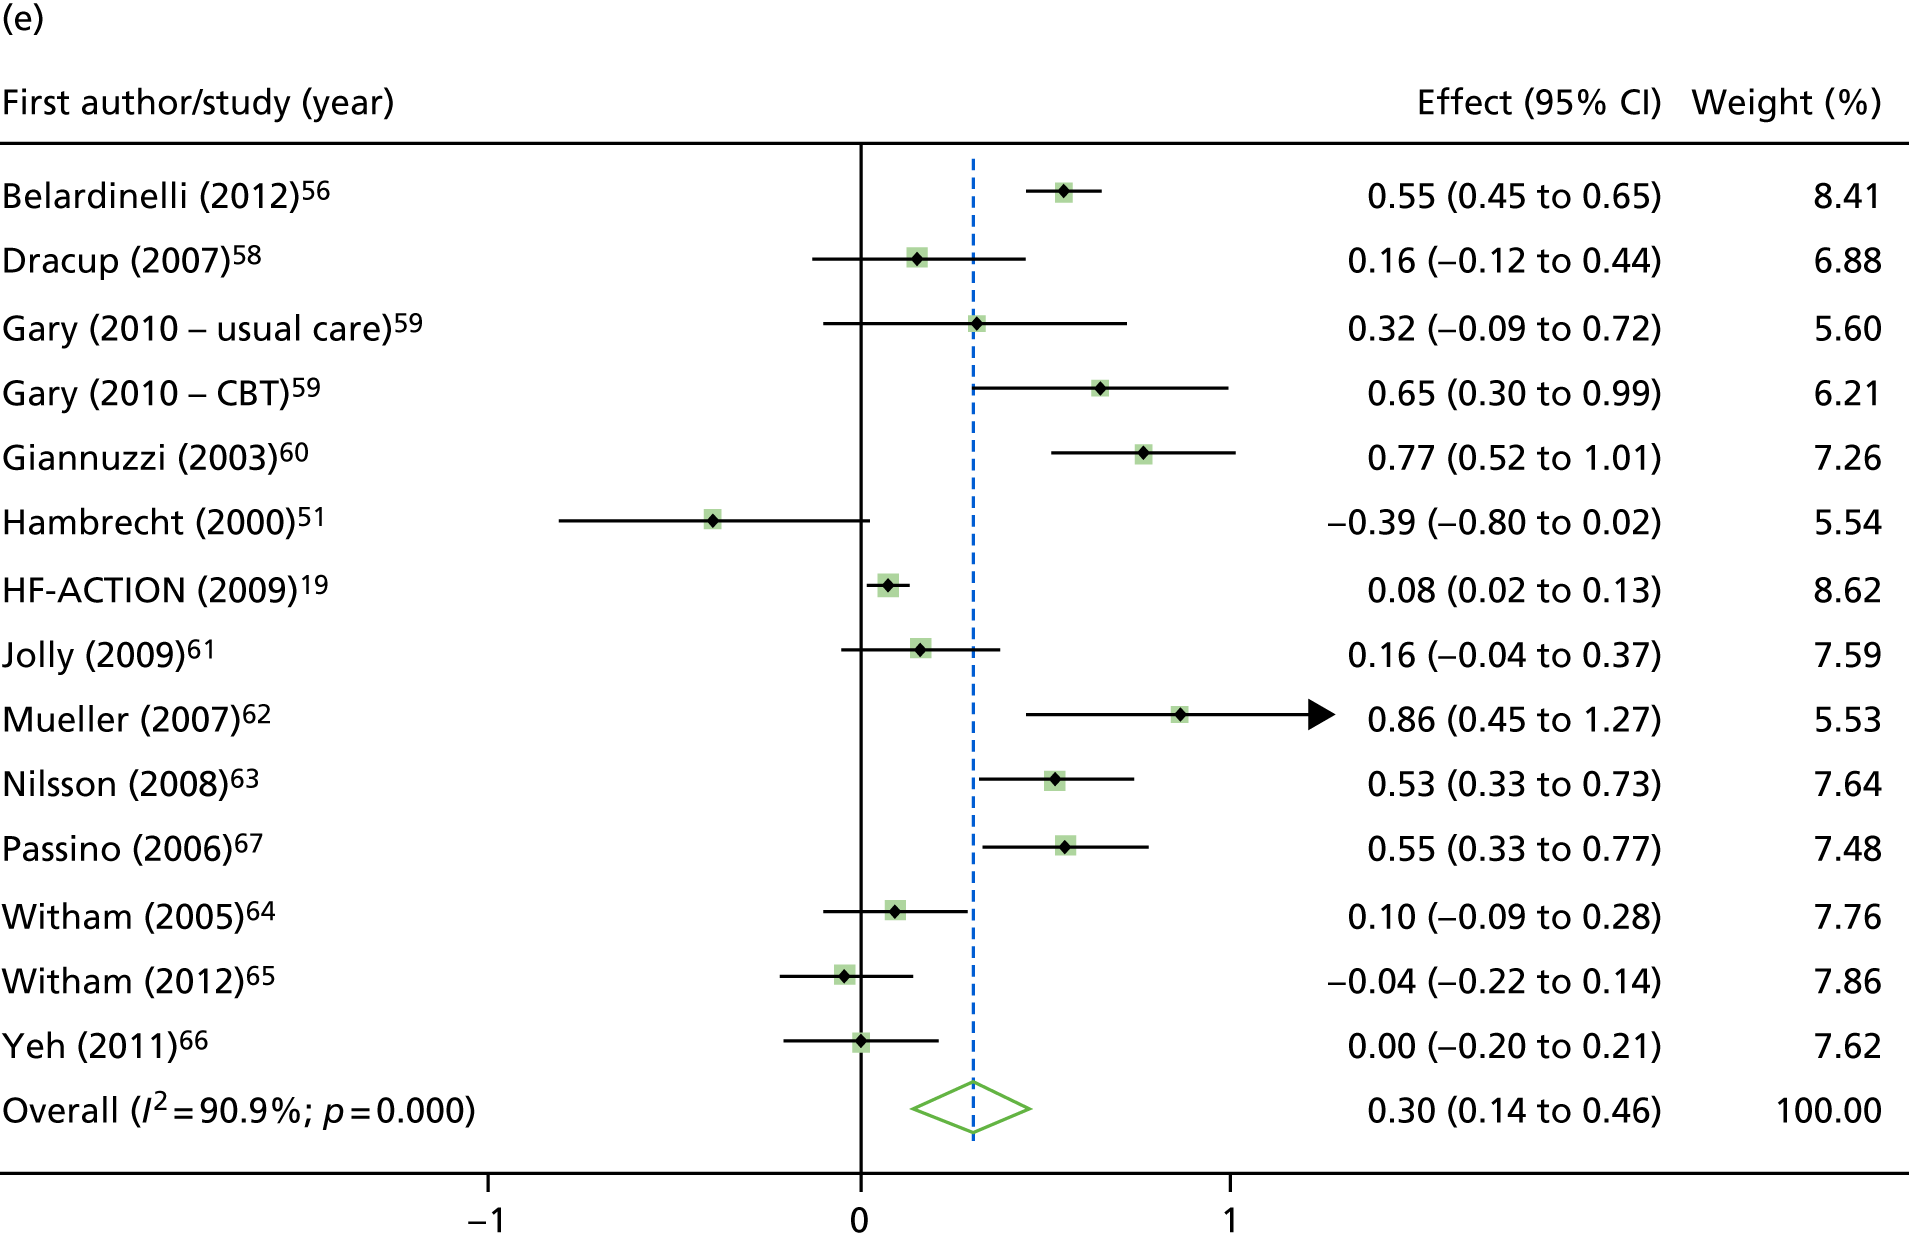
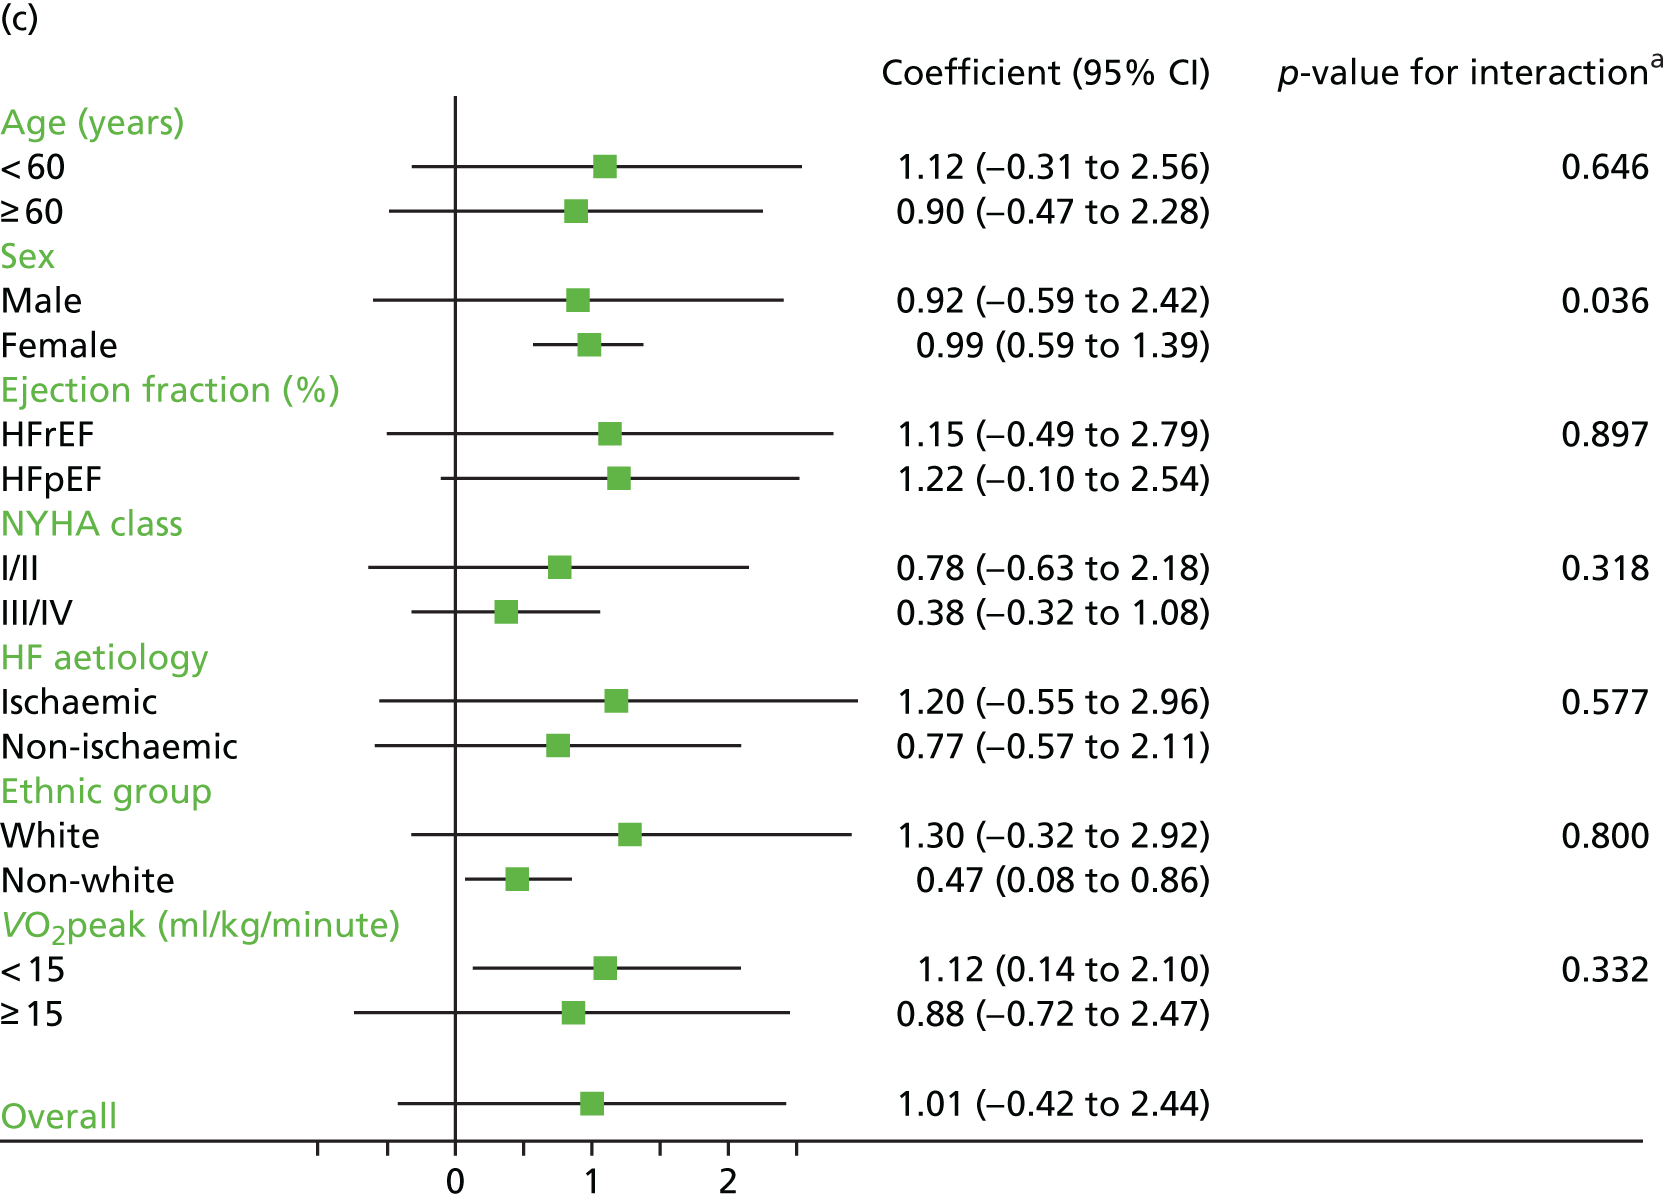
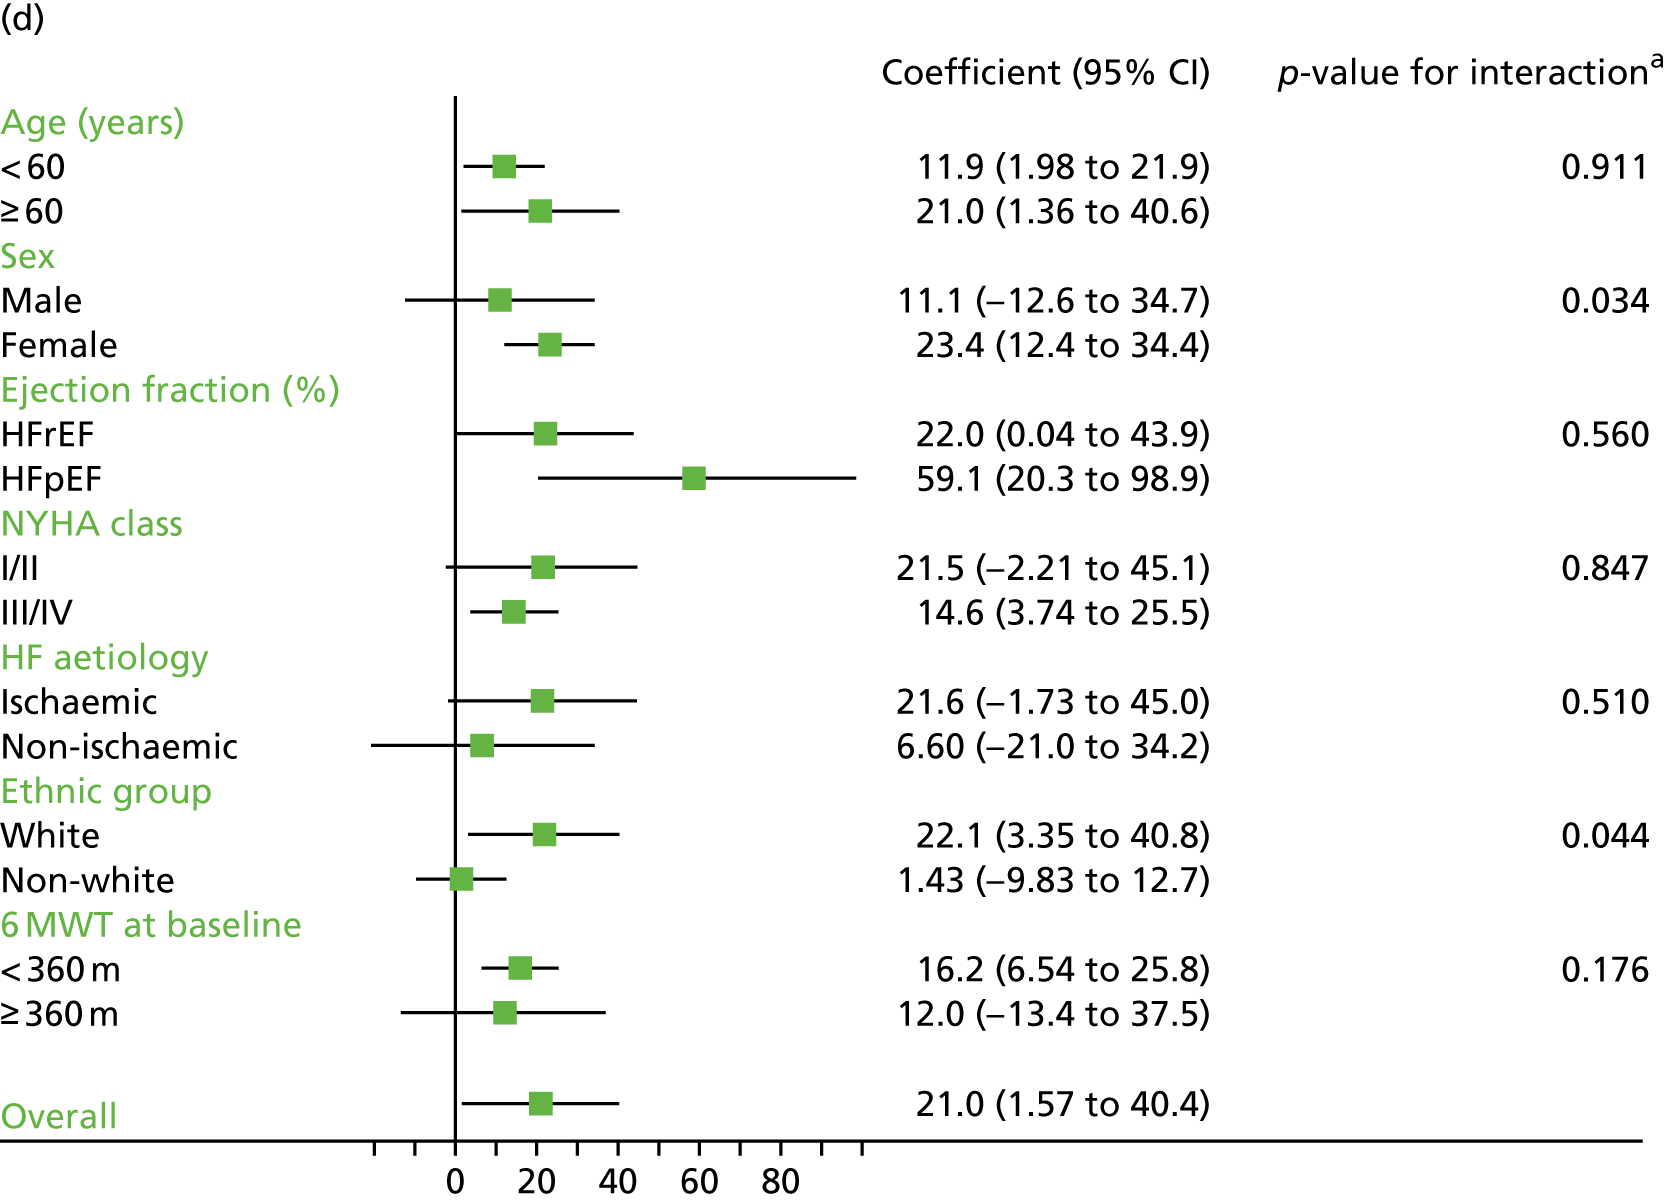
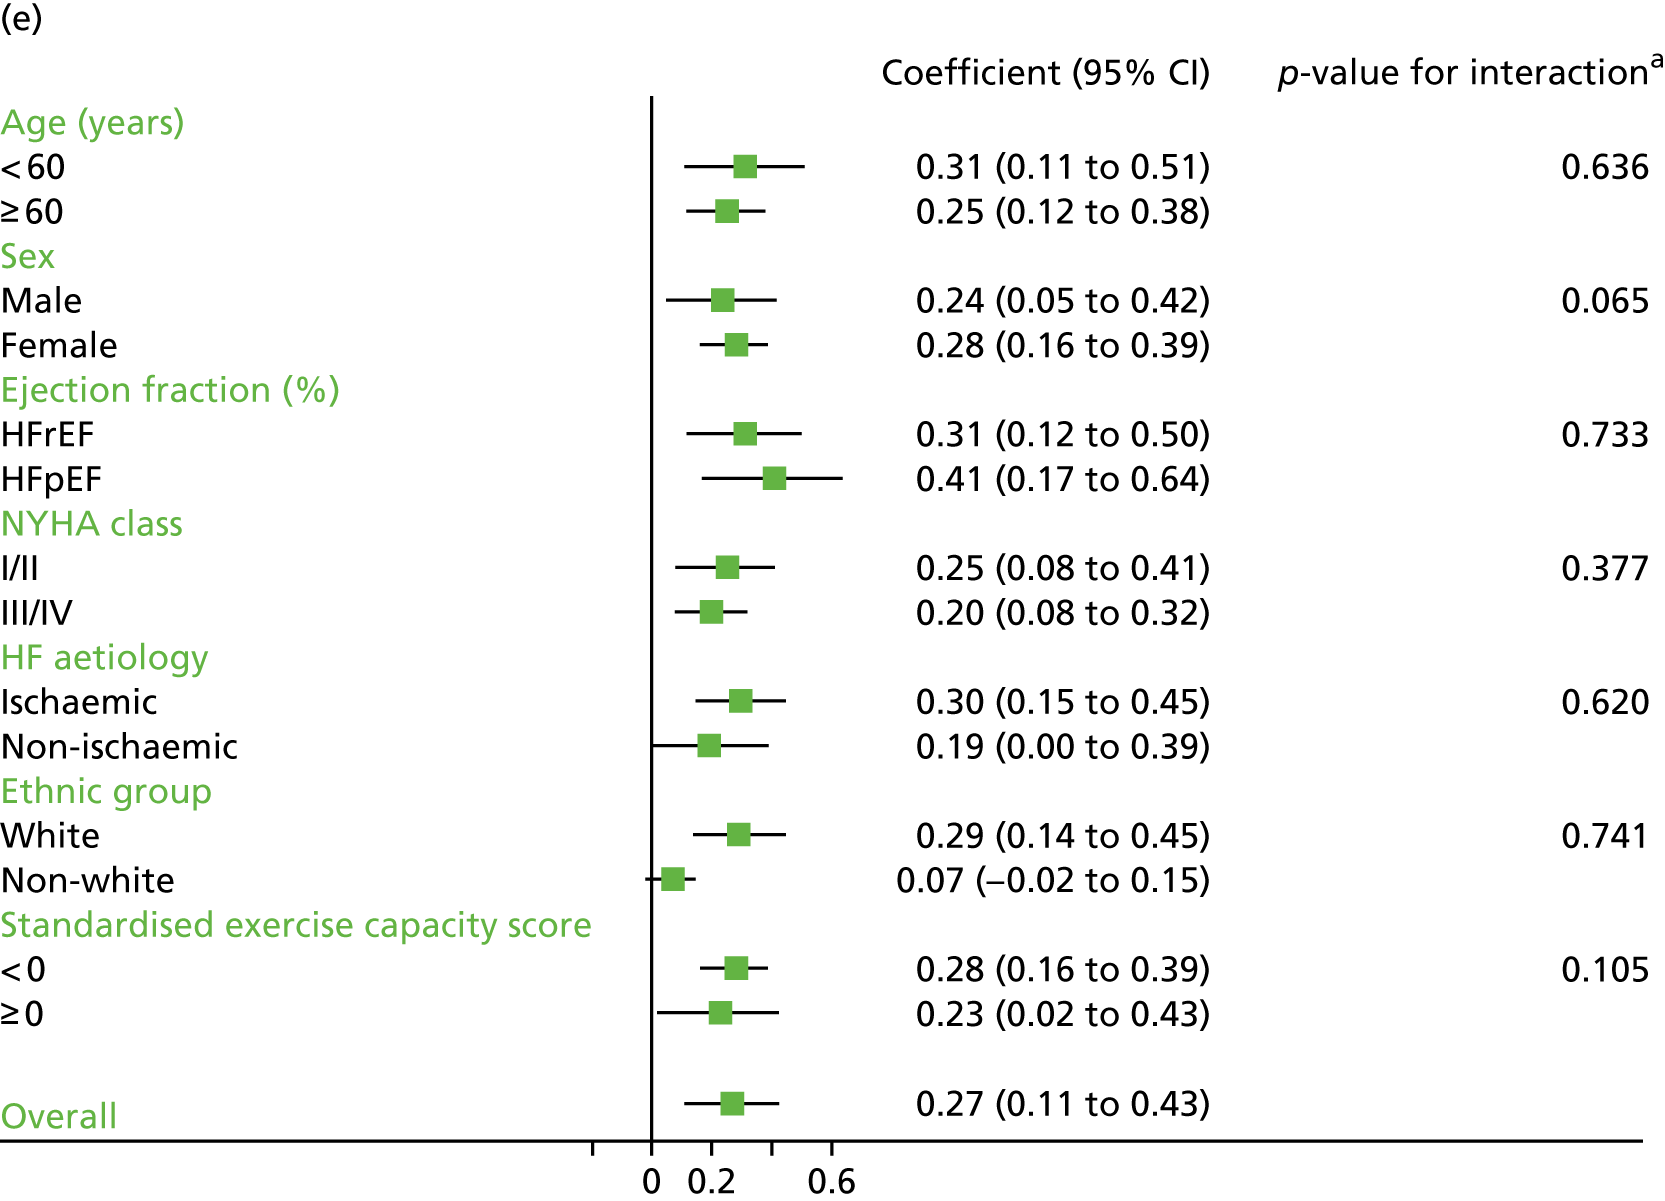
Compared with control, treatment effects from the one-stage meta-analysis at the 12-month follow-up showed a significant improvement with ExCR in exercise capacity as assessed by the 6MWT (mean difference 21.0 m, 95% CI 1.57 to 40.4 m; p = 0.034, τ2 = 491, I2 = 78%) and standardised exercise capacity score (mean difference 0.27 SD units, 95% CI 0.11 to 0.43; p = 0.001, τ2 = 0.08, I2 = 91%). No significant difference in VO2peak at 12 months was observed (1.01 ml/kg/minute, 95% CI –0.42 to 2.44 ml/kg/minute; p = 0.168, τ2 = 2.17, I2 = 94%).
One-stage meta-analysis showed a significant improvement in HRQoL as assessed by the MLHFQ (mean difference –5.94 points, 95% CI –1.0 to –10.9 points; p = 0.018, τ2 = 77, I2 = 88%) and standardised HRQoL score (mean difference SD 0.20, 95% CI 0.03 to 0.37; p = 0.020, τ2 = 0.07, I2 = 85%), at the 12-month follow-up. Similar results were seen at the 6-month follow-up (Figures 8 and 9). Marked statistical heterogeneity (I2 > 70%) was seen for all exercise capacity and HRQoL outcomes.
FIGURE 8.
Effect of ExCR on HRQoL and exercise capacity at 6 months: two-stage IPD meta-analysis. (a) MLHFQ score (points) (mean difference); (b) all HRQoL measures (standardised mean difference); (c) VO2peak directly reported (mean difference); (d) 6MWT (m) directly reported (mean difference); and (e) all exercise capacity measures (standardised mean difference). Note that weights are from random effects, DerSimonian–Laird estimator. CBT, cognitive–behavioural therapy.
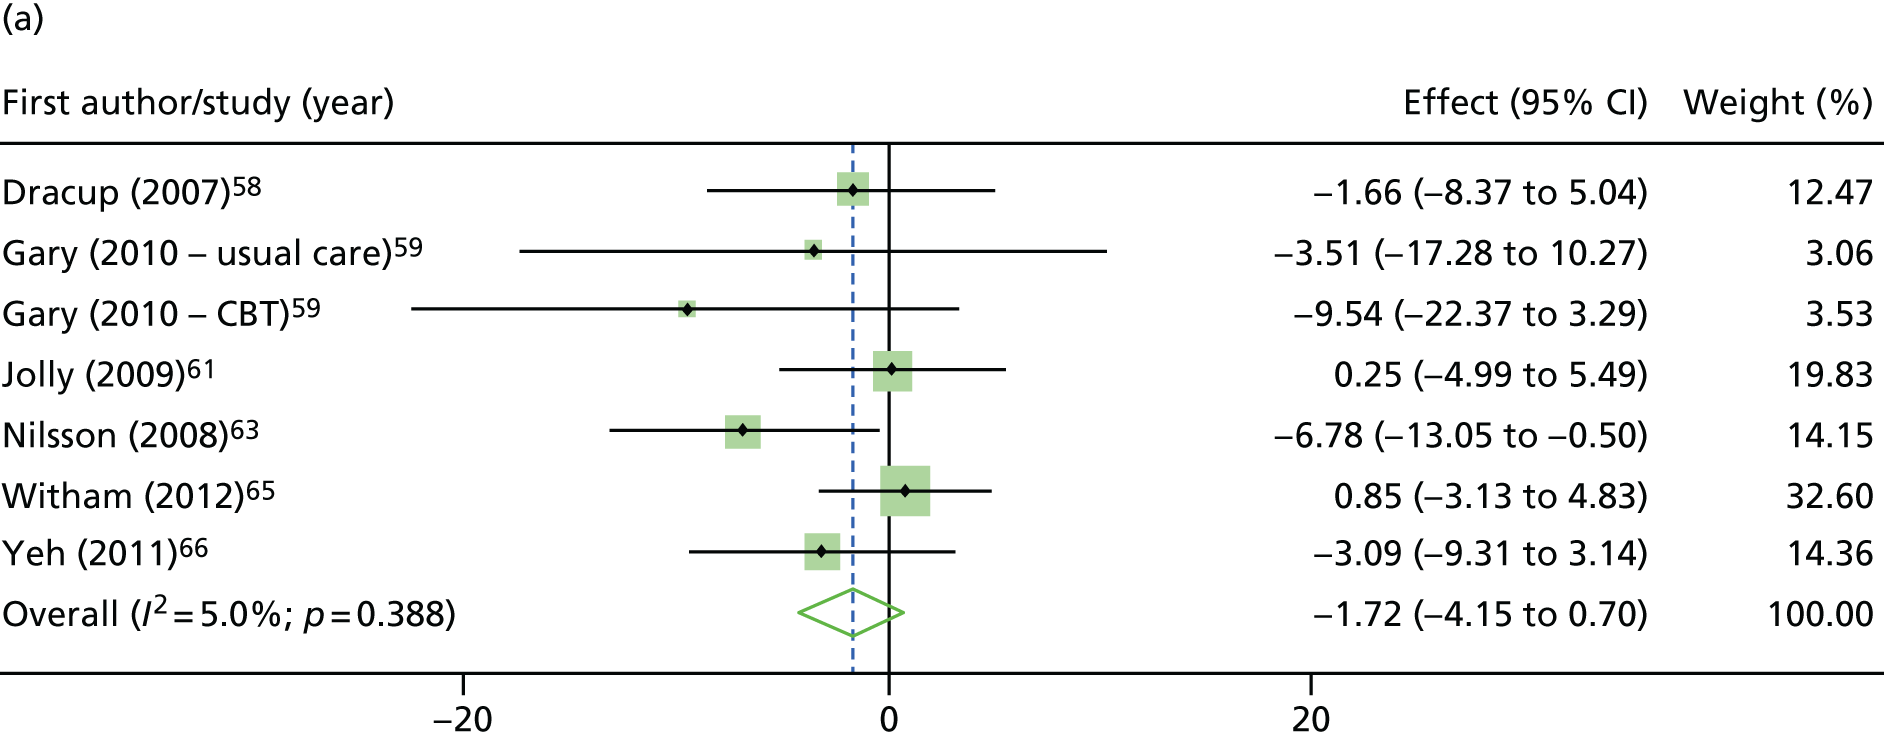
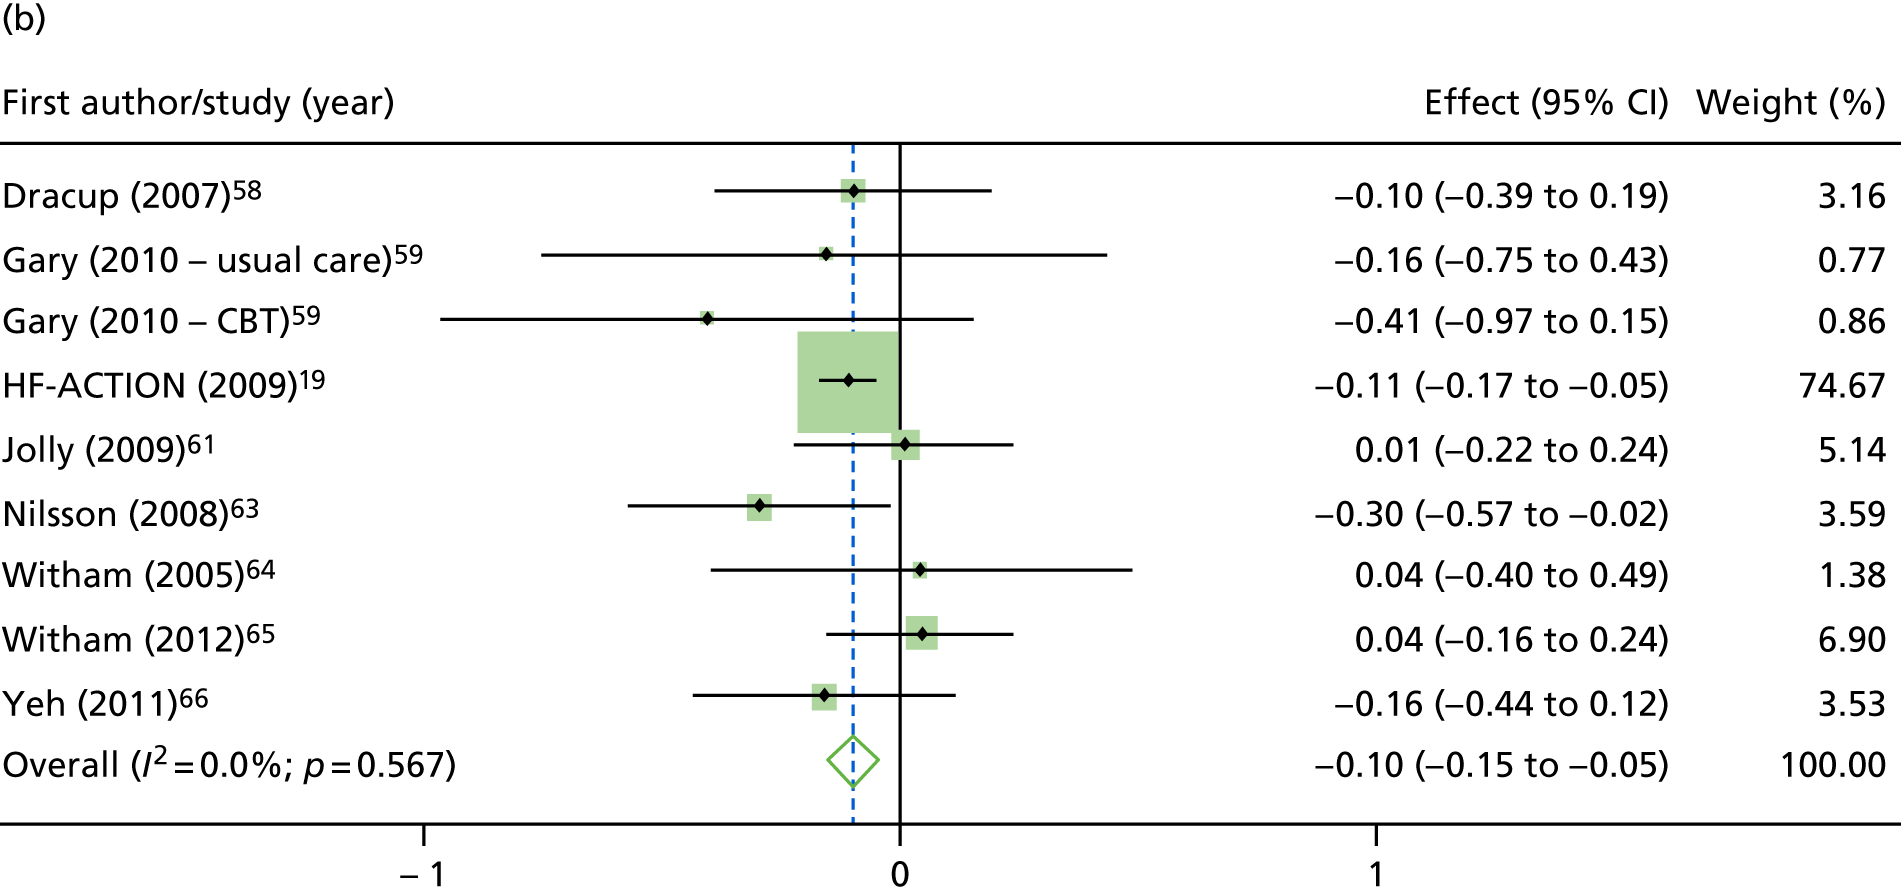
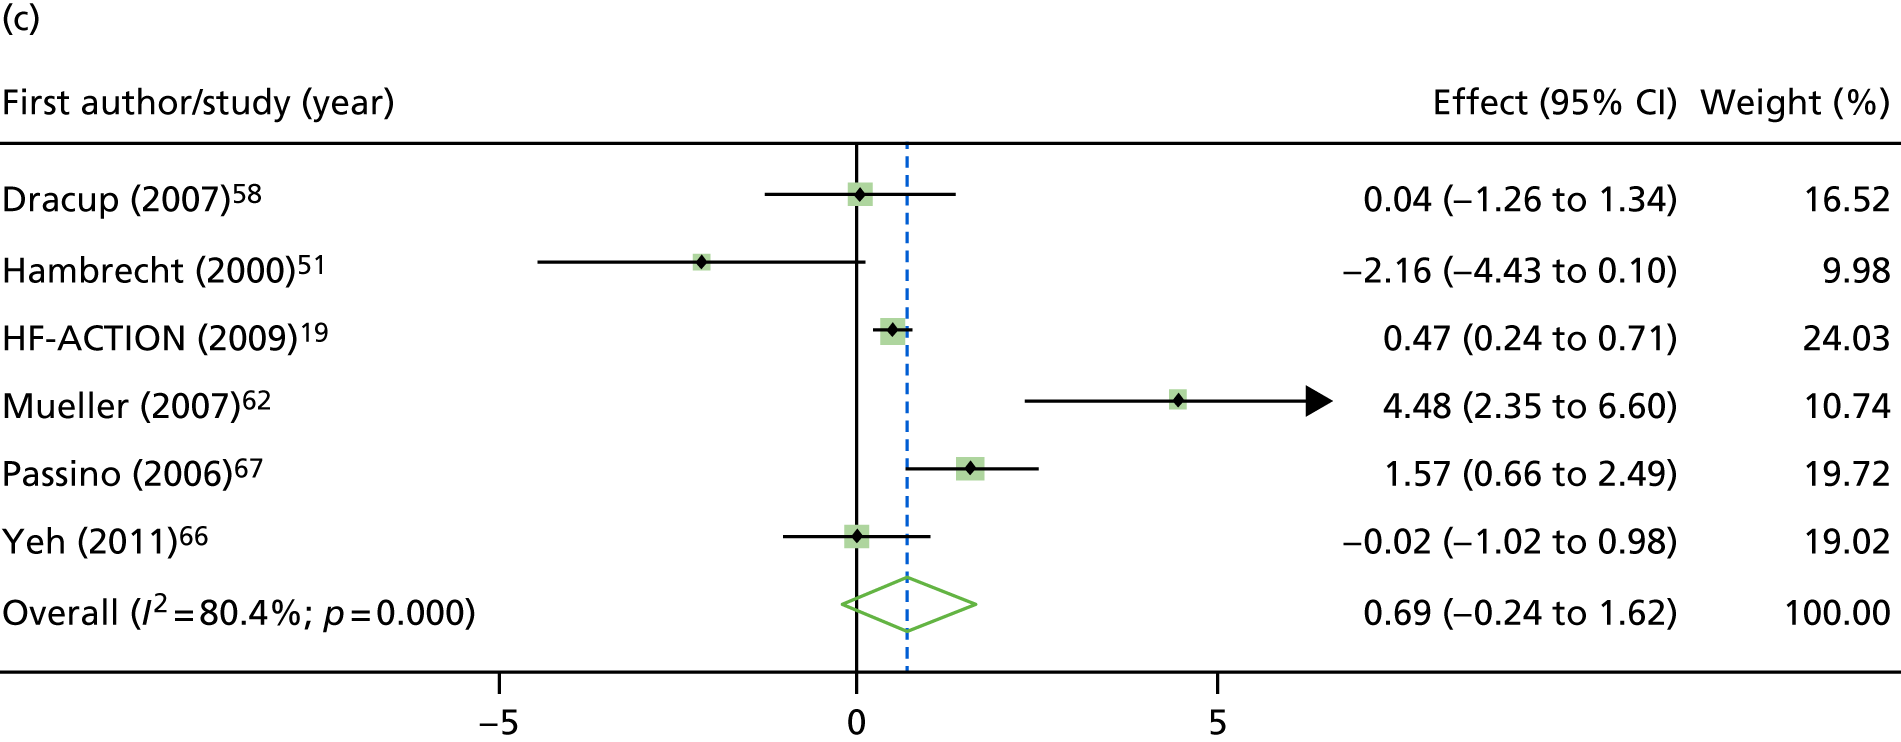
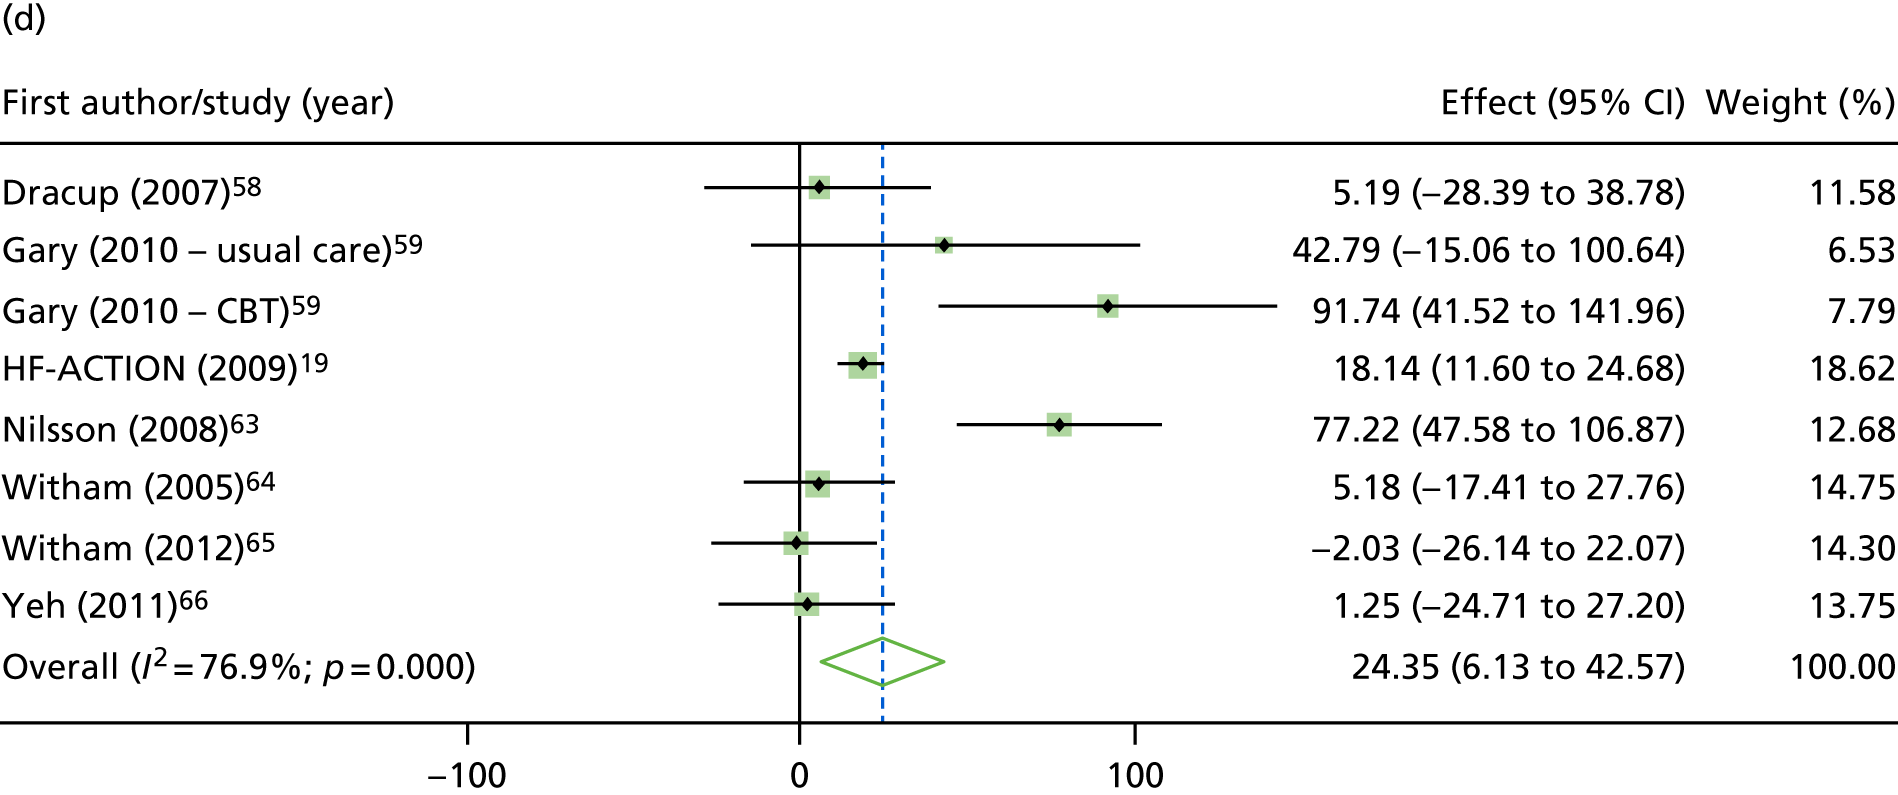
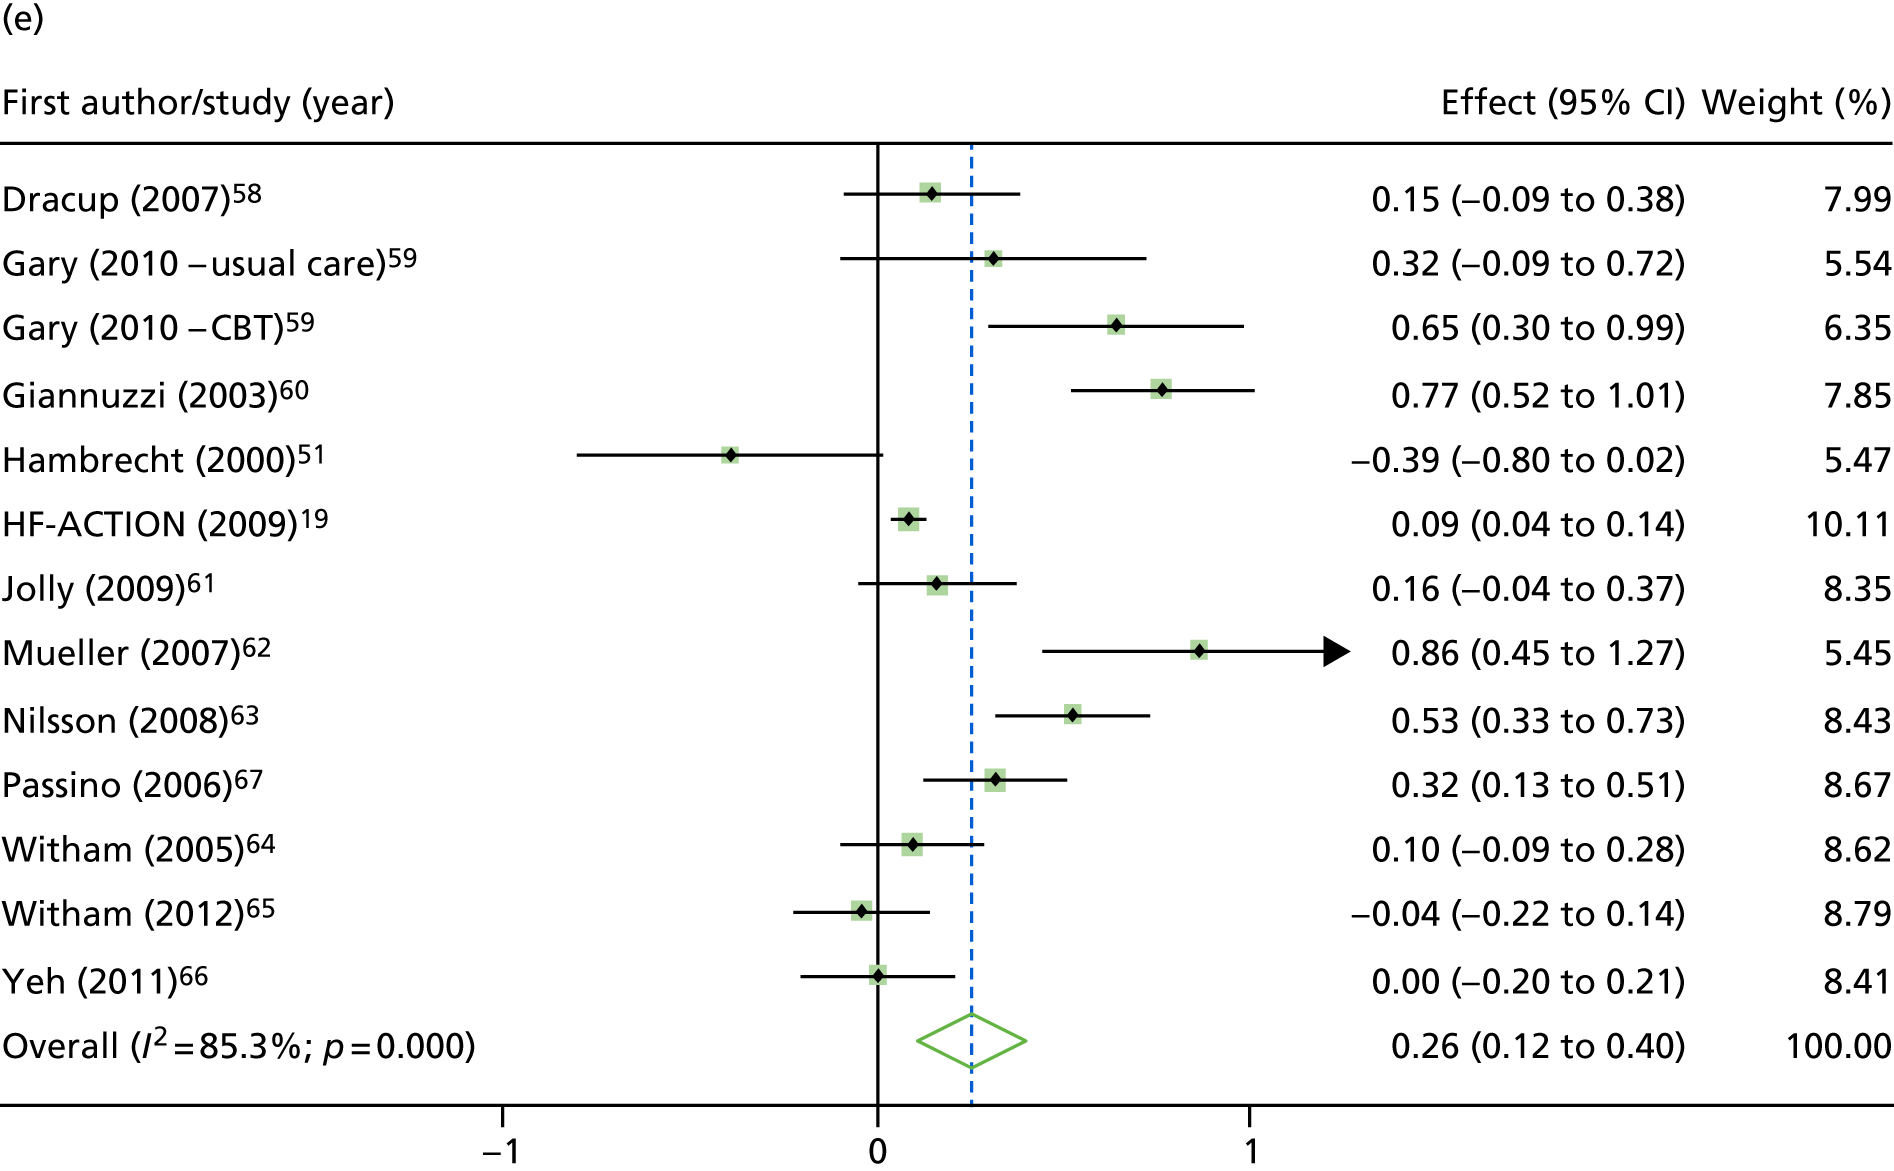
FIGURE 9.
Effect of ExCR on HRQoL and exercise capacity at 12 months: two-stage IPD meta-analysis. (a) MLHFQ score (points) (mean difference); (b) all HRQoL measures (standardised mean difference); (c) VO2peak directly reported (mean difference); (d) 6MWT (m) directly reported (mean difference); and (e) all exercise capacity measures (standardised mean difference). Note that weights are from random effects, DerSimonian–Laird estimator. CBT, cognitive–behavioural therapy.
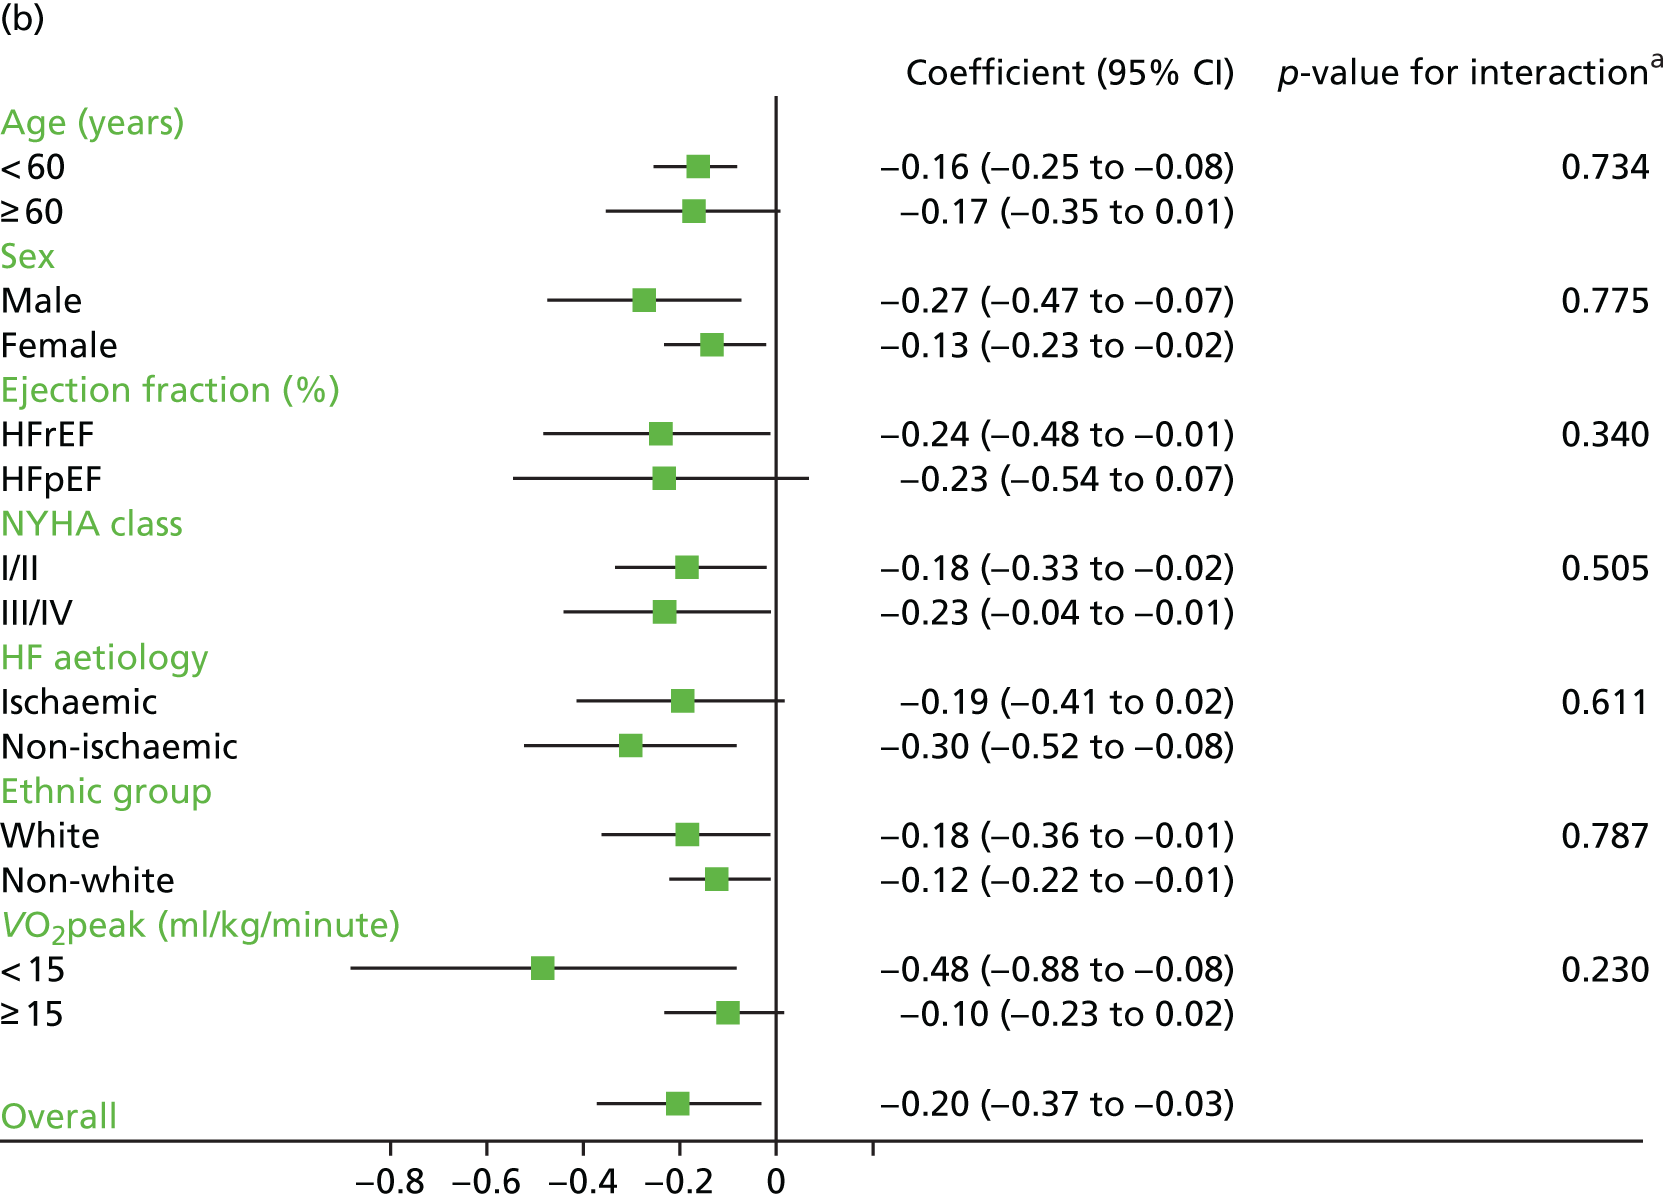
Analyses revealed no consistent interaction between the effect of ExCR and the predefined subgroups (sex, ejection fraction, NYHA class, HF aetiology, ethnicity and baseline exercise capacity), for either exercise or HRQoL.
A differential effect of ExCR across ages was observed in the standardised HRQoL analysis, with a reduction in HRQoL score (i.e. an increase in standardised HRQoL score) as age increased (SD 0.006, 95% 0.002 to 0.011; p = 0.006). To put this into context, based on a MLHFQ SD of 24 points, this equates to a decrease of 1.4 points in the treatment effect on the MLHFQ score for every 10-year increase in patient age.
Interaction analyses for the one-stage model at the 12-month follow-up showed differential effects of ExCR by sex, with women showing greater benefit than men for VO2peak (0.57 ml/kg/minute, 95% CI 0.04 to 1.11 ml/kg/minute; p = 0.036) and the 6MWT (14.9 m, 95% CI 1.2 to 28.7 m; p = 0.034). Differential effects of ExCR were also seen between ethnic groups, with white patients showing a greater improvement in 6MWT distance than non-white patients (14.2 m, 95% CI 0.40 to 28.0 m; p = 0.044).
Secondary analysis
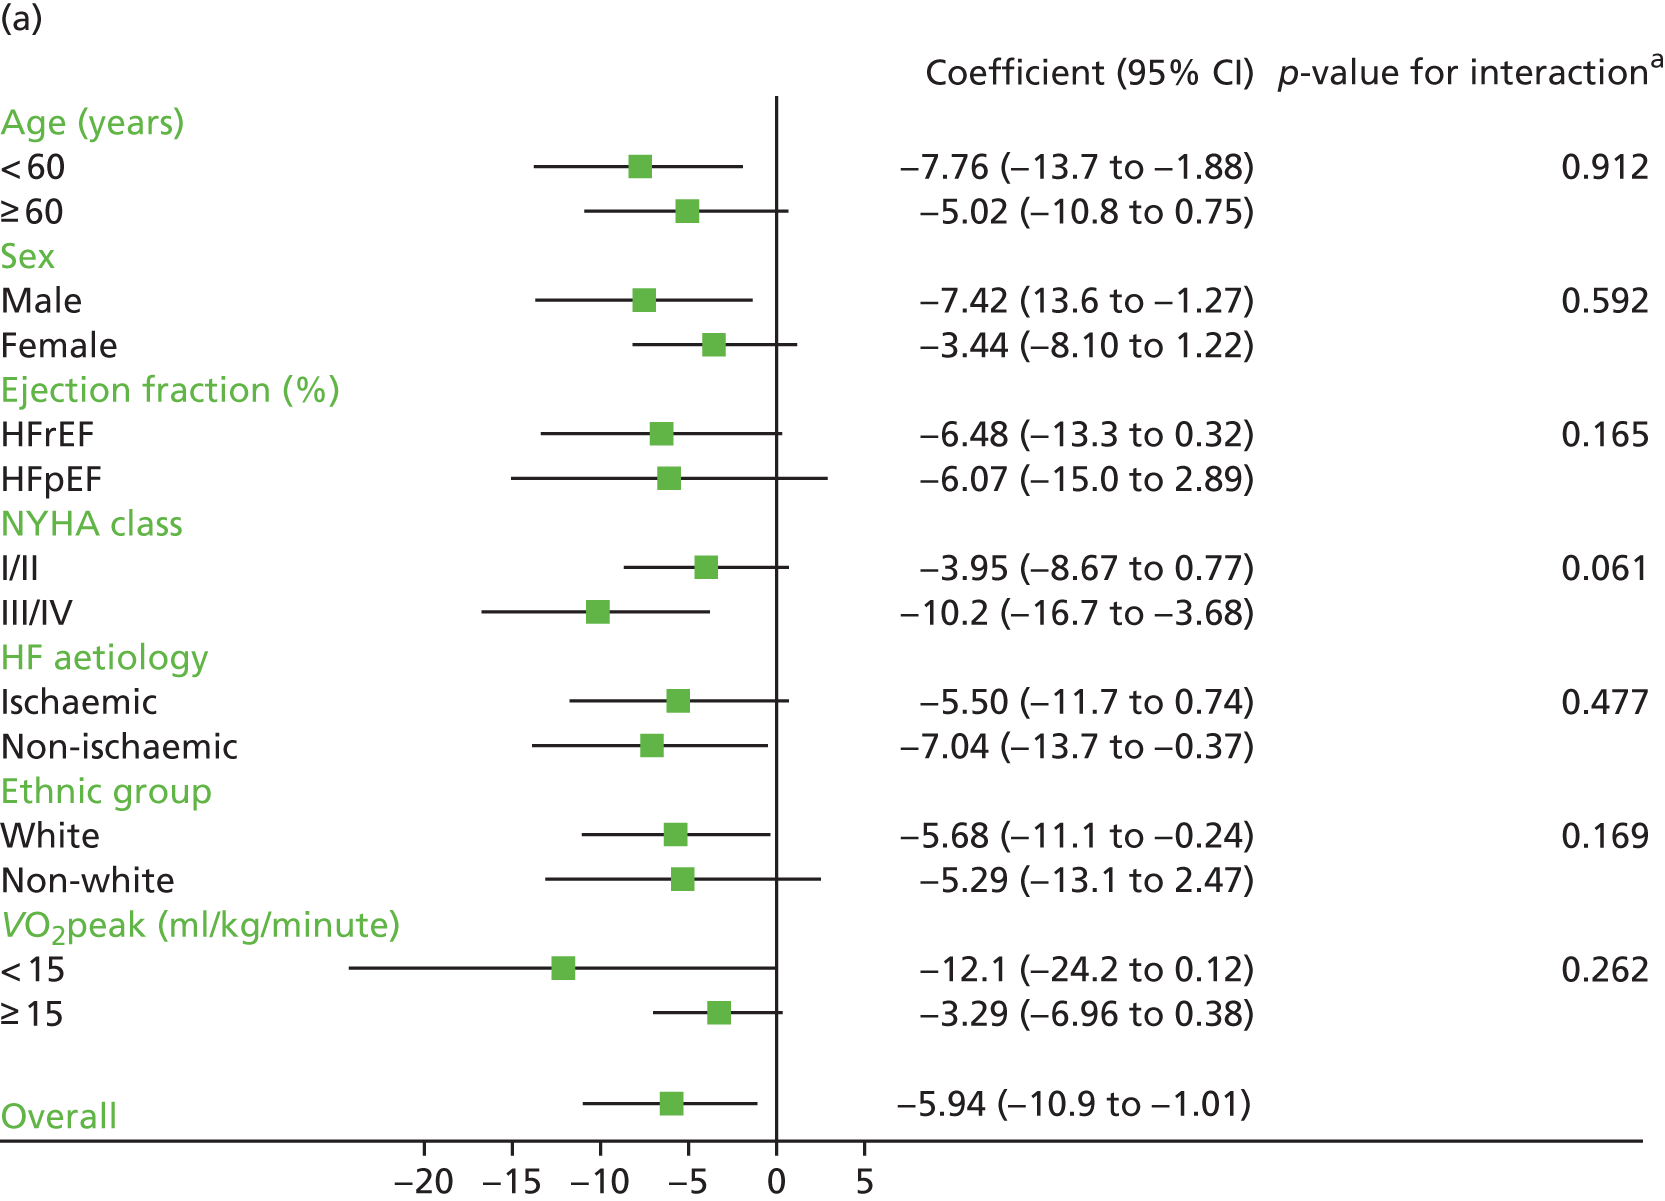
In the repeated measures analyses for each HRQoL and exercise capacity outcome, a significant interaction between ExCR and time was observed (Figure 10). To visualise comparisons of changes in HRQoL and exercise capacity in each subgroup, the effect estimates and associated 95% CI from individual subgroup one-stage IPD meta-analyses are shown in Figure 11. The p-values from the interaction test in the two-stage IPD meta-analyses are presented alongside these estimates.
FIGURE 10.
Effect of ExCR on HRQoL and exercise capacity. (a) MLHFQ score (points) (mean difference); (b) all HRQoL measures (standardised mean difference); (c) VO2peak directly reported (mean difference); (d) 6MWT directly reported (mean difference); and (e) all exercise capacity measures (standardised mean difference).
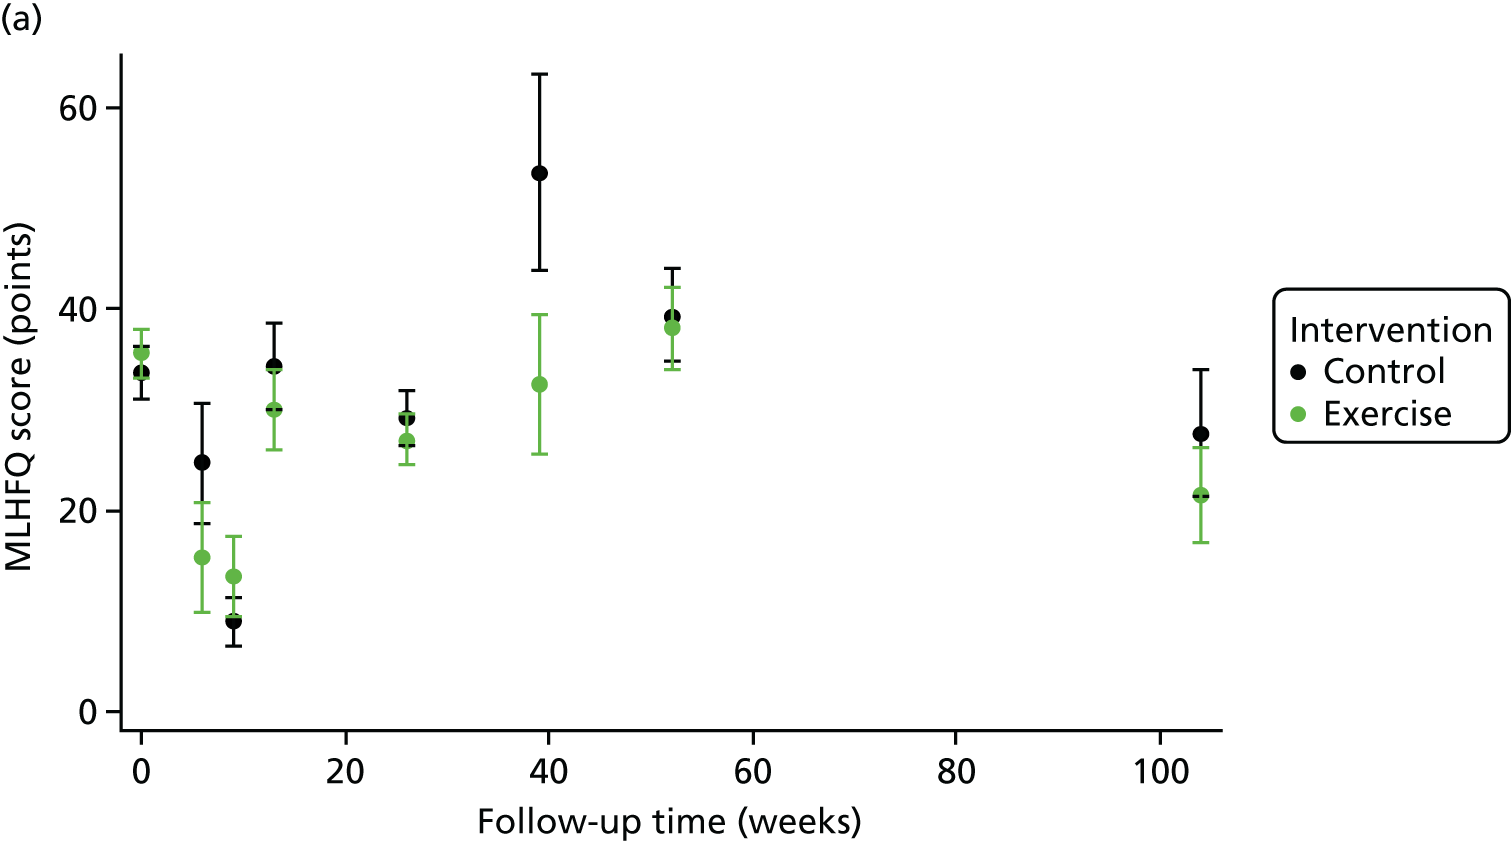
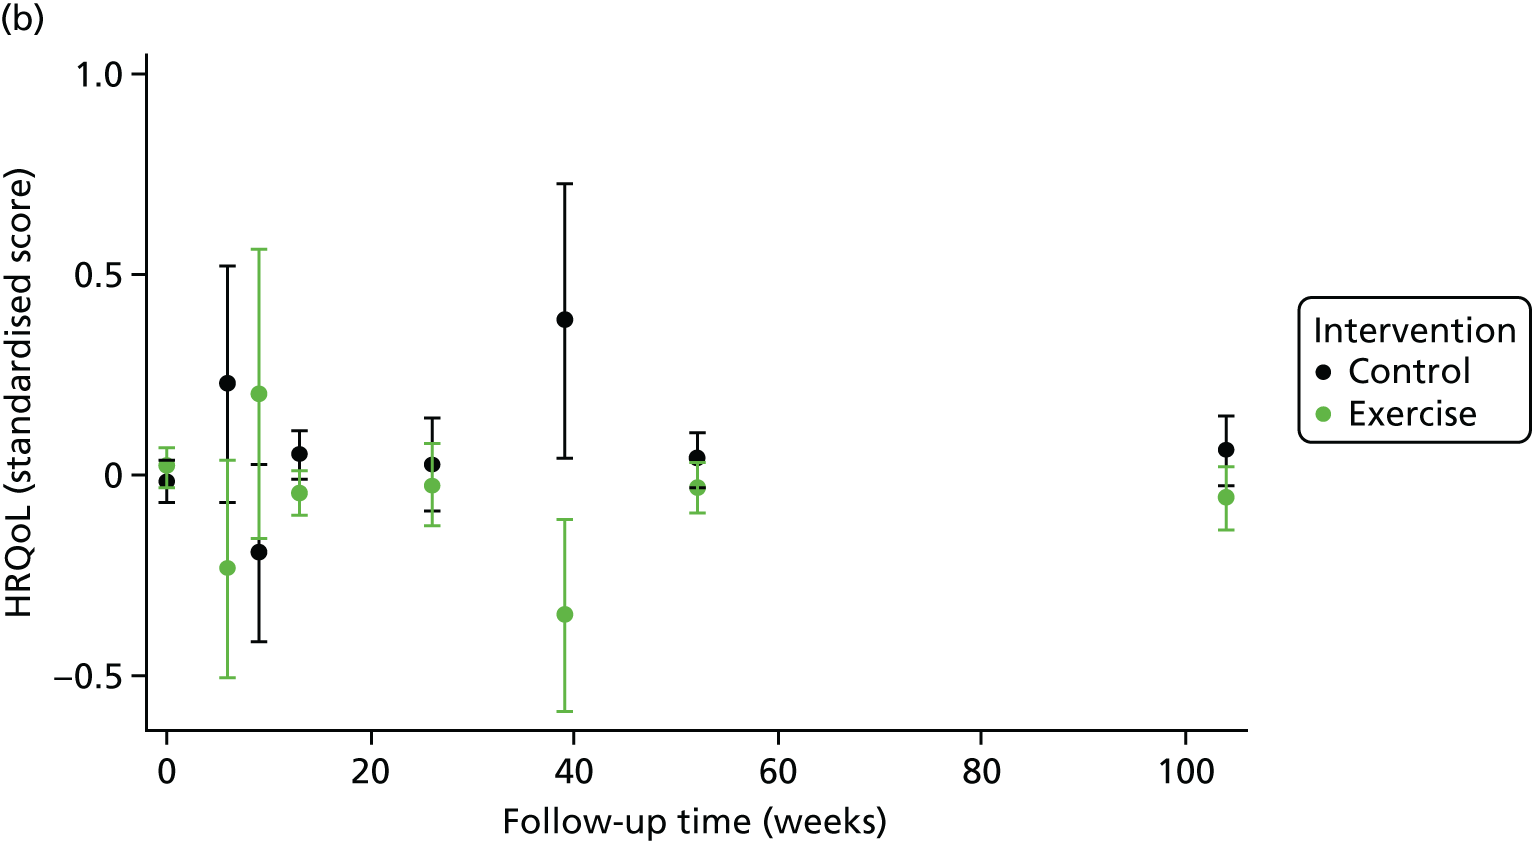
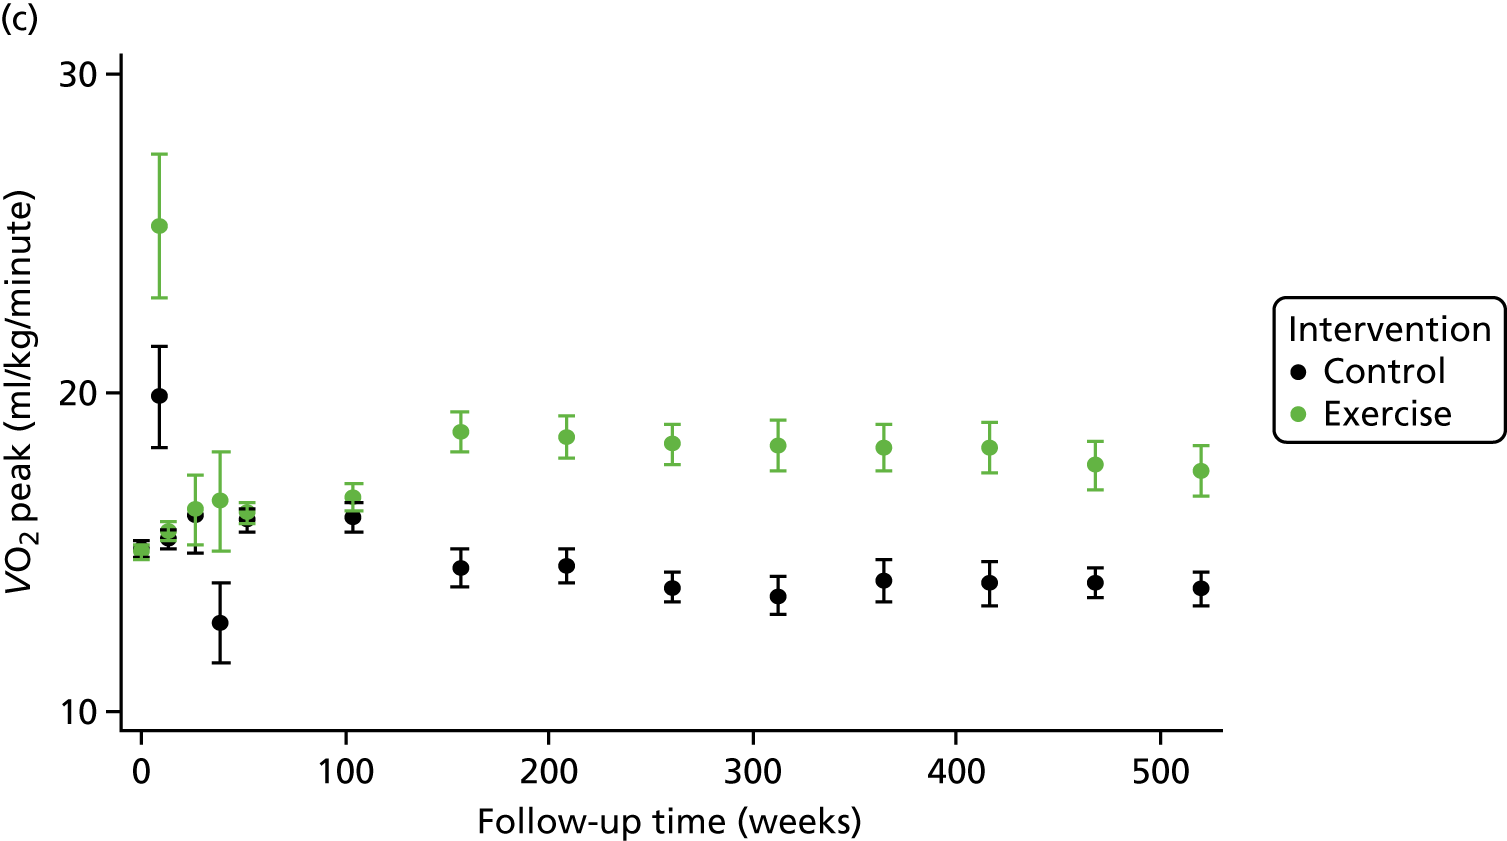
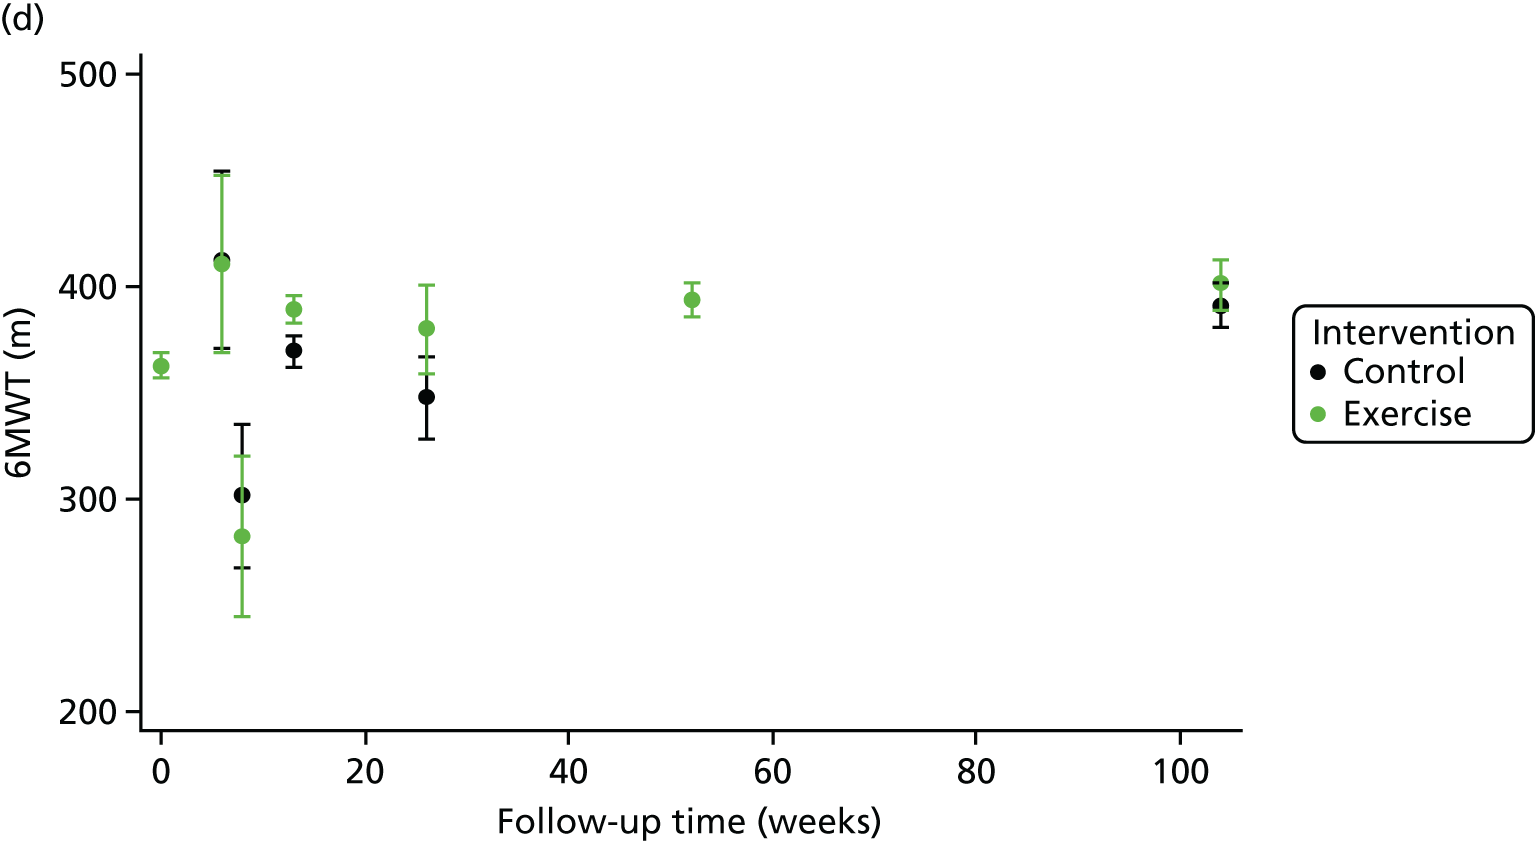
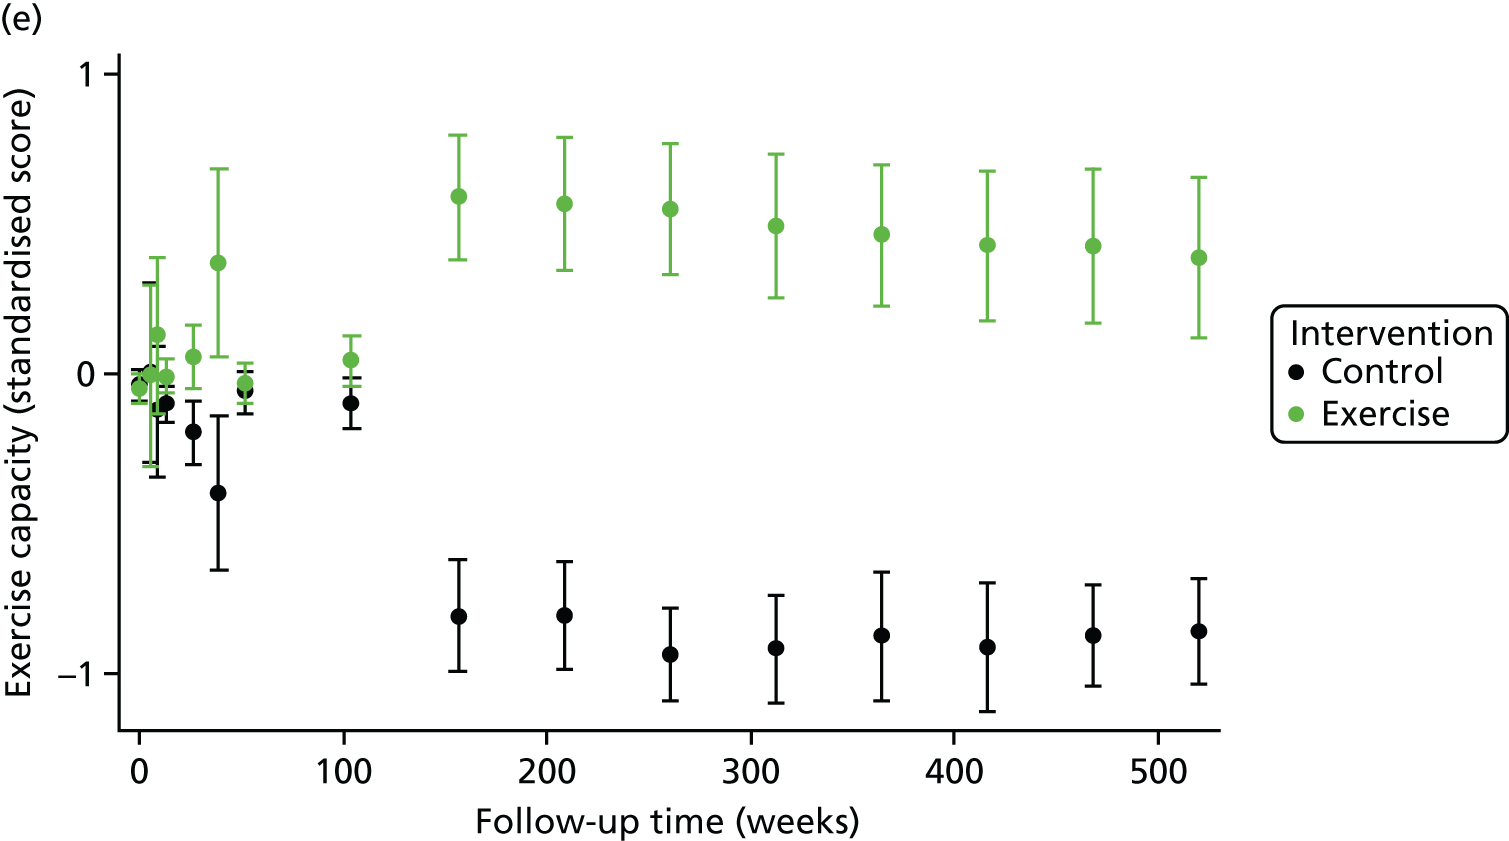
FIGURE 11.
Effect of ExCR on HRQoL and exercise capacity across patient subgroups (individual subgroup one-stage IPD meta-analyses). (a) MLHFQ score (points); (b) all HRQoL measures (standardised score); (c) VO2peak directly reported; (d) 6MWT (m) directly reported; and (e) all exercise capacity measures (standardised score). a, Although stratified meta-analyses are shown, the interaction p-values are calculated based on continuous distribution of age, ejection fraction and baseline exercise capacity.
Sensitivity analyses
In sensitivity analyses, the results of the analyses excluding HF-ACTION,19 were broadly consistent with the overall results (Tables 14–18). Similar results were found with the addition of the study-level aggregate data to the two-stage model at 12 months’ follow-up.
| Baseline variable | Primary analyses, mean difference (95% CI); p-value | Sensitivity analyses excluding HF-ACTION,19 mean difference (95% CI); p-value | ||||||
|---|---|---|---|---|---|---|---|---|
| One-stage model, 6-month follow-up, with random treatment effect | Two-stage model, 6-month follow-up, with random treatment effect | One-stage model, 12-month follow-up, with random treatment effect | Two-stage model, 12-month follow-up, with random treatment effect | One-stage model, 6-month follow-up, with random treatment effect | Two-stage model, 6-month follow-up, with random treatment effect | One-stage model, 12-month follow-up, with random treatment effect | Two-stage model, 12-month follow-up, with random treatment effect | |
| Overall effect | –2.85 (–5.85 to 0.14); 0.062 | –1.73 (–4.15 to 0.70); 0.163 | –5.94 (–10.87 to –1.01); 0.018 | –5.73 (–12.38 to 0.93); 0.091 | Not applicable to MLHFQ analyses as HF-ACTION19 only supplied KCCQ scores | |||
| Interaction term | ||||||||
| Age (years) | 0.12 (–0.10 to 0.35); 0.280 | 0.01 (–0.20 to 0.22); 0.912 | ||||||
| Gender (male vs. female) | –5.31 (–11.01 to 0.39); 0.068 | –1.49 (–6.95 to 3.96); 0.592 | ||||||
| Ejection fraction (%) | 0.22 (–0.14 to 0.58); 0.227 | 0.24 (–0.07 to 0.56); 0.127 | ||||||
| Ejection fraction (HFrEF vs. HFpEF) | 4.06 (–11.0 to 19.1); 0.597 | 8.02 (–3.29 to 19.3); 0.165 | ||||||
| NYHA class (NYHA I/II vs. NYHA III/IV) | –6.38 (–12.31 to –0.45); 0.035 | –5.30 (–10.9 to 0.24); 0.061 | ||||||
| HF aetiology (ischaemic vs. non-ischaemic) | 4.67 (–1.65 to 11.0); 0.147 | 2.08 (–3.64 to 7.80); 0.477 | ||||||
| Ethnic group (white vs. non-white) | 3.15 (–4.31 to 10.6); 0.408 | 5.17 (–2.19 to 12.5); 0.169 | ||||||
| Exercise capacity | ||||||||
| Baseline VO2peak directly measured | 0.24 (–0.82 to 1.31); 0.654 | 0.47 (–0.35 to 1.29); 0.262 | ||||||
| Baseline VO2peak directly measured and predicted | 0.72 (–0.01 to 1.45); 0.053 | 0.62 (–0.02 to 1.26); 0.058 | ||||||
| Baseline variable | Primary analyses, mean difference (95% CI); p-value | Sensitivity analyses excluding HF-ACTION,19 mean difference (95% CI); p-value | ||||||
|---|---|---|---|---|---|---|---|---|
| One-stage model, 6-month follow-up, with random treatment effect | Two-stage model, 6-month follow-up, with random treatment effect | One-stage model, 12-month follow-up, with random treatment effect | Two-stage model, 12-month follow-up, with random treatment effect | One-stage model, 6-month follow-up, with random treatment effect | Two-stage model, 6-month follow-up, with random treatment effect | One-stage model, 12-month follow-up, with random treatment effect | Two-stage model, 12-month follow-up, with random treatment effect | |
| Overall effect | –0.11 (–0.16 to –0.06); < 0.001 | –0.10 (–0.15 to –0.05); < 0.001 | –0.20 (–0.37 to –0.03); 0.020 | –0.19 (–0.38 to –0.01); 0.043 | –0.11 (–0.24 to 0.01); 0.069 | –0.08 (–0.18 to 0.02); 0.131 | –0.17 (–0.28 to –0.07); 0.001a | –0.21 (–0.45 to 0.04); 0.106 |
| Interaction terms | ||||||||
| Age (years) | 0.006 (0.002 to 0.011); 0.006 | 0.001 (–0.004 to 0.005); 0.734 | 0.003 (–0.007 to 0.014); 0.536 | –0.001 (–0.011 to 0.008); 0.788 | ||||
| Gender (male vs. female) | 0.050 (–0.068 to 0.168); 0.407 | 0.018 (–0.105 to 0.140); 0.775 | –0.223 (–0.469 to 0.024); 0.077 | –0.106 (–0.335 to 0.123); 0.365 | ||||
| Ejection fraction (%) | –0.000 (–0.007 to 0.007); 0.963 | –0.004 (–0.011 to 0.004); 0.340 | 0.010 (–0.006 to 0.025); 0.225 | 0.010 (–0.003 to 0.023); 0.150 | ||||
| Ejection fraction (%) (HFrEF vs. HFpEF) | –0.03 (–0.46 to 0.41); 0.902 | 0.13 (–0.26 to 0.53); 0.505 | 0.16 (–0.47 to 0.84); 0.581 | 0.34 (–0.14 to 0.81); 0.163 | ||||
| NYHA class (NYHA I/II vs. NYHA III/IV) | –0.013 (–0.126 to 0.100); 0.824 | 0.031 (–0.086 to 0.149); 0.599 | –0.126 (–0.380 to 0.129); 0.334 | –0.082 (–0.314 to 0.151); 0.491 | ||||
| HF aetiology (ischaemic vs. non-ischaemic) | 0.076 (–0.036 to 0.187); 0.182 | 0.030 (–0.085 to 0.145); 0.611 | 0.220 (–0.055 to 0.494); 0.117 | 0.080 (–0.162 to 0.322); 0.517 | ||||
| Ethnic group (white vs. non-white) | 0.041 (–0.079 to 0.161); 0.506 | 0.017 (–0.108 to 0.142); 0.787 | 0.173 (–0.172 to 0.519); 0.325 | 0.243 (–0.086 to 0.573); 0.147 | ||||
| Exercise capacity | ||||||||
| Baseline VO2peak directly measured | –0.002 (–0.014 to –0.011); 0.775 | 0.008 (–0.005 to 0.021); 0.230 | 0.012 (–0.035 to 0.059); 0.612 | 0.021 (–0.012 to 0.055); 0.216 | ||||
| Baseline VO2peak directly measured and predicted | 0.000 (–0.012 to 0.013); 0.956 | 0.008 (–0.004 to 0.021); 0.208 | 0.023 (–0.010 to 0.056); 0.171 | 0.020 (–0.008 to 0.048); 0.172 | ||||
| Baseline variable | Primary analyses, mean difference (95% CI); p-value | Sensitivity analyses excluding HF-ACTION,19 mean difference (95% CI); p-value | ||||||
|---|---|---|---|---|---|---|---|---|
| One-stage model, 6-month follow-up, with random treatment effect | Two-stage model, 6-month follow-up, with random treatment effect | One-stage model, 12-month follow-up, with random treatment effect | Two-stage model, 12-month follow-up, with random treatment effect | One-stage model, 6-month follow-up, with random treatment effect | Two-stage model, 6-month follow-up, with random treatment effect | One-stage model, 12-month follow-up, with random treatment effect | Two-stage model, 12-month follow-up, with random treatment effect | |
| Overall effect | 0.62 (–0.82 to 2.07); 0.397 | 0.69 (–0.24 to 1.62); 0.145 | 1.01 (–0.42 to 2.44); 0.168 | 1.14 (–0.05 to 2.34); 0.061 | 0.71 (–1.10 to 2.52); 0.444 | 0.77 (–0.73 to 2.28); 0.315 | 1.15 (–0.60 to 2.90); 0.196 | 1.26 (–0.31 to 2.82); 0.115 |
| Interactions term | ||||||||
| Age (years) | 0.00 (–0.02 to 0.02); 0.980 | –0.00 (–0.02 to 0.14); 0.646 | –0.01 (–0.07 to 0.04); 0.628 | –0.02 (–0.06 to 0.03); 0.415 | ||||
| Gender (male vs. female) | –0.25 (–0.78 to 0.27); 0.345 | –0.57 (–1.11 to –0.04); 0.036 | –0.67 (–2.47 to 1.14); 0.468 | –0.42 (–1.80 to 0.95); 0.549 | ||||
| Ejection fraction (%) | 0.03 (0.00 to 0.06); 0.034 | 0.02 (–0.01 to 0.05); 0.157 | 0.05 (–0.04 to 0.13); 0.280 | 0.03 (–0.04 to 0.11); 0.349 | ||||
| Ejection fraction (%) (HFrEF vs. HFpEF) | 0.07 (–1.88 to 2.01); 0.947 | –0.13 (–2.07 to 1.81); 0.897 | –1.34 (–2.42 to 5.09); 0.485 | –0.19 (–3.34 to 2.97); 0.907 | ||||
| NYHA class (NYHA I/II vs. NYHA III/IV) | –0.10 (–0.58 to 0.38); 0.687 | –0.25 (–0.75 to 0.24); 0.318 | –0.50 (–2.13 to 1.13); 0.549 | –0.75 (–1.95 to 0.46); 0.224 | ||||
| HF aetiology (ischaemic vs. non-ischaemic) | 0.02 (–0.44 to 0.47); 0.945 | –0.13 (–0.60 to 0.34); 0.577 | –0.63 (–2.04 to 0.79); 0.386 | –0.24 (–1.39 to 0.91); 0.683 | ||||
| Ethnic group (white vs. non-white) | –0.19 (–0.66 to 0.29); 0.447 | –0.07 (–0.58 to 0.45); 0.800 | –0.47 (–2.36 to 1.43); 0.628 | 0.16 (–1.71 to 2.03); 0.870 | ||||
| Exercise capacity | ||||||||
| Baseline VO2peak directly measured | 0.01 (–0.04 to 0.06); 0.719 | 0.03 (–0.03 to 0.08); 0.332 | –0.06 (–0.21 to 0.09); 0.435 | –0.04 (–0.17 to 0.10); 0.602 | ||||
| Baseline VO2peak directly measured and predicted | 0.01 (–0.04 to 0.06); 0.702 | 0.03 (–0.02 to 0.08); 0.299 | –0.06 (–0.21 to 0.09); 0.452 | –0.03 (–0.16 to 0.10); 0.660 | ||||
| Baseline variable | Primary analyses, mean difference (95% CI); p-value | Sensitivity analyses excluding HF-ACTION,19 mean difference (95% CI); p-value | ||||||
|---|---|---|---|---|---|---|---|---|
| One-stage model, 6-month follow-up, with random treatment effect | Two-stage model, 6-month follow-up, with random treatment effect | One-stage model, 12-month follow-up, with random treatment effect | Two-stage model, 12-month follow-up, with random treatment effect | One-stage model, 6-month follow-up, with random treatment effect | Two-stage model, 6-month follow-up, with random treatment effect | One-stage model, 12-month follow-up, with random treatment effect | Two-stage model, 12-month follow-up, with random treatment effect | |
| Overall effect | 22.1 (1.87 to 42.3); 0.032 | 24.4 (6.13 to 42.6); 0.009 | 21.0 (1.57 to 40.4); 0.034 | 24.0 (5.30 to 42.7); 0.012 | 22.1 (–1.64 to 45.8); 0.068 | 27.9 (1.25 to 54.6); 0.040 | 24.0 (1.25 to 46.7); 0.039 | 29.0 (3.05 to 55.0); 0.029 |
| Interaction terms | ||||||||
| Age (years) | 0.01 (–0.49 to 0.50); 0.973 | –0.03 (–0.56 to 0.50); 0.911 | 0.45 (–0.81 to 1.72); 0.482 | 0.97 (–0.23 to 2.17); 0.115 | ||||
| Gender (male vs. female) | –10.7 (–23.6 to 2.26); 0.106 | –14.9 (–28.7 to –1.16); 0.034 | –19.7 (–47.3 to 7.92); 0.162 | –13.5 (–39.9 to 12.9); 0.317 | ||||
| Ejection fraction (%) | 0.34 (–0.46 to 1.14); 0.399 | 0.21 (–0.64 to 1.06); 0.634 | 1.05 (–0.78 to 2.88); 0.262 | 0.04 (–1.69 to 1.77); 0.963 | ||||
| Ejection fraction (%) (HFrEF vs. HFpEF) | 0.68 (–47.8 to 49.2); 0.978 | 15.4 (–36.3 to 67.0); 0.560 | 13.8 (–6.09 to 88.6); 0.717 | 14.7 (–56.1 to 85.4); 0.685 | ||||
| NYHA class (NYHA I/II vs. NYHA III/IV) | –1.81 (–14.3 to 10.6); 0.776 | 1.31 (–12.0 to 14.6); 0.847 | –5.90 (–34.6 to 22.8); 0.687 | –8.14 (–35.7 to 19.4); 0.563 | ||||
| HF aetiology (ischaemic vs. non-ischaemic) | 3.73 (–8.26 to 15.7); 0.542 | –4.30 (–17.1 to 8.51); 0.510 | 37.9 (9.34 to 66.4); 0.009 | 26.9 (–0.13 to 54.0); 0.051 | ||||
| Ethnic group (white vs. non-white) | 10.46 (–2.55 to 23.5); 0.115 | 14.2 (0.40 to 28.0); 0.044 | –20.7 (–60.5 to 19.0); 0.307 | 8.34 (–29.5 to 46.1); 0.665 | ||||
| Exercise capacity | ||||||||
| Baseline 6MWT directly measured | –0.05 (–0.11 to 0.01); 0.079 | 0.19 (–0.08 to 0.46); 0.176 | –0.06 (–0.18 to 0.06); 0.321 | –0.05 (–0.16 to 0.07); 0.421 | ||||
| Baseline variable | Primary analyses, mean difference (95% CI); p-value | Sensitivity analyses excluding HF-ACTION,19 mean difference (95% CI); p-value | ||||||
|---|---|---|---|---|---|---|---|---|
| One-stage model, 6-month follow-up, with random treatment effect | Two-stage model, 6-month follow-up, with random treatment effect | One-stage model, 12-month follow-up, with random treatment effect | Two-stage model, 12-month follow-up, with random treatment effect | One-stage model, 6-month follow-up, with random treatment effect | Two-stage model, 6-month follow-up, with random treatment effect | One-stage model, 12-month follow-up, with random treatment effect | Two-stage model, 12-month follow-up, with random treatment effect | |
| Overall effect | 0.230 (0.067 to 0.392); 0.006 | 0.256 (0.116 to 0.396); < 0.001 | 0.268 (0.110 to 0.426); 0.001 | 0.302 (0.142 to 0.462); < 0.001 | 0.256 (0.079 to 0.433); 0.005 | 0.278 (0.105 to 0.451); 0.002 | 0.298 (0.125 to 0.471); 0.001 | 0.324 (0.150 to 0.497); < 0.001 |
| Interaction terms | ||||||||
| Age (years) | 0.001 (–0.003 to 0.004); 0.758 | –0.001 (–0.005 to 0.003); 0.636 | 0.003 (–0.008 to 0.014); 0.565 | –0.000 (–0.010 to 0.009); 0.948 | ||||
| Gender (male vs. female) | –0.063 (–0.157 to 0.319); 0.194 | –0.096 (–0.197 to 0.006); 0.065 | –0.066 (–0.250 to 0.118); 0.484 | –0.065 (–0.240 to 0.110); 0.464 | ||||
| Ejection fraction (%) | 0.007 (0.001 to 0.012); 0.021 | 0.005 (–0.001 to 0.011); 0.108 | 0.008 (–0.003 to 0.019); 0.131 | 0.008 (–0.003 to 0.018); 0.169 | ||||
| Ejection fraction (HFrEF vs. HFpEF) | 0.11 (–0.20 to 0.43); 0.487 | 0.06 (–0.28 to 0.40); 0.733 | 0.21 (–0.23 to 0.65); 0.348 | 0.06 (–0.36 to 0.49); 0.766 | ||||
| NYHA class (NYHA I/II vs. NYHA III/IV) | –0.010 (–0.098 to 0.079); 0.826 | –0.043 (–0.138 to 0.052); 0.377 | –0.011 (–0.184 to 0.162); 0.900 | –0.061 (–0.224 to 0.101); 0.459 | ||||
| HF aetiology (ischaemic vs. non-ischaemic) | 0.012 (–0.074 to 0.098); 0.783 | 0.024 (–0.070 to 0.117); 0.620 | 0.035 (–0.143 to 0.213); 0.701 | 0.049 (–0.121 to 0.219); 0.573 | ||||
| Ethnic group (white vs. non-white) | –0.064 (–0.159 to 0.031); 0.187 | 0.018 (–0.088 to 0.124); 0.741 | –0.096 (–0.352 to 0.160); 0.461 | 0.078 (–0.195 to 0.351); 0.577 | ||||
| Exercise capacity | ||||||||
| Standardised scores using baseline VO2peak, 6MWT, ISWT units and watts score | –0.025 (–0.066 to 0.017); 0.240 | –0.017 (–0.048 to 0.508); 0.105 | –0.070 (–0.147 to 0.007); 0.077 | –0.052 (–0.129 to 0.026); 0.191 | ||||
Chapter 7 Results from the surrogate analyses
Inclusion of trials in the ExTraMATCH II surrogate analyses
All 19 trials from the ExTraMATCH II study were eligible for inclusion in the surrogate analyses, if they provided the required data (as detailed in Chapter 3). Only 10 trials19,51,58,61–67 provided data for the surrogate analyses. Figure 12 summarises the availability of studies and patient data for exercise capacity and the patient-relevant outcomes of mortality, hospitalisation and HRQoL.
FIGURE 12.
The PRISMA flow diagram summarising the selection of studies for the ExTraMATCH II surrogate analyses. Δ6MWT, change in 6-minute walk test; ΔVO2peak, change in VO2peak.
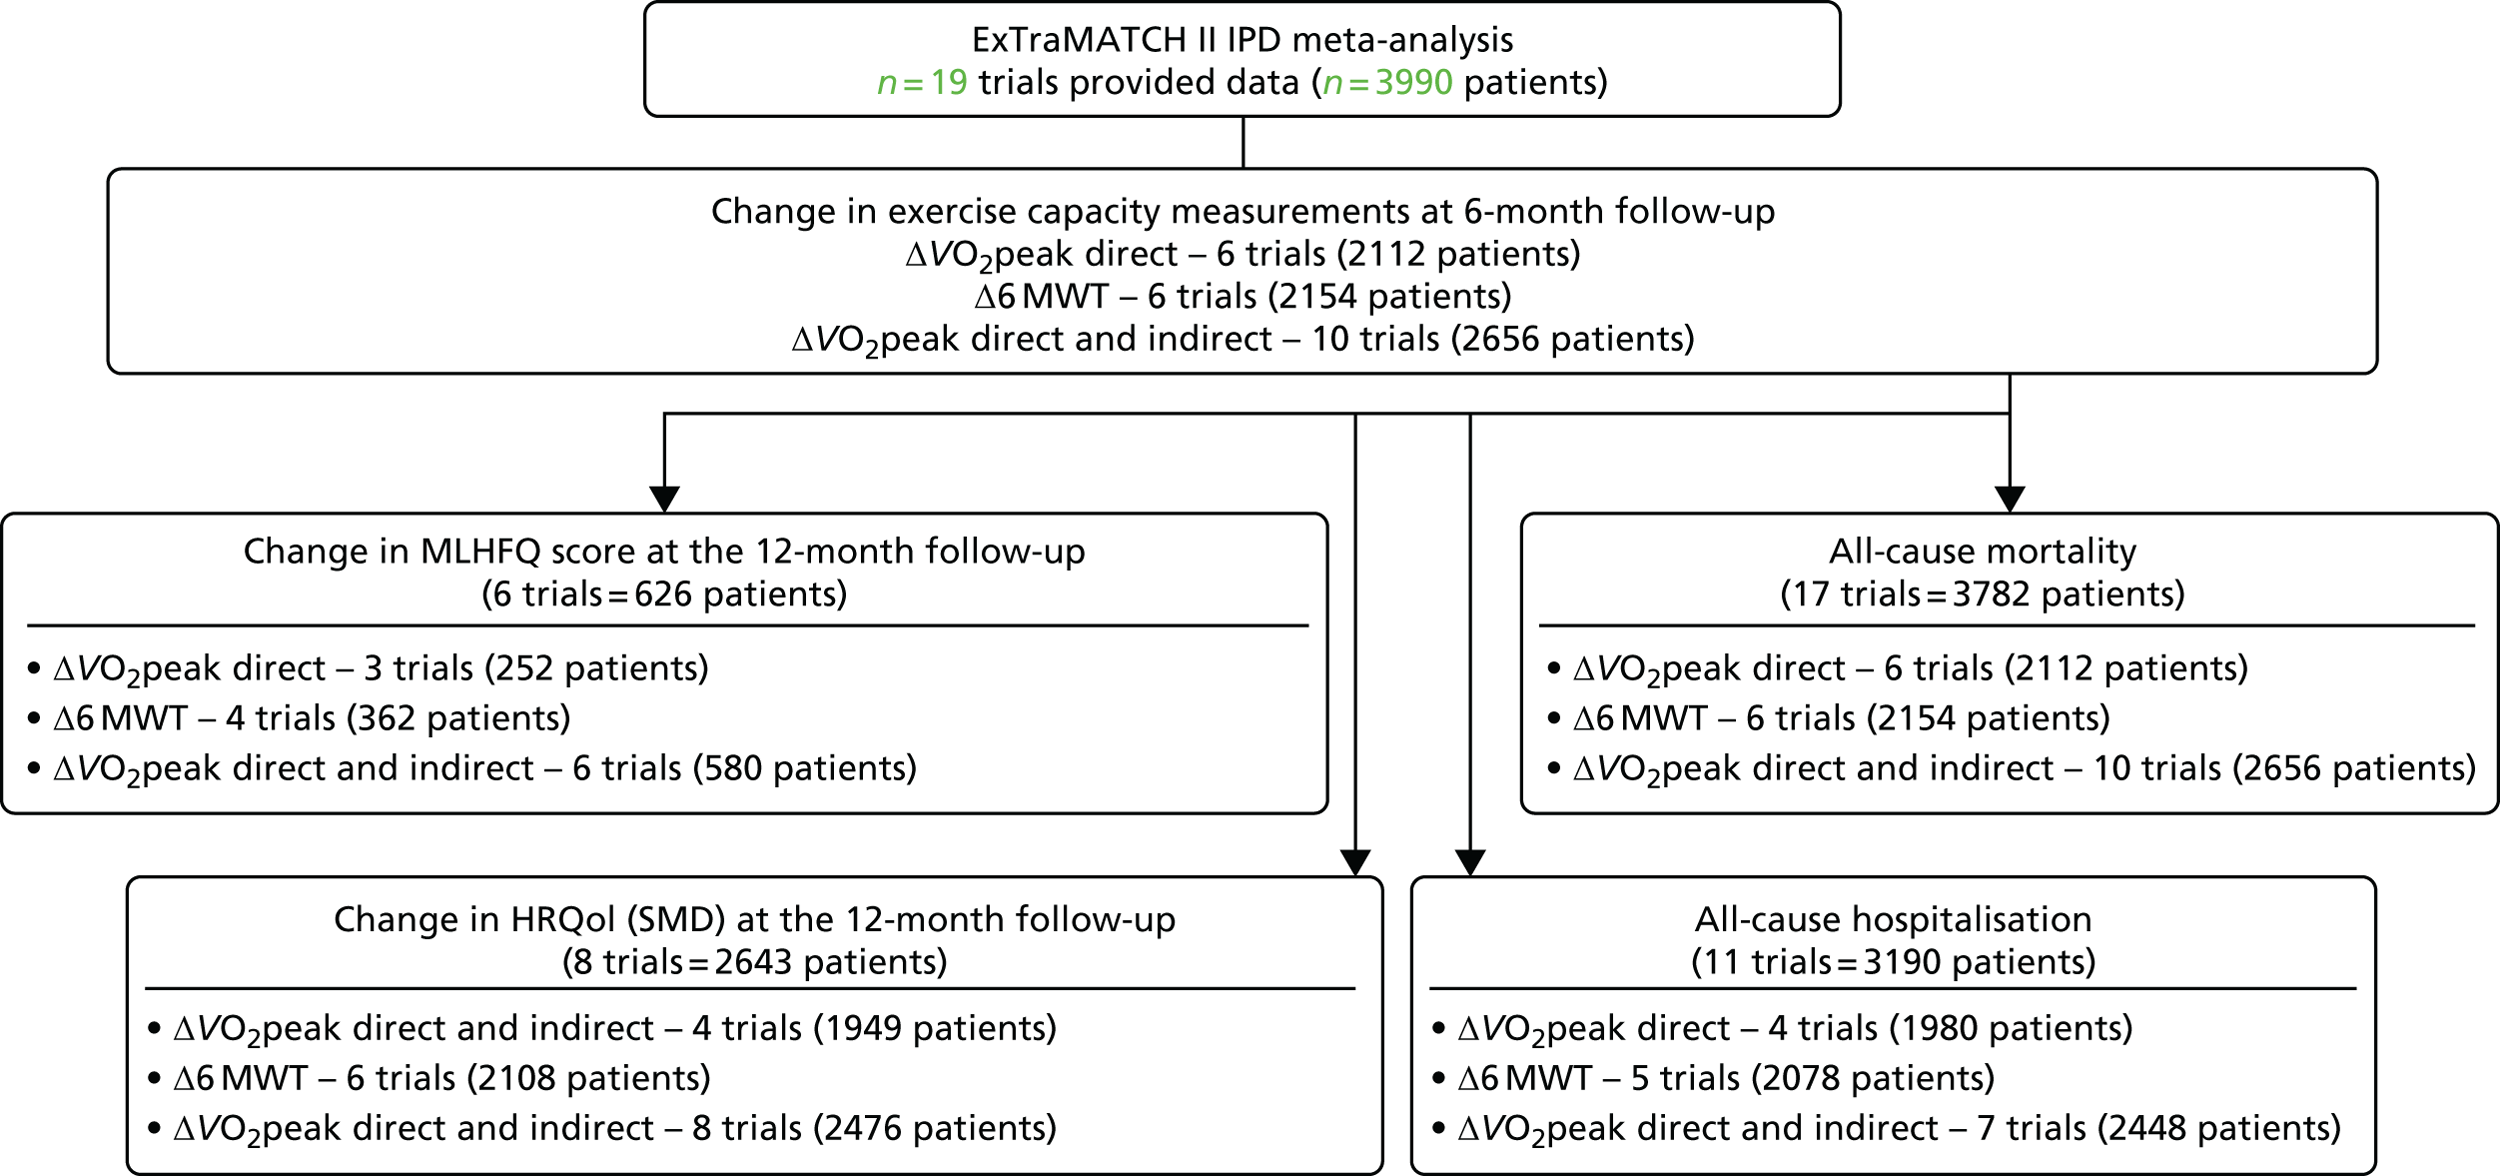
Characteristics of included patients and trials
Patient baseline characteristics were well balanced across the ExCR and control groups (Table 19). Patients had a mean age of 62 years and the majority were male (73%). The mean baseline left ventricular ejection fraction was 26% and most patients were in NYHA functional class II (63%) or III (34%). Studies were published between 2000 and 2012 from a range of geographical locations (Table 20). Sample size was typically small and ranged from 50 to 2130 patients. All trials included ExCR based on an aerobic exercise intervention. The dose of ExCR ranged widely across studies, with an average session duration of 15–60 minutes, of two to seven sessions per week, exercise intensity equivalent of 40–70% VO2peak and delivery duration of 4–120 weeks. The change in exercise capacity and final patient-relevant outcomes for each included study are shown in Table 21.
| Baseline variable | ExCR group (n = 1345) | Control group (n = 1311) | All patients (n = 2656) |
|---|---|---|---|
| Age (years), mean (SD) | 61.2 (13.0) | 61.6 (13.4) | 61.39 (13.19) |
| Gender (male), n (%) | 970 (72.1) | 973 (74.2) | 1943 (73.2) |
| Baseline ejection fraction, mean (SD) | 26.0 (7.9) | 26.2 (7.6) | 26.1 (7.8) |
| NYHA class, n (%) | |||
| Class I | 13 (1) | 27 (2) | 27 (2) |
| Class II | 834 (62) | 861 (64) | 848 (63) |
| Class III | 485 (36) | 444 (33) | 457 (34) |
| Class IV | 13 (1) | 13 (1) | 13 (1) |
| Aetiology (ischaemic), n (%) | 713 (53) | 708 (54) | 1421 (54) |
| Ethnicity (white), n (%) | 914 (70) | 908 (71) | 1822 (70) |
| VO2peak (ml/kg/minute), mean (SD) | 15.1 (4.6) | 15.2 (4.8) | 15.1 (4.7) |
| 6MWT (m), mean (SD) | 368 (108) | 366 (110) | 367 (109) |
| Study characteristic | n (%), unless otherwise stated |
|---|---|
| Publication year | |
| 2000–9 | 8 (80) |
| 2010–12 | 2 (20) |
| Main study location | |
| Europe | 6 (60) |
| North Americaa | 4 (40) |
| Study centre | |
| Single | 7 (70) |
| Multiple | 3 (30) |
| Sample size | |
| 0–99 | 5 (50) |
| 100–999 | 4 (40) |
| ≥ 1000 | 1 (10) |
| Duration of latest follow-up (weeks), median (range) | 10.5 (6–30) |
| Intervention characteristic | |
| Type of exercise | |
| Aerobic exercise only | 6 (60) |
| Aerobic plus resistance training | 4 (40) |
| Dose of intervention | |
| Duration of intervention (weeks), median (range) | 24 (4–120) |
| Frequency (sessions/week), median (range) | 2.75 (2.5–6.5) |
| Length of exercise session (minutes), median (range) | 30 (15–60) |
| Exercise intensity (range) | 40–70% VO2peak |
| 11–15 Borg rating | |
| Setting | |
| Centre based | 3 (30) |
| Home based | 2 (20) |
| Both home and centre based | 5 (50) |
| Study (year) | ΔVO2peak direct (ml/kg/minute), mean difference (95% CI) | Δ6MWT (m), mean difference (95% CI) | ΔVO2peak direct and indirect (ml/kg/minute), mean difference (95% CI) | ΔMLHFQ, mean score (points) difference (95% CI) | ΔHRQoL any validated measure, mean difference (95% CI) | All-cause mortality, HR (95% CI) | All-cause hospital admission, HR (95% CI) |
|---|---|---|---|---|---|---|---|
| Dracup et al. (2007)58 | 0.04 (–1.26 to 1.34) | 5.19 (–28.39 to 38.78) | 0.15 (–0.91 to 1.21) | –2.19 (–9.09 to 4.70) | –0.15 (–0.44 to 0.15) | 1.16 (0.51 to 2.64) | 1.31 (0.84 to 2.05 |
| Hambrecht et al. (2000)51 | –2.16 (–4.43 to 0.10) | –2.16 (–4.43 to 0.10) | 0.93 (0.13 to 6.65) | 0.97 (0.14 to 6.88) | |||
| HF-ACTION (2009)19 | 0.47 (0.24 to 0.71) | 18.14 (11.60 to 24.68) | 0.43 (0.20 to 0.66) | –0.10 (–0.17 to –0.04) | 0.92 (0.75 to 1.13) | 0.93 (0.83 to 1.03) | |
| Jolly et al. (2009)61 | 0.57 (–0.15 to 1.29) | 1.35 (–4.02 to 6.71) | 0.07 (–0.16 to 0.30) | 1.62 (0.45 to 5.78) | 0.72 (0.36 to 1.42) | ||
| Mueller et al. (2007)62 | 4.47 (2.35 to 6.60) | 4.48 (2.35 to 6.60) | 0.78 (0.33 to 1.85) | ||||
| Nilsson et al. (2008)63 | 77.22 (47.58 to 106.87) | 1.78 (1.09 to 2.46) | –6.78 (–13.05 to –0.50) | –0.30 (–0.57 to –0.02) | |||
| Passino et al. (2006)67 | 1.57 (0.66 to 2.49) | 1.57 (0.66 to 2.49) | –23.41 (–28.87 to –17.94) | –0.82 (–1.01 to –0.63) | 0.48 (0.23 to 0.97) | ||
| Witham et al. (2005)64 | 5.18 (–17.41 to 27.76) | 0.12 (–0.40 to 0.64) | 0.04 (–0.40 to 0.49) | 0.29 (0.03 to 2.84) | 1.03 (0.41 to 2.60) | ||
| Witham et al. (2012)65 | –2.03 (–26.14 to 22.08) | –0.05 (–0.60 to 0.51) | 0.86 (–3.13 to 4.84) | 0.04 (–0.16 to 0.24) | 2.09 (0.19 to 23.03) | 0.94 (0.39 to 2.28) | |
| Yeh et al. (2011)66 | –0.02 (–1.02 to 0.98) | 1.25 (–24.71 to 27.20) | –0.17 (–1.16 to 0.82) | –3.09 (–9.31 to 3.14) | –0.16 (–0.43 to 0.12) | 0.57 (0.14 to 2.38) | |
| Pooled results | 0.69 (–0.24 to 1.62); p = 0.145, I2 = 80.4% | 16.69 (–1.08 to 34.36); p = 0.066, I2 = 76.5% | 0.61 (0.10 to 1.11); p = 0.019, I2 = 80.3% | –5.53 (–13.27 to 2.21); p = 0.162, I2 = 91.5% | –0.18 (–0.39 to 0.02); p = 0.084, I2 = 87.9% | 0.83 (0.67 to 1.04); p = 0.107, I2 = 25.7% | 0.90 (0.76 to 1.06); p = 0.210, I2 = 12.4% |
Assessment of study quality and risk of bias
The overall quality of included trials was judged to be moderate to good, with a median TESTEX31 score of 11 (range 10–14) out of a maximum score of 15 (Table 22).
| Study (year) | Eligibility criteria specified | Randomisation specified | Allocation concealed | Groups similar at baseline | Blinding of assessors | Outcome measures in > 85%of participantsa | Intention-to-treat analysisb | Between-group statistical comparisons reported | Point measures and measures of variability reported | Activity monitoring in control group | Relative Exercise intensity reviewed | Exercise volume and energy expended | Overall TESTEX score (maximum score of 15) |
|---|---|---|---|---|---|---|---|---|---|---|---|---|---|
| Dracup et al. (2007)58 | 1 | 0 | 0 | 1 | 0 | 3 | 1 | 2 | 1 | 1 | 1 | 1 | 10 |
| Hambrecht et al. (2000)51 | 1 | 1 | 0 | 1 | 0 | 3 | 0 | 2 | 1 | 0 | 1 | 1 | 11 |
| HF-ACTION (2009)19 | 1 | 1 | 1 | 1 | 1 | 3 | 1 | 2 | 1 | 1 | 0 | 1 | 14 |
| Jolly et al. (2009)61 | 1 | 1 | 1 | 1 | 0 | 2 | 1 | 2 | 1 | 0 | 1 | 1 | 12 |
| Mueller et al. (2007)62 | 1 | 0 | 0 | 1 | 0 | 2 | 1 | 2 | 1 | 0 | 1 | 1 | 10 |
| Nilsson et al. (2008)63 | 1 | 1 | 0 | 1 | 1 | 2 | 1 | 2 | 1 | 0 | 0 | 1 | 11 |
| Passino et al. (2006)67 | 1 | 0 | 0 | 1 | 0 | 2 | 1 | 2 | 1 | 0 | 1 | 1 | 10 |
| Witham et al. (2005)64 | 1 | 1 | 0 | 1 | 1 | 3 | 1 | 2 | 1 | 0 | 1 | 0 | 12 |
| Witham et al. (2012)65 | 1 | 1 | 0 | 1 | 1 | 3 | 1 | 2 | 1 | 0 | 1 | 0 | 12 |
| Yeh et al. (2011)66 | 1 | 1 | 0 | 1 | 1 | 3 | 1 | 2 | 1 | 1 | 0 | 0 | 12 |
Findings
Mediation analysis
The four criteria that must be satisfied to establish that change in exercise capacity is a mediator of mortality, hospitalisation and change in HRQoL are listed in Table 23. First, mean improvements were seen in all exercise capacity metrics of ExCR compared with control, although none reached statistical significance at p < 0.05. Second, greater differences in exercise capacity significantly reduced the risk of mortality and hospitalisation and were associated with a larger gain in HRQoL. Third, although ExCR decreased both the risk of mortality and hospitalisation, and was also associated with a larger gain in HRQoL, there was no statistically significant difference compared with the control. Finally, the effect of ExCR compared with control on final patient-relevant outcomes was attenuated by adding Δ6MWT and ΔVO2peak (directly and indirectly measured) to the model. No attenuation was seen with the addition of ΔVO2peak when measured directly.
| Criteria | ΔVO2peak direct (ml/kg/minute) | Δ6MWT (m) | ΔVO2peak direct and indirect (ml/kg/minute) |
|---|---|---|---|
| Criterion 1 | |||
| Treatment assignment has a significant effect on exercise capacity | 0.61 (95% CI –0.89 to 2.11) | 14.61 (95% CI –6.16 to 35.37) | 0.58 (95% CI –0.35 to 1.51) |
| Criterion 2 | |||
| Exercise capacity has a significant effect on ΔMLHFQ score | –1.64 (95% CI –2.57 to –0.71) | –0.06 (95% CI –0.08 to –0.03) | –1.80 (95% CI –2.77 to –0.83) |
| Exercise capacity has a significant effect on ΔHRQoL all measures (SD units) | –0.06 (95% CI –0.08 to –0.04) | –0.002 (95% CI –0.003 to –0.001) | –0.07 (95% CI –0.08 to –0.05) |
| Exercise capacity has a significant effect on all-cause mortality (HR) | 0.88 (95% CI 0.84 to 0.92) | 0.997 (95% CI 0.995 to 0.998) | 0.88 (95% CI 0.84 to 0.92) |
| Exercise capacity has a significant effect on all-cause hospital admission (HR) | 0.93 (95% CI 0.91 to 0.96) | 0.998 (95% CI 0.997 to 0.999) | 0.94 (95% CI 0.92 to 0.96) |
| Criterion 3 | |||
Treatment assignment has a significant effect on patient-relevant final outcomes:
|
|||
| Criterion 4a | |||
| The effect of treatment assignment on ΔMLHFQ score is attenuated when the change in exercise capacity is added to the model | –8.28 (95% CI –18.56 to 2.01) | –1.77 (95% CI –4.76 to 1.23) | –4.70 (95% CI –10.81 to 1.40) |
| The effect of treatment assignment on ΔHRQoL all outcomes is attenuated when the change in exercise capacity is added to the model | –0.28 (95% CI –0.56 to –0.01) | –0.05 (95% CI –0.12 to 0.01) | –0.17 (95% CI –0.31 to –0.02) |
| The effect of treatment assignment on all-cause mortality HR is attenuated when the change in exercise capacity is added to the model | 0.99 (95% CI 0.79 to 1.24) | 1.00 (95% CI 0.81 to 1.24) | 1.01 (95% CI 0.83 to 1.22) |
| The effect of treatment assignment on all-cause hospital admission HR is attenuated when the change exercise capacity is added to the model | 0.93 (95% CI 0.82 to 1.04) | 0.97 (95% CI 0.86 to 1.09) | 0.95 (95% CI 0.85 to 1.06) |
Meta-analytic regression: R2 and surrogate threshold effect
Regression coefficients of determination (R2) and correlation coefficients (p-value) between the change in exercise capacity and hospitalisation were poor (R2trial < 50% and p < 0.50). Moderate to good levels of correlation (R2trial > 50% and p > 0.50) between exercise capacity VO2peak and 6MWT with mortality and HRQoL were seen (Table 24). The STE for MLHFQ score ranged from an increase of 1.6 to 4.6 ml/kg/minute for VO2peak. The STE was not estimable for the 6MWT. Negative correlation coefficients indicate that larger ExCR effects on exercise capacity are associated with larger ExCR effects on mortality and HRQoL. Figures 13–15 illustrate the results of the meta-regression and STE analyses.
| Surrogate metric | ΔVO2peak direct (ml/kg/minute) | Δ6MWT (m) | ΔVO2peak direct and indirect (ml/kg/minute) |
|---|---|---|---|
| ΔMLHFQ score | R2trial = 94% | R2trial = 65% | R2trial = 54% |
| p = –0.80 | p = –0.90** | p = –0.64 | |
| STE 2 ml/kg/minute | STE not estimable | STE 3.2 ml/kg/minute | |
| ΔHRQoL all outcomes (SD) | R2trial = 81% | R2tria = 54% | R2trial = 62% |
| p = –0.60 | p = –0.57 | p = –0.53 | |
| STE 1.6 ml/kg/minute | STE not estimable | STE 2 ml/kg/minute | |
| All-cause mortality (HR) | R2trial = 21% | R2trial = 1% | R2trial = 7% |
| p = –0.89** | p = –0.20 | p = –0.31 | |
| STE 4.6 ml/kg/minute | STE not estimable | STE not estimable | |
| All-cause hospital admission (HR) | R2trial = 26% | R2trial = 9% | R2trial = 14% |
| p = –0.20 | p = –0.03 | p = –0.21 | |
| STE 1.8 ml/kg/minute | STE 38 ml/kg/minute | STE 1.8 ml/kg/minute |
FIGURE 13.
Regression analyses: relationship at the 6-month follow-up between ΔVO2peak direct and (a) log(HR) of all-cause mortality; (b) ΔHRQoL all outcomes; (c) log(HR) of all-cause hospitalisation; and (d) ΔMLHFQ score. Circles represent trial-level treatment effects, with sizes proportionate to study weights (based on inverse variance weighting). Solid green lines correspond to the bounds of the 95% prediction interval for the true effect on the final outcomes in a new study. SMD, standardised mean difference.
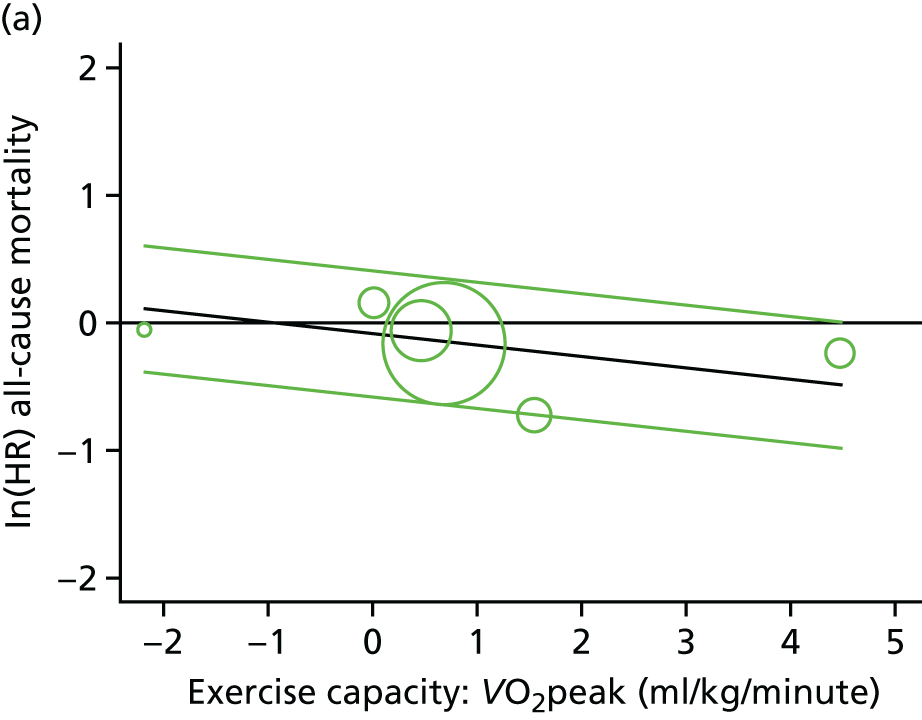
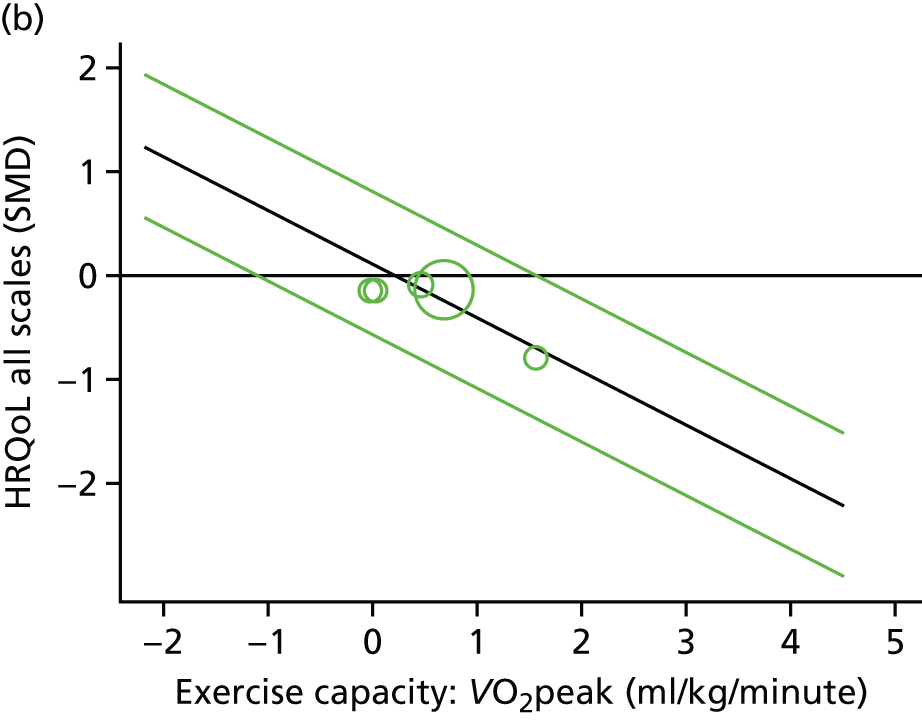
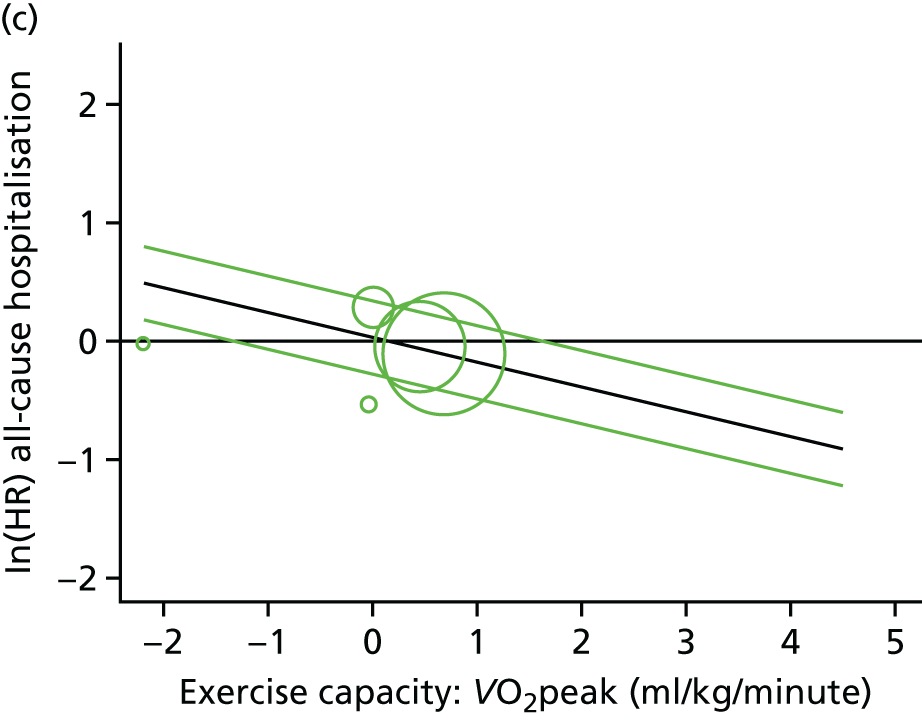
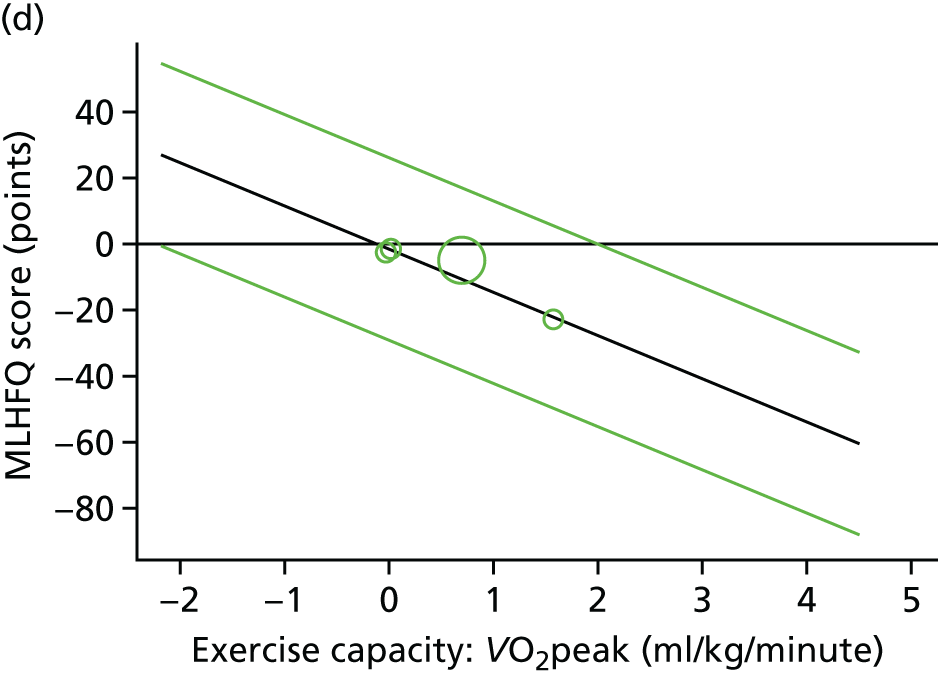
FIGURE 14.
Regression analyses: relationship at the 6-month follow-up between Δ6MWT and (a) log(HR) of all-cause mortality; (b) ΔHRQoL all outcomes; (c) log(HR) of all-cause hospitalisation; and (d) ΔMLHFQ score. Circles represent trial-level treatment effects, with sizes proportionate to study weights (based on inverse variance weighting). Solid green lines correspond to the bounds of the 95% prediction interval for the true effect on the final outcomes in a new study. SMD, standardised mean difference.
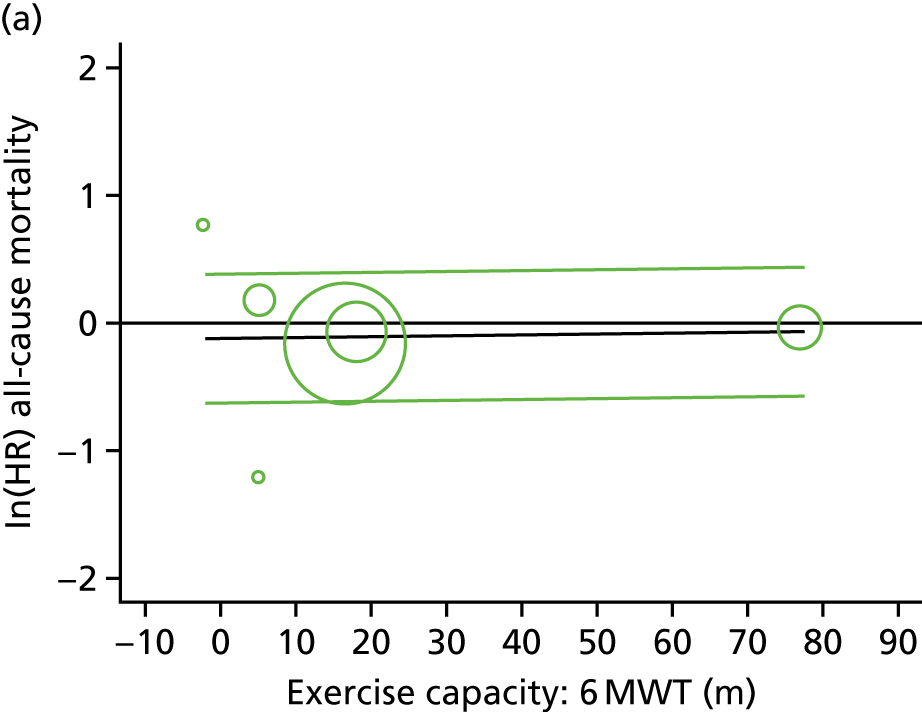
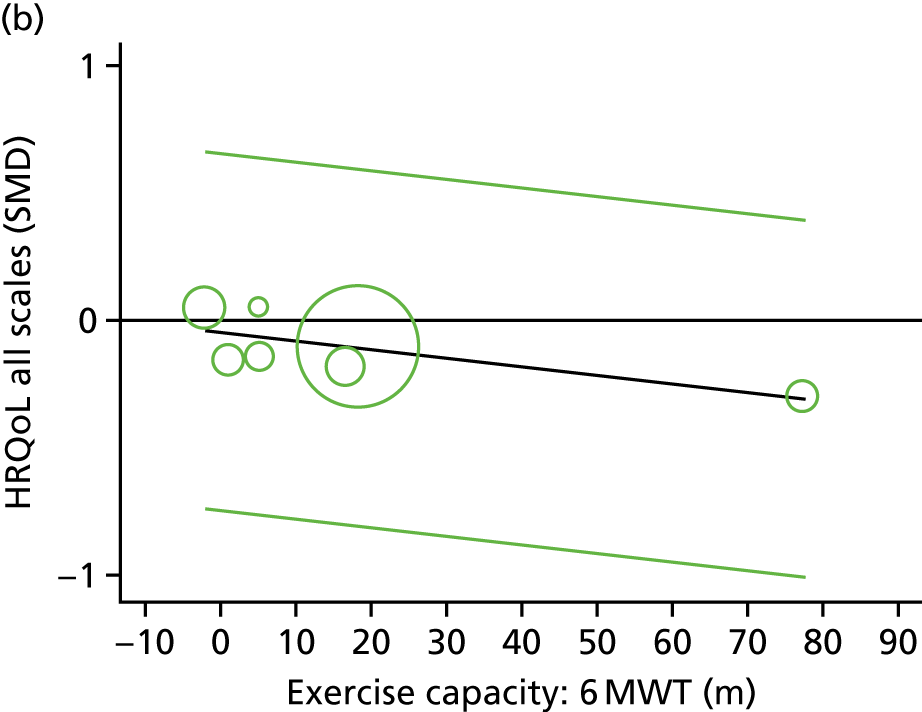
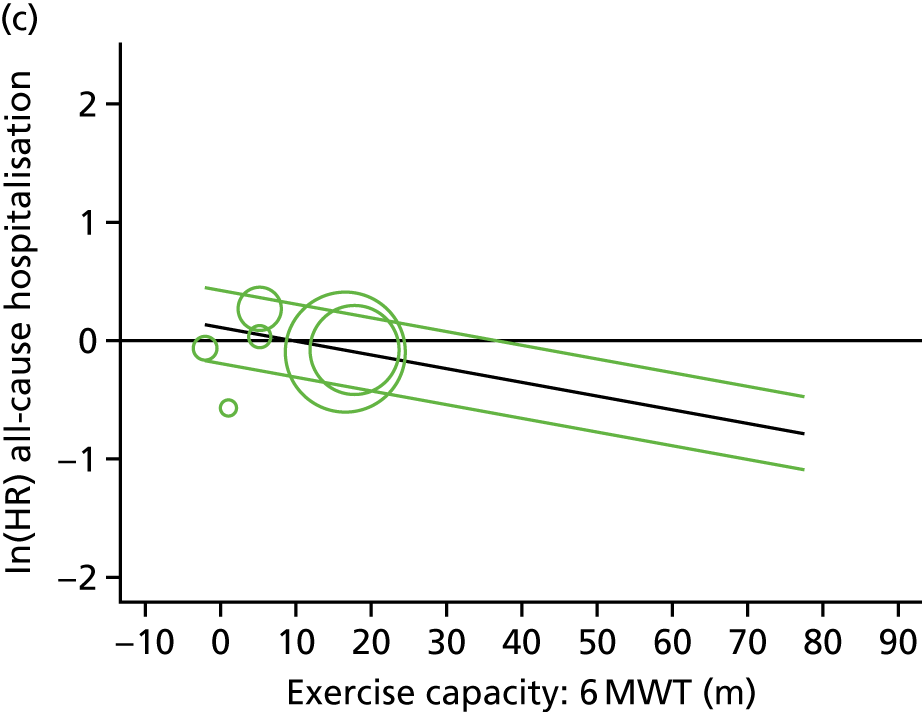
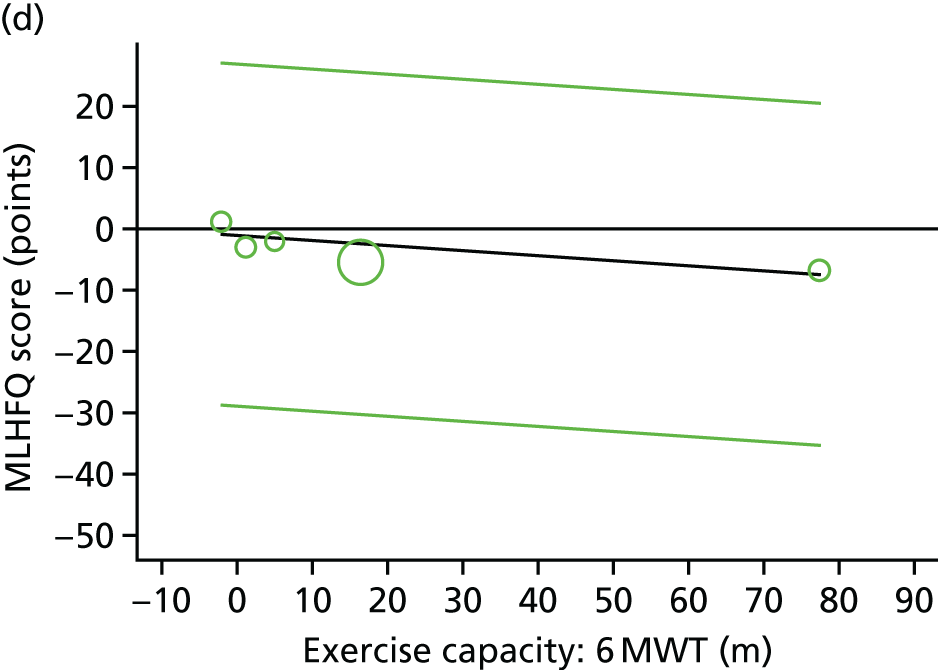
FIGURE 15.
Regression analyses: relationship between ΔVO2peak direct and indirect and (a) log(HR) of all-cause mortality; (b) ΔHRQoL all outcomes; (c) log(HR) of all-cause hospitalisation; and (d) ΔMLHFQ score. Circles represent trial-level treatment effects, with sizes proportionate to study weights (based on inverse variance weighting). Solid green lines correspond to the bounds of the 95% prediction interval for the true effect on the final outcomes in a new study. SMD, standardised mean difference.
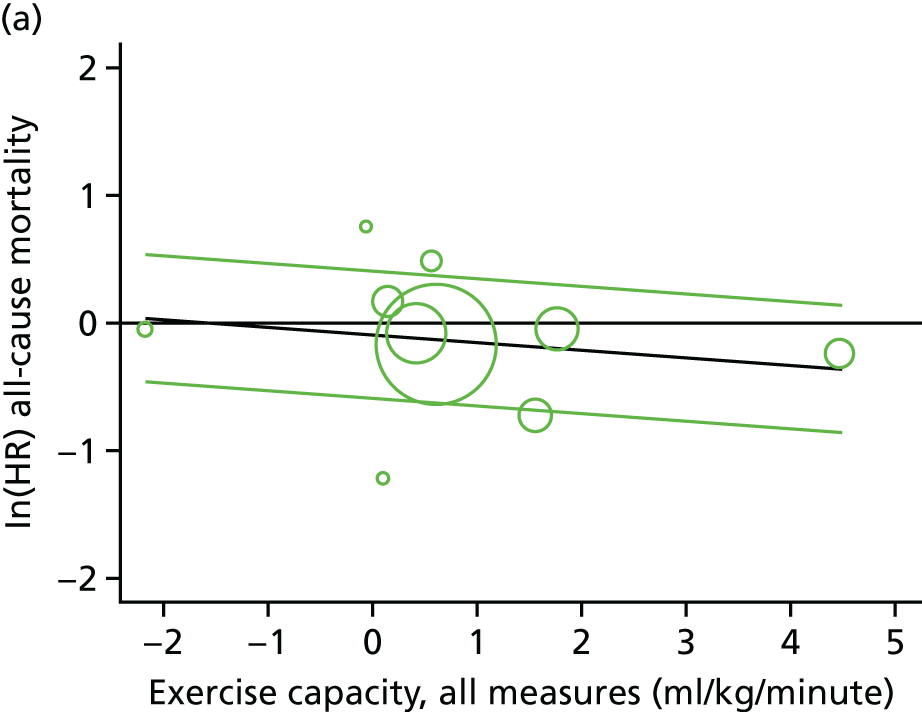
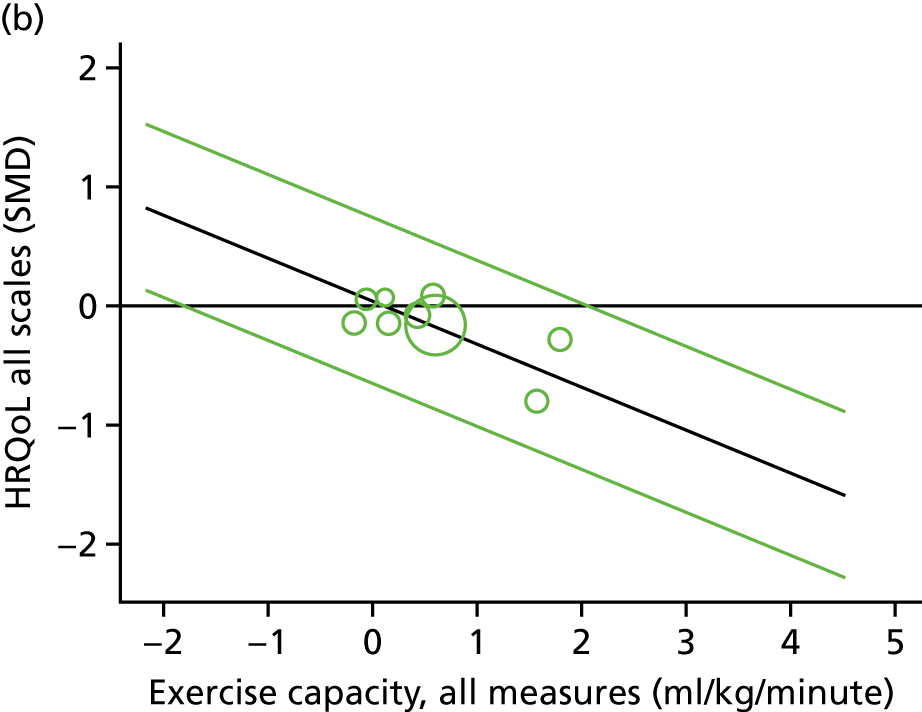
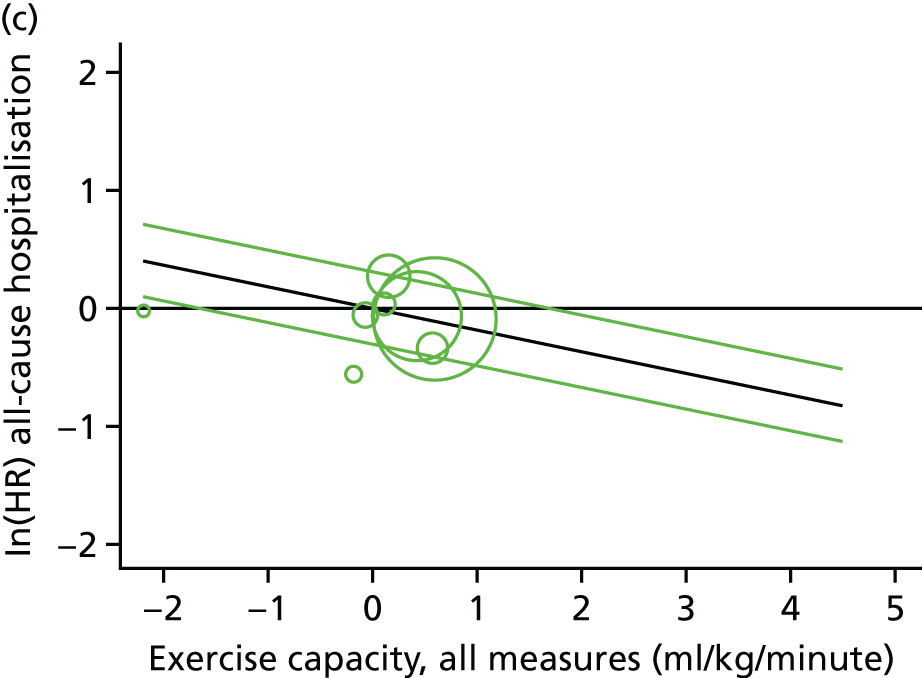
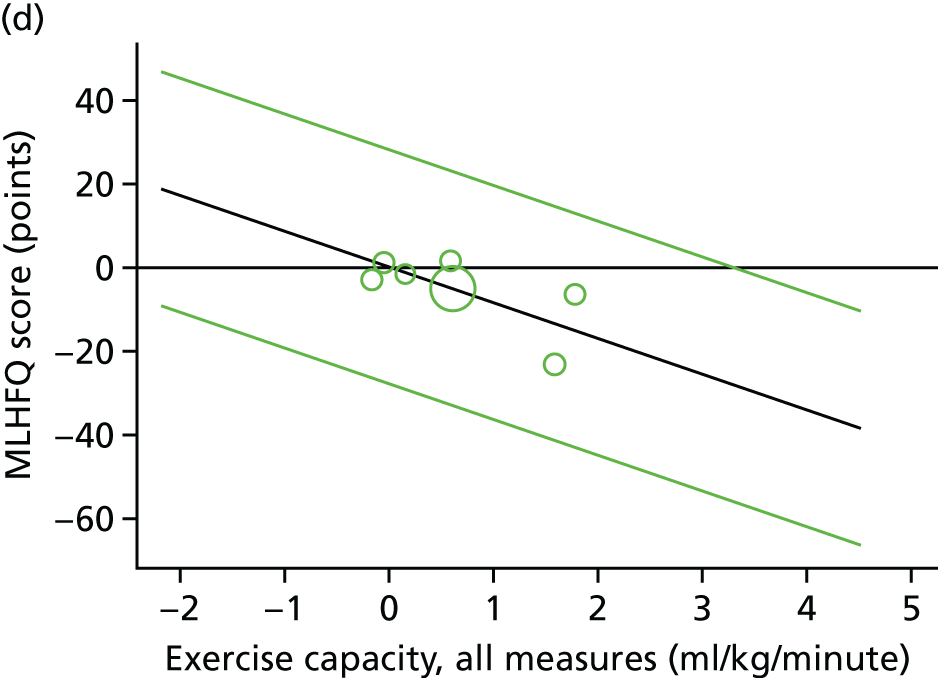
Small-study bias
There was no evidence of significant small-study bias, as shown by the funnel plots (Figure 16) or Egger’s test p-values, for any of the exercise capacity outcomes (ΔVO2peak direct, p = 0.699; Δ6MWT, p = 0.93; ΔVO2peak direct and indirect, p = 0.553), or for the four patient-relevant final outcomes (ΔMLHFQ score, p = 0.607; ΔHRQoL outcomes, p = 0.659; mortality, p = 0.745; hospitalisation, p = 0.733).
FIGURE 16.
Funnel plots for the surrogate analyses. (a) VO2peak; (b) 6MWT; (c) converted exercise capacity score; (d) HRQoL; (e) MLHFQ score; (f) mortality; and (g) hospitalisation.
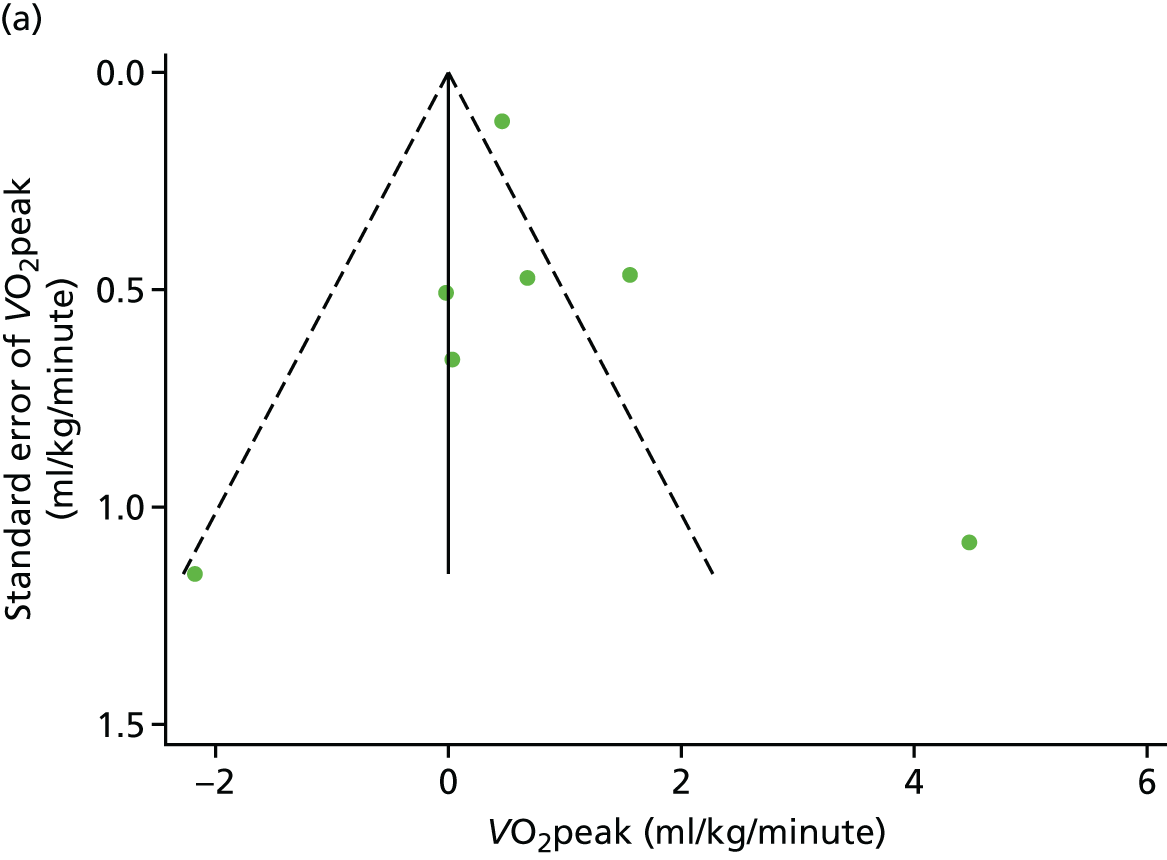
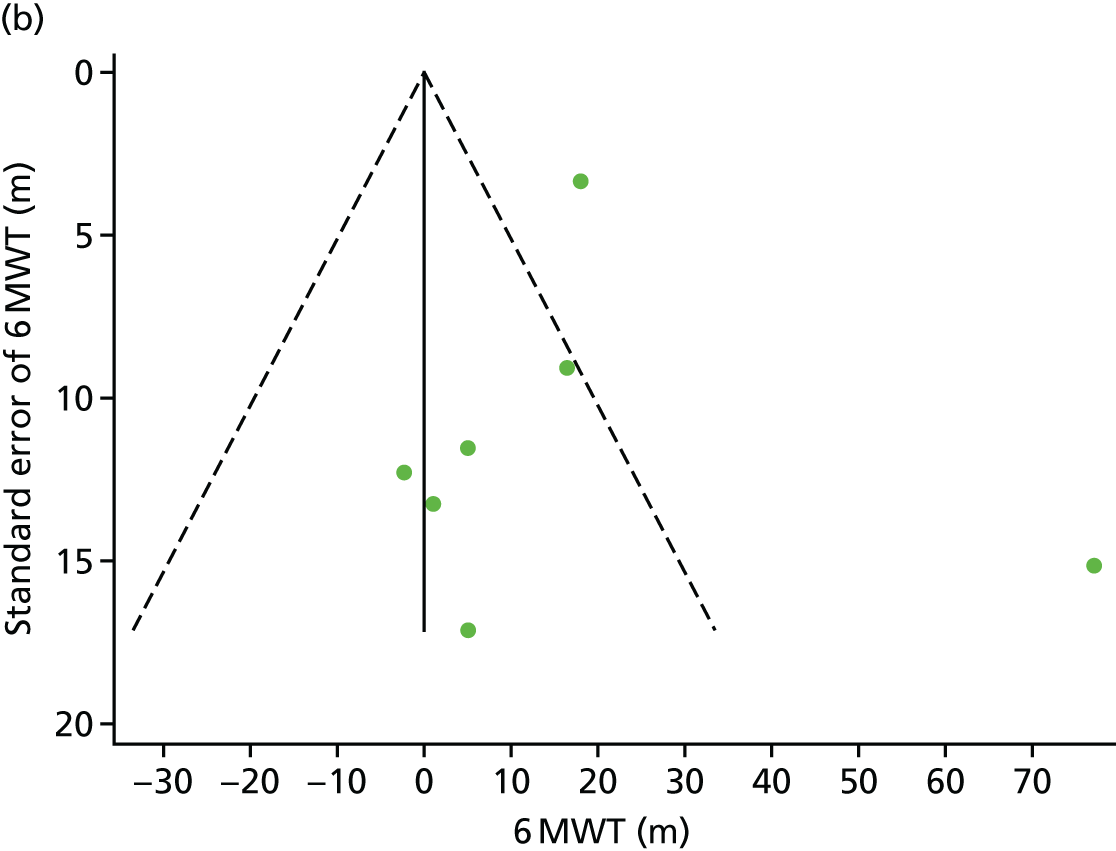
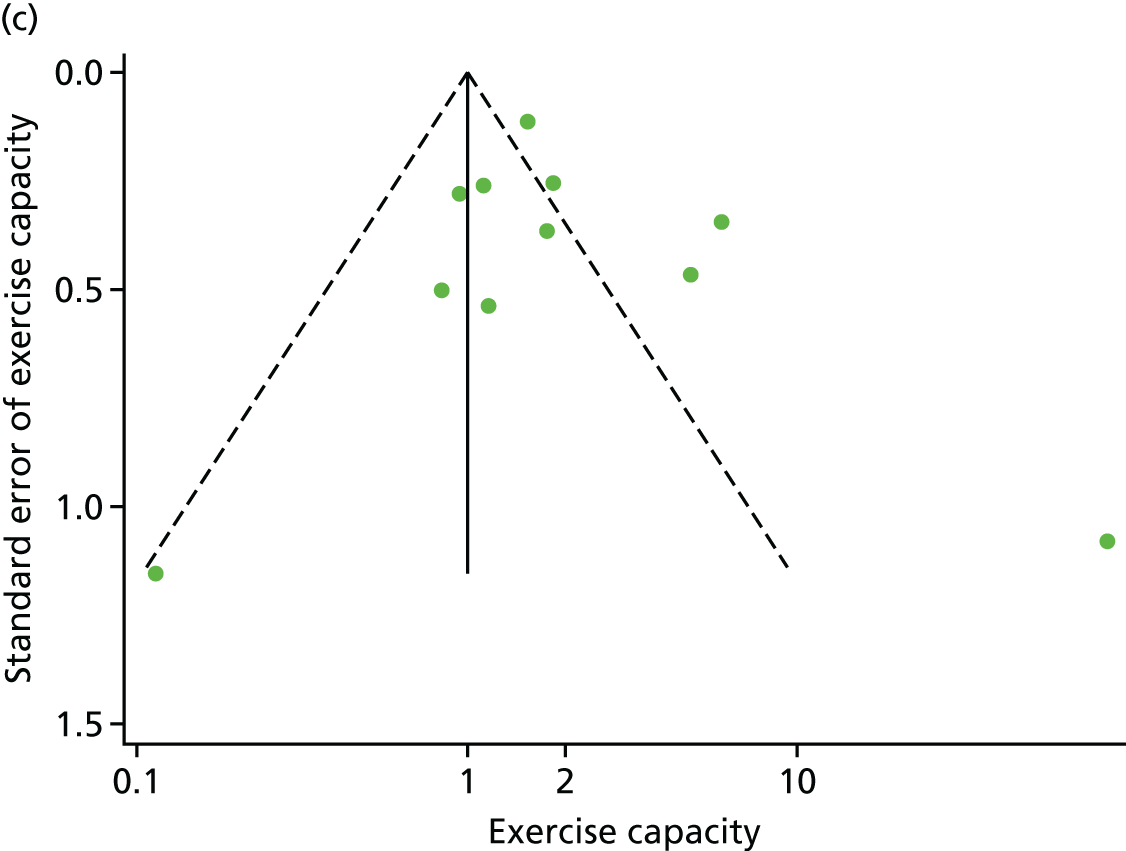
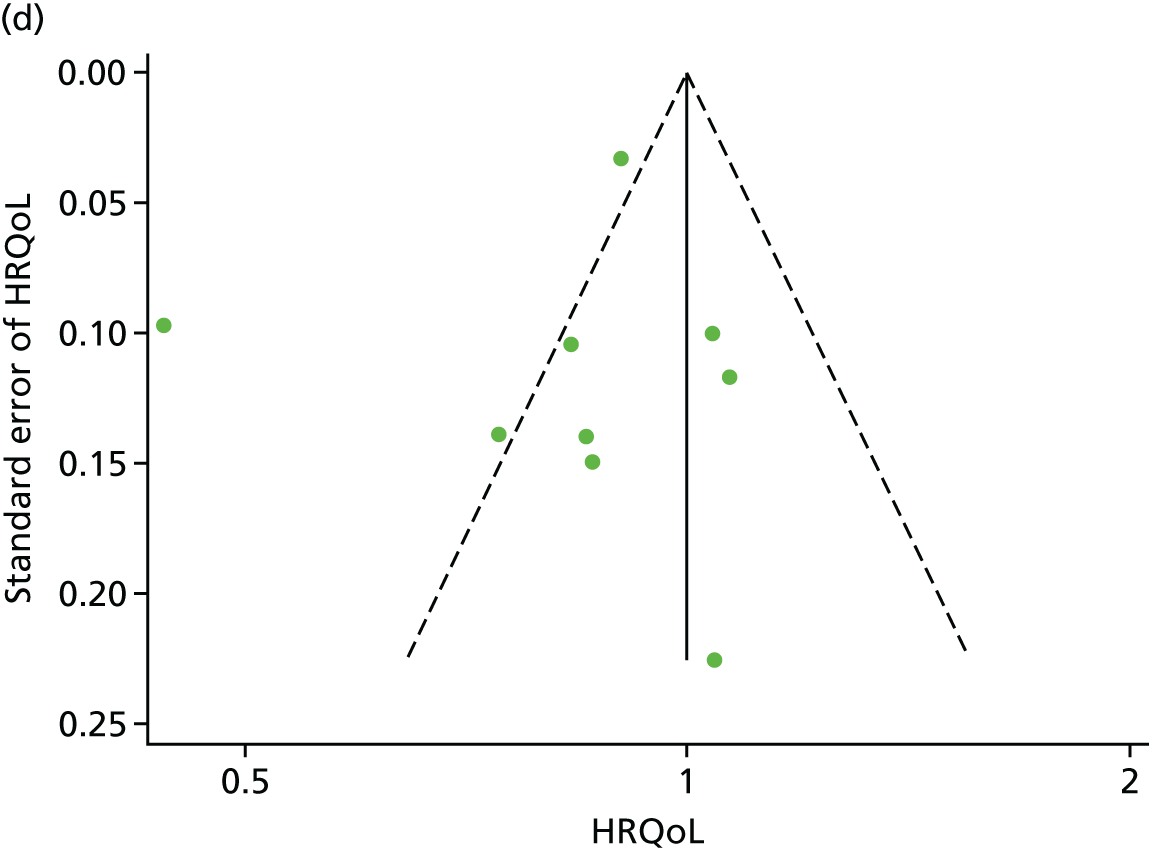
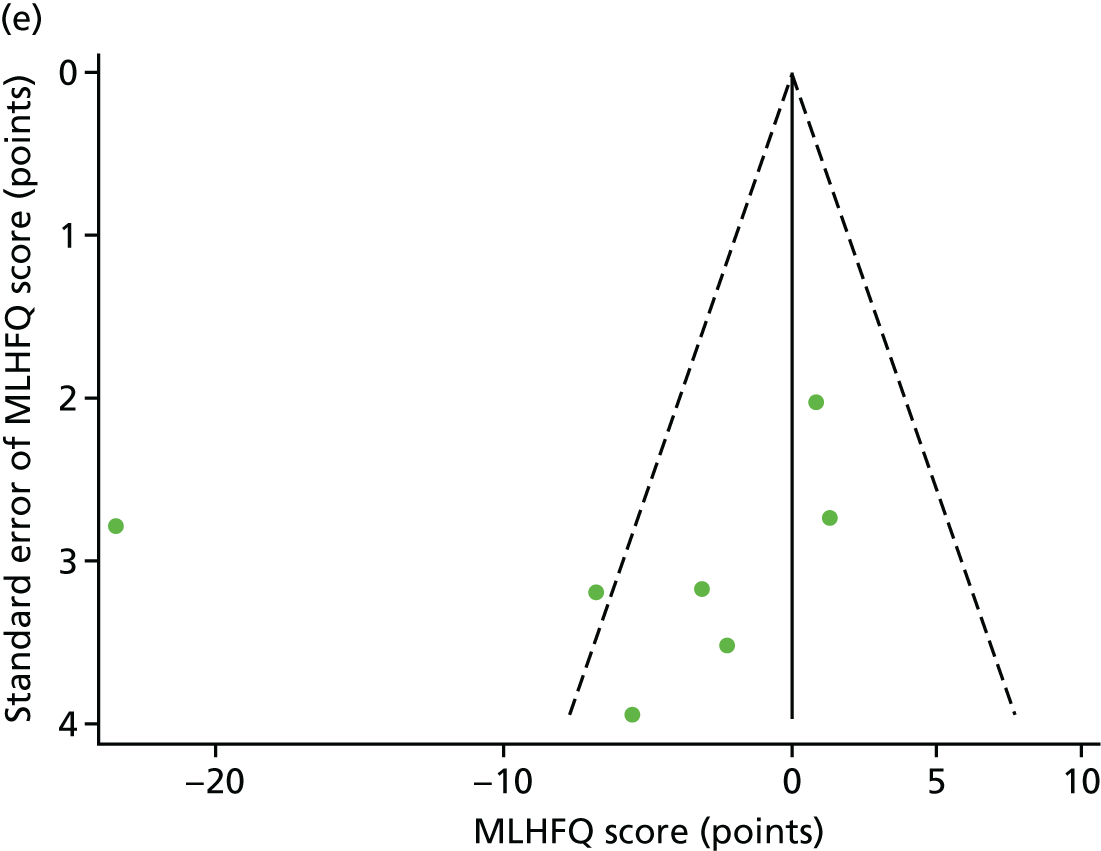
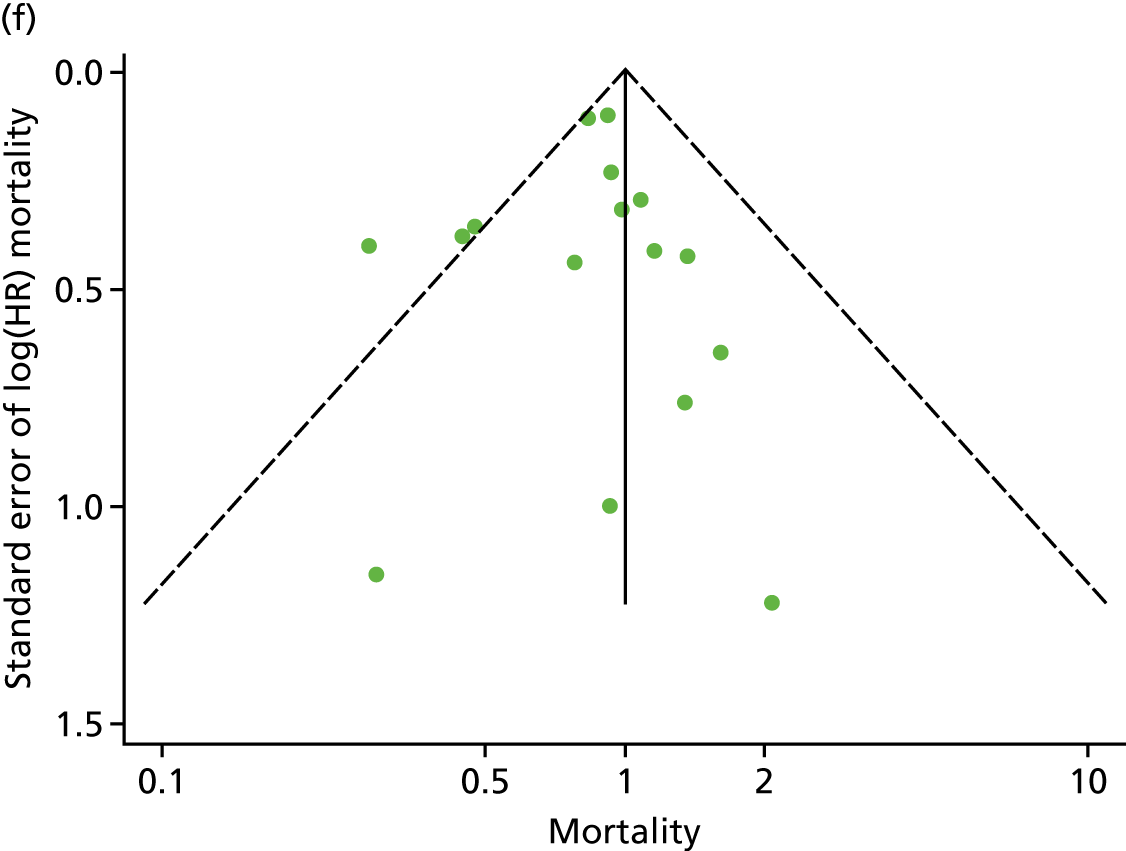
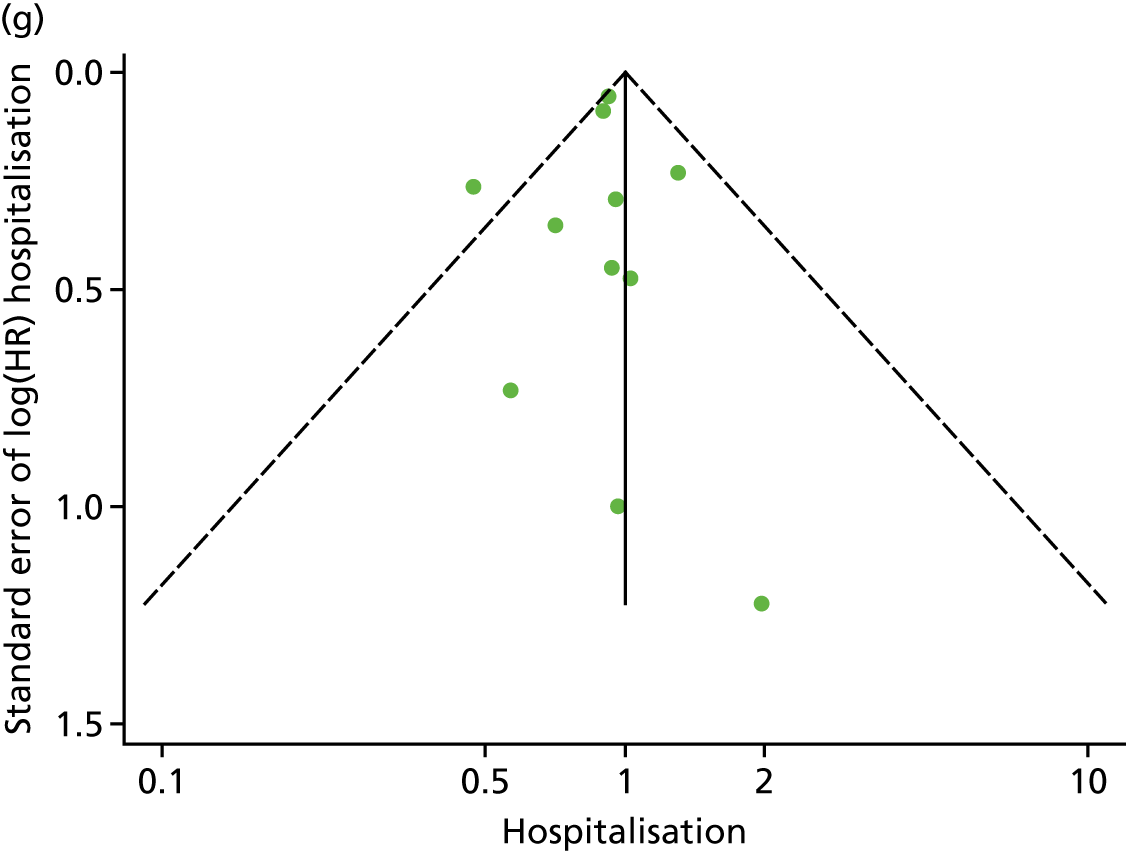
Chapter 8 Discussion
The ExTraMATCH II project is a meta-analysis of IPD from HF patients recruited to RCTs conducted worldwide, which sought to determine which HF patient subgroups benefit most from ExCR and assess the suitability of exercise capacity as a surrogate end point.
Summary of findings
Of the 37 eligible trials, 19 contributed data to the IPD meta-analysis: 18 trials (3912 patients) to the clinical events (mortality and hospitalisation) analysis; 13 trials (3332 patients) to the exercise capacity and HRQoL analysis; and 10 trials (2656 patients) to the exercise capacity mediational/surrogate end-point analysis.
Patient characteristics at baseline were well balanced between patients in the ExCR and control groups. The majority of patients were male (74%), had a mean age of 61 years, had experienced HFrEF (mean left ventricular ejection fraction of 26.9%) and were in NYHA functional class II (59%) or III (38%). Trials from Europe and North America were published between 1990 and 2012. Sample sizes ranged from 50 to 2130 patients. All trials evaluated an aerobic exercise intervention, which was most commonly delivered in either an exclusively centre-based setting or a centre-based setting in combination with some home exercise sessions. The dose of exercise training ranged widely across trials. ExCR was delivered over a period of 15–90 weeks, with between two and seven sessions per week (median session duration was between 4 and 120 minutes, including warm-up and cool-down). The intensity of exercise ranged between 50% and 85% VO2peak. The overall quality of included trials was judged to be moderate to good, with a median TESTEX score31 of 11 (range 9–14) out of a maximum score of 15.
Compared with no exercise control, ExCR did not have a statistically significant effect on the risk of mortality and hospitalisation. However, uncertainty around effect estimates precludes drawing definitive conclusions for these event outcomes. In contrast, ExCR was found to significantly improve both exercise capacity and HRQoL, the improvement in MLHFQ score being also clinically important (i.e. a mean reduction of ≥ 5 points). 74 We found no consistent differences in ExCR effects across patient subgroups (i.e. age, sex, ethnicity, NYHA functional class, ischaemic aetiology, ejection fraction and baseline exercise capacity) on mortality, hospitalisation, exercise capacity or HRQoL. The validation of exercise capacity as a putative surrogate end point for patient-relevant outcomes (i.e. mortality, hospitalisation and HRQoL) was limited by access to only a small number of trials that were able to contribute suitable patient-level data. Although subject to considerable statistical uncertainty, the results provide indicative evidence that VO2peak and 6MWT may be suitable surrogate end points for the treatment effect of ExCR on final outcomes in patients with HF.
Comparison to existing evidence
The finding of a lack of consistent evidence for HF patient subgroup effects of ExCR agrees with both the previous ExTraMATCH18 and Cochrane analyses. 10 However, these two previous studies had major limitations that are likely to have limited their ability to detect subgroup effects. ExTraMATCH18 included data on 801 HF patients and observed 88 deaths and 300 patients with a composite outcome of death or hospitalisation and, therefore, lacked statistical power. Using meta-regression analysis, the 2014 Cochrane review10 found no association between trial-level patient characteristics and ExCR. However, meta-regression analysis is highly prone to study-level confounding (ecological fallacy) and should be interpreted with great caution. 75
The findings are also consistent with the IPD subgroup analyses from the multicentre HF-ACTION study. 19 The HF-ACTION19 investigators reported no significant interaction effect of exercise training intervention on their composite primary outcome (i.e all-cause mortality or hospitalisation) and subgroups of age (≤ 70 vs. > 70 years), sex, race (white vs. non-white), HF aetiology (ischaemic vs. non ischaemic), ejection fraction (≤ 25% vs. > 25%) or NHYA class (II vs. III/IV). 19 A post hoc analysis by HF-ACTION19 investigators found a significant (adjusted p = 0.02) interaction between ExCR and the change in 6MWT with ExCR and ethnicity (+26 m in black patients vs. +11 m in white patients), consistent with the current study. 76
The validation study results of the suitability of exercise as surrogate outcome, albeit uncertain, are broadly in agreement with this research team’s recent study based on a trial-level meta-analysis. 77
Strengths and limitations
The ExTraMATCH II project has a number of strengths. The IPD meta-analysis is the largest to date and has greater power to detect any differential treatment effect across groups than single trials or aggregate meta-analysis. We were able to standardise the handling and analysis of time-to-event outcomes and continuous outcomes across trials. We found no evidence of publication bias. The project was conducted and reported in accordance with current IPD guidance and the PRISMA IPD statement. 21,78
Although systematic reviews and meta-analyses of IPD from randomised trials are recognised as the gold standard for assessing intervention effects,79 the study has a number of limitations. First, there was a lack of consistency in how included trials with IPD in the analyses defined and collected the outcomes of interest (i.e. time to event for death and hospitalisation, exercise capacity and HRQoL). We made considerable efforts to contact study authors to clarify issues around the definition of outcomes, especially HF-related mortality and hospitalisations. Although we were able to resolve data issues in many cases, we recognise that a lack of consistency in outcome definition across included trials may exist, weakening the strength of these conclusions. Second, we were not able to obtain IPD from all includable trials for all outcomes; not all investigators for the trials that met the inclusion criteria were able to provide IPD and, of the trials that did provide IPD, not all collected the outcomes of interest. For example, the large NIH-funded US multicentre HF-ACTION study19 did not collect HF-specific hospitalisation data,19 thus reducing the statistical power for this outcome. Third, we did not seek patient-level data on ‘ExCR dose’ (i.e. adherence according to exercise training duration, frequency and intensity undertaken by an individual patient). Using IPD from HF-ACTION,19 Keteyian et al. 80 found exercise volume (defined as metabolic equivalent of task hours per week) to be a predictor for the composite outcome of all-cause mortality or hospitalisation (p = 0.03). Fourth, there were high levels of statistical heterogeneity for both exercise capacity and HRQoL outcomes. This heterogeneity may well have reflected the variation in ExCR interventions across the included trials. Fifth, the analysis is based on randomised trials identified by literature searches up to 2013 and, therefore, did not include IPD from more recent trials that may have met the inclusion criteria of this study.
Finally, in terms of the surrogate validation analysis, a particular limitation was the proportion of included trials that provided patient-level data on both exercise capacity and patient-relevant outcomes. Of the 19 trials (3990 patients) that met the inclusion criteria, only 10 trials (2656 patients) provided paired data on exercise capacity and mortality, hospitalisation or HRQoL. This has a number of implications for the interpretation of the findings. First, the statistical power of the analysis was low, evidenced by the wide CIs in pooled analysis and, although all outcomes were in direction of benefit of ExCR, none reached a level of formal statistical significance at the 5% level. Second, and relatedly, we had limited statistical power to detect an association between changes in exercise capacity and the final patient-related outcomes. Last, the results are likely to be subject to selection bias and, therefore, may not be representative of all RCT evidence.
Relevance to clinical practice
The observed improvements in patient exercise capacity and HRQoL with ExCR participation support the class I recommendation of current international clinical guidelines that ExCR should be offered to HF patients. 3,13,15 The findings do not endorse limiting ExCR interventions to subgroups of HF patients.
Research recommendations
In spite of the comprehensiveness of this IPD meta-analysis, the findings of this study demonstrate that further evidence is still required to definitively assess the impact of ExCR on mortality and hospitalisation in patients with HFrEF; in particular, to increase the power to examine whether or not the effect of ExCR varies according to patient characteristics. To more reliably quantify the impact of ExCR on clinical outcomes and examine how these effects may vary across HF patients, there is an urgent need for trial investigators to more consistently collect, report and share patient-level data in the future.
Two central aspects of future data collection are a consensus on the definition, collection and reporting of clinical event data, especially hospitalisation, and the capture of data on patient-level adherence to the amount of exercise training during the ExCR intervention period. More generally, the research community should continue to implement policies that encourage primary study authors to make their data sets available, either by depositing in publicly available repositories or by sharing with IPD meta-analysis collaborations when directly requested. 81
Given that the vast majority of IPD in this study was from HFrEF patients, future trials including HFpEF patients are needed to assess the effectiveness of ExCR and whether or not there are differential effects of ExCR in this patient group.
Future IPD meta-analyses of RCTs for interventions in HF are needed to confirm the tentative conclusion that VO2peak and 6MWT may be suitable surrogate end points for the final patient-related outcomes. Such future IPD meta-analyses also need to consider individual patient adherence to exercise training.
Acknowledgements
We thank Mr Tim Eames, Exeter Clinical Trials Unit, Exeter, UK for his advice and support on data management for this study.
We also thank the investigator teams who provided IPD: Professor K Dracup, University of California, Oakland, CA, USA; Professor LS Evangelista, University of California, Irvine, CA, USA; Professor K Jolly, Institute of Applied Health Research, University of Birmingham, Birmingham, UK; Professor RS McKelvie, St. Joseph’s Health Care Centre, ON, Canada; Professor J Myers, Palo Alto Health Care System/Stanford University Division of Medicine, Palo Alto, CA, USA; Associate Professor BB Nilsson, Oslo University Hospital and Faculty of Health Sciences, Oslo Metropolitan University, Oslo, Norway; Professor C O’Connor, Duke Clinical Research Institute, Durham, NC, USA; Professor C Passino, Fondazione G. Monasterio and Scuola Superiore Sant’anna, Pisa, Italy; Dr MD Witham, School of Medicine, University of Dundee, Dundee, UK; Associate Professor GY Yeh, Beth Israel Deaconess Medical Center, Department of Medicine, Boston, MA, USA; and Professor AD Zwisler, National Knowledge Centre for Rehabilitation and Palliative Care, University Hospital Odense and University of Southern Denmark, Odense, Denmark.
We also thank the International Steering Committee (see Appendix 1). We acknowledge the contribution of patient data from Dr Rebecca Gary, Dr Rainer Hambrecht, the late Dr Romualdo Belardinelli and the late Dr Pantaleo Giannuzzi.
We extend our thanks to Kevin Paul and the PPI group of the NIHR programme grant who provided patient involvement in this project and also reviewed the Plain English summary of this report.
We are conscious that this research would not have been possible without the data of the HF patients included in the trials and we are indebted to them.
Contributions of authors
Rod S Taylor (Professor of Health Services Research) was project chief investigator with overall responsibility for the project and guarantor, designed the project, obtained the data, contributed to the design of the data analysis, led the report write-up and edited the final report.
Sarah Walker (Research Fellow in Medical Statistics) performed the data checking and cleaning process, undertook the statistical analysis for the impact of ExCR on clinical events and exercise capacity/HRQoL outcomes, and contributed to drafting of the paper.
Oriana Ciani (Postdoctoral Research Fellow) designed the project, undertook the statistical analysis for the mediation and surrogate validation of exercise capacity, and contributed to drafting of the paper.
Fiona Warren (Senior Lecturer in Medical Statistics) designed the project, advised on the statistical analysis and contributed to the report write-up.
Neil A Smart (Professor in Exercise and Sports Science) designed the project, provided advice and content-specific expertise, contributed to the data checking and cleaning, and contributed to the report write-up.
Massimo Piepoli (Professor of Cardiology) designed the project, provided advice and content-specific expertise and contributed to obtaining the data and report write-up.
Constantinos H Davos (Associate Professor of Cardiovascular Diseases) contributed to obtaining the data, provided advice and content-specific expertise, and contributed to the report write up.
Publications
Taylor RS, Piepoli MF, Smart N, Coats AJS, Ellis S, Dalal H, et al. Exercise training for chronic heart failure (ExTraMATCH II): protocol for an individual participant data meta-analysis. Int J Cardiol 2014;174:683–7.
Ciani O, Piepoli M, Smart N, Uddin J, Walker S, Warren F, et al. Validation of exercise capacity as a surrogate endpoint in exercise-based rehabilitation for chronic heart failure: a meta-analysis of randomised controlled trials. JACC Heart Fail 2018;6:596–604.
Taylor RS, Walker S, Smart NA, Piepoli MF, Warren FC, Ciani O, et al. Impact of exercise-based rehabilitation in patients with heart failure (ExTraMATCH II) on mortality and hospitalisation: an individual-patient data meta-analysis of randomised trials – manuscript submitted for publication. Eur J Heart Failure 2018;20:1735–43.
Taylor RS, Walker S, Smart NA, Piepoli MF, Warren FC, Ciani O, et al. Impact of exercise rehabilitation on exercise capacity and quality-of-life in heart failure. individual participant meta-analysis. J Am Coll Cardio 2019;73:1430–43.
Data–sharing statement
All data requests should be submitted to the corresponding author for consideration. Access to anonymised data may be granted following review.
Patient data
This work uses data provided by patients and collected by the NHS as part of their care and support. Using patient data is vital to improve health and care for everyone. There is huge potential to make better use of information from people’s patient records, to understand more about disease, develop new treatments, monitor safety, and plan NHS services. Patient data should be kept safe and secure, to protect everyone’s privacy, and it’s important that there are safeguards to make sure that it is stored and used responsibly. Everyone should be able to find out about how patient data are used. #datasaveslives You can find out more about the background to this citation here: https://understandingpatientdata.org.uk/data-citation.
Disclaimers
This report presents independent research funded by the National Institute for Health Research (NIHR). The views and opinions expressed by authors in this publication are those of the authors and do not necessarily reflect those of the NHS, the NIHR, NETSCC, the HTA programme or the Department of Health and Social Care. If there are verbatim quotations included in this publication the views and opinions expressed by the interviewees are those of the interviewees and do not necessarily reflect those of the authors, those of the NHS, the NIHR, NETSCC, the HTA programme or the Department of Health and Social Care.
References
- Braunwald E. The war against heart failure: the Lancet lecture. Lancet 2015;385:812-24. https://doi.org/10.1016/S0140-6736(14)61889-4.
- Ponikowski P, Anker SD, AlHabib KF, Cowie MR, Force TL, Hu S, et al. Heart failure: preventing disease and death worldwide. ESC Heart Fail 2014;1:4-25. https://doi.org/10.1002/ehf2.12005.
- Chronic Heart Failure in Adults: Management. Clinical Guideline [CG108]. London: NICE; 2010.
- McKelvie RS. Heart failure. BMJ Clin Evid 2010;2010.
- Anonymous . On the horizon in heart failure. Lancet 2011;378.
- National Population Projections: 2016-Based Statistical Bulletin. Newport: ONS; 2017.
- Cowie MR, Wood DA, Coats AJ, Thompson SG, Poole-Wilson PA, Suresh V, et al. Incidence and aetiology of heart failure; a population-based study. Eur Heart J 1999;20:421-8. https://doi.org/10.1053/euhj.1998.1280.
- Braunstein JB, Anderson GF, Gerstenblith G, Weller W, Niefeld M, Herbert R, et al. Noncardiac comorbidity increases preventable hospitalizations and mortality among Medicare beneficiaries with chronic heart failure. J Am Coll Cardiol 2003;42:1226-33. https://doi.org/10.1016/S0735-1097(03)00947-1.
- Lewinter C, Doherty P, Gale CP, Crouch S, Stirk L, Lewin RJ, et al. Exercise-based cardiac rehabilitation in patients with heart failure: a meta-analysis of randomised controlled trials between 1999 and 2013. Eur J Prev Cardiol 2015;22:1504-12. https://doi.org/10.1177/2047487314559853.
- Taylor RS, Sagar VA, Davies EJ, Briscoe S, Coats AJ, Dalal H, et al. Exercise-based rehabilitation for heart failure. Cochrane Database Syst Rev 2014;4. https://doi.org/10.1002/14651858.CD003331.pub4.
- Haykowsky MJ, Timmons MP, Kruger C, McNeely M, Taylor DA, Clark AM. Meta-analysis of aerobic interval training on exercise capacity and systolic function in patients with heart failure and reduced ejection fractions. Am J Cardiol 2013;111:1466-9. https://doi.org/10.1016/j.amjcard.2013.01.303.
- Taylor RS, Davies EJ, Dalal HM, Davis R, Doherty P, Cooper C, et al. Effects of exercise training for heart failure with preserved ejection fraction: a systematic review and meta-analysis of comparative studies. Int J Cardiol 2012;162:6-13. https://doi.org/10.1016/j.ijcard.2012.05.070.
- Yancy CW, Jessup M, Bozkurt B, Butler J, Casey DE, Drazner MH, et al. 2013 ACCF/AHA guideline for the management of heart failure: a report of the American College of Cardiology Foundation/American Heart Association Task Force on practice guidelines. Circulation 2013;128:e240-327. https://doi.org/10.1161/CIR.0b013e31829e8776.
- Exercise Physiology and Working Group on Heart Failure of the European Society of Cardiology . Recommendations for exercise training in chronic heart failure patients. Eur Heart J 2001;22:125-35. https://doi.org/10.1053/euhj.2000.2440.
- McMurray JJ, Adamopoulos S, Anker SD, Auricchio A, Böhm M, Dickstein K, et al. ESC guidelines for the diagnosis and treatment of acute and chronic heart failure 2012: the Task Force for the Diagnosis and Treatment of Acute and Chronic Heart Failure 2012 of the European Society of Cardiology. Developed in collaboration with the Heart Failure Association (HFA) of the ESC. Eur Heart J 2012;33:1787-847. https://doi.org/10.1093/eurheartj/ehs104.
- Dalal HM, Wingham J, Palmer J, Taylor R, Petre C, Lewin R. REACH-HF investigators . Why do so few patients with heart failure participate in cardiac rehabilitation? A cross-sectional survey from England, Wales and Northern Ireland. BMJ Open 2012;2. https://doi.org/10.1136/bmjopen-2011-000787.
- Piepoli MF, Binno S, Corrà U, Seferovic P, Conraads V, Jaarsma T, et al. ExtraHF survey: the first European survey on implementation of exercise training in heart failure patients. Eur J Heart Fail 2015;17:631-8. https://doi.org/10.1002/ejhf.271.
- Piepoli MF, Davos C, Francis DP, Coats AJ. ExTraMATCH Collaborative . Exercise training meta-analysis of trials in patients with chronic heart failure (ExTraMATCH). BMJ 2004;328. https://doi.org/10.1136/bmj.37938.645220.EE.
- O’Connor CM, Whellan DJ, Lee KL, Keteyian SJ, Cooper LS, Ellis SJ, et al. Efficacy and safety of exercise training in patients with chronic heart failure: HF-ACTION randomized controlled trial. JAMA 2009;301:1439-50. https://doi.org/10.1001/jama.2009.454.
- Sagar VA, Davies EJ, Briscoe S, Coats AJ, Dalal HM, Lough F, et al. Exercise-based rehabilitation for heart failure: systematic review and meta-analysis. Open Heart 2015;2. https://doi.org/10.1136/openhrt-2014-000163.
- Tierney JF, Vale C, Riley R, Smith CT, Stewart L, Clarke M, et al. Individual participant data (IPD) meta-analyses of randomised controlled trials: guidance on their use. PLOS Med 2015;12. https://doi.org/10.1371/journal.pmed.1001855.
- Stewart LA, Clarke M, Rovers M, Riley RD, Simmonds M, Stewart G, et al. PRISMA-IPD Development Group . Preferred Reporting Items for Systematic Review and Meta-Analyses of individual participant data: the PRISMA-IPD Statement. JAMA 2015;313:1657-65. https://doi.org/10.1001/jama.2015.3656.
- Taylor R, Piepoli M, Smart N, Coats A, Ellis S, Dalal H, et al. Exercise Training for Chronic Heart Failure (ExTraMATCH II): Protocol for an Individual Participant Data Meta-Analysis PROSPERO n.d. www.crd.york.ac.uk/PROSPERO/display_record.php?ID=CRD42014007170 (accessed 23 October 2017).
- Smart N, Marwick TH. Exercise training for patients with heart failure: a systematic review of factors that improve mortality and morbidity. Am J Med 2004;116:693-706. https://doi.org/10.1016/j.amjmed.2003.11.033.
- Riley RD, Lambert PC, Abo-Zaid G. Meta-analysis of individual participant data: rationale, conduct, and reporting. BMJ 2010;340. https://doi.org/10.1136/bmj.c221.
- Ahmed I, Sutton AJ, Riley RD. Assessment of publication bias, selection bias, and unavailable data in meta-analyses using individual participant data: a database survey. BMJ 2012;344. https://doi.org/10.1136/bmj.d7762.
- Taylor RS, Piepoli MF, Smart N, Coats AJ, Ellis S, Dalal H, et al. Exercise training for chronic heart failure (ExTraMATCH II): protocol for an individual participant data meta-analysis. Int J Cardiol 2014;174:683-7. https://doi.org/10.1016/j.ijcard.2014.04.203.
- Cartwright J, Kabir T, Simons L. Budgeting for Involvement: Practical Advice on Budgeting for Actively Involving the Public in Research Studies. Southampton: INVOLVE; 2013.
- Higgins JP, Thompson SG. Quantifying heterogeneity in a meta-analysis. Stat Med 2002;21:1539-58. https://doi.org/10.1002/sim.1186.
- Egger M, Davey Smith G, Schneider M, Minder C. Bias in meta-analysis detected by a simple, graphical test. BMJ 1997;315:629-34. https://doi.org/10.1136/bmj.315.7109.629.
- Smart NA, Waldron M, Ismail H, Giallauria F, Vigorito C, Cornelissen V, et al. Validation of a new tool for the assessment of study quality and reporting in exercise training studies: TESTEX. Int J Evid Based Healthc 2015;13:9-18. https://doi.org/10.1097/XEB.0000000000000020.
- Higgins JP, Thompson SG, Deeks JJ, Altman DG. Measuring inconsistency in meta-analyses. BMJ 2003;327:557-60. https://doi.org/10.1136/bmj.327.7414.557.
- Cochrane Handbook for Systematic Reviews of Interventions Version 5.1.0. London: The Cochrane Collaboration; n.d.
- Cleves M, Gould W, Marchenko Y. An Introduction to Survival Analysis Using Stata. College Station, TX: Stata Press; 2016.
- Riley RD, Lambert PC, Staessen JA, Wang J, Gueyffier F, Thijs L, et al. Meta-analysis of continuous outcomes combining individual patient data and aggregate data. Stat Med 2008;27:1870-93. https://doi.org/10.1002/sim.3165.
- Bilbao A, Escobar A, García-Perez L, Navarro G, Quirós R. The Minnesota Living with Heart Failure Questionnaire: comparison of different factor structures. Health Qual Life Outcomes 2016;14. https://doi.org/10.1186/s12955-016-0425-7.
- Green CP, Porter CB, Bresnahan DR, Spertus JA. Development and evaluation of the Kansas City Cardiomyopathy Questionnaire: a new health status measure for heart failure. J Am Coll Cardiol 2000;35:1245-55. https://doi.org/10.1016/S0735-1097(00)00531-3.
- Guyatt GH, Nogradi S, Halcrow S, Singer J, Sullivan MJ, Fallen EL. Development and testing of a new measure of health status for clinical trials in heart failure. J Gen Intern Med 1989;4:101-7. https://doi.org/10.1007/BF02602348.
- Ross RM, Murthy JN, Wollak ID, Jackson AS. The six minute walk test accurately estimates mean peak oxygen uptake. BMC Pulm Med 2010;10. https://doi.org/10.1186/1471-2466-10-31.
- Keell SD, Chambers JS, Francis DP, Edwards DF, Stables RH. Shuttle-walk test to assess chronic heart failure. Lancet 1998;352. https://doi.org/10.1016/S0140-6736(05)60821-5.
- Fowler SJ, Singh SJ, Revill S. Reproducibility and validity of the incremental shuttle walking test in patients following coronary artery bypass surgery. Physiotherapy 2005;91:22-7. https://doi.org/10.1016/j.physio.2004.08.009.
- Du H, Wonggom P, Tongpeth J, Clark RA. Six-minute walk test for assessing physical functional capacity in chronic heart failure. Curr Heart Fail Rep 2017;14:158-66. https://doi.org/10.1007/s11897-017-0330-3.
- Gabler NB, French B, Strom BL, Palevsky HI, Taichman DB, Kawut SM, et al. Validation of 6-minute walk distance as a surrogate end point in pulmonary arterial hypertension trials. Circulation 2012;126:349-56. https://doi.org/10.1161/CIRCULATIONAHA.112.105890.
- Emsley R, Dunn G, White IR. Mediation and moderation of treatment effects in randomised controlled trials of complex interventions. Stat Methods Med Res 2010;19:237-70. https://doi.org/10.1177/0962280209105014.
- VanderWeele TJ. Explanation in Causal Inference: Methods for Mediation and Interaction. Oxford: Oxford University Press; 2015.
- Burzykowski T, Buyse M. Surrogate threshold effect: an alternative measure for meta-analytic surrogate endpoint validation. Pharm Stat 2006;5:173-86. https://doi.org/10.1002/pst.207.
- Buyse M, Sargent DJ, Grothey A, Matheson A, de Gramont A. Biomarkers and surrogate end points – the challenge of statistical validation. Nat Rev Clin Oncol 2010;7:309-17. https://doi.org/10.1038/nrclinonc.2010.43.
- Ciani O, Davis S, Tappenden P, Garside R, Stein K, Cantrell A, et al. Validation of surrogate endpoints in advanced solid tumors: systematic review of statistical methods, results, and implications for policy makers. Int J Technol Assess Health Care 2014;30:312-24. https://doi.org/10.1017/S0266462314000300.
- Riley RD, Higgins JP, Deeks JJ. Interpretation of random effects meta-analyses. BMJ 2011;342. https://doi.org/10.1136/bmj.d549.
- Belardinelli R, Georgiou D, Cianci G, Purcaro A. Randomized, controlled trial of long-term moderate exercise training in chronic heart failure: effects on functional capacity, quality of life, and clinical outcome. Circulation 1999;99:1173-82. https://doi.org/10.1161/01.CIR.99.9.1173.
- Hambrecht R, Gielen S, Linke A, Fiehn E, Yu J, Walther C, et al. Effects of exercise training on left ventricular function and peripheral resistance in patients with chronic heart failure: a randomized trial. JAMA 2000;283:3095-101. https://doi.org/10.1001/jama.283.23.3095.
- McKelvie RS, Teo KK, Roberts R, McCartney N, Humen D, Montague T, et al. Effects of exercise training in patients with heart failure: the Exercise Rehabilitation Trial (EXERT). Am Heart J 2002;144:23-30. https://doi.org/10.1067/mhj.2002.123310.
- Wielenga RP, Huisveld IA, Bol E, Dunselman PH, Erdman RA, Baselier MR, et al. Safety and effects of physical training in chronic heart failure. Results of the Chronic Heart Failure and Graded Exercise study (CHANGE). Eur Heart J 1999;20:872-9. https://doi.org/10.1053/euhj.1999.1485.
- Willenheimer R, Rydberg E, Cline C, Broms K, Hillberger B, Oberg L, et al. Effects on quality of life, symptoms and daily activity 6 months after termination of an exercise training programme in heart failure patients. Int J Cardiol 2001;77:25-31. https://doi.org/10.1016/S0167-5273(00)00383-1.
- Zanelli E, Volterrani M, Scalvini S, Musmeci G, Campana M, Zappa C. Multidisciplinary non-pharmachological intervention prevents hospitalization, improves morbidity rates and functional status in patients with congestive heart failure. Eur Heart J 1997;18.
- Belardinelli R, Georgiou D, Cianci G, Purcaro A. 10-year exercise training in chronic heart failure: a randomized controlled trial. J Am Coll Cardiol 2012;60:1521-8. https://doi.org/10.1016/j.jacc.2012.06.036.
- Zwisler AD, Soja AM, Rasmussen S, Frederiksen M, Abedini S, Abadini S, et al. Hospital-based comprehensive cardiac rehabilitation versus usual care among patients with congestive heart failure, ischemic heart disease, or high risk of ischemic heart disease: 12-month results of a randomized clinical trial. Am Heart J 2008;155:1106-13. https://doi.org/10.1016/j.ahj.2007.12.033.
- Dracup K, Evangelista LS, Hamilton MA, Erickson V, Hage A, Moriguchi J, et al. Effects of a home-based exercise program on clinical outcomes in heart failure. Am Heart J 2007;154:877-83. https://doi.org/10.1016/j.ahj.2007.07.019.
- Gary RA, Dunbar SB, Higgins MK, Musselman DL, Smith AL. Combined exercise and cognitive behavioral therapy improves outcomes in patients with heart failure. J Psychosom Res 2010;69:119-31. https://doi.org/10.1016/j.jpsychores.2010.01.013.
- Giannuzzi P, Temporelli PL, Corrà U, Tavazzi L. ELVD-CHF Study Group . Antiremodeling effect of long-term exercise training in patients with stable chronic heart failure: results of the Exercise in Left Ventricular Dysfunction and Chronic Heart Failure (ELVD-CHF) Trial. Circulation 2003;108:554-9. https://doi.org/10.1161/01.CIR.0000081780.38477.FA.
- Jolly K, Taylor RS, Lip GY, Davies M, Davis R, Mant J, et al. A randomized trial of the addition of home-based exercise to specialist heart failure nurse care: the Birmingham Rehabilitation Uptake Maximisation study for patients with Congestive Heart Failure (BRUM-CHF) study. Eur J Heart Fail 2009;11:205-13. https://doi.org/10.1093/eurjhf/hfn029.
- Mueller L, Myers J, Kottman W, Oswald U, Boesch C, Arbrol N, et al. Exercise capacity, physical activity patterns and outcomes six years after cardiac rehabilitation in patients with heart failure. Clin Rehabil 2007;21:923-31. https://doi.org/10.1177/0269215507079097.
- Nilsson BB, Westheim A, Risberg MA. Long-term effects of a group-based high-intensity aerobic interval-training program in patients with chronic heart failure. Am J Cardiol 2008;102:1220-4. https://doi.org/10.1016/j.amjcard.2008.06.046.
- Witham MD, Gray JM, Argo IS, Johnston DW, Struthers AD, McMurdo ME. Effect of a seated exercise program to improve physical function and health status in frail patients > or = 70 years of age with heart failure. Am J Cardiol 2005;95:1120-4. https://doi.org/10.1016/j.amjcard.2005.01.031.
- Witham MD, Fulton RL, Greig CA, Johnston DW, Lang CC, van der Pol M, et al. Efficacy and cost of an exercise program for functionally impaired older patients with heart failure: a randomized controlled trial. Circ Heart Fail 2012;5:209-16. https://doi.org/10.1161/CIRCHEARTFAILURE.111.963132.
- Yeh GY, McCarthy EP, Wayne PM, Stevenson LW, Wood MJ, Forman D, et al. Tai chi exercise in patients with chronic heart failure: a randomized clinical trial. Arch Intern Med 2011;171:750-7. https://doi.org/10.1001/archinternmed.2011.150.
- Passino C, Severino S, Poletti R, Piepoli MF, Mammini C, Clerico A, et al. Aerobic training decreases B-type natriuretic peptide expression and adrenergic activation in patients with heart failure. J Am Coll Cardiol 2006;47:1835-9. https://doi.org/10.1016/j.jacc.2005.12.050.
- Myers J, Goebbels U, Dzeikan G, Froelicher V, Bremerich J, Mueller P, et al. Exercise training and myocardial remodeling in patients with reduced ventricular function: one-year follow-up with magnetic resonance imaging. Am Heart J 2000;139:252-61. https://doi.org/10.1016/S0002-8703(00)90234-5.
- Davidson PM, Cockburn J, Newton PJ, Webster JK, Betihavas V, Howes L, et al. Can a heart failure-specific cardiac rehabilitation program decrease hospitalizations and improve outcomes in high-risk patients?. Eur J Cardiovasc Prev Rehabil 2010;17:393-402. https://doi.org/10.1097/HJR.0b013e328334ea56.
- Austin J, Williams R, Ross L, Moseley L, Hutchison S. Randomised controlled trial of cardiac rehabilitation in elderly patients with heart failure. Eur J Heart Fail 2005;7:411-17. https://doi.org/10.1016/j.ejheart.2004.10.004.
- Klecha A, Kawecka-Jaszcz K, Bacior B, Kubinyi A, Pasowicz M, Klimeczek P, et al. Physical training in patients with chronic heart failure of ischemic origin: effect on exercise capacity and left ventricular remodeling. Eur J Cardiovasc Prev Rehabil 2007;14:85-91. https://doi.org/10.1097/HJR.0b013e3280114f12.
- Dubach P, Myers J, Dziekan G, Goebbels U, Reinhart W, Muller P, et al. Effect of high intensity exercise training on central hemodynamic responses to exercise in men with reduced left ventricular function. J Am Coll Cardiol 1997;29:1591-8. https://doi.org/10.1016/S0735-1097(97)82540-5.
- Wielenga RP, Erdman RA, Huisveld IA, Bol E, Dunselman PH, Baselier MR, et al. Effect of exercise training on quality of life in patients with chronic heart failure. J Psychosom Res 1998;45:459-64. https://doi.org/10.1016/S0022-3999(97)00309-7.
- Minnesota Living with Heart Failure Questionnaire 2004. New York, NY: ATS; 2004.
- Thompson SG, Higgins JP. How should meta-regression analyses be undertaken and interpreted?. Stat Med 2002;21:1559-73. https://doi.org/10.1002/sim.1187.
- Mentz RJ, Babyak MA, Bittner V, Fleg JL, Keteyian SJ, Swank AM, et al. Prognostic significance of depression in blacks with heart failure: insights from Heart Failure: a Controlled Trial Investigating Outcomes of Exercise Training. Circ Heart Fail 2015;8:497-503. https://doi.org/10.1161/CIRCHEARTFAILURE.114.001995.
- Ciani O, Piepoli M, Smart N, Uddin J, Walker S, Warren FC, et al. Validation of exercise capacity as a surrogate endpoint in exercise-based rehabilitation for heart failure: a meta-analysis of randomized controlled trials. JACC Heart Fail 2018;6:596-604. https://doi.org/10.1016/j.jchf.2018.03.017.
- Stewart LA, Clarke MJ. Practical methodology of meta-analyses (overviews) using updated individual patient data. Cochrane Working Group. Stat Med 1995;14:2057-79. https://doi.org/10.1002/sim.4780141902.
- Chalmers I. The Cochrane Collaboration: preparing, maintaining, and disseminating systematic reviews of the effects of health care. Ann N Y Acad Sci 1993;703:156-63. https://doi.org/10.1111/j.1749-6632.1993.tb26345.x.
- Keteyian SJ, Levine AB, Brawner CA, Kataoka T, Rogers FJ, Schairer JR, et al. Exercise training in patients with heart failure. A randomized, controlled trial. Ann Intern Med 1996;124:1051-7. https://doi.org/10.7326/0003-4819-124-12-199606150-00004.
- Veroniki AA, Straus SE, Ashoor H, Stewart LA, Clarke M, Tricco AC. Contacting authors to retrieve individual patient data: study protocol for a randomized controlled trial. Trials 2016;17. https://doi.org/10.1186/s13063-016-1238-z.
- Myers J, Wagner D, Schertler T, Beer M, Luchinger R, Klein M, et al. Effects of exercise training on left ventricular volumes and function in patients with nonischemic cardiomyopathy: application of magnetic resonance myocardial tagging. Am Heart J 2002;104:719-25. https://doi.org/10.1016/S0002-8703(02)00148-5.
Appendix 1 Project management committees
Project Management Group
Professor Rod S Taylor (chairperson), Institute of Health Research, University of Exeter Medical School, Exeter, UK.
Dr Oriana Ciani, Institute of Health Research, University of Exeter Medical School, Exeter, UK; and Centre for Research on Health and Social Care Management, Bocconi University, Milan, Italy.
Associate Professor Constantinos H Davos, Cardiovascular Research Laboratory, Biomedical Research Foundation, Academy of Athens, Athens, Greece.
Professor Massimo Piepoli, Cardiology Unit, Guglielmo da Saliceto Hospital, Piacenza, Italy.
Professor Neil A Smart, University of New England, Armidale, NSW, Australia.
Dr Sarah Walker, Institute of Health Research, University of Exeter Medical School, Exeter, UK.
Dr Fiona C Warren, Institute of Health Research, University of Exeter Medical School, Exeter, UK.
International Steering Committee
All members of the Project Management Group, plus:
Professor Andrew Coats (chairperson), Istituto di Ricovero e Cura a Carattere Scientifico, San Raffaele, Pisana, Italy; and University of Warwick, Coventry, UK.
Professor Stephen Ellis, Duke Clinical Research Institute, Durham, NC, USA.
Associate Professor Hasnain M Dalal, University of Exeter Medical School, Exeter, UK; and Research, Development & Innovation, Royal Cornwall Hospital, Truro, UK.
Professor Steven Keteyian, Department of Medicine, Henry Ford Hospital, Detroit, MI, USA.
Professor Christopher O’Connor, Duke Clinical Research Institute, Durham, NC, USA.
Professor David Whellan, Department of Medicine, Sidney Kimmel Medical College, Philadelphia, PA, USA.
Appendix 2 Example database search strategy from the Cochrane 2014 review
MEDLINE(R) Ovid
Date range searched: 1946 to January week 4 2013.
Date searched: January 2013.
Search strategy
-
xp Myocardial Ischemia/
-
myocard$4 adj5 (ischaemi$2 or ischemi$2)).ti,ab.
-
(ischaemi$2 or ischemi$2) adj5 heart).ti,ab.
-
xp Coronary Artery Bypass/
-
oronary.ti,ab.
-
xp Coronary Disease/
-
xp Myocardial Revascularization/
-
Myocardial Infarction/
-
myocard$5 adj5 infarct$5).ti,ab.
-
(heart adj5 infarct$5).ti,ab.
-
exp Angina Pectoris/
-
angina.ti,ab.
-
exp Heart Failure/
-
(heart adj5 failure).ti,ab.
-
(HFNEF or HFPEF or HFREF or ‘HF NEF’ or ‘HF PEF’ or ‘HF REF’).ti,ab.
-
or/1-15
-
exp Heart Diseases/
-
(heart adj5 disease$2).ti,ab.
-
myocard$5.ti,ab.
-
cardiac$2.ti,ab.
-
CABG.ti,ab.
-
PTCA.ti,ab.
-
(stent$4 and (heart or cardiac$4)).ti,ab.
-
Heart Bypass, Left/or exp Heart Bypass, Right/
-
or/17-24
-
*Rehabilitation Centers/
-
exp Exercise Therapy/
-
*Rehabilitation/
-
exp Sports/
-
Physical Exertion/or exertion.ti,ab.
-
exp Exercise/
-
rehabilitat$5.ti,ab.
-
(physical$4 adj5 (fit or fitness or train$5 or therap$5 or activit$5)).ti,ab.
-
(train$5 adj5 (strength$3 or aerobic or exercise$4)).ti,ab.
-
((exercise$4 or fitness) adj5 (treatment or intervent$4 or programs$2 or therapy)).ti,ab.
-
Patient Education as Topic/
-
(patient$2 adj5 educat$4).ti,ab.
-
((lifestyle or life-style) adj5 (intervent$5 or program$2 or treatment$2)).ti,ab.
-
*Self Care/
-
(self adj5 (manage$5 or care or motivate$5)).ti,ab.
-
*Ambulatory Care/
-
exp Psychotherapy/
-
psychotherap$2.ti,ab.
-
(psycholog$5 adj5 intervent$5).ti,ab.
-
relax$6.ti,ab.
-
exp Relaxation Therapy/or exp Mind-Body Therapies/
-
exp Counseling/
-
(counselling or counseling).ti,ab.
-
exp Cognitive Therapy/
-
exp Behavior Therapy/
-
((behavior$4 or behaviour$4) adj5 (modify or modificat$4 or therap$2 or change)).ti,ab.
-
*Stress, Psychological/
-
(stress adj5 management).ti,ab.
-
(cognitive adj5 therap$2).ti,ab.
-
meditat$4.ti,ab.
-
*Meditation/
-
exp Anxiety/
-
(manage$5 adj5 (anxiety or depress$5)).ti,ab.
-
CBT.ti,ab.
-
hypnotherap$5.ti,ab.
-
(goal adj5 setting).ti,ab.
-
(goal$2 adj5 setting).ti,ab.
-
(psycho-educat$5 or psychoeducat$5).ti,ab.
-
(motivat$5 adj5 (intervention or interv$3)).ti,ab.
-
Psychopathology/
-
psychopathol$4.ti,ab.
-
psychosocial$4.ti,ab.
-
distress$4.ti,ab.
-
exp Health Education/
-
(health adj5 education).ti,ab.
-
(heart adj5 manual).ti,ab.
-
Autogenic Training/
-
autogenic$5.ti,ab.
-
or/26-39
-
or/40-73
-
16 or 25
-
74 or 75
-
76 and 77
-
randomized controlled trial/
-
randomized controlled trial.pt.
-
controlled clinical trial.pt.
-
controlled clinical trial/
-
Random Allocation/
-
Double-Blind Method/
-
single-blind method/
-
(random$ or placebo$).ti,ab.
-
((singl$3 or doubl$3 or tripl$3 or trebl$3) adj5 (blind$3 or mask$3)).ti,ab.
-
exp Research Design/
-
Clinical Trial.pt.
-
exp clinical trial/
-
(clinic$3 adj trial$2).ti,ab.
-
or/79-91
-
78 and 92
-
(Animals not Humans).sh.
-
93 not 94
-
limit 95 to yr=‘2008 -Current’
Appendix 3 Identified randomised controlled trials meeting inclusion criteria
| First author/study (year) | Total patients (n)a | Trial setting (single or multicentre) | NYHA class | Mean ejection fraction (%) | Mean age (years) | Male (%) | Exercise typeb | Overall exercise duration (minutes) | Exercise frequency (sessions/week) | Mean programme duration (weeks) | Exercise settingc | Longest follow-up (months) |
|---|---|---|---|---|---|---|---|---|---|---|---|---|
| Cochrane 2014 review | ||||||||||||
| Austin et al. (2005)70 | 200 | Single | II/III | NR | 72 | 43 | Mix | 120 | 2.5 | 24 | Both | 60 |
| Belardinelli et al. (1999)50 | 99 | Single | II/IV | 28 | 55 | 89 | Aerobic | 40 | 2.5 | 56 | Centre | 26 |
| Belardinelli et al. (2012)56 | 123 | Single | II/III | 37 | 59 | 78 | Aerobic | 40 | 2.5 | 56 | Centre | 120 |
| Davidson et al. (2010)69 | 105 | Single | I/II/III/IV | NR | 72.3 | 67 | Mix | 40 | 1 | 12 | Centre | 12 |
| Dracup et al. (2007)58 | 173 | Single | II/IV | 26 | 54 | 72 | Mix | 28 | 4 | 52 | Home | 12 |
| DANREHAB (2008)57 | 91 | Single | I/II/III | NR | 66 | 90 | Mix | 90 | 3 | 12 | Both | 12 |
| Gary et al. (2010)59 | 65 | Single | II/III | NR | 65.8 | 42 | Aerobic | 37.5 | 3 | 12 | Home | 6 |
| Giannuzzi et al. (2003)60 | 90 | Multi | II/III | 25 | 60.5 | 88 | Aerobic | 30 | 4 | 24 | Both | 6 |
| Hambrecht et al. (2000)51 | 73 | Single | I/II/III | 29 | 54 | 100 | Aerobic | 15 | 6.5 | 24 | Both | 6 |
| HF-ACTION (2009)19 | 2331 | Multi | II/III/IV | 25 | 59 | 72 | Aerobic | 30 | 2.5 | 120 | Both | 48 |
| Jolly et al. (2009)61 | 169 | Multi | I/II/IV | NR | 66 | 75 | Mix | 25 | 5 | 48 | Home | 12 |
| Klecha et al. (2007)71 | 50 | Single | II/III | 28 | 61 | 100 | Aerobic | 20 | 3 | 24 | Centre | 6 |
| McKelvie et al. (2002)52 | 181 | Multi | I/II/III | NR | 65.5 | 81 | Mix | 30 | 2 | 36 | Both | 12 |
| Mueller et al. (2007)62 | 50 | Single | NR | NR | 55 | 100 | Aerobic | 120 | 5 | 4 | Centre | 74 |
| Nilsson et al. (2008)63 | 80 | Single | II/III | 31 | 70 | 79 | Aerobic | 50 | 2 | 16 | Centre | 12 |
| Passino et al. (2006)67 | 95 | Single | I/II/III | 34 | 60.5 | 87 | Aerobic | 30 | 3 | 36 | Home | 9 |
| Willenheimer (2001)54 | 54 | Single | NR | 36.5 | 64 | 71.5 | Aerobic | 30 | 2.5 | 16 | Centre | 10 |
| Witham et al. (2005)64 | 82 | Single | II/III | NR | 80.5 | 55 | Mix | 20 | 2.5 | 24 | Both | 6 |
| Witham et al. (2012)65 | 107 | Single | II/III | NR | 81 | 100 | Mix | 60 | 2 | 24 | Both | 6 |
| Yeh et al. (2011)66 | 100 | Multi | I/II/III | 29 | 67.5 | 64 | Aerobic | 30 | 2.5 | 12 | Both | 6 |
| ExTraMATCH I (2004) | ||||||||||||
| Dubach et al. (1997);72 Myers (2002)82 | 51 | NR | NR | NR | NR | NR | NR | NR | NR | NR | NR | 8.5 |
| Zanelli et al. (1997)55 | 155 | NR | NR | NR | NR | NR | NR | NR | NR | NR | NR | 10 |
| Wielenga et al. (1999)53 | 80 | NR | NR | NR | NR | NR | NR | NR | NR | NR | NR | 47.3 |
Appendix 4 ExTraMATCH II core data fields
| Variable | Description |
|---|---|
| Study-level data | |
| Centre ID | Centre name |
| Randomised control patients (n) | |
| Randomised exercise patients (n) | |
| Patient-level data: descriptive | |
| Patient ID | |
| Date of randomisation | dd/mm/yyyy |
| Allocated treatment |
1. Exercise 2. Control |
| Date of birth | dd/mm/yyyy |
| Gender |
1. Male 2. Female 9. Data unavailable |
| Race |
1. White/Caucasian 2. African/African-American 3. Asian 4. Other 9. Data unavailable |
| Aetiology of HF |
1. Ischaemic heart disease 2. Idiopathic dilated cardiomyopathy 3. Other/unknown 9. Data unavailable |
| Year of HF diagnosis | yyyy |
| NYHA class at entry/baseline |
1. NYHA class I 2. NYHA class II 3. NYHA class III 4. NYHA class IV 9. Unknown/unavailable |
| Ejection fraction at entry/baseline (%) | |
| Patient level data: outcomes | |
| Method of exercise capacity assessment |
1. 6MWT 2. Bicycle ergometer test 3. Treadmill test 4. Other (state) |
| Exercise capacity score at entry (units) | |
| Follow-up 1 exercise capacity score | Follow-up time (months) |
| Follow-up 2 exercise capacity score | Follow-up time (months) |
| Follow-up 3 exercise capacity score | Follow-up time (months) |
| HRQoL |
1. MLHFQ 2. Other measure (state) |
| HRQoL at entry | Total and subscores |
| Follow-up 1 HRQoL score |
Total and subscores Follow-up time (months) |
| Follow-up 2 HRQoL score |
Total and subscores Follow-up time (months) |
| Follow-up 3 HRQoL score |
Total and subscores Follow-up time (months) |
| Date of death | dd/mm/yyyy |
| Cause of death |
1. Acute myocardial infarction 2. Sudden death 3. Heart failure 4. Other cardiac 5. Stroke 6. Other vascular/thromboembolic 7. Non-cardiovascular 8. Unknown (1–4, cardiac; 1–6, cardiovascular) |
| Date of first all-cause hospital admission |
dd/mm/yyyy 1. De novo hospitalisation 2. Rehospitalisation |
| Date of first HF hospital admission |
dd/mm/yyyy 1. De novo hospitalisation 2. Rehospitalisation |
| Number of all-cause hospitalisations | |
| Number of all HF hospitalisations | |
| Dropout | |
| Date of study discontinuation | dd/mm/yyyy |
| Reason for study discontinuation | |
| Exercise training (applies only to exercise group patients) | |
| Study-level data | |
| Prescribed exercise training | |
| Overall duration | — weeks (ranges if appropriate) |
| Session duration | — minutes (range if appropriate) |
| Frequency of sessions | — sessions/week (range if appropriate) |
| Intensity | — % units (range if appropriate) |
| Setting |
1. Centre only 2. Home only 3. Both centre and home (define proportion of sessions at each location) 4. Other (state) |
| Patient-level data | |
| Attended first exercise training |
1. Yes 2. No 3. Not reported |
| Are details available at patient level on exercise dose received? |
1. Yes 2. No |
Appendix 5 Prediction of VO2peak in heart failure from submaximal exercise tests
6-minute walk test
A number of studies have examined the relationship between 6MWT and VO2peak in HF patients and reported variable levels of association/correlation. Many studies failed to report a prediction equation or reported a multivariate equation that incorporated clinical parameters not available in the ExTraMATCH II IPD set. A recent discussion paper on the use of the 6MWT in HF has questioned the reliability of prediction of VO2peak. 42 However, a review in 2010, by Ross et al. ,39 of 11 studies in 1083 patients with cardiopulmonary disease (many with HF) found generally high levels of association of VO2peak and 6MWT (average correlation coefficient of 0.59). Using a study-level random-effects linear regression approach, the authors derived the following overall prediction model, with a standard error of estimate of 1.1 ml/kg/minute:
Incremental shuttle walk test
Keell et al. 40 tested the safety and acceptability of the ISWT in patients with chronic HF and examined the relationship between ISWT performance and VO2peak:
Similarly, Fowler et al. 41 proposed the following formula in patients following coronary artery bypass surgery:
List of abbreviations
- 6MWT
- 6-minute walk test
- CI
- confidence interval
- ExCR
- exercise-based cardiac rehabilitation
- ExTraMATCH/ExTraMATCH II
- Exercise Training Meta-Analysis of Trials for Chronic Heart Failure
- HF
- heart failure
- HF-ACTION
- Heart Failure: A Controlled Trial Investigating Outcomes of Exercise Training
- HFpEF
- heart failure with preserved ejection fraction
- HFrEF
- heart failure with reduced ejection fraction
- HR
- hazard ratio
- HRQoL
- health-related quality of life
- IPD
- individual participant data
- ISWT
- incremental shuttle walk test
- MLHFQ
- Minnesota Living with Heart Failure Questionnaire
- NIH
- National Institutes of Health
- NIHR
- National Institute for Health Research
- NYHA
- New York Heart Association
- PPI
- patient and public involvement
- PRISMA
- Preferred Reporting Items for Systematic Reviews and Meta-Analyses
- RCT
- randomised controlled trial
- REACH-HF
- Rehabilitation EnAblement in CHronic Heart Failure
- SD
- standard deviation
- STE
- surrogate threshold effect
- TESTEX
- Tool for the assEssment of Study qualiTy and reporting in EXercise
- VO2peak
- peak oxygen uptake
