Notes
Article history
The research reported in this issue of the journal was funded by the HTA programme as project number 10/71/01. The contractual start date was in October 2012. The draft report began editorial review in February 2019 and was accepted for publication in September 2019. The authors have been wholly responsible for all data collection, analysis and interpretation, and for writing up their work. The HTA editors and publisher have tried to ensure the accuracy of the authors’ report and would like to thank the reviewers for their constructive comments on the draft document. However, they do not accept liability for damages or losses arising from material published in this report.
Declared competing interests of authors
Peter T Donnan is a member of the New Drugs Committee of the Scottish Medicines Consortium and has received recent grants from Gilead Sciences, Inc. (Foster City, CA, USA) and Shire Pharmaceuticals Ltd (Basingstoke, UK). Alison Avenell works in the Health Services Research Unit, which is core funded by the Chief Scientific Office of the Scottish Government Health and Social Care Directorate. Paul McNamee works in the Health Economics Research Unit, which is core funded by the Chief Scientist Office of the Scottish Government Health and Social Care Directorate. Huey Chong works in the Health Economics Research Unit, which is core funded by the Chief Scientist Office of the Scottish Government Health and Social Care Directorate.
Permissions
Copyright statement
© Queen’s Printer and Controller of HMSO 2020. This work was produced by Witham et al. under the terms of a commissioning contract issued by the Secretary of State for Health and Social Care. This issue may be freely reproduced for the purposes of private research and study and extracts (or indeed, the full report) may be included in professional journals provided that suitable acknowledgement is made and the reproduction is not associated with any form of advertising. Applications for commercial reproduction should be addressed to: NIHR Journals Library, National Institute for Health Research, Evaluation, Trials and Studies Coordinating Centre, Alpha House, University of Southampton Science Park, Southampton SO16 7NS, UK.
2020 Queen’s Printer and Controller of HMSO
Chapter 1 Introduction
In 2010, the Health Technology Assessment (HTA) programme of the National Institute for Health Research (NIHR) commissioned a randomised controlled trial (RCT) to address the clinical effectiveness and cost-effectiveness of oral sodium bicarbonate therapy for older people with advanced chronic kidney disease (CKD) and mild metabolic acidosis. This monograph reports the findings of the multicentre RCT conducted to address that brief.
The BiCARB trial was a large, multicentre RCT, the aim of which was to determine whether or not oral sodium bicarbonate therapy is more effective than placebo at improving physical function and quality of life in patients aged ≥ 60 years with CKD [glomerular filtration rate (GFR) category 4 or 5 (< 30 ml/minute/1.73 m2), not on renal replacement therapy] and mild metabolic acidosis.
Background and rationale for the trial
Chronic kidney disease is common; 6.1% of the English population have an estimated GFR (eGFR) of < 60 ml/minute/1.73 m2 (i.e. GFR category 3–5 in the international CKD staging system),1 and rates in people aged > 70 years are five times higher than this. 2 Population-based estimates suggest a prevalence of severe CKD (eGFR 15–29 ml/minute/1.73 m2, equivalent to GFR category 4) of approximately 2% in those aged ≥ 70 years,3 and approximately 20% of such patients will have a degree of metabolic acidosis (often operationalised as a serum bicarbonate level of < 22 mmol/l), with rates increasing as renal function declines. 4 As discussed in the following sections, metabolic acidosis has been associated with multiple adverse outcomes, including impaired bone health and vascular health, accelerated renal decline and impaired physical function. The extent to which acidosis is causal for these phenomena, as opposed to associations being the result of residual confounding by other unmeasured factors present in patients with CKD, remains unclear.
Association with progression of renal dysfunction
Several studies have linked the presence of lower serum bicarbonate concentrations to accelerated decline in renal function. 5,6 There is debate as to how many of these observed associations are due to low bicarbonate concentration independent of renal function. Recent pooled data from two large RCTs suggested that lower baseline bicarbonate concentrations correlate with faster decline in GFR and a higher probability of reaching kidney failure, but this association disappeared after adjusting for baseline GFR. 7 In the Modification of Diet in Renal Disease (MDRD) study cohort, serum bicarbonate was not associated with progression to end-stage renal failure or death after adjustment for baseline GFR. 5 Conversely, other studies have found that the association between low serum bicarbonate and accelerated decline in renal function remains even after adjustment for baseline GFR. 8
Association with cardiovascular disease
In the cardiovascular system, acidosis has been associated with increased levels of endothelin and aldosterone, chronic inflammation and endothelial dysfunction. 9–11 There is a lack of evidence of an association between low serum bicarbonate and increased vascular events. 7,12 An elevated serum bicarbonate concentration may, however, be associated with deleterious outcomes, and concern persists that administration of the sodium load that accompanies bicarbonate administration could increase blood pressure. 13
Association with physical function
Recent data suggest an association between lower serum bicarbonate concentrations and impaired physical function, even in patients without advanced CKD. 14 Importantly, for older patients with CKD, low serum bicarbonate also predicts future onset of functional limitations (defined as difficulty walking one-quarter of a mile or climbing 10 steps). Those with a serum bicarbonate concentration of < 23 mmol/l were 1.6 times more likely to develop a functional limitation than those with a baseline serum bicarbonate concentration of ≥ 26 mmol/l, even after adjustment for the presence of CKD. 15 Sarcopenia (the loss of muscle mass and strength) is common in advanced CKD and may, in part, be driven by acidosis, which stimulates muscle proteolysis. 16
Association with bone health
An acidic environment can have direct effects on the skeleton by increasing bone resorption while reducing osteoblastic bone formation. Other contributory pathological consequences include its indirect effects on parathyroid hormone (PTH) and/or vitamin D metabolism. Acidosis has been shown to affect PTH release, as well as the cellular response to PTH, and inhibits PTH-induced 1,25-dihydroxyvitamin D formation by suppressing 1-alpha-hydroxylase activity. 17 Acidosis produces an inflammatory state with the production of cytokines such as interleukin 6 and tumour necrosis factor alpha, which promote osteoclastic bone resorption. These abnormalities can not only exacerbate the bone and mineral abnormalities associated with CKD but can also lead to osteoporosis. Bone mineral density is adversely affected by acidosis in CKD, although the effect on fracture rate remains unclear; few data exist on fracture rates in patients with CKD not undergoing dialysis. 18–20
Review of existing trial evidence
As part of the preparation for this report, we undertook a systematic review to synthesise current trial evidence in this area. The search strategy for this systematic review is provided in Appendix 1; details of included studies are provided in Table 23 (see Appendix 2) and forest plots for the main meta-analysed outcomes are provided in Figures 19–25 (see Appendix 2). The systematic review was registered on the PROSPERO database (CRD42018112908). Evidence available prior to completion of the BiCARB trial is discussed here and has been published along with the full methods;21 meta-analyses were then repeated with the addition of results from the BiCARB trial and these results are discussed in Chapter 6.
Key findings from the systematic review
In total, seven trials were eligible for inclusion,22–28 recruiting a total of 815 participants with CKD not on dialysis. Trial size ranged from 40 to 188 participants, the mean age of participants ranged from 40 to 65 years and follow-up ranged from 3 months to 5 years. Most trials included participants with a baseline bicarbonate concentration within the normal range (i.e. 22 to 30 mmol/l) and compared strategies of bicarbonate replacement (titration to target levels) rather than administering fixed bicarbonate doses. The quality of the trials was poor to moderate, with all seven trials failing to adequately mask participants and clinicians, and the effectiveness of masking of research teams being unclear in five of the seven trials.
The overall treatment effect on bicarbonate concentrations seen in the trials was a mean increase from supplementation of 3.4 mmol/l [95% confidence interval (CI) 1.9 to 4.9 mmol/l]. Marked heterogeneity in the time points used for follow-up makes comparison across trials challenging, but the treatment effect on bicarbonate concentrations at 1 year was a mean increase of 3.2 mmol/l (95% CI 2.0 to 4.3 mmol/l). The eGFR was modestly higher in the intervention groups than in the control groups at the last follow-up time point (mean difference 3.1 ml/minute/1.73 m2, 95% CI 1.3 to 4.9 ml/minute/1.73 m2) but was not significantly different when confining analyses to 1-year outcomes only (mean difference 1.4 ml/minute/1.73 m2, 95% CI –0.7 to 3.4 ml/minute/1.73 m2). Too few trials reported the rate of change of eGFR to meta-analyse this outcome.
Systolic blood pressure was modestly but significantly higher in the intervention groups than in the control groups overall (mean difference 2.1 mmHg, 95% CI –1.0 to 5.2 mmHg); 1-year comparisons could not be made. Body weight and mid-arm muscle circumference (a measure of lean body mass) showed small, non-significant improvements in the meta-analysis from supplementation. No studies reported measures of physical performance or quality of life. Insufficient events were recorded to enable a judgement to be made about whether or not bicarbonate treatment reduced the risk of commencing dialysis or transplantation. One study recorded four participants commencing dialysis in the bicarbonate arm and 22 in the control arm;23 another study recorded three participants commencing dialysis in the bicarbonate arm and four in the control arm. 28
In summary, existing data from before the BiCARB trial do not shed light on whether or not bicarbonate therapy improves physical function or quality of life for older patients with CKD and acidosis; there is significant uncertainty about as to whether bicarbonate therapy can improve or mitigate the decline in renal function seen in advanced CKD, and there is uncertainty as to whether bicarbonate therapy worsens blood pressure control and thus could increase the risk of cardiovascular events.
Potential deleterious effects of bicarbonate
Oral bicarbonate is inexpensive and has been used for many years. For some clinicians, the default position is to presume that the potential benefits are likely to exceed the risks of what is perceived to be a very safe intervention. Oral bicarbonate is not easy for patients to take – the tablets are large and multiple tablets usually need to be taken each day. Older patients are more likely to have dysphagia or a dry mouth and are already subject to polypharmacy. Sodium bicarbonate contains 6 mmol of sodium per 500 mg and a typical daily dose in current nephrology practice is up to 3 g per day, equivalent to the amount of sodium in 0.8 g of table salt. Concerns persist that this sodium load may lead to increased blood pressure and fluid overload. An additional concern is that, by raising the blood pH, calcium phosphate may be more likely to precipitate out into blood vessel walls, worsening vascular calcification. 29 Finally, gastrointestinal side effects (such as abdominal discomfort and bloating) are listed in the Summary of Product Characteristics (see Report Supplementary Material 4); these probably occur as a result of the generation of carbon dioxide in the gut through interaction with stomach acid.
Current guidelines
The introduction of routine eGFR reporting by laboratories has increased the number of older patients diagnosed with CKD30 and bicarbonate is often used to treat older people with a low serum bicarbonate concentration. Trial evidence to underpin the effectiveness and safety of this intervention is, however, lacking and this lack of evidence is reflected in current guidelines, including Kidney Disease: Improving Global Outcomes (KDIGO)31 and UK National Institute for Health and Care Excellence (NICE) guidelines,32 which either give guidance based on expert consensus without underpinning evidence or note that it is not currently possible to make an evidence-based recommendation regarding the correction of mild to moderate metabolic acidosis in CKD. Clinical practice varies in the use of bicarbonate therapy for patients with CKD. Measurement and correction of acidosis is often part of standard care for patients managed under renal services but is less common for patients managed by primary care or geriatric medicine services.
Imperative for the current trial
Few trials to date have included many older people with CKD, despite older people being the group most likely to have CKD. CKD in older patients is almost always accompanied by multimorbidity and thus a narrow focus on measures of kidney disease alone is unlikely to reflect what is important to the patient. Any trial seeking to provide a comprehensive view of the net health gain or loss from treatment in older patients with CKD must therefore measure a range of outcomes of relevance to older people and must seek evidence of both benefit and harm, an approach that is more likely to provide appropriate evidence on which to base guidelines.
Chronic kidney disease is common and affects many older people. The accompanying acidosis may worsen the muscle weakness that affects many older people, as discussed above, with muscle weakness being a key risk factor for falls, disability, institutionalisation and premature death. 33 Only a minority of older people with CKD progress to a point where they require dialysis for renal failure. However, the effect on quality of life, and the cost burden from dialysis, are considerable; the cost burden is between £20,000 and £25,000 per patient per year, depending on modality and dialysis setting. 34 Finally, cardiovascular disease is the leading cause of hospitalisation and death in older people and is responsible itself for half to one-third of the decline in physical function seen with age.
An intervention that successfully reverses acidosis in this older population may therefore be able to simultaneously improve multiple important associated comorbidities in older people, with consequent improvements in function and quality of life, as well as potential reductions in hospitalisation and later institutionalisation.
Trial objectives
The primary objective of the BiCARB trial was to determine whether or not oral bicarbonate therapy improves physical function compared with placebo in older people with CKD and mild acidosis. The secondary objectives were to (1) determine whether or not oral bicarbonate therapy improves health-related quality of life compared with placebo; (2) compare the impact of oral bicarbonate therapy with that of placebo on biochemical markers of CKD; (3) assess whether or not use of oral bicarbonate therapy is associated with an excess of adverse events compared with placebo; (4) estimate the cost-effectiveness of using oral bicarbonate therapy compared with placebo; and (5) assess the effect of oral bicarbonate therapy compared with placebo on bone turnover and vascular health, as assessed by biochemical markers.
The protocol has been previously published by the authors in Witham et al. 35 This is an Open Access article distributed under the terms of the Creative Commons Attribution License (http://creativecommons.org/licenses/by/4.0), which permits unrestricted use, distribution, and reproduction in any medium, provided the original work is properly credited.
Chapter 2 Trial design
The trial was a randomised, double-blind, parallel-group, placebo-controlled trial, analysed according to intention-to-treat principles. The treatment and follow-up were planned to last for up to 2 years for each participant.
Participants
Target population for the trial
The original commissioning brief for the trial stipulated a target population of older patients with advanced CKD (stage 4 or 5, not on dialysis) and mild acidosis (serum bicarbonate concentration of < 22 mmol/l); our inclusion and exclusion criteria reflected these points.
Inclusion and exclusion criteria
Participants were recruited from primary and secondary care, including nephrology, geriatric medicine and general medicine clinics, according to the following inclusion and exclusion criteria:
-
inclusion criteria –
-
willing and able to give informed consent for participation in the study
-
male or female aged ≥ 60 years
-
last known eGFR < 30 ml/minute/1.73 m2 according to the MDRD4 equation36
-
serum bicarbonate concentration < 22 mmol/l
-
able (in the investigator’s opinion) and willing to comply with all study requirements.
-
-
exclusion criteria –
-
severe cognitive impairment precluding written informed consent
-
already taking bicarbonate therapy unless a 3-month washout period is planned
-
documented renal tubular acidosis
-
on renal replacement therapy (haemodialysis or peritoneal dialysis)
-
anticipated to start renal replacement therapy within 3 months
-
terminally ill, defined as < 3 months’ expected survival
-
decompensated chronic heart failure
-
bisphosphonate therapy
-
uncontrolled hypertension at the screening visit (blood pressure > 150/90 mmHg despite use of four agents), unless evidence available from home or 24-hour blood pressure monitoring that blood pressure is usually controlled
-
participation in another clinical trial (not including observational studies and registries) concurrently or within 30 days prior to screening for entry into this trial
-
known allergy to sodium bicarbonate tablets or lactose.
-
Trial intervention and comparator
The trial intervention was oral sodium bicarbonate tablets. Each tablet contained 500 mg of sodium bicarbonate (equivalent to 6 mmol of sodium and 6 mmol of bicarbonate). The initial dose dispensed was one tablet three times per day. If the serum bicarbonate level was still < 22 mmol/l at 3 months, the dose was increased to two tablets three times per day for the remaining duration of participation. The comparator was matching placebo tablets. No specific measures were used to enhance adherence beyond reminding participants to take their medication at each study contact.
Outcome measures
Primary outcome
The primary outcome for the trial was the between-group difference in the Short Physical Performance Battery (SPPB) score at 12 months, adjusted for baseline values. The SPPB is a test of lower limb strength and balance. 37 It comprises three tests: a balance test (tandem balance, semi-tandem balance and single leg balance), a timed sit to stand from a chair five times, and gait speed over a 4-m course. The test is scored from 0 (worst score; includes those who cannot perform any component) to 12 (best score). The SPPB is a robust predictor of a range of adverse outcomes in older people, including death, dependency and future disability. 38,39
Secondary outcomes
Table 1 lists the secondary outcomes measured in the trial and their time points, encompassing a range of measures of physical function, anthropometry, quality of life, vascular health and bone health. For all secondary outcomes, data from all available time points were used in repeated-measures analyses. Repeated-measures evaluation of the SPPB score (in contrast to the 12-month primary outcome measure) was therefore a secondary outcome. Details of the methods used for outcomes measurement and analysis are provided in Appendix 3.
| Test | Time points measured |
|---|---|
| Physical function and anthropometry | |
| 6-minute walk distance40 | 0, 3, 6, 12 and 24 months |
| Handgrip strength41 | 0, 3, 6, 12 and 24 months |
| Weight | 0, 3, 6, 12 and 24 months |
| Mid-arm muscle circumference42 | 0, 3, 6, 12 and 24 months |
| Triceps skinfold thickness42 | 0, 3, 6, 12 and 24 months |
| Mid-thigh circumference42 | 0, 3, 6, 12 and 24 months |
| Health-related quality of life | |
| EQ-5D-3L score43 | 0, 3, 6, 12 and 24 months |
| EQ-5D thermometer43 | 0, 3, 6, 12 and 24 months |
| KDQoL questionnaire44 | 0, 3, 6, 12 and 24 months |
| ICECAP-O questionnaire45 | 0, 3, 6, 12 and 24 months |
| Renal function | |
| Creatinine and eGFR | 0, 3, 6, 12 and 24 months |
| Cystatin C | 0, 3, 6, 12 and 24 months |
| Urinary albumin-to-creatinine ratio | 0, 3, 6, 12 and 24 months |
| Bone and mineral metabolism | |
| Tartrate-resistant acid phosphatase-5b | 0, 12 and 24 months |
| Bone-specific alkaline phosphatase | 0, 12 and 24 months |
| PTH | 0, 12 and 24 months |
| 25-hydroxyvitamin D and 1,25 dihydroxyvitamin D | 0, 12 and 24 months |
| Serum calcium and serum phosphate | 0, 3, 6, 12 and 24 months |
| Vascular risk markers | |
| N-terminal pro-B-type natriuretic peptide | 0, 12 and 24 months |
| Systolic and diastolic blood pressure | 0, 3, 6, 12 and 24 months |
| Total cholesterol | 0, 3, 6, 12 and 24 months |
| Other biochemistry | |
| Thyroid-stimulating hormone | 0, 3, 6, 12 and 24 months |
| Serum potassium, serum albumin, serum bicarbonate | 0, 3, 6, 12 and 24 months |
| Haemoglobin | 0, 3, 6, 12 and 24 months |
| Glycosylated haemoglobin (HbA1c) | 0, 3, 6, 12 and 24 months |
Health economic outcomes
Data on primary care and secondary care (inpatient and outpatient) use were captured by questionnaire at each study visit to inform the health economic analysis. Participants were asked to recall their frequency of service use over the previous month at each follow-up point. Service use included hospital admissions, day case visits, outpatient clinic visits, day hospital visits, other health-care professionals visits [general practitioner (GP), district nurse, physiotherapist, occupational therapist, speech therapist] and other social care visits (day centre and home helper/carer). National published sources were used to value the resources used (see Appendix 4) and the sum of these responses was used to calculate annual costs for the first and second year of follow-up. To assess outcomes, the EuroQoL 5-Dimensions, three-level version (EQ-5D-3L), Investigating Choice Experiments for the preferences of older people CAPability - older people (ICECAP-O) and global life satisfaction measures were used.
Sample size calculation
We based the original sample size calculation on the ability to detect a 1-point difference in the SPPB score (i.e. the primary outcome). This difference has been proposed as the minimum clinically important difference (MCID) by previous investigators. 37 Previous work with older people showed a standard deviation of 2.6 for the SPPB. To detect a 1-point difference between groups at 12 months given this standard deviation would require 143 participants per group, given a two-sided alpha of 0.05 and power of 90%.
To ensure that the trial had sufficient power for the key secondary outcome of health-related quality of life, we also estimated the sample size required to detect the MCID for the EuroQol-5 Dimensions (EQ-5D) measure. For the EQ-5D, the MCID is 0.074. 46 To detect this with a two-sided alpha of 0.05 and power of 90%, assuming a standard deviation of change of 0.2, as found in our previous studies,47,48 would require 154 participants per group.
Assuming a 10% loss to follow-up every 6 months (based on previous medication trials in frail older people47,49), we estimated that we would require 380 participants (190 per group) to ensure adequate power for the primary outcome and the EQ-5D outcome at 12 months.
Chapter 3 Methods
Regulatory approvals
The BiCARB trial was a Clinical Trial of an Investigational Medicinal Product (CTIMP). As such, the trial was subject to approval and oversight from the Medicines and Healthcare products Regulatory Authority (EudraCT number 2011-005271-16; Clinical Trial Authorisation number 41692/0001/001-0001). Ethics approval was granted by the East of Scotland NHS Research Ethics Committee (reference number 12/ES/0023). The trial was co-sponsored by the University of Dundee and NHS Tayside (Tayside Academic Health Sciences Collaboration). The trial was registered at www.isrctn.com with the identifier ISRCTN09486651.
Participants
Site participation
At the trial planning stage, six core sites were selected (Dundee, Aberdeen, Salford, Sheffield, Canterbury and Guy’s/St Thomas’). Early in the course of the trial, the decision was taken to recruit from a much larger number of sites to address issues of slow recruitment rates; potential sites were approached through the NIHR Renal Clinical Research Network. Sites were selected on the basis of willingness to participate, access to a local investigator with appropriate Good Clinical Practice (GCP) training and sufficient nephrology colleagues at the site with clinical equipoise on the trial intervention to support randomising participants rather than immediately commencing oral bicarbonate therapy.
Participant identification
Participants were identified through secondary care services, either by screening attendees at clinics (predominantly renal clinics, including low-clearance clinics) or by searching local renal and biochemistry databases. At two sites (Dundee and Aberdeen), participants were also sought through searches of primary care records. Initial searches focused on identifying patients with CKD category 4 or 5 who were not on dialysis and who had historical serum bicarbonate concentrations of < 22 mmol/l.
Recruitment process
Potentially eligible participants were given information about the study. The participant information sheet is available in Report Supplementary Material 3. Participants were invited to attend a screening visit. After obtaining written informed consent, medical history and medication use were recorded to check for exclusion criteria. If creatinine and bicarbonate results were available within the previous month, these values were used to determine eligibility. If these results were not available, a screening blood sample was taken to measure the creatinine concentration, derive the eGFR (according to the MDRD4 equation) and measure the serum bicarbonate concentration.
Participants found to be eligible at the screening visit underwent the baseline study assessments either on the same day (if historical blood results were available) or at a separate visit (if screening bloods were used).
Washout arrangements
For potentially eligible participants already taking oral sodium bicarbonate who wished to participate, consent was obtained and a 3-month washout period instituted. After the washout period, the screening visit was performed and only those participants fulfilling the eligibility criteria at the screening visit proceeded to the baseline assessment and randomisation.
Randomisation and treatment allocation
Randomisation was performed using an interactive web-based randomisation, drug assignment and inventory management system [Tayside Randomisation SysTem (TRuST)] run by the Health Informatics Centre, University of Dundee. The system was run independently of the research team to preserve allocation concealment. Randomisation was performed in a 1 : 1 ratio, stratified by site, and employed a minimisation algorithm to balance male versus female sex, CKD category 4 versus category 5, and age < 75 years versus ≥ 75 years.
Participants were allocated study medication bottles (one bottle per month) containing either 500-mg sodium bicarbonate tablets or matching placebo tablets; bottles were allocated based on bottle identification numbers generated by the TRuST randomisation system.
Unmasking
The treatment code was broken only when the clinical team treating a participant deemed knowledge of treatment allocation to be essential for management of the participant. Unmasking was performed by the clinical trials pharmacist at Dundee using the TRuST system. The pharmacist was contactable via a 24-hour hotline. After unmasking, TRuST automatically informed the trial team of the unmasking event without disclosing the treatment allocation. No tests for the success of masking (e.g. asking trial personnel to guess which group participants were allocated to) were performed.
Intervention and comparator
The trial intervention consisted of either 500-mg sodium bicarbonate tablets or matching placebo tablets (containing lactose and microcrystalline cellulose). Active and placebo tablets were manufactured and bottled by Legosan AB (Kumla, Sweden). Bottles were imported to the UK via Tayside Pharmaceuticals (Dundee, UK), which undertook quality testing and qualified person release and distributed bottles to participating sites. Study medications were held at site pharmacies under temperature-controlled conditions prior to dispensing to participants. For the first 3 months of participation, participants were instructed to take one tablet three times per day.
Uptitration
Uptitration took place in a double-dummy fashion. Serum bicarbonate concentrations were measured at the 3-month visit. Participants with a serum bicarbonate concentration of < 22 mmol/l were instructed to increase their intake of study medication to two tablets three times per day. Participants with a serum bicarbonate concentration of ≥ 22 mmol/l were instructed to continue taking one tablet three times per day for the remainder of their time in the trial.
Returned medication and tablet counting
At each visit, unused tablets were returned by participants, counted and entered into the study database to allow adherence to be calculated.
Outcomes measurement
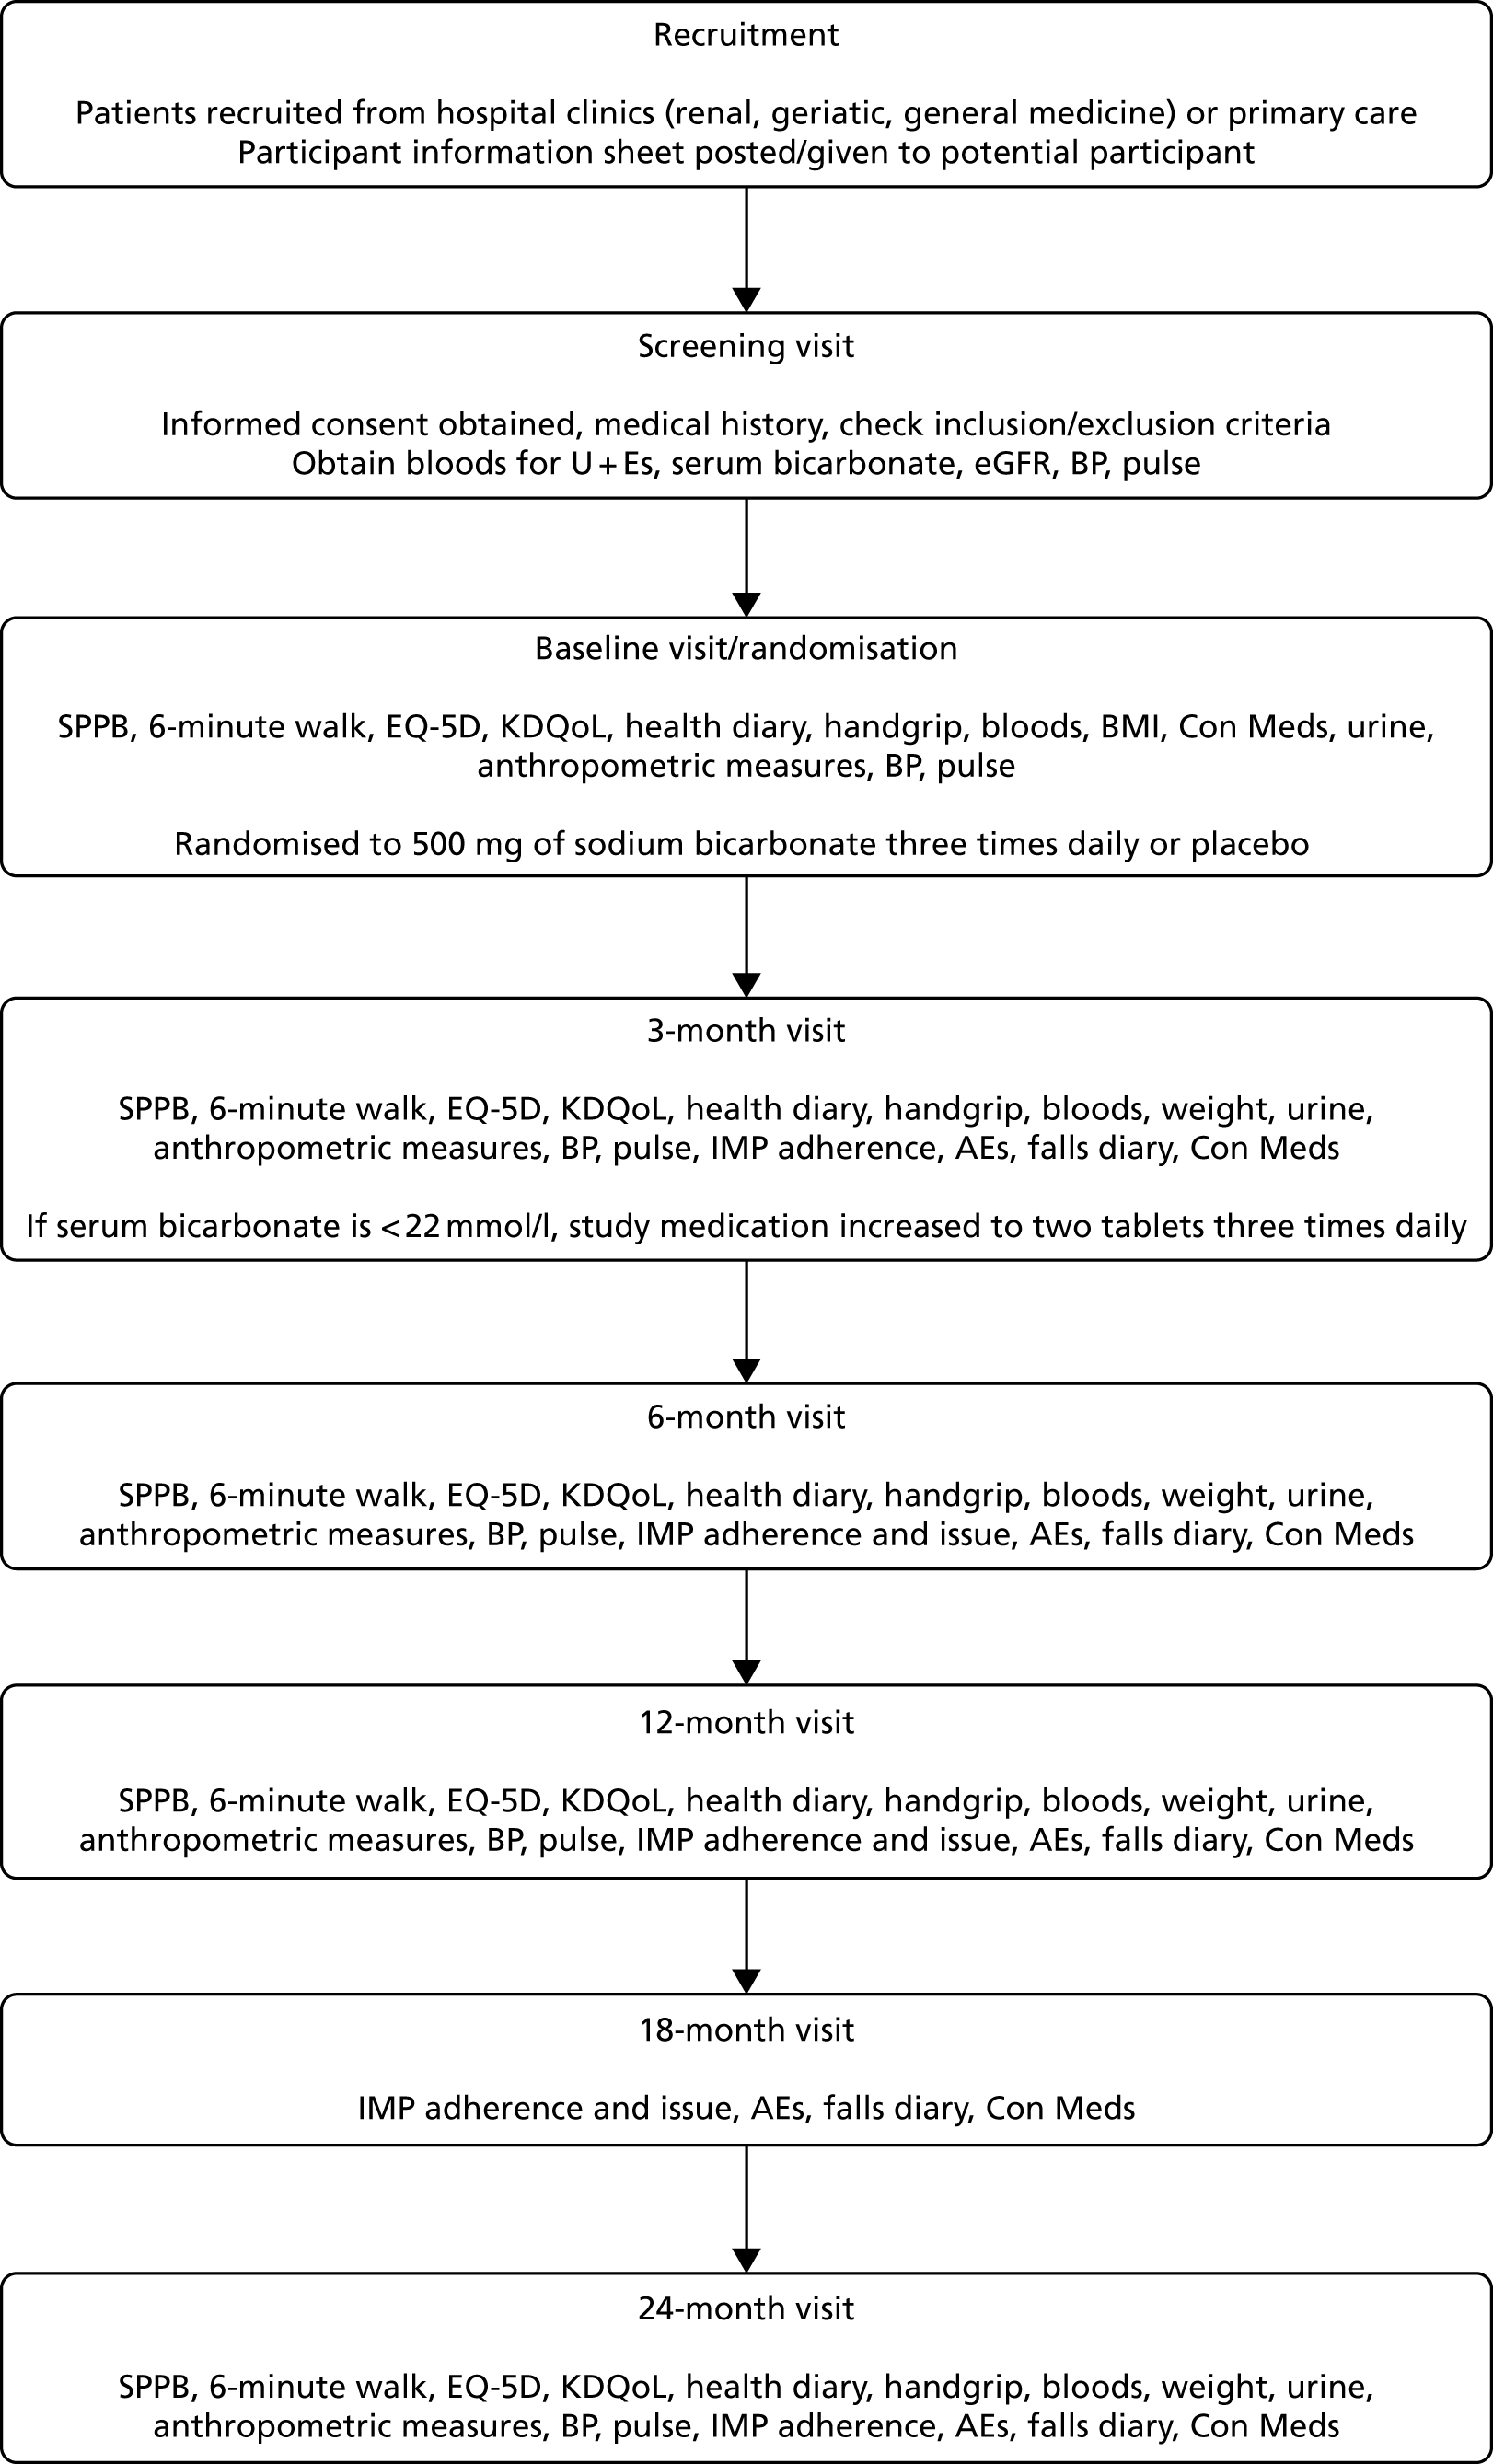
Outcomes were measured at baseline and at 3, 6, 12 and 24 months. Outcomes were collected by research nurses at each site, who were masked to treatment allocation. Figure 1 shows the study processes at each visit, from screening to the end of trial participation.
FIGURE 1.
Flow of participant visits and activities through the trial. AE, adverse event; BMI, body mass index; BP, blood pressure; Con Meds, concomitant medications; IMP, Investigational Medicinal Product; KDQoL, Kidney Disease Quality of Life; U+Es, urea and electrolytes.
Data management
Trial data were collected onto paper case report forms and then entered onto a trial-specific database built using OpenClinica software V3.1.2 (OpenClinica LLC, Waltham, MA, USA). Participants were identified using a unique study identifier and data were stored on a secure, backed-up, University of Dundee server system. Source data verification was conducted for all randomised participants for age, sex, inclusion and exclusion criteria, laboratory values analysed as part of routine clinical practice, baseline medications and adverse events. Batch validation and database audit procedures were run as outlined in the trial Data Management Plan. Target error rates for the primary outcome and adverse events were set at < 0.5% and for other audited fields were set at < 2%, with corrections made until error rates fell within these limits.
Safety reporting
All adverse events (serious and non-serious) were collected at each site using adverse event logs. Adverse events were coded centrally by System Organ Class and Preferred Term using the Medical Dictionary for Regulatory Activities (MedDRA) coding dictionary version 16.1 (www.meddra.org). Given the anticipated high frequency of adverse events in this study population, serious adverse events were collected but not reported to the trial sponsor or to the regulatory authority (Medicines and Healthcare products Regulatory Agency) if they fell into the following categories:
-
any new cardiovascular event
-
any new diagnosis or treatment of cancer
-
any death or hospitalisation as a result of a fall or fracture
-
any death or hospitalisation as a result of infection
-
any death or hospitalisation as a result of exacerbation of an existing medical condition
-
any admission for elective or planned investigation or treatment
-
death, admission or treatment for deteriorating renal function or high or low potassium concentrations.
All adverse events (including those in the above list) were presented to the independent Data Monitoring Committee (DMC) classified by MedDRA System Organ Class; prespecified outcomes of particular interest (death, worsening heart failure, fluid overload or breathlessness) were also presented. All adverse events are included in the analysis reported here.
Trial oversight committees
An independent DMC met every 6 months. The DMC comprised an experienced trials biostatistician, an academic geriatrician and an academic nephrologist. The DMC had access to unblinded data on baseline participant characteristics and adverse events. The DMC reported to the chairperson of the independent Trial Steering Committee (TSC); members were appointed by the NIHR and operated under an agreed charter.
The independent TSC was appointed by the NIHR and was chaired by an experienced triallist specialising in geriatric medicine. Other independent members of the TSC were an academic nephrologist, an academic geriatrician and a lay member with personal experience of kidney disease. The TSC met at least every 6 months over the course of the trial; additional meetings were held as required for timely decision-making. The TSC chairperson reported to the project manager at the NIHR by letter and provided minutes after each TSC meeting; the TSC also operated under an agreed charter.
Day-to-day management of the trial was performed by the Trial Management Group (TMG), comprising the lead applicant, co-applicants and Tayside Clinical Trials Unit (CTU) staff. Local investigators and research nurses at each site were invited to join all TMG meetings, which took place monthly until the end of recruitment and then every 2 months until the end of the grant funding period. Monthly teleconferences between the trial manager and research nurses were used to share best recruitment practice and to troubleshoot trial processes.
Patient and public involvement
A patient representative formed part of the independent TSC and had input into the conduct of the trial, including making significant changes to the protocol; this representative also reviewed the final results. The study design and outcome measures were discussed with a panel of older people at the design stage of the trial, who provided advice and feedback.
Important changes to the trial design and conduct after trial commencement
Several significant changes were made to the conduct of the trial after commencement, mostly in response to the slow recruitment rates:
-
The number of sites planned was originally six; this was expanded to 27 to address the slow recruitment rates.
-
A substudy at two sites (Dundee and Aberdeen) was originally planned to examine bone mineral density by dual-energy X-ray absorptiometry (DEXA) and vascular stiffness by applanation tonometry. These substudies were discontinued because of poor recruitment rates, with only two participants undergoing the substudy measurements.
-
The exclusion criteria were relaxed early in the recruitment phase following a review of reasons for non-recruitment. Changes were made to reduce the lower age limit from 65 to 60 years, to allow the inclusion of those taking calcium acetate or sevelamer and to allow the inclusion of those with hypertension controlled according to home monitoring despite high office blood pressure readings. Both of the phosphate binders, calcium acetate and sevelamer, are routinely used alongside bicarbonate in clinical practice and home monitoring of blood pressure is increasingly used in clinical practice to determine the adequacy of blood pressure control. These changes were therefore deemed not to compromise the safety or scientific integrity of the trial but likely to enhance the generalisability of the results by expanding the pool of eligible participants. In addition, provision was made to include patients currently taking sodium bicarbonate if they underwent a 3-month washout period.
-
The TSC took the decision, in conjunction with the funder, to stop recruitment once 300 of the original target of 380 participants had been randomised. This decision was taken in view of the slowing recruitment rates; the sample size calculations were revisited prior to this decision being taken, as discussed in Re-estimation of the sample size.
-
The TSC took the decision, in conjunction with the funder, to truncate follow-up once all participants had reached the primary outcome point of 12 months. This decision was taken to enable a prompt conclusion to the trial so that the results could be disseminated in a timely fashion; it was not based on an interim analysis of the results. A small number of individuals did not therefore progress to the 24-month follow-up point.
-
Two extensions to the recruitment time were granted by the NIHR to compensate for the slower than anticipated recruitment rates.
Re-estimation of the sample size
To inform the decision on whether or not to terminate recruitment once 300 participants had been randomised, a revised sample size calculation was prepared by the research team and was considered by the TSC. This calculation was carried out without knowledge of treatment allocation or any follow-up data beyond baseline values and standard deviations for the trial population.
The revised sample size calculation assumed the use of a mixed-model repeated-measures analysis with two time points (12-month follow up and baseline), a standard deviation of 2.6 for the primary outcome of SPPB score, an attrition rate of 30% by 12 months and an alpha of 0.05. Assuming a within-person correlation of 0.7, 300 participants would give 85% power to detect a 1-point difference in SPPB score between groups (the MCID) at 12 months. Assuming a within-person correlation of 0.6, the same sample size would give 87% power to detect this difference.
Based on these revised power estimates, the TSC recommended that recruitment stop at 300 participants, as sufficient power to detect the MCID for the primary outcome would still be present and continuing recruitment would risk greatly prolonging the trial with little benefit in terms of statistical power.
Statistical analysis
A prespecified statistical analysis plan (SAP) was drafted, reviewed by the TMG and the independent TSC and signed off before the last visit of the last participant (see Report Supplementary Material 2).
The primary outcome (between-group difference in SPPB score at 12 months) was analysed using linear mixed models, adjusted for baseline measurements, minimisation variables (age, sex and stage of CKD) and a random effect variable for recruitment site. Prespecified subgroup analyses for the primary outcome were conducted (SPPB ≥ 10 points vs. < 10 points, CKD category 4 vs. category 5, age < 75 vs. ≥ 75 years, male vs. female, baseline bicarbonate < 18 mmol/l vs. ≥ 18 mmol/l). These factors were selected as being both of clinical interest and likely to be related to the primary outcome based on previous work. Sensitivity analyses were planned for > 80% versus ≤ 80% adherence, exclusion of those undergoing washout prior to randomisation and using multiple imputation for missing data. Multiple imputation was performed with SAS® PROC MI v9.4 (SAS Institute Inc., Cary, NC, USA) using a Markov chain Monte Carlo method with multiple chains over 1000 iterations (SAS and all other SAS Institute Inc. product or service names are registered trademarks or trademarks of SAS Institute Inc. in the USA and other countries. ® indicates USA registration). Predictor variables were visit, sex, age group, CKD stage and practice.
Secondary outcomes were analysed using repeated-measures models, adjusted for baseline values and minimisation variables as above. Time-to-event analyses (time to death, time to commencing renal replacement therapy) were conducted using Cox proportional hazards models adjusted for minimisation variables as above. For all analyses, a two-sided p-value of < 0.05 was taken as significant, with no adjustment for multiple testing. Analyses were performed using SAS v9.4 software. Unmasking of randomisation groups was performed only after completing the statistical analysis.
Health economic analysis
A prespecified health economic analysis plan was also drafted, reviewed by the TMG and signed off before the last visit of the last participant (see Report Supplementary Material 1).
The primary aim was to assess the cost-effectiveness of the addition of bicarbonate therapy relative to placebo from the perspective of the UK health and social care system. A cost–utility analysis was undertaken that involved estimation of the incremental costs and incremental effects [effectiveness was measured using quality-adjusted life-years (QALYs), based on responses to the EQ-5D-3L instrument]. Estimation was performed using generalised linear regression modelling, with adjustment for skewed data and for baseline differences in cost, EQ-5D-3L values and other patient characteristics (age, sex, stage of CKD). Non-parametric bootstrap methods50 were used for calculating CIs around cost and QALY differences. Cost-effectiveness acceptability curves were employed to show the probability that bicarbonate therapy was cost-effective for different values of willingness to pay per additional QALY. 51
Chapter 4 Clinical effectiveness results
Recruitment
A total of 300 participants were randomised into the trial between May 2013 and February 2017. Appendix 5 shows the cumulative recruitment per month throughout the trial recruitment phase (see Figures 26 and 27) and recruitment by site (see Table 23). Following discussion between the trial team, the independent DMC and TSC and the funder, recruitment was terminated at the end of February 2017 because of the very low ongoing recruitment rates. As part of this decision-making process, revised sample size/power calculations indicated that, under the proposed analysis method for the primary outcome, the trial had 87% power to detect the MCID with the recruited sample size.
Flow of participants through the trial
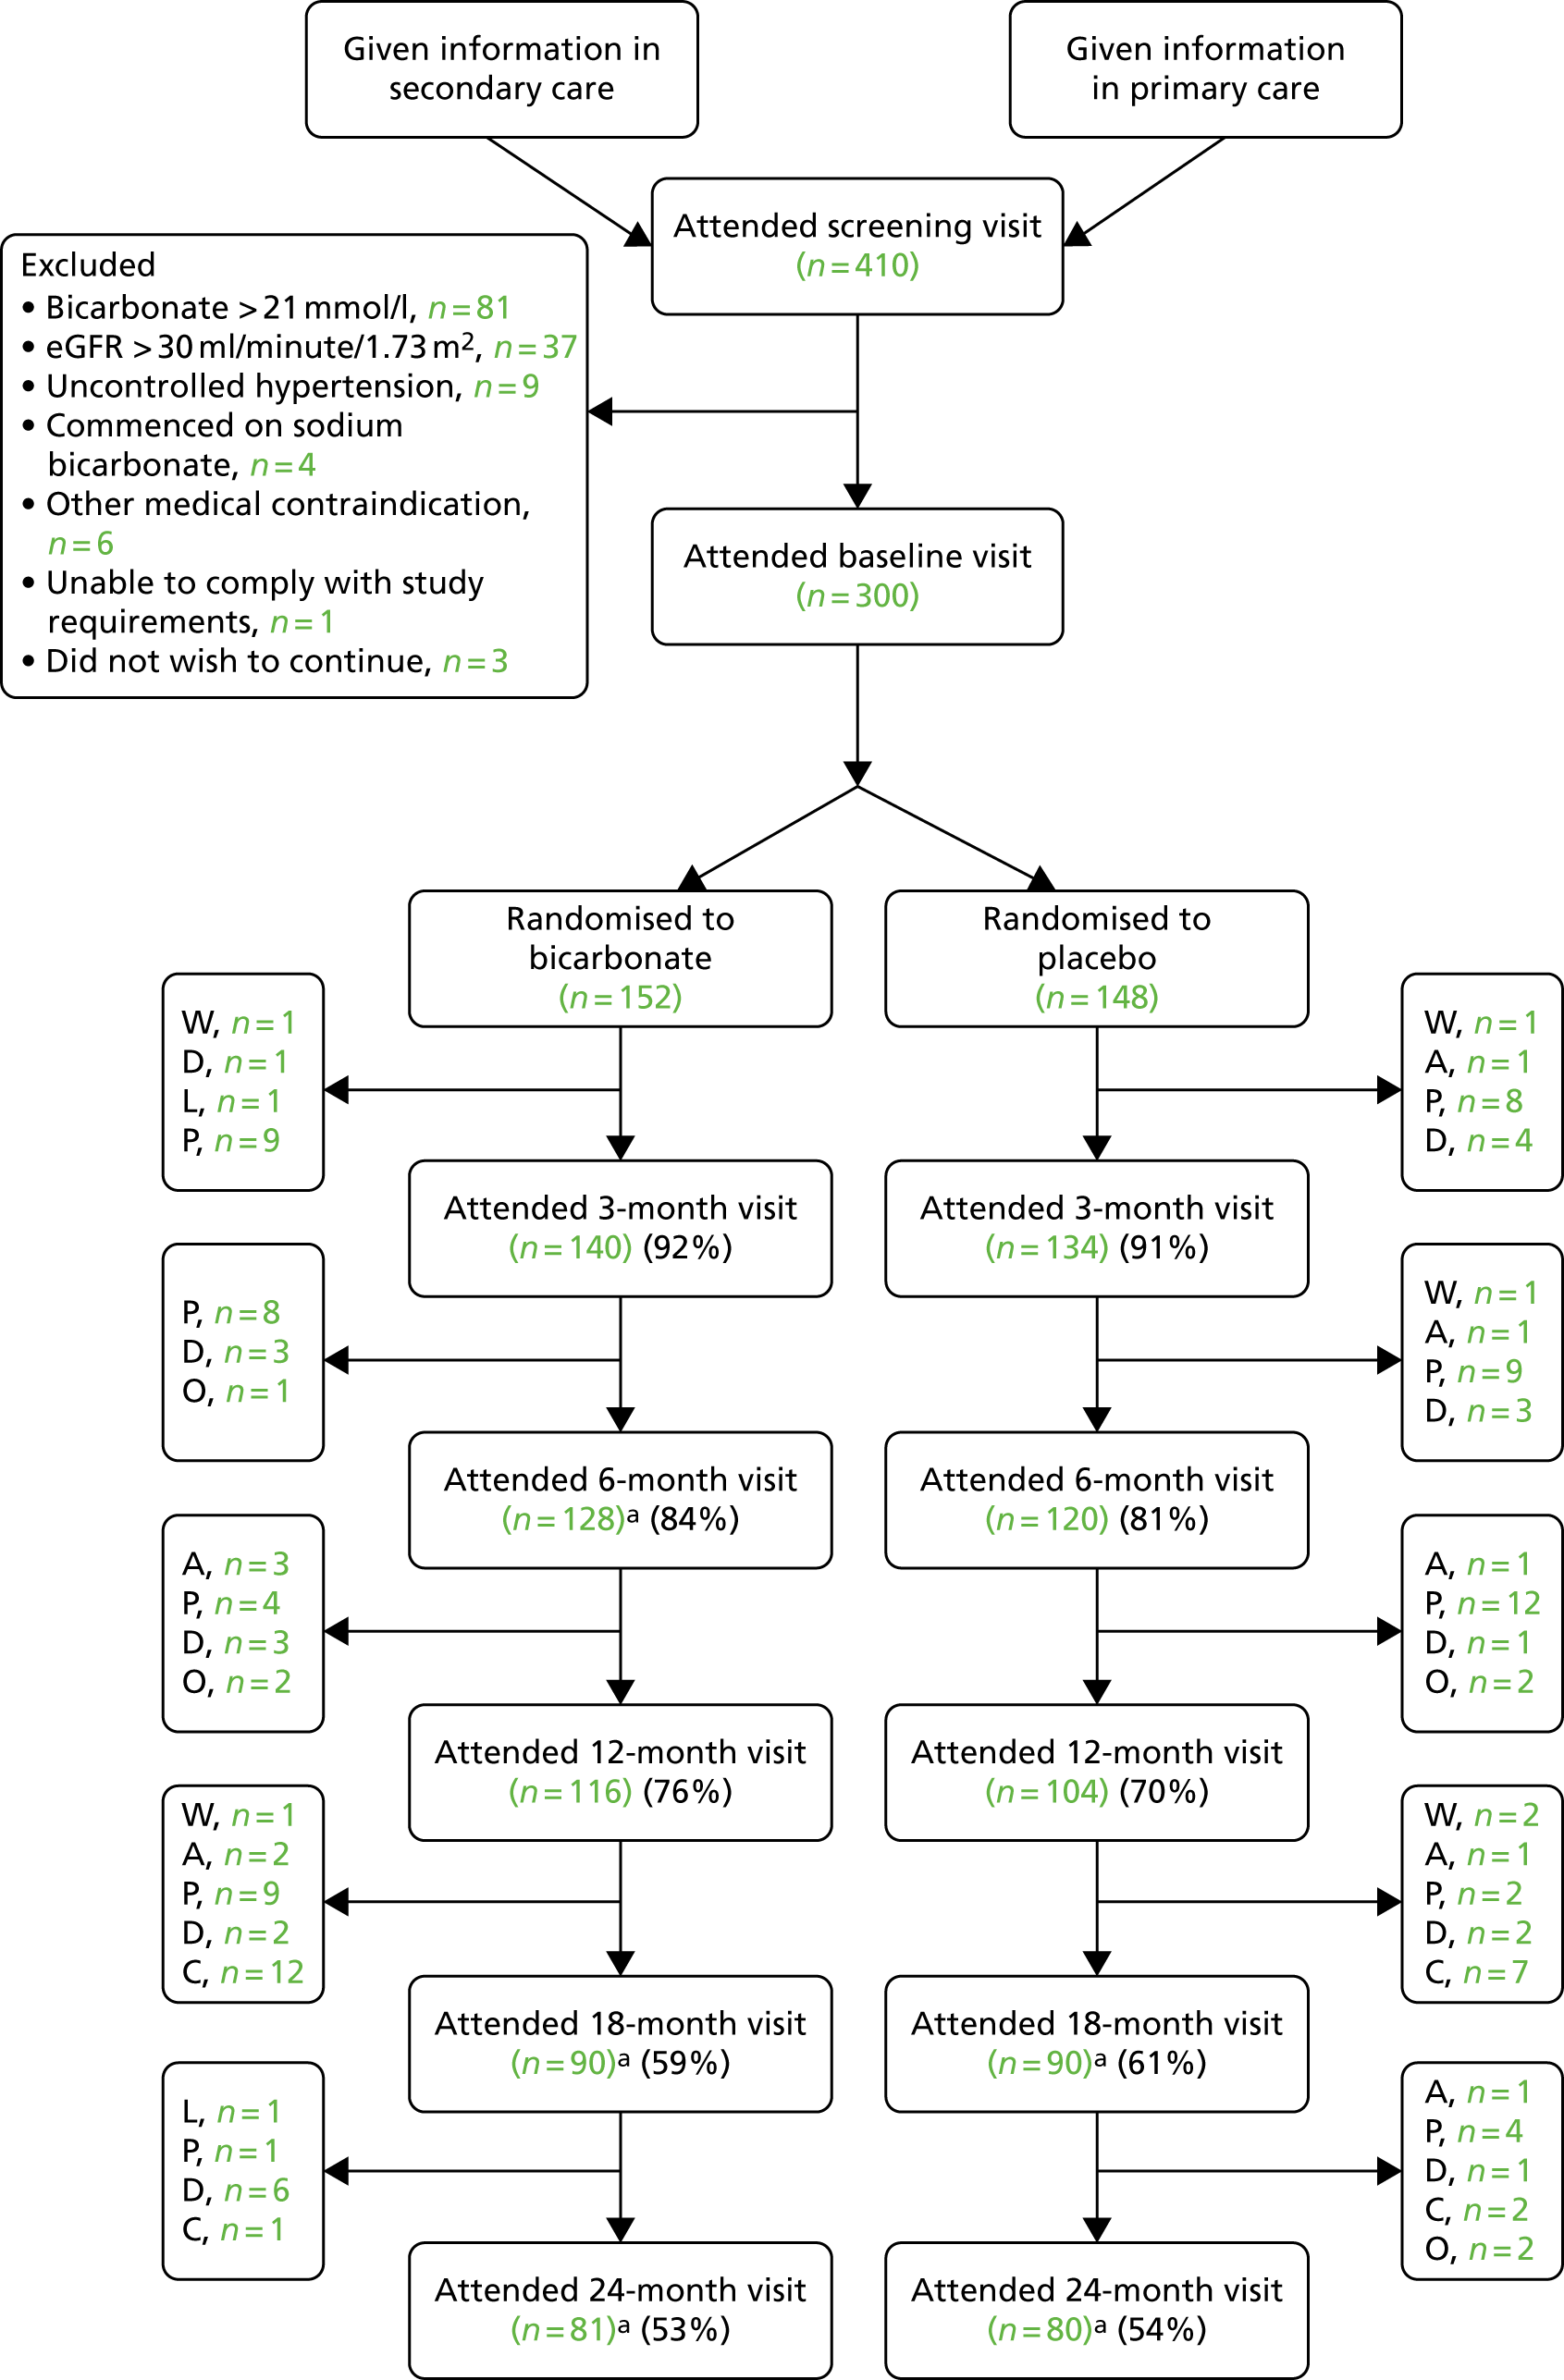
Figure 2 shows the flow of participants through the trial, using the format recommended by the Consolidated Standards of Reporting Trials (CONSORT). 52 Dropout rates were similar in both arms at each time point, but overall dropout rates were slightly higher than anticipated (18% at 6 months and 27% at 12 months). Once all participants had completed their 12-month (primary outcome) visit, the TSC recommended that further follow-up for the last 40 participants be truncated; the last patient visit occurred in February 2018. These participants did not therefore progress to their 18-month or 24-month visit and thus dropout after 12 months appears artefactually higher. Only four participants underwent the 3-month washout option prior to the screening visit.
FIGURE 2.
Consolidated Standards of Reporting Trials (CONSORT) flow diagram. a, Some did not attend visit but had not dropped out. A, withdrew because of adverse event; C, early study completion because of truncated follow-up; D, died; L, lost to follow-up; O, other; P, participant chose to withdraw; W, withdrawn by investigator.
Participant baseline characteristics
Participant baseline characteristics are presented in Table 2. The two groups were well balanced for most key baseline characteristics, including aetiology of renal dysfunction.
| Characteristic | Randomised group | |
|---|---|---|
| Bicarbonate (N = 152) | Placebo (N = 148) | |
| Mean (SD) age (years) | 73.9 (7.6) | 74.0 (6.6) |
| Aged 60–69 years, n (%) | 57 (37.5) | 35 (23.6) |
| Aged 70–79 years, n (%) | 53 (34.9) | 81 (54.7) |
| Aged ≥ 80 years, n (%) | 42 (27.6) | 32 (21.6) |
| Female sex, n (%) | 42 (27.6) | 44 (29.7) |
| Ethnicity, n (%) | ||
| White | 144 (94.7) | 143 (96.6) |
| East Asian | 0 (0) | 1 (0.7) |
| Black | 1 (0.7) | 0 (0) |
| South Asian | 4 (2.6) | 2 (1.4) |
| Hispanic | 1 (0.7) | 0 (0) |
| Other | 2 (1.3) | 2 (1.4) |
| Cause of renal dysfunction, n (%) | ||
| Hypertension | 37 (24.3) | 40 (27.0) |
| Diabetes mellitus | 23 (15.1) | 23 (15.5) |
| Glomerulonephritis | 9 (5.9) | 11 (7.4) |
| Polycystic kidney disease | 11 (7.2) | 9 (6.1) |
| Vascular disease | 19 (12.5) | 21 (14.2) |
| Other | 52 (34.2) | 63 (42.6) |
| Not known | 31 (20.4) | 22 (14.9) |
| Cardiovascular comorbidity, n (%) | ||
| Hypertension | 135 (88.8) | 129 (87.2) |
| Diabetes mellitus | 54 (35.5) | 47 (31.8) |
| Ischaemic heart disease | 26 (17.1) | 31 (20.9) |
| Stroke | 16 (10.5) | 12 (8.1) |
| Heart failure | 19 (12.5) | 5 (3.4) |
| Peripheral vascular disease | 14 (9.2) | 10 (6.8) |
| Previous fragility fracture, n (%) | 2 (1.3) | 5 (3.4) |
| Mean (SD) number of medications, n (%) | 8.2 (3.7) | 7.9 (3.3) |
| Medication use, n (%) | ||
| ACEi/ARB | 105 (69.1) | 91 (61.5) |
| Phosphate binder | 32 (21.1) | 28 (18.9) |
| Activated vitamin D | 77 (50.7) | 73 (49.3) |
| Erythropoietin | 89 (58.6) | 106 (71.6) |
| Iron | 60 (39.5) | 51 (34.5) |
| Mean (SD) eGFR (ml/minute/1.73 m2) | 19.7 (6.5) | 18.2 (6.4) |
| CKD category 5 (%) | 48 (32.4) | 34 (22.4) |
| Mean (SD) serum bicarbonate concentration (mmol/l) | 20.6 (2.6) | 20.1 (2.5) |
| Mean (SD) haemoglobin concentration (g/l) | 115 (14) | 117 (17) |
| Mean (SD) serum potassium concentration (mmol/l) | 4.9 (0.5) | 4.9 (0.5) |
| Mean (SD) SPPB score | 8.0 (2.4) | 8.1 (2.2) |
| Mean (SD) 6-minute walk distance (m) | 304 (134) | 317 (133) |
| Mean (SD) handgrip strength (kg) | ||
| Men | 26.6 (8.8) | 28.0 (7.6) |
| Women | 15.4 (4.8) | 15.8 (4.4) |
| Mean (SD) body mass index (kg/m2) | 28.9 (4.5) | 28.3 (4.6) |
| Mean (SD) mid-arm muscle circumference (cm) | 24.9 (3.6) | 24.8 (4.0) |
| Mean (SD) triceps skinfold thickness (mm) | 16 (8) | 17 (9) |
| Mean (SD) mid-thigh circumference (cm) | 47.4 (7.0) | 46.8 (7.0) |
| Mean (SD) EQ-5D-3L score | 0.73 (0.22) | 0.74 (0.24) |
| Mean (SD) EQ-5D thermometer score | 69 (19) | 71 (19) |
| Mean (SD) KDQoL scores | ||
| SF-36 PCS | 36 (11) | 36 (11) |
| SF-36 MCS | 53 (11) | 54 (9) |
| Burden | 75 (26) | 75 (25) |
| Symptoms | 79 (14) | 81 (12) |
| Effects | 86 (14) | 87 (15) |
| Mean (SD) office systolic blood pressure (mmHg) | 143 (18) | 143 (18) |
| Mean (SD) office diastolic blood pressure (mmHg) | 75 (11) | 73 (10) |
Adherence and effect of the intervention on serum bicarbonate levels
Data on adherence to the study medication are shown in Table 3. The adherence rate was moderate, with approximately 50% in both arms exceeding the threshold of 80% commonly used to denote good adherence. The mean prescribed dose of bicarbonate in the bicarbonate arm across the whole follow-up period was 1.88 g per day (compared with a maximum possible dose of 3 g per day) and the mean ingested dose of bicarbonate in the bicarbonate arm across the whole follow-up period was 1.39 g per day.
| Characteristic | Randomised group, n (%) | |
|---|---|---|
| Bicarbonate (N = 152) | Placebo (N = 148) | |
| 3-month visit | ||
| 500 mg three times per day | 82 (53.9) | 45 (30.4) |
| 1000 mg three times per day | 46 (30.3) | 83 (56.1) |
| Not dispensed | 12 (7.9) | 6 (4.1) |
| Dropped out before 3-month visit | 12 (7.9) | 8 (5.4) |
| Adherence (%) (SD) | 72.8 (35.2) | 73.4 (39.6) |
| Adherence ≤ 80% (%) | 76 (50.0) | 73 (49.3) |
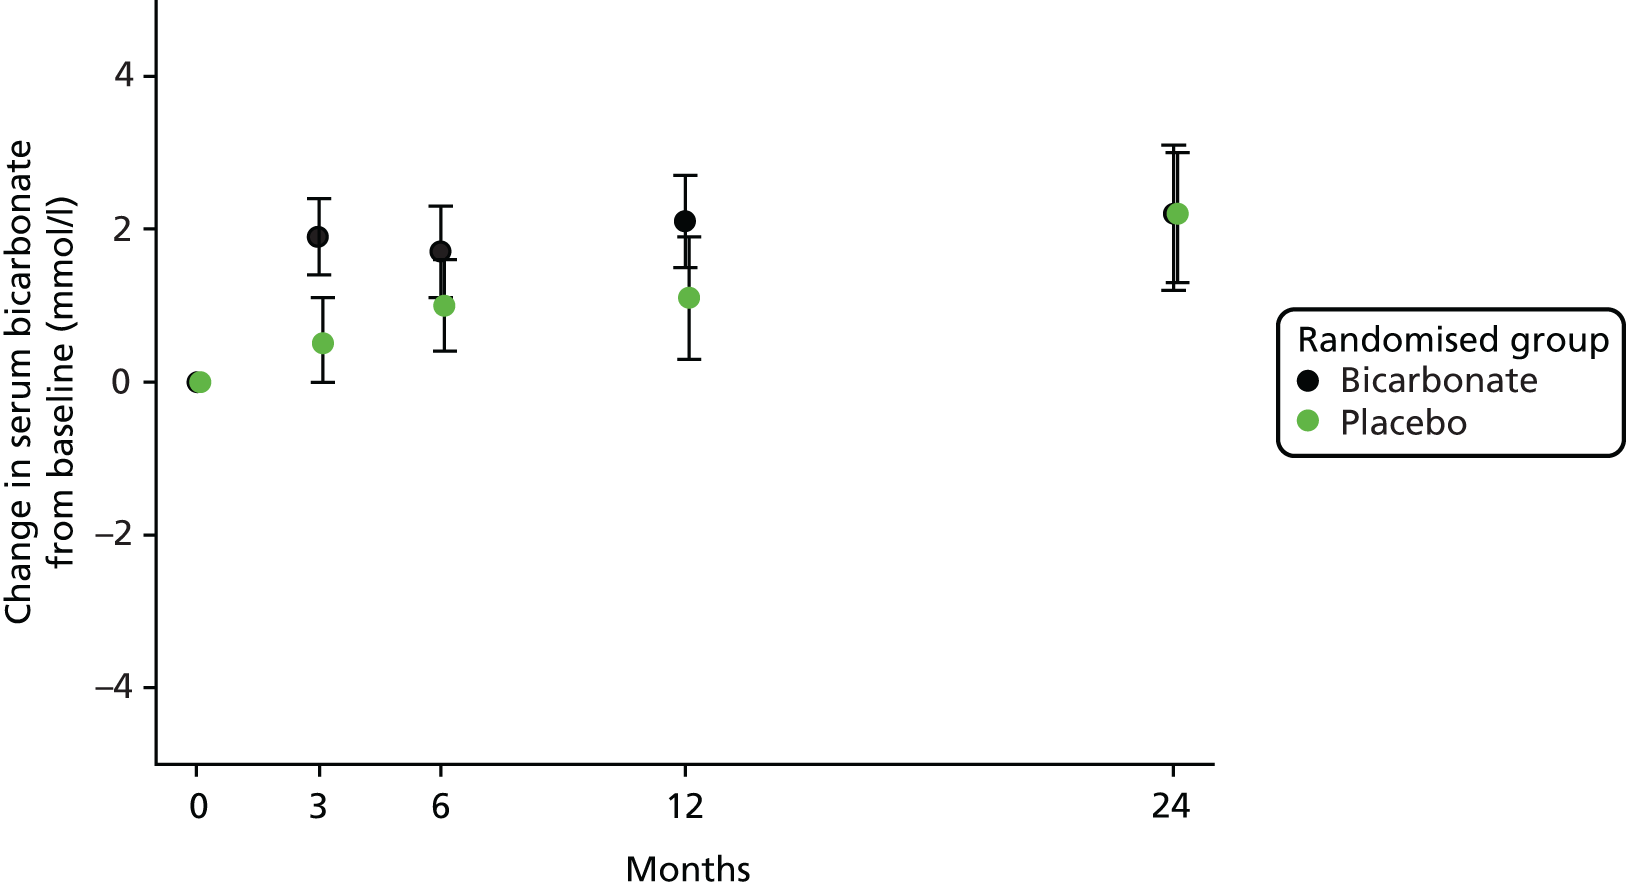
A modest but significant increase in serum bicarbonate concentration was seen in the intervention arm by 3 months; this difference attenuated with time and was no longer significant by 24 months, as shown in Figure 3. The treatment effect of bicarbonate supplementation across the whole follow-up period was 1.1 mmol/l (95% CI 0.6 to 1.6 mmol/l; p < 0.001); bicarbonate levels at each follow-up time point are shown later in this chapter (see Table 7).
FIGURE 3.
Change in bicarbonate concentration relative to baseline.
Primary outcome
Table 4 shows the primary outcome analysis: the difference in SPPB score at 12 months between groups. No significant effect of bicarbonate treatment was seen on the primary outcome (treatment effect –0.4 points, 95% CI –0.9 to 0.1 points; p = 0.15); analysis adjusted only for baseline SPPB score and analyses adjusted for baseline SPPB score, age, sex and CKD category gave the same result. Multiple imputation to account for missing data gave similar results (treatment effect –0.3 points, 95% CI –1.0 to 0.3 points; p = 0.29). As only four participants underwent the washout period prior to randomisation, the sensitivity analysis excluding this subgroup was not conducted.
| Time point | Randomised group, mean (SD) | Adjusted treatment effecta (95% CI) | p-value | |
|---|---|---|---|---|
| Bicarbonate | Placebo | |||
| Baseline | 8.0 (2.4) (n = 140) | 8.1 (2.2) (n = 134) | –0.4 (–0.9 to 0.1) | 0.15 |
| 12 months | 8.3 (2.5) (n = 97) | 8.8 (2.2) (n = 90) | ||
Subgroup analyses
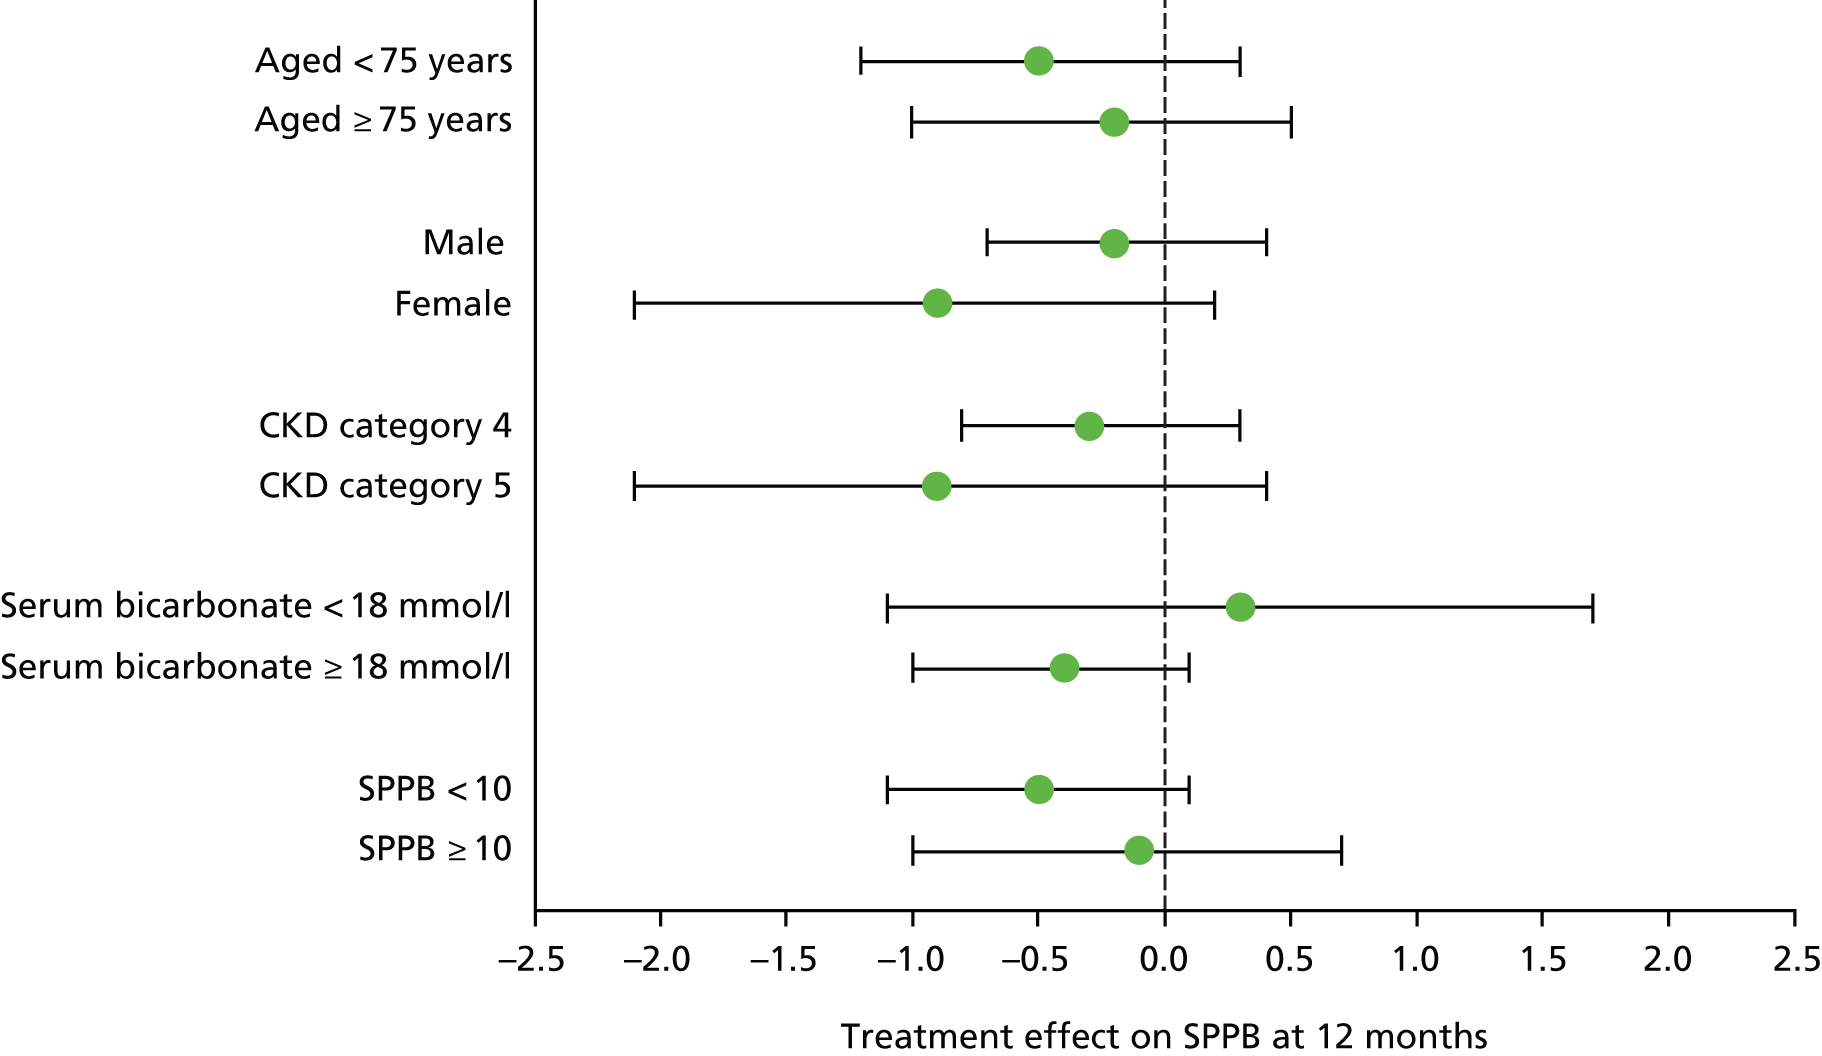
No significant interaction was seen in subgroup analyses (age, sex, CKD category, high vs. low baseline bicarbonate concentration, high vs. low baseline SPPB score), with all subgroups showing similar effect sizes for the primary outcome; all tests for interactions were non-significant. Details are presented in Figure 4.
FIGURE 4.
Subgroup analyses for the primary outcome.
Effect of adherence on the primary outcome
A further preplanned subgroup analysis was conducted, comparing the primary outcome treatment effect for those with good adherence (defined a priori as > 80%) with the treatment effect for those with poorer adherence (defined a priori as ≤ 80%). Those with good adherence showed an adjusted treatment effect at 12 months of –0.6 points (95% CI –1.4 to 0.1 points; p = 0.07), whereas those with poorer adherence showed an adjusted treatment effect of 0.0 points (95% CI –0.7 to 0.7 points; p = 0.97). The difference in treatment effect was not significant (p-value for interaction = 0.27).
Secondary outcomes
Physical function
Repeated-measures analysis showed that the SPPB score was slightly worse in the bicarbonate arm than in the placebo arm. Similarly, 6-minute walk distance and grip strength showed an adverse effect of treatment on repeated-measures analyses. Details are presented in Table 5.
| Outcome | Time point | Randomised group, mean (SD) | Treatment effect (95% CI) | p-value | |
|---|---|---|---|---|---|
| Bicarbonate | Placebo | ||||
| SPPB score (points) | Baseline | 8.0 (2.4) (n = 140) | 8.1 (2.2) (n = 134) | –0.6 (–1.0 to –0.1) | 0.02 |
| 3 months | 8.2 (2.2) (n = 120) | 8.7 (2.3) (n = 123) | |||
| 6 months | 8.2 (2.5) (n = 113) | 8.9 (2.6) (n = 111) | |||
| 12 months | 8.3 (2.5) (n = 97) | 8.8 (2.2) (n = 90) | |||
| 24 months | 7.7 (2.5) (n = 72) | 8.7 (2.5) (n = 73) | |||
| 6-minute walk distance (m) | Baseline | 304 (134) (n = 151) | 317 (133) (n = 148) | –33 (–62 to –4) | 0.02 |
| 3 months | 308 (143) (n = 134) | 333 (131) (n = 128) | |||
| 6 months | 307 (151) (n = 127) | 334 (147) (n = 114) | |||
| 12 months | 294 (162) (n = 109) | 336 (154) (n = 101) | |||
| 24 months | 300 (167) (n = 80) | 327 (184) (n = 79) | |||
| Grip strength (kg) | Baseline | Men: 26.6 (8.8) (n = 110); women: 15.4 (4.8) (n = 42) | Men: 28.0 (7.6) (n = 104); women: 15.8 (4.4) (n = 44) | –1.5 (–2.8 to –0.2) | 0.03 |
| 3 months | Men: 26.5 (7.1) (n = 103); women: 15.8 (4.8) (n = 35) | Men: 27.5 (7.9) (n = 95); women: 16.3 (4.1) (n = 37) | |||
| 6 months | Men: 26.3 (7.1) (n = 97); women: 15.1 (4.7) (n = 31) | Men: 28.3 (7.2) (n = 83); women: 16.6 (4.9) (n = 33) | |||
| 12 months | Men: 25.9 (7.2) (n = 85); women: 15.2 (5.2) (n = 27) | Men: 28.4 (7.9) (n = 72); women: 15.5 (4.1) (n = 30) | |||
| 24 months | Men: 25.5 (8.3) (n = 57); women: 14.1 (5.5) (n = 23) | Men: 28.7 (7.3) (n = 56); women: 15.1 (3.6) (n = 23) | |||
| Weight (kg) | Baseline | 82.3 (16.9) (n = 152) | 81.5 (15.9) (n = 148) | 0.2 (–2.9 to 3.4) | 0.89 |
| 3 months | 83.0 (16.7) (n = 137) | 82.2 (15.4) (n = 131) | |||
| 6 months | 83.1 (16.7) (n = 127) | 81.1 (14.5) (n = 117) | |||
| 12 months | 83.4 (16.3) (n = 112) | 81.1 (14.6) (n = 102) | |||
| 24 months | 80.1 (14.5) (n = 81) | 80.9 (14.6) (n = 79) | |||
| Mid-arm muscle circumference (cm) | Baseline | 24.9 (3.6) (n = 150) | 24.8 (4.0) (n = 147) | 0.0 (–0.6 to 0.6) | 0.99 |
| 3 months | 24.9 (3.5) (n = 136) | 25.2 (4.3) (n = 131) | |||
| 6 months | 25.1 (4.3) (n = 126) | 24.8 (4.1) (n = 115) | |||
| 12 months | 25.2 (3.2) (n = 112) | 24.4 (3.8) (n = 100) | |||
| 24 months | 24.2 (3.5) (n = 78) | 24.9 (3.2) (n = 77) | |||
| Triceps skinfold thickness (mm) | Baseline | 16 (8) (n = 151) | 17 (9) (n = 148) | –1 (–2 to 1) | 0.34 |
| 3 months | 17 (9) (n = 138) | 17 (8) (n = 131) | |||
| 6 months | 15 (7) (n = 126) | 17 (9) (n = 116) | |||
| 12 months | 16 (10) (n = 111) | 17 (8) (n = 100) | |||
| 24 months | 15 (6) (n = 77) | 16 (8) (n = 79) | |||
| Mid-thigh circumference (cm) | Baseline | 47.4 (7.0) (n = 146) | 46.8 (7.0) (n = 143) | 0.1 (–0.8 to 1.1) | 0.80 |
| 3 months | 46.7 (6.7) (n = 133) | 46.7 (6.9) (n = 129) | |||
| 6 months | 46.8 (5.4) (n = 128) | 48.3 (13.4) (n = 112) | |||
| 12 months | 46.5 (6.2) (n = 108) | 45.7 (6.7) (n = 99) | |||
| 24 months | 46.5 (5.2) (n = 79) | 46.4 (4.7) (n = 78) | |||
Anthropometry
No significant difference between groups was seen on repeated-measures analysis for weight, triceps skinfold thickness, mid-thigh circumference or mid-arm muscle circumference (see Table 5).
Quality of life
Both the health state and thermometer scores from the EQ-5D general health-related quality of life tool showed an adverse effect of treatment on repeated-measures analysis, but this did not reach statistical significance. There were no significant differences between groups in the disease-specific quality of life domains from the Kidney Disease Quality of Life (KDQoL) questionnaire, but the mental health component summary of the Short Form questionnaire-36 items (SF-36) (part of the KDQoL questionnaire) was significantly worse in the bicarbonate arm than in the placebo arm. Details are presented in Table 6.
| Outcome | Time point | Randomised group, mean (SD) | Treatment effect (95% CI) | p-value | |
|---|---|---|---|---|---|
| Bicarbonate | Placebo | ||||
| EQ-5D-3L score | Baseline | 0.728 (0.220) (n = 143) | 0.739 (0.240) (n = 137) | –0.039 (–0.079 to 0.001) | 0.06 |
| 3 months | 0.706 (0.220) (n = 132) | 0.759 (0.212) (n = 123) | |||
| 6 months | 0.707 (0.209) (n = 120) | 0.768 (0.172) (n = 108) | |||
| 12 months | 0.699 (0.231) (n = 105) | 0.774 (0.165) (n = 94) | |||
| 24 months | 0.715 (0.243) (n = 70) | 0.751 (0.188) (n = 71) | |||
| EQ-5D thermometer score | Baseline | 69 (19) (n = 146) | 71 (19) (n = 137) | –3 (–7 to 1) | 0.09 |
| 3 months | 68 (19) (n = 134) | 70 (18) (n = 122) | |||
| 6 months | 67 (20) (n = 116) | 73 (16) (n = 110) | |||
| 12 months | 67 (19) (n = 106) | 71 (17) (n = 91) | |||
| 24 months | 68 (20) (n = 73) | 70 (18) (n = 72) | |||
| KDQoL: symptoms | Baseline | 79 (14) (n = 148) | 81 (12) (n = 141) | –1 (–3 to 2) | 0.67 |
| 3 months | 80 (15) (n = 134) | 80 (15) (n = 128) | |||
| 6 months | 81 (13) (n = 122) | 80 (14) (n = 112) | |||
| 12 months | 78 (15) (n = 107) | 81 (14) (n = 96) | |||
| 24 months | 80 (14) (n = 76) | 81 (13) (n = 75) | |||
| KDQOL: burden of disease | Baseline | 75 (25) (n = 148) | 75 (25) (n = 140) | –3 (–8 to 2) | 0.20 |
| 3 months | 72 (27) (n = 133) | 77 (23) (n = 127) | |||
| 6 months | 74 (27) (n = 121) | 76 (23) (n = 112) | |||
| 12 months | 72 (27) (n = 107) | 75 (24) (n = 97) | |||
| 24 months | 72 (26) (n = 74) | 71 (27) (n = 74) | |||
| KDQOL: effect of disease | Baseline | 86 (14) (n = 146) | 87 (15) (n = 141) | –2 (–5 to 1) | 0.25 |
| 3 months | 84 (17) (n = 133) | 86 (16) (n = 127) | |||
| 6 months | 85 (15) (n = 122) | 86 (15) (n = 113) | |||
| 12 months | 83 (18) (n = 106) | 86 (16) (n = 97) | |||
| 24 months | 84 (16) (n = 74) | 85 (19) (n = 74) | |||
| SF-36 PCS | Baseline | 36 (11) (n = 137) | 36 (11) (n = 133) | –1 (–4 to 1) | 0.23 |
| 3 months | 34 (11) (n = 127) | 37 (11) (n = 115) | |||
| 6 months | 35 (11) (n = 115) | 37 (11) (n = 106) | |||
| 12 months | 35 (12) (n = 102) | 37 (10) (n = 87) | |||
| 24 months | 34 (11) (n = 70) | 36 (12) (n = 69) | |||
| SF-36 MCS | Baseline | 53 (11) (n = 137) | 54 (9) (n = 133) | –2 (–4 to 0) | 0.03 |
| 3 months | 52 (10) (n = 127) | 54 (9) (n = 115) | |||
| 6 months | 52 (10) (n = 115) | 54 (10) (n = 106) | |||
| 12 months | 51 (10) (n = 102) | 53 (10) (n = 87) | |||
| 24 months | 51 (10) (n = 70) | 54 (11) (n = 69) | |||
Renal function
No significant treatment effect was seen on renal function between the bicarbonate arm and the treatment arm on repeated-measures analysis; this was consistent whether using serum creatinine concentration, eGFR derived from serum creatinine or serum cystatin C concentration as alternative markers of renal function. There was also no significant treatment effect between arms on the urinary albumin-to-creatinine ratio. Details are presented in Table 7. For those remaining under follow-up in the trial, the rates of decline in eGFR were low, as shown in Figure 5.
| Outcome | Time point | Randomised group | Treatment effecta (95% CI) | p-value | |
|---|---|---|---|---|---|
| Bicarbonate | Placebo | ||||
| Bicarbonate (mmol/l), mean concentration (SD) | Baseline | 20.6 (2.6) (n = 152) | 20.1 (2.5) (n = 148) | 1.1 (0.6 to 1.6) | < 0.001 |
| 3 months | 22.4 (2.7) (n = 137) | 20.7 (3.4) (n = 133) | |||
| 6 months | 22.3 (2.7) (n = 124) | 21.1 (3.2) (n = 116) | |||
| 12 months | 22.5 (2.6) (n = 107) | 21.4 (3.9) (n = 98) | |||
| 24 months | 22.9 (4.1) (n = 79) | 22.5 (3.3) (n = 77) | |||
| eGFR (ml/minute/1.73 m2), mean concentration (SD) | Baseline | 19.7 (6.5) (n = 152) | 18.2 (6.4) (n = 148) | 0.6b (–0.8 to 2.0) | 0.39 |
| 3 months | 18.8 (6.4) (n = 137) | 18.7 (7.6) (n = 133) | |||
| 6 months | 19.0 (7.3) (n = 126) | 18.6 (8.0) (n = 117) | |||
| 12 months | 17.9 (7.6) (n = 112) | 18.1 (7.7) (n = 101) | |||
| 24 months | 19.5 (10.2) (n = 79) | 18.0 (8.2) (n = 78) | |||
| Creatinine (µmol/l), mean concentration (SD) | Baseline | 289 (101) (n = 152) | 307 (103) (n = 148) | –8b (–28 to 13) | 0.46 |
| 3 months | 305 (118) (n = 137) | 309 (116) (n = 133) | |||
| 6 months | 311 (138) (n = 126) | 313 (120) (n = 117) | |||
| 12 months | 341 (177) (n = 112) | 320 (140) (n = 101) | |||
| 24 months | 319 (150) (n = 79) | 332 (150) (n = 78) | |||
| Cystatin C (mg/l), mean concentration (SD) | Baseline | 3.11 (0.74) (n = 143) | 3.14 (0.74) (n = 136) | –0.01b (–0.17 to 0.14) | 0.89 |
| 3 months | 3.20 (0.88) (n = 129) | 3.21 (0.85) (n = 120) | |||
| 6 months | 3.21 (0.87) (n = 121) | 3.21 (0.96) (n = 107) | |||
| 12 months | 3.41 (1.09) (n = 103) | 3.33 (1.04) (n = 93) | |||
| 24 months | 3.39 (1.20) (n = 71) | 3.35 (1.03) (n = 72) | |||
| Urinary albumin-to-creatinine ratio, median (IQR) | Baseline | 23 (7–79) (n = 142) | 22 (7–100) (n = 135) | 0.32c (–0.05 to 0.70) | 0.09 |
| 3 months | 32 (8–112) (n = 131) | 26 (5–99) (n = 127) | |||
| 6 months | 25 (7–106) (n = 113) | 19 (7–76) (n = 110) | |||
| 12 months | 25 (7–115) (n = 102) | 21 (8–71) (n = 90) | |||
| 24 months | 19 (6–91) (n = 63) | 21 (5–53) (n = 69) | |||
FIGURE 5.
Change in eGFR relative to baseline.
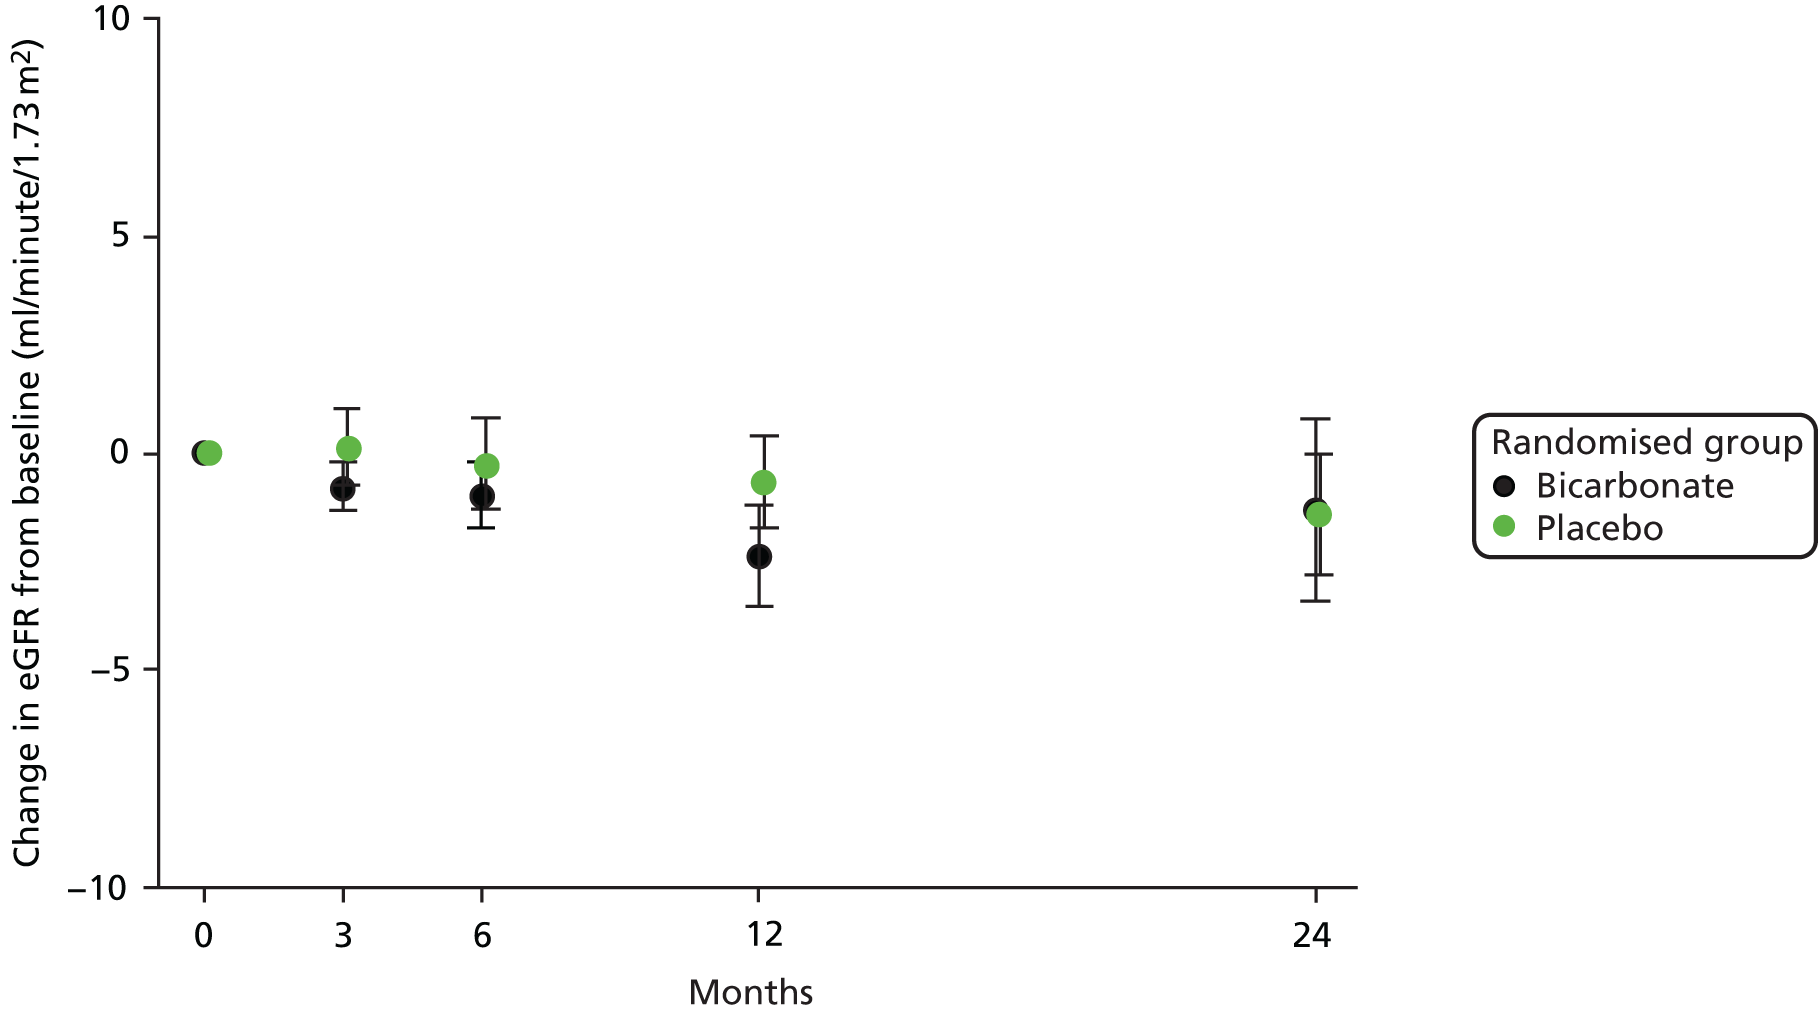
No difference was seen in the time to meeting criteria for a composite end point of decline in renal function, defined as a doubling of the baseline creatinine concentration, a 40% reduction in eGFR from baseline or commencement of renal replacement therapy. The hazard ratio (HR) by Cox proportional hazards modelling for reaching this composite end point, adjusted for age, sex and CKD category at baseline, was 1.03 (95% CI 0.66 to 1.63; p = 0.88).
Vascular health
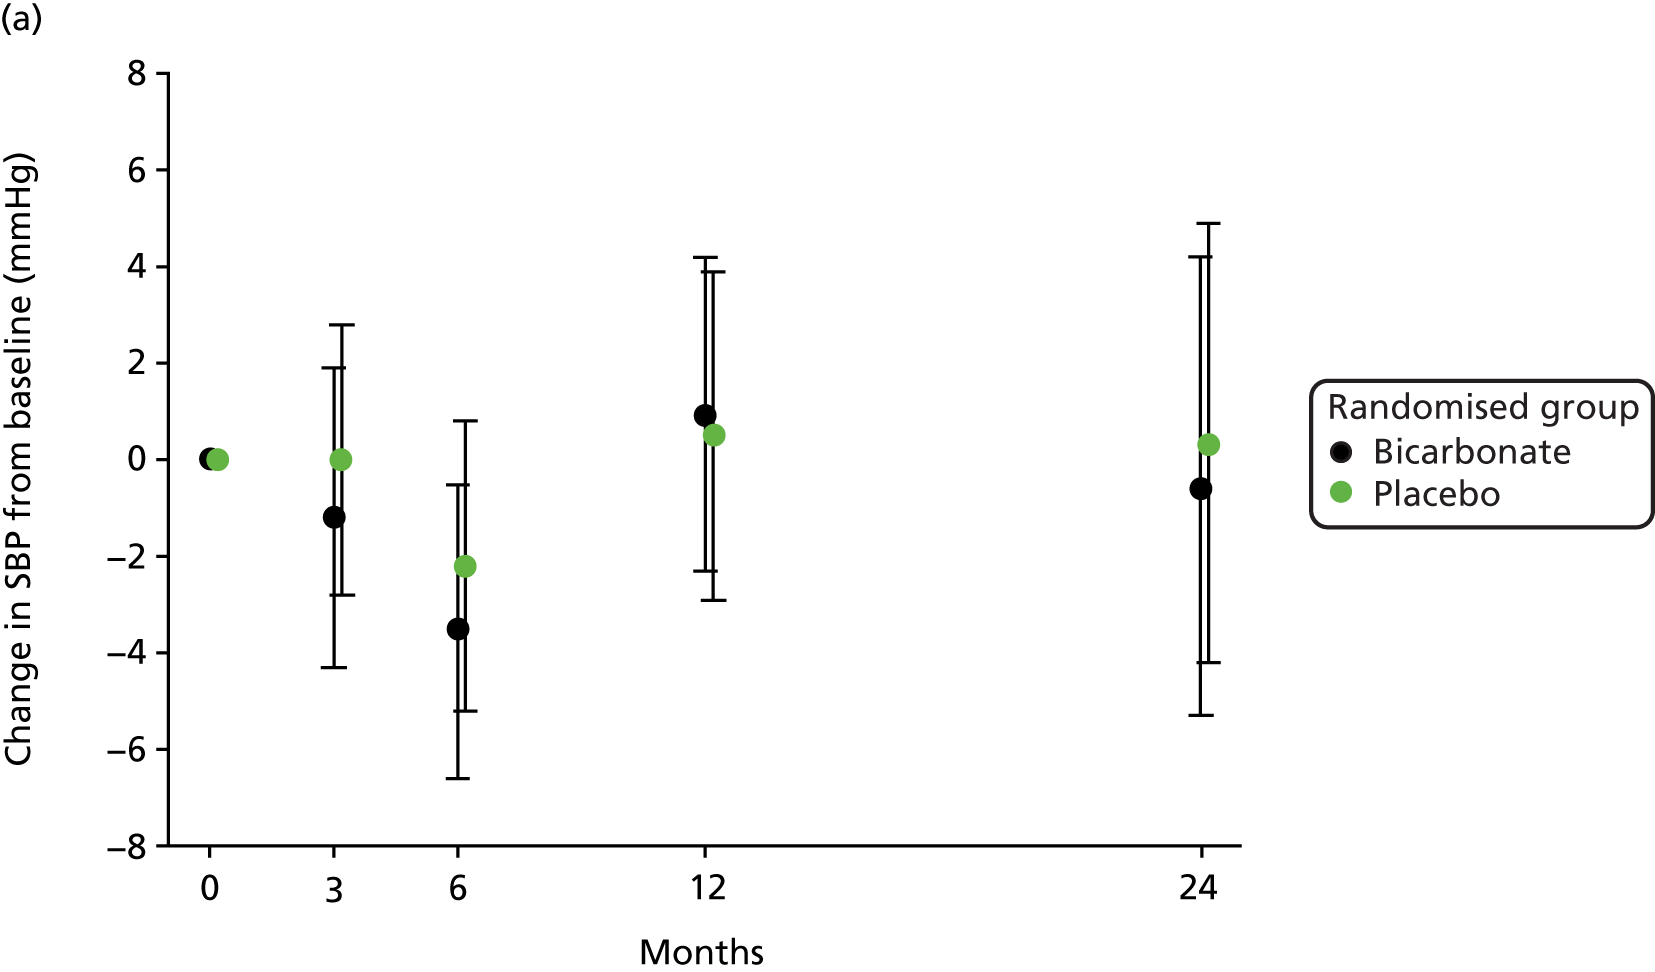
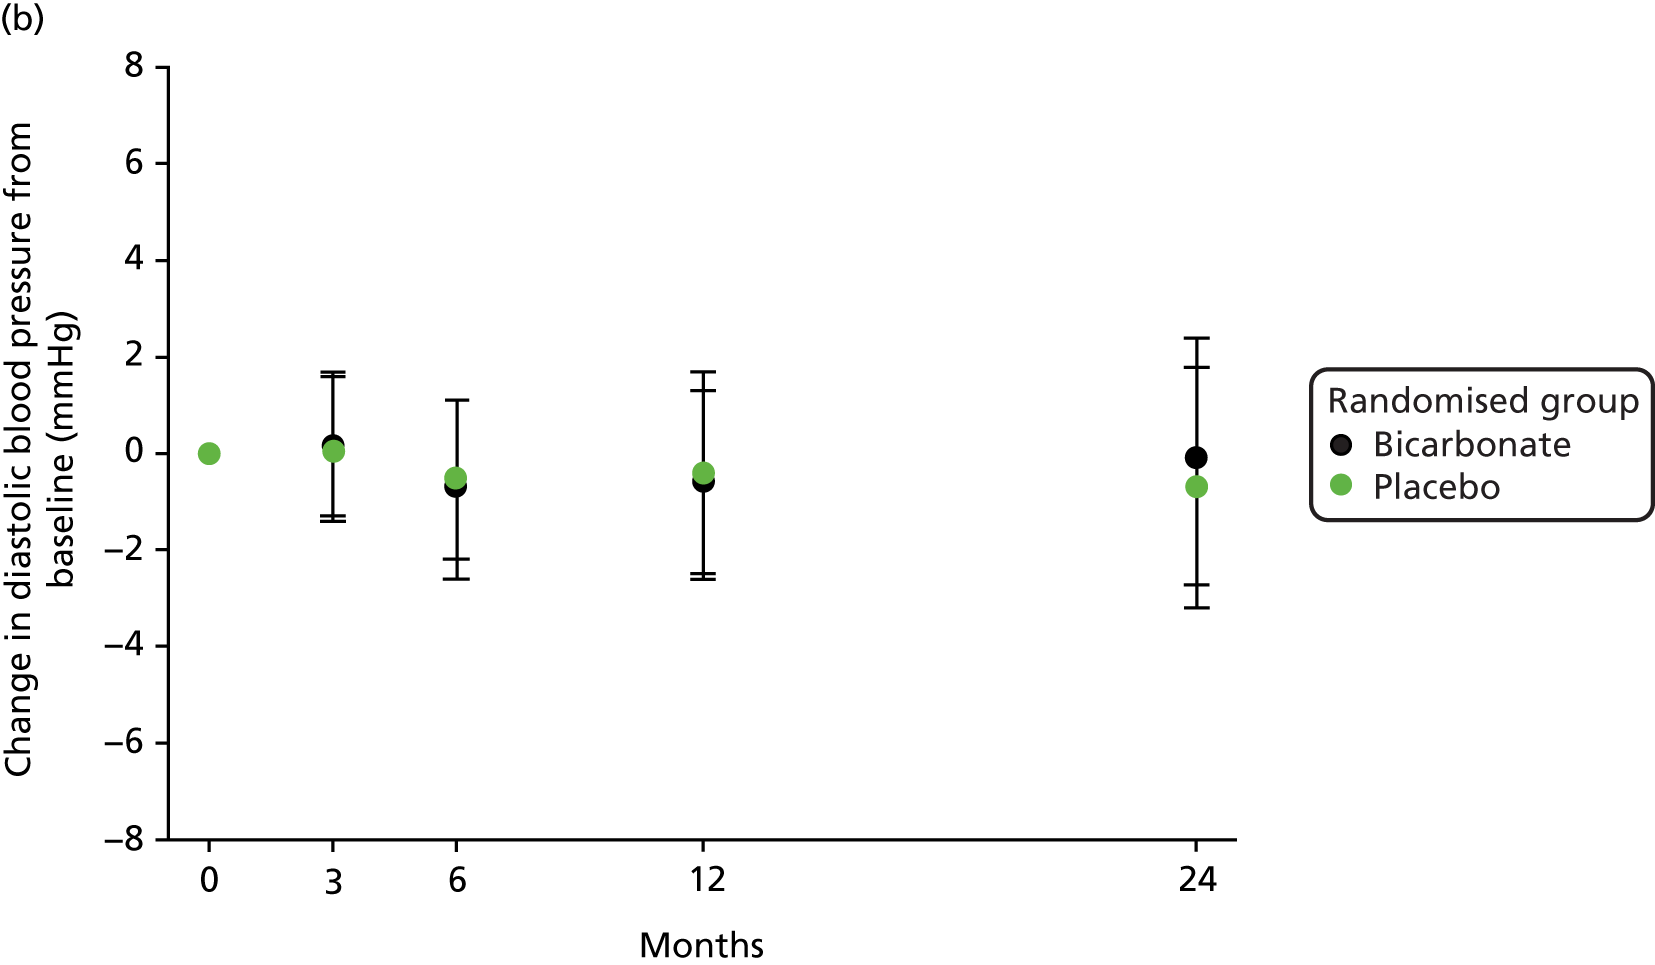
No significant treatment effect was found for blood pressure, total cholesterol or N-terminal pro-B-type natriuretic peptide on repeated-measures analysis. The results are presented in Table 8 and the change in blood pressure relative to baseline in each group is shown in Figure 6.
| Outcome | Time point | Randomised group | Treatment effecta (95% CI) | p-value | |
|---|---|---|---|---|---|
| Bicarbonate | Placebo | ||||
| NT-pro-BNP (pg/ml), median concentration (IQR) | Baseline | 5910 (1678–10,221) (n = 115) | 4453 (1555–10,521) (n = 115) | 0.13 (–0.18 to 0.44)b | 0.42 |
| 12 months | 6809 (1651–12,691) (n = 91) | 4158 (1725–9743) (n = 79) | |||
| 24 months | 5062 (1748–10,357) (n = 80) | 5653 (2369–13,287) (n = 72) | |||
| Total cholesterol (mmol/l), mean (SD) | Baseline | 4.3 (1.0) (n = 144) | 4.2 (1.1) (n = 141) | 0.1 (–0.2 to 0.3) | 0.58 |
| 3 months | 4.4 (1.1) (n = 135) | 4.2 (1.1) (n = 125) | |||
| 6 months | 4.4 (1.1) (n = 124) | 4.2 (1.1) (n = 113) | |||
| 12 months | 4.4 (1.2) (n = 104) | 4.3 (1.2) (n = 96) | |||
| 24 months | 4.4 (1.1) (n = 72) | 4.4 (1.2) (n = 77) | |||
| Systolic blood pressure (mmHg), mean (SD) | Baseline | 143 (18) (n = 152) | 143 (18) (n = 148) | 0 (–4 to 3) | 0.93 |
| 3 months | 143 (20) (n = 138) | 143 (19) (n = 133) | |||
| 6 months | 140 (20) (n = 128) | 141 (16) (n = 117) | |||
| 12 months | 143 (21) (n = 114) | 143 (16) (n = 103) | |||
| 24 months | 143 (21) (n = 81) | 142 (18) (n = 79) | |||
| Diastolic blood pressure (mmHg), mean (SD) | Baseline | 75 (11) (n = 152) | 73 (10) (n = 148) | 1 (–1 to 3) | 0.16 |
| 3 months | 75 (10) (n = 138) | 73 (11) (n = 133) | |||
| 6 months | 74 (12) (n = 128) | 73 (11) (n = 117) | |||
| 12 months | 74 (11) (n = 114) | 73 (9) (n = 103) | |||
| 24 months | 76 (11) (n = 81) | 72 (10) (n = 79) | |||
FIGURE 6.
Change in blood pressure relative to baseline. (a) Change in systolic blood pressure (SBP); and (b) change in diastolic blood pressure.
Bone and mineral metabolism
No significant treatment effect was evident for markers of bone turnover (bone-specific alkaline phosphatase and tartrate-resistant acid phosphatase 5b) or for other key molecules involved in bone and mineral metabolism (vitamin D metabolites, PTH, calcium or phosphate). The results are presented in Table 9.
| Outcome | Time point | Randomised group | Treatment effecta (95% CI) | p-value | |
|---|---|---|---|---|---|
| Bicarbonate | Placebo | ||||
| TRACP-5b (IU/l), median concentration (IQR) | Baseline | 0.58 (0.29–1.30) (n = 122) | 0.88 (0.36–1.57) (n = 126) | –0.18 (–0.43 to 0.08)b | 0.17 |
| 12 months | 0.72 (0.32–1.16) (n = 87) | 0.84 (0.34–1.36)(n = 75) | |||
| 24 months | 0.46 (0.22–0.85) (n = 50) | 0.58 (0.28–1.40) (n = 56) | |||
| Bs-ALP (µg/l), median concentration (IQR) | Baseline | 14.4 (11.5–19.7) (n = 124) | 14.8 (11.4–19.1)(n = 125) | 0.01 (–0.11 to 0.13)b | 0.83 |
| 12 months | 13.6 (10.0–18.1) (n = 89) | 13.9 (11.5–17.4) (n = 77) | |||
| 24 months | 13.7 (10.2–19.7) (n = 55) | 12.6 (10.3–17.5) (n = 57) | |||
| PTH (pmol/l), median concentration (IQR) | Baseline | 16.5 (9.8–26.5) (n = 103) | 15.0 (9.8–23.4) (n = 105) | 0.03 (–0.14 to 0.19)b | 0.75 |
| 12 months | 17.0 (9.8–30.8)(n = 82) | 15.5 (10.2–22.0) (n = 81) | |||
| 24 months | 14.8 (9.6–31.5) (n = 58) | 17.4 (12.2–24.9) (n = 67) | |||
| 25OHD (nmol/l), median concentration (IQR) | Baseline | 33 (24–56) (n = 109) | 41 (24–67) (n = 108) | –0.08 (–0.23 to 0.06)b | 0.24 |
| 12 months | 35 (22–56) (n = 88) | 43 (24–59) (n = 77) | |||
| 24 months | 42 (23–66) (n = 53) | 48 (26–70) (n = 56) | |||
| 1,25OHD (pmol/l), mean concentration (SD) | Baseline | 57 (23) (n = 109) | 54 (24) (n = 109) | 3 (–3 to 9) | 0.30 |
| 12 months | 61 (40) (n = 88) | 55 (23) (n = 78) | |||
| 24 months | 62 (29) (n = 53) | 58 (28) (n = 56) | |||
| Calcium (mmol/l), mean concentration (SD) | Baseline | 2.33 (0.13) (n = 144) | 2.32 (0.14) (n = 145) | 0.02 (0.00 to 0.04) | 0.11 |
| 3 months | 2.34 (0.13) (n = 134) | 2.34 (0.14) (n = 129) | |||
| 6 months | 2.34 (0.11) (n = 123) | 2.34 (0.15) (n = 115) | |||
| 12 months | 2.35 (0.11) (n = 107) | 2.33 (0.12) (n = 100) | |||
| 24 months | 2.37 (0.11) (n = 78) | 2.34 (0.11) (n = 76) | |||
| Phosphate (mmol/l), mean concentration (SD) | Baseline | 1.26 (0.39) (n = 142) | 1.29 (0.27) (n = 140) | 0.02 (–0.03 to 0.06) | 0.52 |
| 3 months | 1.26 (0.26) (n = 123) | 1.28 (0.31) (n = 123) | |||
| 6 months | 1.26 (0.26) (n = 115) | 1.23 (0.27) (n = 106) | |||
| 12 months | 1.27 (0.30) (n = 106) | 1.28 (0.36) (n = 97) | |||
| 24 months | 1.25 (0.27) (n = 75) | 1.24 (0.34) (n = 77) | |||
Other blood markers
No significant treatment effect was evident for blood haemoglobin and glycosylated haemoglobin (HbA1c) level, thyroid function or serum albumin concentration. Of particular note, no treatment effect was evident for serum potassium concentration. The results are presented in Table 10.
| Outcome | Time point | Randomised group | Treatment effecta (95% CI) | p-value | |
|---|---|---|---|---|---|
| Bicarbonate | Placebo | ||||
| Haemoglobin, mean concentration (SD) (g/l) | Baseline | 115 (14) (n = 142) | 117 (17) (n = 144) | –0.1 (–0.4 to 0.2) | 0.48 |
| 3 months | 117 (15) (n = 138) | 119 (15) (n = 131) | |||
| 6 months | 118 (13) (n = 126) | 118 (16) (n = 117) | |||
| 12 months | 116 (15) (n = 112) | 120 (15) (n = 101) | |||
| 24 months | 120 (14) (n = 77) | 120 (16) (n = 78) | |||
| Albumin (g/l), mean concentration (SD) | Baseline | 39 (4) (n = 148) | 40 (5) (n = 146) | 0 (–1 to 1) | 0.67 |
| 3 months | 39 (5) (n = 135) | 39 (5) (n = 132) | |||
| 6 months | 39 (5) (n = 124) | 39 (5) (n = 116) | |||
| 12 months | 39 (5) (n = 109) | 39 (5) (n = 100) | |||
| 24 months | 39 (5) (n = 79) | 39 (4) (n = 78) | |||
| Median concentration of TSH (IQR) | Baseline | 2.1 (1.5–3.0) (n = 138) | 2.1 (1.5–2.8) (n = 137) | 0.07 (–0.10 to 0.24)b | 0.39 |
| 3 months | 2.2 (1.4–3.1) (n = 129) | 1.9 (1.3–2.8) (n = 124) | |||
| 6 months | 2.1 (1.4–3.3) (n = 120) | 2.2 (1.4–3.3) (n = 109) | |||
| 12 months | 2.2 (1.3–3.6) (n = 100) | 2.1 (1.5–2.9) (n = 93) | |||
| 24 months | 2.5 (1.4–3.1) (n = 74) | 2.2 (1.2–3.1) (n = 75) | |||
| Potassium (mmol/l), mean concentration (SD) | Baseline | 4.9 (0.5) (n = 149) | 4.9 (0.5) (n = 148) | 0.0 (–0.1 to 0.1) | 0.80 |
| 3 months | 4.8 (0.5) (n = 136) | 4.9 (0.6) (n = 130) | |||
| 6 months | 4.9 (0.5) (n = 124) | 4.8 (0.5) (n = 116) | |||
| 12 months | 4.8 (0.5) (n = 112) | 4.8 (0.5) (n = 101) | |||
| 24 months | 4.8 (0.6) (n = 77) | 4.8 (0.5) (n = 78) | |||
| HbA1c (mmol/mol), mean concentration (SD) | Baseline | 43 (12) (n = 134) | 42 (13) (n = 131) | 1 (–1 to 4) | 0.38 |
| 3 months | 44 (15) (n = 131) | 42 (12) (n = 126) | |||
| 6 months | 45 (15) (n = 124) | 43 (13) (n = 115) | |||
| 12 months | 44 (14) (n = 103) | 42 (11) (n = 92) | |||
| 24 months | 42 (11) (n = 67) | 43 (11) (n = 68) | |||
Adverse events
A large number of adverse events (n = 857) were recorded, as expected for a trial enrolling older patients with extensive multimorbidity. In total, 263 out of 300 (88%) participants experienced at least one adverse event. Adverse events were more frequent in the bicarbonate arm (457 vs. 400), with a notable excess of events coded as gastrointestinal (45 vs. 25), musculoskeletal (28 vs. 17), cardiac (32 vs. 19), nervous system (24 vs. 12) and respiratory (26 vs. 14). Full details are presented in Table 11.
| Adverse event | Randomised group | |
|---|---|---|
| Bicarbonate (N = 152) | Placebo (N = 148) | |
| At least one adverse event, n (%) | 131 (86.1) | 132 (89.1) |
| Number of adverse events | 457 | 400 |
| SOC classification, number of events | ||
| Blood and lymphatic system disorders | 5 | 1 |
| Cardiac disorders | 32 | 19 |
| Congenital, familial and genetic disorders | 0 | 1 |
| Ear and labyrinth disorders | 1 | 1 |
| Endocrine disorders | 1 | 2 |
| Eye disorders | 6 | 6 |
| Gastrointestinal disorders | 45 | 25 |
| General disorders and administration site conditions | 14 | 20 |
| Hepatobiliary disorders | 0 | 0 |
| Immune system disorders | 0 | 0 |
| Infections and infestations | 113 | 118 |
| Injury, poisoning and procedural complications | 41 | 32 |
| Investigations | 5 | 7 |
| Metabolism and nutrition disorders | 19 | 27 |
| Musculoskeletal and connective tissue disorders | 28 | 17 |
| Neoplasms – benign, malignant and unspecified (incl. cysts and polyps) | 9 | 16 |
| Nervous system disorders | 24 | 12 |
| Psychiatric disorders | 1 | 5 |
| Renal and urinary disorders | 23 | 23 |
| Reproductive system and breast disorders | 4 | 1 |
| Respiratory, thoracic and mediastinal disorders | 26 | 14 |
| Skin and subcutaneous tissue disorders | 16 | 11 |
| Surgical and medical procedures | 34 | 30 |
| Vascular disorders | 10 | 12 |
For cardiac adverse events, no difference in the number of episodes of decompensated heart failure was seen (8 vs. 10), but myocardial infarction was more common in the bicarbonate arm (10 vs. 2) (Table 12).
| Adverse event | Randomised group | |
|---|---|---|
| Bicarbonate (N = 152) | Placebo (N = 148) | |
| Deaths (all), n (%) | 15 (9.9) | 11 (7.4) |
| Death from cardiovascular event, n (%) | 4 (2.6) | 5 (3.4) |
| Death from end-stage renal failure, n (%) | 3 (2.0) | 0 (0) |
| Commenced dialysis or transplanted, n (%) | 33 (21.7) | 33 (22.3) |
| Myocardial infarction or acute coronary syndrome, n (%) | 10 (6.6) | 2 (1.4) |
| Decompensated heart failure or pulmonary oedema, n (%) | 8 (5.3) | 10 (6.8) |
| Fragility fractures (distal radius, vertebra or neck of femur), n (%) | 5 (3.3) | 2 (1.4) |
| At least one fall, n (%) | 49 (32.2) | 39 (26.4) |
| Number of falls | 124 | 70 |
| Falls rate (per year) (95% CI) | 0.99 (0.61 to 1.38) | 0.72 (0.25 to 1.19) |
Need for renal replacement therapy
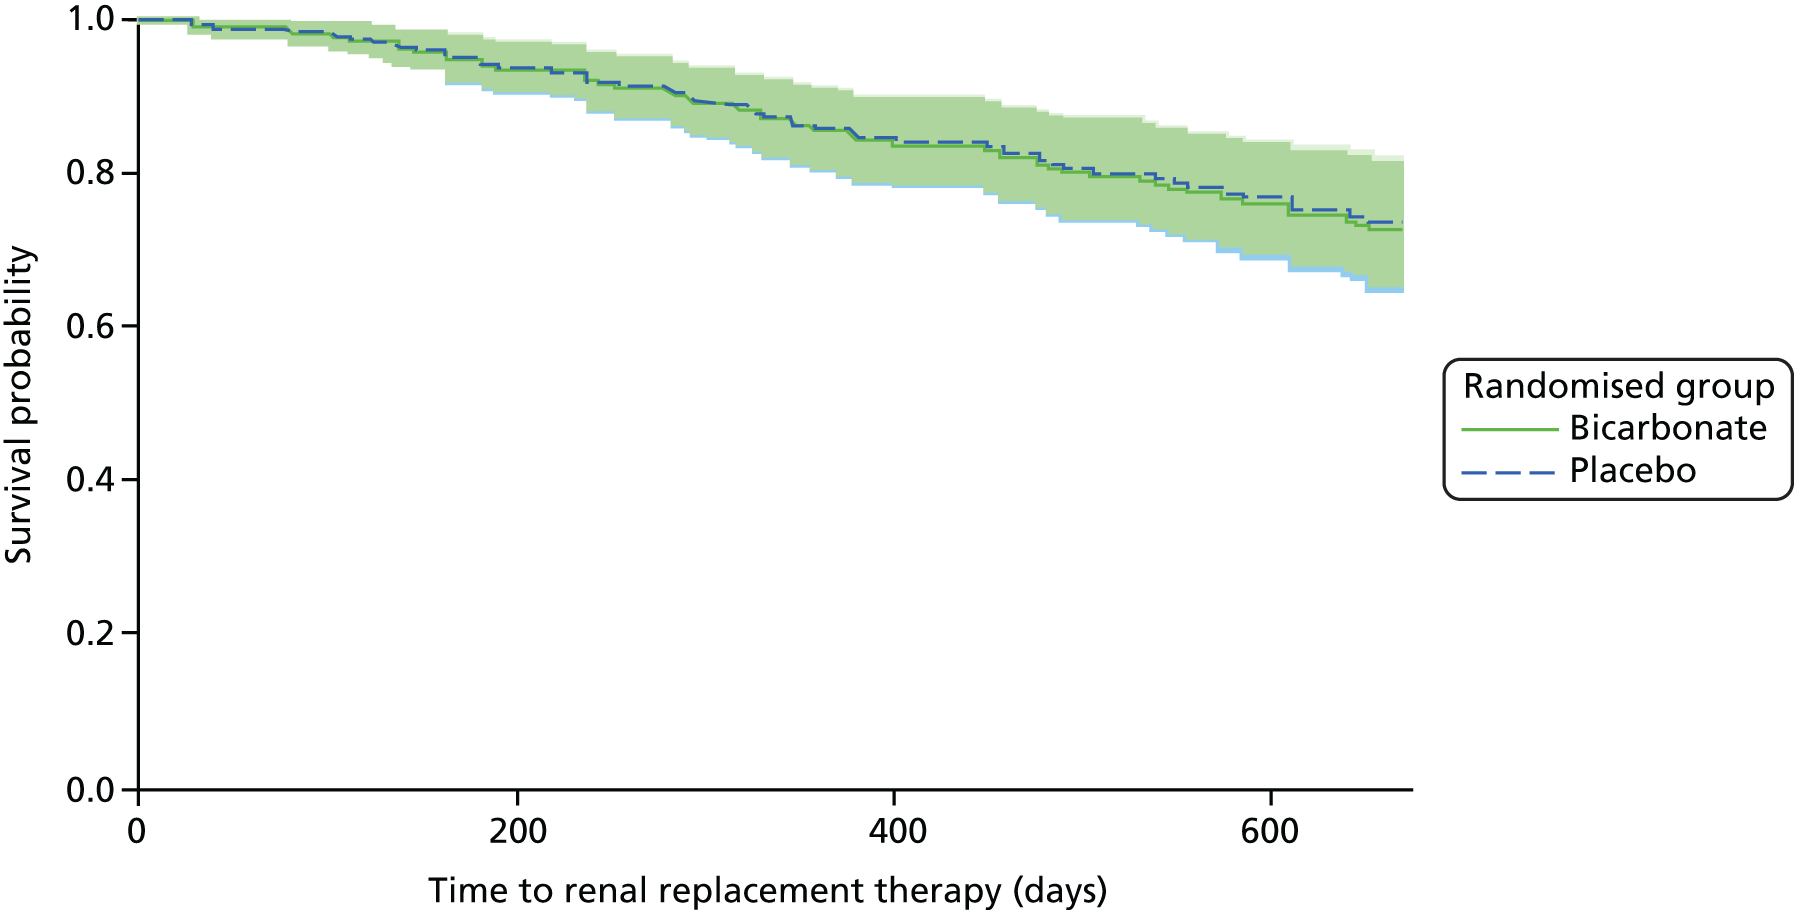
In total, 66 out of 300 (22%) participants commenced dialysis or underwent renal transplantation during the trial, with no difference between the bicarbonate arm and the placebo arm (33 vs. 33; p = 1.0) (see Table 12). Time-to-event analysis showed no significant difference in the HR between groups (HR 1.22, 95% CI 0.74 to 2.02; p = 0.43) (Figure 7). Similar results were seen for time to a composite outcome of either doubling of serum creatinine concentration or commencement of renal replacement therapy (HR 1.16, 95% CI 0.73 to 1.84; p = 0.53).
FIGURE 7.
Time to commencement of renal replacement therapy. HR (adjusted for age, sex and CKD category): 1.22 (95% CI 0.74 to 2.02; p = 0.43).
Deaths
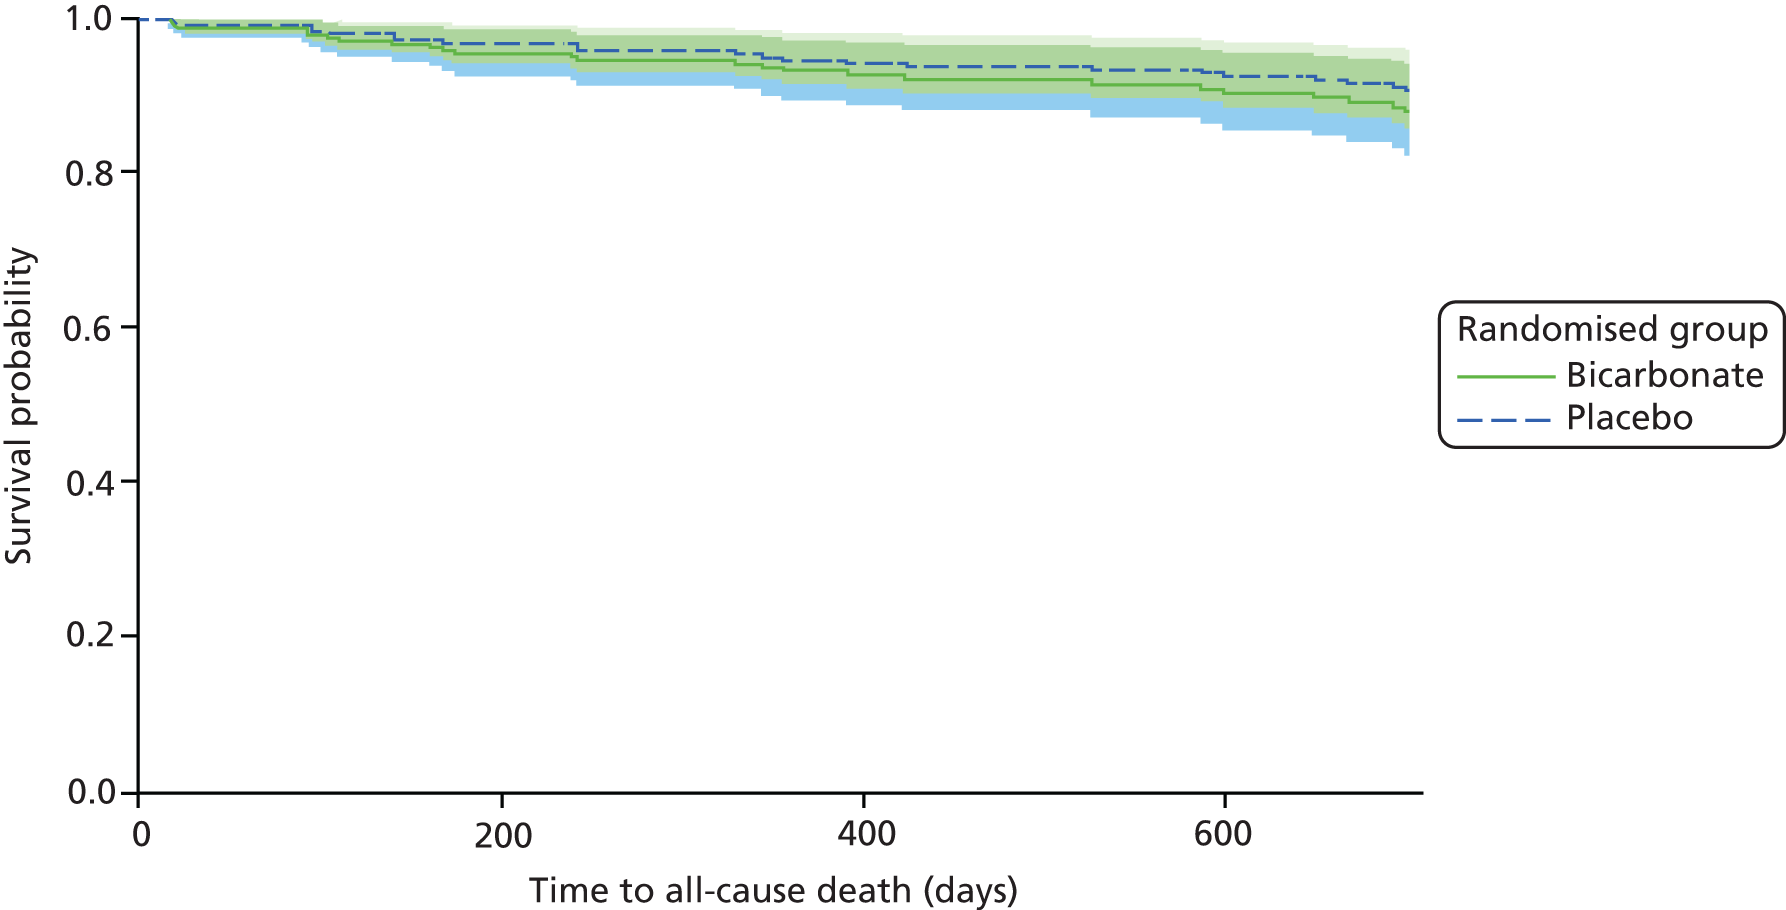
Twenty-six deaths were recorded during the trial, with a similar number of deaths in each arm (bicarbonate vs. placebo: 15 vs. 11; p = 0.45) (see Table 12). Time-to-event analysis showed no significant difference in HR between groups (HR 1.30, 95% CI 0.60 to 2.83; p = 0.51) (Figure 8).
FIGURE 8.
Time to death. HR (adjusted for age, sex and CKD category): 1.30 (95% CI 0.60 to 2.83; p = 0.51).
Falls
More participants in the bicarbonate arm than in the placebo arm reported falling but this did not reach significance (bicarbonate vs. placebo: 49 vs. 39; p = 0.26). The median time to first fall among those who fell was shorter in the bicarbonate arm (130 days vs. 194 days). Cox proportional hazards modelling of time to first fall, adjusted for age, sex and CKD category, gave a HR of 1.43 (95% CI 0.94 to 2.20; p = 0.09).
Meta-analysis of outcomes with the BiCARB trial data included
Figures 9–15 show the results of the meta-analyses of existing trials of bicarbonate therapy, but with the BiCARB trial results added. The increase in serum bicarbonate seen with treatment in the BiCARB trial was lower than that seen in most other trials, and the favourable effect on eGFR seen in other trials was also not seen in the BiCARB trial. Meta-analyses including BiCARB data showed no significant effect of bicarbonate treatment on weight, mid-arm muscle circumference or systolic blood pressure. Heterogeneity was high across all analyses, as shown by the high I2 values.
FIGURE 9.
Meta-analysis: difference in serum bicarbonate concentration (mmol/l) (any time point). IV, instrumental variable; SD, standard deviation.

FIGURE 10.
Meta-analysis: difference in serum bicarbonate concentration (mmol/l) (1-year follow-up only). IV, instrumental variable; SD, standard deviation.

FIGURE 11.
Meta-analysis: difference in eGFR (ml/minute/1.73 m2) (any time point). IV, instrumental variable; SD, standard deviation.

FIGURE 12.
Meta-analysis: difference in eGFR (ml/minute/1.73 m2) (1-year follow-up only). IV, instrumental variable; SD, standard deviation.

FIGURE 13.
Meta-analysis: difference in systolic blood pressure (mmHg) (any time point). IV, instrumental variable; SD, standard deviation.

FIGURE 14.
Meta-analysis: difference in weight (kg) (any time point). IV, instrumental variable; SD, standard deviation.

FIGURE 15.
Meta-analysis: difference in mid-arm muscle circumference (cm) (any time point). IV, instrumental variable; SD, standard deviation.

Chapter 5 Cost-effectiveness results
Table 13 shows the main resource use and costs per participant for complete cases over the first 12 months of follow-up. These initial analyses do not take into account participants who dropped out at the point of commencing renal replacement therapy, which is considered later in this chapter. All cost-effectiveness analyses are based on the unit costs reported in Appendix 4. The most frequently used resource use item was GP visits (63–64% of study participants). The next most frequently used item was outpatient visits (from 60% to 62% for nephrology visits and between 57% and 62% for other outpatient visits). The most expensive resource use item was an inpatient hospital stay, with a mean cost of £480 (bicarbonate arm) or £175 (placebo arm). The least frequently used items were physiotherapy, occupational therapy, speech therapy and social care. Totalling all resource use together over 1 year, costs were lowest among participants randomised to the placebo arm (mean cost £807 per participant in the placebo arm vs. £1234 per participant in the bicarbonate arm).
| Resource use item | Randomised group | |||||
|---|---|---|---|---|---|---|
| Bicarbonate (N = 97) | Placebo (N = 79) | |||||
| Resource users, n (%) | Mean (SD) resource use | Mean (SD) cost (£) | Resource users, n (%) | Mean (SD) resource use | Mean (SD) cost (£) | |
| NHS hospital care | ||||||
| Admission days | 8 (8) | 1.39 (6.24) | 480.41 (2152.51) | 9 (11) | 0.51 (1.66) | 174.77 (571.41) |
| Day cases | 16 (16) | 0.24 (0.69) | 182.01 (509.55) | 7 (9) | 0.11 (0.39) | 83.80 (288.23) |
| Outpatient visits: nephrology | 58 (60) | 1.06 (1.09) | 200.12 (333.47) | 49 (62) | 1.25 (1.73) | 215.24 (339.65) |
| Outpatient visits: other | 60 (62) | 1.46 (1.79) | 175.43 (214.70) | 45 (57) | 1.54 (1.89) | 185.07 (226.08) |
| Day hospital visits | 24 (25) | 0.55 (1.66) | 72.25 (219.30) | 19 (24) | 0.46 (1.47) | 60.26 (194.98) |
| Total hospital-based care costs | 1110.22 (2261.83) | 719.15 (972.64) | ||||
| NHS primary care | ||||||
| GP visits | 62 (64) | 1.51 (1.64) | 57.20 (62.33) | 50 (63) | 1.38 (1.66) | 52.43 (63.03) |
| District nurse visits | 25 (26) | 1.31 (6.36) | 48.35 (234.92) | 23 (29) | 0.62 (1.56) | 22.91 (57.73) |
| Physiotherapist visits | 7 (7) | 0.15 (0.74) | 8.04 (38.54) | 1 (1) | 0.01 (0.11) | 0.66 (5.85) |
| Occupational therapist visits | 4 (4) | 0.04 (0.20) | 2.97 (14.40) | 1 (1) | 0.01 (0.11) | 0.91 (8.11) |
| Speech therapist visits | 0 (0) | 0 | 0 | 1 (1) | 0.01 (0.11) | 1.27 (11.32) |
| Social services | ||||||
| Day centre visits | 5 (5) | 0.10 (0.51) | 6.49 (32.13) | 2 (3) | 0.11 (0.91) | 7.18 (57.06) |
| Home help/carer visits | 1 (1) | 0.06 (0.61) | 0.94 (9.27) | 4 (5) | 0.16 (0.78) | 2.50 (11.84) |
| Total non-hospital-based care costs | 123.00 (241.42) | 87.86 (103.11) | ||||
| Total costs | 1234.22 (2334.29) | 807.01 (1005.91) | ||||
Table 14 describes the main resource use and costs per participant for complete cases over the first 24 months of follow-up. Owing to the additional numbers of participants dropping out over this extended follow-up period, the number of complete cases fell to 114 for this analysis. Totalling all resource use together over 2 years, costs were lowest among participants randomised to the bicarbonate group (mean cost £1184 per participant in the bicarbonate group vs. £1266 per participant in the placebo group).
| Resource use item | Randomised group | |||||
|---|---|---|---|---|---|---|
| Bicarbonate (N = 59) | Placebo (N = 55) | |||||
| Resource users, n (%) | Mean (SD) resource use | Mean (SD) cost (£) | Resource users, n (%) | Mean (SD) resource use | Mean (SD) cost (£) | |
| NHS hospital care | ||||||
| Admission days | 6 (10) | 0.68 (2.58) | 234.02 (891.50) | 8 (15) | 1.05 (4.36) | 364.01 (1505.22) |
| Day cases | 9 (15) | 0.19 (0.47) | 137.15 (347.58) | 8 (15) | 0.18 (0.47) | 133.75 (349.39) |
| Outpatient visits: nephrology | 40 (68) | 1.39 (1.47) | 275.45 (401.21) | 35 (64) | 1.56 (2.04) | 306.43 (469.62) |
| Outpatient visits: other | 41 (69) | 1.93 (2.38) | 231.56 (284.87) | 35 (64) | 1.89 (2.27) | 226.61 (271.59) |
| Day hospital visits | 21 (36) | 1.08 (2.62) | 143.44 (346.63) | 15 (27) | 0.84 (3.30) | 110.59 (436.16) |
| Total hospital-based care costs | 1021.62 (1357.52) | 1141.39 (1939.44) | ||||
| NHS primary care | ||||||
| GP visits | 49 (83) | 2.07 (1.79) | 78.58 (68.00) | 39 (71) | 1.98 (2.15) | 75.31 (81.60) |
| District nurse visits | 18 (31) | 1.15 (2.88) | 42.56 (106.20) | 21 (38) | 0.94 (2.14) | 34.92 (78.96) |
| Physiotherapist visits | 6 (10) | 0.25 (0.96) | 13.23 (49.81) | 0 (0) | 0 | 0 |
| Occupational therapist visits | 1 (2) | 0.02 (0.13) | 1.22 (9.38) | 1 (2) | 0.02 (0.13) | 1.31 (9.72) |
| Speech therapist visits | 0 (0) | 0 | 0 | 0 (0) | 0 | 0 |
| Social services | ||||||
| Day centre visits | 4 (7) | 0.39 (2.15) | 24.56 (135.43) | 2 (4) | 0.16 (1.08) | 10.31 (68.33) |
| Home help/carer visits | 2 (3) | 0.15 (0.94) | 2.32 (14.35) | 3 (5) | 0.24 (1.00) | 3.60 (15.20) |
| Total non-hospital-based care costs | 162.47 (247.16) | 125.44 (144.08) | ||||
| Total costs | 1184.08 (1432.11) | 1266.83 (1958.68) | ||||
The above analyses do not account for the costs of renal replacement (dialysis and renal transplantation) for participants who exited the study. Over the course of 2 years of follow-up, 66 participants proceeded to dialysis or transplantation, but 49 of these withdrew from the trial, commonly at the point of commencing renal replacement therapy. Table 15 includes all dialysis participants as well as complete cases. Their dialysis costs are calculated by using information on the type of dialysis and the date that dialysis commenced. The remaining health-care costs are missing for these participants once they are lost to follow-up. Table 15 shows that dialysis costs dominate other costs in both arms. Totalling all resource use together over 2 years, costs were lowest among participants in the bicarbonate group (mean cost £12,125 per participant in the bicarbonate group vs. £12,967 per participant in the placebo group).
| Resource use item | Randomised group | |||||
|---|---|---|---|---|---|---|
| Bicarbonate (N = 82) | Placebo (N = 81) | |||||
| Resource users, n (%) | Mean (SD) resource use | Mean (SD) cost (£) | Resource users, n (%) | Mean (SD) resource use | Mean (SD) cost (£) | |
| NHS hospital care | ||||||
| Admission days | 11 (13) | 2.24 (8.96) | 774.55 (3091.46) | 12 (15) | 1.74 (7.87) | 600.87 (2715.09) |
| Day cases | 14 (17) | 0.20 (0.46) | 143.54 (335.79) | 11 (14) | 0.16 (0.43) | 118.06 (317.61) |
| Outpatient visits: nephrology | 53 (65) | 1.32 (1.40) | 198.19 (211.33) | 47 (58) | 1.51 (2.25) | 226.65 (338.27) |
| Outpatient visits: other | 55 (67) | 1.96 (2.39) | 235.30 (286.48) | 46 (57) | 1.62 (2.11) | 193.82 (252.50) |
| Dialysis visits (haemodialysis, peritoneal dialysis) | 32 (39) | 88.55 (136.08) | 10,344.34 (14,888.34) | 29 (36) | 99.18 (168.53) | 10,982.17 (17,254.63) |
| Renal transplant | 1 (1) | 0.01 (0.11) | 154.64 (1400.35) | 4 (5) | 0.05 (0.22) | 626.21 (2764.58) |
| Day hospital visits | 27 (33) | 0.91 (2.31) | 120.94 (305.51) | 22 (27) | 0.80 (3.01) | 106.11 (398.57) |
| Total hospital-based care costs | 11,971.5 (15,495.88) | 12,853.88 (17,430.03) | ||||
| NHS primary care | ||||||
| GP visits | 62 (76) | 1.90 (1.79) | 72.29 (68.00) | 51 (63) | 1.78 (2.08) | 67.56 (79.03) |
| District nurse visits | 24 (29) | 1.22 (2.73) | 41.43 (100.74) | 25 (31) | 0.80 (1.94) | 29.64 (71.61) |
| Physiotherapist visits | 7 (9) | 0.22 (0.88) | 11.42 (45.53) | 1 (1) | 0.02 (0.22) | 1.28 (11.56) |
| Occupational therapist visits | 2 (2) | 0.02 (0.16) | 1.76 (11.18) | 2 (2) | 0.02 (0.16) | 1.78 (11.25) |
| Speech therapist visits | 0 (0) | 0 | 0 | 0 (0) | 0 | 0 |
| Social service | ||||||
| Day centre visits | 8 (10) | 0.39 (1.88) | 24.59 (118.69) | 2 (2) | 0.11 (0.89) | 7.00 (56.35) |
| Home help/carer visits | 3 (4) | 0.13 (0.83) | 2.04 (12.59) | 4 (5) | 0.40 (2.25) | 6.01 (34.24) |
| Total non-hospital-based care costs | 153.54 (219.96) | 113.33 (139.86) | ||||
| Total costs | 12,125.03 (15,494.49) | 12,967.15 (17,430.3) | ||||
Tables 16 and 17 show the mean EQ-5D values and QALY over 12 and 24 months, respectively, for complete cases. The EQ-5D value was lower at baseline for the bicarbonate group for the analysis at 12 and 24 months (0.73 and 0.74, respectively) than for the placebo group (0.78 and 0.79, respectively). At 12 months’ follow-up, the mean EQ-5D value had increased in the placebo group (0.79) and had decreased in the bicarbonate group (0.69). At 24 months’ follow-up, the mean EQ-5D value had fallen in both groups, by approximately 0.05 in the placebo group and by 0.03 in the treatment group. Overall, the total QALYs were higher in the placebo group at both 12 and 24 months’ follow-up.
| Time point | Randomised group, mean (SD) | |
|---|---|---|
| Bicarbonate (n = 97) | Placebo (n = 79) | |
| Baseline | 0.733 (0.216) | 0.779 (0.219) |
| 3 months | 0.720 (0.209) | 0.801 (0.152) |
| 6 months | 0.728 (0.190) | 0.782 (0.167) |
| 12 months | 0.692 (0.230) | 0.787 (0.151) |
| Total QALYs over 12 months | 0.717 (0.178) | 0.788 (0.145) |
| Time point | Randomised group, mean (SD) | |
|---|---|---|
| Bicarbonate (n = 59) | Placebo (n = 55) | |
| Baseline | 0.740 (0.204) | 0.786 (0.203) |
| 3 months | 0.700 (0.223) | 0.808 (0.127) |
| 6 months | 0.730 (0.163) | 0.802 (0.147) |
| 12 months | 0.707 (0.219) | 0.794 (0.136) |
| 24 months | 0.709 (0.254) | 0.731 (0.187) |
| Total QALYs over 24 months | 1.402 (0.185) | 1.537 (0.235) |
Tables 18 and 19 describe the mean ICECAP-O values over 12 and 24 months, respectively, for complete cases. In contrast to the EQ-5D and QALY analyses, the baseline differences between the groups are smaller and, for both groups, the differences in values between baseline and follow-up are smaller relative to the EQ-5D values. Tables 20 and 21 show the mean life satisfaction values over 12 and 24 months, respectively, for complete cases. The changes over time for both groups are consistent with the EQ-5D and ICECAP (Investigating Choice Experiments for the preferences of older people CAPability) data.
| Time point | Randomised group, mean (SD) | |
|---|---|---|
| Bicarbonate (n = 97) | Placebo (n = 79) | |
| Baseline | 0.861 (0.118) | 0.875 (0.103) |
| 3 months | 0.867 (0.108) | 0.872 (0.110) |
| 6 months | 0.861 (0.125) | 0.885 (0.092) |
| 12 months | 0.846 (0.124) | 0.892 (0.092) |
| Time point | Randomised group, mean (SD) | |
|---|---|---|
| Bicarbonate (n = 59) | Placebo (n = 55) | |
| Baseline | 0.871 (0.105) | 0.880 (0.098) |
| 3 months | 0.869 (0.102) | 0.870 (0.110) |
| 6 months | 0.868 (0.127) | 0.897 (0.080) |
| 12 months | 0.848 (0.120) | 0.893 (0.088) |
| 24 months | 0.857 (0.110) | 0.873 (0.104) |
| Time point | Randomised group, mean (SD) | |
|---|---|---|
| Bicarbonate (n = 97) | Placebo (n = 79) | |
| Baseline | 5.206 (1.607) | 5.329 (1.677) |
| 3 months | 5.226 (1.623) | 5.405 (1.660) |
| 6 months | 5.000 (1.683) | 5.329 (1.708) |
| 12 months | 4.856 (1.633) | 5.443 (1.534) |
| Time point | Randomised group, mean (SD) | |
|---|---|---|
| Bicarbonate (n = 59) | Placebo (n = 55) | |
| Baseline | 5.203 (1.517) | 5.273 (1.683) |
| 3 months | 5.186 (1.559) | 5.582 (1.572) |
| 6 months | 5.000 (1.462) | 5.364 (1.747) |
| 12 months | 4.763 (1.568) | 5.491 (1.477) |
| 24 months | 4.949 (1.569) | 5.055 (1.840) |
Table 22 shows the adjusted incremental costs and QALYs (ICECAP-O and life satisfaction values in sensitivity analyses) for the bicarbonate group versus the placebo group for the complete-case analyses at 12 and 24 months and for the complete cases plus imputed renal replacement therapy cases at 24 months. The 12- and 24-month analyses show a statistically significant increase in costs associated with bicarbonate treatment (between £564 and £591 per participant). The addition of the renal replacement therapy participants and their associated costs leads to a higher, but non-significant, cost difference (£809 per participant). In all three analyses, there is a QALY difference in favour of the placebo group (ranging from 0.05 to 0.08 QALYs).
| Analysis | Incremental mean costs (95% CI) (£)b,c,d | Incremental mean QALYs (95% CI)b,c,d | ICER (£/QALY) |
|---|---|---|---|
| Complete cases over 12 months’ follow-up (n = 176)e | 563.74 (88.18 to 1154.18) | –0.047 (–0.078 to –0.015) | Dominated |
| SA: lower sodium bicarbonate costf | 352.76 (–154.37 to 957.45) | –0.047 (–0.078 to –0.015) | Dominated |
| SA: lower inpatient stay costg | 539.03 (109.13 to 1050.45) | –0.046 (–0.078 to –0.015) | Dominated |
| SA: using the ICECAP valueh | 636.20 (187.59 to 1189.24) | –0.017 (–0.032 to 0.0001) | Dominated |
| SA: using the life satisfaction valuei | 580.19 (143.38 to 1130.11) | –0.396 (–0.733 to –0.059) | Dominated |
| Complete cases over 24 months’ follow-up (n = 114)j | 591.00 (166.29 to 1078.36) | –0.083 (–0.166 to –0.005) | Dominated |
| SA: lower sodium bicarbonate costf | 242.59 (–179.63 to 720.27) | –0.083 (–0.166 to –0.005) | Dominated |
| SA: lower inpatient stay costg | 593.74 (191.37 to 1072.07) | –0.083 (–0.166 to –0.005) | Dominated |
| SA: using the ICECAP valueh | 598.87 (215.69 to 1052.43) | –0.051 (–0.095 to –0.010) | Dominated |
| SA: using the life satisfaction valuei | 682.44 (257.28 to 1142.63) | –0.974 (–1.762 to –0.190) | Dominated |
| Complete cases over 24 months’ follow-up and all participants starting renal replacement therapy during the trial (n = 161)j | 808.93 (–4124.71 to 5411.89) | –0.074 (–0.151 to –0.003) | Dominated |
| SA: lower sodium bicarbonate costf | 534.61 (–4385.90 to 5149.69) | –0.074 (–0.150 to –0.003) | Dominated |
| SA: lower inpatient stay costg | 817.21 (–4097.90 to 5415.22) | –0.073 (–0.151 to –0.001) | Dominated |
| SA: using the ICECAP valueh,k | 422.08 (–4091.74 to 4629.60) | –0.046 (–0.090 to –0.002) | Dominated |
| SA: lower dialysis costl | 600.26 (–3560.78 to 4379.06) | –0.075 (–0.154 to –0.001) | Dominated |
| SA: higher dialysis costm | 899.41 (–4327.11 to 5714.04) | –0.074 (–0.156 to 0.002) | Dominated |
| SA: using the life satisfaction valuei,n | 928.18 (–4373.23 to 5729.68) | –0.072 (–1.366 to 0.002) | Dominated |
Figure 16 shows the scatterplot and the associated cost-effectiveness acceptability curves for the three analyses. Without the inclusion of dialysis costs, there is almost zero probability of the intervention being cost-effective at conventional thresholds of willingness to pay. For the analysis with the inclusion of renal replacement therapy costs, there is more uncertainty over cost differences, with the intervention having a probability of being cost-effective of between 0.4 and 0.1. At a willingness-to-pay threshold of £30,000 per QALY, there is a 14% probability of the intervention being deemed cost-effective.
FIGURE 16.
Incremental cost differences and incremental QALY differences between randomised groups. (a) Scatterplot for complete cases over 12 months’ follow-up (n = 176); (b) cost-effectiveness acceptability curve for complete cases over 12 months’ follow-up (n = 176); (c) scatterplot for complete cases over 24 months’ follow-up (n = 114); (d) cost-effectiveness acceptability curve for complete cases over 24 months’ follow-up (n = 114); (e) scatterplot for complete cases and all participants starting renal replacement therapy during the trial over 24 months’ follow-up (n = 161); and (f) cost-effectiveness acceptability curve for complete cases and all participants starting renal replacement therapy during the trial over 24 months’ follow-up (n = 161).
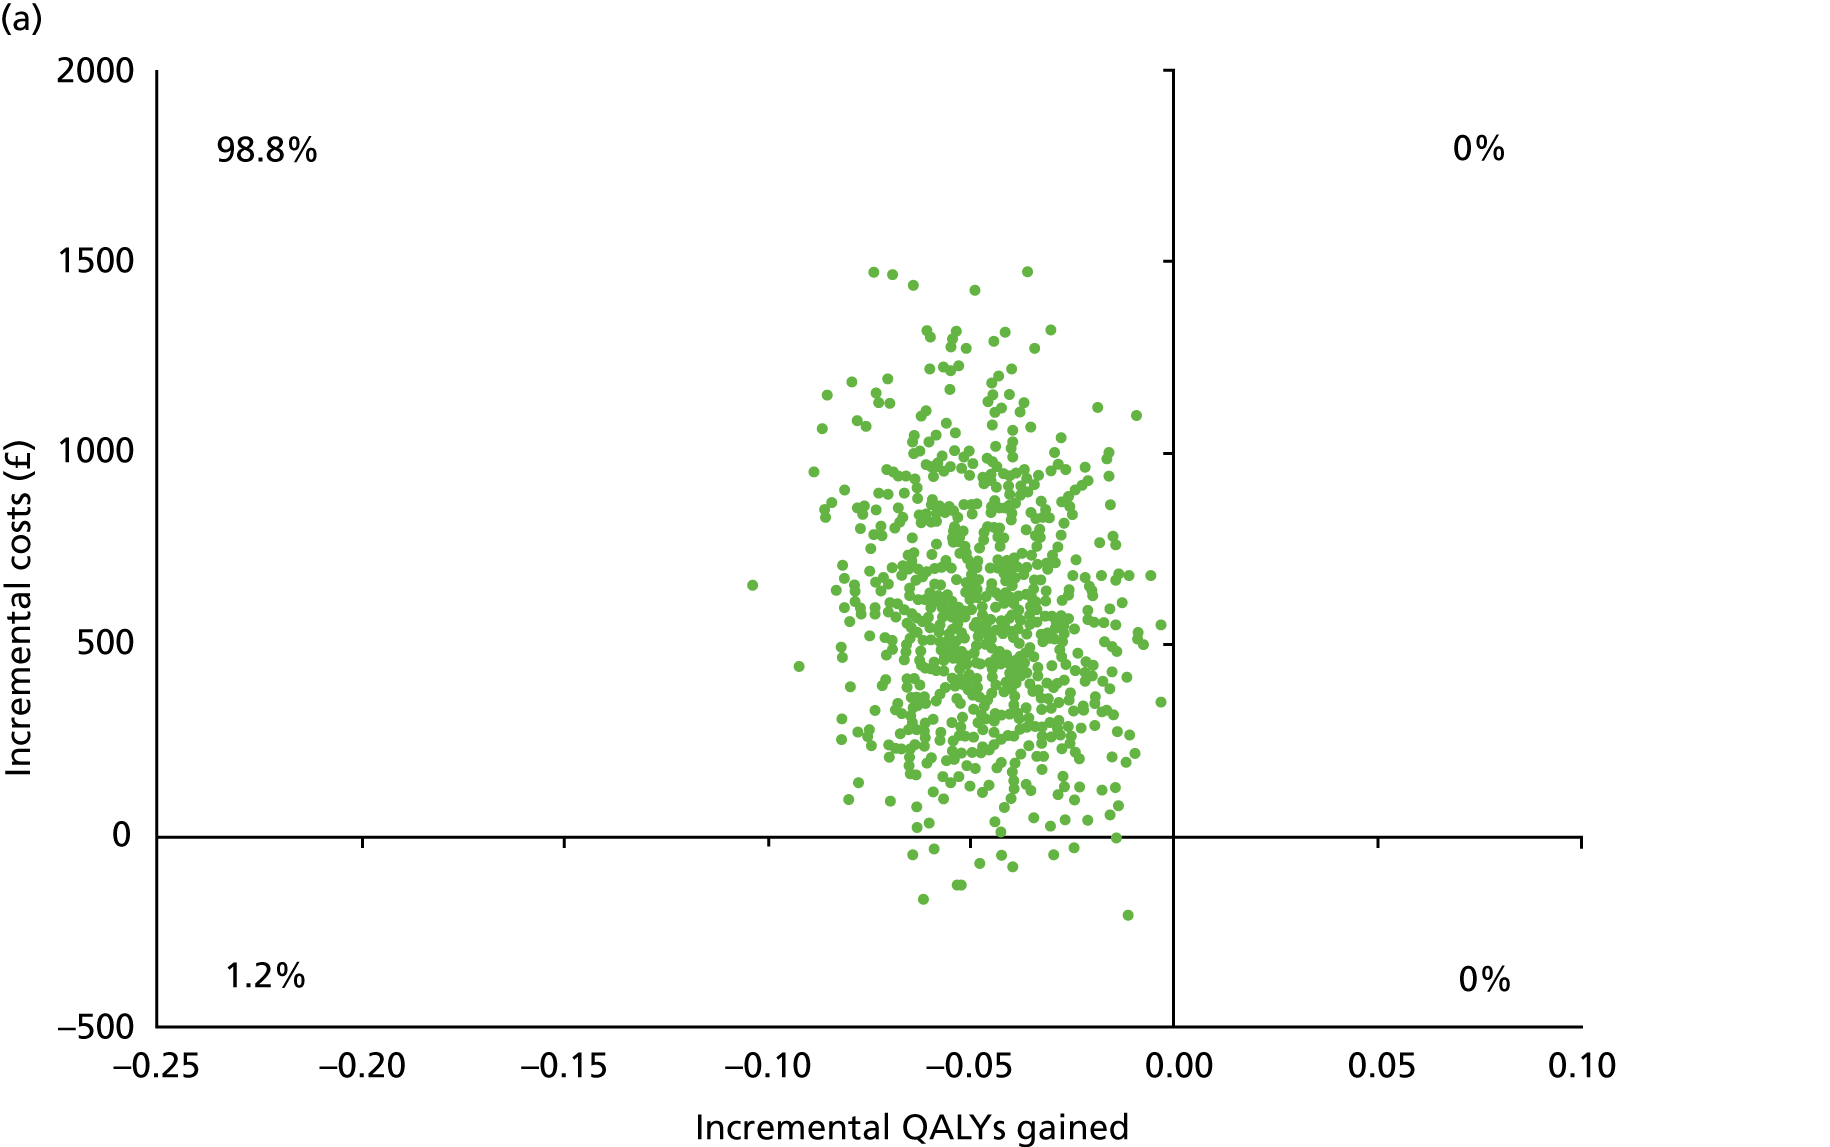
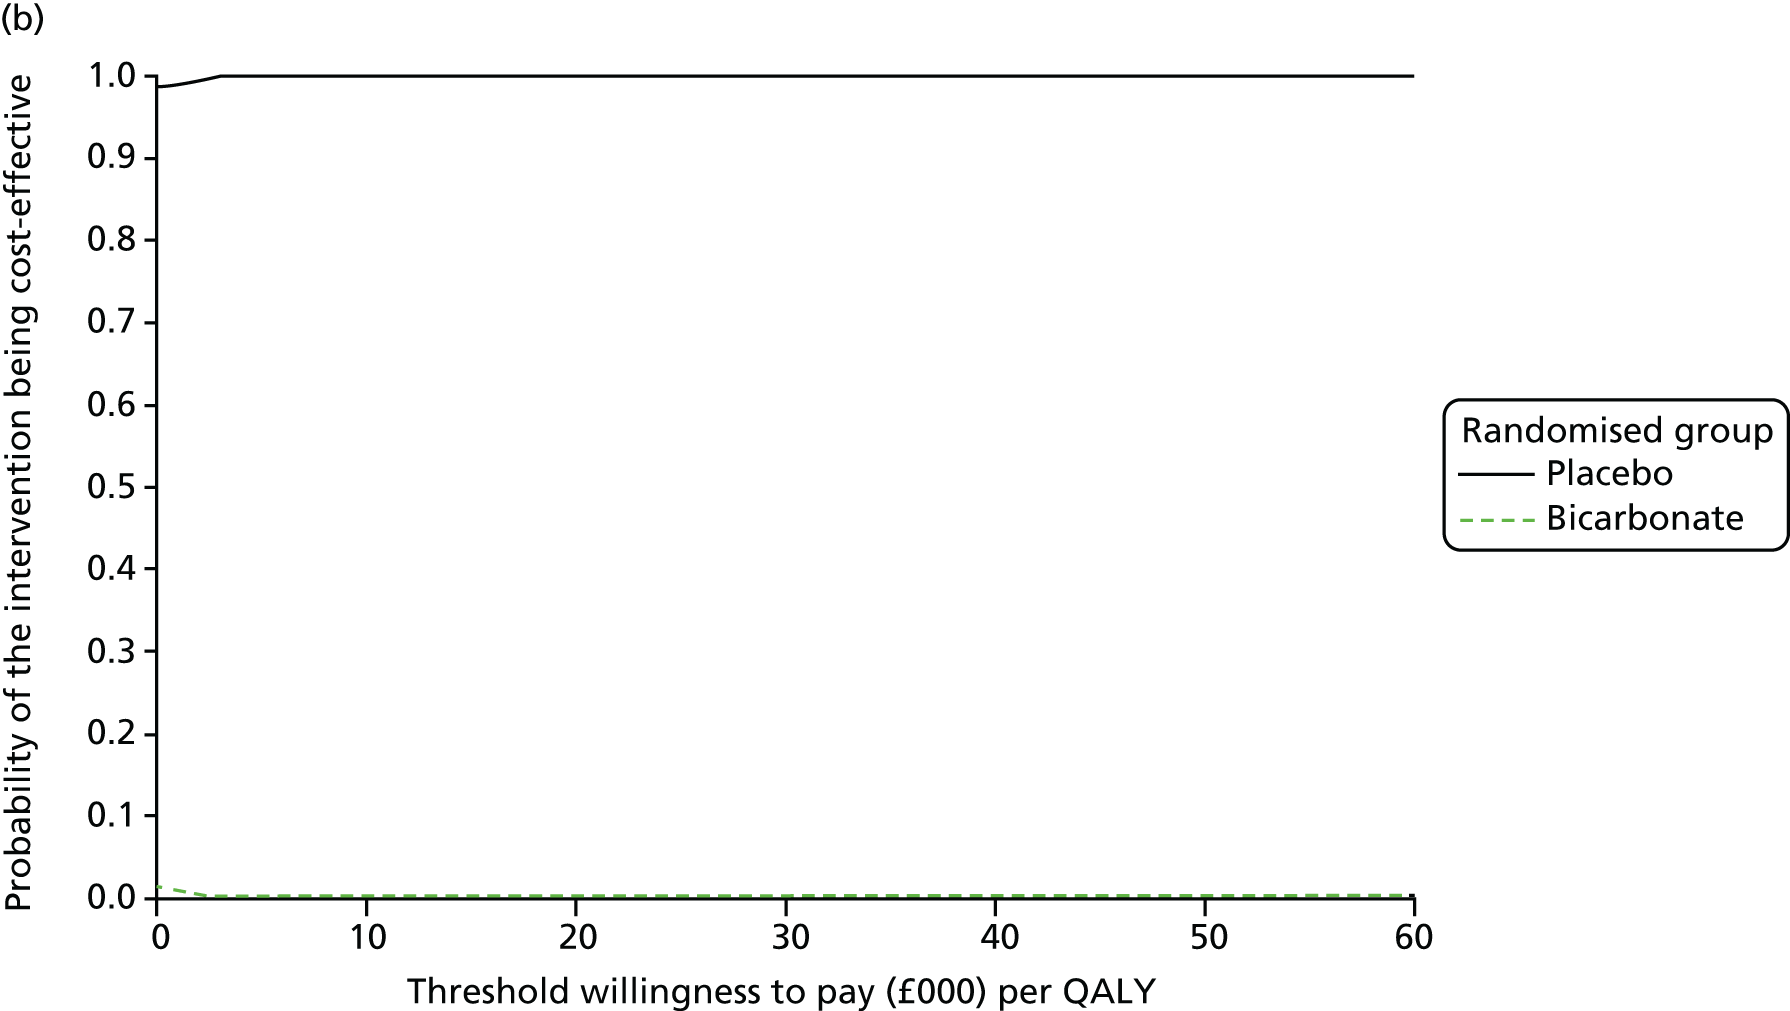
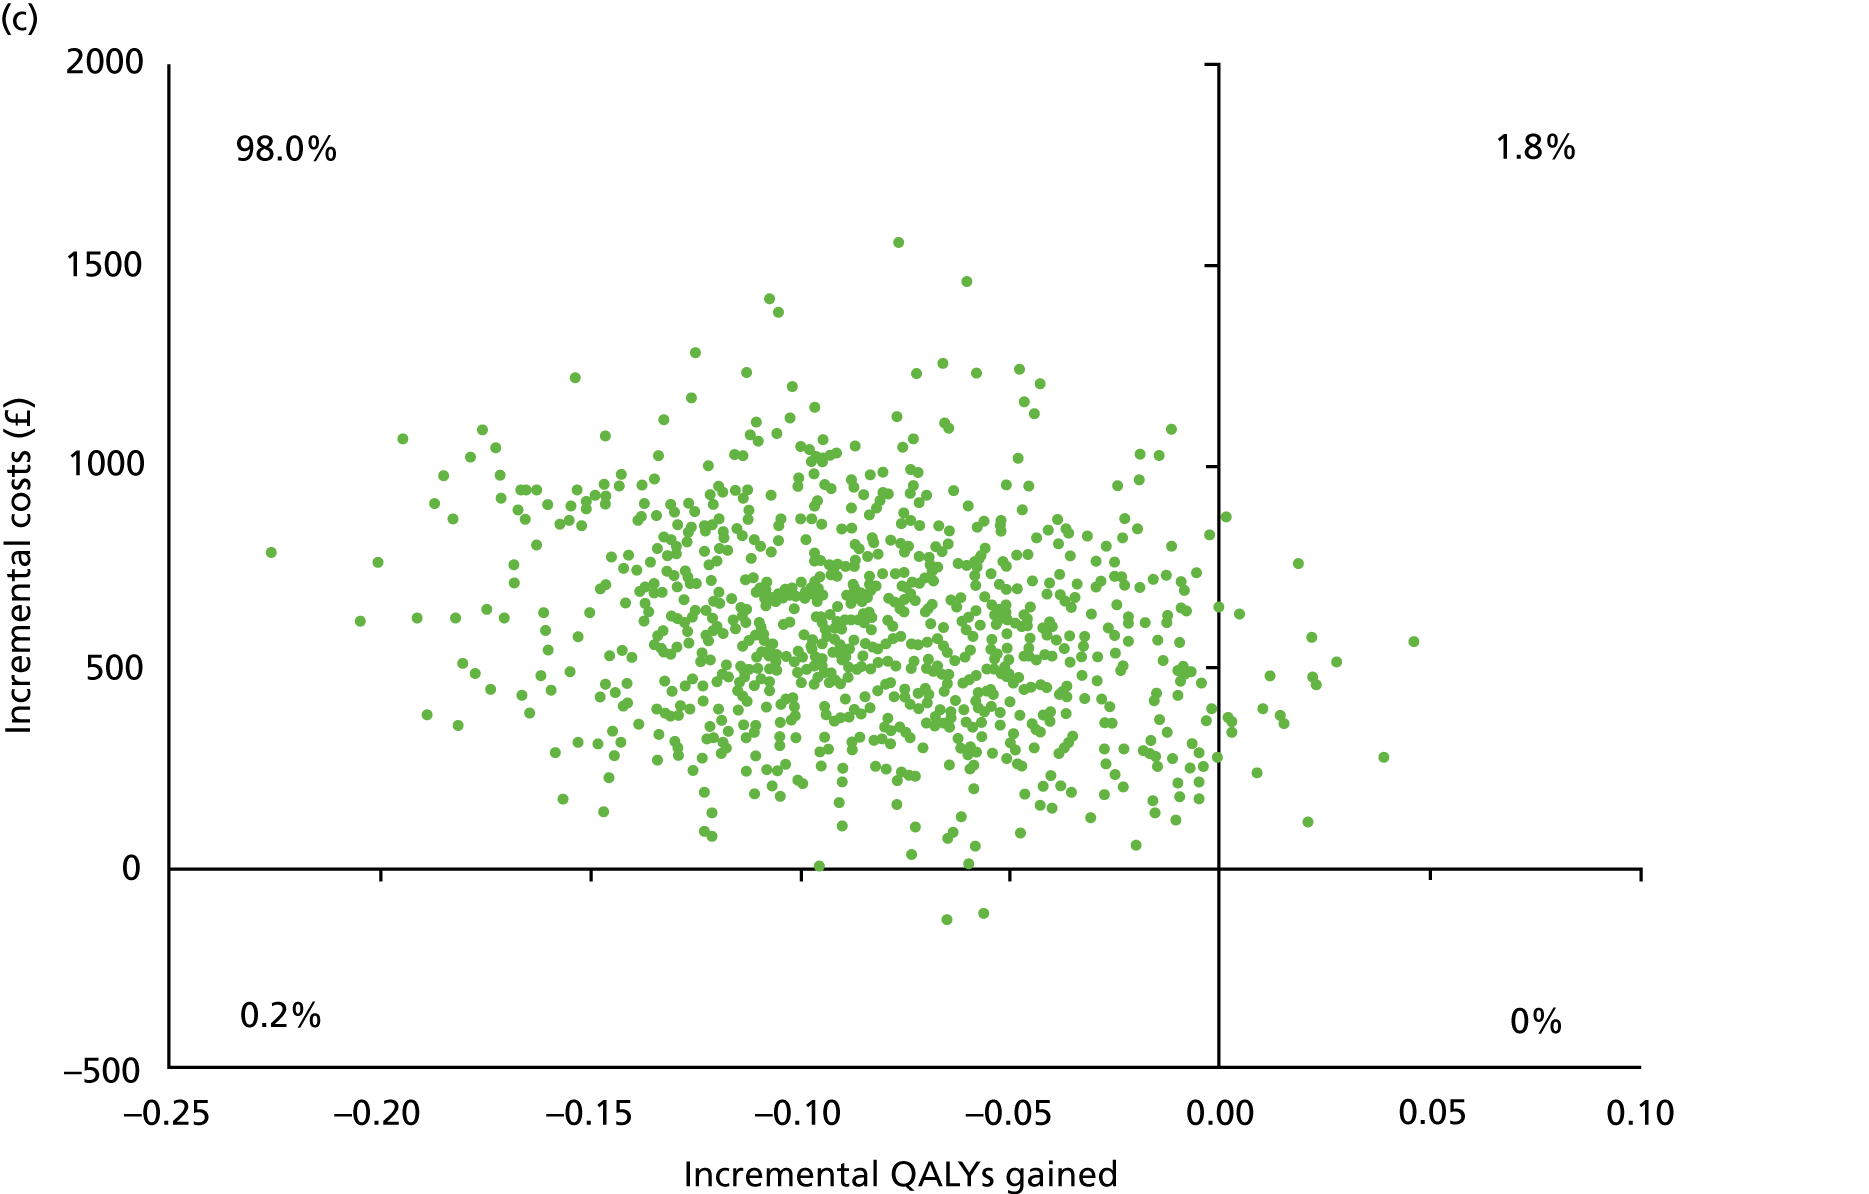
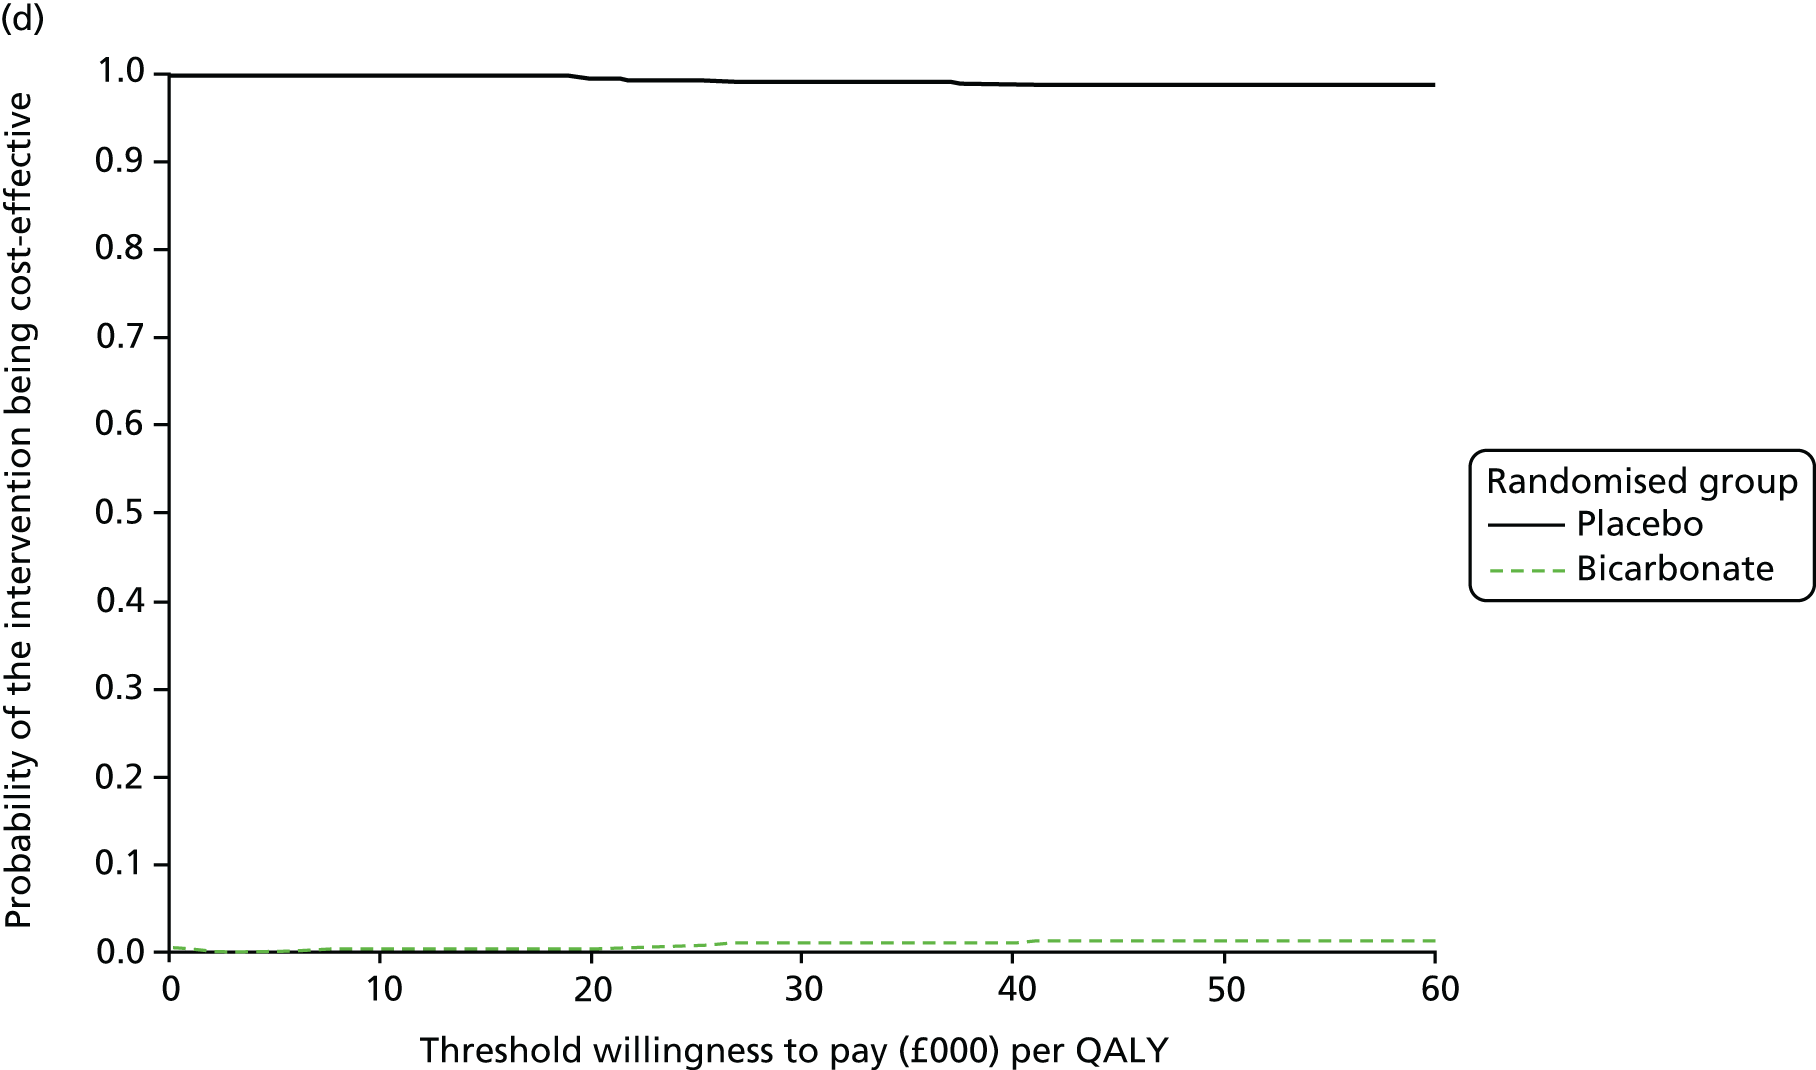
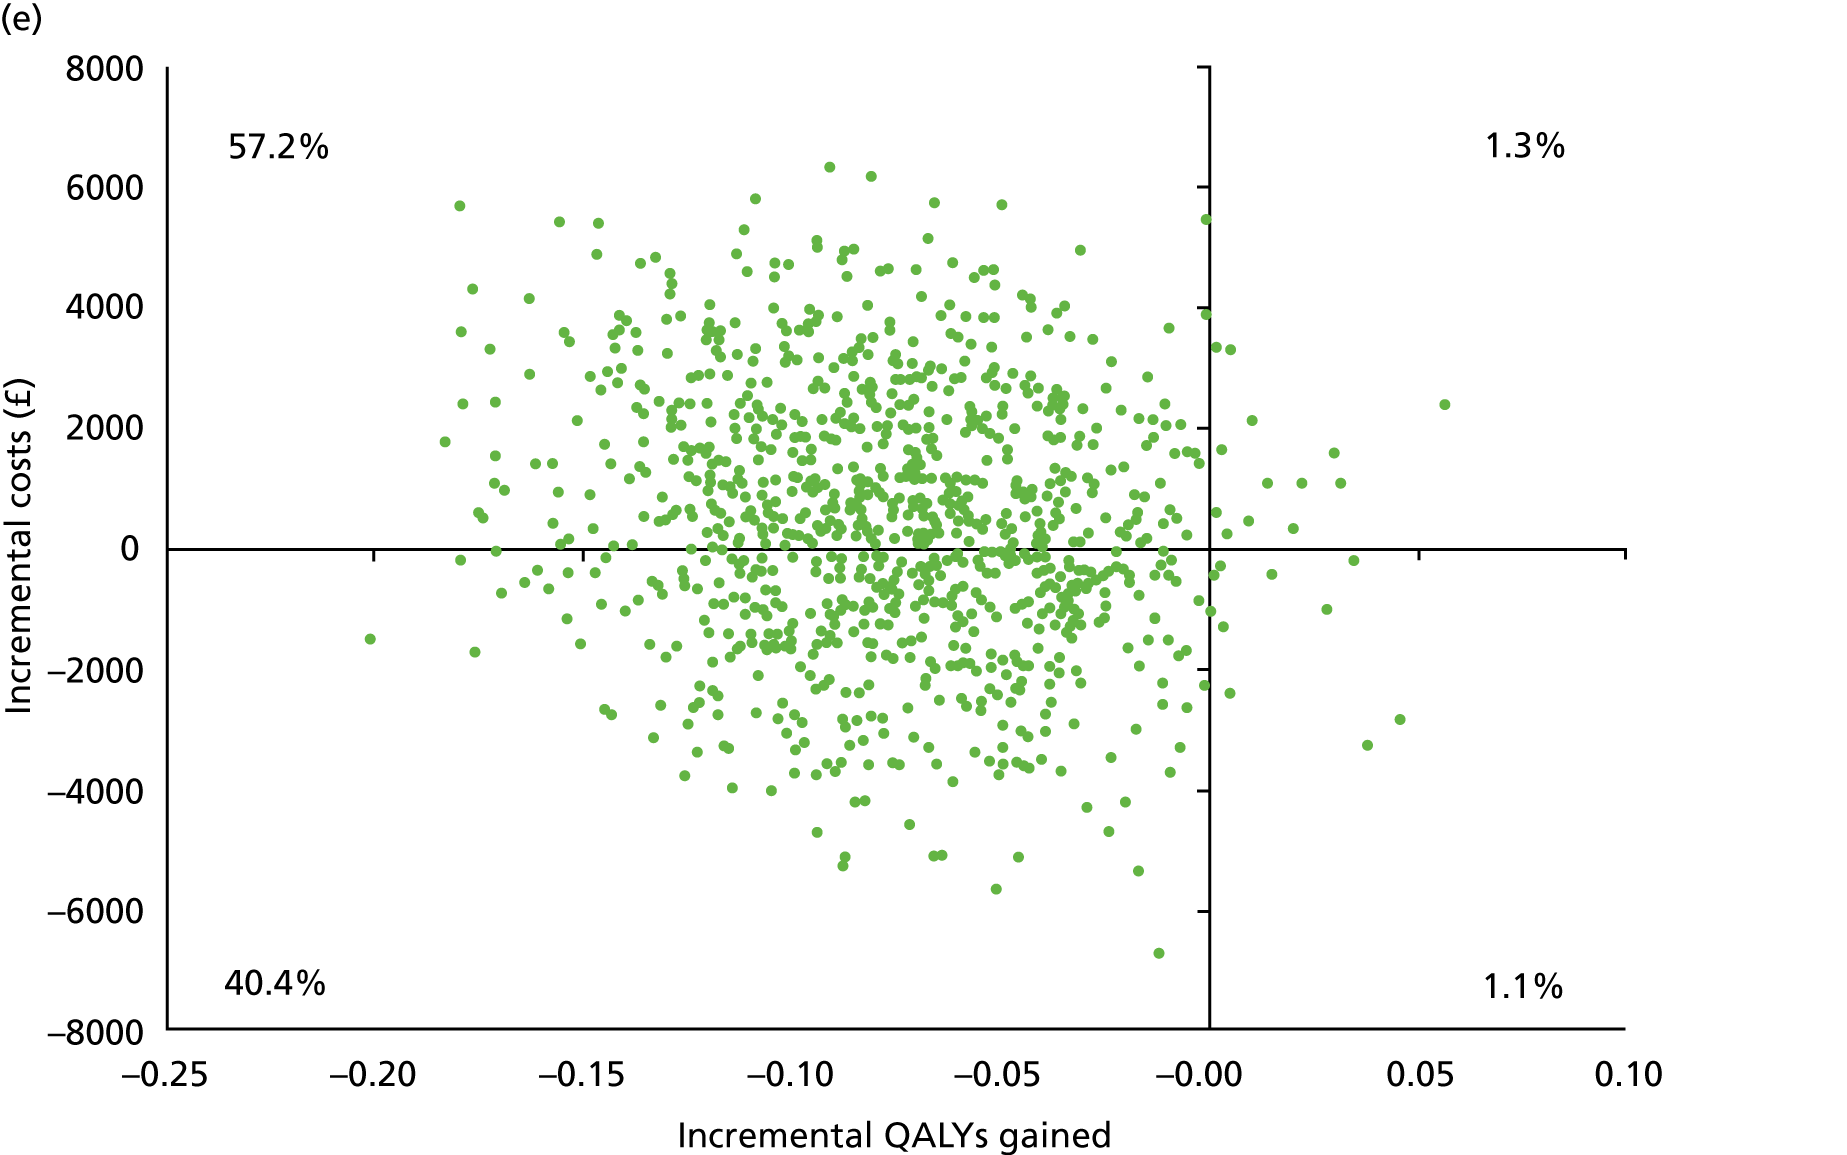
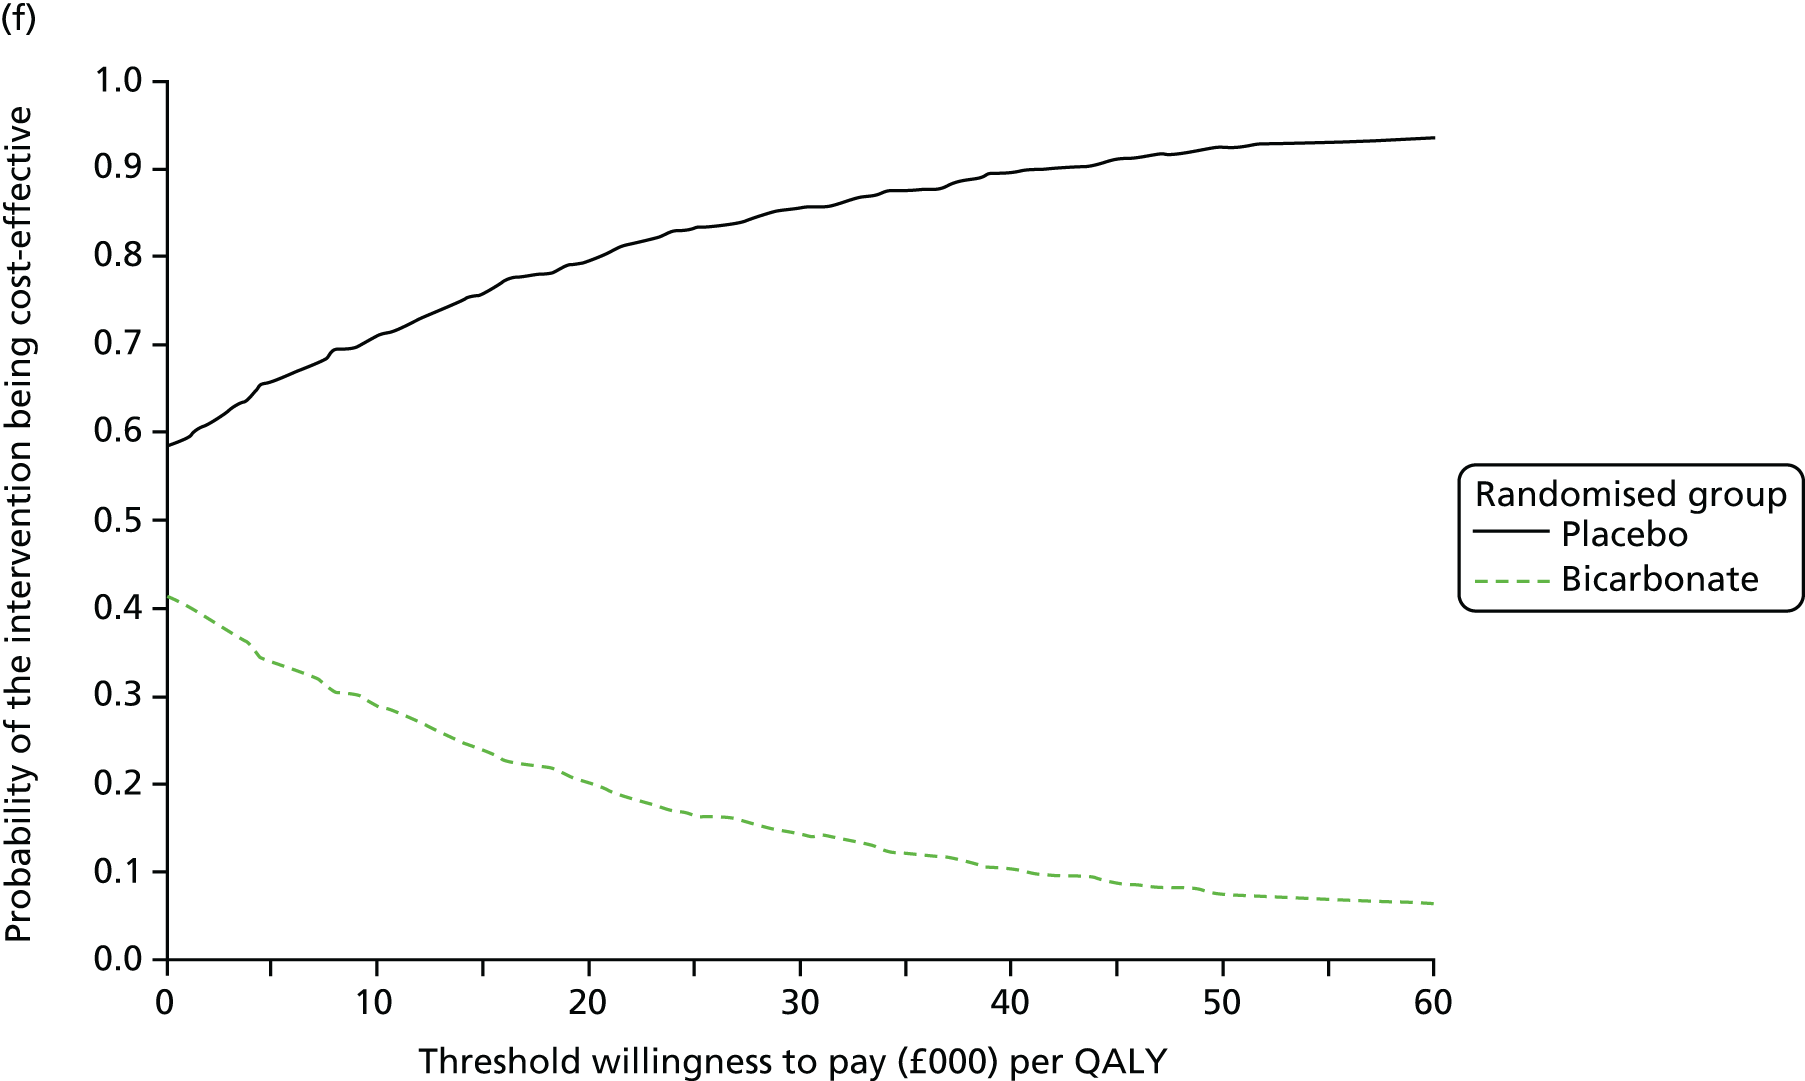
Sensitivity analyses were conducted to explore the impact of different unit cost assumptions and different quality of life weights and outcomes. First, the bicarbonate cost per day was reduced to £0.14 (the base-case value was £0.54 per day) to reflect full generic prescribing. Second, a lower inpatient cost per bed-day, using the lower bound of the interquartile range of £237, was applied (instead of £345 per day). Third, ICECAP or life satisfaction values were used as the measure of effectiveness, rather than EQ-5D values and QALYs. Figures 17, 28 and 29 (see Appendix 6) show that the impact of these changes was minimal. Placebo continued to be dominant over sodium bicarbonate, that is, costs were lower and effectiveness was higher in the placebo group, and there was an almost zero probability of treatment with sodium bicarbonate being cost-effective. Figure 30 (see Appendix 6) shows that, when the participants who dropped out after commencing renal replacement therapy were added to the complete cases, there was more uncertainty over the size of the cost difference between the two groups; however, the probability of placebo being the more cost-effective treatment option was still between 80% and 90% at conventional willingness-to-pay values. These results were very robust in sensitivity analysis, even when the dialysis cost was varied.
FIGURE 17.
Sensitivity analyses of the incremental cost difference and incremental QALY or ICECAP difference between randomised groups: complete cases over 12 months’ follow-up (n = 176). (a) Scatterplot for the lower sodium bicarbonate cost; (b) cost-effectiveness acceptability curve for the lower sodium bicarbonate cost; (c) scatterplot for the lower inpatient stay cost; (d) cost-effectiveness acceptability curve for the lower inpatient stay cost; and (e) scatterplot for use of ICECAP values as the measure of effectiveness.
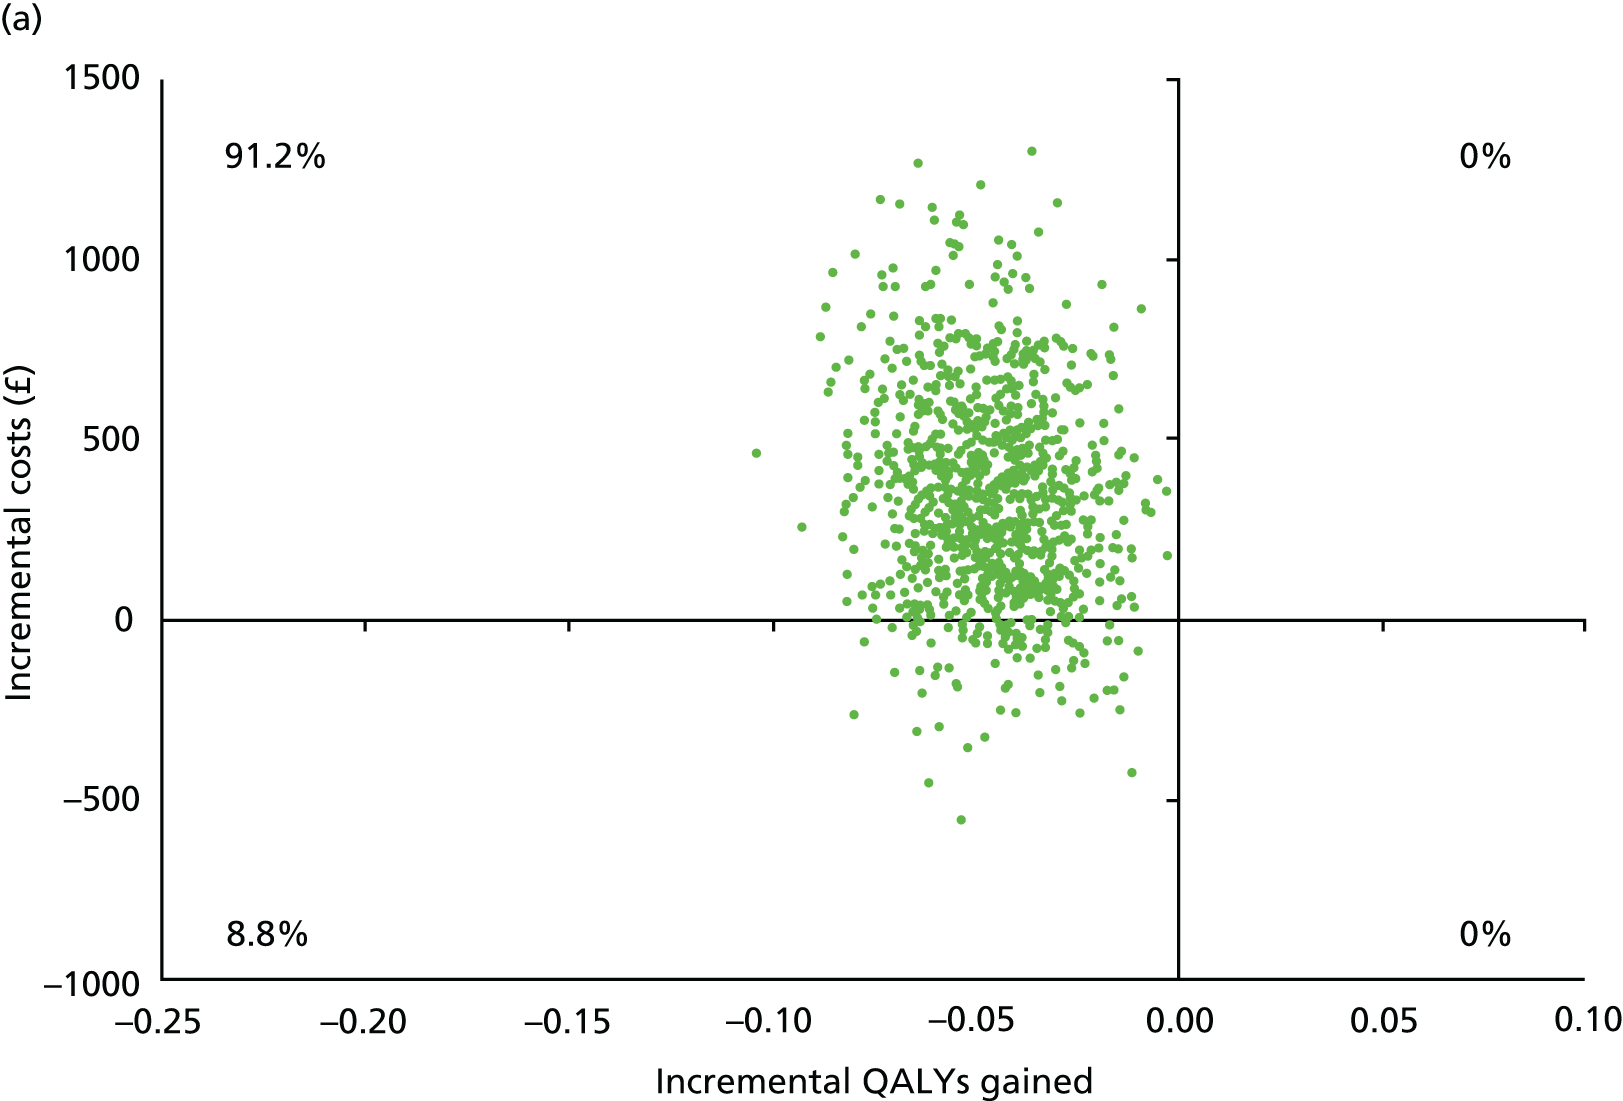
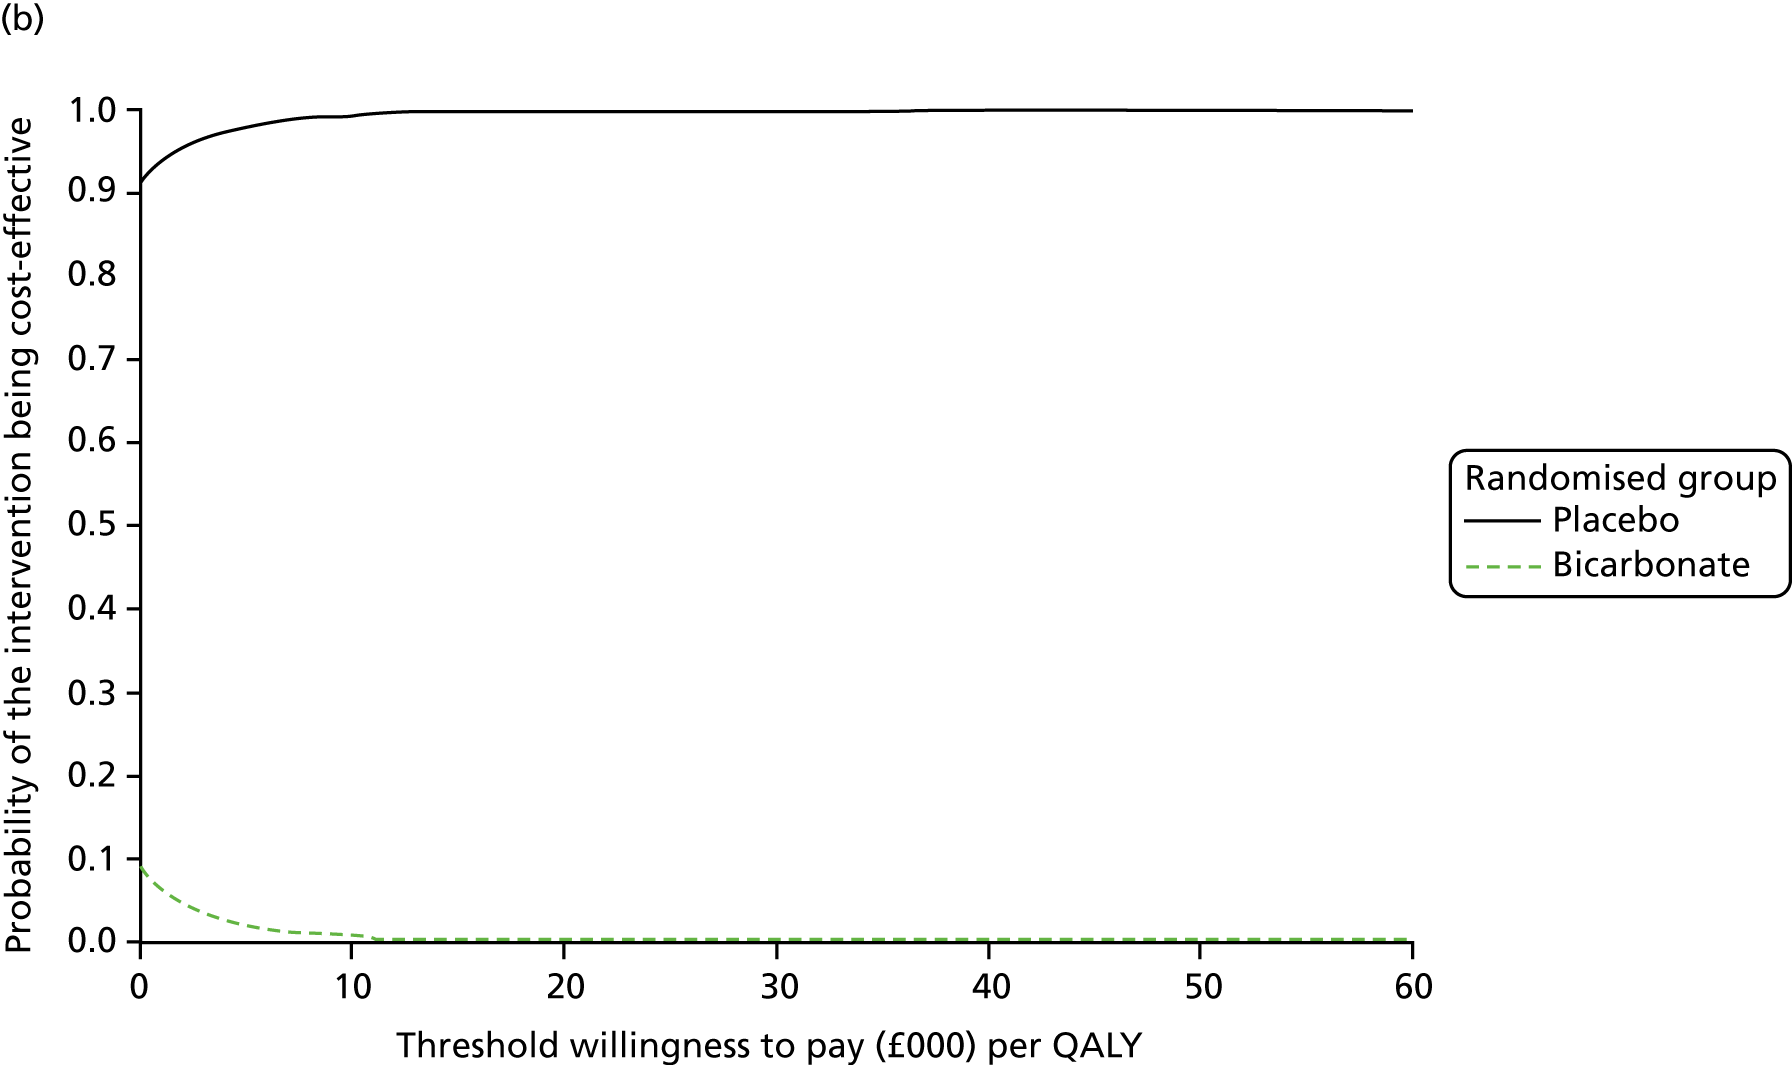
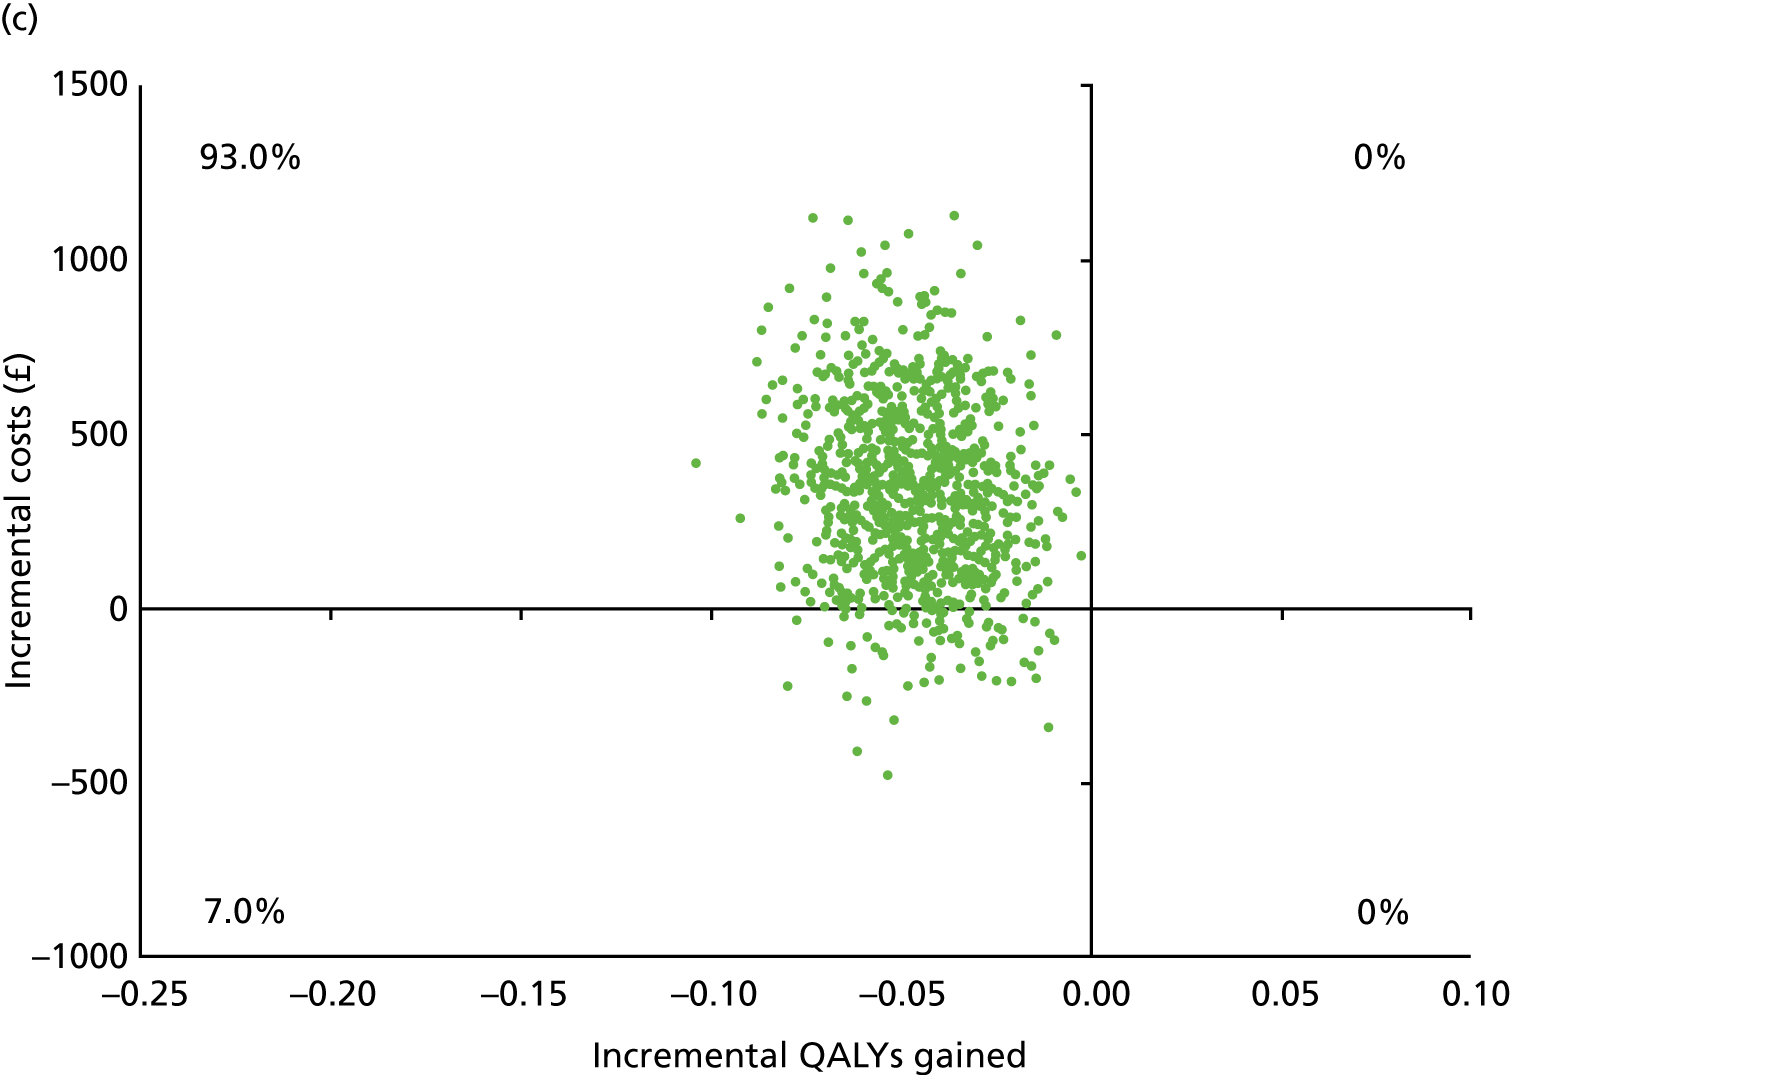
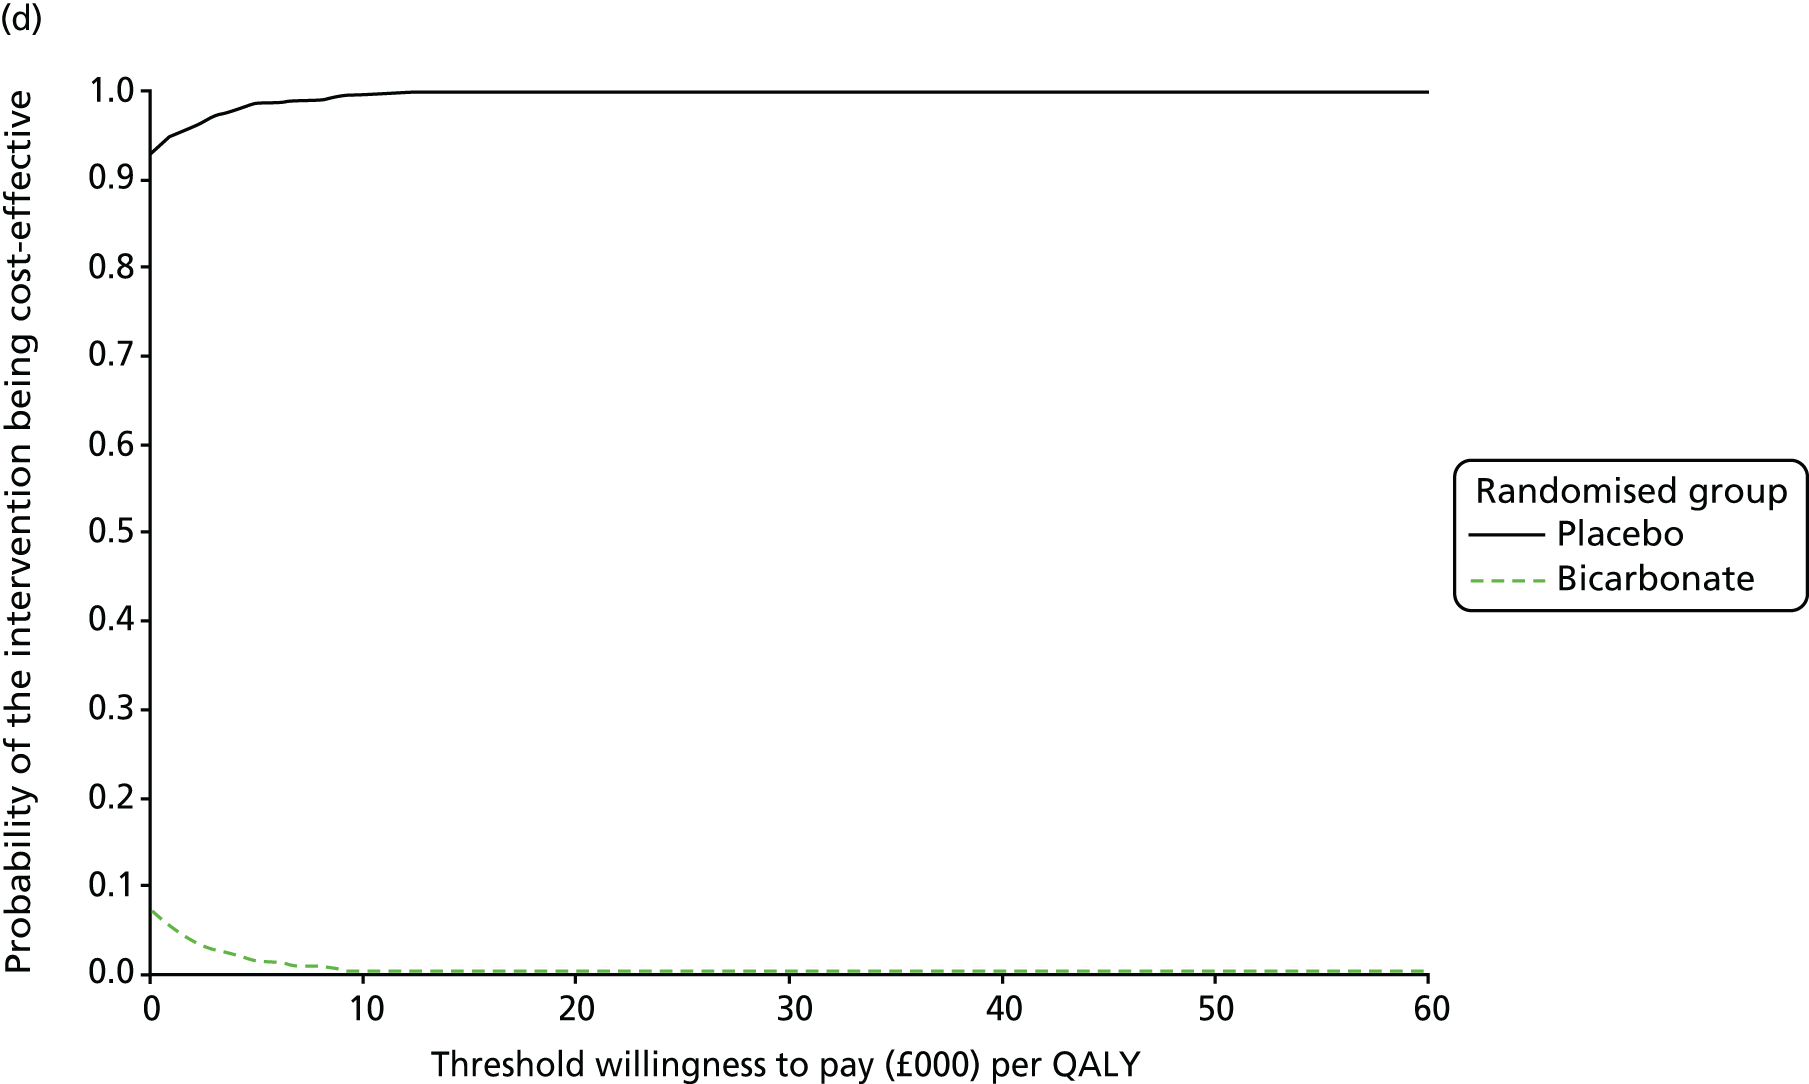
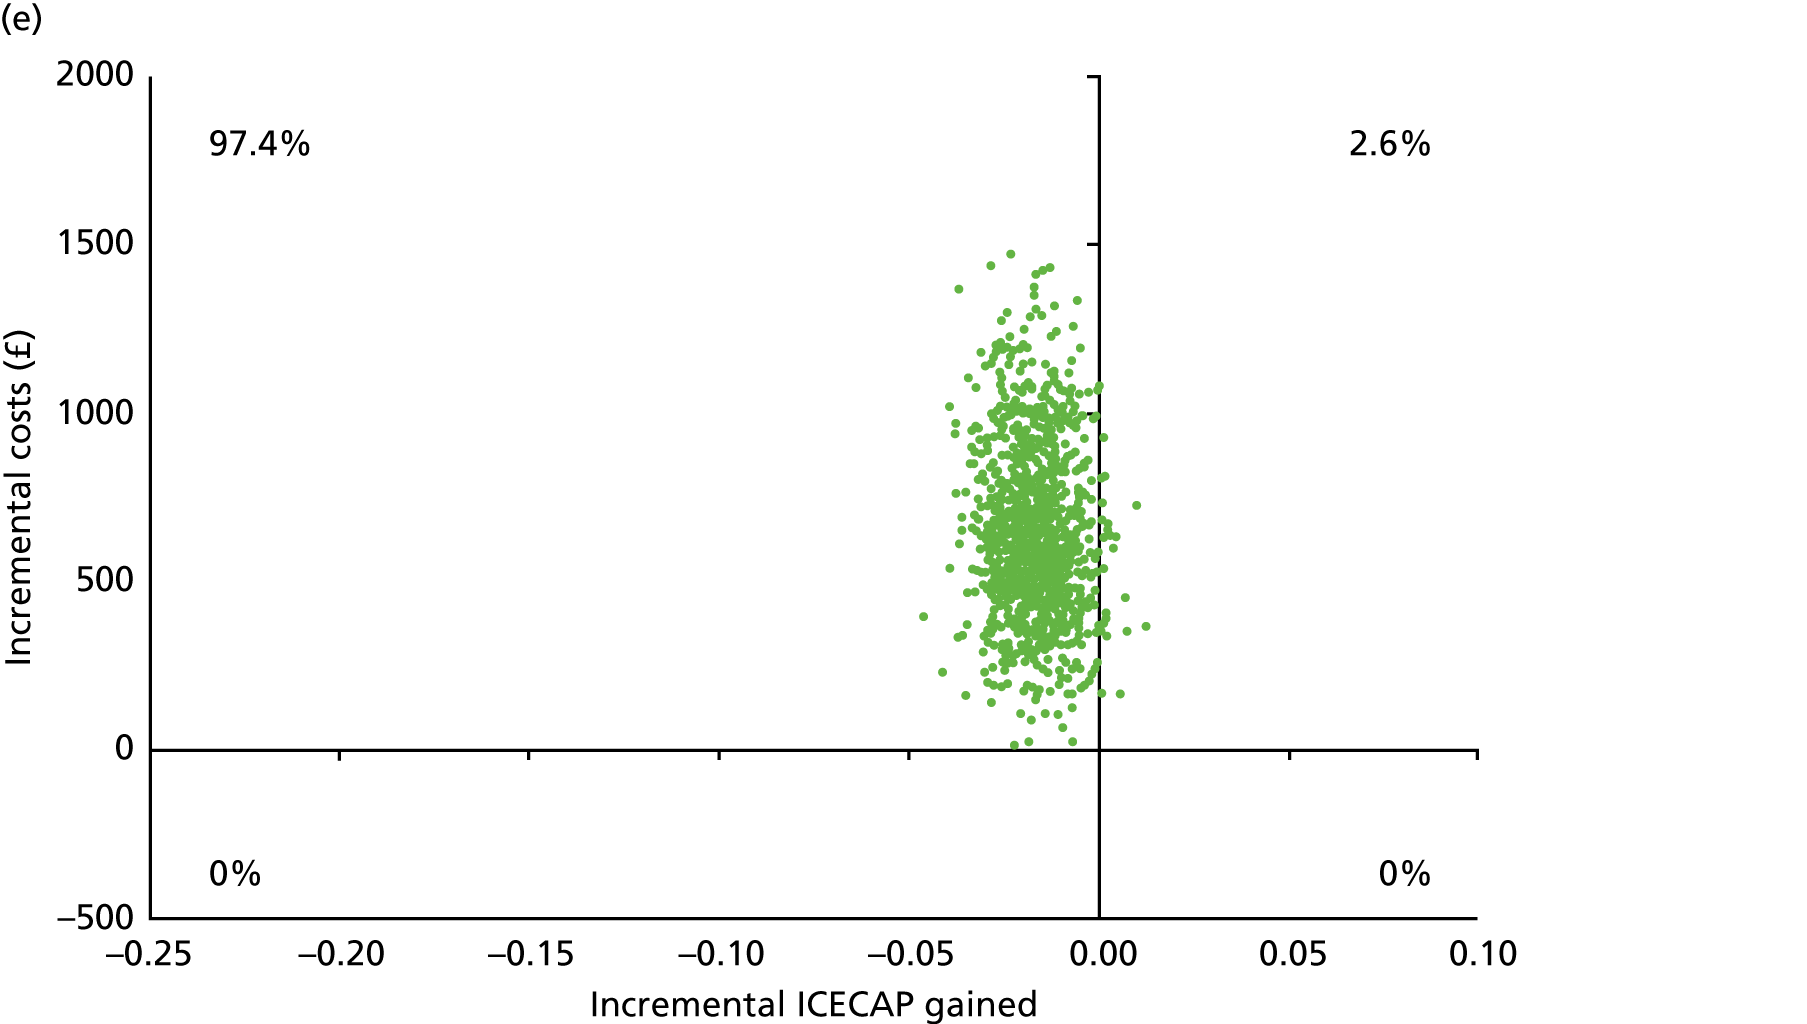
Chapter 6 Discussion
Key findings
This pragmatic, multicentre RCT found that administration of oral sodium bicarbonate using a dose regimen similar to that currently used in UK practice did not improve physical function or quality of life or slow down deterioration of renal function compared with placebo in older people with category 4 or 5 CKD and a serum bicarbonate concentration of < 22 mmol/l. Consistent with these findings, the health economic analysis showed that treatment with bicarbonate was less cost-effective than placebo. Analyses of markers of bone and vascular health found no evidence that bicarbonate improved bone health; blood pressure was neither raised nor lowered significantly by bicarbonate therapy compared with placebo. Bicarbonate therapy was moderately well adhered to. Overall adverse event rates, including that for falls, were higher in the bicarbonate group than in the placebo group despite the two groups being balanced for most comorbidities and medications at baseline. Bicarbonate is known to cause gastrointestinal side effects, such as nausea and bloating, and this was reflected in the higher rate of gastrointestinal side effects in the intervention group. Higher rates of cardiac, respiratory and neurological adverse events were seen in the bicarbonate group, with lower rates of cancer. These differences may be the result of chance, but pooling of these data with the results from other trials of bicarbonate is required to investigate the safety profile further. The excess of cardiovascular events in the intervention group was driven by a higher rate of myocardial infarction, but the mechanism underpinning this is not clear as blood pressure was not increased in the intervention group. Fluid overload as a result of sodium load in patients with heart failure or other types of cardiovascular disease was a concern at the planning stage of the trial, but no difference in fluid overload events was seen between the two groups and decompensated heart failure events were not responsible for the observed excess of cardiovascular events.
Although rates of death and renal replacement therapy were similar in both arms, it is concerning that several measures of physical function were worse in the bicarbonate arm than in the placebo arm, despite adjusting for baseline values. Differential dropout is unlikely to explain this finding as the dropout rate was similar in each arm. Although the difference in SPPB score on repeated measures was of borderline clinical significance, the degree of difference in grip strength and 6-minute walk distance is likely to be of clinical significance. 53 These findings, in conjunction with the higher adverse event rate in the bicarbonate arm, call into question not only the efficacy but also the safety of using bicarbonate in this target patient population.
Results in context
For many of the outcomes measured in the BiCARB trial it was not possible to combine the data with those from previous trials. This was particularly the case for physical function and quality of life data, which have not been a focus of outcome measurement in previous trials. As this is the first trial to examine the effects of bicarbonate supplementation on physical function measures, it is not possible to determine if the observed worsening in physical function measures with bicarbonate is a chance finding or a real effect. Existing observational data suggest a relationship between higher serum bicarbonate concentrations and better physical function,14,15 and a meta-analysis of studies testing the effect of bicarbonate on elite athletic performance found a weak, but significant, positive effect of bicarbonate on the performance of middle-distance athletes. 54 We were unable to find evidence of a biological mechanism that would convincingly explain why bicarbonate supplementation should worsen physical function.
Adding the results of the BiCARB trial to the meta-analysis findings showed no overall effect of bicarbonate on weight or mid-arm muscle circumference. Similarly, there was no significant worsening of systolic blood pressure with bicarbonate treatment, both overall and when confining analyses to 1-year outcomes. When combining all available trials in meta-analysis, overall estimates of the effect of oral bicarbonate therapy on serum bicarbonate levels and eGFR still suggest a modest benefit, but the results are highly heterogeneous, suggesting that the population studied in the BiCARB trial may respond differently for these outcomes from other populations studied to date, which differ in their predominant aetiology, age and ethnic background. It is also important to note that there was considerable heterogeneity in the length of follow-up, treatment schedule and whether or not patients, clinicians and study teams were masked to treatment allocation. Restricting analyses to a single time point (12 months’ follow-up) removes some, but not all, of this heterogeneity. In addition, measures of variance for outcomes in some trials included in the meta-analysis were much lower than would be expected, raising the possibility that standard errors had been reported rather than standard deviations, as advertised in the papers. It is not possible to verify this without access to individual participant-level data, but the use of standard errors would lead to these trials being given undue weight in the meta-analysis results. Results from these meta-analyses should be treated with caution because of these limitations.
Generalisability and limitations with regard to generalisability
Trials of oral bicarbonate therapy to date have targeted a wide range of groups: those with serum bicarbonate concentrations in the normal range as well as those with low serum bicarbonate concentrations; those with specific renal conditions (e.g. CKD of unknown origin, hypertensive nephropathy with albuminuria); and those with moderate renal disease (CKD category 3), which is not a usual target for bicarbonate therapy. This trial is distinctive in targeting older people, who make up the majority of patients with CKD in the UK and most other high-income countries. It included patients from across the UK with advanced CKD (thus reflecting the usual target group for bicarbonate therapy in practice).
The increase in serum bicarbonate concentration seen in the bicarbonate arm compared with the placebo arm was modest and it could be argued that the lack of benefit with regard to the main study outcomes is unsurprising given this modest increment in serum bicarbonate concentration. However, the increase in serum bicarbonate concentration was consistent with that seen in previous trials, including a recent trial published only in abstract form,55 albeit at the lower end of the range of responses seen. Furthermore, several trials demonstrating larger increases in serum bicarbonate concentration used an open-label design and titrated treatment to reach specific bicarbonate targets. In current UK practice, doses of 1.5–3 g per day of oral bicarbonate are commonly used and our treatment strategy reflected this practice. Although we cannot therefore rule out a beneficial effect of higher doses of bicarbonate, our results support the contention that current UK practice for bicarbonate replacement in CKD does not improve a wide range of outcomes in older patients with advanced CKD. Increasing the dose of sodium bicarbonate beyond 3 g per day risks further worsening of adherence, as bicarbonate tablets are large and difficult for older people to swallow. In addition, higher doses run the risk of increasing the rate of adverse events still further, particularly gastrointestinal side effects. Nevertheless, treatment regimens (using either bicarbonate or newer acid-binding agents) that produce greater increases in serum bicarbonate concentration could provide benefits and require testing.
The commissioning brief and trial design focused on patients with a mild degree of acidosis. Few participants with a serum bicarbonate concentration of < 18 mmol/l were enrolled, as most patients with a serum bicarbonate concentration this low are already being treated with bicarbonate. We are therefore unable to comment on the potential benefits of treating more severe levels of acidosis in this population.
Other limitations
One of the key limitations of this study is the high proportion of white participants. One previous UK trial23 that showed positive effects of oral sodium bicarbonate treatment enrolled predominantly participants of South Asian and African ethnicity – there was an insufficient number of participants to exclude a beneficial effect in these ethnic groups. The trial enrolled a preponderance of men, which may limit the generalisability of the results, given the relative under-representation of women. The study population had relatively stable CKD, with low rates of progression to end-stage kidney disease, and this was consistent with the low levels of proteinuria in the study population.
The original target for recruitment in this trial (380 participants) was not reached, despite participants being recruited from 27 UK sites. This was, in part, because of a lack of clinical equipoise; surveys of UK practitioners performed by the trial team during the trial suggested that most nephrologists were treating mild degrees of acidosis with bicarbonate already, thus reducing the pool of eligible participants. Despite this, revised sample size calculations performed to inform the decision to cease recruitment suggested that the sample size randomised (n = 300) had 87% power to detect a 1-point difference in the primary outcome of change in SPPB score. Our results exclude a 1-point improvement in the primary outcome by a wide margin and also exclude a more conservative 0.5-point improvement (posited by some researchers as the MCID for the SPPB53).
Bicarbonate levels in the placebo group increased gradually over time, which reduced the difference in bicarbonate levels between the groups. Some of this increase is likely to have been the result of regression to the mean and some is likely to have been the result of the dropout of participants who started renal replacement therapy (who were more likely to have worse renal function and worse acidosis), but some may also have been the result of individuals in the placebo group stopping the study medication and starting unblinded bicarbonate therapy as part of routine practice. However, the impact of starting unblinded bicarbonate therapy is likely to have been small as only 18 participants in the placebo group stopped the study medication to start unblinded therapy.
The majority of participants who commenced renal replacement therapy were lost to follow-up at the point of commencing renal replacement therapy. The costs of ongoing renal replacement therapy for these participants could not be directly captured as part of the main health economics analysis, and quality of life after starting renal replacement therapy was also not ascertained for participants who dropped out of the trial. Renal replacement therapy costs were included in one of the economic analyses but other associated costs for patients who dropped out were not captured. The same number of participants commenced renal replacement therapy in each arm (33 in each arm), with the time to commencement of therapy being slightly shorter in the bicarbonate arm. The economic analysis is consistent with this finding, with overall costs higher in the bicarbonate arm. It is possible that unmeasured costs associated with, but not attributable to, renal replacement therapy (e.g. additional inpatient stays, additional adverse events) could influence the economic analysis. However, the fact that more adverse events were seen during the trial in the bicarbonate arm suggests that any unmeasured events would tend to accentuate, rather than reverse, the results of the health economic analysis as presented. Similarly, small differences between the groups in the time spent avoiding the commencement of renal replacement therapy are likely to have large effects on costs. However, the analysis of time to commencement of renal replacement therapy suggests that participants in the bicarbonate group started renal replacement sooner, and the addition of these renal replacement costs reinforced, rather than overturned, the results of the main economic analyses.
Strengths
The key strengths of this trial were its comparatively large size; adequate follow-up time; participant, clinician and researcher masking; and broad inclusion criteria. In contrast to almost all previous trials, our use of a placebo control reduced the opportunities for bias, particularly with respect to decision-making around the timing of commencement of renal replacement therapy. An additional key strength was the broad range of outcome measures examined, with a particular focus on physical function and quality of life. These are the outcomes that older people report are the most important to them, and this focus is of particular importance in this group of patients with extensive multimorbidity. A narrow focus on a single disease – even in patients with advanced CKD – is inappropriate in this group, and considering physical function and quality of life enables an assessment of the overall benefit of treatment to patients in a way that organ-specific measures do not.
Chapter 7 Conclusions
Implications for health care
Bicarbonate therapy is currently in widespread use to treat mild degrees of acidosis in patients with stage 4 or 5 CKD. This is largely based on observational data suggesting an association between acidosis and a range of deleterious outcomes, including accelerated decline in renal function and adverse bone health, physical function and vascular health. There is little trial evidence to support current practice, a state of affairs that is acknowledged in guidelines. 31,32 Our results suggest that, at least in this predominantly male and white population of older patients with CKD category 4 and 5, 1.5–3 g per day of oral bicarbonate did not produce any health benefits and may be associated with net harms compared with placebo. Although other indications for the control of acidosis exist (e.g. high potassium concentrations), evidence from the current trial suggests that the additional cost, treatment burden and side effects of oral bicarbonate therapy may not justify its use in older people with advanced CKD and mild acidosis.
Suggestions for future research
A number of other trials of bicarbonate therapy are currently in progress or are in the process of being published. 55–57 These trials have targeted a range of CKD severities (CKD category 3b–5) and a range of entry serum bicarbonate concentrations (< 21 mmol/l, > 18 mmol/l and 20–25 mmol/l); in two of the trials, a strategy of dose adjustment to keep the serum bicarbonate concentration at > 24 mmol/l has been employed. None of these trials targets older people as a specific group. We recommend that the key research priority should be to combine data from these trials once they are available. We therefore make the following suggestions for further research:
-
An individual participant meta-analysis should be conducted, examining the effects of bicarbonate therapy on physical function, quality of life, renal function and progression to renal replacement therapy, anthropometric measurements and bone and vascular health.
-
Importantly, such a meta-analysis should also seek to pool adverse events, particularly cardiovascular events, and to identify the characteristics of those most likely to respond to bicarbonate therapy.
-
The results from the BiCARB trial call into question the usefulness of bicarbonate therapy in other groups in whom it is currently used routinely. Depending on the results of meta-analyses, it may be necessary to formally test the effectiveness of bicarbonate therapy in other groups with CKD, for example younger patients.
-
Alternative methods to manage acidosis in advanced CKD should be tested. A pilot study of dose titration to target would be one way to approach low bicarbonate levels once it is clearer which subgroups (if any) are more likely to benefit. Novel methods of managing acidosis, such as use of non-absorbed hydrochloric acid binders, also require testing.
A final recommendation is that clinical trials in disease areas that affect predominantly older people should be designed and executed in such a way that older people are well represented and should use outcome measures that are important to older people. 58 The BiCARB trial shows how this can be successfully achieved in the field of CKD; there is a need to ensure that similar outcomes and methods are used to answer other questions within the field of CKD, but also more widely in other organ-specific fields of clinical practice. The evidence base underpinning the design and delivery of trials that are appropriate for older people is very limited; research is needed on how best to design trials in older people, how to recruit and retain older people successfully and the use of outcomes that are relevant to older people with multimorbidity.
Acknowledgements
We would like to acknowledge the support received from the NHS Scotland Support for Science scheme and the NIHR Renal and Ageing Comprehensive Research Networks; the work of all the investigators, research nurses and study teams at the different sites and the Tayside CTU staff; and, most importantly, all those with kidney disease who participated in the trial.
In addition, we acknowledge the support and advice that we received from the independent TSC members (Professor David Stott, Professor Patrick Mark, Professor Tahir Masud and Mr Alex Stephen) and the independent DMC members (Professor Alex McConnachie, Professor David Wheeler, Dr Nicosha de Souza and Dr Andrew Clegg).
Professor Marion McMurdo and Dr Simon Ogston were co-applicants on the original proposal, but demitted from the project on retirement and were not involved in the creation of this report.
Local investigators
Aimun Ahmed, Michael Almond, Gowrie Balasubramaniam, Kolitha Basnayake, Deepak Bhatnagar, Coralie Bingham, Anthony Chan, Alex Crowe, Gabor Cserep, Neill Duncan, Helen Eddington, David Goldsmith, Manivarma Kamalnathan, Adam Kirk, Kostantinos Koutroutsos, Stewart Lambie, Madhavan Menon, Biswa Mishra, Sandip Mitra, Jim Moriarty, Noshaba Naz, Johann Nicholas, Tom Picket, Satyanarayana Reddy, Kate Shiell, Paul Stevens, Wai Tse, Martin Wilkie and Georgia Winnett.
Research nurses
Abiola Ali, Rashid Almasarwah, Cecilio Andujar, Alexandra Bailey, Joyce Banda, Janet Bendle, Janet Blood, Karen Borwick, Judith Brade, Fiona Brailsford, Paula Brassey, Margaret Brunton, Georgina Butt, Teresa Byrne, Christine Catley, Karen Chalmers, Sally Chapman, Houda Chea, Zdenka Cipinova, Hazel Clark, Elizabeth Clarke, Laura Cockayne, Viv Colclough, Jacqueline Colnet, Carolyn Corbett, Joanna Cox, Linda Crighton, Sirjana Devkota, Michelle Dorrington, Louese Dunn, Aidan Dunphy, Mary Dutton, Gillian Eaglestone, Dana Foster, Paul Frattaroli, Viji George, Karen Hallett, Deborah Harrison, Audrey Hau, Lesley Haydock, Linda Hill, Martin Hogan, Wanda Ingham, Yvonne Jackson, Linda Johnson, Laura Johnstone, Juliet Jones, Simon Kaye, Melanie Kershaw, Deepsi Khatiwada, Hayley King, Rosemary Kirk, Sarah Knight, Praveen Kunjukunju, Beverley Lane, Tara Leedham, Fiona Leslie, Mandy McAndrew, Alexandra McCarrick, Julie McEntee, Fiona McNeill, Louise Morby, Judith Muir, Estelle Nambela, Laura O’Keeffe, Faith Okhuoya, Lesley Patience, Pamela Paton, Marrissa Plaza, Sonia Raj, Nayyar Rajinder, Angelo Ramos, Caroline Renton, Richard Rye, Anessa Sameja, Belinda Schaefer, Leanne Scott, Lorraine Shah-Goodwin, Isla Smith, Christina Summersgill, Justyna Szklarzewicz, Sandra Toth, Kate Trivedi, Jane Turner, Adan Usmani, Michael Villaruel, Lynn Vinall, Thomas Walters, Joyce Ward, Jane Watkins, Lynn Watkins, Stephanie Whittaker, Joanne Wilcox, Frances Williams, Diane Winstance-Smith, Jackie Wooding and Andrea Young.
Tayside Clinical Trials Unit support staff
Hasithi Bandara, Stephanie Haenicke, Furrah Hussain, Eva Lahnsteiner, Emma McKenzie and Andrew McKenzie.
Contributions of authors
Miles D Witham (https://orcid.org/0000-0002-1967-0990) (Professor of Trials for Older People; lead applicant) led the design and management of the trial, contributed to the analysis and drafted the report.
Margaret Band (https://orcid.org/0000-0001-7275-8468) (Senior Trial Manager) contributed to the design and management of the trial and contributed to writing and critical revision of the report.
Huey Chong (https://orcid.org/0000-0002-0768-1844) (Health Economist) conducted the health economic analysis and contributed to writing and critical revision of the report.
Peter T Donnan (https://orcid.org/0000-0001-7828-0610) (Professor of Biostatistics) contributed to the design and management of the trial, had a major role in the statistical analysis and contributed to critical revision of the report.
Geeta Hampson (https://orcid.org/0000-0001-8465-5247) (Consultant in Chemical Pathology and Metabolic Medicine; co-applicant) contributed to the initial design of the trial, management of the trial, analysis, and writing and critical revision of the report.
May Khei Hu (https://orcid.org/0000-0001-8346-1109) (Systematic Reviewer) led the systematic review and contributed to writing and critical revision of the report.
Roberta Littleford (https://orcid.org/0000-0003-4868-0132) (Assistant CTU Director) contributed to the design and management of the trial and critical revision of the report.
Edmund Lamb (https://orcid.org/0000-0002-5154-7351) (Consultant Biochemist; co-applicant) contributed to the initial design of the trial, management of the trial, analysis and critical revision of report.
Philip A Kalra (https://orcid.org/0000-0001-7652-1572) (Consultant Nephrologist; co-investigator) contributed to the design and management of the trial and critical revision of the report.
Gwen Kennedy (https://orcid.org/0000-0002-9856-3236) (Lead for Analytic Core Services) led the biochemistry analyses and contributed to writing and critical revision of the report.
Paul McNamee (https://orcid.org/0000-0002-4540-8718) (Professor of Health Economics; co-applicant) contributed to the initial design of the trial and management of the trial, led and supervised the health economic analysis and contributed to writing and critical revision of the report.
Deirdre Plews (https://orcid.org/0000-0002-7478-7913) (Trial Manager) contributed to the design and management of the trial and critical revision of the report.
Petra Rauchhaus (https://orcid.org/0000-0003-4994-155X) (Trial Statistician) contributed to management of the trial, led the statistical analysis and contributed to writing and critical revision of the report.
Roy L Soiza (https://orcid.org/0000-0002-1397-4272) (Consultant Geriatrician; co-applicant) contributed to the initial design of the trial, management of the trial, the systematic review, the main analysis and critical revision of the report.
Deepa Sumukadas (https://orcid.org/0000-0002-6832-3063) (Consultant Geriatrician; co-applicant) contributed to the initial design of the trial, management of the trial, analysis and critical revision of the report.
Graham Warwick (https://orcid.org/0000-0002-4178-015X) (Consultant Nephrologist; co-investigator) contributed to the design and management of the trial and critical revision of the report.
Alison Avenell (https://orcid.org/0000-0003-4813-5628) (Professor of Health Services Research; co-applicant) contributed to the initial design of the trial, management of the trial, analysis and critical revision of the report.
Publications
Witham MD, Band MM, Littleford RC, Avenell A, Soiza RL, McMurdo ME, et al. Does oral sodium bicarbonate therapy improve function and quality of life in older patients with chronic kidney disease and low-grade acidosis (the BiCARB trial)? Study protocol for a randomized controlled trial. Trials 2015;16:326.
Witham MD, Lamb EJ. Should chronic metabolic acidosis be treated in older people with chronic kidney disease? Nephrol Dial Transplant 2016;31:1796–802.
Hu MK, Soiza RL, Witham MD. Oral bicarbonate therapy in chronic kidney disease: a systematic review and meta-analysis of randomised controlled trial. J Clin Med 2019;8:ii:E208.
The BiCARB study group. Clinical and cost-effectiveness of oral sodium bicarbonate therapy for older patients with chronic kidney disease and low-grade acidosis (BiCARB): a pragmatic randomised, double-blind, placebo-controlled trial. BMC Med 2020;18:91.
Data-sharing statement
All data requests should be addressed to the corresponding author or the trial sponsor for consideration. Access to anonymised data may be granted following review.
Patient data
This work uses data provided by patients and collected by the NHS as part of their care and support. Using patient data is vital to improve health and care for everyone. There is huge potential to make better use of information from people’s patient records, to understand more about disease, develop new treatments, monitor safety, and plan NHS services. Patient data should be kept safe and secure, to protect everyone’s privacy, and it’s important that there are safeguards to make sure that it is stored and used responsibly. Everyone should be able to find out about how patient data are used. #datasaveslives You can find out more about the background to this citation here: https://understandingpatientdata.org.uk/data-citation.
Disclaimers
This report presents independent research funded by the National Institute for Health Research (NIHR). The views and opinions expressed by authors in this publication are those of the authors and do not necessarily reflect those of the NHS, the NIHR, NETSCC, the HTA programme or the Department of Health and Social Care. If there are verbatim quotations included in this publication the views and opinions expressed by the interviewees are those of the interviewees and do not necessarily reflect those of the authors, those of the NHS, the NIHR, NETSCC, the HTA programme or the Department of Health and Social Care.
References
- Public Health England . Chronic Kidney Disease Prevalence Model 2015. https://assets.publishing.service.gov.uk/government/uploads/system/uploads/attachment_data/file/612303/ChronickidneydiseaseCKDprevalencemodelbriefing.pdf (accessed 6 January 2019).
- Coresh J, Astor BC, Greene T, Eknoyan G, Levey AS. Prevalence of chronic kidney disease and decreased kidney function in the adult US population: Third National Health and Nutrition Examination Survey. Am J Kidney Dis 2003;41:1-12. https://doi.org/10.1053/ajkd.2003.50007.
- Coresh J, Selvin E, Stevens LA, Manzi J, Kusek JW, Eggers P, et al. Prevalence of chronic kidney disease in the United States. JAMA 2007;298:2038-47. https://doi.org/10.1001/jama.298.17.2038.
- Eustace JA, Astor B, Muntner PM, Ikizler TA, Coresh J. Prevalence of acidosis and inflammation and their association with low serum albumin in chronic kidney disease. Kidney Int 2004;65:1031-40. https://doi.org/10.1111/j.1523-1755.2004.00481.x.
- Menon V, Tighiouart H, Vaughn NS, Beck GJ, Kusek JW, Collins AJ, et al. Serum bicarbonate and long-term outcomes in CKD. Am J Kidney Dis 2010;56:907-14. https://doi.org/10.1053/j.ajkd.2010.03.023.
- Goldenstein L, Driver TH, Fried LF, Rifkin DE, Patel KV, Yenchek RH, et al. Serum bicarbonate concentrations and kidney disease progression in community-living elders: the Health, Aging, and Body Composition (Health ABC) Study. Am J Kidney Dis 2014;64:542-9. https://doi.org/10.1053/j.ajkd.2014.05.009.
- Schutte E, Lambers Heerspink HJ, Lutgers HL, Bakker SJ, Vart P, Wolffenbuttel BH, et al. Serum bicarbonate and kidney disease progression and cardiovascular outcome in patients with diabetic nephropathy: a post hoc analysis of the RENAAL (Reduction of End Points in Non-Insulin-Dependent Diabetes With the Angiotensin II Antagonist Losartan) study and IDNT (Irbesartan Diabetic Nephropathy Trial). Am J Kidney Dis 2015;66:450-8. https://doi.org/10.1053/j.ajkd.2015.03.032.
- Driver TH, Shlipak MG, Katz R, Goldenstein L, Sarnak MJ, Hoofnagle AN, et al. Low serum bicarbonate and kidney function decline: the Multi-Ethnic Study of Atherosclerosis (MESA). Am J Kidney Dis 2014;64:534-41. https://doi.org/10.1053/j.ajkd.2014.05.008.
- Wesson DE, Simoni J, Broglio K, Sheather S. Acid retention accompanies reduced GFR in humans and increases plasma levels of endothelin and aldosterone. Am J Physiol Renal Physiol 2011;300:F830-7. https://doi.org/10.1152/ajprenal.00587.2010.
- Kendrick J, Shah P, Andrews E, You Z, Nowak K, Pasch A, et al. Effect of treatment of metabolic acidosis on vascular endothelial function in patients with CKD: a pilot randomized cross-over study. Clin J Am Soc Nephrol 2018;13:1463-70. https://doi.org/10.2215/CJN.00380118.
- Kraut JA, Madias NE. Adverse effects of the metabolic acidosis of chronic kidney disease. Adv Chronic Kidney Dis 2017;24:289-97. https://doi.org/10.1053/j.ackd.2017.06.005.
- Dobre M, Yang W, Chen J, Drawz P, Hamm LL, Horwitz E, et al. Association of serum bicarbonate with risk of renal and cardiovascular outcomes in CKD: a report from the Chronic Renal Insufficiency Cohort (CRIC) study. Am J Kidney Dis 2013;62:670-8. https://doi.org/10.1053/j.ajkd.2013.01.017.
- Clegg DJ, Cody M, Palmer BF. Challenges in treating cardiovascular disease: restricting sodium and managing hyperkalemia. Mayo Clin Proc 2017;92:1248-60. https://doi.org/10.1016/j.mayocp.2017.04.006.
- Abramowitz MK, Hostetter TH, Melamed ML. Association of serum bicarbonate levels with gait speed and quadriceps strength in older adults. Am J Kidney Dis 2011;58:29-38. https://doi.org/10.1053/j.ajkd.2010.12.021.
- Yenchek R, Ix JH, Rifkin DE, Shlipak MG, Sarnak MJ, Garcia M, et al. Association of serum bicarbonate with incident functional limitation in older adults. Clin J Am Soc Nephrol 2014;9:2111-16. https://doi.org/10.2215/CJN.05480614.
- Bailey JL, Wang X, England BK, Price SR, Ding X, Mitch WE. The acidosis of chronic renal failure activates muscle proteolysis in rats by augmenting transcription of genes encoding proteins of the ATP-dependent ubiquitin-proteasome pathway. J Clin Invest 1996;97:1447-53. https://doi.org/10.1172/JCI118566.
- Martin KJ, González EA. Metabolic bone disease in chronic kidney disease. J Am Soc Nephrol 2007;18:875-85. https://doi.org/10.1681/ASN.2006070771.
- Chen W, Melamed ML, Abramowitz MK. Serum bicarbonate and bone mineral density in US adults. Am J Kidney Dis 2015;65:240-8. https://doi.org/10.1053/j.ajkd.2014.07.007.
- Kato A, Kido R, Onishi Y, Kurita N, Fukagawa M, Akizawa T, et al. Association of serum bicarbonate with bone fractures in hemodialysis patients: the mineral and bone disorder outcomes study for Japanese CKD category 5D patients (MBD-5D). Nephron Clin Pract 2014;128:79-87. https://doi.org/10.1159/000365089.
- Grzegorzewska AE, Młot-Michalska M. Predictors of bone mineral density in dialyzed and non-dialyzed patients with chronic kidney disease. Adv Perit Dial 2010;26:116-24.
- Hu MK, Soiza RL, Witham MD. Oral bicarbonate therapy in chronic kidney disease: a systematic review and meta-analysis of randomised controlled trial. J Clin Med 2019. https://doi.org/10.3390/jcm8020208.
- Mathur RP, Dash SC, Gupta N, Prakash S, Saxena S, Bhowmik D. Effects of correction of metabolic acidosis on blood urea and bone metabolism in patients with mild to moderate chronic kidney disease: a prospective randomized single blind controlled trial. Ren Fail 2006;28:1-5. https://doi.org/10.1080/08860220500461187.
- de Brito-Ashurst I, Varagunam M, Raftery MJ, Yaqoob MM. Bicarbonate supplementation slows progression of CKD and improves nutritional status. J Am Soc Nephrol 2009;20:2075-84. https://doi.org/10.1681/ASN.2008111205.
- Mahajan A, Simoni J, Sheather SJ, Broglio KR, Rajab MH, Wesson DE. Daily oral sodium bicarbonate preserves glomerular filtration rate by slowing its decline in early hypertensive nephropathy. Kidney Int 2010;78:303-9. https://doi.org/10.1038/ki.2010.129.
- Goraya N, Simoni J, Jo CH, Wesson DE. Treatment of metabolic acidosis in patients with stage 3 chronic kidney disease with fruits and vegetables or oral bicarbonate reduces urine angiotensinogen and preserves glomerular filtration rate. Kidney Int 2014;86:1031-8. https://doi.org/10.1038/ki.2014.83.
- Jeong J, Kwon SK, Kim HY. Effect of bicarbonate supplementation on renal function and nutritional indices in predialysis advanced chronic kidney disease. Electrolyte Blood Press 2014;12:80-7. https://doi.org/10.5049/EBP.2014.12.2.80.
- Bellasi A, Di Micco L, Santoro D, Marzocco S, De Simone E, Cozzolino M, et al. Correction of metabolic acidosis improves insulin resistance in chronic kidney disease. BMC Nephrol 2016;17. https://doi.org/10.1186/s12882-016-0372-x.
- Dubey AK, Sahoo J, Vairappan B, Haridasan S, Parameswaran S, Priyamvada PS. Correction of metabolic acidosis improves muscle mass and renal function in chronic kidney disease stages 3 and 4: a randomized controlled trial [published online ahead of print 24 July 2018]. Nephrol Dial Transplant 2018. https://doi.org/10.1093/ndt/gfy214.
- Kraut JA, Kurtz I. Metabolic acidosis of CKD: diagnosis, clinical characteristics, and treatment. Am J Kidney Dis 2005;45:978-93. https://doi.org/10.1053/j.ajkd.2005.03.003.
- Melzer D, Tavakoly B, Winder RE, Masoli JA, Henley WE, Ble A, et al. Much more medicine for the oldest old: trends in UK electronic clinical records. Age Ageing 2015;44:46-53. https://doi.org/10.1093/ageing/afu113.
- KDIGO 2012 . Clinical practice guideline for the evaluation and management of chronic kidney disease. Kidney Int Suppls 2013;3:1-50.
- National Institute for Health and Care Excellence (NICE) . Chronic Kidney Disease in Adults: Assessment and Management 2015. www.nice.org.uk/guidance/cg182 (accessed 6 January 2019).
- Beaudart C, Zaaria M, Pasleau F, Reginster JY, Bruyère O. Health outcomes of sarcopenia: a systematic review and meta-analysis. PLOS ONE 2017;12. https://doi.org/10.1371/journal.pone.0169548.
- Kerr M. Chronic Kidney Disease in England: The Human and Financial Cost. NHS England; 2012.
- Witham MD, Band MM, Littleford RC, Avenell A, Soiza RL, McMurdo ME, et al. Does oral sodium bicarbonate therapy improve function and quality of life in older patients with chronic kidney disease and low-grade acidosis (the BiCARB trial)? Study protocol for a randomized controlled trial. Trials 2015;16. https://doi.org/10.1186/s13063-015-0843-6.
- Levey AS, Bosch JP, Lewis JB, Greene T, Rogers N, Roth D. A more accurate method to estimate glomerular filtration rate from serum creatinine: a new prediction equation. Modification of Diet in Renal Disease Study Group. Ann Intern Med 1999;130:461-70. https://doi.org/10.7326/0003-4819-130-6-199903160-00002.
- Guralnik JM, Simonsick EM, Ferrucci L, Glynn RJ, Berkman LF, Blazer DG, et al. A short physical performance battery assessing lower extremity function: association with self-reported disability and prediction of mortality and nursing home admission. J Gerontol 1994;49:M85-94. https://doi.org/10.1093/geronj/49.2.m85.
- Guralnik JM, Ferrucci L, Simonsick EM, Salive ME, Wallace RB. Lower-extremity function in persons over the age of 70 years as a predictor of subsequent disability. N Engl J Med 1995;332:556-61. https://doi.org/10.1056/NEJM199503023320902.
- Wennie Huang WN, Perera S, VanSwearingen J, Studenski S. Performance measures predict onset of activity of daily living difficulty in community-dwelling older adults. J Am Geriatr Soc 2010;58:844-52. https://doi.org/10.1111/j.1532-5415.2010.02820.x.
- Guyatt GH, Sullivan MJ, Thompson PJ, Fallen EL, Pugsley SO, Taylor DW, et al. The 6-minute walk: a new measure of exercise capacity in patients with chronic heart failure. Can Med Assoc J 1985;132:919-23.
- Roberts HC, Denison HJ, Martin HJ, Patel HP, Syddall H, Cooper C, et al. A review of the measurement of grip strength in clinical and epidemiological studies: towards a standardised approach. Age Ageing 2011;40:423-9. https://doi.org/10.1093/ageing/afr051.
- Fouque D, Kalantar-Zadeh K, Kopple J, Cano N, Chauveau P, Cuppari L, et al. A proposed nomenclature and diagnostic criteria for protein-energy wasting in acute and chronic kidney disease. Kidney Int 2008;73:391-8. https://doi.org/10.1038/sj.ki.5002585.
- EuroQol Group . EuroQol – a new facility for the measurement of health-related quality of life. Health Policy 1990;16:199-208. https://doi.org/10.1016/0168-8510(90)90421-9.
- Hays RD, Kallich JD, Mapes DL, Coons SJ, Carter WB. Development of the kidney disease quality of life (KDQOL) instrument. Qual Life Res 1994;3:329-38. https://doi.org/10.1007/BF00451725.
- Flynn TN, Chan P, Coast J, Peters TJ. Assessing quality of life among British older people using the ICEPOP CAPability (ICECAP-O) measure. Appl Health Econ Health Policy 2011;9:317-29. https://doi.org/10.2165/11594150-000000000-00000.
- Walters SJ, Brazier JE. Comparison of the minimally important difference for two health state utility measures: EQ-5D and SF-6D. Qual Life Res 2005;14:1523-32. https://doi.org/10.1007/s11136-004-7713-0.
- Burton LA, Sumukadas D, Witham MD, Struthers AD, McMurdo ME. Effect of spironolactone on physical performance in older people with self-reported physical disability. Am J Med 2013;126:590-7. https://doi.org/10.1016/j.amjmed.2012.11.032.
- Sumukadas D, Witham MD, Struthers AD, McMurdo ME. Effect of perindopril on physical function in elderly people with functional impairment: a randomized controlled trial. CMAJ 2007;177:867-74. https://doi.org/10.1503/cmaj.061339.
- Witham MD, Price RJ, Struthers AD, Donnan PT, Messow CM, Ford I, et al. Cholecalciferol treatment to reduce blood pressure in older patients with isolated systolic hypertension: the VitDISH randomized controlled trial. JAMA Intern Med 2013;173:1672-9. https://doi.org/10.1001/jamainternmed.2013.9043.
- Briggs AH, Wonderling DE, Mooney CZ. Pulling cost-effectiveness analysis up by its bootstraps: a non-parametric approach to confidence interval estimation. Health Econ 1997;6:327-40. https://doi.org/10.1002/(SICI)1099-1050(199707)6:4<327::AID-HEC282>3.0.CO;2-W.
- van Hout BA, Al MJ, Gordon GS, Rutten FF. Costs, effects and the C/E ratios alongside a clinical trial. Health Econ 1994;3:309-19. https://doi.org/10.1002/hec.4730030505.
- Schulz KF, Altman DG, Moher D. CONSORT Group . CONSORT 2010 statement: updated guidelines for reporting parallel group randomised trials. PLOS Med 2010;7. https://doi.org/10.1371/journal.pmed.1000251.
- Perera S, Mody SH, Woodman RC, Studenski SA. Meaningful change and responsiveness in common physical performance measures in older adults. J Am Geriatr Soc 2006;54:743-9. https://doi.org/10.1111/j.1532-5415.2006.00701.x.
- Christensen PM, Shirai Y, Ritz C, Nordsborg NB. Caffeine and bicarbonate for speed: a meta-analysis of legal supplements potential for improving intense endurance exercise performance. Front Physiol 2017;8. https://doi.org/10.3389/fphys.2017.00240.
- Melamed ML, Horwitz EJ, Dobre MA, Abramowitz MK, Lo Y, Hostetter TH. The Effects of Sodium Bicarbonate in CKD Categories 3 and 4: A Randomized, Placebo-Controlled, Multi-Center Clinical Trial n.d.
- Di Iorio B, Aucella F, Conte G, Cupisti A, Santoro D. A prospective, multicenter, randomized, controlled study: the correction of metabolic acidosis with use of bicarbonate in Chronic Renal Insufficiency (UBI) study. J Nephrol 2012;25:437-40. https://doi.org/10.5301/jn.5000014.
- Gaggl M, Cejka D, Plischke M, Heinze G, Fraunschiel M, Schmidt A, et al. Effect of oral sodium bicarbonate supplementation on progression of chronic kidney disease in patients with chronic metabolic acidosis: study protocol for a randomized controlled trial (SoBic-Study). Trials 2013;14. https://doi.org/10.1186/1745-6215-14-196.
- Witham MD, Stott DJ. Conducting and reporting trials for older people. Age Ageing 2017;46:889-94. https://doi.org/10.1093/ageing/afx153.
- Department of Health and Social Care (DHSC) . NHS Reference Costs 2016–17 2017. https://improvement.nhs.uk/documents/3479/201617_ReferenceCostData.zip.
- Curtis L, Burns A. Unit Costs of Health and Social Care 2017. Canterbury: PSSRU, University of Kent; 2017.
- National Institute for Health and Care Excellence (NICE) . Home Care for Older People 2016. www.nice.org.uk/guidance/qs123 (accessed 19 January 2019).
Appendix 1 Search strategy for the systematic review: MEDLINE search
Date range searched: inception to October 2018.
Search strategy
-
exp BICARBONATES [MESH] (24,176)
-
exp Sodium bicarbonate [MESH] (4387)
-
Bicarbonates [mp] (21,707)
-
1 or 2 or 3 (24,458)
-
Chronic kidney disease [mp] (43,554)
-
Renal insufficiency, chronic [MESH] (17,753)
-
CKD [mp] (24,465)
-
Kidney failure, chronic [MESH] (89,084)
-
5 or 6 or 7 or 8 (129,377)
-
4 and 9 (826)
-
Limit 10 to (English language and RCT) (77)
Appendix 2 Systematic review findings
| Study | Location | n | Mean age (years) | CKD category | Bicarbonate level entry criterion | Intervention | Comparator | Duration | Primary outcome |
|---|---|---|---|---|---|---|---|---|---|
| Mathur 200622 | India | 40 | 41 | ‘Mild to moderate’ CKD (creatinine < 442 µmol/l). CKD category not specified | Not specified | 1.2 mEq/kg of oral bicarbonate in three divided doses, titrated to maintain serum bicarbonate in the range 22–26 mmol/l | Placebo | 3 months | Not specified |
| de Brito-Ashurst 200923 | UK | 134 | 55 | 4 or 5 | Bicarbonate > 16 mmol/l and < 19 mmol/l | 600 mg of oral bicarbonate three times per day, increased as needed to maintain serum bicarbonate at > 23 mmol/l | Usual care | 2 years | Decline in creatinine clearance of > 3 ml/minute/year |
| Mahajan 201024 | USA | 120 | 51 | 2, with hypertension and macroalbuminuria | Total CO2 > 24.5 mmol/l | 0.5 mEq/kg lean body weight of oral bicarbonate | Placebo | 5 years | Decline in eGFR decline |
| Jeong 201426 | Republic of Korea | 80 | 55 | 4 or 5 | Total CO2 < 22 mmol/l | 1 g of oral bicarbonate three times per day, titrated to maintain serum bicarbonate at > 22 mmol/l | Usual care | 12 months | eGFR |
| Goraya 201425 | USA | 108 | 54 | 3 | Total CO2 > 22 mmol/l and < 24 mmol/l | 0.3 mEq/kg lean body weight of oral bicarbonate in three divided doses | Usual care | 3 years | eGFR |
| Bellasi 201627 | Italy | 145 | 65 | 3b or 4, in patients with type 2 diabetes mellitus | Bicarbonate < 24 mmol/l | 0.5 mEq/kg of oral bicarbonate twice daily, until serum bicarbonate is in the range 24–28 mmol/l | Usual care | 12 months | Insulin resistance |
| Dubey 201828 | India | 188 | 50 | 3 and 4 | Bicarbonate < 22 mmol/l | Oral bicarbonate titrated with weekly monitoring | Usual care | 6 months | Mid-arm muscle circumference |
FIGURE 18.
Quality assessment of included studies.
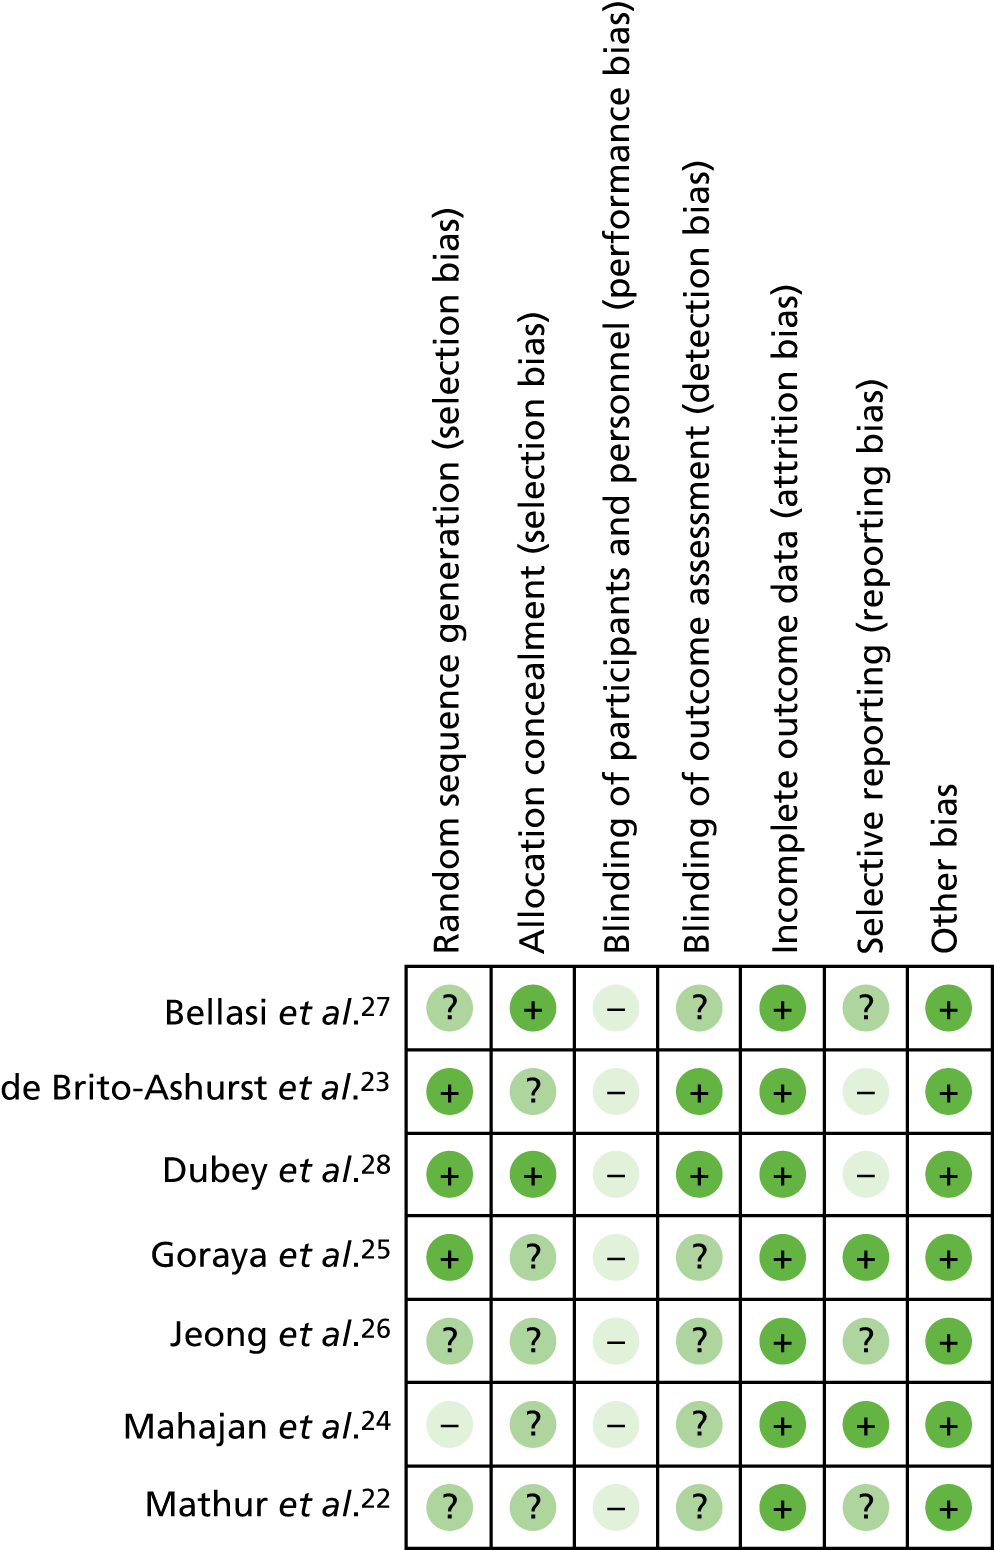
Meta-analysed outcomes, before reporting of the BiCARB trial results
FIGURE 19.
Serum bicarbonate concentration (mmol/l) (any time point). IV, instrumental variable; SD, standard deviation.

FIGURE 20.
Serum bicarbonate concentration (mmol/l) (1-year follow-up only). IV, instrumental variable; SD, standard deviation.

FIGURE 21.
Estimated GFR (ml/minute/1.73 m2) (any time point). IV, instrumental variable; SD, standard deviation.

FIGURE 22.
Estimated GFR (ml/minute/1.73 m2) (1-year follow-up only). IV, instrumental variable; SD, standard deviation.

FIGURE 23.
Systolic blood pressure (mmHg) (any time point). IV, instrumental variable; SD, standard deviation.

FIGURE 24.
Weight (kg) (any time point). IV, instrumental variable; SD, standard deviation.

FIGURE 25.
Mid-arm muscle circumference (cm) (any time point). IV, instrumental variable; SD, standard deviation.

Appendix 3 List of secondary outcomes in the BiCARB trial and details of tests used
| Test | Test details |
|---|---|
| 6-minute walk distance | Measured on a 25-m course with standardised encouragement |
| Handgrip strength | Maximum value in the dominant hand to the nearest 0.1 kg (best of three). Measured using a Takei Grip-D dynamometer (Takei Scientific Instruments Co Ltd. Niigata City, Japan) |
| Weight | To nearest 0.1 kg |
| Mid-arm muscle circumference | Calculated as mid-arm circumference in cm – (π × triceps skinfold thickness in cm) |
| Triceps skinfold thickness | Using callipers, measured to nearest mm |
| Mid-thigh circumference | To nearest 0.1 cm, measured using a tape measure |
| EQ-5D-3L score | Collected using standard published questionnaire. Results mapped to UK preference weights before analysis |
| EQ-5D thermometer | Collected using standard published questionnaire |
| KDQoL questionnaire | Collected using standard published questionnaire |
| eGFR | Derived from serum creatinine concentration via the MDRD4 equation |
| Creatinine | Analysed by local NHS laboratories at each site |
| Cystatin C | Analysed by central laboratory (Canterbury) using a turbidimetric immunoassay (Abbott ARCHITECT analyser, Maidenhead, UK). Analytical CVs: 4.7%, 1.8% and 1.5% at concentrations of 63, 170 and 645 µmol/l, respectively |
| Urinary albumin/creatinine ratio | Analysed by central laboratory (Canterbury). Urinary albumin measured using a turbidimetric immunoassay and urinary creatinine measured using an enzymatic assay, both on an Abbott ARCHITECT analyser. Albumin – analytical CVs: 6.4% and 2.5% at concentrations of 23.3 and 72.2 mg/l, respectively; creatinine – analytical CVs: 1.1% and 0.9% at concentrations of 5.3 and 11.3 mmol/l, respectively |
| Tartrate-resistant acid phosphatase-5b | Analysed by central laboratory (Dundee) using an enzyme-linked immunosorbent assay (CUSABIO, Houston, TX, USA). Intra-assay CVs: 14.3% using plasma pool, 6.3% using 2.5 mIU/ml standard; inter-assay CV: 6.9% using plasma pool |
| Bone-specific alkaline phosphatase | Analysed by central laboratory (Dundee) using a sandwich chemiluminescence assay (DiaSorin, Saluggia, Italy). Mean intra-assay CV: 9.1% using plasma pool; inter-assay CV: 8.5–11.5% using control standards |
| PTH | Analysed by local NHS laboratories at each site |
| 25-hydroxyvitamin D | Analysed by central laboratory (Guy’s and St Thomas’) using a Chemiflex Chemiluminescence Microparticle Immunoassay (Abbott Diagnostics, Lake Forest, IL, USA). Inter-assay CVs: 6.6%, 4% and 3% at serum 25-hydroxyvitamin D concentrations of 13, 25 and 50 nmol/l, respectively |
| 1,25-dihydroxyvitamin D | Analysed by central laboratory (Guy’s and St Thomas’). Immunoextraction followed by chemiluminescence immunoassay on an IDS-iSYS system (Immunodiagnostic Systems Holdings plc, Boldon, UK). Inter-assay CVs: 9.5% and 10.25% at 1,25-dihydroxyvitamin D concentrations of 58 and 103 pmol/l, respectively |
| N-terminal pro-B-type natriuretic peptide | Analysed by central laboratory (Dundee) using an enzyme-linked immunosorbent assay (Meso Scale Discovery, Rockville, MD, USA). Mean intra-assay CVs: 4.7% across all samples, 9.2–11.7% using control standards; inter-assay CV: 2.3–5.3% using control standards |
| Haemoglobin | Analysed by local NHS laboratories at each site |
| Total cholesterol | Analysed by local NHS laboratories at each site |
| Serum albumin | Analysed by local NHS laboratories at each site |
| Thyroid-stimulating hormone | Analysed by local NHS laboratories at each site |
| Serum potassium | Analysed by local NHS laboratories at each site |
| Serum calcium | Adjusted for serum albumin concentration. Analysed by local NHS laboratories at each site |
| Serum phosphate | Analysed by local NHS laboratories at each site |
| HbA1c | Analysed by local NHS laboratories at each site |
| Serum bicarbonate | Analysed by local NHS laboratories at each site |
| Systolic blood pressure | Measured using an OMRON 705CP-II (HEM-759-E2) (Omron Healthcare UK Ltd, Milton Keynes, UK) oscillometric device. Three readings supine were carried out after 5 minutes’ rest; the mean of the second and third readings was used as the blood pressure reading |
| Diastolic blood pressure | |
| Falls | Collected using monthly self-report diaries |
Appendix 4 Unit costs for the health economic analysis
| Resource | Unit | Source | Basis of estimate | Cost (£) |
|---|---|---|---|---|
| Inpatient stay | Day | NHS Reference Costs 2016–17 59 | Non-elective inpatient and elective inpatient stays (mean cost over these two categories) | 345 |
| Day case | Visit | NHS Reference Costs 2016–17 59 | Day case | 736 |
| Outpatient: nephrology | Visit | NHS Reference Costs 2016–17 59 | WF01A Non-Admitted Face-to-Face Attendance, Follow-up 361 Nephrology, WF01B Non-Admitted Face-to-Face Attendance, First 361 Nephrology (mean of consultant-led and non-consultant-led attendance) | 150 |
| Outpatient: other | Visit | NHS Reference Costs 2016–17 59 | Outpatient Attendances (weighted average of all outpatient attendances) | 120 |
| Haemodialysis | Visit | NHS Reference Costs 2016–17 59 | LD01A Hospital Haemodialysis or Filtration, with Access via Haemodialysis Catheter, ≥ 19 years, LD02A Hospital Haemodialysis or Filtration, with Access via Arteriovenous Fistula or Graft, ≥ 19 years, LD02A Hospital Haemodialysis or Filtration, with Access via Arteriovenous Fistula or Graft, ≥ 19 years, LD03A Hospital Haemodialysis or Filtration, with Access via Haemodialysis Catheter, with Blood-Borne Virus, ≥ 19 years, LD04A Hospital Haemodialysis or Filtration, with Access via Arteriovenous Fistula or Graft, with Blood-Borne Virus, ≥ 19 years, LD05A Satellite Haemodialysis or Filtration, with Access via Haemodialysis Catheter, ≥ 19 years, LD06A Satellite Haemodialysis or Filtration, with Access via Arteriovenous Fistula or Graft, ≥ 19 years, LD07A Satellite Haemodialysis or Filtration, with Access via Haemodialysis Catheter, with Blood-Borne Virus, ≥ 19 years, LD08A Satellite Haemodialysis or Filtration, with Access via Arteriovenous Fistula or Graft, with Blood-Borne Virus, ≥ 19 years, LD09A Home Haemodialysis or Filtration, with Access via Haemodialysis Catheter, ≥ 19 years, LD10A Home Haemodialysis or Filtration, with Access via Arteriovenous Fistula or Graft, ≥ 19 years (mean cost over these 10 categories) | 167 |
| Peritoneal dialysis | Session | NHS Reference Costs 2016–17 59 | LD11A Continuous Ambulatory Peritoneal Dialysis, ≥ 19 years, LD12A Automated Peritoneal Dialysis, ≥ 19 years, LD13A Assisted Automated Peritoneal Dialysis, ≥ 19 years (mean cost over these three categories) | 76 |
| Renal transplant | Episode | NHS Reference Costs 2016–17 59 | LA01A Kidney Transplant, ≥ 19 years, from Cadaver Non-Heart-Beating Donor, LA02A Kidney Transplant, ≥ 19 years, from Cadaver Heart-Beating Donor, LD03A Kidney Transplant, ≥ 19 years, from Live Donor (mean cost over these three categories) | 12,681 |
| Day hospital | Visit | NHS Reference Costs 2016–17 59 | DCFRAD Day Care Facilities Regular Attendances, Elderly Patients | 132 |
| Day centre | Visit | Curtis and Burns60 | Local authority own provision day care for older people | 63 |
| GP | Visit | Curtis and Burns60 | 9.22-minute consultation, including qualification and direct staff | 38 |
| Home help/professional home carer | Visit | Curtis and Burns60 | Assume visit lasts 30 minutes.61 Face-to-face, independent sector home care provided for social services (weighted mean over weekday, daytime weekend, night-time weekday and night-time weekend) | 15 |
| District nurse | Visit | NHS Reference Costs 2016–17 59 | N02AF District Nurse, Adult, Face-to-Face | 37 |
| Physiotherapist | Visit | NHS Reference Costs 2016–17 59 | WF01A Non-Admitted Face-to-Face Attendance, Follow up 650 Physiotherapy, WF01B Non-Admitted Face-to-Face Attendance, First 650 Physiotherapy, AHP Allied Health Professionals A08A1 Physiotherapist, Adult, One to One, AHP Allied Health Professionals A08AG Physiotherapist, Adult, Group (mean over these four categories) | 52 |
| Occupational therapist | Visit | NHS Reference Costs 2016–17 59 | WF01A Non-Admitted Face-to-Face Attendance, Follow up 651 Occupational Therapy, WF01B Non-Admitted Face-to-Face Attendance, First 651 Occupational Therapy, AHP Allied Health Professionals A06A1 Occupational Therapist, Adult, One to One, AHP Allied Health Professionals A06AG Occupational Therapist, Adult, Group (mean cost over these four categories) | 72 |
| Speech therapist | Visit | NHS Reference Costs 2016–17 59 | WF01A Non-Admitted Face-to-Face Attendance, Follow up 652 Speech and Language Therapy, WF01B Non-Admitted Face-to-Face Attendance, First 651 Speech and Language Therapy, AHP Allied Health Professionals A13A1 Speech and Language Therapist, Adult, One to One, AHP Allied Health Professionals A13AG Speech and Language Therapist, Adult, Group (mean cost over these four categories) | 101 |
Appendix 5 Recruitment
FIGURE 26.
Monthly recruitment rate.
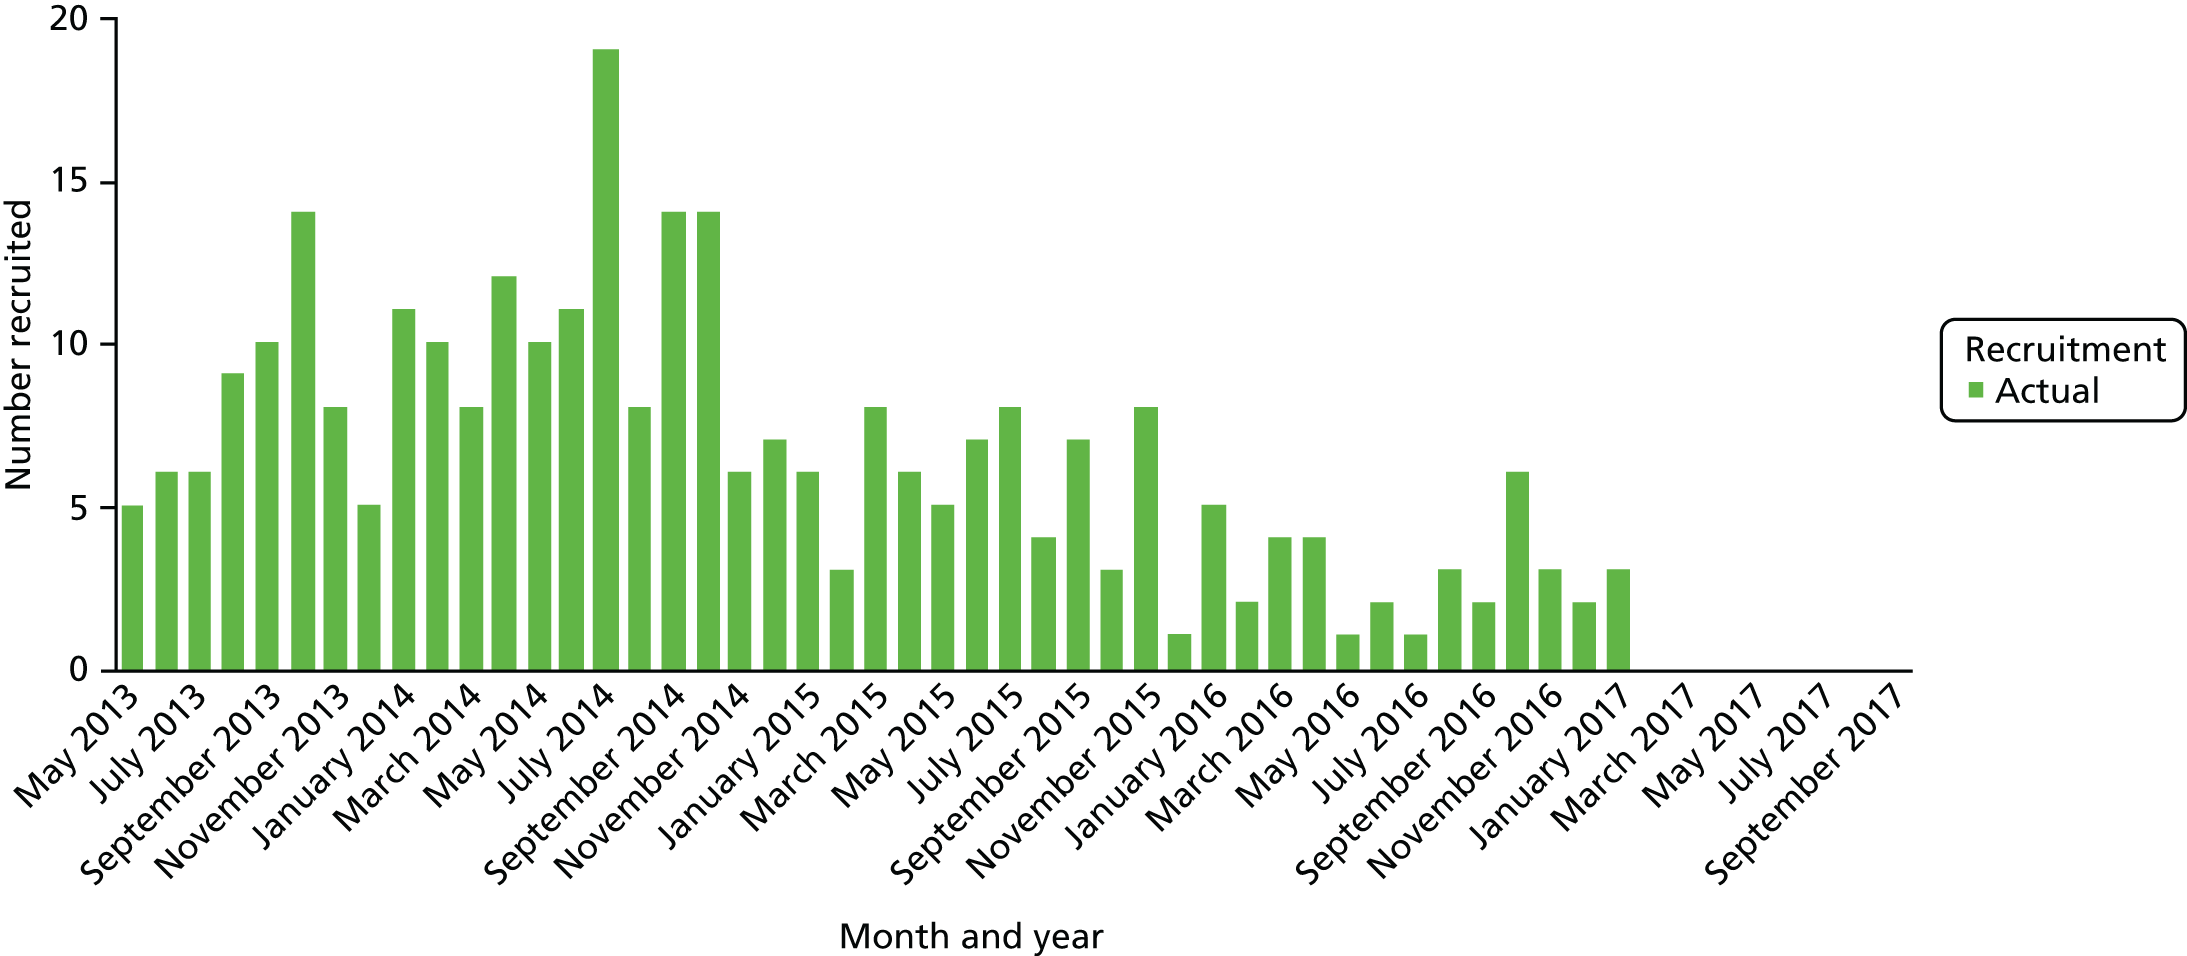
FIGURE 27.
Cumulative recruitment.
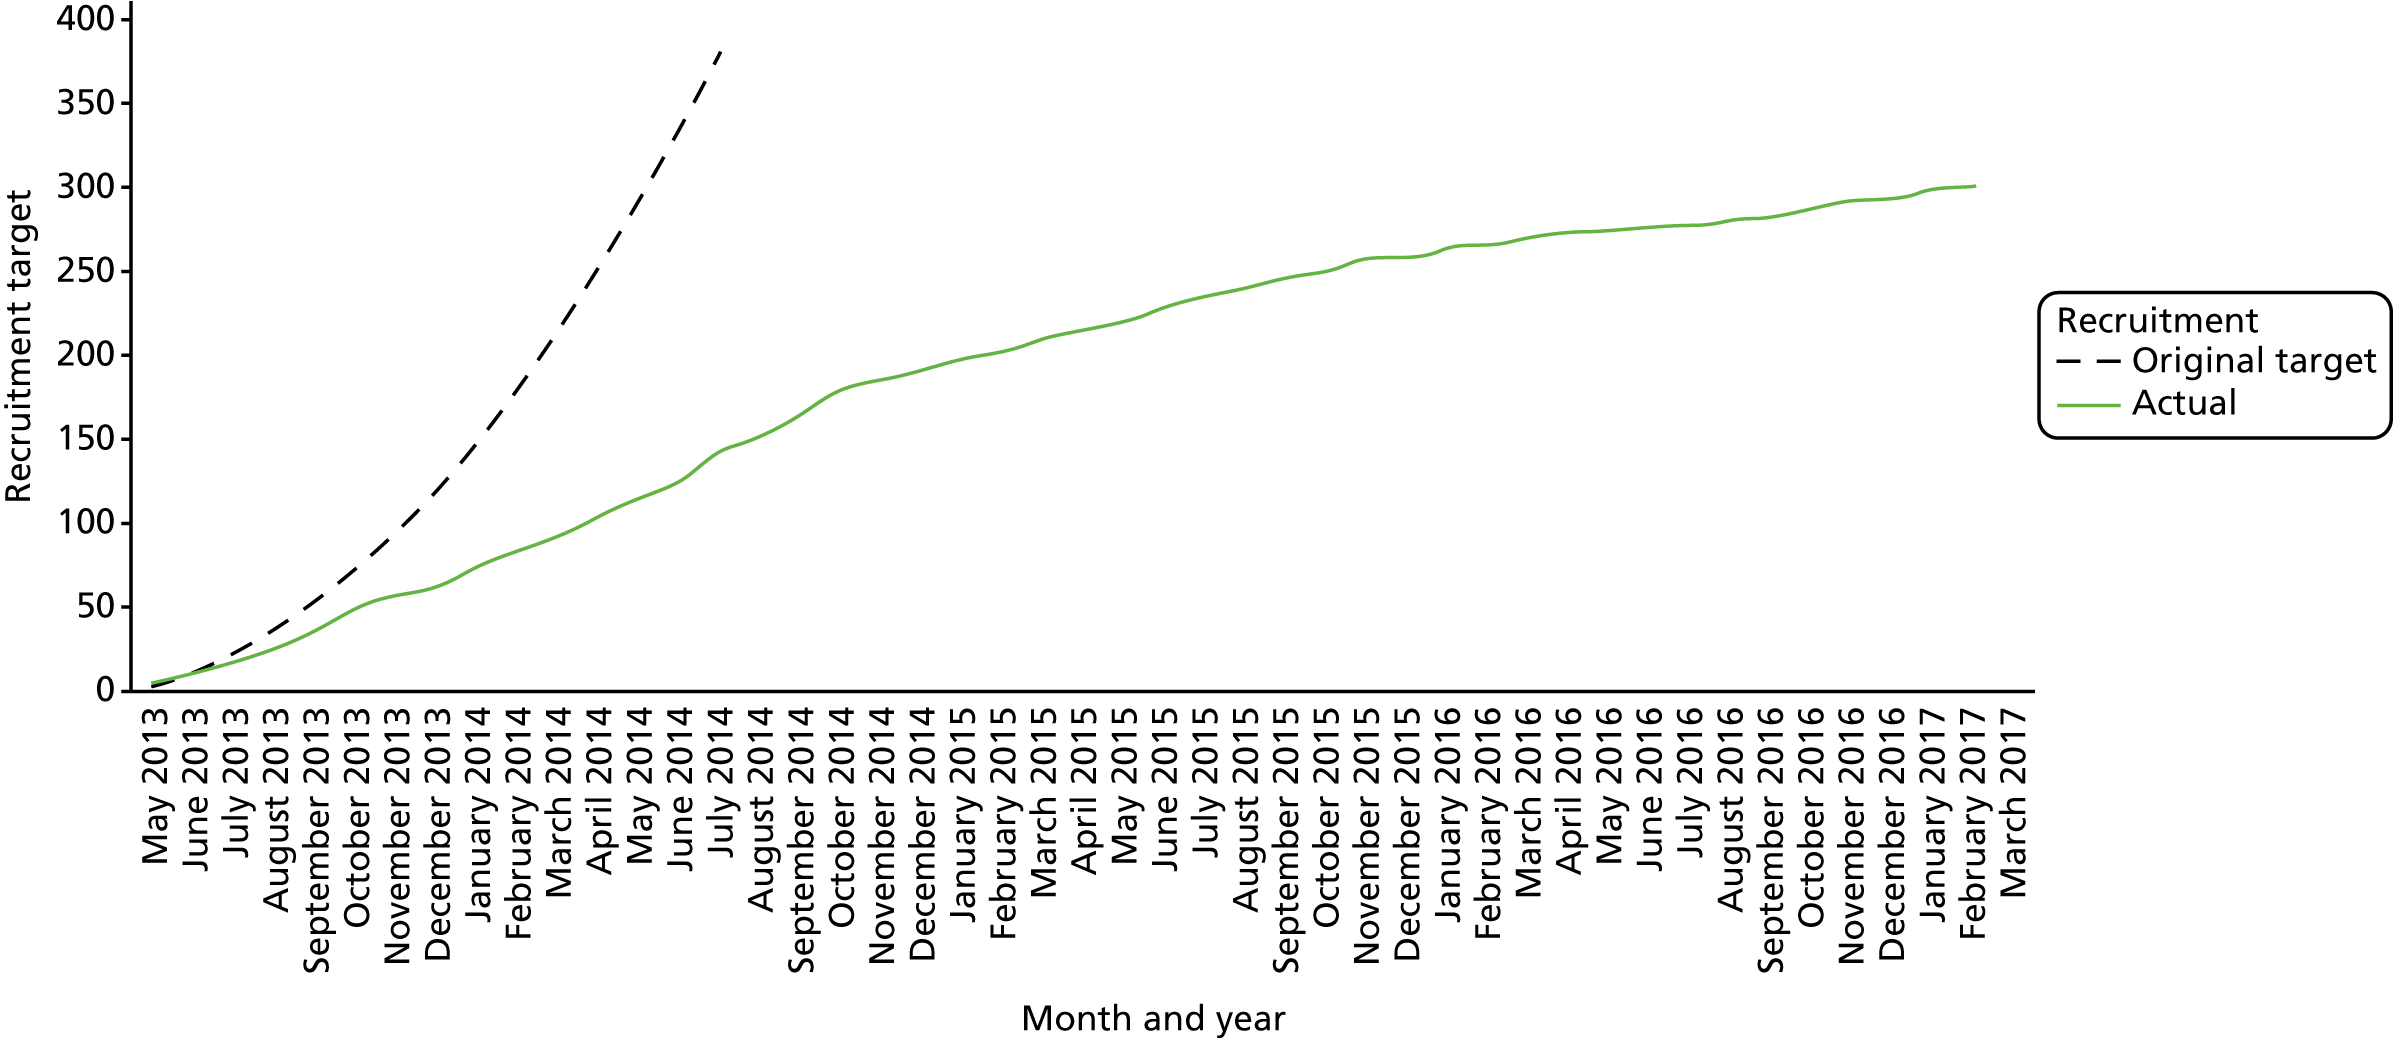
| Site | Month started recruitment | Number randomised |
|---|---|---|
| Aberdeen | May 2013 | 10 |
| Canterbury | May 2013 | 38 |
| Dundeea | May 2013 | 0 |
| Guy’s and St Thomas’a | May 2013 | 1 |
| Salford | May 2013 | 52 |
| Sheffield | May 2013 | 11 |
| Preston | September 2013 | 22 |
| Portsmouth | August 2013 | 23 |
| Mid Essex | August 2013 | 22 |
| Manchester | December 2013 | 19 |
| Leicester | December 2013 | 28 |
| North Staffs | February 2014 | 4 |
| Pennine | December 2013 | 6 |
| Wolverhampton | February 2014 | 15 |
| Highland | February 2014 | 5 |
| Wirral | May 2014 | 1 |
| Sussex | July 2014 | 8 |
| Exeter | March 2015 | 3 |
| Plymouth | July 2014 | 4 |
| Southend | September 2014 | 8 |
| Fife | March 2015 | 8 |
| Gloucester | October 2015 | 3 |
| Birmingham | July 2015 | 5 |
| Imperial | July 2016 | 3 |
| Colchester | November 2016 | 0 |
| Basildon | November 2016 | 1 |
| Total | 300 |
Appendix 6 Health economic sensitivity analyses
FIGURE 28.
Sensitivity analyses of incremental cost difference and incremental ICECAP difference between randomised groups for complete cases over 24 months’ follow-up (n = 114). (a) Scatterplot for lower sodium bicarbonate costs; (b) cost-effectiveness acceptability curve for lower sodium bicarbonate costs; (c) scatterplot for lower inpatient stay costs; (d) cost-effectiveness acceptability curve for lower inpatient stay costs; and (e) scatterplot for ICECAP values.
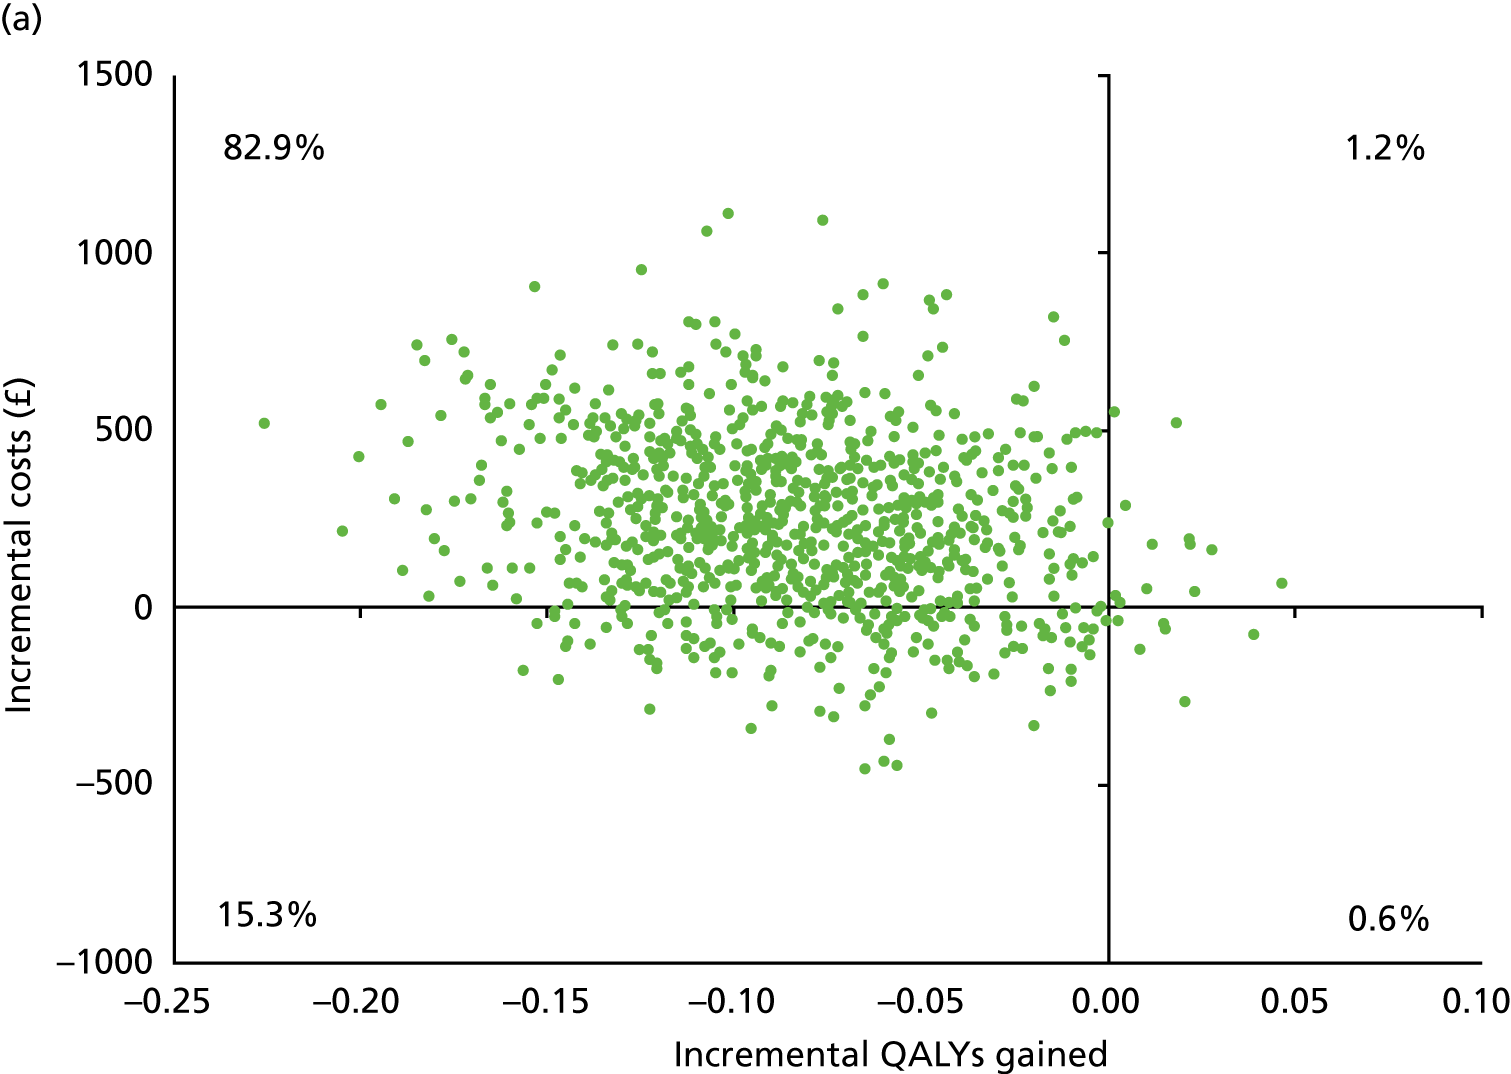
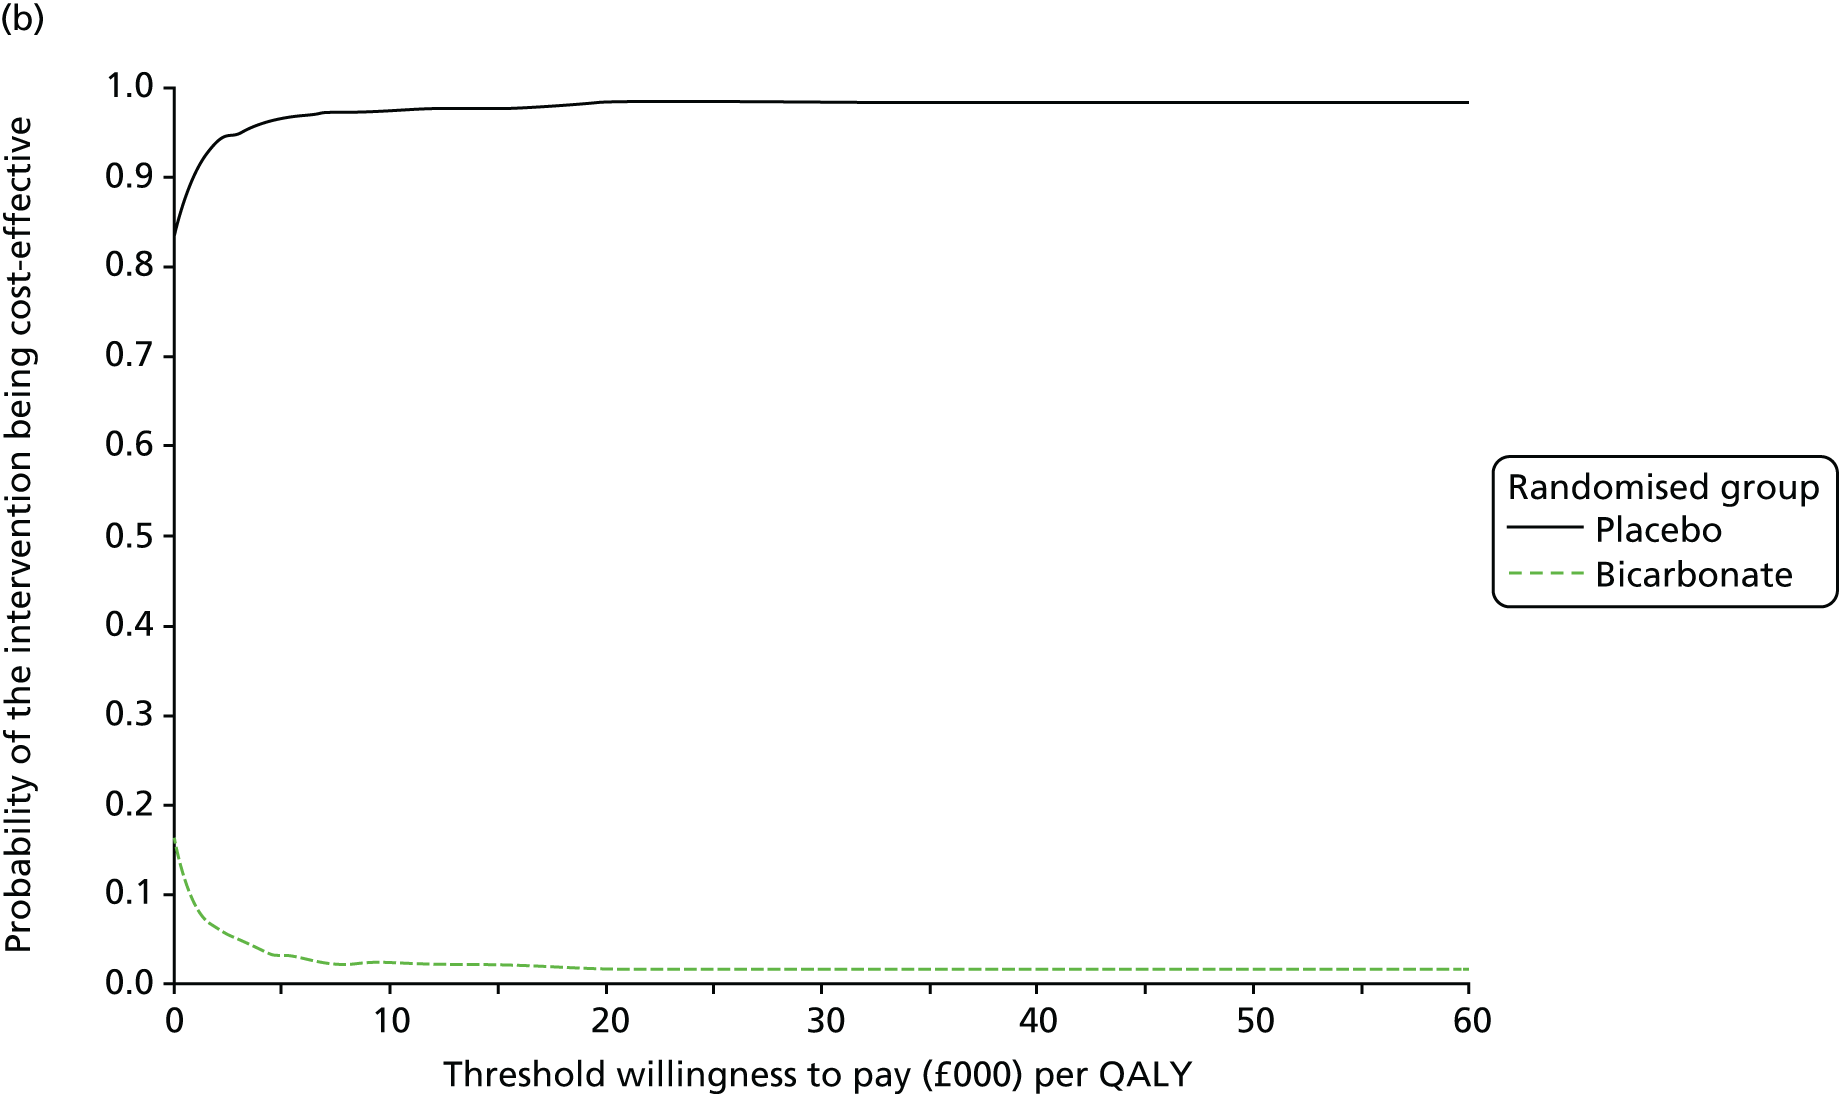
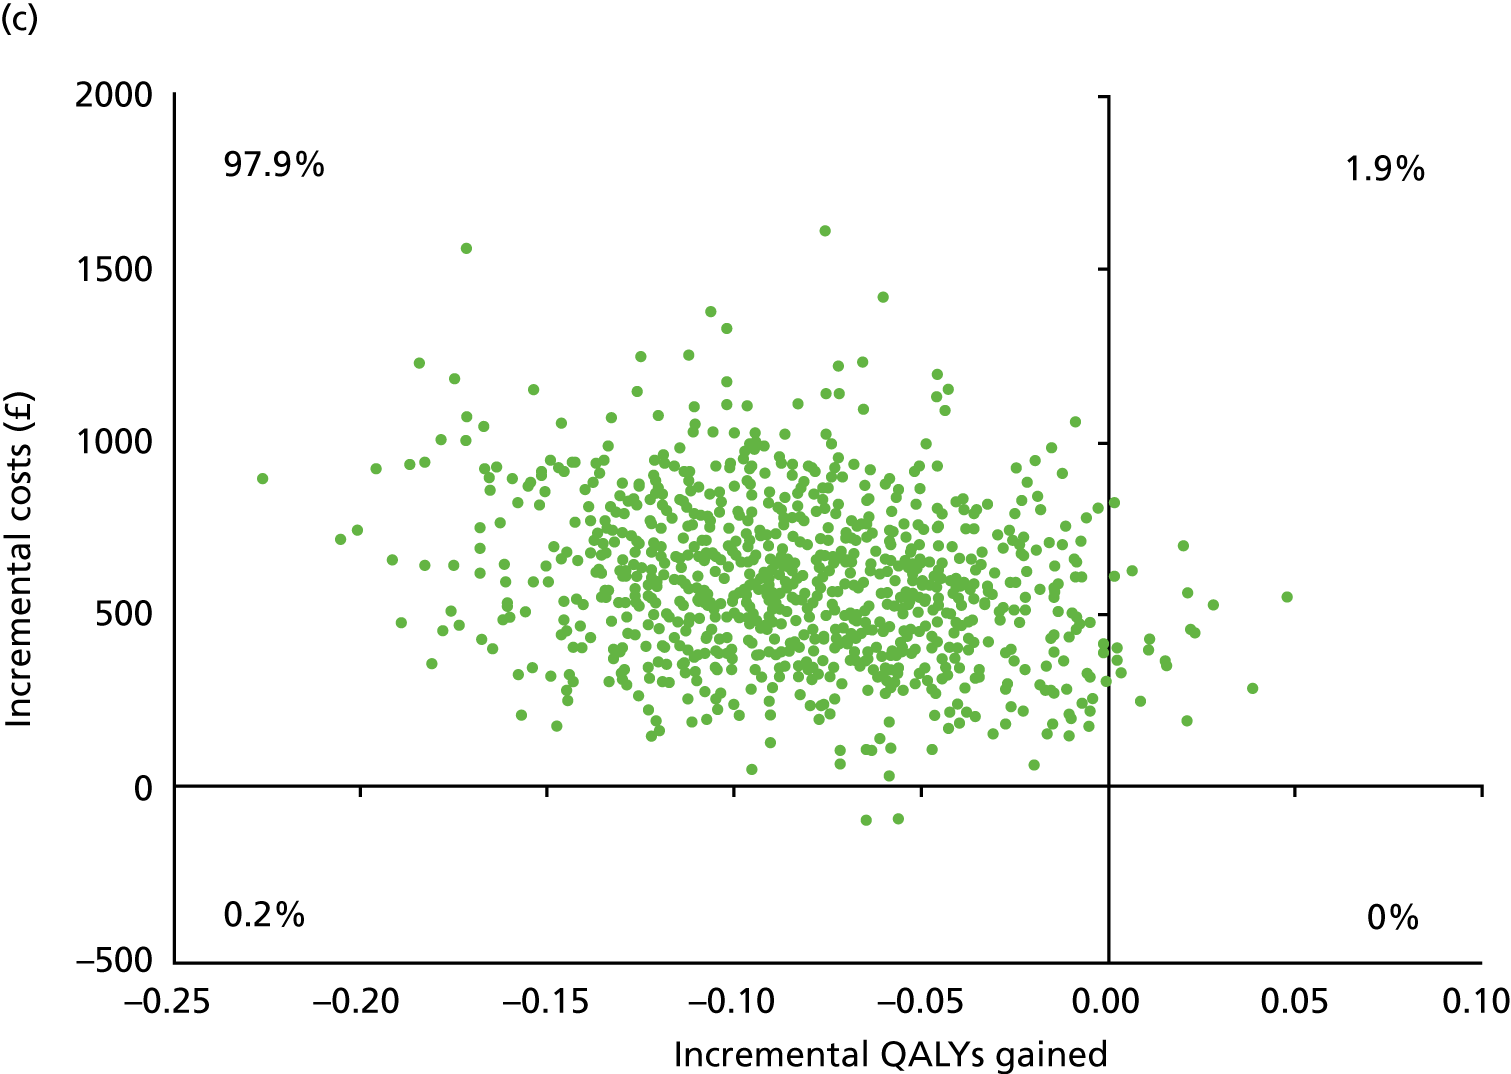
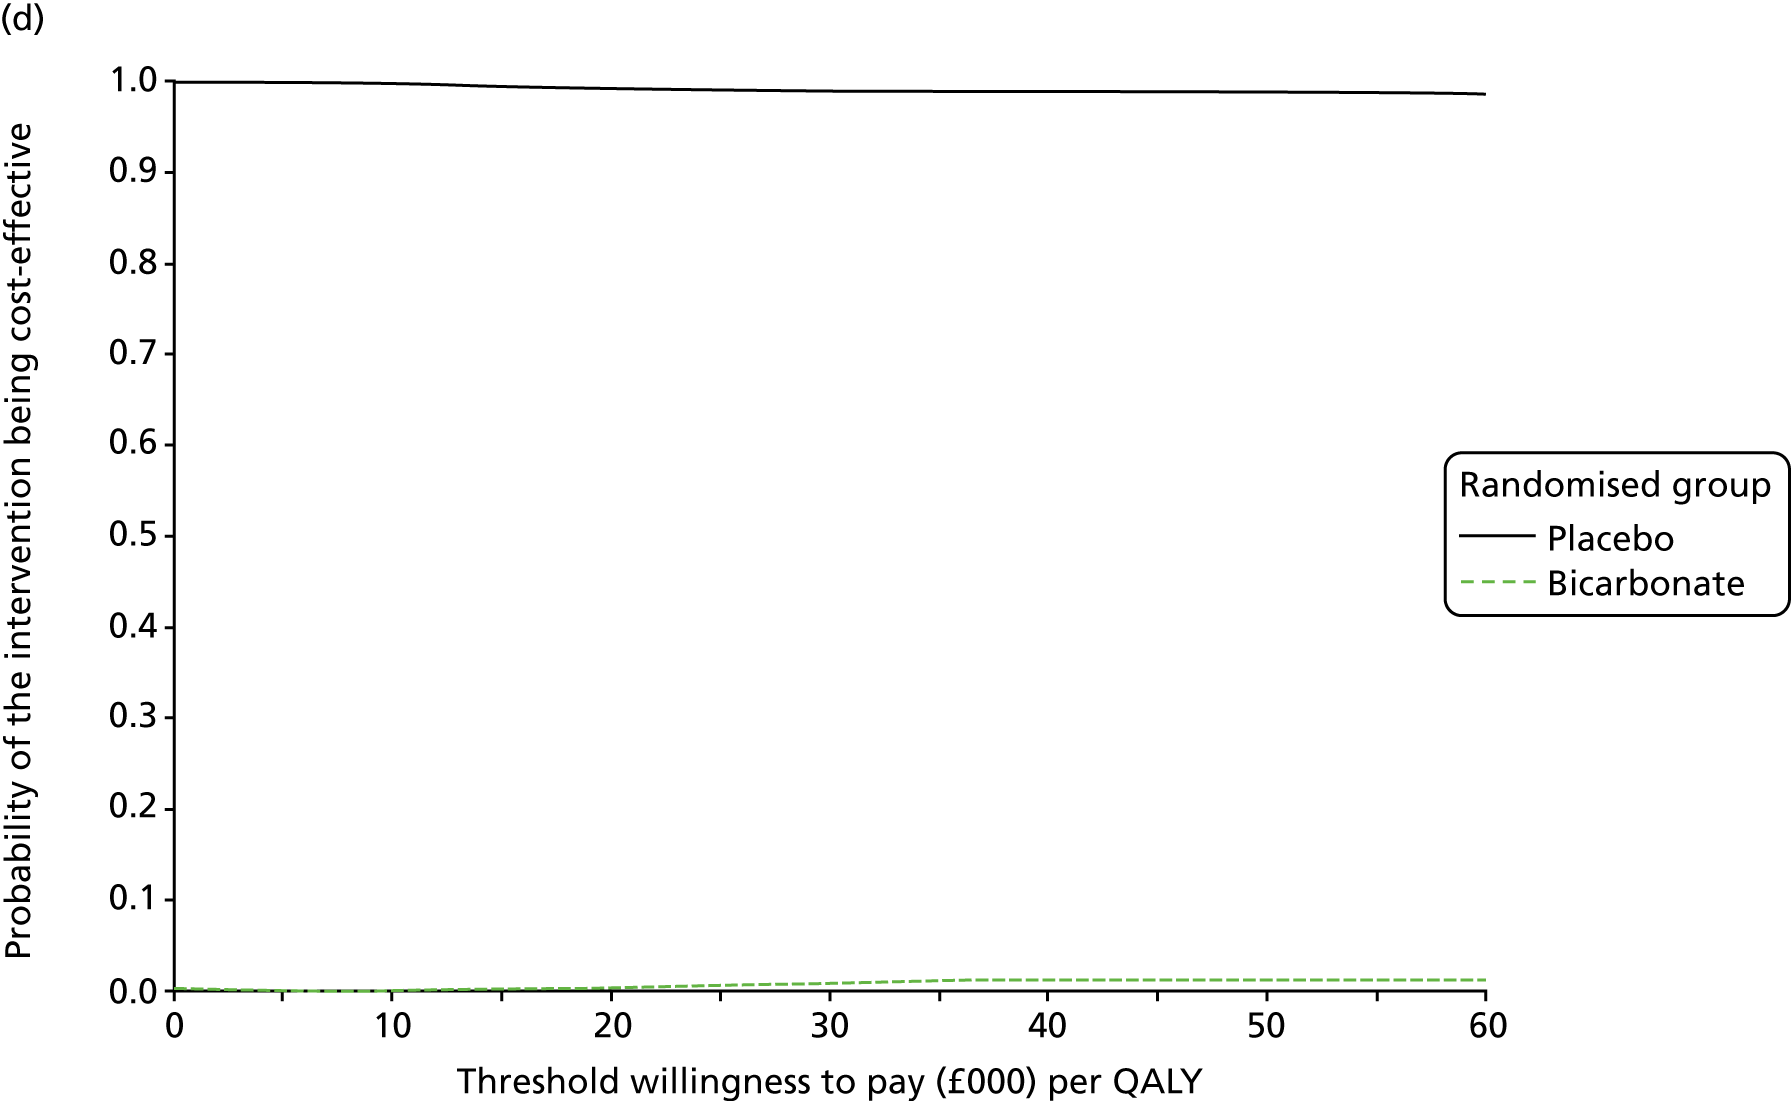
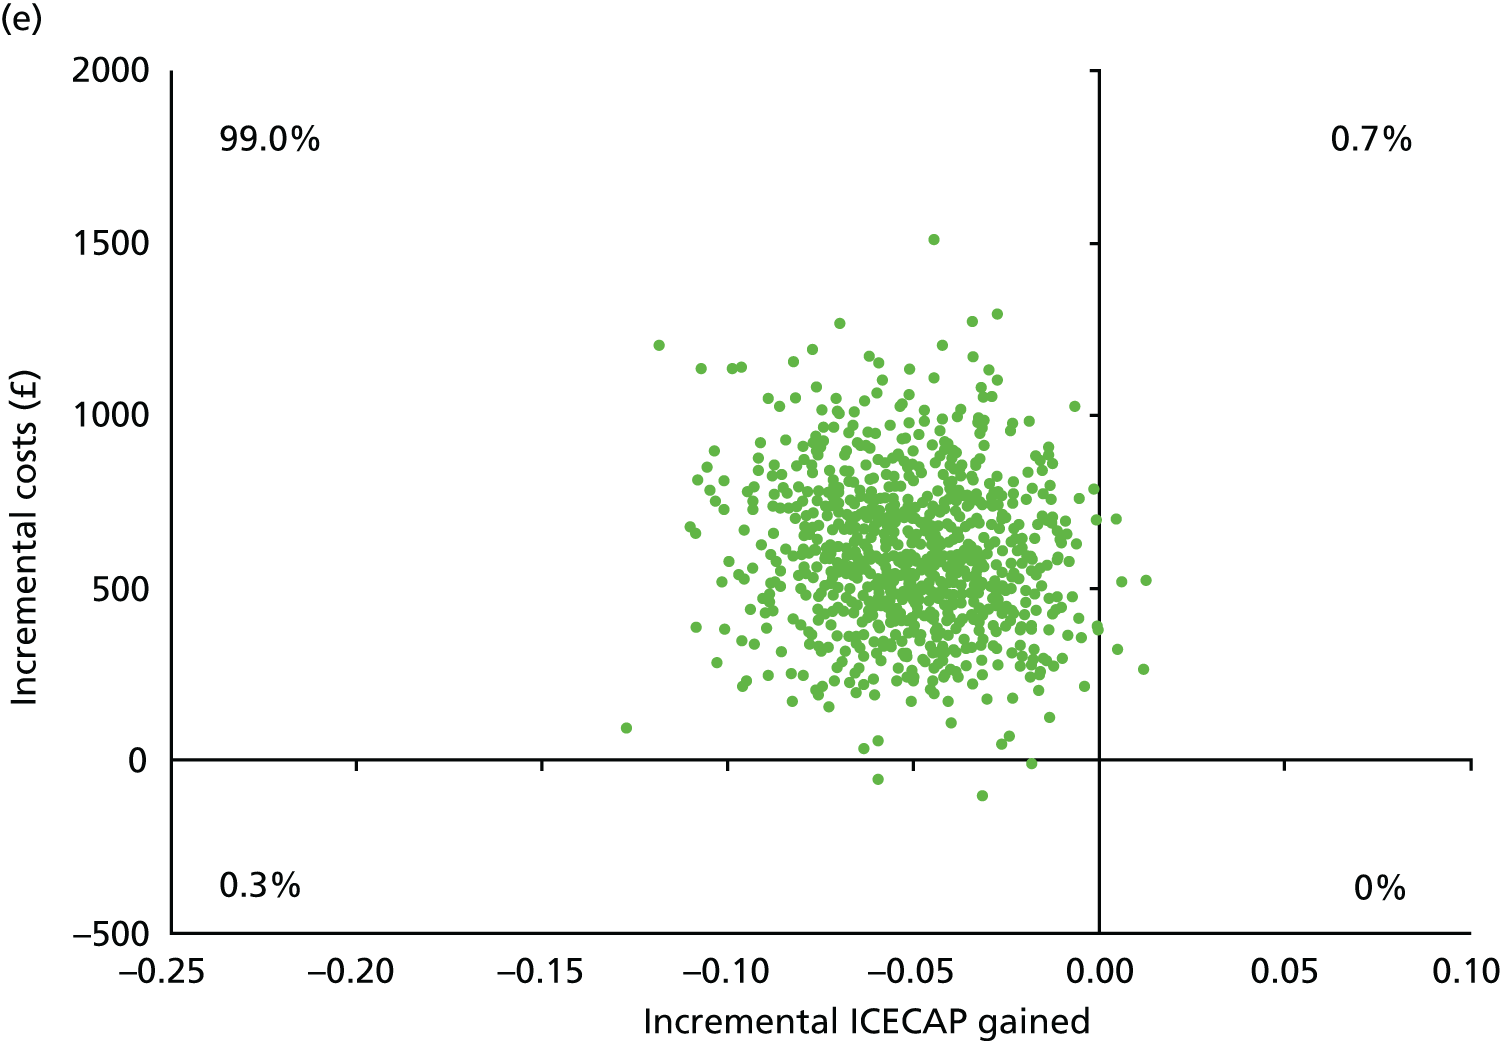
FIGURE 29.
Sensitivity analyses of incremental cost difference and incremental life satisfaction difference between randomised groups. (a) Scatterplot for complete cases over 12 months’ follow-up (n = 176); (b) scatterplot for complete cases over 24 months’ follow-up (n = 114); and (c) scatterplot for complete cases over 24 months’ follow-up and all particpants starting renal replacement therapy during the trial (n = 159).
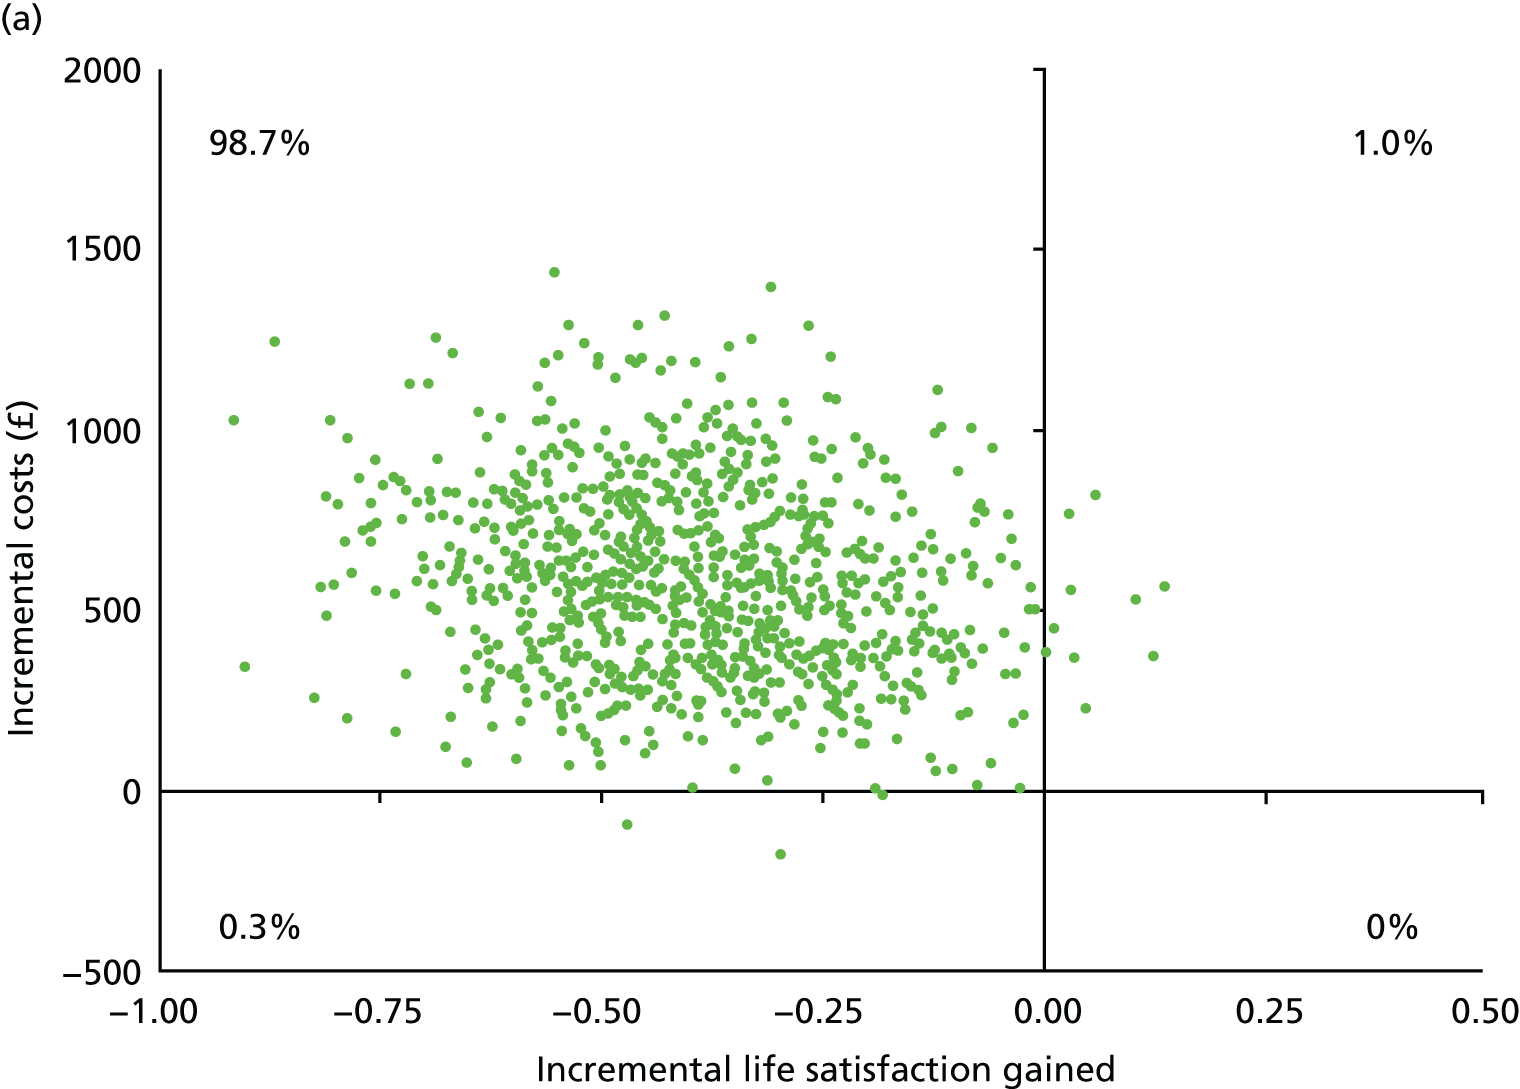
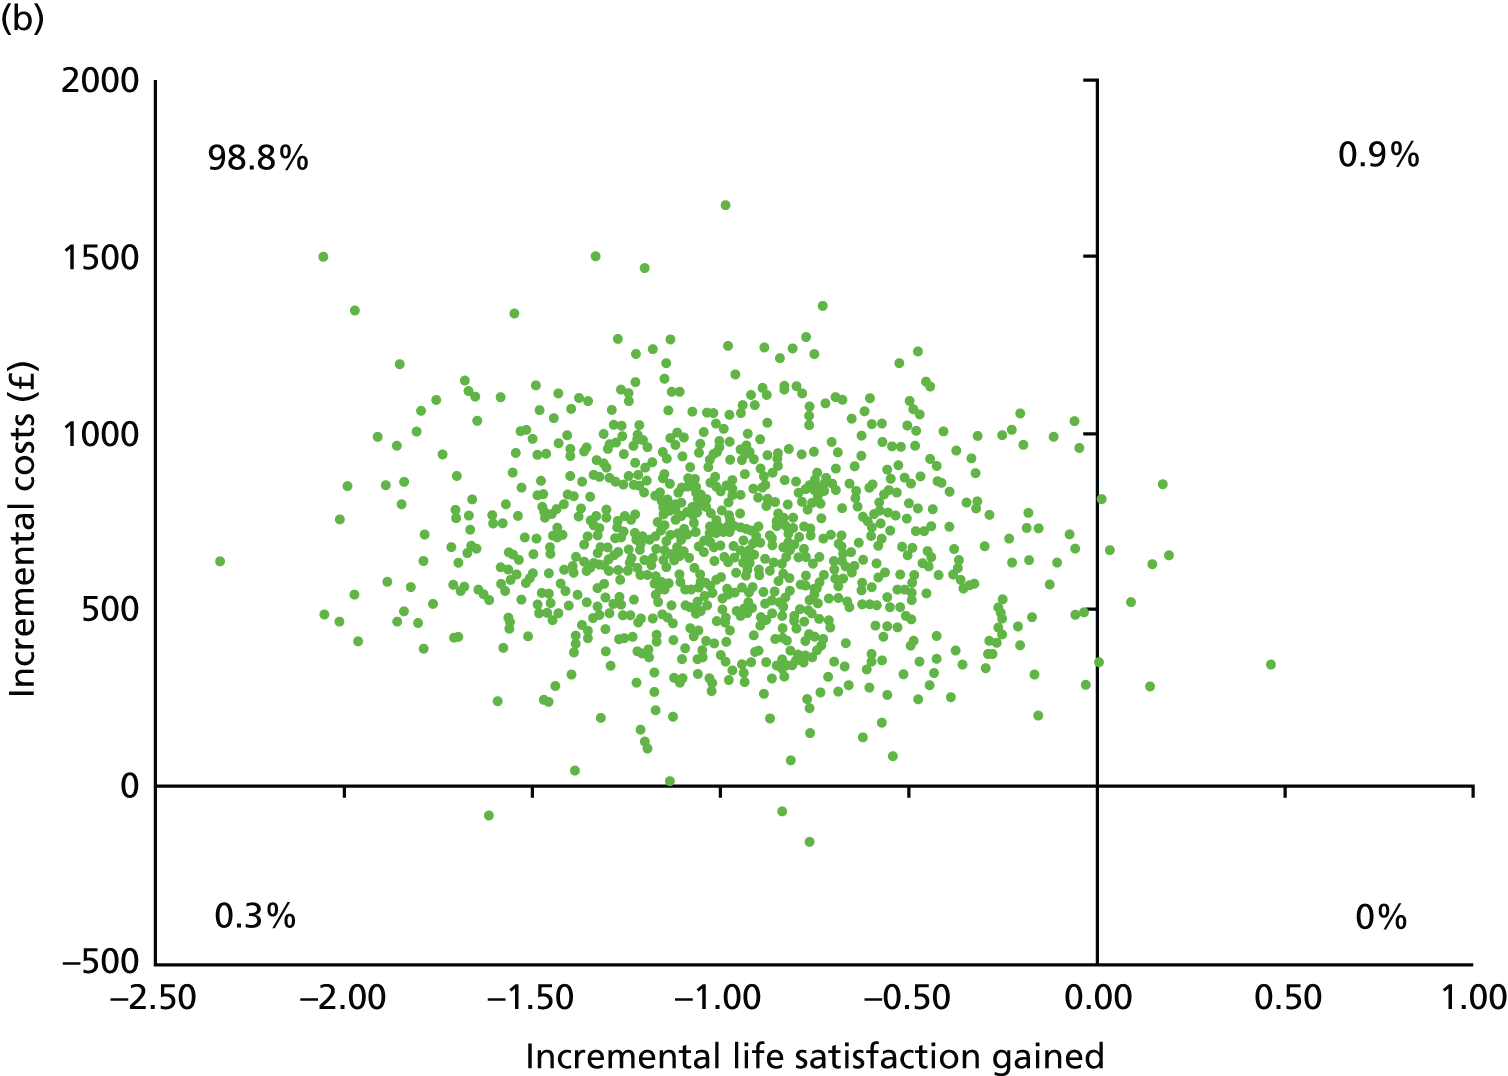
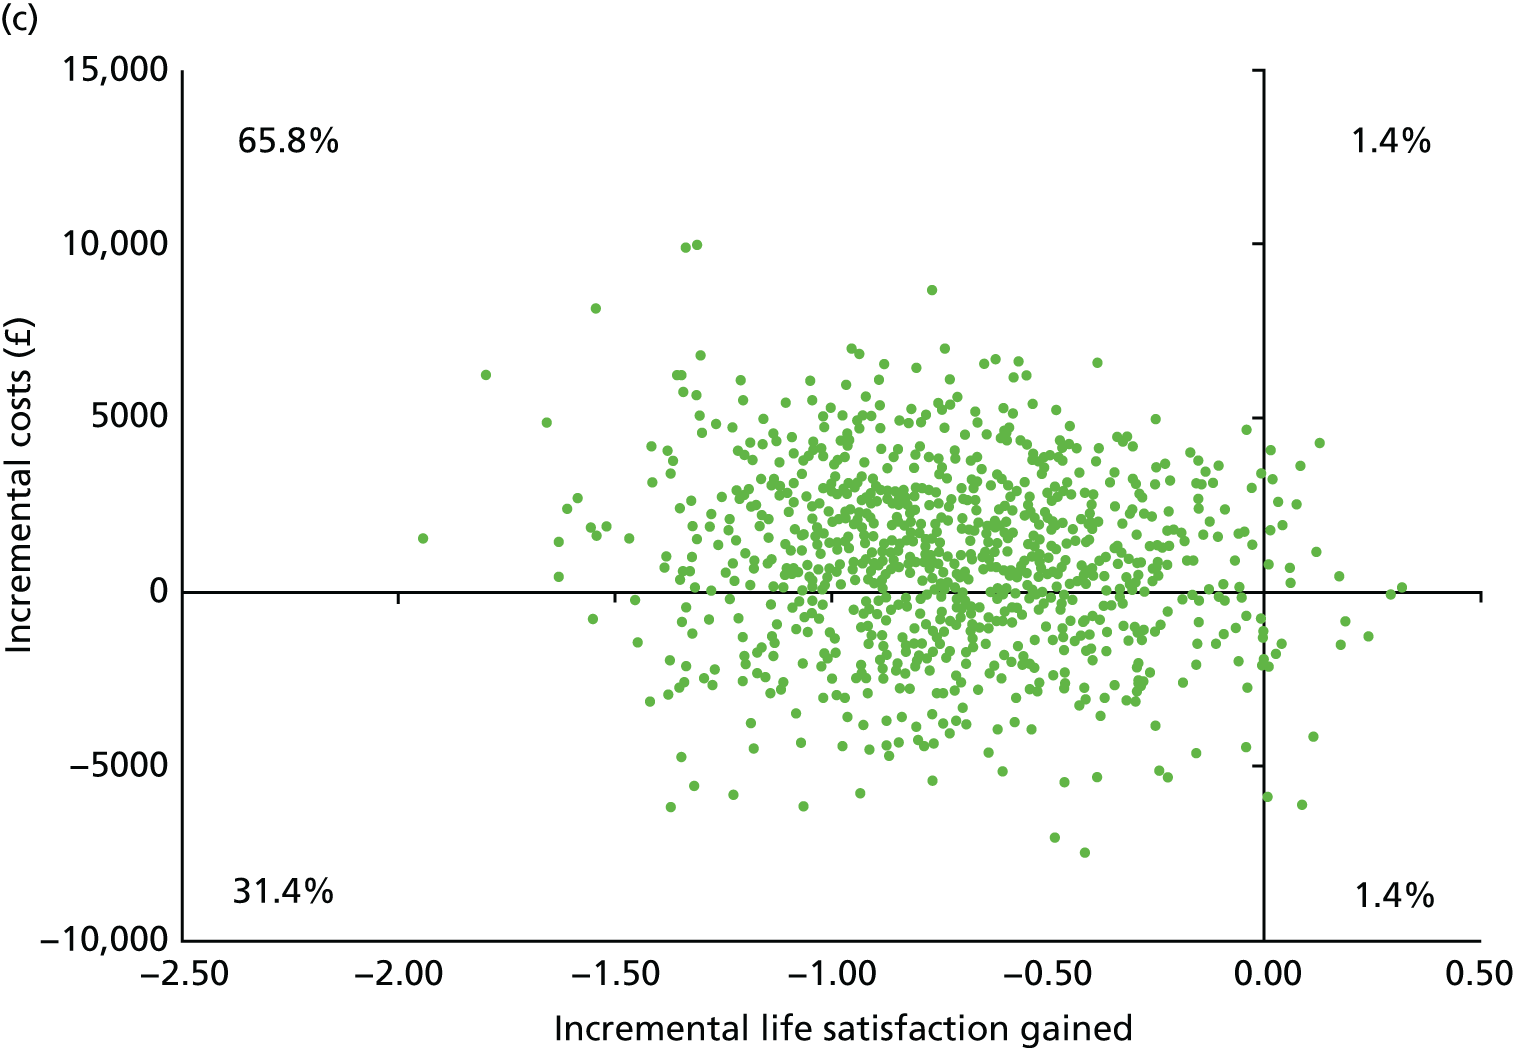
FIGURE 30.
Sensitivity analyses of incremental cost difference and incremental QALY or ICECAP difference between randomised groups for complete cases over 24 months’ follow-up and all participants starting renal replacement therapy during the trial. (a) Scatterplot for lower sodium bicarbonate costs; (b) cost-effectiveness acceptability curve for lower sodium bicarbonate costs; (c) scatterplot for lower inpatient stay costs; (d) cost-effectiveness acceptability curve for lower inpatient stay costs; (e) scatterplot for ICECAP values; (f) scatterplot for lower dialysis costs; (g) cost-effectiveness acceptability curve for lower dialysis costs; (h) scatterplot for higher dialysis costs; and (i) cost-effectiveness acceptability curve for higher dialysis costs.
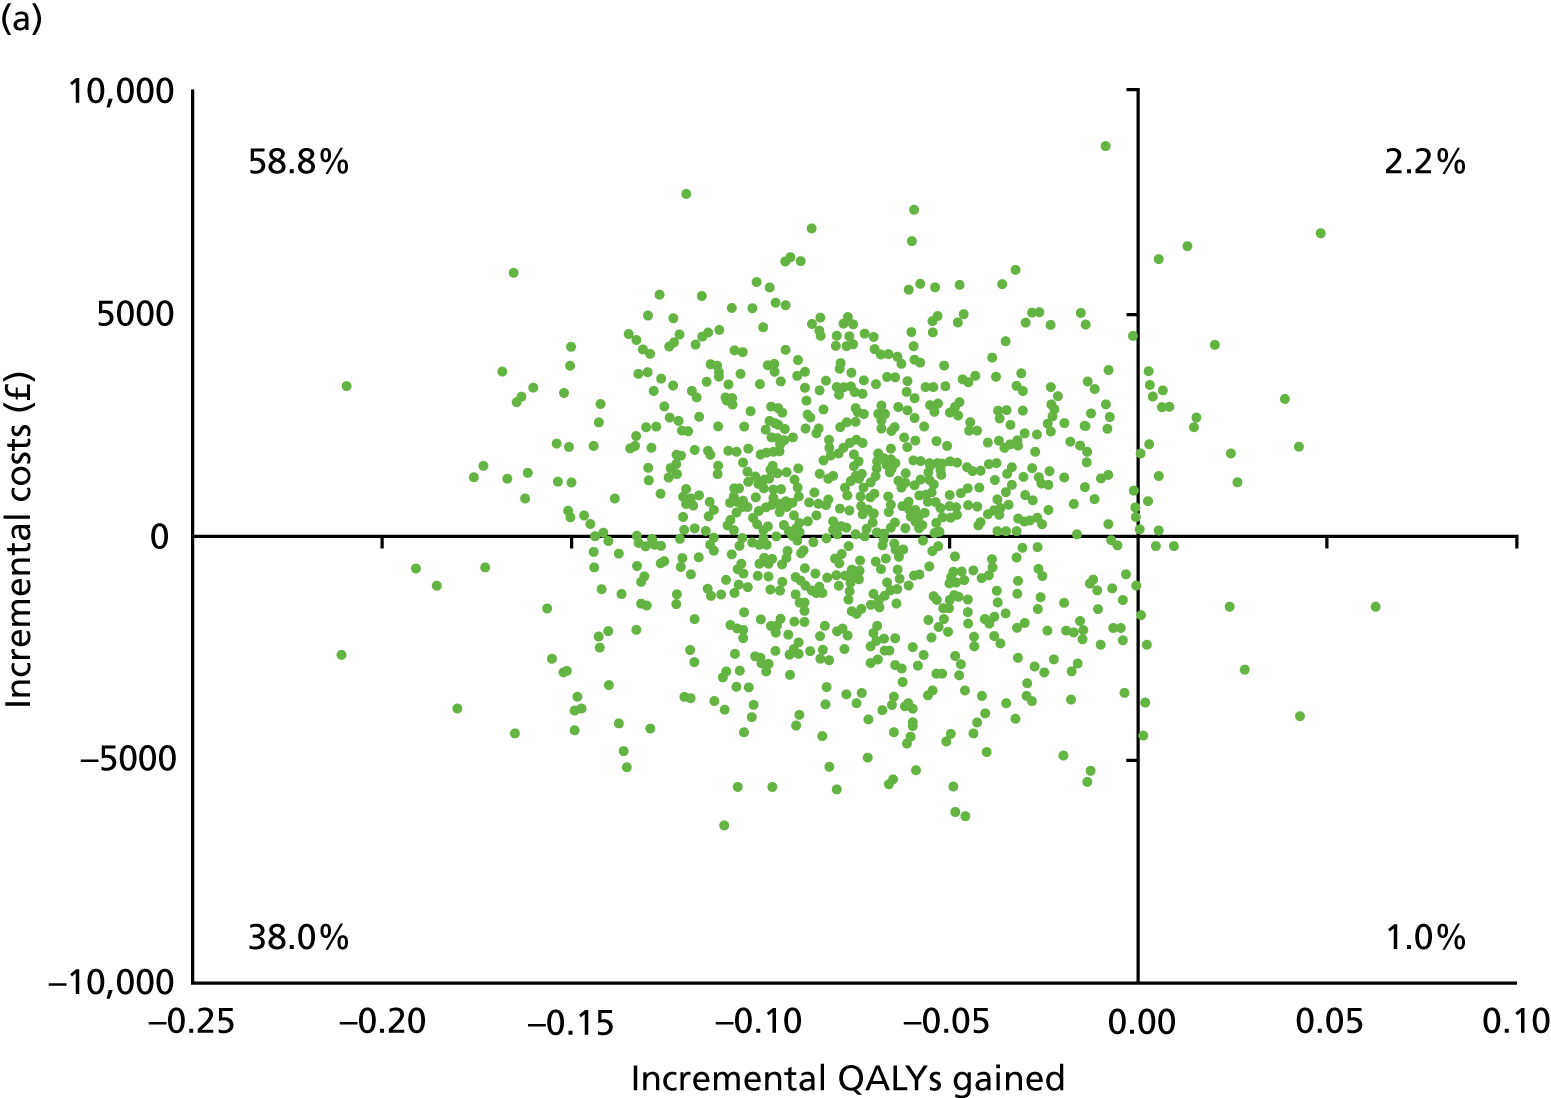
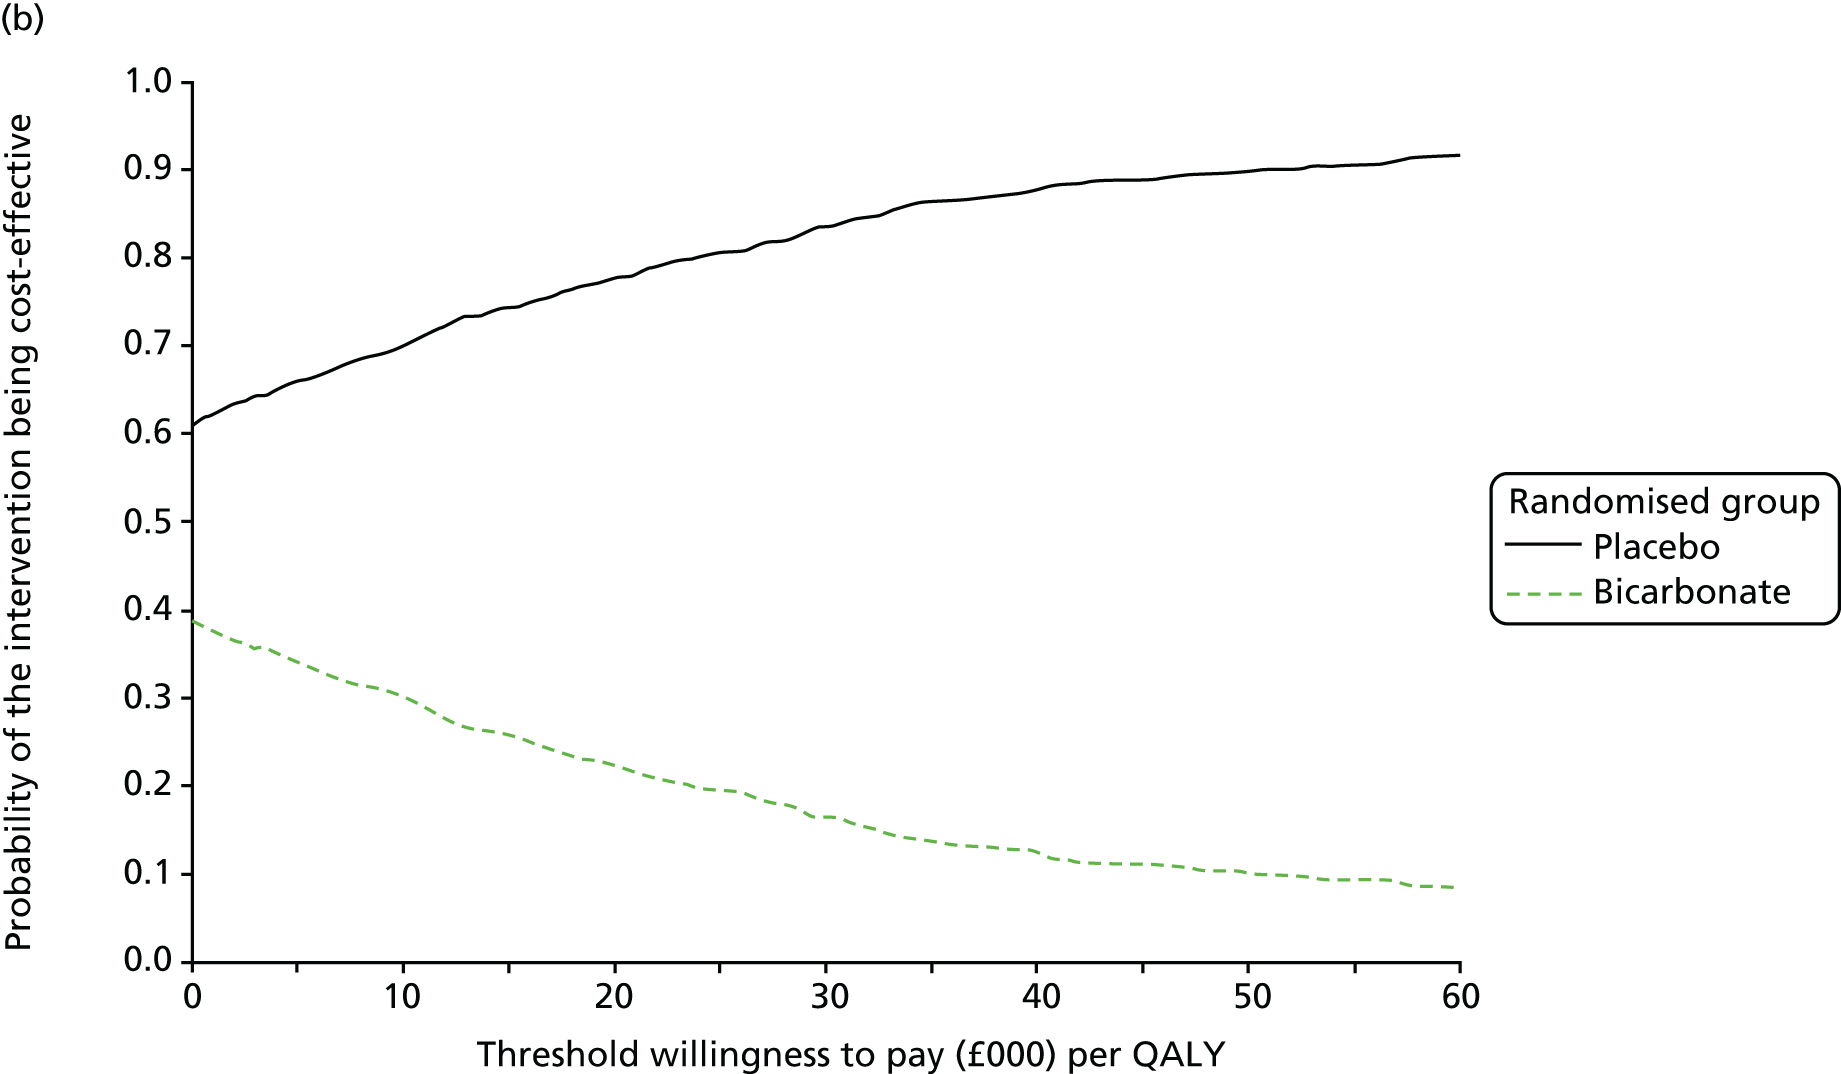
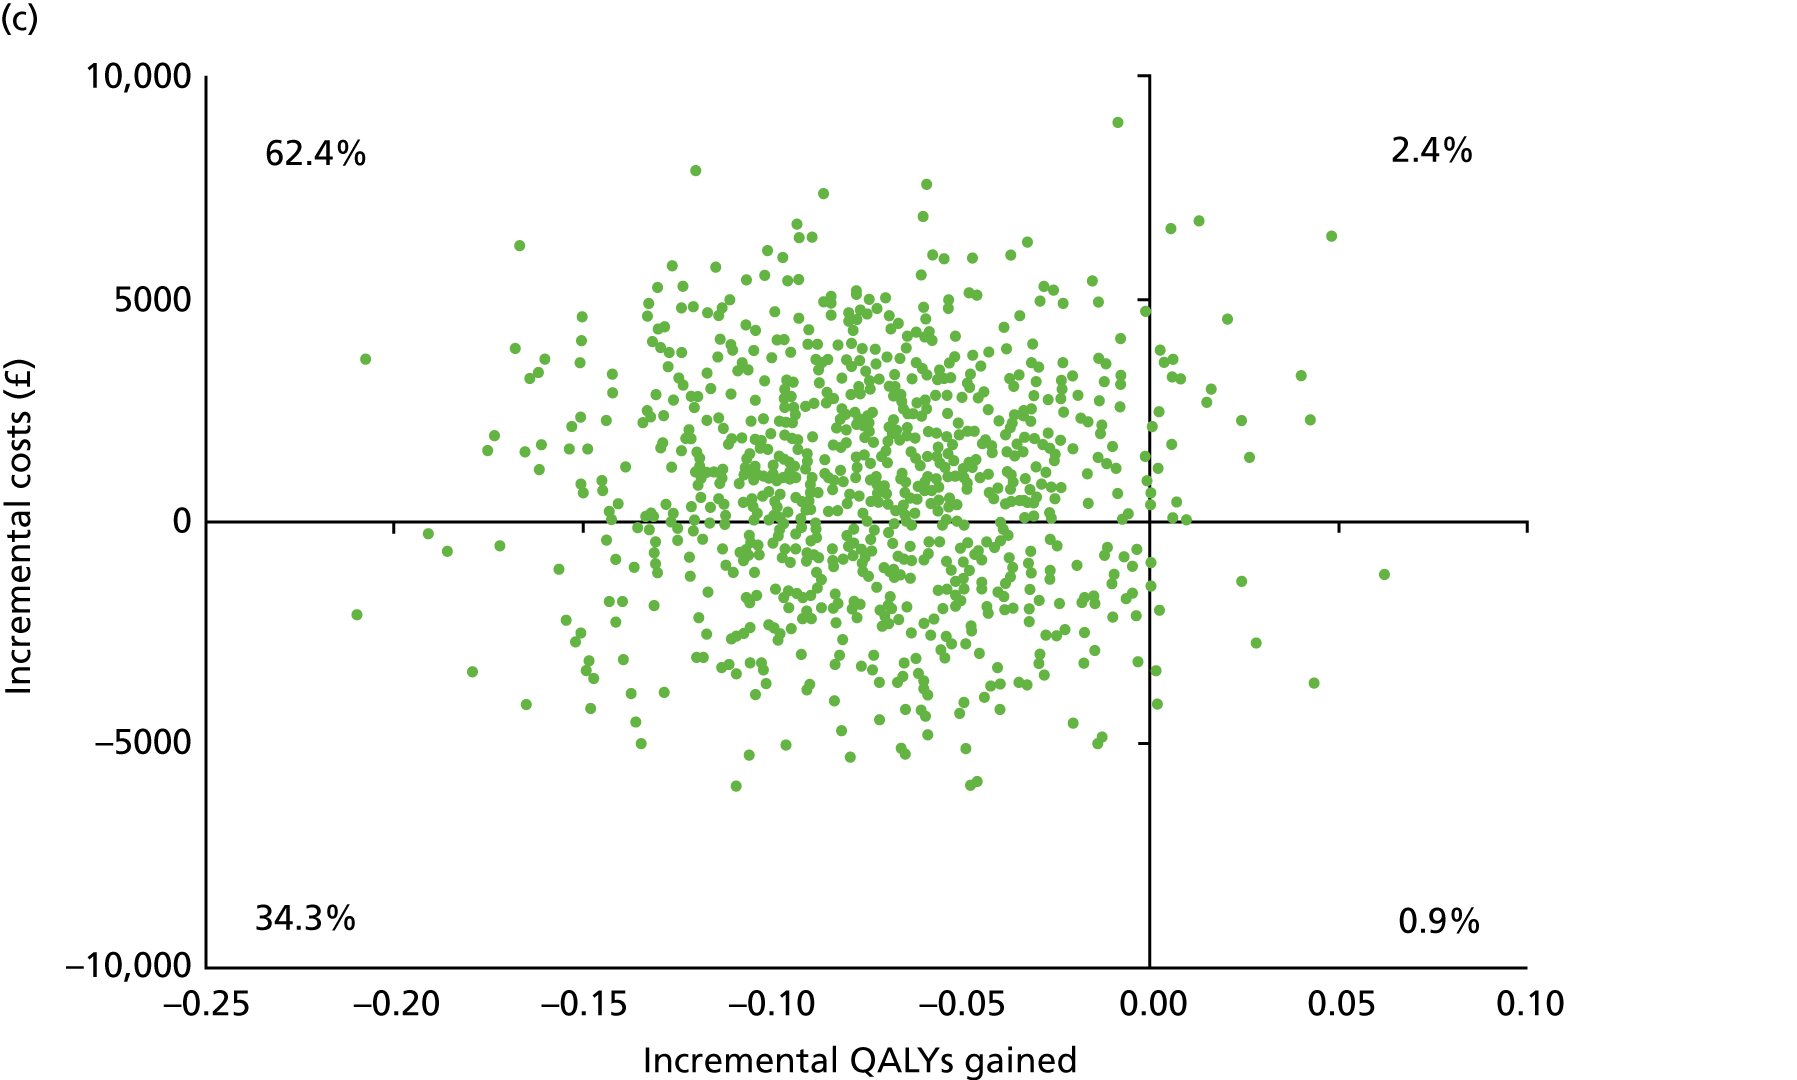
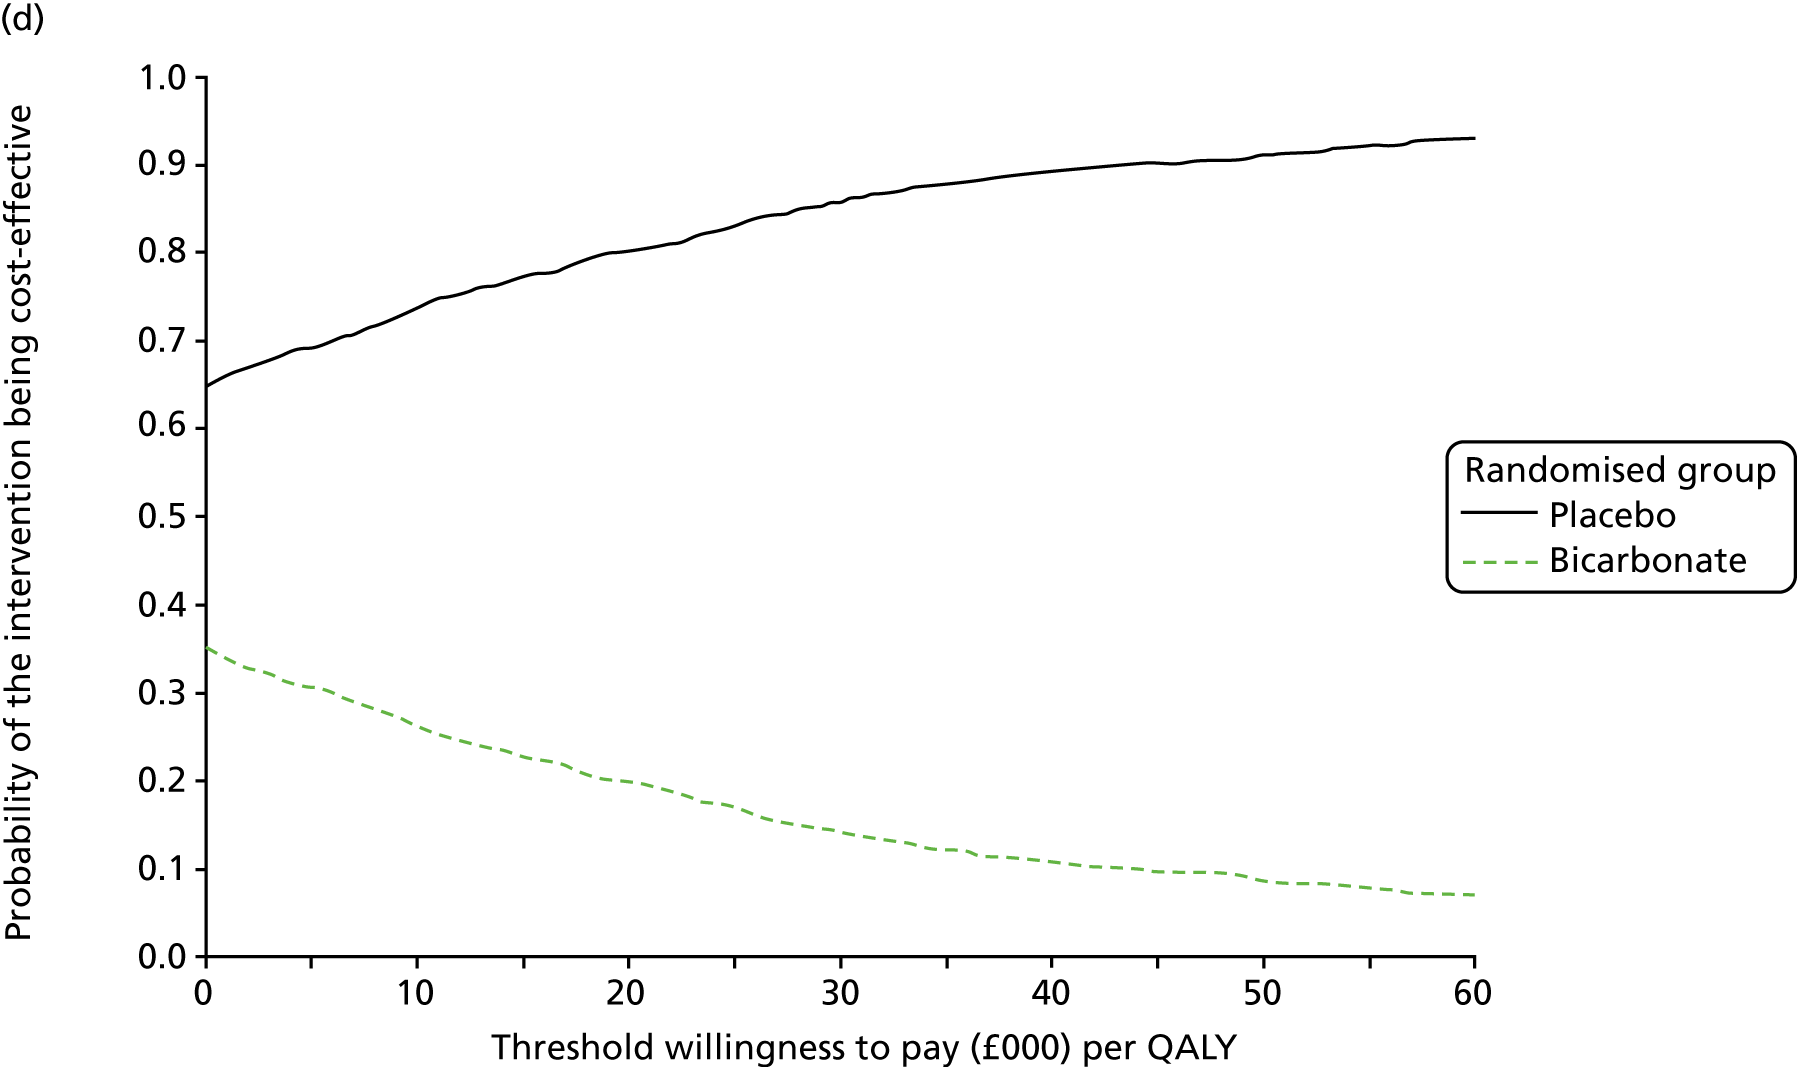
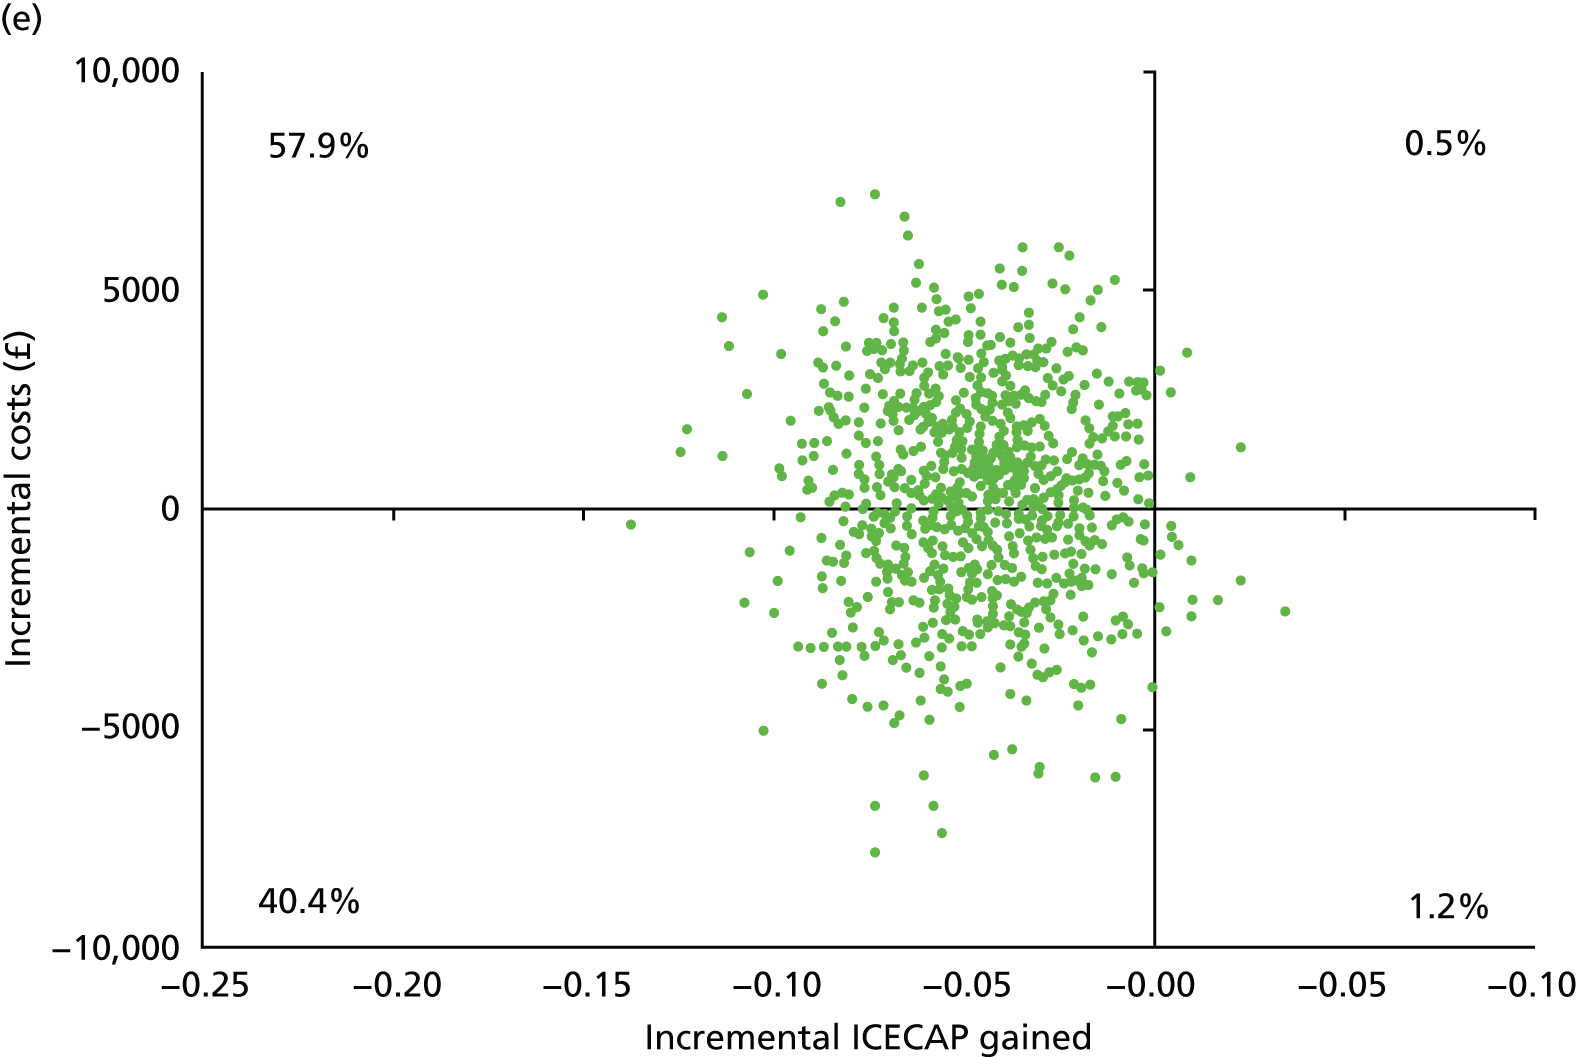
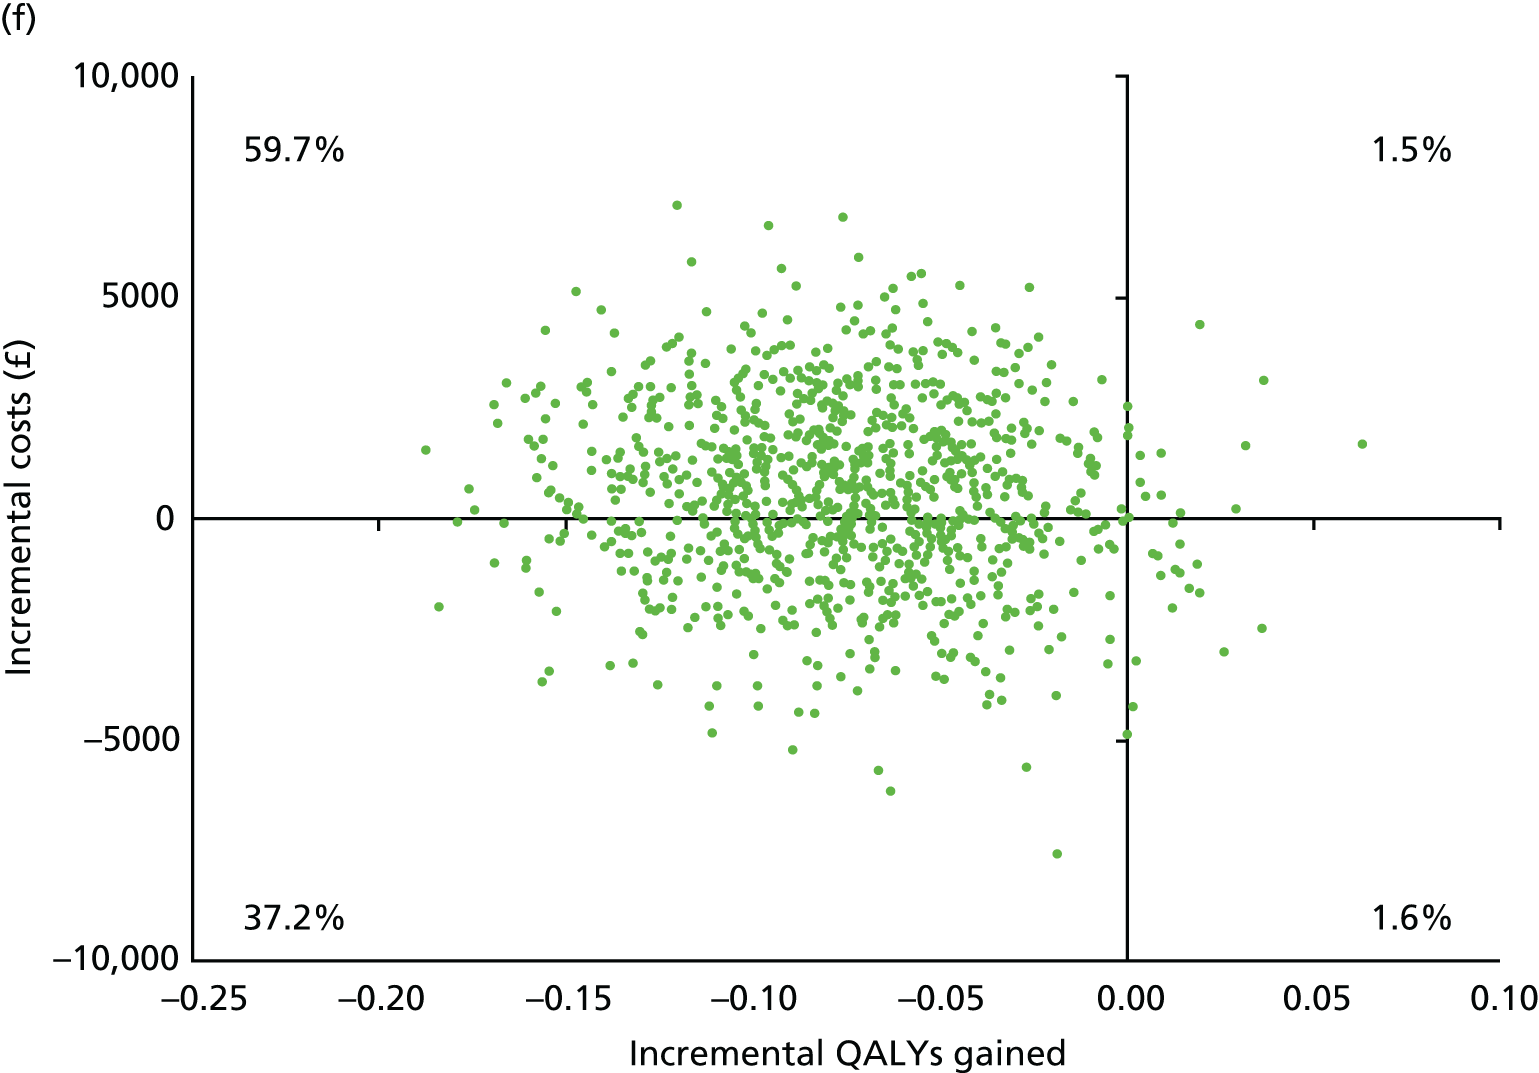
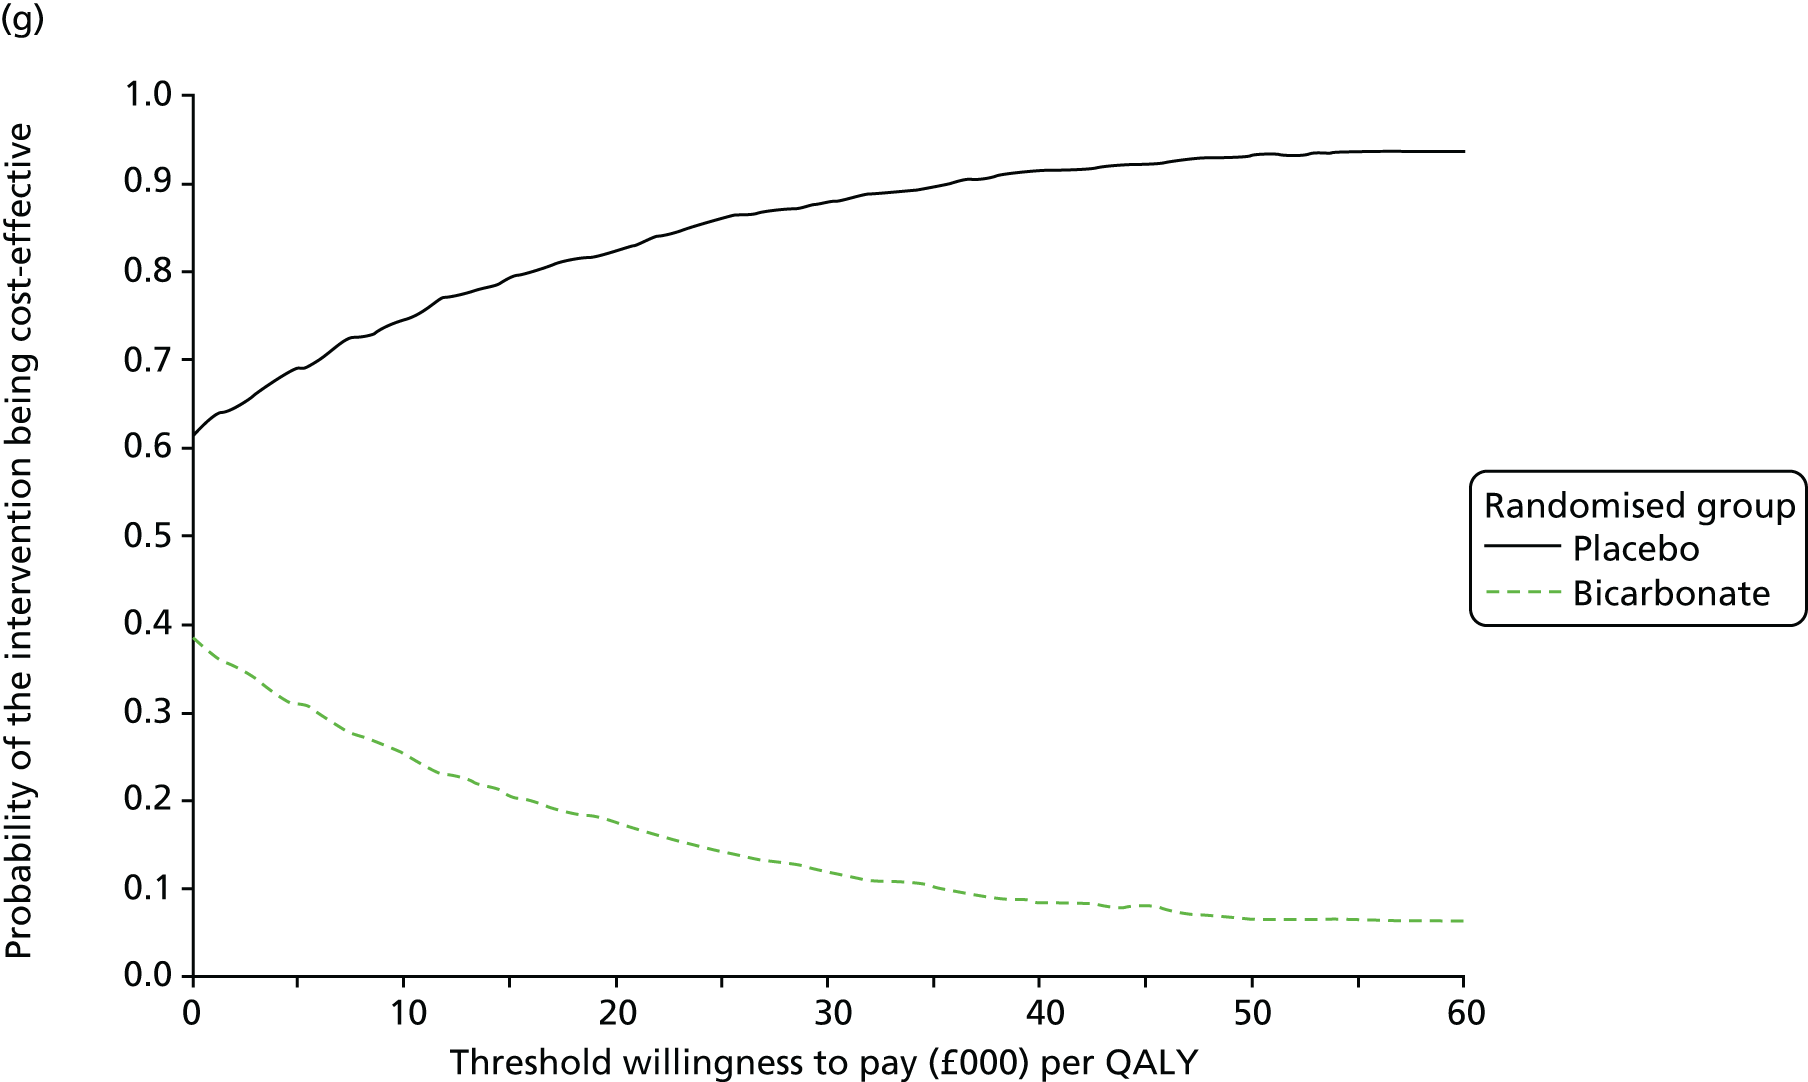
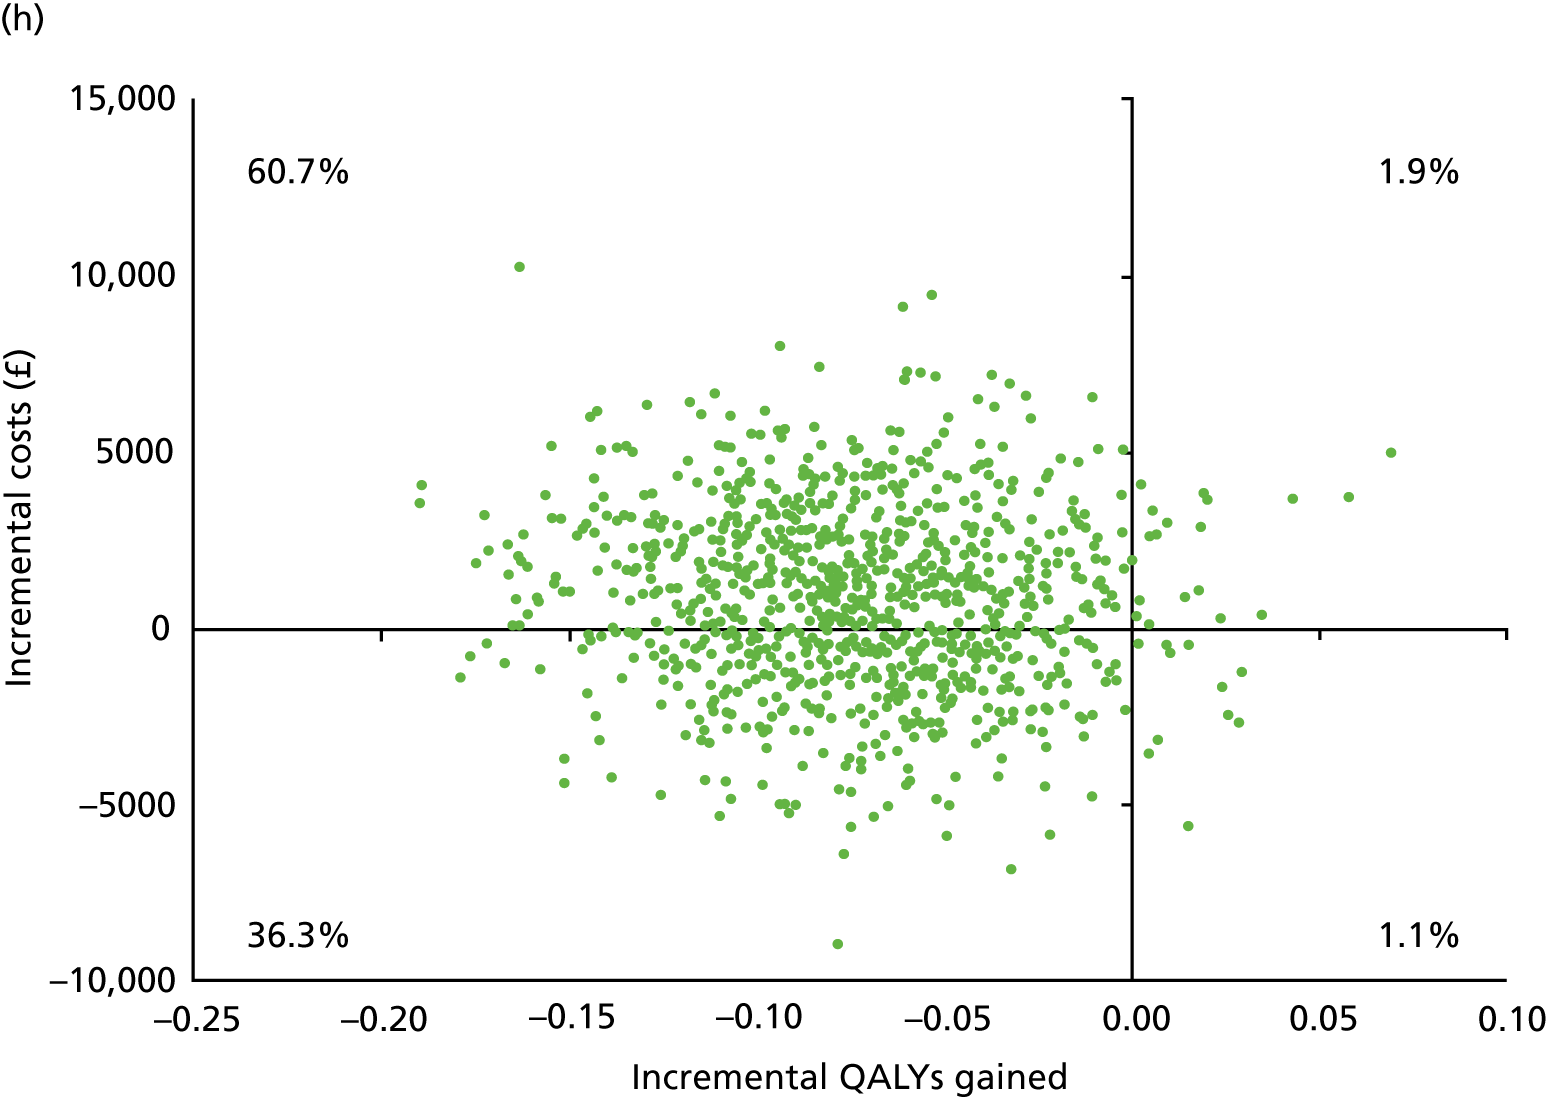
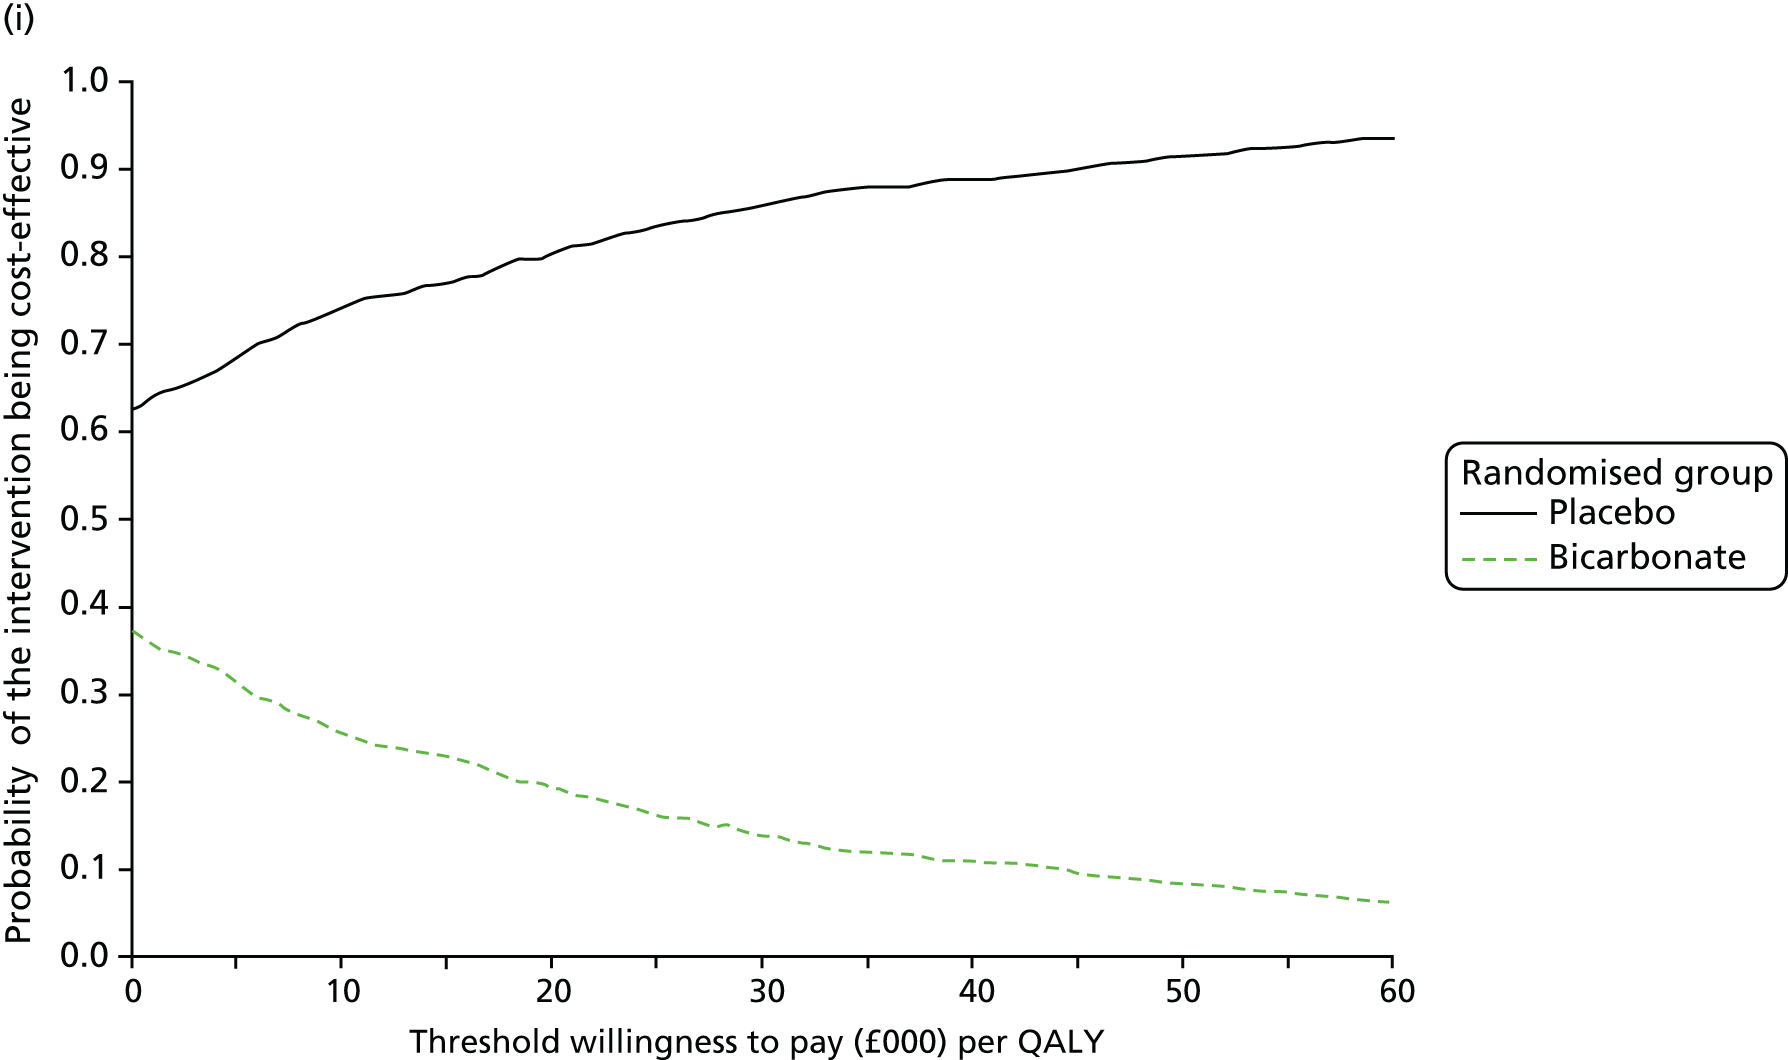
List of abbreviations
- CI
- confidence interval
- CKD
- chronic kidney disease
- CTU
- Clinical Trials Unit
- DMC
- Data Monitoring Committee
- eGFR
- estimated glomerular filtration rate
- EQ-5D
- EuroQoL-5 Dimensions
- EQ-5D-3L
- EuroQoL-5 Dimensions, three-level version
- GFR
- glomerular filtration rate
- GP
- general practitioner
- HbA1c
- glycosylated haemoglobin
- HR
- hazard ratio
- HTA
- Health Technology Assessment
- ICECAP
- Investigating Choice Experiments for the preferences of older people CAPability
- ICECAP-O
- Investigating Choice Experiments for the preferences of older people CAPability-older people
- KDQoL
- Kidney Disease Quality of Life
- MCID
- minimum clinically important difference
- MDRD
- Modification of Diet in Renal Disease
- MedDRA
- Medical Dictionary for Regulatory Activities
- NICE
- National Institute for Health and Care Excellence
- NIHR
- National Institute for Health Research
- PTH
- parathyroid hormone
- QALY
- quality-adjusted life-year
- RCT
- randomised controlled trial
- SF-36
- Short Form questionnaire-36 items
- SPPB
- Short Physical Performance Battery
- TMG
- Trial Management Group
- TRuST
- Tayside Randomisation SysTem
- TSC
- Trial Steering Committee
Notes
Supplementary material can be found on the NIHR Journals Library report page (https://doi.org/10.3310/hta24270).
Supplementary material has been provided by the authors to support the report and any files provided at submission will have been seen by peer reviewers, but not extensively reviewed. Any supplementary material provided at a later stage in the process may not have been peer reviewed.
