Notes
Article history
The research reported in this issue of the journal was funded by the HTA programme as project number 14/213/10. The contractual start date was in January 2016. The draft report began editorial review in May 2018 and was accepted for publication in January 2019. The authors have been wholly responsible for all data collection, analysis and interpretation, and for writing up their work. The HTA editors and publisher have tried to ensure the accuracy of the authors’ report and would like to thank the reviewers for their constructive comments on the draft document. However, they do not accept liability for damages or losses arising from material published in this report.
Declared competing interests of authors
none
Permissions
Copyright statement
© Queen’s Printer and Controller of HMSO 2020. This work was produced by Winkley et al. under the terms of a commissioning contract issued by the Secretary of State for Health and Social Care. This issue may be freely reproduced for the purposes of private research and study and extracts (or indeed, the full report) may be included in professional journals provided that suitable acknowledgement is made and the reproduction is not associated with any form of advertising. Applications for commercial reproduction should be addressed to: NIHR Journals Library, National Institute for Health Research, Evaluation, Trials and Studies Coordinating Centre, Alpha House, University of Southampton Science Park, Southampton SO16 7NS, UK.
2020 Queen’s Printer and Controller of HMSO
Chapter 1 Background
Diabetes mellitus (hereafter referred to as diabetes) is a common chronic, non-communicable disease, affecting an estimated 415 million people globally. 1 Of these, 90% have type 2 diabetes mellitus (T2DM),2 and the remainder have type 1 diabetes mellitus (T1DM). 3 T1DM and T2DM differ in their aetiology and pathophysiology but both exhibit altered glucose metabolism, specifically hyperglycaemia, that can lead to microvascular complications. The difference in aetiology is significant because T1DM generally results in complete dependence on exogenous insulin injection, as there is complete destruction of beta cells owing to an autoimmune response, and this has implications for self-management and psychological adaptation. What causes T1DM is not known although there is a genetic predisposition and a complex interaction with environmental factors. It typically develops in younger people, usually before 40 years of age, and 1 in 300 children are affected by the age of 18 years in the USA. 4 T2DM is associated with insulin resistance and a more gradual destruction of pancreatic beta cells that may or may not lead to complete insulin insufficiency. Obesity, ethnicity, old age and inactivity are associated with the onset of T2DM and hypercholesterolaemia and hypertension often pre date diagnosis; therefore, T2DM is also considered a cardiovascular disease. Self-management for T2DM often involves treatment for weight loss, and management of blood pressure and lipids is essential. 5,6 However, self-management of blood glucose control to re-establish normoglycaemia, without significant hypoglycaemia (caused by over-treatment, change in activity levels or intake of carbohydrates) is important for both T1DM and T2DM,7,8 although the targets set are typically higher for T2DM because there is some evidence for an increased risk of cardiovascular events and mortality in elderly people and those with comorbidity who experience hypoglycaemia. 9,10 Diabetes is costly to health services: in the UK it uses ≈10% of the annual NHS budget. 11 Most of the cost relates to treatment and management of complications that are often preventable.
Self-management and structured education
Self-management of diabetes, for people with a relatively new onset of T2DM, involves behaviour change in terms of diet and exercise and attending diabetes appointments and eye screening. It is recommended that someone with T2DM taking oral antidiabetic medication should spend 2 hours per day managing their diabetes, for example taking tablets and organising tablets for the day or week; problem-solving regarding blood glucose levels, snacks or medicine; shopping and reading labels on food products; exercise; attending support groups or finding out information that can aid self-management; and scheduling appointments. 12 However, for people with T1DM who are dependent on exogenous insulin injection and for people with T2DM that has progressed, self-management becomes more time-consuming and may involve activities specified for T2DM and additional tasks, such as taking tablets, monitoring food and carbohydrate consumption, testing blood glucose levels and acting on the results, managing exercise, sickness, travel and administering insulin or another injectable therapy. People with T1DM have the additional pressures of managing multiple daily injections or an insulin pump.
Diabetes self-management programmes for T1DM and T2DM aim to equip people with the knowledge and skills they need to be confident in self-managing their diabetes, and there is evidence that these are effective in terms of improved patient outcomes, including glycated haemoglobin (HbA1c) levels; cardiovascular risk factors; quality of life (QoL); and measures of psychological health. However, these improvements do not necessarily remain at long-term follow-up, although improvements in QoL, how people think and feel about diabetes (illness cognitions) and satisfaction with treatment do. 13,14 Despite national roll-out in the UK, attendance rates are low, those most in need do not attend15–19 and attendance per se does not guarantee effective diabetes self-management.
The importance of motivation
When we talk about diabetes self-management, we are referring to health-related behaviour that we know can improve an individual’s health; therefore, for many people, this can involve making changes to what they are already doing. Knowledge, skills and confidence to manage diabetes are important but so is motivation to put it into practice. Although the definition of motivation as intrinsic or extrinsic in relation to diabetes self-management is up for debate,20 people with diabetes may or may not find performing the behaviours personally rewarding. Others have considered motivation to be the likelihood or probability that someone will make behavioural change. 21 There are a number of health psychology models that have been proposed to explain behaviour that have motivation at their core, such as the Health Belief Model,22 which considers ‘likelihood of taking action’; the theory of reasoned action23 and the theory of planned behaviour,24 in which motivation either influences ‘behavioural intention’ or is similar in concept to ‘perceived behavioural control’; and Protection Motivation Theory,25,26 which was originally based on how fear can motivate behaviour and coping appraisal, and now considers the efficacy of the behavioural response and an individual’s perception that they can perform the behaviour, known as ‘self-efficacy’.
Motivation to perform effective self-management tasks for people with diabetes might be low as the barriers to doing it are great. We know that < 30% of people with T1DM achieve national targets27 and 30% of people with T2DM in primary care do not achieve target HbA1c levels. 15,28 Diabetes self-management is complex and is not restricted to one target behaviour, such as smoking cessation. Furthermore, as there are no ‘days off’, diabetes self-management is a 24/7 activity and the ‘rewards’ of good glycaemic control or lowering of cardiovascular risk may not be immediate. Motivation to manage diabetes may be affected by previous attempts and occasions in which things do not go according to plan. For example, when people who are insulin treated are aiming for target blood glucose and HbA1c levels, they may find that increasing insulin may put them at risk of hypoglycaemia; this may then dissuade them from future attempts to achieve tight blood glucose control.
Psychological barriers are common and may also interfere with motivation for diabetes self-management. For example, people who are depressed may find that they have little motivation to perform self-management tasks such as testing their blood glucose levels, or eating healthy food; they may also rate their QoL as poor. 29,30 Other psychological barriers may include anxiety disorders,31 abnormal eating behaviours,32 fear of hypoglycaemia,33 fear of complications,34 fear of self-testing or self-injecting,35 psychological insulin resistance,36 diabetes burn-out37,38 and diabetes-specific distress. 38,39 Therefore, psychological interventions that aim to improve motivation and/or reduce psychological barriers to diabetes self-management may improve glycaemic control and QoL, and are considered an important adjunct to support people with diabetes self-management.
Psychological interventions
Psychological interventions differ from educational interventions that aim to improve self-management by increasing diabetes knowledge. Psychological interventions rely on the therapeutic alliance, usually talking or communicating, between a patient and the interventionist to not only improve motivation for self-management, but also promote change in emotional and cognitive functioning. 40,41 Although there is still a lack of any consensus definition of psychological interventions that can be applied to increase motivation for diabetes self-management, they can be categorised by their theoretical framework. 42–44 These include psychoanalytical/psychodynamic therapies, often intensive and longer treatments, which explore internal conflicts perhaps arising from early life experiences that affect personality development and interpersonal functioning;45,46 cognitive–behavioural therapy (CBT) and it’s variations and techniques, which is a brief therapy that targets the current cognitions and emotions associated with behaviours, such as diabetes self-care, and is widely used to treat depression and a broad range of mental health disorders with an underlying assumption that these disorders will remit;47 and counselling or person-centred therapy,48 which can be focused, for example motivational interviewing (MI): a very brief therapy (usually four sessions) developed to strengthen motivation for behaviour change, particularly health-related behaviours. 49–51 Other psychotherapies52 include interpersonal therapy,53 family or systemic therapies54 and variations such as narrative and art therapy. 52,55,56
How psychological interventions in diabetes have evolved
We previously conducted a systematic review and meta-analysis of psychological interventions for people with diabetes up to 2003. In that meta-analysis, for adults with T1DM (11 studies), there was no statistically significant improvement in glycaemic control for adults who received a psychological intervention compared with those in a control group,57 but in children and adolescents (10 studies) there was a small clinically significant improvement: a reduction in HbA1c levels equivalent to 6 mmol/mol. An improvement of ≈4 mmol/mol is considered effective at lowering the risk of microvascular complications. 58 For T2DM (12 studies), glycaemic control was also significantly improved for adults who received a psychological intervention (e.g. counselling, CBT, psychodynamic therapy) compared with the control group, equivalent to a reduction in HbA1c levels of 8 mmol/mol. 40
Since the last review, the types of psychological interventions studied have changed. In the 1980s, stress management and relaxation training interventions were popular, whereas since the late 1990s onwards there has been an explosion of CBT and counselling techniques, and variations of MI interventions have become the norm in clinical practice. Research and treatment for specific clinical groups have grown; therefore, there have been systematic reviews with a specific clinical problem or subgroups of the diabetes population, such as CBT for adults with depression and diabetes,59,60 people with eating disorders in T1DM,61 the effectiveness of MI for people with T2DM62 and family interventions for children and adolescents with T1DM. 63,64 In T1DM, a growth in psychological research for adults with hypoglycaemia unawareness has resulted in clinical trials, currently under way in the UK, the USA and Europe. 65,66
Another major change relates to the improved reporting of clinical trials and the introduction of Consolidated Standards of Reporting Trials (CONSORT) in 2001. 67 Similarly, there have been changes in treatment comparison groups: fewer studies have used treatment as usual (TAU) and more have used an attention control group, such as diabetes education or a different psychological intervention. Not offering treatment for adolescents/children with diabetes could be considered unethical.
Therefore, limitations of the studies described in our early reviews include the poor methodological quality of many of the included studies; insufficient studies to compare the relative effectiveness of specific categories of psychological intervention, such as CBT versus counselling or MI; whether or not choice of control groups had an impact on the overall findings; specialism of the therapist; and which clinical subgroups benefit the most.
Recent systematic reviews and meta-analyses have focused on some of these elements. However, none to date have considered the cost-effectiveness of psychological interventions or the relative effectiveness of psychological interventions and attention controls, nor have they employed newer methods of synthesis such as network and individual patient data (IPD) meta-analysis.
Current review
The aim of the current review was to update the systematic reviews of psychological interventions conducted in 2003, using the same protocol, to assess whether or not the effectiveness of such interventions in improving the primary outcome (i.e. glycaemic control for people with T1DM and T2DM) has changed. In addition, we wanted to evaluate whether or not psychological interventions could be considered cost-effective based on the primary outcome. We also wanted to detect whether or not these treatments could improve emotional health, such as depressive symptoms and QoL, and diabetes self-management behaviours; therefore, these were included as secondary outcomes. We employed three methods of meta-analysis: (1) aggregate (same as the 2003 review); (2) IPD, which allows the use of individual patient characteristics when data are available; and (3) network meta-analysis (NMA) to perform indirect comparisons and simultaneous analysis of clinical trials involving different treatments or control groups. IPD meta-analysis and NMA were not performed for secondary outcomes. Finally, this review also reports on the cost-effectiveness of psychological interventions in diabetes.
Chapter 2 Research question
The overall aim was to summarise evidence from randomised controlled trials (RCTs) and conduct a systematic review, meta-analysis and cost-effectiveness analysis of controlled trials of psychological interventions, specifically to:
-
assess the effectiveness of psychological interventions that aim to improve motivation for patients with T1DM and T2DM so that they have (1) improved glycaemic control, (2) improved diabetes self-management, (3) reduced psychological distress and (4) improved health-related quality of life
-
examine the overall cost-effectiveness analysis of psychological interventions in diabetes and to model the potential predicted savings in reducing the risk of diabetes complications long term
-
compare the clinical effectiveness of different types or techniques of psychological interventions for improved glycaemic control and better self-management
-
examine whether or not psychological interventions are effective in addressing populations who experience health inequalities, such as different ethnic groups, those with severe mental illness and those experiencing social deprivation
-
conduct subgroup analyses to identify the clinical characteristics of patients who have better or worse diabetes self-management or glycaemic control, for example by age, gender, complication status
-
describe the development of new psychological theories and techniques, and of any advancements in research methodologies, such as quality assurance of fidelity of intervention delivery or characteristics of control groups
-
identify gaps in the literature to make recommendations for primary research
-
summarise the data for translation to the NHS via Health Improvement Networks, Diabetes Strategic Networks, Diabetes UK and Clinical Commissioning Groups.
Chapter 3 Review methods
Protocol and registration
This systematic review and meta-analysis is registered with PROSPERO (registration number CRD42016033619). The study protocol is available on the project web page: www.journalslibrary.nihr.ac.uk/programmes/hta/1421310#/ (accessed 14 May 2019).
The methods are reported in accordance with the Preferred Reporting Items for Systematic Reviews and Meta-Analyses (PRISMA) guidelines and relevant extensions. 68 We matched the methods reported here, when possible, for the systematic reviews conducted from the inception of the electronic databases to 2003 by Ismail et al. 40 and Winkley et al. 57 This enabled us to pool data from the current review with an older cohort of studies. Intervention methodologies and psychological technologies have improved, and this method avoids contaminating the modern review with methodological biases and limitations of under-reporting in older studies. We include a list of the additions to the original review, as well as changes between the current protocol and review in Appendix 1.
Part A: systematic review, randomised controlled trial meta-analysis, network meta-analysis and individual patient data meta-analysis methods
Eligibility criteria
Types of studies
Published and unpublished RCTs of interventions to improve self-management were included in the systematic review; non-randomised controlled trials (nRCTs) were included in a separate review (see Part B: non-randomised controlled trial systematic review methods and Chapter 7). Pre-and-post observational and n-of-1 studies were excluded as there is no control group. If there were multiple publications of the same study, the publication that reported the outcome of interest at the relevant time period was included, and in some cases data were extracted from other publications, such as long-term follow-ups or study protocols, for more detailed information regarding the intervention under investigation. There was no restriction on language or the publication status of included studies. Non-English-language study reports were screened and data extracted by a native speaker.
Types of participants
Participants of all ages diagnosed with T1DM or T2DM were included as the population under investigation. People with T1DM and T2DM were considered separately as they are distinct clinical groups. T1DM was stratified by age, adults (≥ 18 years) and adolescents/children (< 18 years). Participants with other medical conditions were excluded, unless the separate analysis for people with diabetes was available or could be provided. People with prediabetes, impaired glucose tolerance or gestational diabetes were excluded as, again, these are distinct and separate clinical groups. If studies included participants with T1DM and T2DM, authors were contacted for the data and separate analysis. If authors did not respond or were unable to provide a separate analysis per diabetes type, studies were included in the systematic review but not the meta-analysis.
Types of intervention (health technologies)
Interventions were described as psychological and were included if they met all of the following criteria:
-
They relied on communication, using the therapeutic alliance between a patient and therapist.
-
The intervention was facilitated by psychologists, psychotherapists and therapists in training, or facilitated by persons trained in a psychological method/supervised by a clinical psychologist or therapist.
-
The intervention was based on a psychological model.
-
The intervention aimed to improve outcome changes in emotional, cognitive or behavioural functioning, including diabetes self-management.
If these criteria were unclear and the intervention could not be clearly described as psychological, then authors were contacted for more information. The psychological interventions were classified into the following categories: psychoanalytical/psychodynamic (including some that used elements of psychotherapy, such as in collaborative care treatments), CBT; counselling (including MI); family therapy; and creative therapy (including music, narrative, art therapy and psychodrama). Studies that used self-help (unless guided by a therapist) were excluded, as were those for which there was no information on dose delivered.
Control groups included usual care (generally usual diabetes care), waiting list control, attention control, diabetes education or a less intensive psychological intervention (i.e. fewer sessions/frequency/duration; delivered by interventionists with less/no psychological training).
Types of outcome measures
The primary outcome of interest was change in glycaemic control, such as HbA1c, which refers to average plasma glucose concentration over the previous 8–12 weeks. HbA1c is measured using percentage or mmol/mol, between baseline and 1-year follow-up. The secondary outcomes of interest were (1) changes in self-management activities [e.g. self-monitoring blood glucose, self-examination, diet, physical activity, oral antidiabetes medication adherence, uptake of insulin therapy, increased clinic attendance], (2) change in psychological functioning (e.g. depressive symptoms, diabetes distress, anxiety, QoL), (3) clinical outcomes [body mass index (BMI)], blood pressure], (4) economic outcomes using unit costs and (5) adverse effects [e.g. incidents of severe hypoglycaemia, diabetic ketoacidosis (DKA), diabetes complications]. For studies to be eligible, they had to have included the primary outcome with or without secondary outcomes. Secondary outcomes were used for meta-analysis when five or more studies provided data for that outcome.
Identification of studies
Information sources
The following electronic databases were searched from January 2003 to July 2016: MEDLINE (Ovid); Cumulative Index to Nursing and Allied Health Literature (CINAHL), The Cochrane Library, PsycINFO, EMBASE (Ovid), Cochrane Controlled Trials Register and Web of Science. When protocols or conference abstracts were identified through database searching, authors were contacted if full-text articles could not be found. If authors did not respond or were unable to provide a full text, the studies were excluded.
In addition, national and international diabetes conference abstracts were searched from 2012 to July 2016 for reports of any trials using psychological therapies. These included Diabetes UK, the American Diabetes Association, the European Association for the Study of Diabetes and the International Diabetes Federation (IDF). The reference lists of included studies and reviews were searched for additional studies. The US government clinical trials registry [https://clinicaltrials.gov (accessed 1 July 2016)] was searched for potential relevant studies that were ‘active, not recruiting’ with an estimated completion of 2016. Authors were contacted for full-text papers, if such papers were available.
Search
The following key search terms were used for MEDLINE and adapted for each database: ‘psychological therapies’ and ‘mood disorders’ and ‘diabetes mellitus’ and ‘clinical trials’ (see Appendix 2). The Scottish Intercollegiate Guidelines Network filter for RCTs was used for ‘clinical trials’ in MEDLINE, EMBASE and CINAHL, and adapted for others.
Study selection
Titles and abstracts of studies, identified by electronic searches, were inspected independently by two researchers (RU and KW). In the first stage, abstracts were selected if they described a controlled trial of a psychological or behavioural intervention for people with T1DM or T2DM. If there was ambiguity in the description of the study or intervention, then the study was included into the second stage. The second stage of study selection involved eligibility assessment of full-text papers by the same two researchers. The inter-reliability for study selection was (Cohen’s kappa = 0.945) conducted on this second stage process. Any differences over inclusion of studies at this stage of study selection were resolved by consensus and discussion with a third researcher (KI).
We encountered problems relying on identifying psychological interventions using titles and abstracts only, as some studies do not explicitly describe the psychological intervention in the abstract. Therefore, we rescreened previously rejected abstracts for a second time to reduce the risk of excluding potentially eligible papers.
Data collection process
Data extraction forms were developed in line with the protocol and piloted on five studies from the scoping searches by two independent researchers (RU and KW) (see Appendix 3). If there was more than one psychological intervention group (e.g. a three- or four-arm controlled trial), all arms were included in the data extraction and NMA, but comparisons of the most intensive intervention arm versus the least intensive arm were used for the aggregate meta-analysis. If data were not available in the study report, corresponding authors were contacted and the missing data items were requested.
Authors of studies included in the aggregate meta-analysis were informed that their study had been included in a systematic review and meta-analysis and were invited to participate in the IPD meta-analysis by contributing IPD. A list of the required data items was provided. The corresponding author was contacted via e-mail. If there was no response within 2–4 weeks, the lead, senior and other authors were contacted. If this was unsuccessful, authors were contacted via ResearchGate (Berlin, Germany) or contacted in person at conferences. If still unsuccessful, the head of the department at an author’s institution and/or the editor of journals in which the paper was published was contacted.
In the first correspondence, a data use agreement (DUA) was sent to the author to be completed by the corresponding institution before data transfer occurred. On some occasions, institutions had their own ethics/legal procedures for sharing data. This was honoured by King’s College London (KCL) and a senior contracts associate at KCL was involved to ensure that legal practices were adhered to. Once authors had agreed to participate and completed the DUA, data transfer could occur.
Data were requested in any format convenient to the author, including Microsoft Excel® (Microsoft Corporation, Redmond, WA, USA), SPSS [Statistical Product and Service Solutions; SPSS Inc., Chicago, IL, USA (version 18 and below) or IBM Corporation, Armonk, NY, USA (IBM SPSS Statistics from version 19 onwards], SAS® (SAS Institute Inc., Cary, NC, USA), Stata® (StataCorp LP, College Station, TX, USA) or text. Fewer data items were requested for the IPD than were extracted for the aggregate meta-analyses. If study authors were unable to provide data, the reason given for not sharing data was recorded and authors were informed that their study would still be included in the aggregate meta-analysis. When data were received from study authors, they were checked against the study report and the data managed in SPSS version 15.
Data items
Data were extracted for the characteristics listed below for the main aggregate meta-analysis; all data items were considered to have the potential to influence efficacy and/or be potential effect modifiers in the aggregated meta-analysis. For the IPD meta-analysis, the items in italics were requested from the study research team for individual participants:
-
Publication characteristics – year of publication, publication type (peer review or not), country of origin, health-care setting, language, funding source.
-
Patient baseline characteristics – participant identification (ID) (IPD only), type of diabetes, mean age, age in years (IPD only), gender, ethnicity, clinical subgroup (e.g. treatment type, smoking status, BMI), socioeconomic setting (e.g. individual or family income, education), duration of diabetes (years) and complication status, receipt of structured education and occupation status/type.
-
Intervention characteristics – type of therapy; number of therapy sessions; average number of sessions attended; duration of overall therapy; duration of therapy sessions; psychological theoretical framework or model; use of manual; specialty of therapist; training of therapist; fidelity assessment of therapist; description of techniques that aim to change emotional, cognitive and behavioural functioning (including adherence); format of delivery (face to face, online, telephone, text messaging); mode of delivery (one to one, group or family/couple); and use of booster or maintenance sessions.
-
Control characteristics – the same data were extracted as for the intervention as applicable.
-
Outcome characteristics –
-
Type of outcome included the primary outcome [change in glycaemic control (HbA1c level in % or mmol/mol)] and secondary outcomes (change in self-reported self-management behaviour, change in self-reported psychological functioning, BMI).
-
Method of assessing the outcomes. For the primary outcome of HbA1c level, this was an objective laboratory measurement. For the secondary outcomes, change in self-reported self-management behaviour was measured using validated measures [e.g. the Summary of Diabetes Self-Care Activities69 measure], as was psychological functioning [e.g. depression was measured using the Patient Health Questionnaire-9 items (PHQ-9)70], the Center for Epidemiologic Studies Depression Scale (CES-D),71 the Montgomery–Åsberg Depression Rating Scale,72 the Beck Depression Inventory,73 the Hospital Anxiety and Depression Scale74 or the Symptom Checklist Depression Scale-20 items75] and QoL [measured using the World Health Organization (WHO) Quality of Life-BREF,76 the Diabetes-specific QoL Measure,77 Ferrans and Powers QoL Index,78 the Short Form questionnaire-12 items or the EuroQol-5 Dimensions79]. Scores were standardised prior to analysis.
-
Time point of follow-up (post baseline or post treatment), baseline and follow-up data (or mean change).
-
For studies that were not reported in the English language, a restricted data extraction took place; for example, not all publication and patient characteristics were extracted. An example of data extracted from an Iranian study can be found in Appendix 4.
Individual patient data integrity
Data integrity was conducted. This involved an initial assessment of data completeness. Each data set received from the study authors was checked to determine the consistency of the main analysis with that in the published report.
Risk of bias in individual studies
The quality of RCTs was assessed using Cochrane Handbook Tool for Risk of Bias (RoB). 80 RoB assessment was carried out by two independent researchers (RU and KW); any disputes were resolved by a third researcher (KI). Studies were assessed as having a high, low or unclear RoB for the following domains: sequence generation, allocation concealment, blinding of participants, personnel and outcome assessors, incomplete outcome data (for glycaemic control HbA1c% or mmol/mol), selective outcome reporting and other potential threats to validity. This was used to generate a graph for data synthesis (study reference vs. RoB domain). Studies were not excluded from the meta-analyses based on RoB assessment; for example those rated as having a high RoB were not excluded.
Synthesis methods
Systematic review
A standardised structured synthesis of all studies included in the systematic review was conducted. If a study did not contain sufficient data to be pooled in the meta-analysis, it was summarised in a narrative synthesis.
Aggregate meta-analysis
The mean difference in change between baseline and follow-up (12 months or closest) scores between the two groups (psychological intervention vs. control group or least psychological intervention) was standardised by calculating Cohen’s d for each of the included studies. The effect size was calculated from the raw published data or, if the necessary raw data were missing from publication, authors were contacted to provide data.
The standardised effects were pooled using a random-effects model and meta-analysis was performed in Stata 14 using the ‘metan’ command. The ‘metainf’ command was used to examine the influence of individual studies whereby meta-analysis estimates are computed omitting one study at a time. Publication bias was assessed using the Stata commands ‘metabias’ (Egger’s test), ‘metafunnel’ (funnel plot) and ‘metatrim’ (fill and trim method for estimating missing studies). Any meta-regression was performed using the ‘metareg’ command. We conducted the meta-analyses only if there were five or more studies available because of problems to reliably estimate the between-studies variance of random-effects models. 81
The combined data from previous systematic reviews40,57 were aggregated with the current review to determine an overall effect size for change in glycaemic control. The findings of the current review were also reported separately.
Network meta-analysis
Organisations such as the NHS and the National Institute for Health and Care Excellence (NICE) need the synthesis of evidence from existing studies to inform their decisions. Meta-analysis methods combine evidence from related studies to produce results based on a whole body of research. However, relevant studies may not provide direct evidence about all the treatments or outcomes of interest. Often treatments are compared with different control treatments. NMA is a method to address this, using correlated or indirect evidence from such studies, alongside any direct evidence. 82
Unlike standard meta-analyses that are based on combining results from the same or similar sets of treatments/and or controls, NMA allows simultaneous analysis of multiple treatments (and multiple outcomes) and, thus, allows the inclusion of all available information towards each outcome and treatment comparison. This is done by incorporating indirect evidence from related treatment comparisons (e.g. A–B and B–C allows one to infer an A–C comparison), in addition to any standard direct evidence. A treatment effect, therefore, can differ not only between studies (heterogeneity) but also by design (inconsistency). NMAs assume ‘transitivity’, which concerns mainly the validity of indirect comparisons. Transitivity refers to the assumption that it was equally probable that any patient in the network could have been given any of the treatments in the network. It is an assumption of balanced clinical and methodological study characteristics between the direct comparisons that make up an indirect comparison. 83
In the first step, network plots of direct comparisons of all available studies for the NMA were assessed. Circles (nodes) represent the intervention type and lines that connect the interventions represent the direct comparisons available in the literature (see Figures 18, 21 and 22). The width of the lines is proportional to the number of trials comparing each pair of treatments and the size of each node is proportional to the number of studies testing the specific treatment. The network pattern plot for all treatments was conducted to show which treatments were used in which studies.
In the main step, we performed network multivariate random-effects meta-analyses to perform frequentist estimation of meta-analyses models84, which allows for both heterogeneity (variation in the true treatment effect between studies) and inconsistency (additional variation in the true treatment effect between different sets of treatments compared in a study). Inconsistency is modelled as a fixed effect using the design-by-treatment interaction model. 84,85
Inconsistency in the contrasts between designs was assessed by comparing direct and indirect treatment effects of a contrast between two treatments and an overall Wald test of inconsistency treatment. 86 If there was no evidence of inconsistency, a consistency model was fitted. Standardised mean differences (SMDs), using treatment as usual as control group, are presented in Chapter 5. The formulae for Hedges’ g in White and Thomas87 are used to estimate the SMD. These are unbiased estimators and involve corrections for small numbers of degrees of freedom.
In the last step, the performance of different treatments was assessed by estimating relative treatment rankings. Ranking probabilities for all treatments at each possible rank for each intervention are presented in Chapter 5 as cumulative probability plots. The treatment hierarchy was established using the surface under the cumulative ranking (SUCRA) curve and mean ranks. SUCRA accounts for the location as well as the variance of all relative treatment effects. The larger the SUCRA value, the better the rank of the treatment.
Individual patient data meta-analysis
For the IPD meta-analysis, baseline variables were described using mean and standard deviation (SD) for continuous variables and frequencies and percentages for categorical variables.
For the outcome measure of HbA1c level, we performed an IPD ‘one-stage’ meta-analysis. The one-stage was preferred to the ‘two-stage’ IPD meta-analysis because it is more suitable for exploring predictors and moderators of response (for reviews, see Simmonds et al. 88 and Debray et al. 89). In addition, the one-stage approach uses a more exact likelihood function and, thus, does not rely on assumptions of within-study normality and known study variances. 90 The one-stage model uses a random effects model to account for the clustering of patients within studies. 91,92
Data were analysed using the Stata commands ‘mixed’ and ‘ipdforest’, in accordance with the recommendations of guidelines for performing IPD one-stage meta-analysis in Stata. 93
Participants with T1DM and T2DM were analysed separately. Of participants with T1DM, adolescents/children (< 18 years) and adults (≥ 18 years) were analysed separately.
We used linear regression models with HbA1c level as outcome, and treatment type and baseline values of HbA1c as fixed independent variables, with a random intercept for study and random treatment effect, and a random effect for baseline measures of HbA1c levels. For adolescents/children with T1DM, only a random effect for treatment arm was included. The variance–covariance structure was considered to be independent; this structure allows a distinct variance for each random effect within a random-effects equation and assumes all covariances to be zero. The random effect structure was selected by model comparisons using the Bayesian information criterion. 94
To identify moderators of improvement in HbA1c levels, we ran several analyses, initially using only one predictor variable and its interaction with treatment arm at a time to avoid reducing sample size. The moderators considered included age, duration of diabetes and, for T2DM only, type of diabetes medication and gender. Non–significant interactions were removed and main effects were reported. In the last step, we assessed year of study as a potential confounder. Because not all variables were collected in all trials, sample sizes change between different studies. However, it can be assumed that data missing by design are missing completely at random, which does not produce any bias. Within studies, a complete-case analyses was performed, assuming that missingness is completely at random, unless a predictor of missingness is included as a covariate. In this case, missing at random is assumed.
The intraclass correlation for the random-effects study was presented as a measure of the correlation of patients in a cluster study site. We also present the estimate I2 statistic to describe the percentage of variation across studies that is caused by heterogeneity rather than chance.
Risk of bias across studies
Publication bias was assessed by inspecting funnel plots and the effect of possible bias was assessed using the ‘trim and fill’ method in sensitivity analyses. 95 Meta-regression was used to investigate the possible effects of age of study and study quality, and compared with the data pooled for the previous T1DM and T2DM meta-analysis. 40,57
Additional analyses
A meta-regression was conducted to determine whether or not factors such as country of study, number of therapy sessions, duration of therapy session, overall duration of treatment, control group and RoB were associated with changes in glycaemic control. Meta-regression was also performed to determine any difference between previous reviews40,57 and the current review with regard to change in glycaemic control.
A network analysis was also undertaken including all arms of studies with more than two intervention arms. The NMAs allowed a comparison of results from two or more studies that have one treatment in common.
Confidence in synthesised evidence
The Grading of Recommendations Assessment, Development and Evaluation (GRADE) was used to determine the quality of the evidence of the outcomes under investigation and subsequent translational strength of recommendations for clinical practice. 96 The GRADE criteria were used to assess the quality of aggregate meta-analysis evidence for each outcome (primary and secondary) for T1DM and T2DM. The quality for each outcome was rated according to the following: RoB, inconsistency, indirectiveness, imprecision and publication bias. Each factor can be rated as not serious, serious or very serious. Overall evidence for each outcome can be rated as high (no problems in any factors), moderate (problem in one factor), low (problem in two factors or very serious problem in one factor) or very low (problem in three or more factors).
Part B: non-randomised controlled trial systematic review methods
Eligibility criteria
Eligibility criteria for the nRCT systematic review follows the same method as the RCT review (see Part A: systematic review, randomised controlled trial meta-analysis, network meta-analysis and individual patient data meta-analysis methods) for type of participants, types of intervention (health technologies) and types of outcome measures. Types of studies was also the same, except this review included published and unpublished non-randomised controlled studies of interventions to improve motivation for self-management rather than RCTs. Only reports of nRCTs written in English were selected.
Identification of studies
Information sources and search strategy
The following electronic databases were searched for nRCTs: EMBASE (2003 to January 2017), MEDLINE (2003 to January 2017) and PsycINFO (2003 to 16 January 2017). The search strategy for nRCTs used in EMBASE and MEDLINE were taken from Li et al. 97 and MEDLINE’s nRCT search terms were used in PsycINFO to generate results (see Appendix 6 for search terms for nRCTs).
Study selection and data collection process
Initially, one reviewer (AK) independently selected abstracts after running the searches in the electronic databases. In the following step, two reviewers (AK and RU) screened the full texts and made a decision to include studies that met the eligibility criteria. Any disagreement was resolved through discussion with a third researcher (KW). The inter-rater reliability was calculated using the Cohen’s kappa. One reviewer (AK) extracted data from the articles that met all the inclusion criteria using a data extraction form (see Appendix 7 for blank data extraction table for nRCTs).
Data items
Data were extracted for the characteristics listed below for the nRCT narrative synthesis:
-
Publication characteristics – year of publication, country of origin, health-care setting, study design.
-
Patient baseline characteristics – type of diabetes, number of participants screened/assessed for eligibility, inclusion/exclusion criteria, number of participants assigned to psychological intervention, number of participants assigned to control, number of participants lost to follow-up, reasons for loss to follow-up, mean age (years at baseline), mean duration of diabetes (years at baseline) and gender.
-
Intervention and control characteristics – same as RCT systematic review reported in Part A: systematic review, randomised controlled trial meta-analysis, network meta-analysis and individual patient data meta-analysis methods.
-
Outcome characteristics – outcome measure, method of assessing outcome, type of outcome (e.g. HbA1c levels, change in psychological functioning, change in self-management behaviours, other), time point of follow-up, post-baseline or post-treatment findings, and other (e.g. any discussion points, notes about the study).
Risk of bias assessment
To assess the quality of studies, we used the Risk of Bias in Non-randomized Studies – of Interventions (ROBINS-I),98 created by the Cochrane Methods Bias Group and Cochrane Non-Randomized Studies for Interventions Methods Group. The tool is designed to approximate the effectiveness of interventions that do not use randomisation to assign treatment groups to subjects. The tool includes seven domains to investigate bias in non-randomised studies. The first two domains are pre intervention and are used to determine confounding at baseline (prognostic factors that predict the outcome and/or predict the intervention received) and participant selection biases (exclusion of subjects who were eligible for the study). The third domain concerns bias when classifying the intervention, such as observer or measurement bias. The last four domains focus on the post-intervention period, addressing biases due to aberrations from the planned intervention, missing data, measurement issues or problems with the reporting of data. A study is said to have a low risk of bias when the study is similar to a well-conducted RCT across all the domains. Moderate risk denotes that a study is comparable to a thorough nRCT but not as good as a RCT. For serious risk, the study has some major issues and critical risk means that the study has too many problems and cannot provide any valuable information. ‘No information’ (NI) is assigned to studies when one or more domain is lacking information that makes decision-making regarding the risk difficult.
Synthesis methods
Systematic review
Structured narrative synthesis was used to evaluate the results of the review as the included studies were heterogeneous in nature and design. Results are reported by diabetes type, T1DM (including both adult and adolescent populations) and T2DM. The studies were systematically appraised by highlighting the similarities/dissimilarities between texts. The current review focused on the study characteristics, type of participants included, intervention and control designs, attendance and dropout rates, reporting of fidelity assessments in studies, types of outcome measures, methods of their assessment, risk of bias in studies and a summary of individual study results.
Part C: health economics methods
In this section, we report the methods for the literature reviews of health economic studies and an overview of the methods used to develop and adapt two existing health economic individual-level simulation models {the Sheffield Type 1 Diabetes Policy Model [Thokala P , Kruger J, Brennan A, Basarir H, Duenas A, Pandor A, et al. The Sheffield Type 1 Diabetes Policy Model. HEDS Discussion Paper 13/05. Sheffield; 2013 (unpublished)] and the School for Public Health Research [SPHR] Type 2 Diabetes Prevention Model99}, which were utilised in this study to address the research questions regarding the cost-effectiveness of psychological interventions. Chapter 8 reports the detail of the health economic analyses undertaken.
Literature searching for previous economic evaluations
Methods
We undertook a process that involved:
-
Web of Science citation-searching on the found articles in the clinical effectiveness systematic review.
-
The reference lists of the articles were read to identify protocol articles.
-
If protocol articles existed, they were also citation-searched.
-
Known literature sources of health economic literature were examined, including studies on T1DM and T2DM.
-
The Mount Hood website100 was also searched.
This process was adopted so that the search for economic studies could use the studies found in the clinical review to find the articles that related to economic evaluations of psychological interventions.
The main inclusion criterion was an economic evaluation in which one arm was a psychological intervention. We did not exclude within-trial analyses, as they could provide useful costing information.
Results
One study was found, the ADaPT (A Diabetes and Psychological Therapies study) within-trial health economic analysis. 101 This was used to inform costings for psychological therapies (see Chapter 8).
Conclusions
A new health economic modelling exercise would be required for both T1DM and T2DM.
Literature searching for long-term effectiveness studies
Methods
-
Web of Science citation searching on the found articles in the clinical effectiveness systematic review.
-
The reference lists of the articles were read to identify protocol articles.
Overview of the health economic analyses undertaken
In this subsection, we summarise the new health economic modelling work undertaken for this report using the Consolidated Health Economic Evaluation Reporting Standards (CHEERS) checklist framework. 102
The CHEERS checklist items are as follows.
Present the study question and its relevance for health policy or practice decisions
We undertook two main studies to examine the cost-effectiveness of psychological interventions versus usual care: one for adults with T1DM and one for adults with T2DM. The interventions chosen were those interventions identified in the NMA results for interventions with more than two studies. Attention control was not included as a comparator arm, as this was not a psychological intervention. Psychotherapy was not assessed for adults with T2DM, as the p-value was very close to 1 (p = 0.98).
-
Cost-effectiveness of CBT versus counselling versus usual care in adults with T1DM.
-
Cost-effectiveness of CBT versus counselling versus usual care in adults with T2DM.
Target population and subgroups
The target populations were adults with T1DM and adults with T2DM. No further subgroup analyses were undertaken because of limited evidence on subgroup effectiveness differences, that is the evidence was too limited to enable NMAs by subgroups. We did not model cost-effectiveness for adolescents with T1DM because the NMAs for adolescents (see Chapter 5) showed only non-significant differences, with p-values typically ranging from 0.4 to 0.9.
Setting and location
The studies were set in the UK.
Study perspective
The perspectives used were the NHS and Personal Social Services (PSS).
Comparators
The comparators were CBT versus counselling versus usual care in adults with T1DM, and CBT versus counselling versus usual care in adults with T2DM.
Time horizon
A lifetime time horizon was used.
Discount rate
A discount rate of 3.5% per annum was applied.
Choice of health outcomes
HbA1c effects in year 1 and HbA1c longer-term trajectories evidence were used as input to the individual-level simulation models, which then analysed the numbers of clinical events. For T1DM, the clinical events included were nephropathy, neuropathy, retinopathy, macular oedema, myocardial infarction, stroke, heart failure, angina, severe hypoglycaemia and DKA. For T2DM, the clinical events included were kidney disease, ulcer, amputation and blindness, cardiovascular disease (CVD), congestive heart failure, osteoarthritis, depression and breast or colon cancer.
Measurement of effectiveness
Quality-adjusted life-years (QALYs) were used as the measure of effectiveness.
Measurement and valuation of preference-based outcomes
Quality-adjusted life-years were based on utility values for health states from published literature and previous studies using the models and life expectancy (see Appendix 16 for the utilities used in the T1DM analyses).
Estimating resources and costs
Resource use associated with model health states was estimated based on published literature and previous studies using the economic models. Costing of psychological interventions was undertaken based on their description in clinical studies and liaison with UK experts in the project team.
Currency, price date and conversion
Costs were inflated to 2015/16 Great British pound (GBP) values.
Choice of model
Two previously used individual-level simulation models were extended and adapted to incorporate evidence on psychological interventions.
Assumptions
Assumptions are reported in detail in Chapter 8 (for T1DM and T2DM populations). The key assumptions in relation to this particular study relate to the evidence to be utilised for the long-term trajectory of HbA1c levels for people who receive a psychological intervention versus those who do not.
Analytic methods
Analytic methods are reported in detail in Chapter 8 (for T1DM and T2DM populations).
Study parameters
Study parameters are reported in detail in Chapter 8 (for T1DM and T2DM populations).
Incremental costs and outcomes
Lifetime discounted costs and QALYs for each comparator are used to quantify incremental cost-effectiveness ratios (ICERs) (incremental cost/incremental QALYs) and net monetary benefit (QALYs × £20,000 – costs).
Characterising uncertainty
A probabilistic sensitivity analysis (PSA) was undertaken using uncertainty on all parameters. A total of 500 samples of the parameters were used; for each sample, 5000 individual patients were simulated in each arm of the model. We used the Sheffield Accelerated Value of Information (SAVI) online tool to calculate the expected value of perfect information (EVPI) to quantify overall decision uncertainty. Expected value of perfect parameter information (EVPPI) analysis was also used to identify key uncertainties to inform priorities for further research in terms of reducing uncertainty about the quantitative effects of psychological interventions.
Characterising heterogeneity (e.g. subgroup differences)
No further subgroup analyses were undertaken because of limited evidence on subgroup effectiveness differences.
The reporting of both models in this report have been compared to the Palmer et al. 103 checklist for the reporting model inputs in diabetes simulation models. These checklists are provided separately for the modelling of psychological interventions for people with T1DM and people with T2DM in Appendix 16.
Part D: patient and public involvement methods
We used qualitative methods to determine the views of people with diabetes with regard to the initial findings of this systematic review and meta-analysis.
Aims
The aims of the focus groups were to:
-
determine patient views on the preliminary findings of the RCT systematic review and meta-analysis
-
discuss the best ways to inform patients and the public regarding the review findings.
Participants, recruitment and setting
People with T1DM and people with T2DM were identified from London and Sheffield and surrounding areas to take part in a focus group. The focus groups were advertised via NHS England, Diabetes UK local groups, Twitter (Twitter, Inc., San Francisco, CA, USA; www.twitter.com), Lay ADvice for Diabetes and Endocrine Research (LADDER) patient and public involvement (PPI) panel in Sheffield, and patient information boards in diabetes clinics.
The focus group in London was held in a conference room at KCL, and the Sheffield focus group was held at the University of Sheffield. The focus groups were facilitated by the principal investigator (KW), PhD student (RU), and a MSc Health Psychology student [Sophie Fawson (SF)].
Focus group meetings were held in March 2017 for the London and Sheffield groups. Participants were offered up to £50 in travel expenses and £75 for their time on the day. Lunch was also provided.
Procedure
Focus group participants were provided with a formal invite and information sheet prior to the focus group meeting. The information sheet detailed what the review involved, a definition of a psychological intervention and what we aimed to achieve through this research.
On the day of the focus groups, participants consented to the session being audio-taped and transcribed, and consented to the use of unattributed quotations in the report.
Kirsty Winkley introduced the research team and initiated participant introductions and discussion. Participants were first asked: ‘What three things do you feel would improve your diabetes care from hospital/general practice?’ Each member of the focus group was given the opportunity to answer this question, which prompted everyone in the group to speak.
Rebecca Upsher presented preliminary findings of the research using mini posters (see Appendix 8), which also included characteristics of the studies included in the review, for example intervention facilitators, mode of delivery, type of psychological intervention and format of delivery. Kirsty Winkley then asked the group questions based on these findings. This was split into three phases, to present findings and ask questions based on studies of adolescents/children with T1DM, adults with T1DM and T2DM. Following this, participants were then asked questions regarding their views on how the findings of the research should be disseminated.
Focus groups lasted ≈2 hours.
Focus group questions
These questions followed the presentation of findings:
-
What are your impressions of these findings for T1DM/T2DM?
-
What are your thoughts on the delivery of psychological interventions for T1DM/T2DM?
-
Do you feel that psychological interventions can help better manage your diabetes? How/why not?
-
In your opinion, what components of a psychological intervention are important to help improve T1DM/T2DM management?
-
What types of psychological support for T1DM/T2DM would you like to see offered?
-
Do these findings convince you that psychological interventions are important in T1DM/T2DM? How so/why not?
Dissemination
-
How do you access information about diabetes-related research?
-
Where would you like to see the results of our research published?
-
If you were to see our research published, what pieces of information are most important to you to inform you about the literature of psychological interventions in diabetes care?
Synthesis of focus group findings
Sophie Fawson took notes during the focus group sessions, listened to interview transcripts and summarised findings detailing participant views of research findings and views of the best methods to disseminate findings.
Chapter 4 Results
Study selection and individual patient data obtained
Literature searches identified 24,694 citations (Figure 1). There were 16,705 citations after removing duplicates; titles/abstracts were screened for eligibility. A total of 259 articles were assessed for full-text eligibility, conducted per protocol. A total of 182 studies were excluded based on the full-text screening. No unpublished studies were identified. Fourteen studies were included in qualitative analysis for adults with T1DM and seven were included in the aggregate meta-analysis (three studies104–106 were from papers that included a T1DM and T2DM population, and separate analysis per diabetes type was provided by the author). Eighteen studies were included in the qualitative analysis for adolescents/children with T1DM and 14 studies were included in the aggregate meta-analysis. Fifty-six studies were included in the qualitative analysis for adults with T2DM and 40 studies were included in the aggregate meta-analysis (three studies104–106 were from papers that included a T1DM and T2DM population, and separate analysis per diabetes type was provided by the author). Eleven studies included in the qualitative analysis included a T1DM and T2DM population; for eight of these studies, no separate analysis per diabetes type could be provided for the aggregate meta-analysis.
FIGURE 1.
The PRISMA flow diagram for all studies (including re-screened studies) for the qualitative synthesis and aggregate meta-analysis. a, Same studies.
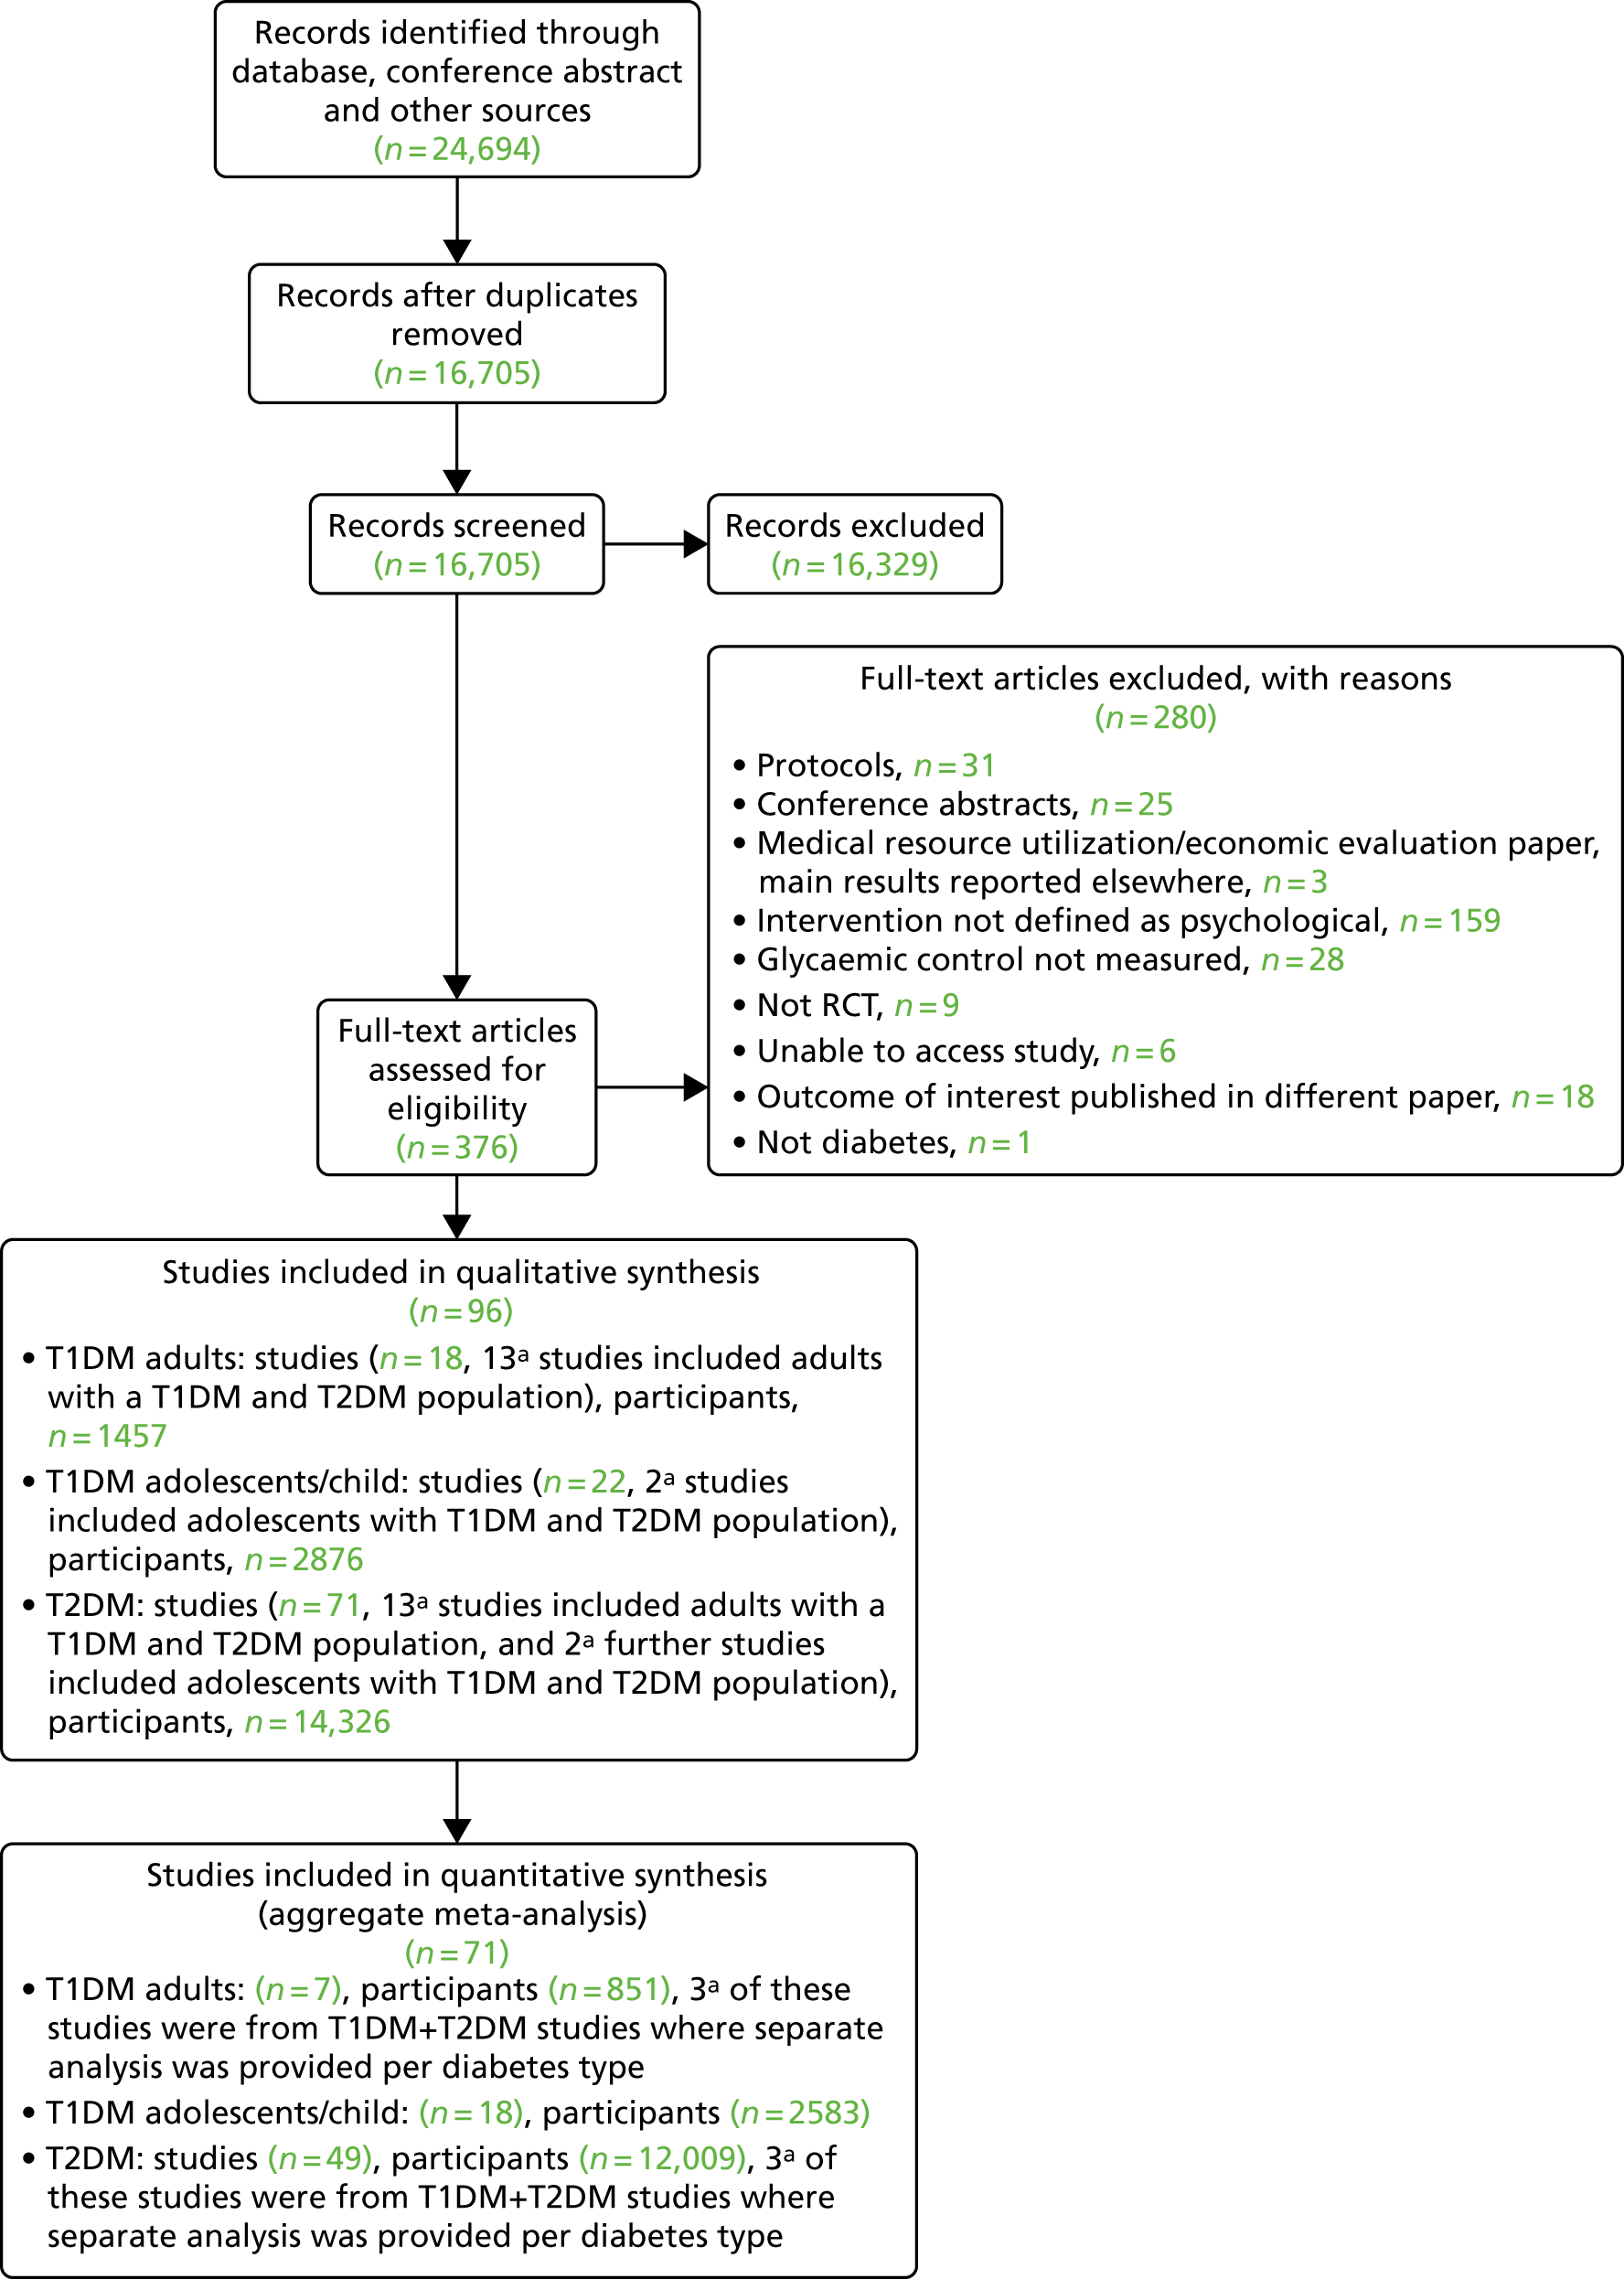
In the re-screen, 19 new studies were identified: (see Figure 1) 11 adult T2DM studies (nine for the aggregate meta-analysis) and four studies on T1DM in adolescents/children (all with sufficient data for the aggregate meta-analysis) and four studies with an adult T1DM and T2DM population (all with sufficient data for the qualitative synthesis).
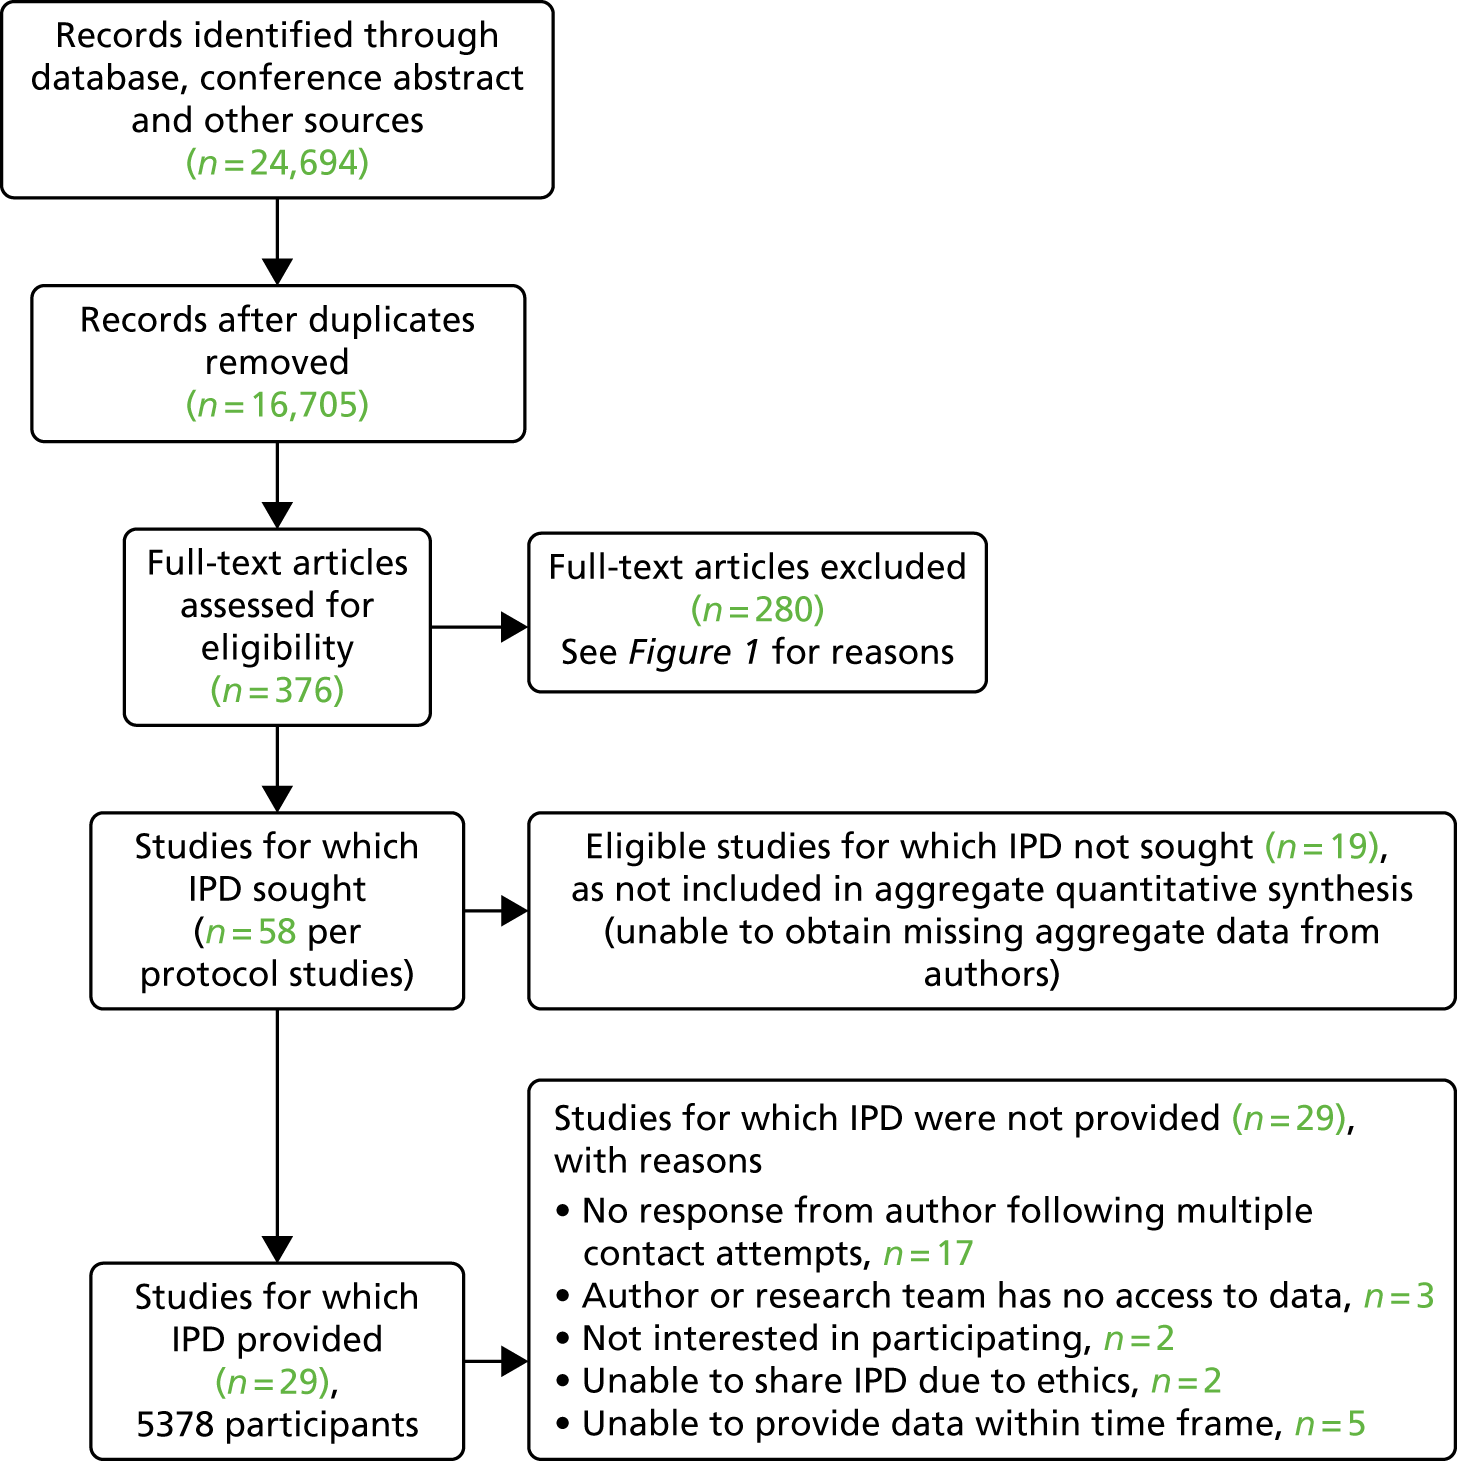
For the IPD (Figure 2), 58 study authors included in the aggregate meta-analysis were contacted (from studies identified prior to re-screening of study abstracts) and 41 responded (70.69%); 29 provided data (50%), (adults with T1DM: n = 6 studies, 751 participants; adolescents/children with T1DM: n = 9 studies, 1392 participants; adults with T2DM: n = 19 studies, 3639 participants; note that five studies included people with T1DM and people with T2DM). Twelve study authors responded but declined to forward data for the following reasons: three authors and/or their research team had no access to data, two authors were not interested in participating, two could not provide data, citing ethical reasons, and five did not have time to find the data set within the given time frame. The total number of participants for the IPD data set was 5823. Authors of studies identified when we re-screened study titles and abstracts were not contacted because of insufficient time.
FIGURE 2.
The IPD PRISMA flow diagram.
Type 1 diabetes mellitus adult study characteristics
For the qualitative synthesis for adults with T1DM, 18 studies were included; 13 studies had a mixed T1DM and T2DM population. Studies are described qualitatively and a summary of study characteristics for each is reported in Table 1. Details of psychological interventions, control groups and interventionist categories are included in Appendix 5.
| Year, country, first author | Total number of participants | Mean age (SD or range) (years) | Clinical subgroup (inclusion criteria for individual studies) | Mean (SD or range) duration of diabetes, years in intervention/control | Type of psychological intervention | Number of sessions in intervention | Intervention description (intervention name, facilitator, format, individual/group) | Control description (control category, facilitator, format, individual/group) | Follow-up, up to 12 months |
|---|---|---|---|---|---|---|---|---|---|
| T2DM studies included in the meta-analysis | |||||||||
| 2004, the USA, Whittemore107 | 49 | All: 57.6 (10.9) | T2DM, 30–70 years, HbA1c level of > 7% | 2.7 (3.0) | Counselling | 6 | Nurse-coaching intervention, nurses, face to face, individual | Usual care | 6 months |
| 2012, the USA, Williams108 | 293 |
|
T2DM, > 60 years | NR | Collaborative care (including psychotherapy) | 6–8 | Collaborative care (depression treatment including problem-solving treatment); depression clinical specialist plus GP; face to face; individual | Usual care | 12 months |
| 2006, Germany, Siebolds109 | 223 |
|
T2DM |
|
Counselling | 4 | Counselling, physician, face to face, individual | Dietary counselling, physician, face to face, individual | 6 months |
| 2006, Thailand, Keeratiyutawong110 | 90 | 27–60 | T2DM for < 10 years; OADs only; fasting blood glucose of > 130 mg/dl on at least two occasions | NR | CBT | 5 | Self-management group; psychology researcher; face to face; group | Diabetes education; diabetes health-care team; face to face; individual | 6 months |
| 2007, the USA, Gregg111 | 81 |
|
T2DM |
|
Counselling | 1 | ACT, psychologist, face to face, group | Diabetes education, psychology masters-level students, face to face, group | 3 months |
| 2007, the USA, West112 | 217 |
|
T2DM, treated with OADs, not insulin; overweight |
|
Counselling | 5 | MI; clinical psychologists; face to face; individual | Diabetes education; health educators; face to face; individual | 12 months |
| 2009, the UK, Dale113 | 231 | n (%)
|
T2DM, not treated with insulin, HbA1c level of > 8% |
|
Counselling | 6 |
|
Usual care | 6 months |
| 2009, Iran, Davazdah114 | 40 | 35–60 | T2DM | NR | CBT | 12 | CBT, trained researcher, face to face, group | Waiting list; see intervention description | 3 months |
| 2009, the USA, Sacco115 | 62 | 52 (8.6) for all participants | T2DM; HbA1c level of > 6.5% | 9.5 (7.2) for all participants | Counselling | 18 | Telephone ‘coaching’ intervention; undergraduates in psychology; telephone; individual | Usual care | 6 months |
| 2010, Australia, Evans116 | 60 | 57.1 (22–84) for all participants | T2DM | 14.3 (1–45) for all participants | CBT | 7 | CBT; face to face; group | Waiting list (usual care for 3 months, then intervention) | 3 months |
| 2010, the USA, Wolever117 | 56 |
|
T2DM for > 1 year, OADs for > 1 year |
|
Counselling | 14 | Integrative health coaching; coaches (masters-level degrees in social work or psychology); telephone; individual | Usual care | 6 months |
| 2010, the USA, D’Eramo Melkus118 | 109 |
|
T2DM; black women; did not require insulin, BMI of < 37 kg/m2 | NR | CBT | 11 | CBT + DSMT + CST; nurse; face to face; group | Diabetes education; nurse; face to face; group | 3 months |
| 2010, Belgium, De Greef119 | 41 |
|
T2DM for ≥ 6 months |
|
CBT | 5 | cognitive–behavioural pedometer-based group intervention; coaches (degree in PE, movement sciences or clinical psychology); face to face; group | Usual care | 52 weeks |
| 2010, the USA, Hawkins120 | 66 |
|
T2DM, ≥ 60 years |
|
CBT | 12 | MI video call; nurses, telephone, individual | Attention control telephone support (no MI); nurses; telephone; individual | 6 months |
| 2010, the USA, Osborn121 | 185 |
|
T2DM for > 1 year; Puerto Rican ethnicity |
|
Counselling | 1 | Culturally tailored diabetes self-care intervention; bilingual medical assistant of Puerto Rican heritage; face to face; individual | Usual care | 3 months |
| 2011, Chile, García-Huidobro122 | 167 |
|
T2DM, 18–70 years, HbA1c level of ≥ 7% | NR | Family therapy | 4 | Family intervention, health-care team, face to face, family | Usual care | 6 months |
| 2011, Ireland, Keogh123 | 121 |
|
T2DM for > 1 year, having at least two of their last three HbA1C readings at ≥ 8.0% |
|
Counselling | 3 | Family-based intervention; health psychologist; face to face; family | Usual care | 6 months |
| 2011, Belgium, De Greef124 | 67 |
|
T2DM for ≥ 6 months, aged ≤ 80 years, BMI of 25–35 kg/m2, HbA1c level of ≤ 12%, pharmaceutically treated for T2DM | < 5 years (%)
|
Counselling | 3 |
|
Usual care | 12 weeks |
> 5 years:
|
|||||||||
| 2011, Iran, Hamid125 | 46 | 32–65 | T2DM | NR | CBT | 12 | CBT, trained researcher, face to face, group | Waiting list, see intervention description | 6 months |
| 2011, the USA, Piette126 | 291 |
|
T2DM, ≥ 21 years; antihyperglycaemic medication; depressed, as measured by the PHQ-9 | NR | CBT | 12 | Telephone-delivered CBT; nurses; telephone; individual | Enhanced usual care (usual care + copy of self-help book based on CBT for depression) | 12 months |
| 2011, the Netherlands, Lamers127 | 70 |
|
T2DM; depressed, as3 measured by the PHQ-9; ≥ 60 years |
|
CBT | 4 | Minimal psychological intervention; nurses; face to face; individual | Usual care | 9 months |
| 2011, the USA, Welch128 | 119 |
|
T2DM, 30–70 years, (HbA1c levels of ≥ 7.5%) |
|
Counselling | 4 |
|
|
6 months |
| 2011, the USA, Ell129 | 229 | All: 54 (8.7) | T1DM or T2DM; ≥ 18 years; depressed, as measured by the PHQ-9 | NR | Collaborative care (elements of psychotherapy) | NR | Socioculturally adapted collaborative care: primary care physicians/graduate social workers/diabetes depression clinical specialists; face to face/telephone; individual | Enhanced usual care (usual care + prescribed antidepressant medication and provided counselling or refer to community mental health care) | 12 months |
| 2012, the UK, Farmer130 | 211 |
|
T2DM, ≥ 18 years, HbA1c levels of ≥ 7.5% |
|
Counselling | 1 | Consultation-based intervention, clinical nurses, face to face, individual | Usual care | 8 weeks |
| 2012, the USA, Penckofer131 | 74 |
|
T2DM for > 6 months; ≥ 18 years; depressed, as measured by the CES-D |
|
CBT | 8 | Psychoeducation: nurses; face to face, group | Usual care | 6 months |
| 2012, Germany, Hartmann132 | 110 |
|
T2DM, albuminuria |
|
Counselling | 8 | Mindfulness-based intervention: psychologist and a resident in internal medicine; face to face; group | Usual care | 12 months |
| 2012, Taiwan, Chen133 | 215 |
|
T2DM for > 3 months, aged > 18 years |
|
Counselling | NR | MI: nurses; face to face; individual | Diabetes education; nurse/diabetes educator; face to face; group | 3 months |
| 2013, Canada, Plotnikoff134 | 287 |
|
T2DM, > 18 years |
|
Counselling | 22 | Telephone counselling (MI): five individuals with relevant degree qualifications related to physical activity promotion and/or counselling; telephone; individual |
|
12 months |
| 2013, the Netherlands, Welschen135 | 154 |
|
T2DM, 18–75 years, HbA1c level of ≥ 52 mmol/mol (7.0%) and/or BMI of 27.0 kg/m2 and/or smoking |
|
CBT | 3–6 | CBT; diabetes nurse and dietitian; face to face; individual | Usual care; dietitian/diabetes nurse; face to face; individual | 12 months |
| 2013, the USA, Mandel136 | 131 |
|
T2DM, 30–85 years, enrolled in diabetes education programme |
|
Creative therapy | 4 | Music therapy; music therapy clinician; face to face; group |
|
3 months |
| 2013, the Netherlands, Jansink137 | 521 |
|
T2DM, < 80 years, HbA1c level of > 7%, BMI of > 25 kg/m2 |
|
Counselling | 5–8 | MI; nurse; face to face; individual | Usual care | 14 months |
| 2014, Denmark, Juul138 | 3946 |
|
T2DM |
|
Counselling | Variable | Nurse-led diabetes consultations, GP & nurses, face to face, individual | Usual care | 18 months |
| 2014, the UK, Steed139 | 124 |
|
T2DM, < 75 years |
|
Counselling | 5 | Self-management intervention, diabetes specialist nurse & dietitian, face to face, group | Usual care | 3 months |
| 2014, the USA, Safren140 | 87 |
|
T2DM; 18–70 years; HbA1c level of > 52 mmol/mol (7.0%); depressed, as measured by the DSM-IV | NR | CBT | 9–12 | CBT-AD: therapist; face to face; individual | Enhanced usual care; nurse/dietitian; face to face; individual | 4 months |
| 2014, Portugal, Gois141 | 22 |
|
T2DM for > 6 months, aged 18–65 years |
|
Psychotherapy | 12 | Interpersonal psychotherapy, psychiatry, face to face, individual | Medical care and sertraline | 6 months |
| 2014, China, Li97 | 101 |
|
T2DM for 1–2 years, aged 40–70 years, HbA1c level of ≥ 9% |
|
Counselling | 4 | MI; therapist; face to face; individual | Diabetes education; face to face; individual | 6 months |
| 2014, the UK, Griffin142 | 478 |
|
T2DM clinical diagnosis within previous 3 years, aged 40–69 years | NR | Counselling | 8 | Intensive plus behavioural intervention: lifestyle facilitators; face to face/telephone; individual | Enhanced usual care; GP; face to face; individual | 12 months |
| 2014, Australia, Eakin143 | 277 |
|
T2DM, 20–75 years, inactive, BMI of ≥ 25 kg/m2 | Median (quartiles):
|
Counselling | 27 | Telephone counselling (MI): trained researchers (degree nutrition or dietetics); telephone; individual | Usual care | 6 months |
| 2014, the Netherlands, van Son104 | 83 |
|
T1DM or T2DM, of emotional well-being (WHO-5) | NR | CBT | 8 | Mindfulness cognitive-based therapy; psychologist; face to face; group | Usual care | 6 months |
| 2015, the USA, Kim144 | 209 |
|
T2DM, ≥ 35 years, HbA1c level of ≥ 7.0% | In months:
|
Counselling | 6 | Self-management intervention, nurses and community health workers, face to face, group | Diabetes education, face to face, group | 12 months |
| 2015, the USA, Chlebowy145 | 62 |
|
T2DM, ≥ 18 years, African American, prescribed oral antihyperglycaemic agents and/or insulin | NR | Counselling | 4 | MI: nurses; face to face; individual | Usual care | 3 months |
| 2015, the USA, Pladevall146 | 1692 |
|
T2DM, ≥ 18 years, HbA1c level of ≥ 7%, LDL-C ≥ 100 mg/dL | NR | Counselling | 6 | MI and adherence information: nurses and pharmacists; face to face/telephone; individual |
|
12 months |
| 2015, Germany, Hermanns105 | 60 |
|
T1DM or T2DM; depressed, as measured by the CES-D; 18–70 years |
|
CBT | 5 | DIAMOS: psychologists, face to face; group | Diabetes education; diabetes educators; face to face; group | 12 months |
| 2015, Croatia, Pibernik-Okanović147 | 121 |
|
T2DM for at least 1 year, aged 18–65 years |
|
CBT | 6 | Psychoeducation: psychologist; face to face; group | Diabetes education; diabetologist; face to face; group | 12 months |
| 2015, Germany, Petrak106 | 53 |
|
T1DM or T2DM, insulin treated, 21–69 years, major depression DSM-IV, HbA1c level of > 7.5% (58 mmol/mol) |
|
CBT | 10 | CBT, clinical psychologists, face to face, group | Usual care and antidepressants | 12 months |
| 2016, Taiwan, Huang148 | 61 |
|
T2DM; ≥ 20 years; depressed, as measured by the CES-D | Months:
|
CBT | 12 | MET + CBT: psychotherapist/clinical nurse; face to face; group | Usual care | 90 days |
| 2016, China, Browning149 | 682 |
|
T2DM, ≥ 50 years |
|
Counselling | 9 | Health coaching: clinicians (doctors, nurses and psychologists; face to face/telephone; individual | Usual care | 12 months |
| 2016, the Netherlands, Kasteleyn150 | 161 |
|
T2DM for > 1 year, aged > 35 years | Mean (IQR):
|
Counselling | 3 | MI: nurses; face to face; individual | Less intensive psychological intervention; nurse, telephone; individual | 5 months |
| 2016, Taiwan, Chiu151 | 174 |
|
T2DM, ≥ 50 years, minor depressive symptoms |
|
Counselling | 4 | Minimal psychological intervention: psychology assistants; telephone; individual | Usual care | 10 weeks |
| Studies in systematic review only (not included in meta-analysis) of T2DM | |||||||||
| 2004, the UK, Clark152 | 100 | All: 59.5 (NR) | T2DM, 40–70 years, BMI of > 25 kg/m2 | NR | Counselling | 1 | Self-management intervention: interventionist (trained in MI); face to face; individual | Usual care | 12 months |
| 2006, the USA, Hokanson153 | 114 |
|
T2DM, smokers | NR | Counselling | 4–7 | Smoking cessation MI, research staff, telephone, individual | Usual care | 6 months |
| 2010, the Netherlands, Heinrich154 | 537 | All: 59 (5.27) | T2DM for ≤ 5 years, aged 40–70 years | 26.4% were diagnosed with diabetes ≤ 1 year previously; 47.0% were diagnosed 2–3 years previously; and 26.6% were diagnosed 4–5 years previously | Counselling | 8 | MI; nurses; face to face; individual | Usual care | 12 months |
| 2010, Iran, Pourisharif155 | 41 | NR | T2DM, 30–75 years, diagnosed in the preceding 12 months | NR | Counselling | 4 |
|
Usual care | 9 weeks |
| 2011, Italy, Castelnuovo156 | 34 |
|
T2DM |
|
CBT | Variable | TECNOB: clinical psychologist; face to face/telephone/online and text messaging; individual/group | Usual care | 12 months |
| 2012, the USA, Waker157 | 154 |
|
T2DM, HbA1c level of ≥ 6.5% |
|
Counselling | 2 | MI: researcher; face to face; individual | Usual care | 3 months |
| 2013, the USA, Gabbay158 | 545 |
|
T2DM, HbA1c level of > 8.5% | NR | Counselling | 8 | MI: nurses; face to face; individual | Usual care | 12 months |
| Jiang 2014159 | 52 | Cannot access paper for this information | T2DM | Cannot access paper for this information | Psychotherapy | Cannot access paper for this information | Psychotherapy, face to face, group | Usual care plus paroxetine | 6 months |
| 2015, the USA, Inouye160 | 207 |
|
T2DM, 18–76 years, received diabetes education | NR | CBT | 6 | CBT: research assistants; face to face; group | Diabetes education; research assistants; face to face; group | 12 months |
| 2016, the USA, Fitzpatrick161 | 182 |
|
T2DM, ≥ 25 years, black/African American | NR | Counselling | 9 |
|
|
20 weeks |
| Studies included in meta-analysis of adults with T1DM | |||||||||
| 2009, Sweden, Amsberg162 | 74 |
|
T1DM for ≥ 2 years, aged 18–65 years, BMI of < 30 kg/m2, HbA1c level of > 7.5% |
|
CBT | 8 | CBT-based intervention; diabetes specialist nurse and psychologist; face to face; group | Waiting list | 48 weeks |
| 2008, the UK, Ismail163 | 344 |
|
T1DM for ≥ 2 years, two records of HbA1c levels of between 8.2% and 15% (within 12 months), aged 18–65 years |
|
CBT |
|
|
Usual care | 12 months |
| 2008, the Netherlands, Snoek164 | 86 | All: 37.8 (10.6) | T1DM for ≥ 1 year, HbA1c level of ≥ 8.0% on two occasions, multiple daily insulin injections (≥ 2) or continuous subcutaneous insulin infusion | All: 18 (10.4) | CBT | 6 | Cognitive–behavioural group training; psychologist; face to face; group | BGAT; psychologist; face to face; group | 12 months |
| 2015, Germany, Hermanns105 | 114 |
|
T1DM and T2DM; depressed, as measured by the CES-D; 18–70 years |
|
CBT | 5 | DIAMOS: psychologists, face to face; group | Diabetes education; diabetes educators; face to face; group | 12 months |
| 2015, Denmark, Zoffmann165 | 200 |
|
T1DM for ≥ 1 year, aged 18–35 years, HbA1c level of ≥ 64 mmol/mol |
|
Counselling | 14 | Flexible GSD; nurses; face to face; group | Waiting list | 12 months |
| 2014, the Netherlands, Van Son104 | 83 |
|
T1DM and T2DM, low level of emotional well-being (WHO-5) | NR | CBT | 8 | Mindfulness cognitive-based therapy; psychologist; face to face; group | Usual care | 6 months |
| 2015, Germany, Petrak106 | 53 |
|
T1DM and T2DM, insulin treated, 21–69 years, major depression DSM-IV, HbA1c level of 7.5% (58 mmol/mol) |
|
CBT | 10 | CBT, clinical psychologists, face to face, group | Usual care and antidepressants | 12 months |
| Studies in systematic review only (not included in meta-analysis) of adults with T1DM | |||||||||
| 2006, Denmark, Zoffmann166 | 50 |
|
T1DM, 18–49 years, HbA1C level of ≥ 8.0% | NR | Counselling | 8 | GSD; nurses; face to face; group | Waiting list | 12 months |
| Studies included in meta-analysis of adolescents/children with T1DM | |||||||||
| 2005, Norway, Graue167 | 83 |
|
T1DM, 11–17 years |
|
Counselling | 3 | Structured educational and counselling programme, physician/diabetes specialist nurse/clinical psychologist/dietitian/social worker, face to face, group | Usual care | 15 months |
| 2007, the UK, Channon168 | 66 |
|
T1DM for ≥ 1 year; aged 14–17 years |
|
Counselling | 4 | MI; nurse; face to face; individual | Non-directive psychological support; nurse; face to face; individual | 12 months |
| 2007, the USA, Ellis169 | 127 |
|
T1DM for ≥ 1 year; HbA1c level of ≥ 8%, 10–17 years |
|
Family therapy | NR | MST; therapist; face to face; family | Usual care | 6 months |
| 2007, the USA, Nansel170 | 81 |
|
T1DM for ≥ 1 year; aged 11–16 years |
|
Counselling | 6 | Diabetes personal trainer intervention; trained non-professional (MI training); face to face/telephone; family/individual | Diabetes education; educational booklet; family | 12 months |
| 2009, the USA, Grey171 | 82 |
|
T1DM for ≥ 6 months; 8–12 years; treated with insulin |
|
CBT | 6 | CST; mental health professional; face to face; group | Diabetes education; nurse; face to face; group | 12 months |
| 2010, the USA, Wang172 | 44 |
|
T1DM for > 1 year; aged 12–18 years; HbA1c level of ≥ 9% |
|
Counselling | 2 | MI; diabetes educators; face to face; group | Diabetes education; diabetes educator; face to face; group | 9 months |
| 2010, the USA, Lehmkuhl173 | 32 |
|
T1DM for ≥ 6 months; HbA1c level of > 9% | NR | Family therapy | 36 | Telehealth behaviour therapy; clinical psychologists or clinical psychology interns; telephone; family | Waiting list control | 12 weeks |
| 2012, the UK, Robling174 | 689 |
|
T1DM for ≥ 12 months, aged 4–15 years |
|
Counselling | Variable | DEPICTED, health-care professionals, face to face, individual | Usual care | 12 months |
| 2012, Germany, Sassmann175 | 33 |
|
T1DM, aged 2–10 years |
|
CBT | 5 | DELFIN, psychologist, face to face, group | Waiting list | 3 months |
| 2012, the USA, Nansel176 | 390 |
|
T1DM for ≥ 3 months, with at least two or more daily injections or use of an insulin pump; aged 9–14.9 years; HbA1c level of > 6% |
|
Family therapy | 9 | Family behavioural intervention; health advisors; face to face/telephone; family | Usual care | 12 months |
| 2013, Iran, Najmi177 | 85 |
|
T1DM for > 1 year; aged 12–18 years | NR | CBT | 8 |
|
Usual care | 3 months |
| 2014, Denmark, Husted178 | 71 |
|
T1DM for > 1 year, aged 13–18 years, |
|
Counselling | 8 | GSD, physicians/diabetes nurses/dietitian, face to face, individual | Usual care | 12 months |
| 2014, the USA, Jaser179 | 40 |
|
T1DM for ≥ 6 months; aged 13–17 years |
|
Counselling | 4 | Positive affect; trained research assistant; telephone; family | Diabetes education; education materials; mail; individual | 6 months |
| 2014, the USA, Katz180 | 153 |
|
T1DM for ≥ 6 months; aged 8–16 years |
|
Family therapy | Variable |
|
Usual care | 12 months |
| 2014, the UK, Christie181 | 315 |
|
T1DM for ≥ 12 months; aged 8–16 years; mean 12-month HbA1c value of ≥ 8.5% |
|
Counselling | 4 | CASCADE (psychoeducation); paediatric diabetes specialist nurse and another health-care professional; face to face; group | Usual care | 12 months |
| 2015, the USA, Harris182 | 90 |
|
T1DM for ≥ 1 year; aged 12–19 years; HbA1c level of ≥ 9.0% |
|
Family therapy | 10 | BFST-D via clinic; therapist; face to face; family | BFST-D via Skype™ (Microsoft Corporation, Redmond, WA, USA); therapist; Skype; family | 3 months |
| 2015, the USA, Nansel183 | 136 |
|
T1DM for ≥ 1 year; aged 8–16.9 years; most recent HbA1c level of between 6.5% and 10.0% |
|
Family therapy | 6 | Family intervention; research assistant; face to face; family | Care ambassador; research assistant; face to face; family | 18 months |
| 2016, Australia, Serlachius184 | 147 |
|
T1DM; aged 13–16 years |
|
CBT | 5 | The BOC; health psychologist; face to face; group | Usual care | 12 months |
| Studies in systematic review only (not included in meta-analysis) of adolescents/children with T1DM | |||||||||
| 2014, the USA, Holmes185 | 40 |
|
T1DM for > 1 year; aged 11–14 years |
|
Family therapy | 4 | CST; interventionist; face to face; family | Diabetes education; BA-level facilitators; face to face; family | 3 months |
| 2008, the USA, Wysocki186 | 104 |
|
T1DM or insulin-treated T2DM for ≥ 2 years; aged 11–16 years; HbA1c level of ≥ 8% |
|
Family therapy | 12 | BFST-D; therapist; face to face; family |
|
12 months |
| Studies of people with T1DM and T2DM (included in systematic review only, as separate analysis T2DM not available) | |||||||||
| 2004, the USA, Katon187 | 329 |
|
T2DM or T1DM |
|
Collaborative care (including psychotherapy) | Variable | Pathways study, nurses/psychiatrists/primary care physician, face to face/telephone, individual | Usual care | 12 months |
| 2004, Norway, Karlsen188 | 63 |
|
T1DM or T2DM | NR | CBT | 9 | Group-based counselling; nurse; face to face; group | Waiting list | 6 months |
| 2006, the USA, Wysocki189 | 104 |
|
T1DM or T2DM for ≥ 2 years; aged 11–16 years; HbA1c level of ≥ 8% |
|
Family | 12 | Behavioural family systems therapy; psychologists; face to face; family |
|
6 months |
| 2010, Germany, Heisler190 | 244 |
|
T2DM or T1DM | NR | Counselling | Variable | Nurse case management, nurses, face to face and telephone, individual | Reciprocal peer support, care manager, face to face, group | 6 months |
| 2011, Denmark, Rosenbek Minet191 | 349 |
|
T1DM or T2DM, aged > 18 years |
|
Counselling | 5 | MI; health-care professionals (nurse, dietitian, physiotherapist or psychologist); face to face; individual | Usual care | 12 months |
| 2011, the USA, Weinger192 | 222 | Median (range)
|
T1DM or T2DM for ≥ 2 years, aged 18–70 years, HbA1c levels of > 7.5% | Median (range)
|
CBT | 5 | Structured behavioural group; diabetes educators; face to face, group |
|
12 months |
| 2012, Australia, Williams108 | 80 |
|
T2DM or T1DM | NR | Counselling | Variable | Self-management intervention, nurse, face to face and telephone, individual | Usual care | 9 months |
| 2012, the USA, Fischer193 | 762 |
|
T2DM or T1DM, aged > 17 years | NR | Counselling | Variable | Telephone-based outreach, nurses, telephone, individual | Usual care | 18 months |
| 2012, the USA, Ellis194 | 146 |
|
T1DM or T2DM for ≥ 1 year; aged 10–18 years; HbA1c level of ≥ 8% |
|
Family | Variable | MST; therapist; face to face; family | Telephone support; therapist; telephone; individual | 12 months |
| 2014, the USA, Lin195 | NR |
|
T1DM or T2DM, depression (score of > 10 points on the PHQ-9) | NR | Collaborative care (including psychotherapy) | Variable | Collaborative care; primary care physician and nurse and psychiatrist and psychologist; face to face; individual | Usual care | 12 months |
| 2015, the USA, Safford196 | NR |
|
T1DM or T2DM | NR | Counselling | Variable | MI; peers, telephone; individual | Diabetes education; face to face; individual | 12 months |
| 2015, the Netherlands, Schroevers197 | 24 |
|
T1DM or T2DM, 18–70 years |
|
CBT | 8 | Mindfulness-based cognitive therapy; clinical psychologist; face to face; individual | Waiting list | 8 weeks |
Study location
Twelve studies were conducted in Europe (Denmark, n = 3;165,166,178 Germany, n = 3;105,106,190 the Netherlands, n = 3;104,164,197 Sweden, n = 1;162 the UK, n = 1;163 and Norway, n = 1188), one in Australia108 and five in North America. 187,192,193,195,196
Participant characteristics
The total sample size for all adult T1DM studies was 1457 (n = 13; five studies with a mixed T1DM and T2DM population did not provide sample size per diabetes type). Across studies, the sample size ranged from 11 to 315 participants.
Intervention characteristics
Most studies tested a CBT intervention (n = 9),104–106,162–164,188,192,197 followed by counselling (n = 7)108,165,166,190,191,193,196 and collaborative care, including elements of psychotherapy (n = 2). 188,195 Studies were delivered by non-diabetes specialists, including psychologists, primary care physicians and peers (n = 8)104–106,164,191,195–197 and diabetes specialists (i.e. diabetes nurses, diabetes educators) (n = 10). 108,162,163,165,166,187,188,190,192,193 The mode of delivery was mostly face to face (n = 15),104–106,162–166,187,188,190–192,195,197 with two intervention studies delivered via telephone. 193,196 One study was delivered face to face and by telephone. 108 Most studies were delivered in a group setting (n = 9);104–106,162,164–166,188,192 the rest were delivered one to one (n = 9). 108,163,187,190,191,193,195–197 The number of psychological therapy sessions ranged from 5 to 14, and sessions lasted between 45 minutes and 2 hours. The total duration of therapy ranged from 1.5 to 20 months.
Control characteristics
Control groups were categorised into two different types: usual care and attention control (matched with the intervention in frequency and length). Fourteen studies104,106,108,162,163,165,166,187,188,191,193,195–197 delivered usual diabetes care as a control, and four studies105,164,190,192 delivered attention control; this included blood glucose awareness training (BGAT) (n = 1)164 and diabetes education (n = 2). 105,192 One study190 delivered peer support to the control participants; this was coded as attention control.
Primary outcome
The primary outcome was HbA1c level (measured as % or mmol/mol). The mean difference was calculated from baseline to 12 months’ follow-up (or the closest measurement to 12 months) for the intervention and control groups. The time between HbA1c level follow-up measurements between studies ranged from 2 to 18 months for adult T1DM studies.
Secondary outcomes
There were insufficient data (i.e. fewer than five studies) to conduct meta-analyses on secondary outcomes for changes in psychological functioning (n = 4 studies) or change in self-management behaviour (n = 2 studies).
Results of individual studies of adults with type 1 diabetes mellitus
All studies included in the systematic review are listed in Table 1.
Synthesis of results
Primary outcome: glycated haemoglobin level
Seven adult T1DM studies104–106,162–165 (total participants, n = 851) had HbA1c level data available to conduct a meta-analysis. A random-effects meta-analysis demonstrated a pooled mean difference of –0.13 [95% confidence interval (CI) –0.33 to 0.07], a non-significant decrease in HbA1c level in favour of psychological intervention (Figure 3). This was a small effect size and equates to –0.18 change in % of HbA1c level (a reduction of ≈2 mmol/mol). There was low heterogeneity (I2 = 43.8%; p = 0.099). Egger’s test demonstrated little evidence of publication bias (p = 0.889) (see Appendix 9, Figure 30). The trim-and-fill method for correcting publication bias found no missing studies.
FIGURE 3.
A meta-analysis of SMD in HbA1c level in the psychological intervention group compared with the control group for adults with T1DM.
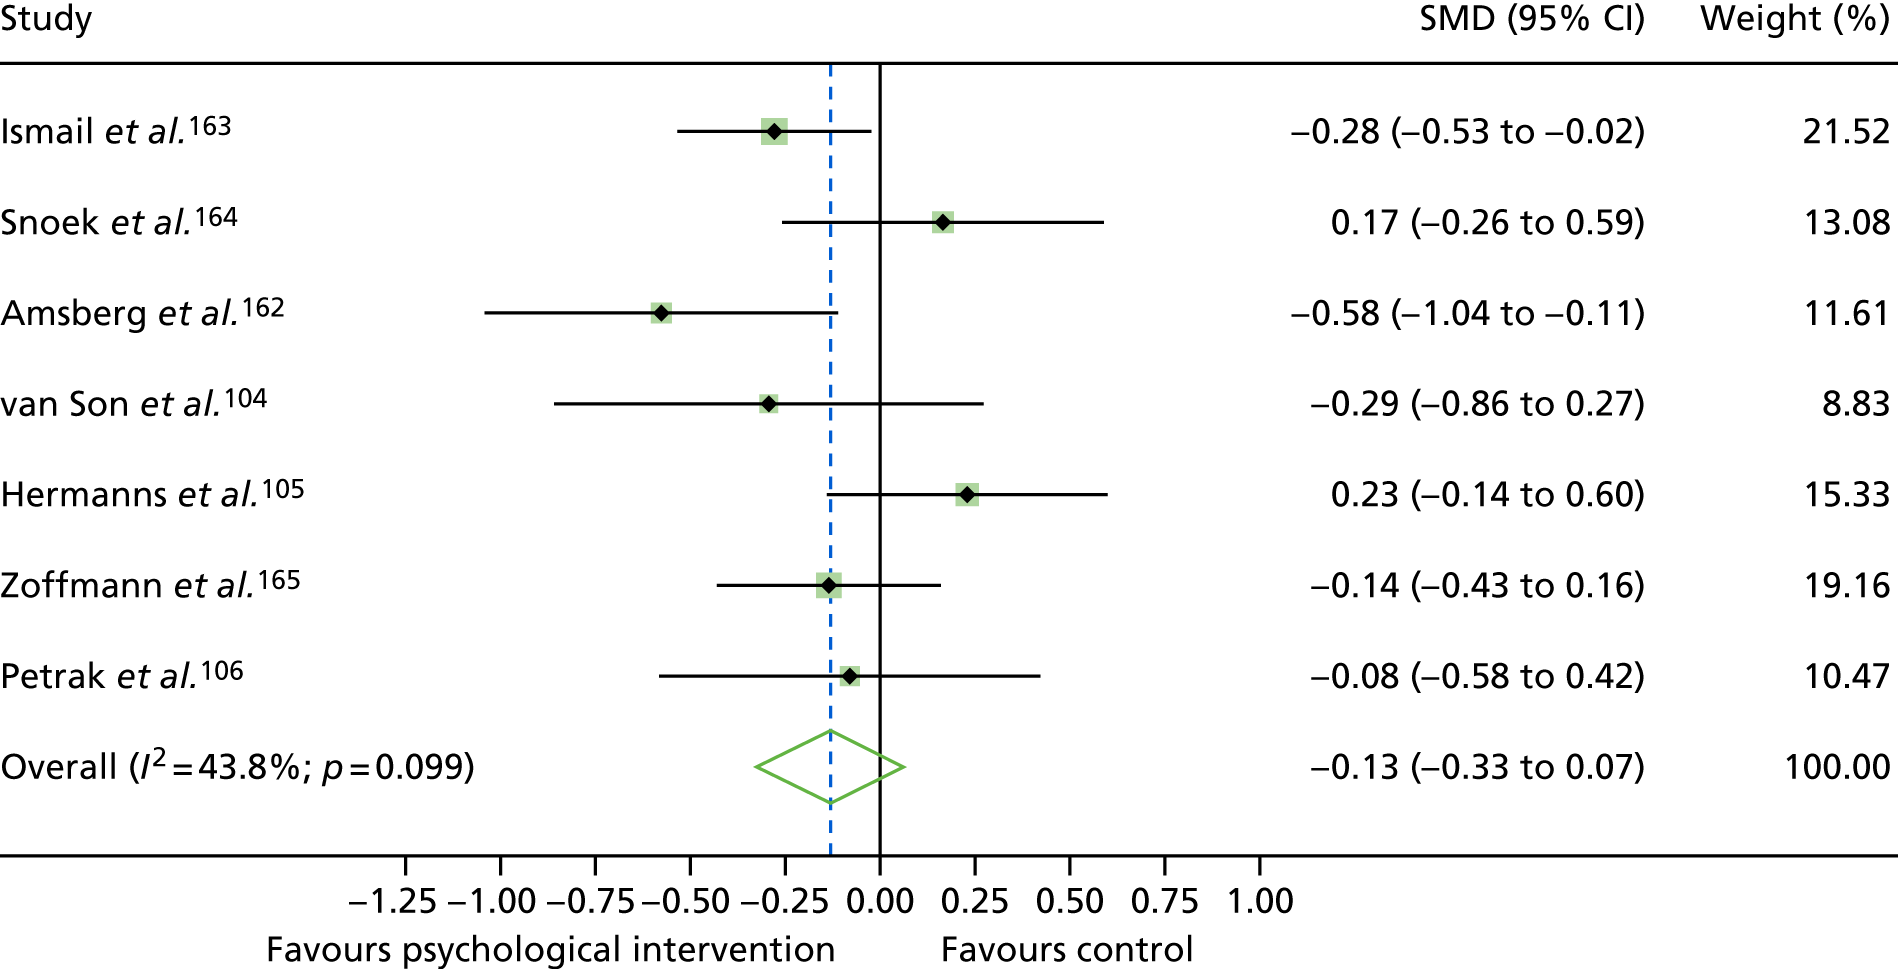
When the main outlier, Hermanns et al. ,105 was removed from the meta-analysis, there was a statistically significant (but not a clinically significant) decrease in HbA1c level in favour of psychological intervention (SMD –0.20, 95% CI –0.37 to –0.02, equivalent to a –0.25 change in % HbA1c level or a reduction of ≈3 mmol/mol). There was little influence when any other single study was removed. Hermanns et al. ’s48 study is one of two studies that compared an intervention with an attention control group (diabetes education); the other, Snoek et al. ,164 used BGAT. When both studies were removed, there was a statistically significant (but not clinically significant) decrease in HbA1c level in favour of the psychological intervention groups (SMD –0.25, 95% CI –0.41 to –0.09, equivalent to a –0.31 change in % HbA1c level, or a reduction of ≈3–4 mmol/mol).
In a meta-regression, there was no statistically significant difference between different group of psychological interventions (CBT vs. counselling, p = 0.985) and HbA1c level, or between type of interventionists delivering the psychological intervention (nurses vs. psychologists, p = 0.074) and HbA1c level. There was no association between the number of therapy sessions (p = 2.98), therapy session duration (p = 0.894) or duration of therapy (p = 0.643) and HbA1c level. There was a statistically significant difference between the type of control group (p = 0.04) and HbA1c level, with a larger treatment effect (coefficient of 0.45) for the attention control group than the usual care group.
Combining the results with those of the previous review of studies of adults with type 1 diabetes mellitus
For adults with T1DM, data from this review (n = 7 trials) and our previous review57 (n = 11 trials with a total of 516 participants) were combined (Figure 4). For these 18 trials (a total of 1367 participants), a random-effects meta-analysis demonstrated a non-statistically significant decrease in HbA1c level in favour of psychological intervention versus control (SMD –0.12, 95% CI –0.29 to 0.04). Both the current review (SMD –0.13, 95% CI –0.33 to 0.07) and the previous review (SMD –0.17, 95% CI –0.45 to 0.10) reported a non-statistically significant decrease in HbA1c levels; a meta-regression demonstrated a non-statistically significant difference in HbA1c change between both reviews (p = 0.927).
FIGURE 4.
A meta-analysis of SMD in HbA1c level in psychological intervention groups compared with control groups for adults with T1DM, combined studies from current and previous review.
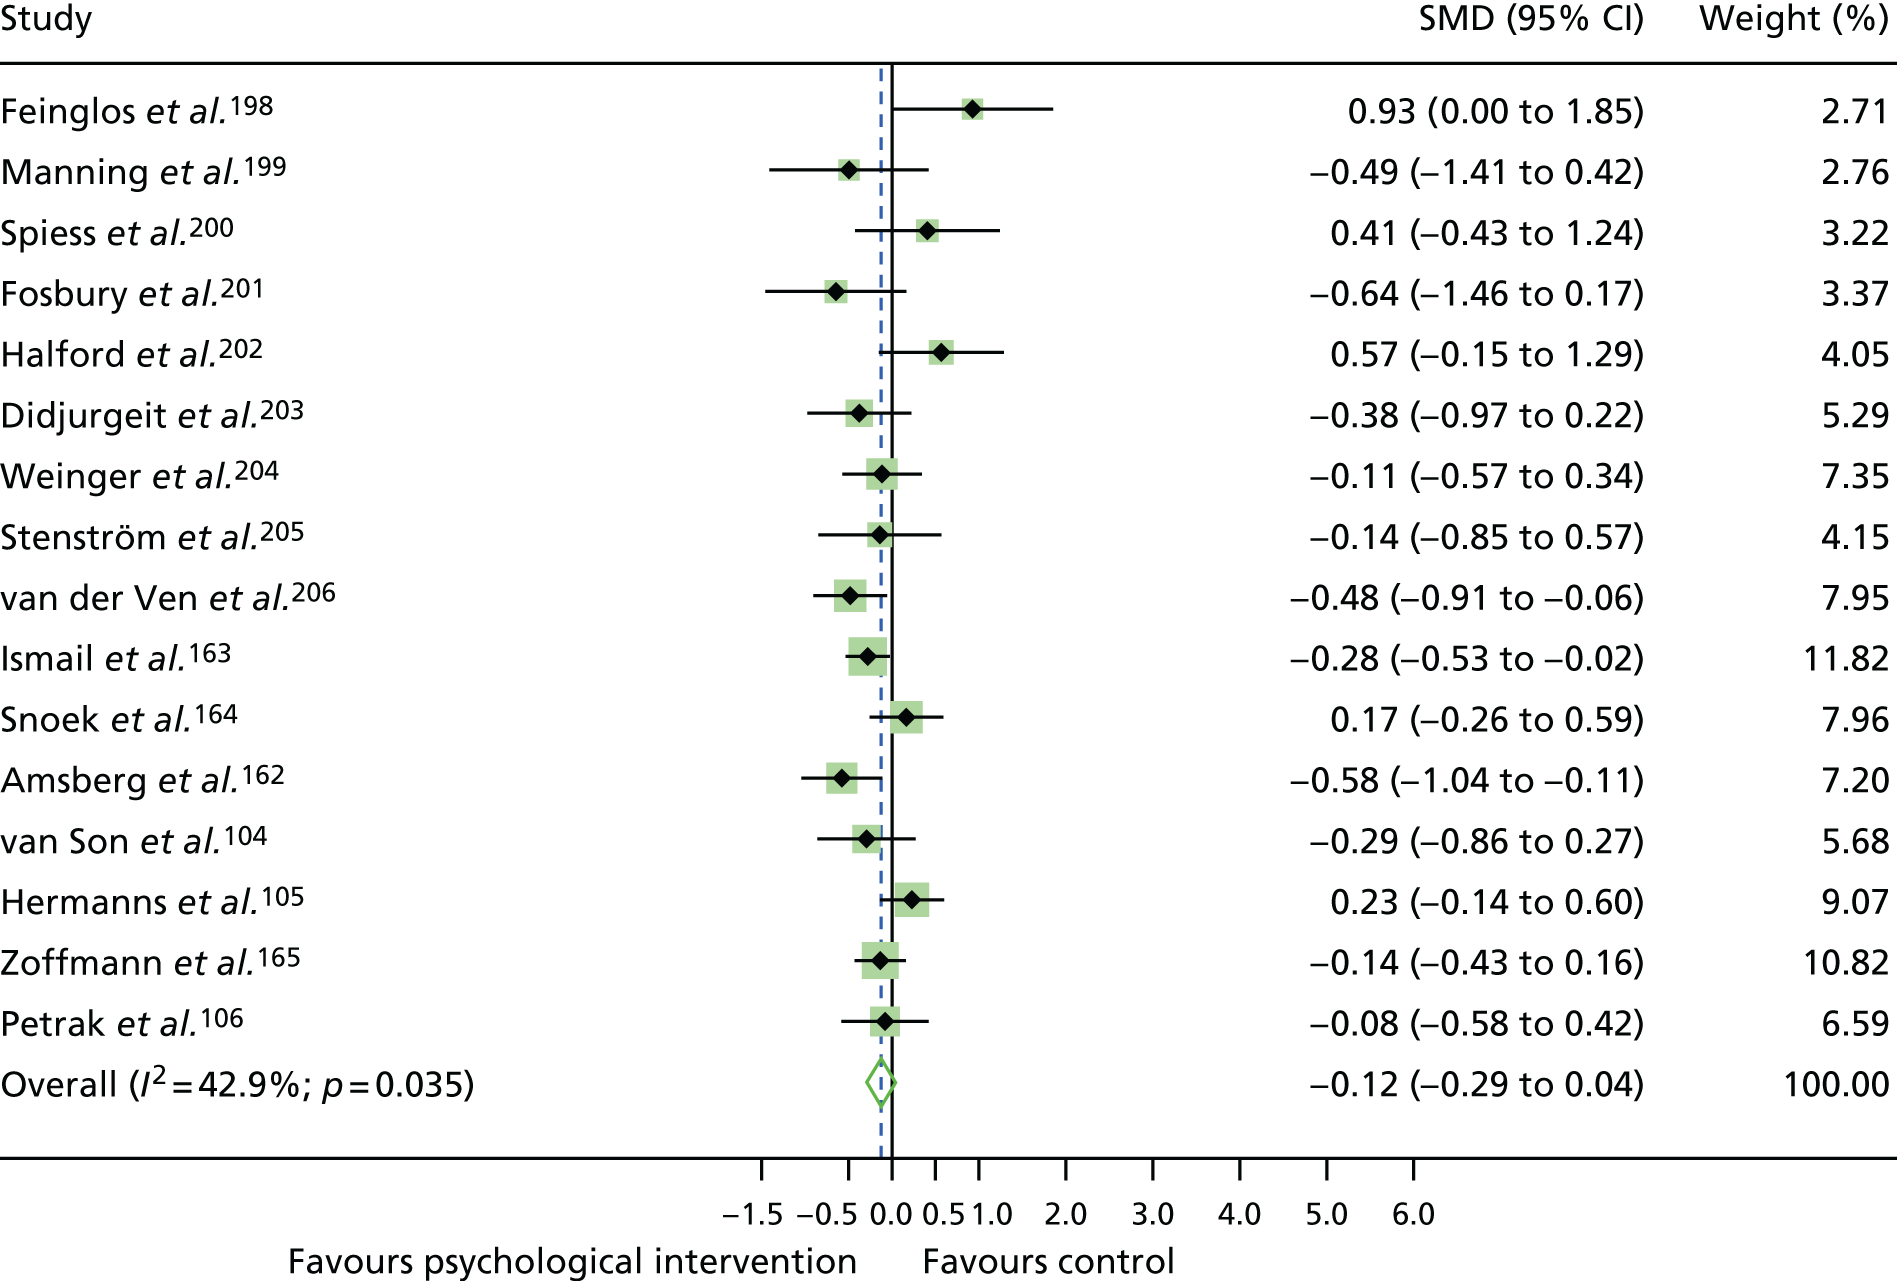
Risk of bias within studies
Overall, the RoB for the studies of adults with T1DM was rated as ‘unclear’ to ‘low’. All domains of RoB were also rated as ‘unclear’ to ‘low’. Of the studies included in the meta-analysis, four104,106,163,164 were rated as being at a ‘low’ RoB and three105,162,165 were rated as being at an ‘unclear’ RoB (see Appendix 9, Figure 29). There were not enough studies to perform a subgroup analysis of HbA1c level by RoB rating.
Risk of bias across studies
For ‘selective reporting’ and ‘other bias’ domains, 100% of bias was rated as being at a ‘low’ RoB across studies (Figure 5). For studies rated as having an ‘unclear’ RoB, this was usually in the ‘random sequence generation’ and ‘blinding of participants and personnel’ domains.
FIGURE 5.
Risk of bias across studies of adults with T1DM.
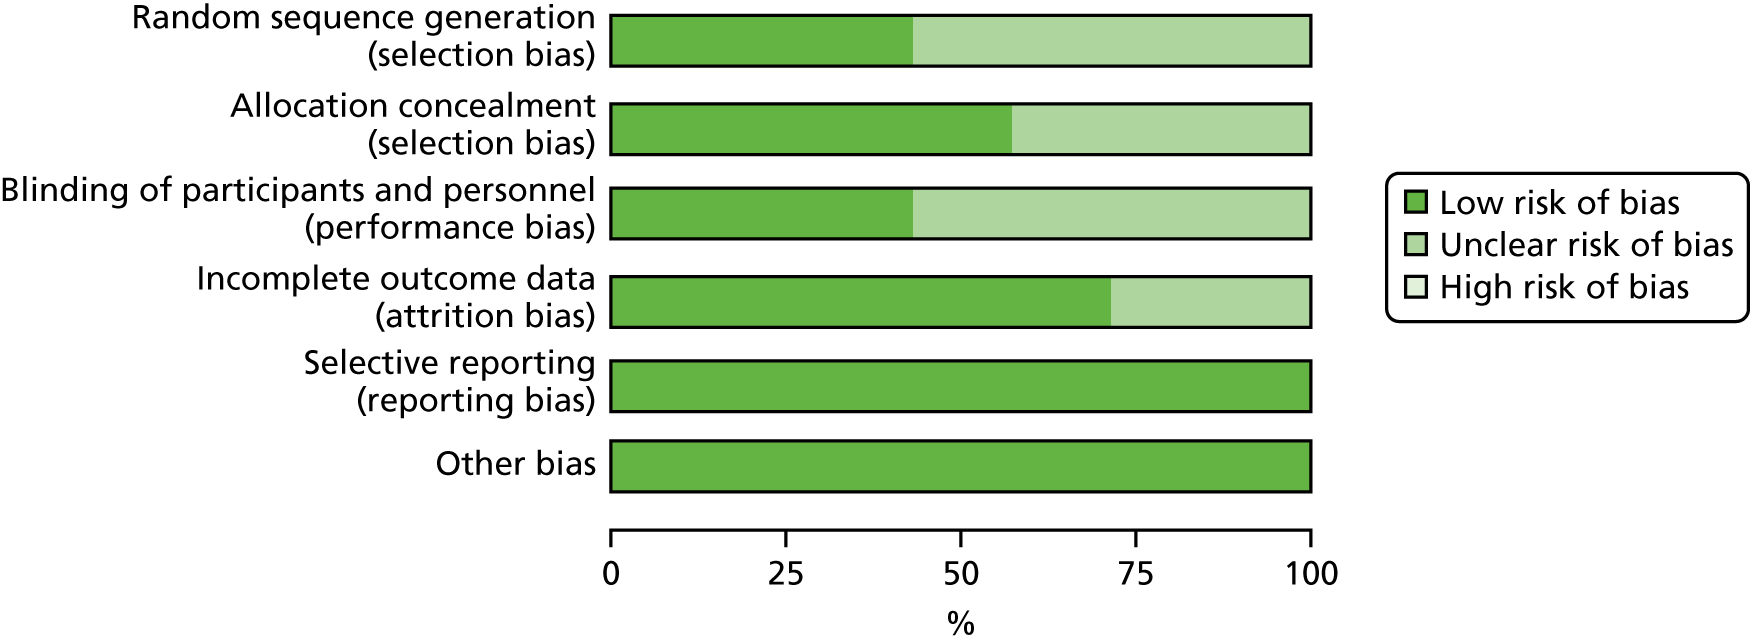
Characteristics of studies on adolescents/children with type 1 diabetes mellitus
A total of 22 studies involving adolescents/children with T1DM were included in the qualitative synthesis; two of these studies had a mixed T1DM and T2DM adolescent/child population. A summary of study characteristics for each study is reported in Table 1.
Study location
Most studies of adolescents/children with T1DM were conducted in the USA (n = 14);169–173,176,179,180,182,183,185,186,189,194 the remaining studies were conducted in the UK (n = 3, including re-screening),168,174,181 Europe (non-UK, n = 3),167,175,178 Asia (n = 1)177 and Australia (n = 1). 184
Participant characteristics
The total sample size for all studies of adolescents/children with T1DM was 2876 participants (n = 22 studies; two studies included a T1DM and T2DM population and did not report the sample size per diabetes type). Sample sizes ranged from 32 to 390 participants.
Intervention characteristics
Psychological interventions were categorised into three types: CBT (n = 4),171,175,177,184 counselling (n = 10)167,168,170,172–174,178,179,181,185 and family therapy (n = 8). 169,176,180,182,183,186,189,194 The interventions were delivered by diabetes specialists [N = 5; made up of diabetes nurses (n = 4)167,168,178,181 and diabetes educators (n = 1)172], psychology professionals [N = 10; made up of clinical psychologists (n = 4),173,175,186,189 therapists (n = 3),169,182,194 mental health professionals (n = 1),171 psychiatrists (n = 1)177 and health psychologists (n = 1)184] and other [N = 7; made up of a health advisor (n = 1),176 a health-care professional (n = 1),174 a trained non-professional (n = 1)170 and research assistants (n = 4)179,180,183,185].
Most psychological interventions were delivered face to face (n = 18);167–169,171,172,174,175,177,178,180–186,189,194 the others were delivered via telephone (n = 2)173,179 or via a combination of face to face and telephone (n = 2). 170,176 Therapy sessions were administered to individuals (n = 3),168,174,178 groups (n = 6),167,171,172,175,181,184 families (n = 12)169,173,176,177,179,180,182,183,185,186,189,194 or families and individuals (n = 1). 170 The number of therapy sessions ranged from 2 to 36. The duration of therapy sessions ranged from 5 minutes to 2 hours. The total duration of therapy ranged from 5 weeks to 2 years.
Control characteristics
The control groups were categorised as follows: usual care (n = 13),167,169,173–178,180,181,184,186,189 attention control [N = 7, made up of diabetes education (n = 5),170–172,179,185,194 care ambassador case management (n = 1)183 and telephone support (n = 1)194] and less intensive psychological intervention [n = 2; made up of Behavioral Family Systems Therapy for Diabetes (BFST-D) via Skype (n = 1)182 and non-directive psychological support (n = 1)168].
Primary outcome
The primary outcome was HbA1c level. The mean difference was calculated from baseline to 12-month follow-up (or closest measurement to 12 months) for the intervention and control groups. The follow-up period for HbA1c level ranged from 3 months to 18 months.
Secondary outcomes
There were insufficient data (i.e. secondary outcomes in five or more studies) to conduct a meta-analysis on secondary outcomes for changes in psychological functioning (n = 4) or in self-management behaviour (n = 2).
Results of individual studies of adolescents/children with type 1 diabetes mellitus
All studies included in the systematic review are listed in Table 1.
Synthesis of results
Eighteen studies (with a total of 2583 participants) were identified that had enough data to include in a meta-analysis. A random-effects meta-analysis demonstrated a pooled mean difference of 0.00 (95% CI –0.18 to 0.18) (Figure 6), equating to no change in HbA1c level (% or mmol/mol). Study heterogeneity was high (I2 = 77.3%; p < 0.001), and may reflect the variation in the categories of interventions tested. There was little influence on the removal of any individual study. There was little evidence of publication bias according to Egger’s test (p = 0.45). No studies were estimated as missing according to the trim-and-fill method for correcting publication bias.
FIGURE 6.
A meta-analysis of the SMD in HbA1c level in the psychological intervention group compared with the control group for adolescents/children with T1DM.
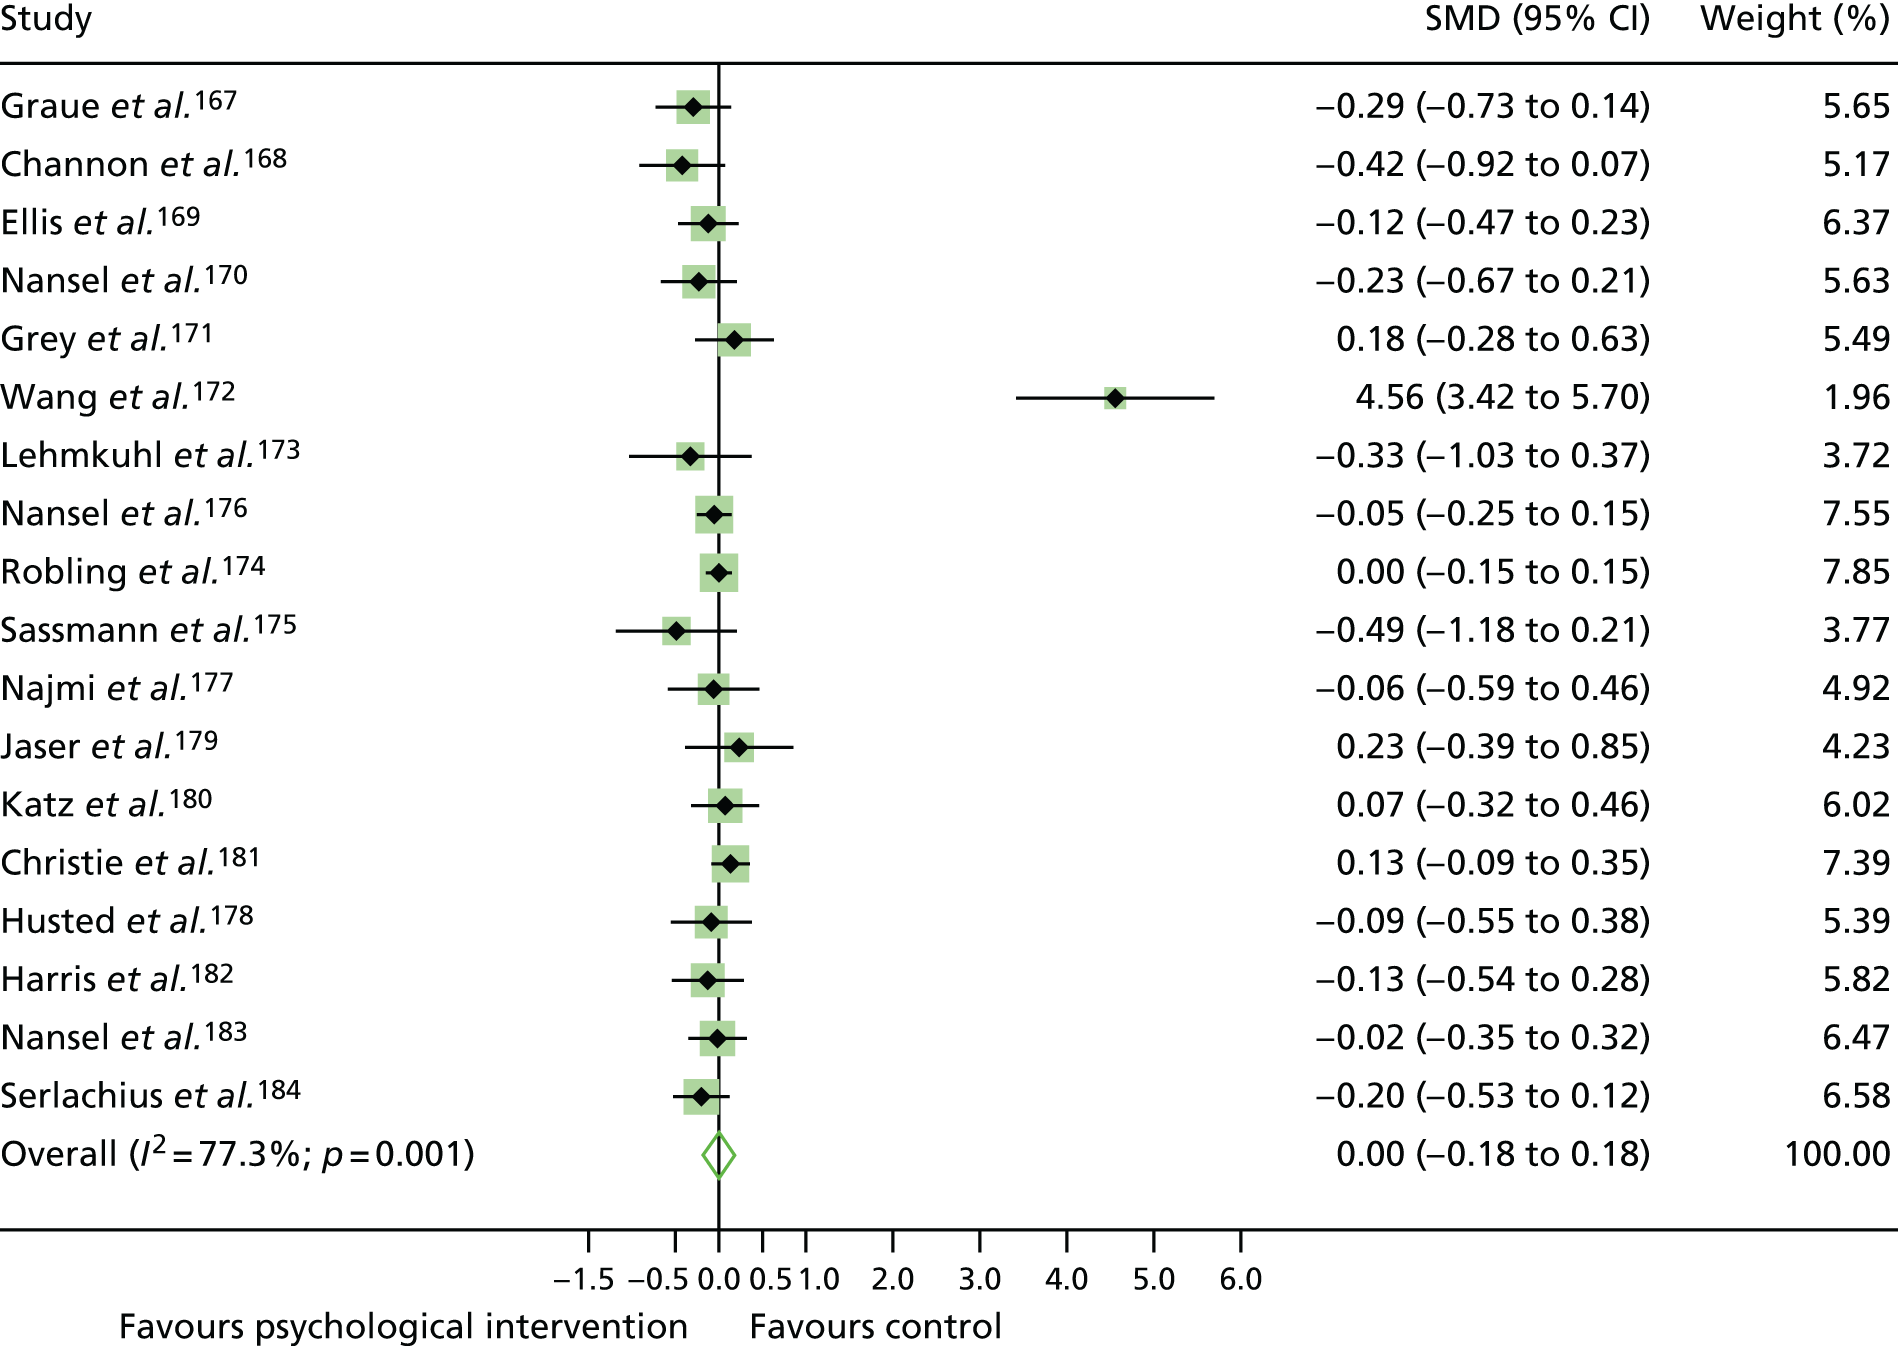
Subgroup analysis of glycated haemoglobin levels by psychological intervention category
A subgroup analysis was conducted for the psychological intervention categories of counselling (n = 8)167,168,170,172,174,178,179,181 and family therapy (n = 6)169,173,176,180,182,183 [there were too few CBT studies (n = 4) to include in the analysis]. There was no statistically significant difference in HbA1c level for counselling studies (SMD 0.23, 95% CI –0.17 to 0.63) or family therapy studies (SMD –0.06, 95% CI –0.19 to 0.07); see Appendix 10, Figure 33. Study heterogeneity was high and statistically significant for counselling studies (I2 = 89.8%; p < 0.001), but low for family therapy studies (I2 = 0%; p = 9.4). There was no evidence of publication bias (p = 0.39) for counselling studies or family therapy studies (p = 0.40), and no studies were estimated as missing according to the trim-and-fill method.
Subgroup analysis of glycated haemoglobin levels by interventionist category
A subgroup analysis by interventionist revealed no statistically significant difference in HbA1c levels for psychological interventions delivered by psychology professionals (SMD –0.13, 95% CI –0.3 to 0.06), diabetes specialists (SMD 0.57, 95% CI –0.24 to 1.38) or ‘other’ interventionists (SMD –0.02, 95% CI –0.12 to –0.03). There was no statistically significant difference (p = 0.47) between interventionist groups; see Appendix 10, Figure 34. Study heterogeneity was high for diabetes specialists (I2 = 94%; p < 0.001), but low for psychology professionals (I2 = 0%; p = 0.76) and ‘other’ interventionists (I2 = 0%; p = 0.86). There was no evidence of publication bias for interventions delivered by psychology professionals (p = 0.55) or diabetes specialists (p = 0.41), and no studies were estimated as missing according to the trim-and-fill method. There was little evidence of publication bias according to Egger’s test (p = 0.84) for interventions delivered by ‘other’ interventionists; however, one study was estimated to be missing according to the trim-and-fill method.
Meta-regression
There was no association between the number of therapy sessions (p = 0.44), therapy session duration (p = 0.60) or duration of overall therapy (p = 0.92) and HbA1c levels. There was no statistically significant difference between types of control groups (p = 0.13) and HbA1c levels.
Combining the results with the previous review of studies on adolescents/children with type 1 diabetes mellitus
For adolescents/children with T1DM, data from this review (n = 18) and the previous review were combined57 (n = 8 studies with a total of 543 participants) (Figure 7). For the combined 26 trials (with a total of 3126 participants), a random-effects meta-analysis demonstrated a non-statistically significant decrease in HbA1c levels for psychological intervention groups versus control groups (SMD –0.07, 95% CI –0.25 to 0.10). The current review reported no change in HbA1c levels (SMD 0.00, 95% CI –0.18 to 0.18), whereas the previous review reported a statistically significant decrease in HbA1c levels (SMD –0.35, 95% CI –0.66 to –0.48; change in % HbA1c level: a reduction of ≈5 mmol/mol). The difference in the change in HbA1c levels between reviews was non-statistically significant (p = 0.38).
FIGURE 7.
A meta-analysis of the SMD in HbA1c levels in psychological intervention groups compared with control groups in studies of adolescents/children with T1DM, combining the current and previous reviews.
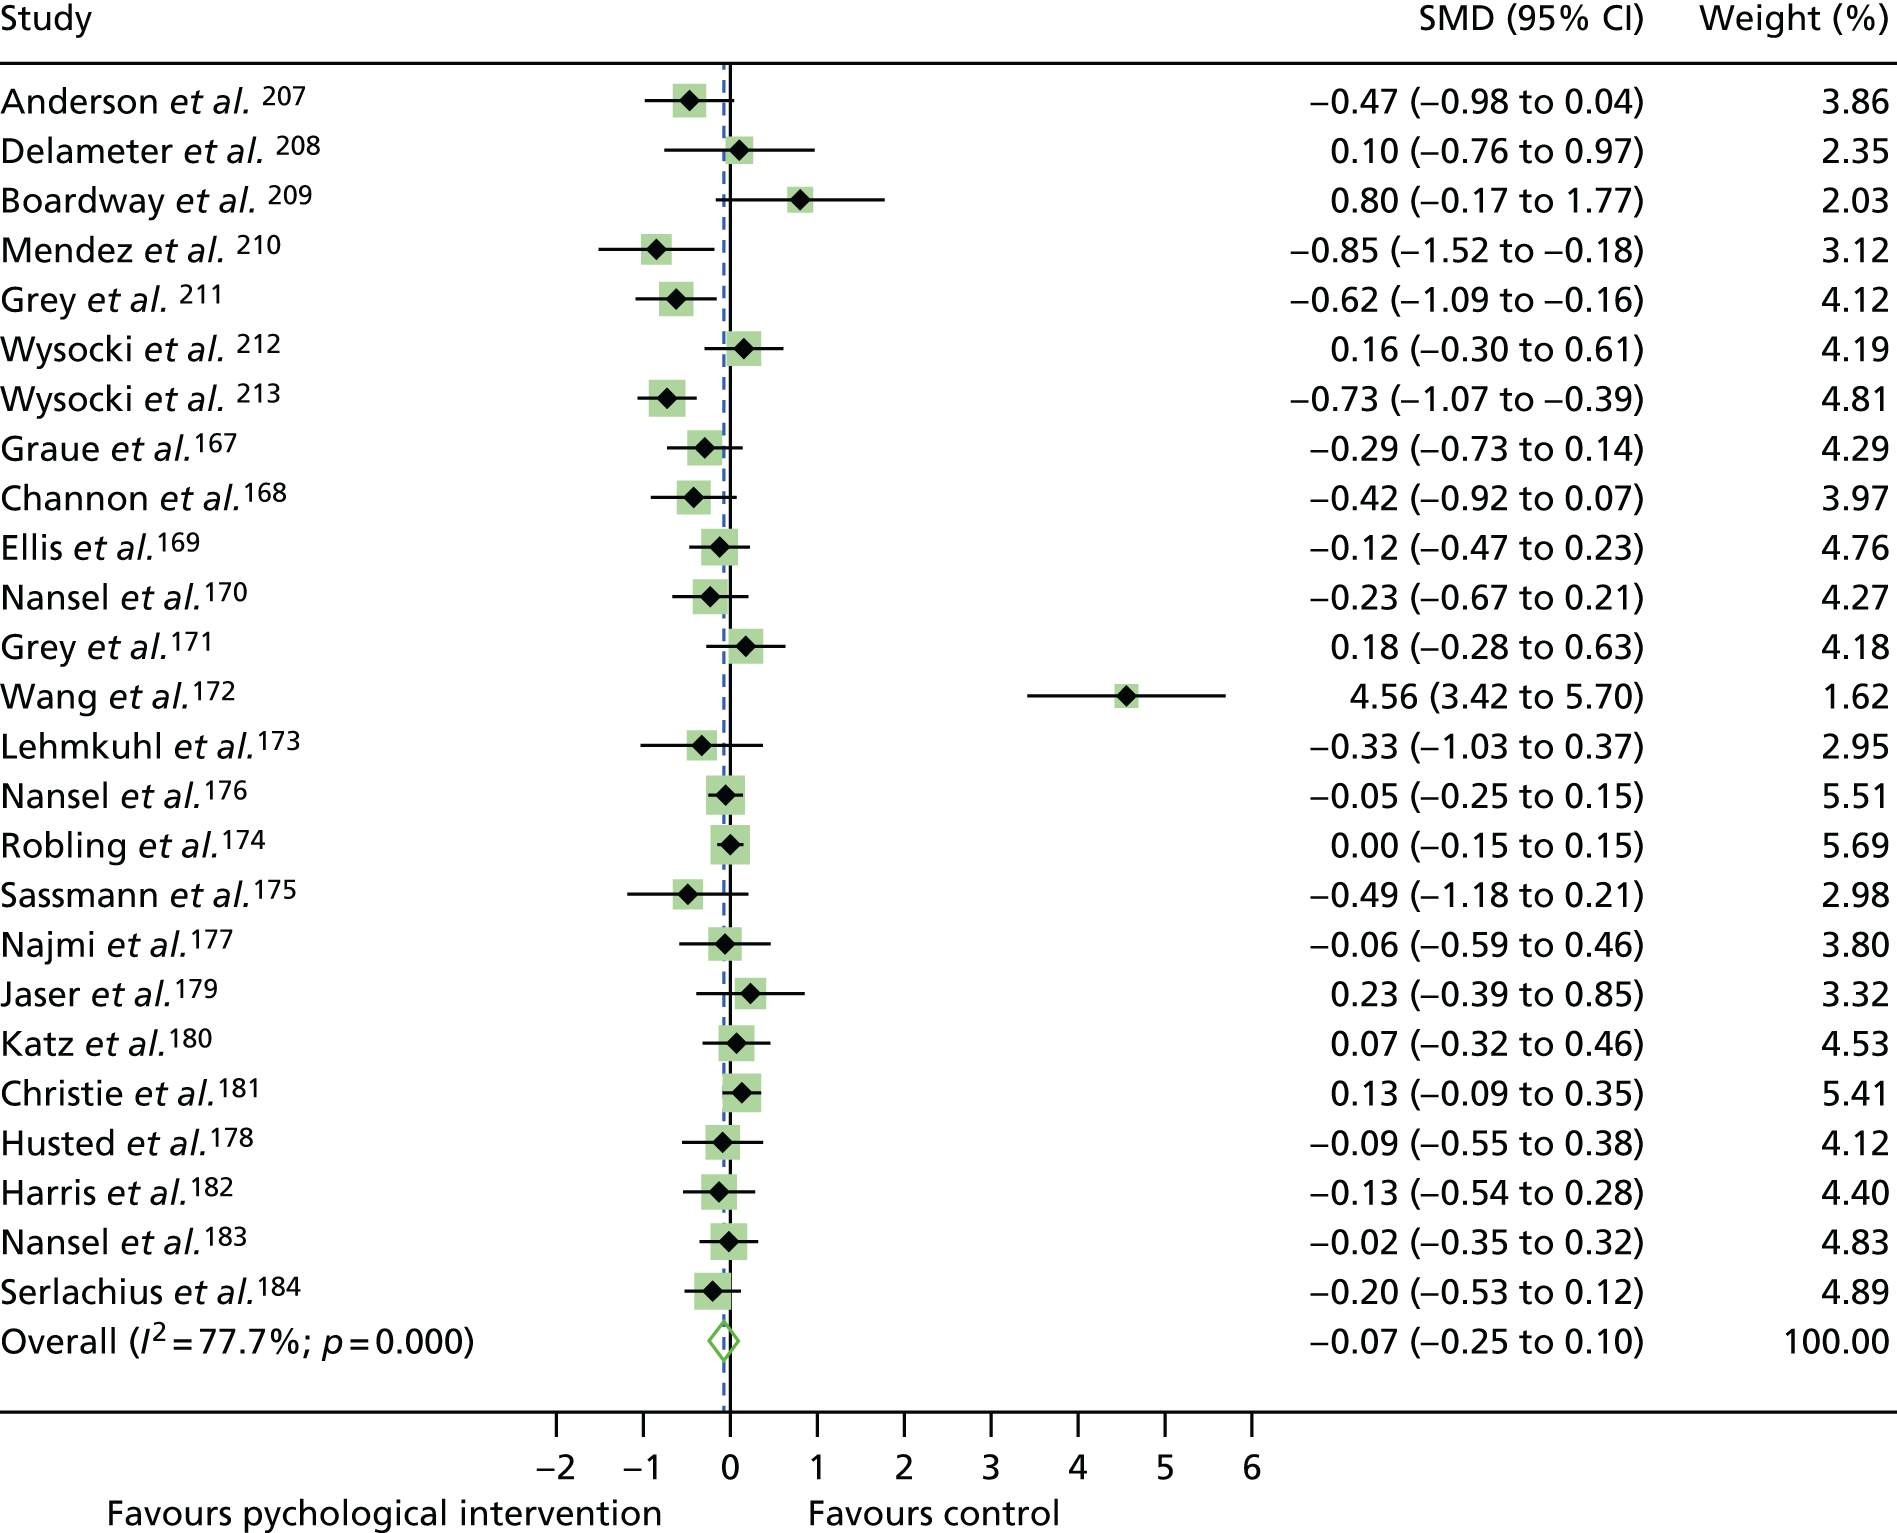
Risk of bias in studies
Overall, the risk of bias in studies of adolescents/children with T1DM was rated as being unclear to low (see Appendix 10, Figure 32). For studies included in the meta-analysis, 10 studies167–170,173,174,178,181,183,184 were rated as having a ‘low’ risk of bias and eight studies171,172,175–177,179,180,182 were rated having an ‘unclear’ risk of bias. In a subgroup analysis of HbA1c levels by risk of bias (see Appendix 10, Figure 31), HbA1c levels reduced non-statistically significantly in studies rated as having a ‘low’ risk of bias (SMD –0.05, 95% CI –0.15 to 0.04) and increased non-statistically significantly for studies rated as having an ‘unclear’ risk of bias (SMD 0.35, 95% CI –0.14 to 0.83), although the difference between these risk-of-bias categories was not statistically significant (p = 0.245).
Risk of bias across studies
The risk of bias for the ‘other’ bias domains was rated as being 100% low across studies (Figure 8). Risk of bias was rated as being most unclear for the ‘blinding of participants and personnel’ domain.
FIGURE 8.
Risk of bias across studies of adolescents/children with T1DM.
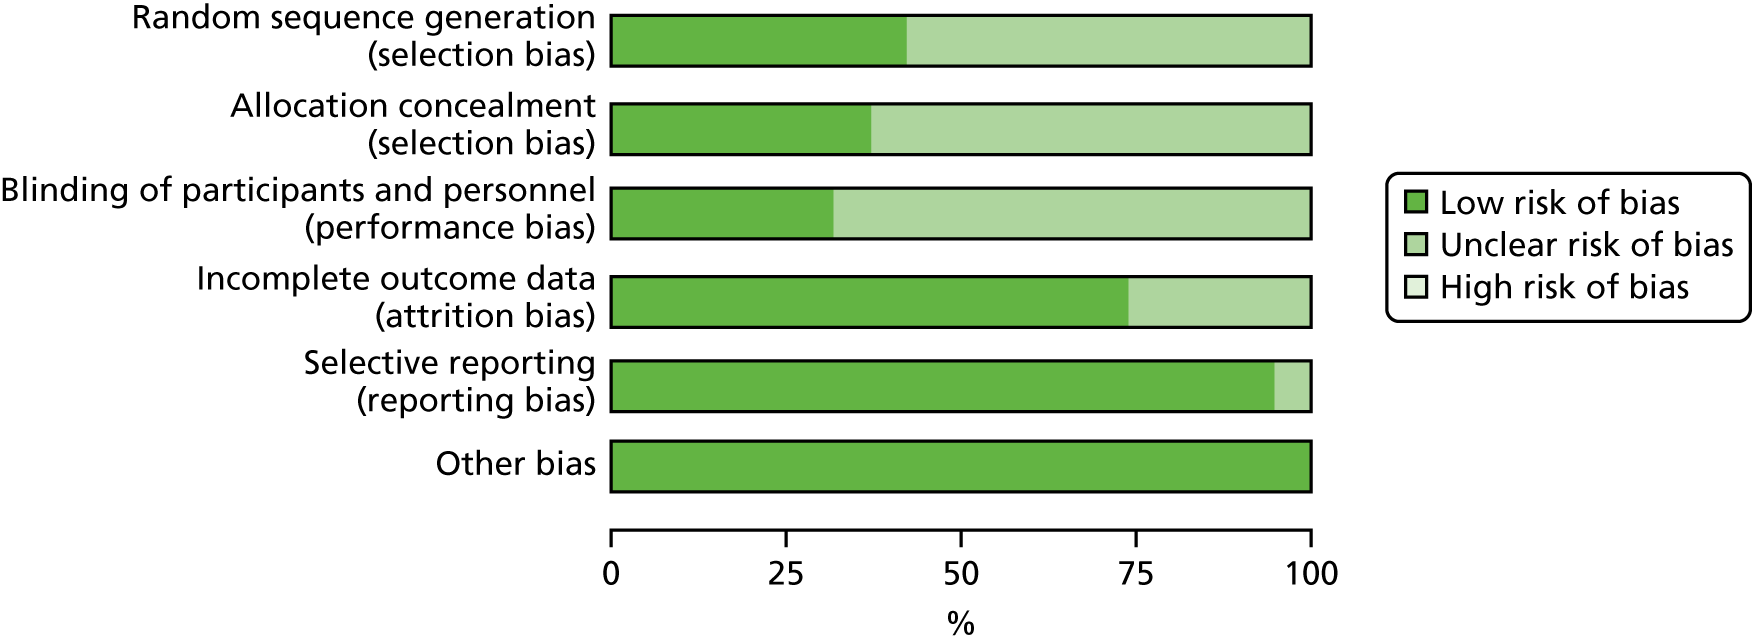
Characteristics of the studies of adults with type 2 diabetes mellitus
For the T2DM qualitative synthesis, 71 T2DM studies were included; 13 of these had a mixed T1DM and T2DM population. A summary of the study characteristics for each study is reported in Table 1.
Study location
These studies were published in Europe [Belgium (n = 2),119,124 Ireland (n = 1),123 the Netherlands (n = 7),104,127,135,137,150,154,197 Germany (n = 5),105,106,109,132,190 Croatia (n = 1),147 Italy (n = 1),156 Norway (n = 1),188 Denmark (n = 2),138,191 Portugal (n = 1)141 and the UK (n = 5)113,130,139,142,152], North America (n = 31),107,111,112,115,117,118,120,121,126,128,129,131,134,136,140,144–146,153,157,158,160,161,187,189,192–196,214 Asia (n = 10),59,110,114,125,133,148,149,151,155,159 Australia (n = 3)108,116,143 and Chile (n = 1). 122
Participant characteristics
The total number of adults with T2DM included in the qualitative synthesis was 14,326 (n = 71 studies; two studies195,196 did not report number of participants per diabetes type). The sample size per study ranged from 13 to 3946 participants. Two studies189,194 included adolescent populations with T2DM.
Fifteen studies included a mixed T1DM and T2DM population. In three of these studies,104–106 a separate analysis per diabetes type was provided, so T2DM data were included in the meta-analysis. For eight studies,12,188,189,191,192,194,195,197 a separate analysis per diabetes type was not available; these studies were included in the qualitative synthesis only.
Studies stipulated various inclusion criteria to study subgroups of people with T2DM. For example, some studies included people with T2DM with suboptimal glycaemic control, which was defined as HbA1c levels of > 6.5%,115,157 > 7%,135,140,146 > 7.5%,106,128,192 > 8%,113,123,189,194 > 8.5%158 and > 9%. 97 One study required patients to have glycaemic control of < 12.5%. 124 Studies focused on populations with differing duration of T2DM, for example having T2DM for < 10 years,110 ≤ 5 years,154 ≤ 3 years,142 < 1 year,155 > 3months,133 ≥ 6 months,119,124,131 > 1 year117,121,123,147,150,194 and ≥ 2 years. 192 Other studies defined a particular age group for participants: ≥ 20 years,148 ≥ 25 years,161 > 35 years,150 40–70 years,152,154 ≥ 60 years,120,126,214 ≥ 50 years,149,151 ≤ 70 years105,192,197 and < 80 years. 124,137 Some studies included only people of a particular ethnicity, for example black women,118 Puerto Rican121 and African American. 145,161 There were criteria for BMI values for some RCTs, for example > 25 kg/m2. 124,135,137,143,152 Ten studies defined the population as depressed. 105,106,126,127,129,131,140,148,151,195
Intervention characteristics
Psychological interventions were categorised into five therapy types according to which psychological model underpinned treatment: CBT (n = 21),104–106,110,114,116,118,119,125–127,131,135,140,147,148,156,160,188,192,197 counselling (n = 40),59,107–109,111–113,115,117,120,121,123,124,128,130,132–134,137–139,142–146,149–155,157,158,161,190,191,193,196 collaborative care (including elements of psychotherapy; n = 6),129,141,159,187,195,214 creative therapy (i.e. music therapy, n = 1)136 and family therapy (n = 3). 122,189,194
Control conditions were categorised into three main types: usual care [N = 51 – waiting list (n = 5),114,116,125,188,197 usual care (n = 41)104,106–108,113,115,117,119,121,122,124,126,127,129–132,135,137–139,142,143,145–149,151–159,187,189,191,193,195,214 and enhanced usual care (n = 5)110,134,141,150,161], attention control [N = 16 – dietary counselling (n = 1),109 diabetes education (n = 11),59,105,111,112,118,128,133,136,144,160,196 attention control (n = 2),120,192 peer support (n = 1)190 and telephone support (n = 1);194 these matched the intervention in duration and frequency] and a less intensive psychological intervention (n = 1). 140
Interventionists who delivered the psychological therapies were categorised as follows: diabetes specialists (n = 32),107–110,113,118,120,126–131,133,135,137–139,144–146,149,150,154,158,187,188,190–193,195 psychology professionals (n = 20)59,104–106,111,112,123,124,132,140,141,147,148,151,156,157,189,194,197,214 and other (n = 16). 114,115,117,119,121,122,125,134,136,142,143,152,153,160,161,196
Psychological interventions were delivered face to face (n = 56),59,104–107,109–112,114,116–119,121–125,127,128,130–133,135–141,144,145,147,148,150,152,154–161,187–192,194,195,197,214 by telephone (n = 10),113,115,120,126,134,143,151,153,193,196 or by telephone and face to face (n = 5). 108,129,142,146,149 Most studies delivered psychological interventions in an individual (n = 42)59,107–109,112,113,115,117,120,121,126–130,133–135,137,138,140–143,145,146,149–154,157,158,187,190,191,193,195–197,214 or group format (n = 25);104–106,110,111,114,116,118,119,124,125,131,132,136,139,144,147,148,155,156,159–161,188,192 four interventions were delivered to families. 122,123,189,194
The mean number of psychological sessions was 7.40 (range 1–27 sessions). The mean overall duration of interventions was 6.67 months (range 30 minutes to 2 years). The mean duration of a psychological intervention session was 1.22 hours (range 15 minutes to 3 hours per session).
Primary outcome
In all studies, HbA1c level (in % or mmol/mol) was assessed at baseline and follow-up. In the meta-analysis, data on HbA1c levels were extracted for 12 months or closest to 12 months. The mean length of follow-up was 7.78 months (range 2–18 months).
Secondary outcomes
The following secondary outcomes were assessed: change in psychological outcomes (i.e. depression and quality of life), change in self-management behaviour (i.e. dietary behaviour), BMI (in kg/m2) and blood pressure (in mmHg).
Results of individual studies of adults with type 2 diabetes mellitus
All studies included in the systematic review are listed and described in Table 1.
Synthesis of results
Data on HbA1c levels for adults with T2DM were available for 49 studies (with a total of 12,009 participants). In a pooled random-effects meta-analysis, the SMD in HbA1c levels was statistically significantly lower for adults with T2DM who received a psychological intervention than for those who received a control condition (SMD –0.21, 95% CI –0.31 to –0.10) (Figure 9), equivalent to –0.33 change in % HbA1c level (a reduction of ≈3.5 mmol/mol). Study heterogeneity was large: I2 = 93.9%; p < 0.001.
FIGURE 9.
A meta-analysis of the SMD in HbA1c levels in the psychological intervention groups compared with the control groups for studies of adults with T2DM.
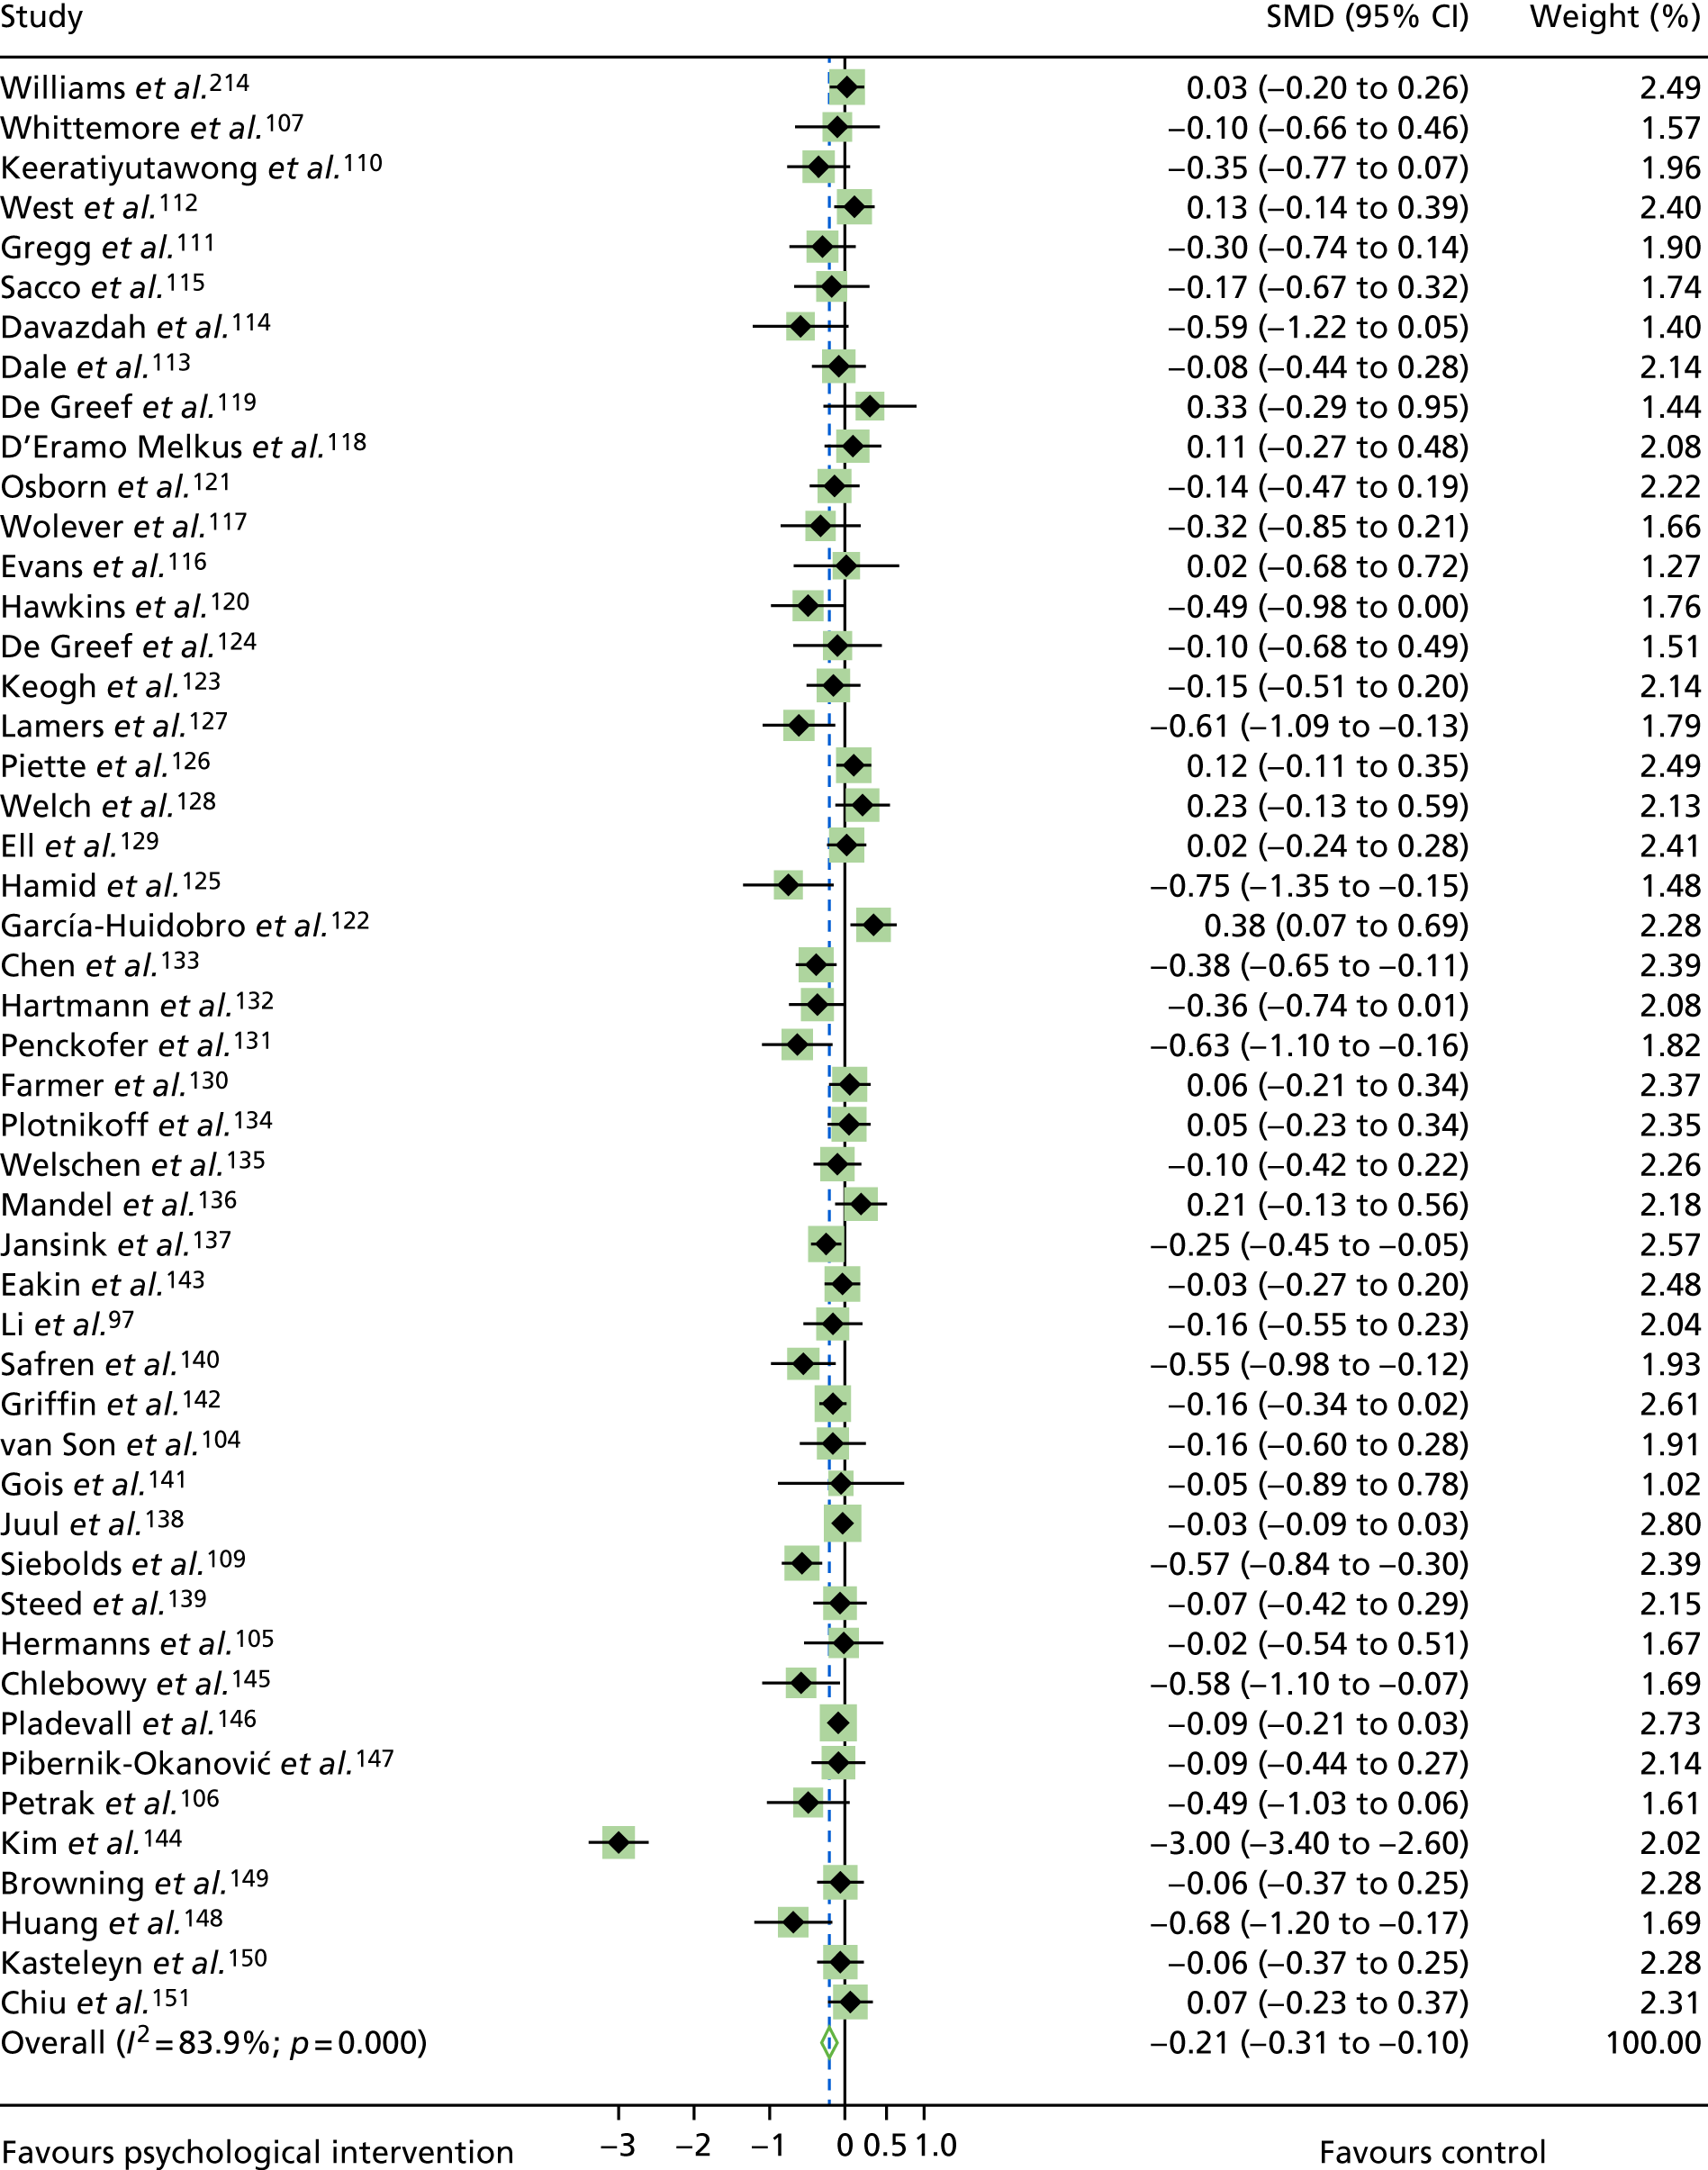
Removal of any of the individual studies from the meta-analysis had little or no impact on HbA1c levels. There was little evidence of publication bias according to Egger’s test (p = 0.80); see Appendix 11, Figure 37. The trim-and-fill method for correcting publication bias did not estimate any missing studies.
Subgroup analysis of glycated haemoglobin levels by psychological intervention category
A subgroup analysis of HbA1c levels by psychological intervention category was conducted (see Appendix 11, Figure 38) for CBT (n = 16)104–106,110,114,116,118,119,125–127,131,135,140,147,148 and counselling (n = 28) studies. 59,107,109,111–113,115,117,120,121,123,124,128,130,132–134,137–139,142–146,149–151 There were too few psychotherapy (n = 3),129,141,214 creative therapy (n = 1)136 and family therapy (n = 1)122 studies to conduct subgroup analyses. CBT studies (SMD –0.25, 95% CI –0.42 to –0.09; –0.44 change in % HbA1c levels, a reduction of ≈4 mmol/mol) and counselling studies (SMD –0.24, 95% CI –0.39 to 0.00; –0.33 change in % HbA1c levels, a reduction of ≈3–4 mmol/mol) demonstrated statistically significant reductions in HbA1c levels compared with controls, although the difference in effect size between psychological intervention categories was not statistically significant (p = 088). The heterogeneity in CBT studies was moderate and statistically significant (I2 = 54%; p = 0.005). There was some evidence of publication bias for CBT studies (p = 0.03), although, the trim-and-fill method for correcting publication bias did not estimate any missing studies. The heterogeneity in counselling studies was high (I2 = 89.1%; p < 0.001). There was no evidence of publication bias for counselling studies (p = 0.12), and the trim-and-fill method revealed no missing studies.
Subgroup analysis of glycated haemoglobin levels by interventionist category for counselling studies only
In a non-prespecified subgroup analysis of counselling studies by interventionist, heterogeneity remained high for counselling interventions delivered by diabetes specialists (I2 = 94.1%; p < 0.001), with a significant reduction in HbA1c levels in favour of counselling (SMD –0.35, 95% CI –0.59 to –0.11; 0.49 change in % HbA1c levels, a reduction of ≈5 mmol/mol). Study heterogeneity was low for counselling interventions delivered by psychological professionals (I2 = 11%; p = 0.35) and ‘other’ interventionists (I2 = 0%; p = 0.75), and there was a non-statistically significant decrease in HbA1c levels for both categories of interventionists (psychology professionals, SMD –0.08, 95% CI –0.23 to 0.02; ‘other’ interventionists, SMD –0.10, 95% CI –0.22 to 0.01).
Subgroup analysis of glycated haemoglobin levels by interventionist category
A subgroup analysis of HbA1c levels by interventionist category (see Appendix 11, Figure 39) for all psychological intervention categories demonstrated that HbA1c levels were significantly lower in intervention than control groups for psychological interventions delivered by psychology professionals (n = 15,59,104–106,111,112,123,124,132,140,141,147,148,151,214 SMD –0.15, 95% CI –0.26 to –0.03; –0.26 change in % HbA1c levels, a reduction of ≈3 mmol/mol) and diabetes specialists (n = 22,107,109,110,113,118,120,126–131,133,135,137–139,144–146,149,150 SMD –0.30, 95% CI –0.48 to –0.11; –0.47 change in % HbA1c levels, a reduction of ≈5 mmol/mol). HbA1c levels were non-statistically significantly lower in intervention than control groups for psychological interventions delivered by ‘other’ interventionists (n = 11,114,115,117,119,121,122,125,134,136,142,143 SMD –0.06, 95% CI –0.22 to 0.11; –0.10 change in % HbA1c levels, a reduction of ≈1 mmol/mol), although there were no statistically significant differences between interventionist groups (p = 0.49). In studies for which the intervention was delivered by a diabetes specialist, heterogeneity was high and statistically significant (I2 = 91.8%; p < 0.001). There is no evidence of publication bias in studies in which the intervention was delivered by a diabetes specialist (p = 0.19); in addition, the-trim and-fill method for correcting publication bias did not estimate any missing studies. In studies for which the intervention was delivered by a psychology professional, heterogeneity was low but non-significant (I2 = 27.3%; p = 0.156). There was some evidence of publication bias in these studies (p = 0.02); however, the trim-and-fill method for correcting publication bias did not estimate any missing studies. Heterogeneity was moderate and statistically significant in studies for which the intervention was delivered by ‘other’ interventionists (I2 = 56.2%; p = 0.01). There was no evidence of publication bias in study interventions delivered by ‘other’ interventionists (p = 0.60), supported by the trim-and-fill method, which did not estimate any missing studies.
Subgroup analysis of glycated haemoglobin levels by the primary outcome of individual studies
A subgroup analysis of HbA1c levels by primary outcome variable was conducted (see Appendix 11, Figure 40). The primary outcome per study could be categorised into three groups:
-
glycaemic control (n = 24)106,107,109–112,114,116,118,120,122,123,125,126,128,133,136–138,144,146,148,149
-
self-management [N = 1359,115,117,119,121,124,130,134,139,140,142,143,145 – adherence (n = 3); medication use, glucose monitoring and physical activity (n = 1); physical activity (n = 5); self-management behaviours (n = 2); diet adherence (n = 1); and medication adherence (n = 1)]
-
psychological [N = 12104,105,113,127,129,131,132,141,147,150,151,214 – depression (n = 8), distress (n = 2), self-efficacy (n = 1) and stress (n = 1)].
When glycaemic control was the main outcome of the study, there was a statistically significant improvement in HbA1c levels (SMD –0.28, 95% CI –0.46 to –0.10). For studies in which self-management was the main outcome, there was a statistically significant improvement in HbA1c levels (SMD –0.11, 95% CI –0.21 to –0.01). When psychological outcomes were the main outcome of the study, there was a non-statistically significant improvement in HbA1c levels (SMD –0.12, 95% CI –0.24 to 0.01). There were no statistically significant differences between these groups (p = 0.63). Study heterogeneity was high and statistically significant for studies in which glycaemic control was the primary outcome (I2 = 91.5%; p < 0.001), but low and not statistically significant for studies in which the primary outcomes were psychological (I2 = 25.6%; p = 0.19) or self-management (I2 = 12.0%; p = 0.33). There is no evidence of publication bias in studies for which the primary outcome was glycaemic control (p = 0.13), self-management (p = 0.47) or psychological outcome (p = 0.06); in addition, the trim-and-fill method for correcting publication bias did not estimate any missing studies for any of these groups.
Meta-regression
Studies conducted in Asia compared with those conducted in the Western world (i.e. Europe, the UK, North America, Australia) demonstrated a greater reduction in HbA1c levels (p = 0.05). There was no association between HbA1c levels and the number of therapy sessions (p = 0.81), the length of therapy sessions (p = 0.23) or the type of control group (p = 0.14).
Secondary outcomes
Depression
Fourteen studies109,115,126,131,132,135,140,141,144,147,148,150,160,214 of T2DM (with a total of 2075 participants) had outcome data for depression (see Appendix 12, Figure 41). There was a non-statistically significant decrease in depression for psychological intervention groups compared with control groups (SMD –0.28, 95% CI –0.63 to 0.06) (Figure 10). Study heterogeneity was high: I2 = 93.1%; p < 0.001). If the Kim et al. 144 study was removed from the analysis, there was a statistically significant decrease in depression in favour of psychological interventions (SMD –042, 95% CI –0.61 to –0.23). Removal of any other individual studies from the meta-analysis had little or no impact on HbA1c levels. There was little evidence of publication bias, demonstrated by the Egger test (p = 0.72), as displayed in Appendix 12, Figure 41. The trim-and-fill method for correcting publication bias did not estimate any missing studies.
FIGURE 10.
A meta-analysis of the SMD in depression in psychological intervention groups compared with control groups for studies of adults with T2DM.
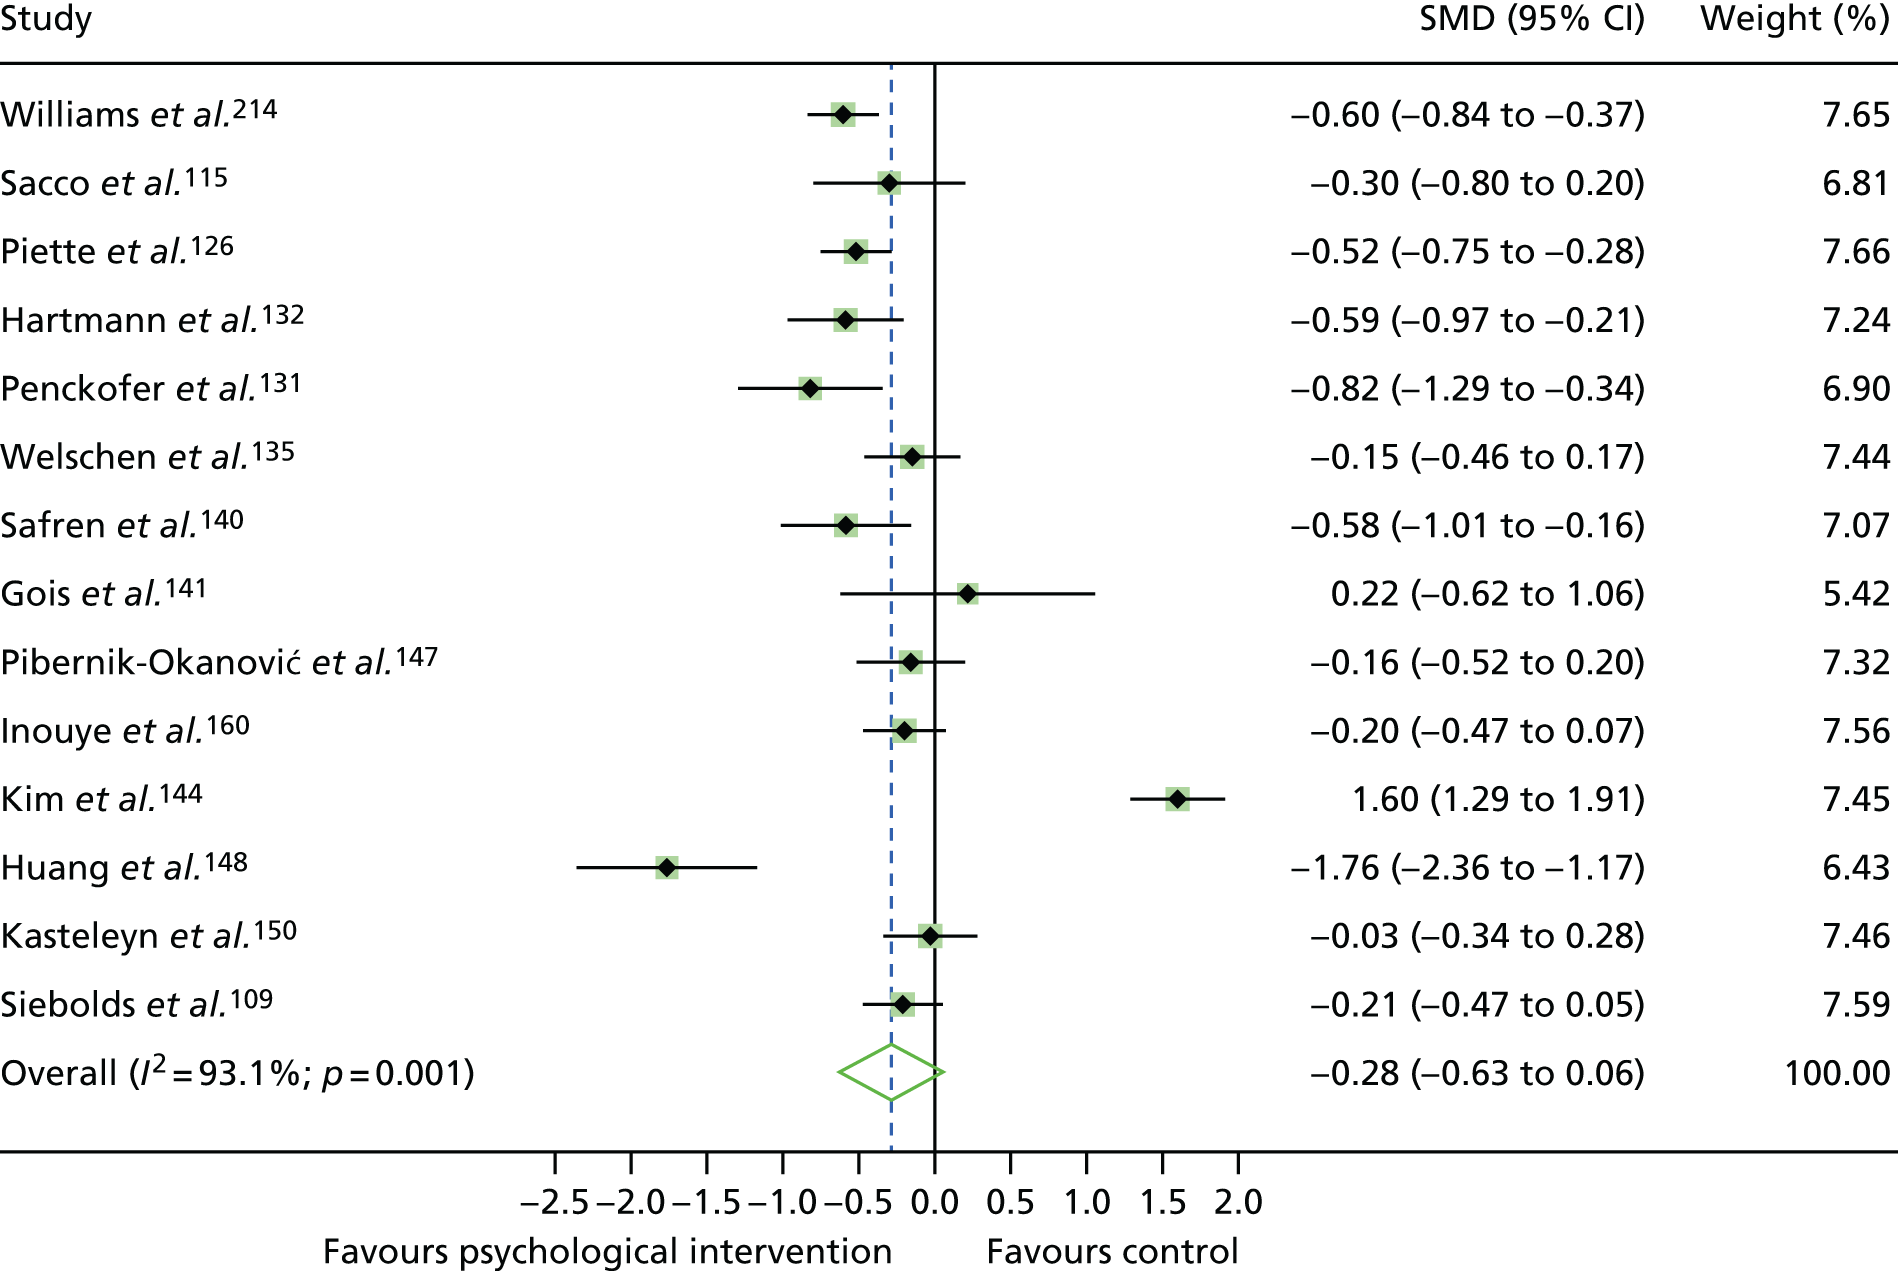
Quality of life
A random-effects meta-analysis was conducted on 13 studies59,109,110,117,131,134,135,137,139,141,144,147,149 (with a total of 2354 participants) reporting QoL measures (Figure 11). Psychological therapies were associated with statistically significant improved QoL compared with control groups (SMD 0.66, 95% CI –0.08 to 0.24). Heterogeneity was high: I2 = 96.9%; p = < 0.001). Removal of the Kim et al. 144 study did not affect QoL. Removal of any other individual studies from the meta-analysis had little or no impact on QoL. Egger’s test indicated some evidence of publication bias (p = 0.048). The trim-and-fill method estimated five missing studies.
FIGURE 11.
A meta-analysis of the SMD in QoL in psychological intervention groups compared with control groups for studies of adults with T2DM.
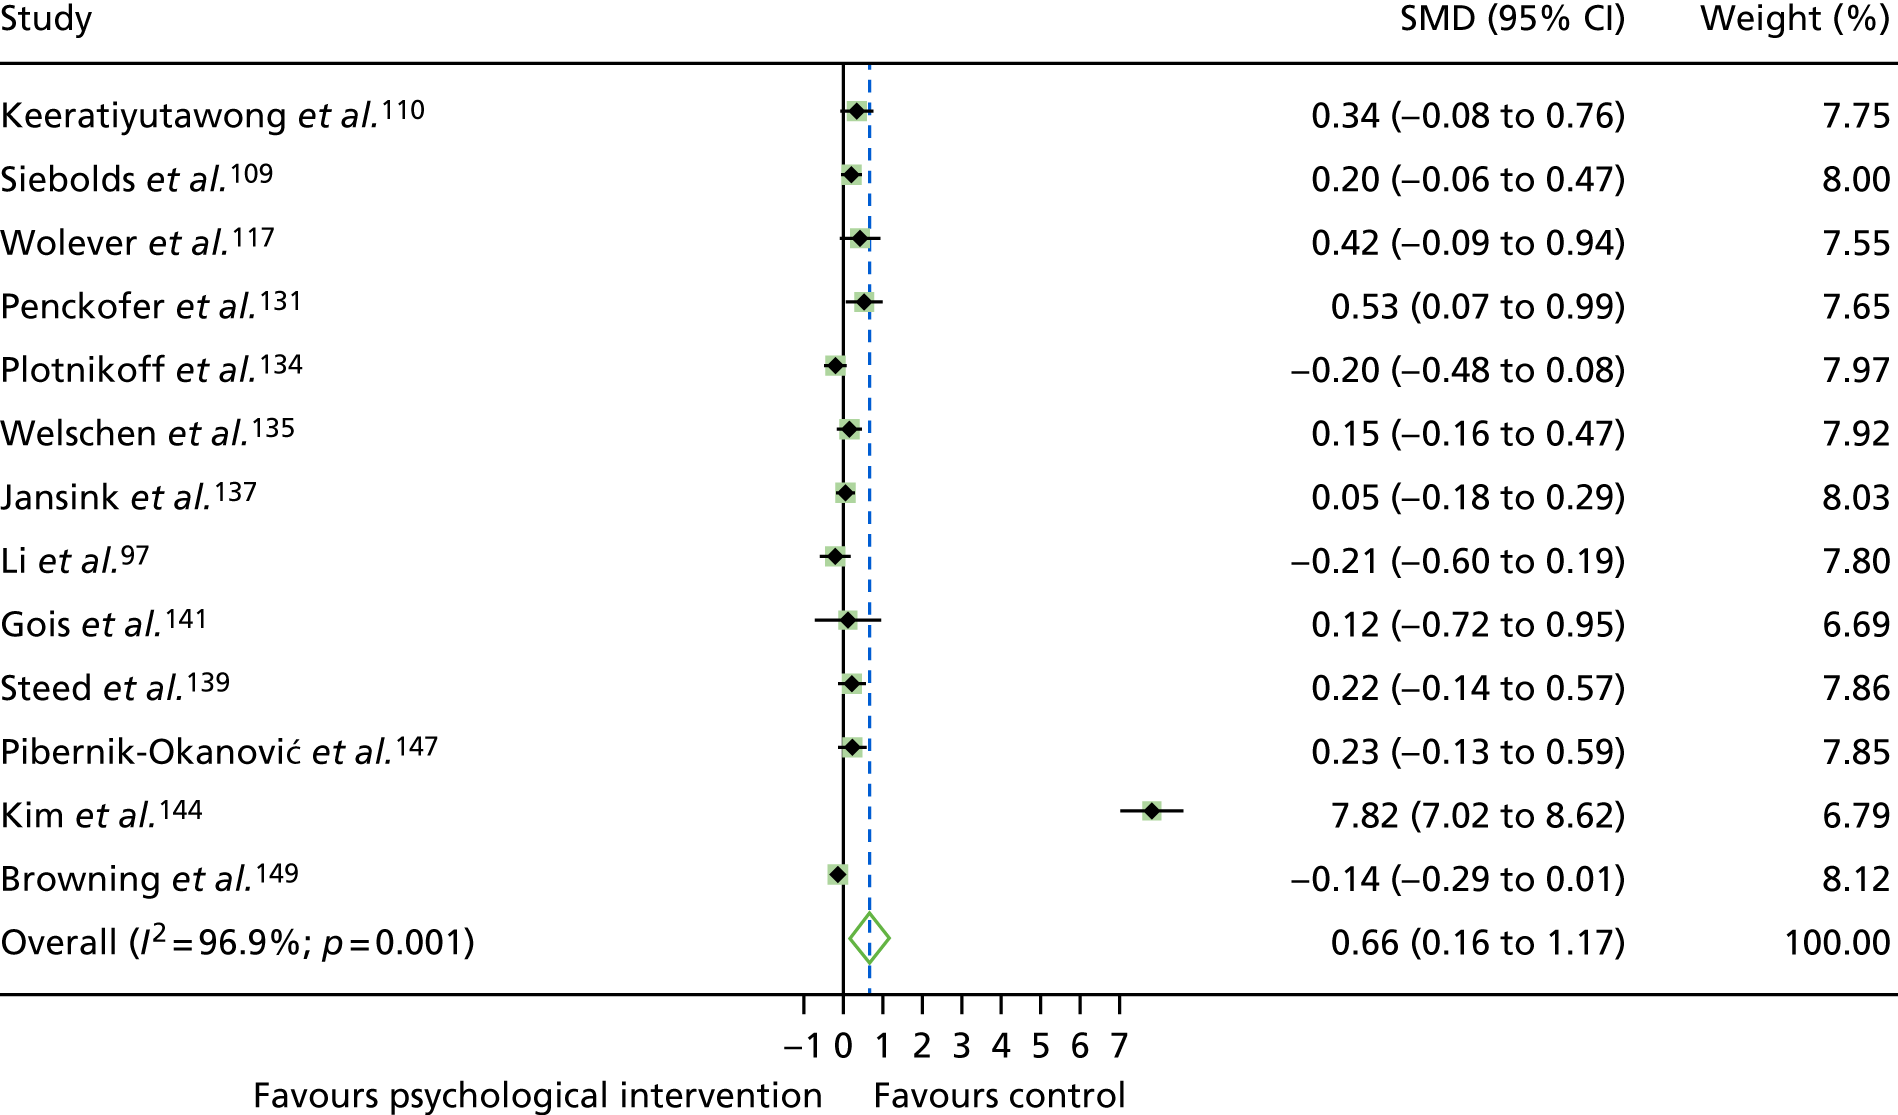
Body mass index
Twelve studies107,119,123,124,134,136,137,142,145,148,149,152 (with a total of 2254 participants) provided BMI outcome data (Figure 12). The pooled mean difference was –0.08 (95% CI –0.16 to 0.00), indicating a non-statistically significant decrease in BMI. Removal of the Griffin et al. 142 study reveals a significant reduction in BMI (SMD –0.09, 95% CI –1.19 to –0.001; equivalent to a change in BMI of –0.80 kg/m2). Heterogeneity was low but not statistically significant (I2 = 0%; p = 0.678). There is little evidence of publication bias (Egger’s test, p = 0.68); see Appendix 12, Figure 43. The trim-and-fill method for correcting publication bias did not estimate any missing studies.
FIGURE 12.
A meta-analysis of the SMD in BMI in psychological intervention groups compared with control groups for studies of adults with T2DM.
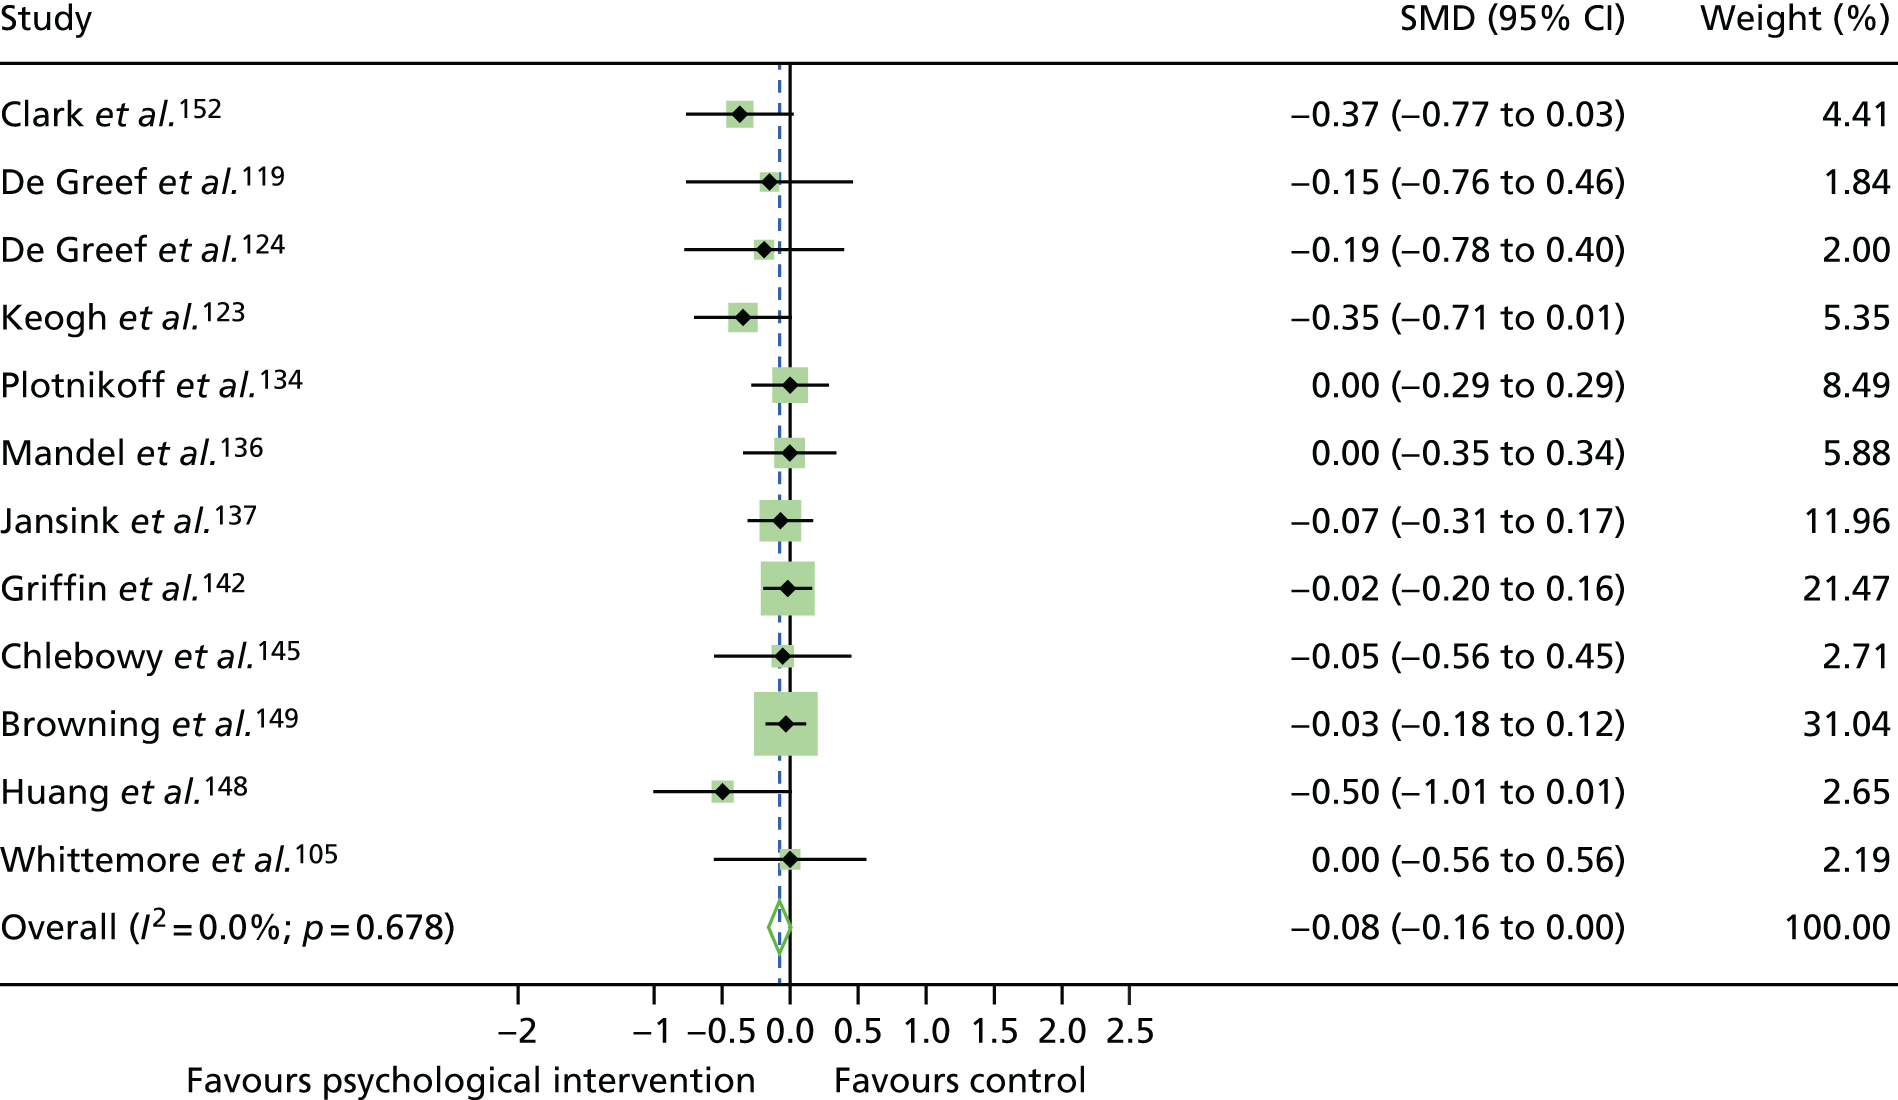
Blood pressure per protocol
Blood pressure outcomes were available for six studies. 119,123,136,137,142,149 In a pooled random-effects meta-analysis, the mean systolic blood pressure (SBP) (Figure 13) and diastolic blood pressure (DBP) (Figure 14) values were non-statistically significantly lower in psychological intervention groups than control groups. Pooled mean differences were –0.11 for SBP (95% CI –0.26 to 0.04; a reduction of 1.97 mmHg) and –0.04 for DBP (95% CI –0.16 to 0.08; a reduction of 0.39 mmHg). Heterogeneity was high for SBP (I2 = 51.5%; p = 0.067) and low for DBP (I2 = 27.6%; p = 0.228). There was little influence of omission of individual studies from the random-effects meta-analysis: the pooled mean difference remained non-statistically significantly lower for SBP and DBP. There was no evidence of publication bias for SBP (p = 0.33) or DBP (p = 0.92); see Appendix 12, Figures 44 and 45, respectively. The trim-and-fill method for correcting publication bias did not estimate any missing studies for SBP. However, for DBP, the trim-and-fill method estimated two missing studies.
FIGURE 13.
A meta-analysis of the SMD in SBP in psychological intervention groups compared with control groups for studies of adults with T2DM.
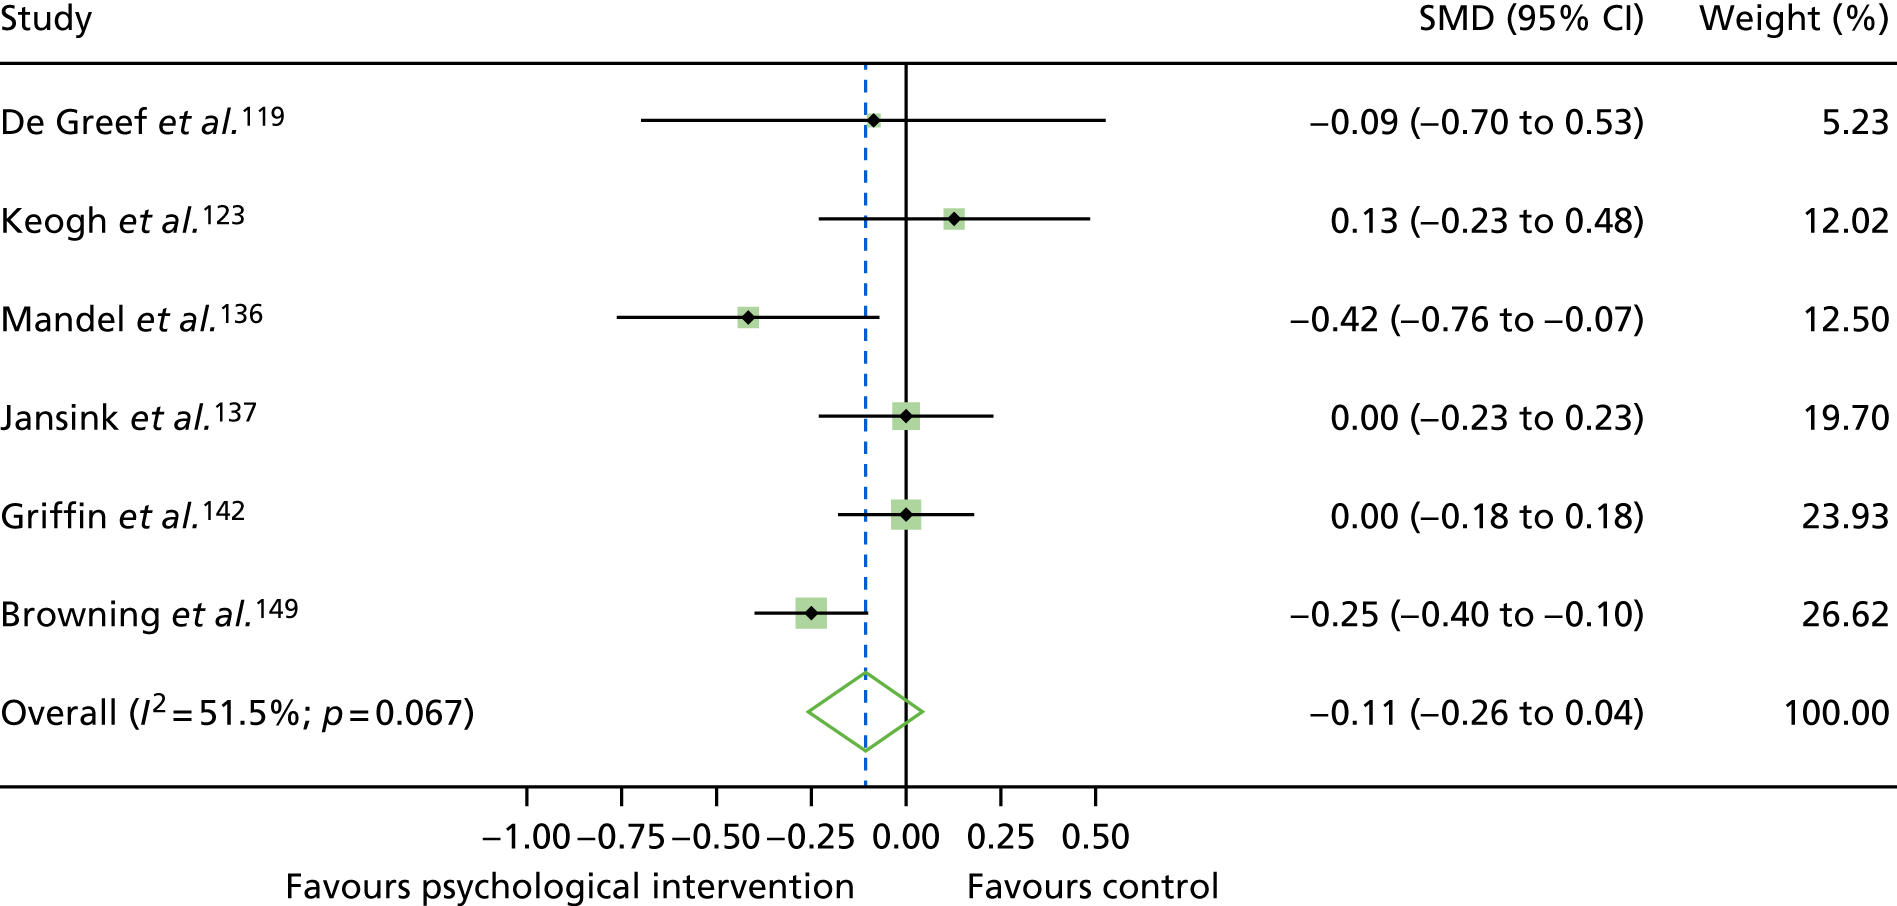
FIGURE 14.
A meta-analysis of the SMD in DBP in psychological intervention groups compared with control groups for studies of adults with T2DM.
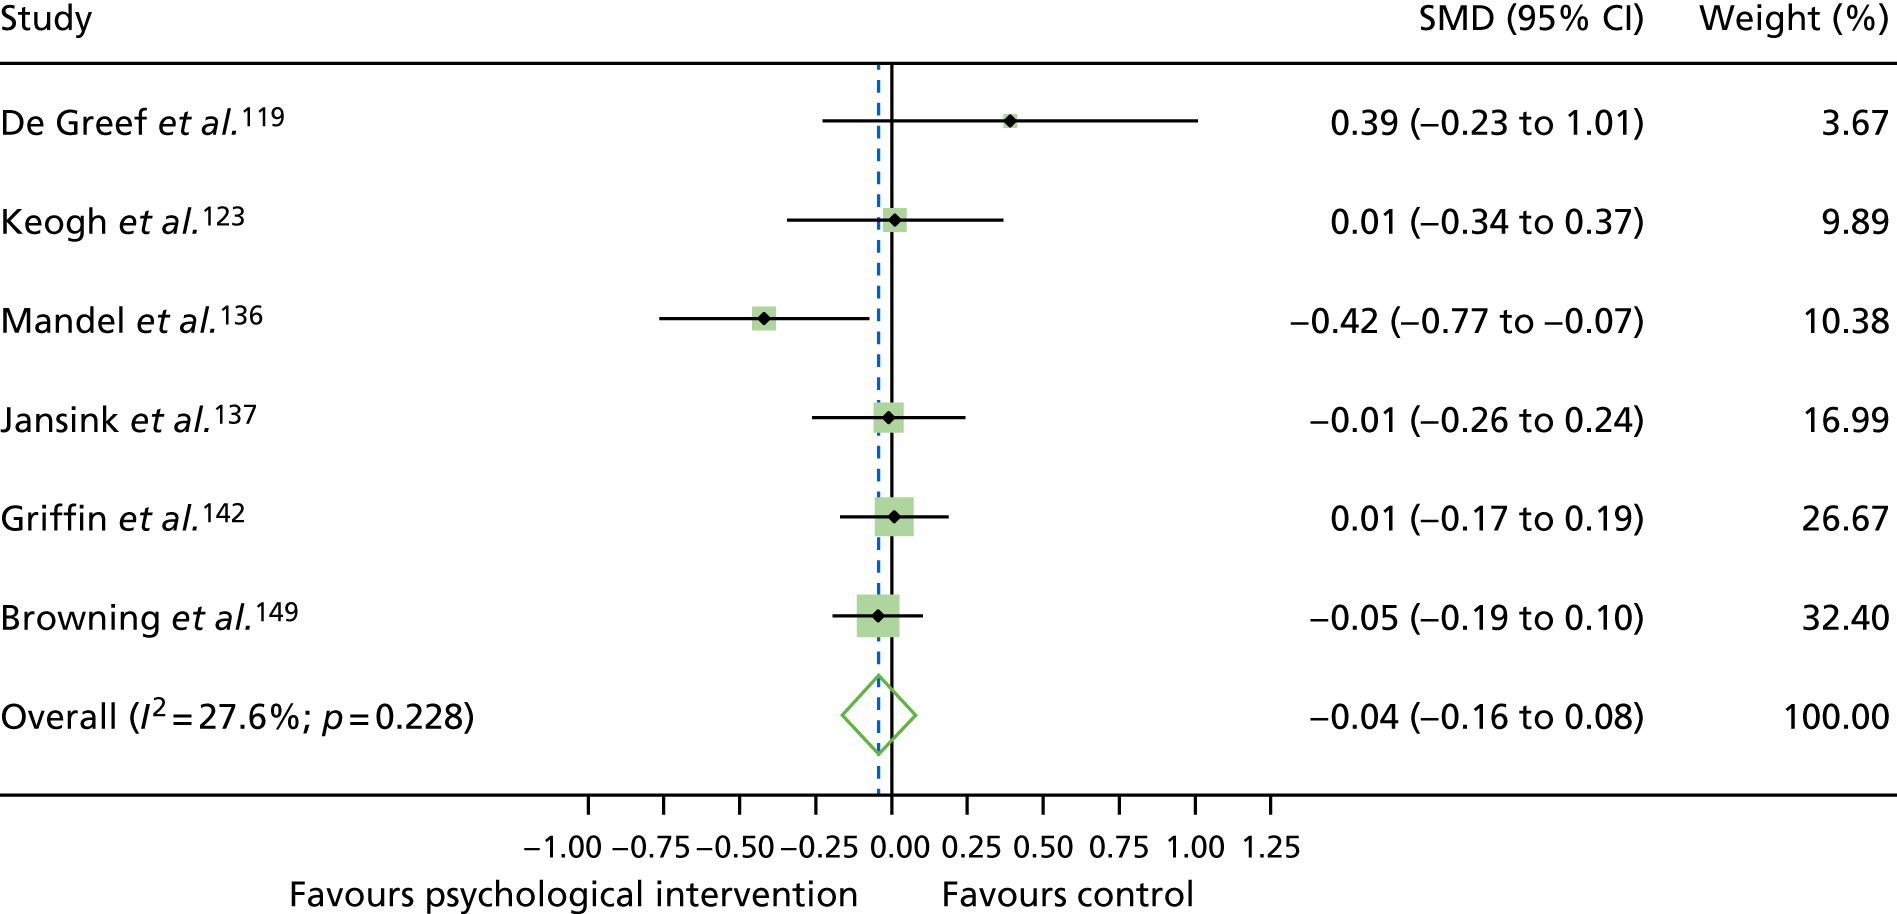
Changes in self-management behaviours
Eight studies111,115,123,139,149,152,157,214 (with a total of 1608 participants) had data available to conduct a meta-analysis for dietary self-management (Figure 15), measured by the SDSCA. A random-effects meta-analysis demonstrated no improvement in general dietary behaviour (SMD 0.47, 95% CI –0.28 to 1.23). High significant heterogeneity was found: I2 = 97.8%; p < 0.001. There was little change on effect size following removal of individual studies. There was little evidence of publication bias (p = 0.18); see Appendix 12,Figure 46. The trim-and-fill method for correcting publication bias did not estimate any missing studies.
FIGURE 15.
A meta-analysis of the SMD in general diet behaviour in psychological intervention groups compared with control groups for studies of adults with T2DM.
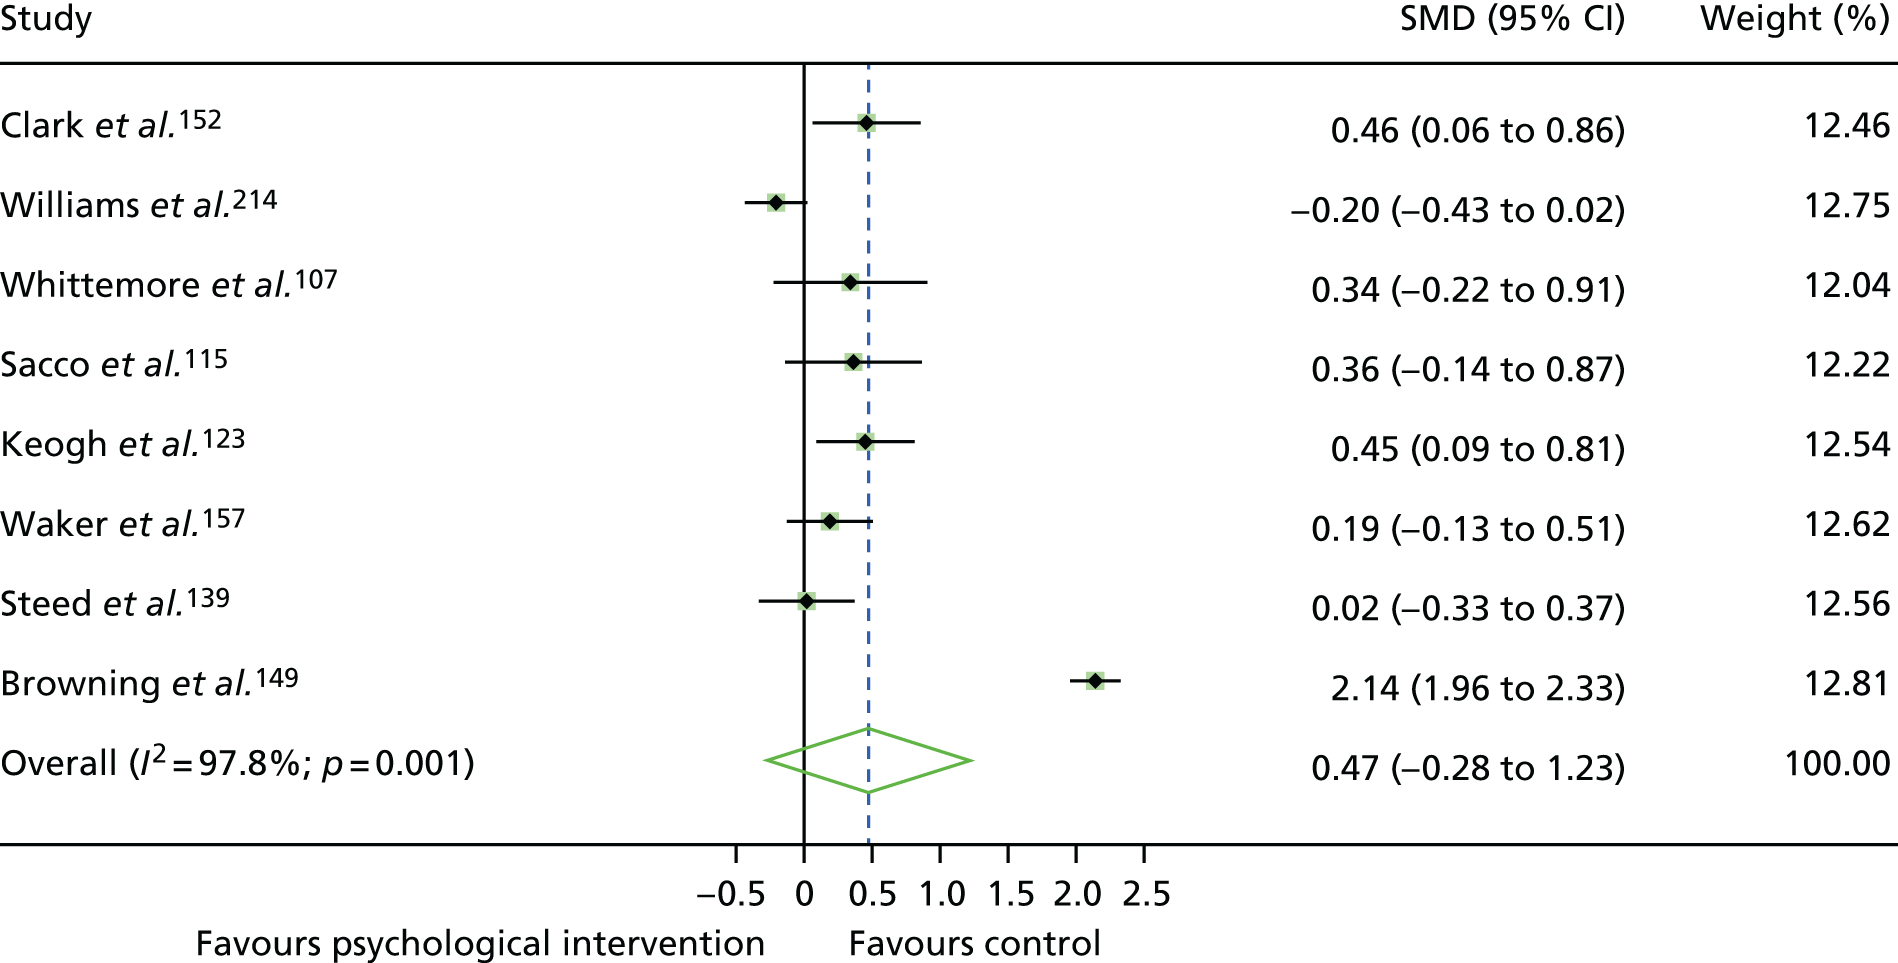
Combining the results with those of the previous review of studies of adults with type 2 diabetes mellitus
In our previous review,40 data on HbA1c levels for 12 trials (with a total of 510 participants) were available for meta-analysis (studies from 1991–2003). Combining data from both reviews (n = 61 studies, with a total of 12,519 participants), a random-effects meta-analysis demonstrated that the SMD in HbA1c levels was statistically significantly lower for people with T2DM in receipt of a psychological intervention than those in a control condition (SMD –0.22, 95% CI –0.32 to –0.12; equivalent to a –0.35 change in % HbA1c levels, a reduction of ≈4 mmol/mol) (Figure 16). The effect size was larger in the previous review (SMD –0.32, 95% CI –0.57 to –0.07; equivalent to a –0.76 change in % HbA1c levels, a reduction of ≈8 mmol/mol) than the current review (SMD –0.21, 95% CI –0.31 to –0.10; equivalent to a –0.33 change in % HbA1c levels, a reduction of ≈3.5 mmol/mol), although the difference between reviews was not statistically significant (p = 0.53).
FIGURE 16.
A meta-analysis of the SMD in HbA1c levels in psychological intervention groups compared with control groups for studies of adults with T2DM, combining the current and previous reviews.
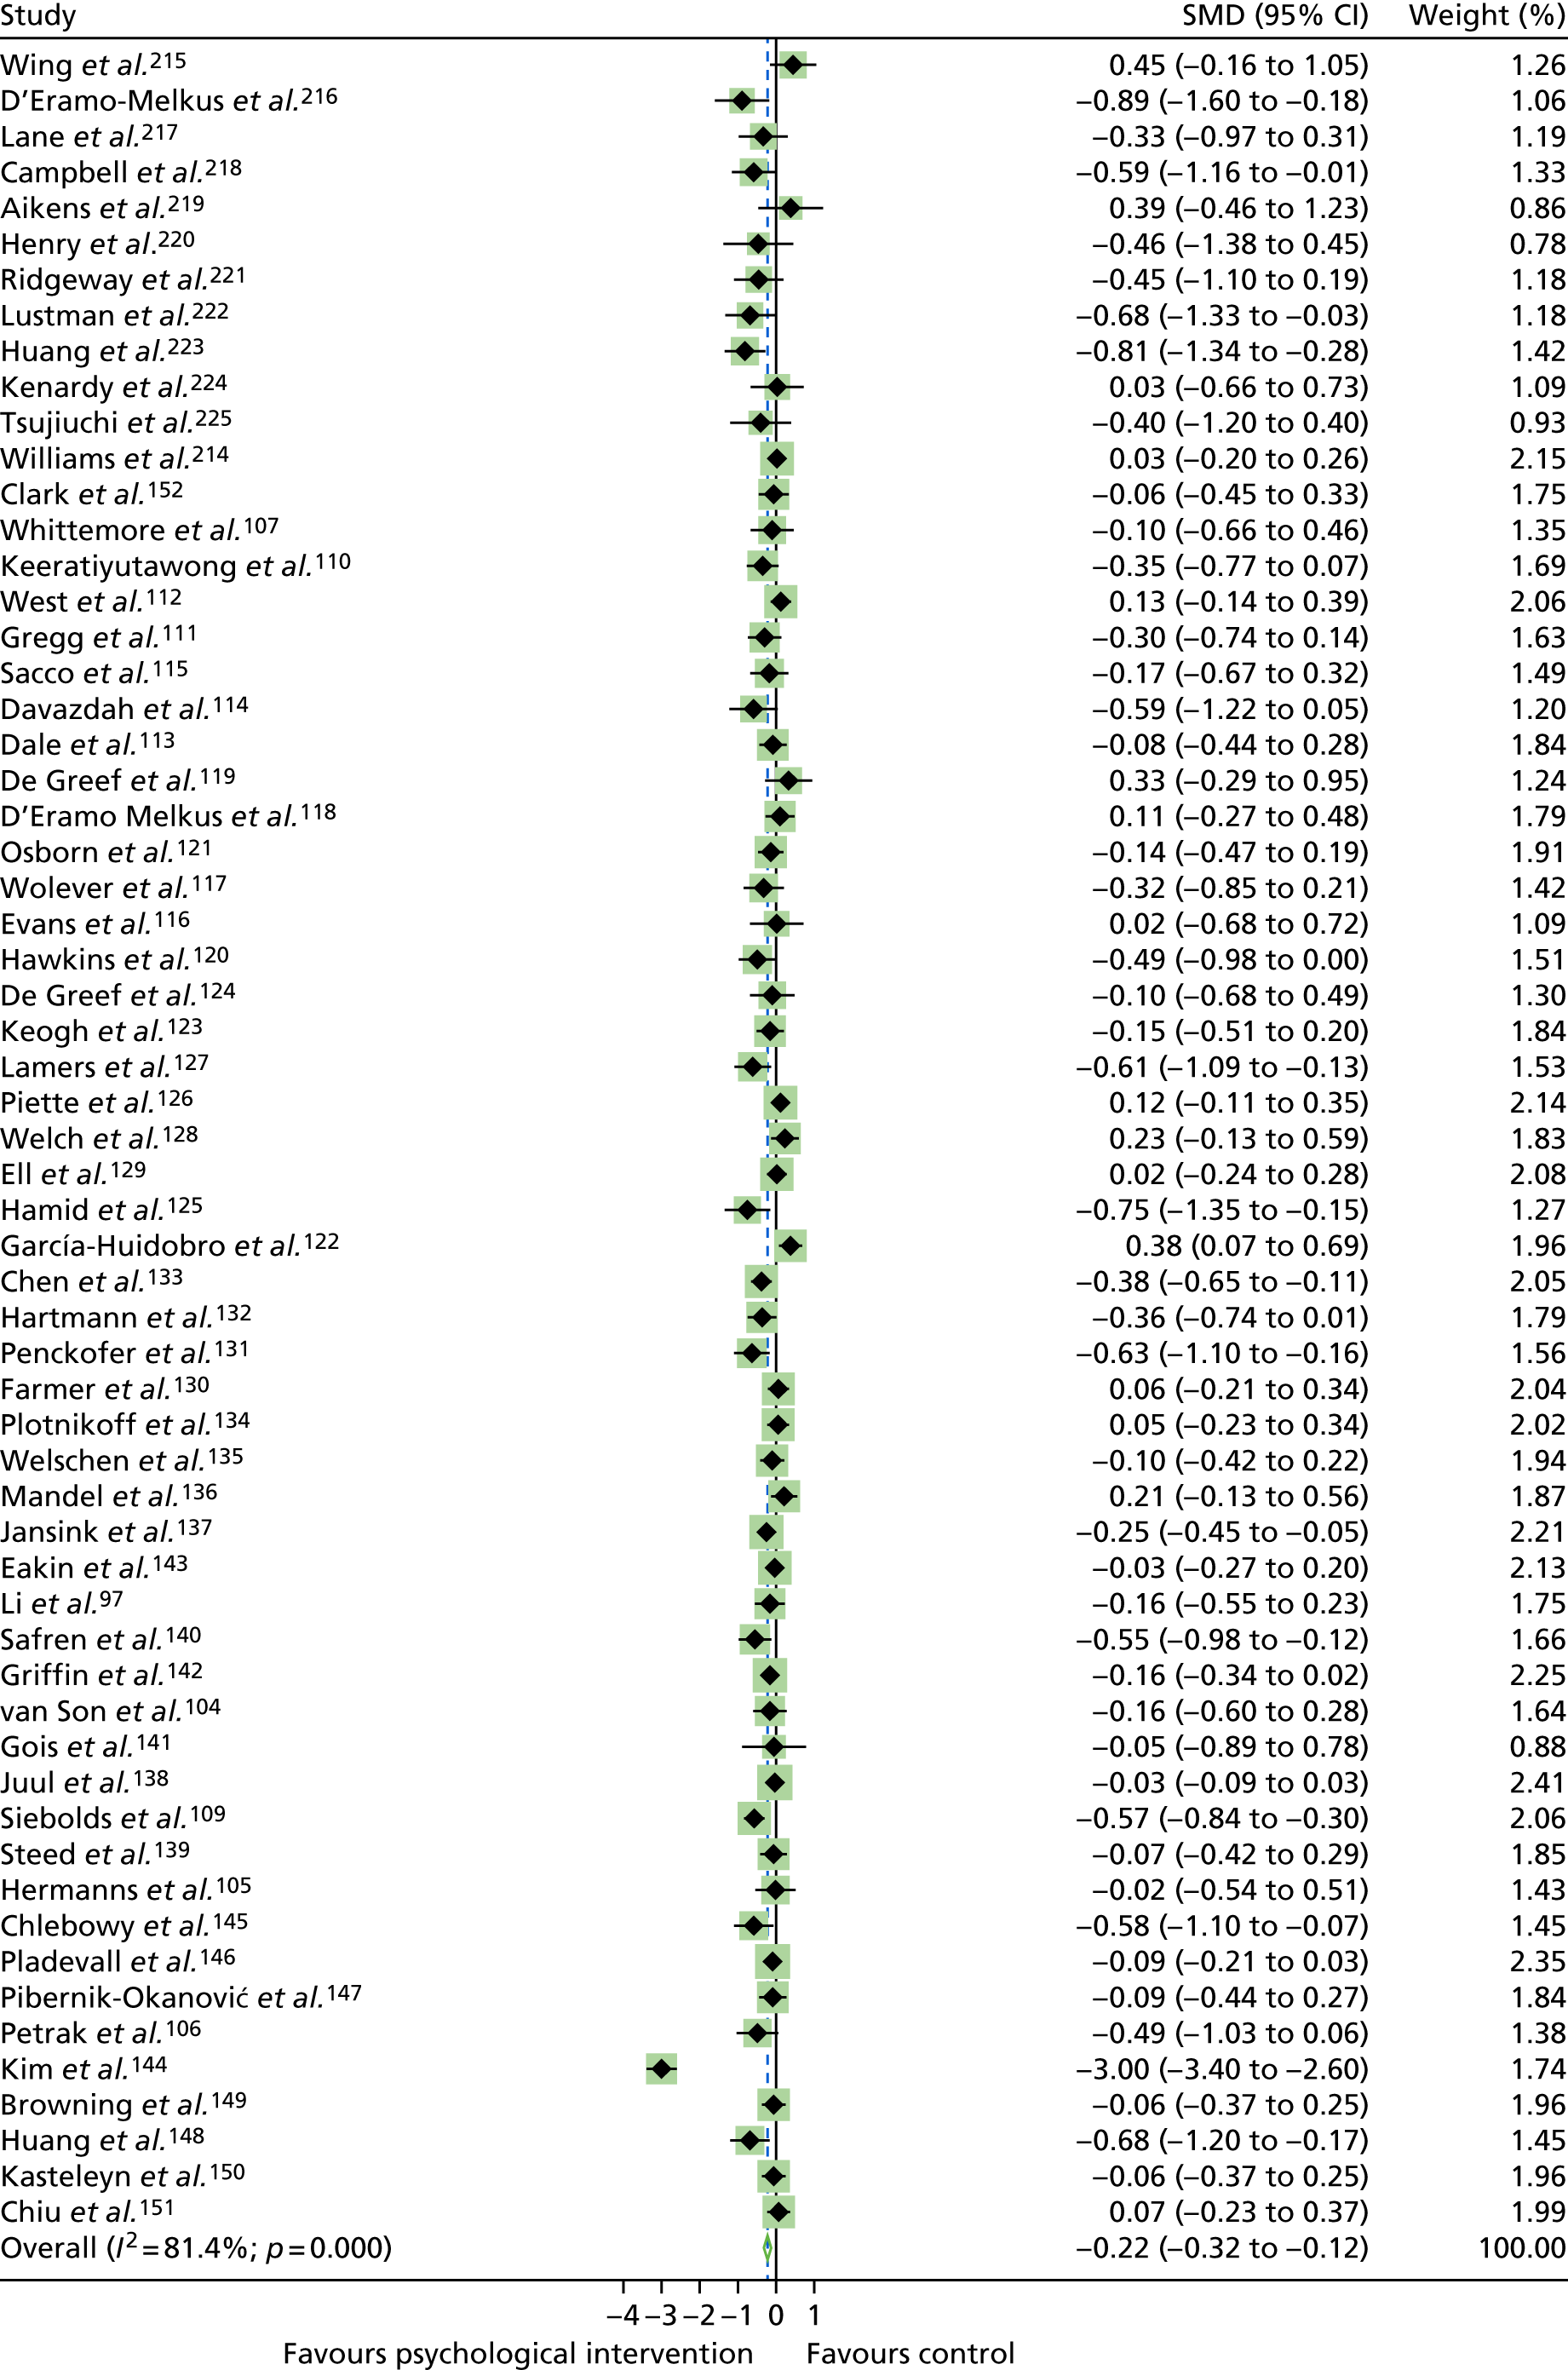
Risk of bias in studies
Of the studies included in the meta-analysis, 23 studies104,106,111,119,120,123,124,126,127,129–131,134,136,138,140–143,147,149,214 were rated as having a ‘low’ RoB, 25studies59,105,107,109,110,112–118,121,125,128,132,133,137,139,144–146,148,150,151 were rated as having an ‘unclear’ RoB and one study122 was rated as having a ‘high’ RoB (see Appendix 11, Figure 35). In a subgroup analysis of HbA1c levels by risk of bias (see Appendix 11, Figure 36), HbA1c levels reduced more in studies rated as having an ‘unclear’ RoB (SMD –0.32, 95% CI –0.53, –0.11) than those rated as having a ‘low’ RoB (SMD –0.08, 95% CI –0.16 to –0.01), although the difference between these RoB categories was not statistically significant (p = 0.178).
Risk of bias across studies
For RoB across studies, the RoB was lowest for the ‘other bias’ domain. The RoB was most unclear in the ‘blinding of outcome assessment domain’; Figure 17.
FIGURE 17.
The RoB across studies of adults with T2DM.

GRADE assessment
The primary outcome, HbA1c levels, was rated as being of ‘high quality’ for studies of adults with T1DM and studies of adolescents/children with T1DM, as there were no problems with any factors (Table 2). Heterogeneity for the outcome of HbA1c levels in studies of adolescents/children with T1DM was high; however, a prespecified subgroup analysis by interventionist revealed low heterogeneity in interventionist groups (i.e. psychology professionals and ‘other’). This meant that a ‘no serious inconsistency’ rating could be allocated to HbA1c levels for this analysis. A ‘high-quality’ rating indicates confidence that the effect size found is close to the true effect.
| Quality assessment | Summary of findings | ||||||||
|---|---|---|---|---|---|---|---|---|---|
| Type of diabetes | Number of studies (design) | Risk of bias | Inconsistency | Indirectiveness | Imprecision | Publication bias | Quality | Total number of participants | SMD (95% CI) |
| Primary outcome | |||||||||
| HbA1c levels | |||||||||
| T1DM in adults | 7 (RCTs) | No serious risk of bias | No serious inconsistency | No serious indirectness | No serious imprecision | No serious publication bias | High | 851 | –0.13 (–0.33 to 0.07) |
| T1DM in adolescents/children | 18 (RCTs) | No serious risk of bias | No serious inconsistency | No serious indirectness | No serious imprecision | No serious publication bias | High | 2583 | 0.00 (–0.18 to 0.18) |
| T2DM | 49 (RCTs) | No serious risk of bias | Serious | No serious indirectness | No serious imprecision | No serious publication bias | Moderate | 12,009 | –0.21 (–0.31 to –0.10) |
| Secondary outcomes | |||||||||
| Depression | |||||||||
| T2DM | 14 (RCTs) | No serious risk of bias | Very serious | No serious indirectness | No serious imprecision | No serious publication bias | Low | 1390 | –0.28 (–0.63 to 0.06) |
| QoL | |||||||||
| T2DM | 13 (RCTs) | No serious risk of bias | Very serious | No serious indirectness | No serious imprecision | Serious publication bias | Low | 2354 | 0.66 (–0.08 to 0.24) |
| BMI | |||||||||
| T2DM | 12 (RCTs) | No serious risk of bias | No serious inconsistency | No serious indirectness | No serious imprecision | No serious publication bias | High | 2254 | –0.08 (–0.16 to 0.00) |
| Blood pressure | |||||||||
| T2DM | 6 (RCTs) | No serious risk of bias | No serious inconsistency | No serious indirectness | No serious imprecision | No serious publication bias | High | 1768 |
|
| General diet behaviour | |||||||||
| T2DM | 8 (RCTs) | No serious risk of bias | Very serious | No serious indirectness | No serious imprecision | No serious publication bias | Low | 1608 | 0.47 (–0.28 to 1.23) |
For studies of adults with T2DM, the outcomes of HbA1c levels was rated as being at a moderate risk of bias, as the inconsistency factors were graded ‘serious’ because heterogeneity was large for this outcome (I2 ≥ 50%).
Meta-analyses were conducted for secondary outcomes in T2DM only. Secondary outcomes assessed as being of ‘high quality’ included BMI and blood pressure, with no problems in either factor.
Depression, QoL and general dietary behaviour (measured by the SDSCA scale) outcomes were rated as being of ‘low quality’, as the inconsistency factor was rated as ‘very serious’; heterogeneity was very large for these outcomes (I2 ≥ 75%). In addition, for the QoL outcome, publication bias was rated as ‘serious’ because the trim-and-fill method estimated five missing studies. Subanalyses were not conducted for secondary outcomes, and could account for high heterogeneity.
Chapter 5 Network meta-analysis results
Network meta-analysis of studies of adults with type 1 diabetes mellitus
Descriptives
In our meta-analyses, we retrieved data from seven studies with two different psychological intervention types and two types of control groups. In addition, one of these studies, Ismail et al. ,163 had two treatment arms (CBT and counselling).
A total of seven studies with 15 treatment or control arms were included in the meta-analyses, with a total sample size of 968 participants (Table 3). CBT (n = 6)104–106,162–164 and counselling (n = 2)163,165 were offered as interventions, and usual care (n = 5)104,106,162,163,165 and attention control (n = 2)105,164 were the control groups. The sample size and the number of studies using counselling and attention control are, thus, limited.
| Treatment | Studies (n) | Studies (%) | Arm | Sample size (n) |
|---|---|---|---|---|
| CBT | 6 | 40.0 | T | 292 |
| Counselling | 2 | 13.3 | T | 251 |
| Usual care | 5 | 33.3 | C | 322 |
| Attention control | 2 | 13.3 | C | 103 |
| Total | 15 | 100 | 968 |
Given that we had four conditions, six contrasts were possible. Figure 18 shows the network plots of evidence for all studies. The plots reflect the number of patients for each arm (size of circles), the observed contrasts (lines) and the amount of evidence for a contrast (width of line). The plot shows that five contrasts were investigated. The two control arms, attention control and usual care, were not directly assessed.
FIGURE 18.
Network plots of direct comparisons for the NMA of studies of adults with T1DM. The width of the lines is proportional to the number of trials comparing each pair of treatments and the size of each node is proportional to the number of studies testing the specific treatment. It shows, roughly, how much information is available for each treatment and for each treatment comparison.
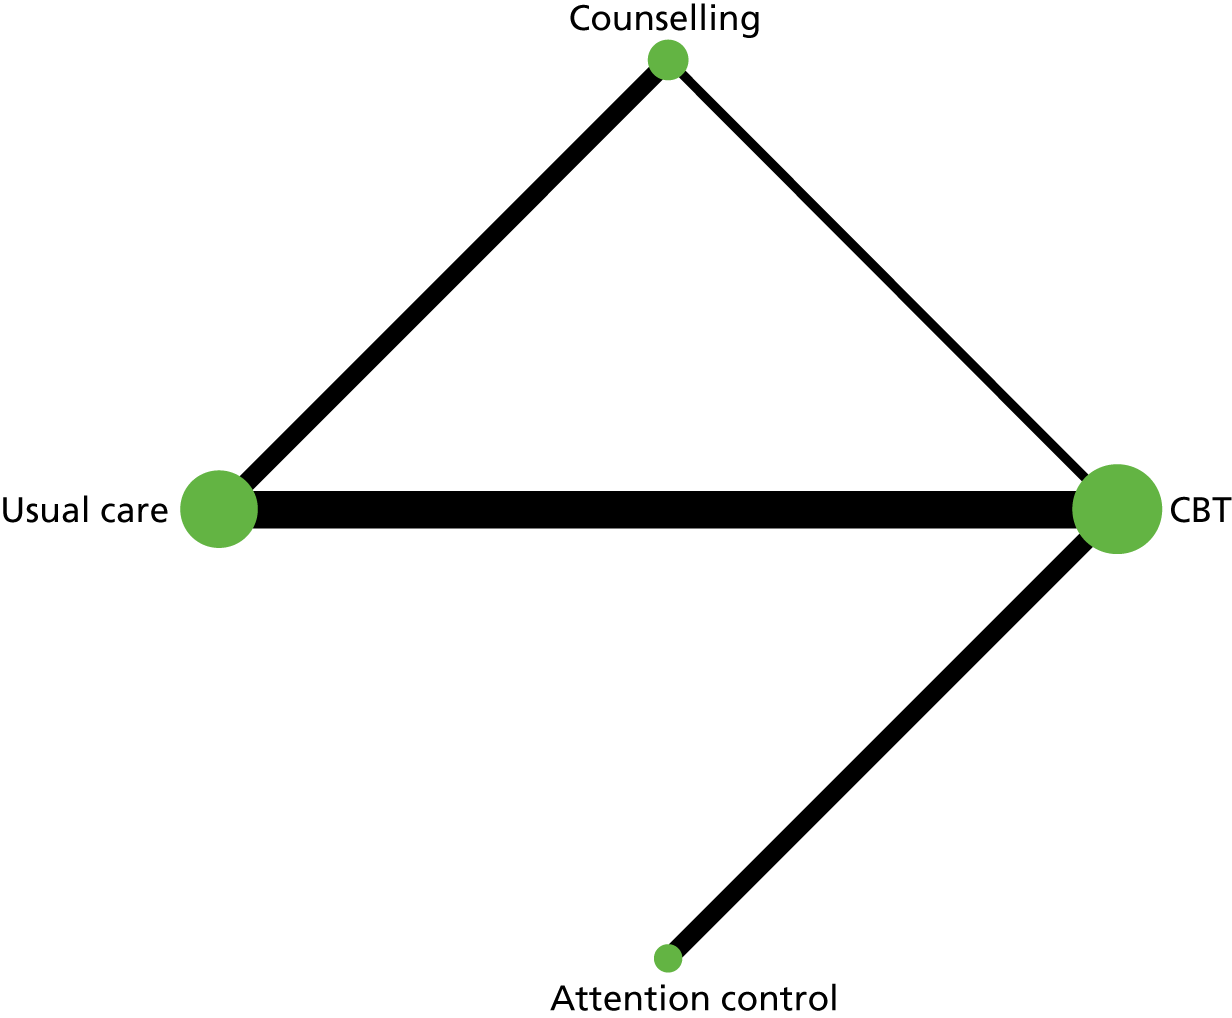
Table 4 shows that the estimated direct and indirect effects between interventions did not differ significantly. The non-significant chi-squared test for inconsistency [χ2(2) = 0.05; p = 0.98, I2 = 0] supports the conclusion of model consistency. Table 5 shows the results of the consistency NMAs comparing treatments with usual care. Only CBT and attention control showed significant reduction in treatment outcome compared with usual care. Effect sizes were moderate (for CBT) or medium (for attention control). A summary of pairwise comparisons of treatment effect can be found in Appendix 13, Table 28.
| Treatment comparison | Side | Direct | Indirect | Difference | p > z | |||
|---|---|---|---|---|---|---|---|---|
| Coefficient | SE | Coefficient | SE | Coefficient | SE | |||
| CBT | Usual care | 0.309 | 0.098 | 0.356 | 0.376 | –0.047 | 0.388 | 0.90 |
| CBT | Counselling | 0.191 | 0.131 | 0.195 | 0.212 | –0.004 | 0.249 | 0.99 |
| CBT | Attention control | –0.200 | 0.142 | 0.629 | 44.652 | –0.829 | 44.652 | 0.99 |
| Counselling | Usual care | 0.117 | 0.098 | 0.173 | 0.375 | –0.056 | 0.387 | 0.88 |
| Treatment | b | 95% CI | SE | z-value | p-value |
|---|---|---|---|---|---|
| Usual care | 0 | ||||
| CBT | –0.312 | (–0.499 to –0.126) | 0.095 | –3.29 | 0.001 |
| Counselling | –0.121 | (–0.307 to 0.066) | 0.095 | –1.27 | 0.21 |
| Attention control | –0.513 | (–0.848 to –0.177) | 0.1701 | –3.00 | 0.003 |
The rankogram graph (Figure 19) shows that attention control has an 88.9% probability of being the best treatment whereas CBT has only a 7.6% probability of being the best treatment; the probabilities of the other two interventions being best are negligible. An assessment of the rescaled mean rank (SUCRA) showed that attention control is certain to be the best treatment, followed by CBT (SUCRA = 0.7) and counselling (0.3), with usual care (0.0) most likely to be the worst therapy (see Appendix 13, Table 26).
FIGURE 19.
Rankogram for all treatments in studies of adults with T1DM. (a) Usual care; (b) CBT; (c) counselling; and (d) attention control. The plot shows the surface under the cumulative ranking curves for all treatments. For example, usual care has a very low probability of being among the best treatments, but a very high probability of being one of the worst.
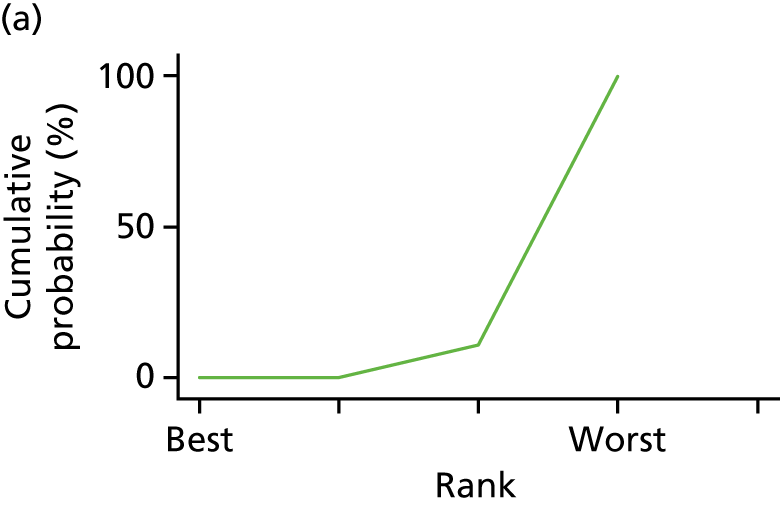
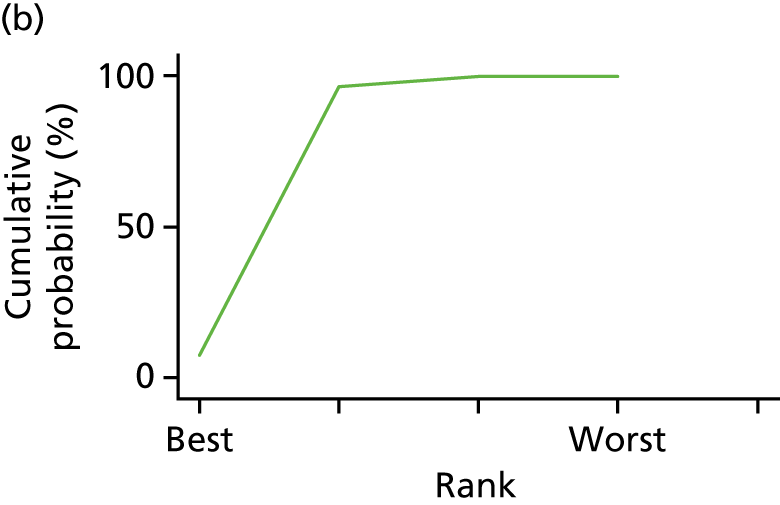
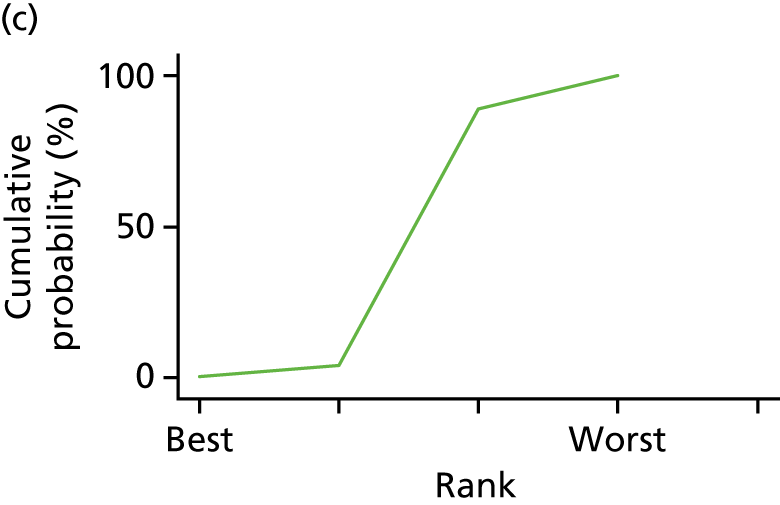
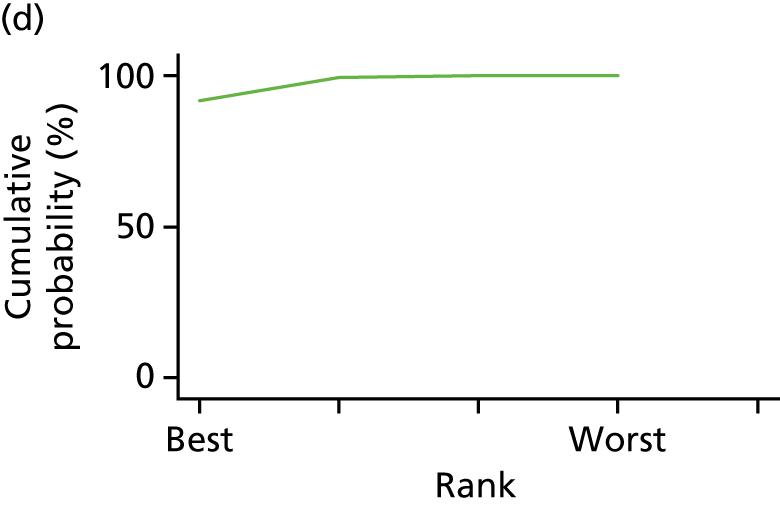
Network meta-analysis results for studies of adolescents/children with type 1 diabetes mellitus
Descriptives
We retrieved data from a total of 18 studies of adolescents/children with T1DM. Two studies had more than one treatment arm (main arm: CBT, extra arm: CBT2;177 main arm: family therapy, extra arm: family therapy via telephone180). However, because the two treatments in each study shared the same category of treatment, one treatment needed to be excluded (i.e. the least intensive).
All studies included
A total of 18 studies with 18 treatment and 18 control arms were included in the meta-analyses, with a total sample size of 2583 participants (see Appendix 13, Table 29). Family therapy (n = 6)169,173,176,180,182,183 and counselling (n = 8)167,168,170,172,174,178,179,181 were offered most often as interventions; usual care (n = 11)167,169,173–178,180,181,184 and attention control (n = 5)170–172,179,183 were mainly offered as control groups.
Given that we had six conditions, 15 contrasts were possible. Appendix 13, Figure 47, shows the network plots of evidence for all studies. The plot shows that eight contrasts were investigated.
Table 6 shows that the estimated direct and indirect effects between interventions did not differ significantly. The non-significant chi-squared test for inconsistency [χ2(3) = 1.19; p = 0.76, I2 = 0] supports the conclusion of model consistency. Table 7 shows the results of the consistency NMAs comparing treatments with usual care. No treatment showed a statistically significant reduction of treatment outcome compared with usual care. The observed effect sizes of the two arms with small sample sizes, coping skills training and attention control, were medium to large. Appendix 13, Table 32, reports pairwise comparisons of treatment effect.
| Side comparison | Direct | Indirect | Difference | p-value | ||||
|---|---|---|---|---|---|---|---|---|
| Intervention | Control | SMD | SE | SMD | SE | SMD | SE | |
| CBT | Usual care | 0.241 | 0.557 | 0.718 | 1.136 | –0.477 | 1.265 | 0.71 |
| CBT | Attention control | –0.177 | 0.955 | –0.654 | 0.830 | 0.478 | 1.265 | 0.71 |
| Counselling | Usual care | 0.058 | 0.453 | –0.984 | 0.928 | 1.042 | 1.033 | 0.31 |
| Counselling | Attention control | –1.227 | 0.571 | –0.184 | 0.862 | –1.043 | 1.033 | 0.31 |
| Family therapy | Usual care | 0.100 | 0.465 | 1.033 | 1.102 | –0.932 | 1.196 | 0.44 |
| Family therapy | Attention control | 0.017 | 0.918 | –0.916 | 0.766 | 0.933 | 1.196 | 0.44 |
| Treatment | b | 95% CI | SE | z-value | p-value |
|---|---|---|---|---|---|
| Usual care | 0 | ||||
| CBT | –0.33 | –1.248 to 0.589 | 0.469 | –0.7 | 0.59 |
| Counselling | 0.141 | –0.635 to 0.917 | 0.396 | 0.36 | 0.92 |
| Family therapy | –0.24 | –1.045 to 0.565 | 0.411 | –0.58 | 0.57 |
| Attention control | –0.767 | –1.757 to 0.222 | 0.505 | –1.52 | 0.22 |
The rankogram graph (Figure 20) shows that attention control has a 66.6% probability of being the best treatment, followed by CBT with an 18.5% probability of being the best; all others have a probability of < 8% of being the best treatment. An assessment of the rescaled mean rank (SUCRA) shows that attention control is most likely to be the best treatment (SUCRA = 0.9), followed by CBT and family therapy (SUCRA = 0.6 and 0.5, respectively), and that less intensive psychological intervention and counselling are least likely to be the best ones (SUCRA = 0.3) (see Appendix 13, Table 27).
FIGURE 20.
Rankogram for all treatments in studies of adolescents/children with T1DM. (a) Usual care; (b) CBT; (c) counselling; (d) family therapy; and (e) attention control. The plot shows the SUCRA curves for all treatments. For example, usual care has a very low probability of being among the best treatments, but a very high probability of being one of the worst.
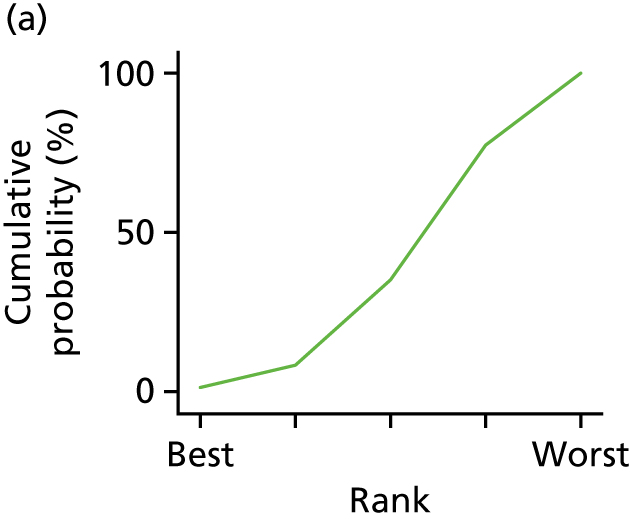
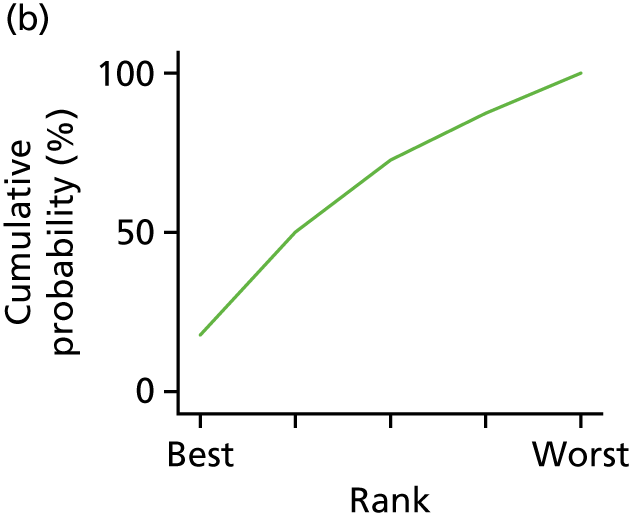
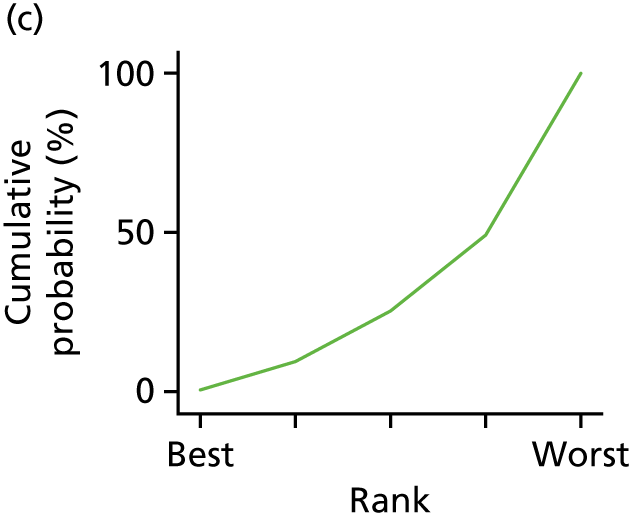
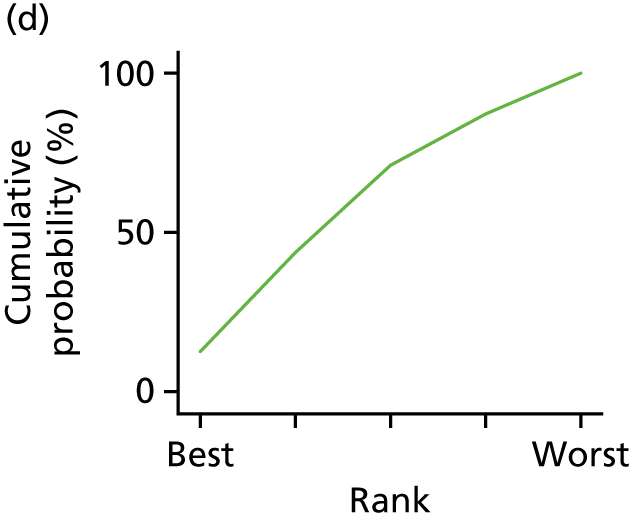
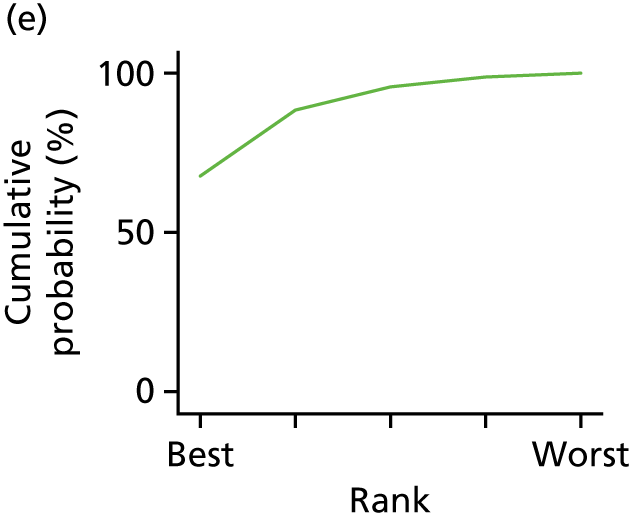
Analyses of studies with more than two sites
Only less intensive psychological intervention was studied fewer than three times. A total of 16 studies with treatment and control arms with five types of treatment (CBT, counselling, family therapy, attention control and usual care) were included in the meta-analyses, with a total sample size of 2427 participants (Table 8).
| Treatment | Studies (n) | Studies (%) | Arm | Sample size (n) |
|---|---|---|---|---|
| CBT | 4 | 11.8 | T | 167 |
| Counselling | 7 | 23.5 | T | 676 |
| Family therapy | 5 | 17.6 | T | 399 |
| Usual care | 11 | 32.4 | C | 1002 |
| Attention control | 5 | 14.7 | C | 183 |
| Total | 32 | 100 | 2427 |
Given that we had five conditions, 10 contrasts were possible. Figure 21 shows the network plots of evidence for all studies. The plot shows that six contrasts were investigated.
FIGURE 21.
Network plots for all studies. Network plots of direct comparisons for the NMA for studies of adolescents/children with T1DM. The width of the lines is proportional to the number of trials comparing each pair of treatments and the size of each node is proportional to the number of studies testing the specific treatment. It shows, roughly, how much information is available for each treatment and for each treatment comparison.
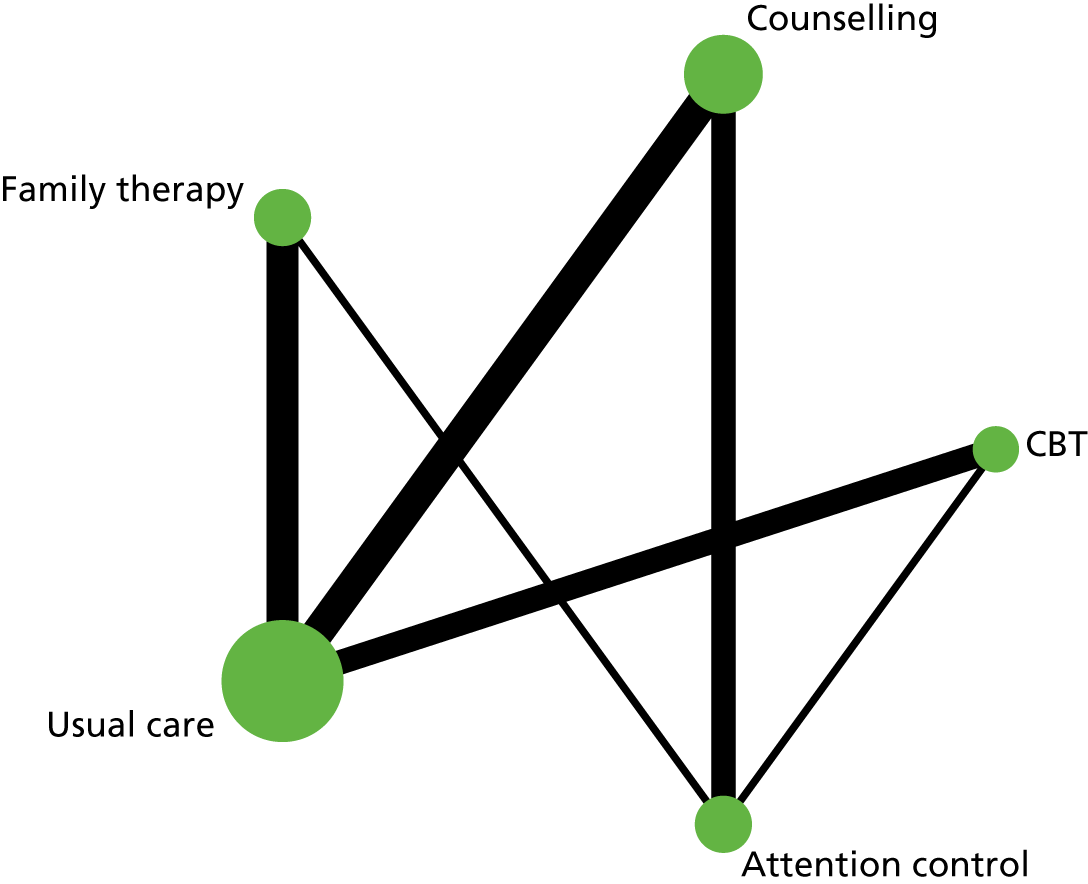
Table 9 shows that the estimated direct and indirect effects between interventions did not differ significantly. The non-significant chi-squared test for inconsistency [χ2(2) = 0.98; p = 0.61, I2 = 0] supports the conclusion of model consistency. Table 10 shows the results of the consistency NMAs comparing treatments with usual care. No treatment showed a statistically significant reduction of treatment outcome compared with usual care. Appendix 13, Table 33, reports pairwise comparisons of treatment effect.
| Side comparison | Direct | Indirect | Difference | p-value | ||||
|---|---|---|---|---|---|---|---|---|
| Treatment | Control | Coefficient | SE | Coefficient | SE | Coefficient | SE | |
| CBT | Usual care | 0.241 | 0.526 | 0.721 | 1.072 | –0.480 | 1.194 | 0.69 |
| CBT | Attention control | –0.177 | 0.901 | –0.657 | 0.784 | 0.481 | 1.194 | 0.69 |
| Counselling | Usual care | 0.058 | 0.438 | –0.559 | 0.775 | 0.617 | 0.890 | 0.49 |
| Counselling | Attention control | –1.198 | 0.541 | –0.129 | 0.780 | –1.069 | 0.949 | 0.26 |
| Counselling | Less intensive psychological intervention | 0.416 | 0.899 | –0.253 | 1.036 | 0.670 | 1.372 | 0.63 |
| Family therapy | Usual care | 0.100 | 0.448 | 0.513 | 0.868 | –0.412 | 0.977 | 0.67 |
| Family therapy | Attention control | 0.017 | 0.857 | –0.969 | 0.682 | 0.986 | 1.095 | 0.37 |
| Family therapy | Less intensive psychological intervention | 0.128 | 0.888 | 0.797 | 1.045 | –0.670 | 1.372 | 0.63 |
| Treatment | b | 95% CI | SE | z-value | p-value |
|---|---|---|---|---|---|
| Usual care | 0 | ||||
| CBT | –0.329 | –1.198 to 0.539 | 0.443 | –0.74 | 0.54 |
| Counselling | 0.088 | –0.621 to 0.797 | 0.362 | 0.24 | 0.8 |
| Family therapy | –0.184 | –0.917 to 0.549 | 0.374 | –0.49 | 0.55 |
| Attention control | –0.768 | –1.704 to 0.169 | 0.478 | –1.61 | 0.17 |
| Less intensive psychological intervention | 0.22 | –1.076 to 1.516 | 0.661 | 0.33 | 1.52 |
Network meta-analysis results for studies of adults with type 2 diabetes mellitus
Descriptives
In our meta-analyses, we retrieved data from 49 studies of adults with T2DM that had five different psychological intervention types and five main types of control groups. In addition, four studies128,134,136,146 had two control groups and three studies had two treatment groups. However, two of those had the same treatment arm (counselling) and only one control group. We had to remove one of the two counselling groups as the network analyses algorithms did not allow the inclusion of two treatment arms of the same type in a study. One study128 had two treatment and control substudies. These were separated into two separate studies in the NMAs.
A total of 50 studies with 103 treatment or control arms were thus included in the meta-analyses, with a total sample size of 12,409 participants (Table 11). Four studies128,134,136,146 provided more than two arms to the NMAs. 128,134,136,146 CBT (used in 53.7% of studies ) and counselling (used in 39% of studies) were the interventions most often studied. Usual care (used in 70.4% of studies) was used most often as control arm, followed by attention control (used in 20.4% of studies). Other intervention and control arms were offered only once or twice.
| Arm | Studies (n) | % | Arm | Sample size (n) |
|---|---|---|---|---|
| CBT | 16 | 15.53 | T | 717 |
| Counselling | 29 | 28.16 | T | 4636 |
| Psychotherapy | 3 | 2.91 | T | 268 |
| Creative therapy | 1 | 0.97 | T | 67 |
| Usual care | 37 | 35.92 | T | 5050 |
| Attention control | 12 | 11.65 | C | 796 |
| Computerised material | 2 | 1.94 | C | 666 |
| Printed material | 1 | 0.97 | C | 68 |
| Music relaxation CD | 1 | 0.97 | C | 58 |
| Family therapy | 1 | 0.97 | T | 83 |
| Total | 103 | 100 | 12,409 |
Descriptive information and the coding of variables for each of the studies are provided earlier in the report (see Chapter 3 and Table 1).
Given that we had 10 conditions, 45 contrasts were possible. Figure 49 shows the network plots of evidence for all studies. The plot shows that only 12 contrasts were investigated and only five conditions had at least moderate sample size, based on more than two studies.
To reduce the overestimation of treatment effects due to publication bias and to obtain robust findings, we performed two NMAs. First, all available studies were analysed. Second, we then restricted our main analyses to five conditions (CBT, counselling, attention control, psychotherapy and usual care).
Results of all available studies
Table 12 shows that the estimated direct and indirect effects between interventions did not differ significantly. The non-significant chi-squared test for inconsistency [χ2(2) = 2.55; p = 0.28, I2 = 0] supports the conclusion of model consistency. Although there was no significant difference between direct and indirect treatment effects, it should be noted that some direct and indirect effects show opposite treatment effects, that is CBT shows a significant positive treatment effect in direct comparison with usual care (–0.292, 95% CI –0.56 to –0.024) but a (non-significant) worsening effect when looking at the indirect evidence (0.277, 95% CI –0.389 to 0.943).
| Comparison | Direct | Indirect | Difference | p-value | ||||
|---|---|---|---|---|---|---|---|---|
| Treatment | Control | SMD | SE | SMD | SE | SMD | SE | |
| Usual care | Computerised material | –0.087 | 0.314 | –0.395 | 0.583 | 0.309 | 0.662 | 0.64 |
| CBT | Usual care | 0.292 | 0.134 | –0.277 | 0.333 | 0.569 | 0.359 | 0.11 |
| CBT | Family therapy | 0.153 | 0.274 | 0.722 | 0.233 | –0.569 | 0.359 | 0.11 |
| Counselling | Usual care | 0.121 | 0.101 | 0.690 | 0.345 | –0.569 | 0.359 | 0.11 |
| Counselling | Family therapy | 0.551 | 0.161 | –0.019 | 0.321 | 0.569 | 0.359 | 0.11 |
| Counselling | Computerised material | –0.059 | 0.314 | 0.250 | 0.583 | –0.309 | 0.662 | 0.64 |
| Counselling | Music relaxation CD | –0.395 | 0.464 | 0.336 | 63.250 | –0.731 | 63.252 | 0.99 |
| Creative therapy | Family therapy | –0.221 | 0.459 | 0.538 | 63.247 | –0.759 | 63.249 | 0.99 |
| Family therapy | Printed material | 0.103 | 0.459 | –0.656 | 63.256 | 0.759 | 63.258 | 0.99 |
Table 13 shows the results of the consistency NMAs comparing treatments with usual care. No therapy shows a significant reduction of treatment outcome compared with usual care. Only music therapy showed a moderate treatment standardised effect size. Appendix 13, Table 35, presents pairwise comparisons of treatment effect.
| Treatment | b | (95% CI) | SE | z-value | p-value |
|---|---|---|---|---|---|
| Usual care | 0 | ||||
| CBT | –0.213 | –0.461 to 0.035 | 0.126 | –1.68 | 0.09 |
| Counselling | –0.166 | –0.36 to 0.027 | 0.099 | –1.68 | 0.09 |
| Psychotherapy | 0.009 | –0.535 to 0.553 | 0.277 | 0.03 | 0.97 |
| Creative therapy | 0.491 | –0.464 to 1.446 | 0.487 | 1.01 | 0.31 |
| Attention control | 0.27 | –0.051 to 0.591 | 0.164 | 1.65 | 0.1 |
| Computerised material | –0.156 | –0.69 to 0.379 | 0.273 | –0.57 | 0.57 |
| Printed material | 0.373 | –0.581 to 1.328 | 0.487 | 0.77 | 0.44 |
| Music relaxation CD | –0.562 | –1.492 to 0.369 | 0.475 | –1.18 | 0.24 |
| Family therapy | 0.379 | –0.507 to 1.265 | 0.452 | 0.84 | 0.4 |
The rankogram graph (see Appendix 13, Figure 50) shows that music therapy has a 62.5% probability of being the best treatment, whereas computerised material treatment has only a 14.9% probability of being the best treatment; the probabilities for all other studies are < 10%. An assessment of the rescaled mean rank (SUCRA) shows that music therapy [music relaxation compact disc (CD)] is potentially the best treatment (SUCRA = 0.9), followed by CBT (SUCRA = 0.8), counselling and computerised material (SUCRA = 0.7 for both), psychotherapy and usual care (SUCRA = 0.5 for both) and printed material and family therapy (both SUCRA = 0.3 for both). Creative therapy and attention control (SUCRA = 0.1 for both) are most likely to be the two worst therapies (see Appendix 13, Table 34).
Music therapy (music relaxation CD) was assessed in only one study, with a sample size of 58 participants. To reduce overestimation of effects and test the robustness of the findings, we conducted further analyses restricted to treatments with more than two studies.
Results of reduced number of treatments (more than two studies per treatment)
A total of 37 studies with 48 treatment and 49 control arms were included in the meta-analyses, with a total sample size of 11,467 participants (Table 14) in the reduced data set.
| Arm | Studies (n) | Studies (%) | Arm | Cases (n) |
|---|---|---|---|---|
| CBT | 16 | 16.5 | T | 717 |
| Counselling | 29 | 29.9 | T | 4636 |
| Psychotherapy | 3 | 3.1 | T | 268 |
| Usual care | 37 | 38.1 | C | 5050 |
| Attention control | 12 | 12.4 | C | 796 |
| Total | 97 | 100 | 100 | 11,467 |
Given that we had five conditions, 10 contrasts were possible. Figure 22 shows the network plots of evidence for all studies. The plot shows that five contrasts were investigated. Psychotherapy was connected only with usual care. Rerunning a sensitivity analyses without psychotherapy did not alter conclusions regarding the four main arms (this is not shown).
FIGURE 22.
Network plots for reduced number of studies. Network plots of direct comparisons for the NMA of studies of adults with T2DM. The width of the lines is proportional to the number of trials comparing each pair of treatments and the size of each node is proportional to the number of studies testing the specific treatment. It shows, roughly, how much information is available for each treatment and for each treatment comparison.
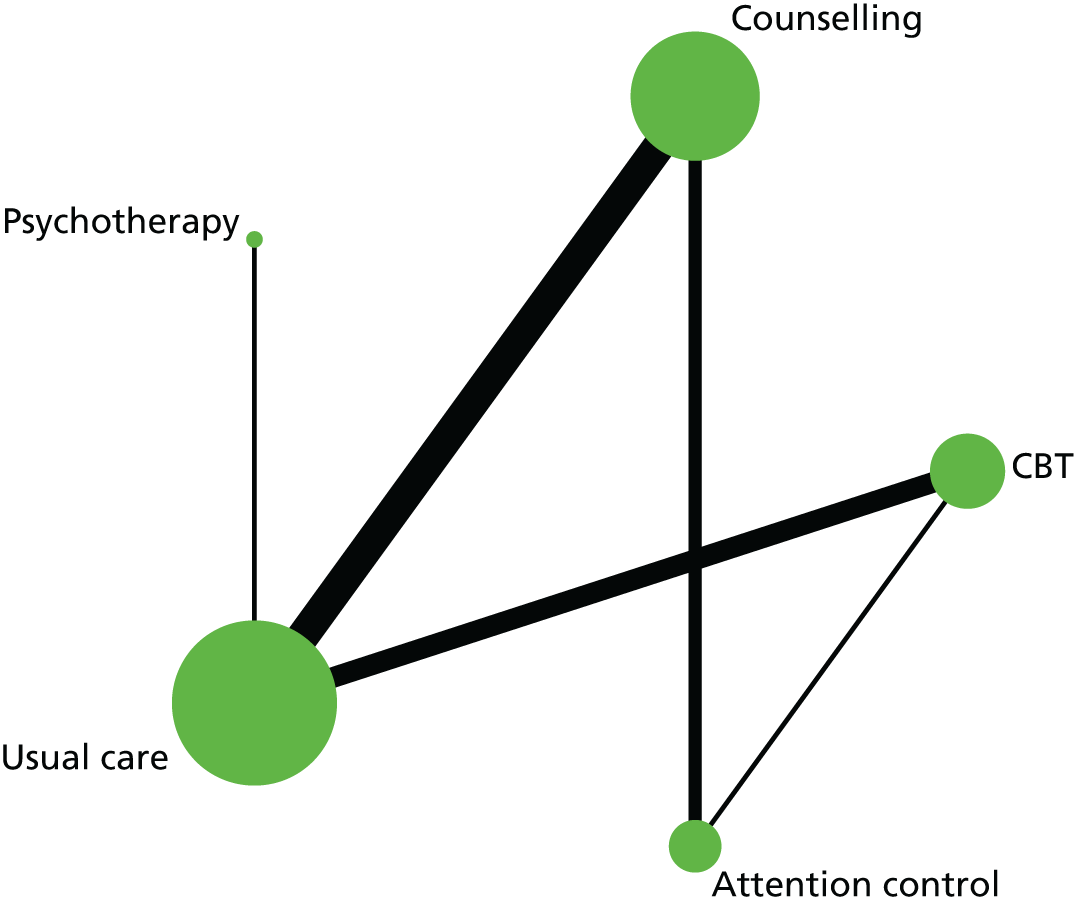
Table 15 shows that the estimated direct and indirect effects between interventions did not differ significantly. The non-significant chi-squared test for inconsistency [χ2(1) = 2.45; p = 0.12, I2 = 18.4%] supports the conclusion of model consistency. Table 16 shows the results of the consistency NMAs comparing treatments with usual care. Similar to the analyses using all studies, it should be noted that some direct and indirect effects again show opposite treatment effects, that is CBT shows a significant positive treatment effect in direct comparison with usual care (–0.292, 95% CI –0.564 to –0.02), but a (non-significant) worsening effect when looking at the indirect evidence (0.278, 95% CI –0.804 to 1.48).
| Comparison | Direct | Indirect | Difference | p-value | ||||
|---|---|---|---|---|---|---|---|---|
| Treatment | Control | SMD | SE | SMD | SE | SMD | SE | |
| CBT | Usual care | 0.292 | 0.136 | –0.278 | 0.338 | 0.571 | 0.364 | 0.117 |
| CBT | Attention control | 0.153 | 0.277 | 0.723 | 0.236 | –0.571 | 0.364 | 0.117 |
| Counselling | Usual care | 0.120 | 0.103 | 0.690 | 0.350 | –0.570 | 0.364 | 0.118 |
| Counselling | Attention control | 0.551 | 0.164 | –0.020 | 0.326 | 0.571 | 0.364 | 0.117 |
| Treatment | b | 95% CI | SE | z-value | p-value |
|---|---|---|---|---|---|
| Usual care | 0 | ||||
| CBT | –0.213 | –0.464 to 0.038 | 0.128 | –1.66 | 0.10 |
| Counselling | –0.166 | –0.362 to 0.03 | 0.1 | –1.66 | 0.10 |
| Psychotherapy | 0.009 | –0.543 to 0.56 | 0.281 | 0.03 | 0.98 |
| Attention control | 0.27 | –0.056 to 0.596 | 0.166 | 1.63 | 0.10 |
Assuming inconsistency, no treatment demonstrates statistically significant reduction of treatment outcome compared with usual care. Observed effect sizes ranged between negligible and small. Appendix 13, Table 36, reports pairwise comparisons of treatment effect.
The rankogram graph (Figure 23) shows that CBT has a 48.4% probability of being the best treatment, followed by counselling (30.5%) and psychotherapy (21%). The probabilities of attention control (< 0.1%) and usual care (0.1%) are negligible. An assessment of the rescaled mean rank (SUCRA) shows that CBT and counselling are estimated to be the best treatments (SUCRA = 0.8), followed by psychotherapy (SUCRA = 0.5); usual care (SUCRA = 0.3) and attention control (SUCRA = 0.1) are most likely to be the worst therapies.
FIGURE 23.
Rankogram for all treatments in studies of adults with T2DM. (a) Usual care; (b) CBT; (c) counselling; (d) psychotherapy; and (e) attention control. The plot shows the SUCRA curves for all treatments. For example, usual care has a very low probability of being the best or second-best treatment.
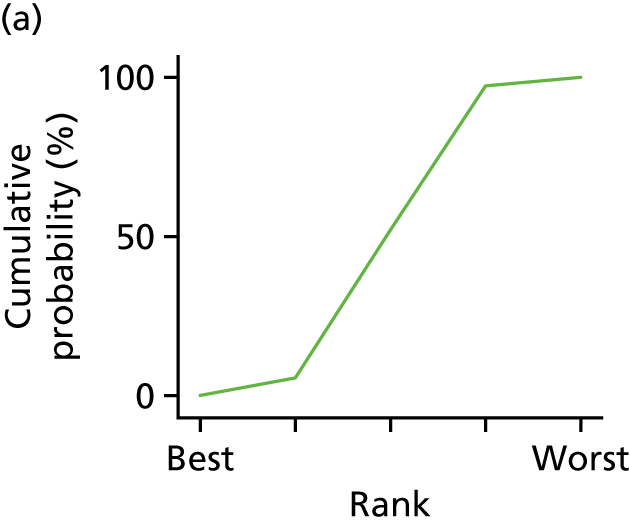
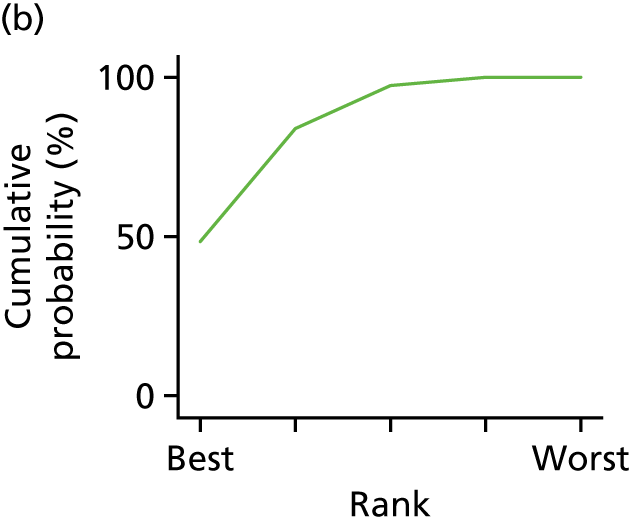
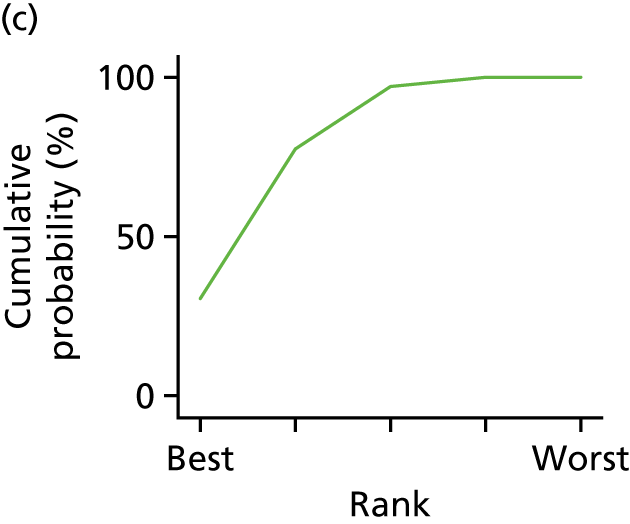
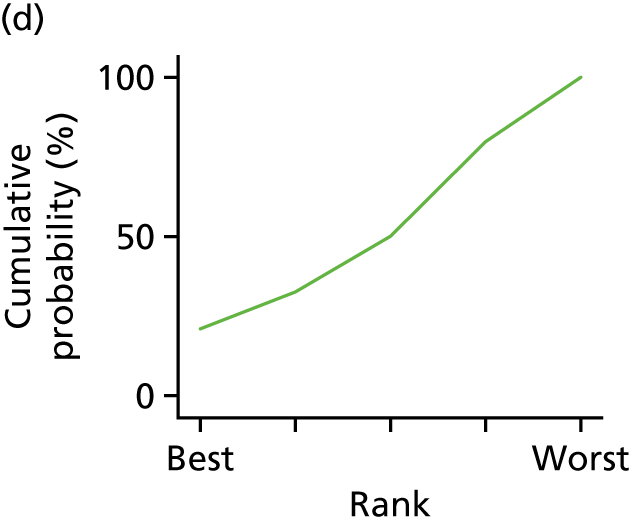
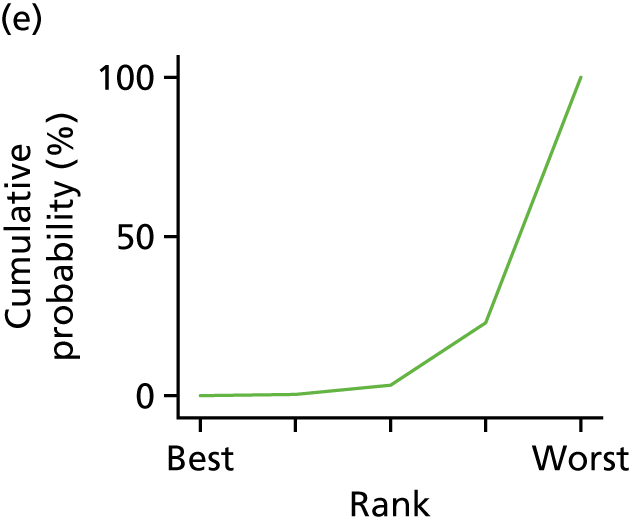
Chapter 6 Individual patient data meta-analysis results
The IPD meta-analyses consisted of 29 studies published between 2007 and 2016, with a total sample size of 5823 participants. The type of diabetes was not known for two people. Fifteen studies104–106,129,163,164,168–171,176,179,181,183,184 included a total of 2182 people with T1DM (range 8–390) and 19 studies104–106,113,118,123,129,132,135–137,140,142,143,145,147,150,151,169 included a total number of 3639 (range 15–521) patients with a diagnosis of T2DM. Of the 29 studies (study IDs listed in Appendix 14, Table 37), five studies104–106,129,169 included a mixed population of T1DM and T2DM cases. 104–106,129,169 There were no issues with IPD integrity. There were no statistically significant differences between studies that provided data and those that did not with regard to sample size, country, year of publication, type of psychological intervention or risk of bias (see Appendix 14, Table 38).
Studies of T1DM were divided into adolescents and children (i.e. those aged < 18 years at recruitment; there were nine such studies, including one with a mixed T1DM and T2DM population) and adult participants (i.e. those aged ≥ 18 years; there were six such studies, including four with a mixed T1DM and T2DM population). People with T1DM were, therefore, typically younger [1392 were adolescents or children (< 18 years); 751 were adults (aged ≥ 18 years)] and typically had higher HbA1c levels at baseline and lower BMI values (Table 17). Adults with T1DM had higher HbA1c level baseline values [9.26% (SD 1.47%); n = 726] and lower BMI values [25.92 kg/m2 (SD 4.62 kg/m2); n = 374) than participants with T2DM. Diabetes duration was, on average, similar in both groups. Only one study145 provided the gender of the participants. Baseline recordings for HbA1c levels were above 95% for both types of diabetes groups, and follow-up rates were 85% and 81% for T1DM and T2DM populations, respectively. Participants with T1DM received mainly insulin treatment whereas only one-quarter of people with T2DM were treated with insulin.
| Variable | T2DM (N = 3639) | T1DM (N = 2182) | ||||
|---|---|---|---|---|---|---|
| n (%) | Mean (SD) or n [%] | Range | n (%) | Mean (SD) | Range | |
| Age (years) | 3117 (85.6) | 58.9 (10.16) | 11.47–90 | 2143 (98.2) | 21.9 (13.95) | 8–78 |
| HbA1c at baseline | 3471 (95.4) | 7.9 (1.69) | 2.7–19 | 2100 (96.2) | 9.1 (1.76) | 4.6–19.5 |
| HbA1c at follow-up | 2797 (80.6) | 7.5 (1.5) | 2–20.8 | 1846 (84.6) | 9.2 (1.81) | 5.4–18.3 |
| Gender (Male = 1) | 57 (1.6) | 25 [43.9] | N/A | 0 (0) | N/A | N/A |
| Duration (years) | 2060 (59.3) | 7.1 (6.73) | 0.08–44 | 1695 (77.7) | 7.9 (7.56) | 0.08–52.7 |
| BMI (kg/m2) | 2909 (83.8) | 32.1 (6.26) | 13.9–63.2 | 1098 (50.3) | 22.9 (5.65) | 0.08–119.1 |
| Treatment | 1988 (91.1) | – | – | 481 (13.2) | – | – |
| Insulin | 535 (26.9) | – | – | 480 (99.8) | – | – |
| Diabetic medication | 154 (7.8) | – | – | 0 (0) | – | – |
| Diet/exercise | 1299 (65.3) | – | – | 1 (0.2) | – | – |
We conducted linear regression models with HbA1c level as outcome and treatment type and baseline values of HbA1c level as fixed independent variables, with a random intercept for study, random treatment effect and a random effect for baseline measures of HbA1c levels. To identify moderators of improvement in HbA1c levels, we ran several analyses, initially using only one predictor variable and its interaction with treatment arm at a time to avoid reducing sample size. For adolescents/children with T1DM, only a random effect for treatment arm was included.
Individual patient data meta-analysis for studies of adults with type 1 diabetes mellitus
Two studies168,169 had one and two participants, respectively, aged 18 years with T1DM; therefore, they were not included in the analyses.
Step 1
In step 1, we investigated the effect of treatment and baseline values for HbA1c levels only.
Glycated haemoglobin levels at baseline did not moderate the treatment outcome [interaction HbA1c level and arm: b = –0.053 (95% CI –0.20 to 0.094; p = 0.480), n = 455 participants, nstudies = 6]. After removing the interaction, there was a small but non-significant decrease in HbA1c level at follow-up, after controlling for baseline values in the treatment compared with the control group [mean difference –0.084 (95% CI –0.412 to 0.244; p = 0.615)]. There was no within-study correlation [intracluster correlation coefficient (ICC) = 0]. The forest plot of the meta-analyses is shown in Appendix 14, Figure 51. Between-study heterogeneity was small (I2 = 0.05).
Step 2
In step 2, we explored age and duration of illness as potential moderators of treatment effect, in addition to treatment arm and baseline HbA1c level.
There were only two studies with diabetes duration information; therefore, we included ‘study’ as a fixed effect in the model. No combined analyses with age were performed.
Including age and the interaction between age and treatment arm did not reveal a significant moderating effect of age [arm × age = –0.002 (95% CI –0.018 to 0.021; p = 0.844, n = 455 participants, nstudies = 6)]. After removing the interactions from the model, age did not predict HbA1c level at follow-up: [age: = –0.008 (95%. CI –0.018 to 0.002; p = 0.112)] and there was a non-significant treatment effect (b = –0.095, 95% CI –0.414 to 0.224; p = 0.561). The ICC for ‘study’ site remained 0. Appendix 14, Figure 52, shows the forest plot of estimated treatment effects after controlling for age and duration of study. There was little between-group variance (I2 = 0.047).
Step 3
The year of publication was not significant (p = 0.520) and did not alter the conclusion of the results.
The analyses of duration of illness with two studies did not reveal a significant moderating treatment effect (arm × duration: 0.002, 95% CI –0.023 to 0.027; p = 0.878, n = 261 participants, nstudies = 2). There was no main effect for duration of treatment after removing the interaction with treatment arm (b = –0.009, 95% CI –0.026 to 0.007; p = 0.262). However, after controlling for duration of outcome, a significant treatment effect was observed. Participants receiving treatment improved, on average, more after treatment (b = –0.38, 95% CI –0.661 to 0.099; p = 0.008, n = 261 participants, nstudies = 2).
Individual patient data meta-analysis for studies of adolescents/children with type 1 diabetes mellitus
Step 1
In step 1, we investigated the effect of treatment and baseline values for HbA1c levels only.
Glycated haemoglobin levels at baseline did not moderate the treatment outcome (interaction HbA1c level and arm: b = –0.022, 95% CI –0.101 to 0.0581; p = 0.595, n = 1257, nstudies = 9). After removing the interaction, there was a small but non-significant decrease in HbA1c levels at follow-up, after controlling for baseline values in the treatment group compared with the control group (mean difference –0.127, 95% CI –0.282 to 0.030; p = 0.112). Within-study correlation was small (ICC 0.039, 95% CI 0.012 to 0.12). The forest plot of the meta-analyses is shown in Appendix 14, Figure 53. Between-study heterogeneity was moderate (I2 = 0.28).
Models included a random study intercept and random treatment HbA1c at baseline effects.
Step 2
In step 2, we explored age and duration of illness as potential moderators of treatment effect, in addition to treatment arm and baseline values for HbA1c levels.
Including age and the interaction between age and treatment arm did not reveal a significant moderating effect of age (arm × age = –0.048, 95% CI –0.115 to 0.019; p = 0.160, n = 1234 participants, nstudies = 9). Similarly, there was no moderating effect of duration of diabetes in years with treatment arm (arm × duration: –0.028, 95% CI –0.017 to 0.073; p = 0.224, n = 1125 participants, nstudies = 8).
Including age and duration together as moderators in the model resulted in similar non-significant moderating effects (arm × age: – 0.068, 95% CI – 0.14 to 0.009; p = 0.07) (arm × duration: 0.039, 95% CI –0.008 to 0.085; p = 0.10, n = 1122 participants, nstudies = 8).
After removing the interactions from the model, age and duration of treatment were significant as main effects: independent of treatment arm, younger patients improved more (age: 0.046, 95% CI 0.005 to 0.086; p = 0.03) and patients with longer duration of diabetes improved more (b = –0.038, 95% CI –0.062 to –0.014; p = 0.002). The treatment effect remained non-significant after including age and duration (–0.149, 95% CI –0.306 to 0.016; p = 0.08). The ICC for ‘study’ site remained small (0.035). Appendix 14, Figure 54, shows the forest plot of estimated treatment effects after controlling for age and duration of study. There was a small amount of between-group variance (I2 = 0.24).
Step 3
The year of publication was not significant (p = 0.273) and did not alter the conclusion of the results.
Individual patient data meta-analysis for studies of adults with type 2 diabetes mellitus
Step 1
In step 1, we investigated the effect of treatment and baseline values for HbA1c levels only.
The models included a random study intercept and random treatment HbA1c level baseline effects.
Glycated haemoglobin level at baseline significantly moderates treatment outcome (interaction HbA1c level and arm: b = –0.077, 95% CI –0.127 to –0.027; p = 0.003, n = 2541 participants, nstudies = 19) (Figure 24). Appendix 14, Figures 24 and 55, show the predicted mean differences in HbA1c levels at follow-up at varying HbA1c baseline levels. At about 6.5% HbA1c (48 mmol/mol) at baseline, there were no treatment differences between the intervention and control groups predicted. There was an increasing advantage of intervention with increasing HbA1c baseline levels. At the mean baseline level of HbA1c of 7.8% (62 mmol/mol), patients in the intervention group had, on average, 0.107% (1 mmol/mol) (95% CI –0.190% to –0.023%; p = 0.013%) lower levels of HbA1c at follow-up than patients in the control group. The random effect of baseline HbA1c level suggests considerable variation between study sites (SD 0.124%, 95% CI –0.081% to 0.190%) and considerable within-study correlation (ICC 0.329, 95% CI 0.147 to 0.582). The forest plot of the meta-analyses with centred baseline HbA1c levels [equivalent to holding baseline values constant at 7.8% (62 mmol/mol)] is shown in Appendix 14, Figure 56. No between-study heterogeneity was estimated (I2 = 0).
FIGURE 24.
The IPD meta-analysis comparing treatment with control in terms of HbA1c levels at follow-up for studies of adults with T2DM. The plot shows the differences in predicted mean treatment outcome together with 95% CIs follow-up between intervention and control groups in dependency of the moderator HbA1c level at baseline. Effect sizes are unstandardized differences in % HbA1c.
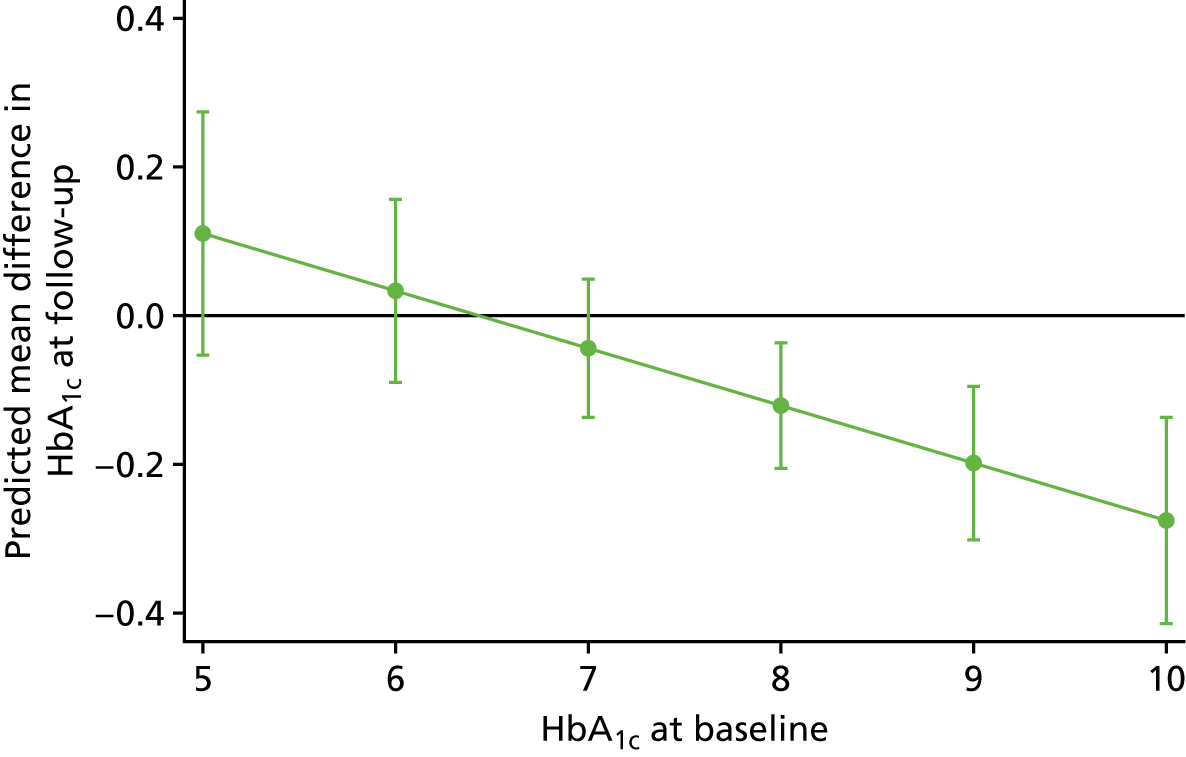
Step 2
In step 2, we explored age and duration of illness as potential moderators of treatment effect, in addition to treatment arm and baseline values of HbA1c, and the interaction between arm and HbA1c baseline values.
Including age and the interaction between age and treatment arm did not reveal a significant moderating effect of age (arm × age = –0.003, 95% CI –0.012 to 0.006; p = 0.580, n = 2336, nstudies = 13). After removing the interactions from the model, age predicted HbA1c level at follow-up (b = –0.009 (95% CI –0.014 to –0.004; p < 0.001). The interaction between baseline HbA1c levels and treatment arm and treatment difference at mean baseline values remained significant. The ICC for study site remained large (0.187).
Including duration of diabetes and the interaction between duration and treatment arm did not reveal a significant moderating effect of duration (arm × duration = 0.012, 95% CI –0.027 to 0.003; p = 0.11, n = 1457 participants, nstudies = 11). After removing the interaction from the model, duration of diabetes predicted HbA1c level at follow-up: participants with a longer duration of illness had lower HbA1c values at follow-up (b = –0.011, 95% CI –0.002 to –0.019; p = 0.011). The interaction between baseline HbA1c level and treatment arm and treatment difference at mean baseline values remained significant. The ICC for study site remained large (0.265).
Including type of treatment and the interaction between type of treatment and treatment arm did not reveal a significant moderating effect of type of treatment (p = 0.211, n = 1415 participants, nstudies = 11). After removing the interaction from the model, type of treatment predicted HbA1c level at follow-up (χ2(2) = 14.83; p < 0.0001): participants treated with diet and exercise improved by 0.47% (5 mmol/mol) HbA1c at follow-up compared with participants treated with insulin (b = –0.471, 95% CI –0.728 to –0.214; p < 0.001). Participants treated with medication also improved compared with those treated with insulin (b = –0.223, 95% CI –0.373 to –0.074; p = 0.003), but significantly less so than those treated with diet and exercise (b = 0.247 95% CI 0.02 to 0.475; p = 0.033).
The interaction between baseline HbA1c level and treatment arm (b = –0.042, 95% CI –0.113 to 0.030; p = 0.251) and treatment difference at mean baseline values (b = –0.042, 95% CI > –0.187 to 0.048; p = 0.245) were not significant. The ICC for study site remained large (0.265).
Including age and duration of illness in the model resulted in a similar conclusion. Independent of treatment type, older people improved more than younger people (b = –0.008, 95% CI –0.013 to –0.002; p = 0.011) and the longer the duration of diabetes, the less the improvement at follow-up (b = 0.013, 95% CI 0042 to 0.021; p = 0.003). The interaction between treatment and HbA1c level remained significant (b = –0.09, 95% CI –0.013 to –0.002; p = 0.008): participants in the intervention group improved more with increasing HbA1c baseline values than participants in the control group. At average HbA1c baseline levels, participants in the intervention group had 0.0134% lower HbA1c levels at follow-up than participants in the control arm (b = –0.0134, 95% CI = –0.232 to –0.035; p = 0.008). The large ICC of 0.236 shows that study site was a factor in the degree to which participants’ HbA1c levels changed.
The forest plot of the meta-analyses with centred baseline HbA1c levels [equivalent to holding baseline values constant at 7.8% (62 mmol/mol)] and controlling for age and duration of illness is shown in Appendix 14, Figure 57. No between-study heterogeneity was estimated (I2 = 0).
Removing the study169 with the small sample size (n = 15) did not alter the results or conclusion in any of the analyses. Appendix 14, Figure 58, shows the forest plot of the previous meta-analyses repeated but excluding this study. 169
Including all three potentials in the model reduced the sample size to six study sites with 873 participants. There were no significant interactions of age, duration of illness or treatment type with treatment. Main effects of age, duration and type of treatment were also not significant. There was no significant treatment effect.
Step 3
The year of publication did not have any significant influence on treatment outcome (p-values of > 0.19) and did not alter conclusions of the meta-analyses.
Chapter 7 Non-randomised controlled trial results
Study selection
A total of 16,900 citations were identified; 1794 duplicates were removed and 15,054 citations were excluded following title/abstract screening. The full texts of 52 citations were screened; 38 were excluded for the following reasons: unable to access published paper (n = 2), not nRCTs (n = 11), did not include a psychological intervention (n = 16), interventionists not trained in psychological therapy (n = 4), HbA1c level was not an outcome (n = 3) and was not limited to a T1DM/T2DM population (and did not report separate analysis for diabetes; n = 2). The remaining 14 studies met the inclusion criteria for review (T1DM, 6 studies; T2DM, 7 studies; and T1DM and T2DM, 1 study). Inter-reliability for full-text inclusion was calculated; 58.8% (Cohen’s kappa 0.588) agreement was found between the two raters (AK and RU). Higher agreement (Cohen’s kappa 0.910) was found after initial discussion. All the included studies were nRCTs (comprising prospective/retrospective cohort studies, quasi-experimental studies, pre-/post-test control designs and observational controlled pre/post studies) published in English.
Characteristics of studies of people with type 1 diabetes mellitus
Six studies226–231 had a T1DM population. People with T1DM and people with T2DM were included in the Harris et al. 232 study, in which 55 patients had T1DM. These 55 patients were included in the T1DM qualitative synthesis. Study characteristics are summarised in Table 18.
| Year, country, first author | Number of participants with T2DM | Mean (SD) age (years)(intervention and control) | Inclusion criteria for individual studies | Mean duration of diabetes (intervention and control) | Type of psychological intervention | Number of sessions | Intervention name; facilitator; format; individual/group | Control category, facilitator, format, individual/group | Follow-up |
|---|---|---|---|---|---|---|---|---|---|
| T2DM nRCT studies | |||||||||
| 2004, South Korea, Kim233 | 45 |
|
T2DM for < 20 years; HbA1c level of < 10.0%; no chronic complications; no insulin |
|
Transtheoretical model | NR | Staged-matched intervention; researcher; face to face and telephone; individual | Usual educational advice; NR | Post intervention |
| 2007, South Korea, Song234 | 59 |
|
T2DM; HbA1c level of > 7.0%; no mental illness; no diabetic complications |
|
Counselling and multidisciplinary diabetes education | NR | Counselling and education; psychologist; face to face and telephone; individual and group | Usual care; diabetes education; NR | 3 months |
| 2009, Italy, Forlani235 | 822 |
|
T2DM | NR | CBT | 12–15 | CBT; psychologist; face to face; group | Usual care (prescriptive diet); dietitian; face to face; individual | Up to 48 months |
| 2009, the USA, Harris232 | 3 |
|
T1DM or T2DM; HbA1c level of ≥ 9.0%; missed more than two clinic appointments |
|
BFST-D | 10 | Family therapy; Master’s level social worker/trainee psychologist; face to face; group | Usual care; NR | Post intervention |
| 2011, South Korea, Lee236 | 83 |
|
T2DM; aged > 50 years; no exercise for > 3 days per week for 1 month; no microvascular complications | NR | Cognitive psychology, educational theory, social problem-solving | 12 | Chronic disease self-care using heart rate monitor; research assistant; face to face; group | See intervention description; without heart rate monitor | 3 and 6 months |
| 2013, Spain, Cervantes Cuesta237 | 72 |
|
T2DM; aged 30–75 years; HbA1c level of ≥ 6.5% | NR | Psychoeducation | 11 | Psychoeducative group; NR; face to face; group | Usual diabetes education; NR | 3 months |
| 2014, Thailand, Ounnapiruk238 | 60 |
|
T2DM for > 6 months; aged 60–79 years; no complications |
|
Bandura’s concept of self-efficacy239 | 4 | Behavioural modification programme; researcher; face to face; individual and group | Usual care; NR | 3–4 months |
| 2014, Taiwan, Wu240 | 228 | 60.83 (12.48) for all participants | T2DM; aged > 20 years; language: Mandarin or Taiwanese; home telephone | 10.27 (8.34) for all participants | Diabetes self-management programme | 4 | Self-management; trained nurses; face to face and telephone, individual and group | Usual care, diabetes education consultant; face to face; individual | 1 month |
| T1DM nRCT studies | |||||||||
| 2003, the USA, Ellis229 | 4 | 14–15 | T1DM for ≥ 1 year; HbA1c levels of ≥ 14%; aged 12–16 years | 5 –10 | Multisystemic therapy | 2 or 3 times a week | Multisystemic therapy; trained therapist; face to face; group | Usual care; NR | 3 months |
| 2003, Japan, Takii226 | 19 |
|
T1DM for ≥ 1 year; female; 3 years post treatment or no treatment for ≥ 2 years after first visit; binge-eating > 500 calories in one sitting and compensatory behaviour two or more times a week for 3 months |
|
Integrated inpatient therapy | NR | Integrated inpatient therapy; therapist; face to face; individual and group | Counselling; physician; face to face; individual |
|
| 2006, Iran, Attari227 | 60 |
|
T1DM for ≥ 1 year; aged 16–30 years |
|
Stress management | 8 | Stress management training; experienced psychiatrist; face to face; group | Usual care; NR | Post intervention |
| 2006, Germany, Kubiak228 | 107 |
|
T1DM; at a high risk of developing hypoglycaemia; no impaired vision, cognitive impairment or psychiatric comorbidity |
|
Self-management intervention | 6 | Self-management treatment; psychologist; face to face; group | Education on hypoglycaemia; psychologist; face to face; group | 6 months |
| 2009, the USA, Harris232 | 55 |
|
T1DM or T2DM; HbA1c level of ≥ 9.0%; missed more than two clinic appointments |
|
BFST-D | 10 | Family therapy; Master’s level social worker/trainee psychologist; face to face; group | Usual care; NR | Post intervention |
| 2010, Spain, García-Pérez230 | 57 |
|
T1DM; aged 11–18 years |
|
Psychoeducation | NR | Summer camp for T1DM; psychologist; face to face; group and individual | Usual care; NR | 3 and 12 months |
| 2013, the USA, Bitsko231 | 117 |
|
T1DM; non-adherence to pharmacological treatment/mental state of concern by medical providers |
|
Psychotherapy | 9 | Talk therapy; licensed doctoral-level psychologist; face to face; individual and group | Usual care; NR | 12 months |
Study location
The studies originated from the following places: the USA (n = 3),229,231,232 Asia [Japan (n = 1)226 and Iran (n = 1)227] and Europe [Germany (n = 1)228 and Spain (n = 1)230].
Participant characteristics
The seven studies investigating people with T1DM included a total of 419 participants (ranging from 4 to 117 people with T1DM per study). Studies included adult (n = 3)226–228 or adolescent populations (n = 4). 229–232
Studies of T1DM stipulated various inclusion criteria for participants, for example a HbA1c level of ≥ 9%;232 or ≥ 14%. 229 Age criteria were also outlined: 12–16 years,229 16–30 years227 and 11–18 years. 230 Other inclusion criteria included being at a high risk of developing hypoglycaemia;228 no impaired vison, cognitive impairment or psychiatric comorbidity;228 binge-eating behaviours;226 missed more than two clinic appointments;232 and non-adherence to pharmacological treatment and/or mental state of concern to medical providers. 231
Intervention characteristics
Psychological interventions were underpinned by various psychological models or principles: family-based interventions,229,232 inpatient therapy,226 stress management,227 a self-management intervention,228 psychoeducation230 and psychotherapy. 231 The number of therapy sessions per study ranged from 6 to 56 (2 or 3 times a week over a 7-month period). 229 The following facilitators delivered the psychological interventions: therapists (n = 2),226,229 psychiatrists/psychologist (n = 4)227,228,230,231 and social worker/trainee psychologist (n = 1). 232
Control characteristics
The nRCTs delivered the following control groups: usual care (n = 5);227,229–232 counselling (n = 1);226 and hypoglycaemia education (n = 1). 228 Details regarding the components and delivery of usual care were limited. The control counselling intervention226 was delivered on a one-to-one basis by a physician. The education on hypoglycaemia control intervention228 was delivered in a group environment by a psychologist.
Primary outcome
In all studies, HbA1c level (in % or mmol/mol) was assessed at baseline and follow-up. Follow-up periods ranged from immediately post intervention to 12 months post intervention.
Secondary outcomes
The types of measures for secondary outcomes are outlined in Appendix 15. The following outcomes were assessed for T1DM studies: presence of eating disorders,226 depression,228 control beliefs,228 fear of hypoglycaemia,228 fear of diabetes complications,228 stress management227 and anxiety. 228,230
Risk of bias in studies of type 1 diabetes mellitus
The quality assessment for each study is reported in Appendix 15, Table 39. Four studies226–228,230 had information missing for more than one domain, which made the assessment of quality difficult; therefore, no decision was made regarding the RoB for these studies. The domains that had missing information included bias arising from deviations from intended interventions and missing data. The remaining three studies229,231,232 also had no information for the bias arising from missing data, but an assessment could be made based on other domains. One study231 was considered to be at a ‘serious’ RoB because of confounding issues with inclusion of participants, non-adjustment of baseline characteristics and possible selection bias. Two studies were rated as being at a critical RoB169,232 because of problems with participant recruitment for the control group and absence of separate information for each group regarding demographic characteristics.
Results of individual studies of type 1 diabetes mellitus
Five studies with a T1DM population reported mean HbA1c levels at baseline and follow-up for intervention groups; two studies226,229 did not report these values (see Appendix 15, Table 40). Of the five studies, only one demonstrated a significant difference between the intervention and control groups, with a greater reduction in HbA1c levels in the intervention group. 227 Three studies did not provide a test for significance for the difference in HbA1c levels between baseline and follow-up, or between groups. 226,229,232
For other outcomes, Takii et al. 226 reported that, in the intervention group, 78% participants no longer met the clinical criteria for eating disorders at follow-up. Attari et al. 227 demonstrated statistically significant between-group differences in positive coping for stress management in favour of the psychological intervention group (stress management) compared with the control (usual care). García-Pérez et al. 230 reported that there were no statistically significant between-group differences in anxiety outcomes.
Harris et al. 232 observed a statistically significant group difference at follow-up and improvement in diabetes responsibility and conflict for adolescents and their mothers, but not their fathers. However, for conflict behaviour, Harris et al. 232 did find statistically significant group difference and improvement at follow-up for adolescents and both parents (mothers and fathers). Note that this was not limited to a T1DM population (three people with T2DM were included in this analysis).
Kubaik et al. ’s228 study did not demonstrate any statistically significant between-group differences for depression, anxiety, control beliefs, fear of hypoglycaemia or fear of diabetic complications.
Characteristics of studies of people with type 2 diabetes mellitus
Seven studies included a T2DM population. In addition, one study (Harris et al. 232) included a mixed T1DM and T2DM population, of which three participants had T2DM; these three participants were included in the T2DM qualitative synthesis when possible. Study characteristics are summarised in Table 18.
Study location
The studies originated from Asia (South Korea, n = 3; Thailand n = 1; and Taiwan n = 1), Europe (Italy, n = 1; and Spain n = 1) and the USA (n = 1).
Participant characteristics
The eight studies investigating people with T2DM represented a total of 1372 participants (ranging from 3 to 822 people with T2DM per study). Studies included adult (n = 7)233–238,240 or adolescent populations (n = 1). 97
Studies stipulated various inclusion criteria for people with T2DM to participate, for example a HbA1c level of < 10%,233 ≥ 6.5%,237 > 7%,234 or ≥ 9%. 232 Some studies specified no complication status,233,234,236,238 no mental health illness,234 treatment type (no insulin233) and duration of diabetes (< 20 years233). Age criteria were also outlined: > 20 years,240 30–75 years,237 > 50 years236 and 60–79 years. 238
Intervention characteristics
Psychological interventions were underpinned by various psychological models or principles: trans-theoretical model,233 counselling,234,240 cognitive–behavioural approach,235,236 BFST-D,232 psychoeducation237 and Bandura’s concept of self-efficacy. 238 Two studies reported the use of manuals. 232,235 The number of therapy sessions per study ranged from 4 to 15.
Psychological interventions were delivered by the following facilitators: researcher or research assistant (n = 3),233,236,238 psychologist (n = 2),234,235 trainee psychologist (n = 1)232 and nurses (n = 1);240 one study did not report the type of facilitator. 237 The level of training received by the facilitators was reported in two studies: one provided intensive training232 and the other reported that the facilitator was provided with reading material regarding the intervention. 240
Control characteristics
Control groups consisted of usual care (n = 7)232–235,237,238,240 and chronic disease self-care (n = 1). 236 In some cases, usual care included diabetes education or dietary advice. Details regarding delivery and components of control groups was limited.
Primary outcome
In all studies, HbA1c level (% or mmol/mol) was assessed at baseline and follow-up. The follow-up period ranged from post intervention to 48 months.
Secondary outcomes
The type of measures used are outlined in Appendix 15, Table 41. The following outcomes were assessed: readiness to exercise;233 diabetes responsibility and conflict;232 coping;236 diabetes self-management self-efficacy;238 depression, anxiety and stress;240 perceived treatment efficacy;240 and well-being. 240
Risk of bias in studies of people with type 2 diabetes mellitus
The quality assessment for each study is reported in Appendix 15, Table 39. Four studies had information missing for more than one domain, which made the assessment of quality difficult; no decision was made regarding the RoB for this study. The domains that had missing information included bias owing to deviations from intended interventions and missing data. The remaining four studies also had no information for the bias arising from missing data, but an assessment could be made based on other domains. One study was considered to be at a ‘serious’ RoB,235 mainly because of confounding issues with inclusion of participants, non-adjustment of baseline characteristics and possible selection bias. Two studies were rated as being at a ‘critical’ RoB232,240 and one as was rated as being at a ‘moderate’ RoB236 because of major problems with participant recruitment for the control group and absence of information regarding demographic characteristics for both groups separately.
Results of individual studies of people with type 2 diabetes mellitus
The following paragraphs present a summary of individual studies. Appendix 15, Table 40, reports HbA1c values (primary outcome) and Appendix 15, Table 41, presents secondary outcomes for all individual studies.
Only two of the eight studies demonstrated a significant difference between the psychological intervention group and the control group, with a greater improvement in HbA1c level in the intervention group. 234,240 Harris et al. 232 and Lee et al. 236 did not provide a significance test for the difference in HbA1c levels between baseline and follow-up, or between groups.
For secondary outcomes, Kim et al. 233 reported a statistically significant increase in the participants’ readiness to change and participate in physical activities in the psychological intervention group, but not the control group. Lee et al. 236 demonstrated no between-group differences in coping strategies post intervention. In one study,238 self-efficacy regarding diabetes management did significantly improve in the intervention group compared with control group at 3 months.
In the study by Wu et al. ,240 statistically significant group differences and improved perceived self-efficacy and self-care, and levels of depression, anxiety and stress were demonstrated in favour of the psychological intervention.
Limitations of the type 1 and type 2 diabetes mellitus studies
Most studies reported the method of non-randomisation as a potential limitation that hindered the validity and reliability of the test results. Other limitations that were reported included small sample size;229,231,233,238 possible selection bias in recruiting participants;144,229,230,235 study design, such as retrospective or lack of participant blinding;231,240 duration of the follow-up;231,234,238,240 difference between the recruiting sites;228,230,238 psychological assessments lacking validity and reliability;234,236 absence of standardisation of measures to gauge clinical significance;232 effect of media or self-study;234,236 and non-adjustment of baseline data for psychological characteristics. 230,235
Chapter 8 Health economic analyses
Overview
In this chapter, we cover the methods and results of two cost-effectiveness modelling exercises:
-
the cost-effectiveness of CBT versus counselling versus usual care in adults with T1DM using an adapted health economic individual-level simulation model – the Sheffield Type 1 Diabetes Policy Model
-
the cost-effectiveness of CBT versus counselling versus usual care in adults with T2DM using an adapted health economic individual-level simulation model – the SPHR Type 2 Diabetes Prevention Model.
Detailed methods on the Sheffield Type 1 Diabetes Policy Model
Sheffield Type 1 Diabetes Policy Model framework
The Sheffield Type 1 Diabetes Policy Model, version 1.4, henceforth ‘the model’, is an individual-level simulation model used to estimate the lifetime costs and QALYs for adults with T1DM. An individual’s HbA1c level determines their risk of progression for all diabetic complications in the model, which include nephropathy, neuropathy, retinopathy, macular oedema, myocardial infarction, stroke, heart failure, angina, severe hypoglycaemia and DKA (see Appendix 16, Tables 48 and 50). A higher HbA1c level increases the risk of progression for all complications in the model, except severe hypoglycaemia, for which a lower HbA1c level increases the risk of experiencing an event. Individuals in the model are at risk of death from the incidence of nephropathy, myocardial infarction, stroke, heart failure, angina and all-cause mortality. HbA1c level indirectly affects mortality in the model, as the probability of death does not differ by HbA1c level; however, the risk of experiencing these events is higher for someone with a higher HbA1c level.
The model has previously been used to assess the cost-effectiveness of various versions of the Dose Adjustment For Normal Eating (DAFNE) course241,242 (see Appendix 16, Table 49), stratification of DAFNE by psychological factors,243 structured education for children with T1DM and extending the use of insulin pumps244,245 to all adults with T1DM who are eligible to receive a structured education course.
Complete details of how the model calculates the incidents of diabetes complications is provided in Heller et al. 245 and Thokala et al. 246
The model attaches costs to clinical events and health states allowing the calculation of costs over a lifetime. Full details are given in Appendix 16, Tables 42–45.
The model attaches utilities to health states, allowing the calculation of QALYs over a lifetime. 247–250 Utility decrements are applied additively; if an individual experiences decrements in two different submodels (e.g. end-stage renal disease in the nephropathy submodel and myocardial infarction), then both decrements are applied. If an individual progresses in a submodel (e.g. in the retinopathy submodel, an individual can progress from proliferative retinopathy to blindness), then only the decrement associated with the more severe health state is applied. Full details are given in Appendix 16, Table 48.
Baseline characteristics for the people with type 1 diabetes mellitus modelled in this study
Individual baseline characteristics were sourced from the NICE T1DM guidelines27 (see table 69 in the appendices of the NICE guideline NG1727) and our previous work on the cost-effectiveness of DAFNE-structured education. Most characteristics and their SDs were sourced from the NICE T1DM guidelines. If SDs were not available from the NICE guidelines27 (because of transformation of variables), the correlation between the variables was sourced from the DAFNE research database. Two variables (the baseline cost of insulin used and the baseline cost of diabetes-related contacts with health-care professionals) were sourced from the Relative Effectiveness of Pumps over Structured Education (REPOSE) trial data set. 245 The samples of these variables were conditional on the other samples. Full details are given in Appendix 16, Table 47.
Incorporating short-term (1 year) clinical effectiveness evidence for people with type 1 diabetes mellitus modelled in this study
In the main economic analysis, the effectiveness of the different psychological interventions was sourced from the NMA shown Table 6. The main estimates are presented in Appendix 16, Table 46. The estimate for the effect of CBT versus usual care was –0.312 (95% CI –0.499 to –0.126). The estimate for the effect of counselling versus usual care was –0.121 (95% CI –0.307 to 0.066). The full variance–covariance matrices used for the PSA on mean effects are presented in Appendix 16, Tables 43–45.
For each individual, the psychological intervention effect and the individual’s baseline HbA1c level were used to generate the HbA1c level at 1 year. In the model, we capture heterogeneity of response to the psychological intervention by allowing individuals’ HbA1c levels at year 1 to vary, but ensuring that, when aggregated, they would have the mean effect from the NMA. The statistical method to incorporate this heterogeneity uses evidence on the dispersion of HbA1c from the REPOSE trial of T1DM244 (see Appendix 16, Tables 47–50, and table 22 of supplementary B material in Pollard et al. 244). The impact of including heterogeneity in HbA1c response is that the modelled HbA1c profile for an individual is more likely to reflect clinical practice, in which some people’s HbA1c level is likely to rise after 1 year and others’ levels are likely to fall, with the average across all the individuals being that from the meta-analysis. Another consequence of using this technique is that the use of the dispersion parameter involves using a beta regression framework, which means that people with a low baseline HbA1c level cannot receive an implausibly low HbA1c value (< 4.8%, based on clinical expert opinion) in the simulation.
Incorporating longer-term clinical effectiveness evidence for type 1 diabetes mellitus
The key study found was Ridge et al. 251 This study used a RCT of adults with T1DM and suboptimal glycaemic control who received motivational enhancement therapy (i.e. counselling) alone or motivational enhancement therapy CBT. The participants in the group that received motivational enhancement therapy CBT showed a greater reduction in their 12-month HbA1c levels than those who received usual care. Whether or not improvements in glycaemic control persisted up to 4 years after randomisation was tested. Statistical analysis was undertaken on 260 (75.6%) people who consented to take part in this post-trial study.
We used the information from this study251 and its supplementary material to examine the duration of treatment effects over 2, 3 and 4 years. We calculated the implied trajectory using the sample size weighted average of the 2-, 3- and 4-year follow-ups. This was calculated as:
This calculation was done separately for the CBT and counselling arms.
We developed to a method to analyse the uncertainty in this trajectory. This was based on the CI for the HbA1c fall at year 1 and the CI for the weighted average HbA1c level in the follow-up years, assuming normal distribution for each. The implied trajectory was calculated for each sample from these distributions. We then calculated the correlation between the trajectory and the fall in HbA1c level at 1 year. We used this to estimate a normal conditional probability distribution for the trajectory, conditional on the 1-year fall in HbA1c level from the NMA. Again, the uncertainty in the trajectory was analysed separately for the CBT and counselling arms.
Appendix 16 (see Tables 70–72) shows the resulting parameters for the conditional distributions for CBT and for counselling.
When a PSA run samples a negative trajectory versus usual care (i.e. a persistently widening gap over the long term), we have modelled maintenance of the initial treatment gap, rather than assuming that a psychological intervention can generate a wider gap at year 10 or 20 than it has at year 4. This was partially because the psychological intervention in the Ridge et al. 251 study was just a 1-year intervention (i.e. no further active psychological intervention was provided after year 1).
Costing psychological interventions for adults with type 1 diabetes
The cost of psychological interventions was calculated, based on the information from the trials and studies from the systematic reviews. The references104,105,162–166 were examined in detail to extract information on the main elements of cost, which are as follows:
-
costs of staff time to deliver the intervention
-
session-related non-contact staff time
-
cost of consumables per session
-
costs associated with training the staff who will deliver the psychological interventions
-
costs associated with supervision of staff
-
proportion of sessions that are individual based versus group based
-
number of course participants in group sessions.
These are broadly split into two categories: those types of resource use/cost that are assumed to be the same across interventions and those that are different (Table 19). The following categories are assumed to be the same across interventions: the interventionists, the session-related non-contact time (either as a ratio of contact time or an absolute value), the cost of consumables and the training costs. In addition, the following categories are assumed to be different: the split between individual and group sessions, the average number of people in a group session, the number of sessions and the duration of each session.
| Parameter | Value(s) (95% CI) | Source/calculation |
|---|---|---|
| Cost of CBT per participant | £657.22 | This study (see Appendix 16, Table 75) |
| Cost of counselling per participant | £580.42 | This study (see Appendix 16, Table 75) |
| Mean reduction in HbA1c level in first year, CBT versus usual care (%) | –0.312 (–0.499 to –0.126) | Chapter 5 of this study. See Appendix 16, Table 66, for variance–covariance matrix |
| Mean reduction in HbA1c level in first year, counselling versus usual care (%) | –0.121 (–0.307 to 0.066) | Chapter 5 of this study |
| Long-term trajectory of HbA1c levels 12 months after CBT: annual change in % HbA1c level versus usual care (%) | –0.009 (–0.176 to 0.158)a | Ridge et al.251 and further analysis in Appendix 16, Table 66 |
| Long-term trajectory of HbA1c levels 12 months after counselling: annual change in % HbA1c level versus usual care (%) | –0.062 (–0.341 to 0.216)a | Ridge et al.251 and further analysis in Appendix 16, Table 66 |
For T1DM, the estimated cost per participant of delivering the interventions is as follows:
-
cost of CBT intervention – £657.22 per participant
-
cost of counselling intervention – £580.42 per participant.
When examined in terms of cost per participant per session, these costs are £82.34 for CBT and £72.72 for counselling, which are of a similar order of magnitude to the costs (£81.12 for CBT and £49.14 at 2005/6 prices) reported in the 2010 Health Technology Assessment study by Ismail et al. 252
All costs were adjusted to 2015/6 GBP prices using the hospital and community health services pay and prices index. 253 A summary of the costs is given in Table 19 and details of the methods and costs can be seen in Appendix 16.
Usual care costs presented in the studies included in the systematic review were either in the context of the intervention being an enhancement to usual care or the usual care contacts when related to protocol requirements (e.g. collection blood samples at baseline). Therefore, it was assumed that there were no additional costs associated with usual care.
Main analysis of cost-effectiveness
The analysis conducted 500 model runs, with each PSA iteration sampling every uncertain parameter from its associated probability distribution, and each PSA run modelling 5000 individuals in each arm of the comparison.
The average of these 500 PSA runs is used to estimate expected discounted lifetime costs and expected discounted QALYs associated with each strategy being compared.
Methods to analyse decision uncertainty in type 1 diabetes model using expected value of perfect parameter information
Uncertainty is analysed using expected value of information statistics. The first is the overall EVPI, which calculates how valuable it would be to a decision-maker (e.g. NICE) to eliminate all uncertainty on all the model parameters (i.e. CIs do not exist, as every parameter is certainly known). The second is the EVPPI, which is the same idea but focused only on particular model parameters (i.e. only a defined subset of model parameters are certainly known, the rest are still uncertain).
The expected value of information calculations were estimated efficiently using a recently developed online tool called SAVI254 at a maximum acceptable ICER of £20,000 per QALY gained, in line with NICE decision-making thresholds.
Two subsets of parameters were explored in the EVPPI calculations: the parameters that would be generated directly by trial information (i.e. 1-year change in HbA1c level for psychological intervention vs. usual care) and the parameters that would be generated directly by the trial and a long-term follow-up study (1-year HbA1c level effects, the long-term trends in HbA1c level post usual care, and the long-term trends in HbA1c level post psychological intervention).
To quantify the overall scale of this uncertainty for the country, we need to consider the number of people affected. We assumed that every adult currently living with T1DM in the UK could potentially be affected by the decision as to whether or not they might benefit from a psychological intervention over a 10-year decision relevance time horizon. This means that ≈370,000 people255 could be affected by the decision to have or not have a psychological intervention over the next 10 years in the UK.
Detailed methods on the School for Public Health Research Type 2 Diabetes Prevention Model
School for Public Health Research Type 2 Diabetes Prevention Model framework
The SPHR Diabetes Prevention Model was developed to forecast long-term health and health-care costs under alternative scenarios for diabetes prevention. A wide range of stakeholders were involved in its development, including clinicians, public health commissioners, diabetes and health economic researchers and members of the public with diabetes. A detailed description of the methodology and assumptions used in the model can be found elsewhere. 99,256 Here we present a summary of the model.
The model is an individual patient simulation model based on the evolution of personalised trajectories for metabolic factors including BMI, SBP, cholesterol and measures of blood glucose (including HbA1c).
The usual baseline population consists of a representative sample of the English population obtained from the Health Survey for England, an annual survey that is designed to provide a snapshot of the nation’s health. 257 Note that we discuss in a later section of this report how the population has been adapted to focus on a population of people already diagnosed with T2DM and treated (see Baseline characteristics for people with type 2 diabetes mellitus modelled in this study).
The model runs in annual cycles over a lifetime horizon. Individuals’ BMI, cholesterol levels, SBP and HbA1c level fluctuate from year to year, representing natural changes as they age and depending on personal characteristics such as gender, ethnicity and smoking status.
The evolution of these individual-level trajectories, apart from HbA1c level, is based on a statistical analysis of the Whitehall II cohort258,259 (see Appendix 16, Tables 51–53), a longitudinal data set of civil servants. Every year in the model, an individual may visit their general practitioner or undergo an opportunistic health check, and be diagnosed with and treated for hypertension, high cardiovascular risk or diabetes, depending on their personal characteristics.
The model simulates a three-stage treatment regimen for people with T2DM:
-
First-line treatment assumes the use of low-cost treatments such as metformin (Glucophage®; Bristol-Myers Squibb, Uxbridge, UK).
-
A second treatment [assumed to be sitagliptin (Januvia®; Merck, Sharp & Dohme Inc., Kenilworth, NJ, USA) for the costings] is added if HbA1c levels rise above 8.48%, based on a recent study by Bennet et al. 260
-
Initiation of insulin or triple therapy (third-stage treatment) occurs if HbA1c level rises above 9.5%, which is the weighted average of the mean HbA1c level when people switched to insulin (9.78%) and triple oral therapy (8.71%), from the same Bennett et al. 260 study.
Individuals with HbA1c levels of ≥ 6.5% are at a risk of microvascular complications of diabetes, whether or not they are diagnosed with diabetes (see Appendix 16, Tables 54 and 55). The UK Prospective Diabetes Study (UKPDS)261,262 outcomes model risk equations are used to model the annual risk of kidney disease, ulcer, amputation and blindness (see Appendix 16, Table 56).
For this diabetes treatment version of the model, we have updated the risk of cardiovascular events for people with diabetes to be based on UKPDS CVD risk equations.
All-cause mortality is based on life tables for England and Wales. 263
Appendix 16 contains a detailed list of parameters and sources used in the model. These include cancer (see Appendix 16, Tables 57 and 58), osteoarthritis (see Appendix 16, Table 59), depression (see Appendix 16, Table 60) and associated utilities (see Appendix 16, Table 61) and unit health-care costs (see Appendix 16, Table 62).
Each condition is associated with a utility decrement and a cost.
The utility of each individual in each year of the model is dependent on their age, gender and medical conditions.
Costs are derived from published literature and inflated to 2015/16 GBP values using the hospital and community health services pay and prices index. 264 Costs for medications were obtained from the British National Formulary265 and costs for health-care resource use were obtained from the Personal Social Services Research Unit (PSSRU) unit costs. 266
The model perspective is that of the NHS and PSS.
Baseline characteristics for people with type 2 diabetes mellitus modelled in this study
The baseline characteristics are taken from recently published NICE guidelines (NG28)267 for T2DM, in which the full health economics report (see appendix F of the guidelines267) undertook simulation modelling for groups of people who are at the first line, second line and third line of diabetes therapy. In appendix F of the NICE guideline,267 section 3.3.3 (tables 20–28) sets out the methods for generating sampled patients in each of the three groups, which we have simply replicated for this study.
Some of the variables needed for the UKPDS outcomes model 2 risk equations were not present in these tables, such as triglycerides,7 haemoglobin262 and sets of other variables268 (low-density lipoprotein, estimated glomerular filtration rate, heart rate, presence of micro- and macro-albuminuria and white blood cell count); therefore, we generated procedures to sample or impute these, based on NICE guidance. 267
Incorporating short-term (1-year) clinical effectiveness evidence for patients with type 2 diabetes mellitus modelled in this study
In the main economic analysis, the effectiveness of the different psychological interventions was sourced from the NMA shown Table 15. The main estimates are presented in Appendix 16, Table 64.
The estimate for the effect of CBT versus usual care is –0.234 (95% CI –0.372 to –0.096). The estimate for the effect of counselling versus usual care is –0.132 (95% CI –0.23 to –0.033). These effects are somewhat smaller than the equivalents for T1DM. The full variance–covariance matrices used for the PSA on mean effects are presented in Appendix 16, Table 63.
For each individual, the mean psychological intervention effect and their baseline HbA1c level were used to generate the HbA1c levels at 1 year (see Appendix 16, Table 65). In the T2DM model, we do not capture heterogeneity of response to the psychological intervention because there was an absence of evidence available from the NMA or other sources regarding this.
Incorporating longer-term clinical effectiveness evidence for type 2 diabetes mellitus
There is an absence of any T2DM long-term psychological intervention follow-up studies analogous to the Ridge et al. 251 study we used for T1DM. Therefore, we used the same conditional distribution for the trajectory, conditional on the initial fall that we obtained from Ridge et al. 251 (see Appendix 16, Tables 66 and 67).
This enabled us to sample trajectories for CBT and for counselling in T2DM. The resulting mean trajectories are shown in Appendix 16, Tables 66 and 67.
Costing psychological interventions for adults with type 2 diabetes mellitus
The cost of psychological interventions was calculated, based on the information from the trials and studies from the systematic reviews (see Chapter 4 for included studies). The references were examined in detail to extract information on the main elements of cost, which are:
-
costs of staff time to deliver the intervention
-
session-related non-contact staff time
-
cost of consumables per session
-
costs associated with training the staff who will deliver psychological interventions
-
costs associated with supervision of staff
-
proportion of sessions that are individual based versus group based
-
number of course participants in group sessions.
These are broadly split into two categories: those types of resource use/cost that are assumed to be the same across interventions and those that are different. The following categories are assumed to be the same across interventions: the interventionists, the session-related non-contact time (either as a ratio of contact time or as an absolute value), the cost of consumables and the training costs (see Appendix 16, Tables 73 and 74). The following categories are assumed to be different: the split between individual and group sessions, the average number of people in a group session, the number of sessions and the duration of each session.
For T2DM, the estimated cost per participant of delivering the interventions is estimated to be as follows:
-
The cost of the CBT intervention is £633.20 per participant.
-
The cost of counselling intervention is £940.02 per participant.
Note that the cost of counselling for T2DM is somewhat higher than the equivalent cost of counselling for T1DM (see Appendix 16, Tables 71 and 72); the main reason for that is a larger number of sessions per participant (≈11 for T2DM compared with ≈7 for T1DM, in the studies from the systematic review) (Table 20).
| Parameter | Value(s) (95% CI) | Source/calculation |
|---|---|---|
| Cost of CBT per participant | £633.20 | This study (see Appendix 16, Table 75) |
| Cost of counselling per participant | £940.02 | This study (see Appendix 16, Table 75) |
| Mean reduction in HbA1c level in first year, CBT versus usual care (%) | –0.234 (–0.372 to –0.096) | Chapter 5 of this study. See Appendix 16, Figure 28, for variance–covariance matrix |
| Mean reduction in HbA1c level in first year, counselling versus usual care (%) | –0.132 (–0.23 to –0.033) | Chapter 5 of this study |
| Long-term trajectory of HbA1c levels post 12 months after CBT: annual change in % HbA1c level versus usual care (%) | –0.063 (–0.257 to 0.130)a | Ridge et al.251 and further analysis based on distribution for trajectory, conditional on initial fall |
| Long-term trajectory of HbA1c levels post 12 months after counselling: annual change in % HbA1c level versus usual care (%) | –0.043 (–0.299 to 0.213)a | Ridge et al.251 and further analysis based on distribution for trajectory, conditional on initial fall |
All costs were adjusted to 2015/6 prices using the hospital and community health services pay and prices index. 264 A summary of the costs is given in Appendix 16, Tables 68–70, and details of the methods and costs can be found in Appendix 16, Tables 76 and 77.
Usual care costs presented in the studies included in the systematic review were in the context of either the intervention being an enhancement to usual care or the usual care contacts being related to protocol requirements (e.g. collection of blood samples at baseline). Therefore, it was assumed that there were no additional costs associated with usual care.
Methods to analyse decision uncertainty in the type 2 diabetes mellitus model using expected value of perfect parameter information
The methods for this are broadly the same as those described for T1DM in Methods to analyse decision uncertainty in type 1 diabetes model using expected value of perfect parameter information.
Uncertainty is analysed using expected value of information statistics. The first is the overall EVPI, which calculates how valuable it would be to a decision-maker (e.g. NICE) to eliminate all uncertainty on all the model parameters (i.e. CIs do not exist, as every parameter is certainly known). The second is the EVPPI, which is the same idea but focused on particular model parameters only (i.e. only a defined subset of model parameters are certainly known; the rest are still uncertain).
The expected value of information calculations were estimated efficiently using a recently developed online tool called SAVI254 at a maximum acceptable ICER of £20,000 per QALY gained, in line with NICE decision-making thresholds.
Two subsets of parameters were explored in the EVPPI calculations: the parameters that would be generated directly by trial information (i.e. 1-year change in HbA1c levels for psychological intervention vs. usual care) and the parameters that would be generated directly by the trial and a long-term follow-up study (1-year HbA1c level effects, the long-term trends in HbA1c levels post usual care and the long-term trends in HbA1c levels post psychological intervention).
To quantify the overall scale of this uncertainty for the country, we need to consider the number of people affected. In the NICE guidelines,267 appendix F reported the number of people at first intensification as 17,871, those at second intensification as 14,069 and those at third intensification as 4462, from the The Health Improvement Network (THIN) database. In 2016, Public Health England reported269 that 3.8 million people in England have diabetes, of whom 90% are estimated to have T2DM, that is 3,420,000 people. It is estimated that 1 in 4 people are unaware of their condition. This means that approximately 2,565,000 people are aware and undergoing treatment.
We used the above information to estimate that:
-
The number of adults with T2DM who are currently at the first-line therapy stage (i.e. people treated with diet and lifestyle advice plus metformin) is 1,259,000.
-
The number of adults with T2DM who are currently at the second-line therapy stage (i.e. people treated with metformin plus another oral agent) is 991,000.
-
The number of adults with T2DM who are currently at the third-line therapy stage (i.e. people on combination triple oral therapy or insulin) is 314,000.
We have assumed that all of these adults could potentially be affected by the decision as to whether or not they might benefit from a psychological intervention over a 10-year decision relevance time horizon.
Main health economic analysis results for adults with type 1 diabetes mellitus
Table 21 shows the mean cost-effectiveness of psychological interventions for adults with T1DM. The main findings are as follows:
-
The CBT strategy is marginally less costly over a lifetime than both the counselling strategy and the usual care strategy. Counselling is marginally more costly than the usual care strategy.
-
The CBT strategy is estimated to provide more QALYs over a lifetime than the counselling strategy, which in turn is estimated to provide more QALYs than the usual care strategy.
-
The CBT strategy is, therefore, the most cost-effective of the three strategies.
-
The counselling strategy is estimated to be more cost-effective than usual care, with an ICER of £3800 per QALY gained, below the typical thresholds of £20,000 per QALY used by NICE.
| Outcomes | Usual care | Counselling | CBT |
|---|---|---|---|
| Lifetime discounted cost of strategy (£) | 70,258 | 70,365 | 68,505 |
| Incremental cost versus usual care (£) | 106 | –1754 | |
| Lifetime discounted QALYs | 12.268 | 12.2959 | 12.3735 |
| Incremental QALY versus usual care | – | 0.0279 | 0.1055 |
| Net monetary benefit of strategy (QALYs × £20,000 – cost) (£) | 175,102 | 175,553 | 178,307 |
| Incremental net monetary benefit versus usual care (£) | – | 452 | 3205 |
| Net benefit on QALY scale (QALYs – cost/£20,000) | 8.7551 | 8.7777 | 8.9154 |
| Incremental net benefit on QALY scale versus usual care | – | 0.022591 | 0.1602725 |
| ICER | Dominated by CBT | Dominated by CBT | Dominant |
| Stability of model results | Average | Standard error | Probability negativea |
| Incremental net monetary benefit of CBT versus the most cost-effective option out of counselling or usual care in each PSA run at | |||
| £20,000 per QALY gained | £911 | £269 | 0.0004 |
| £30,000 per QALY gained | £1249 | £342 | 0.0001 |
Analysis of uncertainty for adults with T1DM
All of these results are subject to substantial uncertainty (shown in the next section) because there is uncertainty about both the 1-year HbA1c level reduction effectiveness of each of the strategies, and because there is uncertainty about the long-term maintenance of the effects.
Figure 25 shows the results of the PSA. The results in Figure 25a show that, although the average of the PSA runs shows that we expect CBT to be more cost-effective than usual care (because the central dark blue dot is below the diagonal line that indicates the cost-effectiveness threshold of £20,000 per QALY gained), there is substantial uncertainty and CBT could be less cost-effective. Similar pictures are shown for Figure 25b and c. The cost-effectiveness acceptability curve (CEAC) shown in Figure 25d demonstrates that the probability that CBT is the most cost-effective of the three strategies is 64.6%.
FIGURE 25.
Analysis of the uncertainty in cost-effectiveness for adults with T1DM. (a) CBT vs. usual care; (b) counselling vs. usual care; (c) CBT vs. counselling; and (d) the cost-effectiveness acceptability curve for CBT vs. usual care.
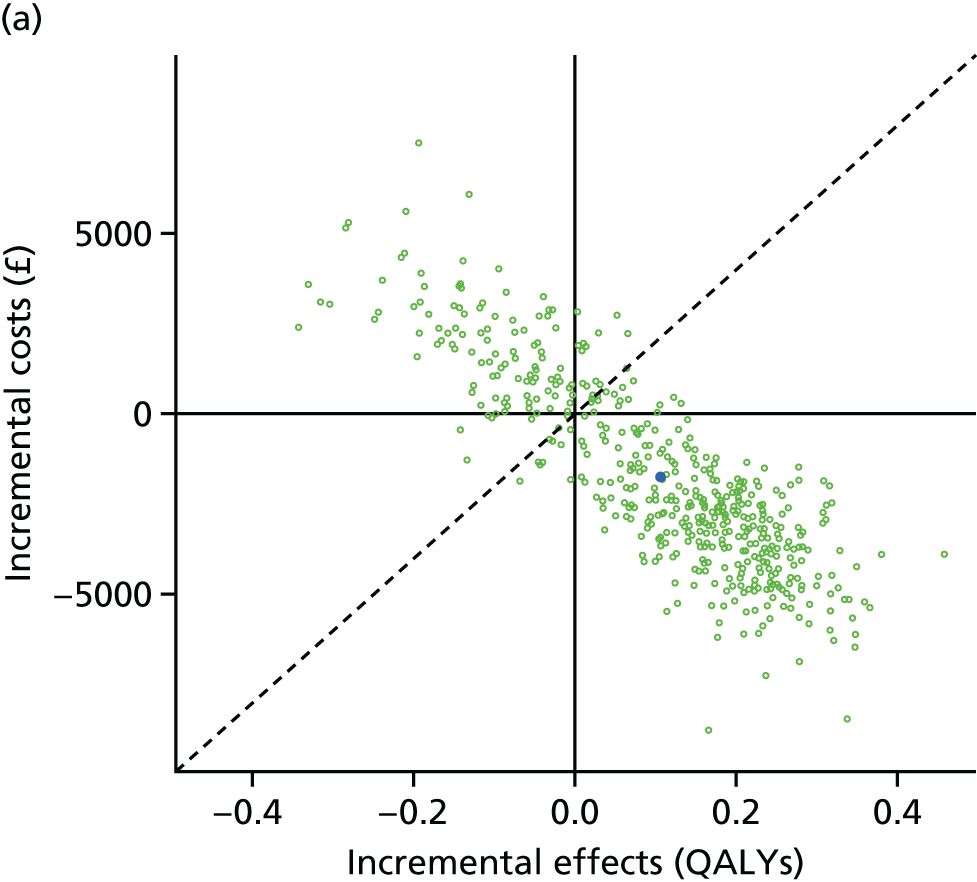
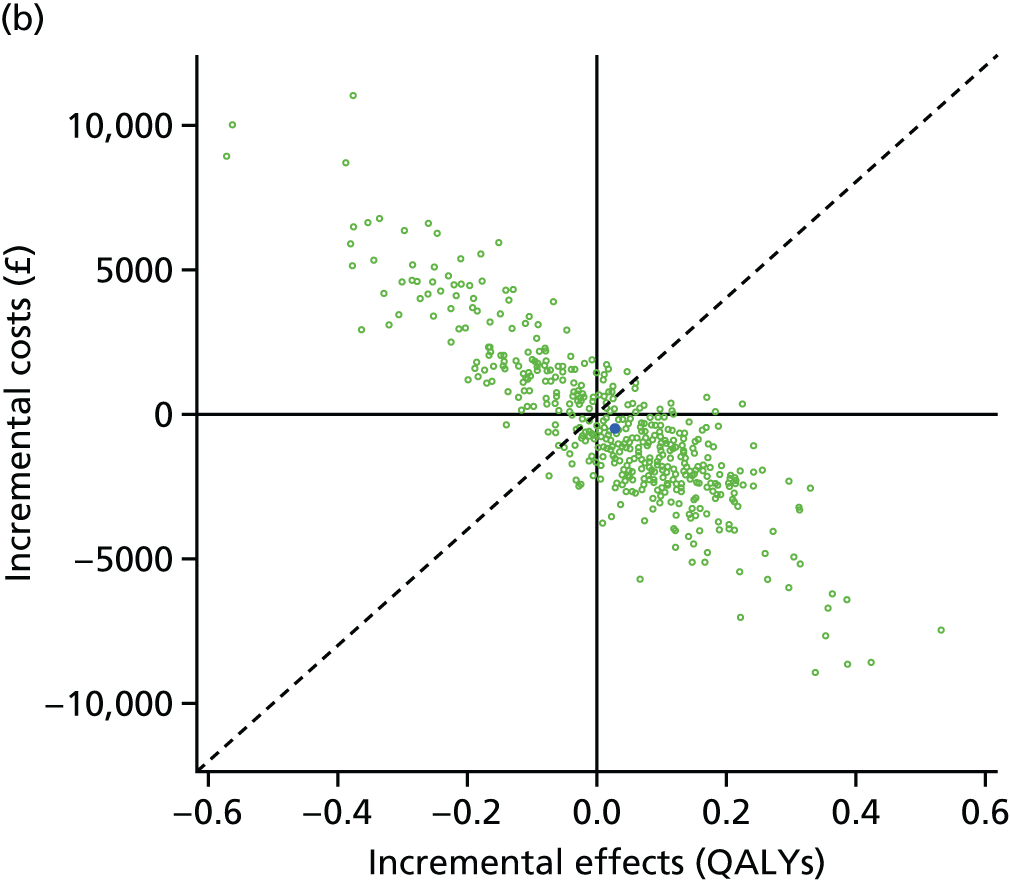
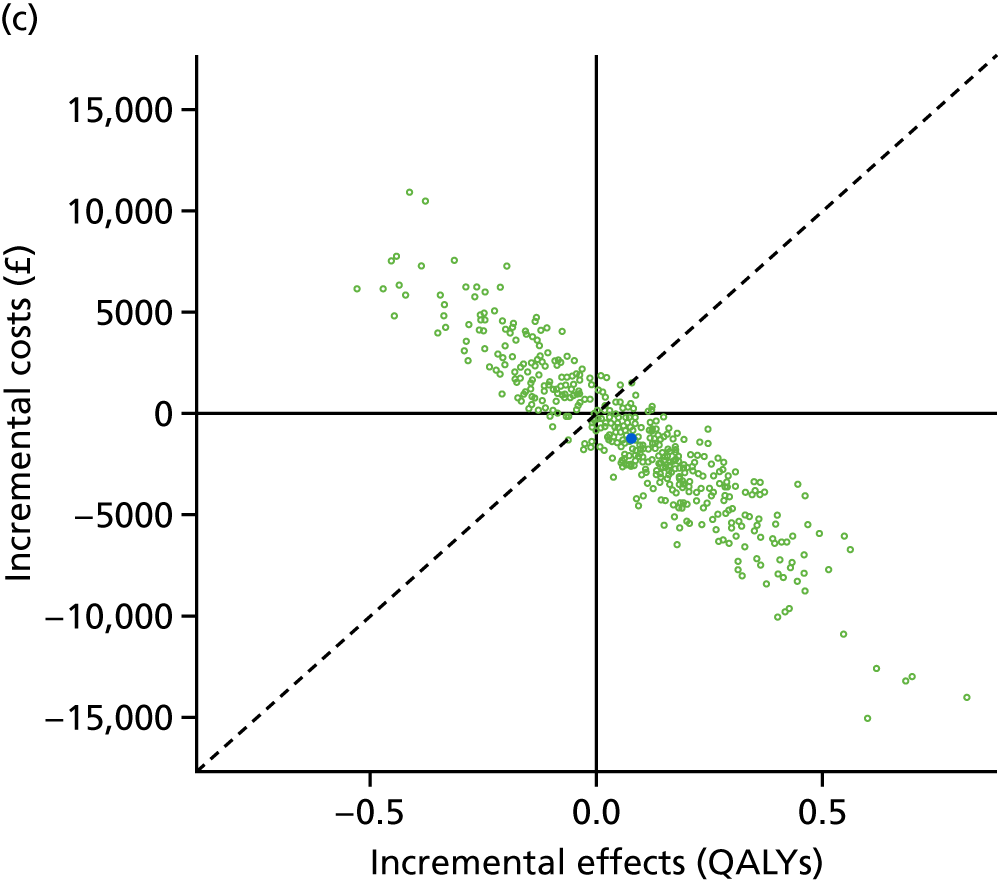
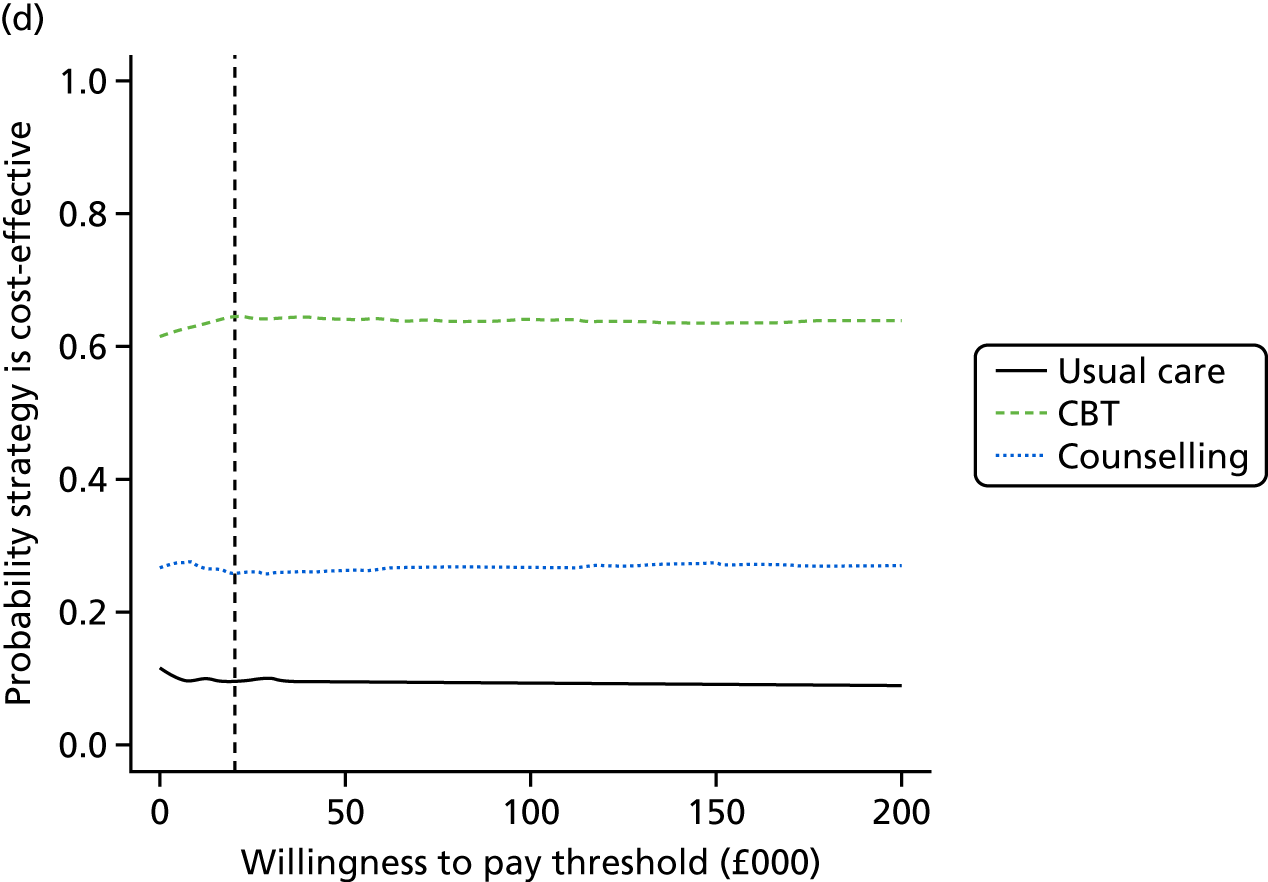
The overall EVPI is estimated at £1989 per person, which is equivalent to 0.0995-worth of uncertainty per person affected by the decision between CBT, counselling and usual care. We can multiply this up by the estimated 370,000 people with T1DM in the UK, and assuming that, say, 10% of these people might be affected by the decision per year over a decision relevance horizon of 10 years, the decision uncertainty is estimated to be valued at £73.6M per annum or £735.9M over the 10 years. This would be equivalent to 36,790 QALYs-worth of uncertainty.
Figure 26 shows a new way of visualising the decision uncertainty called the HTA risk analysis chart,270 which is generated automatically from the PSA results by the online SAVI tool. The HTA risk analysis chart is a method for conveying the uncertainty associated with the decision problem (the green element) as well as the differences in cost-effectiveness measured using the net monetary benefit between the strategies (the blue element) in a single, simple plot. The green bars represent the overall EVPI (also known as the payer uncertainty burden in the risk analysis chart method). They are the same height for each intervention because the payer uncertainty burden is the risk relating to uncertainty associated with the whole decision problem rather than any specific decision strategy. The overall EVPI is £1989 per person affected by the decision, which, at a maximum acceptable ICER of £20,000, is equivalent to 0.0995 QALYs-worth of decision uncertainty per person (Table 22). The payer strategy-specific burden (PSB) is represented by the blue bars stacked on top of the payer uncertainty burden. The PSB is the difference in cost-effectiveness measured using the net monetary benefit between each strategy and the most cost-effective strategy. The most cost-effective intervention, CBT, has a PSB of zero (a blue element of zero).
Given current costs and evidence, both usual care and counselling are less cost-effective than CBT, which is indicated by their respective PSBs of £3862 and £2831 per person (equivalent to 0.1931 QALYs for usual care and 0.1416 QALYs for counselling). The sum of the uncertainty burden and the payer strategy-specific risk burden is shown on the cost scale on the y-axis (£5851 and £4820 respectively) and on the QALY scale above each bar (0.293 and 0.241 QALYs, respectively). Shown below the graph, for the affected patient population per annum, are the overall EVPI (£73.6M) and the PSBs for usual care (£142.9M) and for counselling (£104.8M). This enables cross-comparison between decision problems in terms of the national scale of risk involved. Interpretation of the implications of the HTA risk analysis chart is straightforward. If there is a substantial PSB (a large blue component for an intervention), this suggests that the intervention would need to be cheaper, more cost-saving or more effective for it to be considered cost-effective. If there is a large payer uncertainty burden (a large green component to each bar), this means that there is substantial uncertainty in model parameters based on current evidence, and suggests further evidence collection could help reduce decision uncertainty.
FIGURE 26.
The HTA risk analysis chart for the health technology assessment of CBT, counselling and usual care for adults with T1DM in the UK.
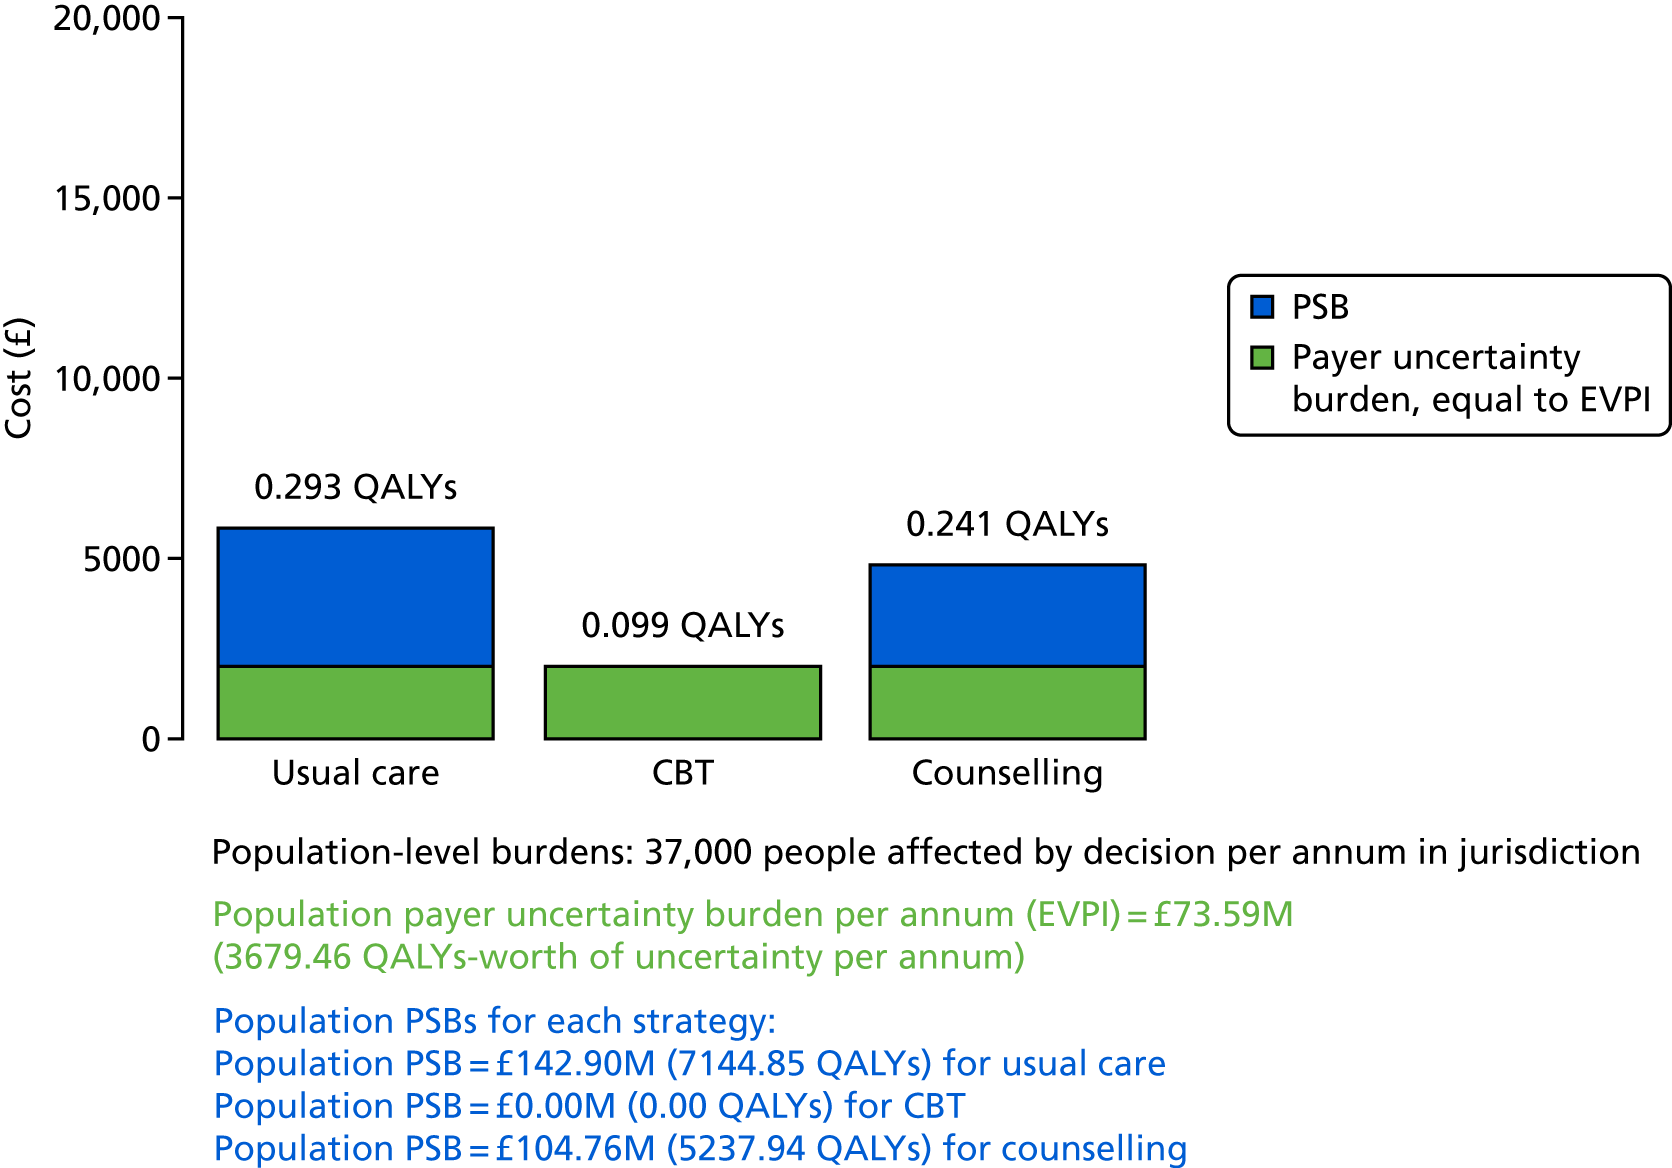
| Parameter(s) | EVPPI per person (£) | SE of EVPPI estimate | EVPPI indexed to EVPI (EVPI = 1.00) |
|---|---|---|---|
| All parameters | 1989 | – | 1.00 |
| 110. CBT 1-year HbA1c effect (HbA1c_drop_CBT) | 53 | 29 | 0.03 |
| 111. Counselling 1-year HbA1c effect (HbA1c_drop_Cou) | 184 | 63 | 0.09 |
| 112. CBT longer-term HbA1c effect (Traj_CBT) | 1143 | 114 | 0.57 |
| 113. Counselling longer-term HbA1c effect (Traj_COU) | 145 | 101 | 0.07 |
| 110 and 112 | 1149 | 99 | 0.58 |
| 111 and 113 | 566 | 93 | 0.28 |
| 110, 111, 112 and 113 | 1752 | 56 | 0.88 |
The EVPPI analysis allows us to understand which are the most uncertain parameters driving decision uncertainty and, therefore, which might be the highest priorities for further evidence collection. The results show that four main parameters are the key drivers of uncertainty. It is partly the 1-year effectiveness that is a key driver – for both CBT and counselling. The single most uncertain and important parameter is the long-term effectiveness of CBT. The long-term effectiveness of counselling is also important to decision uncertainty. Together, these four parameters represent 88% of the overall decision uncertainty (EVPPI = 0.88 when overall EVPI is indexed to 1.00).
Conclusions on the cost-effectiveness of cognitive–behavioural therapy versus counselling versus usual care in adults with type 1 diabetes mellitus
The results of these analyses suggest the following conclusions:
-
CBT could be considered a cost-effective psychological intervention compared with usual care and compared with counselling.
-
Counselling appears to be more cost-effective than usual care but less cost-effective than CBT.
-
There is substantial decision uncertainty around these conclusions and priorities for further evidence collection would, in particular, focus on the longer-term (i.e. beyond 12 months) maintenance of effectiveness compared with usual care. In other words, is the HbA1c level gap between CBT and usual care maintained beyond year 1, and, if not, how quickly does the effect wane and the HbA1c level return to what it would have been without the psychological intervention?
-
We have not been able to analyse subgroups of patients, either by baseline HbA1c level or by those who might respond more or less well than average to psychological interventions, because the NMA could not provide effectiveness evidence on such subgroups.
Results for the cost-effectiveness of cognitive–behavioural therapy versus counselling versus psychotherapy versus usual care in adults with type 2 diabetes mellitus
Main health economic analysis results for adults with type 2 diabetes mellitus
Table 23 shows the mean cost-effectiveness results for adults with T2DM. It is split into three parts: (1) patients receiving first-line treatment (i.e. people treated with diet and lifestyle advice plus metformin), (2) patients receiving second-line treatment (i.e. people treated with metformin plus another oral agent) and (3) patients receiving third-line treatment (i.e. people treated with combination triple oral therapy or on insulin).
| Outcomes | Usual care | Counselling | CBT |
|---|---|---|---|
| (Part 1) Patients receiving first-line treatment (i.e. people treated with diet and lifestyle advice plus metformin) | |||
| Lifetime discounted cost (£) | 36,857 | 37,581 | 37,013 |
| Lifetime discounted QALYs | 8.7002 | 8.7059 | 8.7142 |
| Incremental cost (£) | – | – | 156 |
| Incremental QALYs | – | – | 0.0140 |
| ICER | Dominated by CBT | £11,135 | |
| Net monetary benefit (£) | 137,147 | 136,538 | 137,271 |
| Net benefit on QALY scale | 6.8574 | 6.8269 | 6.8635 |
| (Part 2) Patients receiving second-line treatment (i.e. people treated with metformin plus another oral agent) | |||
| Lifetime discounted cost (£) | 31,582 | 32,353 | 31,861 |
| Lifetime discounted QALYs | 8.9253 | 8.9304 | 8.9398 |
| Incremental cost (£) | – | – | 279 |
| Incremental QALYs | – | – | 0.0145 |
| ICER | – | Dominated by CBT | £19,246 |
| Net monetary benefit (£) | 146,923 | 146,255 | 146,935 |
| Net benefit on QALY scale | 7.3462 | 7.3127 | 7.3468 |
| (Part 3) Patients receiving third-line treatment (i.e. people on combination triple oral therapy or insulin) | |||
| Lifetime discounted cost (£) | 43,526 | 44,479 | 44,195 |
| Lifetime discounted QALYs | 7.6199 | 7.6344 | 7.6531 |
| Incremental cost (£) | – | – | £669 |
| Incremental QALYs | – | – | 0.0332 |
| ICER | – | Dominated by CBT | £20,163 |
| Net monetary benefit (£) | 108,873 | 108,210 | 108,868 |
| Net benefit on QALY scale | 5.4437 | 5.4105 | 5.4434 |
The main findings for patients receiving first-line treatment are as follows:
-
The CBT strategy is marginally less costly over a lifetime than the counselling strategy, which in turn is marginally more costly than the usual care strategy.
-
The CBT strategy is estimated to provide more QALYs over a lifetime than the counselling strategy, which in turn is estimated to provide more QALYs than the usual care strategy.
-
The CBT strategy is the most cost-effective of the three strategies as it has an ICER of £11,135 per QALY gained, compared with usual care.
-
The counselling strategy is estimated to be more cost-effective than usual care.
The main findings for patients receiving second-line treatment are as follows:
-
The CBT strategy is marginally less costly over a lifetime than the counselling strategy, which in turn is marginally more costly than the usual care strategy.
-
The CBT strategy is estimated to provide more QALYs over a lifetime than the counselling strategy, which in turn is estimated to provide more QALYs than the usual care strategy.
-
The CBT strategy is the most cost-effective of the three strategies.
-
The counselling strategy is estimated to be more cost-effective than usual care.
The main findings for patients receiving third-line treatment are as follows:
-
The CBT strategy is marginally less costly over a lifetime than the counselling strategy, which in turn is marginally more costly than the usual care strategy.
-
The CBT strategy is estimated to provide more QALYs over a lifetime than the counselling strategy, which in turn is estimated to provide more QALYs than the usual care strategy.
-
The CBT strategy is, therefore, the most cost-effective of the three strategies using a maximum acceptable ICER of £30,000 per QALY gained, but not at £20,000 per QALY gained.
-
The counselling strategy is estimated to be less cost-effective than usual care at both maximum acceptable ICER values.
All of these results are subject to substantial uncertainty (shown in the next section) because there is uncertainty about both the 1-year HbA1c reduction effectiveness of each of the strategies, and because there is uncertainty about the long-term maintenance of the effects.
Analysis of uncertainty of the results for adults with type 2 diabetes mellitus
Figure 27 shows the results of the PSA.
FIGURE 27.
Analysis of uncertainty in cost-effectiveness results for adults with T2DM. (a) CBT vs. usual care (first line); (b) counselling vs. usual care (first line); (c) CBT vs. counselling (first line); (d) CEAC (first line); (e) CBT vs. usual care (second line); (f) counselling vs. usual care (second line); (g) CBT vs. counselling (second line); (h) CEAC (second line); (i) CBT vs. usual care (third line); (j) counselling vs. usual care (third line); (k) CBT vs. counselling (third line); and (l) CEAC (third line).
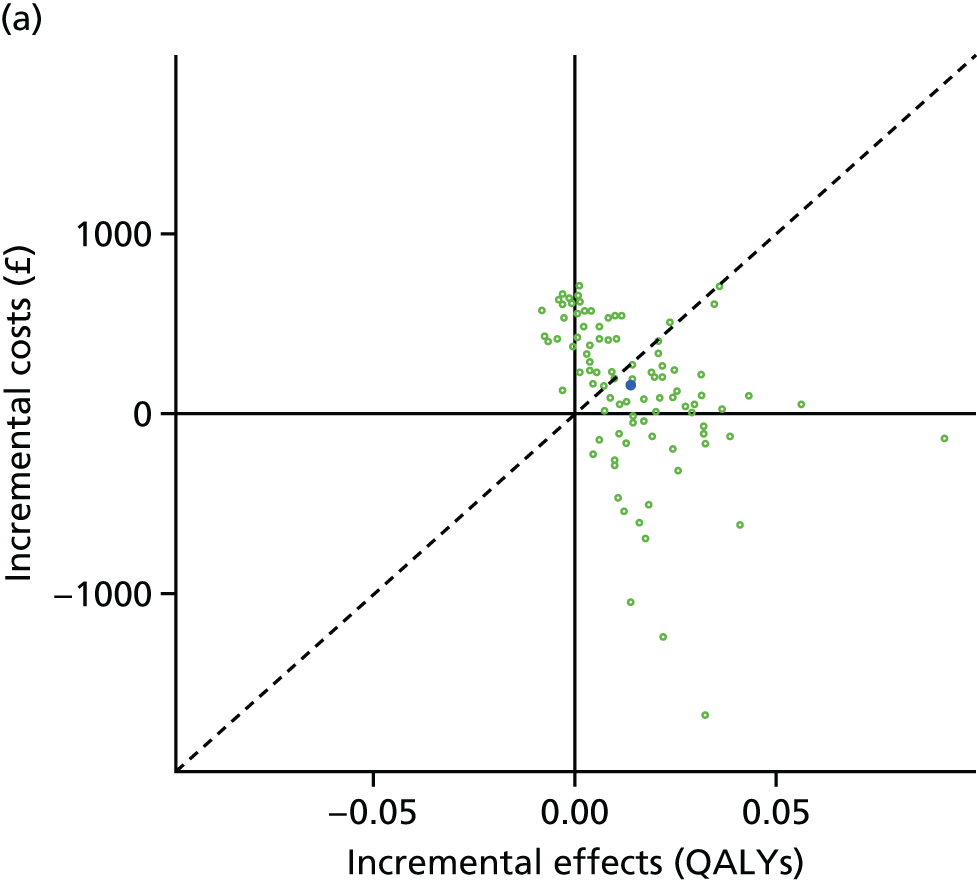
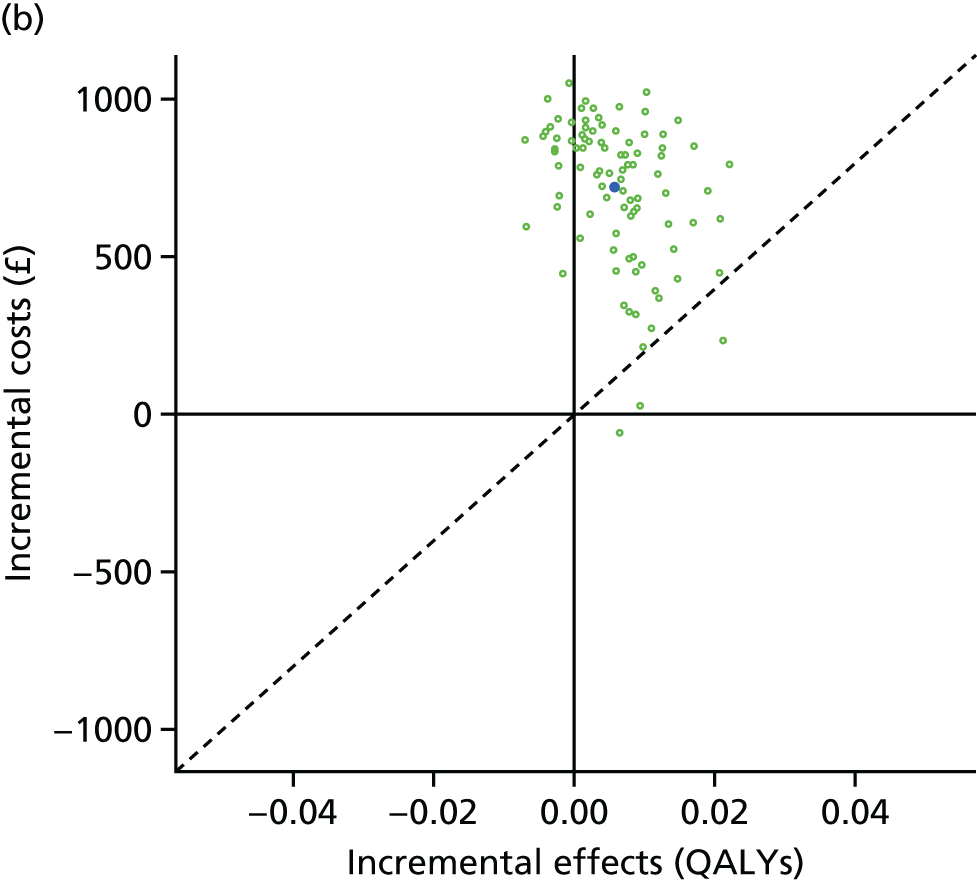
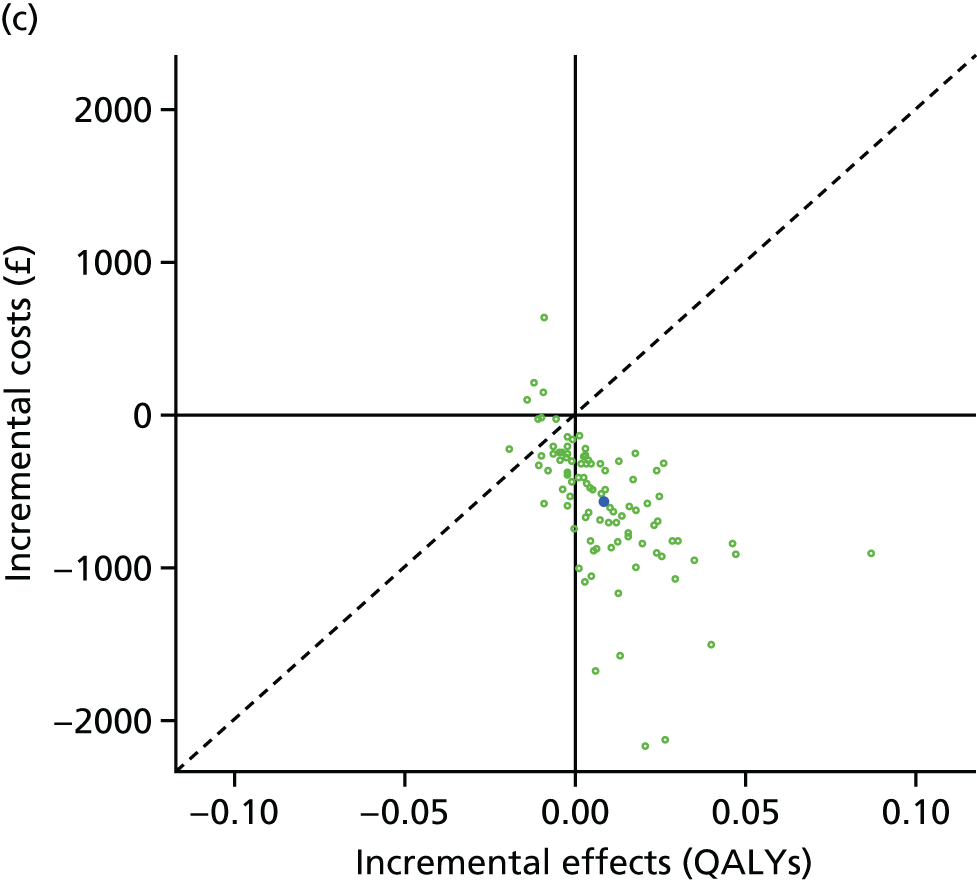
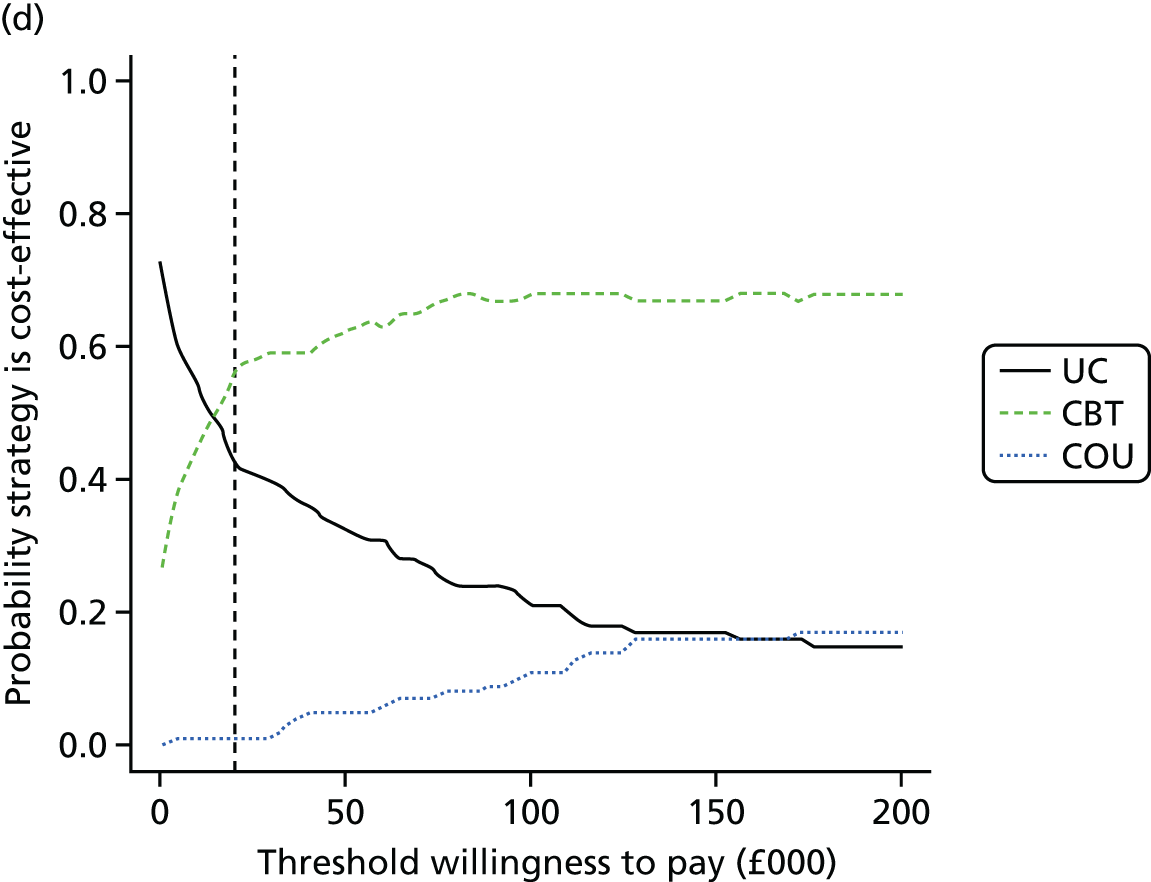
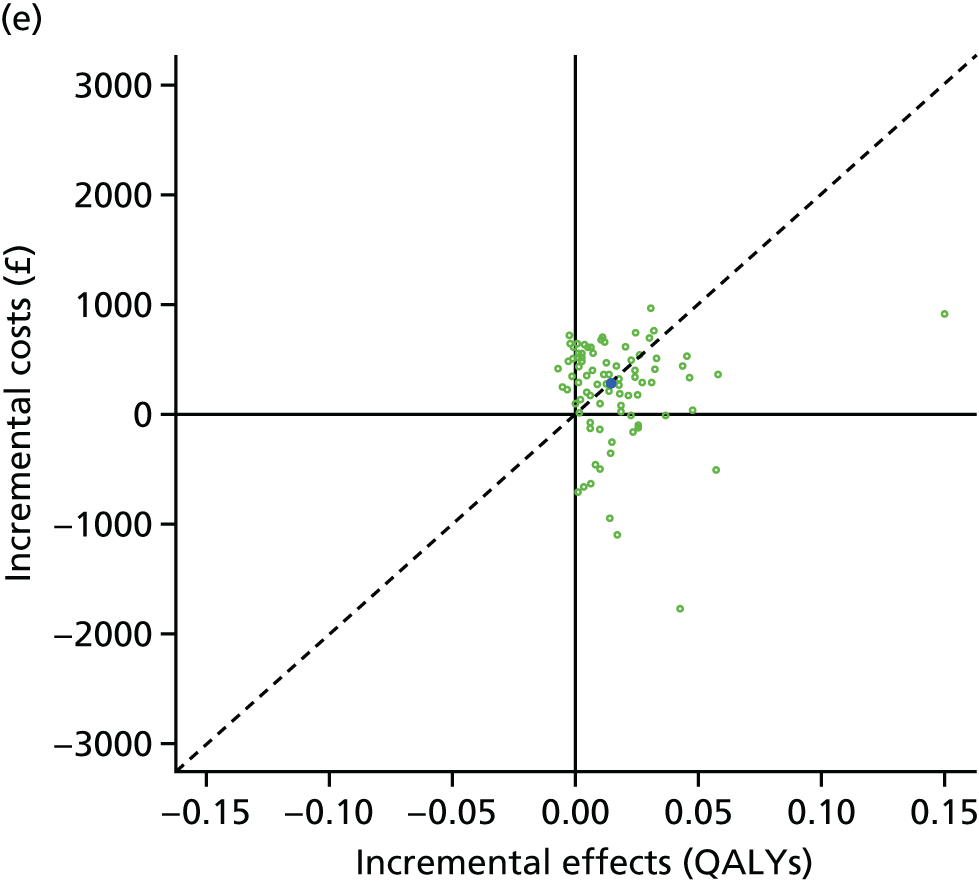
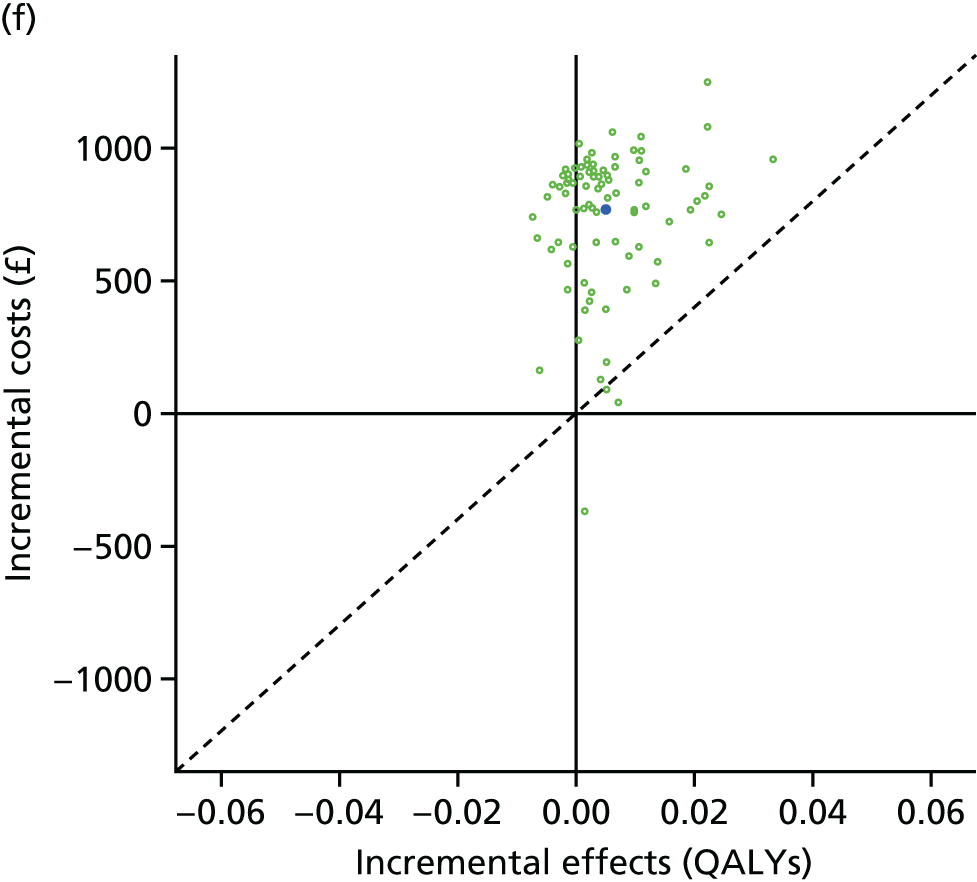
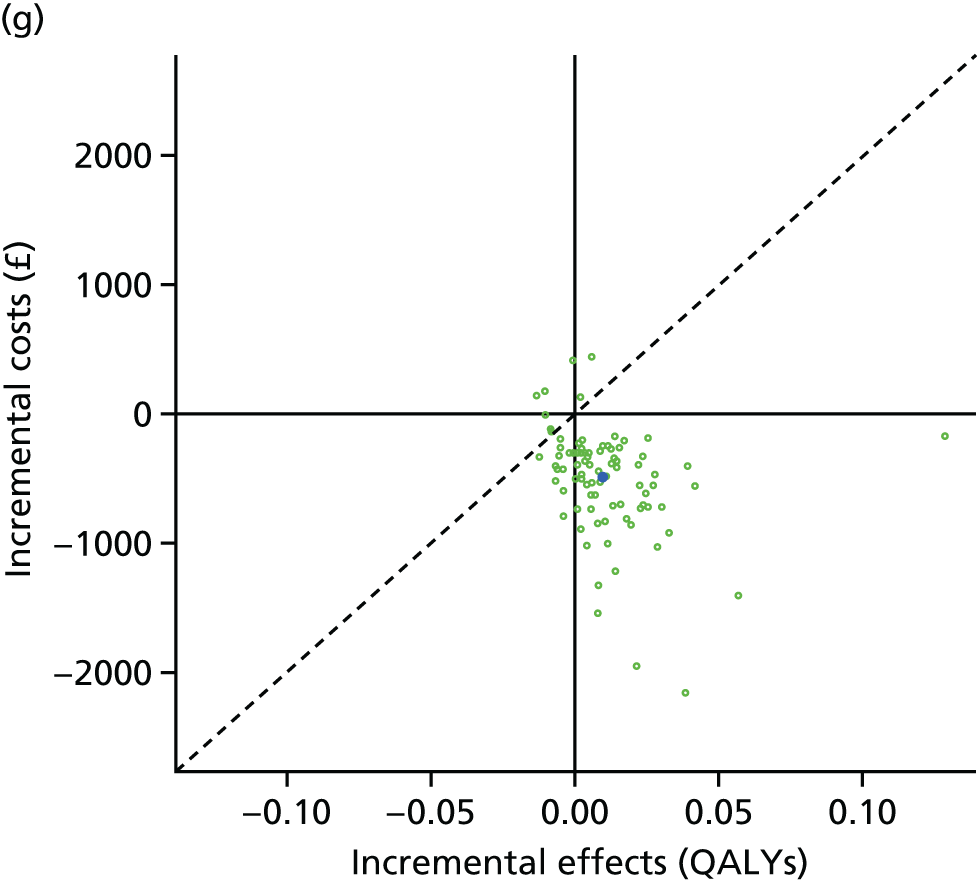
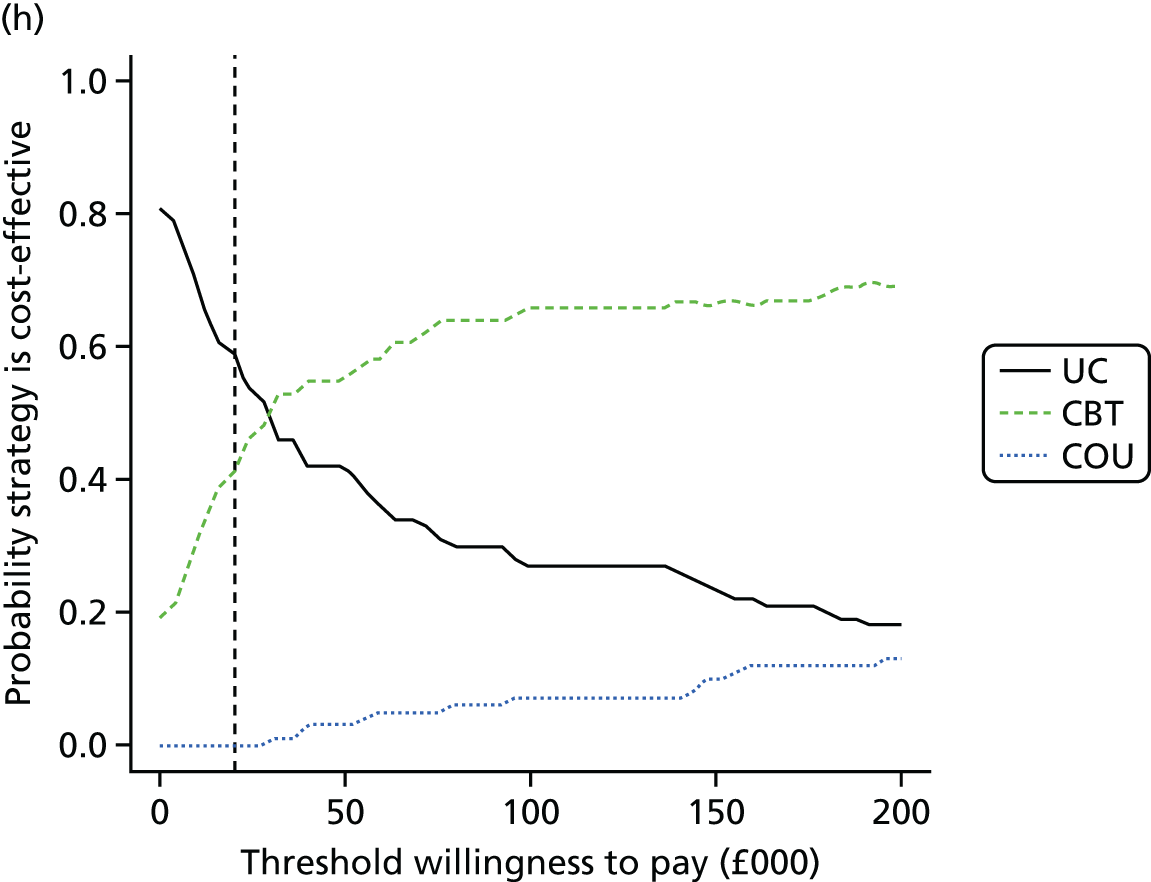
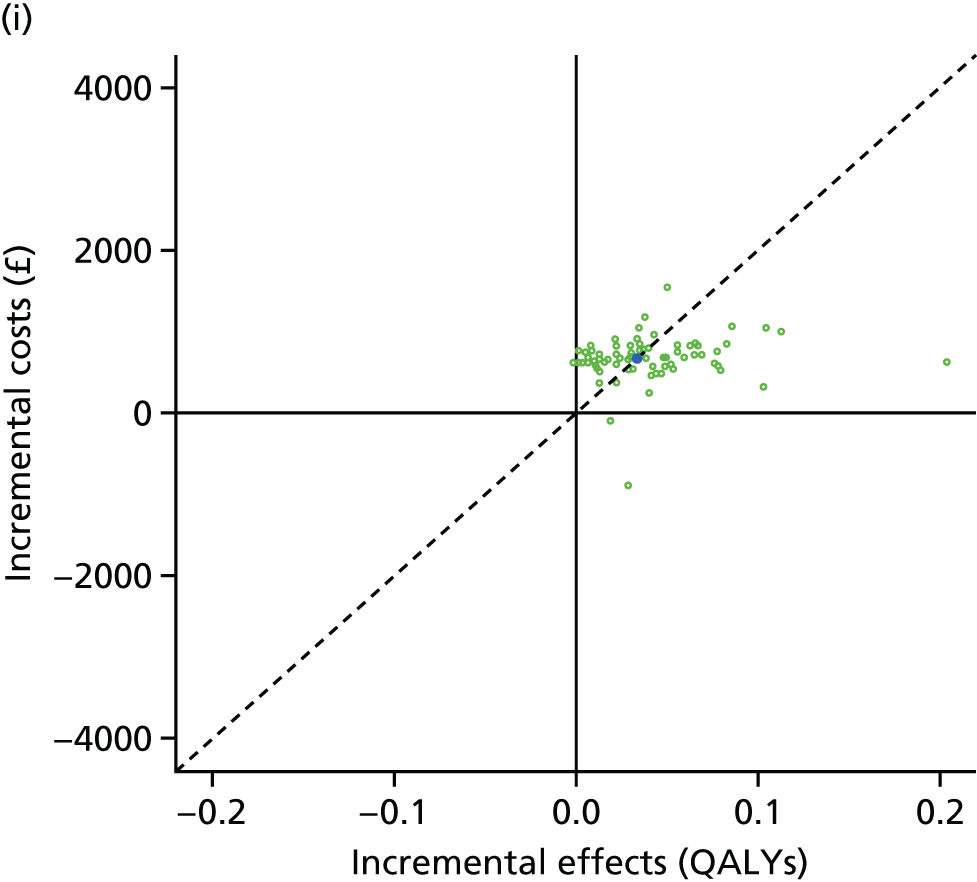
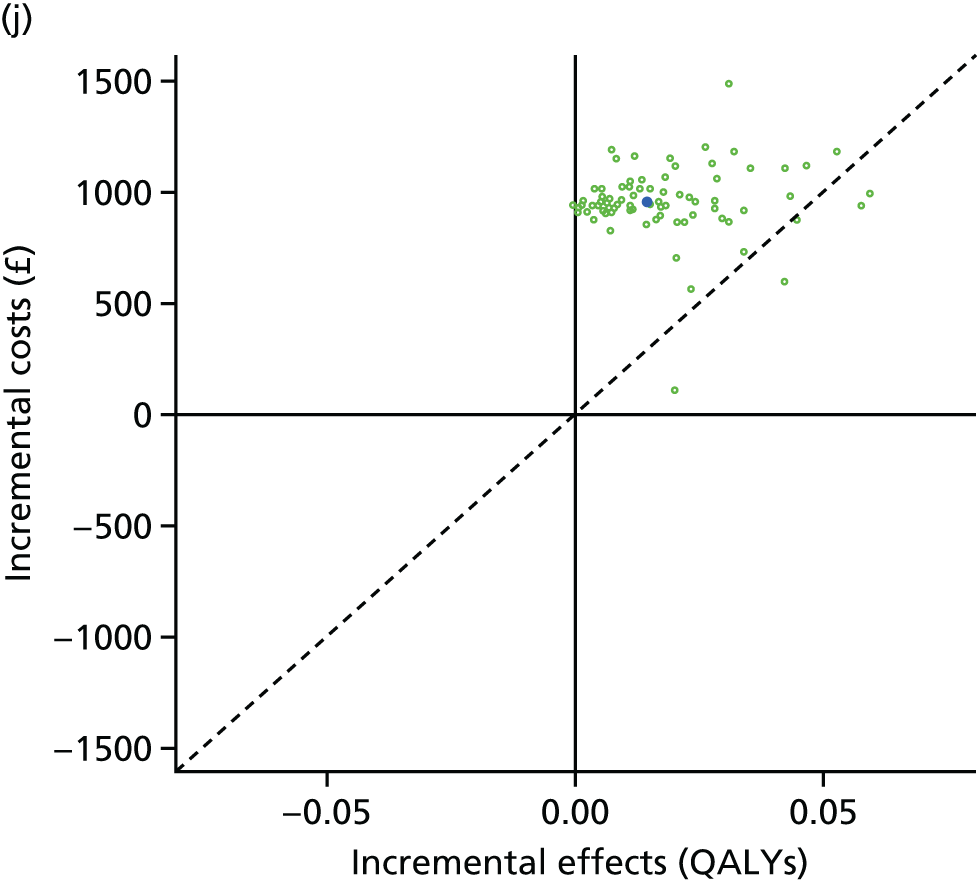
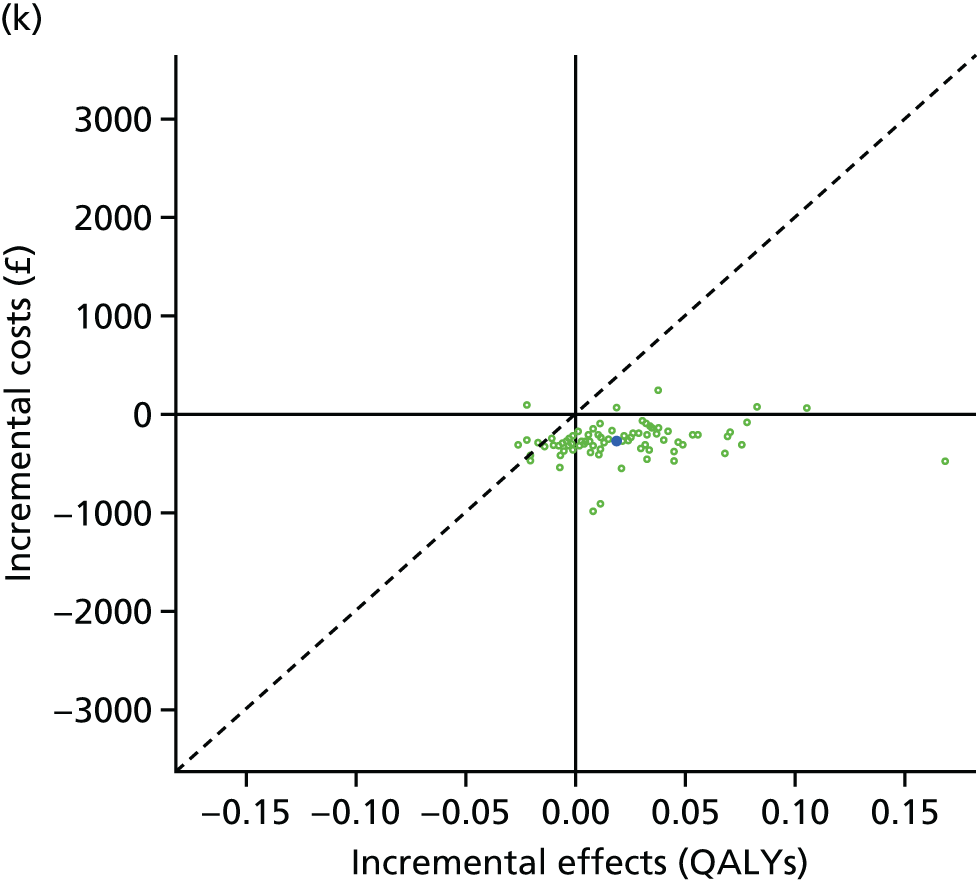
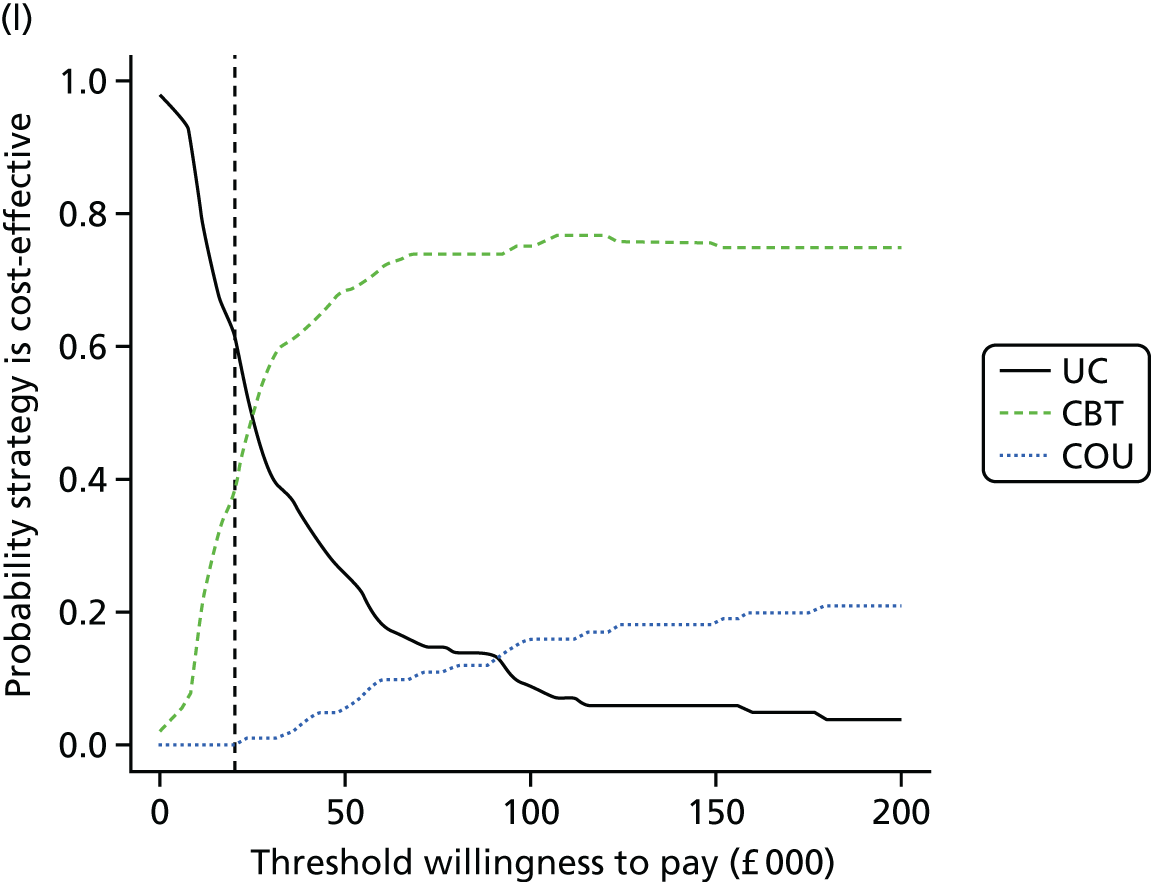
The results for people on first-line therapies (see Figure 27a–d) show that, although the average of the PSA runs shows in Figure 27a that we expect CBT to be more cost-effective than usual care (because the central dark blue dot is below the diagonal line that indicates the cost-effectiveness threshold of £20,000 per QALY gained), there is substantial uncertainty, and CBT could be less cost-effective. Similar pictures are shown for Figure 27b and c. The CEAC shown in Figure 27d demonstrates that the probability that CBT is the most cost-effective of the three strategies is 43%.
The results for people on second-line therapies show (see Figure 27e–h) that, although the average of the PSA runs shows in Figure 27e that we expect CBT to be more cost-effective than usual care (because the central dark blue dot is just below the diagonal line that indicates the cost-effectiveness threshold of £20,000 per QALY gained), there is substantial uncertainty, and CBT could be less cost-effective. Similar pictures are shown for Figure 27f and g. The CEAC shown in Figure 27h demonstrates that the probability that CBT is the most cost-effective of the three strategies is 41%.
The results for people on third-line therapies show (see Figure 27i–l) that, although the average of the PSA runs shows in Figure 27i that we expect CBT to be just less cost-effective than usual care (because the central dark blue dot is just above the diagonal line that indicates the cost-effectiveness threshold of £20,000 per QALY gained), there is substantial uncertainty, and CBT could be more cost-effective. Similar pictures are shown for Figure 27j and k. The CEAC shown in Figure 27l demonstrates that the probability that CBT is the most cost-effective of the three strategies is 37%.
Figure 28 shows the HTA risk analysis charts270 for patients on first-, second- and third-line therapies, separately. The green bars represent the overall EVPI (also known as the payer uncertainty burden in the risk analysis chart method). The PSB is represented by the blue bars stacked on top of the payer uncertainty burden. The PSB is the difference in cost-effectiveness measured using net monetary benefit between each strategy and the most cost-effective strategy. Interpretation of the implications of the HTA risk analysis chart are straightforward. If there is a substantial PSB (a large red component for an intervention), this suggests that the intervention would need to be cheaper or more cost saving or more effective for it to be considered cost-effective. If there is a large payer uncertainty burden (a large blue component to each bar), then this means that there is substantial uncertainty in model parameters based on current evidence, and suggests further evidence collection could help reduce decision uncertainty.
FIGURE 28.
The HTA risk analysis charts for health technology assessment of CBT, counselling and usual care for adults with T2DM in the UK. (a) First line; (b) second line; and (c) third line.
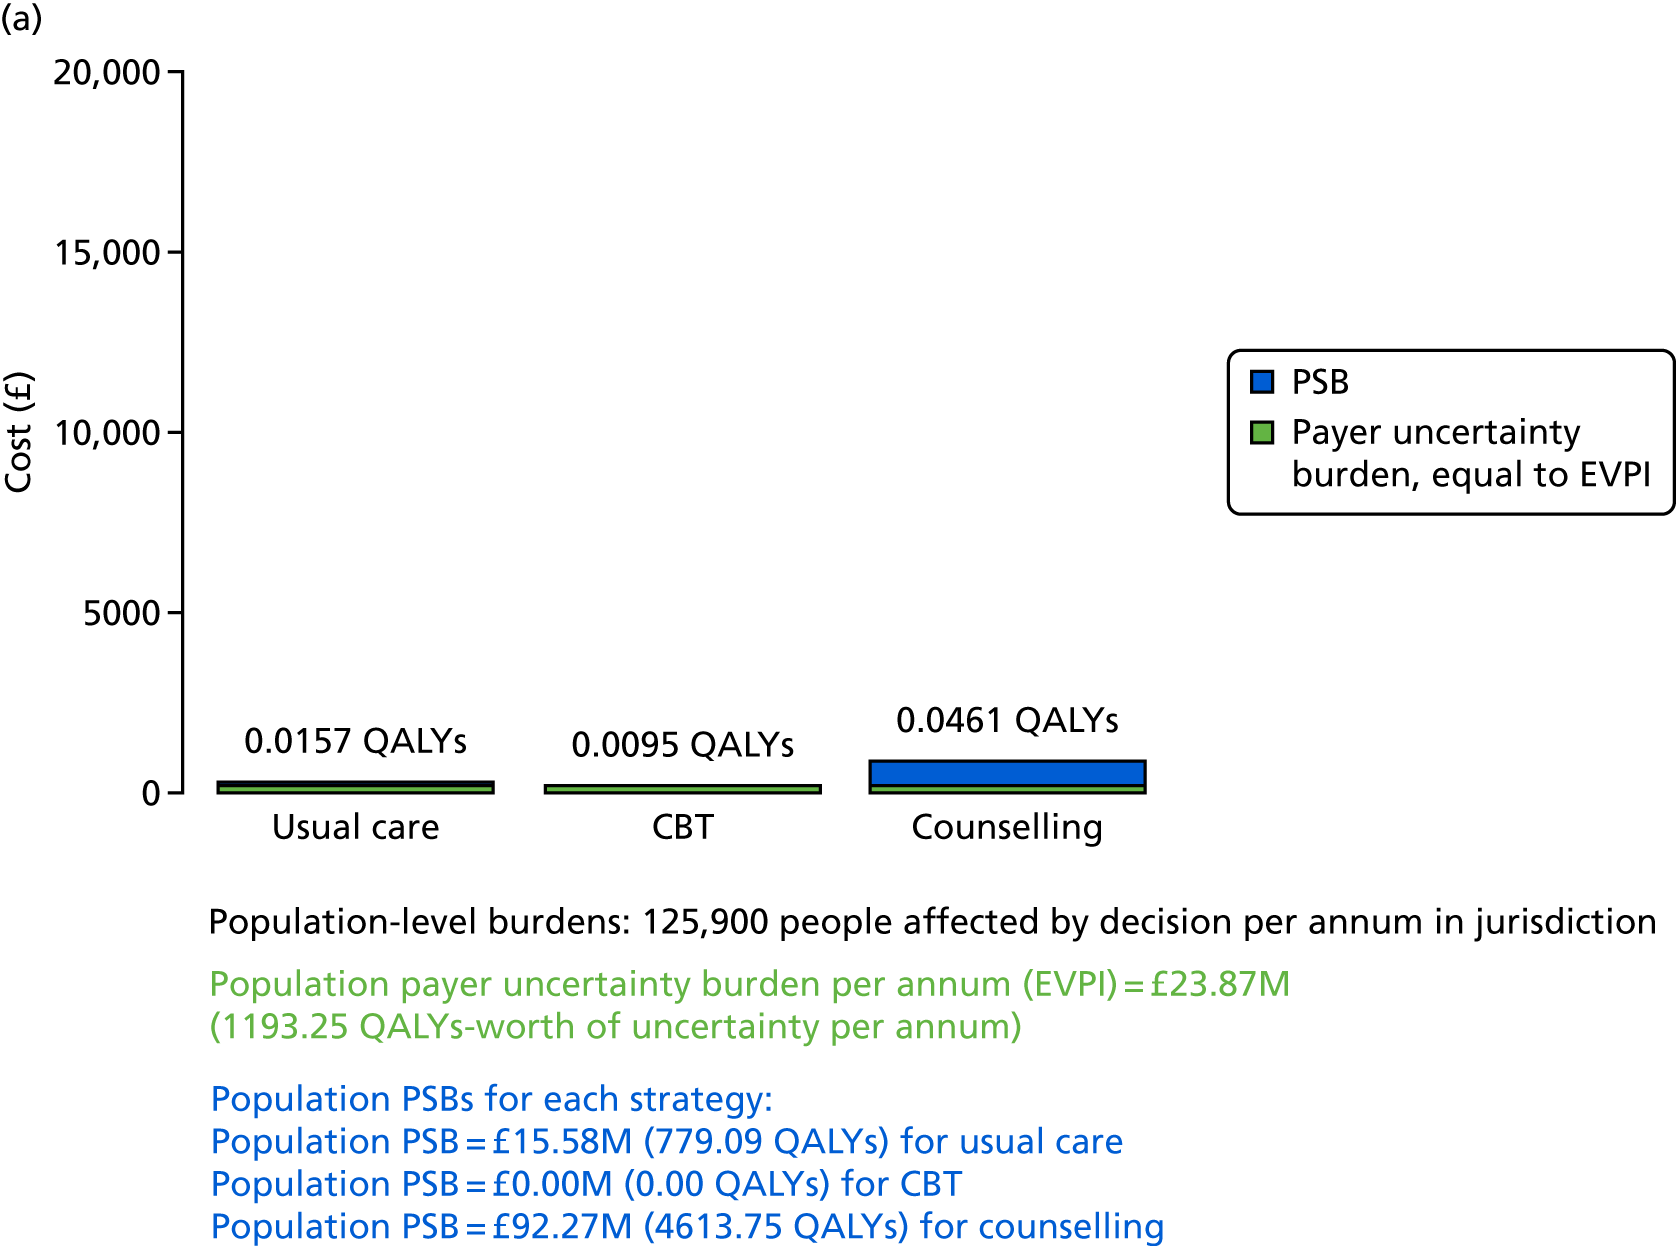
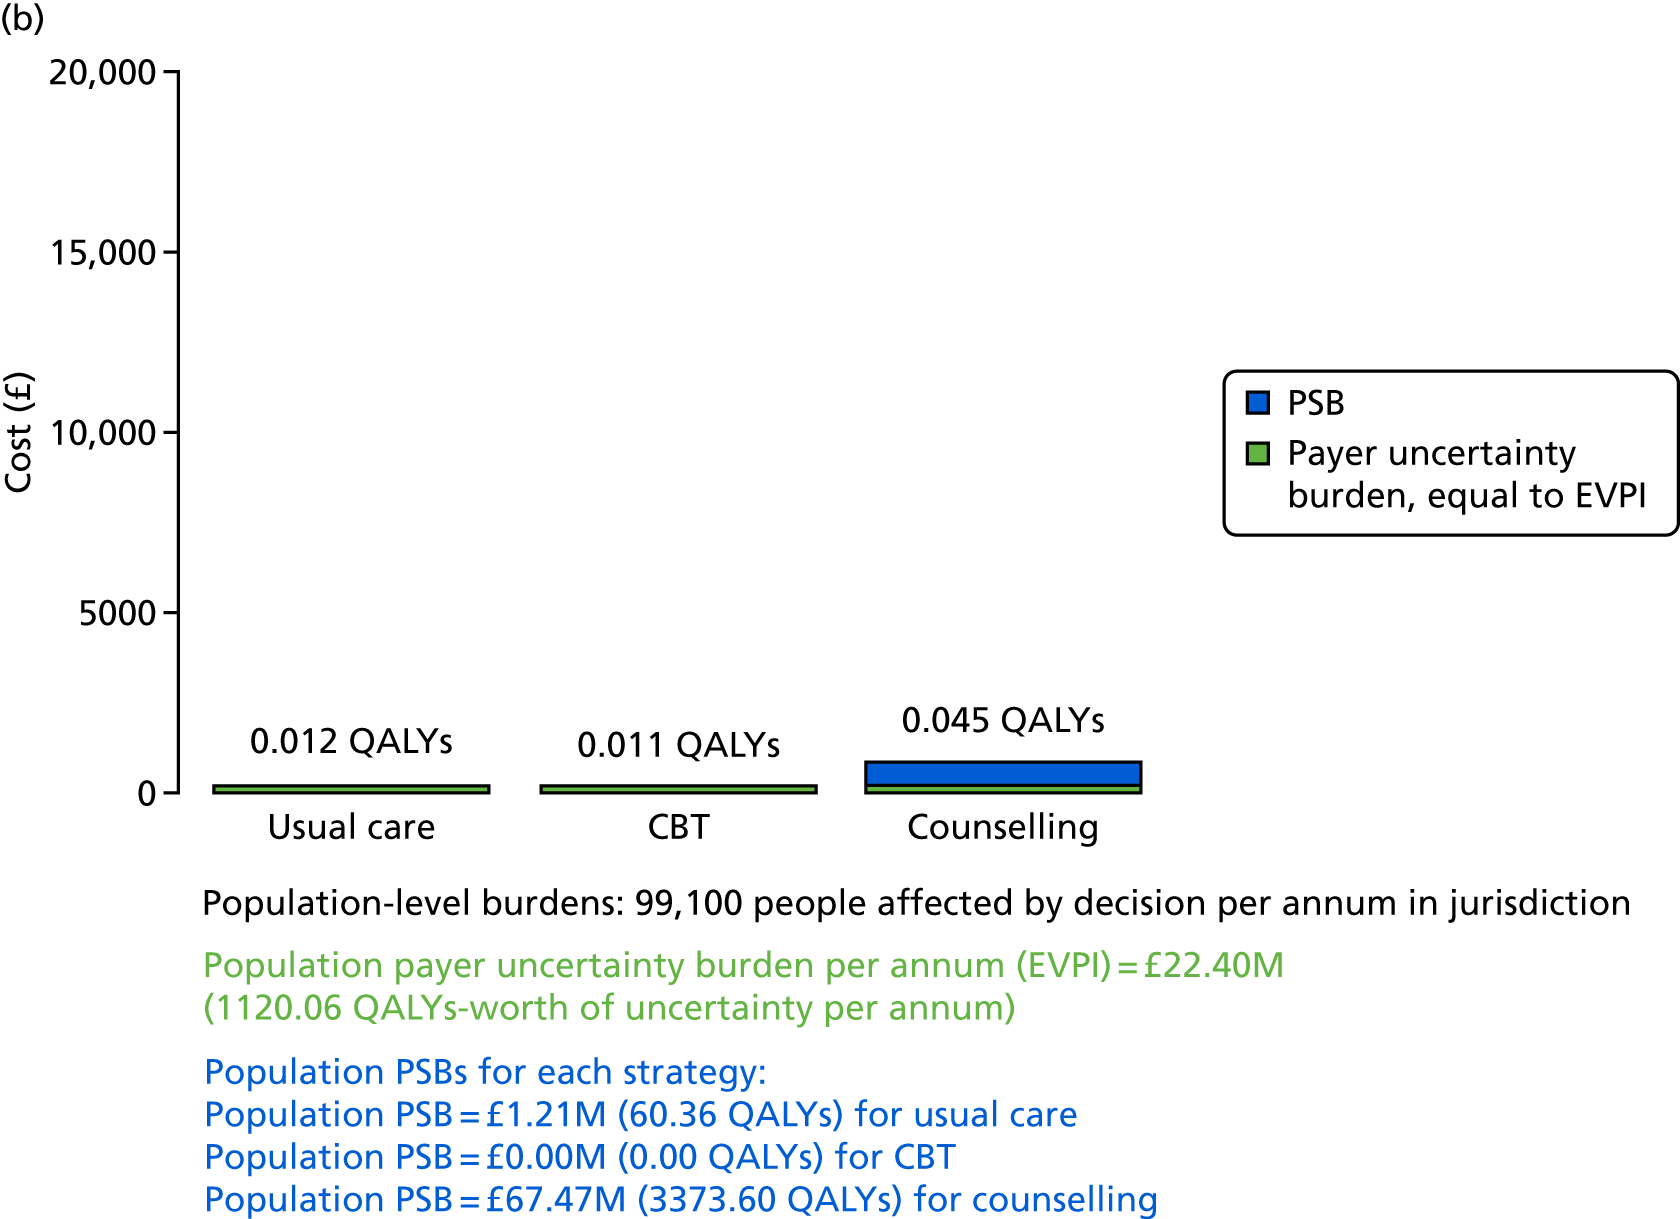
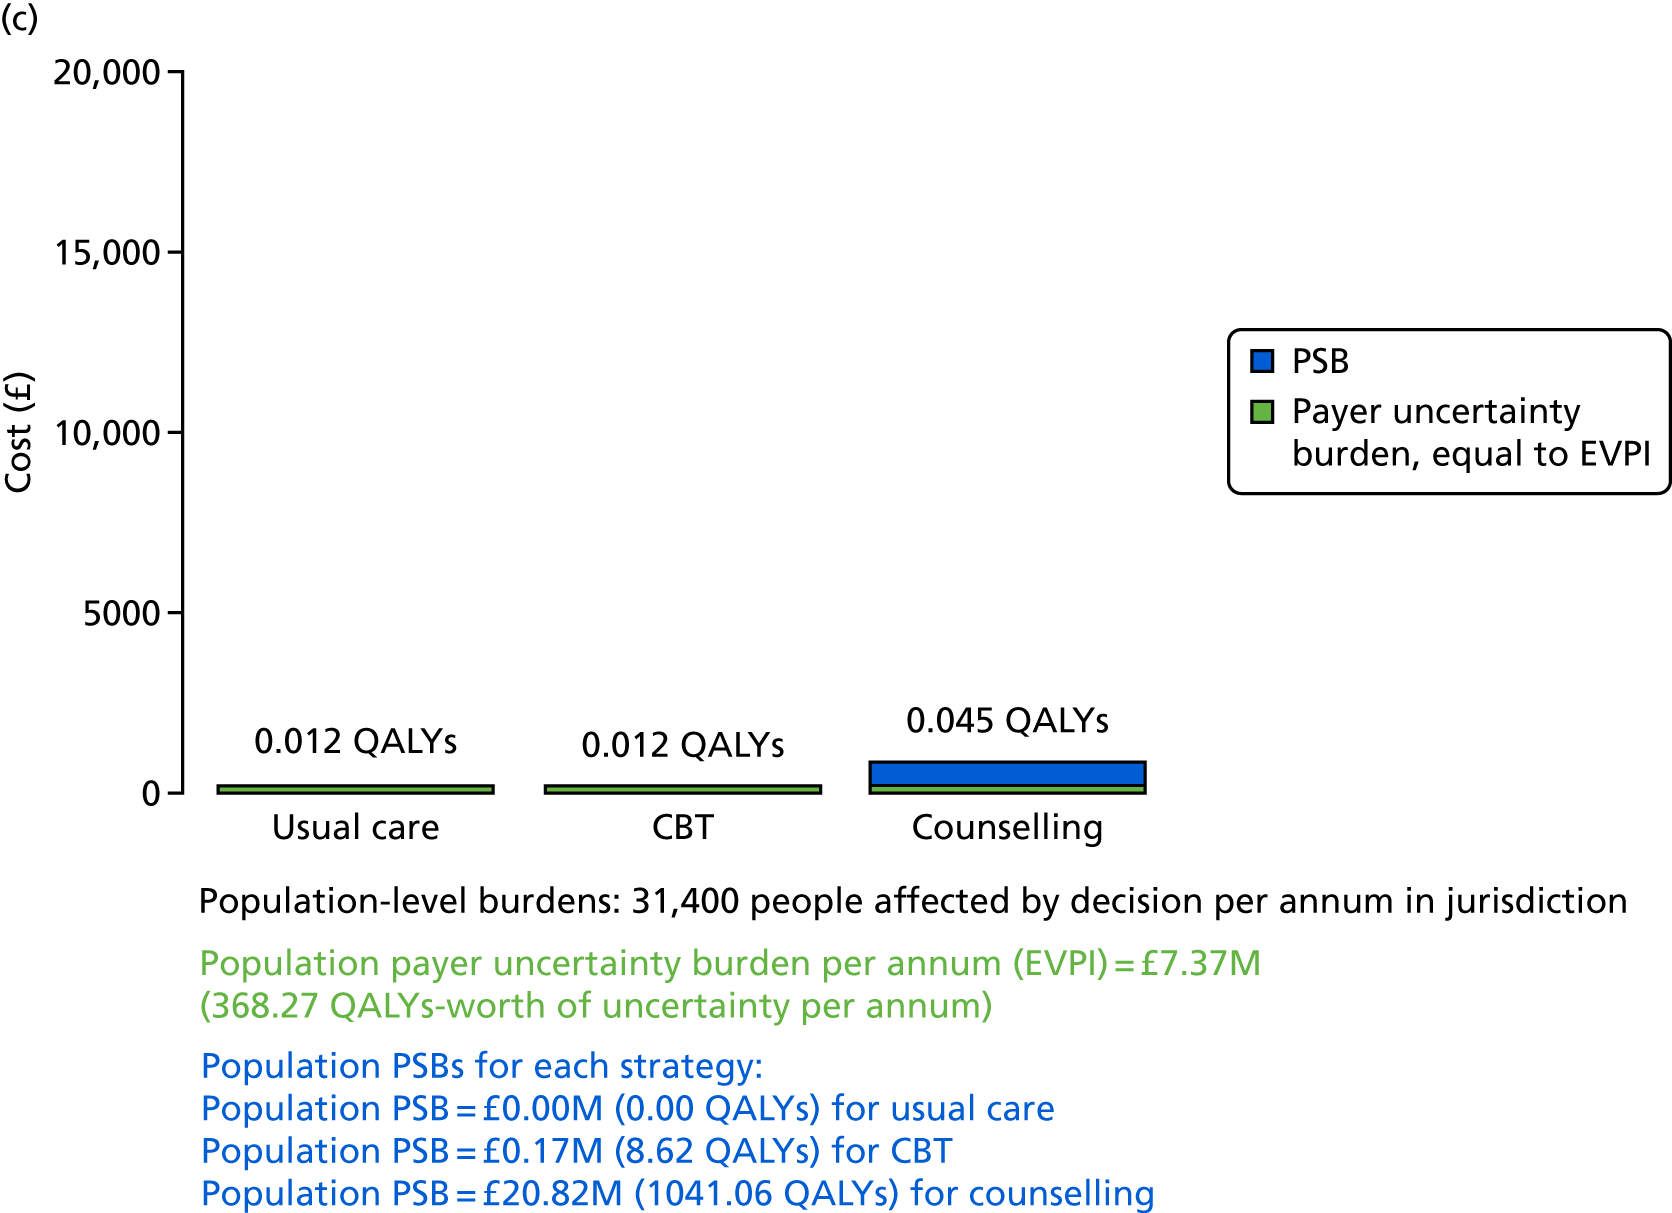
In Figure 28a, results for people on first-line therapies show that the overall EVPI is estimated to be £189.60 per person, which is equivalent to 0.01 QALYs-worth of uncertainty per person affected by the decision between CBT, counselling and usual care. When multiplied by the estimated 1,259,000 people with T2DM in the UK who are receiving first-line therapy, decision uncertainty is estimated to be valued at £23.9M per annum or £238.7M over 10 years (equivalent to 11,930 QALYs-worth of uncertainty). Given current costs and evidence, both usual care and counselling are less cost-effective than CBT, which is indicated by their respective PSBs of £124 and £733 per person (equivalent to 0.0062 QALYs for usual care and 0.0366 QALYs for counselling). Shown at the bottom of Figure 28, for the affected patient population per annum, are the PSBs for usual care (£15.6M) and for counselling (£92.3M).
In Figure 28b, results for people on second-line therapies show that the overall EVPI is estimated to be £226 per person, which is equivalent to 0.01 QALYs-worth of uncertainty per person affected by the decision between CBT, counselling and usual care. When multiplied by the estimated 991,000 people with T2DM in the UK who are receiving second-line therapy, decision uncertainty is estimated to be valued at £22.4M per annum or £224M over 10 years (equivalent to 11,200 QALYs-worth of uncertainty). Given current costs and evidence, both usual care and counselling are less cost-effective than CBT, which is indicated by their respective PSBs of £12 and £681 per person (equivalent to 0.0006 QALYs for usual care and 0.0340 QALYs for counselling). Shown at the bottom of Figure 28, for the affected patient population per annum, are the PSBs for usual care (£1.2M) and for counselling (£67.5M).
In Figure 28c, results for people on third-line therapies show that the overall EVPI is estimated to be £234.60 per person, which is equivalent to 0.01 QALYs-worth of uncertainty per person affected by the decision between CBT, counselling and usual care. When multiplied by the estimated 314,000 people with T2DM in the UK who are receiving third-line therapy, decision uncertainty is estimated to be valued at £7.4M per annum or £74M over 10 years (equivalent to 3683 QALYs-worth of uncertainty). Given current costs and evidence, usual care is just slightly more cost-effective than CBT, and both are much more cost-effective than counselling, which is indicated by the PSBs of £5 and £663 per person for CBT and counselling, respectively (equivalent to 0.0003 QALYs for CBT and 0.0332 QALYs for counselling). Shown at the bottom of Figure 28, for the affected patient population per annum, are the PSBs for CBT (£0.2M) and for counselling (£20.8M).
The EVPPI analysis allows us to understand which are the most uncertain parameters driving decision uncertainty and, therefore, which might be the highest priorities for further evidence collection. The results for each of the first-, second- and third-line therapy analyses show that four main parameters are the key drivers of uncertainty (Table 24). It is partly the 1-year effectiveness that is a key driver, for both CBT and counselling. The single most uncertain and important parameter is the long-term effectiveness of CBT. The long-term effectiveness of counselling is also important to decision uncertainty.
| Parameter | EVPPI per person (£) | SE of EVPPI estimate | Indexed to overall EVPI = 1.00 |
|---|---|---|---|
| (Part 1) Patients receiving first-line treatment (i.e. people treated with diet and lifestyle advice plus metformin) | |||
| All parameters | 189.60 | – | 1.00 |
| 743. CBT, 1-year HbA1c effect (HbA1c_drop_CBT) | 141.97 | 22.87 | 0.75 |
| 745. Counselling, 1-year HbA1c effect (HbA1c_drop_Cou) | 0.16 | 11.02 | 0.00 |
| 744. CBT, longer-term HbA1c effect (Traj_CBT) | 47.04 | 20.40 | 0.25 |
| 746. Counselling, longer-term HbA1c effect (Traj_COU) | 0.26 | 11.26 | 0.00 |
| 743 and 744 | 147.63 | 18.41 | 0.78 |
| 745 and 746 | 3.00 | 15.62 | 0.02 |
| (Part 2) Patients receiving second-line treatment (i.e. people treated with metformin plus another oral agent) | |||
| All parameters | 226.00 | – | 1.00 |
| 743. CBT, 1-year HbA1c effect (HbA1c_drop_CBT) | 145.28 | 23.66 | 0.64 |
| 745. Counselling, 1-year HbA1c effect (HbA1c_drop_Cou) | 0.00 | 11.56 | 0.00 |
| 744. CBT, longer-term HbA1c effect (Traj_CBT) | 58.47 | 23.50 | 0.26 |
| 746. Counselling, longer-term HbA1c effect (Traj_COU) | 14.12 | 15.51 | 0.06 |
| 743 and 744 | 150.13 | 20.27 | 0.66 |
| 745 and 746 | 27.43 | 18.90 | 0.12 |
| (Part 3) Patients receiving third-line treatment (i.e. people on combination triple oral therapy or insulin) | |||
| All parameters | 234.60 | – | 1.00 |
| 743. CBT, 1-year HbA1c effect (HbA1c_drop_CBT) | 150.29 | 18.76 | 0.64 |
| 745. Counselling, 1-year HbA1c effect (HbA1c_drop_Cou) | 25.77 | 17.32 | 0.11 |
| 744. CBT, longer-term HbA1c effect (Traj_CBT) | 61.01 | 25.81 | 0.26 |
| 746. Counselling, longer-term HbA1c effect (Traj_COU) | 3.42 | 13.81 | 0.01 |
| 743 and 744 | 164.43 | 17.00 | 0.70 |
| 745 and 746 | 28.80 | 19.79 | 0.12 |
The results for people on first-line therapies show that it is the 1-year effectiveness that is a key driver, for both CBT (indexed EVPPI = 0.75) and counselling, with counselling much less important to decision uncertainty (indexed EVPPI = 0). The long-term effectiveness of CBT has an indexed EVPPI of 0.25. The long-term effectiveness of counselling is also important (indexed EVPPI = 0).
The results for people on second-line therapies show that it is the 1-year effectiveness that is a key driver – for both CBT (indexed EVPPI = 0.64) and counselling, with counselling much less important to decision uncertainty (indexed EVPPI = 0). The long-term effectiveness of CBT has an indexed EVPPI of 0.25. The long-term effectiveness of counselling is also important (indexed EVPPI = 0.06).
The results for people on third-line therapies show that it is the 1-year effectiveness that is a key driver, for both CBT (indexed EVPPI = 0.64) and counselling, with counselling somewhat important to decision uncertainty (indexed EVPPI = 0.11). The long-term effectiveness of CBT has an indexed EVPPI of 0.26. The long-term effectiveness of counselling is also important (indexed EVPPI = 0.06).
Conclusions on the cost-effectiveness of cognitive–behavioural therapy versus counselling versus usual care in adults with type 2 diabetes mellitus
The results of these analyses suggest the following conclusions for patients receiving:
-
first-line therapy –
-
CBT could be considered a cost-effective psychological intervention compared with usual care (ICER ≈£11,000 per QALY gained) and compared with counselling (CBT dominates counselling).
-
Counselling would appear not to be cost-effective compared with usual care (ICER ≈£127,000 per QALY gained).
-
There is considerable decision uncertainty around these conclusions (although less so than for T1DM). Priorities for further evidence collection would focus on the CBT versus usual care short-term effectiveness, and longer-term (i.e. beyond 12 months) maintenance of effectiveness compared with usual care.
-
-
second-line therapy –
-
CBT could be considered a borderline cost-effective psychological intervention compared with usual care (ICER ≈£19,000 per QALY gained) and very cost-effective compared with counselling.
-
Counselling would appear not to be cost-effective compared with usual care (ICER ≈£151,000 per QALY gained).
-
There is considerable decision uncertainty around these conclusions (although less so than for T1DM). Priorities for further evidence collection would focus on the CBT versus usual care short-term effectiveness, and longer-term (i.e. beyond 12 months) maintenance of effectiveness compared with usual care.
-
-
third-line therapy –
-
CBT could be considered a borderline cost-effective psychological intervention compared with usual care (ICER ≈£20,000 per QALY gained) and very cost-effective compared with counselling.
-
Counselling would appear not to be cost-effective compared with usual care (ICER ≈£65,000 per QALY gained).
-
Once again, there is considerable decision uncertainty around these conclusions (although less so than for T1DM). Priorities for further evidence collection would, again, focus on the CBT versus usual care short-term effectiveness, and longer-term (i.e. beyond 12 months) maintenance of effectiveness compared with usual care.
-
For all therapy lines, a confirmatory trial with a long-term follow-up is necessary to establish the long-term treatment effect of psychological interventions for people with T2DM, as the only available long-term evidence is from a population with T1DM.
Chapter 9 Patient and public involvement focus groups
Participants
Ten people with diabetes participated in the focus groups (five from Sheffield and five from London) (Table 25). Four participants had T1DM and six had T2DM. Three males and seven females participated.
| Characteristic | London focus group (n) | Sheffield focus group (n) | Total (n) |
|---|---|---|---|
| Type of diabetes | |||
| T1DM | 3 | 1 | 4 |
| T2DM | 2 | 4 | 6 |
| Gender | |||
| Male | 1 | 2 | 3 |
| Female | 4 | 3 | 7 |
| Total | 10 | 10 | |
Results of focus groups
Five main themes of discussion were prevalent in both focus groups: (1) the need for psychological support in practice, (2) views on psychological intervention delivery, (3) views on diabetes research outcomes, (4) the importance of diabetes and psychology research and (5) dissemination of diabetes research.
Need for psychological support in practice
Several participants in both locations identified psychological interventions as a missing aspect of their care, and that it should, at least, be offered. The Sheffield group seemed in agreement that if clinicians were more psychologically aware, then some of their diabetes-related issues might be more likely to be addressed:
. . . that psychology behind it and that’s never, that kind of stuff isn’t brought up in those consultant meetings . . .
Male Participant (MP), London
. . . quite a lot of it is emotional, managing your emotions with it, you know, when you have a bad day . . .
Female participant (FP), London
. . . they have something in place for that person, and that is a choice, you’re not saying you have to do it, but give the person the choice . . .
FP, Sheffield
Views on psychological intervention delivery
Participants identified that interventions could be particularly important for children and adolescents, but it can depend on how they are delivered. Their views were in line with the studies, as most studies looked at family interventions, and this was highlighted as important. They also identified peer support groups as being potentially effective for them.
In relation to who should facilitate psychological therapy, psychologists with diabetes knowledge or psychologically trained diabetes nurses were identified as suitable interventionists:
I think that the dream would be a psychologist who had some, even just background knowledge of diabetes . . . if the diabetes nurse had been psychology trained then that should really be the ideal scenario . . .
MP, London
Others expressed a need for a differentiation between a clinician who takes care of medical health, and a clinician addressing mental health:
. . . I think the psychologist is good because you’ve kind of got your consultant and your nurse looking after your medical side of it and I think if you’ve got a psychologist looking after your, you know, perhaps I think I would probably prefer that and not necessarily to mix the two as much.
FP, London
One participant explained that, no matter what illness or condition you have, you need the nurse and psychological input.
. . . you need both for any patient, I don’t care what illness you got, you need that . . .
FP, Sheffield
Views on diabetes research outcomes
In regards to views on components of psychological interventions and how they are explored in research, the London group appeared surprised that follow-up points were not longer and they emphasised that psychological problems are not easily resolved:
Because I would think, you know, if you’re having, like, psychological intervention, that might take longer . . .
FP, London
I would think, if you were having psychological support, that’s going to take a couple of months to get ingrained in you and then to change and then for you to start to change your behaviour, so I wouldn’t imagine that a year is quite a short time . . .
FP, London
There appeared to be a consensus that psychological outcomes were more important to group members than HbA1c level. It was suggested that HbA1c level is of more importance to clinicians and researchers than the patients. Several participants reiterated the fact that only HbA1c level was commented on in clinical appointments:
. . . they are looking only at the HbA1c and not at the whole approach.
FP, London
In the Sheffield group, there was some disagreement about who psychological interventions for people with diabetes should target. For example, some believed interventions should be focused only on people with suboptimal glycaemic control:
It’s a waste of resources going after someone who is already in control of it.
MP, Sheffield
In contrast, a couple of other participants felt psychological interventions should be ‘part of the preventative programme’ (FP, Sheffield) and that patients should be offered this support before glycaemic control worsens.
Both groups emphasised the importance of spending money and investing in psychological support to save money in the long term from complications caused by poor self-management and psychological issues:
. . . what we’re saying is, it’s going to cost a lot of money to put these things into place, but if it means people stay healthier both physically and mentally, in the long run it will save them.
FP, London
Importance of diabetes and psychology research
The participants also emphasised the importance of research being undertaken, in terms of linking diabetes and psychology. The participants identified frequently that there is a psychological impact of living with diabetes:
. . . there is no health without mental health.
MP, London
It’s diabetes forever . . . is that we don’t have a holidays, we have diabetes, even when you go on holiday you still have it to control, we still have it to care, so it’s life without a holiday . . .
FP, London
I think that’s one of the things that’s so difficult is that you don’t get a weekend off or a day off or a minute off, it’s relentless in that way . . .
MP, London
The focus group itself seemed to have a positive impact on participants:
Yeah it’s really marvellous that we can come here and give our own view, I think that that’s so important, as it’s psychological, you needed to talk to diabetics themselves, don’t you?
FP, London
Dissemination of diabetes research
There were a number of points raised that addressed how the research should be disseminated. Some participants belonged to a variety of different research groups and charities, such as Diabetes UK. They expressed interest in seeing updates of the research in Diabetes UK newsletters and magazines:
I always look at the Diabetes UK! In the Diabetes UK website, there is quite a lot.
FP, London
In addition, the knowledge of this research project itself was positively commented on. The participants wanted to be informed about the research and to have copies of the outcomes:
. . . is so important and it’s nice to see that this is actually . . . I’d never heard about any research being done into this side of it until now . . .
MP, London
Some participants expressed concern about whether or not the outcomes of the research could positively and directly influence practice and provide access to psychological support. The group expressed a desire to have this support available and accessible. One member explained that there was no point in being informed about psychological interventions if there was no chance of having access to this support:
. . . if we can’t access it, it’s not much use us knowing about it.
FP, Sheffield
Chapter 10 Discussion
Summary of main results
This systematic review and meta-analysis of psychological interventions to improve self-management in people with T1DM and people with T2DM demonstrates that this is an active area of research; using our original protocol, we identified 96 new RCTs from the literature that were reported between 2003 and 2016. This included five RCTs of adults with T1DM, 20 RCTs of adolescents/children with T1DM, 56 RCTs of adults with T2DM and 13 RCTs with a mixed adult T1DM and T2DM population; there were also two studies that used a mixed adolescent T1DM and T2DM population. 189,194 Only adult studies were included in the meta-analysis of T2DM. Most of the increased level of activity in this field has been in the development and testing of psychological interventions for adults with T2DM.
The main results of the aggregate meta-analysis indicate that, for adults and adolescents/children with T1DM in receipt of a psychological treatment, there is no significant improvement in glycaemic control. Overall, psychological interventions have a statistically significant improvement in glycaemic control for adults with T2DM, but the effect size is small and of borderline clinical significance. Results are discussed in more depth for T1DM and T2DM and refer to the outcome of additional NMAs and IPD meta-analyses.
Adults with type 1 diabetes mellitus
In the aggregate meta-analysis, there was no statistically significant improvement in glycaemic control for adults with T1DM in receipt of psychological treatment compared with those in the control group (i.e. receiving usual care or attention control). These findings are consistent with our previous review of adults with T1DM, which demonstrated a non-significant improvement in glycaemic control compared with controls. 57 However, when one of the outlier adult studies (a study aiming to improve depressive symptoms in which glycaemic control was a secondary outcome)105 was removed from the meta-analysis in the current review, there was a statistically significant improvement in glycaemic control, although it is likely to be a clinically non-significant effect size (SMD –0.20, 95% CI –0.37 to –0.02, equivalent to a –0.25 change in % HbA1c level or a reduction of ≈3 mmol/mol). It is important to consider the problems of ignoring outliers in meta-analysis, especially when removal results in a change to the overall conclusion. 271 Therefore, considering that this remains a small effect size and of limited clinical benefit for adults with T1DM, a reduction of 0.4% in HbA1c level (≈4 mmol/mol) is considered beneficial. 58 Our overall conclusion remains the same: that, based on the available evidence, psychological interventions do not improve glycaemic control in adults with T1DM. To underscore this, when data from the previous review and the current review were combined, there was no change to this conclusion, although the evidence from the current review is of high quality according to GRADE.
Which psychological treatment is the most effective for adults with type 1 diabetes mellitus?
According to the results of the aggregate meta-regression, it was not possible to determine which psychological treatment was more effective, as CBT and counselling studies were not significantly different. However, we also conducted a NMA and, as this uses the same aggregate data, although drawing on direct and indirect comparisons, this does suggest that some treatments may be more effective than others and that treatments can be ranked based on the probability of effectiveness. Therefore, the treatment arm suggested by the NMA to be most effective was not a psychological intervention but ‘attention control’; this was used in two out of seven studies in which ‘BGAT’ and ‘diabetes education’ were compared with a psychological intervention. The fact that the ‘attention control’ groups here are probably most effective is not surprising as, essentially, both are diabetes education interventions predicated on supporting individuals to develop their knowledge and skills to improve self-management and achieve optimal glycaemic control, and they parallel the success of the DAFNE-structured education programme272 and BGAT, which is a treatment to improve blood glucose awareness and glycaemic control. 273 The next most successful treatment identified by the NMA was CBT. Other meta-analyses60,274,275 focusing specifically on CBT interventions have established these as effective in improving depressive symptoms for people with T1DM and T2DM, and one study274 has established short-term improvement in glycaemic control (3–6 months) but not longer-term, namely 12 months, which was the follow-up we used. Longer-term evaluation from the ADaPT study163 suggests that, even when CBT based treatment is effective in improving HbA1c levels for adults with T1DM at 12 months, without ongoing treatment the benefits completely disappear by 24 months. 251
Who should deliver psychological treatments to adults with type 1 diabetes mellitus?
According to the results of the aggregate meta-regression, there was no statistically significant difference in outcome according to who delivered the psychological treatment, for example psychology professionals compared with diabetes specialists. This contrasts with a pilot study of MI for adolescents with T1DM delivered by a psychologist, which was effective,276 but not when diabetes specialists were trained in the intervention for a RCT. 174
Who benefits the most from psychological treatments for adults with type 1 diabetes mellitus?
For the IPD meta-analysis, we had data for six of the seven studies included in the aggregate meta-analysis but data were limited in terms of potential independent or moderating variables, that is only age of participants was available for all studies, and age was not found to be a moderator of treatment outcome or a main effect. Therefore, more and comparable IPD across trials would be required to improve our understanding of which individuals benefit most from psychological interventions.
Interpretation
Explanations for the lack of effectiveness of psychological interventions for adults may be summarised as follows:
-
Improved quality of RCT design and reporting, and, therefore, less potential for biased treatment effect.
In our previous review,57 we established that overall quality of the reporting of the included studies was poor. In the current review, we were able to establish that most included trials were at a low risk of bias, albeit the methods used differed between reviews; therefore, it was not possible to directly compare the quality of the cohorts. However, given that studies included in the current review were more likely to report intention-to-treat analyses, and CONSORT criteria67 and reporting are prerequisites to publishing in most peer-reviewed journals, there is now less potential for overestimation of treatment effects.
-
Use of attention control focused on diabetes education.
As discussed in Chapter 5. The attention control groups used in two of the seven studies were identified by the NMA as having the highest probability of being the best treatment. Therefore, educational interventions that have a direct focus on diabetes self-management are likely to be as effective as, if not more effective than, a psychological treatment that may focus more on improving motivation for diabetes self-management; we did not have data on the secondary outcomes that could be pooled. Furthermore, it may be a consequence that individuals who participated in these trials had not received educational training in self-management prior to participation in the studies.
-
Timing of psychological interventions in adults with T1DM.
Delivering psychological treatments to adults with T1DM at the right time for each individual may influence their effectiveness. It has been suggested by a range of researchers that psychological support should come before, during or after structured education. Poor psychological adaptation to T1DM may occur in childhood-onset277 or adult-onset T1DM; around half of people with T1DM are diagnosed in adulthood. 278 In a meta-synthesis of qualitative research on adjustment to diagnosis in adults with T1DM, Due-Christensen et al. 279 conclude that the physical and social stress of adapting to T1DM causes psychological distress and, without support to minimise the distress, may increase the likelihood of developing beliefs and behaviours that have a detrimental impact on motivation for diabetes self-management and optimisation of glycaemic control. The average duration of diabetes for participants included in the IPD meta-analysis was ≈8 years; therefore, most of the interventions in the current review were not focused on people with new-onset T1DM. This suggests that we need to determine whether we need to address skills training in diabetes self-management first and psychological distress later or both together. We should also consider what is the best outcome, as measuring change in diabetes distress and depressive symptoms may be more appropriate than glycaemic control. We may also need to consider whether or not existing interventions, such as CBT, are in fact the best approach, as many are derived from mental health models to improve depression and do not necessarily provide the best fit for someone trying to cope with a long-term chronic condition such as diabetes. 280,281
Health economics
Cognitive–behavioural therapy interventions are potentially cost-effective, because of the potential for a larger improvement in glycaemic control compared with counselling therapies or usual care; this is supported by the NMA. However, there was a substantial uncertainty with the economic modelling; long-term studies are required to determine the maintenance of benefits and to eliminate decision uncertainty.
Adolescents/children with type 1 diabetes mellitus
In the aggregate meta-analysis, there was no statistically significant improvement in glycaemic control for adolescents/children with T1DM in receipt of a psychological treatment compared with those in receipt of a control (i.e. usual care, attention control or a less intensive psychological intervention). The current findings are inconsistent with the previous review for adolescents/children with T1DM, which demonstrated a significant improvement in glycaemic control for people in receipt of a psychological therapy. 57 However, the evidence from the current review is rated as being of high quality according to GRADE and, therefore, is likely to contain more reliable estimates.
Which psychological treatment is the most effective for adolescents/children with type 1 diabetes mellitus?
It was not possible to determine from the meta-regression which type of psychological therapy (i.e. counselling, family therapy or CBT) had the most potential for effectiveness in improving glycaemic control. However, one of the reasons why the results of this review are in contrast to the earlier review could be because of the increased use of attention control groups, used in 27% of included studies. In addition, although the NMA suggests that none of the treatments was effective overall, attention control had the highest probability of being the best treatment in terms of improving glycaemic control for young people, followed by CBT and family therapy. A recent systematic review and meta-analysis282 of UK-based psychoeducational interventions for adolescents with T1DM achieved a similar non-significant improvement in glycaemic control; the authors did not compare types of psychological therapy,282 but were able to determine a moderate effect on improving self-efficacy. However, a systematic review283 of educational interventions that aimed to improve skill development reported improved QoL for young people when interventions incorporated psychological components such as stress reduction and coping skills training.
Who should deliver psychological treatments to adolescents/children with type 1 diabetes mellitus?
We compared interventionist type in the aggregate meta-regression; there were no statistically significant differences in effectiveness for interventions delivered by psychology professionals compared with those delivered by diabetes specialists. Therefore, we can say the challenge now is to make diabetes health professionals more effective in delivering psychological interventions to young people with T1DM; although other recent reviews282,283 have mainly included studies delivered by nurses, these have not conducted a comparative analysis.
Who benefits the most from psychological treatments for adolescents/children with type 1 diabetes mellitus?
Our IPD meta-analysis was based on 50% of the studies included in the aggregate meta-analysis and suggested that participation in research was beneficial for young people. There were main effects demonstrating that younger participants had improved glycaemic control over the intervention period, as did participants with a longer duration of diabetes. However, we were not able to determine whether particular subgroups of young people, such as those with behaviour problems or depression,284 benefited more as these data were not requested from study authors given that it would have been difficult to request comparable information across studies.
Interpretation
Explanations for the lack of effectiveness of psychological interventions for adolescents/children may be summarised as follows:
-
Improved quality of trial reporting, as noted for adults with T1DM.
-
Increased use of attention control groups.
This highlights the ethical dilemma faced by researchers who may want to ensure ‘therapeutic equipoise’: the need to establish genuine doubt regarding the superiority of the treatments being compared. 285 This means that offering ‘something’ rather than nothing, that is standard or usual care alone, is considered important and may encourage participation in a RCT, and that participation can provide benefit. Therefore, on the one hand, this makes it more difficult to derive an overall effect and, on the other hand, attention control is a good comparator if the psychological intervention is more intense and process evaluation is conducted to identify key ingredients that may be common to both groups.
-
Relatively varied psychological interventions tested in combination with varied control groups.
Under the umbrella of psychological treatments for adolescents/children with T1DM, there are now multiple treatment comparisons, and not only is there heterogeneity in terms of the type of intervention, the mode of intervention delivery and the recipients, be they individual, family, parents or a combination of all three, but also there are numerous control groups to consider. Related to points 2 and 3 is that, for adolescents/children, it was not possible to conduct meta-analysis on secondary outcomes, such as psychological status, DKA admission rates or self-management activities such as blood glucose testing. There were too few studies using secondary outcome measures that could be pooled.
Health economics
It was not possible to determine the cost-effectiveness of psychological interventions for adolescents/children with T1DM as there was no evidence of any improvement in HbA1c levels from the meta-analyses.
Type 2 diabetes mellitus
In an aggregate meta-analysis of 49 trials, there was a statistically significant improvement in glycaemic control for adults with T2DM in receipt of a psychological treatment compared with those in receipt of a control (usual care or attention control). This was a small effect at –0.21 (95% CI –0.31 to –0.10) or –0.33 change in % HbA1c level (a reduction of ≈3.5 mmol/mol) and, therefore, of borderline clinical significance,58 usually a 0.4% (4–5 mmol/mol) reduction in HbA1c level, as this is associated with a reduction in the development of microvascular disease. Our previous review40 to determine the effectiveness of psychological interventions for T2DM included in the meta-analysis 12 studies published from 1983 to January 2003, whereas this review compared studies from February 2003 to 2016. The previous review40 reported a clinically relevant moderate effect size in terms of improved glycaemic control, whereas the current review reported a smaller effect size. When combined (n = 61), there remained a small effect, but the combined effect was at the level of clinical significance (SMD –0.22, 95% CI –0.32 to –0.12, equivalent to a –0.35 change in % HbA1c level, or a reduction of ≈4 mmol/mol). However, it is difficult to determine which cohort is most reliable as the moderate GRADE assessment indicates that there was significant heterogeneity across studies for glycaemic control and other outcomes. Other systematic reviews from 2015–1762,286,287 of psychological interventions for people with T2DM have reported variable improvement in glycaemic control. In other words, the effectiveness of psychological treatments is getting smaller over time.
Which psychological treatment is the most effective for adults with type 2 diabetes mellitus?
The aggregate meta-regression demonstrated that both CBT- and counselling-based interventions were effective in improving glycaemic control, but there was no significant difference between the two. Results of the NMA suggested that, when direct and indirect evidence was combined, there was no psychological treatment that demonstrated an overall effect, although some power is lost to support model consistency and effect sizes were similar to aggregate results (CBT –0.213, p = 0.09 and counselling –0.166, p = 0.09). The NMA ranking of CBT and counselling suggested that each shared the probability of being the best treatment. A recent systematic review62 of MI (therefore counselling interventions) reported that three62,286,287 of the 13 included studies demonstrated a significant reduction in HbA1c levels compared with a control group. In contrast, a systematic review and meta-analysis287 of CBT for people with depression and T2DM reported moderate to large effect sizes for glycaemic control and improvement in depressive symptoms, respectively.
For secondary outcomes, there was no evidence for psychological therapies improving depression over controls. Previous reviews focusing on distinct populations of people with depression and diabetes find that psychological treatments are effective. 59,60,275 However, the current review included different clinical subgroups, suboptimal glycaemic control, specific age groups and ethnicities and specific diabetes duration, and few were depressed populations. Our earlier reviews40,288 also demonstrated that psychological interventions significantly reduced psychological distress over controls. QoL and dietary behaviour, a potential moderator of glycaemic control, for participants in receipt of psychological interventions improved significantly compared with controls. However, there was no statistically significant improvement in BMI or blood pressure. Our previous review40 also found no effect of psychological therapies in improving weight control. However, weight loss, if successful, may take longer than improvement in glycaemic control, and behavioural or lifestyle interventions that specifically target BMI as an outcome are likely to be more effective. 286
Who should deliver psychological treatments to adults with type 2 diabetes mellitus?
It was not possible to determine whether psychology professionals or diabetes specialists were more effective as interventionists. Both were effective according to aggregate meta-regression; however, there was a high level of heterogeneity for interventions delivered by diabetes specialists. An explanation for these results could be twofold: (1) there may be less variability in psychological interventions delivered by psychologists across studies as the techniques and training is likely to be more in-depth and (2) there is also qualitative evidence that psychological techniques are difficult for non-psychologists to deliver and they may not want to be trained in psychological techniques. 289
Who benefits the most from psychological treatments for adults with type 2 diabetes mellitus?
Our IPD meta-analysis was based on 50% of the included studies and demonstrated a significant interaction effect between baseline HbA1c level and treatment, suggesting that psychological interventions are most effective when the baseline HbA1c level is ≥ 8% (≥ 64 mmol/mol). This finding has previously been established in a systematic review and NMA of behavioural and lifestyle self-management programmes for people with T2DM. 286 Therefore, it would make sense to target interventions for people who are struggling with glycaemic control rather than for people with relatively good HbA1c levels, who are probably motivated to self-manage their diabetes effectively. This finding may also, in part, explain why there was such heterogeneity of effect across studies in the aggregate meta-analyses. There were main effects for age and diabetes duration, and older participants and people with a shorter duration of diabetes improved over the intervention period. It is concerning that younger people with T2DM are less likely to improve and younger adults with T2DM are less likely to attend for diabetes monitoring such as annual checks (National Diabetes Audit 2016/17). The reasons for this are likely to be multifactorial, reflecting the difficulties faced by people of working age in managing a chronic illness16 and perhaps also approaches to lifestyle that have led to diagnosis of T2DM when young that may be more resistant to change.
Considering the high level of heterogeneity across trials in terms of their effectiveness in improving glycaemic control, it is helpful to consider whether or not there could be a ‘blueprint’ for a successful psychological treatment for adults with T2DM. A crude method for doing this is to summarise the main characteristics of trials that demonstrated the largest effect. The five studies with the largest effect size from this meta-analysis suggest that the most effective treatments are counselling, usually MI, and CBT-based interventions. The interventionists were nurses or psychologists/therapists, although most did not adequately describe the training the interventionists received. However, some were pre-trained, such as fully trained therapists, or were in receipt of training delivered by clinical psychologists and psychiatrists. The dose of therapy received by participants was 4 to 12 group or individual face-to-face sessions.
Interpretation
Explanations for the small effect of psychological interventions on improving glycaemic control for adults with T2DM may be summarised as follows:
-
Improved quality of trial reporting, as previously described for T1DM.
-
Improved ‘usual’ care in control groups and/or availability of attention control groups, both of which may include diabetes education together with a lack of an effect of psychological treatment –
the standards of diabetes care for people with T2DM in the UK has improved markedly since the introduction of the primary care targets and Quality and Outcomes Framework. 290
-
Including diverse populations in the meta-analyses and including interventions for which glycaemic control was a secondary outcome –
this includes interventions that recruited participants with optimal glycaemic control, who therefore had little room for improvement and determination of effect of treatment.
-
potential lack of fidelity and quality assurance of psychological treatment –
although most studies reported on the training interventionists received, few reported whether or not interventionists actually achieved competency in the techniques prior to the start of the intervention, or quality assurance of ongoing performance was not described. These aspects are inherent to the successful delivery of psychological interventions and, over time, this may become a marker of quality for this type of non-pharmacological intervention.
-
reducing the intensity of the psychological interventions –
there is increased pressure on NHS resources and research funders seek the most cost-effective interventions. Researchers are perhaps more likely to get research funding for a low-intensity intervention as it is cheaper to run and, if effective, cheaper to deliver.
Health economics
Cognitive–behavioural therapy was found to be less costly than counselling interventions, mainly because there were fewer sessions involved across studies. CBT was also potentially more cost-effective than counselling interventions or usual care, although this varied according to whether or not participants were in receipt of treatment for T2DM. Therefore, CBT was the most cost-effective when participants were treated with diet and exercise plus or minus metformin, rather than two or more oral antidiabetic agents and/or insulin treatment. However, larger studies are required to reduce decision uncertainty; as for adults with T1DM, more long-term data on effectiveness are required. This is particularly the case for people with T2DM, as no long-term studies were found in a population of people with T2DM that could inform how long the effects of psychological interventions were maintained.
Other evidence
Evidence from the patient and public involvement focus groups
When we presented preliminary findings of our evidence synthesis to people with diabetes, one of the main themes generated from the focus groups was the fact that psychological support and treatment is one aspect of diabetes care that is currently missing. This is interesting, as some of the participants attended King’s College Hospital NHS Foundation Trust and others attended Sheffield Teaching Hospitals NHS Foundation Trust, both of which provide some psychological treatment and much more than smaller hospitals or primary care clinics. All participants spoke about the day-to-day psychological struggle of managing diabetes and they believed that this approach might really help them. Although they understood why we were focusing on glycaemic control for this review, they felt that psychological outcomes were just as important, if not more so, but unfortunately these were not measured in most of the included studies. Despite the fact that psychological treatments, overall, were not effective in improving glycaemic control in adolescents/children and adults with T1DM and of limited effect for adults with T2DM, they believed that these treatments would be cost-effective in the long term.
The importance of psychological support among people with diabetes was recently highlighted by a report generated by Diabetes UK called The Future of Diabetes. 291 This report is the result of conversations with 9000 people with diabetes who identified psychological support as the most important area that could make it easier to live with diabetes in the future. Therefore, even though psychological interventions were not, on the whole, effective in terms of glycaemic control, they may have discrete benefits, but we were not able to analyse other outcomes, such as diabetes distress, because of the heterogeneity of outcome measures used across studies.
Evidence from non-randomised controlled trials
We conducted a systematic review of nRCTs comparing the effectiveness of a psychological treatment versus a control group. Fourteen studies were identified (T1DM, n = 6;226–231 T2DM, n = 7;233–238,240 and mixed T1DM and T2DM, n = 1232); only three demonstrated statistically significant improvement for those receiving psychological treatment versus usual care control203,234,240 (one study of people with T1DM in receipt of stress management intervention and two studies of people with T2DM in receipt of counselling240). Few studies demonstrated significant results for different reasons. The RoB assessment suggested that most studies were of poor quality or did not provide adequate information; sample sizes were small and exhibited selection bias; and the competency of the interventionists was questionable. As studies were generally of poor quality, we did not consider adding them to aggregate meta-analyses or NMAs.
Strengths and limitations of this evidence synthesis
The strengths of this review included our choice of a defined research question and conducting a systematic review according to PRISMA guidance. 292 We did not limit the research to English language publications and we attempted to identify published and unpublished studies, including hand-searching conference abstracts from the main national and international diabetes conferences. We used a detailed protocolised approach to identify studies for inclusion in terms of the definition of the health technology (i.e. psychological intervention) and main and secondary outcomes. We contacted authors when information was missing for inclusion in meta-analyses and also performed network analyses to maximise data from studies comparing multiple interventions. We also conducted an IPD meta-analysis for the main outcome of interest, namely glycaemic control. A further strength is our inclusion of the same protocol we used approximately 10 years ago, to allow us to pool results and so determine cohort effects.
Limitations of the review include that we were unable to determine whether or not psychological interventions worked best among different cultures, as most were conducted in western Europe and North America and few studies adequately described the specific cultural setting. There are also potential difficulties applying psychological interventions developed in one country to another with a different health system, such as the difference between UK and non-UK studies. We did determine that studies conducted in Asian countries were more likely to be effective, but they also had a higher RoB. Although we know that there are periods on a person’s journey with diabetes that might be particularly psychologically stressful, such as diagnosis, starting insulin for T2DM or the onset of diabetes complications, we were not able to find studies that had been specifically developed for these subgroups. Other factors that may affect the results of this review include the rising numbers of people diagnosed with T2DM, meaning there may be an increased awareness of diabetes among the general public and an associated awareness of psychological distress,291 which may make people more aware of the need to seek psychological help. Treatment for depression and anxiety is widespread in the UK since the Improving Access to Psychological Therapies programme, which provides low-intensity psychological treatments, was introduced in 2008. 293 Prior access to psychological support was not adequately measured in the included studies.
Limitations at the protocol level include our reliance on using title and abstract to screen for relevant studies. In our previous reviews, this was an adequate strategy as the terminology used to describe psychological interventions was explicit. However, in the current work, we identified that this approach was not adequate to detect all studies as the detail of psychological interventions was sometimes described only in the main text rather than the abstract and suggests that there is a dilution and infusion of psychological theory into complex interventions without specifying directly what the components are. We tried to address this by conducting a re-screen of abstracts previously rejected and undertaking sensitivity analyses. Other limitations reflect the concentration of psychological interventions in particular countries; most were from the USA and western Europe. We assume that our search strategy was robust enough to identify trials in other regions as some were identified and included, although these were relatively few. We also restricted our analyses to those reporting follow-up to 12 months from baseline. In terms of the searches, we restricted our grey literature search to conference proceedings for the main diabetes conferences and did not include behavioural medicine or other conferences; this was based on the assumption that diabetes RCTs were more likely to be presented at these. However, we may have missed some eligible studies using this method. For the systematic review of nRCTs, only one researcher screened titles and abstracts although two researchers screened the full-text articles; therefore, there is the potential for some studies to have been missed in error.
Limitations at the study level may relate to publication bias. Our ability to assess this was limited because of the small number of studies in some analyses (e.g. subgroup analyses and secondary outcomes). We tried to address this by using the Egger test, funnel plots and the trim-and-fill method in combination. We found little evidence of publication bias for adolescent/children and adult T1DM studies. We did not limit the systematic review to studies that combined psychological treatment with diabetes self-management strategies. However, we were able to subsequently address this in a meta-regression for the adult T2DM studies.
At the outcome level, our main analyses were limited to glycaemic control; in some studies included in the evidence synthesis, this was not the primary outcome. However, we were unable to conduct meta-analysis for psychological outcomes in studies of people with T1DM. This underlines the need to establish consolidated outcome sets. 294 CONSORT criteria were introduced in 200167 and our RoB assessment demonstrated a low to unclear RoB. This is an improvement on the quality of studies included in our previous review, as many of the studies were conducted prior to the introduction of CONSORT criteria. A further limitation at the outcome level is that we used data closest to the 12-month follow-up, but this meant including outcome data at varying time points, such as at the 3- or 6-month follow-ups, and, although we did conduct meta-regression on overall duration of therapy, we did not specifically address this; therefore our analyses may overestimate the effectiveness of psychological treatments.
Our IPD meta-analysis was limited to 40–50% of the included studies from the aggregate meta-analysis. Therefore, the finding from this analysis are subject to response bias. However, there were no significant differences between studies that provided data and those that did not according to date of publication, type of psychological treatment tested and country of origin.
The overall heterogeneity for studies involving adults with T2DM and adults with T1DM was low to moderate for the primary outcome (i.e. glycaemic control) according to GRADE, which may be surprising considering the range of different psychological therapies pooled for analysis. We decided to pool a range of psychological therapies used in diabetes care to address the research question. All psychological therapies met the predefined criteria described in Chapter 3, Types of intervention (health technologies) which may account for lower heterogeneity than expected. When heterogeneity existed, we conducted meta-regression and sensitivity analyses. Because of the relatively small number of studies, negative results of meta-regressions need to be treated with care because of a lack of power, and estimations of regressions may not be robust. 295
The key limitation regarding the health economic analysis was the lack of available data on how long any changes in biomarkers would be maintained. Consequently, how long the treatment effects found in the systematic review and meta-analyses would last was highly uncertain and was identified as key driver of decision uncertainty around the cost-effectiveness of psychological interventions for both people with T1DM and people with T2DM. It should be noted that this parameter was more uncertain for people with T2DM, as no evidence on the long-term effects of psychological interventions was available in this population.
The GRADE assessment of certainty of evidence
The evidence for adults with T1DM, and adolescents/children with T1DM was rated as being of high quality, increasing our confidence that the result reflects a true effect for the primary outcome, HbA1c level. The quality of evidence in studies involving adults with T2DM was rated as being of moderate quality, indicating only moderate confidence in the estimate. Further research may improve the quality of evidence in terms of HbA1c level. This moderate rating reflects inconsistency and considerable heterogeneity, which remained moderate to high in most subgroups of psychological interventions (i.e. CBT, counselling) and interventionist subgroups (i.e. diabetes specialists, other).
Secondary outcomes were assessed only for adults with T2DM, when outcomes such as BMI and blood pressure were of high quality. Other outcomes including depression, QoL and general diet behaviour were considered to be of low quality, due to major heterogeneity. The true effect may significantly differ from these estimates. Subgroup analyses were not conducted on these outcomes; therefore, heterogeneity may be less in certain subgroups, for example for different psychological intervention types (i.e. counselling, CBT) or for interventionist type (e.g. diabetes specialists, diabetes professionals).
The NMAs results rely on the assumptions of homogeneity and transitivity. However, the small number of comparisons for most treatments limit the interpretation of the heterogeneity assumptions using inferential statistics. The indirect comparisons are not protected by randomisation and may be confounded by differences between the trials. Unlike homogeneity, transitivity cannot be evaluated quantitatively and is difficult to assess.
Chapter 11 Conclusions
The aim of this evidence synthesis was to determine whether or not psychological interventions are clinically effective and cost-effective in improving self-management for adults and adolescents/children with T1DM and adults with T2DM. The evidence was generally considered to be of good quality according to GRADE96 and suggests that, overall, psychological interventions to improve motivation for diabetes self-management, specifically glycaemic control, are not clinically effective for adults and adolescents/children with T1DM. For adults with T2DM, there was evidence of a borderline clinically significant effect. Although results for adults with T1DM suggest that there is no effect of psychological interventions on glycaemic control, there was some evidence that CBT is potentially a cost-effective treatment. Likewise, for adults with T2DM, CBT was considered potentially cost-effective for people in receipt of first-line diabetes treatment, namely diet, exercise and metformin (i.e. biguanide). For both adults with T1DM and adults with T2DM, there was substantial uncertainty in the economic modelling, particularly around how long any differences in effectiveness would be maintained.
Implications for clinical practice
Policy-makers and service providers generally recognise the benefits of providing psychological support for people with diabetes, yet there are few services available for adults;296 however, service provision for children and young people is improving. 297 This review does not support the use of psychological interventions over control interventions (such as diabetes education) to improve glycaemic control for adults and adolescents/children with T1DM;298 for adults with T2DM there is only weak evidence of borderline clinical significance. 298 However, for adults with T2DM, psychological interventions may be effective in people with suboptimal glycaemic control. There are also additional benefits in terms of healthy eating and improved QoL. Nevertheless, despite the lack of evidence, people with diabetes want access to psychological support;291 in our focus groups, patients were less concerned regarding the degree of clinical effectiveness in terms of HbA1c levels. A lack of psychological support when indicated may lead to a vicious cycle of maladaptive coping behaviours and poor diabetes self-management. 279
Implications for future research
In adolescents/children with diabetes, there are challenges in using a RCT to test the effectiveness of psychological interventions, as it may be unethical to withhold potentially effective treatment. In this group, non-randomised designs may be more appropriate. 299 We were unable to determine if psychological treatments improved self-management using outcome variables other than glycaemic control for adolescents/children and adults with T1DM as there were typically fewer available studies; therefore, common outcome sets may be useful.
In the current review, we found it difficult to identify psychological interventions from titles and abstracts and had to re-screen rejected abstracts because of the lack of ‘psychological language’ used in them.
Although most of the included studies in this review were deemed to be at a low or unclear risk of bias according to the metrics commonly used, it was generally unclear whether or not individuals who were delivering the psychological interventions were competent to do so. Few studies reported this level of detail. A 2018 study300 highlights this problem: in a pragmatic trial, community practice nurses were trained in psychological techniques to support people with T2DM, but none achieved competency prior to the study starting. In the current review, we were able to demonstrate that psychology professionals and diabetes specialists can deliver psychological treatments, although, perhaps unsurprisingly, there was more heterogeneity between studies when interventions were delivered by diabetes specialists than when they were delivered by psychology professionals. Further research is required to determine who can be trained to deliver psychological interventions at a competent level.
In summary, based on the findings of this evidence synthesis and the gaps in the literature, we would recommend the following research questions or priorities:
-
Promote the use of consolidated outcome sets in trials of psychological interventions to ensure that treatment efficacy is not limited to glycaemic control, particularly for studies involving adolescents/children and adults with T1DM.
-
Encourage researchers to be more explicit in their description of psychological techniques/interventions in titles and abstracts to enable future reviewers to identify studies.
-
Determine the long-term clinical effectiveness and cost-effectiveness of psychological interventions.
-
Develop different models of psychological care depending on where the person is in their life journey with diabetes.
-
Determine whether or not psychological interventions are effective at improving motivation for diabetes self-management when interventionists are competent to deliver the intervention.
-
Develop a multifactorial intervention involving both psychology and education to address psychological distress, such as depressive symptoms, and diabetes self-management.
Acknowledgements
We would like to thank:
-
Sophie Fawson (MSc student, KCL), for recruiting and assisting with the running of focus groups in London and Sheffield, in addition to assisting in writing the PPI section of the report
-
Rayane Chami (PhD student, KCL), for screening two full-text papers in Iranian, plus extracting data and conducting the RoB assessment on these papers
-
Carmen Jacob (MSc student, KCL), for screening a full-text paper in German
-
Virginie Kirk (MSc student, KCL), for screening a full-text paper in French
-
the LADDER PPI panel in Sheffield, for helping to recruit people for the focus group in Sheffield
-
the people with T1DM and those with T2DM who took part in our focus groups in London and Sheffield.
Authors contributing individual patient data
We would like to thank the following authors who contributed IPD for this report: Khalida Ismail, Johnathon Bartlett, Frank Snoek, Maartje de Wit, Vibeke Zoffmann, Mette Due-Christensen, Sue Channon, Michelle Huws-Thomas, Deborah Christie, Elizabeth Allen, Deborah Ellis, April Carcone, Robin Whittemore, Jeon Sangchoon, Sarah Jaser, Tonja Nansel, Leah Lipsky, Anna Serlachius, Anna Chapman, Colette Browning, Diane Chlebowy, Ching-Ju Chiu, Gail D-Eramo Meluk, Deborah Chyun, Elisabeth Eakin, Elisabeth Winkler, Simon Griffin, Clare Boothby, Mechthild Hartmann, Renate Jansink, Joze Braspenning, Rimke Vos, Marise Kasteleyn, Karen Keogh, Susan Mandel, Beth Davis, Mirjana Pibernik-Okanović, Steven Safren, Jeffrey Gonzalez, Laura Welschen, Giel Nijpels, Norbert Hermanns, Kathleen Ell, Frank Petrak, Stephan Herpertz, Jenny van Son, Ivan Nyklíček, Jeremy Dale.
Contributions of authors
Kirsty Winkley (Reader in Diabetes and Primary Care, Chief Investigator) conceived the study design, supervised systematic review methods, screened studies for inclusion, conducted RoB assessments, ran PPI focus groups, interpreted the data, wrote the final report and is accountable for all aspects of the work.
Rebecca Upsher (PhD student, Research Assistant) contributed to the acquisition of data; undertook systematic review methods, screening records, data extraction and RoB assessments; assisted in running PPI focus groups; ran the aggregate meta-analysis; assisted in writing the final report; and is accountable for the work.
Daniel Stahl (Reader of Biostatistics, Co-applicant) substantially contributed to the conception and design of the study, supported the aggregate meta-analysis, conducted network and IPD meta-analyses, wrote the NMA and IPD sections of the report, approved the final report for publication and is accountable for the work.
Daniel Pollard (Research assistant in Health Economics and Decision Science, Research Assistant) substantially contributed to the analysis and acquisition of data, conducted the health economics analysis, wrote the health economics section of the report, approved the final report for publication and is accountable for the work.
Architaa Kasera (MSc student) substantially contributed to the analysis and acquisition of data; undertook systematic review methods, screening records, data extraction and RoB assessments; assisted in writing the final report; approved the final report for publication; and is accountable for the work.
Alan Brennan (Professor of Health Economics and Decision Modelling, Co-applicant) substantially contributed to the conception and design of the study; conducted the health economic analysis and interpretation of data; supervised the writing of the economic analysis in the final report; approved the final report for publication; and is accountable for the work.
Simon Heller (Professor of Clinical Diabetes, Co-applicant) substantially contributed to the conception and design of the study, provided clinical guidance, critiqued the draft final report, approved the final report for publication and is accountable for the work.
Khalida Ismail (Professor of Psychiatry and Medicine, Co-applicant) conceived the study design, advised on psychological models and review methodology, critiqued the draft final report, approved the final report for publication and is accountable for the work.
Publications
Winkley K, Upsher R, Stahl D, Pollard D, Brennan A, Heller S, Ismail K. Psychological interventions to improve glycemic control in adults with type 2 diabetes: a systematic review and meta-analysis. BMJ Open Diabetes Res Care 2020;8:e001150.
Winkley K, Upsher R, Stahl D, Pollard D, Brennan A, Heller S, Ismail K. Systematic review and meta-analysis of randomized controlled trials of psychological interventions to improve glycaemic control in children and adults with type 1 diabetes. Diabet Med 2020;37:735–46.
Data-sharing statement
All data requests should be submitted to the corresponding author for consideration. Access to available anonymised data may be granted following review.
Patient data
This work uses data provided by patients and collected by the NHS as part of their care and support. Using patient data is vital to improve health and care for everyone. There is huge potential to make better use of information from people’s patient records, to understand more about disease, develop new treatments, monitor safety, and plan NHS services. Patient data should be kept safe and secure, to protect everyone’s privacy, and it’s important that there are safeguards to make sure that it is stored and used responsibly. Everyone should be able to find out about how patient data are used. #datasaveslives You can find out more about the background to this citation here: https://understandingpatientdata.org.uk/data-citation.
Disclaimers
This report presents independent research funded by the National Institute for Health Research (NIHR). The views and opinions expressed by authors in this publication are those of the authors and do not necessarily reflect those of the NHS, the NIHR, NETSCC, the HTA programme or the Department of Health and Social Care. If there are verbatim quotations included in this publication the views and opinions expressed by the interviewees are those of the interviewees and do not necessarily reflect those of the authors, those of the NHS, the NIHR, NETSCC, the HTA programme or the Department of Health and Social Care.
References
- Ogurtsova K, da Rocha Fernandes JD, Huang Y, Linnenkamp U, Guariguata L, Cho NH, et al. IDF Diabetes Atlas: global estimates for the prevalence of diabetes for 2015 and 2040. Diabetes Res Clin Pract 2017;128:40-5. https://doi.org/10.1016/j.diabres.2017.03.024.
- World Health Organization . Global Report on Diabetes 2016.
- Melmed S, Polonsky KS, Reed Larsen P, Kronenberg K. Williams Textbook of Endocrinology. Philadelphia, PA: Elsevier; 2016.
- Maahs DM, West NA, Lawrence JM, Mayer-Davis EJ. Epidemiology of type 1 diabetes. Endocrinol Metab Clin North Am 2010;39:481-97. https://doi.org/10.1016/j.ecl.2010.05.011.
- Inzucchi SE. Oral antihyperglycemic therapy for type 2 diabetes: scientific review. JAMA 2002;287:360-72. https://doi.org/10.1001/jama.287.3.360.
- Beckman JA, Goldfine AB, Gordon MB, Garrett LA, Keaney JF, Creager MA. Oral antioxidant therapy improves endothelial function in type 1 but not type 2 diabetes mellitus. Am J Physiol Heart Circ Physiol 2003;285:H2392-H8. https://doi.org/10.1152/ajpheart.00403.2003.
- UK Prospective Diabetes Study Group . Intensive blood-glucose control with sulphonylureas or insulin compared with conventional treatment and risk of complications in patients with type 2 diabetes (UKPDS 33). Lancet 1998;352:837-53. https://doi.org/10.1016/S0140-6736(98)07019-6.
- The Diabetes Control and Complications Trial Research Group . Lifetime benefits and costs of intensive therapy as practiced in the diabetes control and complications trial. The Diabetes Control and Complications Trial Research Group. JAMA 1996;276:1409-15. https://doi.org/10.1001/jama.276.17.1409.
- Chow E, Bernjak A, Williams S, Fawdry RA, Hibbert S, Freeman J, et al. Risk of cardiac arrhythmias during hypoglycemia in patients with type 2 diabetes and cardiovascular risk. Diabetes 2014;63:1738-47. https://doi.org/10.2337/db13-0468.
- Dluhy RG, McMahon GT. Intensive glycemic control in the ACCORD and ADVANCE trials. N Engl J Med 2008;358:2630-3. https://doi.org/10.1056/NEJMe0804182.
- Hex N, Bartlett C, Wright D, Taylor M, Varley D. Estimating the current and future costs of type 1 and type 2 diabetes in the UK, including direct health costs and indirect societal and productivity costs. Diabet Med 2012;29:855-62. https://doi.org/10.1111/j.1464-5491.2012.03698.x.
- Safford MM, Russell L, Suh DC, Roman S, Pogach L. How much time do patients with diabetes spend on self-care?. J Am Board Fam Pract 2005;18:262-70. https://doi.org/10.3122/jabfm.18.4.262.
- Khunti K, Gray LJ, Skinner T, Carey ME, Realf K, Dallosso H, et al. Effectiveness of a diabetes education and self management programme (DESMOND) for people with newly diagnosed type 2 diabetes mellitus: three year follow-up of a cluster randomised controlled trial in primary care. BMJ 2012;344. https://doi.org/10.1136/bmj.e2333.
- Speight J, Amiel SA, Bradley C, Heller S, Oliver L, Roberts S, et al. Long-term biomedical and psychosocial outcomes following DAFNE (Dose Adjustment For Normal Eating) structured education to promote intensive insulin therapy in adults with sub-optimally controlled type 1 diabetes. Diabetes Res Clin Pract 2010;89:22-9. https://doi.org/10.1016/j.diabres.2010.03.017.
- Gadsby R, Young B. Diabetes care in England and Wales: information from the 2010–2011 National Diabetes Audit. Diabet Med 2013;30:799-802. https://doi.org/10.1111/dme.12182.
- Winkley K, Stahl D, Chamley M, Stopford R, Boughdady M, Thomas S, et al. Low attendance at structured education for people with newly diagnosed type 2 diabetes: general practice characteristics and individual patient factors predict uptake. Patient Educ Couns 2016;99:101-7. https://doi.org/10.1016/j.pec.2015.08.015.
- Winkley K, Evwierhoma C, Amiel SA, Lempp HK, Ismail K, Forbes A. Patient explanations for non-attendance at structured diabetes education sessions for newly diagnosed type 2 diabetes: a qualitative study. Diabet Med 2015;32:120-8. https://doi.org/10.1111/dme.12556.
- Horigan G, Davies M, Findlay-White F, Chaney D, Coates V. Reasons why patients referred to diabetes education programmes choose not to attend: a systematic review. Diabet Med 2017;34:14-26. https://doi.org/10.1111/dme.13120.
- Harris S, Mulnier H, Amiel S. The barriers to uptake of diabetes education study. Lancet 2017;389. https://doi.org/10.1016/S0140-6736(17)30440-3.
- Ryan RM, Deci EL. Intrinsic and extrinsic motivations: classic definitions and new directions. Contemp Educ Psychol 2000;25:54-67. https://doi.org/10.1006/ceps.1999.1020.
- Pettinati HM, Weiss RD, Miller WR, Donovan D, Ernst DB, Rounsaville BJ. COMBINE Monograph Series, Volume 2. Medical Management Treatment Manual: A Clinical Research Guide for Medically Trained Clinicians Providing Pharmacotherapy as Part of the Treatment for Alcohol Dependence. Bethesda, MD; 2004.
- Becker MH. The health belief model and sick role behavior. Health Education Monographs 1974;2:409-19. https://doi.org/10.1177/109019817400200407.
- Fishbein M, Ajzen I. Predicting and Changing Behavior: The Reasoned Action Approach. New York, NY: Taylor & Francis; 2010.
- Ajzen I. The theory of planned behavior. Organ Behav Hum Decis Process 1991;50:179-211. https://doi.org/10.1016/0749-5978(91)90020-T.
- Rogers RW. A protection motivation theory of fear appeals and attitude change1. J Psychol 1975;91:93-114. https://doi.org/10.1080/00223980.1975.9915803.
- Rogers RW, Cacioppo JT, Petty RE. Social Psychophysiology: A Sourcebook. New York, NY: Guildford Publications Inc.; 1983.
- National Institute for Health and Care Excellence (NICE) . Type 1 Diabetes in Adults: Diagnosis and Management 2016. www.nice.org.uk/guidance/ng17 (accessed 21 September 2018).
- National Institute for Health and Care Excellence . Review of Clinical Guideline (CG66 and CG87 Partial Update) – Type 2 Diabetes: The Management of Type 2 Diabetes 2009.
- Anderson RJ, Freedland KE, Clouse RE, Lustman PJ. The prevalence of comorbid depression in adults with diabetes: a meta-analysis. Diabetes Care 2001;24:1069-78. https://doi.org/10.2337/diacare.24.6.1069.
- Moussavi S, Chatterji S, Verdes E, Tandon A, Patel V, Ustun B. Depression, chronic diseases, and decrements in health: results from the World Health Surveys. Lancet 2007;370:851-8. https://doi.org/10.1016/S0140-6736(07)61415-9.
- Smith KJ, Béland M, Clyde M, Gariépy G, Pagé V, Badawi G, et al. Association of diabetes with anxiety: a systematic review and meta-analysis. J Psychosom Res 2013;74:89-9. https://doi.org/10.1016/j.jpsychores.2012.11.013.
- Ercan A, Kiziltan G. Obesity-related abnormal eating behaviors in type 2 diabetic patients. Pak J Med Sci 2013;29:1323-8. https://doi.org/10.12669/pjms.296.3657.
- Ahola AJ, Saraheimo M, Freese R, Mäkimattila S, Forsblom C, Groop PH. FinnDiane Study Group . Fear of hypoglycaemia and self-management in type 1 diabetes. J Clin Transl Endocrinol 2016;4:13-8. https://doi.org/10.1016/j.jcte.2016.02.002.
- Quandt SA, Reynolds T, Chapman C, Bell RA, Grzywacz JG, Ip EH, et al. Older adults’ fears about diabetes: using common sense models of disease to understand fear origins and implications for self-management. J Appl Gerontol 2013;32:783-80. https://doi.org/10.1177/0733464811435506.
- Davies MJ, Gagliardino JJ, Gray LJ, Khunti K, Mohan V, Hughes R. Real-world factors affecting adherence to insulin therapy in patients with type 1 or type 2 diabetes mellitus: a systematic review. Diabet Med 2013;30:512-24. https://doi.org/10.1111/dme.12128.
- Polonsky WH, Fisher L, Earles J, Dudl RJ, Lees J, Mullan J, et al. Assessing psychosocial distress in diabetes: development of the diabetes distress scale. Diabetes Care 2005;28:626-31. https://doi.org/10.2337/diacare.28.3.626.
- Polonsky WH. Diabetes Burnout: What To Do When You Can’t Take It Anymore. Arlington, VA: American Diabetes Association; 1999.
- van Bastelaar KM, Pouwer F, Geelhoed-Duijvestijn PH, Tack CJ, Bazelmans E, Beekman AT, et al. Diabetes-specific emotional distress mediates the association between depressive symptoms and glycaemic control in type 1 and type 2 diabetes. Diabet Med 2010;27:798-803. https://doi.org/10.1111/j.1464-5491.2010.03025.x.
- Fisher L, Skaff MM, Mullan JT, Arean P, Mohr D, Masharani U, et al. Clinical depression versus distress among patients with type 2 diabetes: not just a question of semantics. Diabetes Care 2007;30:542-8. https://doi.org/10.2337/dc06-1614.
- Ismail K, Winkley K, Rabe-Hesketh S. Systematic review and meta-analysis of randomised controlled trials of psychological interventions to improve glycaemic control in patients with type 2 diabetes. Lancet 2004;363:1589-97. https://doi.org/10.1016/S0140-6736(04)16202-8.
- Hodes M, Moorey S. Psychological Treatment in Disease and Illness. London: Gaskell Publications; 1993.
- Abraham C, Michie S. A taxonomy of behavior change techniques used in interventions. Health Psychol 2008;27:379-87. https://doi.org/10.1037/0278-6133.27.3.379.
- Hool N. BABCP Core Curriculum Reference Document. Bury: British Association for Behavioural &Amp; Cognitive Psychotherapies 2010. www.babcp.com/files/About/BABCP-Core-Curriculum-V2-190913.pdf (accessed 1 December 2017).
- Royal College of Psychiatrists . Psychotherapies n.d. www.rcpsych.ac.uk/mental-health/treatments-and-wellbeing/psychotherapies (accessed 1 December 2017).
- Candy J, Balfour FH, Cawley RH, Hildebrand HP, Malan DH, Marks IM, et al. A feasibility study for a controlled trial of formal psychotherapy. Psychol Med 1972;2:345-62. https://doi.org/10.1017/S0033291700045165.
- Ciechanowski PS, Walker EA, Katon WJ, Russo JE. Attachment theory: a model for health care utilization and somatization. Psychosom Med 2002;64:660-7. https://doi.org/10.1097/00006842-200207000-00016.
- Churchill R, Hunot V, Corney R, Knapp M, McGuire H, Tylee A, et al. A systematic review of controlled trials of the effectiveness and cost-effectiveness of brief psychological treatments for depression. Health Technol Assess 2001;5. https://doi.org/10.3310/hta5350.
- Rogers C, Nelson-Jones R. Six Key Approaches to Counselling and Therapy. Thousand Oaks, CA: SAGE Publications Inc.; 2000.
- Burke BL, Arkowitz H, Menchola M. The efficacy of motivational interviewing: a meta-analysis of controlled clinical trials. J Consult Clin Psychol 2003;71:843-61. https://doi.org/10.1037/0022-006X.71.5.843.
- Miller WR, Rollnick S. Motivational Interviewing: Preparing People to Change Addictive Behaviour. New York, NY: The Guildford Press; 2002.
- Rollnick S, Miller WR. What is motivational interviewing?. Behav Cogn Psychother 1995;23:325-34. https://doi.org/10.1017/S135246580001643X.
- Kellerman P. Participation’s perceptions of therapeutic factors in psychodrama. J Group Psychother Psychodrama Sociometry 1992;38:123-33.
- Klerman GL, Weissman MM, Rounsaville BJ, Chevron ES. Interpersonal Psychotherapy of Depression: A Brief, Focused, Specific Strategy. Lanham, MD: Jason Aronson, Incorporated; 1994.
- Carr A. The effectiveness of family therapy and systemic interventions for child-focused problems. J Fam Ther 2009;31:3-45. https://doi.org/10.1111/j.1467-6427.2008.00451.x.
- Pennebaker JW, Seagal JD. Forming a story: the health benefits of narrative. J Clin Psychol 1999;55:1243-54. https://doi.org/10.1002/(SICI)1097-4679(199910)55:10<1243::AID-JCLP6>3.0.CO;2-N.
- Malchiodi CA. Understanding Children’s Drawings. New York, NY: Guilford Press; 1998.
- Winkley K, Ismail K, Landau S, Eisler I. Psychological interventions to improve glycaemic control in patients with type 1 diabetes: systematic review and meta-analysis of randomised controlled trials. BMJ 2006;333. https://doi.org/10.1136/bmj.38874.652569.55.
- Baxter M, Hudson R, Mahon J, Bartlett C, Samyshkin Y, Alexiou D, et al. Estimating the impact of better management of glycaemic control in adults with type 1 and type 2 diabetes on the number of clinical complications and the associated financial benefit. Diabet Med 2016;33:1575-81. https://doi.org/10.1111/dme.13062.
- Li C, Xu D, Hu M, Tan Y, Zhang P, Li G, et al. A systematic review and meta-analysis of randomized controlled trials of cognitive behavior therapy for patients with diabetes and depression. J Psychosom Res 2017;95:44-5. https://doi.org/10.1016/j.jpsychores.2017.02.006.
- Wang ZD, Xia YF, Zhao Y, Chen LM. Cognitive behavioural therapy on improving the depression symptoms in patients with diabetes: a meta-analysis of randomized control trials. Biosci Rep 2017;37. https://doi.org/10.1042/BSR20160557.
- Clery P, Stahl D, Ismail K, Treasure J, Kan C. Systematic review and meta-analysis of the efficacy of interventions for people with type 1 diabetes mellitus and disordered eating. Diabet Med 2017;34:1667-75. https://doi.org/10.1111/dme.13509.
- Ekong G, Kavookjian J. Motivational interviewing and outcomes in adults with type 2 diabetes: a systematic review. Patient Educ Couns 2016;99:944-52. https://doi.org/10.1016/j.pec.2015.11.022.
- Armour TA, Norris SL, Jack L, Zhang X, Fisher L. The effectiveness of family interventions in people with diabetes mellitus: a systematic review. Diabet Med 2005;22:1295-305. https://doi.org/10.1111/j.1464-5491.2005.01618.x.
- Couch R, Jetha M, Dryden DM, Hooten N, Liang Y, Durec T, et al. Diabetes education for children with type 1 diabetes mellitus and their families. Evid Rep Technol Assess 2008;166:1-144.
- Lawton J, Rankin D, Elliott J, Heller SR, Rogers HA, De Zoysa N, et al. Experiences, views, and support needs of family members of people with hypoglycemia unawareness: interview study. Diabetes Care 2014;37:109-15. https://doi.org/10.2337/dc13-1154.
- Rondags SM, de Wit M, Snoek FJ. HypoAware: development and pilot study of a brief and partly web-based psychoeducational group intervention for adults with type 1 and insulin-treated type 2 diabetes and problematic hypoglycaemia. Diabet Med 2016;33:184-91. https://doi.org/10.1111/dme.12876.
- Moher D, Schulz KF, Altman DG. The CONSORT statement: revised recommendations for improving the quality of reports of parallel-group randomised trials. Lancet 2001;357:1191-4. https://doi.org/10.1016/S0140-6736(00)04337-3.
- Moher D, Liberati A, Tetzlaff J, Altman DG. PRISMA Group . Preferred reporting items for systematic reviews and meta-analyses: the PRISMA statement. Ann Intern Med 2009;151:264-9. https://doi.org/10.7326/0003-4819-151-4-200908180-00135.
- Toobert DJ, Hampson SE, Glasgow RE. The summary of diabetes self-care activities measure: results from 7 studies and a revised scale. Diabetes Care 2000;23:943-50. https://doi.org/10.2337/diacare.23.7.943.
- Kroenke K, Spitzer RL, Williams JB. The PHQ-9: validity of a brief depression severity measure. J Gen Intern Med 2001;16:606-13. https://doi.org/10.1046/j.1525-1497.2001.016009606.x.
- Lewinsohn PM, Seeley JR, Roberts RE, Allen NB. Center for Epidemiologic Studies Depression Scale (CES-D) as a screening instrument for depression among community-residing older adults. Psychol Aging 1997;12:277-87. https://doi.org/10.1037/0882-7974.12.2.277.
- Montgomery SA, Asberg M. A new depression scale designed to be sensitive to change. Br J Psychiatry 1979;134:382-9. https://doi.org/10.1192/bjp.134.4.382.
- Beck AT, Steer RA, Brown GK. Manual for the Beck Depression Inventory-II. San Antonio, TX: Psychological Corporation; 1996.
- Zigmond AS, Snaith RP. The hospital anxiety and depression scale. Acta Psychiatr Scand 1983;67:361-70. https://doi.org/10.1111/j.1600-0447.1983.tb09716.x.
- Derrogatis L, Lipman R, Covi I. The SCL-90: an outpatient psychiatric rating scale. Psychopharmacology Bulletin 1973;9:13-28.
- Chopra P, Herrman H, Kennedy G. Comparison of disability and quality of life measures in patients with long-term psychotic disorders and patients with multiple sclerosis: an application of the WHO Disability Assessment Schedule II and WHO Quality of Life-BREF. Int J Rehabil Res 2008;31:141-9. https://doi.org/10.1097/MRR.0b013e32830150e6.
- Bott U, Mühlhauser I, Overmann H, Berger M. Validation of a diabetes-specific quality-of-life scale for patients with type 1 diabetes. Diabetes Care 1998;21:757-69. https://doi.org/10.2337/diacare.21.5.757.
- Ferrans CE, Powers MJ. Quality of life index: development and psychometric properties. ANS Adv Nurs Sci 1985;8:15-24. https://doi.org/10.1097/00012272-198510000-00005.
- Ware J, Kosinski M, Keller SD. A 12-Item Short-Form Health Survey: construction of scales and preliminary tests of reliability and validity. Med Care 1996;34:220-33. https://doi.org/10.1097/00005650-199603000-00003.
- Higgins JP, Altman DG, Gøtzsche PC, Jüni P, Moher D, Oxman AD, et al. The Cochrane Collaboration’s tool for assessing risk of bias in randomised trials. BMJ 2011;343. https://doi.org/10.1136/bmj.d5928.
- Borenstein M, Hedges LV, Higgins JPT, Rothstein HR. Introduction to Meta-analysis. Chichester: John Wiley & Sons Ltd; 2011.
- Riley RD, Jackson D, Salanti G, Burke DL, Price M, Kirkham J, et al. Multivariate and network meta-analysis of multiple outcomes and multiple treatments: rationale, concepts, and examples. BMJ 2017;358. https://doi.org/10.1136/bmj.j3932.
- Faltinsen EG, Storebø OJ, Jakobsen JC, Boesen K, Lange T, Gluud C. Network meta-analysis: the highest level of medical evidence?. BMJ Evid Based Med 2018;23:56-9. https://doi.org/10.1136/bmjebm-2017-110887.
- White IR, Barrett JK, Jackson D, Higgins JP. Consistency and inconsistency in network meta-analysis: model estimation using multivariate meta-regression. Res Synth Methods 2012;3:111-25. https://doi.org/10.1002/jrsm.1045.
- Higgins JP, Jackson D, Barrett JK, Lu G, Ades AE, White IR. Consistency and inconsistency in network meta-analysis: concepts and models for multi-arm studies. Res Synth Methods 2012;3:98-110. https://doi.org/10.1002/jrsm.1044.
- White IR. Network meta-analysis. Stata J 2015;15:951-85. https://doi.org/10.1177/1536867X1501500403.
- White IR, Thomas J. Standardized mean differences in individually-randomized and cluster-randomized trials, with applications to meta-analysis. Clin Trials 2005;2:141-51. https://doi.org/10.1191/1740774505cn081oa.
- Simmonds MC, Higgins JP, Stewart LA, Tierney JF, Clarke MJ, Thompson SG. Meta-analysis of individual patient data from randomized trials: a review of methods used in practice. Clin Trials 2005;2:209-17. https://doi.org/10.1191/1740774505cn087oa.
- Debray TP, Moons KG, van Valkenhoef G, Efthimiou O, Hummel N, Groenwold RH, et al. GetReal Methods Review Group . Get real in individual participant data (IPD) meta-analysis: a review of the methodology. Res Synth Methods 2015;6:293-309. https://doi.org/10.1002/jrsm.1160.
- Burke DL, Ensor J, Riley RD. Meta-analysis using individual participant data: one-stage and two-stage approaches, and why they may differ. Stat Med 2017;36:855-75. https://doi.org/10.1002/sim.7141.
- Higgins JP, Whitehead A, Turner RM, Omar RZ, Thompson SG. Meta-analysis of continuous outcome data from individual patients. Stat Med 2001;20:2219-41. https://doi.org/10.1002/sim.918.
- Turner RM, Omar RZ, Yang M, Goldstein H, Thompson SG. A multilevel model framework for meta-analysis of clinical trials with binary outcomes. Stat Med 2000;19:3417-32. https://doi.org/10.1002/1097-0258(20001230)19:24<3417::AID-SIM614>3.0.CO;2-L.
- Kontopantelis E, Reeves D. A short guide and a forest plot command (ipdforest) for one-stage meta-analysis. Stata J 2013;13:574-87. https://doi.org/10.1177/1536867X1301300308.
- Schwarz G. Estimating the dimension of a model. Ann Stat 1978;6:461-4. https://doi.org/10.1214/aos/1176344136.
- Duval S, Tweedie R. Trim and fill: a simple funnel-plot-based method of testing and adjusting for publication bias in meta-analysis. Biometrics 2000;56:455-63. https://doi.org/10.1111/j.0006-341X.2000.00455.x.
- Guyatt GH, Oxman AD, Vist GE, Kunz R, Falck-Ytter Y, Alonso-Coello P, et al. GRADE: an emerging consensus on rating quality of evidence and strength of recommendations. BMJ 2008;336:924-6. https://doi.org/10.1136/bmj.39489.470347.AD.
- Li M, Li T, Shi BY, Gao CX. Impact of motivational interviewing on the quality of life and its related factors in type 2 diabetes mellitus patients with poor long-term glycemic control. Int J Nurs Sci 2014;1:250-4. https://doi.org/10.1016/j.ijnss.2014.05.022.
- Sterne JA, Hernán MA, Reeves BC, Savović J, Berkman ND, Viswanathan M, et al. ROBINS-I: a tool for assessing risk of bias in non-randomised studies of interventions. BMJ 2016;355. https://doi.org/10.1136/bmj.i4919.
- Breeze P, Thomas C, Squires H, Brennan A, Greaves C, Diggle P, et al. SPHR Diabetes Prevention Model: Detailed Description of Model Background, Methods, Assumptions and Parameters. HEDS Discussion Paper Series (15.01). Sheffield: Health Economics and Decision Science, School of Health and Related Research (ScHARR), University of Sheffield; 2015.
- Mount Hood Diabetes Challenge Network . Diabetes Simulation Modeling Database n.d. www.mthooddiabeteschallenge.com/registry (accessed 1 July 2016).
- Patel A, Maissi E, Chang HC, Rodrigues I, Smith M, Thomas S, et al. Motivational enhancement therapy with and without cognitive behaviour therapy for type 1 diabetes: economic evaluation from a randomized controlled trial. Diabet Med 2011;28:470-9. https://doi.org/10.1111/j.1464-5491.2010.03198.x.
- Husereau D, Drummond M, Petrou S, Carswell C, Moher D, Greenberg D, et al. Consolidated Health Economic Evaluation Reporting Standards (CHEERS) statement. Cost Eff Resour Alloc 2013;11. https://doi.org/10.1186/1478-7547-11-6.
- Palmer AJ, Si L, Tew M, Hua X, Willis MS, Asseburg C, et al. Computer modeling of diabetes and its transparency: a report on the eighth Mount Hood challenge. Value Health 2018;21:724-31. https://doi.org/10.1016/j.jval.2018.02.002.
- van Son J, Nyklíček I, Pop VJ, Blonk MC, Erdtsieck RJ, Pouwer F. Mindfulness-based cognitive therapy for people with diabetes and emotional problems: long-term follow-up findings from the DiaMind randomized controlled trial. J Psychosom Res 2014;77:81-4. https://doi.org/10.1016/j.jpsychores.2014.03.013.
- Hermanns N, Schmitt A, Gahr A, Herder C, Nowotny B, Roden M, et al. The effect of a Diabetes-Specific Cognitive Behavioral Treatment Program (DIAMOS) for patients with diabetes and subclinical depression: results of a randomized controlled trial. Diabetes Care 2015;38:551-60. https://doi.org/10.2337/dc14-1416.
- Petrak F, Herpertz S, Albus C, Hermanns N, Hiemke C, Hiller W, et al. Cognitive behavioral therapy versus sertraline in patients with depression and poorly controlled diabetes: the Diabetes and Depression (DAD) study: a randomized controlled multicenter trial. Diabetes Care 2015;38:767-75. https://doi.org/10.2337/dc14-1599.
- Whittemore R, Melkus GD, Sullivan A, Grey M. A nurse-coaching intervention for women with type 2 diabetes. Diabetes Educ 2004;30:795-804. https://doi.org/10.1177/014572170403000515.
- Williams A, Manias E, Walker R, Gorelik A. A multifactorial intervention to improve blood pressure control in co-existing diabetes and kidney disease: a feasibility randomized controlled trial. J Adv Nurs 2012;68:2515-25. https://doi.org/10.1111/j.1365-2648.2012.05950.x.
- Siebolds M, Gaedeke O, Schwedes U. SMBG Study Group . Self-monitoring of blood glucose – psychological aspects relevant to changes in HbA1c in type 2 diabetic patients treated with diet or diet plus oral antidiabetic medication. Patient Educ Couns 2006;62:104-10. https://doi.org/10.1016/j.pec.2005.06.013.
- Keeratiyutawong P, Hanucharurnkul S, Melkus GDE, Panpakdee O, Vorapongsathorn T. Effectiveness of a self-management program for Thais with type 2 diabetes. Thai J Nurs Res 2006;10:85-97.
- Gregg JA, Callaghan GM, Hayes SC, Glenn-Lawson JL. Improving diabetes self-management through acceptance, mindfulness, and values: a randomized controlled trial. J Consult Clin Psychol 2007;75:336-43. https://doi.org/10.1037/0022-006X.75.2.336.
- West DS, DiLillo V, Bursac Z, Gore SA, Greene PG. Motivational interviewing improves weight loss in women with type 2 diabetes. Diabetes Care 2007;30:1081-7. https://doi.org/10.2337/dc06-1966.
- Dale J, Caramlau I, Sturt J, Friede T, Walker R. Telephone peer-delivered intervention for diabetes motivation and support: the telecare exploratory RCT. Patient Educ Couns 2009;75:91-8. https://doi.org/10.1016/j.pec.2008.09.014.
- Davazdah Emamy MH, Roshan R, Mehrabi A, Attari A. The effectiveness of cognitive-behavioral stress management training on glycemic control and depression in patients with type 2 diabetes. [Persian]. Iran J Endocrinol Metab 2009;11:385-92.
- Sacco WP, Malone JI, Morrison AD, Friedman A, Wells K. Effect of a brief, regular telephone intervention by paraprofessionals for type 2 diabetes. J Behav Med 2009;32:349-59. https://doi.org/10.1007/s10865-009-9209-4.
- Evans G, Lewin TJ, Bowen K, Lowe J. Dealing with anxiety: a pilot cognitive behavioural therapy program for diabetic clinic outpatient attendees. Int J Diabetes Mellit 2010;2:51-5. https://doi.org/10.1016/j.ijdm.2009.12.010.
- Wolever RQ, Dreusicke M, Fikkan J, Hawkins TV, Yeung S, Wakefield J, et al. Integrative health coaching for patients with type 2 diabetes: a randomized clinical trial. Diabetes Educ 2010;36:629-39. https://doi.org/10.1177/0145721710371523.
- D’Eramo Melkus G, Chyun D, Vorderstrasse A, Newlin K, Jefferson V, Langerman S. The effect of a diabetes education, coping skills training, and care intervention on physiological and psychosocial outcomes in black women with type 2 diabetes. Biol Res Nurs 2010;12:7-19. https://doi.org/10.1177/1099800410369825.
- De Greef K, Deforche B, Tudor-Locke C, De Bourdeaudhuij I. A cognitive-behavioural pedometer-based group intervention on physical activity and sedentary behaviour in individuals with type 2 diabetes. Health Educ Res 2010;25:724-36. https://doi.org/10.1093/her/cyq017.
- Hawkins SY. Improving glycemic control in older adults using a videophone motivational diabetes self-management intervention. Res Theory Nurs Pract 2010;24:217-32. https://doi.org/10.1891/1541-6577.24.4.217.
- Osborn CY, Amico KR, Cruz N, O’Connell AA, Perez-Escamilla R, Kalichman SC, et al. A brief culturally tailored intervention for Puerto Ricans with type 2 diabetes. Health Educ Behav 2010;37:849-62. https://doi.org/10.1177/1090198110366004.
- García-Huidobro D, Bittner M, Brahm P, Puschel K. Family intervention to control type 2 diabetes: a controlled clinical trial. Fam Pract 2011;28:4-11. https://doi.org/10.1093/fampra/cmq069.
- Keogh KM, Smith SM, White P, McGilloway S, Kelly A, Gibney J, et al. Psychological family intervention for poorly controlled type 2 diabetes. Am J Manag Care 2011;17:105-13.
- De Greef K, Deforche B, Tudor-Locke C, De Bourdeaudhuij I. Increasing physical activity in Belgian type 2 diabetes patients: a three-arm randomized controlled trial. Int J Behav Med 2011;18:188-98. https://doi.org/10.1007/s12529-010-9124-7.
- Hamid N. Effects of stress management training on glycemic control in women with type 2 diabetes. [Persian]. Iran J Endocrinol Metab 2011;13:346-53.
- Piette JD, Richardson C, Himle J, Duffy S, Torres T, Vogel M, et al. A randomized trial of telephonic counseling plus walking for depressed diabetes patients. Med Care 2011;49:641-8. https://doi.org/10.1097/MLR.0b013e318215d0c9.
- Lamers F, Jonkers CC, Bosma H, Knottnerus JA, van Eijk JT. Treating depression in diabetes patients: does a nurse-administered minimal psychological intervention affect diabetes-specific quality of life and glycaemic control? A randomized controlled trial. J Adv Nurs 2011;67:788-99. https://doi.org/10.1111/j.1365-2648.2010.05540.x.
- Welch G, Zagarins SE, Feinberg RG, Garb JL. Motivational interviewing delivered by diabetes educators: does it improve blood glucose control among poorly controlled type 2 diabetes patients?. Diabetes Res Clin Pract 2011;91:54-60. https://doi.org/10.1016/j.diabres.2010.09.036.
- Ell K, Katon W, Xie B, Lee PJ, Kapetanovic S, Guterman J, et al. One-year postcollaborative depression care trial outcomes among predominantly Hispanic diabetes safety net patients. Gen Hosp Psychiatry 2011;33:436-42. https://doi.org/10.1016/j.genhosppsych.2011.05.018.
- Farmer A, Hardeman W, Hughes D, Prevost AT, Kim Y, Craven A, et al. An explanatory randomised controlled trial of a nurse-led, consultation-based intervention to support patients with adherence to taking glucose lowering medication for type 2 diabetes. BMC Fam Pract 2012;13. https://doi.org/10.1186/1471-2296-13-30.
- Penckofer SM, Ferrans C, Mumby P, Byrn M, Emanuele MA, Harrison PR, et al. A psychoeducational intervention (SWEEP) for depressed women with diabetes. Ann Behav Med 2012;44:192-206. https://doi.org/10.1007/s12160-012-9377-2.
- Hartmann M, Kopf S, Kircher C, Faude-Lang V, Djuric Z, Augstein F, et al. Sustained effects of a mindfulness-based stress-reduction intervention in type 2 diabetic patients: design and first results of a randomized controlled trial (the Heidelberger Diabetes and Stress-study). Diabetes Care 2012;35:945-7. https://doi.org/10.2337/dc11-1343.
- Chen SM, Creedy D, Lin HS, Wollin J. Effects of motivational interviewing intervention on self-management, psychological and glycemic outcomes in type 2 diabetes: a randomized controlled trial. Int J Nurs Stud 2012;49:637-44. https://doi.org/10.1016/j.ijnurstu.2011.11.011.
- Plotnikoff RC, Karunamuni N, Courneya KS, Sigal RJ, Johnson JA, Johnson ST. The Alberta Diabetes and Physical Activity Trial (ADAPT): a randomized trial evaluating theory-based interventions to increase physical activity in adults with type 2 diabetes. Ann Behav Med 2013;45:45-56. https://doi.org/10.1007/s12160-012-9405-2.
- Welschen LM, van Oppen P, Bot SD, Kostense PJ, Dekker JM, Nijpels G. Effects of a cognitive behavioural treatment in patients with type 2 diabetes when added to managed care; a randomised controlled trial. J Behav Med 2013;36:556-66. https://doi.org/10.1007/s10865-012-9451-z.
- Mandel SE, Davis BA, Secic M. Effects of music therapy and music-assisted relaxation and imagery on health-related outcomes in diabetes education: a feasibility study. Diabetes Educ 2013;39:568-81. https://doi.org/10.1177/0145721713492216.
- Jansink R, Braspenning J, Keizer E, van der Weijden T, Elwyn G, Grol R. No identifiable Hb1Ac or lifestyle change after a comprehensive diabetes programme including motivational interviewing: a cluster randomised trial. Scand J Prim Health Care 2013;31:119-27. https://doi.org/10.3109/02813432.2013.797178.
- Juul L, Maindal HT, Zoffmann V, Frydenberg M, Sandbaek A. Effectiveness of a training course for general practice nurses in motivation support in type 2 diabetes care: a cluster-randomised trial. PLOS ONE 2014;9. https://doi.org/10.1371/journal.pone.0096683.
- Steed L, Barnard M, Hurel S, Jenkins C, Newman S. How does change occur following a theoretically based self-management intervention for type 2 diabetes. Psychol Health Med 2014;19:536-46. https://doi.org/10.1080/13548506.2013.845301.
- Safren SA, Gonzalez JS, Wexler DJ, Psaros C, Delahanty LM, Blashill AJ, et al. A randomized controlled trial of cognitive behavioral therapy for adherence and depression (CBT-AD) in patients with uncontrolled type 2 diabetes. Diabetes Care 2014;37:625-33. https://doi.org/10.2337/dc13-0816.
- Gois C, Dias VV, Carmo I, Duarte R, Ferro A, Santos AL, et al. Treatment response in type 2 diabetes patients with major depression. Clin Psychol Psychother 2014;21:39-48. https://doi.org/10.1002/cpp.1817.
- Griffin SJ, Simmons RK, Prevost AT, Williams KM, Hardeman W, Sutton S, et al. Multiple behaviour change intervention and outcomes in recently diagnosed type 2 diabetes: the ADDITION-Plus randomised controlled trial. Diabetologia 2014;57:1308-19. https://doi.org/10.1007/s00125-014-3236-6.
- Eakin EG, Winkler EA, Dunstan DW, Healy GN, Owen N, Marshall AM, et al. Living well with diabetes: 24-month outcomes from a randomized trial of telephone-delivered weight loss and physical activity intervention to improve glycemic control. Diabetes Care 2014;37:2177-85. https://doi.org/10.2337/dc13-2427.
- Kim MT, Kim KB, Huh B, Nguyen T, Han HR, Bone LR, et al. The effect of a community-based self-help intervention: Korean Americans with type 2 diabetes. Am J Prev Med 2015;49:726-37. https://doi.org/10.1016/j.amepre.2015.04.033.
- Chlebowy DO, El-Mallakh P, Myers J, Kubiak N, Cloud R, Wall MP. Motivational interviewing to improve diabetes outcomes in African Americans adults with diabetes. West J Nurs Res 2015;37:566-80. https://doi.org/10.1177/0193945914530522.
- Pladevall M, Divine G, Wells KE, Resnicow K, Williams LK. A randomized controlled trial to provide adherence information and motivational interviewing to improve diabetes and lipid control. Diabetes Educ 2015;41:136-46. https://doi.org/10.1177/0145721714561031.
- Pibernik-Okanović M, Hermanns N, Ajduković D, Kos J, Prašek M, Šekerija M, et al. Does treatment of subsyndromal depression improve depression-related and diabetes-related outcomes? A randomised controlled comparison of psychoeducation, physical exercise and enhanced treatment as usual. Trials 2015;16. https://doi.org/10.1186/s13063-015-0833-8.
- Huang CY, Lai HL, Chen CI, Lu YC, Li SC, Wang LW, et al. Effects of motivational enhancement therapy plus cognitive behaviour therapy on depressive symptoms and health-related quality of life in adults with type II diabetes mellitus: a randomised controlled trial. Qual Life Res 2016;25:1275-83. https://doi.org/10.1007/s11136-015-1165-6.
- Browning C, Chapman A, Yang H, Liu S, Zhang T, Enticott JC, et al. Management of type 2 diabetes in China: the Happy Life Club, a pragmatic cluster randomised controlled trial using health coaches. BMJ Open 2016;6. https://doi.org/10.1136/bmjopen-2015-009319.
- Kasteleyn MJ, Vos RC, Rijken M, Schellevis FG, Rutten GE. Effectiveness of tailored support for people with type 2 diabetes after a first acute coronary event: a multicentre randomized controlled trial (the Diacourse-ACE study). Diabet Med 2016;33:125-33. https://doi.org/10.1111/dme.12816.
- Chiu CJ, Hu YH, Wray LA, Beverley EA, Yang YC, Wu JS, et al. Dissemination of evidence-base minimal psychological intervention for diabetes management in Taiwan adults with type 2 diabetes. Int J Clin Exp Med 2016;9:14489-98.
- Clark M, Hampson SE, Avery L, Simpson R. Effects of a tailored lifestyle self-management intervention in patients with type 2 diabetes. Br J Health Psychol 2004;9:365-79. https://doi.org/10.1348/1359107041557066.
- Hokanson JM, Anderson RL, Hennrikus DJ, Lando HA, Kendall DM. Integrated tobacco cessation counseling in a diabetes self-management training program: a randomized trial of diabetes and reduction of tobacco. Diabetes Educ 2006;32:562-70. https://doi.org/10.1177/0145721706289914.
- Heinrich E, Candel MJ, Schaper NC, de Vries NK. Effect evaluation of a Motivational Interviewing based counselling strategy in diabetes care. Diabetes Res Clin Pract 2010;90:270-8. https://doi.org/10.1016/j.diabres.2010.09.012.
- Pourisharif H, Babapour J, Zamani R, Besharat MA, Mehryar AH, Rajab A. The effectiveness of motivational interviewing in improving health outcomes in adults with type 2 diabetes. Procedia Soc Behav Sci 2010;5:1580-4. https://doi.org/10.1016/j.sbspro.2010.07.328.
- Castelnuovo G, Manzoni GM, Cuzziol P, Cesa GL, Corti S, Tuzzi C, et al. TECNOB Study: ad interim results of a randomized controlled trial of a multidisciplinary telecare intervention for obese patients with type-2 diabetes. Clin Pract Epidemiol Ment Health 2011;7:44-50. https://doi.org/10.2174/1745017901107010044.
- Waker CL. Effects of Motivational Interviewing on Diabetes Self-Management Behaviors and Glycemic Control in Type 2 Diabetes: A Translational Study 2012.
- Gabbay RA, Añel-Tiangco RM, Dellasega C, Mauger DT, Adelman A, Van Horn DH. Diabetes nurse case management and motivational interviewing for change (DYNAMIC): results of a 2-year randomized controlled pragmatic trial. J Diabetes 2013;5:349-57. https://doi.org/10.1111/1753-0407.12030.
- Jiang FG, Dong ZQ, Li XR, Fu XQ, Zhang X, Zhang L, et al. Effects of paroxetine plus group psychotherapy in treatment of anxiety disorders accompanying impaired glucose regulation: a randomized double-blind controlled trial. Chinese Mental Health Journal 2014;28:321-6.
- Inouye J, Li D, Davis J, Arakaki R. Psychosocial and clinical outcomes of a cognitive behavioral therapy for Asians and Pacific Islanders with Type 2 diabetes: a randomized clinical trial. Hawaii J Med Public Health 2015;74:360-8.
- Fitzpatrick SL, Golden SH, Stewart K, Sutherland J, DeGross S, Brown T, et al. Effect of DECIDE (Decision-making Education for Choices In Diabetes Everyday) program delivery modalities on clinical and behavioral outcomes in urban African Americans with type 2 diabetes: a randomized trial. Diabetes Care 2016;39:2149-57. https://doi.org/10.2337/dc16-0941.
- Amsberg S, Anderbro T, Wredling R, Lisspers J, Lins PE, Adamson U, et al. A cognitive behavior therapy-based intervention among poorly controlled adult type 1 diabetes patients – a randomized controlled trial. Patient Educ Couns 2009;77:72-80. https://doi.org/10.1016/j.pec.2009.01.015.
- Ismail K, Thomas SM, Maissi E, Chalder T, Schmidt U, Bartlett J, et al. Motivational enhancement therapy with and without cognitive behavior therapy to treat type 1 diabetes: a randomized trial. Ann Intern Med 2008;149:708-19. https://doi.org/10.7326/0003-4819-149-10-200811180-00005.
- Snoek FJ, van der Ven NC, Twisk JW, Hogenelst MH, Tromp-Wever AM, van der Ploeg HM, et al. Cognitive behavioural therapy (CBT) compared with blood glucose awareness training (BGAT) in poorly controlled type 1 diabetic patients: long-term effects on HbA moderated by depression. A randomized controlled trial. Diabet Med 2008;25:1337-42. https://doi.org/10.1111/j.1464-5491.2008.02595.x.
- Zoffmann V, Vistisen D, Due-Christensen M. Flexible guided self-determination intervention for younger adults with poorly controlled type 1 diabetes, decreased HbA1c and psychosocial distress in women but not in men: a real-life RCT. Diabet Med 2015;32:1239-46. https://doi.org/10.1111/dme.12698.
- Zoffmann V, Lauritzen T. Guided self-determination improves life skills with type 1 diabetes and A1C in randomized controlled trial. Patient Educ Couns 2006;64:78-86. https://doi.org/10.1016/j.pec.2005.11.017.
- Graue M, Wentzel-Larsen T, Hanestad BR, Søvik O. Evaluation of a programme of group visits and computer-assisted consultations in the treatment of adolescents with Type 1 diabetes. Diabet Med 2005;22:1522-9. https://doi.org/10.1111/j.1464-5491.2005.01689.x.
- Channon SJ, Huws-Thomas MV, Rollnick S, Hood K, Cannings-John RL, Rogers C, et al. A multicenter randomized controlled trial of motivational interviewing in teenagers with diabetes. Diabetes Care 2007;30:1390-5. https://doi.org/10.2337/dc06-2260.
- Ellis DA, Templin T, Naar-King S, Frey MA, Cunningham PB, Podolski CL, et al. Multisystemic therapy for adolescents with poorly controlled type I diabetes: stability of treatment effects in a randomized controlled trial. J Consult Clin Psychol 2007;75:168-74. https://doi.org/10.1037/0022-006X.75.1.168.
- Nansel TR, Iannotti RJ, Simons-Morton BG, Cox C, Plotnick LP, Clark LM, et al. Diabetes personal trainer outcomes: short-term and 1-year outcomes of a diabetes personal trainer intervention among youth with type 1 diabetes. Diabetes Care 2007;30:2471-7. https://doi.org/10.2337/dc06-2621.
- Grey M, Whittemore R, Jaser S, Ambrosino J, Lindemann E, Liberti L, et al. Effects of coping skills training in school-age children with type 1 diabetes. Res Nurs Health 2009;32:405-18. https://doi.org/10.1002/nur.20336.
- Wang YC, Stewart SM, Mackenzie M, Nakonezny PA, Edwards D, White PC. A randomized controlled trial comparing motivational interviewing in education to structured diabetes education in teens with type 1 diabetes. Diabetes Care 2010;33:1741-3. https://doi.org/10.2337/dc10-0019.
- Lehmkuhl HD, Storch EA, Cammarata C, Meyer K, Rahman O, Silverstein J, et al. Telehealth behavior therapy for the management of type 1 diabetes in adolescents. J Diabetes Sci Technol 2010;4:199-208. https://doi.org/10.1177/193229681000400125.
- Robling M, McNamara R, Bennert K, Butler CC, Channon S, Cohen D, et al. The effect of the Talking Diabetes consulting skills intervention on glycaemic control and quality of life in children with type 1 diabetes: cluster randomised controlled trial (DEPICTED study). BMJ 2012;344. https://doi.org/10.1136/bmj.e2359.
- Sassmann H, de Hair M, Danne T, Lange K. Reducing stress and supporting positive relations in families of young children with type 1 diabetes: a randomized controlled study for evaluating the effects of the DELFIN parenting program. BMC Pediatr 2012;12. https://doi.org/10.1186/1471-2431-12-152.
- Nansel TR, Iannotti RJ, Liu A. Clinic-integrated behavioral intervention for families of youth with type 1 diabetes: randomized clinical trial. Pediatrics 2012;129:e866-73. https://doi.org/10.1542/peds.2011-2858.
- Najmi SB, Marasi MR, Hashemipour M, Hovsepian S, Ghasemi M. The perceived self-efficacy and its interrelation with communication in family and glycemic control in adolescents with type 1 diabetes. Pak J Med Sci 2013;29:334-9. https://doi.org/10.12669/pjms.291(Suppl).3528.
- Husted GR, Thorsteinsson B, Esbensen BA, Gluud C, Winkel P, Hommel E, et al. Effect of guided self-determination youth intervention integrated into outpatient visits versus treatment as usual on glycemic control and life skills: a randomized clinical trial in adolescents with type 1 diabetes. Trials 2014;15. https://doi.org/10.1186/1745-6215-15-321.
- Jaser SS, Patel N, Rothman RL, Choi L, Whittemore R. Check it! A randomized pilot of a positive psychology intervention to improve adherence in adolescents with type 1 diabetes. Diabetes Educ 2014;40:659-67. https://doi.org/10.1177/0145721714535990.
- Katz ML, Volkening LK, Butler DA, Anderson BJ, Laffel LM. Family-based psychoeducation and Care Ambassador intervention to improve glycemic control in youth with type 1 diabetes: a randomized trial. Pediatr Diabetes 2014;15:142-50. https://doi.org/10.1111/pedi.12065.
- Christie D, Thompson R, Sawtell M, Allen E, Cairns J, Smith F, et al. Structured, intensive education maximising engagement, motivation and long-term change for children and young people with diabetes: a cluster randomised controlled trial with integral process and economic evaluation – the CASCADE study. Health Technol Assess 2014;18. https://doi.org/10.3310/hta18200.
- Harris MA, Freeman KA, Duke DC. Seeing is believing: using Skype to improve diabetes outcomes in youth. Diabetes Care 2015;38:1427-34. https://doi.org/10.2337/dc14-2469.
- Nansel TR, Laffel LM, Haynie DL, Mehta SN, Lipsky LM, Volkening LK, et al. Improving dietary quality in youth with type 1 diabetes: randomized clinical trial of a family-based behavioral intervention. Int J Behav Nutr Phys Act 2015;12. https://doi.org/10.1186/s12966-015-0214-4.
- Serlachius AS, Scratch SE, Northam EA, Frydenberg E, Lee KJ, Cameron FJ. A randomized controlled trial of cognitive behaviour therapy to improve glycaemic control and psychosocial wellbeing in adolescents with type 1 diabetes. J Health Psychol 2016;21:1157-69. https://doi.org/10.1177/1359105314547940.
- Holmes CS, Chen R, Mackey E, Grey M, Streisand R. Randomized clinical trial of clinic-integrated, low-intensity treatment to prevent deterioration of disease care in adolescents with type 1 diabetes. Diabetes Care 2014;37:1535-43. https://doi.org/10.2337/dc13-1053.
- Wysocki T, Harris MA, Buckloh LM, Mertlich D, Lochrie AS, Taylor A, et al. Randomized, controlled trial of Behavioral Family Systems Therapy for Diabetes: maintenance and generalization of effects on parent-adolescent communication. Behav Ther 2008;39:33-46. https://doi.org/10.1016/j.beth.2007.04.001.
- Katon WJ, Von Korff M, Lin EH, Simon G, Ludman E, Russo J, et al. The Pathways Study: a randomized trial of collaborative care in patients with diabetes and depression. Arch Gen Psychiatry 2004;61:1042-9. https://doi.org/10.1001/archpsyc.61.10.1042.
- Karlsen B, Idsoe T, Dirdal I, Rokne Hanestad B, Bru E. Effects of a group-based counselling programme on diabetes-related stress, coping, psychological well-being and metabolic control in adults with type 1 or type 2 diabetes. Patient Educ Couns 2004;53:299-308. https://doi.org/10.1016/j.pec.2003.10.008.
- Wysocki T, Harris MA, Buckloh LM, Mertlich D, Lochrie AS, Taylor A, et al. Effects of behavioral family systems therapy for diabetes on adolescents’ family relationships, treatment adherence, and metabolic control. J Pediatr Psychol 2006;31:928-38. https://doi.org/10.1093/jpepsy/jsj098.
- Heisler M, Vijan S, Makki F, Piette JD. Diabetes control with reciprocal peer support versus nurse care management: a randomized trial. Ann Intern Med 2010;153:507-15. https://doi.org/10.7326/0003-4819-153-8-201010190-00007.
- Rosenbek Minet LK, Wagner L, Lønvig EM, Hjelmborg J, Henriksen JE. The effect of motivational interviewing on glycaemic control and perceived competence of diabetes self-management in patients with type 1 and type 2 diabetes mellitus after attending a group education programme: a randomised controlled trial. Diabetologia 2011;54:1620-9. https://doi.org/10.1007/s00125-011-2120-x.
- Weinger K, Beverly EA, Lee Y, Sitnokov L, Ganda OP, Caballero AE. The effect of a structured behavioral intervention on poorly controlled diabetes: a randomized controlled trial. Arch Intern Med 2011;171:1990-9. https://doi.org/10.1001/archinternmed.2011.502.
- Fischer HH, Eisert SL, Everhart RM, Durfee MJ, Moore SL, Soria S, et al. Nurse-run, telephone-based outreach to improve lipids in people with diabetes. Am J Manag Care 2012;18:77-84.
- Ellis DA, Naar-King S, Chen X, Moltz K, Cunningham PB, Idalski-Carcone A. Multisystemic therapy compared to telephone support for youth with poorly controlled diabetes: findings from a randomized controlled trial. Ann Behav Med 2012;44:207-15. https://doi.org/10.1007/s12160-012-9378-1.
- Lin EH, Von Korff M, Peterson D, Ludman EJ, Ciechanowski P, Katon W. Population targeting and durability of multimorbidity collaborative care management. Am J Manag Care 2014;20:887-95.
- Safford MM, Andreae S, Cherrington AL, Martin MY, Halanych J, Lewis M, et al. Peer coaches to improve diabetes outcomes in rural Alabama: a cluster randomized trial. Ann Fam Med 2015;13:18-26. https://doi.org/10.1370/afm.1798.
- Schroevers MJ, Tovote K, Keers JC, Links TP, Sanderman R, Fleer J. Individual mindfulness-based cognitive therapy for people with diabetes: a pilot randomized controlled trial. Mindfulness 2015;6:99-110. https://doi.org/10.1007/s12671-013-0235-5.
- Feinglos MN, Hastedt P, Surwit RS. Effects of relaxation therapy on patients with type 1 diabetes mellitus. Diabetes Care 1987;10:72-5. https://doi.org/10.2337/diacare.10.1.72.
- Manning RM, Jung RT, Leese GP, Newton RW. The comparison of four weight reduction strategies aimed at overweight diabetic patients. Diabet Med 1995;12:409-15. https://doi.org/10.1111/j.1464-5491.1995.tb00504.x.
- Spiess K, Sachs G, Pietschmann P, Prager R. A program to reduce onset distress in unselected type 1 diabetic patients: effects on psychological variables and metabolic control. Eur J Endocrinol 1995;132:580-6. https://doi.org/10.1530/eje.0.1320580.
- Fosbury JA, Bosley CM, Ryle A, Sönksen PH, Judd SL. A trial of cognitive analytic therapy in poorly controlled type 1 patients. Diabetes Care 1997;20:959-64. https://doi.org/10.2337/diacare.20.6.959.
- Halford WK, Goodall TA, Nicholson JM. Diet and diabetes (II): a controlled trial of problem solving to improve dietary self-management in patients with insulin dependent diabetes. Psychol Health 1997;12:231-8. https://doi.org/10.1080/08870449708407401.
- Didjurgeit U, Kruse J, Schmitz N, Stuckenschnieder P, Sawicki PT. A time-limited, problem-orientated psychotherapeutic intervention in type 1 diabetic patients with complications: a randomized controlled trial. Diabet Med 2002;19:814-21. https://doi.org/10.1046/j.1464-5491.2002.00811.x.
- Weinger K, Schwartz E, Davis A, Rodriguez M, Simonson D, Jacobson A. Cognitive behavioral treatment in type 1 diabetes: a randomized controlled trial. Abstract from the American Diabetes Association 62nd Scientific Sessions, San Francisco, CA, USA, 2002. Diabetes 2002;51.
- Stenström U, Göth A, Carlsson C, Andersson PO. Stress management training as related to glycaemic control and mood in adults with type 1 diabetes mellitus. Diabet Res Clin Pract 2003;60:147-52. https://doi.org/10.1016/S0168-8227(03)00018-4.
- van der Ven NC, Hogenelst MH, Tromp-Wever AM, Twisk JW, der Ploeg HM, Heine RJ, et al. Short-term effects of cognitive behavioural group training (CBGT) in adult type 1 diabetes patients in prolonged poor glycaemic control. A randomized controlled trial. Diabet Med 2005;22:1619-23. https://doi.org/10.1111/j.1464-5491.2005.01691.x.
- Anderson B, Wolf F, Burkhart M, Cornell R, Bacon G. Effects of peer-group intervention on metabolic control of adolescents with IDDM: randomized outpatient study. Diabetes Care 1989;12:179-83. https://doi.org/10.2337/diacare.12.3.179.
- Delameter A, Bubb J, Davis S, Smith J, Schmidt L, White N, et al. Randomized prospective study of self management training with newly diagnosed diabetic children. Diabetes Care 1990;13:492-8. https://doi.org/10.2337/diacare.13.5.492.
- Boardway R, Delamater A, Tomakowsky J, Gutai J. Stress management training for adolescents with diabetes. J Pediatr Psychol 1993;18:29-45. https://doi.org/10.1093/jpepsy/18.1.29.
- Mendez F, Olivares J, Ros C, Bermejo y MR. Aplicabilidad de estrategias reductoras del estres en los padres de ninos con diabetes mellitus insulinodependiente. Analisis Y Modificacion De Conducta 1997;23:649-69.
- Grey M, Boland E, Davidson M, Yu C, Sullivan-Bolyai S, Tamborlane W. Short-term effects of coping skills training as adjunct to intensive therapy in adolescents. Diabetes Care 1998;21:902-8. https://doi.org/10.2337/diacare.21.6.902.
- Wysocki T, Greco P, Harris M, Bubb J, White N. Behavior therapy for families of adolescents with diabetes. Diabetes Care 2001;24:441-6. https://doi.org/10.2337/diacare.24.3.441.
- Wysocki T, Harris M, Wilkinson K, Sadler M, Mauras N, White N. Self-management competence as a predictor of outcomes of intensive therapy or usual care in youth with type 1 diabetes. Diabetes Care 2003;26:2043-7. https://doi.org/10.2337/diacare.26.7.2043.
- Williams JW, Katon W, Lin EH, Nöel PH, Worchel J, Cornell J, et al. The effectiveness of depression care management on diabetes-related outcomes in older patients. Ann Intern Med 2004;140:1015-24. https://doi.org/10.7326/0003-4819-140-12-200406150-00012.
- Wing R, Epstein L, Nowalk M, Koeske R, Hagg S. Behavior change, weight loss, and physiological improvements in type II diabetic patients. J Consult Clin Psychol 1985;53:111-22. https://doi.org/10.1037/0022-006X.53.1.111.
- D’Eramo-Melkus G, Wylie-Rosett J, Hagan J. Metabolic impact of education in NIDDM. Diabetes Care 1992;15:864-9. https://doi.org/10.2337/diacare.15.7.864.
- Lane J, McCaskill C, Ross SL, Feinglos M, Surwit R. Relaxation training for NIDDM. Diabetes Care 1993;16:1087-94. https://doi.org/10.2337/diacare.16.8.1087.
- Campbell L, Barth R, Gosper J, Jupp J, Simons L, Chisholm D. Impact of intensive educational approach to dietary change in NIDDM. Diabetes Care 1990;13:841-7. https://doi.org/10.2337/diacare.13.8.841.
- Aikens J, Kiolbasa T, Sobel R. Psychological predictors of glycemic change with relaxation training in non-insulin-dependent diabetes mellitus. Psychother Psychosom 1997;66:302-6. https://doi.org/10.1159/000289152.
- Henry J, Wilson P, Bruce D, Chisholm D, Rawling P. Cognitive-behavioural stress management for patients with non-insulin dependent diabetes mellitus. Psychology Health Med 1997;2:109-18. https://doi.org/10.1080/13548509708400569.
- Ridgeway N, Harvill D, Harvill L, Falin T, Forester GM, Gose O. Improved control of Type 2 diabetes mellitus: a practical education/behavior modification program in a primary care clinic. South Med J 1999;92:667-72. https://doi.org/10.1097/00007611-199907000-00004.
- Lustman P, Griffith L, Freedland K, Kissel S, Clouse R. Cognitive behavior therapy for depression in type 2 diabetes mellitus: a randomized, controlled trial. Ann Intern Med 1998;129:613-21. https://doi.org/10.7326/0003-4819-129-8-199810150-00005.
- Huang X, Song L, Li T. The effect of social support on type II diabetes with depression. Chin J Clin Psychol 2001;9:187-9.
- Kenardy J, Mensch M, Bowen K, Green B, Walton J. Group therapy for binge eating in type 2 diabetes: a randomized trial. Diabetes Med 2002;19:234-9. https://doi.org/10.1046/j.1464-5491.2002.00679.x.
- Tsujiuchi T, Kumano H, Yoshiuchi K, He DG, Tsujiuchi Y, Kuboki T, et al. The effect of Qi-Gong relaxation exercise on the control of type 2 diabetes mellitus. Diabetes Care 2002;25:241-2. https://doi.org/10.2337/diacare.25.1.241.
- Takii M, Uchigata Y, Komaki G, Nozaki T, Kawai H, Iwamoto Y, et al. An integrated inpatient therapy for type 1 diabetic females with bulimia nervosa: a 3-year follow-up study. J Psychosom Res 2003;55:349-56. https://doi.org/10.1016/S0022-3999(02)00629-3.
- Attari A, Sartippour M, Amini M, Haghighi S. Effect of stress management training on glycemic control in patients with type 1 diabetes. Diabetes Res Clin Pract 2006;73:23-8. https://doi.org/10.1016/j.diabres.2005.11.014.
- Kubiak T, Hermanns N, Schreckling HJ, Kulzer B, Haak T. Evaluation of a self-management-based patient education program for the treatment and prevention of hypoglycemia-related problems in type 1 diabetes. Patient Educ Couns 2006;60:228-34. https://doi.org/10.1016/j.pec.2005.01.008.
- Ellis DA, Naar-King S, Frey M, Rowland M, Greger N. Case study: feasibility of multisystemic therapy as a treatment for urban adolescents with poorly controlled type 1 diabetes. J Pediatr Psychol 2003;28:287-93. https://doi.org/10.1093/jpepsy/jsg017.
- García-Pérez L, Perestelo-Pérez L, Serrano-Aguilar P, Del Mar Trujillo-Martín M. Effectiveness of a psychoeducative intervention in a summer camp for children with type 1 diabetes mellitus. Diabetes Educ 2010;36:310-17. https://doi.org/10.1177/0145721710361784.
- Bitsko MJ, Bean MK, Bart S, Foster RH, Thacker L, Francis GL. Psychological treatment improves hemoglobin A1c outcomes in adolescents with type 1 diabetes mellitus. J Clin Psychol Med Settings 2013;20:333-42. https://doi.org/10.1007/s10880-012-9350-z.
- Harris MA, Freeman KA, Beers M. Family therapy for adolescents with poorly controlled diabetes: initial test of clinical significance. J Pediatr Psychol 2009;34:1097-107. https://doi.org/10.1093/jpepsy/jsp009.
- Kim CJ, Hwang AR, Yoo JS. The impact of a stage-matched intervention to promote exercise behavior in participants with type 2 diabetes. Int J Nurs Stud 2004;41:833-41. https://doi.org/10.1016/j.ijnurstu.2004.03.009.
- Song MS, Kim HS. Effect of the diabetes outpatient intensive management programme on glycaemic control for type 2 diabetic patients. J Clin Nurs 2007;16:1367-73. https://doi.org/10.1111/j.1365-2702.2007.01800.x.
- Forlani G, Lorusso C, Moscatiello S, Ridolfi V, Melchionda N, Di Domizio S, et al. Are behavioural approaches feasible and effective in the treatment of type 2 diabetes? A propensity score analysis vs. prescriptive diet. Nutr Metab Cardiovasc Dis 2009;19:313-20. https://doi.org/10.1016/j.numecd.2008.06.004.
- Lee H, Kim MS, Park KY, Park HS, Kim IJ. Effects of a problem-solving counseling program to facilitate intensified walking on Koreans with type 2 diabetes. Jpn J Nurs Sci 2011;8:129-39. https://doi.org/10.1111/j.1742-7924.2010.00163.x.
- Cervantes Cuesta MÁ, García-Talavera Espín NV, Brotons Román J, Núñez Sánchez MÁ, Brocal Ibáñez P, Villalba Martín P, et al. Psychoeducative groups help control type 2 diabetes in a primary care setting. Nutr Hosp 2013;28:497-505. https://doi.org/10.3305/nh.2013.28.2.6063.
- Ounnapiruk L, Wirojratana V, Meehatchai N, Turale S. Effectiveness of a behavior modification program for older people with uncontrolled type 2 diabetes. Nurs Health Sci 2014;16:216-23. https://doi.org/10.1111/nhs.12089.
- Bandura A. Self-Efficacy: The Exercise of Control. New York, NY: W.H. Freeman and Company; 1997.
- Wu SF, Liang SY, Lee MC, Yu NC, Kao MJ. The efficacy of a self-management programme for people with diabetes, after a special training programme for healthcare workers in Taiwan: a quasi-experimental design. J Clin Nurs 2014;23:2515-23. https://doi.org/10.1111/jocn.12440.
- Kruger J, Brennan A, Thokala P, Basarir H, Jacques R, Elliott J, et al. The cost-effectiveness of the Dose Adjustment for Normal Eating (DAFNE) structured education programme: an update using the Sheffield Type 1 Diabetes Policy Model. Diabet Med 2013;30:1236-44. https://doi.org/10.1111/dme.12270.
- Heller S, Lawton J, Amiel S, Cooke D, Mansell P, Brennan A, et al. Improving management of type 1 diabetes in the UK: the Dose Adjustment For Normal Eating (DAFNE) programme as a research test-bed. A mixed-method analysis of the barriers to and facilitators of successful diabetes self-management, a health economic analysis, a cluster randomised controlled trial of different models of delivery of an educational intervention and the potential of insulin pumps and additional educator input to improve outcomes. Programme Grants Appl Res 2014;2. https://doi.org/10.3310/pgfar02050.
- Kruger J, Pollard D, Basarir H, Thokala P, Cooke D, Clark M, et al. Incorporating psychological predictors of treatment response into health economic simulation models: a case study in type 1 diabetes. Med Decis Making 2015;35:872-87. https://doi.org/10.1177/0272989X15590143.
- Pollard DJ, Brennan A, Dixon S, Waugh N, Elliott J, Heller S, et al. Cost-effectiveness of insulin pumps compared with multiple daily injections both provided with structured education for adults with type 1 diabetes: a health economic analysis of the Relative Effectiveness of Pumps over Structured Education (REPOSE) randomised controlled trial. BMJ Open 2018;8. https://doi.org/10.1136/bmjopen-2017-016766.
- Heller S, White D, Lee E, Lawton J, Pollard D, Waugh N, et al. A cluster randomised trial, cost-effectiveness analysis and psychosocial evaluation of insulin pump therapy compared with multiple injections during flexible intensive insulin therapy for type 1 diabetes: the REPOSE Trial. Health Technol Assess 2017;21. https://doi.org/10.3310/hta21200.
- Thokala P, Kruger J, Brennan A, Basarir H, Duenas A, Pandor A, et al. Assessing the cost-effectiveness of type 1 diabetes interventions: the Sheffield type 1 diabetes policy model. Diabet Med 2014;31:477-86. https://doi.org/10.1111/dme.12371.
- Alva M, Gray A, Mihaylova B, Clarke P. The effect of diabetes complications on health-related quality of life: the importance of longitudinal data to address patient heterogeneity. Health Econ 2014;23:487-500. https://doi.org/10.1002/hec.2930.
- Clarke P, Gray A, Holman R. Estimating utility values for health states of type 2 diabetic patients using the EQ-5D (UKPDS 62). Med Decis Making 2002;22:340-9. https://doi.org/10.1177/0272989X0202200412.
- Coffey JT, Brandle M, Zhou H, Marriott D, Burke R, Tabaei BP, et al. Valuing health-related quality of life in diabetes. Diabetes Care 2002;25:2238-43. https://doi.org/10.2337/diacare.25.12.2238.
- Peasgood T, Brennan A, Mansell P, Elliott J, Basarir H, Kruger J. The impact of diabetes-related complications on preference-based measures of health-related quality of life in adults with type 1 diabetes. Med Decis Making 2016;36:1020-33. https://doi.org/10.1177/0272989X16658660.
- Ridge K, Bartlett J, Cheah Y, Thomas S, Lawrence-Smith G, Winkley K, et al. Do the effects of psychological treatments on improving glycemic control in type 1 diabetes persist over time? A long-term follow-up of a randomized controlled trial. Psychosom Med 2012;74:319-23. https://doi.org/10.1097/PSY.0b013e31824c181b.
- Ismail K, Maissi E, Thomas S, Chalder T, Schmidt U, Bartlett J, et al. A randomised controlled trial of cognitive behaviour therapy and motivational interviewing for people with Type 1 diabetes mellitus with persistent sub-optimal glycaemic control: a Diabetes and Psychological Therapies (ADaPT) study. Health Technol Assess 2010;14. https://doi.org/10.3310/hta14220.
- Curtis L, Burns A. Unit Costs of Health and Social Care 2013. Canterbury: Personal Social Services Research Unit, University of Kent; 2013.
- Strong M, Oakley JE, Brennan A. Estimating multiparameter partial expected value of perfect information from a probabilistic sensitivity analysis sample: a nonparametric regression approach. Med Decis Making 2014;34:311-26. https://doi.org/10.1177/0272989X13505910.
- Juvenile Diabetes Research Foundation (JDFR) . Type 1 Diabetes Facts and Figures 2018. https://jdrf.org.uk/information-support/about-type-1-diabetes/facts-and-figures/?gclid=EAIaIQobChMIk-zrw8Pr2QIVsxbTCh344QCzEAAYASAAEgK9C_D_BwE.%202018 (accessed 14 March 2018).
- Breeze PR, Thomas C, Squires H, Brennan A, Greaves C, Diggle PJ, et al. The Impact of Type 2 Diabetes Prevention Programmes Based on Risk-Identification and Lifestyle Intervention Intensity Strategies: A Cost-Effectiveness Analysis 2017;34:632-40.
- UK Data Service . Health Survey for England 2012. https://discover.ukdataservice.ac.uk/series/?sn=2000021 (accessed March 2018).
- Breeze P, Squires H, Chilcott J, Stride C, Diggle PJ, Brunner E, et al. A statistical model to describe longitudinal and correlated metabolic risk factors: the Whitehall II prospective study. J Public Health 2016;38:679-87. https://doi.org/10.1093/pubmed/fdv160.
- Marmot M, Brunner E. Cohort Profile: the Whitehall II study. Int J Epidemiol 2005;34:251-6. https://doi.org/10.1093/ije/dyh372.
- Bennett H, McEwan P, Bergenheim K, Gordon J. Assessment of unmet clinical need in type 2 diabetic patients on conventional therapy in the UK. Diabetes Ther 2014;5:567-78. https://doi.org/10.1007/s13300-014-0079-6.
- Clarke PM, Gray AM, Briggs A, Farmer AJ, Fenn P, Stevens RJ, et al. A model to estimate the lifetime health outcomes of patients with type 2 diabetes: the United Kingdom Prospective Diabetes Study (UKPDS) Outcomes Model (UKPDS no. 68). Diabetologia 2004;47:1747-59. https://doi.org/10.1007/s00125-004-1527-z.
- Hayes AJ, Leal J, Gray AM, Holman RR, Clarke PM. UKPDS outcomes model 2: a new version of a model to simulate lifetime health outcomes of patients with type 2 diabetes mellitus using data from the 30 year United Kingdom Prospective Diabetes Study: UKPDS 82. Diabetologia 2013;56:1925-33. https://doi.org/10.1007/s00125-013-2940-y.
- Office for National Statistics . Mortality Statistics: Deaths Registered in England and Wales 2013. www.ons.gov.uk/peoplepopulationandcommunity/birthsdeathsandmarriages/deaths/bulletins/deathsregisteredinenglandandwalesseriesdr/2014-10-29 (accessed 1 December 2017).
- Curtis L, Burns A. Unit Costs of Health and Social Care 2017. Canterbury: Personal Social Services Research Unit, University of Kent; 2017.
- Joint Formulary Committee . British National Formulary n.d. www.medicinescomplete.com (accessed 12 March 2018).
- Curtis L. Unit Costs of Health and Social Care 2014. Canterbury: Personal Social Services Research Unit, University of Kent; 2014.
- National Institute for Health and Care Excellence (NICE) . Appendix F: Full Health Economics Report 2015. www.nice.org.uk/guidance/ng28/evidence/appendix-f-full-health-economics-report-pdf-2185320355 (accessed 14 March 2018).
- Kearns B, Rafia R, Leaviss J, Preston L, Brazier JE, Palmer S, et al. The cost-effectiveness of changes to the care pathway used to identify depression and provide treatment amongst people with diabetes in England: a model-based economic evaluation. BMC Health Serv Res 2017;17. https://doi.org/10.1186/s12913-017-2003-z.
- Public Health England . 3.8 Million People in England Now Have Diabetes 2016. www.gov.uk/government/news/38-million-people-in-england-now-have-diabetes (accessed 14 March 2018).
- Grimm SE, Strong M, Brennan A, Wailoo AJ. The HTA Risk Analysis Chart: visualising the need for and potential value of managed entry agreements in health technology assessment. PharmacoEconomics 2017;35:1287-96. https://doi.org/10.1007/s40273-017-0562-9.
- Viechtbauer W, Cheung MW. Outlier and influence diagnostics for meta-analysis. Res Synth Methods 2010;1:112-25. https://doi.org/10.1002/jrsm.11.
- Group DS . Training in flexible, intensive insulin management to enable dietary freedom in people with type 1 diabetes: dose adjustment for normal eating (DAFNE) randomised controlled trial. BMJ 2002;325. https://doi.org/10.1136/bmj.325.7367.746.
- Cox DJ, Gonder-Frederick L, Julian D, Cryer P, Lee JH, Richards FE, et al. Intensive versus standard blood glucose awareness training (BGAT) with insulin-dependent diabetes: mechanisms and ancillary effects. Psychosom Med 1991;53:453-62. https://doi.org/10.1097/00006842-199107000-00010.
- Uchendu C, Blake H. Effectiveness of cognitive-behavioural therapy on glycaemic control and psychological outcomes in adults with diabetes mellitus: a systematic review and meta-analysis of randomized controlled trials. Diabet Med 2017;34:328-39. https://doi.org/10.1111/dme.13195.
- van der Feltz-Cornelis CM, Nuyen J, Stoop C, Chan J, Jacobson AM, Katon W, et al. Effect of interventions for major depressive disorder and significant depressive symptoms in patients with diabetes mellitus: a systematic review and meta-analysis. Gen Hosp Psychiatry 2010;32:380-95. https://doi.org/10.1016/j.genhosppsych.2010.03.011.
- Channon S, Smith VJ, Gregory JW. A pilot study of motivational interviewing in adolescents with diabetes. Arch Dis Child 2003;88:680-3. https://doi.org/10.1136/adc.88.8.680.
- Delamater AM, de Wit M, McDarby V, Malik J, Acerini CL. International Society for Pediatric and Adolescent Diabetes . ISPAD Clinical Practice Consensus Guidelines 2014. Psychological care of children and adolescents with type 1 diabetes. Pediatr Diabetes 2014;15:232-44. https://doi.org/10.1111/pedi.12191.
- Thunander M, Petersson C, Jonzon K, Fornander J, Ossiansson B, Torn C, et al. Incidence of type 1 and type 2 diabetes in adults and children in Kronoberg, Sweden. Diabetes Res Clin Pract 2008;82:247-55. https://doi.org/10.1016/j.diabres.2008.07.022.
- Due-Christensen M, Zoffmann V, Willaing I, Hopkins D, Forbes A. The process of adaptation following a new diagnosis of type 1 diabetes in adulthood: a meta-synthesis. Qual Health Res 2018;28:245-58. https://doi.org/10.1177/1049732317745100.
- Hind D, O’Cathain A, Cooper CL, Parry GD, Isaac CL, Rose A, et al. The acceptability of computerised cognitive behavioural therapy for the treatment of depression in people with chronic physical disease: a qualitative study of people with multiple sclerosis. Psychol Health 2010;25:699-712. https://doi.org/10.1080/08870440902842739.
- Moss-Morris R. Adjusting to chronic illness: time for a unified theory. Br J Health Psychol 2013;18:681-6. https://doi.org/10.1111/bjhp.12072.
- Charalampopoulos D, Hesketh KR, Amin R, Paes VM, Viner RM, Stephenson T. Psycho-educational interventions for children and young people with type 1 diabetes in the UK: how effective are they? A systematic review and meta-analysis. PLOS ONE 2017;12. https://doi.org/10.1371/journal.pone.0179685.
- Abualula NA, Jacobsen KH, Milligan RA, Rodan MF, Conn VS. Evaluating diabetes educational interventions with a skill development component in adolescents with type 1 diabetes: a systematic review focusing on quality of life. Diabetes Educ 2016;42:515-28. https://doi.org/10.1177/0145721716658356.
- Northam EA, Matthews LK, Anderson PJ, Cameron FJ, Werther GA. Psychiatric morbidity and health outcome in type 1 diabetes – perspectives from a prospective longitudinal study. Diabet Med 2005;22:152-7. https://doi.org/10.1111/j.1464-5491.2004.01370.x.
- Freedman B. Equipoise and the ethics of clinical research. N Engl J Med 1987;317:141-5. https://doi.org/10.1056/NEJM198707163170304.
- Pillay J, Armstrong MJ, Butalia S, Donovan LE, Sigal RJ, Vandermeer B, et al. Behavioral programs for type 2 diabetes mellitus: a systematic review and network meta-analysis. Ann Intern Med 2015;163:848-60. https://doi.org/10.7326/M15-1400.
- Xie J, Deng W. Psychosocial intervention for patients with type 2 diabetes mellitus and comorbid depression: a meta-analysis of randomized controlled trials. Neuropsychiatr Dis Treat 2017;13:2681-90. https://doi.org/10.2147/NDT.S116465.
- Alam R, Sturt J, Lall R, Winkley K. An updated meta-analysis to assess the effectiveness of psychological interventions delivered by psychological specialists and generalist clinicians on glycaemic control and on psychological status. Patient Educ Couns 2009;75:25-36. https://doi.org/10.1016/j.pec.2008.08.026.
- Graves H, Garrett C, Amiel SA, Ismail K, Winkley K. Psychological skills training to support diabetes self-management: qualitative assessment of nurses’ experiences. Prim Care Diabetes 2016;10:376-82. https://doi.org/10.1016/j.pcd.2016.03.001.
- Gillam SJ, Siriwardena AN, Steel N. Pay-for-performance in the United Kingdom: impact of the quality and outcomes framework: a systematic review. Ann Fam Med 2012;10:461-8. https://doi.org/10.1370/afm.1377.
- Diabetes UK . The Future of Diabetes 2017. www.diabetes.org.uk/resources-s3/2017-11/1111B%20The%20future%20of%20diabetes%20report_FINAL_.pdf (accessed 14 March 2018).
- Liberati A, Altman DG, Tetzlaff J, Mulrow C, Gøtzsche PC, Ioannidis JP, et al. The PRISMA statement for reporting systematic reviews and meta-analyses of studies that evaluate health care interventions: explanation and elaboration. PLOS Med 2009;6. https://doi.org/10.1371/journal.pmed.1000100.
- NHS England . Adult Improving Access to Psychological Therapies Programme 2017. www.england.nhs.uk/mental-health/adults/iapt/ (accessed 14 March 2018).
- Byrne M, O’Connell A, Egan AM, Dinneen SF, Hynes L, O’Hara MC, et al. A core outcomes set for clinical trials of interventions for young adults with type 1 diabetes: an international, multi-perspective Delphi consensus study. Trials 2017;18. https://doi.org/10.1186/s13063-017-2364-y.
- Thompson SG, Higgins JP. How should meta-regression analyses be undertaken and interpreted?. Stat Med 2002;21:1559-73. https://doi.org/10.1002/sim.1187.
- Diabetes UK . Minding the Gap 2008. www.diabetes.org.uk/resources-s3/2017-11/minding_the_gap_psychological_report.pdf (accessed 14 March 2018).
- Diabetes UK . Paediatric Best Practice Tariff 2013. www.diabetes.org.uk/resources-s3/2017-09/Paediatric%20Diabetes%20Best%20Practice%20Tariff%20Criteria.pdf (accessed 14 March 2018).
- Andrews J, Guyatt G, Oxman AD, Alderson P, Dahm P, Falck-Ytter Y, et al. GRADE guidelines: 14. Going from evidence to recommendations: the significance and presentation of recommendations. J Clin Epidemiol 2013;66:719-25. https://doi.org/10.1016/j.jclinepi.2012.03.013.
- Bonell CP, Hargreaves JR, Cousens SN, Ross DA, Hayes R, Petticrew M, et al. Alternatives to randomisation in the evaluation of public health interventions: design challenges and solutions. J Epidemiol Community Health 2011;65:582-7. https://doi.org/10.1136/jech.2008.082602.
- Ismail K, Winkley K, de Zoysa N, Patel A, Heslin M, Graves H, et al. Nurse-led psychological intervention for type 2 diabetes: a cluster randomised controlled trial (Diabetes-6 study) in primary care. Br J Gen Pract 2018;68:e531-40. https://doi.org/10.3399/bjgp18X696185.
- Dhatariya KK, Skedgel C, Fordham R. The cost of treating diabetic ketoacidosis in the UK: a national survey of hospital resource use. Diabet Med 2017;34:1361-6. https://doi.org/10.1016/j.jval.2017.08.573.
- McEwan P, Poole CD, Tetlow T, Holmes P, Currie CJ. Evaluation of the cost-effectiveness of insulin glargine versus NPH insulin for the treatment of type 1 diabetes in the UK. Curr Med Res Opin 2007;23:S7-19. https://doi.org/10.1185/030079907X167561.
- Department of Health and Social Care . NHS Reference Costs: Financial Year 2011 to 2012 n.d. www.gov.uk/government/publications/nhs-reference-costs-financial-year-2011-to-2012 (accessed 7 November 2019).
- Currie CJ, Poole CD, Woehl A, Morgan CL, Cawley S, Rousculp MD, et al. The financial costs of healthcare treatment for people with Type 1 or Type 2 diabetes in the UK with particular reference to differing severity of peripheral neuropathy. Diabet Med 2007;24:187-94.
- Technology appraisal guidance [TA274] . Ranibizumab for Treating Diabetic Macular Oedema 2013. www.nice.org.uk/guidance/ta274 (accessed 26 Janurary 2018).
- Alva ML, Gray A, Mihaylova B, Leal J, Holman RR. The impact of diabetes-related complications on healthcare costs: new results from the UKPDS (UKPDS 84). Diabet Med 2015;32:459-66. https://10.1111/dme.12647.
- Pischon T, Lahmann PH, Boeing H, Friedenreich C, Norat T, Tjønneland A, et al. Body size and risk of colon and rectal cancer in the European Prospective Investigation Into Cancer and Nutrition (EPIC). J Natl Cancer Inst 2006;98:920-31. https://doi.org/10.1093/jnci/djj246.
- Lahmann PH, Hoffmann K, Allen N, van Gils CH, Khaw KT, Tehard B, et al. Body size and breast cancer risk: findings from the European Prospective Investigation into Cancer And Nutrition (EPIC). Int J Cancer 2004;111:762-71. https://doi.org/10.1002/ijc.20315.
- Renehan AG, Tyson M, Egger M, Heller RF, Zwahlen M. Body-mass index and incidence of cancer: a systematic review and meta-analysis of prospective observational studies. Lancet 2008;371:569-78. https://doi.org/10.1016/S0140-6736(08)60269-X.
- Schett G, Kleyer A, Perricone C, Sahinbegovic E, Iagnocco A, Zwerina J, et al. Diabetes is an independent predictor for severe osteoarthritis: results from a longitudinal cohort study. Diabetes Care 2013;36:403-9. https://doi.org/10.2337/dc12-0924.
- Golden SH, Lazo M, Carnethon M, Bertoni AG, Schreiner PJ, Diez Roux AV, et al. Examining a bidirectional association between depressive symptoms and diabetes. JAMA 2008;299:2751-9. https://doi.org/10.1001/jama.299.23.2751.
- Whyte EM, Mulsant BH, Vanderbilt J, Dodge HH, Ganguli M. Depression after stroke: a prospective epidemiological study. J Am Geriatr Soc 2004;52:774-8. https://doi.org/10.1111/j.1532-5415.2004.52217.x.
- Ward S, Lloyd Jones M, Pandor A, Holmes M, Ara R, Ryan A, et al. A systematic review and economic evaluation of statins for the prevention of coronary events. Health Technol Assess 2007;11. https://doi.org/10.3310/hta11140.
- Yabroff KR, Lawrence WF, Clauser S, Davis WW, Brown ML. Burden of illness in cancer survivors: findings from a population-based national sample. J Natl Cancer Inst 2004;96:1322-30. https://doi.org/10.1093/jnci/djh255.
- Black C, Clar C, Henderson R, MacEachern C, McNamee P, Quayyum Z, et al. The clinical effectiveness of glucosamine and chondroitin supplements in slowing or arresting progression of osteoarthritis of the knee: a systematic review and economic evaluation. Health Technol Assess 2009;13. https://doi.org/10.3310/hta13520.
- Benedict A, Arellano J, De Cock E, Baird J. Economic evaluation of duloxetine versus serotonin selective reuptake inhibitors and venlafaxine XR in treating major depressive disorder in Scotland. J Affect Disord 2010;120:94-104. https://doi.org/10.1016/j.jad.2009.04.017.
- Poole CD, Tetlow T, McEwan P, Holmes P, Currie CJ. The prescription cost of managing people with type 1 and type 2 diabetes following initiation of treatment with either insulin glargine or insulin detemir in routine general practice in the UK: a retrospective database analysis. Curr Med Res Opin 2007;23:S41-S8. https://doi.org/10.1185/030079907X167589.
- Curtis L. Unit Costs of Health and Social Care 2012. Canterbury: Personal Social Services Research Unit, University of Kent; 2012.
- Burr JM, Mowatt G, Hernández R, Siddiqui MA, Cook J, Lourenco T, et al. The clinical effectiveness and cost-effectiveness of screening for open angle glaucoma: a systematic review and economic evaluation. Health Technol Assess 2007;11. https://doi.org/10.3310/hta11410.
- Department of Health and Social Care (DHSC) . NHS Reference Costs 2012 to 2013 2015. www.gov.uk/government/publications/nhs-reference-costs-2012-to-2013 (accessed 14 March 2018).
- Ara R, Pandor A, Stevens J, Rees A, Rafia R. Early high-dose lipid-lowering therapy to avoid cardiac events: a systematic review and economic evaluation. Health Technol Assess 2009;13. https://doi.org/10.3310/hta13340.
- Palmer S, Sculpher M, Philips Z, Robinson M, Ginnelly L, Bakhai A, et al. A cost-effectiveness model comparing alternative management strategies for the use of glycoprotein IIb/IIIa antagonists in non-ST-elevation acute coronary syndrome. London: National Institute for Health and Care Excellence; 2002.
- Youman P, Wilson K, Harraf F, Kalra L. The economic burden of stroke in the United Kingdom. PharmacoEconomics 2003;21:43-50. https://doi.org/10.2165/00019053-200321001-00005.
- Luengo-Fernandez R, Gray AM, Rothwell PM. Oxford Vascular Study . A population-based study of hospital care costs during 5 years after transient ischemic attack and stroke. Stroke 2012;43:3343-51. https://doi.org/10.1161/STROKEAHA.112.667204.
- Baboolal K, McEwan P, Sondhi S, Spiewanowski P, Wechowski J, Wilson K. The cost of renal dialysis in a UK setting – a multicentre study. Nephrol Dial Transplant 2008;23:1982-9. https://doi.org/10.1093/ndt/gfm870.
- Organ Donation . Cost-Effectiveness of Transplantation. NHS Blood and Transplant 2013. www.organdonation.nhs.uk/newsroom/fact_sheets/organ_donation_registry_fact_sheet_7_21337.pdf (accessed 14 March 2018).
- Gordois A, Scuffham P, Shearer A, Oglesby A, Tobian JA. The health care costs of diabetic peripheral neuropathy in the US. Diabetes Care 2003;26:1790-5. https://doi.org/10.2337/diacare.26.6.1790.
- Madan J, Rawdin A, Stevenson M, Tappenden P. A rapid-response economic evaluation of the UK NHS Cancer Reform Strategy breast cancer screening program extension via a plausible bounds approach. Value Health 2010;13:215-21. https://doi.org/10.1111/j.1524-4733.2009.00667.x.
- Tappenden P, Eggington S, Nixon R, Chilcott J, Sakai H, Karnon J. Colorectal Cancer Screening Options Appraisal 2004.
- Oxford Economics . The Economic Costs of Arthritis for the UK Economy 2014. www.oxfordeconomics.com/publication/open/222531 (accessed 14 March 2018).
- Chalder M, Wiles NJ, Campbell J, Hollinghurst SP, Searle A, Haase AM, et al. A pragmatic randomised controlled trial to evaluate the cost-effectiveness of a physical activity intervention as a treatment for depression: the treating depression with physical activity (TREAD) trial. Health Technol Assess 2012;16. https://doi.org/10.3310/hta16100.
- National Institute for Health and Care Excellence (NICE) . Hypertension in Adults: Diagnosis and Management 2011. http://guidance.nice.org.uk/CG127/CostingTemplate/xls/English (accessed 14 March 2018).
- Curtis L, Burns A. Unit Costs of Health and Social Care 2016. Canterbury: Personal Social Services Research Unit, University of Kent; 2016.
- DAFNE . Fact Sheet Six n.d. www.dafne.uk.com/uploads/135/documents/06_factsheetsix_12pt_18_06_12.pdf (accessed 17 October 2019).
- National Institute for Health and Care Excellence . Guide to the Methods of Technology Appraisal 2013 2013.
- Walker C. Effects of Motivational Interviewing on Diabetes Self-Management Behavoiurs and Glycemic Control in Type 2 Diabetes: A Translational Study 2012.
- Gillett M, Dallosso HM, Dixon S, Brennan A, Carey ME, Campbell MJ, et al. Delivering the Diabetes Education and Self Management for Ongoing and Newly Diagnosed (DESMOND) programme for people with newly diagnosed type 2 diabetes: cost effectiveness analysis. BMJ 2010;341. https://10.1136/bmj.c4093.
Appendix 1 List of the additions to the original review
List of additions to original review
-
Network meta-analysis.
-
Individual patient data meta-analysis.
-
Cost-effectiveness analysis.
-
Non-randomised controlled trials systematic review.
-
Patient and public involvement input.
List of changes between current protocol and review
The following amendments were made to version 1.3 of the protocol:
-
We were more explicit in the exclusion criteria, by saying that patients who had other medical conditions would be excluded unless the data on patients with diabetes have been summarised and are extractable as a subgroup, or a separate analysis can be provided by the author.
-
We updated our definition of a psychological intervention. We defined an intervention as psychological if it: (1) had a reliance on communication, using a therapeutic alliance between patient and the therapist; (2) was facilitated by psychologists, psychotherapists and therapists in training, or facilitated by persons trained/supervised by a clinical psychologist or therapist; (3) was based on a psychological model; and (4) aimed to improve outcome changes in emotional, cognitive or behavioural functioning including adherence. If these criteria were unclear and the intervention could not clearly be described as psychological from the publication, then authors were contacted for more information to determine eligibility.
-
We included ‘diabetes education’ as a comparator.
-
We searched international conference abstracts from 2012–current. We also searched clinicaltrials.gov for grey literature.
Appendix 2 Search strategy in MEDLINE for randomised controlled trials
MEDLINE (via OvidSP)
-
exp Diabetes Mellitus/
-
diabet$.ab,ti.
-
(DKA or IDDM).mp. or DMI.ab,ti. [mp=title, original title, abstract, name of substance word, subject heading word]
-
(MODY or DM2 or NIDDM).mp. or IIDM.ti,ab. [mp=title, original title, abstract, name of substance word, subject heading word]
-
insulin$ secret$ dysfunc$.ti,ab.
-
insulin$ resist$.ti,ab.
-
((impaired glucose tolerance or glucose intoleran$ or insulin$ resist$) and (DM or DM2)).ti,ab.
-
insulin$ depend$.mp. or insulin?depend$.ti,ab. [mp=title, original title, abstract, name of substance word, subject heading word]
-
(non insulin$ depend$ or nonisulin$ depend$ or nonisulin?depend).mp. or non insulin?depend$.ti,ab. [mp=title, original title, abstract, name of substance word, subject heading word]
-
(("typ$ 1" or typ$ I) adj6 DM).ti,ab.
-
(("typ$ 2" or typ$ II) adj6 DM).ti,ab.
-
((juvenil$ or child$ or keto$ or labil$ or brittl$ or earl$ onset) adj6 (DM or DM1)).ti,ab.
-
((keto$ prone or autoimmun$ or auto immun$ or sudden onset) adj6 (DM or DM1)).ti,ab.
-
((keto$ resist$ or nonketo$ or non keto$ or adult$ onset or matur$ onset or late$ onset or slow onset or stabl$) adj6 (DM or DM2)).ti,ab.
-
exp Insulin Resistance/
-
(insulin$ defic$ adj6 (absolut$ or relativ$)).ti,ab.
-
metabolic$ syndrom$.ti,ab.
-
(syndrom$ X not (fragil$ X or X linked)).ti,ab.
-
(plurimetabolic$ syndrom$ or pluri metabolic$ syndrom$).ti,ab.
-
or/1-19
-
exp Psychotherapy/
-
exp Counseling/
-
exp Mood disorders/
-
exp Depression/
-
psycho$.mp
-
counsel$.mp
-
depression.mp
-
depressive.mp
-
(interpersonal adj5 therap$).mp
-
art therap$.mp
-
aversion therap$.mp
-
balint.mp
-
behavio?r adj5 (intervention or therap* or modific*)
-
cognitive adj5 (therap* or intervention or program* or train* or theory)
-
(family adj3 (intervention or treatment or counsel* or therap*)
-
colo?r therap$.mp.
-
crisis intervention.mp
-
dance therap$.mp
-
gestalt therap$.mp
-
music therap$.mp
-
milieu therap$.mp
-
(assert$ adj5 training).mp
-
Narrative therap$.mp.
-
nondirective therap$.mp
-
(problem solving adj5 therap$).mp
-
(self control adj5 therap$).mp
-
person cent$.mp
-
client cent$.mp
-
psychodrama$.mp
-
paradoxical technique$.mp
-
play therap$.mp
-
rational emotive.mp
-
reality therap$.mp
-
role play$.mp
-
(relax$ adj5 training).mp
-
sociotherap$.mp
-
socioenvironmental.mp
-
supportive therap$.mp
-
transactional.mp
-
acceptance adj2 (commitment therap*)
-
coping skills training.mp.
-
exp Mindfulness/
-
motivation* adj2 (interview* or therap*)
-
multisystemic therapy
-
or/21-64
-
Randomized Controlled Trials as Topic/
-
randomized controlled trial/
-
Random Allocation/
-
Double Blind Method/
-
Single Blind Method/
-
clinical trial/
-
clinical trial, phase i.pt
-
clinical trial, phase ii.pt
-
clinical trial, phase iii.pt
-
clinical trial, phase iv.pt
-
controlled clinical trial.pt
-
randomized controlled trial.pt
-
multicenter study.pt
-
clinical trial.pt
-
exp Clinical Trials as topic/
-
(clinical adj25 trial$).tw
-
((singl$ or doubl$ or treb$ or tripl$) adj25 (blind$3 or mask$3)).tw
-
PLACEBOS/
-
placebo$.tw
-
randomly allocated.tw
-
(allocated adj2 random$).tw
-
or/66-86
-
case report.tw
-
letter/
-
historical article/
-
or/88-90
-
87 NOT 91
-
20 AND 65 AND 92
-
limit 93 to yr=“2003-Current”
Appendix 3 Data extraction items for randomised controlled trials
Items for data extraction (conducted in Microsoft Excel):
-
reference
-
name of first author/trial name
-
psychological intervention category
-
publication characteristics –
-
Digital Object Identifier (DOI)
-
year of publication
-
country of origin
-
health-care setting
-
language
-
funding source
-
study design
-
-
patient characteristics –
-
type of diabetes
-
number of participants screened/assessed for eligibility
-
number of participants excluded
-
reasons participants were excluded
-
number participants declined before randomisation
-
intervention/control label
-
number of participants randomised to group
-
number of participants lost to follow-up in group
-
reasons for loss to follow-up
-
intervention/control label for age and duration
-
baseline characteristics –
-
age (mean, SD)
-
duration of diabetes in group (years: mean, SD)
-
sex (n, %)
-
clinical subgroup information (treatment type, smoking status, weight/BMI)
-
ethnicity group (n, %)
-
socioeconomic setting type (e.g. individual’s or family’s income, education)
-
complication status information
-
-
receipt of diabetes education
-
-
intervention characteristics –
-
type of therapy
-
number of therapy sessions
-
duration of overall treatment
-
duration of treatment session
-
psychological theoretical framework or model
-
specialty of facilitator
-
use of manual
-
interventionist training
-
format of delivery
-
mode of delivery
-
use of boost or maintenance sessions
-
-
control characteristics –
-
same as intervention characteristics, if applicable
-
-
primary outcome characteristics –
-
intervention
-
comparison
-
outcome measure
-
time point of follow-up
-
baseline intervention (n, mean, SD)
-
baseline control (n, mean, SD)
-
intervention follow-up (n, mean, SD)
-
control follow-up (n, mean, SD)
-
-
secondary outcome characteristics –
-
same as primary outcome characteristics in addition to:
-
type of secondary outcome, for example (1) changes in self-management behaviours or (2) change in psychological functioning or (3) other.
-
-
Appendix 4 Data extraction items for randomised controlled trial non-English studies
Items for data extraction (conducted in Microsoft Excel):
-
reference
-
year
-
country of study
-
total number of participants
-
age (mean, SD) in intervention
-
age (mean,SD) in control
-
duration of diabetes (mean, SD) in intervention
-
duration of diabetes (mean, SD) in control
-
type of intervention
-
duration of therapy in intervention
-
number of sessions in intervention
-
interventionist
-
interventionist training
-
type of control, for example usual care/diabetes education
-
follow-up period
-
HbA1c level at baseline in intervention (mean, SD)
-
HbA1c level at baseline in control (mean, SD)
-
HbA1c level at follow-up in intervention (mean, SD)
-
HbA1c level at follow-up in control (mean, SD).
Appendix 5 Psychological intervention, control and interventionist categories
| T2DM studies | |
|---|---|
| Psychological intervention category | Psychological intervention condition |
| CBT | |
| Counselling |
|
| Collaborative care | |
| Creative therapy | Music therapy136 |
| Family therapy | |
| Control condition category | Control condition |
| Usual care | |
| Attention control | |
| Interventionist category | Interventionist |
| Diabetes specialists | |
| Psychology professionals | |
| Other |
|
| T1DM adult studies | |
| Psychological intervention category | Psychological intervention condition |
| CBT | |
| Counselling | |
| Control condition category | Control condition |
| Usual care | |
| Attention control | |
| Interventionist category | Interventionist |
| Diabetes specialists | |
| Non-diabetes specialist | |
| T1DM adolescent studies | |
| Psychological intervention category | Psychological intervention condition |
| CBT | |
| Counselling | |
| Family therapy | |
| Control condition category | Control condition |
| Usual care | |
| Attention control | Diabetes education (Nansel et al.,170 Grey et al.,171 Wang et al.,172 Jaser et al.,179 Holmes et al.185) |
| Less intensive psychological intervention | |
| Interventionist category | Interventionist |
| Diabetes specialists | |
| Psychology professionals | |
| Other | |
| T2DM and T2DM studies | |
| Psychological intervention category | Psychological intervention condition |
| CBT | |
| Counselling | |
| Family therapy | |
| Collaborative care |
|
| Control condition category | Control condition |
| Usual care | |
| Attention control | |
| Less intensive psychological intervention |
|
| Interventionist category | Interventionist |
| Diabetes specialists | |
| Non-diabetes specialists | |
Appendix 6 Non-randomised controlled trial search terms for non-randomised studies for MEDLINE
MEDLINE (via OvidSP)
Date range searched: January 2003 to July 2016.
Date searched 8 August 2016.
Search strategy
-
case-control studies/
-
retrospective studies/
-
cohort studies/
-
longitudinal studies/
-
follow-up studies/
-
prospective studies/
-
cohort.ti,ab.
-
longitudinal.ti,ab.
-
follow up.ti,ab.
-
followup.ti,ab.
-
prospective*.ti,ab.
-
retrospective*.ti,ab.
-
comparison group*.ti,ab.
-
control group*.ti,ab.
-
nonrandom*.ti,ab.
-
or/65-79
-
or/21-64
-
20 and 80 and 81
-
limit 82 to yr=“2003 -Current“
Appendix 7 Data extraction items for non-randomised controlled trial studies
Items for data extraction (conducted in Microsoft Excel):
-
reference
-
name of first author/trial name
-
psychological intervention category
-
publication characteristics –
-
DOI
-
Year of publication
-
country of origin
-
healthcare setting
-
language
-
funding source
-
study design
-
-
patient characteristics –
-
type of diabetes
-
number of participants screened/assessed for eligibility
-
number of participants excluded
-
reasons for participants excluded
-
number participants declined before randomisation
-
intervention/control label
-
number of participants randomised to group
-
number of participants lost to follow-up in group
-
reasons for loss to follow-up
-
intervention/control label for age and duration
-
baseline characteristics –
-
age (mean, SD)
-
duration of diabetes in group (years: mean, SD)
-
sex (n, %)
-
-
-
intervention characteristics –
-
type of therapy
-
number of therapy sessions
-
duration of overall treatment
-
duration of treatment session
-
psychological theoretical framework or model
-
specialty of facilitator
-
use of manual
-
interventionist training
-
format of delivery
-
mode of delivery
-
use of boost or maintenance sessions
-
-
control characteristics –
-
same as intervention characteristics, if applicable
-
-
outcome characteristics –
-
intervention
-
comparison
-
outcome measure
-
method of assessing outcome
-
type of outcome: (1) HbA1c level, (2) change in psychological functioning, (3) change in self-management behaviours, (4) other
-
time point of follow-up
-
findings
-
limitations.
-
Appendix 8 Mini posters of preliminary findings of randomised controlled trial aggregate meta-analysis for focus groups
The King’s College London logo has been reproduced with permission.
Appendix 9 Additional tables and figures for the glycated haemoglobin level aggregate meta-analysis for adults with type 1 diabetes mellitus
FIGURE 29.
The RoB in studies of adults with T1DM.
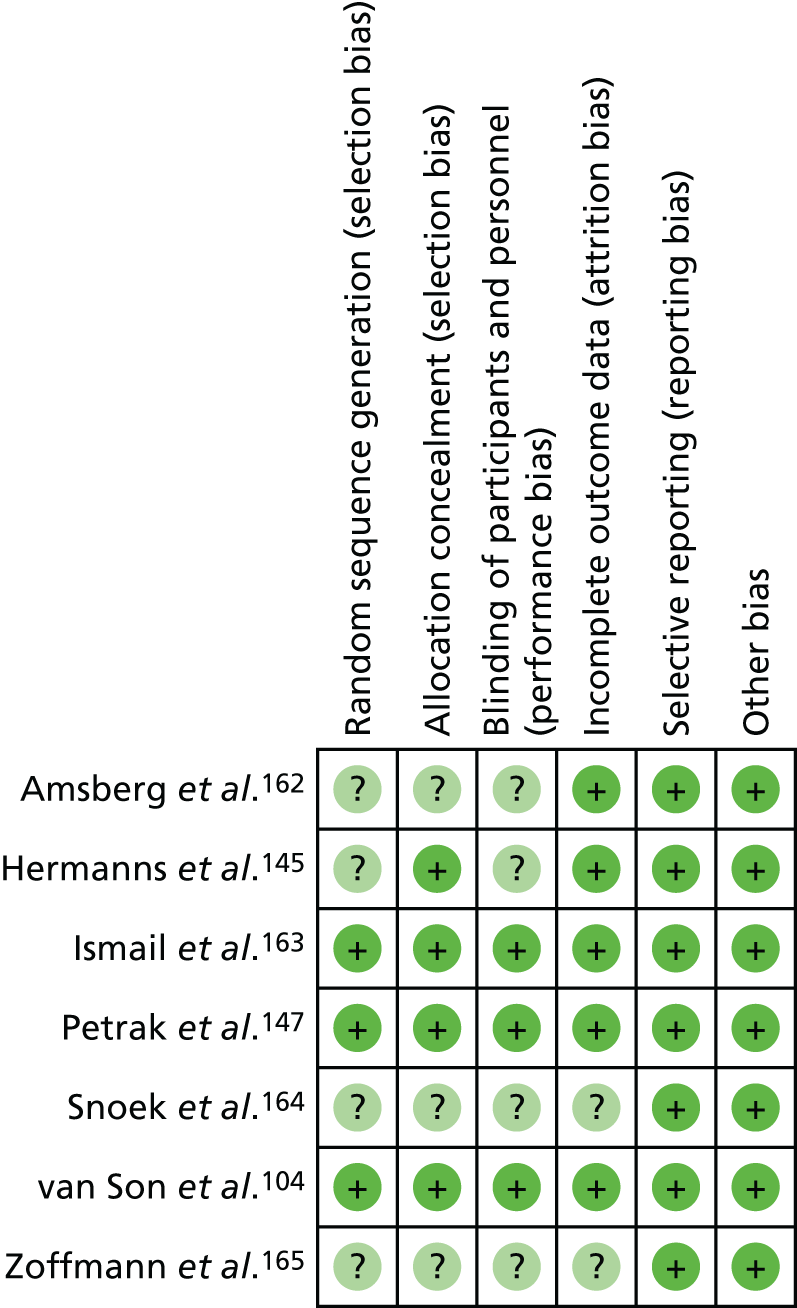
FIGURE 30.
Funnel plot of publication bias in HbA1c level outcome for adults with T1DM.
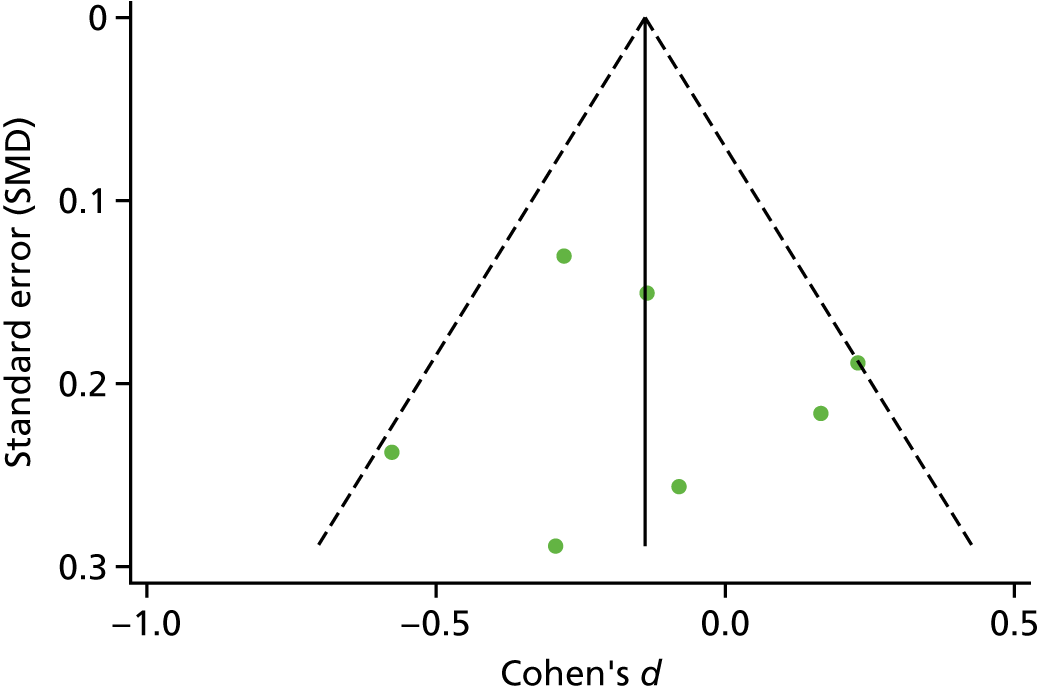
Appendix 10 Additional tables and figures for the glycated haemoglobin level aggregate meta-analysis for adolescents/children with type 1 diabetes mellitus
FIGURE 31.
Subgroup analysis by RoB for adolescent/children with T1DM. Weights are from random effects analysis.
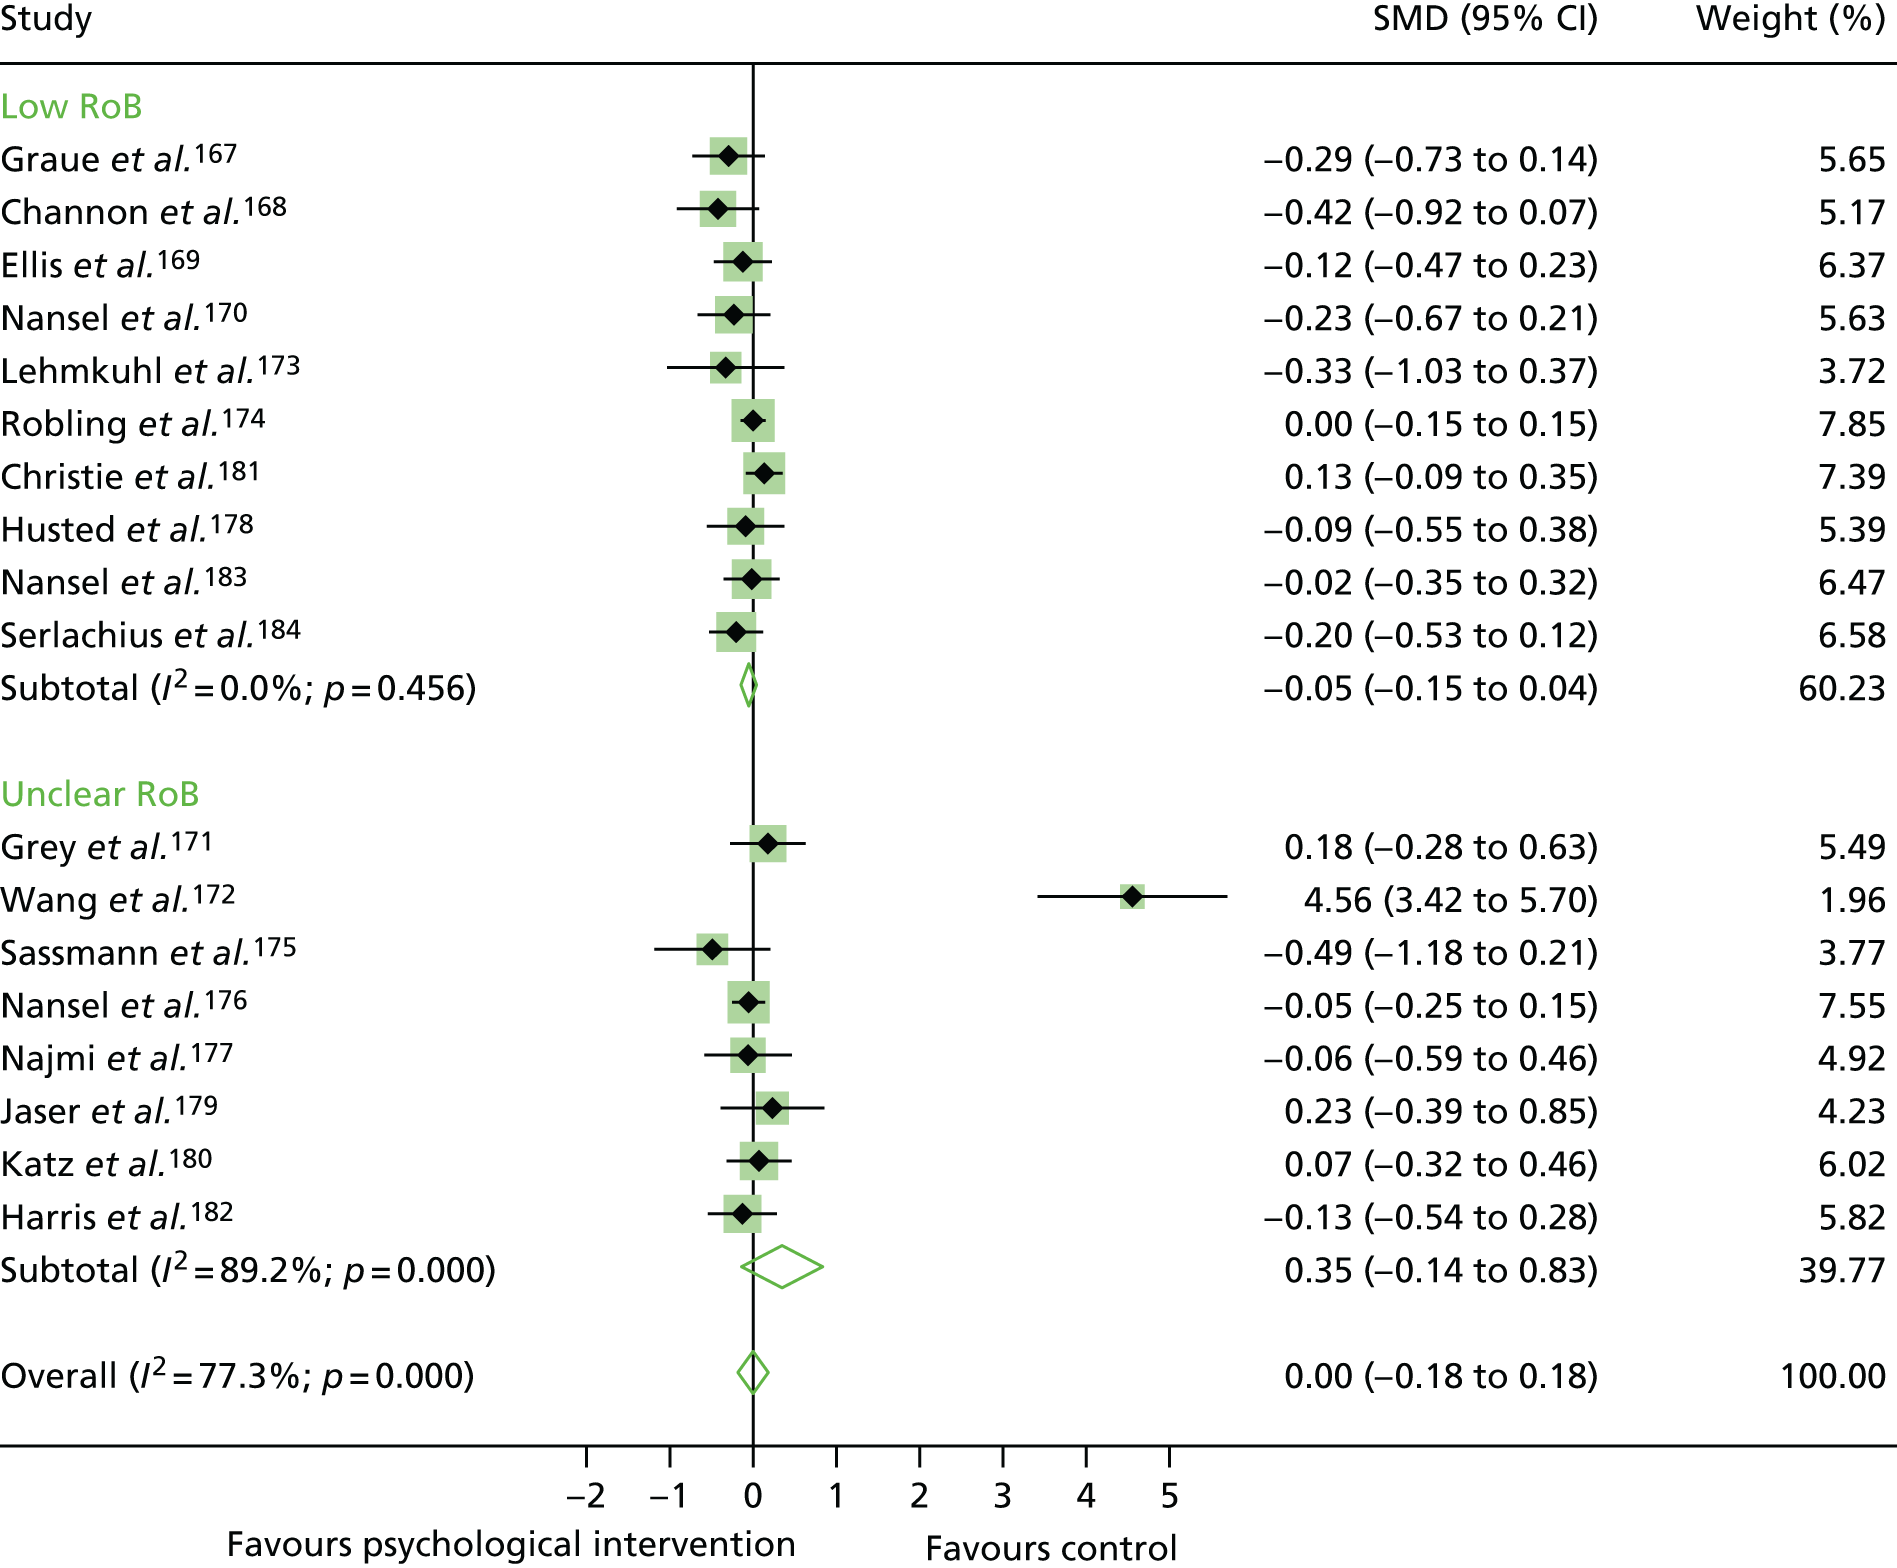
FIGURE 32.
The RoB in studies of adolescents/children with T1DM.

FIGURE 33.
A subgroup meta-analysis of the SMD in HbA1c levels by psychological intervention category in the psychological intervention groups compared with control groups in studies of adolescents/children with T1DM. Weights are from random effects analysis.
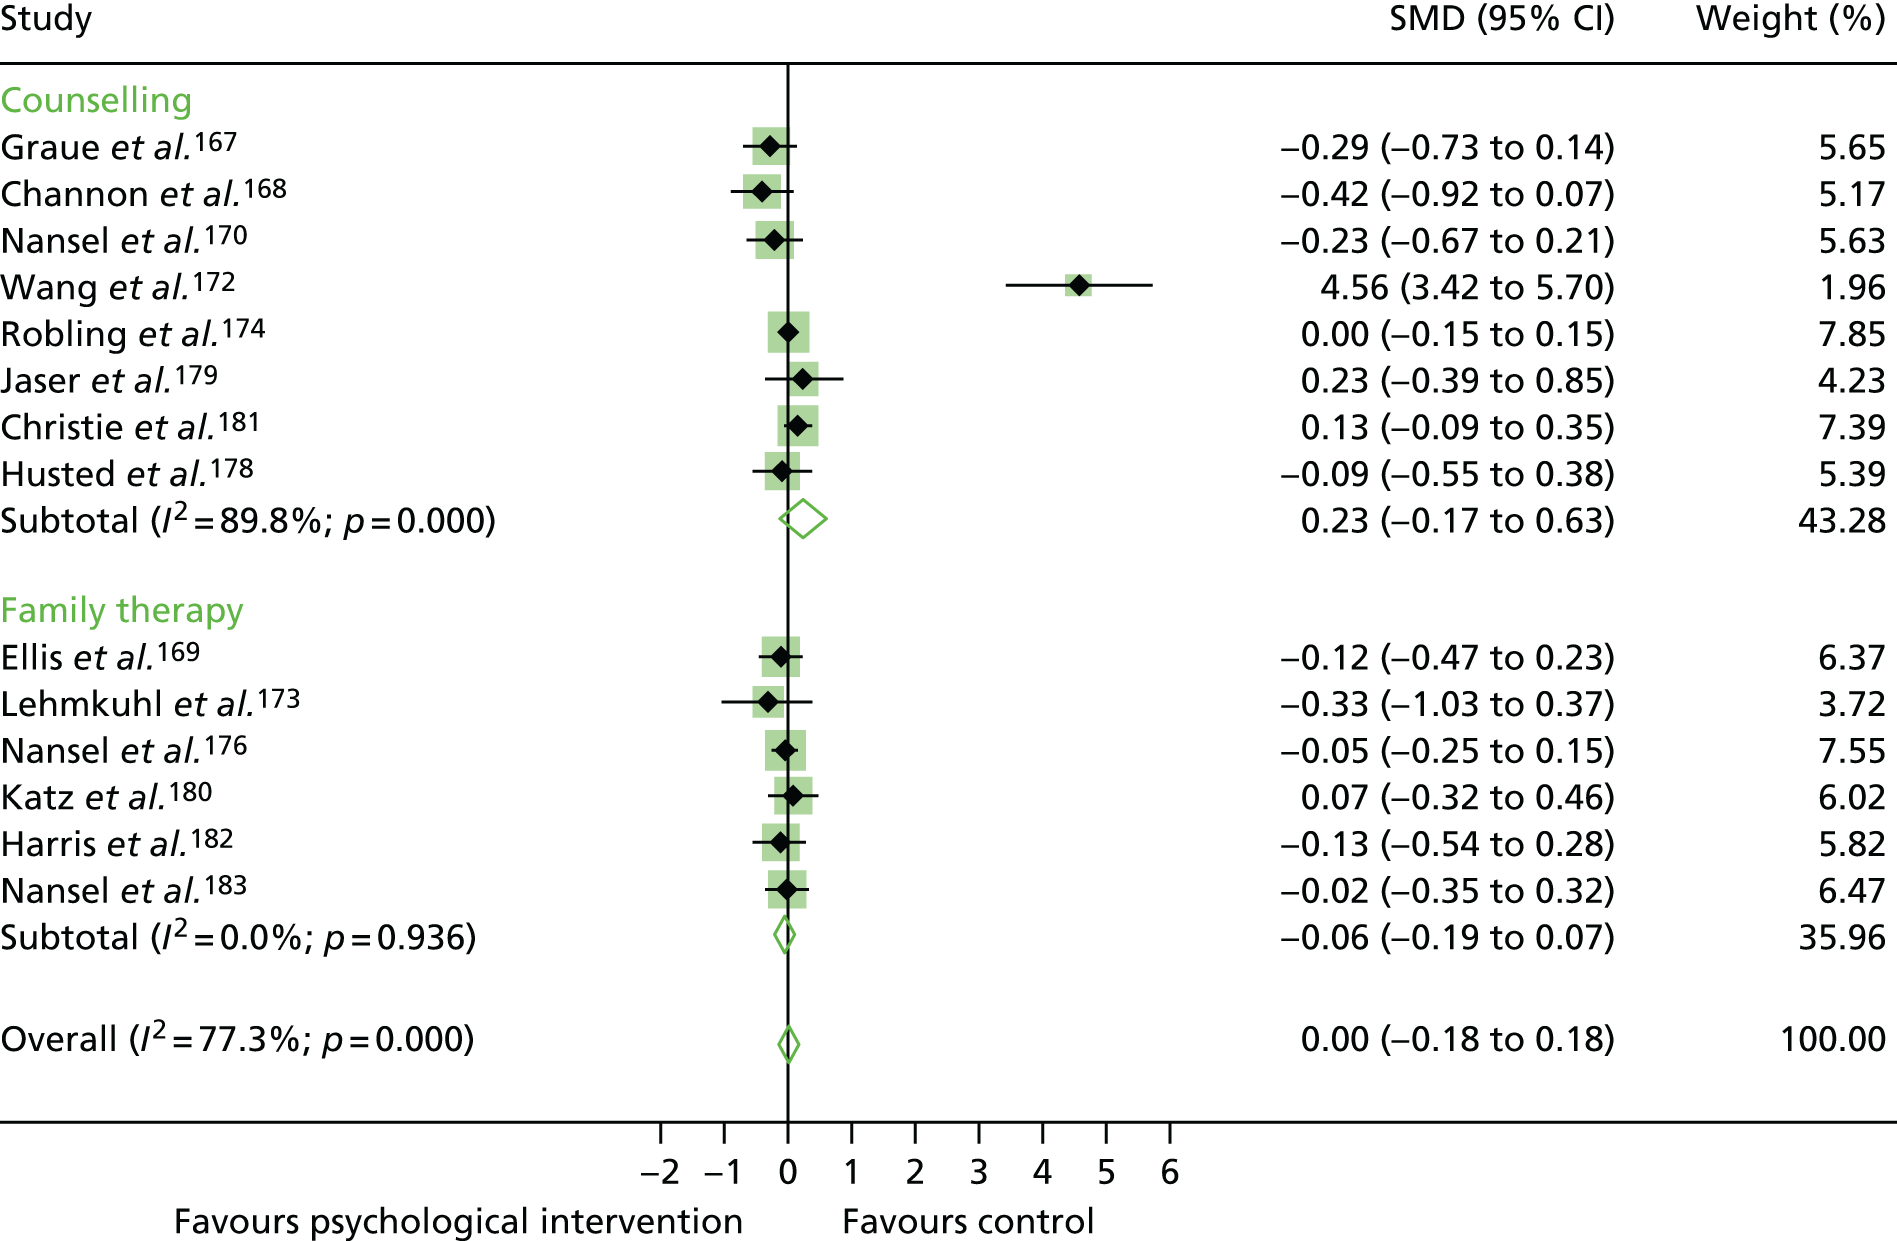
FIGURE 34.
A subgroup meta-analysis of the SMD in HbA1c level by interventionist in the psychological intervention groups compared with control groups in studies of adolescents/children with T1DM. Weights are from random effects analysis.
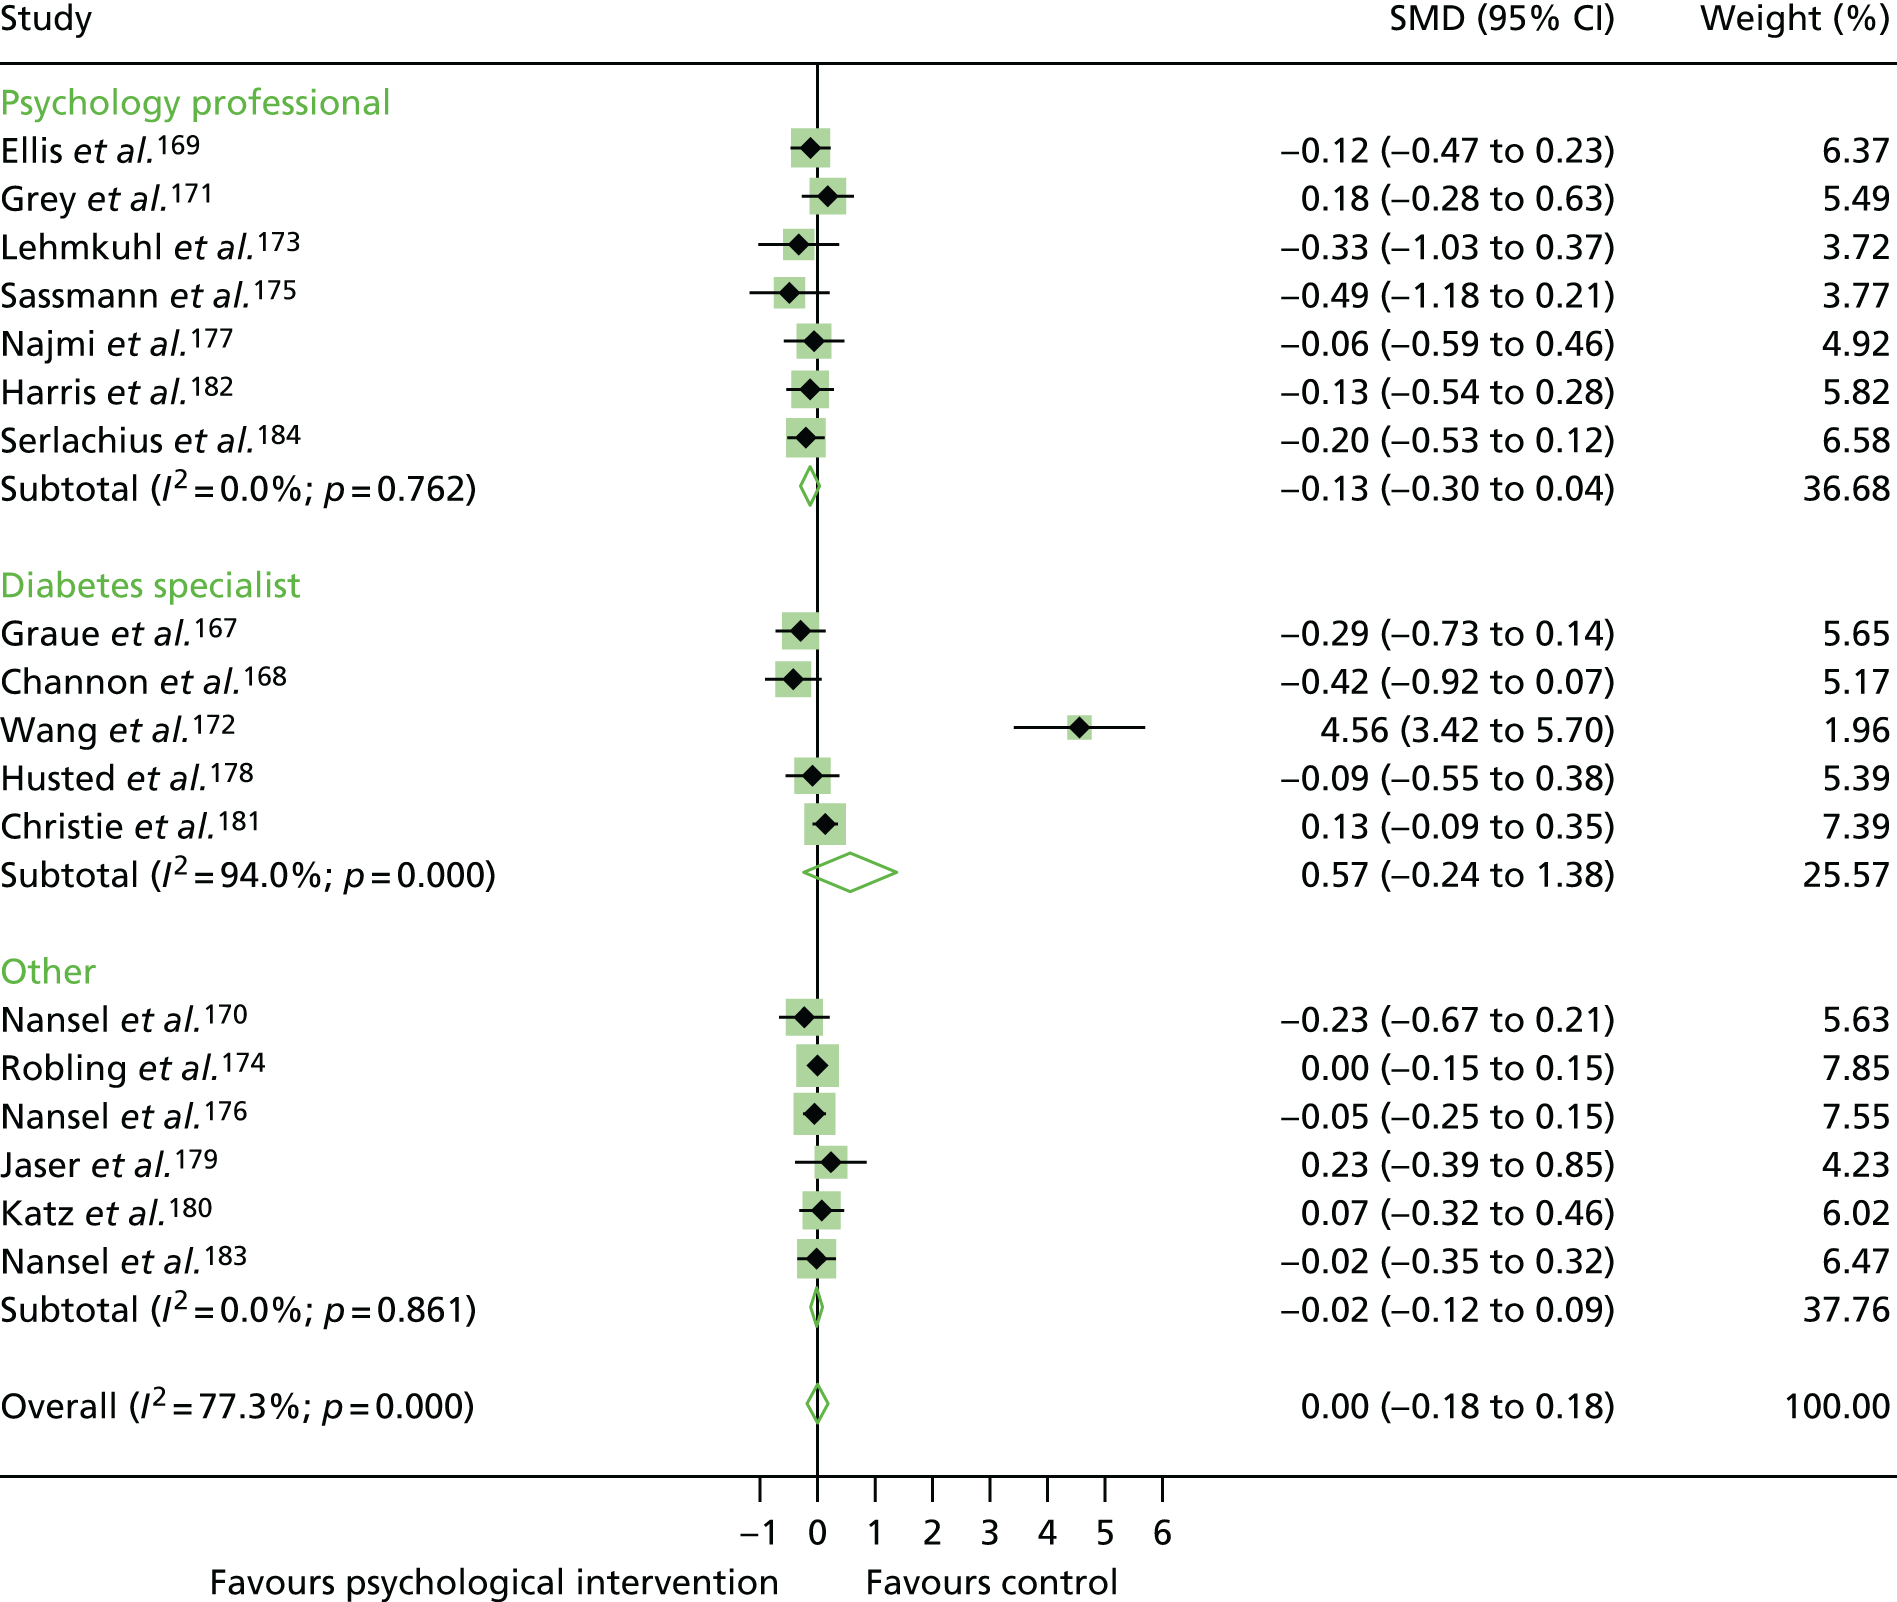
Appendix 11 Additional figures for glycated haemoglobin level aggregate meta-analysis for adults with type 2 diabetes mellitus
FIGURE 35.
The RoB in studies of adults with T2DM.

FIGURE 36.
Subgroup analysis by RoB for studies of adults with T2DM. Weights are from random-effects analysis.
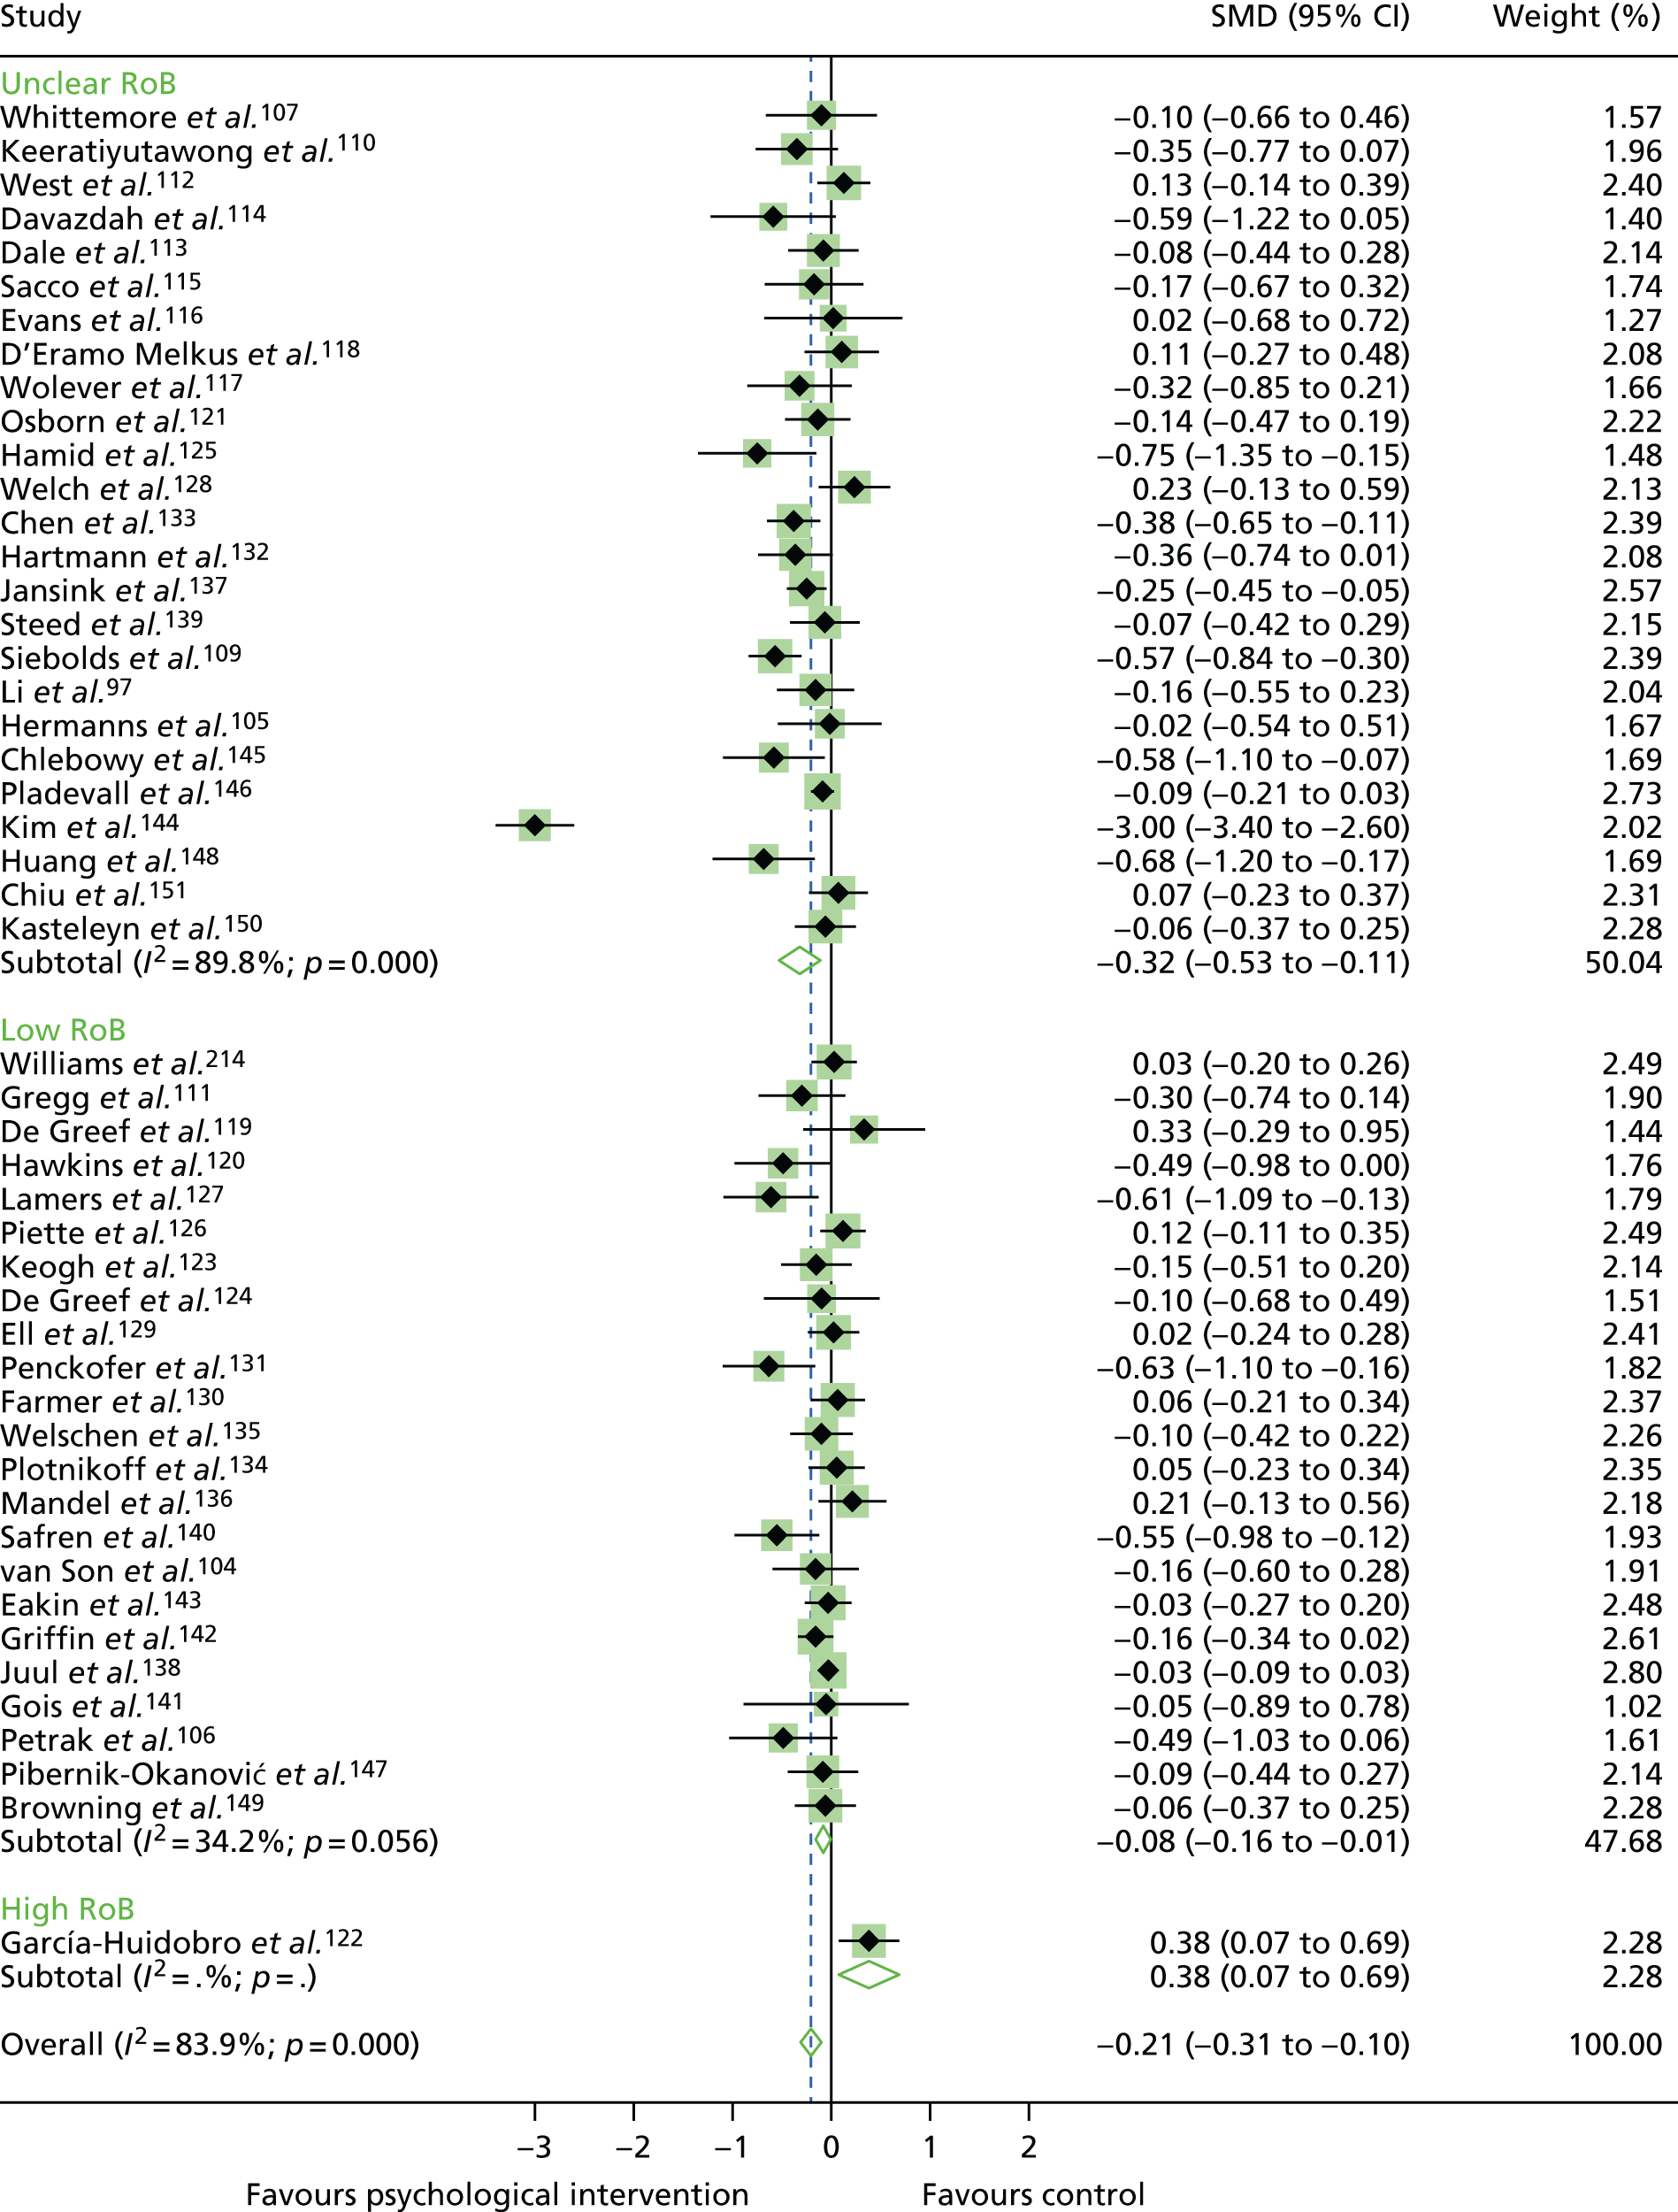
FIGURE 37.
Funnel plot of publication bias for the outcome of HbA1c levels in studies of adults with T2DM.
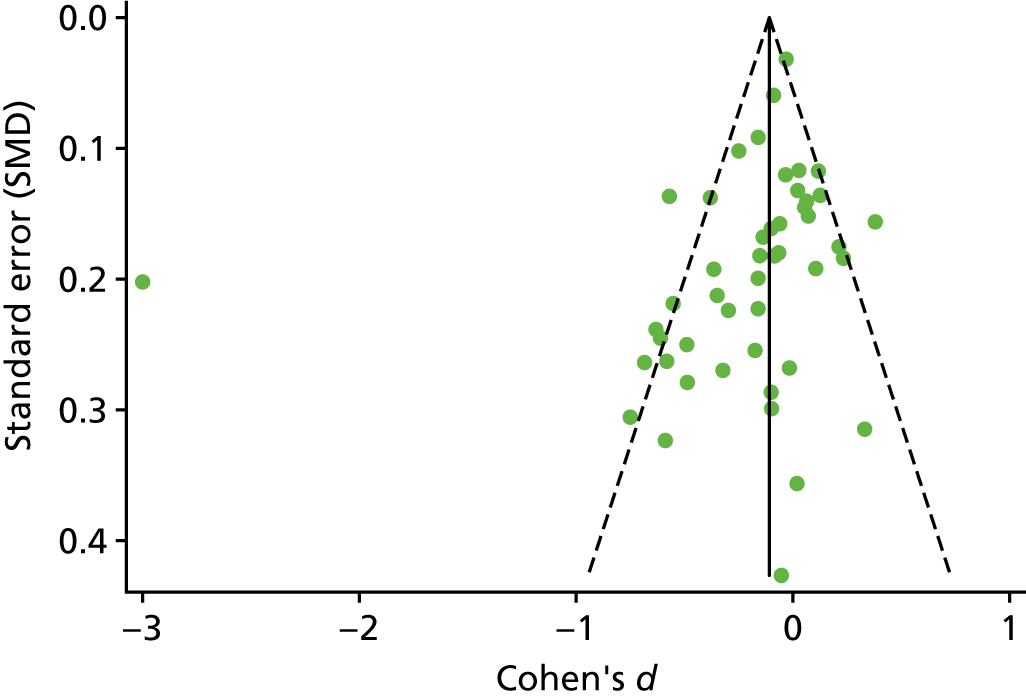
FIGURE 38.
Subgroup meta-analysis of the SMD in HbA1c levels by psychological intervention category in psychological intervention groups compared with control groups for studies of adults with T2DM. Weights are from random-effects analysis.
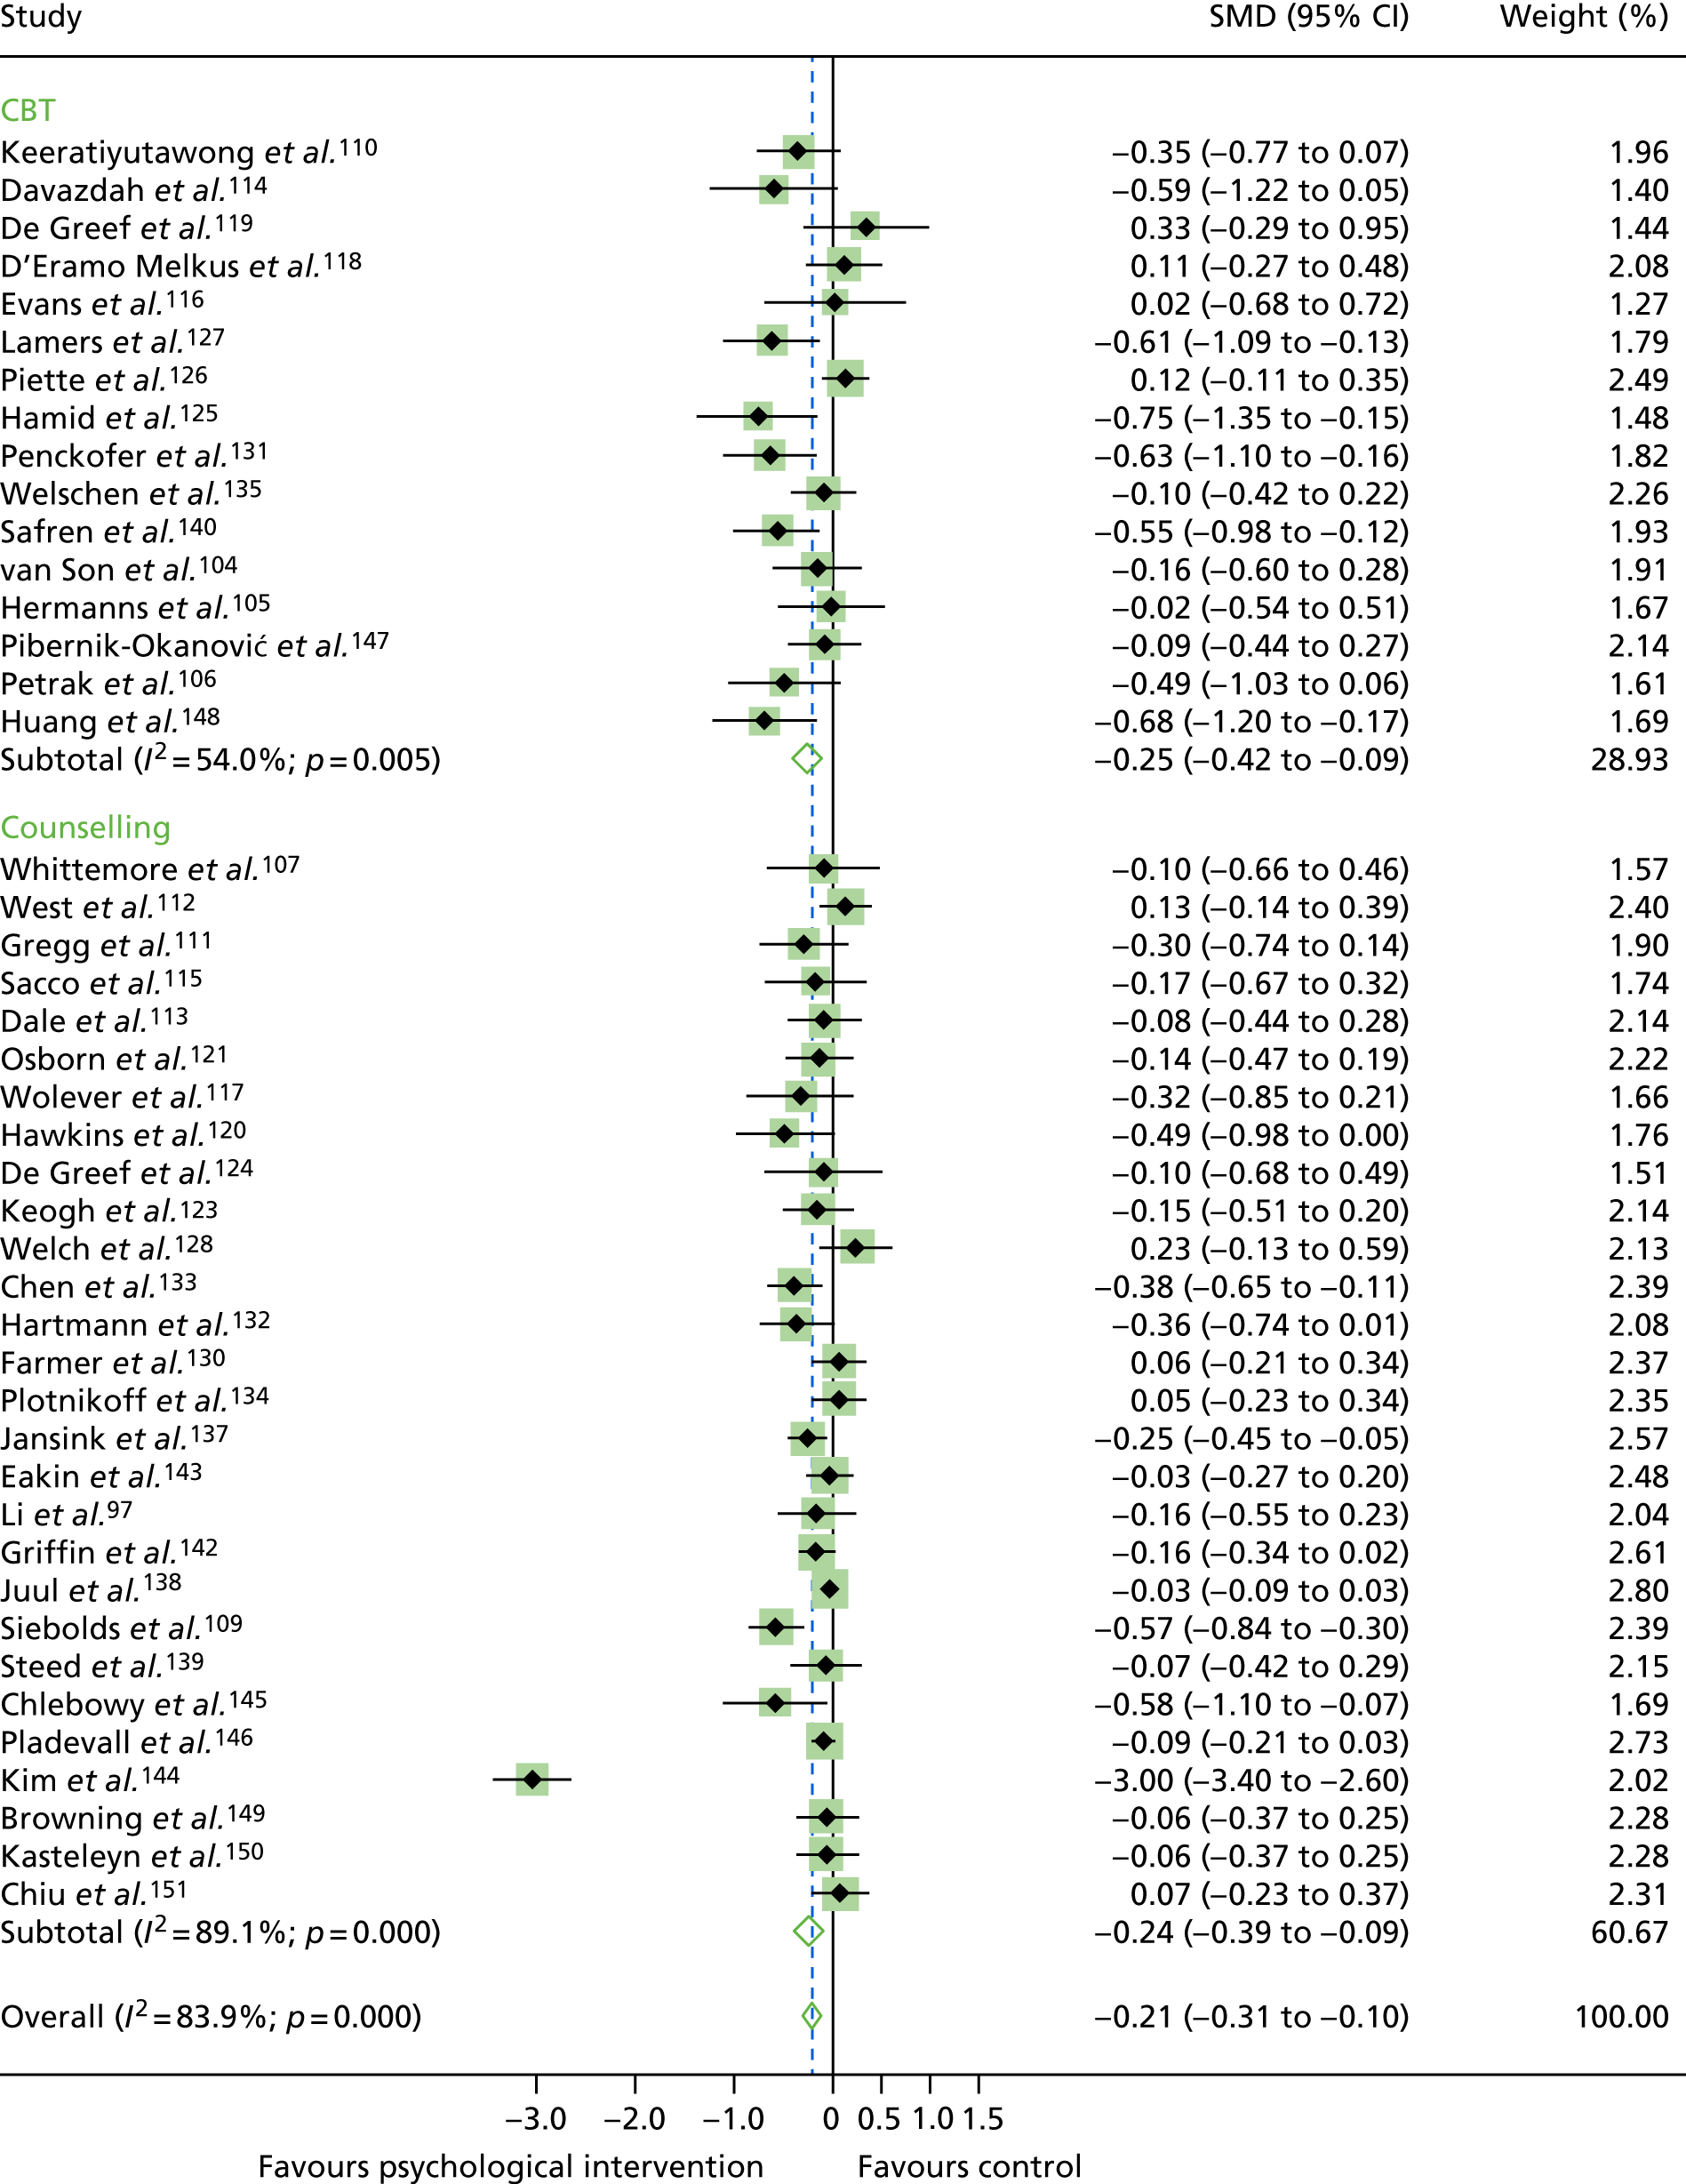
FIGURE 39.
Subgroup meta-analysis of the SMD in HbA1c levels by interventionist in psychological intervention groups compared with control groups for studies of adults with T2DM. Weights are from random-effects analysis.
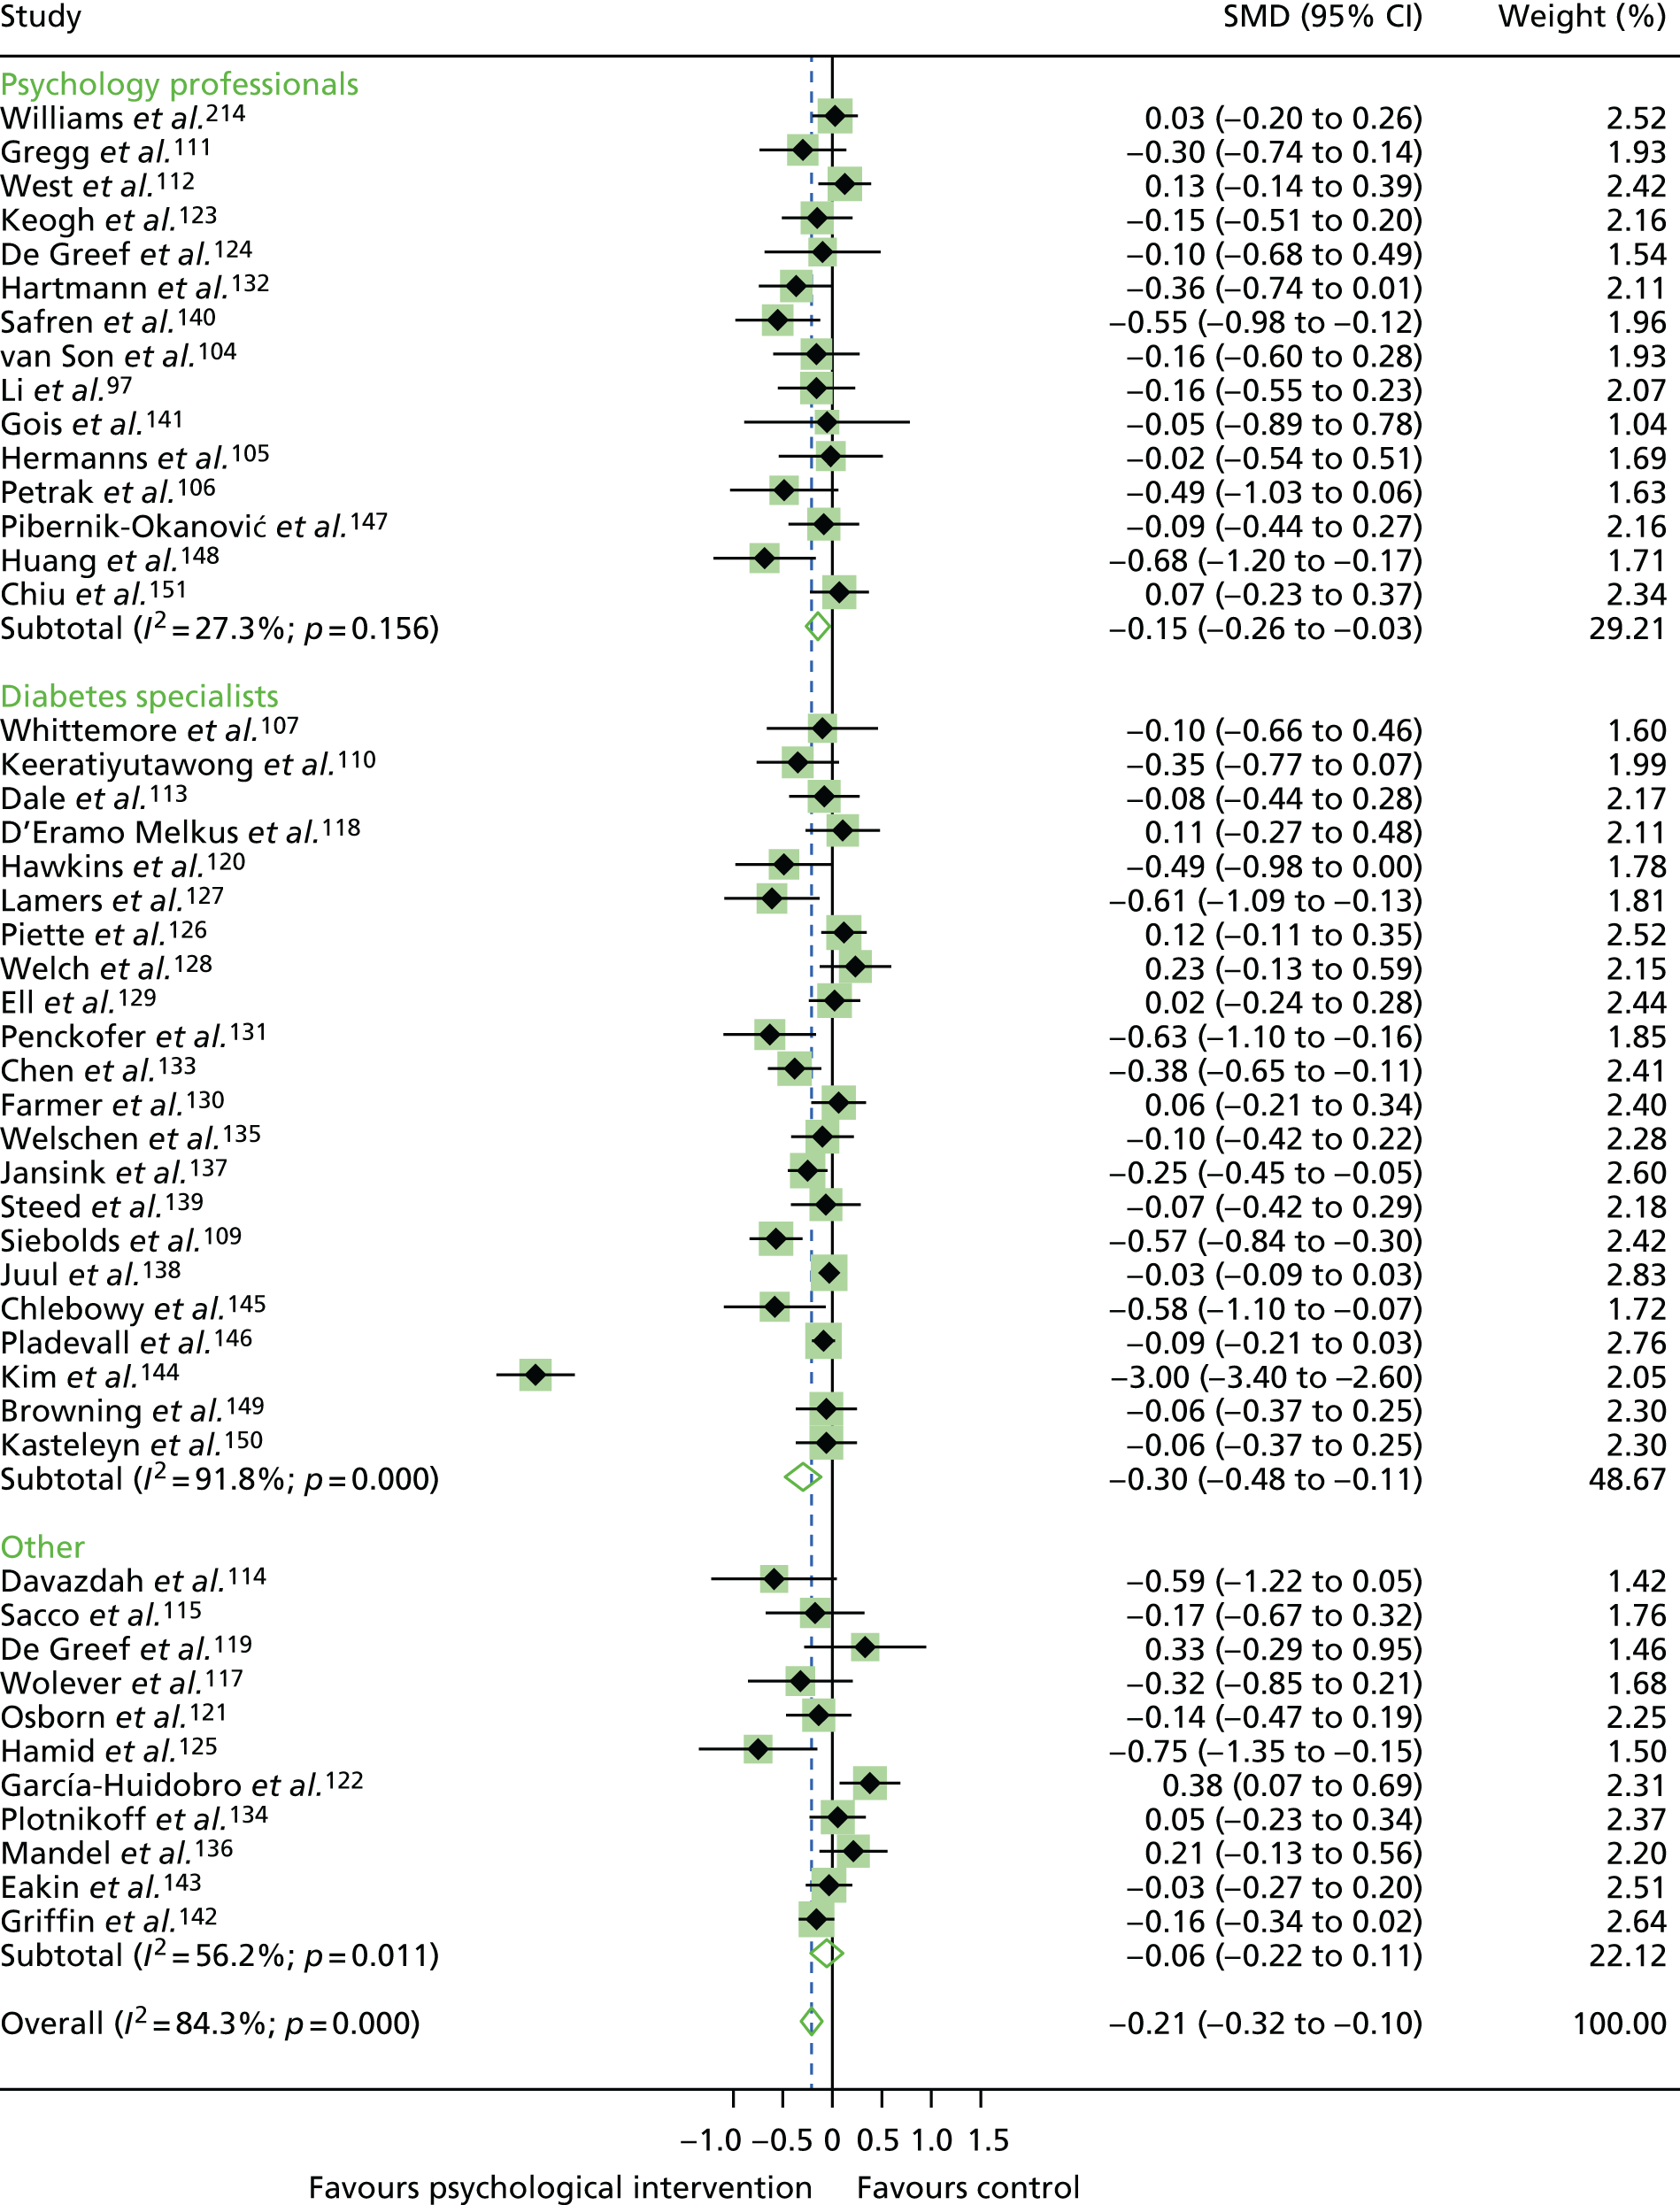
FIGURE 40.
Subgroup meta-analysis of the SMD in HbA1c levels by primary outcome in psychological intervention groups compared with control groups for studies of adults with T2DM. Weights are from random-effects analysis.
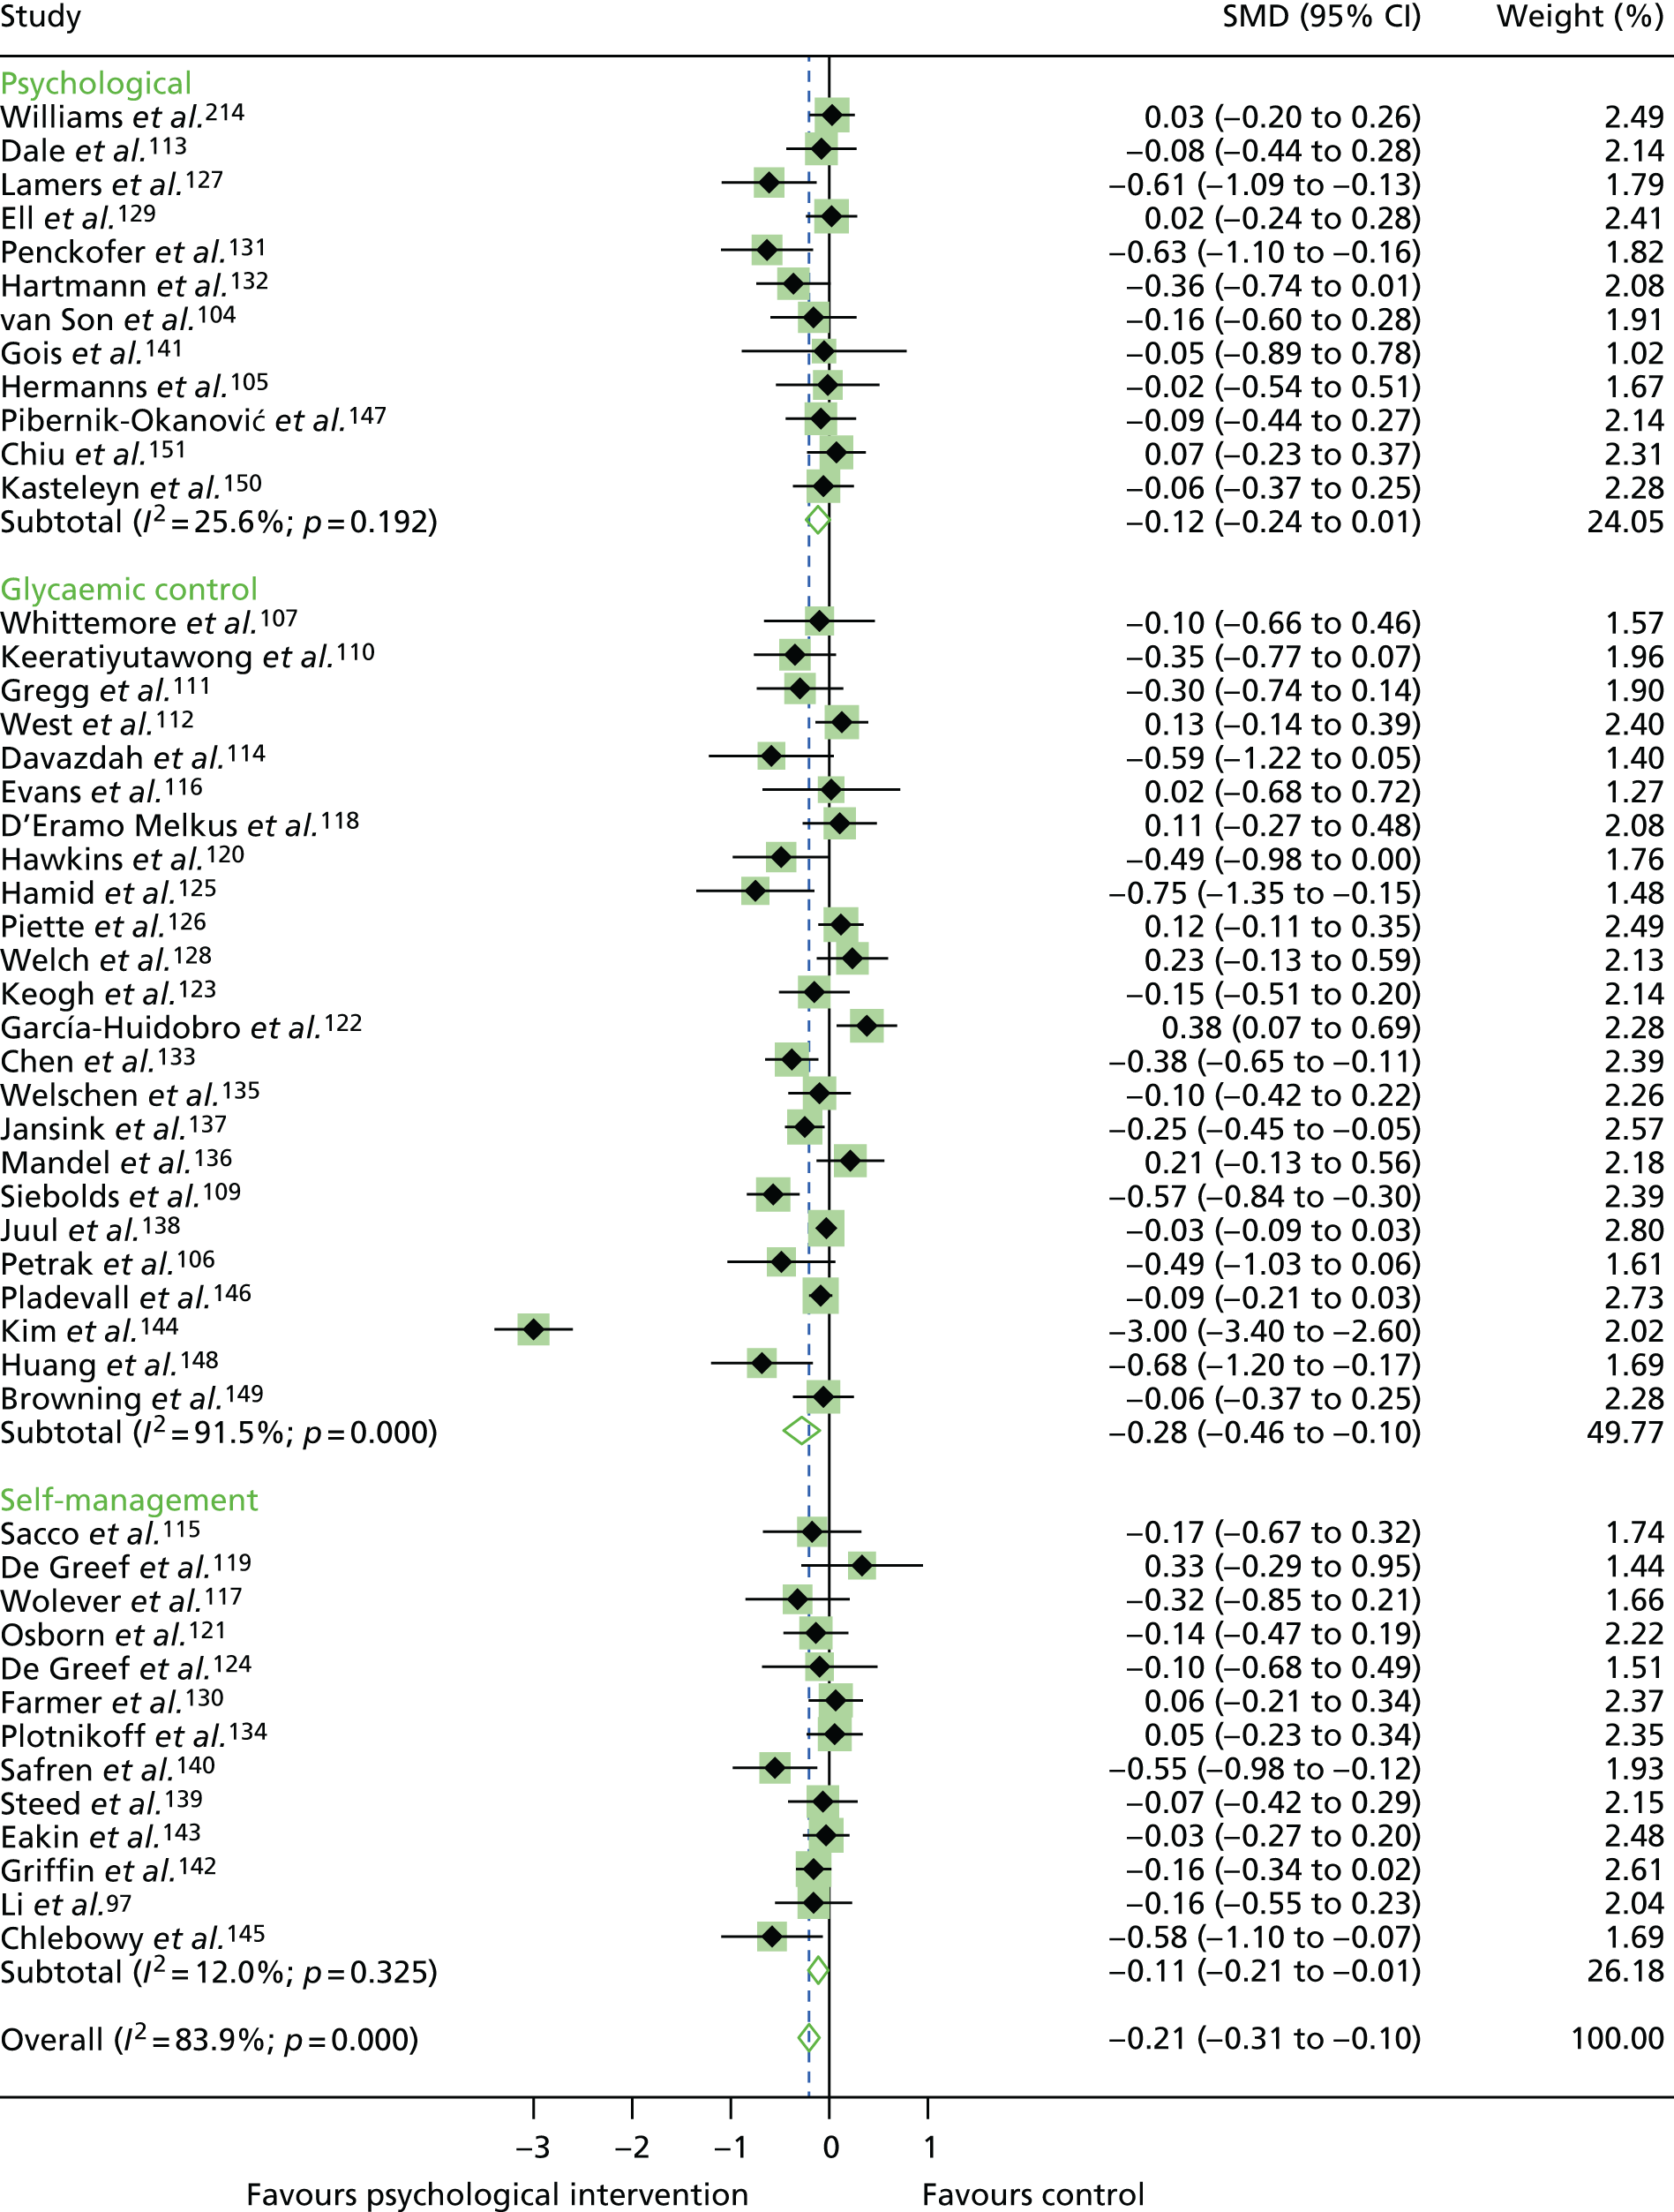
Appendix 12 Additional figures for secondary outcome aggregate meta-analysis for adults with type 2 diabetes mellitus
FIGURE 41.
Funnel plot of publication bias for depression in studies of T2DM.
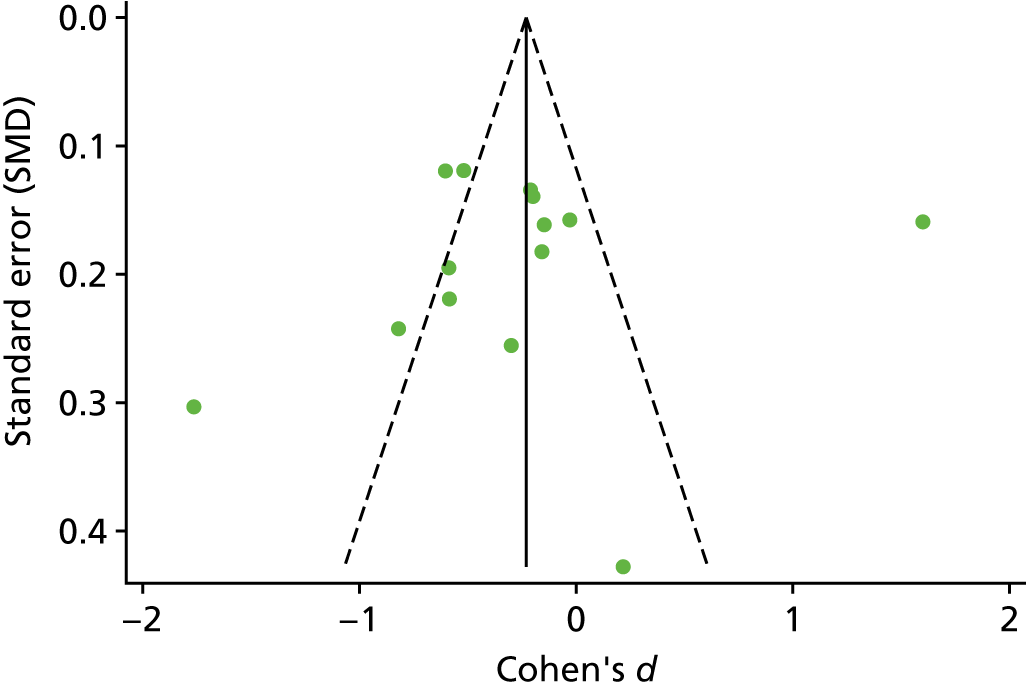
FIGURE 42.
Funnel plot of publication bias for QoL in studies of T2DM.
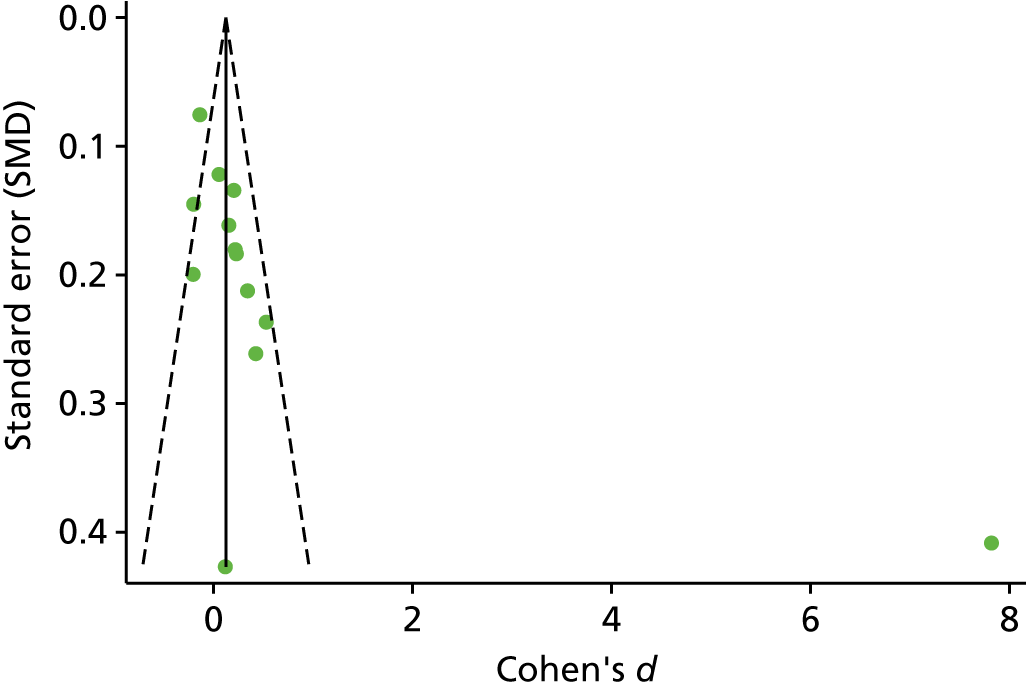
FIGURE 43.
Funnel plot of publication bias for BMI in studies of T2DM.
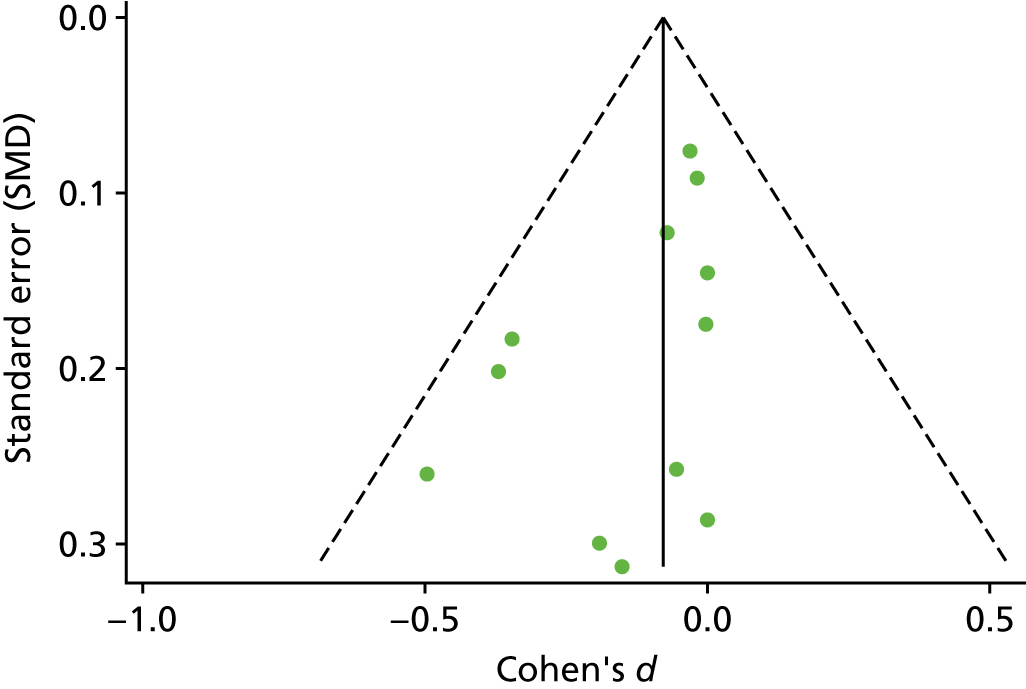
FIGURE 44.
Funnel plot of publication bias for SBP in studies of adults with T2DM.
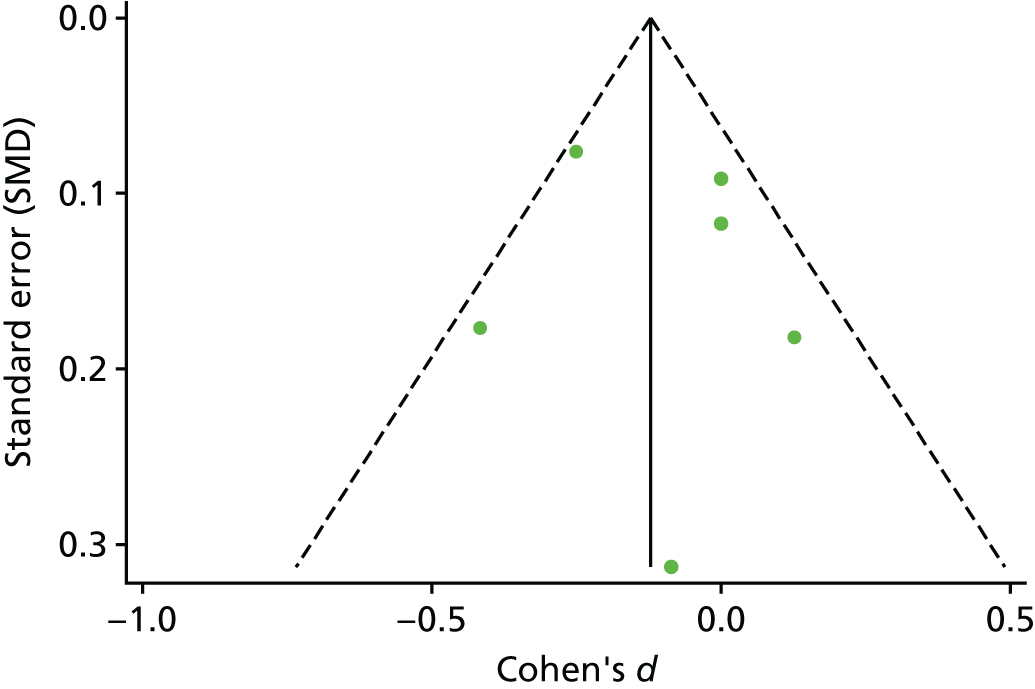
FIGURE 45.
Funnel plot of publication bias for DBP in studies of adults with T2DM.
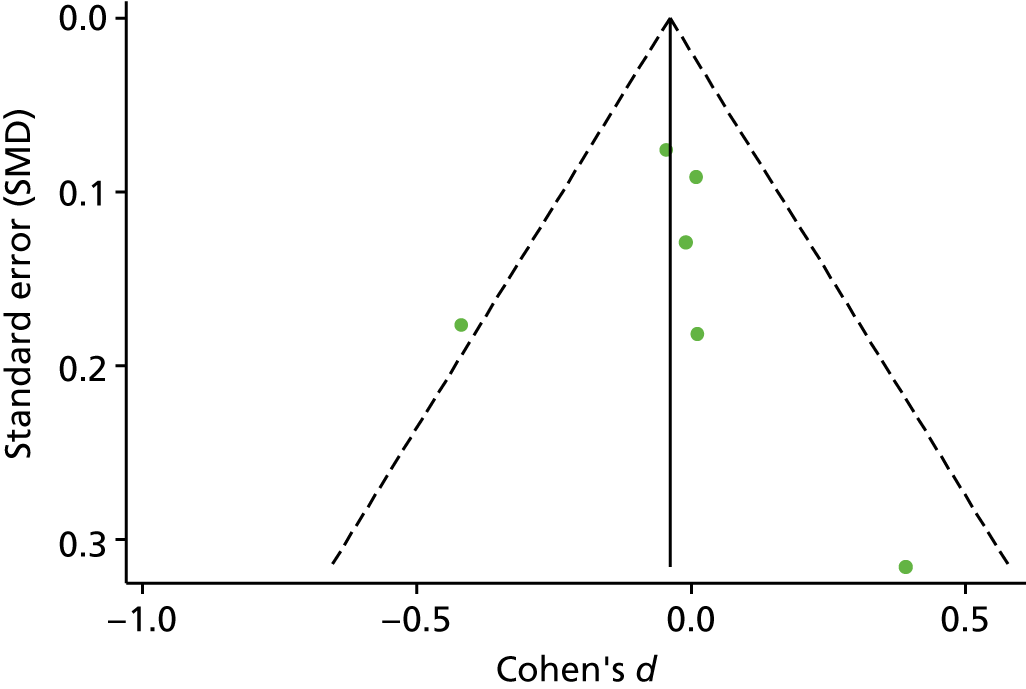
FIGURE 46.
Funnel plot of publication bias for general diet behaviour in studies of adults with T2DM.
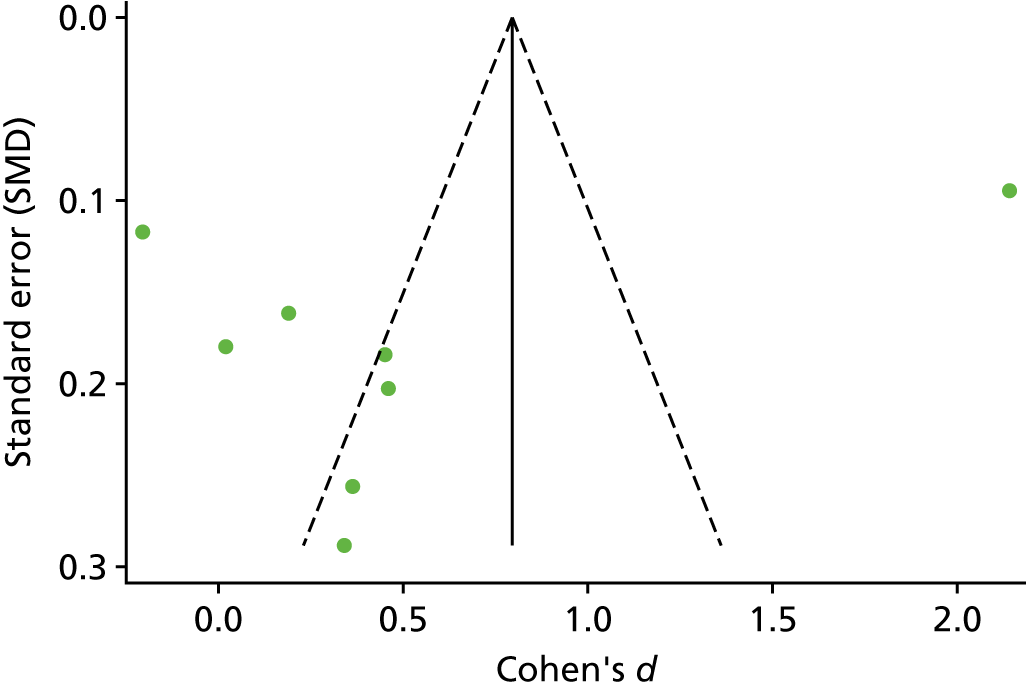
Appendix 13 Additional tables and figures for the network meta-analyses
| Treatment | Mean rank | SUCRA | Order of treatment |
|---|---|---|---|
| Usual care | 3.9 | 0 | 4 |
| CBT | 2.0 | 0.7 | 3 |
| Counselling | 3.1 | 0.3 | 2 |
| Attention control | 1.1 | 1 | 1 |
| Treatment | Mean rank | SUCRA | Order of treatment |
|---|---|---|---|
| Usual care | 3.4 | 0.4 | 4 |
| CBT | 1.7 | 0.8 | 1.5 |
| Counselling | 1.9 | 0.8 | 1.5 |
| Psychotherapy | 3.2 | 0.5 | 3 |
| Attention control | 4.7 | 0.1 | 5 |
| Treatment comparison | b | 95% CI | SE | z-value | p-value | |
|---|---|---|---|---|---|---|
| Usual care | CBT | –0.312 | –0.499 to –0.126 | 0.095 | –3.29 | 0.001 |
| Usual care | Counselling | –0.121 | –0.307 to 0.066 | 0.095 | –1.27 | 0.21 |
| Usual care | Attention control | –0.513 | –0.848 to –0.177 | 0.1701 | –3 | 0.003 |
| Counselling | CBT | 0.192 | –0.027 to 0.410 | 0.111 | 1.72 | 0.085 |
| CBT | Attention control | –0.2 | –0.479 to 0.078 | 0.142 | –1.41 | 0.078 |
| Counselling | Attention control | –0.392 | –0.746 to –0.038 | 0.181 | –2.17 | 0.03 |
| Treatment | Studies (n) | Studies (%) | Arm | Sample size (n) |
|---|---|---|---|---|
| CBT | 4 | 11.1 | T | 167 |
| Counselling | 8 | 22.2 | T | 714 |
| Family therapy | 6 | 16.7 | T | 443 |
| Usual care | 11 | 30.6 | C | 1002 |
| Attention control | 5 | 13.9 | C | 183 |
| Less intensive psychological intervention | 2 | 5.7 | C | 74 |
| Total | 36 | 100 | 2583 |
FIGURE 47.
Network plots for all studies. Network plots of direct comparisons for the NMA of studies of adolescents/children with T1DM. The width of the lines is proportional to the number of trials comparing each pair of treatments and the size of each node is proportional to the number of studies testing that specific treatment. It shows, roughly, how much information is available for each treatment and for each treatment comparison.
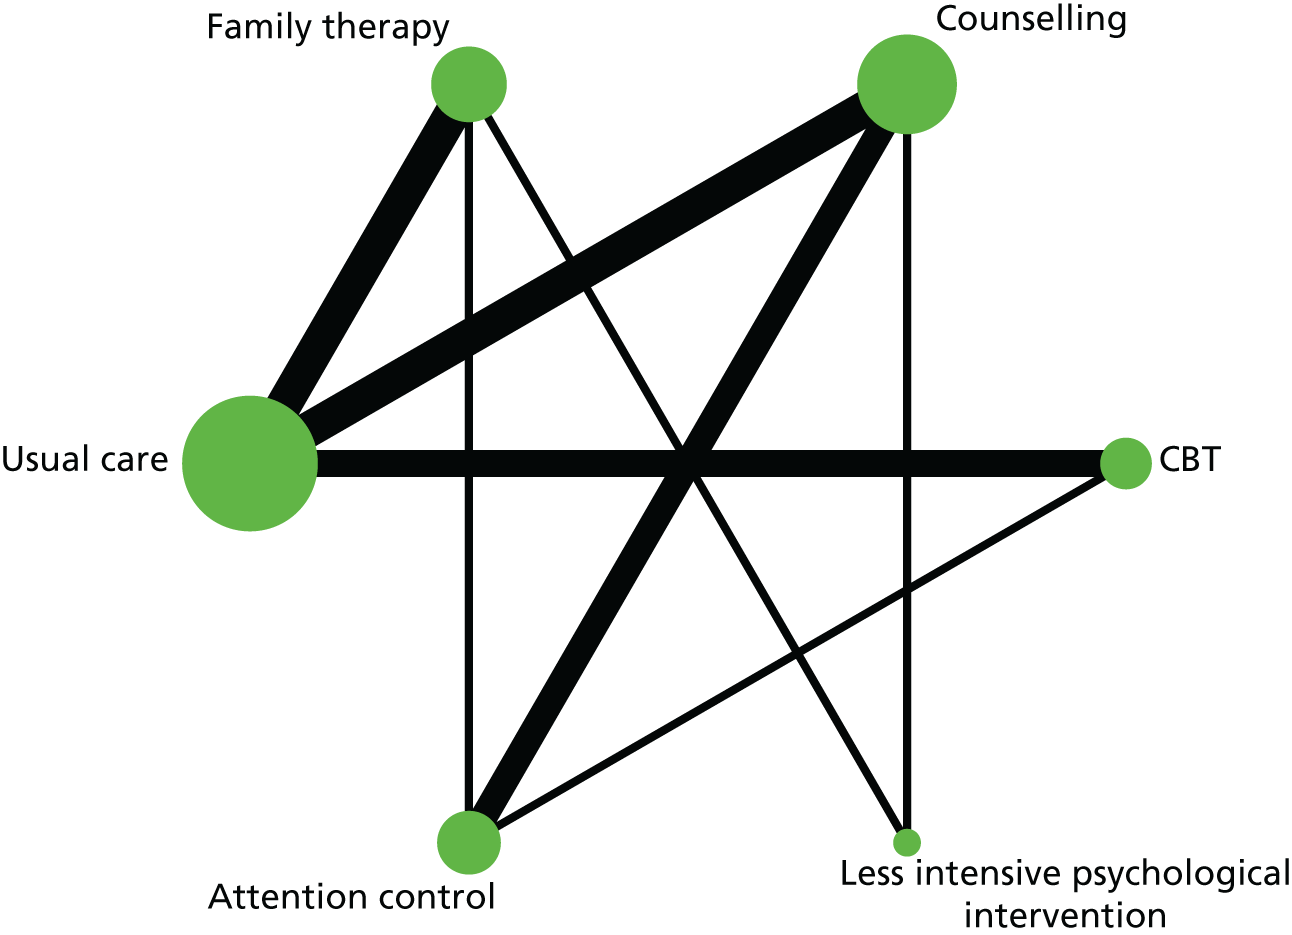
FIGURE 48.
Rankogram for all treatments. The plot shows the SUCRA curves for all treatments for adolescents/children with T1DM. (a) Usual care; (b) CBT; (c) counselling; (d) family therapy; (e) attention control; and (f) less intensive psychological intervention. For example, usual care has a very low probability of being among the best treatments but a very high probability of being one of the worst.
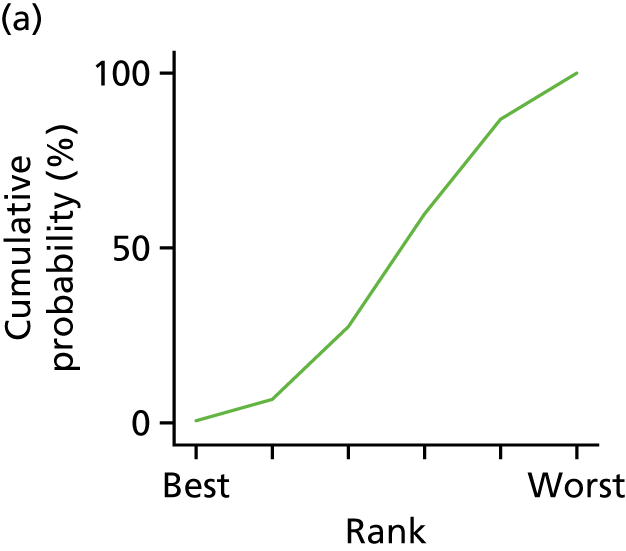
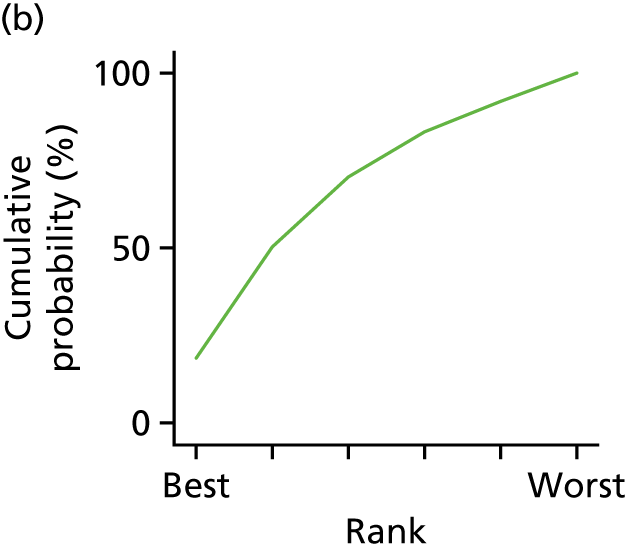
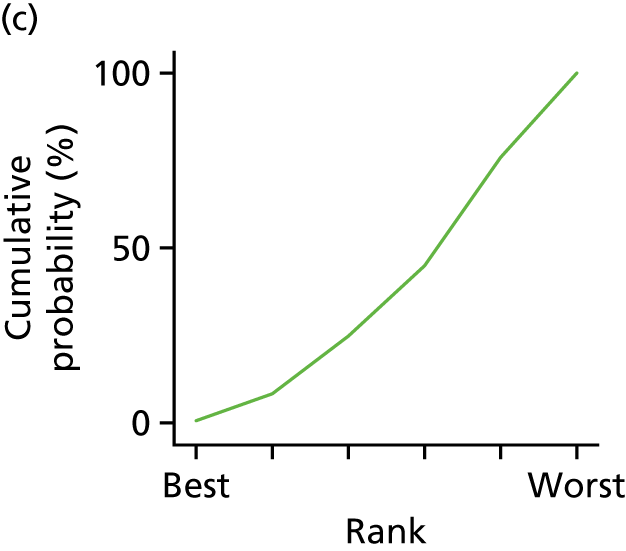
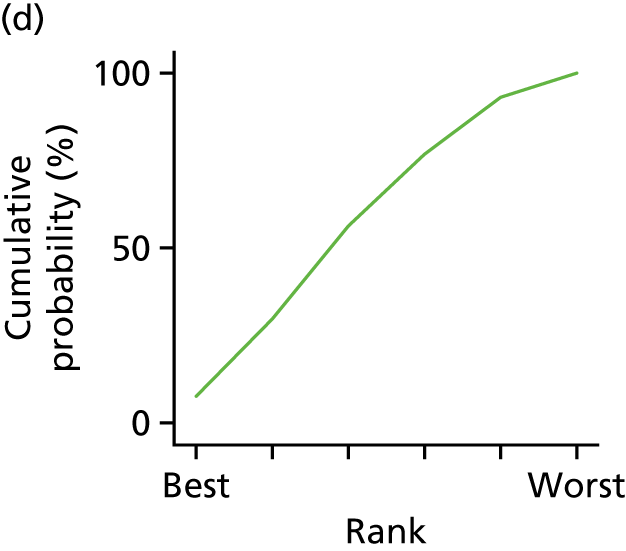
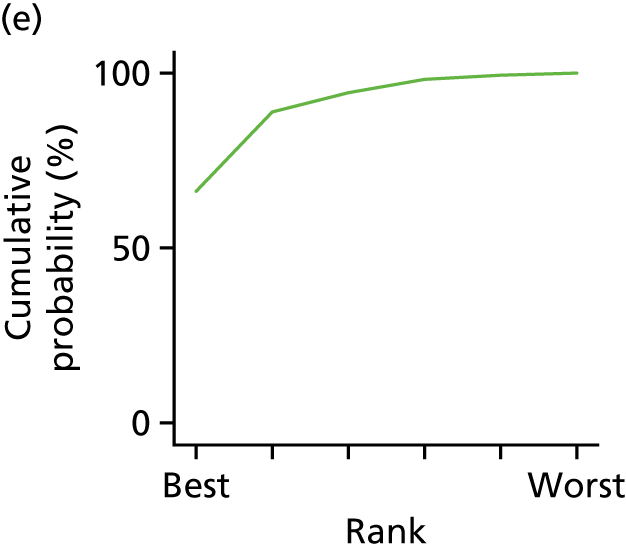
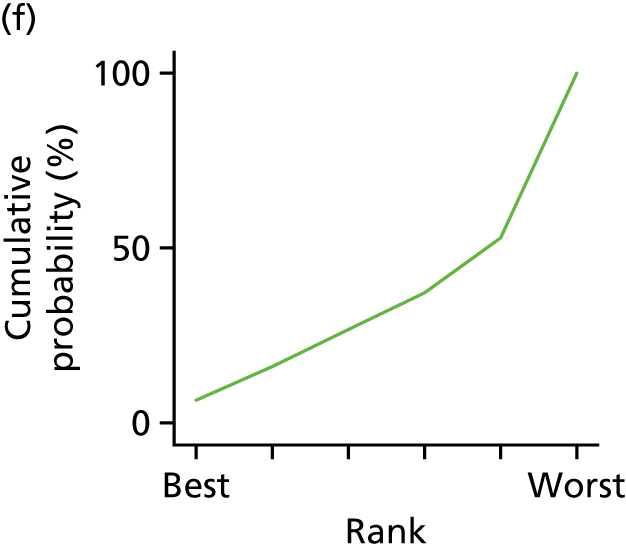
| Treatment | Mean rank | SUCRA | Order of treatment |
|---|---|---|---|
| Usual care | 4.2 | 0.4 | 4 |
| CBT | 2.9 | 0.6 | 2 |
| Counselling | 4.5 | 0.3 | 5.5 |
| Family therapy | 3.4 | 0.5 | 3 |
| Attention control | 1.5 | 0.9 | 1 |
| Less intensive psychological intervention | 4.6 | 0.3 | 5.5 |
| Treatment | Mean rank | SUCRA | Order of treatment |
|---|---|---|---|
| Usual care | 3.8 | 0.3 | 4 |
| CBT | 2.7 | 0.6 | 2.5 |
| Counselling | 4.2 | 0.2 | 5 |
| Family therapy | 2.9 | 0.5 | 2.5 |
| Attention control | 1.5 | 0.9 | 1 |
| Treatment comparison | b | 95% CI | SE | z-value | p-value | |
|---|---|---|---|---|---|---|
| CBT | Counselling | 0.417 | –0.628 to 1.462 | 0.533 | 0.78 | 0.43 |
| CBT | Family therapy | 0.145 | –0.946 to 1.236 | 0.557 | 0.26 | 0.8 |
| CBT | Usual care | 0.329 | –0.538 to 1.196 | 0.442 | 0.74 | 0.46 |
| CBT | Attention control | –0.439 | –1.525 to 0.648 | 0.554 | –0.79 | 0.43 |
| CBT | Less intensive psychological intervention | 0.549 | –0.967 to 2.066 | 0.774 | 0.71 | 0.48 |
| Counselling | Family therapy | –0.275 | –1.194 to 0.645 | 0.469 | –0.59 | 0.56 |
| Counselling | Usual care | –0.09 | –0.804 to 0.625 | 0.365 | –0.25 | 0.81 |
| Counselling | Attention control | –0.864 | –1.732 to 0.005 | 0.443 | –1.95 | 0.05 |
| Counselling | Less intensive psychological intervention | 0.131 | –1.137 to 1.399 | 0.647 | 0.2 | 0.84 |
| Family therapy | Usual care | 0.184 | –0.548 to 0.916 | 0.374 | 0.49 | 0.62 |
| Family therapy | Attention control | –0.584 | –1.598 to 0.431 | 0.518 | –1.13 | 0.26 |
| Family therapy | Less intensive psychological intervention | 0.404 | –0.848 to 1.657 | 0.639 | 0.63 | 0.53 |
| Usual care | Attention control | –0.768 | –1.704 to 0.169 | 0.478 | –1.61 | 0.11 |
| Usual care | Less intensive psychological intervention | 0.22 | –1.076 to 1.516 | 0.661 | 0.33 | 0.74 |
| Attention control | Less intensive psychological intervention | 0.993 | –0.449 to 2.435 | 0.736 | 1.35 | 0.18 |
| Treatment comparison | b | 95% CI | SE | z-value | p-value | |
|---|---|---|---|---|---|---|
| CBT | Counselling | 0.47 | –0.649 to 1.59 | 0.571 | 0.82 | 0.41 |
| CBT | Family therapy | 0.09 | –1.088 to 1.267 | 0.601 | 0.15 | 0.88 |
| CBT | Usual care | 0.329 | –0.588 to 1.246 | 0.468 | 0.7 | 0.48 |
| CBT | Attention control | –0.438 | –1.587 to 0.711 | 0.586 | –0.75 | 0.46 |
| Counselling | Family therapy | –0.383 | –1.439 to 0.672 | 0.538 | –0.71 | 0.48 |
| Counselling | Usual care | –0.143 | –0.924 to 0.639 | 0.399 | –0.36 | 0.72 |
| Counselling | Attention control | –0.915 | –1.835 to 0.005 | 0.469 | –1.95 | 0.05 |
| Family therapy | Usual care | 0.24 | –0.565 to 1.044 | 0.41 | 0.58 | 0.56 |
| Family therapy | Attention control | –0.528 | –1.634 to 0.579 | 0.565 | –0.93 | 0.35 |
| Usual care | Attention control | –0.767 | –1.757 to 0.222 | 0.505 | –1.52 | 0.13 |
FIGURE 49.
Network plots for all studies. Network plots of direct comparisons for the NMA for adults with T2DM. The width of the lines is proportional to the number of trials comparing each pair of treatments and the size of each node is proportional to the number of studies testing the specific treatment. It shows roughly how much information is available for each treatment and for each treatment comparison.
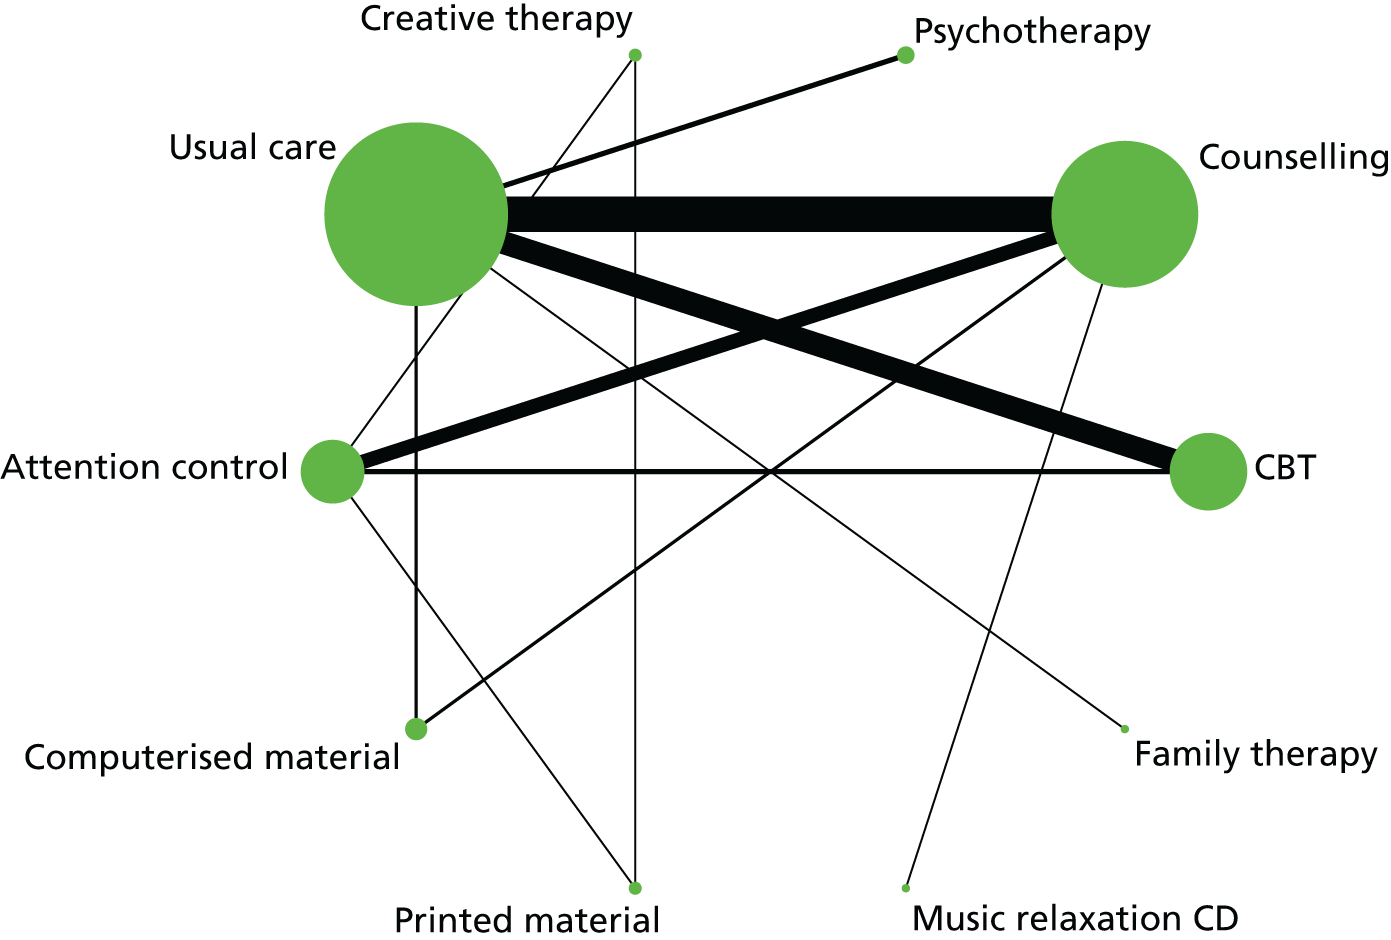
FIGURE 50.
Rankogram for all treatments in studies of adults with T2DM. (a) Usual care; (b) CBT; (c) counselling; (d) psychotherapy; (e) creative therapy; (f) attention control; (g) computerised material; (h) printed material; (i) music relaxation CD; and (j) family therapy. The plot shows the SUCRA curves for all treatments. For example, usual care has a very low probability of being among the best treatments, but a very high probability of being one of the worst treatments.
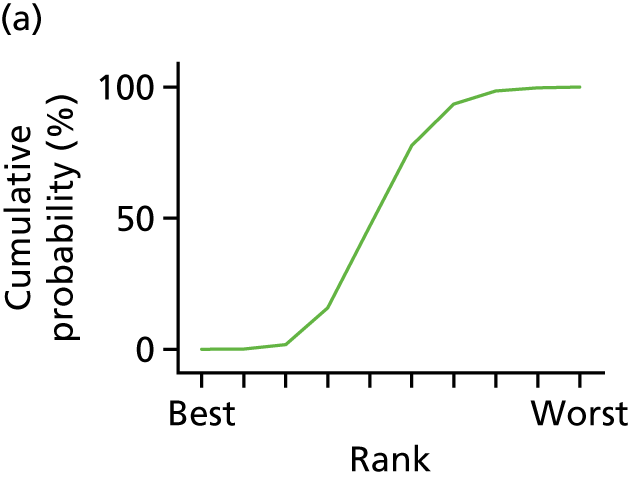
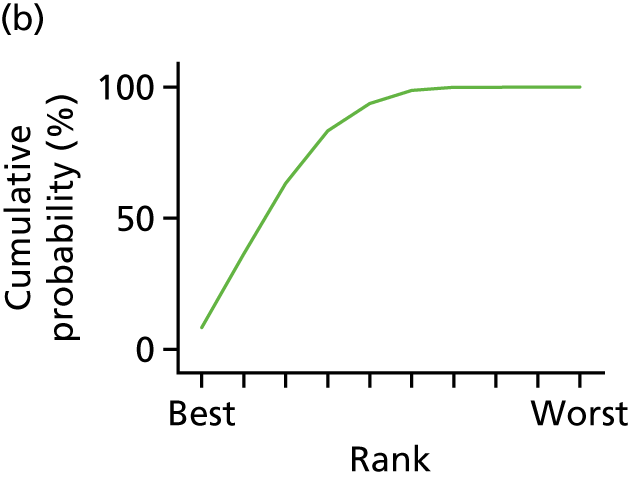
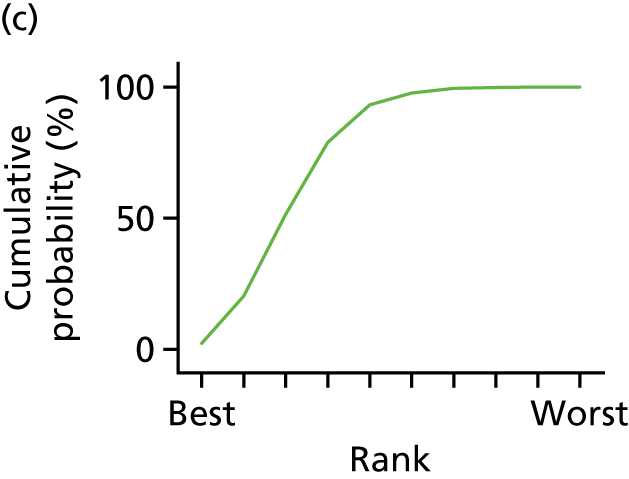
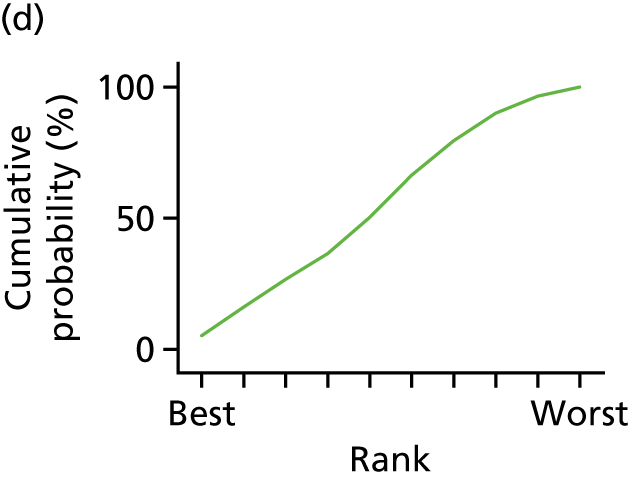
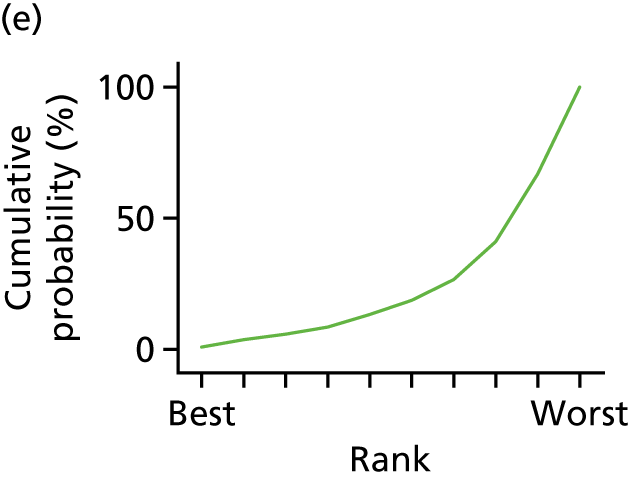
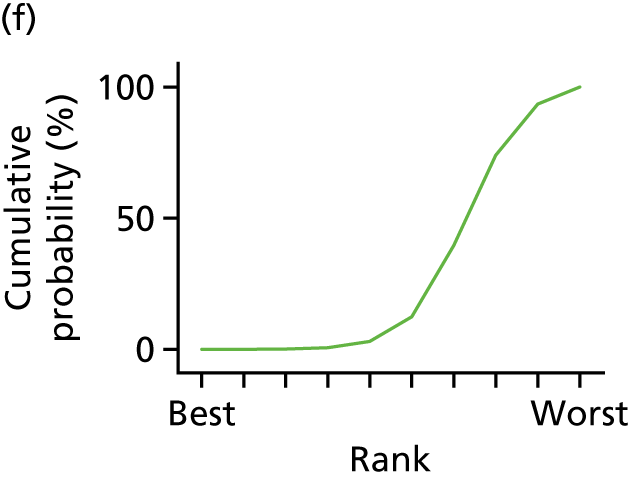
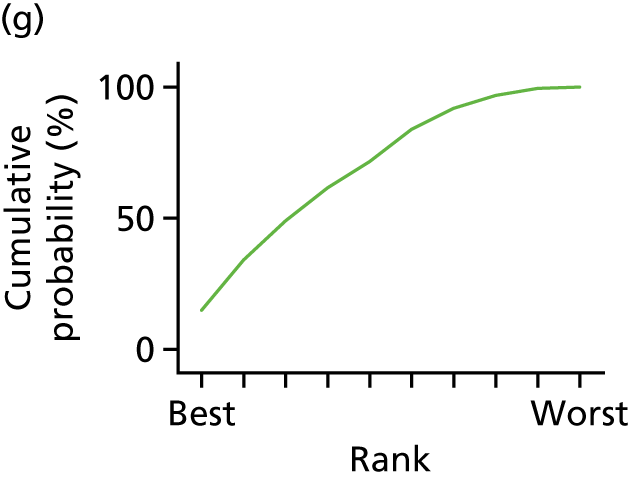
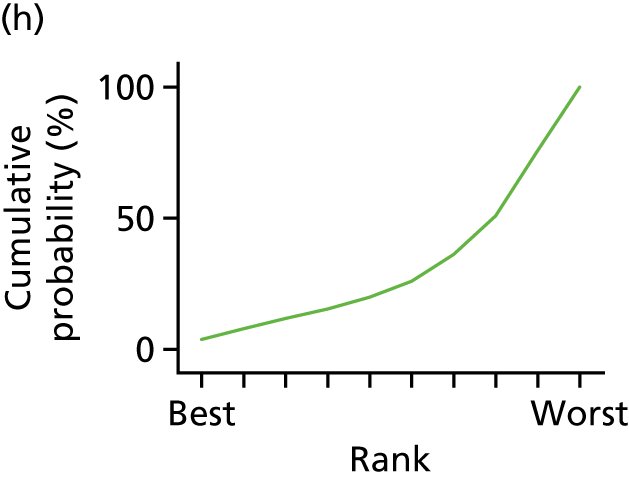
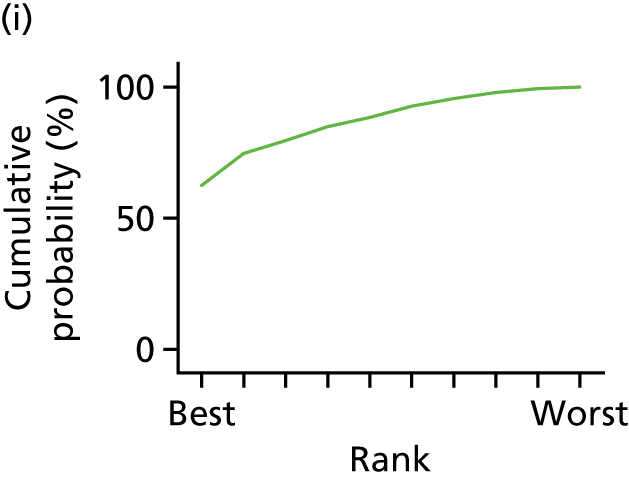
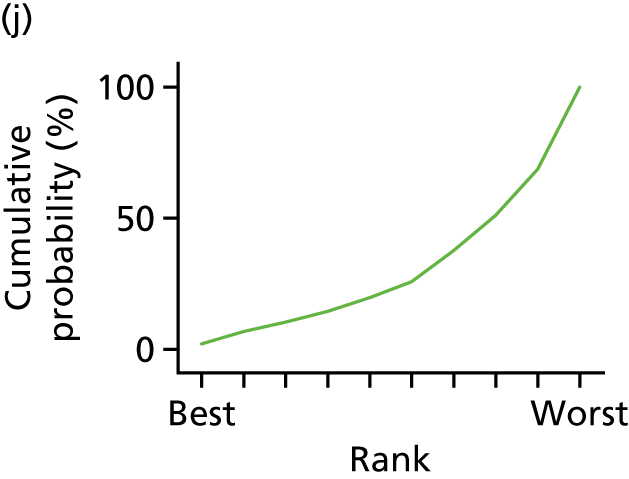
| Treatment | Mean rank | SUCRA | Order of treatment |
|---|---|---|---|
| Usual care | 5.7 | 0.5 | 5.5 |
| CBT | 3.2 | 0.8 | 2 |
| Counselling | 3.6 | 0.7 | 3.5 |
| Psychotherapy | 5.3 | 0.5 | 5.5 |
| Creative therapy | 8.1 | 0.2 | 9.5 |
| Attention control | 7.8 | 0.2 | 9.5 |
| Computerised material | 4.0 | 0.7 | 3.5 |
| Printed material | 7.5 | 0.3 | 7.5 |
| Music relaxation CD | 2.2 | 0.9 | 1 |
| Family therapy | 7.6 | 0.3 | 7.5 |
| Number | Treatment comparison | b | 95% CI | SE | z-value | p-value | |
|---|---|---|---|---|---|---|---|
| 1 | CBT | Counselling | 0.046 | –0.249 to 0.342 | 0.151 | 0.31 | 0.76 |
| 2 | CBT | Psychotherapy | 0.222 | –0.376 to 0.819 | 0.305 | 0.73 | 0.47 |
| 3 | CBT | Creative therapy | 0.703 | –0.263 to 1.67 | 0.493 | 1.43 | 0.15 |
| 4 | CBT | Usual care | 0.213 | –0.035 to 0.46 | 0.126 | 1.68 | 0.09 |
| 5 | CBT | Attention control | 0.483 | 0.13 to 0.835 | 0.18 | 2.68 | 0.01 |
| 6 | CBT | Computerised material | 0.057 | –0.527 to 0.641 | 0.298 | 0.19 | 0.85 |
| 7 | CBT | Printed material | 0.586 | –0.38 to 1.551 | 0.493 | 1.19 | 0.23 |
| 8 | CBT | Music relaxation CD | –0.349 | –1.305 to 0.608 | 0.488 | –0.71 | 0.48 |
| 9 | CBT | Family therapy | 0.591 | –0.329 to 1.511 | 0.469 | 1.26 | 0.21 |
| 10 | Counselling | Psychotherapy | 0.175 | –0.402 to 0.753 | 0.295 | 0.6 | 0.55 |
| 11 | Counselling | Creative therapy | 0.657 | –0.287 to 1.602 | 0.482 | 1.36 | 0.17 |
| 12 | Counselling | Usual care | 0.166 | –0.027 to 0.36 | 0.099 | 1.68 | 0.09 |
| 13 | Counselling | Attention control | 0.436 | 0.15 to 0.723 | 0.146 | 2.98 | 0 |
| 14 | Counselling | Computerised material | 0.01 | –0.524 to 0.545 | 0.273 | 0.04 | 0.97 |
| 15 | Counselling | Printed material | 0.54 | –0.404 to 1.483 | 0.481 | 1.12 | 0.26 |
| 16 | Counselling | Music relaxation CD | –0.395 | –1.305 to 0.515 | 0.464 | –0.85 | 0.4 |
| 17 | Counselling | Family therapy | 0.545 | –0.362 to 1.452 | 0.463 | 1.18 | 0.24 |
| 18 | Psychotherapy | Creative therapy | 0.482 | –0.616 to 1.58 | 0.56 | 0.86 | 0.39 |
| 19 | Psychotherapy | Usual care | –0.009 | –0.551 to 0.534 | 0.277 | –0.03 | 0.98 |
| 20 | Psychotherapy | Attention control | 0.261 | –0.369 to 0.892 | 0.322 | 0.81 | 0.42 |
| 21 | Psychotherapy | Computerised material | –0.165 | –0.926 to 0.597 | 0.389 | –0.42 | 0.67 |
| 22 | Psychotherapy | Printed material | 0.365 | –0.733 to 1.462 | 0.56 | 0.65 | 0.52 |
| 23 | Psychotherapy | Music relaxation CD | –0.57 | –1.647 to 0.506 | 0.549 | –1.04 | 0.3 |
| 24 | Psychotherapy | Family therapy | 0.37 | –0.669 to 1.409 | 0.53 | 0.7 | 0.49 |
| 25 | Creative therapy | Usual care | –0.485 | –1.435 to 0.465 | 0.485 | –1 | 0.32 |
| 26 | Creative therapy | Attention control | –0.215 | –1.11 to 0.679 | 0.456 | –0.47 | 0.64 |
| 27 | Creative therapy | Computerised material | –0.641 | –1.717 to 0.436 | 0.549 | –1.17 | 0.24 |
| 28 | Creative therapy | Printed material | –0.115 | –1.011 to 0.781 | 0.457 | –0.25 | 0.8 |
| 29 | Creative therapy | Music relaxation CD | –1.046 | –2.353 to 0.261 | 0.667 | –1.57 | 0.12 |
| 30 | Creative therapy | Family therapy | –0.106 | –1.405 to 1.193 | 0.663 | –0.16 | 0.87 |
| 31 | Usual care | Attention control | 0.27 | –0.051 to 0.591 | 0.164 | 1.65 | 0.1 |
| 32 | Usual care | Computerised material | –0.156 | –0.69 to 0.379 | 0.273 | –0.57 | 0.57 |
| 33 | Usual care | Printed material | 0.373 | –0.581 to 1.328 | 0.487 | 0.77 | 0.44 |
| 34 | Usual care | Music relaxation CD | –0.562 | –1.492 to 0.369 | 0.475 | –1.18 | 0.24 |
| 35 | Usual care | Family therapy | 0.379 | –0.507 to 1.265 | 0.452 | 0.84 | 0.4 |
| 36 | Attention control | Computerised material | –0.426 | –1.025 to 0.174 | 0.306 | –1.39 | 0.16 |
| 37 | Attention control | Printed material | 0.103 | –0.796 to 1.002 | 0.459 | 0.23 | 0.82 |
| 38 | Attention control | Music relaxation CD | –0.831 | –1.785 to 0.123 | 0.487 | –1.71 | 0.09 |
| 39 | Attention control | Family therapy | 0.109 | –0.834 to 1.051 | 0.481 | 0.23 | 0.82 |
| 40 | Computerised material | Printed material | 0.529 | –0.551 to 1.608 | 0.551 | 0.96 | 0.34 |
| 41 | Computerised material | Music relaxation CD | –0.406 | –1.46 to 0.648 | 0.538 | –0.75 | 0.45 |
| 42 | Computerised material | Family therapy | 0.534 | –0.5 to 1.568 | 0.528 | 1.01 | 0.31 |
| 43 | Printed material | Music relaxation CD | –0.93 | –2.237 to 0.376 | 0.667 | –1.4 | 0.16 |
| 44 | Printed material | Family therapy | 0.01 | –1.288 to 1.308 | 0.662 | 0.02 | 0.99 |
| 45 | Music relaxation CD | Family therapy | 0.935 | –0.346 to 2.215 | 0.653 | 1.43 | 0.15 |
| Number | Treatment comparison | b | 95% CI | SE | z-value | p-value | |
|---|---|---|---|---|---|---|---|
| 1 | CBT | Counselling | 0.047 | –0.253 to 0.347 | 0.153 | 0.31 | 0.76 |
| 2 | CBT | Psychotherapy | 0.222 | –0.384 to 0.828 | 0.309 | 0.72 | 0.47 |
| 3 | CBT | Usual care | 0.213 | –0.038 to 0.464 | 0.128 | 1.66 | 0.1 |
| 4 | CBT | Attention control | 0.483 | 0.125 to 0.841 | 0.183 | 2.65 | 0.01 |
| 5 | Counselling | Psychotherapy | 0.175 | –0.411 to 0.76 | 0.299 | 0.58 | 0.56 |
| 6 | Counselling | Usual care | 0.166 | –0.031 to 0.362 | 0.1 | 1.66 | 0.1 |
| 7 | Counselling | Attention control | 0.436 | 0.146 to 0.727 | 0.148 | 2.94 | 0 |
| 8 | Psychotherapy | Usual care | –0.009 | –0.559 to 0.542 | 0.281 | –0.03 | 0.98 |
| 9 | Psychotherapy | Attention control | 0.262 | –0.378 to 0.901 | 0.326 | 0.8 | 0.42 |
| 10 | Usual care | Attention control | 0.27 | –0.056 to 0.596 | 0.166 | 1.63 | 0.1 |
Appendix 14 Additional tables and figures for the individual patient data meta-analysis
| Reference | ID |
|---|---|
| Studies of only adults with T1DM | |
| Ismail K, Thomas SM, Maissi E, Chalder T, Schmidt U, Bartlett J, et al. Motivational enhancement therapy with and without cognitive behavior therapy to treat type 1 diabetes: a randomized trial. Ann Intern Med 2008;149:708–19163 | ITM08 |
| Snoek FJ, van der Ven NC, Twisk JW, Hogenelst MH, Tromp-Wever AM, van der Ploeg HM, Heine RJ. Cognitive behavioural therapy (CBT) compared with blood glucose awareness training (BGAT) in poorly controlled type 1 diabetic patients: long-term effects on HbA moderated by depression. A randomized controlled trial. Diabet Med 2008;25:1337–42164 | SVT08 |
| Studies of adolescents/children with T1DM | |
| Channon SJ, Huws-Thomas MV, Rollnick S, Hood K, Cannings-John RL, Rogers C, Gregory JW. A multicenter randomized controlled trial of motivational interviewing in teenagers with diabetes. Diabetes Care 2007;30:1390–5168 | CHR07 |
| Ellis DA, Templin T, Naar-King S, Frey MA, Cunningham PB, Podolski CL, Cakan N. Multisystemic therapy for adolescents with poorly controlled type I diabetes: stability of treatment effects in a randomized controlled trial. J Consult Clin Psychol 2007;75:168–74169 | ETN07 |
| Grey M, Whittemore R, Jaser S, Ambrosino J, Lindemann E, Liberti L, et al. Effects of coping skills training in school-age children with type 1 diabetes. Res Nurs Health 2009;32:405–18171 | GWJ09 |
| Nansel TR, Iannotti RJ, Liu A. Clinic-integrated behavioral intervention for families of youth with type 1 diabetes: randomized clinical trial. Pediatrics 2012;129:e866–73176 | NIL12 aka FMOD |
| Jaser SS, Patel N, Rothman RL, Choi L, Whittemore R. Check it! A randomized pilot of a positive psychology intervention to improve adherence in adolescents with type 1 diabetes. Diabetes Educ 2014;40:659–67179 | JPR14 |
| Nansel TR, Laffel LM, Haynie DL, Mehta SN, Lipsky LM, Volkening LK, et al. Improving dietary quality in youth with type 1 diabetes: randomized clinical trial of a family-based behavioral intervention. Int J Behav Nutr Phys Act 2015;12:58183 | NLH15 aka CHEF |
| Serlachius AS, Scratch SE, Northam EA, Frydenberg E, Lee KJ, Cameron FJ. A randomized controlled trial of cognitive behaviour therapy to improve glycaemic control and psychosocial wellbeing in adolescents with type 1 diabetes. J Health Psychol 2016;21:1157–69184 | SSN16 |
| Nansel TR, Iannotti RJ, Simons-Morton BG, Cox C, Plotnick LP, Clark LM, Zeitzoff L. Diabetes personal trainer outcomes: short-term and 1-year outcomes of a diabetes personal trainer intervention among youth with type 1 diabetes. Diabetes Care 2007;30:2471–7170 | NIS07 aka DPT study |
| Christie D, Thompson R, Sawtell M, Allen E, Cairns J, Smith F, et al. Structured, intensive education maximising engagement, motivation and long-term change for children and young people with diabetes: a cluster randomised controlled trial with integral process and economic evaluation – the CASCADE study. Health Technol Assess 2014;18(20)181 | CTS14 |
| Studies of adults with T2DM | |
| Chiu CJ, Hu YH, Wray LA, Beverley EA, Yang YC, Wu JS, Lu FH. Dissemination of evidence-base minimal psychological intervention for diabetes management in Taiwan adults with type 2 diabetes. Int J Clin Exp Med 2016;9:14489–98151 | CHW16 |
| D’Eramo Melkus G, Chyun D, Vorderstrasse A, Newlin K, Jefferson V, Langerman S. The effect of a diabetes education, coping skills training, and care intervention on physiological and psychosocial outcomes in black women with type 2 diabetes. Biol Res Nurs 2010;12:7–19118 | ECV10 |
| Keogh KM, Smith SM, White P, McGilloway S, Kelly A, Gibney J, O’Dowd T. Psychological family intervention for poorly controlled type 2 diabetes. Am J Manag Care 2011;17:105–13123 | KSW11 |
| Hartmann M, Kopf S, Kircher C, Faude-Lang V, Djuric Z, Augstein F, et al. Sustained effects of a mindfulness-based stress-reduction intervention in type 2 diabetic patients: design and first results of a randomized controlled trial (the Heidelberger Diabetes and Stress-study). Diabetes Care 2012;35:945–7132 | HKK12 |
| Safren SA, Gonzalez JS, Wexler DJ, Psaros C, Delahanty LM, Blashill AJ, et al. A randomized controlled trial of cognitive behavioral therapy for adherence and depression (CBT-AD) in patients with uncontrolled type 2 diabetes. Diabetes Care 2014;37:625–33140 | SGW14 |
| Welschen LM, van Oppen P, Bot SD, Kostense PJ, Dekker JM, Nijpels G. Effects of a cognitive behavioural treatment in patients with type 2 diabetes when added to managed care; a randomised controlled trial. J Behav Med 2013;36:556–66135 | WOB13 |
| Eakin EG, Winkler EA, Dunstan DW, Healy GN, Owen N, Marshall AM, et al. Living well with diabetes: 24-month outcomes from a randomized trial of telephone-delivered weight loss and physical activity intervention to improve glycemic control. Diabetes Care 2014;37:2177–85143 | EWD14 |
| Chlebowy DO, El-Mallakh P, Myers J, Kubiak N, Cloud R, Wall MP. Motivational interviewing to improve diabetes outcomes in African Americans adults with diabetes. West J Nurs Res 2015;37:566–80145 | CEM15 |
| Kasteleyn MJ, Vos RC, Rijken M, Schellevis FG, Rutten GE. Effectiveness of tailored support for people with type 2 diabetes after a first acute coronary event: a multicentre randomized controlled trial (the Diacourse-ACE study). Diabet Med 2016;33:125–33150 | KVR16 |
| Griffin SJ, Simmons RK, Prevost AT, Williams KM, Hardeman W, Sutton S, et al. Multiple behaviour change intervention and outcomes in recently diagnosed type 2 diabetes: the ADDITION-Plus randomised controlled trial. Diabetologia 2014;57:1308–19142 | GSP14 |
| Mandel SE, Davis BA, Secic M. Effects of music therapy and music-assisted relaxation and imagery on health-related outcomes in diabetes education: a feasibility study. Diabetes Educ 2013;39:568–81136 | MDS13 |
| Jansink R, Braspenning J, Keizer E, van der Weijden T, Elwyn G, Grol R. No identifiable HbA1c or lifestyle change after a comprehensive diabetes programme including motivational interviewing: a cluster randomised trial. Scand J Prim Health Care 2013;31:119–27137 | JBK13 |
| Dale J, Caramlau I, Sturt J, Friede T, Walker R. Telephone peer-delivered intervention for diabetes motivation and support: the telecare exploratory RCT. Patient Educ Couns 2009;75:91–8113 | DCS09 |
| Ell K, Katon W, Xie B, Lee PJ, Kapetanovic S, Guterman J, Chou CP. One-year postcollaborative depression care trial outcomes among predominantly Hispanic diabetes safety net patients. Gen Hosp Psychiatry 2011;33:436–42129 | EKX11 |
| Pibernik-Okanović M, Hermanns N, Ajduković D, Kos J, Prašek M, Šekerija M, Lovrenčić MV. Does treatment of subsyndromal depression improve depression-related and diabetes-related outcomes? A randomised controlled comparison of psychoeducation, physical exercise and enhanced treatment as usual. Trials 2015;16:305147 | PHA15 |
| Studies of adults with a T1DM and T2DM population | |
| Hermanns N, Schmitt A, Gahr A, Herder C, Nowotny B, Roden M, et al. The effect of a Diabetes-Specific Cognitive Behavioral Treatment Program (DIAMOS) for patients with diabetes and subclinical depression: results of a randomized controlled trial. Diabetes Care 2015;38:551–60105 | HSG15 |
| van Son J, Nyklíček I, Pop VJ, Blonk MC, Erdtsieck RJ, Pouwer F. Mindfulness-based cognitive therapy for people with diabetes and emotional problems: long-term follow-up findings from the DiaMind randomized controlled trial. J Psychosom Res 2014;77:81–4104 | VNP14 |
| Petrak F, Herpertz S, Albus C, Hermanns N, Hiemke C, Hiller W, et al. Cognitive behavioral therapy versus sertraline in patients with depression and poorly controlled diabetes: the Diabetes and Depression (DAD) study: a randomized controlled multicenter trial. Diabetes Care 2015;38:767–75106 | PET15 |
| Variable | Included in IPD | All studies (n = 74) | Difference between studies included in IPD and all studies (p-value) |
|---|---|---|---|
| Population, mean (SD); range | 160.03 (111.85); 40–478 | 202.62 (469.74), 22–3946 | 0.63 |
| Location, n (%) | |||
| Asia | 1 (3.45) | 9 (12.16) | 0.62 |
| Australia | 2 (6.90) | 3 (4.05) | |
| Europe (non-UK) | 10 (34.48) | 24 (32.43) | |
| North America | 5 (17.24) | 19 (25.68) | |
| South America | 0 (0) | 1 (1.35) | |
| UK | 5 (17.24) | 8 (10.81) | |
| USA | 6 (20.69) | 10 (13.51) | |
| Year, range | 2007–2016 | 2004–2016 | 0.45 |
| Type of psychological intervention, n (%) | |||
| CBT | 11 (37.93) | 26 (35.14) | 0.95 |
| Counselling | 13 (44.83) | 37 (50) | |
| Creative therapy | 1 (3.45) | 1 (1.35) | |
| Family therapy | 3 (10.34) | 7 (9.46) | |
| Psychotherapy | 1 (3.45) | 3 (4.05) | |
| RoB assessment, n (%) | |||
| Low | 18 (62.07) | 37 (50) | 0.48 |
| Unclear | 11 (37.03) | 36 (48.65) | |
| High | 0 (0) | 1 (1.35) | |
FIGURE 51.
The IPD meta-analysis comparing treatment arms with control arms in terms of HbA1c response at follow-up for adults with T1DM. Effect sizes are unstandardized differences in mmol HbA1c at follow-up between treatment and control arms after controlling for baseline HbA1c values (six study sites).
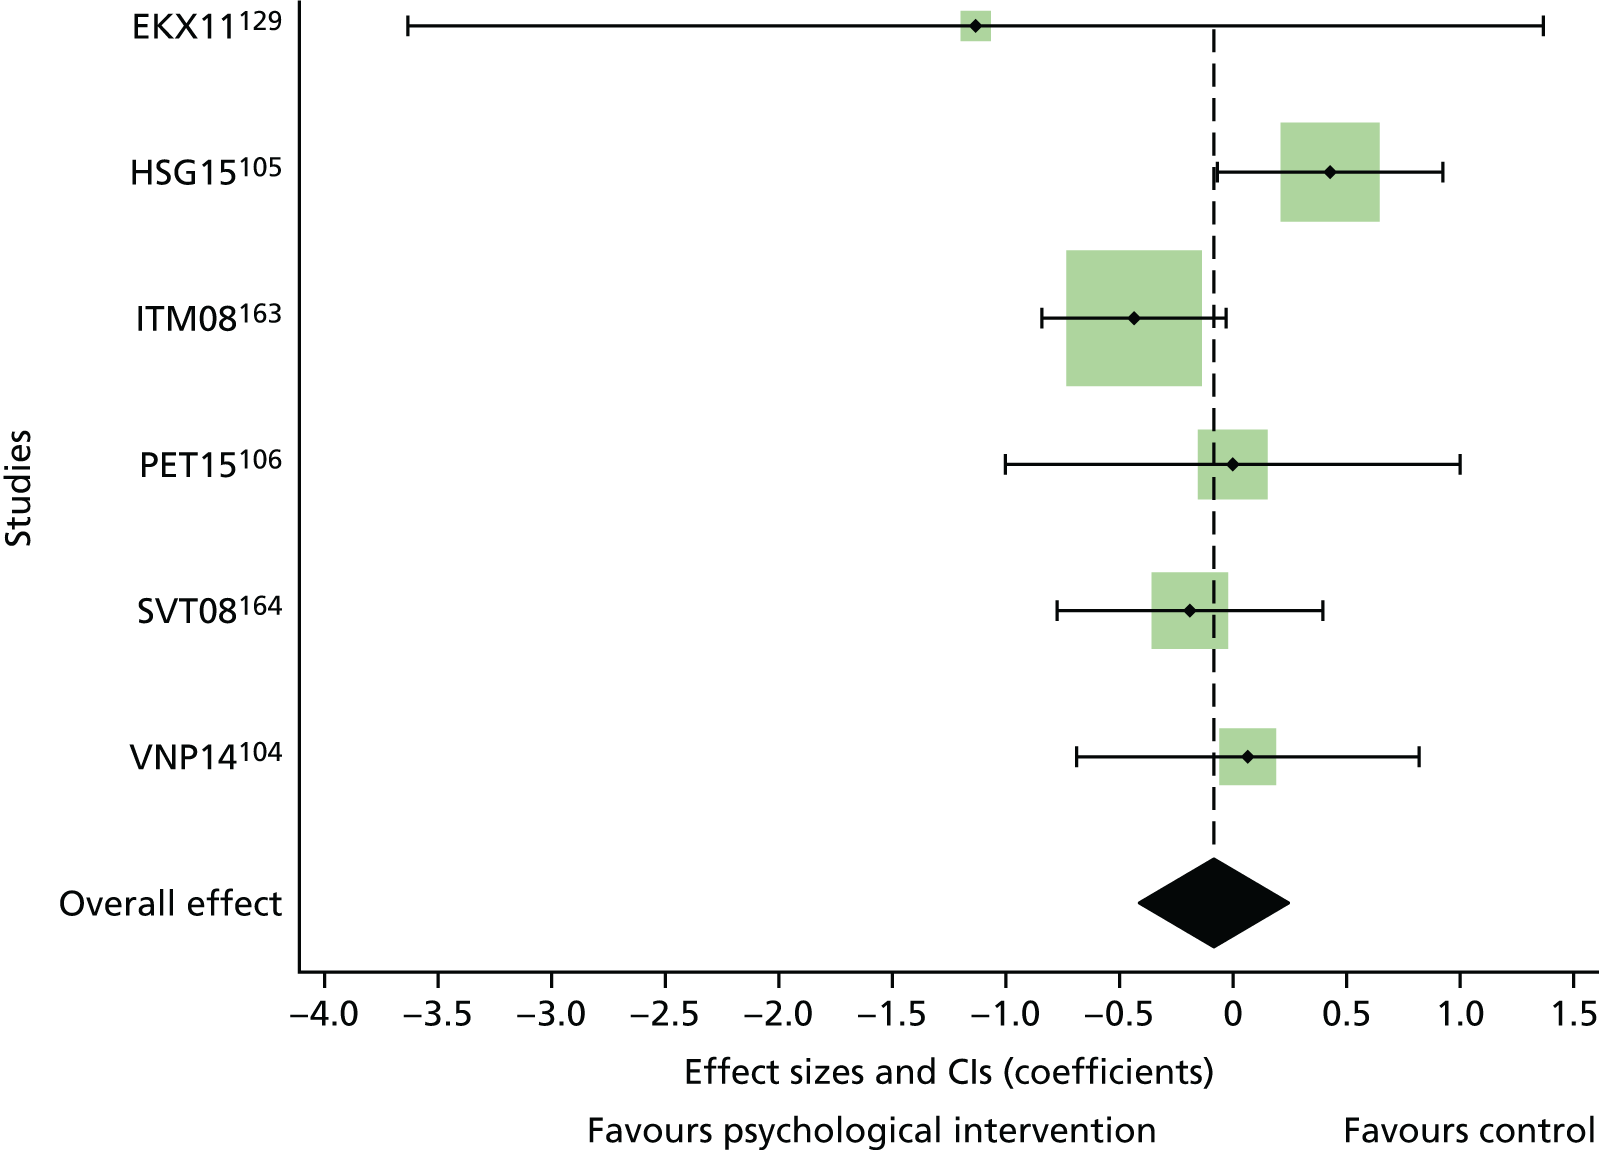
FIGURE 52.
The IPD meta-analysis comparing treatment arms with control arms in terms of HbA1c levels at follow-up for adults with T1DM. Effect sizes are unstandardized differences in % HbA1c at follow-up between treatment and control arms after controlling for baseline HbA1c values and age (six study sites).
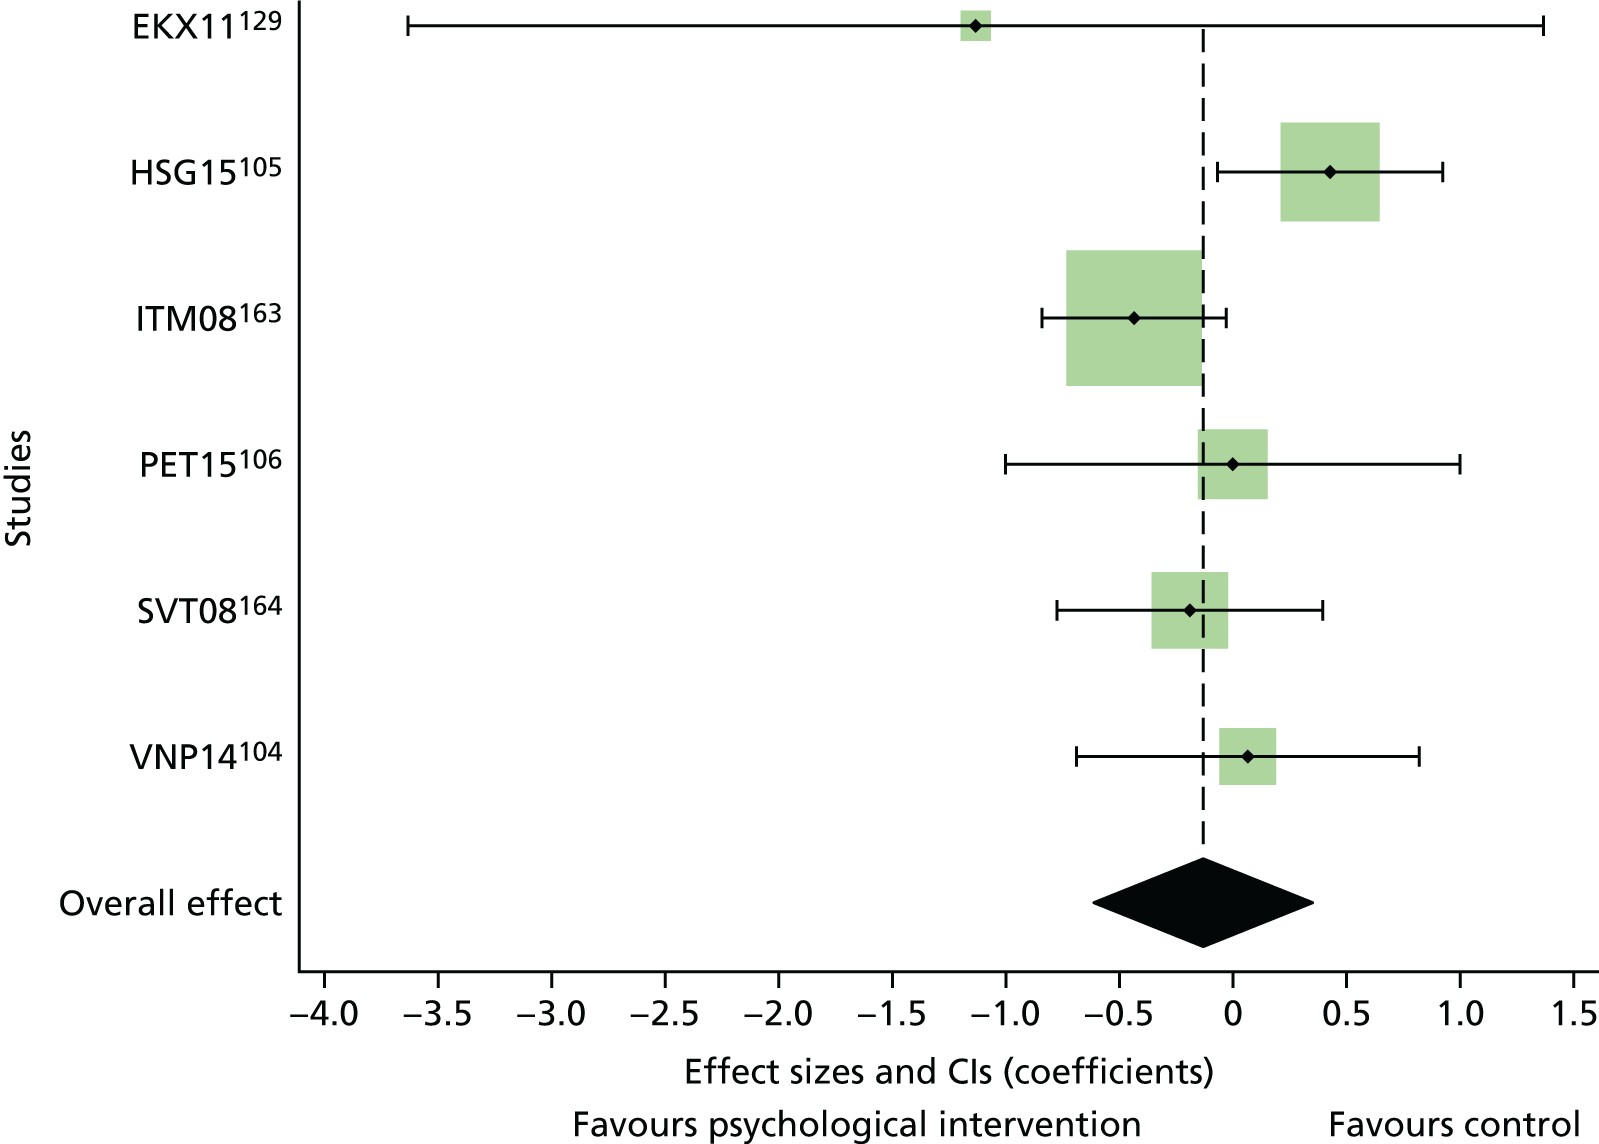
FIGURE 53.
The IPD meta-analysis comparing treatment arms with control arms in terms of HbA1c levels at follow-up for adolescents and children with T1DM. Effect sizes are unstandardized differences in % HbA1c at follow-up between treatment and control arms after controlling for baseline HbA1c values.
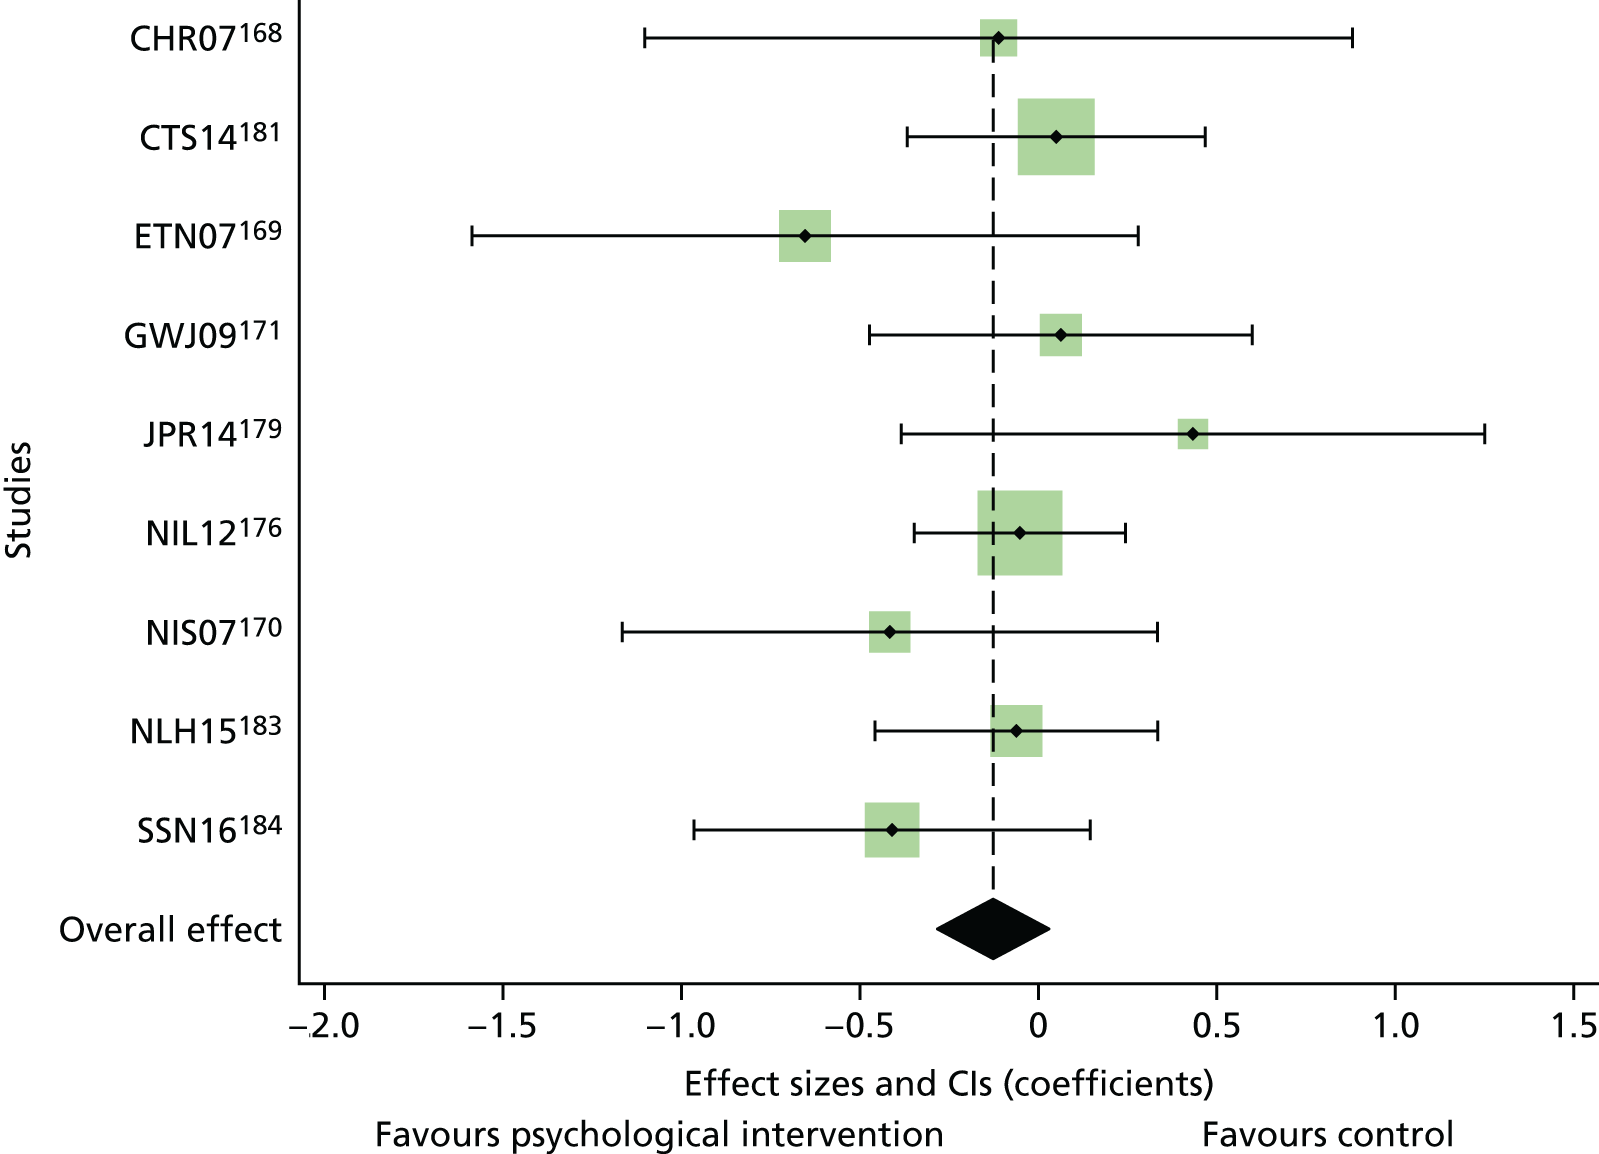
FIGURE 54.
The IPD meta-analysis comparing treatment arms with control arms in terms of HbA1c levels at follow-up for adolescents and children with T1DM. Effect sizes are unstandardized differences in mmol HbA1c at follow-up between treatment and control arms after controlling for baseline HbA1c values, age and duration of diabetes (eight study sites).
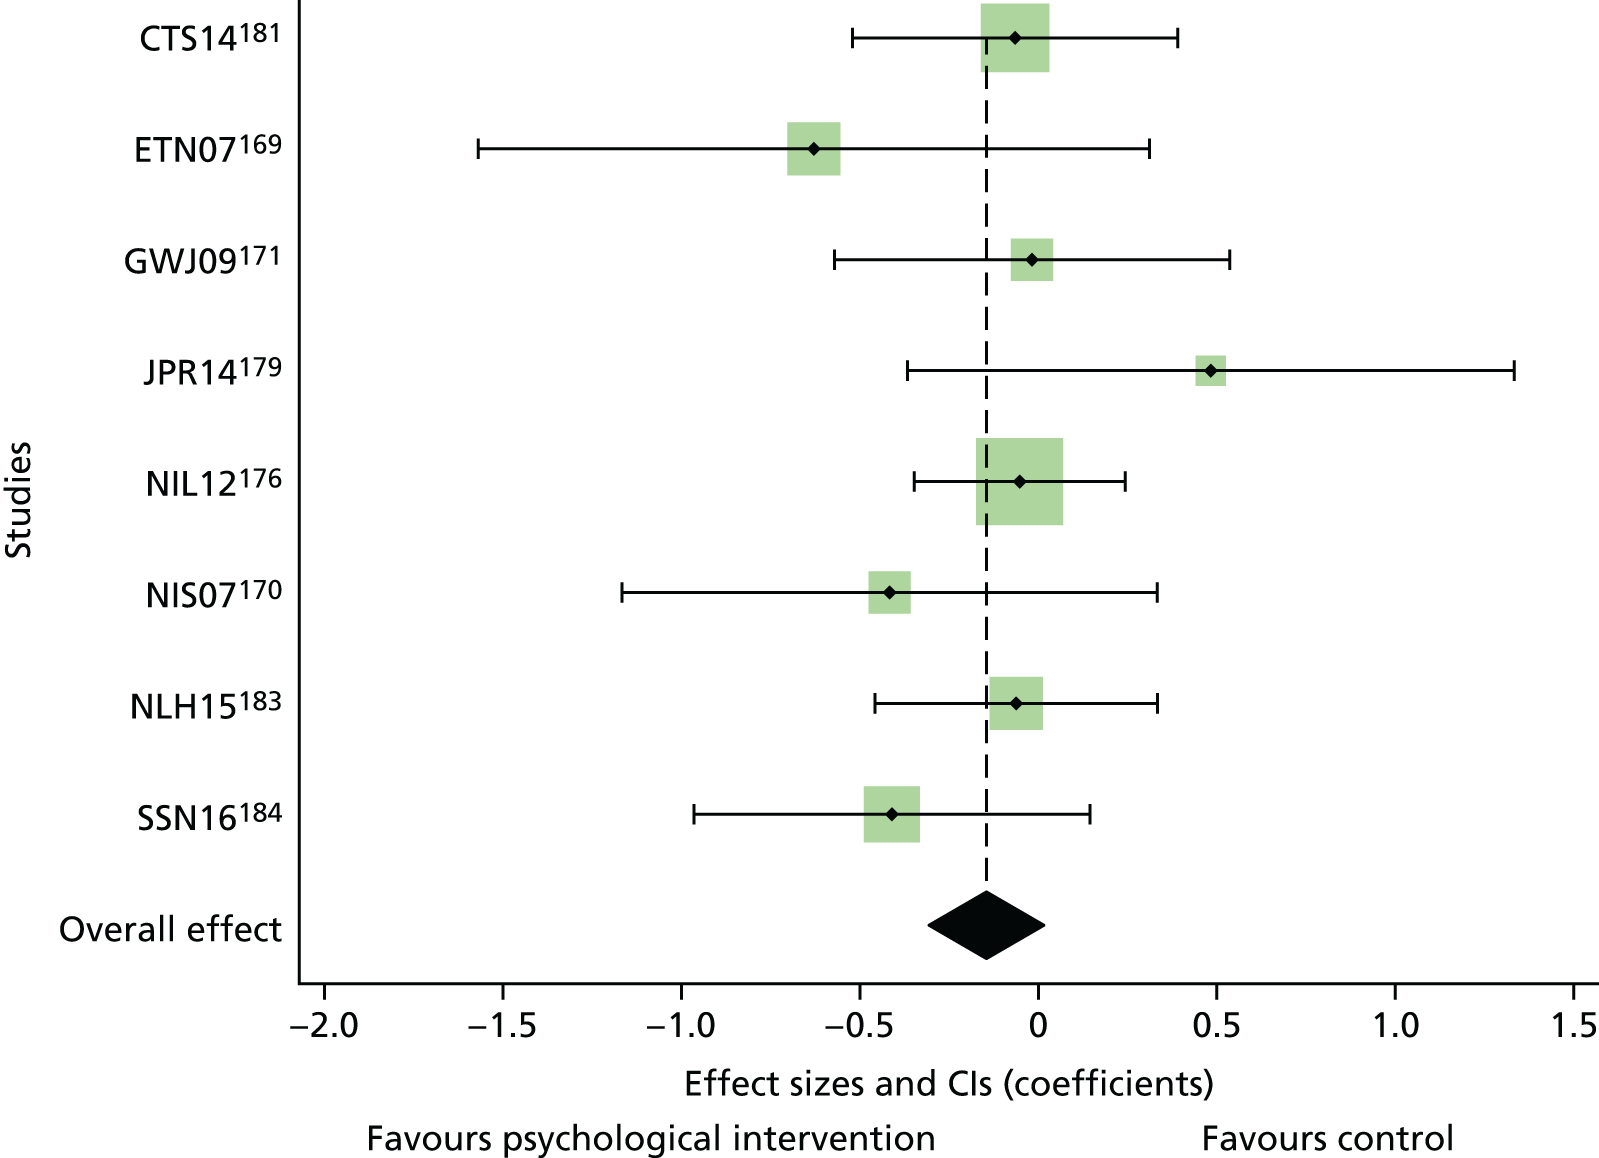
FIGURE 55.
The HbA1c levels (%) at follow-up, adjusted for HbA1c baseline values for each treatment arm separately for adults with T2DM.
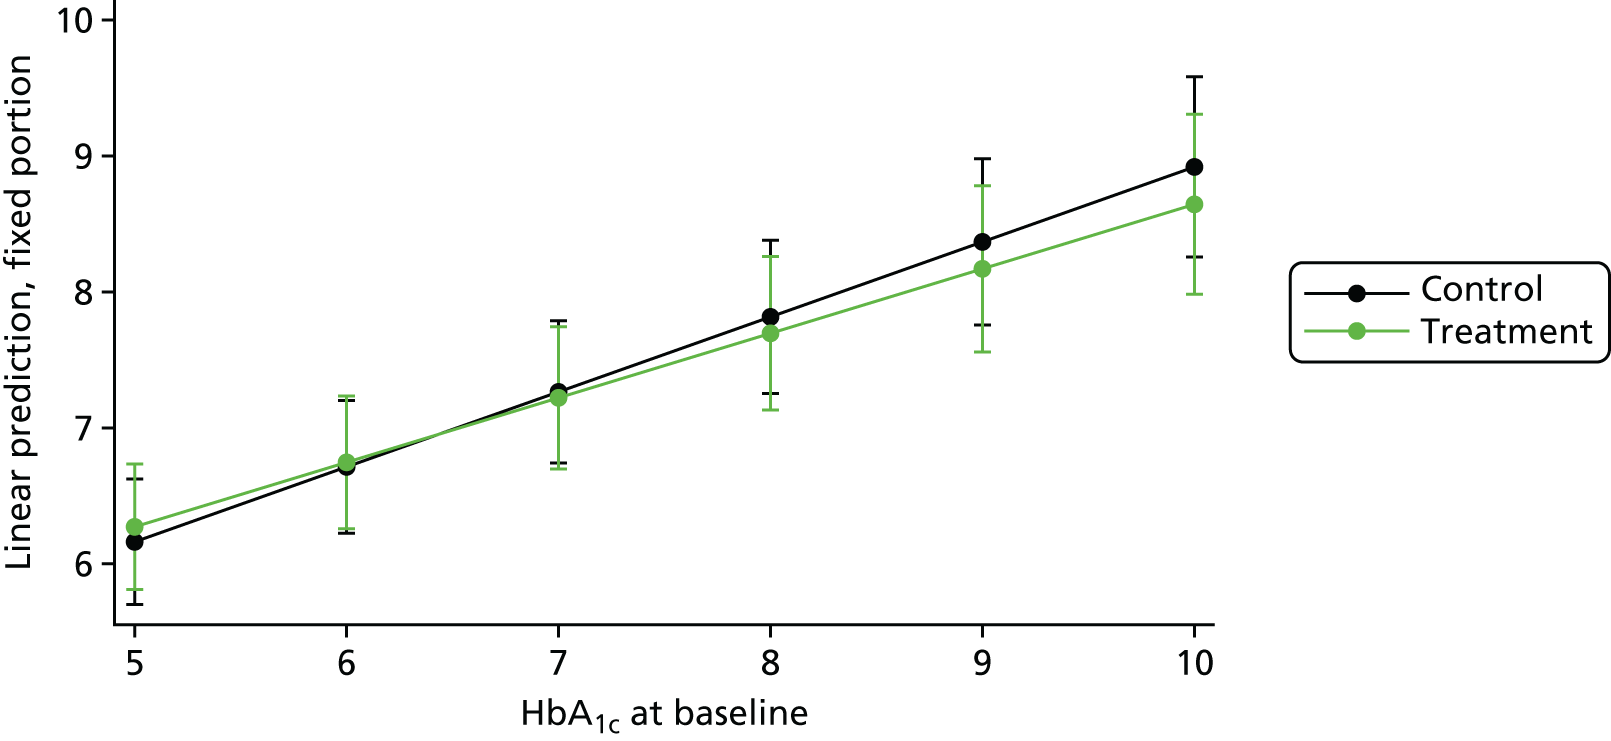
FIGURE 56.
The IPD meta-analysis comparing treatment arms with control arms in terms of HbA1c response at follow-up for adults with T2DM. Effect sizes are unstandardized differences in % HbA1c at follow-up between treatment and control arms after controlling at an average baseline HbA1c values of 7.8% (19 study sites).
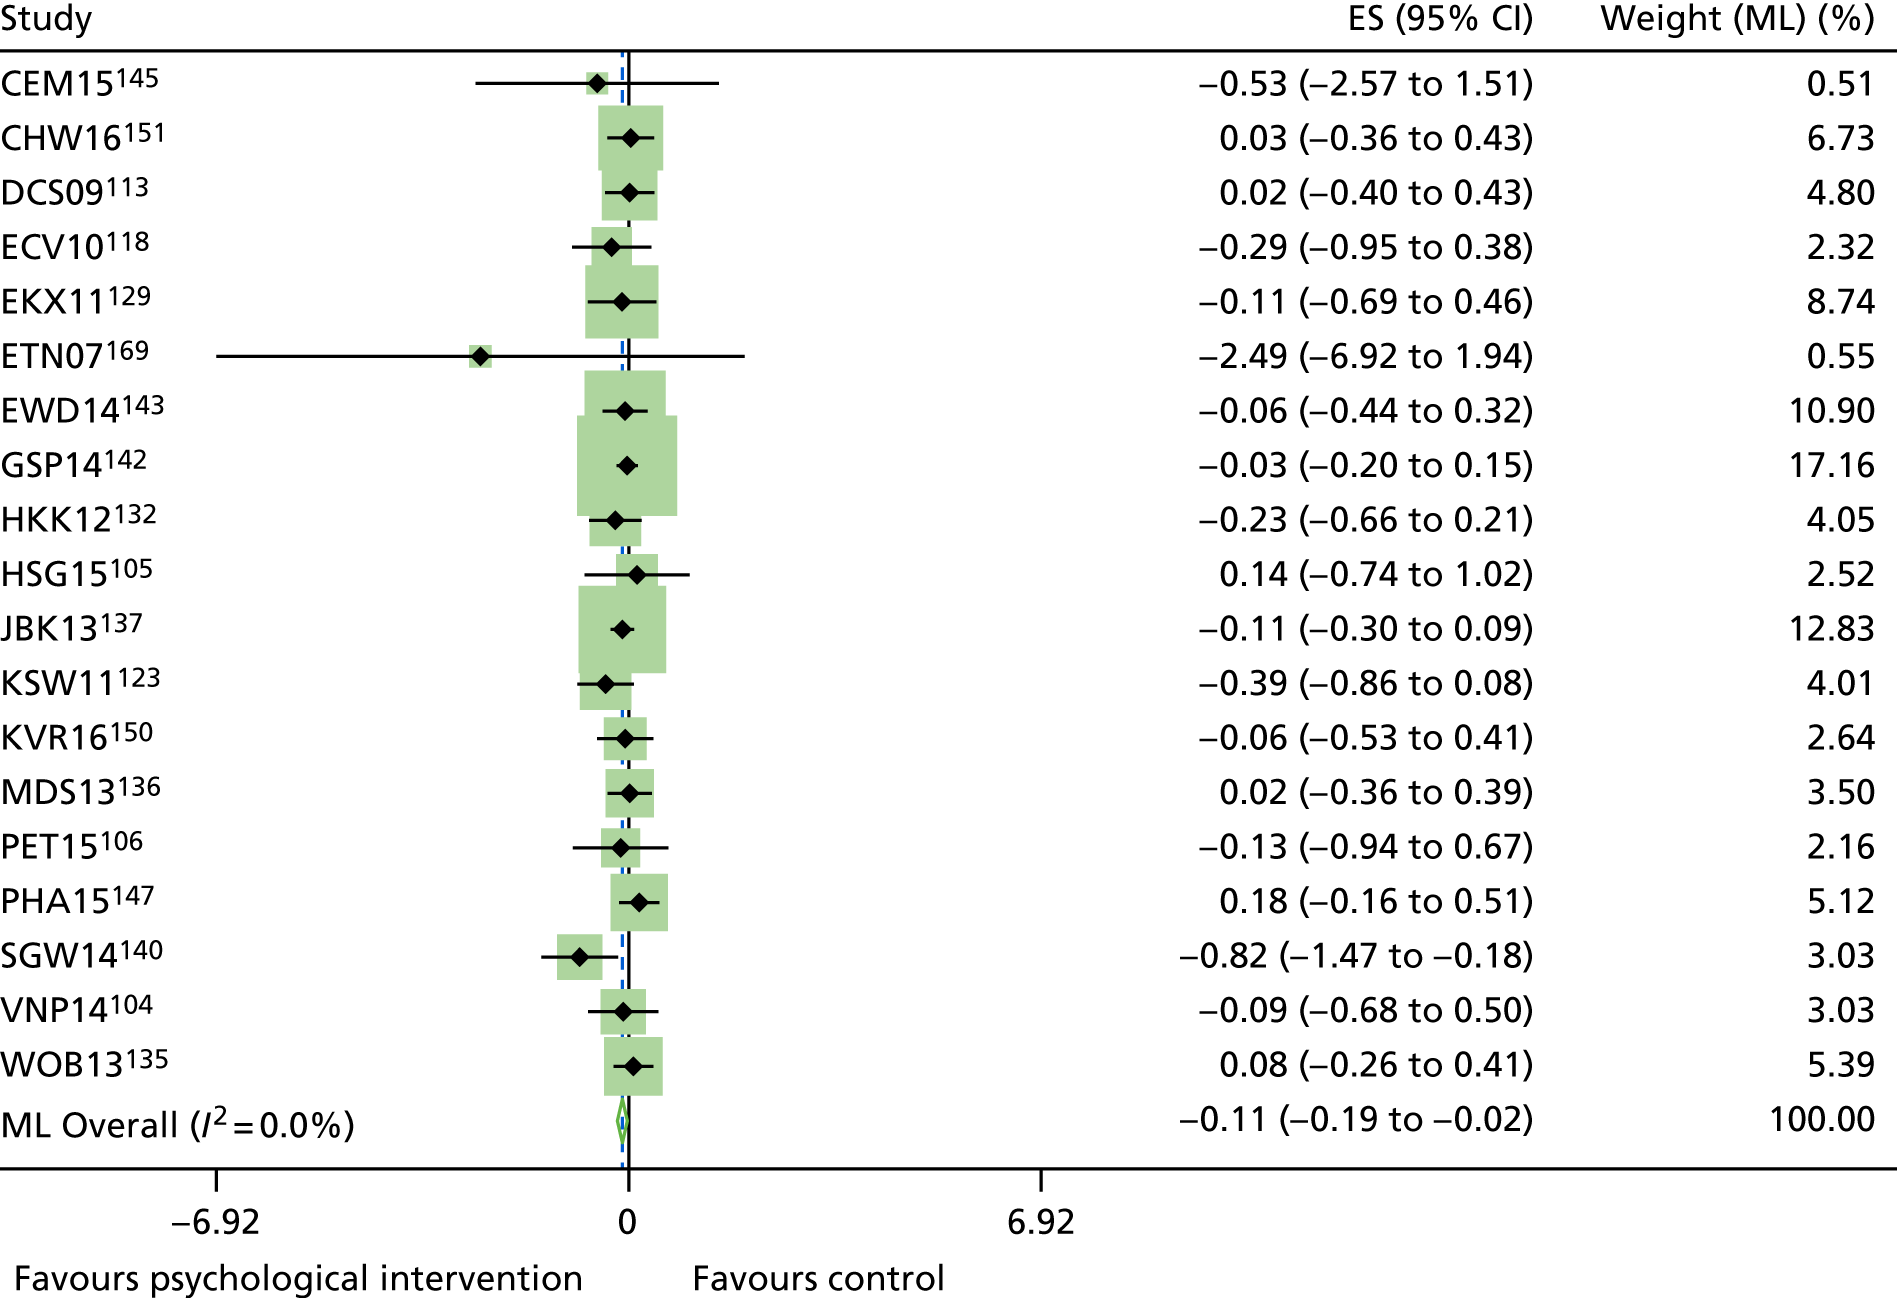
FIGURE 57.
The IPD meta-analysis comparing treatment arms with control arms in terms of HbA1c response at follow-up for adults with T2DM. Effect sizes are unstandardized differences in mmol HbA1c at follow-up between treatment and control arms after controlling at an average baseline HbA1c values of 7.8% (19 study sites), age and duration of illness.
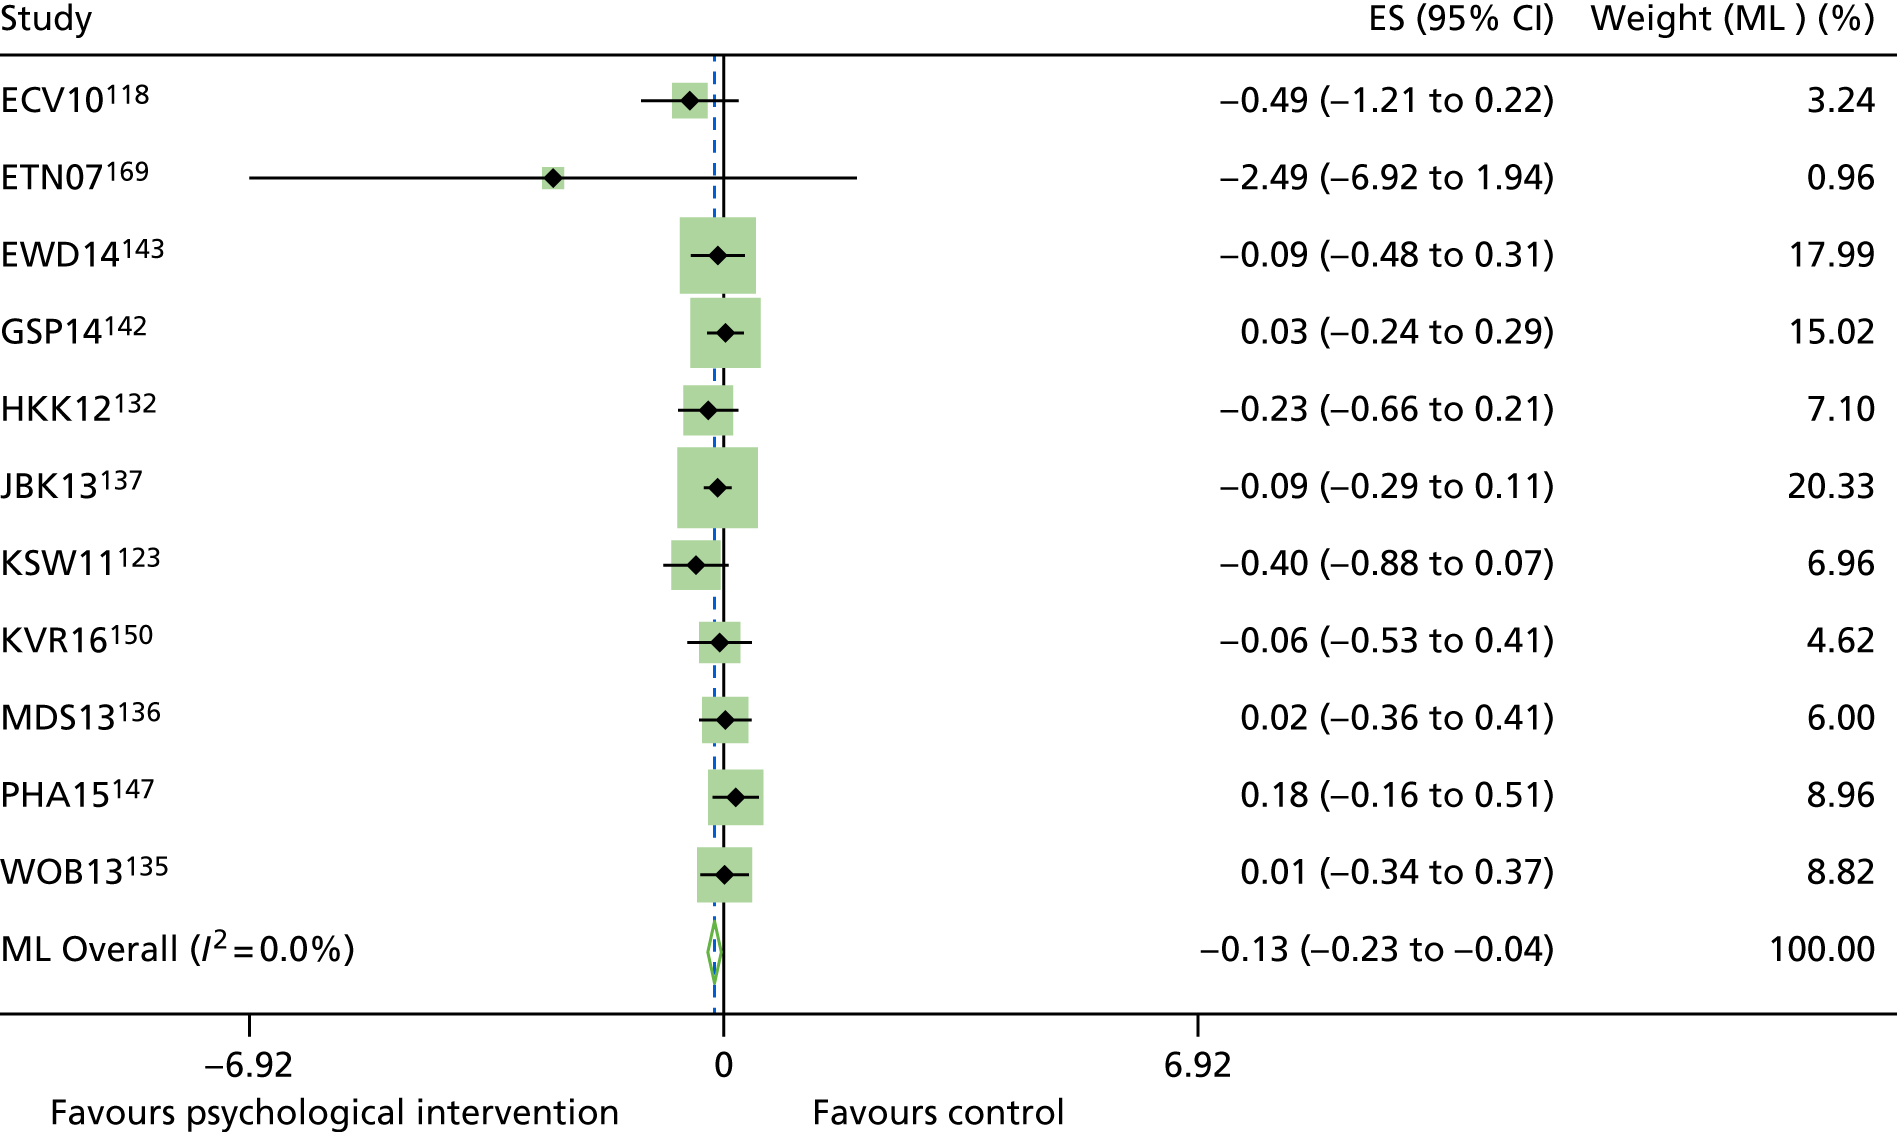
FIGURE 58.
Sensitivity analyses: IPD meta-analysis comparing treatment arms with control arms in terms of HbA1c response at follow-up for adults with T2DM without the Ellis et al. 169 study. Effect sizes are unstandardized differences in mmol HbA1c at follow-up between treatment and control arms after controlling at an average baseline HbA1c values of 7.8% (19 study sites), age and duration of illness.
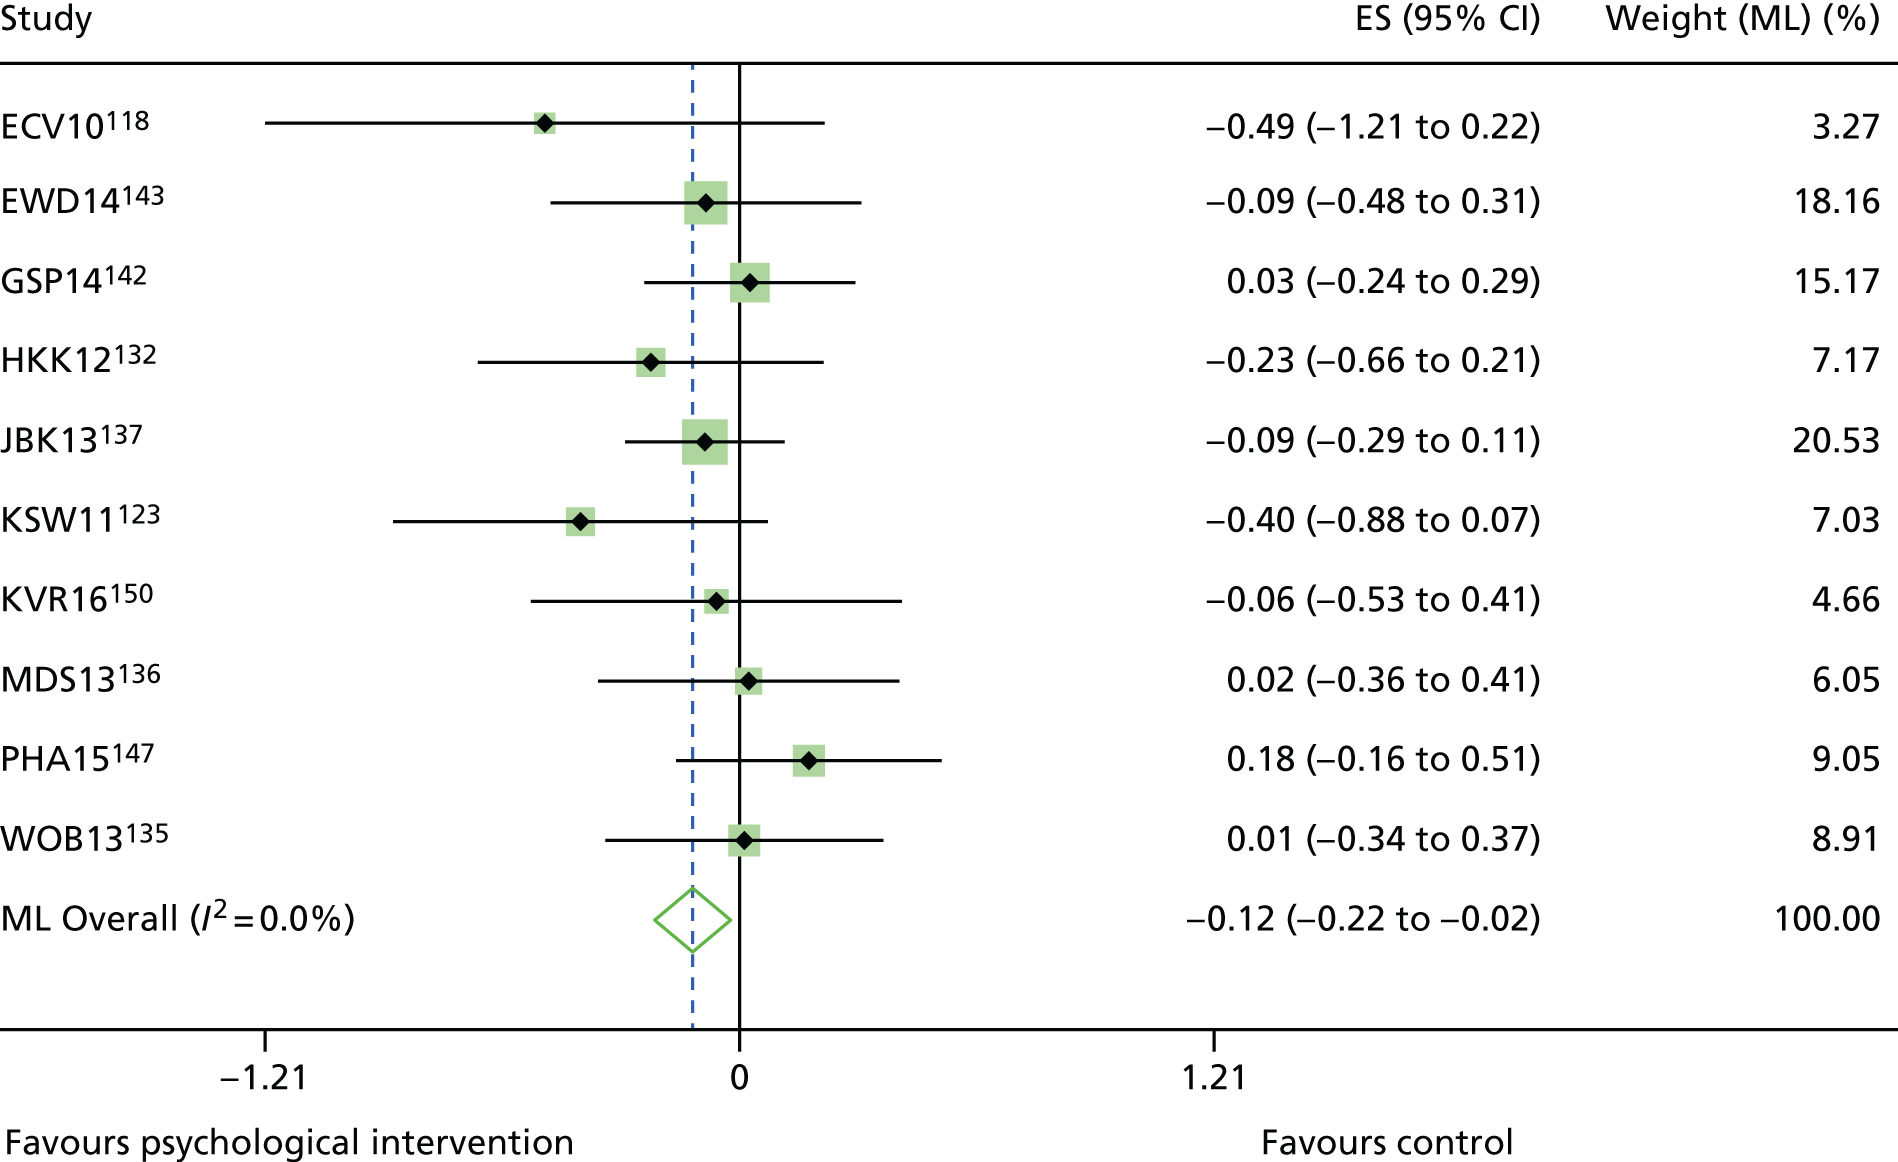
Appendix 15 Additional tables for non-randomised controlled trials
| Year, country, reference | Confounding | Selection of participants | Classification of interventions | Deviations from intended interventions | Missing data | Measurement of outcomes | Selection of reported results | Overall assessment |
|---|---|---|---|---|---|---|---|---|
| T2DM studies | ||||||||
| 2004, South Korea, Kim et al.233 | Moderate | Low | Low | NI | NI | Moderate | Moderate | NI |
| 2007, South Korea, Song and Kim234 | Low | Low | Low | NI | NI | Moderate | Moderate | NI |
| 2009, Italy, Forlani et al.235 | Serious | Moderate | Low | Low | NI | Moderate | Moderate | Serious |
| 2011, South Korea, Lee et al.236 | Low | Low | Moderate | Low | NI | Moderate | Moderate | Moderate |
| 2013, Spain, Cervantes Cuesta et al.237 | Moderate | Low | Low | NI | NI | Moderate | Moderate | NI |
| 2014, Thailand, Ounnapiruk et al.238 | Low | Low | Low | NI | NI | Moderate | Moderate | NI |
| 2014, Taiwan, Wu et al.240 | Critical | Moderate | Moderate | NI | NI | Moderate | Moderate | Critical |
| T1DM studies | ||||||||
| 2003, USA, Ellis et al.229 | Serious | Serious | Moderate | Serious | NI | Serious | Critical | Critical |
| 2003, Japan, Takii et al.226 | Moderate | Moderate | Moderate | NI | NI | Moderate | Moderate | NI |
| 2006, Germany, Kubiak et al.228 | Moderate | Low | Moderate | NI | NI | Moderate | Moderate | NI |
| 2006, Iran, Attari et al.227 | Moderate | Low | Moderate | NI | NI | Moderate | Moderate | NI |
| 2010, Spain, García-Pérez et al.230 | Moderate | Low | Low | NI | NI | Moderate | Moderate | NI |
| 2013, USA, Bitsko et al.231 | Serious | Low | Low | NI | NI | Moderate | Moderate | Serious |
| Studies including a T2DM and T1DM population | ||||||||
| 2009, USA, Harris et al.232 | Critical | Serious | Low | NI | NI | Moderate | Moderate | Critical |
| Year, country, reference | Follow-up period (months) | Intervention group | Control group | p-value | ||
|---|---|---|---|---|---|---|
| Baseline | Follow-up | Baseline | Follow-up | |||
| T2DM studies | ||||||
| 2004, South Korea, Kim et al.233 | Post intervention | 7.84 ± 1.63 | 6.96 ± 1.19 | 7.78 ± 1.72 | 8.19 ± 2.07 | 0.02 |
| 2007, South Korea, Song and Kim234 | 3 | 9.4 ± 1.8 | 7.1 ± 1.2 | 9.0 ± 1.2 | 8.6 ± 71.3 | 0.001 |
| 2009, Italy, Forlani et al.235 | 48 | 7.4 ± 1.8 | 7.0 (2.3) | 7.9 ± 1.9 | 7.5 (1.9) | NR |
| 2011, South Korea, Lee et al.236 | 6 | 7.95 ± 1.43 | 7.33 ± 1.22 | 7.42 ± 1.67 | 7.08 ± 1.79 | NR |
| 2013, Spain, Cervantes Cuesta et al.237 | 3 | 6.89 ± 1.16 | 6.38 ± 0.88 | 7.03 ± 1.20 | 6.97 ± 1.30 | 0.04 |
| 2014, Thailand, Ounnapiruk et al.238 | 3 | 8.17 ± 0.44 | 7.71 ± 0.28 | 7.99 ± 0.42 | 8.24 ± 0.41 | 0.292 |
| 2014, Taiwan, Wu et al.240 | 1 | 8.18 ± 1.76 | 7.79 ± 1.62 | 8.49 ± 1.99 | 8.60 ± 2.02 | ** |
| T1DM studies | ||||||
| 2003, USA, Ellis et al.229 |
|
NR | NR | NR | NR | NR |
| 2003, Japan, Takii et al.226 | 36 | 12.2 ± 1.7 | NR | 12.8 ± 2.9 | NR | NR |
| 2006, Germany, Kubiak et al.228 | 6 | 6.8 ± 1.6 | 6.3 ± 0.9 | 6.8 ± 1.5 | 6.2 ± 1.3 | 0.67 |
| 2006, Iran, Attari et al.227 | Post intervention | 11.7 ± 2.9 | 8.5 ± 1.7 | 10.9 ± 2.1 | 10.3 ± 2.1 | ** |
| 2010, Spain, García-Pérez et al.230 | 3 | 8.63 ± 1.75 | 9.19 ± 1.89 | 9.06 ± 1.37 | 9.42 ± 1.87 | .646 |
| 2013, USA, Bitsko et al.231 | 12 | 10.40 ± 2.21 | 9.67 ± 2.19 | 8.65 ± 1.99 | 9.34 ± 1.79 | 0.459 |
| Studies including a T2DM and T1DM population | ||||||
| 2009, USA, Harris et al.232 | Post intervention | 11.4 ± 1.4 | 11.1 ± 1.4 | 11.1 ± 1.6 | NR | NR |
| Year, country, reference | Psychological measures | Follow-up period (months) | Intervention group | Control group | p-value | ||
|---|---|---|---|---|---|---|---|
| Baseline | Follow-up | Baseline | Follow-up | ||||
| T2DM studies | |||||||
| 2004, South Korea, Kim et al.233 | Stages of Readiness Exercise Behavior Scale | Psychological intervention | 3.41 ± 1.33 | 4.36 ± 0.66 | 3.22 ± 1.35 | 3.22 ± 1.38 | 0.001 |
| 2011, South Korea, Lee et al.236 | Jalowiec Coping Scale | 6 | |||||
| Affective-oriented | 59.52 ± 9.98 | 58.45 ± 10.74 | 61.00 ± 9.65 | 61.71 ± 10.07 | 0.643 | ||
| Problem-oriented | 42.03 ± 10.50 | 43.41 ± 9.04 | 47.00 ± 10.12 | 46.18 ± 11.64 | 0.112 | ||
| 2014, Thailand, Ounnapiruk et al.238 | Diabetes Management Self-Efficacy Scale | 3 | 28.86 ± 0.71 | 30.63 ± 0.51 | 28.96 ± 0.67 | 27.73 ± 0.63 | 0.001 |
| 2014, Taiwan, Wu et al.240 | Perceived Therapeutic Efficacy Scale | 1 | |||||
| Self-efficacy | 75.22 ± 18.97 | 81.90 ± 15.65 | 75.09 ± 16.62 | 76.24 ± 16.00 | ** | ||
| Self-care | 37.33 ± 14.20 | 56.20 ± 14.21 | 37.58 ± 12.33 | 48.55 ± 14.66 | ** | ||
| Depression, Anxiety and Stress Scale | 16.51 ± 13.68 | 15.50 ± 14.29 | 16.49 ± 13.88 | 16.56 ± 13.95 | ** | ||
| WHO Well-Being Index | 16.60 ± 5.65 | 17.17 ± 5.66 | 15.06 ± 5.17 | 15.42 ± 5.36 | 0.21 | ||
| T1DM studies | |||||||
| 2003, Japan, Takii et al.226 | Eating Disorder Inventory |
|
102.3 ± 19.2 | 40.6 ± 32.6 | 78.7 ± 25.6 | 75.0 ± 23.8 | NR |
| Self-Rating Depression Scale | 52.8 ± 05.7 | 36.8 ± 13.4 | 49.9 ± 5.2 | 51.2 ± 4.0 | NR | ||
| STAI | 58.8 ± 05.7 | 44.1 ± 14.0 | 53.9 ± 4.6 | 57.9 ± 5.9 | NR | ||
| 2006, Germany, Kubiak et al.228 | Zerssen-d-Scale (Depression) | 6 | 7.9 ± 6.1 | 6.8 ± 6.1 | 6.5 ± 6.2 | 7.9 ± 6.8 | 0.09 |
| STAI | 36.5 ± 10.1 | 38.1 ± 11.5 | 36.2 ± 8.5 | 36.5 ± 10.5 | 0.83 | ||
| Control beliefs: IPC-D Q | |||||||
| Internal control | 38.4 ± 7.0 | 38.2 ± 5.7 | 37.7 ± 6.0 | 38.7 ± 7.1 | 0.12 | ||
| External control | 23.1 ± 7.1 | 21.7 ± 8.2 | 22.5 ± 7.0 | 19.5 ± 7.4 | 0.26 | ||
| Unpredictability | 26.7 ± 7.7 | 28.1 ± 7.8 | 25.2 ± 8.1 | 24.4 ± 8.2 | 0.41 | ||
| Luck and chance | 7.9 ± 3.3 | 8.8 ± 4.3 | 7.8 ± 4.0 | 7.5 ± 3.4 | 0.43 | ||
| Visual Analogue scales | |||||||
| Fear of hypoglycemia | 6.0 ± 6.1 | 5.3 ± 3.9 | 5.1 ± 4.2 | 4.3 ± 3.7 | 0.83 | ||
| Fear of diabetes complications | 13.5 ± 2.5 | 8.2 ± 3.9 | 13.9 ± 1.6 | 9.8 ± 5.2 | 0.17 | ||
| 2006, Iran, Attari et al.227 | Stress Management Questionnaire: applied positive coping | Psychological intervention | 5.06 ± 2.75 | 8.13 ± 2.44 | 5.63 ± 2.97 | 5.8 ± 2.09 | 0.001 |
| 2010, Spain, García-Pérez et al.230 | STAI (State) | 3 | 35 (54) | 28 (60) | 20 (34) | 10 (28) | 0.347 |
| STAI-C (Trait) | 48 (43) | 53 (71) | 21 (51) | 18 (41) | 0.091 | ||
| Studies including a T2DM and T1DM population | |||||||
| 2009, USA, Harris et al.232 | Diabetes Responsibility and Conflict Scale | Psychological intervention | |||||
| Adolescents | 30.7 ± 15.0 | 25.4 ± 12.8 | NR | 37.7 ± 12.3 | ** | ||
| Mothers | 29.7 ± 15.0 | 23.9 ± 6.9 | NR | 37.6 ± 13.5 | * | ||
| Fathers | 27.1 ± 08.1 | 26.6 ± 7.6 | NR | 36.3 ± 11.2 | Non-significant | ||
| Conflict Behaviour Questionnaire | |||||||
| Adolescents | 06.1 ± 5.7 | 4.5 ± 4.5 | NR | 6.6 ± 5.5 | * | ||
| Mothers | 9.5 ± 4.7 | 5.1 ± 5.0 | NR | 7.3 ± 6.1 | * | ||
| Fathers | 9.9 ± 6.1 | 6.8 ± 7.2 | NR | 7.3 ± 6.3 | * | ||
Appendix 16 Technical appendices to the health economic analysis
Technical appendix on details of baseline characteristics used for modelling type 1 diabetes patients
| What is needed | Key | Transformations applied for sampling | Values used | Source | |
|---|---|---|---|---|---|
| Mean | SD | ||||
| Age | Years | None | 40.9819 | 13.59232 | DAFNE research database |
| Duration of diabetes | Years | None | 16.92 | 13.31 | National Diabetes Audit |
| Gender | 0 = female, 1 = male | 0.57 | 0.50006 | National Diabetes Audit (mean) DAFNE research database (SD) | |
| Smoker | 1 = current smoker, 2 = former smoker, 3 = non-smoker | 2.380388 | 0.780509 | DAFNE research database | |
| Systolic blood pressure | mmHg | LN | 4.854137 | 0.132766 | National Diabetes Audit (mean) DAFNE research database (SD) |
| LDL cholesterol | mmol/l | None | 2.84 | 0.75 | National Diabetes Audit |
| HDL cholesterol | mmol/l | LN | 0.41996 | 0.278074 | DAFNE research database |
| Total cholesterol | mmol/l | LN | 1.507881 | 0.20003 | DAFNE research database |
| Triglycerides | mmol/l | LN | 0.032197 | 0.575833 | DAFNE research database |
| Physical activity | |||||
| Race | 0 = white, 1 = Hispanic, 2 = black | 0.1 | 0.369242 | National Diabetes Audit (mean) DAFNE research database (SD) | |
| Baseline insulin costs | £ | – | – | ||
| Baseline diabetes-related costs | £ | – | – | ||
| HbA1c level | DCCT aligned | LN (HbA1c) | 2.151762 | 0.172024 | National Diabetes Audit (mean) DAFNE research database (SD) |
| Nephropathy | 1 = no comps/missing, 2 = microalbumuria, 3 = macroalbumuria, 4 = dialysis/transplant | 1.103301 | 0.431909 | DAFNE research database | |
| Neuropathy | 1 = no comps/missing, 2 = neuropathy or ulcers, 5 = reported amputation (above or below the toe) | 3 = amputation (above or below toe) | 1.055378 | 0.62177 | DAFNE research database |
| Retinopathy | 1 = no comps/missing, 2 = BDR, 3 = PDR, 4 = partially sighted/blind | 1.339723 | 0.62177 | DAFNE research database | |
| Myocardial infarction | 1 = no comps/missing, 2 = myocardial infarction | 1.014909 | 0.233451 | DAFNE research database | |
| Stroke | 1 = no comps/missing, 2 = stroke | 1.007455 | 0.121255 | DAFNE research database | |
| Heart failure | 1 = no comps/missing, 2 = hear failure | 1 | NR | DAFNE research database | |
| Angina | 1 = no comps/missing, 2 = angina | 1.011715 | 0.107655 | DAFNE research database | |
| Characteristic | Age | Duration | Gender | Smoke | ldl_mol_result | eth | neph | neuro | ret | Myocardial infarction | Stroke | Angina | l_A1c | l_SBP | l_HDL | l_tri | l_chol |
|---|---|---|---|---|---|---|---|---|---|---|---|---|---|---|---|---|---|
| Age | 1 | 0.461557 | 0.077086 | –0.05265 | –0.20529 | –0.05886 | 0.064699 | 0.127438 | 0.166778 | 0.125375 | 0.06462 | 0.160945 | –0.0713 | 0.316724 | 0.110877 | –0.02584 | –0.13275 |
| Duration | 0.461557 | 1 | 0.002752 | 0.066821 | –0.11464 | –0.02671 | 0.1989 | 0.187423 | 0.441926 | 0.151865 | 0.106954 | 0.169587 | 0.000766 | 0.258778 | 0.121674 | –0.08435 | –0.08116 |
| Gender | 0.077086 | 0.002752 | 1 | –0.0821 | –0.04005 | 0.05245 | 0.014266 | 0.000739 | 0.062288 | 0.033366 | 0.023498 | 0.047723 | –0.07077 | 0.091767 | –0.31077 | 0.081835 | –0.17903 |
| Smoke | –0.05265 | 0.066821 | –0.0821 | 1 | –0.0406 | 0.02119 | –0.03963 | –0.04292 | –0.03751 | 0.015813 | –0.09482 | 0.023793 | –0.17369 | 0.043068 | 0.088948 | –0.13688 | –0.03202 |
| ldl_mol_result | –0.20529 | –0.11464 | –0.04005 | –0.0406 | 1 | –0.00499 | 0.029985 | –0.0176 | –0.05926 | –0.04299 | 0.005286 | –0.04058 | 0.138707 | –0.06789 | –0.12822 | 0.21733 | 0.816337 |
| eth | –0.05886 | –0.02671 | 0.05245 | 0.02119 | –0.00499 | 1 | 0.024462 | 0.018193 | –0.00289 | –0.02692 | 0.06937 | –0.02552 | 0.137036 | –0.02343 | –0.10038 | 0.064053 | –0.03019 |
| neph | 0.064699 | 0.1989 | 0.014266 | –0.03963 | 0.029985 | 0.024462 | 1 | 0.264598 | 0.260778 | 0.089258 | 0.021153 | –0.02767 | 0.046666 | 0.104641 | 0.017395 | 0.070919 | 0.054139 |
| neuro | 0.127438 | 0.187423 | 0.000739 | –0.04292 | –0.0176 | 0.018193 | 0.264598 | 1 | 0.267284 | 0.079597 | 0.056058 | 0.029498 | 0.127995 | 0.100522 | 0.044187 | –0.00618 | 0.012525 |
| ret | 0.166778 | 0.441926 | 0.062288 | –0.03751 | –0.05926 | –0.00289 | 0.260778 | 0.267284 | 1 | 0.134453 | 0.037145 | 0.105935 | 0.107738 | 0.107083 | –0.05104 | 0.057722 | –0.0549 |
| Myocardial infarction | 0.125375 | 0.151865 | 0.033366 | 0.015813 | –0.04299 | –0.02692 | 0.089258 | 0.079597 | 0.134453 | 1 | 0.131752 | 0.519815 | 0.023971 | 0.009747 | –0.03703 | 0.014236 | –0.0947 |
| Stroke | 0.06462 | 0.106954 | 0.023498 | –0.09482 | 0.005286 | 0.06937 | 0.021153 | 0.056058 | 0.037145 | 0.131752 | 1 | –0.01078 | 0.11291 | 0.002222 | 0.020342 | –0.00582 | 0.0119 |
| Angina | 0.160945 | 0.169587 | 0.047723 | 0.023793 | –0.04058 | –0.02552 | –0.02767 | 0.029498 | 0.105935 | 0.519815 | –0.01078 | 1 | –0.00576 | 0.121203 | –0.11386 | 0.062528 | –0.10244 |
| l_A1c | –0.0713 | 0.000766 | –0.07077 | –0.17369 | 0.138707 | 0.137036 | 0.046666 | 0.127995 | 0.107738 | 0.023971 | 0.11291 | –0.00576 | 1 | 0.041214 | –0.06577 | 0.245816 | 0.148099 |
| l_SBP | 0.316724 | 0.258778 | 0.091767 | 0.043068 | –0.06789 | –0.02343 | 0.104641 | 0.100522 | 0.107083 | 0.009747 | 0.002222 | 0.121203 | 0.041214 | 1 | 0.002022 | 0.142123 | –0.01014 |
| l_HDL | 0.110877 | 0.121674 | –0.31077 | 0.088948 | –0.12822 | –0.10038 | 0.017395 | 0.044187 | –0.05104 | –0.03703 | 0.020342 | –0.11386 | –0.06577 | 0.002022 | 1 | –0.32514 | 0.282313 |
| l_tri | –0.02584 | –0.08435 | 0.081835 | –0.13688 | 0.21733 | 0.064053 | 0.070919 | –0.00618 | 0.057722 | 0.014236 | –0.00582 | 0.062528 | 0.245816 | 0.142123 | –0.32514 | 1 | 0.29572 |
| l_chol | –0.13275 | –0.08116 | –0.17903 | –0.03202 | 0.816337 | –0.03019 | 0.054139 | 0.012525 | –0.0549 | –0.0947 | 0.0119 | –0.10244 | 0.148099 | –0.01014 | 0.282313 | 0.29572 | 1 |
| Annual cost of insulin and MDI consumables (year 1) | Annual cost of insulin and MDI consumables (ongoing) | Annual cost of DRC (year 1) | Annual cost of DRC (ongoing) | Source | |
|---|---|---|---|---|---|
| Multiplier for the baseline DRC cost (β1) | b | b | –0.11 | 0.03 | Heller et al.245 |
| Multiplier for the baseline insulin cost (β2) | –0.99 | –1.07 | b | b | |
| Multiplier for the baseline HbA1c (DCCT % scale) (β3) | –5.19 | –13.10 | –22.15 | –12.42 | |
| Constant (β0) | 379.14 | 303.60 | 472.43 | 179.73 |
| Health state | Mean cost (£) | SE | Source | Health state | Mean cost (£) | SE | Source |
|---|---|---|---|---|---|---|---|
| Adverse events | |||||||
| Hypoglycaemia | 191 | 19 | Heller et al.242 | DKA | 2091 | 197 | Dhatariya et al.301 |
| Nephropathy | |||||||
| Ongoing yearly cost of microalbuminuria | 36 | 4 | BNF265 and McEwan et al.302 | Ongoing yearly cost of microalbuminuria – ongoing | 36 | 4 | BNF265 and McEwan et al.302 |
| Ongoing yearly cost of ESRD | 24,983 | 2498 | NHS reference costs303 | Death due to ESRD | 0 | 0 | Assumed equal to Zero |
| Neuropathy | |||||||
| Clinically confirmed neuropathy | 277 | 28 | Currie et al.304 | Clinical neuropathy | 277 | 28 | Currie et al.304 |
| Diabetic foot syndrome | 2912 | 291 | NHS Reference costs303 | PAD with amputation (year 1) | 7383 | 738 | NHS Reference costs303 |
| Ongoing yearly cost of PAD with amputation | 449 | 45 | McEwan et al.302 | ||||
| Retinopathy | |||||||
| Background retinopathy | 148 | 15 | McEwan et al.302 | Proliferative retinopathy | 676 | 68 | McEwan et al.302 |
| Macular oedema (year 1) | 5726 | 573 | NICE,305 BNF265 | Macular oedema (year 2) | 3432 | 343 | NICE,305 BNF265 |
| Macular oedema (year 3) | 2574 | 257 | NICE,305 BNF265 | Macular oedema (ongoing) | 280 | 28 | NICE,305 BNF265 |
| Blindness (year 1) | 2227 | 223 | Alva et al.306 | Blindness (ongoing) | 207 | 21 | Alva et al.306 |
| Cardiovascular | |||||||
| First myocardial infarction (year 1) | 6565 | 657 | Alva et al.306 | Second myocardial infarction (year 1) | 6565 | 657 | Alva et al.306 |
| Final myocardial infarction (year 1) | 6565 | 657 | Alva et al.306 | Ongoing yearly cost of a myocardial infarction | 862 | 86 | Alva et al.306 |
| Fatal myocardial infarction | 1098 | 110 | Alva et al.306 | Heart failure (year 1) | 3286 | 329 | Alva et al.306 |
| Heart failure (ongoing) | 1504 | 150 | Alva et al.306 | Fatal heart failure | 3286 | 329 | Alva et al.306 |
| First stroke (year 1) | 7132 | 714 | Alva et al.306 | Second stroke | 7132 | 713 | Alva et al.306 |
| Fatal stroke | 3613 | 361 | Alva et al.306 | First stroke (ongoing) | 920 | 92 | Alva et al.306 |
| Angina (year 1) | 9965 | 997 | Alva et al.306 | Angina (ongoing) | 870 | 87 | Alva et al.306 |
| Health state for event | Utility | SE | Beta distribution | Source | |
|---|---|---|---|---|---|
| Alpha | Beta | ||||
| Baseline utility value | |||||
| Male with type 1 diabetes and no complications | 0.866 | 0.010 | 947.79 | 146.90 | Peasgood et al.250 |
| Disutility | SE | Gamma distribution | Source | ||
| Alpha | Beta | ||||
| Complications or covariates | |||||
| Female with type 1 diabetes and no complications | –0.0236 | 0.008 | 8.70 | 0.003 | Peasgood et al.250 |
| Age decrement (per 10 years) | –0.0214 | 0.003 | 50.88 | 0.0004 | Peasgood et al.250 |
| Adverse eventsa | |||||
| Severe hypoglycaemia | –0.002 | –0.002 | 1 | 0.002 | Peasgood et al.250 |
| DKA | –0.0091 | –0.01 | 0.83 | 0.01 | Peasgood et al.250 |
| Nephropathy | |||||
| Microalbuminuria | 0 | Assumption | |||
| Microalbuminuria | –0.017 | 0.01 | 2.89 | 0.01 | Coffey et al.249 |
| ESRD | –0.078 | 0.026 | 9 | 0.01 | Coffey et al.249 |
| Neuropathy | |||||
| Clinical neuropathy | –0.055 | 0.01 | 30.25 | 0.002 | Coffey et al.249 |
| Clinically confirmed neuropathy | –0.055 | 0.01 | 30.25 | 0.002 | Coffey et al.249 |
| Diabetic foot syndrome | –0.1042 | –0.119 | 0.77 | 0.14 | Peasgood et al.250 |
| PAD with amputation | –0.1172 | –0.055 | 4.54 | 0.03 | Peasgood et al.250 |
| Retinopathy | |||||
| Background retinopathy | –0.0544 | –0.023 | 5.59 | 0.01 | Peasgood et al.250 |
| Proliferative retinopathy | –0.0288 | –0.026 | 1.23 | 0.02 | Peasgood et al.250 |
| Blindness | –0.208 | 0.013 | 256 | 0.001 | Coffey et al.249 |
| Cardiovascular | |||||
| Myocardial infarction (first year)a | –0.065 | 0.03 | 4.69 | 0.01 | Alva et al.247 |
| Myocardial infarction (subsequent years) | –0.057 | 0.03 | 3.61 | 0.02 | Alva et al.247 |
| Heart failure | –0.101 | 0.032 | 9.96 | 0.010 | Alva et al.247 |
| Stroke | –0.165 | 0.035 | 22.22 | 0.007 | Alva et al.247 |
| Anginab | –0.09 | 0.018 | 25 | 0.004 | Clarke et al.248 |
Technical appendix on methods to model severe hypoglycaemia and diabetic ketoacidosis in people with type 1 diabetes
Data on the incidence and severe hypoglycaemia and DKA was obtained from analyses of the DAFNE research database. 242 This source was used for three reasons: first, it had the largest sample size for this data; second, it was not clinically expected that the inclusion of a bolus advisor to a DAFNE course would affect the incidence of these two serious adverse events; and third, it was expected that the REPOSE trial exclusion of people immediately eligible for a pump would have lowered the incidence of these two events compared with the population who normally receive DAFNE.
| Parameters | Coefficient | SE | 95% CI | Relative risk | 95% CI | Source |
|---|---|---|---|---|---|---|
| Constant | –7.601 | 1.2041 | –9.961 to –5.241 | – | – | Re-analysis of data used in Heller et al.242 and Thokala et al.246 |
| DAFNE receipt (before = 0/after = 1) | –0.943 | 0.3443 | –1.618 to –0.268 | 0.006 | 0.198 to 0.765 | |
| HbA1c (DCCT aligned) | 0.563 | 0.1235 | 0.320 to 0.805 | 1.755 | 1.376 to 2.236 | |
| Overdispersion parameter | 6.974 | N/A |
| Parameters | Intercept | (After DAFNE = 1, otherwise = 0) | HbA1c |
|---|---|---|---|
| Intercept | 1.20397 | 0.19004 | –0.12386 |
| (After DAFNE = 1, otherwise = 0) | 0.19004 | 0.12308 | –0.02408 |
| HbA1c | –0.12386 | –0.02408 | 0.01318 |
Risk of severe hypoglycaemia
| Parameters | Coefficient | SE | 95% CI | Relative risk | 95% CI | Source |
|---|---|---|---|---|---|---|
| Constant | 0.912 | 0.5961 | –0.257 to 2.080 | – | – | Re-analysis of data used in Heller et al. (1) & Thokala et al.246 (7) |
| DAFNE (before = 0/after = 1) | –1.288 | 0.1487 | –1.580 to –0.977 | 0.275 | 0.208 to 0.363 | |
| HbA1c (DCCT aligned) | –0.131 | 0.0689 | –0.266 to 0.004 | 0.876 | 0.772 to 0.994 | |
| Overdispersion parameter | 8.525 | N/A |
| Parameters | Intercept | (After DAFNE = 1, otherwise = 0) | HbA1c |
|---|---|---|---|
| Intercept | 0.35534 | –0.02779 | –0.04043 |
| (After DAFNE = 1, otherwise = 0) | –0.02779 | 0.02212 | 0.00195 |
| HbA1c | –0.04043 | 0.00195 | 0.00475 |
How to sample from these negative binomial regressions
The number of events was directly sampled for each individual in the model. An example of how to estimate the number of severe hypoglycaemic events that occur in 1 year for a person with a HbA1c level of 10% and post DAFNE using the central estimates of the coefficients is given below.
-
The fitted value (FV) of the regression coefficients was estimated: (FV = 0.912 + –1.288 + –0.131 × 10).
-
The mean number of events for this individual (µ) was calculated using the following formula: µ = eFV.
-
A parameter of the negative binomial distribution (p) was calculated using the following formula: p = 1 – [1 / (8.525 + 1 / µ)].
-
A parameter of the negative binomial distribution (r) was calculated using the following formula: r = [µ × (1 – p)] / p.
-
A random sample (λ) from the following gamma distribution (using a shape and scale parameterisation) was taken: λ ∼ gamma [r, p/(1 – p)].
-
A random sample for the number of predicted events (N) was taken from the following Poisson distribution: N ∼ Poisson(λ).
-
This process was applied in the model in each year that each individual was run through the model.
-
In each PSA run, the coefficients of the negative binomial regression were sampled from a multivariate normal distribution.
It should be noted that the formulae for p and r depend on the parameterisation of the variance in the negative binomial regression that an analyst is using. These formulae are valid for SPSS; the formulae may be different if other statistical software is used to fit the negative binomial regression.
Technical appendix on Sheffield Type 2 Diabetes Prevention Model adapted to this study
Whitehall II statistical model of metabolic trajectories
The metabolic trajectories used in the model are derived from statistical analysis of the longitudinal Whitehall II cohort. 258 The parameters derived from this model are described in Tables 51–53.
| Parameters | Parameter description | Estimated mean | SE | p-value |
|---|---|---|---|---|
| BMI intercept | ||||
| α10 | Population mean BMI intercept | 2.2521 | 0.045 | < 0.001 |
| γ10 | Age at baseline coefficient for BMI intercept | 0.0056 | 0.001 | < 0.001 |
| Sex coefficient for BMI intercept | –0.0311 | 0.012 | 0.009 | |
| Family history of CVD coefficient for BMI intercept | –0.0079 | 0.012 | 0.515 | |
| υ10 | Random error term for BMI intercept | 0.1165 | 0.003 | < 0.001 |
| BMI linear slope | ||||
| α11 | Population mean BMI linear slope | 0.6409 | 0.042 | < 0.001 |
| γ11 | Age at baseline coefficient for BMI linear slope | –0.0084 | 0.001 | < 0.001 |
| Sex coefficient for BMI linear slope | –0.0285 | 0.011 | 0.009 | |
| Family history of CVD coefficient for BMI linear slope | –0.0155 | 0.010 | 0.117 | |
| υ11 | Random error term for BMI linear slope | 0.0222 | < 0.001 | < 0.001 |
| BMI quadratic slope | ||||
| α12 | Population mean BMI quadratic slope | –0.2007 | 0.023 | < 0.001 |
| γ12 | Age at baseline coefficient for quadratic slope | 0.0026 | < 0.001 | < 0.001 |
| Sex coefficient for quadratic slope | 0.0089 | 0.006 | 0.147 | |
| Family history of CVD coefficient for quadratic slope | 0.0104 | 0.006 | 0.061 | |
| ϵ1 | Random error term for BMI | 0.0104 | < 0.001 | < 0.001 |
| Glycaemic intercept | ||||
| α20 | Population mean glycaemic intercept | 0 | NA | NA |
| γ20 | Smoker coefficient for glycaemic intercept | –0.1388 | 0.029 | < 0.001 |
| τ20 | Association between BMI intercept and glycaemic intercept | 0.2620 | 0.024 | < 0.001 |
| υ20 | Random error term for glycaemic intercept | 0.0851 | 0.008 | < 0.001 |
| Glycaemic linear slope | ||||
| α21 | Population mean glycaemic linear slope | –0.4255 | 0.071 | < 0.001 |
| γ21 | Sex coefficient for glycaemic linear slope | 0.1486 | 0.045 | 0.001 |
| Ethnicity coefficient for glycaemic linear slope | –0.0218 | 0.081 | 0.786 | |
| Family history of T2DM coefficient for glycaemic linear slope | –0.0512 | 0.054 | 0.345 | |
| Smoker coefficient for glycaemic linear slope | 0.1796 | 0.066 | 0.007 | |
| τ21 | Association between BMI intercept and glycaemic linear slope | 0.0821 | 0.024 | 0.001 |
| τ22 | Association between BMI linear slope and glycaemic linear slope | 0.1984 | 0.073 | 0.007 |
| υ21 | Random error term for glycaemic linear slope | 0.0222 | 0.011 | 0.053 |
| Glycaemic quadratic slope | ||||
| α22 | Population mean glycaemic quadratic slope | 0.1094 | 0.025 | < 0.001 |
| γ22 | Sex coefficient for glycaemic quadratic slope | –0.0855 | 0.027 | 0.002 |
| Ethnicity coefficient for glycaemic quadratic slope | 0.0899 | 0.049 | 0.067 | |
| Family history of T2DM coefficient for glycaemic quadratic slope | 0.0633 | 0.033 | 0.052 | |
| Smoker coefficient for glycaemic quadratic slope | –0.0390 | 0.040 | 0.330 | |
| υ22 | Random error term for glycaemic quadratic slope | 0.0107 | 0.003 | 0.002 |
| ϵ2 | Glycaemic measurement error | 0.0707 | 0.005 | < 0.001 |
| SBP intercept | ||||
| α30 | Population mean SBP intercept | 0.6934 | 0.021 | < 0.001 |
| γ30 | Age at baseline coefficient for SBP intercept | 0.0043 | < 0.001 | < 0.001 |
| Sex coefficient for SBP intercept | 0.0380 | 0.004 | < 0.001 | |
| Smoking coefficient for SBP intercept | –0.0243 | 0.006 | < 0.001 | |
| Ethnicity coefficient for SBP intercept | 0.0078 | 0.007 | 0.300 | |
| Family history of CVD coefficient for SBP intercept | 0.0061 | 0.004 | 0.160 | |
| τ31 | Association between BMI intercept and SBP intercept | 0.1080 | 0.006 | < 0.001 |
| υ30 | Random error term for SBP intercept | 0.0085 | 0.00 | < 0.001 |
| SBP linear slope | ||||
| α31 | Population mean SBP linear slope | –0.0227 | 0.021 | 0.278 |
| γ31 | Age at baseline coefficient for SBP linear slope | 0.0024 | < 0.001 | < 0.001 |
| Sex coefficient for SBP linear slope | –0.0004 | 0.004 | 0.927 | |
| Smoking coefficient for SBP linear slope | 0.0205 | 0.005 | < 0.001 | |
| Ethnicity coefficient for SBP linear slope | 0.0224 | 0.007 | 0.001 | |
| Family history of CVD coefficient for SBP linear slope | –0.0013 | 0.004 | 0.748 | |
| τ31 | Association between BMI intercept and SBP linear slope | –0.0396 | 0.006 | < 0.001 |
| Association between BMI linear slope and SBP linear slope | 0.2325 | 0.019 | < 0.001 | |
| υ31 | Random error term for SBP linear slope | 0.0024 | < 0.001 | < 0.001 |
| ϵ3 | SBP measurement error variance | 0.0093 | < 0.001 | < 0.001 |
| TC intercept | ||||
| α40 | Population mean TC intercept | 2.9956 | 0.176 | < 0.001 |
| γ40 | Age at baseline coefficient for TC intercept | 0.0456 | 0.003 | < 0.001 |
| Sex coefficient for TC intercept | 0.0660 | 0.036 | 0.070 | |
| τ40 | Association between BMI intercept and TC intercept | 0.4459 | 0.049 | < 0.001 |
| υ40 | Random error term for TC intercept | 0.8960 | 0.025 | < 0.001 |
| TC linear slope | ||||
| α41 | Population mean TC linear slope | 2.1216 | 0.128 | < 0.001 |
| γ41 | Age at baseline coefficient for TC linear slope | –0.0316 | 0.002 | < 0.001 |
| Sex coefficient for TC linear slope | –0.2677 | 0.026 | < 0.001 | |
| τ41 | Association between BMI intercept and TC linear slope | –0.4808 | 0.035 | < 0.001 |
| τ42 | Association between BMI linear slope and TC linear slope | 0.9802 | 0.108 | < 0.001 |
| υ41 | Random error term for TC linear slope | 0.1583 | 0.011 | < 0.001 |
| ϵ4 | TC measurement error variance | 0.3426 | 0.006 | < 0.001 |
| HDL intercept | ||||
| α50 | Population mean HDL intercept | 2.4124 | 0.054 | < 0.001 |
| γ50 | Age at baseline coefficient for HDL intercept | 0.0032 | 0.011 | < 0.001 |
| Sex coefficient for HDL intercept | –0.3710 | 0.001 | < 0.001 | |
| τ51 | Association between BMI intercept and HDL intercept | –0.3514 | 0.015 | < 0.001 |
| υ50 | Random error term for HDL intercept | 0.0827 | –0.040 | < 0.001 |
| HDL linear slope | ||||
| α51 | Population mean HDL linear slope | 0.1241 | 0.034 | < 0.001 |
| γ51 | Age at baseline coefficient for HDL linear slope | 0.0020 | 0.001 | < 0.001 |
| Sex coefficient for HDL linear slope | 0.0041 | 0.007 | 0.558 | |
| τ51 | Association between BMI intercept and HDL linear slope | –0.0400 | 0.010 | < 0.001 |
| υ51 | Random error term for HDL linear slope | 0.0090 | 0.001 | < 0.001 |
| ϵ5 | HDL measurement error variance | 0.0333 | 0.001 | < 0.001 |
| Parameters | Parameter description | Estimated mean | SE | p-value |
|---|---|---|---|---|
| μ0 | FPG intercept | 4.2903 | 0.089 | < 0.001 |
| θ01 | Glycaemic factor to FPG | 1 | NA | NA |
| θ02 | Age to FPG | 0.0031 | 0.001 | 0.022 |
| θ03 | Sex to FPG | 0.2129 | 0.021 | < 0.001 |
| θ04 | Ethnicity to FPG | 0.0100 | 0.037 | 0.786 |
| θ05 | Family history of diabetes to FPG | 0.1168 | 0.025 | < 0.001 |
| ϵ0 | FPG measurement error variance | 0.1649 | 0.007 | < 0.001 |
| μ1 | Two-hour glucose intercept | 0.5707 | 0.223 | 0.011 |
| θ11 | Glycaemic factor to 2-hour glucose | 2.4384 | 0.078 | < 0.001 |
| θ12 | Age to 2-hour glucose | 0.0716 | 0.003 | < 0.001 |
| θ13 | Sex to 2-hour glucose | –0.1411 | 0.058 | 0.014 |
| θ14 | Ethnicity to 2-hour glucose | 0.3047 | 0.100 | 0.002 |
| θ15 | Family history of diabetes to 2-hour glucose | 0.3496 | 0.068 | < 0.001 |
| ϵ1 | 2-hour measurement error variance | 2.3679 | 0.054 | < 0.001 |
| μ2 | HbA1c intercept | 4.4769 | 0.073 | < 0.001 |
| θ21 | Glycaemic factor to HbA1c | 0.5074 | 0.016 | < 0.001 |
| θ22 | Age to HbA1c | 0.0101 | 0.001 | < 0.001 |
| θ23 | Sex to HbA1c | –0.0457 | 0.001 | < 0.001 |
| θ24 | Ethnicity to HbA1c | 0.1854 | 0.030 | < 0.001 |
| θ25 | Family history of diabetes to HbA1c | 0.0563 | 0.020 | 0.004 |
| ϵ2 | HbA1c measurement error variance | 0.1166 | 0.003 | < 0.001 |
| Parameters | υ10 | υ11 | υ20 | υ21 | υ22 | υ30 | υ31 | υ40 | υ41 | υ50 | υ51 |
|---|---|---|---|---|---|---|---|---|---|---|---|
| υ10 | 0.1165 | ||||||||||
| υ11 | 0.0095 | 0.0131 | |||||||||
| υ20 | < 0.0010 | < 0.0010 | 0.0851 | ||||||||
| υ21 | < 0.0010 | < 0.0010 | 0.0222 | 0.0209 | |||||||
| υ22 | < 0.0010 | < 0.0010 | < 0.0010 | < 0.0010 | 0.0107 | ||||||
| υ30 | < 0.0010 | < 0.0010 | 0.0080 | < 0.0010 | < 0.0010 | 0.0085 | |||||
| υ31 | < 0.0010 | < 0.0010 | < 0.0010 | 0.0018 | < 0.0010 | < 0.0017 | 0.0024 | ||||
| υ40 | < 0.0010 | < 0.0010 | 0.0324 | < 0.0010 | < 0.0010 | 0.0031 | < 0.0010 | 0.8960 | |||
| υ41 | < 0.0010 | < 0.0010 | < 0.0010 | < 0.0012 | < 0.0010 | < 0.0010 | 0.0066 | –0.2229 | 0.1583 | ||
| υ50 | < 0.0010 | < 0.0010 | –0.0118 | < 0.0010 | < 0.0010 | 0.0010 | < 0.0010 | 0.0273 | < 0.0010 | 0.0827 | |
| υ51 | < 0.0010 | < 0.0010 | < 0.0010 | –0.0059 | < 0.0010 | < 0.0010 | 0.0020 | < 0.0010 | 0.0159 | 0.0061 | 0.0090 |
Glycated haemoglobin trajectory in individuals diagnosed with type 2 diabetes mellitus
The input parameters for the initial reduction in HbA1c level and long-term trend in HbA1c level following diagnosis, derived from analysis of the UKPDS outcomes model, are reported in Tables 54 and 55.
| Parameters | Distribution | Parameter 1 | Parameter 2 | Central estimate |
|---|---|---|---|---|
| Change in HbA1c intercept | Normal | –2.9465 | 0.0444513 | –2.9465 |
| HbA1c at baseline | Normal | 0.5184 | 0.4521958 | 0.5184 |
| Parameter description | Distribution | Parameter 1 | Parameter 2 | Central estimate |
|---|---|---|---|---|
| Longitudinal HbA1c for diabetes intercept | Normal | –0.024 | 0.017 | –0.024 |
| Longitudinal HbA1c for diabetes log(time since diagnosis) | Normal | 0.144 | 0.009 | 0.144 |
| Longitudinal HbA1c for diabetes second year | Normal | –0.333 | 0.05 | –0.333 |
| Longitudinal HbA1c for diabetes lag HbA1c | Normal | 0.759 | 0.004 | 0.759 |
| Longitudinal HbA1c for diabetes HbA1c at diagnosis | Normal | 0.085 | 0.004 | 0.0896 |
Microvascular complications
The parameter distributions for the risk models for foot ulcer, blindness, renal failure, first amputation and second amputation are reported in Table 56. Parameters for renal failure were based on the UKPDS Outcomes Model 1,261 whereas parameters for other microvascular complications were based on the UKPDS Outcomes Model 2. 262
| Parameter description | Distribution | Parameter 1 | Parameter 2 | Central estimate |
|---|---|---|---|---|
| Renal failure baseline hazard | Normal | –10.016 | 0.939 | –10.016 |
| Renal failure Weibull shape | Normal | 1.865 | 1.4352 | 1.865 |
| Renal failure SBP | Normal | 0.404 | 0.106 | 0.404 |
| Renal failure blindness | Normal | 2.082 | 0.551 | 2.082 |
| Foot ulcer baseline hazard | Normal | –11.295 | 1.13 | –11.295 |
| Foot ulcer age at diagnosis | Normal | 0.043 | 0.014 | 0.043 |
| Foot ulcer female | Normal | –0.962 | 0.255 | –0.962 |
| Foot ulcer BMI | Normal | 0.053 | 0.019 | 0.053 |
| Foot ulcer HbA1c | Normal | 0.16 | 0.056 | 0.16 |
| Foot ulcer PVD | Normal | 0.968 | 0.258 | 0.968 |
| Amputation baseline hazard | Normal | –14.844 | 1.205 | –14.844 |
| Amputation age at diagnosis | Normal | 0.023 | 0.011 | 0.023 |
| Amputation female | Normal | –0.445 | 0.189 | –0.445 |
| Amputation atrial fibrillation | Normal | 1.088 | 0.398 | 1.088 |
| Amputation HbA1c | Normal | 0.248 | 0.042 | 0.248 |
| Amputation HDL | Normal | –0.059 | 0.032 | –0.059 |
| Amputation heart rate | Normal | 0.098 | 0.05 | 0.098 |
| Amputation MMALB | Normal | 0.602 | 0.18 | 0.602 |
| Amputation PVD | Normal | 1.01 | 0.189 | 1.01 |
| Amputation white blood count | Normal | 0.04 | 0.017 | 0.04 |
| Amputation stroke | Normal | 1.299 | 0.245 | 1.299 |
| Amputation shape | Normal | 2.067 | 0.193 | 2.067 |
| Amputation with ulcer lambda | Normal | –0.881 | 0139 | –0.881 |
| Amputation with ulcer age at diagnosis | Normal | –0.065 | 0.027 | –0.065 |
| Amputation with ulcer PVD | Normal | 1.769 | 0.449 | 1.769 |
| Second amputation baseline hazard | Normal | –3.455 | 0.565 | –3.455 |
| Second amputation HbA1c | Normal | 0.127 | 0.06 | 0.127 |
| Blindness baseline hazard | Normal | –10.6774 | 0.759 | –10.6774 |
| Blindness age at diagnosis | Normal | 0.047 | 0.009 | 0.047 |
| Blindness HbA1c | Normal | 0.171 | 0.032 | 0.171 |
| Blindness heart rate | Normal | 0.08 | 0.039 | 0.08 |
| Blindness SBP | Normal | 0.068 | 0.032 | 0.068 |
| Blindness white blood cells | Normal | 0.052 | 0.019 | 0.052 |
| Blindness CHF | Normal | 0.841 | 0.287 | 0.841 |
| Blindness IHD | Normal | 0.61 | 0.208 | 0.61 |
Cancer
The parameter distributions for the incidence and hazard ratios for breast cancer and colorectal cancer are reported in Table 57.
| Parameter description | Distribution | Parameter 1 | Parameter 2 | Central estimate | Source |
|---|---|---|---|---|---|
| Colorectal cancer men | Normal | 0.0011 | 0.0001 | 0.0011 | Pischon et al.307 |
| Colorectal cancer women | Normal | 0.0005 | 0.0000 | 0.0005 | Pischon et al.307 |
| Breast cancer pre menopause | Normal | 0.0010 | 0.0001 | 0.0010 | Lahmann et al.308 |
| Breast cancer post menopause | Normal | 0.0028 | 0.0002 | 0.0028 | Lahmann et al.308 |
| Colorectal cancer BMI relative risk for men | Lognormal | 0.1906 | 0.0111 | 1.21 | Renehan et al.309 |
| Colorectal cancer BMI relative risk for women | Lognormal | 0.0392 | 0.0151 | 1.04 | Renehan et al.309 |
| Breast cancer BMI relative risk for pre menopause | Lognormal | –0.1165 | 0.0251 | 0.89 | Renehan et al.309 |
| Breast cancer BMI relative risk for post menopause | Lognormal | 0.0862 | 0.0205 | 1.09 | Renehan et al.309 |
The parameter distributions for breast and colorectal cancer mortality are reported in Table 58.
| Parameter description | Distribution | Parameter 1 | Parameter 2 | Central estimate |
|---|---|---|---|---|
| Breast cancer 5-year survival | Beta | 439.69 | 2354.44 | 0.157 |
| Colorectal cancer 5-year survival | Beta | 1457.56 | 1806.35 | 0.447 |
Osteoarthritis
The parameter distributions for the incidence and hazard ratios for osteoarthritis are reported in Table 59.
| Parameter description | Distribution | Parameter 1 | Parameter 2 | Central estimate |
|---|---|---|---|---|
| Osteoarthritis incidence | Normal | 0.0053 | 0.0000004 | 0.0053 |
| Osteoarthritis relative risk of diabetes mellitus | Lognormal | 0.723 | 0.317 | 2.06 |
| Osteoarthritis relative risk of BMI | Lognormal | 0.073 | 0.026 | 1.076 |
Depression
The parameter distributions for the incidence and hazard ratios for depression are reported in Table 60.
Utilities
The parameter distributions used to estimate health state utilities in the model are reported in Table 61.
| Parameter description | Distribution | Parameter 1 | Parameter 2 | Central estimate | Source |
|---|---|---|---|---|---|
| Renal/ulcer baseline utility | Normal | 0.689 | 0.014 | 0.689 | Coffey et al.249 |
| Renal dialysis | Normal | –0.078 | 0.026 | –0.078 | Coffey et al.249 |
| Foot ulcer | Normal | –0.099 | 0.013 | –0.099 | Coffey et al.249 |
| Amputation/heart failure baseline utility | Normal | 0.807 | 0.005 | 0.807 | Hayes et al.262 |
| Heart failure | Normal | –0.101 | 0.032 | –0.101 | Hayes et al.262 |
| Amputation | Normal | –0.172 | 0.045 | –0.172 | Hayes et al.262 |
| Stable angina multiplicative factor decrement | Normal | 0.801 | 0.038 | 0.801 | Ward et al.313 |
| Unstable angina multiplicative factor decrement | Normal | 0.77 | 0.038 | 0.77 | Ward et al.313 |
| Myocardial infarction multiplicative factor decrement | Normal | 0.76 | 0.018 | 0.76 | Ward et al.313 |
| Stroke multiplicative factor decrement | Normal | 0.629 | 0.04 | 0.629 | Ward et al.313 |
| Cancer baseline utility | Normal | 0.8 | 0.0026 | 0.8 | Yabroff et al.314 |
| Cancer decrement | Normal | –0.06 | 0.008 | –0.06 | Yabroff et al.314 |
| Osteoarthritis utility | Normal | 0.69 | 0.069 | 0.69 | Black et al.315 |
| Depression baseline utility | Normal | 0.48 | 0.048 | 0.48 | Benedict et al.316 |
| Depression remitters | Normal | 0.31 | 0.031 | 0.31 | Benedict et al.316 |
| Depression responders | Normal | 0.20 | 0.020 | 0.20 | Benedict et al.316 |
| Depression non-responders | Normal | 0.070 | 0.007 | 0.070 | Benedict et al.316 |
| Depression drop-outs | Normal | 0.050 | 0.005 | 0.050 | Benedict et al.316 |
| Age utility decrement | Normal | –0.004 | 0.0001 | –0.004 | Ward et al.313 |
Unit health-care costs
The parameter distributions used to estimate health state utilities in the model are reported in Table 62.
| Parameter description | Distribution | Parameter 1 | Parameter 2 | Central estimate | Source/reference |
|---|---|---|---|---|---|
| Diabetes costs | |||||
| Insulin (annual cost) | Gamma | 3.367 | 408.6 | £1375.72 | Poole et al.317 |
| Metformin (annual cost) | Constant | NA | NA | £28.24 | Curtis318 |
| Sitagliptin (annual cost) | Constant | NA | NA | £433.77 | Curtis318 |
| Nurse appointment (advanced) | Gamma | 100 | 0.26 | £25.52 | Curtis318 |
| Health-care assistant appointment | Gamma | 100 | 0.03 | £3.40 | Curtis318 |
| Eye screening | Gamma | 15.3664 | 1.58219 | £24.31 | Burr et al.319 |
| HbA1c test | Gamma | 100 | 0.03 | £3.00 | NHS Reference Costs 320 |
| Lipids test | Gamma | 100 | 0.01 | £1.00 | NHS Reference Costs 320 |
| Liver function test | Gamma | 100 | 0.03 | £3.13 | NHS Reference Costs 320 |
| Vitamin B12 test | Gamma | 100 | 0.03 | £3.13 | NHS Reference Costs 320 |
| Nicotine replacement therapy | Gamma | 100 | 1.03 | £103.00 | Curtis318 |
| CVD costs | |||||
| Unstable angina hospital admission | Gamma | 100 | 12.75591 | £1275.59 | Ara et al.321 |
| Revascularisation in hospital | Gamma | 100 | 60.36846 | £6036.85 | Ara et al.321 |
| Myocardial infarction hospital admission | Gamma | 100 | 15.54896 | £1554.90 | Ara et al.321 |
| First outpatient appointment | Gamma | 100 | 1.653571 | £165.36 | Ara et al.321 |
| Subsequent outpatient appointments | Gamma | 100 | 1.100574 | £110.06 | Ara et al.321 |
| Fatal coronary heart disease | Gamma | 100 | 7.125001 | £712.50 | Palmer et al.322 |
| Fatal stroke | Gamma | 100 | 44.42562 | £4442.56 | Youman et al.323 |
| First year stroke | Gamma | 100 | 126.77 | £12676.60 | Luengo-Fernandez et al.324 |
| Subsequent year stroke | Gamma | 100 | 17.399 | £1739.91 | Luengo-Fernandez et al.324 |
| Transient ischaemic attack | Gamma | 100 | 27.226 | £2722.65 | Luengo-Fernandez et al.324 |
| Glyceryl Trinitrate Spray (Glytrin spray; Aspire Pharma Ltd, Petersfield, UK) | Constant | NA | NA | £12.61 | Ara et al.321 |
| Isosorbide mononitrate | Constant | NA | NA | £13.54 | Ara et al.321 |
| Verapamil | Constant | NA | NA | £50.57 | Ara et al.321 |
| (Tenormin®; AstraZeneca plc, Cambridge, UK) | Constant | NA | NA | £36.42 | Ara et al.321 |
| Aspirin | Constant | NA | NA | £8.01 | Ara et al.321 |
| Ramipril | Constant | NA | NA | £90.45 | Ara et al.321 |
| ARB | Constant | NA | NA | £253.28 | Ara et al.321 |
| Clopidogrel | Constant | NA | NA | £554.41 | Ara et al.321 |
| Chronic heart failure year 1 inpatient | Gamma | 17.08787 | 197.607 | £3376.68 | Alva et al.247 |
| Chronic heart failure year 1 non inpatient | Gamma | 50.13476 | 20.66365 | £1035.97 | Alva et al.247 |
| Chronic heart failure subsequent years inpatient | Gamma | 23.46525 | 66.42644 | £1558.71 | Alva et al.247 |
| Chronic heart failure subsequent years non inpatient | Gamma | 109.7982 | 9.377373 | £1029.62 | Alva et al.247 |
| Microvascular costs | |||||
| Blindness year 1 inpatient | Gamma | 7.982428 | 179.6254 | £1433.85 | Alva et al.247 |
| Blindness year 1 non-inpatient | Gamma | 14.79887 | 127.9935 | £1894.16 | Alva et al.247 |
| Blindness subsequent years inpatient | Gamma | 41.39524 | 11.58007 | £479.36 | Alva et al.247 |
| Blindness subsequent years non-inpatient | Gamma | 79.72506 | 9.795462 | £780.94 | Alva et al.247 |
| Amputation year 1 inpatient | Gamma | 35.73274 | 282.6952 | £10101.48 | Alva et al.247 |
| Amputation year 1 outpatient | Gamma | 16.81661 | 169.8352 | £2856.05 | Alva et al.247 |
| Amputation subsequent years inpatient | Gamma | 23.02322 | 82.36361 | £1896.28 | Alva et al.247 |
| Amputation subsequent years outpatient | Gamma | 57.06248 | 29.87502 | £1704.74 | Alva et al.247 |
| Renal haemodialysis | Gamma | 100 | 420.49 | £42,049.00 | Baboolal et al.325 |
| Renal automated peritoneal dialysis | Gamma | 100 | 272.1714 | £27,217.14 | Baboolal et al.325 |
| Renal ambulatory peritoneal dialysis | Gamma | 100 | 197.4225 | £19,742.25 | Baboolal et al.325 |
| Renal transplant | Gamma | 100 | 236.5973 | £23,659.73 | Organ Donation326 |
| Immunosuppressants | Gamma | 100 | 69.58745 | £6958.75 | Organ Donation326 |
| Foot ulcer not infected | Gamma | 100 | 1.677526 | £167.75 | Gordois et al.327 |
| Foot ulcer with cellulitis | Gamma | 100 | 4.431003 | £443.10 | Gordois et al.327 |
| Foot ulcer with osteomyelitis | Gamma | 100 | 8.215817 | £821.58 | Gordois et al.327 |
| Other disease costs | |||||
| Breast cancer | Gamma | 100 | 138.1811 | £13,818.11 | Madan et al.328 |
| Colorectal cancer Dukes A | Gamma | 100 | 100.9135 | £10,091.35 | Tappenden et al.329 |
| Colorectal cancer Dukes B | Gamma | 100 | 173.1532 | £17,315.32 | Tappenden et al.329 |
| Colorectal cancer Dukes C | Gamma | 100 | 265.5026 | £26,550.26 | Tappenden et al.329 |
| Colorectal cancer Dukes D | Gamma | 100 | 166.2553 | £16,625.53 | Tappenden et al.329 |
| Osteoarthritis | Gamma | 100 | 9.616886 | £961.69 | Oxford Economics330 |
| Depression – Practice nurse surgery | Gamma | 100 | 0.090154 | £9.02 | Chalder et al.331 |
| Depression – Practice nurse home | Gamma | 100 | 0.270463 | 27.05 | Chalder et al.331 |
| Depression – Practice nurse telephone | Gamma | 100 | 0.090154 | 9.02 | Chalder et al.331 |
| Depression – health visitor | Gamma | 100 | 0.387834 | 38.78 | Chalder et al.331 |
| Depression – district nurse | Gamma | 100 | 0.377628 | 37.76 | Chalder et al.331 |
| Depression – other nurse | Gamma | 100 | 0.090154 | 9.02 | Chalder et al.331 |
| Depression – health-care assistant phlebotomist | Gamma | 100 | 0.034021 | 3.40 | Chalder et al.331 |
| Depression – other primary care | Gamma | 100 | 0.255154 | 25.52 | Chalder et al.331 |
| Depression – out of hours | Gamma | 100 | 0.268661 | 26.87 | Chalder et al.331 |
| Depression – NHS Direct | Gamma | 100 | 0.25295 | 25.30 | Chalder et al.331 |
| Depression – walk-in centre | Gamma | 100 | 0.388316 | 38.83 | Chalder et al.331 |
| Depression – prescribed medicines | Gamma | 100 | 0.096144 | 9.61 | Chalder et al.331 |
| Depression – secondary care | Gamma | 100 | 0.81 | 81.00 | Chalder et al.331 |
| Diagnosis and other costs | |||||
| GP appointment | Gamma | 100 | 0.47 | £46.95 | Chalder et al.331 |
| Diabetes diagnosis | Gamma | 100 | 0.12 | £14.81 | NHS Reference Costs 320 |
| Hypertension diagnosis | Gamma | 100 | 0.57 | £56.51 | NICE332 |
| Antihypertensives | Gamma | 100 | 1.96 | £195.94 | |
| Simvastatin | Constant | NA | NA | £26.59 | |
Technical appendix on network meta-analysis results used in cost-effectiveness modelling
Adults with type 1 diabetes mellitus
| _y_A: | _y_B: | _y_D: | tau: | |
|---|---|---|---|---|
| _cons | _cons | _cons | _cons | |
| _y_A:_cons | 0.00902538 | |||
| _y_B:_cons | 0.00283336 | 0.0090491 | ||
| _y_D:_cons | 0.0090252 | 0.0028333 | 0.02923929 | |
| tau:_cons | 1.174 × 10⁹ | 1.189 × 10⁹ | 1.479 × 10⁹ | 0.00995378 |
Adults with type 2 diabetes mellitus
| _y_A: | _y_B: | _y_C: | _y_E: | tau: | |
|---|---|---|---|---|---|
| _cons | _cons | _cons | _cons | _cons | |
| _y_A:_cons | 0.01642376 | ||||
| _y_B:_cons | 0.00152833 | 0.01004061 | |||
| _y_C:_cons | 4.068 × 10⁻⁶ | 3.676 × 10⁻⁶ | .0791886 | ||
| _y_E:_cons | 0.00537357 | 0.00783819 | 2.476 × 10⁻⁶ | 0.02765208 | |
| tau:_cons | –0.00016284 | –0.00014717 | –0.00008289 | –0.00009913 | 0.00331815 |
Adults with type 1 diabetes mellitus: dispersion parameters
| HbA1c at 1 year (beta scale) | Coefficient | SE | t | p > t | 95% CI |
|---|---|---|---|---|---|
| Dispersion parameter (phi), using a natural logarithm link function | |||||
| Baseline HbA1c (beta scale) | –2.996862 | 0.9980645 | –3 | 0.003 | –4.954 to –1.040 |
| Constant | 4.912 | 0.332 | 14.79 | 0 | 4.261 to 5.563 |
See appendix 22 of supplementary materials B in Pollard et al. 244 to obtain the covariance matrix for these coefficients.
Technical appendix on longer-term (post 1 year) duration of treatment effect for psychological interventions
| Mean and SEs from the Ridge et al.251 analysis | Mean | SE | Covariance matrix | |
|---|---|---|---|---|
| Initial fall | –0.46 | 0.178575 | 0.031888927 | –0.01613 |
| Trajectory | 0.062145 | 0.116901 | –0.016134413 | 0.013666 |
| Mean and SEs from the Ridge et al.251 analysis | Mean | SE | Covariance matrix | |
|---|---|---|---|---|
| Initial fall | –0.19 | 0.178575 | 0.030984323 | –0.01489 |
| Trajectory | –0.02707 | 0.14901 | –0.014886507 | 0.022204 |
Technical appendix on costing psychological interventions
Purpose of this section
This section details the assumptions made in estimating the cost of the different types of psychological interventions for adults with T1DM and people with T2DM. Values used in the costing are underlined.
Adults with type 1 diabetes mellitus
This section highlights the different components of intervention resource use and cost associated with the different types of psychological interventions delivered to adults with T1DM. These are broadly split into two categories: those types of resource use/cost that are assumed to be the same across interventions and those that are different. The following categories are assumed to be the same across interventions: the interventionists, the session-related non-contact time (either as a ratio of contact time or an absolute value), the cost of consumables and the training costs. The following categories are assumed to be different: the split between individual and group sessions, the average number of people in a group session, the number of sessions and the duration of each session. These are all dealt with in the following sections.
Resources that are the same across the different psychological interventions
Interventionists
Table 68 shows the different interventionists who delivered psychological interventions for people with T1DM and associated UK full economic costs (from the PSSRU Unit Costs of Health and Social Care 2016333).
| Interventionist | Number of studies | Typical NHS band (PSSRU) | Cost (£) per hour (PSSRU) |
|---|---|---|---|
| Nurse/dietitian/educator | 4 | Band 6 (nurse specialist) | 44 (excluding standard non-patient contact) |
| Band 7 (nurse advanced) | 53 (excluding standard non-patient contact) | ||
| Band 8a (modern matron) | 62 | ||
| Psychologist | 2 | Band 7 (clinical psychologist) | 52 |
| Band 8a–b (clinical psychologist principle) | 62 | ||
| Band 8d–9 (clinical psychologist consultant) | Not stated | ||
| Nurse and psychologist | 1 | Combination of the two above categories | |
| Nurse or psychologist | 1 | Combination of the two above categories | |
We have assumed that the person delivering the intervention is a band 7 nurse. The full economic cost of staff time will be £53 per hour worked, as most studies used nurses rather than psychologists for psychological interventions for people with T1DM.
Q1 – Is a band 7 nurse an appropriate interventionist, if a psychological intervention were to be implemented for adults with T1DM in the UK?
Session-related non-contact time
The number of hours spent on course administration was reported in only one study (ADaPT);251 it was 0.25 hours per session. As this is only one study, there are some concerns of the applicability of this, more generally, to psychological interventions in a UK setting. Therefore, the proportion of non-contact time to contact time will be based on the ratio of direct to indirect contacts reported for band 7 hospital nurses in the PSSRU. 333 This is for every hour of face-to-face contact, there is 1.44 hours of indirect time. This was chosen as it is based on a nationally representative ratio of non-contact to contact time for this grade of nurse in the UK.
Q2 – Are you aware of any other information which gives information on the non-contact time associated with delivering a psychological intervention to adults with T1DM?
Q3 – Does the ratio of 1.44 non-contact hours per hour of contact capture all non-contact time spent delivering the session (e.g. administration, rearranging session times)? If not, what alternative assumption do you think that we should make?
Consumable cost per session
Only one study reported the cost of consumables per session (ADaPT); this was £0.72 in 2005–06 prices. After inflating these to 2015–16 prices using the Hospital and Community Health Service (HCHS) pay and prices index,333 this gives a consumable cost per session of £0.89.
Q4 – Are you aware of any other studies that give a cost of consumables spent delivering psychological interventions in T1DM adults?
Training duration
The mean duration of training for interventionists to deliver a group session across all psychological interventions for adults with T1DM was 40 hours of contact time. The mean duration of training for individual sessions was 30 hours of contact time.
We will assume that both sessions were delivered by a band 8 clinical psychologist (£62 per hour) to band 7 nurses. We will assume that the training session is delivered to, on average, 15 nurses at the same time. This is based on the DAFNE activity report from 2014–15 in which 46 educators were trained in three courses (DAFNE programme activity, 1 April 2014–31 March 2015). Furthermore, based on the costings conducted for DAFNE, we will assume that each site will train three trainees, and that there will be a 10% depletion of staff per year (DAFNE fact sheet 6). The yearly costs of training were calculated assuming a 10-year lifespan and a depreciation rate of 3.5%.
A breakdown of the costs of training staff to deliver psychological interventions is presented in Table 69.
| Breakdown of training costs per recipient of psychological interventions | Course cost | |
|---|---|---|
| Individual | Group | |
| a) Trainer | £1860 | £2480 |
| b) Cost per trainee (a / 15.3) | £121.30 | £161.74 |
| c) Cost of trainee time | £1590 | £2120 |
| d) Cost for three trainees [(b + c) × 3] | £5133.91 | £6845.22 |
| e) Annuity factora | 8.32 | 8.32 |
| f) Cost per year (d / e) | £617.31 | £823.08 |
| g) Cost per recipient of psychological intervention (f / 48) | £12.86 | £17.15 |
Q5 – Is a band 8 clinical psychologist an appropriate grade for the average person likely to deliver training sessions for psychological interventions?
Q6 – Is DAFNE an appropriate source for the duration of training effect and the number of trainees per session?
Q7 – If not, what data/values should be used instead to estimate the training costs of delivering psychological interventions?
Resource use specific to the different psychological interventions
The resource use specific to the different psychological interventions are presented in Table 70. The mean number of sessions, the mean time spent delivering sessions and the average number of people receiving an intervention in each session were obtained from a sample size-weighted average of the data reported in the studies in the systematic review.
| Breakdown of training costs per recipient of psychological interventions | CBT | Counselling |
|---|---|---|
| a) Proportion of the intervention that is delivered to a group | 71.1% | 27.8% |
| Mean number of sessions | ||
| b.1) Individual | 9.2 | 7 |
| b.2) Group | 7 | 9.6 |
| Mean time spent delivering sessions (hours) | ||
| c.1) Individual | 0.9 | 0.9 |
| c.2) Group | 2.2 | 2.3 |
| Average number of people receiving an intervention per session | ||
| d.1) Individual | 1 | 1 |
| d.2) Group | 6.6 | 6.2 |
| Direct costs | ||
| e.1) Direct cost of an individual session [(b.1 × c.1 × £53) / d.1] | £433 | £336 |
| e.2) Direct cost of a group session [(b.2 × c.2 × £53) / d.2] | £133 | £186 |
| Average cost of the intervention [a*e.1 +(1-a)*e.2] | £219.86 | £294.01 |
| Indirect cost of nurse time for the session | £65.96 | £55.90 |
| Transcription of the sessions | £21.74 | £27.64 |
| Supervision costs | ||
| Direct | £279.00 | £85.31 |
| Indirect | £52.34 | £115.87 |
| Training cost per participant | £18.26 | £16.15 |
| Capital costs of running the course (tape recorder) | £0.07 | £0.07 |
| Total cost | £657 | £580 |
The cost of delivering a CBT intervention is £657 per participant and the cost of delivering a counselling intervention is £580 per participant.
Usual care
Whenever data on usual care were presented in the studies included in the systematic review, it was either an enhancement to usual care or the contacts were related to protocol requirements (e.g. collection of blood samples at baseline). Therefore, it was assumed that there were no additional costs associated with usual care.
| Item | Value | Notes | Source |
|---|---|---|---|
| Cost per hour of interventionist time | £53 | Band 7 nurse | Unit Costs of Health and Social Care 2016 333 |
| Cost per hour of trainer time | £62 | Band 8a clinical psychologist | Unit Costs of Health and Social Care 2016 333 |
| Cost per hour of supervisor time | £62 | Band 8a clinical psychologist | Unit Costs of Health and Social Care 2016 333 |
| HCHS pay and prices 2011/12 | 282.5 | Unit Costs of Health and Social Care 2016 333 | |
| HCHS pay and prices 2015/16 | 297 | Unit Costs of Health and Social Care 2016 333 | |
| Transcription costs | £0.80 | 2011/12 prices | Ismail et al.300 |
| Number of people delivered to per year | 48 | DAFNE334 | |
| CBT | |||
| Proportion of the interventions that are delivered to a group | 71.1% | Systematic review of this study | |
| Individual sessions | |||
| Number of sessions | 9.197452229 | Systematic review of this study | |
| Mean time spent delivering sessions | 0.88761175 | Systematic review of this study | |
| Average number of people receiving an intervention | 1 | Definition | |
| Group sessions | |||
| Number of sessions | 7.487046632 | Systematic review of this study | |
| Mean time spent delivering sessions | 2.221631206 | Systematic review of this study | |
| Average number of people receiving an intervention | 6.613475177 | Systematic review of this study | |
| Hours of non-contact time per hour of contact time | 0.3 | ADaPT251 | |
| Counselling | |||
| Proportion of the interventions that are delivered to a group | 27.8% | ||
| Individual sessions | |||
| Number of sessions | 7 | Systematic review of this study | |
| Mean time spent delivering sessions | 0.904761905 | Systematic review of this study | |
| Average number of people receiving an intervention | 1 | Definition | |
| Group sessions | |||
| Number of sessions | 9.615384615 | Systematic review of this study | |
| Mean time spent delivering sessions | 2.269230769 | Systematic review of this study | |
| Average number of people receiving an intervention | 6.230769231 | Systematic review of this study | |
| Hours of non-contact time per hour of contact time | 0.2 | ADaPT251 | |
| Training | |||
| Number of people trained at once | 5.5 | Ismail et al.300 | |
| Depletion of staff trained per year | 10% | DAFNE334 | |
| Depreciation rate | 3.50% | NICE methods guide335 | |
| Capital costs | |||
| Room hire | £3.10 | per hour, 2011/12 prices | Ismail et al.300 |
| Video camera | £19.99 | 2011/12 prices | |
| Costs per person | |||
| Handbook | £11.94 | 2011/12 prices | Ismail et al.300 |
| Slides | £7.20 | 2011/12 prices | Ismail et al.300 |
| Individual sessions | |||
| Time of training sessions | 30 | Systematic review of this study | |
| Group sessions | |||
| Time of training sessions | 40 | Systematic review of this study | |
| Supervision | |||
| Capital costs | |||
| Audio-recorder | 24.99 | 2011/12 prices | Ismail et al.300 |
| Lifespan of technology | 5 | years | Ismail et al.300 |
| Staff costs | |||
| Counselling | |||
| Supervision time per session | 0.140666667 | per hour of contact | ADaPT251 |
| Therapist non-contact | 0.25 | per hour of contact | ADaPT251 |
| Supervisor non-contact | 0.140666667 | per hour of contact | ADaPT251 |
| CBT | |||
| Supervision time per session – senior | 0.033166667 | per hour of contact | ADaPT251 |
| Supervisor non-contact – senior | 0.01153845 | per hour of contact | ADaPT251 |
| Supervision time per session – non-senior | 0.551666667 | per hour of contact | ADaPT251 |
| Supervisor non-contact – non-senior | 0.19196155 | per hour of contact | ADaPT251 |
| Therapist non-contact | 0.25 | per hour of contact | ADaPT251 |
| Intermediate calculations | |||
| Average contact time per person | |||
| CBT | |||
| Group | 2.515085638 | ADaPT251 | |
| Individual | 8.163766666 | ADaPT251 | |
| Average | 4.148313854 | ADaPT251 | |
| Counselling | |||
| Group | 2.515085638 | ||
| Individual | 6.333333333 | ||
| Average | 5.273463866 | ||
| Transcription costs applied to % of sessions | 10% | ||
| Item | Individual | Group |
|---|---|---|
| Training costs (£) | ||
| Trainer time | 1860 | 2480 |
| Room hire | 93 | 124 |
| Video recording | 21.02 | 21.02 |
| Sum | 1974 | 2625 |
| Per participant | 359 | 477 |
| Cost of participant time | 1590 | 2120 |
| Cost of handbooks | 13 | 13 |
| Cost of slide printouts | 8 | 8 |
| Cost for number of trainees | 5907.10 | 7852.19 |
| Annuity factor | 8.32 | 8.32 |
| Cost per annum | 710.28 | 944.16 |
| Cost per recipient of a psychological intervention | 14.80 | 19.67 |
| Capital costs | ||
| Tape recorder | £26.27 | |
| Assumed lifespan (years) | 5 | |
| Depreciation rate | 3.50% | |
| Annuity factor | 8.32 | |
| Cost per year | £3.16 | |
| Cost per psychological intervention recipient | £0.07 | |
| Intervention costs | ||
| CBT (£) | ||
| Direct costs of staff time to deliver the session | ||
| Individual | 432.68 | |
| Group | 133.30 | |
| Average | 219.86 | |
| Indirect cost of nurse time for the session | 65.96 | |
| Transcription of the sessions | 21.74 | |
| Supervision costs | ||
| Direct | 279.00 | |
| Indirect | 52.34 | |
| Training cost per participant | 18.26 | |
| Capital costs of running the course (tape recorder) | 0.07 | |
| Total cost | 657 | |
| Cost per session for comparison with Ismail et al.252 | 82.34 | |
| Counselling (£) | ||
| Direct costs of staff time to deliver the session | ||
| Individual | 335.67 | |
| Group | 133.29 | |
| Average | 279.49 | |
| Indirect cost of nurse time for the session | 55.90 | |
| Transcription of the sessions | 27.64 | |
| Supervision costs | ||
| Direct | 85.31 | |
| Indirect | 115.87 | |
| Training cost per participant | 16.15 | |
| Capital costs of running the course (tape recorder) | 0.07 | |
| Total cost | 580 | |
| Cost per session for comparison with Ismail et al.252 | 72.72 | |
Type 2 diabetes mellitus
Resources that are the same across the different psychological interventions
This section highlights the different components of intervention resource use and cost associated with the different types of interventions. These are broadly split into two categories: those types of resource use/cost that are assumed to be the same across interventions and those that are different. The following categories are assumed to be the same across interventions: the interventionists, the session-related non-contact time (either as a ratio of contact time or an absolute value), the cost of consumables and the training costs. The following categories are assumed to be different: the split between individual and group sessions, the average number of people in a group session, the number of sessions and the duration of each session. These are all dealt with in turn in the following sections.
Interventionists
| Interventionist | Number of studies | Typical NHS band (PSSRU) | Cost per hour (PSSRU) |
|---|---|---|---|
| Nurse/dietitian/educator | 23 | Band 6 (nurse specialist) | £44 (excluding standard non-patient contact) |
| Band 7 (nurse advanced) | £53 (excluding standard non-patient contact) | ||
| Band 8a (modern matron) | £62 | ||
| Psychologist/psychotherapist | 12 | Band 7 (clinical psychologist) | £52 |
| Band 8a–b (clinical psychologist principle) | £62 | ||
| Band 8d–9 (clinical psychologist consultant) | Not stated | ||
| Counsellor | 1 | Band 5 counsellor (entry level) | £32 |
| Band 6 counsellor | £42 | ||
| Band 7 counsellor (specialist) | £52 | ||
| Band 8a–c counsellor consultant | £62–74 | ||
| Music therapists | 1 | Band 6 | £42 |
| Pharmacist | 1 | Band 6 pharmacist | £42 |
| Band 7 pharmacist specialist | £52 | ||
| Band 8a–b pharmacist advanced | £62–74 | ||
| Band 8b–d pharmacist consultant | Not stated | ||
| General practitioner/community doctor | 2 | £3.90 per minute (direct staff care costs and with qualifications) |
Assume that the interventionist is a band 7 (regardless of type). We will cost this as £53 per hour worked, as most studies used nurses for psychological interventions for people with T2DM.
Q8 – Is a band 7 interventionist (either a nurse or clinical psychologist) appropriate, if a psychological intervention were to be implemented in the UK for people with T2DM?
Session-related non-contact time
The number of hours spent on course administration was reported in only one study (Walker336); it was 10 minutes per 1- hour session. As this is only one study and it has been conducted in the US health-care setting, there are some concerns of the applicability of this, more generally, to psychological interventions in a UK setting. The proportion of non-contact time to contact time will be based on the ratio of direct to indirect contacts reported for band 7 hospital nurses in the PSSRU. This is for every hour of face-to-face contact; there are 1.44 hours of indirect time.
Q9 – Are you aware of any other information that gives the session-related non-contact time for health-care professionals in the field of diabetes?
Q10 – Does the ratio of 1.44 non-contact hours per hour of contact capture all non-contact time spent delivering the session (e.g. administration, rearranging session times)?
Consumable cost per session
Only one study reported the cost of consumables per session (Walker336), this was US$650 across 154 sessions (US$4.22 per session) in 2010–11 prices. This gives a cost of £3.18 per session after converting the cost to Great British pounds using the Organisation for Economic Co-operation and Development (OECD) purchasing power parity rates and inflating to 2015–16 prices using the HCHS pay and prices index.
Q11 – Are you aware of any other studies that give a cost of consumables spent delivering psychological interventions for people with T2DM?
Training duration
The mean duration of training for individual sessions was 30.63 hours of contact time. No studies that used a group session reported the training duration, so it was assumed that the time taken to train health-care professionals to deliver a psychological intervention was also 30.63 hours.
We will assume that both sessions were delivered by a band 8 clinical psychologist (£62 per hour) to band 7 nurses. Based on the economic analysis of the DESMOND (Diabetes Education and Self Management for Ongoing and Newly Diagnosed) structured education course for people with T2DM (Gillett et al. 337), it was assumed that:
-
the training session is delivered to, on average, 13 interventionists at the same time
-
three interventionists per site will be trained for the course
-
training will be valid for 3 years
-
Each trained educator will conduct, on average, 18.7 (56/3) interventions per year.
| Course cost | Individual | Group |
|---|---|---|
| a) Trainer | £2065.32 | £2065.32 |
| b) Cost per trainee (a / 13) | £158.87 | £158.87 |
| c) Cost of trainee time | £1765.51 | £1765.51 |
| d) Cost for three trainees [(b + c) × 3] | £5296.53 | £5296.53 |
| e) Annuity factora | 2.80 | 2.80 |
| f) Cost per year (d / e) | £1890.51 | £1890.51 |
| g) Cost per recipient of psychological intervention (f / 18.7) | £101.28 | £101.28 |
Q12 – Is a band 8 clinical psychologist an appropriate grade for the average person likely to deliver training sessions for psychological interventions?
Q13 – Is DESMOND an appropriate source for the duration of training effect and the number of trainees per session?
Q14 – Would DAFNE be a more appropriate source of evidence for the duration of training effect and the number of trainees per session? (10-year effect of training, three trainees per site, trainees would see 48 people per annum.)
Q15 – If neither of these data sources are appropriate, what data/values should be used instead?
Interventions
The cost of the staff time for delivering the intervention (both direct and indirect) was recalculated for the studies based on the classification in the NMA. The three categories of intervention for people with T2DM were CBT, counselling and psychotherapy. Only weighted averages between individual and group interventions were used to estimate the cost of each of the intervention categories. The results of these analyses are presented in Table 75.
| CBT | Counselling | |
|---|---|---|
| a) Proportion of the interventions that is delivered to a group | 72.0% | 5.5% |
| Mean number of sessions | ||
| b.1) Individual | 14.9 | 11.0 |
| b.2) Group | 7.3 | 5.9 |
| Mean time spent delivering sessions (hours) | ||
| c.1) Individual | 0.6 | 0.8 |
| c.2) Group | 1.6 | 2.2 |
| Average number of people receiving an intervention per session | ||
| d.1) Individual | 1 | 1 |
| d.2) Group | 7.1 | 8.5 |
| Direct costs | ||
| e.1) Direct cost of an individual session [(b.1*c.1*£53)/d.1] | £444.07 | £466.17 |
| e.2) Direct cost of an group session [(b.2*c.2*£53)/d.2] | £87.66 | £80.74 |
| Average cost of the intervention [a × e.1 + (1 – a) × e.2] | £187.29 | £444.79 |
| Other costs | ||
| Indirect cost of nurse time for the session | £56.19 | £88.96 |
| Transcription of the sessions | £18.52 | £43.98 |
| Supervision costs | ||
| Direct | £237.66 | £136 |
| Indirect | £91.41 | £184 |
| Training cost per participant | £42.07 | £42.07 |
| Capital costs of running the course (tape recorder) | £0.07 | £0.07 |
| Total cost | £633 | £940 |
The cost of delivering a CBT intervention is £633 per participant; the cost of delivering a counselling intervention is £940 per participant.
Usual care
Whenever data on usual care were presented in the studies included in the systematic review, they were either an enhancement to usual care or the contacts were related to protocol requirements (e.g. collection of blood samples at baseline). Therefore, it was assumed that there were no additional costs associated with usual care.
| Item | Value | Notes | Source |
|---|---|---|---|
| Cost per hour of interventionist time | £53 | Band 7 nurse | Unit Costs of Health and Social Care 2016 333 |
| Cost per hour of trainer time | £62 | Band 8a clinical psychologist | Unit Costs of Health and Social Care 2016 333 |
| Cost per hour of supervisor time | £62 | Band 8a clinical psychologist | Unit Costs of Health and Social Care 2016 333 |
| HCHS Pay and prices 2011/12 | £282.5 | Unit Costs of Health and Social Care 2016 333 | |
| HCHS Pay and prices 2015/16 | £297 | Unit Costs of Health and Social Care 2016 333 | |
| Transcription costs | £0.80 | 2011/12 prices | Ismail et al.300 |
| Number of people delivered to per year | 48 | DAFNE334 | |
| CBT | |||
| Proportion of the interventions that are delivered to a group | 72.0% | SR | |
| Individual sessions | |||
| Number of sessions | 14.94 | Systematic review of this study | |
| Mean time spent delivering sessions (hours) | 0.561 | Systematic review of this study | |
| Average number of people receiving an intervention | 1 | Definition | |
| Group sessions | |||
| Number of sessions | 7.35 | Systematic review of this study | |
| Mean time spent delivering sessions (hours) | 1.591 | Systematic review of this study | |
| Average number of people receiving an intervention | 7.071 | Definition | |
| Hours of non-contact time per hour of contact time | 0.3 | ADaPT251 | |
| Counselling | |||
| Proportion of the interventions that are delivered to a group | 5.5% | Systematic review of this study | |
| Individual sessions | |||
| Number of sessions | 10.99 | Systematic review of this study | |
| Mean time spent delivering sessions (hours) | 0.8 | Systematic review of this study | |
| Average number of people receiving an intervention | 1 | Definition | |
| Group sessions | |||
| Number of sessions | 5.885 | Systematic review of this study | |
| Mean time spent delivering sessions (hours) | 2.191 | Systematic review of this study | |
| Average number of people receiving an intervention | 8.465 | Definition | |
| Hours of non-contact time per hour of contact time | 0.2 | ADaPT251 | |
| Psychotherapy | |||
| Proportion of the interventions that are delivered to a group | 0.0% | ||
| Individual sessions | |||
| Number of sessions | 12 | ||
| Mean time spent delivering sessions (hours) | 0.5 | ||
| Average number of people receiving an intervention | 1 | ||
| Group sessions | |||
| Number of sessions | – | ||
| Mean time spent delivering sessions (hours) | – | ||
| Average number of people receiving an intervention | – | ||
| Hours of non-contact time per hour of contact time | 0.2 | Assumed it is closer to counselling than CBT (as a result of the proportion of events that are individual sessions) | ADaPT251 |
| Training | |||
| Time spent training nurses (hours) | 33.31 | ||
| Cost per hour of trainer time | £62 | PSSRU | |
| Cost per hour of interventionist time | £53 | PSSRU | |
| Duration of training (hours) | 10 | Assumed same as type 1 | |
| Number of people in a training session | 13 | Gillett et al.337 | |
| Number of nurses per centre | 3 | Gillett et al.337 | |
| Depreciation rate | 0.035% | NICE methods guide335 | |
| Number of people trained at once | 5.5 | Ismail et al.300 | |
| Number of people receiving a psychological intervention per year | 18.7 | Gillett et al.337 | |
| Capital costs | |||
| Room hire | £3.1 | Per hour, 2011/12 prices | Ismail et al.300 |
| Video camera | £19.99 | 2011/12 prices | |
| Costs per person | |||
| Handbook | £11.94 | 2011/12 prices | Ismail et al.300 |
| Slides | £7.2 | 2011/12 prices | Ismail et al.300 |
| Intermediate calcs | |||
| Average contact time per person (hours) | |||
| CBT | |||
| Group | 1.654 | ||
| Individual | 8.379 | ||
| Average | 3.534 | ||
| Counselling | |||
| Group | 1.523 | ||
| Individual | 8.796 | ||
| Average | 8.392 | ||
| Item | Cost (£) |
|---|---|
| Training costs | |
| Trainer time | 2065 |
| Room hire | 98.22 |
| Video-recording | 21.02 |
| Sum | 2185 |
| Per participant | 397.19 |
| Cost of participant time | 1765.51 |
| Cost of handbooks | 11.36 |
| Cost of slide print outs | 6.85 |
| Cost for number of trainees | 6542.73 |
| Annuity factor | 8.32 |
| Cost per annum | 786.71 |
| Cost per recipient of a psychological intervention | 42.07 |
| CBT | |
| Direct costs of staff time to deliver the session | |
| Average | 187.29 |
| Indirect cost of nurse time for the session | 56.19 |
| Transcription of the sessions | 18.52 |
| Supervision costs | |
| Direct | 237.66 |
| Indirect | 91.41 |
| Training cost per participant | 42.07 |
| Capital costs of running the course (tape recorder) | 0.07 |
| Total cost | 633 |
| Counselling | |
| Direct costs of staff time to deliver the session | |
| Average | 445 |
| Indirect cost of nurse time for the session | 88.96 |
| Transcription of the sessions | 43.98 |
| Supervision costs | |
| Direct | 136 |
| Indirect | 184 |
| Training cost per participant | 42.07 |
| Capital costs of running the course (tape recorder) | 0.07 |
| Total cost | 940 |
| Psychotherapy | |
| Direct costs of staff time to deliver the session | |
| Average | 318 |
| Indirect cost of nurse time for the session | 63.6 |
| Transcription of the sessions | 31.44 |
| Supervision costs | |
| Direct | 97.06 |
| Indirect | 131.828 |
| Training cost per participant | 42.07 |
| Capital costs of running the course (tape recorder) | 0.07 |
| Total cost | 684 |
List of abbreviations
- ADaPT
- A Diabetes and Psychological Therapies study
- BFST-D
- Behavioral Family Systems Therapy for Diabetes
- BGAT
- blood glucose awareness training
- BMI
- body mass index
- CBT
- cognitive–behavioural therapy
- CEAC
- cost-effectiveness acceptability curve
- CES-D
- Center for Epidemiologic Studies Depression Scale
- CHEERS
- Consolidated Health Economic Evaluation Reporting Standards
- CI
- confidence interval
- CINAHL
- Cumulative Index to Nursing and Allied Health Literature
- CONSORT
- Consolidated Standards of Reporting Trials
- CVD
- cardiovascular disease
- DAFNE
- Dose Adjustment For Normal Eating
- DBP
- diastolic blood pressure
- DESMOND
- Diabetes Education and Self Management for Ongoing and Newly Diagnosed
- DKA
- diabetic ketoacidosis
- DUA
- data use agreement
- EVPI
- expected value of perfect information
- EVPPI
- expected value of perfect parameter information
- FP
- female participant
- FV
- fitted value
- GBP
- Great British pounds
- GRADE
- Grading of Recommendations Assessment, Development and Evaluation
- HbA1c
- glycated haemoglobin
- HCHS
- Hospital and Community Health Service
- HTA
- health technology assessment
- ICC
- intracluster correlation coefficient
- ICER
- incremental cost-effectiveness ratio
- ID
- identification
- IDF
- International Diabetes Federation
- IPD
- individual patient data
- KCL
- King’s College London
- LADDER
- Lay ADvice for Diabetes and Endocrine Research
- MI
- motivational interviewing
- MP
- male participant
- NICE
- National Institute for Health and Care Excellence
- NMA
- network meta-analysis
- nRCT
- non-randomised controlled trials
- PHQ-9
- Patient Health Questionnaire-9 items
- PPI
- patient and public involvement
- PRISMA
- Preferred Reporting Items for Systematic Reviews and Meta-Analyses
- PSA
- probabilistic sensitivity analysis
- PSB
- payer strategy-specific burden
- PSS
- Personal Social Services
- PSSRU
- Personal Social Services Research Unit
- QALY
- quality-adjusted life-year
- QoL
- quality of life
- RCT
- randomised controlled trial
- REPOSE
- Relative Effectiveness of Pumps over Structured Education
- RoB
- risk of bias
- SAVI
- Sheffield Accelerated Value of Information
- SBP
- systolic blood pressure
- SD
- standard deviation
- SDSCA
- Summary of Diabetes Self-Care Activities Measure
- SMD
- standardised mean difference
- SPHR
- School for Public Health Research
- SUCRA
- surface under the cumulative ranking
- T1DM
- type 1 diabetes mellitus
- T2DM
- type 2 diabetes mellitus
- TAU
- treatment as usual
- UKPDS
- UK Prospective Diabetes Study
- WHO
- World Health Organization
