Notes
Article history
The research reported in this issue of the journal was funded by the HTA programme as project number 16/79/03. The contractual start date was in September 2017. The draft report began editorial review in December 2019 and was accepted for publication in June 2020. The authors have been wholly responsible for all data collection, analysis and interpretation, and for writing up their work. The HTA editors and publisher have tried to ensure the accuracy of the authors’ report and would like to thank the reviewers for their constructive comments on the draft document. However, they do not accept liability for damages or losses arising from material published in this report.
Permissions
Copyright statement
Copyright © 2021 Gale et al. This work was produced by Gale et al. under the terms of a commissioning contract issued by the Secretary of State for Health and Social Care. This is an Open Access publication distributed under the terms of the Creative Commons Attribution CC BY 4.0 licence, which permits unrestricted use, distribution, reproduction and adaption in any medium and for any purpose provided that it is properly attributed. See: https://creativecommons.org/licenses/by/4.0/. For attribution the title, original author(s), the publication source – NIHR Journals Library, and the DOI of the publication must be cited.
2021 Gale et al.
Chapter 1 Introduction
Background
In the UK and other high-income settings, therapeutic hypothermia is standard of care for babies who are born at ≥ 36 weeks’ gestational age and show signs of hypoxic–ischaemic encephalopathy (HIE). 1 Although the administration of therapeutic hypothermia itself is well defined and based on high-quality randomised controlled trials (RCTs),2 the optimal nutritional management of babies receiving this therapy is not. There are two primary components of nutritional management: (1) enteral nutrition in the form of milk feeds and (2) intravenous or parenteral nutrition (PN).
During therapeutic hypothermia, babies can have milk feeds introduced incrementally or can have milk feeds withheld (this is the enteral component of nutritional support). Babies who receive therapeutic hypothermia in high-income countries will be commenced on intravenous fluid shortly after admission. This is because they are often unable to effectively co-ordinate sucking and swallowing, regulate fluid balance or maintain glucose metabolism. This intravenous fluid may be an intravenous dextrose solution (with electrolytes, such as sodium and potassium, as required) or PN, which contains protein, fat, carbohydrate, minerals and vitamins (this is the parenteral component of nutritional support).
The lack of high-quality evidence to inform nutritional practice during therapeutic hypothermia leads to variation in the provision of both enteral and parenteral components of nutrition. A recent UK survey of nutrition practices during therapeutic hypothermia reported that only 31% of responding units have feeding guidelines for these babies, 59% of neonatal units report routinely starting enteral feeding and 29% of neonatal units report routinely administering PN during therapeutic hypothermia. 3 International practice is also mixed. In some settings withholding enteral feeds during therapeutic hypothermia is almost universal,4 whereas in other settings starting and incrementing milk feeds is routine practice. 5
A key reason for withholding enteral feeds during therapeutic hypothermia is the premise that this may reduce the risk of necrotising enterocolitis (NEC). 6 NEC is seen in term and near-term babies with HIE; however, its incidence is poorly reported. NEC was reported in only 3 of the 11 RCTs that evaluated therapeutic hypothermia in HIE and only one case was documented. 7–9 Furthermore, there is no evidence that withholding or delaying milk feeds is useful in preventing NEC, even among very preterm babies at high risk of the disease. 10,11 Conversely, there is some limited evidence that enteral feeding of babies with HIE during hypothermia may be associated with lower biochemical markers of systemic inflammation,4 and the wider benefits of maternal breast milk feeding in term babies are well described. 12
In relation to PN support, intravenous dextrose provides sufficient hydration and energy to prevent hypoglycaemia, but does not provide the protein and fat necessary for tissue growth. It is not known how a short period of undernutrition may impact growth or the secondary and tertiary recovery phases that follow brain injury. 3,13,14 Parenteral nutrition is nutritionally superior but leads to higher rates of infection and other adverse outcomes in RCTs in paediatric and adult intensive care settings. 15,16 Moreover, PN is expensive17 and should, therefore, be used only when likely to be beneficial.
To address this paucity of high-quality evidence we aimed to identify optimal enteral and PN strategies for term and near-term babies receiving therapeutic hypothermia. As key outcomes such as NEC are rarely reported in this population, a RCT with power sufficient to analyse such outcomes is not feasible. We therefore undertook an observational study using routinely recorded data and applying propensity score matching to form groups for comparison with near-identical distributions of background variables.
Aims and objectives
Principal research questions
We sought to test the following null hypotheses:
-
There is no difference in the incidence of NEC or other clinical outcomes between babies who are enterally fed during therapeutic hypothermia and those whose feeds are withheld.
-
There is no difference in the incidence of late-onset bloodstream infection (BSI) or other clinical outcomes between babies who receive PN during therapeutic hypothermia and those who receive only intravenous dextrose and electrolytes.
Primary objectives
-
The primary objective of the enteral feeding analysis was to assess the effect of enteral feeding during therapeutic hypothermia on the incidence of NEC.
-
The primary objective of the PN analysis was to assess the effect of administering PN during therapeutic hypothermia on the incidence of BSI after the first 3 days.
Secondary objectives
In both analyses, the secondary objectives were to assess the effects of provision of enteral feeds and PN during therapeutic hypothermia on:
-
survival until discharge from the neonatal unit
-
length of neonatal stay
-
incidence of hypoglycaemia
-
breastfeeding at discharge
-
onset of breastfeeding
-
time to first feed with maternal breast milk
-
number of days when a central line was in situ
-
weight at neonatal discharge
-
number of days PN was administered (this outcome was examined for the enteral comparison only).
Chapter 2 Methods
Study design
This was a retrospective, population-based, cohort study that used existing data held in the National Neonatal Research Database (NNRD) and applied propensity score methodology.
Setting
The study used data from all designations of NHS neonatal units (i.e. special care baby units, local neonatal units and neonatal intensive care units) in England, Scotland and Wales. 18 Data were extracted for babies born between 1 January 2010 and 31 December 2017 who were admitted to neonatal units contributing to the NNRD, with follow-up data recorded until neonatal unit discharge.
Data source
The NNRD holds de-identified routinely recorded clinical data from all babies admitted to participating NHS neonatal units in England, Scotland and Wales. All NHS neonatal units in England and Wales have contributed data to the NNRD since 2012. The majority of NHS neonatal units in Scotland have contributed data to the NNRD since 2015, with all NHS units contributing as of 2019. Contributing neonatal units are known as the UK Neonatal Collaborative (UKNC). Data are extracted from point-of-care neonatal electronic health records that are completed by health professionals during routine clinical care. A defined data extract, the Neonatal Data Set, of approximately 450 data items19 is transmitted quarterly to the Neonatal Data Analysis Unit at Imperial College London and Chelsea and Westminster Hospital NHS Foundation Trust, where data are checked for internal inconsistencies and duplicates. Data items include demographic and admission items (e.g. maternal conditions, gestation and birthweight), daily items (e.g. respiratory support and feeding information), discharge items (e.g. feeding and weight at discharge) and ad hoc items (entered if and when they occur, e.g. suspected infection, ultrasound scan findings and abdominal radiographic findings). A formal comparison of NNRD data with case record forms from a multicentre RCT showed high levels of data agreement. 20
Access to the full NNRD database population is restricted to authorised users at the Neonatal Data Analysis Unit. A patient-level data set was extracted from the NNRD for the purpose of this analysis. Data linkage with any other database was not performed for this study.
Participants
Babies were eligible for inclusion in the study if they met the following criteria:
-
were born and admitted to a NHS neonatal unit between 1 January 2010 and 31 December 2017
-
received care at a neonatal unit in England, Scotland and Wales that was part of the UKNC and, therefore, contributing data to the NNRD
-
had a recorded gestational age of ≥ 36+0 weeks+days at birth
-
were recorded as receiving therapeutic hypothermia for 3 consecutive days during their neonatal unit stay or died during the period of therapeutic hypothermia.
Details of data extraction procedures are provided in Appendix 1, Tables 22–24.
Data imputation
Babies who had missing data for receipt of cooling on the second day of cooling, but who were recorded as having received cooling on both the first and the last day and who did not die during cooling, had data for the second day of cooling imputed. No other data imputation was performed.
Variables
The variables used in the analysis are described in this section and are grouped as intervention, background and outcome variables. A detailed description of the data extraction procedure and any transformations or recoding applied to variables during the analysis are provided in Appendix 1, Tables 22–24.
Variables that define interventions
There were two interventions of interest:
-
provision of enteral feeds during therapeutic hypothermia for the enteral nutrition analysis
-
provision of PN during therapeutic hypothermia for the PN analysis.
Definitions of the intervention and control groups for each analysis are provided in Table 1.
| Analysis | Classification of intervention groups |
|---|---|
| Enteral feeding analysis |
No enteral feeds: defined as no record of receiving an enteral feed during first 3 days after birth (or up to the day of death for babies who died during therapeutic hypothermia) and having at least 1 day for which no enteral feeding was recorded. A sensitivity analysis restricting the no enteral feeding group to only those babies who were recorded as having no enteral feeding for all 3 days or up to the day of death was also conducted Enterally fed: defined as receiving milk feeds of any type (including expressed maternal breast milk, expressed donor breast milk and artificial formula), by any route of administration (including nasogastric tube, bottle and suckling at breast) and in any quantity for at least 1 day while receiving therapeutic hypothermia |
| PN analysis |
No PN: defined as no recorded administration of PN on any day for the first 3 days after birth (or up to the day of death for those babies who died during therapeutic hypothermia) and recorded as having received intravenous dextrose (which will include different volumes and routes of administration) on at least 1 day. A sensitivity analysis restricting the no PN group to only those babies who were recorded as having no PN and receiving intravenous dextrose for all 3 days (or up to the day of death) was also conducted PN: defined as receiving PN of any type (including standard, pre-prepared bags of nutrition and individually tailored PN), by any route of administration (including peripheral intravenous cannula, percutaneous central venous catheter or umbilical venous catheter) and in any volumes, for at least 1 day during therapeutic hypothermia |
Background variables
A variable is termed as a background variable if its values are defined prior to the assignment of the intervention variables. A large number of background variables are available within the NNRD. Background variables were reviewed by the Clinical Investigator Group (see Appendix 2). The background variables’ relative clinical importance to the analysis was decided and variables were classified into three groups. These background variables were used to form matched groups for subsequent analysis.
The variables deemed to be of highest importance were termed principal background variables, of which there were two:
-
birth year
-
pH of arterial blood in the umbilical cord.
Highly important background variables are next in the hierarchy, of which there were 15:
-
birthweight (g)
-
gestational age (weeks)
-
sex
-
resuscitation drugs received
-
delivery instrument used (forceps or ventouse)
-
mode of delivery (vaginal or other)
-
smoking during pregnancy
-
suspected maternal chorioamnionitis
-
Apgar score at 1 minute
-
Apgar score at 5 minutes
-
umbilical cord blood base excess concentration (venous)
-
mean blood pressure at first neonatal unit admission
-
oxygen saturation at first neonatal unit admission
-
blood glucose concentration at first neonatal unit admission
-
maternal socioeconomic decile as defined using maternal lower-layer super output area (LSOA).
The remaining background variables are classified as moderately important and are listed in Appendix 1, Tables 22–24.
For variables with a considerable number of missing data, binary missing data indicators were also defined.
Outcomes
The primary outcome of interest for the enteral nutrition analyses was incidence of severe NEC. This was defined as in the UK Neonatal Collaborative NEC study. 21 Briefly, this uses daily, diagnostic, abdominal radiographic and procedural variables held on the NNRD, with subsequent verification of cases with neonatal clinical teams. Some data items used in identifying cases of the UK Neonatal Collaborative definition of severe NEC were not recorded in the NNRD prior to 2010 and, therefore, an alternative and more pragmatic definition of NEC was used as a secondary outcome (Table 2). We had planned to use the NEC definition described by Battersby et al. ;22 however, this was not possible because of many missing values for a critical component of this definition in the study cohort (i.e. abdominal radiographic findings).
| Analysis | Outcome | |
|---|---|---|
| Enteral feeds | PN | |
| ✓ a | ✓ | Severe NEC: a binary variable defined in accordance with the UKNC definition of Battersby et al.21 This case definition uses daily diagnosis and discharge data items, and clinical and radiographic findings recorded as ad hoc data items in the NNRD. Suspected cases of severe NEC were subsequently confirmed through contact with a neonatal or paediatric clinician at the relevant unit |
| ✓ | ✓ | NEC (pragmatic definition): a binary variable defined as a recorded diagnosis of NEC (in daily data or diagnosis data items) in a baby who received at least 5 consecutive days of antibiotics while being kept nil by mouth |
| ✓ | ✓ a | Late-onset BSI: a binary variable defined in accordance with the NNAP case definition as pure growth of a pathogen from blood or either a pure growth of a skin commensal or a mixed growth with ≥ 3 clinical signs at the time of blood sampling, recorded > 3 days after birth. This definition uses data that are recorded as ad hoc data items in the NNRD |
| ✓ | ✓ | Late-onset BSI (pragmatic definition): a binary variable defined as 5 consecutive days of antibiotic treatment that commenced later than 3 days after birth |
| ✓ | ✓ | Survival at discharge: a binary variable indicating whether or not the baby was alive at final neonatal discharge |
| ✓ | ✓ | Length of stay in neonatal units: a continuous variable defined as the number of days between first admission to a neonatal unit and final discharge from a neonatal unit for surviving babies or date of death for babies who died while in neonatal care. The length of stay was analysed both as a continuous variable and as a binary variable indicating whether a baby had stayed in the unit for ≤ 14 or > 14 days |
| ✓ | ✓ | Hypoglycaemia: a binary variable defined as any diagnosis of hypoglycaemia recorded after therapeutic hypothermia is commenced and before the final neonatal unit discharge |
| ✓ | ✓ | Breastfeeding at discharge: a binary variable defined as any breastfeeding (suckling at the breast) at discharge |
| ✓ | ✓ | Onset of breastfeeding: a continuous variable defined as the first day on which a baby is recorded to be suckling at the breast (this does not include maternal breast milk given by bottle or nasogastric tube). Analysed as both a continuous variable and a binary variable indicating whether or not a baby began suckling at the breast within 28 days (babies who died or were discharged within 28 days without suckling at the breast were classified as not suckling at the breast within 28 days) |
| ✓ | ✓ | Onset of first maternal breast milk feed: a continuous variable defined as the first day when a baby is recorded to be receiving maternal breast milk by any route (including suckling at the breast, by bottle or nasogastric tube). Analysed as both a continuous variable and a binary variable indicating whether or not a baby had its first maternal breast milk feed within 28 days (babies who died or were discharged within 28 days without having a maternal breast milk feed were classified as not having a maternal breast milk feed within 28 days) |
| ✓ | ✓ | Number of days with a central venous line in situ: a continuous variable defined as the number of recorded days a baby has a central venous line in situ. Analysed as both a continuous variable and a binary variable indicating whether or not a baby received a central venous line |
| ✓ | ✓ | Growth: a continuous variable defined as the SDS or z-score of the weight for postmenstrual age and sex at final neonatal unit discharge |
| ✓ | Duration of PN: a continuous variable defined as the number of days that a baby was recorded to be receiving PN. Analysed as both a continuous variable and a binary variable indicating whether or not PN was received | |
The primary outcome of interest in the analysis for the PN analyses was late-onset BSI, which was defined in accordance with the Healthcare Quality Improvement Partnership National Neonatal Audit Programme (NNAP) case definition. 23 Briefly, the NNAP case definition uses NNRD data items recorded in ad hoc fields that relate to blood culture results with subsequent verification of cases with neonatal clinical teams. The annual NNAP reports demonstrate variation in the completeness of these fields at the level of neonatal units. 23 Therefore, an alternative more pragmatic definition of late-onset BSI was used as a secondary outcome.
Primary and secondary outcomes in both the enteral nutrition and the PN analyses are defined in more detail in Table 2.
Bias
This was an observational study. The primary source of bias was deemed to be confounding owing to systemic differences in the clinical characteristics between babies receiving different nutritional interventions. For instance, babies with hypotension who receive inotropes may be more likely to have feeds withheld as well as having poorer outcomes. To overcome this bias, matching using propensity scores was implemented to form groups of babies with different enteral and parenteral nutritional interventions during therapeutic hypothermia, but who were balanced in terms of all measured background variables. The process of matching is described in detail in Statistical methods. This approach cannot overcome bias related to systemic differences in unmeasured confounding factors.
Study size
It was estimated that approximately 7200 babies would meet the study inclusion criteria. Pilot data extracted from the NNRD showed that in 2015 a total of 809 babies met the study inclusion criteria, of whom 37% (301/809) received enteral feeds and 29% (238/809) received PN during hypothermia. Using these rates, a sample size of 7200 babies receiving therapeutic hypothermia would be able to detect (two-sided significance 5%, power 90%) a difference of 0.7% in NEC with 2000 matched pairs (assuming that the rate of NEC is negligible in the reference treatment) and a difference of 2% in BSI with 1500 pairs (assuming rates of 1% and 3%). The difference of 0.7% for the rates of NEC (and similar figures for other outcomes) is selected for illustration and does not represent any imperative or objective in the study design.
Statistical methods
Overview
In this analysis we applied the potential outcomes framework and propensity score methodology. For each outcome variable we consider two potential outcomes for every baby: the first associated with receiving the intervention (enteral feeding or PN) and the second associated with not receiving the intervention. The subject-level treatment effect is defined as the difference in these potential outcomes for each baby. The average treatment effect in a group of subjects is defined as the mean of the subject-level treatment effects in this group. In practice, only one potential outcome per baby is observed. Therefore, no subject-level treatment effect can be evaluated or estimated. In a randomised trial, the average treatment effect can be estimated by comparing outcomes of subjects who were provided with the outcomes of subjects who were withheld the intervention since randomisation (with a large enough sample size) ensures that, on average, intervention arms will be balanced in terms of both observed and unobserved confounders. By contrast, a simple comparison of outcomes in intervention groups using observational data is likely to be a biased estimate for the average treatment effect because of the presence of confounding, for example by indication. Propensity analysis can arrange balance on observed background variables, but not on variables that are not observed.
The use of propensity scores allows us to analyse observational data so that it mimics some of the characteristics of a RCT. 24 Specifically, it establishes a balance for the observed background characteristics between babies who are provided the intervention of interest and babies from whom the intervention is withheld. The propensity score itself is defined as the probability of receiving the intervention conditional on the observed background characteristics. The propensity score plays a key role in forming two well-balanced groups: one with babies who received the intervention and one with those babies who did not. 25
We adopt the assumption of stable unit–treatment variable assignment, according to which the outcome of each subject depends on only the treatment assigned to the subject. In principle, the outcome could depend also on the treatment assigned to other subjects, but in this study we rule out such interference. We are interested to estimate the average treatment effect in those babies who received the intervention, that is what difference in outcomes (on average) do we expect to observe if all babies who were fed were instead not fed.
Primary analysis
In the primary analyses we performed 1 : 1 matching of babies who had no enteral feeds to those enterally fed for the enteral nutrition analysis, and 1 : 1 matching of babies who received no PN to those who received PN for the PN analysis. Background groups were first defined using the principal background variables, so that babies were required to be within the same birth year group (2-year bands) and arterial cord blood pH group (i.e. < 6.9, 6.9–7.0 and > 7.0). There were 12 groups in total. Matched pairs were formed within propensity score deciles defined separately for each background group. The matched pairs were then reconstituted as an intervention group (i.e. babies who received enteral feeds or PN) and a control group (i.e. babies who did not receive enteral feeds or PN). The intervention and control groups outcomes were compared by the same method that would be appropriate if these two matched groups arose in a RCT, applying the Student’s t-test.
Propensity modelling
We fitted a propensity model in which the observed intervention group as the outcome is related to the background variables. The outcome variable in propensity analysis is binary, so logistic regression is applied. As we had many background (confounding) variables, a model had to be selected from multiple candidate models. We followed the step-wise approach proposed by Imbens and Rubin. 26 The background variables classified as being highly important were included in the model a priori. Models were then fitted with each of the remaining background variables added individually. The model with the largest value of the chi-squared statistic (with one degree of freedom) was adopted if the test statistic exceeded 1.0. This procedure constitutes one cycle. In the next and following cycles all of the remaining background variables were tested similarly and the variable with the largest value of the chi-squared statistic was retained. The cycles were stopped when none of the chi-squared statistics for including a covariate exceeded 1.0 and the variables included in the model at this point are referred to as the main effects.
Interactions were then selected for the propensity model. The main effects were sorted in descending order of their absolute t-ratios (|estimate/st.error|). For each variable A we formed a list of variables B for which the interaction A × B was an appropriate candidate for inclusion. For example, no two categories of a discrete variable could appear in an interaction. A continuous variable could be interacted with itself (the result is the quadratic transformation of the variable), but a binary variable could not. Similarly, a variable could not be interacted with its missing value indicator.
Starting with the first covariate we fitted the models with one interaction of this covariate added, and selected up to two of the interactions that have the largest values of the chi-squared statistic for inclusion, subject to the condition that they exceeded 2.71 (i.e. the 10th percentile of the chi-squared distribution with 1 degree of freedom). When an interaction A × B was adopted (added to the model), the interaction B × A was removed from the list of candidate interactions to avoid singularity in the model search that followed. After the interactions of the first covariate, the interactions of the second and successive covariates were tested and the model was expanded by the interactions found to be the most important, subject to the constraint of including at most two interactions in each cycle.
The concluding model yielded the fitted propensities (i.e. the estimated probabilities of being assigned to the groups receiving enteral feeds or receiving PN, given each baby’s background profile). Therefore, each baby was associated with a (fitted) propensity. The set of babies in the analysis was then reduced by excluding babies with extreme propensities, first by reducing to the subjects in the overlap of intervention and control group, that is letting the propensities in the two groups be in the ranges (m1, M1) and (m2, M2), then by excluding all subjects with propensities smaller than m = max(m1, M1) and greater than M = min (m2, M2). Another criterion, described in Imbens and Rubin,26 was applied to reduce the sampling variance of the average treatment effect to be evaluated. It yields a positive constant of γ < 1. Subjects with propensities outside the range (γ, 1 – γ) were discarded from the analysis. Such reduction of the data set by discarding subjects with extreme propensities is referred to as trimming.
The entire modelling exercise, with selection of the main effects (added to the covariates selected a priori) and selection of the interactions, was repeated on the reduced (trimmed) data set. This was followed by discarding subjects with extreme propensities (fitted by the revised model). Trimming was applied after each stage of model selection.
The variables in each final propensity model have no interpretation for inference. The sole purpose of the propensity model is to facilitate a good balance of all the background variables in matched groups.
Matching on propensity scores
To form matched subgroups, we first formed background groups based on unique combinations of the two principal background variables. Four birth year groups (as birth year is grouped according to 2-year bands) were crossed with three cord blood pH groups to generate 12 background groups. We then defined propensity groups within each background group by recoding the propensities to a set of (propensity) groups separated by cut-off points. An established method splits the propensities into K groups of approximately equal size. We use K = 10 to form propensity score deciles. Within each background group, a baby who received enteral feeds was paired to a randomly drawn baby who did not receive enteral feeds who fell within the same propensity group. After the matching process was complete, the matched pairs of babies were reconstituted as the intervention group (i.e. received enteral feeds) and control group (i.e. received no enteral feeds) and termed the matched cohort. As this matching procedure involves some randomness, it was replicated 25 times to produce 25 matched cohorts. Every subsequent analysis is conducted separately for each matched cohort and the (replicate) results are averaged to reduce the impact of the uncertainty involved in matching. This process was repeated to create a matched cohort containing babies who did and did not receive PN.
Assessment of the quality of the match
The selected (or any other) propensity model has no interpretation for inference. Its sole purpose is to facilitate the formation of an intervention and control group (the matched cohorts) for both the enteral and the PN analyses that are well balanced with regard to measured background variables. It was essential that no outcome variables or, more precisely, no variables that have differing potential outcomes were involved in this stage. The motivation for this is that the background should be considered in earnest and that this is undertaken with no foreknowledge of the outcomes. Accordingly, assessing the balance on all the background variables is the only relevant diagnostic for the fitted propensities.
The imbalance of an ordinal variable across two groups is defined as the difference of the within-group means divided by the standard deviation (SD) pooled across the two groups. The absolute imbalance is defined as the absolute value of the imbalance. The imbalance for a set of ordinal variables is defined as the mean of the absolute imbalances of the variables. We used this statistic as a summary or characteristic of the (overall) imbalance of two (sub)groups. Smaller values indicate tighter balance. Imbens and Rubin27 regard the balance of a variable as satisfactory if its absolute imbalance is < 0.1. For a data set, original or formed by matching, we report the total of the absolute imbalances and the largest and smallest imbalances. Variables that are not ordinal (i.e. categorical variables) are avoided by defining indicator (dummy) variables: H – 1 indicators for a variable with H categories. The choice of the ‘omitted’ (reference) category is immaterial.
Baseline characteristics and outcomes
Baseline characteristics for the entire study cohort and for the cohorts matched for the enteral nutrition and PN analyses were tabulated, with categorical variables presented as frequencies and percentages, and continuous variables presented as means, SDs, medians and interquartile ranges. To prevent potential identification of individuals, a count of events in a particular category is presented as < 5 and the corresponding percentage is omitted when the count is < 5 (or < 10 when use of < 5 would result in potential identification).
Descriptive analyses of patterns of feeding for the entire study cohort and matched cohorts were made. These include examination of the time to first enteral feed or first administration of PN, type of milk feed provided up to 7 days after birth and variation in the rates of enteral feeding and PN provision by the neonatal operational delivery network (ODN).
The outcome variables were either binary or continuous. Dichotomous versions were defined for several continuous variables. For binary outcomes, the absolute difference in mean rates of the outcome (intervention vs. control) and the odds ratio (OR) (intervention vs. control) were estimated and the two-sided 95% confidence interval (CI) and a p-value were evaluated for each of them. For a continuous outcome, the absolute difference in mean rates was computed with the two-sided 95% CI and p-value. Results were averaged over the 25 replications. The results for matched groups (see Table 10) differ slightly from the results of analyses of binary outcomes (see Table 11) because entries in both tables entail some randomness. This randomness is ameliorated by averaging over 25 replicates, but it is not eradicated.
Prespecified sensitivity analyses
Two prespecified sensitivity analyses were conducted. The first analysis restricted the sample to babies born between 2012 and 2017. This was performed because from 2012 onwards all NHS neonatal units across England and Wales contributed data to the NNRD and, therefore, fewer missing data were expected for this period. This sensitivity analysis examined the robustness of the results to missing data. The second analysis applied a more restrictive definition of the intervention variables: only babies positively confirmed as not having received enteral feeds or PN for each day of treatment with therapeutic hypothermia were classified as being in the control groups for the enteral and parenteral analyses, respectively. This analysis examined the robustness of the results to misclassification to control groups.
In the study protocol, a further subgroup analysis was planned to exclude all babies whose first admission to neonatal care was from a postnatal ward to exclude babies for whom therapeutic hypothermia was administered following postnatal collapse. This was not undertaken because of the small number of babies admitted from a postnatal ward in the entire cohort.
Post hoc sensitivity analyses
Two post hoc sensitivity analyses were conducted:
-
Receipt of PN on the first day of life was added as a highly important background variable to the propensity model for the enteral nutrition analysis.
-
Receipt of enteral feeds on the first day of life was added as a highly important background variable to the propensity model for the PN analysis.
These post hoc analyses were undertaken following advice of the Clinical Investigator Group and with the agreement of the Study Steering Committee. The intention of these sensitivity analyses was to examine the impact of nutritional practice on the first day as an additional background (matching) variable.
Alternative methods for matching on the propensity score and background variables
We refer to the statistical methods detailed thus far as the preliminary method of analysis. We explored the robustness of results to alternative matching methods at three stages of the matching process (see Figure 1). In the preliminary analysis, babies in the intervention group were matched on a 1 : 1 basis to those in the control group. Inverse probability weighting (IPW) is an alternative to matching. In IPW a matched cohort is formed by applying to the babies the reciprocal of the probability of receiving the treatment that was actually received. The weights assigned to babies who received and did not receive enteral feeds and the estimated average effect of being enterally fed and not fed are as follows.
Enterally fed weight:
Estimated average effect of receiving enteral feeds:
Not enterally fed weight:
Estimated average effect of not being enterally fed:
where PSi is the fitted propensity for baby i, Ti is a binary indicator of the treatment received (Ti = 1 indicates that a baby received enteral feeds) and Yi is the outcome for subject i. Treatment effects are calculated by the method appropriate for the type of outcome variable (continuous or binary). The standard errors are estimated by the weighted versions of the formulae for random samples.
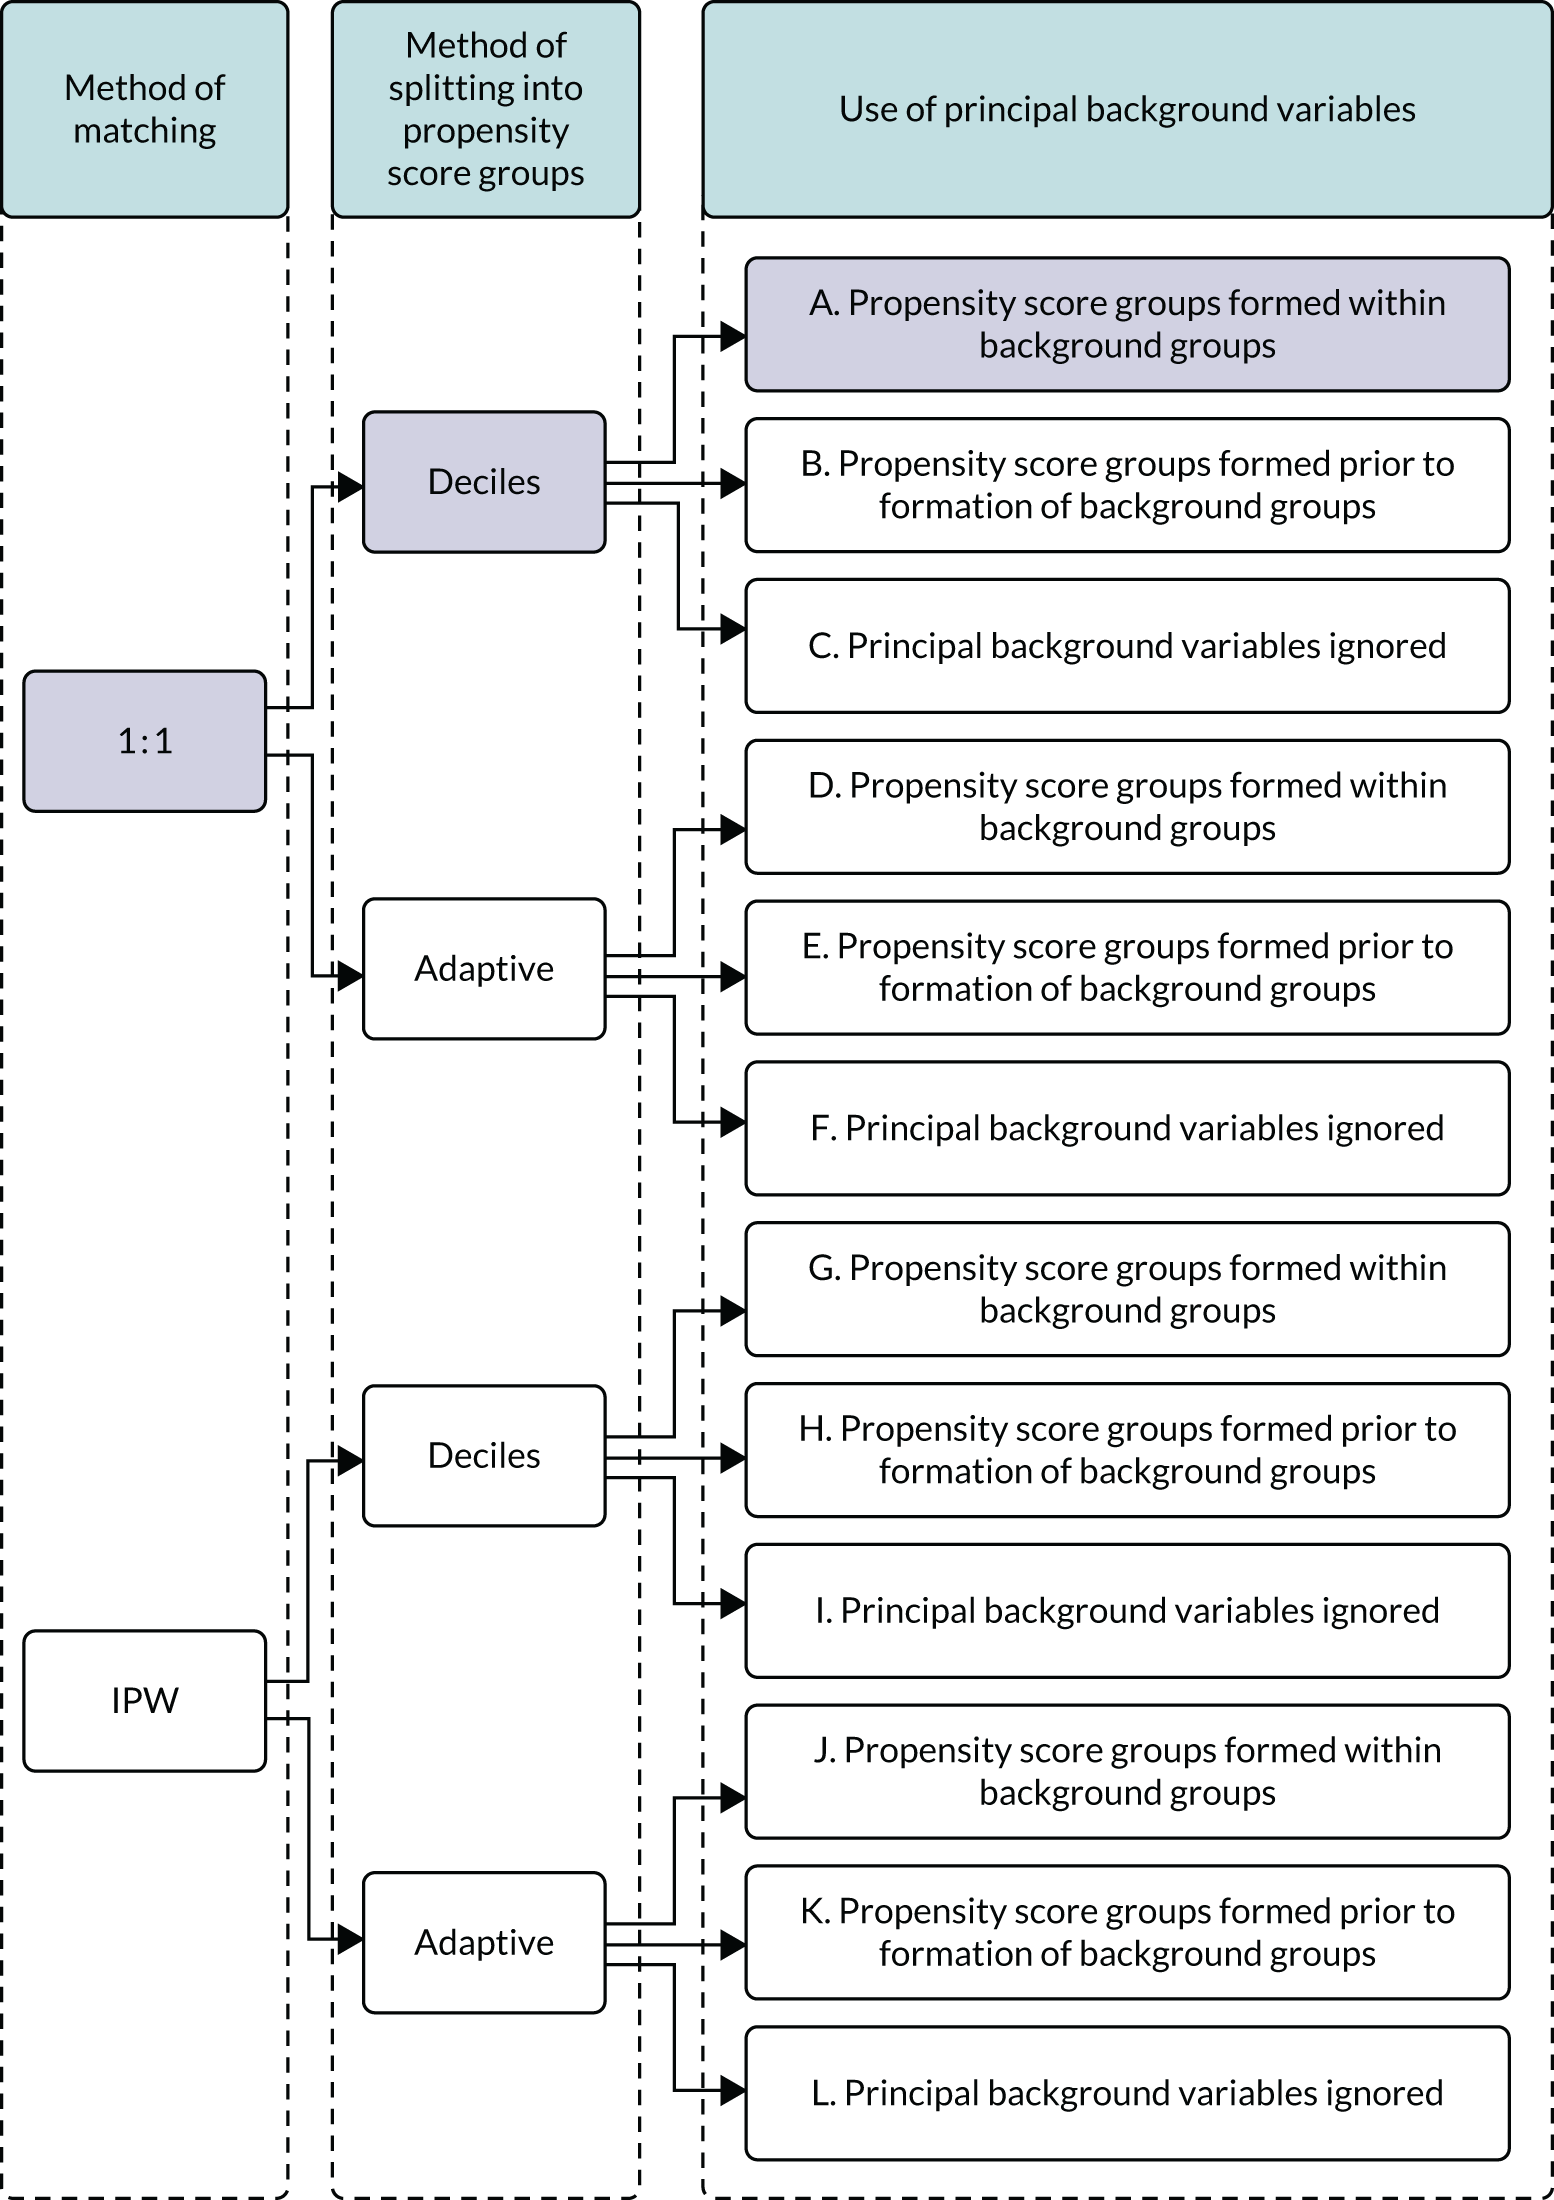
In the preliminary analysis, propensity score deciles were formed within each background group so that thresholds between deciles varied across the 12 principal background groups. We implemented two alternatives. First, we formed propensity groups prior to forming background groups so that thresholds were common to all the background groups. Second, we ignored background groups altogether and matched only on the propensity groups. In addition to forming propensity groups by splitting into deciles, we also implemented an adaptive method proposed by Imbens and Rubin. 28 Propensities were repeatedly split by the within-group median propensities of provisional propensity groups until the subjects in each group were well balanced on (i.e. had similar means of) the propensities. This method is called adaptive splitting.
In summary, in addition to the preliminary analysis (Figure 1, analysis A) we conducted 11 further analyses (see Figure 1, analyses B–L), implementing alternative methods of propensity and background matching in the primary analysis and all three sensitivity analyses.
FIGURE 1.
Alternative methods of matching on the propensity scores and principal background groups. The preliminary method of analysis is shaded in purple.
Chapter 3 Parent and patient involvement
Background
Involvement of parents, patients and the public in research can be defined as research being carried out ‘with’ parents, patients and the public, rather than ‘to’ or ‘for’ them. 29 High-quality parent, patient and public involvement in research is considered best practice and is associated with tangible benefits, including higher enrolment in clinical trials. 30 Parents and parent representatives were involved in this study at all stages from conception through to dissemination.
Aim
To gain meaningful parent perspectives into the design, analysis, interpretation and dissemination of this study.
Objectives
Objective 1
To ensure that the views of parents with experience of having a baby who received therapeutic hypothermia are incorporated in the design of the study.
Objective 2
To ensure that the views of parents are represented in the meetings of the Study Steering Committee.
Objective 3
To ensure that study results are disseminated using a parent-centred approach and in plain English.
Methods
The study was planned and designed by a multiprofessional investigator group that included a parent who had experienced having a baby who received therapeutic hypothermia (author ES). The investigator group also included a representative (author LC) from the national charity Bliss (a charity for babies born prematurely or who are sick) (London, UK) to represent parents more widely and to support ES in contributing to the study. ES and LC contributed to the design, planning, analysis, interpretation and dissemination stages of the study.
A further parent who had experienced having a baby who received therapeutic hypothermia was recruited to join the Study Steering Committee as an independent member through social media channels of the national charity Bliss [i.e. Facebook (URL: www.facebook.com; Facebook, Inc., Menlo Park, CA, USA); Twitter, (URL: www.twitter.com; Twitter, Inc., San Francisco, CA, USA); and Instagram, (URL: www.instagram.com; Instagram, Inc., Menlo Park, CA, USA).
The parent co-investigator, parent Study Steering Committee member and parent representatives were strongly encouraged to actively contribute to discussions, investigator group and steering group meetings.
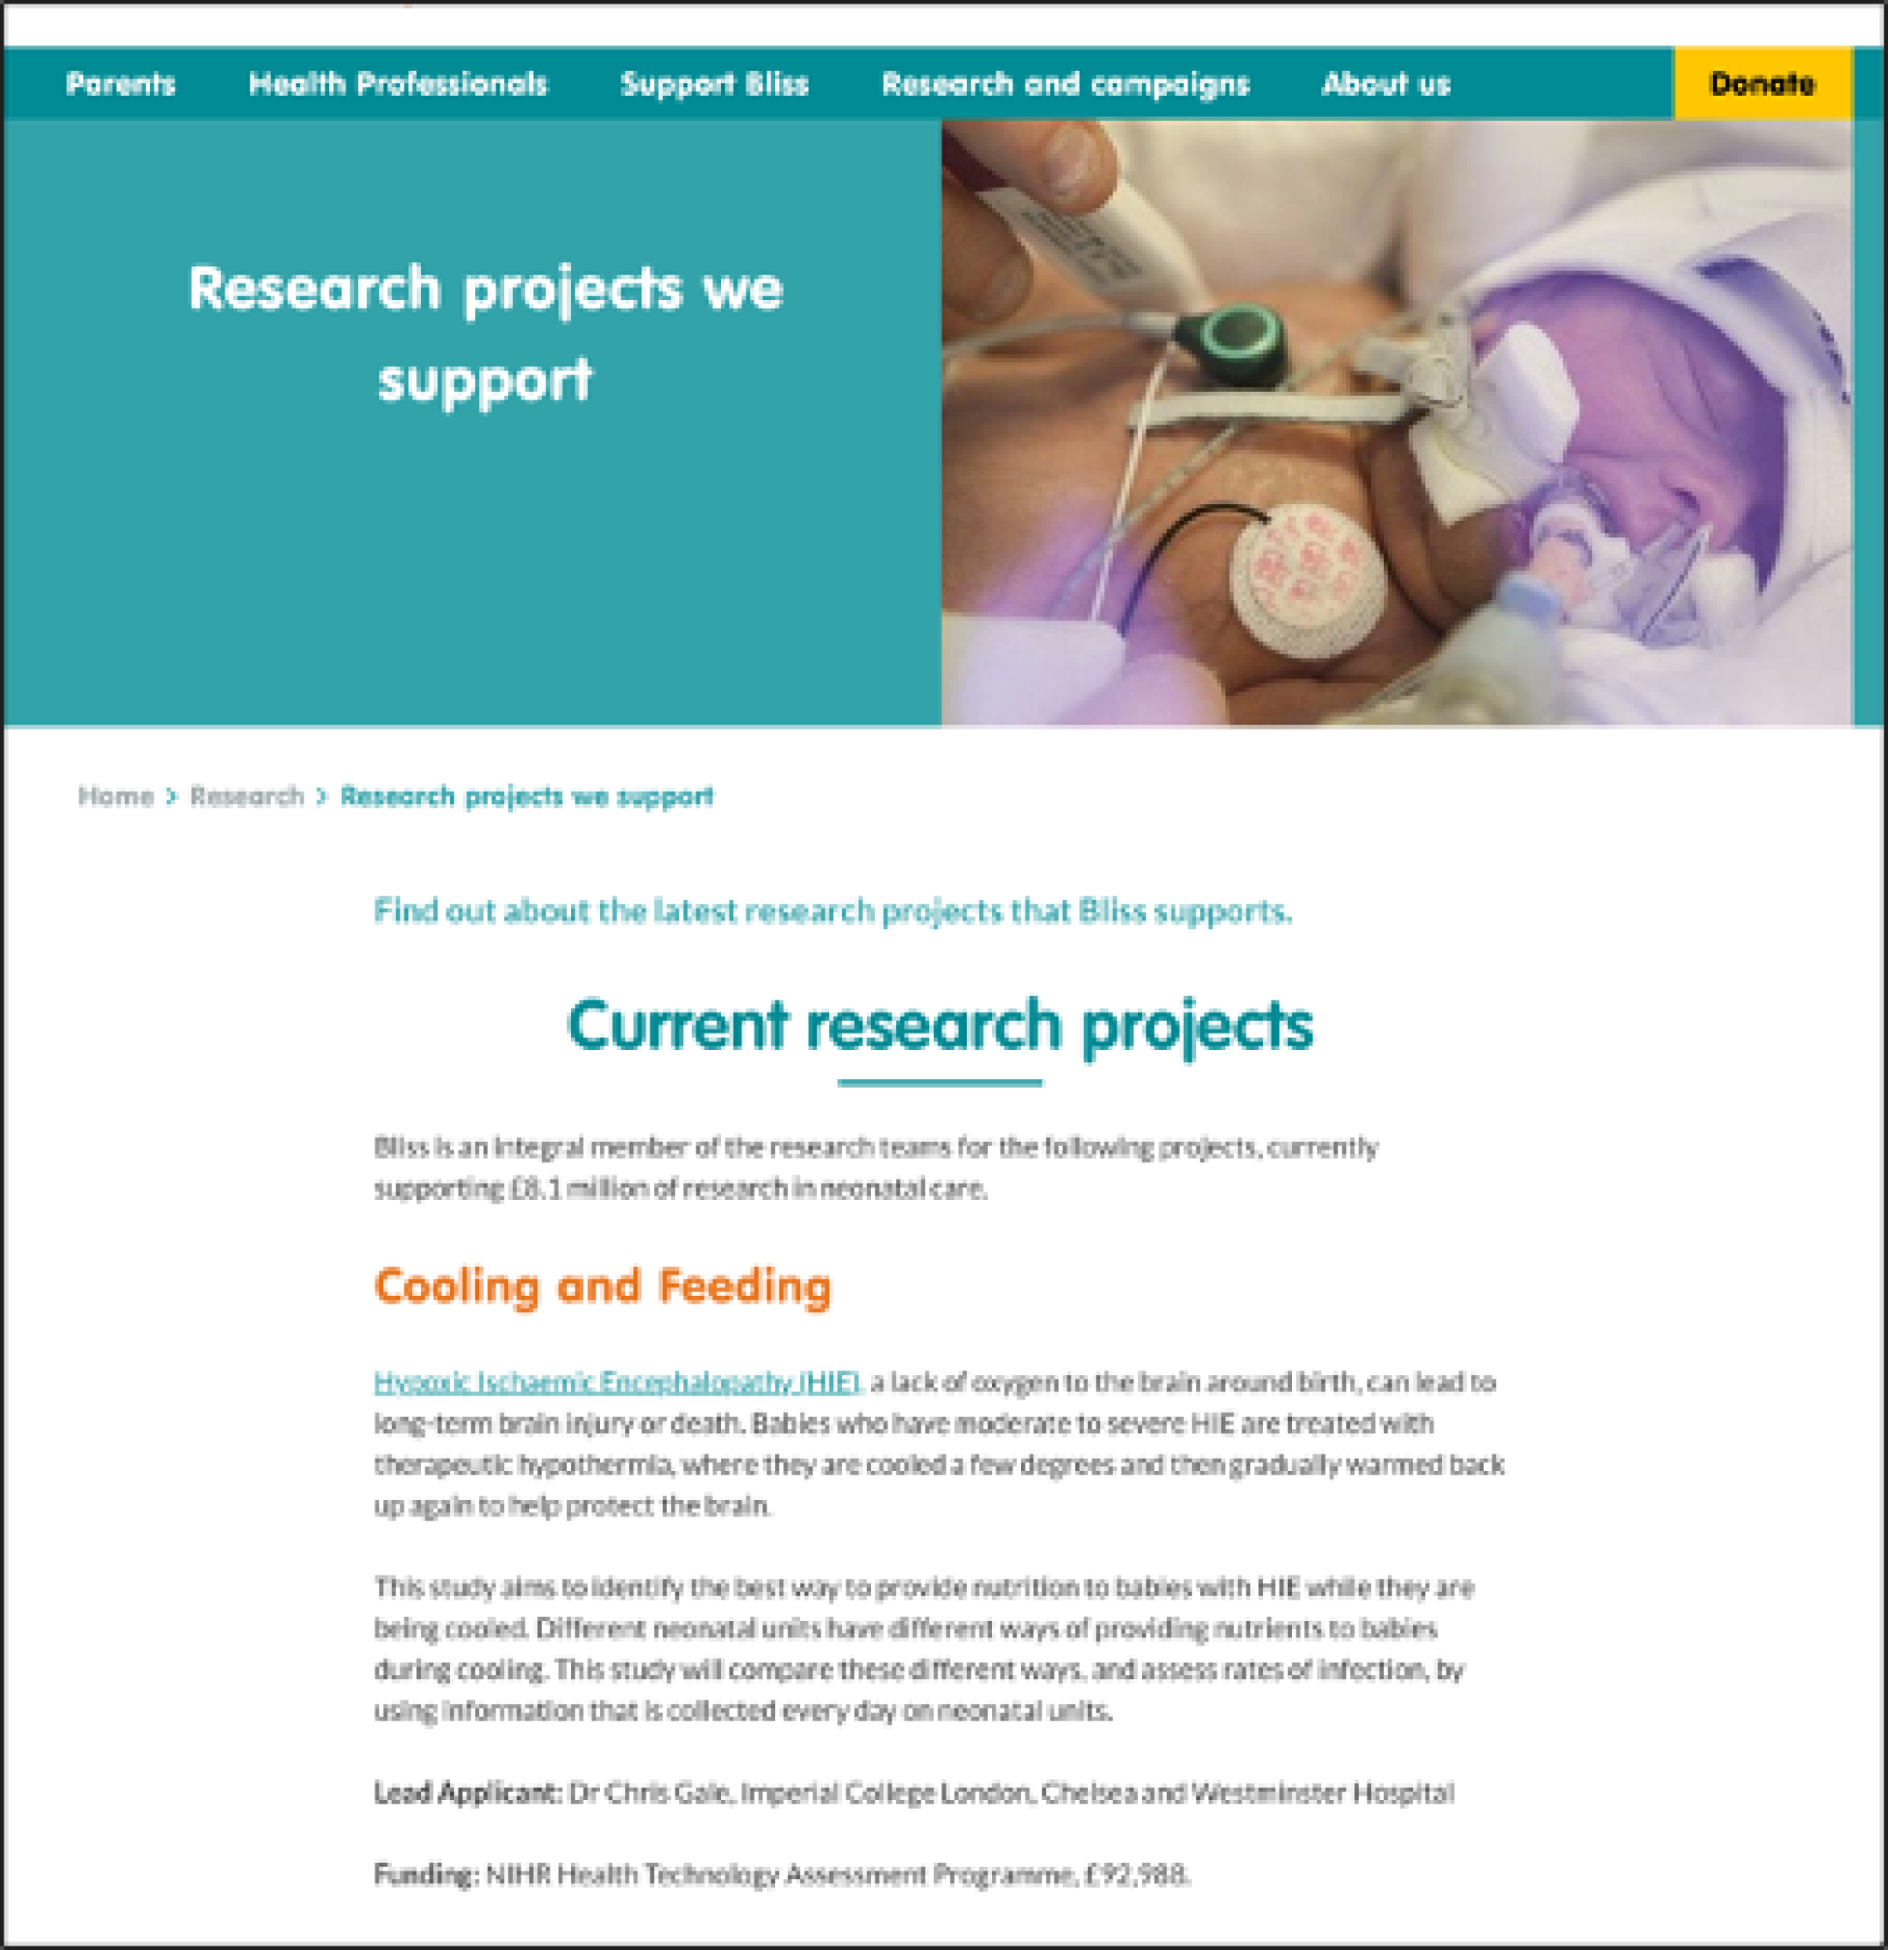
Parents were informed about the study through the website of the national charity Bliss (Figure 2). Parents were informed that data about their babies were collected by neonatal staff and were added to the NNRD to improve neonatal care through research, using posters and leaflets on all NHS neonatal units [URL: www.imperial.ac.uk/neonatal-data-analysis-unit/about-us/for-parents-and-carers/ (accessed 24 July 2020)].
FIGURE 2.
Bliss webpage informing parents about the study. URL: www.bliss.org.uk/research-campaigns/research/current-research (accessed 29 October 2019). Reproduced with permission from Bliss.
Results
Parents influenced the study design and, specifically, the choice of outcomes in several ways. The primary outcome for the enteral nutrition comparison is NEC and the primary outcome for the PN comparison is late-onset infection. Prevention of these outcomes was identified as the third and second most important treatment uncertainties, respectively, by parents, patients and professionals in a James Lind Alliance Priority Setting Partnership related to neonatal care. 31,32
A parent (ES) and a parent representative (Bliss) identified that ‘breastfeeding’ as a binary outcome was not sufficient to capture the different aspects of breastfeeding that may be important to parents of babies who are receiving therapeutic hypothermia. The following outcomes were included in the study as a direct result of this:
-
First maternal breast milk feed, defined as the first day when a baby is recorded as receiving maternal breast milk by any route, including suckling at the breast, by bottle or by nasogastric tube.
-
Onset of breastfeeding, defined as the first day when a baby is recorded as suckling at the breast. This does not include maternal breast milk given by bottle or nasogastric tube.
-
Breastfeeding at discharge, defined as any breastfeeding (i.e. suckling at the breast) at discharge.
Both a parent and a parent representative were actively involved in study oversight and were present at all Study Steering Committee meetings.
A parent and a parent representative contributed to the analysis of study results and drafting of study publications, including this report.
Planned dissemination
Parent-centred plain English summaries of key study results are being co-designed by parents, parent representatives and the study statistician (DJ) to facilitate dissemination of the study results to parents. These will be made freely available online through the Bliss [URL: www.bliss.org.uk (accessed 24 July 2020)] and NNRD [URL: www.imperial.ac.uk/neonatal-data-analysis-unit/ (accessed 24 July 2020)] websites and will be publicised through the Bliss and study team social media channels.
Discussion
Parents and parent representatives were actively involved in this study from its outset. Meaningful parent involvement was achieved, and this translated into the inclusion of outcomes relevant to parents. These outcomes included different aspects of breastmilk feeding, such as first administration of breast milk and first feed at the breast, recognising the different value and importance of these events to parents. Parent and parent representative involvement has also been essential for development of effective plain English research summaries. This study uses data held in the NNRD. Parents have been extensively involved in the development of the NNRD and have expressed strong support for sharing health data for research. 33
The strengths of the study include involvement of a parent who had experienced having a baby who received therapeutic hypothermia from study inception with parallel involvement of a parent representative charity to provide further parent representation and support for the parent co-investigator (ES). This enabled the parent co-investigator (ES) to gain experience and expertise in study design and to contribute meaningfully. Having the same parent co-investigator throughout the study also provided continuity in relation to the parent perspective and input.
The limitations include the challenge of involving parents in a retrospective observational study in which the choice of study outcomes was limited by available data. A further limitation is that we did not involve ex-neonatal patients who experienced therapeutic hypothermia in the neonatal period. This was challenging because of the neonatal patient population and because the treatment of interest, therapeutic hypothermia, became standard of care only 10 years ago.
Parent involvement in this study led to beneficial changes in the design of the study and in the outcomes analysed.
Chapter 4 Results
Participants
A total of 703,911 babies were recorded as having been admitted to a NHS neonatal unit in England, Scotland or Wales between 1 January 2010 and 31 December 2017. Of these babies, 6033 were ≥ 36 weeks’ gestational age and recorded as being treated with therapeutic hypothermia for HIE for 6 days or as having died during treatment. After exclusion of babies with missing data for sex or missing feeding data on all days when they were recorded as receiving therapeutic hypothermia, the enteral nutrition and PN cohorts comprised 5847 and 6010 babies, respectively (Figure 3).
FIGURE 3.
Participant flow through study for the primary analysis.
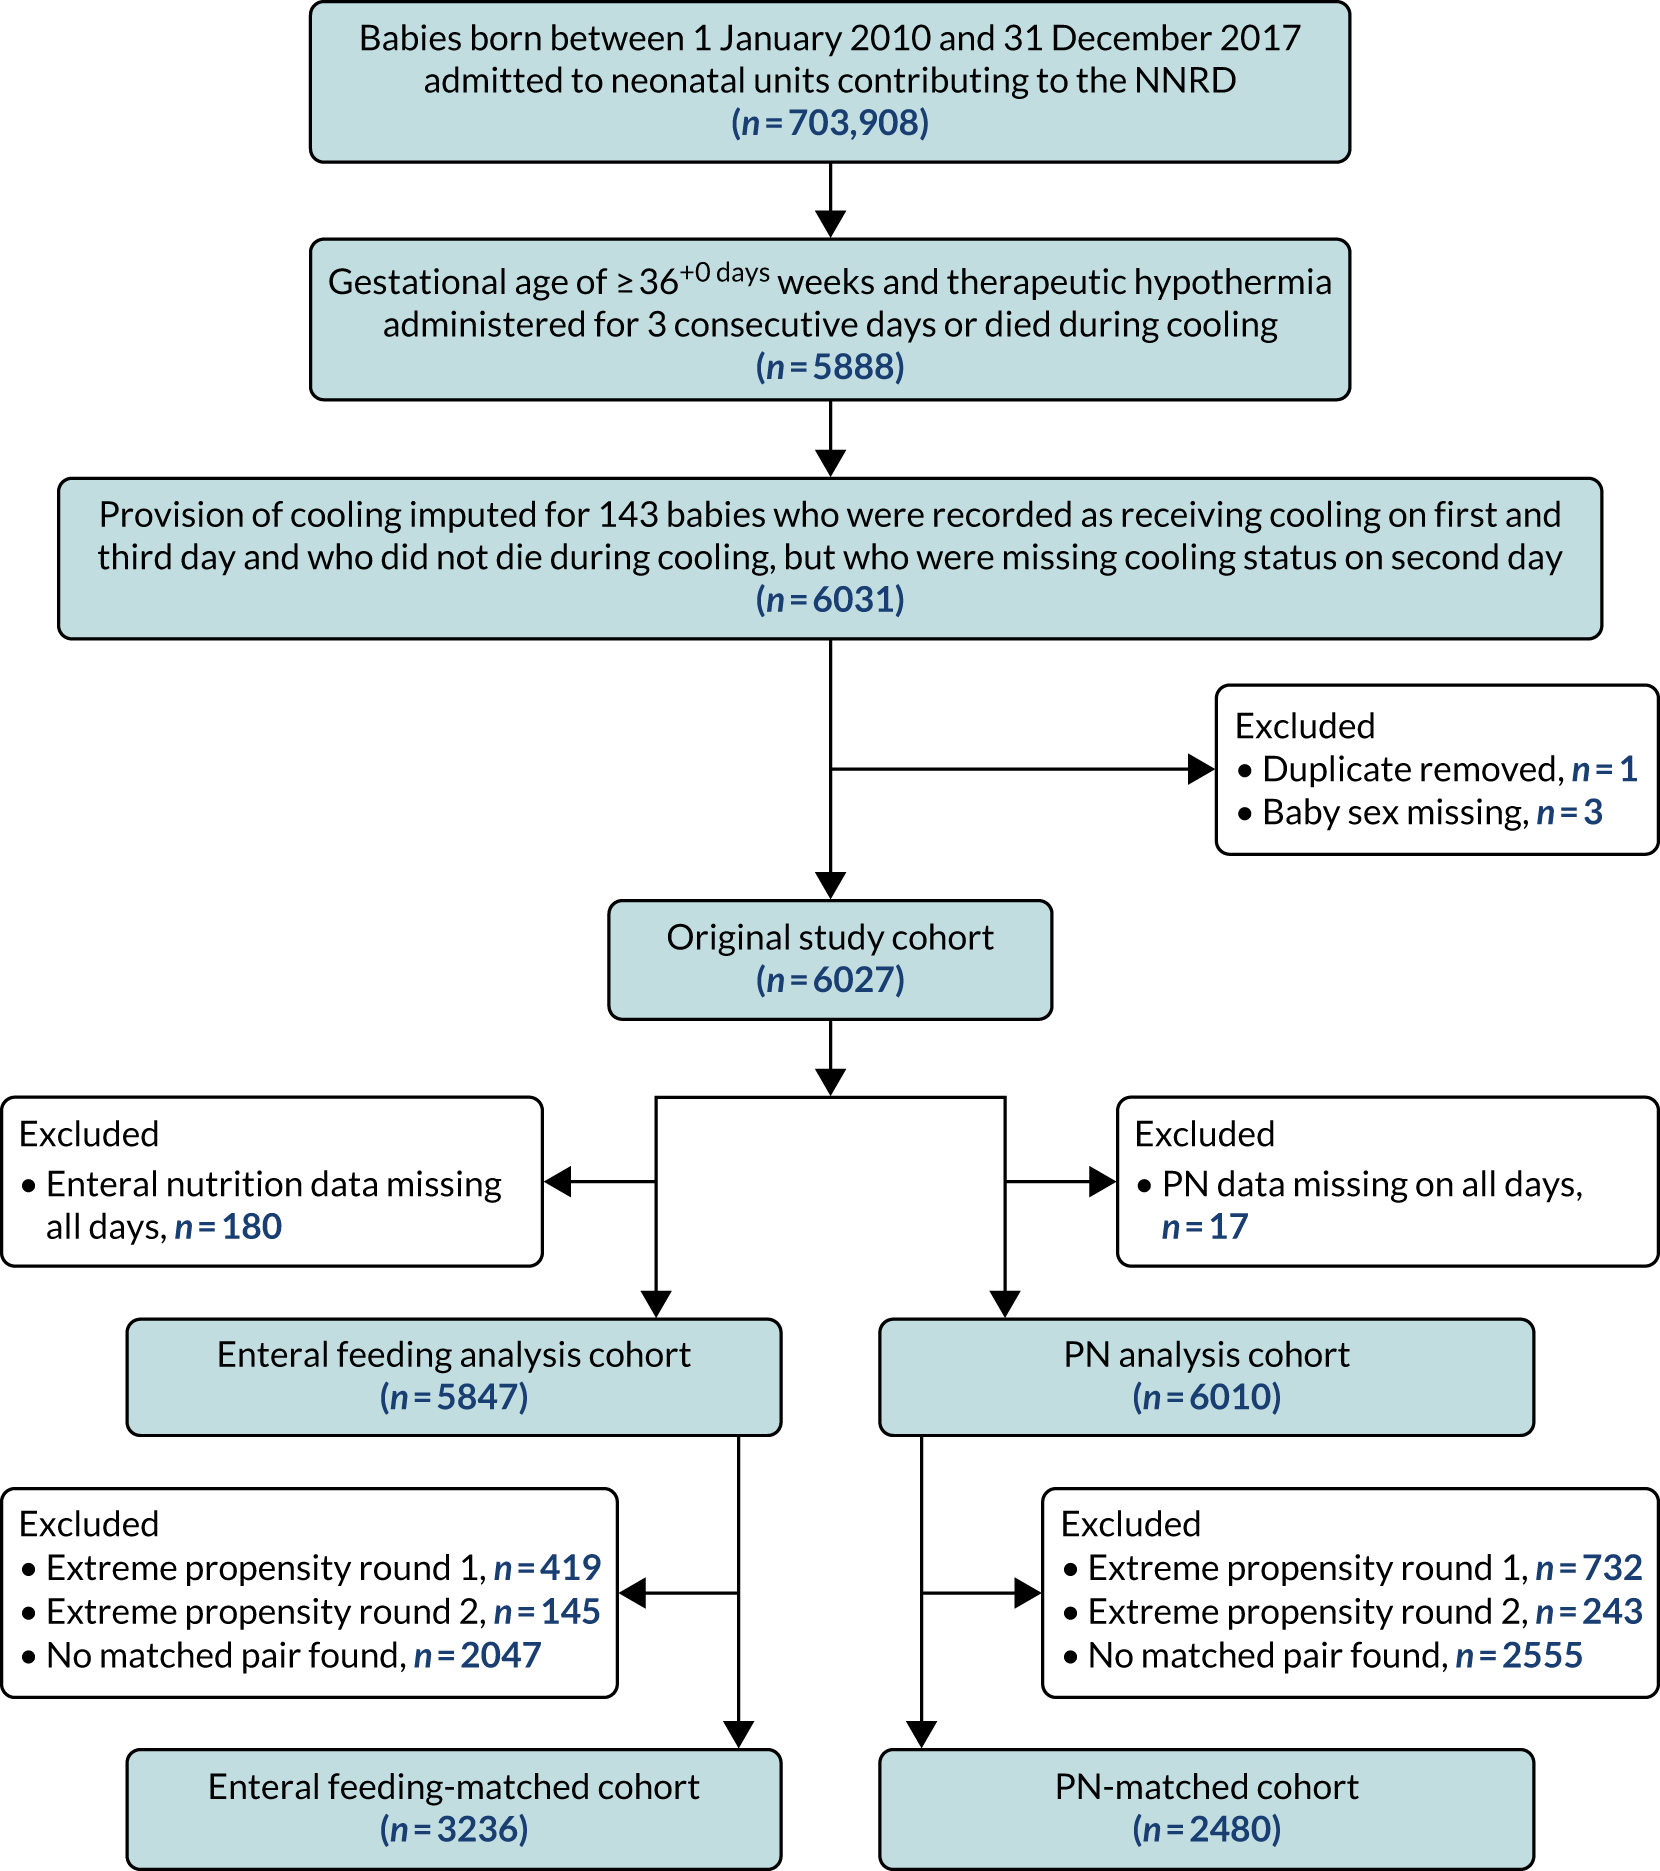
In the primary analysis, propensity score matching created matched cohorts of 3236 babies (i.e. 1618 pairs) for the enteral feeding analysis and 2480 babies (i.e. 1240 pairs) for the PN analysis. These cohorts were smaller than the sample sizes estimated in the protocol of 2000 matched pairs for the enteral nutrition analysis and 1500 matched pairs for the PN analysis.
Descriptive analyses: original study cohort
Background variables
Tables 3 and 4 report selected background variables used in the analyses summarised by year of birth. Annual summary data for other background variables used in the analyses are presented in Appendix 3, Tables 25–27.
| Variable | Year | All years | |||||||
|---|---|---|---|---|---|---|---|---|---|
| 2010 | 2011 | 2012 | 2013 | 2014 | 2015 | 2016 | 2017 | ||
| Total number of babies | 474 | 678 | 686 | 815 | 871 | 859 | 819 | 825 | 6027 |
| Male | |||||||||
| n | 246 | 369 | 379 | 421 | 481 | 496 | 464 | 472 | 3328 |
| % | 51.9 | 54.4 | 55.2 | 51.7 | 55.2 | 57.7 | 56.7 | 57.2 | 55.2 |
| Multiple birth | |||||||||
| n | 21 | 24 | 23 | 29 | 22 | 22 | 24 | 15 | 180 |
| % | 4.4 | 3.5 | 3.4 | 3.6 | 2.5 | 2.6 | 2.9 | 1.8 | 3 |
| Gestational age at birth (weeks) | |||||||||
| Mean | 39.4 | 39.4 | 39.4 | 39.4 | 39.4 | 39.3 | 39.3 | 39.4 | 39.4 |
| SD | 1.6 | 1.6 | 1.6 | 1.5 | 1.5 | 1.6 | 1.5 | 1.5 | 1.6 |
| Birthweight (g) | |||||||||
| Mean | 3403 | 3360 | 3397 | 3348 | 3347 | 3394 | 3345 | 3398 | 3372 |
| SD | 669 | 628 | 641 | 614 | 603 | 603 | 627 | 594 | 619 |
| Caesarean delivery | |||||||||
| n | 221 | 324 | 297 | 385 | 410 | 361 | 369 | 375 | 2742 |
| % | 46.6 | 47.8 | 43.3 | 47.2 | 47.1 | 42 | 45.1 | 45.5 | 45.5 |
| Maternal age (years) | |||||||||
| Median | 30 | 31 | 30 | 30 | 30 | 31 | 31 | 30 | 31 |
| Lower quartile | 25 | 26.8 | 26 | 26 | 26 | 27 | 27 | 26 | 26 |
| Upper quartile | 34 | 35 | 34 | 34 | 35 | 35 | 34 | 34 | 35 |
| Maternal suspected chorioamnionitis | |||||||||
| n | 51 | 73 | 76 | 83 | 105 | 78 | 90 | 98 | 654 |
| % | 10.8 | 10.8 | 11.1 | 10.2 | 12.1 | 9.1 | 11 | 11.9 | 10.9 |
| Smoking in pregnancy | |||||||||
| n | 63 | 92 | 82 | 110 | 112 | 96 | 106 | 73 | 734 |
| % | 13.3 | 13.6 | 12 | 13.5 | 12.9 | 11.2 | 12.9 | 8.8 | 12.2 |
| Missing, n | 78 | 92 | 97 | 89 | 124 | 124 | 107 | 137 | 848 |
| % | 16.5 | 13.6 | 14.1 | 10.9 | 14.2 | 14.4 | 13.1 | 16.6 | 14.1 |
| Ethnicity (maternal) (%) | |||||||||
| White | 77.0 | 74.2 | 71.9 | 66.3 | 63.7 | 59.7 | 57.0 | 55.8 | 64.6 |
| Asian and mixed | 7.8 | 10.0 | 11.2 | 11.0 | 10.7 | 8.4 | 10.9 | 10.5 | 10.2 |
| Black and mixed | 7.8 | 8.1 | 6.9 | 6.7 | 7.1 | 6.5 | 5.5 | 6.1 | 6.8 |
| Other | 6.7 | 5.6 | 4.8 | 4.7 | 3.0 | 6.1 | 5.1 | 5.7 | 5.1 |
| Maternal diabetesa | |||||||||
| n | 8 | 18 | 18 | 40 | 36 | 39 | 49 | 48 | 256 |
| % | 1.7 | 2.7 | 2.6 | 4.9 | 4.1 | 4.5 | 6 | 5.8 | 4.2 |
| Deprivation score (LSOA) (%) | |||||||||
| Deciles 1 or 2 (most deprived) | 27.9 | 25 | 27.2 | 26.8 | 26.8 | 23.8 | 28.7 | 28.6 | 26.8 |
| Primiparousa | |||||||||
| n | 272 | 402 | 389 | 433 | 494 | 414 | 370 | 436 | 3210 |
| % | 57.4 | 59.3 | 56.7 | 53.1 | 56.7 | 48.2 | 45.2 | 52.8 | 53.3 |
| Variable | Year | All years | |||||||
|---|---|---|---|---|---|---|---|---|---|
| 2010 | 2011 | 2012 | 2013 | 2014 | 2015 | 2016 | 2017 | ||
| Total number of babies | 474 | 678 | 686 | 815 | 871 | 859 | 819 | 825 | 6027 |
| Cord blood gas pH: arterial | |||||||||
| > 7.0, n | 123 | 196 | 216 | 254 | 290 | 289 | 245 | 283 | 1896 |
| % | 25.9 | 28.9 | 31.5 | 31.2 | 33.3 | 33.6 | 29.9 | 34.3 | 31.5 |
| 6.9–7.0, n | 85 | 109 | 111 | 143 | 158 | 134 | 129 | 139 | 1008 |
| % | 17.9 | 16.1 | 16.2 | 17.5 | 18.1 | 15.6 | 15.8 | 16.8 | 16.7 |
| < 6.9, n | 136 | 168 | 179 | 207 | 180 | 180 | 174 | 156 | 1380 |
| % | 28.7 | 24.8 | 26.1 | 25.4 | 20.7 | 21 | 21.2 | 18.9 | 22.9 |
| Missing, n | 130 | 205 | 180 | 211 | 243 | 256 | 271 | 247 | 1743 |
| % | 27.4 | 30.2 | 26.2 | 25.9 | 27.9 | 29.8 | 33.1 | 29.9 | 28.9 |
| Apgar score at 1 minute | |||||||||
| 0 or 1, n | 228 | 321 | 321 | 367 | 376 | 400 | 364 | 372 | 2749 |
| % | 48.1 | 47.3 | 46.8 | 45 | 43.2 | 46.6 | 44.4 | 45.1 | 45.6 |
| 2–4, n | 174 | 246 | 227 | 291 | 332 | 289 | 274 | 267 | 2100 |
| % | 36.7 | 36.3 | 33.1 | 35.7 | 38.1 | 33.6 | 33.5 | 32.4 | 34.8 |
| 5–7, n | 27 | 41 | 57 | 69 | 58 | 60 | 67 | 85 | 464 |
| % | 5.7 | 6.0 | 8.3 | 8.5 | 6.7 | 7.0 | 8.2 | 10.3 | 7.7 |
| 8–10, n | 6 | 18 | 32 | 31 | 36 | 29 | 41 | 27 | 220 |
| % | 1.3 | 2.7 | 4.7 | 3.8 | 4.1 | 3.4 | 5.0 | 3.3 | 3.7 |
| Missing, n | 39 | 52 | 49 | 57 | 69 | 81 | 73 | 74 | 494 |
| % | 8.2 | 7.7 | 7.1 | 7.0 | 7.9 | 9.4 | 8.9 | 9.0 | 8.2 |
| Apgar score at 5 minutes | |||||||||
| 0 or 1, n | 93 | 134 | 118 | 126 | 114 | 127 | 130 | 112 | 954 |
| % | 19.6 | 19.8 | 17.2 | 15.5 | 13.1 | 14.8 | 15.9 | 13.6 | 15.8 |
| 2–4, n | 187 | 261 | 239 | 317 | 345 | 310 | 302 | 308 | 2269 |
| % | 39.5 | 38.5 | 34.8 | 38.9 | 39.6 | 36.1 | 36.9 | 37.3 | 37.6 |
| 5–7, n | 129 | 187 | 210 | 246 | 266 | 270 | 252 | 251 | 1811 |
| % | 27.2 | 27.6 | 30.6 | 30.2 | 30.5 | 31.4 | 30.8 | 30.4 | 30 |
| 8–10, n | 24 | 44 | 66 | 72 | 81 | 69 | 71 | 79 | 506 |
| % | 5.1 | 6.5 | 9.6 | 8.8 | 9.3 | 8 | 8.7 | 9.6 | 8.4 |
| Missing, n | 41 | 52 | 53 | 54 | 65 | 83 | 64 | 75 | 487 |
| % | 8.6 | 7.7 | 7.7 | 6.6 | 7.5 | 9.7 | 7.8 | 9.1 | 8.1 |
| Received chest compressions at resuscitationa | |||||||||
| n | 202 | 298 | 289 | 286 | 292 | 313 | 300 | 253 | 2233 |
| % | 42.6 | 44 | 42.1 | 35.1 | 33.5 | 36.4 | 36.6 | 30.7 | 37 |
| Received resuscitation drugsa | |||||||||
| n | 103 | 128 | 124 | 117 | 105 | 118 | 130 | 102 | 927 |
| % | 21.7 | 18.9 | 18.1 | 14.4 | 12.1 | 13.7 | 15.9 | 12.4 | 15.4 |
| Intubated at resuscitationa | |||||||||
| n | 328 | 471 | 462 | 517 | 548 | 555 | 512 | 473 | 3866 |
| % | 69.2 | 69.5 | 67.3 | 63.4 | 62.9 | 64.6 | 62.5 | 57.3 | 64.1 |
| Time to first spontaneous breath | |||||||||
| > 5 minutes, n | 279 | 401 | 412 | 493 | 531 | 509 | 494 | 483 | 3602 |
| % | 58.9 | 59.1 | 60.1 | 60.5 | 61 | 59.3 | 60.3 | 58.5 | 59.8 |
| Missing, n | 144 | 195 | 186 | 191 | 195 | 213 | 200 | 190 | 1514 |
| % | 30.4 | 28.8 | 27.1 | 23.4 | 22.4 | 24.8 | 24.4 | 23 | 25.1 |
| Time to admission (minutes) | |||||||||
| Median | 30 | 30 | 30 | 30 | 30 | 30 | 31 | 30 | 30 |
| Lower quartile | 20.2 | 19 | 20 | 20 | 20 | 21 | 22 | 21 | 20 |
| Upper quartile | 49.8 | 46 | 45 | 44 | 42 | 43 | 45 | 43 | 44 |
| Temperature on admission (°C) | |||||||||
| Mean | 35.8 | 35.7 | 35.8 | 35.9 | 35.9 | 35.8 | 35.9 | 36 | 35.9 |
| SD | 1.3 | 1.3 | 1.3 | 1.2 | 1.2 | 1.3 | 1.2 | 1.3 | 1.3 |
| Transfusion of any blood products on day of admission | |||||||||
| n | 79 | 103 | 107 | 131 | 95 | 120 | 110 | 118 | 863 |
| % | 16.7 | 15.2 | 15.6 | 16.1 | 10.9 | 14.0 | 13.4 | 14.3 | 14.3 |
| Mechanical ventilation on day of admission | |||||||||
| n | 375 | 535 | 534 | 613 | 679 | 655 | 637 | 613 | 4641 |
| % | 79.1 | 78.9 | 77.8 | 75.2 | 78 | 76.3 | 77.8 | 74.3 | 77 |
| Early-onset infection (in the first 3 days, defined using NNAP definition) | |||||||||
| n | 1 | 2 | 5 | 10 | 14 | 7 | 10 | 6 | 55 |
| % | 0.2 | 0.3 | 0.7 | 1.2 | 1.6 | 0.8 | 1.2 | 0.7 | 0.9 |
| Admitted to neonatal unit from postnatal ward | |||||||||
| n | < 5 | < 5 | < 5 | 9 | 9 | 5 | 7 | 10 | 46 |
| % | 1.1 | 1.0 | 0.6 | 0.9 | 1.2 | 0.8 | |||
| Postnatal transfer to another neonatal unit within the first 48 hours | |||||||||
| n | 213 | 338 | 319 | 397 | 387 | 415 | 419 | 374 | 2862 |
| % | 44.9 | 49.9 | 46.5 | 48.7 | 44.4 | 48.3 | 51.2 | 45.3 | 47.5 |
In the entire study cohort, 55.2% of babies were male. The babies had a mean gestational age at birth of 39.4 weeks, 26.8% of mothers lived in areas considered to be the most deprived (i.e. within deciles 1 or 2 of the deprivation score) and this was the first birth for 53.3% of mothers.
Nutritional interventions
Table 5 displays the annual rates of enteral feeding and administration of PN for the study cohort. Approximately 31% of babies were recorded as having received enteral feeds during their treatment with therapeutic hypothermia. There was no evidence of a (linear) trend in the proportion of babies being enterally fed over the study period (chi-squared test for trend p = 0.24). Over the study period, approximately 25% of babies treated with therapeutic hypothermia were recorded as having received PN during hypothermia. There was strong evidence (p = 0.003) of an increasing (linear) trend in the proportion of babies who received PN over the study period, although the magnitude of the slope was small (slope = 0.007), indicating that the increase in PN use over the study period was small.
| Nutritional intervention | Year | All years | |||||||
|---|---|---|---|---|---|---|---|---|---|
| 2010 | 2011 | 2012 | 2013 | 2014 | 2015 | 2016 | 2017 | ||
| Total number of babies | 474 | 678 | 686 | 815 | 871 | 859 | 819 | 825 | 6027 |
| Received enteral feeds during therapeutic hypothermia | |||||||||
| n | 132 | 209 | 220 | 234 | 244 | 298 | 268 | 267 | 1872 |
| % | 27.8 | 30.8 | 32.1 | 28.7 | 28 | 34.7 | 32.7 | 32.4 | 31.1 |
| Missing, n | 29 | 56 | 16 | 21 | 17 | 18 | 9 | 14 | 180 |
| % | 6.1 | 8.3 | 2.3 | 2.6 | 2.0 | 2.1 | 1.1 | 1.7 | 3.0 |
| Received PN during therapeutic hypothermia | |||||||||
| n | 73 | 138 | 179 | 239 | 218 | 211 | 225 | 192 | 1475 |
| % | 15.4 | 20.4 | 26.1 | 29.3 | 25 | 24.6 | 27.5 | 23.3 | 24.5 |
| Missing, n | 1 | 2 | 2 | 0 | 0 | 7 | 1 | 4 | 17 |
| % | 0.2 | 0.3 | 0.3 | 0 | 0 | 0.8 | 0.1 | 0.5 | 0.3 |
Outcomes in the unmatched cohort
The annual number of incidences of outcomes in the whole study cohort is summarised in Tables 6 and 7. Counts and rates for binary outcomes are presented in Table 6. Median and quartiles for the continuous outcome variables, and the counts and rates for their dichotomised versions (which are defined for all continuous outcomes except for weight z-score at discharge), are presented in Table 7.
| Variable | Year | All years | |||||||
|---|---|---|---|---|---|---|---|---|---|
| 2010 | 2011 | 2012 | 2013 | 2014 | 2015 | 2016 | 2017 | ||
| Total number of babies | 474 | 678 | 686 | 815 | 871 | 859 | 819 | 825 | 6027 |
| Severe NEC | |||||||||
| n | 0 | < 5 | < 5 | < 5 | < 5 | < 5 | 0 | < 5 | 7 |
| % | 0 | 0 | 0.1 | ||||||
| NEC (pragmatic definition) | |||||||||
| n | 10 | < 10 | 11 | 14 | < 10 | 10 | < 10 | < 10 | 68 |
| % | 2.1 | 1.6 | 1.7 | 1.2 | 1.1 | ||||
| Late-onset infection (NNAP definition) | |||||||||
| n | < 5 | 0 | < 5 | < 5 | < 5 | < 5 | 6 | 11 | 30 |
| % | 0 | 0.7 | 1.3 | 0.5 | |||||
| Late-onset infection (pragmatic definition) | |||||||||
| n | 134 | 191 | 182 | 208 | 237 | 209 | 177 | 221 | 1559 |
| % | 28.3 | 28.2 | 26.5 | 25.5 | 27.2 | 24.3 | 21.6 | 26.8 | 25.9 |
| Survival to neonatal discharge | |||||||||
| n | 408 | 603 | 609 | 720 | 802 | 788 | 745 | 766 | 5441 |
| % | 86.1 | 88.9 | 88.8 | 88.3 | 92.1 | 91.7 | 91 | 92.8 | 90.3 |
| Missing, n | 1 | 2 | 2 | 0 | 0 | 0 | 0 | 1 | 6 |
| % | 0.2 | 0.3 | 0.3 | 0 | 0 | 0 | 0 | 0.1 | 0.1 |
| Hypoglycaemia | |||||||||
| n | 97 | 145 | 122 | 169 | 183 | 171 | 155 | 166 | 1208 |
| % | 20.5 | 21.4 | 17.8 | 20.7 | 21 | 19.9 | 18.9 | 20.1 | 20 |
| Breastfeeding at discharge | |||||||||
| n | 185 | 310 | 305 | 359 | 410 | 411 | 401 | 403 | 2784 |
| % | 39 | 45.7 | 44.5 | 44 | 47.1 | 47.8 | 49 | 48.8 | 46.2 |
| Had a central venous line | |||||||||
| n | 450 | 635 | 625 | 754 | 826 | 810 | 764 | 776 | 5640 |
| % | 94.9 | 93.7 | 91.1 | 92.5 | 94.8 | 94.3 | 93.3 | 94.1 | 93.6 |
| Variable | Year | All years | |||||||
|---|---|---|---|---|---|---|---|---|---|
| 2010 | 2011 | 2012 | 2013 | 2014 | 2015 | 2016 | 2017 | ||
| Total number of babies | 475 | 678 | 686 | 815 | 871 | 861 | 820 | 825 | 6031 |
| Length of stay (days) | |||||||||
| Median | 11 | 11 | 11 | 11 | 11 | 11 | 10 | 11 | 11 |
| Lower quartile | 8 | 8 | 8 | 8 | 8 | 8 | 8 | 8 | 8 |
| Upper quartile | 18 | 17 | 16 | 16 | 16 | 16 | 15 | 15 | 16 |
| Missing, n | 1 | 0 | 0 | 0 | 0 | 0 | 0 | 0 | 1 |
| % | 0.2 | 0 | 0 | 0 | 0 | 0 | 0 | 0 | 0 |
| > 14 days, n | 163 | 220 | 197 | 254 | 272 | 262 | 212 | 228 | 1808 |
| % | 34.4 | 32.4 | 28.7 | 31.2 | 31.2 | 30.5 | 25.9 | 27.6 | 30 |
| Time to suckling at breast (days) in babies who breastfed | |||||||||
| ≤ 28 days, n | 271 | 406 | 407 | 496 | 541 | 518 | 498 | 490 | 3627 |
| % | 57.2 | 59.9 | 59.3 | 60.9 | 62.1 | 60.3 | 60.8 | 59.4 | 60.2 |
| Median | 7 | 7 | 7 | 7 | 7 | 7 | 7 | 7 | 7 |
| Lower quartile | 6 | 6 | 5 | 6 | 6 | 6 | 6 | 6 | 6 |
| Upper quartile | 10 | 10 | 9 | 9 | 10 | 9 | 9 | 9 | 9 |
| Missing, n | 201 | 266 | 275 | 311 | 325 | 340 | 314 | 330 | 2362 |
| % | 42.4 | 39.2 | 40.1 | 38.2 | 37.3 | 39.6 | 38.3 | 40 | 39.2 |
| Time to receiving mother’s milk (days) | |||||||||
| ≤ 28 days, n | 374 | 552 | 561 | 653 | 727 | 709 | 676 | 674 | 4926 |
| % | 78.9 | 81.4 | 81.8 | 80.1 | 83.5 | 82.5 | 82.5 | 81.7 | 81.7 |
| Median | 5 | 5 | 5 | 5 | 5 | 5 | 5 | 5 | 5 |
| Lower quartile | 4 | 4 | 4 | 4 | 4 | 3 | 3 | 3 | 4 |
| Upper quartile | 6 | 6 | 6 | 6 | 6 | 6 | 5 | 5 | 6 |
| Missing, n | 100 | 125 | 125 | 161 | 144 | 149 | 143 | 150 | 1097 |
| % | 21.1 | 18.4 | 18.2 | 19.8 | 16.5 | 17.3 | 17.5 | 18.2 | 18.2 |
| Received PN | |||||||||
| n | 157 | 263 | 274 | 372 | 378 | 340 | 349 | 309 | 2442 |
| % | 33.1 | 38.8 | 39.9 | 45.6 | 43.4 | 39.6 | 42.6 | 37.5 | 40.5 |
| Duration of PN (days) | |||||||||
| Median | 4 | 3 | 3 | 3 | 3 | 3 | 3 | 3 | 3 |
| Lower quartile | 3 | 2 | 2 | 2 | 2 | 2 | 2 | 2 | 2 |
| Upper quartile | 5 | 5 | 4 | 4 | 4 | 4 | 5 | 4 | 4 |
| Central venous line duration (days) | |||||||||
| Median | 5 | 5 | 5 | 5 | 5 | 5 | 5 | 5 | 5 |
| Lower quartile | 4 | 3 | 3 | 3 | 4 | 3 | 3 | 4 | 3 |
| Upper quartile | 7 | 6 | 6 | 6 | 6 | 6 | 6 | 6 | 6 |
| Weight z-score at discharge | |||||||||
| Mean | –0.6 | –0.7 | –0.5 | –0.6 | –0.7 | –0.5 | –0.6 | –0.5 | –0.6 |
| SD | 1.3 | 1.3 | 1.3 | 1.7 | 1.2 | 1.2 | 1.2 | 1.2 | 1.2 |
| Median | –0.6 | –0.8 | –0.6 | –0.7 | –0.7 | –0.6 | –0.6 | –0.6 | –0.6 |
| Lower quartile | –1.4 | –1.5 | –1.4 | –1.5 | –1.5 | –1.3 | –1.4 | –1.3 | –1.4 |
| Upper quartile | 0.2 | 0.1 | 0.2 | 0.1 | 0.2 | 0.2 | 0.2 | 0.2 | 0.2 |
| Missing, n | 1 | 1 | 0 | 0 | 0 | 0 | 7 | 0 | 12 |
| % | 0.2 | 0.1 | 0 | 0 | 0 | 0 | 0.9 | 0 | 0.2 |
Seven babies (0.1%) who received therapeutic hypothermia were diagnosed with severe NEC over the 8-year study period. When the more pragmatic definition of NEC was applied (i.e. any recorded diagnosis of NEC concurrent with 5 days of antibiotics and 5 days nil by mouth), 68 babies (1.1%) were classified as having NEC over the study period. There were no detectable (linear) trends in the annual incidence rates of either severe or pragmatically defined NEC.
The incidence of NNAP-defined late-onset infection was low. Thirty babies (0.5%) had a pure growth of a recognised pathogen in a blood culture after day 3. The incidence of the more pragmatically defined late-onset infection (i.e. 5 concurrent days of antibiotic treatment) was substantially higher, with 25.9% of babies (n = 1559) receiving therapeutic hypothermia having late-onset infection by this measure. Survival to discharge rates from the neonatal unit were high (90.3%) and there was strong evidence (chi-squared test for trend p < 0.001) of an increase in the rates of survival over the study period.
Just under half of babies were breastfeeding at discharge (46.2%). This proportion increased over the study period. Among the babies who did suckle at the breast, the first breastfeed was at a median age of 7 days. In babies who were fed maternal breast milk, the median age at first receiving maternal breast milk (by any route of administration) was 5 days. The median length of stay in the neonatal unit was 11 days (interquartile range 8–16 days).
Enteral feeding analyses
Overview
In this section, we present matched-group analyses comparing different approaches with enteral feeding (i.e. starting enteral feeds compared with not starting enteral feeds during therapeutic hypothermia). First, we present summary data for selected background variables within the unmatched groups by approach to feeding. Second, we present summary background data by approach to feeding for the matched subgroups and summaries of the quality of the match. The main results of the primary analyses are the estimates and CIs for the treatment effects for each outcome.
To better describe feeding within the study cohort, exploratory analyses were conducted into the type of enteral feeding provided to babies and time to receipt of first enteral feed in the unmatched and matched cohorts. We also present regional variation in the provision of enteral feeds during therapeutic hypothermia.
Primary analysis
Background variables in unmatched and matched cohorts
Tables 8 and 9 (see also Appendix 4, Tables 28–31) present the background characteristics of babies recorded as having received enteral feeds during therapeutic hypothermia and babies for whom enteral feeds were recorded as being withheld, before and after matching. There are clear differences between unmatched cohorts of babies who received and babies who did not receive enteral feeds. Higher proportions of babies were delivered by caesarean section and to mothers living in the most deprived LSOAs in the withheld enteral feeds group. Babies who did not receive enteral feeds during therapeutic hypothermia also received more intensive medical care at resuscitation and on the first day of their life. After matching, differences in baseline characteristics between babies who received enteral feeds and babies from whom enteral feeds were withheld were markedly reduced (see Tables 8 and 9), as intended.
| Variable | Cohort | |||
|---|---|---|---|---|
| Unmatched | Matched | |||
| No enteral feeds | Enterally fed | No enteral feeds | Enterally fed | |
| Total number of babies | 3975 | 1872 | 1618 | 1618 |
| Male | ||||
| n | 2173 | 1055 | 903 | 903 |
| % | 54.7 | 56.4 | 55.8 | 55.8 |
| Multiple birth | ||||
| n | 116 | 61 | 48 | 54 |
| % | 2.9 | 3.3 | 3.0 | 3.3 |
| Gestational age at birth (weeks) | ||||
| Mean | 39.3 | 39.5 | 39.5 | 39.5 |
| SD | 1.6 | 1.5 | 1.5 | 1.5 |
| Birthweight (g) | ||||
| Mean | 3358 | 3395 | 3403 | 3386 |
| SD | 621 | 636 | 625 | 633 |
| Caesarean delivery | ||||
| n | 1921 | 738 | 649 | 638 |
| % | 50.6 | 41.2 | 41.9 | 41.1 |
| Maternal age (years) | ||||
| Median | 30 | 31 | 31 | 31 |
| Lower quartile | 26 | 27 | 26.9 | 26.5 |
| Upper quartile | 34 | 35 | 35 | 35 |
| Maternal suspected chorioamnionitis | ||||
| n | 406 | 240 | 202 | 187 |
| % | 12.6 | 15.2 | 15.2 | 13.7 |
| Smoking in pregnancy | ||||
| n | 524 | 191 | 159 | 169 |
| % | 15.4 | 11.7 | 11.3 | 12 |
| Missing, n | 566 | 244 | 207 | 205 |
| % | 16.6 | 15 | 14.7 | 14.5 |
| Ethnicity (maternal) (%) | ||||
| White | 65.4 | 63.3 | 74.5 | 74.9 |
| Asian and mixed | 10.0 | 10.7 | 12.5 | 12.2 |
| Black and mixed | 7 | 6.4 | 7.0 | 7.5 |
| Other and missing | 17.6 | 19.6 | 6.0 | 5.5 |
| Maternal diabetesa | ||||
| n | 171 | 75 | 66 | 60 |
| % | 4.3 | 4.0 | 4.1 | 3.7 |
| Deprivation score (LSOA) (%) | ||||
| In deciles 1 or 2 (most deprived) | 29.4 | 21.0 | 23.1 | 21.6 |
| Primiparousa | ||||
| n | 2107 | 991 | 857 | 844 |
| % | 53 | 52.9 | 53 | 52.2 |
| Variable | Cohort | |||
|---|---|---|---|---|
| Unmatched | Matched | |||
| No enteral feeds | Enterally fed | No enteral feeds | Enterally fed | |
| Total number of babies | 3975 | 1872 | 1618 | 1618 |
| Cord blood gas pH: arterial | ||||
| > 7.0, n | 1240 | 613 | 536 | 536 |
| % | 44.1 | 45.4 | 46 | 46 |
| 6.9–7.0, n | 661 | 318 | 262 | 262 |
| % | 23.5 | 23.5 | 22.5 | 22.5 |
| < 6.9, n | 913 | 420 | 368 | 368 |
| % | 32.4 | 31.1 | 31.6 | 31.6 |
| Missing, n | 1161 | 521 | 452 | 452 |
| % | 29.2 | 27.8 | 27.9 | 27.9 |
| Apgar score at 1 minute | ||||
| 0 or 1, n | 1886 | 778 | 720 | 687 |
| % | 47.4 | 41.6 | 44.5 | 42.5 |
| 2–4, n | 1311 | 731 | 604 | 632 |
| % | 33.0 | 39.0 | 37.3 | 39.1 |
| 5–7, n | 304 | 154 | 130 | 129 |
| % | 7.6 | 8.2 | 8 | 7.9 |
| 8–10, n | 135 | 76 | 60 | 61 |
| % | 3.4 | 4.1 | 3.7 | 3.8 |
| Missing, n | 339 | 133 | 104 | 109 |
| % | 8.5 | 7.1 | 6.4 | 6.8 |
| Apgar score at 5 minutes | ||||
| 0 or 1, n | 695 | 223 | 231 | 198 |
| % | 17.5 | 11.9 | 14.3 | 12.2 |
| 2–4, n | 1476 | 736 | 650 | 648 |
| % | 37.1 | 39.3 | 40.2 | 40 |
| 5–7, n | 1140 | 623 | 490 | 537 |
| % | 28.7 | 33.3 | 30.3 | 33.2 |
| 8–10, n | 324 | 166 | 147 | 132 |
| % | 8.2 | 8.9 | 9.1 | 8.2 |
| Missing, n | 340 | 124 | 100 | 103 |
| % | 8.6 | 6.6 | 6.2 | 6.4 |
| Received chest compressions at resuscitationa | ||||
| n | 1555 | 608 | 560 | 532 |
| % | 39.1 | 32.5 | 34.6 | 32.9 |
| Received resuscitation drugsa | ||||
| n | 683 | 209 | 191 | 183 |
| % | 17.2 | 11.2 | 11.8 | 11.3 |
| Intubated at resuscitationa | ||||
| n | 2619 | 1126 | 1020 | 995 |
| % | 65.9 | 60.1 | 63 | 61.5 |
| Time to first spontaneous breath | ||||
| > 5 minutes, n | 2369 | 1128 | 985 | 985 |
| % | 59.6 | 60.3 | 60.9 | 60.9 |
| Missing, n | 1011 | 452 | 383 | 387 |
| % | 25.4 | 24.1 | 23.7 | 23.9 |
| Temperature (°C) | ||||
| Mean | 35.9 | 36.0 | 36 | 35.9 |
| SD | 1.3 | 1.2 | 1.2 | 1.2 |
| Transfusion of any blood products on day of admission | ||||
| n | 641 | 196 | 180 | 172 |
| % | 16.1 | 10.5 | 11.1 | 10.6 |
| Mechanical ventilation on day of admission | ||||
| n | 3176 | 1335 | 1196 | 1189 |
| % | 83.1 | 73.4 | 77.6 | 75.3 |
| Inhaled nitric oxide on day of admission | ||||
| n | 201 | 57 | 56 | 51 |
| % | 5.3 | 3.2 | 3.7 | 3.3 |
| Treatment with inotropes on day of admission | ||||
| n | 1099 | 320 | 295 | 288 |
| % | 29.0 | 17.9 | 19.3 | 18.5 |
| Early-onset infection (in the first 3 days, defined using NNAP’s definition) | ||||
| n | 44 | 11 | 16 | 11 |
| % | 1.1 | 0.6 | 1.0 | 0.7 |
| Admission from postnatal ward | ||||
| n | 30 | 14 | 14 | 11 |
| % | 0.8 | 0.7 | 0.9 | 0.7 |
| Postnatal transfer to another neonatal unit within the first 48 hours | ||||
| n | 1908 | 913 | 790 | 796 |
| % | 48.0 | 48.8 | 48.8 | 49.2 |
Quality of the match for enteral feeding analysis
Figure 4 presents histograms of the estimated propensity scores from the final enteral feeding propensity model by intervention (i.e. received enteral feeds) and control (i.e. no enteral feeds) groups. There is good overlap of the propensity scores in the intervention and control groups and so many matched pairs can be formed. Data from 574 babies (9.8% of total sample) were discarded because of extreme propensities.
FIGURE 4.
Histograms of estimated propensity scores for primary enteral feeding analysis. Thick vertical dashed lines indicate trimming thresholds for extreme propensities, thin vertical dashed lines indicate propensity deciles for babies retained for the analysis. (a) Round 1, no enteral feeds; (b) round 1, received enteral feeds; (c) round 2, no enteral feeds; and (d) round 2, received enteral feeds.
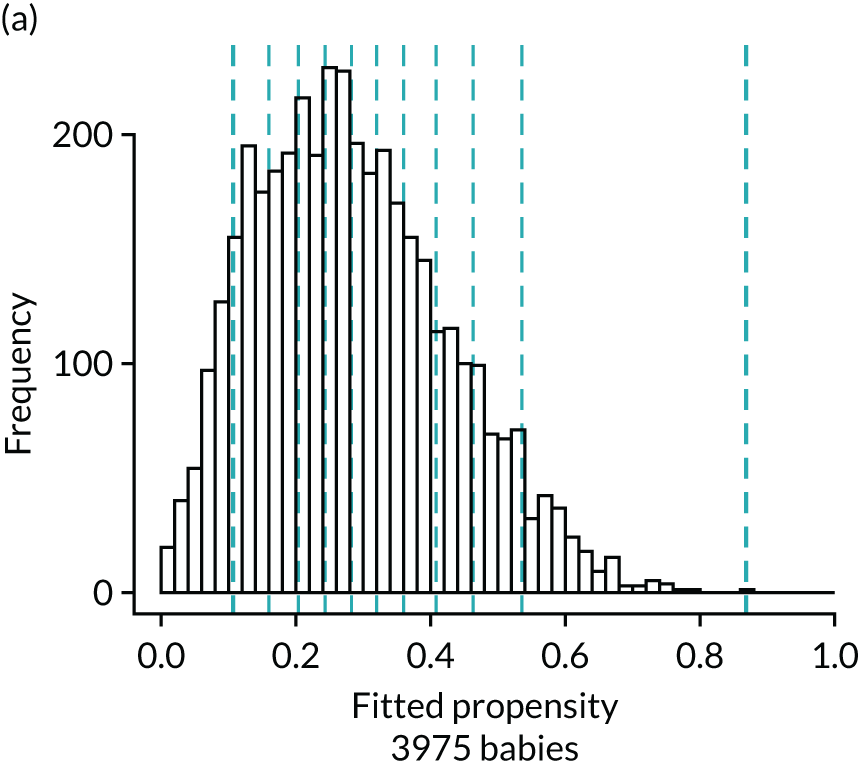
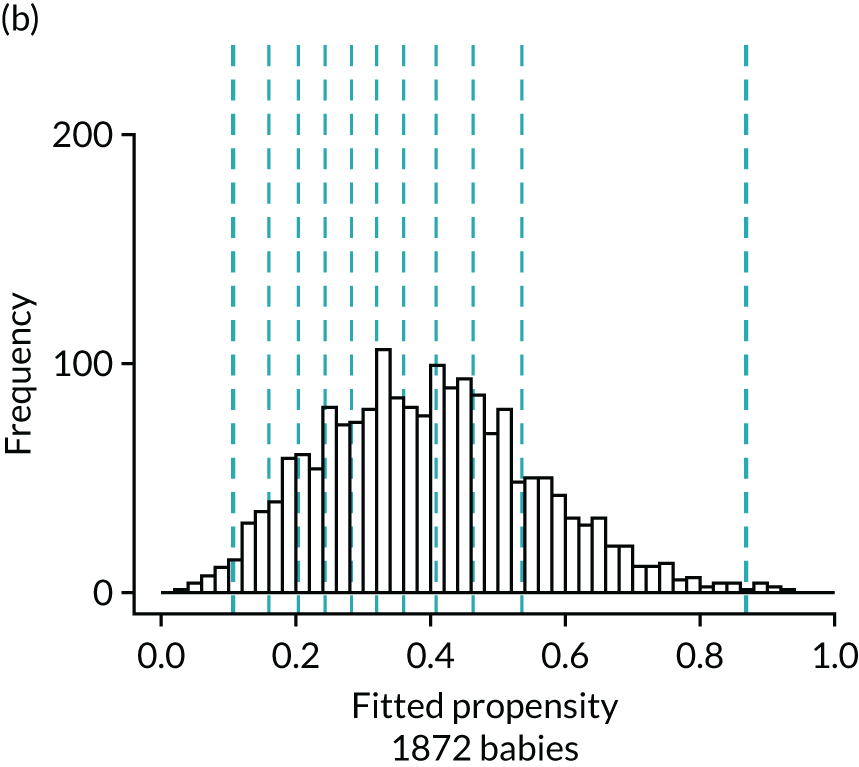
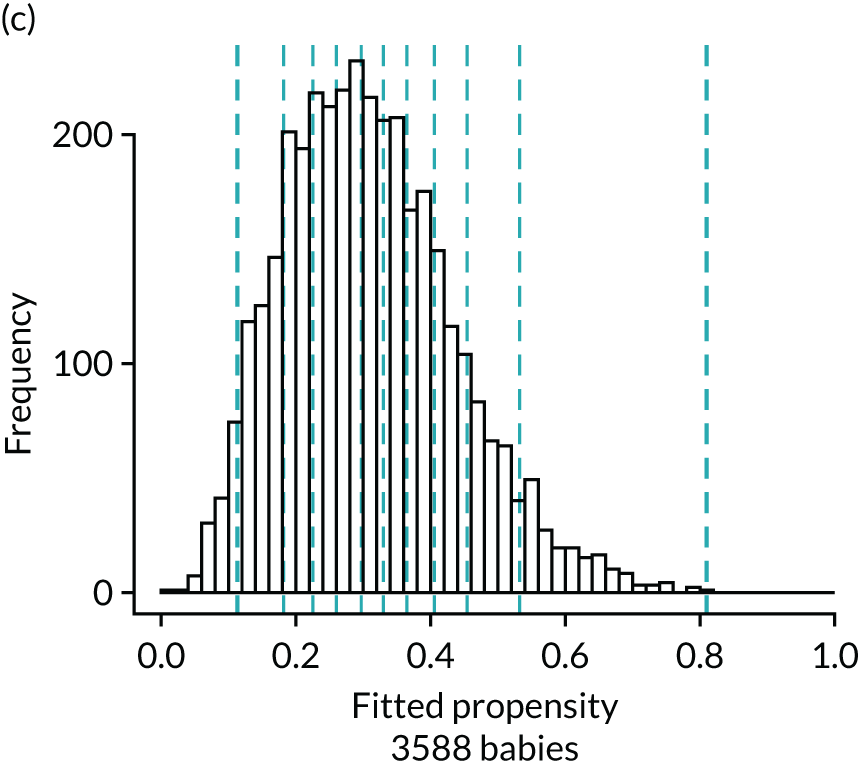
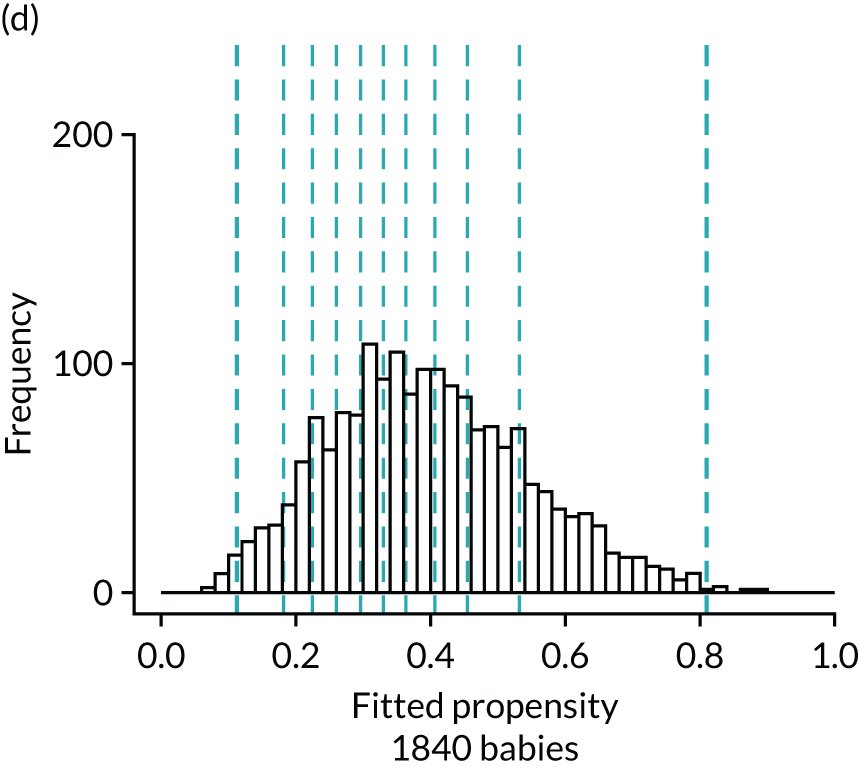
Figure 5 presents the balance plot for the background variables included in the final enteral nutrition comparison propensity model. The dashed black line indicates perfect balance between the enteral nutrition for a specific background variable. The shaded area indicates the acceptable limits of imbalance for any variable, equivalent to an imbalance of ≤ 0.01 in absolute value. The imbalance for a specific background variable in the unmatched cohort is depicted by the bold dash, and the light dash indicates the opposite of this imbalance (imbalance multiplied by –1), which represents the same extent of imbalance. The imbalance in the matched cohort is marked by the black disc. The balances for the background variables are summarised by the mean of their absolute values. Prior to matching the mean balance is 0.064 and the balances are between –0.248 and 0.188. The mean balance for the matched data set is 0.0090 and the balances are between –0.037 and 0.029. The mean balances are displayed in Figure 5.
FIGURE 5.
Balance plot for primary analysis of the effect of enteral feeding (1 : 1 matching within propensity score deciles). The dashed black line indicates perfect balance for a specific background variable. The shaded area indicates the acceptable limits of imbalance for any variable, equivalent to an imbalance of ≤ 0.1 in absolute value. The imbalance for a specific background variable in the unmatched cohort is depicted by the bold dash and the light dash indicates the opposite of this imbalance (imbalance multiplied by –1), which represents the same extent of imbalance. The imbalance in the matched cohort is marked by the black disc. Mean balances are displayed in the bottom right of the figure. AdmitBG, admission glucose; AdmitBP, admission blood pressure; AdmitHR, admission heart rate; AdmitOS, oxygen saturation on admission; AdmitTempCe, admission temperature; AdmitTime, admission time; BloodTrans, blood transfusion on day 1; Bweight, birthweight; ChestCompr, chest compressions at resuscitation; CordBaseExcess, umbilical cord base excess; CordpHArt, umbilical cord arterial pH; CsinLabour, in-labour caesarean; FetusAtDelivC, presentation of fetus at delivery; GAweeks, gestational age in weeks; InstrDeliv, instrumental delivery; IntrPartAntiB, intrapartum antibiotics; LSOAdec, LSOA decile; MaternalDis, maternal obstetric condition; Ms, data for this item were missing; MulipleBrt, multiple birth set; OnsetLabour, spontaneous/induced labour; PostNTransfer, postnatal transfer; ProbMedic, maternal medical condition in pregnancy; prp, propensity; RespiSupprt, received respiratory support on day of admission; ResusDrugs, received drugs during resuscitation; SmokePreg, maternal smoking in pregnancy; SpontRespTime, time to first breath.
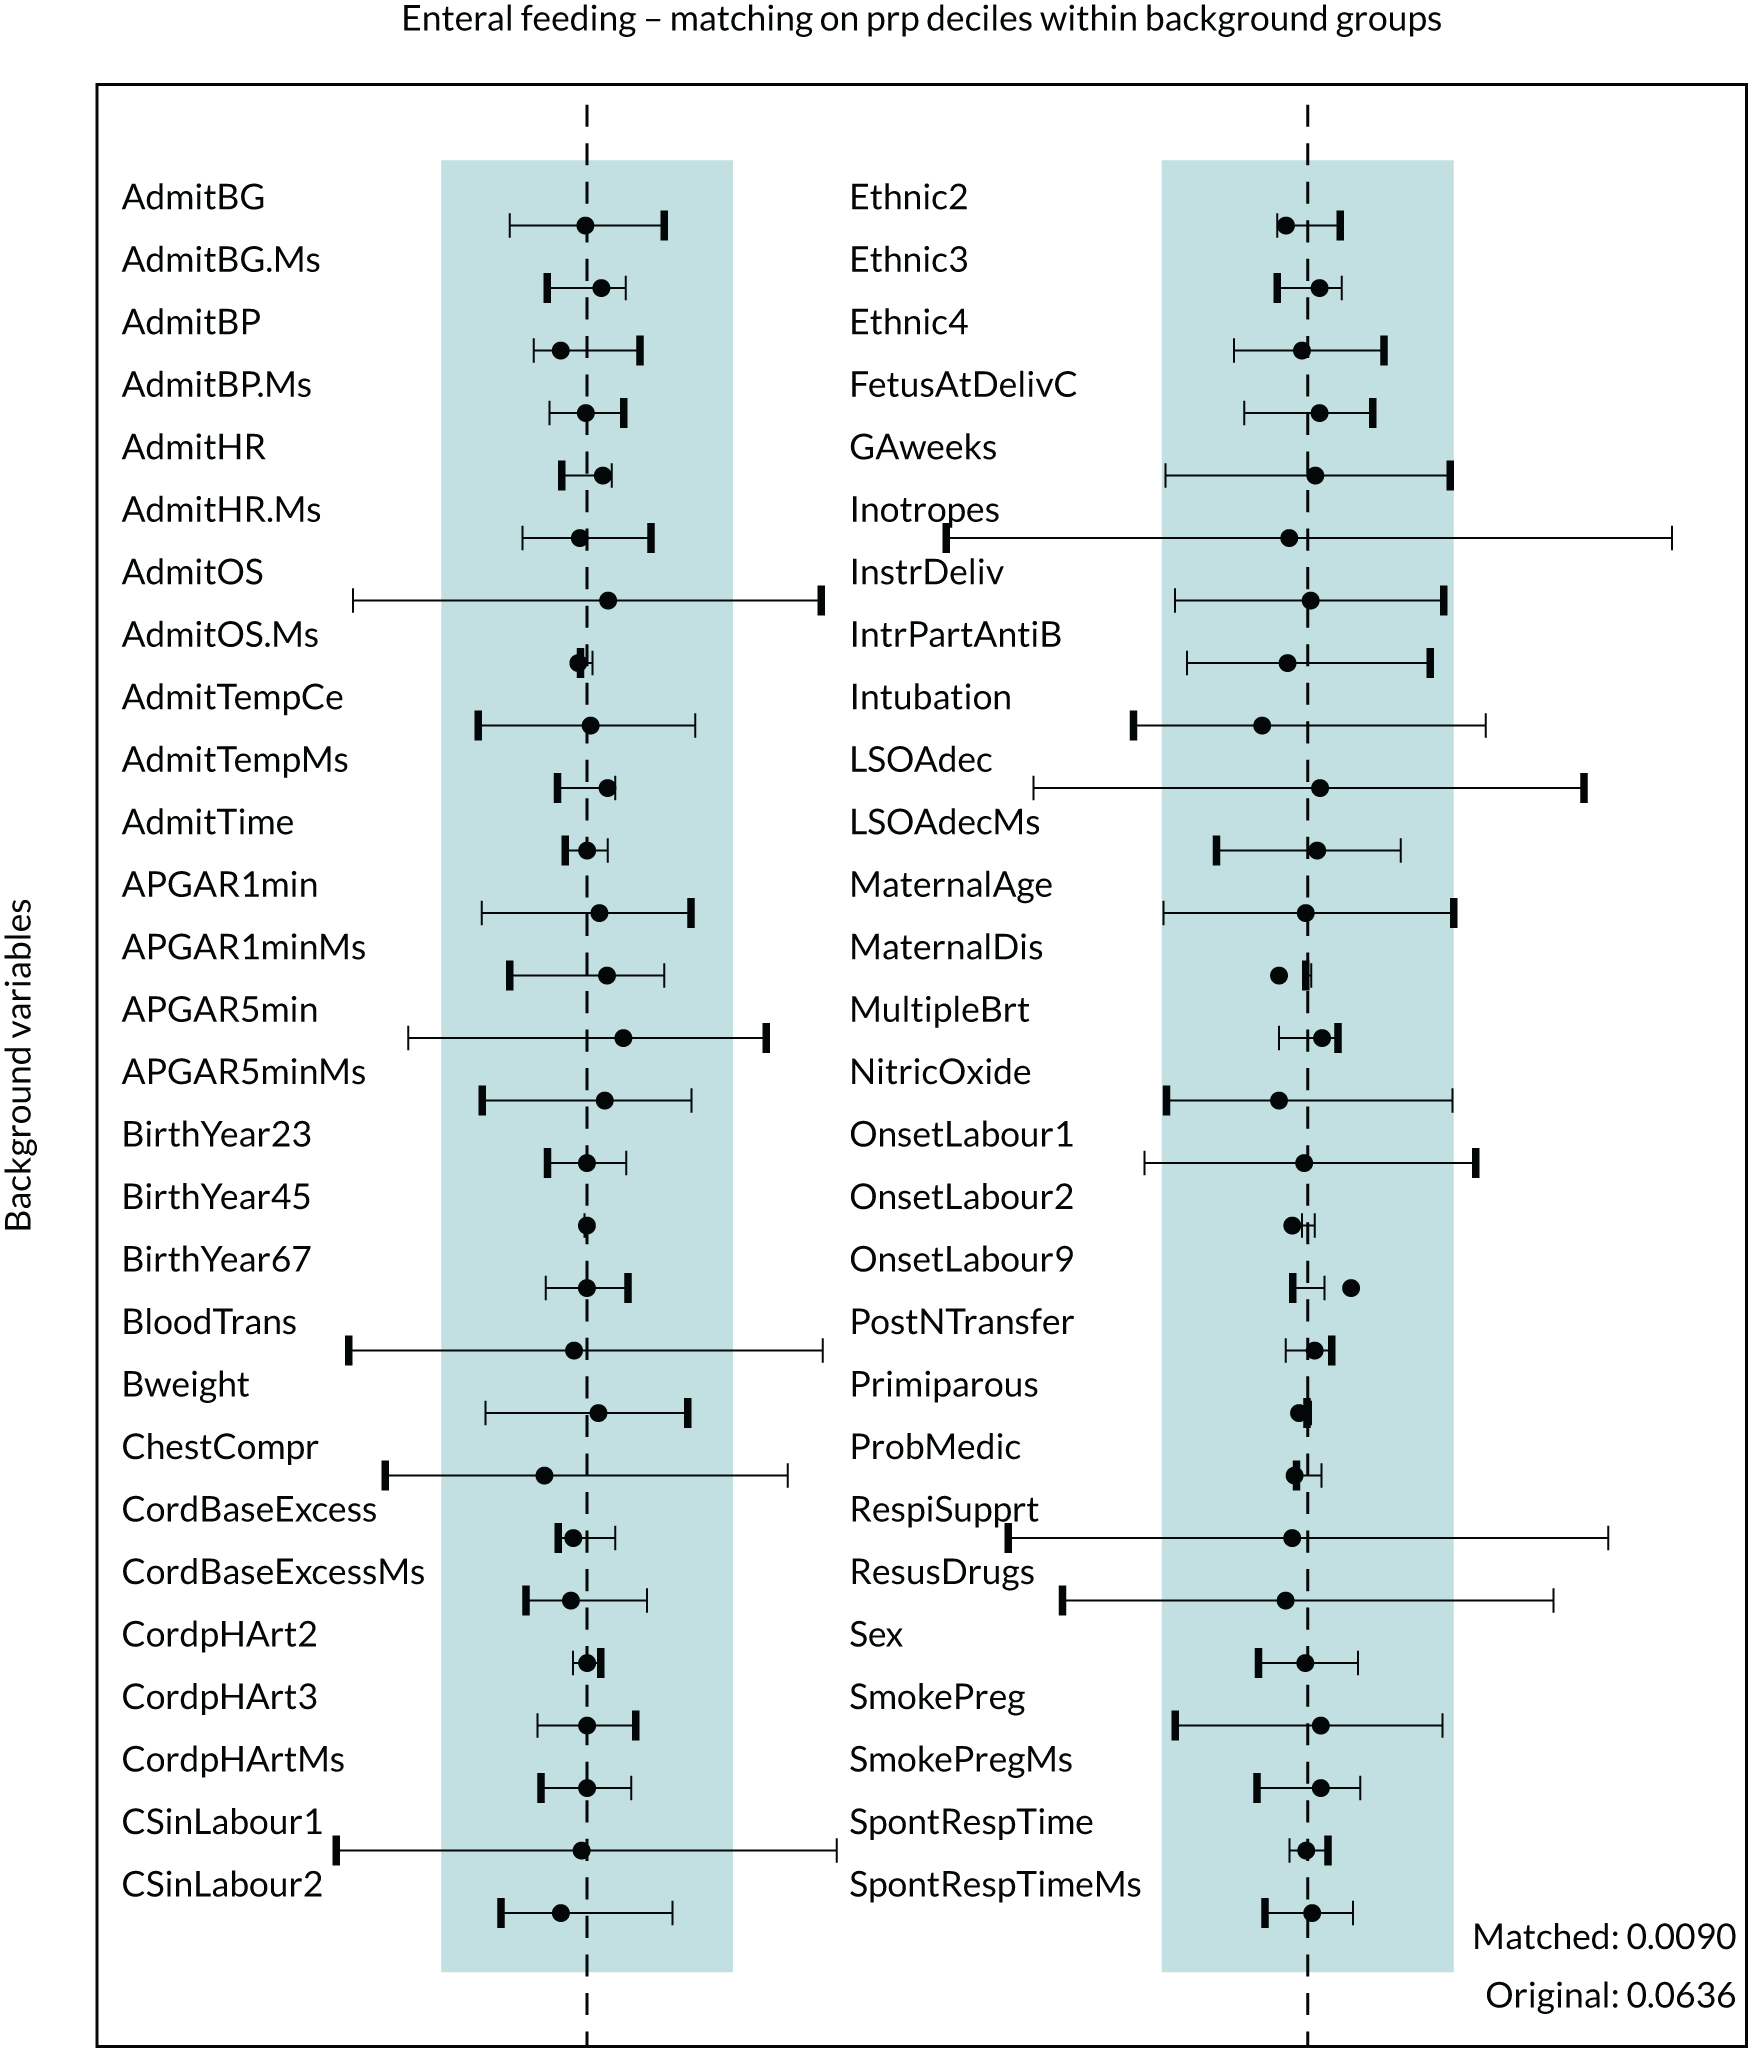
The balance plot (see Figure 5) demonstrates that several variables in the unmatched cohort exhibited large imbalances between the babies who were provided enteral feeds and the babies from whom enteral feeds were withheld. For example, unacceptable levels of imbalance (imbalance of > 0.1 in absolute value) between the two groups existed in the proportion of babies receiving respiratory support (see Figure 5, RespiSupprt) and the proportion of babies receiving blood transfusions (see Figure 5, BloodTrans). However, after the process of matching all background variables showed acceptable levels of imbalance and in the vast majority of cases the balance was much improved when compared with the unmatched cohort.
Results for outcomes in enteral feeding matched comparisons
The outcomes in babies who were enterally fed during therapeutic hypothermia and in babies who were not fed are presented in Table 10, in unmatched and matched cohorts. Tables 11 and 12 present the results for binary and continuous outcome variables, respectively. The results for dichotomised outcome variables can be found in Appendix 5, Table 32.
| Variable | Cohort | |||
|---|---|---|---|---|
| Unmatched | Matched | |||
| No enteral feeds | Enterally fed | No enteral feeds | Enterally fed | |
| Total number of babies | 3975 | 1872 | 1618 | 1618 |
| Severe NEC | ||||
| n | < 5 | < 5 | < 5 | < 5 |
| NEC (pragmatic definition) | ||||
| n | 54 | 11 | 18 | 9 |
| % | 1.4 | 0.6 | 1.1 | 0.6 |
| Late-onset infection (NNAP definition) | ||||
| n | 25 | 5 | 8 | < 5 |
| % | 0.6 | 0.3 | 0.5 | |
| Late-onset infection (pragmatic definition) | ||||
| n | 1193 | 321 | 460 | 271 |
| % | 30.0 | 17.1 | 28.4 | 16.8 |
| Survival at discharge | ||||
| n | 3498 | 1794 | 1465 | 1552 |
| % | 88.1 | 95.9 | 90.6 | 96.0 |
| Hypoglycaemia | ||||
| n | 846 | 316 | 293 | 269 |
| % | 21.3 | 16.9 | 18.1 | 16.6 |
| Breastfeeding at discharge | ||||
| n | 1690 | 1029 | 752 | 883 |
| % | 42.5 | 55.0 | 46.5 | 54.6 |
| Onset of breastfeeding (days) | ||||
| Median | 7 | 6 | 7 | 6 |
| Lower quartile | 6 | 5 | 6 | 5 |
| Upper quartile | 10 | 8 | 9.4 | 8 |
| Missing, n | 1735 | 544 | 626 | 477 |
| % | 43.6 | 29.1 | 38.7 | 29.5 |
| ≤ 28 days, n | 2211 | 1320 | 982 | 1133 |
| % | 55.6 | 70.5 | 60.7 | 70.0 |
| Time to first mother’s milk (days) | ||||
| Median | 5 | 3 | 5 | 3 |
| Lower quartile | 5 | 2 | 5 | 2 |
| Upper quartile | 6 | 4 | 6 | 4 |
| Missing, n | 832 | 221 | 294 | 197 |
| % | 20.9 | 11.8 | 18.2 | 12.2 |
| ≤ 28 days, n | 3140 | 1650 | 1324 | 1420 |
| % | 79.0 | 88.1 | 81.8 | 87.8 |
| Received PN | ||||
| n | 1689 | 683 | 674 | 596 |
| % | 42.5 | 36.5 | 41.6 | 36.8 |
| Duration of PN (days) | ||||
| Median | 3 | 3 | 3 | 3 |
| Lower quartile | 2 | 2 | 2 | 2 |
| Upper quartile | 5 | 3 | 5 | 3 |
| Had a central venous line | ||||
| n | 3832 | 1637 | 1546 | 1417 |
| % | 96.4 | 87.4 | 95.5 | 87.6 |
| Days of central venous line in situ | ||||
| Median | 5 | 4 | 5 | 4 |
| Lower quartile | 4 | 3 | 4 | 3 |
| Upper quartile | 7 | 5 | 6 | 5 |
| Weight z-score at discharge | ||||
| Median | –0.7 | –0.6 | –0.6 | –0.7 |
| Lower quartile | –1.5 | –1.3 | –1.4 | –1.4 |
| Upper quartile | 0.1 | 0.2 | 0.2 | 0.1 |
| Missing, n | 2 | 9 | 4 | 8 |
| % | 0.1 | 0.5 | 0.1 | 0.3 |
| Length of stay (days) | ||||
| Median | 11 | 10 | 11 | 10 |
| Lower quartile | 8 | 7 | 8 | 7 |
| Upper quartile | 17 | 13 | 16 | 13 |
| > 14 days, n | 1351 | 392 | 484 | 344 |
| % | 34.0 | 21.0 | 29.9 | 21.3 |
| Variable | Intervention, % (95% CI) | Rate difference, % (95% CI) | OR estimate (95% CI) | p-value | |
|---|---|---|---|---|---|
| No enteral feeds rate | Enterally fed rate | ||||
| Total number of babies | 1618 | 1618 | |||
| Severe NEC | n/a | n/a | n/a | n/a | n/a |
| NEC (pragmatic definition) | 1.1 (0.7 to 1.4) | 0.5 (0.2 to 0.9) | –0.5 (–1.0 to –0.1) | 0.50 (0.22 to 1.12) | 0.03 |
| Late-onset infection (NNAP definition) | 0.5 (0.2 to 0.7) | 0.3 (0.04 to 0.4) | –0.2 (–0.5 to 0.1) | 0.55 (0.17 to 1.80) | 0.19 |
| Late-onset infection (pragmatic definition) | 28.4 (26.7 to 30.0) | 16.7 (15.0 to 184) | –11.6 (–14.0 to –9.3) | 0.51 (0.43 to 0.60) | < 0.001 |
| Hypoglycaemia | 18.1 (16.7 to 19.5) | 16.6 (15.0 to 18.3) | –1.5 (–3.7 to 0.6) | 0.90 (0.75 to 1.08) | 0.17 |
| Survival at discharge | 90.8 (89.7 to 91.8) | 96.0 (95.0 to 96.8) | 5.2 (3.9 to 6.6) | 2.42 (1.80 to 3.26) | < 0.001 |
| Breastfeeding at discharge | 46.7 (44.8 to 48.5) | 54.6 (52.4 to 56.8) | 8.0 (5.1 to 10.8) | 1.38 (1.20 to 1.58) | < 0.001 |
| Variable | Intervention | Difference (95% CI) | p-value | |
|---|---|---|---|---|
| No enteral feeds | Enterally fed | |||
| Total number of babies | 1618 | 1618 | ||
| Length of stay (days) (95% CI) | 14.8 (14.2 to 15.5) | 12.7 (12.0 to 13.3) | –2.2 (–3.0 to –1.2) | < 0.001 |
| First day suckling at breast (95% CI) | 8.7 (8.4 to 9.0) | 7.3 (6.9 to 7.7) | –1.4 (–1.9 to –0.9) | < 0.001 |
| First day of maternal milk 95% CI) | 5.4 (5.4 to 5.5) | 3.3 (3.2 to 3.4) | –2.1 (–2.2 to –2.0) | < 0.001 |
| Duration of PN (days) (95% CI) | 3.7 (3.5 to 3.8) | 3.0 (2.7 to 3.4) | –0.7 (–1.1 to –0.2) | 0.02 |
| Duration of central venous line in situ (days) (95% CI) | 5.5 (5.3 to 5.7) | 4.3 (4.1 to 4.5) | –1.2 (–1.5 to –0.9) | < 0.001 |
| Weight z-score (95% CI) | –0.60 (–0.65 to –0.55) | –0.54 (–0.59 to –0.48) | 0.06 (–0.01 to 0.13) | 0.11 |
The incidence of severe NEC was so low that cases were potentially identifiable and, therefore, counts of < 5 were used in Tables 10 and 11. Owing to the small numbers of cases in both babies who were fed and babies from whom feeds were withheld, no further analyses were undertaken for severe NEC. Although it was rare in both groups, following matching the incidence of pragmatically defined NEC was lower in babies fed than in babies not fed during therapeutic hypothermia (0.5% and 1.1%, respectively; p = 0.03) (see Tables 10 and 11).
Late-onset infection, as defined using the NNAP definition, was rare and, after matching the incidence, was similar between babies fed and babies not fed during therapeutic hypothermia. We found no evidence (p = 0.19) of a difference in the rates of NNAP-defined late-onset infection between babies who received enteral feeds and babies from whom enteral feeds were withheld. However, when defined using the more pragmatic definition, there was strong evidence (p < 0.001) that the risk of late-onset infection was lower in babies who were provided with enteral feeds. Babies who were provided with enteral feeds were estimated to have approximately half the odds of having pragmatically defined late-onset infection than babies from whom enteral feeds were withheld (OR 0.51, 95% CI 0.43 to 0.60) (see Table 11).
We found strong evidence (p < 0.001) of a higher survival rate in babies who were fed during therapeutic hypothermia in the matched comparison, in addition to higher rates of breastfeeding at discharge (p < 0.001) (see Tables 10 and 11). In matched comparisons, babies who received enteral feeds during therapeutic hypothermia had a mean length of stay of 2.2 days (95% CI 1.2 to 3.0 days) shorter than those babies who were not fed (p < 0.001) and a mean duration of central line placement in situ that was 1.2 days (95% CI 0.9 to 1.5 days) shorter than those who were not fed (p < 0.001) (see Table 12). Similar patterns were observed in matched comparisons for the dichotomised versions of the continuous outcomes. The odds of a baby staying in the neonatal unit for > 14 days was reduced by an estimated 37% in babies fed compared with those from whom enteral feeds were withheld (OR 0.63, 95% CI 0.54 to 0.74; p < 0.001) (see Appendix 5, Table 32).
Sensitivity analyses
The reduction of the time period of interest to years of birth (i.e. 2012–17), omitting the first 2 years of the study period, resulted in a reduction in the number of matched pairs to 1300. Excluding babies who were not actively recorded as receiving no enteral feeds reduced the matched cohort to 1453 pairs and adding receipt of PN on the first day of life resulted in a matched cohort of 1644 pairs. Results of the three sensitivity analyses were consistent with the corresponding results of the primary analysis (Table 13; see also Appendix 6, Table 33).
| Variable | Sensitivity analysis | ||
|---|---|---|---|
| Years 2012–17 | Intervention redefined | Inclusion of PN in PSM | |
| Binary outcomes: estimate of rate difference (95% CI) [p-value] | |||
| NEC (pragmatic definition) | –0.7 (–1.3 to –0.1) [0.03] | –0.6 (–1.2 to –0.1) [0.07] | –0.5 (–1.0 to –0.0) [0.15] |
| Late-onset BSI (NNAP definition) | –0.4 (–0.8 to –0.003) [0.05] | –0.3 (–0.7 to 0.1) [0.22] | –0.3 (–0.6 to –0.0) [0.15] |
| Late-onset BSI (pragmatic definition) | –11.1 (–13.7 to –8.4) [< 0.001] | –11.3 (–13.9 to –8.7) [< 0.001] | –11.4 (–13.8 to –9.1) [< 0.001] |
| Hypoglycaemia | –1.3 (–3.7 to 1.2) [0.31] | –0.5 (–2.8 to 1.9) [0.83] | –1.1 (–3.3 to 1.1) [0.52] |
| Survival at discharge | 4.8 (3.3 to 6.3) [< 0.001] | 4.4 (2.9 to 5.9) [< 0.001] | 4.5 (3.2 to 5.8) [< 0.001] |
| Breastfeeding at discharge | 8.3 (5.0 to 11.5) [< 0.001] | 6.5 (3.4 to 9.6) [0.003] | 7.9 (5.0 to 10.7) [< 0.001] |
| Continuous outcomes: mean difference (95% CI) [p-value] | |||
| Length of stay (days) | –2.3 (–3.4 to –1.3) [< 0.001] | –2.0 (–2.9 to –1.1) [< 0.001] | –2.0 (–2.8 to –1.1) [< 0.001] |
| First day of suckling at breast | –1.3 (–1.9 to –0.7) [< 0.001] | –1.2 (–1.8 to –0.6) [< 0.001] | –1.4 (–1.9 to –0.9) [< 0.001] |
| First day of maternal milk | –2.2 (–2.3 to –2.0) [< 0.001] | –2.1 (–2.3 to –2.0) [< 0.001] | –2.1 (–2.2 to –2.0) [< 0.001] |
| Duration of PN (days) | –0.7 (–1.2 to –0.2) [0.02] | –0.7 (–1.2 to –0.2) [0.02] | –0.6 (–1.0 to –0.2) [0.01] |
| Duration of central venous line in situ (days) | –1.3 (–1.6 to –1.0) [< 0.001] | –1.2 (–1.4 to –1.0) [< 0.001] | –1.1 (–1.4 to –0.9) [< 0.001] |
| Weight z-score at discharge | 0.09 (0.01 to 0.17) [0.06] | 0.08 (0.00 to 0.16) [0.13] | 0.07 (0.00 to 0.15) [0.12] |
Babies admitted from the postnatal ward
A subgroup analysis was planned to exclude all babies whose first admission to neonatal care was from a postnatal ward to exclude babies to whom therapeutic hypothermia was administered following postnatal collapse rather than following resuscitation at birth. Only 46 babies in the entire cohort were admitted from a postnatal ward and, therefore, this sensitivity analysis was not conducted. The number of babies admitted from the postnatal ward by enteral feeding group is similar before and after matching (see Table 9).
Influence of alternative matching methods
The results were found to be consistent across all alternative methods of matching on the propensity groups and principal background variables (see Appendix 7, Figure 9).
Patterns of enteral feeding
Details of the types of milk that babies received during therapeutic hypothermia and up to day 7, in both matched and unmatched cohorts, are shown in Figure 6. In both cohorts, the most common enteral feed type was mother’s breast milk. There were a substantial number of missing data on the type of milk provided to babies on the first day of life.
FIGURE 6.
Type of enteral feeds provided up to 7 days of life for babies treated with therapeutic hypothermia, in (a) unmatched and (b) matched cohorts, as a proportion of babies who received enteral feeds.
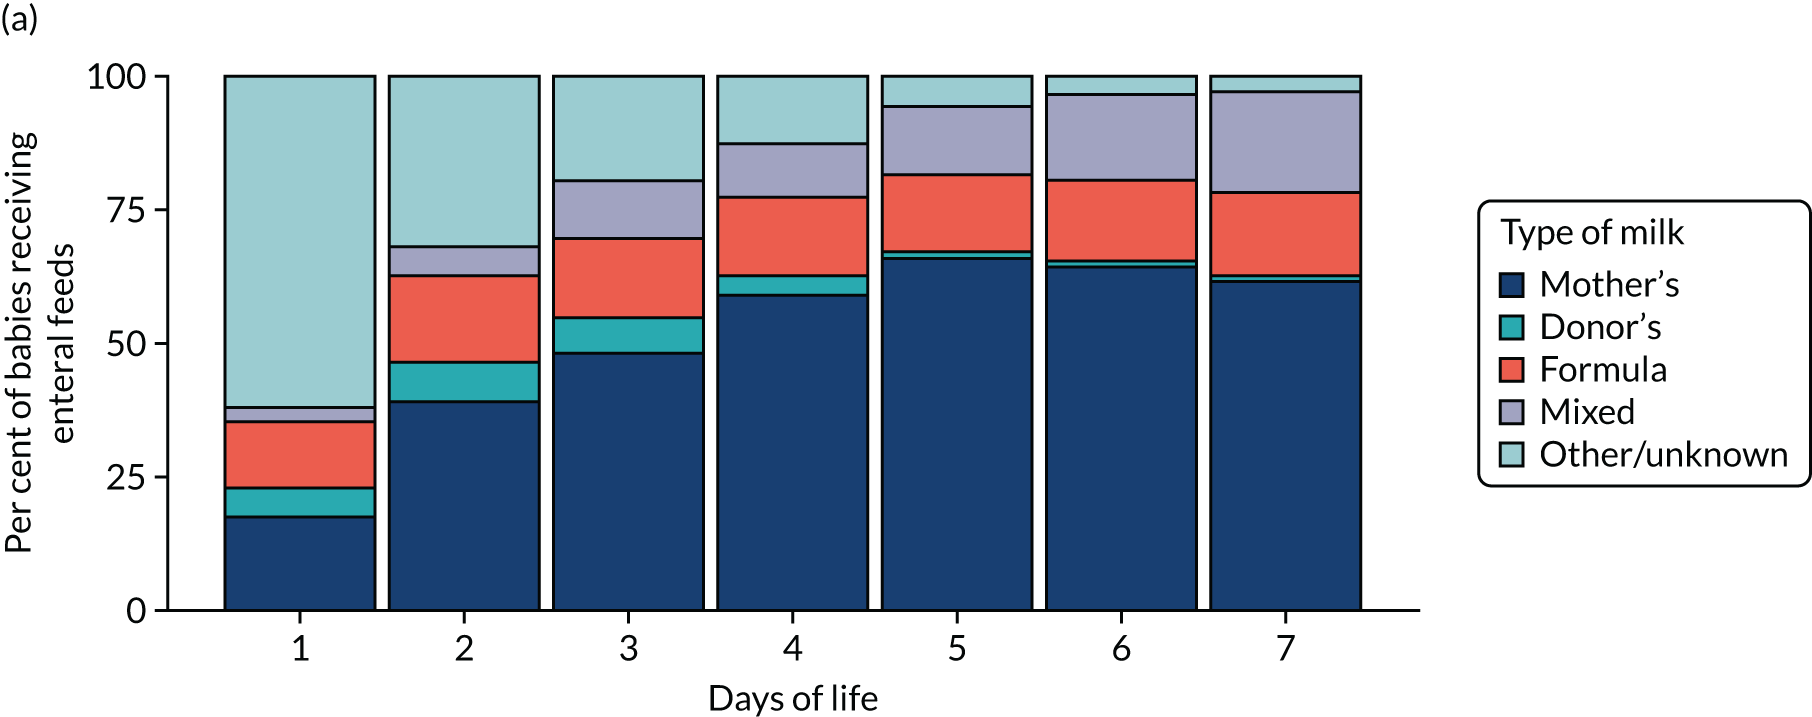
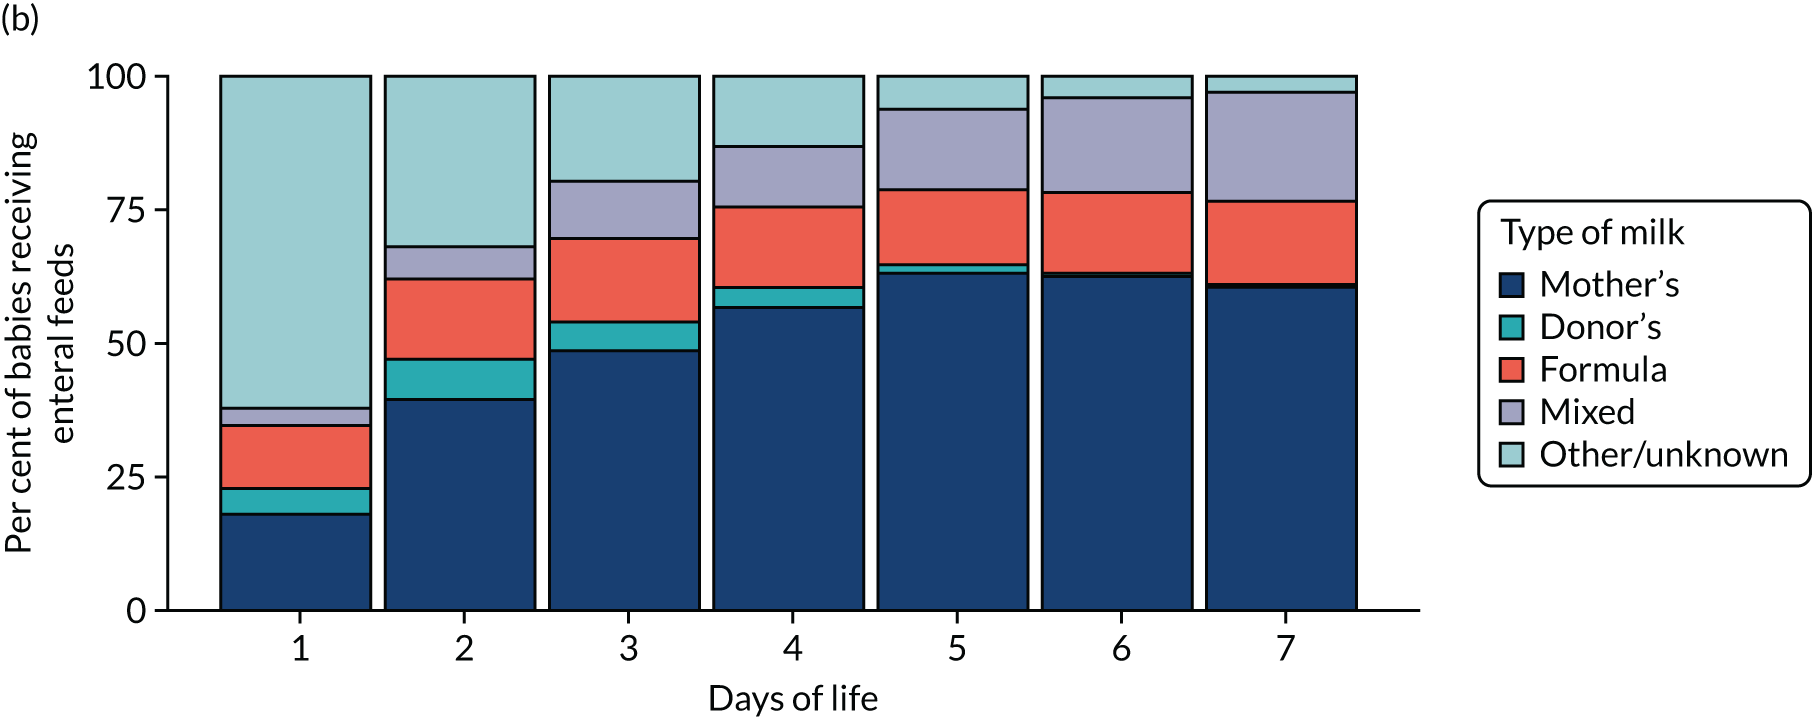
In the unmatched cohort the median time to first enteral feed was 5 days after birth, with the probability of being enterally fed reaching 80% at 6 days after birth.
The highest rates of enteral feeding were in the North West London ODN and South East Coast ODN (89% and 59% of babies treated with therapeutic hypothermia, respectively). The lowest rates of enteral feeding during therapeutic hypothermia were in West Midlands (12%), East Midlands (13%) and Wales (13%) (Table 14).
| ODN | Provision of enteral feeds | |||
|---|---|---|---|---|
| No | Yes | |||
| n | % | n | % | |
| East Midlands | 313 | 86.9 | 47 | 13.1 |
| East of England | 369 | 68.0 | 174 | 32.0 |
| North Central and East London | 324 | 72.5 | 123 | 27.5 |
| North West | 521 | 81.8 | 116 | 18.2 |
| North West London | 25 | 11.0 | 203 | 89.0 |
| Northern | 157 | 69.5 | 69 | 30.5 |
| South East Coast | 228 | 41.0 | 328 | 59.0 |
| South West | 314 | 62.6 | 188 | 37.5 |
| South London | 253 | 66.1 | 130 | 33.9 |
| Thames Valley and Wessex | 361 | 63.9 | 204 | 36.1 |
| West Midlands | 492 | 88.0 | 67 | 12.0 |
| Yorkshire and the Humber | 290 | 70.7 | 120 | 29.3 |
| Isle of Man | < 5 | < 5 | ||
| Scotland | 121 | 63.0 | 71 | 37.0 |
| Wales | 194 | 86.6 | 30 | 13.4 |
| Total | 3962 | 67.9 | 1870 | 32.1 |
Parenteral nutrition analysis
Overview
In this section we present matched analyses comparing different approaches to PN (i.e. administering PN vs. not administering PN during therapeutic hypothermia). We present summary data for selected background variables within the unmatched groups and summary background data by use of PN for the matched subgroups, and data describing the quality of the match. The main results of the primary analyses are presented as estimates and CIs for the treatment effects for each outcome.
Primary analysis
Background variables in unmatched and matched cohorts
Tables 15 and 16 (see also Appendix 8, Tables 34–37) present the background characteristics of babies recorded as having received PN during therapeutic hypothermia and those babies who were not recorded as receiving PN, before and after matching. Prior to matching, the characteristics of babies who received PN were similar to those who did not receive PN, although the latter tended to have higher proportions of mothers from areas of deprivation. After matching, differences in baseline characteristics between babies who received PN and babies who did not receive PN were reduced (see Tables 15 and 16).
| Variable | Cohort | |||
|---|---|---|---|---|
| Unmatched | Matched | |||
| No PN | PN | No PN | PN | |
| Total number of babies | 4535 | 1475 | 1240 | 1240 |
| Male | ||||
| n | 2507 | 810 | 652 | 664 |
| % | 55.3 | 54.9 | 52.6 | 53.5 |
| Multiple birth | ||||
| n | 121 | 58 | 42 | 45 |
| % | 2.7 | 3.9 | 3.4 | 3.6 |
| Gestational age at birth (weeks) | ||||
| Mean | 39.4 | 39.29 | 39.4 | 39.4 |
| SD | 1.55 | 1.6 | 1.6 | 1.6 |
| Birthweight (g) | ||||
| Mean | 3385 | 3321 | 3330 | 3328 |
| SD | 621 | 631 | 609 | 628 |
| Caesarean delivery | ||||
| n | 2066 | 667 | 545 | 549 |
| % | 47.7 | 47.1 | 45.9 | 46.1 |
| Maternal age (years) | ||||
| Median | 30 | 31 | 30 | 31 |
| Lower quartile | 26 | 26 | 26 | 26 |
| Upper quartile | 35 | 34 | 34 | 34 |
| Maternal suspected chorioamnionitis | ||||
| n | 479 | 175 | 147 | 150 |
| % | 12.8 | 14.5 | 14.5 | 14.6 |
| Smoking in pregnancy | ||||
| n | 520 | 211 | 175 | 176 |
| % | 13.3 | 16.9 | 16.6 | 16.8 |
| Ethnicity (maternal) (%) | ||||
| White | 65.7 | 61.4 | 80.8 | 79.9 |
| Asian and mixed | 11.2 | 6.8 | 7.9 | 7.5 |
| Black and mixed | 7.5 | 4.3 | 4.3 | 5 |
| Other and missing | 15.5 | 27.5 | 6.9 | 7.6 |
| Maternal diabetesa | ||||
| n | 191 | 65 | 49 | 53 |
| % | 4.2 | 4.4 | 4.0 | 4.3 |
| Deprivation score (LSOA) (%) | ||||
| In deciles 1 or 2 (most deprived) | 27.9 | 22.3 | 23.9 | 21.7 |
| Primiparousa | ||||
| n | 2425 | 778 | 669 | 671 |
| % | 53.5 | 52.7 | 54 | 54.1 |
| Variable | Cohort | |||
|---|---|---|---|---|
| Unmatched | Matched | |||
| No PN | PN | No PN | PN | |
| Total number of babies | 4535 | 1475 | 1240 | 1240 |
| Cord blood gas pH: arterial | ||||
| > 7.0, n | 1439 | 451 | 396 | 396 |
| % | 44.4 | 44.0 | 45.3 | 45.3 |
| 6.9–7.0, n | 756 | 248 | 198 | 198 |
| % | 23.3 | 24.2 | 22.7 | 22.7 |
| < 6.9, n | 1049 | 326 | 280 | 280 |
| % | 32.3 | 31.8 | 32.0 | 32.0 |
| Missing, n | 1291 | 450 | 366 | 366 |
| % | 28.5 | 30.5 | 29.5 | 29.5 |
| Apgar score at 1 minute | ||||
| 0 or 1, n | 2062 | 679 | 553 | 562 |
| % | 45.5 | 46.0 | 44.6 | 45.3 |
| 2–4, n | 1601 | 494 | 429 | 415 |
| % | 35.3 | 33.5 | 34.6 | 33.5 |
| 5–7, n | 347 | 116 | 99 | 99 |
| % | 7.7 | 7.9 | 8 | 8 |
| 8–10, n | 165 | 53 | 47 | 49 |
| % | 3.6 | 3.6 | 3.7 | 4.0 |
| Missing, n | 360 | 133 | 113 | 115 |
| % | 7.9 | 9.0 | 9.1 | 9.3 |
| Apgar score at 5 minutes | ||||
| 0 or 1, n | 730 | 218 | 188 | 182 |
| % | 16.1 | 14.8 | 15.1 | 14.7 |
| 2–4, n | 1704 | 563 | 450 | 470 |
| % | 37.6 | 38.2 | 36.2 | 37.9 |
| 5–7, n | 1372 | 433 | 389 | 362 |
| % | 30.3 | 29.4 | 31.3 | 29.2 |
| 8–10, n | 374 | 130 | 107 | 116 |
| % | 8.2 | 8.8 | 8.6 | 9.4 |
| Missing, n | 355 | 131 | 107 | 109 |
| % | 7.8 | 8.9 | 8.6 | 8.8 |
| Received chest compressions at resuscitationa | ||||
| n | 1705 | 523 | 431 | 427 |
| % | 37.6 | 35.5 | 34.8 | 34.4 |
| Received resuscitation drugsa | ||||
| n | 719 | 206 | 176 | 172 |
| % | 15.9 | 14.0 | 14.2 | 13.9 |
| Intubated at resuscitationa | ||||
| n | 2925 | 935 | 784 | 783 |
| % | 64.5 | 63.4 | 63.2 | 63.1 |
| Time to first spontaneous breath | ||||
| 6 (> 5 minutes) , n | 2701 | 896 | 757 | 758 |
| % | 59.6 | 60.7 | 61 | 61.1 |
| Missing, n | 1160 | 344 | 283 | 284 |
| % | 25.6 | 23.3 | 22.8 | 22.9 |
| Time to admission (minutes) | ||||
| Median | 30 | 30 | 30 | 29 |
| Lower quartile | 20 | 20 | 21 | 20 |
| Upper quartile | 44 | 45 | 45 | 44 |
| Temperature (°C) | ||||
| Mean | 35.9 | 35.9 | 35.9 | 35.9 |
| SD | 1.3 | 1.2 | 1.3 | 1.2 |
| Transfusion of any blood products on day of admission | ||||
| n | 648 | 214 | 195 | 187 |
| % | 14.3 | 14.5 | 15.8 | 15.1 |
| Mechanical ventilation on day of admission | ||||
| n | 3508 | 1122 | 951 | 956 |
| % | 80.2 | 79.5 | 79.6 | 80.2 |
| Inhaled nitric oxide on day of admission | ||||
| n | 197 | 70 | 50 | 58 |
| % | 4.5 | 5.0 | 4.2 | 4.9 |
| Treatment with inotropes on day of admission | ||||
| n | 1126 | 335 | 295 | 287 |
| % | 26.0 | 23.9 | 25.0 | 24.2 |
| Early-onset infection (in the first 3 days, defined using NNAP definition) | ||||
| n | 37 | 18 | 9 | 14 |
| % | 0.8 | 1.2 | 0.7 | 1.1 |
| Admission from postnatal ward | ||||
| n | 32 | 12 | 11 | 11 |
| % | 0.7 | 0.8 | 0.9 | 0.9 |
| Postnatal transfer to another neonatal unit within the first 48 hours | ||||
| n | 2219 | 640 | 546 | 549 |
| % | 48.9 | 43.4 | 44.0 | 44.2 |
Quality of the match of parenteral nutrition analysis
Figure 7 presents the estimated propensity scores from the primary PN comparison propensity model by intervention (i.e. received PN) and control (i.e. did not receive PN) groups. The fitted propensities for the two treatment groups have good overlap. Data from 687 babies (11.4% of unmatched sample) were discarded because of extreme propensities.
FIGURE 7.
Histograms of estimated propensity scores for primary parenteral nutrition analysis. Thick vertical dashed lines indicate trimming thresholds for extreme propensities and thin vertical dashed lines indicate propensity deciles for babies retained for analysis. (a) Round 1, no parental nutrition; (b) round 1, received parental nutrition; (c) round 2, no parental nutrition; and (d) round 2, received parental nutrition.
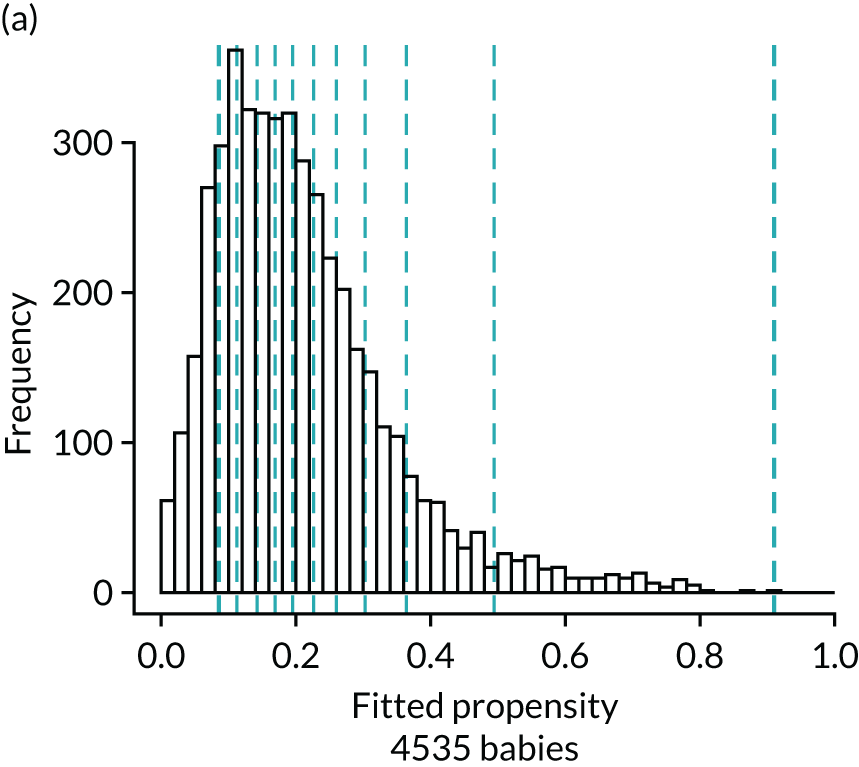
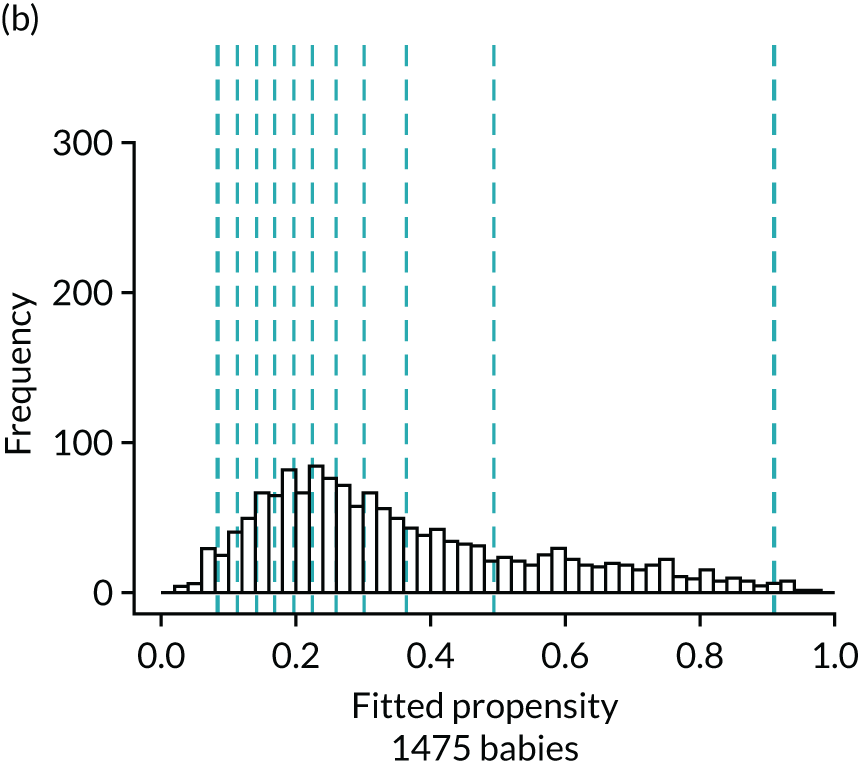
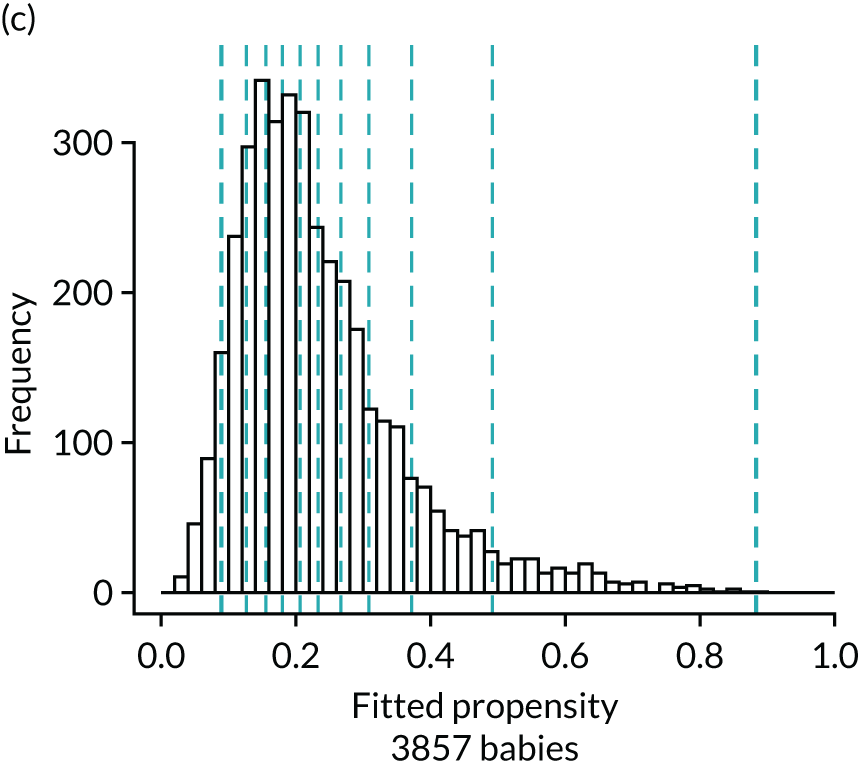
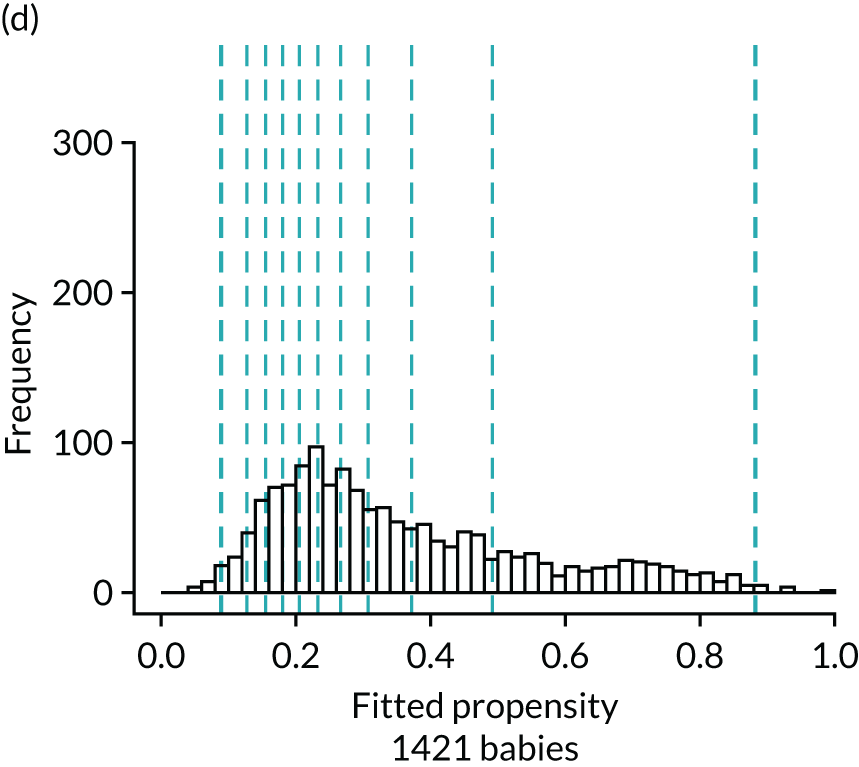
Figure 8 presents the balance plot for the background variables included in the primary propensity model for the PN comparison. As previously, the dashed black line indicates perfect balance between the PN analysis groups for each specific background variable. The shaded area indicates the acceptable limits of imbalance for the variables, from –0.1 to 0.1. The imbalance for a specific background variable in the unmatched cohort is marked by a bold dash and the light dash indicates this imbalance by –1 to facilitate comparison to imbalance in the matched cohort, which itself is marked by the black disc. The balances for the background variables are summarised by the mean of their absolute values. Prior to matching, the mean balance is 0.061 and the balances are in the range from –0.215 to 0.563. The mean balance for the matched data set is 0.010 and the balances are between –0.025 and 0.051. The mean balances are displayed in Figure 8.
FIGURE 8.
Balance plot for primary analysis of the effect of parenteral nutrition (1 : 1 matching within propensity score deciles). The dashed black line indicates perfect balance for a specific background variable. The shaded area indicates the acceptable limits of imbalance for any variable, equivalent to an imbalance of ≤ 0.1 in absolute value. The imbalance for a specific background variable in the unmatched cohort is depicted by the bold dash and the light dash indicates the opposite of this imbalance (multiplied by –1), which represents the same extent of imbalance. The imbalance in the matched cohort is marked by the black disc. Mean balances are displayed in the bottom right of the figure. AdmitBG, admission glucose; AdmitBP, admission blood pressure; AdmitHR, admission heart rate; AdmitOS, oxygen saturation on admission; AdmitTempCe, admission temperature; AdmitTime, admission time; BloodTrans, blood transfusion on day 1; Bweight, birthweight; ChestCompr, chest compressions at resuscitation; CordBaseExcess, umbilical cord base excess; CordpHArt, umbilical cord arterial pH; CsinLabour, in-labour caesarean; FetusAtDelivC, presentation of fetus at delivery; GAweeks, gestational age in weeks; InstrDeliv, instrumental delivery; IntrPartAntiB, intrapartum antibiotics; LSOAdec, LSOA decile; MaternalDis, maternal obstetric condition; Ms, data for this item were missing; MulipleBrt, multiple birth set; OnsetLabour, spontaneous/induced labour; PostNTransfer, postnatal transfer; ProbMedic, maternal medical condition in pregnancy; prp, propensity; RespiSupprt, received respiratory support on day of admission; ResusDrugs, received drugs during resuscitation; SmokePreg, maternal smoking in pregnancy; SpontRespTime, time to first breath.
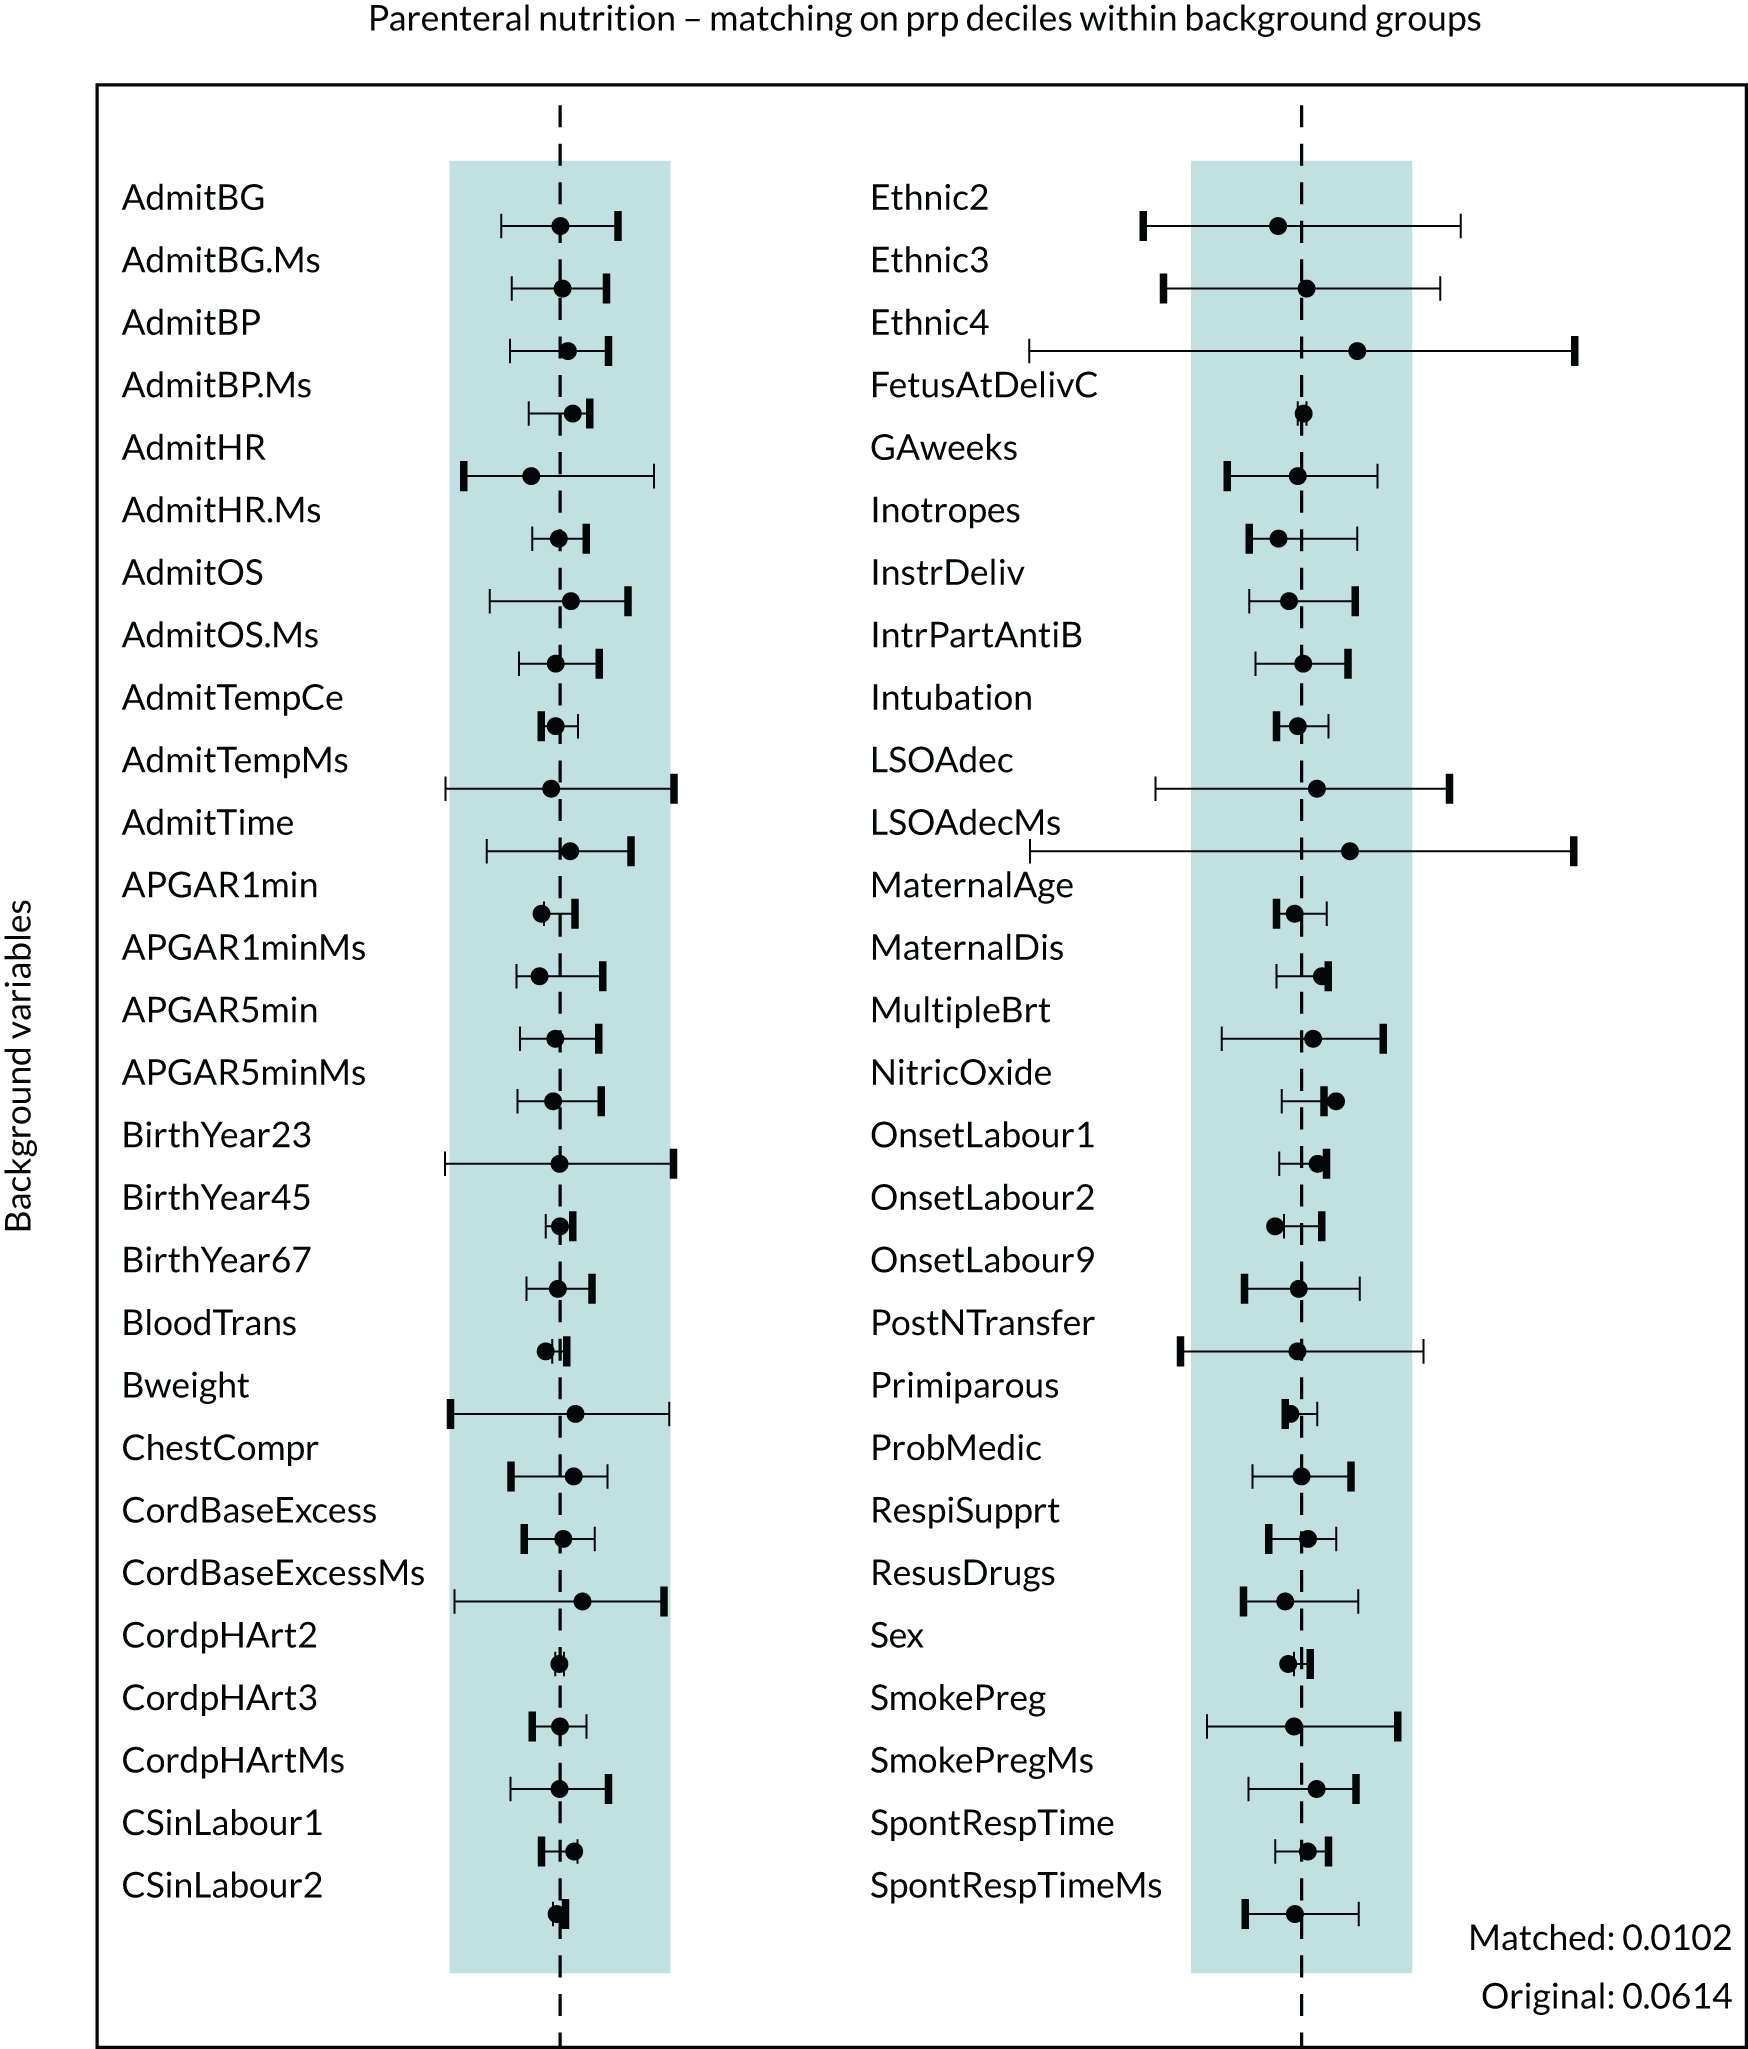
The balance plot shows that several variables in the unmatched cohort exhibited large imbalances between the two treatment groups. For example, unacceptable levels of imbalance (i.e. an imbalance of > 0.1 in absolute value) were present for ethnicity other or not given, and missing deprivation score. After matching, all background variables showed acceptable levels of imbalance. Several variables, including sex and proportion of babies delivered by caesarean section, demonstrated slightly greater imbalances after matching. The balance plot confirms that these imbalances are not substantial and that all variables included in the propensity model have acceptable levels of imbalance after matching.
Results for outcomes in parenteral nutrition matched comparisons
Outcomes for babies who received PN during therapeutic hypothermia and babies who did not are presented in Table 17, in unmatched and matched cohorts. Tables 18 and 19 present the results for binary and continuous outcome variables. The results for dichotomised outcome variables can be found in Appendix 9, Table 38.
| Variable | Cohort | |||
|---|---|---|---|---|
| Unmatched | Matched | |||
| No PN | PN | No PN | PN | |
| Total number of babies | 4538 | 1476 | 1240 | 1240 |
| Late-onset infection (NNAP definition) | ||||
| n | 16 | 14 | < 5 | 11 |
| % | 0.4 | 0.9 | 0.9 | |
| Late-onset infection (pragmatic definition) | ||||
| n | 1175 | 383 | 313 | 323 |
| % | 25.9 | 26.0 | 25.3 | 26.1 |
| Severe NEC | ||||
| n | 6 | < 5 | 7 | < 5 |
| % | 0.1 | 0.6 | ||
| NEC (pragmatic definition) | ||||
| n | 52 | 16 | 17 | 13 |
| % | 1.1 | 1.1 | 1.4 | 1.1 |
| Survival at discharge | ||||
| n | 4056 | 1374 | 1116 | 1154 |
| % | 89.5 | 93.2 | 90.0 | 93.1 |
| Hypoglycaemia | ||||
| n | 946 | 258 | 235 | 212 |
| % | 20.9 | 17.5 | 18.9 | 17.1 |
| Breastfeeding at discharge | ||||
| n | 2110 | 670 | 582 | 575 |
| % | 46.5 | 45.4 | 47.0 | 46.4 |
| Onset of breastfeeding (days) | ||||
| Median | 7 | 7 | 7 | 7 |
| Lower quartile | 6 | 6 | 6 | 6 |
| Upper quartile | 9 | 9 | 9 | 9 |
| Missing, n | 1774 | 576 | 488 | 474 |
| % | 39.1 | 39.1 | 39.3 | 38.2 |
| ≤ 28 days, n | 2735 | 888 | 744 | 757 |
| % | 60.3 | 60.2 | 60.0 | 61.0 |
| Time to first mother’s milk (days) | ||||
| Median | 5 | 5 | 5 | 5 |
| Lower quartile | 4 | 3 | 4 | 3 |
| Upper quartile | 6 | 5 | 6 | 5 |
| Missing, n | 868 | 223 | 235 | 182 |
| % | 19.1 | 15.1 | 18.9 | 14.7 |
| ≤ 28 days, n | 3665 | 1250 | 1005 | 1057 |
| % | 80.8 | 84.7 | 81.1 | 85.2 |
| Had a central venous line | ||||
| n | 4184 | 1441 | 1145 | 1213 |
| % | 92.3 | 97.7 | 92.3 | 97.9 |
| Days of central venous line in situ | ||||
| Median | 5 | 5 | 5 | 5 |
| Lower quartile | 3 | 4 | 3 | 4 |
| Upper quartile | 6 | 7 | 6 | 7 |
| Weight z-score at discharge | ||||
| Median | –0.6 | –0.7 | –0.7 | –0.6 |
| Lower quartile | –1.4 | –1.4 | –1.4 | –1.4 |
| Upper quartile | 0.2 | 0.1 | 0.1 | 0.2 |
| Missing, n | 9 | 2 | 8 | 4 |
| % | 0.2 | 0.1 | 0.2 | 0.2 |
| Length of stay (days) | ||||
| Median | 11 | 10 | 10 | 11 |
| Lower quartile | 8 | 7 | 8 | 8 |
| Upper quartile | 17 | 13 | 16 | 16 |
| > 14 days, n | 1338 | 466 | 361 | 382 |
| % | 29.5 | 31.6 | 29.1 | 30.8 |
| Variable | Intervention, % (95% CI) | Rate difference, % (95% CI) | OR estimate (95% CI) | p-value | |
|---|---|---|---|---|---|
| No PN rate | PN rate | ||||
| Total number of babies | 1240 | 1240 | |||
| Late-onset infection (NNAP definition) | 0.3 (0.1 to 0.5) | 0.9 (0.4 to 1.4) | 0.6 (0.1 to 1.2) | 3.04 (0.95 to 9.76) | 0.03a |
| Late-onset infection (pragmatic definition) | 25.3 (23.6 to 27.1) | 26.1 (23.8 to 28.3) | 0.8 (–2.1 to 3.6) | 1.04 (0.87 to 1.25) | 0.61 |
| Severe NEC | n/a | n/a | n/a | n/a | n/a |
| NEC (pragmatic definition) | 1.4 (0.9 to 1.9) | 1.1 (0.6 to 1.6) | –0.3 (–1.0 to 0.4) | 0.77 (0.38 to 1.58) | 0.39 |
| Hypoglycaemia | 19.0 (17.5 to 20.6) | 17.0 (15.1 to 18.9) | –2.1 (–4.5 to 0.4) | 0.87 (0.71 to 1.07) | 0.10 |
| Survival at discharge | 89.9 (88.7 to 91.1) | 93.2 (91.8 to 94.5) | 3.1 (1.5 to 4.7) | 1.50 (1.17 to 2.01) | < 0.001 |
| Breastfeeding at discharge | 47.0 (45.1 to 48.9) | 46.4 (43.9 to 48.9) | –0.6 (–3.8 to 2.6) | 0.98 (0.83 to 1.14) | 0.71 |
| Variable | Intervention | Difference (95% CI) | p-value | |
|---|---|---|---|---|
| No PN | PN | |||
| Total number of babies | 1240 | 1240 | ||
| Length of stay (days) (95% CI) | 14.1 (13.6 to 14.7) | 15.0 (14.1 to 15.8) | 0.8 (–0.2 to 1.8) | 0.12 |
| Onset of breastfeeding (days) (95% CI) | 8.4 (8.0 to 8.7) | 8.6 (8.0 to 9.1) | 0.2 (–0.5 to 0.8) | 0.56 |
| First maternal milk (days) (95% CI) | 4.9 (4.8 to 4.9) | 4.6 (4.5 to 4.8) | –0.2 (–0.4 to –0.1) | 0.01 |
| Duration of central venous line in situ (days) (95% CI) | 5.1 (5.0 to 5.3) | 6.0 (5.7 to 6.3) | 0.9 (0.5 to 1.2) | < 0.001 |
| Weight z-score (95% CI) | –0.66 (–0.71 to –0.61) | –0.65 (–0.71 to –0.58) | 0.02 (–0.07 to 0.10) | 0.68 |
Although late-onset infection defined using the NNAP definition was rare, there was some evidence (p = 0.03) of increased late-onset infection in babies who were provided PN compared with babies from whom PN was withheld during therapeutic hypothermia (risk difference 0.6%, 95% CI 0.1% to 1.2%). Late-onset infection defined using the more pragmatic definition was more common, but we found no evidence of a difference (p = 0.61) in incidence between babies who did and did not receive PN during therapeutic hypothermia (see Table 18). Mortality was lower among babies who received PN during therapeutic hypothermia in the matched comparison. There was no evidence of differences between matched groups in the incidence of hypoglycaemia, pragmatically defined NEC or breastfeeding at discharge. The incidence of severe NEC was so low that cases were potentially identifiable and, therefore, counts of < 5 were used and comparative analyses after matching were not undertaken for this comparison.
After matching, length of stay, time to first breastfeed, time to first feed with maternal breast milk and weight at discharge were all similar between babies who received PN during therapeutic hypothermia and those who did not (see Table 19). Although there was a statistically significant difference in time to first feed with maternal breast milk, this difference of 0.2 days (95% CI 0.1 to 0.4 days) was not considered clinically important. Babies who did not receive PN had a shorter duration with a central line in situ, with a mean difference of approximately 1 day (p < 0.001).
Similar patterns were observed in matched comparisons when continuous outcomes were dichotomised. Babies who did not receive PN had a lower rate of any central line insertion than babies who received PN (92.4% vs. 97.9%; p < 0.001) (see Appendix 9, Table 38).
Sensitivity analyses
The reduction of the time period of interest to years 2012–17, omitting the first 2 years of the study period, resulted in a sample for the matched cohort of 1059 pairs, excluding babies who were not actively recorded as receiving no PN resulted in a matched cohort of 1253 pairs, and adding receipt of enteral nutrition on the first day of life resulted in a matched cohort of 1251 pairs. Results of the three sensitivity analyses were largely consistent with the corresponding results of the primary analysis (Table 20; see also Appendix 10, Table 39).
| Variable | Sensitivity analysis | ||
|---|---|---|---|
| Years 2012–17 | Intervention redefined | Inclusion of enteral feeds on day 1 in PSM | |
| Total number of babies | 2118 | 2506 | 2502 |
| Binary outcomes: estimate of rate difference (95% CI) [p-value] | |||
| Late-onset infection (NNAP definition) | 0.6 (0.0 to 1.2) [0.04] | 0.6 (0.1 to 1.1) [0.02] | 0.6 (0.0 to 1.1) [0.03] |
| Late-onset infection (pragmatic definition) | 2.2 (–0.8 to 5.3) [0.15] | 1.4 (–1.4 to 4.2) [0.34] | 1.7 (–1.0 to 4.5) [0.22] |
| NEC (pragmatic definition) | –0.4 (–1.2 to 0.4) [0.34] | –0.2 (–0.9 to 0.5) [0.62] | –0.3 (–1.0 to 0.4) [0.36] |
| Hypoglycaemia | –1.4 (–4.0 to 1.3) [0.32] | –2.1 (–4.5 to 0.3) [0.08] | –2.1 (–4.6 to 0.3) [0.08] |
| Survival at discharge | 2.8 (0.9 to 4.8) [0.004] | 3.0 (1.2 to 4.7) [< 0.001] | 3.8 (2.0 to 5.5) [< 0.001] |
| Breastfeeding at discharge | –0.2 (–3.7 to 3.3) [0.90] | –0.1 (–3.3 to 3.1) [0.96] | 0.4 (–2.8 to 3.5) [0.82] |
| Continuous outcomes: estimate of mean difference (95% CI) [p-value] | |||
| Length of stay (days) | 0.5 (–0.5 to 1.4) [0.32] | 0.6 (–0.3 to 1.6) [0.16] | 1.0 (0.1 to 1.9) [0.02] |
| First day suckling at breast (days) | –0.2 (–0.7 to 0.3) [0.51] | 0.1 (–0.4 to 0.7) [0.63] | 0.0 (–0.5 to 0.6) [0.88] |
| First day of mother’s milk (days) | –0.3 (–0.5 to –0.1) [0.004] | –0.2 (–0.4 to –0.1) [0.01] | –0.2 (–0.4 to –0.1) [0.01] |
| Duration of central venous line in situ (days) | 0.8 (0.4 to 1.2) [< 0.001] | 0.9 (0.5 to 1.2) [< 0.001] | 0.9 (0.6 to 1.2) [< 0.001] |
| Weight z-score | 0.01 (–0.08 to 0.10) [0.88] | 0.03 (0.0 to 0.1) [0.42] | 0.01 (–0.07 to 0.09) [0.80] |
Babies admitted from the postnatal ward
In the study protocol, a subgroup analysis was planned to exclude all babies whose first admission to neonatal care was from a postnatal ward to exclude cases for whom therapeutic hypothermia was administered following postnatal collapse. Only 46 babies in the entire cohort were admitted from a postnatal ward and, therefore, this sensitivity analysis was not conducted. The distribution of babies admitted from the postnatal ward by PN groups before and after matching is shown in Table 16.
Influence of alternative matching methods
The results were found to be consistent across all alternative methods of matching on the propensity groups and principal background variables (see Appendix 11, Figure 12).
Patterns of parenteral nutrition provision
The highest rates of PN were in neonatal ODNs in Scotland and Wales (79% and 61% of babies treated with therapeutic hypothermia, respectively) and the lowest rates were in the North West ODN and Yorkshire and the Humber ODNs (9% and 7%, respectively) (Table 21).
| ODN | Provision of PN | |||
|---|---|---|---|---|
| No | Yes | |||
| n | % | n | % | |
| East Midlands | 282 | 77.9 | 80 | 22.1 |
| East of England | 479 | 87.9 | 66 | 12.1 |
| North Central and East London | 351 | 76.8 | 106 | 23.2 |
| North West | 209 | 91.3 | 20 | 8.7 |
| North West London | 540 | 84.1 | 102 | 15.9 |
| Northern | 182 | 78.8 | 49 | 21.2 |
| South East Coast | 417 | 74.1 | 146 | 25.9 |
| South West | 430 | 78.6 | 117 | 21.4 |
| South London | 332 | 84.9 | 59 | 15.1 |
| Thames Valley and Wessex | 270 | 47.2 | 302 | 52.8 |
| West Midlands | 472 | 84.0 | 90 | 16.0 |
| Yorkshire and the Humber | 428 | 93.3 | 31 | 6.8 |
| Isle of Man | < 5 | < 5 | ||
| Scotland | 44 | 21.2 | 164 | 78.9 |
| Wales | 89 | 39.0 | 139 | 61.0 |
| Total | 4525 | 75.5 | 1471 | 24.5 |
Chapter 5 Discussion
Key results
In this large, UK population-based cohort of term and near-term infants treated with therapeutic hypothermia, we identify widespread variation in nutritional practice, with sizable minorities of babies receiving milk feeds and/or PN during hypothermia. We demonstrate that severe NEC, using a robust and validated definition, is rare in this population, with an incidence of < 1 per 1000 babies. Late-onset, culture-positive BSI is also rare in these infants, occurring in approximately 5 per 1000 infants.
To identify optimal nutritional management we undertook comparative analyses using matched groups that were balanced on multiple potentially confounding background variables and followed a pre-registered protocol. 34 We found that severe NEC, defined using a validated case definition,21 was comparatively rare whether or not babies were fed during therapeutic hypothermia. We used a more pragmatic definition of NEC to identify potential cases that were not fatal and did not require surgery, and, although NEC defined in this way was rare, it was somewhat more common in babies for whom feeds were witheld during therapeutic hypothermia. Introduction of feeds during therapeutic hypothermia was associated with benefit across multiple other outcomes in matched analyses, including earlier initiation of breastfeeding and higher rates at discharge, lower rates of pragmatically defined late-onset infection, shorter lengths of stay and higher survival to neonatal unit discharge. When feeds were introduced they were predominantly maternal breast milk and tended to be started later in the course of therapeutic hypothermia. Based on the consistent benefit associated with introduction of milk feeding during hypothermia, we conclude that initiating milk feeds, preferably with maternal breast milk, during therapeutic hypothermia is safe and may be beneficial.
Matched analyses comparing babies who received PN during therapeutic hypothermia with those who did not found more mixed results. Although culture-positive infection was rare in both groups, it was more common in babies who received PN. Conversely, survival to discharge rates were higher in babies who received PN. Results for other outcomes, such as breastfeeding outcomes and length of stay, were similar between babies who received PN and those who did not, with the exception of central line duration, which was longer in babies who received PN. The apparent survival benefit seen in babies who received PN is contrary to RCT data from neonates being cared for on paediatric intensive care units. 35 This result may reflect residual confounding by indication, favouring babies who received PN.
Putative benefits from administering PN to infants during therapeutic hypothermia include improved brain growth and repair, potentially leading to improved neurodevelopment. 36 In this study we were unable to examine later neurodevelopmental outcomes because of high incompleteness of such data within currently available routine databases. Therefore, we were unable to evaluate a key potential benefit of administering PN in this group. Conclusions from this study are uncertain in relation to provision of PN during therapeutic hypothermia, and are consistent with both potential benefits and potential harms from this practice. We are unable to identify an optimal approach to PN during therapeutic hypothermia using currently available routinely recorded neonatal data and recommend further prospective interventional research that captures longer-term neurodevelopmental outcomes.
Results in context
This study involved > 6000 infants who received therapeutic hypothermia and reports population-level data from all babies admitted to NHS neonatal care in England, Scotland and Wales (neonatal intensive care such as therapeutic hypothermia is not undertaken at non-NHS units in the UK). To the best of our knowledge, this is the largest and most comprehensive cohort of such babies. For comparison, the most recent Cochrane review2 in this area identified 11 trials and 1505 infants in total. NEC is one of the most feared complications of neonatal care6 and is well described in case studies and single-centre series in babies with HIE. 37,38 There has been a paucity of robust incidence data because studies have hitherto been limited by small size and the use of subjective definitions of NEC. By applying a validated definition of severe NEC with confirmation of cases to large-scale population data,21 we have produced robust incidence rates for rare but important outcomes (e.g. NEC and late-onset infection) in babies receiving therapeutic hypothermia.
Using routinely recorded national data we have accurately described current nutritional practice in the UK for babies receiving therapeutic hypothermia, in contrast to previous studies that have relied on surveys that report intention rather than actual practice. 3 We find that feeding during therapeutic hypothermia occurs less commonly in practice (i.e. 31% of babies) than would be suggested by the most recent survey3 (in which 59% of responding neonatal units reported feeding during hypothermia). Furthermore, and in contrast to surveys of UK practice that suggest that enteral feeding is becoming more common during hypothermia (i.e. 29% of units in 20106 vs. 59% of units in 20163), we found that the proportion of babies for whom enteral feeds were introduced (31%) remained stable over the 8-year period 2010–17. These findings may be explained by incomplete survey coverage or simply reflect the difference between reported and actual practice. We note that the rate of PN administration seen in this study (i.e. 25%) more closely mirrors that seen in the most recent UK survey3 (i.e. 29%).
Our finding that the introduction of enteral feeding during therapeutic hypothermia is safe and may be associated with benefits such as a lower risk of pragmatically defined NEC, earlier initiation of breastfeeding, higher rates of breastfeeding at discharge and shorter lengths of stay is supported by the limited data from previous studies. 4,5 A retrospective case–control study4 of 34 infants in the USA compared minimal enteral nutrition with withholding feeds during therapeutic hypothermia, and found that the duration of PN and hospital stay was shorter in the enteral feeding group. This study did not adjust for illness severity and there were some differences between groups, for example in relation to clinical staging of encephalopathy. 4 This suggests that confounding by indication (whereby infants who are more sick have their feeds withheld) may in part explain these results. Another small retrospective study5 compared 34 babies cared for at a unit in the UK in which feeds are commonly withheld with 51 babies cared for in Sweden where feeds are commonly initiated during hypothermia. 5 In keeping with our data, this study also found that feeding during hypothermia was safe, with no complications noted in either group. In addition, rates of breastfeeding at discharge were higher among babies cared for in Sweden where enteral feeds were started during hypothermia. The degree to which this is explained by cultural and social differences between countries, rather than initiation of treatment, is unclear. Our study adds considerably to the existing literature through the very large population-level nature of the cohort and by application of statistically robust approaches to deal with potential confounding in comparative analyses.
In the UK and other high-income settings, infants who receive therapeutic hypothermia receive some form of intravenous fluid to maintain hydration and blood glucose concentration. This can be in the form of intravenous fluid or PN. We find that the use of PN is associated with a higher incidence of culture-positive BSI, but also with lower mortality prior to neonatal discharge. This latter finding is counter to adult and paediatric intensive care trials that demonstrated clinical benefits from later compared with early initiation of PN. 15,16 Although similar trials have not been undertaken in neonatal intensive care units or among infants receiving therapeutic hypothermia, the paediatric intensive care-based PEPaNIC (Early versus Late Parenteral Nutrition in the Pediatric Intensive Care Unit) trial15 randomised 209 infants in the neonatal period (< 28 days) to early (i.e. < 24 hours after admission) or late (i.e. > 7 days after admission) commencement of PN. Pre-planned secondary analysis of these infants found lower rates of infection in babies recruited at < 1 week of age and randomised to receive early PN,35 in keeping with our study. This secondary neonatal analysis found similar mortality between early and late PN groups, but mortality was low in both trial arms and, therefore, the trial lacked power to detect a clinically important difference. The PEPaNIC trial15 also found higher rates of hypoglycaemia in neonates randomised to late PN, which is not confirmed in our study. This may be explained by how data are held in the NNRD, whereby diagnoses (such as hypoglycaemia) are not recorded in a way that is attributable to a particular day of stay, but are attributed to an ‘episode’ of care on a particular neonatal unit. As a result, we were unable to determine whether or not hypoglycaemic episodes occurred during the period of therapeutic hypothermia. We were unable to identify further studies that examined the use of PN in babies receiving therapeutic hypothermia. The conflicting findings seen both in this study and when considered with the of the PEPaNIC trial15 indicate that further research is required to identify the role of PN in these babies. We note that supplemental nutrition following brain injury has shown promise in a small pilot trial,36 supporting a potential role of early nutrition in optimising longer-term neurodevelopmental outcomes and highlighting the importance of such outcomes in any future research.
Strengths and limitations
The main aim of this study was to identify optimal approaches to nutrition through comparative analyses of babies fed milk and those not fed milk, and between babies who received PN and babies who did not. Although we did not undertake a randomised trial, we applied multiple approaches to limit bias. We utilised the comprehensive range of background data items held in the Neonatal Data Set19 and available within the NNRD to form matched groups, balanced on all measured potential confounders by matching on key background factors and on propensity score. To prevent outcome switching or data dredging, we followed a detailed pre-registered protocol that specified exposures, background factors and outcomes, and the data items used to define them, as well as the matching process to be applied. 34 The use of routinely recorded data reduced the risk of ascertainment bias, as data collection occurred well in advance of study conception. Furthermore, we applied prespecified sensitivity analyses to examine whether or not data quality and definitions of the nutritional exposures influenced results, and post hoc sensitivity analyses to determine whether or not different approaches to matching influenced the findings. Finally, primary results were robust to sensitivity analyses. By using existing data we were able to include a large number of infants and to examine rare outcomes, such as pragmatically defined NEC and culture-positive BSI. The sample size was several times larger than in all previous randomised trials of therapeutic hypothermia combined. 2 A further strength of this study was the considerably lower level of resources required to undertake it. The study was funded at < 10% of the cost of contemporaneous National Institute for Health Research-funded neonatal clinical trials and reported over a shorter time frame.
The most important limitation of this study stems from the non-randomised design used (i.e. the matching approach applied in this study was able to account for only measured confounders). Although we utilised a wide range of background and day 1 clinical data items to form matched groups, and the statistical measures of balance indicated that acceptable balance had been obtained, we cannot exclude the possibility that clinically relevant factors may have differed by small but clinically relevant degrees between the groups, or that there were important differences in unmeasured factors between the comparator groups. In matched analyses we found higher survival to neonatal unit discharge in babies who were fed during therapeutic hypothermia. This difference in survival is unlikely to be caused by enteral feeding during therapeutic hypothermia and suggests that residual confounding is present in the enteral comparison. This is supported by background data indicating that, although the proportion of babies receiving inotropes on the first day was more balanced after matching, a potentially clinically relevant difference remained (see Table 9). Furthermore, there may be other additional markers of ‘sickness’ that are discernible to clinicians and influence decision-making around enteral feeding, but are not captured in the extensive data items held in the NNRD. Such residual and unmeasured confounding by indication may overestimate the benefit associated with enteral feeding, and results should be interpreted accordingly. However, in the light of the low rate of adverse outcomes seen in both fed and non-fed infants, and the consistent benefit seen across outcomes favouring fed infants, we conclude that initiating milk feeds, preferably with maternal breast milk, during therapeutic hypothermia is safe and may be beneficial.
Similar residual or unmeasured confounding by indication may be present in the comparative analyses of PN. This study found a higher level of survival among babies treated with PN, despite higher levels of culture-positive late-onset BSI, a finding that is counter to randomised trials of early compared with late PN in adults. Such confounding is, again, likely to overestimate the benefit of early PN in this population of infants. Given the more mixed results of the PN analyses, which were consistent with both benefit and harm from early administration of PN, we suggest further randomised evaluations of early PN in this group.
Other limitations include the smaller than planned numbers of infant pairs that were able to be included in the matched analyses (i.e. 1618 pairs were analysed for the enteral nutrition analysis and 1240 pairs for the PN analysis vs. estimated samples of 2000 matched pairs and 1500 matched pairs, respectively). The planned numbers of pairs were selected for illustration only and did not represent an imperative or objective of the study design. Consequently, the lower than planned achieved number of pairs should not be interpreted as indicating that the study is underpowered. These matched groups were still considerably larger than in previous trials2 and are able to detect small but clinically relevant differences of 1.0% in NEC and 2.5% in the incidence of late-onset infection. As with any study that utilises routinely recorded data, data completeness and accuracy are dependent on the health-care professionals who enter the data and may be variable between sites. The NNRD is formed from data entered as part of a baby’s clinical care record and data are used for multiple purposes, including national audit and determining neonatal unit activity for purposes such as funding and staffing. Furthermore, the data held in the NNRD have been validated against those data recorded in case record forms of a multicentre trial,39 which demonstrated a high degree of data agreement (> 95%) for multiple background and outcome variables,10 including key data items for this study, such as receipt of enteral feeds and presence of central line in situ. This validation study did not examine other key data items used in this study, such as receipt of therapeutic hypothermia, administration of PN or type of enteral feed (for which considerable missing data were found on day 1; see Figure 6), and, therefore, data quality for such items is less well known. For these reasons, we do not consider incomplete and inaccurate data to be a major problem in this study. Given the retrospective nature of this study and the routine nature of data collection, there is no reason for poor data quality to be more common in one comparative arm than another and, therefore, any incompleteness or inaccurate data would be expected to lead to imprecision in all estimates, rather than any systematic bias. We also acknowledge that cases of both severe and pragmatic NEC may have been missed when suspected NEC occurred in infants with severe encephalopathy and a decision to provide palliative care had been made. When NEC was felt to contribute to the infant death then this would have been recorded on the death certificate (and hence in the severe NEC definition) and so the incidence of such missed cases is likely to be very low. Finally, limitations in the data available within the NNRD meant that we were unable to examine the relationship between volume of feeds, including very small-volume or ‘trophic feeds’, and outcomes in this study.
Interpretation
The incremental introduction of enteral feeds in term and near-term babies during therapeutic hypothermia appears safe and may be associated with benefits including higher rates of breastfeeding at discharge and shorter lengths of stay.
Necrotising enterocolitis is rare in term and near-term babies receiving therapeutic hypothermia and may be less common in babies fed during therapeutic hypothermia.
Optimal parenteral nutritional support for babies receiving therapeutic hypothermia could not be established.
Generalisability
This study used data from all babies who were ≥ 36 gestational weeks of age and who were recorded as receiving therapeutic hypothermia in NHS neonatal units, over a contemporary 8-year period. As ongoing neonatal intensive care is not undertaken outside NHS units, this population-level study is highly generalisable to current neonatal care in the UK and other high-income health-care systems. We did not limit the study to infants who met National Institute for Health and Care Excellence guidance for therapeutic hypothermia and, therefore, the analysed population included infants who were treated for mild HIE and other conditions (e.g. postnatal collapse). As such babies are increasingly treated with therapeutic hypothermia in the UK40 and internationally, the results of this study are therefore generalisable to current clinical practice, where ‘therapeutic creep’ is widespread in relation to hypothermia treatment.
We did not include preterm babies earlier than 36 gestational weeks of age in this study because of the specifications laid out by the funder when commissioning this research. More preterm infants have higher rates of feed intolerance than term infants and the results of this study may not be generalisable to these more preterm babies receiving therapeutic hypothermia. A number of infants who received therapeutic hypothermia were not able to be matched (see Figure 3). This occurred because for babies with certain background profile one or the other nutritional management was selected almost exclusively by clinical staff. Consequently, the results of this study are generalisable to the range of infants described by the matched cohorts, rather than the wider population of all infants who received therapeutic hypothermia.
Recommendations/implications for future research
-
Optimal PN for babies receiving therapeutic hypothermia is unknown. This should be examined in a RCT comparing early with delayed provision of PN, which should examine both short-term outcomes, such as late-onset infection and neonatal survival, and longer-term outcomes, such as neurodevelopment.
-
Future RCTs to examine enteral feeding during therapeutic hypothermia are unlikely to be warranted or feasible. The optimal speed of introduction of enteral feeds or optimal choice of milk when mothers’ milk is not available are not known and may benefit from further research.
-
Mechanisms to obtain population-level, long-term outcome data for babies who receive neonatal care generally and babies who are treated with hypothermia specifically, such as data linkage and national routine reporting, should be prioritised.
Chapter 6 Conclusions
Necrotising enterocolitis is rare in babies receiving therapeutic hypothermia and may be less common in babies fed during therapeutic hypothermia. Introduction of enteral feeds is associated with a lower risk of pragmatically defined NEC and other beneficial outcomes, including higher rates of survival and breastfeeding at discharge. Receipt of PN during therapeutic hypothermia is associated with higher rates of late-onset infection, but lower rates of mortality. Residual confounding may partially explain these findings. Further research should focus on identifying optimal PN for babies receiving therapeutic hypothermia. Commencing enteral feeding during therapeutic hypothermia appears to be safe and may be beneficial.
Acknowledgements
We thank the families who agreed to the inclusion of their infants’ data in the NNRD and the health professionals who recorded the data.
Contributions of authors
Chris Gale (https://orcid.org/0000-0003-0707-876X) (Reader in Neonatal Medicine and Consultant Neonatologist) conceived, designed and planned the study. He contributed to planning data extraction and analysis, interpretation of results and wrote the first and final draft of the study report.
Dusha Jeyakumaran (https://orcid.org/0000-0002-8209-9694) (Neonatal Research Statistician) contributed to planning data extraction, analysis and interpretation the results, wrote the first draft of the study report and contributed to and approved the final report.
Cheryl Battersby (https://orcid.org/0000-0002-2898-553X) (Senior Clinical Lecturer in Neonatal Medicine and Consultant Neonatologist) conceived, designed and planned the study. She contributed to planning data extraction and analysis, undertook data extraction, interpreted the results, and contributed to and approved the final report.
Kayleigh Ougham (https://orcid.org/0000-0002-6724-1867) (Senior Data Analyst) contributed to the planning of the study and led data extraction. She contributed to and approved the final report.
Shalini Ojha (https://orcid.org/0000-0001-5668-4227) (Clinical Associate Professor in Neonatal Medicine and Consultant Neonatologist) conceived, designed and planned the study. She contributed to the analysis and interpretation of the results. She contributed to and approved the final report.
Lucy Culshaw (https://orcid.org/0000-0002-4542-2659) (Senior Research Engagement Officer at Bliss) contributed to the planning of the study and interpretation of results. She led parent involvement in the study, and contributed to and approved the final report.
Ella Selby (https://orcid.org/0000-0002-1125-7712) (parent with experience of having a baby that needed therapeutic hypothermia) contributed to the planning of the study and interpretation of results. She led parent involvement in the study, and contributed to and approved the final report.
Jon Dorling (https://orcid.org/0000-0002-1691-3221) (Professor of Paediatrics and Division Head of Neonatal-Perinatal Medicine) conceived, designed and planned the study. He contributed to the analysis and interpretation of the results. He contributed to and approved the final report.
Nicholas Longford (https://orcid.org/0000-0003-4129-9726) (Senior Statistician) conceived, designed and planned the study. He led the analysis and undertook matching. He contributed to the interpretation of the results. He contributed to and approved the final report.
Publications
Battersby C, Longford N, Patel M, Selby E, Ojha S, Dorling J, Gale C. Study protocol: optimising newborn nutrition during and after neonatal therapeutic hypothermia in the United Kingdom: observational study of routinely collected data using propensity matching. BMJ Open 2018;8:e026739.
Ojha S, Dorling J, Battersby C, Longford N, Gale C. Optimising nutrition during therapeutic hypothermia. Arch Dis Child Fetal Neonatal Ed 2019;104:F230–1.
Gale C, Longford NT, Jeyakumaran D, Ougham K, Battersby C, Ojha S, Dorling J. Feeding during neonatal therapeutic hypothermia, assessed using routinely collected National Neonatal Research Database data: a retrospective, UK population-based cohort study. Lancet Child Adolesc Health 2021;5:408–16.
Gale C, Jeyakumaran D, Longford N, Battersby C, Ojha S, Oughham K, Dorling J. Administration of parenteral nutrition during therapeutic hypothermia: a population level observational study using routinely collected data held in the National Neonatal Research Database. Arch Dis Child Fetal Neonatal Ed 2021. Published online 5 May 2021.
Data-sharing statement
Data are available through the NNRD with relevant approvals. More information is available at URL: www.imperial.ac.uk/neonatal-data-analysis-unit/neonatal-data-analysis-unit/utilising-the-national-neonatal-research-database/. All data requests should be submitted to the corresponding author for consideration.
Patient data
This work uses data provided by patients and collected by the NHS as part of their care and support. Using patient data is vital to improve health and care for everyone. There is huge potential to make better use of information from people’s patient records, to understand more about disease, develop new treatments, monitor safety, and plan NHS services. Patient data should be kept safe and secure, to protect everyone’s privacy, and it’s important that there are safeguards to make sure that it is stored and used responsibly. Everyone should be able to find out about how patient data are used. #datasaveslives You can find out more about the background to this citation here: https://understandingpatientdata.org.uk/data-citation.
Disclaimers
This report presents independent research funded by the National Institute for Health Research (NIHR). The views and opinions expressed by authors in this publication are those of the authors and do not necessarily reflect those of the NHS, the NIHR, NETSCC, the HTA programme or the Department of Health and Social Care. If there are verbatim quotations included in this publication the views and opinions expressed by the interviewees are those of the interviewees and do not necessarily reflect those of the authors, those of the NHS, the NIHR, NETSCC, the HTA programme or the Department of Health and Social Care.
References
- National Institute for Health and Care Excellence (NICE) . Therapeutic Hypothermia With Intracorporeal Temperature Monitoring for Hypoxic Perinatal Brain Injury – Interventional Procedures Guidance 2010.
- Jacobs SE, Berg M, Hunt R, Tarnow-Mordi WO, Inder TE, Davis PG. Cooling for newborns with hypoxic–ischaemic encephalopathy. Cochrane Database Syst Rev 2013;1. https://doi.org/10.1002/14651858.CD003311.pub3.
- Hazeldine B, Thyagarajan B, Grant M, Chakkarapani E. Survey of nutritional practices during therapeutic hypothermia for hypoxic–ischaemic encephalopathy. BMJ Paediatr Open 2017;1. https://doi.org/10.1136/bmjpo-2017-000022.
- Chang LL, Wynn JL, Pacella MJ, Rossignol CC, Banadera F, Alviedo N, et al. Enteral feeding as an adjunct to hypothermia in neonates with hypoxic–ischemic encephalopathy. Neonatology 2018;113:347-52. https://doi.org/10.1159/000487848.
- Thyagarajan B, Tillqvist E, Baral V, Hallberg B, Vollmer B, Blennow M. Minimal enteral nutrition during neonatal hypothermia treatment for perinatal hypoxic–ischaemic encephalopathy is safe and feasible. Acta Paediatr 2015;104:146-51. https://doi.org/10.1111/apa.12838.
- Allen G, Babarao S, Murphy A, Derwas E. PO-0581 Nutrition during therapeutic hypothermia in neonates. Arch Dis Child 2014;99:A441-2. https://doi.org/10.1136/archdischild-2014-307384.1223.
- Eicher DJ, Wagner CL, Katikaneni LP, Hulsey TC, Bass WT, Kaufman DA, et al. Moderate hypothermia in neonatal encephalopathy: safety outcomes. Pediatr Neurol 2005;32:18-24. https://doi.org/10.1016/j.pediatrneurol.2004.06.015.
- Azzopardi DV, Strohm B, Edwards D, Dyet L, Halliday HL, Juszczak E, et al. Moderate hypothermia to treat perinatal asphyxial encephalopathy. N Engl J Med 2009;361:1349-58. https://doi.org/10.1056/NEJMoa0900854.
- Jacobs SE, Morley CJ, Inder TE, Stewart MJ, Smith KR, McNamara PJ, et al. Whole-body hypothermia for term and near-term newborns with hypoxic-ischemic encephalopathy: a randomized controlled trial. Arch Pediatr Adolesc Med 2011;165:692-700. https://doi.org/10.1001/archpediatrics.2011.43.
- Morgan J, Young L, McGuire W. Delayed introduction of progressive enteral feeds to prevent necrotising enterocolitis in very low birth weight infants. Cochrane Database Syst Rev 2014;12. https://doi.org/10.1002/14651858.CD001970.pub5.
- Leaf A, Dorling J, Kempley S, McCormick K, Mannix P, Linsell L, et al. Early or delayed enteral feeding for preterm growth-restricted infants: a randomized trial. Pediatrics 2012;129:e1260-8. https://doi.org/10.1542/peds.2011-2379.
- Ip S, Chung M, Raman G, Chew P, Magula N, DeVine D, et al. Breastfeeding and maternal and infant health outcomes in developed countries. Evid Rep Technol Assess 2007;153:1-186.
- Hassell KJ, Ezzati M, Alonso-Alconada D, Hausenloy DJ, Robertson NJ. New horizons for newborn brain protection: enhancing endogenous neuroprotection. Arch Dis Child Fetal Neonatal Ed 2015;100:F541-52. https://doi.org/10.1136/archdischild-2014-306284.
- Kimkool P, Duckworth EC, Ollerenshaw RH, King K, Beardsall K. PC.34 Current practice regarding feeding/nutrition in babies being cooled for HIE in the UK. Arch Dis Child 2014;99. https://doi.org/10.1136/archdischild-2014-306576.135.
- Fivez T, Kerklaan D, Mesotten D, Verbruggen S, Wouters PJ, Vanhorebeek I, et al. Early versus late parenteral nutrition in critically ill children. N Engl J Med 2016;374:1111-22. https://doi.org/10.1056/NEJMoa1514762.
- Casaer MP, Mesotten D, Hermans G, Wouters PJ, Schetz M, Meyfroidt G, et al. Early versus late parenteral nutrition in critically ill adults. N Engl J Med 2011;365:506-17. https://doi.org/10.1056/NEJMoa1102662.
- Walter E, Liu FX, Maton P, Storme T, Perrinet M, von Delft O, et al. Cost analysis of neonatal and pediatric parenteral nutrition in Europe: a multi-country study. Eur J Clin Nutr 2012;66:639-44. https://doi.org/10.1038/ejcn.2011.225.
- Department of Health and Social Care (DHSC) . Toolkit for High Quality Neonatal Services 2009.
- NHS Digital . Supporting Information: National Neonatal Data Set Overview n.d. www.datadictionary.nhs.uk/data_dictionary/messages/clinical_data_sets/overviews/national_neonatal_data_set_overviews/national_neonatal_data_set_overview.asp?shownav=0 (accessed 15 November 2019).
- Battersby C, Statnikov Y, Santhakumaran S, Gray D, Modi N, Costeloe K. UK Neonatal Collaborative and Medicines for Neonates Investigator Group . The United Kingdom National Neonatal Research Database: a validation study. PLOS ONE 2018;13. https://doi.org/10.1371/journal.pone.0201815.
- Battersby C, Longford N, Mandalia S, Costeloe K, Modi N. UK Neonatal Collaborative Necrotising Enterocolitis (UKNC-NEC) Study Group . Incidence and enteral feed antecedents of severe neonatal necrotising enterocolitis across neonatal networks in England, 2012–13: a whole-population surveillance study. Lancet Gastroenterol Hepatol 2017;2:43-51. https://doi.org/10.1016/S2468-1253(16)30117-0.
- Battersby C, Longford N, Costeloe K, Modi N. UK Neonatal Collaborative Necrotising Enterocolitis Study Group . Development of a gestational age-specific case definition for neonatal necrotizing enterocolitis. JAMA Pediatr 2017;171:256-63. https://doi.org/10.1001/jamapediatrics.2016.3633.
- Royal College of Paediatrics and Child Health (RCPCH) . National Neonatal Audit Programme (NNAP) 2018 Annual Report on 2017 Data 2018.
- Austin PC. An introduction to propensity score methods for reducing the effects of confounding in observational studies. Multivariate Behav Res 2011;46:399-424. https://doi.org/10.1080/00273171.2011.568786.
- Rosenbaum PR. From association to causation in observational studies: the role of tests of strongly ignorable treatment assignment. J Am Stat Assoc 1984;79:41-8. https://doi.org/10.1080/01621459.1984.10477060.
- Imbens GW, Rubin DB, Imbens GW, Rubin DB. Causal Inference for Statistics, Social, and Biomedical Sciences. Cambridge: Cambridge University Press; 2015.
- Imbens GW, Rubin DB, Imbens GW, Rubin DB. Causal Inference for Statistics, Social, and Biomedical Sciences. Cambridge: Cambridge University Press; 2015.
- Imbens GW, Rubin DB, Imbens GW, Rubin DB. Causal Inference for Statistics, Social, and Biomedical Sciences. Cambridge: Cambridge University Press; 2015.
- NIHR INVOLVE . What Is Public Involvement in Research? n.d. www.invo.org.uk/find-out-more/what-is-public-involvement-in-research-2/ (accessed 14 November 2019).
- Crocker JC, Ricci-Cabello I, Parker A, Hirst JA, Chant A, Petit-Zeman S, et al. Impact of patient and public involvement on enrolment and retention in clinical trials: systematic review and meta-analysis. BMJ 2018;363. https://doi.org/10.1136/bmj.k4738.
- Duley L, Uhm S, Oliver S. Preterm Birth Priority Setting Partnership Steering Group . Top 15 UK research priorities for preterm birth. Lancet 2014;383:2041-2. https://doi.org/10.1016/S0140-6736(14)60989-2.
- Oliver S, Uhm S, Duley L, Crowe S, David AL, James CP, et al. Top research priorities for preterm birth: results of a prioritisation partnership between people affected by preterm birth and healthcare professionals. BMC Pregnancy and Childbirth 2019;19. https://doi.org/10.1186/s12884-019-2654-3.
- Modi N, Ashby D, Battersby C, Brocklehurst P, Chivers Z, Costeloe K, et al. Developing routinely recorded clinical data from electronic patient records as a national resource to improve neonatal health care: the Medicines for Neonates Research Programme. Programme Grants Appl Res 2019;7. https://doi.org/10.3310/pgfar07060.
- Battersby C, Longford N, Patel M, Selby E, Ojha S, Dorling J, et al. Study protocol: optimising newborn nutrition during and after neonatal therapeutic hypothermia in the United Kingdom: observational study of routinely collected data using propensity matching. BMJ Open 2018;8. https://doi.org/10.1136/bmjopen-2018-026739.
- van Puffelen E, Vanhorebeek I, Joosten KFM, Wouters PJ, Van den Berghe G, Verbruggen SCAT. Early versus late parenteral nutrition in critically ill, term neonates: a preplanned secondary subgroup analysis of the PEPaNIC multicentre, randomised controlled trial. Lancet Child Adolesc Health 2018;2:505-15. https://doi.org/10.1016/S2352-4642(18)30131-7.
- Andrew MJ, Parr JR, Montague-Johnson C, Laler K, Qi C, Baker B, et al. Nutritional intervention and neurodevelopmental outcome in infants with suspected cerebral palsy: the Dolphin infant double-blind randomized controlled trial. Dev Med Child Neurol 2018;60:906-13. https://doi.org/10.1111/dmcn.13586.
- Laura F, Mori A, Tataranno ML, Muraca MC, Rodriquez DC, Giomi S, et al. Therapeutic hypothermia in a late preterm infant. J Matern Fetal Neonatal Med 2012;25:125-7. https://doi.org/10.3109/14767058.2012.663172.
- Al Tawil K, Sumaily H, Ahmed IA, Sallam A, Al Zaben A, Al Namshan M, et al. Risk factors, characteristics and outcomes of necrotizing enterocolitis in late preterm and term infants. J Neonatal Perinatal Med 2013;6:125-30. https://doi.org/10.3233/NPM-1365912.
- Costeloe K, Hardy P, Juszczak E, Wilks M, Millar MR. Probiotics in Preterm Infants Study Collaborative Group . Bifidobacterium breve BBG-001 in very preterm infants: a randomised controlled phase 3 trial. Lancet 2016;387:649-60. https://doi.org/10.1016/S0140-6736(15)01027-2.
- Oliveira V, Singhvi DP, Montaldo P, Lally PJ, Mendoza J, Manerkar S, et al. Therapeutic hypothermia in mild neonatal encephalopathy: a national survey of practice in the UK. Arch Dis Child Fetal Neonatal Ed 2018;103:F388-90. https://doi.org/10.1136/archdischild-2017-313320.
Appendix 1 Variable definitions and extractions
| Variable | Data items from the NNRD | Definition |
|---|---|---|
| Enteral feeding |
ENTERAL FEEDING GROUP DEFINED AS Any of the following items entered in the Daily Care Fluids and Feeding during the first 3 days Any entry (1–6) under ENTERAL FEED TYPE GIVEN OR any entry (0–88) under FORMULA MILK OR MILK FORTIFIER TYPE OR any value > 0 for TOTAL VOLUME OF MILK RECEIVED OR any entry (1–8) under ENTERAL FEEDING METHOD NO ENTERAL FEEDING GROUP DEFINED AS All other babies not fulfilling above criteria |
Dichotomous (no enteral feeds = 0; provided enteral feeds = 1) |
| PN |
PARENTERAL NUTRITION GROUP DEFINED AS Any of the following items entered in the Daily Care Fluids and Feeding during the first 3 days Y entry for PARENTERAL NUTRITION RECEIVED INDICATOR OR The following drug code entered in the Daily care medication during the first 3 days 1010238 Total parenteral nutrition NO PARENTERAL NUTRITION GROUP DEFINED AS All other babies not fulfilling above criteria For sensitivity analyses also extract Daily Care Fluids and Feeding INTRAVENOUS INFUSION OF GLUCOSE AND ELECTROLYTE SOLUTION RECEIVED INDICATOR = Y/N |
Dichotomous (no parenteral nutrition = 0; provided parenteral nutrition = 1) |
| Variable | Data items from the NNRD | Definition(s) | Classification |
|---|---|---|---|
| Cord blood gas pH in bands |
Labour and delivery details UMBILICAL CORD BLOOD pH LEVEL (ARTERIAL) Or, if not recorded, use Labour and delivery details UMBILICAL CORD BLOOD pH LEVEL (ARTERIAL) |
CordpHArt: trichotomised into bands: > 7.0, 6.9–7.0 and < 6.9 | Principal |
| Birth year | Baby demographics YEAR AND MONTH OF BIRTH (BABY) | BirthYear: categorised into 2-year bands: 2010–11, 2012–13, 2014–15 and 2016–17 | Principal |
| Gestational age week | Baby demographics GESTATION LENGTH (AT DELIVERY): gestational weeks and days | GAweeks: integers | Highly important |
| Birthweight | Baby demographics BIRTH WEIGHT | Bweight: original entries trimmed from above at 3500 g and entries smaller than 1000 g with a non-zero digit are multiplied by 10. Square-root transformed | Highly important |
| Sex | Baby demographics PERSON PHENOTYPIC SEX | Sex: dichotomous (male = 0; female = 1) | Highly important |
| Emergency resuscitation drugs administered |
Labour and delivery details NEONATAL RESUSCITATION METHOD Dichotomous: Y = code 17 (adrenaline) OR 88 (any other drug) N = any other codes OR no code |
ResusDrugs: dichotomous (no = 0; yes = 1) | Highly important |
| Instrument of delivery | Labour and Delivery Details DELIVERY INSTRUMENT TYPE | InstrDeliv: dichotomised (no instrument used = 0; forceps or ventouse = 1) | Highly important |
| Mode of delivery |
Labour and Delivery Details MODE OF DELIVERY Categorical: codes = 1–4 AND Labour and Delivery Details IN LABOUR BEFORE CAESARIAN SECTION INDICATOR = Y/N |
Delivery: dichotomous (vaginal = 0, caesarean = 1) | Highly important |
| Maternal smoking status |
Pregnancy Details MOTHER CURRENT SMOKER AT BOOKING INDICATOR (Categorical, codes 1–6) |
SmokePreg: dichotomised (not smoking = 0; smoking during pregnancy = 1) SmokePregMs: binary missing indicator created (not missing = 0; missing = 1) |
Highly important |
| Maternal-suspected chorioamnionitis | Labour and delivery details INTRAPARTUM ANTIBIOTICS GIVEN INDICATORS | IntrPartAntiB: dichotomous (no intrapartum antibiotics given = 0, intrapartum antibiotics = 1) | Highly important |
| Apgar score at 1 minute |
Labour and delivery details APGAR SCORE (1 MINUTE) Continuous: 0–10 |
APGAR1min: categorical (0–10) APGAR1minMs: binary missing indicator created (not missing = 0; missing = 1) |
Highly important |
| Apgar score at 5 minutes |
Labour and delivery details APGAR SCORE (5 MINUTE) Continuous: 0–10 |
APGAR5min: categorical (0–10) APGAR5minMs: binary missing indicator created (not missing = 0; missing = 1) |
Highly important |
| Umbilical cord base excess |
Labour and delivery details UMBILICAL CORD BLOOD BASE EXCESS CONCENTRATION (ARTERIAL) Continuous OR if not available use Labour and delivery details UMBILICAL CORD BLOOD BASE EXCESS CONCENTRATION (VENOUS) |
CordBaseExcess: continuous (to one decimal place) CordBaseExcessMs: binary missing indicator created (not missing = 0; missing = 1) |
Highly important |
| Admission mean blood pressure |
Admission details MEAN ARTERIAL BLOOD PRESSURE (ON ADMISSION TO NEONATAL CRITICAL CARE) Continuous |
AdmitBP: Continuous, square-root transformed AdmitBP.Ms: binary missing indicator created (not missing = 0; missing = 1) |
Highly important |
| Admission blood glucose concentration |
Admission details BLOOD GLUCOSE CONCENTRATION (ON ADMISSION TO NEONATAL CRITICAL CARE) Continuous |
AdmitBG: continuous, trimmed from above at 20 AdmitBG.MS: binary missing indicator created (not missing = 0; missing = 1) |
Highly important |
| Admission oxygen saturation |
Admission details OXYGEN SATURATION (ON ADMISSION TO NEONATAL CRITICAL CARE) Continuous |
AdmitOS: continuous, trimmed to be within the range (50, 100) AdmitOS.Ms: binary missing indicator created (not missing = 0; missing = 1) |
Highly important |
| Maternal deprivation score (from LSOA) | Parents demographics POSTCODE OF USUAL ADDRESS (LSOA) |
LSOAdec: Categorised into deciles (1, 2, . . . 10) LSOAdecMs: binary missing indicator created (not missing = 0; missing = 1) |
Highly important |
| Multiplicity |
Labour and delivery details BIRTH ORDER (MATERNITY SERVICES) Labour and delivery details NUMBER OF FETUSES (NOTED DURING PREGNANCY EPISODE) |
MultipleBrt: dichotomised (single birth = 0; multiple births = 1) | Moderately important |
| Maternal age | Parents demographics YEAR OF BIRTH (MOTHER) | MaternalAge: continuous (years) trimmed to be within range 17–45 years | Moderately important |
| Maternal duration of rupture of membranes (time in hours) |
Labour and delivery details RUPTURE OF MEMBRANES DATE TIME or RUPTURE OF MEMBRANES YEAR AND MONTH and NUMBER OF MINUTES (BIRTH TO EVENT) Continuous |
Variable not used (too many missing values) | |
| Maternal disease during pregnancy |
Labour and delivery details SIGNIFICANT MATERNAL PYREXIA IN LABOUR INDICATOR (Y/N) Pregnancy details MATERNITY COMPLICATING MEDICAL DIAGNOSIS TYPE Dichotomous: Y = code 16 (endocrine disorder), N = any other or no code Pregnancy details MATERNITY COMPLICATING MEDICAL DIAGNOSIS TYPE Dichotomous: Y = code 08 (diabetes) OR Pregnancy details MATERNITY OBSTETRIC DIAGNOSIS TYPE Dichotomous: Y = code 06 (gestational diabetes mellitus) N = any other or no code |
MaternalDis: dichotomised (no diagnosis = 0; at least one of pyrexia in labour, hypothyroidism, diabetes = 1) | Moderately important |
| Maternal ethnicity |
Parents demographics ETHNIC CATEGORY (MOTHER) (Categorical) Coded as: WHITE (A – British, B – Irish, C – any other white background); MIXED (D – white and black Caribbean, E – white and black African, F – white and Asian, G – any other mixed background); ASIAN OR ASIAN BRITISH (H – Indian, J – Pakistani, K - Bangladeshi, L – any other Asian background); BLACK OR BLACK BRITISH (M – Caribbean, N – African, P – any other black background); OTHER ETHNIC GROUPS (R – Chinese, S – any other ethnic group); UNKNOWN (Z, DTA – not stated, 99 –not known) This data item is based on self-reported ethnicity as recorded in maternity notes |
Ethnicity: categorised into four groups (white = 1; Asian and mixed = 2; black and mixed = 3; other and not given = 4) | Moderately important |
| Parity of mother (primiparous Y/N) |
Pregnancy details PREGNANCY TOTAL PREVIOUS PREGNANCIES Dichotomous: code 00 = Y; code 01-29 = N |
Primiparous: dichotomous (not first pregnancy = 0; first pregnancy = 1) | Moderately important |
| Chest compressions administered |
Labour and delivery details NEONATAL RESUSCITATION METHOD Dichotomous: code 16 = Y; any other code = N |
ChestCompr: dichotomous (no chest compressions applied = 0; chest compressions applied = 1) | Moderately important |
| Intubated at resuscitation |
Labour and delivery details NEONATAL RESUSCITATION METHOD Dichotomous: code 15 = Y; any other code = N |
Intubation: dichotomous (not intubated = 0; intubated = 1) | Moderately important |
| Time to first spontaneous breath |
Labour and delivery details TIME BETWEEN DELIVERY AND SPONTANEOUS RESPIRATION CODE Continuous |
SpontRespTime: dichotomised (≤ 5 minutes = 0; > 5 minutes = 1) SpontRespTimeMs: binary missing indicator created (not missing = 0; missing = 1) |
Moderately important |
| Admission heart rate |
Admission details HEART RATE (ON ADMISSION TO NEONATAL CRITICAL CARE) Continuous |
AdmitHR: continuous, trimmed to be within the range 80–100 b.p.m. AdmitHR.Ms: binary missing indicator created (not missing = 0; missing = 1) |
Moderately important |
| Admission temperature |
Admission details TEMPERATURE (ON ADMISSION TO NEONATAL CRITICAL CARE) Continuous |
AdmitTempCe: continuous, trimmed to be within 26–40 °C AdmitTempMs: binary missing indicator created (not missing = 0; missing = 1) |
Moderately important |
| Positive blood or CSF culture with a recognised pathogen recorded in the first 3 days | Defined from infection cultures (episodic) recorded up to and including day 3
|
Infection: dichotomous (0 = no infection; 1 = infection) | Moderately important |
| Treatment for low blood pressure with an intravenous inotrope (e.g. dopamine, noradrenaline) |
Daily care medication on day 1 onlyDichotomous: any of above = Y, none of above = N OR Daily care cardiovascular INOTROPE INFUSION RECEIVED INDICATOR Y/N |
Inotropes: dichotomous (inotropes not administered = 0; inotropes administered = 1) | Moderately important |
| Mechanical ventilation method |
Daily care respiratory on day 1 only; RESPIRATORY SUPPORT MODE Dichotomous: codes 1, 2, 3 = Y; any other or no code = N |
RespiSupprt: dichotomous (respiratory support not provided = 0; respiratory support provided = 1) | Moderately important |
| Received inhaled nitric oxide (Y/N) |
Daily care respiratory on day 1 only; NITRIC OXIDE GIVEN INDICATOR Dichotomous: Y/N |
NitricOxide: dichotomous (nitric oxide not given = 0; nitric oxide given = 1) | Moderately important |
| Required acute postnatal transfer, within 24 hours (Y/N) |
Admission details SITE CODE (OF ADMITTING NEONATAL UNIT) or ORGANISATION CODE (OF ADMITTING NEONATAL UNIT) Different from Baby demographics SITE CODE (OF ACTUAL PLACE OF DELIVERY) or ORGANISATION CODE (OF ACTUAL PLACE OF DELIVERY) And Baby demographics EPISODE NUMBER |
PostNTransfer: dichotomous (no transfer = 0; transfer = 1) | Moderately important |
| Maternal occupation | Parents demographics (withheld) OCCUPATION MOTHER (SNOMED CT) | MumJob: dichotomous (no occupation = 0; any occupation = 1) | Moderately important |
| Onset of labour | Labour and delivery details LABOUR OR DELIVERY ONSET METHOD CODE | OnsetLabour: categorised into four groups (not in labour = 0; spontaneous = 1; induced = 2; missing = 9) | Moderately important |
| Time to admission | Admission details CRITICAL CARE START YEAR AND MONTH and NUMBER OF MINUTES (BIRTH TO EVENT) | AdmitTime: log-transformed with zero recoded to zero | Moderately important |
| Presentation at delivery |
Labour and delivery details PRESENTATION AT DELIVERY 1 – breech 2 – cephalic 3 – transverse 8 – other 9 – unknown |
FetusAtDelivC: dichotomised (cephalic = 1, not cephalic = 0) | Moderately important |
| Blood transfusion |
Daily care blood transfusion BLOOD TRANSFUSION PRODUCT TYPE On day 1 only |
BloodTrans: dichotomised (no = 0; yes = 1) | Moderately important |
| Maternal or obstetric medical problem |
Pregnancy details MATERNITY OBSTETRIC DIAGNOSIS TYPE (CURRENT PREGNANCY) Pregnancy details MATERNITY MEDICAL DIAGNOSIS TYPE (CURRENT PREGNANCY) |
ProblMedic: dichotomised (no medical problems = 0; some medical problems = 1) | Moderately important |
| Variable | Data items from NNRD | Definition |
|---|---|---|
| Severe NEC |
Gestational age-specific NEC score based on Battersby et al. 21 Data items needed: ABDOMINAL X-RAYS (EPISODIC)Only available following introduction of ABDOMINAL X-RAY (EPISODIC) field Cases identified using these data items were individually confirmed with clinicians |
Dichotomous (no severe NEC = 0; severe NEC = 1) |
| NEC (non-UKNC definition) |
The following entered in the daily care gastrointestinal on any 1 day during stay in a neonatal unitOR the following diagnostic codes:AND 5 or more days nil by mouth defined by the daily care fluids and feeding for a continuous period of 5 daysNo entry under FORMULA MILK OR MILK FORTIFIER TYPE No value OR 0 for TOTAL VOLUME OF MILK RECEIVEDWHILE ALSO RECEIVING 5 or more days of antibiotics over the same 5 days as the baby was nil by mouth, defined as 5 consecutive days of any of the following Daily care medication: |
Dichotomous (no NEC = 0; NEC = 1) |
| Late-onset BSI (NNAP definition) | Defined from infection cultures (episodic) recorded after day 3
|
Dichotomous (no infection = 0; infection = 1) |
| Late-onset infection, non-NNAP |
5 consecutive days of antibiotic treatment defined as 5 consecutive days of any of the following (including in combination and changing during the 5 days) after day 3 Daily care medication: |
Dichotomous (no infection = 0; infection = 1) |
| Survival to discharge | Defined from the discharge details from final neonatal unit stay
|
Dichotomous (died during neonatal stay = 0; survived until discharge = 1) |
| Length of neonatal unit stay | Defined as the total number of days a baby received neonatal care (any level of care) from daily care general information – LOCATIONS OF HIGHEST LEVEL OF CARE | Continuous, integers |
| Hypoglycaemia | Defined as any of the following diagnostic codes recorded at any time during an babies neonatal units stay:
|
Dichotomous (no hypoglycaemia = 0; hypoglycaemia = 1) |
| Breastfeeding at discharge | Defined from final day of neonatal care entry in daily care fluids and feeding of
|
Dichotomous (not suckling at the breast at discharge = 0; suckling at the breast at discharge = 1) |
| Onset of breastfeeding | Number of days until first entry in daily care fluids and feeding of
|
Continuous, integers |
| Time to first maternal breast milk feed | First day on which a baby is recorded to be receiving maternal breast milk by any route (including suckling at the breast, by bottle or nasogastric tube) defined as Daily Care Fluids and Feeding of
|
Continuous, integers |
| Duration of parenteral nutrition | Defined as the number of days UNTIL a baby has:
|
Continuous, integers |
| Number of days a baby has a central venous line in situ | Defined as the number of days that has a baby has:
|
Continuous, integers |
| Weight SDS at discharge | Defined as the following data item on the final day of neonatal care:
|
Continuous |
Appendix 2 Study oversight committees
Clinical Investigator Group members
-
Chris Gale (Chairperson), Reader in Neonatal Medicine and Consultant Neonatologist, Imperial College London and Chelsea and Westminster Hospital NHS Foundation Trust, London, UK.
-
Nicholas Longford, Senior Statistician, Imperial College London, London, UK.
-
Cheryl Battersby, Clinical Senior Lecturer in Neonatal Medicine and Consultant Neonatologist, Imperial College London and Chelsea and Westminster Hospital NHS Foundation Trust, London, UK.
-
Jon Dorling, Professor of Neonatal Medicine, IWK Health Centre, Halifax, NS, Canada.
-
Shalini Ojha, Clinical Associate Professor in Neonatal Medicine, University of Nottingham, Nottingham, UK.
-
Lucy Culshaw, Senior Research Engagement Officer, Bliss, London, UK. (Prior to March 2019 this role was held by Mehali Patel, Research Engagement Officer, Bliss, London, UK.)
-
Ella Selby, mother of child who received therapeutic hypothermia as a baby.
Study Steering Group members
-
David Odd (Independent chairperson), Senior Clinical Lecturer in Neonatal Medicine and Consultant Neonatologist, University of Bristol and North Bristol NHS Trust, Bristol, UK.
-
Louise Linsell (Independent), Senior Medical Statistician, Clinical Trials Unit, National Perinatal Epidemiology Unit, University of Oxford, Oxford, UK.
-
James Carpenter (Independent), Professor of Medical Statistics, London School of Hygiene and Tropical Medicine, London, UK.
-
Carol Rhodes (Independent), mother of child who received therapeutic hypothermia as a baby.
-
Chris Gale (Non-independent), Reader in Neonatal Medicine and Consultant Neonatologist, Imperial College London and Chelsea and Westminster Hospital NHS Foundation Trust, London, UK.
Appendix 3 Annual summary data for remaining background variables
| Variable | Year | All years | |||||||
|---|---|---|---|---|---|---|---|---|---|
| 2010 | 2011 | 2012 | 2013 | 2014 | 2015 | 2016 | 2017 | ||
| Total number of babies | 474 | 678 | 686 | 815 | 871 | 859 | 819 | 825 | 6027 |
| Place of birth: England | |||||||||
| n | 459 | 647 | 635 | 728 | 763 | 747 | 701 | 718 | 5398 |
| % | 96.8 | 95.4 | 92.6 | 89.3 | 87.6 | 87.0 | 85.6 | 87.0 | 89.6 |
| Birth length (cm) | |||||||||
| Mean | 50.7 | 51.8 | 50.8 | 49.8 | 51.3 | 51.7 | 50.9 | 49.4 | 50.8 |
| SD | 3.4 | 4.0 | 4.4 | 3.8 | 4.6 | 4.9 | 3.7 | 5.9 | 4.4 |
| Median | 51 | 52 | 51 | 50 | 52 | 53 | 51 | 50 | 51 |
| Lower quartile | 49.1 | 50.9 | 48 | 47 | 48 | 51 | 48.2 | 48 | 48 |
| Upper quartile | 51.9 | 54 | 54.6 | 52 | 54 | 54 | 53.4 | 53.8 | 54 |
| Missing, n | 454 | 642 | 651 | 770 | 821 | 825 | 785 | 794 | 5742 |
| % | 95.8 | 94.7 | 94.9 | 94.5 | 94.3 | 96.0 | 95.8 | 96.2 | 95.3 |
| Birth head circumference (cm) | |||||||||
| Mean | 34.8 | 34.7 | 34.8 | 34.7 | 34.6 | 34.5 | 34.6 | 34.4 | 34.6 |
| SD | 2.0 | 1.7 | 1.7 | 1.8 | 1.8 | 2.4 | 2.1 | 2.6 | 2.0 |
| Median | 35 | 35 | 35 | 34.6 | 34.7 | 34.8 | 34.5 | 34.5 | 34.8 |
| Lower quartile | 33.7 | 33.7 | 33.6 | 33.5 | 33.5 | 33.5 | 33.5 | 33.5 | 33.5 |
| Upper quartile | 36.0 | 36.0 | 36.0 | 36.0 | 35.8 | 35.8 | 36 | 35.7 | 36 |
| Missing, n | 219 | 276 | 303 | 422 | 525 | 570 | 529 | 518 | 3362 |
| % | 46.2 | 40.7 | 44.2 | 51.8 | 60.3 | 66.4 | 64.6 | 62.8 | 55.8 |
| Maternal pyrexia | |||||||||
| n | 26 | 35 | 40 | 32 | 58 | 36 | 30 | 51 | 308 |
| % | 5.5 | 5.2 | 5.8 | 3.9 | 6.7 | 4.2 | 3.7 | 6.2 | 5.1 |
| Missing, n | 86 | 107 | 109 | 121 | 128 | 153 | 146 | 168 | 1018 |
| % | 18.1 | 15.8 | 15.9 | 14.8 | 14.7 | 17.8 | 17.8 | 20.4 | 16.9 |
| Maternal diabetesa | |||||||||
| n | 8 | 18 | 18 | 40 | 36 | 39 | 49 | 48 | 256 |
| % | 1.7 | 2.7 | 2.6 | 4.9 | 4.1 | 4.5 | 6.0 | 5.8 | 4.2 |
| Maternal hypothyroidisma,b | |||||||||
| n | 6 | 17 | 17 | 10 | 15 | 65 | |||
| % | 0.7 | 2.0 | 2.0 | 1.2 | 1.8 | 1.1 | |||
| Maternal obstetric diagnosisa | |||||||||
| n | 240 | 361 | 385 | 421 | 394 | 391 | 367 | 359 | 2918 |
| % | 50.6 | 53.2 | 56.1 | 51.7 | 45.2 | 45.5 | 44.8 | 43.5 | 48.4 |
| Maternal medical diagnosisa | |||||||||
| n | 11 | 59 | 223 | 392 | 466 | 431 | 424 | 2006 | |
| % | 1.6 | 8.6 | 27.4 | 45.0 | 54.2 | 52.6 | 51.4 | 33.3 | |
| Variable | Year | All years | |||||||
|---|---|---|---|---|---|---|---|---|---|
| 2010 | 2011 | 2012 | 2013 | 2014 | 2015 | 2016 | 2017 | ||
| Total number of babies | 475 | 678 | 686 | 815 | 871 | 861 | 820 | 825 | 6031 |
| Umbilical cord base excess | |||||||||
| Median | –14.6 | –13.7 | –13.0 | –13.8 | –12.5 | –12.9 | –12.1 | –12.4 | –13.0 |
| Lower quartile | –19.3 | –18.6 | –17.3 | –17.8 | –16.7 | –17.0 | –16.8 | –16.5 | –17.4 |
| Upper quartile | –8.5 | –8.0 | –8.9 | –9.1 | –8.1 | –8.1 | –7.8 | –7.6 | –8.2 |
| Missing, n | 148 | 219 | 225 | 260 | 310 | 325 | 348 | 313 | 2148 |
| % | 31.2 | 32.3 | 32.8 | 31.9 | 35.6 | 37.8 | 42.5 | 37.9 | 35.6 |
| Time to first spontaneous breath | |||||||||
| 0 (< 1 minute), n | 0 | 0 | 0 | 0 | 0 | 0 | 0 | 0 | 0 |
| % | 0.0 | 0.0 | 0.0 | 0.0 | 0.0 | 0.0 | 0.0 | 0.0 | 0.0 |
| 1 (1–1.5 minutes), n | 4 | 8 | 19 | 21 | 17 | 26 | 20 | 24 | 139 |
| % | 0.8 | 1.2 | 2.8 | 2.6 | 2.0 | 3.0 | 2.4 | 2.9 | 2.3 |
| 2 (1.6–2 minutes), n | 6 | 10 | 14 | 18 | 13 | 17 | 20 | 24 | 122 |
| % | 1.3 | 1.5 | 2.0 | 2.2 | 1.5 | 2.0 | 2.4 | 2.9 | 2.0 |
| 3 (2.1–3 minutes), n | 16 | 17 | 16 | 40 | 36 | 36 | 31 | 36 | 228 |
| % | 3.4 | 2.5 | 2.3 | 4.9 | 4.1 | 4.2 | 3.8 | 4.4 | 3.8 |
| 4 (3.1–4 minutes), n | 12 | 24 | 18 | 25 | 45 | 20 | 24 | 34 | 202 |
| % | 2.5 | 3.5 | 2.6 | 3.1 | 5.2 | 2.3 | 2.9 | 4.1 | 3.4 |
| 5 (4.1–5 minutes), n | 13 | 23 | 21 | 27 | 34 | 38 | 30 | 34 | 220 |
| % | 2.7 | 3.4 | 3.1 | 3.3 | 3.9 | 4.4 | 3.7 | 4.1 | 3.7 |
| 6 (> 5 minutes) | 279 | 401 | 412 | 493 | 531 | 509 | 494 | 483 | 3602 |
| % | 58.9 | 59.1 | 60.1 | 60.5 | 61.0 | 59.3 | 60.3 | 58.5 | 59.8 |
| Missing, n | 144 | 195 | 186 | 191 | 195 | 213 | 200 | 190 | 1514 |
| % | 30.4 | 28.8 | 27.1 | 23.4 | 22.4 | 24.8 | 24.4 | 23.0 | 25.1 |
| Variable | Year | All years | |||||||
|---|---|---|---|---|---|---|---|---|---|
| 2010 | 2011 | 2012 | 2013 | 2014 | 2015 | 2016 | 2017 | ||
| Total number of babies | 475 | 678 | 686 | 815 | 871 | 861 | 820 | 825 | 6031 |
| Blood glucose concentration at admission (mmol/l) | |||||||||
| Median | 5.9 | 5.8 | 5.9 | 5.7 | 5.6 | 5.5 | 5.5 | 5.3 | 5.6 |
| Lower quartile | 3.5 | 3.5 | 3.8 | 3.7 | 3.7 | 3.7 | 3.7 | 3.4 | 3.6 |
| Upper quartile | 8.1 | 8.1 | 8.1 | 7.8 | 7.8 | 7.4 | 7.4 | 7.3 | 7.7 |
| Missing, n | 108 | 124 | 131 | 137 | 154 | 178 | 155 | 156 | 1143 |
| % | 22.8 | 18.3 | 19.1 | 16.8 | 17.7 | 20.7 | 18.9 | 18.9 | 19.0 |
| Heart rate (b.p.m.) | |||||||||
| Median | 140 | 144 | 142 | 144 | 145 | 145 | 144 | 145 | 144 |
| Lower quartile | 127 | 130 | 128 | 130 | 130 | 130 | 130 | 132 | 130 |
| Upper quartile | 155 | 159 | 155.5 | 160 | 160 | 160 | 158 | 160 | 159 |
| Missing, n | 73 | 79 | 67 | 42 | 53 | 66 | 51 | 57 | 488 |
| % | 15.4 | 11.7 | 9.8 | 5.2 | 6.1 | 7.7 | 6.2 | 6.9 | 8.1 |
| Oxygen saturation (mmHg) | |||||||||
| Median | 96 | 96 | 97 | 96 | 97 | 97 | 97 | 98 | 97 |
| Lower quartile | 90 | 91 | 92 | 92 | 92 | 93 | 93 | 93 | 92 |
| Upper quartile | 99 | 99 | 100 | 99 | 100 | 100 | 100 | 100 | 100 |
| Missing, n | 86 | 78 | 79 | 50 | 63 | 77 | 75 | 67 | 575 |
| % | 18.1 | 11.5 | 11.5 | 6.1 | 7.2 | 9.0 | 9.2 | 8.1 | 9.5 |
| Temperature (°C) | |||||||||
| Mean | 35.8 | 35.7 | 35.8 | 35.9 | 35.9 | 35.8 | 35.9 | 36 | 35.9 |
| SD | 1.3 | 1.3 | 1.3 | 1.2 | 1.2 | 1.3 | 1.2 | 1.3 | 1.3 |
| Median | 36.2 | 36.0 | 36.1 | 36.2 | 36.2 | 36.2 | 36.2 | 36.4 | 36.2 |
| Lower quartile | 35.4 | 35.1 | 35.2 | 35.5 | 35.6 | 35.5 | 35.6 | 35.8 | 35.5 |
| Upper quartile | 36.6 | 36.6 | 36.6 | 36.7 | 36.7 | 36.6 | 36.7 | 36.8 | 36.7 |
| Missing, n | 11 | 7 | 26 | 38 | 39 | 46 | 35 | 39 | 241 |
| % | 2.3 | 1.0 | 3.8 | 4.7 | 4.5 | 5.4 | 4.3 | 4.7 | 4.0 |
| Inhaled nitric oxide on day of admission | |||||||||
| n | 17 | 31 | 34 | 37 | 38 | 39 | 31 | 40 | 267 |
| % | 3.6 | 4.6 | 5.0 | 4.5 | 4.4 | 4.5 | 3.8 | 4.8 | 4.4 |
| Missing, n | 30 | 46 | 32 | 42 | 36 | 38 | 31 | 35 | 290 |
| % | 6.3 | 6.8 | 4.7 | 5.2 | 4.1 | 4.4 | 3.8 | 4.2 | 4.8 |
| Treatment for low blood pressure on day of admission | |||||||||
| n | 153 | 191 | 184 | 200 | 203 | 173 | 195 | 164 | 1463 |
| % | 32.3 | 28.2 | 26.8 | 24.5 | 23.3 | 20.1 | 23.8 | 19.9 | 24.3 |
| Missing, n | 30 | 46 | 31 | 38 | 36 | 40 | 31 | 32 | 284 |
| % | 6.3 | 6.8 | 4.5 | 4.7 | 4.1 | 4.7 | 3.8 | 3.9 | 4.7 |
Appendix 4 Background variables by enteral feeding status in unmatched and matched cohorts
| Variable | Cohort | |||
|---|---|---|---|---|
| Unmatched | Matched | |||
| No enteral feeds | Enteral feeds | No enteral feeds | Enteral feeds | |
| Total number of babies | 3975 | 1872 | 1618 | 1618 |
| Male | ||||
| n | 2173 | 1055 | 903 | 903 |
| % | 54.7 | 56.4 | 55.8 | 55.8 |
| Missing, n | 0 | 0 | 0 | 0 |
| Multiple birth | ||||
| n | 116 | 61 | 48 | 54 |
| % | 2.9 | 3.3 | 3 | 3.3 |
| Missing, n | 0 | 1 | 0 | 1 |
| % | 0 | 0.1 | 0 | 0.1 |
| Gestational age at birth (weeks) | ||||
| Median | 40 | 40 | 40 | 40 |
| Lower quartile | 38 | 38.8 | 38.8 | 38.3 |
| Upper quartile | 41 | 41 | 41 | 41 |
| Missing, n | 0 | 0 | 0 | 0 |
| Birthweight (g) | ||||
| Median | 3340 | 3390 | 3400 | 3372.1 |
| Lower quartile | 2940 | 2984.5 | 2988.5 | 2987.6 |
| Upper quartile | 3748.5 | 3796.2 | 3792.3 | 3787.2 |
| Missing, n | 0 | 0 | 0 | 0 |
| Birth length (cm) | ||||
| Median | 51.0 | 51.0 | 51.9 | 51.0 |
| Lower quartile | 48.0 | 48.4 | 49.5 | 48.2 |
| Upper quartile | 54.0 | 54.0 | 54.0 | 54.0 |
| Missing, n | 3764 | 1800 | 1528.6 | 1555.4 |
| % | 94.7 | 96.2 | 94.5 | 96.1 |
| Birth head circumference (cm) | ||||
| Median | 34.6 | 35.0 | 34.9 | 35.0 |
| Lower quartile | 33.5 | 33.6 | 33.5 | 33.6 |
| Upper quartile | 36.0 | 36.0 | 36.0 | 35.9 |
| Missing, n | 2300 | 967 | 906 | 828 |
| % | 57.9 | 51.7 | 56.0 | 51.2 |
| Caesarean delivery | ||||
| n | 1921 | 738 | 649 | 638 |
| % | 50.6 | 41.2 | 41.9 | 41.1 |
| Missing, n | 178 | 80 | 70 | 68 |
| % | 4.7 | 4.5 | 4.5 | 4.4 |
| Cord blood gas pH: arterial | ||||
| > 7.0, n | 1240 | 613 | 536 | 536 |
| % | 44.1 | 45.4 | 46.0 | 46.0 |
| 6.9–7.0, n | 661 | 318 | 262 | 262 |
| % | 23.5 | 23.5 | 22.5 | 22.5 |
| < 6.9, n | 913 | 420 | 368 | 368 |
| % | 32.4 | 31.1 | 31.6 | 31.6 |
| Missing, n | 1161 | 521 | 452 | 452 |
| % | 29.2 | 27.8 | 27.9 | 27.9 |
| Variable | Cohort | |||
|---|---|---|---|---|
| Unmatched | Matched | |||
| No enteral feeds | Enteral feeds | No enteral feeds | Enteral feeds | |
| Total number of babies | 3975 | 1872 | 1618 | 1618 |
| Maternal age (years) | ||||
| Median | 30 | 31 | 31 | 31 |
| Lower quartile | 26 | 27 | 26.9 | 26.5 |
| Upper quartile | 34 | 35 | 35 | 35 |
| Missing, n | 38 | 21 | 15 | 18.2 |
| % | 1.0 | 1.1 | 0.9 | 1.1 |
| Maternal pyrexia | ||||
| n | 205 | 98 | 91 | 78.7 |
| % | 6.3 | 6.1 | 6.7 | 5.7 |
| Missing, n | 708 | 266 | 261.5 | 224.9 |
| % | 21.7 | 16.6 | 19.3 | 16.1 |
| Maternal suspected chorioamnionitis | ||||
| n | 406 | 240 | 202 | 187 |
| % | 12.6 | 15.2 | 15.2 | 13.7 |
| Missing, n | 757 | 288 | 283 | 247 |
| % | 23.5 | 18.2 | 21.2 | 18.0 |
| Smoking in pregnancy | ||||
| n | 524 | 191 | 159 | 169 |
| % | 15.4 | 11.7 | 11.3 | 12.0 |
| Missing, n | 566 | 244 | 207 | 205 |
| % | 16.6 | 15.0 | 14.7 | 14.5 |
| Deprivation score (LSOA) | ||||
| Median | 4 | 5 | 5 | 4 |
| Lower quartile | 2 | 3 | 2 | 2 |
| Upper quartile | 7 | 8 | 7 | 7 |
| Missing, n | 515 | 204 | 379 | 374 |
| % | 13.0 | 10.9 | 11.7 | 13.4 |
| Maternal hypothyroidisma,b | ||||
| n | 40 | 24 | 18 | 21 |
| % | 1.0 | 1.3 | 1.1 | 1.3 |
| Maternal diabetesa | ||||
| n | 171 | 75 | 66 | 60 |
| % | 4.3 | 4.0 | 4.1 | 3.7 |
| Maternal obstetric diagnosisa | ||||
| n | 1921 | 916 | 837 | 798 |
| % | 48.3 | 48.9 | 51.7 | 49.3 |
| Maternal medical diagnosisa | ||||
| n | 1328 | 644 | 569 | 554 |
| % | 33.4 | 34.4 | 35.2 | 34.3 |
| Primiparousa | ||||
| n | 2107 | 991 | 857 | 844 |
| % | 53.0 | 52.9 | 53.0 | 52.2 |
| Variable | Cohort | |||
|---|---|---|---|---|
| Unmatched | Matched | |||
| No enteral feeds | Enteral feeds | No enteral feeds | Enteral feeds | |
| Total number of babies | 3975 | 1872 | 1618 | 1618 |
| Apgar score at 1 minute | ||||
| Median | 1 | 2 | 2 | 2 |
| Lower quartile | 1 | 1 | 1 | 1 |
| Upper quartile | 3 | 3 | 3 | 3 |
| Missing, n | 339 | 133 | 104 | 109 |
| % | 8.5 | 7.1 | 6.4 | 6.8 |
| Apgar score at 5 minutes | ||||
| Median | 4 | 4 | 4 | 4 |
| Lower quartile | 2 | 3 | 3 | 3 |
| Upper quartile | 6 | 6 | 6 | 6 |
| Missing, n | 340 | 124 | 100 | 103 |
| % | 8.6 | 6.6 | 6.2 | 6.4 |
| Chest compressionsa | ||||
| n | 1555 | 608 | 560 | 532 |
| % | 39.1 | 32.5 | 34.6 | 32.9 |
| Emergency resuscitation drugsa | ||||
| n | 683 | 209 | 191 | 183 |
| % | 17.2 | 11.2 | 11.8 | 11.3 |
| Intubated at resuscitationa | ||||
| n | 2619 | 1126 | 1020 | 995 |
| % | 65.9 | 60.1 | 63.0 | 61.5 |
| Umbilical cord base excess | ||||
| Median | –13 | –12.7 | –12.9 | –12.7 |
| Lower quartile | –17.5 | –17.1 | –17 | –17.1 |
| Upper quartile | –8.4 | –8.1 | –8.2 | –8.1 |
| Missing, n | 1433 | 638 | 564.3 | 557 |
| % | 36.1 | 34.1 | 34.9 | 34.4 |
| Time to first spontaneous breath | ||||
| 0–5 minutes, n | 595 | 292 | 250 | 246 |
| % | 15.0 | 15.6 | 15.5 | 15.2 |
| > 5 minutes, n | 2369 | 1128 | 985 | 985 |
| % | 59.6 | 60.3 | 60.9 | 60.9 |
| Missing, n | 1011 | 452 | 383 | 387 |
| % | 25.4 | 24.1 | 23.7 | 23.9 |
| Variable | Cohort | |||
|---|---|---|---|---|
| Unmatched | Matched | |||
| No enteral feeds | Enteral feeds | No enteral feeds | Enteral feeds | |
| Total number of babies | 3975 | 1872 | 1607 | 1607 |
| Time to admission (minutes) | ||||
| Median | 30 | 30 | 29 | 30 |
| Lower quartile | 20 | 20 | 20 | 20 |
| Upper quartile | 44 | 43 | 43 | 43 |
| Missing, n | 0 | 0 | 0 | 0 |
| Blood glucose concentration at admission (mmol/l) | ||||
| Median | 5.6 | 5.6 | 5.8 | 5.6 |
| Lower quartile | 3.4 | 4.0 | 3.8 | 4.0 |
| Upper quartile | 7.8 | 7.7 | 7.8 | 7.7 |
| Missing, n | 766 | 341 | 281 | 287 |
| % | 19.3 | 18.2 | 17.3 | 17.7 |
| Heart rate (b.p.m.) | ||||
| Median | 145 | 144 | 144 | 144 |
| Lower quartile | 130 | 130 | 130 | 130 |
| Upper quartile | 160 | 158 | 160 | 158 |
| Missing, n | 301 | 164 | 124 | 124 |
| % | 7.6 | 8.8 | 7.7 | 7.6 |
| Oxygen saturation (mmHg) | ||||
| Median | 96 | 97 | 97 | 97 |
| Lower quartile | 92 | 93 | 93 | 93 |
| Upper quartile | 99 | 100 | 100 | 100 |
| Missing, n | 374 | 174 | 140 | 143 |
| % | 9.4 | 9.3 | 8.7 | 8.8 |
| Temperature (°C) | ||||
| Median | 36.2 | 36.3 | 36.1 | 36.2 |
| Lower quartile | 35.4 | 35.6 | 35.3 | 35.6 |
| Upper quartile | 36.6 | 36.7 | 36.6 | 36.7 |
| Missing, n | 164 | 70 | 114 | 127 |
| % | 4.1 | 3.7 | 3.5 | 4.6 |
| Mechanical ventilation on day of admission | ||||
| n | 3176 | 1335 | 1196 | 1189 |
| % | 83.1 | 73.4 | 77.6 | 75.3 |
| Missing, n | 155 | 53 | 76 | 40 |
| % | 4.1 | 2.9 | 4.9 | 2.5 |
| Inhaled nitric oxide on day of admission | ||||
| n | 201 | 57 | 56 | 51 |
| % | 5.3 | 3.2 | 3.7 | 3.3 |
| Missing, n | 184 | 81 | 92 | 64 |
| % | 4.9 | 4.5 | 6.0 | 4.1 |
| Treatment with inotropes on day of admission | ||||
| n | 1099 | 320 | 295 | 288 |
| % | 29 | 17.9 | 19.3 | 18.5 |
| Missing, n | 180 | 80 | 90 | 63 |
| % | 4.7 | 4.5 | 5.9 | 4.0 |
| Infection in the first 3 days (NNAP)a | ||||
| n | 44 | 11 | 16 | 11 |
| % | 1.1 | 0.6 | 1 | 0.7 |
| Postnatal transfer (acute) | ||||
| n | 1908 | 913 | 790 | 796 |
| % | 48.0 | 48.8 | 48.8 | 49.2 |
| Missing, n | 0 | 0 | 0 | 0 |
Appendix 5 Primary analysis of dichotomous outcome variables in enteral feeding comparison
| Variable | Intervention | Rate difference, % (95% CI) | OR (95% CI) | p-value | |
|---|---|---|---|---|---|
| No enteral feeds rate | Enterally fed rate | ||||
| Total number of babies | 1618 | 1618 | |||
| Length of stay (> 14 days), % (95% CI) | 30.0 (28.3 to 31.7) | 21.2 (19.4 to 23.0) | –8.8 (–11.2 to –6.3) | 0.63 (0.54 to 0.74) | < 0.001 |
| First day suckling at breast (≤ 28 days), % (95% CI) | 60.6 (58.8 to 62.4) | 70.1 (68.0 to 72.1) | 9.4 (6.7 to 12.1) | 1.52 (1.31 to 1.76) | < 0.001 |
| First day of maternal milk (≤ 28 days), % (95% CI) | 81.8 (80.4 to 83.2) | 87.7 (86.2 to 89.2) | 5.9 (3.9 to 8.0) | 1.59 (1.31 to 1.93) | < 0.001 |
| Had a central venous line in situ, % (95% CI) | 95.6 (94.8 to 96.4) | 87.5 (86.1 to 89.0) | –8.1 (–9.7 to –6.4) | 0.32 (0.25 to 0.43) | < 0.001 |
| Received PN, % (95% CI) | 41.7 (39.9 to 43.6) | 36.8 (34.7 to 39.0) | –4.9 (–7.7 to –2.1) | 0.81 (0.71 to 0.94) | 0.36 |
Appendix 6 Sensitivity analyses of dichotomous outcome variables in enteral feeding comparison
| Outcome | Sensitivity analysis, estimate of rate difference (95% CI) [p-value] | ||
|---|---|---|---|
| Years 2012–17 | Intervention redefined | Inclusion of PN in PSM | |
| Length of stay (> 14 days) | –8.6 (–11.4 to –5.9) [< 0.001] | –9.9 (–12.6 to –7.1) [< 0.001] | –9.0 (–11.5 to –6.6) [< 0.001] |
| First day suckling at breast (≤ 28 days) | 10.5 (7.5 to 13.6) [< 0.001] | 9.3 (6.4 to 12.2) [< 0.001] | 9.5 (6.8 to 12.2) [< 0.001] |
| First day of maternal milk (≤ 28 days) | 7.1 (4.8 to 9.3) [< 0.001] | 5.6 (3.3 to 7.8) [< 0.001] | 6.6 (4.6 to 8.6) [< 0.001] |
| Had a central venous line in situ | –7.1 (–8.8 to –5.3) [< 0.001] | –7.7 (–9.4 to –6.0) [< 0.001] | –7.9 (–9.5 to –6.3) [< 0.001] |
| Received PN | –2.0 (–5.2 to 1.2) [0.32] | –5.2 (–8.2 to –2.2) [0.006] | –4.6 (–7.4 to –1.8) [0.02] |
Appendix 7 Results for alternative methods of matching on the propensity score and background variables in enteral feeding analysis
The consistency of results using alternative methods of matching on the propensity groups and principal background variables was explored and is presented using jail plots for each outcome of interest (Figures 9–11). Each of the six plots presents the results for a single outcome of interest [i.e. plot (a) presents the results for the outcome of pragmatically defined NEC]. Each plot contains 48 vertical segments that connect the lower and upper 95% CIs for the estimate of the treatment effect (i.e. rate difference for binary variables and mean difference for continuous variables). The estimate of the treatment effect is represented by a black disc. The 48 estimates and CIs are grouped into four sets of 12. Each of these four groups represents a set of analyses: (1) the primary analysis, (2) restricting to years 2012–17, (3) implementing a more restrictive definition of the enteral feeding intervention groups and (4) including receipt of PN on the first day in the propensity model. Within each group, the preliminary method of analysis is presented in bold, and is followed by the 11 alternative methods of analysis that are ordered as in Figure 1. For all outcomes, there was a high level of consistency between treatment effect estimates across all methods of analysis.
FIGURE 9.
Jail plots of binary outcomes for enteral feeding analyses. (a) NEC (pragmatic definition); (b) late infection (NNAP); (c) late infection (pragmatic definition); (d) survival till discharge; (e) hypoglycaemia; and (f) breastfeeding at discharge. PRI, primary analyses; SE1, sensitivity analysis 1 (reduction to years 2012–17); SE2, sensitivity analysis 2 (redefining enteral feeding variable); SE3, sensitivity analysis 3 (adding receipt of PN on first day of life to propensity model).
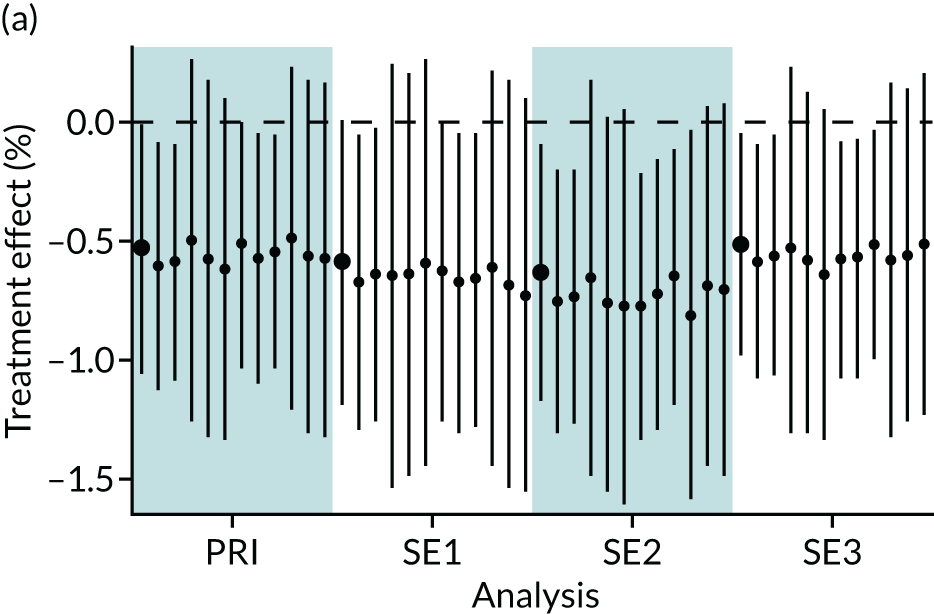
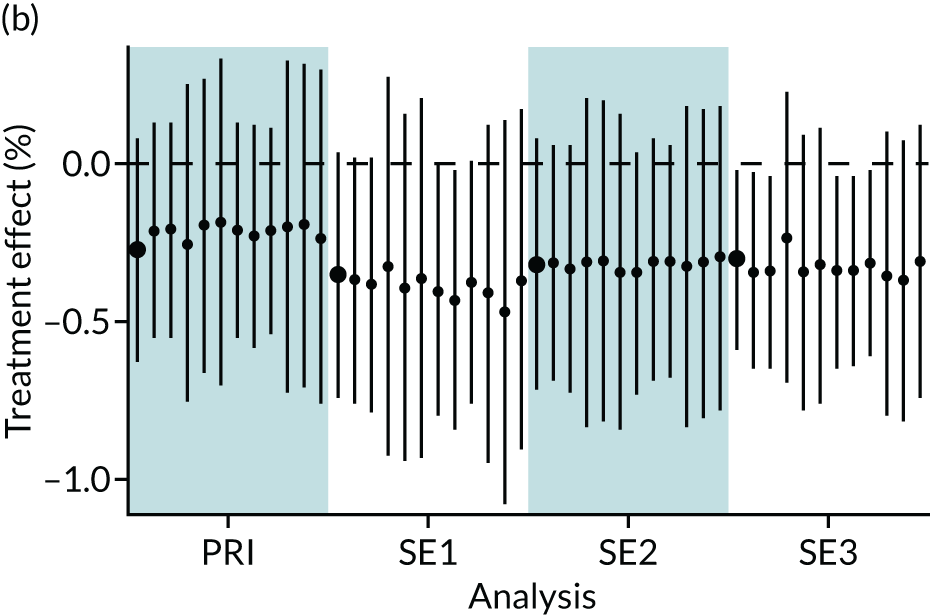
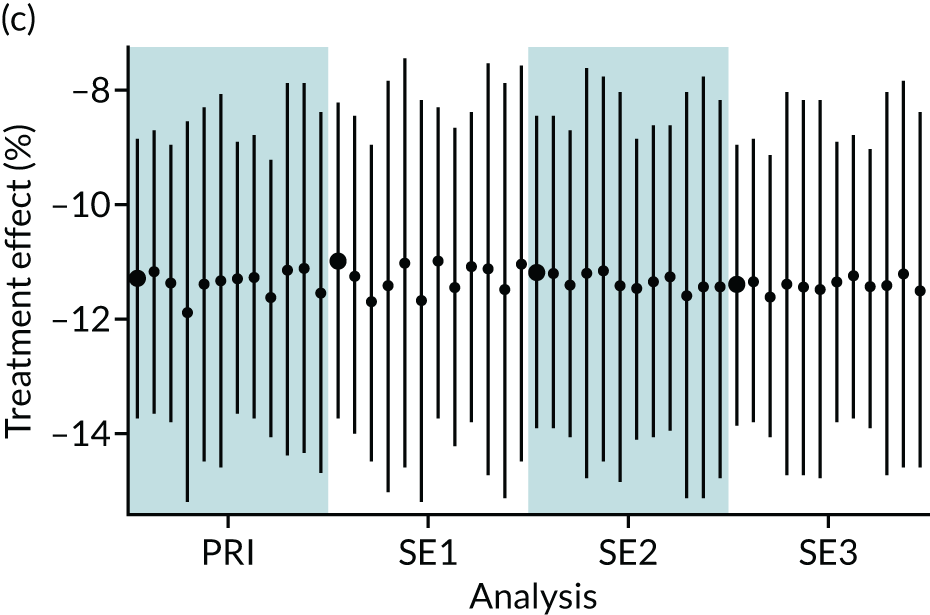
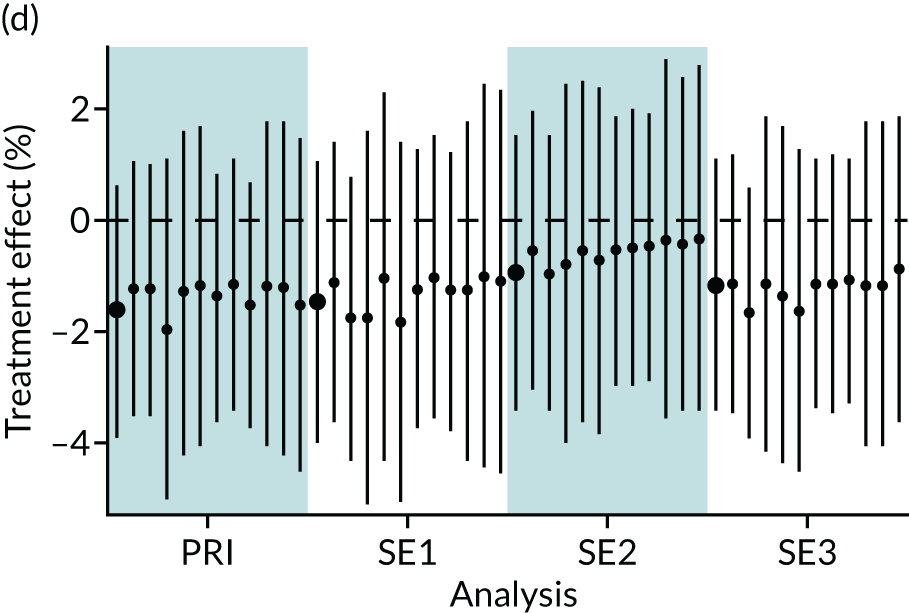
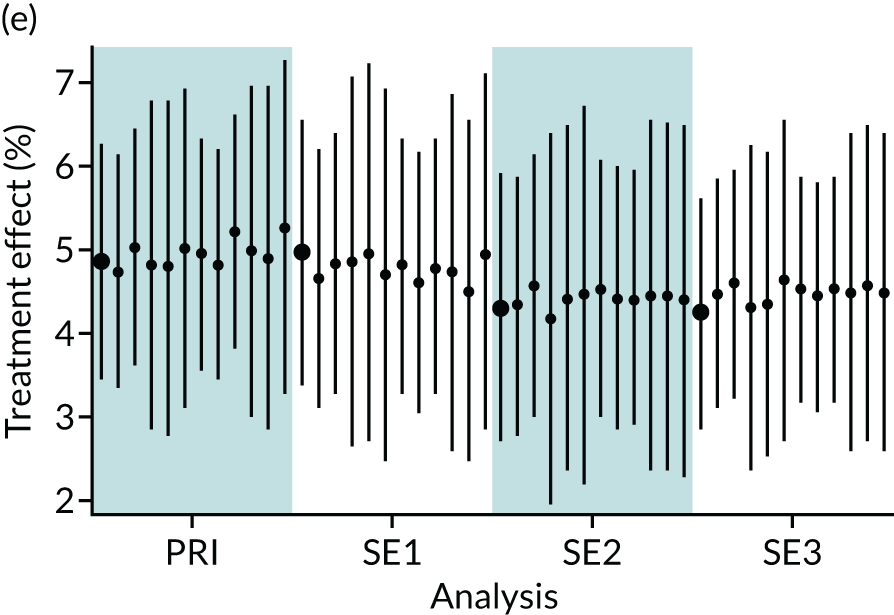
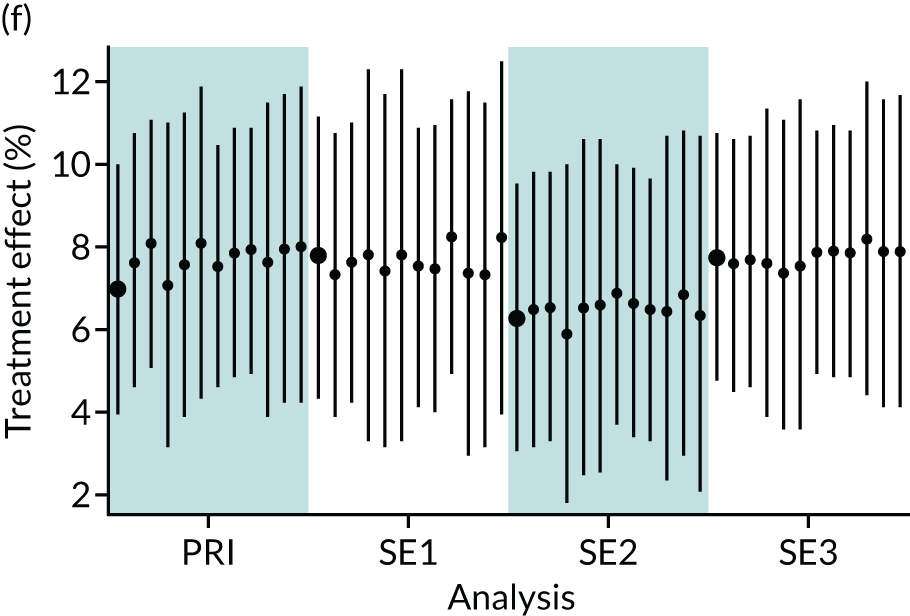
FIGURE 10.
Jail plots of continuous outcomes for enteral feeding analyses. (a) Length of stay; (b) first day of suckling at breast; (c) first day of maternal milk; (d) first day of PN; (e) duration of central venous line; and (f) z-score of weight at discharge. PRI, primary analyses; SE1, sensitivity analysis 1 (reduction to years 2012–17); SE2, sensitivity analysis 2 (redefining enteral feeding variable); and SE3, sensitivity analysis 3 (adding receipt of PN on first day of life to propensity model).
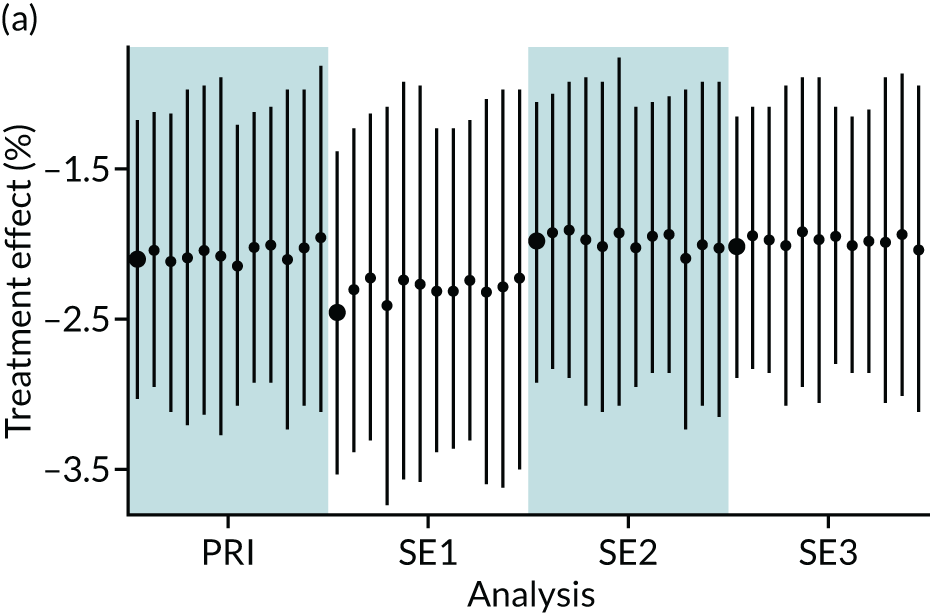
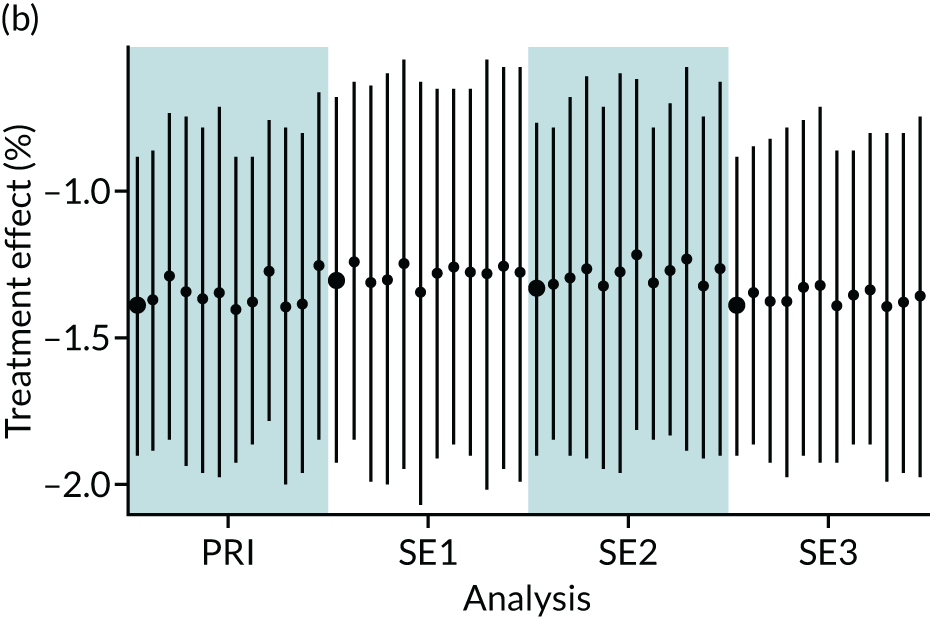
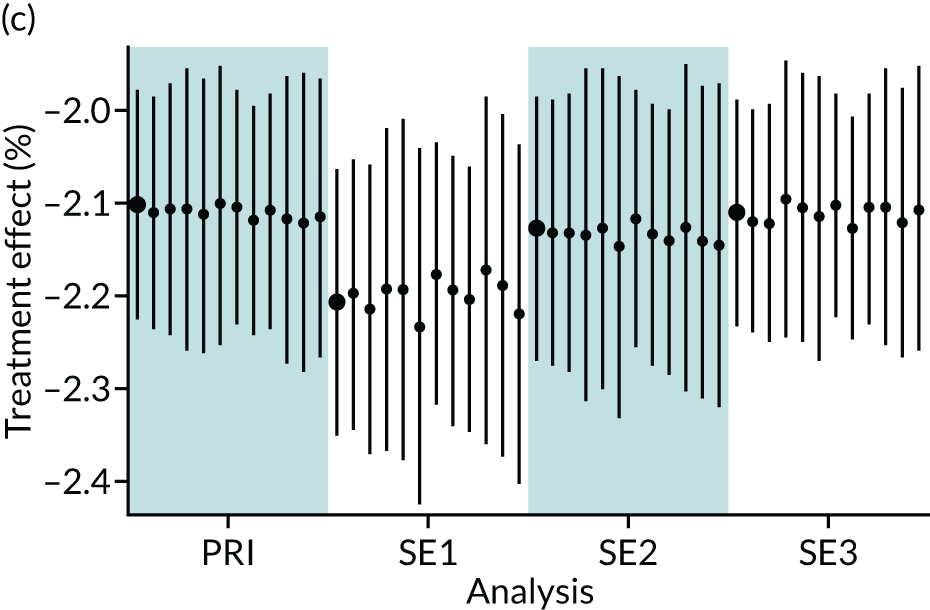
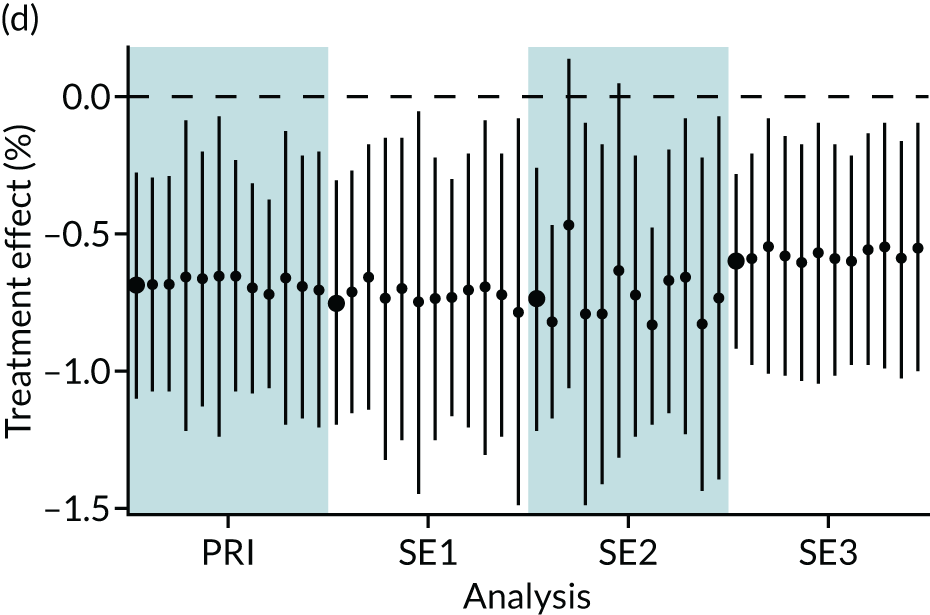
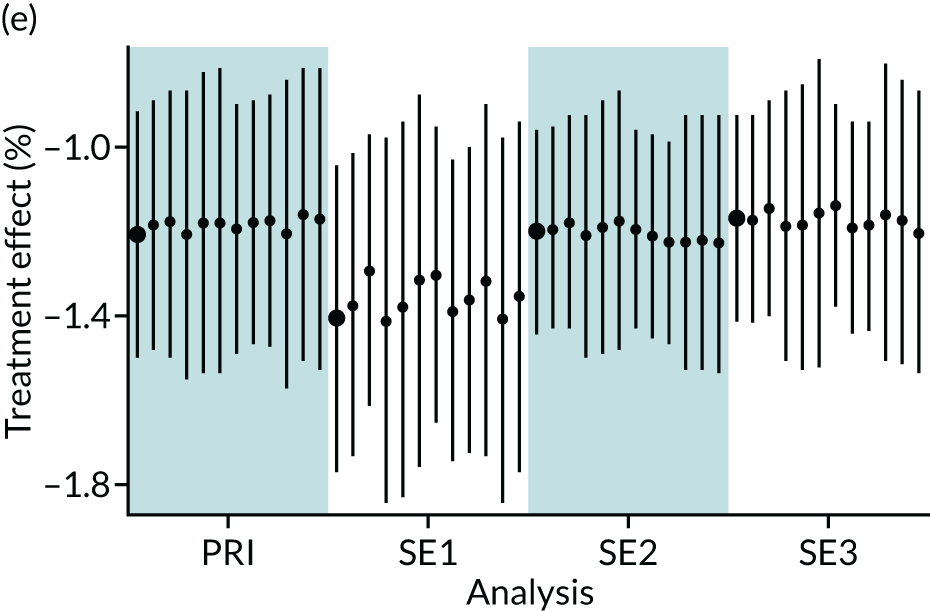
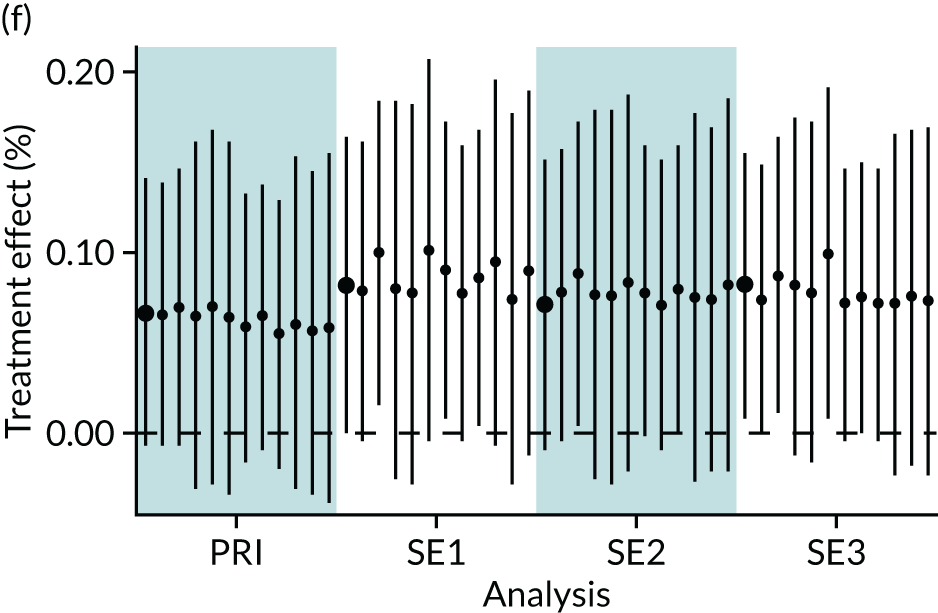
FIGURE 11.
Jail plots of dichotomous outcomes for enteral feeding analyses. (a) Length of stay > 14 days; (b) first time suckling at breast < 29 days; (c) first day of maternal milk < 29 days; (d) any parental nutrition; and (e) central venous line on at least 1 day. PRI, primary analyses; SE1, sensitivity analysis 1 (reduction to years 2012–17); SE2, sensitivity analysis 2 (redefining enteral feeding variable); SE3, sensitivity analysis 3 (adding receipt of PN on first day of life to propensity model).
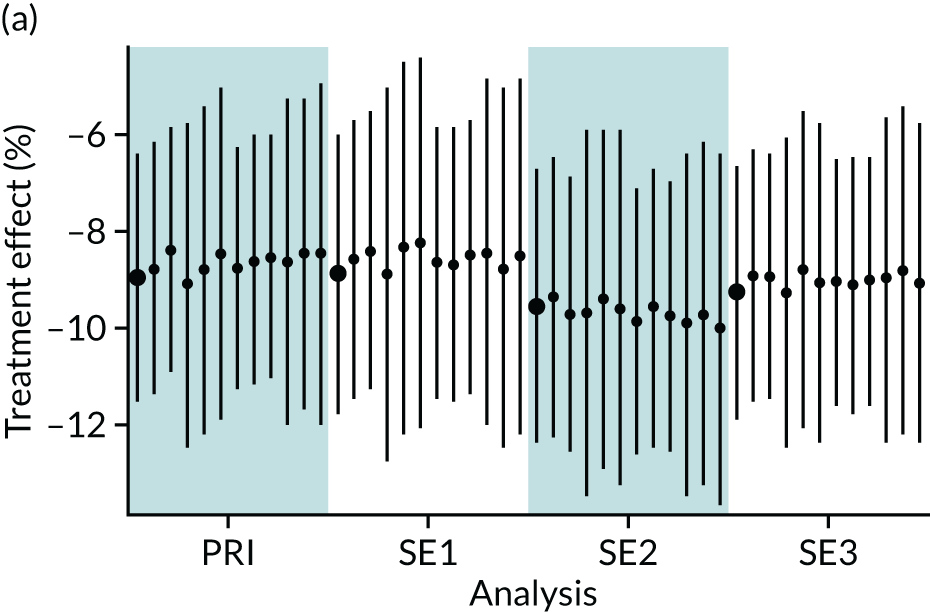
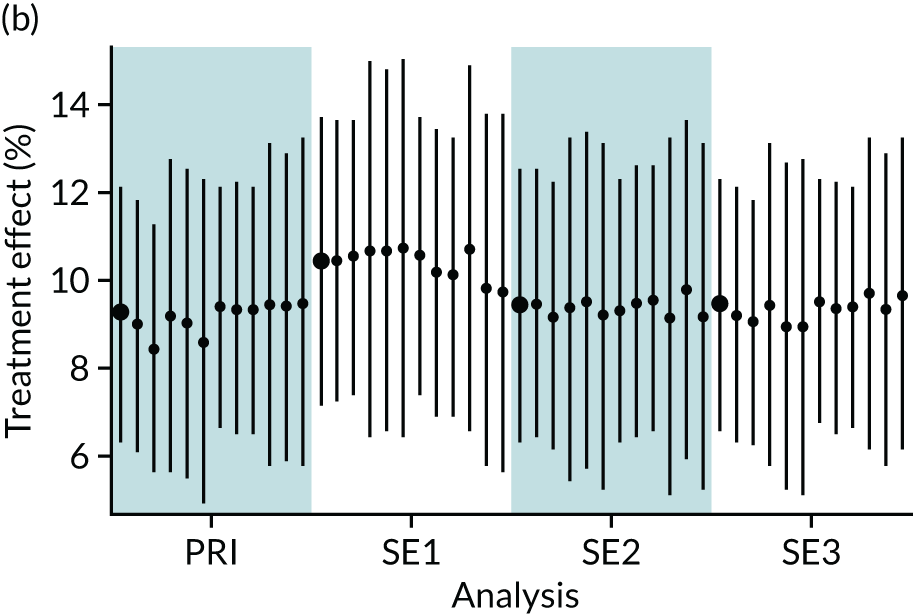
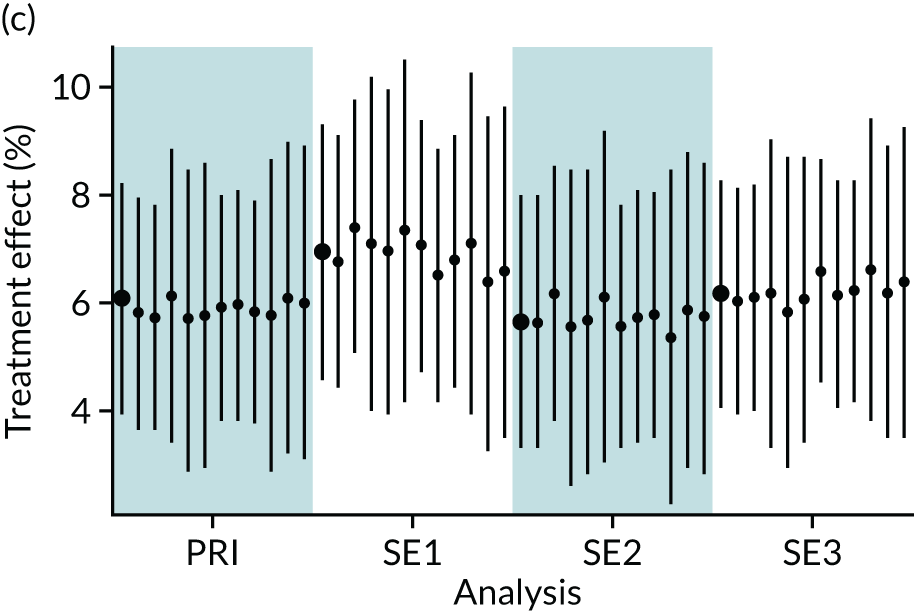
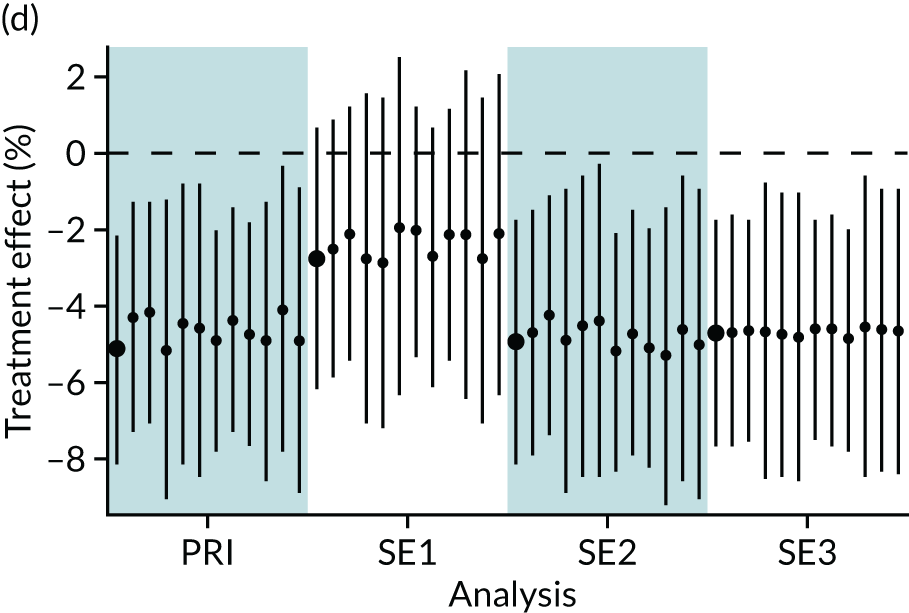
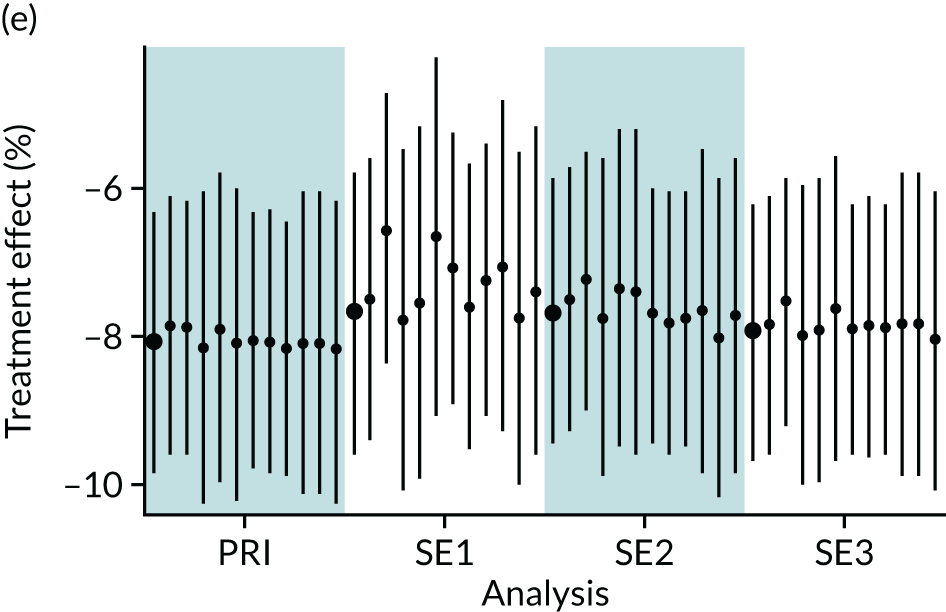
Appendix 8 Background variables by parenteral nutrition status in unmatched and matched cohorts
| Variable | Cohort | |||
|---|---|---|---|---|
| Unmatched | Matched | |||
| No PN | PN | No PN | PN | |
| Total number of babies | 4535 | 1475 | 1240 | 1240 |
| Male | ||||
| n | 2507 | 810 | 652 | 664 |
| % | 55.3 | 54.9 | 52.6 | 53.5 |
| Missing, n | 0 | 0 | 0 | 0 |
| Multiple birth | ||||
| n | 121 | 58 | 42 | 45 |
| % | 2.7 | 3.9 | 3.4 | 3.6 |
| Missing, n | 0 | 1 | 0 | 1 |
| % | 0 | 0.1 | 0 | 0.1 |
| Gestational age at birth (weeks) | ||||
| Median | 40 | 40 | 40 | 40 |
| Lower quartile | 38 | 38 | 38 | 38 |
| Upper quartile | 41 | 40 | 41 | 41 |
| Missing, n | 0 | 0 | 0 | 0 |
| Birthweight (g) | ||||
| Median | 3365 | 3300 | 3309 | 3319 |
| Lower quartile | 2971 | 2909 | 2906 | 2916 |
| Upper quartile | 3780 | 3716 | 3729 | 3719 |
| Missing, n | 0 | 0 | 0 | 0 |
| Birth length (cm) | ||||
| Median | 51.0 | 51.0 | 51.4 | 51.6 |
| Lower quartile | 48.0 | 49.0 | 48.3 | 49.1 |
| Upper quartile | 54.0 | 53.8 | 54.0 | 54.0 |
| Missing, n | 4317 | 1405 | 1182 | 1184 |
| % | 95.2 | 95.3 | 51.4 | 51.6 |
| Birth head circumference (cm) | ||||
| Median | 34.9 | 34.5 | 34.7 | 34.5 |
| Lower quartile | 33.5 | 33.5 | 33.5 | 33.5 |
| Upper quartile | 36.0 | 35.8 | 35.9 | 35.7 |
| Missing, n | 2526 | 826 | 686 | 704 |
| % | 55.7 | 56.0 | 55.3 | 56.8 |
| Caesarean delivery | ||||
| n | 2066 | 667 | 545 | 549 |
| % | 47.7 | 47.1 | 45.9 | 46.1 |
| Missing, n | 208 | 58 | 51 | 49 |
| % | 4.8 | 4.1 | 4.3 | 4.1 |
| Cord blood gas: arterial pH | ||||
| > 7.0, n | 1439 | 451 | 396 | 396 |
| % | 44.4 | 44.0 | 45.3 | 45.3 |
| 6.9–7.0, n | 756 | 248 | 198 | 198 |
| % | 23.3 | 24.2 | 22.7 | 22.7 |
| < 6.9, n | 1049 | 326 | 280 | 280 |
| % | 32.3 | 31.8 | 32.0 | 32.0 |
| Missing, n | 1291 | 450 | 366 | 366 |
| % | 28.5 | 30.5 | 29.5 | 29.5 |
| Variable | Cohort | |||
|---|---|---|---|---|
| Unmatched | Matched | |||
| No PN | PN | No PN | PN | |
| Total number of babies | 4535 | 1475 | 1240 | 1240 |
| Maternal age (years) | ||||
| Median | 30 | 31 | 30 | 31 |
| Lower quartile | 26 | 26 | 26 | 26 |
| Upper quartile | 35 | 34 | 34 | 34 |
| Missing, n | 39 | 27 | 19 | 21 |
| % | 0.9 | 1.8 | 1.5 | 1.7 |
| Maternal pyrexia | ||||
| n | 228 | 80 | 61 | 69 |
| % | 6.1 | 6.5 | 5.9 | 6.5 |
| Missing, n | 767 | 240 | 204 | 190 |
| % | 20.4 | 19.4 | 19.7 | 18.1 |
| Maternal suspected chorioamnionitis | ||||
| n | 479 | 175 | 147 | 150 |
| % | 12.8 | 14.5 | 14.5 | 14.6 |
| Missing, n | 804 | 269 | 224 | 212 |
| % | 21.5 | 22.3 | 22.1 | 20.7 |
| Smoking in pregnancy | ||||
| n | 520 | 211 | 175 | 176 |
| % | 13.3 | 16.9 | 16.6 | 16.8 |
| Missing, n | 620 | 227 | 187 | 189 |
| % | 15.8 | 18.2 | 17.8 | 18.0 |
| Deprivation score (LSOA) | ||||
| Median | 4 | 5 | 4 | 4.5 |
| Lower quartile | 2 | 3 | 2 | 2 |
| Upper quartile | 7 | 8 | 7 | 7 |
| Missing, n | 364 | 385 | 425 | 328 |
| % | 8 | 26.1 | 12 | 13.2 |
| Maternal hypothyroidisma,b | ||||
| n | 50 | 15 | 14.3 | 12.8 |
| % | 1.1 | 1.0 | 1.2 | 1.0 |
| Maternal diabetesa | ||||
| n | 191 | 65 | 49 | 53 |
| % | 4.2 | 4.4 | 4.0 | 4.3 |
| Maternal obstetric diagnosisa | ||||
| n | 2196 | 720 | 585 | 623 |
| % | 48.4 | 48.8 | 47.2 | 50.2 |
| Maternal medical diagnosisa | ||||
| n | 1456 | 544 | 429 | 449 |
| % | 32.1 | 36.9 | 34.6 | 36.2 |
| Primiparousa | ||||
| n | 2425 | 778 | 669 | 671 |
| % | 53.5 | 52.7 | 54.0 | 54.1 |
| Variable | Cohort | |||
|---|---|---|---|---|
| Unmatched | Matched | |||
| No PN | PN | No PN | PN | |
| Total number of babies | 4535 | 1475 | 1240 | 1240 |
| Apgar score at 1 minute | ||||
| Median | 2 | 1 | 2 | 2 |
| Lower quartile | 1 | 1 | 1 | 1 |
| Upper quartile | 3 | 3 | 3 | 3 |
| Missing, n | 360 | 133 | 113 | 115 |
| % | 7.9 | 9.0 | 9.1 | 9.3 |
| Apgar score at 5 minutes | ||||
| Median | 4 | 4 | 4 | 4 |
| Lower quartile | 2 | 3 | 3 | 3 |
| Upper quartile | 6 | 6 | 6 | 6 |
| Missing, n | 355 | 131 | 107 | 109 |
| % | 7.8 | 8.9 | 8.6 | 8.8 |
| Received chest compressionsa | ||||
| n | 1705 | 523 | 431 | 427 |
| % | 37.6 | 35.5 | 34.8 | 34.4 |
| Received emergency resuscitation drugsa | ||||
| n | 719 | 206 | 176 | 172 |
| % | 15.9 | 14.0 | 14.2 | 13.9 |
| Intubated at resuscitationa | ||||
| n | 2925 | 935 | 784 | 783 |
| % | 64.5 | 63.4 | 63.2 | 63.1 |
| Umbilical cord base excess (mmol/l) | ||||
| Median | –13 | –12.7 | –12.9 | –12.5 |
| Lower quartile | –17.4 | –17.4 | –17.4 | –17.3 |
| Upper quartile | –8.2 | –8.3 | –8.2 | –8.2 |
| Missing, n | 1562 | 576 | 463 | 468 |
| % | 34.4 | 39.1 | 37.3 | 37.7 |
| Time to first spontaneous breath | ||||
| 0–5 minutes, n | 674 | 235 | 200 | 198 |
| % | 14.9 | 15.9 | 16.1 | 16.0 |
| > 5 minutes, n | 2701 | 896 | 757 | 758 |
| % | 59.6 | 60.7 | 61.0 | 61.1 |
| Missing, n | 1160 | 344 | 283 | 284 |
| % | 25.6 | 23.3 | 22.8 | 22.9 |
| Variable | Cohort | |||
|---|---|---|---|---|
| Unmatched | Matched | |||
| No PN | PN | No PN | PN | |
| Total number of babies | 4535 | 1475 | 1240 | 1240 |
| Time to admission (minutes) | ||||
| Median | 30 | 30 | 30 | 29 |
| Lower quartile | 20 | 20 | 21 | 20 |
| Upper quartile | 44 | 45 | 45 | 44 |
| Missing, n | 0 | 0 | 0 | 0 |
| Blood glucose concentration at admission (mmol/l) | ||||
| Median | 5.6 | 5.6 | 5.8 | 5.6 |
| Lower quartile | 3.6 | 3.8 | 3.8 | 3.9 |
| Upper quartile | 7.7 | 8.0 | 7.7 | 8.0 |
| Missing, n | 836 | 297 | 241 | 242 |
| % | 18.4 | 20.1 | 19.4 | 19.5 |
| Heart rate (b.p.m.) | ||||
| Median | 145 | 143 | 144 | 144 |
| Lower quartile | 130 | 128 | 129 | 130 |
| Upper quartile | 160 | 157 | 158 | 157 |
| Missing, n | 354 | 125 | 99 | 101 |
| % | 7.8 | 8.5 | 7.9 | 8.1 |
| Oxygen saturation (mmHg) | ||||
| Median | 97 | 97 | 97 | 97 |
| Lower quartile | 92 | 93 | 93 | 92 |
| Upper quartile | 100 | 100 | 100 | 100 |
| Missing, n | 416 | 151 | 117 | 118 |
| % | 9.2 | 10.2 | 9.4 | 9.5 |
| Temperature (°C) | ||||
| Median | 36.2 | 36.2 | 36.2 | 36.2 |
| Lower quartile | 35.4 | 35.5 | 35.5 | 35.4 |
| Upper quartile | 36.7 | 36.6 | 36.7 | 36.6 |
| Missing, n | 159 | 82 | 146 | 95 |
| % | 3.5 | 5.6 | 4.1 | 3.8 |
| Mechanical ventilation | ||||
| n | 3508 | 1122 | 951 | 956 |
| % | 80.2 | 79.5 | 79.6 | 80.2 |
| Missing, n | 161 | 63 | 46 | 49 |
| % | 3.7 | 4.5 | 3.9 | 4.1 |
| Inhaled nitric oxide | ||||
| n | 197 | 70 | 50 | 58 |
| % | 4.5 | 5 | 4.2 | 4.9 |
| Missing, n | 204 | 71 | 59 | 56 |
| % | 4.7 | 5.1 | 5.0 | 4.7 |
| Treatment for low blood pressure | ||||
| n | 1126 | 335 | 295 | 287 |
| % | 26 | 23.9 | 25 | 24.2 |
| Missing, n | 198 | 71 | 57 | 56 |
| % | 4.6 | 5.1 | 4.8 | 4.7 |
| Infection in the first 3 days (NNAP)a | ||||
| n | 37 | 18 | 9 | 14 |
| % | 0.8 | 1.2 | 0.7 | 1.1 |
| Postnatal transfer (acute) | ||||
| n | 2219 | 640 | 546 | 549 |
| % | 48.9 | 43.4 | 44 | 44.2 |
| Missing, n | 0 | 0 | 0 | 0 |
Appendix 9 Primary analysis of dichotomous outcome variables in parenteral nutrition comparison
| Variable | Intervention | Rate difference, % (95% CI) | OR (95% CI) | p-value | |
|---|---|---|---|---|---|
| No PN rate | PN rate | ||||
| Total number of babies | 1240 | 1240 | |||
| Length of stay (> 14 days), % (95% CI) | 29.2 (27.4 to 31.0) | 30.9 (28.5 to 33.2) | 1.7 (–1.3 to 4.6) | 1.08 (0.91 to 1.28) | 0.27 |
| First day suckling at breast (≤ 28 days), % (95% CI) | 59.8 (57.9 to 61.8) | 61.1 (58.6 to 63.5) | 1.2 (–1.9 to 4.4) | 1.05 (0.90 to 1.24) | 0.44 |
| First day of maternal milk (≤ 28 days), % (95% CI) | 80.8 (79.3 to 82.4) | 85.3 (83.5 to 87.0) | 4.4 (2.1 to 6.8) | 137 (1.11 to 1.69) | < 0.001 |
| Days of central venous line in situ (> 0 days), % (95% CI) | 92.4 (91.4 to 93.4) | 97.9 (97.2 to 98.6) | 5.5 (4.3 to 6.8) | 3.85 (2.48 to 5.97) | < 0.001 |
Appendix 10 Sensitivity analyses of dichotomous outcome variables in parenteral nutrition comparison
| Outcome | Sensitivity analysis, estimate of rate difference (95% CI) [p-value] | ||
|---|---|---|---|
| Years 2012–17 | Intervention redefined | Inclusion of enteral feeds on day 1 in PSM | |
| Length of stay (> 14 days) | 2.5 (–0.7 to 5.7) [0.13] | 1.9 (–1.0 to 4.9) [0.20] | 2.5 (–0.4 to 5.5) [0.09] |
| First day suckling at breast (≤ 28 days) | 0.8 (–2.7 to 4.2) [0.66] | 1.3 (–1.8 to 4.4) [0.40] | 2.2 (–0.9 to 5.4) [0.16] |
| First day of maternal milk (≤ 28 days) | 3.3 (0.6 to 5.9) [0.02] | 4.4 (2.0 to 6.8) [< 0.001] | 4.9 (2.5 to 7.3) [< 0.001] |
| Days of central venous line in situ (> 0 days) | 4.8 (3.5 to 6.2) [< 0.001] | 5.7 (4.5 to 7.0) [< 0.001] | 5.6 (4.3 to 6.8) [< 0.001] |
Appendix 11 Results for alternative methods for matching on the propensity score and background variables in the parenteral nutrition comparison
The consistency of the results using alternative methods of matching on the propensity groups and principal background variables was explored and is presented using jail plots for each outcome of interest (Figures 12–14). Each of the six plots presents the results for a single outcome of interest [i.e. plot (a) presents the results for the outcome of pragmatically defined NEC]. Each plot contains 48 vertical segments that connects the lower and upper 95% CIs for the estimate of the treatment effect (i.e. rate difference for binary variables and mean difference for continuous variables). The estimate of the treatment effect is represented by the black disc. The 48 estimates and CIs are grouped into four groups of 12. Each of the four groups represents a set of analyses: (1) the primary analysis, (2) restricting to years 2012–17, (3) implementing a more restrictive definition of the PN intervention groups, and (4) including receipt of enteral feeds on the first day in the propensity model. Within each group, the preliminary method of analysis is presented in bold and is followed by the 11 alternative methods of analysis that are ordered as in Figure 1. For all outcomes, there was a high level of consistency between treatment effect estimates across all methods of analysis.
FIGURE 12.
Jail plots of binary outcomes for parenteral nutrition analyses. (a) NEC (pragmatic definition); (b) late infection (NNAP); (c) late infection (pragmatic definition); (d) survival till discharge; (e) hypoglycaemia; and (f) breastfeeding at discharge. PRI, primary analyses; SE1, sensitivity analysis 1 (reduction to years 2012–17); SE2, sensitivity analysis 2 (redefining PN variable); SE3, sensitivity analysis 3 (adding receipt of enteral feeds on first day of life to propensity model).
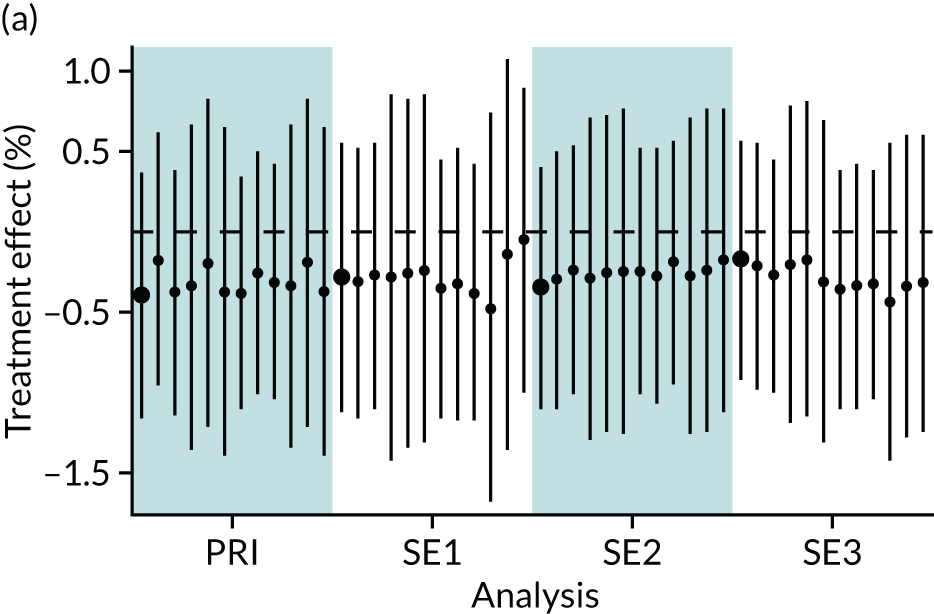
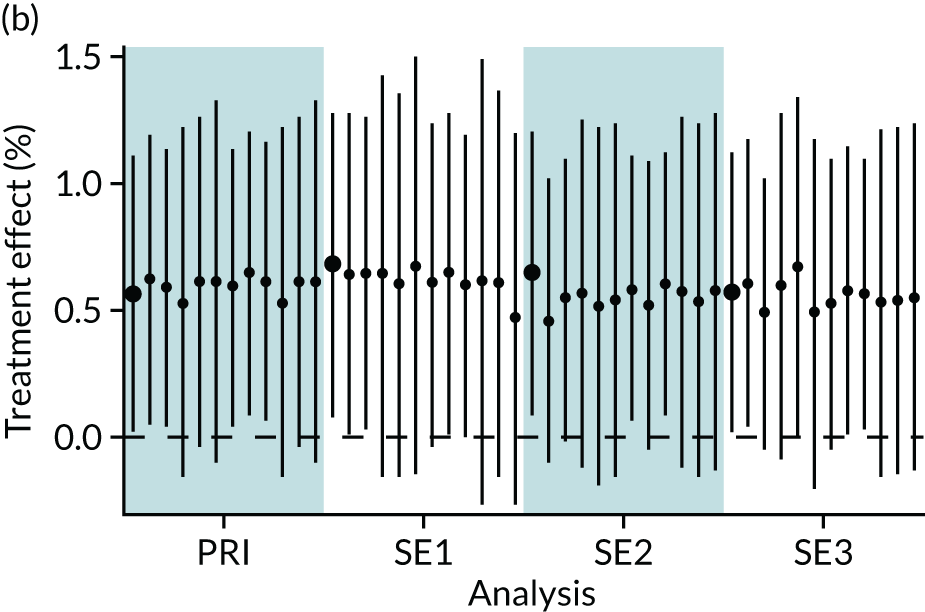
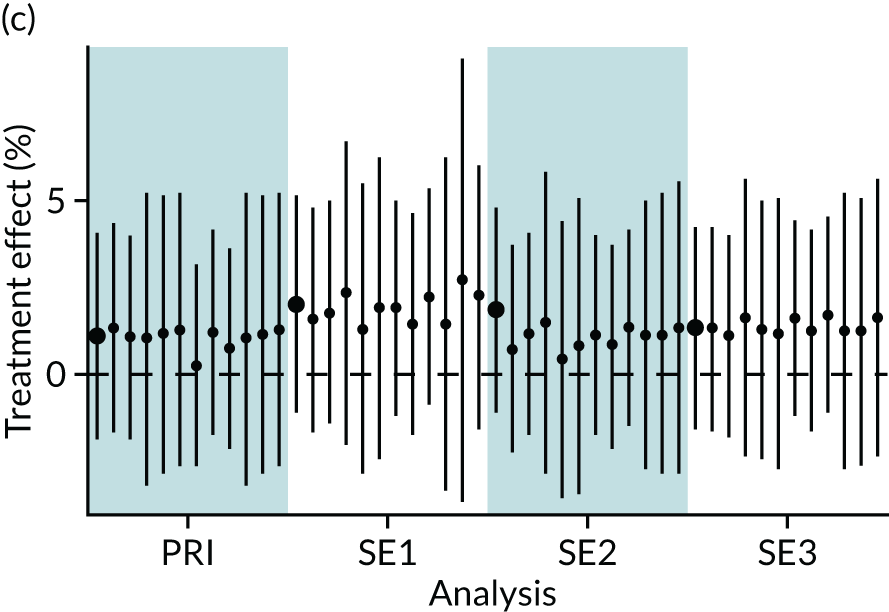
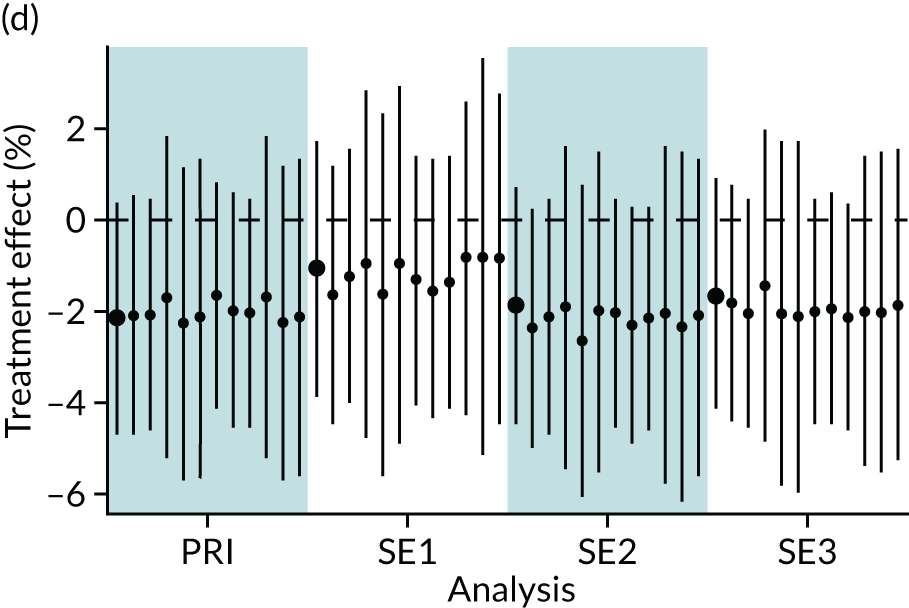
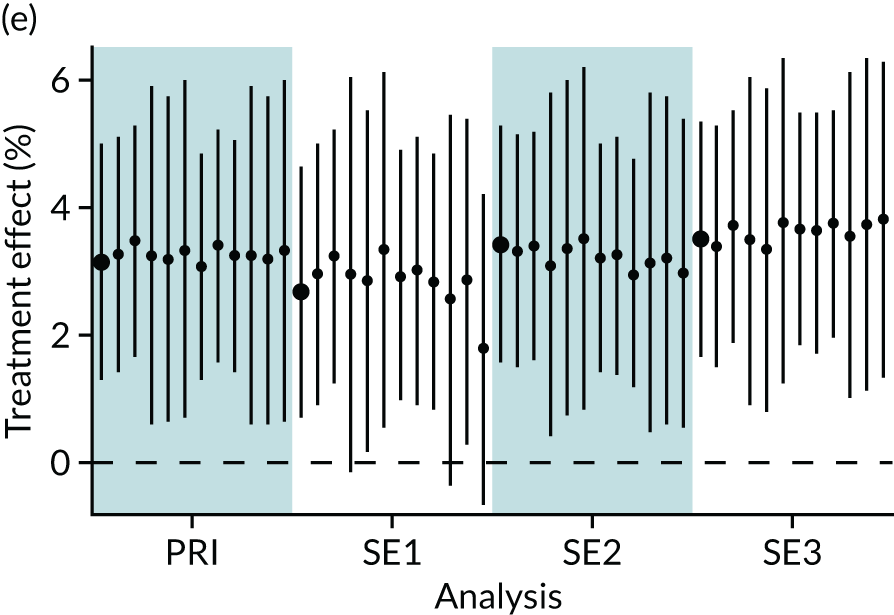
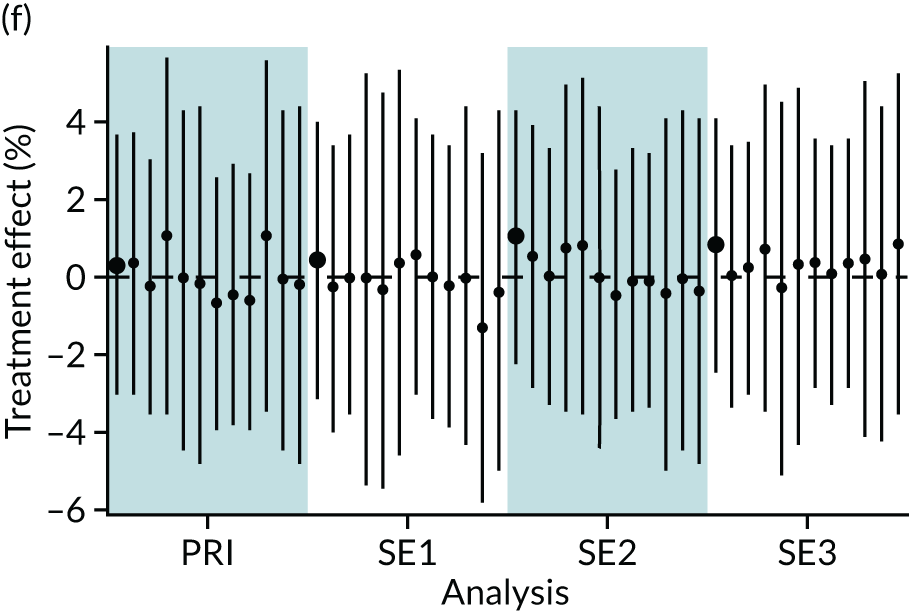
FIGURE 13.
Jail plots of continuous outcomes for parenteral nutrition analyses. (a) Length of stay; (b) first day of suckling at breast; (c) first day of maternal milk; (d) duration of central venous line in situ; and (e) z-score of weight at discharge. PRI, primary analyses; SE1, sensitivity analysis 1 (reduction to years 2012–17); SE2, sensitivity analysis 2 (redefining PN variable); SE3, sensitivity analysis 3 (adding receipt of enteral feeds on first day of life to propensity model).
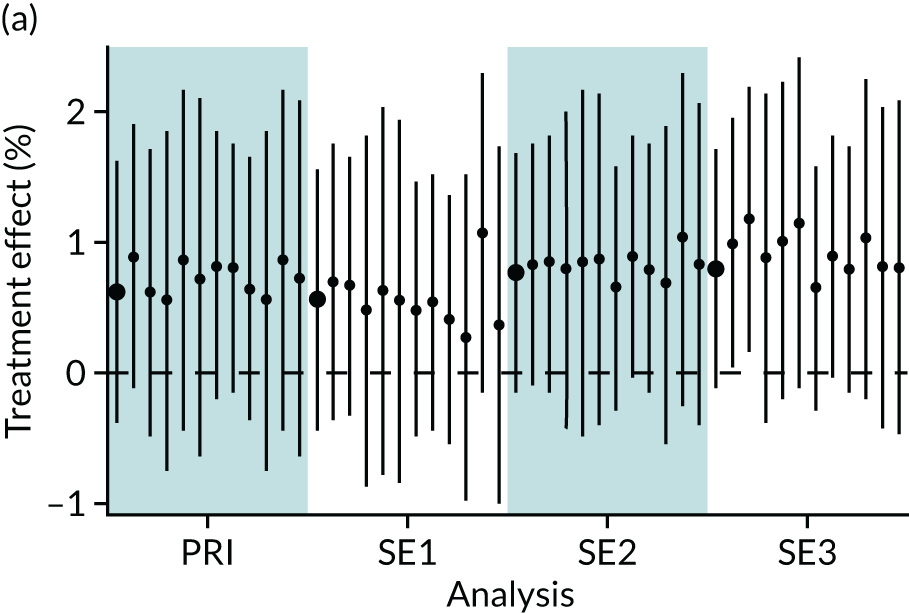
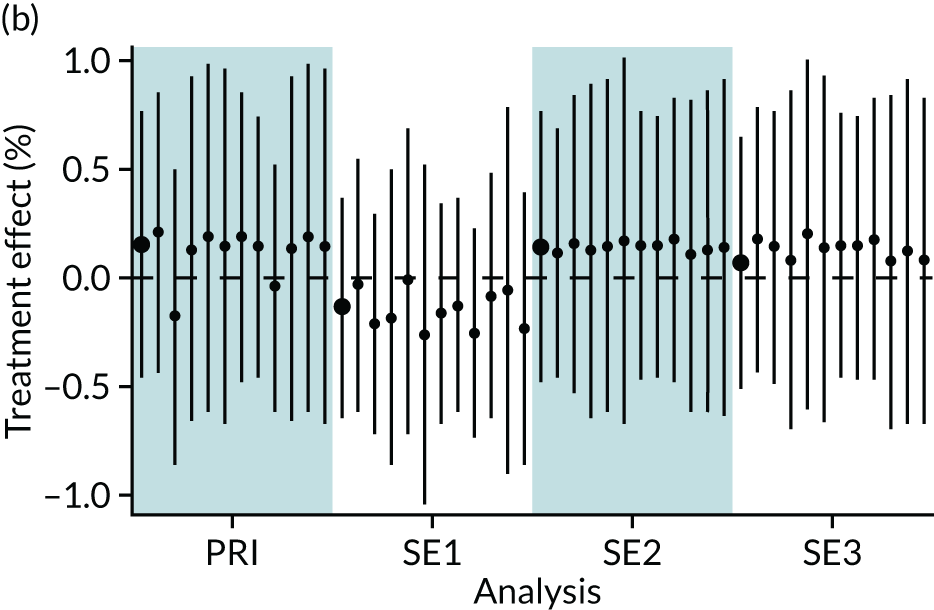
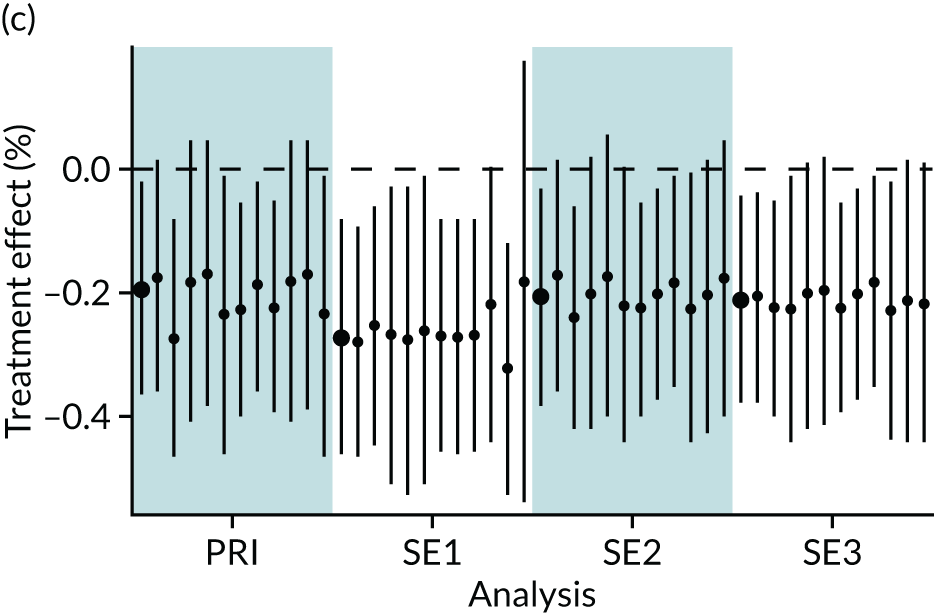
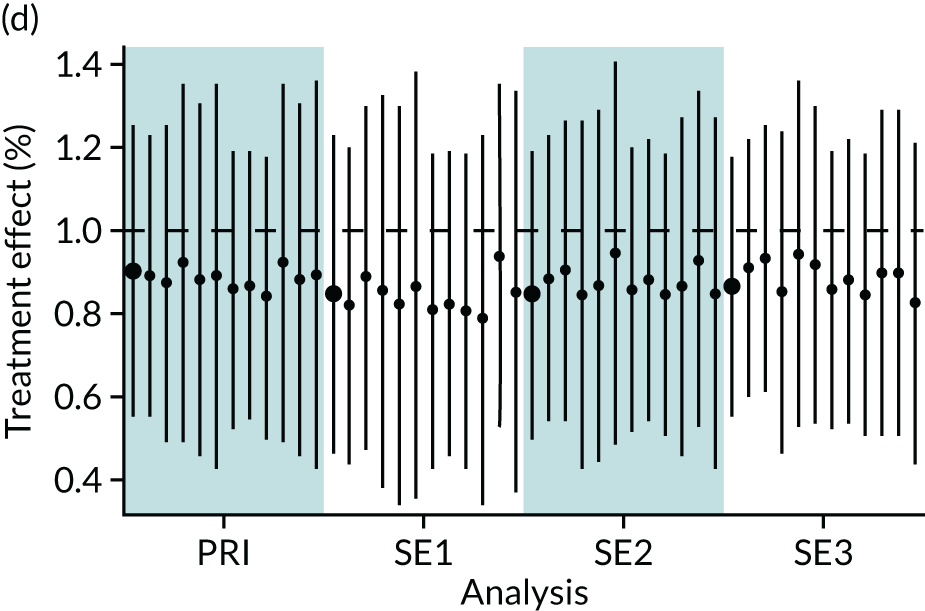
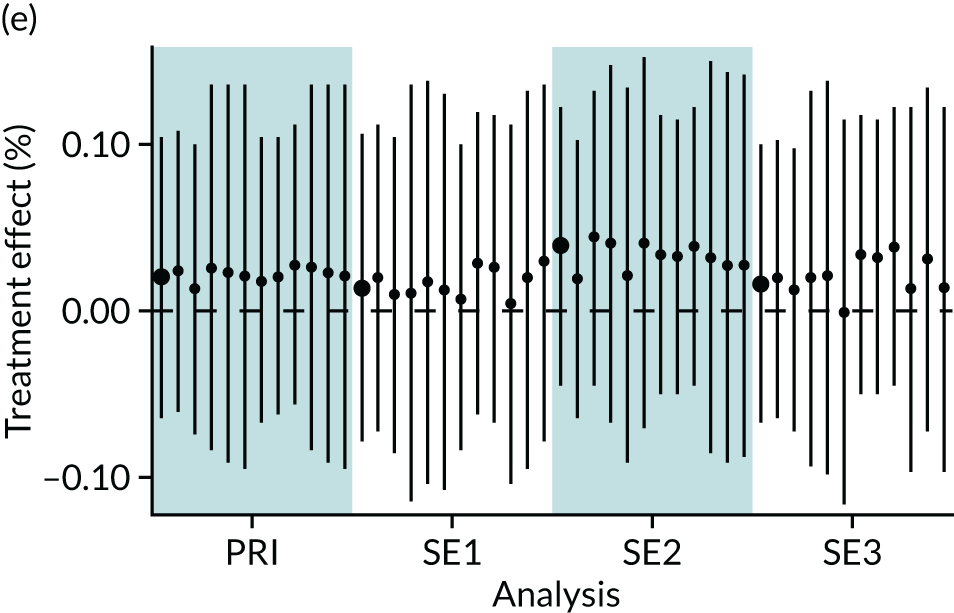
FIGURE 14.
Jail plots of dichotomous outcomes for parenteral nutrition analyses. (a) Length of stay > 14 days; (b) first time suckling at breast < 29 days; (c) first day of maternal milk < 29 days; and (d) central venous line in situ on at least 1 day. PRI, primary analyses; SE1, sensitivity analysis 1 (reduction to years 2012–17); SE2, sensitivity analysis 2 (redefining PN variable); SE3, sensitivity analysis 3 (adding receipt of enteral feeds on first day of life to propensity model).
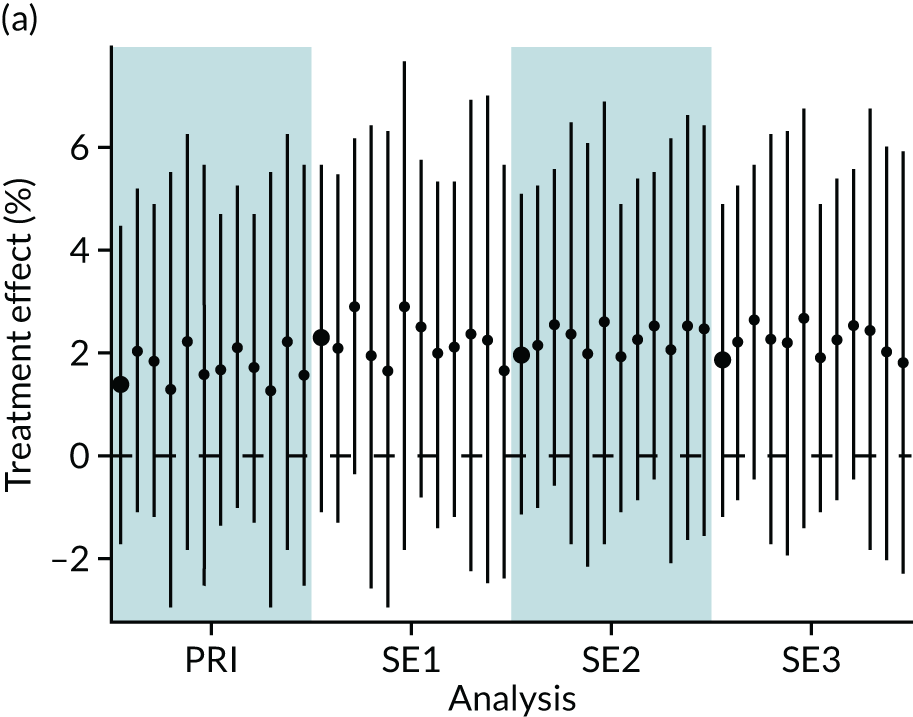
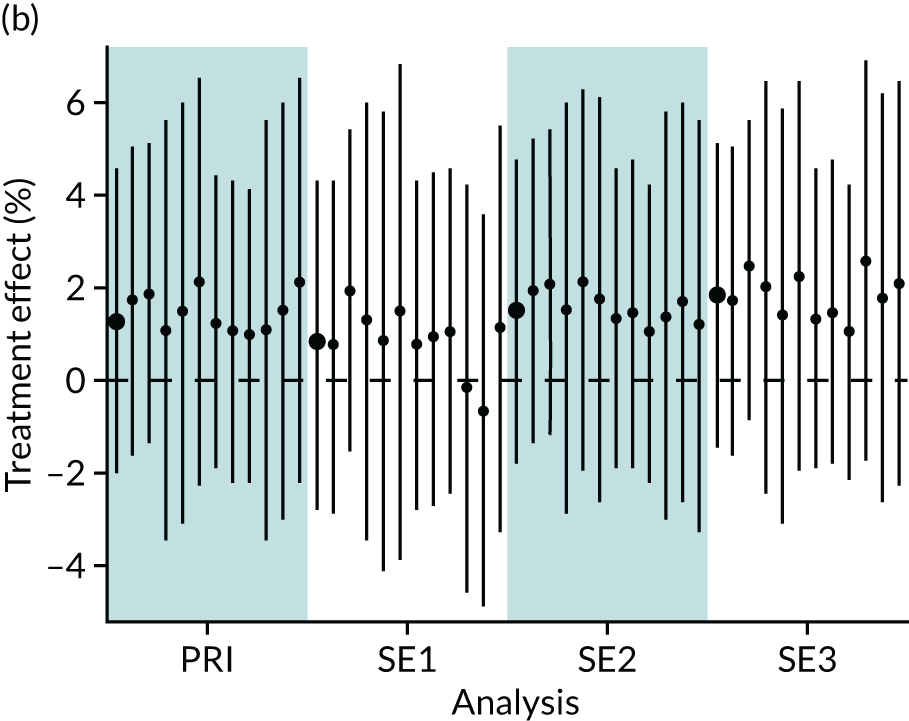
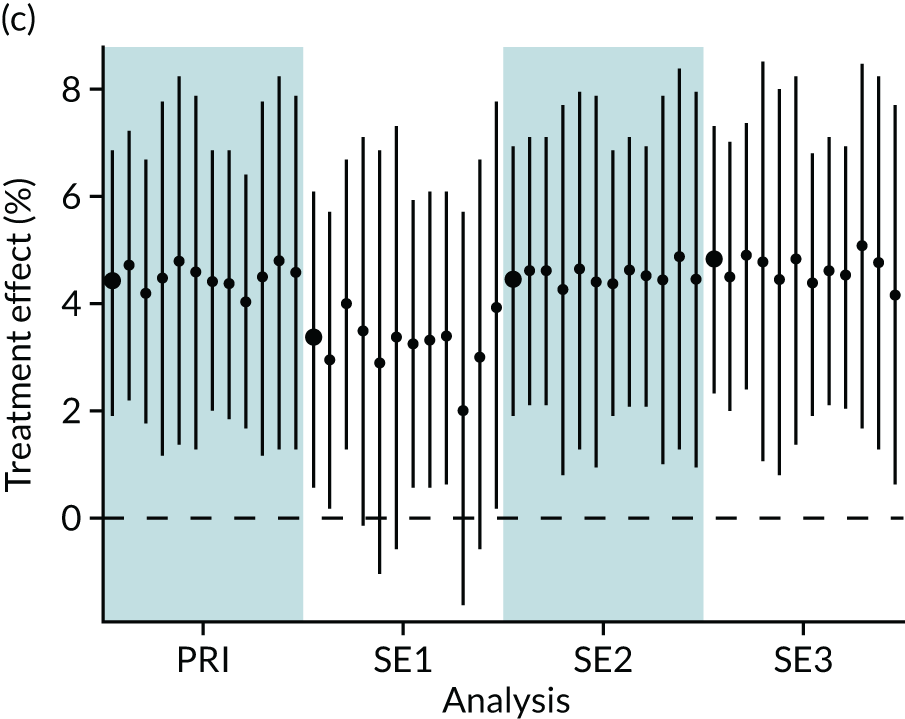
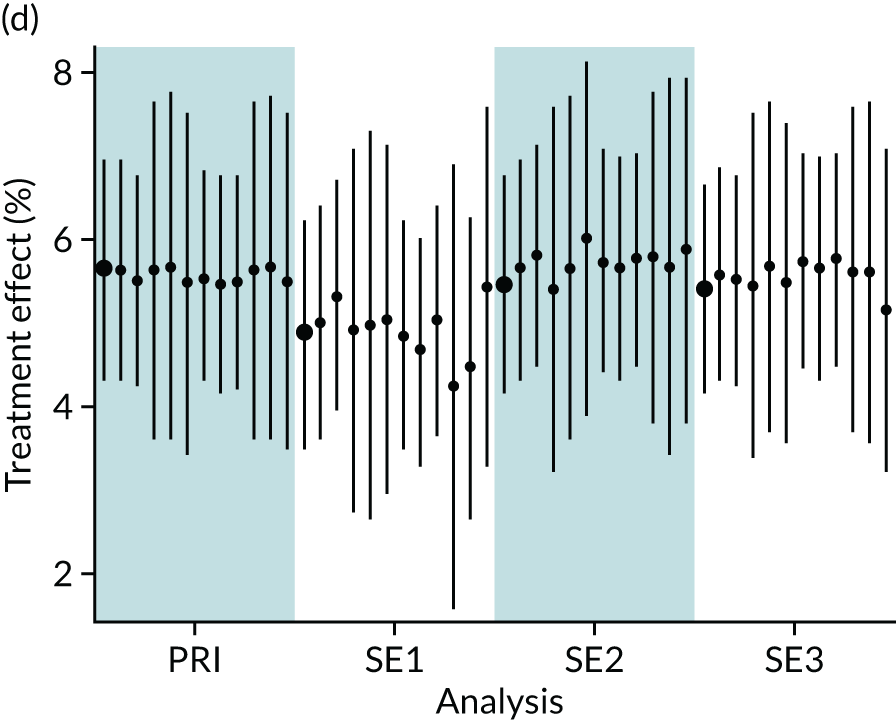
List of abbreviations
- BSI
- bloodstream infection
- CI
- confidence interval
- HIE
- hypoxic–ischaemic encephalopathy
- IPW
- inverse probability weighting
- LSOA
- lower-layer super output area
- NEC
- necrotising enterocolitis
- NNAP
- National Neonatal Audit Programme
- NNRD
- National Neonatal Research Database
- ODN
- operational delivery network
- OR
- odds ratio
- PEPaNIC
- Early versus Late Parenteral Nutrition in the Pediatric Intensive Care Unit
- PN
- parenteral nutrition
- RCT
- randomised controlled trial
- SD
- standard deviation
- UKNC
- UK Neonatal Collaborative
