Notes
Article history
The research reported in this issue of the journal was commissioned and funded by the Evidence Synthesis Programme on behalf of NICE as project number NIHR132154. The protocol was agreed in August 2020. The assessment report began editorial review in January 2021 and was accepted for publication in April 2021. The authors have been wholly responsible for all data collection, analysis and interpretation, and for writing up their work. This report has been published following a shortened production process and, therefore, did not undergo the usual number of proof stages and opportunities for correction. The HTA editors and publisher have tried to ensure the accuracy of the authors’ report and would like to thank the reviewers for their constructive comments on the draft document. However, they do not accept liability for damages or losses arising from material published in this report.
Permissions
Copyright statement
Copyright © 2021 Stevenson et al. This work was produced by Stevenson et al. under the terms of a commissioning contract issued by the Secretary of State for Health and Social Care. This is an Open Access publication distributed under the terms of the Creative Commons Attribution CC BY 4.0 licence, which permits unrestricted use, distribution, reproduction and adaption in any medium and for any purpose provided that it is properly attributed. See: https://creativecommons.org/licenses/by/4.0/. For attribution the title, original author(s), the publication source – NIHR Journals Library, and the DOI of the publication must be cited.
2021 Stevenson et al.
Chapter 1 Introduction
Severe acute respiratory syndrome coronavirus 2 (SARS-CoV-2) is the virus that causes coronavirus disease 2019 (COVID-19), which was identified in China in 2019. In January 2021, there had been over 100 million cases of COVID-19 and more than 2.25 million deaths had been attributed to it worldwide. 1 Based on the reported number of cases, SARS-CoV-2 appears to be highly transmissible and is spread primarily through secretions from the nose or mouth, which can occur when coughing, sneezing or talking. Diagnosis of COVID-19 may not be straightforward. British Geriatrics Society (BGS) guidance suggests traits that would make a COVID-19 diagnosis likely and those that would be associated with possible COVID-19. The characteristics associated with a likely diagnosis are a new continuous cough, a temperature of ≥ 37.8 °C, and loss of or change in normal sense of smell or taste. The symptoms associated with possible COVID-19 are fairly generic and include new onset of confusion and/or drowsiness, decreased mobility, diarrhoea or abdominal pain, and loss of appetite and/or reduced oral intake.
The National Institute for Health and Care Excellence (NICE) scope2 details the exploratory economic modelling of SARS-CoV-2 viral detection point-of-care tests (POCTs) and serology tests that is to be undertaken. The scope covers a number of use cases, including hospitals, care homes, prisons and general practice, and includes the use of both viral detection POCTs and serology tests. With the agreement of NICE, this report covers a small portion of the scope, namely the clinical effectiveness and cost-effectiveness of the use of viral detection POCTs in relation to use within residential care facilities, with a focus on a care home for elderly residents. Previous work by the External Assessment Group (EAG) has explored the use of SARS-CoV-2 testing when used at admission to hospital through accident and emergency departments. Potential future work will focus on some of the remaining areas in the scope.
The potential benefits of SARS-CoV-2 POCTs for those in residential care facilities will be, primarily, the speed of obtaining the test result. A quicker test result may allow a decision to be made on whether or not a resident can be released from isolation, or whether or not to isolate all residents if a positive SARS-CoV-2 test result is received. The perspective taken was that of the NHS and Personal Social Services, with prices in Great British pounds at 2020 values. The results presented provide an exploratory evaluation of the clinical effectiveness and cost-effectiveness of hypothetical SARS-CoV-2 POCTs compared with current laboratory-based SARS-CoV-2 tests.
This work is atypical of a standard diagnostic assessment report (DAR) for NICE for the following reasons. First, the SARS-CoV-2 POCTs being evaluated are hypothetical and, therefore, there may be no results relevant to marketed tests. Second, as discussed, there is the fragmentation of the scope, which will result in multiple reports. Third, and linked to the second point, the time allocated for this DAR has been reduced markedly because of the importance of the topic and has been completed within 7 weeks. Fourth, the software package used within this DAR, Simul8 (Simul8 Corporation, Glasgow, UK), is not one of NICE’s standard packages, but NICE consented to its use, given the complexity of the decision problem and the reduced timelines. Fifth, owing to the reduced timelines, it was agreed with NICE in the protocol2 that there would be no systematic review related to the diagnostic accuracy of the performance of the tests. It was further anticipated that the EAG would not ‘undertake systematic literature reviews for model parameters but will instead use publicly available data from bodies such as Public Health England (PHE), request confidential data from bodies such as PHE or rely on expert advice to populate the model’. 2 The protocol also states that the EAG:
. . . will try to keep abreast of newly published evidence relating to SARS-CoV-2/COVID-19 and anticipates that where NICE or the specialist committee members recruited to the Diagnostic Advisory Committee become aware of potentially relevant research that this would be signalled to the EAG.
NICE. 2
Finally, given the complexity of the model, and the uncertainty around key variables within the model the results produced should be taken as indicative rather than definitive to a greater extent than results from other DARs.
The work covered in this report relates to residential care facilities. The majority of the modelling relates to residential care facilities where the residents are elderly, although sensitivity analyses have been undertaken to explore the impact if residents were younger.
The focus of the work is on comparing the clinical effectiveness and cost-effectiveness of SARS-CoV-2 POCTs with laboratory-based SARS-CoV-2 tests. The diagnostic accuracy for the SARS-CoV-2 tests are taken from the target product profiles (TPPs) issued by the Medicines and Healthcare products Regulatory Agency (MHRA),3 although data estimated from real-world use are also considered. The SARS-CoV-2 tests are evaluated assuming that the current guidance is followed. However, in calibrating the model, the circumstances prevalent at the start of the pandemic were modelled, which did not include routine testing of residents or staff, unless they were symptomatic. The type of viral-detection POCT was flexible, with the key characteristics being the time to produce a test result, diagnostic accuracy and failure rate.
The outcomes in the model are the number of SARS-CoV-2 infections, the number of days spent in isolation, the quality-adjusted life-years (QALYs) lost (both from contracting COVID-19 and from isolation) and the costs associated with testing. There is an inevitable trade-off between the complexity of the model, construction time and running time. Simplifications have been made so that results can be generated faster.
The EAG stresses that the work undertaken is largely based on hypothetical tests meeting the TPPs. There is no certainty that SARS-CoV-2 POCTs can meet the criteria for turnaround times within residential care facilities. If the TPPs for SARS-CoV-2 POCTs are not met, then the results within this report relating to SARS-CoV-2 POCTs may be redundant. This point is made in guidance produced by the BGS,4 which notes that many available POCTs for SARS-CoV-2 have not been validated for use in care homes. The recent BGS guidance (updated on 18 November 2020) notes that:
Point-of-care tests should not be used in place of formal laboratory tests unless this approach is specifically recommended either through government guidance or local Directors of Public Health and Health Protection Teams. At the time of publication, this was not the case.
Research is under way that assesses diagnostic accuracy through organisations such as the COVID-19 National Diagnostic Research and Evaluation Platform (Oxford, UK). 5
This work was discussed at a NICE Diagnostic Advisory Committee meeting. The process for such appraisals includes patient and public involvement (PPI) representatives, who are involved in the making of recommendations and present slides to comment on issues related to PPI. Therefore, no PPI was sought by the EAG, which was to respond to any issue raised during the committee’s deliberations. No such issues were explicitly raised to the EAG.
Chapter 2 The conceptual mathematical model
The conceptual model: residents and staff
The EAG spoke with topic experts to validate the proposed conceptual model and to highlight potential sources of data that could populate the model. It was clear that there were potential areas in which residential care facilities could differ in interpretation of past and current guidelines, and so the model has been structured to allow an exploration of the changes in clinical effectiveness and cost-effectiveness of SARS-CoV-2 tests under different underlying assumptions relating to SARS-CoV-2 test accuracy, actions taken on the result of the SARS-CoV-2 test, turnaround times for SARS-CoV-2 tests, configuration of the residential care facility and changed assumptions relating to the spread of SARS-CoV-2 within the residential care facility.
The EAG modelled single bubbles within a care home. A simplified schematic of a typical residential care facility ‘bubble’ is shown in Figure 1. It is assumed that a large residential care facility may have multiple bubbles that could comprise different floors or wings, allowing residents to be separated and prohibit mixing between different bubbles. The analyses presented focus on a bubble within a residential care facility. Advice provided by care home representatives and experts indicated that splitting larger residential care facilities into bubbles was commonplace.
FIGURE 1.
A simplified schematic of key elements in the modelling of a residential care facility.
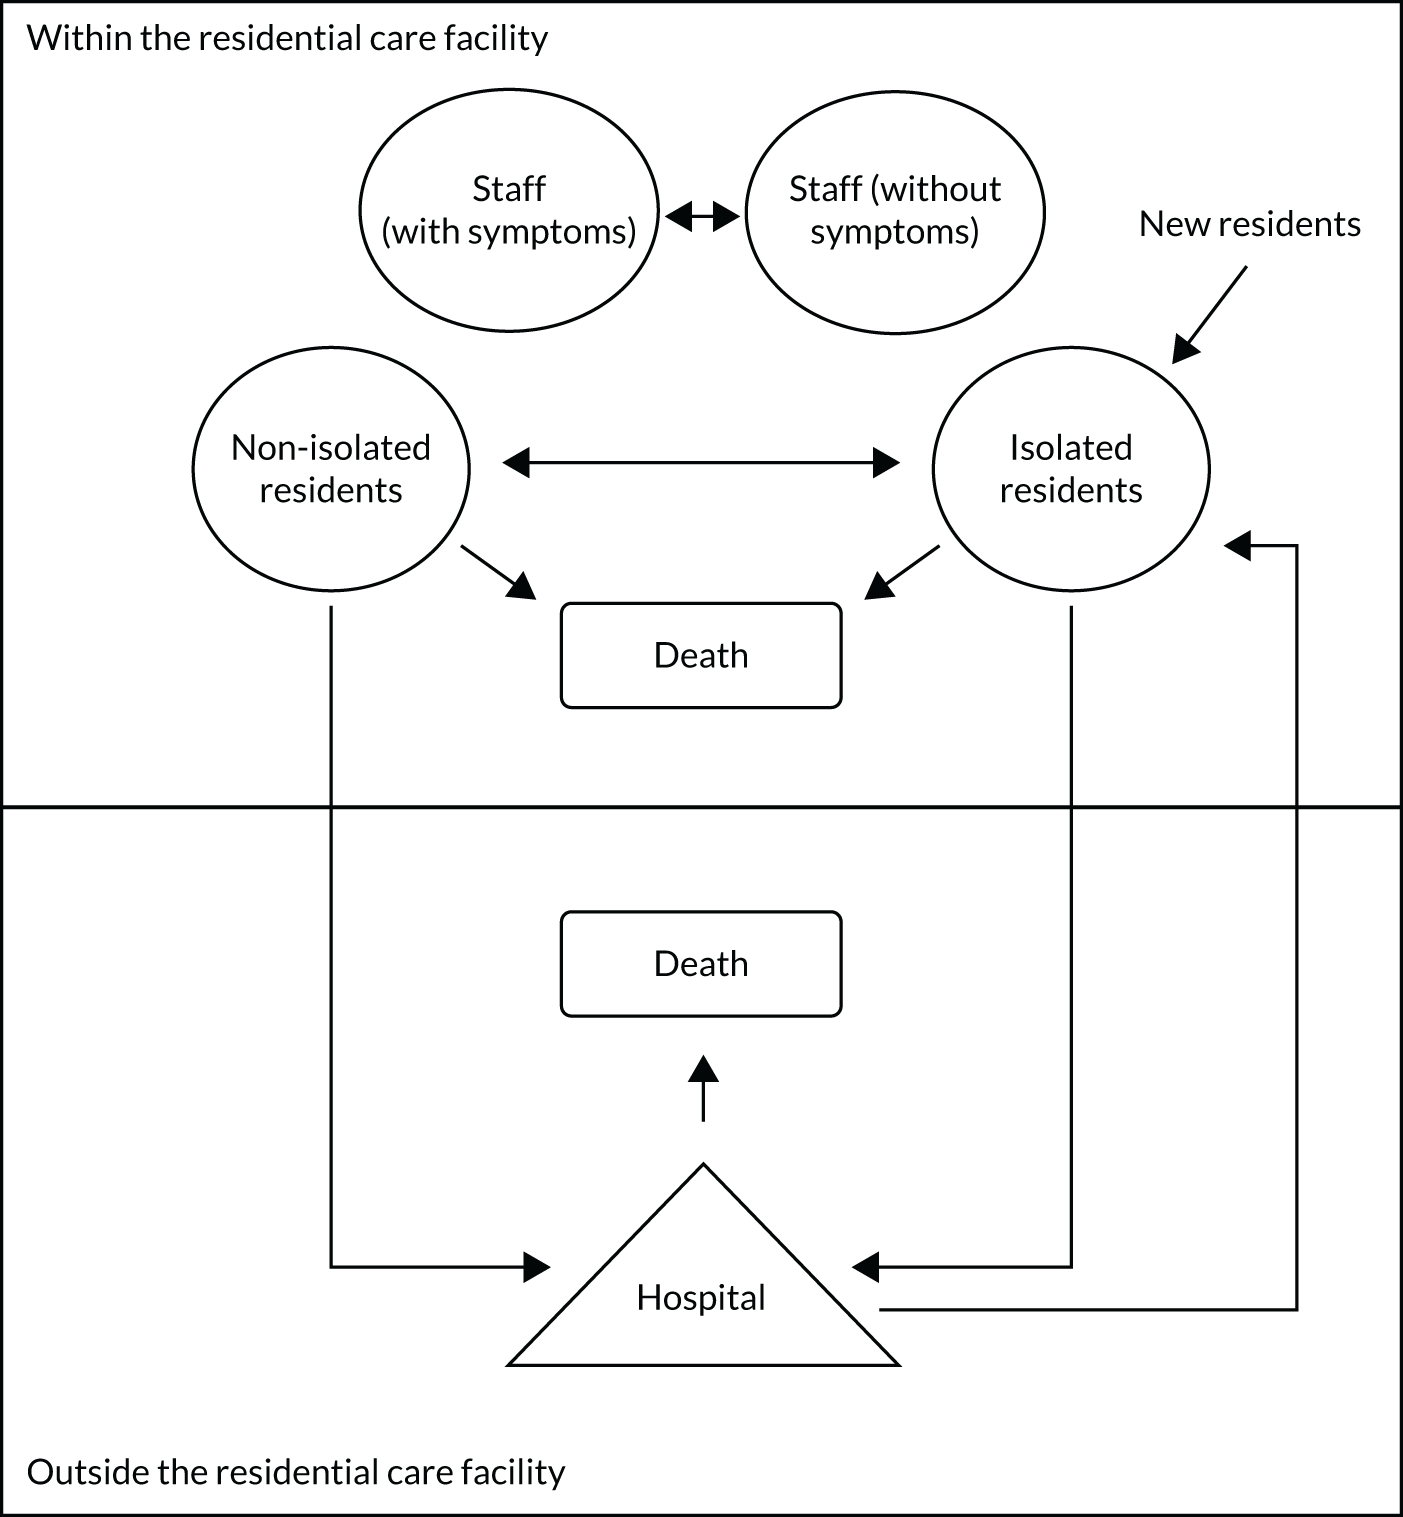
The use of SARS-CoV-2 testing, in particular the differences between laboratory-based tests and POCTs, is not shown in this diagram, but will be discussed in this chapter. The pathway for residents within Figure 1 is relatively simple. Within the residential care facility, residents are assumed to be either in isolation or free to mix, maintaining social distancing where possible. Residents leave the residential care facility when they die or when hospital treatment is required. Residents who have died are replaced, following a delay, by new residents. Further details are provided in Detailing the elements of Figure 1.
As the consequences of a resident contracting COVID-19 can be severe, including, potentially, death, the modelling assumes a lifetime perspective. Discounting is undertaken at a rate of 3.5% per annum for health, as recommended by NICE. 6 Costs were considered in the initial year only and are not discounted.
Detailing the elements of Figure 1
Each subsection discusses the assumptions and data sources associated with each element of Figure 1.
Non-isolated residents
This element simulates the day-to-day behaviour of residents who are not in isolation. This would involve potentially interacting with other residents and members of staff. Further details on how these interactions are modelled are provided in Chapter 3, Parameters relating to the simulated spread of SARS-CoV-2 infection within the residential care facility.
Isolated residents
This element simulates the day-to-day behaviour of residents who are in isolation, where it is assumed that they are confined to their room as much as possible and interaction is limited to essential contacts. It is assumed that staff will attend to residents in isolation to provide food and necessary support.
Residents are assumed to be isolated for the following reasons: (1) having symptoms that resemble COVID-19, which may or may not be SARS-CoV-2 related, (2) having a positive SARS-CoV-2 test and (3) because of a suspected SARS-CoV-2 case within the unit, in which case all residents are isolated until it is believed that there is no longer a risk of SARS-CoV-2 infection. Further details on the assumed likelihood of these reasons are provided in Chapter 3, The percentage of residents with SARS-CoV-2 that are assumed to develop clinical symptoms and The incidence of diseases that are not COVID-19 but have symptoms suggestive of COVID-19, along with a description of the criteria that are assumed to be necessary for residents to be released from isolation. The model has the functionality to change the third criterion so that residents are isolated on a positive SARS-CoV-2 test result only, rather than on symptoms; however, this was not considered further as it is not in line with current guidance. 7
Staff
This element is divided into two broad groups: (1) staff without clinical symptoms and (2) staff with clinical symptoms. It is assumed that staff members who have symptoms suggestive of COVID-19 would be withdrawn from duty and would not attend to residents. For simplicity, it has been assumed that the staff member can be instantly replaced, although the EAG acknowledges that this would not be the case in reality.
Staff members without symptoms were divided into two subelements: (1) those who attend to residents in isolation and (2) those who attend to residents not in isolation. The number of staff in each subelement is user-definable, although, for simplicity, no formal modelling of work shifts was undertaken and, instead, all staff working across shifts were included and randomly selected to attend to a resident.
It is assumed that when the entire unit is put into isolation because of a suspected SARS-CoV-2 case then all bar one staff member would attend to residents in isolation. One staff member is still allocated to residents not in isolation so that there will always be a member of staff available to attend to residents who may leave isolation earlier than other residents. As staff attend to more than one resident, it is possible for a staff member with a SARS-CoV-2 infection to infect multiple residents and, therefore, staff can be an indirect cause of the spread of SARS-CoV-2 from resident to resident. Staff members with SARS-CoV-2 infection can also infect other staff members with whom they come into contact. For simplicity in the modelling, it is assumed that staff members can infect only those staff members in the same subelement (i.e. those treating residents in isolation or those treating residents not in isolation). In addition, the implications of staff infected with SARS-CoV-2 spreading the virus within the community, which could result in mortality, hospitalisation and increased pressure on the health system, are not considered. This will be unfavourable to the strategies that have fewer staff infections.
The model assumes that staff members do not move between bubbles within a residential care facility. It is noted that funds are available to care homes to support measures to stop the spread of SARS-CoV-2, which include:
. . . limiting or cohorting staff to individual groups of residents or floors/wings, including segregation of COVID-19 positive residents, for example paying for extra staff cover to provide the necessary level of care and support to residents, or paying for structural/physical changes to support separation of floors/wings and/or residents.
Requirement for hospitalisation
As detailed in Chapter 3, The proportion of residents with COVID-19 who experience severe consequences, a resident in a residential care facility can require hospitalisation because of COVID-19-related causes or because of other conditions. Owing to uncertainty in the data and the fact that hospitalisation for non-COVID-19 causes should not be affected by the SARS-CoV-2 tests used, for simplicity, it was assumed that no residents went to hospital other than for COVID-19-related reasons.
Death
As detailed in Chapter 3, The risk of non-COVID-19 mortality for residents, a resident in a residential care facility can die from SARS-CoV-2-related causes or from another condition. It is also possible for residents to die while receiving care for COVID-19 in hospital.
The conceptual model: introduction of SARS-CoV-2 to the residential care facility
Severe acute respiratory syndrome coronavirus 2 can be introduced into a residential care facility in a number of ways, for example a staff member having caught SARS-CoV-2 in the community, a resident having caught SARS-CoV-2 following a visit from a family member or from new residents to the residential care facility arriving with a pre-existing SARS-CoV-2 infection. The probability of these events happening are uncertain and may be rare. In addition, these events would require many simulations to provide a robust answer, with many of these simulations consisting of a residential care facility that remains free of SARS-CoV-2 throughout the modelling time horizon.
To counter this potential inefficiency, an alternative approach was adopted in which a seed who had just been infected with SARS-CoV-2 infection was sown in the residential care facility. This seed could be a result of an asymptomatic transmission from a visitor, new resident, residents attending outpatient appointments or a member of staff. This seed could be either a resident or member of staff (either attending to isolated or non-isolated residents) who has been infected with SARS-CoV-2; however, for time reasons, the model is run with a seed resident in the base case, although sensitivity analyses explore the impact of the seed being a staff member. Each model run estimates the impact on a residential care facility 90 days (3 months) after the seed penetrates the bubble. The 3-month duration is arbitrary, as any (non-infinite) time point would not consider the full pathway of all potential infections and 3 months was believed to be a reasonable period over which indicative results would be useful. This aligned with the work for SARS-CoV-2 testing in hospitals, where the pressure in winter was likely to be more acute. The seed will then progress through the relative stages of SARS-CoV-2 infection: becoming infectious, potentially becoming symptomatic (or remaining asymptomatic) and then becoming non-infectious, if the seed did not die from COVID-19. While infectious, the seed has the potential to infect both fellow residents and staff members, and these processes are described in more detail in Chapter 3, Parameters relating to the simulated spread of SARS-CoV-2 infection within the residential care facility. Longer durations were not run. However, it is unlikely that a longer time horizon would alter the results because of the assumption that a bubble could be penetrated only once. The results from the 3-month period are believed to be generalisable to longer periods.
The placement of the seed was at a random time point; therefore, the time to the next set of routine testing for staff and residents (see Chapter 3, Testing strategies within the residential care facility) changed between trials (see Chapter 4, The number of different random number streams used per analysis). The seed was randomly chosen from all residents/staff within the residential care facility. It was assumed that only one penetration of SARS-CoV-2 would occur within the 90-day period.
There will be no spread of SARS-CoV-2 for residential care facilities that remain clear of SARS-CoV-2 infection; however, there may still be differences in the results for POCTs and laboratory-based tests. These results will depend on the specificity of the SARS-CoV-2 test used (as a false-positive result can cause isolation) and on the time to a test result if early release from isolation is permitted (see Chapter 4, The strategies modelled). Therefore, results have been run for residential care facilities that are not simulated to have a SARS-CoV-2 infection.
Assumptions relating to the initiation of unit lockdown
Following a suspected SARS-CoV-2 case, it is anticipated that the unit will enter lockdown, with all residents entering isolation following the government guidance. 7 For larger residential care facilities that have multiple floors and wings, it is assumed that only the specific bubble would enter lockdown. The model has the functionality to use different criteria for the initiation of a lockdown, which change the level of certainty required. In the model, the following criteria are available to initiate isolation for all residents: symptoms suggestive of COVID-19 in a resident, symptoms suggestive of COVID-19 in a staff member, a positive SARS-CoV-2 result for a resident and a positive SARS-CoV-2 result for a staff member. Initiating full lockdown on clinical symptoms alone has the advantage that this may reduce the spread of SARS-CoV-2 within the residential care facility; however, it has the disadvantage that residents would spend more time in isolation. Conversely, isolating the individual with symptoms suggestive of COVID-19 but waiting for a positive SARS-CoV-2 test result to isolate all other residents has the advantage that isolation is not as lengthy, but there is danger that SARS-CoV-2 could be spreading within the residential care facility between the time of clinical symptoms and the time of the SARS-CoV-2 test result.
The results presented in this report provide two broad configurations of residential care facilities. The first residential care facility is assumed to be configured with single-occupancy rooms that have en suite facilities. Therefore, it is assumed that, in lockdown, all residents are isolated in their individual rooms and that there would be contact with only those members of staff attending to the resident.
The second configuration is to assume that the residents have shared rooms and bathrooms. In this instance, it is assumed that residents have pre-assigned rooms and that these cannot be changed, even if a resident were to show signs suggestive of COVID-19. In lockdown, people within the pre-assigned groupings would continue to interact and would therefore have a possibility of spreading SARS-CoV-2. This configuration is extreme and residential care facilities would attempt to segregate people with symptoms. However, the results produced are expected to be useful to the NICE Diagnostics Advisory Committee.
The model has the functionality to examine an in-between configuration, where residents have single rooms but need to share common facilities (e.g. a bathroom). In this configuration, the residents were assigned to ‘sharing groups’ to reduce the spread of infection. One sharing group would be for residents deemed to be at higher risk of having SARS-CoV-2 than the average resident. Residents falling into this group would be known to have either a positive SARS-CoV-2 test result or to have symptoms suggestive of COVID-19. All remaining residents would be allocated to the lower-risk sharing group. The higher- and lower-risk sharing groups may also have subgroups if there are sufficient bathrooms to make this possible. Although this functionality exists, results were not produced because of time constraints.
Assumptions related to the release of residents from isolation
Following a resident or staff member developing clinical symptoms suggestive of COVID-19, or a positive SARS-CoV-2 test result in a resident or a staff member, all residents are isolated. The standard time in isolation is assumed to be 14 days, as reported in guidance. 7 However, the model has the functionality for this duration to be shortened or extended in certain circumstances, if these options are selected.
The default option in the model is that all residents stay in isolation for 14 days once isolated, with all residents tested following a resident/staff member displaying clinical symptoms suggestive of SARS-CoV-2 or a resident/member of staff receiving a positive SARS-CoV-2 test result. This is because residential care facility managers know that current SARS-CoV-2 tests have less than perfect sensitivity, meaning that the test result may be a false negative. Some support for this approach is provided in the BGS guidance,4 which states that residents with a negative SARS-CoV-2 test result should not be released from isolation before a discussion with an appropriate physician is held, but this also leaves an option for a resident to be released from isolation if deemed clinically appropriate. To assess the impact of releasing residents from isolation early, the model has the functionality to release residents from isolation provided that two criteria are met: (1) the resident has returned a negative SARS-CoV-2 test and, in the shared facilities model and (2) the resident has not been in shared facilities with a resident who has a positive SARS-CoV-2 test or symptoms suggestive of COVID-19, a resident who is awaiting the result from a SARS-CoV-2 test or a ‘new’ resident, either residing in the residential care facility for the first time or having returned from a stay in hospital (see Chapter 3, The proportion of residents with COVID-19 who experience severe consequences). This option has the advantage that residents have a reduced time in isolation, but does carry risk that some SARS-CoV-2 test results could be false negatives and, consequently, SARS-CoV-2 could spread within the residential care facility. It is anticipated that the default option and the early release option will provide extreme positions with respect to the release of residents from isolation.
The model has the facility to allow all residents to be released from isolation if the resident suspected of being the index case within the residential care facility has a negative SARS-CoV-2 test result. An index case is defined as the first resident who is suspected of having SARS-CoV-2 infection when the bubble is not in lockdown. If the option to release residents early is selected, then residents can be released from isolation, provided that they meet the criteria in the paragraph above; however, this option is more restrictive, as the SARS-CoV-2 test for the index resident must be negative for all residents to be released. The model also assesses whether or not, in the time required for the SARS-CoV-2 test to be returned, a resident has developed clinical symptoms suggestive of COVID-19. In this scenario, the resident would also be required to have a negative SARS-CoV-2 test result before the bubble is released from isolation.
The rules for releasing residents from isolation, based on the possible model functionality, are provided in Table 1. Although these options are implemented in a Boolean fashion, the EAG acknowledges that, in reality, these decisions are likely to be nuanced and depend on resident characteristics and clinical judgement, which cannot be incorporated into the model in the allocated timelines.
| Allow early release from isolation if the SARS-CoV-2 test in index resident is negative | |||
|---|---|---|---|
| Yes | No | ||
| Allow early release from isolation if the criteria are met | Yes | Release resident provided that the criteria within the text related to SARS-CoV-2 test results, other infectious diseases and ‘new’ residents (see Assumptions related to the release of residents from isolation) are met | |
| No | All residents must isolate for 14 days minimum unless the SARS-CoV-2 test for the index resident is negative and the criteria associated with early release from isolation are met | All residents must isolate for 14 days minimum | |
The model has an additional functionality to extend the isolation time for people already in isolation when another incident occurs (either development of clinical symptoms suggestive of COVID-19 or the return of a positive SARS-CoV-2 test). This would require people already in isolation to be isolated for a further 14 days, regardless of the time already spent in isolation, increasing the isolation time beyond those in Table 1. This has the advantage that the resident is likely to be protected against SARS-CoV-2 infection, but has the disadvantage that the isolation time could be greatly increased.
Potential uncaptured benefits within the conceptual model
By necessity, the model did not capture all aspects of the decision problem; however, in the majority of cases, this is unlikely to affect comparisons between POCTs and laboratory-based SARS-CoV-2 tests. POCTs may be disadvantaged by the following omissions: the introduction of POCTs could help reduce the administrative burden associated with requesting and registering laboratory-based tests;9 could potentially facilitate easier access to residential care facilities by allowing the required SARS-CoV-2 test to be carried out at the residential care facility and; in the future, could allow potential treatment on identification of SARS-CoV-2 in symptomatic residents to be undertaken in a more timely manner because of the quicker turnaround times associated with the tests. The EAG notes that trials are under way to provide treatment for people with diagnosed COVID-19 to reduce the probability that it develops into severe COVID-19. 10
Chapter 3 Population of the mathematical model
Each subsection of this chapter discusses the assumptions and data sources associated with populating the model.
The demographics of residents in a residential care facility
The model sampled a starting age and determined a resident’s sex in accordance with published Office for National Statistics data on care home populations in England in 2020. 11 As the focus of the main model was on residents in a care home for older people, only those residents aged ≥ 65 years were considered (although younger residents were considered in sensitivity analyses). Table 2 shows the age and sex distribution of the modelled cohort. Interpolation between age ranges was undertaken to estimate the age of individual residents. The age breakdown was quite crude, with no statistics reported for median or mean ages. The EAG has assumed that the age distribution of male residents in the residential care facility can be approximated by a triangular distribution that has a mean of 83 years (minimum 65 years, mode 83 years and maximum 100 years). For female residents in the residential care facility, a triangular distribution that has a mean of 87 years (minimum 65 years, mode 96 years and maximum 100 years) was used in the model.
| Age (years) | Male (%) | Female (%) |
|---|---|---|
| 65–74 | 4.54 | 4.75 |
| 75–84 | 10.38 | 19.96 |
| ≥ 85 | 14.21 | 46.16 |
| All ages | 29.13 | 70.87 |
For simplicity, neither ethnicity nor comorbidities were modelled. Where residential care facilities have residents at a greater or lower risk of complications from COVID-19, this should be considered when interpreting the results. Sensitivity analyses have been conducted to assess the impact of assuming double QALY losses to consider cases where there are potentially worse consequences of COVID-19 and where more residents have severe SARS-CoV-2.
The characteristics of staff working in the residential care facility
At the start of the model, it is assumed that no staff have been infected by SARS-CoV-2 and that no staff exhibit clinical symptoms suggestive of COVID-19. Age distributions, ethnicity and comorbidity status for staff were not required, as the model does not explicitly take into consideration the consequences of infection for staff beyond infecting other staff and residents.
The configuration of the residential care facility used in the main model
As described (see The conceptual model: residents and staff), the model focused on single bubbles in a care home. From discussion with experts, it was clear that the size of bubbles was very heterogeneous between real-world residential care facilities. To provide example results, it was assumed that the bubble consisted of 16 residents (with demographics sampled in accordance with Table 2) and nine staff members, initially divided into six staff attending residents not in isolation and three staff attending residents in isolation. As a simplification, we have assumed that these staff are the full pool of staff across the week and that staff starting and ending shifts are only implicitly considered. Any resident–staff interaction involves a randomly chosen member from the staff pool and so not all staff will be assumed to be working at all times.
Two types of residential care facilities were considered. The first type was a residential care facility in which all rooms were en suite, in which case we assumed that, if lockdown were initiated, there would be no interaction with other residents in the bubble. The second type was a residential care facility in which it was assumed that the 16 residents were divided into four groups of four residents who shared rooms and bathrooms.
New arrivals in the residential care facility
The model considers two types of new residents in the residential care facility bubble: (1) those who have never been in the residential care facility and who are taking the place vacated by a resident who has died and (2) those who are returning to the residential care facility after a stay in hospital.
In the calibration model (see Chapter 4, Calibration of the model), it has been assumed that residents who die are not replaced. For the models tested, it has been assumed that there is a delay of 3 weeks between a resident dying and a new resident entering the room. The new resident is assumed to have had a recent negative SARS-CoV-2 test and to spend 14 days in isolation prior to being allowed to mix freely with other residents within the bubble.
The percentage of residents with SARS-CoV-2 who are assumed to develop clinical symptoms
There is considerable uncertainty related to the proportion of residents with SARS-CoV-2 who become symptomatic. This estimate can range from 70%, reported by Smith et al. ,12 to 19%, in the Vivaldi report,13 which reported that 5455 out of 6747 positive tests (81%) were in residents who were asymptomatic and therefore 19% of residents were symptomatic. Other estimates include the following: 61% of people with confirmed SARS-CoV-2 in a skilled nursing facility had clinical symptoms,14 56.2% of residents with a positive SARS-CoV-2 test in six care homes in London had clinical symptoms15 and 33% of those who tested positive in the community had clinical symptoms. 16 Within these estimates, it is not always clear if repeat testing was undertaken to establish whether or not the resident was pre-symptomatic and, if not, it is likely that these values will be underestimates. In addition, the exact definition of clinical symptoms is unclear. It has been noted in terms of the Vivaldi data that the definition of symptomatic was omitted and that other symptoms in addition to new cough, fever and loss of taste and smell may be appropriate in elderly care home residents. 17
Given the wide range in results, we have assumed in our model base case that 50% of residents would become symptomatic following infection with SARS-CoV-2. Sensitivity analyses were undertaken that assumed that 33% of residents became symptomatic.
The incidence of diseases that are not COVID-19 but have symptoms suggestive of COVID-19
For residents who have not been infected with SARS-CoV-2, the proportion of residents who have symptoms that are indicative of COVID-19, but do not have COVID-19, was estimated from Hayward et al. 18 to be approximately 0.12 in vaccinated residents over a 147-day period, covering the winter months and based on data for influenza-like illnesses. Assuming that a resident could have only one influenza-like illness during this period, this would translate to an estimated daily risk of 0.087%.
A sensitivity analysis was undertaken using data from Smith et al. ,12 who reported a daily incidence of COVID-like symptoms of 1.1%, which was calculated using data from French emergency departments, average daily incidence of influenza-like illness among older adults (50–99 years, 2008–2017) was used as a proxy attack rate for patients and staff presenting with COVID-like symptoms of other aetiologies. 12 The reported source was a conference abstract (Fouillet et al. 19) that does not mention influenza-like illness and, therefore, the robustness and generalisability of the 1.1% value are uncertain.
For simplicity, it was assumed that residents in isolation could not catch an illness that had symptoms suggestive of COVID-19. This could be unfavourable to strategies that allow early release, as it may result in residents having a higher incidence of non-COVID-19 illness than those held in isolation.
The proportion of residents with COVID-19 who experience severe consequences
Smith et al. 12 reported that 20% of residents with COVID-19 have severe COVID-19. We have assumed that this value is independent of age and that severe COVID-19 means that a resident either dies or requires hospital care. It is acknowledged that there may be residents too frail to be transported to hospital and these residents would not leave the residential care facility, but would have the same outcomes as if hospital treatment were provided. The data for these probabilities were from a previous report of exploratory economic modelling of hospital point-of-care SARS-CoV-2 viral detection tests produced by the EAG20 and assumed to be the same as the proportion of people who died in hospital with COVID-19 but who were not moved to the intensive care unit, presumably as they were too frail. These values, for residents aged ≥ 65 years, are shown in Table 3.
| Age (years) | Male | Female |
|---|---|---|
| 65–69 | 0.402 | 0.366 |
| 70–74 | 0.532 | 0.457 |
| 75–79 | 0.638 | 0.590 |
| 80–84 | 0.761 | 0.723 |
| 85–89 | 0.859 | 0.822 |
| ≥ 90 | 0.940 | 0.924 |
Based on the previous report of exploratory economic modelling of hospital point-of-care SARS-CoV-2 viral detection tests produced by the EAG, the probabilities of death for residents hospitalised with COVID-19 were calculated. These estimated values, conditional on age and sex, for people aged ≥ 65 years are provided in Table 4.
| Age band (years) | Probability of deatha (%) | Probability of survival following hospital treatmenta (%) | ||
|---|---|---|---|---|
| Male | Female | Male | Female | |
| < 15 | 1.93 | 1.33 | 98.07 | 98.67 |
| 15–19 | 4.44 | 1.94 | 95.56 | 98.06 |
| 20–24 | 4.65 | 2.65 | 95.35 | 97.35 |
| 25–29 | 4.51 | 1.91 | 95.49 | 98.09 |
| 30–34 | 3.68 | 2.78 | 96.32 | 97.22 |
| 35–39 | 4.52 | 3.22 | 95.48 | 96.78 |
| 40–44 | 6.55 | 5.45 | 93.45 | 94.55 |
| 45–49 | 8.82 | 6.82 | 91.18 | 93.18 |
| 50–54 | 12.77 | 10.67 | 87.23 | 89.33 |
| 55–59 | 19.90 | 12.70 | 80.10 | 87.30 |
| 60–64 | 26.66 | 22.76 | 73.34 | 77.24 |
| 65–69 | 35.47 | 32.67 | 64.53 | 67.33 |
| 70–74 | 48.22 | 40.12 | 51.78 | 59.88 |
| 75–79 | 54.95 | 47.65 | 45.05 | 52.35 |
| 80–84 | 59.40 | 50.50 | 40.60 | 49.50 |
| 85–89 | 60.95 | 47.75 | 39.05 | 52.25 |
| ≥ 90 | 63.78 | 49.38 | 36.22 | 50.62 |
In the case of residents who require hospitalisation for COVID-19 reasons and then return to the residential care facility, it was assumed that the length of stay was distributed log-normally (on a log-scale) with a mean of 2.29 (standard deviation 0.59) days. This is in accordance with the time allocated to residents aged > 70 years in the previous EAG report of exploratory economic modelling of hospital point-of-care SARS-CoV-2 viral detection tests. This distribution was estimated from data in Docherty et al. 21 For simplicity, the costs of hospitalisation has not been included in the model. This will be unfavourable to the strategies with fewer SARS-CoV-2 infections.
In the case of residents who die from COVID-19, the distribution of length of stay was represented by a log-normal distribution with a mean of 2.00 (standard deviation 0.79) days, which was the distribution used in the previous work undertaken by the EAG, relating to the use of SARS-CoV-2 tests in hospital, and based on a study by Docherty et al. 21
The risk of non-COVID-19 mortality for residents
Data on the number of people in care homes and the number of deaths per age band not involving COVID-19 were taken from Office for National Statistics mortality data. 22 The population data used wider age bands (10-year bands) than the death data (5-year bands). Therefore, the EAG needed to make the assumption that the population count in a specific 10-year band is equally divided between the two included 5-year bands (e.g. the population data states that there are 15,838 males aged between 65 and 74 years; therefore, we assumed 7919 males for each of the 65–69 years age band and the 70–74 years age band). The estimated risk of death per 28-day period is shown in Table 5.
| Age band (years) | Male (%) | Female (%) |
|---|---|---|
| < 65 | 0.43 | 0.41 |
| 65–69 | 2.21 | 1.42 |
| 70–74 | 4.81 | 4.09 |
| 75–79 | 3.84 | 1.90 |
| 80–84 | 6.62 | 4.09 |
| 85–89 | 6.31 | 3.00 |
| ≥ 90 | 7.50 | 2.93 |
Immunity from SARS-CoV-2 infection
It has been hypothesised that some people may have immunity to SARS-CoV-2 infection, although this theory is subject to much debate. 23 In the base case, it has been assumed that no person has immunity to SARS-CoV-2 infection unless they had a SARS-CoV-2 infection at model initiation or were infected with SARS-CoV-2 during the simulation. The model has the functionality to allow a proportion of residents without current SARS-CoV-2 infection to be considered immune from infection.
Parameters relating to the simulated spread of SARS-CoV-2 infection within the residential care facility
The model simulates the probability of transmission of SARS-CoV-2 in the following four categories: (1) resident to resident, (2) resident to staff, (3) staff to resident and (4) staff to staff. These are controlled by variables relating to the chance of a contact in which SARS-CoV-2 could be transmitted (termed an effective contact), the likelihood of infection being transmitted given an effective contact (termed an attack rate) and a calibration factor that attempts to ensure that the values used relating to effective contacts and attack rates produce results that would be relatively consistent with those observed, to date, within residential care facilities (see Chapter 4, Calibration of the model). To decrease the running time of the model, it was assumed that the simulation of infections with SARS-CoV-2 occurred in distinct 6-hour periods.
Effective contacts
In the absence of better data, the number of effective contacts in each category over a 6-hour period deemed reasonable by the EAG was used with the knowledge that the absolute values would be adjusted in the calibration process. Staff use of personal protective equipment could arguably be used to adjust either effective contacts or attack rate, and we have applied its impact to effective contacts. The duration of contact was used in conjunction with data from Smith et al. ,12 who reported a transmission probability of 0.14% per minute of contact. These parameters, in conjunction with attack rates, provided ratios of staff and resident infections that appeared consistent with the data reported in the Vivaldi report,13 which reported approximately three times more SARS-CoV-2 infections in residents than in staff (20% vs 7%, respectively). 13 The values used in the model are provided in Table 6.
| Description of contact | Assumed number of effective contacts per 6-hour period | Assumed duration of effective contacts (minutes) |
|---|---|---|
| Resident to resident (not in isolation) | 1.10 | 8 |
| Resident to resident (in isolation)a | 0.20 | 8 |
| Resident to staff member (independent of isolation status) | 0.05 | 8 |
| Staff member to resident (not in isolation) | 0.60 | 8 |
| Staff member to resident (in isolation) | 0.20 | 8 |
| Staff member to staff member | 0.03 | 2 |
Although the effective contacts can be a non-integer number, within each 6-hour period these are probabilistically adjusted to an integer. For example, assuming 1.1 effective contacts between a resident and another resident, there would be a 10% chance of two effective contacts being made and a 90% chance of one effective contact. To improve computational efficiency, the contacts of only infectious residents or staff are simulated. The code has been written so that the contacts are logically consistent, such that if an infectious resident was assumed to contact another infectious resident, the second resident would have one less randomly assigned contact than if they had not been simulated to have already contacted an infectious resident.
Attack rates
Following an effective contact, the model determines whether or not infection has been passed by use of an attack rate. The attack rate lies between 0 and 1, with this value being the probability that a resident has become infected. Therefore, if the attack rate was 0.4, then, assuming that an infinite number of residents were run through the model, 40% of those with an effective contact would become infected with SARS-CoV-2 and 60% would not. In the model, the attack rate is assumed to be based on the duration of the effective contact and whether or not the person with the SARS-CoV-2 infection is symptomatic. As shown in Table 6, the duration of all effective contacts was assumed to be 8 minutes, with the exception of those involving staff members, which were assumed to last only 2 minutes. These values were loosely derived from data presented by Smith et al. ,12 who suggested that residents in geriatric wards had 47 minutes of cumulative contacts per day, with health-care workers having fewer contacts. The previous work conducted by the EAG, which explored the use of POCTs in accident and emergency departments, assumed that the attack rate for asymptomatic people was 69% that of symptomatic people. This value was based on data from Koh et al. 24 and Grassly et al. ,25 with input from specialist committee members of the NICE Diagnostic Advisory Committee.
Times to becoming infectious, developing symptoms if symptomatic and becoming non-infectious for a resident infected with SARS-CoV-2 in hospital
Residents and staff who have been infected have defined periods before they become infectious, have clinical symptoms (if the resident is to be symptomatic) and reach a point at which they are no longer infectious for SARS-CoV-2. These values, along with their sources, are shown in Table 7. It has been assumed that symptomatic and asymptomatic residents have the same time to key milestones, although asymptomatic people have a lower probability of transmitting infection (see Attack rates). These values are consistent with the data used in the previous work, with the exception of the time to becoming non-infectious, which used data from Singanayagam et al.,28 and had previously been a sensitivity analysis because of the timing of the identification for the previous publication. For our analysis, we have assumed arbitrary uniform ranges to account for heterogeneity among residents.
| Event: time from element 1 to element 2 | Assumed mean time to the event (days) | Source | Assumed range (days) |
|---|---|---|---|
| Catching infection to becoming infectious | 3.4 | Clifford et al.26 | 2.5–4.3 |
| Becoming infectious to having clinical symptoms, if the resident is to develop them | 2.3 | He et al.27 | 1.6–3.0 |
| Becoming infectious with SARS-CoV-2 to becoming non-infectious | 10.0 | Singanayagam et al.28 | 8.0–12.0 |
The model updates disease progression every 6 simulated hours. This was believed to represent a reasonable compromise between model complexity and sufficient accuracy, given the uncertainty in the decision problem.
Characteristics of the point-of-care tests and laboratory-based tests
The TPPs for POCTs and laboratory tests for SARS-CoV-2 are not linked to any marketed test, but are values put forward by the MHRA to designate what would be seen as desirable or acceptable characteristics for forthcoming tests. These values may bear no resemblance to the laboratory-based tests that were used in the early phases of the pandemic and so the EAG decided to use values for diagnostic accuracy from its previous work on the use of POCTs for SARS-CoV-2 in a hospital setting. This resulted in an assumed sensitivity of laboratory-based tests of 89%, based on a meta-analysis conducted by Kim et al.,29 with an assumed specificity of 1, following Grassly et al. 25 The turnaround time for laboratory-based tests for care homes in the early stages of the pandemic was estimated by experts in the research team to be 3 days. It is believed that the turnaround times for laboratory-based tests have improved over time, with data from NHS test and trace weekly reports30 reporting a median time to test result of 45 hours. We have assumed that this equates to a mean time of 2 days.
The assumed diagnostic accuracies of the POCTs and laboratory-based tests, the times for the result to become known by the treating physician and the failure rates used in the model base case are shown in Table 8. It is assumed that neither the laboratory-based test nor the POCT can detect SARS-CoV-2 until 0.5 days after infection (based on Jarvis and Kelley33). The model uses a simplifying assumption that SARS-CoV-2 cannot be detected until this point is reached, although false-positive tests could still occur in this situation. Beyond this time point, the sensitivity values reported in Table 8 are considered appropriate, which the EAG acknowledges as a simplification of viral load dynamics. It is believed that the sensitivity of SARS-CoV-2 tests may be reduced in asymptomatic people. Based on data provided in Clifford et al. ,26 it was assumed that the ratio of sensitivities was 0.826, having assumed 0.75 sensitivity in symptomatic cases and 0.62 for asymptomatic cases.
| Scenario analysis | Assumed time to obtain the result | Assumed sensitivity (symptomatic residents) (%) | Assumed sensitivity (asymptomatic residents) (%) | Assumed specificity (%) | Assumed failure rate (%) |
|---|---|---|---|---|---|
| SARS-CoV-2 laboratory-based test | |||||
| Calibration period | 3 days | 89.0 | 73.5 | 100.0 | 5.0 |
| TPP (desirable) | 2 days | 99.0 | 81.8 | 99.0 | 0.2 |
| TPP (acceptable) | 2 days | 95.0 | 78.5 | 95.0 | 1.0 |
| Real-world evidence | 2 days | 89.0 | 73.5 | 100.0 | 5.0 |
| SARS-CoV-2 POCT | |||||
| TPP (desirable) | 3 hours | 97.0 | 80.1 | 99.0 | 1.0 |
| TPP (acceptable) | 3 hours | 80.0 | 66.1 | 95.0 | 5.0 |
| Data from currently available POCTs | 3.8 hours | 84.7 | 70.0 | 98.9 | 5.0 |
| Exploratory analyses only: lateral flow tests | |||||
| PHE report31 | 30 minutes | 85.9 | 70.9 | 99.7 | 5.0 |
| Cochrane review32 | 30 minutes | 69.1 | 57.1 | 99.7 | 5.0 |
The TPPs published by the MHRA were used for both the POCTs and laboratory-based tests. 34,35 These were divided into desired and acceptable characteristics. The characteristics of these are presented in Table 8. The estimate of 3 hours for the POCTs was made, considering that it is probable that there would be only one POCT machine per residential care facility, and that swabs from residents and staff members would need to be stored and be in a queue before being processed. As detailed in Testing strategies within the residential care facility, a staggered approach to resident testing was employed; however, this would not be possible when there is a suspected case of COVID-19. In the instance of a suspected case of COVID-19, the average time to receive a result from a SARS-CoV-2 POCT was assumed to increase to 1 day.
In addition, real-world evidence is explored, as has been used for the laboratory-based tests in the calibration period. For SARS-CoV-2 POCTs, data from currently available SARS-CoV-2 POCTs were used. These data suggest that the time to obtain the result is 3.8 hours (based on data presented in Collier et al. 36 and with sensitivity and specificity taken from a Cochrane review by Dinnes et al. ,37 which were multiplied by the sensitivity and specificity of the real-world laboratory-based test diagnostic accuracy). It is seen that the real-world evidence for the SARS-CoV-2 POCT has better diagnostic accuracy than the acceptable TPP, with only a small increase in time to the test result, which would not be captured in the model because of the model updating every 6 hours.
Additionally, recent (after the completion of work for NICE) diagnostic accuracy data from testing using lateral flow methods in mass community testing have been reported,31 as has a Cochrane review. 32 These data have been used in sensitivity analyses and assume that the tests would be undertaken every 5 days for both staff and residents, and that the lateral flow test was £10 cheaper than the other SARS-CoV-2 POCTs and laboratory-based SARS-CoV-2 tests. From the mass community testing report,31 the sensitivity for all individuals, irrespective of viral load, was assumed to be 85.85% (mid-way between 77.8% and 93.9%) and specificity was assumed to be 99.68%, meaning that the diagnostic accuracy of the lateral flow tests was similar to real-world evidence for POCTs. The failure rate was maintained at 5%, despite a mid-point estimate of 5.4% (502/9276), as these data were skewed by the observation from ‘phase 4, school 1’, which is reported to had 311 failures out of 2166 tests (14.4%) and was also reported to have a 16.8% failure rate (the discrepancy between these numbers in not clear). The mass community testing report suggests that there might be a difference in failure rates between batches. If this is correct and the problem can be rectified, then the failure rates may decrease.
From the Cochrane report,32 sensitivity data for the four Instructions for Use-compliant evaluations were taken from three evaluations of symptomatic patients (69.1%) and specificity data were taken from two evaluations of symptomatic patients (99.7%). The assumed time to a result when using a lateral flow test was 30 minutes. These data have been added to Table 8.
The lateral flow analyses were not appraised by the NICE Diagnostic Committee. Caveats to this analysis include that the model does not include visitor testing, that confirmatory tests after a lateral flow test have not been included, behaviour change has not been assumed, that incorrect diagnoses are assumed to occur at random (as the diagnostic accuracy has not come from a strategy of repeated tests), that no analyses increasing the frequency of other POCTs have been modelled and that sufficient data to allow diagnostic accuracy specific to residential care facilities are not available. Therefore, conclusions related to lateral flow tests should be considered indicative rather than definitive. Recent work that assessed the implementation of staff and visitor testing protocols using lateral flow devices concluded that there was poor adherence to using the tests and no reduction in either the number or scale of COVID-19 outbreaks with the use of lateral flow tests. 38
The model has not considered the possibility that less well-trained staff could increase the spread of SARS-CoV-2 when performing the tests. We have assumed that training has been undertaken with care home staff to mitigate this.
Testing strategies in the residential care facility
In accordance with guidance,7 it was assumed that residents were tested every 28 days for SARS-CoV-2 and that asymptomatic staff members are tested weekly. In sensitivity analyses looking at lateral flow SARS-CoV-2 tests, the testing strategy was changed to every 5 days for both residents and staff. No analyses that reduced the frequency of testing for non-lateral flow POCTs were undertaken.
For residents, it was assumed that 16 residents are divided into four groups of four residents and that testing was undertaken on 4 consecutive days so that a single POCT is not overwhelmed. It is assumed that all asymptomatic staff members are tested in one batch, although, in reality, this would be scheduled according to their working patterns. It is further assumed that, when there is a suspected case of SARS-CoV-2 infection within the residential care facility, all residents and staff are tested immediately, with the turnaround times for test results increased to 1 day.
The assumed costs of SARS-CoV-2 tests
In the earlier work undertaken by the EAG, the cost of the hypothetical POCT was assumed to be £27.76,39 which is based on the 5.8 million DnaNudge (London, UK) tests ordered by the government at a cost of £161M, although it was acknowledged that, as the deal was likely to include 5000 platforms for running the tests, this could overestimate the cost. For laboratory-based tests, the cost was assumed to be £21.90,40 assuming that the cost of the urine and plasma laboratory-based test (BioPorto, Needham, MA, USA) used to assess acute kidney failure for people considered for admission to critical care is a reasonable proxy. The staff costs associated with POCTs and laboratory-based tests were assumed to be equal.
At the previous Diagnostic Advisory Committee meeting, there was considerable discussion of the relative costs of POCTs and laboratory-based tests for SARS-CoV-2. Some members contended that the costs used were relatively favourable to POCTs, whereas others argued the opposite. In the light of these discussions, and acknowledging the fact that the costs are uncertain, the costs were assumed equal in the base case, and sensitivity analyses were performed to explore the impact of changes in the incremental cost-effectiveness ratios (ICERs). To facilitate a comparison with a strategy of no routine testing (for academic interest), it was assumed that SARS-CoV-2 tests cost £22. All costs used within the analyses are assumed to be in Great British pounds in 2020.
An exception was for the sensitivity analyses using lateral flow methods. In the exploratory analyses, it was assumed that these would be £10 cheaper than the other tests, averaging £12 per test.
Quality-adjusted life-years lost because of COVID-19
The model estimates the additional discounted QALYs lost (assuming a discount rate of 3.5% per annum, as recommended by NICE6) and life-years lost due to COVID-19. These values have been estimated using data from Office for National Statistics life tables41 (2016–18) and age- and sex-adjusted general population utility values reported from Ara and Brazier,42 which used estimated utility values from 26,679 people (aged 16–98 years) who completed EuroQol-5 Dimensions, three-level version (EQ-5D-3L), questionnaires. 42 The EAG acknowledges that these QALY losses will be overestimated if the average utility for residents in a care home is lower than the average of people in England, and these are conditional on the age and sex of people in England.
Example values of the estimated QALY losses and life-years lost for selected ages are provided in Table 9.
| Resident age (years) | QALYs lost | Life-years lost | ||
|---|---|---|---|---|
| Male | Female | Male | Female | |
| 30 | 19.24 | 18.85 | 50.10 | 53.52 |
| 40 | 17.15 | 16.96 | 40.57 | 43.80 |
| 50 | 14.71 | 14.73 | 31.38 | 34.33 |
| 60 | 11.87 | 12.12 | 22.67 | 25.28 |
| 70 | 8.76 | 9.13 | 14.87 | 16.91 |
| 80 | 5.64 | 5.96 | 8.39 | 9.69 |
| 90 | 3.18 | 3.28 | 4.06 | 4.61 |
For residents who had severe COVID-19, a multiplier was applied to take into consideration the fact that the QALYs gained would be lower than that of the average age- and sex-matched people because of reduced life expectancy and/or reduced quality of life. As no data were found to populate these multipliers, an arbitrary value of 0.9 was applied for residents who had severe COVID-19. This is higher than the value (0.8) used in the earlier work undertaken by the EAG in a hospital setting,20 as the latter value was applied to only those people who had received care in an intensive care unit.
With the previous work undertaken by the EAG, the QALYs lost could be strongly influenced by Monte Carlo sampling error (MCSE) (i.e. the differences in results purely because of the random numbers used) and so an evaluation was undertaken with the full runs completed at the time of the analysis. The results were influenced less by MCSE, but the EAG still thought it prudent to generate a statistical model based on the data so that the effects of MCSE were reduced. The assumed statistical relationship for QALYs lost from death due to COVID-19 is provided in Chapter 5, Estimating the discounted quality-adjusted life-years lost from death due to COVID-19, with the assumed statistical relationship for the expected QALYs that would be gained for those residents with severe, non-fatal COVID-19, if there were no longer-term consequences, provided in Chapter 5, Estimating the discounted quality-adjusted life-years gained after survival from severe, non-fatal COVID-19, assuming no long-term consequences.
Quality-adjusted life-year losses due to isolation within the residential care facility
It was considered that time in isolation could have an important impact on residents of a residential care facility, particularly elderly residents. This was explored by estimating a utility decrement associated with increased depression or anxiety. It was assumed that all residents of the residential care facility had some problems in the mobility, self-care, usual activities and pain dimensions of the EQ-5D-3L (which were represented by a score of 2) and that half of the residents had a score of 2 for the anxiety dimension, with the remaining half having a score of 1. The decrease in utility when increasing the score on the anxiety dimension was then explored. This resulted in a decrease in utility (using the UK tariff) of 0.434 (0.516 – 0.082) for those who started with a score of 2 for anxiety and a decrease in utility of 0.071 (0.587 – 0.516) for those who started with a score of 1 for anxiety. 43 Having considered these values, the EAG deemed it reasonable that a resident’s utility was reduced by 0.25 when in isolation. A sensitivity analysis was undertaken that assumed that there was no disutility associated with isolation.
The EAG acknowledges that isolation could affect utility beyond the isolation period, which means that the QALYs lost because of isolation may be underestimated. However, the extent of any increased anxiety about multiple lockdowns over and above the first lockdown is unknown.
Estimation of the proportion of bubbles penetrated by SARS-CoV-2 infection in the near future
Initial results from the Vivaldi study,13 reported by the Office for National Statistics,44 show that an estimated 56% of care homes reported at least one confirmed case of COVID-19. However, this value may not be generalisable to our decision problem, as some care homes are likely to have more than one bubble, meaning that the reported value will be an overestimate of the penetration for the average bubble. Additionally, it is unclear what effect changes in policy relating to a multitude of aspects, such as allowing visitors to the residential care facility, would have on the anticipated proportion of bubbles that would be penetrated. Given the large uncertainty, the EAG has decided that, in the base case, it should be assumed that 50% of bubbles will be penetrated, although this will be changed in sensitivity analyses.
Chapter 4 Modelling methodology
The strategies modelled
The strategies modelled were replicated for four broad sets of analyses. The first division was based on the type of residential care facility modelled (i.e. en suite vs. shared rooms and facilities). The second division was based on whether or not the bubble would be penetrated by SARS-CoV-2 infection (i.e. a seeded model vs. a model without SARS-CoV-2 infection). It is acknowledged that whether or not a residential care facility is penetrated cannot be known in advance; however, modelling in this manner makes it easier to change the percentage of bubbles estimated to be penetrated in future sensitivity analyses.
For each of the four combinations (en suite vs. shared, and penetrated vs. not), the strategies shown in Table 10 were run. The following elements were common to all strategies: isolating all residents on the identification of clinical symptoms suggestive of COVID-19 and isolating all residents on receiving a positive SARS-CoV-2 test. For all strategies except strategy 1 (the calibration strategy), it was assumed that there was routine testing, that routine testing would be undertaken in residents in isolation and that all residents would be tested when lockdown was initiated. If this option were selected, isolation could be extended if an additional suspected COVID-19 case or positive SARS-CoV-2 test result came back when the bubble was not in lockdown.
| Strategy number | Type of SARS-CoV-2 test used in routine testing | Characteristics of SARS-CoV-2 test as defined in . . .a | Allow early release from isolation |
|---|---|---|---|
| 1 | N/Ab | Calibration period | No |
| 2 | Laboratory-based test | TPP (desirable) | No |
| 3 | POCT | TPP (desirable) | No |
| 4 | Laboratory-based test | TPP (desirable) | Yes |
| 5 | POCT | TPP (desirable) | Yes |
| 6 | Laboratory-based test | TPP (acceptable) | No |
| 7 | POCT | TPP (acceptable) | No |
| 8 | Laboratory-based test | TPP (acceptable) | Yes |
| 9 | POCT | TPP (acceptable) | Yes |
| 10 | Laboratory-based test | Real-world evidence | No |
| 11 | POCT | Real-world evidence | No |
| 12 | Laboratory-based test | Real-world evidence | Yes |
| 13 | POCT | Real-world evidence | Yes |
Calibration of the model
It is acknowledged that many parameter estimates are uncertain or have no data (such as effective contact and attack rates). To attempt to provide meaningful results, the model was calibrated to obtain results consistent with observed data by applying a calibration factor to the product of effective contacts and attack rates.
Data from the Vivaldi report13 showed that, among the care homes that reported at least one case of COVID-19, an estimated 19.9% (95% confidence interval 18.5% to 21.3%) of residents tested positive for SARS-CoV-2, with this value being 6.9% (95% confidence interval 5.9% to 7.9%) for staff members. However, the calibration target of the proportion of people with SARS-CoV-2 infection within strategy 1 (i.e. the calibration strategy) was chosen to be 40% for residents and 14% for staff. This value is higher than that reported in the Vivaldi report,13 as the EAG acknowledges that many residential care facilities may have more than one bubble and, if only one bubble had been penetrated, then the values reported in the Vivaldi report13 would underestimate the true number of infections in a single bubble. The calibration factors were 25 for en suite rooms and 20 for shared facilities, which resulted in 38% of residents and 14% of staff being infected in the en suite scenario, and 40% of residents and 13% of staff being infected in the shared-facilities scenario. As it was plausible that there would be more infections of residents in shared facilities, this was deemed acceptable.
The number of different random number streams used per analysis
As with all individual patient-based models, there is the possibility of ‘first-order’ uncertainty, which is the phenomenon that identical residents do not get identical outcomes because of the random numbers drawn to simulate whether or not a resident has an event of interest. The results for a given scenario will therefore change depending on the random number stream seed selected, as will the comparative results with alternative strategies/scenarios, even when the same random number seed is used, as the allocation of random numbers will differ between the strategies/scenarios. To reduce the impact of random number streams, sufficient simulations, using different random number seeds, should be undertaken.
Analyses were undertaken to assess the variability in the mean results as the number of simulations was increased using a near-final version of the calibration model. Appendix 1, Figure 24, depicts the average number of residents infected in the en suite residential care facility as the number of trials increases. This analysis is replicated for the time spent in isolation (see Appendix 1, Figure 25). It is believed that both outcomes have stabilised after 1000 random number streams, with no material change in the number of residents infected between 800 and 1000 random number streams. This conclusion was also reached for the shared facilities. There is a trade-off between decreased model computation time and improved accuracy as more simulations with different random number streams are undertaken. In this instance, we believed that 1000 random number streams were sufficient to provide accurate estimates of the number of infections and days in isolation.
Note that the number of cases identified in the care home, as opposed to residents actually infected, is a function of both the number of residents who become symptomatic and the diagnostic accuracy of the SARS-CoV-2 test used.
The use of net monetary benefit
Incremental cost-effectiveness ratios, being ratios of incremental costs divided by incremental QALYs, can be misleading when incremental QALY gains are small, or when the estimated values are very close between two interventions and one is stated to be dominating the other. Incremental net monetary benefit (NMB), defined as the cost per QALY threshold multiplied by the incremental QALY gain minus the incremental cost,45 removes these limitations. For brevity, incremental NMB will be shortened to NMB throughout this report. Under this framework, the largest NMB is associated with the most cost-effective strategy at the stated cost-per-QALY threshold and multiple strategies can be compared simultaneously, as the absolute difference in strategies in terms of NMB can be easily determined. These analyses have been undertaken at assumed cost thresholds of £20,000, £30,000 and £50,000, which are thresholds used in NICE technology appraisals,6 with the highest value used for treatments meeting the end-of-life criteria. ICERs are presented for strategies that are believed to be comparable.
Potential wider societal benefits
In addition to the cost per QALY results required by NICE,6 the EAG is mindful of potential wider societal benefits that may be associated with the decision problem. A number of aspects have not been formally included in the cost and/or QALY calculations. These include the impacts of staff members not being available to work because of symptoms suggestive of COVID-19 and subsequent isolation; the impacts on the family of staff members who have symptoms suggestive of COVID-19 and subsequent isolation; the potential for further spread of SARS-CoV-2 from infected staff members; the increased burden on general practitioners; the increased burden on hospitals from staff members or those in a chain of infection initiated by the staff member who was infected with SARS-CoV-2 and the potential suspension of visitors to the residential care facility.
Some of these costs (i.e. general practitioners and hospital) will fall directly on the NHS, although the EAG notes that the government will bear costs associated with staff members who need to self-isolate through the government’s Adult Social Care Infection Control Fund,8 which can top up statutory sick pay. Depending on the staff member required to self-isolate and their working pattern, this cost is likely to be between £500 and £900 for a 10-day isolation period, based on pay estimates of £10 per hour for care home workers and £16.50 per hour for a registered nurse.
Chapter 5 Results
The estimated number of infections per strategy
Figure 2 provides the modelled number of SARS-CoV-2 infections for each of the 13 strategies listed in Table 10 for the seeded en suite model. Figure 3 provides similar information for the seeded shared facilities model. The number of SARS-CoV-2 infections for non-seeded models is, by definition, zero.
FIGURE 2.
The estimated number of infections per strategy for an en suite residential care facility.
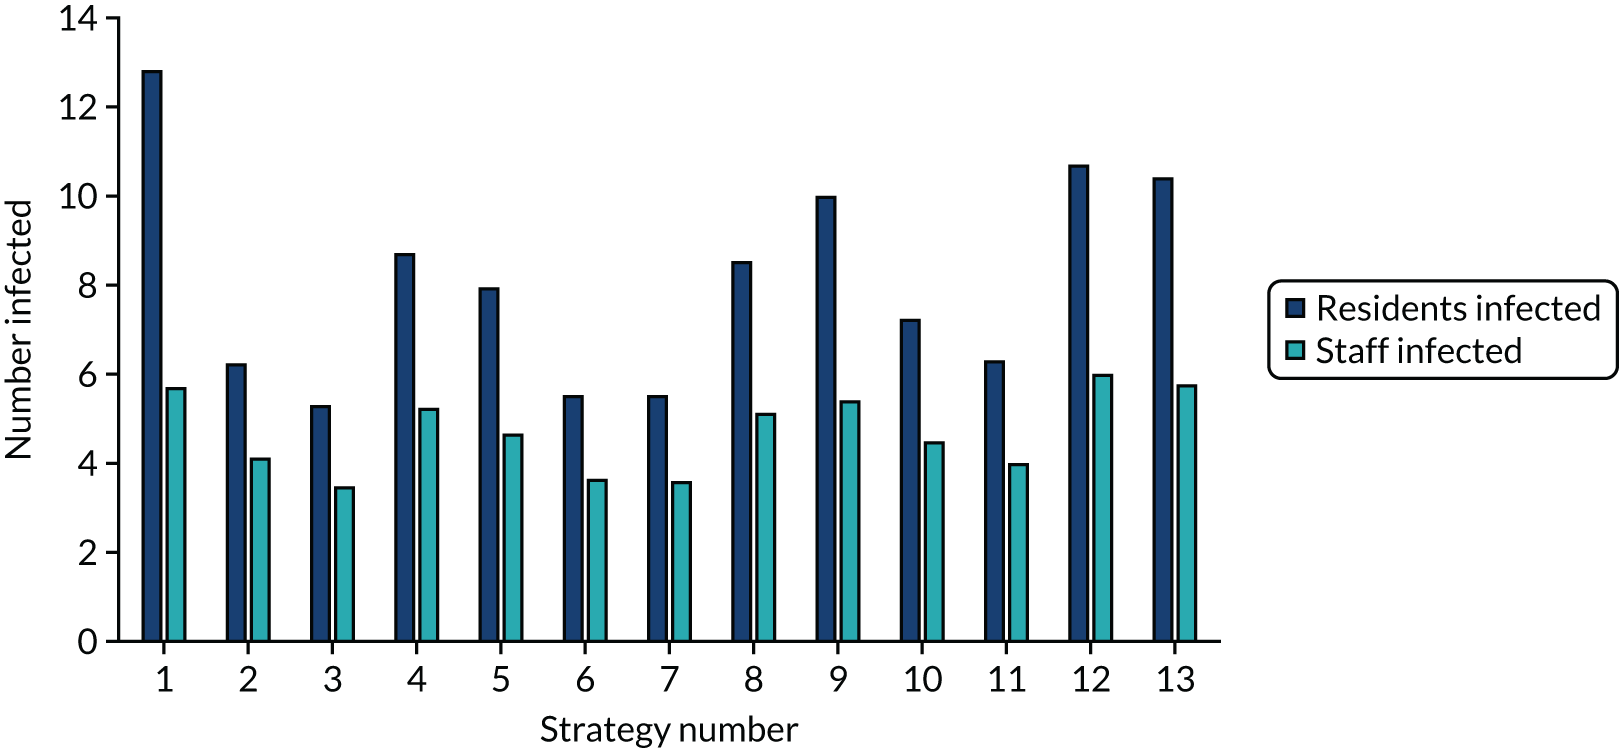
FIGURE 3.
The estimated number of infections per strategy for a shared facilities residential care facility.
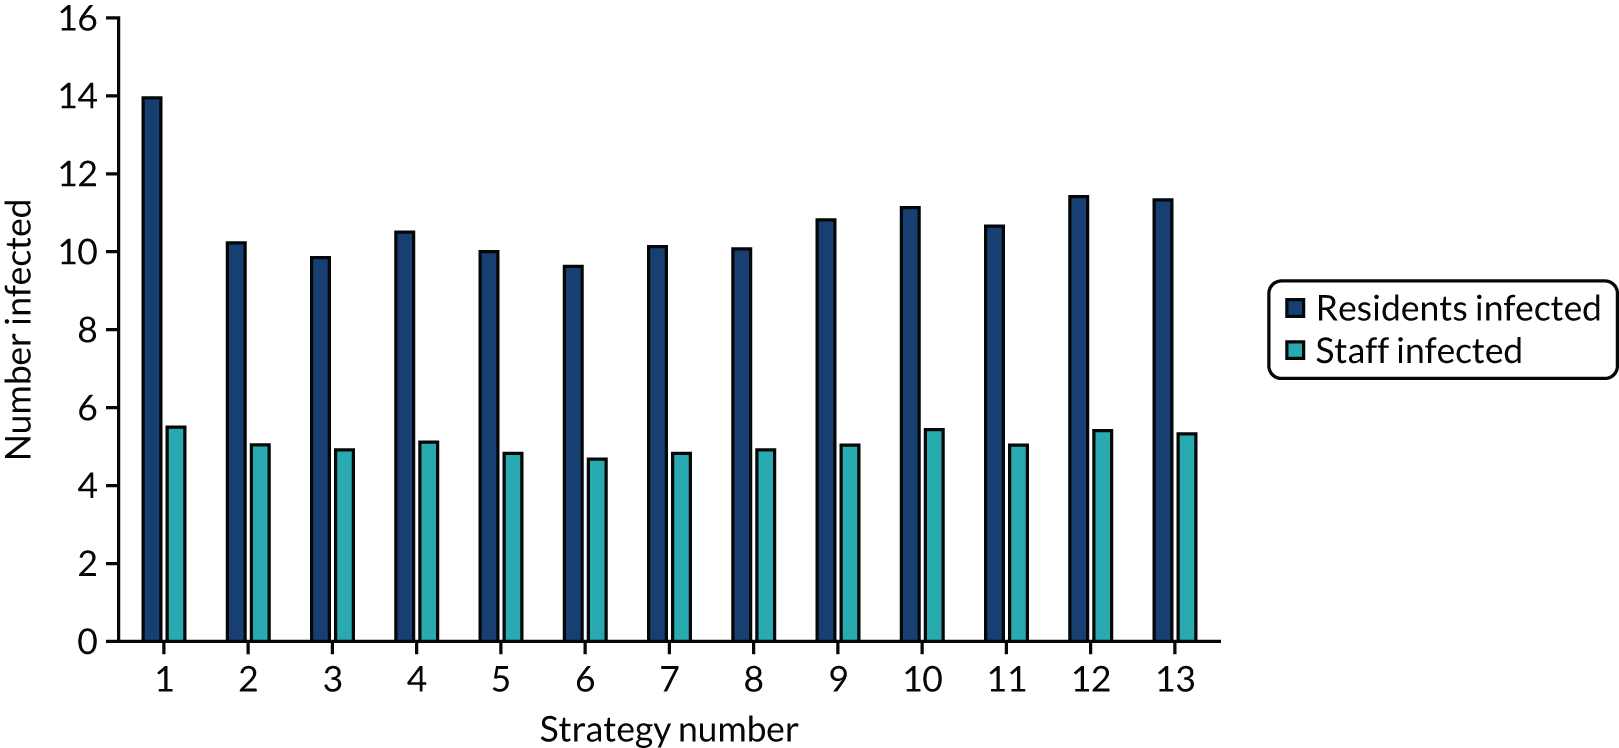
Strategy 1, which was believed to have been used in many care home facilities in the early response to SARS-CoV-2 infection, has the largest number of infections. This was because there was no routine testing and those with pre-symptomatic or asymptomatic SARS-CoV-2 infection would not have been detected, allowing the spread of SARS-CoV-2 infection. Given the assumption of the model that lockdown is initiated at clinical symptoms or a positive SARS-CoV-2 test result, the numbers of SARS-CoV-2 infections for strategies that do not allow early release from isolation are similar. The strategies that allow an early release have more infections than the counterpart strategies without early release.
The results are not always intuitive; for example, at face value, one may expect that the desirable TPP for a laboratory-based SARS-CoV-2 test would be to produce fewer SARS-CoV-2 infections than the acceptable TPP, as it performs better on sensitivity, specificity and failure rates (see Table 8). However, the decreased specificity for the acceptable TPP for the laboratory-based SARS-CoV-2 test means that the residential care facility would enter lockdown more often than when the desirable TPP was used. More frequent lockdowns decrease the spread of SARS-CoV-2 when the infected resident or staff member is asymptomatic, resulting in fewer infections, but at the expense of days in isolation, which may have a negative impact on residents.
The estimated days spent in isolation
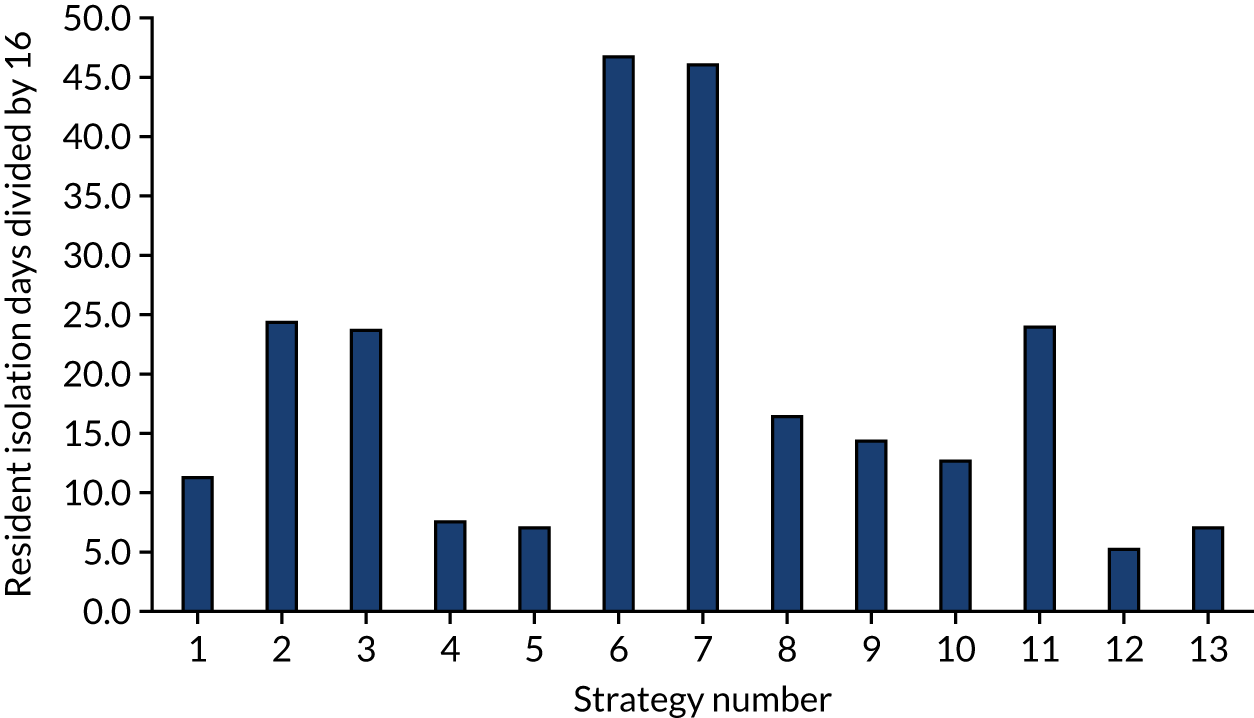
The model records the days spent in isolation by the entire cohort. For the purposes of presentation, we have assumed that there were no deaths within the bubble and have presented totals per resident by dividing the cohort total by 16. These values per strategy for the seeded en suite model are provided in Figure 4. Corresponding results for the seeded shared facility model, the non-seeded en suite model and the non-seeded shared facility model are provided in Figures 5–7, respectively.
FIGURE 4.
The estimated number of days in isolation per resident by strategy in the seeded en suite model.
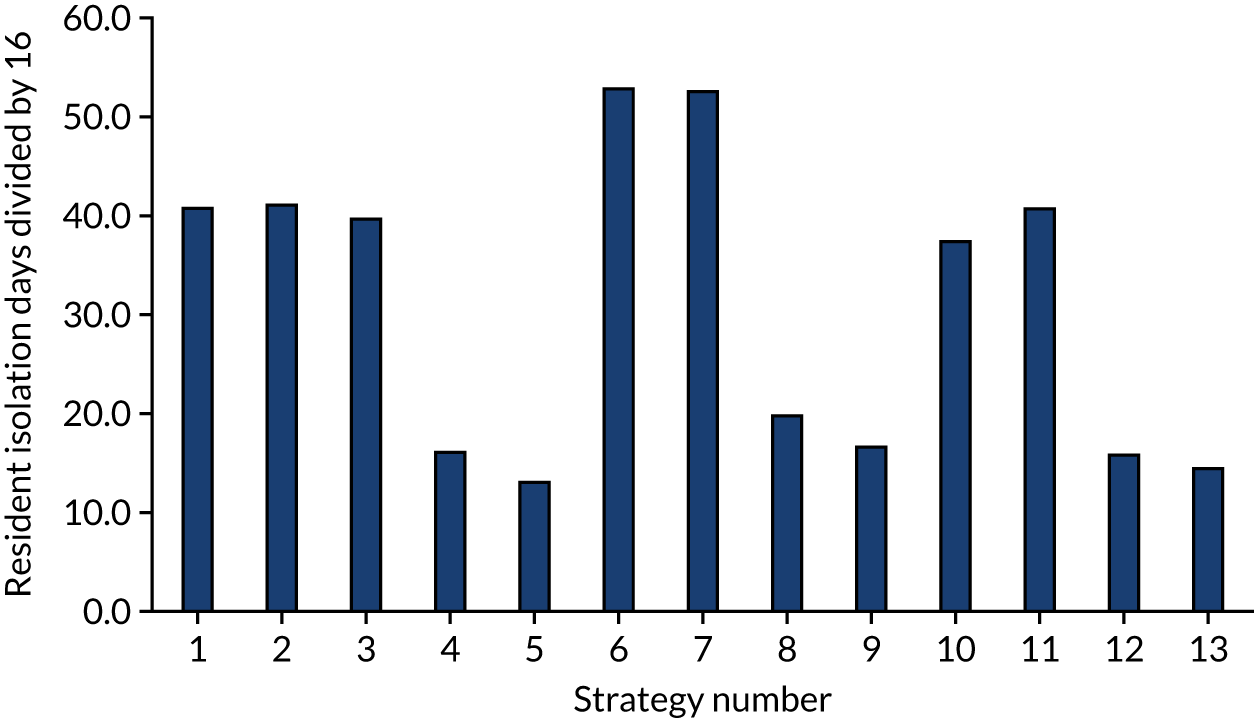
FIGURE 5.
The estimated number of days in isolation per resident by strategy in the seeded shared facility model.
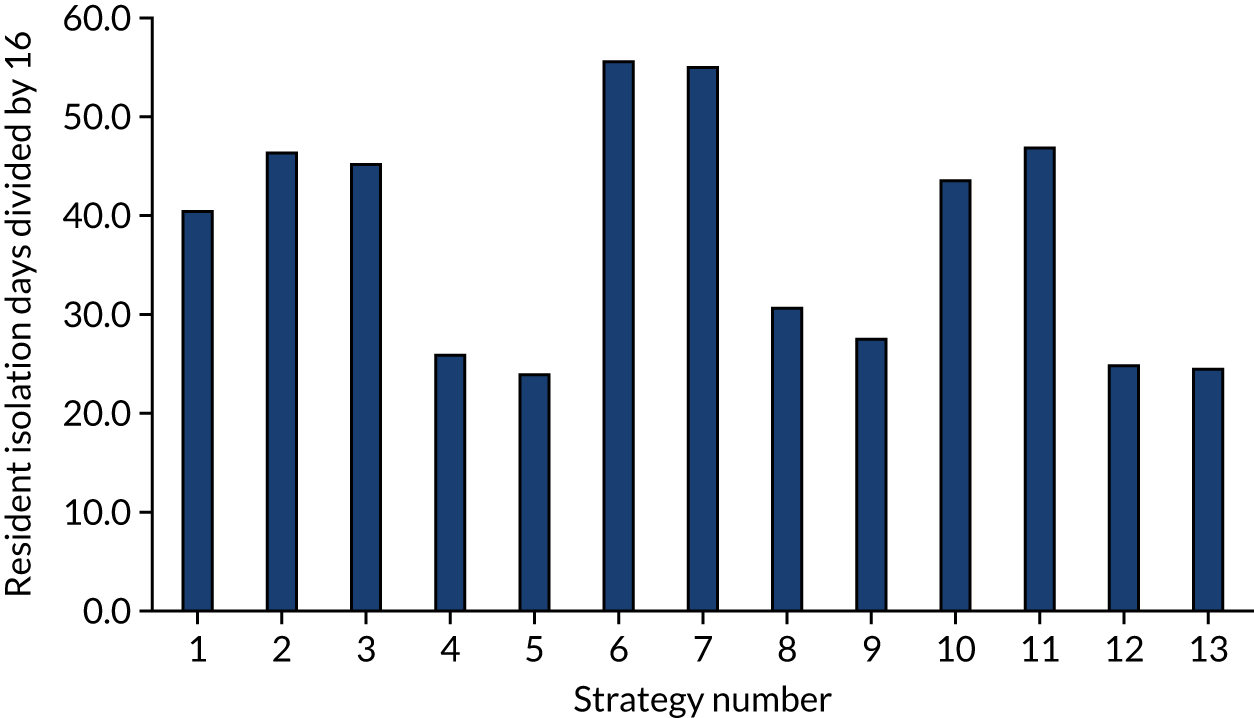
FIGURE 6.
The estimated number of days in isolation per resident by strategy in the non-seeded en suite model.
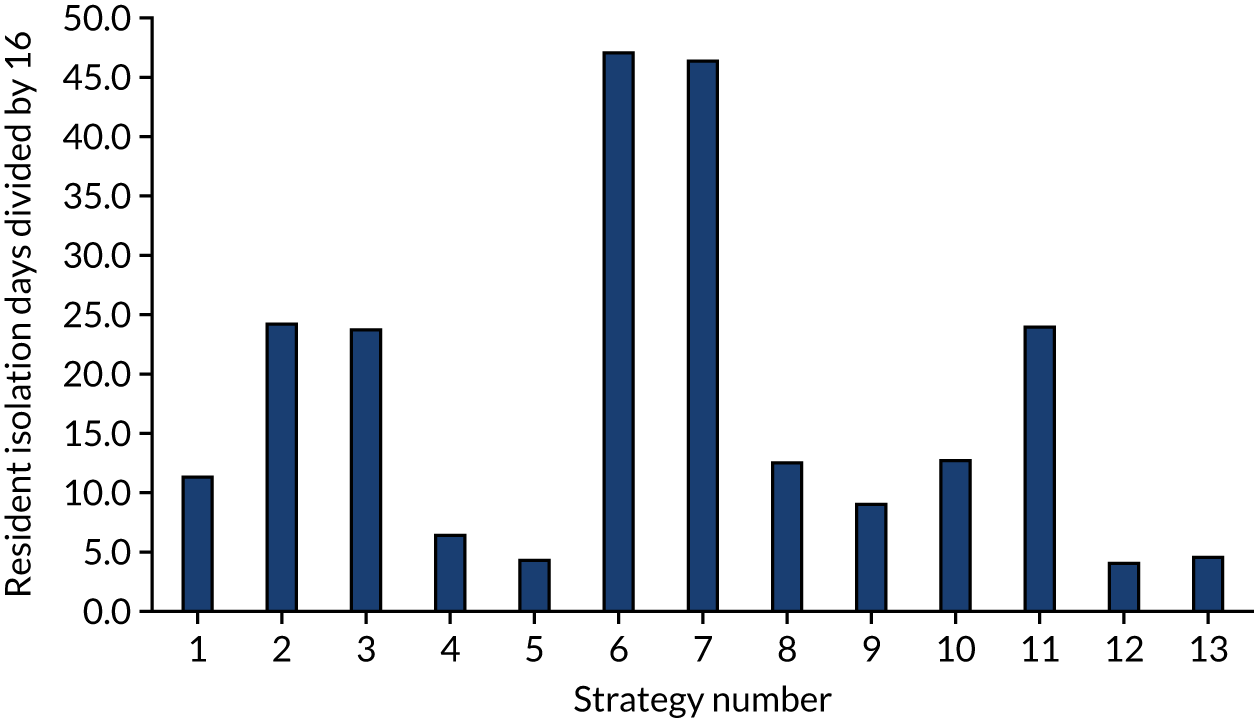
FIGURE 7.
The estimated number of days in isolation per resident by strategy in the non-seeded shared facility model.
The estimated number of SARS-CoV-2 tests performed
The number of tests performed in the seeded models were fairly similar, with the exceptions of the calibration strategy, for which the number was smaller, as there was no routine testing and all residents and staff were not tested following a suspected case or a positive SARS-CoV-2 test, and the strategies that had a poorer specificity, for which the numbers were larger, as there was a larger number of false-positive SARS-CoV-2 tests. Table 11 provides, to the nearest integer, the number of tests performed for strategies 1–13 for en suite or shared facilities, and when seeded or not.
| Strategy number | En suite (n) | Shared facilities (n) | ||
|---|---|---|---|---|
| Seeded | Non-seeded | Seeded | Non-seeded | |
| 1 | 7 | 1 | 8 | 1 |
| 2 | 250 | 215 | 263 | 215 |
| 3 | 248 | 214 | 261 | 214 |
| 4 | 258 | 224 | 264 | 221 |
| 5 | 255 | 223 | 263 | 221 |
| 6 | 277 | 262 | 287 | 262 |
| 7 | 279 | 262 | 287 | 262 |
| 8 | 287 | 271 | 288 | 269 |
| 9 | 289 | 272 | 288 | 269 |
| 10 | 241 | 191 | 255 | 191 |
| 11 | 251 | 215 | 265 | 215 |
| 12 | 247 | 195 | 254 | 194 |
| 13 | 261 | 225 | 265 | 223 |
Estimating the discounted quality-adjusted life-years lost from death due to COVID-19
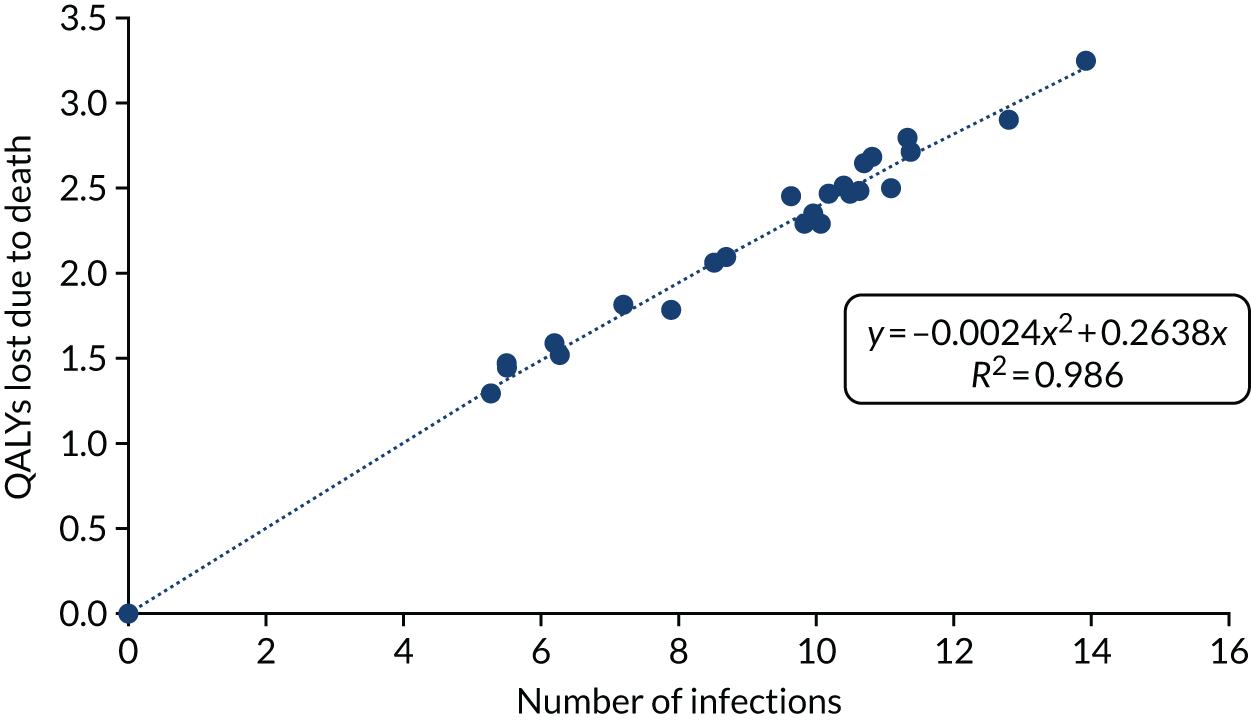
The equation for QALYs lost from death due to COVID-19 is seen in Figure 8. The statistical fit was very good, with an R2 of 0.986. The statistical model shown was forced to go through the origin to maintain the logic that zero infections would be associated with no QALY losses.
FIGURE 8.
The relationship between the number of SARS-CoV-2 infections and the QALYs lost from death due to COVID-19.
Estimating the discounted quality-adjusted life-years gained after survival from severe, non-fatal COVID-19, assuming no long-term consequences
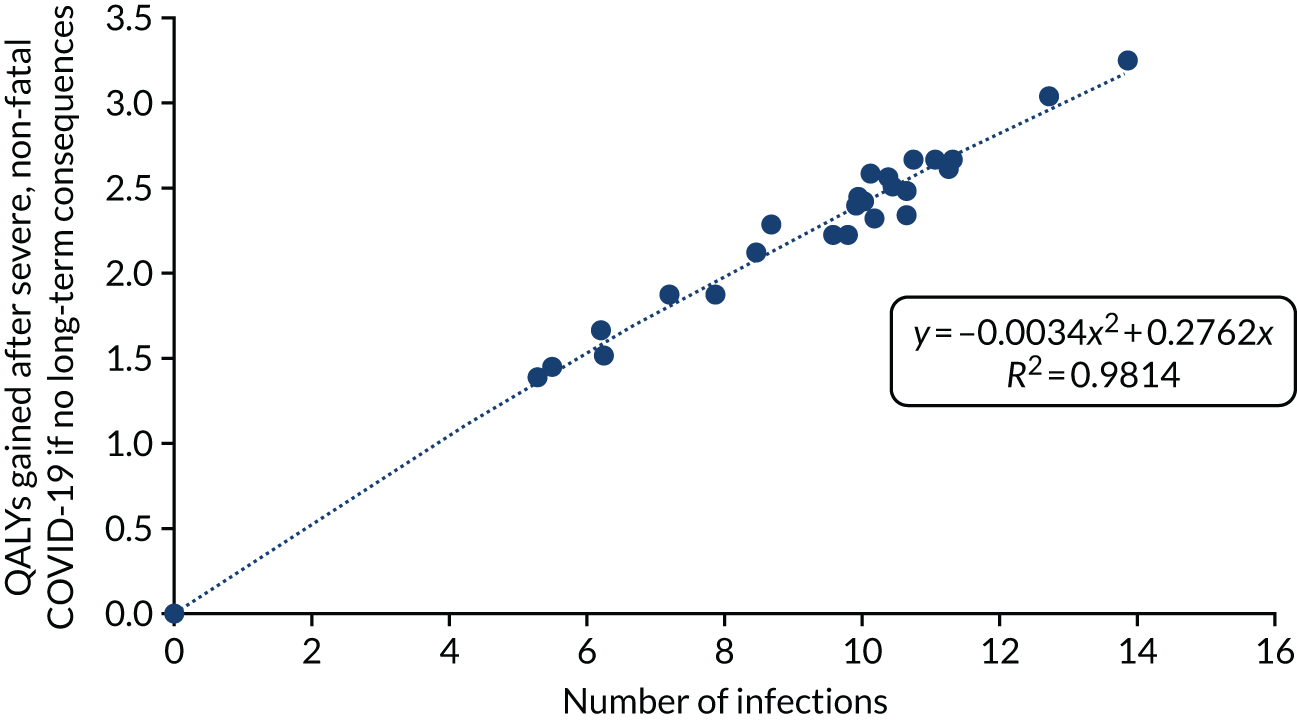
The assumed statistical relationship of discounted QALYs gained after survival from severe, non-fatal COVID-19, assuming no long-term consequences, is shown in Figure 9. As with the model for QALY losses due to COVID-19 deaths, the statistical model was forced to go through the origin. Again, there was a very good statistical fit, with an R2 of 0.981.
FIGURE 9.
The relationship between the number of SARS-CoV-2 infections and the expected QALYs gained after severe, non-fatal COVID-19, assuming long-term consequences.
Estimating the discounted quality-adjusted life-years lost for each strategy and the costs for each strategy for all models
The QALY loss and the cost of testing for each strategy in the seeded en suite model are shown in Table 12. Tables 13–15 provide similar information for the seeded shared facility model, the non-seeded en suite model and the non-seeded shared facility model, respectively. The non-seeded models will not have any QALYs losses due to COVID-19.
| QALY loss/cost of testing | Strategy | ||||||||||||
|---|---|---|---|---|---|---|---|---|---|---|---|---|---|
| 1 | 2 | 3 | 4 | 5 | 6 | 7 | 8 | 9 | 10 | 11 | 12 | 13 | |
| QALYs lost due to COVID-19 death | 2.98 | 1.54 | 1.32 | 2.11 | 1.93 | 1.38 | 1.38 | 2.07 | 2.39 | 1.78 | 2.54 | 1.56 | 2.48 |
| QALY loss post severe, non-fatal COVID-19 | 0.30 | 0.16 | 0.14 | 0.21 | 0.20 | 0.14 | 0.14 | 0.21 | 0.24 | 0.18 | 0.26 | 0.16 | 0.25 |
| QALY loss associated with isolation | 0.45 | 0.45 | 0.44 | 0.18 | 0.14 | 0.58 | 0.57 | 0.22 | 0.18 | 0.41 | 0.17 | 0.45 | 0.16 |
| Total QALY loss | 3.72 | 2.15 | 1.89 | 2.50 | 2.27 | 2.10 | 2.10 | 2.50 | 2.82 | 2.37 | 2.97 | 2.17 | 2.89 |
| Cost of testing (£) | 162 | 5500 | 5459 | 5677 | 5617 | 6099 | 6143 | 6323 | 6351 | 5298 | 5436 | 5521 | 5747 |
| QALY loss/cost of testing | Strategy | ||||||||||||
|---|---|---|---|---|---|---|---|---|---|---|---|---|---|
| 1 | 2 | 3 | 4 | 5 | 6 | 7 | 8 | 9 | 10 | 11 | 12 | 13 | |
| QALYs lost due to COVID-19 death | 3.21 | 2.44 | 2.36 | 2.50 | 2.39 | 2.31 | 2.43 | 2.41 | 2.57 | 2.63 | 2.54 | 2.69 | 2.68 |
| QALY loss post severe, non-fatal COVID-19 | 0.32 | 0.25 | 0.24 | 0.25 | 0.24 | 0.23 | 0.25 | 0.24 | 0.26 | 0.26 | 0.26 | 0.27 | 0.27 |
| QALY loss associated with isolation | 0.44 | 0.51 | 0.50 | 0.28 | 0.26 | 0.61 | 0.60 | 0.34 | 0.30 | 0.48 | 0.51 | 0.27 | 0.27 |
| Total QALY loss | 3.97 | 3.19 | 3.09 | 3.03 | 2.89 | 3.16 | 3.28 | 2.99 | 3.13 | 3.37 | 3.31 | 3.23 | 3.21 |
| Cost of testing (£) | 172 | 5776 | 5741 | 5807 | 5781 | 6303 | 6314 | 6343 | 6337 | 5601 | 5820 | 5579 | 5834 |
| QALY loss/cost of testing | Strategy | ||||||||||||
|---|---|---|---|---|---|---|---|---|---|---|---|---|---|
| 1 | 2 | 3 | 4 | 5 | 6 | 7 | 8 | 9 | 10 | 11 | 12 | 13 | |
| QALY loss associated with isolation | 0.12 | 0.26 | 0.26 | 0.07 | 0.05 | 0.51 | 0.51 | 0.14 | 0.10 | 0.14 | 0.26 | 0.05 | 0.05 |
| Cost of testing (£) | 22 | 4728 | 4707 | 4918 | 4903 | 5755 | 5771 | 5972 | 5977 | 4208 | 4730 | 4297 | 4943 |
| QALY loss/cost of testing | Strategy | ||||||||||||
|---|---|---|---|---|---|---|---|---|---|---|---|---|---|
| 1 | 2 | 3 | 4 | 5 | 6 | 7 | 8 | 9 | 10 | 11 | 12 | 13 | |
| QALY loss associated with isolation | 0.12 | 0.27 | 0.26 | 0.08 | 0.08 | 0.51 | 0.51 | 0.18 | 0.16 | 0.14 | 0.26 | 0.06 | 0.08 |
| Cost of testing (£) | 22 | 4737 | 4705 | 4854 | 4858 | 5768 | 5757 | 5909 | 5926 | 4201 | 4726 | 4269 | 4899 |
Estimating the implications of a bubble being penetrated
When a bubble is penetrated, there will be an increase in the number of SARS-CoV-2 infections and in the time residents spend in isolation. The increase in the numbers of infections is provided in Figures 2 and 3. By definition, there are no infections in the non-seeded group. However, isolation occurs in both groups. Figure 10 provides the increase in isolation days that occurs when a bubble is penetrated by SARS-CoV-2, which is the difference between Figures 4 and 6 for the en suite model and between Figures 5 and 7 for the shared facilities model. It can be seen that the strategies that use the acceptable TPPs for one of laboratory-based SARS-CoV-2 tests or SARS-CoV-2 POCTs only have a smaller increase in isolation time, as more residents were isolated because of the larger number of false-positive tests.
FIGURE 10.
The number of additional isolation days per resident for penetrated bubbles vs. infection-free bubbles.
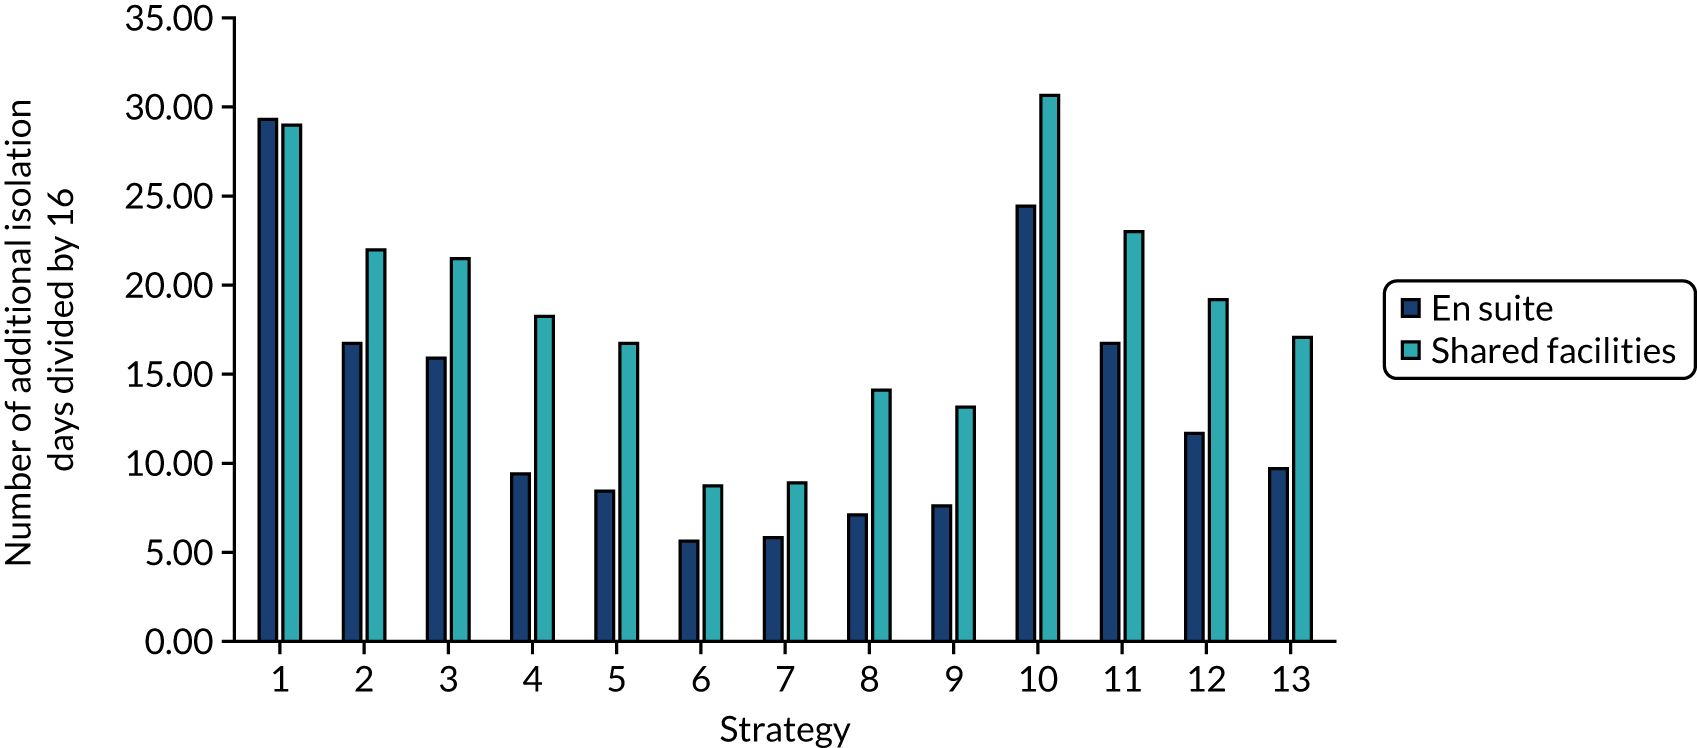
Estimating the cost-effectiveness of the strategies for given combinations of residential care facility type and whether or not the bubble is penetrated
For the seeded en suite model, the NMB values associated with each strategy are presented in Figure 11. Corresponding results for the seeded shared facility model, the non-seeded en suite model and the non-seeded shared facility model are provided in Figures 12–14, respectively.
FIGURE 11.
The NMB associated with each strategy at stated cost-per-QALY thresholds for the seeded en suite model.
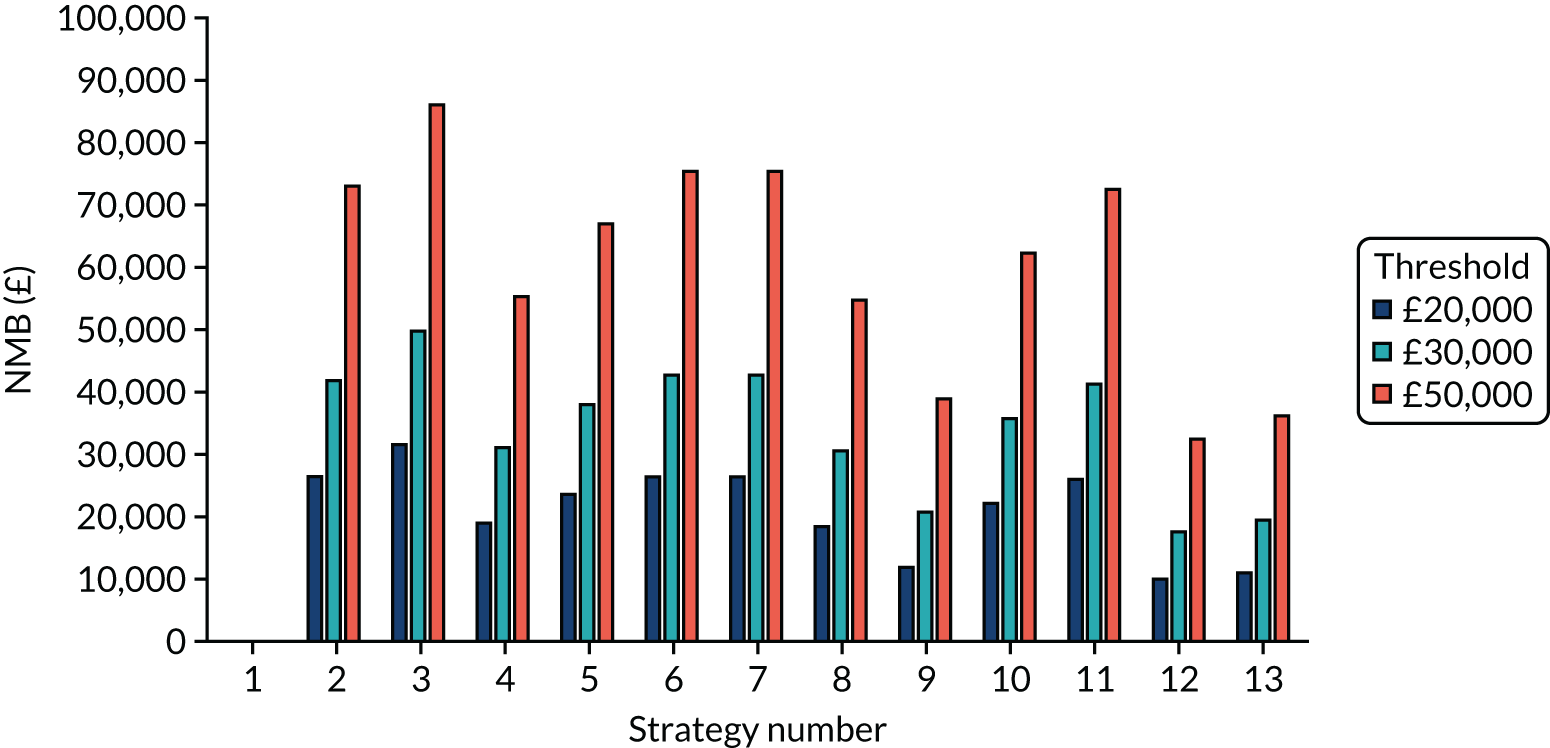
FIGURE 12.
The NMB associated with each strategy at stated cost-per-QALY thresholds for the seeded shared facility model.
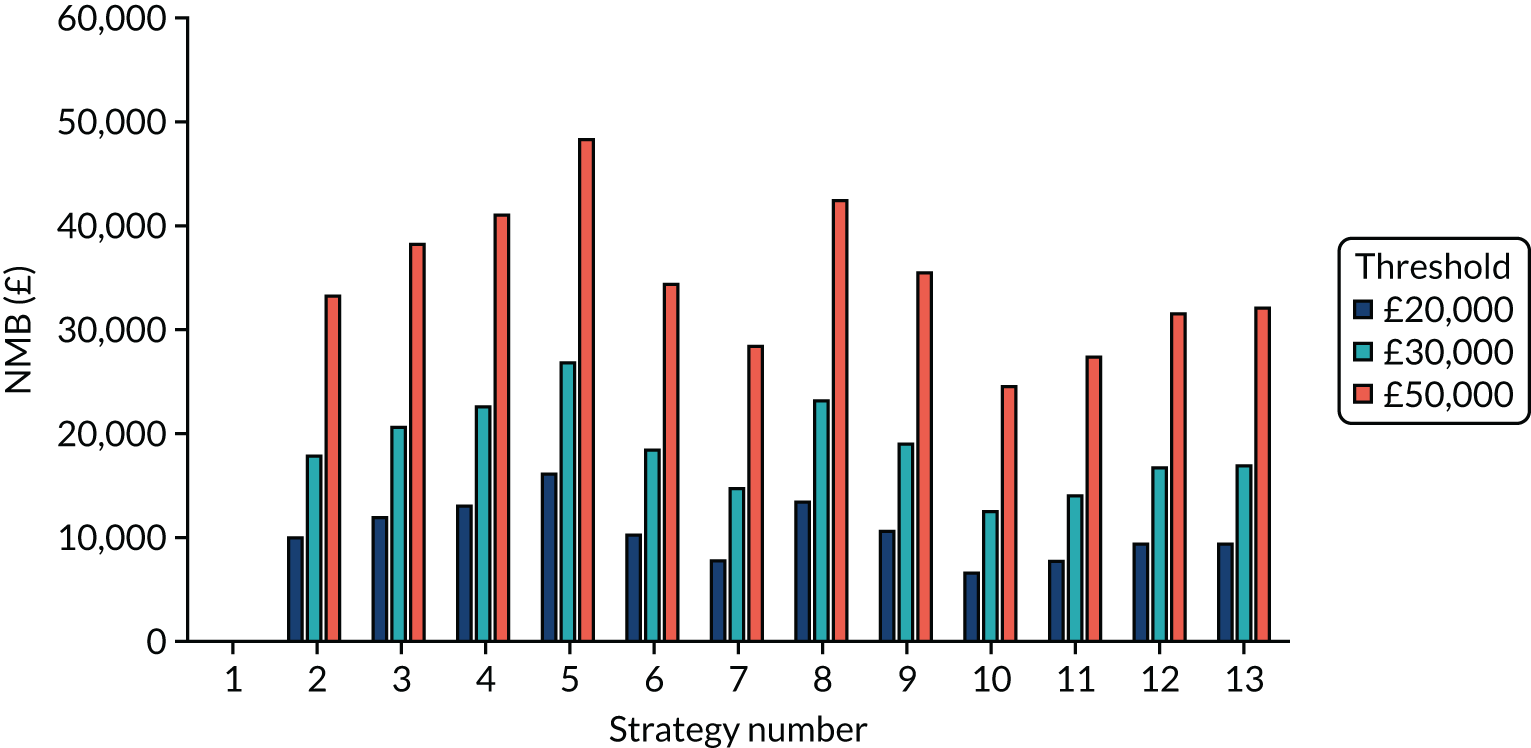
FIGURE 13.
The NMB associated with each strategy at stated cost-per-QALY thresholds for the non-seeded en suite model.
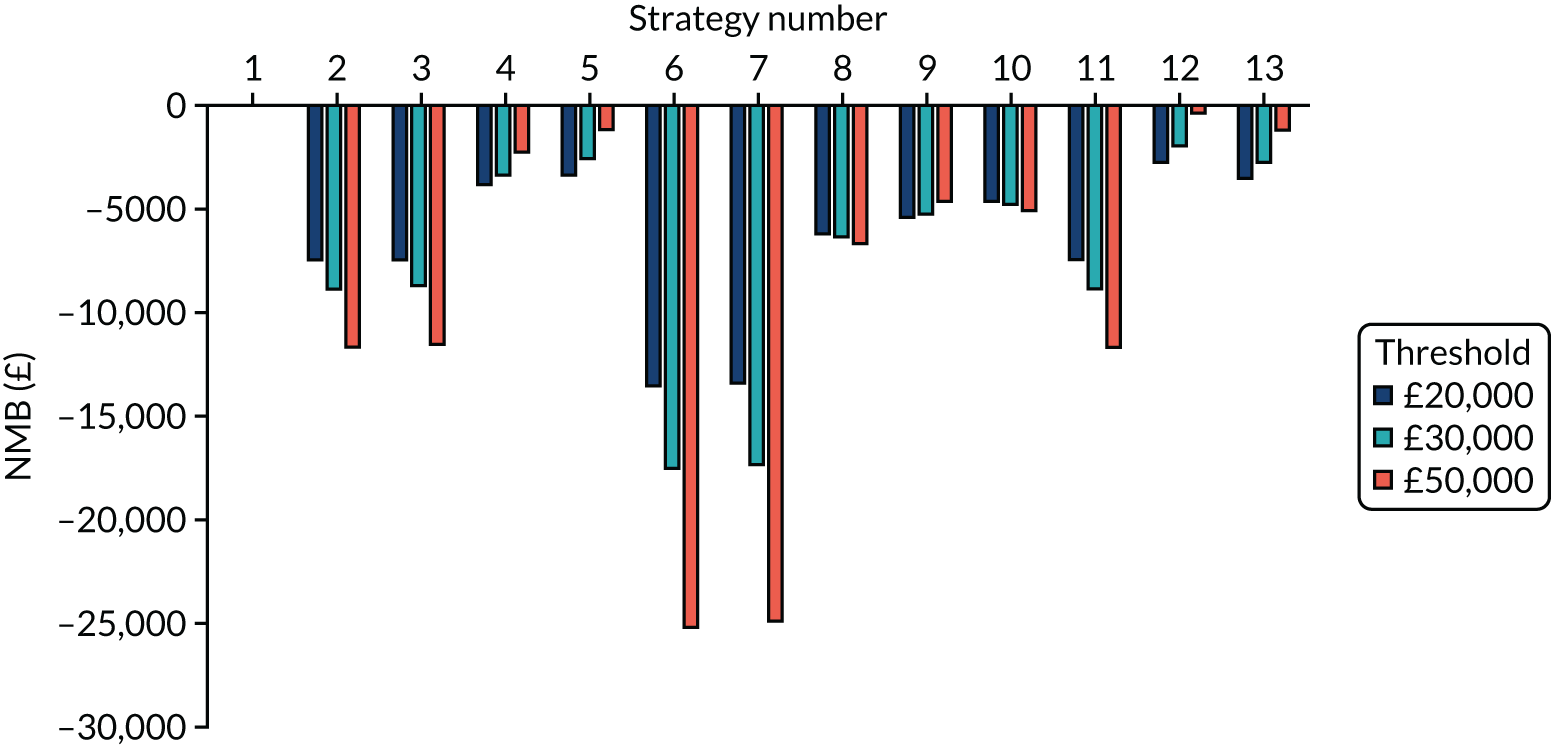
FIGURE 14.
The NMB associated with each strategy at stated cost-per-QALY thresholds for the non-seeded shared facility model.
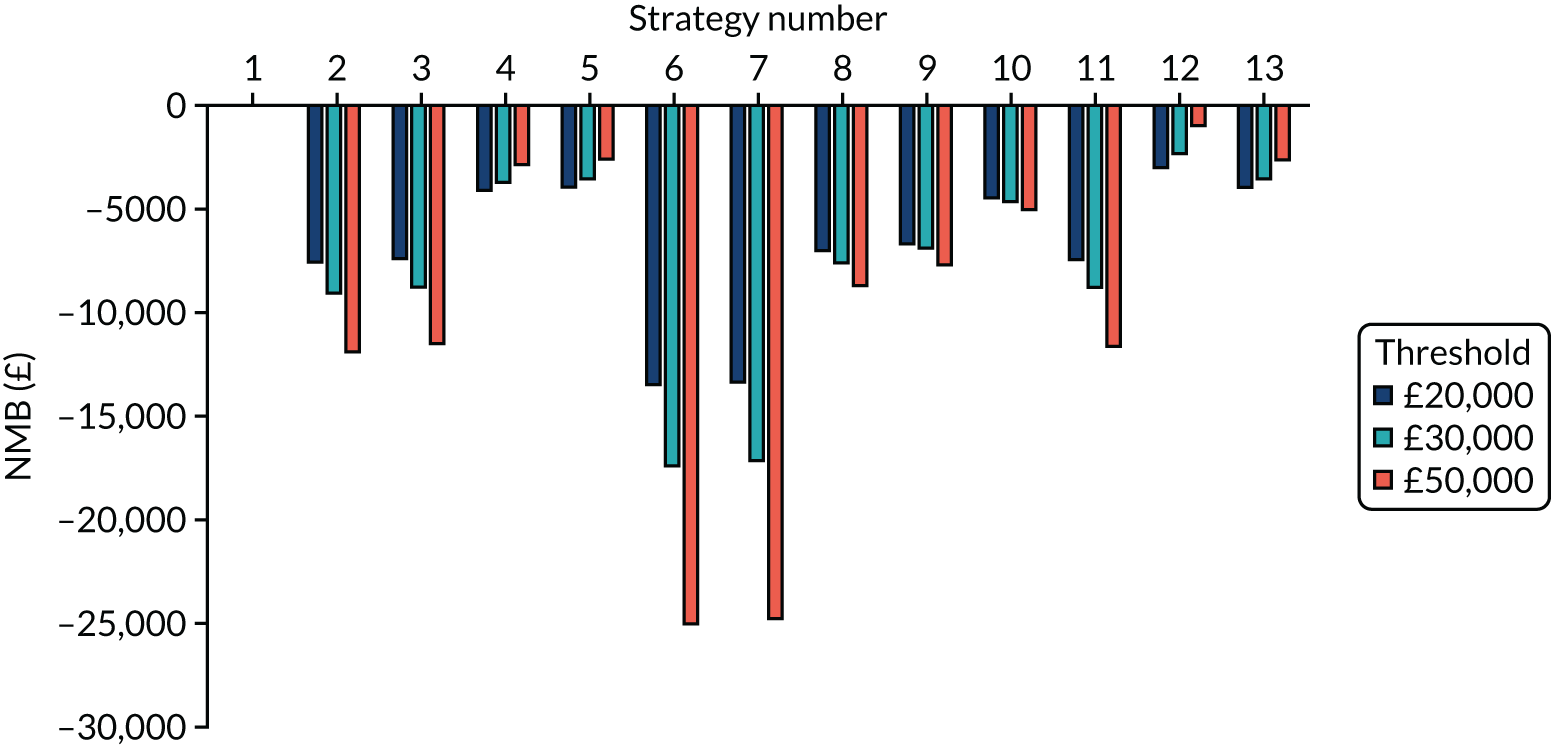
As expected, the NMBs for all strategies in the seeded model are positive compared with strategy 1, indicating that the strategies appear to result in ICERs below the thresholds stated when the bubble is penetrated. Conversely, all NMBs in the non-seeded models are less than zero, indicating that, when a bubble is not penetrated, the strategies do not result in ICERs lower than the thresholds stated when the bubble remains free of SARS-CoV-2 infection. However, it is not known which bubbles will be penetrated and which will not. The weighted average NMB for estimations of the proportion of bubbles penetrated is provided in The weighted net monetary benefit for each strategy.
Results having assumed that the proportion of bubbles penetrated is 50%
The following subsections provide the estimated number of infections, the estimated days in isolation per resident and the expected NMB for each strategy having assumed that 50% of bubbles are penetrated. The results are provided for en suite residential care facilities and those with shared facilities.
The weighted number of expected infections per strategy
The weighted number of infections in the en suite residential care facility model per strategy is shown in Figure 15. Figure 16 provides the same information for residential care facilities with shared facilities.
FIGURE 15.
The weighted number of infections per strategy, assuming that 50% of bubbles are penetrated in the en suite model.
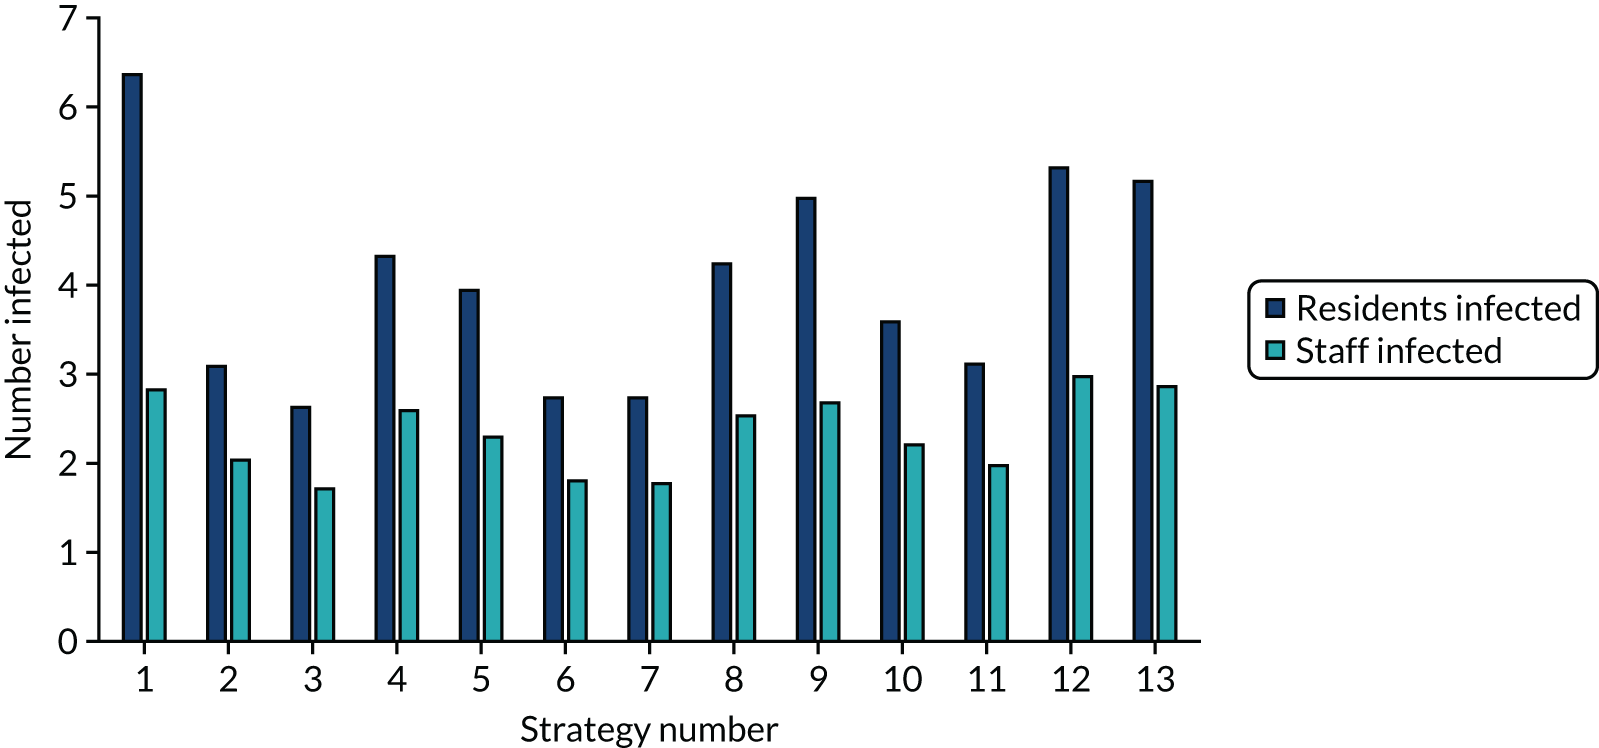
FIGURE 16.
The weighted number of infections per strategy, assuming that 50% of bubbles are penetrated in the shared facility model.
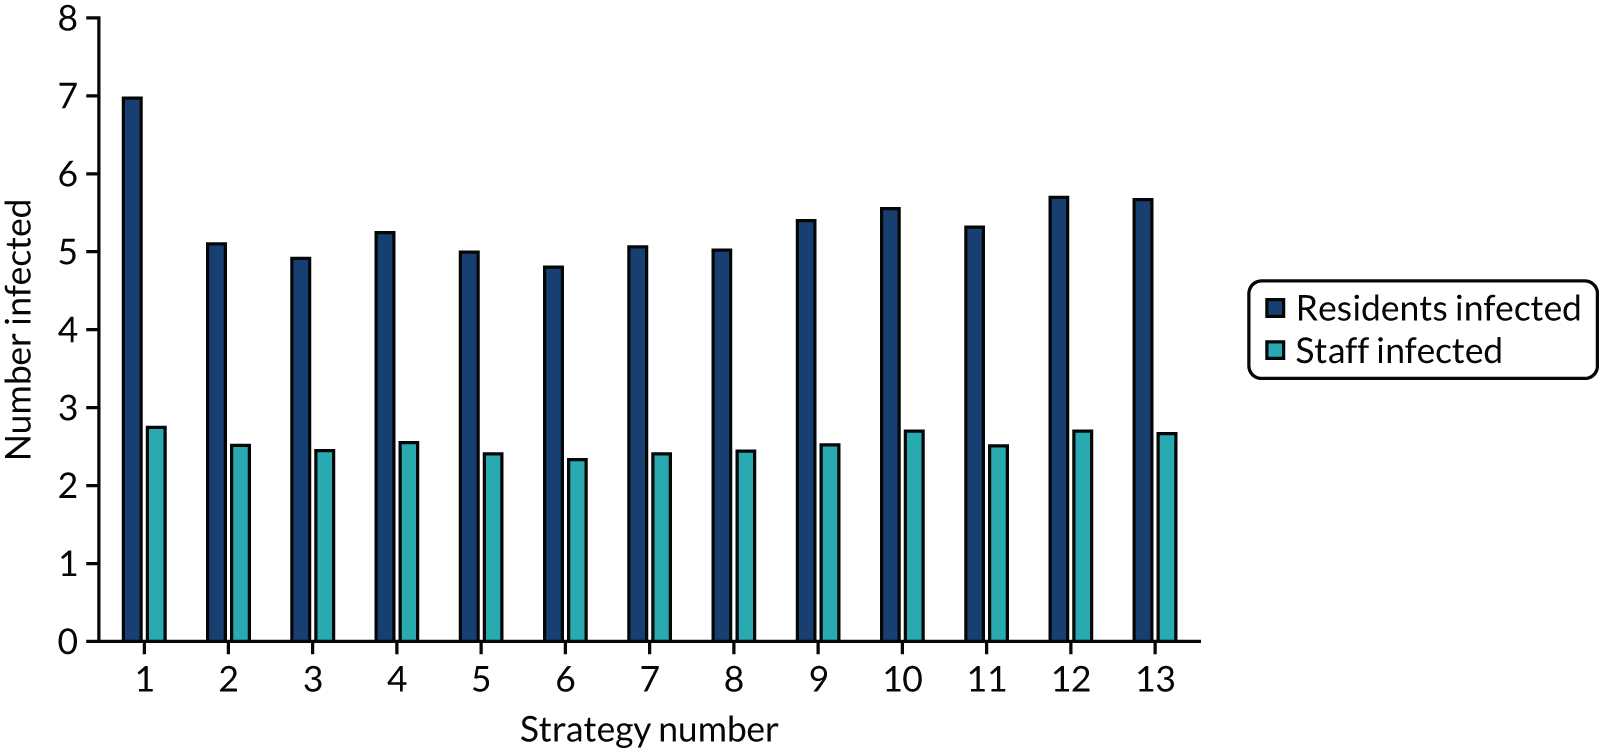
The weighted number of estimated days in isolation per resident
The weighted number of days in isolation for residents in the en suite residential care facility model per strategy is shown in Figure 17. Figure 18 provides the same information for residential care facilities with shared facilities.
FIGURE 17.
The weighted number of days in isolation per resident per strategy, assuming that 50% of bubbles are penetrated in the en suite model.
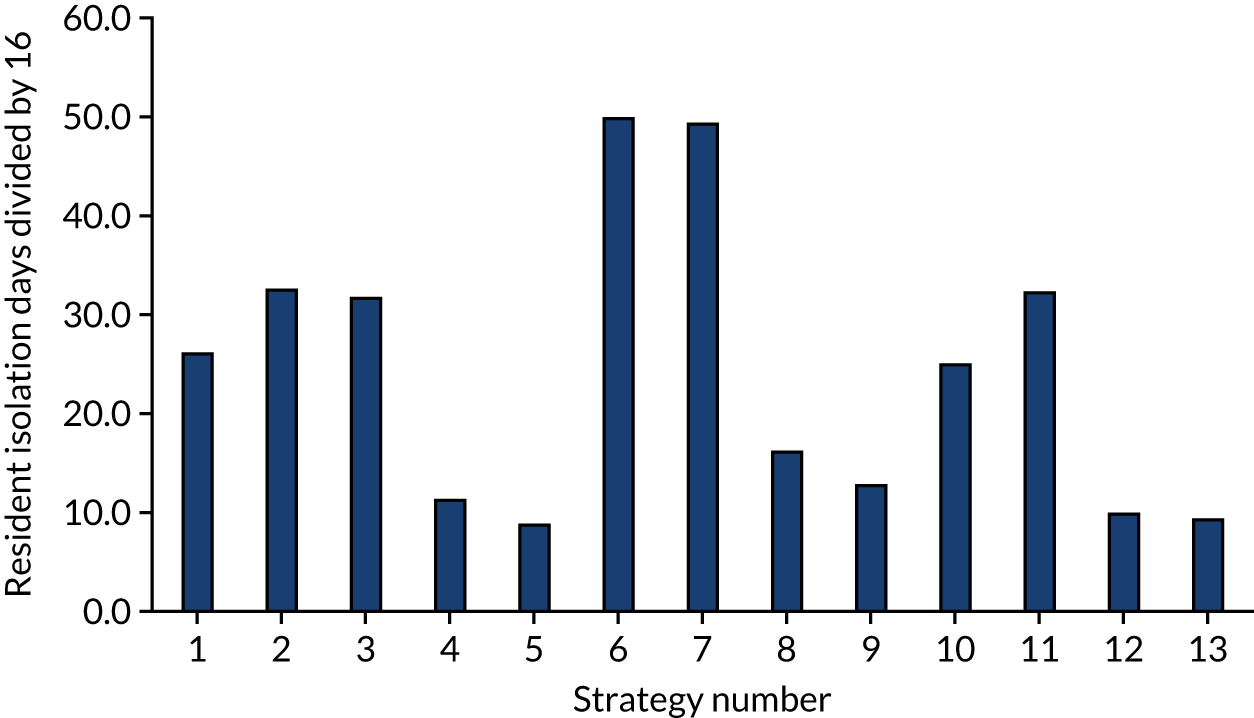
FIGURE 18.
The weighted number of days in isolation per resident per strategy, assuming that 50% of bubbles are penetrated in the shared facility model.
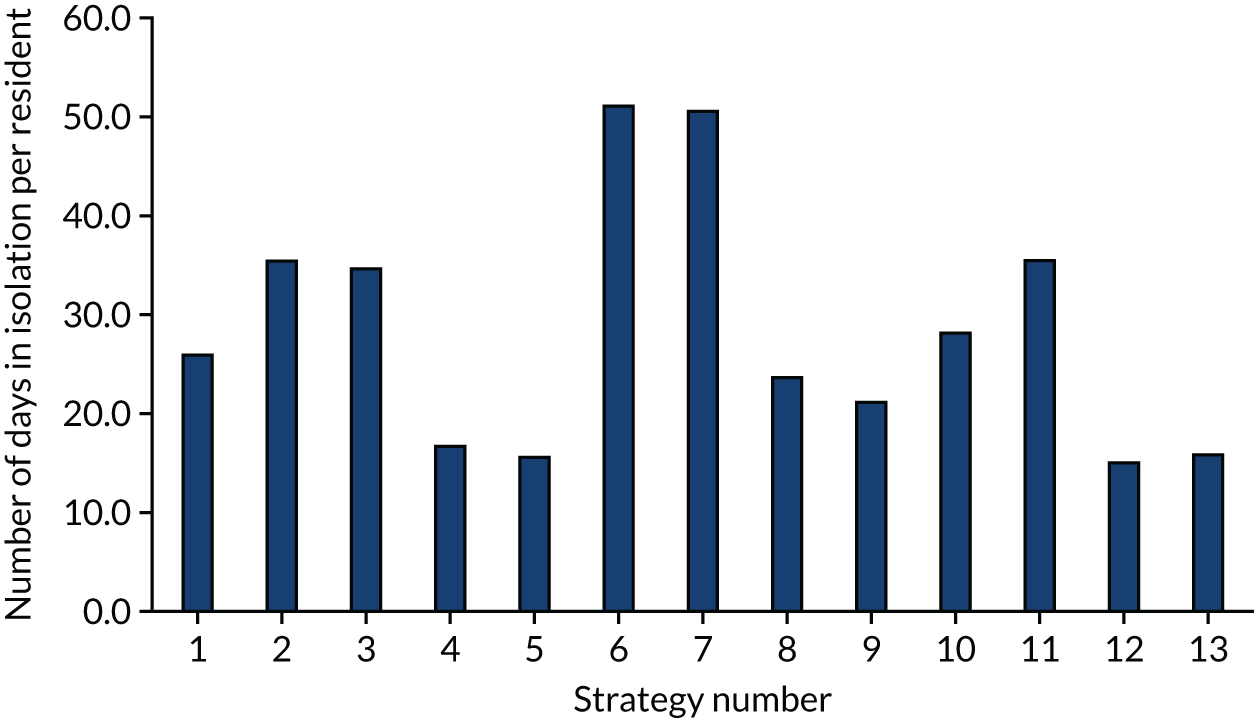
The weighted net monetary benefit for each strategy
The weighted NMBs, assuming that 50% of bubbles are penetrated, in the en suite model per strategy are shown in Figure 19. Figure 20 provides the same information for residential care facilities with shared facilities.
FIGURE 19.
The weighted NMB per strategy in the base-case en suite model.
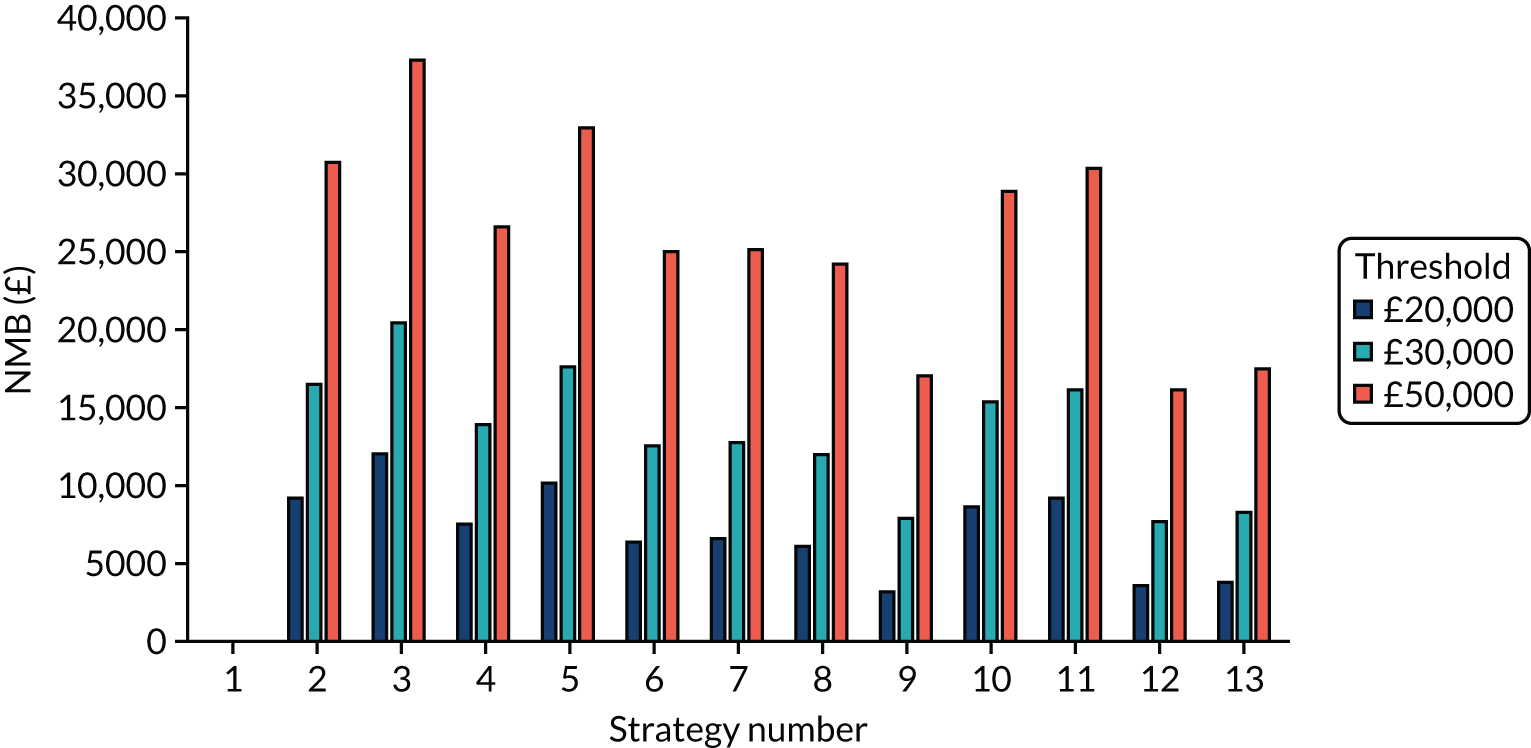
FIGURE 20.
The weighted NMB per strategy in the shared facility model.
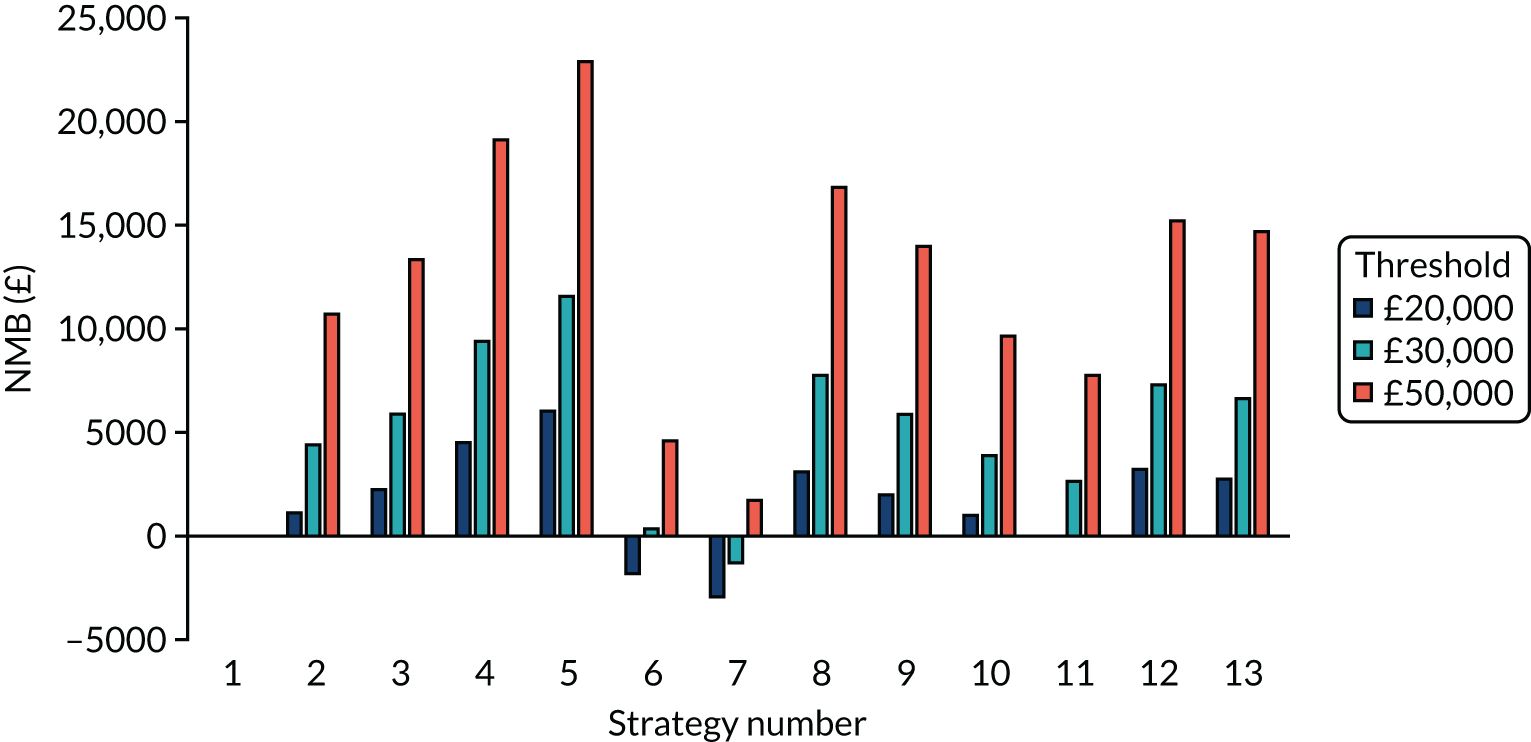
For en suite residential care facilities, all strategies have a positive NMB compared with strategy 1 and the ranking of the strategies remains largely constant, independent of the cost per QALY threshold value chosen. Strategy 3 (i.e. a SARS-CoV-2 POCT with a desirable TPP) has the highest expected NMB.
For residential care facilities with shared facilities, the NMBs are lower and some are negative, indicating that some strategies (i.e. strategies 6 and 7) have ICERs greater than the £20,000 and £30,000 thresholds, compared with strategy 1. These two strategies are when the laboratory-based SARS-CoV-2 tests and the SARS-CoV-2 POCTs are at the acceptable TPP, questioning whether or not the acceptable TPP requirement needs to be tightened or if this specific-use case should be excluded. The reason for this result is the large NMB loss in the non-seeded scenario (see Figure 14), which is caused by the additional days in isolation associated with the lower specificity of the acceptable TPPs. Strategy 5 (i.e. SARS-CoV-2 POCT with desirable a TPP and early release) has the highest expected NMB.
Key incremental cost-effectiveness ratios
The provided NMBs allow quick comparison of multiple strategies, but not all comparisons are informative. For example, comparing the cost-effectiveness of a desirable TPP with an acceptable TPP at the same price may provide little insight. The EAG has selected comparisons that it believes are pertinent to inform the NICE Diagnostics Advisory Committee. These are presented in four blocks that reflect the possible combinations of residential care facilities with en suite and shared facilities and assumptions made regarding the early release of residents. Care must be taken in interpreting ICERs, particularly those in the south-west quadrant of the cost-effectiveness plane, where QALYs are being lost and a value greater than the threshold would be cost-effective (the reverse of standard rules), and also not placing too much significance in ICERs when the absolute differences in costs and QALYs are small.
The results for residents in en suite residential care facilities are shown in Table 16. Table 17 provides the results for residents in residential care facilities with shared facilities. In both tables, the incremental costs and QALYs are those of the first test compared with the second test, and so in Table 16 a laboratory-based SARS-CoV-2 test with a desirable TPP is assumed to incur £31 more cost and to accrue 0.13 less QALYs than a SARS-CoV-2 POCT with a desirable TPP, and is dominated.
| Tests compared | No early release permitted | Early release permitted | ||||
|---|---|---|---|---|---|---|
| Incremental costs (£) | Incremental QALYs | ICER (£) | Incremental costs (£) | Incremental QALYs | ICER (£) | |
| POCT (D) compared with a laboratory-based test (D) | –31 | 0.13 | Dominating | –37 | 0.13 | Dominating |
| POCT (A) compared with a laboratory-based test (A) | 20 | 0.00 | 5621 | 17 | –0.14 | Dominated |
| POCT (A) compared with a laboratory-based test (D) | 843 | –0.10 | Dominated | 867 | –0.17 | Dominated |
| POCT (D) compared with a laboratory-based test (A) | –854 | 0.23 | Dominating | –887 | 0.16 | Dominating |
| POCT (RWE) compared with a laboratory-based test (RWE) | 372 | 0.04 | 9274 | 479 | 0.04 | 13,127 |
| Laboratory-based test (D) compared a with laboratory-based test (RWE) | 361 | 0.05 | 7672 | 431 | 0.22 | 1960 |
| Laboratory-based test (A) compared with a laboratory-based test (RWE) | 1184 | –0.05 | Dominated | 1280 | 0.19 | 6791 |
| POCT (D) compared with a POCT (RWE) | –42 | 0.14 | Dominating | –85 | 0.31 | Dominating |
| POCT (A) compared with a POCT (RWE) | 831 | –0.09 | Dominated | 819 | 0.01 | 71,483 |
| Tests compared | No early release permitted | Early release permitted | ||||
|---|---|---|---|---|---|---|
| Incremental costs (£) | Incremental QALYs | ICER (£) | Incremental costs (£) | Incremental QALYs | ICER (£) | |
| POCT (D) compared with a laboratory-based test (D) | –34 | 0.05 | Dominating | –11 | 0.07 | Dominating |
| POCT (A) compared with a laboratory-based test (A) | 0 | –0.06 | Dominated | 6 | –0.06 | Dominated |
| POCT (A) compared with a laboratory-based test (D) | 779 | –0.16 | Dominated | 801 | –0.09 | Dominated |
| POCT (D) compared with a laboratory-based test (A) | –813 | 0.16 | Dominating | –806 | 0.10 | Dominating |
| POCT (RWE) compared with a laboratory-based test (RWE) | 372 | –0.03 | Dominated | 442 | –0.00 | Dominated |
| Laboratory-based test (D) compared with a laboratory-based test (RWE) | 356 | 0.03 | 13,666 | 406 | 0.09 | 4767 |
| Laboratory-based test (A) compared with a laboratory-based test (RWE) | 1134 | –0.08 | Dominated | 1202 | 0.06 | 21,108 |
| POCT (D) compared with a POCT (RWE) | –50 | 0.11 | Dominating | –47 | 0.16 | Dominating |
| POCT (A) compared with a POCT (RWE) | 763 | –0.11 | Dominated | 765 | 0.00 | 3,393,252 |
It is seen that the results are dependent on the diagnostic accuracy assumed for the laboratory-based SARS-CoV-2 test and the SARS-CoV-2 POCT, as would be expected. For example, a SARS-CoV-2 POCT with a desirable TPP dominates a laboratory-based SARS-CoV-2 test with a desirable TPP. However, a SARS-CoV-2 POCT with an acceptable TPP is dominated by a laboratory-based SARS-CoV-2 test with a desirable TPP.
Sensitivity analyses undertaken
There is considerable uncertainty relating to the parameters in the model. This has been explored in sensitivity analyses, although these analyses were constrained by the deadlines for the report. The change in the difference in key outcomes between the strategies may be informative to the NICE Diagnostics Advisory Committee. Owing to time constraints, only selected strategies, types of residential care facility and seeding options, were run. As there appeared to be no difference in the conclusions between pairs of tests in the en suite or the shared facilities model (see Tables 16 and 17), the sensitivity analyses were largely undertaken in the en suite version only.
Ten sets of sensitivity analyses were undertaken to explore how the results of the model changed when key assumptions related to key elements were altered. Five sets of sensitivity analyses required the simulation model to be re-run. For the other five sets, the analyses could be undertaken with the results produced when deriving the base-case results. The results for sensitivity analyses that did not materially affect the conclusions are presented in Appendix 1.
The five sensitivity analyses that required new runs of the simulation model were (1) changing the age of residents within the residential care facility, (2) changing the underlying rates of non-COVID-19 diseases that had symptoms suggestive of COVID-19, (3) assuming that a proportion of residents within the residential care facility had immunity to SARS-CoV-2, potentially because of vaccination, (4) changing the seed to a member of staff allocated to dealing with non-isolated residents and (5) assuming that a lower proportion of people become symptomatic following SARS-CoV-2 infection.
The following five sensitivity analyses could be applied after the model has been run and therefore results are provided for all of these strategies: (1) altering the proportion of bubbles that are assumed to be penetrated, (2) changing the relative costs of laboratory-based SARS-CoV-2 tests and the costs of SARS-CoV-2 POCTs, (3) assuming that there is no loss of QALYs for those residents who do not die from COVID-19, (4) increasing the severity of consequences after severe COVID-19 infection and (5) varying the QALY multiplier for residents who have had severe non-fatal COVID-19.
Exploring the effects of younger residents within the residential care facility
The base-case model focused on a residential care facility with elderly residents, although there are residential care facilities that accommodate younger residents. An analysis was undertaken that assumed a residential care facility with residents aged between 18 and 34 years, following a uniform distribution. A recent PHE report46 reported that, for people with learning disabilities who are aged 18–34 years, who have been taken as a proxy for people in residential care facilities, the death rate from COVID-19 was 6.3 times higher than that of the general population and all-cause mortality was 30 times higher than in the general population. These multipliers have been applied to the probabilities in Tables 4 and 5. For simplicity, it has been assumed that 50% of residents aged 18–34 years in residential care facilities are male.
As the only impacts of younger residents would be on the risk of death following severe COVID-19 and the QALYs lost because of COVID-19, only strategies 2–5 were run for the seeded en suite model. Although there were fewer deaths in the younger resident scenario, the number of QALYs lost per death was significantly larger (see Table 9), resulting in more QALY losses overall. However, the ranking in terms of NMB, as shown in Appendix 1, Figure 26, has the same pattern as that in the base case (see Figure 11), indicating similar rankings of strategies, albeit with higher NMBs.
Exploring the effects of assuming different rates of clinical symptoms suggestive of COVID-19 that are not caused by SARS-CoV-2
The rate of clinical symptoms suggestive of COVID-19 in residents who do not have COVID-19 that was used in the base case (0.00087 per day) is uncertain. It may be an underestimate, as it was taken from residents with influenza-like illness only and other symptoms may suggest COVID-19. However, the value may be an overestimate if clinical judgement of staff can determine that the resident does not have COVID-19. In sensitivity analyses, we have used a value of 0.11 per day from Smith et al. 12 As this change may have an impact on the relative cost-effectiveness of strategies with different assumptions related to early release, strategies 4 and 5 were re-run for both the seeded and non-seeded models. The number of infections reduced, as transmission reduced when residents were isolated for non-COVID-19 diseases. The NMBs, compared with the strategy 4 unseeded model, are shown in Appendix 1, Figure 27. The pattern between strategies 4 and 5 is similar to those in the base case for both seeded (see Figure 11) and non-seeded (see Figure 12) en suite scenarios, indicating similar conclusions, although the NMBs were slightly smaller. For this reason, we did not re-run the model with a lower value for the rate of symptoms suggestive of COVID-19 in residents who do not in fact have COVID-19.
Exploring the effects of resident immunity from SARS-CoV-2 from vaccination
The model has the functionality to allow a proportion of residents and staff (simulated at an individual person level) to be immune from SARS-CoV-2 infection. This will reduce the number of simulated infections in two ways: (1) directly (i.e. owing to the immune person not becoming infected with SARS-CoV-2) and (2) indirectly (i.e. if the person had been infected, they could have infected residents and staff within the care home).
Analyses have been undertaken for both residential care facilities with en suites and for residential care facilities with shared facilities; however, because of time constraints and because SARS-CoV-2 tests with acceptable TPPs performed poorly, only the first five strategies and strategies 10–13 have been re-run. For each strategy, three levels of protection, in terms of the chance of becoming immune, from receiving a vaccine have been explored: 50%, 70% and 90%. The method used may represent a simplification, as immunity may not be as clear as fully immune or fully susceptible, and people may be still susceptible after a vaccine; however, the impacts of COVID-19 are less severe. Additionally, it has been assumed that the vaccine has reached full efficacy at the time of seeding the model with SARS-CoV-2 infection. Despite the limitation in the results, it is believed that these analyses provide useful information to the NICE Diagnostics Advisory Committee.
A further set of analyses has been conducted where it was assumed that a vaccine would not stop a person from being infected with SARS-CoV-2, but that, for those who are symptomatic, it would reduce the probability of severe outcomes by 50%, 70% or 90%. All results presented are weighted assuming that 50% of bubbles are penetrated.
The analyses undertaken have shown that, if an effective vaccine is available for residential care facility residents and staff, strategies with early release will become more favourable. Even at high immunity levels (90%), it is still estimated that desirable TPPs and real-world evidence strategies for both laboratory-based SARS-CoV-2 tests and SARS-CoV-2 POCTs can have positive NMB values at willingness-to-pay levels of £30,000 per QALY and greater for the en suite residential care facility, and at willingness-to-pay levels of £50,000 per QALY for the residential care facility with shared facilities. Therefore, vaccination does not necessarily make SARS-CoV-2 POCTs redundant.
En suite residential care facilities
The number of resident infections in each vaccination scenario is provided in Figure 21. As anticipated, the more immunity conferred by the vaccination, the smaller the number of infections.
FIGURE 21.
The weighted number of resident infections in each vaccination scenario for en suite residential care facilities when the vaccine can confer immunity.
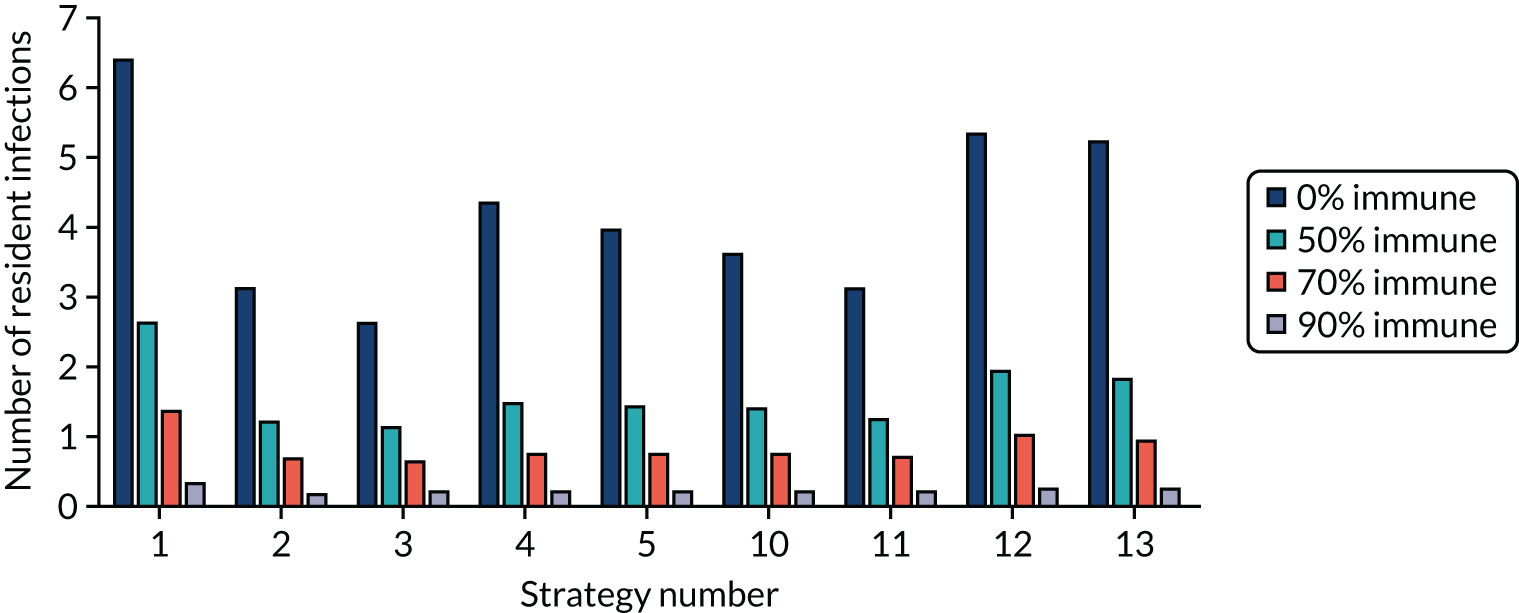
The weighted NMB in each vaccination scenario (50%, 70% and 90% immunity) is provided in Appendix 1, Figures 28–30. The rankings of NMB remain similar; however, the NMB is reduced and as immunity increases the number of strategies with a negative NMB compared with strategy 1 increases.
It is seen that, as the efficacy of the vaccination increases, the NMB of the strategies, compared with strategy 1, decreases. In addition, there is a clear NMB advantage for strategies that allow early release from isolation (i.e. strategies 4, 5, 12 and 13). When efficacy is assumed to be 70%, only those strategies with early release had a positive NMB, compared with strategy 1. However, when it is assumed that efficacy was 90%, the willingness-to-pay threshold needs to be £50,000 per QALY or higher for the NMB of early release strategies to be positive. However, these results are dependent on the assumed 50% of bubbles being penetrated, with the NMB of strategies compared with strategy 1 improving as the proportion of bubbles penetrated increases, and vice versa.
The weighted NMB, which assumes that the vaccine reduces the proportion of COVID-19 cases that are critical but does not affect transmission of SARS-CoV-2 for each vaccination scenario, is provided in Appendix 1, Figures 31–33. It is observed that, as the proportion of COVID-19 cases that are critical decreases, strategies that favour less time in isolation (i.e. strategies 4, 5, 8, 9, 12 and 13) become more favourable, as QALY losses due to isolation begin to outweigh the QALY losses associated with COVID-19. However, these results are dependent on the assumed 50% of bubbles being penetrated, with the NMB of strategies compared with strategy 1 improving as the proportion of bubbles penetrated increases, and vice versa.
Residential care facilities with shared facilities
The number of resident infections in each vaccination scenario is provided in Appendix 1, Figure 34. As anticipated, the more immunity conferred by the vaccination, the smaller the number of infections.
The NMB in each vaccination scenario relating to immunity is provided in Appendix 1, Figures 35–37. The interpretation of the results for the residential care facility with shared facilities is similar to that of the en suite residential care facility, although there is a smaller NMB in that residents in shared facilities are less likely to be released early than those in en suite residential care facilities, as release is dependent on all members of the shared room being non-index cases and returning a negative SARS-CoV-2 test. In addition, while under lockdown, SARS-CoV-2 infection can still be passed among residents in shared rooms.
The NMBs in each vaccination scenario are provided in Appendix 1, Figures 38–40.
The interpretation of the results for the residential care facilities with shared facilities is similar to that of the en suite residential care facility, although the NMB is lower in shared facilities because of the increased time in isolation and there are smaller numbers of infections in the en suite model, as infections are reduced in lockdown because of single-occupancy rooms.
Exploring the impacts of using a staff seed rather than a resident seed
In the base case, it was assumed that a resident was the seed when the bubble was penetrated by SARS-CoV-2. A sensitivity analysis was conducted to explore the changes in results if it was assumed that the seed was a staff member who attended to residents not in isolation. The NMBs for strategies 1–5 are provided in Appendix 1, Figure 41. The rankings are largely consistent with the base case, indicating similar results, although the NMB was higher. Strategies 4 and 5 did relatively better than the base case. Examining the results showed that a staff seed produced more SARS-CoV-2 infections in strategy 1, where no routine testing was performed, but that strategies 2–5 had fewer SARS-CoV-2 infections, presumably because of the weekly testing of staff members for SARS-CoV-2 infection.
Exploring the impact of using a reduced proportion of residents infected with SARS-CoV-2 who develop clinical symptoms
As detailed in Chapter 3, The percentage of residents with SARS-CoV-2 who are assumed to develop clinical symptoms, there is considerable uncertainty in the proportion of residents who are infected with SARS-CoV-2 and develop COVID-19. To test the robustness of the results to changing this proportion, an analysis was conducted using a lower proportion of residents becoming symptomatic (33%), which is more in line with data from the Vivaldi report13 and the Office for National Statistics. 16
In running this analysis, it was seen that the percentage of residents identified with SARS-CoV-2 infection could not reach the assumed calibration target of 40% (see Chapter 4, Calibration of the model), as strategy 1 tests only residents with symptoms, which would be 33% of those infected. It appears, therefore, that the Vivaldi13 data that relate to symptomatic residents may be inconsistent with the proportion of residents reported as having COVID-19. This may be because the figure reported was the number of residents testing positive for SARS-CoV-2 as a proportion of all residents tested rather than as a proportion of symptomatic residents only. In this analysis, we reduced the calibration target to 26%, which was attainable.
The NMBs for strategies 1–5 in the en suite model are provided in Appendix 1, Figure 42. Reassuringly, the ranking of the strategies appears consistent, indicating that the proportion of people infected with SARS-CoV-2 who develop COVID-19, although uncertain, does not greatly influence the results, although the NMB decreases slightly.
Altering the proportion of bubbles assumed to be penetrated by SARS-CoV-2
The base case assumed that 50% of bubbles would be penetrated, although this value was highly uncertain as it depends on a multitude of factors that cannot be predicted from historical data. To provide a wide range for penetration of bubbles for the NICE Diagnostics Advisory Committee to consider, two sensitivity analyses were run. The first assumed that 20% of bubbles were penetrated and the second assumed that 80% of bubbles were penetrated. The results at 0% and 100% penetration are those presented for the non-seeded residential care facilities and the seeded residential care facilities, respectively. Although the conclusions regarding whether pairwise ICERs are above or below stated thresholds often do not change, they do in some instances, showing that the cost-effectiveness is sensitive to the proportion of bubbles penetrated. Appendix 1, Table 19, provides selected ICERs for the en suite model assuming that 80% of bubbles are penetrated, and the weighted NMBs for the en suite model are shown in Appendix 1, Figure 43. Appendix 1, Table 20 and Figure 44, provide the equivalent information for the residential care facility with shared facilities.
The strategy with the highest NMB for the en suite residential care facility and the residential care facility with shared facilities did not change when bubble penetration was increased to 80%. When bubble penetration was decreased to 20%, strategies with an early release became more cost-effective and strategy 5 had the highest NMB in the en suite residential care facility.
Appendix 1, Table 21, provides selected ICERs for the en suite model assuming that 20% of bubbles are penetrated, and the weighted NMBs for the en suite model are shown in Appendix 1, Figure 45. Table 22 and Figure 46 in Appendix 1 provide the equivalent information for the residential care facility with shared facilities.
Changing the relative costs of laboratory-based SARS-CoV-2 tests and SARS-CoV-2 point-of-care tests
The relative costs of laboratory-based SARS-CoV-2 tests and SARS-CoV-2 POCTs are uncertain and therefore the EAG assumed that these were equal in the base case. Two sensitivity analyses and threshold analyses were undertaken to assess the influence of costs of SARS-CoV-2 tests on cost-effectiveness results.
In the first set of sensitivity analyses, it was assumed that SARS-CoV-2 POCTs cost £10 more per test than laboratory-based tests. In the second set of sensitivity analyses, it was assumed that laboratory-based SARS-CoV-2 tests were £10 more expensive. In both analyses, the cheaper test was assumed to cost £22.
The NMBs when the SARS-CoV-2 POCT is assumed to cost £10 more are shown in Appendix 1, Figure 47, for the weighted en suite model and in Appendix 1, Figure 48, for the weighted shared facilities model. As anticipated, the NMBs decreased further for POCTs than for laboratory-based tests, but the strategy with the highest NMB did not change in the en suite residential care facility. However, in the residential care facility with shared facilities, strategy 4 (i.e. laboratory-based SARS-CoV-2 test with a desirable TPP and early release) has a higher NMB than its POCT counterpart at lower cost per QALY thresholds.
The NMBs when the laboratory-based SARS-CoV-2 test is assumed to cost £10 more are shown in Appendix 1, Figure 49, for the weighted en suite model and in Appendix 1, Figure 50, for the weighted shared facilities model. As anticipated, the NMBs decreased further for laboratory-based tests than for POCTs. The strategy with the highest NMB did not change in either the en suite residential care facility or the residential care facility with shared facilities.
A threshold analysis was undertaken to provide the price difference (POCT cost minus laboratory-based cost) at which the cost-effectiveness of selected comparisons equalled the stated threshold. Negative values signify that the POCT would need to be cheaper than the laboratory-based SARS-CoV-2 test. The thresholds are given in Appendix 1, Tables 23 and 24, for the en suite and shared facilities models, respectively. To aid interpretation, a POCT with a desirable TPP priced at £17 more than the laboratory-based SARS-CoV-2 test with a desirable TPP would have the same NMB at a cost per QALY threshold of £30,000. All values are presented to the nearest integer. It is seen that the comparative price threshold for a SARS-CoV-2 POCT is dependent on the test characteristics for both SARS-CoV-2 POCTs and laboratory-based tests, the cost per QALY threshold assumed, and whether or not early release is permitted.
Assuming that there is no loss of quality-adjusted life-years associated with either non-fatal, severe COVID-19 or time spent in isolation
There is uncertainty related to the impact of non-fatal, severe COVID-19 in elderly residents of residential care facilities and also the utility loss for residents from being in isolation. In the base case, the EAG assumed that the expected QALYs accrued by a resident were 10% lower after non-severe COVID-19 and that the utility loss was 0.25 for each day spent in isolation. In exploratory analyses, it was assumed that neither non-fatal, severe COVID-19 nor isolation had an impact on expected QALYs.
The NMBs for the en suite model are provided in Appendix 1, Figure 51, with selected pairwise ICERs provided in Appendix 1, Table 25. It is noticeable that strategies 6 and 7, which have large periods of isolation, do comparatively better under this sensitivity analysis. However, the strategy with the highest NMB does not change from base case.
For the shared facilities model, results assuming that there are no QALY losses from non-fatal, severe COVID-19 or from isolation are provided in Appendix 1, Table 26 and Figure 52. As with the en suite model, strategies 6 and 7 do comparatively better under this sensitivity analysis. However, the strategy with the highest NMB changes to strategy 6 (i.e. laboratory-based SARS-CoV-2 test with an acceptable TPP), which, because of relatively poor specificity, requires considerably more time in isolation than strategies with better diagnostic accuracy.
Assuming greater quality-adjusted life-year losses due to death or non-fatal, severe COVID-19
It is known that some individuals are at greater risk from SARS-CoV-2 infection than others. This includes those with certain comorbidities, as well as those from some minority ethnic groups. To allow insight into whether or not the better strategies change when the risk from SARS-CoV-2 is increased, an analysis was undertaken in which the QALYs lost from COVID-19, but not from isolation, were doubled. This analysis was undertaken to implicitly take into consideration the fact that the number of people dying from COVID-19 could be larger than in the base case, and that the proportion of people with COVID-19 who need hospitalisation could be greater in higher-risk groups. Selected pairwise ICERs are provided in Appendix 1, Table 27, and the NMBs are provided in Appendix 1, Figure 53, for the weighted en suite model. The rankings, in terms of NMB, are relatively constant, although strategies 6 and 7 do comparatively better, as they have relatively fewer infections because of the increased time in isolation. The strategy with the highest NMB does not change from the base case.
Results with greater QALY losses for the shared facilities model are provided in Appendix 1, Table 28 and Figure 54. As with the en suite model, strategies 6 and 7 do comparatively better under this sensitivity analysis, although the strategy with the highest NMB does not change from base case.
Assuming a different multiplier for residents who have had severe, non-fatal COVID-19
The base case assumed that residents with severe, non-fatal COVID-19 would have their expected QALYs diminished through one or both of shortened life expectancy or lower utility for their remaining life. An arbitrary multiplier of 0.9 was used. Sensitivity analyses have been run assuming a multiplier of 1.0 (indicating no loss of QALYs from COVID-19) and 0.8. These analyses have been conducted for the en suite residential care facility only. There is little change in the interpretation of the ICERs when the QALY multiplier was changed from 0.8 to 1.0, indicating that the results are not sensitive to this parameter. ICERs are reported in Appendix 1, Tables 29 and 30, with the NMBs shown in Appendix 1, Figures 55 and 56.
Assuming a halving of effective contacts and attack rate in the product
There is considerable uncertainty in both the attack rates and number of effective contacts, although this was mitigated, to some extent, by the calibration undertaken (see Chapter 4, Calibration of the model). Sensitivity analyses were undertaken with the product halved and compared with the start of the pandemic. These analyses could represent better knowledge and protective equipment in limiting the spread of SARS-CoV-2. The results produced were more favourable to the tests, as a large number of infections at the beginning, before testing, was less likely, but the broad pattern between the strategies was maintained (see Appendix 1, Figure 57).
Assuming that time spent in isolation is reduced from 14 days to 10 days
Following the completion of the initial work, the recommended number of days in isolation was reduced from 14 to 10. Sensitivity analyses were undertaken to explore whether or not this had a impact on the conclusions. The results produced were more favourable to the tests, as it was assumed that the quality of life in patients would be improved by less time in isolation, but the broad pattern between the strategies was maintained (see Appendix 1, Figure 58).
Exploring the use of lateral flow tests
In response to comments from peer reviewers and the emergence of new data on lateral flow tests (see Chapter 3, Characteristics of the point-of-care tests and laboratory-based tests), exploratory analyses were undertaken that assumed lateral flow tests were used every 5 days for both residents and staff members. The results were compared with the desirable POCT assuming that there is no early release from isolation (i.e. strategy 3) or early release from isolation (i.e. strategy 5). The NMB results for the en suite residential care facility are shown in Figure 22, with the results in the residential care facility with shared facilities shown in Figure 23. Summary results are shown in Table 18.
FIGURE 22.
Exploratory analyses assessing the NMB of lateral flow tests in en suite residential care facilities.
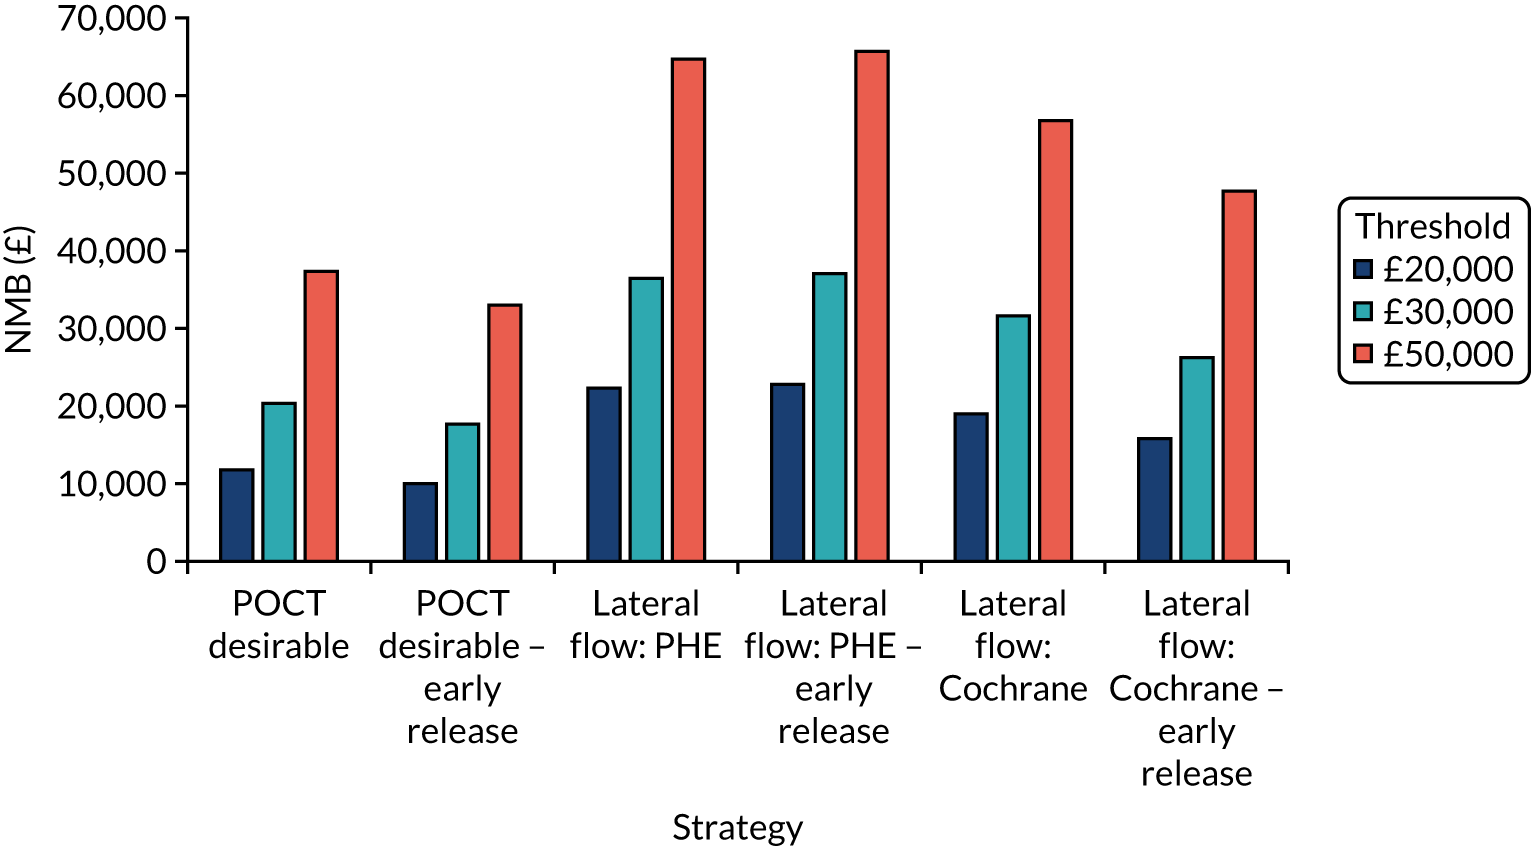
FIGURE 23.
Exploratory analyses assessing the NMB of lateral flow tests in residential care facilities with shared facilities.
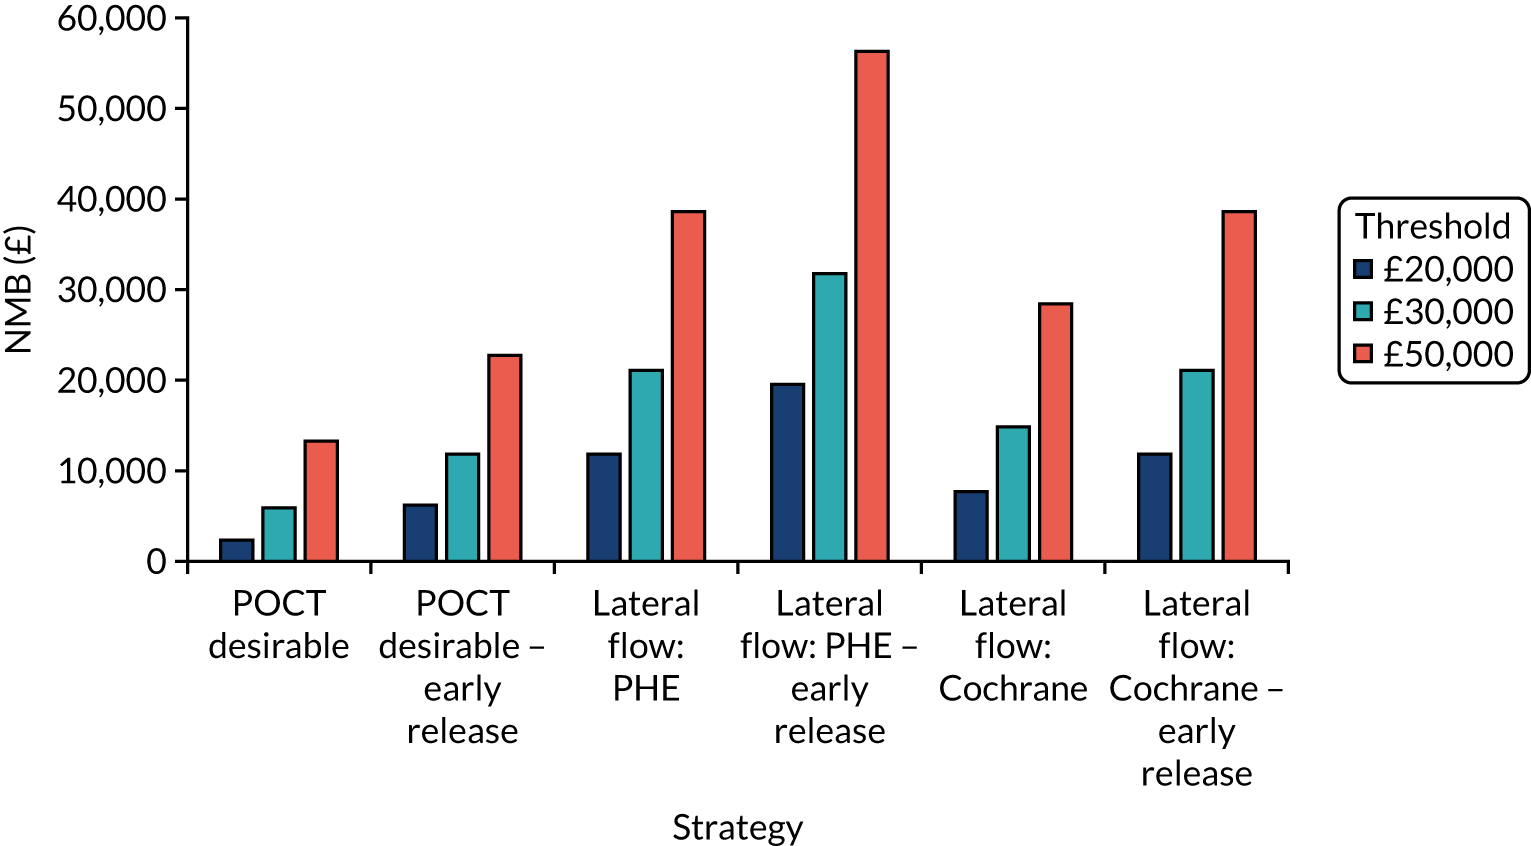
| Residential care facility | Number of resident infections | Days in isolation per resident | Costs of testing (£) | QALYs lost |
|---|---|---|---|---|
| En suite | ||||
| POCT desirable | 2.63 | 31.7 | 5083 | 1.08 |
| POCT desirable – early release | 3.94 | 8.7 | 5260 | 1.16 |
| Lateral flow: PHE report31 | 0.87 | 23.8 | 6098 | 0.51 |
| Lateral flow: PHE report31 – early release | 1.51 | 5.2 | 6122 | 0.49 |
| Lateral flow: Cochrane review32 | 1.39 | 24.7 | 6115 | 0.67 |
| Lateral flow: Cochrane review32 – early release | 2.83 | 6.3 | 6148 | 0.85 |
| Shared facilities | ||||
| POCT desirable | 4.91 | 34.5 | 5223 | 1.68 |
| POCT desirable – early release | 4.93 | 15.5 | 5320 | 1.48 |
| Lateral flow: PHE report31 | 2.97 | 30.3 | 6182 | 1.15 |
| Lateral flow: PHE report31 – early release | 2.56 | 12.2 | 6171 | 0.85 |
| Lateral flow: Cochrane review32 | 3.75 | 31.0 | 6203 | 1.36 |
| Lateral flow: Cochrane review32 – early release | 3.69 | 13.4 | 6191 | 1.15 |
Chapter 6 Discussion and conclusions
The EAG has constructed a mathematical model to simulate the spread of SARS-CoV-2 infection in residents and staff within a residential care facility. This model was developed following discussions with clinical experts. The model was populated using the best data identified, and the model was calibrated in an attempt to try and obtain plausible parameters where data were unknown; however, there is considerable uncertainty in parameter population estimates. Therefore, the model results should be viewed with caution and be taken as indicative rather than definitive. Sensitivity analyses have been conducted to provide insight into the impact of uncertain parameter values.
The cost-effectiveness results are of limited value if the strategies evaluated are not realistic or the SARS-CoV-2 POCTs do not meet requirements in terms of diagnostic accuracy or in the turnaround time from the test being conducted to the result being known. For example, at the time of writing, it is uncertain whether or not a SARS-CoV-2 POCT that meets the desirable, or even acceptable, TPP will be available in the near future. It is imperative that diagnostic accuracy is established within the context of residential care facilities, as the experience and qualification of the staff undertaking the testing may influence the results.
Analyses using data from currently available SARS-CoV-2 POCTs and laboratory-based SARS-CoV-2 tests have been undertaken. Real-world results suggest that the NMB of both laboratory-based SARS-CoV-2 tests and SARS-CoV-2 POCTs is greater than that of the acceptable TPPs.
If the SARS-CoV-2 POCT with desirable TPP existed, then it appears that it would have a relatively high NMB, indicating that there is potential benefit associated with SARS-CoV-2 POCT. However, this benefit is dependent on both the diagnostic accuracy and cost of any such tests that reach market.
The model has known limitations:
-
Residents at high risk of severe consequences from SARS-CoV-2 infections were not explicitly considered.
-
Only one SARS-CoV-2 penetration could occur in seeded bubbles.
-
Wider societal effects were not explicitly evaluated.
-
The model updating cycle time (every 6 hours) may be too long to capture small differences in turnaround times.
-
The costs of hospitalisation were not considered.
-
Additional aspects, including the reduced pressure on the health system and the infections of staff members that can cascade into the community, have not been explicitly incorporated.
In addition, many other simplifying assumptions were made. Nevertheless, it is believed that broad conclusions can be taken from the results presented.
The absence of relevant data limited our ability to explore subgroup analyses based on ethnicity or comorbidities, although sensitivity analyses were undertaken that increased the risks from SARS-CoV-2.
Exploratory analyses were undertaken to assess lateral flow tests. These analyses show promising results, but should be considered as indicative only because of the caveats listed in Chapter 3, Characteristics of the point-of-care tests and laboratory-based tests, and in the light of recent data on poor adherence within a care home setting. 38 Diagnostic accuracy data within a residential care facility setting and more certainty in the cost per lateral flow test would improve the robustness of the modelled results.
In conclusion, SARS-CoV-2 POCTs have considerable potential for benefit for use within residential care facilities, but whether or not this materialises is dependent on the diagnostic accuracy within this setting and the costs of forthcoming SARS-CoV-2 POCTs. Vaccination does not necessarily make SARS-CoV-2 POCTs redundant. In addition, a modelling structure has been developed, which is anticipated to be useful for assessing the cost-effectiveness of SARS-CoV-2 POCTs within residential care facilities as further information on their costs, turnaround times and diagnostic accuracy become known.
Acknowledgements
We would like to thank Tom Walker, Suvi Harmala, Hannah Maiden and Alex Allen at NICE for advice throughout this work and for highlighting relevant literature. We thank Andrea Shippam for help in formatting the document and Hazel Squires for providing comments relating to the document.
No PPI was directly used in producing this report. However, patient and public representatives on the NICE Diagnostics Advisory Committee provided guidance to the authors.
Contributions of authors
Matt Stevenson (https://orcid.org/0000-0002-3099-9877) is a Professor of Health Technology Assessment at ScHARR, University of Sheffield. He led the project, constructed the mathematical model and interpreted the results.
Andrew Metry (https://orcid.org/0000-0001-7412-6093) is a Research Associate at ScHARR, University of Sheffield. He reviewed the evidence to populate the model, critiqued the model and helped interpret the results.
Michael Messenger (https://orcid.org/0000-0002-4975-0158) is Head of Personalised Medicine and Health, University of Leeds; and Deputy Director of NIHR Leeds Medtech and In Vitro Diagnostic Co-Operative. He reviewed the results, suggested additional strategies to run and provided guidance throughout the work.
All authors commented on the final monograph.
Publications
For related publications and further information, see the NIHR funding and awards web page for the overall project: https://fundingawards.nihr.ac.uk/award/NIHR133409.
Data-sharing statement
All data requests should be submitted to the corresponding author for consideration.
Patient data
This work uses data provided by patients and collected by the NHS as part of their care and support. Using patient data is vital to improve health and care for everyone. There is huge potential to make better use of information from people’s patient records, to understand more about disease, develop new treatments, monitor safety, and plan NHS services. Patient data should be kept safe and secure, to protect everyone’s privacy, and it’s important that there are safeguards to make sure that it is stored and used responsibly. Everyone should be able to find out about how patient data are used. #datasaveslives You can find out more about the background to this citation here: https://understandingpatientdata.org.uk/data-citation.
Disclaimers
This report presents independent research funded by the National Institute for Health Research (NIHR). The views and opinions expressed by authors in this publication are those of the authors and do not necessarily reflect those of the NHS, the NIHR, NETSCC, the HTA programme or the Department of Health and Social Care. If there are verbatim quotations included in this publication the views and opinions expressed by the interviewees are those of the interviewees and do not necessarily reflect those of the authors, those of the NHS, the NIHR, NETSCC, the HTA programme or the Department of Health and Social Care.
References
- Worldometer . COVID-19 Coronavirus Pandemic 2020. www.worldometers.info/coronavirus/ (accessed 15 November 2020).
- National Institute for Health and Care Excellence (NICE) . Exploratory Economic Modelling of SARS-CoV-2 Viral Detection Point of Care Tests and Serology Tests. Final Scope 2020.
- Medicines and Healthcare products Regulatory Agency . Target Product Profile. Point of Care SARS-CoV-2 Detection Tests 2020. https://assets.publishing.service.gov.uk/government/uploads/system/uploads/attachment_data/file/895745/TPP_Point_of_Care_SARS-CoV-2_Detection_Tests.pdf (accessed 16 July 2020).
- British Geriatrics Society . COVID-19: Managing the COVID-19 Pandemic in Care Homes for Older People 2020. www.bgs.org.uk/resources/covid-19-managing-the-covid-19-pandemic-in-care-homes (accessed 15 November 2020).
- CONDOR . CONDOR-CH Care Homes 2020. www.condor-platform.org/condor_workstreams/condor-ch (accessed 15 November 2020).
- National Institute for Health and Care Excellence . Guide to the Methods of Technology Appraisal 2013 2013. www.nice.org.uk/process/pmg9/ (accessed 7 September 2020).
- Department of Health and Social Care (DHSC) . Admission and Care of Residents in a Care Home During COVID-19 2020.
- Department of Health and Social Care . About the Adult Social Care Infection Control Fund 2020. www.gov.uk/government/publications/adult-social-care-infection-control-fund/about-the-adult-social-care-infection-control-fund (accessed 15 November 2020).
- Micocci M, Gordon AL, Allen AJ, Hicks T, Kierkegaard P, McLister A, et al. Understanding COVID-19 Testing Pathways in English Care Homes to Identify the Role of Point-of-Care Testing: An Interview-Based Process Mapping Study 2020. www.medrxiv.org/content/10.1101/2020.11.02.20224550v1 (accessed 5 May 2021).
- AVID-CC . Adalimumab for Coronavirus in Community Care 2020. https://avid-cc.octru.ox.ac.uk/avid-cc-adalimumab-coronavirus-community-care (accessed 6 May 2021).
- Office for National Statistics . Care Home and Non-Care Home Populations Used in the Deaths Involving COVID-19 in the Care Sector Article, England and Wales 2020. www.ons.gov.uk/peoplepopulationandcommunity/birthsdeathsandmarriages/deaths/adhocs/12215carehomeandnoncarehomepopulationsusedinthedeathsinvolvingcovid19inthecaresectorarticleenglandandwales (accessed 15 November 2020).
- Smith DRM, Duval A, Pouwels KB, Guillemot D, Fernandes J, Huynh BT, et al. Optimizing COVID-19 surveillance in long-term care facilities: a modelling study. BMC Med 2020;18. https://doi.org/10.1186/s12916-020-01866-6.
- Department of Health and Social Care (DHSC) . Vivaldi 1: COVID-19 Care Homes Study Report 2020.
- Patel MC, Chaisson LH, Borgetti S, Burdsall D, Chugh RK, Hoff CR, et al. Asymptomatic SARS-CoV-2 infection and COVID-19 mortality during an outbreak investigation in a skilled nursing facility. Clin Infect Dis 2020;71:2920-6. https://doi.org/10.1093/cid/ciaa763.
- Ladhani SN, Chow JY, Janarthanan R, Fok J, Crawley-Boevey E, Vusirikala A, et al. Investigation of SARS-CoV-2 outbreaks in six care homes in London, April 2020. EClinicalMedicine 2020;26. https://doi.org/10.1016/j.eclinm.2020.100533.
- Office for National Statistics . Coronavirus (COVID-19) Infections in the Community in England: July 2020. Characteristics of People Testing Positive for the Coronavirus (COVID-19) in England from the COVID-19 Infection Survey 2020. www.ons.gov.uk/peoplepopulationandcommunity/healthandsocialcare/conditionsanddiseases/articles/coronaviruscovid19infectionsinthecommunityinengland/july2020 (accessed 26 November 2020).
- Bird S. Expert Reaction to First Results from the Vivaldi Study Looking at COVID-19 Infections Care Homes 2020. www.sciencemediacentre.org/expert-reaction-to-first-results-from-the-vivaldi-study-looking-at-covid-19-infections-care-homes/ (accessed 26 November 2020).
- Hayward AC, Harling R, Wetten S, Johnson AM, Munro S, Smedley J, et al. Effectiveness of an influenza vaccine programme for care home staff to prevent death, morbidity, and health service use among residents: cluster randomised controlled trial. BMJ 2006;333. https://doi.org/10.1136/bmj.39010.581354.55.
- Fouillet A, Bousquet V, Pontais I, Gallay A, Schönemann CC. The French Emergency Department OSCOUR Network: evaluation after a 10-year existence. Online J Public Health Inform 2015;7. https://doi.org/10.5210/ojphi.v7i1.5740.
- Stevenson M, Metry A, Messenger A. Modelling of hypothetical SARS-CoV-2 point-of-care tests on admission to hospital from A&E: rapid cost-effectiveness analysis. Health Technol Assess 2021;25.
- Docherty AB, Harrison EM, Green CA, Hardwick HE, Pius R, Norman L, et al. Features of 20,133 UK patients in hospital with covid-19 using the ISARIC WHO Clinical Characterisation Protocol: prospective observational cohort study. BMJ 2020;369. https://doi.org/10.1136/bmj.m1985.
- Office for National Statistics . Deaths Involving COVID-19, England and Wales: Deaths Occurring in June 2020 2020. www.ons.gov.uk/peoplepopulationandcommunity/birthsdeathsandmarriages/deaths/bulletins/deathsinvolvingcovid19englandandwales/deathsoccurringinjune2020 (accessed 6 May 2021).
- Doshi P. Covid-19: do many people have pre-existing immunity?. BMJ 2020;370. https://doi.org/10.1136/bmj.m3563.
- Koh W, Naing L, Rosledzana M, Alikhan M, Chaw L, Griffith M, et al. What do we know about SARS-CoV-2 transmission? A systematic review and meta-analysis of the secondary attack rate, serial interval, and asymptomatic infection. PLOS ONE 2020;15. https://doi.org/10.1371/journal.pone.0240205.
- Grassly NC, Pons-Salort M, Parker EPK, White PJ, Ferguson NM. Imperial College COVID-19 Response Team . Comparison of molecular testing strategies for COVID-19 control: a mathematical modelling study. Lancet Infect Dis 2020;20:1381-9. https://doi.org/10.1016/S1473-3099(20)30630-7.
- Clifford S, Quilty B, Russell T, Liu Y, Chan Y-W, Pearson C, et al. Strategies to Reduce The Risk of SARS-CoV-2 Reintroduction From International Travellers 2020. www.medrxiv.org/content/10.1101/2020.07.24.20161281v2 (accessed 26 November 2020).
- He X, Lau EHY, Wu P, Deng X, Wang J, Hao X, et al. Temporal dynamics in viral shedding and transmissibility of COVID-19. Nat Med 2020;26:672-5.
- Singanayagam A, Patel M, Charlett A, Lopez Bernal J, Saliba V, Ellis J, et al. Duration of infectiousness and correlation with RT-PCR cycle threshold values in cases of COVID-19, England, January to May 2020. Euro Surveill 2020;25. https://doi.org/10.2807/1560-7917.ES.2020.25.32.2001483.
- Kim H, Hong H, Yoon SH. Diagnostic performance of CT and reverse transcriptase polymerase chain reaction for coronavirus disease 2019: a meta-analysis. Radiology 2020;296:E145-55. https://doi.org/10.1148/radiol.2020201343.
- GOV.UK . NHS Test and Trace (England) and Coronavirus Testing (UK) Statistics: 15 October to 21 October 2020. www.gov.uk/government/publications/nhs-test-and-trace-england-and-coronavirus-testing-uk-statistics-15-october-to-21-october (accessed 6 May 2021).
- Public Health England . Preliminary Report From the Joint PHE Porton Down &Amp; University of Oxford SARS-CoV-2 Test Development and Validation Cell: Rapid Evaluation of Lateral Flow Viral Antigen Detection Devices (LFDs) for Mass Community Testing 2020. www.ox.ac.uk/sites/files/oxford/media_wysiwyg/UK%20evaluation_PHE%20Porton%20Down%20%20University%20of%20Oxford_final.pdf (accessed 6 May 2021).
- Dinnes J, Deeks JJ, Berhane S, Taylor M, Adriano A, Davenport C, et al. Rapid, point of care antigen and molecular based tests for diagnosis of SARS CoV 2 infection (review). Cochrane Database Syst Rev 2021;3. https://doi.org/10.1002/14651858.CD013705.
- Jarvis KF, Kelley JB. Temporal dynamics of viral load and false negative rate influence the levels of testing necessary to combat COVID19 spread. MedRxiv 2020. https://doi.org/10.1101/2020.08.12.20173831.
- Medicines and Healthcare products Regulatory Agency (MHRA) . Target Product Profile. Laboratory-Based SARS-CoV-2 Viral Detection Tests 2020.
- Medicines and Healthcare products Regulatory Agency (MHRA) . Target Product Profile. Point of Care SARS-CoV-2 Detection Tests 2020.
- Collier DA, Assennato SM, Warne B, Sithole N, Sharrocks K, Ritchie A, et al. Point of care nucleic acid testing for SARS-CoV-2 in hospitalized patients: a clinical validation trial and implementation study. Cell Rep Med 2020;1. https://doi.org/10.1016/j.xcrm.2020.100062.
- Dinnes J, Deeks JJ, Adriano A, Berhane S, Davenport C, Dittrich S, et al. Rapid, point-of-care antigen and molecular-based tests for diagnosis of SARS-CoV-2 infection. Cochrane Database Syst Rev 2020;8. https://doi.org/10.1002/14651858.CD013705.
- Tulloch J, Micocci M, Buckle P, Lawrenson K, Kierkegaard P, McLister A, et al. Enhanced Lateral Flow Testing Strategies in Care Homes Are Associated With Poor Adherence and Were Insufficient to Prevent COVID-19 Outbreaks: Results from a Mixed Methods Implementation Study 2021. https://ssrn.com/abstract=3822257 (accessed 6 May 2021).
- Scheuber A. 90 Minute COVID-19 Tests: Government Orders 5.8 Million DnaNudge Kits 2020. www.imperial.ac.uk/news/201073/90-minute-covid-19-tests-government-orders/ (accessed 14 September 2020).
- Brazzelli M, Aucott L, Aceves-Martins M, Robertson C, Jacobsen E, Imamura M, et al. Biomarkers for assessing acute kidney injury for people who are being considered for admission to critical care: a systematic review and cost-effectiveness analysis. Health Technol Assess 2021.
- Office for National Statistics (ONS) . Dataset. National Life Tables: UK 2019.
- Ara R, Brazier JE. Populating an economic model with health state utility values: moving toward better practice. Value Health 2010;13:509-18. https://doi.org/10.1111/j.1524-4733.2010.00700.x.
- Szende A, Oppe M, Devlin N. EQ5D Value Sets: Inventory, Comparative Review and User Guide. New York, NY: Springer; 2007.
- Office for National Statistics (ONS) . Impact of Coronavirus in Care Homes in England: 26 May to 19 June 2020 2020.
- Stinnett AA, Mullahy J. Net health benefits: a new framework for the analysis of uncertainty in cost-effectiveness analysis. Med Decis Making 1998;18:68-80. https://doi.org/10.1177/0272989X98018002S09.
- GOV.UK . COVID-19: Deaths of People With Learning Disabilities 2020. www.gov.uk/government/publications/covid-19-deaths-of-people-with-learning-disabilities (accessed 6 May 2021).
Appendix 1 Supplementary results
Estimating the number of random number streams at which stable results are produced
FIGURE 24.
Assessing how many simulations are required to stabilise the number of residents infected with SARS-CoV-2 in strategy 1.
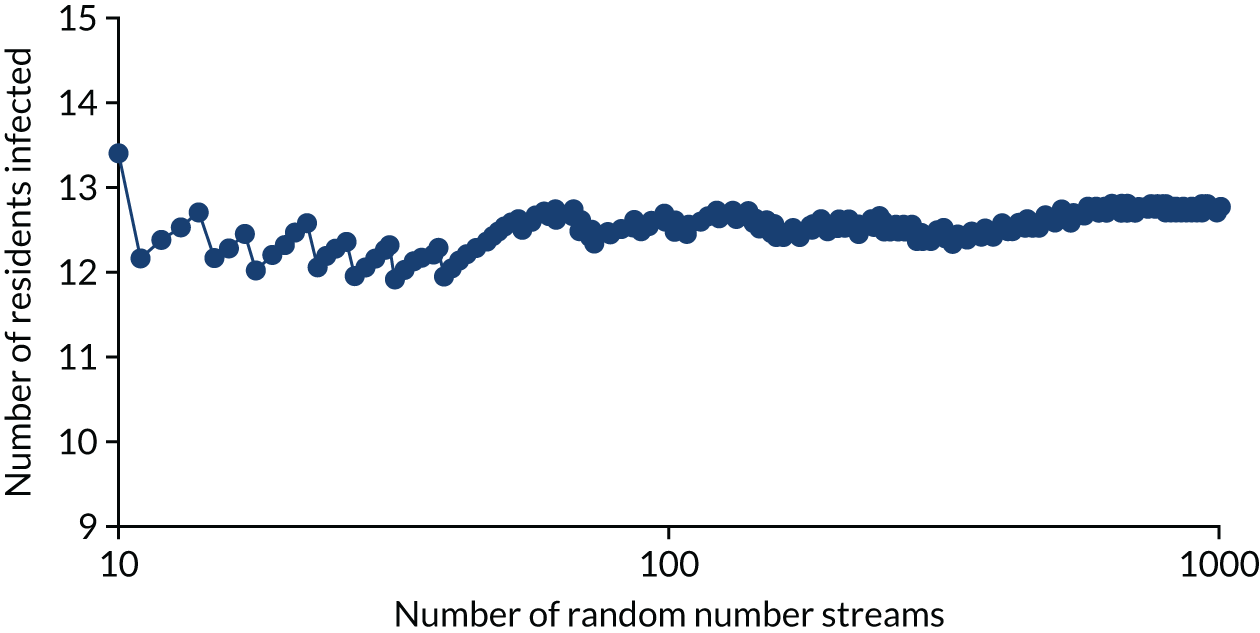
FIGURE 25.
Assessing how many simulations are required to stabilise the number of days spent in isolation by the cohort in strategy 1.
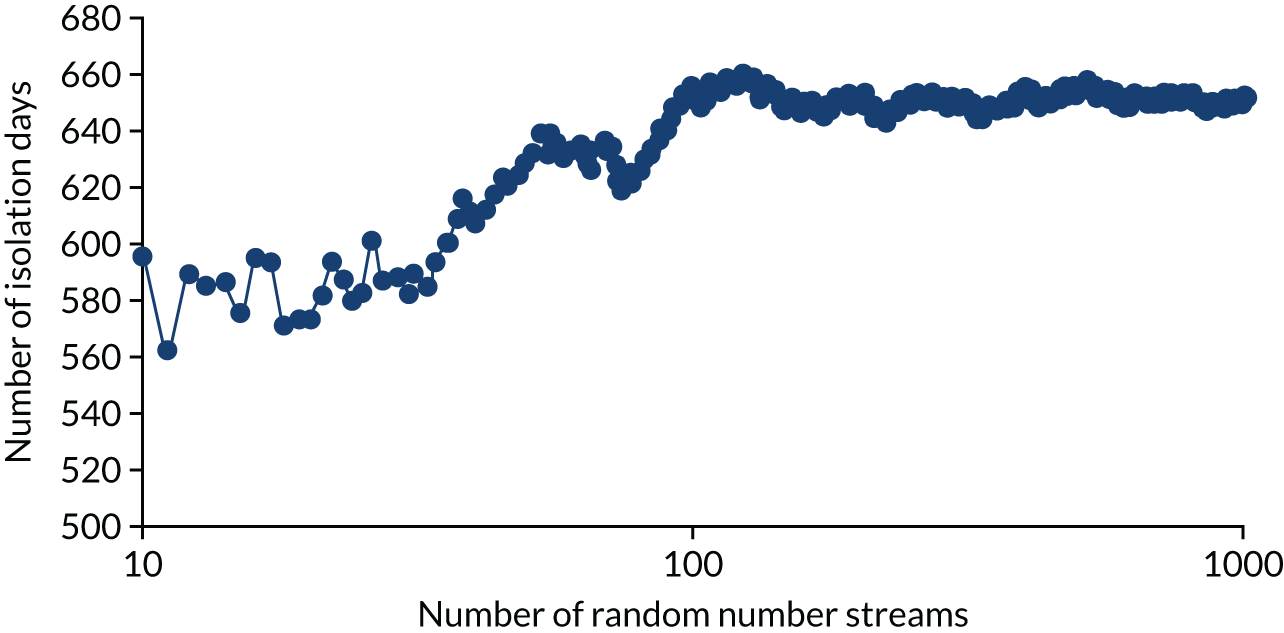
Exploring the effects of younger residents within the residential care facility
FIGURE 26.
The NMBs for selected strategies in the seeded en suite model when younger residents were assumed.
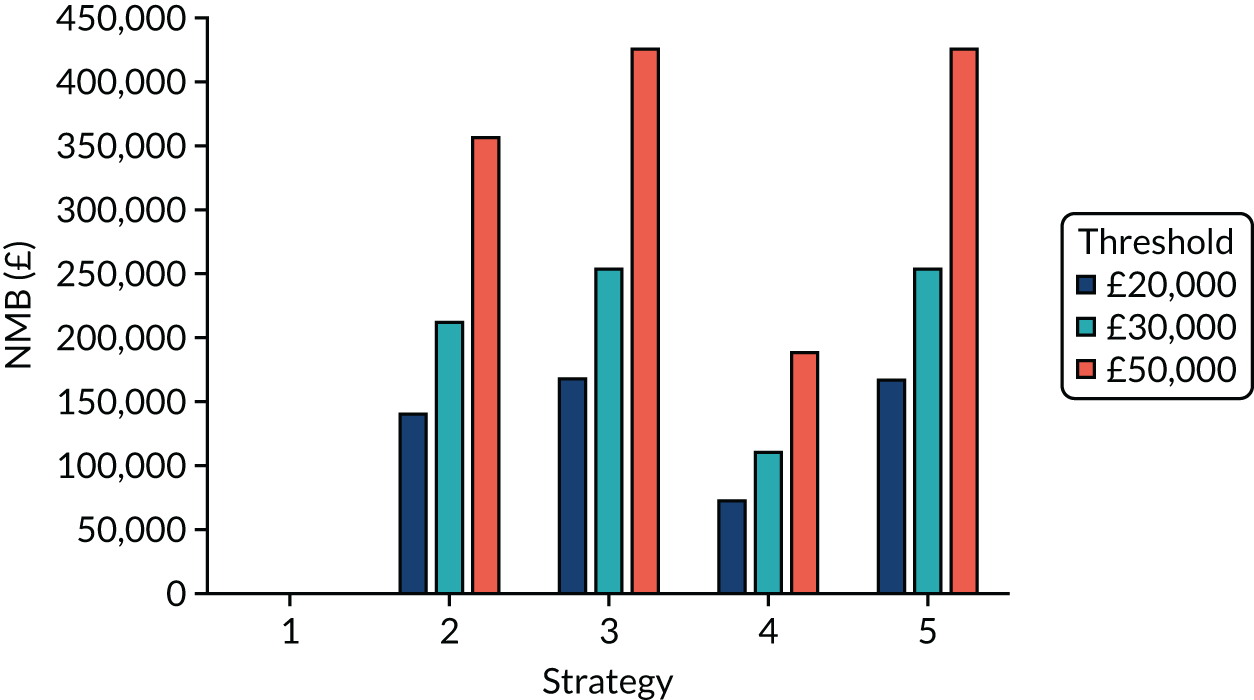
Exploring the effects of a higher prevalence of clinical symptoms suggestive of COVID-19 that are not caused by SARS-CoV-2
FIGURE 27.
The NMBs for selected strategies in the en suite model when a higher rate of diseases that are not COVID-19, but produce symptoms suggestive of COVID-19, was used
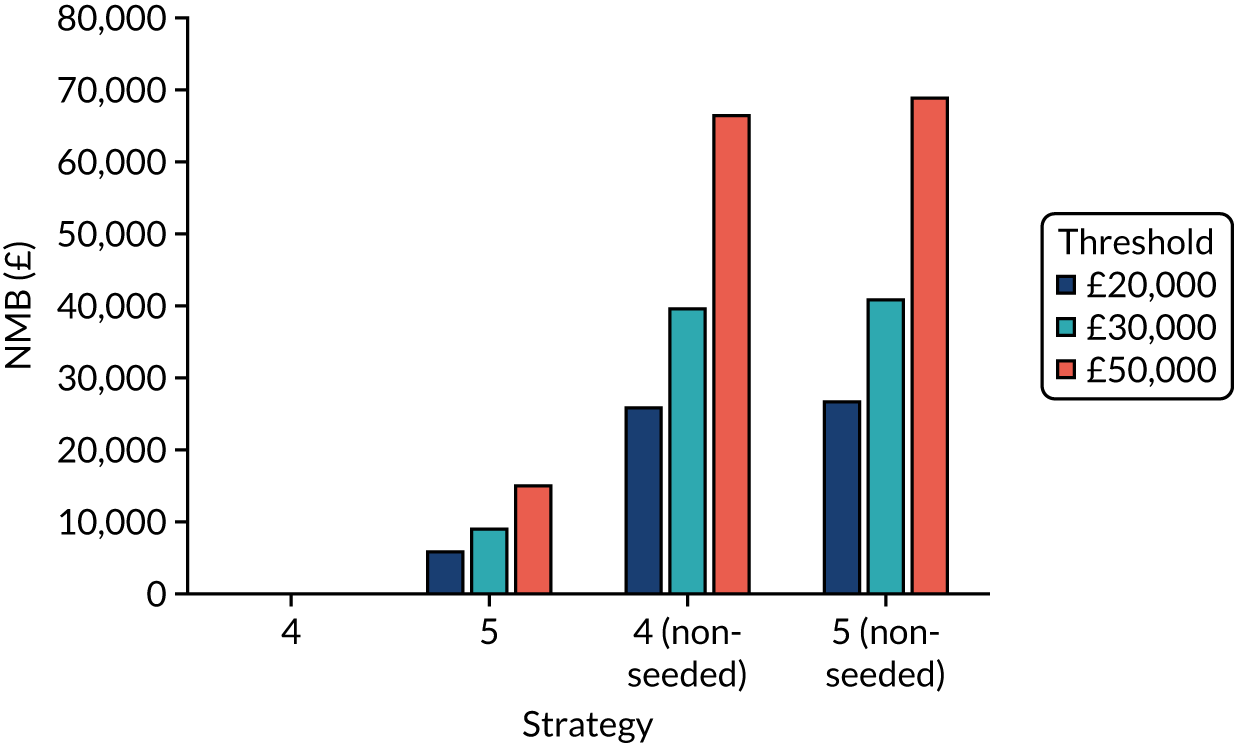
Exploring the effects of different vaccination protection assumptions related to immunity: en suite facilities
FIGURE 28.
The weighted NMB assuming that the chance of immunity with the vaccine is 50% for en suite residential care facilities.
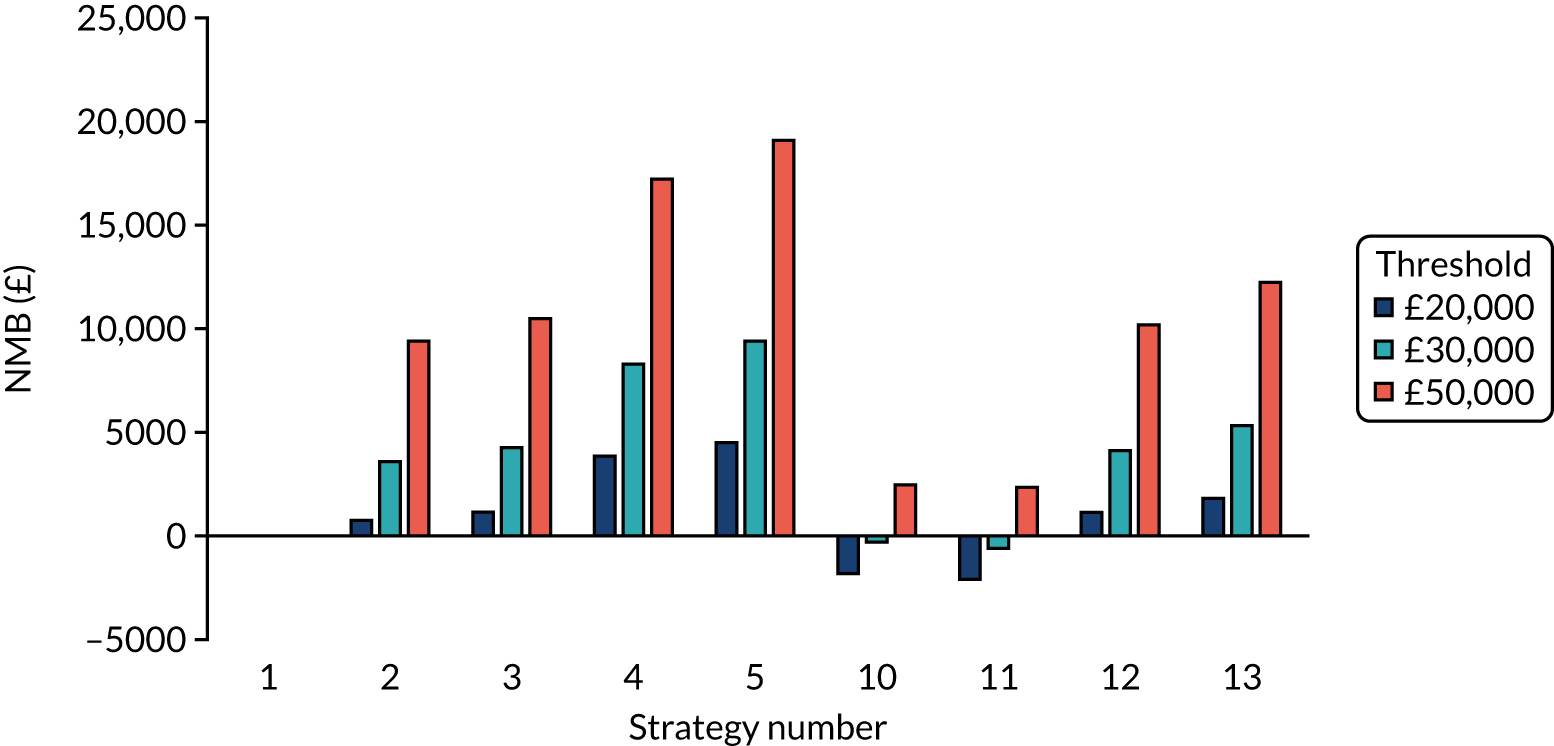
FIGURE 29.
The weighted NMB assuming that the chance of immunity with the vaccine is 70% for en suite residential care facilities.
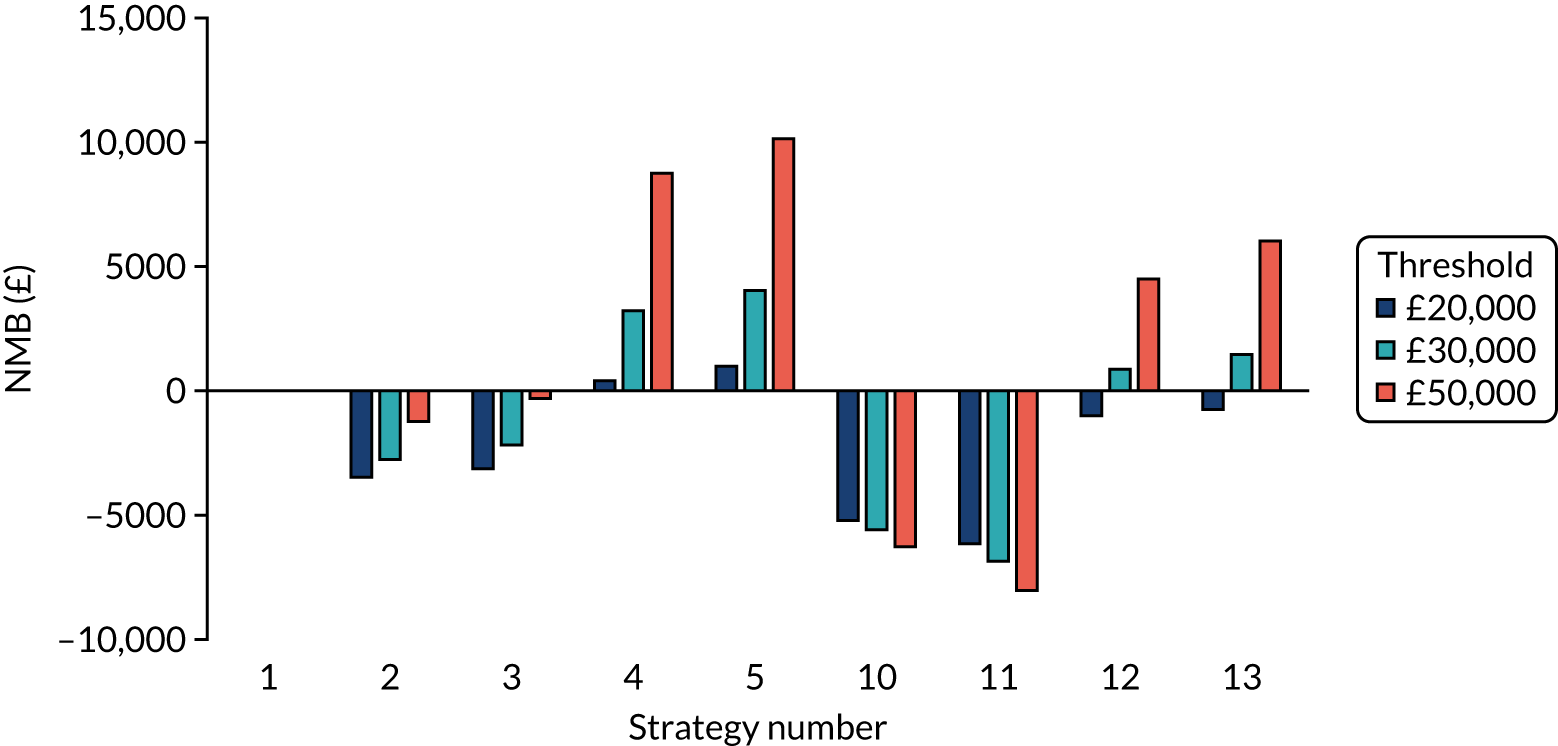
FIGURE 30.
The weighted NMB assuming that the chance of immunity with the vaccine is 90% for en suite residential care facilities.
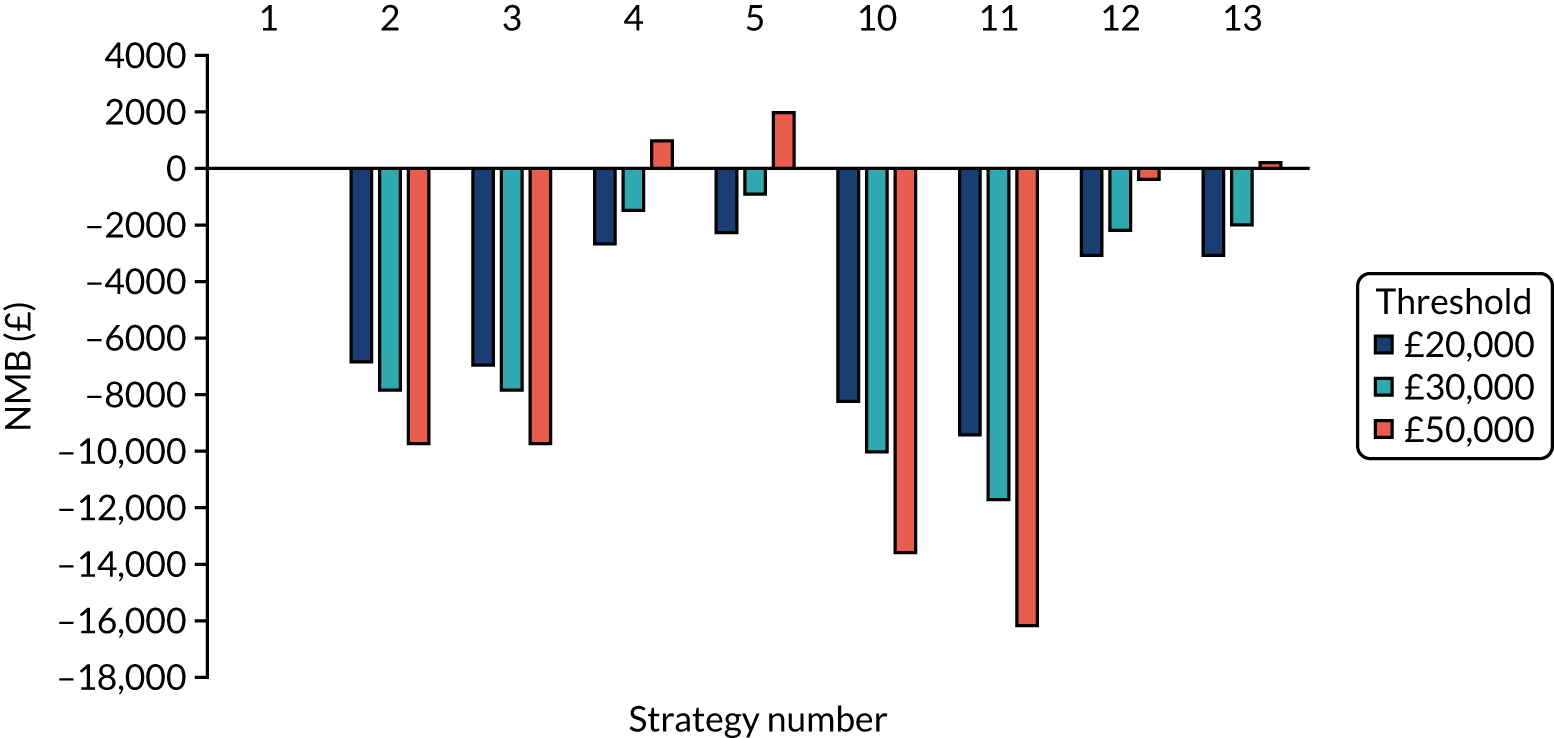
Exploring the effects of different vaccination protection assumptions related to the probability of COVID-19 becoming critical: en suite facilities
FIGURE 31.
The weighted NMB assuming that the chance of critical COVID-19 with the vaccine is reduced by 50% for en suite residential care facilities.
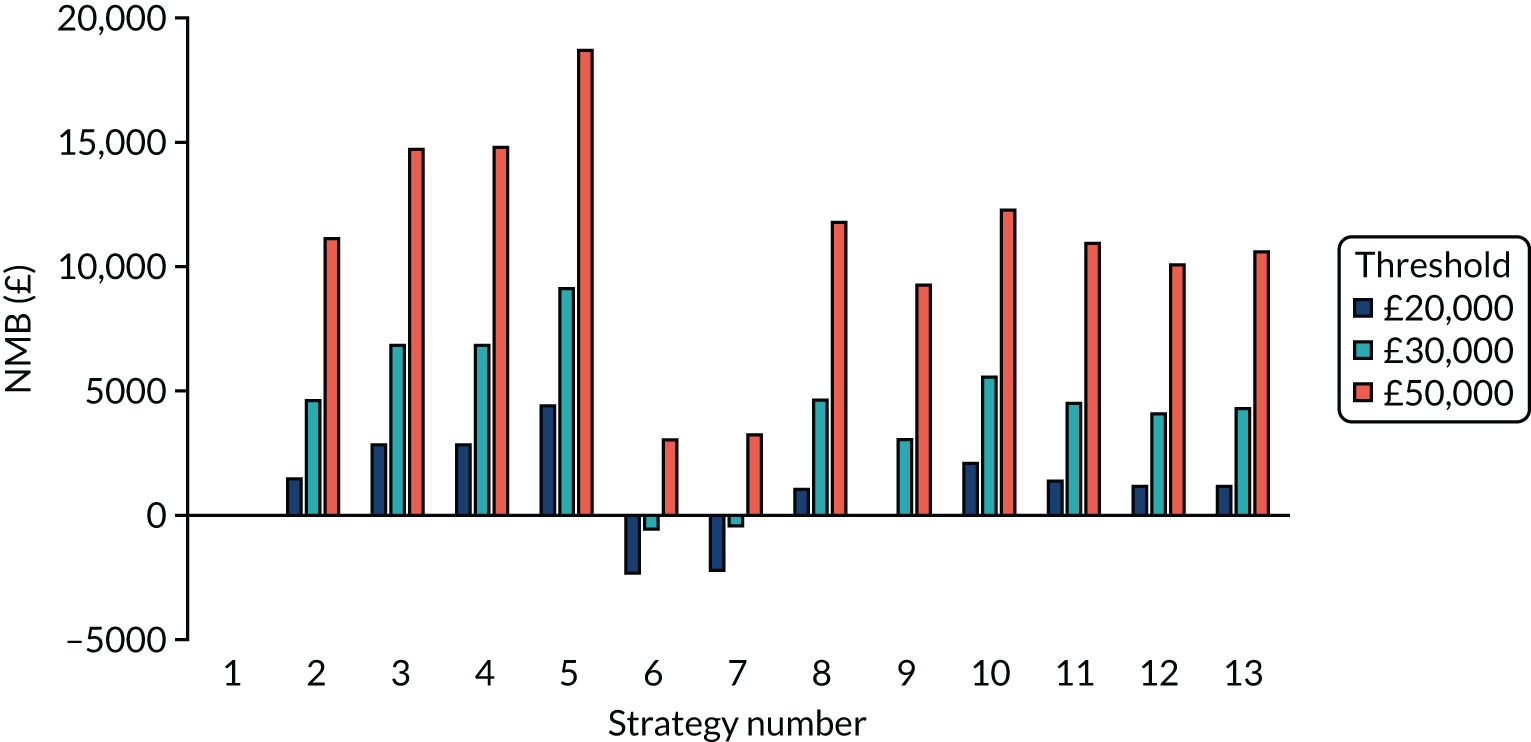
FIGURE 32.
The weighted NMB assuming that the chance of critical COVID-19 with the vaccine is reduced by 70% for en suite residential care facilities.
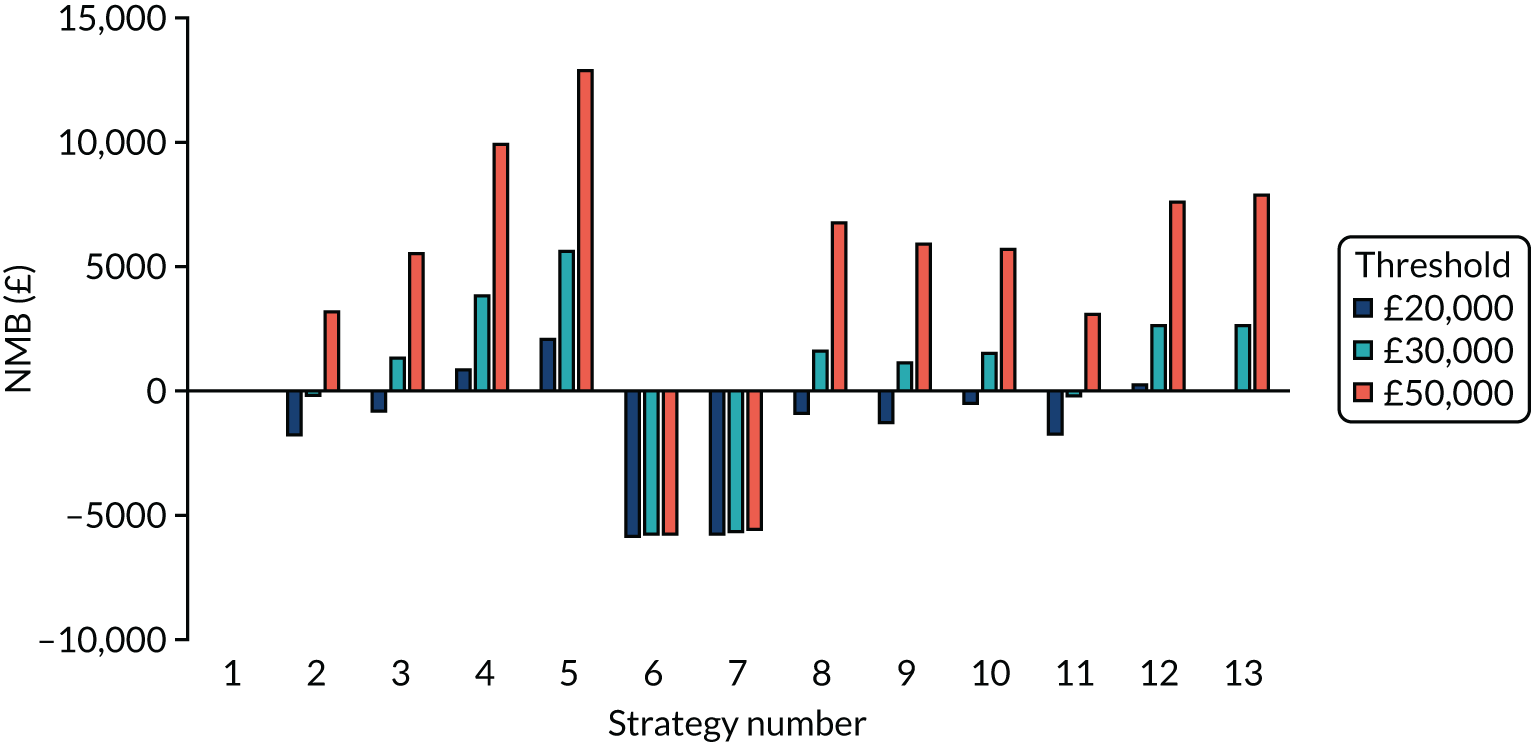
FIGURE 33.
The weighted NMB assuming that the chance of critical COVID-19 with the vaccine is reduced by 90% for en suite residential care facilities.
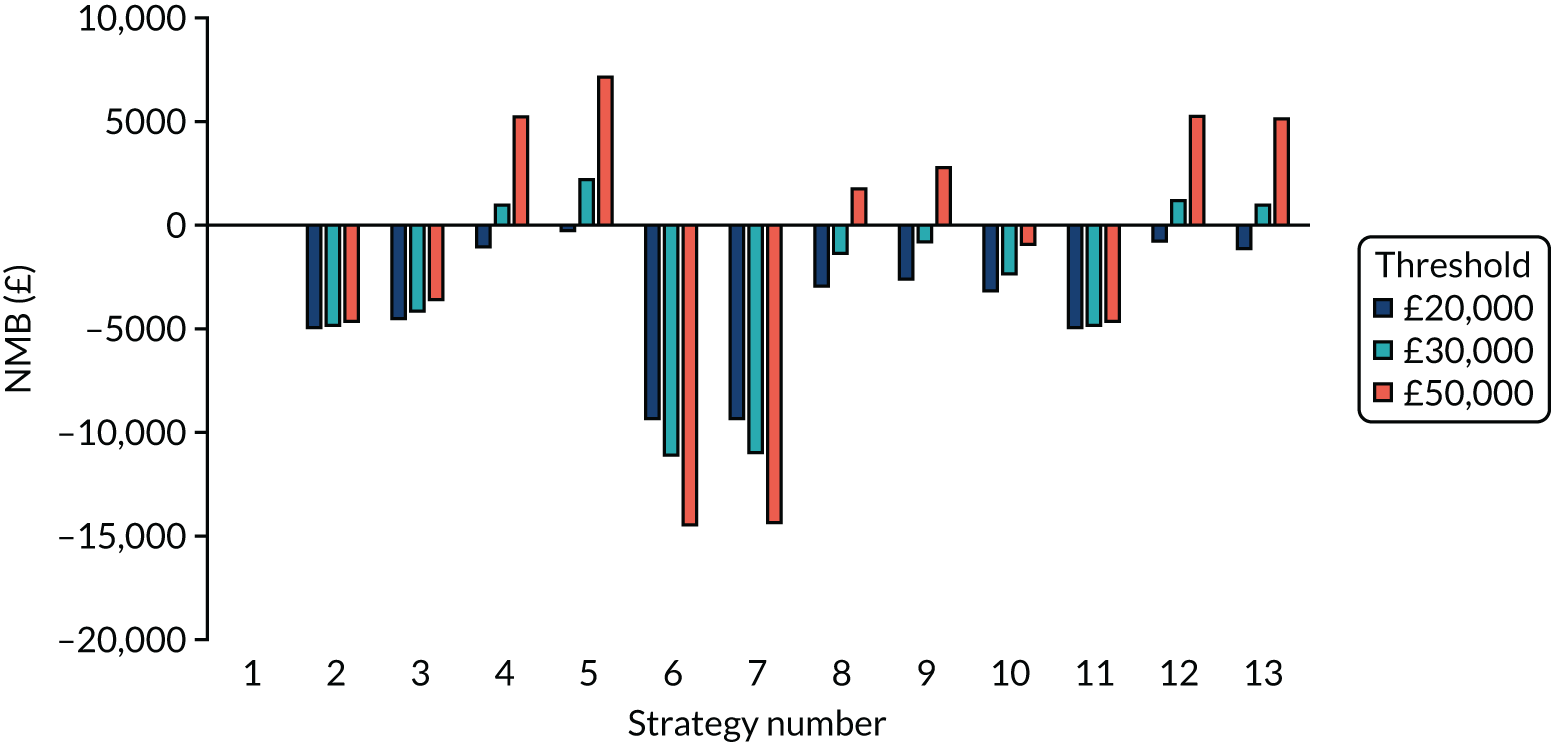
Exploring the effects of different vaccination protection assumptions related to immunity: shared facilities
FIGURE 34.
The weighted number of resident infections in each vaccination scenario for residential care facilities with shared facilities.
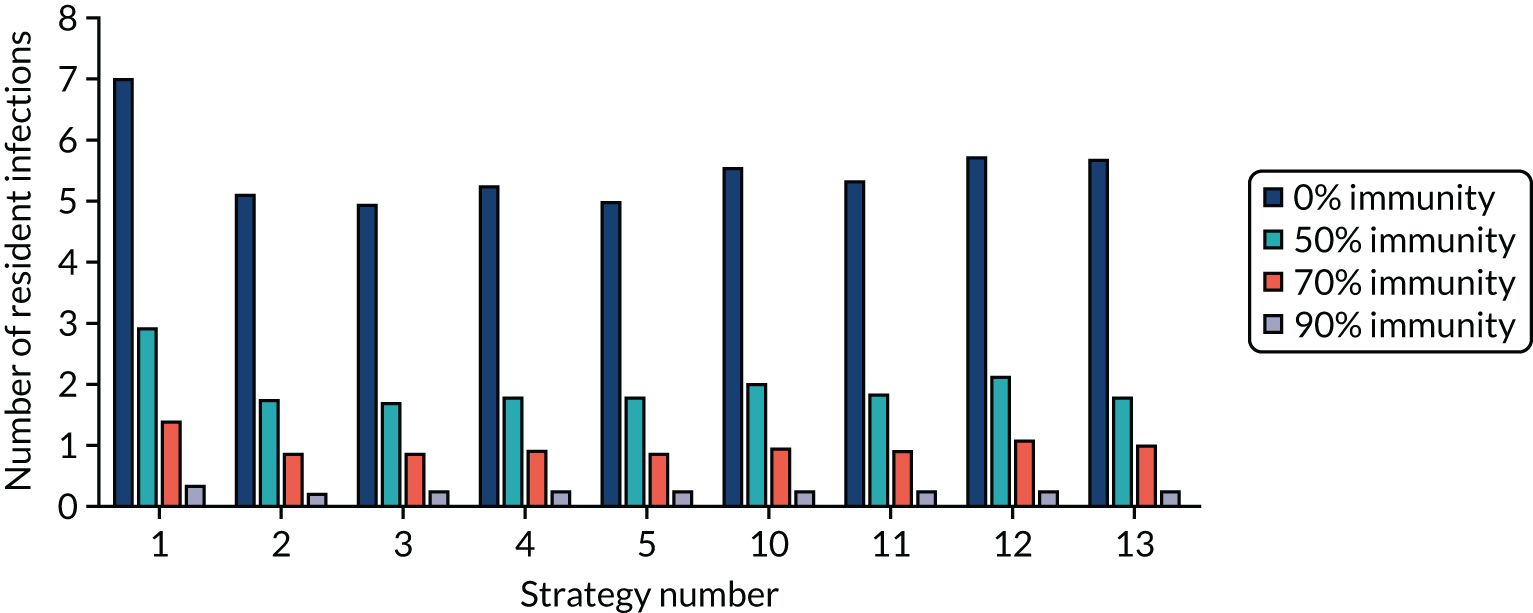
FIGURE 35.
The weighted NMB assuming that the chance of immunity with the vaccine is 50% for residential care facilities with shared facilities.
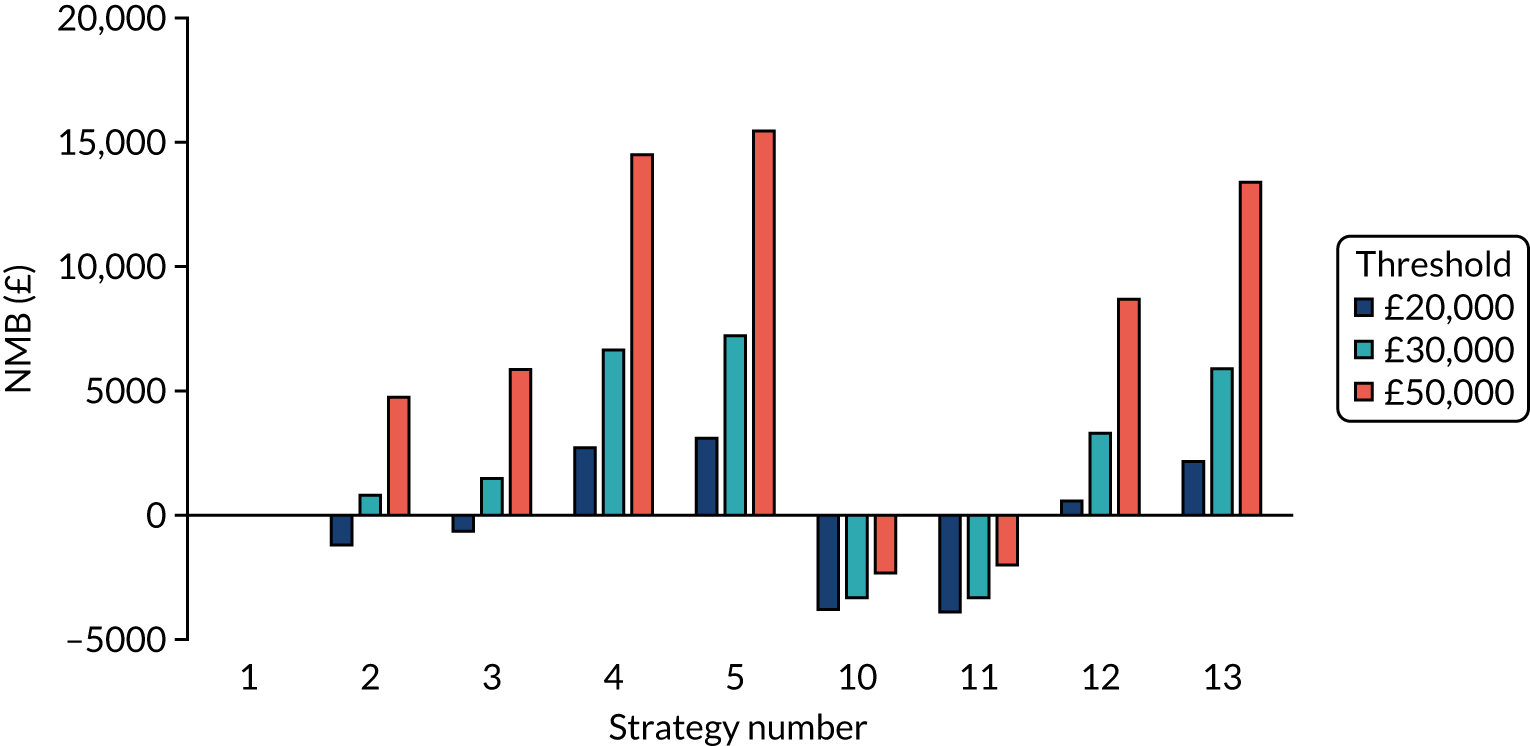
FIGURE 36.
The weighted NMB assuming that the chance of immunity with the vaccine is 70% for residential care facilities with shared facilities.
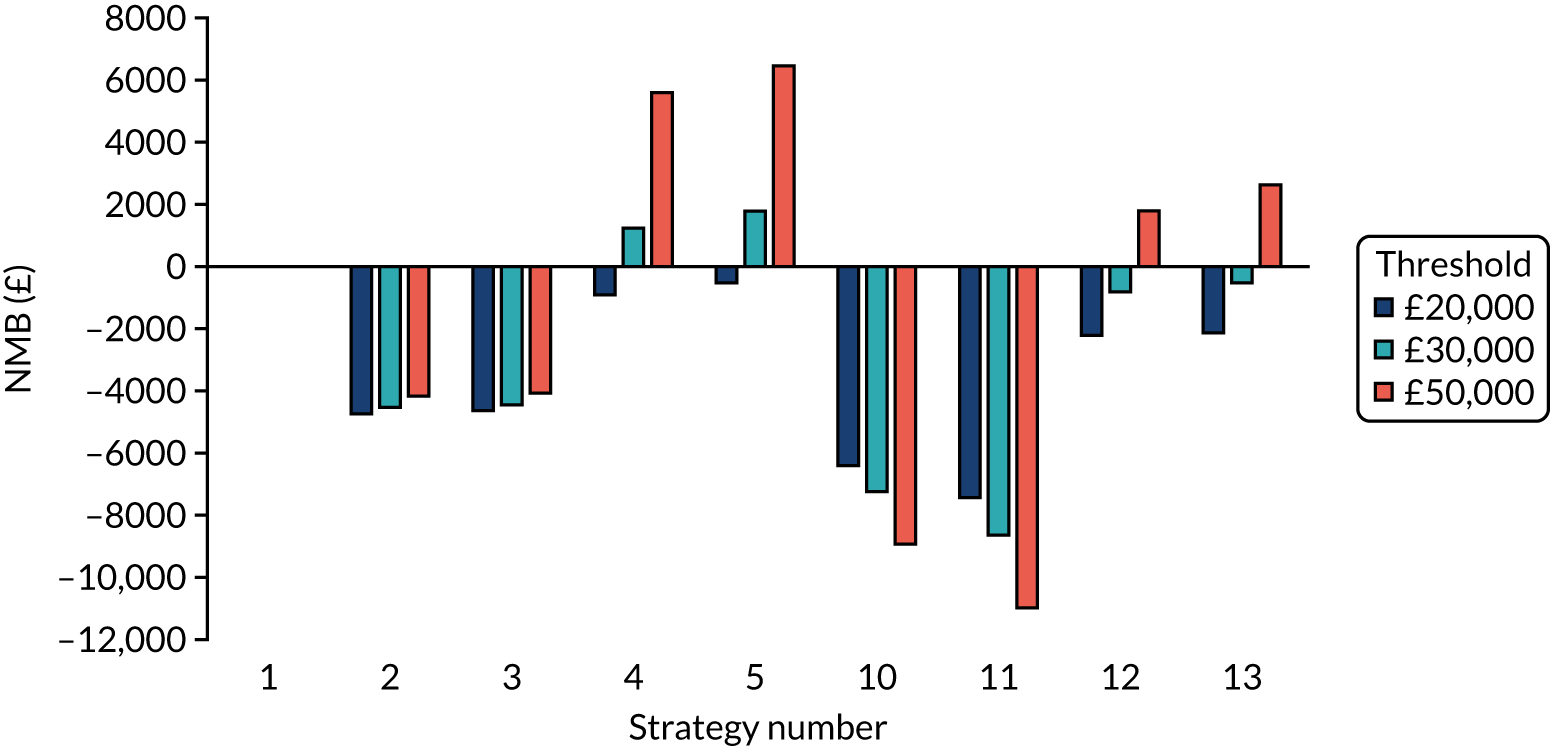
FIGURE 37.
The weighted NMB assuming that the chance of immunity with the vaccine is 90% for residential care facilities with shared facilities.
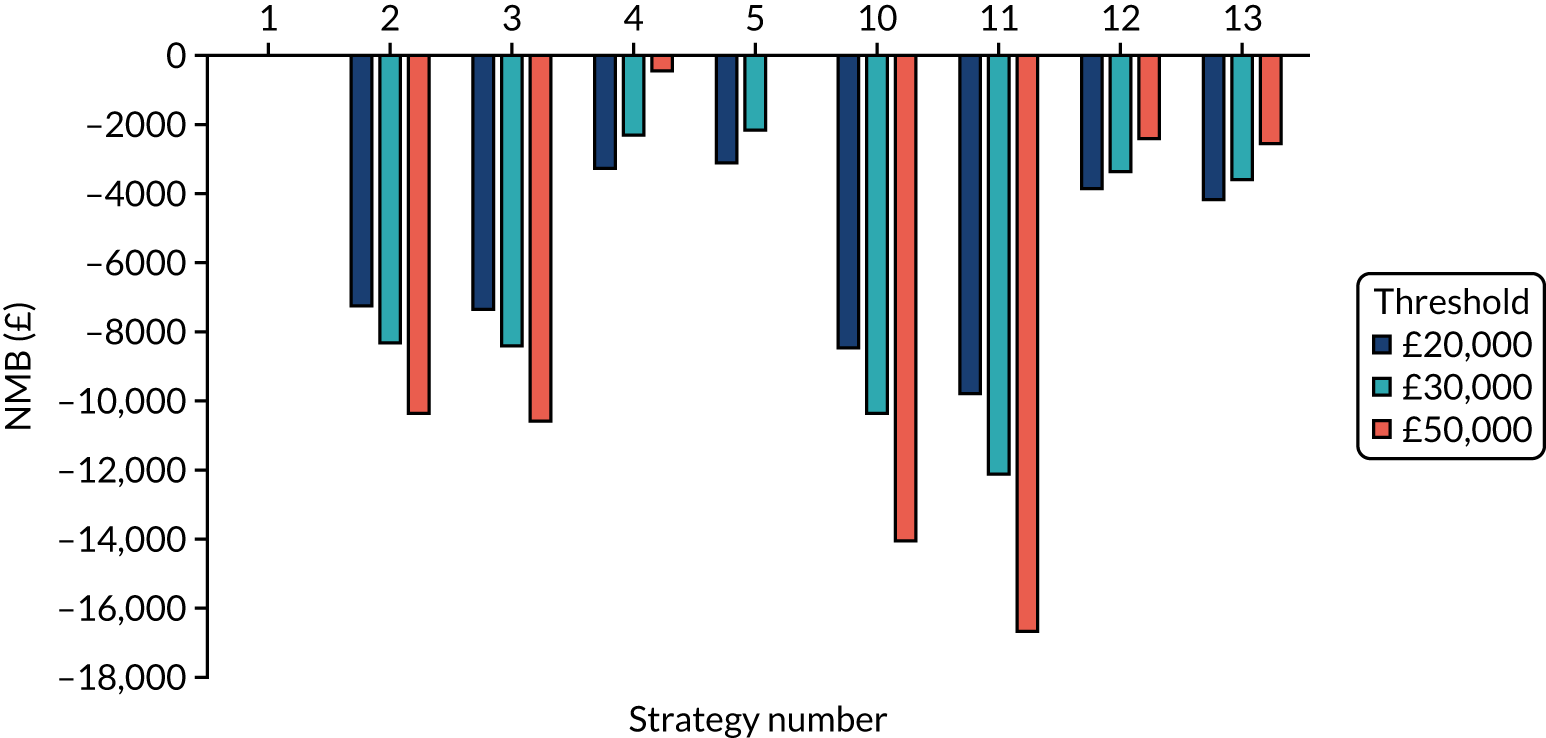
Exploring the effects of different vaccination protection assumptions related to the probability of COVID-19 becoming critical: shared facilities
FIGURE 38.
The weighted NMB assuming that the chance of critical COVID-19 with the vaccine is reduced by 50% for residential care facilities with shared facilities.
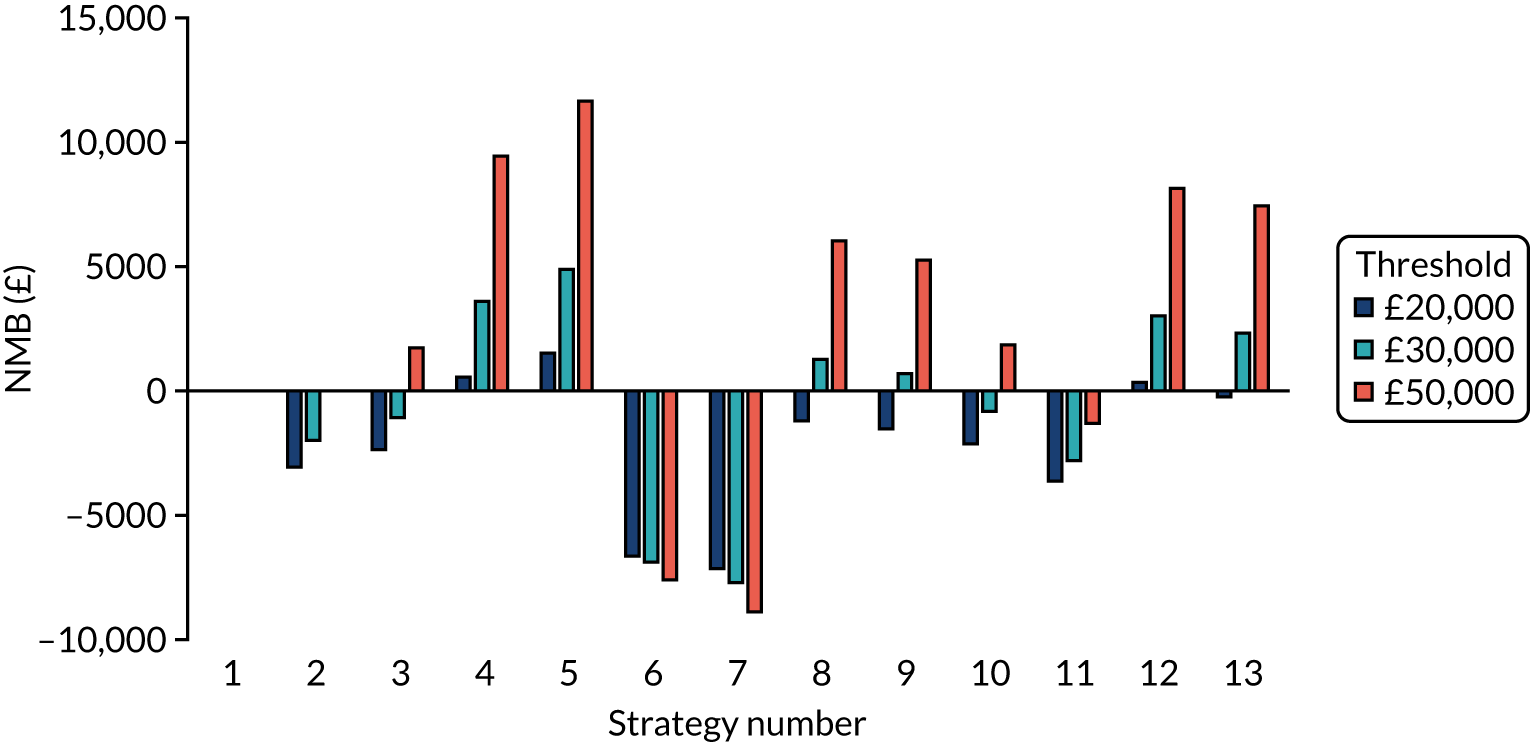
FIGURE 39.
The weighted NMB assuming that the chance of critical COVID-19 with the vaccine is reduced by 70% for residential care facilities with shared facilities.
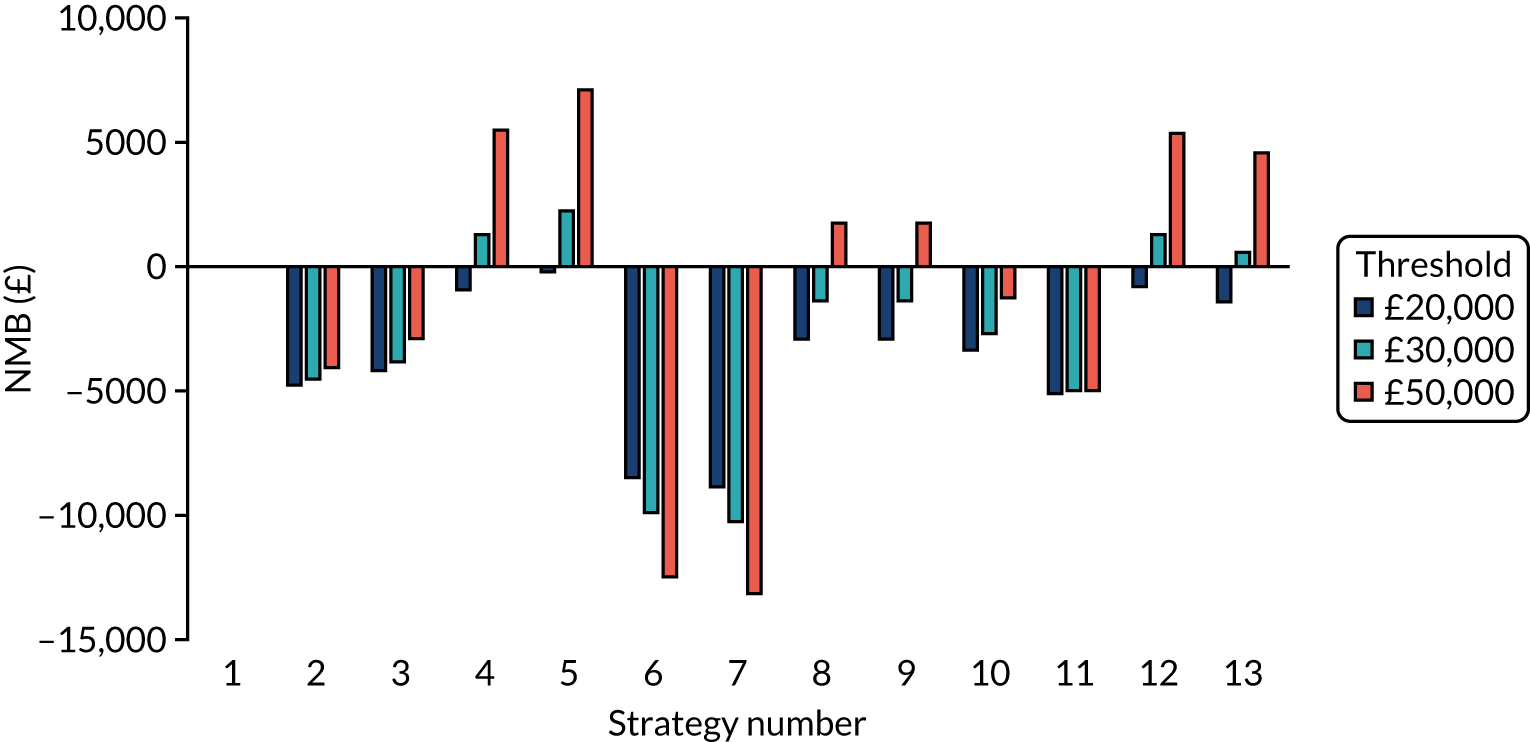
FIGURE 40.
The weighted NMB assuming that the chance of critical COVID-19 with the vaccine is reduced by 90% for residential care facilities with shared facilities.
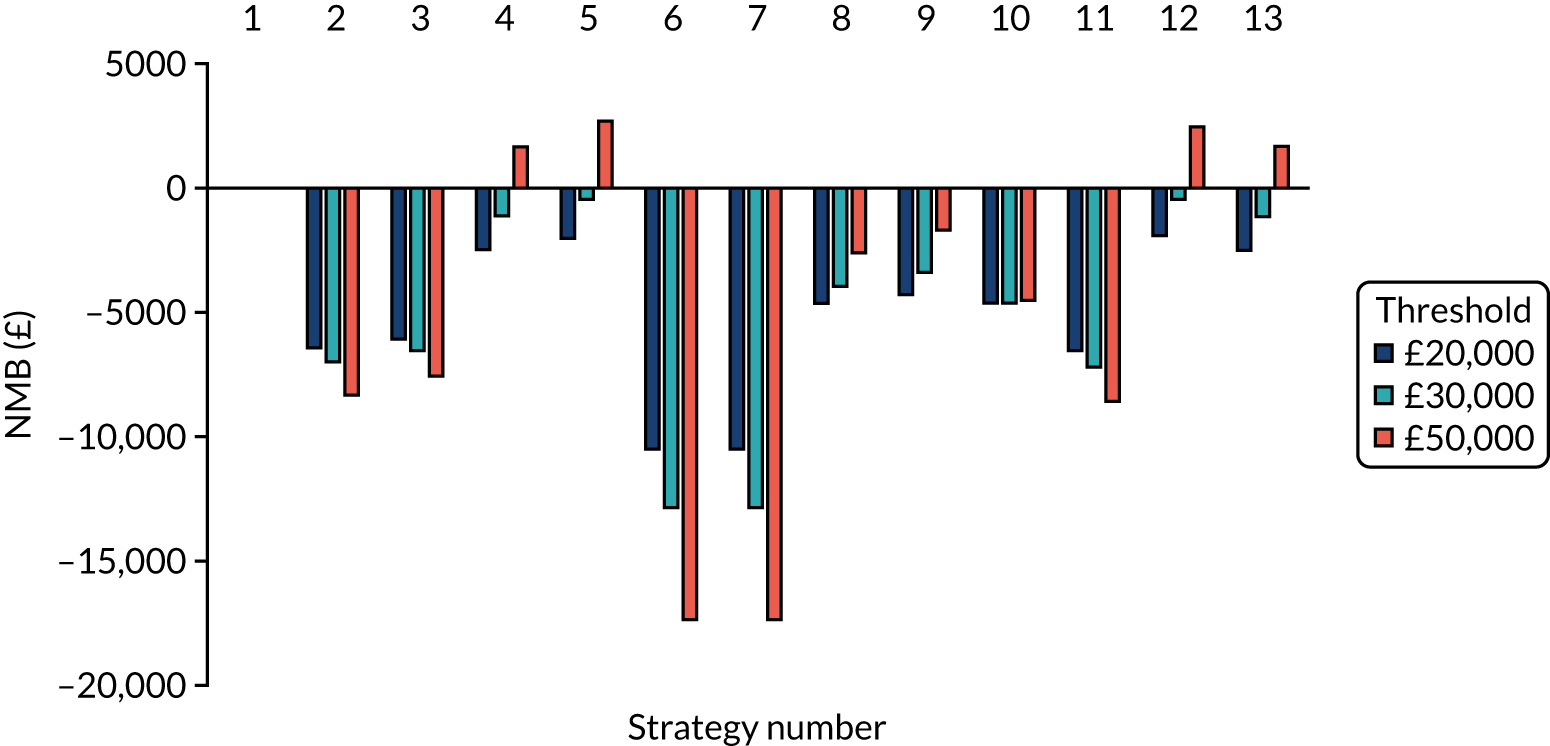
Exploring the effects of having the seed as a staff member rather than as a resident
FIGURE 41.
The NMBs for selected strategies in the seeded en suite model when it was assumed that the seed was a staff member rather than a resident.
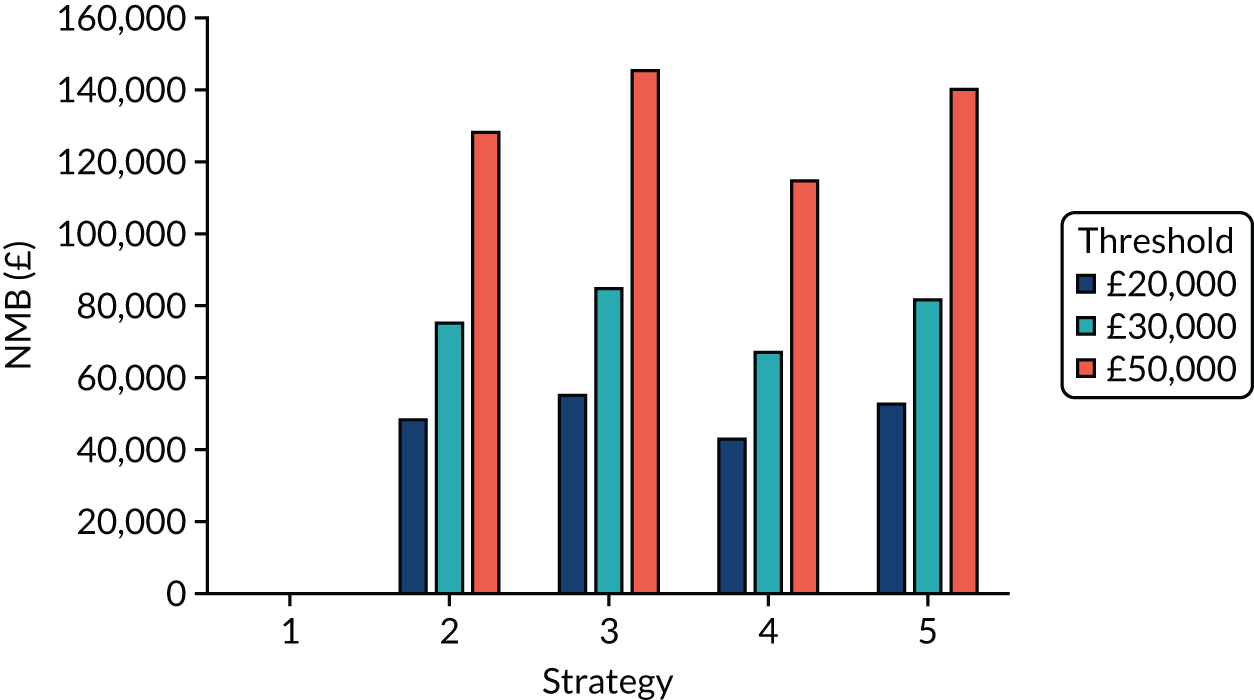
Exploring the effects of assuming that a lower proportion of residents with SARS-CoV-2 develop symptoms: en suite facilities
FIGURE 42.
The NMBs for selected strategies in the seeded en suite model when it was assumed that 33% of people with SARS-CoV-2 infection became symptomatic.
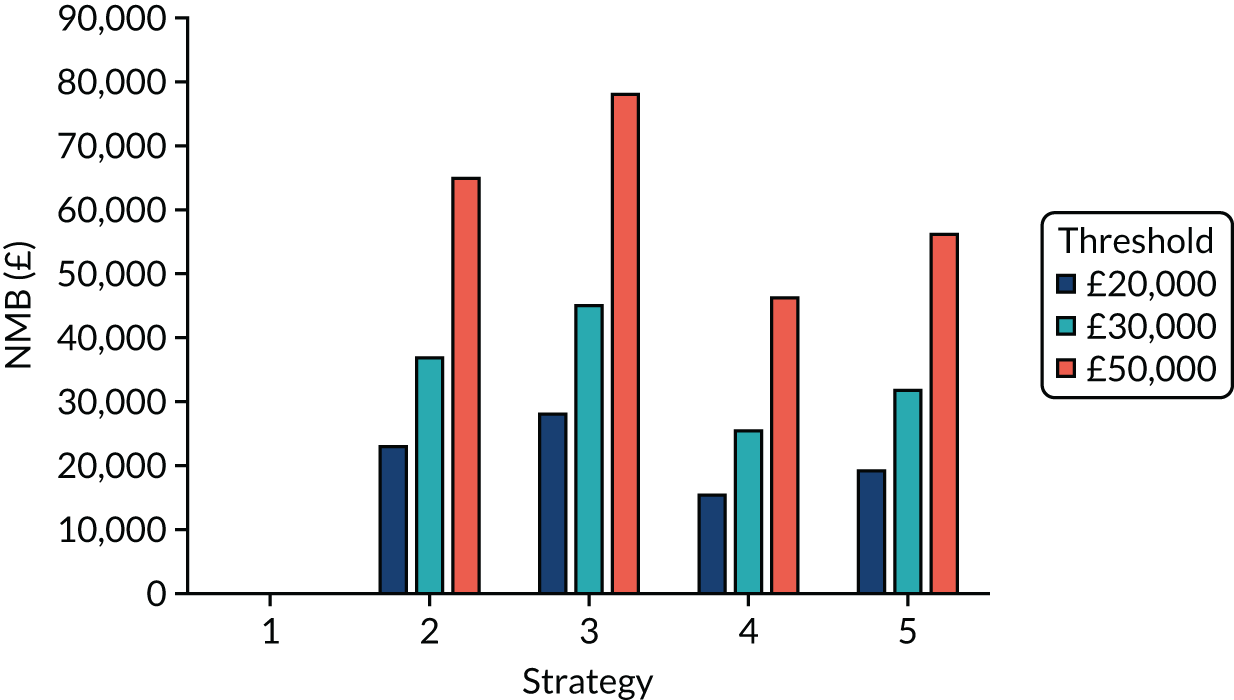
Exploring the effects of assuming that a higher proportion of residential care facilities were penetrated by SARS-CoV-2
| Tests compared | No early release permitted | Early release permitted | ||||
|---|---|---|---|---|---|---|
| Incremental costs (£) | Incremental QALYs | ICER (£) | Incremental costs (£) | Incremental QALYs | ICER (£) | |
| POCT (D) compared with a laboratory-based test (D) | –37 | 0.21 | Dominating | –51 | 0.19 | Dominating |
| POCT (A) compared with a laboratory-based test (A) | 34 | 0.00 | 13,892 | 24 | –0.25 | Dominated |
| POCT (A) compared with a laboratory-based test (D) | 723 | –0.01 | Dominated | 751 | –0.26 | Dominated |
| POCT (D) compared with a laboratory-based test (A) | –726 | 0.22 | Dominating | –778 | 0.20 | Dominating |
| POCT (RWE) compared with a laboratory-based test (RWE) | 282 | 0.14 | 2051 | 378 | 0.06 | 6191 |
| Laboratory-based test (D) compared with a laboratory-based test (RWE) | 265 | 0.15 | 1776 | 317 | 0.37 | 862 |
| Laboratory-based test (A) compared with a laboratory-based test (RWE) | 954 | 0.14 | 6773 | 1044 | 0.36 | 2921 |
| POCT (D) compared with a POCT (RWE) | –54 | 0.22 | Dominating | –113 | 0.49 | Dominating |
| POCT (A) compared with a POCT (RWE) | 705 | 0.01 | 127,175 | 690 | 0.05 | 14,547 |
FIGURE 43.
The weighted NMBs for the en suite residential care facility when it was assumed that 80% of bubbles were penetrated by SARS-CoV-2.
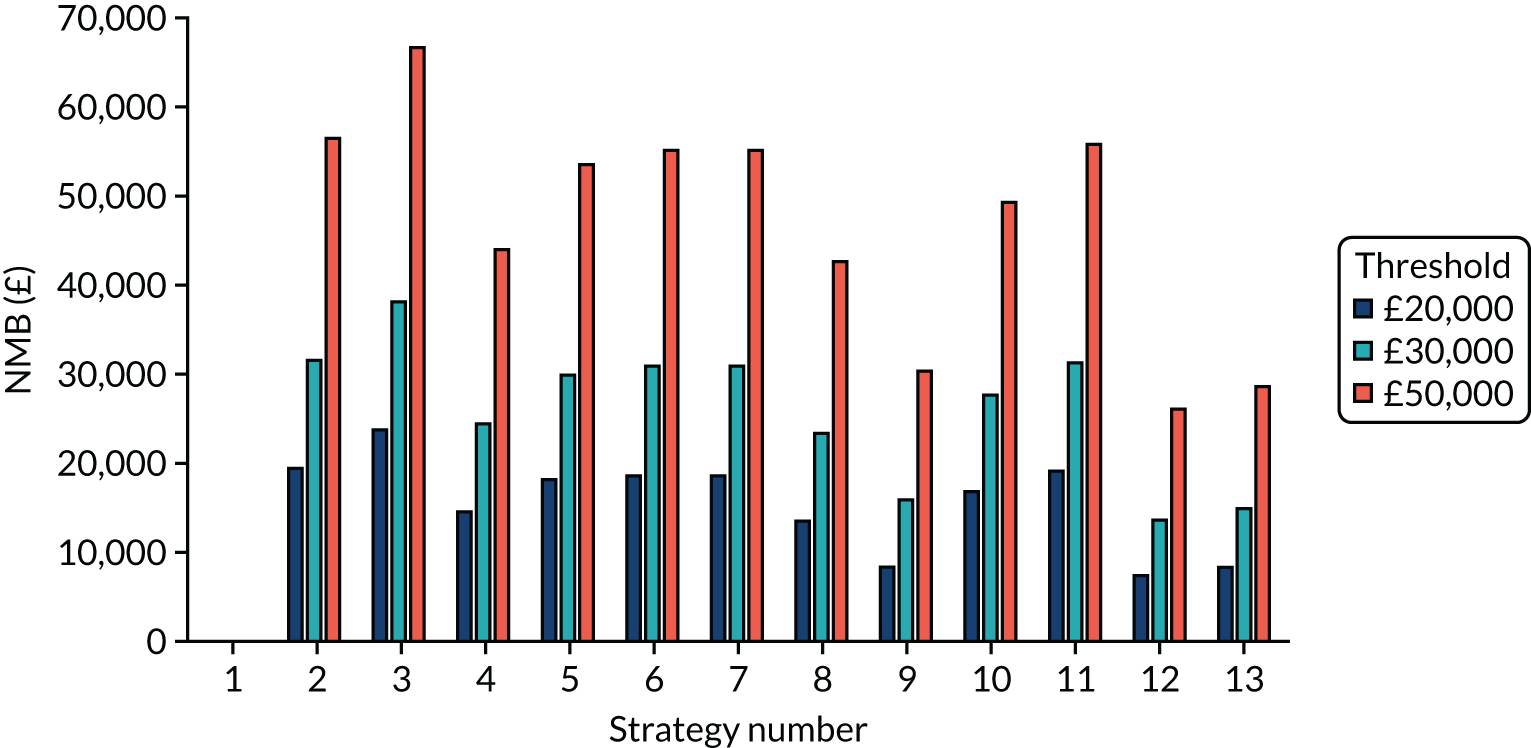
| Tests compared | No early release permitted | Early release permitted | ||||
|---|---|---|---|---|---|---|
| Incremental costs (£) | Incremental QALYs | ICER (£) | Incremental costs (£) | Incremental QALYs | ICER (£) | |
| POCT (D) compared with a laboratory-based test (D) | –35 | 0.08 | Dominating | –20 | 0.12 | Dominating |
| POCT (A) compared with a laboratory-based test (A) | 7 | –0.09 | Dominated | –1 | –0.11 | 12a |
| POCT (A) compared with a laboratory-based test (D) | 634 | –0.12 | Dominated | 639 | –0.10 | Dominated |
| POCT (D) compared with a laboratory-based test (A) | –662 | 0.10 | Dominating | –660 | 0.10 | Dominating |
| POCT (RWE) compared with a laboratory-based test (RWE) | 280 | 0.03 | 11,047 | 330 | 0.01 | 42,515 |
| Laboratory-based test (D) compared with a laboratory-based test (RWE) | 247 | 0.12 | 2096 | 299 | 0.15 | 1978 |
| Laboratory-based test (A) compared with a laboratory-based test (RWE) | 875 | 0.10 | 9092 | 939 | 0.16 | 5721 |
| POCT (D) compared with a POCT (RWE) | –67 | 0.17 | Dominating | –51 | 0.26 | Dominating |
| POCT (A) compared with a POCT (RWE) | 602 | –0.02 | Dominated | 608 | 0.05 | 12,596 |
FIGURE 44.
The weighted NMBs for the residential care facility with shared facilities when it was assumed that 80% of bubbles were penetrated by SARS-CoV-2.
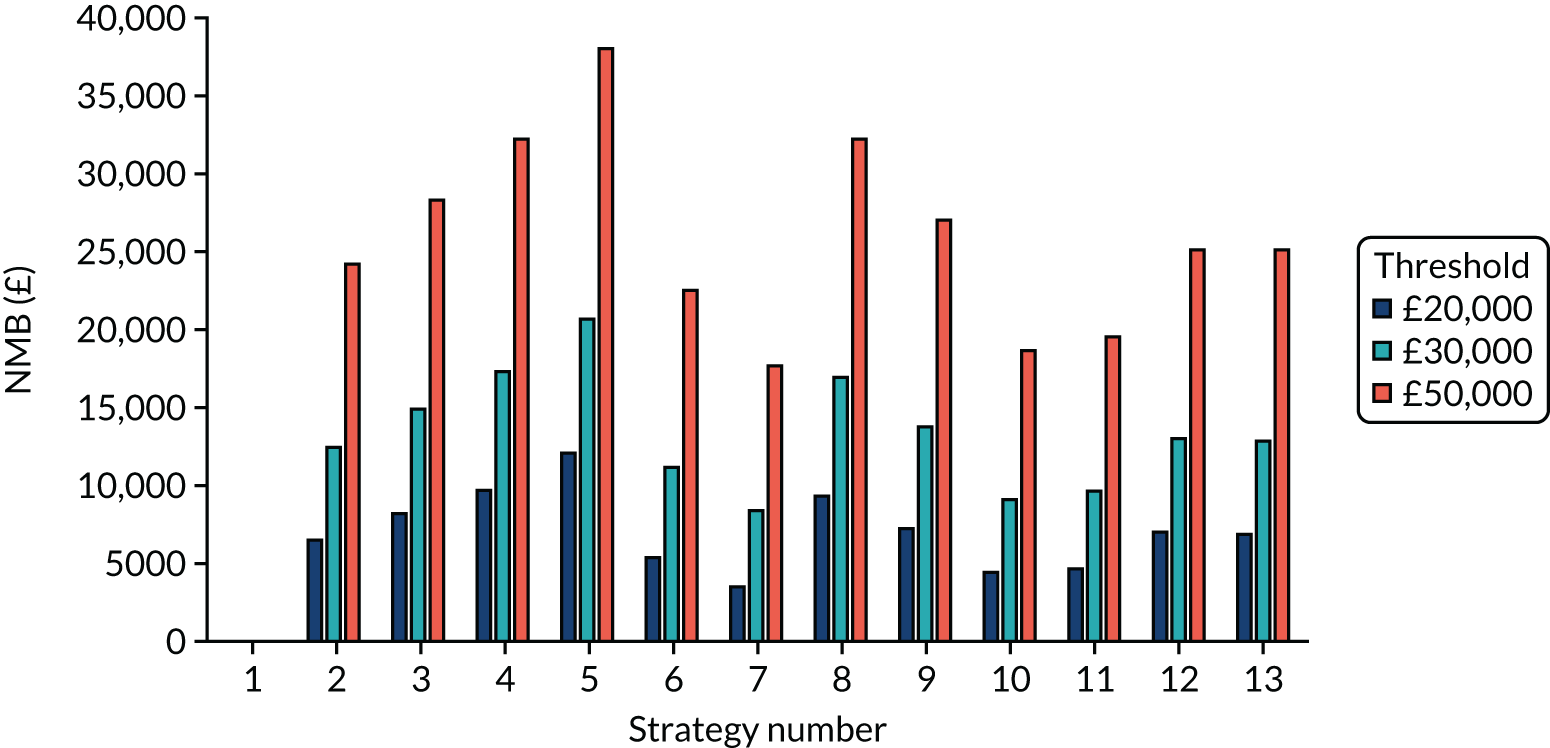
Exploring the effects of assuming that a lower proportion of residential care facilities were penetrated by SARS-CoV-2
| Tests compared | No early release permitted | Early release permitted | ||||
|---|---|---|---|---|---|---|
| Incremental costs (£) | Incremental QALYs | ICER (£) | Incremental costs (£) | Incremental QALYs | ICER (£) | |
| POCT (D) compared with a laboratory-based test (D) | –25 | 0.06 | Dominating | –24 | 0.06 | Dominating |
| POCT (A) compared with a laboratory-based test (A) | 5 | 0.00 | 1183 | 10 | –0.03 | Dominated |
| POCT (A) compared with a laboratory-based test (D) | 963 | –0.19 | Dominated | 982 | –0.08 | Dominated |
| POCT (D) compared with a laboratory-based test (A) | –982 | 0.25 | Dominating | –996 | 0.12 | Dominating |
| POCT (RWE) compared with a laboratory-based test (RWE) | 462 | –0.06 | Dominated | 579 | 0.01 | 48,895 |
| Laboratory-based test (D) compared with a laboratory-based test (RWE) | 456 | –0.06 | Dominated | 544 | 0.07 | 7589 |
| Laboratory-based test (A) compared with a laboratory-based test (RWE) | 1414 | –0.25 | Dominated | 1517 | 0.02 | 77,050 |
| POCT (D) compared with a POCT (RWE) | –30 | 0.06 | Dominating | –58 | 0.12 | Dominating |
| POCT (A) compared with a POCT (RWE) | 957 | –0.18 | Dominated | 948 | 0.02 | Dominated |
FIGURE 45.
The weighted NMBs for the en suite residential care facility when it was assumed that 20% of bubbles were penetrated by SARS-CoV-2.
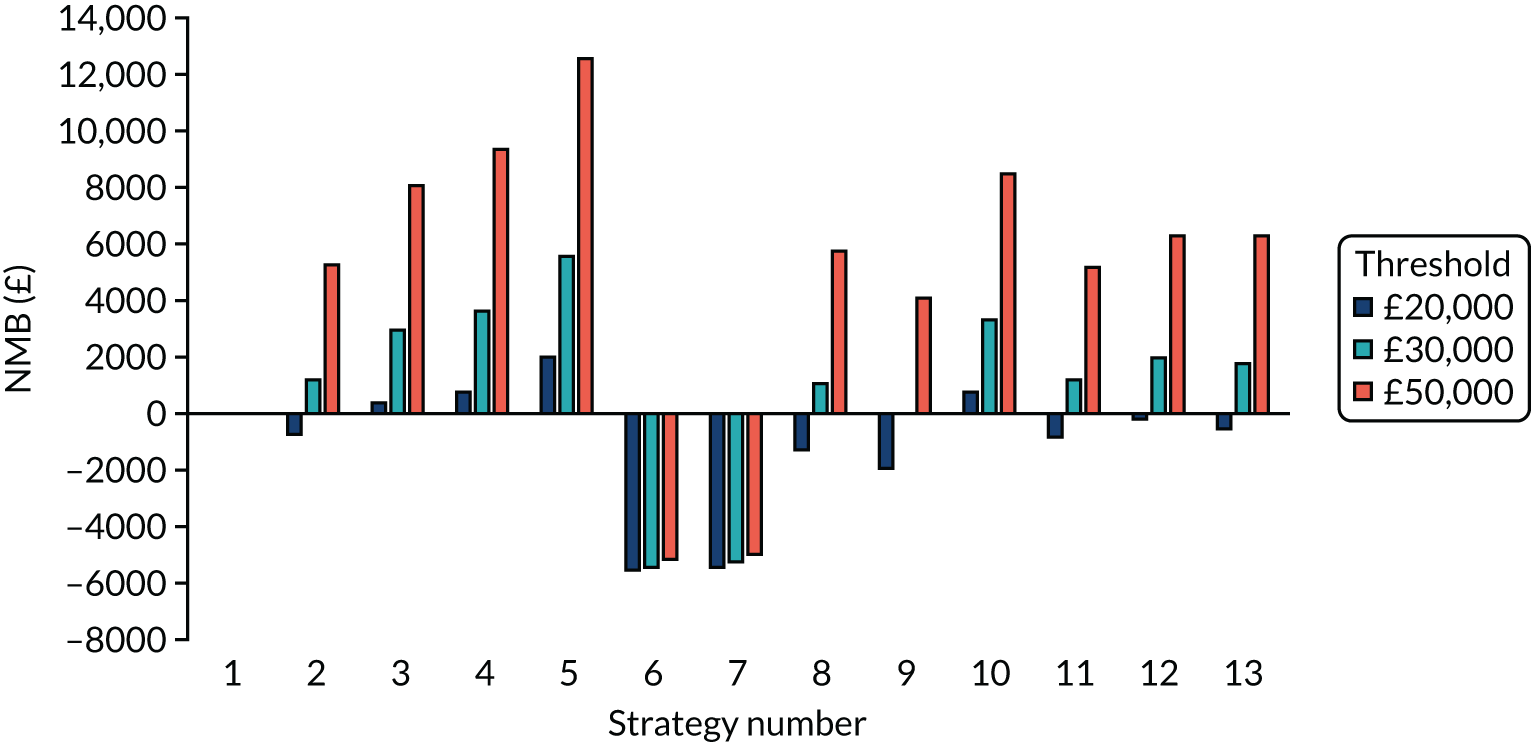
| Tests compared | No early release permitted | Early release permitted | ||||
|---|---|---|---|---|---|---|
| Incremental costs (£) | Incremental QALYs | ICER (£) | Incremental costs (£) | Incremental QALYs | ICER (£) | |
| POCT (D) compared with a laboratory-based test (D) | –33 | 0.03 | Dominating | –2 | 0.03 | Dominating |
| POCT (A) compared with a laboratory-based test (A) | –6 | –0.02 | 344a | 12 | –0.01 | Dominated |
| POCT (A) compared with a laboratory-based test (D) | 923 | –0.21 | Dominated | 964 | –0.08 | Dominated |
| POCT (D) compared with a laboratory-based test (A) | –963 | 0.21 | Dominating | –953 | 0.10 | Dominating |
| POCT (RWE) compared with a laboratory-based test (RWE) | 464 | –0.09 | Dominated | 554 | 0.01 | Dominated |
| Laboratory-based test (D) compared with a laboratory-based test (RWE) | 464 | –0.07 | Dominated | 514 | 0.02 | 26,679 |
| Laboratory-based test (A) compared with a laboratory-based test (RWE) | 1393 | –0.26 | Dominated | 1465 | –0.05 | Dominated |
| POCT (D) compared with a POCT (RWE) | –33 | 0.04 | Dominating | –43 | 0.07 | Dominating |
| POCT (A) compared with a POCT (RWE) | 924 | –0.19 | Dominated | 923 | –0.05 | Dominated |
FIGURE 46.
The weighted NMBs for the residential care facility with shared facilities when it was assumed that 20% of bubbles were penetrated by SARS-CoV-2.
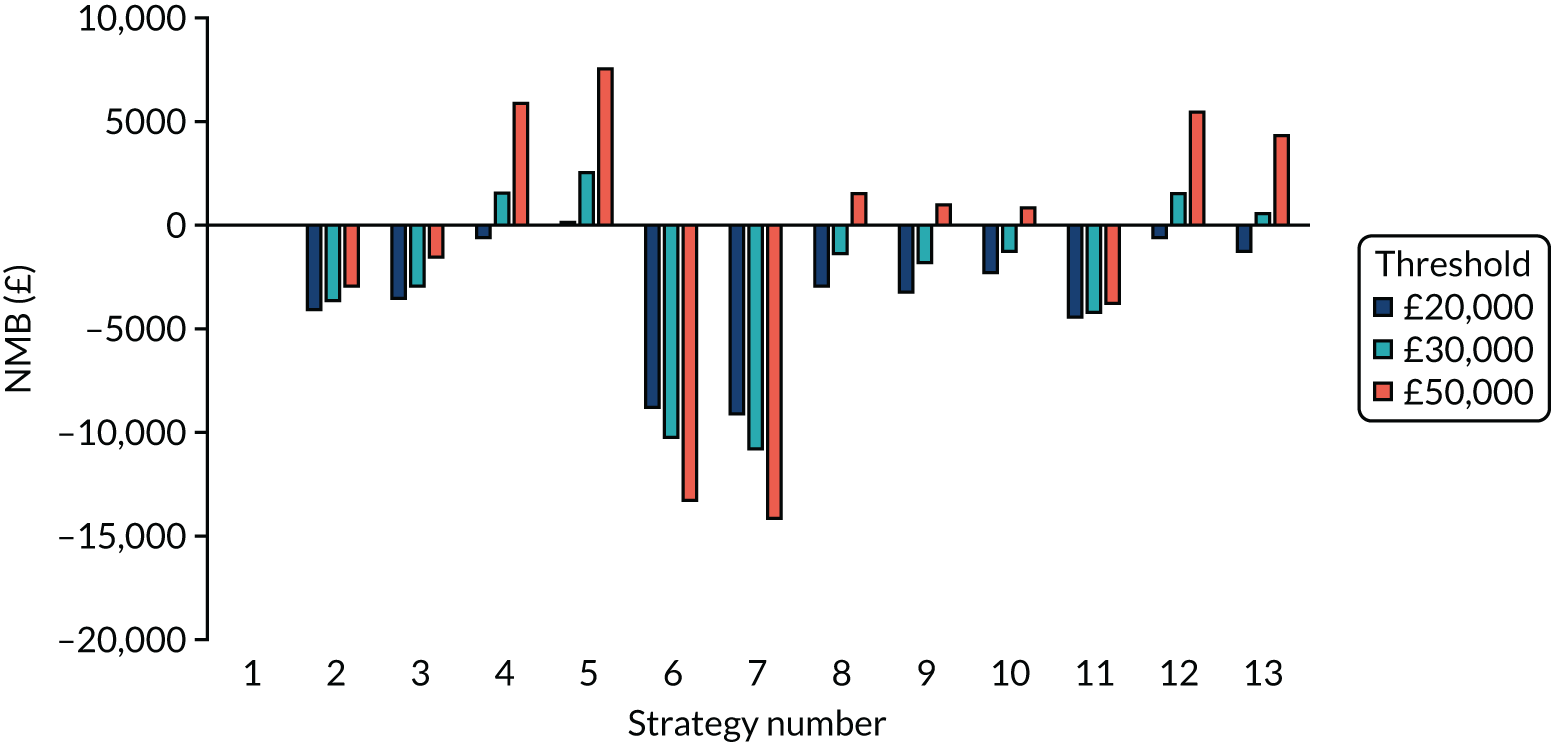
Exploring the effects of assuming that SARS-CoV-2 point-of-care tests cost more
FIGURE 47.
The weighted NMBs for the en suite residential care facility assuming that SARS-CoV-2 POCTs cost £10 more than in the base case.
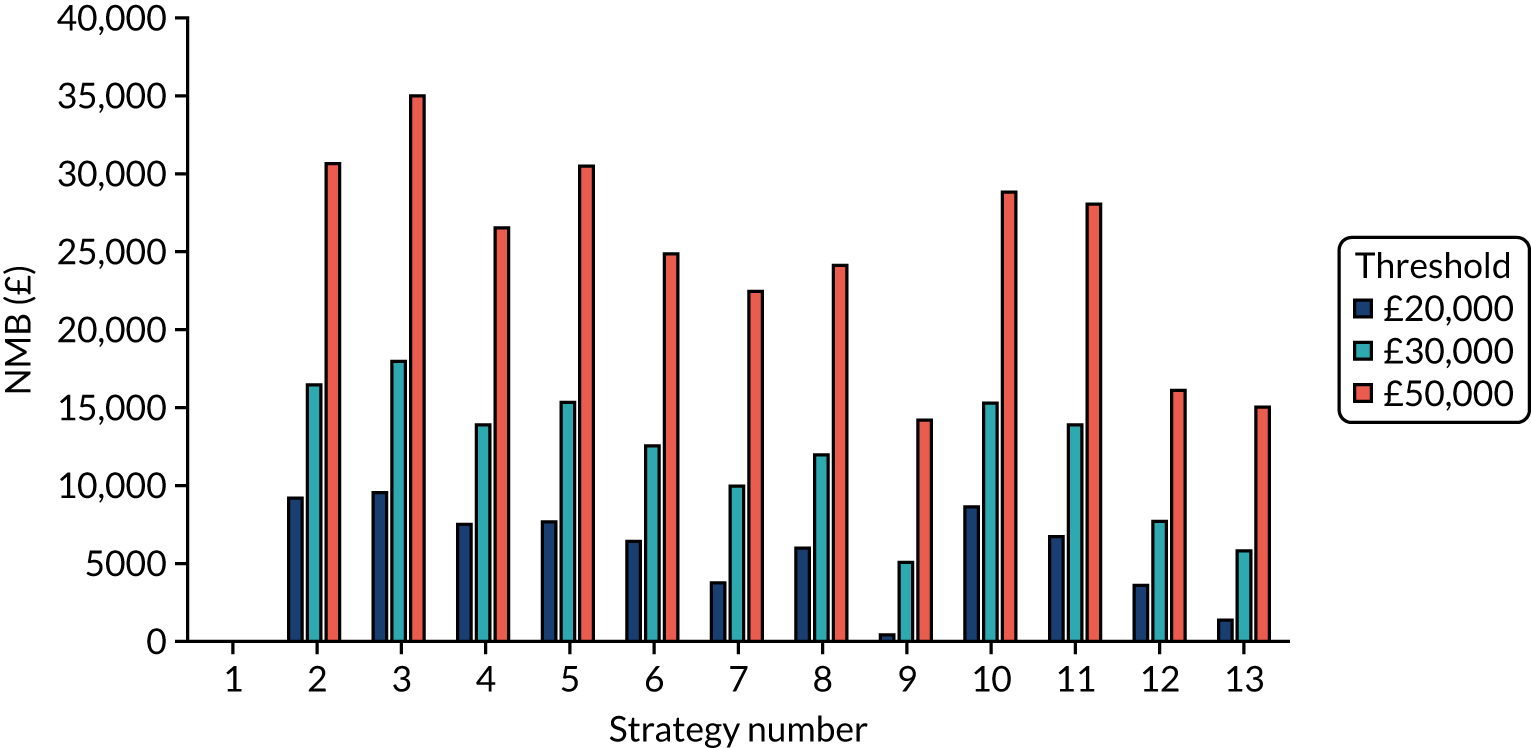
FIGURE 48.
The weighted NMBs for the residential care facility with shared facilities assuming that SARS-CoV-2 POCTs cost £10 more than in the base case.
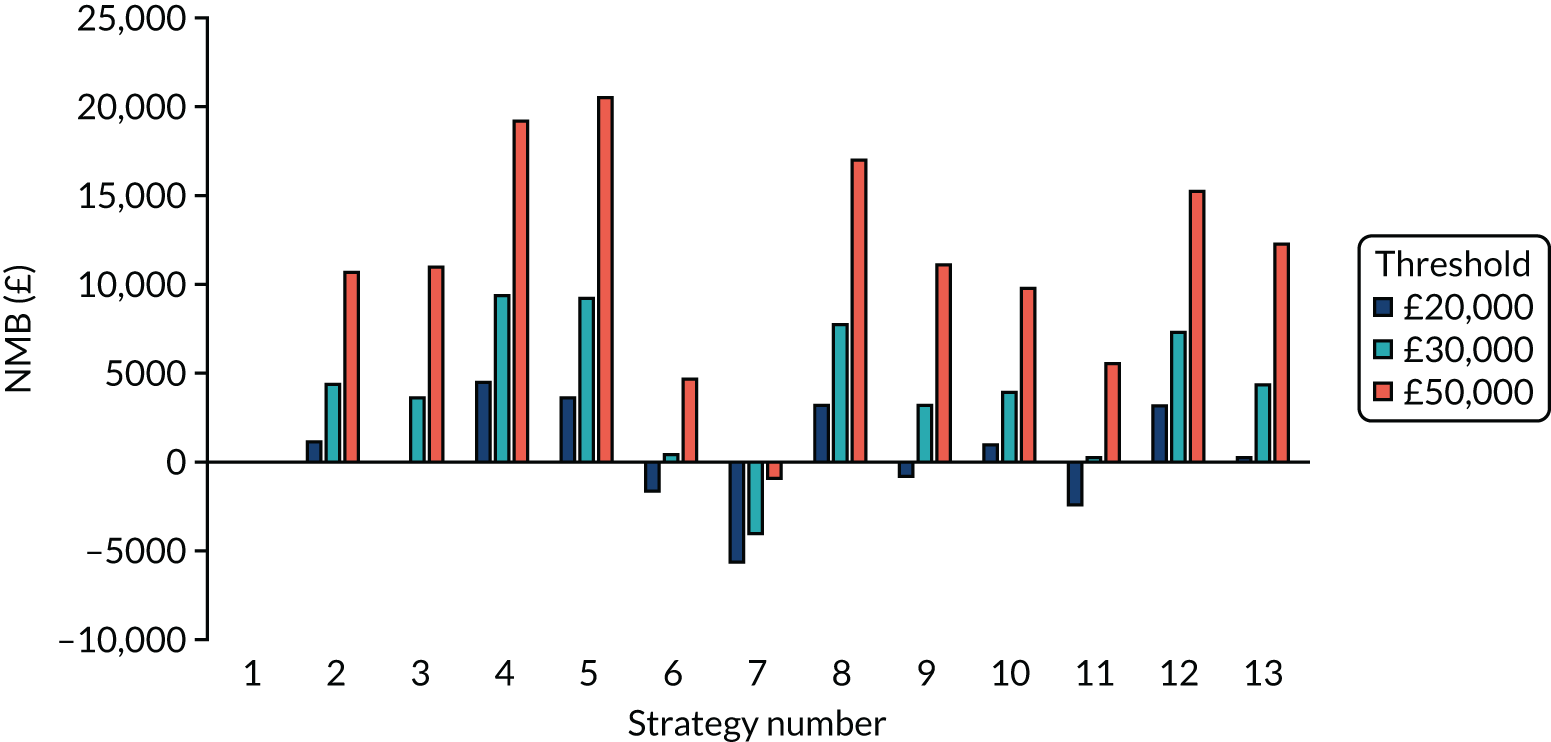
Exploring the effects of assuming that laboratory-based SARS-CoV-2 tests cost more
FIGURE 49.
The weighted NMBs for the en suite residential care facility assuming that laboratory-based SARS-CoV-2 tests cost £10 more than in the base case.
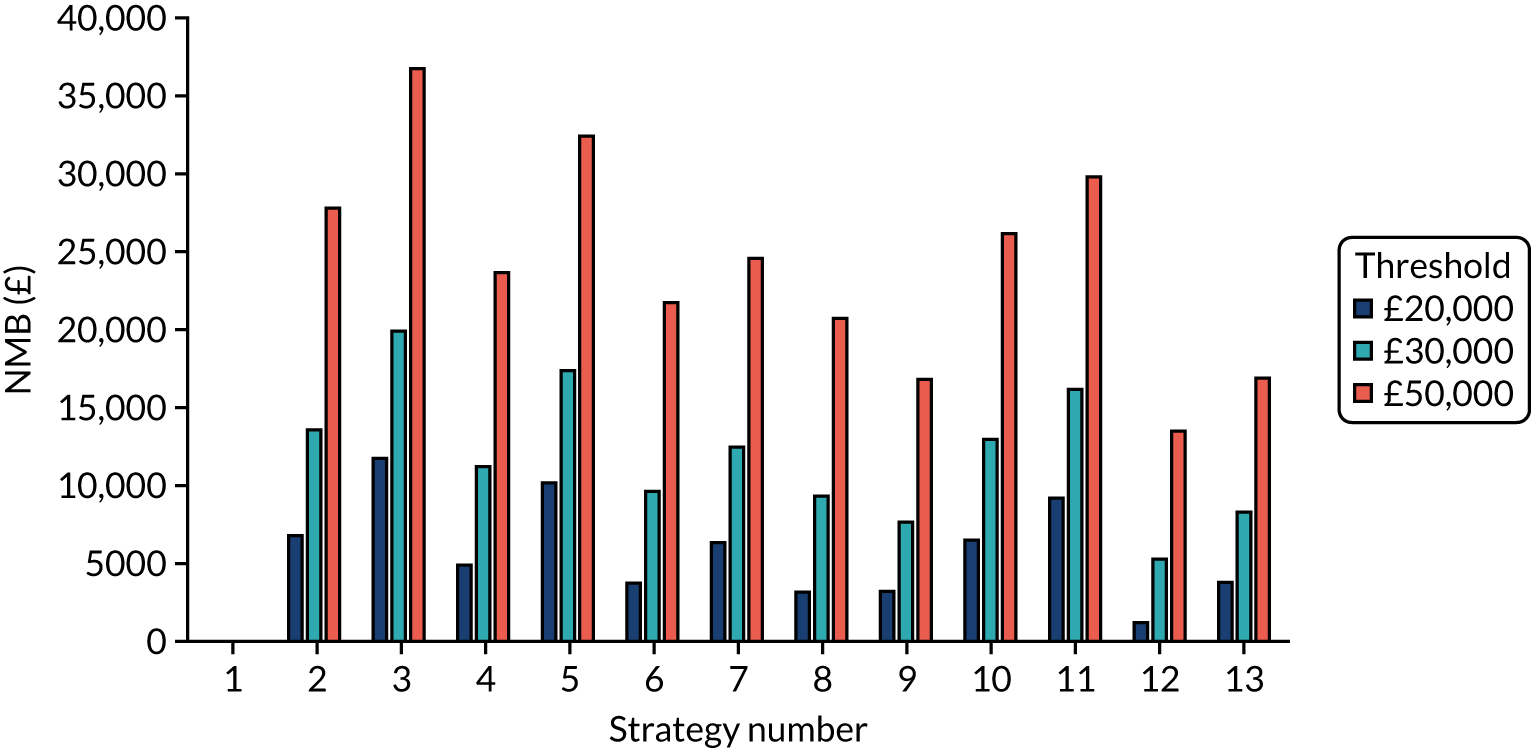
FIGURE 50.
The weighted NMBs for the residential care facility with shared facilities assuming that laboratory-based SARS-CoV-2 tests cost £10 more than in the base case.
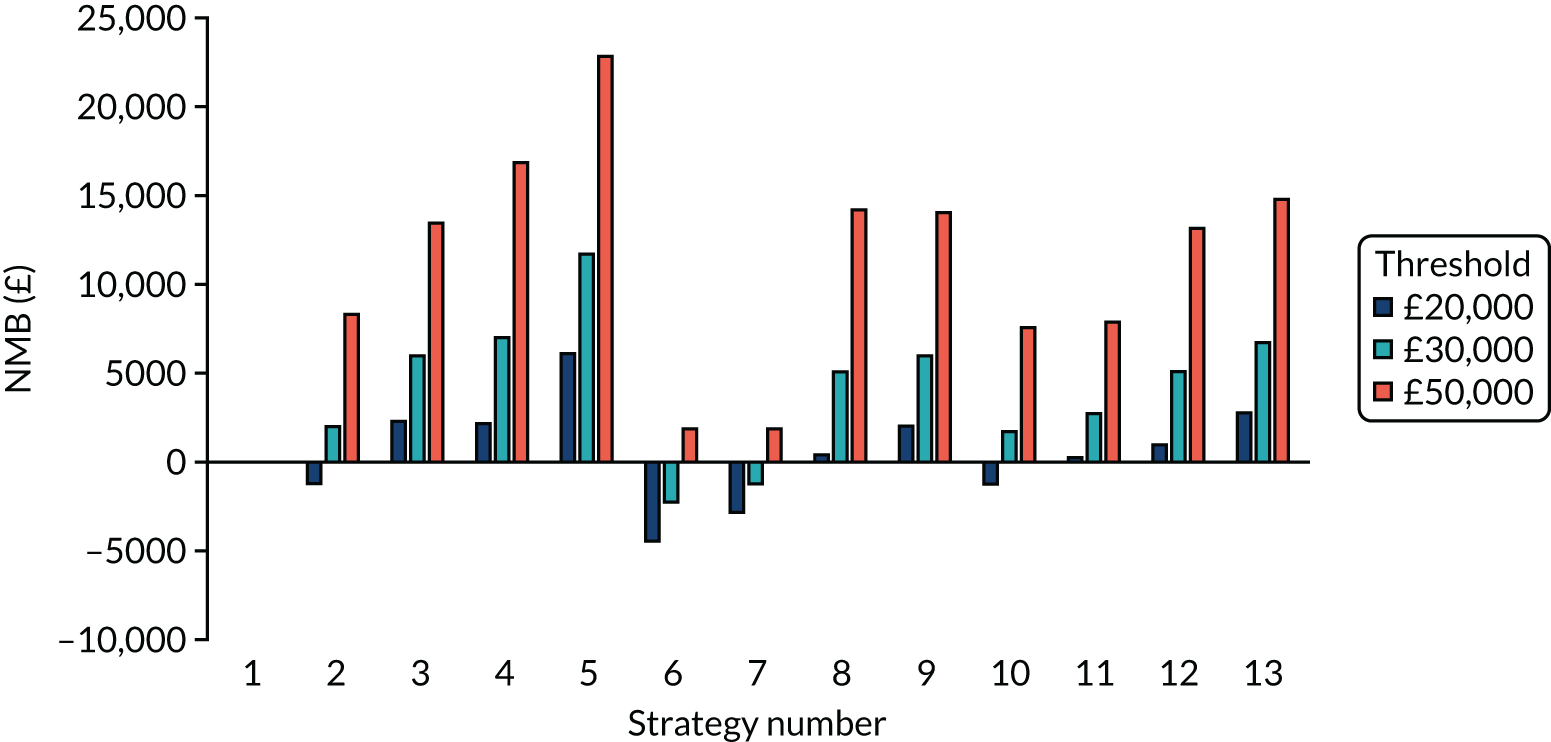
Estimating the cost of SARS-CoV-2 point-of-care tests that would produce the same net monetary benefit as laboratory-based tests
| Tests compared | No early release permitted (£) | Early release permitted (£) | ||||
|---|---|---|---|---|---|---|
| £20,000 | £30,000 | £50,000 | £20,000 | £30,000 | £50,000 | |
| POCT (D) compared with a laboratory-based test (D) | 11 | 17 | 29 | 11 | 16 | 27 |
| POCT (A) compared with a laboratory-based test (A) | 0 | 0 | 1 | –10 | –15 | –25 |
| POCT (A) compared with a laboratory-based test (D) | –10 | –14 | –21 | –15 | –21 | –34 |
| POCT (D) compared with a laboratory-based test (A) | 24 | 34 | 54 | 17 | 23 | 37 |
| POCT (RWE) compared with a laboratory-based test (RWE) | 2 | 4 | 7 | 1 | 3 | 6 |
| Tests compared | No early release permitted (£) | Early release permitted (£) | ||||
|---|---|---|---|---|---|---|
| £20,000 | £30,000 | £50,000 | £20,000 | £30,000 | £50,000 | |
| POCT (D) compared with a laboratory-based test (D) | 5 | 7 | 11 | 6 | 9 | 15 |
| POCT (A) compared with a laboratory-based test (A) | –4 | –6 | –10 | –4 | –6 | –11 |
| POCT (A) compared with a laboratory-based test (D) | –15 | –21 | –32 | –9 | –12 | –19 |
| POCT (D) compared with a laboratory-based test (A) | 17 | 23 | 37 | 12 | 16 | 25 |
| POCT (RWE) compared with a laboratory-based test (RWE) | –4 | –5 | –8 | –2 | –2 | –2 |
Exploring the effects of assuming that there are no quality-adjusted life-year losses from isolation or non-fatal, severe COVID-19
| Tests compared | No early release permitted | Early release permitted | ||||
|---|---|---|---|---|---|---|
| Incremental costs (£) | Incremental QALYs | ICER (£) | Incremental costs (£) | Incremental QALYs | ICER (£) | |
| POCT (D) compared with a laboratory-based test (D) | –31 | 0.11 | Dominating | –37 | 0.09 | Dominating |
| POCT (A) compared with a laboratory-based test (A) | 20 | –0.00 | Dominated | 17 | –0.16 | Dominated |
| POCT (A) compared with a laboratory-based test (D) | 843 | 0.08 | 10,290 | 867 | –0.14 | Dominated |
| POCT (D) compared with a laboratory-based test (A) | –854 | 0.03 | Dominating | –887 | 0.07 | Dominating |
| POCT (RWE) compared with a laboratory-based test (RWE) | 372 | 0.11 | 3401 | 479 | 0.03 | 17,127 |
| Laboratory-based test (D) compared with a laboratory-based test (RWE) | 361 | 0.12 | 3094 | 431 | 0.21 | 2011 |
| Laboratory-based test (A) compared with a laboratory-based test (RWE) | 1184 | 0.20 | 5950 | 1280 | 0.23 | 5474 |
| POCT (D) compared with a POCT (RWE) | –42 | 0.12 | Dominating | –85 | 0.27 | Dominating |
| POCT (A) compared with a POCT (RWE) | 831 | 0.09 | 9377 | 819 | 0.04 | 18,541 |
FIGURE 51.
The weighted NMBs for the en suite residential care facility assuming that there are no QALY losses from isolation or non-fatal, severe COVID-19.
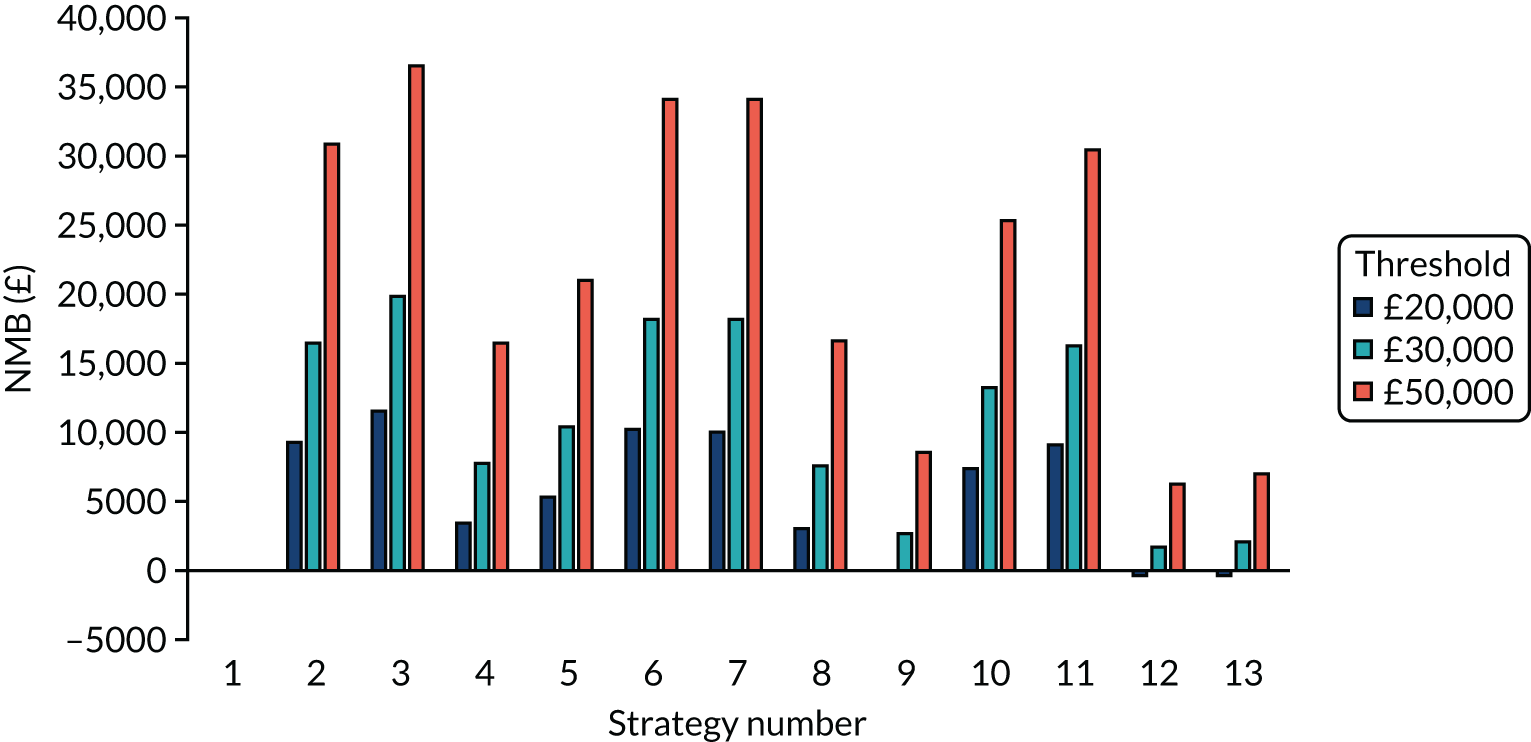
| Tests compared | No early release permitted | Early release permitted | ||||
|---|---|---|---|---|---|---|
| Incremental costs (£) | Incremental QALYs | ICER (£) | Incremental costs (£) | Incremental QALYs | ICER (£) | |
| POCT (D) compared with a laboratory-based test (D) | –34 | 0.04 | Dominating | –11 | 0.06 | Dominating |
| POCT (A) compared with a laboratory-based test (A) | 0 | –0.06 | Dominated | 6 | –0.08 | Dominated |
| POCT (A) compared with a laboratory-based test (D) | 779 | 0.00 | 195,754 | 801 | –0.04 | Dominated |
| POCT (D) compared with a laboratory-based test (A) | –813 | –0.02 | 37,048a | –806 | 0.01 | Dominating |
| POCT (RWE) compared with a laboratory-based test (RWE) | 372 | 0.05 | 8037 | 442 | 0.01 | 79,688 |
| Laboratory-based test (D) compared with a laboratory-based test (RWE) | 356 | 0.10 | 3677 | 406 | 0.09 | 4285 |
| Laboratory-based test (A) compared with a laboratory-based test (RWE) | 1134 | 0.16 | 7187 | 1202 | 0.14 | 8754 |
| POCT (D) compared with a POCT (RWE) | –50 | 0.09 | Dominating | –47 | 0.15 | Dominating |
| POCT (A) compared with a POCT (RWE) | 763 | 0.05 | 14,010 | 765 | 0.05 | 14,527 |
FIGURE 52.
The weighted NMBs for the residential care facility with shared facilities assuming that there are no QALY losses from isolation or non-fatal, severe COVID-19.
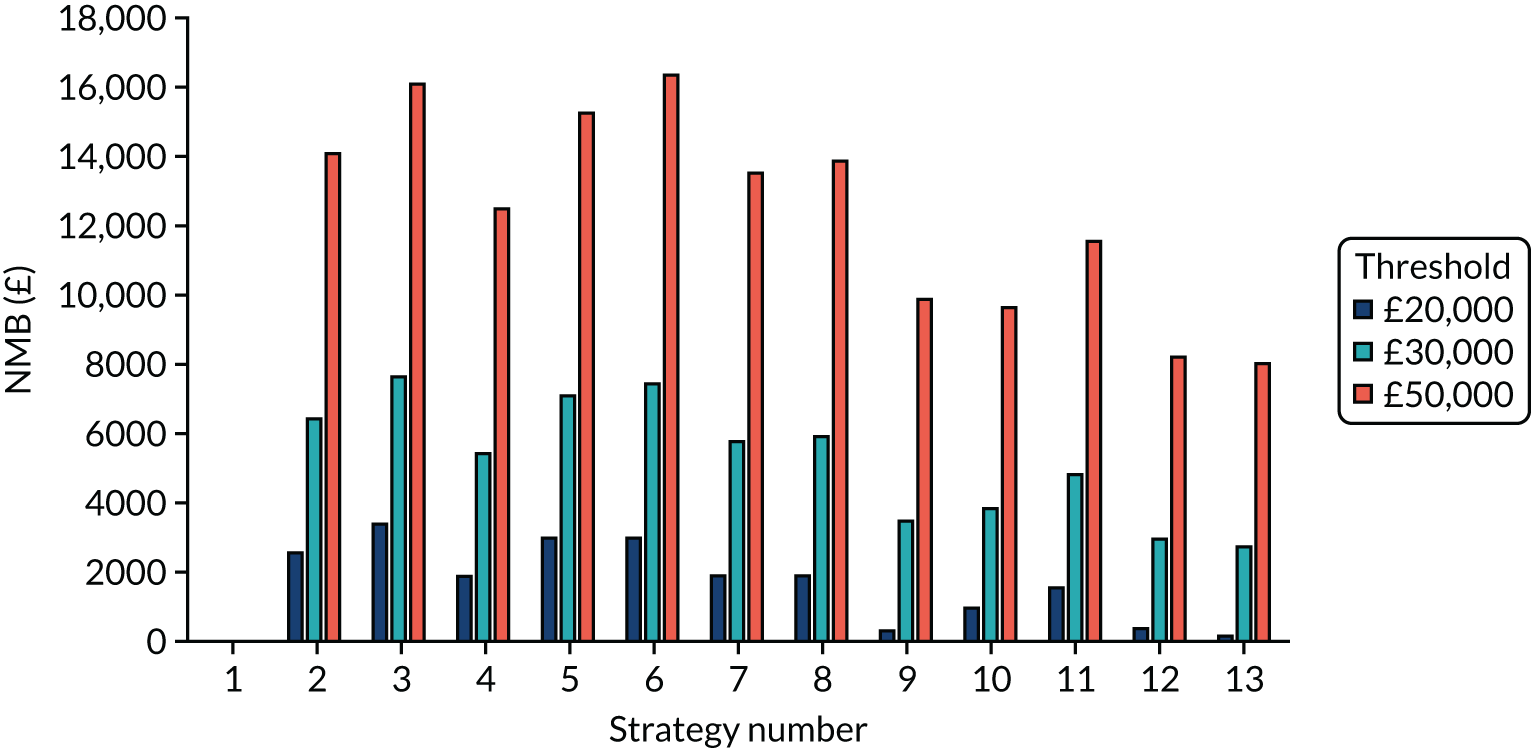
Exploring the effects of assuming that the quality-adjusted life-year losses associated with COVID-19 are doubled
| Tests compared | No early release permitted | Early release permitted | ||||
|---|---|---|---|---|---|---|
| Incremental costs (£) | Incremental QALYs | ICER (£) | Incremental costs (£) | Incremental QALYs | ICER (£) | |
| POCT (D) compared with a laboratory-based test (D) | –31 | 0.25 | Dominating | –37 | 0.22 | Dominating |
| POCT (A) compared with a laboratory-based test (A) | 20 | 0.00 | 6607 | 17 | –0.32 | Dominated |
| POCT (A) compared with a laboratory-based test (D) | 843 | –0.01 | Dominated | 867 | –0.33 | Dominated |
| POCT (D) compared with a laboratory-based test (A) | –854 | 0.26 | Dominating | –887 | 0.23 | Dominating |
| POCT (RWE) compared with a laboratory-based test (RWE) | 372 | 0.16 | 2319 | 479 | 0.07 | 7134 |
| Laboratory-based test (D) compared with a laboratory-based test (RWE) | 361 | 0.18 | 2059 | 431 | 0.45 | 947 |
| Laboratory-based test (A) compared with a laboratory-based test (RWE) | 1184 | 0.17 | 7102 | 1280 | 0.45 | 2877 |
| POCT (D) compared with a POCT (RWE) | –42 | 0.27 | Dominating | –85 | 0.61 | Dominating |
| POCT (A) compared with a POCT (RWE) | 831 | 0.01 | 90,749 | 819 | 0.06 | 13,676 |
FIGURE 53.
The weighted NMBs for the en suite residential care facility assuming that QALY losses from COVID-19 are doubled.
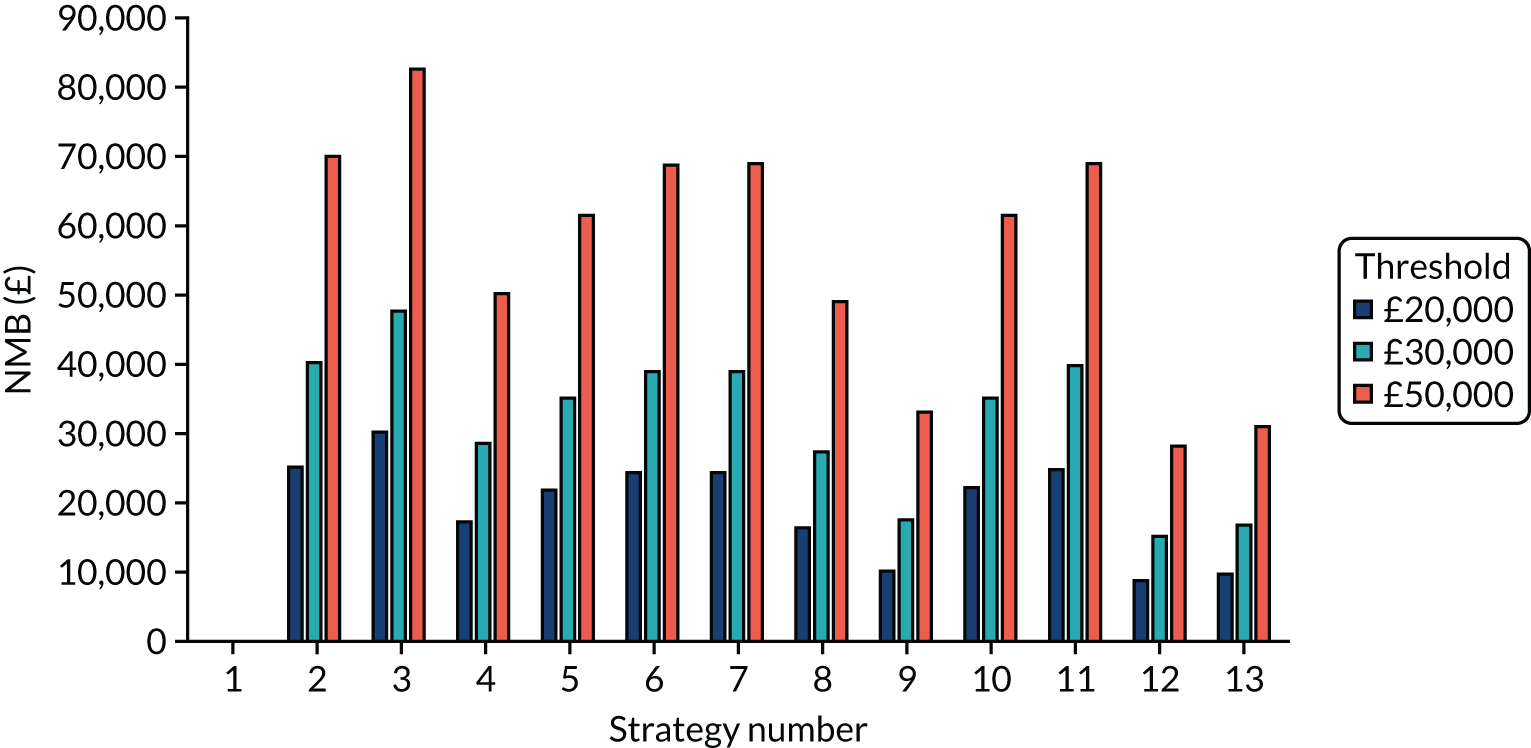
| Tests compared | No early release permitted | Early release permitted | ||||
|---|---|---|---|---|---|---|
| Incremental costs (£) | Incremental QALYs | ICER (£) | Incremental costs (£) | Incremental QALYs | ICER (£) | |
| POCT (D) compared with a laboratory-based test (D) | –34 | 0.10 | Dominating | –11 | 0.14 | Dominating |
| POCT (A) compared with a laboratory-based test (A) | 0 | –0.12 | Dominated | 6 | –0.15 | Dominated |
| POCT (A) compared with a laboratory-based test (D) | 779 | –0.16 | Dominated | 801 | –0.13 | Dominated |
| POCT (D) compared with a laboratory-based test (A) | –813 | 0.13 | Dominating | –806 | 0.12 | Dominating |
| POCT (RWE) compared with a laboratory-based test (RWE) | 372 | 0.02 | 17,865 | 442 | 0.00 | 135,211 |
| Laboratory-based test (D) compared with a laboratory-based test (RWE) | 356 | 0.13 | 2694 | 406 | 0.19 | 2149 |
| Laboratory-based test (A) compared with a laboratory-based test (RWE) | 1134 | 0.09 | 12,137 | 1202 | 0.21 | 5795 |
| POCT (D) compared with a POCT (RWE) | –50 | 0.21 | Dominating | –47 | 0.32 | Dominating |
| POCT (A) compared with a POCT (RWE) | 763 | –0.05 | Dominated | 765 | 0.06 | 13,210 |
FIGURE 54.
The weighted NMBs for the residential care facility with shared facilities assuming that QALY losses from COVID-19 are doubled.
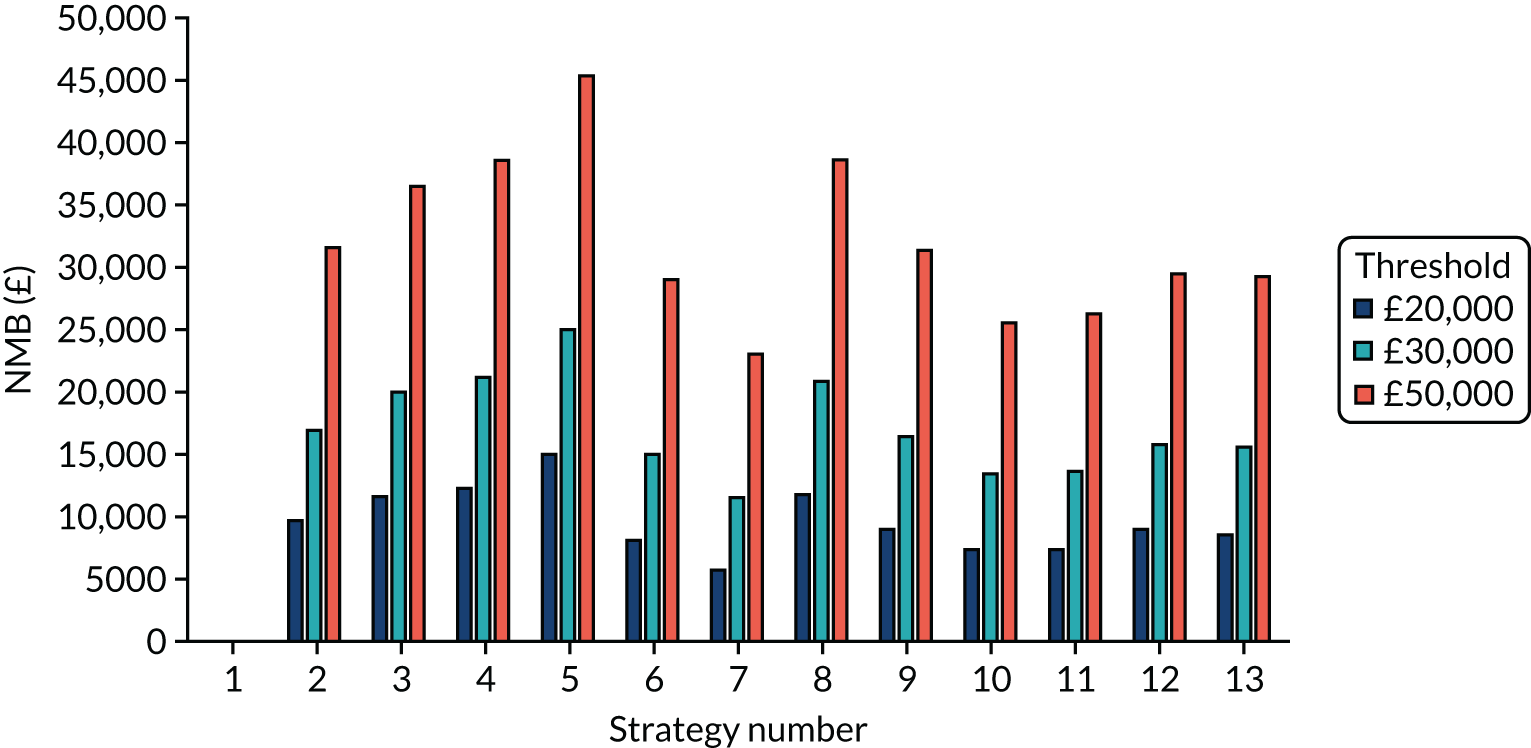
Exploring the effects of assuming that there are no quality-adjusted life-year losses associated with severe, non-fatal COVID-19
| Tests compared | No early release permitted | Early release permitted | ||||
|---|---|---|---|---|---|---|
| Incremental costs (£) | Incremental QALYs | ICER (£) | Incremental costs (£) | Incremental QALYs | ICER (£) | |
| POCT (D) compared with a laboratory-based test (D) | –31 | 0.12 | Dominating | –37 | 0.12 | Dominating |
| POCT (A) compared with a laboratory-based test (A) | 20 | 0.00 | 5546 | 17 | –0.12 | Dominated |
| POCT (A) compared with a laboratory-based test (D) | 843 | –0.10 | Dominated | 867 | –0.16 | Dominated |
| POCT (D) compared with a laboratory-based test (A) | –854 | 0.23 | Dominating | –887 | 0.15 | Dominating |
| POCT (RWE) compared with a laboratory-based test (RWE) | 372 | 0.03 | 12,730 | 479 | 0.03 | 14,169 |
| Laboratory-based test (D) compared with a laboratory-based test (RWE) | 361 | 0.04 | 10,186 | 431 | 0.20 | 2164 |
| Laboratory-based test (A) compared with a laboratory-based test (RWE) | 1184 | –0.07 | Dominated | 1280 | 0.17 | 7719 |
| POCT (D) compared with a POCT (RWE) | –42 | 0.13 | Dominating | –85 | 0.28 | Dominating |
| POCT (A) compared with a POCT (RWE) | 831 | –0.10 | Dominated | 819 | 0.01 | 113,688 |
FIGURE 55.
The weighted NMBs for the en suite residential care facility assuming that there were no QALY losses from non-fatal, severe COVID-19.
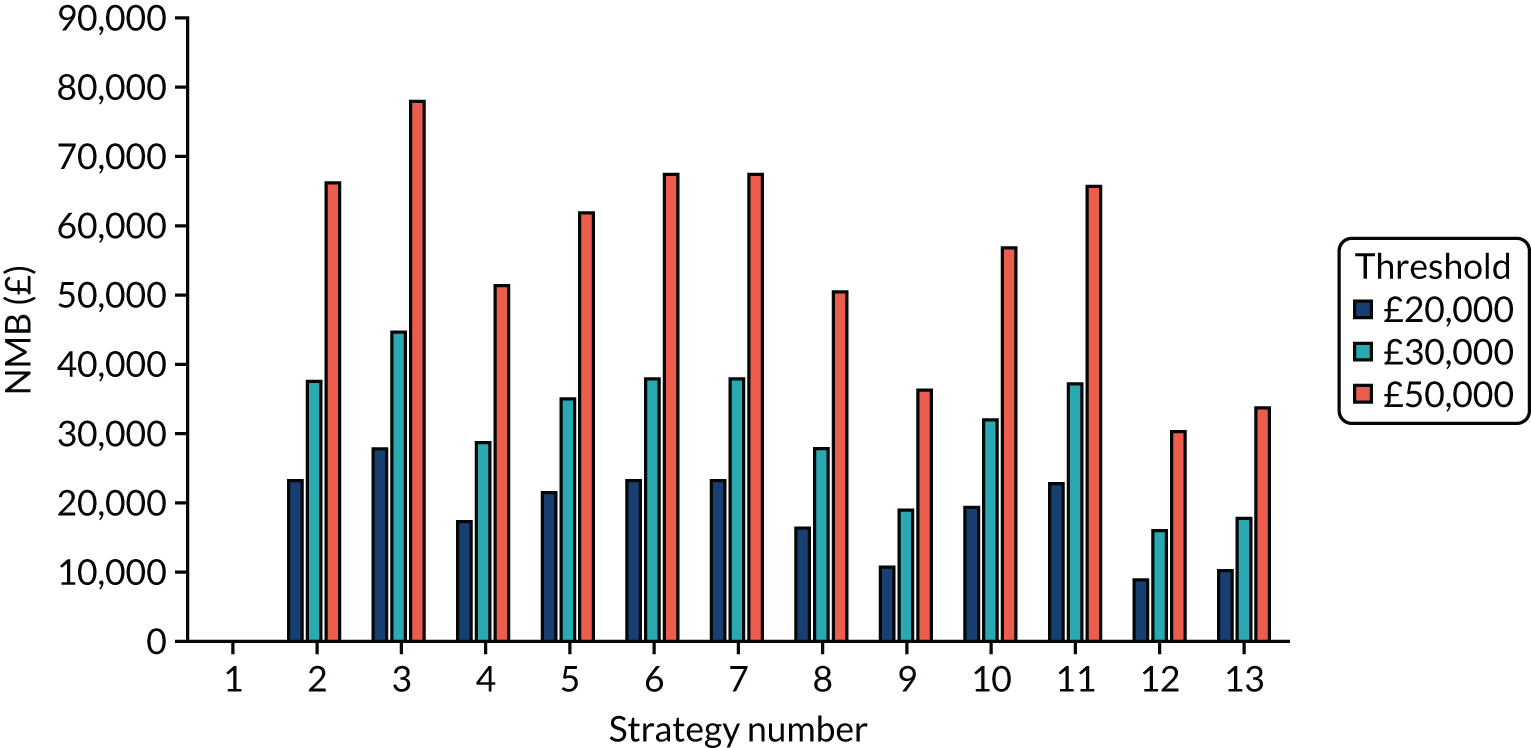
Exploring the effects of assuming that the multiplier for a quality-adjusted life-year gain following severe, non-fatal COVID-19 was 0.8 of the age-matched population
| Tests compared | No early release permitted | Early release permitted | ||||
|---|---|---|---|---|---|---|
| Incremental costs (£) | Incremental QALYs | ICER (£) | Incremental costs (£) | Incremental QALYs | ICER (£) | |
| POCT (D) compared with a laboratory-based test (D) | –31 | 0.14 | Dominating | –37 | 0.13 | Dominating |
| POCT (A) compared with a laboratory-based test (A) | 20 | 0.00 | 5699 | 17 | –0.16 | Dominated |
| POCT (A) compared with a laboratory-based test (D) | 843 | –0.09 | Dominated | 867 | –0.19 | Dominated |
| POCT (D) compared with a laboratory-based test (A) | –854 | 0.23 | Dominating | –887 | 0.16 | Dominating |
| POCT (RWE) compared with a laboratory-based test (RWE) | 372 | 0.05 | 7294 | 479 | 0.04 | 12,228 |
| Laboratory-based test (D) compared with a laboratory-based test (RWE) | 361 | 0.06 | 6153 | 431 | 0.24 | 1791 |
| Laboratory-based test (A) compared with a laboratory-based test (RWE) | 1184 | –0.03 | Dominated | 1280 | 0.21 | 6063 |
| POCT (D) compared with a POCT (RWE) | –42 | 0.15 | Dominating | –85 | 0.34 | Dominating |
| POCT (A) compared with a POCT (RWE) | 831 | –0.08 | Dominated | 819 | 0.02 | 52,131 |
FIGURE 56.
The weighted NMBs for the en suite residential care facility assuming that there were no QALY losses from non-fatal, severe COVID-19.
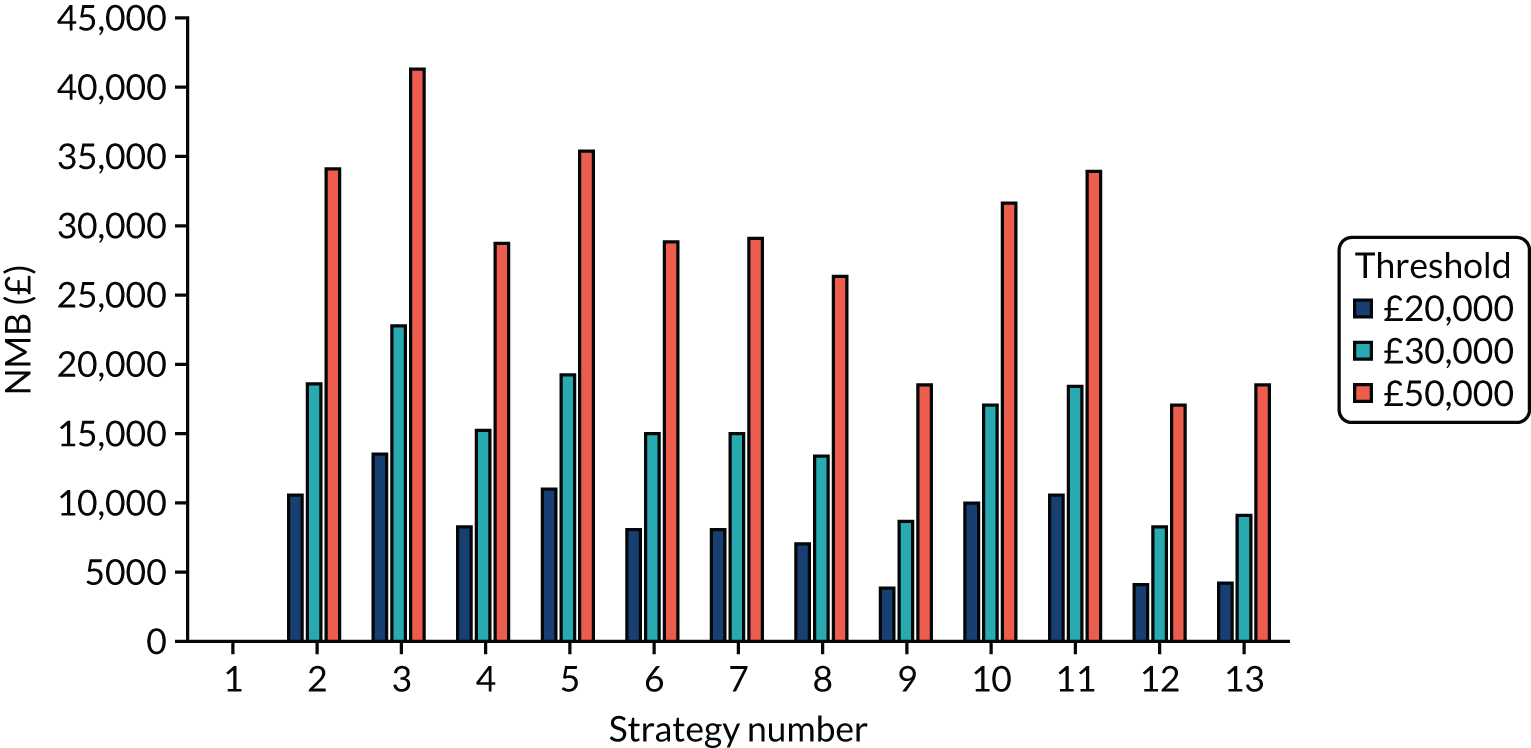
Exploring the effects of halving effective contacts and attack rate in the product
FIGURE 57.
The NMBs for selected strategies in the seeded en suite model when the effective contacts and attack rate is halved.
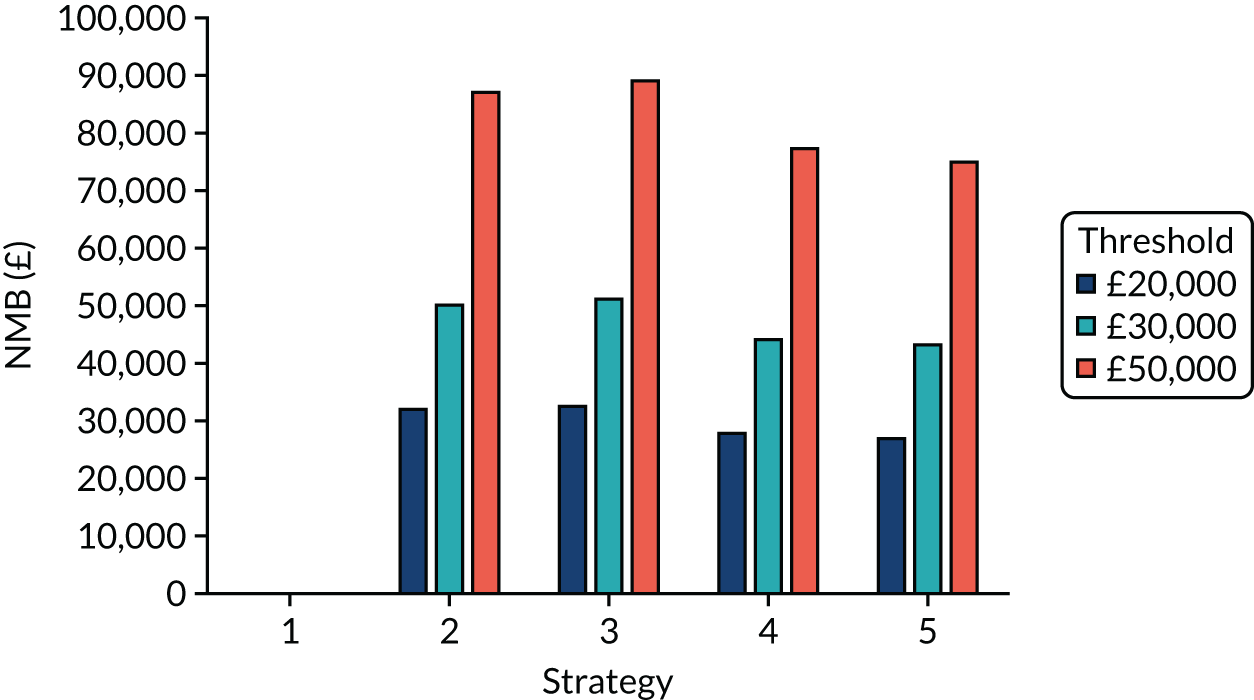
Exploring the effects of reducing the number of days in isolation from 14 to 10
FIGURE 58.
The NMBs for selected strategies in the seeded en suite model when the time spent in isolation was reduced from 14 days to 10 days.
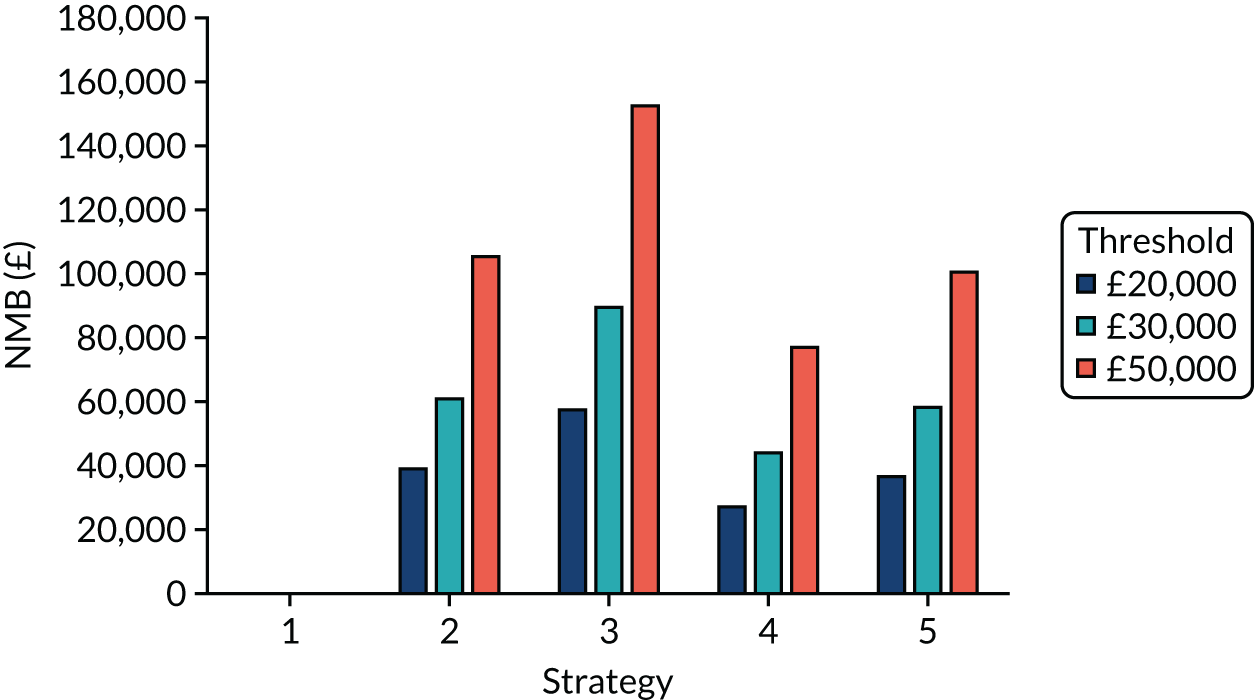
List of abbreviations
- BGS
- British Geriatrics Society
- COVID-19
- coronavirus disease 2019
- DAR
- diagnostic assessment report
- EAG
- External Assessment Group
- EQ-5D-3L
- EuroQol-5 Dimensions, three-level version
- ICER
- incremental cost-effectiveness ratio
- MCSE
- Monte Carlo sampling error
- MHRA
- Medicines and Healthcare products Regulatory Agency
- NICE
- National Institute for Health and Care Excellence
- NMB
- net monetary benefit
- PHE
- Public Health England
- POCT
- point-of-care test
- PPI
- patient and public involvement
- QALY
- quality-adjusted life-year
- SARS-CoV-2
- severe acute respiratory syndrome coronavirus 2
- TPP
- target product profile
