Notes
Article history
The research reported in this issue of the journal was funded by the HTA programme as project number 07/51/01. The contractual start date was in December 2009. The draft report began editorial review in August 2019 and was accepted for publication in December 2020. The authors have been wholly responsible for all data collection, analysis and interpretation, and for writing up their work. The HTA editors and publisher have tried to ensure the accuracy of the authors’ report and would like to thank the reviewers for their constructive comments on the draft document. However, they do not accept liability for damages or losses arising from material published in this report.
Permissions
Copyright statement
© Queen’s Printer and Controller of HMSO 2021. This work was produced by Langton Hewer et al. under the terms of a commissioning contract issued by the Secretary of State for Health and Social Care. This issue may be freely reproduced for the purposes of private research and study and extracts (or indeed, the full report) may be included in professional journals provided that suitable acknowledgement is made and the reproduction is not associated with any form of advertising. Applications for commercial reproduction should be addressed to: NIHR Journals Library, National Institute for Health Research, Evaluation, Trials and Studies Coordinating Centre, Alpha House, University of Southampton Science Park, Southampton SO16 7NS, UK.
2021 Queen’s Printer and Controller of HMSO
Chapter 1 Introduction
Scientific background
Cystic fibrosis (CF) is the most common life-limiting recessively inherited condition in white populations. It is a multisystem disorder in which the airways frequently become blocked with mucus, often associated with respiratory infections. These infections may lead to progressive respiratory failure and ultimately to death from breathing failure. Pseudomonas aeruginosa is a common infection in the lungs of patients with CF. The age-specific prevalence of P. aeruginosa in pre-school children is 9%, rising to 32% for 10- to 15-year-olds. 1 Early infection can be eradicated in the majority of patients. However, once chronic infection is established, P. aeruginosa is virtually impossible to eradicate and is associated with increased morbidity and mortality. 2 Long-term infection is associated with poor outcomes, including more rapid decline in lung function, such as the amount of air expired in 1 second of forced expiration [forced expiratory volume in 1 second (FEV1)]. 3,4 New isolation of P. aeruginosa is treated with antibiotics in an attempt to eradicate the infection and to delay acquisition of chronic infection. 5 However, there is uncertainty about the best method to eradicate P. aeruginosa from the lower respiratory tract, and several different strategies are used, including oral quinolones such as ciprofloxacin, and intravenous (i.v.) and nebulised antibiotics. 6–10
There are clear differences between the available treatments in terms of the impact on the patient and their family, the use of resources and the cost of treatment. However, few studies have compared the efficacy and cost-effectiveness of these treatments.
Fourteen days of i.v. treatment will usually necessitate admission to hospital and siting of one or more i.v. lines for drug infusion. The siting of lines can be traumatic, especially for children and their families.
Intravenous aminoglycosides are commonly used and they require further blood tests for monitoring of plasma levels, and can be associated with kidney and inner ear damage. 11 No study has yet been conducted to investigate the therapeutic advantage of i.v. and oral treatment.
In 2005, the NHS National Institute for Health Research (NIHR) commissioned the Medicines for Children Research Network to assess the feasibility of conducting a randomised controlled trial to investigate the prevention of colonisation with P. aeruginosa in CF patients. This report was completed in 2007, having surveyed UK clinical practice, surveyed opinions of CF patients and families, and assessed the number of potentially eligible patients for such a trial. 12 The result of this feasibility study was to show that, generally, clinicians treat first or new growth of P. aeruginosa in accordance with the UK CF Trust guidelines13 and 95% of clinicians reported that they would consider i.v. treatment of first isolation of P. aeruginosa. In addition, 71% of clinician and 43% of consumer respondents would consider entry for themselves/their patients into a randomised controlled trial comparing oral with i.v. antibiotics. The conclusion of the study stated ‘[T]he clinical community are in equipoise when considering effectiveness of eradication therapy for treatment of P. aeruginosa in patients with cystic fibrosis’ and recommended that it is feasible to consider the initiation of a randomised controlled trial investigating eradication therapy to treat P. aeruginosa in patients with CF.
This study has been conceived and designed in response to addressing this clinical equipoise and has been commissioned by the NIHR.
Rationale for research
There is equipoise about the best method to eradicate P. aeruginosa from the lower respiratory tract. Several strategies exist to treat early infection with P. aeruginosa. This includes the use of inhaled antibiotics, such as colistin and tobramycin,9,14,15 oral quinolones, such as ciprofloxacin,6,10 and i.v. antibiotics, usually consisting of a combination of an aminoglycoside with a beta-lactam.
Antibiotic strategies for eradication of P. aeruginosa in people with CF have been investigated in a systematic review of randomised clinical trials,16 which concluded that there is an urgent need for well-designed and well-executed trials. The review made the specific recommendation that any future trial should investigate the hypothesis to see if antibiotic treatment of early P. aeruginosa infection prevents or delays chronic infection, and whether or not this then results in an appreciable clinical benefit to patients, without causing them harm. The systematic review made the recommendation that the following outcomes be considered for any future randomised controlled trial: spirometric lung function; nutritional status;11 and socioeconomic outcomes, including quality of life.
The UK CF Trust has published guidance for antibiotic treatment for CF, including treatment for eradication of newly acquired P. aeruginosa infection. 11 This guidance recommends energetic treatment for a patient who has isolated P. aeruginosa where cultures have previously been negative and the report commented that there is no evidence favouring any particular regimen for eradication. The guidance states that appropriate treatment in this situation will include oral ciprofloxacin for the duration of treatment up to 3 months or i.v. treatment such as a beta-lactam antibiotic (e.g. ceftazidime or meropenem) or an anti-pseudomonal penicillin in combination with i.v. tobramycin. 11 Intravenous antibiotics are usually administered for 10–14 days in patients with CF, although there have been no randomised controlled trials of shorter treatment durations.
The rationale for choosing 14 days of i.v. treatment and for choosing 3 months for oral treatment is that both of these regimens are standard practice in many UK CF centres identified in the feasibility study,12 both are standard recommendations within the published UK guideline11 and they are believed to represent current best practice.
Interventions
Participants recruited into the study were randomised to one of the following treatment groups.
Group A
In this treatment group, participants received up to 14 days (recommended treatment duration of 14 days; minimum treatment duration 10 days) of i.v. antibiotics as follows:
-
Ceftazidime 150 mg/kg/day, in three divided doses (maximum of 3 g three times daily). Some centres used a once-daily continuous infusion (where the maximum daily dose would usually be 6 g/day) or twice-daily regimen for ceftazidime. These centres were permitted to continue using this regimen for the study and should have followed their local dosing guidelines.
-
Tobramycin 10 mg/kg/day once daily (maximum 660 mg/day). Some centres used a twice-daily or thrice-daily regimen for tobramycin. These centres were permitted to continue using their current regimen for the study and should have followed their local dosing guidelines.
Therapeutic drug monitoring was used to guide tobramycin dosing as per national guidelines11 and usual clinic procedures.
Group B
In this treatment group, participants received 3 months (12 weeks) of treatment oral ciprofloxacin twice daily. Ciprofloxacin dose was 20 mg/kg twice daily (maximum 750 mg twice daily). This was in line with the British National Formulary (BNF) for children. 17 Some clinicians preferred to use a lower dose of 15 mg/kg twice daily for children < 5 years, as used in national CF guidelines. 11
Both treatment arms received 3 months (12 weeks) of nebulised colistin in conjunction with the randomised treatment. The colistin dose was as recommended by the UK CF Trust: 1,000,000 units twice daily for children aged ≤ 2 years and 2,000,000 units twice daily for children aged > 2 years and adults. If the colistin was administered using an I-neb™ (Philips Respironics, Murrysville, PA, USA), then a lower dose of 1,000,000 units twice daily was used for all ages.
It was considered likely that during the study period a small proportion of participants would develop a further P. aeruginosa infection. These participants were treated as per local centre guidelines.
Objective
This study aimed to establish the superiority of 14 days of i.v. therapy compared with 3 months of oral therapy.
Chapter 2 Trial design and methods
Study design
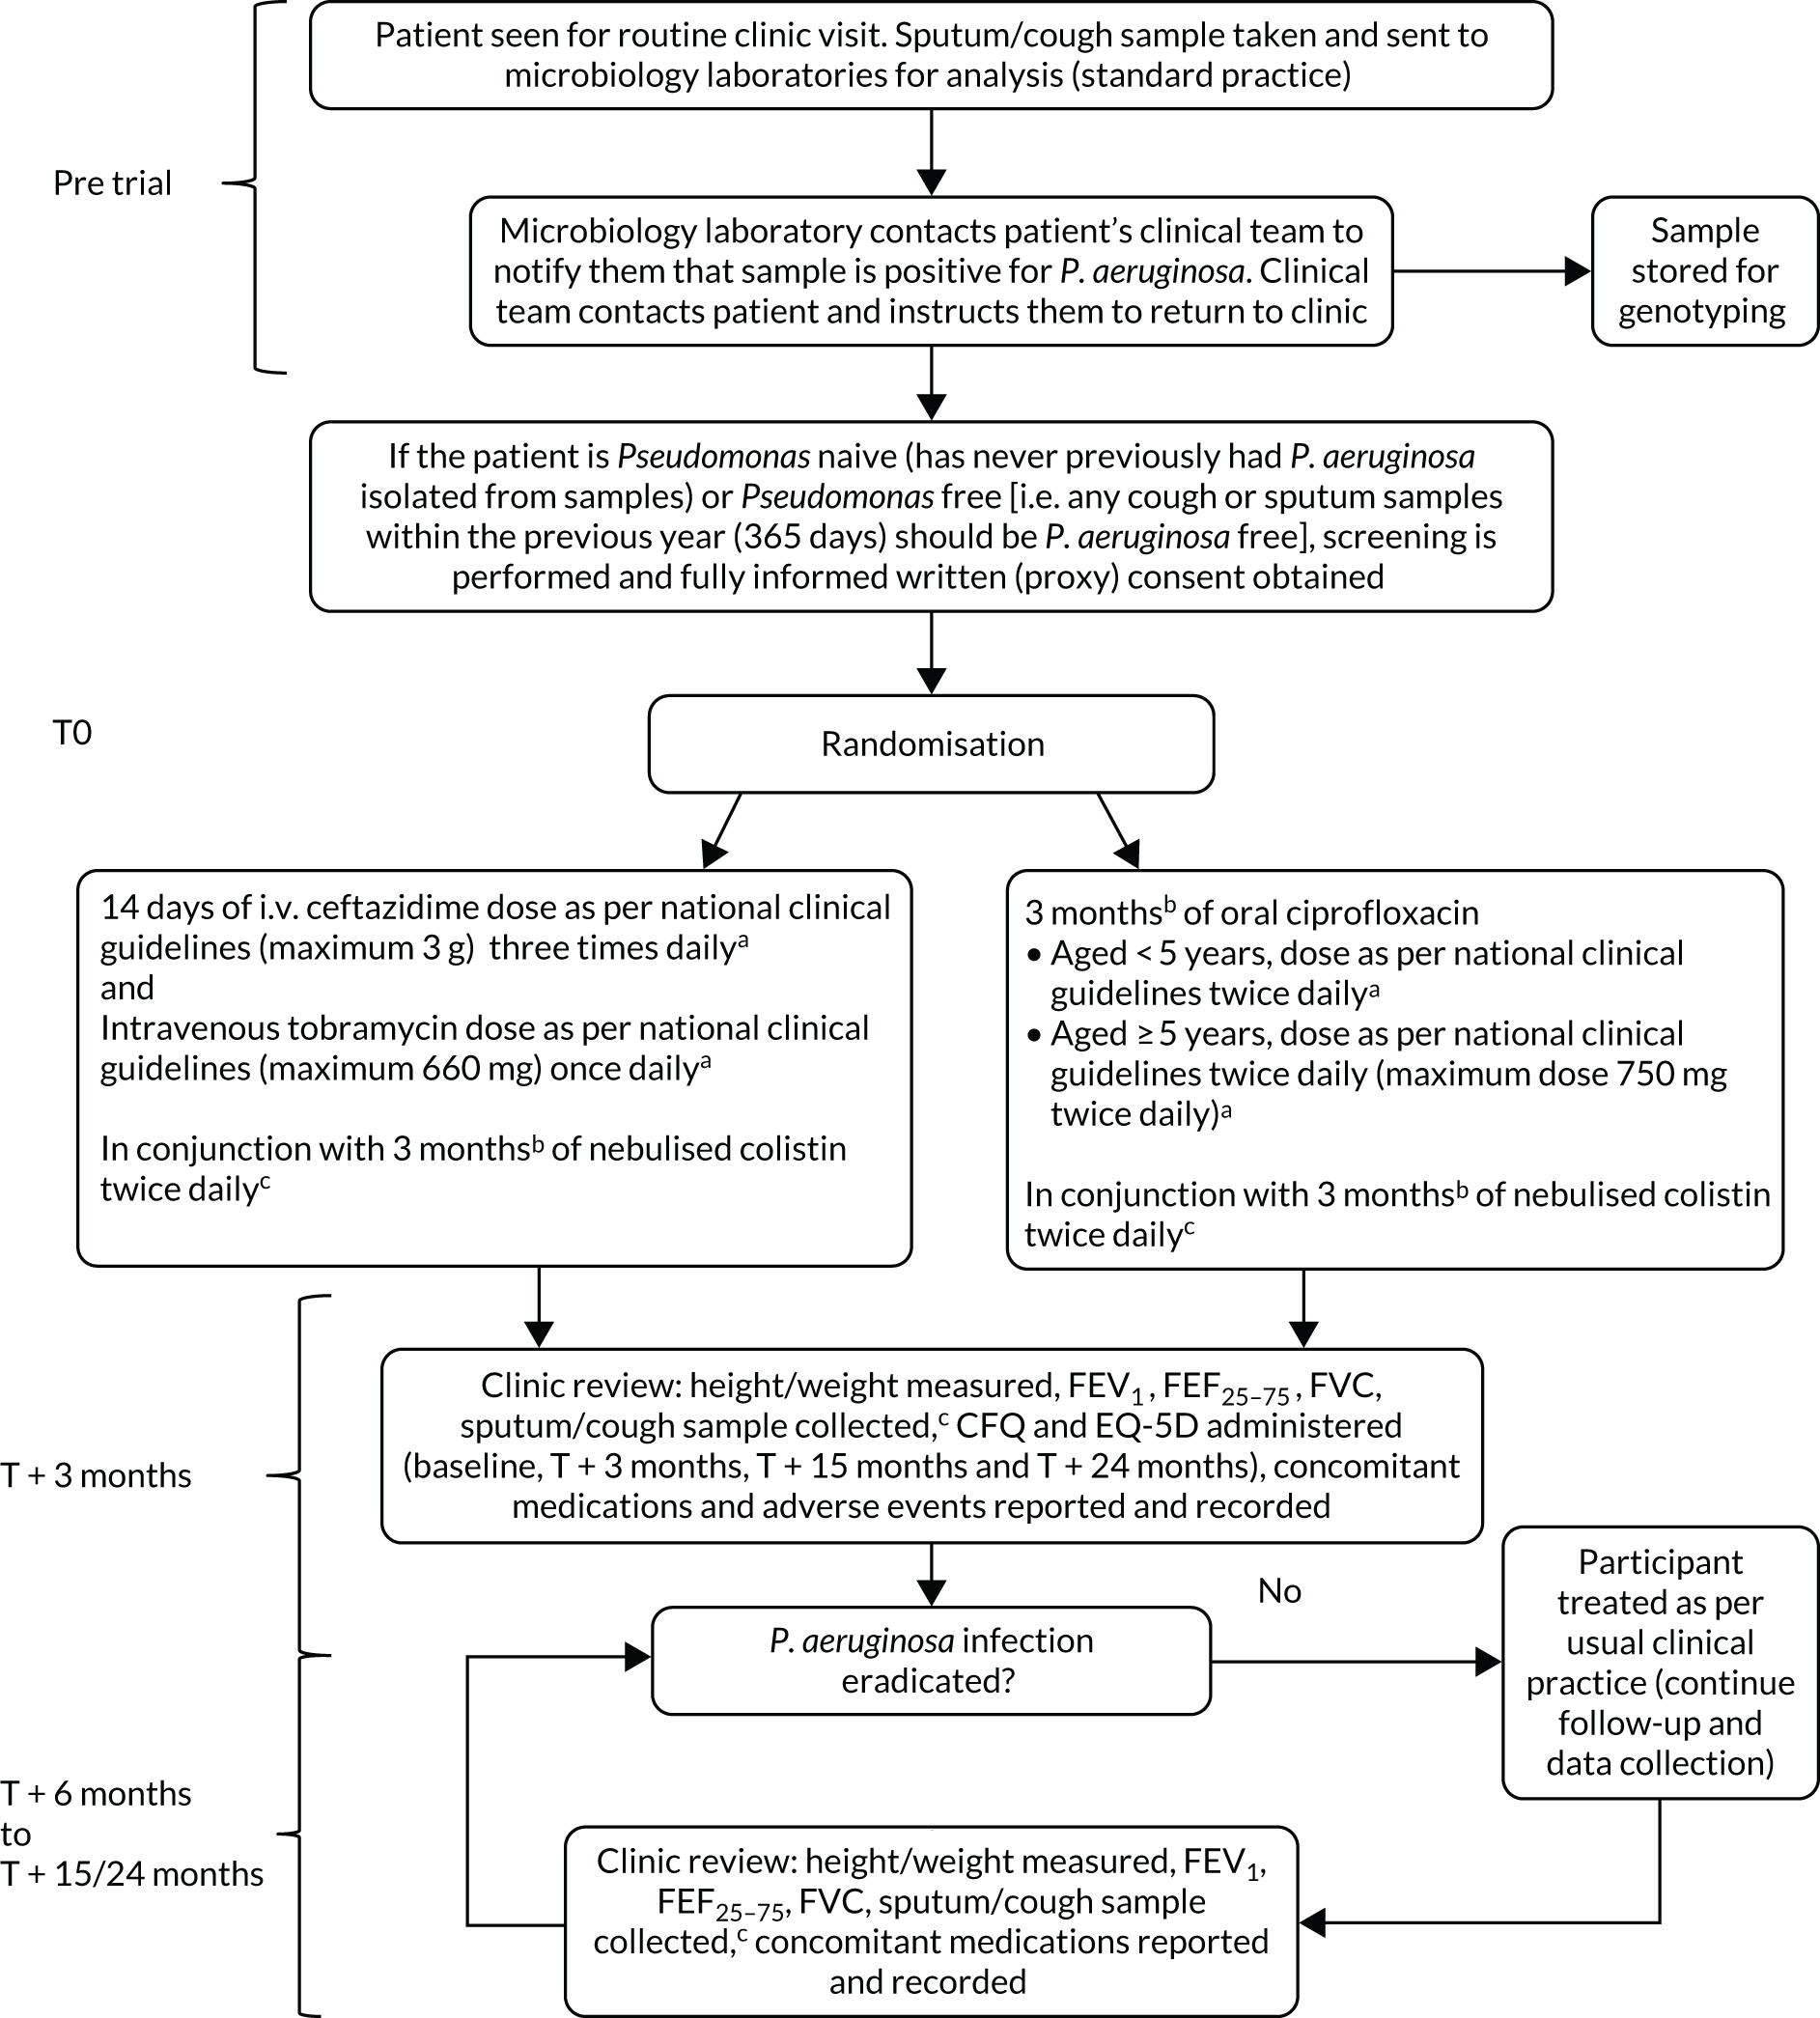
This study was a Phase IV, multicentre, parallel-group, randomised controlled trial comparing 14 days of i.v. antibiotic therapy with 3 months of oral antibiotic therapy for participants with CF (Figure 1).
FIGURE 1.
The TORPEDO-CF study design. a, Sites that are unable to comply with the trial dosing regimen can use their current dosing regimen as long as the total daily dose administered is within national clinical guidelines; b, 3 months is defined as 12 weeks; and c, sample stored for genotyping.
Trial registration and ethics
The trial was registered on the European Union Drug Regulating Authorities Clinical Trials (EudraCT) database on 5 May 2009 (as EudraCT number 2009-012575-10) and received clinical trials authorisation from the Medicines and Healthcare products Regulatory Agency on 2 November 2009 (clinical trials authorisation reference 12893/0220/001). The trial and all subsequent protocol amendments were reviewed and authorised by the Medicines and Healthcare products Regulatory Agency.
The trial protocol was not initiated until it had received the favourable opinion of the National Research Ethics Committee (REC) (London REC reference 09/H0718/51) on 16 November 2009. It was then reviewed at the research and development offices at participating sites. All subsequent amendments were reviewed and approved by the National Research Ethics Committee, London REC.
The trial was listed on the International Standard Randomised Controlled Trial Number (ISRCTN) registry on 21 May 2009 as ISRCTN02734162.
Participant inclusion and exclusion criteria
Inclusion criteria
-
Individuals with a diagnosis of CF.
-
Children over the age of 28 days, older children and adult CF participants (i.e. there was no upper age limit).
-
Competent adults who had provided fully informed written consent to participate in the trial.
-
Minors for whom proxy consent had been given by their parent or legal guardian and who had provided their assent to participate in the trial (where possible).
-
Individuals who had isolated P. aeruginosa and were either:
-
P. aeruginosa naive (i.e. never previously had P. aeruginosa isolated from samples) or
-
P. aeruginosa free [i.e. any cough or sputum samples within the previous year (365 days) were P. aeruginosa free].
-
-
Participants were able to commence treatment no later than 21 days from the date of a P. aeruginosa-positive microbiology report.
Exclusion criteria
-
Antibiotic resistance of the current P. aeruginosa sample to any of ciprofloxacin, ceftazidime, tobramycin or colistin reported by local microbiology laboratory.
-
Known participant hypersensitivity to ciprofloxacin, ceftazidime, tobramycin or colistin.
-
Other known contraindications to any of ciprofloxacin, ceftazidime, tobramycin or colistin including previous aminoglycoside hearing or renal damage.
-
Participants in receipt of P. aeruginosa-suppressing treatment, in particular nebulised colistin or tobramycin, or oral ciprofloxacin for the previous 9 calendar months. Short courses of oral ciprofloxacin or i.v. antibiotics (with an anti-pseudomonal spectrum of action) were not a reason for exclusion unless given to treat proven infections with P. aeruginosa.
-
Treatment with other anti-pseudomonal nebulised antibiotics.
-
Pregnant and nursing mothers (women of child-bearing age were counselled on the risks of becoming pregnant during the trial and were offered a pregnancy test).
-
Previous randomisation in the Trial of Optimal TheRapy for Pseudomonas EraDicatiOn in Cystic Fibrosis (TORPEDO-CF).
-
Previous participation in another related intervention trial within 4 weeks of taking part in TORPEDO-CF.
Recruitment
The trial took place in 70 UK CF centres and two CF centres in Italy.
Recruitment commenced on 5 October 2010 and the final participant was randomised on 27 January 2017.
Informed consent
The trial recruited adults and minors (defined in statutory instrument 200418 No. 1031 as aged < 16 years). Informed consent procedures reflected the legal and ethical requirements for obtaining valid written informed consent in these populations.
Prior written informed consent was required for all trial participants. In obtaining and documenting informed consent, the investigator was required to comply with the applicable regulatory requirements, and adhered to the principles of good clinical practice (GCP) and to the ethical principles that have their origin in the Declaration of Helsinki. 19
Potential participants and their families were provided information regarding the trial both verbally and in writing using the ethics-approved patient information sheets and consent forms (PISCs). They were given the opportunity to discuss the trial with the site team. The PISCs took into account the age of minors and their assent was obtained, where appropriate. Potential participants and their families were provided with a clear overview of the trial and details of the procedures, and the potential risks and benefits of all trial medications were carefully discussed.
Adequate time to consider trial entry (generally 24 hours, although it was acknowledged that some patients/families came to a decision sooner) was allowed and all participants were given the opportunity to ask questions, had the opportunity to discuss the study with their surrogates and had time to consider the information prior to agreeing to participate. All PISCs used in TORPEDO-CF were made available in the native language of the countries participating in the trial (with the exception of Wales, where the majority language was used).
All of the recruiting investigators were experienced CF physicians familiar with imparting information to the relevant trial populations. All investigators requesting consent to participate had attended GCP training. During the screening process, if a potential patient was identified, then they/their parent or the person with parental responsibility were approached by the investigator or a designated member of the investigating team. The trial and its objectives were then described to them, at which point any questions could also be answered. The treatment schedule and trial visits were in line with standard clinical care. The potential risks and benefits of the trial interventions were discussed, as well as what would happen if they chose not to enter the trial or had to withdraw from the trial for any reason.
The right of the patient (non-minors) or parent/legal guardian (for minors) to refuse consent to participate in the trial without giving reasons was respected. After the patient had entered the trial, the clinician remained free to give alternative treatment to that specified in the protocol, at any stage, if they felt that it was in the best interest of the participant. However, the reason for doing so was recorded and the patient remained within the trial for the purpose of follow-up and data analysis according to the treatment option to which they had been allocated. Similarly, the patient remained free to withdraw from the protocol treatment and trial follow-up at any time without giving reasons and without prejudicing their further treatment.
Randomisation
Participants were randomised using a secure (24-hour) web-based randomisation programme, which was controlled centrally by the Liverpool Clinical Trials Centre (LCTC), to ensure allocation concealment. Randomisation lists were generated in a 1 : 1 ratio using simple block randomisation, with random variable blocks of length of two and four after an initial block of length of three to reduce predictability. Randomisation was stratified by site, but this was not disclosed in the protocol to further reduce predictability.
Participant treatment allocation was displayed on a secure web page and an automated e-mail confirmation was sent to the authorised randomiser and the principal investigator (PI) or co-investigator (where applicable) at the randomising site. It was the responsibility of the PI or delegated research staff to inform the pharmacy department at their centre of the potential participant prior to randomisation to ensure that there was a sufficient supply of the study drugs.
In the event of an internet connection failure between the centre and the randomisation system, the centre contacted the LCTC to resolve the problem. In the event that site access could not be promptly reinstated, LCTC would attempt to centrally randomise the patient using the web system. Where this was not possible, LCTC would randomise the participant using a back-up randomisation envelope. Of the 286 participants who were randomised, four were randomised utilising a back-up randomisation envelope.
Interventions
Participants recruited into the study were randomised to one of the following treatment groups.
Group A
Up to 14 days (recommended treatment duration of 14 days; minimum treatment duration 10 days) of i.v. antibiotics as follows:
-
Ceftazidime 150 mg/kg/day, in three divided doses (maximum of 3 g three times daily). Some centres used a once-daily continuous infusion (where the maximum daily dose would usually be 6 g/day) or twice-daily regimen for ceftazidime. These centres were permitted to continue using this regimen for the study and should have followed their local dosing guidelines.
-
Tobramycin 10 mg/kg/day once daily (maximum 660 mg/day). Some centres used a twice-daily or thrice-daily regimen for tobramycin. These centres were permitted to continue using their current regimen for the study and should have followed their local dosing guidelines.
Therapeutic drug monitoring was used to guide tobramycin dosing as per national guidelines11 and usual clinic procedures.
Group B
Three months (12 weeks) of oral ciprofloxacin twice daily. Ciprofloxacin dose was 20 mg/kg twice daily (maximum 750 mg twice daily). This was in line with the BNF for children. 17 Some clinicians preferred to use a lower dose of 15 mg/kg twice daily for children < 5 years, as used in national CF guidelines. 11
Both treatment arms received 3 months (12 weeks) of nebulised colistin in conjunction with the randomised treatment. Colistin dose was as recommended by the UK CF Trust: 1,000,000 units twice daily for children aged ≤ 2 years and 2,000,000 units twice daily for children aged > 2 years and adults. If the colistin was administered using an I-neb™, a lower dose of 1,000,000 units twice daily was used for all ages.
During the study period, it was likely that a small proportion of participants would develop a further P. aeruginosa infection. These participants were treated as per local centre guidelines.
Data collection and management
Outcome measures
Primary outcome
The primary outcome is the successful eradication of P. aeruginosa infection 3 months after allocated treatment has started, and remaining infection free through to 15 months after the start of allocated treatment.
Secondary outcomes
-
Time to reoccurrence of original P. aeruginosa infection.
-
Reinfection with a different genotype of P. aeruginosa.
-
Lung function: FEV1, forced vital capacity (FVC), forced expiratory flow at 25–75% of forced vital capacity (FEF25–75).
-
Oxygen saturation.
-
Growth and nutritional status: height, weight and body mass index (BMI).
-
Number of pulmonary exacerbations. (Definition of pulmonary exacerbation used guidelines by Rosenfeld. 20)
-
Admission to hospital.
-
Number of days spent as an inpatient in hospital during treatment phase and between 3 and 15 months after randomisation.
-
Quality of life [Cystic Fibrosis Questionnaire (CFQ)].
-
Utility [EuroQol-5 Dimensions (EQ-5D)].
-
Adverse events (AEs).
-
Other sputum/cough microbiology [meticillin-resistant Staphylococcus aureus (MRSA), Burkholderia cepacia complex, Aspergillus, Candida spp. infection].
-
Cost per patient (from an NHS perspective).
-
Incremental cost-effectiveness ratio (ICER) [cost per successfully treated patient, cost per quality-adjusted life-year (QALY)].
-
Carer burden (absenteeism from education or work).
-
Participant burden (absenteeism from education or work).
The protocol wording for the outcome ‘[N]umber of days spent as an inpatient in hospital during treatment phase and between 3 and 15 months after randomisation’ is: ‘[N]umber of days spent as inpatient in hospital over the three-month period after allocated treatment has finished treatment, and between three months and 15 months after eradication treatment has finished-finished (other than 14 days spent on initial intravenous treatment)’. It has been changed in the list of secondary outcomes to aid clarity.
Data collection tools
Cystic Fibrosis Questionnaire
The CFQ is the only published, disease-specific measure of health-related quality of life (HRQoL) for children (aged 6–13 years), adults and adolescents (aged ≥ 14 years) with CF. 21 Twelve domains of HRQoL are covered in a 44-item survey, which includes physical functioning, role functioning, vitality, health perceptions, emotional functioning and social functioning, as well as domains specific to CF: body image, eating disturbances, treatment burden, and respiratory and digestive symptoms. 22 Quality-of-life questionnaires (i.e. CFQs) were completed at baseline, and at 3, 15 and 24 months after the allocated treatment was started. (Note that the 24-month scores were collected for only those trial participants who started allocated treatment before 1 January 2016.)
Health Utility (EuroQol-5 Dimensions)
The EuroQol-5 Dimensions, three-level version (EQ-5D-3L)23 scores were collected at baseline, and at 3, 15 and 24 months post treatment commencement (24-month scores were collected for only those trial participants who started allocated treatment before 1 January 2016). Participants completed the baseline booklet before their treatment allocation was revealed.
The PI or delegated research staff were required to ensure that the randomisation number and time point at which the questionnaire booklet was administered were recorded and to notify LCTC if a participant was too unwell to complete the questionnaire booklet or missed an assessment. Participants who failed to complete their full treatment allocation were still given the questionnaire booklet to complete at the protocol-defined time points to avoid bias.
Sample size
Original trial sample size calculation
The sample size calculation was based on the primary outcome of initial eradication of P. aeruginosa following the start of allocated treatment and continued eradication until 15 months after the start of allocated treatment. Data dating back to 1995 on the eradication of P. aeruginosa 3 months after the start of treatment and 12 months following the end of treatment were obtained from an audit conducted on all current CF participants treated according to a standard UK CF trust protocol at Alder Hey Children’s Hospital, Liverpool (conducted by Louisa Heaf and Kate Davenport) (Louise Heaf and Kate Davenport, Alder Hey Children’s Hospital, 2008, personal communication). The data were treated in accordance with a standard UK CF Trust protocol. Data on 48 children were collected, with infection eradicated in 77% (37/48) of children at 3 months following the start of treatment and 58% (28/48) of children continuing to remain infection free at 12 months after the end of treatment (i.e. equivalent to 15 months after the start of allocated treatment in the proposed trial).
For 90% power, at a 5% level of significance, to detect an absolute difference between the control group (oral ciprofloxacin) and the treatment group (i.v.) of 20% (a difference of between 55% and 75%), 128 participants were required in each group. A 20% difference between the two treatment regimens was regarded to be of clinical importance, since the more intensive i.v. treatment would need to be justified by such a substantial benefit. Based on the experience of the TOPIC trial,24 in which five out of 244 (2%) participants who were randomised did not provide primary outcome data for the intention-to-treat (ITT) analysis, it was expected that the number of participants who would not provide data for the primary outcome during TORPEDO-CF would be quite small. Every effort was made to follow up all randomised participants, regardless of treatment tolerance, but the sample size was inflated to allow for 10% of participants not providing primary outcome data, increasing the total target sample size to 286 participants.
Based on the results of the feasibility study conducted for the Health Technology Assessment programme,12 it was found that the median rate per annum for the number of first or new growths of P. aeruginosa was 3% (range 1–8%) in adults and was 10% (range 2.5–23%) in children. Applying these estimates to the UK CF population (based on figures from 22 adult centres, 28 paediatric centres and two centres with combined populations) enabled a potential population of eligible adults and children of approximately 122 and 475, respectively, per annum. From the feasibility report, the consent rate was estimated to be 44%; therefore, the anticipated number of eligible participants was approximately 54 adults and 209 children per annum.
Patient and public involvement
TORPEDO-CF was conceived as a NIHR-commissioned call and thus had patient and public involvement (PPI) through this process. In addition, it benefited from a feasibility study that explored the importance, and acceptability, of the research question for children, young people and their parents, and adults with CF.
In its set-up, TORPEDO-CF profited from PPI involvement through the Young Persons Advisory Group of the Medicines for Children Research Network, which provided input on the design of documentation intended for the use of trial participants (e.g. information sheets and promotional materials).
During its conduct, TORPEDO-CF received support from the CF Trust and PPI representation within the Trial Management Group (TMG) was in the form of ad hoc representation through the CF Trust Special Adviser on Research and Patient Involvement, who advised on activities to enhance engagement with the CF community generally and with potentially eligible individuals in particular.
An important element of PPI involvement was provided by the independent Trial Steering Committee (TSC). PPI representation on the committee provided reassurance that TORPEDO-CF remained of relevance to and in the interests of the CF community.
Changes to the protocol
The first site was opened to recruitment on 18 June 2010 and version 2.0 of the protocol was in operation at this time.
Over the course of the trial, eight substantial amendments were made to the protocol. Each amendment was assessed by the TMG and approved by the REC and by the Medicines and Healthcare products Regulatory Agency. The main corrections to the protocol included changes to the management of the trial and the addition of further guidance for participating sites. The definition of the primary outcome was also amended from ‘[S]uccessful eradication of P. aeruginosa infection at three months post randomisation, remaining infection free through to 15 months post randomisation’ to ‘[S]uccessful eradication of P. aeruginosa infection three months after allocated treatment has started, remaining infection free through to 15 months after the start of allocated treatment’ to eliminate any systematic bias due to the inevitable delay in starting i.v. treatment compared with oral treatment (caused by the need for the patient to be admitted to hospital to receive i.v. treatment).
The initial changes to the protocol were to provide clarification of the exclusion criteria and the secondary outcomes. Following site set up, several sites raised an issue with regard to differences in site dosing regimens compared with that specified in the protocol. The TMG confirmed that the changes were acceptable clinically and from a trial perspective.
Please refer to the trial protocol for a full list of protocol amendments (see NIHR Journals Library; www.journalslibrary.nihr.ac.uk). A summary of amendments follows.
Protocol version 1.0 (21 August 2009) to version 2.0 (15 February 2010)
-
The length of treatment for the i.v. group was changed from 10 to 14 days to reflect clinical practice.
-
Inclusion criteria 1 and 3 clarified.
-
The inclusion criteria were amended: the text ‘has not isolated P. aeruginosa from cough, sputum or bronchoalvelolar lavage’ was replaced with ‘[A] minimum number of four consecutive cough or sputum samples should be P. aeruginosa free within a 12 month period to satisfy eligibility’ and the text ‘three weeks after the clinical team has been informed that P. aeruginosa has been isolated’ was replaced with ‘21 days’.
-
Clarification of text in exclusion criteria 1–5.
-
An extra exclusion criterion was added: ‘[P]revious participation in another intervention trial within four weeks of taking part in TORPEDO-CF’.
-
Secondary outcome ‘[T]ime to reoccurrence of P. aeruginosa infection’ amended to ‘[T]ime to reoccurrence of original P. aeruginosa infection’.
-
Secondary outcome ‘time to new P. aeruginosa infection’ replaced with ‘re-infection with a different genotype of P. aeruginosa’.
-
Secondary outcome ‘[C]arer burden (absenteeism from school or work)’ was clarified by changing to ‘[C]arer burden (absenteeism from education or work)’.
-
Clarifications made to section 6, ‘Trial treatments’.
-
Clarifications made to section 7, ‘Assessments and Procedures’.
Protocol version 2.0 (15 February 2010) to version 3.0 (1 September 2010)
-
Clarification text added to exclusion criterion 4: ‘[P]lease note, short courses of oral ciprofloxacin or intravenous antibiotics (with an anti-pseudomonal spectrum of action) are not an exclusion unless they are given to treat proven infections with P. aeruginosa’.
-
Primary end-point text amended from ‘[S]uccessful eradication of P. aeruginosa infection at three months post randomisation, remaining infection free through to 15 months post randomisation’ changed to read ‘[S]uccessful eradication of P. aeruginosa infection three months after allocated treatment has started, remaining infection free through to 15 months after the start of allocated treatment’.
-
Secondary end point 8 changed from ‘[N]umber of days spent as inpatient in hospital over the three-month period post-treatment and between three months and 15 months post-treatment (other than 14 days spent on initial intravenous treatment)’ to ‘[N]umber of days spent as inpatient in hospital over the three-month period post-randomisation and between three months and 15 months post-randomisation (other than 14 days spent on initial intravenous treatment)’.
-
In section 8.4 of the protocol, text in sample size calculation changed to reflect change in analysis from post randomisation to post treatment.
-
In section 9.7 of the protocol, change in the reporting timelines for AEs/serious adverse events (SAEs), beginning from the time allocation treatment started up to 28 days after treatment cessation.
Protocol version 3.0 (1 September 2010) to version 4.0 (13 December 2011)
-
Inclusion criterion 1 changed from ‘[D]iagnosis of cystic fibrosis (CF) (clinical feature + sweat chloride > 60 mmol/l and/or 2 CFTR [cystic fibrosis transmembrane conductance regulator] mutations)’ to ‘[D]iagnosis of cystic fibrosis (CF)’.
-
Trial treatment text (arm A) changed from ‘[F]ourteen days intravenous ceftazidime 50 mg/kg/dose (maximum three grams) three times daily and intravenous tobramycin 10 mg/kg/d (maximum 660mg) once daily’ to ‘[F]ourteen days intravenous ceftazidime dose as per national clinical guidelines (maximum three grams) three times daily and intravenous tobramycin dose as per national clinical guidelines (maximum 660 mg) once daily’.
-
Trial treatment text (arm B) changed from ‘[T]hree months oral ciprofloxacin < 5 years, 15 mg/kg twice daily, ≥ 5 years, 20 mg/kg twice daily (maximum dose 750 mg twice daily)’ to ‘[T]hree months oral ciprofloxacin, < 5 years, dose as per national clinical guidelines twice daily, ≥ 5 years, dose as per national clinical guidelines twice daily (maximum dose 750 mg twice daily)’.
Protocol version 4.0 (13 December 2011) to version 5.0 (11 January 2012)
-
Changes made to section 6, ‘Trial Treatments’, in relation to the provision of drug by home care companies.
Protocol version 5.0 (11 January 2012) to version 6.0 (17 October 2013)
-
Inclusion criterion 5b changed from ‘P. aeruginosa free (i.e. a minimum of four consecutive cough or sputum samples should be P. aeruginosa free within a 12 month period to satisfy eligibility.)’ to ‘P. aeruginosa free (i.e. any cough or sputum samples within the previous year (365 days) should be P. aeruginosa free.)’.
-
Exclusion criterion 4 changed from ‘previous 9 months’ to ‘previous 9 calendar months’.
-
Removing requirement for all SAEs to be reported on a SAE report form. Replaced with ‘[A]ll AEs that has been assessed and judged by the investigator to be not serious to be reported on an AE form and returned to MCRN CTU [Medicines for Children Research Network Clinical Trials Unit] as per routine schedule. All SAEs that have been assessed and judged by the investigator to be unrelated or unlikely to be related to be reported on an AE form and returned to MCRN CTU as per routine schedule. All serious adverse reactions (SARs) and Suspected unexpected serious adverse reactions (SUSARs) must be reported immediately by the investigator to the MCRN CTU on a SAR report form.’
Protocol version 6.0 (17 October 2013) to version 7.0 (12 August 2014)
-
Addition of University of Liverpool as co-sponsor; it will act as sole sponsor for international sites.
Protocol version 7.0 (12 August 2014) to version 8.0 (23 December 2015)
-
Clarifying follow-up period: patients who start randomised treatment before 1 January 2016 will continue follow-up for 24 months, patients who start randomised treatment on or after 1 January 2016 will continue follow-up for 15 months.
-
Clarification to section 6, ‘Trial Treatments’.
Protocol version 8.0 (23 December 2015) to version 9.0 (12 October 2016)
-
Updated number of patients to be enrolled.
Compliance with intervention
Participants’ compliance with trial treatment was monitored using participant-completed treatment diaries to record their daily treatment routine.
The majority of the trial treatment for participants in the i.v. antibiotic therapy group was anticipated to be administered during hospital in-patient visits, ensuring accurate monitoring of investigational medicinal product (IMP) compliance. Participants who had experience of administering i.v. antibiotics at home or those who preferred to have home i.v. were allowed to self-administer i.v. antibiotics at the discretion of their local PI. In this event, participants were asked to complete a home i.v. treatment diary each day to ensure compliance with the study medication. Any unused medication and the packaging of all used medication were to be returned at the next scheduled follow-up visit. All returned medication/packaging was destroyed as per local procedures.
Trial management and oversight
University Hospitals Bristol NHS Foundation Trust was the sponsoring organisation, and delegated responsibilities to LCTC, the University of Liverpool and the chief investigator. LCTC was responsible for co-ordination of the trial (see Appendix 1).
University of Liverpool was co-sponsor, having no responsibility for the conduct of the trial in the UK, but acting as sole sponsor for non-UK centres (i.e. the University of Liverpool was legally responsible for the non-UK conduct of the trial).
Trial Management Group
The TMG was a multidisciplinary team comprising the chief investigators, scientific co-investigators, PPI representatives, sponsor representative, health economists and members of LCTC (see Appendix 1).
The TMG was responsible for the day-to-day clinical and practical aspects of the trial.
Independent Data and Safety Monitoring Committee
The Independent Data and Safety Monitoring Committee (IDSMC) comprised two independent clinicians and a statistician (see Appendix 2). The main responsibilities of the IDSMC were to safeguard the interests of the TORPEDO-CF participants, assess the safety and efficacy of the interventions during the trial, and monitor the overall progress and conduct of the trial. The IDSMC met at least annually during the trial and provided recommendations to the TSC. Reports to the IDSMC were produced by the statistical team at LCTC.
Trial Steering Committee
The TSC comprised an independent chairperson, two independent physicians, two PPI representatives, an independent statistician and representatives from the TMG (see Appendix 2). An observer from the sponsor and from the funder were also invited to meetings. The TSC met at least annually throughout the trial, both by teleconference and by e-mail, shortly after the IDSMC met and its main role was to provide overall oversight of the trial.
Chapter 3 Statistical methods
General statistical considerations
The analysis and reporting of the study were undertaken in accordance with the Consolidated Standards of Reporting Trials (CONSORT)25 and the International Conference on Harmonisation E9 Guidelines. 26 The main features of the statistical analysis plan are included here with a full and detailed statistical analysis plan (available at www.uhbristol.nhs.uk/media/3933191/torpedo_final_analysis_statistical_analysis_plan_v2.pdf; accessed 8 October 2021). All statistical analyses were undertaken using SAS® software version 9.3 or later (SAS Institute Inc., Cary, NC, USA).
A two-sided p-value ≤ 0.05 was used to declare statistical significance for all analyses, and all confidence intervals (CIs) were calculated at the 95% level. There were no adjustments for multiple testing; rather, all secondary analyses were treated as hypothesis generating.
The primary analysis followed the ITT principle as far as practically possible; all randomised participants were analysed on the basis of the treatment to which they were randomised, regardless of whether or not they received it. If consent for treatment was withdrawn but the participant was happy to remain in the study for follow-up, then they were followed up until completion. However, if they decided to withdraw consent completely, then the reasons for withdrawal of consent were collected (when possible) and reported for both groups.
Analysis of baseline data
Demographic and baseline characteristics were summarised for each treatment group using descriptive statistics. No formal statistical testing was performed on these data. Descriptive statistics, including the number of observations, mean and standard deviation (SD) for continuous variables, and counts and percentages for discrete variables, were presented, as appropriate.
Analysis of compliance data
For i.v. antibiotic therapy, the number of daily doses that participants received varied by site. The protocol stated that patients should receive at least 10 days of treatment. For these reasons, compliance is presented in terms of the number of days on treatment rather than in terms of the number of doses received.
For oral antibiotic therapy, compliance is presented in terms of the number of doses received and a compliance rate [the percentage of the total doses (n = 168: two doses per day for three lots of 28 days) that were received].
For nebulised therapy, compliance is presented in the same way as oral antibiotic therapy. Data are presented split by treatment group.
All compliance data are presented descriptively [total (n), mean, SD, median, interquartile (IQR) range, range, minimum and maximum]. No formal statistical testing was undertaken.
Analysis of primary outcome
The primary outcome, successful eradication of P. aeruginosa 3 months after the start of treatment, and remaining infection free through to 15 months after the start of treatment, was a binary outcome. Participants were classified as a success if there was no record of P. aeruginosa on their microbiology case report form between 3 and 15 months after treatment commencement, and a failure if there was at least one record of P. aeruginosa on their microbiology report during this time.
To determine if a participant had eradicated P. aeruginosa at 3 months, they must have had a sample within 28 days on either side of their expected 3-month visit date (treatment commencement date + 84 days), which was at least 2 days after the last date of any anti-pseudomonal treatment. To determine if a patient had remained P. aeruginosa free at 15 months, they must have had either a positive sample within the primary outcome window (3–15 months) or a sample within 28 days either side of their expected 15-month visit date (treatment commencement date + 420 days). Participants who had not regrown P. aeruginosa and did not have a sample within the 15-month window (defined above) were not included in the primary analysis. If a patient was withdrawn before 15 months of follow-up was completed, they were included in the primary outcome analysis only if they had isolated P. aeruginosa; if there was no evidence that they had isolated P. aeruginosa prior to being withdrawn they were not included in the primary analysis.
The number and percentage of participants who were classified as a success and a failure for the primary outcome were presented for each treatment group. The difference between the groups was tested using the chi-squared test, and the relative risk and associated 95% CI are presented. The number and percentage of patients who had a positive sample at their 3-month follow-up visit are also presented for each treatment group. As a post hoc analysis, the difference between the groups at 3 months was also tested using the chi-squared test, the relative risk and associated 95% CI were calculated, and a sensitivity analysis was also carried out that extended the 3-month window to – 4 weeks/+ 10 weeks.
Six sensitivity analyses were conducted to determine the robustness of the results of the primary analysis:
-
All participants followed up past 3 months, but with no 15-month sample were classified as successes.
-
All participants followed up past 3 months, but with no 15-month sample were classified as failures.
-
All patients followed up past 3 months, but with no 15-month sample were classified as successes/failures according to the next sample taken after the end of the 15-month window.
-
Primary analysis adjusted for centre effect – a logistic regression model was fitted to investigate heterogeneity across centres and adjusted for centre as a random effect.
-
Analysis as per the primary analysis, but 3- and 15-month windows extended to 10 weeks either side of the expected visit dates: post hoc analysis.
-
Analysis as per the primary analysis, but 15-month window removed (any sample after 3-month window included): post hoc analysis.
Analysis of secondary outcomes
Time to reoccurrence of the original P. aeruginosa infection was presented graphically using Kaplan–Meier curves stratified by treatment. The difference between the two treatment groups was tested using the log-rank test. Two analyses of this outcome were performed as a result of blind review. The first assumed that all patients who had had a reoccurrence of P. aeruginosa but did not have both a baseline and a follow-up sample (between 3 and 24 months) sent for genotyping did not have a reoccurrence of the original P. aeruginosa strain. The second assumed that these patients did have a reoccurence of the original P. aeruginosa strain.
Reinfection with a different genotype of P. aeruginosa and admission to hospital were analysed using the chi-squared test. The relative risk and 95% CI are also presented.
Lung function [percentage predicted FEV1, percentage predicted FVC and percentage predicted FEF25–75 (not measured in participants < 5 years)], oxygen saturation and growth and nutritional status [height z-scores (children only), weight z-scores (children only), BMI z-scores (children only) and BMI (adults only)] were analysed using a repeated-measures random effects model with a special power covariance structure. The baseline measurement, treatment group and time were included in the model as coefficients and a treatment-by-time interaction was also fitted. The treatment difference at 15 months and 95% CI are presented.
For the number of pulmonary exacerbations and the number of days spent in hospital, a Mann–Whitney U-test was used to test whether or not the distribution was the same in each treatment arm.
Quality of life (as measured by the CFQ – Revised) was analysed using a mixed-effects model for repeated measures with an unstructured covariance matrix. The baseline measurement, treatment group and time were included in the model as coefficients and a treatment-by-time interaction was also fitted. The treatment difference at 15 months and 95% CI are presented.
Whether or not participants had grown at least one positive culture of MRSA, Burkholderia cepacia complex, Aspergillus or Candida was analysed using the chi-squared test (where there were sufficient events), and the relative risk and 95% CI are presented. Other sputum microbiology was presented descriptively; no formal analysis was undertaken.
Carer and participant burden was analysed in two ways. Whether or not carers/participants had been absent from work/education was analysed using the chi-squared test and presented with a relative risk and 95% CI. The Mann–Whitney U-test was used to determine whether or not there was a difference in the distributions of the number of days carers/participants were absent from work/education in each treatment group.
Analysis of safety data
The safety analysis data set contained all participants who were randomised and had commenced treatment. All events were coded using the Medical Dictionary for Regulatory Activities (MedDRA).
The number of occurrences of each AE [at the preferred term and System Organ Class (SOC) levels] and the number (and percentage) of patients experiencing each AE are presented for each treatment arm and overall. A similar table was produced for all SAEs reported under all versions of the protocol.
Each SAE reported under versions 1.0–5.0 of the protocol and each SAR reported under version 6.0 of the protocol onwards is presented in the form of line listings detailing:
-
SAE number
-
treatment
-
preferred term
-
SOC
-
date of onset
-
serious criteria (reporting of all that apply from seven possible options) (PI and chief investigator assessment)
-
severity (mild/moderate/severe) (PI assessment)
-
relationship to study drug (PI and chief investigator assessment)
-
expectedness (chief investigator assessment)
-
most likely cause (disease under study/other illness/prior or concomitant treatment/protocol procedure/lack of efficacy) (PI assessment)
-
outcome.
There was no formal statistical analysis of any safety data.
Post hoc analyses
Time to P. aeruginosa reoccurrence is presented graphically using Kaplan–Meier curves stratified by treatment. The difference between the two treatment groups was tested using the log-rank test. Two analyses of this outcome were performed; the first included all positive samples after 3 months and the second included samples post 3 months and prior to 15 months. The hazard ratio (HR) and 95% CI were also calculated for the second analysis.
Additional analyses were performed on the lung function, oxygen saturation, growth and nutritional status, and quality-of-life outcomes. Where the interaction term was not significant in the original model, it was removed and an overall treatment difference and 95% CI are presented. Treatment differences at 3 and 24 months and the associated 95% CIs were also presented from the original model.
Chapter 4 Genotyping of Pseudomonas aeruginosa isolates
Variable number tandem repeats (VNTRs) are short nucleotide sequences that vary in copy number in bacterial genomes and are thought to occur through deoxyribonucleic acid (DNA) strand slippage during replication. This variation in copy number may be exploited to generate a VNTR typing scheme comprising between 9 and 15 selected ‘loci’, or regions of the bacterial genome. Variation in the number of repeats at each locus generates a numerical code (representing the number of repeat units at each locus) that may be used to correlate with a bacterial strain type. This method of bacterial strain typing has been widely used for a range of different bacterial organisms such as Mycobacterium tuberculosis, Mycobacteroides abscessus, Klebsiella pneumoniae, Acinetobacter baumannii and P. aeruginosa. 27–31
Selecting suitable loci for a VNTR typing scheme is critical for defining the scheme’s capacity for strain discrimination. Usually, loci are selected following specialised computer software analysis of whole-genome sequence(s) of isolate(s) of the species of interest. 32 Factors such as a small repeat size, choosing non-coding parts of the genome as well as areas that are not likely to contain insertions or deletions, and whole-genome coverage are important when choosing potential loci.
Use of variable number tandem repeat in a reference laboratory setting
Public Health England (PHE) has used VNTR analysis at nine loci as a method for P. aeruginosa strain typing since 2010 and, to date (May 2019), PHE has a national database of 31,028 profiles comprising CF, non-CF and environmental isolates from hospitals across the UK, providing a good national picture. Good concordance of this methodology was found on comparison with the gold standard, pulsed-field gel electrophoresis (PFGE). 31 In addition, as it is a polymerase chain reaction-based method, results can be generated rapidly and are portable between laboratories, making it preferable to PFGE, which is more laborious and not easily comparable between laboratories. Of the nine loci chosen for this scheme, the ninth is particularly discriminatory and may be used to evaluate relatedness between isolates from hospital outbreaks and in other settings among non-CF patients,33–36 but this locus is not always useful for CF isolate discrimination, as variation in copy number may be found in different colonies from the same sputum sample.
Examining the UK Pseudomonas aeruginosa population structure using variable number tandem repeat analysis
A study conducted by PHE in 2013 used VNTR analysis to examine the population structure of P. aeruginosa among UK CF patients, non-CF patients and hospital environmental isolates over a 2-year period. 37 In total, 3870 isolates were examined, comprising 726 environmental isolates from 47 hospitals and 2325 isolates from 2230 patients (of whom approximately 54% were CF patients) from 143 centres. The study highlighted the existence of VNTR profiles representing common clones present in both patient and environmental specimens, submitted from hospitals across the UK. Fourteen common types, each found in more than 24 patients within this 2-year period, were described. Among these were three well-characterised strains associated with transmissibility, which have been isolated almost exclusively from CF patients, namely the Liverpool, Manchester and Midlands 1 strains. 38,39 These were isolated from 6%, 1.7% and 1.5%, respectively, of 1204 CF patient isolates in the above-named study. 37
Four of the most common profiles were examined in more detail. Two of these correlated with previously well-established international clonal lineages, namely ‘PA14’ (VNTR profile: 12, 2, 1, 5, 5, 2, 4, 5, x, where the ninth locus is variable) and ‘clone C’ (VNTR profile: 11, 6, 2, 2, 1, 3, 7/8, 2/3, x, where the seventh, eighth and ninth loci may vary in copy number),40,41 which correspond to multilocus sequence types ST253 and 17, respectively. The other two types were ‘cluster A’ (VNTR profile: 8, 3, 4, 5, 2, 3, 5, 2, x), corresponding to ST27, and ‘cluster D’ (VNTR profile: 10, 3, 5, 5, 4, 1, 3, 7, x), where ‘x’ is variable (ST395). These four types were isolated from 6%, 5%, 3% and 2% of patients, respectively, and were geographically widespread, although they were not always isolated in large numbers in individual hospitals. PFGE analysis of representatives of each of these VNTR types from multiple hospitals separated the isolates into four broad clusters corresponding to their VNTR type with an overall similarity of approximately 70%. This led to the hypothesis that in most cases patients acquired these strains independently rather than by patient-to-patient transmission. Further evidence for the clonal nature of these four common profiles was found by examining the sequences for the intrinsic blaOXA-50-like gene.
To examine the hypothesis that these strains were often acquired independently, whole-genome sequences for 12 isolates of ‘cluster A’ from nine hospitals comprising six CF, five non-CF and one environmental isolate from geographically distant sites and separated in time were examined. The presence and absence of genes from the accessory genome detected 9454 variable sequences across the 12 isolates and the six reference genomes that were compared. A set of seven accessory genes were chosen from these, which were found to be variably present among a larger set of ‘cluster A’ isolates. Representatives from patients within a single centre mostly had distinct accessory gene profiles, suggesting that these patients acquired the strain independently, whereas those with clear epidemiological links shared the same profile. Profiles also varied between representatives from different centres.
Challenges in variable number tandem repeat analysis of cystic fibrosis isolates
Variable number tandem repeat analysis of CF isolates often poses additional challenges compared with the analysis of non-CF outbreaks, particularly, although not exclusively, among chronically infected patients. In addition to the variation at the last locus found between different colony types from the same sputum, variation of up to two repeats at one out of the first eight loci may also be found in some patient samples. There may also be variation between sequential isolates over time. Caution needs to be applied when inferring strain relatedness solely using VNTR analysis in certain cases. For example, it is unlikely to be sufficiently discriminatory when assessing whether isolates with similar profiles pre and post antibiotic therapy represent reinfection from an environmental/other source or therapeutic failure. In these cases, the greater discrimination provided through whole-genome sequencing of isolates may be required. Despite these drawbacks, this method has been successfully used by PHE to type P. aeruginosa isolates from hospitals throughout the UK since 2010, and has proved invaluable for highlighting outbreaks and aiding cross-infection decisions in CF clinics.
Chapter 5 Clinical effectiveness results
Participant recruitment
The first participant was randomised on 5 October 2010 and the final participant was randomised on 27 January 2017, when the recruitment target was met. The last follow-up visit occurred on 10 April 2018.
Sixty-one out of the 72 sites (see Appendix 3) that screened patients randomised at least one participant. Twenty-two sites randomised at least five participants.
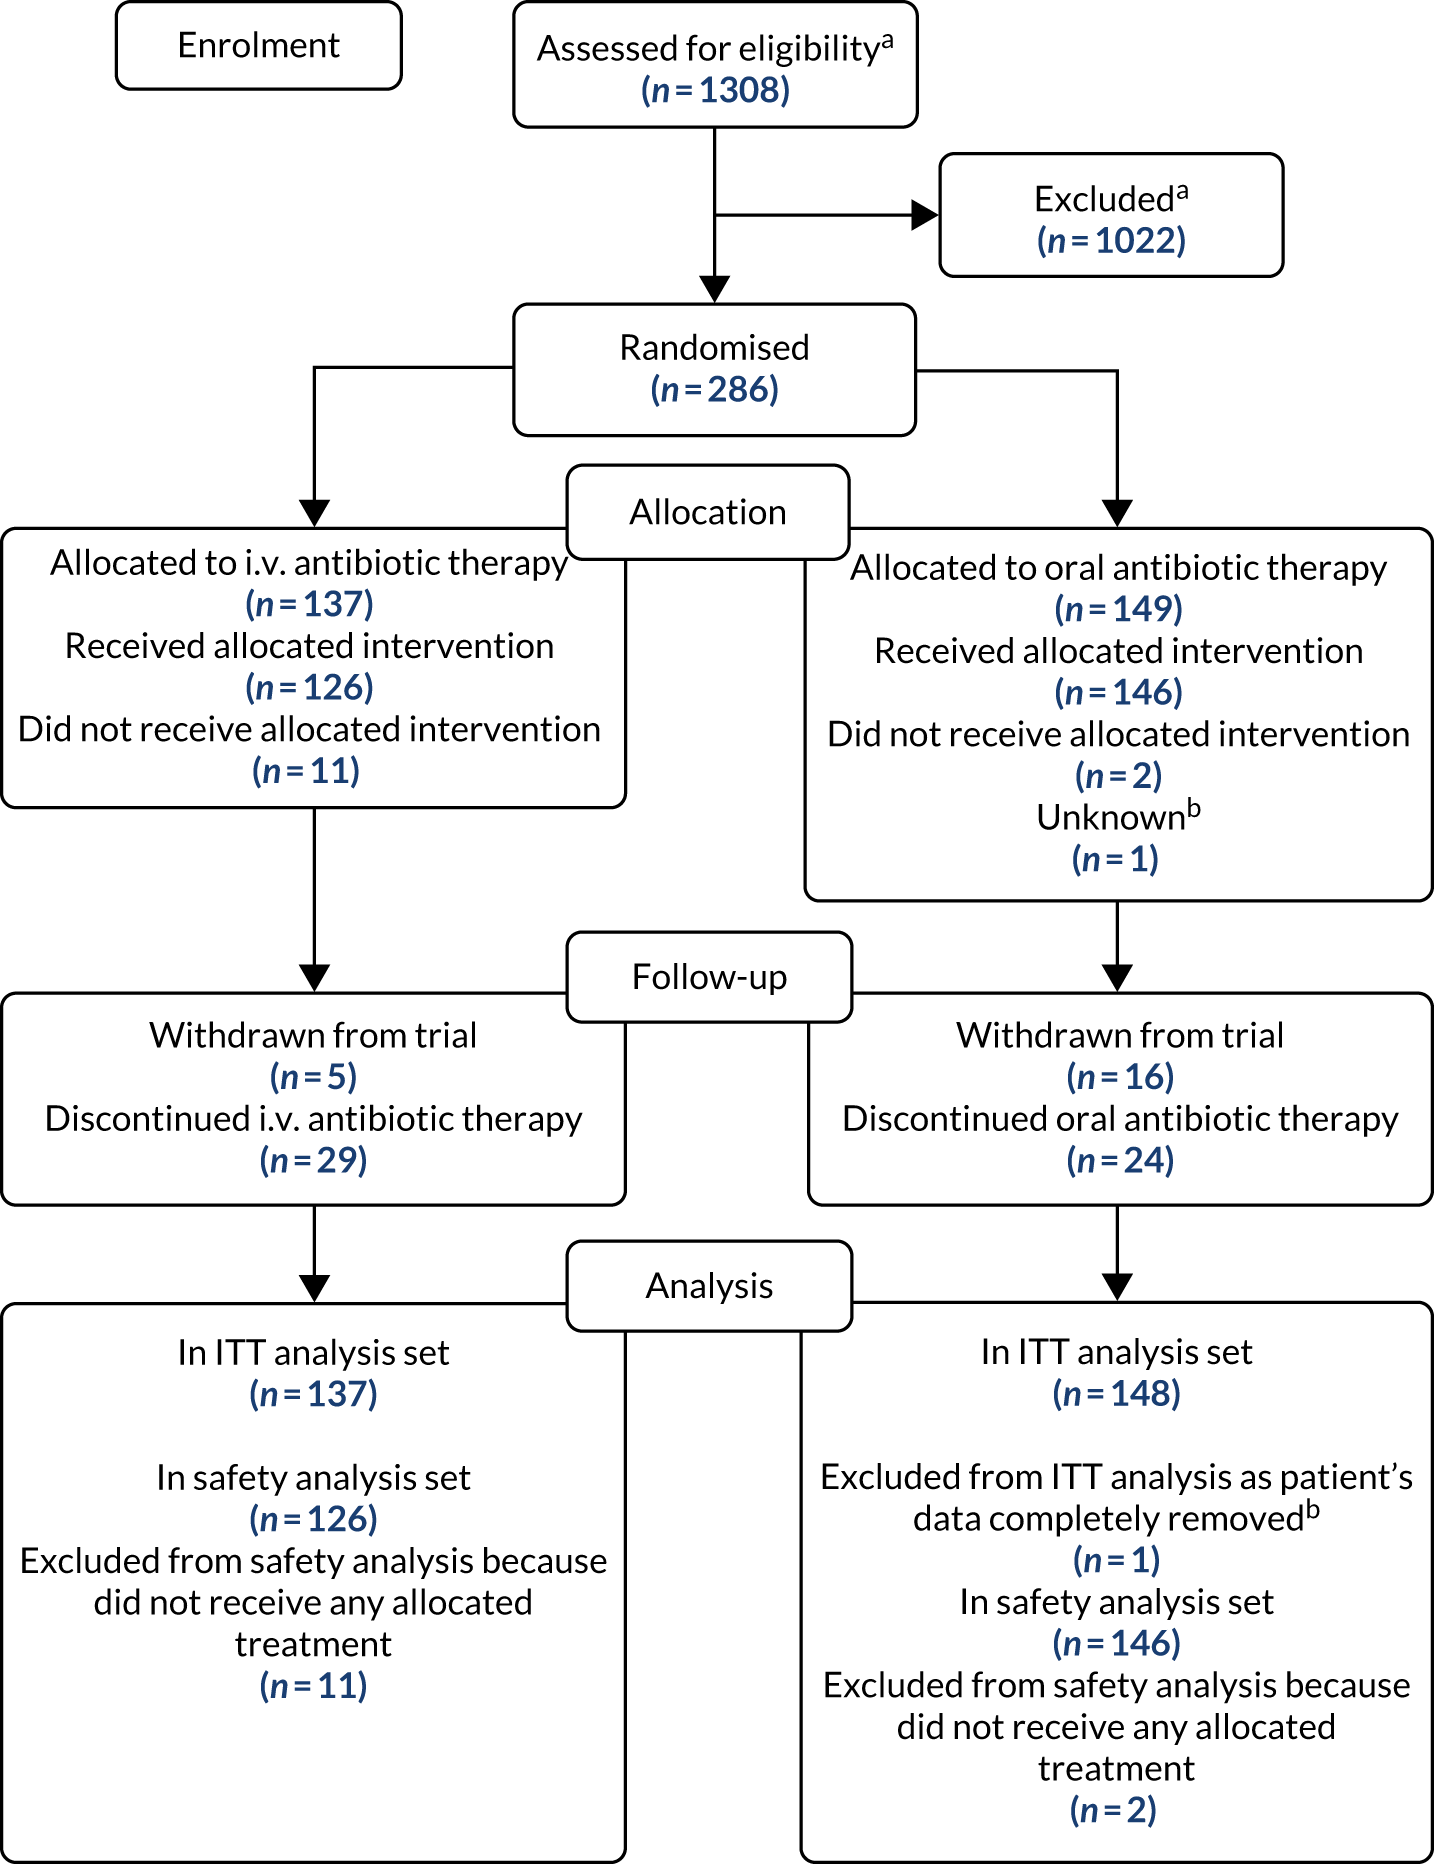
The flow of participants through the trial is presented in the CONSORT flow diagram (Figure 2). A total of 1308 patients screened for eligibility (patients could be screened on multiple occasions); 1022 did not undergo randomisation because they did not meet the eligibility criteria and 286 patients were randomised (137 to i.v. antibiotic therapy and 149 to oral antibiotic therapy). Detailed information on recruitment is provided in Appendix 4, Tables 28–32.
FIGURE 2.
The CONSORT flow diagram for all trial participants. a, Multiple screenings allowed; b, Patient randomised by all data completely removed as PI sign off could not be obtained.
Analysis populations
The ITT analysis population included 285 of the 286 participants (99.7%) who were randomised; one participant’s data could not be included as PI approval could not be obtained despite every effort being made by the TMG to do so. The safety population included 272 of the 286 randomised participants (95.1%); 13 patients did not receive any of their allocated treatment and one participant’s data could not be included as PI approval could not be obtained. The analysis set for the primary outcome included 255 participants: 125 in the i.v. antibiotic therapy group and 130 in the oral antibiotic therapy group.
All participants who withdrew consent for trial continuation contributed outcome data up until the point of withdrawal.
Premature discontinuations
Premature discontinuation of treatment (either IMP or non-IMP) occurred in 40 of the 137 participants in the i.v. antibiotic therapy group (29.2%) and 26 of the 148 participants in the oral antibiotic therapy group (17.6%). The most common reasons for premature discontinuation of treatment in the i.v. antibiotic therapy group were withdrawal of consent (n = 9; 22.5%), venous access problem (n = 7; 17.5%) and long-line failure (n = 5; 12.5%), and in the oral antibiotic therapy group the reasons were AE (n = 13; 50%) and withdrawal of consent (n = 4; 15.4%). Reasons for premature discontinuation of treatment are summarised in Table 1.
| Reason | Treatment group, n (%) | Total, n (%) | |
|---|---|---|---|
| i.v. antibiotic therapy | Oral antibiotic therapy | ||
| AE | 1 (2.5) | 13 (50.0) | 14 (21.2) |
| Withdrawn consent | 9 (22.5) | 4 (15.4) | 13 (19.7) |
| Venous access problem | 7 (17.5) | 0 (0.0) | 7 (10.6) |
| Long-line failure | 5 (12.5) | 0 (0.0) | 5 (7.6) |
| Missing | 4 (10.0) | 1 (3.8) | 5 (7.6) |
| Clinician decision | 3 (7.5) | 1 (3.8) | 4 (6.1) |
| Othera | 3 (7.5) | 1 (3.8) | 4 (6.1) |
| SAE/reaction | 1 (2.5) | 3 (11.5) | 4 (6.1) |
| Errorb | 3 (7.5) | 0 (0.0) | 3 (4.5) |
| Bed not available | 2 (5.0) | 0 (0.0) | 2 (3.0) |
| Insufficient medication supplied | 0 (0.0) | 2 (7.7) | 2 (3.0) |
| Lost to follow-up | 1 (2.5) | 0 (0.0) | 1 (1.5) |
| Poor adherence | 0 (0.0) | 1 (3.8) | 1 (1.5) |
| Unknown | 1 (2.5) | 0 (0.0) | 1 (1.5) |
| Total | 40 | 26 | 66 |
Withdrawal from follow-up occurred in 5 of the 137 participants in the i.v. antibiotic therapy group (3.6%) and 16 of the 148 participants in the oral antibiotic therapy group (10.8%). The most common reason in both groups was that participants were lost to follow-up [three participants in the i.v. antibiotic therapy group (60%); nine participants in the oral antibiotic therapy group (56.3%)]. Reasons for withdrawals from follow-up are summarised in Table 2.
| Reason | Treatment group, n (%) | Total, n (%) | |
|---|---|---|---|
| i.v. antibiotic therapy | Oral antibiotic therapy | ||
| AE | 0 (0.0) | 1 (6.3) | 1 (4.8) |
| Lost to follow-up | 3 (60.0) | 9 (56.3) | 12 (57.1) |
| Othera | 1 (20.0) | 2 (12.5) | 3 (14.3) |
| Withdrawn consent | 1 (20.0) | 4 (25.0) | 5 (23.8) |
| Total | 5 | 16 | 21 |
Baseline characteristics
The demographic baseline data of the 285 randomised participants were comparable between the two groups. The proportion of infants and toddlers was slightly larger in the i.v. antibiotic therapy group (30.7%, compared with 18.9% in the oral antibiotic therapy group). The proportions of male and female participants were approximately the same across the two treatment groups, with slightly more female than male participants (Table 3).
| Baseline characteristic | Treatment group, n (%) | |
|---|---|---|
| i.v. antibiotic therapy (N = 137) | Oral antibiotic therapy (N = 148) | |
| Age groupa | ||
| Infants and toddlers (28 days–23 months) | 42 (30.7) | 28 (18.9) |
| Children (2–11 years) | 71 (51.8) | 92 (62.2) |
| Adolescents (12–17 years) | 18 (13.1) | 19 (12.8) |
| Adults (18–64 years) | 6 (4.4) | 9 (6.1) |
| Sex | ||
| Male | 63 (46) | 67 (45.3) |
| Female | 74 (54) | 81 (54.7) |
| P. aeruginosa | ||
| Naive | 81 (59.1) | 93 (62.8) |
| Free | 56 (40.9) | 55 (37.2) |
| Other micro-organisms detected | ||
| Candida albicans | 11 (8) | 17 (11.5) |
| MRSA | 0 (0.0) | 2 (1.4) |
| Burkholderia cepacia complex | 0 (0.0) | 0 (0.0) |
| Aspergillus fumigatus | 2 (1.5) | 2 (1.4) |
| Other organisms | 26 (19) | 31 (20.9) |
| Genotype | ||
| p.Phe508del/p.Phe508del | 70 (51.1) | 90 (60.8) |
| p.Phe508del/other | 40 (29.2) | 43 (29.1) |
| p.Phe508del/unknown | 4 (2.9) | 5 (3.4) |
| Other/other | 12 (8.8) | 7 (4.7) |
| Unknown | 11 (8.0) | 3 (2) |
| Pulmonary exacerbation present | 18 (13.1) | 17 (11.5) |
| BMI z-score (paediatric), n, mean (SD) | 125, 0.3 (1) | 131, 0.3 (0.9) |
| BMI (adults) (kg/m2), n, mean (SD) | 6, 24.6 (1.8) | 9, 23.2 (2.3) |
| Time from P. aeruginosa isolation to treatment initiation (days), n, mean (SD) | 126, 8.8 (5.3) | 145, 6.8 (5.3) |
| FEV1% predicted (l), n, mean (SD) | 67, 86.6 (15.8) | 70, 85.7 (16) |
| FVC% predicted (l), n, mean (SD) | 67, 92.2 (15.5) | 70, 95.1 (14.5) |
| FEF25–75% predicted (l), n, mean (SD) | 44, 72.7 (26.6) | 53, 70.6 (30.3) |
| Oxygen saturation (%), n, mean (SD) | 118, 97.7 (1.4) | 133, 97.7 (1.7) |
Body mass index, lung function and oxygen saturation were similar across the two treatment groups. The proportions of patients who were naive or free from P. aeruginosa for the preceding 12 months and who had experienced a pulmonary exacerbation were also comparable across the two groups. There were fewer patients in the i.v. antibiotic therapy that had a diagnosis based on a homozygous delta f508 mutation (60.8%, compared with 51.1% in the oral antibiotic therapy group). Similar numbers of participants in each treatment group had other microorganisms detected at baseline (see Table 3).
Protocol deviations
Protocol deviations were monitored centrally by evaluating inclusion/exclusion criteria at trial entry and throughout the trial. A total of 284 participants (99.6%) had at least one major protocol deviation. The most common protocol deviations related to visits occurring outside the protocol-specified visit windows; 282 participants (98.9%) had a visit outside the window at 3 or 15 months (major deviation) and 280 participants (98.2%) had a visit outside the window at 6, 9, 12, 18, 21 or 24 months (minor deviation). All protocol deviations were agreed with the co-chief investigators prior to them seeing any unblinded results (Table 4).
| Deviation | Treatment group, n (%) | Total, n (%) (N = 285) | |
|---|---|---|---|
| i.v. antibiotic therapy (N = 137) | Oral antibiotic therapy (N = 148) | ||
| Any protocol deviation | 137 (100.0) | 148 (100.0) | 285 (100.0) |
| At least one major deviation | 137 (100.0) | 147 (99.3) | 284 (99.6) |
| Consent not obtained | 0 (0.0) | 0 (0.0) | 0 (0.0) |
| Inclusion of patient previously randomised into TORPEDO-CF | 0 (0.0) | 0 (0.0) | 0 (0.0) |
| Treatment non-compliance (< 10 days of i.v. treatment or 120 doses of ciprofloxacin) | 35 (25.5) | 6 (4.1) | 41 (14.4) |
| Premature discontinuation of randomised treatment because of safety | 2 (1.5) | 16 (10.8) | 18 (6.3) |
| Premature discontinuation of randomised treatment because of patient preference | 15 (10.9) | 5 (3.4) | 20 (7.0) |
| Scheduled visits at 3 and 15 months occurring outside appropriate time frame (3 months should be more than 48 hours after and no more than 14 days after; 15 months should be no more than 7 days before and 14 days after) | 136 (99.3) | 146 (98.6) | 282 (98.9) |
| At least one minor deviation | 134 (97.8) | 146 (98.6) | 280 (98.2) |
| Outside age range | 0 (0.0) | 0 (0.0) | 0 (0.0) |
| Patient starting treatment > 21 days after a positive microbiology report | 1 (0.7) | 3 (2.0) | 4 (1.4) |
| Inclusion of patient who has not been clear of P. aeruginosa for 12 months | 1 (0.7) | 0 (0.0) | 1 (0.4) |
| Scheduled visits at 6, 9, 12, 18, 21 and 24 months occurring outside appropriate time frame (no more than 7 days either side) | 134 (97.8) | 146 (98.6) | 280 (98.2) |
Compliance
Intravenous antibiotic therapy
Serum creatinine levels prior to the administration of the first dose of tobramycin are presented in Table 5, along with tobramycin serum concentrations prior to the administration of the second dose and after 1 week. Table 6 provides summary statistics for the number of days that participants received i.v. treatment.
| Summary statistic | Serum creatinine level (mmol/l) prior to first tobramycin dose administration | Tobramycin serum levels (mg/l) | |
|---|---|---|---|
| Prior to second dose administration | After 1 week | ||
| n | 109 | 112 | 102 |
| Mean | 35.6 | 0.7 | 1.2 |
| SD | 17.7 | 1.3 | 4.3 |
| Minimum | 0 | 0 | 0 |
| Median | 33 | 0.4 | 0.4 |
| Maximum | 132.6 | 8.7 | 41 |
| Missing (n) | 28 | 25 | 35 |
| Summary statistic | Number of days on treatment | |
|---|---|---|
| Ceftazidime | Tobramycin | |
| n | 137 | 137 |
| Mean | 11.5 | 11.0 |
| SD | 5.3 | 5.1 |
| Minimum | 0 | 0 |
| Median | 14 | 14 |
| Maximum | 16 | 16 |
| Missing (n) | 0 | 0 |
Oral antibiotic therapy
Table 7 provides summary statistics for the number of doses that participants received along with a compliance rate based on a denominator of 168 doses [two doses per day for 84 days (3 × 28 days)]. As some participants remained on treatment for longer than the required 84 days, this information was updated (post hoc) to include only those doses taken in the first 84 days.
| Summary statistic | All doses | Doses from first 84 days | ||
|---|---|---|---|---|
| Number of doses | Compliance rate (%) | Number of doses | Compliance rate (%) | |
| n | 105 | 105 | 105 | 105 |
| Mean | 167.1 | 99.5 | 156.6 | 93.2 |
| SD | 32.8 | 19.5 | 29 | 17.27 |
| Minimum | 0 | 0.0 | 0 | 0.0 |
| Median | 173 | 103.0 | 166 | 98.8 |
| Maximum | 230 | 136.9 | 168 | 100 |
| Missing (n) | 43 | 43 | 43 | 43 |
| Summary statistic | Compliance rate (%) using all doses | Compliance rate (%) using doses from the first 84 days | ||
|---|---|---|---|---|
| i.v. antibiotic therapy | Oral antibiotic therapy | i.v. antibiotic therapy | Oral antibiotic therapy | |
| n | 97 | 105 | 97 | 105 |
| Mean | 87.8 | 97.7 | 82.1 | 91.6 |
| SD | 34.4 | 21.4 | 31.5 | 19.0 |
| Minimum | 0.0 | 0.0 | 0.0 | 0.0 |
| Median | 100.6 | 101.2 | 98.2 | 98.2 |
| Maximum | 125 | 136.9 | 100 | 100 |
| Missing (n) | 40 | 43 | 40 | 43 |
Colistin therapy
Table 8 provides summary statistics for the compliance rate based on a denominator of 168 doses [two doses per day for 84 days (3 × 28 days)]. As some participants remained on treatment for longer than the required 84 days, this information was updated (post hoc) to include only those doses taken in the first 84 days.
Time from randomisation to treatment commencement
The median (IQR) time from randomisation to treatment commencement was 3 (1–6) days in the i.v. antibiotic therapy group and 0 (0–1) days in the oral antibiotic therapy group.
Primary outcome
The primary outcome (successful eradication of P. aeruginosa infection 3 months after allocated treatment has started and remaining infection free through to 15 months after the start of allocated treatment) was achieved by 55 of the 125 participants (44.0%) in the i.v. antibiotic therapy group and by 68 of the 130 participants (52.3%) in the oral antibiotic therapy group. Participants who were randomised to the i.v. antibiotic therapy group had a reduced chance of having successful eradication of P. aeruginosa 3 months after the start of treatment and remaining infection free through to 15 months (relative risk 0.84, 95% CI 0.65 to 1.09; p = 0.184). Results from five of the six sensitivity analyses to address missing data can be found in Table 9, which details the number of patients included in each analysis, the number in each treatment group in whom eradication was or was not observed, the relative risk, 95% CI and the p-value from the chi-squared test. The results from all five sensitivity analyses are consistent with the results from the primary analysis, indicating that the original results are robust with regard to the assumptions that were made. The additional sensitivity analysis not reported in Table 9 applied all of the same assumptions as the primary analysis, but used a logistic regression model to adjust for centre as a random effect. The adjustment to the model for centre did not significantly affect the results (p = 0.218), indicating that there was no statistically significant effect of centre on the primary results. Results from a post hoc subgroup analyses in P. aeruginosa naive and P. aeruginosa free patients are also reported in Table 9. A Mantel–Haenszel test for interaction was conducted and the relative risks were not significantly different in the two subgroups (p = 0.19).
| Analysis | Treatment group, n/N (%) | Relative risk (95% CI) | p-value | |
|---|---|---|---|---|
| i.v. antibiotic therapy | Oral antibiotic therapy | |||
| Primary outcome: successful eradication of P. aeruginosa infection 3 months after allocated treatment has started, remaining infection free through to 15 months after the start of allocated treatment | ||||
| Primary analysis | 55/125 (44) | 68/130 (52.3) | 0.84 (0.65 to 1.09) | 0.184 |
| Sensitivity analysis 1: all participants followed up past 3 months with no 15-month sample classified as success | 66/136 (48.5) | 85/144 (56.9) | 0.85 (0.68 to 1.07) | 0.159 |
| Sensitivity analysis 2: all participants followed up past 3 months with no 15-month sample classified as failure | 55/136 (40.4) | 68/144 (47.2) | 0.86 (0.66 to 1.12) | 0.253 |
| Sensitivity analysis 3: all participants followed up past 3 months with no 15-month sample classified as success/failure in accordance with the next sample taken after 15-month window | 66/136 (48.5) | 81/144 (56.3) | 0.86 (0.69 to 1.08) | 0.196 |
| Sensitivity analysis 4: as primary analysis, but 3- and 15-month windows extended to – 4 weeks/+ 10 weeks of the expected visit dates | 61/132 (46.2)a | 73/139 (52.5)a | 0.88 (0.69 to 1.12)a | 0.299a |
| Sensitivity analysis 5: as per primary analysis, but 15-month window removed (any sample after 3-month window included) | 58/136 (42.7)a | 70/144 (48.6)a | 0.88 (0.68 to 1.13)a | 0.317a |
| Subgroup analysis 1: P. aeruginosa free participants | 23/49 (46.9) | 21/50 (42.0) | 1.12 (0.72 to 1.74) | NR |
| Subgroup analysis 2: P. aeruginosa naive participants | 32/76 (42.1) | 47/80 (58.8) | 0.72 (0.53 to 0.99) | NR |
| Unsuccessful eradication of P. aeruginosa 3 months after allocated treatment has started | ||||
| Primary analysis | 13/110 (11.8) | 5/116 (4.3) | 2.74 (1.01 to 7.44)a | 0.037a |
| Sensitivity analysis: as primary analysis, but 3-month window extended to –4 weeks/+10 weeks of the expected visit date | 22/124 (17.7)a | 12/135 (8.9)a | 2.00 (1.03 to 3.86)a | 0.035a |
The number of participants who did not eradicate P. aeruginosa 3 months after the start of treatment was 13 (11.8%) in the i.v. antibiotic therapy group and five (4.3%) in the oral antibiotic therapy group. Participants who were randomised to the i.v. antibiotic therapy had an increased risk of unsuccessful eradication of P. aeruginosa 3 months after the start of treatment (relative risk 2.74, 95% CI 1.01 to 7.44; p = 0.037) (post hoc analysis). The results of this analysis were supported by a sensitivity analysis in which the 3-month window was widened to – 4 weeks/+ 10 weeks of the expected 3-month visit date (relative risk 2.00, 95% CI 1.03 to 3.86; p = 0.035).
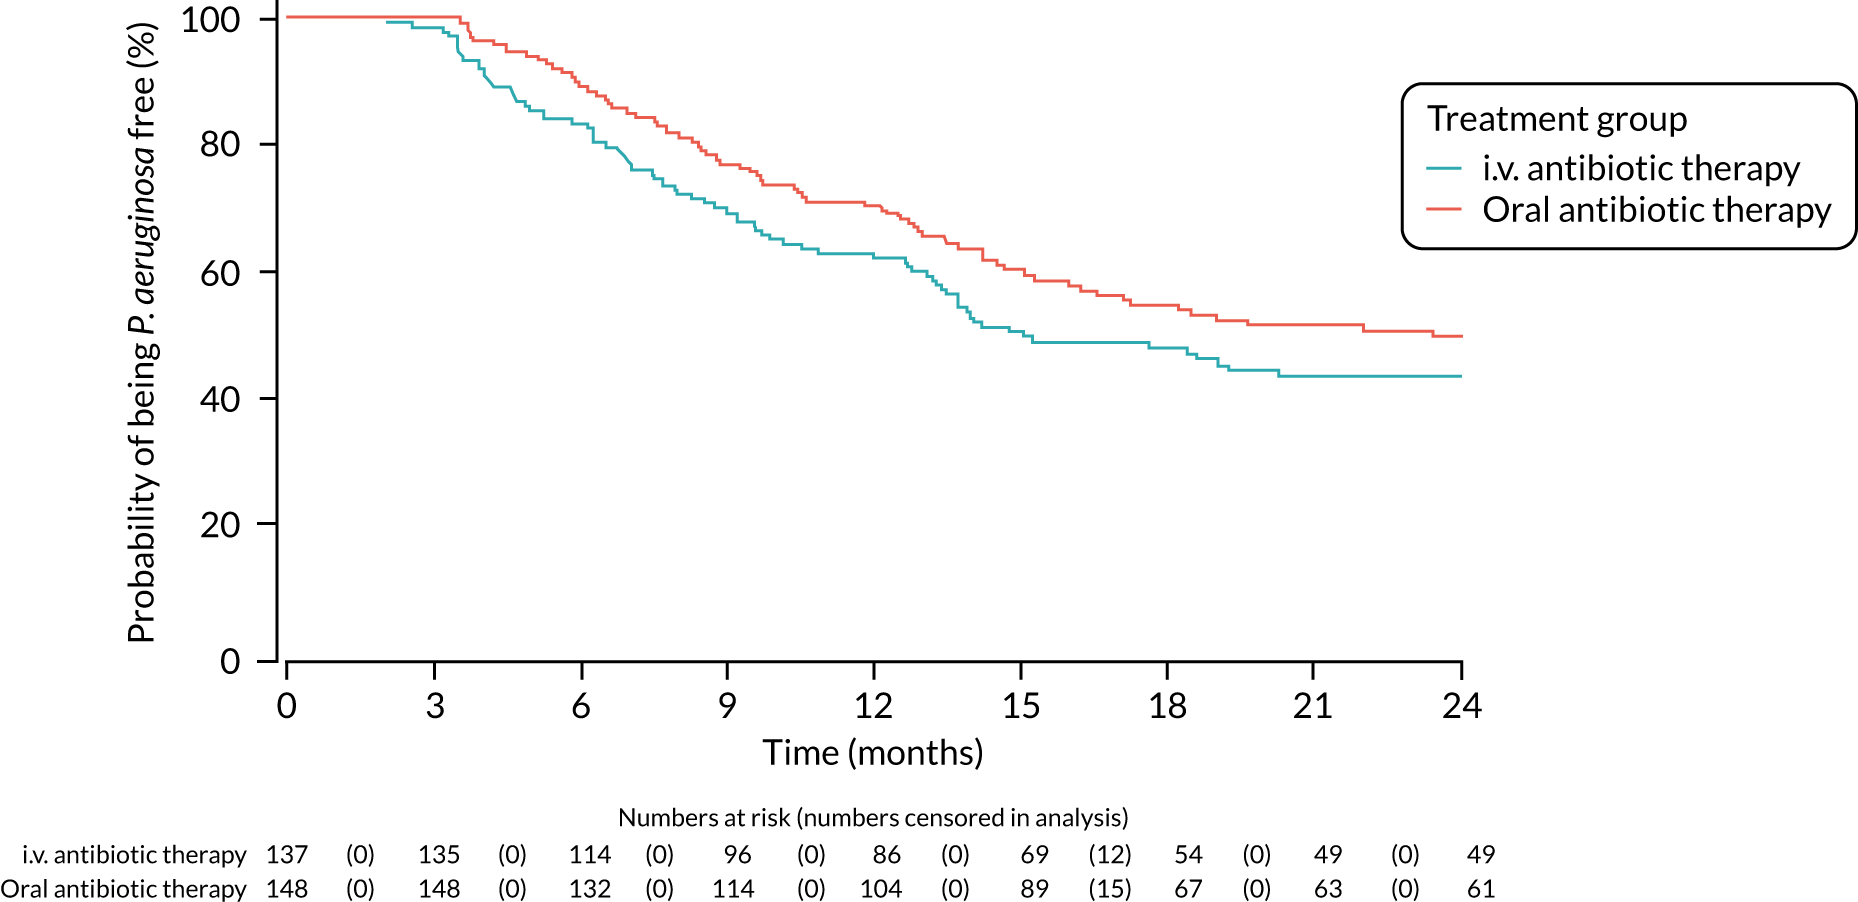
A post hoc analysis was performed on time to P. aeruginosa reoccurrence. Figure 3 is the Kaplan–Meier plot for time to P. aeruginosa reoccurrence up until the end of the 15-month window. This analysis included the 255 participants included in the primary analysis. Oral antibiotic therapy delayed time to P. aeruginosa reoccurrence compared with i.v. antibiotic therapy; however, the effect was not statistically significant (HR 1.31, 95% CI 0.93 to 1.85; p = 0.119). Figure 4 is the Kaplan–Meier plot for time to P. aeruginosa reoccurrence up until the end of the 24-month follow-up period.
FIGURE 3.
Time to reoccurrence of P. aeruginosa infection (any strain) up to the end of the 15-month window.
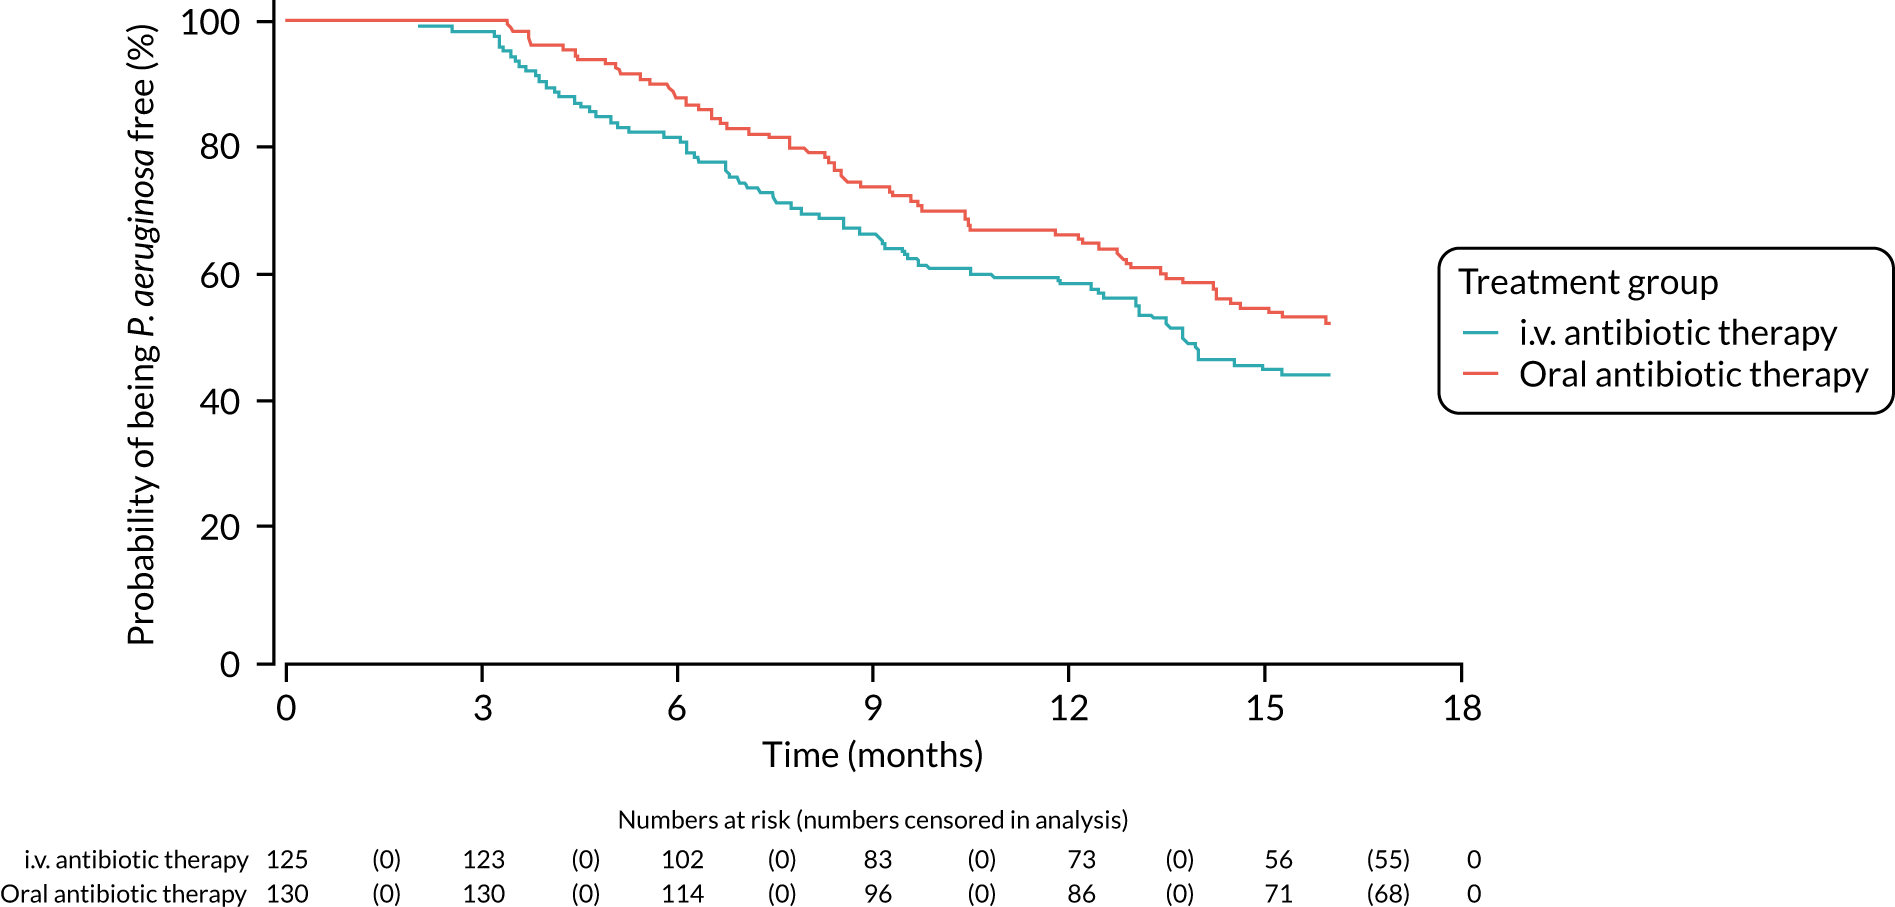
FIGURE 4.
Time to reoccurrence of P. aeruginosa infection (any strain) up to the end of the 24-month follow-up period.
Following database lock and the unblinding of the treatment allocations, it was found that one participant (who had withdrawn from the trial and was not included in the primary analysis) had a positive sample for P. aeruginosa on the day that they had stopped treatment. The definition in the statistical analysis plan stated that any samples taken in the 48-hour window following treatment cessation should be excluded and this was executed for the primary analysis shown above; however, this should have stated that only samples that were negative for isolation of P. aeruginosa in this period should be excluded – positive samples should have been included. Further investigation identified no other occurrences of this; in a post hoc analysis that included this participant, there was no impact on the primary analysis.
Secondary outcomes
Time to reoccurrence of original Pseudomonas aeruginosa infection
A total of 50 participants (n = 28 in the i.v. antibiotic therapy group; n = 22 in the oral antibiotic therapy group) had P. aeruginosa genotyping performed on both a baseline and a follow-up sample over the course of the trial. Owing to the limited numbers of participants with genotyping results, two analyses were performed on this outcome, in which assumptions were made around whether any reoccurring P. aeruginosa infections were the same strain or different. Both analyses included all 285 participants.
In the first analysis, in which participants who had regrown P. aeruginosa but did not have genotyping performed were assumed to have regrown the same strain, there was no statistically significant difference between oral antibiotic and i.v. antibiotic therapy treatment groups in time to reoccurrence of infection with the original P. aeruginosa strain (HR 1.37, 95% CI 0.99 to 1.91; p = 0.061) (Table 10, and Appendix 4, Figure 6). The results from a sensitivity analysis using time from treatment commencement, rather than time from randomisation, confirmed this finding (HR 1.38, 95% CI 0.99 to 1.92; p = 0.060) (see Table 10 and Appendix 4, Figure 7).
| Analysis | Treatment group, n (%) | HR (95% CI) | p-value | |
|---|---|---|---|---|
| i.v. antibiotic therapy (N = 137) | Oral antibiotic therapy (N = 148) | |||
| Unknown strains assumed to be the same as baseline | ||||
| Time from randomisation | 74 (54.0%) | 66 (44.6%) | 1.37 (0.99 to 1.91) | 0.061 |
| Time from treatment commencement | 74 (54.0%) | 66 (44.6%) | 1.38 (0.99 to 1.92) | 0.060 |
| Unknown strains assumed to be different from baseline | ||||
| Time from randomisation | 21 (15.3%) | 14 (9.5%) | 1.85 (0.94 to 3.64) | 0.075 |
| Time from treatment commencement | 21 (15.3%) | 14 (9.5%) | 1.85 (0.94 to 3.64) | 0.074 |
Similarly, in the second analysis, in which participants who had regrown P. aeruginosa but did not have genotyping performed were assumed to have regrown a different strain, oral antibiotic therapy delayed time to reoccurrence of the original P. aeruginosa compared with i.v. antibiotic therapy, but, again, this was not statistically significant (HR 1.85, 95% CI 0.94 to 3.64; p = 0.075) (see Table 6 and Appendix 4, Figure 8). The results from a sensitivity analysis using time from treatment commencement rather than time from randomisation confirmed this finding (HR 1.85, 95% CI 0.94 to 3.64; p = 0.074) (see Table 6 and Appendix 4, Figure 9).
Reinfection with a different strain of Pseudomonas aeruginosa
A total of 42 participants (n = 25 in i.v. antibiotic therapy group; n = 17 in oral antibiotic therapy group) had genotyping performed on both a baseline and a follow-up sample in the first 15 months of follow-up. In the i.v. antibiotic therapy group, 19 participants (76%) regrew the same strain and six participants (24%) regrew a different strain. In the oral antibiotic therapy group, 12 participants (70.6%) regrew the same strain and five participants (29.4%) regrew a different strain. The risk of regrowing a different strain was slightly lower in the i.v. antibiotic therapy group than in the oral antibiotic therapy group, but the difference was not statistically significant (relative risk 0.82, 95% CI 0.30 to 2.25; p = 0.733).
Lung function
Lung function analyses were undertaken on patients aged ≥ 5 years (157/285 randomised patients: 76 in the i.v. antibiotic therapy group and 81 in the oral antibiotic therapy group).
A total of 134 participants had a baseline measurement and at least one follow-up measurement of FEV1 and FVC, and 96 participants had a baseline and at least one follow-up measurement of FEF25–75 and were therefore included in the models. Table 11 provides the mean and standard error (SE) in each treatment group predicted by the random effects model that fitted a time-by-treatment interaction and also those from the model when no time-by-treatment interaction was included (post hoc), along with the mean treatment difference, 95% CI and the p-value for the model with no interaction term (overall) and for each time point for the model with the interaction term. All three measures of lung function were very slightly higher in the i.v. antibiotic therapy than in the oral antibiotic therapy group across all estimates.
| Outcome | n | Time point | Treatment group, mean (SE) | Mean treatment difference (95% CI) | p-value | |
|---|---|---|---|---|---|---|
| i.v. antibiotic therapy | Oral antibiotic therapy | |||||
| Lung function | ||||||
| % predicted FEV1 | 134 | 3 months | 85.68 (1.02) | 81.93 (0.98) | 3.75 (0.97 to 6.53)a | 0.008a |
| 15 months | 86.19 (1.1) | 84.11 (1.1) | 2.08 (–0.99 to 5.14) | 0.184 | ||
| 24 months | 86.57 (1.55) | 85.75 (1.54) | 0.82 (–3.45 to 5.1)a | 0.705a | ||
| Overall | 86.32 (0.99)a | 83.16 (0.98)a | 3.16 (0.51 to 5.8)a | 0.019a | ||
| % predicted FVC | 134 | 3 months | 91.87 (1.04) | 88.01 (0.99) | 3.86 (1.03 to 6.69)a | 0.008a |
| 15 months | 94.08 (1.08) | 90.94 (1.08) | 3.14 (0.15 to 6.14) | 0.039 | ||
| 24 months | 95.74 (1.5) | 93.13 (1.47) | 2.61 (–1.52 to 6.73)a | 0.216a | ||
| Overall | 93.53 (0.97)a | 89.98 (0.97)a | 3.56 (0.9 to 6.21)a | 0.009a | ||
| % predicted FEF25–75 | 96 | 3 months | 74.14 (2.62) | 70.38 (2.23) | 3.76 (–2.99 to 10.52)a | 0.274a |
| 15 months | 72.39 (2.73) | 68.93 (2.45) | 3.46 (–3.74 to 10.66) | 0.345 | ||
| 24 months | 71.07 (3.63) | 67.84 (3.22) | 3.23 (–6.29 to 12.76)a | 0.505a | ||
| Overall | 73.36 (2.5)a | 69.71 (2.22)a | 3.64 (–2.82 to 10.11)a | 0.269a | ||
| Oxygen saturation (%) | 241 | 3 months | 97.81 (0.1) | 97.76 (0.09) | 0.05 (–0.21 to 0.3)a | 0.728a |
| 15 months | 97.83 (0.09) | 97.78 (0.09) | 0.05 (–0.2 to 0.29) | 0.709 | ||
| 24 months | 97.84 (0.13) | 97.79 (0.12) | 0.05 (–0.3 to 0.4)a | 0.79a | ||
| Overall | 97.82 (0.08)a | 97.77 (0.08)a | 0.05 (–0.18 to 0.27)a | 0.686a | ||
| Growth and nutritional status | ||||||
| Height z-score | 256 | 3 months | –0.34 (0.02) | –0.34 (0.02) | 0 (–0.06 to 0.05)a | 0.952a |
| 15 months | –0.34 (0.04) | –0.31 (0.04) | –0.03 (–0.13 to 0.07) | 0.572 | ||
| 24 months | –0.34 (0.06) | –0.29 (0.06) | –0.05 (–0.21 to 0.11)a | 0.543a | ||
| Overall | –0.33 (0.02)a | –0.33 (0.02)a | 0 (–0.06 to 0.05)a | 0.939a | ||
| Weight z-score | 211 | 3 months | 0.06 (0.02) | 0.06 (0.02) | 0 (–0.06 to 0.06)a | 0.988a |
| 15 months | 0.11 (0.05) | 0.13 (0.05) | –0.02 (–0.15 to 0.11) | 0.794 | ||
| 24 months | 0.15 (0.08) | 0.18 (0.08) | –0.03 (–0.24 to 0.18)a | 0.78a | ||
| Overall | 0.09 (0.03)a | 0.09 (0.03)a | 0 (–0.06 to 0.06)a | 0.987a | ||
| BMI z-score | 256 | 3 months | 0.31 (0.03) | 0.32 (0.02) | –0.01 (–0.08 to 0.06)a | 0.767a |
| 15 months | 0.34 (0.05) | 0.33 (0.05) | 0.01 (–0.14 to 0.16) | 0.912 | ||
| 24 months | 0.36 (0.09) | 0.33 (0.08) | 0.02 (–0.22 to 0.26)a | 0.854a | ||
| Overall | 0.32 (0.03)a | 0.33 (0.03)a | –0.01 (–0.08 to 0.06)a | 0.774a | ||
| BMI (kg/m2) | 13 | 3 months | 23.56 (0.18) | 24.04 (0.18) | –0.48 (–1.0 to 0.03)a | 0.067a |
| 15 months | 23.51 (0.22) | 24.25 (0.24) | –0.73 (–1.39 to –0.08) | 0.029 | ||
| 24 months | 23.47 (0.37) | 24.4 (0.39) | –0.92 (–2.01 to 0.16)a | 0.093a | ||
| Overall | 23.58 (0.18)a | 24.14 (0.19)a | –0.56 (–1.03 to -0.09)a | 0.02a | ||
Oxygen saturation
A total of 241 participants had a baseline measurement of oxygen saturation and at least one follow-up measurement, and these participants were therefore included in the models. Table 11 provides the mean and SE in each treatment group predicted by the random effects model that fitted a time-by-treatment interaction and also those from the model when no time-by-treatment interaction was included (post hoc), along with the mean treatment difference, 95% CI and the p-value for the model with no interaction term (overall) and for each time point for the model with the interaction term. There was no difference between the two treatment groups.
Growth and nutritional status
Of the 268 children (recruited at a paediatric centre), 256 were included in the analyses of height and BMI, as they had a baseline measurement and at least one follow-up measurement. The analysis of weight was restricted to participants aged ≤ 10 years, so included only 211 children. Table 11 provides the mean and SE in each treatment group predicted by the random effects model that fitted a time-by-treatment interaction and also those from the model when no time-by-treatment interaction was included (post hoc), along with the mean treatment difference, 95% CI and the p-value for the model with no interaction term (overall) and for each time point for the model with the interaction term. There was very little difference between the two treatment groups in terms of the height, weight and BMI z-scores that were measured in children. BMI (measured in adults) was slightly lower in the i.v. antibiotic therapy group than in the oral antibiotic therapy group, but only 13 participants were included in this model.
Number of pulmonary exacerbations
A total of 283 participants were included in the analysis of the number of pulmonary exacerbations within the first 15 months of follow-up. In both treatment groups, most participants did not experience any pulmonary exacerbations (i.v. 72.3%; oral 64.4%) during this time, but the risk of experiencing at least one pulmonary exacerbation was lower in the i.v. antibiotic therapy group than in the oral antibiotic therapy group (relative risk 0.78, 95% CI 0.55 to 1.10; p = 0.155). The median (IQR) number of exacerbations experienced in each group was 0 (0–1). The distributions of the number of exacerbations experienced in each treatment group were not significantly different (p = 0.090). Table 12 provides the results of the additional analyses of this outcome over different time periods of interest. The results of these analyses were all consistent with the results over the first 15 months of follow-up. The analysis investigating the time to first pulmonary exacerbation found no significant difference between the two treatment groups (HR 0.73, 95% CI 0.50 to 1.06; p = 0.1); the Kaplan–Meier plot can be seen in Figure 5.
| Outcome | Time period | Treatment group, n/N (%)a | Relative risk (95% CI) | p-value | |
|---|---|---|---|---|---|
| i.v. antibiotic therapy | Oral antibiotic therapy | ||||
| Number of pulmonary exacerbations | Up to 15 months | 38/137 (27.7) | 52/146 (35.6) | 0.78 (0.55 to 1.10) | 0.155 |
| Up to 3 months | 8/135 (5.9) | 15/144 (10.4) | 0.57 (0.25 to 1.3) | 0.173 | |
| 3–15 months | 31/131 (23.7) | 46/136 (33.8) | 0.7 (0.48 to 1.03) | 0.067 | |
| 15–24 months | 14/99 (14.1) | 26/103 (25.2) | 0.56 (0.31 to 1.01) | 0.048 | |
| Admission to hospital | Up to 3 months | 25/135 (18.5) | 15/143 (10.5) | 1.77 (0.97 to 3.2) | 0.057 |
| 3–15 months | 40/129 (31.0) | 61/136 (44.9) | 0.69 (0.5 to 0.95) | 0.02 | |
| 15–24 months | 33/105 (31.4) | 41/107 (38.3) | 0.82 (0.57 to 1.19) | 0.293 | |
| Admission to hospital: sensitivity analysis | Up to 3 months | 24/135 (17.8) | 9/143 (6.3) | 2.82 (1.36 to 5.86) | 0.003 |
| 3–15 months | 39/129 (30.2) | 63/136 (46.3) | 0.65 (0.47 to 0.9) | 0.007 | |
| 15–24 months | 34/104 (32.7) | 41/108 (38.0) | 0.86 (0.6 to 1.24) | 0.422 | |
FIGURE 5.
Time to first pulmonary exacerbation.
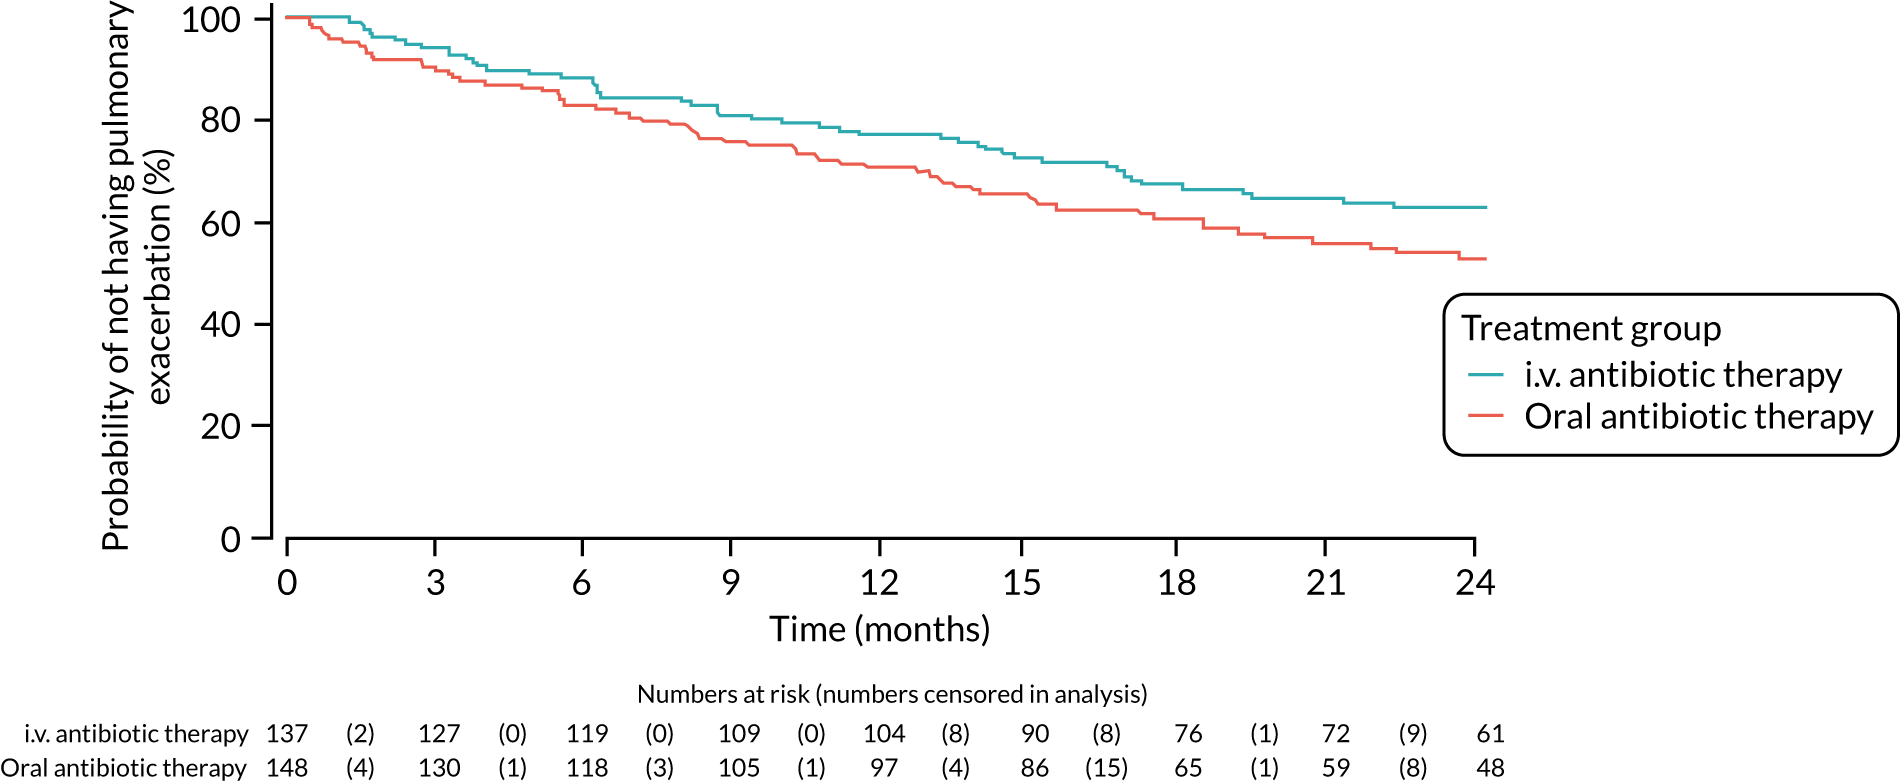
Admission to hospital
A total of 278 participants were included in the analysis over the 3-month treatment period. During this time, most participants were not admitted to hospital (i.v. antibiotic therapy, 81.5%; oral antibiotic therapy, 89.5%). However, the risk of being admitted to hospital (not including admission for the i.v. treatment if randomised to the i.v. antibiotic therapy group) was higher for participants randomised to i.v. antibiotic therapy than for participants randomised to oral antibiotic therapy (relative risk 1.77, 95% CI 0.97 to 3.2; p = 0.057). After this time, the risk of being admitted to hospital was reduced for the i.v. antibiotic therapy group compared with the oral antibiotic therapy group. There were 265 participants included in the analysis from 3 to 15 months (relative risk 0.69, 95% CI 0.5 to 0.95; p = value 0.02) and 212 participants included in the analysis from 15 to 24 months (relative risk 0.82, 95% CI 0.57 to 1.19; p = 0.293); the reduced number of patients post 15 months was mainly because of the fact that only those participants randomised prior to 1 January 2016 were followed up for 24 months. All results are presented in Table 12, along with information on the proportions of participants with no admissions or at least one admission. Results from the sensitivity analysis are also presented in Table 13 and are consistent with the primary analysis of this outcome.
| Outcome | Time period | Treatment group | p-value | |||
|---|---|---|---|---|---|---|
| i.v. antibiotic therapy | Oral antibiotic therapy | |||||
| n | Median (range) | n | Median (range) | |||
| Number of pulmonary exacerbations | Up to 15 months | 137 | 0 (0–1) | 146 | 0 (0–1) | 0.087 |
| Number of days spent in hospital | Up to 3 months | 135 | 0 (0–29) | 143 | 0 (0–14.8) | 0.066 |
| 3–15 months | 129 | 0 (0–69) | 136 | 0 (0–64) | 0.005 | |
| 15–24 months | 99 | 0 (0–33) | 102 | 0 (0–28) | 0.261 | |
| Number of days spent in hospital: sensitivity analysis 1 | Up to 3 months | 135 | 0 (0–29) | 143 | 0 (0–16) | 0.050 |
| 3–15 months | 129 | 0 (0–69) | 136 | 0 (0–64) | 0.007 | |
| 15–24 months | 99 | 0 (0–28) | 102 | 0 (0–28) | 0.273 | |
| Number of days spent in hospital: sensitivity analysis 2 | Up to 3 months | 135 | 0 (0–29) | 143 | 0 (0–10) | 0.003 |
| 3–15 months | 129 | 0 (0–69) | 136 | 0 (0–66) | 0.004 | |
| 15–24 months | 99 | 0 (0–42) | 102 | 0 (0–28) | 0.574 | |
Number of days spent as an inpatient in hospital
A total of 278 participants were included in the analysis over the 3-month treatment period, 265 participants were included over the period from 3 to 15 months’ follow-up and 201 participants were included from 15 to 24 months’ follow-up. The median number of days spent as an inpatient in hospital was zero in both treatment groups across all time periods. The distributions of the number of days in hospital in each group were significantly different over the time period from 3 to 15 months’ follow-up (p = 0.005), but not at the other time points (a p-value of 0.066 for the 3-month treatment period; a p-value of 0.261 for the 15–24 months’ follow-up). The results from sensitivity analyses were consistent with these results. All results are provided in Table 13.
Quality of life (Cystic Fibrosis Questionnaire)
For this outcome, the analyses were undertaken on patients aged ≥ 6 years (134/285 patients randomised: 62 patients to i.v. antibiotic therapy and 72 patients to oral antibiotic therapy). Of these, 62 patients were expected to be in the self-report analyses and 46 patients were expected to be in the parent analyses for i.v. antibiotic therapy. For oral antibiotic therapy, 72 patients were expected to be in the self-report analyses and 51 patients were expected to be in the parent analyses.
A total of 106 participants were included in the analysis of the majority of domains in the self-report questionnaire (some domains included 105 participants because of missing data). The analysis of the domains that were completed by participants aged ≥ 14 years included 27 participants. A total of 73 participants (or 72 participants when missing data occurred) were included in the analyses of the domains in the parent/carer questionnaire. There were no statistically significant differences between the two treatment groups at 15 months across any of the domains in each questionnaire (Table 14 shows the treatment difference, associated CI and p-value from the model). The mean score for each treatment group at each time point for each of the domains is shown in Appendix 4, Figures 10–32.
| Domain | Participants (n) | Mean treatment difference at 15 months (95% CI) | p-value |
|---|---|---|---|
| Self-report questionnaire | |||
| Physical functioning | 106 | –3.63 (–10.41 to 3.16) | 0.292 |
| Role/school functioninga | 27 | 7.66 (–6.21 to 21.52) | 0.267 |
| Vitalitya | 27 | 5.4 (–6.88 to 17.69) | 0.373 |
| Emotional functioning | 106 | –1.59 (–7.39 to 4.22) | 0.589 |
| Social functioning | 106 | 2.11 (–4.03 to 8.25) | 0.498 |
| Body image | 105 | –4.01 (–11.78 to 3.77) | 0.309 |
| Eating problems | 106 | –0.39 (–6.78 to 6) | 0.903 |
| Treatment burden | 105 | 2.86 (–6.19 to 11.92) | 0.532 |
| Health perceptionsa | 27 | 5.06 (–13.72 to 23.84) | 0.583 |
| Weighta | 27 | 1.4 (–19.02 to 21.83) | 0.725 |
| Respiratory symptoms | 106 | 2.82 (–3.44 to 9.08) | 0.374 |
| Digestive symptoms | 106 | –0.01 (–9.95 to 9.93) | 0.998 |
| Parent/carer questionnaire | |||
| Physical functioning | 73 | –5.17 (–13.55 to 3.22) | 0.223 |
| Role/school functioning | 72 | –1.47 (–10.22 to 7.28) | 0.738 |
| Vitality | 72 | –0.44 (–9.36 to 8.48) | 0.923 |
| Emotional functioning | 72 | 3.32 (–3.56 to 10.2) | 0.339 |
| Body image | 72 | –0.56 (12.03 to 10.9) | 0.922 |
| Eating problems | 72 | 6.15 (–2.78 to 15.08) | 0.174 |
| Treatment burden | 73 | –0.28 (–11.25 to 10.69) | 0.96 |
| Health perceptions | 72 | –7.25 (–15.09 to 0.6) | 0.07 |
| Weight | 73 | –1.19 (–17.63 to 15.26) | 0.886 |
| Respiratory symptoms | 73 | –3.33 (–11.71 to 9.93) | 0.432 |
| Digestive symptoms | 72 | 3.54 (–4.9 to 11.98) | 0.405 |
Other sputum/cough microbiology
Different numbers of participants were included in the analyses of the different organisms, as, if patients had withdrawn prior to the end of the time point, they were included only if they had previously had an occurrence of the organism of interest. There were no statistically significant differences between the two treatment groups in terms of the occurrence of the four organisms of interest at any time point.
Table 15 shows the numbers of participants in each treatment group who did/did not have cough or sputum samples containing each organism, the relative risks and 95% CIs and the p-values from the chi-squared tests for each organism over each time period of interest.
The number of participants who had cough or sputum samples containing additional organisms of interest is reported in Appendix 5, Table 34.
| Outcome | Time period | Treatment group, n/N (%) | Relative risk (95% CI) | p-value | |
|---|---|---|---|---|---|
| i.v. antibiotic therapy | Oral antibiotic therapy | ||||
| MRSA | Up to 3 months | 0/136 (0.0) | 1/145 (0.7) | – | – |
| Up to 15 months | 4/135 (3.0) | 2/140 (1.4) | 2.07 (0.39 to 11.14) | 0.441 | |
| Up to 24 months | 4/132 (3.0) | 4/133 (3.0) | 1.01 (0.26 to 3.94) | 0.999 | |
| Burkholderia cepacia complex | Up to 3 months | 1/136 (0.7) | 0/144 (0.0) | – | – |
| Up to 15 months | 2/135 (1.5) | 4/139 (2.9) | 0.51 (0.10 to 2.76) | 0.684 | |
| Up to 24 months | 2/132 (1.5) | 4/133 (3.0) | 0.50 (0.09 to 2.70) | 0.684 | |
| Candida infection | Up to 3 months | 26/137 (19.0) | 27/146 (18.5) | 1.03 (0.63 to 1.67) | 0.917 |
| Up to 15 months | 55/136 (40.4) | 55/142 (38.7) | 1.04 (0.78 to 1.40) | 0.771 | |
| Up to 24 months | 66/135 (48.9) | 63/137 (45.7) | 1.07 (0.83 to 1.38) | 0.592 | |
| Aspergillus | Up to 3 months | 6/130 (4.4) | 5/144 (3.5) | 1.27 (0.40 to 4.07) | 0.686 |
| Up to 15 months | 14/121 (10.4) | 20/139 (14.4) | 0.72 (0.38 to 1.37) | 0.313 | |
| Up to 24 months | 21/113 (15.7) | 25/134 (18.7) | 0.84 (0.50 to 1.42) | 0.517 | |
Carer and participant burden (absenteeism from education or work)
A total of 270 carers were included in the analysis of absenteeism from education or work during the 15 months following randomisation. Approximately one-third of carers had at least one episode of absence (i.v. antibiotic therapy group, 33.6%; oral antibiotic therapy group, 35.3%), but the risk of absence was not significantly greater in either treatment group (Table 16). The median (IQR) number of days of absence experienced in each group for carers was 0 (0–1) and the distributions of the number of days of absence experienced in each group were not significantly different (p = 0.616).
| Outcome | Time period | Treatment group, n/N (%) | Relative risk (95% CI) | p-value | |
|---|---|---|---|---|---|
| i.v. antibiotic therapy | Oral antibiotic therapy | ||||
| Carer burden | Up to 15 months | 44/131 (33.6) | 49/139 (35.3) | 1.03 (0.86 to 1.22) | 0.774 |
| Participant burden | Up to 15 months | 65/131 (49.6) | 76/140 (54.3) | 1.10 (0.86 to 1.41) | 0.442 |
A total of 271 participants were included in the analysis of absenteeism from education or work during the 15 months following randomisation. Approximately half of the participants had at least one episode of absence (i.v. antibiotic therapy group, 49.6%; oral antibiotic therapy group, 54.3%), but the risk of absence was not significantly greater in either treatment group (see Table 16). The median number of days of absence for participants in the i.v. antibiotic therapy group was 0 (IQR 0–6.2) and the median was 1 (IQR 0–10) in the oral antibiotic therapy group, and the distributions of the number of days absence experienced in each group were not significantly different (p = 0.263).
Safety
Safety reporting at database lock
A complete list of AEs (verbatim) and the original MedDRA code (preferred term and SOC) that was agreed by the chief investigator prior to the database being locked are shown in Appendix 5, Table 35.
The non-serious AEs and SAEs that were recorded on the locked database are shown, grouped by the SOC and preferred term, in Appendix 5, Tables 36 and 37, respectively. Line listings of the SAEs are shown in Appendix 5, Table 38.
Changes made to safety reporting post hoc
After the database was locked and the blind was broken, it was found that there had been several instances where P. aeruginosa and pulmonary exacerbations had been reported both as an AE and also as a primary or secondary outcome, respectively.
There were four SAEs reported as both an outcome and a SAE: three SAEs (reported from three participants in the oral antibiotic therapy group) were included as events for the primary outcome and one SAE (reported from one participant in the oral antibiotic therapy group) was included as both a SAE and a secondary outcome. These events have not been included in Table 17 and have been reported only in each of the secondary outcome analyses.
| SOC | Preferred term | Treatment group, n (%) | Total (N = 272), n (%) | ||||
|---|---|---|---|---|---|---|---|
| i.v. antibiotic therapy (N = 126) | Oral antibiotic therapy (N = 146) | ||||||
| Events | Patients | Events | Patients | Events | Patients | ||
| Gastrointestinal disorders | Distal intestinal obstruction syndrome | 2 | 2 (1.6) | 1 | 1 (0.7) | 3 | 3 (1.1) |
| General disorders and administration site conditions | Chest pain | 0 | 0 (0.0) | 1 | 1 (0.7) | 1 | 1 (0.4) |
| General physical health deterioration | 0 | 0 (0.0) | 1 | 1 (0.7) | 1 | 1 (0.4) | |
| Pyrexia | 1 | 1 (0.8) | 0 | 0 (0.0) | 1 | 1 (0.4) | |
| Hepatobiliary disorders | Hepatic failure | 1 | 1 (0.8) | 0 | 0 (0.0) | 1 | 1 (0.4) |
| Infections and infestationsa,b | Bronchiolitis | 0 | 0 (0.0) | 1 | 1 (0.7) | 1 | 1 (0.4) |
| Croup infectious | 0 | 0 (0.0) | 1 | 1 (0.7) | 1 | 1 (0.4) | |
| Gastroenteritis | 0 | 0 (0.0) | 1 | 1 (0.7) | 1 | 1 (0.4) | |
| Infective pulmonary exacerbation of cystic fibrosis | 1 | 1 (0.8) | 0 | 0 (0.0) | 1 | 1 (0.4) | |
| Lower respiratory tract infectionb | 0 | 0 (0.0) | 1 | 1 (0.7) | 1 | 1 (0.4) | |
| Rhinitis | 0 | 0 (0.0) | 1 | 1 (0.7) | 1 | 1 (0.4) | |
| Upper respiratory tract infection | 0 | 0 (0.0) | 1 | 1 (0.7) | 1 | 1 (0.4) | |
| Viral infection | 0 | 0 (0.0) | 1 | 1 (0.7) | 1 | 1 (0.4) | |
| Nervous system disorders | Headache | 1 | 1 (0.8) | 0 | 0 (0.0) | 1 | 1 (0.4) |
| Psychiatric disorders | Anxietyc | 0 | 0 (0.0) | 1 | 1 (0.7) | 1 | 1 (0.4) |
| Renal and urinary disorders | Haematuria | 1 | 1 (0.8) | 0 | 0 (0.0) | 1 | 1 (0.4) |
| Respiratory, thoracic and mediastinal disorders | Dyspnoea | 0 | 0 (0.0) | 1 | 1 (0.7) | 1 | 1 (0.4) |
| Lung consolidation | 0 | 0 (0.0) | 1 | 1 (0.7) | 1 | 1 (0.4) | |
| Pneumothorax | 0 | 0 (0.0) | 1 | 1 (0.7) | 1 | 1 (0.4) | |
| Productive cough | 0 | 0 (0.0) | 3 | 3 (2.1) | 3 | 3 (1.1) | |
| Skin and subcutaneous tissue disorders | Rash pruritic | 1 | 1 (0.8) | 0 | 0 (0.0) | 1 | 1 (0.4) |
| Surgical and medical procedures | Catheter management | 1 | 1 (0.8) | 0 | 0 (0.0) | 1 | 1 (0.4) |
| Vascular disorders | Deep-vein thrombosis | 1 | 1 (0.8) | 0 | 0 (0.0) | 1 | 1 (0.4) |
| Thrombophlebitis | 1 | 1 (0.8) | 0 | 0 (0.0) | 1 | 1 (0.4) | |
| Totala,b,d | 11 | 10 (7.9) | 17 | 12 (8.2) | 28 | 22 (8.1) | |
There were 17 non-serious AEs reported as both an outcome and an AE: 14 AEs (nine AEs reported from nine participants in the i.v. antibiotic therapy group and five AEs from five participants in the oral antibiotic therapy group) met the definition of the primary outcome and three AEs (reported from three participants in the oral antibiotic therapy group) met the definition of the secondary outcome pulmonary exacerbation. These non-serious AEs have not been included in Table 18.
| SOC | Preferred term | Treatment group, n (%) | Total (N = 272), n (%) | ||||
|---|---|---|---|---|---|---|---|
| i.v. antibiotic therapy (N = 126) | Oral antibiotic therapy (N = 146) | ||||||
| Events | Patients | Events | Patients | Events | Patients | ||
| Ear and labyrinth disorders | Ear discomfort | 1 | 1 (0.8) | 0 | 0 (0.0) | 1 | 1 (0.4) |
| Ear pain | 0 | 0 (0.0) | 2 | 2 (1.4) | 2 | 2 (0.7) | |
| Gastrointestinal disorders | Abdominal pain | 1 | 1 (0.8) | 2 | 2 (1.4) | 3 | 3 (1.1) |
| Abdominal pain upper | 1 | 1 (0.8) | 1 | 1 (0.7) | 2 | 2 (0.7) | |
| Constipation | 1 | 1 (0.8) | 1 | 1 (0.7) | 2 | 2 (0.7) | |
| Diarrhoea | 6 | 5 (4) | 3 | 3 (2.1) | 9 | 8 (2.9) | |
| Distal intestinal obstruction syndrome | 2 | 2 (1.6) | 3 | 3 (2.1) | 5 | 5 (1.8) | |
| Haematemesis | 0 | 0 (0.0) | 1 | 1 (0.7) | 1 | 1 (0.4) | |
| Nausea | 1 | 1 (0.8) | 1 | 1 (0.7) | 2 | 2 (0.7) | |
| Pancreatitis | 1 | 1 (0.8) | 0 | 0 (0.0) | 1 | 1 (0.4) | |
| Paraesthesia oral | 0 | 0 (0.0) | 1 | 1 (0.7) | 1 | 1 (0.4) | |
| Rectal haemorrhage | 0 | 0 (0.0) | 1 | 1 (0.7) | 1 | 1 (0.4) | |
| Tongue discolouration | 1 | 1 (0.8) | 0 | 0 (0.0) | 1 | 1 (0.4) | |
| Vomiting | 3 | 3 (2.4) | 0 | 0 (0.0) | 3 | 3 (1.1) | |
| General disorders and administration site conditions | Administration site bruise | 1 | 1 (0.8) | 0 | 0 (0.0) | 1 | 1 (0.4) |
| Administration site pain | 1 | 1 (0.8) | 0 | 0 (0.0) | 1 | 1 (0.4) | |
| Adverse drug reaction | 1 | 1 (0.8) | 1 | 1 (0.7) | 2 | 2 (0.7) | |
| Catheter site-related reaction | 1 | 1 (0.8) | 0 | 0 (0.0) | 1 | 1 (0.4) | |
| Chest pain | 1 | 1 (0.8) | 1 | 1 (0.7) | 2 | 2 (0.7) | |
| Influenza-like illness | 0 | 0 (0.0) | 1 | 1 (0.7) | 1 | 1 (0.4) | |
| Malaise | 0 | 0 (0.0) | 1 | 1 (0.7) | 1 | 1 (0.4) | |
| Pain | 1 | 1 (0.8) | 1 | 1 (0.7) | 2 | 2 (0.7) | |
| Pyrexia | 2 | 2 (1.6) | 7 | 7 (4.8) | 9 | 9 (3.3) | |
| Nasal swellinga | 0 | 0 (0.0) | 1 | 1 (0.7) | 1 | 1 (0.4) | |
| Immune system disorders | Seasonal allergy | 1 | 1 (0.8) | 1 | 1 (0.7) | 2 | 2 (0.7) |
| Infections and infestations | Allergic bronchopulmonary aspergillosisa | 0 | 0 (0.0) | 1 | 1 (0.7) | 1 | 1 (0.4) |
| Candida infection | 1 | 1 (0.8) | 5 | 5 (3.4) | 6 | 6 (2.2) | |
| Chest infectiona | 0 | 0 (0.0) | 1 | 1 (0.7) | 1 | 1 (0.4) | |
| Conjunctivitis | 1 | 1 (0.8) | 0 | 0 (0.0) | 1 | 1 (0.4) | |
| Eczema infected | 0 | 0 (0.0) | 1 | 1 (0.7) | 1 | 1 (0.4) | |
| Enterobacter cloacae respiratory infectiona | 1 | 1 (0.8) | 0 | 0 (0.0) | 1 | 1 (0.4) | |
| Eye infection | 1 | 1 (0.8) | 0 | 0 (0.0) | 1 | 1 (0.4) | |
| Hand, foot and mouth diseasea | 0 | 0 (0.0) | 1 | 1 (0.7) | 1 | 1 (0.4) | |
| Hand, foot and mouth disease (recorded as foot and mouth disease)a,b | 0 | 0 (0.0) | 1 | 1 (0.7) | 1 | 1 (0.4) | |
| Gastroenteritis | 0 | 0 (0.0) | 1 | 1 (0.7) | 1 | 1 (0.4) | |
| Haemophilus influenzae respiratory infection | 3 | 3 (2.4) | 0 | 0 (0.0) | 3 | 3 (1.1) | |
| Haemophilus parainfluenzae respiratory infection | 1 | 1 (0.8) | 0 | 0 (0.0) | 1 | 1 (0.4) | |
| Infectious mononucleosis | 0 | 0 (0.0) | 1 | 1 (0.7) | 1 | 1 (0.4) | |
| Infective pulmonary exacerbation of cystic fibrosisc | 4 | 3 (2.4) | 3 | 3 (2.1) | 7 | 6 (2.2) | |
| Klebsiella pneumoniae respiratory infectiona | 0 | 0 (0.0) | 1 | 1 (0.7) | 1 | 1 (0.4) | |
| Mycobacterium avium complex infection | 0 | 0 (0.0) | 1 | 1 (0.7) | 1 | 1 (0.4) | |
| Nasal vestibulitis | 1 | 1 (0.8) | 0 | 0 (0.0) | 1 | 1 (0.4) | |
| Nasopharyngitis | 1 | 1 (0.8) | 0 | 0 (0.0) | 1 | 1 (0.4) | |
| Oral candidiasis | 0 | 0 (0.0) | 1 | 1 (0.7) | 1 | 1 (0.4) | |
| Otitis media | 1 | 1 (0.8) | 0 | 0 (0.0) | 1 | 1 (0.4) | |
| Pneumonia | 1 | 1 (0.8) | 0 | 0 (0.0) | 1 | 1 (0.4) | |
| Respiratory tract infection | 1 | 1 (0.8) | 2 | 2 (1.4) | 3 | 3 (1.1) | |
| Sinusitis | 1 | 1 (0.8) | 0 | 0 (0.0) | 1 | 1 (0.4) | |
| Stenotrophomonas maltophilia respiratory infectiona | 0 | 0 (0.0) | 1 | 1 (0.7) | 1 | 1 (0.4) | |
| Streptococcus pyogenes respiratory infectiona | 0 | 0 (0.0) | 1 | 1 (0.7) | 1 | 1 (0.4) | |
| Upper respiratory tract infection | 15 | 11 (8.7) | 3 | 2 (1.4) | 18 | 13 (4.8) | |
| Urinary tract infection | 1 | 1 (0.8) | 0 | 0 (0.0) | 1 | 1 (0.4) | |
| Varicella | 3 | 3 (2.4) | 1 | 1 (0.7) | 4 | 4 (1.5) | |
| Viral infection | 1 | 1 (0.8) | 1 | 1 (0.7) | 2 | 2 (0.7) | |
| Vulvovaginal candidiasis | 2 | 2 (1.6) | 0 | 0 (0.0) | 2 | 2 (0.7) | |
| Injury, poisoning and procedural complications | Fall | 1 | 1 (0.8) | 2 | 2 (1.4) | 3 | 3 (1.1) |
| Skull fracture | 0 | 0 (0.0) | 1 | 1 (0.7) | 1 | 1 (0.4) | |
| Sunburn | 0 | 0 (0.0) | 1 | 1 (0.7) | 1 | 1 (0.4) | |
| Wrist fracture | 1 | 1 (0.8) | 0 | 0 (0.0) | 1 | 1 (0.4) | |
| Investigations | Alanine aminotransferase increased | 1 | 1 (0.8) | 0 | 0 (0.0) | 1 | 1 (0.4) |
| Blood glucose increased | 1 | 1 (0.8) | 0 | 0 (0.0) | 1 | 1 (0.4) | |
| Chest X-ray abnormal | 0 | 0 (0.0) | 1 | 1 (0.7) | 1 | 1 (0.4) | |
| Metabolism and nutrition disorders | Decreased appetite | 0 | 0 (0.0) | 1 | 1 (0.7) | 1 | 1 (0.4) |
| Vitamin A deficiency | 0 | 0 (0.0) | 1 | 1 (0.7) | 1 | 1 (0.4) | |
| Vitamin D deficiency | 0 | 0 (0.0) | 1 | 1 (0.7) | 1 | 1 (0.4) | |
| Vitamin E deficiency | 0 | 0 (0.0) | 1 | 1 (0.7) | 1 | 1 (0.4) | |
| Musculoskeletal and connective tissue disorders | Arthralgia | 0 | 0 (0.0) | 3 | 3 (2.1) | 3 | 3 (1.1) |
| Back pain | 1 | 1 (0.8) | 0 | 0 (0.0) | 1 | 1 (0.4) | |
| Flank pain | 0 | 0 (0.0) | 1 | 1 (0.7) | 1 | 1 (0.4) | |
| Limb discomfort | 1 | 1 (0.8) | 0 | 0 (0.0) | 1 | 1 (0.4) | |
| Musculoskeletal chest pain | 0 | 0 (0.0) | 1 | 1 (0.7) | 1 | 1 (0.4) | |
| Musculoskeletal stiffness | 0 | 0 (0.0) | 1 | 1 (0.7) | 1 | 1 (0.4) | |
| Myalgia | 0 | 0 (0.0) | 1 | 1 (0.7) | 1 | 1 (0.4) | |
| Pain in extremity | 0 | 0 (0.0) | 1 | 1 (0.7) | 1 | 1 (0.4) | |
| Tendonitis | 0 | 0 (0.0) | 1 | 1 (0.7) | 1 | 1 (0.4) | |
| Neoplasms benign, malignant and unspecified (including cysts and polyps) | Malignant melanoma | 0 | 0 (0.0) | 1 | 1 (0.7) | 1 | 1 (0.4) |
| Nervous system disorders | Dizziness | 1 | 1 (0.8) | 1 | 1 (0.7) | 2 | 2 (0.7) |
| Febrile convulsion | 0 | 0 (0.0) | 1 | 1 (0.7) | 1 | 1 (0.4) | |
| Headache | 3 | 2 (1.6) | 0 | 0 (0.0) | 3 | 2 (0.7) | |
| Lethargy | 0 | 0 (0.0) | 1 | 1 (0.7) | 1 | 1 (0.4) | |
| Migraine | 0 | 0 (0.0) | 1 | 1 (0.7) | 1 | 1 (0.4) | |
| Product issues | Device occlusion | 2 | 2 (1.6) | 0 | 0 (0.0) | 2 | 2 (0.7) |
| Psychiatric disorders | Enuresis | 0 | 0 (0.0) | 1 | 1 (0.7) | 1 | 1 (0.4) |
| Renal and urinary disorders | Dysuria | 0 | 0 (0.0) | 1 | 1 (0.7) | 1 | 1 (0.4) |
| Polyuria | 1 | 1 (0.8) | 0 | 0 (0.0) | 1 | 1 (0.4) | |
| Respiratory, thoracic and mediastinal disorders | Bronchospasm | 1 | 1 (0.8) | 1 | 1 (0.7) | 2 | 2 (0.7) |
| Cough | 26 | 22 (17.5) | 28 | 23 (15.8) | 54 | 45 (16.5) | |
| Epistaxis | 1 | 1 (0.8) | 2 | 2 (1.4) | 3 | 3 (1.1) | |
| Haemoptysis | 1 | 1 (0.8) | 0 | 0 (0.0) | 1 | 1 (0.4) | |
| Nasal congestion | 1 | 1 (0.8) | 0 | 0 (0.0) | 1 | 1 (0.4) | |
| Pharyngeal oedema | 0 | 0 (0.0) | 1 | 1 (0.7) | 1 | 1 (0.4) | |
| Pulmonary function decreaseda | 1 | 1 (0.8) | 2 | 2 (1.4) | 3 | 3 (1.1) | |
| Productive cough | 5 | 5 (4) | 8 | 8 (5.5) | 13 | 13 (4.8) | |
| Sputum increased | 1 | 1 (0.8) | 0 | 0 (0.0) | 1 | 1 (0.4) | |
| Wheezing | 3 | 3 (2.4) | 6 | 6 (4.1) | 9 | 9 (3.3) | |
| Skin and subcutaneous tissue disorders | Dermatitis diaper | 1 | 1 (0.8) | 1 | 1 (0.7) | 2 | 2 (0.7) |
| Dry skin | 1 | 1 (0.8) | 0 | 0 (0.0) | 1 | 1 (0.4) | |
| Eczema | 1 | 1 (0.8) | 0 | 0 (0.0) | 1 | 1 (0.4) | |
| Onychoclasis | 1 | 1 (0.8) | 0 | 0 (0.0) | 1 | 1 (0.4) | |
| Petechiae | 0 | 0 (0.0) | 1 | 1 (0.7) | 1 | 1 (0.4) | |
| Photosensitivity reaction | 0 | 0 (0.0) | 1 | 1 (0.7) | 1 | 1 (0.4) | |
| Rash | 2 | 2 (1.6) | 1 | 1 (0.7) | 3 | 3 (1.1) | |
| Skin discolouration | 0 | 0 (0.0) | 1 | 1 (0.7) | 1 | 1 (0.4) | |
| Urticaria | 0 | 0 (0.0) | 1 | 1 (0.7) | 1 | 1 (0.4) | |
| Totalc,d | 126 | 60 (47.6) | 136 | 72 (49.3) | 262 | 132 (48.5) | |
On reflection, the chief investigator and co-chief investigator also felt that there were descriptions of non-serious AEs that could be clarified to aid the reader. The original classifications as recorded on the locked trial database and the clarified classifications (as agreed by both the chief investigator and co-chief investigator) are shown in Appendix 5, Table 39.
Table 18 uses the clarified classifications.
Safety population
A total of 272 participants received at least one dose of their allocated treatment and were included in the safety population: 126 participants (91.9%) in the i.v. antibiotic therapy group and 146 participants (98.6%) in the oral antibiotic therapy group.
Serious adverse events/reactions
In the i.v. antibiotic therapy group, 11 SAEs/SARs were reported from 10 participants (7.9%) and, in the oral antibiotic therapy group, 21 SAEs/SARs were reported from 14 participants (9.6%). None of the SARs that was reported met the criteria for SUSAR reporting.
Table 17 indicates the number of events reported for each SOC and the number of participants who experienced the event.
Non-serious adverse events
In the i.v. antibiotic therapy arm, 126 non-serious AEs were reported from 60 participants (47.6%) and, in the oral antibiotic therapy group, 136 non-serious AEs were reported from 72 participants (49.3%). The most common SOCs in which events were reported for both treatment groups were respiratory, thoracic and mediastinal disorders; infections and infestations; and gastrointestinal disorders. A complete list of all non-serious AEs [excluding events counted in the analyses of primary and secondary outcomes, and using clarified terms (Table 39)] can be found in Table 18.
Chapter 6 Economic evaluation
Overview
A prospective economic evaluation was conducted alongside the randomised controlled trial to assess the cost-effectiveness of oral antibiotic therapy compared with i.v. antibiotic therapy. The primary analysis used an NHS and Personal Social Services (PSS) perspective for the collection and incorporation of resource use, as recommended by the National Institute for Health and Care Excellence (NICE). 42 The time horizon for the primary analysis was 15 months from randomisation.
The primary outcome within the economic evaluation was the same as that in the clinical study and measured the percentage of patients with successful eradication of P. aeruginosa 3 months after the start of treatment and who remained infection free through 15 months after the start of treatment. Analysis for the economic evaluation was based on the population with data for the primary outcome; missing health economic data within that population were multiply imputed.
The primary cost-effectiveness analysis measured the incremental cost per successful eradication of P. aeruginosa infection 3 months after allocated treatment had started, and of remaining infection free through to 15 months after the start of allocated treatment, in the oral antibiotic therapy group and the i.v. antibiotic therapy group. Regression analysis controlled for baseline differences between groups.
Secondary cost-effectiveness analyses were carried out and used the EQ-5D-3L (completed by a mixture of patients/carers, as appropriate) and QALYs to value health outcomes.
Where the EQ-5D-3L and QALYs were used to value health outcomes, cost–utility analysis was conducted to measure the incremental net benefit (INB) of treating patients in the oral antibiotic therapy group and the i.v. antibiotic therapy group. Sensitivity analyses explored factors that were identified a priori as likely to be key drivers of cost-effectiveness, including assumptions regarding the incorporation of costs for the intervention.
Resource use and costs
Total resource use and costs for each patient in the clinical trial were calculated. The main resource use and cost components for both the oral antibiotic therapy and i.v. antibiotic therapy arm comprised (1) the different modes of antibiotic intervention, information on which was collected through the use of case report forms and (2) any follow-up interactions with the health and social care system, which information was captured through patient diaries and collected at 3, 6, 9, 12 and 15 months. All costs were calculated in Great British pounds with the price year of 2016/17 used. Where possible, unit costs were sourced from national databases including the BNF43 for medicines; NHS reference costs44 for inpatient, outpatient and accident and emergency (A&E) visits; and Personal Social Services Research Unit (PSSRU)45 for primary care consultations (Tables 19 and 20 present the complete list of unit costs). Where relevant unit costs were not available for the correct price year of 2016/17, unit costs from other price years were inflated using the Hospital and Community Health Service (HCHS) pay and price inflation index. 45
| Resource | Measurement | Unit cost (£) | Source | Detail |
|---|---|---|---|---|
| Primary care | ||||
| GP visit in surgery | Per visit | 38 | PSSRU 201745 | With qualification and including direct care costs |
| Nurse visit in surgery | Per visit | 14 | PSSRU 201745 | With qualification and including direct care costs. Assuming a 20-minute consultation |
| Doctor in walk-in centre | Per visit | 44 | NHS reference costs 2016–1744 | Weighted average of non-admitted, type 4 A&E visits |
| Nurse in walk-in centre | Per visit | 44 | NHS reference costs 2016–1744 | Weighted average of non-admitted, type 4 A&E visits |
| Other | Per visit | 35 | Average of above | |
| Home visits | ||||
| GP visit | Per home visit | 161 | PSSRU 201745 | With qualification and including direct care costs, assuming 40 minutes with travel |
| District nurse | Per home visit | 29 | PSSRU 201046 | With qualification and including direct care costs, inflated to 2016–17 using HCHS index45 |
| Health visitor | Per home visit | 58 | PSSRU 201046 | With qualification and including direct care costs, inflated to 2016–17 using HCHS index45 |
| Nurse | Per home visit | 44 | PSSRU 201046 | With qualification and including direct care costs, inflated to 2016–17 using HCHS index45 |
| Physiotherapist | Per home visit | 61 | PSSRU 201046 | With qualification and including direct care costs, inflated to 2016–17 using HCHS index45 |
| Occupational therapy | Per home visit | 45 | PSSRU 201745 | With qualification and including direct care costs |
| Other | Per home visit | 47 | Average of all apart from GP visit | |
| Community-based professional | ||||
| Home care worker | Per visit | 21 | PSSRU 201745 | With qualification and including direct care costs, 1 hour |
| Nurse | Per visit | 44 | PSSRU 201745 | Same as nurse home visit |
| Physiotherapist | Per visit | 49 | PSSRU 201745 | Same as physiotherapist home visit |
| Social worker | Per visit | 57 | PSSRU 201745 | With qualification and including direct care costs |
| Resource | Measurement | Unit cost (£) | Source | Detail |
|---|---|---|---|---|
| Outpatients | ||||
| Non-consultant led, adult | Per visit | 75 | NHS reference costs 2016–1744 | Any non-paediatric outpatient, weighted average |
| Non-consultant led, child | Per visit | 149 | NHS reference costs 2016–1744 | Any paediatric outpatient, weighted average |
| Consultant led, adult | Per visit | 136 | NHS reference costs 2016–1744 | Any non-paediatric outpatient, weighted average |
| Consultant led, child | Per visit | 196 | NHS reference costs 2016–1744 | Any paediatric outpatient, weighted average |
| Dietitian | Per visit | 37 | PSSRU 201046 | With qualification and including direct care costs, inflated to 2016–17 using HCHS index45 |
| Physiotherapist | Per visit | 49 | NHS reference costs 2016–1744 | |
| MDT, adult | Per visit | 1541 | NICE 201747 | MDT clinic, based on 250 adult patients per year, six visits per person per year |
| MDT, child | Per visit | 1254 | NICE 201747 | MDT clinic, based on 250 child patients per year, six visits per person per year |
| Radiology | Per visit | 135 | NHS reference costs 2016–1744 | Interventional radiology |
| Pharmacy | Per visit | PSSRU 201046 | With qualification and including direct care costs, inflated to 2016–17 using HCHS index45 | |
| A&E, discharged | Per visit | 128 | NHS reference costs 2016–1744 | Any A&E discharged, weighted average |
| A&E, admitted | Per visit | 221 | NHS reference costs 2016–1744 | Any A&E admitted, weighted average |
| Intervention | ||||
| Ceftazidime | Per vial | 4.25–17.59 | BNF 201743 | |
| Tobramycin | Per vial | 19 | BNF 201743 | |
| Ciprofloxacin | Per tablet | 0.80–1.20 | BNF 201743 | |
| Home i.v. | ||||
| Fixed cost | Per course | 159 | James Sutton, Nottingham University Hospitals, 2019, personal communication | Dispensing fee, delivery fee and ancillaries |
| Tobramycin | Per day | 20–27 | James Sutton, Nottingham University Hospitals, 2019, personal communication | Eclipse or intermate (once per day infusions) |
| Ceftazidime | Per day | 22.70–36.30 | James Sutton, Nottingham University Hospitals, 2019, personal communication | Eclipse or intermate (once per day infusions) |
| Inpatient ward stays | ||||
| General ward, adult | Per day | 380 | NHS reference costs 2016–1744 | Excess bed-days, weighted average for adults |
| General ward, child | Per day | 595 | NHS reference costs 2016–1744 | Excess bed-day, weighted average for paediatrics |
Interventions
Oral antibiotic therapy and intravenous antibiotic therapy drug costs
In both the oral antibiotic therapy arm and i.v. antibiotic therapy arm, the antibiotic dosage and quantity of all antibiotics prescribed were recorded through data collected in case report forms to calculate a cost per course. Drug resource use was calculated assuming that whole vials or ampoules were used for each dose. Unit costs for the drug resource use were sourced from the BNF for i.v. antibiotic therapy within hospital and for the oral antibiotic therapy arm. For i.v. antibiotic therapy within hospital and for oral antibiotic therapy, no dispensing fees or disposable equipment were included in the cost, as this was assumed to be an overhead for the inpatient stay or outpatient visit and incorporated within the reference cost.
For patients who started i.v. antibiotic therapy in hospital and then completed treatment at home, the dose and quantity of drugs prescribed for home i.v. antibiotic therapy were calculated. Dispensing fees, delivery fees and ancillaries were included for home i.v. antibiotic therapy, with unit costs sourced from local pharmacy tariffs. Any unused medicines were assumed to become waste.
Inpatient stay for intravenous antibiotic therapy
For the i.v. antibiotic therapy arm, the length of stay in hospital was recorded. A per diem unit cost, a weighted average of all general ward stays in NHS Reference Costs, stratified by adult or child, was multiplied by the length of stay in days to generate an inpatient stay cost for i.v. antibiotic therapy treatment.
Follow-up resource use and costs
Patient diaries collected follow-up resource use for 15 months following randomisation. Resource use was recorded in diaries when patients interacted with primary care [in general practitioner (GP) practices and home visits], interacted with secondary care (inpatients, outpatients, A&E, walk-in centres), had a diagnostic test in primary or secondary care, or met with a community-based professional (e.g. physiotherapists or social workers). Patients also recorded any medications prescribed through the NHS, as well as any aids or home modifications.
For patients who had recorded an inpatient stay, the length of stay was calculated. A per diem unit cost, stratified by adult or child, was multiplied by the length of stay to generate an inpatient stay cost. The number of visits to A&E and whether the patient was admitted or discharged was calculated with appropriate unit costs attached. For each patient, the number of outpatient visits, stratified by whether the consultation was consultant led or non-consultant led, was calculated and unit costs were attached based on a weighted average of outpatient visits from NHS Reference Costs. 48 Any costs associated with interactions with primary care were based on whether the consultation was with a GP or nurse, and whether the consultation took place within the practice or at home. The number of visits with community-based professionals were recorded and costed. Where patients recorded that they had visited a multidisciplinary team as part of a CF clinic, an appropriate unit cost was attached based on a previously conducted micro-costing study. 47
The dosage and quantity of all drugs prescribed for patients were recorded and unit costs from the BNF were attached. Drug resource use was calculated assuming that all medications prescribed were used or became waste.
Wider resource use and costs
To record wider societal costs, patient diaries also recorded:
-
out-of-pocket costs for transport to consultations using car, bus or taxi
-
out-of-pocket costs for over-the-counter medicines
-
out-of-pocket costs for aids and appliances
-
time from work lost by the carer or patient.
For patients reporting car, bus or taxi travel, the total travel time in minutes was calculated and multiplied by appropriate unit costs per minute of travel. Lost productivity was estimated as the number of minutes lost to work by the care giver or patient multiplied by mean hourly earnings reported by the Office for National Statistics. 49 Out-of-pocket costs for over-the-counter medicines, as well as aids and appliances, were calculated using currently available prices.
Outcomes
The primary outcome measure was the percentage of patients with successful eradication of P. aeruginosa 3 months after the start of treatment and who remained infection free through 15 months after the start of treatment and this was calculated for both the i.v. antibiotic therapy arm and the oral antibiotic therapy arm.
The secondary outcome was the QALY, which is a composite of HRQoL, as measured by the EQ-5D-3L, and length of life. The EQ-5D-3L questionnaire has five domains (i.e. mobility, self-care, usual activities, pain and discomfort, and anxiety and depression) and three levels (i.e. no problems, some problems and extreme problems) and was completed by either patients or their carers (if < 13 years) at baseline, and at 3, 15 and 24 months. It is still unclear what the most appropriate method is to elicit HRQoL for very young children. 50,51 The EQ-5D-3L was selected in this study as it was available at the time of study design and provides consistency with measures of HRQoL frequently used in economic evaluations within adult populations. However, although there are now specific measures of HRQoL developed for children, none of the new measures has a robust evidence base for performance yet. 50 In the primary analysis, the time horizon of 15 months was used to match the collection of resource use data. In sensitivity analysis, the long-term 24-month horizon for QALYs was assessed. The EQ-5D-3L utility tariff was applied to the EQ-5D-3L questionnaire responses to generate utility scores for each time point for each patient. To calculate the QALYs, linear interpolation was assumed between the time points and the area under the curve method was applied. 52
Statistical analysis: bootstrapping and missing data
Missing data were multiply imputed (m = 25) through the use of chained equations. 53 The data were assumed to be missing at random. To account for non-normality in the distributions of costs and HRQoL, predictive mean matching was used. Missing cost data were imputed at the level of the category (inpatient care, outpatient visits, A&E visits, primary care, etc.) and total costs were passively imputed as a sum of the individual cost domains for those with missing data. For HRQoL, missing data were imputed for the utility score for each of the time points and QALYs were passively calculated. Predictors in both the cost and HRQoL multiple imputation models were patients’ age, sex, treatment arm, and costs at baseline. Owing to the large numbers of patients with missing data for wider resource use, missing data were not imputed and, instead, individuals were assumed to have zero use.
To account for statistical uncertainty and the correlation between costs and patient outcomes, the data were bootstrap sampled with replacement 2000 times. 54 For each bootstrap sample, missing data were imputed55 and incremental measures of cost and outcome were calculated using regression analysis, controlling for baseline HRQoL, age and treatment arm. The regression analysis used ordinary least squares, accounting for the multiply imputed data through the use of Rubin’s rules. 56 All regression analysis, including bootstrapping and multiple imputation, was conducted using Stata® v14 (StatCorp LP, College Station, TX, USA).
Cost-effectiveness
In the primary analysis, mean incremental costs and outcomes were calculated using the binary treatment arm variable within the linear regression models. To calculate the uncertainty around mean incremental costs and outcomes, the percentile method was used, with the 97.5th and 2.5th percentile bootstrap iterations representing the 95% CIs. Each of the 2000 bootstrap iterations were plotted on a cost-effectiveness plane. If feasible, an ICER was calculated:
where OT is oral therapy and IVT is i.v. therapy.
A cost-effectiveness acceptability curve (CEAC) reflecting the likelihood of either technology being cost-effective for a decision-maker’s willingness to pay for the outcome variable was also plotted.
In the secondary analysis, mean incremental costs and QALYs were calculated, with 95% CIs estimated through the percentile method. The INB was estimated from the incremental costs and QALYs for i.v. antibiotic therapy compared with oral antibiotic therapy using the following formula:
with λ representing the opportunity cost of health-care resources used in the NHS, otherwise known as the cost-effectiveness threshold. NICE uses a threshold range between £20,000 and £30,000 per QALY. 57 A positive INB suggests that i.v. antibiotic therapy is the cost-effective option and a negative INB suggests oral antibiotic therapy is the cost-effective option. Cost-effectiveness planes and CEACs were also plotted for the secondary analyses.
Sensitivity analysis
A series of assumptions used in the economic evaluation were explored through one-way sensitivity analysis. Separate analyses explored:
-
full time horizon of QALYs (24 months) alongside the collection of resource use data (15 months)
-
using generalised linear models (GLMs) for the cost analysis with different link and family functions
-
using yearly health-care resource use codes for CF instead of treatment costs and inpatient stay per diem
-
using a societal perspective for the collection and incorporation of costs.
Generalised linear models
Owing to the skewed and zero-centred nature of costing data, some analysts have recommended using more complex models such as GLMs to assess incremental differences. 58 GLMs have an associated link function and family function. The base-case approach for both primary and secondary analyses involved using an identity link with Gaussian family, equivalent to ordinary least squares regression. For sensitivity analysis, a range of different family functions were also explored alongside an identity link and log-link, including inverse Gaussian, Poisson and gamma. The method of recycled predictions was used to estimate the incremental difference in costs.
Using cystic fibrosis Healthcare Resource Groups
Since 2013–14, the NHS has used specialised tariffs for patients with CF. 59 The CF currency uses a risk-adjusted banding system with seven bands of increasing complexity, with providers reimbursed on a yearly basis according to the risk-adjusted bands. The CF currency is intended to include all direct medical costs associated with treatment and bandings are split according to whether patients are adults (≥ 17 years) or children.
Patients were placed in bands according to their age, any length of stay associated with the initial intervention and the recorded length of stay for further hospitalisation.
Appendix 6, Table 40 includes the banding algorithm and Table 41 provides the unit costs for the bandings. Inpatient costs were then replaced in totality with banding costs for 1 year. All other costing estimates were included within this separate Healthcare Resource Group (HRG) analysis to calculate a total NHS and PSS cost.
Societal perspective for the inclusion of costs
A societal perspective included patients’ purchase of home aids or over-the-counter medicines, and the cost of transport to attend outpatient visits or inpatient stays, as well as work lost by patients or caregivers during the trial. Unit costs were attached to resource use using costs reported in Appendix 6. The total societal costs were calculated by adding these wider costs to the NHS and PSS costs.
Results
The analysis for health economics was based on a total of 255 patients, of whom 130 patients were randomised to the oral antibiotic therapy arm and 125 patients were randomised to the i.v. antibiotic therapy arm.
Tables 21 and 22 present resource utilisation and levels of missingness for NHS and societal resource use data, respectively. Most resource use was balanced between the arms. However, the resource use in the oral antibiotic therapy arm was suggestive of having a larger proportion of inpatient stays than the i.v. antibiotic therapy arm.
| Resource use | Treatment group, n (SD) | |
|---|---|---|
| i.v. antibiotic therapy (N = 125) | Oral antibiotic therapy (N = 130) | |
| Secondary care | ||
| ≥ 3 visits | 0.12 (0.42) | 0.12 (0.42) |
| Missing | 66 | 61 |
| A&E attendance, discharged | 0.05 (0.29) | 0.06 (0.29) |
| Missing | 66 | 61 |
| Inpatient stay | 0.27 (0.61) | 0.38 (0.71) |
| Missing | 43 | 40 |
| Outpatient (visits) | 1.57 (0.77) | 1.58 (0.79) |
| Missing | 78 | 82 |
| Primary care | ||
| GP at surgery | 0.25 (0.62) | 0.30 (0.71) |
| Missing | 40 | 34 |
| Doctor at walk-in centre | 0.00 (0.00) | 0.05 (0.27) |
| Missing | 40 | 34 |
| Nurse at surgery | 0.09 (0.29) | 0.13 (0.42) |
| Missing | 40 | 34 |
| Nurse at walk-in centre | 0.00 (0.00) | 0.00 (0.00) |
| Missing | 40 | 34 |
| Other | 0.16 (0.55) | 0.14 (0.54) |
| Missing | 40 | 34 |
| Number of prescriptions | 2.02 (2.79) | 2.18 (3.02) |
| Missing | 41 | 39 |
| Home visits | ||
| GP | 0.39 (0.49) | 0.30 (0.46) |
| Missing | 66 | 57 |
| District nurse | 0.44 (0.62) | 0.32 (0.50) |
| Missing | 66 | 57 |
| Health visitor | 0.44 (0.62) | 0.36 (0.63) |
| Missing | 66 | 57 |
| Nurse | 0.56 (0.82) | 0.44 (0.78) |
| Missing | 66 | 57 |
| Physiotherapy | 0.49 (0.73) | 0.34 (0.58) |
| Missing | 66 | 57 |
| Occupational therapy | 0.39 (0.49) | 0.30 (0.46) |
| Missing | 66 | 57 |
| Other | 0.39 (0.49) | 0.30 (0.46) |
| Missing | 66 | 57 |
| Home care worker | 0.07 (0.37) | 0.20 (0.60) |
| Missing | 68 | 60 |
| Community-based professionals | ||
| Social worker | 0.07 (0.37) | 0.20 (0.60) |
| Missing | 68 | 60 |
| Nurse | 0.11 (0.49) | 0.06 (0.29) |
| Missing | 68 | 60 |
| Physiotherapist | 0.00 (0.00) | 0.07 (0.39) |
| Missing | 68 | 60 |
| Resource use | Treatment group, n (%) | |
|---|---|---|
| i.v. antibiotic therapy (N = 125) | Oral antibiotic therapy (N = 130) | |
| Patient aids | ||
| Missing | 67 | 61 |
| Transport car | ||
| No trips | 1 (0.8) | 5 (4.0) |
| 1–5 trips | 51 (41.5) | 49 (39.2) |
| 6–10 trips | 7 (5.7) | 13 (10.4) |
| > 10 trips | 64 (52.0) | 58 (46.4) |
| Missing | 2 | 5 |
| Transport bus | ||
| No trips | 29 (23.2) | 39 (30.0) |
| 0–5 trips | 2 (1.6) | 3 (2.3) |
| 6–10 trips | 0 (0.0) | 1 (0.8) |
| > 10 trips | 94 (75.2) | 87 (66.9) |
| Transport taxi | ||
| No trips | 26 (20.8) | 37 (28.5) |
| 0–5 trips | 9 (7.2) | 10 (7.7) |
| 6–10 trips | 1 (0.8) | 0 (0.0) |
| > 10 trips | 89 (71.2) | 83 (63.8) |
| Transport other | ||
| No trips | 21 (16.8) | 30 (23.3) |
| 0–5 trips | 20 (16.0) | 14 (10.9) |
| 6–10 trips | 0 (0.0) | 2 (1.6) |
| > 10 trips | 84 (67.2) | 83 (64.3) |
| Missing | 0 | 1 |
| Over-the-counter medicines | ||
| 0 purchases | 110 (88.0) | 102 (78.5) |
| 1 purchase | 7 (5.6) | 19 (14.6) |
| 2 purchases | 6 (4.8) | 8 (6.2) |
| 3 purchases | 2 (1.6) | 1 (0.8) |
| Reported as losing time from work (patient) | ||
| No | 116 (99.1) | 124 (100.0) |
| Yes | 1 (0.9) | 0 (0.0) |
| Reported as losing time from work (carer) | ||
| No | 106 (90.6) | 115 (92.7) |
| Yes | 11 (9.4) | 9 (7.3) |
Table 23 presents data for the completion of the EQ-5D-3L for the different time points recorded. The domains most affected by CF were pain and discomfort, and self-care, with fewer patients having ‘no problems’ in these domains. There was no clear difference between EQ-5D-3L levels between arms of the trial or over the duration of the trial.
| EQ-5D-3L domain and level | Time point (%) | |||||||
|---|---|---|---|---|---|---|---|---|
| Baseline | 3 months | 15 months | 24 months | |||||
| i.v. antibiotic therapy (n = 89) | Oral antibiotic therapy (n = 103) | i.v. antibiotic therapy (n = 86) | Oral antibiotic therapy (n = 97) | i.v. antibiotic therapy (n = 71) | Oral antibiotic therapy (n = 89) | i.v. antibiotic therapy (n = 57) | Oral antibiotic therapy (n = 65) | |
| Mobility | ||||||||
| No problems | 93.8 | 95.4 | 93.3 | 94.1 | 82.2 | 93.7 | 89.8 | 94.1 |
| Some problems | 6.3 | 4.6 | 6.7 | 5.9 | 17.8 | 6.3 | 10.2 | 5.9 |
| Extreme problems | 0.0 | 0.0 | 0.0 | 0.0 | 0.0 | 0.0 | 0.0 | 0.0 |
| Self-care | ||||||||
| No problems | 73.6 | 84.5 | 77.9 | 84.8 | 75.3 | 86.7 | 84.2 | 89.7 |
| Some problems | 14.3 | 4.9 | 11.6 | 6.1 | 16.4 | 8.9 | 12.3 | 5.9 |
| Extreme problems | 12.1 | 10.7 | 10.5 | 9.1 | 8.2 | 4.4 | 3.5 | 4.4 |
| Usual activities | ||||||||
| No problems | 84.4 | 93.5 | 91.0 | 89.9 | 80.3 | 89.4 | 91.4 | 93.9 |
| Some problems | 13.5 | 6.5 | 7.9 | 10.1 | 18.3 | 10.6 | 6.9 | 6.1 |
| Extreme problems | 2.1 | 0.0 | 1.1 | 0.0 | 1.4 | 0.0 | 1.7 | 0.0 |
| Pain and discomfort | ||||||||
| No problems | 80.0 | 81.7 | 82.0 | 82.0 | 74.0 | 81.9 | 75.9 | 86.8 |
| Some problems | 20.0 | 17.4 | 18.0 | 18.0 | 23.3 | 18.1 | 24.1 | 13.2 |
| Extreme problems | 0.0 | 0.9 | 0.0 | 0.0 | 2.7 | 0.0 | 0.0 | 0.0 |
| Anxiety and depression | ||||||||
| No problems | 86.3 | 88.9 | 85.2 | 88.9 | 80.6 | 87.2 | 84.7 | 95.5 |
| Some problems | 12.6 | 11.1 | 12.5 | 11.1 | 18.1 | 11.7 | 15.3 | 3.0 |
| Extreme problems | 1.1 | 0.0 | 2.3 | 0.0 | 1.4 | 1.1 | 0.0 | 1.5 |
Incremental costs and outcomes
Unit costs used in the analysis are shown in Appendix 6.
In Table 24, mean costs and outcomes are calculated for the arms of the trial. The mean costs for the intervention were far higher for the i.v. antibiotic therapy arm (£7284.40) than for the oral antibiotic therapy arm (£264.30). Follow-up inpatient costs and outpatient costs were higher for the oral antibiotic therapy arm than for the i.v. antibiotic therapy arm. Overall, oral antibiotic therapy was less costly than i.v. antibiotic therapy, with the incremental difference in mean costs between the arms being –£5938.50 (95% CI –£7190.30 to –£4686.70) after adjusting for baseline covariates. Most of the total cost difference reflects the difference in intervention costs, with i.v. antibiotic therapy being associated with high inpatient stay costs. The inclusion of societal costs had a trivial impact on overall incremental cost differences between the arms of the trial, with the incremental societal cost, after adjusting for baseline covariates, being –£5938.50 (95% CI –£7190.30 to –£4686.70) for the oral antibiotic therapy arm compared with the i.v. antibiotic therapy group.
| Cost and outcome | Treatment group | Incremental difference (95% CI) | ||
|---|---|---|---|---|
| Oral antibiotic therapy (N = 130) | i.v. antibiotic therapy (N = 125) | Oral – i.v. | Baseline adjusteda | |
| NHS resource use (£) | ||||
| A&E | 23.79 | 24.15 | ||
| Inpatients | 1682.40 | 1027.00 | ||
| Outpatients | 1414.00 | 1221.50 | ||
| Primary care | 25.13 | 28.42 | ||
| Home visits | 172.00 | 185.10 | ||
| Intervention cost | 264.30 | 7284.40 | ||
| Prescribed medicines | 248.20 | 124.30 | ||
| Total costs | 3565.40 | 2610.50 | 954.90 (–132.10 to 2041.90) | 1018.50 (–91.60 to 2128.70) |
| Intervention cost | 264.30 | 7284.40 | –7020.20 (–7548.50 to –6491.80) | –6957.00 (–7492.80 to –6421.20) |
| Total NHS costs (plus intervention) | 3829.70 | 9895.00 | –6065.30 (–7287.10 to –4843.40) | –5938.50 (–7190.30 to –4686.70) |
| Wider resource use (£) | ||||
| Patient/carer lost work | 1.88 | 7.67 | ||
| Aids and appliances | 11.13 | 8.77 | ||
| Over-the-counter medicine | 1.04 | 1.01 | ||
| Travel costs | 90.49 | 86.05 | ||
| Total societal costs (plus intervention) | 3934.30 | 9998.50 | –6064.20 (–7296.20 to –4832.20) | –5937.00 (–7120.80 to –4659.10) |
| Outcomes | ||||
| Primary outcome (% successfully eradicated) | 0.52 | 0.44 | 0.083 (–0.040 to 0.21) | 0.091 (–0.034 to 0.22) |
| HRQoL | ||||
| EQ-5D baseline | 0.873 | 0.820 | ||
| EQ-5D 3 months | 0.893 | 0.854 | ||
| EQ-5D 15 months | 0.893 | 0.829 | ||
| EQ-5D 24 months | 0.923 | 0.895 | ||
| QALYs (over 15 months) | 1.114 | 1.050 | 0.063 (0.0074 to 0.12) | 0.035 (–0.007 to 0.088) |
| QALYs (over 24 months) | 1.795 | 1.697 | 0.098 (0.013 to 0.18) | 0.058 (–0.004 to 0.140) |
The primary outcome measure showed that the oral antibiotic therapy arm had a larger proportion of successful eradications of P. aeruginosa 3 months after the start of treatment and remaining infection free through 15 months after start of treatment than the i.v. antibiotic therapy arm. The incremental difference in effect after adjusting for baseline covariates was 0.091 (95% CI –0.034 to 0.22).
For a 15-month time horizon, patients in the oral antibiotic therapy arm gained 1.14 QALYs, with patients in the i.v. antibiotic therapy arm gaining only 1.05 QALYs. There was an overall unadjusted incremental difference in QALYs of 0.063 (95% CI 0.0074 to 0.12) after 15 months, with an adjusted incremental difference in QALYs of 0.035 (95% CI –0.015 to 0.086). After 24 months, patients in the oral antibiotic therapy arm gained 1.8 QALYs and patients in the i.v. antibiotic therapy arm gained 1.7 QALYs. There was an unadjusted incremental difference in QALYs of 0.098 (95% CI 0.013 to 0.18) and an adjusted incremental difference in QALYs of 0.058 (95% CI –0.020 to 0.14) for the oral antibiotic therapy arm compared with the i.v. antibiotic therapy arm.
Cost-effectiveness analysis
Table 25 shows incremental cost-effectiveness for the primary and secondary analysis, as well as the impact of sensitivity analyses on cost-effectiveness. In all scenarios, oral antibiotic therapy was associated with lower costs than i.v. antibiotic therapy, and was also more effective. Consequently, oral antibiotic therapy dominated i.v. antibiotic therapy in both the primary and the secondary analyses. In the secondary analysis, for a threshold of £20,000 per QALY, oral antibiotic therapy generated £6770.80 (95% CI £5027.40 to £7906.20) benefit per patient, compared with i.v. antibiotic therapy.
| Analysis | Incremental cost (£) (95% CI) | Incremental outcome (95% CI) | ICER | INB (95% CI) |
|---|---|---|---|---|
| Primary analysis: proportion infection free, NHS and PSS perspective costs, 15-month horizon, adjusted | –5938.50 (–7107.40 to –4666.30) | 0.091 (–0.034 to 0.22) | Oral dominates | N/A |
| Sensitivity analysis | ||||
| Primary analysis: proportion infection free, NHS and PSS perspective costs, 15-month horizon, covariate adjusted, CF HRG costs used | –653.08 (–1197.80 to –79.80) | 0.091 (–0.034 to 0.22) | Oral dominates | N/A |
| Primary analysis: clinical effect, societal perspective costs, 15-month horizon, adjusted | –5937.00 (–7120.80 to –4659.10) | 0.091 (–0.034 to 0.22) | Oral dominates | N/A |
| Primary analysis: proportion infection free, NHS and PSS perspective costs, covariate adjusted, GLM cost model [link(log); family (Gaussian)] | –5942.40 (–7054.90 to –4713.10) | 0.091 (–0.034 to 0.22) | Oral dominates | N/A |
| Primary analysis: proportion infection free, NHS and PSS perspective costs, covariate adjusted, GLM cost model [link(log); family (Gaussian)] | –6625.50 (–8574.80 to –5196.60) | 0.091 (–0.034 to 0.22) | Oral dominates | N/A |
| Secondary analysis: 15-month horizon QALYs, NHS and PSS perspective costs, covariate | –5938.50 (–7107.40 to –4666.30) | 0.035 (–0.007 to 0.088) | Oral dominates | 6770.8 (5027.4 to 7906.2) |
| Sensitivity analysis | ||||
| Secondary analysis: 24-month horizon QALYs, NHS and PSS perspective costs, covariate adjusted | –5938.50 (–7107.40 to –4666.30) | 0.058 (–0.004 to 0.140) | Oral dominates | 7229.8 (5411.8 to 8553.1) |
| Secondary analysis: 15-month horizon QALYs, NHS and PSS perspective costs, covariate, CF HRG costs used | –653.08 (–1197.80 to –79.80) | 0.035 (–0.007 to 0.088) | Oral dominates | 653.1 (79.8 to 1197.8) |
| Secondary analysis: 15-month horizon QALYs, societal perspective costs, covariate | –5937.00 (–7052.60 to –4713.20) | 0.035 (–0.007 to 0.088) | Oral dominates | 6755.7 (4977.4 to 8409.3) |
| Secondary analysis: 15-month horizon QALYs, NHS and PSS perspective costs, covariate adjusted, GLM cost model [link(log); family (Gaussian)] | –5942.40 (–7054.90 to –4713.10) | 0.035 (–0.007 to 0.088) | Oral dominates | 6684.4 (5057.0 to 8406.9) |
| Secondary analysis: 15-month horizon QALYs, NHS and PSS perspective costs, covariate adjusted, GLM cost model [link(log); family (inverse Gaussian)] | –6625.50 (–8574.80 to –5196.60) | 0.035 (–0.007 to 0.088) | Oral dominates | 7343.0 (5586.8 to 9756.2) |
| Secondary analysis: 15-month horizon QALYs, NHS and PSS perspective costs, CF HRG, covariate adjusted, GLM cost model [link(log); family (Gaussian)] | –656.60 (–1231.00 to –75.33) | 0.035 (–0.007 to 0.088) | Oral dominates | 1518.9 (251.8 to 2678.9) |
| Secondary analysis: 15-month horizon QALYs, NHS and PSS perspective costs, CF HRG, covariate adjusted, GLM cost model [link(log); family (inverse Gaussian)] | –636.70 (–1238.40 to –45.30) | 0.035 (–0.007 to 0.088) | Oral dominates | 1499.1 (224.2 to 2666.1) |
The use of specialised HRG costs led to a smaller difference in costs between the two arms, but the oral antibiotic therapy arm still had a lower incremental cost of –£653.08 (95% CI–£1197.80 to –£79.80) compared with the i.v. antibiotic therapy arm. Table 26 shows how patients were grouped into HRG bands. Patients in the oral antibiotic therapy arm were more likely to be in band 1 than patients in the i.v. antibiotic therapy arm, in which patients tended to be clustered in higher-risk/higher-cost bands. However, the highest band reported in the data (band 3) included a larger proportion of patients in the oral antibiotic therapy arm than in the i.v. antibiotic therapy arm as a result of a small number of patients in the oral antibiotic therapy arm having a long inpatient stay in the follow-up period. In the secondary analysis with CF HRG costs, the oral antibiotic therapy arm generated £653.10 (95% CI £79.80 to £1197.80) benefit per patient for a cost-effectiveness threshold of £20,000 per QALY.
| HRG band | Treatment group (%) | Incremental difference (95% CI) | ||
|---|---|---|---|---|
| Oral antibiotic therapy (N = 130) | i.v. antibiotic therapy (N = 125) | Oral – i.v. | Baseline adjusteda | |
| 1 | 81 | 0 | ||
| 1a | 8 | 38 | ||
| 2 | 0 | 50 | ||
| 2a | 8 | 9 | ||
| 3 | 4 | 2 | ||
| Mean cost, £ (SE) | 6263.10 (205.80) | 7154.60 (164.30) | 843.80 (–1369.30 to –318.30) | 894.40 (–1412.60 to –370.20) |
Changes in model function for the cost data and the inclusion of societal costs led to only small changes in the incremental cost differences between the arms of the trial. The INB was large for oral antibiotic therapy compared with i.v. antibiotic therapy in each scenario.
Incremental cost-effectiveness planes and CEACs for the primary analysis, secondary analysis and associated sensitivity analyses are shown in Appendix 6, Figures 33–45.
For each scenario, oral antibiotic therapy was highly likely to be cost-effective, with virtually all of the bootstrap replicates falling within the south-east quadrant, demonstrating that the oral antibiotic therapy was both more effective and less costly than i.v. antibiotic therapy. For the secondary analysis involving a cost-effectiveness threshold of £20,000 per QALY, oral antibiotic therapy had a 100% chance of being cost-effective compared with i.v. antibiotic therapy in the base-case analysis, and findings were robust to assumptions regarding the use of CF HRG codes, costing model specification and inclusion of societal costs.
Chapter 7 Discussion
We tested the hypothesis that, for eradicating a new infection with P. aeruginosa in people with CF, an i.v. antibiotic regimen (2 weeks of i.v. ceftazidime and tobramycin) is more effective than an oral antibiotic (12 weeks of oral ciprofloxacin). In line with UK CF antibiotic guidelines,11 inhaled colistimethate sodium was included in both regimens. We found that the i.v. regimen was not superior in achieving the primary outcome – eradication of P. aeruginosa at 3 months and remaining free of infection to 15 months. The clinically important difference that was set at the beginning of the trial, was not contained in the 95% CI. In the 12 months following completion of the eradication regimen, there was a statistically significant difference in the length of hospital stay in favour of the i.v. antibiotic therapy group. However, this is unlikely to be clinically important as the median length of stay was 0 days in both groups. The proportion of patients who had at least one hospital stay was significantly lower in the i.v. antibiotic therapy group (30.2%) than in the oral antibiotic therapy group (46.3%). A possible explanation of this finding is that patients who already had one hospital admission for eradication might be less likely to be offered or to accept a further admission in the subsequent 12-month period. We found significant differences in percentage predicted FVC and adult BMI in favour of the i.v. regimen; however, these differences were based on small numbers, were numerically small and are unlikely to be clinically important. There were no other significant differences in secondary outcome measures, AEs or acquisition of new organisms between the two groups.
A recent systematic review pointed out that, although P. aeruginosa infection carries an adverse prognosis and eradication is an effective approach, there is no evidence to favour one eradication regimen over another. 16 Uncontrolled studies have advocated an i.v. eradication regimen. 60 However, i.v. treatment often entails hospital admission, requires i.v. access (which may be traumatic)61 and carries the risk of side effects such as nephrotoxicity and, in the case of aminoglycosides such as tobramycin, ototoxicity. 62 Regardless of which regimen is used, regular collection of airways’ specimens is advised to detect P. aeruginosa early. 11 Furthermore, eradication treatment should be initiated as soon as possible after P. aeruginosa is detected in respiratory secretions. 63 A recent crossover trial of eradication in young children demonstrated a much lower eradication rate in those who received the placebo in the initial 28-day treatment period. 64 The TORPEDO-CF protocol mandated that the eradication regimen should start no more than 21 days from the report demonstrating P. aeruginosa in the airways.
The TORPEDO-CF used a pragmatic design which aimed to minimise the burden of participation. Respiratory specimens for microbiology were collected at routine clinic visits, which meant that not all specimens were obtained in the 3-week time window at the end of the 15-month follow-up period. To address this, we extended the window to include patients with samples 4 weeks on either side of 15 months and conducted a sensitivity analysis using the next sample collected after the 15-month window. We collected sputum and (where this was not possible) a cough swab. Bronchoscopy has been used to collect samples for microbiological outcomes in previous eradication trials,9 but it is not used for this purpose in routine clinical practice, and, hence, was not mandated in TORPEDO-CF.
A strength of our study is the large sample size and the length of follow-up. In the first generation of placebo-controlled eradication trials, sample size was often small and microbiological eradication was reported immediately after the end of eradication treatment. 9 More recently, a large randomised controlled trial, evaluating two 28-day eradication regimens, found that > 60% of participants had further infection with P. aeruginosa during a median follow-up period of 16 months. 65 Arguably, with longer periods of follow-up, reoccurrence of P. aeruginosa will be influenced to a lesser degree by a single course of eradication treatment. Hence, the 12 months of post-eradication follow-up used in our study is a reasonable period over which to evaluate the effect of treatment in achieving sustained eradication of P. aeruginosa.
There were several limitations of TORPEDO-CF. It took longer than expected to recruit the required sample size for the trial. Feasibility data suggested that 25% of eligible patients would be adults. 12 However, we recruited only 15 adults out of a total sample size of 286 participants, partly because of a smaller number of adult centres participating in the trial. We advise caution in applying these trial findings to the adult CF population.
Many patients and families had a strong preference for one eradication regimen; 324 patients/families declined to participate because they did not want i.v. treatment and 34 patients/families declined because they did not want an oral regimen. Our feasibility study suggested that 45% of parents and patients would consider participation. The consent rates achieved in TORPEDO-CF were a little lower: 286 out of 772 (37%) eligible patients approached. A total of 1308 patients were screened for eligibility for the trial; 1022 patients did not meet the eligibility criteria and we randomised 286 patients.
The possibility that the trial participants may be different from the rest of the CF population and may have had a better clinical status and, therefore, be more likely to agree to the uncertainty of trial participation cannot be ruled out. Thirty participants were excluded from the primary analysis (12 participants in the i.v. antibiotic treatment group and 18 participants in the oral antibiotic treatment group). These were participants in whom P. aeruginosa was not detected following completion of eradication, but who did not have a sample taken at the 15-month time window. These exclusions will diminish the power of the study to show superiority of one regimen over another.
Not all participants received their allocated treatment, and a further group did not receive the prescribed course in full. Of the 137 participants in the i.v. antibiotic therapy group, 11 (8.0%) participants did not receive treatment (either allocated intervention or colistimethate sodium) and 29 (21.2%) participants stopped treatment early. In the oral antibiotic therapy group, 2 out of 148 participants (1.4%) did not start treatment and 24 (16.1%) participants stopped treatment early. The most common reason for not completing allocated treatment was difficulty with i.v. access. Lack of complete fidelity to allocated treatment will also reduce the trial’s power to demonstrate superiority.
Recent engagement work from the UK has identified ‘the best way of eradicating pseudomonas’ as one of the top 10 research priorities for the patient community. 66 In the USA, ‘respiratory microorganism detection and treatment was the top priority’. 67 Future research studies should combine long-term follow-up with regimens to reduce reoccurrence after eradication. The recent OPTIMIZE (Optimizing Treatment for Early Pseudomonas aeruginosa Infection in Cystic Fibrosis) trial68 used 18 months of oral azithromycin as an adjunct to eradication with inhaled tobramycin, but found no difference in time to reoccurrence. In future, a randomised registry design such as used in the ongoing cystic fibrosis (CF) anti-staphylococcal antibiotic prophylaxis trial (CF-START); ISRCTN18130649] may be applied to Pseudomonas eradication trials to allow long-term follow-up and to reduce both the cost of trials and the inconvenience to trial participants.
Engagement work with the CF community both in the UK66 and in the USA67 has highlighted research to reduce the treatment burden in CF as a priority. When a treatment (such as i.v. antibiotics) is burdensome, but no more effective, it follows that patients should be offered an eradication regimen that is appropriate to their clinical condition and personal circumstances. P. aeruginosa may be identified at the time of a pulmonary exacerbation when i.v. antibiotics are clinically indicated. In other cases, when the patient is asymptomatic, oral eradication is appropriate. In our trial, only 13.1% of patients in the i.v. group and 11.5% in the oral group had an exacerbation at baseline. If the findings of this trial are implemented in routine clinical practice, most patients will receive oral treatment as an outpatient and many admissions will be avoided. This will reduce treatment burden and will reduce health-care costs.
The health economic analysis was partially limited by difficulties associated with gathering HRQoL data in young children. Although the EQ-5D-3L was selected for consistency and practical reasons, its completion by young patients or by carers is subject to great uncertainty. Measures of HRQoL in young patients have been developed since the inception of this trial, but evidence of their validity is still at an early stage. As a consequence of the challenges associated with eliciting HRQoL, the health economics analysis for cost-effectiveness primarily relied on the results that similar proportions of individuals had a repeat infection over the duration of the trial, while oral antibiotics were considerably cheaper to administer. Oral therapy was clearly shown to be less expensive than i.v. therapy, with a cost saving of £5938.50 (equivalent to US$7543.00). Consequently, the most cost-effective strategy was the use of oral antibiotics. If the trial had found significant clinical benefit from i.v. eradication therapy over oral therapy, then some additional cost for i.v. therapy could be balanced against this to assist decision-making. However, there were no important clinical benefits to the use of i.v. over oral therapy and the large difference in cost suggests that oral therapy should usually be recommended for eradication of early infection with P. aeruginosa in CF.
Our trial found that, even in the oral arm (which had the better result for our primary outcome), only around half of participants were free of infection 15 months after randomisation. Future research should aim to improve rates of eradication through approaches such as earlier detection of P. aeruginosa and salvage therapy for failed eradication. It should also be a priority to evaluate the effects of CFTR modulators on acquisition and eradication of P. aeruginosa.
Acknowledgements
This project was funded by the UK NIHR Health Technology Assessment programme, project number 07/51/01 and trial registration number EudraCT 2009-012575-10. The trial sponsor was University Hospitals Bristol NHS Foundation Trust and co-sponsor for the Italian sites was the University of Liverpool, a member of Liverpool Health Partners.
We would like to thank all the participants and their families who took part in this trial and the staff from all participating centres (see Appendix 3, Table 28). We would also like to give thanks for the contributions of the independent members of the TSC [Professor Jonathan Grigg (chairperson), Dr Ranjit Lall, Mrs Jennifer Wederell, Ms Sophie Lewis, Mr Dominic Kavanagh, Dr David Stableforth and Professor Duncan Geddes (until November 2011)] and to the IDSMC [Dr Robert Dinwiddie (chairperson), Professor Christiane De Boeck and Mrs Enid Hennessy].
Contributions of authors
Simon C Langton Hewer (https://orcid.org/0000-0002-2711-8258) (chief investigator, lead applicant on grant, PI at Bristol Royal Hospital for Children, Consultant Respiratory Paediatrician) contributed to the conception and design of the trial, delivery and management of the trial, interpretation of data, drafting and revision of the report and approval of the report.
Alan R Smyth (https://orcid.org/0000-0001-5494-5438) (co-chief investigator, lead applicant on grant, PI at Nottingham Children’s Hospital, Consultant Respiratory Paediatrician) contributed to the conception and design of the trial, delivery and management of the trial, interpretation of data, drafting and revision of the report and approval of the report.
Michaela Brown (https://orcid.org/0000-0002-7772-271X) (Trial Statistician) contributed to the delivery and management of the trial, analysis and interpretation of data, drafting and revision of the report and approval of the report.
Ashley P Jones (Co-applicant on grant, Lead Statistician) contributed to the conception and design of the trial, delivery and management of the trial, analysis and interpretation of data, drafting and revision of the report and approval of the report.
Helen Hickey (https://orcid.org/0000-0003-0467-0362) (Head of Trial Management) contributed to the delivery and management of the trial, interpretation of data, drafting and revision of the report and approval of the report.
Dervla Kenna (https://orcid.org/0000-0002-3105-3637) (Clinical Scientist) contributed to the analysis of the laboratory samples, delivery and management of the trial, analysis and interpretation of data, drafting and revision of the report and approval of the report.
Deborah Ashby (https://orcid.org/0000-0003-3146-7466) (Co-applicant, Senior Statistician) contributed to the conception and design of the trial, delivery and management of the trial, analysis and interpretation of data, drafting and revision of the report and approval of the report.
Alexander Thompson (https://orcid.org/0000-0003-4930-5107) (Health Economist) contributed to the analysis and interpretation of data, drafting and revision of the report and approval of the report.
Laura Sutton (https://orcid.org/0000-0003-3327-5927) (Trial Statistician) contributed to the analysis and interpretation of data, revision of the report and approval of the report.
Dannii Clayton (https://orcid.org/0000-0003-3535-3466) (Trial Statistician) contributed to the analysis and interpretation of data, revision of the report and approval of the report.
Barbara Arch (https://orcid.org/0000-0001-6060-8091) (Trial Statistician) contributed to the analysis and interpretation of data, revision of the report and approval of the report.
Łukasz Tanajewski (https://orcid.org/0000-0002-4387-3093) (Health Economist) contributed to the analysis and interpretation of data and approval of the report.
Vladislav Berdunov (https://orcid.org/0000-0002-5743-2184) (Health Economist) contributed to analysis and interpretation of data and approval of the report.
Paula R Williamson (https://orcid.org/0000-0001-9802-6636) (Senior Statistician) was the Director of the Medicines for Children Clinical Trials Unit (now Liverpool Clinical Trials Centre) at the time the study was conceived, and was also involved in the feasibility study (https://trialsjournal.biomedcentral.com/articles/10.1186/1745-6215-11-11) supporting the trial. She provided statistical input to the main study design, grant application, and case report forms. She was on the Trial Management Group, provided input to the protocol, supervised and oversaw contributions from CTU staff (statistical monitoring and analysis, trial and data management) throughout. She undertook blind review of the data prior to final analysis. She contributed to, and approved the final report.
Publications
Smith CT, Williamson P, Jones A, Smyth A, Langton Hewer S, Gamble C. Risk-proportionate clinical trial monitoring: an example approach from a non-commercial trials unit. Trials 2014;15:127.
Langton Hewer SC, Smyth AR, Brown M, Jones AP, Hickey H, Kenna D, et al. Intravenous vs. oral antibiotics for eradication of Pseudomonas aeruginosa in cystic fibrosis (TORPEDO-CF): a randomised controlled trial. Lancet Respir Med 2020;8:975–86.
Data-sharing statement
All data requests should be submitted to the corresponding author for consideration. Access to anonymised data may be granted following review and appropriate agreements being in place.
Patient data
This work uses data provided by patients and collected by the NHS as part of their care and support. Using patient data is vital to improve health and care for everyone. There is huge potential to make better use of information from people’s patient records, to understand more about disease, develop new treatments, monitor safety, and plan NHS services. Patient data should be kept safe and secure, to protect everyone’s privacy, and it’s important that there are safeguards to make sure that it is stored and used responsibly. Everyone should be able to find out about how patient data are used. #datasaveslives You can find out more about the background to this citation here: https://understandingpatientdata.org.uk/data-citation.
Disclaimers
This report presents independent research funded by the National Institute for Health Research (NIHR). The views and opinions expressed by authors in this publication are those of the authors and do not necessarily reflect those of the NHS, the NIHR, NETSCC, the HTA programme or the Department of Health and Social Care. If there are verbatim quotations included in this publication the views and opinions expressed by the interviewees are those of the interviewees and do not necessarily reflect those of the authors, those of the NHS, the NIHR, NETSCC, the HTA programme or the Department of Health and Social Care.
References
- UK Cystic Fibrosis Registry . Annual Data Report 2013 2014.
- Emerson J, Rosenfeld M, McNamara S, Ramsey B, Gibson RL. Pseudomonas aeruginosa and other predictors of mortality and morbidity in young children with cystic fibrosis. Pediatr Pulmonol 2002;34:91-100. https://doi.org/10.1002/ppul.10127.
- Konstan MW, Morgan WJ, Butler SM, Pasta DJ, Craib ML, Silva SJ, et al. Risk factors for rate of decline in forced expiratory volume in one second in children and adolescents with cystic fibrosis. J Pediatr 2007;151:134-9. https://doi.org/10.1016/j.jpeds.2007.03.006.
- Li Z, Kosorok MR, Farrell PM, Laxova A, West SE, Green CG, et al. Longitudinal development of mucoid Pseudomonas aeruginosa infection and lung disease progression in children with cystic fibrosis. JAMA 2005;293:581-8. https://doi.org/10.1001/jama.293.5.581.
- Lee TW. Eradication of early Pseudomonas infection in cystic fibrosis. Chron Respir Dis 2009;6:99-107. https://doi.org/10.1177/1479972309104661.
- Valerius NH, Koch C, Høiby N. Prevention of chronic Pseudomonas aeruginosa colonisation in cystic fibrosis by early treatment. Lancet 1991;338:725-6. https://doi.org/10.1016/0140-6736(91)91446-2.
- Wiesemann HG, Steinkamp G, Ratjen F, Bauernfeind A, Przyklenk B, Döring G, et al. Placebo-controlled, double-blind, randomized study of aerosolized tobramycin for early treatment of Pseudomonas aeruginosa colonization in cystic fibrosis. Pediatr Pulmonol 1998;25:88-92. https://doi.org/10.1002/(SICI)1099-0496(199802)25:2<88::AID-PPUL3>3.0.CO;2-J.
- McCoy KS, Quittner AL, Oermann CM, Gibson RL, Retsch-Bogart GZ, Montgomery AB. Inhaled aztreonam lysine for chronic airway Pseudomonas aeruginosa in cystic fibrosis. Am J Respir Crit Care Med 2008;178:921-8. https://doi.org/10.1164/rccm.200712-1804OC.
- Gibson RL, Emerson J, McNamara S, Burns JL, Rosenfeld M, Yunker A, et al. Significant microbiological effect of inhaled tobramycin in young children with cystic fibrosis. Am J Respir Crit Care Med 2003;167:841-9. https://doi.org/10.1164/rccm.200208-855OC.
- Taccetti G, Campana S, Festini F, Mascherini M, Döring G. Early eradication therapy against Pseudomonas aeruginosa in cystic fibrosis patients. Eur Respir J 2005;26:458-61. https://doi.org/10.1183/09031936.05.00009605.
- UK Cystic Fibrosis Trust Antibiotic Working Group . Antibiotic Treatment for Cystic Fibrosis – Report of the UK Cystic Fibrosis Trust Antibiotic Working Group 2009.
- Hickey HR, Jones AP, Lenney W, Williamson PR, Smyth RL. Feasibility study to inform the design of a randomised controlled trial to eradicate Pseudomonas aeruginosa infection in individuals with cystic fibrosis. Trials 2010;11. https://doi.org/10.1186/1745-6215-11-11.
- Cystic Fibrosis Trust Clinical Standards and Accreditation Group . Standards for the Clinical Care of Children and Adults With Cystic Fibrosis in the UK 2001.
- Littlewood JM, Miller MG, Ghoneim AT, Ramsden CH. Nebulised colomycin for early pseudomonas colonisation in cystic fibrosis. Lancet 1985;1. https://doi.org/10.1016/S0140-6736(85)92222-6.
- Ratjen F, Döring G, Nikolaizik WH. Effect of inhaled tobramycin on early Pseudomonas aeruginosa colonisation in patients with cystic fibrosis. Lancet 2001;358:983-4. https://doi.org/10.1016/S0140-6736(01)06124-4.
- Langton Hewer SC, Smyth AR. Antibiotic strategies for eradicating Pseudomonas aeruginosa in people with cystic fibrosis. Cochrane Database Syst Rev 2017;4. https://doi.org/10.1002/14651858.CD004197.pub5.
- BNF for Children 2017. London: BMJ Group, Pharmaceutical Press, and RCPCH Publications; 2017.
- UK Statutory Instruments . The Medicines for Human Use (Clinical Trials) Regulations 2004 n.d. www.legislation.gov.uk/uksi/2004/1031/contents/made (accessed 24 August 2021).
- World Medical Association . Declaration of Helsinki: ethical principles for medical research involving human subjects. JAMA 2013;310:2191-4. https://doi.org/10.1001/jama.2013.281053.
- Rosenfeld M, Emerson J, Williams-Warren J, Pepe M, Smith A, Montgomery AB, et al. Defining a pulmonary exacerbation in cystic fibrosis. J Pediatr 2001;139:359-65. https://doi.org/10.1067/mpd.2001.117288.
- Quittner AL, Buu A, Messer MA, Modi AC, Watrous M. Development and validation of the Cystic Fibrosis Questionnaire in the United States: a health-related quality-of-life measure for cystic fibrosis. Chest 2005;128:2347-54. https://doi.org/10.1378/chest.128.4.2347.
- Modi AC, Quittner AL. Validation of a disease-specific measure of health-related quality of life for children with cystic fibrosis. J Pediatr Psychol 2003;28:535-45. https://doi.org/10.1093/jpepsy/jsg044.
- Dolan P. Modeling valuations for EuroQol health states. Med Care 1997;35:1095-108. https://doi.org/10.1097/00005650-199711000-00002.
- Smyth A, Tan KH, Hyman-Taylor P, Mulheran M, Lewis S, Stableforth D, et al. TOPIC Study Group . Once versus three-times daily regimens of tobramycin treatment for pulmonary exacerbations of cystic fibrosis – the TOPIC study: a randomised controlled trial. Lancet 2005;365:573-8. https://doi.org/10.1016/S0140-6736(05)17906-9.
- Moher D, Hopewell S, Schulz KF, Montori V, Gøtzsche PC, Devereaux PJ, et al. CONSORT 2010 explanation and elaboration: updated guidelines for reporting parallel group randomised trials. Int J Surg 2012;10:28-55. https://doi.org/10.1016/j.ijsu.2011.10.001.
- European Medicines Agency . ICH Topic E 9 Statistical Principles for Clinical Trials n.d. https://www.ema.europa.eu/en/documents/scientific-guideline/ich-e-9-statistical-principles-clinical-trials-step-5_en.pdf (accessed 27 May 2021).
- Vynnycky E, Keen AR, Evans JT, Khanom S, Hawkey PM, White RG, et al. Mycobacterium tuberculosis transmission in an ethnically-diverse high incidence region in England, 2007–11. BMC Infect Dis 2019;19. https://doi.org/10.1186/s12879-018-3585-8.
- Harris KA, Kenna DT, Blauwendraat C, Hartley JC, Turton JF, Aurora P, et al. Molecular fingerprinting of Mycobacterium abscessus strains in a cohort of pediatric cystic fibrosis patients. J Clin Microbiol 2012;50:1758-61. https://doi.org/10.1128/JCM.00155-12.
- Turton JF, Perry C, Elgohari S, Hampton CV. PCR characterization and typing of Klebsiella pneumoniae using capsular type-specific, variable number tandem repeat and virulence gene targets. J Med Microbiol 2010;59:541-7. https://doi.org/10.1099/jmm.0.015198-0.
- Turton JF, Baddal B, Perry C. Use of the accessory genome for characterization and typing of Acinetobacter baumannii. J Clin Microbiol 2011;49:1260-6. https://doi.org/10.1128/JCM.02335-10.
- Turton JF, Turton SE, Yearwood L, Yarde S, Kaufmann ME, Pitt TL. Evaluation of a nine-locus variable-number tandem-repeat scheme for typing of Pseudomonas aeruginosa. Clin Microbiol Infect 2010;16:1111-16. https://doi.org/10.1111/j.1469-0691.2009.03049.x.
- Benson G. Tandem repeats finder: a program to analyze DNA sequences. Nucleic Acids Res 1999;27:573-80. https://doi.org/10.1093/nar/27.2.573.
- Decraene V, Ghebrehewet S, Dardamissis E, Huyton R, Mortimer K, Wilkinson D, et al. An outbreak of multidrug-resistant Pseudomonas aeruginosa in a burns service in the North of England: challenges of infection prevention and control in a complex setting. J Hosp Infect 2018;100:e239-e245. https://doi.org/10.1016/j.jhin.2018.07.012.
- Nayar G, Darley ESR, Hammond F, Matthews S, Turton J, Wach R. Does screening neonates in the neonatal intensive care unit for Pseudomonas aeruginosa colonization help prevent infection?. J Hosp Infect 2018;100:54-9. https://doi.org/10.1016/j.jhin.2018.06.019.
- Evans H, Bolt H, Heinsbroek E, Lloyd B, English P, Latif S, et al. National outbreak of Pseudomonas aeruginosa associated with an aftercare solution following piercings, July to September 2016, England. Euro Surveill 2018;23. https://doi.org/10.2807/1560-7917.ES.2018.23.37.1700795.
- De Soyza A, Perry A, Hall AJ, Sunny SS, Walton KE, Mustafa N, et al. Molecular epidemiological analysis suggests cross-infection with Pseudomonas aeruginosa is rare in non-cystic fibrosis bronchiectasis. Eur Respir J 2014;43:900-3. https://doi.org/10.1183/09031936.00167813.
- Martin K, Baddal B, Mustafa N, Perry C, Underwood A, Constantidou C, et al. Clusters of genetically similar isolates of Pseudomonas aeruginosa from multiple hospitals in the UK. J Med Microbiol 2013;62:988-1000. https://doi.org/10.1099/jmm.0.054841-0.
- Scott FW, Pitt TL. Identification and characterization of transmissible Pseudomonas aeruginosa strains in cystic fibrosis patients in England and Wales. J Med Microbiol 2004;53:609-15. https://doi.org/10.1099/jmm.0.45620-0.
- Fothergill JL, Walshaw MJ, Winstanley C. Transmissible strains of Pseudomonas aeruginosa in cystic fibrosis lung infections. Eur Respir J 2012;40:227-38. https://doi.org/10.1183/09031936.00204411.
- Cramer N, Klockgether J, Wrasman K, Schmidt M, Davenport CF, Tümmler B. Microevolution of the major common Pseudomonas aeruginosa clones C and PA14 in cystic fibrosis lungs. Environ Microbiol 2011;13:1690-704. https://doi.org/10.1111/j.1462-2920.2011.02483.x.
- Kresse AU, Blöcker H, Römling U. ISPa20 advances the individual evolution of Pseudomonas aeruginosa clone C subclone C13 strains isolated from cystic fibrosis patients by insertional mutagenesis and genomic rearrangements. Arch Microbiol 2006;185:245-54. https://doi.org/10.1007/s00203-006-0089-5.
- National Institute of Health and Care Excellence (NICE) . Guide to the Methods of Technology Appraisal 2013 2013.
- Joint Formulary Committee . British National Formulary 2017.
- Department of Health and Social Care (DHSC) . National Schedule of Reference Costs 2016–2017 2017.
- Curtis L, Burns A. Unit Costs of Health and Social Care 2017. Canterbury: Personal Social Services Research Unit, University of Kent; 2017.
- Curtis L. Unit Costs of Health and Social Care 2010. Canterbury: Personal Social Services Research Unit, University of Kent; 2010.
- National Institute for Health and Care Excellence (NICE) . Cystic Fibrosis: Diagnosis and Management; Appendix K 2017.
- NHS Improvement . NHS Reference Costs 2016 17 n.d. https://webarchive.nationalarchives.gov.uk/20200501111106/https://improvement.nhs.uk/resources/reference-costs/ (accessed 12 July 2021).
- Office for National Statistics . Annual Survey of Hours and Earnings Time Series of Selected Estimates n.d. www.ons.gov.uk/employmentandlabourmarket/peopleinwork/earningsandworkinghours/datasets/ashe1997to2015selectedestimates (accessed 31 July 2019).
- Rowen D, Keetharuth A, Poku E, Wong R, Pennington B, Wailoo A. A Review of the Psychometric Peformance of Child and Adolescent Preference-Based Measures Used to Genereate Utility Values for Children 2020. http://nicedsu.org.uk/wp-content/uploads/2020/04/DSU-psychometrics-final-report-150120-SUBMITTED.pdf (accessed 5 October 2020).
- Germain N, Aballea S, Toumi M. Measuring the health-related quality of life in young children: how far have we come?. J Mark Access Health Policy 2019;7. https://doi.org/10.1080/20016689.2019.1618661.
- Manca A, Hawkins N, Sculpher MJ. Estimating mean QALYs in trial-based cost-effectiveness analysis: the importance of controlling for baseline utility. Health Econ 2005;14:487-96. https://doi.org/10.1002/hec.944.
- White IR, Royston P, Wood AM. Multiple imputation using chained equations: issues and guidance for practice. Stat Med 2011;30:377-99. https://doi.org/10.1002/sim.4067.
- Nixon RM, Wonderling D, Grieve RD. Non-parametric methods for cost-effectiveness analysis: the central limit theorem and the bootstrap compared. Health Econ 2010;19:316-33. https://doi.org/10.1002/hec.1477.
- Schomaker M, Heumann C. Bootstrap inference when using multiple imputation. Stat Med 2018;37:2252-66. https://doi.org/10.1002/sim.7654.
- Rubin DB, Schenker N. Multiple imputation in health-care databases: an overview and some applications. Stat Med 1991;10:585-98. https://doi.org/10.1002/sim.4780100410.
- McCabe C, Claxton K, Culyer AJ. The NICE cost-effectiveness threshold: what it is and what that means. PharmacoEconomics 2008;26:733-44. https://doi.org/10.2165/00019053-200826090-00004.
- Manning WG, Mullahy J. Estimating log models: to transform or not to transform?. J Health Econ 2001;20:461-94. https://doi.org/10.1016/S0167-6296(01)00086-8.
- Department of Health and Social Care, NHS England . The Commissioning of Specialised Services in the NHS 2016.
- Lillquist YP, Cho E, Davidson AG. Economic effects of an eradication protocol for first appearance of Pseudomonas aeruginosa in cystic fibrosis patients: 1995 vs. 2009. J Cyst Fibros 2011;10:175-80. https://doi.org/10.1016/j.jcf.2011.01.002.
- Quittner AL, Abbott J, Georgiopoulos AM, Goldbeck L, Smith B, Hempstead SE, et al. International Committee on Mental Health in Cystic Fibrosis: Cystic Fibrosis Foundation and European Cystic Fibrosis Society consensus statements for screening and treating depression and anxiety. Thorax 2016;71:26-34. https://doi.org/10.1136/thoraxjnl-2015-207488.
- Prayle A, Watson A, Fortnum H, Smyth A. Side effects of aminoglycosides on the kidney, ear and balance in cystic fibrosis. Thorax 2010;65:654-8. https://doi.org/10.1136/thx.2009.131532.
- Castellani C, Duff AJA, Bell SC, Heijerman HGM, Munck A, Ratjen F, et al. ECFS best practice guidelines: the 2018 revision. J Cyst Fibros 2018;17:153-78. https://doi.org/10.1016/j.jcf.2018.02.006.
- Ratjen F, Moeller A, McKinney ML, Asherova I, Alon N, Maykut R, et al. EARLY study group . Eradication of early P. aeruginosa infection in children < 7 years of age with cystic fibrosis: the early study. J Cyst Fibros 2019;18:78-85. https://doi.org/10.1016/j.jcf.2018.04.002.
- Taccetti G, Bianchini E, Cariani L, Buzzetti R, Costantini D, Trevisan F, et al. Early antibiotic treatment for Pseudomonas aeruginosa eradication in patients with cystic fibrosis: a randomised multicentre study comparing two different protocols. Thorax 2012;67:853-9. https://doi.org/10.1136/thoraxjnl-2011-200832.
- Rowbotham NJ, Smith S, Leighton PA, Rayner OC, Gathercole K, Elliott ZC, et al. The top 10 research priorities in cystic fibrosis developed by a partnership between people with CF and healthcare providers. Thorax 2018;73:388-90. https://doi.org/10.1136/thoraxjnl-2017-210473.
- Hollin IL, Donaldson SH, Roman C, Aliaj E, Riva D, Boyle M, et al. Beyond the expected: identifying broad research priorities of researchers and the cystic fibrosis community. J Cyst Fibros 2019;18:375-7. https://doi.org/10.1016/j.jcf.2018.11.010.
- Mayer-Hamblett N, Retsch-Bogart G, Kloster M, Accurso F, Rosenfeld M, Albers G, et al. Azithromycin for early Pseudomonas infection in cystic fibrosis. The OPTIMIZE randomized trial. Am J Respir Crit Care Med 2018;198:1177-87. https://doi.org/10.1164/rccm.201802-0215OC.
- Wilko . Anti Allergy Pillow n.d. www.wilko.com/wilko-anti-allergy-medium-support-pillows-2pk/p/0478243 (accessed 31 July 2019).
- Wilko . Anti Allergy Bed Covers n.d. www.wilko.com/en-uk/wilko-king-size-anti-allergy-mattress-protector/p/0324832 (accessed 31 July 2019).
- Department for Transport . Average Speed, Delay and Reliability of Travel Times n.d. www.gov.uk/government/statistical-data-sets/average-speed-delay-and-reliability-of-travel-times-cgn (accessed 31 July 2019).
- The NHS Staff Council . Pay Circular (AforC) 3 2014: Amendment Number 32. Annex 12: Motoring Costs n.d. www.nhsemployers.org/employershandbook/Annex-12-Motoring-costs.pdf (accessed 31 July 2019).
- Department for Transport . Transport Expenditure (TSGB13) n.d. www.gov.uk/government/statistical-data-sets/transport-expenditure-tsgb13 (accessed 31 July 2019).
- Department for Transport . Passenger Distance Travelled (BUS03) n.d. www.gov.uk/government/statistical-data-sets/bus03-passenger-distance-travelled (accessed 31 July 2019).
- Department for Transport . Local Bus Passenger Journeys (BUS01) n.d. www.gov.uk/government/statistical-data-sets/bus01-local-bus-passenger-journeys (accessed 31 July 2019).
- Department for Transport . Passenger Distance Travelled (BUS03) n.d. www.gov.uk/government/statistical-data-sets/bus03-passenger-distance-travelled (accessed 31 July 2019).
- Scottish Procurement and Property Directorate . Glasgow Taxi n.d. www.gov.scot/Topics/Government/Procurement/Selling/taxiglasgow (accessed 31 July 2019).
- Liverpool City Council . The City of Liverpool Hackney Carriage Rates of Fare n.d. https://liverpool.gov.uk/media/9294/tariff-sheet-2018.pdf (accessed 31 July 2019).
- Plymouth City Council . Plymouth Taxi n.d. www.plymouth.gov.uk/parkingandtravel/publictransport/taxis (accessed 31 July 2019).
- Manchester City Council . Manchester Taxi n.d. https://secure.manchester.gov.uk/downloads/download/3399/hackney_carriage_vehicle-fare_card_2011_2012 (accessed 31 July 2019).
- Transport for London . Taxi Fares and Tariffs Consultation n.d. https://consultations.tfl.gov.uk/taxis/fares-2018/supporting_documents/taxifareconsultation2018.pdf (accessed 31 July 2019).
Appendix 1 Clinical Trials Unit team
The trial was conducted by the LCTC, University of Liverpool, Liverpool, UK.
| Role | Team member |
|---|---|
| Director | Professor Paula Williamsona |
| Senior statistician | Dr Ashley Jones |
| Senior trial manager | Ms Helen Hickey |
| Senior data managers |
Ms Sue Howlin Ms Clare Jackson Ms Joanne Eatock |
| Information systems managers |
Dr Duncan Appelbe Ms Marie Connor |
| Trial statistician | Mrs Michaela Brown |
| Trial co-ordinator(s) |
Dr Christopher Smith Ms Hannah Short Ms Claire Taylor Mr Tom Kearns Ms Farhiya Ashoor |
| Trial co-ordinator assistant | Ms Sarah Olsen |
| Contributing statisticians |
Professor Carrol Gamble Mrs Barbara Arch Ms Dannii Clayton Mr Andrew McKay Dr Laura Sutton |
| Data managers |
Ms Michelle Girvan Mr Paul Tate |
| Database developers |
Mrs Janet Harrison Mr Meirion Thomas |
Appendix 2 Trial oversight committees
Trial Steering Committee
Independent members: Professor Jonathan Grigg, Dr David Stableforth, Professor Barry Plant, Professor Duncan Geddes, Mrs Jennifer Wederell, Dr Ranjit Lall, Ms Sophie Lewis and Mr Dominic Kavanagh.
Non-independent members: Dr Simon Langton Hewer and Professor Alan Smyth.
Independent Data and Safety Monitoring Committee
Dr Robert Dinwiddie, Professor Christiane De Boeck and Mrs Enid Hennessy.
Trial Management Group
Dr Simon Langton Hewer, Professor Alan Smyth, Professor Deborah Ashby, Professor Paula Williamson, Ms Jessica Bissett, Dr Ashley Jones, Mrs Michaela Brown, Ms Helen Hickey, Ms Sue Howlin, Ms Farhiya Ashoor and Dr Dervla Kenna.
Appendix 3 Recruiting centres in centre number order
| Centre and clinic | Investigators |
|---|---|
| Addenbrooke’s Hospital – Paediatrics | Dr Robert Ross-Russell |
| Alder Hey Children’s Hospital – Paediatrics | Professor Kevin Southern |
| Barts and The London Children’s Hospital – Paediatrics | Dr Chinedu Nwokoro |
| Belfast City Hospital – Adults | Dr Damian Downey |
| Birmingham Children’s Hospital – Paediatrics | Dr Maya Desai |
| Birmingham Heartlands Hospital – Adults | Dr Joanna L Whitehouse |
| Birmingham Heartlands Hospital – Paediatrics | Dr Sarah Denniston |
| Bradford Royal Infirmary – Paediatrics | Dr Eduardo Moya |
| Bristol Royal Hospital for Children – Paediatrics | Dr Simon Langton Hewer |
| Bristol Royal Infirmary – Adults | Dr Simon Langton Hewer |
| Chesterfield Royal Hospital – Paediatrics | Professor Jim Crossley |
| Conquest Hospital – Paediatrics | Dr Geeta Gopal |
| Countess of Chester Hospital – Paediatrics | Dr Ravi Jayaram |
| Darlington Memorial Hospital – Paediatrics | Dr John Furness |
| Derriford Hospital – Adults | Dr David Derry |
| Derriford Hospital – Paediatrics | Dr Alan Cade |
| Eastbourne District General Hospital – Paediatrics | Dr. Geeta Gopal |
| Genoa CF Centre – Adults | Dr Laura Minicucci |
| Genoa CF Centre – Paediatrics | Dr Laura Minicucci |
| Gloucestershire Royal Hospital – Paediatrics | Dr Mike Webb |
| Great Ormond Street Hospital – Paediatrics | Dr Colin Wallis |
| Hillingdon Hospital – Paediatrics | Dr Stephen Goldring |
| Hull Royal Infirmary – Paediatrics | Dr Ashwini Kotwal |
| James Cook University Hospital – Paediatrics | Dr Rajamanickam Jayaraj |
| James Paget University Hospital – Paediatrics | Dr Caroline Kavanagh |
| Kettering General Hospital – Paediatrics | Dr Patti Rao |
| King’s College Hospital – Paediatrics | Dr Gary Ruiz |
| King’s Mill Hospital – Paediatrics | Dr Mike Yanney |
| Leicester Children’s Hospital – Paediatrics | Dr Erol Gaillard |
| Leighton Hospital – Paediatrics | Dr Julie Ellison |
| Lincoln County Hospital – Paediatrics | Dr Amol Chingale |
| Macclesfield District General Hospital – Paediatrics | Dr Surendran Chandrasekaran |
| Musgrove Park Hospital – Paediatrics | Dr Alexandra Powell |
| New Cross Hospital – Paediatrics | Dr Rosie Rayner |
| Norfolk and Norwich University Hospital – Paediatrics | Dr Caroline Kavanagh |
| North Devon District Hospital – Paediatrics | Dr Dermot Dalton |
| Nottingham City Hospital – Adults | Dr Jane Dewar |
| Nottingham Children’s Hospital – Paediatrics | Professor Alan Smyth |
| Oxford Children’s Hospital – Paediatrics | Dr Jeremy Hull |
| Pilgrim Hospital – Paediatrics | Dr Margaret Crawford |
| Queen Alexandra Hospital – Paediatrics | Dr Hannah Buckley |
| Royal Alexandra Children’s Hospital – Paediatrics | Dr Paul Seddon |
| Royal Berkshire Hospital – Paediatrics | Dr Claire Holt |
| Royal Brompton Hospital – Adults | Dr Nick Simmonds |
| Royal Brompton Hospital – Paediatrics | Professor Andrew Bush |
| Royal Cornwall Hospital – Paediatrics | Dr Anne Prendiville |
| Royal Derby Hospital – Paediatrics | Dr Nigel Ruggins |
| Royal Devon and Exeter Hospital – Adults | Dr Patrick Oades |
| Royal Devon and Exeter Hospital – Paediatrics | Dr Patrick Oades |
| Royal Hospital for Sick Children – Paediatrics | Professor Steve Cunningham |
| Royal Preston Hospital – Paediatrics | Dr Karnam Sugumar |
| Royal Shrewsbury Hospital – Paediatrics | Dr Martyn Rees |
| Royal United Hospital – Paediatrics | Dr Rebecca Winterson |
| Royal Victoria Infirmary – Adults | Dr Simon Doe |
| Royal Victoria Infirmary – Paediatrics | Dr Malcolm Brodie |
| Salisbury District Hospital – Paediatrics | Dr Robert Scott-Jupp |
| Sheffield Children’s Hospital – Paediatrics | Dr Christopher Taylor |
| Southampton General Hospital – Adults | Dr Mary Carroll |
| Southampton General Hospital – Paediatrics | Dr Julian Legg |
| St James’s University Hospital – Paediatrics | Dr Tim Lee |
| Torbay Hospital – Adults | Dr Lee Dobson |
| Torbay Hospital – Paediatrics | Dr Atanu Mukherjee |
| University Hospital North Staffordshire – Adults | Professor Warren Lenny |
| University Hospital North Staffordshire – Paediatrics | Professor Warren Lenny |
| University Hospital of Wales – Adults | Dr Ian Ketchell |
| University Hospital of Wales – Paediatrics | Dr Julian Forton |
| Walsgrave Hospitals NHS Trust – Paediatrics | Dr Edward Simmonds |
| Warrington Hospital – Paediatrics | Dr Christopher Bedford |
| William Harvey Hospital – Paediatrics | Dr Ola Smith |
| Wythenshawe Hospital – Adults | Dr Naveen Rao |
| Wythenshawe Hospital – Paediatrics | Dr Naveen Rao |
| York Teaching Hospital – Paediatrics | Dr Murray Wheeler |
Appendix 4 Additional results
| Centre and clinic | Total patients screened, n | Total screening assessments,a n | Ineligible | Not approached for consent | Consent not obtained | Randomised | Consent rate, % | ||||
|---|---|---|---|---|---|---|---|---|---|---|---|
| n | % | n | % | n | % | n | % | ||||
| Addenbrooke’s Hospital – Paediatrics | 22 | 23 | 1 | 4.3 | 1 | 4.3 | 16 | 69.6 | 5 | 21.7 | 23.8 |
| Alder Hey Children’s Hospital – Paediatrics | 53 | 55 | 12 | 21.8 | 2 | 3.6 | 19 | 34.5 | 22 | 40 | 53.7 |
| Barts and The London Children’s Hospital – Paediatrics | 25 | 26 | 3 | 11.5 | 3 | 11.5 | 17 | 65.4 | 3 | 11.5 | 15 |
| Belfast City Hospital – Adults | 3 | 3 | 2 | 66.7 | 0 | 0.0 | 0 | 0.0 | 1 | 33.3 | 100 |
| Birmingham Children’s Hospital – Paediatrics | 75 | 76 | 17 | 22.4 | 14 | 18.4 | 30 | 39.5 | 15 | 19.7 | 33.3 |
| Birmingham Heartlands Hospital – Adults | 4 | 4 | 0 | 0.0 | 0 | 0.0 | 0 | 0.0 | 4 | 100 | 100 |
| Birmingham Heartlands Hospital – Paediatrics | 13 | 13 | 5 | 38.5 | 1 | 7.7 | 6 | 46.2 | 1 | 7.7 | 14.3 |
| Bradford Royal Infirmary – Paediatrics | 2 | 2 | 1 | 50 | 1 | 50 | 0 | 0.0 | 0 | 0.0 | – |
| Bristol Royal Hospital for Children – Paediatrics | 48 | 48 | 4 | 8.3 | 7 | 14.6 | 15 | 31.3 | 22 | 45.8 | 59.5 |
| Bristol Royal Infirmary – Adults | 1 | 1 | 0 | 0.0 | 0 | 0.0 | 0 | 0.0 | 1 | 100 | 100 |
| Chesterfield Royal Hospital – Paediatrics | 4 | 5 | 0 | 0.0 | 0 | 0.0 | 3 | 60 | 2 | 40 | 40 |
| Conquest Hospital – Paediatrics | 5 | 6 | 1 | 16.7 | 0 | 0.0 | 2 | 33.3 | 3 | 50 | 60 |
| Countess of Chester Hospital – Paediatrics | 6 | 6 | 1 | 16.7 | 1 | 16.7 | 4 | 66.7 | 0 | 0.0 | 0.0 |
| Darlington Memorial Hospital – Paediatrics | 2 | 2 | 1 | 50 | 1 | 50 | 0 | 0.0 | 0 | 0.0 | – |
| Derriford Hospital – Adults | 29 | 49 | 39 | 79.6 | 1 | 2 | 5 | 10.2 | 4 | 8.2 | 44.4 |
| Derriford Hospital – Paediatrics | 17 | 19 | 1 | 5.3 | 0 | 0.0 | 15 | 78.9 | 3 | 15.8 | 16.7 |
| Eastbourne District General Hospital – Paediatrics | 2 | 2 | 0 | 0.0 | 0 | 0.0 | 0 | 0.0 | 2 | 100 | 100 |
| Genoa CF Centre – Adults | 1 | 1 | 0 | 0.0 | 0 | 0.0 | 0 | 0.0 | 1 | 100 | 100 |
| Genoa CF Centre – Paediatrics | 1 | 1 | 0 | 0.0 | 0 | 0.0 | 0 | 0.00 | 1 | 100 | 100 |
| Gloucestershire Royal Hospital – Paediatrics | 37 | 54 | 32 | 59.3 | 5 | 9.3 | 16 | 29.6 | 1 | 1.9 | 5.9 |
| Great Ormond Street Hospital – Paediatrics | 46 | 46 | 9 | 19.6 | 12 | 26.1 | 18 | 39.1 | 7 | 15.2 | 28 |
| Hillingdon Hospital – Paediatrics | 1 | 1 | 0 | 0.0 | 0 | 0.0 | 0 | 0.0 | 1 | 100 | 100 |
| Hull Royal Infirmary – Paediatrics | 13 | 14 | 3 | 21.4 | 1 | 7.1 | 4 | 28.6 | 6 | 42.9 | 60 |
| James Cook University Hospital – Paediatrics | 23 | 39 | 26 | 66.7 | 1 | 2.6 | 5 | 12.8 | 7 | 17.9 | 58.3 |
| James Paget Univeristy Hospital – Paediatrics | 3 | 3 | 3 | 100 | 0 | 0.0 | 0 | 0.0 | 0 | 0.0 | – |
| Kettering General Hospital – Paediatrics | 7 | 7 | 1 | 14.3 | 0 | 0.0 | 2 | 28.6 | 4 | 57.1 | 66.7 |
| King’s College Hospital – Paediatrics | 14 | 14 | 1 | 7.1 | 1 | 7.1 | 1 | 7.1 | 11 | 78.6 | 91.7 |
| King’s Mill Hospital – Paediatrics | 9 | 9 | 1 | 11.1 | 0 | 0.0 | 3 | 33.3 | 5 | 55.6 | 62.5 |
| Leicester Children’s Hospital – Paediatrics | 56 | 79 | 48 | 60.8 | 10 | 12.7 | 13 | 16.5 | 8 | 10.1 | 38.1 |
| Leighton Hospital – Paediatrics | 6 | 6 | 0 | 0.0 | 3 | 50 | 1 | 16.7 | 2 | 33.3 | 66.7 |
| Lincoln County Hospital – Paediatrics | 15 | 15 | 1 | 6.7 | 0 | 0.0 | 9 | 60 | 5 | 33.3 | 35.7 |
| Macclesfield District General Hospital – Paediatrics | 2 | 3 | 1 | 33.3 | 2 | 66.7 | 0 | 0.0 | 0 | 0.0 | – |
| Musgrove Park Hospital – Paediatrics | 10 | 10 | 3 | 30 | 0 | 0.0 | 2 | 20 | 5 | 50 | 71.4 |
| New Cross Hospital – Paediatrics | 20 | 21 | 6 | 28.6 | 2 | 9.5 | 10 | 47.6 | 3 | 14.3 | 23.1 |
| Norfolk and Norwich University Hospital – Paediatrics | 18 | 25 | 9 | 36 | 3 | 12 | 9 | 36 | 4 | 16 | 30.8 |
| North Devon District Hospital – Paediatrics | 2 | 2 | 0 | 0.0 | 0 | 0.0 | 0 | 0.0 | 2 | 100 | 100 |
| Nottingham City Hospital – Adults | 9 | 9 | 6 | 66.7 | 0 | 0.0 | 3 | 33.3 | 0 | 0.0 | 0.0 |
| Nottingham Children’s Hospital – Paediatrics | 44 | 52 | 12 | 23.1 | 3 | 5.8 | 24 | 46.2 | 13 | 25 | 35.1 |
| Oxford Children’s Hospital – Paediatrics | 6 | 6 | 1 | 16.7 | 0 | 0.0 | 3 | 50 | 2 | 33.3 | 40 |
| Pilgrim Hospital – Paediatrics | 5 | 6 | 1 | 16.7 | 0 | 0.0 | 2 | 33.3 | 3 | 50 | 60 |
| Queen Alexandra Hospital – Paediatrics | 15 | 22 | 9 | 40.9 | 1 | 4.5 | 3 | 13.6 | 9 | 40.9 | 75 |
| Royal Alexandra Children’s Hospital – Paediatrics | 12 | 13 | 0 | 0.0 | 0 | 0.0 | 8 | 61.5 | 5 | 38.5 | 38.5 |
| Royal Berkshire Hospital – Paediatrics | 3 | 3 | 0 | 0.0 | 0 | 0.0 | 0 | 0.0 | 3 | 100 | 100 |
| Royal Brompton Hospital – Adults | 31 | 31 | 19 | 61.3 | 3 | 9.7 | 8 | 25.8 | 1 | 3.2 | 11.1 |
| Royal Brompton Hospital – Paediatrics | 78 | 79 | 4 | 5.1 | 14 | 17.7 | 55 | 69.6 | 6 | 7.6 | 9.8 |
| Royal Cornwall Hospital – Paediatrics | 25 | 38 | 20 | 52.6 | 1 | 2.6 | 14 | 36.8 | 3 | 7.9 | 17.6 |
| Royal Derby Hospital – Paediatrics | 13 | 14 | 3 | 21.4 | 2 | 14.3 | 9 | 64.3 | 0 | 0.0 | 0.0 |
| Royal Devon and Exeter Hospital – Adults | 11 | 12 | 7 | 58.3 | 2 | 16.7 | 1 | 8.3 | 2 | 16.7 | 66.7 |
| Royal Devon and Exeter Hospital – Paediatrics | 33 | 33 | 13 | 39.4 | 2 | 6.1 | 8 | 24.2 | 10 | 30.3 | 55.6 |
| Royal Hospital for Sick Children – Paediatrics | 24 | 24 | 4 | 16.7 | 3 | 12.5 | 12 | 50 | 5 | 20.8 | 29.4 |
| Royal Preston Hospital – Paediatrics | 14 | 14 | 3 | 21.4 | 1 | 7.1 | 6 | 42.9 | 4 | 28.6 | 40 |
| Royal Shrewsbury Hospital – Paediatrics | 10 | 13 | 3 | 23.1 | 0 | 0.0 | 1 | 7.7 | 9 | 69.2 | 90 |
| Royal United Hospital – Paediatrics | 17 | 19 | 10 | 52.6 | 0 | 0.0 | 5 | 26.3 | 4 | 21.1 | 44.4 |
| Royal Victoria Infirmary – Adults | 3 | 3 | 0 | 0.0 | 1 | 33.3 | 1 | 33.3 | 1 | 33.3 | 50 |
| Royal Victoria Infirmary – Paediatrics | 11 | 11 | 3 | 27.3 | 2 | 18.2 | 4 | 36.4 | 2 | 18.2 | 33.3 |
| Salisbury District Hospital – Paediatrics | 2 | 2 | 0 | 0.0 | 0 | 0.0 | 0 | 0.0 | 2 | 100 | 100 |
| Sheffield Children’s Hospital – Paediatrics | 43 | 52 | 18 | 34.6 | 3 | 5.8 | 25 | 48.1 | 6 | 11.5 | 19.4 |
| Southampton General Hospital – Adults | 2 | 2 | 0 | 0.0 | 0 | 0.0 | 1 | 50 | 1 | 50 | 50 |
| Southampton General Hospital – Paediatrics | 4 | 4 | 0 | 0.0 | 0 | 0.0 | 2 | 50 | 2 | 50 | 50 |
| St James’s University Hospital – Paediatrics | 197 | 264b | 154 | 58.3 | 71 | 26.9 | 32 | 12.1 | 4 | 1.5 | 11.1 |
| Torbay Hospital – Adults | 1 | 1 | 0 | 0.0 | 0 | 0.0 | 0 | 0.0 | 1 | 100 | 100 |
| Torbay Hospital – Paediatrics | 13 | 15 | 13 | 86.7 | 0 | 0.0 | 2 | 13.3 | 0 | 0.0 | 0.0 |
| University Hospital North Staffordshire – Adults | 6 | 7 | 2 | 28.6 | 1 | 14.3 | 4 | 57.1 | 0 | 0.0 | 0.0 |
| University Hospital North Staffordshire – Paediatrics | 20 | 20 | 1 | 5 | 2 | 10 | 4 | 20 | 13 | 65 | 76.5 |
| University Hospital of Wales – Adults | 2 | 2 | 0 | 0.0 | 0 | 0.0 | 1 | 50 | 1 | 50 | 50 |
| University Hospital of Wales – Paediatrics | 8 | 8 | 1 | 12.5 | 2 | 25 | 2 | 25 | 3 | 37.5 | 60 |
| Walsgrave Hospitals NHS Trust – Paediatrics | 16 | 18 | 3 | 16.7 | 2 | 11.1 | 8 | 44.4 | 5 | 27.8 | 38.5 |
| Warrington Hospital – Paediatrics | 3 | 3 | 1 | 33.3 | 0 | 0.0 | 1 | 33.3 | 1 | 33.3 | 50 |
| William Harvey Hospital – Paediatrics | 3 | 3 | 0 | 0.0 | 0 | 0.0 | 2 | 66.7 | 1 | 33.3 | 33.3 |
| Wythenshawe Hospital – Adults | 12 | 12 | 7 | 58.3 | 3 | 25 | 2 | 16.7 | 0 | 0.0 | 0.0 |
| Wythenshawe Hospital – Paediatrics | 10 | 10 | 4 | 40 | 1 | 10 | 2 | 20 | 3 | 30 | 60 |
| York Teaching Hospital – Paediatrics | 7 | 7 | 0 | 0.0 | 1 | 14.3 | 6 | 85.7 | 0 | 0.0 | 0.0 |
| Reason for ineligibility | Number of patientsa |
|---|---|
| Aged ≤ 28 days | 4 |
| Known to be pregnant | 5 |
| Not P. aeruginosa free | 168 |
| Not able to commence treatment within 21 days from the date of a P. aeruginosa-positive microbiology report | 20 |
| Antibiotic resistance of the current P. aeruginosa sample to any of the study drugs | 49 |
| Has been receiving P. aeruginosa-suppressing treatment | 211 |
| Known hypersensitivity to any of the study drugs | 29 |
| Other known contraindications to any of the study drugs | 7 |
| Had treatment with other anti-pseudomonal nebulisers | 47 |
| Previously randomised into TORPEDO-CF | 22 |
| Participated in another interventional trial within last 4 weeks | 14 |
| Poor compliance | 22 |
| Did not identify P. aeruginosa | 18 |
| Unknown whether patient is P. aeruginosa free/naive | 1 |
| Reason patient not approached | Number of patientsa |
|---|---|
| Clinician decision | 113 |
| Family circumstances | 11 |
| No bed available | 2 |
| Patient missed | 25 |
| Patient transferred | 4 |
| Social concerns | 12 |
| Did not understand English | 8 |
| Other reason | 4 |
| No reason given | 14 |
| Reason patient not consented | Number of patientsa |
|---|---|
| Did not want i.v. treatment | 324 |
| Did not want oral treatment | 34 |
| Did not want to attend follow-up | 7 |
| Did not want to be involved in research | 3 |
| Did not want to be randomised | 7 |
| Did not want to receive the eradication therapy | 4 |
| Family circumstances | 22 |
| Leaving country | 1 |
| Unclear | 4 |
| No reason given | 80 |
| Centre and clinic | Date site opened to recruitment | Date site closed to recruitment | Date of first randomisation | Date of last randomisation | Total randomised (n) |
|---|---|---|---|---|---|
| Addenbrooke’s Hospital – Paediatrics | 22 September 2011 | 27 January 2017 | 10 May 2012 | 29 September 2015 | 5 |
| Alder Hey Children’s Hospital – Paediatrics | 21 February 2011 | 27 January 2017 | 5 October 2011 | 24 November 2016 | 22 |
| Barts and The London Children’s Hospital – Paediatrics | 21 September 2012 | 27 January 2017 | 6 October 2014 | 9 November 2015 | 3 |
| Belfast City Hospital – Adults | 22 January 2013 | 27 January 2017 | 4 March 2014 | 4 March 2014 | 1 |
| Birmingham Children’s Hospital – Paediatrics | 1 September 2010 | 27 January 2017 | 5 October 2010 | 6 December 2016 | 15 |
| Birmingham Heartlands Hospital – Adults | 1 June 2012 | 27 January 2017 | 21 May 2013 | 26 February 2014 | 4 |
| Birmingham Heartlands Hospital – Paediatrics | 25 May 2012 | 27 January 2017 | 20 November 2014 | 20 November 2014 | 1 |
| Bristol Royal Hospital for Children – Paediatrics | 18 June 2010 | 27 January 2017 | 18 November 2010 | 18 January 2017 | 22 |
| Bristol Royal Infirmary – Adults | 13 September 2011 | 27 January 2017 | 3 June 2014 | 3 June 2014 | 1 |
| Chesterfield Royal Hospital – Paediatrics | 19 January 2011 | 27 January 2017 | 20 January 2011 | 24 March 2011 | 2 |
| Conquest Hospital – Paediatrics | 27 February 2012 | 27 January 2017 | 13 April 2012 | 24 March 2014 | 3 |
| Derriford Hospital – Adults | 30 July 2010 | 27 January 2017 | 16 April 2013 | 24 February 2015 | 4 |
| Derriford Hospital – Paediatrics | 30 July 2010 | 27 January 2017 | 12 October 2010 | 7 October 2016 | 3 |
| Eastbourne District General Hospital – Paediatrics | 25 January 2012 | 27 January 2017 | 1 February 2012 | 3 October 2013 | 2 |
| Genoa CF Centre – Adults | 6 October 2016 | 27 January 2017 | 11 October 2016 | 11 October 2016 | 1 |
| Genoa CF Centre – Paediatrics | 6 October 2016 | 27 January 2017 | 25 October 2016 | 25 October 2016 | 1 |
| Gloucestershire Royal Hospital – Paediatrics | 21 October 2010 | 27 January 2017 | 7 January 2011 | 7 January 2011 | 1 |
| Great Ormond Street Hospital – Paediatrics | 1 November 2011 | 27 January 2017 | 19 March 2012 | 28 November 2013 | 7 |
| Hillingdon Hospital – Paediatrics | 21 August 2012 | 27 January 2017 | 21 August 2012 | 21 August 2012 | 1 |
| Hull Royal Infirmary – Paediatrics | 26 January 2012 | 27 January 2017 | 3 February 2014 | 16 February 2016 | 6 |
| James Cook University Hospital – Paediatrics | 28 March 2012 | 27 January 2017 | 23 July 2012 | 21 January 2015 | 7 |
| Kettering General Hospital – Paediatrics | 11 April 2012 | 27 January 2017 | 31 August 2012 | 15 February 2016 | 4 |
| King’s College Hospital – Paediatrics | 26 October 2011 | 27 January 2017 | 18 January 2012 | 17 October 2016 | 11 |
| King’s Mill Hospital – Paediatrics | 2 November 2011 | 27 January 2017 | 20 April 2012 | 22 November 2016 | 5 |
| Leicester Children’s Hospital – Paediatrics | 28 June 2011 | 27 January 2017 | 5 January 2012 | 11 November 2016 | 8 |
| Leighton Hospital – Paediatrics | 6 September 2011 | 27 January 2017 | 3 January 2012 | 7 August 2014 | 2 |
| Lincoln County Hospital – Paediatrics | 29 July 2011 | 27 January 2017 | 16 December 2011 | 19 November 2014 | 5 |
| Musgrove Park Hospital – Paediatrics | 21 July 2010 | 27 January 2017 | 11 March 2011 | 20 November 2015 | 5 |
| New Cross Hospital – Paediatrics | 15 March 2011 | 27 January 2017 | 24 May 2011 | 30 December 2014 | 3 |
| Norfolk and Norwich University Hospital – Paediatrics | 10 February 2012 | 27 January 2017 | 30 April 2012 | 28 July 2016 | 4 |
| North Devon District Hospital – Paediatrics | 26 April 2013 | 27 January 2017 | 24 September 2013 | 9 September 2014 | 2 |
| Nottingham Children’s Hospital – Paediatrics | 12 July 2010 | 27 January 2017 | 22 February 2011 | 6 September 2016 | 13 |
| Oxford Children’s Hospital – Paediatrics | 17 May 2011 | 27 January 2017 | 18 October 2012 | 7 November 2014 | 2 |
| Pilgrim Hospital – Paediatrics | 6 February 2012 | 27 January 2017 | 7 February 2012 | 25 August 2015 | 3 |
| Queen Alexandra Hospital – Paediatrics | 24 April 2012 | 27 January 2017 | 9 August 2012 | 30 September 2016 | 9 |
| Royal Alexandra Children’s Hospital – Paediatrics | 11 May 2012 | 27 January 2017 | 31 July 2012 | 12 February 2016 | 5 |
| Royal Berkshire Hospital – Paediatrics | 10 December 2013 | 27 January 2017 | 24 February 2015 | 5 October 2016 | 3 |
| Royal Brompton Hospital – Adults | 6 January 2015 | 27 January 2017 | 2 February 2015 | 2 February 2015 | 1 |
| Royal Brompton Hospital – Paediatrics | 20 July 2011 | 27 January 2017 | 2 July 2012 | 18 September 2015 | 6 |
| Royal Cornwall Hospital – Paediatrics | 20 December 2010 | 27 January 2017 | 26 January 2011 | 25 June 2013 | 3 |
| Royal Devon and Exeter Hospital – Adults | 4 August 2010 | 27 January 2017 | 31 October 2012 | 30 April 2014 | 2 |
| Royal Devon and Exeter Hospital – Paediatrics | 4 August 2010 | 27 January 2017 | 4 January 2011 | 30 December 2015 | 10 |
| Royal Hospital for Sick Children – Paediatrics | 25 July 2012 | 27 January 2017 | 10 April 2013 | 8 January 2016 | 5 |
| Royal Preston Hospital – Paediatrics | 25 October 2011 | 27 January 2017 | 15 November 2011 | 13 February 2014 | 4 |
| Royal Shrewsbury Hospital – Paediatrics | 6 December 2012 | 27 January 2017 | 3 October 2013 | 27 January 2017 | 9 |
| Royal United Hospital – Paediatrics | 2 March 2011 | 27 January 2017 | 27 March 2013 | 26 January 2017 | 4 |
| Royal Victoria Infirmary – Adults | 22 March 2016 | 27 January 2017 | 18 May 2016 | 18 May 2016 | 1 |
| Royal Victoria Infirmary – Paediatrics | 22 March 2016 | 27 January 2017 | 1 September 2016 | 19 September 2016 | 2 |
| Salisbury District Hospital – Paediatrics | 23 April 2013 | 27 January 2017 | 13 October 2015 | 6 December 2016 | 2 |
| Sheffield Children’s Hospital – Paediatrics | 23 February 2011 | 27 January 2017 | 03 October 2012 | 7 December 2016 | 6 |
| Southampton General Hospital – Adults | 19 February 2013 | 27 January 2017 | 12 February 2015 | 12 February 2015 | 1 |
| Southampton General Hospital – Paediatrics | 4 February 2013 | 27 January 2017 | 22 April 2013 | 24 March 2014 | 2 |
| St James’s University Hospital – Paediatrics | 20 April 2011 | 27 January 2017 | 30 April 2012 | 17 October 2014 | 4 |
| Torbay Hospital – Adults | 17 November 2011 | 27 January 2017 | 15 December 2011 | 15 December 2011 | 1 |
| University Hospital North Staffordshire – Paediatrics | 26 January 2011 | 27 January 2017 | 30 January 2012 | 9 September 2015 | 13 |
| University Hospital of Wales – Adults | 24 October 2012 | 27 January 2017 | 29 September 2014 | 29 September 2014 | 1 |
| University Hospital of Wales – Paediatrics | 20 February 2013 | 27 January 2017 | 16 January 2014 | 2 October 2014 | 3 |
| Walsgrave Hospitals NHS Trust – Paediatrics | 26 August 2011 | 27 January 2017 | 20 October 2011 | 11 March 2015 | 5 |
| Warrington Hospital – Paediatrics | 6 November 2012 | 27 January 2017 | 20 September 2013 | 20 September 2013 | 1 |
| William Harvey Hospital – Paediatrics | 25 May 2012 | 27 January 2017 | 15 November 2013 | 15 November 2013 | 1 |
| Wythenshawe Hospital – Paediatrics | 20 November 2012 | 27 January 2017 | 5 August 2013 | 7 October 2013 | 3 |
FIGURE 6.
Time to reoccurrence of original P. aeruginosa infection: unknown strains assumed to be same as baseline.
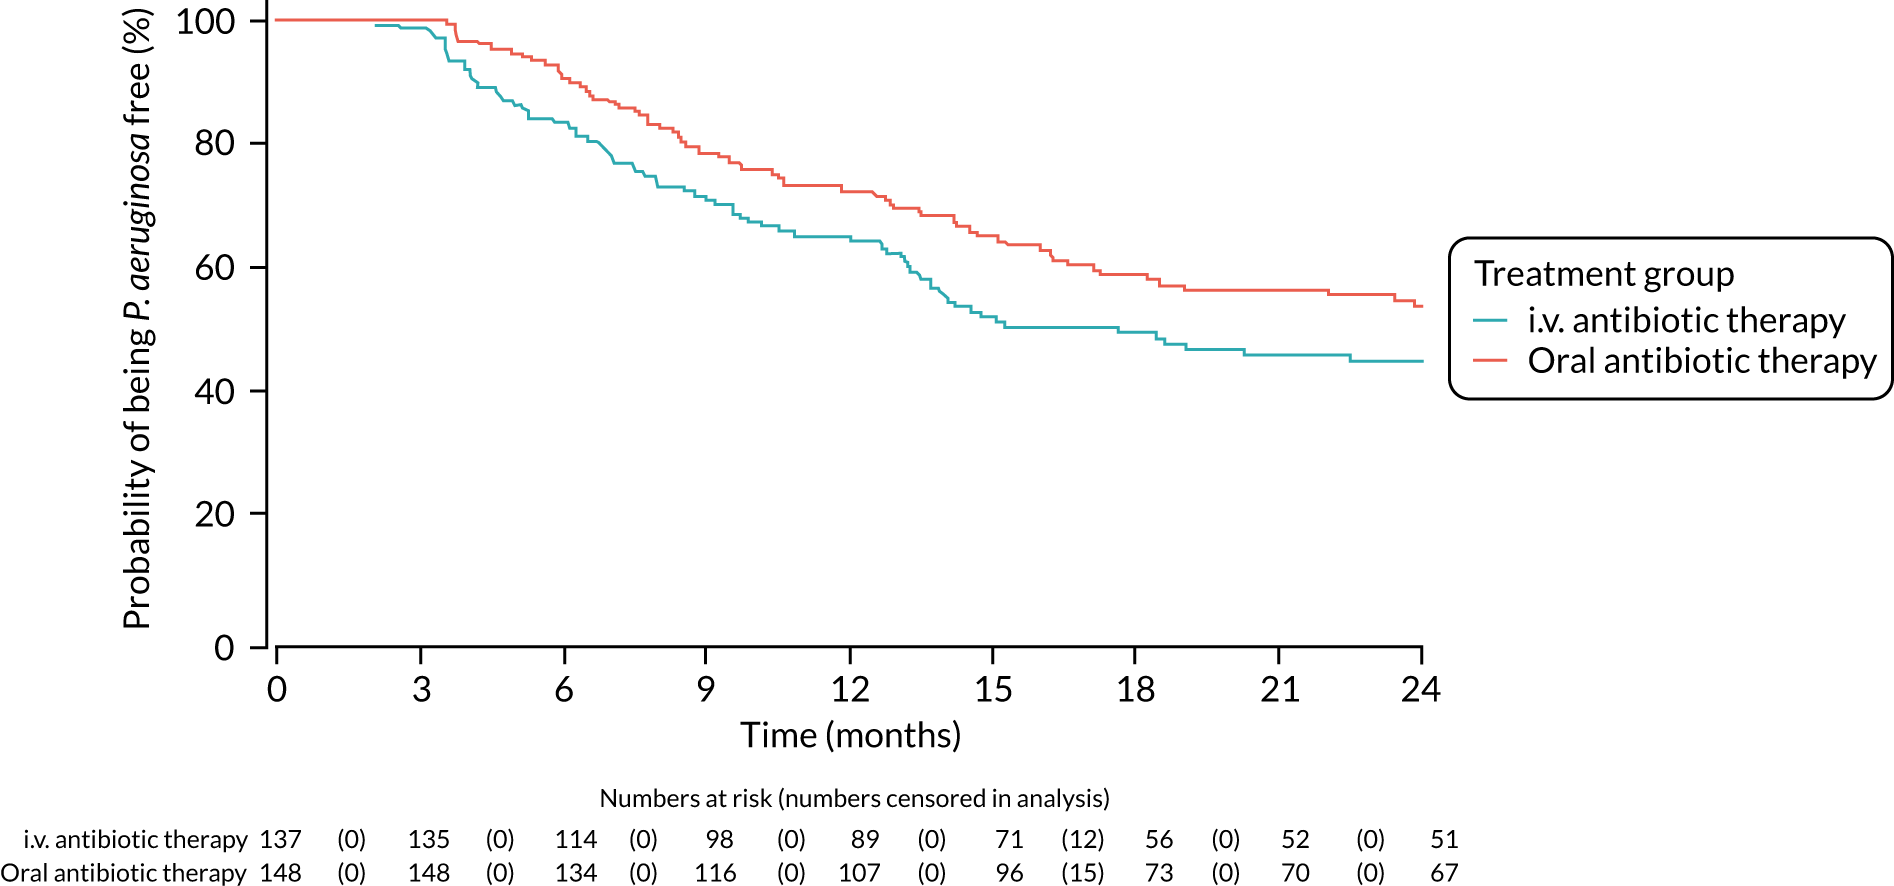
FIGURE 7.
Time to reoccurrence of original P. aeruginosa infection: unknown strains assumed to be same as baseline (sensitivity analysis using date of treatment commencement rather than date of randomisation).
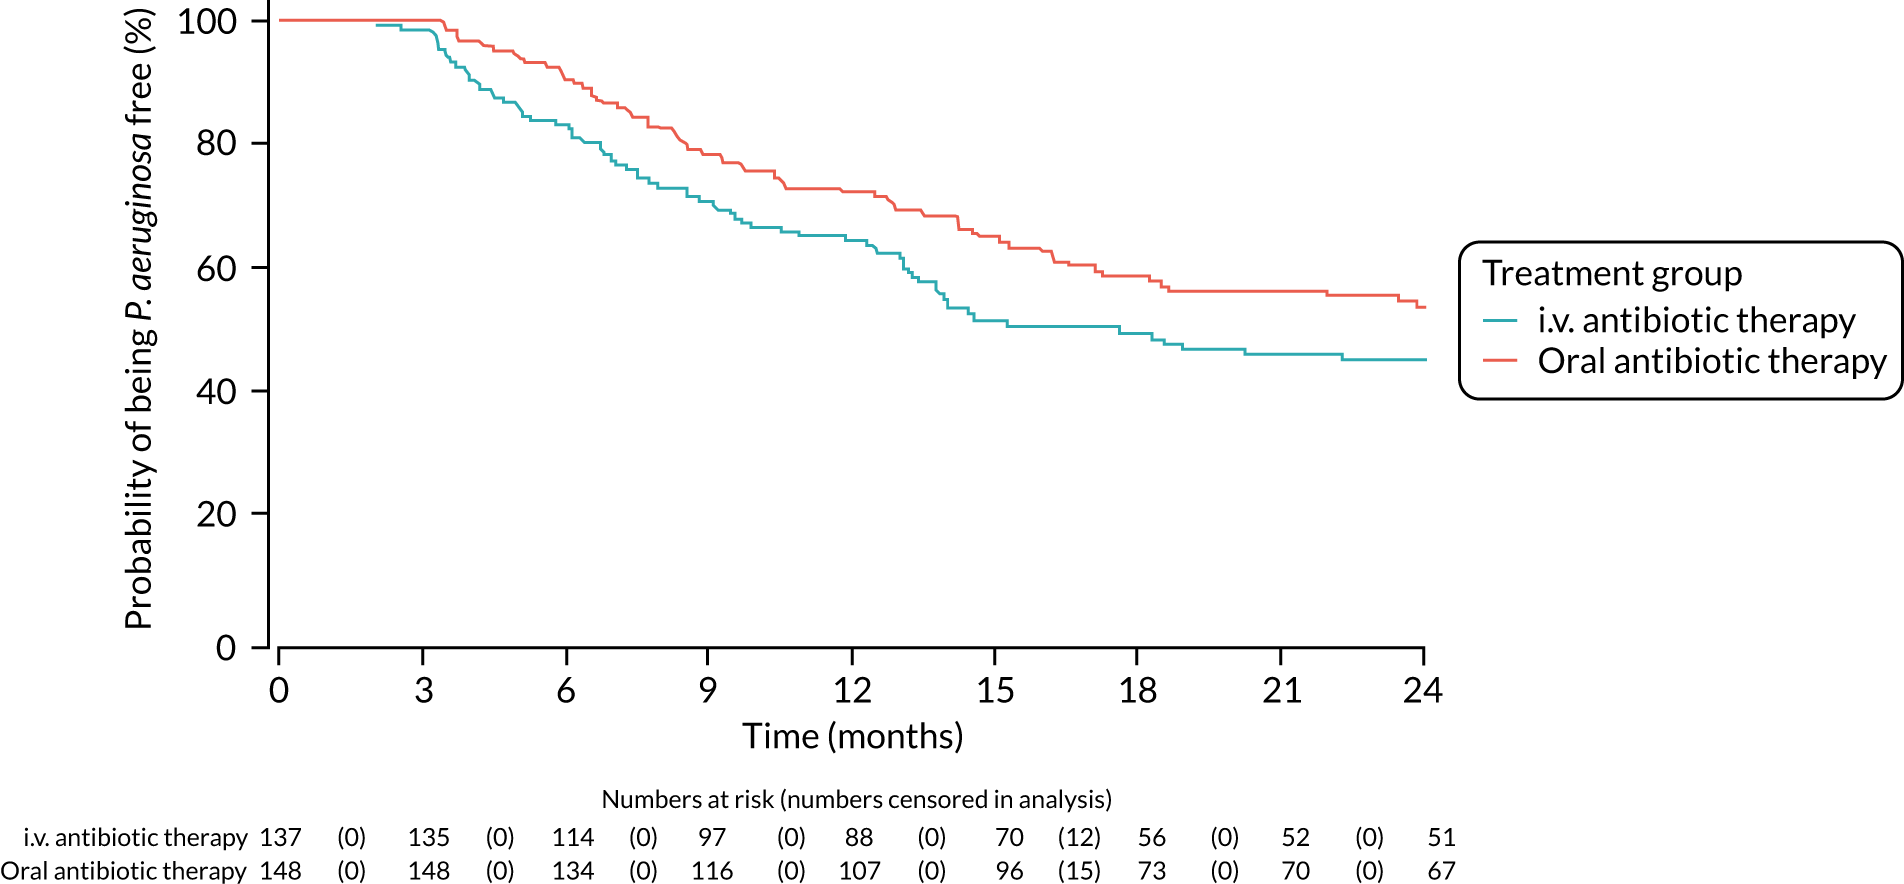
FIGURE 8.
Time to reoccurrence of original P. aeruginosa infection: unknown strains assumed to be different from baseline.
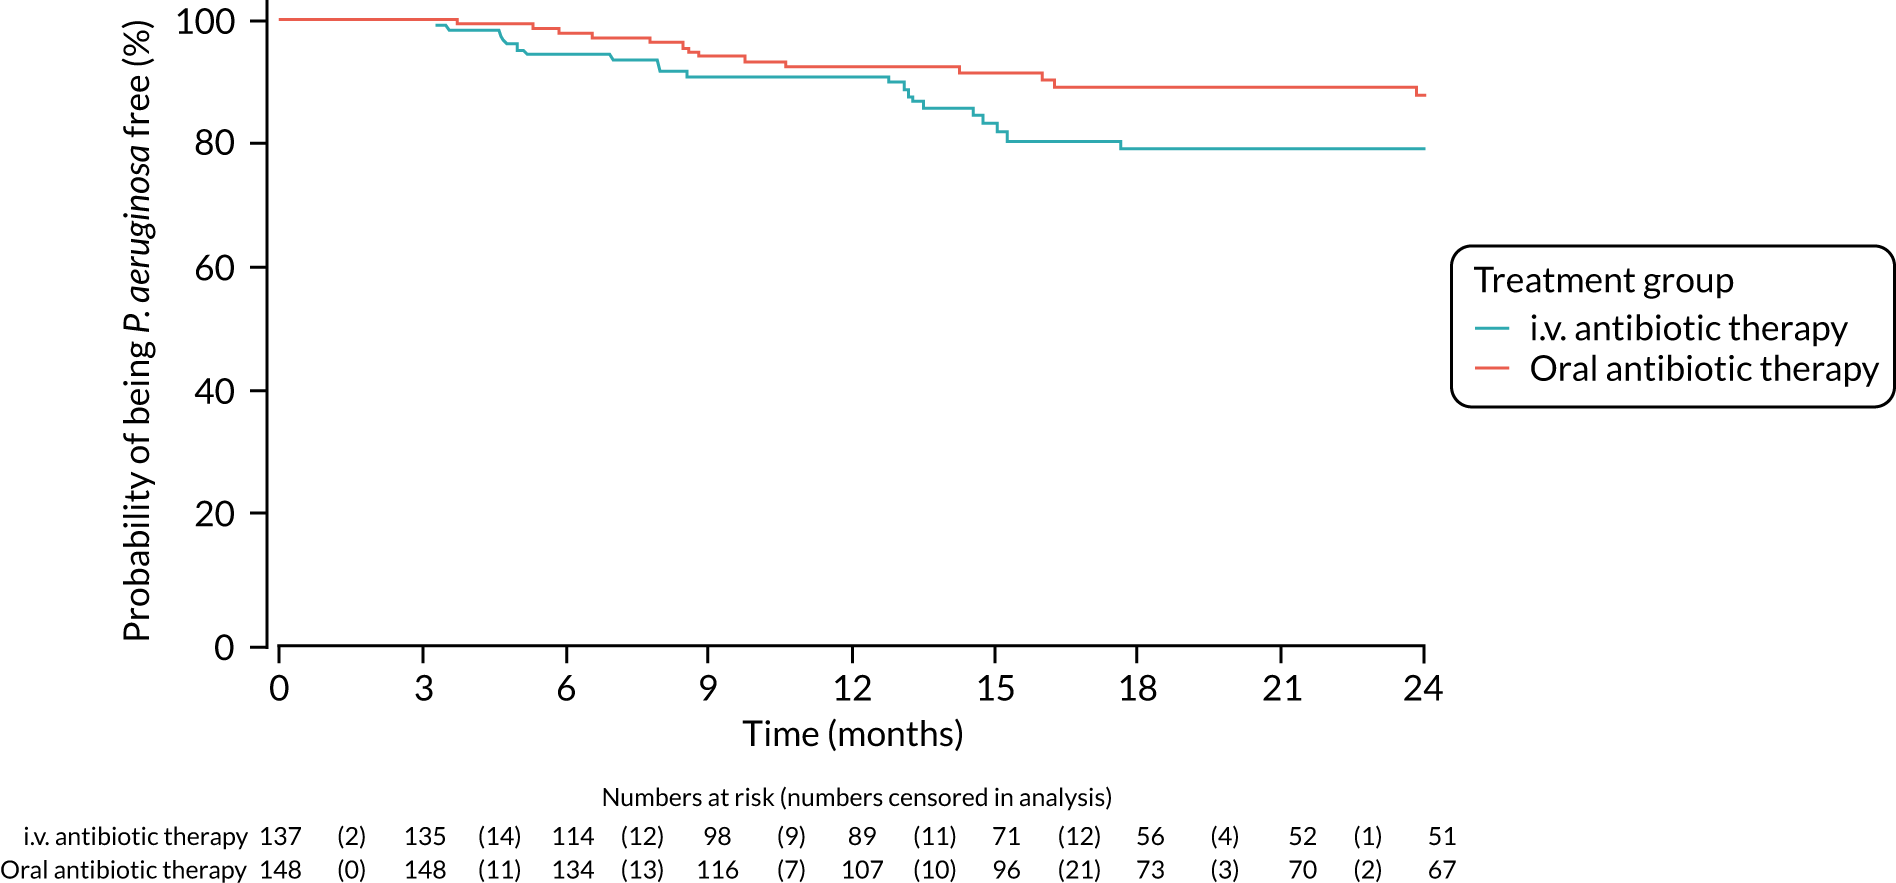
FIGURE 9.
Time to reoccurrence of original P. aeruginosa infection: unknown strains assumed to be different from baseline (sensitivity analysis using date of treatment commencement rather than date of randomisation).
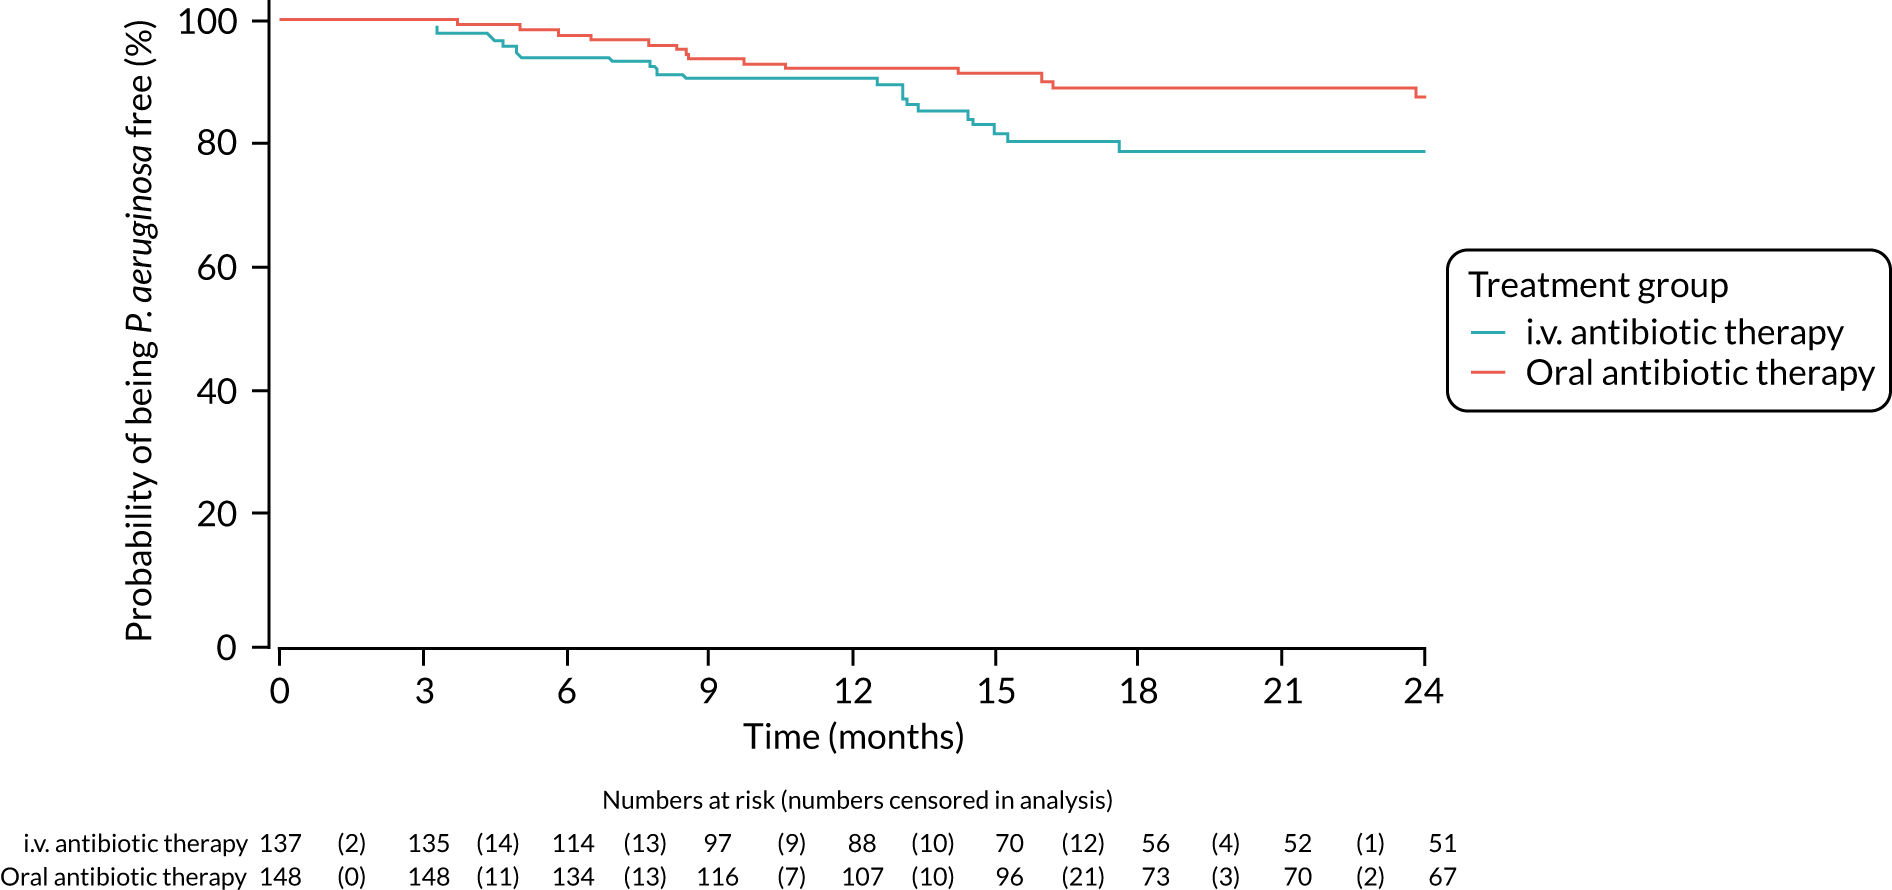
FIGURE 10.
Physical functioning (self-report): mean scores over time by treatment group.
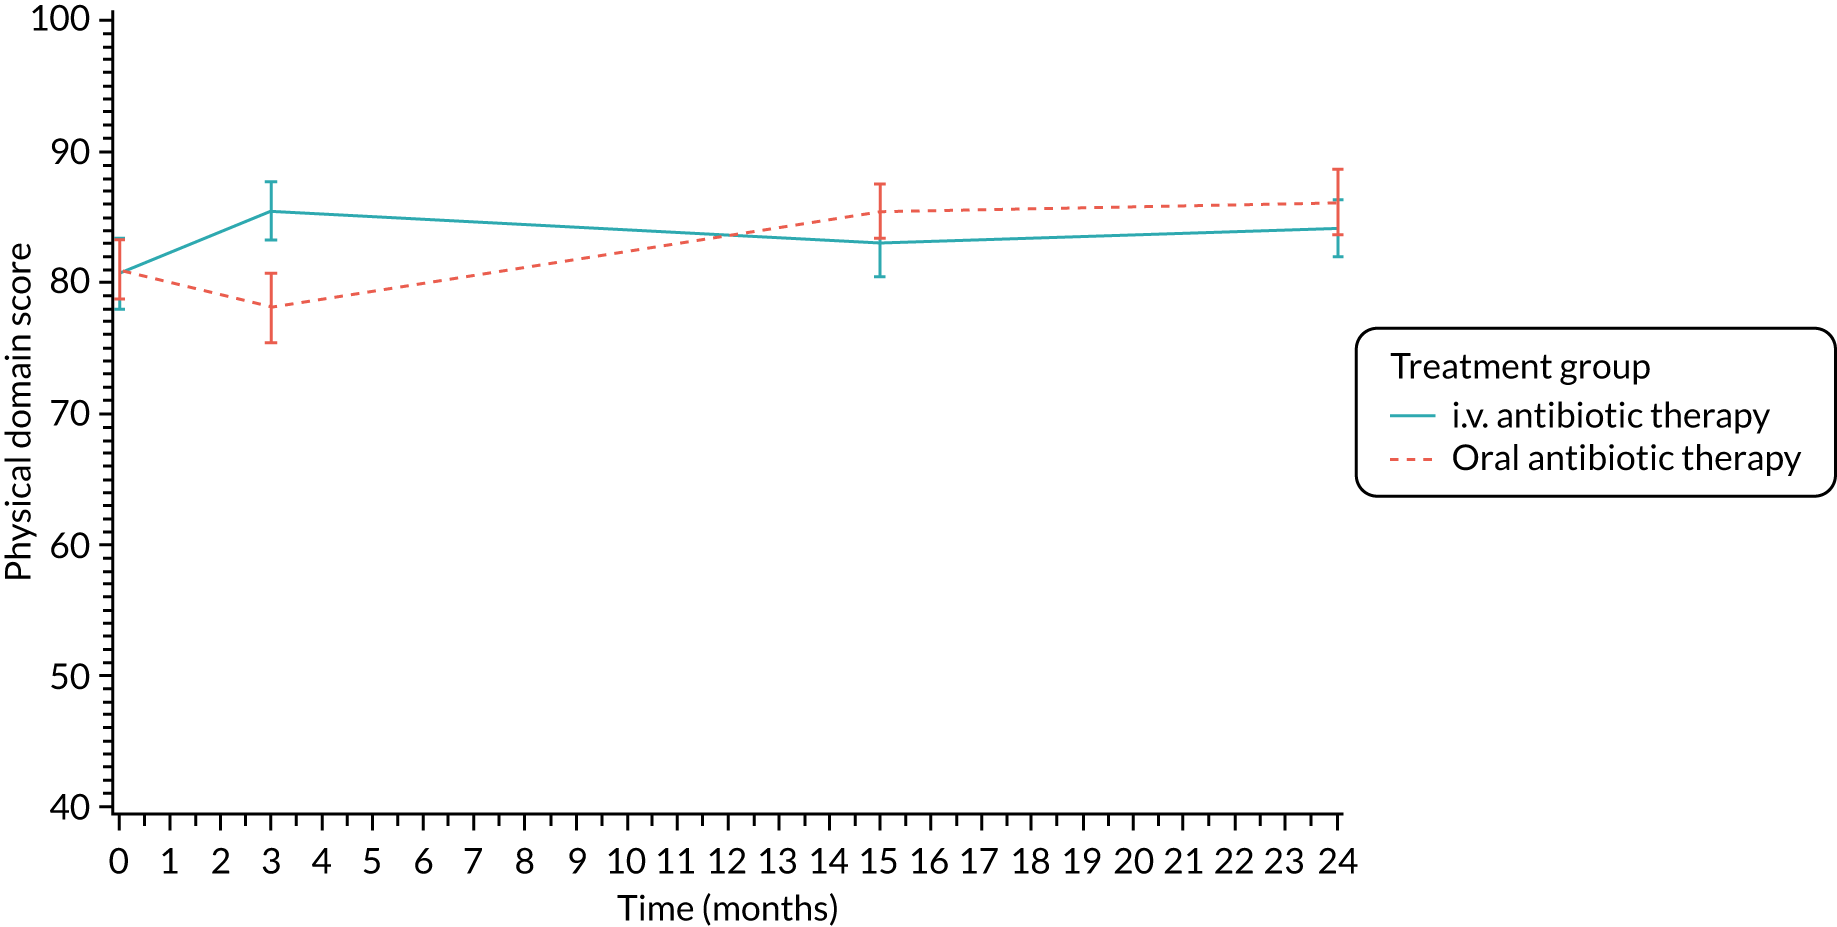
FIGURE 11.
Role/school functioning (self-report): mean scores over time by treatment group.
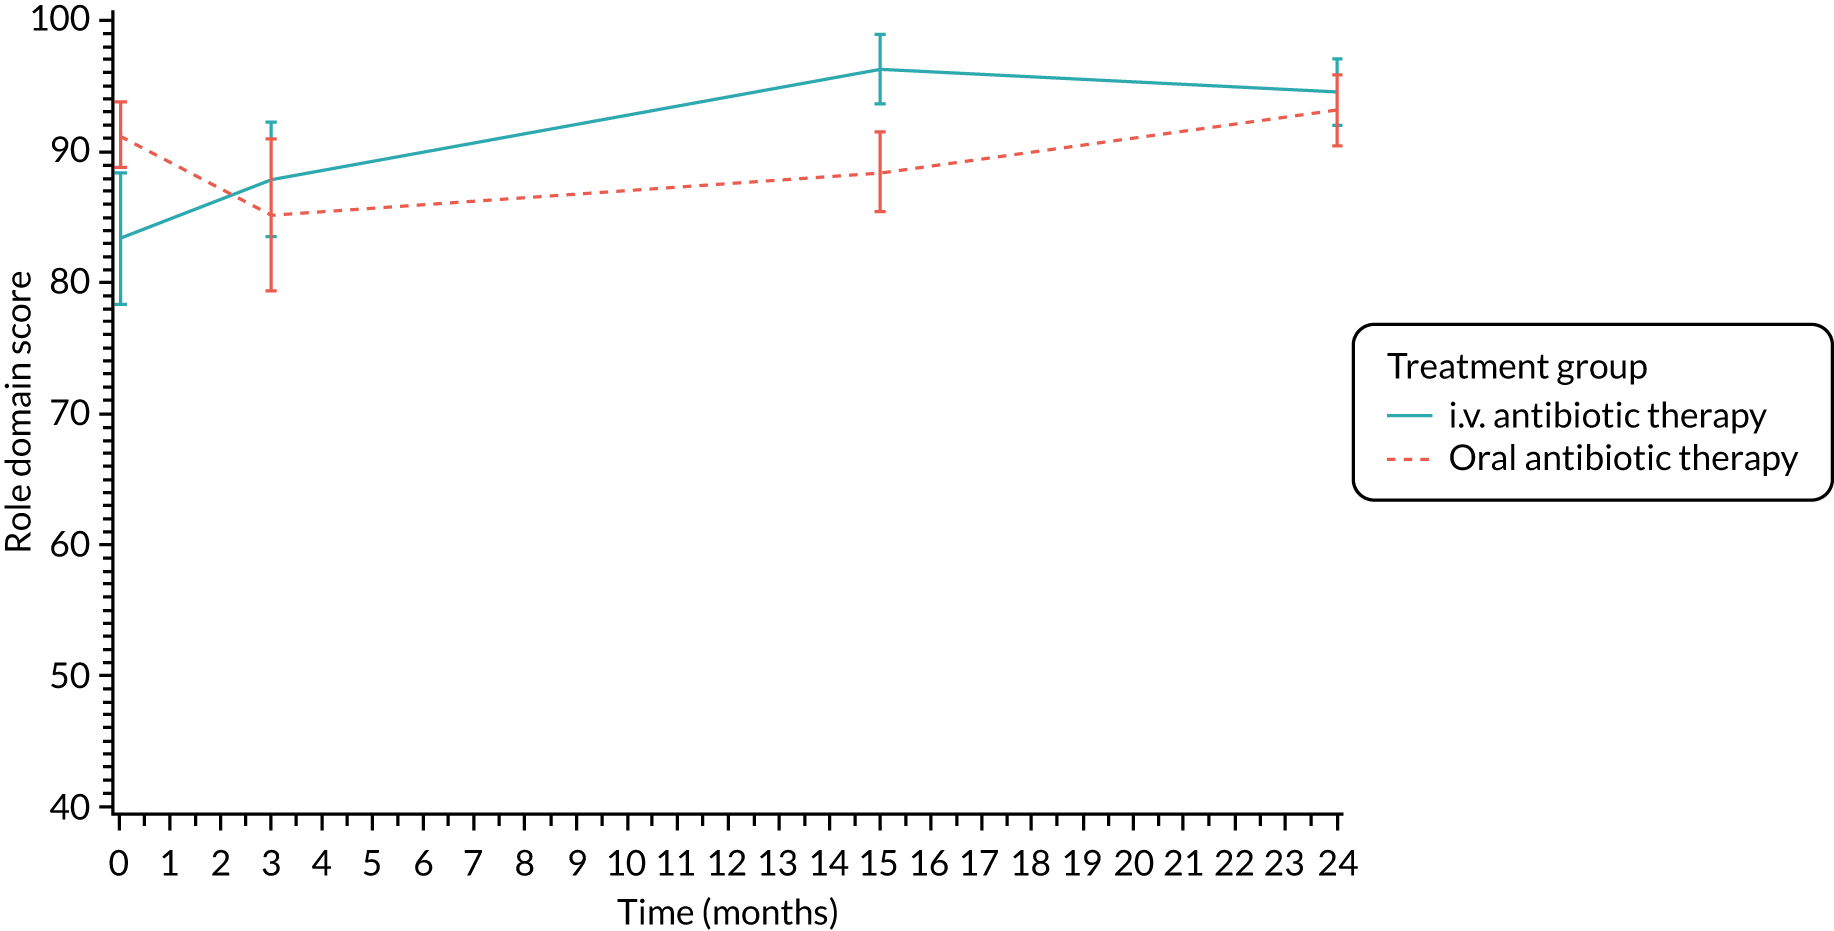
FIGURE 12.
Vitality (self-report): mean scores over time by treatment group.
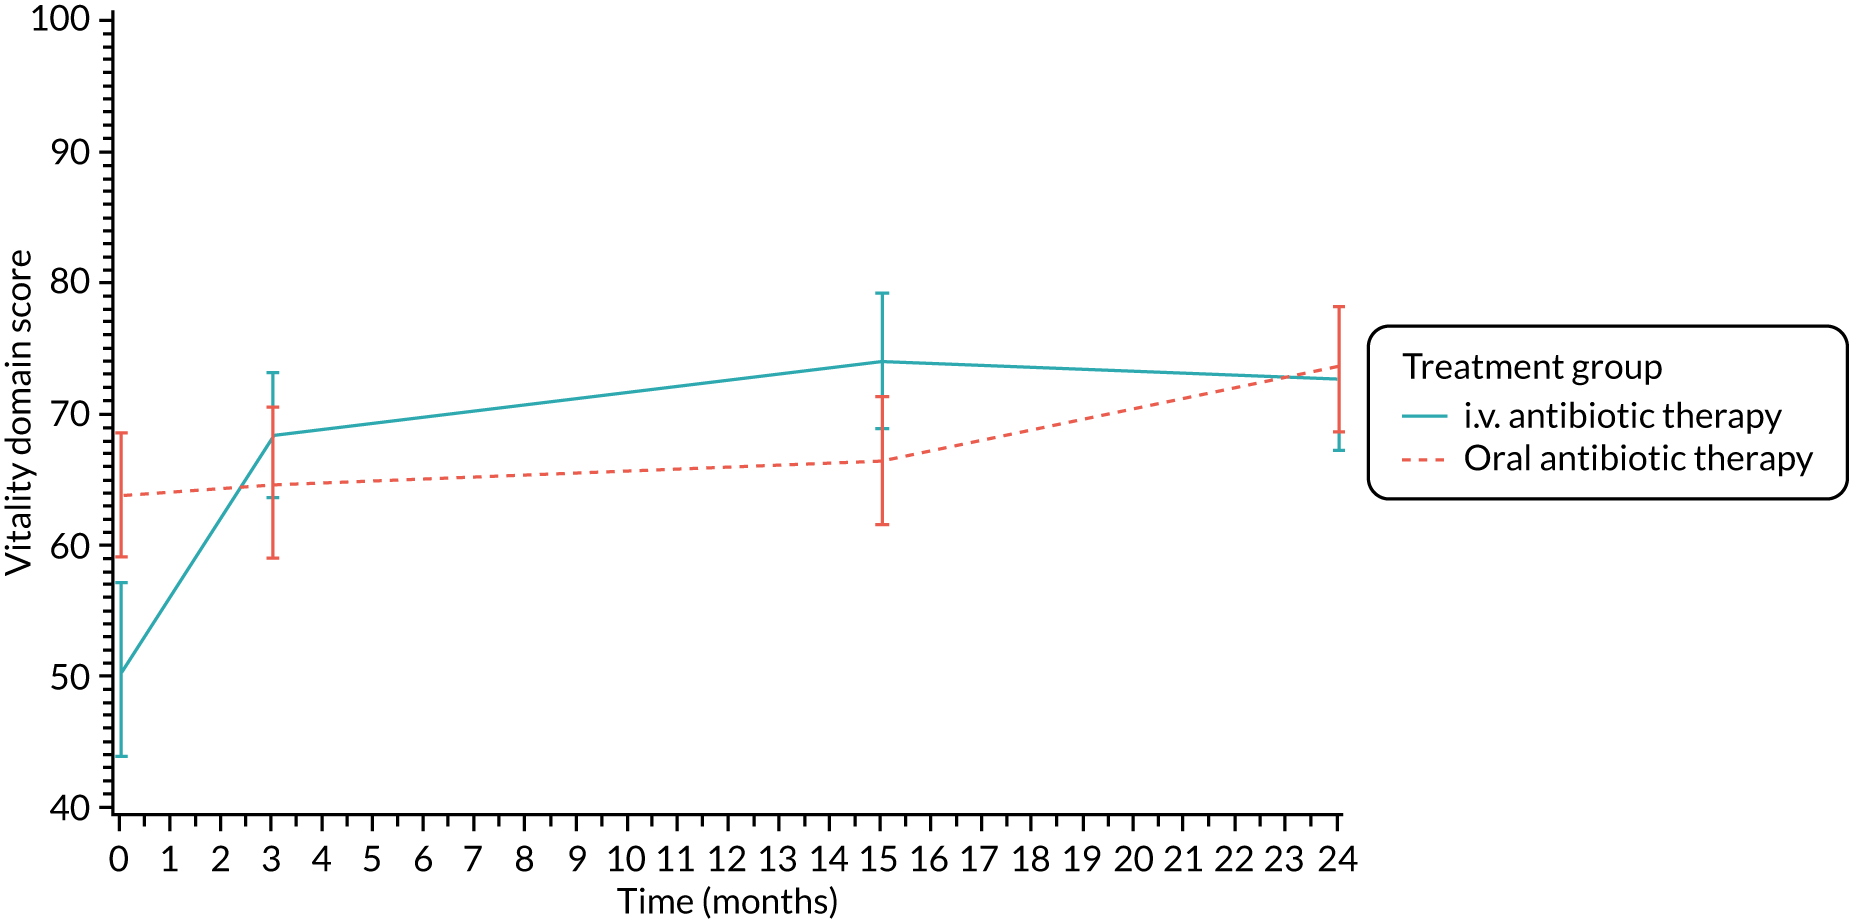
FIGURE 13.
Emotional functioning (self-report): mean scores over time by treatment group.
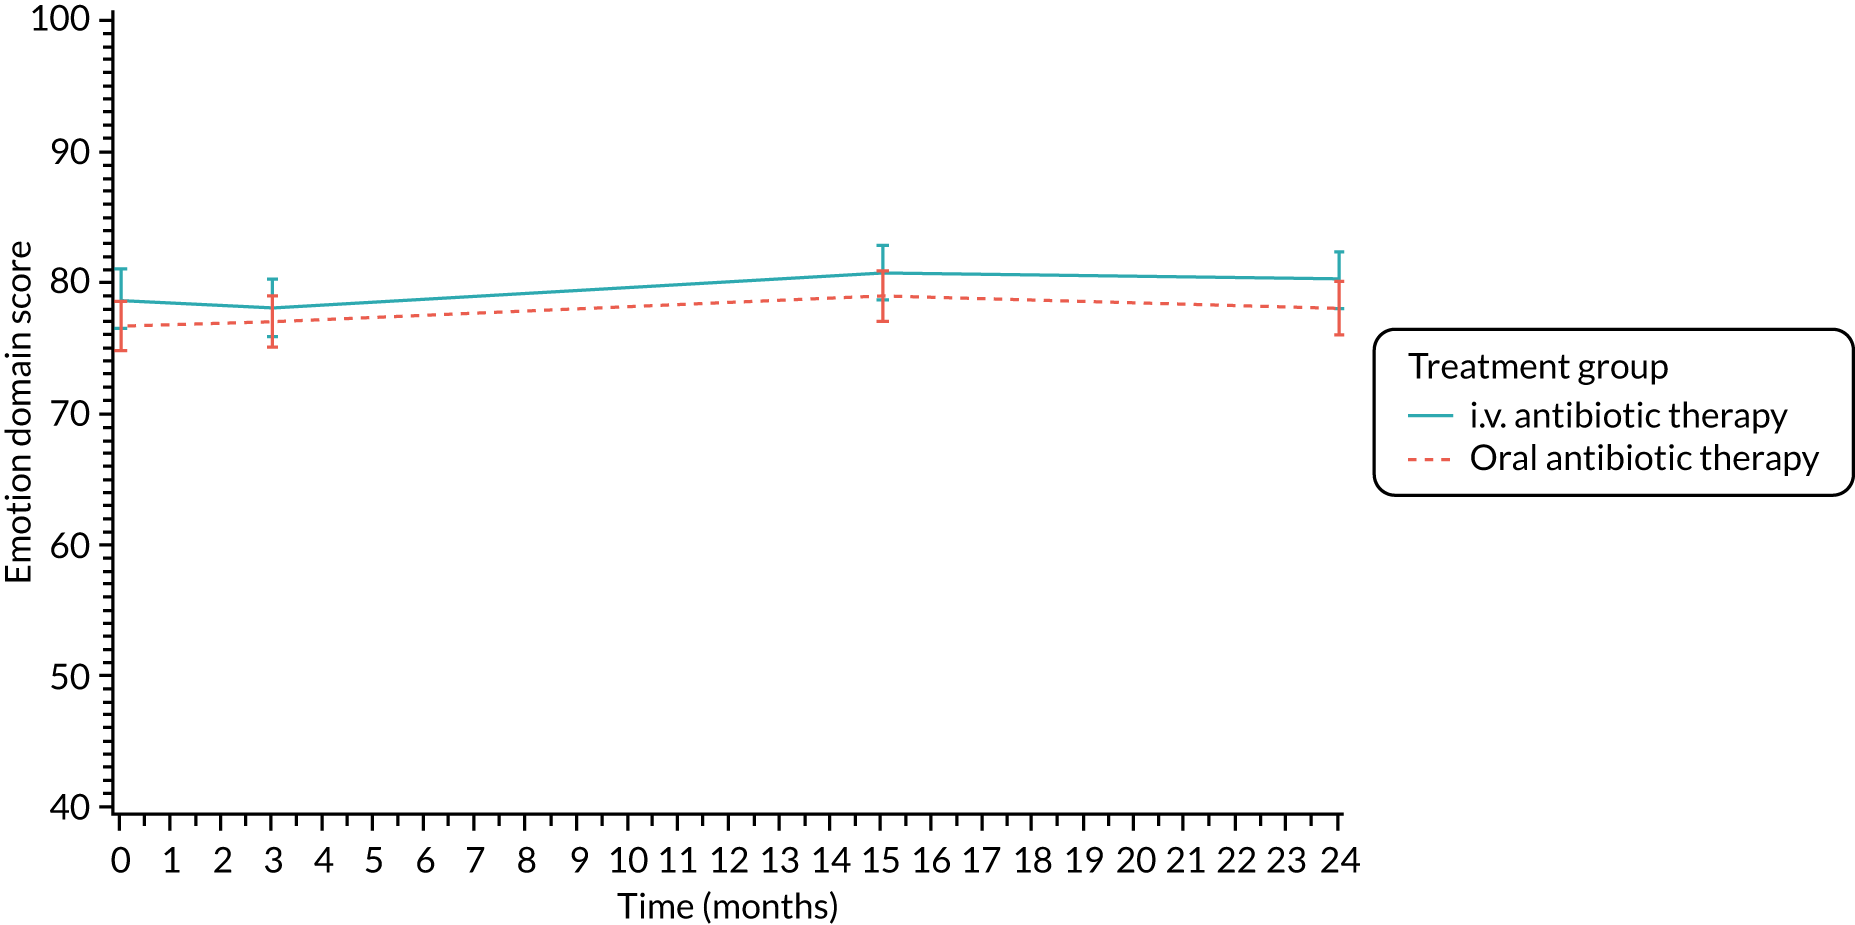
FIGURE 14.
Social functioning (self-report): mean scores over time by treatment group.
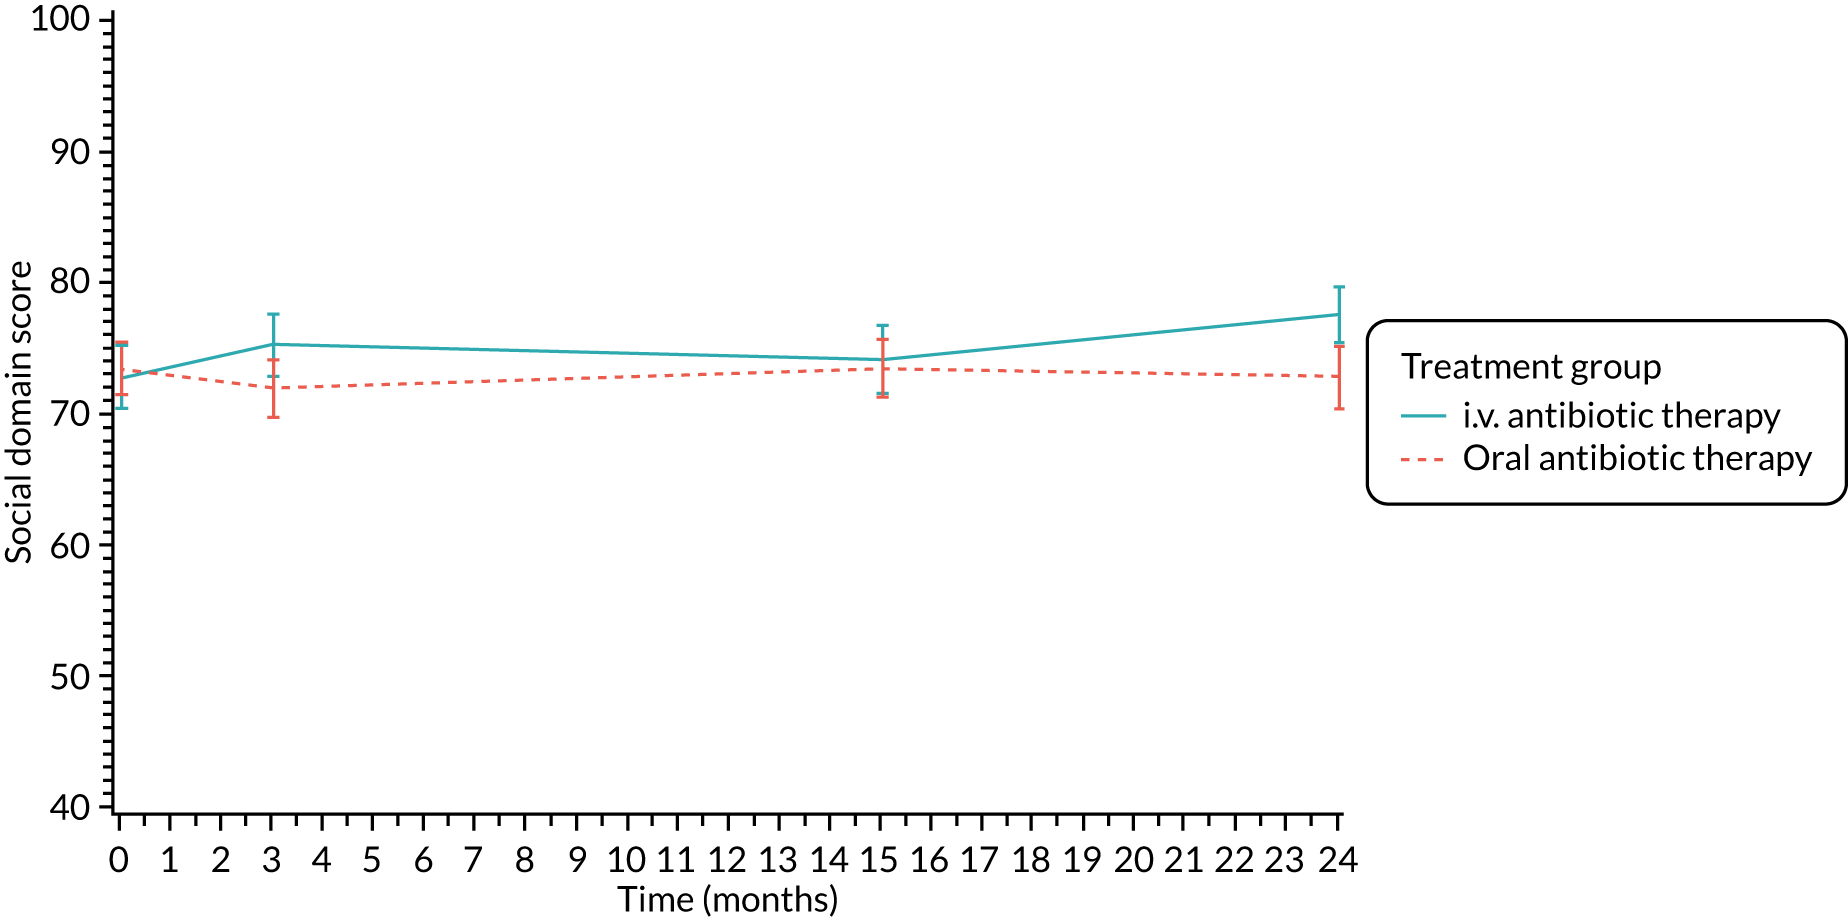
FIGURE 15.
Body image (self-report): mean scores over time by treatment group.
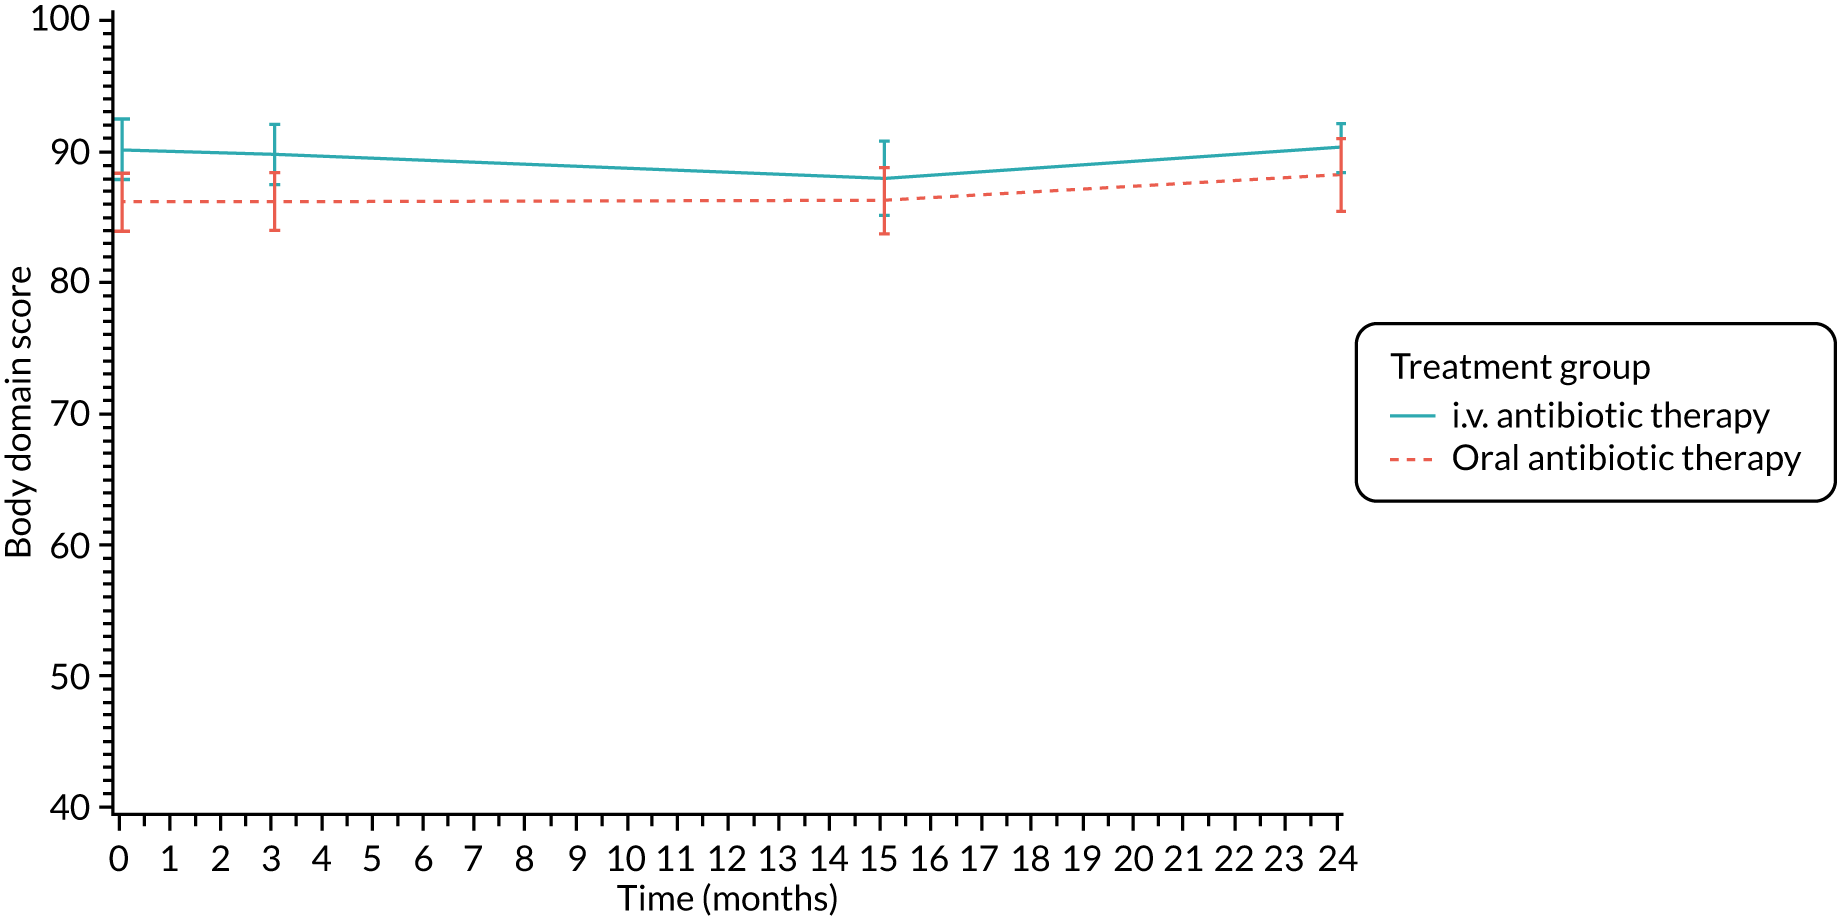
FIGURE 16.
Eating problems (self-report): mean scores over time by treatment group.
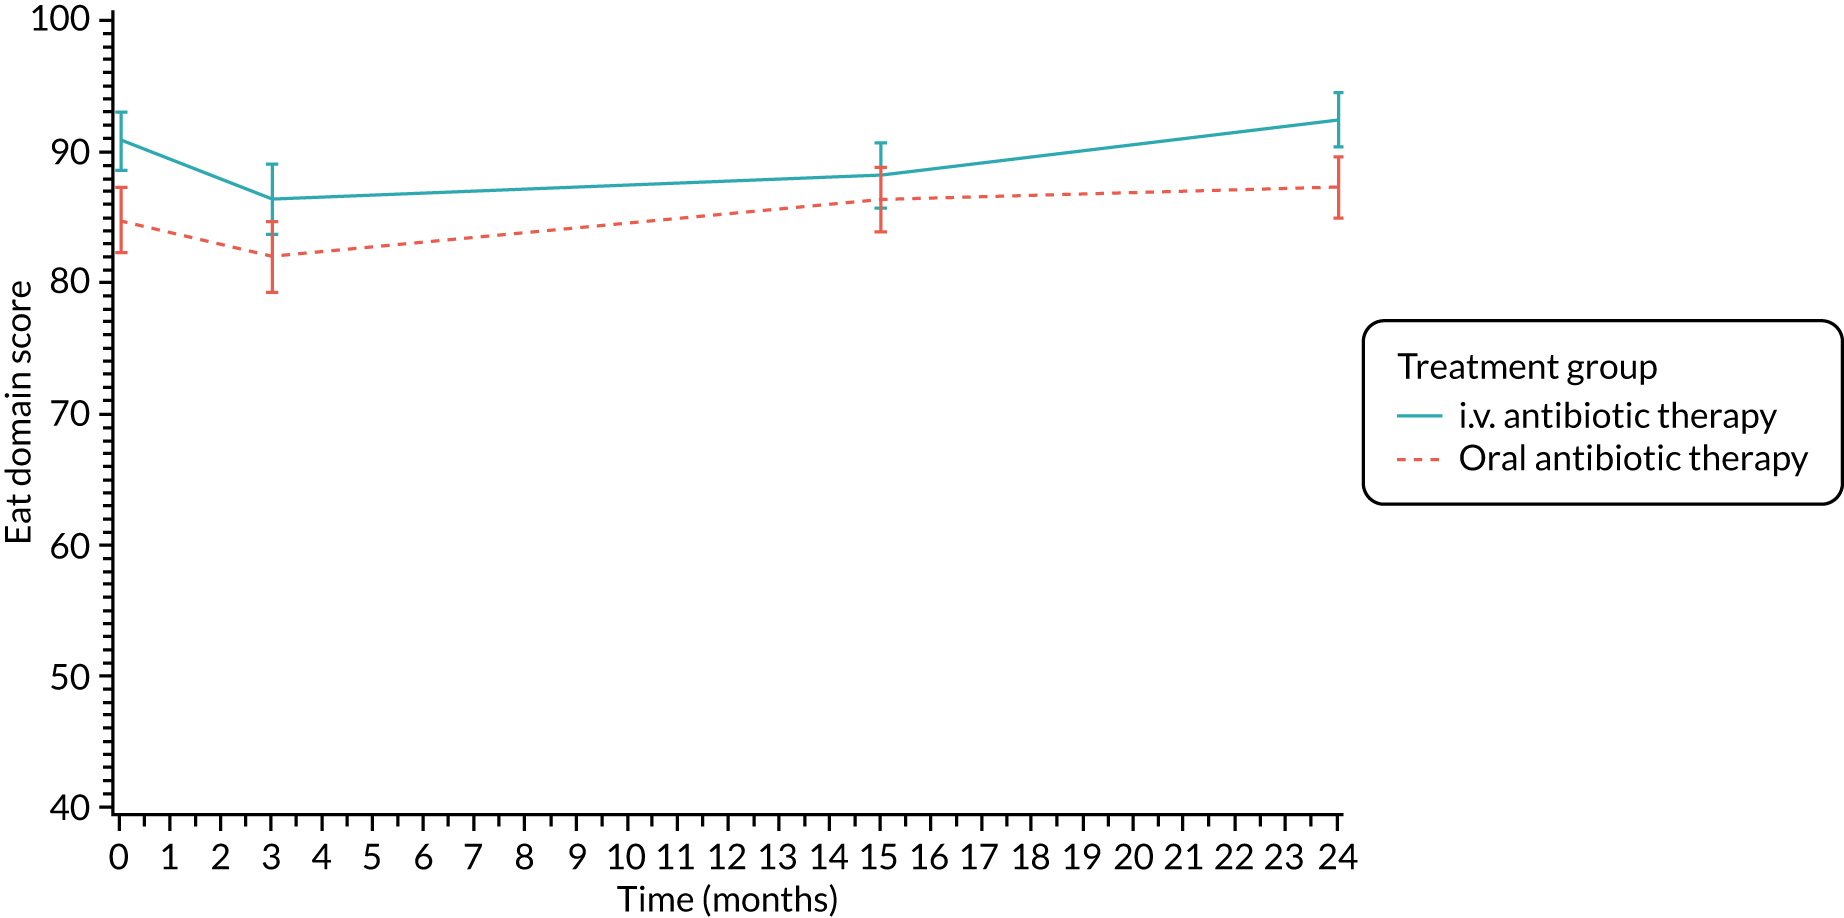
FIGURE 17.
Treatment burden (self-report): mean scores over time by treatment group.
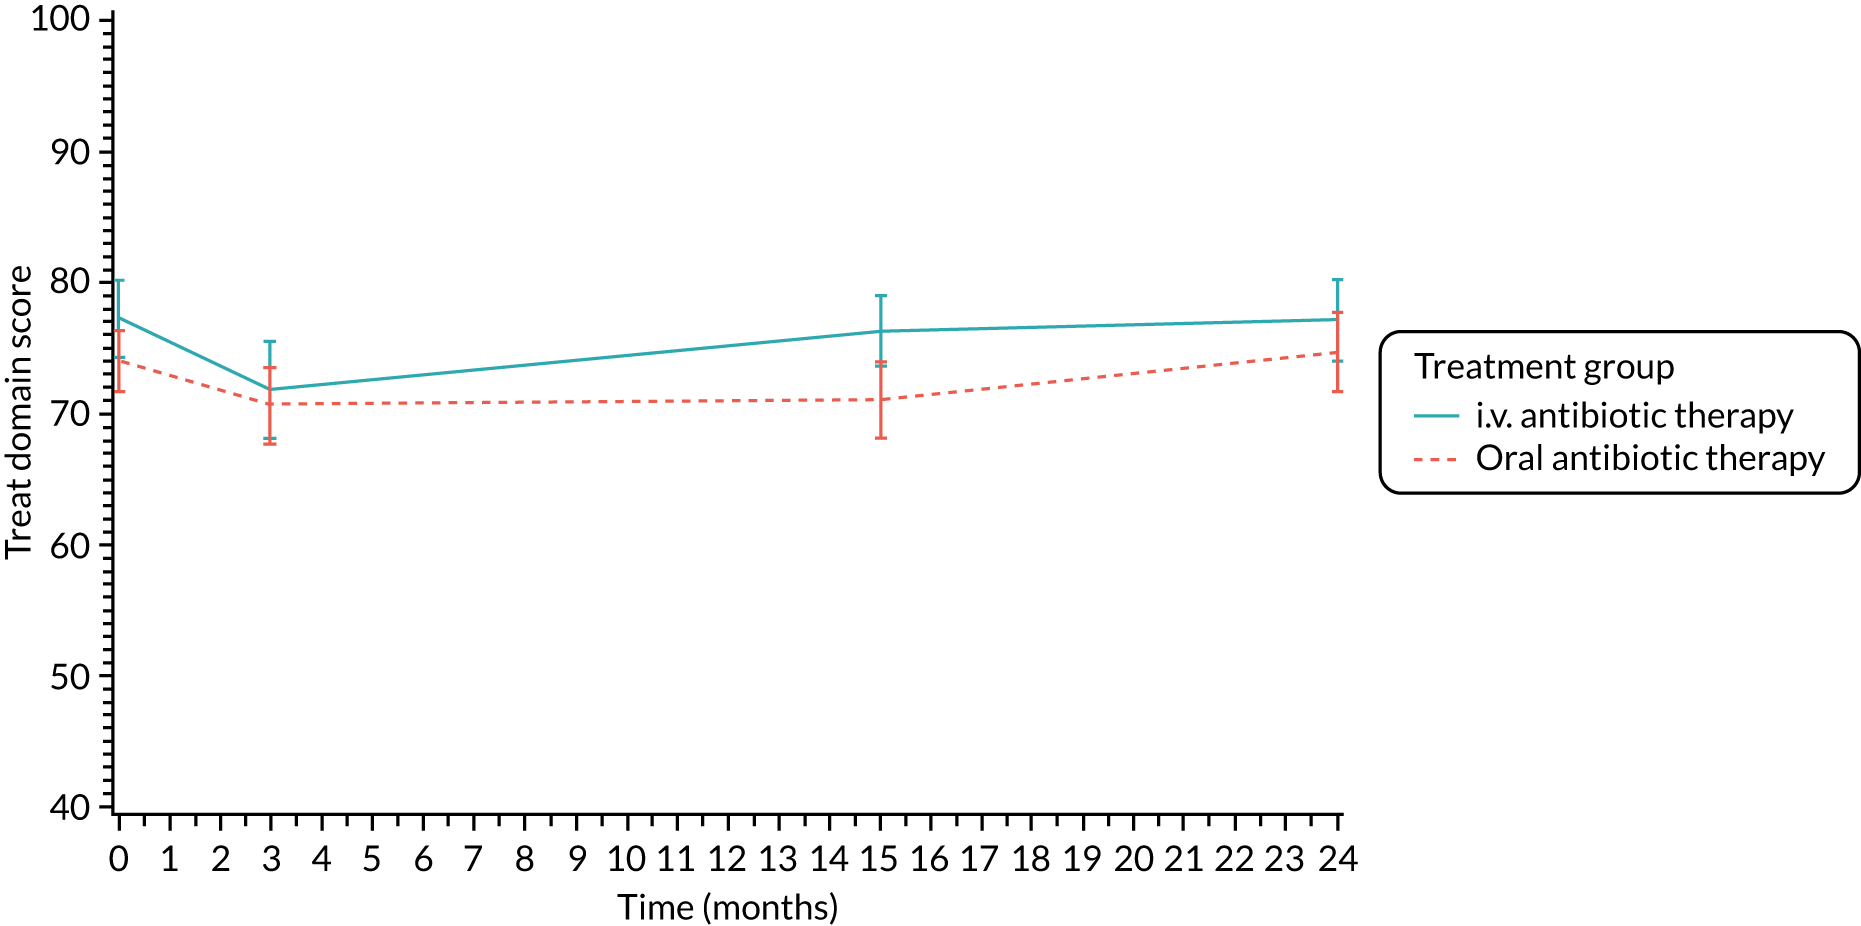
FIGURE 18.
Health perceptions (self-report): mean scores over time by treatment group.
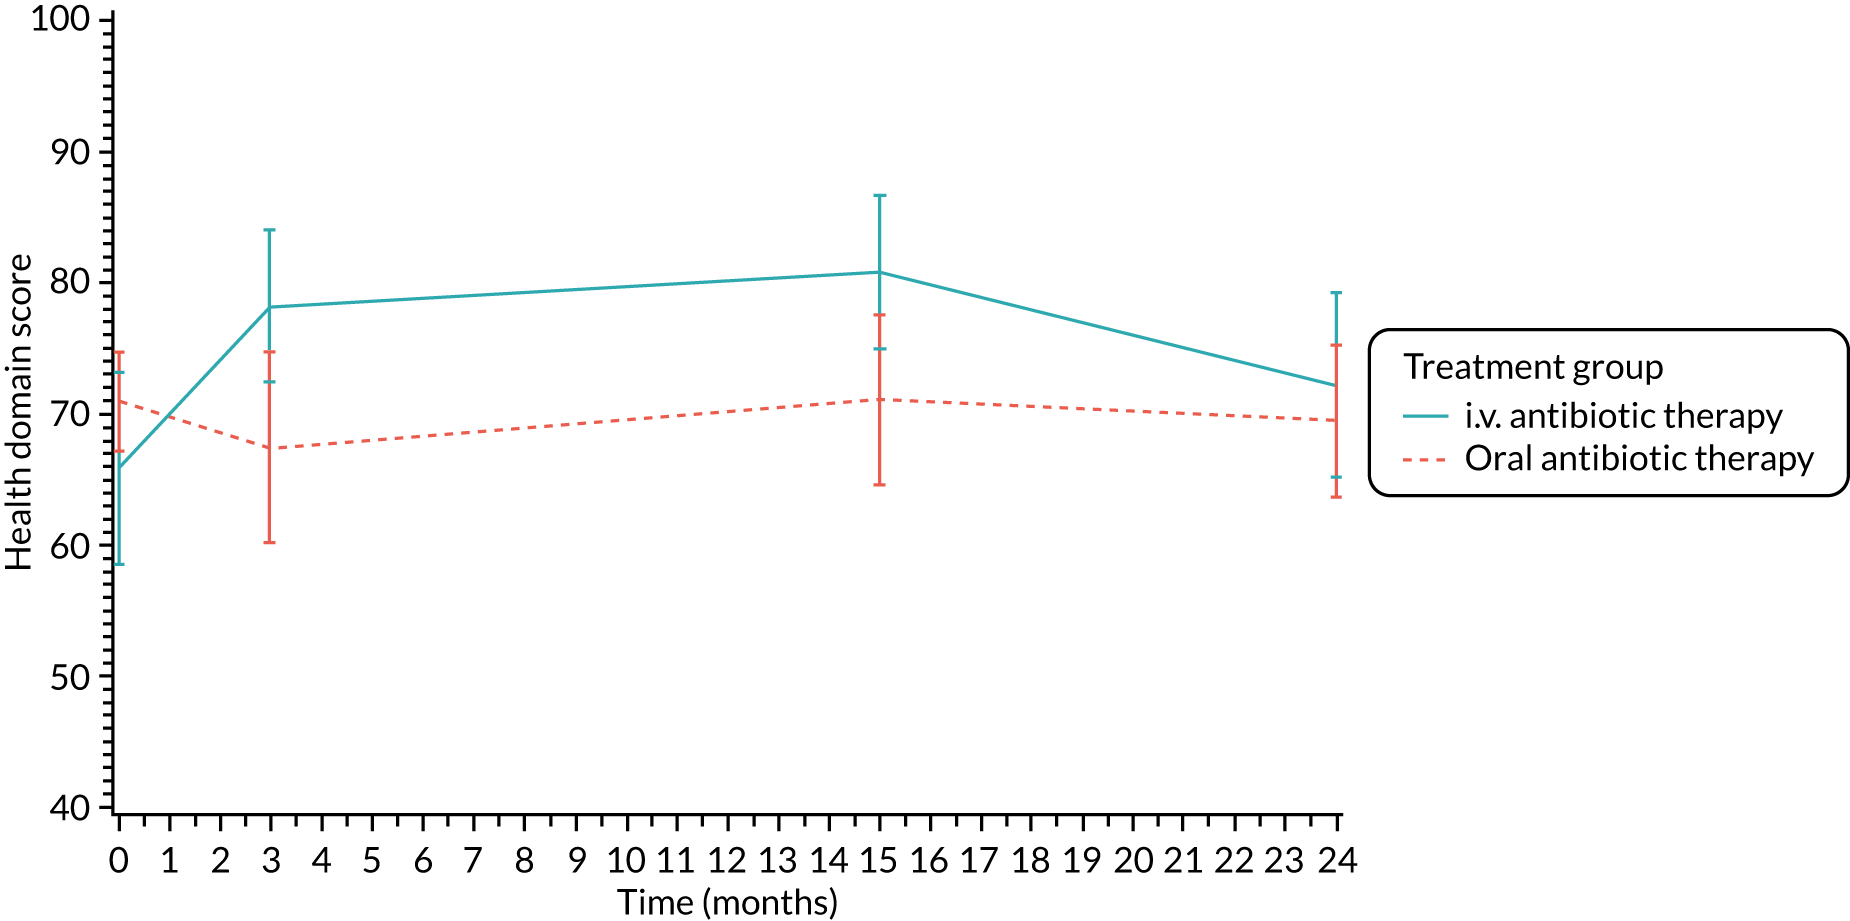
FIGURE 19.
Weight (self-report): mean scores over time by treatment group.
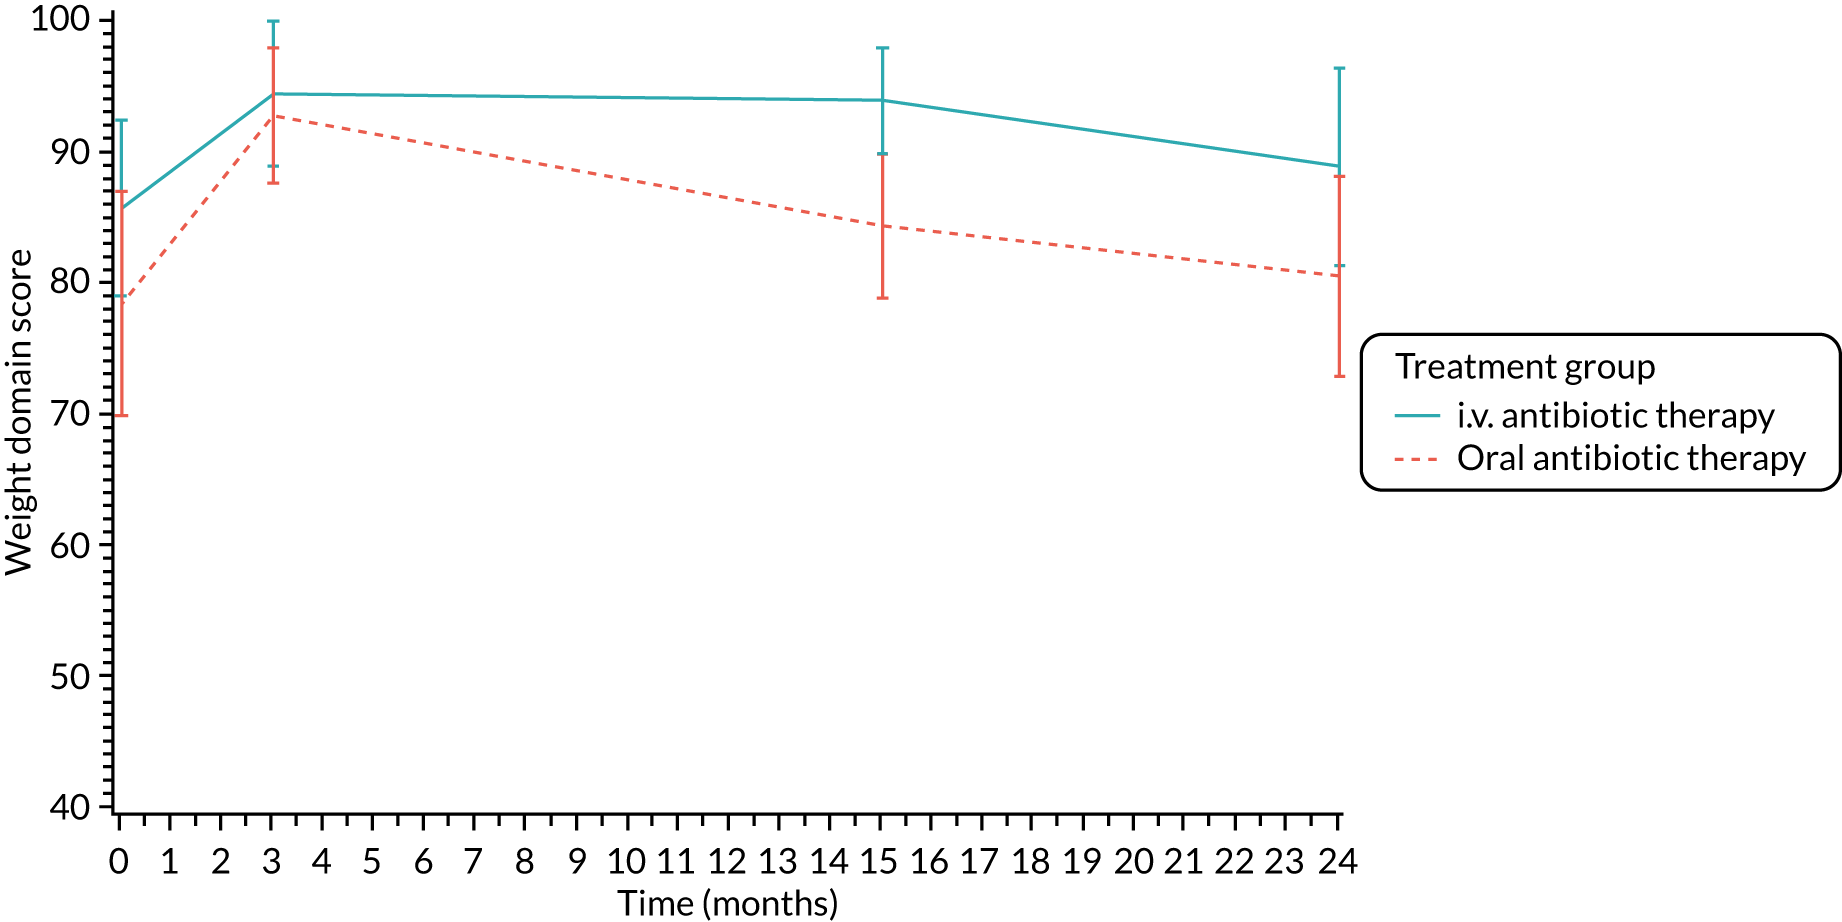
FIGURE 20.
Respiratory symptoms (self-report): mean scores over time by treatment group.
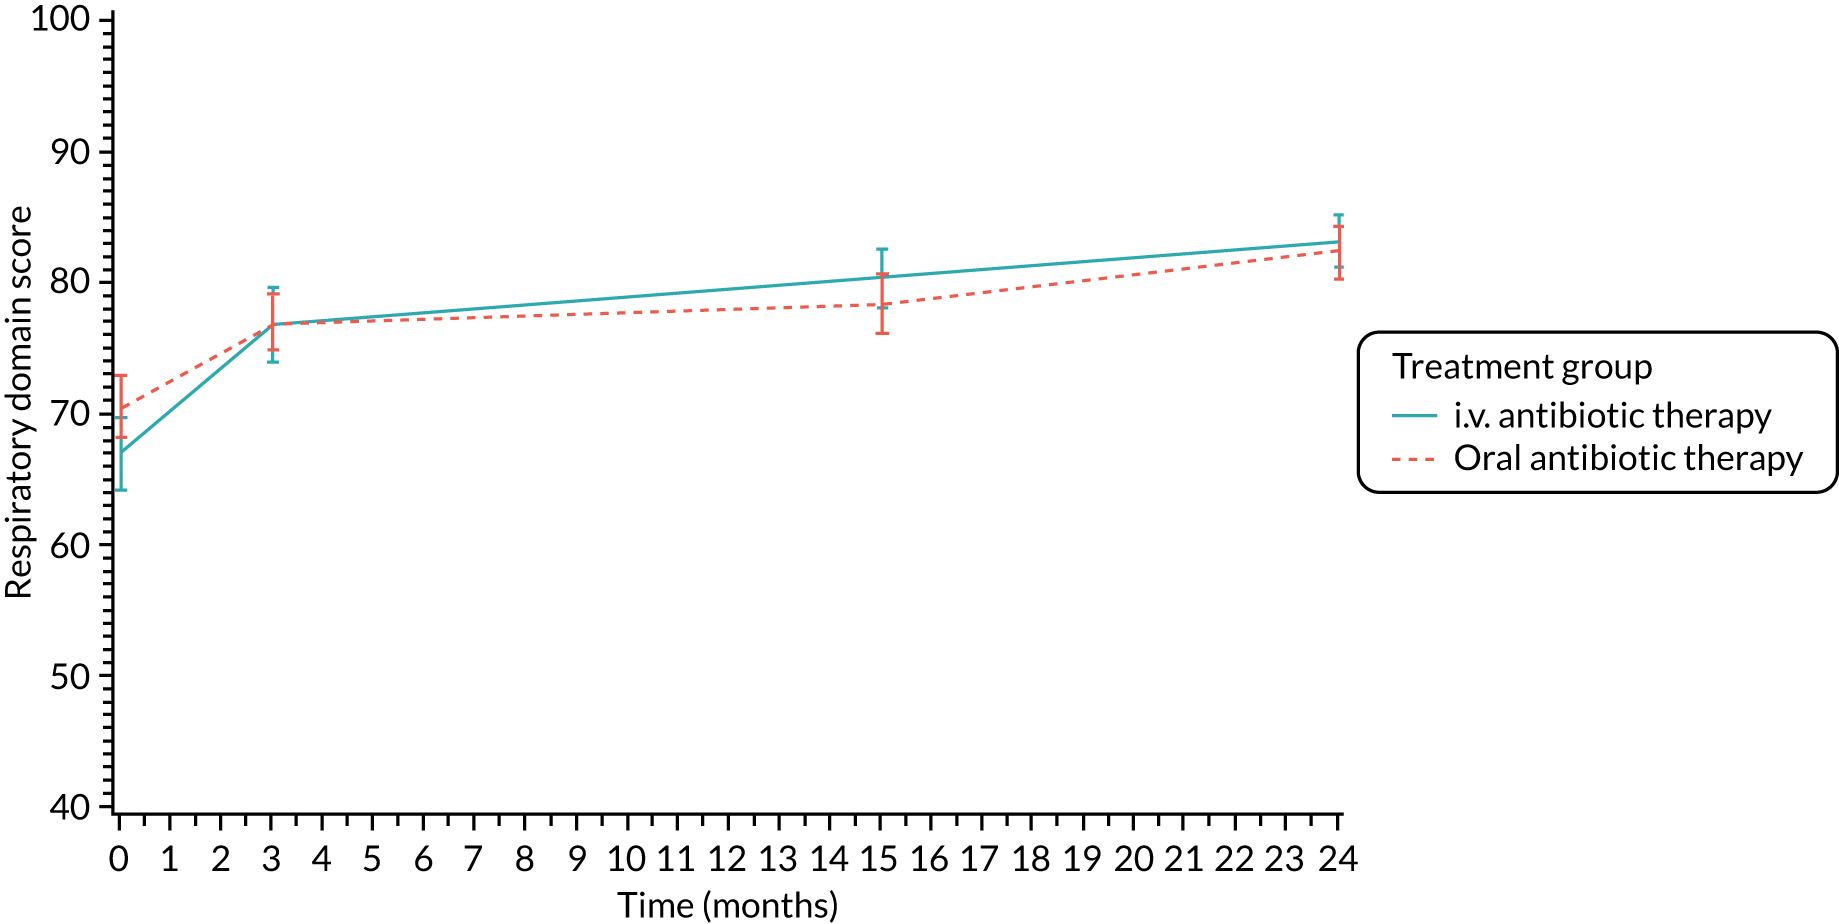
FIGURE 21.
Digestive symptoms (self-report): mean scores over time by treatment group.
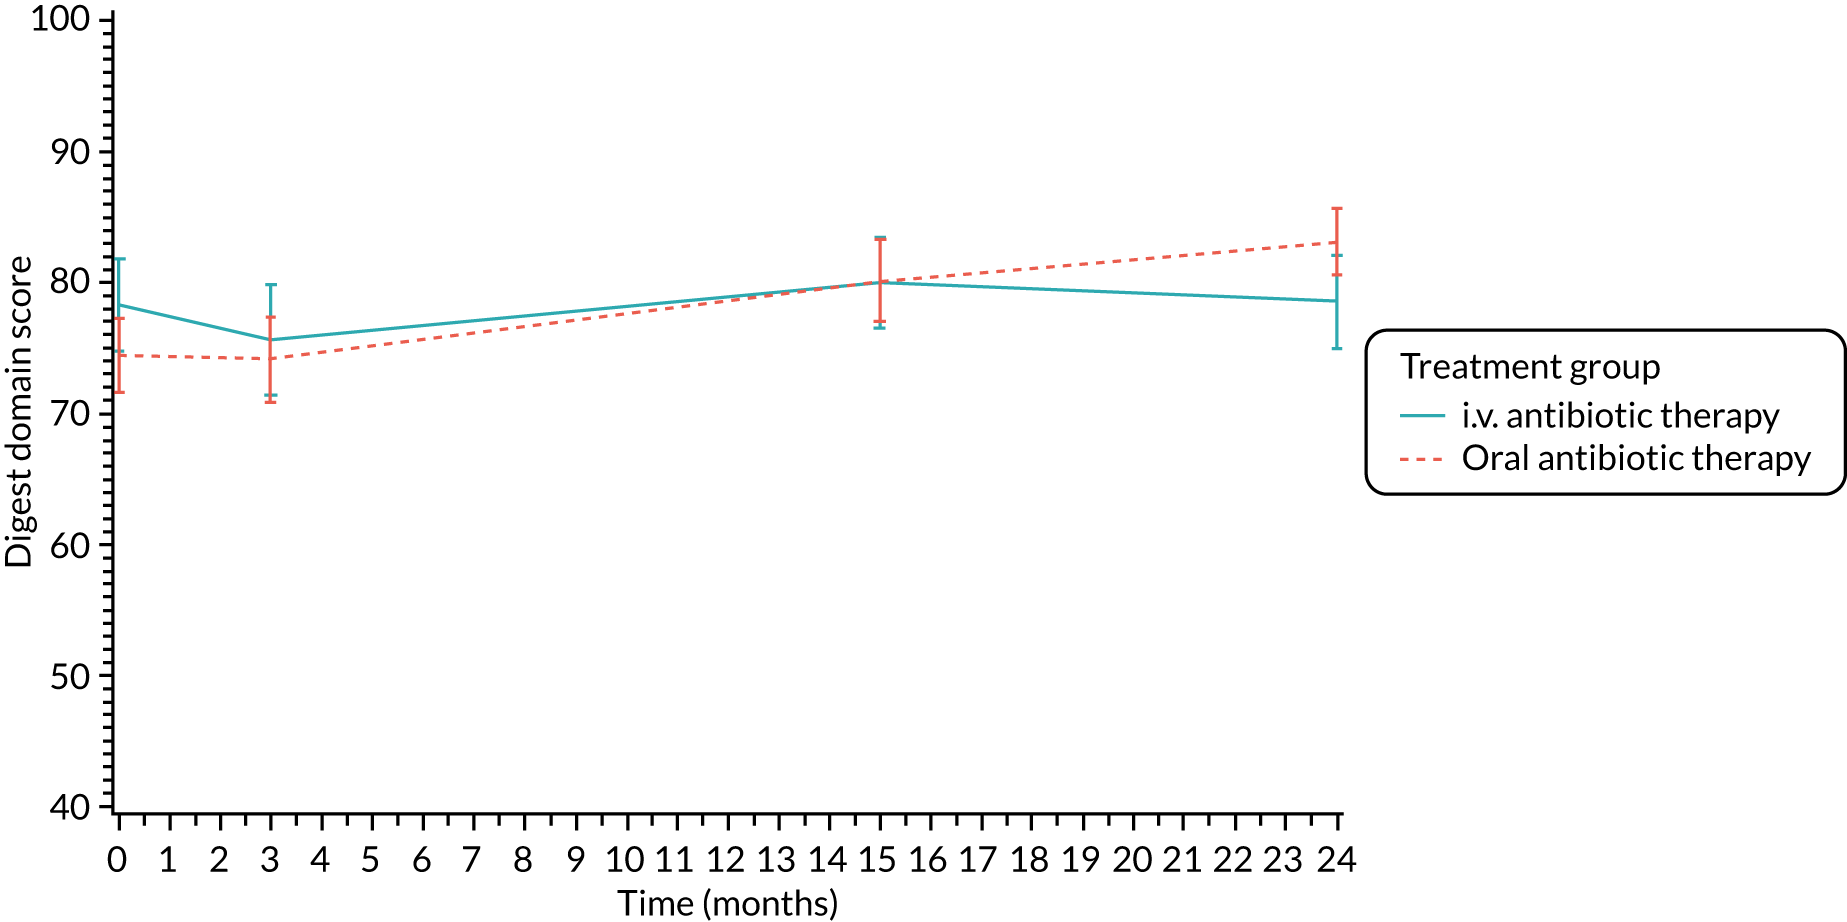
FIGURE 22.
Physical functioning (parent/carer): mean scores over time by treatment group.
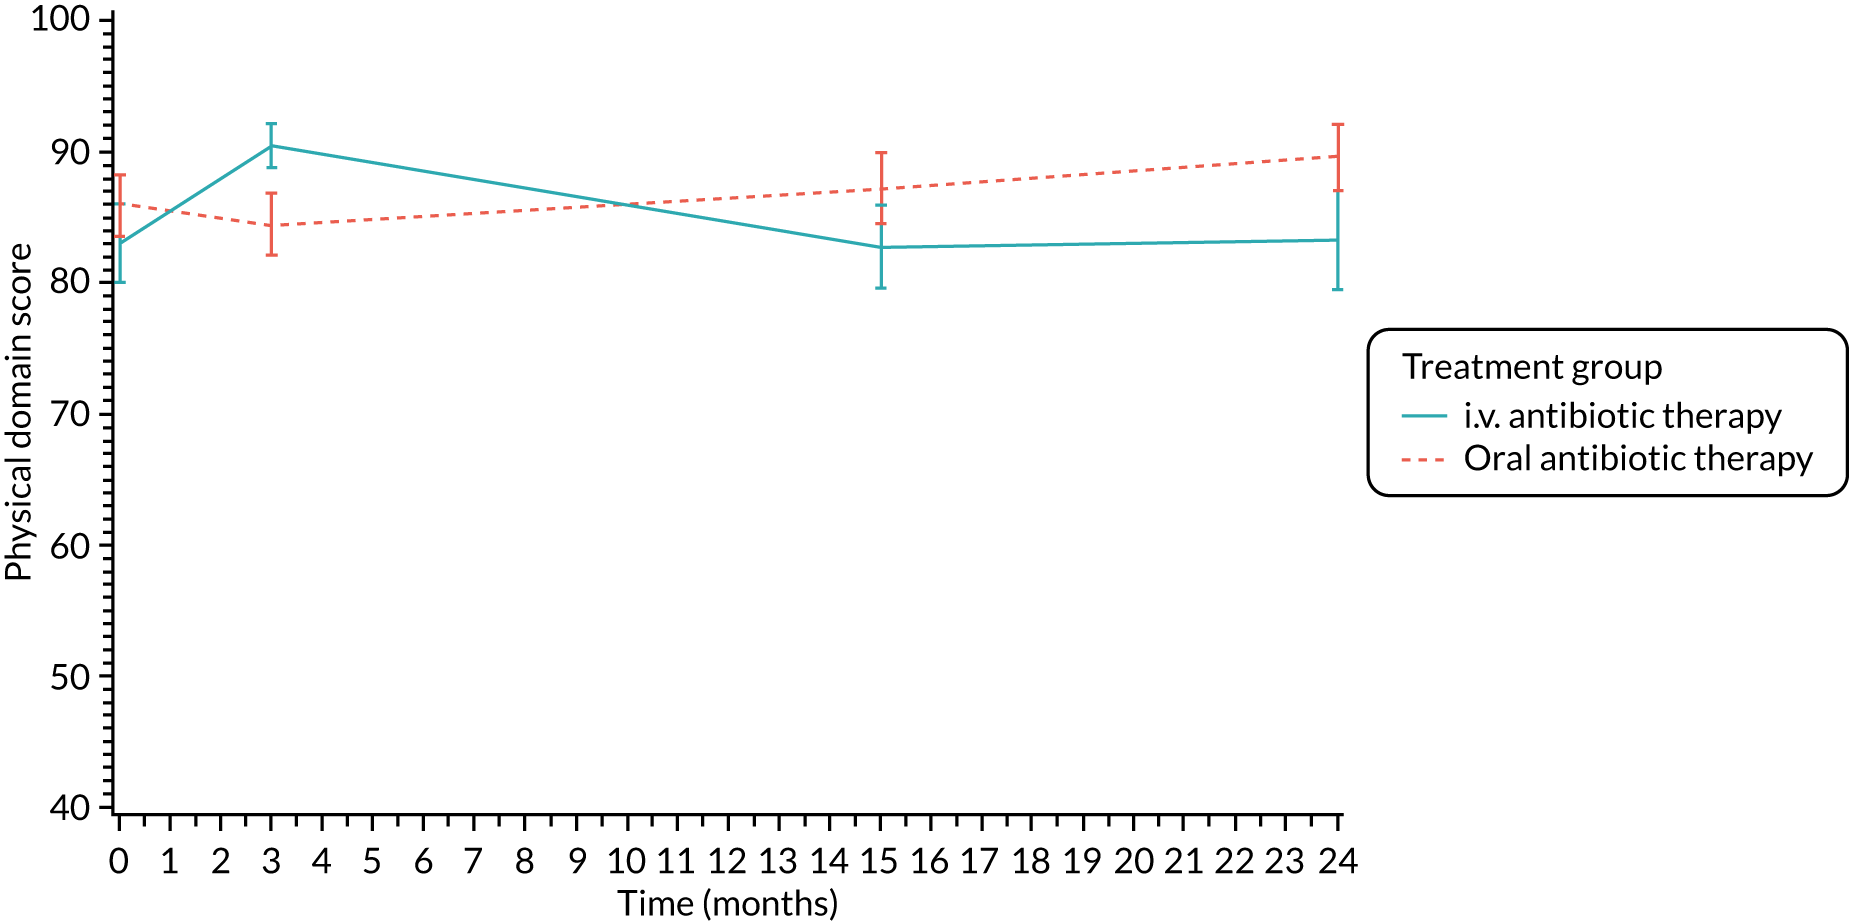
FIGURE 23.
Role/school functioning (parent/carer): mean scores over time by treatment group.
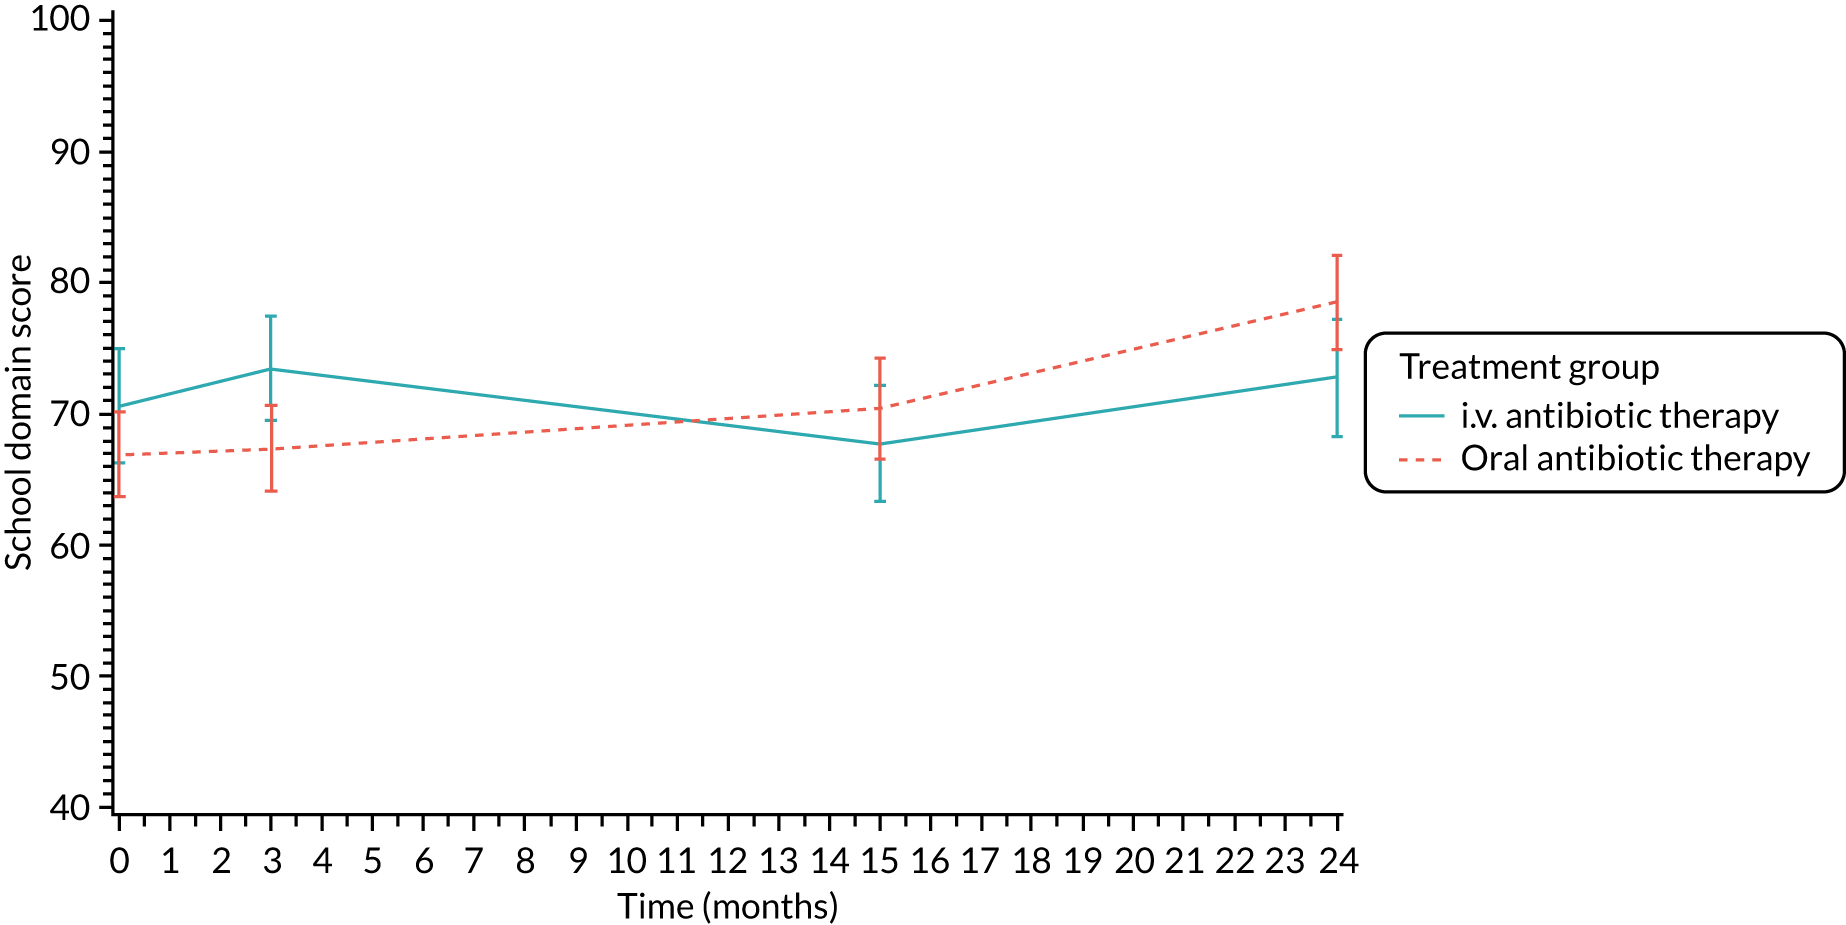
FIGURE 24.
Vitality (parent/carer): mean scores over time by treatment group.
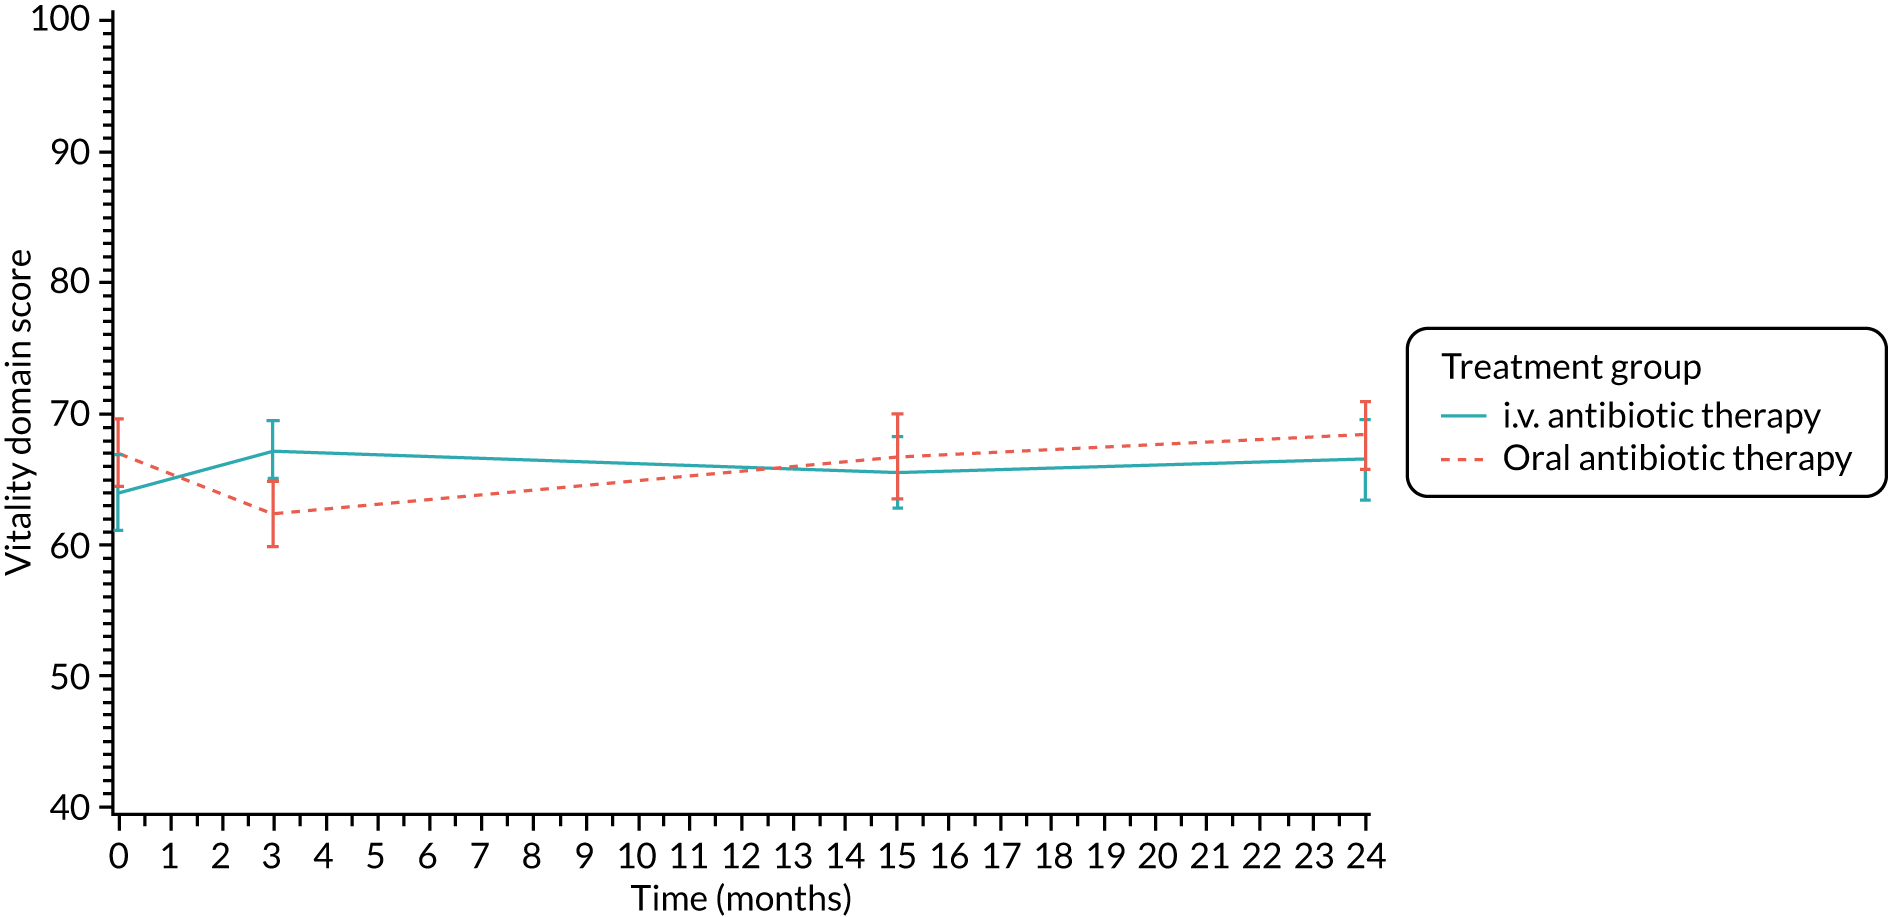
FIGURE 25.
Emotional functioning (parent/carer): mean scores over time by treatment group.
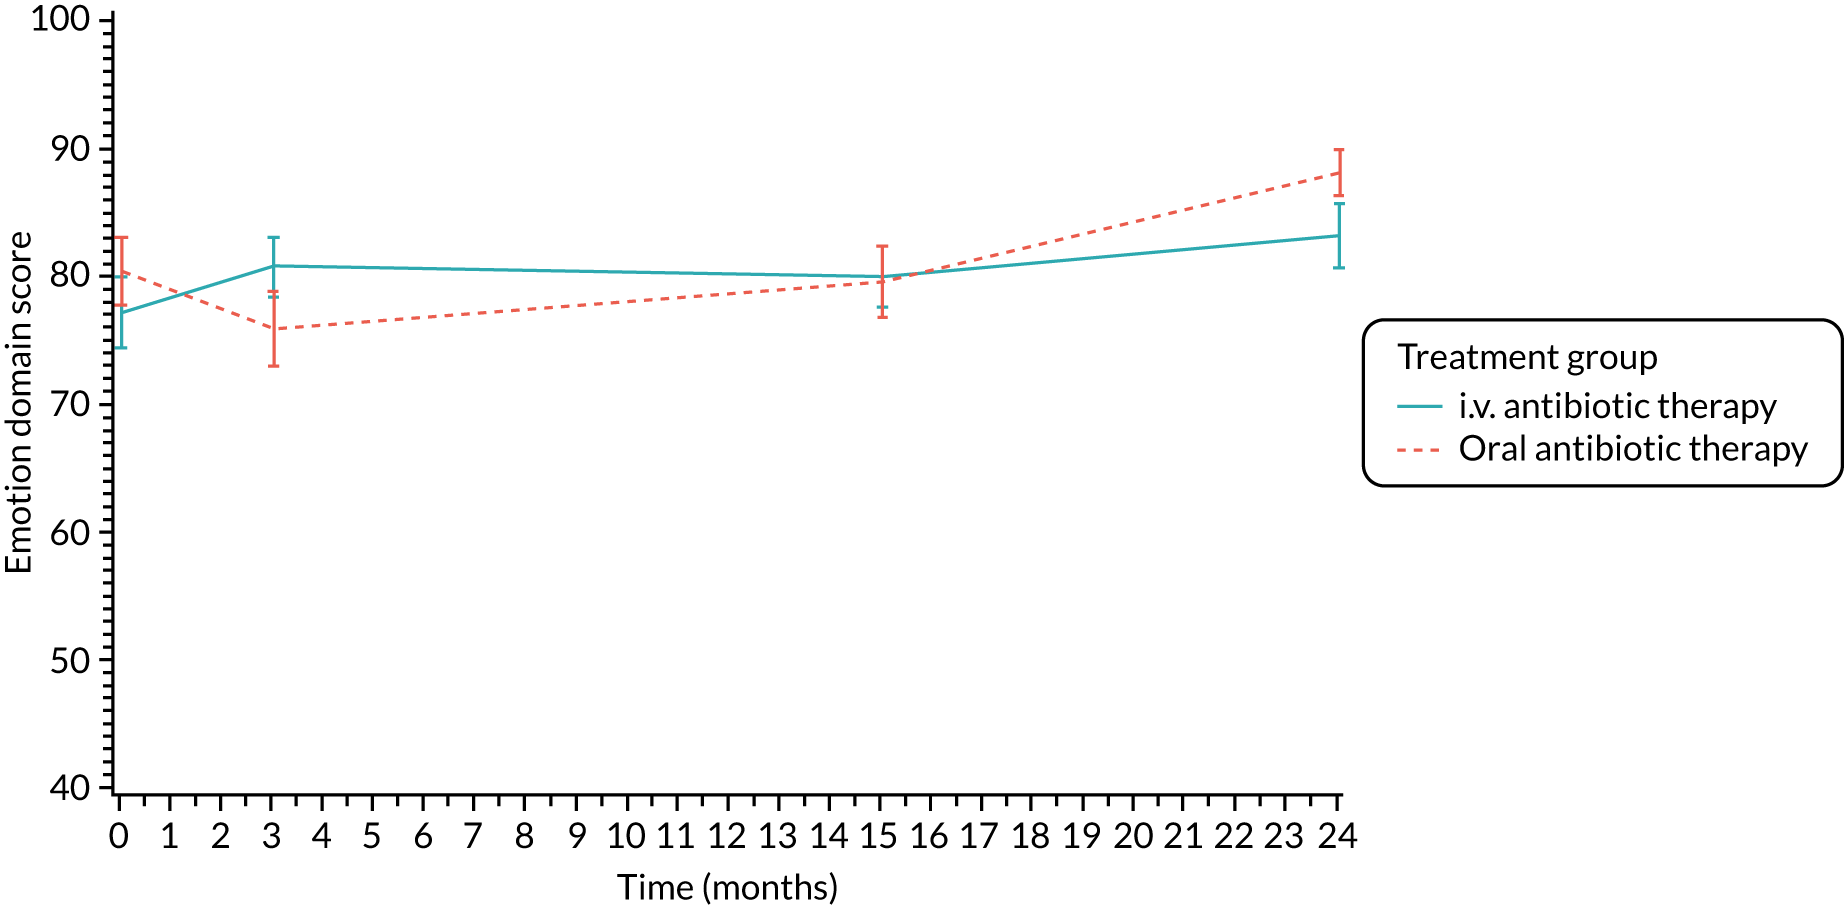
FIGURE 26.
Body image (parent/carer): mean scores over time by treatment group.
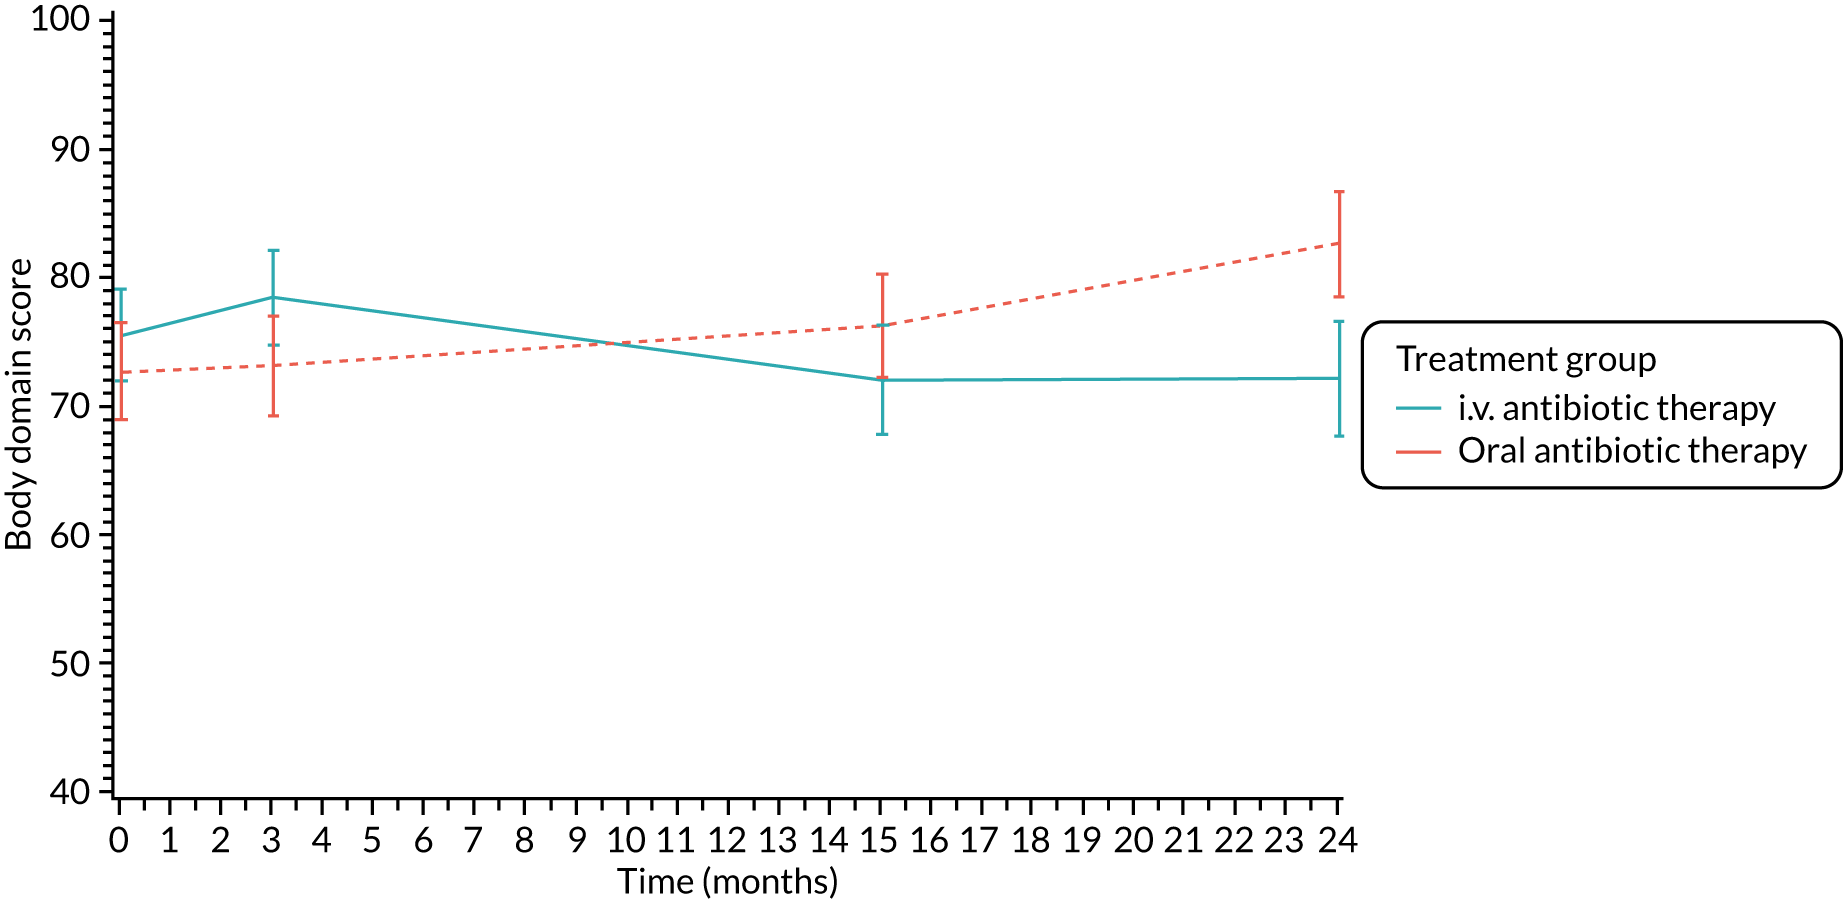
FIGURE 27.
Eating problems (parent/carer): mean scores over time by treatment group.
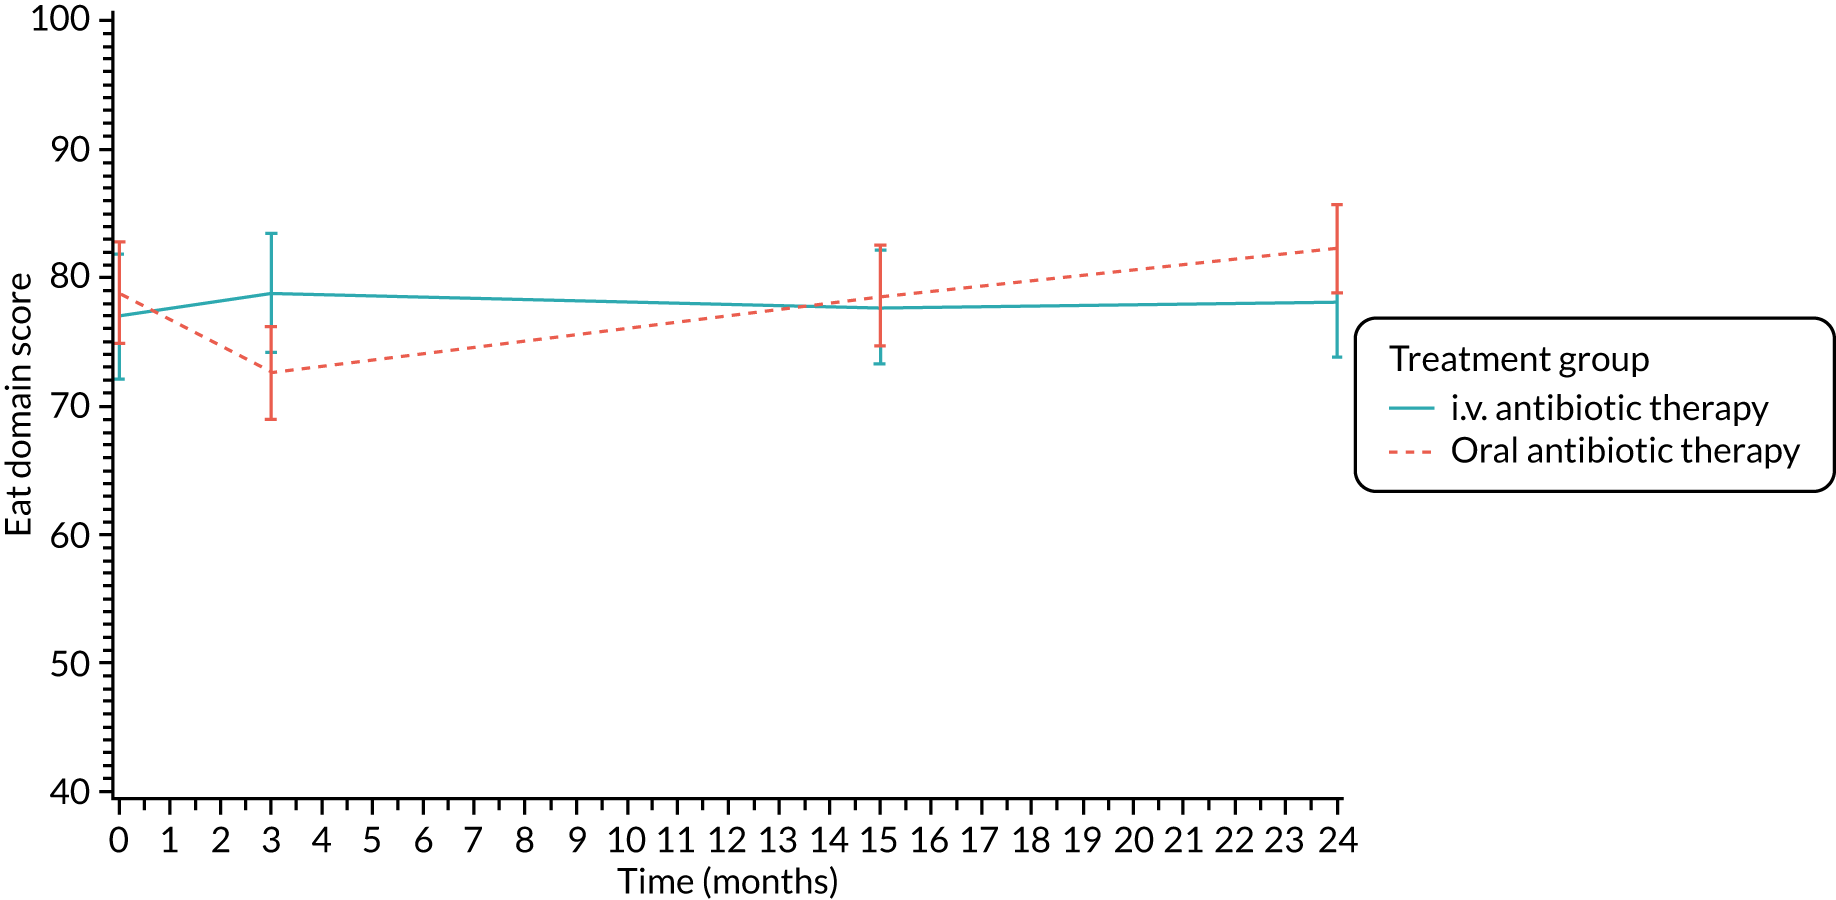
FIGURE 28.
Treatment burden (parent/carer): mean scores over time by treatment group.
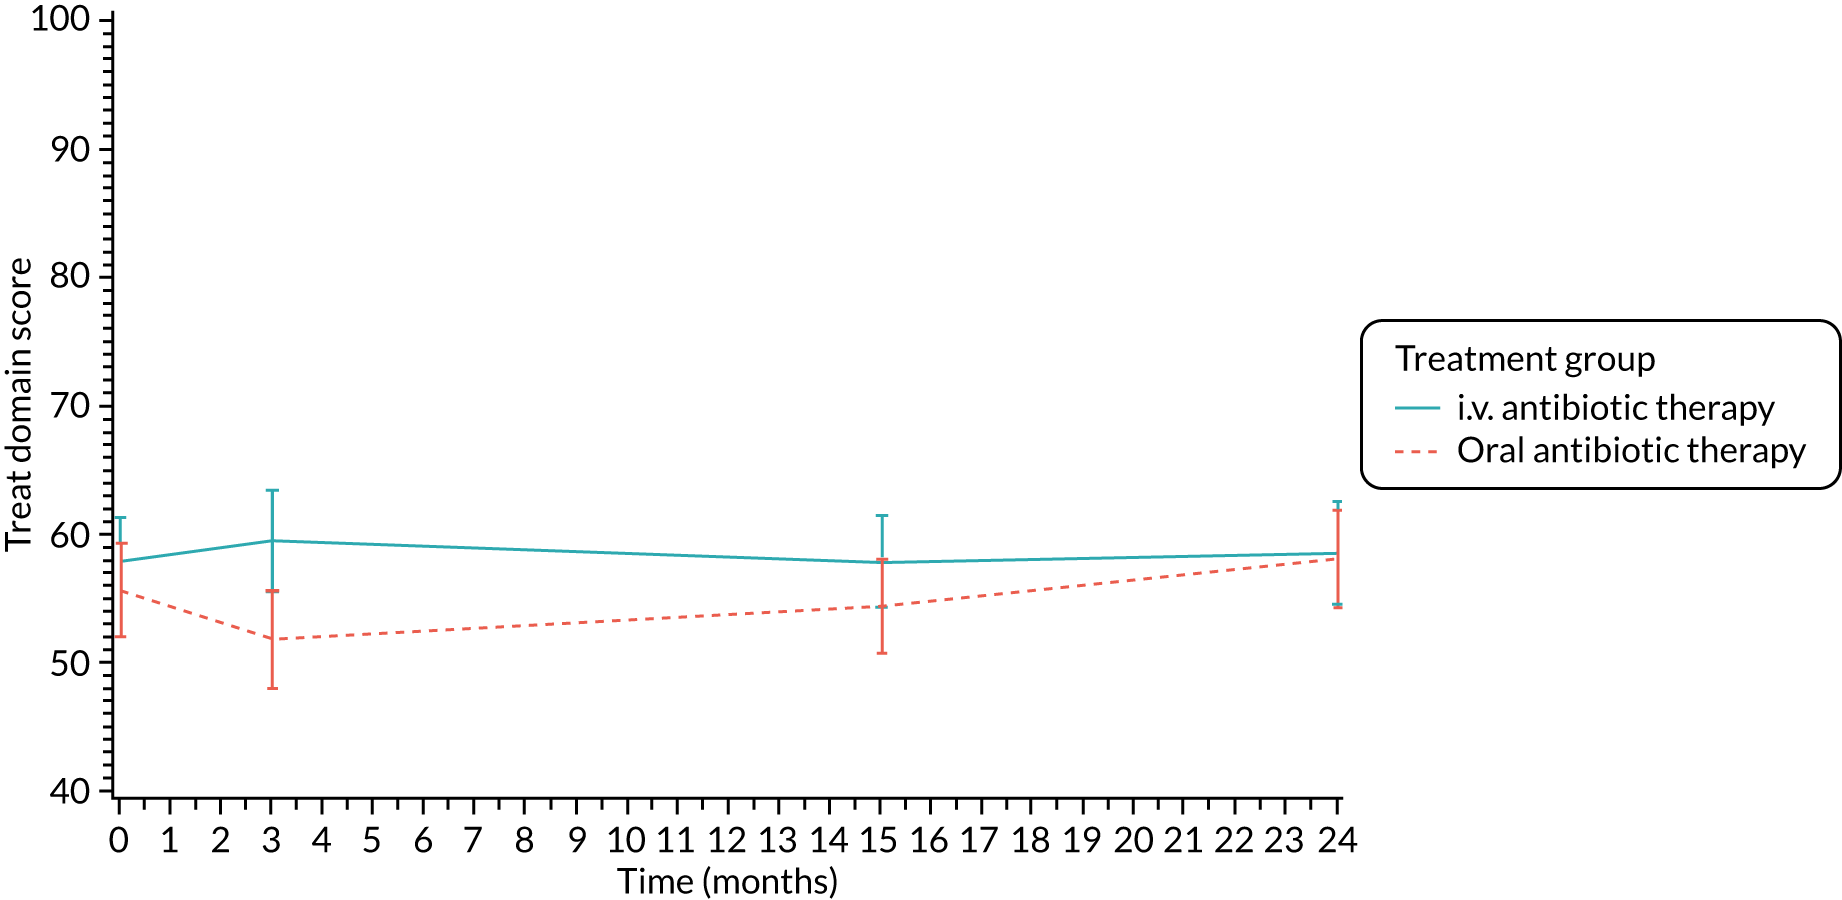
FIGURE 29.
Health perceptions (parent/carer): mean scores over time by treatment group.
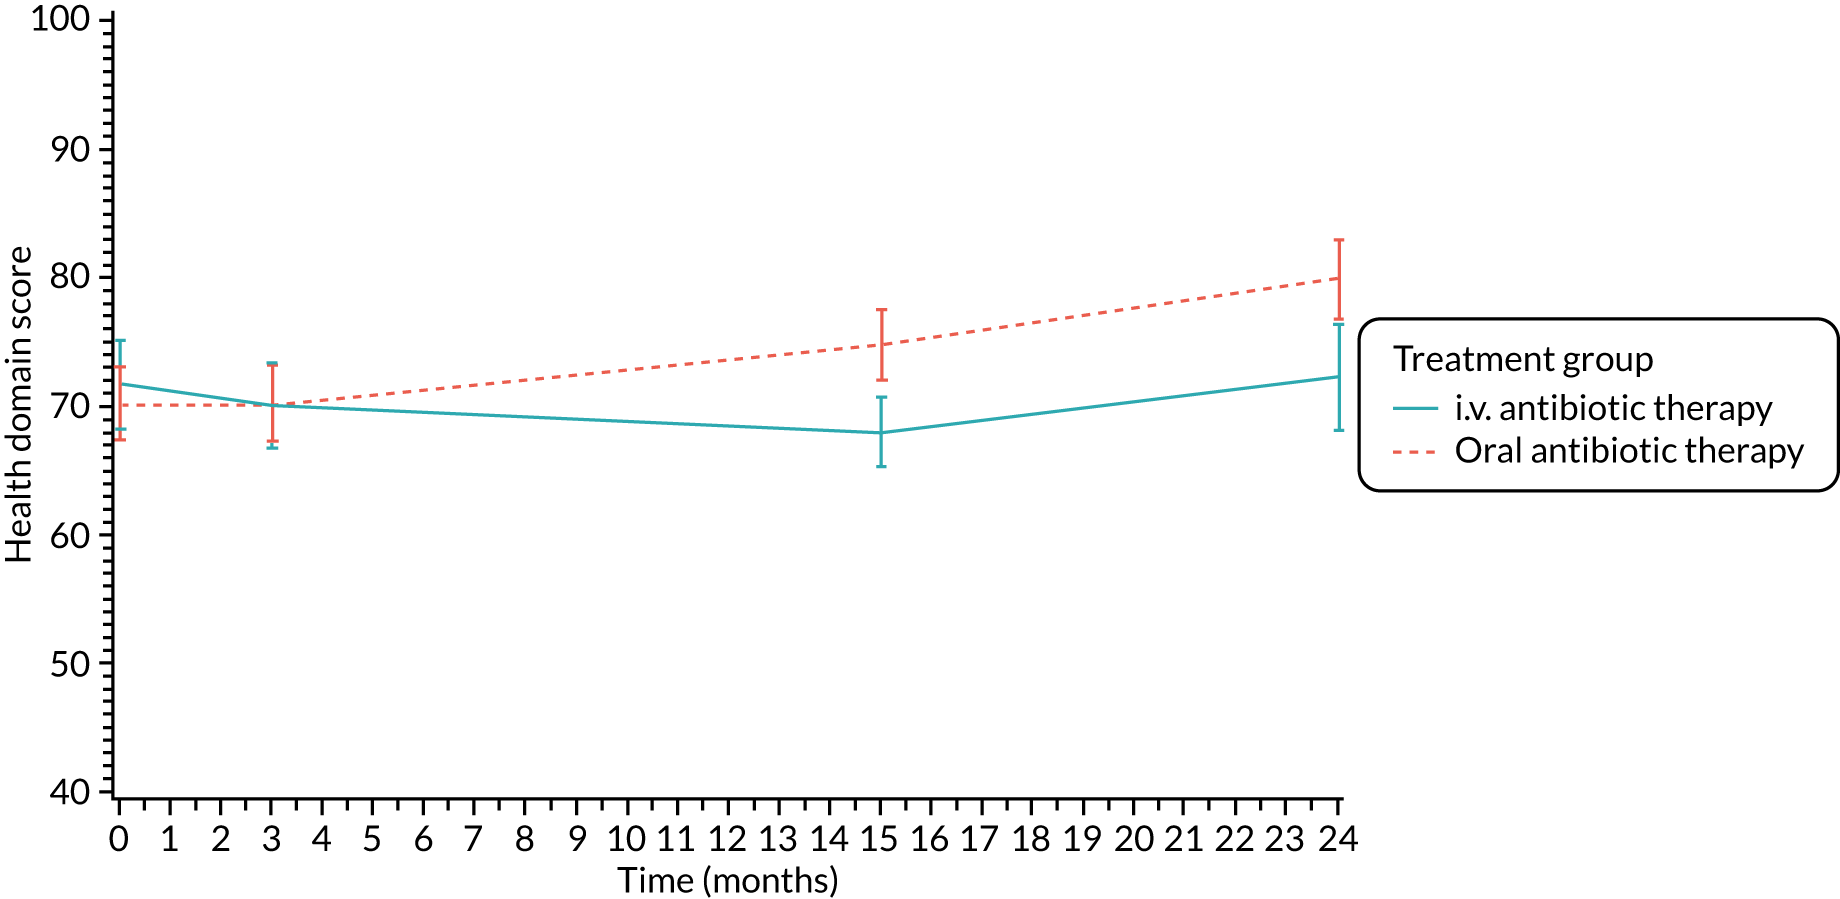
FIGURE 30.
Weight (parent/carer): mean scores over time by treatment group.
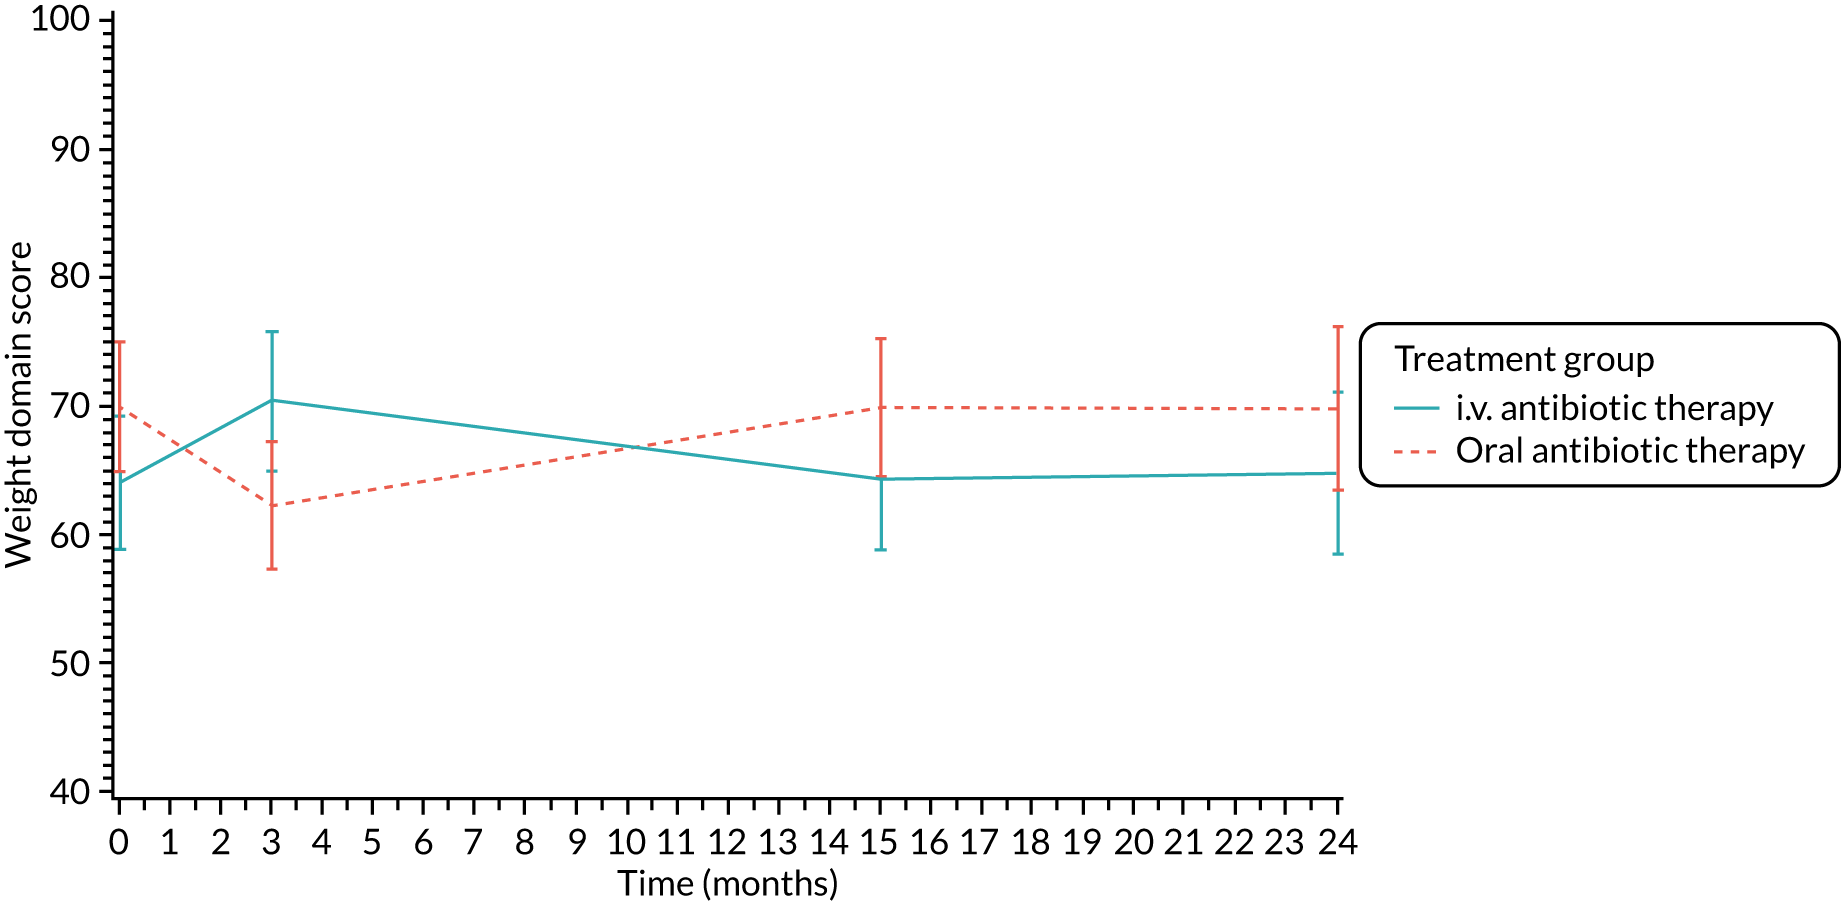
FIGURE 31.
Respiratory symptoms (parent/carer): mean scores over time by treatment group.
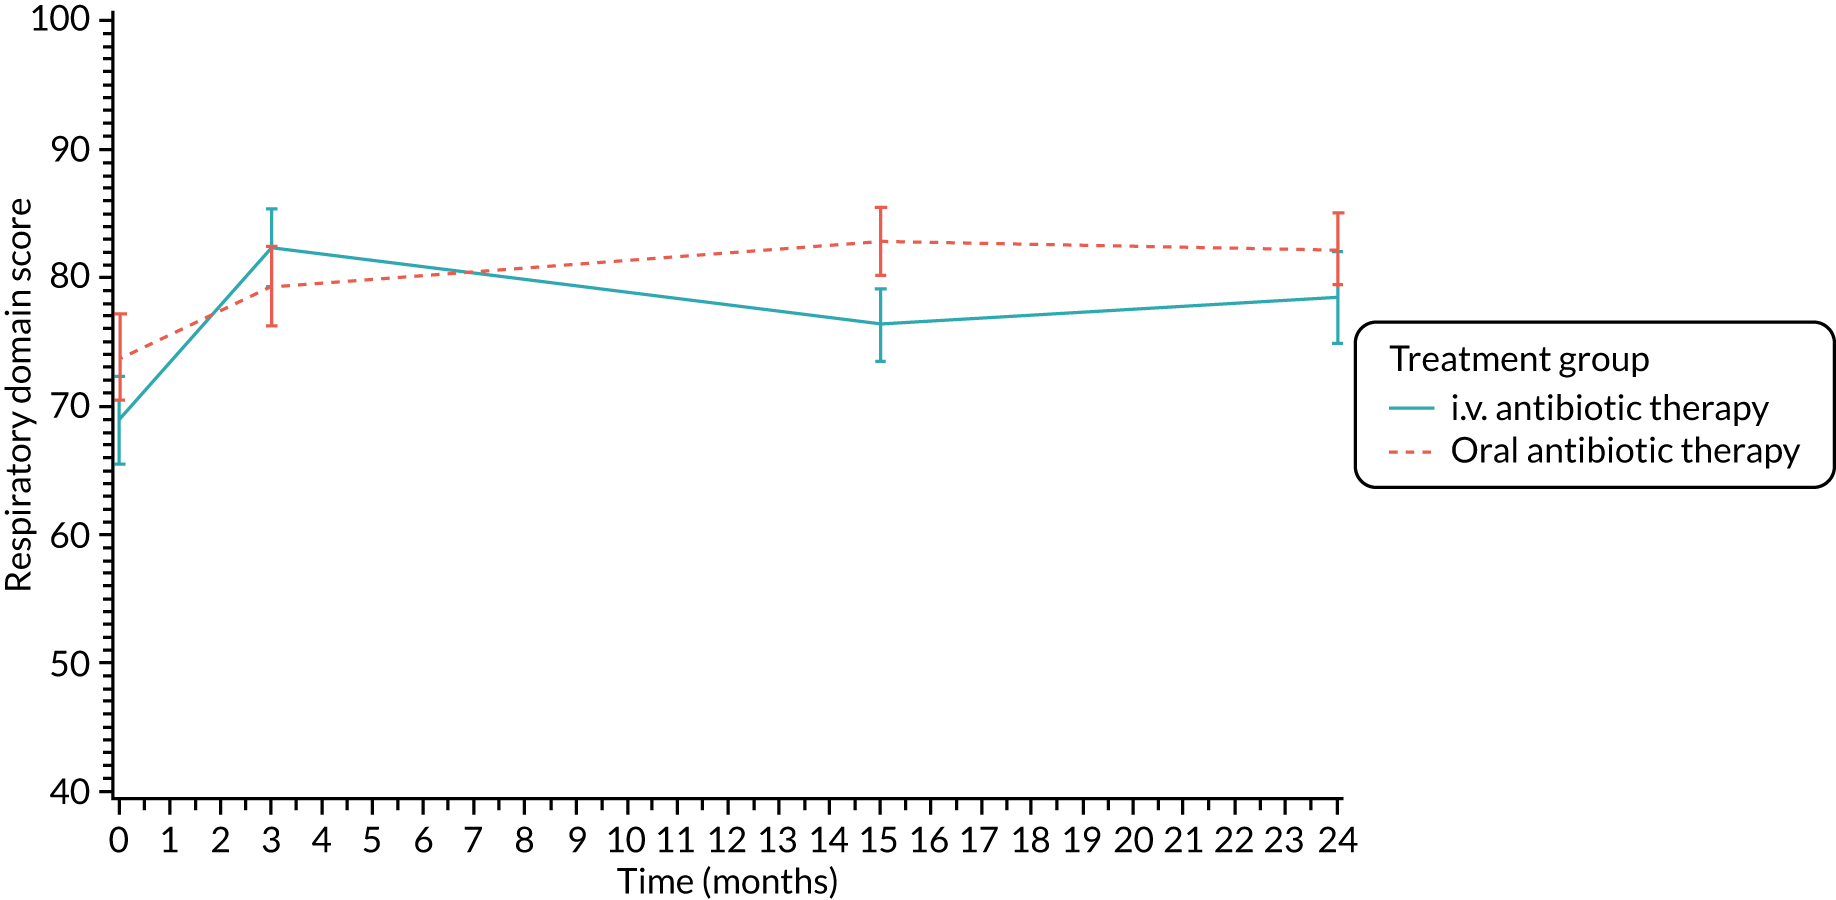
FIGURE 32.
Digestive symptoms (parent/carer): mean scores over time by treatment group.
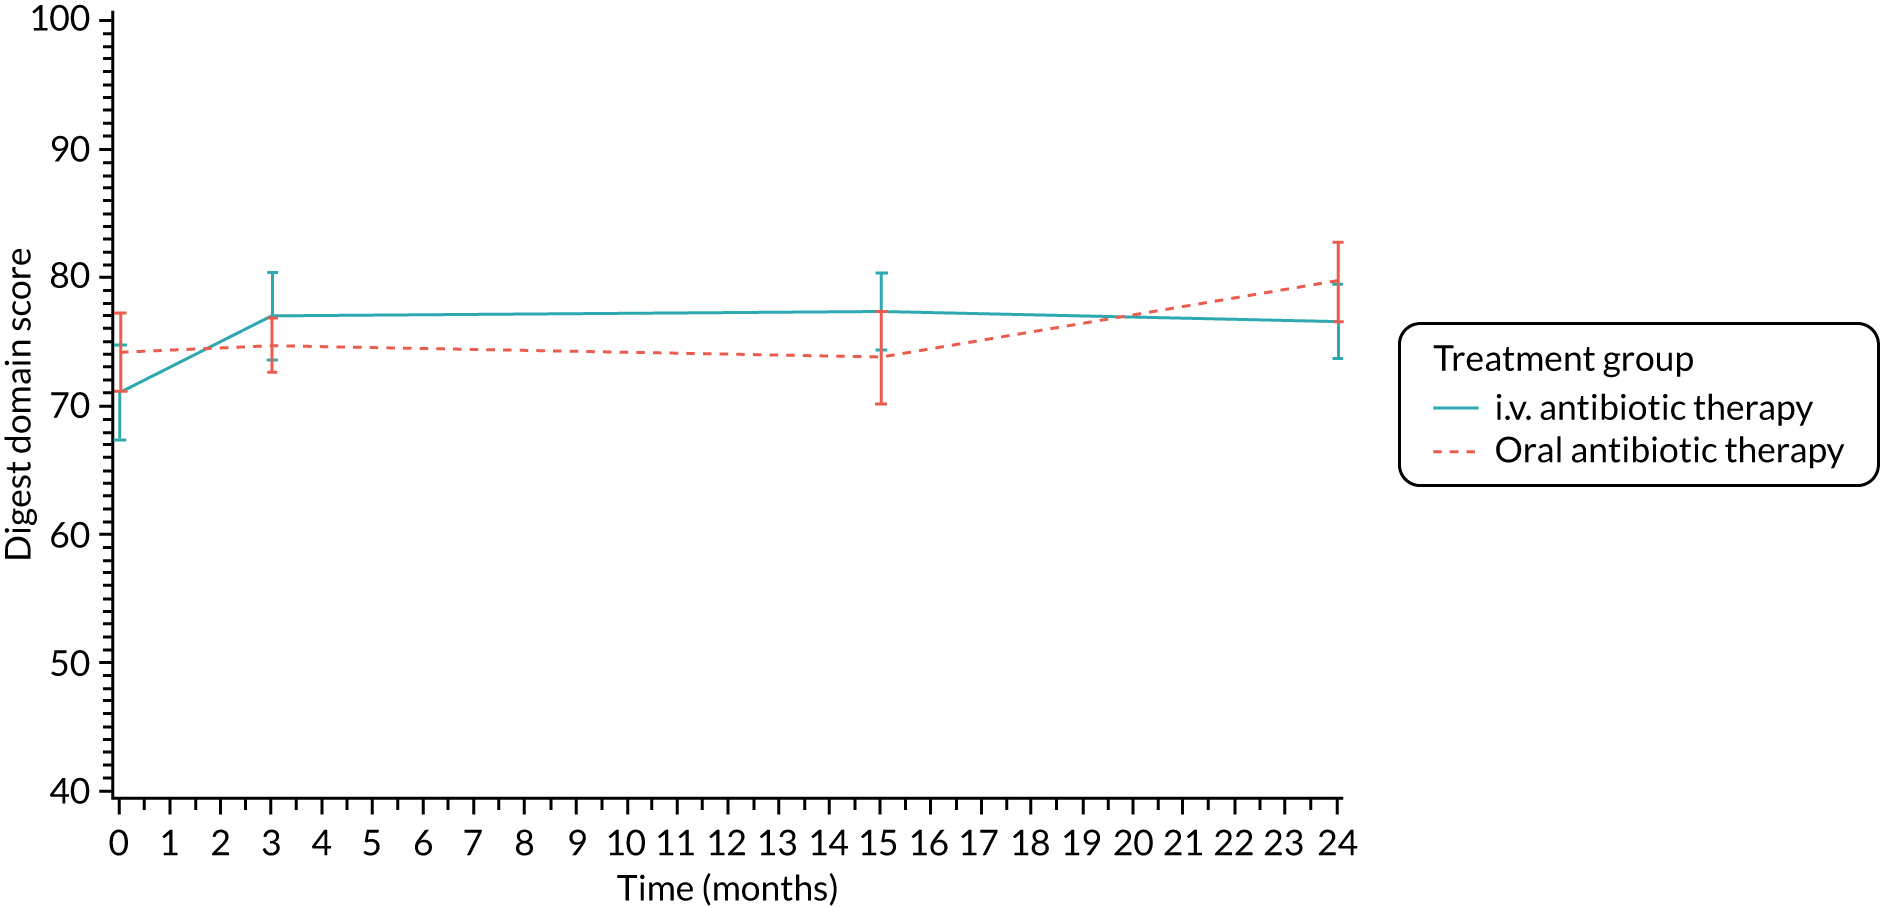
| Organism | Treatment group, n (%) | |
|---|---|---|
| i.v. antibiotic therapy (N = 137) | Oral antibiotic therapy (N = 148) | |
| Staphylococcus aureus | 51 (37.2) | 53 (35.8) |
| Haemophilus influenzae | 36 (26.3) | 32 (21.6) |
| Mycobacterium abscessus | 0 (0) | 1 (0.7) |
| Mycobacterium avium–intracellulare complex | 0 (0) | 0 (0) |
| Other non-tuberculous mycobacteria | 0 (0) | 0 (0) |
| Stenotrophomonas maltophilia | 6 (4.4) | 9 (6.1) |
| Achromobacter xylosoxidans | 1 (0.7) | 3 (20.0) |
Appendix 5 Additional safety data
| AE description (verbatim) | Preferred term | SOC |
|---|---|---|
| 48 hours of spiking temperatures | Pyrexia | General disorders and administration site conditions |
| ?DIOS-Distal Intestinal Obstruction Syndrome | Distal intestinal obstruction syndrome | Gastrointestinal disorders |
| A and E admission corzal illness | Upper respiratory tract infection | Infections and infestations |
| Abdominal pain | Abdominal pain | Gastrointestinal disorders |
| Abdominal pain? distal intestinal obstruction syndrome | Distal intestinal obstruction syndrome | Gastrointestinal disorders |
| Abnormal CXR | Chest X-ray abnormal | Investigations |
| Achilles tendonitis | Tendonitis | Musculoskeletal and connective tissue disorders |
| Adverse drug reaction to colomycin (i.v.) | Adverse drug reaction | General disorders and administration site conditions |
| Allergic broncho pulmonary aspergillosis (ABPA) | Bronchopulmonary aspergillosis allergic | Infections and infestations |
| Bed wetting | Enuresis | Psychiatric disorders |
| Bilateral knee pain | Arthralgia | Musculoskeletal and connective tissue disorders |
| Black tongue | Tongue discolouration | Gastrointestinal disorders |
| Bronchospasm caused by colistin | Bronchospasm | Respiratory, thoracic and mediastinal disorders |
| CF exacerbation | Infective pulmonary exacerbation of cystic fibrosis | Infections and infestations |
| Candidiasis of nappy area | Candida infection | Infections and infestations |
| Chest pain | Chest pain | General disorders and administration site conditions |
| Chest infection | Lower respiratory tract infection | Infections and infestations |
| Chicken pox | Varicella | Infections and infestations |
| Cold productive cough | Productive cough | Respiratory, thoracic and mediastinal disorders |
| Corza | Rhinitis | Infections and infestations |
| Cough | Cough | Respiratory, thoracic and mediastinal disorders |
| Croup, runny nose | Cough | Respiratory, thoracic and mediastinal disorders |
| DIOS | Distal intestinal obstruction syndrome | Gastrointestinal disorders |
| Deterioration over 1 month | General physical health deterioration | General disorders and administration site conditions |
| Diarrhoea | Diarrhoea | Gastrointestinal disorders |
| Diarrhoea started 3 days after starting cipro | Diarrhoea | Gastrointestinal disorders |
| Diarrhoea | Diarrhoea | Gastrointestinal disorders |
| Dizzy episodes | Dizziness | Nervous system disorders |
| Eczema under dressing | Eczema | Skin and subcutaneous tissue disorders |
| Episode of ciprofloxacin-resistant P. aeruginosa colonisation | Pseudomonas infection | Infections and infestations |
| Exacerbation of cystic fibrosis | Infective pulmonary exacerbation of cystic fibrosis | Infections and infestations |
| Fall from cot on ward | Fall | Injury, poisoning and procedural complications |
| Fall whilst at school – painful neck | Fall | Injury, poisoning and procedural complications |
| Fell whilst sledging and hit back of head on road | Fall | Injury, poisoning and procedural complications |
| Fever/high temperature | Pyrexia | General disorders and administration site conditions |
| Foot and mount disease | Foot and mouth disease | Infections and infestations |
| Fractured skull | Skull fracture | Injury, poisoning and procedural complications |
| Gastroenteritis | Gastroenteritis | Infections and infestations |
| Glandular fever | Infectious mononucleosis | Infections and infestations |
| H. influenza on cough swab | Haemophilus test positive | Investigations |
| H. influenza infection | Haemophilus infection | Infections and infestations |
| Hay fever | Seasonal allergy | Immune system disorders |
| Headache | Headache | Nervous system disorders |
| High temperature | Pyrexia | General disorders and administration site conditions |
| Hospital admission with croup | Croup infectious | Infections and infestations |
| i.v. cannula tissued | Catheter site-related reaction | General disorders and administration site conditions |
| Increase cough + sputum production | Pyrexia | General disorders and administration site conditions |
| Increased cough | Cough | Respiratory, thoracic and mediastinal disorders |
| Increased cough and sputum production | Productive cough | Respiratory, thoracic and mediastinal disorders |
| Increased cough and sputum production prior to surgery | Productive cough | Respiratory, thoracic and mediastinal disorders |
| Increased cough at night | Cough | Respiratory, thoracic and mediastinal disorders |
| Increased faecal loading | Constipation | Gastrointestinal disorders |
| Increased temperature | Pyrexia | General disorders and administration site conditions |
| Increased wet cough | Productive cough | Respiratory, thoracic and mediastinal disorders |
| Infected eczema | Eczema infected | Infections and infestations |
| Infective exacerbation | Infective pulmonary exacerbation of cystic fibrosis | Infections and infestations |
| Isolate of Pseudomonas | Pseudomonas infection | Infections and infestations |
| Isolate of Pseudomonas aeruginosa | Pseudomonas infection | Infections and infestations |
| Itchy rash | Rash pruritic | Skin and subcutaneous tissue disorders |
| Long line removed as thrombophlebitis evident | Thrombophlebitis | Vascular disorders |
| Loose stool | Diarrhoea | Gastrointestinal disorders |
| Loose stools | Diarrhoea | Gastrointestinal disorders |
| MAI in sputum | Mycobacterium avium complex infection | Infections and infestations |
| Manifestation of anxiety | Anxiety | Psychiatric disorders |
| Migraine | Migraine | Nervous system disorders |
| Mild epistaxis | Epistaxis | Respiratory, thoracic and mediastinal disorders |
| Nausea | Nausea | Gastrointestinal disorders |
| Neck ache/stiffness | Pain | General disorders and administration site conditions |
| New growth of pseudomonas | Pseudomonas infection | Infections and infestations |
| Nosebleed | Epistaxis | Respiratory, thoracic and mediastinal disorders |
| Oral thrush | Oral candidiasis | Infections and infestations |
| P. aeruginosa at 3-month follow-up | Pseudomonas infection | Infections and infestations |
| PR bleed | Rectal haemorrhage | Gastrointestinal disorders |
| Pain in knees | Arthralgia | Musculoskeletal and connective tissue disorders |
| Pain in legs | Pain in extremity | Musculoskeletal and connective tissue disorders |
| Pancreatitis | Pancreatitis | Gastrointestinal disorders |
| Petechial rash to trunk | Petechiae | Skin and subcutaneous tissue disorders |
| Photosensitive rash | Photosensitivity reaction | Skin and subcutaneous tissue disorders |
| Positive pseudomonas aeruginosa | Pseudomonas infection | Infections and infestations |
| Productive cough | Productive cough | Respiratory, thoracic and mediastinal disorders |
| Prolonged cough | Productive cough | Respiratory, thoracic and mediastinal disorders |
| Pulmonary exacerbation | Infective pulmonary exacerbation of cystic fibrosis | Infections and infestations |
| Pyrexia (high temp) productive cough | Pyrexia | General disorders and administration site conditions |
| RTI | Respiratory tract infection | Infections and infestations |
| Re-growth pseudomonas | Pseudomonas infection | Infections and infestations |
| Respiratory exacerbation bronchiolitis | Infective pulmonary exacerbation of cystic fibrosis | Infections and infestations |
| Respiratory tract infection | Respiratory tract infection | Infections and infestations |
| Right-sided rib pain | Musculoskeletal chest pain | Musculoskeletal and connective tissue disorders |
| Short of breath, coughing with exercise/spontaneous moist cough, considerably reduced air entry R side | Dyspnoea | Respiratory, thoracic and mediastinal disorders |
| Shoulder ache/stiffness | Musculoskeletal stiffness | Musculoskeletal and connective tissue disorders |
| Stomach ache | Abdominal pain upper | Gastrointestinal disorders |
| Swollen throat | Pharyngeal oedema | Respiratory, thoracic and mediastinal disorders |
| Thrush | Candida infection | Infections and infestations |
| Thrush (nappy area) | Candida infection | Infections and infestations |
| Tingling lips, itchy ears and decreased vision | Paraesthesia oral | Gastrointestinal disorders |
| Tracheal tug and wheeze | Wheezing | Respiratory, thoracic and mediastinal disorders |
| Tummy pain | Abdominal pain upper | Gastrointestinal disorders |
| Tummy pain, loose stools | Diarrhoea | Gastrointestinal disorders |
| URTI | Upper respiratory tract infection | Infections and infestations |
| URTI, cough + wheeze | Upper respiratory tract infection | Infections and infestations |
| UTI | Urinary tract infection | Infections and infestations |
| Viral infection | Viral infection | Infections and infestations |
| Viral illness | Viral infection | Infections and infestations |
| Vitamin A deficiency | Vitamin A deficiency | Metabolism and nutrition disorders |
| Vitamin D deficiency | Vitamin D deficiency | Metabolism and nutrition disorders |
| Vitamin E deficiency | Vitamin E deficiency | Metabolism and nutrition disorders |
| Vomiting starting 3 days after starting Cipro | Vomiting | Gastrointestinal disorders |
| Vulva candidiasis | Vulvovaginal candidiasis | Infections and infestations |
| Wet cough | Productive cough | Respiratory, thoracic and mediastinal disorders |
| Wet cough | Productive cough | Respiratory, thoracic and mediastinal disorders |
| Wheeze | Wheezing | Respiratory, thoracic and mediastinal disorders |
| Wheezy 4/52 | Wheezing | Respiratory, thoracic and mediastinal disorders |
| abdominal pain | Abdominal pain | Gastrointestinal disorders |
| abdominal pain | Abdominal pain | Gastrointestinal disorders |
| abdominal pain and vomiting – distal intestinal obstruction syndrome | Distal intestinal obstruction syndrome | Gastrointestinal disorders |
| admission for i.v. antibiotic for chest infection | Lower respiratory tract infection | Infections and infestations |
| back/side pain | Flank pain | Musculoskeletal and connective tissue disorders |
| bleeding at site of line insertion | Administration site bruise | General disorders and administration site conditions |
| blocked feeling in ears | Ear discomfort | Ear and labyrinth disorders |
| blood in vomit | Haematemesis | Gastrointestinal disorders |
| bronchospasm | Bronchospasm | Respiratory, thoracic and mediastinal disorders |
| chest exacerbation | Infective pulmonary exacerbation of cystic fibrosis | Infections and infestations |
| chest pain (posteria) pain under rt ribs | Chest pain | General disorders and administration site conditions |
| chest pain and tiredness | Chest pain | General disorders and administration site conditions |
| chesty | Cough | Respiratory, thoracic and mediastinal disorders |
| chicken pox | Varicella | Infections and infestations |
| cold | Nasopharyngitis | Infections and infestations |
| conjunctivitis | Conjunctivitis | Infections and infestations |
| constipation | Constipation | Gastrointestinal disorders |
| corysal + coughing | Upper respiratory tract infection | Infections and infestations |
| coryza | Upper respiratory tract infection | Infections and infestations |
| coryzal illness | Upper respiratory tract infection | Infections and infestations |
| coryzed and coughing | Upper respiratory tract infection | Infections and infestations |
| cough | Cough | Respiratory, thoracic and mediastinal disorders |
| cough, runny nose | Cough | Respiratory, thoracic and mediastinal disorders |
| cough/wheeze | Cough | Respiratory, thoracic and mediastinal disorders |
| development of vaginal thrush | Vulvovaginal candidiasis | Infections and infestations |
| device blockage | Device occlusion | Product issues |
| diarrhoea | Diarrhoea | Gastrointestinal disorders |
| distal intestinal obstruction syndrome (DIOS) | Distal intestinal obstruction syndrome | Gastrointestinal disorders |
| dizzy | Dizziness | Nervous system disorders |
| dry cough | Cough | Respiratory, thoracic and mediastinal disorders |
| dry, peeling skin on toes- both feet | Dry skin | Skin and subcutaneous tissue disorders |
| dvt proximal left calf | Deep vein thrombosis | Vascular disorders |
| earache | Ear pain | Ear and labyrinth disorders |
| elevated blood sugars | Blood glucose increased | Investigations |
| eye infection | Eye infection | Infections and infestations |
| febrile convulsion | Febrile convulsion | Nervous system disorders |
| fever | Pyrexia | General disorders and administration site conditions |
| flu-like symptoms (fever/cough) | Influenza-like illness | General disorders and administration site conditions |
| fractured left and right wrist | Wrist fracture | Injury, poisoning and procedural complications |
| gastroenteritis | Gastroenteritis | Infections and infestations |
| grown pseudomonas | Bacterial disease carrier | Infections and infestations |
| growth haemophilus on cough swab | Haemophilus test positive | Investigations |
| growth of ent cloacae | Enterobacter test positive | Investigations |
| growth of Klebisella pneumoniae | Klebsiella test positive | Investigations |
| growth of Stenotrophomonas maltophilia in swab | Stenotrophomonas test positive | Investigations |
| haemoptysis (post nasal polyectomy operation) | Haemoptysis | Respiratory, thoracic and mediastinal disorders |
| hand foot and mouth | Foot and mouth disease | Infections and infestations |
| headache | Headache | Nervous system disorders |
| heamophilus influenza infection | Haemophilus infection | Infections and infestations |
| high temperature, hoppy dry cough | Pyrexia | General disorders and administration site conditions |
| hospital admission due to exacerbation of cf | Infective pulmonary exacerbation of cystic fibrosis | Infections and infestations |
| increase cough | Cough | Respiratory, thoracic and mediastinal disorders |
| increase cough and sputum | Productive cough | Respiratory, thoracic and mediastinal disorders |
| increased cough | Cough | Respiratory, thoracic and mediastinal disorders |
| increased cough and sputum and extra oral abs | Cough | Respiratory, thoracic and mediastinal disorders |
| increased cough since 1st May 2015 | Cough | Respiratory, thoracic and mediastinal disorders |
| increased dry cough | Cough | Respiratory, thoracic and mediastinal disorders |
| increased frequency passing urine | Polyuria | Renal and urinary disorders |
| increased sputum | Sputum increased | Respiratory, thoracic and mediastinal disorders |
| increased sputum congestion | Productive cough | Respiratory, thoracic and mediastinal disorders |
| increased temperature | Pyrexia | General disorders and administration site conditions |
| increased wheeze | Wheezing | Respiratory, thoracic and mediastinal disorders |
| involved in accident injured, bump to abdomen with heamaturic | Haematuria | Renal and urinary disorders |
| joint pain | Arthralgia | Musculoskeletal and connective tissue disorders |
| left lower lobe pneumonia | Pneumonia | Infections and infestations |
| left side intermittent back pain | Back pain | Musculoskeletal and connective tissue disorders |
| lethargy | Lethargy | Nervous system disorders |
| liver failure | Hepatic failure | Hepatobiliary disorders |
| long line blocked | Device occlusion | Product issues |
| loose stools | Diarrhoea | Gastrointestinal disorders |
| loss of appetite | Decreased appetite | Metabolism and nutrition disorders |
| lung consolidation | Lung consolidation | Respiratory, thoracic and mediastinal disorders |
| lung function not back to normal values | Pulmonary function test | Investigations |
| malaise | Malaise | General disorders and administration site conditions |
| meconium ileus equivalent | Distal intestinal obstruction syndrome | Gastrointestinal disorders |
| mild cough | Cough | Respiratory, thoracic and mediastinal disorders |
| myalgia | Myalgia | Musculoskeletal and connective tissue disorders |
| nappy rash | Dermatitis diaper | Skin and subcutaneous tissue disorders |
| nasal congestion | Nasal congestion | Respiratory, thoracic and mediastinal disorders |
| nasal vestibulitis | Nasal vestibulitis | Infections and infestations |
| new diagnosis of melanoma | Malignant melanoma | Neoplasms benign, malignant and unspecified (including cysts and polyps) |
| no improvement in lung function | Pulmonary function test | Investigations |
| ongoing respiratory exacerbation | Infective pulmonary exacerbation of cystic fibrosis | Infections and infestations |
| onset of productive cough | Cough | Respiratory, thoracic and mediastinal disorders |
| otitis media | Otitis media | Infections and infestations |
| p. aeruginosa reoccurred | Pseudomonas test positive | Investigations |
| pain at site of line insertion | Administration site pain | General disorders and administration site conditions |
| pain and rash from passing urine | Dysuria | Renal and urinary disorders |
| persistent cough | Cough | Respiratory, thoracic and mediastinal disorders |
| persisting cough wheeze | Productive cough | Respiratory, thoracic and mediastinal disorders |
| playground collision – sore arm | Limb discomfort | Musculoskeletal and connective tissue disorders |
| productive cough | Productive cough | Respiratory, thoracic and mediastinal disorders |
| pseudomonas aeruginosa – growth on cough swab | Pseudomonas infection | Infections and infestations |
| pseudomonas aeruginosa | Pseudomonas test | Investigations |
| pseudomonas growth | Pseudomonas infection | Infections and infestations |
| pseudomonas isolated on cough swab at end of trial intervention | Pseudomonas test positive | Investigations |
| pseudomonas re occurrence | Pseudomonas infection | Infections and infestations |
| pulmonary exacerbation | Infective pulmonary exacerbation of cystic fibrosis | Infections and infestations |
| pulmonary exacerbation | Infective pulmonary exacerbation of cystic fibrosis | Infections and infestations |
| pyrexia | Pyrexia | General disorders and administration site conditions |
| raised alanine transaminase | Alanine aminotransferase increased | Investigations |
| rash | Rash | Skin and subcutaneous tissue disorders |
| rash due to ciprofloxacilin | Adverse drug reaction | General disorders and administration site conditions |
| rash on neck | Rash | Skin and subcutaneous tissue disorders |
| re growth of pseudomonas aeruginosa | Pseudomonas infection | Infections and infestations |
| re-growth of Pseudomonas – i.v. antibiotics as in-patient | Pseudomonas infection | Infections and infestations |
| recurrent L episaxis for about 2 months | Epistaxis | Respiratory, thoracic and mediastinal disorders |
| reduction in lung function | Pulmonary function test decreased | Investigations |
| regrowth of pseudomonas aeruginosa | Pseudomonas test positive | Investigations |
| required added co-amoxiclav for cough | Cough | Respiratory, thoracic and mediastinal disorders |
| respiratory exacerbation | Infective pulmonary exacerbation of cystic fibrosis | Infections and infestations |
| respiratory exacerbation | Infective pulmonary exacerbation of cystic fibrosis | Infections and infestations |
| respiratory syncytial virus positive | Bronchiolitis | Infections and infestations |
| segmental right middle lobe collapse/conslidation consistent with acute plugging or infection | Pneumothorax | Respiratory, thoracic and mediastinal disorders |
| sinus infection | Sinusitis | Infections and infestations |
| strep pyogenes – extra oral antibiotics | Streptococcus test positive | Investigations |
| sunburn with skin blistering | Sunburn | Injury, poisoning and procedural complications |
| swollen nose | Swelling | General disorders and administration site conditions |
| thrush | Candida infection | Infections and infestations |
| toe nails peeling – both feet | Onychoclasis | Skin and subcutaneous tissue disorders |
| transient discolouration of arms/legs | Skin discolouration | Skin and subcutaneous tissue disorders |
| upper arm pain | Pain | General disorders and administration site conditions |
| upper respiratory tract infection | Upper respiratory tract infection | Infections and infestations |
| urticrial rash following ciprofloxacin and a mixed nut bar. Subsequent doses of cipro proved to have no adverse reaction | Urticaria | Skin and subcutaneous tissue disorders |
| venous long line leaking from exit site on flushing | Catheter management | Surgical and medical procedures |
| viral illness | Viral infection | Infections and infestations |
| vomits | Vomiting | Gastrointestinal disorders |
| vomiting | Vomiting | Gastrointestinal disorders |
| wet cough | Productive cough | Respiratory, thoracic and mediastinal disorders |
| wet cough increased sputum | Productive cough | Respiratory, thoracic and mediastinal disorders |
| wheeze | Wheezing | Respiratory, thoracic and mediastinal disorders |
| wheezy | Wheezing | Respiratory, thoracic and mediastinal disorders |
| wheezy cough with colomycin | Wheezing | Respiratory, thoracic and mediastinal disorders |
| wheezy with exercise (montekulast) | Wheezing | Respiratory, thoracic and mediastinal disorders |
| SOC | Preferred term | Treatment group, n (%) | Total (N = 272), n (%) | ||||
|---|---|---|---|---|---|---|---|
| i.v. antibiotic therapy (N = 126) | Oral antibiotic therapy (N = 146) | ||||||
| Events | Patients | Events | Patients | Events | Patients | ||
| Ear and labyrinth disorders | Ear discomfort | 1 | 1 (0.8) | 0 | 0 (0.0) | 1 | 1 (0.4) |
| Ear pain | 0 | 0 (0.0) | 2 | 2 (1.4) | 2 | 2 (0.7) | |
| Gastrointestinal disorders | Abdominal pain | 1 | 1 (0.8) | 2 | 2 (1.4) | 3 | 3 (1.1) |
| Abdominal pain upper | 1 | 1 (0.8) | 1 | 1 (0.7) | 2 | 2 (0.7) | |
| Constipation | 1 | 1 (0.8) | 1 | 1 (0.7) | 2 | 2 (0.7) | |
| Diarrhoea | 6 | 5 (4) | 3 | 3 (2.1) | 9 | 8 (2.9) | |
| Distal intestinal obstruction syndrome | 2 | 2 (1.6) | 3 | 3 (2.1) | 5 | 5 (1.8) | |
| Haematemesis | 0 | 0 (0.0) | 1 | 1 (0.7) | 1 | 1 (0.4) | |
| Nausea | 1 | 1 (0.8) | 1 | 1 (0.7) | 2 | 2 (0.7) | |
| Pancreatitis | 1 | 1 (0.8) | 0 | 0 (0.0) | 1 | 1 (0.4) | |
| Paraesthesia oral | 0 | 0 (0.0) | 1 | 1 (0.7) | 1 | 1 (0.4) | |
| Rectal haemorrhage | 0 | 0 (0.0) | 1 | 1 (0.7) | 1 | 1 (0.4) | |
| Tongue discolouration | 1 | 1 (0.8) | 0 | 0 (0.0) | 1 | 1 (0.4) | |
| Vomiting | 3 | 3 (2.4) | 0 | 0 (0.0) | 3 | 3 (1.1) | |
| General disorders and administration site conditions | Administration site bruise | 1 | 1 (0.8) | 0 | 0 (0.0) | 1 | 1 (0.4) |
| Administration site pain | 1 | 1 (0.8) | 0 | 0 (0.0) | 1 | 1 (0.4) | |
| Adverse drug reaction | 1 | 1 (0.8) | 1 | 1 (0.7) | 2 | 2 (0.7) | |
| Catheter site-related reaction | 1 | 1 (0.8) | 0 | 0 (0.0) | 1 | 1 (0.4) | |
| Chest pain | 1 | 1 (0.8) | 1 | 1 (0.7) | 2 | 2 (0.7) | |
| Influenza-like illness | 0 | 0 (0.0) | 1 | 1 (0.7) | 1 | 1 (0.4) | |
| Malaise | 0 | 0 (0.0) | 1 | 1 (0.7) | 1 | 1 (0.4) | |
| Pain | 1 | 1 (0.8) | 1 | 1 (0.7) | 2 | 2 (0.7) | |
| Pyrexia | 2 | 2 (1.6) | 7 | 7 (4.8) | 9 | 9 (3.3) | |
| Swelling | 0 | 0 (0.0) | 1 | 1 (0.7) | 1 | 1 (0.4) | |
| Immune system disorders | Seasonal allergy | 1 | 1 (0.8) | 1 | 1 (0.7) | 2 | 2 (0.7) |
| Infections and infestations | Bacterial disease carrier | 0 | 0 (0.0) | 1 | 1 (0.7) | 1 | 1 (0.4) |
| Bronchopulmonary aspergillosis allergic | 0 | 0 (0.0) | 1 | 1 (0.7) | 1 | 1 (0.4) | |
| Candida infection | 1 | 1 (0.8) | 5 | 5 (3.4) | 6 | 6 (2.2) | |
| Conjunctivitis | 1 | 1 (0.8) | 0 | 0 (0.0) | 1 | 1 (0.4) | |
| Eczema infected | 0 | 0 (0.0) | 1 | 1 (0.7) | 1 | 1 (0.4) | |
| Eye infection | 1 | 1 (0.8) | 0 | 0 (0.0) | 1 | 1 (0.4) | |
| Foot and mouth disease | 0 | 0 (0.0) | 2 | 2 (1.4) | 2 | 2 (0.7) | |
| Gastroenteritis | 0 | 0 (0.0) | 1 | 1 (0.7) | 1 | 1 (0.4) | |
| Haemophilus infection | 2 | 1 (0.8) | 0 | 0 (0.0) | 2 | 1 (0.4) | |
| Infectious mononucleosis | 0 | 0 (0.0) | 1 | 1 (0.7) | 1 | 1 (0.4) | |
| Infective pulmonary exacerbation of cystic fibrosis | 4 | 3 (2.4) | 6 | 6 (4.1) | 10 | 9 (3.3) | |
| Lower respiratory tract infection | 0 | 0 (0.0) | 1 | 1 (0.7) | 1 | 1 (0.4) | |
| Mycobacterium avium complex infection | 0 | 0 (0.0) | 1 | 1 (0.7) | 1 | 1 (0.4) | |
| Nasal vestibulitis | 1 | 1 (0.8) | 0 | 0 (0.0) | 1 | 1 (0.4) | |
| Nasopharyngitis | 1 | 1 (0.8) | 0 | 0 (0.0) | 1 | 1 (0.4) | |
| Oral candidiasis | 0 | 0 (0.0) | 1 | 1 (0.7) | 1 | 1 (0.4) | |
| Otitis media | 1 | 1 (0.8) | 0 | 0 (0.0) | 1 | 1 (0.4) | |
| Pneumonia | 1 | 1 (0.8) | 0 | 0 (0.0) | 1 | 1 (0.4) | |
| Pseudomonas infection | 7 | 7 (5.6) | 2 | 2 (1.4) | 9 | 9 (3.3) | |
| Respiratory tract infection | 1 | 1 (0.8) | 2 | 2 (1.4) | 3 | 3 (1.1) | |
| Sinusitis | 1 | 1 (0.8) | 0 | 0 (0.0) | 1 | 1 (0.4) | |
| Upper respiratory tract infection | 15 | 11 (8.7) | 3 | 2 (1.4) | 18 | 13 (4.8) | |
| Urinary tract infection | 1 | 1 (0.8) | 0 | 0 (0.0) | 1 | 1 (0.4) | |
| Varicella | 3 | 3 (2.4) | 1 | 1 (0.7) | 4 | 4 (1.5) | |
| Viral infection | 1 | 1 (0.8) | 1 | 1 (0.7) | 2 | 2 (0.7) | |
| Vulvovaginal candidiasis | 2 | 2 (1.6) | 0 | 0 (0.0) | 2 | 2 (0.7) | |
| Injury, poisoning and procedural complications | Fall | 1 | 1 (0.8) | 2 | 2 (1.4) | 3 | 3 (1.1) |
| Skull fracture | 0 | 0 (0.0) | 1 | 1 (0.7) | 1 | 1 (0.4) | |
| Sunburn | 0 | 0 (0.0) | 1 | 1 (0.7) | 1 | 1 (0.4) | |
| Wrist fracture | 1 | 1 (0.8) | 0 | 0 (0.0) | 1 | 1 (0.4) | |
| Investigations | Alanine aminotransferase increased | 1 | 1 (0.8) | 0 | 0 (0.0) | 1 | 1 (0.4) |
| Blood glucose increased | 1 | 1 (0.8) | 0 | 0 (0.0) | 1 | 1 (0.4) | |
| Chest X-ray abnormal | 0 | 0 (0.0) | 1 | 1 (0.7) | 1 | 1 (0.4) | |
| Enterobacter test positive | 1 | 1 (0.8) | 0 | 0 (0.0) | 1 | 1 (0.4) | |
| Haemophilus test positive | 2 | 2 (1.6) | 0 | 0 (0.0) | 2 | 2 (0.7) | |
| Klebsiella test positive | 0 | 0 (0.0) | 1 | 1 (0.7) | 1 | 1 (0.4) | |
| Pseudomonas test | 1 | 1 (0.8) | 0 | 0 (0.0) | 1 | 1 (0.4) | |
| Pseudomonas test positive | 1 | 1 (0.8) | 2 | 2 (1.4) | 3 | 3 (1.1) | |
| Pulmonary function test | 0 | 0 (0.0) | 2 | 2 (1.4) | 2 | 2 (0.7) | |
| Pulmonary function test decreased | 1 | 1 (0.8) | 0 | 0 (0.0) | 1 | 1 (0.4) | |
| Stenotrophomonas test positive | 0 | 0 (0.0) | 1 | 1 (0.7) | 1 | 1 (0.4) | |
| Streptococcus test positive | 0 | 0 (0.0) | 1 | 1 (0.7) | 1 | 1 (0.4) | |
| Metabolism and nutrition disorders | Decreased appetite | 0 | 0 (0.0) | 1 | 1 (0.7) | 1 | 1 (0.4) |
| Vitamin A deficiency | 0 | 0 (0.0) | 1 | 1 (0.7) | 1 | 1 (0.4) | |
| Vitamin D deficiency | 0 | 0 (0.0) | 1 | 1 (0.7) | 1 | 1 (0.4) | |
| Vitamin E deficiency | 0 | 0 (0.0) | 1 | 1 (0.7) | 1 | 1 (0.4) | |
| Musculoskeletal and connective tissue disorders | Arthralgia | 0 | 0 (0.0) | 3 | 3 (2.1) | 3 | 3 (1.1) |
| Back pain | 1 | 1 (0.8) | 0 | 0 (0.0) | 1 | 1 (0.4) | |
| Flank pain | 0 | 0 (0.0) | 1 | 1 (0.7) | 1 | 1 (0.4) | |
| Limb discomfort | 1 | 1 (0.8) | 0 | 0 (0.0) | 1 | 1 (0.4) | |
| Musculoskeletal chest pain | 0 | 0 (0.0) | 1 | 1 (0.7) | 1 | 1 (0.4) | |
| Musculoskeletal stiffness | 0 | 0 (0.0) | 1 | 1 (0.7) | 1 | 1 (0.4) | |
| Myalgia | 0 | 0 (0.0) | 1 | 1 (0.7) | 1 | 1 (0.4) | |
| Pain in extremity | 0 | 0 (0.0) | 1 | 1 (0.7) | 1 | 1 (0.4) | |
| Tendonitis | 0 | 0 (0.0) | 1 | 1 (0.7) | 1 | 1 (0.4) | |
| Neoplasms benign, malignant and unspecified (including cysts and polyps) | Malignant melanoma | 0 | 0 (0.0) | 1 | 1 (0.7) | 1 | 1 (0.4) |
| Nervous system disorders | Dizziness | 1 | 1 (0.8) | 1 | 1 (0.7) | 2 | 2 (0.7) |
| Febrile convulsion | 0 | 0 (0.0) | 1 | 1 (0.7) | 1 | 1 (0.4) | |
| Headache | 3 | 2 (1.6) | 0 | 0 (0.0) | 3 | 2 (0.7) | |
| Lethargy | 0 | 0 (0.0) | 1 | 1 (0.7) | 1 | 1 (0.4) | |
| Migraine | 0 | 0 (0.0) | 1 | 1 (0.7) | 1 | 1 (0.4) | |
| Product issues | Device occlusion | 2 | 2 (1.6) | 0 | 0 (0.0) | 2 | 2 (0.7) |
| Psychiatric disorders | Enuresis | 0 | 0 (0.0) | 1 | 1 (0.7) | 1 | 1 (0.4) |
| Renal and urinary disorders | Dysuria | 0 | 0 (0.0) | 1 | 1 (0.7) | 1 | 1 (0.4) |
| Polyuria | 1 | 1 (0.8) | 0 | 0 (0.0) | 1 | 1 (0.4) | |
| Respiratory, thoracic and mediastinal disorders | Bronchospasm | 1 | 1 (0.8) | 1 | 1 (0.7) | 2 | 2 (0.7) |
| Cough | 26 | 22 (17.5) | 28 | 23 (15.8) | 54 | 45 (16.5) | |
| Epistaxis | 1 | 1 (0.8) | 2 | 2 (1.4) | 3 | 3 (1.1) | |
| Haemoptysis | 1 | 1 (0.8) | 0 | 0 (0.0) | 1 | 1 (0.4) | |
| Nasal congestion | 1 | 1 (0.8) | 0 | 0 (0.0) | 1 | 1 (0.4) | |
| Pharyngeal oedema | 0 | 0 (0.0) | 1 | 1 (0.7) | 1 | 1 (0.4) | |
| Productive cough | 5 | 5 (4) | 8 | 8 (5.5) | 13 | 13 (4.8) | |
| Sputum increased | 1 | 1 (0.8) | 0 | 0 (0.0) | 1 | 1 (0.4) | |
| Wheezing | 3 | 3 (2.4) | 6 | 6 (4.1) | 9 | 9 (3.3) | |
| Skin and subcutaneous tissue disorders | Dermatitis diaper | 1 | 1 (0.8) | 1 | 1 (0.7) | 2 | 2 (0.7) |
| Dry skin | 1 | 1 (0.8) | 0 | 0 (0.0) | 1 | 1 (0.4) | |
| Eczema | 1 | 1 (0.8) | 0 | 0 (0.0) | 1 | 1 (0.4) | |
| Onychoclasis | 1 | 1 (0.8) | 0 | 0 (0.0) | 1 | 1 (0.4) | |
| Petechiae | 0 | 0 (0.0) | 1 | 1 (0.7) | 1 | 1 (0.4) | |
| Photosensitivity reaction | 0 | 0 (0.0) | 1 | 1 (0.7) | 1 | 1 (0.4) | |
| Rash | 2 | 2 (1.6) | 1 | 1 (0.7) | 3 | 3 (1.1) | |
| Skin discolouration | 0 | 0 (0.0) | 1 | 1 (0.7) | 1 | 1 (0.4) | |
| Urticaria | 0 | 0 (0.0) | 1 | 1 (0.7) | 1 | 1 (0.4) | |
| Total | 135 | 64 (50.8) | 144 | 75 (51.4) | 279 | 139 (51.1) | |
| SOC | Preferred term | Treatment group, n (%) | Total (N = 272), n (%) | ||||
|---|---|---|---|---|---|---|---|
| i.v. antibiotic therapy (N = 126) | Oral antibiotic therapy (N = 146) | ||||||
| Events | Patients | Events | Patients | Events | Patients | ||
| Gastrointestinal disorders | Distal intestinal obstruction syndrome | 2 | 2 (1.6) | 1 | 1 (0.7) | 3 | 3 (1.1) |
| General disorders and administration site conditions | Chest pain | 0 | 0 (0.0) | 1 | 1 (0.7) | 1 | 1 (0.4) |
| General physical health deterioration | 0 | 0 (0.0) | 1 | 1 (0.7) | 1 | 1 (0.4) | |
| Pyrexia | 1 | 1 (0.8) | 0 | 0 (0.0) | 1 | 1 (0.4) | |
| Hepatobiliary disorders | Hepatic failure | 1 | 1 (0.8) | 0 | 0 (0.0) | 1 | 1 (0.4) |
| Infections and infestations | Bronchiolitis | 0 | 0 (0.0) | 1 | 1 (0.7) | 1 | 1 (0.4) |
| Croup infectious | 0 | 0 (0.0) | 1 | 1 (0.7) | 1 | 1 (0.4) | |
| Gastroenteritis | 0 | 0 (0.0) | 1 | 1 (0.7) | 1 | 1 (0.4) | |
| Infective pulmonary exacerbation of cystic fibrosis | 1 | 1 (0.8) | 1 | 1 (0.7) | 2 | 2 (0.7) | |
| Lower respiratory tract infection | 0 | 0 (0.0) | 1 | 1 (0.7) | 1 | 1 (0.4) | |
| Pseudomonas infection | 0 | 0 (0.0) | 3 | 3 (2.1) | 3 | 3 (1.1) | |
| Rhinitis | 0 | 0 (0.0) | 1 | 1 (0.7) | 1 | 1 (0.4) | |
| Upper respiratory tract infection | 0 | 0 (0.0) | 1 | 1 (0.7) | 1 | 1 (0.4) | |
| Viral infection | 0 | 0 (0.0) | 1 | 1 (0.7) | 1 | 1 (0.4) | |
| Nervous system disorders | Headache | 1 | 1 (0.8) | 0 | 0 (0.0) | 1 | 1 (0.4) |
| Psychiatric disorders | Anxietya | 0 | 0 (0.0) | 1 | 1 (0.7) | 1 | 1 (0.4) |
| Renal and urinary disorders | Haematuria | 1 | 1 (0.8) | 0 | 0 (0.0) | 1 | 1 (0.4) |
| Respiratory, thoracic and mediastinal disorders | Dyspnoea | 0 | 0 (0.0) | 1 | 1 (0.7) | 1 | 1 (0.4) |
| Lung consolidation | 0 | 0 (0.0) | 1 | 1 (0.7) | 1 | 1 (0.4) | |
| Pneumothorax | 0 | 0 (0.0) | 1 | 1 (0.7) | 1 | 1 (0.4) | |
| Productive cough | 0 | 0 (0.0) | 3 | 3 (2.1) | 3 | 3 (1.1) | |
| Skin and subcutaneous tissue disorders | Rash pruritic | 1 | 1 (0.8) | 0 | 0 (0.0) | 1 | 1 (0.4) |
| Surgical and medical procedures | Catheter management | 1 | 1 (0.8) | 0 | 0 (0.0) | 1 | 1 (0.4) |
| Vascular disorders | Deep-vein thrombosis | 1 | 1 (0.8) | 0 | 0 (0.0) | 1 | 1 (0.4) |
| Thrombophlebitis | 1 | 1 (0.8) | 0 | 0 (0.0) | 1 | 1 (0.4) | |
| Total | 11 | 10 (7.9) | 21 | 14 (9.6) | 32 | 24 (8.8) | |
| SAE numbera | Allocation | SOC | Preferred term | Onset date | Serious criteria | Severity (PI assessment) | Expectedness (CI assessment) | Relationship | Most likely cause, if unrelated (PI assessment) | Outcome | ||
|---|---|---|---|---|---|---|---|---|---|---|---|---|
| PI assessment | CI assessment | PI assessment | CI assessment | |||||||||
| 1 | Oral | Respiratory, thoracic and mediastinal disorders | Dyspnoea | 10 December 2010 | Required hospitalisation | Required hospitalisation | Moderate | Unexpected | Unrelated | Unlikely | Disease under study | Resolved |
| 2 | Oral | Infections and infestations | Pseudomonas infection | 7 March 2011 | Required hospitalisation | Required hospitalisation | Mild | Unexpected | Unrelated | Unrelated | Disease under study | Resolved |
| 4 | Oral | Infections and infestations | Croup infectious | 13 January 2012 | Required hospitalisation | Required hospitalisation | Moderate | Unexpected | Unrelated | Unrelated | Other illness | Resolved |
| 5 | Oral | Infections and infestations | Pseudomonas infection | 26 January 2012 | Required hospitalisation | Required hospitalisation | Moderate | Unexpected | Unrelated | Unrelated | Disease under study | Resolved |
| 6 | Oral | Infections and infestations | Bronchiolitis | 26 January 2012 | Required hospitalisation | Required hospitalisation | Moderate | Expected | Unrelated | Unrelated | Other illness | Resolved |
| 7 | i.v. | Skin and subcutaneous tissue disorders | Rash pruritic | 5 February 2012 | Prolonged existing hospitalisation | Prolonged existing hospitalisation | Moderate | Expected | Possibly | Probably | Resolved | |
| 8 | Oral | Infections and infestations | Viral infection | 23 March 2012 | Required hospitalisation | Required hospitalisation | Severe | Unexpected | Unrelated | Unrelated | Other illness | Resolved |
| 9 | Oral | Infections and infestations | Pseudomonas infection | 26 March 2012 | Required hospitalisation | Required hospitalisation | Mild | Expected | Probably | Probably | Resolved with sequelae | |
| 10 | Oral | Infections and infestations | Infective pulmonary exacerbation of cystic fibrosis | 3 July 2012 | Required hospitalisation | Required hospitalisation | Mild | Unexpected | Unrelated | Unrelated | Disease under study | Resolved |
| 12 | Oral | Gastrointestinal disorders | Distal intestinal obstruction syndrome | 4 September 2012 | Required hospitalisation | Required hospitalisation | Moderate | Unexpected | Unlikely | Unrelated | Other illness | Resolved |
| 13 | Oral | General disorders and administration site conditions | Chest pain | 17 August 2012 | Required hospitalisation | Required hospitalisation | Moderate | Unexpected | Unrelated | Unrelated | Other illness | Resolved |
| 14 | Oral | Infections and infestations | Lower respiratory tract infection | 11 September 2012 | Required hospitalisation | Required hospitalisation | Moderate | Unexpected | Unrelated | Unrelated | Disease under study | Resolved |
| 15 | Oral | Respiratory, thoracic and mediastinal disorders | Productive cough | 1 October 2012 | Required hospitalisation | Required hospitalisation | Moderate | Unexpected | Unrelated | Unrelated | Disease under study | Resolved with sequelae |
| 16 | Oral | Infections and infestations | Gastroenteritis | 9 October 2012 | Required hospitalisation | Required hospitalisation | Moderate | Unexpected | Unrelated | Unrelated | Other illness | Resolved |
| 17 | i.v. | Gastrointestinal disorders | Distal intestinal obstruction syndrome | 13 October 2012 | Required hospitalisation | Required hospitalisation | Moderate | Unexpected | Unrelated | Unrelated | Disease under study | Resolved |
| 18 | i.v. | Gastrointestinal disorders | Distal intestinal obstruction syndrome | 25 November 2012 | Required hospitalisation | Required hospitalisation | Mild | Unexpected | Unrelated | Unrelated | Disease under study | Resolved |
| 19 | i.v. | Vascular disorders | Thrombophlebitis | 27 January 2013 | Required hospitalisation | Required hospitalisation | Mild | Expected | Probably | Probably | Resolved | |
| 20 | i.v. | Surgical and medical procedures | Catheter management | 12 March 2013 | Required hospitalisation | Required hospitalisation | Mild | Unexpected | Unrelated | Unrelated | Protocol procedure | Resolved |
| 21 | Oral | Respiratory, thoracic and mediastinal disorders | Pneumothorax | 2 May 2013 | Required hospitalisation | Required hospitalisation | Moderate | Unexpected | Unrelated | Unrelated | Disease under study | Resolved |
| 22 | i.v. | Renal and urinary disorders | Haematuria | 25 May 2013 | Required hospitalisation | Required hospitalisation | Moderate | Unexpected | Unrelated | Unrelated | Resolved | |
| 23 | i.v. | Hepatobiliary disorders | Hepatic failure | 21 August 2013 | Required hospitalisation | Immediately life-threatening. Required hospitalisation | Severe | Unexpected | Unrelated | Unrelated | Other illness | Resolved with sequelae |
| 24 | Oral | Infections and infestations | Upper respiratory tract infection | 18 October 2013 | Required hospitalisation | Required hospitalisation | Mild | Unexpected | Unrelated | Unrelated | Other illness | Resolved with sequelae |
| 25 | Oral | Respiratory, thoracic and mediastinal disorders | Productive cough | 13 October 2013 | Required hospitalisation | Required hospitalisation | Mild | Unexpected | Unrelated | Unrelated | Disease under study | Resolved |
| 26 | Oral | Respiratory, thoracic and mediastinal disorders | Productive cough | 17 December 2013 | Required hospitalisation | Required hospitalisation | Moderate | Unexpected | Unlikely | Unrelated | Lack of efficacy | Resolved |
| 27 | Oral | Psychiatric disorders | Anxietyb | 22 March 2014 | Medically significant/important | Medically significant/important | Moderate | Expected | Possibly | Possibly | Other illness | Resolved |
| 28 | i.v. | Infections and infestations | Infective pulmonary exacerbation of cystic fibrosis | 17 December 2013 | Required hospitalisation | Required hospitalisation | Moderate | Unexpected | Unrelated | Unrelated | Disease under study | Resolved |
| 29 | i.v. | General disorders and administration site conditions | Pyrexia | 6 September 2014 | Required hospitalisation | Required hospitalisation | Moderate | Expected | Possibly | Unlikely | Other illness | Resolved |
| AE term on locked database | Preferred term on locked database | SOC on locked database | Agreed terminology to be used for preferred term | SOC for agreed terminology | |
|---|---|---|---|---|---|
| 1 | Left lower lobe pneumonia | Pneumonia | Infections and infestations | Pneumonia | Infections and infestations |
| 2 | Heamophilus influenza infection | Haemophilus infection | Infections and infestations | Haemophilus parainfluenzae respiratory infection | Infections and infestations |
| 3 | H. influenza infection | Haemophilus infection | Infections and infestations | Haemophilus influenzae respiratory infection | Infections and infestations |
| 4 | Swollen nose | Swelling | General disorders and administration site conditions | Nasal swelling | General disorders and administration site conditions |
| 5 | Strep pyogenes – extra oral antibiotics | Streptococcus test positive | Investigations | Streptococcus pyogenes respiratory infection | Infections and infestations |
| 6 | Hand foot and mouth | Foot and mouth disease | Infections and infestations | Hand, foot and mouth disease | Infections and infestations |
| 7 | Growth haemophilus on cough swab | Haemophilus test positive | Investigations | Haemophilus influenzae respiratory infection | Infections and infestations |
| 8 | Nasal vestibulitis | Nasal vestibulitis | Infections and infestations | Nasal vestibulitis | Infections and infestations |
| 9 | Chest infection | Lower respiratory tract infection | Infections and infestations | Chest infection | Infections and infestations |
| 10 | Allergic broncho pulmonary aspergillosis (ABPA) | Bronchopulmonary aspergillosis allergic | Infections and infestations | Allergic broncho pulmonary aspergillosis | Infections and infestations |
| 11 | Growth of ent cloacae | Enterobacter test positive | Investigations | Enterobacter cloacae respiratory infection | Infections and infestations |
| 12 | H. influenza on cough swab | Haemophilus test positive | Investigations | Haemophilus influenzae respiratory infection | Infections and infestations |
| 13 | Growth of klebsiella pneumoniae | Klebsiella test positive | Investigations | Klebsiella pneumoniae respiratory infection | Infections and infestations |
| 14 | Reduction in lung fuction | Pulmonary function test decreased | Investigations | Pulmonary function decreased | Respiratory, thoracic and mediastinal disorders |
| 15 | No improvement in lung function | Pulmonary function test | Investigations | Pulmonary function decreased | Respiratory, thoracic and mediastinal disorders |
| 16 | Foot and mount disease | Foot and mouth disease | Infections and infestations | Hand, foot and mouth | Infections and infestations |
| 17 | Growth of stenotrophomonas mealtephilia in swab | Stenotrophomonas test positive | Investigations | Stenotrophomonas maltophilia respiratory infection | Infections and infestations |
| 18 | Lung function not back to normal values | Pulmonary function test | Investigations | Pulmonary function decreased | Respiratory, thoracic and mediastinal disorders |
| 19 | Admission for i.v. antibiotic for chest infection | Lower respiratory tract infection | Infections and infestations | Chest infection | Infections and infestations |
Appendix 6 Additional economic evaluation information
| Category | Criteria | Band | ||||||
|---|---|---|---|---|---|---|---|---|
| 1 | 1A | 2 | 2A | 3 | 4 | 5 | ||
| Therapies | Maximum number of total days of i.v. antibiotics | 0 | 14 | 28 | 56 | 84 | 112 | ≥ 113 |
| Hospitalisations | Maximum numbers of days in hospital | 0 | 7 | 14 | 14 | 57 | 112 | ≥ 113 |
| Band | Measurement | Unit cost (£) | Source | Detail |
|---|---|---|---|---|
| Band 1, adults ≥ 17 years | Per year | 3362 | NHS reference costs 2016–1744 | Table 39 |
| Band 1A, adults ≥ 17 years | Per year | 5380 | NHS reference costs 2016–1744 | Table 39 |
| Band 1A, children ≤ 16 years | Per year | 5778 | NHS reference costs 2016–1744 | Table 39 |
| Band 1, children ≤ 16 years | Per year | 5685 | NHS reference costs 2016–1744 | Table 39 |
| Band 2, adults ≥ 17 years | Per year | 6498 | NHS reference costs 2016–1744 | Table 39 |
| Band 2A, adults ≥ 17 years | Per year | 8922 | NHS reference costs 2016–1744 | Table 39 |
| Band 2A, children ≤ 16 years | Per year | 8968 | NHS reference costs 2016–1744 | Table 39 |
| Band 2, children ≤ 16 years | Per year | 7492 | NHS reference costs 2016–1744 | Table 39 |
| Band 3, adults ≥ 17 years | Per year | 15,337 | NHS reference costs 2016–1744 | Table 39 |
| Band 3, children ≤ 16 years | Per year | 16,770 | NHS reference costs 2016–1744 | Table 39 |
Calculation of societal costs
Table 42 provides the societal unit costs used for the sensitivity analysis in the trial. Societal unit costs covered patient aids paid for out of pocket by the carer/patient; any travel time, stratified by mode of transport, recorded during the trial for carers/patients; time lost from work for the carer/patient; and over-the-counter medicines.
| Item | Measurement | Unit cost (£) | Source | Detail |
|---|---|---|---|---|
| Patient aids | ||||
| Anti-allergy pillow | Per item | 8.00 | Wilko (Wilko Retail Ltd, Worksop, UK)69 | |
| Anti-allergy bed covers | Per item | 10.00 | Wilko70 | |
| Peak flow medicine | Per item | 5.00 | BNF 201743 | |
| Travel costs | ||||
| Car | Per minute | 0.23 | AA plc (Basingstoke, UK) | Based on the motoring costs per mile for domestic purposes |
| Bus | Per minute | 0.08 | Department for Transport | Local bus transport statistics reported. 3.5 miles per journey |
| Taxi | Per minute | 0.53 | Local authority average | Assumption (based on average of Glasgow, Liverpool, Manchester and Plymouth) |
| Time lost from work | ||||
| Carer/patient time | Per hour | 17.00 | Office for National Statistics49 | Work per minute using the mean hourly earnings reported by the Office for National Statistics49 |
| Over-the-counter medicines | ||||
| Various | Per medicine/pill | Various | BNF 201743 | |
Transport
Car
The car travel costs are summarised in Table 43. The cost per mile was converted to the cost per minute using the mean speed of 25 miles per hour reported by the Department for Transport in 2018. 71 Speed per minute was 0.42 miles per minute during free flow and 0.23 miles per minute with adjustment for congestion, assuming a mean delay of 47 seconds per minute.
| Item | Cost per mile (£) | Cost per minute (£) | |
|---|---|---|---|
| Without congestion | With congestion | ||
| Standing charges (tax, insurance, capital) | 0.35 | 0.15 | 0.08 |
| Running costs (fuel, service, parts) | 0.20 | 0.08 | 0.05 |
| Total running costs | 0.56a | 0.23 | 0.13 |
The cost estimates are based on the motoring costs per mile for domestic purposes reported by the AA in 2014. 72 The cost of personal transport did not change between 2014–17 according to the Department for Transport, so the estimates from 2014 were assumed to be applicable to the 2017/18 cost year used in the analysis. 73
Bus
The bus travel costs are summarised in Table 44. The unit cost of bus transport was based on the operating cost per passenger journey in English metropolitan areas in 2017/18. 74 Given that bus transport is predominantly publicly funded in England, it was assumed that this cost is reflective of the cost paid by the passenger.
| Item | Cost (£) |
|---|---|
| Cost per passenger journey | 1.23 |
| Cost per minute | 0.08 |
The cost per minute was derived from the local bus transport statistics reported by the Department for Transport in 2017/18. There were 4844 million journeys covering 16.9 billion miles, which corresponds to 3.5 miles per journey. 75,76 Assuming a mean speed of 25 miles per hour during free flow and 14 miles per hour adjusting for congestion, the mean duration of a bus journey is 15 minutes.
Taxi
It was assumed that the mean length of a taxi journey is equivalent to the mean length of a bus journey as described above (3.5 miles) lasting 15 minutes.
There is a large variation in regulated taxi fares across the UK. For example, the estimated cost of a 3.5-mile journey (including minimum charge) during daytime hours on a weekday is £6.30 in Glasgow,77 £8.00 in Liverpool,78 £8.25 in Plymouth79 and £8.90 in Manchester. 80 The cost of a 3.5-mile taxi journey was substantially higher in London (£12.40). 81
The unit cost of a taxi journey depends on whether the journey was taken in or outside London, as presented in Table 45.
| Location | Unit cost per journey (£) | Unit cost per minute (£) | Source |
|---|---|---|---|
| London | 12.40 | 0.83 | Transport for London81 |
| Outside London | 8.00 | 0.53 | Assumption (based on average of Glasgow, Liverpool, Manchester and Plymouth) |
Lost productivity
Lost productivity was estimated as the lost income from work per minute using the mean hourly earnings reported by the Office for National Statistics,49 as recorded in Table 46.
| Category | Per hour (£) | Per minute (£) | Source |
|---|---|---|---|
| Mean hourly earnings excluding overtime | 16.76 | 0.28 | Office for National Statistics49 |
FIGURE 33.
Primary analysis: proportion infection free, NHS and PSS perspective costs, 15-month horizon, covariate adjusted. (a) Incremental cost-effectiveness plane; and (b) CEAC.
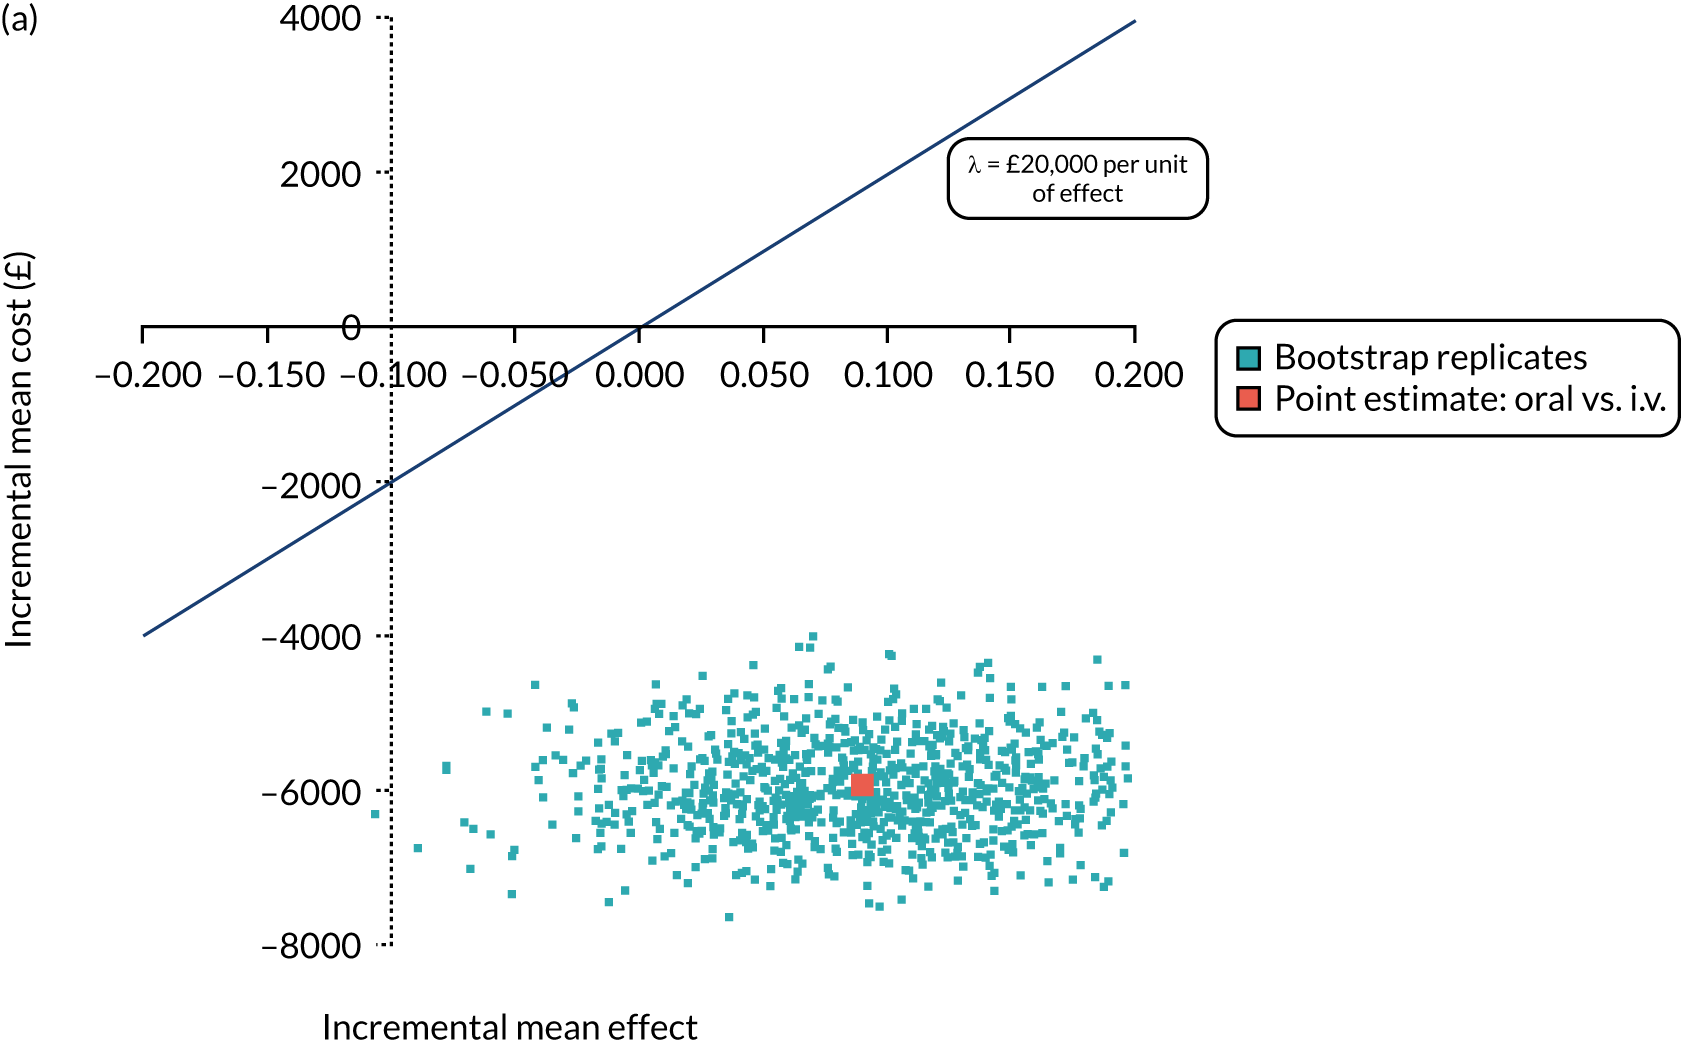
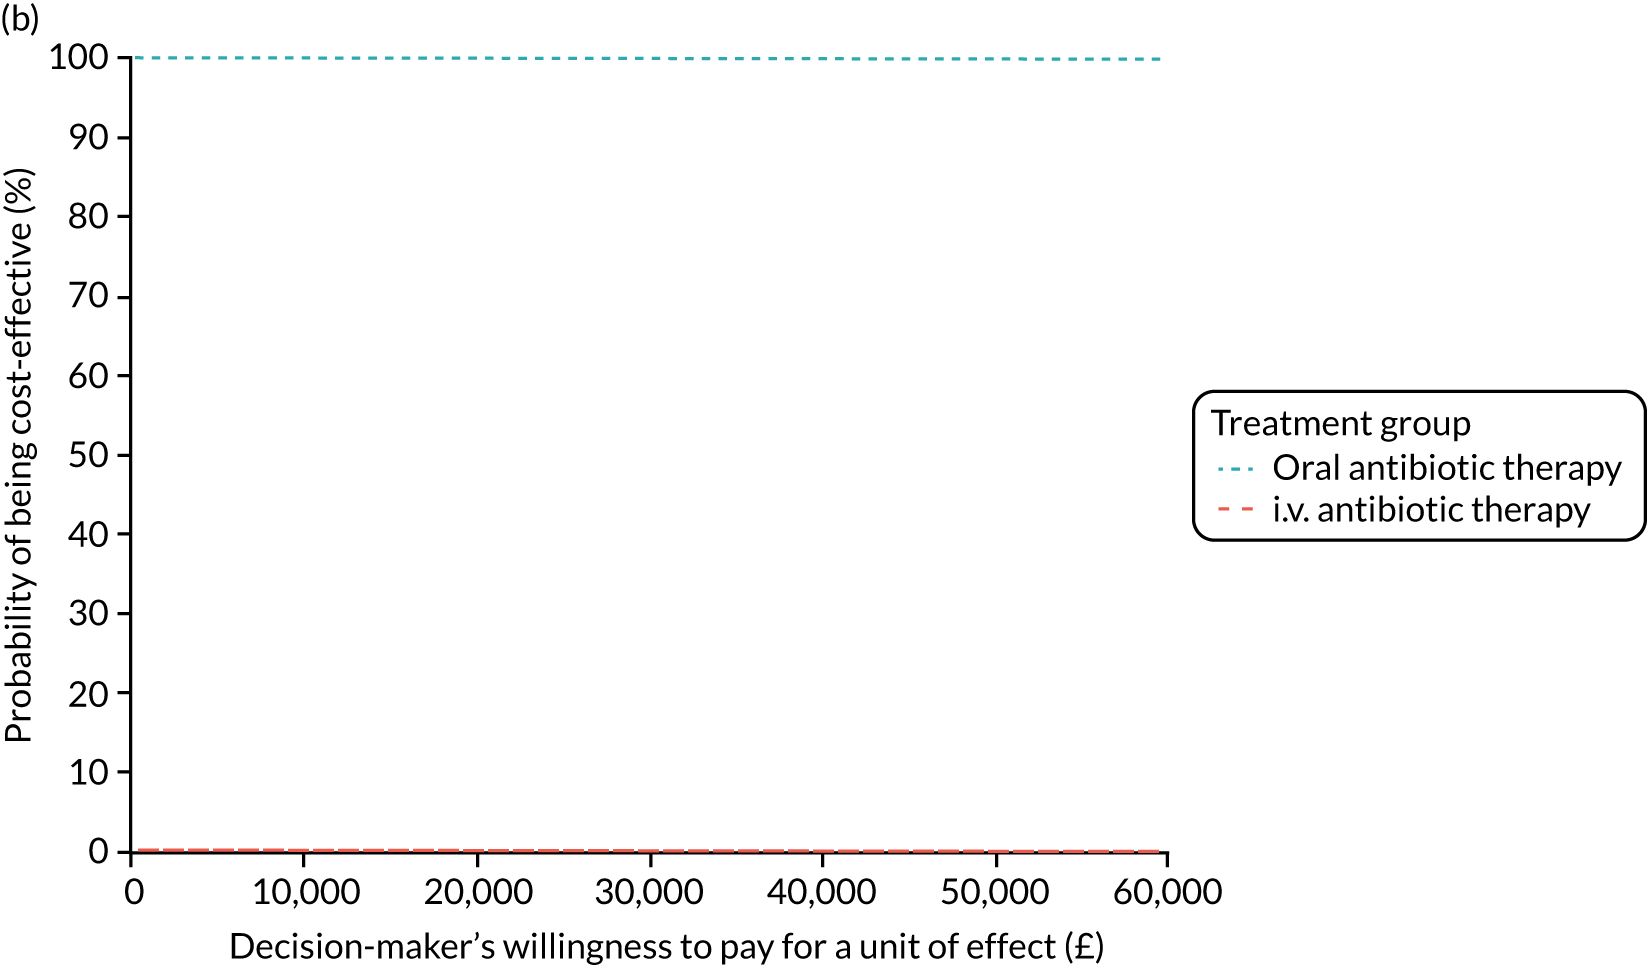
FIGURE 34.
Primary analysis with sensitivity test using specialist HRG costs for CF patients. (a) Incremental cost-effectiveness plane; and (b) CEAC.
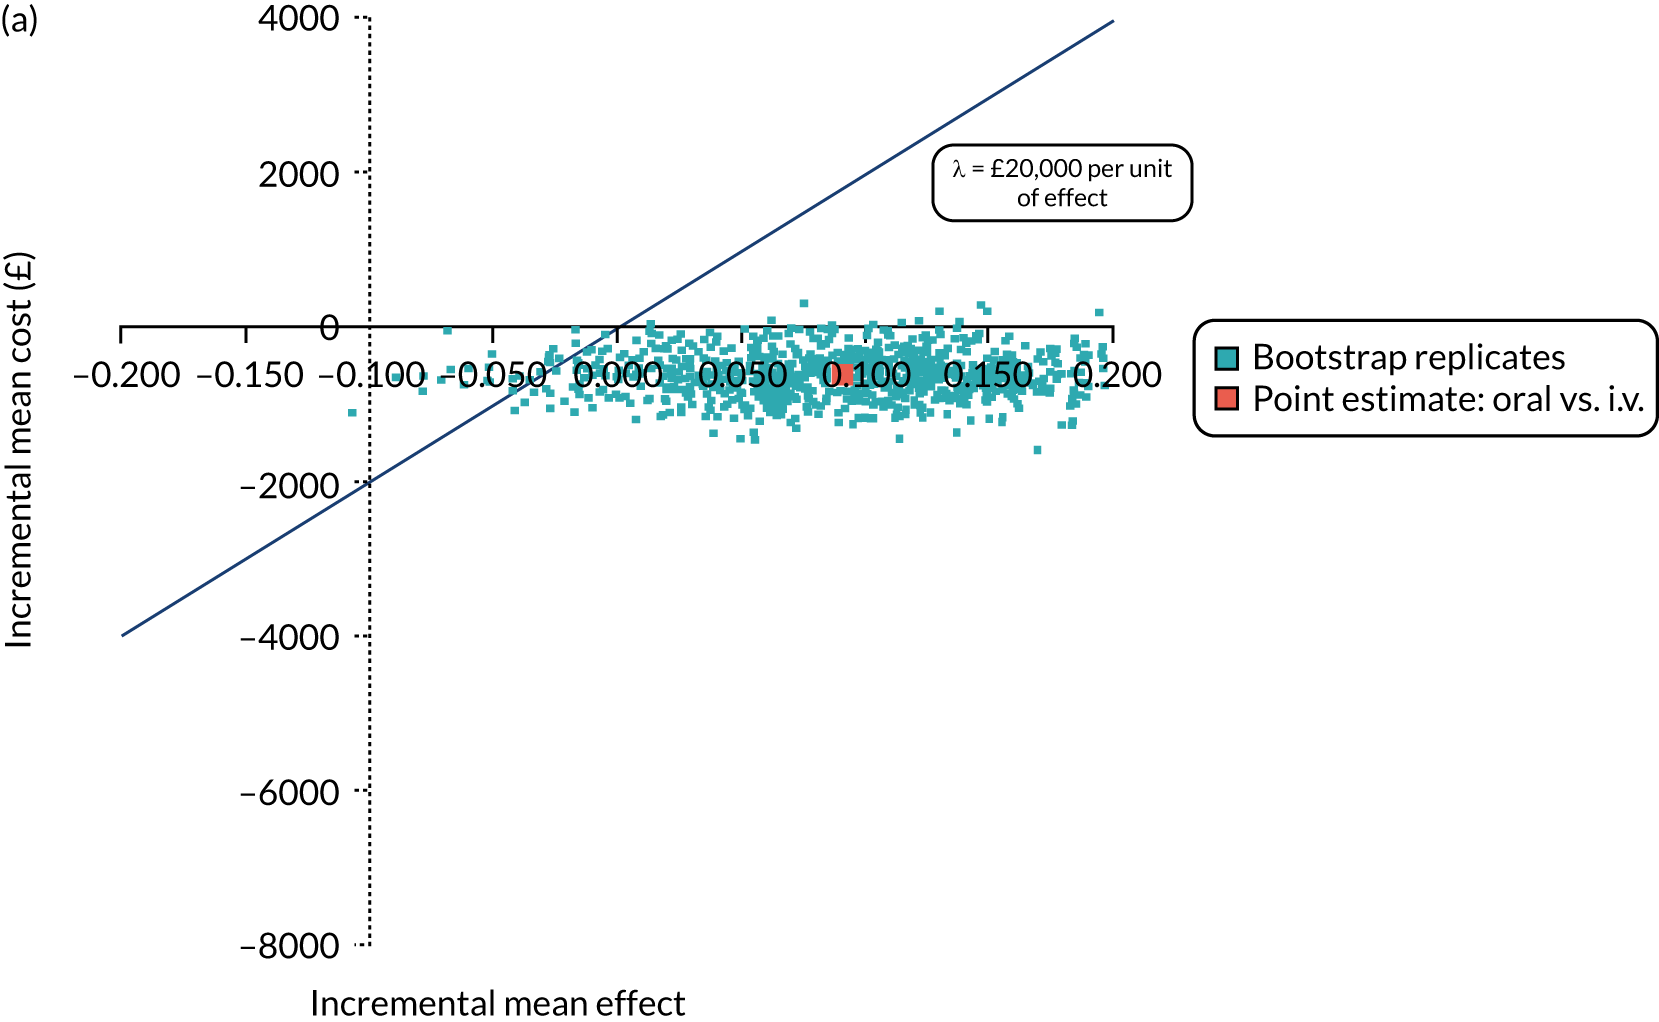
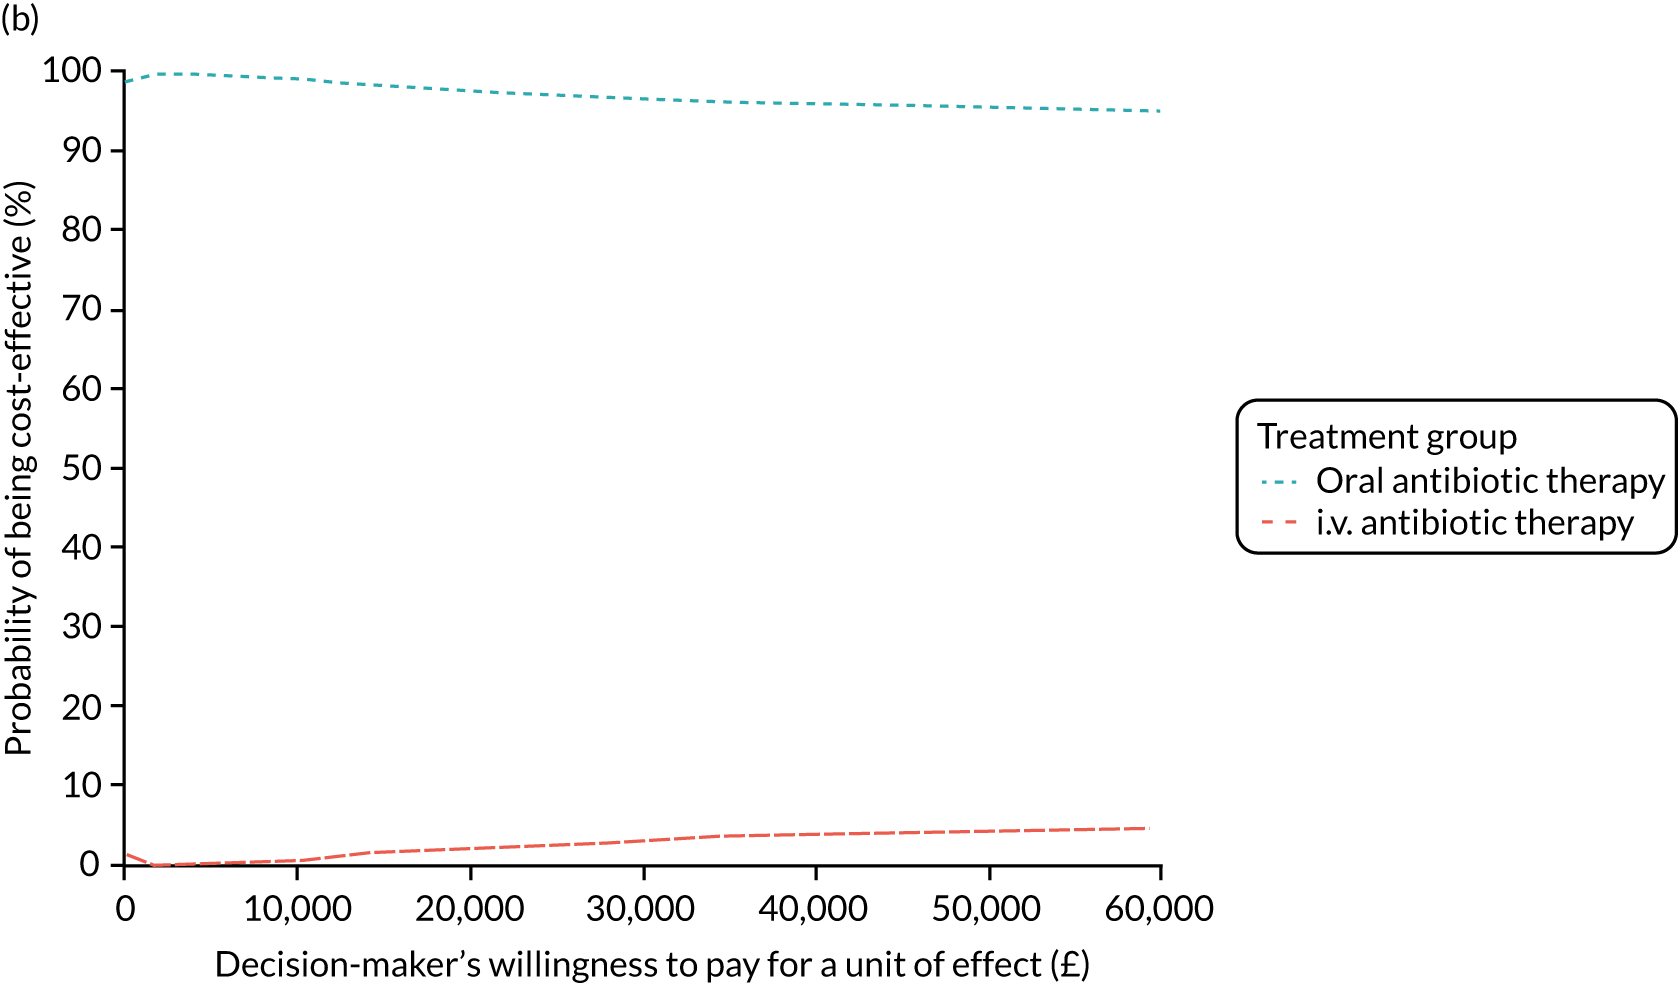
FIGURE 35.
Primary analysis: proportion infection free, NHS and PSS perspective costs, covariate adjusted, GLM cost model [link(log); family (Gaussian)]. (a) Incremental cost-effectiveness plane; and (b) CEAC.
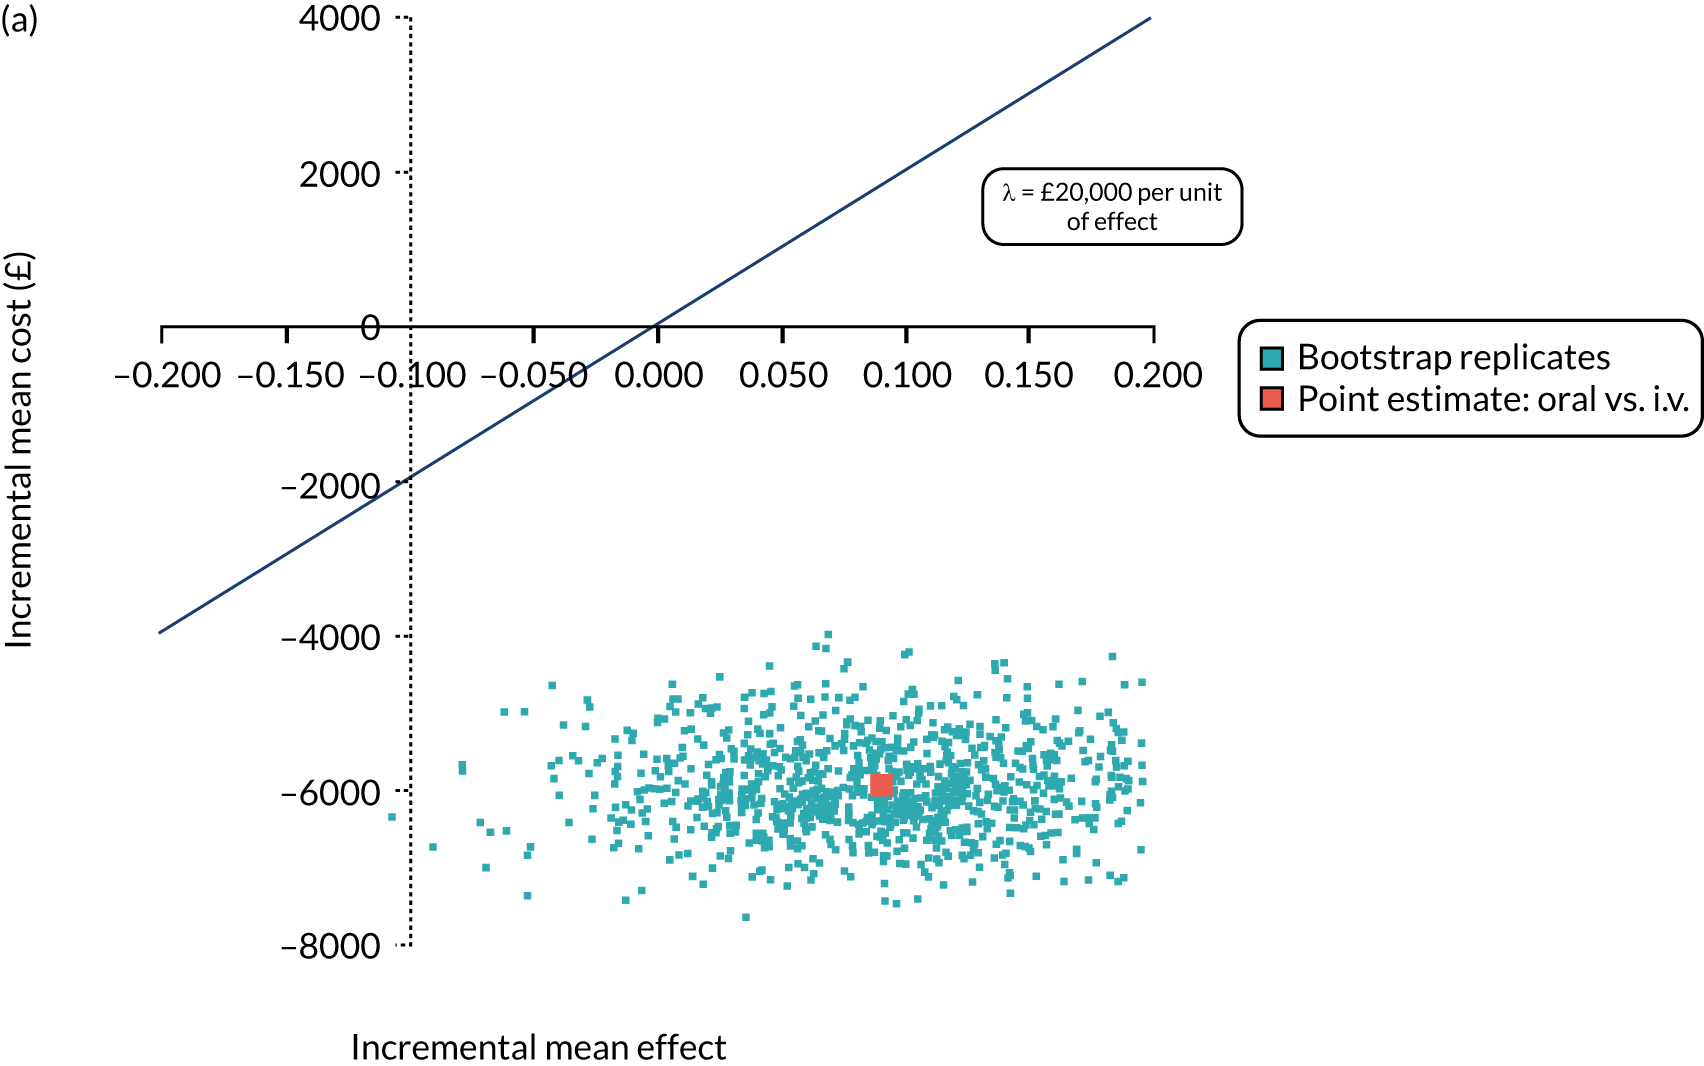
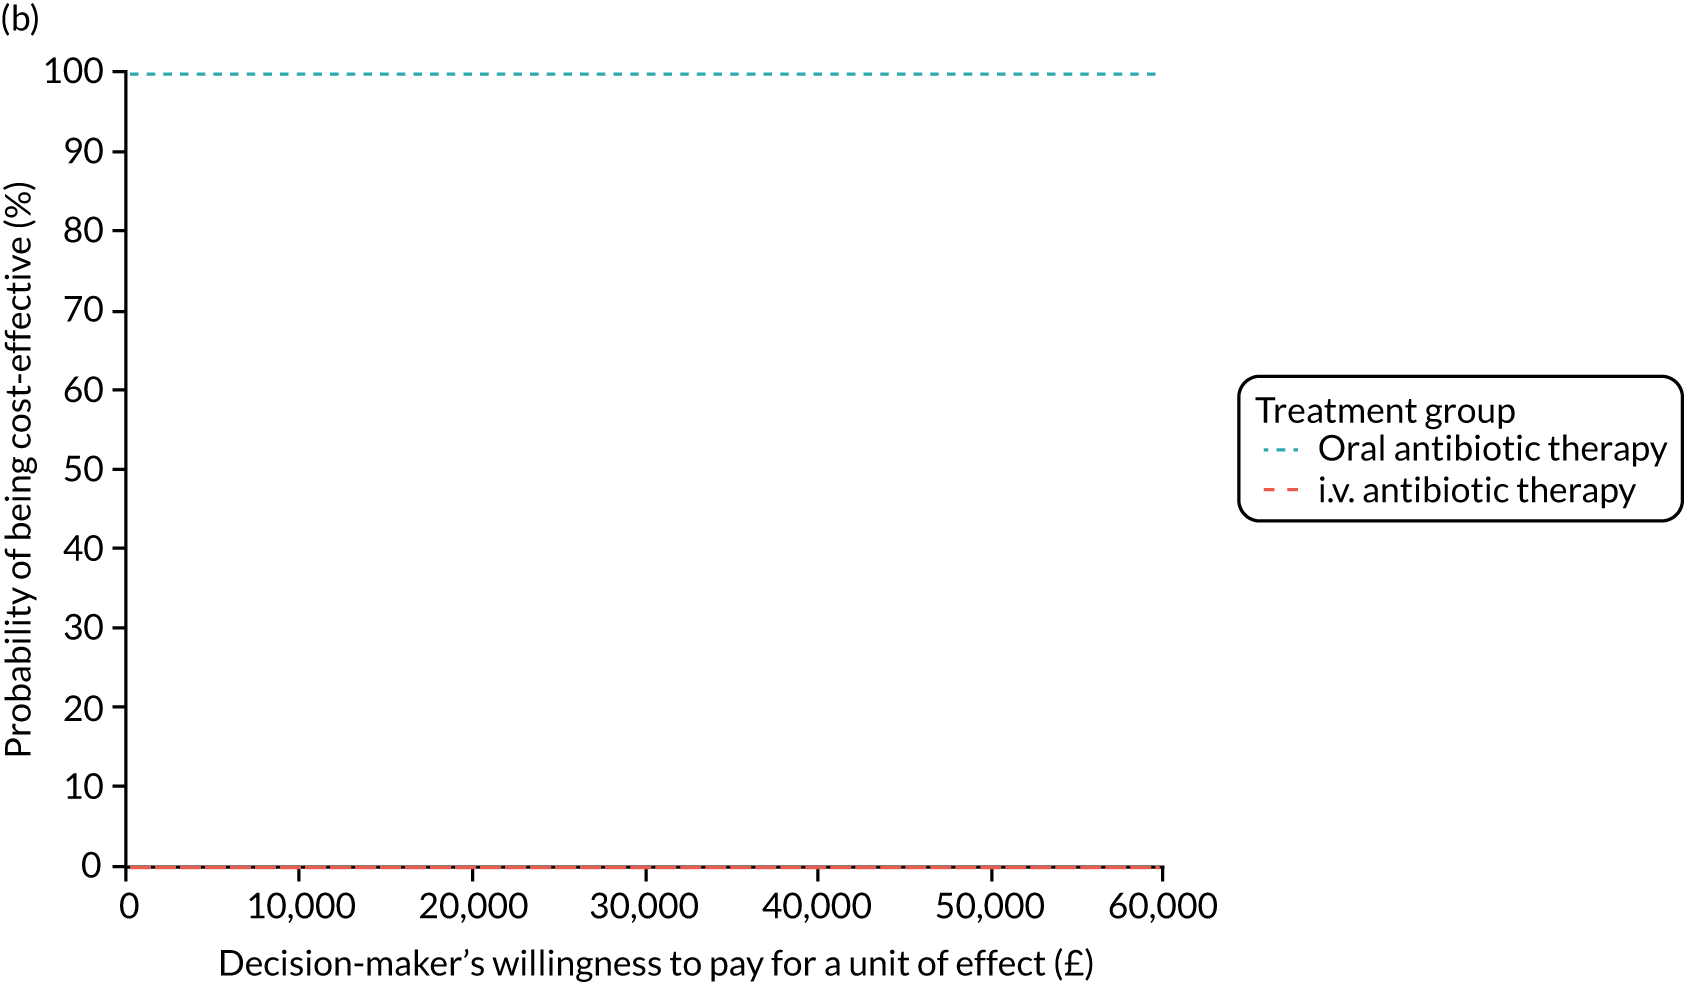
FIGURE 36.
Primary analysis: proportion infection free, NHS and PSS perspective costs, covariate adjusted, GLM cost model [link(log); family (Gaussian)]. (a) Incremental cost-effectiveness plane; and (b) CEAC.
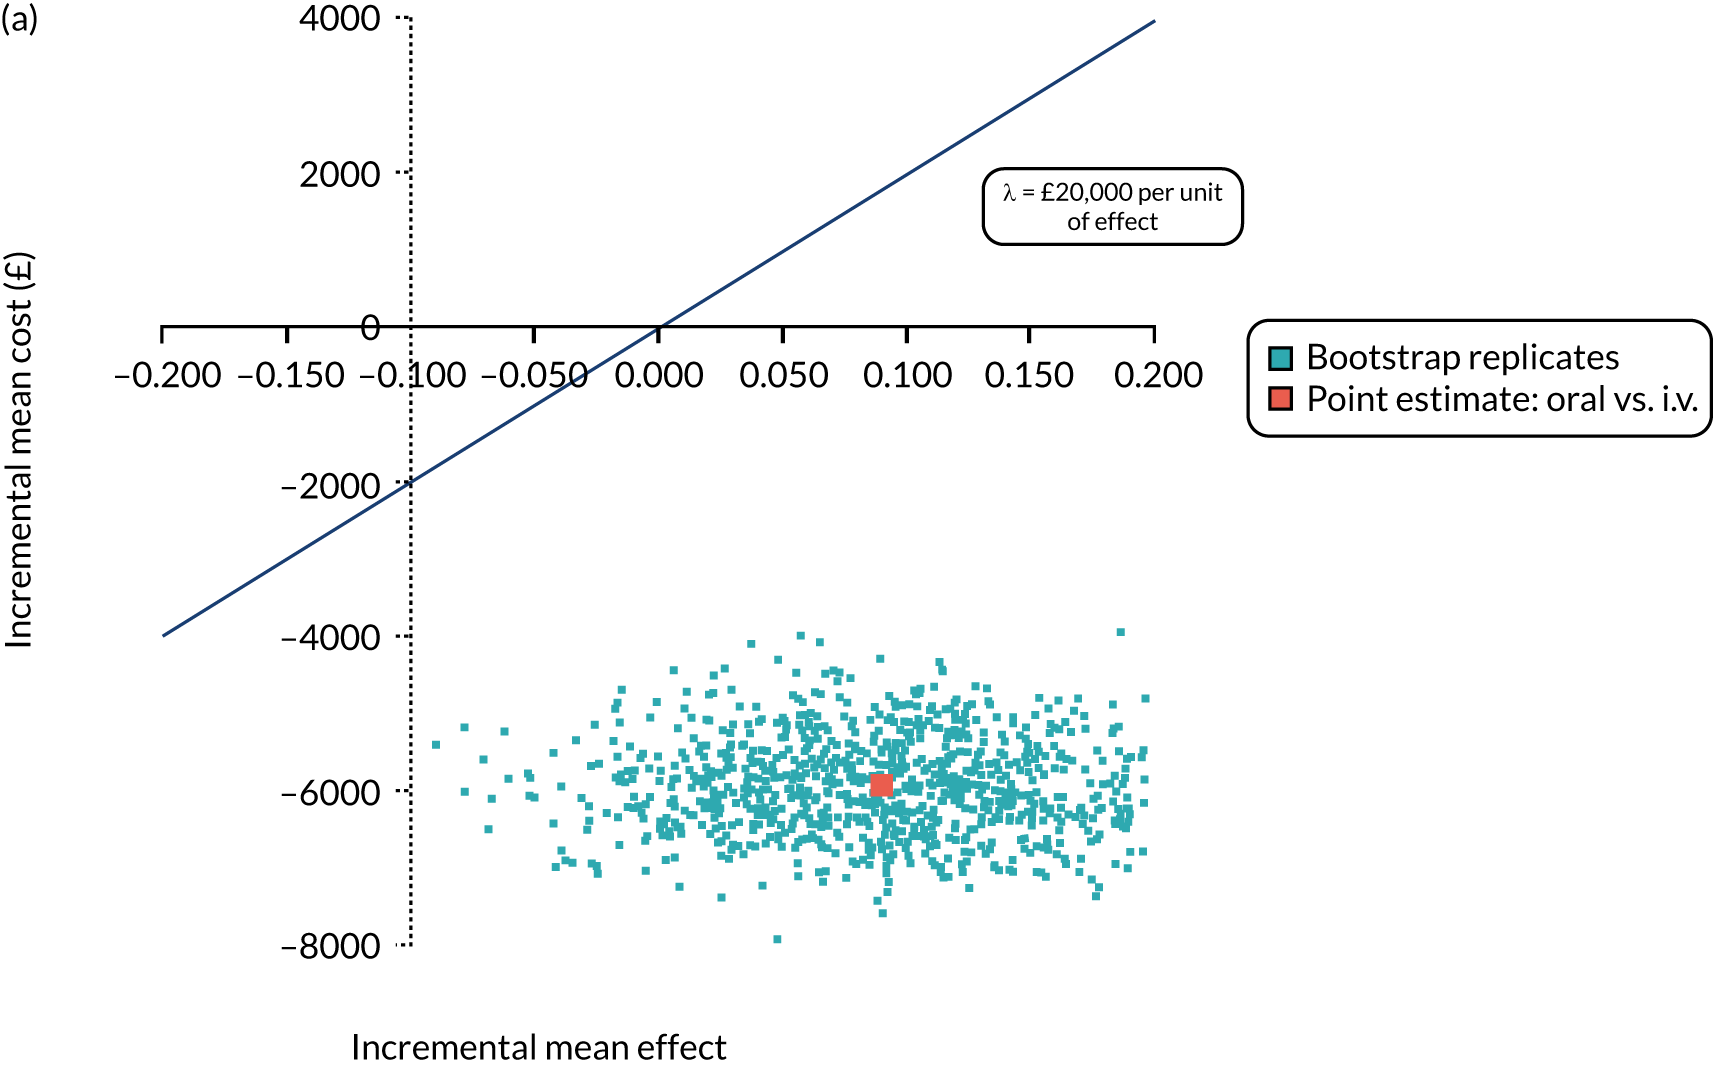
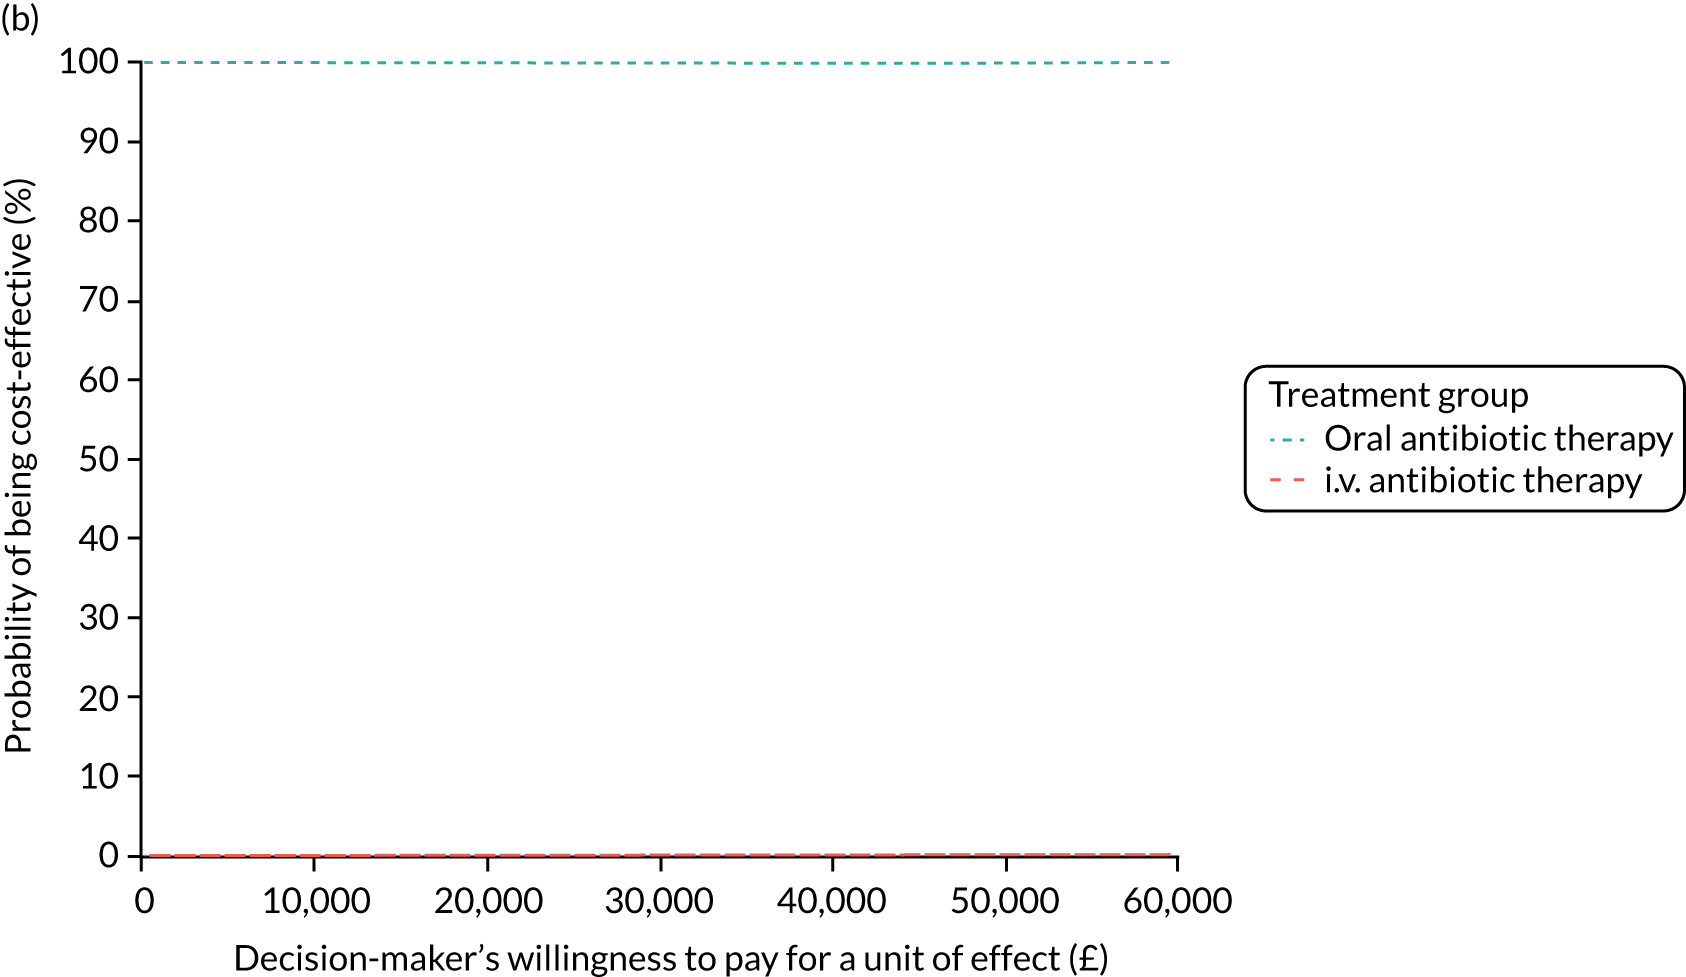
FIGURE 37.
Primary analysis: clinical effect, NHS and PSS perspective costs, covariate adjusted, GLM cost model [link(log); family (Gaussian)]. (a) Incremental cost-effectiveness plane; and (b) CEAC.
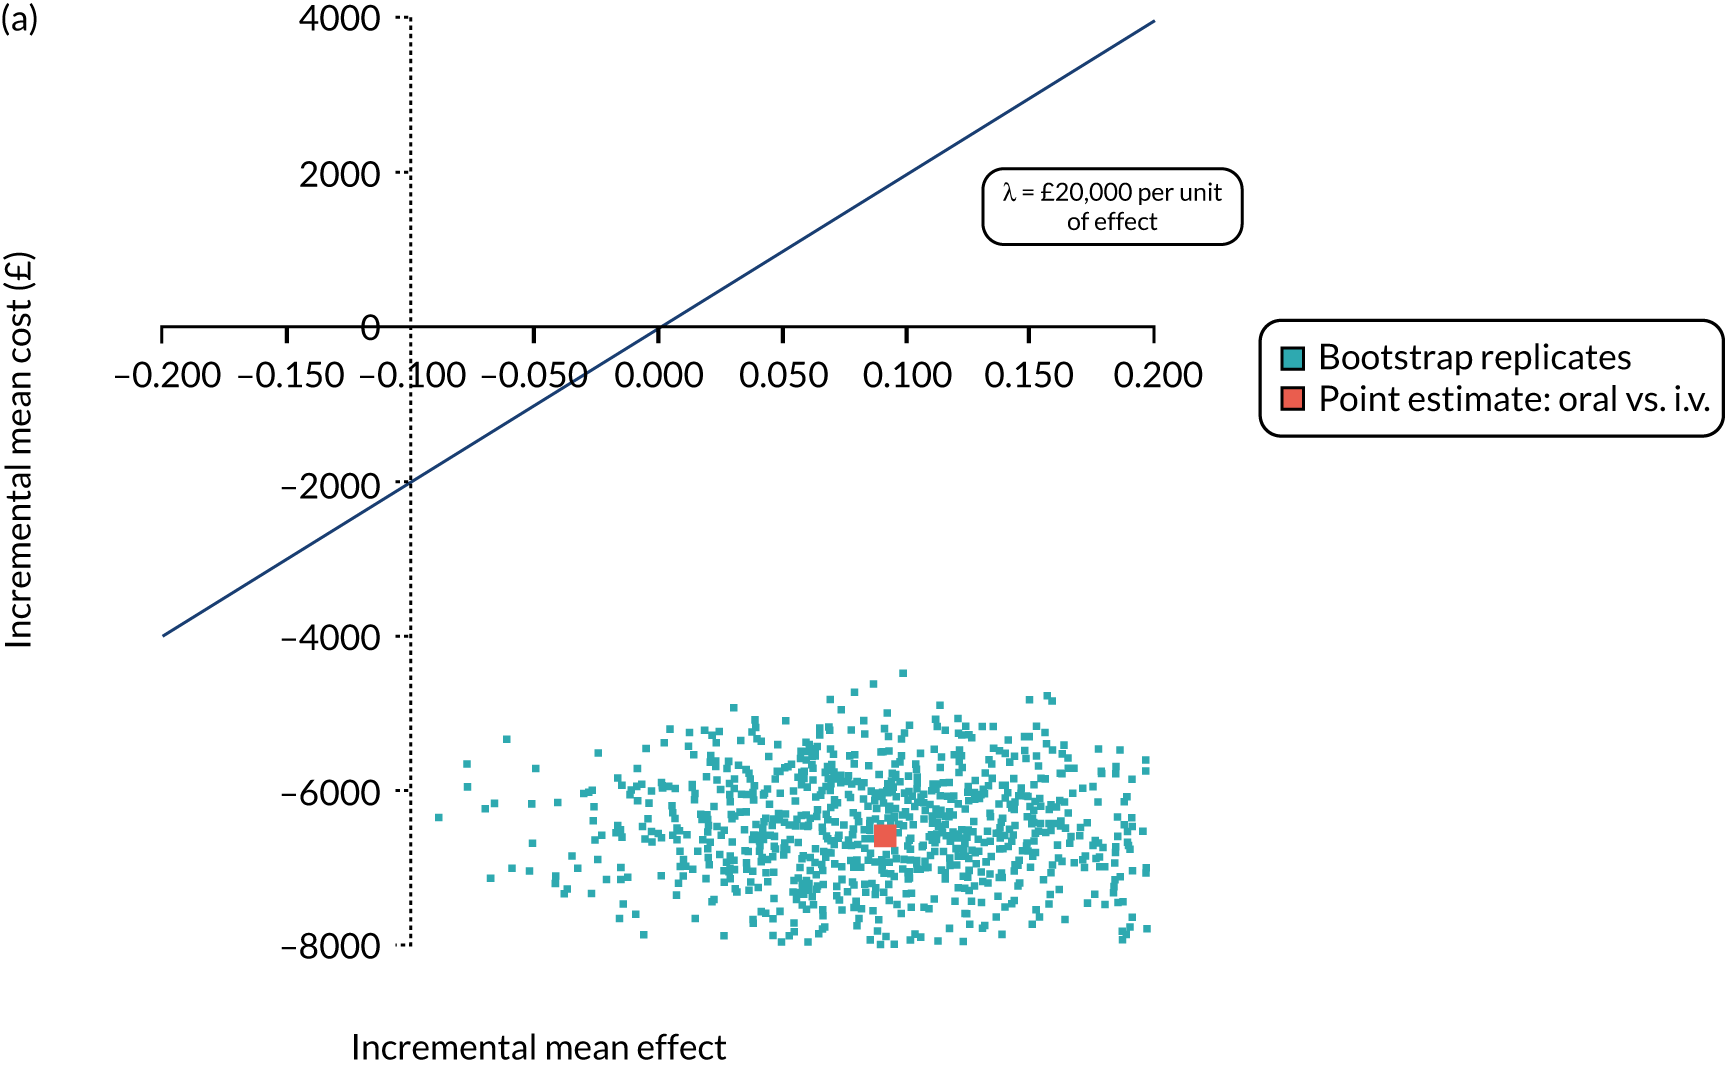
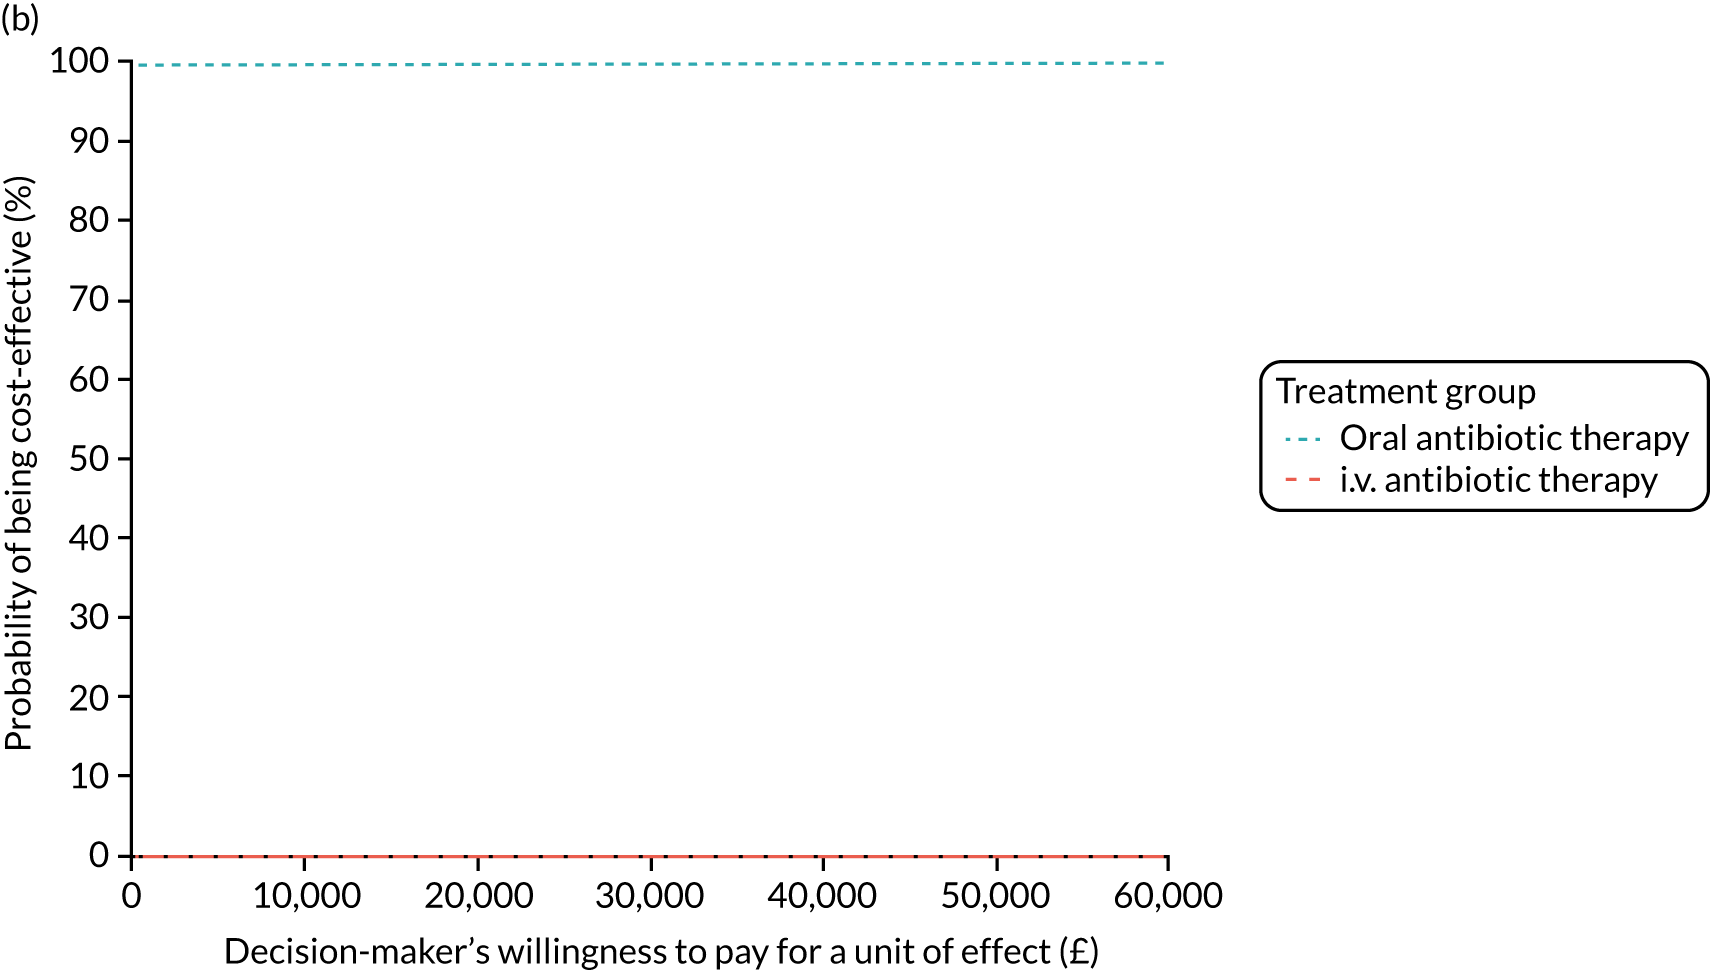
FIGURE 38.
Secondary analysis: 15-month horizon QALYs, NHS and PSS perspective costs, covariate. (a) Incremental cost-effectiveness plane; and (b) CEAC.
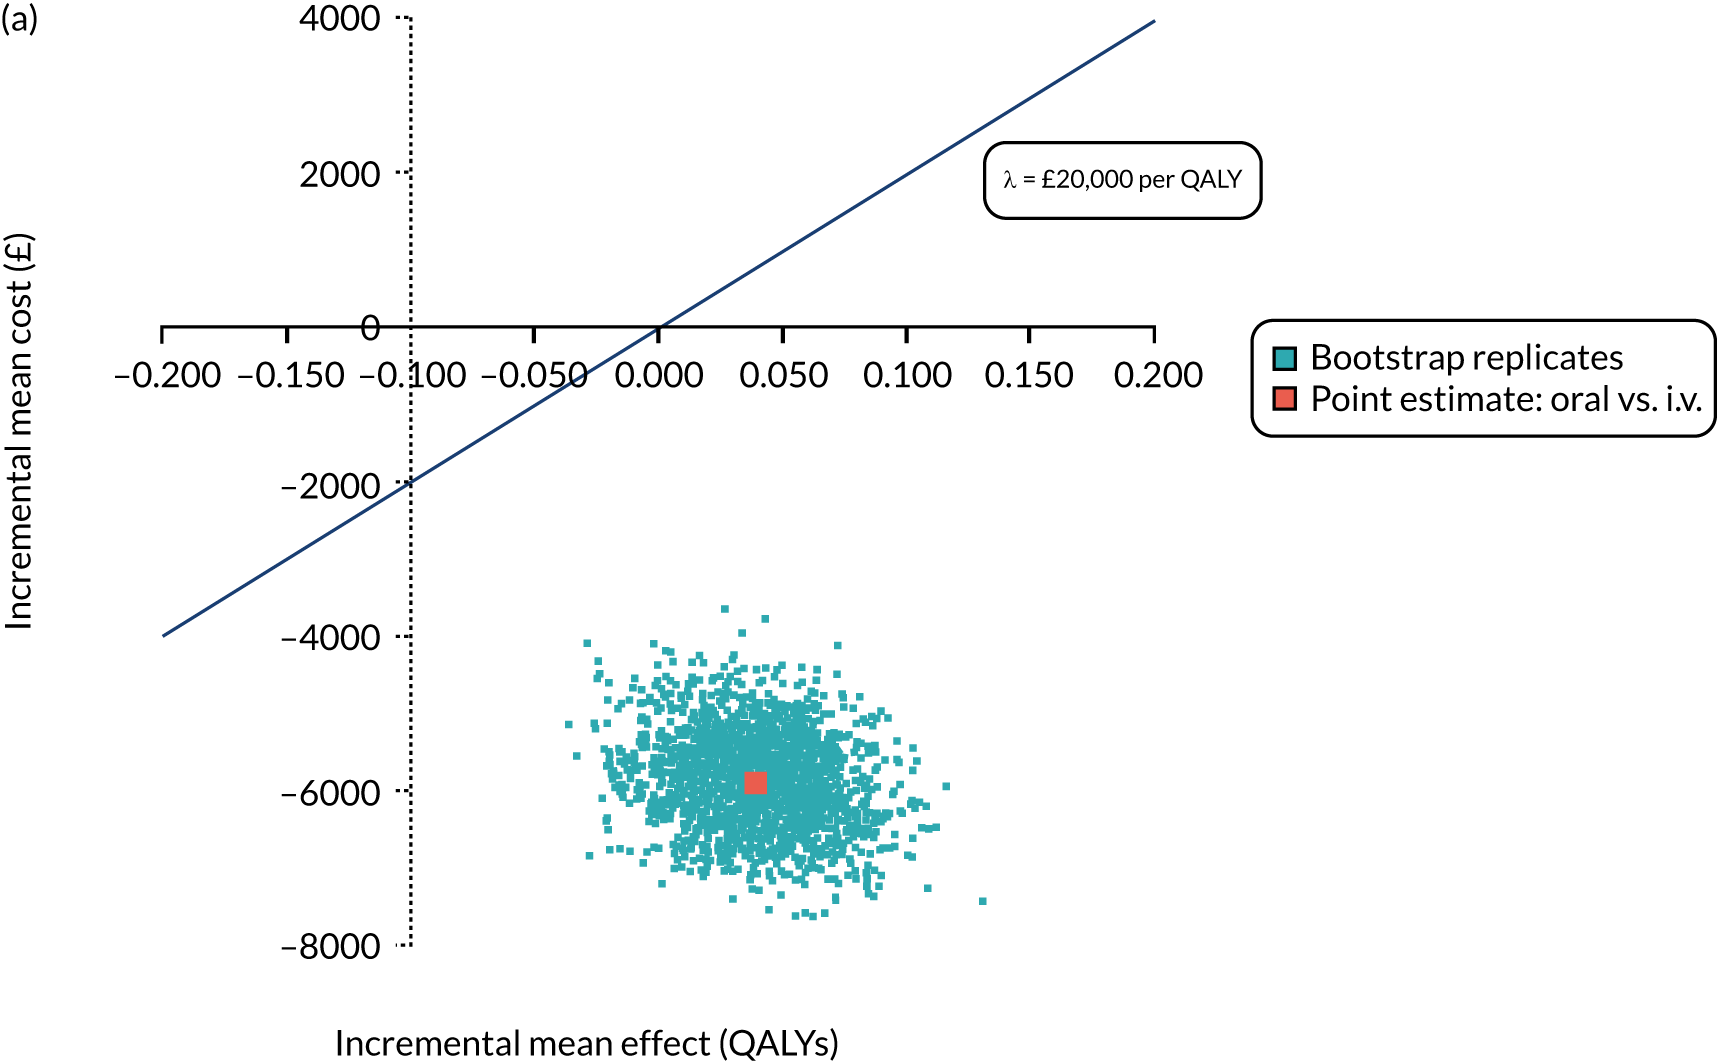
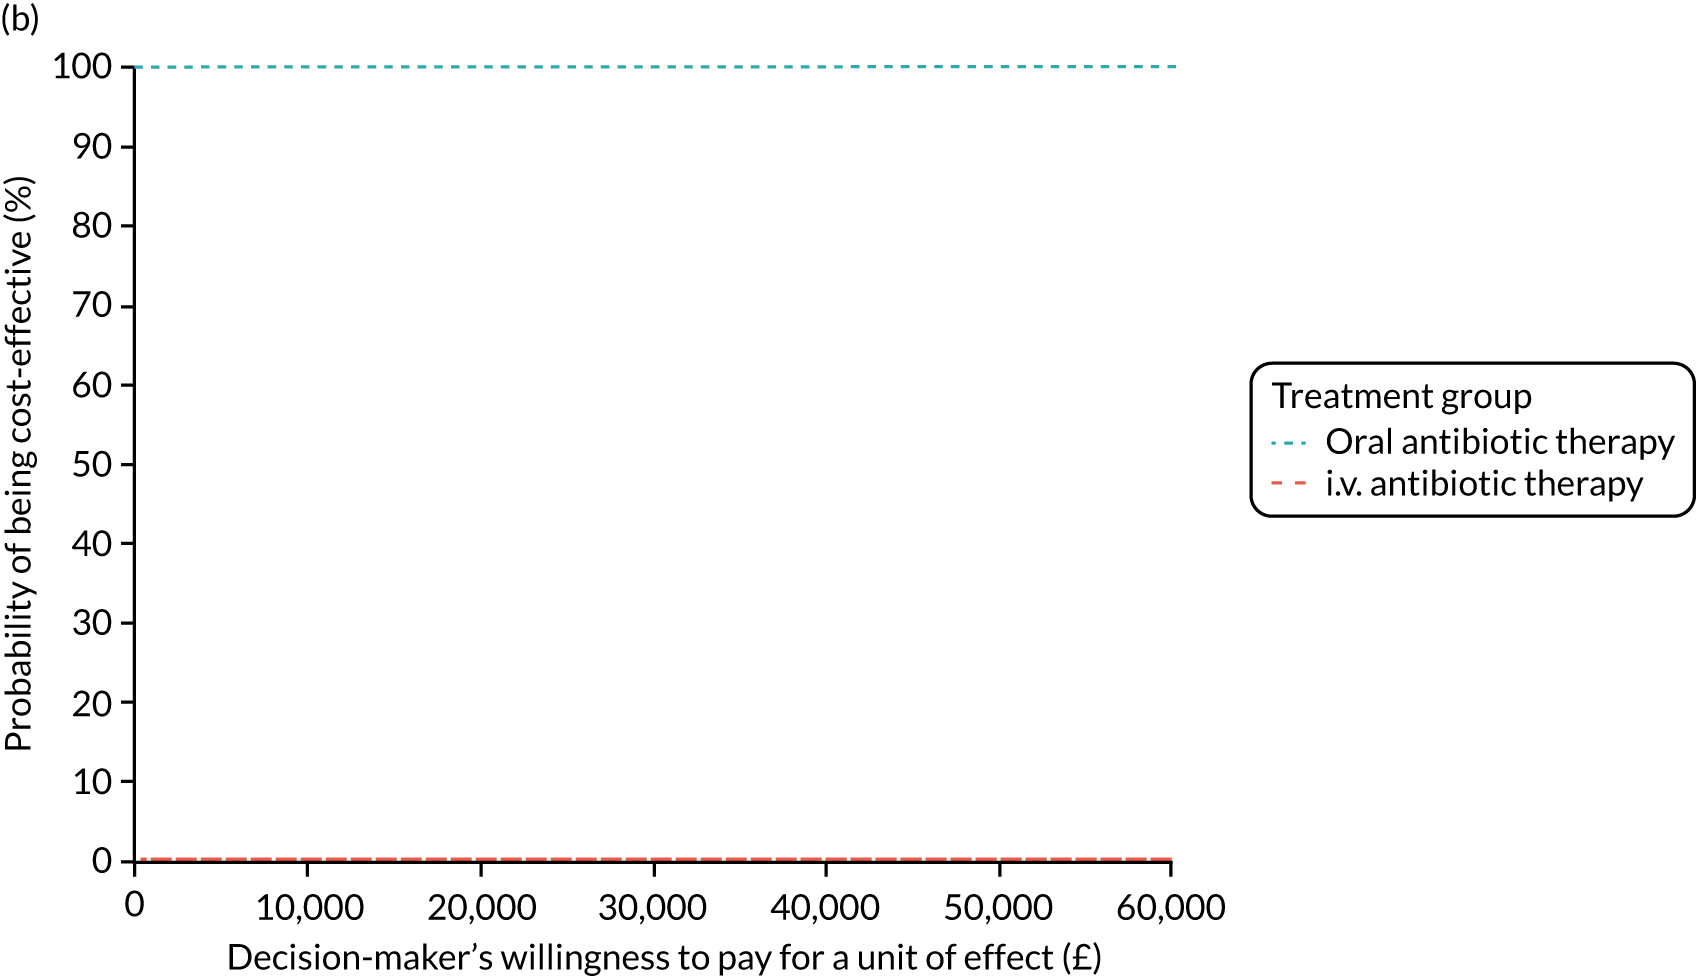
FIGURE 39.
Secondary analysis: 24-month horizon QALYs, NHS and PSS perspective costs, covariate adjusted. (a) Incremental cost-effectiveness plane; and (b) CEAC.
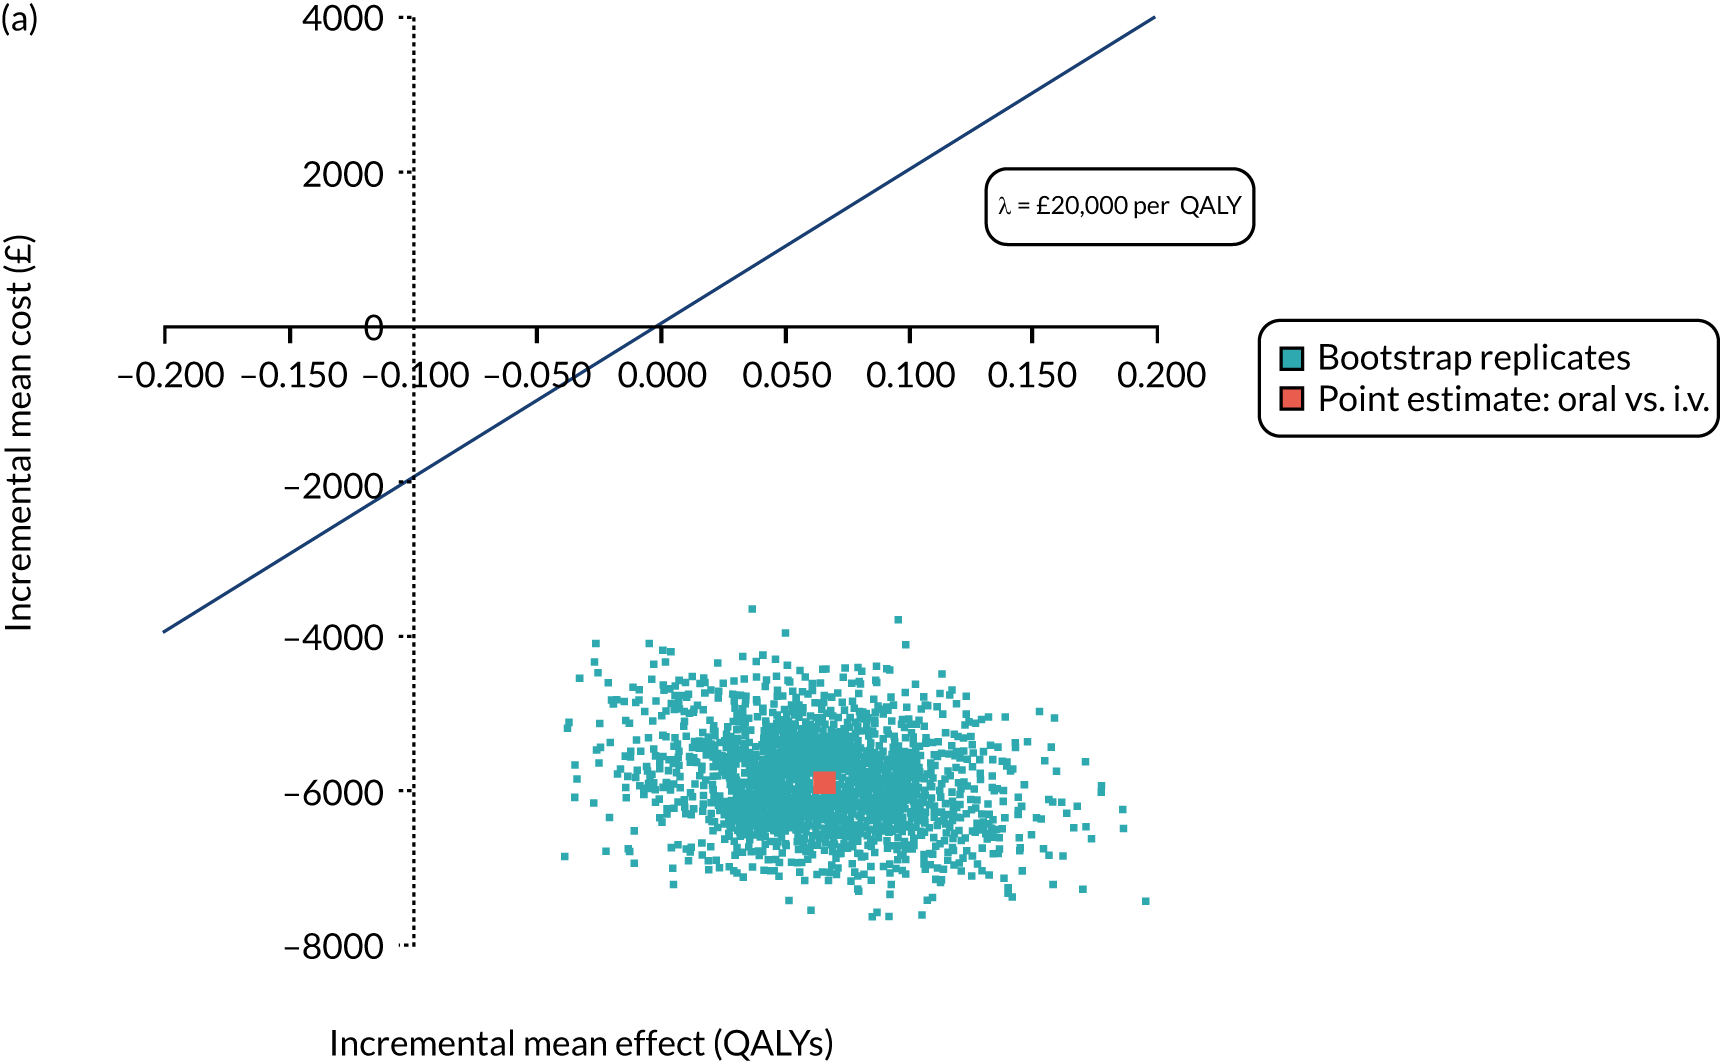
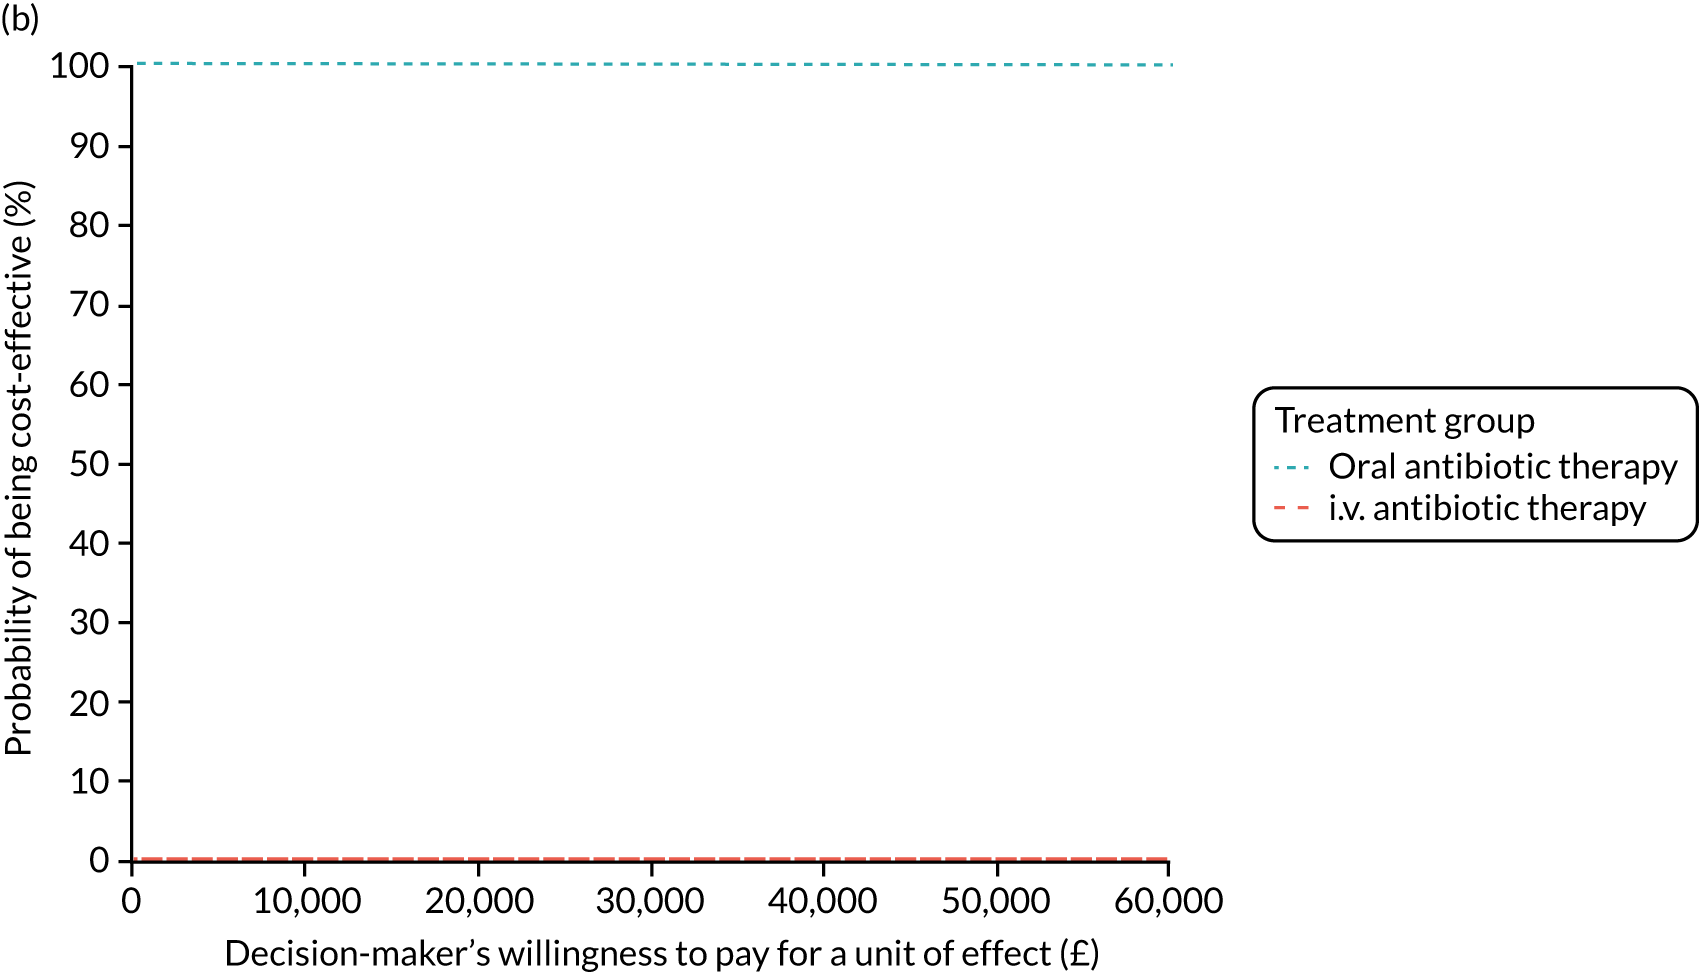
FIGURE 40.
Secondary analysis: 15-month horizon QALYs, NHS and PSS perspective costs, covariate adjusted, CF HRG used. (a) Incremental cost-effectiveness plane; and (b) CEAC.
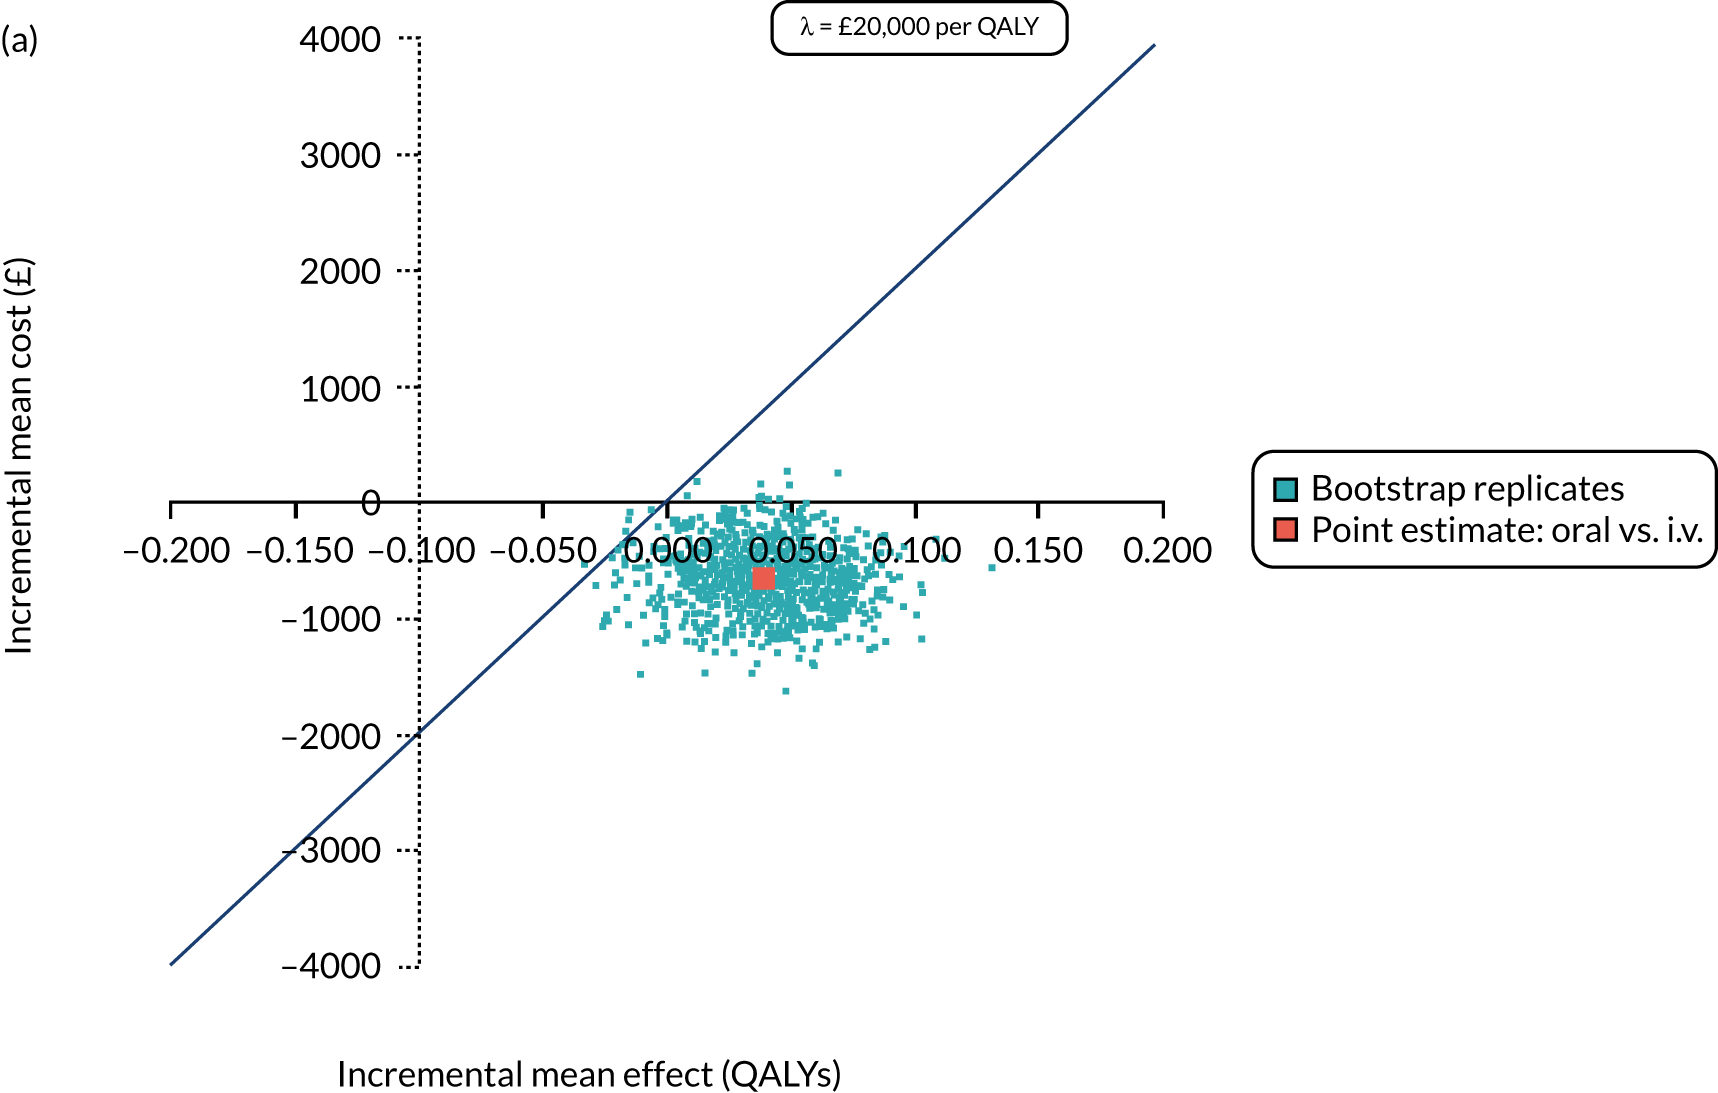
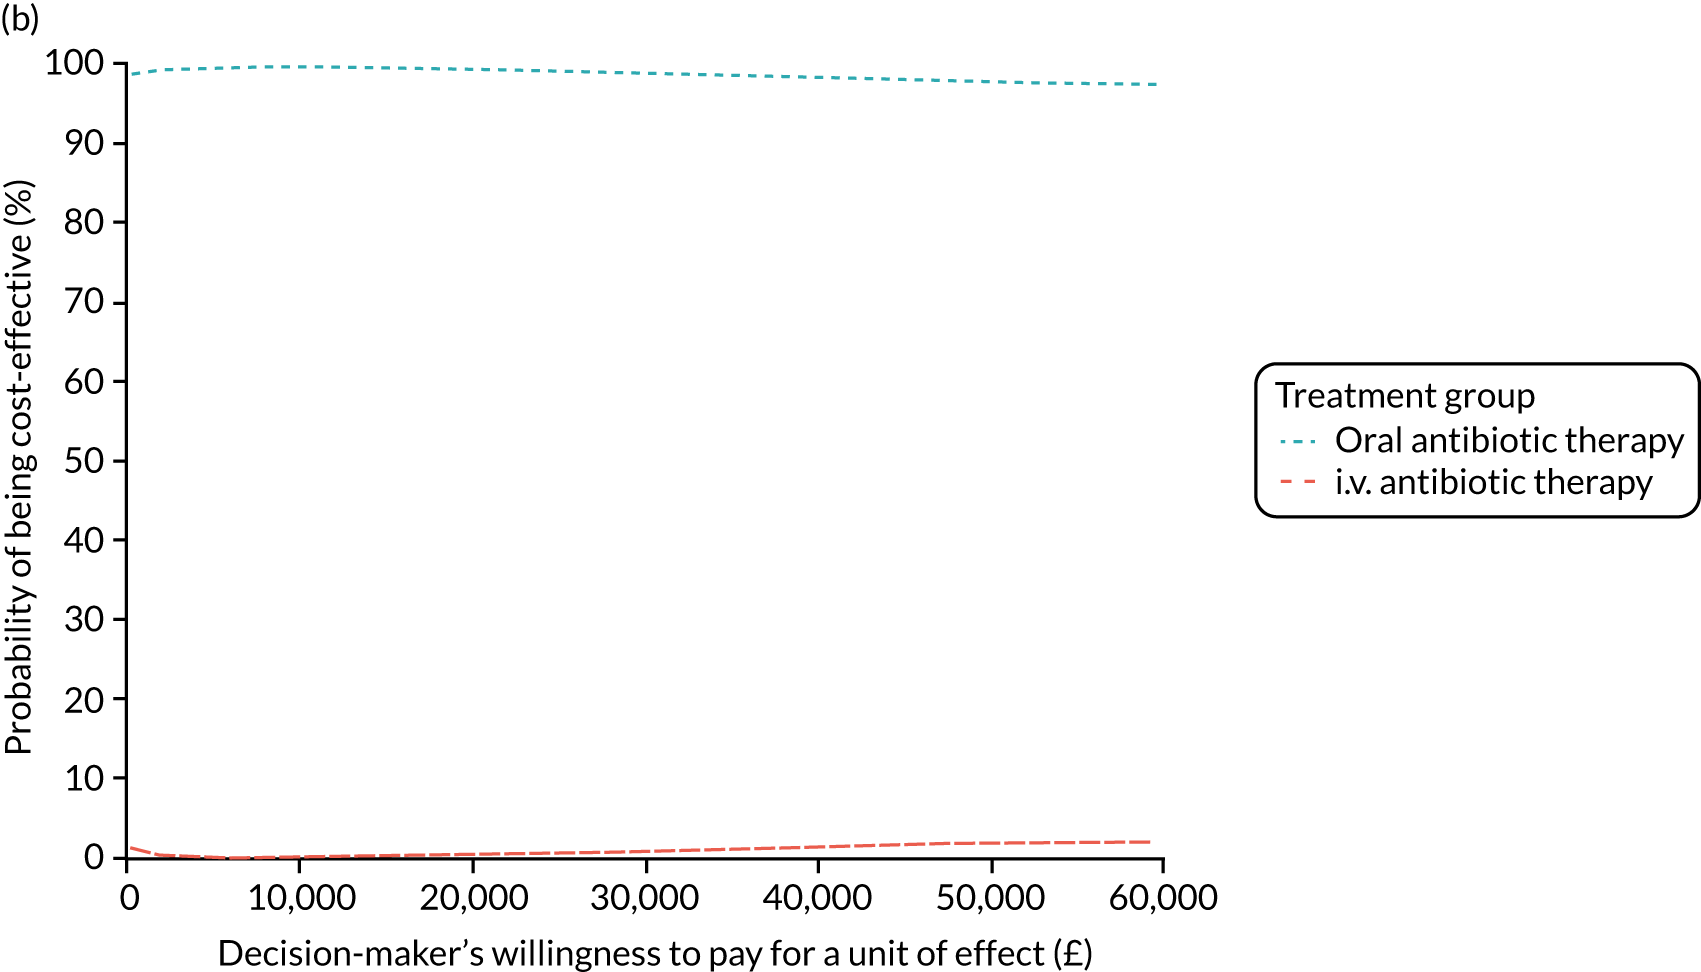
FIGURE 41.
Secondary analysis: 15-month horizon QALYs, societal perspective costs, covariate adjusted. (a) Incremental cost-effectiveness plane; and (b) CEAC.
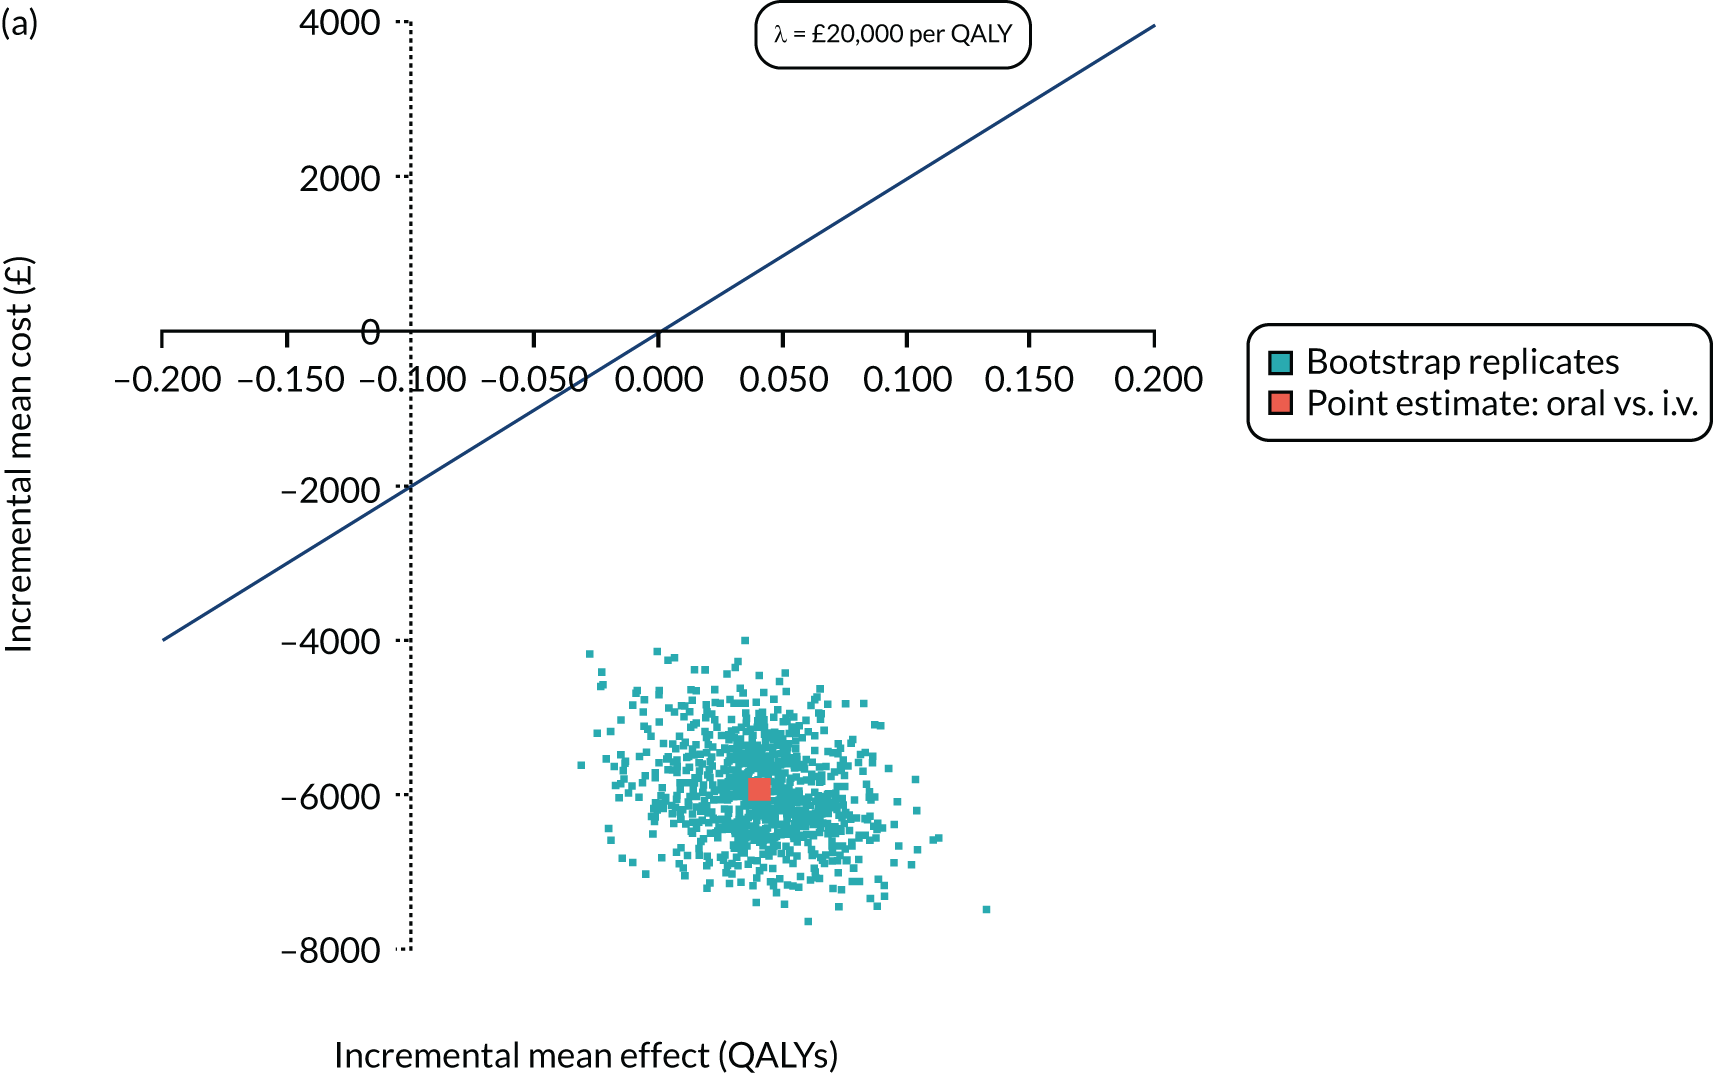
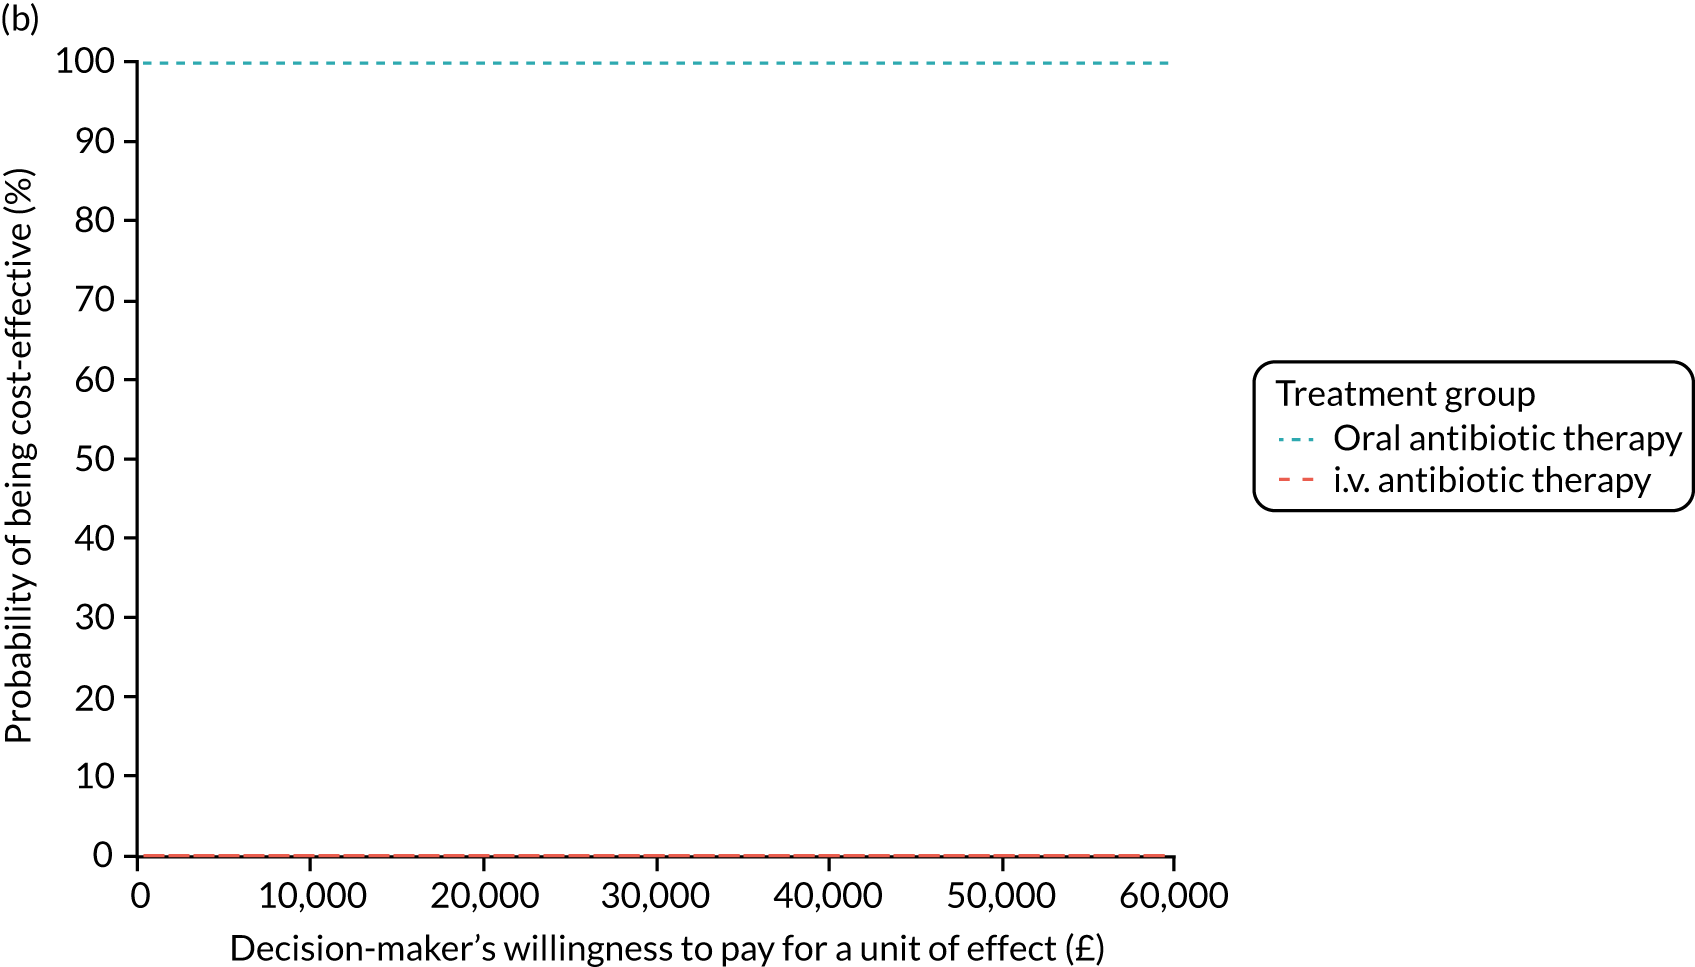
FIGURE 42.
Secondary analysis: 15-month horizon QALYs, NHS and PSS perspective costs, covariate adjusted, GLM cost model [link(log); family (Gaussian)]. (a) Incremental cost-effectiveness plane; and (b) CEAC.
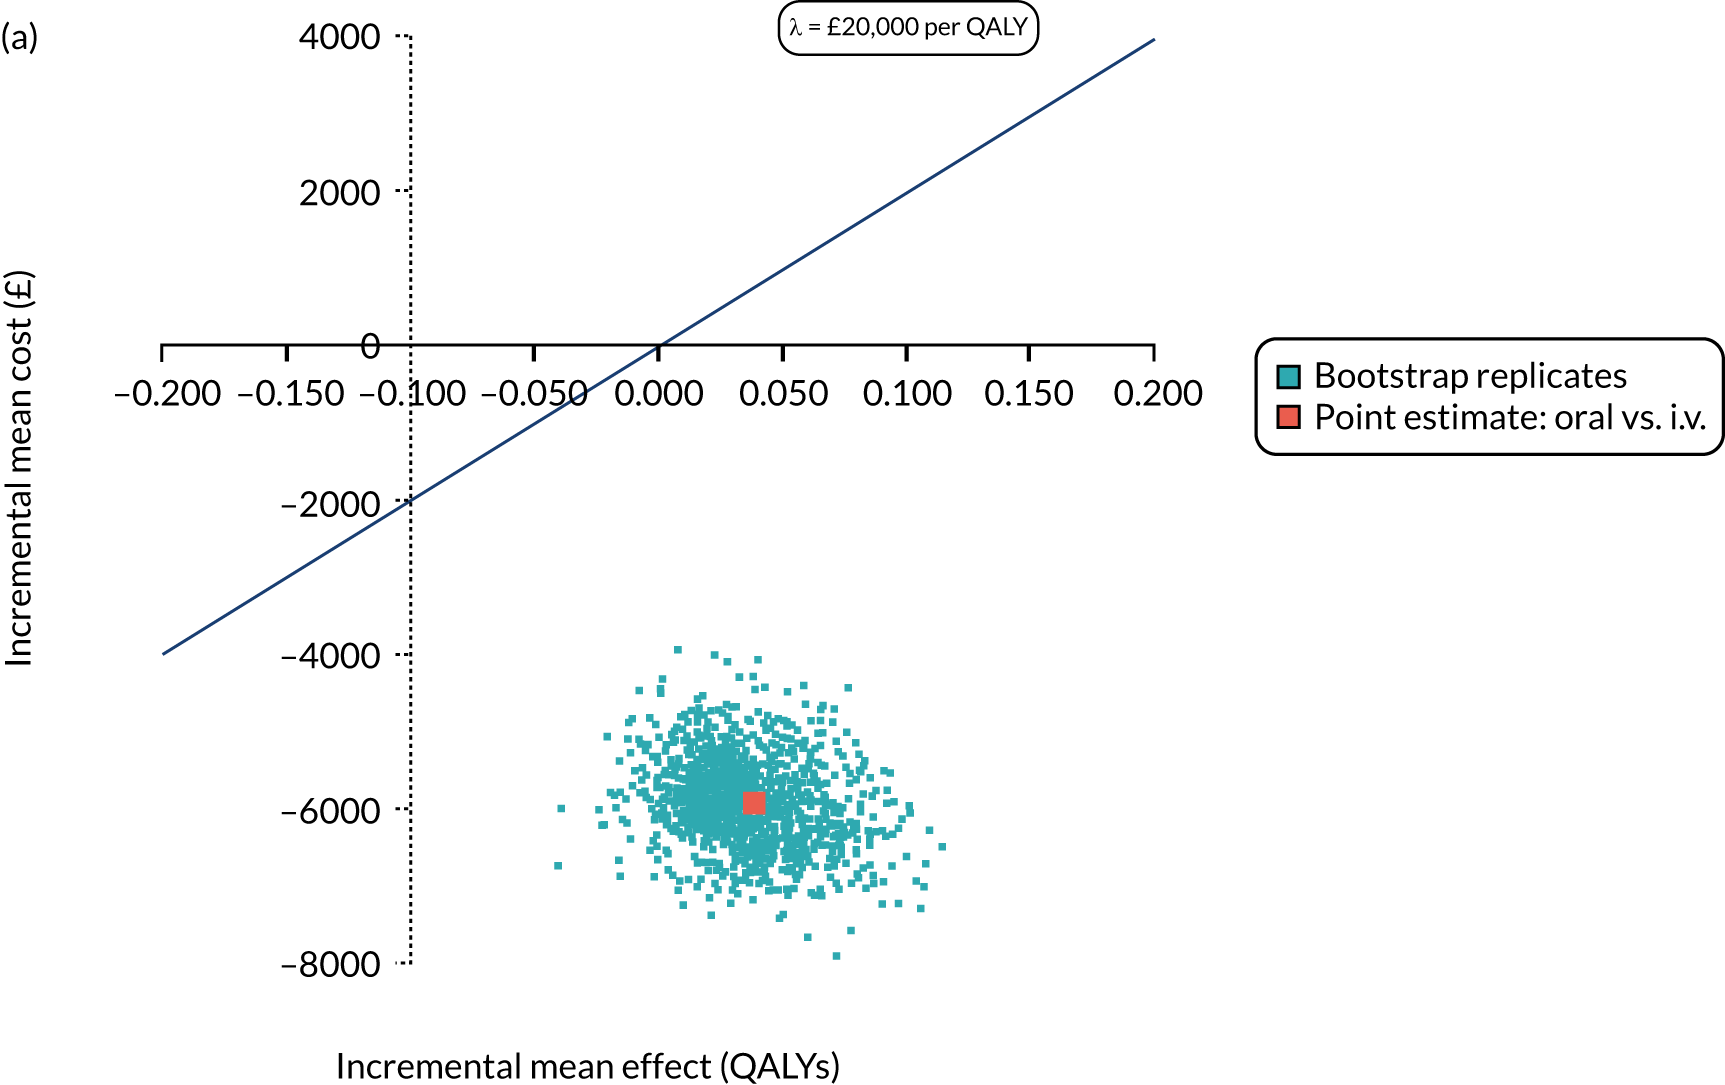
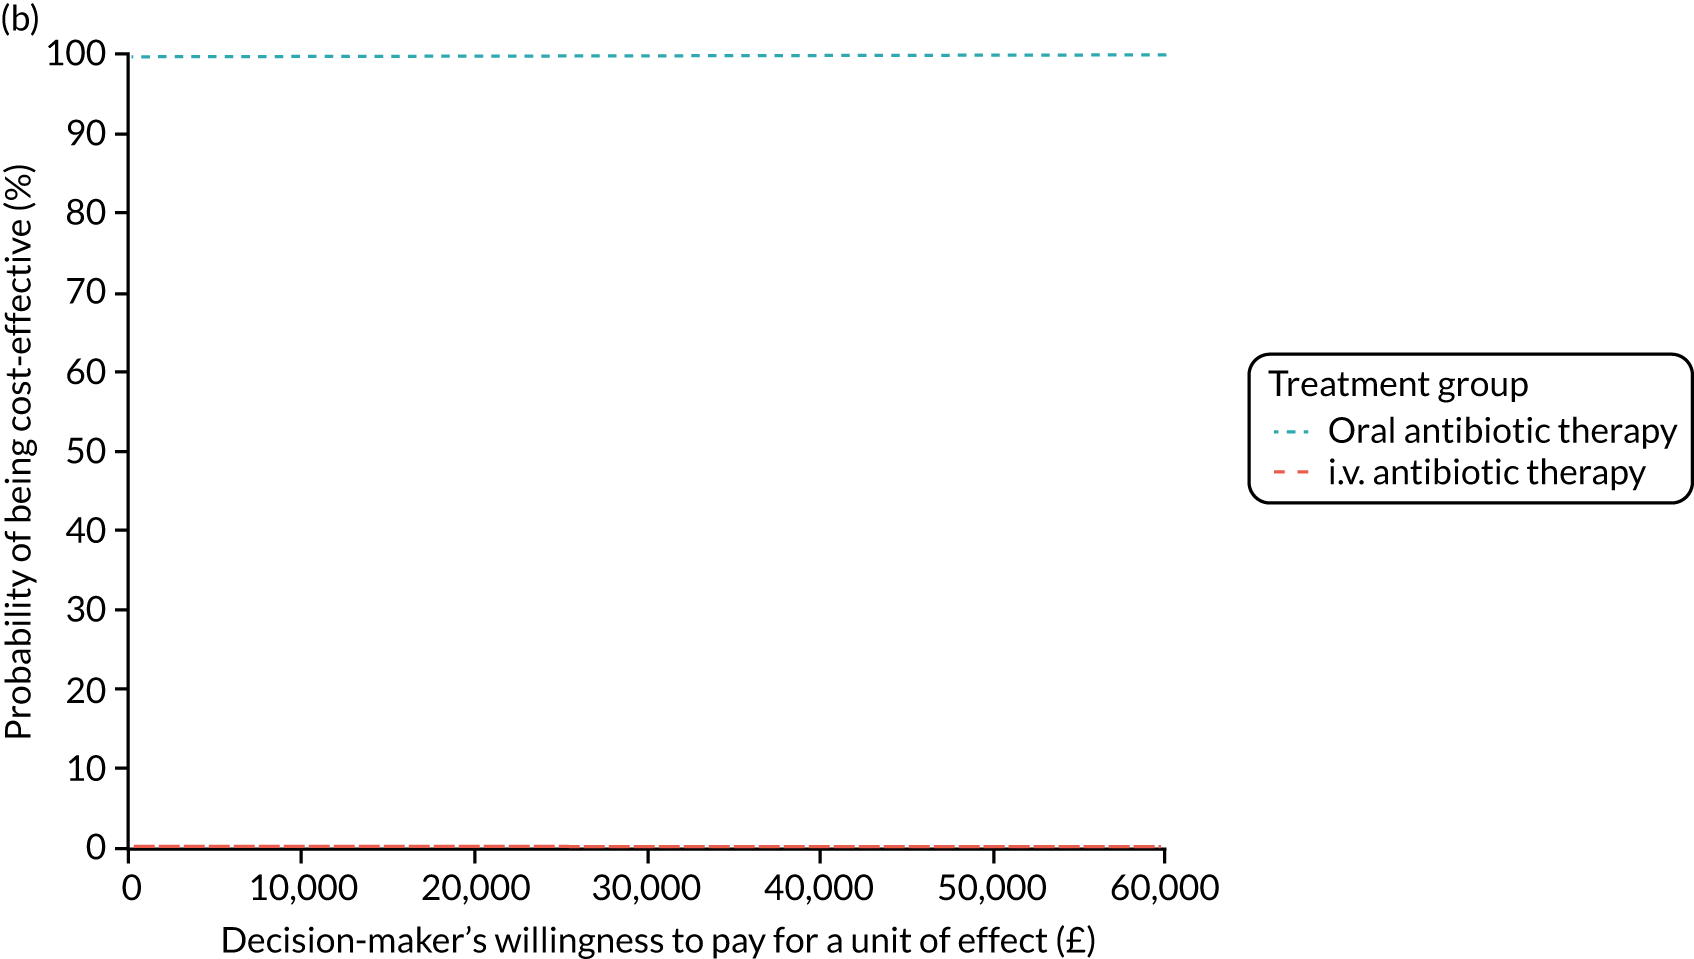
FIGURE 43.
Secondary analysis: 15-month horizon QALYs, NHS and PSS perspective costs, covariate adjusted, GLM cost model [link(log); family (inverse Gaussian)]. (a) Incremental cost-effectiveness plane; and (b) CEAC.
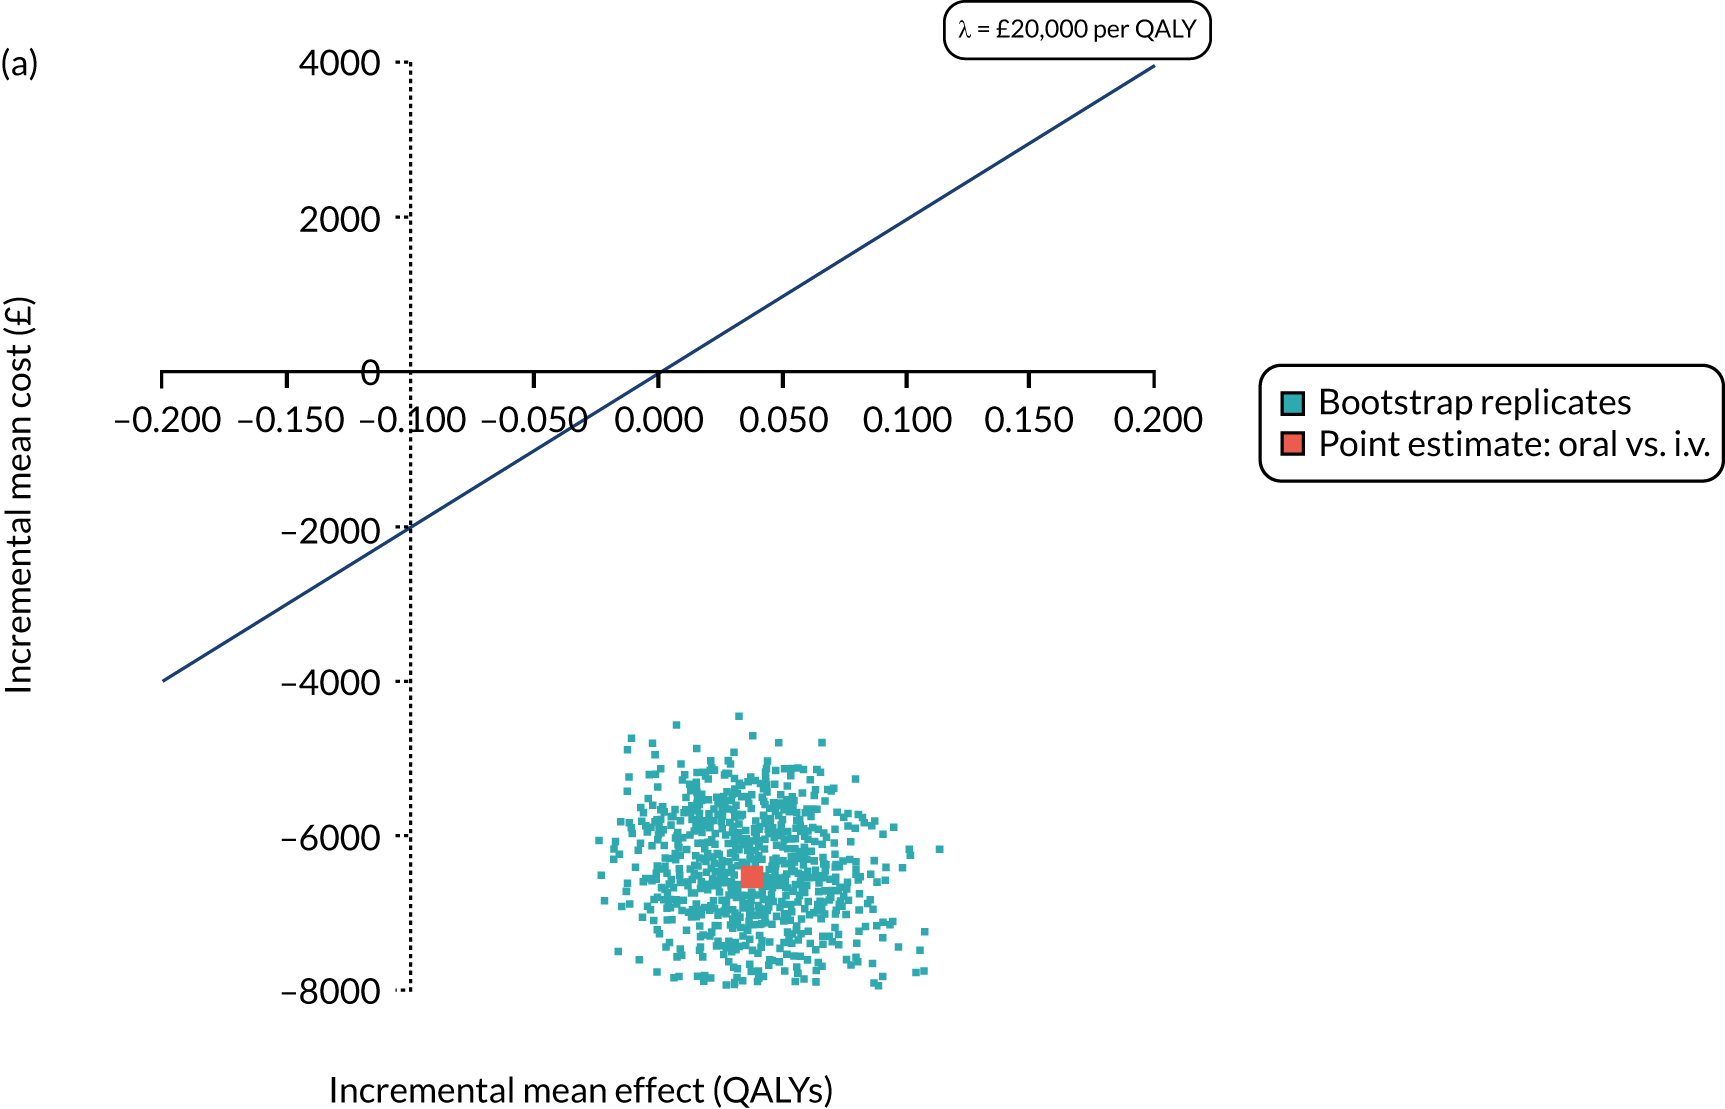
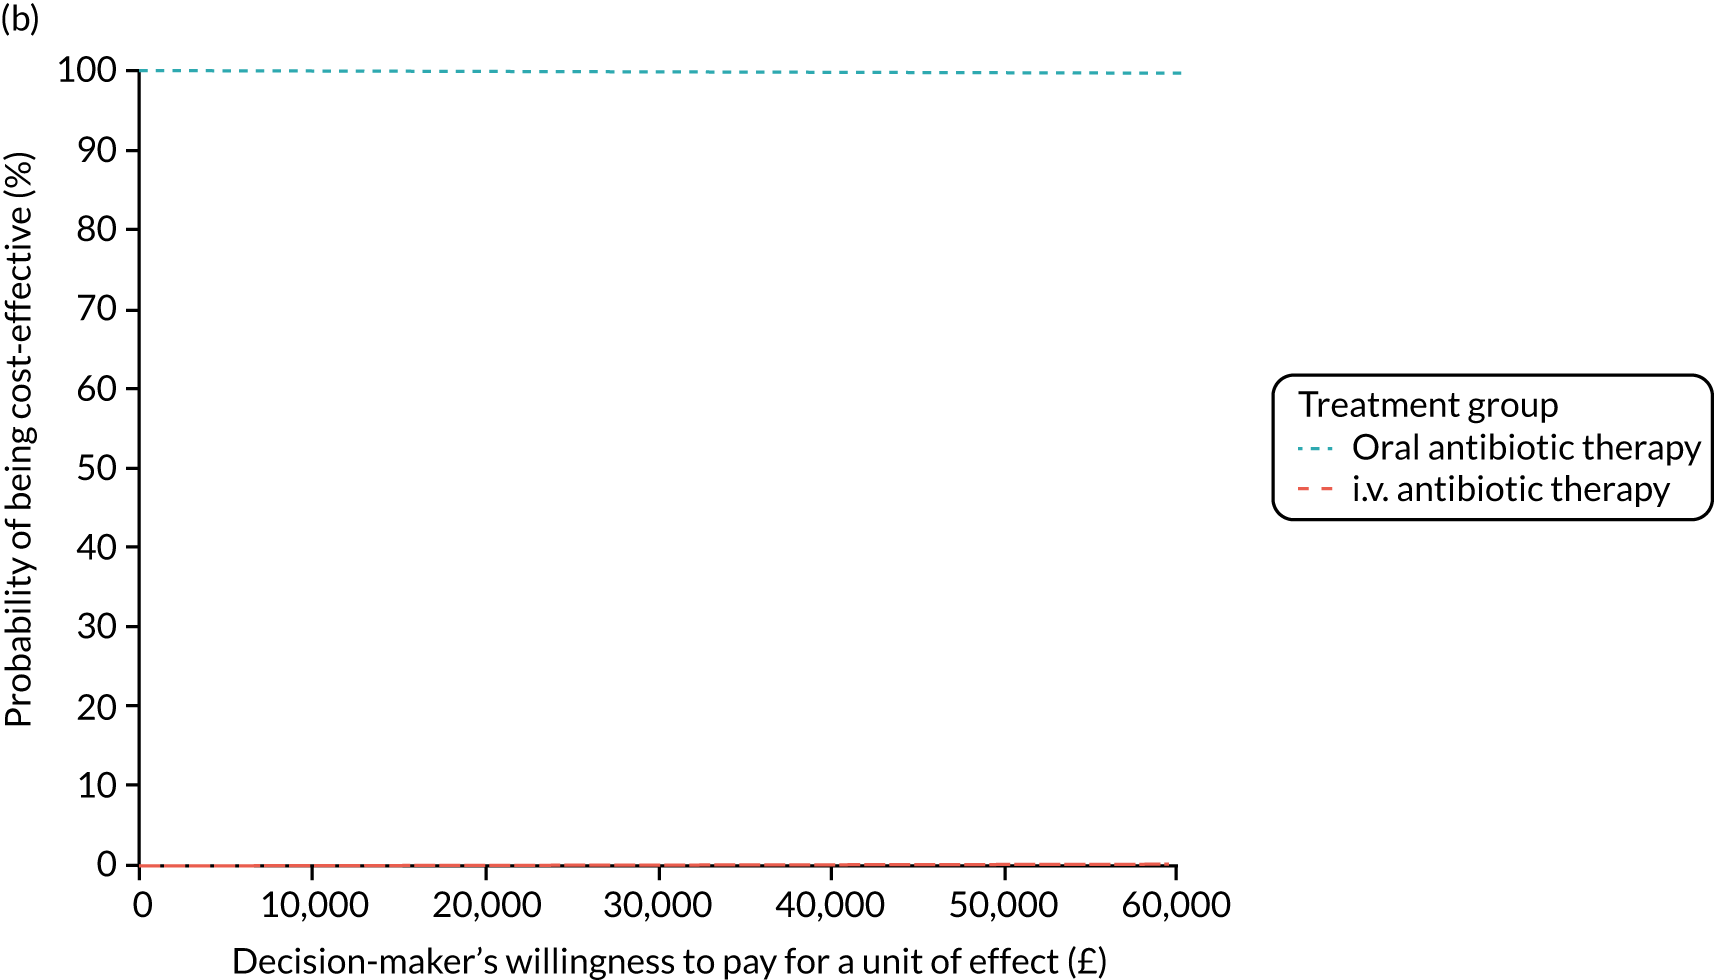
FIGURE 44.
Secondary analysis: 15-month horizon QALYs, NHS and PSS perspective costs, CF HRG, covariate adjusted, GLM cost model [link(log); family (Gaussian)]. (a) Incremental cost-effectiveness plane; and (b) CEAC.
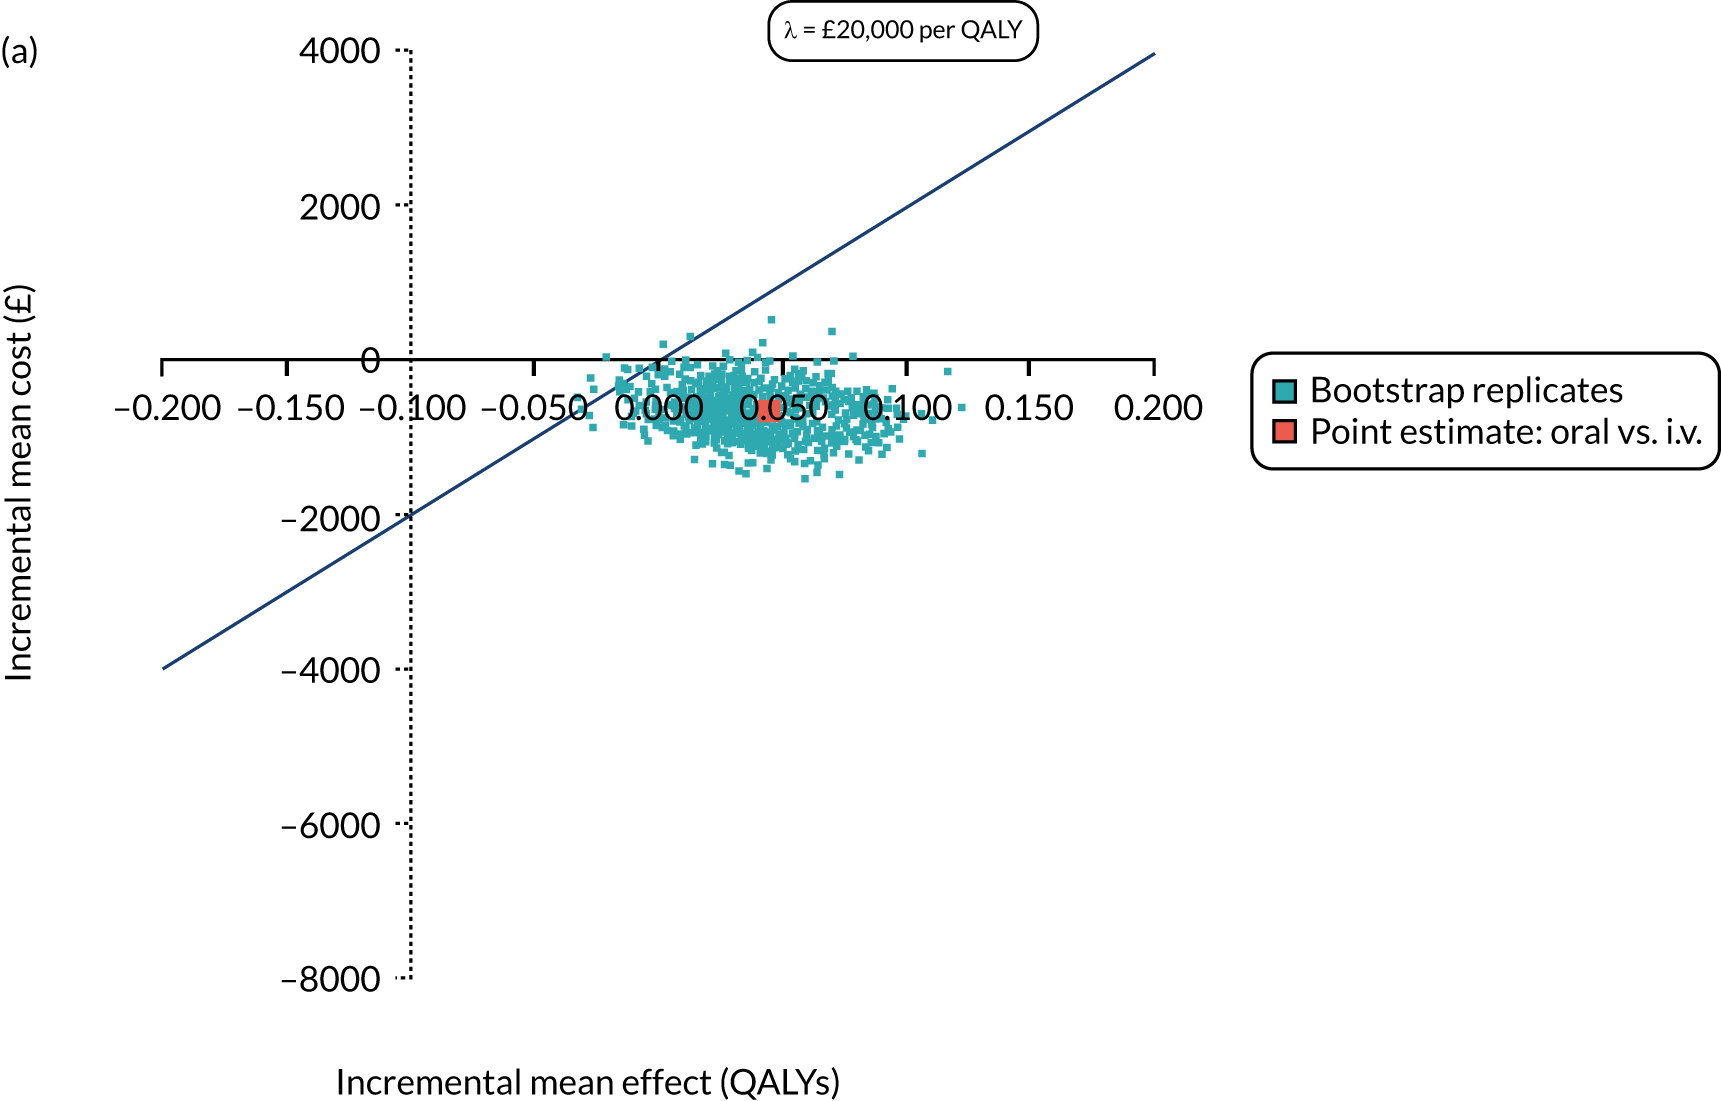
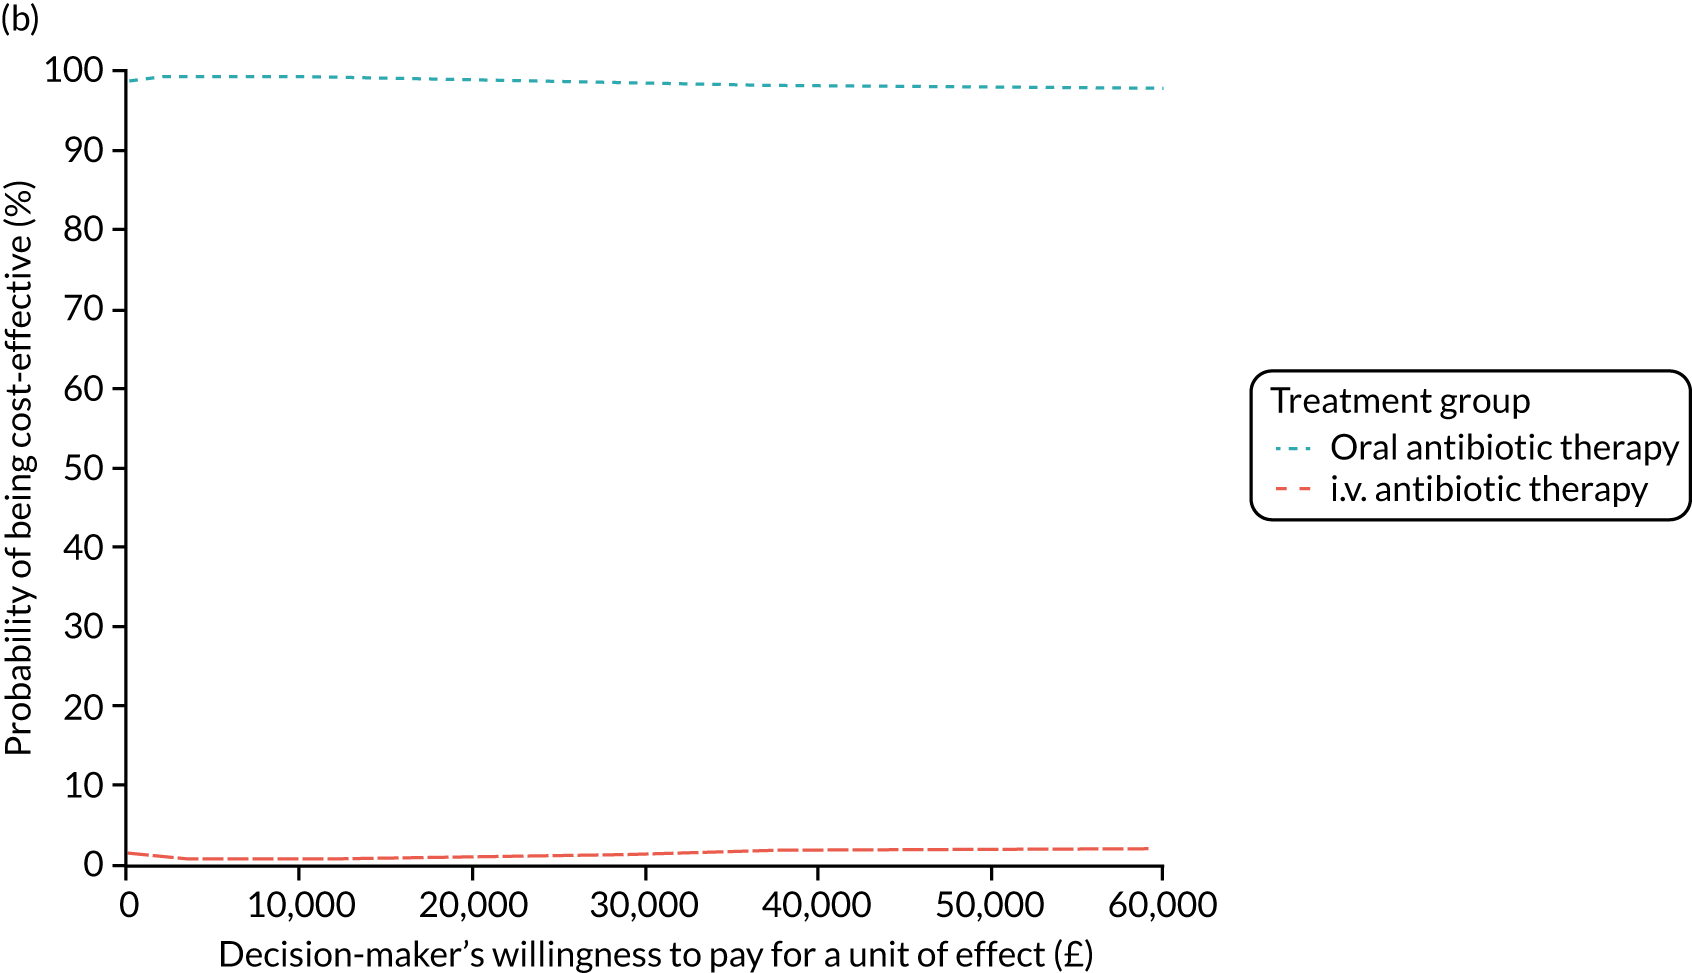
FIGURE 45.
Secondary analysis: 15-month horizon QALYs, NHS and PSS perspective costs, CF HRG, covariate adjusted, GLM cost model [link(log); family (inverse Gaussian)]. (a) Incremental cost-effectiveness plane; and (b) CEAC.
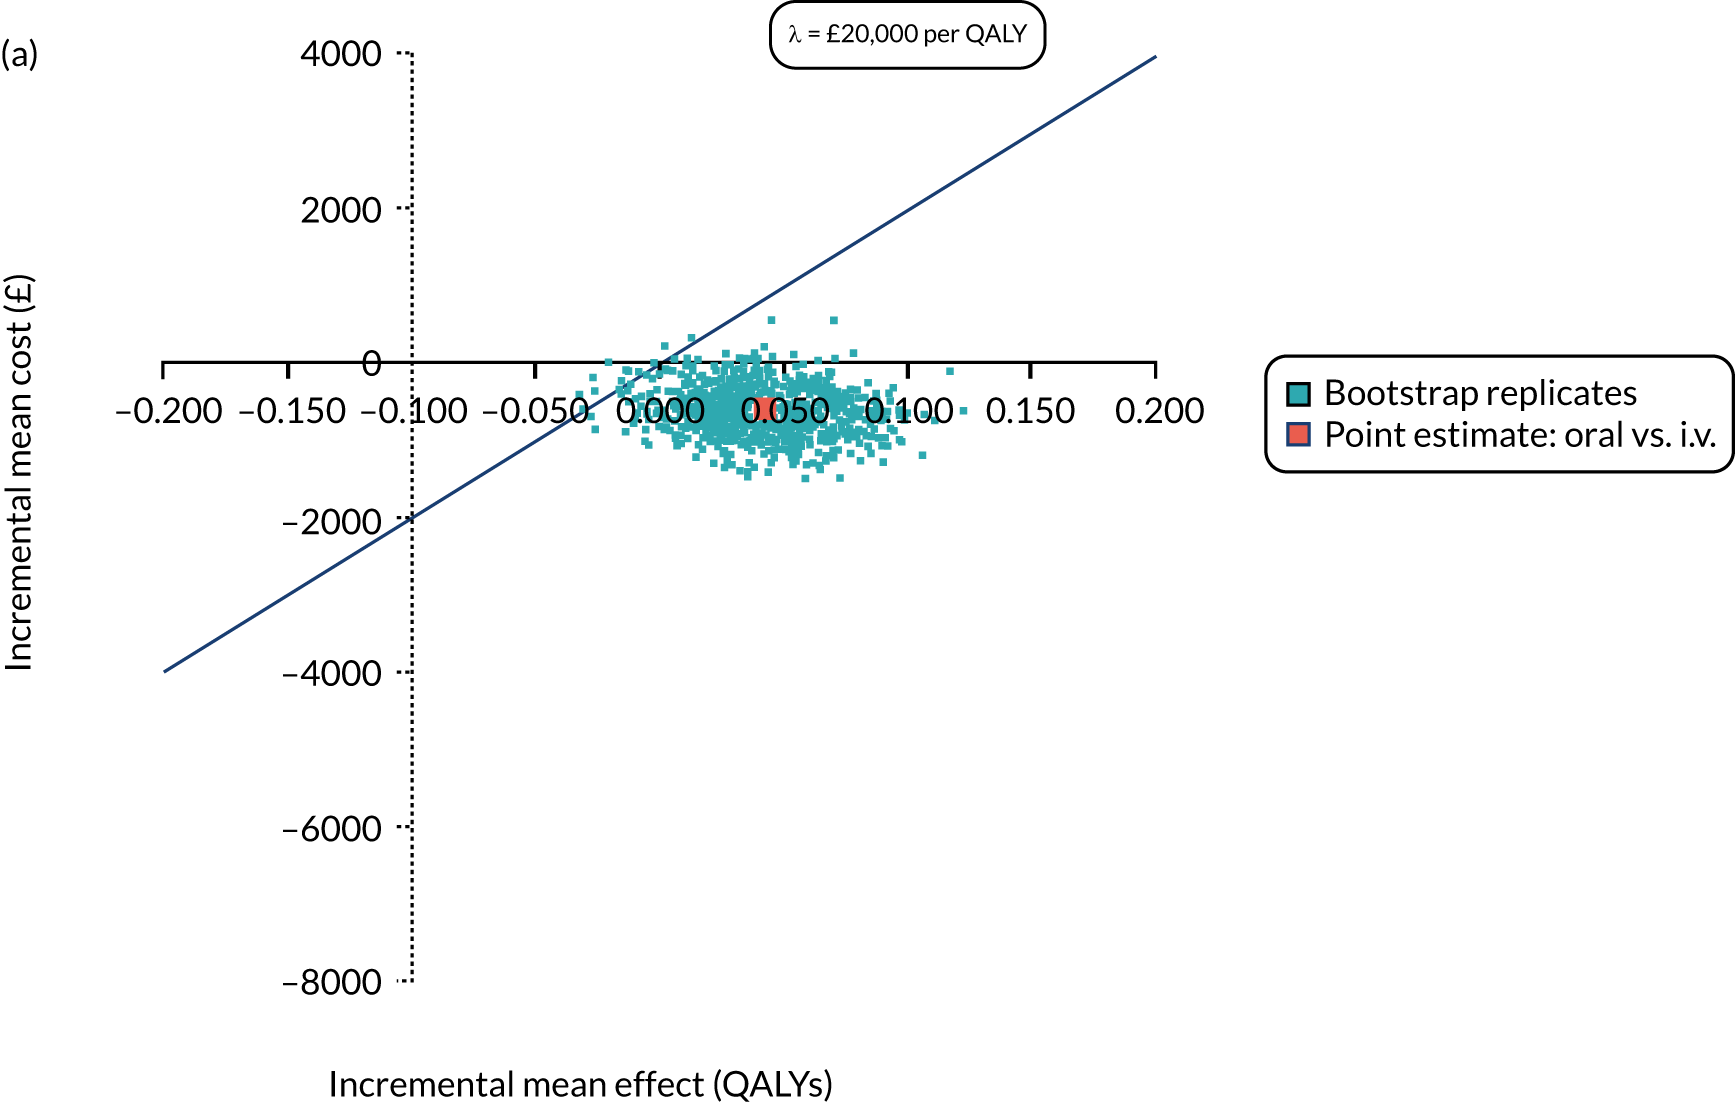
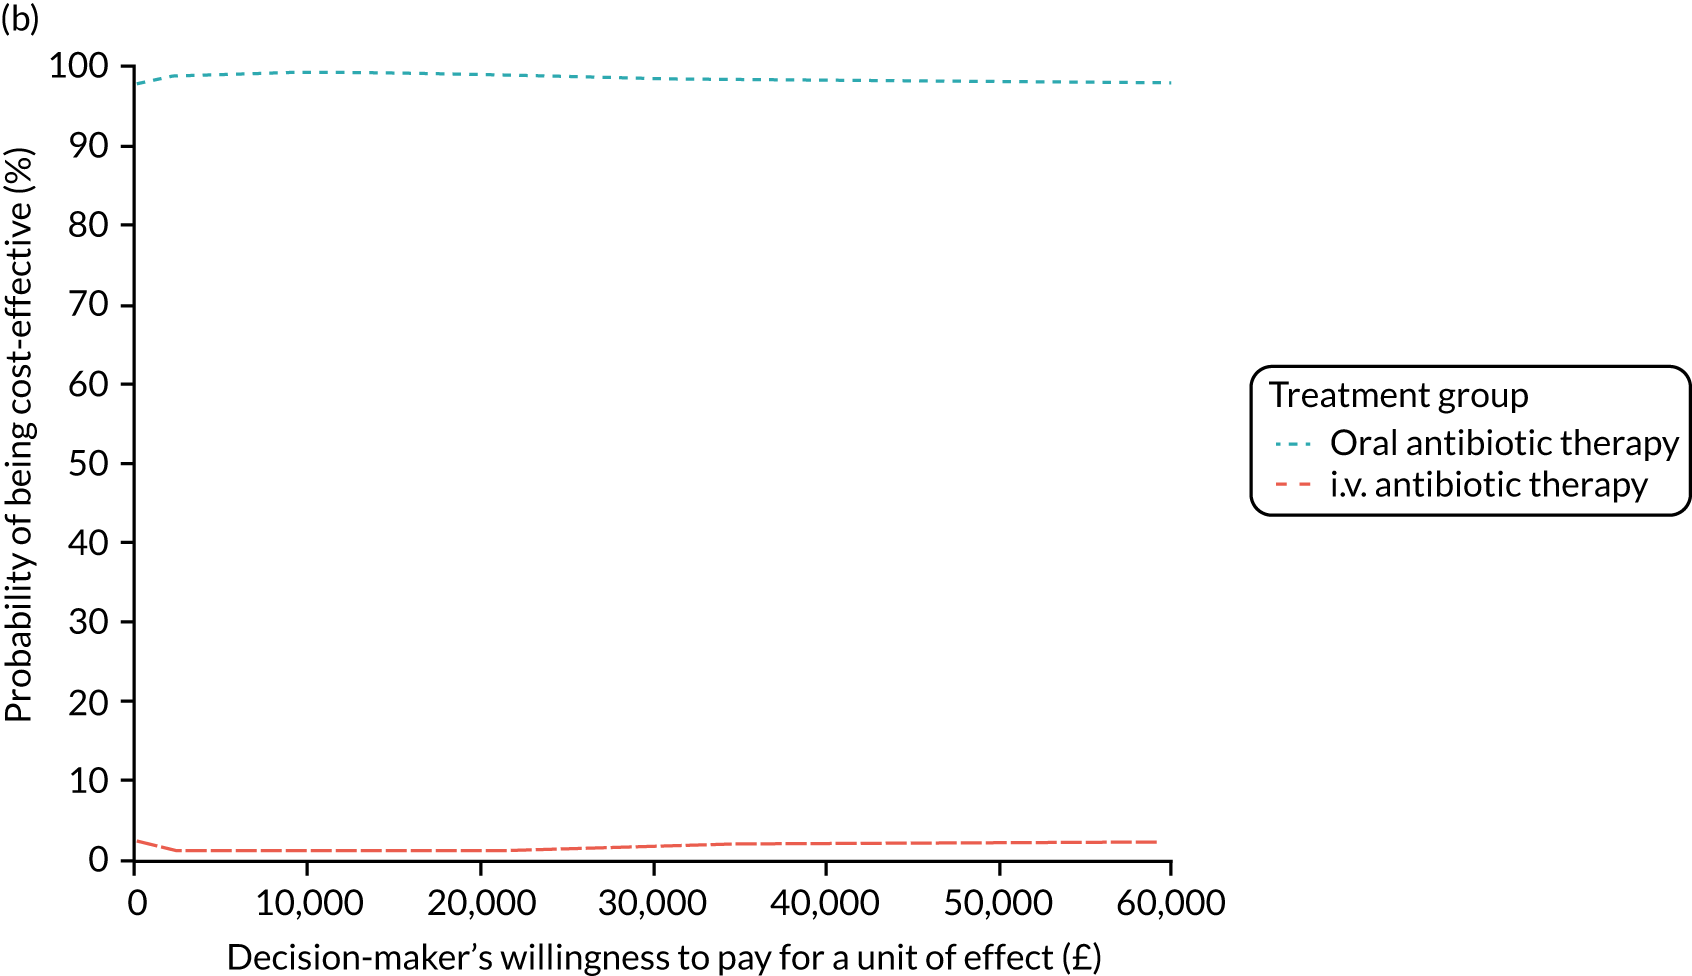
List of abbreviations
- A&E
- accident and emergency
- AE
- adverse event
- BMI
- body mass index
- BNF
- British National Formulary
- CEAC
- cost-effectiveness acceptability curve
- CF
- cystic fibrosis
- CFQ
- Cystic Fibrosis Questionnaire
- CFTR
- cystic fibrosis transmembrane conductance regulator
- CI
- confidence interval
- CONSORT
- Consolidated Standards of Reporting Trials
- EQ-5D
- EuroQol-5 Dimensions
- EQ-5D-3L
- EuroQol-5 Dimensions, three-level version
- EudraCT
- European Union Drug Regulating Authorities Clinical Trials
- FEF25–75
- forced expiratory flow at 25–75% of forced vital capacity
- FEV1
- forced expiratory volume in 1 second
- FVC
- forced vital capacity
- GCP
- good clinical practice
- GLM
- generalised linear model
- GP
- general practitioner
- HCHS
- Hospital and Community Health Service
- HR
- hazard ratio
- HRG
- Healthcare Resource Group
- HRQoL
- health-related quality of life
- ICER
- incremental cost-effectiveness ratio
- IDSMC
- Independent Data and Safety Monitoring Committee
- IMP
- investigational medicinal product
- INB
- incremental net benefit
- IQR
- interquartile range
- ITT
- intention to treat
- i.v.
- intravenous
- LCTC
- Liverpool Clinical Trials Centre
- MCRN CTU
- Medicines for Children Research Network Clinical Trials Unit
- MedDRA
- Medical Dictionary for Regulatory Activities
- MRSA
- meticillin-resistant Staphylococcus aureus
- NICE
- National Institute for Health and Care Excellence
- NIHR
- National Institute for Health Research
- PFGE
- pulsed-field gel electrophoresis
- PHE
- Public Health England
- PI
- principal investigator
- PISC
- patient information sheet and consent form
- PPI
- patient and public involvement
- PSS
- Personal Social Services
- PSSRU
- Personal Social Services Research Unit
- QALY
- quality-adjusted life-year
- REC
- Research Ethics Committee
- SAE
- serious adverse event
- SAR
- serious adverse reaction
- SD
- standard deviation
- SE
- standard error
- SOC
- System Organ Class
- SUSAR
- suspected unexpected serious adverse reaction
- TMG
- Trial Management Group
- TORPEDO-CF
- Trial of Optimal TheRapy for Pseudomonas EraDicatiOn in Cystic Fibrosis
- TSC
- Trial Steering Committee
- VNTR
- variable number tandem repeat
