Notes
Article history
The research reported in this issue of the journal was funded by the PHR programme as project number 14/186/58. The contractual start date was in March 2018. The final report began editorial review in May 2018 and was accepted for publication in January 2019. The authors have been wholly responsible for all data collection, analysis and interpretation, and for writing up their work. The PHR editors and production house have tried to ensure the accuracy of the authors’ report and would like to thank the reviewers for their constructive comments on the final report document. However, they do not accept liability for damages or losses arising from material published in this report.
Declared competing interests of authors
Emma McIntosh and Andy Jones are members of the National Institute for Health Research Public Health Research programme funding board.
Permissions
Copyright statement
© Queen’s Printer and Controller of HMSO 2019. This work was produced by Lewsey et al. under the terms of a commissioning contract issued by the Secretary of State for Health and Social Care. This issue may be freely reproduced for the purposes of private research and study and extracts (or indeed, the full report) may be included in professional journals provided that suitable acknowledgement is made and the reproduction is not associated with any form of advertising. Applications for commercial reproduction should be addressed to: NIHR Journals Library, National Institute for Health Research, Evaluation, Trials and Studies Coordinating Centre, Alpha House, University of Southampton Science Park, Southampton SO16 7NS, UK.
2019 Queen’s Printer and Controller of HMSO
Chapter 1 Background
Introduction
It is widely recognised that drink driving is a leading cause of road traffic accidents (RTAs). In 2000, the European Commission estimated that one-quarter of road accident fatalities were a result of alcohol consumption. 1 Although there have been large reductions in accidents involving drink driving in Great Britain over recent decades (deaths and serious injuries related to drink driving fell by three-quarters between 1980 and 20102), drink-drive accidents still accounted for 13% of all road deaths in 2012. 3 It has been estimated that drink-driver injury accidents cost the Scottish economy £80M per year. 4 There is evidence that accident risk increases with blood alcohol concentration (BAC), such that the relative risk of being involved in a fatal crash as a driver is 4–10 times greater with a BAC in the range 0.05–0.07 g/dl than for a zero BAC. 5
The first country to introduce a legal BAC limit to combat drink driving was Norway in 1936, where it became illegal to drive with a BAC level of ≥ 0.05 g/dl. Since then, many other countries and jurisdictions have followed this ‘Scandinavian model’ to deter drink driving. Legal BAC limits are in place in countries and regions across Europe, North America, Japan and Australasia, with most countries having BAC limits of 0.05 or 0.08 g/dl. 6 The British Road Safety Act (BRSA)7 introduced a legal limit of 0.08 g/dl in 1967, which is still in place today. The exception is Scotland, where the BAC limit was reduced to 0.05 g/dl on 5 December 2014.
The desired effect of a legal BAC limit or a reduction of the legal BAC limit is to deter people from drink driving. However, in an early study assessing the impact of the BRSA, it was found that single-vehicle night-time collisions returned to pre-law levels after an initial marked and statistically significant decline. 7 It has been suggested that the reason for this observation is that drivers initially have a heightened perception of risk of being caught drink driving, followed by a realisation that the actual risk is lower than initially thought. 6 Hence, it has been argued that for a law or a change in law to be successful, publicity and public education has to be maintained, and that random breath testing (RBT) measures are required in conjunction with other efforts. 8
Effectiveness of reducing the blood alcohol concentration limit from 0.08 to 0.05 g/dl
In France, where the BAC limit was reduced from 0.08 to 0.05 g/dl (which from now on will be referred to BAC8to5) in 1996, a study in the Haute-Savoie province showed that by 1997 the annual number of alcohol-related accidents causing death had reduced by over one-third. 9 In addition, the effectiveness of the BAC8to5 has been demonstrated in the states of Queensland and New South Wales in Australia. In Queensland, after the reduction of the BAC limit was made law in 1982, a 14% reduction in serious accidents and an 18% reduction in fatal accidents was observed. In New South Wales, where the law change was in 1980, reductions of 7% and 8% were observed, respectively. 10 A study from Austria, evaluating the change in law in 1988, showed a 9.4% reduction in the percentage of drink-driving accidents related to the total number of accidents. 11 In Denmark, the BAC8to5 happened in 1998 and a study showed that the percentage of drivers who reported that they would have no alcohol or restrict themselves to one drink within 2 hours before driving increased from 71% to 80% in the first year of the change in law. However, this study did not observe a reduction in alcohol-related crashes. 12 A meta-analysis, which did not take into account the quality of the individual studies included, estimated that a lowering of the BAC limit to 0.05 g/dl is associated with a 11% reduction in fatal alcohol-related crashes. 13
The scientific quality of these studies examining the effectiveness of the BAC8to5 is variable, with mostly before-and-after-type study designs being employed,9,11 which have known flaws. The Danish study12 used survey data on drink-driving behaviour, which are susceptible to self-reporting biases. The Australian study,10 the main focus of which was to evaluate RBT, was of better quality, with RTA data spanning a long period, and adjustments being made for seasonal, temporal trend, road usage and economic factors in a time-series model.
From a critique of the literature, the highest quality studies are ones that used European data from 15 EU countries to evaluate the change in law or introduction of law to 0.05 g/dl BAC limits,14 and the aforementioned evaluation from Australia. 10 The European study created a panel data set across countries and time, and employed difference-in-differences (DiD)-type methods via generalised linear models to estimate intervention effects. The natural variation in when and where BAC changes occurred allowed the researchers to estimate before-and-after RTA rates, in intervention and control groups. The results show that the 0.05 g/dl BAC limit is associated with a 4.5% and 7.4% reduction in total death rates (using population and per distance driven denominators, respectively). However, a major limitation of this study was that the unit of time was years and the change in law or introduction of law to 0.05 g/dl limits for the individual countries was rarely the start of a calendar year. Therefore, a crude fractional correction had to be applied to the time-varying binary covariate that would switch on in the year the BAC law changed. Furthermore, it was not possible to adjust for seasonal effects and other contextual factors that varied within a year and between countries. Finally, the outcome measure was not all RTA rates, but only those RTAs that caused death. The Australian study10 evaluated BAC law changes that occurred in two states over 30 years prior to the intervention under study and it is reasonable to suggest that the large effect sizes observed may be more difficult to achieve given the large improvements over time in road safety and drink driving becoming increasingly socially unacceptable.
In the studies summarised above, it has been assumed that any BAC intervention effect is homogeneous across the population. Evidence that a reduced BAC limit is effective not only at the BAC levels involved (i.e. in Scotland, 0.05–0.08 g/dl) but at all BAC levels6 gives credence to a homogeneous effect. If this is true, this would mean that a BAC intervention reduces absolute levels of socioeconomic deprivation (SED) inequality if RTA prevalence differs by SED group. A higher RTA prevalence in more deprived groups is plausible because the amount of alcohol individuals drink is positively associated with the probability of drink driving,15 and high levels of SED are associated with high levels of drinking. 16 To our knowledge, no study has evaluated whether or not SED could influence the magnitude of the BAC intervention effect in this manner.
Cost-effectiveness of blood alcohol concentration limits
There have been a limited number of studies investigating whether BAC limit laws, or changes to BAC limit laws, is cost-effective policy-making. A key message from a Lancet review paper on effective and cost-effective policies to reduce the harm caused by alcohol was that drink-driving countermeasures (namely, reduction in BAC limits and enforcement via breath-testing campaigns) are cost-effective. 17 The modelling exercises in this paper estimated the cost per disability-adjusted life-year (DALY) saved for different World Health Organization sub-regions, assuming effect sizes taken from one of the systematic reviews already mentioned. 6 In a study that estimated the costs and effects of a range of enforcement strategies for reducing the burden of RTAs in developing countries, drink-driving legislation (and enforcement via breath-testing campaigns) was shown to be a cost-effective strategy, saving as many DALYs as bicycle helmet use. 18 A recent cost–benefit analysis (CBA) was undertaken to inform policy-makers in New Zealand about the merits of the BAC8to5. The analysis indicated that the policy would produce a net benefit to the economy, with a net present value of NZ$200M. 19
As well as there being a lack of studies in general, to our knowledge no study has concurrently measured effectiveness and cost-effectiveness using the same data sources.
Association between blood alcohol concentration and population drinking
In a National Institute for Health and Care Excellence (NICE) review of the effectiveness of laws to limit BAC, a conceptual framework was developed to set out the rationale as to why a reduction of BAC from 0.08 to 0.05 g/dl could work. A logic model was developed, based on a set of assumptions about the links between the BAC intervention, change in drink-driving behaviours and risk of RTAs. 20 Interestingly, this work emphasised not only the importance of the perception of risk of being detected and punished but also the potential of a BAC intervention to reduce overall alcohol consumption.
It has been shown that population drinking (i.e. alcohol consumption per capita) is positively associated with a large number of outcomes (e.g. liver cirrhosis, suicide, violence). 21 A recent study, by Norström and Rossow, hypothesised that population drinking would also be associated with driving while under the influence of alcohol. The study’s area-based analyses, using Norwegian and Swedish data, demonstrated a strong and statistically significant association; as alcohol consumption per capita increases or decreases, so does the incidence of driving under the influence of alcohol. 22 We are not aware of any studies that have evaluated whether or not a legal reduction in the BAC limit (for a whole country) has led to a reduction in that country's population drinking. This could be a wider, unintended, outcome that can be attributed to change in BAC legislation. This would be beneficial to public health because alcohol consumption per capita is positively associated with alcohol-related harms. 23
The change of the drink-drive limit in Scotland
The reduction of the BAC limit in Scotland from 0.08 to 0.05 g/dl on 5 December 2014 is the intervention under study in this report. Although there is an evidence base that establishing a 0.05 g/dl BAC limit, and changing the limit from 0.08 to 0.05 g/dl, is effective in reducing RTAs, the scientific quality of the studies is poor, and the best study,14 in our view, still had limitations with regard to the unit of time used and lack of adjustment for seasonal and other contextual effects.
No previous study has investigated whether or not the effectiveness of a change in BAC legislation varies by levels of SED. If, as the evidence suggests, that any intervention effect is observed across the entire population of drink drivers, then it would be expected that absolute levels of SED inequality would be reduced because of the different RTA prevalence across SED groups.
The study is also interested in whether or not a legal reduction in the BAC limit leads to a reduction in that country's population drinking. In early 2015, a Scottish newspaper, in separate articles, reported that pub operators were indicating that overall sales had been ‘hit’ by the change in drink-driving legislation,24 with representatives of the Scottish Licensed Trade Association (SLTA) saying that the change would be worse for business than the smoking ban,25 and the Bank of Scotland's chief economist saying that the change had stunted the growth of the licensed trade. 26 In addition, it was heard, anecdotally, of individuals stating that they had reduced their alcohol drinking consumption in the evening before driving the next morning. In this study, the intervention effect was measured for a population drinking outcome measure using high-quality market research off- and on-sales data with coverage across GB, the off- and on-sales data having been used in past evaluations of Scotland's alcohol strategy. These evaluations are carried out by the Monitoring and Evaluating Scotland's Alcohol Strategy (MESAS) team in NHS Health Scotland.
At the start of this research, in conjunction with MESAS, a theory of change was developed for the change in drink-drive limit in Scotland. This theory of change (Table 1) helped to contextualise and scope the research plan for this project.
| Inputs | Outputs | Outcomes | |||
|---|---|---|---|---|---|
| Shorter term | Behaviour change | Outcome type | Longer term | ||
| Political will (investment of money) | Change in drink-driving legislation |
Awareness of legislation change Increased public knowledge of ‘allowed’ drinking levels (e.g. half-pint of beer) and how long it takes for alcohol to get out of system Drink driving less socially acceptable |
Maintained drinking at current levels but reduced driving
|
|
|
| Government campaigns | |||||
| Media reporting of government statements |
Publicity and information about the legislation and BAC Action on attitudes to drink driving |
||||
| Public health messages | |||||
| Visible road-side police presence | Actions taken to make people believe they will be caught | The perception you can be caught and there are consequences |
Reduced drinking, but maintained levels of driving (but within the 2014 BAC limit)
|
|
|
| Legislation failure | No change in drinking or driving levels |
|
|
||
There is a lack of economic evaluation studies in the BAC literature. In a review paper on cost-effective policies to reduce the harm caused by alcohol,17 a large number of assumptions had to be made, partly as a result of pulling together evidence from various sources. The cost-effectiveness analysis that is proposed in this study allows the joint distribution of costs and effects to be consistently measured, as the same data sources for measures of effectiveness and cost are being drawn on.
Research questions
The research answered four primary questions:
-
Has the change in drink-driving legislation in Scotland been effective (i.e. a reduction in RTAs)?
-
Has the change in drink-driving legislation in Scotland led to changes in the relative, and absolute, RTA rates and can these changes be correlated to the level of SED?
-
Has the change in drink-driving legislation in Scotland led to a reduction in population alcohol consumption?
-
Has the change in drink-driving legislation in Scotland provided good value for money (i.e. has the legislation been cost-effective)?
Chapter 2 Methods
Introduction
In this chapter, the overall research design is summarised and then the methods used to answer each research question under study are described.
Research design
A natural experimental design was employed to measure the causal effect of the change in BAC legislation in Scotland from 0.08 to 0.05 g/dl on 5 December 2014 (i.e. the intervention, BAC8to5). The control group was England and Wales, that is, the countries in GB that still have a 0.08 g/dl BAC law. The data for the intervention and control groups used to measure effectiveness came from the same data sources and cover the same study period (4 years in duration, 2 years pre and post change in legislation, January 2013–December 2016). The study followed the Medical Research Council’s guidelines on best practice for conducting natural experiments27 and referred to the Strengthening the Reporting of OBservational studies in Epidemiology reporting guidelines for observational studies. 28
Research question 1: has the change in drink-driving legislation in Scotland been effective (i.e. a reduction in road traffic accidents)?
The approach to answering this question was to measure the percentage change in the weekly level of RTAs attributable to BAC8to5 by quantifying the change observed in pre- and post-intervention periods and contrasting these between intervention and control groups.
Outcome measure
Weekly counts and rates of all RTAs.
Data source
In GB, data on RTAs reported to the police are recorded in a database called STATS19. This individual-level data set is used by the Department for Transport (DfT) to populate its annual reports on road casualties. 2,3 STATS19 variables that were used are accident identifier, date of accident, number of drivers, number of casualties, age of driver(s), sex of driver(s), postcode of driver(s) and name of the local police force reporting the RTA.
Denominators for road traffic accident rates
In order to compare outcomes between the intervention and control group (which are vastly different sizes), weekly rates of RTAs were calculated. The ideal denominator for these rates is the number of miles driven by each person at risk of having a RTA. Clearly these data do not exist, but traffic counts would provide a useful proxy. This study has utilised the DfTs automatic traffic counters (ATCs) that count vehicles passing over them 24 hours a day to produce weekly counts for both the intervention and the control groups. 29 The DfT use these continuous measurements from approximately 300 ATCs across GB in combination with 12-hour manual counting (approximately 8000 roadside counts per year) to produce annual estimates of traffic on GB’s roads. Crucially, the ATCs provided good estimates of how traffic flows vary on a temporal basis, which the manual counts do not.
It was not possible to split the traffic flow denominator by potential confounding variables that were adjusted for in our statistical models (i.e. age, sex, SED). Therefore, as an alternative approach, mid-year population estimates, obtained from National Records of Scotland (NRS)30 and Office for National Statistics (ONS), were used. 31 The annual-based mid-year population estimates (split by age, sex and SED) were linearly interpolated to obtain weekly estimates both for Scotland, and for England and Wales.
Statistical analysis
For RTA counts and rates, and separately for the intervention and control group, the time series of the outcome measure were plotted with a vertical line superimposed to denote the time when the BAC8to5 started. The plots of rates have been produced in two ways: with traffic flow counts and population estimates used as denominators.
To assess the comparability of the intervention and control groups, the age, sex and SED (area-based measurement derived from postcode of driver, more detail is provided below in the methods for research question 2) demographics were provided for each group. As the unit of analysis is an accident, when the RTA involved more than one vehicle the maximum age of the drivers, the most frequent driver sex (when RTA involved same number of male and female drivers, the RTA was assigned to be male), and the most ‘deprived’ SED (generated from postcode of driver) level of the drivers was used for analysis. It would be erroneous to infer anything about the demographics of those involved in RTAs from these results, for that purpose it would be more informative to compare the demographics of either drivers or casualties (or both). As a sensitivity analysis, analyses were repeated using a different rule of demographic assignment [youngest age, less frequent sex (when RTA involved the same number of male and female drivers, the RTA was assigned to be female) and least deprived SED group].
For RTA counts and rates, and separately for the intervention and control group, negative binomial regression models were fitted to panel data sets to test for a change in outcome level after the 2014 legislation was in place. The change in level was measured by fitting a covariate that took the value zero at all points before the 2014 legislation and took the value one at all points thereafter (note that in the control group models, this covariate represents a pseudo-change in legislation). The models were adjusted for underlying temporal trend by fitting a covariate representing week number, and for seasonality by covariates representing 4-weekly periods of the year (13 months). The models were then further adjusted for age, sex and SED. The modelling of rates was done in two ways, with traffic flow counts and population estimates used as offsets.
To obtain a DiD-type measure of effect, an interaction term between the intervention group indicator and the binary covariate for indicating pre and post change in legislation (pseudo-change for control) was assessed. In this model an interaction term between week number and intervention group indicator allowed for a relaxation of the usual DiD parallel trends assumption.
Research question 2: has the change in drink-driving legislation in Scotland led to changes in the relative, and absolute, road traffic accident rates and can these changes be correlated to the level of socioeconomic deprivation?
To answer this research question, the study followed the same methods as outlined for research question 1.
Measuring socioeconomic deprivation
The study required an area-based measure of SED that was appropriate to use across GB. During the course of the study it became apparent that there was not a gold standard approach to follow. It was originally planned to use the Carstairs Index. 32 A difficulty to overcome was that postcode sectors and electoral wards, traditionally the levels at which the Carstairs Index is measured, markedly differ in size when comparing Scotland to the rest of GB. Therefore, it would have been important to standardise the Carstairs Index score for the entire GB distribution before creating Carstairs Index deciles that could be used in statistical analyses. Unfortunately, after starting to explore this approach it became apparent it would be logistically impossible to complete this because of the unavailability of bespoke look-up tables that NRS could not provide within the timescales and budget of the project. Therefore, the approach was changed and, rather than standardise for the whole of GB, an area-based measure of SED derived separately for Scotland and England and Wales was used. This was based on the Index of Multiple Deprivation (IMD) and provided by Scottish and UK Governments. 33–35 This is still a valid approach, but it is necessary to make clear that the SED deciles produced in the study are based on rankings within Scotland (and England and Wales) and not GB.
Statistical analysis
Effect modification was tested by including in the statistical models an interaction term between the intervention group indicator and SED. If this interaction was statistically significant, it would measure the slope index of inequality (SII) and relative index of inequality (RII) based on rates of RTAs in the before-and-after intervention periods, and in both the intervention and the control groups, and test for a change in the SII and RII.
Research question 3: has the change in drink-driving legislation in Scotland led to a reduction in population alcohol consumption?
The approach to answering this question was to measure the percentage change in alcohol consumption per capita attributable to the BAC8to5 by quantifying the change observed in pre- and post-intervention periods, and contrasting between intervention and control groups.
Outcome measures
Alcohol consumption per capita was split by whether estimates were from off- or on-trade alcohol retail sales data. The unit of analysis was weekly alcohol consumption (on-trade alcohol sales were only available in 4-weekly units, so a linear interpolation method was used to impute weekly on-trade sales). Alcohol sales were then divided by the number in the population aged ≥ 16 years (mid-year population estimates were obtained from the NRS for Scotland, and from the ONS for England and Wales) to obtain an estimate of alcohol consumption per capita.
Data source
Alcohol retail sales data were provided from market research specialists, Nielsen (Nielsen Holdings Inc., New York, NY, USA). 36 These data provide population-level estimates based on electronic sales records from large retailers and a weighted stratified sample of smaller retailers. MESAS reviewed the validity and reliability of this data source for evaluation purposes and identified the main potential sources of bias as underestimation owing to unrecorded alcohol (e.g. home brewing, illicit alcohol, cross-border purchases) and overestimation as a result of wastage/spillage. 36 However, in the absence of a true gold standard, alcohol retail sales data are a high-quality measure of per capita alcohol consumption, and superior to relying on self-reports of alcohol drinking from surveys, which substantially underestimate total consumption. 37 Regardless, the main concern is if there is a differential temporal impact in terms of bias caused by data quality between the intervention and control group and this seems unlikely.
It should be noted that sales from discount stores Aldi (Essen, Germany) and Lidl (Neckarsulm, Germany) were not included in the Nielsen data. However, as MESAS has done previously in its evaluations, the models were adjusted for country-specific market share percentages and the results checked for sensitivity.
Statistical analysis
For off- and on-trade sales, and separately for the intervention and control group, the time series of the outcome measure was plotted with a vertical line superimposed to denote the time when the BAC8to5 started.
For off- and on-trade sales, and separately for the intervention and control group, seasonal autoregressive integrated moving average (SARIMA) error models were fitted to the relevant time series of data points. The study considered SARIMA errors to be the best choice of model to not only account for the very strong seasonality that was known from a previous study38 (that may be present in the outcome variables), but also model the short-term variability in the series. A change in level associated with the change of legislation was measured by fitting a covariate that took the value zero at all points before the 2014 legislation and took the value one at all points thereafter. The form of the autocorrelation for the SARIMA errors was identified from autocorrelation plots and partial autocorrelation plots. Statistically significant lags in the error series were then included in the SARIMA part of the model. Logarithms of the outcome measures were used in the modelling to reduce the variability in the time series and to aid interpretation. Tests of residual correlation were conducted using correlograms to ensure that the final models had a good fit with ‘white noise’ normally distributed residuals. Each SARIMA model controlled for two exogenous variables: off-trade sales from the same intervention group (or on-trade sales, depending on model) and on-trade sales from the other intervention group (or off-trade sales, depending on model).
Research question 4: has the change in drink-driving legislation in Scotland provided good value for money (i.e. has the legislation been cost-effective)?
The economic evaluation ran in parallel to the effectiveness analyses. Three frameworks for economic evaluation (cost-effectiveness, cost–utility and CBA) were considered to reflect different outcomes and, as such, were dependent on identification and measurement of differences in effectiveness. If differences in effectiveness were not detected, the economic evaluation would revert to a cost analysis.
Costs
In line with guidance from a recent DfT economic valuation study of road accidents in the UK,39 the costs associated with prevention of accidents were categorised into ‘casualty-related costs’ and ‘accident-related costs’. Using this distinction, casualty-related costs comprised human costs, medical and ambulance costs and lost output. Accident-related costs comprised police costs, insurance and administration costs and costs of damaged property. The methodology used to value the cost of accidents/casualties has been updated and is published in the UK Government’s Transport Analysis Guidance: WebTAG. 40 In order for this economic evaluation to be comparable with DfT estimates, this methodology was mirrored for these costing elements. Estimates of the average value of prevention per reported road accident casualty and per reported RTA were obtained. Additional associated costs related to deaths were estimated (ambulance, accident and emergency admissions, coroner and legal costs) based on Scottish data sources and estimates from the literature. Costs also included the implementation costs of the law change and associated campaign to advertise the reduced limit, as well as the associated surveillance and monitoring costs.
Outcomes
Outcome measures included in the economic evaluation included weekly rate of RTAs (for the cost-effectiveness analysis), years of life lost, quality-adjusted life-years (QALYs) (for the cost–utility analysis) and contingent valuation values related to prevented fatalities as well as human injuries (for the CBA). The estimation of QALYs gained though the prevention of RTAs was informed by a literature review. The purpose of this review was to extract utility values associated with relevant common health states arising because of motor vehicle-related injuries. Previous research has compiled health states and QALYs associated with RTAs, including crash survivor utility values. 41 These values can be broken down in relation to health-state utility associated with presence of a fracture/dislocation, body region injured (e.g. head, neck, thorax, spinal cord, pelvis, lower extremity, upper extremity) and hospitalised versus non-hospitalised injuries. By utilising such data, estimates of QALYs lost per injured survivor can be included in the evaluation to generate any resulting QALY impacts associated with the change in drink-driving legislation.
Contingent valuation estimates for injuries and deaths prevented were identified and combined with costs within a CBA framework. Key in this process was the identification of monetary valuation estimates for avoided death and injury in addition to identifying standard values for lost productivity due to absenteeism. The DfT report such values,42 and since 1993 the valuation of both fatal and non-fatal casualties has been based on a willingness-to-pay approach. This approach encompasses all aspects of the valuation of casualties, including the human costs (which reflect pain, grief and suffering), the direct economic costs of lost output and the medical costs associated with RTAs.
If the study was to find evidence of effectiveness, the cost and outcome results from the 2-year follow-up results would have been extrapolated within a lifetime cohort model to identify the likely longer-term impacts of the change in Scottish drink-driving legislation.
Perspective, discounting and sensitivity analysis
The perspective of the economic evaluation was the societal perspective to allow health sector and broader judiciary costs to be included. The time horizon was lifetime costs and outcomes with a population health economics discount rate of 1.5% applied (as recommended by NICE). A detailed sensitivity analysis was undertaken to identify thresholds of cost–utility (when using QALYs as the outcome measure) and cost–benefit (when using contingent valuation for prevented injuries). The results were reported and presented with associated uncertainty around the costs, outcomes and net benefit.
Chapter 3 Methodological development: road traffic accident denominators
The DfT provided the study with daily ATC data from counters located across GB for the period 2013–16. Approximately 80% of these data were flagged as ‘high quality’, which indicates that the counter was operational for every hour of the day, and in both road directions. The remainder of the data had variable quality, indicated by a score between 1 and 48 which represented how many hours in the day (48 hours because of the two directions of traffic) the counter was operational.
The study has undertaken three different approaches to account for low-quality traffic flow. The three approaches are outlined below.
Approach 1: use of traffic count data as they are (include low-quality data)
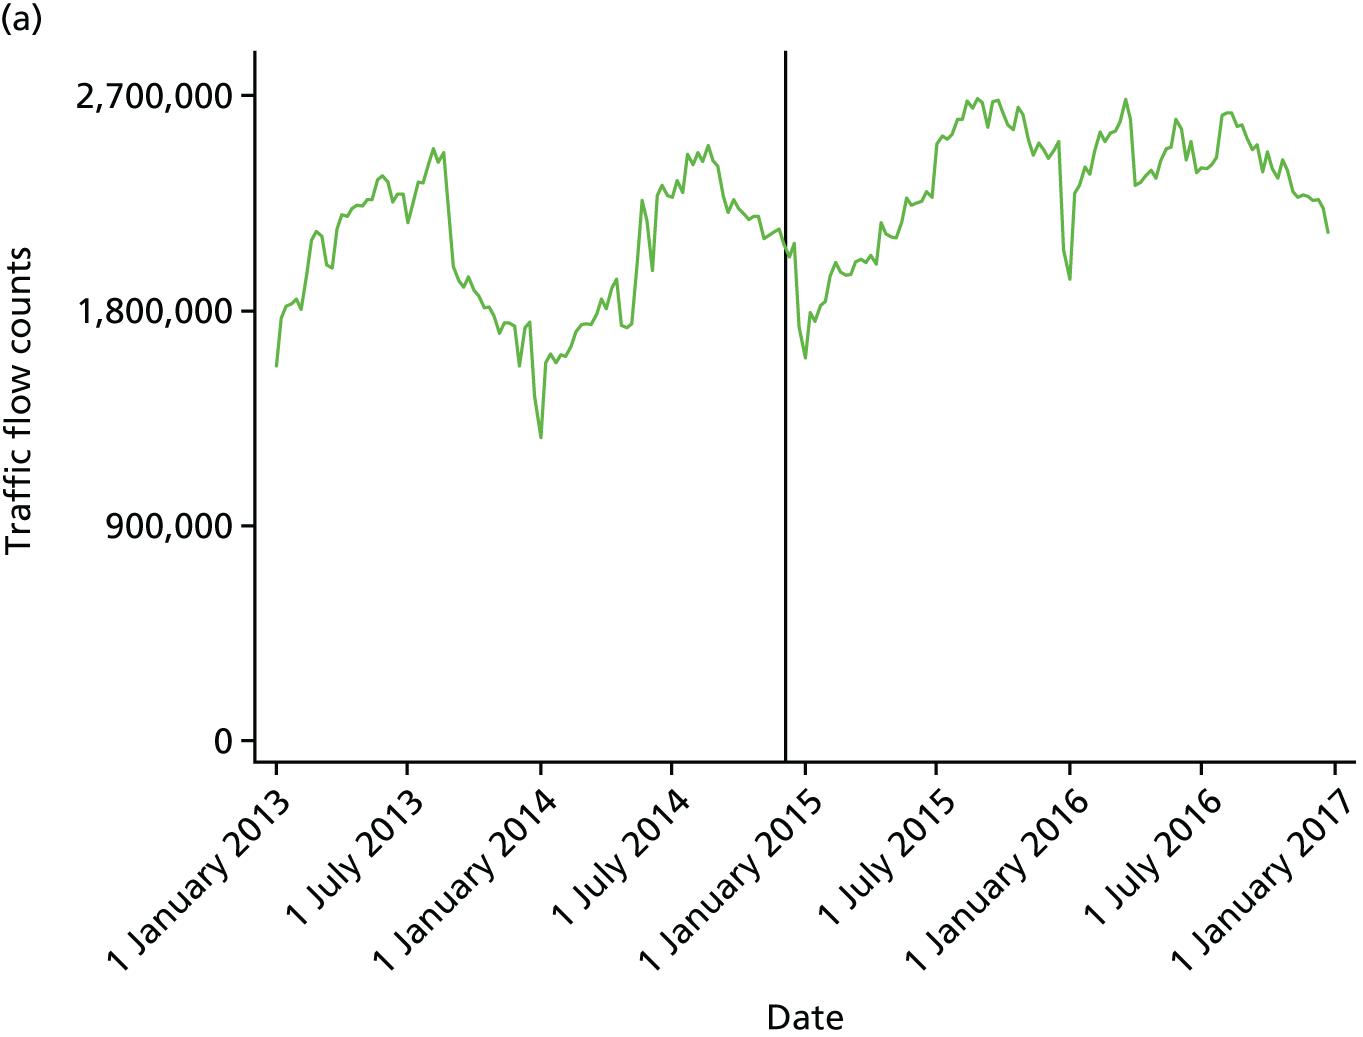
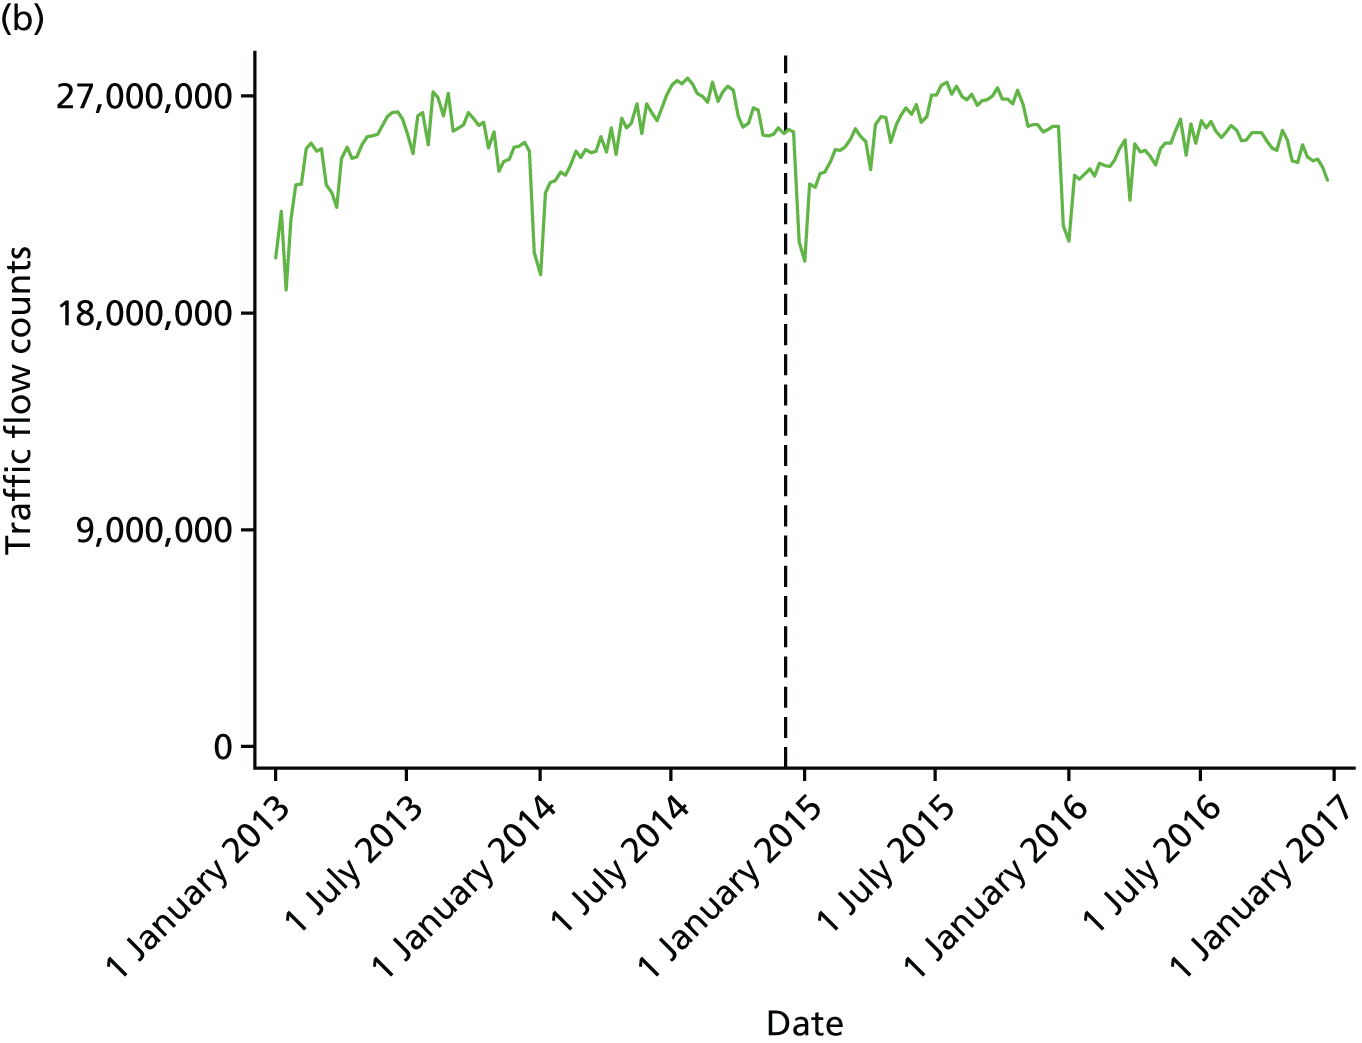
In this approach, the study made no attempt to ‘clean’ the data and just used them as they are, regardless of data quality (or missing data altogether). Figure 1 plots traffic flow over time using this approach, showing an increasing amount of traffic over time in Scotland but not in England and Wales.
FIGURE 1.
Traffic flow counts in (a) Scotland and (b) England and Wales: including missing values and poor-quality data. Note that the solid black line indicates a change in legislation date and the dashed black line indicates a pseudo-change in legislation date.
Approach 2: low-quality and missing values imputed by algorithm
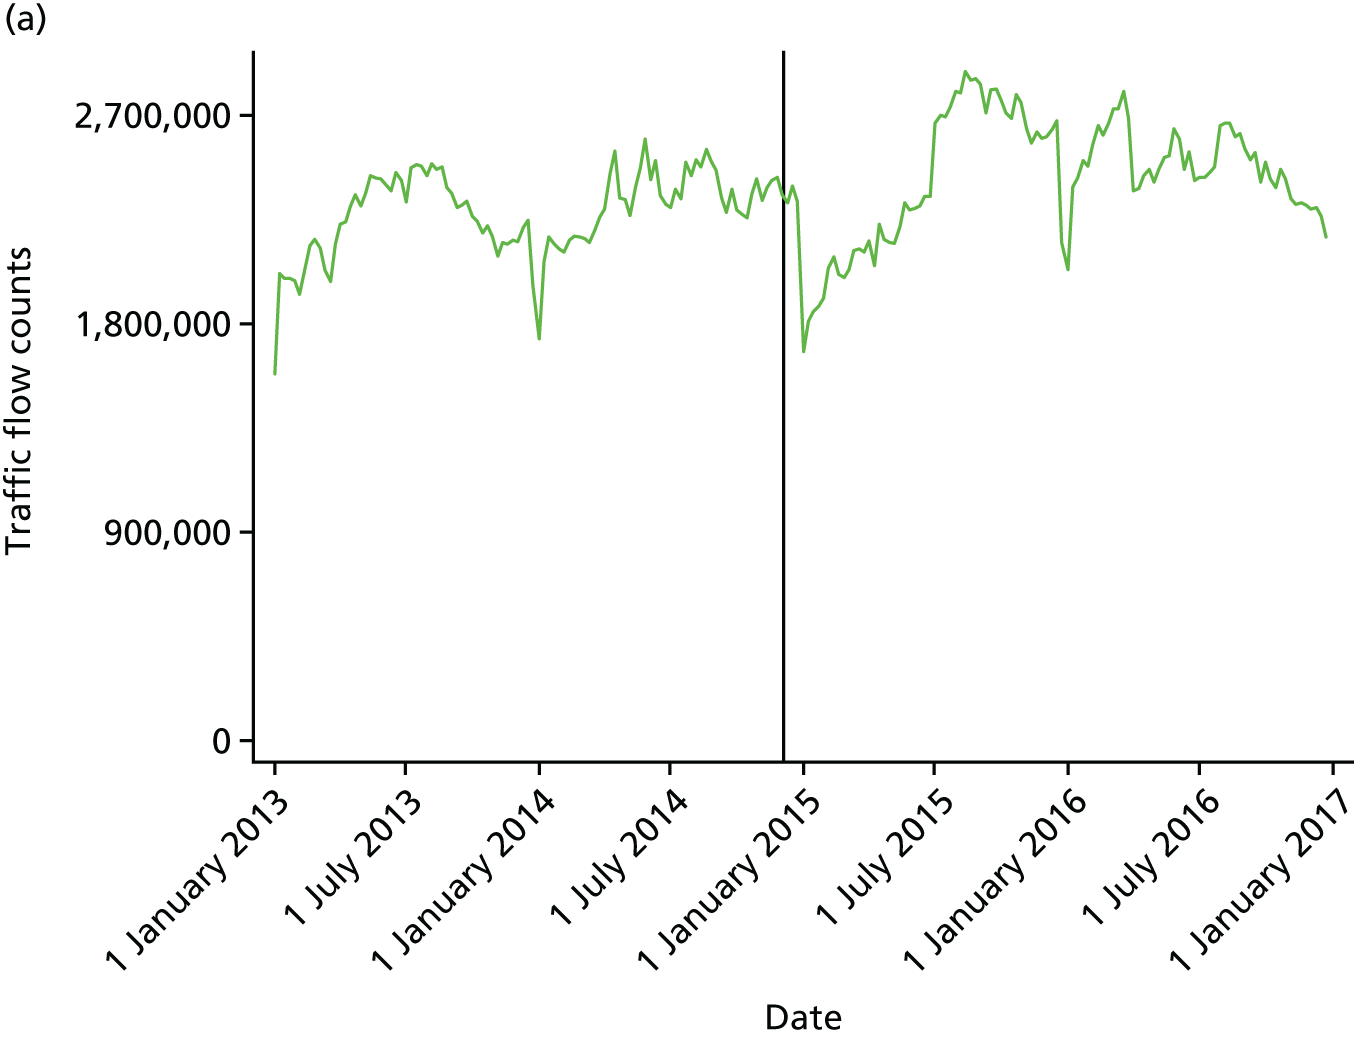
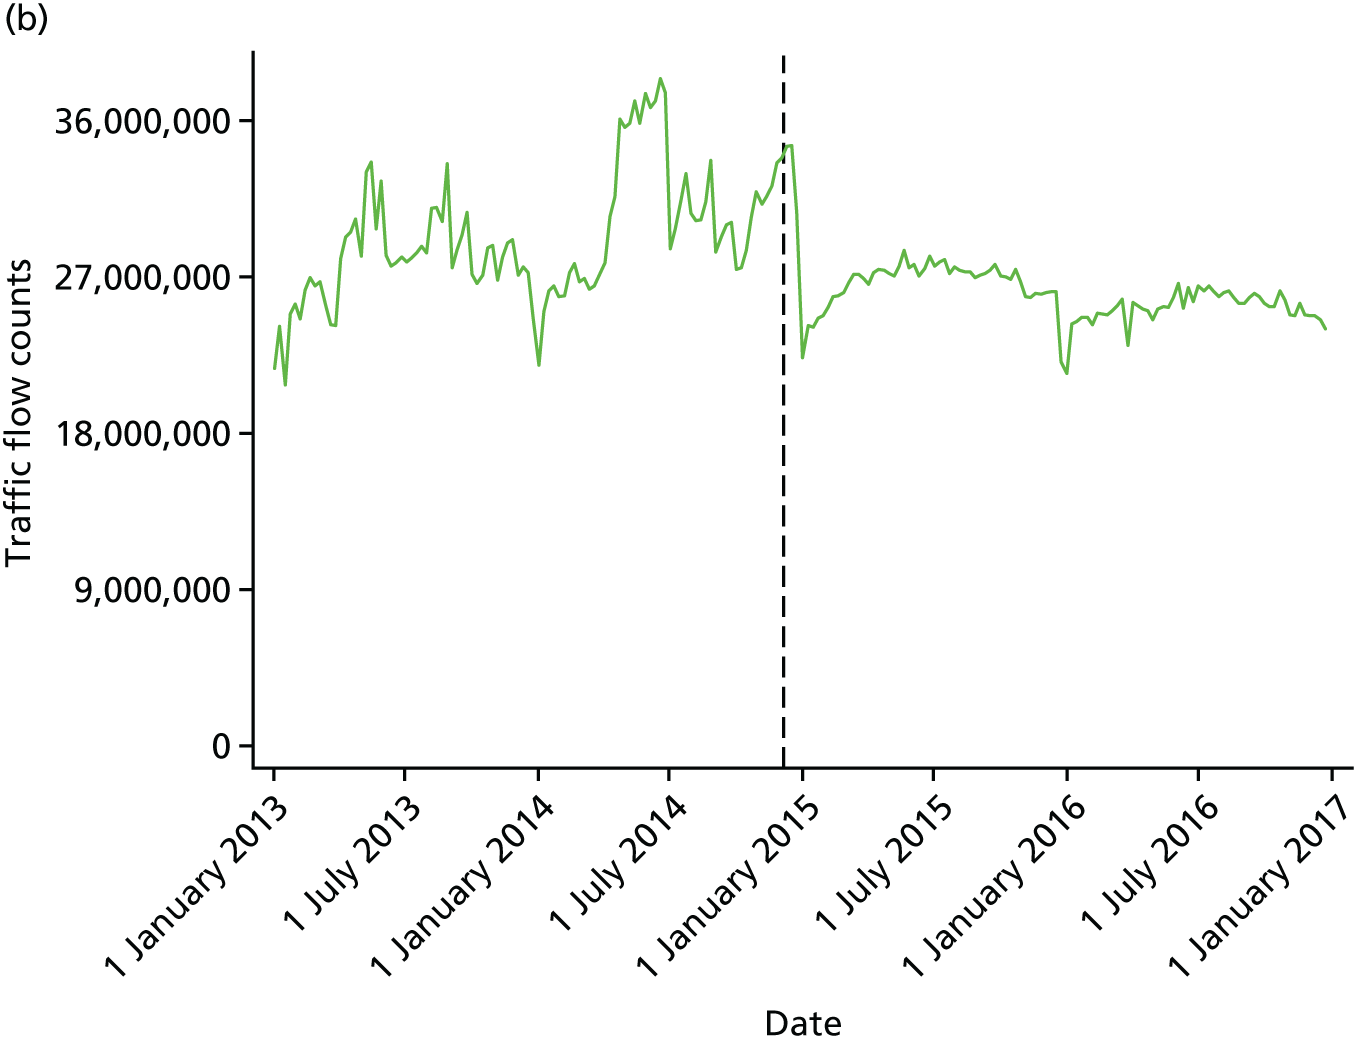
In this approach, if a count was not flagged as ‘high quality’ it was recorded as missing. A missing value was imputed by the average of the previous and the following day. If this was not possible because either of those values were missing, the average of 2 days back and forward was used. For the remaining missing data, the algorithm moved to 7-day steps to account for any day-of-the-week effects. Figure 2 plots traffic flow over time using this approach, showing an increasing amount of traffic over time in Scotland, but a decrease in England and Wales.
FIGURE 2.
Traffic flow counts in (a) Scotland and (b) England and Wales: missing values and poor-quality data imputed by average values. Note that the solid black line indicates a change in legislation date and the dashed black line indicates a pseudo-change in legislation date.
Approach 3: low-quality and missing values imputed by multiple imputation method
In this approach, the study used multiple imputation to impute missing values for the traffic counts (as for approach 2, if the count was not flagged as ‘high quality’ it was recorded as missing). Using this model-based multiple imputation approach allows any patterns in the data to be reflected in the imputed data sets. The study used the ‘Amelia’ package in R (The R Foundation for Statistical Computing, Vienna, Austria)43 to carry out the imputations, as this routine is specifically designed for the imputation of time series data. The study created 20 imputed data sets for each region in Scotland and in England and Wales, using spline terms with up to four knots to model the underlying time trend. The data sets were then aggregated, and a mean value calculated for each missing data point prior to use in the main statistical analysis. Figure 3 plots traffic flow over time using this approach, showing an increasing amount of traffic over time in Scotland and in England and Wales.
FIGURE 3.
Traffic flow counts in (a) Scotland and (b) England and Wales: missing values and poor-quality data imputed by the multiple imputation method. Note that the solid black line indicates a change in legislation date and the dashed black line indicates a pseudo-change in legislation date. W, week.
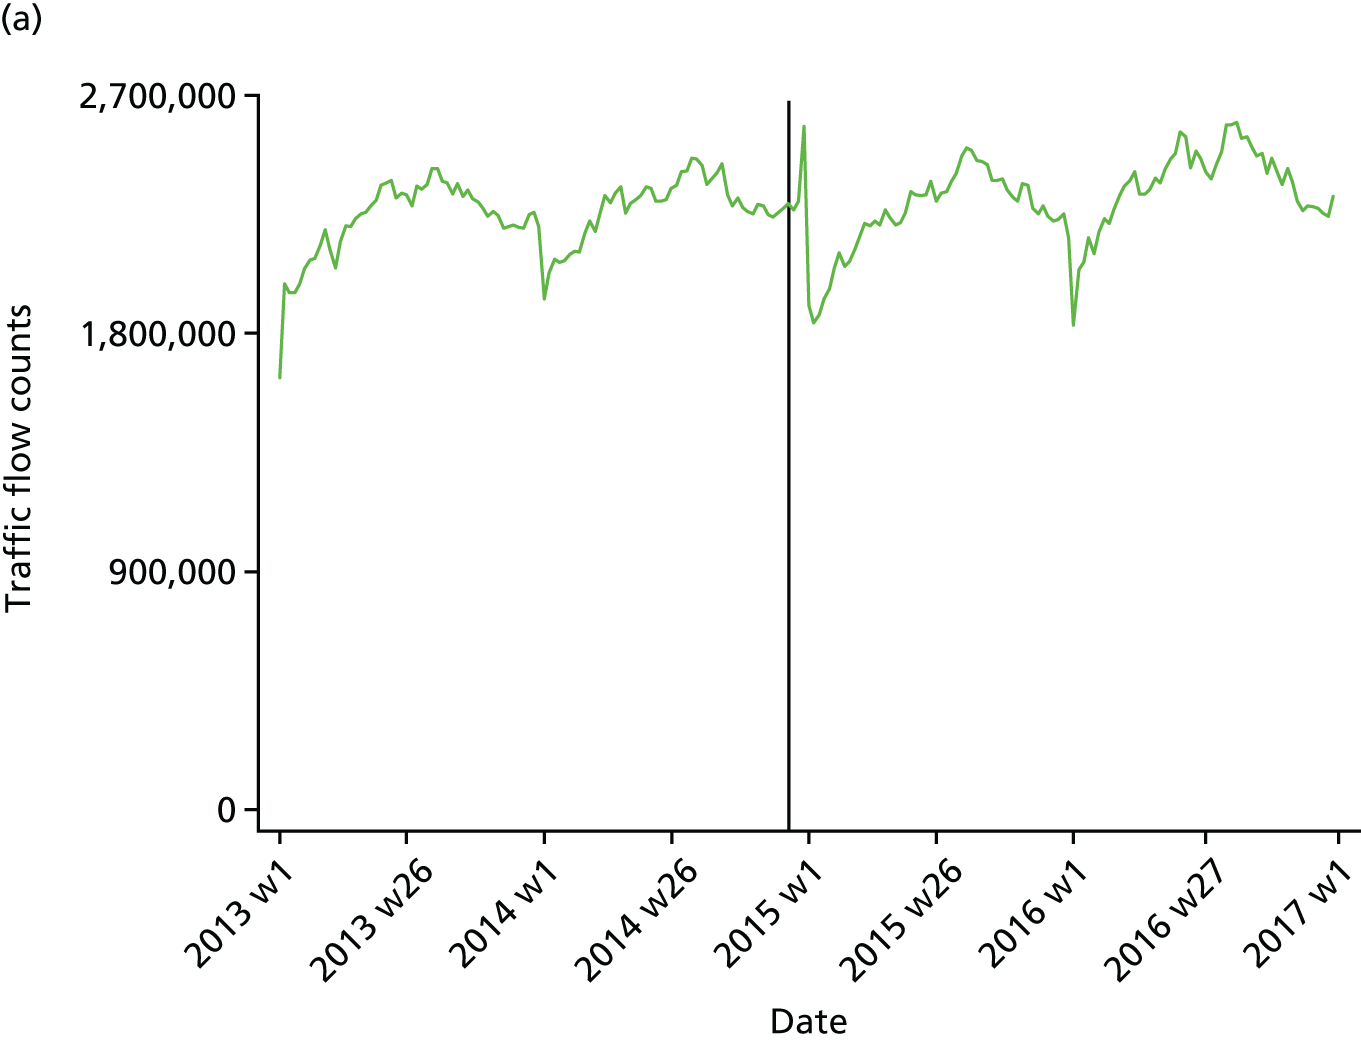
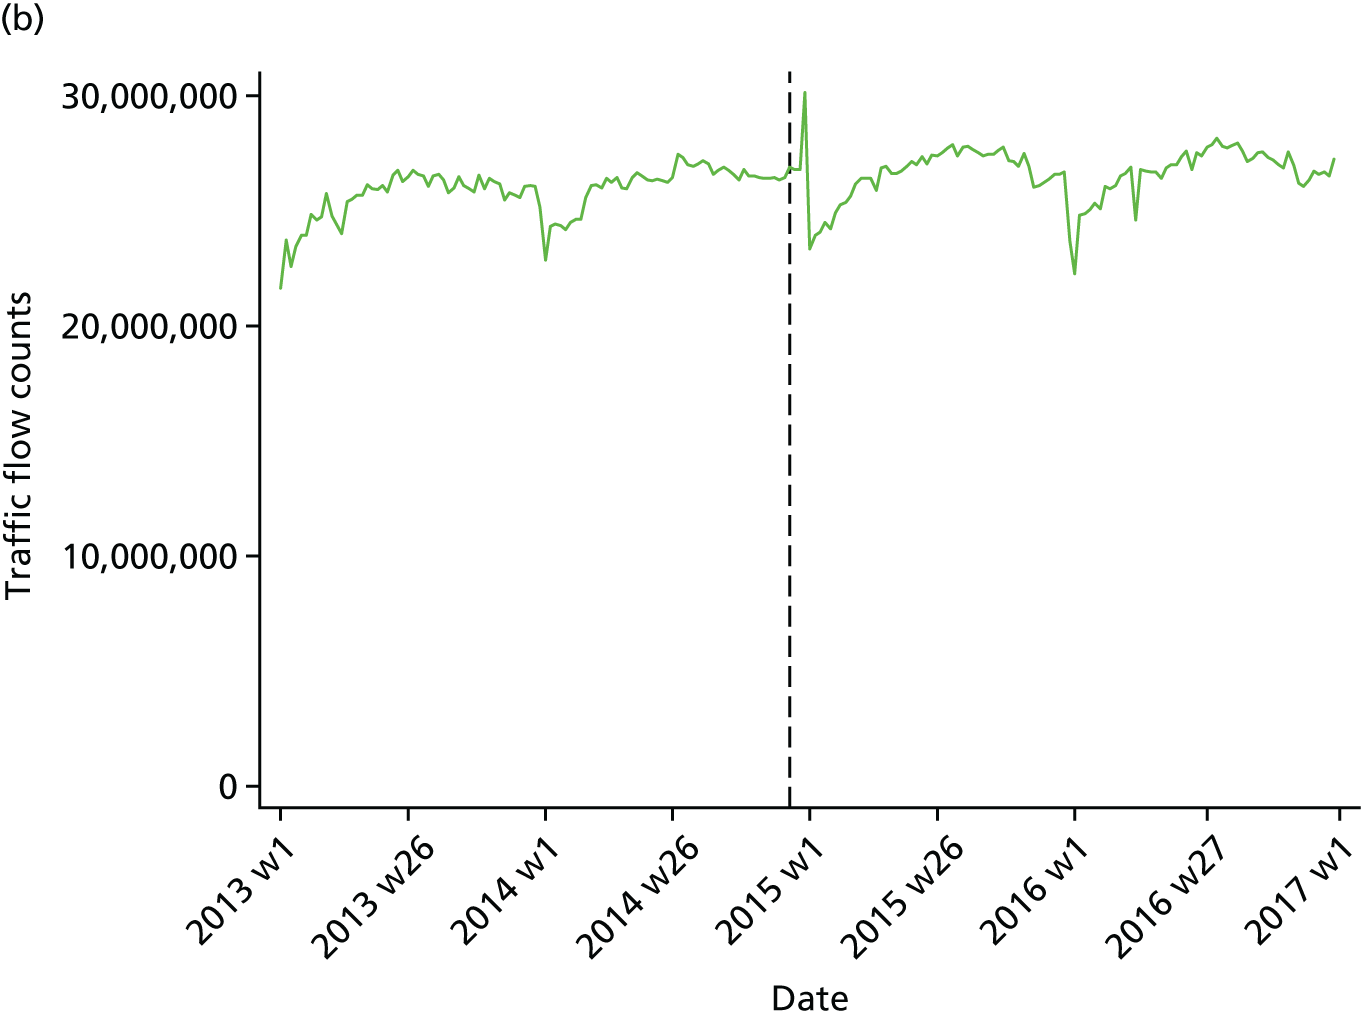
The study considered this third approach to be the best, as it applies the most statistically robust approach to low-quality/missing data. Furthermore, the general increasing trend in traffic flow over time that results (see Figure 3) fits with DfT reporting. 29 Therefore, the study used these estimates as traffic flow denominators for RTA rates in the statistical analyses (see Chapter 5).
Chapter 4 Patient and public involvement
A representative from The Royal Society for the Prevention of Accidents (RoSPA), Mr Sandy Allan, was invited and agreed to be part of the steering group for this project. RoSPA is a charitable organisation that has a remit to promote safety and the prevention of accidents at work, at leisure, on the road, in the home and through safety education. 44 Mr Allan participated in the steering group meetings and reviewed this final report.
The study engaged a public involvement group that has been set up by Dr Niamh Fitzgerald (Senior Lecturer in Alcohol Studies, University of Stirling) to support alcohol research across the UK Centre for Tobacco and Alcohol Studies. The held a public engagement meeting with this group on 11 May 2017. At this meeting, the principal investigator and the main researcher outlined the change in drink-drive legislation in Scotland and the research questions of the project. The study then split the participants (approximately 20 people) into four groups for discussions on the following warm-up questions:
-
Do you think people pay attention to the drink-drive limit?
-
What do you think the risk of getting caught drink driving is?
-
Have attitudes to drink driving changed in your lifetime?
-
Other thoughts on drink driving?
The study then explained the difficulty of being sure of an intervention effect when there is no randomised design. The following questions were asked:
-
What other factors, apart from drink driving, do you think can increase or decrease road traffic accident rates?
-
Do these factors change over time (e.g. are they seasonal)?
-
Is it plausible that the factors have changed over time differently in Scotland compared with England and Wales?
-
If a difference is observed, like shown in the plot, how confident would you be in concluding it was due to the drink-drive policy change?
The discussion around these questions led to the following list of potential confounding variables: weather, use of Uber (Uber Technologies Inc., San Francisco, CA, USA), road quality, police presence, traffic-calming measures [e.g. 50-mph (mile-per-hour) zones], substitution to other drugs/legal highs, tourism levels, type of road distribution, public holidays/cultural events, ethnic group (people of some religions/cultures do not drink alcohol), public transport services (late-hour services) and high-powered vehicles. The project team carefully considered these variables in terms of their likelihood of confounding and whether or not it was possible to measure them within the time and budget constraints of the project. It was decided at the second steering group meeting to attempt to measure ‘weather’ by contacting the MET Office (Exeter, UK) for data on weekly rainfall and average temperature, and then adjust for these variables in the statistical models for RTAs.
Chapter 5 Results
Introduction
In this chapter, the reporting of the results is structured by the following four research questions:
-
Has the change in drink-driving legislation in Scotland been effective (i.e. a reduction in RTAs)?
-
Has the change in drink-driving legislation in Scotland led to changes in the relative, and absolute, RTA rates and can these changes be correlated to the level of SED?
-
Has the change in drink-driving legislation in Scotland led to a reduction in population alcohol consumption?
-
Has the change in drink-driving legislation in Scotland provided good value for money (i.e. has the legislation been cost-effective)?
Research question 1: has the change in drink-driving legislation in Scotland been effective (i.e. a reduction in road traffic accidents)?
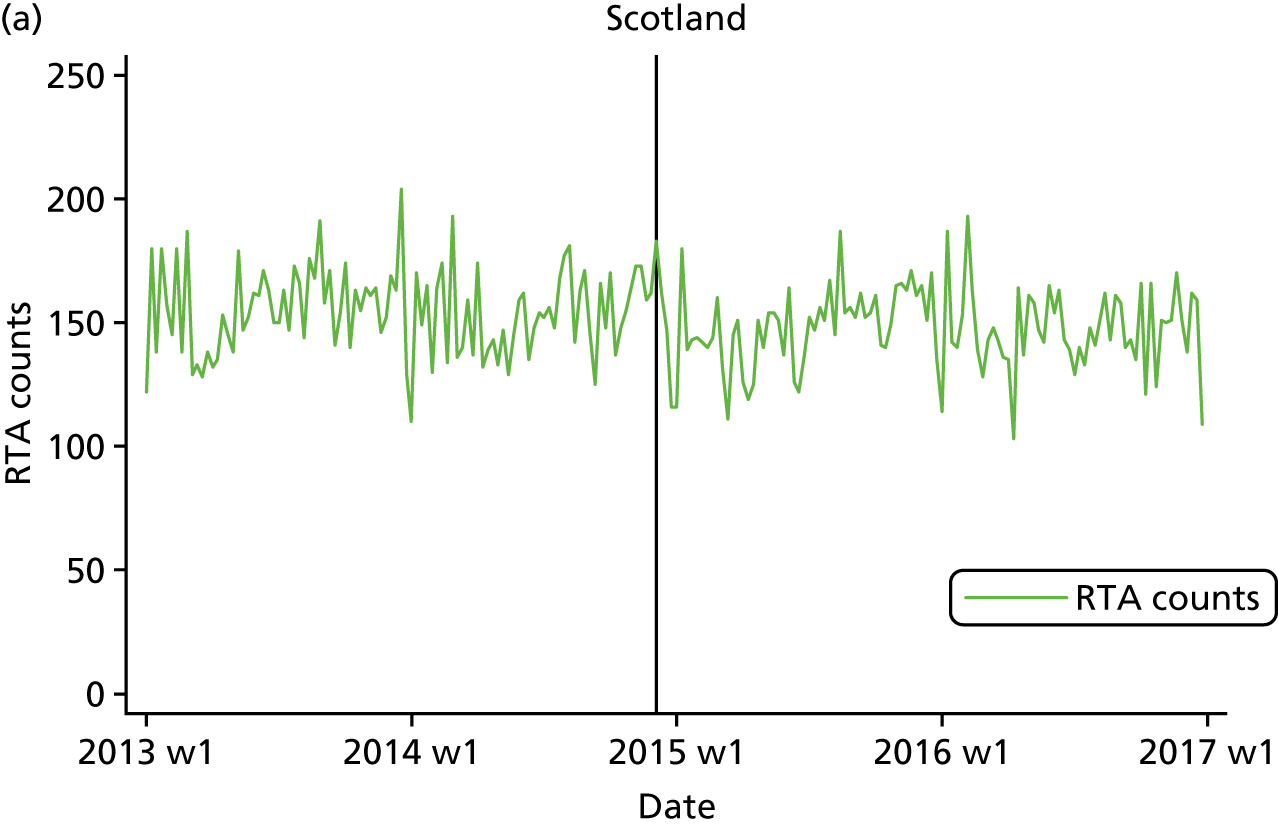
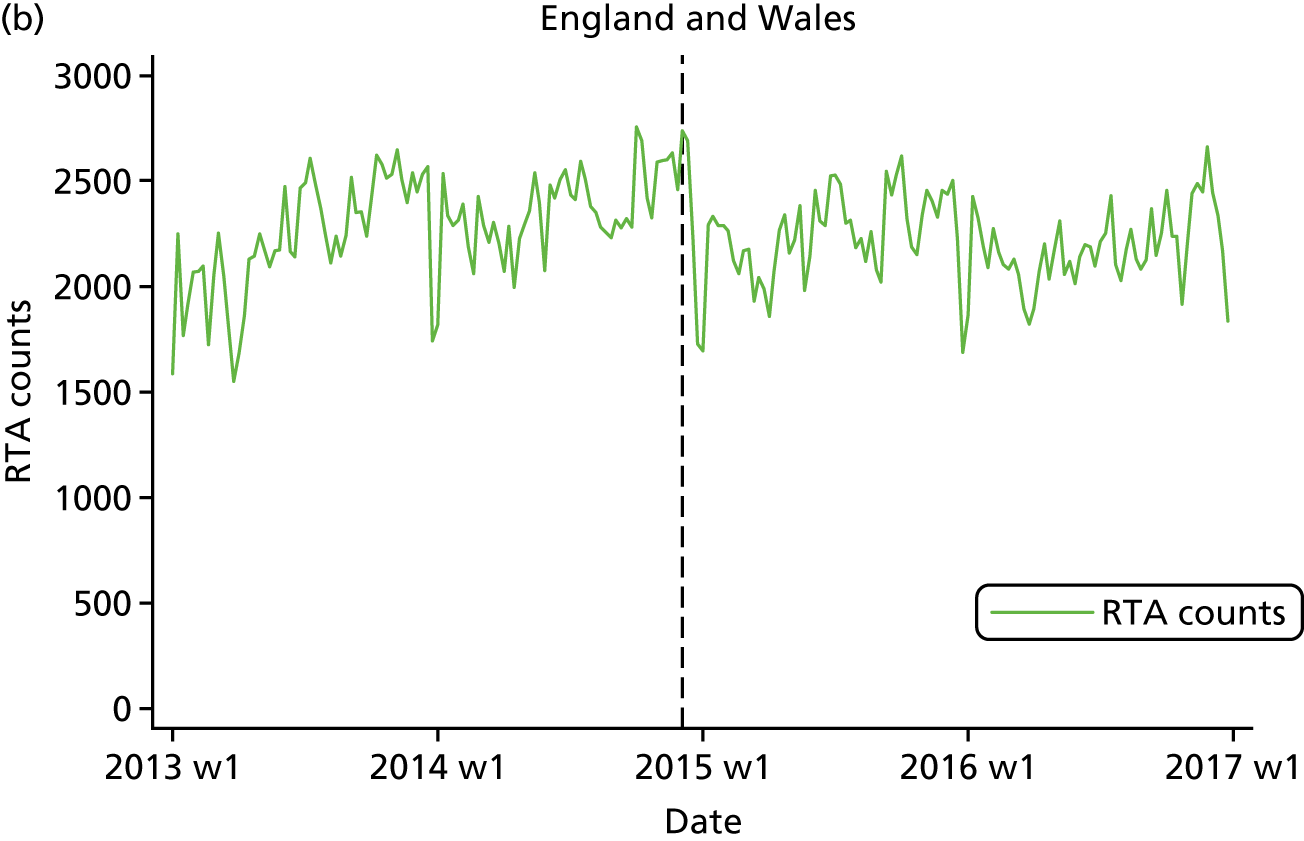
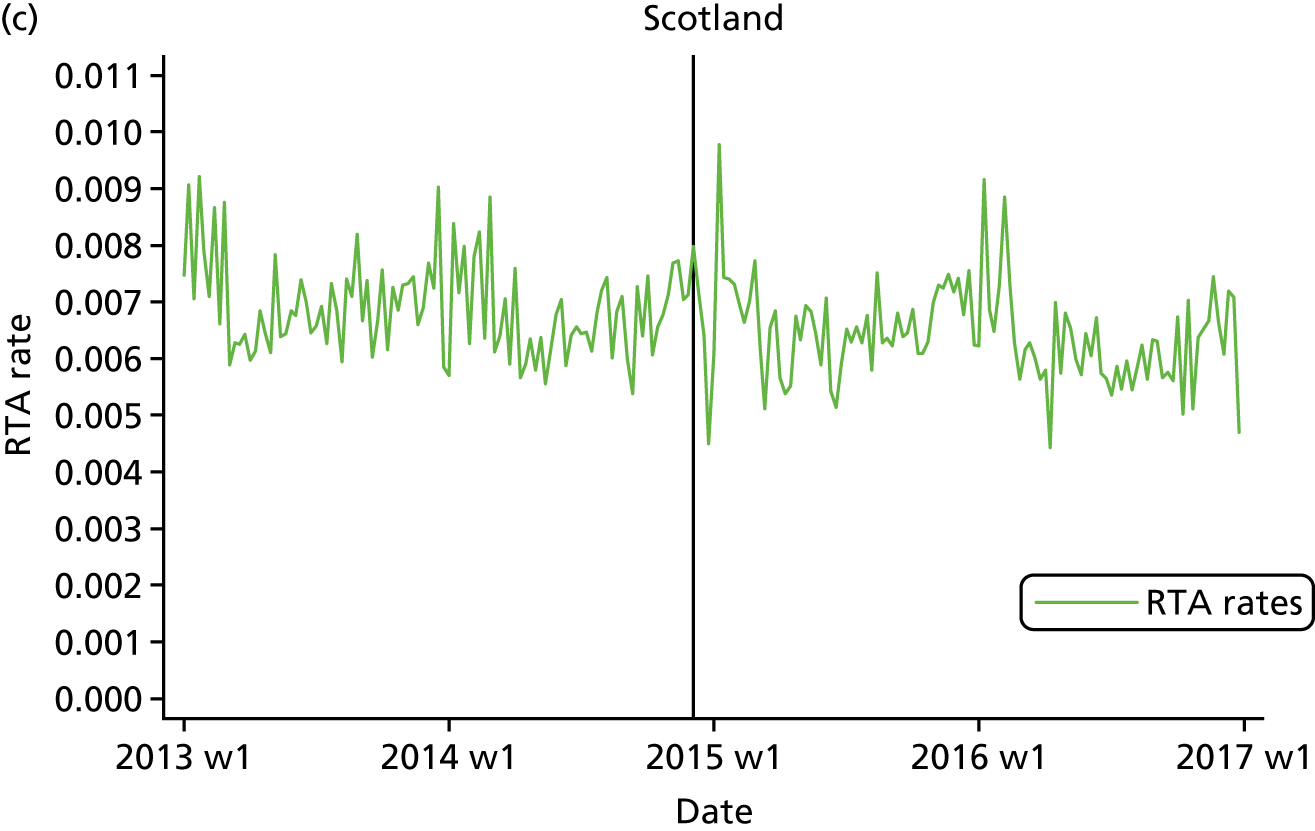
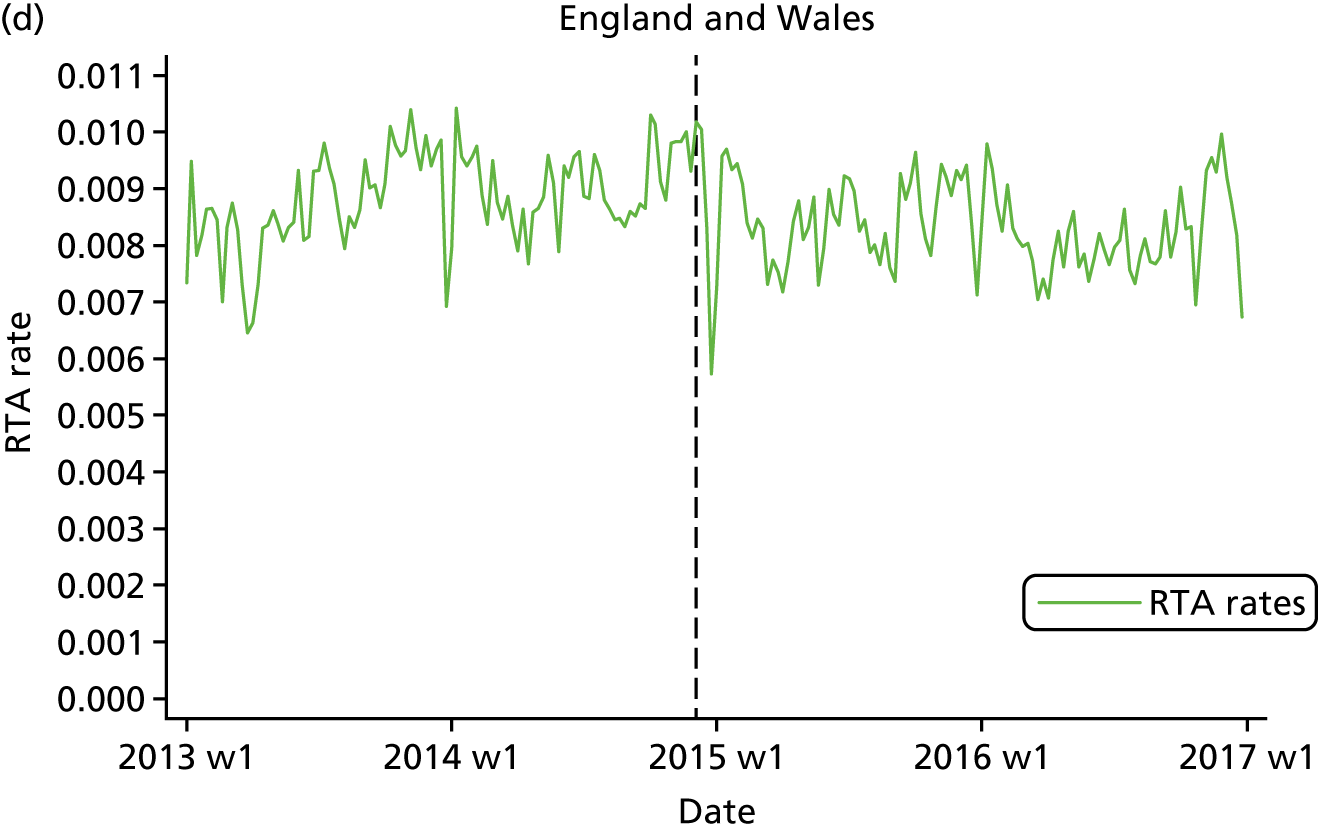
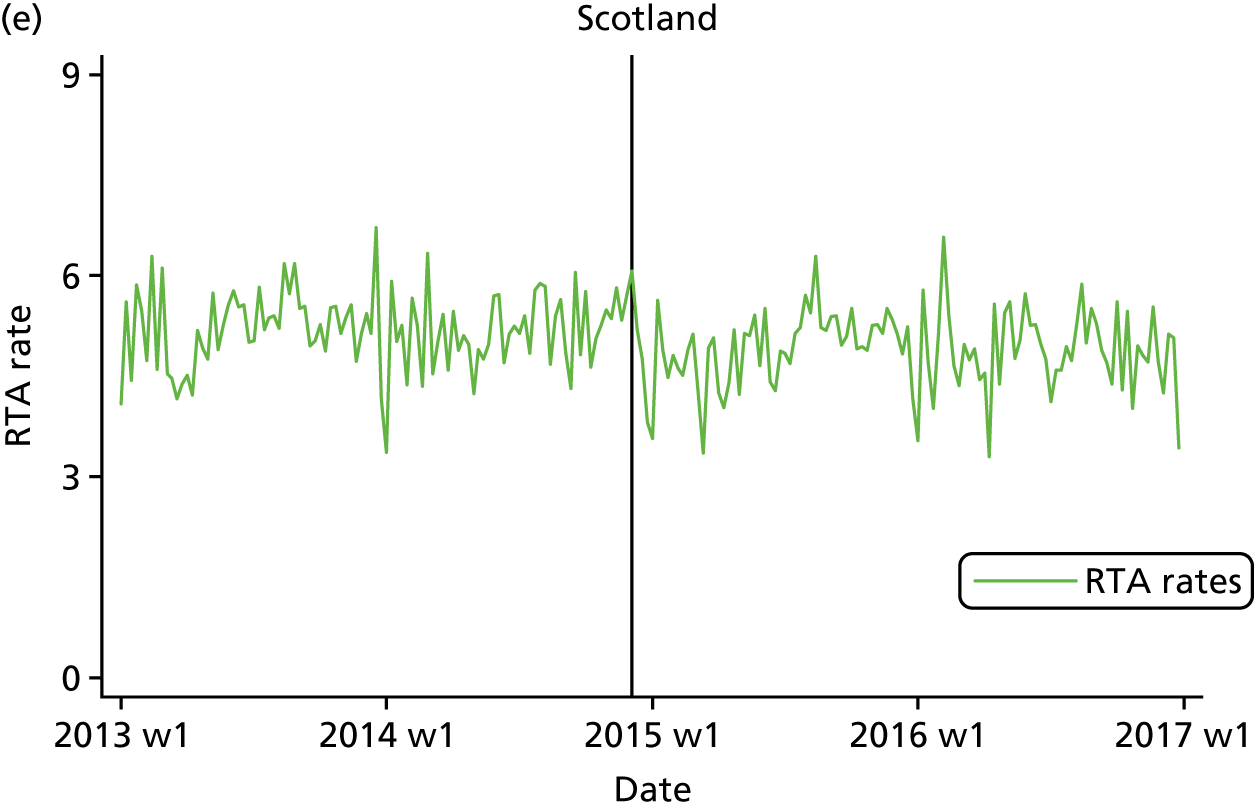
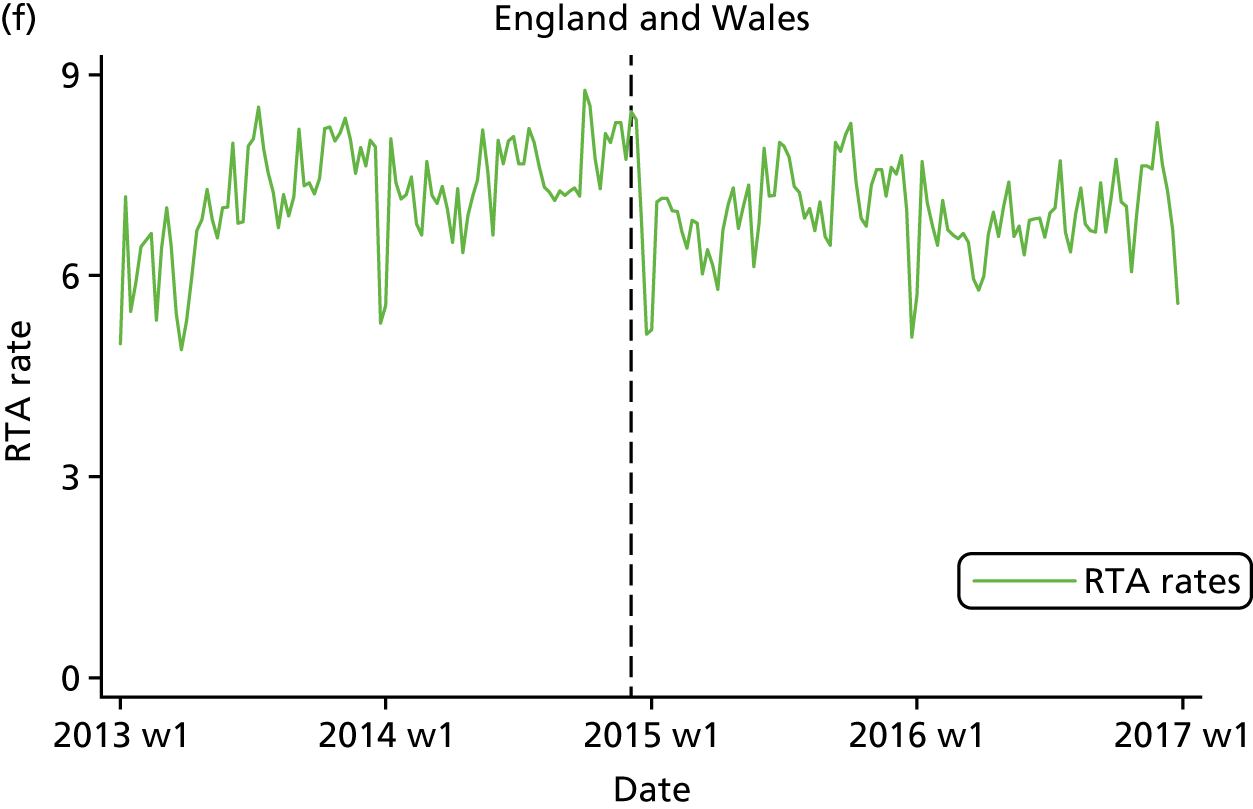
Plots of the time series of the outcome measure, with a vertical line superimposed to denote the time when the BAC8to5 started, are shown in Figure 4. It can be seen, in general, that weekly RTA rates are higher in England and Wales than in Scotland. This is true both for rates calculated with traffic flow (see Figure 4b) and for population (see Figure 4c) denominators. For example, broadly, the rates are between 5 and 9 RTAs per 1000 traffic count in Scotland and in the corresponding figures the rates are between 6 and 10 for England and Wales (see Figure 4b). From visual inspection of the plots for Scotland, no clear interruption of the time series (i.e. a BAC8to5 effect) is apparent after the change in drink-drive legislation. In the pre-intervention periods, the level of RTAs in Scotland was stable but for England and Wales an increase was observed.
FIGURE 4.
Weekly RTA counts for (a) Scotland and (b) England and Wales, RTA rates with traffic flow as the denominator for (c) Scotland and (d) England and Wales, RTA rates with population as the denominator for (e) Scotland and (f) England and Wales between January 2013 and December 2016. Note that the solid black line indicates a change in legislation date and the dashed black line indicates a pseudo-change in legislation date. W, week.
In Table 2, the age, sex and SED demographics of the RTAs based on the demographics of the drivers involved in the accidents are described. Although it can be seen that the demographic distributions are very similar between the intervention and control groups (also the case when using a different demographic assignment; see Table 8), this is reassuring in terms of having chosen an appropriate control group; however, it would be erroneous to infer anything about the demographics of those involved in RTAs using these statistics. To assist in this regard, further descriptive analysis shows that the mean [standard deviation (SD)] number of drivers per RTA was 1.72 (SD 0.73) in Scotland and 1.84 (SD 0.71) in England and Wales. The corresponding figures for the number of casualties per RTA was 1.29 (SD 0.77) for Scotland and 1.33 (SD 0.82) for England and Wales.
| Demographic | Group, n (%) | |
|---|---|---|
| Scotland | England and Wales | |
| Sex | ||
| Male | 27,075 (78.3) | 426,533 (80.9) |
| Female | 6938 (20.1) | 88,087 (16.7) |
| Missing | 565 (1.6) | 12,448 (2.4) |
| Age group (years) | ||
| ≤ 20 | 1716 (4.9) | 25,280 (4.8) |
| 21–25 | 2261 (6.5) | 38,457 (7.3) |
| 26–35 | 5326 (15.4) | 90,880 (17.2) |
| 36–45 | 6343 (18.3) | 102,268 (19.4) |
| 46–55 | 8180 (23.7) | 111,742 (21.2) |
| 56–65 | 5669 (16.4) | 71,698 (13.6) |
| 66–75 | 2798 (8.1) | 38,863 (7.4) |
| > 75 | 1792 (5.2) | 25,089 (4.8) |
| Missing | 493 (1.4) | 22,791 (4.3) |
| SED | ||
| 1 (most deprived) | 4687 (13.5) | 70,881 (13.4) |
| 2 | 4518 (13.1) | 69,663 (13.2) |
| 3 | 4118 (12.0) | 63,043 (12.0) |
| 4 | 3768 (11.0) | 57,301 (10.9) |
| 5 | 3343 (9.7) | 50,796 (9.6) |
| 6 | 3082 (9.0) | 45,228 (8.6) |
| 7 | 2647 (7.7) | 37,540 (7.1) |
| 8 | 2182 (6.3) | 31,417 (6.0) |
| 9 | 1735 (5.0) | 26,695 (5.0) |
| 10 (least deprived) | 1402 (4.0) | 19,708 (3.7) |
| Missing | 3096 (9.0) | 54,796 (10.4) |
| Total number of RTAs | 34,578 | 527,068 |
The modelling results are shown in Table 3. The change in drink-drive legislation was associated with a 2% relative decrease in RTA counts in Scotland [relative risk (RR) 0.98, 95% CI 0.91 to 1.04; p = 0.53]. However, the pseudo-change in legislation was associated with a 5% decrease in RTA counts in England and Wales (RR 0.95, 95% CI 0.90 to 1.00; p = 0.05). Similar results were observed when modelling RTA rates, both with the traffic flow denominator and with the population denominator. For RTA rates with traffic flow as the denominator, the DiD-type estimate indicates a 7% increase in rates for Scotland relative to England and Wales (unadjusted RR 1.07, 95% CI 0.98 to 1.17; p = 0.1). Adjustment for age, sex and SED changed these results minimally, as would be expected given the comparability of the demographics described in the last paragraph. Appendix 1, Table 9, shows the corresponding table (for models d and f only) based on a different demographic assignment: youngest age, less frequent sex and least deprived SED group. This did not substantially change the modelling results.
| Models | Group |
DiD-type estimate (Scotland/England and Wales) |
|||||||
|---|---|---|---|---|---|---|---|---|---|
| Scotland | England and Wales | ||||||||
| Effect size | p-value | 95% CI | Effect size | p-value | 95% CI | Effect size | p-value | 95% CI | |
| Model a | |||||||||
| RTA counts | 0.98 | 0.53 | 0.91 to 1.04 | 0.95 | 0.05 | 0.90 to 1.00 | |||
| Model b | |||||||||
| RTA counts | 0.98 | 0.40 | 0.93 to 1.03 | 0.95 | < 0.001 | 0.93 to 0.96 | |||
| Model c | |||||||||
| RTA rates with traffic flow as the denominator | 1.01 | 0.77 | 0.94 to 1.08 | 0.94 | 0.02 | 0.89 to 0.99 | 1.07 | 0.10 | 0.98 to 1.17 |
| Model da | |||||||||
| RTA rates with traffic flow as the denominator | 1.00 | 0.73 | 0.96 to 1.06 | 0.94 | < 0.001 | 0.92 to 0.96 | 1.07 | 0.007 | 1.02 to 1.13 |
| Model e | |||||||||
| RTA rates with population as the denominator | 0.98 | 0.53 | 0.91 to 1.05 | 0.95 | 0.11 | 0.90 to 1.01 | 1.03 | 0.57 | 0.94 to 1.12 |
| Model fb | |||||||||
| RTA rates with population as the denominator | 0.98 | 0.40 | 0.93 to 1.03 | 0.94 | < 0.001 | 0.93 to 0.96 | 1.03 | 0.19 | 0.98 to 1.09 |
Research question 2: has the change in drink-driving legislation in Scotland led to changes in the relative, and absolute, road traffic accident rates and can these changes be correlated to the level of socioeconomic deprivation?
Table 4 shows the modelled estimates of the BAC8to5 effect size by quintiles of SED, which have been obtained from models fitted with the appropriate interaction terms. To illustrate, for RTAs in which the postcode of the driver indicates the highest level (20%) of SED in Scotland, the change in drink-drive legislation was associated with a 0% relative decrease in RTA counts in Scotland (RR 1.00, 95% CI 0.92 to 1.10; p = 0.93). As can be seen by scanning the results in Table 4, for both the intervention and the control group, effect sizes were relatively homogeneous across SED levels and this is reinforced by the p-values for the tests of interactions (p = 0.72, RTA counts; p = 0.71, RTA rates with traffic flow as the denominator; and p = 0.72, RTA rates with population as the denominator). For England and Wales (pseudo-intervention), the corresponding p-values are p = 0.58 for RTA counts, p = 0.58 for RTA rates with traffic flow as the denominator and p = 0.59 RTA rates with population as the denominator. Appendix 1, Table 10, shows the corresponding table based on assigning the RTA with demographics of the driver based on the following rules: youngest age, less frequent sex and least deprived SED group. This did not substantially change the modelling results.
| SED | Group | |||||
|---|---|---|---|---|---|---|
| Scotland | England and Wales | |||||
| Effect size | p-value | 95% CI | Effect size | p-value | 95% CI | |
| RTA counts | ||||||
| 1 (most deprived) | 1.00 | 0.93 | 0.92 to 1.10 | 0.96 | 0.008 | 0.94 to 0.99 |
| 2 | 1.00 | 0.95 | 0.90 to 1.10 | 0.96 | 0.004 | 0.93 to 0.98 |
| 3 | 0.93 | 0.19 | 0.83 to 1.04 | 0.94 | < 0.001 | 0.91 to 0.97 |
| 4 | 1.01 | 0.90 | 0.87 to 1.15 | 0.93 | 0.001 | 0.90 to 0.97 |
| 5 (least deprived) | 0.92 | 0.32 | 0.79 to 1.08 | 0.94 | 0.01 | 0.90 to 0.98 |
| RTA rates with traffic flow as the denominator | ||||||
| 1 (most deprived) | 1.03 | 0.44 | 0.95 to 1.13 | 0.95 | 0.001 | 0.93 to 0.98 |
| 2 | 1.03 | 0.59 | 0.93 to 1.13 | 0.95 | < 0.001 | 0.92 to 0.97 |
| 3 | 0.96 | 0.44 | 0.86 to 1.07 | 0.93 | < 0.001 | 0.90 to 0.96 |
| 4 | 1.04 | 0.56 | 0.91 to 1.18 | 0.93 | < 0.001 | 0.89 to 0.96 |
| 5 (least deprived) | 0.95 | 0.54 | 0.81 to 1.11 | 0.93 | 0.003 | 0.89 to 0.97 |
| RTA rates with population denominator | ||||||
| 1 (most deprived) | 1.00 | 0.93 | 0.92 to 1.10 | 0.96 | 0.004 | 0.93 to 0.99 |
| 2 | 1.00 | 0.95 | 0.90 to 1.10 | 0.95 | 0.002 | 0.92 to 0.98 |
| 3 | 0.93 | 0.20 | 0.83 to 1.04 | 0.93 | < 0.001 | 0.90 to 0.96 |
| 4 | 1.01 | 0.89 | 0.88 to 1.15 | 0.93 | < 0.001 | 0.90 to 0.97 |
| 5 (least deprived) | 0.92 | 0.32 | 0.80 to 1.08 | 0.94 | 0.007 | 0.89 to 0.98 |
Research question 3: has the change in drink-driving legislation in Scotland led to a reduction in population alcohol consumption?
Plots of the time series of the outcome measure, with a vertical line superimposed to denote the time when the BAC8to5 started, are shown in Figure 5. From visual inspection of the plots for Scotland, no clear interruption of the time series (i.e. a BAC8to5 effect) is apparent after the change in drink-drive legislation. Strong seasonal patterning is shown with large peaks and smaller troughs at the end and start of a calendar year, respectively.
FIGURE 5.
Weekly (a) off-trade (Scotland), (b) off-trade (England and Wales), (c) on-trade (Scotland) and (d) on-trade (England and Wales) alcohol sales between January 2013 and December 2016. Note that the solid black line indicates a change in legislation date and the dashed black line indicates a pseudo-change in legislation date) (a) off-trade alcohol sales (Scotland), (b) off-trade alcohol sales (England and Wales), (c) on-trade alcohol sales (Scotland) and (d) on-trade alcohol sales (England and Wales), W, week.
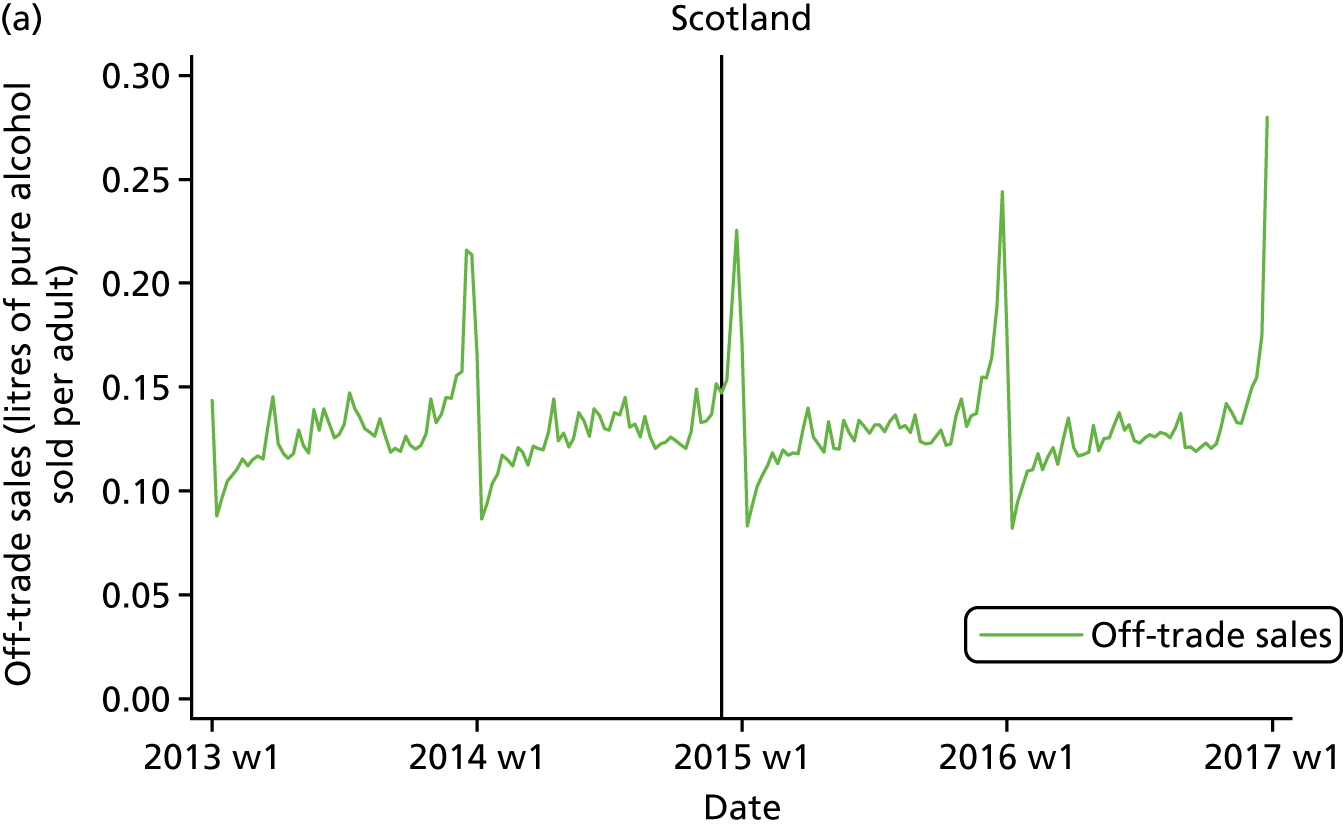
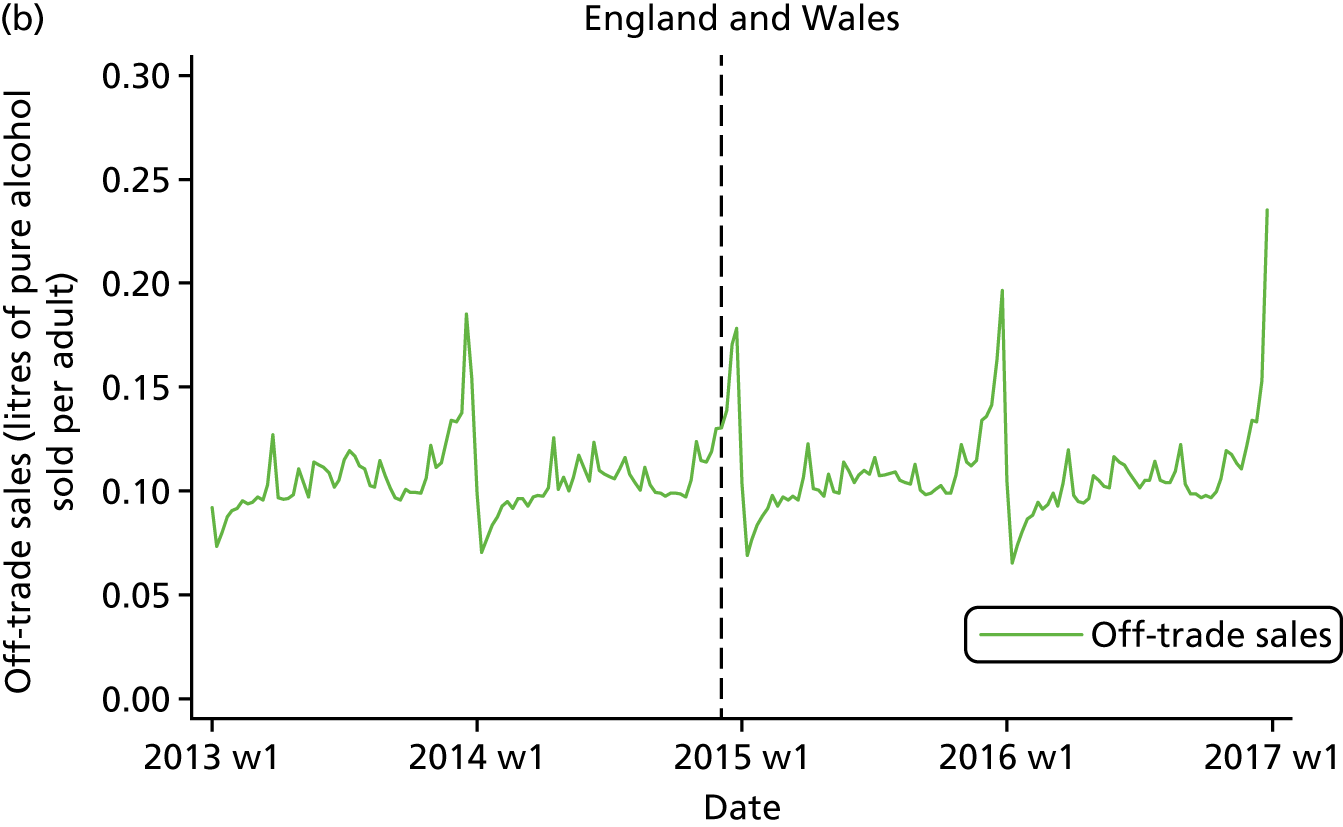
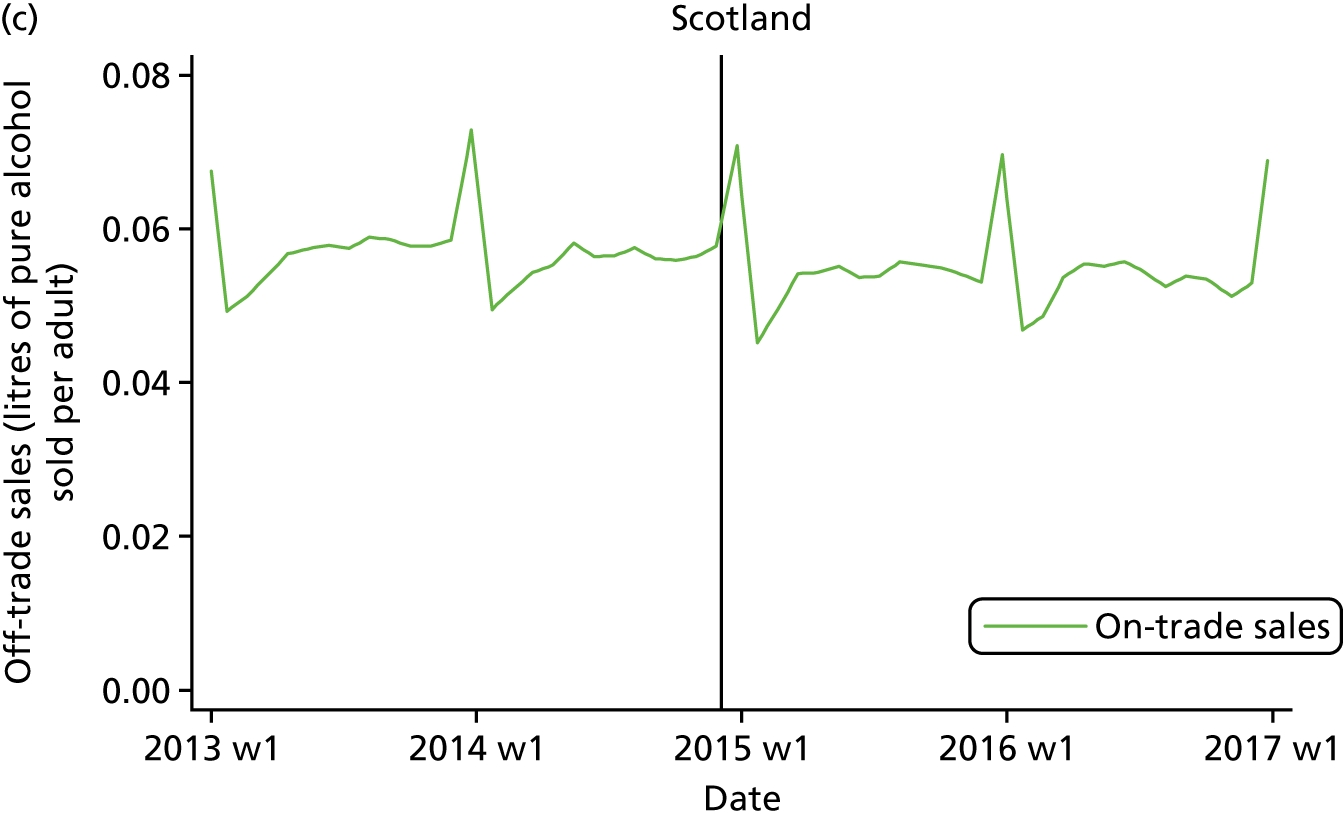
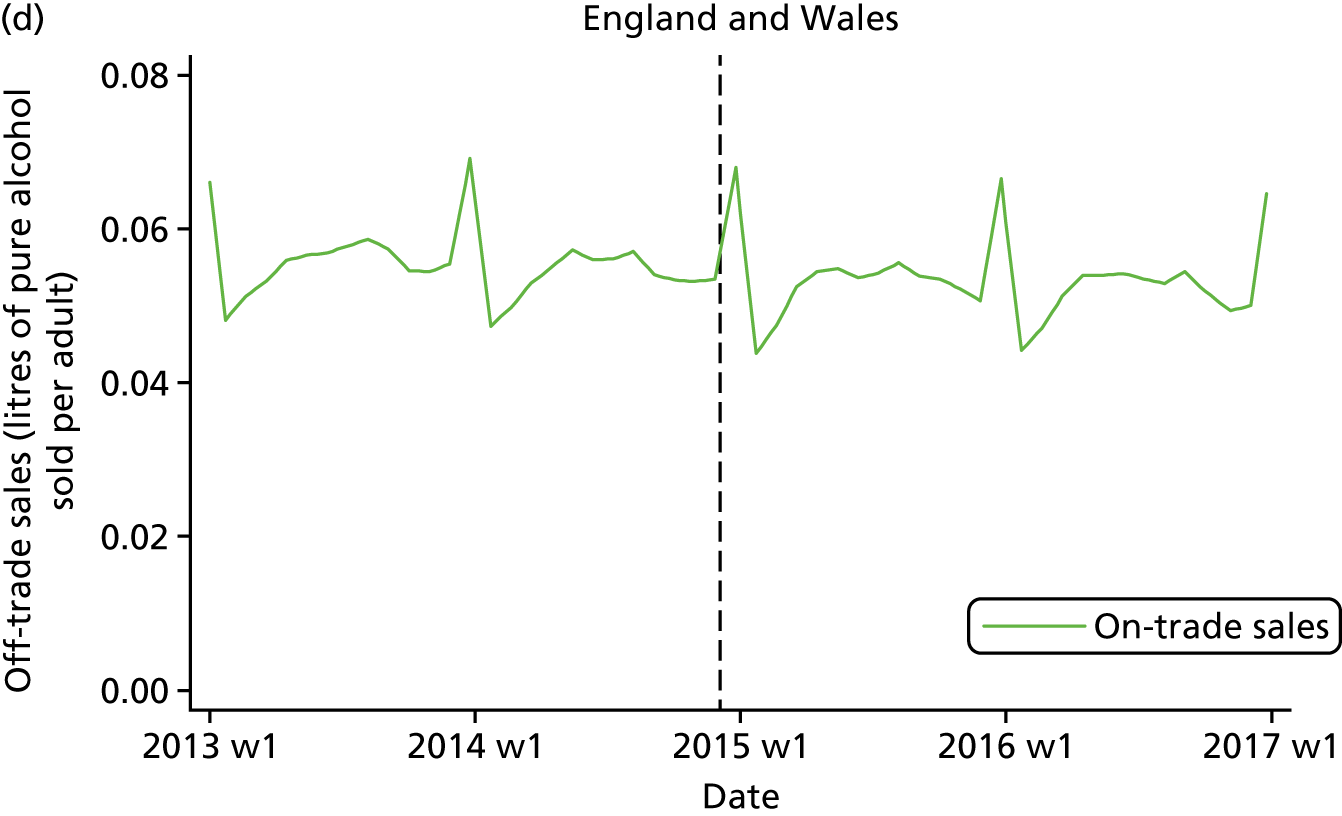
The modelling results are shown in Table 5. The change in legislation was associated with a 0.3% relative decrease in per capita off-trade sales (–0.3%, 95% CI –1.7% to 1.1%; p = 0.71) and a 0.7% decrease in per capita on-trade sales (–0.7%, 95% CI –0.8% to –0.5%; p < 0.001). The corresponding results for the effect of the pseudo-change in legislation in England and Wales indicate increases in per capita off- and on-trade sales. The statistical testing provided no evidence against the null hypothesis that the residuals were normally distributed and, therefore, the SARIMA models fit the data well. Furthermore, adjustment for a covariate reflecting country-specific Aldi and Lidl market-share percentages marginally changed only the effect sizes reported for on-trade sales outcomes.
| Models | Group | |||||
|---|---|---|---|---|---|---|
| Scotland | England and Wales | |||||
| Effect size | p-value | 95% CI | Effect size | p-value | 95% CI | |
| Model a | ||||||
| Off-trade | –0.3% | 0.71 | –1.7% to 1.1% | 1.1% | 0.18 | –0.5% to 2.8% |
| Model b | ||||||
| On-trade | –0.7% | < 0.001 | –0.8% to –0.5% | 0.7% | < 0.001 | 0.5% to 0.8% |
Research question 4: has the change in drink-driving legislation in Scotland provided good value for money (i.e. has the legislation been cost-effective)?
With the results from the earlier analyses revealing no significant change in effectiveness, the economic evaluation proceeded as a cost analysis focusing on the resource impacts of the legislation.
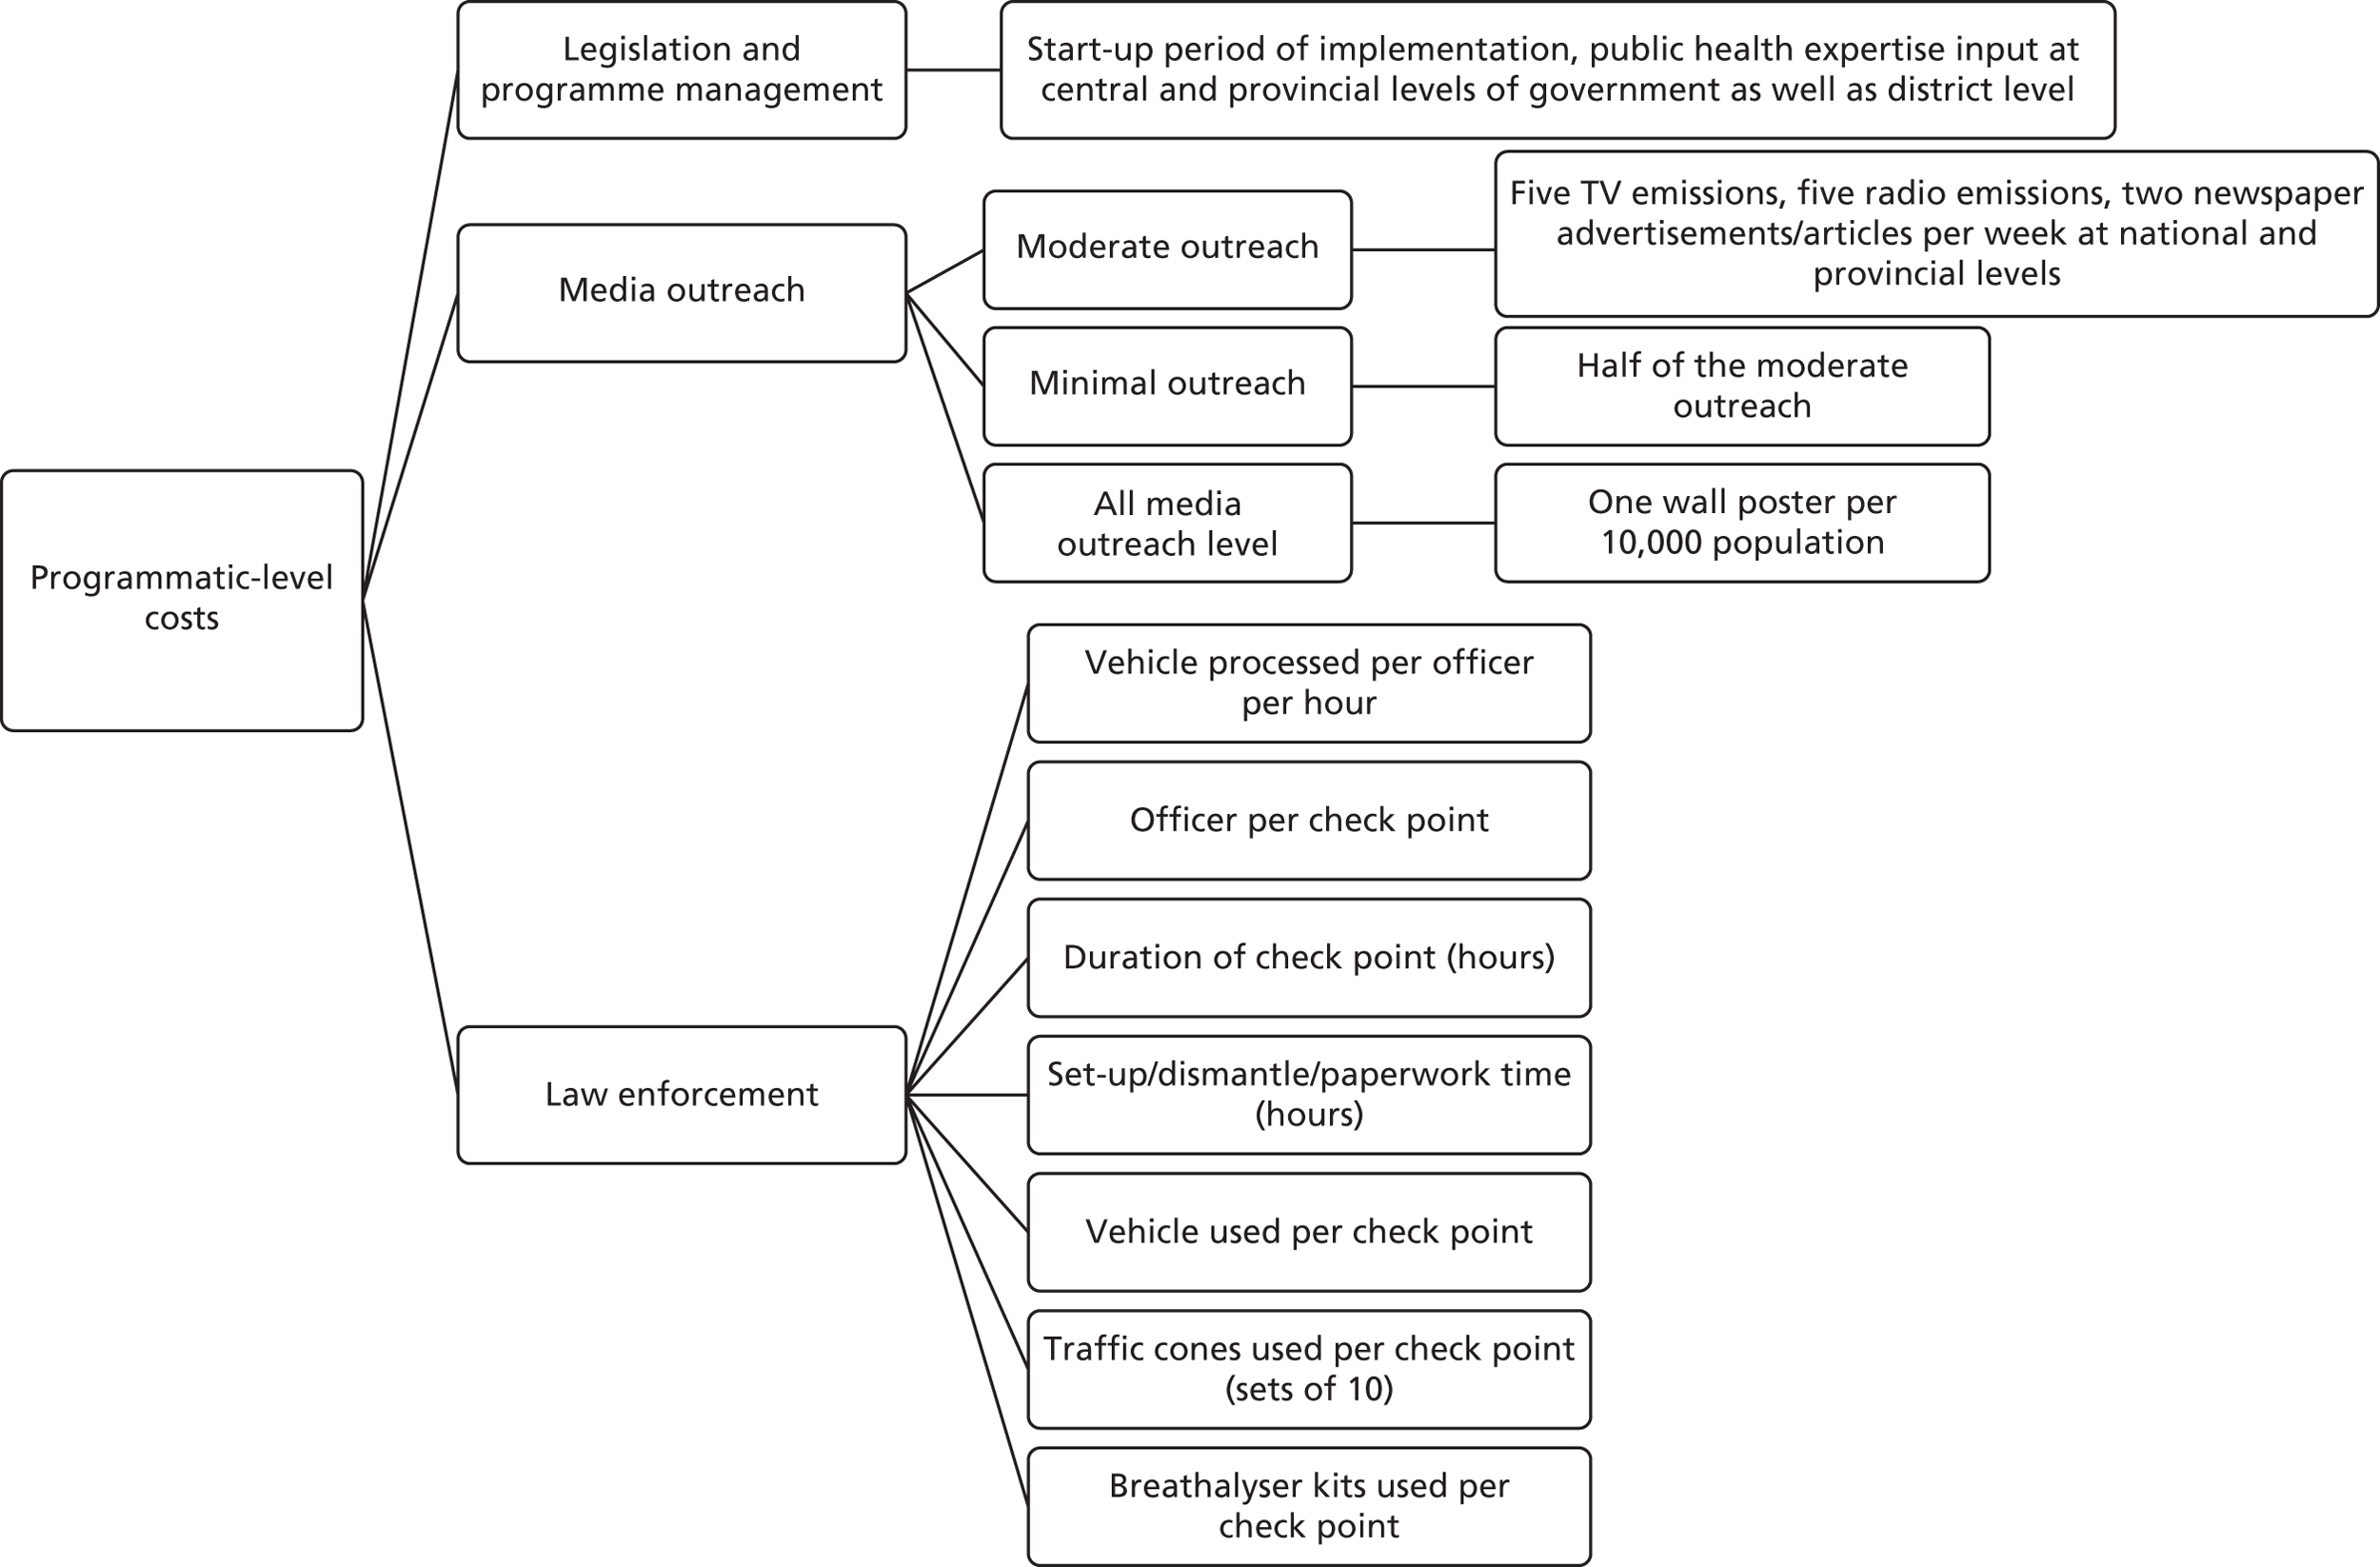
Resource data were obtained from the Scottish Government (SG) on the financial impact of the change in drink-drive legislation. The data could be classified as legislation and programme management costs and publicity costs. Law enforcement details and costs from Police Scotland were not publicly accessible. The details of the costing elements are further broken down in Figure 6.
FIGURE 6.
Details of programmatic-level costs of changing drink-drive legislation.
Legislation and programme management costs
A reduction in the drink-drive limit required that the evidential breath testing instruments (EBTIs) used by Police Scotland to enforce the drink-drive limit were recalibrated for use at the lower limit. The costs incurred at a programmatic level include the Scottish administration cost to recalibrate and adjust EBTIs with the 2014 drink-drive limit; prosecution, courts and legal aid costs; and, costs of other bodies, individuals and businesses. Administration costs were a one-off cost, met by the SG. According to a financial note published in 2014,45 costs of recalibrating and recertifying the EBTIs currently in use were around £90,000; specimens of breath to obtain type approval of the EBTIs at the lower limit cost £25,000; and re-writing of the software used to calibrate the EBTIs at the lower limit cost £5000. Therefore, total administration costs were approximately £120,000 (inflation-adjusted estimate of £122,604 in 2016).
The SG conducted a scenario analysis for potential costs for prosecution, court time and legal aid costs arising due to the lowering of the drink-drive limit. These analyses include scenarios in which the introduction of a lower drink-drive limit in Scotland may lead, at least initially, to a small rise in the number of prosecutions and convictions for drink-driving offences, thus causing an increase in the number of persons prosecuted for drink driving for the courts, Crown Office and Procurator Fiscal Service, Scottish Legal Aid Board and Scottish Prison Service (Table 6). It should be noted that this simply represents a scenario analyses and does not reflect the actual results from our effectiveness analyses.
| Cost items | Unit costs (£) | Scenario | ||
|---|---|---|---|---|
| 10% increase (additional 500 cases) | 20% increase (additional 1000 cases) | 10% decrease (500 fewer cases) | ||
| Legal aid | £610 | £305,000 | £610,000 | –£305,000 |
| Prosecution | £400 | £200,000 | £400,000 | –£200,000 |
| Additional prisoners | (Assuming 2% custodial sentences) | 5 | 10 | –5 |
| Increase in average daily prison population | 1 | 2 | –1 | |
| Annual cost of prison places | £42,650 | £85,300 | –£42,650 | |
| Total annual cost or saving | £715,150 | £1,430,300 | £715,150 | |
| Adjusted for inflation total annual cost or saving (the base year was 2016) | £730,672 | £1,461,344 | £730,672 | |
Publicity costs
The publicity costs include media buying costs and creative advertising costs for TV as well as costs of print, booklets, billboard, newspapers, radio, and social media. According to a RoSPA factsheet,46 the introduction of the lower drink-drive limit in Scotland was supported by a public awareness campaign ahead of the legislation taking effect. This was followed by a high-profile social marketing campaign over the festive period across TV, radio, video-on-demand, digital, public relations, field activity and partnership working;47 the ‘Don’t risk it’ campaign (a 4-week festive drink-drive campaign) including TV advertisements like Blue Light, and designing a website and maintaining it;48 and an awareness campaign to reinforce the message that ‘the best approach is none’. 49
There was no extra funding for raising awareness of the change in drink-driving legislation; rather the existing budget for the usual festive anti-drink-drive campaigns was used. The data on costs are reported in a SG Questions webpage. 50 Table 7 shows a breakdown of the SG expenditure on drink-driving awareness campaigns in each financial year since 2011–12, showing a total cost of £1,601,618 (inflation adjusted). It should be noted that costs incurred developing materials in any given financial year may also be used in future years’ campaigns, hence exact apportionment is not clear. However, it can be seen from Table 7 that the expenditure on publicity decreased significantly for the 2016–17 campaign.
| Financial year | Campaigns | Cost | Adjusted for inflation (base year 2016) |
|---|---|---|---|
| 2011–12 | Drink-drive campaign work | £376,214.04 | £394,104.45 |
| 2012–13 | Drink-drive campaign work | £150,584.70 | £153,853.09 |
| 2013–14 |
Drink drive: lower limit Drink drive: winter campaign |
£41,104.98 £429,077.77 |
£41,388.74 £432,039.78 |
| 2014–15 |
Drink drive: lower limit Drink drive: summer campaign Drink drive: winter campaign |
£137,077.66 £157,627.49 £143,149.47 |
£137,954.96 £158,636.31 £144,065.63 |
| 2015–16 | Drink drive: summer campaign | £139,575.11 | £139,575.11 |
| 2016–17 | Drink drive | £29,000.00 | £17,682.93 |
| Total cost | £1,603,411.22 | £1,601,618.06 |
Law enforcement costs
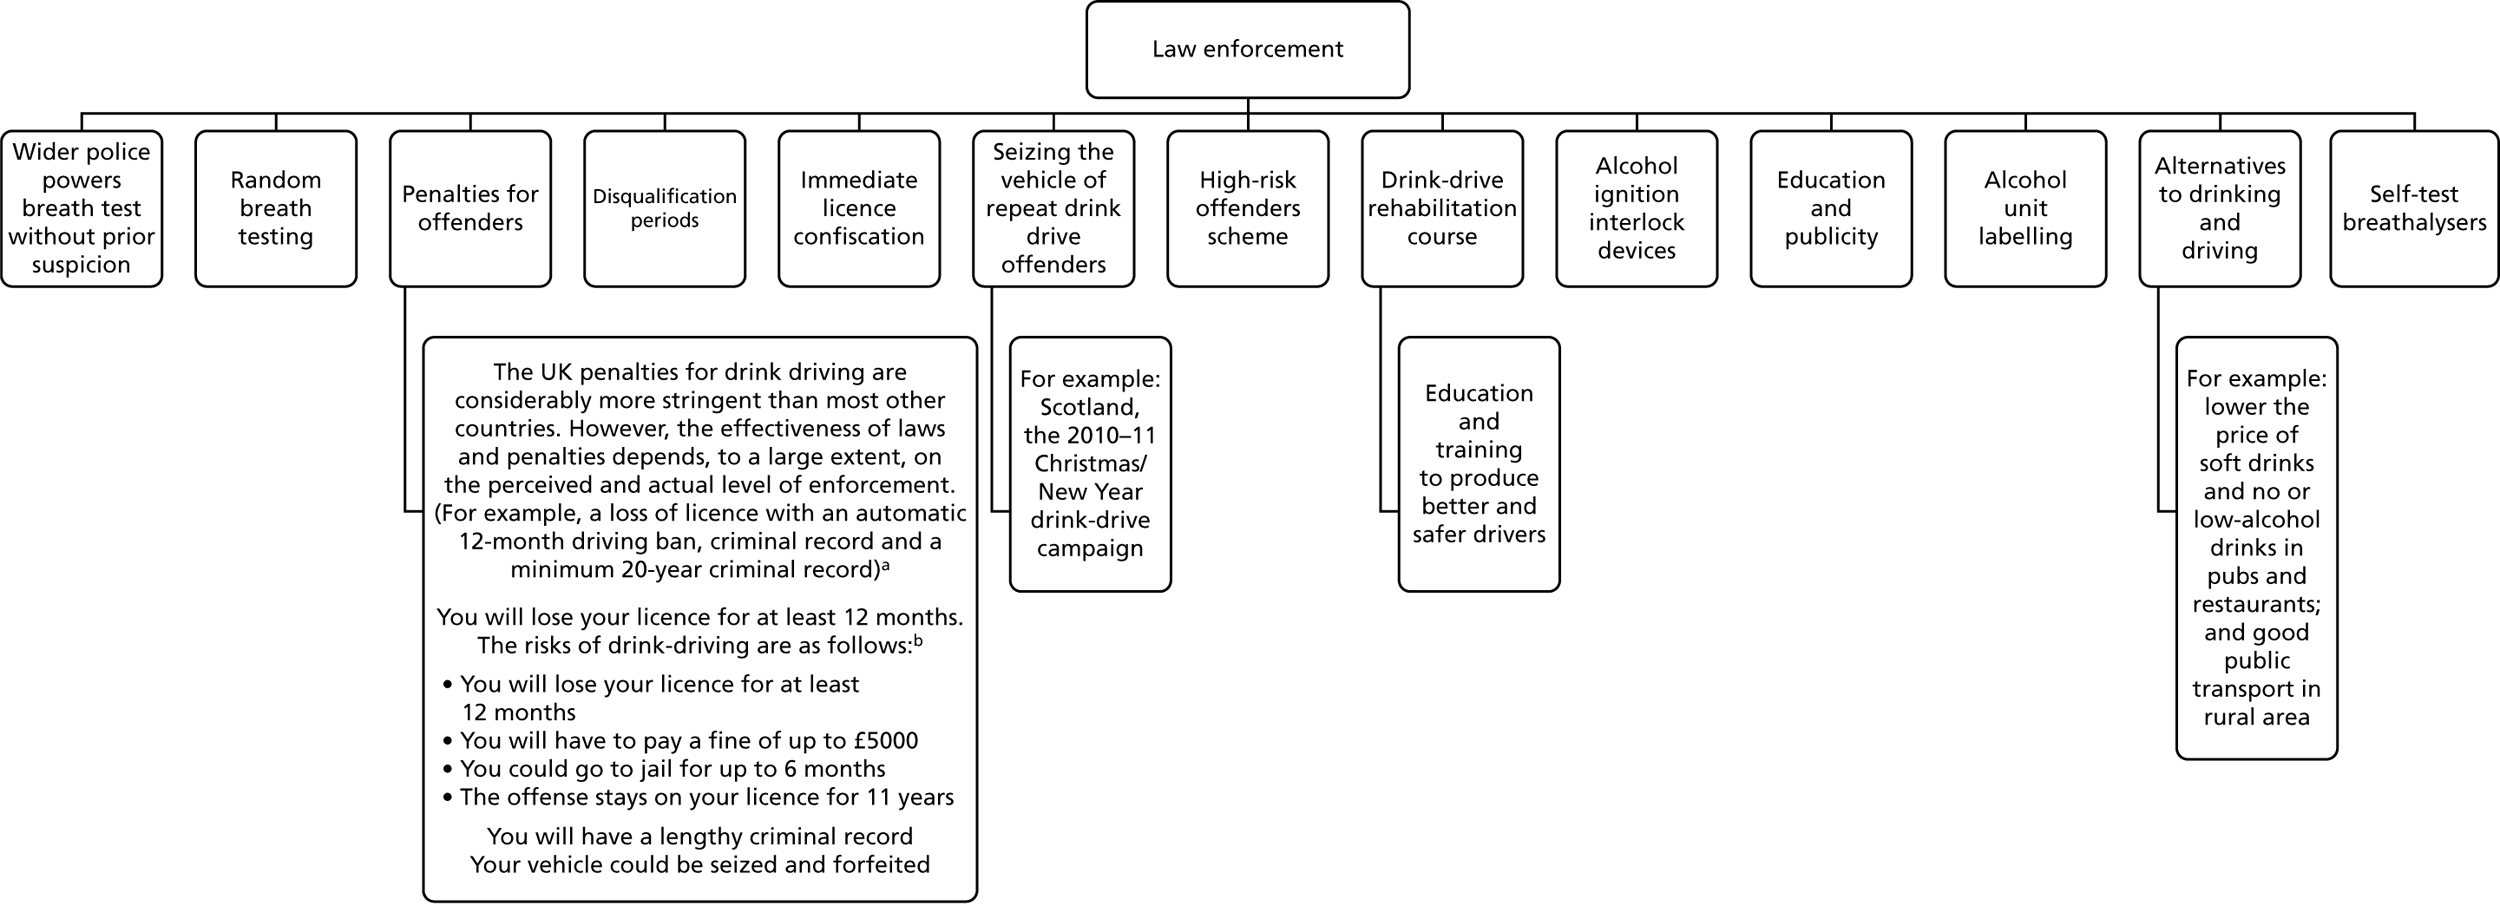
Law enforcement costs include costs involving police officers, vehicles and roadside equipment used in the enforcement process. 18 However, data on enforcement costs associated with the legislation are not centrally held and require separate negotiation with Police Scotland. However, RoSPA46 provided suggestions for resources required to enforce drink-driving legislation, and these are summarised in Figure 7.
FIGURE 7.
Suggested law enforcement costs from RoSPA (summarised from The Royal Society for the Prevention of Accidents’ Road Safety Factsheet46). a, https://news.gov.scot/news/drink-drive-campaign-success (accessed 24 May 2019); and b, https://roadsafety.scot/topics/drink-driving/ (accessed 24 May 2019).
Chapter 6 Discussion
Summary of principal findings
-
The study found that lowering the BAC limit from 0.08 to 0.05 g/dl in Scotland was not associated with a change in the level of RTAs in the first 2 years post change in legislation.
-
As well as no overall effect for RTA outcome, no effect modification by SED level was found.
-
The study found that lowering the BAC limit from 0.08 to 0.05 g/dl in Scotland was not associated with a change in the level of off-trade alcohol consumption in the first 2 years post change in legislation.
-
The study found that lowering the BAC limit from 0.08 to 0.05 g/dl in Scotland was associated with a small relative reduction (< 1%) in the level of on-trade alcohol consumption in the first 2 years post change in legislation.
Findings in context of literature and theory of change
The RTA finding was unexpected, given that the existing evidence base (as summarised in Chapter 1) supported a reduction in RTAs and associated mortality outcomes. A high-quality study14 found a reduction in total death rates between 4.5% and 7.4% (depending on the choice of denominator). Although the outcome is all RTAs and not just those that resulted in deaths, the 95% CIs of the results (see Table 3) are not congruent with effect sizes of that magnitude. Moreover, when the results are expressed relative to the concurrent control group (England and Wales), increases in rates of RTAs are observed.
Referring to the theory of change (see Table 1), which was developed a priori to this research being undertaken, legislation failure was put forward as an explanation if no change in the RTA outcome was found. The legislation could have failed because of the lack of enforcement; a previous study found a significant negative association between enforcement and RTA rates. 9 The European commission stated that a key to the success of changing drink-drive legislation is the accompanying enforcement (i.e. frequent and systematic RBT), supported by public education, publicity and awareness campaigns involving all stakeholders. 51 English police force data have shown that there were 25% fewer RBTs in 2015 compared with 2011. 52 Findings from a parallel qualitative evaluation of the change in drink-drive legislation in Scotland show that an initial substantial investment in public education and media campaigning at the time of the limit reduction in December 2014 was not maintained in 2015 and 2016 (Dr Niamh Fitzgerald, Institute for Social Marketing, University of Stirling, 2018, personal communication). Other plausible reasons for legislation failure are if the majority of drink-driving RTAs are caused by people who continue to ignore the law under the 2014 legislation, or if drink-driving RTAs are caused by people who used to drink-drive within a BAC of 0.05–0.08 g/dl under the old legislation (but obey the 2014 legislation) are a small fraction of all RTAs.
To the study authors’ knowledge, no previous study has evaluated whether or not a legislation change of the BAC limit has led to a reduction in that country's population drinking (and it should be pointed out that the SG never suggested that it would). For off-trade alcohol sales, no association was found, and it is worth emphasising that off-trade sales account for a large proportion of alcohol consumption in Scotland (e.g. approximately 70% of total alcohol sales in 2016). The study observed a small reduction in on-trade alcohol sales; this is in line with findings from the aforementioned qualitative study with publicans/on-licensees reporting small impacts on their businesses. It is worth noting that this small reduction is contrary to early post change in legislation newspaper reporting24 and SLTA viewpoints,25 which suggested larger reductions would be found. In summary, the concern of drinking heavily the night before driving in the morning (which was expressed in the theory of change and was discussed by participants of the public involvement group meeting), and any other mechanisms, have not changed Scotland's alcohol drinking levels.
With the study’s results showing no significant change in effectiveness, the economic evaluation proceeded as a cost analysis focusing on the resource impacts of the legislation. The cost results show that the financial costs of changing the drink-driving legislation in Scotland were not insubstantial. These resources need to be considered as one component of the wider portfolio of interventions (e.g. minimum unit pricing) to change Scotland's relationship with alcohol. As such, although a traditional micro-economic evaluation provides evidence relating to the costs/cost-effectiveness of the legislation to reduce drink driving, the short- and long-term macro effects of the complete portfolio of interventions are less amenable to formal identification, measurement and valuation.
Challenges, strengths and limitations of the study
Challenges of the study
The major challenge of a non-randomised intervention study is to obtain a valid causal estimate of the intervention effect. The study employed a natural experimental design for this purpose and the control group of England and Wales, which provides a strong counterfactual (i.e. ‘what would have happened to RTA and alcohol consumption outcomes in the absence of a change in drink-drive legislation?’). In a hierarchy of design,53 an interrupted time series with a control series is considered a ‘strong design’, whereas an interrupted time series without a control series is considered an ‘intermediate design’.
Another challenge was the unit of analysis for RTAs. The study considered the natural unit of analysis to be RTAs, rather than the level down of drivers involved in RTAs or casualties involved in RTAs. However, this led to difficulties when the study wanted to risk-adjust for age, sex and SED, which are obviously associated with drivers/casualties. The study’s approach was to apply two ‘rules’ of demographic assignment to the RTA and to subsequently check the sensitivity of the results. Fortunately, the results were not sensitive and, moreover, risk adjustment had little influence anyway because the intervention and control groups were well matched by the sociodemographic variables (see Table 2 and Table 8).
As mentioned in Chapter 2, for the purposes of this study, a GB-wide area-based measure of SED was wanted. Over the course of the study it became apparent that this would not be logistically possible to obtain. However, it was felt that the approach of standardising within the countries of GB was fit for purpose and did not compromise the internal validity of our study. Another related challenge was whether SED should be based on the location of the RTA or on the postcode of driver. Although a case could be made for both, it was decided that the latter was most appropriate for answering the study’s research questions.
A substantial challenge for the RTA analyses was obtaining a suitable denominator for rates. The ideal, but unobtainable, denominator would be the number of miles driven by each person at risk of having a RTA. The ATCs were used as a proxy. Unfortunately, the counters used by the DfT are not always operational every hour of the day and readings can be partial or missing altogether. Therefore, some methodological development to account for this had to be undertaken (see Chapter 3). This resulted in using a robust multiple imputation method to obtain a traffic flow denominator for RTA rates, which in turn allowed the study to obtain a DiD-type causal estimate of the intervention effect.
Strengths of the study
Research design
The strengths of the research design were that the study was a controlled natural experiment with strong counterfactual; there was a small risk of selection biases owing to nationally representative data sets; and alcohol consumption was measured by sales rather than self-report.
Follow-up
The study had 2 years of data post change in legislation and, in conjunction, the weekly data points provided very good statistical power.
Informed by theory of change
The study developed a theory of change a priori and this helped shape the design, analysis and interpretation.
Multidisciplinary team
The study had a strong team that covered the fields/methods of public health, statistics, epidemiology, econometrics and health economics. The study also engaged with key stakeholders and worked closely with a team involved in a qualitative evaluation of the same intervention.
Limitations of the study
Data coverage
Not all RTAs will become known to the police,54 and many casualties of RTAs who attend hospital will not be captured in STATS19. A study that linked STATS19 with the Scottish Morbidity Records – General/Acute and Inpatient Day Case data set (SMR01)55 showed that 45% of hospital admissions as a result of road casualties were not reported to (or recorded by) the police. Reassuringly, research by the DfT that linked STATS19 with Hospital Episode Statistics,54 showed that both data sources cover a representative (albeit different) population of the more seriously injured casualties in England.
The off-trade alcohol consumption data do not include sales from Aldi and Lidl supermarket chains. If the increase in market share of these retailers over time was different in the intervention and control groups, then this would create a bias. However, an adjustment for country-specific Aldi/Lidl market-share percentages only marginally changed the modelling results.
Traffic flow denominator
As already discussed, using the DfT’s ATC data was challenging because of data quality issues. Furthermore, although the location of the (approximately) 300 ATCs across GB are placed to be broadly representative of the entire road network, they are obviously an estimate and will not perfectly equate to the true traffic flows. It is acknowledged that absolute estimates of traffic flow will not be perfect using this method, but it does provide good estimates of how traffic flows vary on a temporal basis (both in the intervention and the control groups). Encouragingly, the road traffic statistics team at the DfT (Mr Behnom Havaei-Ahary, DfT, 2018, personal communication) have confirmed that the trends that are reported in this study (see Figure 3) are consistent with the trends reported in its annual publications, which are based on a combination of manual counting and ATCs. 29
It was not possible to split the traffic flow denominator by age, sex and SED. However, this would be a concern only if at different levels within these subgroups there were different temporal trends in traffic counts observed, and there is no reason (or evidence) to support this. Reassuringly, our effect sizes were not sensitive to whether in our modelling we used traffic flow or population denominators for rates, or just used counts (see Table 3).
Missing data in confounders
For the RTA analyses, there were low to moderate numbers of missing data in age, sex and SED. For the adjusted models, the study used a complete-case analysis as it was felt that, with a lack of variables to inform an imputation model, multiple imputation was likely to be inaccurate. Owing to the low or moderate numbers of missing data, and the fact that these variables do not confound because of good balance between the intervention groups, this is unlikely to introduce bias.
Unmeasured confounding
As with all observational studies, the potential for unmeasured confounding exists. A candidate for this is weather. It is known that adverse weather is associated with the risk of RTAs and it could be that the patterning of weather over time is different between Scotland and England and Wales. The study intended to adjust for weekly mean temperature and rainfall. However, with the study’s research design it would have just used single weekly estimates for each intervention group, and it was felt that this would provide too crude an adjustment given that weather is so variable within Scotland and within England and Wales. Ultimately, it was thought that it was implausible that weather would be such a strong confounder so as to introduce a bias of such a magnitude that would fundamentally change the study’s RTA results.
Conclusion
The findings indicate that the change in drink-drive legislation in Scotland in December 2014 did not have the expected effect of reducing RTAs in the country, and nor did it change Scotland's alcohol drinking levels.
Implications
There are several implications of our findings.
Why did the intervention fail to reduce road traffic accidents?
The main finding of a null effect was unexpected. In the a priori theory of change, legislation failure was cited as a plausible explanation if the study went on to find no change in the RTA outcome. The research, alongside that from a parallel-qualitative evaluation of the intervention, suggests that a lack of enforcement is the most likely reason for legislation failure. This should be considered alongside the possibility that the large effect sizes observed in previous high-quality studies are now difficult to achieve given the major improvements over time in road safety and drink-driving becoming increasingly socially unacceptable.
Is total number of road traffic accidents too insensitive an outcome measure?
Previous high-quality studies have reported statistically significant effects when using RTA outcomes that resulted in death or serious injury, and it may be that any effect is being diluted by our use of total RTAs. However, it is maintained that using total RTAs is the most appropriate outcome measure when evaluating the impact of the evaluation on public health, and when the analyses were repeated for serious and fatal RTAs combined only, null effects were observed.
Do the results indicate that Scottish drivers/riders have not changed their drink-drive behaviour over the period in which the legislation changed?
This cannot be answered with the quantitative data available. Ideally, there would be BAC readings for all drivers/riders involved in a RTA, but such information is often not recorded; for example, in GB only half of all those drivers/riders involved in RTAs are breath-tested by the police. 56 It could be that the majority of drink-driving RTAs are caused by those people who continue to ignore the law under the 2014 legislation, or that those who previously used to drink drive between the new 2014 and the old BAC limits have indeed changed their behaviour but are actually not responsible for a large proportion of RTAs.
Did the intervention negatively impact the alcohol licensed trade industry?
There was media reporting in the early period after the legislation change that pubs and other licensed premises had falls in alcohol sales. This study shows that, although there was a statistically significant reduction in on-trade sales associated with the change in drink-drive legislation, the magnitude of the reduction was small (i.e. < 1%).
Recommendations for research
-
The need for investigations into public awareness of the change in legislation and how the public interpreted and acted on the change in legislation: such qualitative evaluations will be important for improving our understanding of the null finding for RTAs, and for shaping recommendations for policy-makers.
-
Exploring any geographical variations in Scotland: the study has analysed data on weekly RTAs in Scotland (also split by SED group), but has not explored whether or not geographical variations exist. This is worthy of investigation to see whether or not, in certain regions of Scotland, there was evidence of an intervention effect on RTAs, especially if that could be linked to evidence of more enforcement in those regions.
-
Evaluation of the 0.08 to 0.05 g/dl BAC change with appropriate enforcement: ultimately, new evidence is awaited from countries/jurisdictions that investigate the same intervention as this study but with appropriate enforcement levels. In the interim, research into whether or not previous change in drink-drive legislation effects on RTAs are associated with the level of enforcement that took place would be welcome.
Acknowledgements
Wider contributions
Sandy Allan (RoSPA) participated in the steering group meetings and reviewed this final report.
Clare Beeston (NHS Health Scotland) assisted in developing the theory of change.
Denise Brown (Institute of Health and Wellbeing, University of Glasgow), Maya Clayton (NRS), Lauren Schofield (NHS National Services Scotland) and David Walsh (Glasgow Centre for Population Health) all assisted by providing expertise and resources to allow the appropriate measurement of SED for this study.
Niamh Fitzgerald (Institute for Social Marketing, University of Stirling) is principal investigator of a parallel-qualitative evaluation of the change in drink-drive legislation in Scotland (funded by the Chief Scientist Office – HIPS/16/49) and she participated in a steering group meeting and reviewed the discussion of this final report. Furthermore, Niamh facilitated and took part in the public involvement group meeting.
Behnom Havaei-Ahary (Road Traffic Statistics, DfT) assisted in obtaining and providing guidance on the STATS19 data set.
Mark Robinson (NHS Health Scotland) participated in the steering group meetings and reviewed this final report.
Contributions of authors
Jim Lewsey (Reader in Medical Statistics, Institute of Health and Wellbeing, University of Glasgow) led the design and execution of the study, oversaw all analyses and led the preparation of the final report.
Houra Haghpanahan (Research Assistant, Institute of Health and Wellbeing, University of Glasgow) was the lead researcher on the study, leading the preparation of all analyses and contributed to all sections of the final report.
Daniel Mackay (Reader in Public Health, Institute of Health and Wellbeing, University of Glasgow) contributed to the overall design, in particular the design and analysis of all statistical analyses.
Emma McIntosh (Professor of Health Economics, Institute of Health and Wellbeing, University of Glasgow) led the design of, and supervised the, economic evaluation analyses and reviewed and commented on the final report.
Jill Pell (Henry Mechan Professor of Public Health, Institute of Health and Wellbeing, University of Glasgow) contributed to the design of the study.
Andy Jones (Professor in Public Health, Norwich Medical School, University of East Anglia) contributed to the design, provided advice on some of the statistical analyses, and reviewed and commented on the final report.
All authors contributed to the design of the final report and approved the final version.
Publication
Haghpanaha H, Lewsey J, Mackay D, McIntosh E, Pell J, Jones A. An evaluation of the effects of lowering blood alcohol concentration limits for drivers on the rates of road traffic accidents and alcohol consumption: a natural experiment. Lancet 2018;393:321–9.
Data-sharing statement
All data requests should be submitted to the corresponding author for consideration. Access to available anonymised data may be granted following review.
Disclaimers
This report presents independent research funded by the National Institute for Health Research (NIHR). The views and opinions expressed by authors in this publication are those of the authors and do not necessarily reflect those of the NHS, the NIHR, NETSCC, the PHR programme or the Department of Health and Social Care. If there are verbatim quotations included in this publication the views and opinions expressed by the interviewees are those of the interviewees and do not necessarily reflect those of the authors, those of the NHS, the NIHR, NETSCC, the PHR programme or the Department of Health and Social Care.
References
- Drinking and Driving in Europe – A Eurocare Report to the EU. London: Institute of Alcohol Studies; 2003.
- Reported Road Casualties in Great Britain: 2010 Annual Report – Statistical Release. London: Department for Transport; 2010.
- Reported Road Casualties in Great Britain: Estimates for Accidents Involving Illegal Alcohol Levels: 2012 (Final) – Statistical Release. London: Department for Transport; 2012.
- Reducing the Drink Drive Limit in Scotland. Edinburgh: Scottish Government; 2012.
- Zador PL, Krawchuk SA, Voas RB. Alcohol-related relative risk of driver fatalities and driver involvement in fatal crashes in relation to driver age and gender: an update using 1996 data. J Stud Alcohol 2000;61:387-95. https://doi.org/10.15288/jsa.2000.61.387.
- Mann RE, Macdonald S, Stoduto LG, Bondy S, Jonah B, Shaikh A. The effects of introducing or lowering legal per se blood alcohol limits for driving: an international review. Accid Anal Prev 2001;33:569-83. https://doi.org/10.1016/S0001-4575(00)00077-4.
- Ross HL. Law, science, and accidents: the British Road Safety Act of 1967. J Legal Stud 1973;2:1-78. https://doi.org/10.1086/467491.
- Homel R, Wilson RJ, Mann RE. Drinking and Driving: Advances in Research and Prevention. New York, NY: Guilford Press; 1990.
- Mercier-Guyon C. Lowering the BAC Limit to 0.05: Results of the French Experience n.d.
- Henstridge J, Homel R, Mackay P. The Long-term Effects of Random Breath Testing in Four Australian States?: A Time Series Analysis. CR 162. Canberra, ACT: Federal Office of Road Safety; 1997.
- Bartl G, Esperger R. Effects of Lowering the Legal BAC Limit in Austria n.d.
- Bernhoft IM, Behrensdorff I. Effect of lowering the alcohol limit in Denmark. Accid Anal Prev 2003;35:515-25. https://doi.org/10.1016/S0001-4575(02)00029-5.
- Fell JC, Scherer M. Estimation of the potential effectiveness of lowering the blood alcohol concentration (BAC) limit for driving from 0.08 to 0.05 grams per deciliter in the United States. Alcohol Clin Exp Res 2017;41:2128-39. https://doi.org/10.1111/acer.13501.
- D Albalate . Lowering blood alcohol content levels to save lives: the European experience. J Policy Anal Manag 2007;27:20-39. https://doi.org/10.1002/pam.20305.
- Schechtman E, Shinar D, Compton R. The relationship between drinking habits and safe driving behaviors. Transport Res Pt F Traffic Psychol Behav 1999;2:15-26. https://doi.org/10.1016/S1369-8478(99)00004-2.
- Fone DL, Farewell DM, White J, Lyons RA, Dunstan FD. Socioeconomic patterning of excess alcohol consumption and binge drinking: a cross-sectional study of multilevel associations with neighbourhood deprivation. BMJ Open 2013;3. https://doi.org/10.1136/bmjopen-2012-002337.
- Anderson P, Chisholm D, Fuhr DC. Effectiveness and cost-effectiveness of policies and programmes to reduce the harm caused by alcohol. Lancet 2009;373:2234-46. https://doi.org/10.1016/S0140-6736(09)60744-3.
- Chisholm D, Naci H, Hyder AA, Tran NT, Peden M. Cost effectiveness of strategies to combat road traffic injuries in sub-Saharan Africa and South East Asia: mathematical modelling study. BMJ 2012;344. https://doi.org/10.1136/bmj.e612.
- Leung J. Alcohol Impairment Project – Lowering Legal Adult Blood Alcohol Concentration (BAC) – Cost Benefit Analysis 2013. www.transport.govt.nz/assets/Uploads/Legislation/Documents/d1cd370707/Cost-Benefit-Analysis-blood-alcohol-report-Nov-2013.pdf (accessed 8 January 2019).
- Killoran A, Canning U, Doyle N, Sheppard L. Review of Effectiveness of Laws Limiting Blood Alcohol Concentration Levels to Reduce Alcohol-Related Road Injuries and Deaths – Centre for Public Health Excellence NICE. London: Institute of Alcohol Studies; 2010.
- Norström T, Ramstedt M. Mortality and population drinking: a review of the literature. Drug Alcohol Rev 2005;24:537-47. https://doi.org/10.1080/09595230500293845.
- Norström T, Rossow I. Population drinking and drink driving in Norway and Sweden: an analysis of historical data 1957-89. Addiction 2013;108:1051-8. https://doi.org/10.1111/add.12126.
- Rehm J, Baliunas D, Borges GL, Graham K, Irving H, Kehoe T, et al. The relation between different dimensions of alcohol consumption and burden of disease: an overview. Addiction 2010;105:817-43. https://doi.org/10.1111/j.1360-0443.2010.02899.x.
- Pub group Greene King says new driving laws hit festive sales in Scotland. Daily Record 2015. www.insider.co.uk/company-results-forecasts/pub-group-greene-king-says-9873751 (accessed 8 January 2019).
- Clements C. Scotland’s lower drink-drive limit could have worse effect on country’s pub trade than smoking ban. Daily Record 2015. www.dailyrecord.co.uk/news/business-consumer/scotlands-lower-drink-drive-limit-could-5007648 (accessed 8 January 2019).
- Mind S. Lost orders: pub landlords say new drink-drive limit is killing off licensed trade as a third of pubs report a slump in business. Daily Record 2015. www.dailyrecord.co.uk/news/scottish-news/lost-orders-pub-landlords-say-5394628 (accessed 8 January 2019).
- Craig P, Cooper C, Gunnell D, Haw S, Lawson K, Macintyre S, et al. Using natural experiments to evaluate population health interventions: new Medical Research Council guidance. J Epidemiol Community Health 2012;66:1182-6. https://doi.org/10.1136/jech-2011-200375.
- von Elm E, Altman DG, Egger M, Pocock SJ, Gøtzsche PC, Vandenbroucke JP. STROBE Initiative . The Strengthening the Reporting of Observational Studies in Epidemiology (STROBE) statement: guidelines for reporting observational studies. Lancet 2007;370:1453-7. https://doi.org/10.1016/S0140-6736(07)61602-X.
- Road Traffic Estimates: Great Britain 2016. London: Department for Transport; 2017.
- Mid-year Population Estimates. Edinburgh: National Records of Scotland; n.d.
- Population Estimates. Newport: Office for National Statistics; n.d.
- Carstairs V. Deprivation indices: their interpretation and use in relation to health. J Epidemiol Community Health 1995;49:3-8. https://doi.org/10.1136/jech.49.Suppl_2.S3.
- English Indices of Deprivation 2015. London: Ministry of Housing Communities and Local Government; 2015.
- Scottish Index of Multiple Deprivation: A Data Cube Spreadsheet. Edinburgh: Scottish Government; n.d.
- Welsh Index of Multiple Deprivation. Cardiff: StatsWales; n.d.
- MESAS: A Review of the Validity and Reliability of Alcohol Retail Sales Data. Edinburgh: NHS Health Scotland; 2012.
- Gray L, McCartney G, White IR, Katikireddi SV, Rutherford L, Gorman E, et al. Use of record-linkage to handle non-response and improve alcohol consumption estimates in health survey data: a study protocol. BMJ Open 2013;3. https://doi.org/10.1136/bmjopen-2013-00264.
- Robinson M, Geue C, Lewsey J, Mackay D, McCartney G, Curnock E, et al. Evaluating the impact of the alcohol act on off-trade alcohol sales: a natural experiment in Scotland. Addiction 2014;109:2035-43. https://doi.org/10.1111/add.12701.
- A Valuation of Road Accidents and Casualties in Great Britain: Methodology Note. London: UK Government; n.d.
- Transport Analysis Guidance: WebTAG. London: UK Government; 2014.
- Spicer RS, Miller TR, Hendrie D, Blincoe LJ. Quality-adjusted life years lost to road crash injury: updating the injury impairment index. Ann Adv Automot Med 2011;55:365-77.
- Reported Road Casualties in Great Britain: 2011 Annual Report – A Valuation of Road Accidents and Casualties in Great Britain in 2011. London: Department for Transport; 2011.
- Honaker J, King G, Blackwell M. Amelia II: a program for missing data. J Stat Softw 2011;1. https://doi.org/10.18637/jss.v045.i07.
- The Royal Society for the Prevention of Accidents n.d. www.rospa.com/ (accessed 8 January 2019).
- The Road Traffic Act 1988 (Prescribed Limit) (Scotland) Regulations. Edinburgh: Scottish Government; 2014.
- Road Safety Factsheet. Birmingham: The Royal Society for the Prevention of Accidents; 2017.
- Drink Drive Campaign Success. Edinburgh: Scottish Government; 2015.
- Drink Drive Mythbuster. Edinburgh: Scottish Government; n.d.
- Festive Drink Drive Reminder. Edinburgh: Scottish Government; 2016.
- Question S5W-06885. Edinburgh: Scottish Government; n.d.
- Drink Driving: Towards Zero Tolerance. Etterbeek: European Transport Safety Council; 2012.
- Drink Drive Risk as Breath Tests Fall by 25%. London: Institute of Alcohol Studies; n.d.
- Soumerai SB, Starr D, Majumdar SR. How do you know which health care effectiveness research you can trust? A guide to study design for the perplexed. Prev Chronic Dis 2015;12. https://doi.org/10.5888/pcd12.150187.
- Reported Road Casualties in Great Britain: 2011 Annual Report – Hospital Admissions Data on Road Casualties in England. London: Department for Transport; 2011.
- Jeffrey S, Stone DH, Blamey A, Clark D, Cooper C, Dickson K, et al. An evaluation of police reporting of road casualties. Inj Prev 2009;15:13-8. https://doi.org/10.1136/ip.2008.018630.
- Reported Road Casualties in Great Britain: Estimates for Accidents Involving Illegal Alcohol Levels: 2013 (Final) and 2014 (Provisional). London: Department for Transport; 2015.
Appendix 1 Extra tables and figures
| Demographics | Group, n (%) | |
|---|---|---|
| Scotland | England and Wales | |
| Sex | ||
| Male | 9039 (26.1) | 101,420 (19.2) |
| Female | 24,974 (72.3) | 413,200 (78.4) |
| Missing | 565 (1.6) | 12,448 (2.4) |
| Age group (years) | ||
| ≤ 20 | 4653 (13.4) | 75,155 (14.3) |
| 21–25 | 5560 (16.1) | 95,099 (18.0) |
| 26–35 | 9129 (26.4) | 142,168 (27.0) |
| 36–45 | 6331 (18.3) | 89,037 (16.9) |
| 46–55 | 4847 (14) | 59,370 (11.3) |
| 56–65 | 2202 (6.4) | 25,673 (4.9) |
| 66–75 | 876 (2.5) | 11,122 (2.1) |
| > 75 | 487 (1.4) | 6653 (1.3) |
| Missing | 493 (1.4) | 22,791 (4.3) |
| SED | ||
| 1 (most deprived) | 2038 (6.0) | 30,145 (5.7) |
| 2 | 2476 (7.2) | 38,228 (7.3) |
| 3 | 2645 (7.6) | 42,216 (8.0) |
| 4 | 3024 (8.7) | 45,461 (8.6) |
| 5 | 3183 (9.2) | 47,227 (9.0) |
| 6 | 3515 (10.2) | 49,942 (9.5) |
| 7 | 3517 (10.2) | 51,408 (9.7) |
| 8 | 3663 (10.6) | 53,754 (10.2) |
| 9 | 3884 (11.2) | 56,955 (10.8) |
| 10 (least deprived) | 3628 (10.5) | 56,936 (10.8) |
| Missing | 3096 (9.0) | 54,796 (10.4) |
| Total number of RTAs | 34,578 | 527,068 |
| Models | Group | DiD-type estimate (Scotland/England and Wales) | |||||||
|---|---|---|---|---|---|---|---|---|---|
| Scotland | England and Wales | ||||||||
| Effect size | p-value | 95% CI | Effect size | p-value | 95% CI | Effect size | p-value | 95% CI | |
| Model d | |||||||||
| RTA rates with traffic flow as the denominator | 1.01 | 0.72 | 0.96 to 1.06 | 0.94 | < 0.001 | 0.92 to 0.97 | 1.07 | 0.02 | 1.01 to 1.13 |
| Model f | |||||||||
| RTA rates with population as the denominator | 0.98 | 0.41 | 0.93 to 1.03 | 0.95 | < 0.001 | 0.93 to 0.97 | 1.02 | 0.33 | 0.97 to 1.09 |
| SED | Group | |||||
|---|---|---|---|---|---|---|
| Scotland | England and Wales | |||||
| Effect size | p-value | 95% CI | Effect size | p-value | 95% CI | |
| RTA counts | ||||||
| 1 (most deprived) | 1.03 | 0.61 | 0.91 to 1.18 | 1.00 | 0.92 | 0.95 to 1.04 |
| 2 | 0.98 | 0.77 | 0.87 to 1.10 | 0.96 | 0.03 | 0.92 to 1.00 |
| 3 | 0.97 | 0.60 | 0.87 to 1.08 | 0.95 | 0.01 | 0.92 to 1.00 |
| 4 | 1.00 | 0.96 | 0.90 to 1.11 | 0.95 | 0.006 | 0.91 to 0.98 |
| 5 (least deprived) | 0.93 | 0.14 | 0.87 to 1.03 | 0.93 | < 0.001 | 0.90 to 0.96 |
| RTA rates with traffic flow as the denominator | ||||||
| 1 (most deprived) | 1.06 | 0.33 | 0.93 to 1.22 | 0.99 | 0.59 | 0.94 to 1.03 |
| 2 | 1.01 | 0.84 | 0.90 to 1.14 | 0.95 | 0.008 | 0.91 to 0.98 |
| 3 | 1.00 | 0.98 | 0.90 to 1.11 | 0.94 | 0.002 | 0.91 to 0.98 |
| 4 | 1.03 | 0.53 | 0.93 to 1.15 | 0.94 | 0.001 | 0.90 to 0.97 |
| 5 (least deprived) | 0.95 | 0.37 | 0.86 to 1.06 | 0.92 | < 0.001 | 0.89 to 0.95 |
| RTA rates with population as the denominator | ||||||
| 1 (most deprived) | 1.03 | 0.62 | 0.90 to 1.18 | 1.00 | 0.88 | 0.95 to 1.04 |
| 2 | 0.98 | 0.77 | 0.87 to 1.10 | 0.95 | 0.03 | 0.91 to 1.00 |
| 3 | 0.97 | 0.60 | 0.87 to 1.08 | 0.95 | 0.01 | 0.91 to 0.99 |
| 4 | 1.00 | 0.97 | 0.90 to 1.11 | 0.94 | 0.006 | 0.91 to 0.98 |
| 5 (least deprived) | 0.93 | 0.14 | 0.84 to 1.03 | 0.93 | < 0.001 | 0.90 to 0.96 |
List of abbreviations
- ATC
- automatic traffic counter
- BAC
- blood alcohol concentration
- BAC8to5
- reduction of the blood alcohol concentration limit from 0.08 to 0.05 g/dl
- BRSA
- British Road Safety Act
- CBA
- cost–benefit analysis
- DALY
- disability-adjusted life-year
- DfT
- Department for Transport
- DiD
- difference-in-differences
- EBTI
- evidential breath testing instrument
- MESAS
- Monitoring and Evaluating Scotland’s Alcohol Strategy
- NICE
- National Institute for Health and Care Excellence
- NRS
- National Records Scotland
- ONS
- Office for National Statistics
- QALY
- quality-adjusted life-year
- RBT
- random breath testing
- RII
- relative index of inequality
- RoSPA
- The Royal Society for the Prevention of Accidents
- RR
- relative risk
- RTA
- road traffic accident
- SARIMA
- seasonal autoregressive integrated moving average
- SD
- standard deviation
- SED
- socioeconomic deprivation
- SG
- Scottish Government
- SII
- slope index of inequality
- SLTA
- Scottish Licensed Trade Association
