Notes
Article history
The research reported in this issue of the journal was funded by the PHR programme as project number 15/63/01. The contractual start date was in November 2015. The final report began editorial review in May 2019 and was accepted for publication in January 2020. The authors have been wholly responsible for all data collection, analysis and interpretation, and for writing up their work. The PHR editors and production house have tried to ensure the accuracy of the authors’ report and would like to thank the reviewers for their constructive comments on the final report document. However, they do not accept liability for damages or losses arising from material published in this report.
Permissions
Copyright statement
© Queen’s Printer and Controller of HMSO 2020. This work was produced by Holmes et al. under the terms of a commissioning contract issued by the Secretary of State for Health and Social Care. This issue may be freely reproduced for the purposes of private research and study and extracts (or indeed, the full report) may be included in professional journals provided that suitable acknowledgement is made and the reproduction is not associated with any form of advertising. Applications for commercial reproduction should be addressed to: NIHR Journals Library, National Institute for Health Research, Evaluation, Trials and Studies Coordinating Centre, Alpha House, University of Southampton Science Park, Southampton SO16 7NS, UK.
2020 Queen’s Printer and Controller of HMSO
Chapter 1 Background
This report includes direct quotations from media and in places, where copyright permission could not be obtained, comments have been paraphrased by the authors (see Chapter 3). These statements include a range of opinions that relate to the quoted source and do not reflect the views of authors or funders.
Alcohol is a major contributor to global mortality and ill health and is a causal factor in over 200 health conditions including liver disease, heart disease, injuries and seven types of cancer. 1 The Global Burden of Disease study attributed an estimated 2.3 million deaths and 85 million disability-adjusted life-years (DALYs) lost to alcohol in 2015. 2 In England, alcohol caused an estimated 24,208 deaths in 2017 and 1.2 million hospital admissions in 2017–18 and was reported by victims as a factor in 39% of violent crimes. 3,4 Estimates of the economic cost to society of alcohol-related health and social harms vary, but the most commonly used estimate is £21B (UK annual estimate). 5
In response to this, successive UK Governments have published a series of alcohol strategies aiming to reduce alcohol consumption and the harm and disruption it causes to drinkers and those around them. 5–7 The most recent strategy was published in 20125 and included the aim to:
Support people to make informed choices about healthier and responsible drinking, so it is no longer considered acceptable to drink excessively.
It further sought to:
Ensure everyone understands the risks around excessive alcohol consumption to help them make the right choices for themselves and their families.
A key policy for achieving these goals was to ask the Chief Medical Officer (CMO) to oversee a review of the country’s low-risk drinking guidelines.
Guidelines for low-risk drinking
Drinking guidelines have proliferated internationally since the 1980s and health authorities in most high-income countries now issue guidelines for alcohol consumption. 8 These usually recommend a quantified level of alcohol consumption that drinkers should not exceed over a specific time period (e.g. per day or per week). The consumption level is usually expressed in standard drinks or units of alcohol. In the UK, 1 unit is 8 g or 10 ml of pure ethanol and is approximately half a pint of beer, 75 ml of wine or one 25-ml shot of spirits, depending on the alcoholic strength of the drink. The guideline consumption threshold is also usually accompanied by textual information that may include, among other things, the source of the guideline (e.g. the CMO recommends . . .), a reason to listen to the advice (e.g. to reduce your risk of alcohol-related disease . . .) and supplementary recommendations (e.g. do not drink every day).
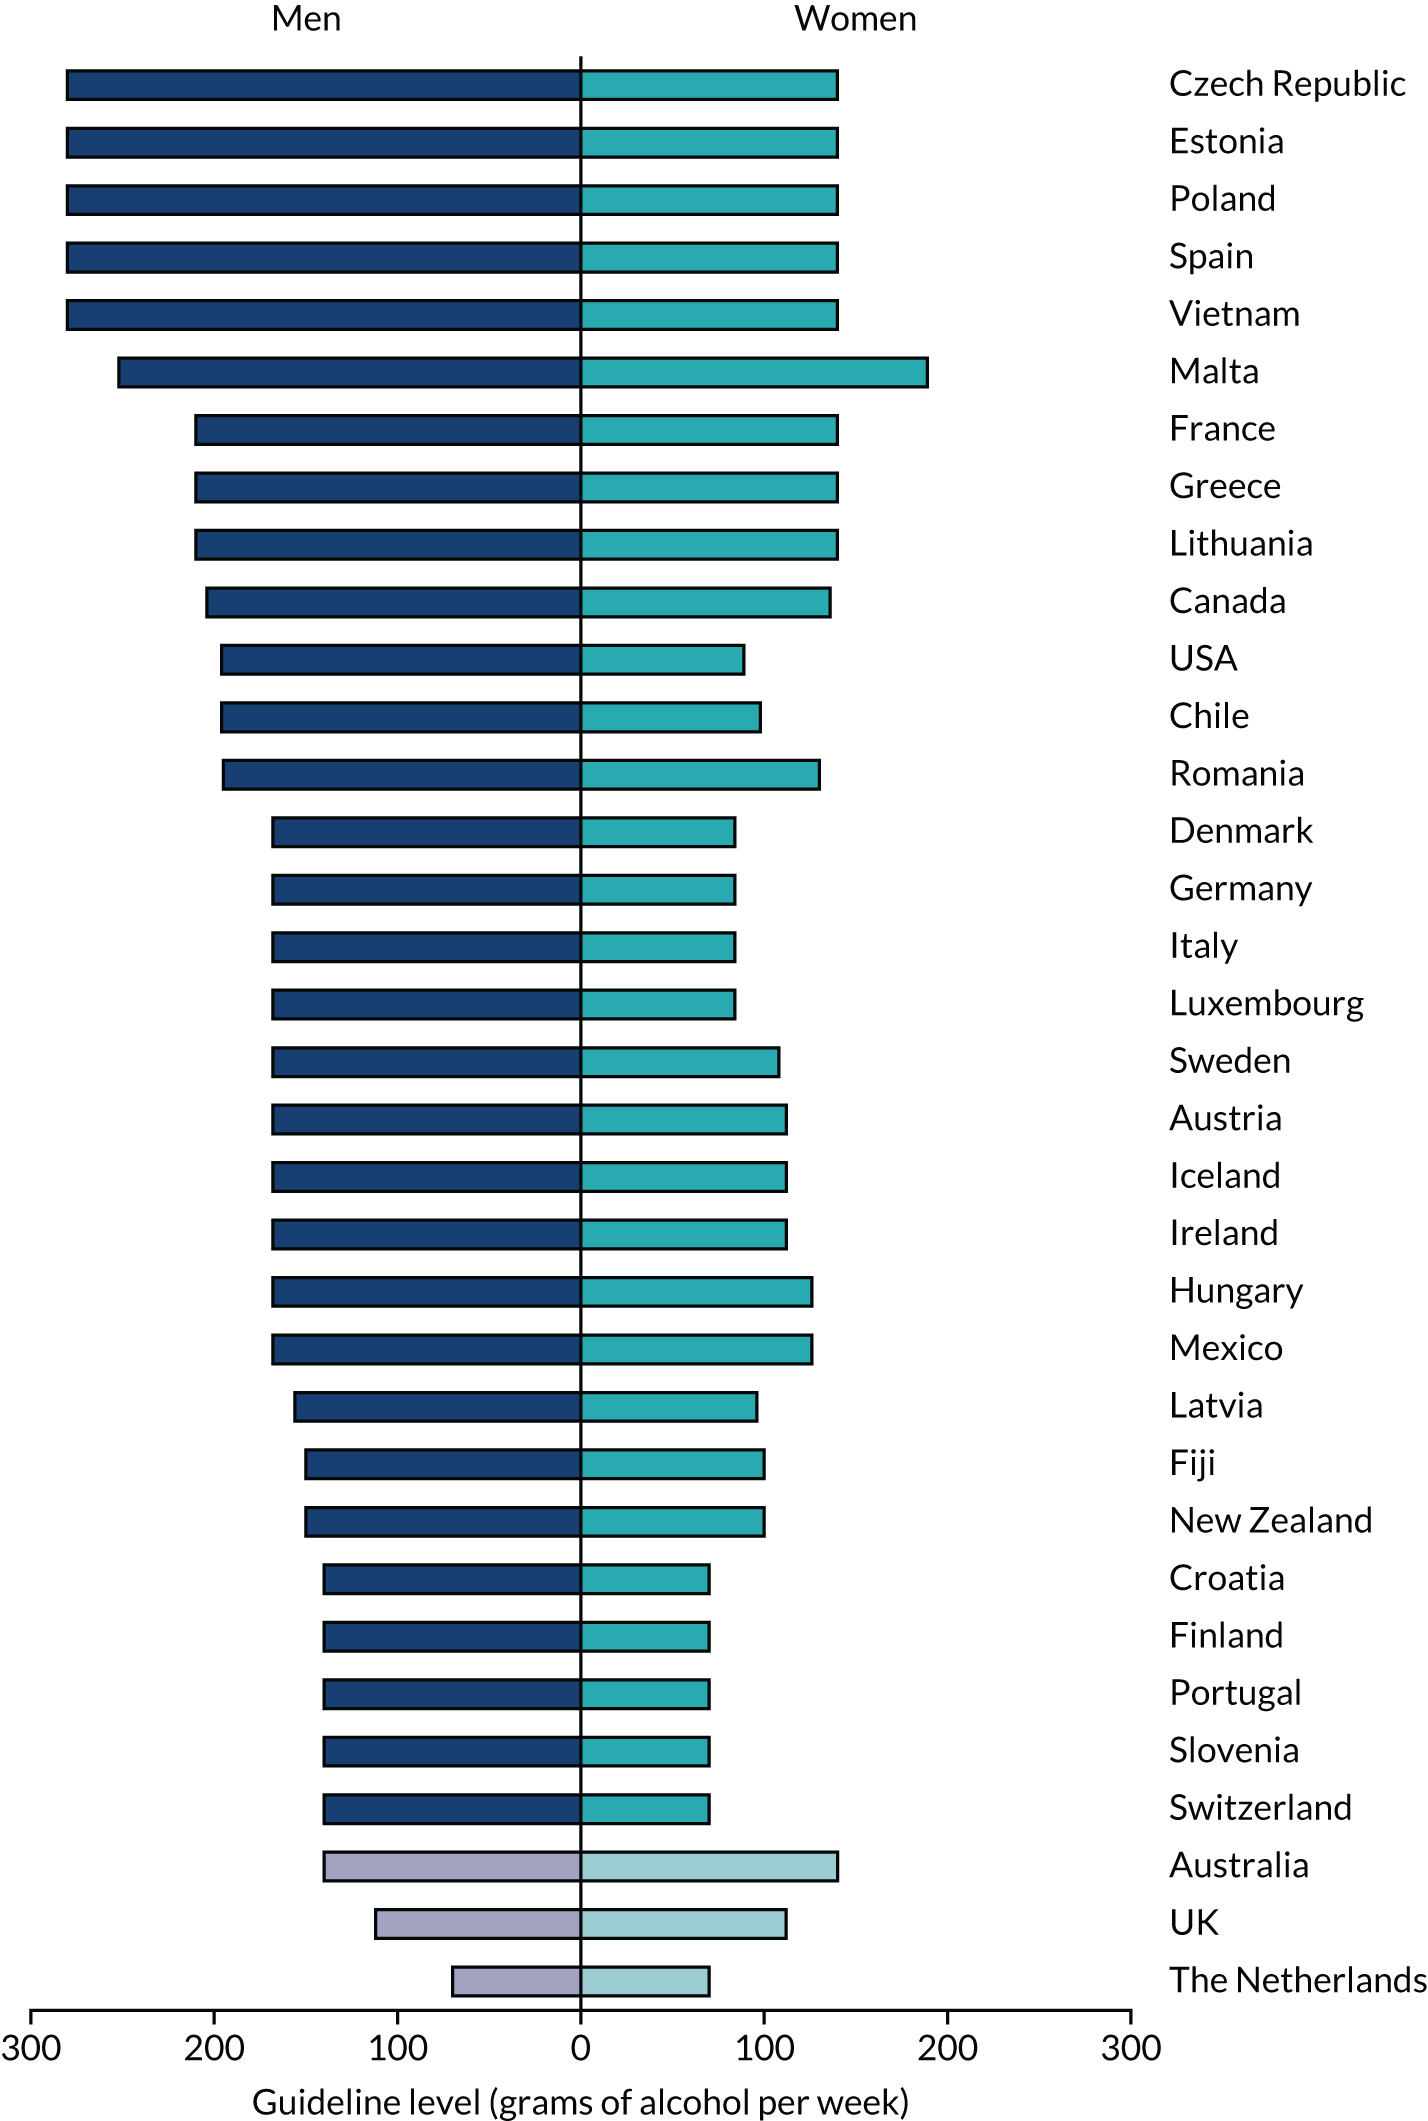
Figure 1 shows that drinking guidelines often vary markedly between countries. There may be a number of reasons for this. First, the purpose of guidelines often differs between countries. For example, Denmark provided guidelines to help people avoid high-risk levels of alcohol consumption until 2010, whereas the UK has tended to issue guidelines to promote low-risk consumption. 8 Other countries use guidelines primarily to inform government policy (e.g. to assess levels of excessive drinking) or clinical practice, rather than as health promotion information for the public. Second, the riskiness of drinking may vary between countries depending on the prevalence of competing or compounding risk factors, such as smoking and obesity. Third, guidelines are usually expressed in units or standard drinks, but these measures vary widely across countries. For example, 1 unit is 8 g of pure ethanol in the UK, 10 g in Ireland, 12 g in Finland, 14 g in the USA and 20 g in Austria. 9 If guidelines are to be easily understood by the public and not expressed in decimals, variation in the definition of 1 unit necessitates variation in drinking guidelines.
FIGURE 1.
Weekly drinking guidelines for women and men in selected countries in 2016. Shaded countries at the bottom of the figure are those with the same guideline for men and women.
Guidelines also vary over time. The earliest quantified guideline dates back to Anstie’s limit of 28–43 g per day, which was developed in the 1860s and used in life assurance in the UK and USA. 10 More recently, UK health authorities published ‘safe limits’ for men of 64 g per day in 1979 and then 144 g per week in 1984, followed by ‘sensible limits’ of 168 g per week in 1987 and then 24–32 g per day in 1995. 11 These changes reflect improvements in epidemiological evidence, societal standards regarding the acceptability of health risks and the purpose of guidelines, as described above. They also reflect changes in how guidelines are set. As described by Holmes et al. ,12 the evidence used by guideline development committees is increasingly likely to include bespoke epidemiological modelling exercises in addition to reviews of scientific literature.
Despite their widespread use, drinking guidelines do not enjoy universal support from public health actors. As discussed below, their effectiveness as a public health intervention is questioned,13,14 and some researchers believe that they are counterproductive. For example, Casswell15 argued in 1996 that guidelines are unlikely to affect behaviour when presented in the context of the pro-alcohol messages that suffuse contemporary media, a view shared by the authors of the leading summary of alcohol policy effectiveness. 13 In 2012, Casswell16 reiterated this point and added that promoting guidelines draws government away from more effective interventions. Similarly, Bellis17 argues that, when implemented in practice, drinking guidelines serve the interests of the alcohol industry as, ‘rather than explaining risks, [they] can read more like an alcohol promotion slogan’ that presents recommended consumption levels.
Other public health actors view guidelines more positively. Heather18 argues that they are essential as the public has a right to know about alcohol-related health risks and they facilitate discussions about alcohol consumption in clinical practice. Marteau19 further suggests that, although guidelines may not lead directly to reductions in alcohol consumption, they increase public concern about the risks of alcohol consumption and may make it easier to introduce effective alcohol control policies.
Drinking guidelines in the UK, 1995–2016
Prior to 2016, the UK drinking guidelines had not changed since 1995, when the Sensible Drinking report20 recommended that men should not regularly consume more than 3–4 units a day and women should not regularly consume more than 2–3 units a day, where regularly means drinking this amount every day or on most days.
The House of Commons Science and Technology Committee launched an inquiry in 2011 to assess whether or not the 1995 guidelines were ‘robust’ as a foundation for alcohol policy. 11 It sought submissions on the evidence underpinning the guidelines, whether or not that evidence could be improved, how well the government communicates the guidelines and how the guidelines compare with other countries. The report concluded that the passage of time, greater evidence on the causal relationship between alcohol and cancer and increased scientific scepticism regarding the health benefits of moderate drinking meant that the guidelines should be reviewed by an expert group.
In 2012, the UK Government published its alcohol strategy5 and announced that the CMO would lead a review of the guidelines, which ran from 2013 to 2016. Although the review was led jointly by the four UK CMOs, it was conducted primarily by a guideline development group (GDG) that mainly comprises civil servants, clinicians and academics with expertise in health and behavioural science. The GDG considered published studies, commissioned new systematic reviews, epidemiological modelling and focus group research, and heard presentations from expert advisors. In 2014, its interim report concluded that that there was sufficient new evidence to justify changes to the guidelines. The CMOs accepted this conclusion.
In 2016, the GDG published its final report21 along with the new draft guidelines,22 which recommended that the guidelines should be revised to state that men and women could keep their risks from alcohol consumption low by consuming no more than 14 units per week. Additional accompanying guidance recommended that drinkers consuming ≥ 14 units per week spread their alcohol consumption across several days and have at least 2 drink-free days per week. These recommendations differed from the 1995 guidelines in three main ways. First, they switched from a daily to a weekly guideline, citing evidence that the previous guideline was often misinterpreted as a limit on consumption on any single occasion and seen as less useful as a result. 23 Second, they set the same guideline for men and women, a decision that triggered substantial comment and criticism as only two other countries take this approach (see Figure 1). Third, they reduced the previous guideline for men. That guideline was often interpreted as ≤ 14 units per week for women and ≤ 21 units for men, a legacy of pre-1995 guidance, and the revisions were, therefore, viewed as reducing the guideline for men by one-third.
The GDG also revised the guidance in two other key areas. First, it updated the guidance on drinking alcohol during pregnancy. Previously, the guidance in Scotland was that women should not drink during pregnancy, whereas the guidance in England was that women should not drink more than 1 or 2 units once or twice per week. The revised guidance removed this inconsistency and took a precautionary approach that recommended:
. . . the safest approach is not to drink alcohol at all, to keep risks to your baby to a minimum.
Second, the GDG provided updated guidance on single occasions of drinking and elected not to provide a specific guideline but instead recommended that drinkers keep their risk to a low level by:
Limiting the total amount of alcohol you drink on any single occasion, drinking more slowly, drinking with food and alternating with water, and planning ahead to avoid problems.
Notably, this guidance did not incorporate the widely used definition of binge drinking as the consumption on a single occasion of more than 6 units (women) or more than 8 units (men). The GDG elected not to set a guideline consumption threshold for single drinking occasions as risks strongly vary substantially between individuals depending on their ability to reduce such risks by other means. 21
The new guidelines were announced publicly by the CMOs in January 2016 and were formally adopted by the UK Government in August 2016 following a public consultation. 25
The effectiveness of drinking guidelines
Little evidence is available on the effects of drinking guidelines, and reviews note that there have been no rigorous evaluations of the impact of producing, revising or promoting drinking guidelines on alcohol consumption or on other factors related to behaviour change. 13,26–28 This is somewhat surprising as public guidance on a wide range of health-related behaviours, including smoking, physical activity, drink-driving and nutrition, has produced small to moderate effects on knowledge, attitudes and behaviour. 28–32
A number of factors may explain the lack of evidence on the effectiveness of drinking guidelines. Opportunities to evaluate the impact of guidelines are rare as revisions take place at intervals of ≥ 10 years and, when they do happen, the new guidelines are often not promoted via large-scale campaigns after the initial announcement. Furthermore, few countries routinely collect data that would facilitate robust evaluation. For example, data on awareness, knowledge or exposure to guidelines are not a common feature of public health surveys, and alcohol consumption data are typically collected on an annual basis only, which makes robust analysis of intervention effects difficult as they are likely to be modest given the scale of promotional activity. For these reasons, the small literature that does attempt to examine effects of promoting drinking guidelines relies on relatively weak research designs.
Studies in several countries have used cross-sectional analyses to examine public knowledge of guidelines. These analyses generally find that large minorities of the population are aware of drinking guidelines and can correctly identify guideline consumption levels, but there is little evidence that this influences drinking behaviours. 33–35 For example, studies in Australia, Denmark and the UK have examined changes in guideline-related knowledge and perceptions over time using annual cross-sectional data. 36–39 In each case, the results suggest that knowledge of guidelines improved over time. In Denmark, this appeared to be linked to annual mass media campaigns to promote the guidelines, but, in Australia, beliefs about what constitutes safe drinking also changed.
The UK data are particularly relevant to the present study. The Office for National Statistics (ONS) Opinion Survey collected data on knowledge of units and guidelines between 1997 and 2009 and summarised the findings in a 2010 report. 40 The report shows that the proportion of drinkers who had heard of units rose from 79% in 1997 to 90% in 2009. Similarly, the proportion who knew how much beer, wine and spirits constituted 1 unit also rose by up to 10–15 percentage points. In 2009, 63% of respondents knew that 1 unit of beer was approximately half a pint, 69% knew that 1 unit of spirits was a single measure, but only 27% knew that 1 unit of wine was less than a 125-ml glass. The proportion of respondents who had heard of guidelines increased from 54% in 1997 to 75% in 2009. However, only 44% of men and 55% of women in 2009 correctly identified the guideline for their sex, an improvement of only 6 percentage points among men and of 14 percentage points among women over a period of 12 years. Moreover, only 13% of respondents kept a check on their units, with no increase in this proportion between 1997 and 2009. There was little variation in these measures by sex, but heavier drinkers generally showed greater awareness and knowledge of the guidelines and of units.
Prior to the present study, the most detailed evaluation of promoting drinking guidelines focused on an Australian campaign aiming to raise awareness of guidelines and alcohol-related cancer risks. 41 The study used repeat cross-sectional surveys of 150–200 women at three time points over a 15-month period and concluded that multiple waves of advertising led to good recognition and awareness of the campaign content. Promoting drinking guidelines also led to increased cancer risk awareness, knowledge of guidelines and intentions to reduce alcohol consumption among heavier alcohol drinkers in particular. However, there was no evidence of impacts on drinking behaviour.
In addition to these quantitative analyses, a number of qualitative studies have sought to understand how drinkers respond to and use drinking guidelines. These studies report that drinkers typically disregard guidelines as they do not align well with their current drinking practices and rely on drinkers understanding units, which is often not the case. 23,42,43 Instead, drinkers monitor their consumption through embodied means; that is, they make judgements on the riskiness of their drinking based on how intoxicated they feel and their previous experiences of alcohol and its after-effects.
Effectiveness of alcohol health warning labels
Although there is little robust research on the effectiveness of promoting drinking guidelines, a separate body of research exists examining the effectiveness, potential effectiveness and appropriate design of alcohol health warning labels. This literature is important, as approximately 80% of products sold in the UK in 2014 included the CMO’s guidelines on their label,44,45 and this is a key location where drinkers are likely to encounter the guidelines when they are not being promoted via more active means. 46 More generally, information on labels is argued to be a potential influence on social norms around alcohol consumption and increase support for other alcohol policies. 47
The USA introduced mandatory health warning labels on alcoholic products in 1989, which read ‘Government Warning: (1) According to the Surgeon General, women should not drink alcoholic beverages during pregnancy because of the risk of birth defects. (2) Consumption of alcohol impairs your ability to drive a car or operate machinery, and may cause health problems’. 48 Evaluations of the impact of these labels constitute a large proportion of the alcohol labelling literature and the highest-quality evidence on the effectiveness of alcohol health warning labels as a public health intervention. 49 Overall, the evaluations suggest that awareness and recall of USA alcohol warning labels increased initially,48,50,51 but plateaued after around 3–4 years in both adults and adolescents. 52,53 As with drinking guidelines, there was little evidence that these gains in awareness and knowledge translated into changes in alcohol-related behaviours, such as reduced drink-driving or alcohol consumption. 49,53,54
More recent research has used survey, focus group and experimental methods to examine several themes relating to how consumers may use and respond to information and warnings provided on alcohol product labels. For example, focus group research in Australia found that participants favoured labels providing messages related to short-term risks and also found messages with positive rather than fear-based or numerical framings, general health messages rather than ones relating to cancer or specific cancers, and risk-based rather than deterministic messages more believable, convincing and personally relevant. 55 A small experimental study of students at a UK university56 found no significant differences between text-based messages and pictorial messages in terms of fear arousal and intentions to reduce or stop alcohol consumption, and Hobin et al. 57 obtained a similar finding in an experimental study with Canadian adults. This is in contrast to a general view that pictorial messages are more effective,58 although Hobin et al. 57 obtained a similar finding in an experimental study.
The UK’s Royal Society for Public Health surveyed drinkers to determine what information they find most useful. 47 The results revealed that drinkers view alcoholic strength and units as the most important information to include on labels and consider warnings against drink-driving and drinking during pregnancy as moderately important; however, drinking guidelines and links to online information are viewed as substantially less important. 47 Thomson et al. 59 found that drinkers in Australia supported the provision of health information and warnings on product labels, whereas other studies found that drinkers in Australia report poor recall or use of industry-backed logos and weblinks on product labels60 but good awareness of standard drink labels. 61 In Canada, drinkers demonstrate a high level of ability to use standard drink information on product labels, and a focus group study of drinkers in Yukon, Canada, also found that detailed product labels including a health warning, guidelines and standard drink information were seen as of intrinsic value. 57,62 The information provided in this study was viewed by participants as new, useful, important and something they had a right to know. Participants also suggested that it could prompt new conversations and potentially influence behaviour. However, other studies suggest that, particularly among some younger drinkers, standard drink information may be used to maximise the volume of alcohol purchased rather than to moderate consumption. 47,61,63 More broadly, a criticism common across research on alcohol labels is that the information provided on real-world labels is too small, discreet, vague or ambiguous, or otherwise lacking in visual impact, to inform or influence consumer behaviour. 44,55,60
The breadth of findings here and the reliance on small-scale, cross-sectional, focus group or experimental research are perhaps the greatest weaknesses of the literature. Hassan and Shiu64 reviewed studies of the efficacy of alcohol warning labels published between 2000 and 2015 and concluded that the literature is ‘a weak and fragmented evidence base to guide policy-makers or practitioners, which requires further research on most key questions’. 64 They particularly criticise the lack of consistent research approaches and measures, which prevents comparison across studies, and the lack of long-term research on the effects of labels. As with the literature on drinking guidelines, we further note that few of these more recent studies following the US warning label evaluations provide evidence on whether such labels can or do affect drinking behaviour. One exception is Maynard et al. ,63 who found that providing calorie or unit information did not affect alcohol consumption by UK undergraduates in a laboratory study. Maynard et al. ’s63 additional qualitative analyses suggest that this is because such information fits poorly with drinking to get drunk or socialise, echoing findings from previous studies. 23,43
Despite their apparent lack of direct impact on alcohol-related behaviours, alcohol health warning labels may, like drinking guidelines, be important in other ways. The US labels are often viewed by the authors of evaluation studies as important because they inform consumers about alcohol-related risks and reinforce this information, even if they do not affect drinking behaviour. 52 Others note that such labels help to stimulate conversations about alcohol and its risks as well as changing social and cultural norms, potentially leading to behavioural changes in future generations,47,54,62 or greater acceptance of alcohol control measures. 19,47 More simply, warning labels may fulfil consumers’ right to know about the risks of a product they are purchasing. 47,62
The literature on the evaluation of alcohol labels has three main implications for our evaluation of drinking guidelines. First, it supports the evidence from the limited literature on the effectiveness of promoting drinking guidelines in showing that health-related information pertaining to alcohol can be recalled and used by drinkers. Second, it also supports the evidence that such information does not generally lead to changes in alcohol consumption behaviour. As suggested by behaviour change theory, such behaviour changes may require well-designed and implemented messaging. 65 In this context, the text around the numerical guideline consumption level may matter as much as the guideline consumption level itself and the content of promotional activity may be as important as its presence. Third, despite the importance of such design and implementation, there is insufficient evidence available to date to identify clear recommendations regarding what is effective in the design of drinking guidelines or guideline-related messaging. Literature from health promotion in other areas, particularly tobacco warning labels, can provide some guidance, but it is unclear whether or not this can be translated unproblematically to alcohol, the risks of which are smaller in scale, different in nature and interact with more positive public attitudes. 64 This means that it is difficult to assess if we would expect the guidelines as written to be effective or what effects they may have.
Rationale for the present study
Despite concerns about their effectiveness, drinking guidelines still play an important role in alcohol policy debate in the UK and internationally. Successive UK governments have been reluctant to increase regulation of the alcohol market and have focused instead on promoting ‘responsible drinking’ with the support of alcohol producers and retailers. 66 The 2012 alcohol strategy5 initially departed from this approach by promising the introduction of minimum unit pricing (MUP) for alcohol, a greater role for public health within alcohol licensing and possible restrictions on price-based promotional deals for alcohol. However, all of these measures were removed from the strategy following a public consultation,67 leaving the review of the drinking guidelines as one of the headline measures alongside increased attempts to identify and deliver brief interventions to drinkers within primary care. The 2016 revisions to the UK drinking guidelines therefore represented both a central plank of government alcohol policy and a rare opportunity to undertake a prospective evaluation of a widely used but under-researched intervention.
Designing an evaluation is not straightforward as promoting drinking guidelines is a complex intervention. Promotional activity is delivery by many different organisations and actors in varying forms, with an extended causal chain from implementation to outcome. Organisations involved include governmental and non-governmental bodies, such as Public Health England (PHE), the NHS, Drinkaware (London, UK) (an industry-funded charity), alcohol producers, retailers and social aspect organisations, public health charities, and news media. Individual actors include social media users, public commentators, individual politicians and the general public to the extent that each of these discusses the guidelines. Likewise, promotional activity ranges across mass media campaigns, interactive social media, consultations with health professionals, product labels, point-of-sale advertising and general public debate. Behaviour change theory suggests that any changes in alcohol consumption that arise from this network of promoters and promotion will be mediated by changes in behavioural influences, including individuals’ knowledge of the guidelines and alcohol-related risks, their motivations and their social context. 65,68 Therefore, a robust and comprehensive evaluation requires an understanding of not just the effects of promoting drinking guidelines on key outcomes, such as alcohol consumption, but also how and by whom guidelines are promoted and the effects of this promotion on proximal outcomes, such as behavioural influences. Appendix 1 presents a causal logic model indicating our understanding of the connections between these processes and informs the design of the evaluation.
Aims and objectives
The aim of this study was therefore to conduct a prospective evaluation of promoting revised UK drinking guidelines on alcohol consumption behaviour. To do so, it sought to meet the following objectives:
-
to document the timing, audience and content of major promotional activity following the publication of revised drinking guidelines
-
to use interrupted time series analysis of monthly survey data to assess whether or not trends in alcohol consumption behaviour, as a primary outcome, changed following publication and promotion of the revised drinking guidelines
-
to undertake subgroup analyses to examine whether or not there are variations in intervention effects across groups of the population defined by age, sex and socioeconomic status
-
to use difference-in-difference methods to examine whether or not direct and frequent exposure to promotion of drinking guidelines increases their effectiveness
-
to undertake pathway analyses to validate theorised capability, opportunity and motivation to change behaviour and behaviour itself
-
to assess cost-effectiveness of any identified effects on alcohol consumption using the Sheffield Alcohol Policy Model framework. 69
During the project, the objectives were amended as follows in consultation with the Project Steering Committee. First, as we identified no large-scale promotional activity relating to the guidelines beyond the announcement of the revisions, the first objective was abandoned. This was replaced with a new objective: to conduct a review of the scale and content of news media coverage relating to the guidelines. Second, preliminary analyses showed no changes in the primary outcome measure and, in the absence of any promotional activity, we decided not to conduct a cost-effectiveness analysis. Third, the lack of any substantial change in the outcome measures meant that we did not pursue the difference-in-difference analysis or pathway analyses.
At the same time, a decision was also taken to not conduct a cost-effectiveness analysis as preliminary analyses indicated that, in addition to there being no promotional activity that attracted a cost, there was also no change in the primary outcome (alcohol consumption). We judged, in consultation with the Project Steering Committee, that conducting the news media review was a better use of resources. The cost-effectiveness analysis is therefore not discussed further in this report.
Patient and public involvement
The research team conducted two patient and public involvement (PPI) sessions during the project to support the interpretation of the early and final results of the evaluation analyses. In the absence of a pre-existing and appropriate PPI panel in England, we worked with an established PPI panel based in Scotland. The panel comprised approximately 30 adult drinkers from the general population and living in or around Stirling, where the panel meets. The UK Centre for Tobacco and Alcohol Studies recruited the initial panel members in 2014 via social media, with additional members added over time to maintain the group’s size. The panel meets two or three times per year and provides members with a £25 voucher plus an offer to cover travel costs for each meeting attended.
One member of this PPI panel also joined the Project Advisory Group and attended the group’s meetings.
Structure of the report
The remainder of the report comprises a further four chapters. Chapter 2 describes the initial attempt to construct a timeline of promotional activity and the early findings prior to the abandonment of this exercise. Chapter 3 describes the review of print news media coverage of the guidelines. Chapter 4 describes the interrupted time series analyses. Chapter 5 brings together the main findings and discusses the strengths and limitations of the research and its implications for future research, policy and practice before presenting our conclusions.
Chapter 2 Constructing a timeline of activity promoting the revised drinking guidelines
Introduction
As stated in Chapter 1, the promotion of drinking guidelines is a complex intervention. The CMOs announced the UK Government’s revised guidelines in January 2016 and the Government’s Alcohol Strategy5 states that their purpose is to:
Support people to in make informed choices about healthier and responsible drinking.
However, this is an incomplete account of the intervention and its aims. Subsequent promotional activity may be delivered by multiple stakeholders at different points in time, using different techniques and targeting outcomes that may be more or less proximal to alcohol consumption behaviours. These different promotional activities are likely to vary in their effectiveness, and changes in targeted outcomes arising from one activity may also be contingent on the timing and impact of other activities. As a result, identifying a single intervention time point or primary outcome measure for evaluation analyses is not straightforward.
Most previous studies evaluating the effectiveness of drinking guidelines as a public health intervention do not address this point. Many studies use simple before-and-after designs or analyses of annual time series and generic outcome measures, such as drinkers’ awareness of guidelines in general and their knowledge of specific guidelines. They also tend to evaluate the announcement of new or revised guidelines rather than the effects of specific promotional activities promoting those guidelines. As a result, there is little engagement with the actual aims, design or outcomes targeted by such activities. It is often unclear, therefore, whether promotion is ineffective, absent, poorly designed or targeted at outcomes that are not examined by evaluation studies. Exceptions to this include analyses of annual Danish promotional campaigns organised by the National Board of Health, which targeted different groups and used different messages in different years, and this is partly reflected in the interpretation of evaluation results. 37,38 Similarly, Dixon et al. ’s41 evaluation of a campaign in Australia that focused on drinking guidelines as well as alcohol and cancer in women surveyed samples of women on their knowledge of the alcohol–cancer link as well as more generic guideline-related knowledge and drinking behaviours before the campaign and at two time points afterwards.
For the purposes of this study, it is important that evaluation analyses start from a more detailed assessment of promotional activity. The use of a monthly time series within an interrupted time series design means that our results are likely to be sensitive to misspecification of the intervention point. For example, if the guidelines were announced in January 2016 but a large promotional campaign took place in September 2016, we would need to consider the appropriate analytical design to best estimate the effects of these two intervention points. It also clear that health promotion campaigns informed by theory are more effective than those with no clear theoretical basis and that behaviour change arises from multiple factors rather than a single outcome. 65 Therefore, it is important to assess the content and characteristics of promotional campaigns to identify their likely effectiveness, the outcomes in which we would expect to see changes and whether or not we would expect these changes, either alone or in combination with those arising from other promotional activities, to lead to changes in alcohol consumption behaviour.
We therefore aimed to construct a timeline of promotional activity relating to the drinking guidelines, detailing when activities occurred and what they involved. We also sought to identify the cost of activities to inform a planned cost-effectiveness analysis of promotional activity as a whole. For the purpose of this study, we defined promotional activity as any deliberate and planned effect to communicate the drinking guidelines with a view to having a national-level impact of a scale detectable within our analyses, whether directly (e.g. via a mass media campaign) or indirectly (e.g. via education of health professionals). We were interested in capturing promotion of any aspect of the guidelines described in the final documentation. 24 In addition to the guideline consumption threshold, this includes messages around drink-free days and the number of drinking days per week, the disputed cardioprotective benefits of moderate drinking, the cancer risks associated with low levels of alcohol consumption, risks for different adult age groups and drinking in pregnancy. The final example was not a focus of our study but was included in the data collection instruments for completeness.
Methods
Sample
We aimed to survey key stakeholders within organisations in five sectors:
-
government and quasi-non-governmental bodies (e.g. Department of Health and Social Care and PHE)
-
public health advocacy organisations (e.g. Institute of Alcohol Studies and Cancer Research UK)
-
professional bodies (e.g. the Royal College of General Practitioners)
-
non-health-related bodies (e.g. the police and the Local Government Association)
-
industry and industry-related actors (e.g. Drinkaware and the Portman Group).
We generated a list of 23 potential organisations across these sectors and planned to request contacts within each to complete a survey on promotional activity by their organisation. However, during development of the survey, our monitoring of media content relating to guidelines and our informal conversations with stakeholders provided little indication that any organisation was promoting the guidelines in a way that might have a population-level impact. We therefore narrowed our initial survey sample to five key organisations that we judged to be most likely to be engaging in promotional activity. These organisations were also selected for the likelihood that they would also be aware, through their ongoing activities and networks, of promotional activity being undertaken by other organisations.
Known contacts in each of the five organisations were approached initially via e-mail in June 2017 and sent information about the study. The instructions in the e-mail asked individuals, or their nominated alternative, to follow a link to an online questionnaire containing questions about current or planned promotional activity. The questionnaire also asked participants to consent to recontact in 6 months to be asked about any further promotional activity.
Measures
The online questionnaire is provided in Appendix 2 and was informed by a similar tool created for documenting mass media campaigns related to tobacco. 70 It includes questions about each major promotion or communication activity undertaken since January 2016. The questions covered:
-
type of activity (e.g. advertising, distribution of health promotion materials)
-
communication platform [e.g. television (TV), social media]
-
which aspects of the guidelines were communicated (e.g. 14 units per week, number of drinking days)
-
when the activity occurred and how frequently it was repeated
-
any supplementary promotional activity (e.g. social media posts)
-
intended target audience (e.g. national or local, men or women, particular age groups)
-
whether or not the promotional content was interactive
-
actual or estimated cost of the activity (if available)
-
evidence of audience reached (if available)
-
a request for the creative brief or other associated documents that could be shared with the research team.
The survey also asked about press statements released or interviews given by staff in the organisation in relation to drinking guidelines and whether or not respondents were aware of promotional activities by other organisations.
Analyses
Survey results were analysed descriptively.
The following planned analytical work did not take place because of the lack of promotional activity (see Results) and we include a description of it here for completeness. We planned for two members of the research team to review the content of each promotional activity using a structured tool adapted from Langley et al. 71 The tool classifies the thematic, informational and emotional content of campaigns as well as the style of delivery. It was intended to aid identification of the targeted outcomes and likely effectiveness of the campaign with reference to prior research literature. As the tool was designed to look at the content of mass media campaigns, we planned to adapt and expand it iteratively to cover any other activities identified by the survey. We then planned to determine, in discussion with the Project Advisory Group and the PPI group, which promotional activities were important and appropriate to consider when designing the main evaluation analyses described in Chapter 4.
Results
None of the five organisations reported undertaking any substantial promotional activity relating to the revised drinking guidelines between January 2016 and June 2017. Furthermore, none of the organisations reported any knowledge of substantial promotional activity undertaken by other organisations or any awareness of planned activities by their own or other organisations.
Some organisations did report smaller-scale activities. These included news media activities, such as issuing press releases or giving interviews. These activities usually related to the guidelines being announced in January 2016, their formal adoption in August 2016 or other occasional media requests.
Given the lack of substantial activity identified by our respondents or the research team after 19 months of our 22-month study and the lack of indications of any future activity, we decided that surveying the remaining organisations was unwarranted and we discontinued this work after discussions with our Project Advisory Group and the funder.
Discussion
The main finding of this work was that there was no substantial active promotion of the revised drinking guidelines after they were announced in January 2016. This does not mean that no organisation promoted the guidelines at all. It is clear that the guidelines are promoted intermittently on social media by a range of organisations, that organisations such as PHE and Drinkaware provide the guidelines and related information on their websites and in other materials, and that news media routinely mention the guidelines in day-to-day reporting of alcohol-related and health-related topics (see Chapter 3). However, it is unclear that these activities would substantially affect the design or findings of our evaluation analyses as they are unlikely to either reach large audiences or lead on their own to changes in behaviour or in key influences on behaviour change. 65 It is also unclear that they are of sufficient scale or sufficiently different in timing or nature to justify analysis of an additional intervention point beyond January 2016. Our monitoring of stakeholder websites and social media accounts suggests that most organisations changed their messaging on guidelines immediately after the January 2016 announcement and rolled out updated materials in the subsequent months. In the absence of large-scale promotional campaigns, it seems appropriate to regard this activity as part of a general accumulation of drinkers’ exposure to the revised drinking guidelines starting from January 2016 rather than seeking to identify additional intervention points.
Given the above, the remainder of this report proceeds on the basis that there was no significant activity promoting the revised guidelines after the announcement in January 2016. The implications of this for future research, policy and practice are discussed in the main discussion of the project findings in Chapter 5.
Chapter 3 How did news media communicate the revised UK drinking guidelines?
Introduction
News media can play an important role in communicating and shaping public perceptions of social issues, including those related to alcohol. However, the nature of this role is complicated and it is described in many different ways in the literature. For example, Casswell72 describes the media in general terms as ‘key players’ and argues that ‘much of the [public] debate is shaped by the portrayal of alcohol and alcohol policy in mass media’,72 a view broadly shared by several other authors. 73–75 Hansen and Gunter76 suggest that social issues are ‘elaborated, contested, redefined and eventually removed from the public agenda’76 within news media, implying that news media are engaged in multiple sequential or simultaneous processes. Törrönen77 views newspapers in more agentic terms, characterising their editorials as ‘indicators of the opinion climate . . . try[ing] consistently to exert influence . . . evaluate arguments and decisions . . . and make an assessment of them and of situations and attempting to influence policy and public opinion’,77 whereas Nicholls73 addresses only the first aspect of this quotation, noting that ‘news reporting plays a key role in articulating shared cultural values around alcohol’. Mercille78 argues more forcefully that news media deliberately, strategically and inevitably ‘. . . reflect the views of the political and economic establishment on public health measures’. Mercille78 argues this based on the links between media owners and government, their financial links to health-harming industries via advertising and the reliance on establishment contacts for sourcing of news stories and reactions. These different perspectives suggest that the role of news media in alcohol policy debate is complex and multifaceted. As such, it is difficult to capture or demonstrate fully within a single analysis,79 but remains an important area of study when assessing how public perceptions are formed on a particular topic.
Studies of news media coverage of alcohol use are a relatively recent phenomenon. In 2011, Nicholls73 noted that few such studies existed, particularly in the UK; however, a much larger body of literature emerged in subsequent years. This includes analyses of news media reports of policy debates around MUP in the UK,80–82 advertising restrictions and regulation of the night-time economy in Australia,74,83 strategies tackling college drinking in the USA84 and general alcohol policy in several countries. 77,78,85,86 It also includes analysis of news media coverage of contemporary social issues specific to alcohol or with which alcohol intersects, including alcohol’s harm to those other than the drinker,87 alcohol-related health risks,88,89 sex,75,90–93 sexual violence,94,95 parenting96 and personal freedoms. 97 Furthermore, a number of studies examine overall reporting of alcohol-related topics within news media. 73,98–101
A review of this literature in 2007 argued that analyses of news media coverage of alcohol, in addition to being few in number, had failed to draw on relevant theories and techniques developed within the communications and political science literature. 76 In particular, it noted the value of analyses of change over time, a lack of cross-referencing between studies, the mediating role of advocacy within news media or perspective taking by news organisations, the significance of message sources (e.g. individuals quoted within reports) and the medium of the coverage. More recent work has drawn on these arguments to develop rich understandings of how alcohol-related issues are reported in the media. For example, studies have demonstrated that public health actors have successfully positioned themselves as key sources of information within policy debates but provide conflicting findings as to whether or not those actors have also successfully framed debates in public health terms as population-level issues rather than the industry’s favoured individual-level and personal responsibility oriented perspective. 73,74,80 Many studies also identify key frames through which alcohol-related issues are discussed, many of which are replicated across policy debates. For example, men’s drinking is often found to be framed in relation to violence, whereas women’s drinking is linked to a wider set of concerns pertaining to transgression of traditional models of femininity. 73,75 Similarly, in debates about advertising, liberalisation of retail monopolies and MUP, opposition to alcohol policy is framed with reference to individual freedoms or the need to protect industry from an overbearing state. 74,77,80 Analyses of policy debates in Finland and Ireland also suggest that, as agentic actors in policy debate, news media are often unsupportive of public health arguments and alcohol-related problems; even when such problems are identified, the discussion and policies recommended tend to coincide with an underlying view that liberalised alcohol markets are desirable. 77,78
Despite this now-broad literature, only one briefly reported study to date has examined how news media report on drinking guidelines. 102 This is an important oversight as TV, radio, newspapers and magazines are the primary places where the public report seeing drinking guidelines when revisions are announced. 46 At such times, guidelines are discussed prominently by news outlets within ordinary news reports, opinion pieces and editorials. At other times, news media continue to expose the public to drinking guidelines by mentioning them within stories about alcohol-related health risks, drinking trends and lifestyle topics. Such repeated exposure aids awareness and recall of guidelines in the absence of active promotion via mass media campaigns. For example, evaluations of alcohol health warning labels in the USA found higher rates of awareness and recall of the health warnings among heavier drinkers and argued that this was because they see the label more often. 103 Debate within news media may also inform public opinion and responses to drinking guidelines, but, given the wide variety of roles that the media play in public debate, this is unlikely to be a straightforward or unidirectional process. 79 Moreover, differences in news media reports across publications and platforms may play an important role in determining who is exposed to guidelines and informing their attitudes towards them as engagement with news outlets and content is socially patterned. 76
Therefore, the aim of this review was to conduct an exploratory analysis to describe the scale and content of news media coverage of drinking guidelines in England during our study period of February 2014 to October 2017. As this was a retrospective study, broadcast media reports were difficult to access. Therefore, we focused on reviewing print news media, which are searchable via online databases. There were three stages of the review:
-
a systematic search to identify all news articles published in England during the study period that mentioned drinking guidelines or closely related terms
-
a quantitative analysis to develop a timeline of when and where the identified articles were published and to summarise the main content of articles
-
a qualitative analysis to explore the content of articles in more depth.
Methods
Identification of articles
We conducted three searches of the Nexis ‘UK publications’ database across the period from 1 February 2014 to 31 October 2017. Nexis contains all print and online articles published by UK local and national newspapers, including daily and Sunday editions, and a large number of magazines and news websites. As this project focuses on the impact of drinking guidelines in England, we did not search the Scottish editions of UK newspapers (e.g. the Scottish Daily Mail).
Nexis’s news search does not allow users to build complex search strategies and restricts searches to no more than 3000 results, so we conducted three searches using different search terms, across multiple subsections of the search period, if the total results exceeded 3000. Search terms were Alcohol guidelines OR drinking guidelines OR alcohol units (search 1); 14 units OR 21 units OR 2–3 units OR 3–4 units (search 2) and alcohol recommendations OR alcohol limits OR alcohol guidance OR alcohol advice (search 3).
Many members of the public read news on the websites of leading broadcasters, and these are not fully included in the Nexis database. Therefore, we searched the BBC News (British Broadcasting Corporation, London, UK) and Sky News (Sky UK, London, UK) websites by using Google (Google Inc., Mountain View, CA, USA) to find pages within the BBC News website (www.bbc.co.uk/news) and the Sky News website (www.news.sky.com) published during the same study period and including the same search terms as above. The search on the BBC News website was additionally restricted to pages created in the UK.
Articles from both Nexis and Google searches were included in the final sample if they fully or partially mentioned the guidelines (e.g. articles discussing the guidelines for women but not the guidelines for men would be included) or if they commented on the process of developing the guidelines or the guidelines’ content without explicitly stating what the guidelines are. Articles were excluded if they did not mention the guidelines or if they discussed only guidelines or recommendations for drinking in pregnancy or drink-driving. We also excluded articles in local newspapers as we are primarily interested in coverage that would have a national-level impact. It is plausible that a large number of similar stories at a local level in local newspapers could aggregate to have a national-level impact, but analysing patterns of local news coverage is beyond the scope of this study.
Headline and full-text screening was undertaken by one researcher, who discussed any difficult cases with the lead author. We then extracted publication name, source type (e.g. broadsheet/quality press, online only), publication date and period (i.e. before or after the revised guidelines were announced), and what aspects of the guidelines were mentioned (e.g. 2–3 units per day for women or having drink-free days).
Quantitative analysis
As our aim was exploratory, we developed a coding frame from an initial random sample of 50 articles, stratified by source type, and sought to identify their main discriminating features. We then selected a final random sample of approximately half (n = 500) of the identified articles, again stratified by source type, and coded them for the following characteristics.
Primary topic of the article
We coded articles into one of four mutually exclusive categories based on their primary topic:
-
articles primarily discussing drinking guidelines, for example articles that discuss the change in drinking guidelines or opinion pieces that discuss the merit of the guidelines
-
articles that primarily discuss alcohol, but do not focus on the drinking guidelines, for example articles that discuss the relationship between alcohol consumption and certain health outcomes or population statistics on alcohol consumption prevalence
-
articles that primarily discuss health, but do not have alcohol or the drinking guidelines as their main focus, for example articles discussing strategies to prevent certain health outcomes or achieve a healthy lifestyle
-
articles whose primary focus is not the drinking guidelines, alcohol or health, for example articles that use the guidelines as an example of the nanny state or articles presenting gift-giving guides that mention the guidelines when discussing alcohol-related gifts.
Primary role of guidelines within the article
We used five categories to code articles based on our perception of the purpose of mentioning guidelines in the article:
-
articles that mention the guidelines to inform people of the forthcoming or actual change in drinking guidelines
-
articles that discuss the merits of the guidelines in more detail, including articles that discuss information that discredits the guidelines or that discuss the guideline development process in more depth
-
articles that mention the guidelines in the context of promoting health or preventing ill health, including articles providing the guidelines as advice, mentioning them in connection with health outcomes or using them to provide context to a story about health
-
articles that mention the guidelines to illustrate consumption levels of specific groups or individuals, including articles mentioning the guidelines to provide context to alcohol consumption statistics without necessarily linking the guideline to those statistics
-
articles that mention guidelines for another purpose.
Overall tone
We coded the broad tone in which the guidelines were discussed as positive, negative or neutral. An article was coded as positive if a reader who was unfamiliar with the argument could reasonably be expected to have a positive impression of the guidelines after reading the article. Positive articles included those sought to rebut criticism of the guidelines or illustrate how scientific evidence supports them. Articles were coded as negative if the researcher judged that readers unfamiliar with the relevant information could be expected to have a negative impression of the guidelines after reading the article. These included articles that criticised the guidelines without balancing this with support for the guidelines. Articles were coded as neutral if they merely stated the guidelines, or if they balanced supporting and critical information relating to the guidelines.
Qualitative analysis
One researcher (IK) conducted a thematic analysis on a subset of articles sampled for in-depth coding. 104 Articles were coded for quantitative and qualitative analysis simultaneously. First, the researcher coded a random sample of 100 articles, again stratified by source. As saturation had not been reached, the researcher coded another randomly sampled 100 articles. This satisfied the requirement for data saturation and the researcher was confident that no new themes would arise. The researcher organised the codes into themes that describe how the guidelines were covered in the media. Themes were discussed with another researcher (JH) with a strong prior knowledge of media coverage of the guidelines.
Results
Identified articles
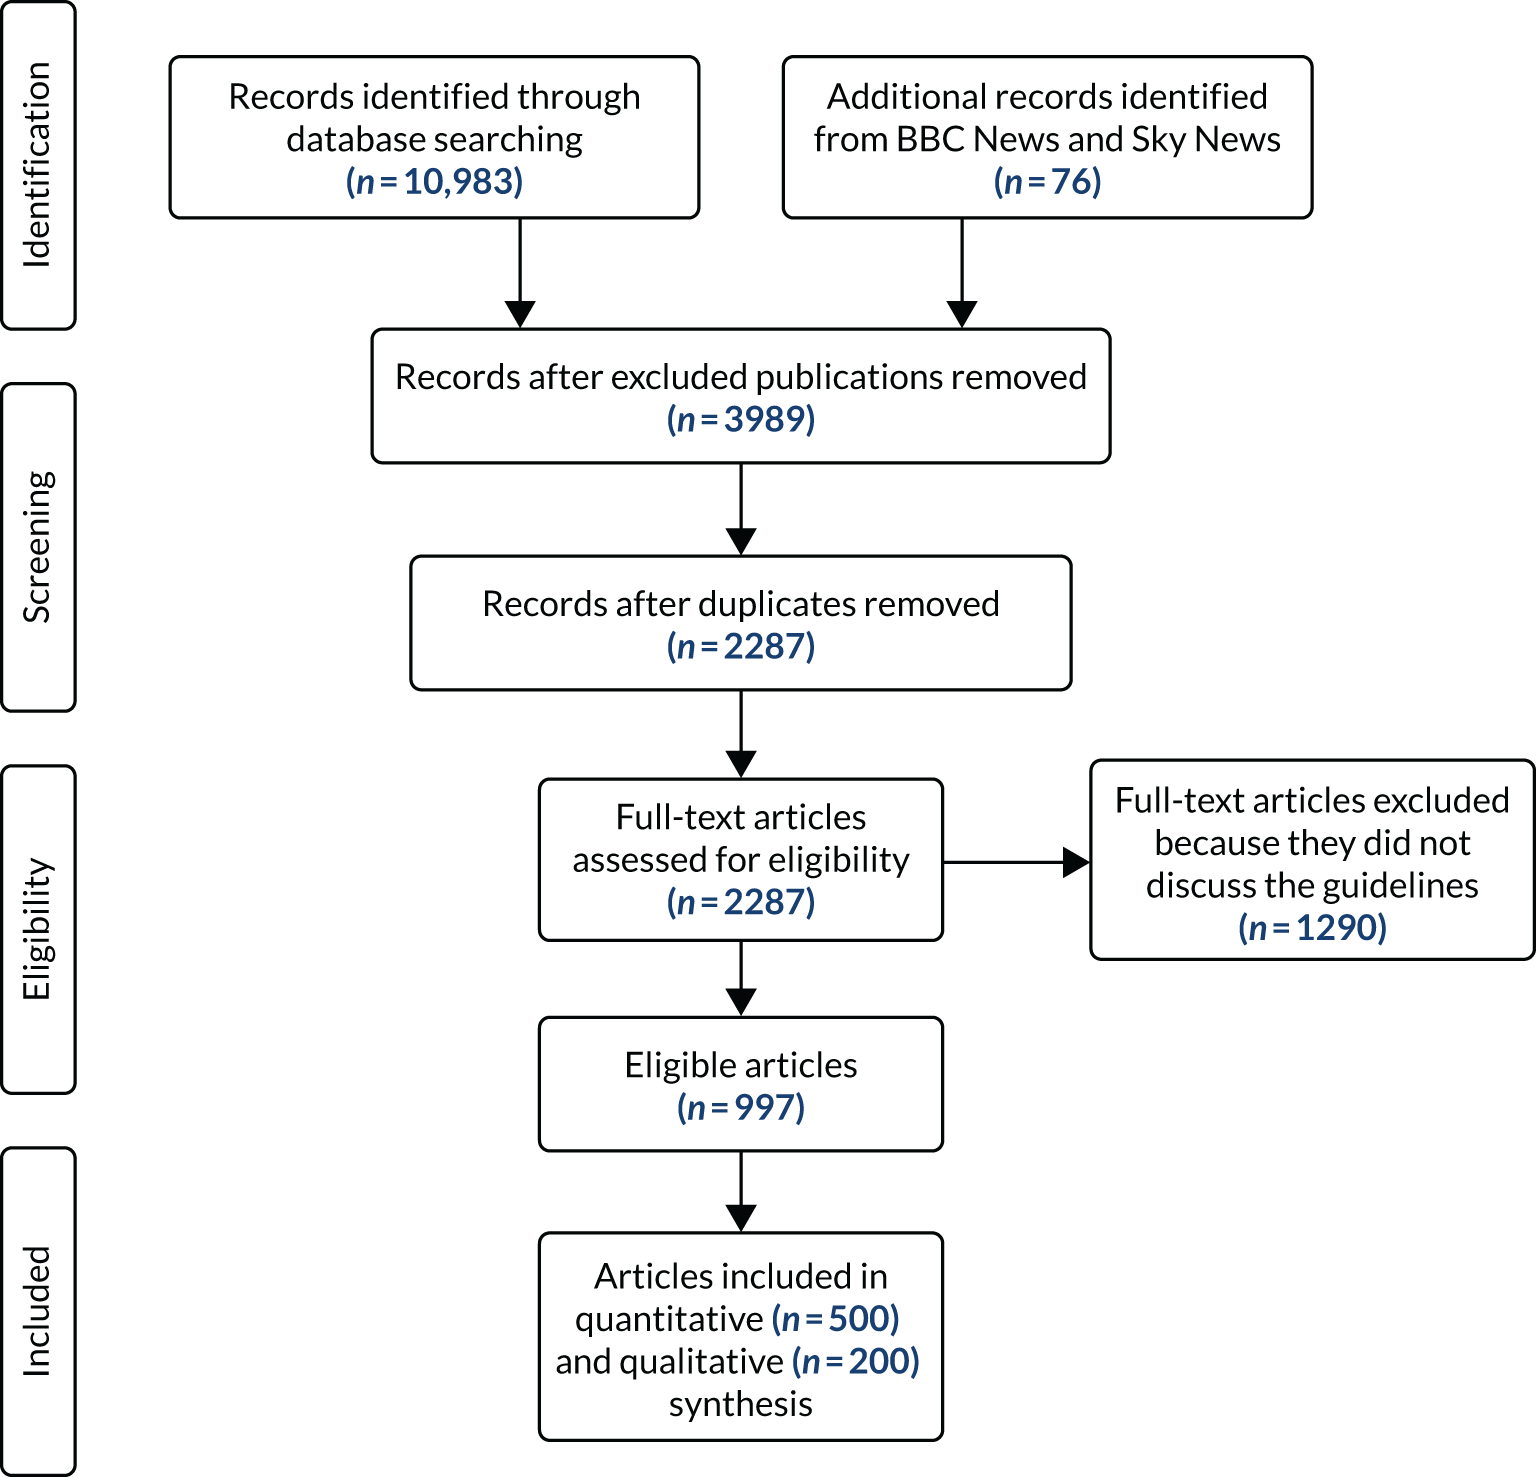
Figure 2 shows the results of the search and selection process. The three Nexis searches yielded 10,983 articles in total. After excluding articles published in local publications or The Associated Press planners (i.e. collections of press releases that are disseminated to journalists and news publications, which are included in the Nexis database; n = 7070) and removing duplicates (n = 1702), we were left with 2211 articles in 41 publications. After concurrent headline and full-text screening of these articles, we excluded a further 1261 articles because they did not discuss the guidelines. The Google searches yielded 70 results on the BBC News website and six on the Sky News website. After headline and full-text screening of these articles, we excluded 29 articles (28 from the BBC) because they did not mention the guidelines. This left 41 further articles in addition to those identified via the Nexis search. After adding the website and Nexis searches together, our final data set comprised 997 eligible articles from 29 publications (Table 1).
FIGURE 2.
The PRISMA flow diagram showing the results of the search for news articles mentioning drinking guidelines.
| Source type | Publication | Number of articles | |
|---|---|---|---|
| Total (n = 997) | Sample (n = 500) | ||
| Broadsheet/quality press | The Daily Telegraph (including telegraph.co.uk) | 112 | 53 |
| The Independent (including the i, The Independent Magazine, independent.co.uk) | 83 | 41 | |
| The Guardian (including The Observer) | 56 | 32 | |
| The Times (including thetimes.co.uk, The Sunday Times) | 88 | 44 | |
| Middle market | Daily Mail (including MailOnline, The Mail on Sunday) | 215 | 99 |
| Daily Express (including Express Online, Sunday Express) | 115 | 66 | |
| Red-top tabloid | Daily Mirror (including mirror.co.uk, The People) | 62 | 29 |
| Daily Star (including Daily Star Online) | 29 | 14 | |
| The Sun (including thesun.co.uk, The Sun on Sunday) | 96 | 52 | |
| Online only | BBC News | 42 | 21 |
| BigHospitality.co.uk | 1 | 0 | |
| FoodNavigator.com | 2 | 1 | |
| Sky News | 13 | 8 | |
| Other | Arts and Book Review | 1 | 0 |
| Convenience Store | 1 | 1 | |
| Financial Wire | 12 | 5 | |
| Good Housekeeping | 9 | 5 | |
| Men’s Health | 4 | 1 | |
| Metro | 11 | 5 | |
| Morning Advertiser | 8 | 3 | |
| New Scientist | 3 | 2 | |
| Nursing Times | 3 | 1 | |
| Prima | 5 | 2 | |
| Runner’s World | 1 | 0 | |
| The Grocer | 12 | 8 | |
| The MCA Report (formerly The M&C Report) | 2 | 1 | |
| UK Government News | 11 | 6 | |
Quantitative analysis
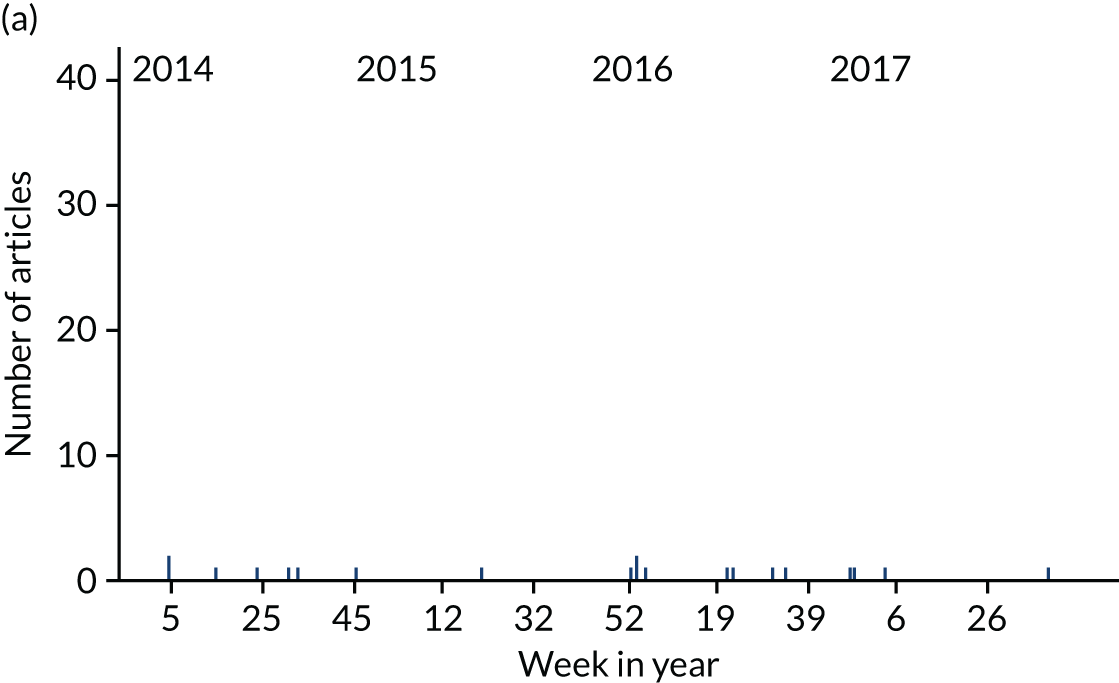
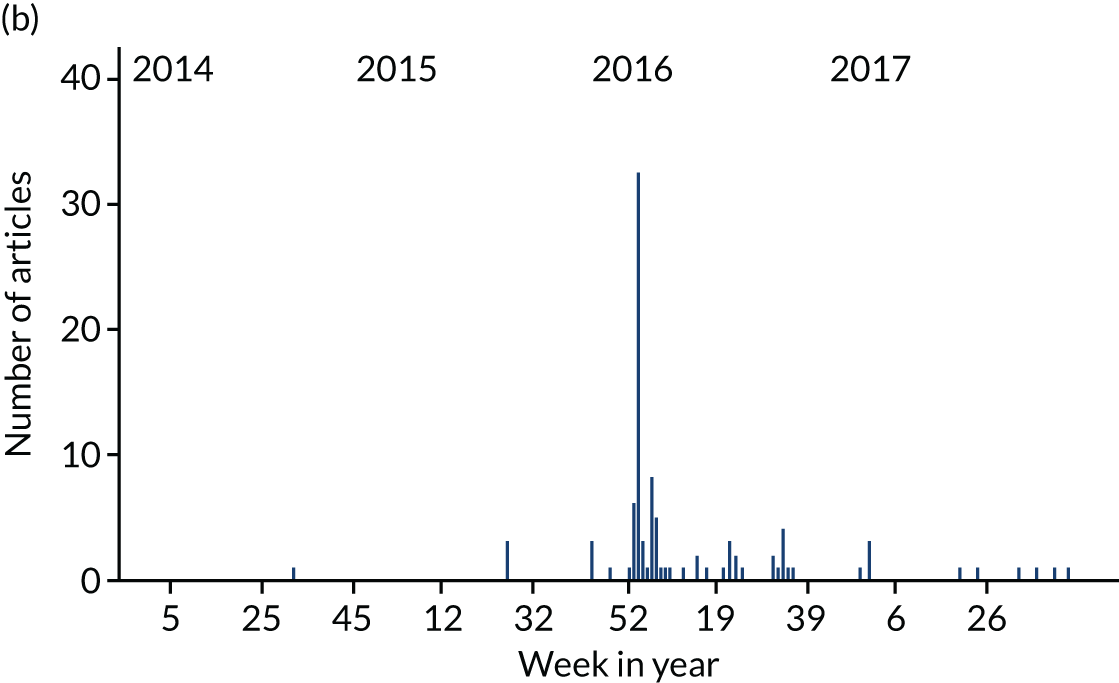
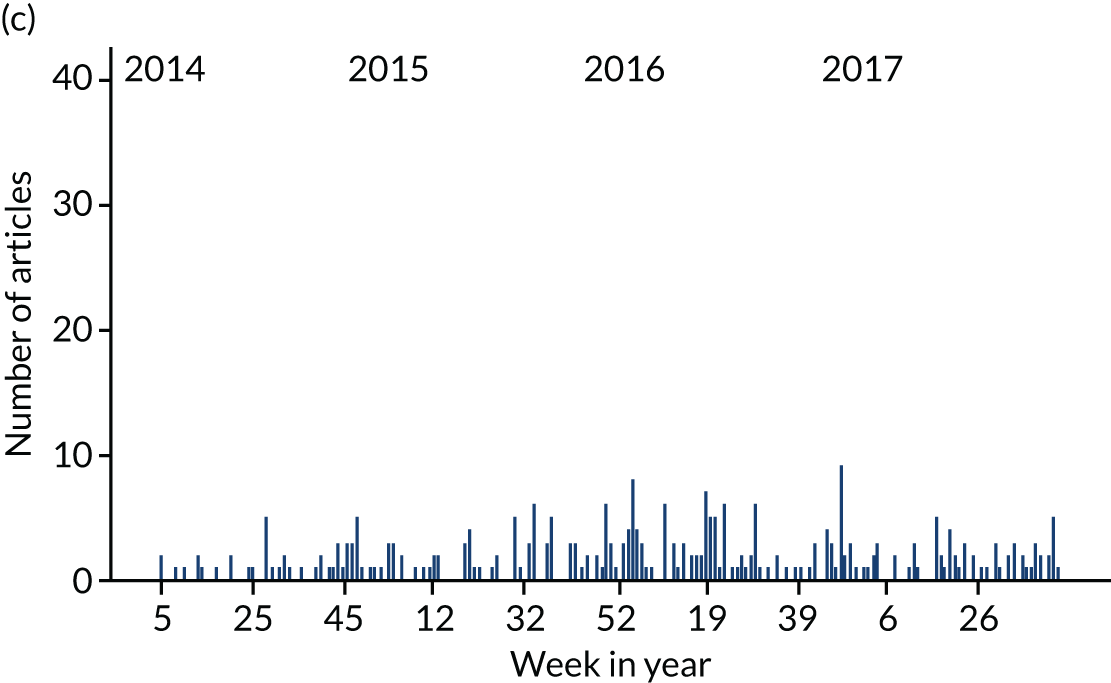
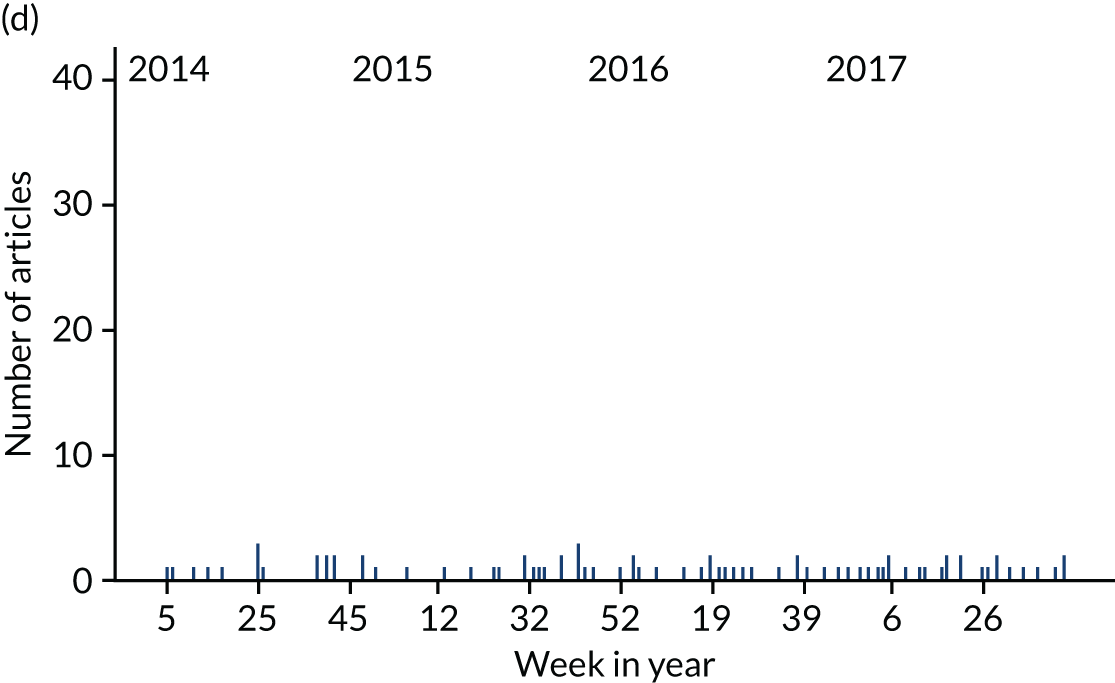
Drinking guidelines were mentioned regularly in news articles across the study period. Figure 3 shows that the number of articles per week peaked when the revised guidelines were announced in January 2016. There were also many smaller peaks that occurred when guidelines were mentioned in articles related to general alcohol- or health-related topics, as shown in Figure 4, whereas guidelines were mentioned only infrequently in articles unrelated to alcohol or health.
FIGURE 3.
Number of news articles mentioning guidelines per week within the analysed sample (n = 500) between 1 February 2014 and 31 October 2017. The guidelines changed in week 2 of 2016.
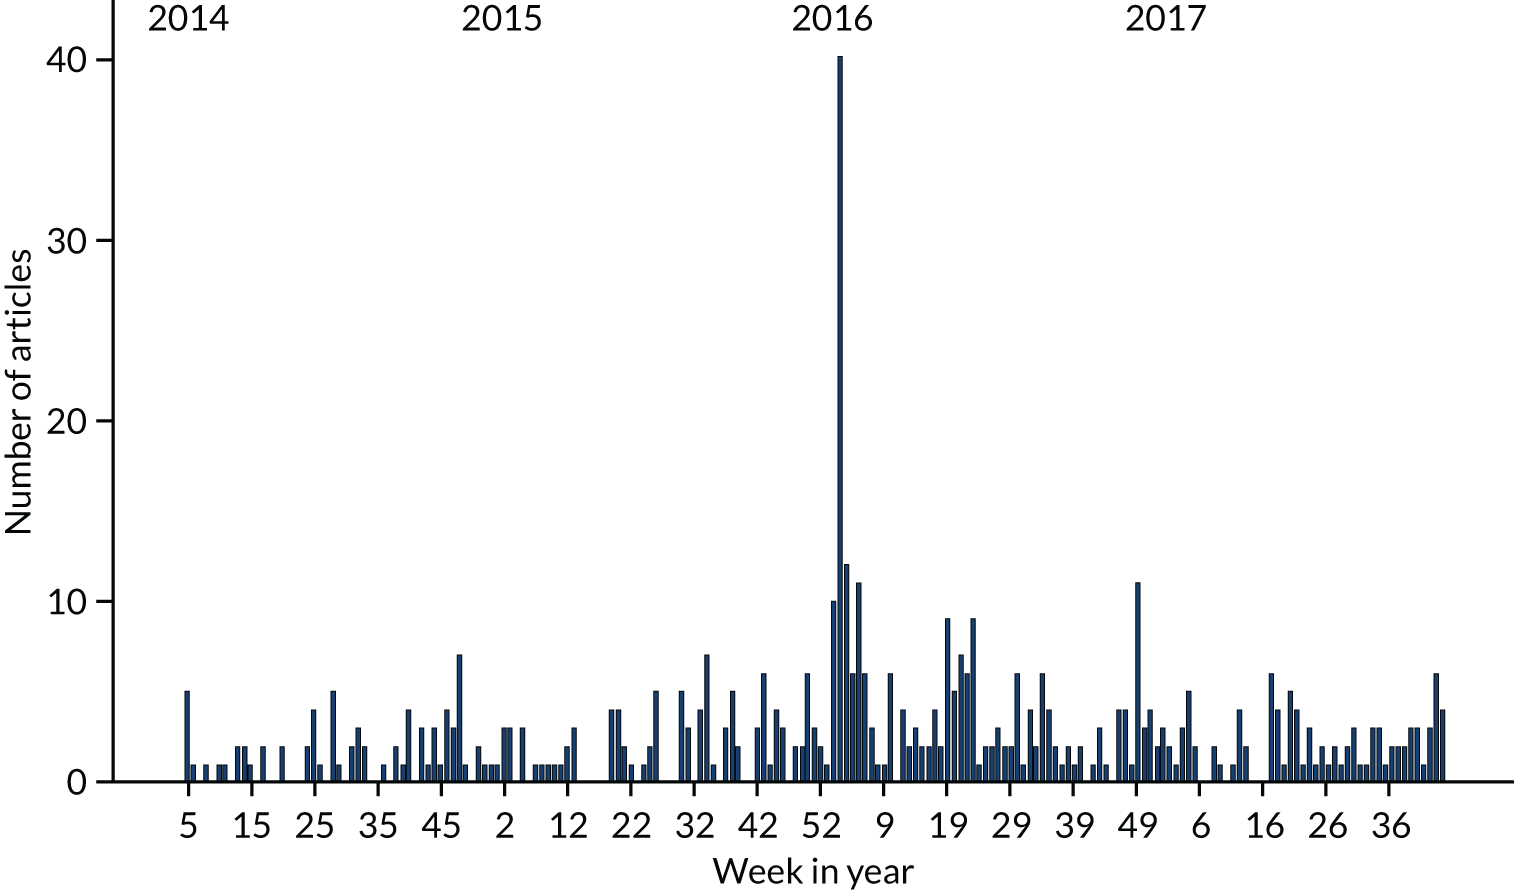
FIGURE 4.
Number of news articles mentioning guidelines per week within the analysed sample (n = 500) between 1 February 2014 and 31 October 2017, split by primary topic in article. (a) Not related to drinking guidelines of alcohol or health; (b) related to drinking guidelines; (c) related to alcohol but not drinking guidelines; and (d) related to health but not alcohol.
The guidelines were mentioned for different reasons at different time points. Figure 5 shows that a large number of articles mentioned the guidelines in January 2016 to inform the public of the revisions and that there were also a large number of articles that discussed the merits of the guidelines at this time and in the subsequent 23 weeks. However, outside this period, the merits of the guidelines were rarely discussed, and guidelines were mentioned instead to promote health, to prevent ill health and, less often, to provide context to articles discussing alcohol consumption. Around the time that the revised guidelines were announced, there were also a number of articles that mentioned the guidelines for other reasons, including to discuss state intervention in health care and nanny state policies in general, and to criticise UK drinking culture.
FIGURE 5.
Number of news articles mentioning guidelines per week between 1 February 2014 and 31 October 2017, split by primary purpose of guidelines in article. (a) To discuss the merit of guidelines; (b) to inform the public of the change in guidelines; (c) to promote health; (d) to provide context for drinking habits; and (e) other.
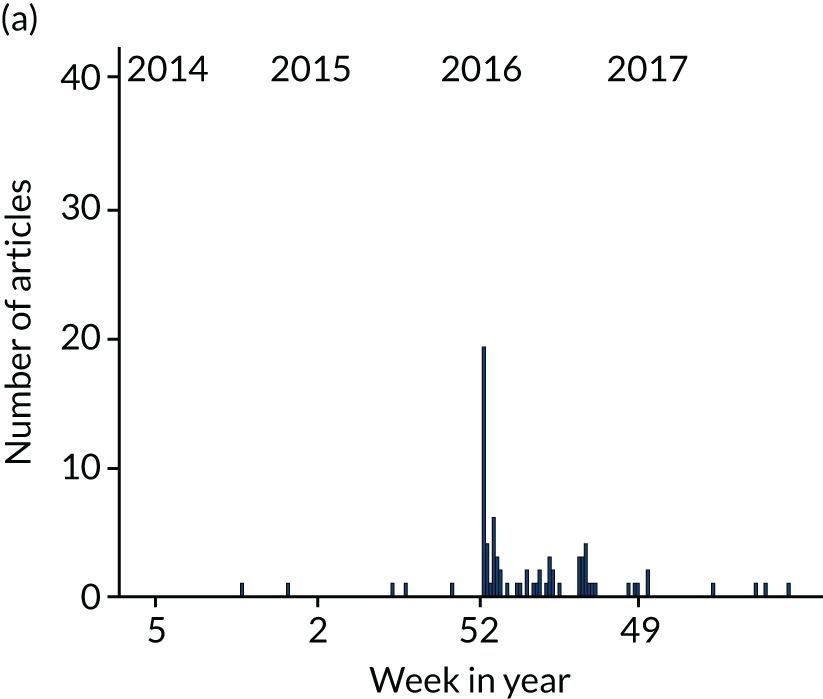
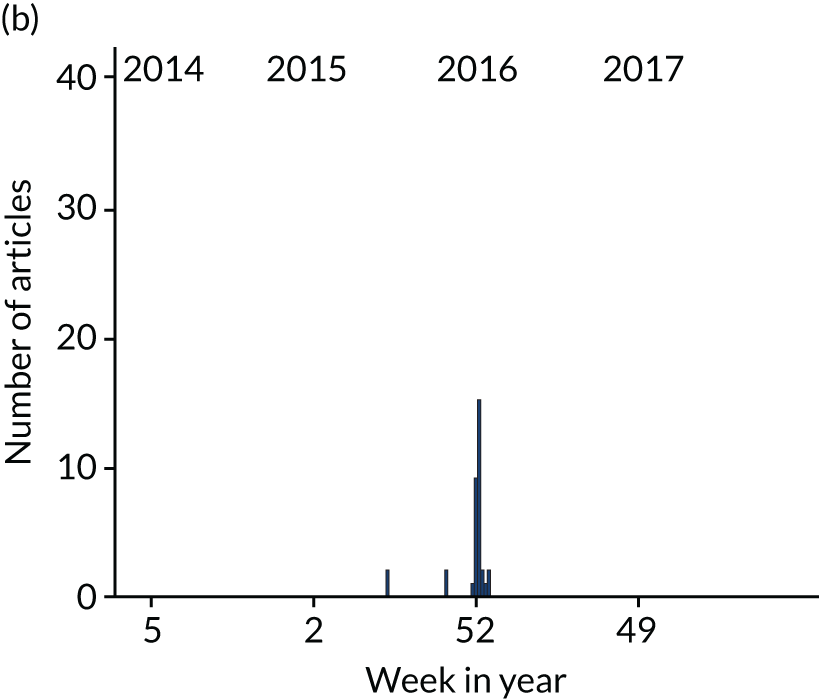
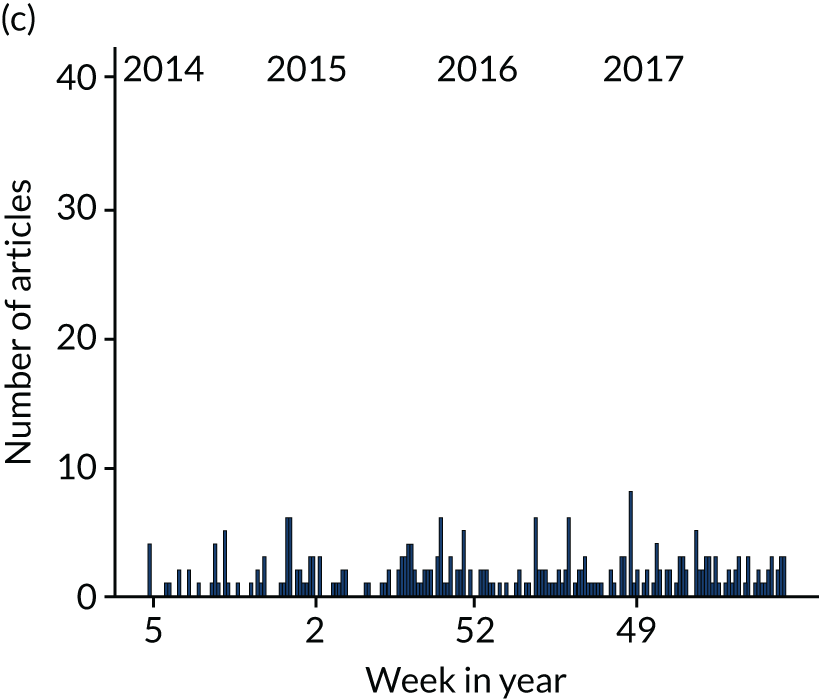
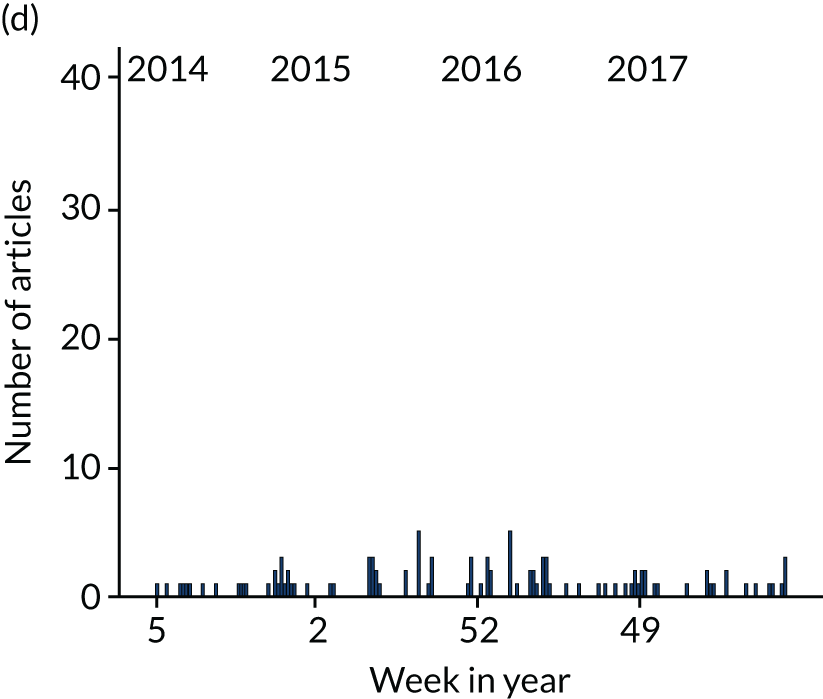
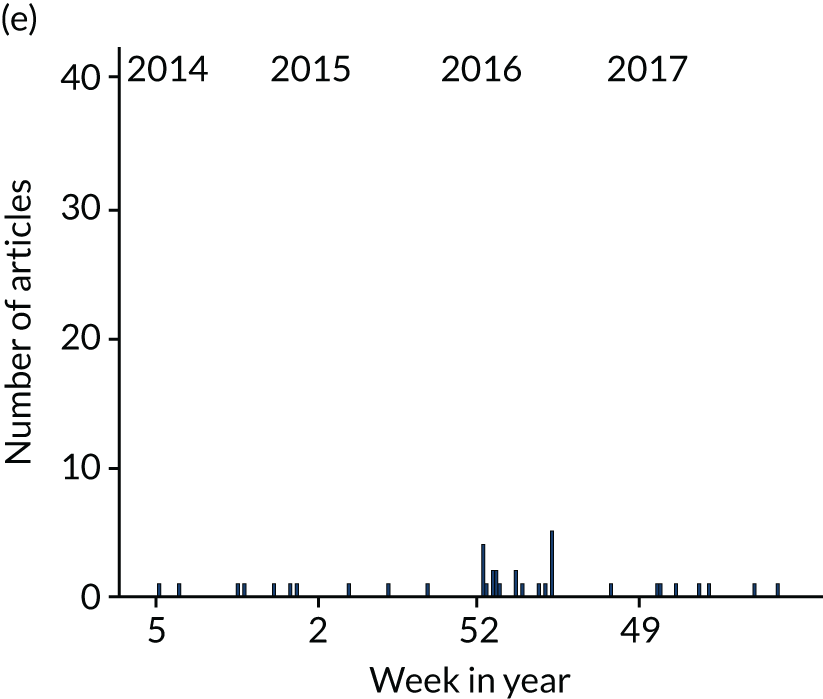
Figure 6 shows that the tone of articles was typically neutral in the overwhelming majority of cases and that articles with a positive tone were rare. Articles with a negative tone were also rare but became more common for several weeks after the revisions were announced.
FIGURE 6.
Numbers of news articles mentioning guidelines per week between 1 February 2014 and 31 October 2017, split by article tone.
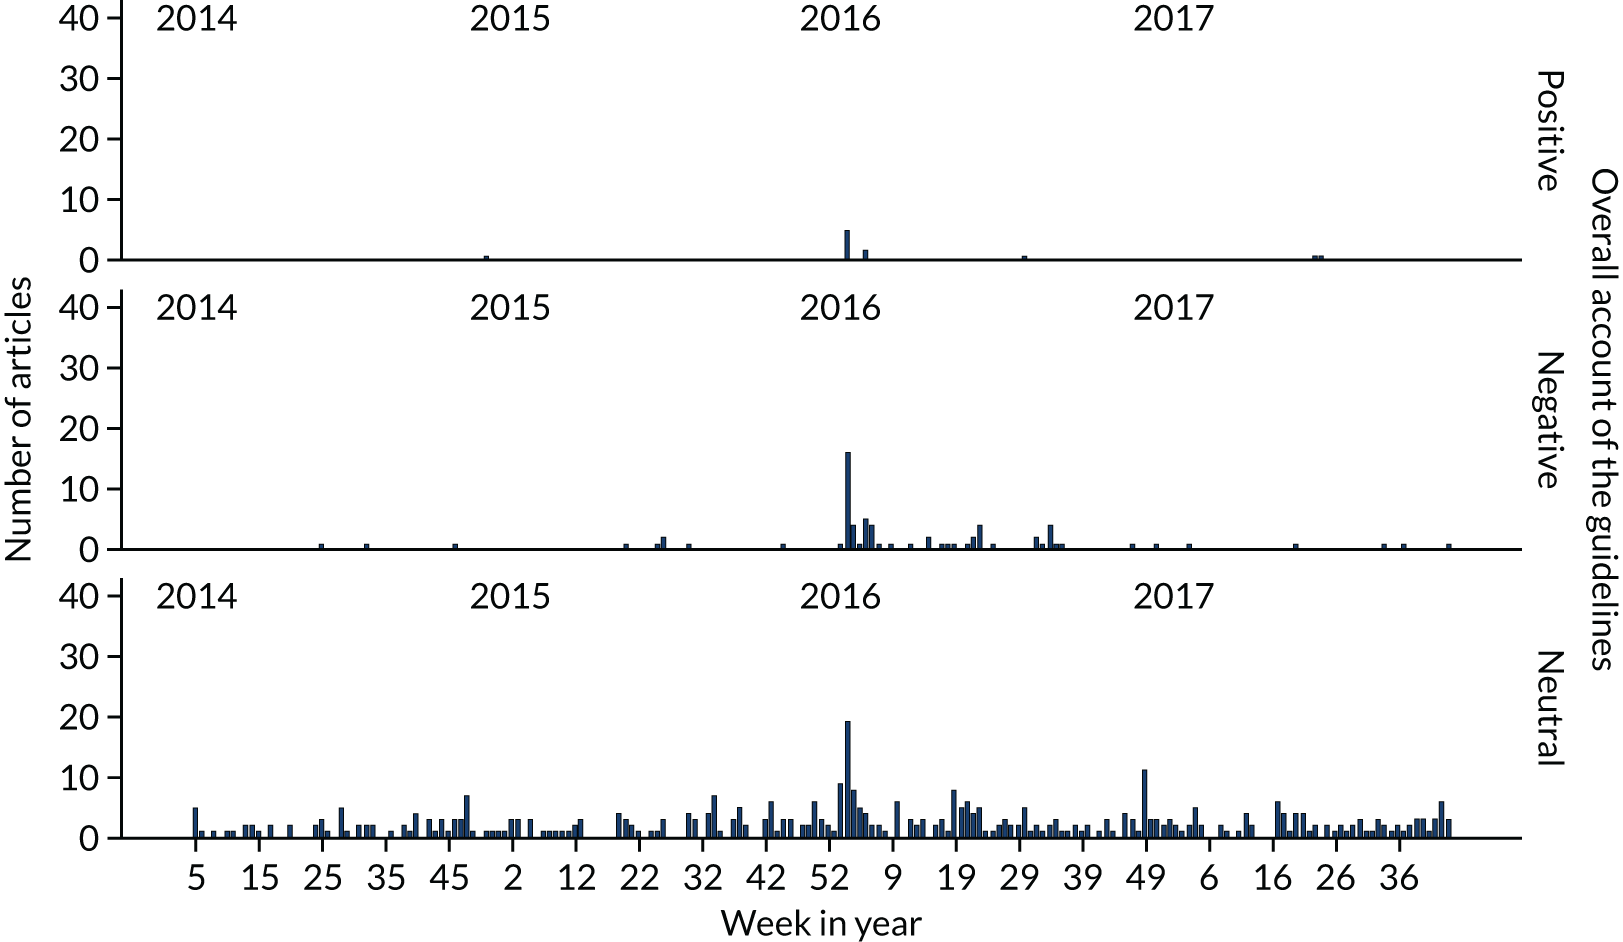
Table 2 shows the different aspects of the drinking guidelines that were mentioned in articles and how the aspects mentioned changed before and after the guidelines were revised. Most articles (95.4%) mentioned the guideline threshold, although sometimes this was provided for only one sex. Even after the same guidelines were set for men and women in January 2016, 94.0% of articles mentioned the guideline consumption level but only 88.6% mentioned that it applied to men. Prior to the revisions, the 1995 guidelines of 3–4 units per day for men and 2–3 units per day for women were mentioned in approximately half of the articles, but the pre-1995 guidelines of 21 units per week for men and 14 units per week for women were also mentioned in around one-third of the articles, with both guidelines sometimes mentioned for comparison (e.g. 3–4 units per day or 21 units per week), suggesting that the public was provided with inconsistent information during this time. After the revisions, only 9 out of 296 articles mentioned a guideline other than 14 units per week for men or women. Out of these nine articles, three mentioned the previous daily guidelines, whereas the other six mentioned the previous weekly guidelines.
| Aspect of guidelines communicated | Before (n = 185) | After (n = 315) | Total (n = 500) | |||
|---|---|---|---|---|---|---|
| Yes (%) | No (%) | Yes (%) | No (%) | Yes (%) | No (%) | |
| Recommended consumption levels (at least one of the following) | 97.8 | 2.2 | 94.0 | 6.0 | 95.4 | 4.6 |
| 3–4 units per day for men | 56.8 | 43.2 | 0.6 | 99.4 | 21.4 | 78.6 |
| 14 units per week for men | 6.5 | 93.5 | 88.6 | 11.4 | 58.2 | 41.8 |
| 21 units per week for men | 35.7 | 64.3 | 1.9 | 38.1 | 14.4 | 85.6 |
| 2–3 units per day for women | 59.5 | 40.5 | 1.0 | 99.0 | 22.6 | 77.4 |
| 14 units per week for women | 36.8 | 63.2 | 88.9 | 11.1 | 69.6 | 30.4 |
| Spread weekly limit over multiple days | 1.1 | 98.9 | 13.7 | 86.3 | 9.0 | 91.0 |
| No alcohol on at least 2 days per week | 9.2 | 90.8 | 10.2 | 89.8 | 9.8 | 90.2 |
| No safe level of drinking | ||||||
| Communicated as part of guidelines | 2.2 | 97.8 | 23.2 | 76.8 | 15.4 | 84.6 |
| Communicated separate from guidelines | 4.9 | 95.1 | 2.5 | 97.5 | 3.4 | 96.6 |
Other aspects of the guidelines were mentioned much less frequently, and the announcement of the revisions did not always lead to increased mentions. The advice to spread the weekly guideline of 14 units across at least 3 days was mentioned in 13.7% of articles after the announcement, compared with 1.1% before. However, the advice to have at least 2 drink-free days per week was mentioned in 10.2% of articles after the revisions and 9.2% before, perhaps because this advice was part of PHE’s Change for Life mass media campaign prior to the guideline review.
Information that was not part of the guidelines was also sometimes presented as though it was. One particular example of this arose because the revised guidelines were announced in conjunction with a report on the relationship between alcohol consumption and cancer, which argued that there was no safe level of drinking with regard to cancer risk. 105 Although the UK CMOs’ report and the report of the GDG discussed evidence on alcohol and cancer and noted the risk at low levels of consumption, the ‘no safe level’ message is not part of the drinking guidelines. 22,24 Despite this, 23.2% of articles published after the revisions stated or implied that this message was part of the guidelines, for example by mentioning it shortly before or after the consumption guidelines without clarifying that it is not part of the guidelines. This compares with 2.5% of articles that mentioned the ‘no safe level’ message as separate to the guidelines (e.g. by stating this explicitly, or by attributing the ‘no safe level’ message to a source other than the guidelines).
Relationship between timing, tone and other article characteristics
We examined the relationship between the tone of articles, whether they were published before or after the guidelines announcement, and their other characteristics. As only 11 out of 500 articles analysed were positive in tone, the analysis focuses on a comparison of articles with a neutral or negative tone.
Table 3 shows that articles were significantly more likely to have a negative tone and less likely to have a neutral tone after the revised guidelines were announced (χ2 = 20.3; p < 0.001). Across the whole study period, articles that had drinking guidelines as the primary topic were more likely to have a negative tone than those related to alcohol in general, those related to health in general or those that were unrelated to guidelines, alcohol or health (χ2 = 179.2; p < 0.001). Guidelines were also more likely to be discussed negatively if the primary purpose of mentioning the guidelines was to discuss their merits (χ2 = 282.8; p < 0.001). There were no significant differences in the likelihood of the guidelines being discussed negatively across source types (χ2 = 4.76; p = 0.31) or their political leanings (χ2 = 0.66; p = 0.72). Articles were, however, more likely to be negative in tone if they communicated the ‘no safe level’ message as part of the guidelines rather than identifying it as a separate message or not mentioning it at all (χ2 = 42.32; p < 0.001).
| Context in which guidelines were communicated | Positive (%) | Negative (%) | Neutral (%) | Total (%) | ||||||||
|---|---|---|---|---|---|---|---|---|---|---|---|---|
| Before (n = 1) | After (n = 10) | Total (n = 11) | Before (n = 10) | After (n = 62) | Total (n = 72) | Before (n = 174) | After (n = 243) | Total (n = 417) | Before (n = 185) | After (n = 315) | Total (n = 500) | |
| Source type | ||||||||||||
| Broadsheet/quality press | 0.0 | 40.0 | 36.4 | 50.0 | 32.3 | 34.7 | 36.8 | 31.7 | 33.8 | 37.3 | 32.1 | 34.0 |
| Middle market | 100.0 | 30.0 | 36.4 | 40.0 | 29.0 | 30.1 | 27.6 | 37.4 | 33.3 | 28.6 | 35.6 | 33.0 |
| Red-top tabloid | 0.0 | 0.0 | 0.0 | 0.0 | 21.0 | 18.1 | 23.0 | 17.3 | 19.7 | 21.6 | 17.5 | 19.0 |
| Online only | 0.0 | 30.0 | 27.3 | 10.0 | 1.6 | 2.8 | 2.9 | 8.2 | 6.0 | 3.2 | 7.6 | 6.0 |
| Other | 0.0 | 0.0 | 0.0 | 0.0 | 16.1 | 13.9 | 9.8 | 5.3 | 7.2 | 9.2 | 7.3 | 8.0 |
| Context | ||||||||||||
| Related to drinking guidelines | 0.0 | 60.0 | 54.5 | 40.0 | 80.6 | 75.0 | 6.3 | 10.7 | 8.9 | 8.1 | 26.0 | 19.4 |
| Related to alcohol (but not drinking guidelines) | 0.0 | 40.0 | 36.4 | 40.0 | 11.3 | 15.3 | 69.5 | 67.9 | 68.6 | 67.6 | 55.9 | 60.2 |
| Related to health (but not alcohol) | 100.0 | 0.0 | 9.1 | 10.0 | 4.8 | 5.6 | 19.5 | 17.7 | 18.5 | 19.5 | 14.6 | 16.4 |
| Not related to guidelines, alcohol or health | 0.0 | 0.0 | 0.0 | 10.0 | 3.2 | 4.2 | 4.6 | 3.7 | 4.1 | 4.9 | 3.5 | 4.0 |
| Role of guidelines within article | ||||||||||||
| To discuss merit of guidelines | 0.0 | 30.0 | 27.3 | 50.0 | 82.3 | 77.8 | 0.0 | 6.2 | 3.6 | 2.7 | 21.9 | 14.8 |
| To inform public of change in guidelines (but not discuss their appropriateness) | 0.0 | 20.0 | 18.2 | 20.0 | 3.2 | 5.6 | 6.9 | 6.6 | 6.7 | 7.6 | 6.3 | 6.8 |
| To promote health | 100.0 | 30.0 | 36.4 | 20.0 | 3.2 | 5.6 | 59.8 | 56.8 | 58.0 | 57.8 | 45.4 | 50.0 |
| To provide context for drinking | 0.0 | 0.0 | 0.0 | 0.0 | 1.6 | 1.4 | 28.2 | 22.2 | 24.7 | 26.5 | 17.5 | 20.8 |
| Other | 0.0 | 20.0 | 18.2 | 10.0 | 9.7 | 9.7 | 5.2 | 8.2 | 7.0 | 5.4 | 8.9 | 7.6 |
Qualitative thematic analysis
The analysis identified four main themes: (1) factual reporting of the guidelines, (2) the guidelines are not based on the best available science and should not exist in their current form, (3) the guidelines threaten autonomy and should not exist at all and (4) alcohol advice is changing constantly and it is unclear what advice to follow. Most articles contributed to theme 1, but did not discuss the guidelines in greater detail. The thematic analysis, therefore, was strongly informed by the large minority of articles that discuss guidelines in more detail, and the findings of the analysis reflect that these more discursive articles were primarily negative in tone. Each of these themes is discussed in turn.
Factual reporting of the guidelines
Most articles mention the guidelines very briefly, in a factual manner and without significant linkage to broader themes within the articles. For example, in an article about lifestyle changes to prevent diabetes, only one sentence refers to the guidelines, which tells readers to keep in mind that the recommended guidelines are now only 14 units per week for men and women (paraphrased). 106
Similarly, in a news article about drinking on cruises, the guidelines are mentioned in only one sentence, which states that the average passenger drinks 168 units per week, according to Drinkaware website’s unit calculator, which is eight times the recommended allowance for men (21 units) and 12 times above the recommended level for women (14 units) (paraphrased). 107
In most cases, the reason for sticking to the guidelines (to prevent ill health) was implied rather than explicitly stated. This is achieved by stating the link between alcohol and health outcomes, directly followed by the guidelines or by referring to exceeding the guidelines as drinking at unsafe levels. The vast majority of articles mention the consumption level for both men and women. If an article mentioned the guidelines for only one sex, this was typically because it discussed a condition that affects more men than women or vice versa. For example, Push Doctor’s (an online medical consultation service based in Manchester, UK) medical officer, Dr Dan Robertson, recommended that men stick to the recommended weekly alcohol limit to prevent erectile problems. 108
Many articles reported the guideline amounts in equivalent alcoholic drinks. This information was largely accurate, but there were variations in how it was presented. Most sources opted to provide the equivalent in an integer of drinks, but some sources provided the information in fractions of a glass or how many units are typically contained in a standard-sized drink, such as a bottle of wine or pint of beer:
14 units is equivalent to 14 single measures of spirits at 37.5 per cent ABV [alcohol by volume]; seven pints of 4 per cent strength beer, nine and one-third 125 ml glasses, seven 175 ml glasses, or four and two-thirds 250 ml glasses of 12 per cent-strength wine.
News article, The Independent, 8 January 2016; reproduced with permission from The Independent109
The UK Department of Health recommends that men should drink no more than three to four units of alcohol a day and women should drink no more than two to three units a day. A 750 ml bottle of red, white or rosé wine with an alcohol content of 13.5 per cent contains 10 units. A standard 175 ml glass of red, white or rosé wine contains just over two units and a large 250 ml glass contains three units. A small glass, at 125 ml, contains 1.5 units.
News article, The Independent, 26 November 2015; reproduced with permission from The Independent110
Few articles reported the full set of guidelines including auxiliary advice. Those that did were mainly published around the announcement of the new guidelines. The advice that one should spread alcohol consumption over multiple days and have at least 2 alcohol-free days per week was most often communicated alongside the drinking guidelines. Similar to the recommended consumption levels, this advice is often merely stated without further elaboration:
How much alcohol is too much? Some can probably safely drink more than others; your size, genetics, lifestyle and state of your liver make a difference. But in general, less than 14 units, spread over at least three days a week should be OK. That’s just under a bottle-and-a-half of wine (ABV 13.5%), or an average of one 175 ml glass per day. For beer drinkers, that’s less than five pints of higher strength beer (ABV 5.2%) a week.
News article, The Guardian, 25 January 2016; courtesy of Guardian News & Media Ltd111
Criticism of the scientific basis for the guidelines
Criticism of the scientific basis for the guidelines focused on three main areas: the emphasis on cancer risks while downplaying of the benefits of moderate drinking, the guideline consumption level itself and the integrity of the scientific process.
Although not part of the guidelines, much criticism addressed the ‘no safe level’ message, which was prominent in news reports announcing the revision to the guidelines because of the simultaneous release with the cancer report. The no safe level message was given further prominence as public health actors communicating the guidelines also emphasised it in their interviews and other statements. 112 This criticism was often linked to proponents of the guidelines also downplaying previous evidence that moderate drinking benefited cardiovascular health. 113,114 The cancer risk was not challenged directly, but critics allege that the guidelines failed to take into account evidence of benefits to cardiovascular health or that these benefits might outweigh any increased cancer risk. Criticism of this kind comes from a variety of sources, including alcohol industry actors, free-market think tanks and pro-alcohol consumer groups, but also reputable scientists and laypeople. The first quotation below also illustrates how industry actors often criticised the drinking guidelines using multiple arguments within a single sentence, an approach noted in the context of MUP by Hilton et al. 80 A leading drinks producer told The Mail on Sunday that it would send a strongly worded response, stating that the new limits go against decades of scientific research, that having the same limits for men and women contradicts research on how men and women process alcohol, and that the limits are different from almost every other country. He said that there was no discussion about the changes beforehand and the government is consulting only on how the guidelines will be communicated. The drinks producer believes that the content needs to be discussed more, particularly the scientific basis for the guidelines. The Portman Group said that it would also be voicing reservations about the interpretation of the evidence. The group said that more than four in five adults are already drinking within the lower-risk guidelines. Guidelines are important because they help people make informed decisions and the group is concerned that the proposed guidelines are confusing because they are not clear about the relative risks of sensible drinking. 115 Top academics from the Royal Statistical Society criticised the advice, stating that not all alcohol was dangerous and stressing a ‘protective effect’ from small amounts:116
In January new drinking guidelines were issued which cut the recommended weekly limit to 14 units for both men and women – slightly more than a standard bottle of wine – and said that no level of drinking was safe. The change was criticised by some experts, including the Royal Statistical Society, which said that the evidence showed a unit a day was in fact beneficial.
News report, The Times, 30 December 2016; reproduced with permission; © News UK & Ireland Limited117
The guidelines conveniently ignore the evidence around the cardioprotective and neuroprotective effects of moderate alcohol consumption and the results of the largest study ever conducted for alcohol by the American Cancer Society, published in the New England Journal of Medicine, which concluded that adults who drink six units per day have lower mortality rates than adults who drink none at all.
Letter from member of the public, The Guardian, 14 January 2016; courtesy of Guardian News & Media Ltd118
Another prominent criticism was levelled at the guideline consumption amount itself. This came in several forms. Some questioned the decision to set the same guideline for men and women (see first quotation above117). Others criticised the idea of a single guideline that does not take individual differences into account. Further commentators argued that the risk level at which the guidelines are set is disproportionately low and that the public would have accepted higher risks. In some cases, the reasoning behind the guidelines was published alongside these criticisms, but more often the criticism stands unchallenged. Although much of this criticism came from the alcohol industry or consumer groups, it was again partly supported by reputable scientists via the Science Media Centre, which gathers quotations from scientists and provides advice to help journalists communicate research accurately:
There’s no scientific evidence for these ridiculous units, Mr Hardman [CAMRA] said. You can’t set rules for everybody, just as you can’t say that all shoes should be eight and a half, because some people have smaller feet and some have bigger feet.
News report, The Independent, 31 March 2016; reproduced with permission from The Independent119
Prof. Sir David Spiegelhalter, Winton Professor of the Public Understanding of Risk at the University of Cambridge, said: ‘These guidelines define ‘low-risk’ drinking as giving you less than a 1% chance of dying from an alcohol-related condition. So should we feel ok about risks of this level? An hour of TV watching a day, or a bacon sandwich a couple of times a week, is more dangerous to your long-term health. In contrast, an average driver faces much less than this lifetime risk from a car accident. It all seems to come down to what pleasure you get from moderate drinking.
Reproduced with permission from the Science Media Centre. Appeared in news report, Daily Mail, 2 February 2016120
A final strand of scientific criticism addressed the integrity of the process of developing the guidelines and those involved in it. Four members of the GDG were either employed by or affiliated with the Institute of Alcohol Studies (London, UK), which is a public health charity established and funded by the Alliance House Foundation (London, UK), a prominent organisation in the now-defunct UK temperance movement. The GDG also drew extensively on evidence provided by the University of Sheffield, which had previously provided evidence supporting the introduction of MUP for alcohol in the UK and internationally. 121 In both cases, the individuals in question were perceived to be likely to have acted politically in steering the development process towards setting a lower guideline. In this context, articles sometimes argued that the alcohol industry should also have been involved in the development process. Criticisms of this kind originated primarily from people affiliated with the alcohol industry; however, the authors of the articles did not similarly question the integrity of such people. Although the reason for this unbalanced approach is unclear, it has echoes of Mercille’s78 arguments that the news media inevitably reflect the views of the political and economic establishment. However, it may more simply reflect that journalists were not provided with arguments or quotations raising such points:
FOUR anti-booze campaigners were on a panel of experts that led to Brits’ safe drinking levels being cut, it was claimed last night.
News report, The Sun, 30 May 2016; reproduced with permission; © News UK & Ireland Limited122
In addition, why should public health researchers be allowed to tell people how much wine is bad for them, just because they make a living from disapproving of people selling alcohol, tobacco and sweets? Why can’t alcohol producers or retailers set drinking guidelines, given they better understand who drinks too much and why? (paraphrased). 123
In addition to the three main strands of criticism addressing the scientific basis for the guidelines, additional comments argued that the guidelines are unlikely to change behaviour and that the review was unnecessary because alcohol consumption is declining in the UK. In some cases, all of the criticisms were drawn together, again echoing Hilton et al. ’s80 analysis of the MUP debate rather than appearing across separate articles. Critics of the new guidelines point to a range of problems. These include a reliance on work by researchers at the University of Sheffield who are committed to the political and unscientific cause of minimum pricing, an overemphasis on cancer risks and underplaying of benefits to cardiovascular health, a lack of concern with level of risk and the recent decline in binge drinking (paraphrased). 123
Guidelines threaten personal autonomy
Other criticisms focused on the role guidelines play in the broader political landscape. The guidelines were frequently framed as a nanny state policy that would be used to facilitate introduction of more extreme policies in the future, a view also advanced, albeit in softer language, by a member of the GDG in a British Medical Journal article. 19 It is important to realise that these guidelines are not a single policy. Like enthusiasts in other areas, public health campaigners want to enact evermore policies to trap those they do not like (paraphrased). 123
Critics contrasted this perceived agenda with a view that people know their own limits and should be allowed to decide for themselves what risks they find acceptable. Public health advice was presented as coming from a different type of people (‘healthy people’ or ‘puritans’), who are disconnected from the experiences of ‘normal people’ and lead lives devoid of joy:
There is no one speaking up for the man and woman on the street. We want to represent people who are saying, ‘I know my limits and I don’t need them to be dictated to me’ and I don’t want to feel guilty for having a drink.
Quotation from Amy O’Callaghan, co-founder of Drinkers’ Voice, in news report, The Times, 10 September 2017; reproduced with permission; © News UK & Ireland Limited124
Another critic of the guidelines claimed to know many public health doctors, but felt that even though they all mean well and appear trustworthy none of them seem to loosen up and party every now and then. And thought that, that is part of the issue. They are so disconnected with what normal, regular people enjoy and how they live their lives, their messages consistently miss their mark. If only public health officials understood that their puritanical and ‘holier-than-thou’ approach puts people off (paraphrased). 125
At the same time, public health officials are also accused of hypocrisy when they are seen engaging in any ‘unhealthy’ behaviour, even when this behaviour does not deviate from the guidelines they promote. As with some of the criticisms above, allegations of hypocrisy are supported by exaggerating the drinking guidelines to be more restrictive policy than they actually are. For example, it is implied that the advice is to abstain rather than to consume under the low-risk guidelines. The UK’s CMO has been ‘terrorising’ moderate drinkers into giving up wine and telling women to see every sip of alcohol as a step towards breast cancer. But it seems that [the CMO at the time], Britain’s ‘nanny in chief’ who told others to ‘do as I do’, is not that strict on alcohol at home. Photographs show the CMO holding a glass of champagne in their £3M London townhouse (paraphrased). 126
Public health advice on drinking changes frequently
Many articles suggested that the revised guidelines were another episode in a series of frequent changes to alcohol-related health advice. These articles argue that people are confused by the variety of information that is available and, as a result, decide to not take any of it seriously because they do not know what is right. Although many reports point out that this is the first update to the guidelines since 1995, the view remains that alcohol advice has changed frequently in this period. Importantly, this view is often supported by contrasting the guidelines with apparently contradictory, but nonetheless reputable, scientific evidence, a problem also noted in debates relating to dietary guidance:127
These days the health advice is so conflicting. We are told red wine in moderation can ward off dementia and heart disease as it contains flavonoids, and the Chief Medical Officer says all alcohol is deadly. So what are we mortals to make of it?
Letter from a retired nurse, The Guardian, 3 February 2016; courtesy of Guardian News & Media Ltd128
Contrary to UK Government advice suggesting keeping several days ‘alcohol free’, a new study from researchers in Finland, published in the Alcohol and Alcoholism journal, found several glasses of wine per day with an evening meal could actually be good for you.
News report, The Independent, 1 May 2016; reproduced with permission from The Independent129
Thus, the distinction between official guidelines and reporting of health-related research is not always clear to the authors of articles, and the guidelines are often considered alongside results from a single study as journalists and commentators apply different approaches to constructing their own understandings of the various pieces of evidence presented to them. 23,127,130,131 This appears to play into the narrative that one day alcohol is good for you and the next day alcohol is bad. Although our sample included one BBC article132 that clarified that the guidelines are in place because there is so much mixed evidence, in many cases the guidelines were presented as just one more instance of conflicting advice. This criticism was also not limited to alcohol, but took in a broader range of health risks for which there was perceived to be conflicting advice:
A lot of people have flagged up that there is conflicting evidence out there. One of the reasons the guidance has been issued is that there has been so much evidence published. So this has attempted to review what is out there and come up with some definitive advice. The advice is there, it says, to inform. It is up to people to decide what they do with it. But on the benefits of drinking, it is clear this only stands for women aged 55 and over – and then only when they limit themselves to five units a week. That’s about two glasses of wine.
Q&A about alcohol guidelines with BBC health correspondent, BBC, 8 January 2016; reproduced with permission from BBC News at bbc.co.uk/news132
Another critic claims that whether it is eating five pieces of fruit and vegetables a day or drinking no more than 14 units of alcohol in 1 week, they will strongly question all advice knowing that ministers will soon tell us to do the complete opposite, and will probably even try to make us pay for following their original advice (paraphrased). 133
One specific method used to evidence inconsistencies in advice is to cite drinking guidelines from other countries. This argument was common partly because a scientific paper published shortly after the UK revisions were announced highlighted large variation in guidelines internationally and also showed that the UK guideline for men was low by international standards. 9 Articles often used this information to point out that different countries come up with different guidelines using the same underlying evidence, suggesting that there are other factors in play that are assumed not to be scientific. Notably, prior to the guidelines change, articles often gave examples of other countries with lower guidelines, whereas after the guidelines changed articles gave examples of countries with much higher guidelines, although this partly reflects there being few countries with lower guidelines than the UK after the revisions. This criticism came forward in quotations from representatives of the alcohol industry, but also in opinion pieces by writers who are not affiliated with the alcohol industry and as single-line illustrations of guidelines. The safe alcohol limits in Canada and Australia have already been reduced to lower than in the UK to account for the new evidence on health risks from drinking. In Canada, men are now advised to drink no more than 15 units a week and women just 10, while Australia tells all adults not to exceed 2 units per day. A Department of Health and Social Care spokesperson confirmed that the UK guidelines will be revised later this year (paraphrased). 134
Henry Ashworth, of drinks industry body the Portman Group, said: ‘Saying there is no safe level flies in the face of international evidence. The US and most European countries have much higher limits, based on the same evidence’.
News report, The Sun, 26 August 2016; reproduced with permission; © News UK & Ireland Limited135
Discussion
Mentions of drinking guidelines in UK news media articles during our study period took one of three general forms. First, there were incidental mentions within articles about broader alcohol- or health-related topics. These mentions accounted for 76.6% of articles, occurred on a continuous basis over time, and were generally informational in purpose and neutral in tone. Second, guidelines were mentioned in articles reporting and explaining the revisions to the guidelines. These mentions accounted for 19.4% of articles, occurred immediately after the announcement in January 2016, and were also generally informational in purpose and neutral in tone. Third, articles mentioned the guidelines when discussing their merits. These mentions accounts for 4.0% of articles, occurred primarily in the 23 weeks after the revisions were announced, and were discursive in purpose and often negative in tone.
As mentions of guidelines in most articles were either incidental or factual, these provided little scope for thematic analysis. Therefore, our themes emerged primarily from the third type of article and generally relate to criticism of the guidelines. These criticisms focus on the guidelines’ scientific basis and the integrity of the process by which they were developed, the broader purpose of guidelines with regard to a potentially malign public health agenda and the perceived inconsistency of public health advice around alcohol and other behaviours.
The main strengths of this analysis are that it covers periods when revised guidelines were discussed in the news media and status quo periods, whereas many previous articles focused only on a specific policy debate. It also combined quantitative and qualitative analyses to provide a detailed account of how guidelines are communicated to the public through news media. The analysis also has important limitations. First, we did not examine broadcast or social media as it was not feasible to do so within this retrospective analysis. This is common in many studies of news coverage of alcohol policy questions. 74,76–78,80,81 In part, this is because newspaper coverage is of importance in its own right as a distinct form of news reporting, but it is also the case that newspapers in the UK broadly reflect and shape the news that is reported by broadcast outlets. Therefore, we would not expect our findings to vary substantially were we to conduct a more resource-intensive review of broadcast news stories. Furthermore, UK broadcast news is dominated by the BBC, and we captured an understanding of its reporting via inclusion of articles on the BBC News website, as well as the website of another major broadcaster, Sky News. A previous study136 examined initial reactions to the guidelines by tracking a single hashtag on Twitter (www.twitter.com; Twitter, Inc., San Francisco, CA, USA) for 1 week immediately after they were announced and found a roughly equal split between tweets that were supportive and unsupportive of the guidelines. Second, we searched only for articles that mentioned the guidelines and, therefore, we cannot assess how much alcohol-related news the public is exposed to that does not make mention of the guidelines, nor can we compare the coverage of drinking guidelines with other alcohol-related advice that may be reported (e.g. drinking clear spirits to limit calorie intake from alcohol). Third, we do not know the social patterning of the audience for different articles. Identifying such information would be challenging as media outlets promote certain articles more than others to attract advertising revenue or because of newsworthiness. Thus, although neutral articles were more common, it may be that these articles attracted a different audience or were less read overall than more negative articles. The analyses in Chapter 4 do, however, provide some insights into whether or not the overall body of news reports the impact on key outcomes relating to drinking guidelines. Fourth, our search focused only on the main guideline message to not consume more than 14 units per week. Other elements of the guidelines, such as those relating to drink-free days or spreading consumption across multiple days, were not covered and we may, therefore, have missed some aspects of the news media’s discussion of the guidelines.
The findings suggest that the revised guidelines, including some of the secondary advice (e.g. on drink-free days), were initially communicated to the public via large-scale news media coverage, which was mostly factual and accurate. This communication was then reinforced on a continuous basis by incidental mention of the guidelines within alcohol- and health-related articles. If this communication was effective, we would expect changes in proximal outcome measures (e.g. awareness and knowledge of the guidelines) to accumulate sharply following the initial announcement and then continue to accumulate more steadily in the subsequent time period as the public is exposed repeatedly to the guidelines via incidental mentions in news articles. However, there are three caveats to this. First, health messages require reinforcement and effects may decline among drinkers who are exposed to the initial announcement but not to subsequent mentions of guidelines in lower-profile news stories that are less likely to be read by certain sociodemographic groups. 76 Second, diffusion theory suggests that repetition of a message does not lead to universal penetration. 52 Instead, some people may never be exposed to the message and others may become insensitive to it because of overexposure. According to theories of psychological reactance,58 some drinkers may go further and actively reject the message or choose to increase their drinking if they perceive it as an unjustified threat to their freedom, as is described in some of the nanny state-oriented criticisms. Third, the negative commentary on the revised guidelines and the substantive criticisms that underpin it may also lead some people to reject or misunderstand the guidelines even if they are exposed to them. In combination, these caveats may mean that the initial sharp accumulation in effects on proximal outcomes from the announcement of revisions dissipates among drinkers who are not further exposed to the guidelines. Effects on these outcomes may then begin to accumulate steadily as some drinkers are repeatedly exposed to the guidelines through incidental mentions within articles, but this accumulation may plateau as the maximum level of diffusion is reached. Effects on distal outcomes, such as alcohol consumption behaviour, may be unlikely to arise from the news media reports identified as only the initial reporting contained sufficiently detailed explanation of the guidelines to constitute a call to action. Incidental mentions were more likely to state only the guideline consumption level and, therefore, were unlikely to prompt behaviour change. In the absence of any large-scale promotional campaign beyond the initial announcement, we would not expect this trajectory to be interrupted by any sharp changes in outcome measures at further time points after the initial announcement of revisions.
The findings also point to important implications for practice. First, the lack of articles presenting a positive, as opposed to simply factual, view of the drinking guidelines suggests a one-sided public debate. The lack of positive accounts of the guidelines from regular newspaper columnists is perhaps unsurprising as the majority of UK newspapers are regarded as on the political right and are often hostile to public health interventions. However, it is commonplace for public health actors to engage in public debate within newspapers via opinion pieces and letters to editors,73 so it is unclear why this did not happen after the revised drinking guidelines were announced. Analyses of previous policy debates in the UK and internationally suggest that, although public health actors have successfully embedded themselves with news media debate as valued information sources, their contributions are often less co-ordinated or strategic than those of commercial actors. 74,80 The dominance of negatively framed discussion of the guidelines after the initial announcement may be a further example of this strategic deficit.
Second, the criticism of drinking guidelines can be looked at from two perspectives. On the one hand, it features strategies commonly used by commercial actors within policy debate. These features include cherry-picking of evidence (e.g. citing evidence of cardiovascular benefits without noting that these were included in the epidemiological model underpinning the guidelines),137 invoking complexity as a barrier to action (e.g. highlighting that risk varies between individuals)138 and, less widely discussed in prior literature, questioning the integrity and motives of public health actors. On the other hand, public health actors should be conscious of their active role in facilitating these criticisms. For example, the decision to announce the revised guidelines alongside a report on cancer played a critical role in the guidelines being conflated with the ‘no safe level’ message, one of the key points of contention for critics. The CMO reinforced this by telling a parliamentary committee that people should follow my lead. Every time I drink, I choose between my glass of wine or an increased risk of breast cancer (paraphrased). 139 In a radio interview, she also described the extensive if disputed scientific evidence showing cardiovascular benefits of moderate drinking as ‘an old wives’ tale’ (The Guardian, 8 January 2016; reproduced with permission; Courtesy of Guardian News & Media Ltd). 140 Similarly, several members of the GDG are prominent advocates for public health interventions to tackle alcohol-related harm and can, therefore, legitimately be regarded as both political and scientific actors. 21 Furthermore, the public is presented with conflicting alcohol-related health advice on a regular basis, usually by scientific and public health institutions keen to promote their work. 141 Previous studies highlight the resulting difficulties faced and strategies adopted by the public in using such conflicting information to construct their understandings of health-related risks. 127,131,142 These examples suggest that criticism of drinking guidelines is in part a strategic response by commercial actors to a threat to their interests, but is also a reflection of the way that public health actors, and particularly public health scientists, engage with news media and the wider policy debate.
Third, the day-to-day reporting of alcohol-related topics is a continuous process irrespective of major policy announcements and presents an opportunity for exposing the public to alcohol-related health information. If this is regarded as important by public health actors, then they should seek to embed such information within press releases or in supporting or reaction quotations. Although the effectiveness of techniques used by different actors is not tested directly, previous research suggests that embedding multiple arguments within single quotations may be effective as well as providing a greater focus on population-level perspectives, the harms of alcohol to drinkers and others and the likely benefits of individual policies and multicomponent strategies. 74,80 In undertaking these actions, public health actors should, however, be mindful of the problems outlined above with regard to public health actors’ role in constructing criticism of the guidelines.
Chapter 4 Effects of promoting drinking guidelines on alcohol consumption behaviours and behavioural influences
Parts of this chapter have been reproduced with permission from Holmes et al. 143 This is an open access article distributed in accordance with the Creative Commons Attribution 4.0 Unported (CC BY 4.0) license, which permits others to copy, redistribute, remix, transform and build upon this work for any purpose, provided the original work is properly cited, a link to the licence is given, and indication of whether changes were made. See: https://creativecommons.org/licenses/by/4.0/.
Introduction
There is little robust evidence available on if and how the promotion of drinking guidelines affects alcohol-related outcomes. 13,28 One reason for this is that health authorities often do not actively promote drinking guidelines after publishing them. Our analysis of promotional activity (see Chapter 2) and news media coverage (see Chapter 3) suggests that this was the case for the 2016 revisions to the UK guidelines. We identified no large-scale promotional activity by the UK Government, PHE or any third-sector organisation. We also identified no large peaks in news media coverage after the initial announcement of the revised guidelines in January 2016.
The lack of promotional activity has three implications for our evaluation. First, it indicates that we should focus on January 2016 as our intervention point. Although the government did not formally adopt the revised guidelines until it had completed a public consultation in August 2016, there was no substantial change in news reporting at this time, and this leaves the January announcement as the only large-scale promotional event. Second, the lack of any large-scale promotional activity after January 2016 means that we cannot undertake our planned analysis of the effect of promotional campaigns that occurred at different points in time and we treat January 2016 as the sole intervention point. Third, our preregistered protocol and earlier chapters of this report state that our aim is to evaluate the impact of promoting revised drinking guidelines on alcohol consumption behaviour. However, in the absence of significant promotional activity, it is more accurate to describe the analyses below as an evaluation of the impact of announcing such guidelines, and we will use this language henceforth.
We planned to use a monthly repeat cross-sectional survey of adults in England to conduct a series of analyses to evaluate the impact of announcing the guidelines in three stages. First, we describe trends in respondents’ awareness and knowledge of drinking guidelines, where they report being exposed to the guidelines and influences on change in drinking behaviours. As part of this, we test whether or not the average level of measures of these outcomes differed between the pre- and post-intervention time point (i.e. January 2016) and across key population subgroups defined by sociodemographics and alcohol consumption level. Second, the primary analysis uses segmented regression to test whether or not alcohol consumption behaviour changed following the announcement of the revised drinking guidelines. Third, we assess the robustness of our results and competing interpretations via a series of secondary analyses involving alternative outcome measures and model specifications.
Methods
Data
The analyses use data from the Alcohol Toolkit Study (ATS). The ATS methods are summarised here and are described in full elsewhere. 144 The study is nested within a wider omnibus survey conducted by the research agency Ipsos MORI (Ipsos MORI, London, UK) and collects data from nationally representative samples of approximately 1700 adults aged ≥ 16 years living in private households in England each month. It samples participants using a hybrid between random location sampling and quota sampling, in which England is split into 171,356 areas containing approximately 300 households and a random sample is drawn from strata defined by area-level geographic and sociodemographic profiles. Each area is allocated to an interviewer, who conducts in-home computer-assisted interviews until they fill quotas tailored to each area and based on factors that influence the probability of an individual being at home (e.g. employment status, age and sex).
Although the ATS has collected data since March 2014, this project allowed additional questions relating to drinking guidelines to be added to the survey between November 2015 and October 2017. Therefore, the primary evaluation analysis used data collected between March 2014 and October 2017 (i.e. 22 months before and 22 months after the revised guidelines were announced) and descriptive or secondary analyses use data collected between November 2015 and October 2017 (i.e. 2 months before and 22 months after the announcement).
Measures for descriptive analyses
The ATS questionnaire asks drinkers about their awareness and knowledge of and exposure to the guidelines in sequence, as described below. We define drinkers as those who did not respond ‘never’ to the first question of the Alcohol Use Disorders Identification Test – Consumption (AUDIT-C) (see Primary outcome measures). Only drinkers who are aware of drinking guidelines are asked about their knowledge and only those who give a numerical response to the knowledge questions are asked about their exposure. Thus, the baseline sample is progressively smaller across each of these questions. The full Alcohol Use Disorders Identification Test (AUDIT) questionnaire is provided as an additional file (www.journalslibrary.nihr.ac.uk/programmes/phr/156301/#/documentation; accessed April 2020).
Awareness
The ATS measures awareness of guidelines using the question: ‘Before this interview, had you ever heard of there being a recommended maximum number of alcohol units people should drink in a day or a week? This is sometimes known as a “drinking guideline”’.
Knowledge
The questionnaire measured knowledge using the question ‘How many units per day or per week is the drinking guideline for males/females?’. Participants were asked only about their own sex’s guideline, with those identifying with neither sex excluded from analyses as it was unclear which guideline was appropriate to them. Participants could respond in either units per week or units per day to allow the question to remain unchanged before and after the revised guidelines were announced. This means that women giving the 1995 daily guideline would still be classed as having given the correct answer if they said 2 units per day rather than 14 units per week, but not if they said 1 unit per day. We trichotimise responses as more than, exactly or below 14 units per week or 2 units per day. This allows us to examine whether or not announcing the new guidelines increased the proportion of people saying the guideline was 14 units per week (or the daily equivalent).
Exposure
Interviewers provided participants with a list of places and scenarios and asked if they had seen, read or heard about the guideline figure they provided in each of them during the last month. The full list of options is as follows: TV/radio, newspapers/magazines, websites/social media, shops/supermarkets, pubs/bars/restaurants, at place of work/study, talking to health professional, posters/booklets at health service, talking to friends/family/colleagues, other, and none of the above. Responses were dichotomised as yes or no and there was no limit on the number of places participants could say ‘yes’ to.
Capability, opportunity, motivation and behaviour determinants of behaviour change
The ATS included an additional set of 10 questions with ordinal responses scales to capture the capability, opportunity and motivation components of the capability, opportunity, motivation and behaviour (COM-B) model of behaviour change. 68 COM-B is a well-supported model that integrates core constructs present in many earlier theories. It specifies that capability, opportunity and motivation interact within a system to generate behaviour. The 10 questions are presented in Table 4. The questions were designed for this project and were influenced by questions found to predict smoking behaviour in the Smoking Toolkit Study. 145 Responses to the COM-B questions are dichotomised into ‘positive’ and ‘negative’ groupings, as shown in Table 4. The first question is an exception as it asks how many units of alcohol can be regularly consumed in a day without significantly harming health, and the first two responses (1 and 2 units) are classed as positive to be consistent with the revised guidelines.
| COM-B dimension | Response option |
|---|---|
| Capability | |
| Knowledge | |
| Item 1: What do you think is the most number of units you can personally drink in a day on a regular basis before it does significant harm to your health? | 1a to 7+ units |
| Don’t know | |
| Perceived capability | |
| Item 2: How easy or difficult do you personally find it to drink three or fewer units of alcohol a day? | 1, extremely difficult, to 7, extremely easya |
| Skills | |
| Item 3: How often, if at all, do you keep track of how many units of alcohol you personally drink each week? | 1, never, to 7, alwaysa |
| Opportunity | |
| Social opportunity | |
| Item 4: How easy or difficult do you think your lifestyle makes it for you to personally drink three or fewer units of alcohol a day? | 1, extremely difficult, to 7, extremely easya |
| Item 5: Do you know where to go if you wanted advice or information on how to cut down on your drinking of alcoholic drinks? | 1, I have no idea, to 5, yes, definitelya |
| Motivation | |
| Reflective motivation | |
| Item 7: To what extent are you actively trying to avoid drinking more alcohol than is good for you? | 1, not at all, to 5, definitelya |
| Item 9: To what extent do you intend to keep your drinking within safe limits? | 1, not at all, to 5, definitelya |
| Automatic motivation | |
| Item 6: To what extent do you want to avoid drinking more than is good for you rather than just thinking that you should? | 1, not at all,, to 5, definitelya |
| Item 8: To what extent do you want to keep your drinking within safe limits? | 1, not at all, to 5, definitelya |
| Item 10: Nowadays how concerned, if at all, are you about drinking more units of alcohol than is good for you? | 1, not at all concerned, to 5, definitely concerneda |
Sociodemographic measures
Ipsos MORI collects a battery of sociodemographic measures from respondents as part of the wider omnibus survey. 144 Of these, we use participants’ sex, age (16–34, 35–64 and ≥ 65 years) and social grade, an occupation-based measure of socioeconomic status derived from the National Readership Survey. 147 Respondents are classified as grade AB (high), C1C2 (intermediate) or DE (low). The descriptive analyses also explore differences by alcohol consumption level using the graduated frequency measure of alcohol consumption described in Secondary outcome measures. Respondents are classified into three groups based on their weekly alcohol consumption: moderate drinkers, consuming < 14 units per week; increasing-risk drinkers, consuming between 14 and 35 units per week (women) or between 14 and 50 units per week (men); and high-risk drinkers, consuming > 35 units per week for women and > 50 units per week for men. 148
Measures for primary and secondary evaluation analyses
Primary outcome measures
The primary outcome is alcohol consumption behaviour, which the ATS measures using participants’ AUDIT-C scores. AUDIT-C is the short form of the AUDIT and is a validated screening test for heavy drinking and/or active alcohol abuse or dependence and has demonstrated excellent reliability and responsiveness to short-term change. 149,150 Although the ATS collects data using the extended AUDIT-C, which provides additional response options on one question, we collapsed these additional options to match those in the standard questionnaire before calculating participants’ scores. The AUDIT-C questionnaire comprises three questions that ask about respondents’ alcohol consumption frequency (never, monthly or less, 2–4 times per month, 2 or 3 times per week or ≥ 4 times per week), quantity of standard drinks consumed on a typical drinking day (1–2, 3–4, 5–6, 7–9, 10–12, 13–15 or ≥ 16) and frequency of drinking six or more standard drinks (never, monthly or less, monthly, weekly, or daily or almost daily). A standard drink is defined for ATS respondents as 1 UK unit (i.e. 8 g/10 ml ethanol). Each response option is scored from 0 to 4, with the extended AUDIT-C response options of ≥ 10 for the quantity question all scoring 4 points. Scores are then summed to give the total AUDIT-C score.
Secondary outcome measures
We also explore a series of secondary outcome measures to test the robustness of our results.
Alcohol consumption measured using graduated frequency
Between November 2015 and October 2017, the ATS also collected alcohol consumption data using a graduated frequency approach. 151,152 This asks drinkers (1) on how many days they drank during the last 4 weeks, (2) how many units they consumed on their heaviest drinking day, (3) on how many days they drank at that level and (4) on how many days they drank at the following progressively decreasing levels starting from their maximum (31–40 units, 21–30 units, 16–20 units, 11–15 units, 8–10 units, 5–7 units, 3–4 units, 1–2 units). The number of days consuming each quantity was then multiplied by that quantity (with midpoints used for ranges) and the sum of the multiples was divided by 4 to give a measure of average weekly units consumed.
Alcohol consumption measured using alcohol duty data
We also use an aggregate-level measure of alcohol consumption that can be derived from the monthly alcohol duty bulletins released by Her Majesty’s Revenue and Customs (HMRC). This measure is litres of pure alcohol released for sale per adult aged ≥ 16 years. It is not subject to self-report biases but is subject to other general biases that are discussed by Meier et al. 153 It may also be subject to temporal biases when used as a monthly time series, as it is here, to the extent that alcohol producers stockpile or release excess volumes of product onto the market for commercial reasons rather than to meet demand.
Hospital admissions for alcohol-related harm
Data on monthly hospital admissions for alcohol poisoning [International Statistical Classification of Diseases and Related Health Problems, Tenth Revision (ICD-10): T51.0, T51.1, T51.9] and assaults (ICD-10: X85–Y09) provide objective proxy measures of change in heavy episodic drinking and alcohol-related violence, respectively. We use raw counts of monthly hospital admission for each of two groups of ICD-10 codes.
Covariates
The evaluation analyses control for change in alcohol prices and weather. We control for prices using monthly retail price indices for four beverage categories (on-trade beer, off-trade beer, on-trade wine and spirits, and off-trade wine and spirits) from the ONS. 154 The Met Office provides freely accessible monthly temperature data for locations in England but not for the country as a whole. 155 Therefore, we use the Met Office’s Hadley Centre Central England Temperature (HadCET), which records the average monthly temperature across an area of central England approximately enclosed by London, Bristol and Lancashire. 156
Analysis
Descriptive analyses
All descriptive analyses are based on data that are weighted using an iterative sequence of weighting adjustments that compares variables against separate nationally representative target profiles for sex, working status, children in the household, age, social grade and region until the targets are met. Comparisons of outcome measures pre and post intervention are based on the average response of all respondents surveyed in each of the two time periods and the significance of differences is assessed using chi-squared tests. Comparisons between population subgroups defined by sociodemographic characteristics or alcohol consumption levels are based on post-intervention data only so as to assess whether or not differences are present between groups after the guidelines are announced. The significance of differences is tested using multivariate logistic regressions adjusting for each of the other subgroup characteristics.
Primary analyses (planned): alcohol consumption
We used an interrupted time series design to assess the effect of the drinking guidelines on AUDIT-C scores using individual-level data. Data were analysed with segmented regression using generalised additive models (GAM) [R (The R Foundation for Statistical Computing, Vienna, Austria) package mgvc], which allow the analyst to account for complex seasonality. The analyses use the Gaussian family with identity link. Each GAM modelled the trend in the dependent variable in the pre-intervention period, any immediate step change in the dependent variable when the guidelines were introduced and any change in the trend in the post-intervention period relative to the pre-intervention period. We ran unadjusted models and models adjusting for temperature and monthly price index for four beverage categories. All models were adjusted for seasonality.
Secondary analyses (planned)
We evaluated the impact of announcing the revised drinking guidelines on two alternative alcohol consumption measures (i.e. graduated frequency and alcohol duty data). The ATS included graduated frequency questions only from November 2015, 2 months before the new drinking guidelines came into effect. As the series was not long enough to model the pre-intervention trend, the analysis could not use the preplanned interrupted time series design. Instead, we conducted a simple pre/post analysis. We ran unadjusted and adjusted GAMs, controlling for alcohol prices and temperature, at the individual level for graduated frequency and at the aggregate level for sales data. The partial autocorrelation function indicated the presence of first-order autoregression for the sales data. This was confirmed by comparing models with various fitted autoregression moving average (MA) terms using the Akaike information criterion (AIC). This autocorrelation was taken into account by extending the GAM to a generalised additive mixed model (GAMM) using the Gaussian family with identity link.
We also use an interrupted time series design to evaluate the impact of announcing the revised guidelines on incidence of alcohol poisoning and assaults. As above, the partial autocorrelation function indicated the presence of first-order autoregression. We again confirmed this by comparing models with various fitted autoregression and MA terms using the AIC and then took this autocorrelation into consideration by extending the GAM to a GAMM. The hospital admissions data were counts and overdispersed, which required negative binomial regression models. As above, each GAM modelled the trend in the dependent variable in the pre-intervention period, any immediate step change in the dependent variable when the guidelines were introduced and any change in the trends in the post-intervention period relative to the pre-intervention period. We again ran unadjusted models and adjusted models.
In addition to using the January 2016 announcement as the break point in the segmented regression models, we also used an iterative procedure to identify statistically if there were any alternative significant break points present in the AUDIT-C data. This analysis was run using the R segmented package, which compares models specified with different break points. The analyst must give a starting value for the break point parameters, but, as the package implements bootstraps, restarting it makes the algorithm insensitive to starting values. 157 After identifying an alternative break point, we then re-ran the GAM to model the trend before the identified break point and the trend following the identified break point.
We also tested for a pulse effect (i.e. an immediate but short-term change) following the intervention by running GAMs with a 2-month (January to February 2016) and 3-month (January to March 2016) pulse. Furthermore, we tested whether a quadratic or cubic model fitted the trends in the data better than the linear model in our primary analyses by running segmented polynomial GAM regression models.
Sensitivity analyses (unplanned)
Variability in AUDIT-C post intervention was greater than anticipated. Such variability reduces power to detect an effect and can produce poor model specification if there are significant outliers or influential points. To mitigate this variability, sensitivity analyses were included that specified a longer post-intervention period, until February 2018.
Analyses not undertaken
We did not proceed with the planned difference-in-difference analyses to test whether or not effects were larger in drinkers exposed to the guideline and a pathway analysis to understand the relationship between changes in the COM-B measures after assessing the final results from the primary analysis.
Results
Descriptive analyses: awareness, knowledge and exposure
Table 5 summarises the characteristics of the sample and provides pre- and post-intervention data on the primary and secondary outcome measures, as well as measures of statistical differences in measures between these time points. Figure 7 shows that the proportion of respondents who were drinkers varied across the study period, between 72.8% in April 2015 and 62.7% in November 2016. The proportion of respondents who were drinkers was higher in the pre-intervention period than in the post-intervention period (70.4% vs. 65.7%, χ2 = 171.5; p < 0.001). During the shorter period from November 2015, when the ATS included questions related to drinking guidelines, the proportion of respondents who were drinkers peaked at 70.3% in November 2015.
| Measure | Total (n)a | Pre interventiona | Post interventiona | Chi-squared test | p-value |
|---|---|---|---|---|---|
| Total | |||||
| n (March 2014 to October 2017) | 74,388 | 36,905 | 37,483 | ||
| n (November 2015 to October 2017) | 40,832 | 3349 | 37,483 | ||
| Sex | |||||
| Men | 74,371 | 49.0 | 49.0 | 0.0 | 0.99 |
| Women | 51.0 | 51.0 | |||
| Age (years) | |||||
| 16–34 | 74,388 | 31.1 | 31.1 | 0.3 | 0.73 |
| 35–64 | 48.1 | 47.9 | |||
| ≥ 65 | 20.8 | 21.1 | |||
| Social grade | |||||
| AB | 74,388 | 27.0 | 27.1 | 0.1 | 0.93 |
| C1C2 | 49.4 | 49.3 | |||
| DE | 43.6 | 23.7 | |||
| Drinker (March 2014 – October 2017) | 48,875 | 70.4 | 65.7 | 163.7 | 0.00 |
| AUDIT-C score (mean)b | 48,696 | 4.1 c | 4.4 c | –10.2 c | 0.00 |
| Litres of ethanol released for sale per adult | 0.81c | 0.79c | 0.64c | 0.26 | |
| Assaults | 2261.7c | 2197.6c | 1.0c | 0.16 | |
| Alcohol poisonings | 190.9c | 186.2c | 0.7c | 0.25 | |
| Drinker (November 2015 to October 2017) | 26,335 | 68.1 | 65.7 | 6.5 | 0.01 |
| Units per week from graduated frequency | 22,404 | 9.7 | 9.9 | –0.3 | 0.61 |
| Moderated | 21,829 | 78.3 | 77.3 | 0.9 | 0.41 |
| Increasing riskd | 18.7 | 20.0 | |||
| High riskd | 3.0 | 2.7 | |||
| Aware of guidelines | 26,306 | 86.0 | 87.0 | 1.6 | 0.20 |
| Identifies guidelines as 14 units per week | 22,466 | 21.4 | 23.9 | 16.6 | 0.00 |
| Last month exposure to guideline via: | 19,548 | ||||
| Product label | 20.1 | 22.1 | 2.6 | 0.11 | |
| TV or radio | 34.2 | 39.1 | 11.8 | 0.00 | |
| Newspapers or magazines | 15.8 | 17.6 | 2.5 | 0.11 | |
| Websites or social media | 6.0 | 7.5 | 3.7 | 0.05 | |
| Shops or supermarkets | 8.3 | 8.3 | 0.0 | 0.98 | |
| Pubs, bars or nightclubs | 13.0 | 11.1 | 4.5 | 0.03 | |
| Place of work or study | 6.5 | 7.4 | 1.1 | 0.30 | |
| Health professional | 8.9 | 8.0 | 1.5 | 0.22 | |
| Health service | 11.1 | 11.7 | 0.5 | 0.47 | |
| Friends, family or colleagues | 6.4 | 7.5 | 2.0 | 0.16 | |
| Other | 1.4 | 0.6 | 9.4 | 0.00 | |
| None of these places | 29.3 | 23.5 | 20.9 | 0.00 | |
| COM-B measures | |||||
| Can drink only up to 2 units before harm | 24,245 | 34.2 | 35.6 | 1.26 | 0.26 |
| Easy to drink moderately | 26,203 | 82.5 | 82.0 | 0.24 | 0.63 |
| Tracks units | 26,274 | 26.7 | 25.9 | 0.46 | 0.50 |
| Lifestyle makes it easy | 26,143 | 76.9 | 79.4 | 6.5 | 0.01 |
| Know where to get advice | 26,233 | 78.6 | 82.3 | 16.0 | 0.00 |
| Trying not to drink more than is good for me | 26,063 | 48.7 | 51.2 | 3.8 | 0.05 |
| Intends to drink moderately | 26,249 | 77.0 | 77.5 | 0.2 | 0.65 |
| Wants to avoid drinking excessively | 26,247 | 76.0 | 76.4 | 0.2 | 0.69 |
| Trying to avoid drinking excessively | 26,224 | 39.3 | 39.6 | 0.1 | 0.77 |
| Concerned by drinking too much | 26,256 | 24.4 | 23.8 | 0.3 | 0.56 |
FIGURE 7.
The proportion of respondents who are (a) drinkers; (b) drinkers who are aware of the guidelines; and (c) drinkers who can correctly identify the guideline. Reproduced with permission from Holmes et al. 143 This is an open access article distributed in accordance with the Creative Commons Attribution 4.0 Unported (CC BY 4.0) license, which permits others to copy, redistribute, remix, transform and build upon this work for any purpose, provided the original work is properly cited, a link to the licence is given, and indication of whether changes were made. See: https://creativecommons.org/licenses/by/4.0/.
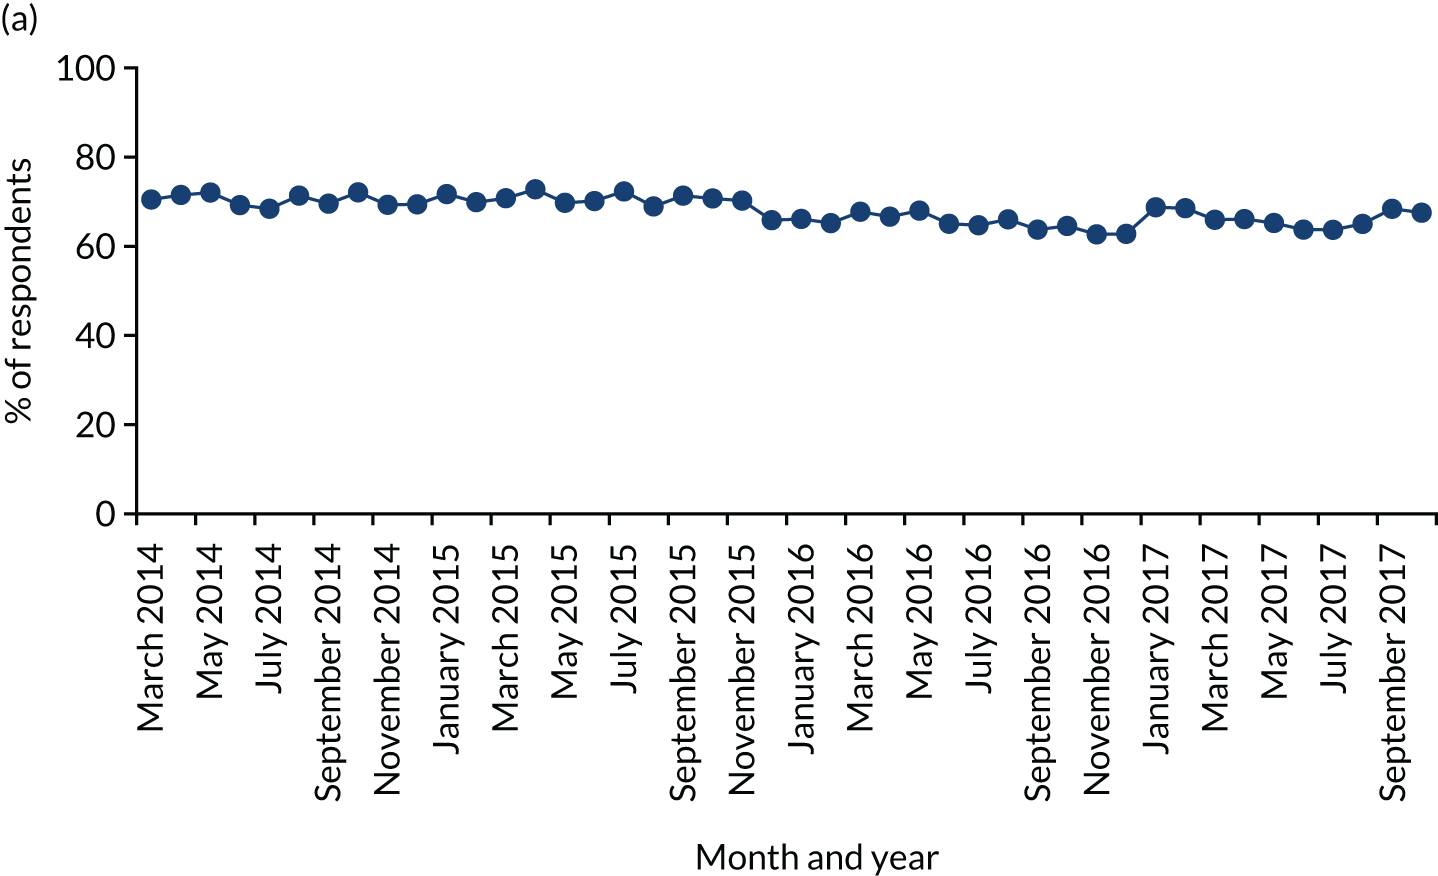
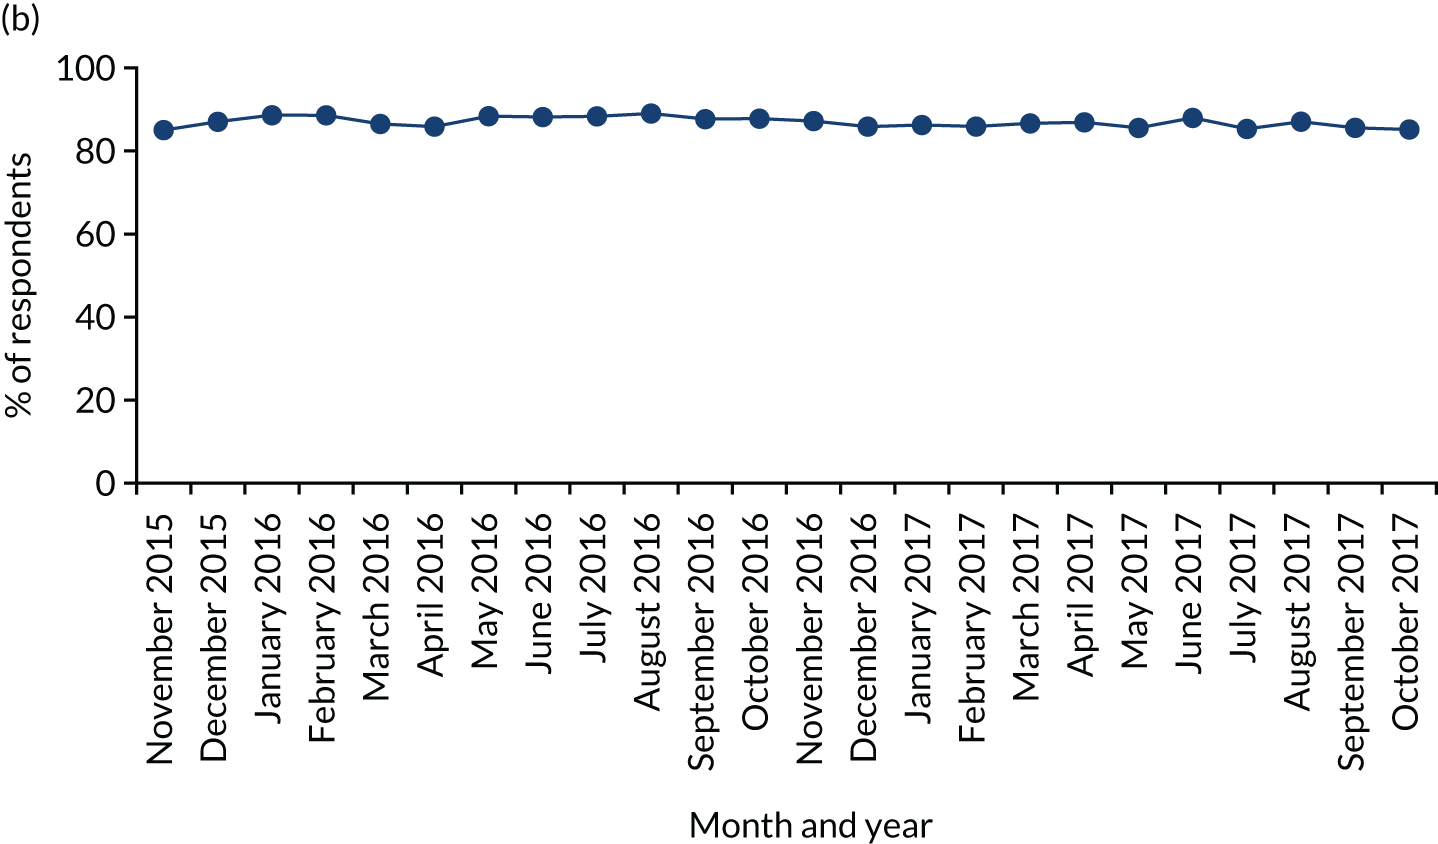
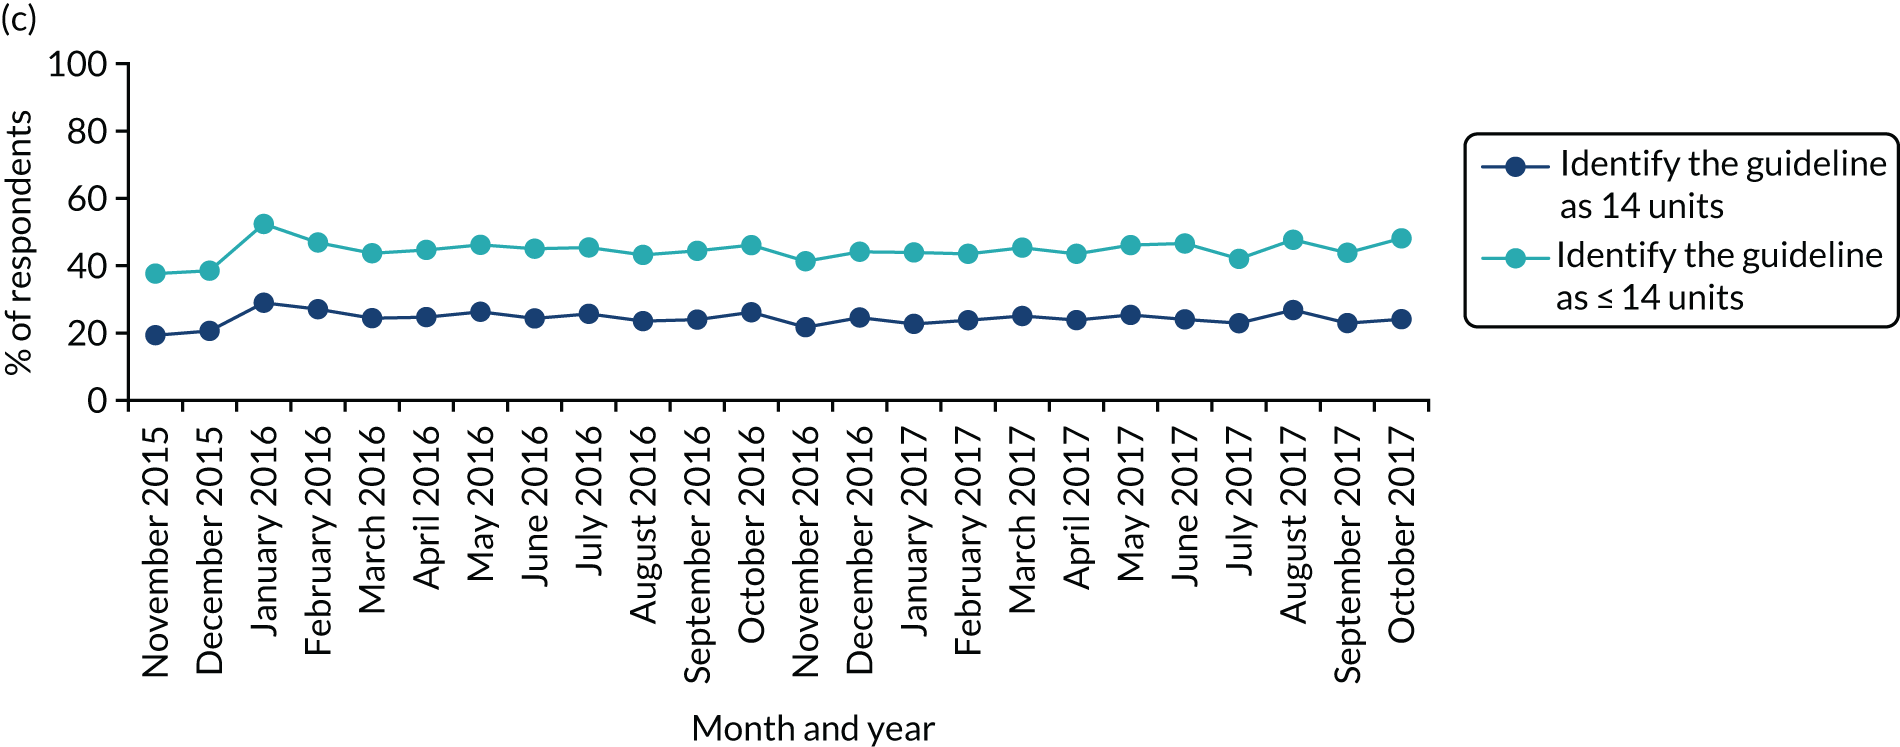
Figure 7 also shows that awareness of guidelines among drinkers was high across the shorter study period, at an average of 86.9%, and did not change substantively after the revised guidelines were announced. Furthermore, Figure 7 shows that knowledge of guidelines did change to a modest degree during the study period. Among drinkers who were aware of guidelines, in December 2015, 20.6% said that the guideline was 14 units per week (or 2 units per day), and this rose to 29.0% in January 2016, when the guidelines were announced. However, this increase in knowledge dissipated over subsequent months, and only 24.1% of drinkers identified the guideline correctly in October 2017.
Overall, the proportion of drinkers who correctly identified the guideline was slightly lower in the pre-intervention than the post-intervention period, suggesting a small improvement in knowledge (20.6% vs. 23.7%, χ2 = 4.2; p = 0.04). The analyses show a similar pattern of results if those who said that the guideline was < 14 units are combined with those who gave the correct answer.
The guideline for men changed to a greater degree than the guideline for women, so we compared the change in knowledge between the two sexes (Figure 8). Among drinkers, in December 2015, 9.1% of men who were aware of the guidelines said that the guideline was 14 units per week, and this rose to 23.8% in January 2016 before falling to 20.1% in October 2017. Among women, the change was smaller: the proportion of drinkers who stated that the guideline was 14 units per week was 33.2% in December 2015, rising to 34.6% in January 2016 and falling to 28.6% in October 2017. The proportion of male drinkers identifying the guideline correctly was higher in the post-intervention period than in the pre-intervention period (17.6% vs. 9.1%, χ2 = 42.9; p < 0.001), but this was not the case for women (30.1% vs. 31.7%, χ2 = 0.9; p = 0.35).
FIGURE 8.
The proportion of drinkers correctly identifying the guidelines, by sex.
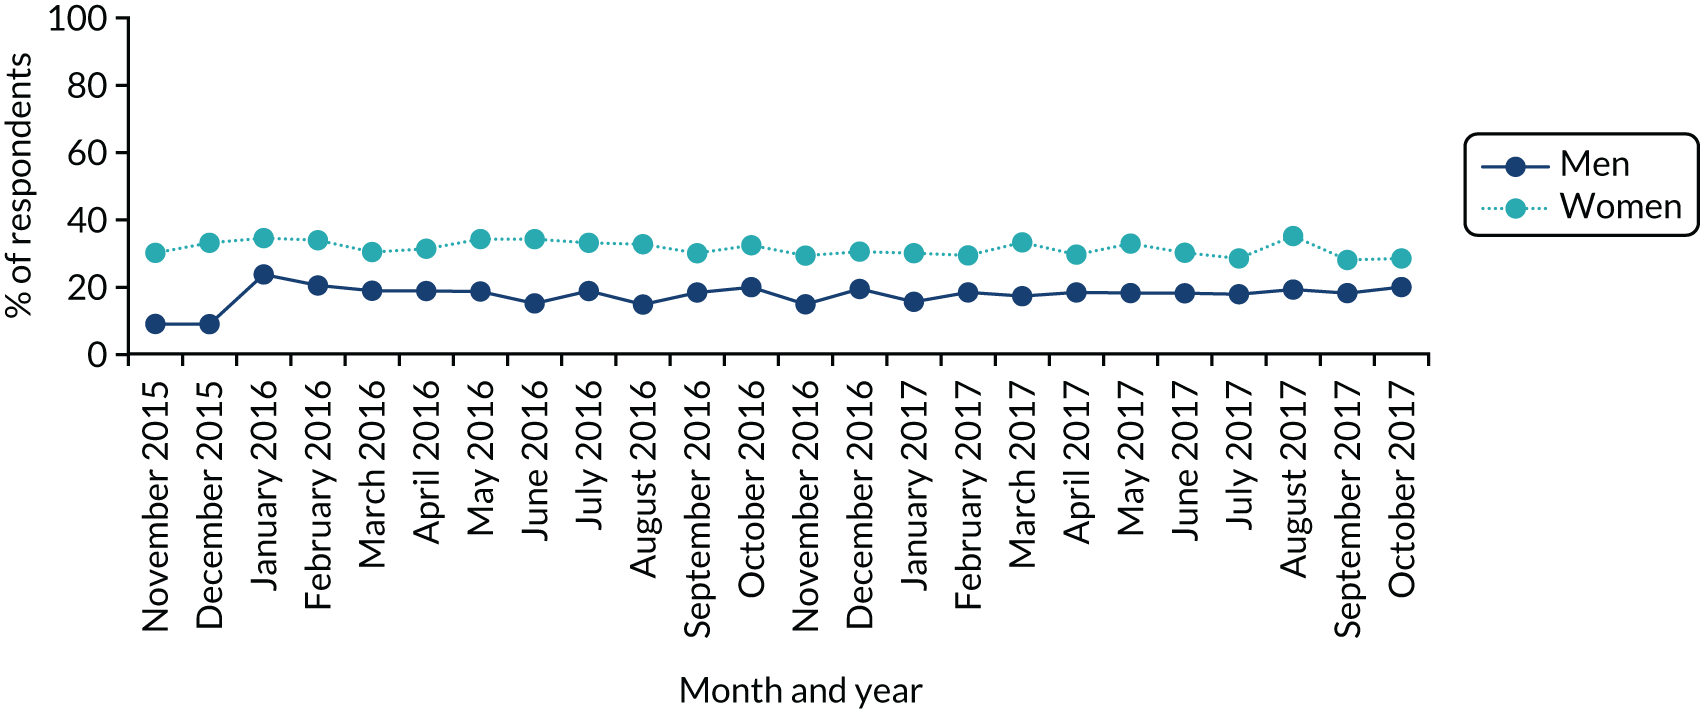
Exposure questions were asked only to the 68.8% of drinkers who were able to name a figure for the guideline consumption level irrespective of whether or not it was correct. There were only three locations in which more than 20% of this subsample reported exposure to the guideline in the last month (Figure 9). These locations were on the TV or radio, on product labels, and in newspapers or magazines. TV and radio was the most commonly cited source of exposure to the guideline, with 32.5% reporting last-month exposure in December 2015, rising to 64.8% following the guideline announcement in January 2016, which attracted prominent news coverage. Exposure via TV and radio then fell gradually to vary between 28.8% and 35.6% across 2017. Exposure via newspapers and magazines showed a similar peak and then decline but varied only between 12.6% and 24.3% across the study period. As would be expected, exposure via product labels did not peak when the revised guidelines were announced as product labels were not updated immediately and exposure via labels varied between 14.3% and 27.7% across the study period. Overall, slightly more of this subsample of drinkers reported exposure to their reported guideline figure post intervention than pre intervention (76.5% vs. 70.8%, χ2 = 20.9; p < 0.001). However, a significant increase in exposure was found only in the case of TV and radio (39.1% vs. 34.2%). The findings on exposure did not differ substantively when limiting the subsample to those respondents who correctly identified the guideline rather than those identifying any guideline. Figure 10 shows that, across the study period, only between 20% and 30% of the subsample were not exposed to guidelines in any location during the last month.
FIGURE 9.
The proportion of drinkers giving a figure for the guidelines who reported exposure to that figure in different locations during the last month. Reproduced with permission from Holmes et al. 143 This is an open access article distributed in accordance with the Creative Commons Attribution 4.0 Unported (CC BY 4.0) license, which permits others to copy, redistribute, remix, transform and build upon this work for any purpose, provided the original work is properly cited, a link to the licence is given, and indication of whether changes were made. See: https://creativecommons.org/licenses/by/4.0/.
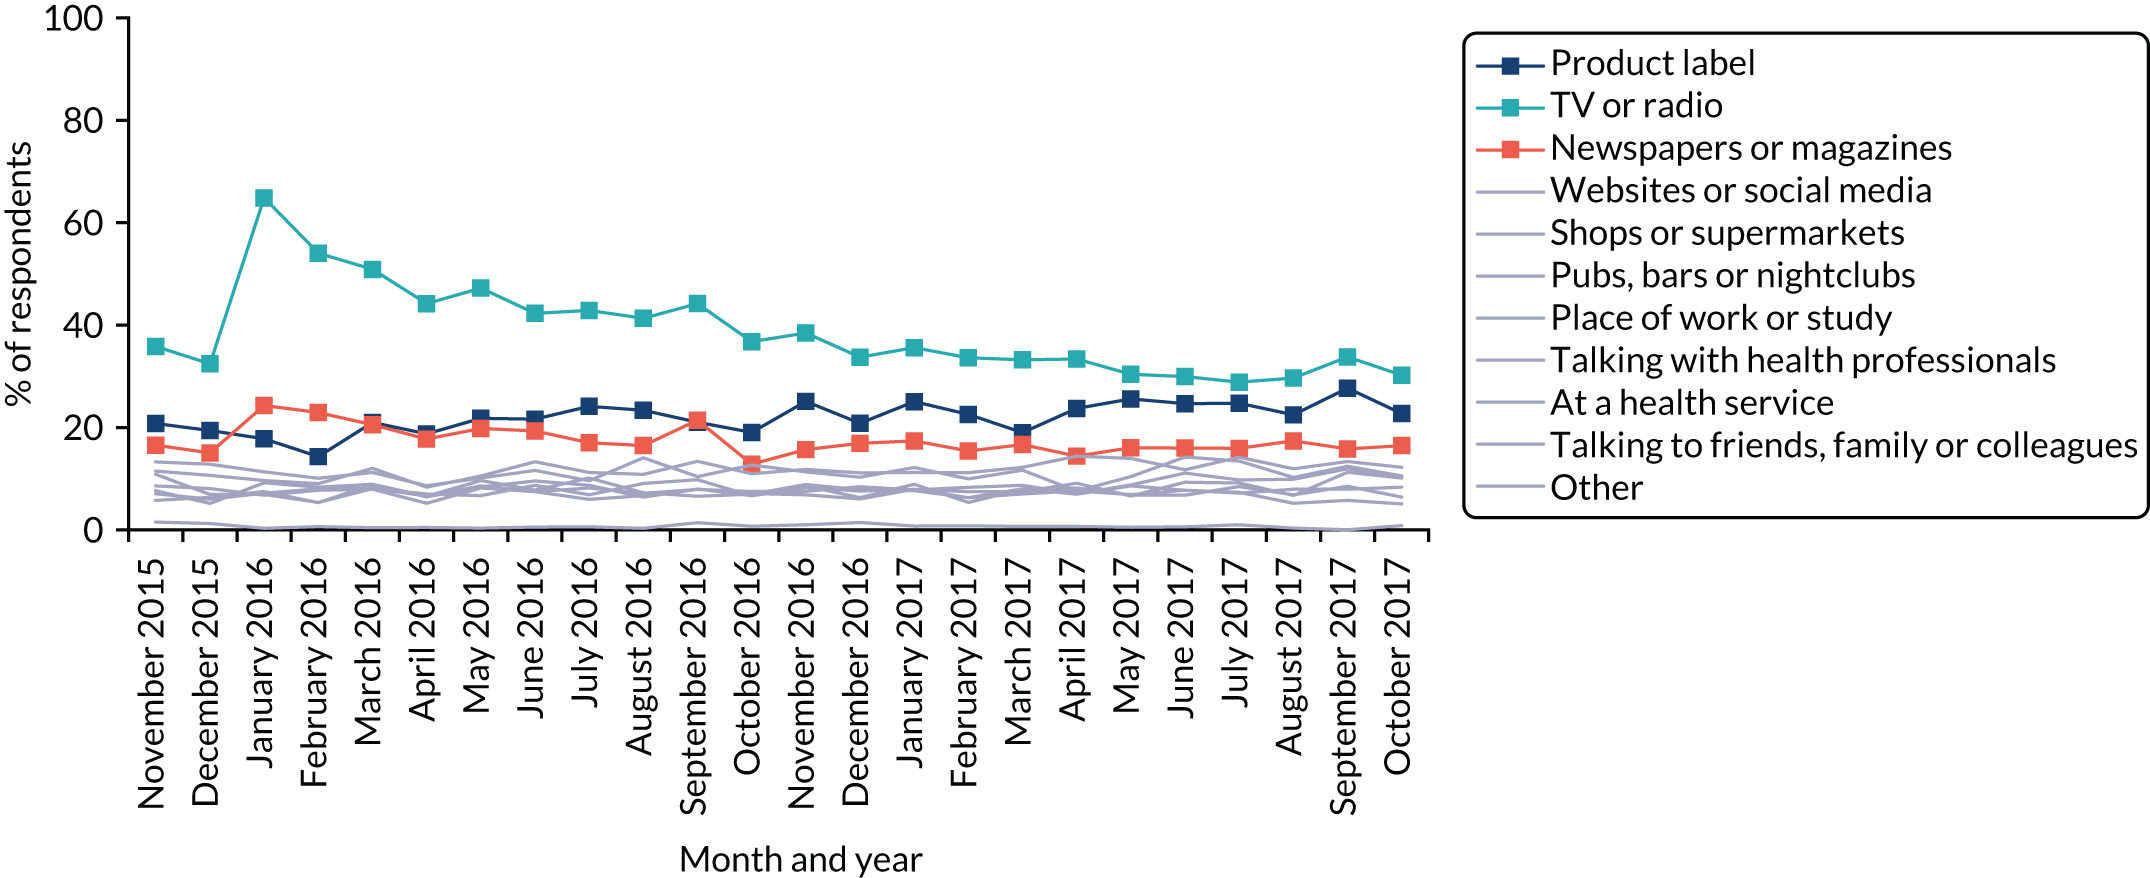
FIGURE 10.
The proportion of drinkers giving a figure for the guidelines who reported no exposure to that figure in any location during the last month.
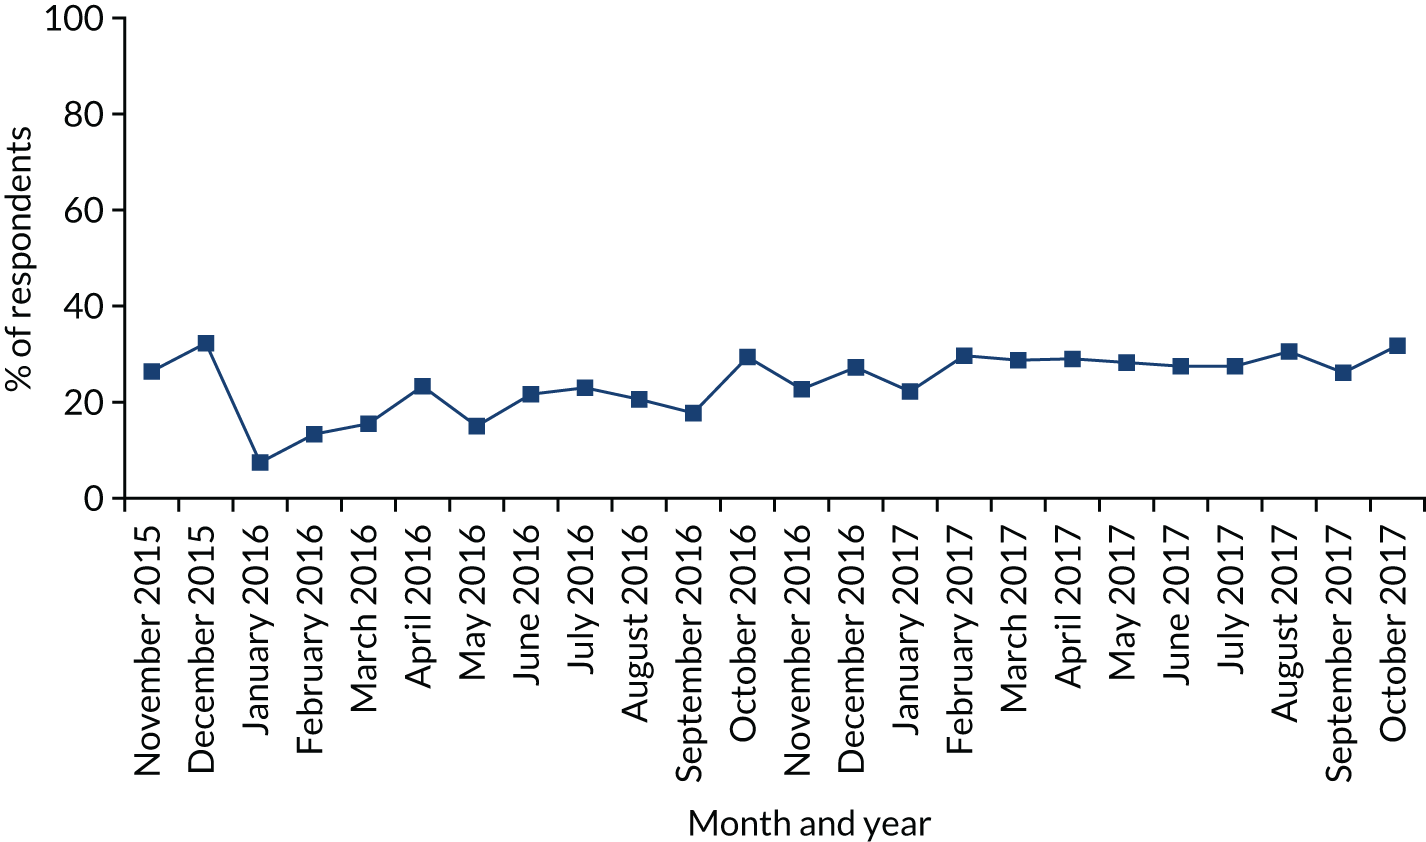
There were differences between sociodemographic and consumption groups in likelihood of being a drinker as well as awareness, knowledge and exposure to the guideline (Figure 11; see Appendix 3 for full regression results). Respondents who were men, older or of a higher social grade were more likely to be drinkers. In general, awareness, knowledge and exposure were higher among those in higher social grades and those drinking at increasing- or high-risk levels. For example, awareness and knowledge varied particularly by social grade. Awareness fell from 92.4% among those in grade AB to 78.5% among those in grade DE, and 27.3% of those in grade AB identified the guideline correctly, compared with 18.1% of those in grade DE. Exposure showed more variation in social patterning depending on the medium, although rates of exposure were generally low in all cases and the most likely means of exposure for all groups were via product labels, TV or radio, and newspapers or magazines. Overall, those aged 16–24 years and heavier drinkers were more likely to report exposure in at least one medium. Older drinkers were more likely to report exposure through TV, radio, newspapers and magazines but younger drinkers were more likely to report exposure via product labels, licensed venues or talking to friends, family and colleagues. Those in lower social grades were less likely to report exposure via newspapers and magazines. Notably, heavier drinkers were more likely to report exposure by talking to health professionals, or from posters or booklets at health services, as well as by talking to friends, family or colleagues.
FIGURE 11.
The proportion of respondents who are drinkers, aware of guidelines, know the correct guideline or have been exposed to the guidelines in different locations, by sociodemographic and consumption group. (a) Drinker; (b) aware of guidelines; (c) know correct guideline; (d) exposed via product labels; (e) exposed via TV or radio; (f) exposed via newspapers or magazines; (g) exposed via websites or social media; (h) exposed via shops or supermarkets; (i) exposed via pubs, bars or nightclubs; (j) exposed via place of work or study; (k) exposed via health professionals; (l) exposed via health services; (m) exposed via friends, etc.; (n) exposed via other means; and (o) exposed in no places. Light-blue bars indicate a significant difference compared with the left-most category within characteristic in multivariate logistic regressions adjusting for all listed characteristics.
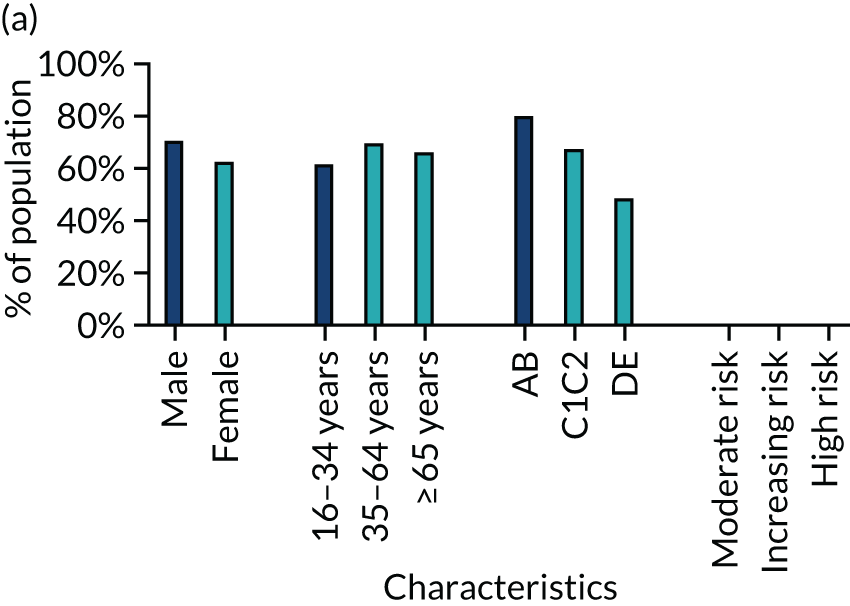
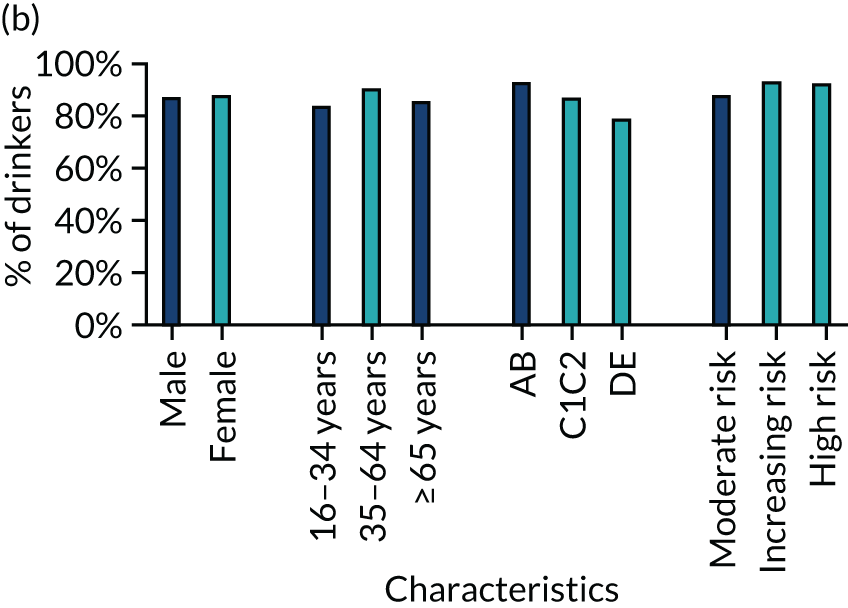
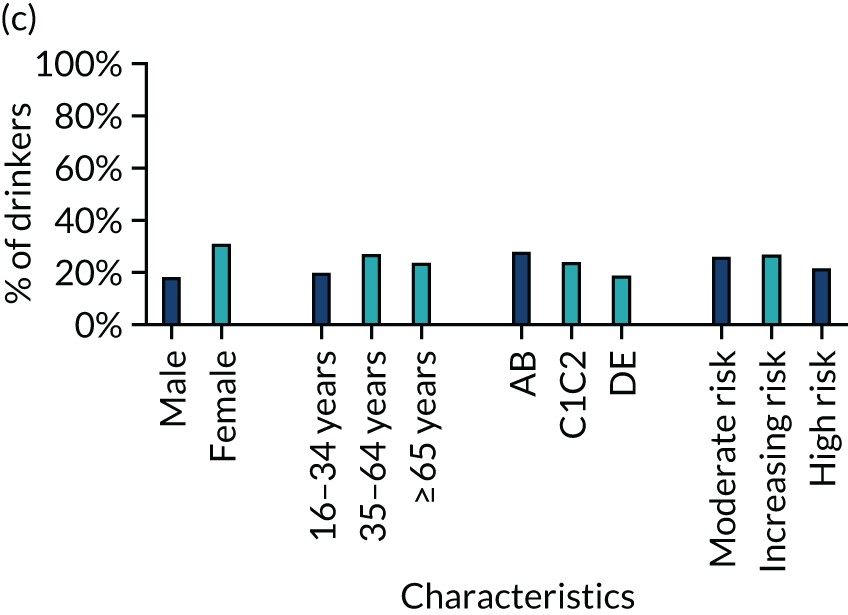
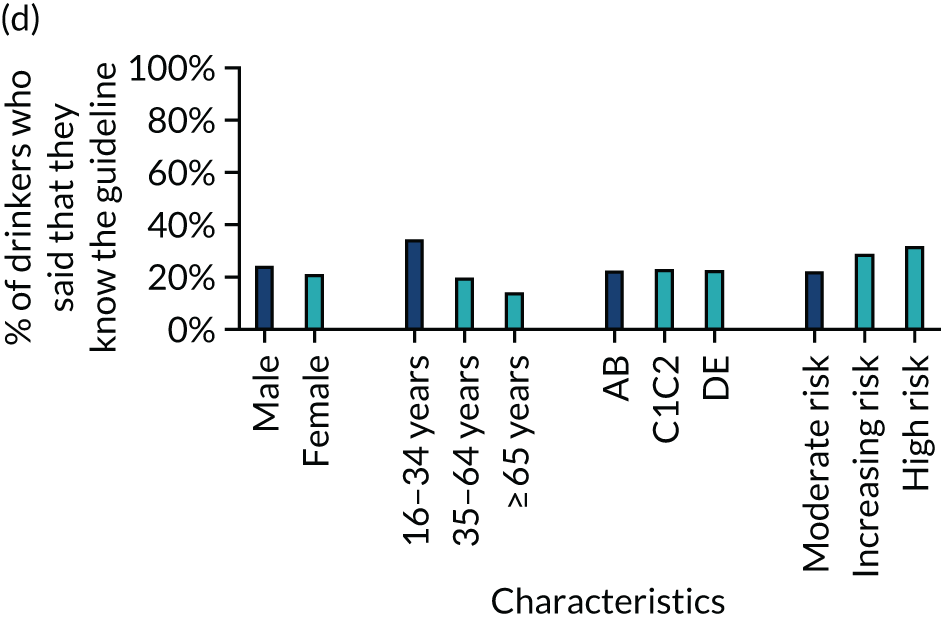
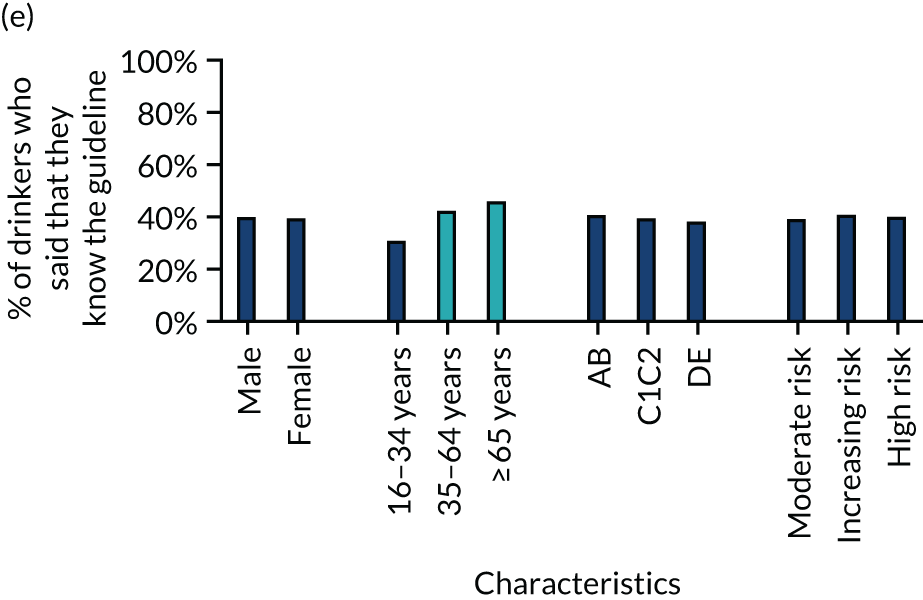
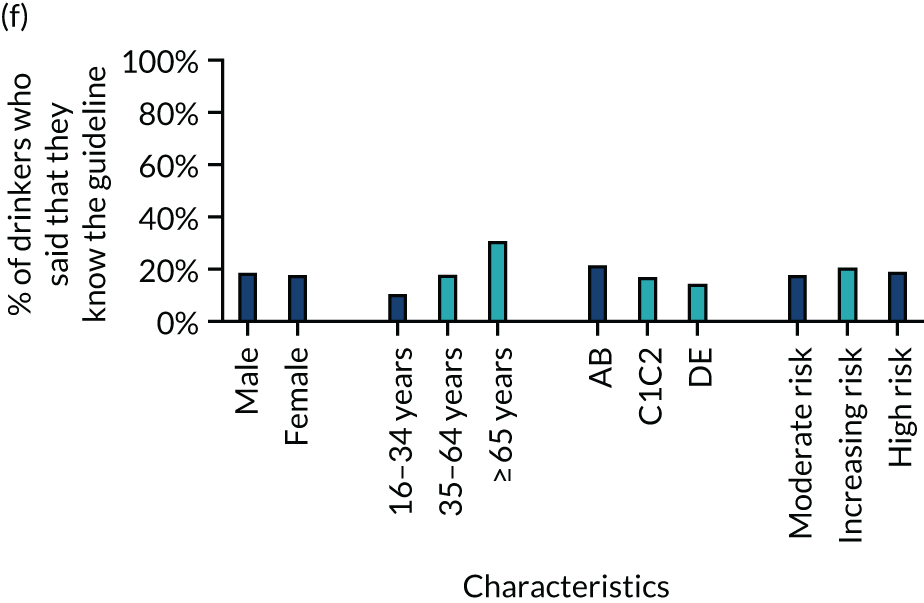
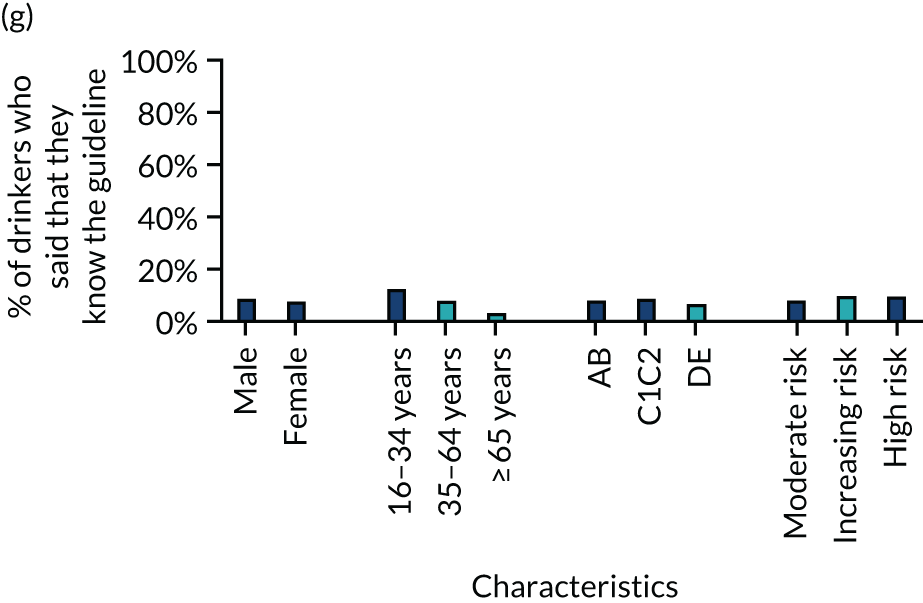
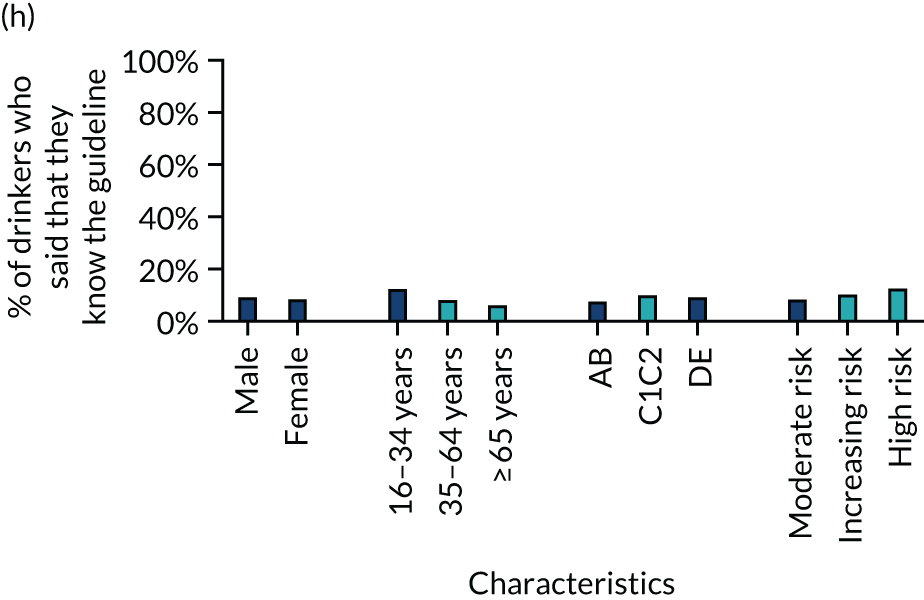
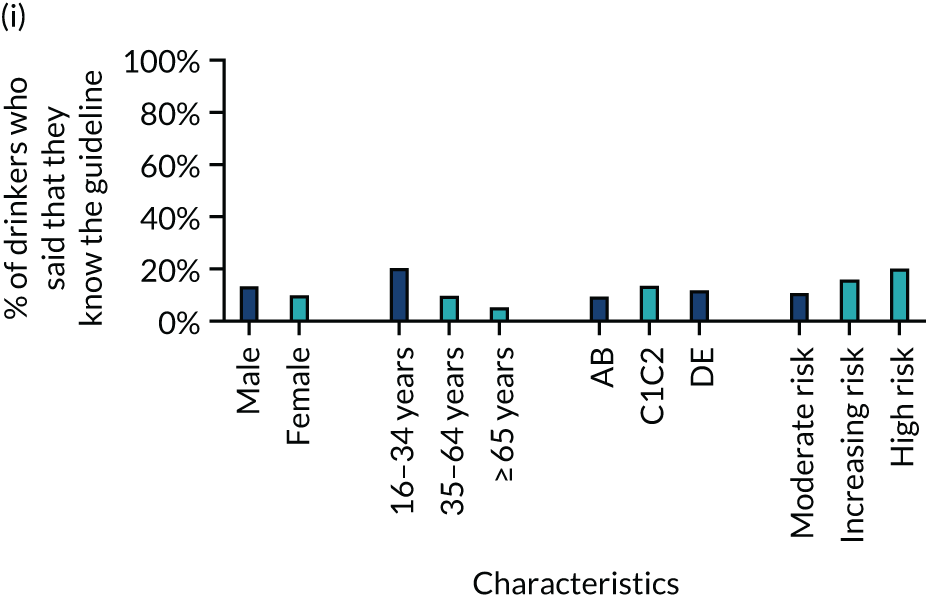
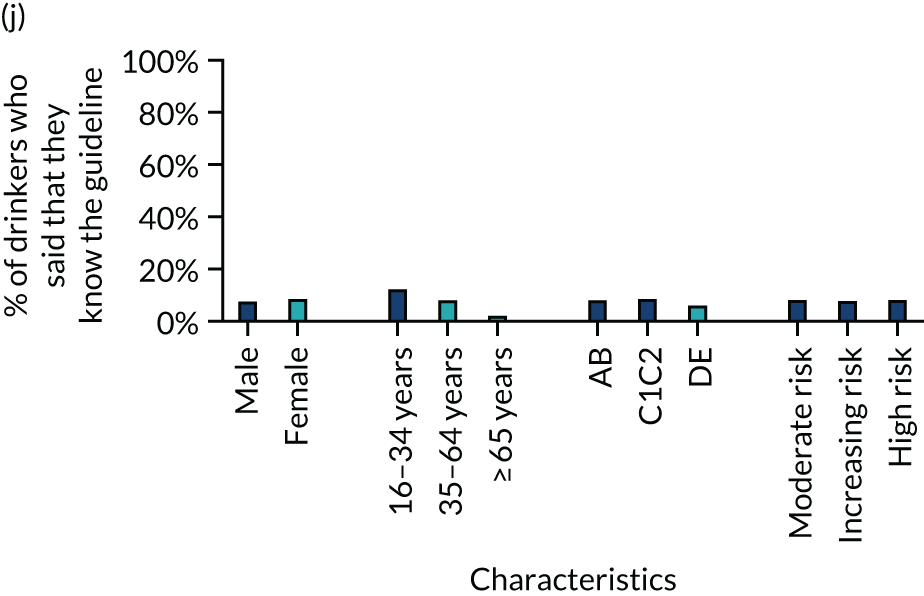
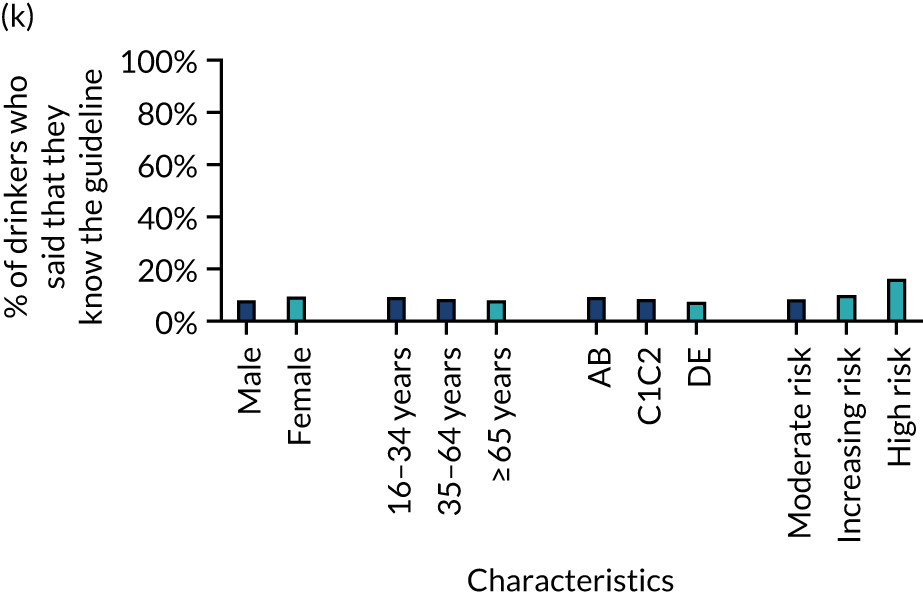
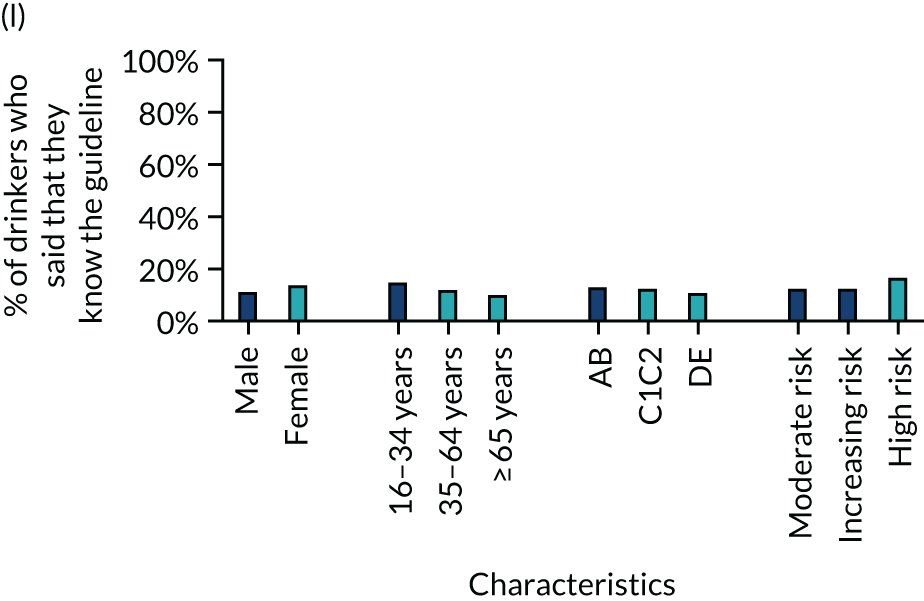
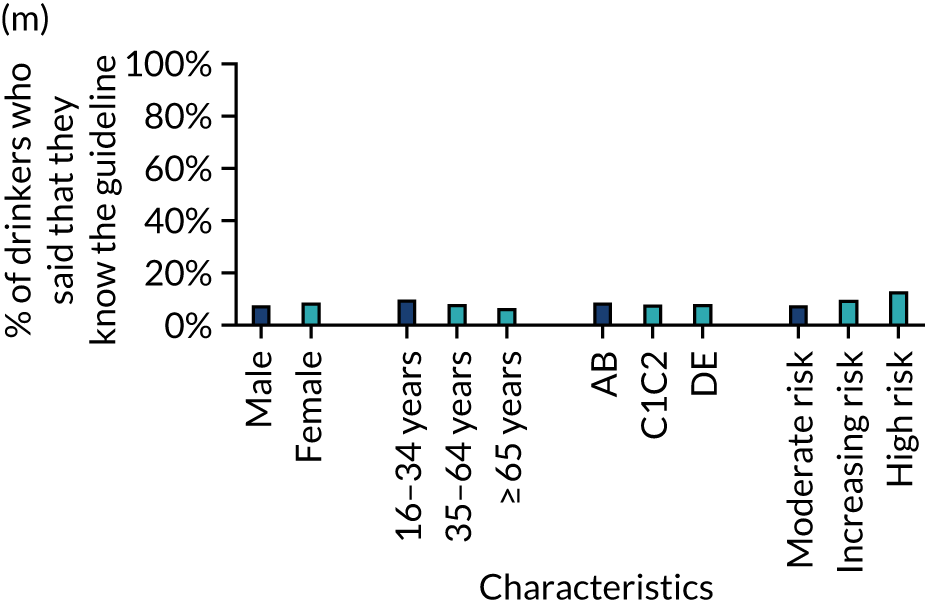
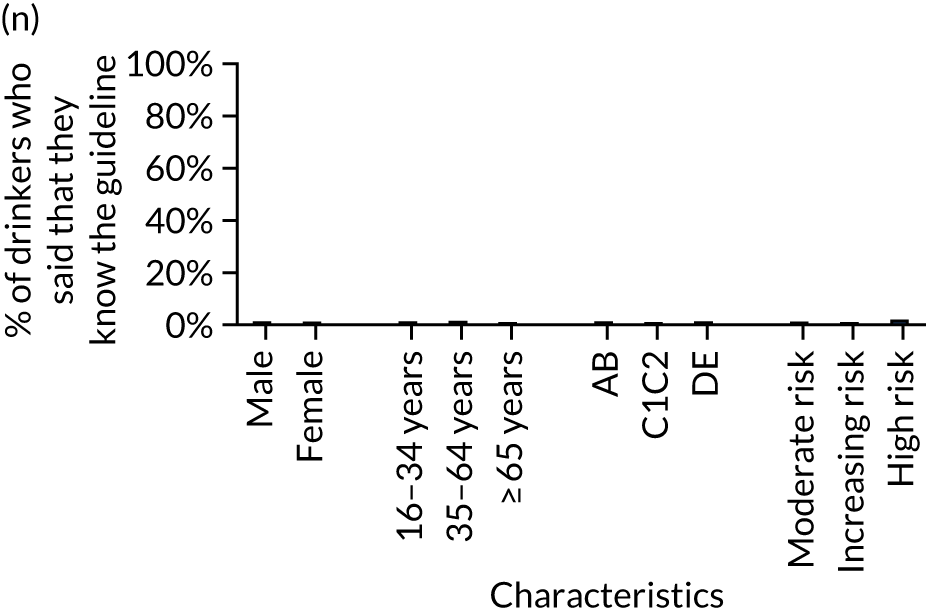
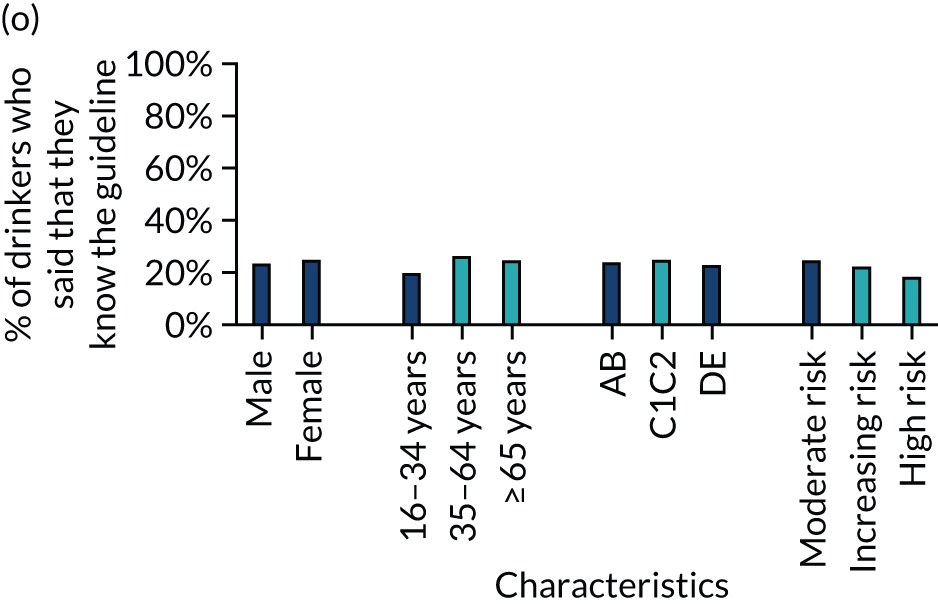
Descriptive analyses: capability, opportunity and motivation
Figures 12–15 show trends in the dichotomised COM-B measures over the study period. Although some of these measures did change significantly after the announcement of revised guidelines, these changes were small and there is little evidence of any substantial change over time.
FIGURE 12.
The proportion of respondents answering positively to capability-related outcome measures over time. Reproduced with permission from Holmes et al. 143 This is an open access article distributed in accordance with the Creative Commons Attribution 4.0 Unported (CC BY 4.0) license, which permits others to copy, redistribute, remix, transform and build upon this work for any purpose, provided the original work is properly cited, a link to the licence is given, and indication of whether changes were made. See: https://creativecommons.org/licenses/by/4.0/.
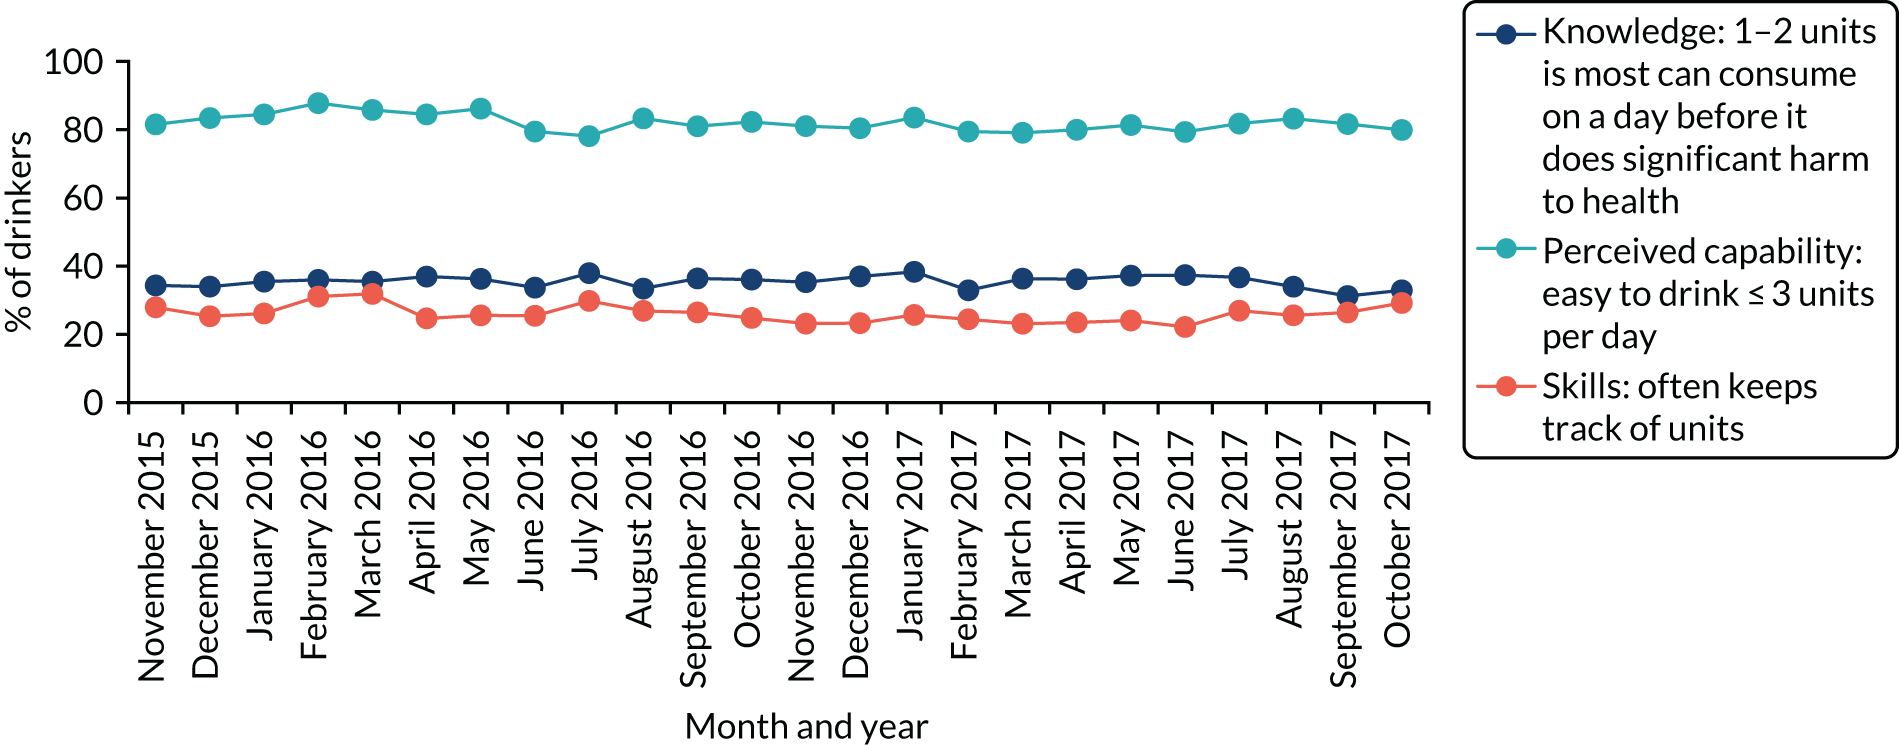
FIGURE 13.
The proportion of respondents answering positively to opportunity-related outcome measures over time. Reproduced with permission from Holmes et al. 143 This is an open access article distributed in accordance with the Creative Commons Attribution 4.0 Unported (CC BY 4.0) license, which permits others to copy, redistribute, remix, transform and build upon this work for any purpose, provided the original work is properly cited, a link to the licence is given, and indication of whether changes were made. See: https://creativecommons.org/licenses/by/4.0/.
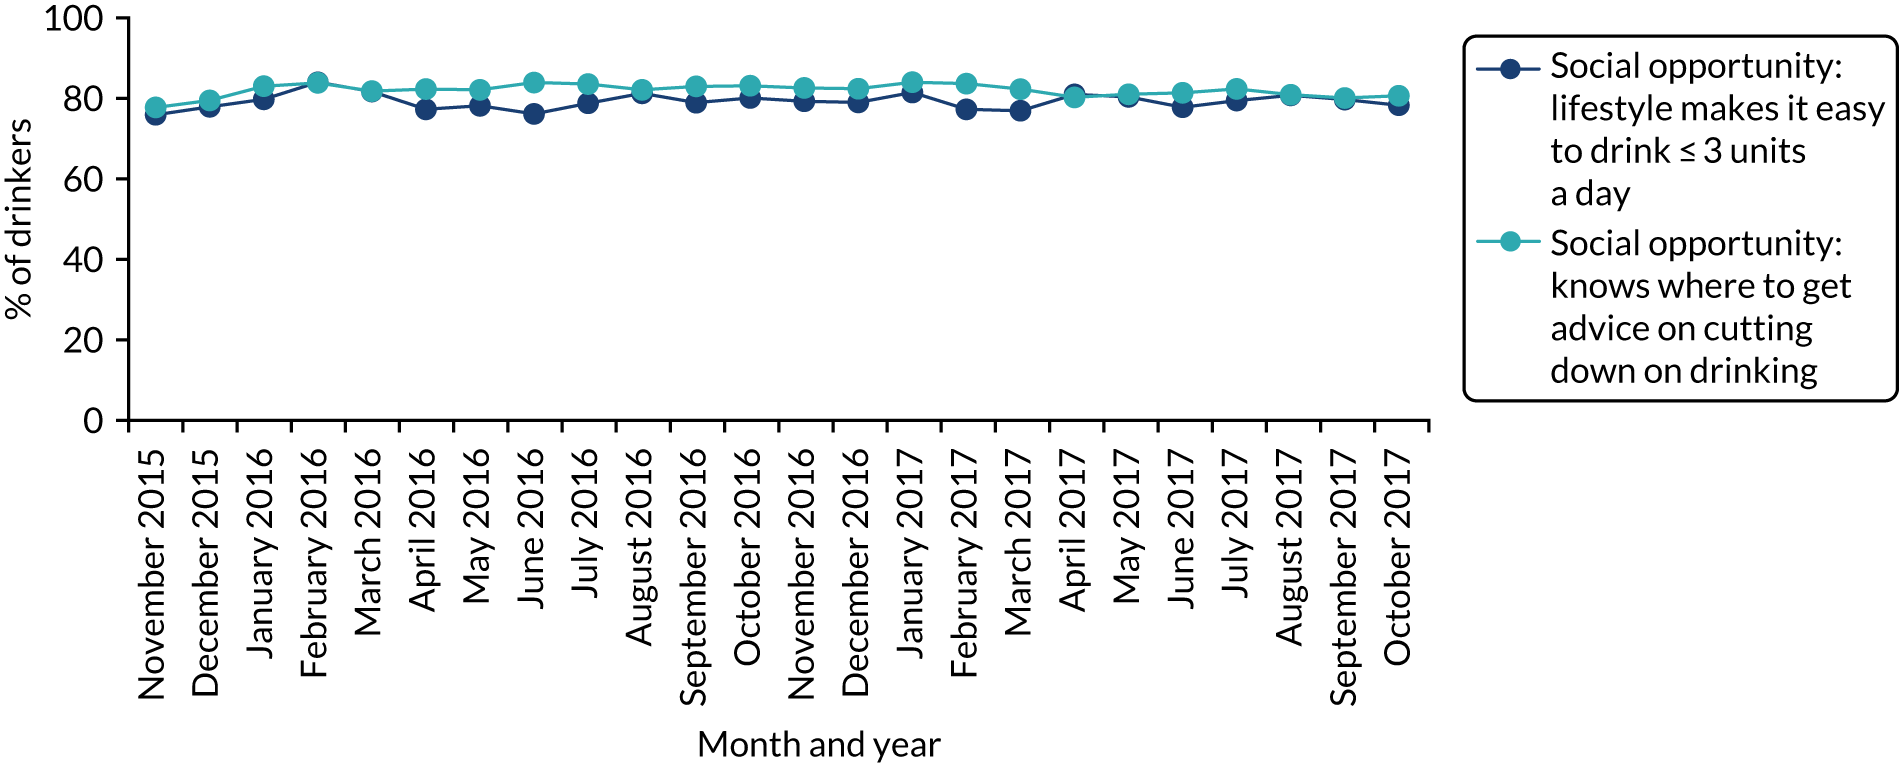
FIGURE 14.
The proportion of respondents answering positively to automatic motivation-related outcome measures over time. Reproduced with permission from Holmes et al. 143 This is an open access article distributed in accordance with the Creative Commons Attribution 4.0 Unported (CC BY 4.0) license, which permits others to copy, redistribute, remix, transform and build upon this work for any purpose, provided the original work is properly cited, a link to the licence is given, and indication of whether changes were made. See: https://creativecommons.org/licenses/by/4.0/.
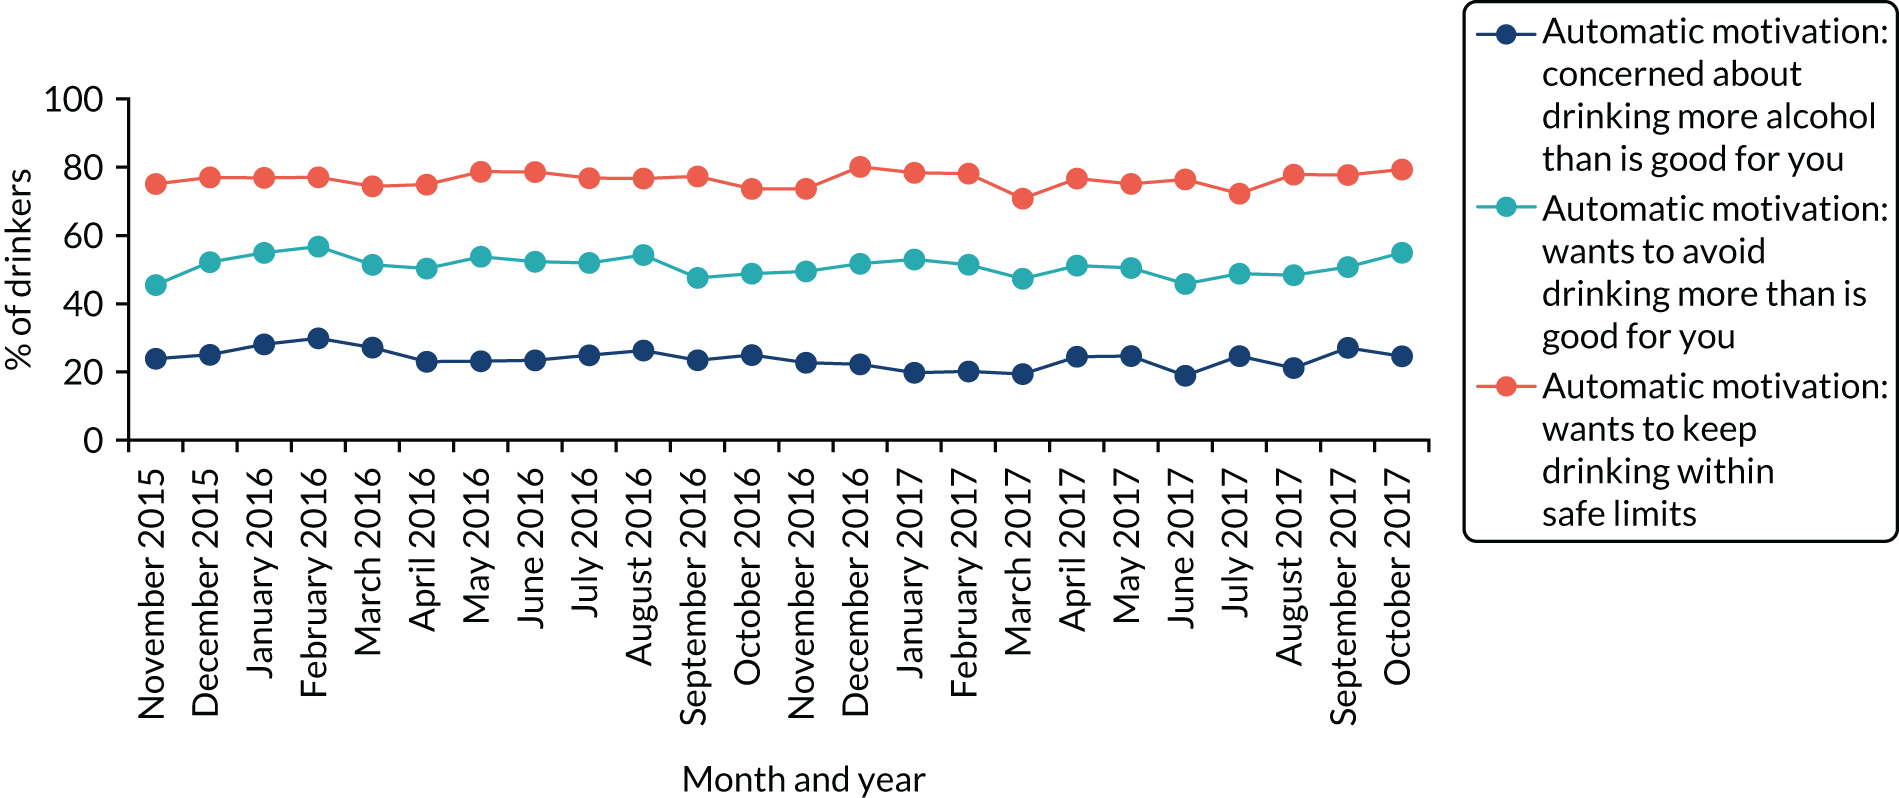
FIGURE 15.
The proportion of respondents answering positively to reflective motivation-related outcome measures over time. Reproduced with permission from Holmes et al. 143 This is an open access article distributed in accordance with the Creative Commons Attribution 4.0 Unported (CC BY 4.0) license, which permits others to copy, redistribute, remix, transform and build upon this work for any purpose, provided the original work is properly cited, a link to the licence is given, and indication of whether changes were made. See: https://creativecommons.org/licenses/by/4.0/.
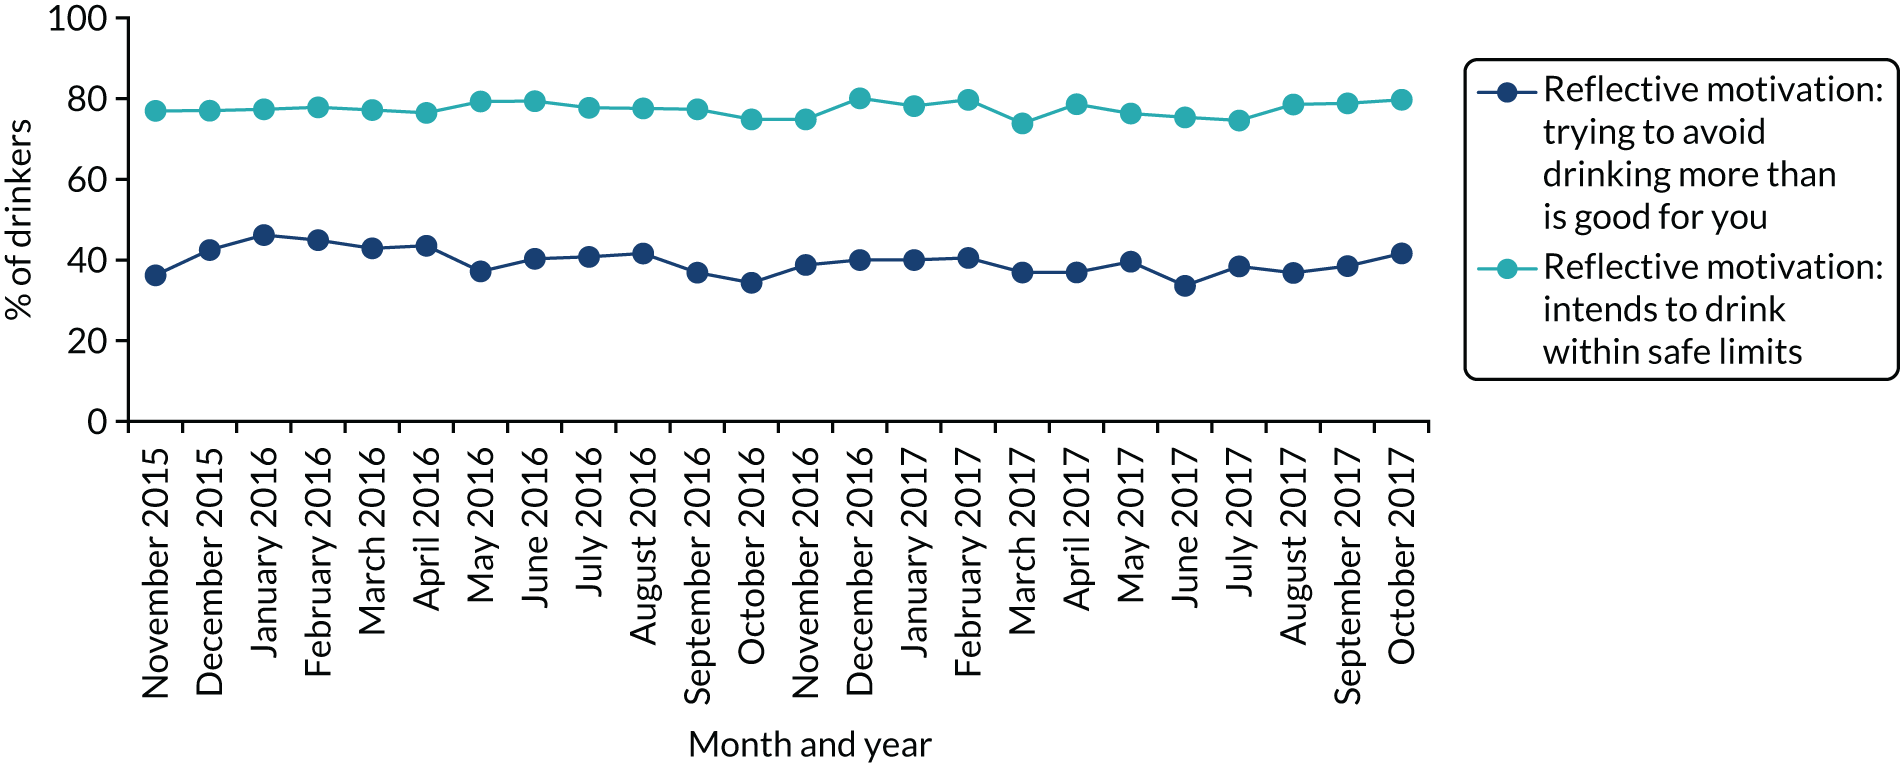
Capability
Across the whole study period, 35.5% of drinkers thought that they could regularly drink no more than 2 units per day before doing significant harm to their health. This did not change significantly after the announcement of revised guidelines (34.25% pre change vs. 35.6% post change, χ2 = 1.26; p = 0.26). Unlike the knowledge question above, there was also no change among male drinkers (24.8% pre change vs. 26.9% post change, χ2 = 1.67; p = 0.20). Most drinkers indicated that they would find it easy to drink ≤ 3 units per day, with 82.0% saying this across the study period, although only 26.0% indicated that they often tracked their units. In both cases, there was no significant change between the pre- and post-intervention periods.
Opportunity
The proportion of drinkers who indicated that their lifestyle made it easy to drink ≤ 3 units per day was 79.2% across the study period and increased slightly after the announcement of revised guidelines (76.9% pre change vs. 79.4% post change, χ2 = 6.5; p = 0.01). The proportion who knew where to get advice to cut down drinking was also high across the study period, at 82.0%, and, again, increased slightly post intervention (78.6% pre change vs. 82.3% post change, χ2 = 16.0; p < 0.001).
Motivation
Only a minority of drinkers (23.9%) were concerned about drinking more alcohol than was good for them, but 51.0% of drinkers wanted to avoid consuming this amount, although 76.4% wanted to keep their drinking within safe limits. Only the proportion wanting to avoid drinking more than was good for them increased post intervention, and the increase was small (48.7% vs. 51.2%, χ2 = 3.9; p = 0.05). A large minority, comprising 39.6% of drinkers, were trying not to drink more than was good for them across the study period, and 77.4% indicated that they intended to drink within safe limits. Neither of these two measures changed post intervention.
Figure 16 shows that there are several significant differences in the COM-B measures between sociodemographic and, particularly, drinking groups during the post-intervention period (see Appendix 3 for full regression results).
FIGURE 16.
The proportion of respondents giving positive responses to COM-B questions by sociodemographic and consumption. (a) Knowledge: 1–2 units is most can consume on a day before it does significant harm to health; (b) perceived capability: easy to drink ≤ 3 units per day; (c) skills: often keeps track of units; (d) social opportunity: lifestyle makes it easy to drink ≤ 3 units per day; (e) social opportunity: knows where to get advice on cutting down on drinking; (f) automatic motivation: concerned about drinking more alcohol than is good for you; (g) automatic motivation: wants to avoid drinking more than is good for you; (h) reflective motivation: trying to avoid drinking more than is good for you; (i) automatic motivation: wants to keep drinking within safe limits; and (j) reflective motivation: intends to drink within safe limits. Light-blue bars indicate a significant difference compared with the left-most category within characteristic in multivariate logistic regressions adjusting for all listed characteristics.
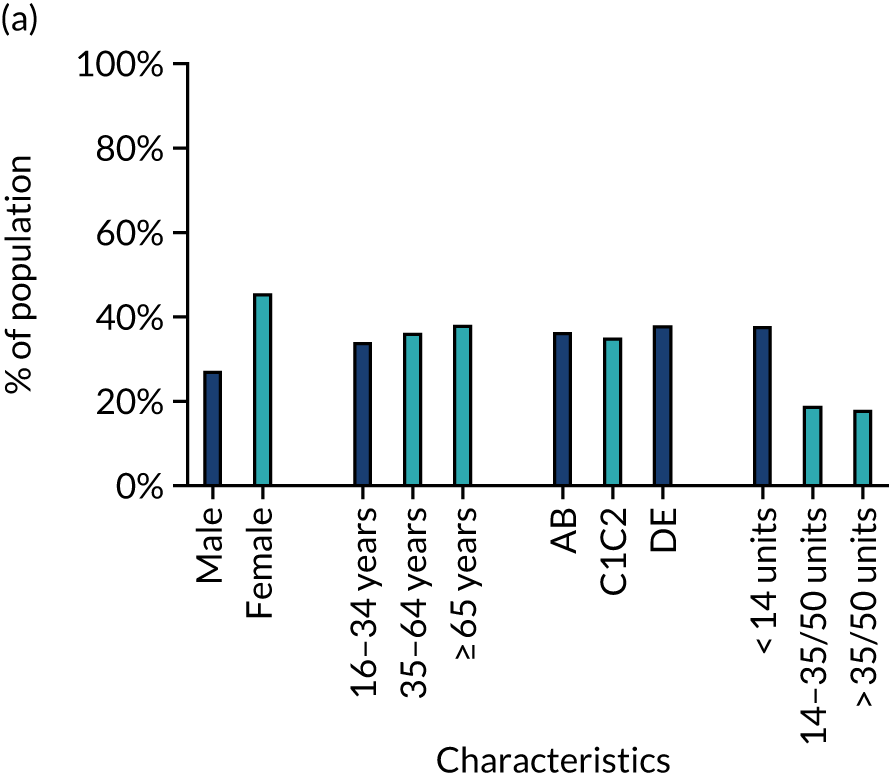
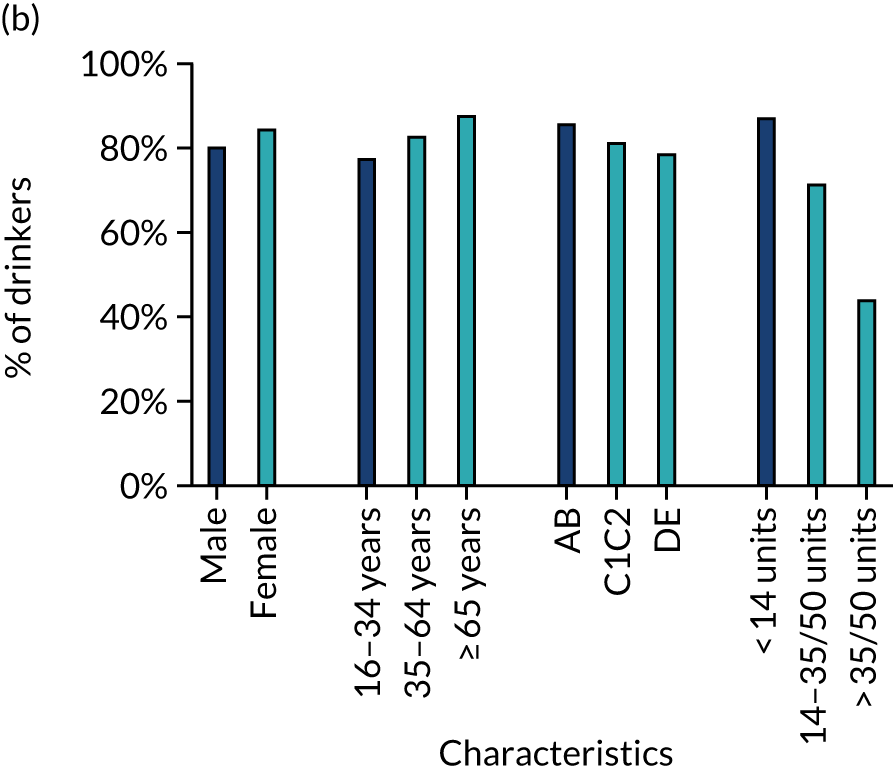
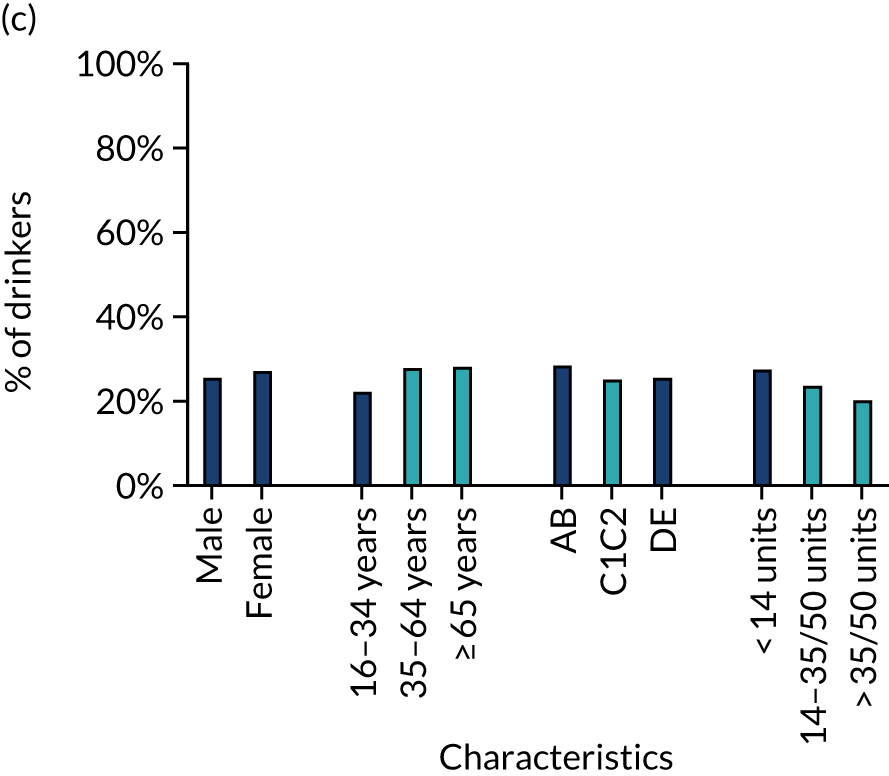
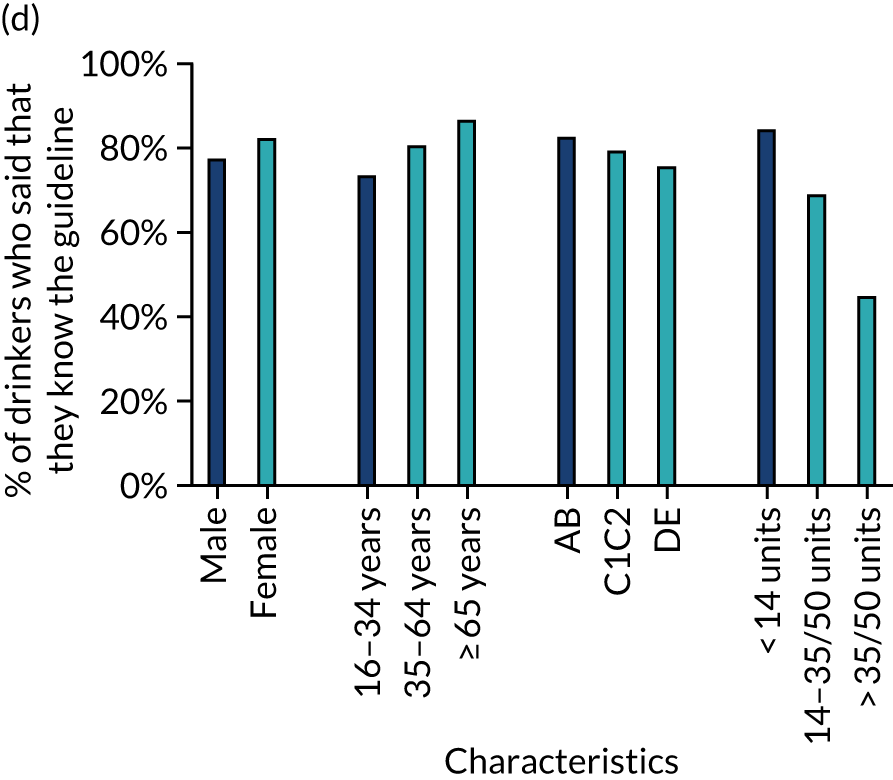
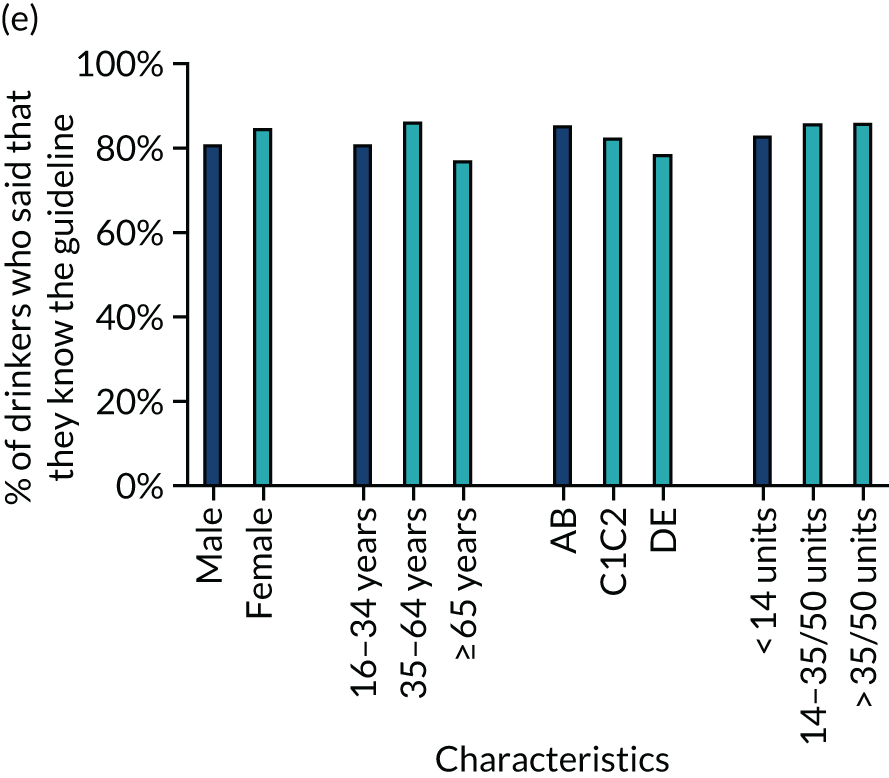
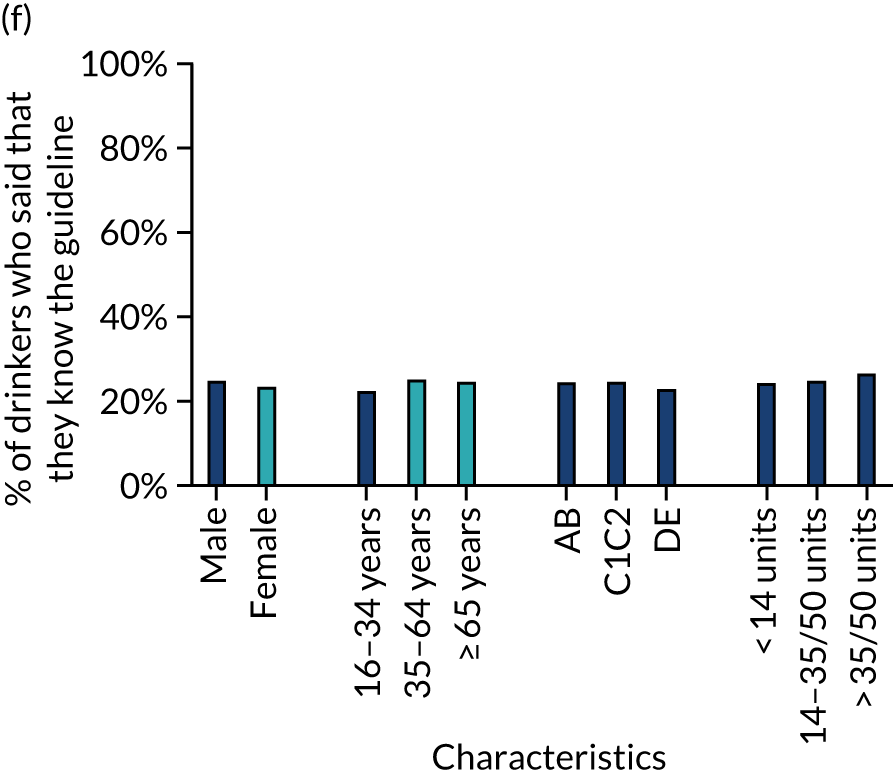
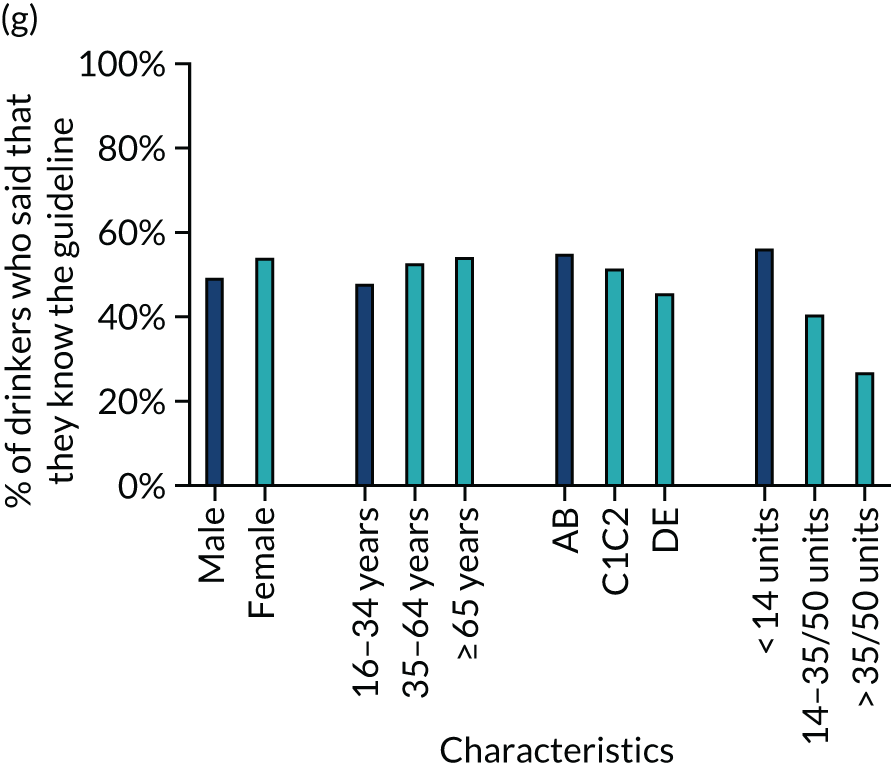
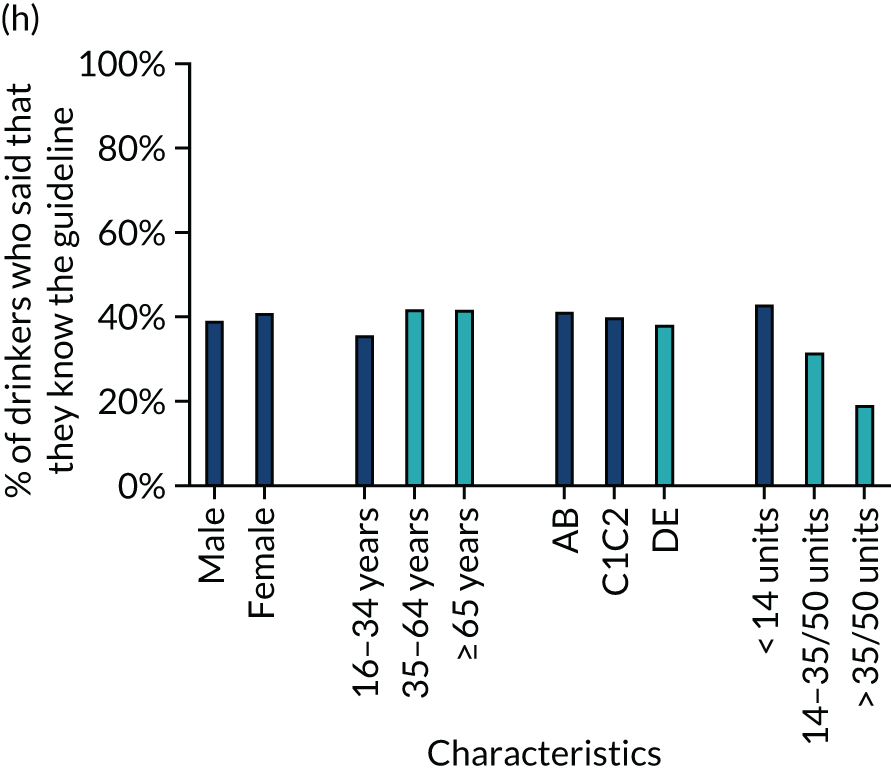
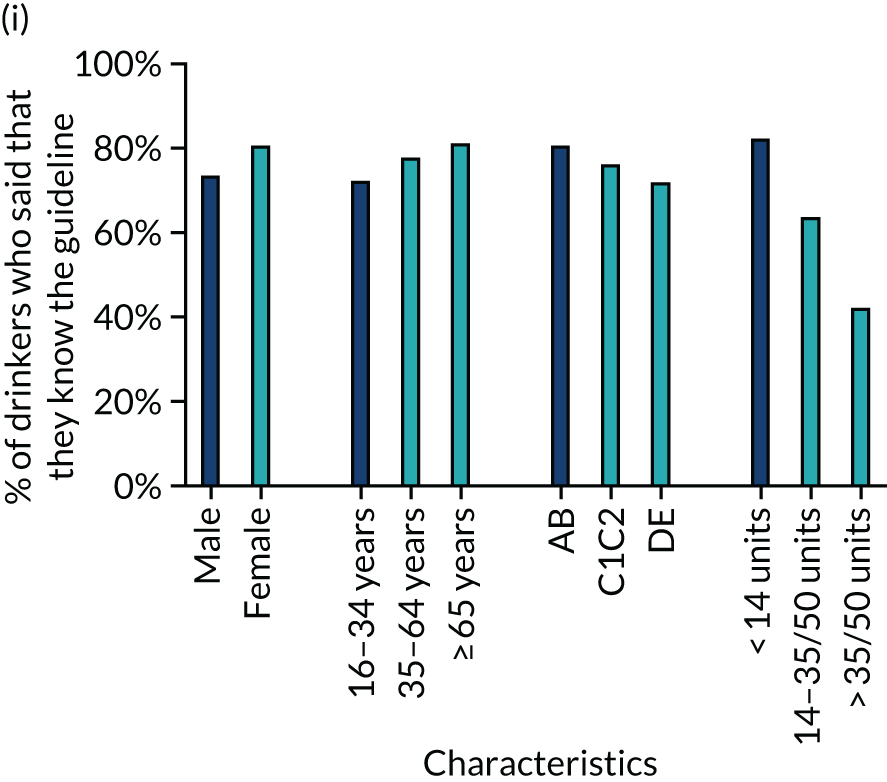
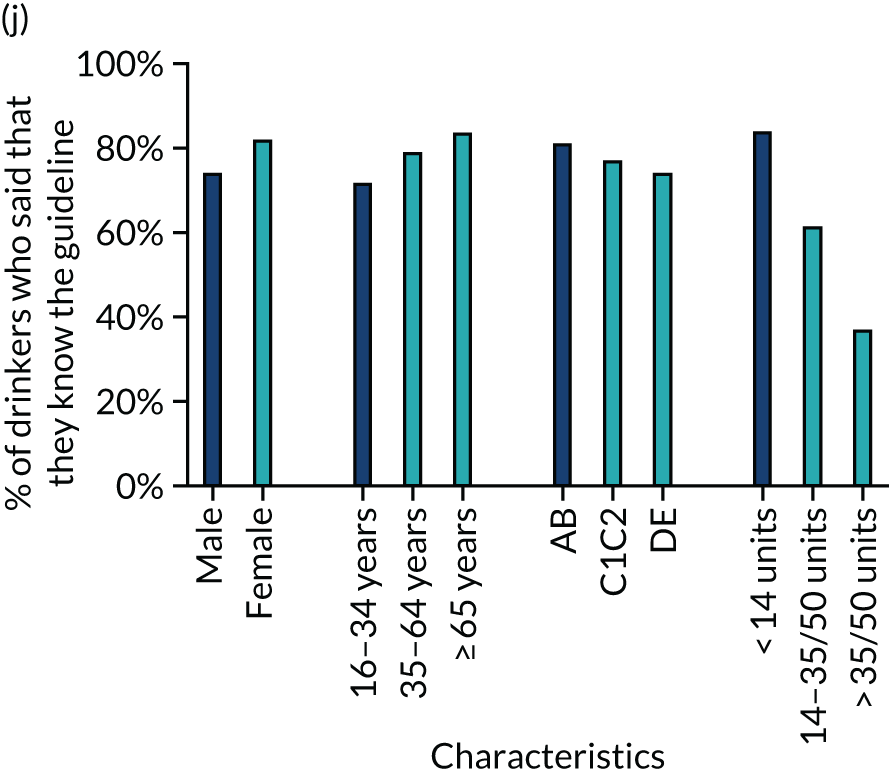
Although the descriptive analyses above show that men’s knowledge of the correct guideline increased over the study period, women were significantly more likely than men to say that ≤ 2 units per day is the most they can consume regularly before it harms their health. Differences on other measures, although statistically significant in most cases, were smaller. The exceptions are that women were more likely than men to both want and intend to keep their drinking within safe limits.
With regard to age, the largest differences were that those aged ≥ 65 years were more likely to say that they would find it easy to drink ≤ 3 units per day and that their lifestyle made this easy. This age group was also more likely to want to, and intend to, keep their drinking within safe limits. Differences between those aged 16–34 years and those aged 35–64 years were generally small, although often statistically significant. The largest difference was that those aged 16–34 years were less likely to say that their lifestyle made it easy to drink < 3 units per day.
Differences by social grade were of similar size to those by age. Those in social grade AB were more likely than those in lower social grades, and particularly those in grade DE, to say that they would find it easy to drink ≤ 3 units per day, that their lifestyle made it easy to do so and that they knew where to get advice on cutting down drinking. They were also more likely to say that they wanted to avoid drinking more than is good for them and both wanted and intended to stay within safe limits.
The differences between drinker groups were much larger than the sociodemographic differences. Although the descriptive analyses above show that increasing- and high-risk drinkers are more likely to know and be exposed to the guidelines, the COM-B measures suggest that they are much less likely to say that ≤ 2 units per day is the most they can consume regularly before it harms their health. Increasing-risk and especially high-risk drinkers are also much less likely to say that they are able to drink ≤ 3 units per day or that their lifestyle would make this easy. Similarly, increasing-risk and especially high-risk drinkers were much less likely to say that they wanted to or were trying to avoid drinking more than is good for them or that they wanted to or intended to keep their drinking within safe limits.
Primary analyses (planned): alcohol consumption
The primary evaluation analyses showed that there was no significant change in the level of AUDIT-C scores in the unadjusted model after the announcement of the revised guideline, but there was a significant change in the AUDIT-C score trend (Figure 17 and Table 6). In December 2015, the modelled average AUDIT-C score was 2.719, and it was decreasing by 0.003 each month. After the January 2016 announcement, AUDIT-C scores increased immediately but non-significantly to 2.720 [β = 0.001, 95% confidence interval (CI) –0.079 to 0.099] and the trend changed significantly such that scores subsequently increased by 0.005 each month (β = 0.008, 95% CI 0.001 to 0.015). This is equivalent to an additional 0.5% of the population increasing their AUDIT-C score by 1 point each month by, for example, drinking four or more times per week rather than two or three times per week. The results did not change after adjusting for average temperature, but the change in trend was no longer significant when controlling for alcohol prices or in the fully adjusted model.
FIGURE 17.
Primary analysis showing AUDIT-C scores before and after the announcement of revised drinking guidelines in January 2016. Reproduced with permission from Holmes et al. 143 This is an open access article distributed in accordance with the Creative Commons Attribution 4.0 Unported (CC BY 4.0) license, which permits others to copy, redistribute, remix, transform and build upon this work for any purpose, provided the original work is properly cited, a link to the licence is given, and indication of whether changes were made. See: https://creativecommons.org/licenses/by/4.0/.
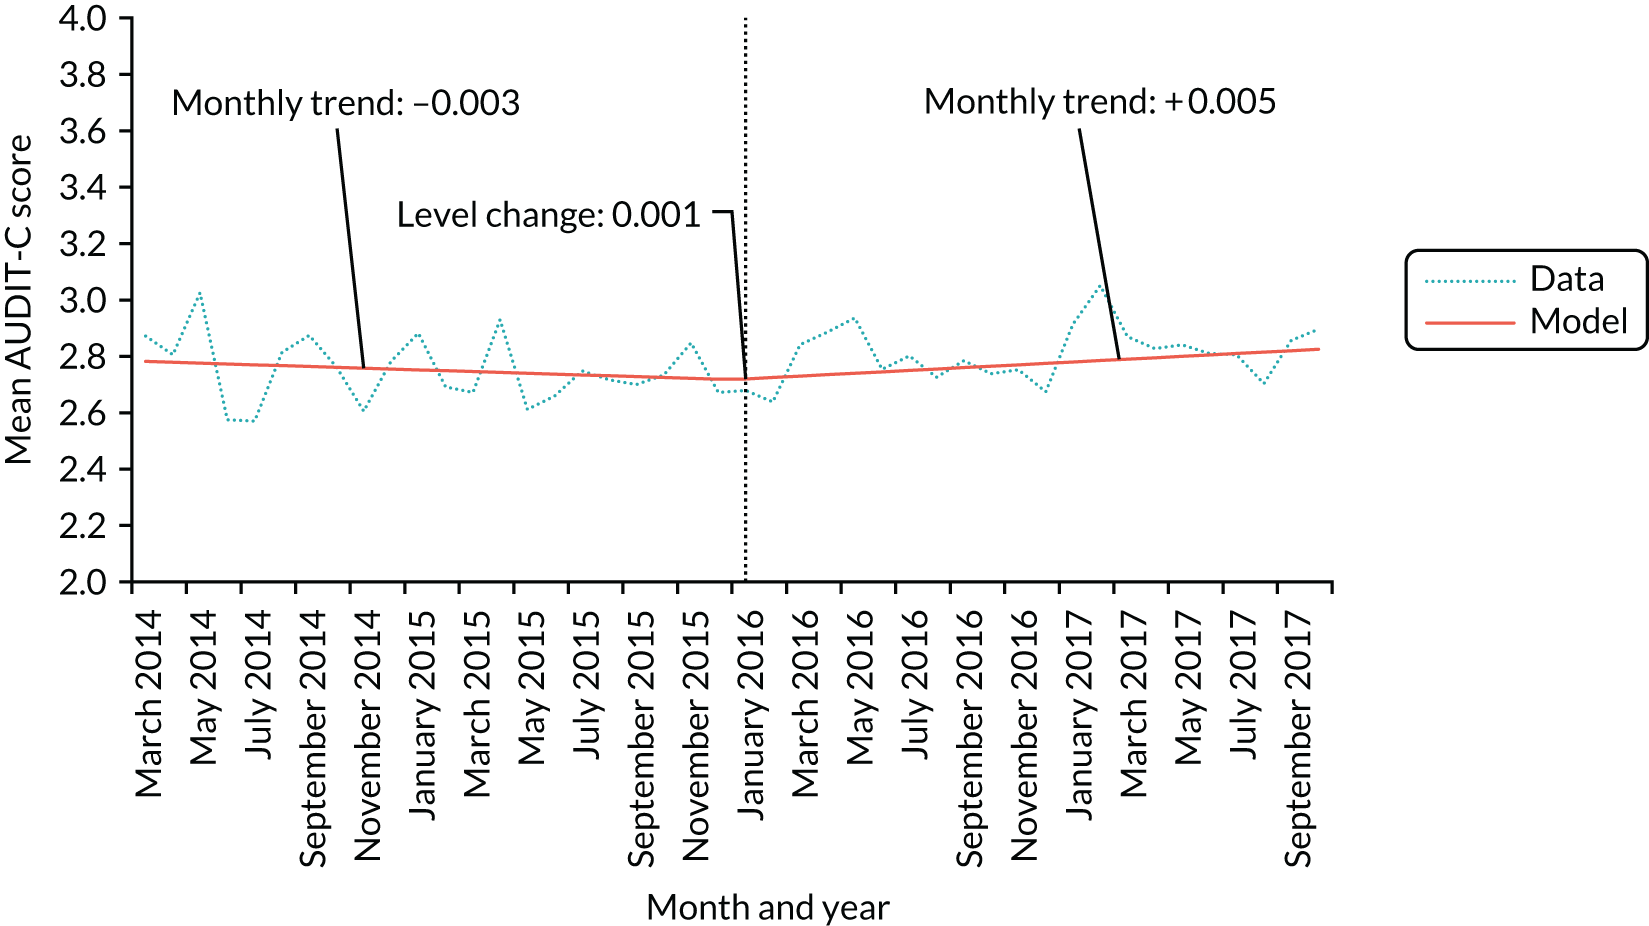
| Coefficient | Unadjusted | Adjusted for temperature | Adjusted for off-trade and on-trade sales of beer and wine | Adjusted for temperature and on-trade and off-trade sales of beer and wine | ||||||||
|---|---|---|---|---|---|---|---|---|---|---|---|---|
| β | 95% CI | p-value | β | 95% CI | p-value | β | 95% CI | p-value | β | 95% CI | p-value | |
| Intercept | 2.785 | 2.723 to 2.847 | < 0.001 | 2.740 | 2.554 to 2.926 | < 0.001 | 5.055 | –5.893 to 16.003 | 0.365 | 3.484 | –7.775 to 14.743 | 0.544 |
| Pre-intervention trend | –0.003 | –0.008 to 0.002 | 0.306 | –0.002 | –0.007 to 0.003 | 0.325 | < 0.001 | –0.010 to 0.010 | 0.975 | < 0.001 | –0.010 to 0.010 | 0.977 |
| Step-level change | 0.001 | –0.079 to 0.099 | 0.824 | 0.011 | –0.078 to 0.100 | 0.805 | 0.027 | –0.081 to 0.135 | 0.619 | 0.029 | –0.079 to 0.137 | 0.596 |
| Change in trend | 0.008 | 0.001 to 0.015 | 0.015 | 0.008 | 0.001 to 0.015 | 0.020 | 0.007 | –0.008 to 0.022 | 0.343 | 0.008 | –0.007 to 0.023 | 0.314 |
| Temperature | 0.004 | –0.012 to 0.020 | 0.615 | 0.010 | –0.007 to 0.027 | 0.241 | ||||||
| Wine on | –0.002 | –0.003 to –0.001 | 0.002 | –0.002 | –0.003 to –0.001 | 0.002 | ||||||
| Wine off | 0.023 | –0.003 to 0.049 | 0.083 | 0.026 | < 0.001 to 0.052 | 0.053 | ||||||
| Beer on | –0.020 | –0.105 to 0.065 | 0.649 | –0.011 | –0.097 to 0.075 | 0.810 | ||||||
| Beer off | –0.020 | –0.049 to 0.009 | 0.178 | –0.019 | –0.048 to 0.010 | 0.185 | ||||||
Secondary analyses (planned)
Tables 7 and 8 show the results of analyses using alternative graduated frequency and taxation measures, respectively (also shown in Figures 18 and 19). There was a non-significant increase in alcohol consumption measured by graduated frequency of 0.1 units after the announcement of revised guidelines (β = 0.105, 95% CI –0.652 to 0.862). Similarly, there was an immediate non-significant increase in per capita litres of alcohol released for sale of 0.006 l (β = 0.006, 95% CI –0.025 to 0.036), and the trend in this measure changed non-significantly from declining by 0.001 l per capita per month to remaining stable (β = 0.001, 95% CI –0.001 to 0.004).
| Coefficient | Unadjusted | Adjusted for temperature | Adjusted for off-trade and on-trade sales of beer and wine | Adjusted for temperature and on-trade and off-trade sales of beer and wine | ||||||||
|---|---|---|---|---|---|---|---|---|---|---|---|---|
| β | 95% CI | p-value | β | 95% CI | p-value | β | 95% CI | p-value | β | 95% CI | p-value | |
| Intercept | 9.861 | 9.134 to 10.588 | < 0.001 | 9.737 | 8.882 to 10.592 | < 0.001 | –0.567 | –58.095 to 56.961 | 0.985 | 7.858 | –62.354 to 78.070 | 0.826 |
| Step-level change | 0.105 | –0.652 to 0.862 | 0.785 | 0.089 | –0.671 to 0.849 | 0.818 | 0.047 | –0.715 to 0.809 | 0.905 | –0.007 | –0.799 to 0.785 | 0.987 |
| Temperature | 0.013 | –0.034 to 0.060 | 0.588 | –0.002 | –0.068 to 0.064 | 0.955 | ||||||
| Wine on | 0.008 | –0.001 to 0.017 | 0.088 | 0.008 | –0.001 to 0.017 | 0.088 | ||||||
| Wine off | –0.241 | –0.483 to 0.001 | 0.051 | –0.225 | –0.478 to 0.028 | 0.081 | ||||||
| Beer on | 0.175 | –0.304 to 0.654 | 0.474 | 0.114 | –0.455 to 0.683 | 0.696 | ||||||
| Beer off | 0.074 | –0.150 to 0.298 | 0.520 | 0.048 | –0.193 to 0.289 | 0.699 | ||||||
| Coefficient | Unadjusted | Adjusted for temperature | Adjusted for off-trade and on-trade sales of beer and wine | Adjusted for temperature and on-trade and off-trade sales of beer and wine | ||||||||
|---|---|---|---|---|---|---|---|---|---|---|---|---|
| β | 95% CI | p-value | β | 95% CI | p-value | β | 95% CI | p-value | β | 95% CI | p-value | |
| Intercept | 0.797 | 0.776 to 0.818 | < 0.001 | 0.77 | 0.679 to 0.861 | < 0.001 | 7.696 | –1.32 to 16.713 | 0.105 | 7.364 | –2.242 to 16.97 | 0.144 |
| Pre-intervention trend | –0.001 | –0.002 to 0.001 | 0.405 | –0.001 | –0.002 to 0.001 | 0.451 | –0.007 | –0.015 to 0.001 | 0.116 | –0.006 | –0.015 to 0.003 | 0.174 |
| Step-level change | 0.006 | –0.025 to 0.036 | 0.715 | 0.005 | –0.026 to 0.037 | 0.747 | –0.060 | –0.144 to 0.024 | 0.174 | –0.056 | –0.144 to 0.032 | 0.223 |
| Change in trend | 0.001 | –0.001 to 0.004 | 0.248 | 0.001 | –0.001 to 0.004 | 0.294 | 0.003 | –0.007 to 0.013 | 0.559 | 0.003 | –0.008 to 0.014 | 0.577 |
| Temperature | 0.002 | –0.005 to 0.010 | 0.548 | 0.006 | –0.008 to 0.021 | 0.394 | ||||||
| Wine on | 0.001 | < 0.001 to 0.002 | 0.093 | 0.001 | < 0.001 to 0.002 | 0.071 | ||||||
| Wine off | –0.025 | –0.054 to 0.004 | 0.102 | –0.020 | –0.051 to 0.011 | 0.209 | ||||||
| Beer on | –0.032 | –0.101 to 0.038 | 0.379 | –0.032 | –0.104 to 0.041 | 0.399 | ||||||
| Beer off | –0.014 | –0.037 to 0.010 | 0.264 | 7.364 | –2.242 to 16.97 | 0.144 | ||||||
FIGURE 18.
Mean weekly consumption in units measured by graduated frequency before and after the announcement of revised drinking guidelines in January 2016 (data only available from November 2015).
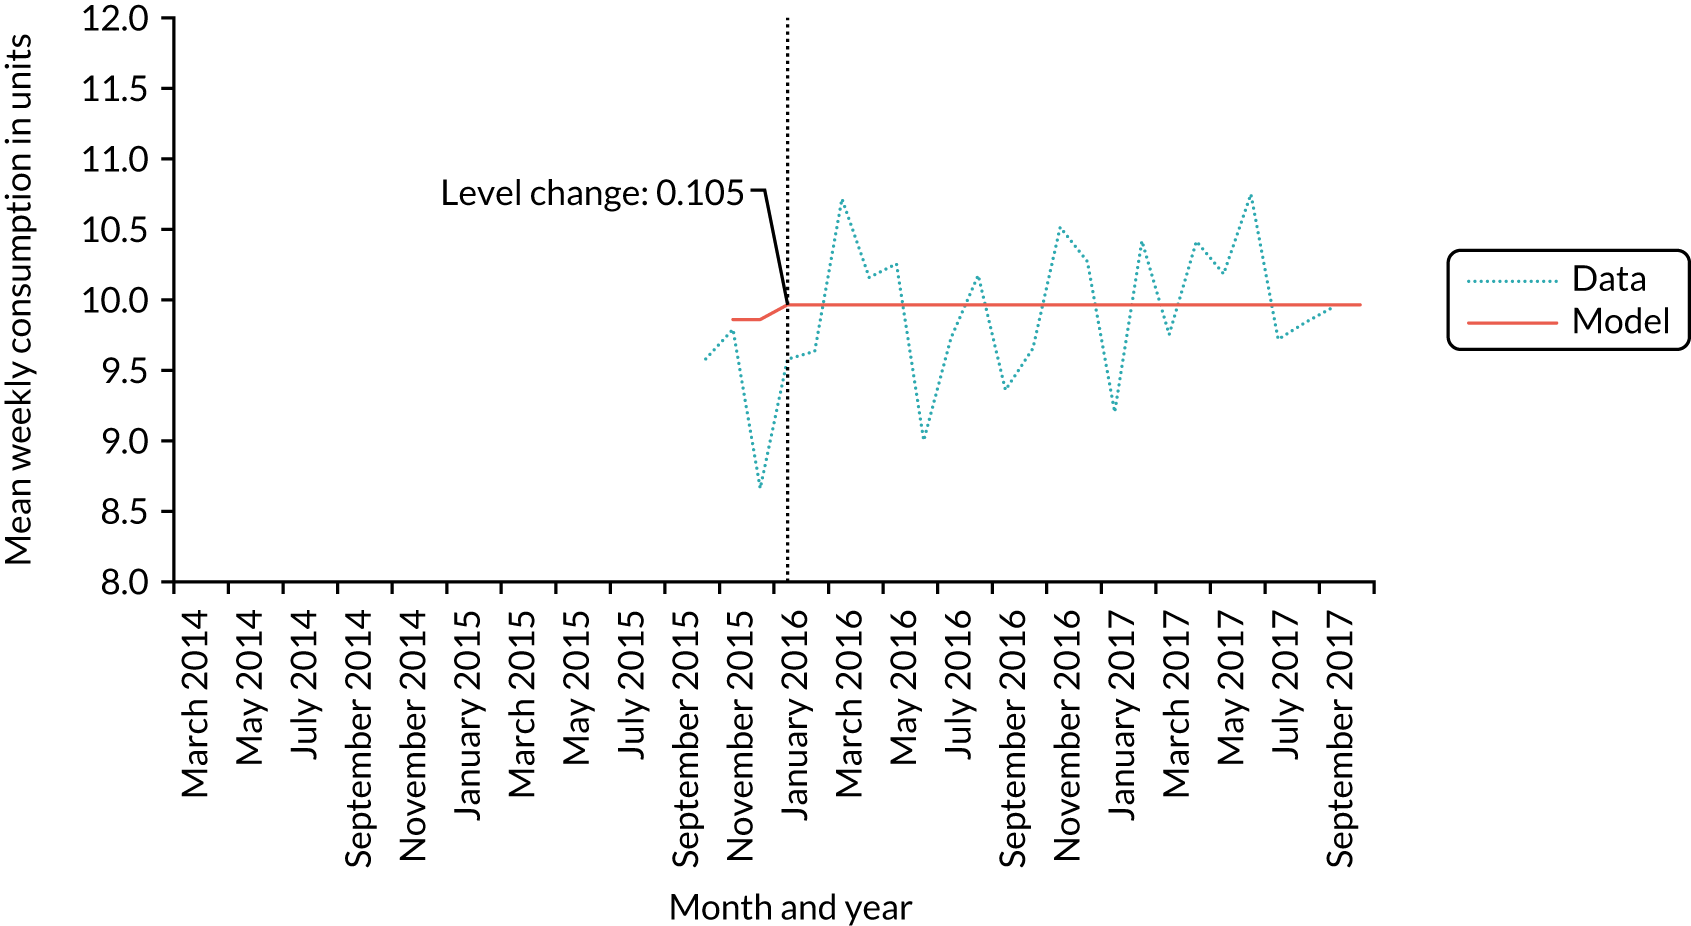
FIGURE 19.
Litres of ethanol released for sale per capita adult before and after the announcement of revised drinking guidelines in January 2016. Reproduced with permission from Holmes et al. 143 This is an open access article distributed in accordance with the Creative Commons Attribution 4.0 Unported (CC BY 4.0) license, which permits others to copy, redistribute, remix, transform and build upon this work for any purpose, provided the original work is properly cited, a link to the licence is given, and indication of whether changes were made. See: https://creativecommons.org/licenses/by/4.0/.
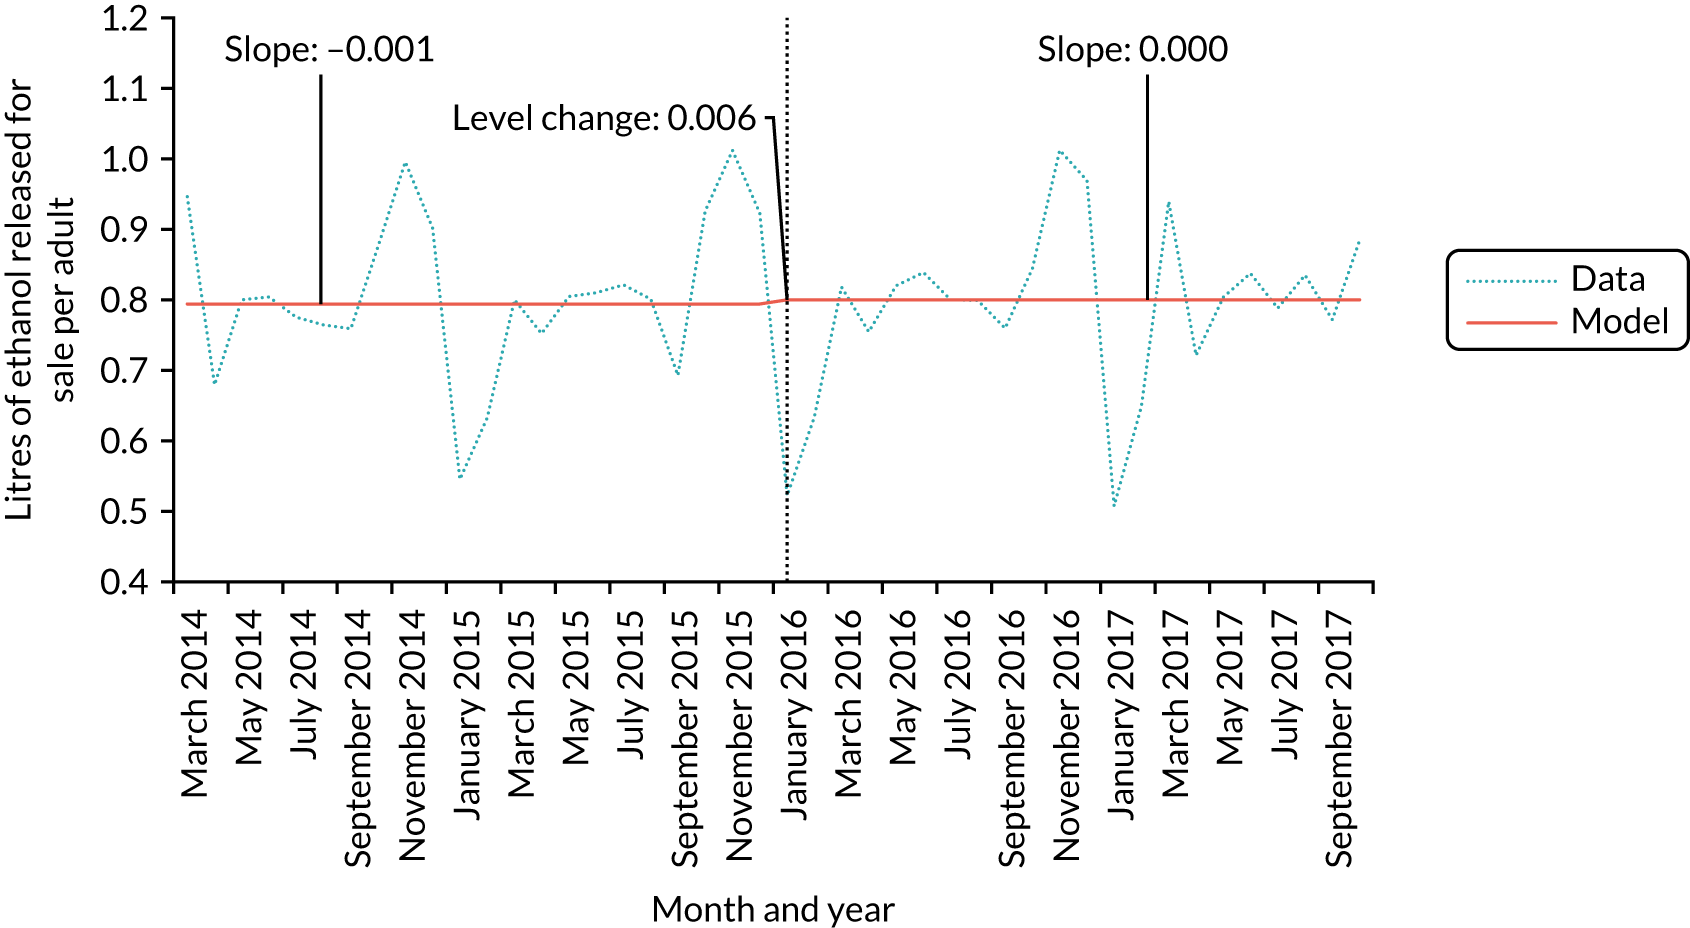
Tables 9 and 10 show the results for measures of alcohol-related hospital admissions for assaults and alcohol poisonings, respectively (also shown in Figures 20 and 21). There was a significant step change and change in trend for incidence of assault hospitalisations after the announcement of the revised guidelines. Hospitalisations for assault decreased by 7.3% immediately after the announcement [incidence rate ratio (IRR) 0.927, 95% CI 0.875 to 0.983], but this was partly counteracted by a change from a flat trend pre intervention to a 0.5% increase in the incidence of assault hospitalisations each month (IRR 1.005, 95% CI 1.001 to 1.009). The step change but not the change in trend remained in the adjusted models. There was also a significant step change of –15.4% in the incidence of alcohol poisoning hospitalisations (IRR 0.846, 95% CI 0.735 to 0.975), whereas the trend changed non-significantly from increasing by 0.9% each month to increasing by 0.5% each month (IRR 0.996, 95% CI 0.984 to 1.007). The step change was no longer significant after adjusting for the temperature trend.
| Coefficient | Unadjusted | Adjusted for temperature | Adjusted for off-trade and on-trade sales of beer and wine | Adjusted for temperature and on-trade and off-trade sales of beer and wine | ||||||||
|---|---|---|---|---|---|---|---|---|---|---|---|---|
| IRR | 95% CI | p-value | IRR | 95% CI | p-value | IRR | 95% CIa | p-value | IRRa | 95% CIa | p-value | |
| Intercept | 2249 | 2160 to 2342 | < 0.001 | 1786 | 1592 to 2004 | < 0.001 | 4,885,231 | 4395 to 5,430,641,194 | < 0.001 | 236,874 | 739 to 75,971,915 | < 0.001 |
| Pre-intervention trend | 1.000 | 0.997 to 1.003 | 0.934 | 1.001 | 0.998 to 1.003 | 0.757 | 1.002 | 0.996 to 1.008 | 0.546 | 1.001 | 0.996 to 1.006 | 0.807 |
| Step-level change | 0.927 | 0.875 to 0.983 | 0.015 | 0.927 | 0.878 to 0.978 | 0.009 | 0.941 | 0.885 to 1.000 | 0.061 | 0.925 | 0.875 to 0.977 | 0.009 |
| Change in trend | 1.005 | 1.001 to 1.009 | 0.030 | 1.004 | 1.000 to 1.008 | 0.080 | 0.997 | 0.989 to 1.005 | 0.440 | 0.999 | 0.992 to 1.007 | 0.867 |
| Temperature | 1.021 | 1.011 to 1.031 | < 0.001 | 1.015 | 1.012 to 1.019 | < 0.001 | ||||||
| Wine on | 1.001 | 1.000 to 1.002 | 0.045 | 1.001 | 1.000 to 1.002 | 0.012 | ||||||
| Wine off | 0.985 | 0.967 to 1.003 | 0.103 | 0.984 | 0.971 to 0.998 | 0.031 | ||||||
| Beer on | 0.948 | 0.898 to 1.001 | 0.062 | 0.969 | 0.927 to 1.013 | 0.172 | ||||||
| Beer off | 1.005 | 0.987 to 1.024 | 0.594 | 1.006 | 0.990 to 1.021 | 0.471 | ||||||
| Coefficient | Unadjusted | Adjusted for temperature | Adjusted for off-trade and on-trade sales of beer and wine | Adjusted for temperature and on-trade and off-trade sales of beer and wine | ||||||||
|---|---|---|---|---|---|---|---|---|---|---|---|---|
| IRR | 95% CI | p-value | IRR | 95% CI | p-value | IRR | 95% CI | p-value | IRR | 95% CI | p-value | |
| Intercept | 173 | 156 to 192 | < 0.001 | 149 | 129 to 172 | < 0.001 | 86,236 | 0 to 41,597,607,191 | 0.098 | 6267 | 0 to 5,691,240,593 | 0.220 |
| Pre-intervention trend | 1.009 | 1.001 to 1.017 | 0.040 | 1.008 | 1.000 to 1.016 | 0.061 | 1.009 | 0.996 to 1.022 | 0.189 | 1.008 | 0.995 to 1.022 | 0.221 |
| Step-level change | 0.846 | 0.735 to 0.975 | 0.026 | 0.874 | 0.760 to 1.004 | 0.064 | 0.862 | 0.749 to 0.993 | 0.047 | 0.868 | 0.751 to 1.004 | 0.064 |
| Change in trend | 0.996 | 0.984 to 1.007 | 0.443 | 0.995 | 0.983 to 1.006 | 0.383 | 0.992 | 0.973 to 1.011 | 0.413 | 0.993 | 0.974 to 1.013 | 0.500 |
| Temperature | 1.015 | 1.006 to 1.023 | 0.002 | 1.010 | 0.998 to 1.023 | 0.123 | ||||||
| Wine on | 1.002 | 1.000 to 1.004 | 0.022 | 1.002 | 1.000 to 1.004 | 0.040 | ||||||
| Wine off | 1.000 | 0.972 to 1.029 | 0.994 | 1.001 | 0.973 to 1.029 | 0.975 | ||||||
| Beer on | 0.958 | 0.865 to 1.060 | 0.409 | 0.974 | 0.876 to 1.083 | 0.628 | ||||||
| Beer off | 0.987 | 0.954 to 1.022 | 0.467 | 0.991 | 0.957 to 1.027 | 0.629 | ||||||
FIGURE 20.
Number of hospitalisations for assaults before and after the announcement of revised drinking guidelines in January 2016.
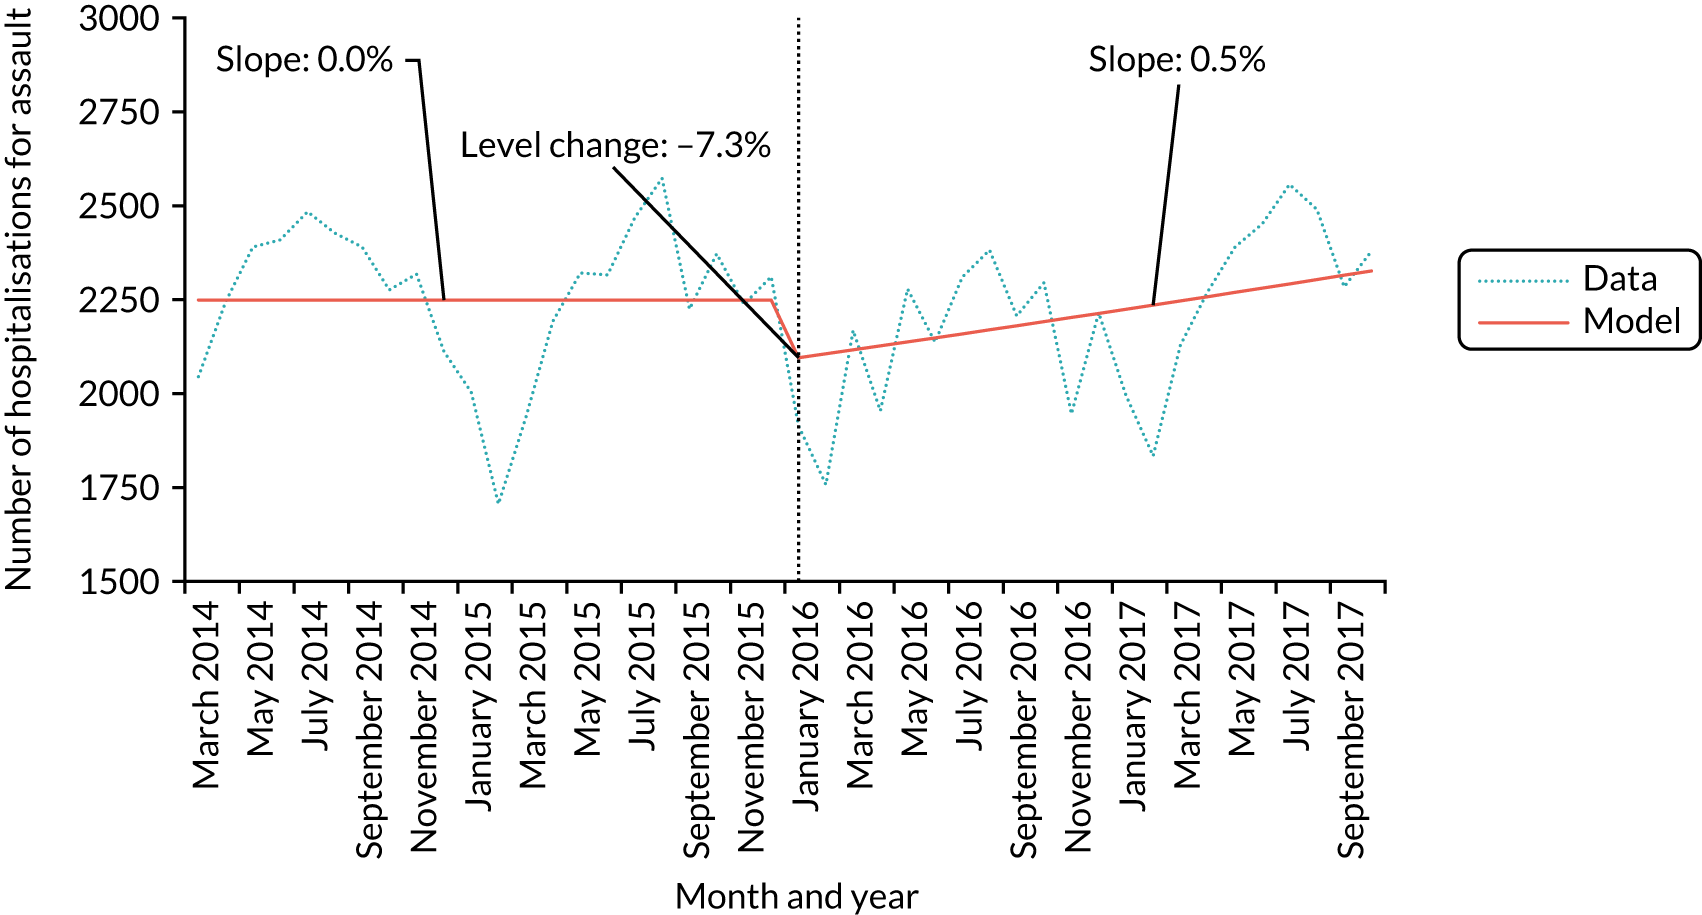
FIGURE 21.
Number of hospitalisations for alcohol poisoning before and after the announcement of revised drinking guidelines in January 2016.
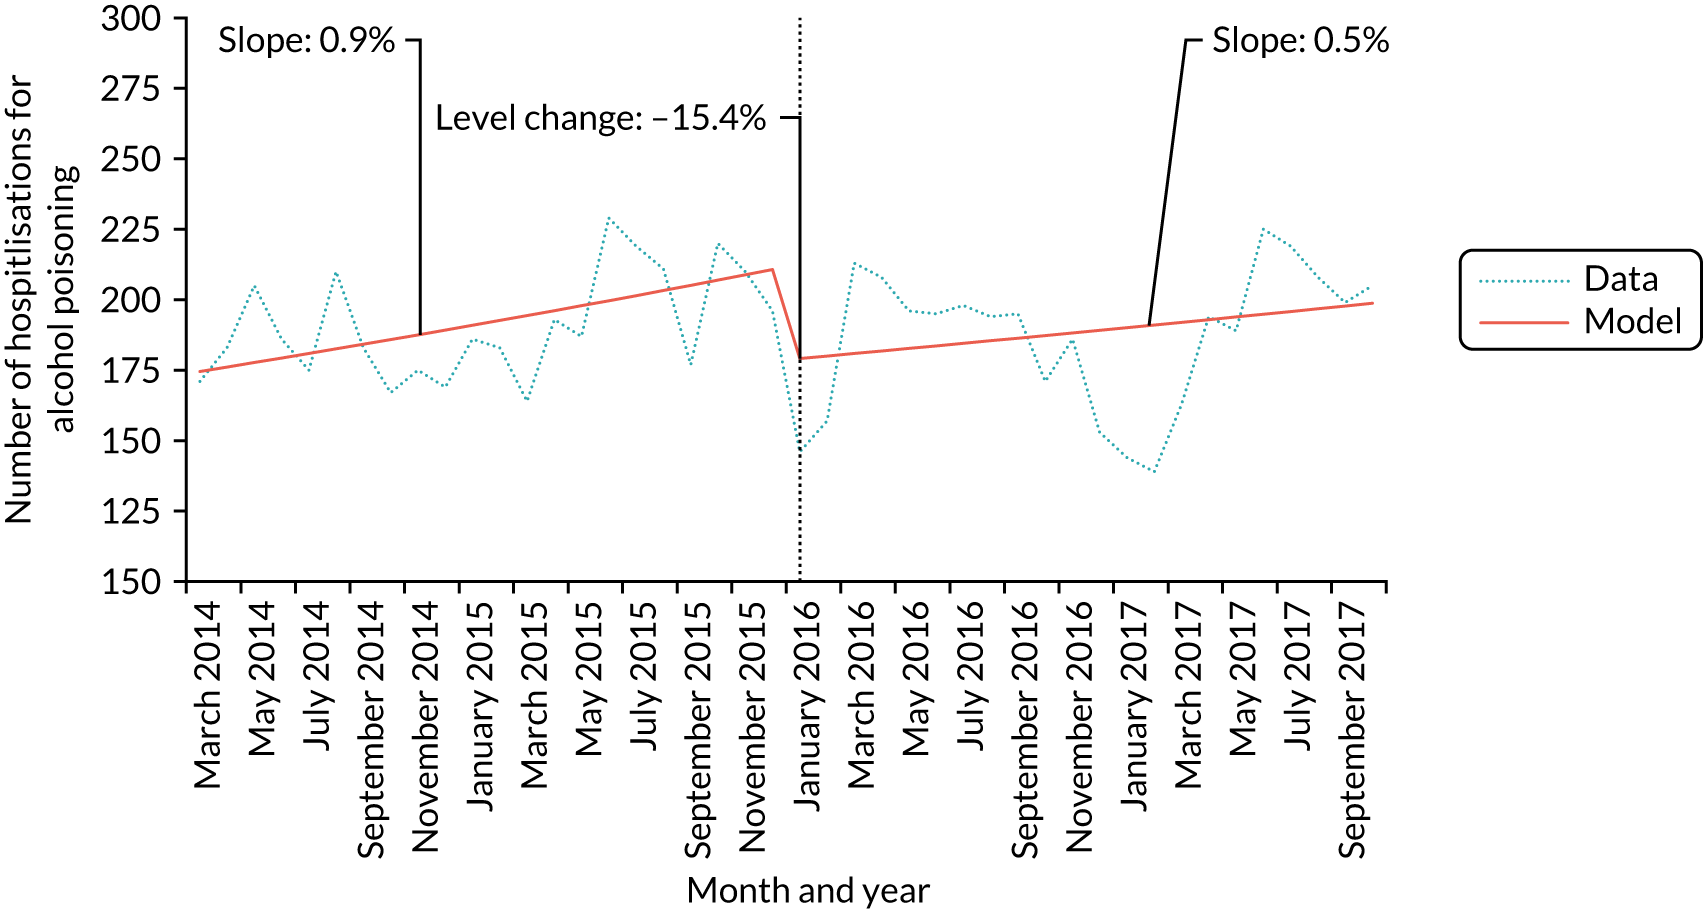
We used an iterative procedure to identify any statistically significant break points in the AUDIT-C score trend. Table 11 and Figure 22 show that the procedure identified a break point in June 2015, 7 months before the announcement of the revised guidelines. In this model, AUDIT-C scores declined by 0.005 points per month up to June 2015 and began to increase significantly, by 0.011 points per month, thereafter (β = 0.011, 95% CI 0.003 to 0.019).
| Coefficient | β | 95% CI | p-value |
|---|---|---|---|
| Intercept | 2.806 | 2.739 to 2.873 | < 0.001 |
| Trend up to June 2015 | –0.005 | –0.011 to 0.001 | 0.059 |
| Trend after June 2015 | 0.011 | 0.003 to 0.019 | 0.006 |
FIGURE 22.
Model-defined break point in trend in mean AUDIT-C score across the study period. Reproduced with permission from Holmes et al. 143 This is an open access article distributed in accordance with the Creative Commons Attribution 4.0 Unported (CC BY 4.0) license, which permits others to copy, redistribute, remix, transform and build upon this work for any purpose, provided the original work is properly cited, a link to the licence is given, and indication of whether changes were made. See: https://creativecommons.org/licenses/by/4.0/.
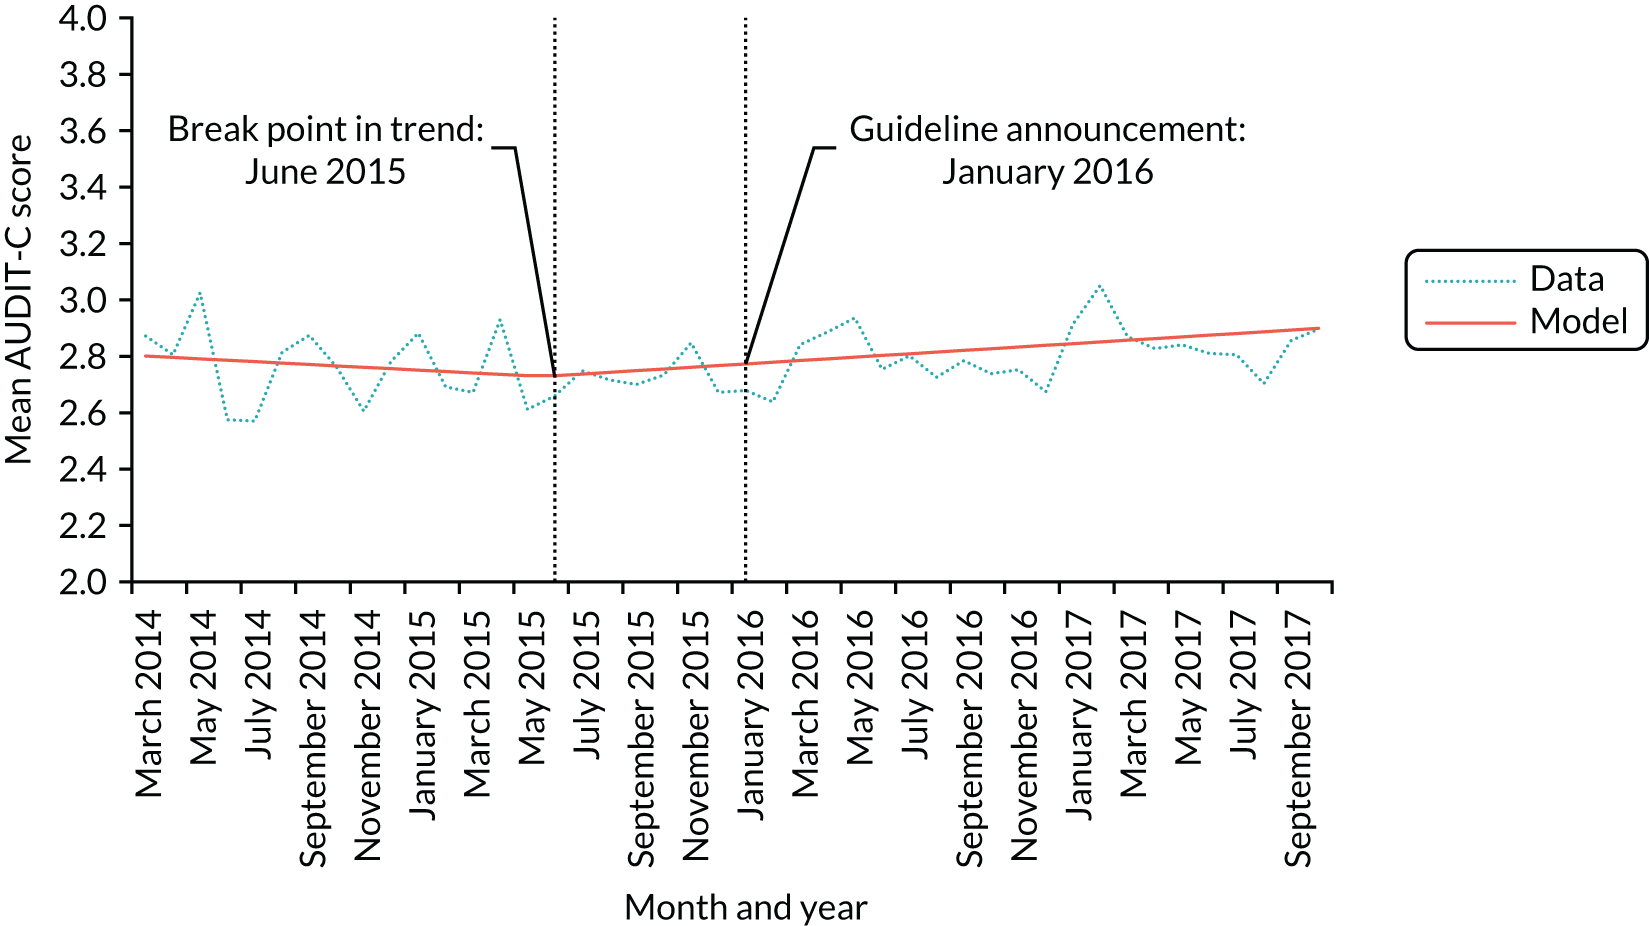
We also tested for the presence of pulse effects at 2 and 3 months after the announcement of the revised guidelines. Table 12 shows that we found evidence in both cases of a significant pulse effect, such that AUDIT-C scores were significantly lower, by 0.184 points for 2 months after the intervention (β = –0.184, 95% CI –0.292 to 0.076) and by 0.126 points for 3 months after the intervention (β = –0.126, 95% CI –0.218 to 0.034). These effects are equivalent to 1.8% of the population reducing their AUDIT-C score by 1 point for 2 months or 1.3% of the population reducing their AUDIT-C score by 1 point for 3 months. We also ran unplanned sensitivity analyses to assess when the identified pulse effects dissipated. The results in Table 13 suggest that the pulse effects lasted for a 4-month period after the announcement of the revised guidelines. Figure 23 shows the pulse effect visually.
| Coefficient | β | 95% CI | p-value |
|---|---|---|---|
| Intercept | 2.740 | 2.697 to 2.783 | < 0.001 |
| Underlying trend | 0.002 | < 0.001 to 0.004 | 0.009 |
| Pulse effect 2 months | –0.184 | –0.292 to –0.076 | 0.001 |
| Pulse effect 3 months | –0.126 | –0.218 to –0.034 | 0.007 |
| Coefficient | β | 95% CI | p-value |
|---|---|---|---|
| Intercept | 2.740 | 2.697 to 2.783 | < 0.001 |
| Underlying trend | 0.002 | < 0.001 to 0.004 | 0.009 |
| Pulse effect 2 months | –0.184 | –0.292 to –0.076 | 0.001 |
| Pulse effect 3 months | –0.126 | –0.218 to –0.034 | 0.007 |
| Pulse effect 4 months | –0.087 | –0.167 to –0.007 | 0.032 |
| Pulse effect 5 months | –0.042 | –0.114 to 0.030 | 0.246 |
| Pulse effect 6 months | –0.035 | –0.101 to 0.031 | 0.290 |
FIGURE 23.
Short-term or pulse effect on AUDIT-C following the announcement of revised drinking guidelines in January 2016. Reproduced with permission from Holmes et al. 143 This is an open access article distributed in accordance with the Creative Commons Attribution 4.0 Unported (CC BY 4.0) license, which permits others to copy, redistribute, remix, transform and build upon this work for any purpose, provided the original work is properly cited, a link to the licence is given, and indication of whether changes were made. See: https://creativecommons.org/licenses/by/4.0/.
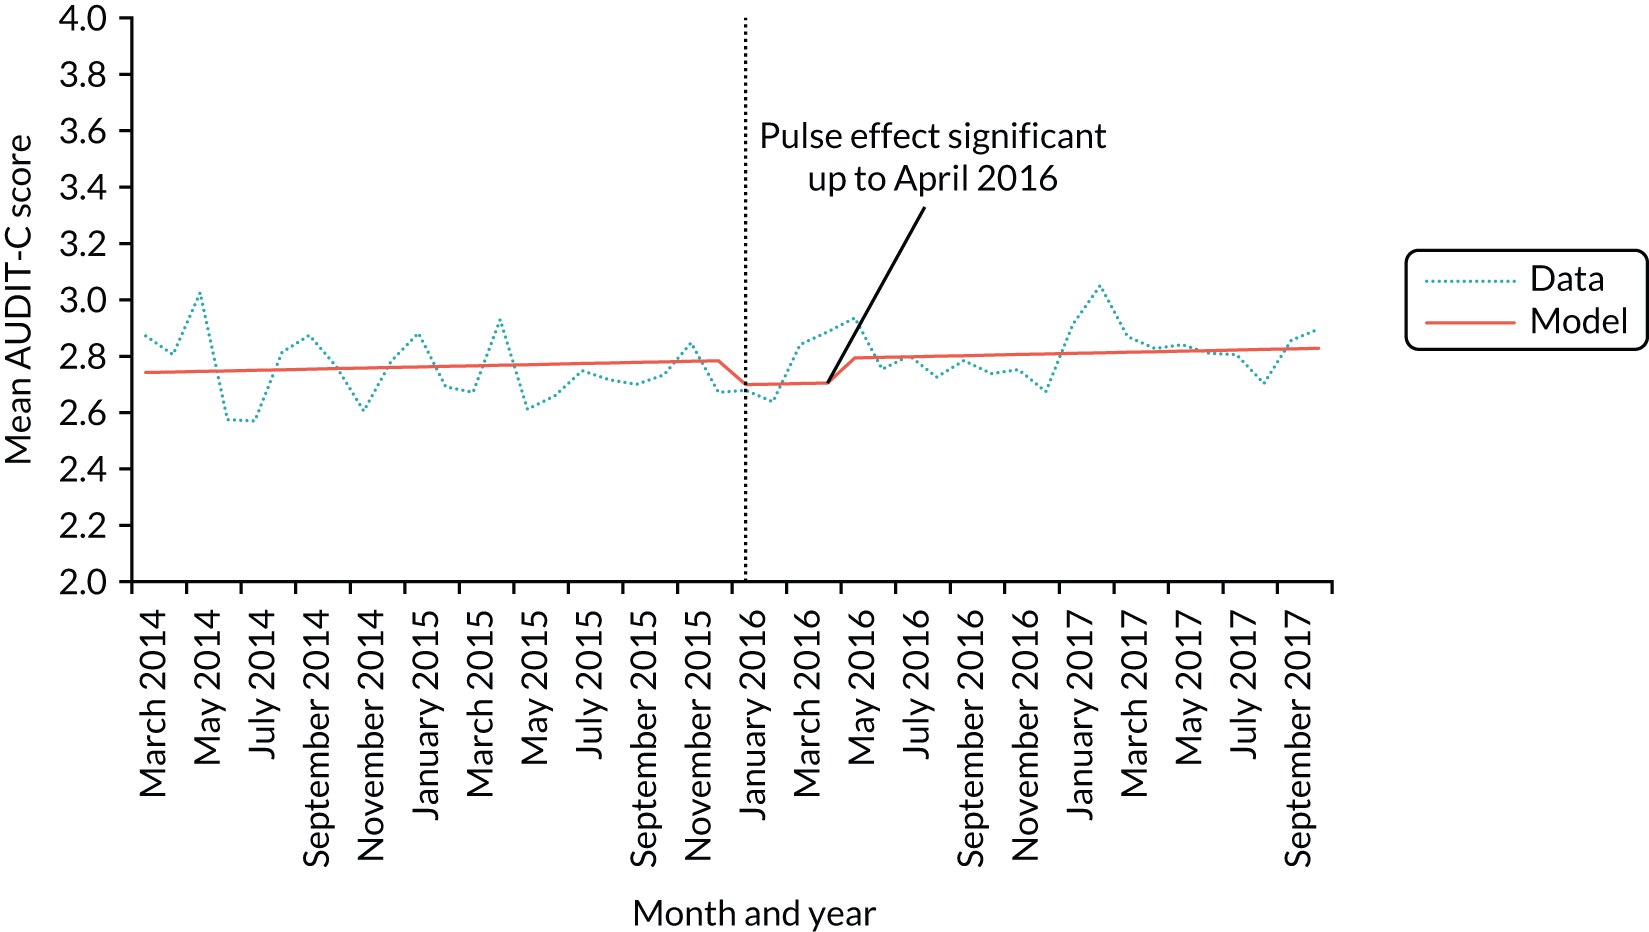
The AUDIT-C scores showed greater than anticipated variation across the post-intervention period, so we ran unplanned sensitivity analyses to assess whether or not the results changed when using an extended post-intervention period of 48 months (i.e. until February 2018). Table 14 shows that we found similar results to the primary analysis. The pre-intervention trend of a reduction in AUDIT-C scores of 0.002 units each month changed significantly to an increase in AUDIT-C scores of 0.010 units each month (β = 0.010, 95% CI 0.004 to 0.016). Furthermore, in planned sensitivity analyses, we tested whether quadratic or cubic segmented regressions models provided a better fit.
| Coefficient | β | 95% CI | p-value |
|---|---|---|---|
| Intercept | 2.785 | 2.722 to 2.848 | < 0.001 |
| Pre-intervention trend | –0.002 | –0.007 to 0.003 | 0.342 |
| Step-level change | –0.015 | –0.099 to 0.069 | 0.731 |
| Change in trend | 0.001 | 0.004 to 0.016 | 0.001 |
Discussion
The analyses above suggest that announcing revised drinking guidelines did not lead to a step-change decline or a reduction in the longer-term trend in self-reported alcohol consumption behaviour. Further analyses inconsistently indicated small and short-term reductions in various secondary outcomes relating to alcohol consumption. There were small and selective impacts on drinkers’ awareness and knowledge of the guidelines and key influences on behaviour change. We summarise the results below and then discuss the key strengths and limitations of the analysis. Chapter 5 presents a broader summary of the project findings, drawing on previous chapters, as well as a discussion of the implications for policy, practice and future research of the main evaluation analyses presented here.
Summary of findings
The evaluation analyses focused on alcohol consumption behaviour and showed mixed effects of announcing revised guidelines depending on the outcome measure and analytical approach used. The primary analysis suggested that the announcement of the revised drinking guidelines coincided with a change in trend towards slightly higher AUDIT-C scores. However, this change in trend was not significant in some adjusted models and secondary analyses showed that it was not present in analyses using alternative alcohol consumption measures. Furthermore, secondary analyses also suggested that any change in alcohol consumption behaviour was small and short term (i.e. a pulse effect) and any change in trend may have begun 6 months before the revised guidelines were announced. In contrast, the analyses of hospital admission data did suggest that assault admissions fell by 7.2% and alcohol poisoning admissions fell by 15.4% immediately after the guideline announcement. These results should, however, be interpreted with caution as they contradict findings for both self-reported and objective measures of alcohol consumption, they are larger than expected given the modest change in guidelines and lack of promotional activity, and they do not align well with the descriptive analyses discussed below. It appears more likely that the reductions in admissions are attributable to other factors or an artefact of the analyses, and we discuss this further in Strengths and limitations. Overall, it appears unlikely that the guideline announcement led to a change in alcohol consumption behaviour. Any change that did occur was not sufficiently substantial or sustained to be identified independent of other overlapping changes.
The descriptive analyses provide useful insights into key factors affecting drinkers’ ability to make use of the guidelines and to change their drinking behaviour. Awareness of drinking guidelines is generally high, a small majority of drinkers are exposed to guidelines each month, and most report finding it easy to consume only moderate amounts. However, only around one-fifth of drinkers can correctly identify the guideline, few keep track of the units they consume and most drinkers also think that they can regularly exceed the guideline without doing significant harm to their health. Motivations related to alcohol consumption also vary depending on the questions asked, with drinkers generally wanting and intending to drink within safe limits but less likely to say that they are trying to avoid drinking more than is good for them or want to do so. These results suggest that, although the concept and communication of guidelines are well established, albeit by passive means rather than active promotional campaigns, drinking guidelines are not achieving the government’s aim to:
Support people to make informed choices about healthier and responsible drinking.
They are also unlikely to function effectively as a behaviour change intervention.
Of particular concern are differences in measures relating to guidelines across sociodemographic groups, as these may give rise to or perpetuate alcohol-related health inequalities. 158 Drinkers in social grade DE are of particular concern because those of lower socioeconomic status are at greater risk from their alcohol consumption. 159–161 It is therefore worrying that the descriptive analyses point to substantial deficits in communication of the guidelines and greater impediments to behaviour change within this group. Drinkers in social grade DE are less likely than those in other social grades to be aware of guidelines or to know what the guideline is. They also find it more difficult to drink at moderate levels, are less motivated to do so and are less sure where to get advice on cutting down. Smokers of lower socioeconomic status, compared with those of higher socioeconomic status, also find quitting smoking more difficult but, in contrast, tend to be at least as educated on harms, as motivated to stop and as willing to use support. 162,163 There were fewer and smaller differences between other sociodemographic groups. Only the guideline for men changed substantially, and men were more likely to say that their guideline was 14 units per week (or 2 units per day) after January 2016. However, they remained substantially less likely than women to know this guideline, and knowledge remained low among both sexes. Drinkers aged 16–24 years are more likely to be exposed to guidelines, particularly via product labels, but find it harder to drink at moderate levels and are less motivated to do so.
Those drinking at increasing-risk and, particularly, high-risk levels are also of concern as it these groups that the government particularly wishes to make healthier and responsible choices about drinking (paraphrased). 5
In line with previous studies of alcohol-related health information,50,52 heavier drinkers are more likely than those drinking at moderate levels to be aware of and exposed to the guideline, although they are not more likely to correctly identify it. Heavier drinkers are also much less likely to say that 2 units a day is the most they can drink without harming their health, suggesting that knowledge of the guideline is not translating into acceptance of it. Furthermore, heavier drinkers find it harder to drink at moderate levels, are less motivated to do so and are less likely to track the units they consume.
Strengths and limitations
To the best of our knowledge, this is the most detailed study to date of the impact of announcing or promoting drinking guidelines. Strengths include the use of a monthly time series of nationally representative survey data over a time period varying between 24 and 44 months, depending on the analysis. We analyse a range of outcome measures that align with concepts addressed in previous evaluations of drinking guidelines and alcohol-related health warnings (e.g. awareness, knowledge and exposure), the behaviour change literature (e.g. the COM-B measures) and key public health outcomes (e.g. alcohol consumption and hospital admissions). These measures allow us to test the robustness of our results and to interpret and contextualise the findings of the primary analysis within a broader understanding of drinkers’ interactions with the guidelines and their perspectives on alcohol and associated health risks. The detailed data series also permit robust statistical analyses that control for important confounders. A particular strength is our exploration of alternative temporal processes (including different break points or pulse effects and non-linear polynomial trends) that point towards different interpretations of the primary analysis.
There are, however, a number of important limitations. First, our primary outcome measure of alcohol consumption behaviour, AUDIT-C, and our secondary outcome measure, derived using graduated frequency questions, may be subject to self-report biases that may interact with the intervention. For example, the announcement of lower guidelines may lead drinkers to report lower alcohol consumption than they would have done otherwise. This problem is common to all survey-based studies of alcohol consumption,164 and our objective secondary outcome measures derived from alcohol taxation and hospital admission data are useful in this regard. Second, the UK Government and CMOs chose to announce the revised guidelines in January 2016. This hinders evaluation as December is typically a heavy drinking month and January a light drinking month. Although our models seek to control for seasonal trends, our time series remains relatively short and this control may be inadequate if seasonal trends vary substantially from year to year. Third, our descriptive analyses and our analyses of graduated frequency rely on questions that were included in the ATS for only 2 months prior to the announcement of revised guidelines. Although we are able to observe post-intervention trends in measures derived from these questions, our knowledge of how these differ from the pre-intervention period is limited. Fourth, a number of our survey questions have limitations. Self-reported measures are known to underestimate alcohol consumption,153,164 although we mitigate this by also including objective outcome measures derived from alcohol taxation and hospitalisation data. Our measures of exposure to the guidelines relate only to last-month exposure and are asked only to drinkers who are aware of guidelines and are able to provide a figure for the guideline threshold, whether correct or incorrect. Thus, we cannot talk about exposure of drinkers in general to guidelines but only about exposure of this select group within a defined time period. Fifth, our measures of influence on behaviour change are informed by theory and measures shown to predict tobacco consumption but have not been formally validated. Finally, although the change in guidelines for men was greater than for women, the primary analysis did not include a test for a sex-specific effect. This is because the full population analyses found no substantial or sustained effect of the guidelines and the inconsistent findings across outcome measures and analytical approaches suggest that any subgroup analyses would be unlikely to produce results leading to clear conclusions.
Chapter 5 Discussion
Summary of findings
The overall findings of this project are that the announcement of the revised UK lower-risk drinking guidelines (1) was not subject to large-scale promotion by any organisation following the initial media launch, (2) was not associated with substantial and sustained changes in most influences on behaviour change and (3) was not associated with clearly detectable changes in drinking behaviour. In this chapter, we expand on and discuss these three findings in turn.
The drinking guidelines were not subject to large-scale promotion by any organisation following the initial announcement
Paid, earned, shared and owned media promoting the drinking guidelines
Marketers differentiate between paid, earned, shared and owned (PESO) media to classify different types of marketing activity or means of communicating a marketing message. 165 There are overlaps between these four categories but they can be broadly understood as follows. Paid media are purchased advertising spaces such as sponsored social media postings, TV and radio advertisements and paid-for endorsements. Earned media are publicity generated by, for example, press releases or other activities resulting in news reports. Shared media include social media posts that may then be distributed further by others. Finally, owned media are information under the complete control of the marketer, including apps, e-mail lists and websites. We summarise evidence for each PESO medium below.
Paid media
We detected no reports or evidence of any large-scale paid media to promote the revised UK drinking guidelines.
Earned media
The guidelines were initially promoted prominently via earned media, which was generated by a press launch, broadcast and print interviews, and published materials. This activity is clearly visible in our survey-based measures of exposure to the guidelines, with sharp increases in exposure via ‘TV or radio’ and ‘newspapers or magazines’ in January 2016. As demonstrated by our news review, the earned media exposure generated by the initial announcement extended for many weeks, although the tone of news reports was often negative as commentators queried and criticised the guidelines. Underneath this commentary was an additional, more incidental, form of earned media whereby the guidelines were routinely mentioned in articles on other topics, usually still related to alcohol or health.
Shared media
We did not directly examine shared media; however, our survey of the promotional activities of key organisations suggests that this existed in only a limited and passive form. For example, organisations reported occasionally posting a small amount of material related to the drinking guidelines on social media, but this did not amount to a large-scale co-ordinated campaign.
Owned media
We also did not directly examine owned media but we observed that the guidelines were rapidly incorporated into the published materials, websites, apps and other media of major organisations, such as PHE, Drinkaware and the leading alcohol and public health charities. Drinkers were still required to access this information in order to view it, and our survey data, and findings from previous studies, suggest that such passive promotion of alcohol-related health information has limited reach or impact. 46,47,60 One additional form of owned media is product labels. Approximately 80% of alcoholic product labels carried the previous guidelines in 2014;44 however, the revision to the guidelines did not, in most cases, lead to these labels being updated, for reasons discussed below.
Overall, it appears the UK Government and other organisations responsible for interested in promoting the drinking guidelines relied on a short earned media campaign that announced the revisions in January 2016, followed by small-scale, and largely passive, earned, shared and owned media activities over the remainder of our study period.
Promotional activities outside the study period
The data collection period for this study ended in November 2017 and two large-scale promotional activities took place after this date.
First, Drinkaware launched a campaign in September 2018 to promote the recommendation to have at least 2 drink-free days per week. This activity included a press launch, social media postings and interactive website materials. The campaign attracted substantial criticism following the decision by PHE to endorse it and allow Drinkaware to use its branding on their campaign materials. 166 As Drinkaware is almost exclusively funded by alcohol producers and retailers, it is argued by many public health actors to be an inappropriate partner for PHE. 167 PHE commissioned the market research company Kantar (Kantar Group, London, UK) to provide an independent evaluation of the campaign. This concluded that that the drink-free days message had reached its intended targets, and was credible and well understood, but that there was little evidence of attitudinal or behavioural change. 168
Second, the Scottish Government, through NHS Health Scotland, launched a paid mass media campaign that ran in Scotland for 3 weeks in March 2019, entitled ‘Count 14’. The campaign aimed to improve drinkers’ understanding of units and the main guideline recommending that drinkers do not consume > 14 units per week. The forthcoming evaluation of the campaign is not yet published at the time of writing. Although this may provide additional information on the potential effectiveness of promoting the revised drinking guidelines in England, the campaign ran only in Scotland and is, therefore, unlikely to lead to substantial changes in any of our outcome measures.
Why was there not more promotional activity?
Given that the review of drinking guidelines was a major component of the UK Government’s alcohol strategy,5 it is reasonable to ask why promotional activity was so limited. This question is outside the scope of the present project, but some elements of our findings and wider aspects of alcohol policy debate point towards potential answers.
First, the guidelines were received poorly by alcohol producers, retailers and some sections of the news media. As demonstrated by our review of news media coverage, the reasons for this include the decision to lower the male guideline to 14 units per week, the prominent linking of the guideline announcement to alcohol-related cancer risks and the associated use of the ‘no safe level’ of alcohol consumption message. A further contributory factor may have been the quality of the press launch itself, which was discussed in Chapter 3 and was criticised by the GDG in the minutes of its final meeting. 169 The UK Government has often developed and implemented alcohol policy in partnership with the alcohol industry over recent decades, and this allowed the government to avoid politically challenging and potentially costly regulation of the industry in favour of voluntary or self-regulatory agreements. Examples of such agreements include the Portman Group’s codes of practice on alcohol marketing and product labelling, the financial support provided by industry to Drinkaware and the pledges made under the Public Health Responsibility Deal (PHRD) by the alcohol industry. 167,170–172 The lack of support for the drinking guidelines among industry actors threatens this partnership-based approach and may have directly or indirectly influenced government decision-making regarding promotion of the guidelines.
Second, the broadly negative view of the guidelines within the alcohol industry also influenced their promotion via product labels. The Portman Group updated its best practice guidance on product labelling in 2017 and removed a previous requirement that producers include the drinking guidelines on labels. 173 The new guidance required only active signposting to Drinkaware’s website. 172 This is part of a broader pattern of behaviour whereby alcohol producers seek to limit the health-related information available on product labels. For example, the Department of Health and Social Care notes that alcohol producers agreed in 2007 to include health and unit information on the majority of UK product labels by 2008. 174 By 2009, only 15% of products included such information, and producers stated only that they had plans to increase this to 19% by the end of 2010. In 2011, some producers suggested that they could achieve 50% by the end of 2012 but ultimately committed to the PHRD pledge to include the guidelines on 80% of labels, a pledge they now appear to have tacitly withdrawn from. The decision by the Portman Group not to include drinking guidelines in its best practice guidance explains, in part, why only 7.5% of 320 products reviewed by the Alcohol Health Alliance in 2018 included the updated guidelines on their label. 175 In 2019, the Portman Group announced that its members would update product labels, but to an unspecified timetable.
A third potential reason why the guidelines were not promoted more extensively is the 18% decline in alcohol consumption per capita adult between 2004 and 2016. 176 In contrast to the 1990s and early 2000s, when alcohol-related problems were often front-page news and therefore a major government priority,177 there is now less immediate pressure on the government to demonstrate that it is tackling the problem. In this context, there is no immediate political or policy need for a mass media campaign promoting guidelines that enjoy only lukewarm support among several key government stakeholders.
Fourth, the shifts in the broader political context since the guideline review was announced in 2012 may have contributed to the lack of promotional activity. The UK Government changed from a Conservative–Liberal Democrat coalition to a majority Conservative government in 2015. In the build-up to the election that delivered the Conservative majority, it was widely reported that the Conservatives had deliberately sought to ‘scrape the barnacles off the boat’, meaning they dropped or deprioritised all potentially unpopular policies, including those relating to alcohol, and this approach continued into the subsequent parliament. 66 In 2016, the UK voted to leave the European Union and the resulting political crisis led to a change of Prime Minister and to increased government and parliamentary attention, both political and legislative, focusing on European matters in the subsequent years. 178 As developing, financially supporting or launching a large-scale campaign to promote drinking guidelines is an uncommon occurrence under any circumstances in the UK, it seems unlikely to be a government priority during this period.
Fifth, organisations outside the government that could have promoted the guidelines at scale were not able to do so. PHE relies on the UK Treasury to fund any campaign and is therefore subject to the problems discussed above. Drinkaware is among the most visible alcohol health information charities in the UK but is financially reliant on the alcohol producers and retailers, who had significant concerns about the guidelines. Alcohol Concern, previously a major health promotion charity, lost its block grant from the Department of Health and Social Care in 2011,179 and its resulting financial difficulties eventually forced a drawn-out merger with another organisation, Alcohol Research UK, that limited the activities of both in the ensuing period. 180 A succession of other alcohol and public health charities suffered similar financial difficulties over recent years. These arose in part from problems in securing funding during the UK Government’s austerity policies, but also from new rules that restricted how charities could use public grants for campaigning purposes. 181
Overall, it appears likely that the guidelines were not promoted owing to a combination of competing interests, indifference and distraction on the part of the UK Government, opposition on the part of the alcohol industry and infeasibility on the part of other organisations.
Announcing revised guidelines did not lead to substantial and sustained changes in most influences on behaviour change
Analyses of trends in key influences on behaviour change, specifically drinkers’ awareness, knowledge and exposure to drinking guidelines and their capability, opportunity and motivation to change their behaviour, suggest that none of these outcomes changed substantially or in a sustained way following the announcement of revised guidelines. This is perhaps unsurprising given that large-scale promotional activity was limited to a short period of earned news media coverage rather than a well-designed campaign aiming to change drinkers’ behaviour or affect their preparation to change their behaviour. Nonetheless, the lack of substantial changes in drinkers’ awareness and, especially, knowledge of the guidelines merits discussion.
Over 85% of drinkers were aware of guidelines before the announcement and, although this did not increase after the announcement, this figure is a high baseline. However, fewer than 25% of drinkers were able to correctly identify the guideline, and fewer than half gave a figure below 14 units per week or 2 units per day. These findings are broadly in line with a separate nationally representative UK survey conducted 1 month after the revised guidelines were announced, which found that just 8% of drinkers knew the revised guidelines. 182 In the present study, the proportion of men who knew the guideline did increase significantly after the revision was announced but remained below 25% at the end of the study period. The equivalent figure for women was only 29%, despite the guideline for women changing to a lesser degree, suggesting a general lack of knowledge of drinking guidelines among both sexes. It is unlikely that the government’s aim for drinkers to use the guidelines to make responsible and healthy choices about alcohol consumption will be achieved with such low rates of knowledge about what the guideline is.
Responses to other questions assessing influences on behaviour change varied. Among the COM-B measures of drinkers’ capability, opportunity and motivations to change behaviour, most drinkers felt that it was easy to drink at moderate levels (i.e. ≤ 3 units per day), felt that their lifestyle made it easy to do so, wanted to do so, intended to do so and said that they knew where to get help if they wanted to cut down. However, drinkers gave less positive responses on two capability measures. First, only around one-quarter of drinkers kept track of their units. Although unit counting may be unnecessary for those already drinking moderately, the proportion doing so was even lower among drinkers exceeding the guidelines. Second, only around one-third of drinkers said that 1–2 units is the most they can consume on 1 day before it does significant harm. This aligns with the findings above on drinkers’ low knowledge of the guideline, but it also suggests that drinkers may require convincing that the guideline is set at an appropriate level. Drinkers also had mixed motivations for behaviour change. Most drinkers wanted to and intended to stay within safe limits but only half of drinkers were trying not to drink more than is good for them and, as with tracking units, this was more common among those already drinking within the guidelines than among those exceeding them. Only one-quarter of drinkers were concerned by drinking more alcohol than is good for them, and < 40% were trying to avoid drinking excessively. The contradiction between these responses and drinkers’ wanting to and intending to stay within safe limits suggests that, although, in a general sense, drinkers are motivated to stay within the guidelines, they are not strongly motivated by concerns about alcohol-related health risks or necessarily willing to forgo heavier drinking. This appears to reflect a concern expressed repeatedly in prior literature regarding a conflict between the consumption threshold set by guidelines and the desire of drinkers to become intoxicated. 23,42,142 This, in turn, reflects a broader concern that drinking guidelines, like other forms of health promotion, engage insufficiently with positive motivations for unhealthy behaviour, such as pleasure, transgression and the enhancement of traits such as self-confidence, and we return to this point below. 183,184
In addition to examining time trends in behavioural influences, we also examined the social patterning of these influences and identified important inequalities. In particular, drinkers in social grade DE were the least likely to be aware of guidelines or to know what the guideline is. They also found it more difficult to drink moderately, were less motivated to do so and were less sure where to get advice on cutting down. Taken together, these findings suggest that drinkers of lower socioeconomic status are less able and less likely than their counterparts of higher socioeconomic status to use the revised drinking guidelines to make responsible and healthy choices about alcohol consumption. As drinkers of lower socioeconomic status also suffer greater harm from alcohol despite drinking less, on average,161,185 it is likely that these differences will contribute to the perpetuation and, possibly, exacerbation of alcohol-related health inequalities.
Furthermore, drinkers exceeding the guidelines also differed significantly from those not doing so on the measures of behavioural influences. Heavier drinkers were more likely to be aware of and exposed to the guidelines, potentially reflecting an accumulation effect from seeing guidelines on product labels and more general engagement with or sensitivity to alcohol-related materials. However, these heavier drinkers were no more likely than moderate drinkers to know what the guideline was. It is difficult to explain this anomaly. It may be a form of psychological reactance, in which individuals reject or disengage from information that threatens their freedom to act. 58 Support for this interpretation is provided by the finding that heavier drinkers were also substantially less likely to say that 2 units per day is the most they can drink without harming their health. As with the low level of agreement on this measure across the population, it suggests that heavier drinkers in particular require convincing that the drinking guidelines are set at an appropriate level. Heavier drinkers were also less likely to respond positively to other questions about their capability to change behaviour. They were less likely than those drinking within the guidelines to find it easy to drink at moderate levels and were less likely to track the units they consume. They also responded less positively on most measures of their motivations.
In general, these findings suggest that those at elevated risk from their drinking are among the least well prepared to use the drinking guidelines to make informed or healthier choices about their alcohol consumption.
Announcing revised guidelines did not lead to clearly detectable changes in drinking behaviour
The main evaluation analyses present a somewhat mixed picture of the impact of announcing the revised guidelines on alcohol consumption behaviours, with different findings for different outcome measures and analytical models. Analyses of our primary outcome measure suggest that the revised guidelines were associated with an increasing trend towards more problematic alcohol consumption, but this trend appears to have begun 6 months prior to the revised guidelines being announced and it may also have been only a short-term trend. The findings were also specific to our primary outcome measure of AUDIT-C scores and were not seen in our secondary measures of drinking behaviours derived from graduated frequency questions and alcohol taxation data. There was evidence of a step change to a lower level of hospital admissions for alcohol poisoning and assaults following the guideline announcement, but these changes were too large to be attributed plausibly to the guidelines given the lack of evidence of change in any other outcome measures. We judge that these changes in hospitalisations are more likely to result from other uncontrolled confounding factors or from artefacts of the research methods.
These findings are in line with previous studies examining the effects of alcohol-related health information on alcohol consumption, including previous announcements of new or revised drinking guidelines, evaluation or testing of health warning labels and evaluation of mass media campaigns. 28,41,49,63 They are also in line with our logic model, shown in Appendix 1, which suggests that changes in alcohol consumption behaviours are contingent on promotional activity, which was limited, and changes in influences on behaviour change, which did not take place.
Strengths and limitations
Strengths
This is the most comprehensive evaluation to date of the impact of promoting new or revised low-risk drinking guidelines. The study includes a focused analysis of how the drinking guidelines are promoted. Despite drinking guidelines being discussed extensively within the research literature, including studies of people’s knowledge and adherence to the guidelines,33,34,36–38,40,46,182 their attitudes towards them23,142,186,187 and more general discourse around their utility and effectiveness,15,16,18,43,188 no previous study has examined their promotion in detail. Similarly, although there are studies of news media coverage of policy debates relating to the pricing, advertising, licensing and general regulation of alcohol,74,77,80,81,99 only one briefly reported study has examined how alcohol-related health information and, specifically, drinking guidelines are reported by news media. 102 To the best of our knowledge, the present study is also the first to use high-frequency survey data over an extended time period (i.e. 24, 44 or 48 monthly data points depending on the analysis) to examine the effects of drinking guidelines on individual drinkers. Previous studies have tended to use annual or less frequent data series36–38 or a small number of repeated surveys over a shorter time period. 41 Although informative, such studies lack sufficient data points to allow the well-controlled time series analyses undertaken here. 189 Finally, we included a set of measures of drinkers’ capability, opportunity and motivation to change behaviour that were informed by an established model of behaviour change and were based on measures found to predict smoking behaviour. 68,145
The main evaluation analyses in this study are also strengthened by the use of multiple outcome measures. Alcohol consumption behaviours are widely acknowledged to be difficult to measure via survey data because of a range of biases embedded in sampling frames, research instruments and participants’ self-reports. 153,164 However, in the absence of viable individual-level objective measures of alcohol consumption, measurement via surveys is essential to capture differences in alcohol consumption behaviours across population subgroups. We therefore used two well-established alcohol consumption measures: the AUDIT-C tool and graduated frequency questions. 149,152,190–193 We then supplemented these with an objective population-level measure derived from government alcohol taxation data and also used measures of hospitalisations for alcohol poisoning and assaults as proxy measures for heavy episodic drinking and alcohol-related violence, respectively. We also controlled for two potential confounders of alcohol consumption trends: alcohol prices and weather. Finally, we conducted sensitivity analyses to test the robustness of the results to alternative model specifications, several of which suggested important caveats to the findings of the primary analysis (e.g. that an identified change in trend actually occurred 6 months before the guidelines were announced).
Limitations
Limitations of the individual components of the project are discussed in the relevant chapters and here we discuss overarching limitations.
The lack of promotional activity beyond the initial announcement of the revised guidelines means that our conclusions regarding the effectiveness of promoting drinking guidelines as a behaviour change intervention have only limited generalisability to scenarios where more extensive promotion takes place. Our results are likely to remain useful evidence as limited promotional activity is common in other countries, such as Australia. 102 However, our results will be less useful in informing the likely effectiveness of future promotional campaigns.
The short pre-intervention period of data collection for some outcome measures, which arose because of a delay in securing research funding, means that our conclusions regarding changes in influences on behaviour change should be treated with some caution. It is possible that these measures were subject to large random variations during the pre-intervention period, which included November and December 2015 only, and this may mean that our findings are misleading. However, the lack of large random variations or time trends in these measures across the post-intervention period suggests that the risk of misleading findings is modest.
Our understanding of how drinkers responded to the revised guidelines is informed only by survey-based data. We may also gain indirect insights into drinkers’ responses to the extent that news media reporting reflects public opinion, but separating public opinion from other aspects of reporting, editorial influence and journalistic personal perspective is challenging. 76,79,80 Understanding public responses is important, as previous qualitative research on drinking guidelines, units and product labelling has identified that some drinkers not only struggle to understand and use key concepts such as units and guidelines, but also actively reject the content of these concepts. For example, several studies demonstrate that drinkers motivated to drink to intoxication find typical guidelines unhelpful as they do not accommodate such practices and think that the idea of counting units on heavier and social drinking occasions is unrealistic. 23,42,142,187 Beyond alcohol, studies of dietary advice in Denmark reveal that, even when campaigns promoting such guidance are effective in raising public awareness and knowledge, the public do not follow the guidance in a literal sense, but interpret and enact it through their pre-existing understandings and attitudes towards what constitutes healthy eating. 127,130 Therefore, it is important to not make assumptions regarding why drinkers did not change their behaviour. Insufficient promotional activity affecting influences on behaviour change is likely to be part of the story, but there may be additional factors that this study has not examined.
Finally, the drinking guidelines examined here were developed for the UK as a whole. This study focused on England only as this is the sampling frame for the ATS. It is possible that the guidelines had a larger effect in Scotland, Wales or Northern Ireland where the wider alcohol policy context is different, particularly in Scotland, which has followed a more public health-oriented approach to alcohol policy in recent years. 194 It is also possible that promotional activity was more extensive in these contexts, although we are not aware of any large-scale campaigns beyond the Count 14 campaign mentioned in Promotional activities outside the study period, which fell outside the study period. The evaluation of the Count 14 campaign may provide insights into whether or not Scotland differs from England on key outcome measures.
Patient and public involvement
We conducted two PPI sessions throughout the course of the project to support the interpretation of the early and final results of the evaluation analyses. The sessions took place in 2016 and 2018. In the absence of a pre-existing and appropriate PPI panel in England, we worked with an established PPI panel comprising approximately 30 adults within the general population of Scotland who regularly consume alcohol. The lead researcher gave a presentation on drinking guidelines, the present project and the preliminary findings at that point in time. He then led a discussion of panel members’ views on drinking guidelines, their exposure to the revised guidelines and their perspective on the results.
The main outcome of these sessions was to confirm our interpretation that the guidelines had had little impact on drinkers in the general population. The comments of panel members generally matched our own interpretations of the extent of promotional activity, the likelihood of the guidelines affecting behaviour and the reasons underlying this. For example, some panel members said that they had noticed the news reports announcing the new guidelines but had seen little other information and had largely forgotten the content of those news reports. Panel members were apathetic towards the guidelines for a variety of reasons, including their impenetrability, scepticism about the ‘nanny state’ and their lack of usefulness for those motivated to drink to intoxication. These views aligned well with the findings of our survey data and the themes we discuss above when interpreting our results. Panel members also suggested that the messaging they had seen, particularly in news media, was generally negative and focused on the risks of drinking. They were keen to see more positive messages that engaged with drinkers’ motivations to drink or the benefits of not drinking. They also wanted to see messaging that set out the positive actions that drinkers could take to gain these benefits.
The PPI sessions were useful to the extent that they confirmed our interpretations of the data, but they did not substantially influence the methods or write-up of the study as no new practicable suggestions or ideas for research activities or interpreting the data and results emerged. Panel members were engaged and insightful in their comments and the format of the sessions worked well.
One panel member also attended Project Advisory Group meetings and made useful suggestions regarding sources of news media data.
Implications for policy
The findings of this project suggest that the public is not in a position to use the revised drinking guidelines to make the responsible and healthy choices about their drinking envisaged by the 2012 Alcohol Strategy. 5 This finding echoes those from previous studies relating to the 1995 UK guidelines40,186 and to guidelines internationally. 33,36 Although governments aspire to use drinking guidelines and unit or standard drink information to help drinkers to consume alcohol in moderation, they have not been successful in equipping drinkers with the knowledge and skills to achieve this or in persuading drinkers that the guideline is appropriate or useful. Below, we discuss three key areas of concern: problems with units, problems with the guidelines in general and problems with the specific revised UK guideline.
First, the available evidence suggests that drinkers in the UK have only a partial understanding of units and few use units to monitor their consumption. 23,34,40,47,146 Drinkers typically overestimate the size of 1 unit, suggest that it is difficult to remember the unit content of drinks when this information is not provided (e.g. in on-trade settings) and argue that it is difficult to use the information in real-life contexts. 8,34,42,195 This is problematic as units are the metric by which guidelines communicate the recommended maximum level of consumption to the public. However, the problem is slightly more complicated than it appears at first glance. The UK Opinions Survey found that 90% of adults had heard of units in 2009 and that, although only one-quarter of respondents knew that 1 unit of wine was less than a 125-ml glass, two-thirds knew that 1 unit of beer was half a pint and 1 unit of a spirit was a single measure, and half said that 1 unit of wine was a ‘small glass’. 40 This suggests that the basic knowledge of units is less of a problem than the skills necessary to apply that knowledge in practice, for example to estimate the number of units in a particular drink, to adapt estimates to beers, wine or spirits of different alcoholic strengths or to calculate the total number of units consumed across a number of differently sized drinks drank during a night out. Equipping people with these skills is likely to be important if drinkers are to effectively use units as part of an effort to moderate their alcohol consumption.
Second, the evidence from the present project and previous research is also clear that drinkers have only a limited understanding of drinking guidelines, which, coupled with an incomplete understanding of units, is likely to hinder their ability to respond to guidelines as envisaged by the government’s alcohol strategy. The present project additionally demonstrates that drinkers’ capabilities, opportunities and motivations to use the guidelines to change behaviour are inconsistent. Key areas for attention include drinkers’ knowledge of the guidelines, their beliefs regarding the riskiness of exceeding the recommended maximum consumption level, and aspects of their motivations relating to deliberate efforts to drink at moderate levels and avoid excessive drinking. The need for greater knowledge and preparedness to use the information to change behaviour is also not evenly distributed across the population. In particular, those drinkers at greatest risk from their alcohol consumption, namely heavier drinkers and those in lower socioeconomic groups, differ in important ways from those at lower risk. Our findings suggest that enabling heavier drinkers to change their alcohol consumption behaviours will require increases in their motivations to do so and also changes in their beliefs about the riskiness of higher levels of alcohol consumption. Those in lower socioeconomic groups require greater awareness and knowledge of guidelines if they are to use them effectively and, if they are to change their drinking behaviour, efforts may also be required to influence their motivations to do so.
Third, evidence that drinkers believe that they can drink > 2 units per day without being at risk of serious harm suggests that the UK guideline of 14 units per week does not align well with drinkers’ perceptions of risky levels of alcohol consumption. This may reflect that the guideline is set to recommend a low-risk level of consumption rather than to identify a high-risk level. However, it may also reflect drinkers’ perceptions of the risks associated with lower levels of alcohol consumption. For example, several studies have demonstrated low awareness of the relationship between alcohol consumption and cancer risk,196–198 which is an important driver of risks at low consumption levels. There is also widespread awareness among drinkers of evidence that low levels of alcohol consumption may provide some protection against cardiovascular disease,199,200 despite the most recent evidence suggesting that such protective effects may be smaller and less certain than previously thought. 201–203 Furthermore, qualitative evidence suggests that drinkers’ judgements regarding the risks of exceeding the guidelines are informed less by their understanding of epidemiological data and more by a wider set of considerations that jointly amount to a lay epidemiology of alcohol. 23,131,204 These considerations do include formal scientific evidence, as reported via news media, but also include drinkers’ understandings of alcohol-related risks as developed through their own experience of alcohol consumption and alcohol-related problems and the consequences of alcohol consumption they observe and discuss within their families, social networks and communities. Drinkers’ judgements also draw on embodied understandings of risk, regarding whether they feel they are intoxicated or unwell or have reached their personal consumption limit. 23,42,142,187,205 In combination, this mixture of inconsistent awareness of epidemiological evidence and risk perceptions informed by a wide set of personalised factors presents two options for increasing drinkers’ use of guidelines. First, health authorities may seek to increase public understanding of alcohol-related health risk and increase their motivations to avoid these risks. One approach to this may be to promote the basis for the guidelines, that drinking 14 units per week entails an approximately 1% risk of dying due to alcohol (although note that we have argued elsewhere that this basis for the guidelines is problematic188). The 1% figure could be set in context by comparing it to the risk associated with other everyday activities. However, the effectiveness of this approach may be limited to the extent that drinkers find that information does not accord with their own experience and lay epidemiological perspectives and their positive motivations for drinking. 184 The second option, therefore, is to develop further evidence on how drinking guidelines can be designed and prompted. This evidence should address how drinkers use, or might use, guidelines in practice. 188
Implications for future research
We identify three priority areas for future research, namely identification of effective alcohol-related health promotion messages, how to tailor those messages to be effective for particularly at-risk groups and how to set drinking guidelines to be effective as a behaviour change intervention. We discuss each of these in turn.
There is an extensive literature describing effective approaches to changing behaviour, but there is a lack of evidence to inform the specifics of what alcohol-related health promotion messages should say if they are to be effective. For example, a review by Hassan and Shiu64 found that the literature on the effectiveness of warning labels for alcoholic products was ‘weak and fragmented’,64 with little consistency in research approach and few clear recommendations available on key questions such as the use of imagery, recommendations and specific versus general messages. 64 The small literature evaluating the effectiveness of promoting drinking guidelines similarly provides little guidance on which messages are more or less effective, often because evaluation studies do not focus on particular campaigns or do not describe those campaigns in detail. Addressing these problems through a more structured programme of research that promotes comparability across studies and focuses on key unanswered questions is an important priority going forwards.
A corollary to this is the need to identify messages that are effective for particular population groups. This project identifies heavier drinkers and those of lower socioeconomic status as groups of particular concern as both groups are at elevated risk from their alcohol consumption and less prepared to change their behaviour. The existing literature offers little guidance on how to tailor alcohol-related health promotion messages to these groups. Studies evaluating the mandatory US alcohol warning labels do describe diffusion processes by which heavier drinkers, who are exposed to the labels through increased contact with alcoholic products, are more aware of and able to recall the warning labels. 52 This literature also demonstrates that there are limits to diffusion of awareness and knowledge via the simple accumulation of exposure, as trends in these outcomes plateaued 3–4 years after the labels were implemented. 52 Study authors often discuss the possibility that this reflects psychological reactance or the effects of repeated exposure that no longer attracts attention,58,64,136 but there is little direct evidence to support these arguments. We are unaware of any evidence discussing the effectiveness of alcohol-related health promotion messages targeting those of lower socioeconomic status. As above, developing an evidence base in this area is an important priority.
Finally, greater attention is needed to the design of drinking guidelines themselves. As we have discussed elsewhere, guidelines are often designed with reference, or at least explicit reference, only to formal epidemiological evidence. 188 This is particularly true of the guideline consumption threshold. Little consideration or evidence is brought to bear on questions regarding whether or not guidelines and the consumption threshold are appropriate to achieve the desired effect. This omission is particularly concerning where guidelines are conceived as a behaviour change intervention, as in the UK,5 but remains important where the purpose of guidelines is to communicate scientific evidence to the public, as reducing an extensive and nuanced evidence base to a single number is inevitably a simplification of that evidence and different approaches may communicate the full implications of the evidence in better or worse ways. The EU-funded Reducing Alcohol Related Harm project made best practice recommendations for the development of drinking guidelines in 2017,8 but these appear to be based primarily on epidemiological considerations and do not engage with considerations drawn from the wider scientific literature, such as how drinkers actually use guidelines in practice, how guidelines intersect with positive motivations for drinking (e.g. pleasure) and how the effectiveness of drinking guidelines is shaped by their acceptability and credibility within public debate.
Conclusions
The announcement of revised UK low-risk drinking guidelines was not subject to large-scale promotion by any organisation following the initial media launch, was not associated with substantial and sustained changes in most influences on behaviour change and was not associated with clearly detectable changes in drinking behaviour. Therefore, we conclude that the limited promotional activity does not appear to have led to the guidelines being used to inform responsible and healthier choices among drinkers, as intended by the UK Government.
Acknowledgements
We would like to thank Dr Duncan Gillespie and Laura Webster for their contributions to data preparation, Professor Sara Lewis for her contributions to the design of the review of promotional activity, the University of Stirling’s drink panel for their contributions to the PPI activities and the members of the Project Advisory Group for their support and advice.
Additional data collection was funded by the National Institute for Health Research School for Public Health Research.
Contributions of authors
John Holmes (https://orcid.org/0000-0001-9283-2151) (Reader in Alcohol Policy, Public Health) led the project and drafted the report.
Emma Beard (https://orcid.org/0000-0001-8586-1261) (Research Fellow, Health Psychology and Statistics) conducted the evaluation analyses and contributed to the drafting of the report.
Jamie Brown (https://orcid.org/0000-0002-2797-5428) (Principal Research Fellow, Health Psychology) contributed to project and analysis design, evaluation analysis and drafting of the report.
Alan Brennan (https://orcid.org/0000-0002-1025-312X) (Professor of Health Economics and Decision Modelling, Health Economics) contributed to project and analysis design and drafting of the report.
Inge Kersbergen (https://orcid.org/0000-0002-8799-8963) (Research Associate, Public Health) led the review of news coverage of the drinking guidelines and contributed to drafting of the report.
Petra S Meier (https://orcid.org/0000-0001-5354-1933) (Professor of Public Health, Public Health) contributed to project and analysis design and drafting of the report.
Susan Michie (https://orcid.org/0000-0003-0063-6378) (Professor of Health Psychology, Health Psychology) contributed to project and analysis design and drafting of the report.
Abigail K Stevely (https://orcid.org/0000-0002-5637-5245) (PhD Student, Public Health) analysed influences on behaviour change and contributed to drafting of the report.
Penny Buykx (https://orcid.org/0000-0003-4788-4002) (Associate Professor, Behavioural Science) contributed to project design, led the review of promotional activity and contributed to drafting of the report.
Publication
Holmes J, Beard E, Brown J, Brennan A, Meier PS, Michie S, et al. Effects on alcohol consumption of announcing and implementing revised UK low-risk drinking guidelines: findings from an interrupted time series analysis [published online ahead of print July 19 2020]. J Epidemiol Community Health 2020.
Data-sharing statement
All data requests should be submitted to the corresponding author for consideration. Access to available anonymised data may be granted following review.
Disclaimers
This report presents independent research funded by the National Institute for Health Research (NIHR). The views and opinions expressed by authors in this publication are those of the authors and do not necessarily reflect those of the NHS, the NIHR, NETSCC, the PHR programme or the Department of Health and Social Care. If there are verbatim quotations included in this publication the views and opinions expressed by the interviewees are those of the interviewees and do not necessarily reflect those of the authors, those of the NHS, the NIHR, NETSCC, the PHR programme or the Department of Health and Social Care.
References
- Rehm J, Gmel GE, Gmel G, Hasan OSM, Imtiaz S, Popova S, et al. The relationship between different dimensions of alcohol use and the burden of disease – an update. Addiction 2017;112:968-1001. https://doi.org/10.1111/add.13757.
- Forouzanfar MH, Afshin A, Alexander LT, Anderson HR, Bhutta ZA, Biryukov S, et al. Global, regional, and national comparative risk assessment of 79 behavioural, environmental and occupational, and metabolic risks or clusters of risks, 1990–2015: a systematic analysis for the Global Burden of Disease Study 2015. Lancet 2016;388:1659-724. https://doi.org/10.1016/S0140-6736(16)31679-8.
- Public Health England . Local Alcohol Profiles for England 2018. https://fingertips.phe.org.uk/profile/local-alcohol-profiles (accessed 10 October 2018).
- Office for National Statistics . Estimates of Violent Incidents Where the Victim Believed the Offender(S) to Be Under the Influence of Alcohol or Drugs in England And Wales, Year Ending March 2006 to Year Ending March 2016 Crime Survey for England and Wales 2017. www.ons.gov.uk/peoplepopulationandcommunity/crimeandjustice/adhocs/007185estimatesofviolentincidentswherethevictimbelievedtheoffenderstobeundertheinfluenceofalcoholordrugsinenglandandwalesyearendingmarch2006toyearendingmarch2016crimesurveyforenglandandwales (accessed 6 May 2019).
- HM Government . The Government’s Alcohol Strategy 2012.
- Cabinet Office . Alcohol Harm Reduction Strategy for England 2004.
- HM Government . Safe. Sensible. Social. The Next Steps in the National Alcohol Strategy 2007.
- Broholm K, Galluzzo L, Gandin C, Ghirini S, Ghiselli A, Jones L, et al. Good Practice Principles for Low-Risk Drinking Guidelines. Helsinki: National Institute for Health and Welfare (THL); 2016.
- Kalinowski A, Humphreys K. Governmental standard drink definitions and low-risk alcohol consumption guidelines in 37 countries. Addiction 2016;111:1293-8. https://doi.org/10.1111/add.13341.
- Kneale J, French S. Moderate drinking before the unit: medicine and life assurance in Britain and the US c.1860–930. Drug: Educ Prev Polic 2015;22:111-17. https://doi.org/10.3109/09687637.2014.964185.
- House of Commons Science and Technology Committee . Alcohol Guidelines, Eleventh Report of Session 2010–12 (HC 1536) 2012.
- Holmes J, Angus C, Meier PS, Buykx P, Brennan A. How should we set consumption thresholds for low risk drinking guidelines? Achieving objectivity and transparency using evidence, expert judgement and pragmatism. Addiction 2019;114:590-60. https://doi.org/https://doi.org/10.1111/add.14381.
- Babor TF, Caetano R, Casswell S, Edwards G, Giesbrecht N, Graham K, et al. Alcohol: No Ordinary Commodity. Research and Public Policy. Oxford: Oxford University Press; 2010.
- Moss A, Dyer K, Albery I. Knowledge of drinking guidelines does not equal sensible drinking. Lancet 2009;374. https://doi.org/10.1016/S0140-6736(09)61788-8.
- Casswell S. Drinking guidelines offer little over and above much needed public health policies. Addiction 1996;91:26-9. https://doi.org/10.1111/j.1360-0443.1996.tb03155.x.
- Casswell S. Why have guidelines at all? A critical perspective. Drug Alcohol Rev 2012;31:151-2. https://doi.org/10.1111/j.1465-3362.2011.00376.x.
- Bellis MA. UK drinking guidelines are better for the alcohol industry than the public. BMJ 2011;343. https://doi.org/10.1136/bmj.d6023.
- Heather N. Drinking guidelines are essential in combating alcohol-related harm: comments on the new Australian and Canadian guidelines. Drug Alcohol Rev 2012;31:153-5. https://doi.org/10.1111/j.1465-3362.2011.00397.x.
- Marteau TM. Will the UK’s new alcohol guidelines change hearts, minds – and livers?. BMJ 2016;352. https://doi.org/10.1136/bmj.i704.
- Department of Health and Social Care (DHSC) . Sensible Drinking: The Report of an Inter-Departmental Working Group 1995.
- Department of Health and Social Care (DHSC) . Alcohol Guidelines Review: Report from the Guidelines Development Group to the UK Chief Medical Officers. 2016.
- Department of Health and Social Care (DHSC) . UK Chief Medical Officers’ Alcohol Guidelines Review: Summary of the Proposed New Guidelines 2016.
- Lovatt M, Eadie D, Meier PS, Li J, Bauld L, Hastings G, et al. Lay epidemiology and the interpretation of low-risk drinking guidelines by adults in the United Kingdom. Addiction 2015;110:1912-19. https://doi.org/10.1111/add.13072.
- Department of Health and Social Care (DHSC) . UK Chief Medical Officers’ Low Risk Drinking Guidelines 2016.
- Department of Health and Social Care (DHSC) . How to Keep Health Risks from Drinking Alcohol to a Low Level: Government Response to the Public Consultation 2016.
- Anderson P, Chisholm D, Fuhr DC. Effectiveness and cost-effectiveness of policies and programmes to reduce the harm caused by alcohol. Lancet 2009;373:2234-46. https://doi.org/10.1016/S0140-6736(09)60744-3.
- Walsh GW, Bondy SJ, Rehm J. Review of Canadian low-risk drinking guidelines and their effectiveness. Can J Public Health 1998;89:241-7. https://doi.org/10.1007/BF03403927.
- Wakefield MA, Loken B, Hornik RC. Use of mass media campaigns to change health behaviour. Lancet 2010;376:1261-71. https://doi.org/10.1016/S0140-6736(10)60809-4.
- Capacci S, Mazzocchi M. Five-a-day, a price to pay: an evaluation of the UK program impact accounting for market forces. J Health Econ 2011;30:87-98. https://doi.org/10.1016/j.jhealeco.2010.10.006.
- Randolph W, Viswanath K. Lessons learned from public health mass media campaigns: marketing health in a crowded media world. Annu Rev Public Health 2004;25:419-37. https://doi.org/10.1146/annurev.publhealth.25.101802.123046.
- Noar S. A 10-year retrospective of research in health mass media campaigns: where do we go from here?. J Health Commun Int Perspect 2006;11:21-42. https://doi.org/10.1080/10810730500461059.
- Stead M, Gordon R, I H, Moodie C, Hastings G, Angus K. Changing Attitudes, Knowledge and Behaviour: A Review of Successful Initiatives. York: Joseph Rowntree Foundation; 2009.
- Bowden J, Delfabbro P, Room R, Miller C, Wilson C. Alcohol consumption and NHMRC guidelines: has the message got out, are people conforming and are they aware that alcohol causes cancer?. Aust N Z J Public Health 2014;38:66-72. https://doi.org/10.1111/1753-6405.12159.
- de Visser RO, Birch JD. My cup runneth over: young people’s lack of knowledge of low-risk drinking guidelines. Drug Alcohol Rev 2012;31:206-12. https://doi.org/10.1111/j.1465-3362.2011.00371.x.
- Bendtsen P, Karlsson N, Dalal K, Nilsen P. Hazardous drinking concepts, limits and methods: low levels of awareness, knowledge and use in the Swedish population. Alcohol Alcohol 2011;46:638-45. https://doi.org/10.1093/alcalc/agr065.
- Livingston M. Perceptions of low-risk drinking levels among Australians during a period of change in the official drinking guidelines. Drug Alcohol Rev 2012;31:224-30. https://doi.org/10.1111/j.1465-3362.2011.00414.x.
- Grønbaek M, Strøger U, Strunge H, Møller L, Graff V, Iversen L. Impact of a 10-year nation-wide alcohol campaign on knowledge of sensible drinking limits in Denmark. Eur J Epidemiol 2001;17:423-7. https://doi.org/10.1023/a: 1013765827585.
- Strunge H. Danish experiences of national campaigns on alcohol 1990–1996. Drug: Educ Prev Polic 1998;5:73-9. https://doi.org/10.3109/09687639809035772.
- Health and Social Care Information Centre . Statistics on Alcohol: England, 2013 2013.
- Office for National Statistics . Opinions Survey Report No. 42 Drinking: Adults’ Behaviour and Knowledge in 2009 2010.
- Dixon HG, Pratt IS, Scully ML, Miller JR, Patterson C, Hood R, et al. Using a mass media campaign to raise women’s awareness of the link between alcohol and cancer: cross-sectional pre-intervention and post-intervention evaluation surveys. BMJ Open 2015;5. https://doi.org/10.1136/bmjopen-2014-006511.
- Furtwängler NAF, de Visser RO. University students’ beliefs about unit-based guidelines: a qualitative study. J Health Psychol 2017;22:1701-11. https://doi.org/10.1177/1359105316634449.
- Jayne M, Vallentine G, Holloway SL. What use are units? Critical geographies of alcohol policy. Antipode 2012;44:828-46. https://doi.org/10.1111/j.1467-8330.2011.00927.x.
- Petticrew M, Douglas N, Knai C, Durand MA, Eastmure E, Mays N. Health information on alcoholic beverage containers: has the alcohol industry’s pledge in England to improve labelling been met?. Addiction 2015;111:51-5. https://doi.org/10.1111/add.13094.
- Campden BRI. Final Report On: Audit of Compliance of Alcoholic Beverage Labels Available from the Off-Trade With the Public Health Responsibility Deal Labelling Pledge 2014.
- Holmes J, Brown J, Meier P, Beard E, Michie S, Buykx P. Short-term effects of announcing revised lower risk national drinking guidelines on related awareness and knowledge: a trend analysis of monthly survey data in England. BMJ Open 2016;6. https://doi.org/10.1136/bmjopen-2016-013804.
- Royal Society for Public Health . Labelling the Point: Towards Better Alcohol Health Information 2018.
- Kaskutas L, Greenfield TK. First effects of warning labels on alcoholic beverage containers. Drug Alcohol Depend 1992;31:1-14. https://doi.org/10.1016/0376-8716(92)90002-T.
- Stockwell T. A Review of Research into the Impacts of Alcohol Warning Labels on Attitudes and Behaviour. Victoria, BC: Centre for Addictions Research of BC, University of Victoria; 2006.
- Mazis MB, Morris LA, Swasy JL. An evaluation of the alcohol warning label: initial survey results. J Public Policy Mark 1991;10:229-41. https://doi.org/10.1177/074391569101000116.
- MacKinnon DP, Pentz MA, Stacy AW. The alcohol warning label and adolescents: the first year. Am J Public Health 1993;83:585-7. https://doi.org/10.2105/ajph.83.4.585.
- Greenfield TK, Kaskutas LA. Five years’ exposure to alcohol warning label messages and their impacts: evidence from diffusion analysis. Appl Behav Sci Rev 1998;6:39-68. https://doi.org/10.1016/S1068-8595(99)80004-X.
- MacKinnon DP, Nohre L, Pentz MA, Stacy AW. The alcohol warning and adolescents: 5-year effects. Am J Public Health 2000;90:1589-94. https://doi.org/10.2105/AJPH.90.10.1589.
- MacKinnon DP, Nohre L, Cheong J, Stacy AW, Pentz MA. Longitudinal relationship between the alcohol warning label and alcohol consumption. J Stud Alcohol 2001;62:221-7. https://doi.org/10.15288/jsa.2001.62.221.
- Pettigrew S, Jongenelis M, Chikritzhs T, Slevin T, Pratt IS, Glance D, et al. Developing cancer warning statements for alcoholic beverages. BMC Public Health 2014;14. https://doi.org/10.1186/1471-2458-14-786.
- Wigg S, Stafford LD. Health warnings on alcoholic beverages: perceptions of the health risks and intentions towards alcohol consumption. PLOS ONE 2016;11. https://doi.org/10.1371/journal.pone.0153027.
- Hobin E, Vallance K, Zuo F, Stockwell T, Rosella L, Simniceanu A, et al. Testing the efficacy of alcohol labels with standard drink information and national drinking guidelines on consumers’ ability to estimate alcohol consumption. Alcohol Alcohol 2018;53:3-11. https://doi.org/10.1093/alcalc/agx052.
- Andrews JC. The effectiveness of alcohol warning lables: a review and extension. Am Behav Sci 1995;38:622-32. https://doi.org/10.1177/0002764295038004011.
- Thomson LM, Vandenberg B, Fitzgerald JL. An exploratory study of drinkers views of health information and warning labels on alcohol containers. Drug Alcohol Rev 2012;31:240-7. https://doi.org/10.1111/j.1465-3362.2011.00343.x.
- Coomber K, Martino F, Barbour IR, Mayshak R, Miller PG. Do consumers ‘Get the facts’? A survey of alcohol warning label recognition in Australia. BMC Public Health 2015;15. https://doi.org/10.1186/s12889-015-2160-0.
- Jones SC, Gregory P. The impact of more visible standard drink labelling on youth alcohol consumption: helping young people drink (ir)responsibly?. Drug Alcohol Rev 2009;28:230-4. https://doi.org/10.1111/j.1465-3362.2008.00020.x.
- Vallance K, Romanovska I, Stockwell T, Hammond D, Rosella L, Hobin E. ‘We have a right to know’: exploring consumer opinions on content, design and acceptability of enhanced alcohol labels. Alcohol Alcohol 2018;53:20-5. https://doi.org/10.1093/alcalc/agx068.
- Maynard OM, Langfield T, Attwood AS, Allen E, Drew I, Votier A, et al. No impact of calorie or unit information on ad libitum alcohol consumption. Alcohol Alcohol 2018;53:12-9. https://doi.org/10.1093/alcalc/agx066.
- Hassan LM, Shiu E. A systematic review of the efficacy of alcohol warning labels: insights from qualitative and quantitative research in the new millennium. J Soc Mark 2018;8:333-52. https://doi.org/https://doi.org/10.1108/JSOCM-03-2017-0020.
- Michie S, West R, Campbell R, Brown J, Gainforth H. An ABC of Behaviour Change Theories. London: Silverback Publishing; 2014.
- Gornall J. Under the influence. BMJ 2014;348. https://doi.org/10.1136/bmj.f7646.
- Home Office . Next Steps Following the Consultation on Delivering the Government’s Alcohol Strategy 2013.
- Michie S, van Stralen M, West R. The behaviour change wheel: a new method for characterising and designing behaviour change interventions. Implement Sci 2011;6:1-11. https://doi.org/10.1186/1748-5908-6-42.
- Brennan A, Meier P, Purshouse R, Rafia R, Meng Y, Hill-Macmanus D, et al. The Sheffield Alcohol Policy Model – a mathematical description. Health Econ 2015;24:1368-88. https://doi.org/10.1002/hec.3105.
- Langley T, Lewis S, McNeill A, Gilmore A, Szatkowski L, West R, et al. Characterizing tobacco control mass media campaigns in England. Addiction 2013;108:2001-8. https://doi.org/10.1111/add.12293.
- Langley T, Szatkowski L, Lewis S, McNeill A, Gilmore AB, Salway R, et al. The freeze on mass media campaigns in England: a natural experiment of the impact of tobacco control campaigns on quitting behaviour. Addiction 2014;109:995-1002. https://doi.org/10.1111/add.12448.
- Casswell S. Public discourse on alcohol. Health Promot Int 1997;12:251-7. https://doi.org/10.1093/heapro/12.3.251.
- Nicholls J. UK news reporting of alcohol: an analysis of television and newspaper coverage. Drug: Educ Prev Polic 2011;18:200-6. https://doi.org/10.3109/09687631003796453.
- Fogarty AS, Chapman S. Advocates, interest groups and Australian news coverage of alcohol advertising restrictions: content and framing analysis. BMC Public Health 2012;12. https://doi.org/10.1186/1471-2458-12-727.
- Patterson C, Emslie C, Mason O, Fergie G, Hilton S. Content analysis of UK newspaper and online news representations of women’s and men’s ‘binge’ drinking: a challenge for communicating evidence-based messages about single-episodic drinking?. BMJ Open 2016;6. https://doi.org/10.1136/bmjopen-2016-013124.
- Hansen A, Gunter B. Constructing public and political discourse on alcohol issues: towards a framework for analysis. Alcohol Alcohol 2007;42:150-7. https://doi.org/10.1093/alcalc/agl114.
- Törrönen J. The Finnish press’s political position on alcohol between 1993 and 2000. Addiction 2003;98:281-90. https://doi.org/10.1046/j.1360-0443.2003.00320.x.
- Mercille J. Media coverage of alcohol issues: a critical political economy framework – a case study from Ireland. Int J Environ Res Public Health 2017;14. https://doi.org/10.3390/ijerph14060650.
- Baillie RK. Determining the effects of media portrayals of alcohol: going beyond short term influence. Alcohol Alcohol 1996;31:235-42. https://doi.org/10.1093/oxfordjournals.alcalc.a008142.
- Hilton S, Wood K, Patterson C, Katikireddi SV. Implications for alcohol minimum unit pricing advocacy: what can we learn for public health from UK newsprint coverage of key claim-makers in the policy debate?. Soc Sci Med 2014;102:157-64. https://doi.org/https://doi.org/10.1016/j.socscimed.2013.11.041.
- Katikireddi SV, Hilton S. How did policy actors use mass media to influence the Scottish alcohol minimum unit pricing debate? Comparative analysis of newspapers, evidence submissions and interviews. Drugs 2015;22:125-34. https://doi.org/10.3109/09687637.2014.977228.
- Patterson C, Katikireddi SV, Wood K, Hilton S. Representations of minimum unit pricing for alcohol in UK newspapers: a case study of a public health policy debate. J Public Health 2015;37:40-9. https://doi.org/10.1093/pubmed/fdu078.
- Cook M, Wilkinson C. How did live music become central to debates on how to regulate the Victorian night-time economy? A qualitative analysis of Victorian newspaper reporting since 2003. Drug: Educ Prev Polic 2019;26:265-72. https://doi.org/10.1080/09687637.2018.1426730.
- Campo S, Askelson NM, Mastin T, Slonske M. Using evidence-based research to redirect a conversation: newspapers’ coverage of strategies to address college binge drinking. Public Relations Rev 2009;35:411-8. https://doi.org/https://doi.org/10.1016/j.pubrev.2009.05.013.
- Lawhon M, Herrick C. Alcohol control in the news: the politics of media representations of alcohol policy in South Africa. J Health Polit Policy Law 2013;38:987-1021. https://doi.org/10.1215/03616878-2334683.
- Thornton M, Hawkins B. Between a rock and a hard place: economic expansion and social responsibility in UK media discourses on the global alcohol industry. Soc Sci Med 2017;175:169-76. https://doi.org/10.1016/j.socscimed.2017.01.003.
- Wood K, Patterson C, Katikireddi SV, Hilton S. Harms to ‘others’ from alcohol consumption in the minimum unit pricing policy debate: a qualitative content analysis of UK newspapers (2005–12). Addiction 2014;109:578-84. https://doi.org/10.1111/add.12427.
- Bogren A. ‘Alcohol short-circuits important part of the brain’: Swedish newspaper representations of biomedical alcohol research. Addict Res Theory 2017;25:177-87. https://doi.org/10.1080/16066359.2016.1239720.
- McCallum K, Holland K. ‘To drink or not to drink’: media framing of evidence and debate about alcohol consumption in pregnancy. Crit Public Health 2018;28:412-23. https://doi.org/10.1080/09581596.2017.1414150.
- Lyons AC, Dalton SI, Hoy A. ‘Hardcore drinking’: portrayals of alcohol consumption in young women’s and men’s magazines. J Health Psychol 2006;11:223-32. https://doi.org/10.1177/1359105306061183.
- Atkinson AM, Kirton AW, Sumnall HR. The gendering of alcohol in consumer magazines: an analysis of male and female targeted publications. J Gend Stud 2012;21:365-86. https://doi.org/10.1080/09589236.2012.681180.
- Bogren A. Gender and alcohol: the Swedish press debate. J Gend Stud 2011;20:155-69. https://doi.org/10.1080/09589236.2011.565196.
- Day K, Gough B, McFadden M. ‘Warning! alcohol can seriously damage your feminine health’. Fem Media Stud 2004;4:165-83. https://doi.org/10.1080/1468077042000251238.
- Bernhardsson J, Bogren A. Drink sluts, brats and immigrants as others. Fem Media Stud 2012;12:1-16. https://doi.org/10.1080/14680777.2011.558344.
- Meyer A. ‘Too drunk to say no’. Fem Media Stud 2010;10:19-34. https://doi.org/10.1080/14680770903457071.
- Askelson NM, Campo S, Mastin T, Slonske M. The missing role of parents: a content analysis of newspaper coverage of parenting practices and communication strategies for addressing binge drinking. Commun Res Rep 2009;26:50-61. https://doi.org/10.1080/08824090802637031.
- Törrönen J. Between public good and the freedom of the consumer: negotiating the space, orientation and position of us in the reception of alcohol policy editorials. Media Cult Soc 2001;23:171-93. https://doi.org/10.1177/016344301023002002.
- Lemmens PH, Vaeth PA, Greenfield TK. Coverage of beverage alcohol issues in the print media in the United States, 1985–1991. Am J Public Health 1999;89:1555-60. https://doi.org/10.2105/AJPH.89.10.1555.
- Fogarty AS, Chapman S. Australian television news coverage of alcohol, health and related policies, 2005 to 2010: implications for alcohol policy advocates. Aust N Z J Public Health 2012;36:530-6. https://doi.org/10.1111/j.1753-6405.2012.00933.x.
- Myhre SL, Saphir MN, Flora JA, Howard KA, Gonzalez EM. Alcohol coverage in California newspapers: frequency, prominence, and framing. J Public Health Policy 2002;23:172-90. https://doi.org/10.2307/3343193.
- Azar D, White V, Bland S, Livingston M, Room R, Chikritzhs T, et al. ‘Something’s brewing’: the changing trends in alcohol coverage in Australian newspapers 2000-2011. Alcohol Alcohol 2014;49:336-42. https://doi.org/10.1093/alcalc/agt139.
- Wolfaardt BM, Brownbill AL, Mahmood MA, Bowden JA. The Australian NHMRC guidelines for alcohol consumption and their portrayal in the print media: a content analysis of Australian newspapers. Aust N Z J Public Health 2018;42:43-5. https://doi.org/10.1111/1753-6405.12758.
- Greenfield TK, Kaskutas LA. Early impacts of alcoholic beverage warning labels: national study findings relevant to drinking and driving behavior. Saf Sci 1993;16:689-707. https://doi.org/10.1016/0925-7535(93)90031-8.
- Braun V, Clarke V. Using thematic analysis in psychology. Qual Res Psycho 2006;3:77-101. https://doi.org/10.1191/1478088706qp063oa.
- Department of Health and Social Care . New Alcohol Guidelines Show Increased Risk of Cancer 2016. www.gov.uk/government/news/new-alcohol-guidelines-show-increased-risk-of-cancer (accessed 30 November 2017).
- Utton D, Warren J. 10 Simple Lifestyle Changes to Prevent Type 2 Diabetes 2017. www.express.co.uk/life-style/health/786167/diabetes-type-2-lifestyle-changes-cure-healthy-living (accessed 12 October 2019).
- Smith O. An Average Cruise Passenger Consumes 168 Units of Alcohol Per Week, New Research Has Claimed 2014. www.telegraph.co.uk/travel/cruises/news/168-units-of-alcohol-just-an-average-week-on-a-cruise-ship/ (accessed June 2020).
- Buchanan S. Drinking THIS Much Alcohol Kills Your Erection 2017. www.dailystar.co.uk/love-sex/alcohol-erectile-dysfunction-whiskey-dick-17037359 (accessed 12 October 2019).
- Gander K. New Alcohol Guidelines: Everything You Need to Know About the Drinking Recommendations; The UK’s Chief Medical Officer Has Warned That Any Level Of Drinking Cannot Be Classed As ‘Safe’ 2016. www.independent.co.uk/life-style/health-and-families/health-news/new-alcohol-guidelines-everything-you-need-to-know-about-how-much-experts-say-you-should-drink-a6802031.html (accessed 12 October 2019).
- Grant K. Smaller glass sizes will give drinkers a lesson in moderation. The Independent 2015.
- Robinson A. Cirrhosis: How Dangerous Is Drinking?; Most Of Us Who Drink Alcohol Won’t Die from Liver Disease – But It Still Kills More of Us Than Diabetes and Road Deaths Combined 2016. www.theguardian.com/society/shortcuts/2016/jan/25/cirrhosis-how-dangerous-is-drinking (accessed 12 October 2019).
- Donnely L. Do As I Do, Think About Cancer Before You Have a Glass Of Wine, Says Chief Medical Officer 2016. www.telegraph.co.uk/news/health/12136938/Do-as-I-do-think-about-cancer-before-you-have-a-glass-of-wine-says-chief-medical-officer.html (accessed 13 May 2019).
- Roerecke M, Rehm J. The cardioprotective association of average alcohol consumption and ischaemic heart disease: a systematic review and meta-analysis. Addiction 2012;107:1246-60. https://doi.org/10.1111/j.1360-0443.2012.03780.x.
- Naimi TS, Stockwell T, Zhao J, Xuan Z, Dangardt F, Saitz R, et al. Selection biases in observational studies affect associations between ‘moderate’ alcohol consumption and mortality. Addiction 2017;112:207-14. https://doi.org/10.1111/add.13451.
- Bridge S. Alcohol guidelines don’t add up, says drinks industry. Mail on Sunday 2019.
- Sculthorpe T. Britain’s Top Doctor Warns Drinkers to Ask With EVERY Glass Whether They Want the Wine or the Raised Risk of Cancer 2016. www.dailymail.co.uk/news/article-3428377/Britain-s-doctor-ask-want-glass-wine-want-raise-risk-breast-cancer.html (accessed 1 February 2019).
- Whipple T. Breast Cancer Wine Warning Was a Mistake, Chief Medical Officer Says 2016. www.thetimes.co.uk/article/breast-cancer-wine-warning-was-a-mistake-chief-medical-officer-says-xhq2dbs5v (accessed 1 February 2019).
- The Guardian . Inanity and Incoherence on Safe Alcohol Levels 2016. www.theguardian.com/society/2016/jan/14/inanity-and-incoherence-on-safe-alcohol-levels (accessed 1 February 2019).
- Green C. Camra Consults Its 177,000 Members Over Name Change and Future; Group May Change Direction to Focus on Saving Pubs and the Targeting of Moderate Drinkers By Government Health Advisers 2016. www.independent.co.uk/life-style/food-and-drink/news/camra-consults-its-177000-members-over-name-change-and-future-a6959821.html (accessed 12 October 2019).
- Science Media Centre . Expert Reaction to New Alcohol Guidelines Review from the Chief Medical Officers 2016. www.sciencemediacentre.org/expert-reaction-to-new-alcohol-guidelines-review-from-the-chief-medical-officers/ (accessed 10 January 2020).
- Katikireddi S, Hilton S, Bond L. The role of the Sheffield model on the minimum unit pricing of alcohol debate: the importance of a rhetorical perspective. Evid Policy 2016;12:521-39. https://doi.org/10.1332/174426415X14430986392944.
- The Sun . Boozing limits row. The Sun 2016.
- Moore C. Don’t Let the Public Health Zealots Demonise Us Innocent Drinkers 2016. www.telegraph.co.uk/news/health/12090284/Dont-let-the-public-health-zealots-demonise-us-innocent-drinkers.html (accessed 12 October 2019).
- Gillespie J. Female Drinkers Call Time On ‘Ridiculous’ Alcohol Advice 2017. www.thetimes.co.uk/article/female-drinkers-call-time-on-ridiculous-alcohol-advice-6zq7q8jhn (accessed 1 February 2019).
- Pemberton M. Po-Faced Health Nannies Who Harangue Us Only Make Us Behave Worse 2017. www.dailymail.co.uk/health/article-4524260/Health-nannies-harangue-make-behave-worse.html (accessed 1 February 2019).
- Robinson M. Thought You Said This Was Bad For You! Government’s ‘Nanny in Chief’ Who Told Women to Think of Cancer When Reaching for the Wine Is Pictured Enjoying Drinks With Her Husband and Daughters 2016. www.dailymail.co.uk/news/article-3431444/The-health-hypocrite-Chief-medical-officer-told-women-think-cancer-reaching-wine-pictured-enjoying-drinks-family.html (accessed 12 October 2019).
- Halkier B. Mundane negotiations around official Danish dietary advice: connection, expert knowledge, and everyday agency. Crit Public Health 2018;30:1-12. https://doi.org/10.1080/09581596.2018.1554244.
- Marsh S. The Guardian readers . ‘It’s Death By Bacon for Me’ – Our Readers on Listening to Health Warnings; Chief Medical Officer Dame Sally Davies Says We Should Consider the Risk of Cancer Before Drinking. Our Readers Share Their Views on Such Health Guidance 2016. www.theguardian.com/commentisfree/2016/feb/03/death-bacon-readers-health-warnings-cancer-alcohol (accessed 12 October 2019).
- Sinclair H. New Study Shows a Glass or Two of Wine With Dinner Is Good for Your Health; People Who Drank a Few Glasses of Wine With Dinner Had Good Physical and Mental Health 2016. www.independent.co.uk/life-style/health-and-families/health-news/wine-with-dinner-good-for-health-a7008476.html (accessed 12 October 2019).
- Kristensen DB, Jacobsen CB, Pihl-Thingvad S. Perception and translation of numbers: the case of a health campaign in Denmark. Crit Public Health 2017;28:1-12. https://doi.org/10.1080/09581596.2017.1347605.
- Frankel S, Davison C, Smith GD. Lay epidemiology and the rationality of responses to health education. Br J Gen Pract 1991;41:428-30.
- BBC News . Alcohol Guidelines: The BBC’s Nick Triggle Answers Your Questions 2016. www.bbc.co.uk/news/uk-35263311 (accessed 12 October 2019).
- Clark R. Enough to make you choke!. Daily Mail 2016.
- Borland S. Safe drink limits to be cut because of cancer danger. Daily Mail 2015.
- Davidson L. Fury over killjoy six pints limit on booze. Sun 2016. https://doi.org/10.1111/pan.12968.
- Stautz K, Bignardi G, Hollands GJ, Marteau TM. Reactions on Twitter to updated alcohol guidelines in the UK: a content analysis. BMJ Open 2017;7. https://doi.org/10.1136/bmjopen-2016-015493.
- McCambridge J, Hawkins B, Holden C. Industry use of evidence to influence alcohol policy: a case study of submissions to the 2008 Scottish Government consultation. PLOS Med 2013;10. https://doi.org/10.1371/journal.pmed.1001431.
- Petticrew M, Katikireddi SV, Knai C, Cassidy R, Maani Hessari N, Thomas J, et al. ‘Nothing can be done until everything is done’: the use of complexity arguments by food, beverage, alcohol and gambling industries. J Epidemiol Community Health 2017;71:1078-83. https://doi.org/10.1136/jech-2017-209710.
- BBC News . England'S Medical Chief Gives Stark Alcohol Warning n.d. www.bbc.co.uk/news/health-35471958 (accessed June 2020).
- Weaver M. New tough alcohol guidelines not scaremongering, says chief medical officer. The Guardian 2016.
- Sumner P, Vivian-Griffiths S, Boivin J, Williams A, Venetis CA, Davies A, et al. The association between exaggeration in health related science news and academic press releases: retrospective observational study. BMJ 2014;349. https://doi.org/10.1136/bmj.g7015.
- Harrison L, Kelly P, Lindsay J, Advocat J, Hickey C. ‘I don’t know anyone that has two drinks a day’: young people, alcohol and the government of pleasure. Health Risk Soc 2011;13:469-86. https://doi.org/10.1080/13698575.2011.596190.
- Holmes J, Beard E, Brown J, Brennan A, Meier PS, Michie S, et al. Effects on alcohol consumption of announcing and implementing revised UK low-risk drinking guidelines: findings from an interrupted time series analysis [published online ahead of print July 19 2020]. J Epidemiol Community Health 2020. https://doi.org/10.1136/jech-2020-213820.
- Beard E, Brown J, West R, Acton C, Brennan A, Drummond C, et al. Protocol for a national monthly survey of alcohol use in England with 6-month follow-up: ‘the Alcohol Toolkit Study’. BMC Public Health 2015;15. https://doi.org/10.1186/s12889-015-1542-7.
- Fidler JA, Shahab L, West O, Jarvis MJ, McEwen A, Stapleton JA, et al. ‘The smoking toolkit study’: a national study of smoking and smoking cessation in England. BMC Public Health 2011;11. https://doi.org/10.1186/1471-2458-11-479.
- Stevely AK, Buykx P, Brown J, Beard E, Michie S, Meier PS, et al. Exposure to revised drinking guidelines and ‘COM-B’ determinants of behaviour change: descriptive analysis of a monthly cross-sectional survey in England. BMC Public Health 2018;18. https://doi.org/10.1186/s12889-018-5129-y.
- National Readership Survey . Social Grade n.d. www.nrs.co.uk/nrs-print/lifestyle-and-classification-data/social-grade/ (accessed 6 June 2020).
- Public Health England . The Public Health Burden of Alcohol and the Effectiveness and Cost-Effectiveness of Alcohol Control Policies: An Evidence Review 2016.
- Bush K, Kivlahan DR, McDonell MB, Fihn SD, Bradley KA. The AUDIT alcohol consumption questions (AUDIT-C): an effective brief screening test for problem drinking. Ambulatory Care Quality Improvement Project (ACQUIP). Alcohol Use Disorders Identification Test. Arch Intern Med 1998;158:1789-95. https://doi.org/10.1001/archinte.158.16.1789.
- Bradley KA, McDonell MB, Bush K, Kivlahan DR, Diehr P, Fihn SD. The AUDIT alcohol consumption questions: reliability, validity, and responsiveness to change in older male primary care patients. Alcohol Clin Exp Res 1998;22:1842-9. https://doi.org/10.1097/00000374-199811000-00034.
- Greenfield TK, Kerr WC. Alcohol measurement methodology in epidemiology: recent advances and opportunities. Addiction 2008;103:1082-99. https://doi.org/10.1111/j.1360-0443.2008.02197.x.
- Gmel G, Graham K, Kuendig H, Kuntsche S. Measuring alcohol consumption – should the ‘graduated frequency’ approach become the norm in survey research?. Addiction 2006;101:16-30. https://doi.org/10.1111/j.1360-0443.2005.01224.x.
- Meier PS, Meng Y, Holmes J, Baumberg B, Purshouse R, Hill-McManus D, et al. Adjusting for unrecorded consumption in survey and per capita sales data: quantification of impact on gender- and age-specific alcohol-attributable fractions for oral and pharyngeal cancers in Great Britain. Alcohol Alcohol 2013;48:241-9. https://doi.org/10.1093/alcalc/agt001.
- Office for National Statistics . Consumer Price Inflation, UK Statistical Bulletins 2019. www.ons.gov.uk/economy/inflationandpriceindices/bulletins/consumerpriceinflation/previousReleases (accessed 8 May 2019).
- Met Office . Data n.d. www.metoffice.gov.uk/research/climate/maps-and-data/data/index (accessed 6 June 2020).
- Met Office . Hadley Centre Central England Temperature (HadCET) Dataset 2019. www.metoffice.gov.uk/hadobs/hadcet/ (accessed 7 May 2019).
- Wood SN. Minimizing model fitting objectives that contain spurious local minima by bootstrap restarting. Biometrics 2001;57:240-4. https://doi.org/10.1111/j.0006-341x.2001.00240.x.
- Marmot M. Fair Society, Healthy Lives: Strategic Review of Health Inequalities in England Post-2010. London: The Marmot Review; 2010.
- Lewer D, Meier P, Beard E, Boniface S, Kaner E. Unravelling the alcohol harm paradox: a population-based study of social gradients across very heavy drinking thresholds. BMC Public Health 2016;16. https://doi.org/10.1186/s12889-016-3265-9.
- Bellis MA, Hughes K, Nicholls J, Sheron N, Gilmore I, Jones L. The alcohol harm paradox: using a national survey to explore how alcohol may disproportionately impact health in deprived individuals. BMC Public Health 2016;16. https://doi.org/10.1186/s12889-016-2766-x.
- Mäkelä P, Paljärvi T. Do consequences of a given pattern of drinking vary by socioeconomic status? A mortality and hospitalisation follow-up for alcohol-related causes of the Finnish Drinking Habits Surveys. J Epidemiol Community Health 2008;62:728-33. https://doi.org/10.1136/jech.2007.065672.
- Kotz D, West R. Explaining the social gradient in smoking cessation: it’s not in the trying, but in the succeeding. Tob Control 2009;18:43-6. https://doi.org/10.1136/tc.2008.025981.
- Jackson SE, Smith C, Cheeseman H, West R, Brown J. Finding smoking hot-spots: a cross-sectional survey of smoking patterns by housing tenure in England. Addiction 2019;114:889-95. https://doi.org/10.1111/add.14544.
- Gmel R, Rehm J. Measuring alcohol consumption. Contemp Drug Prob 2004;31:467-540. https://doi.org/10.1177/009145090403100304.
- Dietrich G. Spin Sucks: Communication and Reputation Management in the Digital Age. London: Pearson; 2014.
- The Times . Experts Threaten Public Health Body Over Link to Drink Industry 2018. www.thetimes.co.uk/article/experts-threaten-public-health-body-over-link-to-drink-industry-j06vd2dq9 (accessed 13 May 2019).
- McCambridge J, Kypri K, Miller P, Hawkins B, Hastings G. Be aware of Drinkaware. Addiction 2014;109:519-24. https://doi.org/10.1111/add.12356.
- Kantar Public . Drink Free Days 2018: Campaign Evaluation 2019.
- Department of Health and Social Care . Guidelines Development Group, 5 May 2016 – Meeting Note and Action Points 2016. www.gov.uk/government/uploads/system/uploads/attachment_data/file/545922/GDG_meeting_note.pdf (accessed 13 May 2019).
- Department of Health and Social Care (DHSC) . The Public Health Responsibility Deal 2011.
- Portman Group . Code Of Practice on the Naming, Packaging and Promotion of Alcoholic Drinks 2019.
- Portman Group . Communicating Alcohol and Health-Related Information 2019. www.portmangroup.org.uk/codes/alcohol-marketing/communicating-alcohol-and-health-related-information-(toolkit) (accessed 13 May 2019).
- The Daily Mail . Tough New Drink Limits You Won’t See on the Bottle: Industry Ignores Health Bosses’ Demands to Display Guidelines on Their Products 2017. www.dailymail.co.uk/health/article-4961360/Tough-new-drink-limits-won-t-bottle.html (accessed 27 February 2019).
- Government WA . Consultation on Options for Improving Information on the Labels of Alcoholic Drinks to Support Consumers to Make Healthier Choices in the UK: UK Government and Devolved Administrations’ Response 2011.
- Alcohol Health Alliance UK . Our Right to Know: How Alcohol Labelling Is Failing Consumers 2018.
- British Beer and Pub Association . Statistical Handbook 2017 2017.
- Plant M, Plant M. Binge Britain: Alcohol and the National Response. Oxford: Oxford University Press; 2006.
- Shipman T. Fall Out: A Year of Political Mayhem. London: William Collins; 2017.
- Morning Advertiser . Alcohol Concern Likely to Scale Back Activity 2011. www.morningadvertiser.co.uk/Article/2011/11/03/Alcohol-Concern-likely-to-scale-back-activity (accessed 13 May 2019).
- Alcohol Policy UK . Alcohol Research UK and Alcohol Concern Merger Consultation 2018. www.alcoholpolicy.net/2018/03/alcohol-research-uk-and-alcohol-concern-merger-consultation.html (accessed 13 May 2019).
- Gov.UK . Government Announces New Clause to Be Inserted into Grant Agreements 2016. www.gov.uk/government/news/government-announces-new-clause-to-be-inserted-into-grant-agreements (accessed 13 May 2019).
- Rosenberg G, Bauld L, Hooper L, Buykx P, Holmes J, Vohra J. New national alcohol guidelines in the UK: public awareness, understanding and behavioural intentions. J Public Health 2018;40:549-56. https://doi.org/10.1093/pubmed/fdx126.
- Bergmark A. Risk, pleasure and information – notes concerning the discursive space of alcohol prevention. Nord Alk Narkotikatidskr 2004;21:7-16. https://doi.org/10.1177/145507250402101s02.
- O’Malley P, Valverde M. Pleasure, freedom and drugs: the uses of ‘pleasure’ in liberal governance of drug and alcohol consumption. Sociology 2004;38:25-42. https://doi.org/10.1177/0038038504039359.
- Centre for Public Health . Understanding the Alcohol Harm Paradox in Order to Focus the Development of Interventions 2015.
- Buykx P, Li J, Gavens L, Hooper L, Gomes de Matos E, Holmes J. Self-reported knowledge, correct knowledge and use of UK drinking guidelines among a representative sample of the English population. Alcohol Alcohol 2018;53:453-60. https://doi.org/10.1093/alcalc/agx127.
- Ling J, Smith KE, Wilson GB, Brierley-Jones L, Crosland A, Kaner EF, et al. The ‘other’ in patterns of drinking: a qualitative study of attitudes towards alcohol use among professional, managerial and clerical workers. BMC Public Health 2012;12. https://doi.org/10.1186/1471-2458-12-892.
- Holmes J, Angus C, Meier PS, Buykx P, Brennan A. How should we set consumption thresholds for low risk drinking guidelines? Achieving objectivity and transparency using evidence, expert judgement and pragmatism. Addiction 2019;114:590-60. https://doi.org/10.1111/add.14381.
- Beard E, Marsden J, Brown J, Tombor I, Stapleton J, Michie S, et al. Understanding and using time series analyses in addiction research. Addiction 2019;114:1866-84. https://doi.org/10.1111/add.14643.
- Bradley KA, DeBenedetti AF, Volk RJ, Williams EC, Frank D, Kivlahan DR. AUDIT-C as a brief screen for alcohol misuse in primary care. Alcohol Clin Exp Res 2007;31:1208-17. https://doi.org/10.1111/j.1530-0277.2007.00403.x.
- Heeb JL, Gmel G. Measuring alcohol consumption: a comparison of graduated frequency, quantity frequency, and weekly recall diary methods in a general population survey. Addict Behav 2005;30:403-13. https://doi.org/10.1016/j.addbeh.2004.04.022.
- Stockwell T, Donath S, Cooper-Stanbury M, Chikritzhs T, Catalano P, Mateo C. Under-reporting of alcohol consumption in household surveys: a comparison of quantity-frequency, graduated-frequency and recent recall. Addiction 2004;99:1024-33. https://doi.org/10.1111/j.1360-0443.2004.00815.x.
- Poikolainen K, Podkletnova I, Alho H. Accuracy of quantity-frequency and graduated frequency questionnaires in measuring alcohol intake: comparisons with daily diary and commonly used laboratory markers. Alcohol Alcohol 2002;37:573-6. https://doi.org/10.1093/alcalc/37.6.573.
- The Scottish Government . Changing Scotland’s Relationship With Alcohol: A Framework for Action 2009.
- Gill JS, Donaghy M. Variation in the alcohol content of a ‘drink’ of wine and spirit poured by a sample of the Scottish population. Health Educ Res 2004;19:485-91. https://doi.org/10.1093/her/cyg059.
- Buykx P, Li J, Gavens L, Hooper L, Lovatt M, Gomes de Matos E, et al. Public awareness of the link between alcohol and cancer in England in 2015: a population-based survey. BMC Public Health 2016;16. https://doi.org/10.1186/s12889-016-3855-6.
- Buykx P, Gilligan C, Ward B, Kippen R, Chapman K. Public support for alcohol policies associated with knowledge of cancer risk. Int J Drug Policy 2015;26:371-9. https://doi.org/10.1016/j.drugpo.2014.08.006.
- Scheideler JK, Klein WMP. Awareness of the link between alcohol consumption and cancer across the world: a review. Cancer Epidemiol Biomarkers Prev 2018;27:429-37. https://doi.org/10.1158/1055-9965.EPI-17-0645.
- Smart RG, Ogborne AC. Beliefs about the cardiovascular benefits of drinking wine in the adult population of Ontario. Am J Drug Alcohol Abuse 2002;28:371-8. https://doi.org/10.1081/ada-120002979.
- Whitman IR, Pletcher MJ, Vittinghoff E, Imburgia KE, Maguire C, Bettencourt L, et al. Perceptions, information sources, and behavior regarding alcohol and heart health. Am J Cardiol 2015;116:642-6. https://doi.org/10.1016/j.amjcard.2015.05.029.
- Holmes MV, Dale CE, Zuccolo L, Silverwood RJ, Guo Y, Ye Z, et al. Association between alcohol and cardiovascular disease: Mendelian randomisation analysis based on individual participant data. BMJ 2014;349. https://doi.org/10.1136/bmj.g4164.
- Millwood IY, Walters RG, Mei XW, Guo Y, Yang L, Bian Z, et al. Conventional and genetic evidence on alcohol and vascular disease aetiology: a prospective study of 500,000 men and women in China. Lancet 2019;393:1831-42. https://doi.org/10.1016/S0140-6736(18)31772-0.
- Stockwell T, Zhao J, Panwar S, Roemer A, Naimi T, Chikritzhs T. Do ‘moderate’ drinkers have reduced mortality risk? A systematic review and meta-analysis of alcohol consumption and all-cause mortality. J Stud Alcohol Drugs 2016;77:185-98. https://doi.org/10.15288/jsad.2016.77.185.
- Davison C, Smith GD, Frankel S. Lay epidemiology and the prevention paradox: the implications of coronary candidacy for health-education. Sociol Health Illn 1991;13:1-19. https://doi.org/10.1111/1467-9566.ep11340301.
- Lyons AC, Emslie C, Hunt K. Staying ‘in the zone’ but not passing the ‘point of no return’: embodiment, gender and drinking in mid-life. Sociol Health Illn 2014;36:264-77. https://doi.org/10.1111/1467-9566.12103.
Appendix 1 Logic model for effects of promoting drinking guidelines
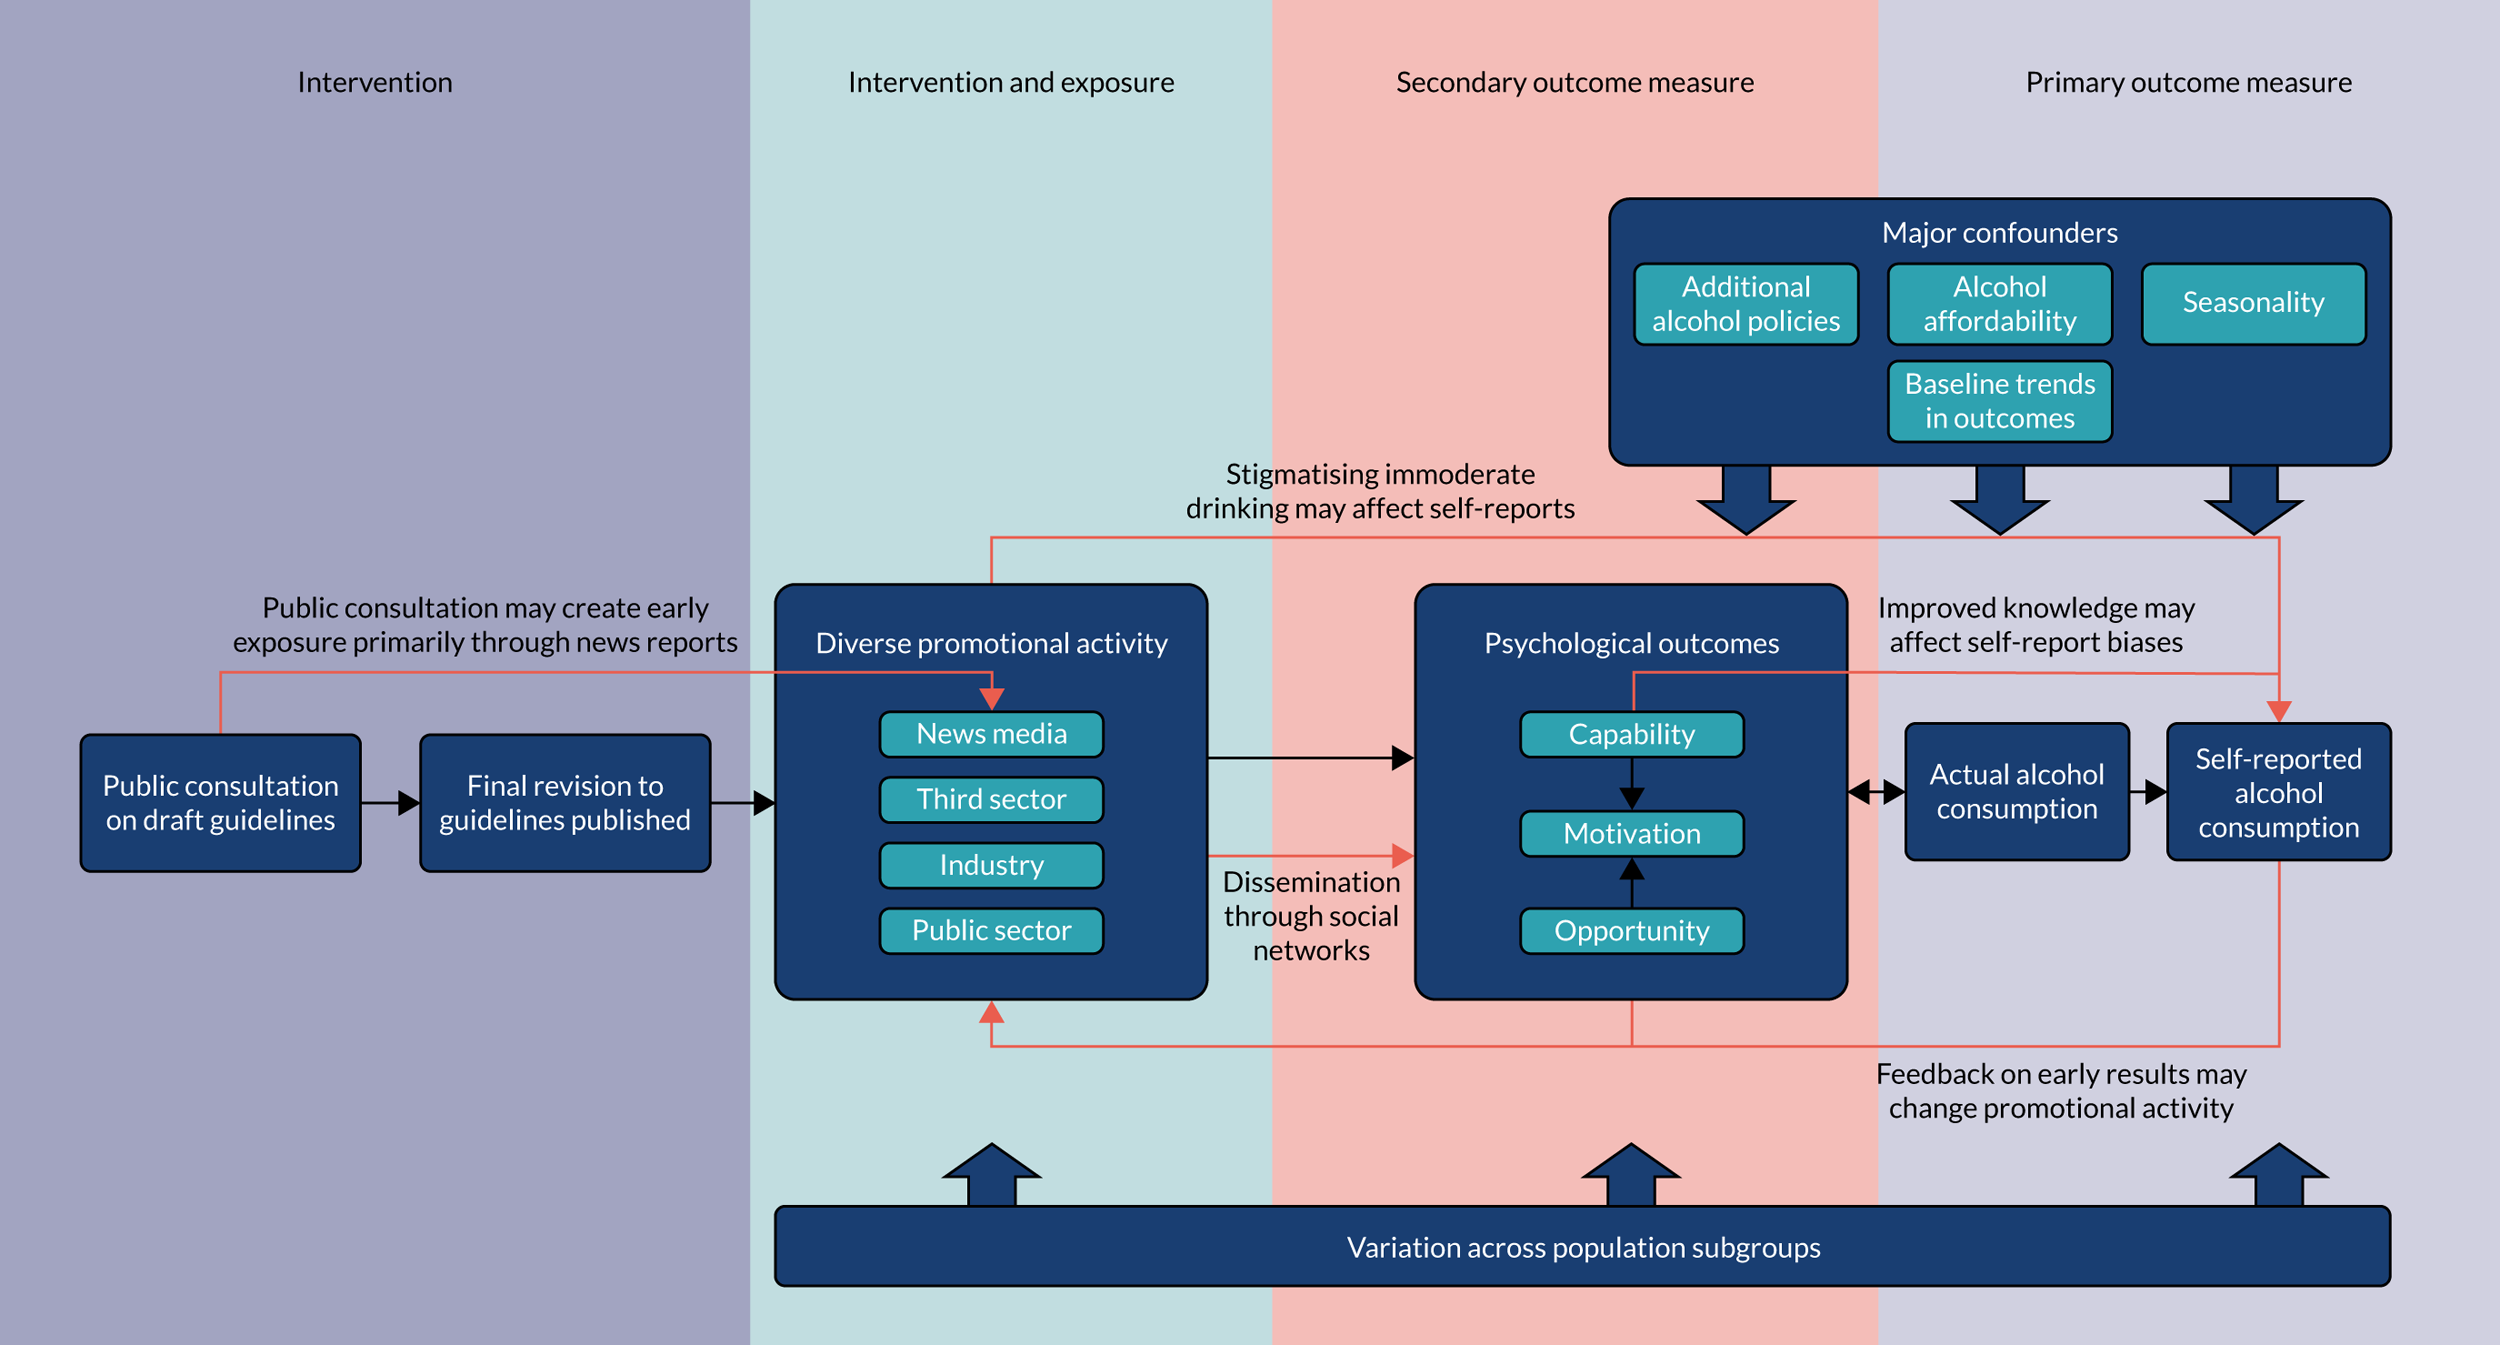
Black arrows represent primary theory of change. Red arrows represent alternative theories of change.
Appendix 2 Promotional activity questionnaire
Appendix 3 Logistic regression results for drinking status, awareness, knowledge, exposure and capability, opportunity, motivation and behaviour measures
| OR | 95% CI | p-value | |
|---|---|---|---|
| Outcome: whether or not drinker | |||
| Sex (vs. men) | |||
| Women | 0.71 | 0.68 to 0.75 | 0.00 |
| Age (years) (vs. 16–34) | |||
| 35–64 | 1.26 | 1.20 to 1.33 | 0.00 |
| ≥ 65 | 1.16 | 1.10 to 1.24 | 0.00 |
| Social grade (vs. AB) | |||
| C1C2 | 0.54 | 0.50 to 0.57 | 0.00 |
| DE | 0.25 | 0.23 to 0.27 | 0.00 |
| Outcome: whether or not aware of guidelines | |||
| Sex (vs. men) | |||
| Women | 1.26 | 1.15 to 1.38 | 0.00 |
| Age (years) (vs. 16–34) | |||
| 35–64 | 1.59 | 1.43 to 1.76 | 0.00 |
| ≥ 65 | 1.10 | 0.98 to 1.23 | 0.10 |
| Social grade (vs. AB) | |||
| C1C2 | 0.59 | 0.53 to 0.66 | 0.00 |
| DE | 0.34 | 0.30 to 0.39 | 0.00 |
| Consumption group (vs. moderate) | |||
| Increasing risk | 1.92 | 1.69 to 2.19 | 0.00 |
| High risk | 1.76 | 1.29 to 2.40 | 0.00 |
| Outcome: knows guidelines is 14 units/week | |||
| Sex (vs. men) | |||
| Women | 2.23 | 2.08 to 2.38 | 0.00 |
| Age (years) (vs. 16–34) | |||
| 35–64 | 1.43 | 1.32 to 1.56 | 0.00 |
| ≥ 65 | 1.24 | 1.13 to 1.36 | 0.00 |
| Social grade (vs. AB) | |||
| C1C2 | 0.84 | 0.79 to 0.91 | 0.00 |
| DE | 0.61 | 0.55 to 0.68 | 0.00 |
| Consumption group (vs. moderate) | |||
| Increasing risk | 1.25 | 1.15 to 1.36 | 0.00 |
| High risk | 0.88 | 0.71 to 1.09 | 0.25 |
| Exposure to guidelines in last month via: | |||
| Product labels | |||
| Sex (vs. men) | |||
| Women | 0.91 | 0.84 to 0.98 | 0.02 |
| Age (years) (vs. 16–34) | |||
| 35–64 | 0.43 | 0.39 to 0.47 | 0.00 |
| ≥ 65 | 0.30 | 0.27 to 0.34 | 0.00 |
| Social grade (vs. AB) | |||
| C1C2 | 0.89 | 0.82 to 0.97 | 0.01 |
| DE | 0.86 | 0.76 to 0.98 | 0.03 |
| Consumption group (vs. moderate) | |||
| Increasing risk | 1.44 | 1.32 to 1.58 | 0.00 |
| High risk | 1.60 | 1.29 to 1.98 | 0.00 |
| TV or radio | |||
| Sex (vs. men) | |||
| Women | 1.00 | 0.93 to 1.07 | 0.95 |
| Age (years) (vs. 16–34) | |||
| 35–64 | 1.74 | 1.60 to 1.90 | 0.00 |
| ≥ 65 | 1.91 | 1.74 to 2.10 | 0.00 |
| Social grade (vs. AB) | |||
| C1C2 | 1.04 | 0.97 to 1.12 | 0.29 |
| DE | 1.02 | 0.91 to 1.13 | 0.75 |
| Consumption group (vs. moderate) | |||
| Increasing risk | 1.04 | 0.96 to 1.13 | 0.35 |
| High risk | 1.11 | 0.91 to .35 | 0.30 |
| Newspapers or magazines | |||
| Sex (vs. men) | |||
| Women | 0.97 | 0.89 to 1.06 | 0.53 |
| Age (years) (vs. 16–34) | |||
| 35–64 | 1.85 | 1.64 to 2.09 | 0.00 |
| ≥ 65 | 3.78 | 3.33 to 4.29 | 0.00 |
| Social grade (vs. AB) | |||
| C1C2 | 0.82 | 0.75 to 0.90 | 0.00 |
| DE | 0.64 | 0.56 to 0.74 | 0.00 |
| Consumption group (vs. moderate) | |||
| Increasing risk | 1.19 | 1.08 to 1.31 | 0.00 |
| High risk | 1.14 | 0.90 to 1.46 | 0.28 |
| Websites or social media | |||
| Sex (vs. men) | |||
| Women | 0.90 | 0.79 to 1.02 | 0.09 |
| Age (years) (vs. 16–34) | |||
| 35–64 | 0.53 | 0.46 to 0.60 | 0.00 |
| ≥ 65 | 0.19 | 0.16 to 0.24 | 0.00 |
| Social grade (vs. AB) | |||
| C1C2 | 0.97 | 0.85 to 1.11 | 0.66 |
| DE | 0.69 | 0.56 to 0.86 | 0.00 |
| Consumption group (vs. moderate) | |||
| Increasing risk | 1.22 | 1.06 to 1.41 | 0.01 |
| High risk | 1.22 | 0.87 to 1.72 | 0.25 |
| Pubs, bars or nightclubs | |||
| Sex (vs. men) | |||
| Women | 0.78 | 0.70 to 0.87 | 0.00 |
| Age (years) (vs. 16–34) | |||
| 35–64 | 0.38 | 0.34 to 0.42 | 0.00 |
| ≥ 65 | 0.20 | 0.17 to 0.24 | 0.00 |
| Social grade (vs. AB) | |||
| C1C2 | 1.32 | 1.17 to 1.48 | 0.00 |
| DE | 1.17 | 0.99 to 1.40 | 0.07 |
| Consumption group (vs. moderate) | |||
| Increasing risk | 1.52 | 1.34 to 1.71 | 0.00 |
| High risk | 2.15 | 1.66 to 2.77 | 0.00 |
| Place of work or study | |||
| Sex (vs. men) | |||
| Women | 1.21 | 1.06 to 1.37 | 0.00 |
| Age (years) (vs. 16–34) | |||
| 35–64 | 0.51 | 0.45 to 0.59 | 0.00 |
| ≥ 65 | 0.09 | 0.07 to 0.12 | 0.00 |
| Social grade (vs. AB) | |||
| C1C2 | 0.93 | 0.81 to 1.07 | 0.31 |
| DE | 0.65 | 0.52 to 0.81 | 0.00 |
| Consumption group (vs. moderate) | |||
| Increasing risk | 1.03 | 0.89 to 1.21 | 0.67 |
| High risk | 0.99 | 0.68 to 1.45 | 0.97 |
| Health professionals | |||
| Sex (vs. men) | |||
| Women | 1.25 | 1.12 to 1.41 | 0.00 |
| Age (years) (vs. 16–34) | |||
| 35–64 | 0.88 | 0.77 to 1.01 | 0.07 |
| ≥ 65 | 0.85 | 0.72 to 1.00 | 0.05 |
| Social grade (vs. AB) | |||
| C1C2 | 0.87 | 0.77 to 0.99 | 0.03 |
| DE | 0.74 | 0.61 to 0.89 | 0.00 |
| Consumption group (vs. moderate) | |||
| Increasing risk | 1.31 | 1.15 to 1.50 | 0.00 |
| High risk | 2.17 | 1.65 to 2.84 | 0.00 |
| Posters/leaflets at health service | |||
| Sex (vs. men) | |||
| Women | 1.33 | 1.21 to 1.47 | 0.00 |
| Age (years) (vs. 16–34) | |||
| 35–64 | 0.73 | 0.65 to 0.81 | 0.00 |
| ≥ 65 | 0.60 | 0.53 to 0.70 | 0.00 |
| Social grade (vs. AB) | |||
| C1C2 | 0.87 | 0.79 to 0.97 | 0.01 |
| DE | 0.74 | 0.63 to 0.88 | 0.00 |
| Consumption group (vs. moderate) | |||
| Increasing risk | 1.09 | 0.96 to 1.23 | 0.17 |
| High risk | 1.37 | 1.05 to 1.79 | 0.02 |
| Family, friends or colleagues | |||
| Sex (vs. men) | |||
| Women | 1.17 | 1.03 to 1.32 | 0.01 |
| Age (years) (vs. 16–34) | |||
| 35–64 | 0.73 | 0.63 to 0.84 | 0.00 |
| ≥ 65 | 0.60 | 0.50 to 0.71 | 0.00 |
| Social grade (vs. AB) | |||
| C1C2 | 0.83 | 0.73 to 0.95 | 0.01 |
| DE | 0.79 | 0.65 to 0.97 | 0.02 |
| Consumption group (vs. moderate) | |||
| Increasing risk | 1.40 | 1.21 to 1.61 | 0.00 |
| High risk | 1.98 | 1.48 to 2.65 | 0.00 |
| Other | |||
| Sex (vs. men) | |||
| Women | 0.79 | 0.52 to 1.21 | 0.28 |
| Age (years) (vs. 16–34) | |||
| 35–64 | 0.97 | 0.60 to 1.58 | 0.91 |
| ≥ 65 | 0.59 | 0.31 to 1.10 | 0.10 |
| Social grade (vs. AB) | |||
| C1C2 | 0.56 | 0.36 to 0.88 | 0.01 |
| DE | 0.87 | 0.47 to 1.61 | 0.67 |
| Consumption group (vs. moderate) | |||
| Increasing risk | 0.62 | 0.35 to 1.10 | 0.10 |
| High risk | 1.68 | 0.67 to 4.20 | 0.27 |
| None of these places | |||
| Sex (vs. men) | |||
| Women | 1.01 | 0.94 to 1.09 | 0.72 |
| Age (years) (vs. 16–34) | |||
| 35–64 | 1.55 | 1.40 to 1.70 | 0.00 |
| ≥ 65 | 1.44 | 1.29 to 1.60 | 0.00 |
| Social grade (vs. AB) | |||
| C1C2 | 1.09 | 1.01 to 1.19 | 0.03 |
| DE | 1.01 | 0.89 to 1.14 | 0.90 |
| Consumption group (vs. moderate) | |||
| Increasing risk | 0.85 | 0.78 to 0.94 | 0.00 |
| High risk | 0.66 | 0.52 to 0.85 | 0.00 |
| COM-B measuresa | |||
| Knowledge: 1–2 units is most can consume on a day before it does significant harm to health | |||
| Sex (vs. men) | |||
| Women | 1.14 | 1.05 to 1.23 | 0.00 |
| Age (years) (vs. 16–34) | |||
| 35–64 | 1.41 | 1.29 to 1.54 | 0.00 |
| ≥ 65 | 2.11 | 1.89 to 2.35 | 0.00 |
| Social grade (vs. AB) | |||
| C1C2 | 0.82 | 0.75 to 0.89 | 0.00 |
| DE | 0.62 | 0.55 to 0.70 | 0.00 |
| Consumption group (vs. moderate) | |||
| Increasing risk | 0.38 | 0.34 to 0.41 | 0.00 |
| High risk | 0.12 | 0.10 to 0.15 | 0.00 |
| Perceived capability: easy to drink three or fewer units per day | |||
| Sex (vs. men) | |||
| Women | 1.04 | 0.98 to 1.11 | 0.19 |
| Age (years) (vs. 16–34) | |||
| 35–64 | 1.39 | 1.28 to 1.51 | 0.00 |
| ≥ 65 | 1.45 | 1.33 to 1.59 | 0.00 |
| Social grade (vs. AB) | |||
| C1C2 | 0.90 | 0.84 to 0.96 | 0.00 |
| DE | 0.92 | 0.83 to 1.01 | 0.08 |
| Consumption group (vs. moderate) | |||
| Increasing risk | 0.83 | 0.77 to 0.90 | 0.00 |
| High risk | 0.64 | 0.51 to 0.79 | 0.00 |
| Skills: often keeps track of units | |||
| Sex (vs. men) | |||
| Women | 1.14 | 1.06 to 1.23 | 0.00 |
| Age (years) (vs. 16–34) | |||
| 35–64 | 1.65 | 1.52 to 1.79 | 0.00 |
| ≥ 65 | 2.55 | 2.30 to 2.83 | 0.00 |
| Social grade (vs. AB) | |||
| C1C2 | 0.90 | 0.83 to 0.98 | 0.02 |
| DE | 0.67 | 0.60 to 0.75 | 0.00 |
| Consumption group (vs. moderate) | |||
| Increasing risk | 0.41 | 0.38 to 0.44 | 0.00 |
| High risk | 0.15 | 0.12 to 0.18 | 0.00 |
| Social opportunity: lifestyle makes it easy to drink three or fewer units a day | |||
| Sex (vs. men) | |||
| Women | 1.43 | 1.32 to 1.54 | 0.00 |
| Age (years) (vs. 16–34) | |||
| 35–64 | 1.40 | 1.28 to 1.54 | 0.00 |
| ≥ 65 | 0.76 | 0.69 to 0.84 | 0.00 |
| Social grade (vs. AB) | |||
| C1C2 | 0.83 | 0.76 to 0.90 | 0.00 |
| DE | 0.65 | 0.58 to 0.72 | 0.00 |
| Consumption group (vs. moderate) | |||
| Increasing risk | 1.26 | 1.14 to 1.39 | 0.00 |
| High risk | 1.28 | 1.01 to 1.63 | 0.04 |
| Social opportunity: knows where to get advice on cutting down on drinking | |||
| Sex (vs. men) | |||
| Women | 1.43 | 1.32 to 1.54 | 0.00 |
| Age (years) (vs. 16–34) | |||
| 35–64 | 1.40 | 1.28 to 1.54 | 0.00 |
| ≥ 65 | 0.76 | 0.69 to 0.84 | 0.00 |
| Social grade (vs. AB) | |||
| C1C2 | 0.83 | 0.76 to 0.90 | 0.00 |
| DE | 0.65 | 0.58 to 0.72 | 0.00 |
| Consumption group (vs. moderate) | |||
| Increasing risk | 1.26 | 1.14 to 1.39 | 0.00 |
| High risk | 1.28 | 1.01 to 1.63 | 0.04 |
| Automatic motivation: concerned about drinking more alcohol than is good for you | |||
| Sex (vs. men) | |||
| Women | 0.91 | 0.85 to 0.97 | 0.01 |
| Age (years) (vs. 16–34) | |||
| 35–64 | 1.16 | 1.07 to 1.26 | 0.00 |
| ≥ 65 | 1.18 | 1.07 to 1.29 | 0.00 |
| Social grade (vs. AB) | |||
| C1C2 | 1.00 | 0.93 to 1.07 | 1.00 |
| DE | 0.96 | 0.87 to 1.06 | 0.43 |
| Consumption group (vs. moderate) | |||
| Increasing risk | 0.96 | 0.88 to 1.04 | 0.31 |
| High risk | 1.00 | 0.82 to 1.21 | 0.97 |
| Automatic motivation: wants to avoid drinking more than is good for you | |||
| Sex (vs. men) | |||
| Women | 1.09 | 1.03 to 1.16 | 0.00 |
| Age (years) (vs. 16–34) | |||
| 35–64 | 1.23 | 1.15 to 1.32 | 0.00 |
| ≥ 65 | 1.33 | 1.23 to 1.44 | 0.00 |
| Social grade (vs. AB) | |||
| C1C2 | 0.88 | 0.83 to 0.94 | 0.00 |
| DE | 0.69 | 0.63 to 0.75 | 0.00 |
| Consumption group (vs. moderate) | |||
| Increasing risk | 0.54 | 0.50 to 0.58 | 0.00 |
| High risk | 0.28 | 0.23 to 0.34 | 0.00 |
| Reflective motivation: trying to avoid drinking more than is good for you | |||
| Sex (vs. men) | |||
| Women | 1.00 | 0.94 to 1.06 | 0.96 |
| Age (years) (vs. 16–34) | |||
| 35–64 | 1.36 | 1.27 to 1.47 | 0.00 |
| ≥ 65 | 1.37 | 1.26 to 1.48 | 0.00 |
| Social grade (vs. AB) | |||
| C1C2 | 0.97 | 0.91 to 1.03 | 0.33 |
| DE | 0.89 | 0.82 to 0.98 | 0.01 |
| Consumption group (vs. moderate) | |||
| Increasing risk | 0.61 | 0.57 to 0.66 | 0.00 |
| High risk | 0.30 | 0.24 to 0.38 | 0.00 |
| Automatic motivation: wants to keep drinking within safe limits | |||
| Sex (vs. men) | |||
| Women | 1.27 | 1.19 to 1.37 | 0.00 |
| Age (years) (vs. 16–34) | |||
| 35–64 | 1.43 | 1.31 to 1.55 | 0.00 |
| ≥ 65 | 1.73 | 1.57 to 1.90 | 0.00 |
| Social grade (vs. AB) | |||
| C1C2 | 0.79 | 0.73 to 0.85 | 0.00 |
| DE | 0.61 | 0.55 to 0.68 | 0.00 |
| Consumption group (vs. moderate) | |||
| Increasing risk | 0.40 | 0.37 to 0.43 | 0.00 |
| High risk | 0.16 | 0.13 to 0.19 | 0.00 |
| Reflective motivation: intends to drink within safe limits | |||
| Sex (vs. men) | |||
| Women | 1.30 | 1.21 to 1.40 | 0.00 |
| Age (years) (vs. 16–34) | |||
| 35–64 | 1.64 | 1.51 to 1.78 | 0.00 |
| ≥ 65 | 2.17 | 1.97 to 2.40 | 0.00 |
| Social grade (vs. AB) | |||
| C1C2 | 0.82 | 0.75 to 0.89 | 0.00 |
| DE | 0.68 | 0.61 to 0.76 | 0.00 |
| Consumption group (vs. moderate) | |||
| Increasing risk | 0.32 | 0.30 to 0.35 | 0.00 |
| High risk | 0.11 | 0.09 to 0.13 | 0.00 |
List of abbreviations
- ABV
- alcohol by volume
- AIC
- Akaike information criterion
- ATS
- Alcohol Toolkit Study
- AUDIT
- Alcohol Use Disorders Identification Test
- AUDIT-C
- Alcohol Use Disorders Identification Test – Consumption
- CI
- confidence interval
- CMO
- Chief Medical Officer
- COM-B
- capability, opportunity, motivation and behaviour
- DALY
- disability-adjusted life-year
- GAM
- generalised additive model
- GAMM
- generalised additive mixed model
- GDG
- guideline development group
- HMRC
- Her Majesty’s Revenue and Customs
- ICD-10
- International Statistical Classification of Diseases and Related Health Problems, Tenth Revision
- IRR
- incidence rate ratio
- MA
- moving average
- MUP
- minimum unit pricing
- ONS
- Office for National Statistics
- PESO
- paid, earned, shared and owned
- PHE
- Public Health England
- PHRD
- Public Health Responsibility Deal
- PPI
- patient and public involvement
- TV
- television
