Notes
Article history
The research reported in this issue of the journal was funded by the HSDR programme or one of its preceding programmes as project number 16/04/13. The contractual start date was in January 2018. The final report began editorial review in December 2020 and was accepted for publication in July 2021. The authors have been wholly responsible for all data collection, analysis and interpretation, and for writing up their work. The HSDR editors and production house have tried to ensure the accuracy of the authors’ report and would like to thank the reviewers for their constructive comments on the final report document. However, they do not accept liability for damages or losses arising from material published in this report.
Permissions
Copyright statement
Copyright © 2022 Willis et al. This work was produced by Willis et al. under the terms of a commissioning contract issued by the Secretary of State for Health and Social Care. This is an Open Access publication distributed under the terms of the Creative Commons Attribution CC BY 4.0 licence, which permits unrestricted use, distribution, reproduction and adaption in any medium and for any purpose provided that it is properly attributed. See: https://creativecommons.org/licenses/by/4.0/. For attribution the title, original author(s), the publication source – NIHR Journals Library, and the DOI of the publication must be cited.
2022 Willis et al.
Chapter 1 Background, rationale and objectives
Clinical and health services research continually produces new evidence that can benefit patients. However, this evidence does not reliably find its way into everyday NHS practice. 1 There are frequent failures to introduce effective new interventions and clinical practices quickly enough, consistently use those already proven to be effective, or stop using those found to be ineffective or even harmful. The resulting inappropriate variations in health care and outcomes are well documented and pervasive across different settings and specialities. 2–9 The gap between evidence and practice is a strategically important problem for policy-makers, health-care systems and research funders because it limits the health, social and economic effects of research. 10
Audit and feedback (A&F) aims to improve the uptake of recommended practice by reviewing clinical performance against explicit standards and directing action towards areas not meeting those standards. 11 It is a widely used foundational component of quality improvement in health-care systems internationally, including within around 60 National Clinical Audit (NCA) programmes in the UK. 12 These programmes address a range of priorities (e.g. diabetes, cancer) and therefore play key roles in both measuring the extent of inappropriate variations and using feedback to promote improvement.
The most recent Cochrane review of 140 randomised trials found that A&F had modest effects on patient processes of care, leading to a median 4.3% absolute improvement [interquartile range (IQR) 0.5–16%] in compliance with recommended practice. 11 One-quarter of A&F interventions had a relatively large positive effect on quality of care, whereas another quarter had a negative or null effect. The review found that feedback may be more effective when the source is a supervisor or colleague, it is provided more than once, it is delivered in both verbal and written formats, and it includes both explicit targets and an action plan. Given the relative paucity of head-to-head comparisons of different methods of providing feedback and comparisons of A&F with other interventions, it remains difficult to recommend the use of one feedback strategy over another on empirical grounds. 13
Strategies to promote the uptake of recommended practice need to take account of the cost-effectiveness of implementation interventions. 14 Given that health-care and research resources are finite, it is important to determine how to enhance the effects and reliability of A&F to maximise population benefit. There is little evidence about the cost-effectiveness of implementation strategies, including A&F. 15,16 Although NCAs may appear to be relatively costly, any modest effects can potentially be cost-effective if audit programmes build in efficiencies. For example, the increasing availability of routinely collected data on quality of care provides opportunities for large scale, efficient A&F programmes. 17,18 Effective use of feedback offers potential advantages over other quality improvement approaches (e.g. educational outreach visits or inspections) in terms of reach and cost-effectiveness,14 particularly given the scope to enhance impact on patient care within existing resources and systems. There are further opportunities to improve the alignment of A&F with national and local quality-improvement drives, such as aligning audits more closely with National Institute for Health and Care Excellence (NICE) guidance and standards.
We have identified, through expert interviews, systematic reviews and our own experience with providing, evaluating and receiving practice feedback, 15 state-of-the-science, theory-informed suggestions for effective feedback interventions (Box 1). 19 These suggestions relate to the nature of the desired action (e.g. improving the specificity of recommendations for action), the nature of the data available for feedback (e.g. providing more rapid or multiple feedback), feedback display (e.g. minimising cognitive load for recipients) and delivery of feedback (e.g. addressing credibility of information). These represent practical ways to bring about tangible improvements in feedback methods that can maximise the value of existing national audit programmes and health-care infrastructures and, hence, improve patient care and outcomes.
-
Recommend actions that are consistent with established goals and priorities.
-
Recommend actions that have room for improvement and are under the recipient’s control.
-
Recommend specific actions.
-
Provide multiple instances of feedback.
-
Provide feedback as soon as possible and at a frequency informed by the number of new patient cases.
-
Provide individual (e.g. practitioner-specific) rather than general data.
-
Choose comparators that reinforce desired behaviour change.
-
Closely link the visual display and summary message.
-
Provide feedback in more than one way.
-
Minimise extraneous cognitive load for feedback recipients.
-
Address barriers to feedback use.
-
Provide short, actionable messages followed by optional detail.
-
Address the credibility of the information.
-
Prevent defensive reactions to feedback.
-
Construct feedback through social interaction.
We (NI, JG) undertook a cumulative meta-analysis of A&F trials included in the Cochrane review. 20 The effect size and associated confidence intervals (CIs) stabilised in 2003 after 51 comparisons from 30 trials. Cumulative meta regressions suggested that new trials were contributing little further information on the impact of common effect modifiers, indicating that this field of research has become ‘stagnant’. Research needs to shift its focus from asking whether or not A&F can improve professional practice towards how to optimise its effects. We identified a research agenda for A&F at an international meeting in Ottawa in 2012. 21 Our research built on this agenda and sought to revitalise A&F research and reduce research waste. We aimed to improve patient care by optimising the content, format and delivery of feedback from NCAs through three linked objectives.
Objective 1: to develop and evaluate, within an online randomised screening experiment, the effects of modifications to feedback on intended enactment, user comprehension, experience, preferences and engagement
Research questions
Out of a set of recent, state-of-the-science, theory-informed suggestions for improving feedback, which are the most important and feasible to evaluate further within national audit programmes?
What is the effect of such modifications to feedback on intended enactment, comprehension, engagement among clinicians and managers targeted by national audits, user experience and preferences under ‘virtual laboratory’ conditions?
The 15 suggestions for improving feedback indicate a way forward but require further development and evaluation. 19 Rigorous evaluation methods, such as well-conducted cluster randomised trials, can establish the relative effectiveness of following such modifications to feedback. However, varying only five elements of feedback (e.g. timing, frequency, comparators, display and information credibility) produces 288 combinations – not allowing for replication of studies or the addition of other interventions, such as education meetings of outreach visits. 22 Given the multiplicity of factors that would need to be addressed, such an approach is not feasible; more efficient ways are needed to prioritise which of these to study. In objective 1, we undertook a fractional factorial screening experiment, building on current evidence and knowledge of behaviour change, and produced a statistical model to predict the effects of a large number of single and combined feedback modifications. This model can subsequently guide choices for further evaluation, as well as suggest practical ways of adapting feedback to enhance NCA impacts.
Objective 2: to evaluate how different modifications of feedback from national audit programmes are delivered, perceived and acted on in health-care organisations
This included feedback modifications identified in objective 1 and allowed for more organisationally focused modifications not amenable to online experimentation.
Research question
How do health-care organisations act in response to modifications of feedback from national audit programmes under ‘real-world’ conditions?
Our overall approach was consistent with the development, feasibility and (early) evaluation stages of the UK Medical Research Council guidance on complex interventions. 23 Having identified the most promising single and combined feedback modifications in a virtual experiment, we aimed to investigate how they work in ‘real-world’ conditions.
Our earlier programme, AFFINITIE (Audit and feedback interventions to increase evidence-based transfusion practice),24 evaluated the separate and combined effects of enhanced content of feedback and enhanced support following delivery of feedback with the National Clinical Audit of Blood Transfusion (NCABT). We identified marked variations in local NHS trust responses to blood transfusion audits, including a lack of clarity about who feedback should target and who is responsible for action;25,26 such problems are likely to apply to other national audits. Objective 2 aimed to evaluate how our different modifications of feedback from national audit programmes were delivered, perceived and acted on in health-care organisations, guided by Clinical Performance Feedback Intervention Theory (CP-FIT). 27 We worked with two national audit programmes that were introducing changes to how they delivered feedback.
The COVID-19 pandemic halted all non-essential research in the NHS, forcing us to abandon this objective in the early stages of fieldwork. With funder approval, we therefore modified our approach and drew on ‘expert’ interviews and CP-FIT to identify the strengths of the two national audit programmes, how their planned changes would strengthen their audit cycles, and further scope for strengthening their audit cycles.
Objective 3: to explore the opportunities, costs and benefits of national audit programme participation in a long-term international collaborative to improve audits through a programme of trials
Research question
What are the opportunities, costs and benefits of national audit programme participation in an international collaborative to improve audits through a programme of trials?
Large scale improvement initiatives, such as national audit programmes, continually aim to enhance their impacts, often by making incremental changes over time (e.g. in use of comparators, feedback displays). Given that such changes usually result in small to modest effects on patient care and outcomes, it is difficult to judge whether or not they are effective in the absence of rigorous experimental evaluations. There are potential significant returns on investment from NCA participation in a co-ordinated programme of research to improve effectiveness. We have proposed ‘implementation laboratories’ that embed research within existing large-scale initiatives such as national audit programmes. 28 Close partnerships between health-care systems delivering implementation strategies at scale and research teams hold the potential for a more systematic approach to identify and address priorities, sequential head-to-head trials comparing modifications to improvement strategies (e.g. of A&F), promoting good methodological practice in both improvement methods and evaluation, enhancing the generalisability of research and demonstrating the impact of improvement programmes. However, there is very limited experience of establishing such implementation laboratories. Objective 3 explored the opportunities, costs and benefits of national audit programme participation in a long-term international collaborative to improve audits through a programme of trials.
Collaborating National Clinical Audit programmes
We conducted this work in partnership with five NCA programmes:
-
NCABT
-
the Paediatric Intensive Care Audit Network (PICANet)
-
the Myocardial Ischaemia National Audit Project (MINAP)
-
the Trauma Audit & Research Network (TARN)
-
the National Diabetes Audit (NDA).
These national audit programmes offered diversity in audit methods, topics and targeted audiences, thereby increasing confidence that our outputs would be relevant to the wider range of national audit programmes. All participated in objectives 1 and 3, whereas objective 2 focused on TARN and the NDA. The five programmes are summarised next.
Myocardial Ischaemia National Audit Project
This project collects data from admissions in England, Wales and Northern Ireland for myocardial infarction. It aims to improve clinical care through the audit process and to provide high-resolution data for research. 29
Data span the course of patient care, from the moment the patient calls for professional help through to hospital discharge and rehabilitation. Clinicians and clerical staff in hospitals collect data on patient demographics, medical history, clinical assessment, investigations and treatments. Pseudonymised records are uploaded centrally to the National Institute for Cardiovascular Outcomes Research. In total, 206 hospitals submit more than 92,000 new cases to MINAP annually. The database currently holds approximately 1.5 M patient records. Vital status following hospital discharge is obtained via linkage to data from the Office for National Statistics. An annual report is compiled using these data, including individual hospital summary data.
National Diabetes Audit
The NDA programme is made up of four modules: the National Diabetes Core Audit, the National Pregnancy in Diabetes Audit, the National Diabetes Footcare Audit and the National Inpatient Diabetes Audit. 30 The NDA helps improve the quality of diabetes care by enabling participating NHS services and organisations to assess local practice against NICE guidelines, compare their care and outcomes with similar services and organisations, identify gaps or shortfalls that are priorities for improvement, identify and share best practice, and provide comprehensive national pictures of diabetes care and outcomes in England and Wales.
Our study focused on the National Diabetes Core Audit. For this, general practices and specialist services participate through the General Practice Extraction Service. Secondary care and structured education providers submit data manually via the Clinical Audit Platform. Audit reports provide national-level information for prevalence, care process completion, treatment target achievement, referral and attendance at structured education, comparisons for people with a learning disability, comparisons for people with a severe mental illness and complication rates. Reports also provide local-level information for registrations, demographics, complications, care process completion and treatment target achievement.
Paediatric Intensive Care Audit Network
PICANet was established to develop and maintain a secure and confidential high-quality clinical database of paediatric intensive care activity to identify best clinical practice, monitor supply and demand, monitor and review outcomes of treatment episodes, facilitate health-care planning and quantify resource requirements, and study the epidemiology of critical illness in children. 31
PICANet collects data from 30 hospitals providing specialist care. The core data set of demographic and clinical data on all admissions allows comparison of PICU activity at a local level with national benchmarks such as Paediatric Intensive Care Standards. This data set provides an important evidence base on outcomes, processes and structures that permits planning for future practice, audit and interventions. Each year, PICANet produces audit reports to show changes and comparisons over the 3-year reporting period.
Trauma Audit and Research Network
TARN is the NCA for traumatic injury and is the largest European Trauma Registry, holding data on > 800,000 injured patients, including > 50,000 injured children. 32 It aims to monitor processes and outcomes of care to demonstrate the impact of trauma networks, providing local, regional and national information on trauma patient outcomes and, thereby, help clinicians and managers to improve trauma services.
TARN collects data from 220 hospitals across England, Wales, Northern Ireland and the Republic of Ireland. Individual patient data are inputted manually at the trauma unit to an online data collection, validation and in-built reporting system, aiming to be available within 25 days of patient discharge or death. TARN produces annual national reports, triannual hospital network-level reports, triannual performance comparisons (e.g. hospital survival rates), quarterly patient-reported outcome measures (e.g. patient experience, return to work), and quarterly trauma dashboards for benchmarking against peers. TARN also provides continuous reporting and ad hoc analyses.
National Comparative Audit of Blood Transfusion
This programme of clinical audits examines the use and administration of blood and blood components in NHS and independent hospitals in the UK. 33 The programme aims to provide evidence that blood is being prescribed and used appropriately and administered safely, and highlight where practice is deviating from the guidelines to the possible detriment of patient care.
There is a rolling programme of audits and re-audits, with two or three taking place each year. Recent topics include the management of major haemorrhage, transfusion-associated circulatory overload, and patient blood management in adults undergoing elective, scheduled surgery. The NCABT contrasts with most other national clinical audit programmes, which consistently focus on a core, limited set of indicators. Consequently, the NCABT has to develop and implement different audit criteria and methods for the collection, validation and analysis of data within relatively short periods of time. The resultant feedback reports are subsequently uploaded and delivered to the hospital transfusion team via a hospital-specific NCA web page.
Chapter 2 The development of feedback modifications for an online randomised screening experiment (objective 1)
Background
Many proposed ways of improving feedback require further development and evaluation. 19 The Multiphase Optimisation Strategy (MOST) offers a methodological approach for building, optimising and evaluating multicomponent interventions, such as audit and feedback. 34 MOST comprises three steps: preparation, to lay the groundwork for optimisation by conceptualising and piloting components; optimisation, conducting optimisation trials to identify the most promising single or combined intervention components; and evaluation, a definitive randomised trial to assess intervention effectiveness.
Work in objective 1 most closely corresponded with the first and second steps of MOST and included a screening experiment, previously used in implementation research to identify and prioritise the most promising ‘active ingredients’ for further study. 35,36 In this type of study, components of an intervention are systematically varied within a randomised controlled design in a manner that simulates a real situation as much as possible. Interim end points (e.g. behavioural intention, behavioural simulation) are measured rather than changes in actual behaviour or health-care outcome. These experiments can be conducted virtually (e.g. online) with targeted participants using interim outcomes. One design, the fractional factorial experiment, can produce a statistical model to predict the effects of a large number of single and combined intervention components and, hence, guide choices for further evaluation.
We therefore undertook an online fractional factorial experiment to investigate the single and combined effects of ways of delivering feedback. We based these ways of delivering feedback on the 15 suggestions for improving feedback, and refer to them as feedback modifications. In consultation with our patient and public involvement (PPI) panel, we considered and added a further suggestion that involved incorporating ‘the patient voice’ in feedback.
We assessed the effects of these feedback modifications on health professionals’ intended enactment of audit standards, user comprehension, experience, and engagement. We first describe the development of the feedback modifications and the building of the interface for the online experiment, before describing the experiment methods and results.
Methods
We used a two-step process to select and then design the feedback modifications.
Step 1 was priority setting. A consensus process guided team discussions on which feedback modifications to prioritise for development.
Step 2 was user-centred design (UCD). Through iterative UCD, we developed modifications from high-level suggestions through to implementation. UCD is an iterative design approach that focuses on users and their needs. It emphasises initial user research to define system requirements, followed by repeated phases of design and evaluation with users to deliver progressively more usable system designs. This ensured that our priorities and choices reflected those of the people planning, delivering or receiving feedback from NCAs. In parallel, we held regular research team discussions around the feasibility and detailed design of the evolving feedback modifications.
Step one: priority setting
Design
We used a structured consensus process to guide the selection of feedback modifications for inclusion in the experiment. 37 Our method involved face-to-face meetings and discussion to elicit all views and promote transparent decision-making.
Participants
We used an 11-member reference panel. Consensus processes gain relatively little in reliability by exceeding this number. 37 Panel members brought a range of perspectives from patient and public, national audit, clinical, behavioural science and research backgrounds. This helped to ensure that shared deliberations took account of service, public and research priorities. The reference panel comprised:
-
an active member of a patient participation group in general practice and former paediatric epidemiologist who helped establish PICANet
-
a cardiology specialist registrar associated with MINAP
-
a national audit operational manager for PICANet
-
a haematology consultant specialising in transfusion (former lead for NCABT)
-
a member of the public with experience in marketing
-
a consultant neonatologist with a lead role in the National Neonatal Audit Programme
-
a behavioural scientist with interests in patient safety and audit and feedback in surgical contexts
-
a behavioural scientist with interest in audit and feedback (also a member of the research team; FL)
-
an academic general practitioner with experience of leading a regional A&F programme (also a member of the research team; SA)
-
an academic general practitioner with an interest in A&F and informatics (also a member of the research team; BB)
-
an academic foundation year medical trainee.
Procedure
We sent reference panel members a document outlining the rationale for and examples of candidate feedback modifications. At the first meeting, we presented and summarised key features of each proposed modification and invited requests for clarification. We then asked panellists to consider each modification against the following criteria:
-
current evidence and need for further research, prioritising modifications for which there was greater uncertainty of effectiveness
-
feasibility of adopting and embedding modifications within NCA materials and processes
-
the extent to which feedback modifications combine with other data and quality improvement processes to the best effect.
Panel members independently rated each modification item on a 1–9 scale, where ‘1’ indicated the lowest support and ‘9’ indicated the highest support. We collated the scores for each modification and presented the median and range to all panel members at a second face-to-face meeting. We categorised low overall agreement as at least three raters scoring the item 1–3 and at least three scoring it 7–9, moderate agreement as at least two raters scoring the item 1–3 and at least two scoring it 7–9, and high agreement as one or no raters scoring the item 1–3 and one or zero scoring it 7–9. The second meeting focused on modification items with low levels of agreement. The panel found the third criterion (‘the extent to which feedback modifications can be combined with other data and quality improvement processes to the best effect’) difficult to operationalise consistently. We therefore dropped this criterion. Following discussion, panellists independently re-rated the modifications.
We reviewed reference panel outputs at Project Management Team meetings, at an A&F MetaLab meeting that included our Canadian-based co-investigators in Toronto (May 2018), and at a UCD workshop held at City, University of London (June 2018), generally prioritising those with higher scores for further evaluation.
We were aware that it would be problematic to develop and apply online versions of all proposed modifications (e.g. construct feedback through social interaction) or to test them within a single online experiment (e.g. provide multiple instances of feedback). We also had to ensure that each feedback modification included in the online experiment was compatible with other modifications to fulfil the requirements of the fractional factorial design. Based on these considerations, we excluded nine modifications from further consideration and took seven modifications forward into the UCD activity.
Step 2: user-centred design
Design
Our approach followed human–computer interaction processes of UCD38 to design both the online versions of the modifications and other aspects of the experiment, including a questionnaire to measure participant responses. We started with two UCD workshops at City, University of London (May 2018 and June 2018), then undertook three iterative rounds of design and evaluation (summarised in Figure 1), followed by testing by the research team. Each of the three iterative rounds of UCD comprised designing a set of prototypes in consultation with team members familiar with each of the national audits, followed by formative evaluation of the prototypes with participants using the think-aloud technique. 39 This qualitative approach to design was intended to assess functionality, usability and user experience to optimise modification content and format.
FIGURE 1.
User-centred design process.

Throughout the development process, we held regular face-to-face, teleconference and e-mail discussions as a research team around the feasibility and detailed design of the candidate and evolving online modifications. We took notes and kept records of these exchanges.
User-centred design workshops
The first UCD workshop brought research team members together with human–computer interaction researchers. We employed the creative techniques of constraint removal and analogical reasoning40 to generate ideas for ways of delivering the modifications in the online experiment. By imagining that various operational and design constraints did not exist, team members could think creatively about ways to remove or work around the issues identified. Analogical reasoning was used to draw on researchers’ experiences of how web-based technologies were used in other domains (e.g. online shopping) to inspire design ideas.
The second UCD workshop considered findings from the priority setting process and defined the design brief for the UCD of the modifications. We started by considering how people typically receive, use and share feedback. We assumed that most feedback recipients work in high-pressure environments with constrained resources and competing priorities on time. We also assumed that computing equipment for staff in health-care settings might be of variable age and capability. We considered designing the online experiment for hand-held devices, but decided against this for three reasons: (1) some feedback reports might only be delivered via secure NHS systems; (2) full rather than small screens might be more conducive to viewing any tables and graphs; and (3) the additional programming required to configure the experiment for multiple hand-held devices was beyond our means. Likely computing limitations and the unacceptability of audio output in shared working environments also precluded adding audio to feedback modifications.
We considered whether to present feedback modifications within full feedback reports or as isolated excerpts. Although the former would have greater ecological validity, developing realistic, fictitious, whole feedback reports for five national audits, all incorporating randomised combinations of six modifications, would not have been feasible. However, we recognised that the online experiment would still need to present contextual information about each NCA and present baseline formatting and content that would be reasonably familiar to participants. We therefore identified the information architecture of a ‘typical’ feedback report in the five participating NCAs and mapped key sections onto the modifications. The key sections identified were About this audit, Audit standard (criteria), Results (feedback), Recommendations for action, Further information, and Patient story.
We considered the feasibility of including multiple audit criteria within each online report. We opted to present results for one main audit criterion within each online report to reduce participant burden and simplify outcome assessment for the experiment. We aimed to ensure that the audit criterion selected for each NCA would be perceived as valid and credible by experiment participants. We therefore selected the main audit criterion with advice from relevant national audit collaborators (Box 2).
Patients with non-ST-segment elevation myocardial infarction or unstable angina who have an intermediate or higher risk of future adverse cardiovascular events are offered coronary angiography (with follow-on percutaneous coronary intervention if indicated) within 72 hours of first admission to hospital.
National Clinical Audit of Blood TransfusionClinical staff should prescribe tranexamic acid for surgical patients expected to have moderate or more significant blood loss unless contraindicated.
National Diabetes AuditPatients with type 2 diabetes whose HbA1c level is ≥ 58 mmol/mol (7.5%) after 6 months with single-drug treatment are offered dual therapy.
Paediatric Intensive Care Audit NetworkMinimising the number of unplanned extubations for paediatric intensive care patients per 1000 days of invasive ventilation.
Trauma Audit and Research NetworkPatients who have had urgent three-dimensional imaging for major trauma have a provisional written radiology report within 60 minutes of the scan.
HbA1c, haemoglobin A1c.
Participants
The UCD participants comprised professionals typically involved in developing or targeted by national audits, identified via our collaborating audit programmes. We e-mailed invitations and scheduled evaluation sessions for those who expressed an interest in the study. We obtained informed consent and conducted evaluation sessions face to face at the most convenient site for the participants, such as their place of work or at one of our partner universities.
We held a total of 17 evaluation sessions, involving 13 participants, over 8 months between July 2018 and February 2019. Seven participants were involved in round 1, four in round 2 and six in round 3 (Table 1). Four participants were associated with MINAP, three with NCABT, three with PICANet, two with NDA and one with TARN.
| Interview number | Participant ID | UCD round | Audit | Session date | Role |
|---|---|---|---|---|---|
| 01 | P01 | 1 | MINAP | 24 July 2018 | Nurse |
| 02 | P02 | 1 | MINAP | 8 August 2018 | Consultant cardiologist |
| 03 | P03 | 1 | MINAP | 9 August 2018 | Consultant cardiologist |
| 04 | P04 | 1 | NCABT | 16 August 2018 | Lead transfusion practitioner |
| 05 | P05 | 1 | MINAP | 16 August 2018 | Radiology matron |
| 06 | P06 | 1 | NCABT | 17 August 2018 | Risk and compliance manager |
| 07 | P07 | 1 | TARN | 23 August 2018 | Network manager |
| 08 | P08 | 2 | NDA | 16 October 2018 | Senior quality improvement lead (diabetes) |
| 09 | P09 | 2 | PICANet | 17 October 2018 | Data and audit manager |
| 10 | P10 | 2 | PICANet | 23 October 2018 | Consultant in intensive care |
| 11 | P11 | 2 | NCABT | 6 November 2018 | Acting clinical lead |
| 12 | P04a | 3 | NCABT | 20 December 2018 | Lead transfusion practitioner |
| 13 | P07a | 3 | TARN | 14 January 2019 | Network manager |
| 14 | P08a | 3 | NDA | 16 January 2019 | Senior quality improvement lead (diabetes) |
| 15 | P12 | 3 | NDA | 18 January 2019 | GP |
| 16 | P13 | 3 | PICANet | 5 February 2019 | Consultant paediatrician |
| 17a | P08a | 3 | PICANet | 21 February 2019 | Data manager |
Procedure
We undertook three rounds of UCD using prototypes of increasing fidelity to the intended online modifications (Table 2). The evaluation sessions employed a variety of techniques to gather information about current feedback report usage and elicit preferences for modification content, user interface elements, naming and ordering (‘information architecture’) of key sections of the audit report, the design of the online questionnaire, and the e-mail invitation to take part in the experiment.
| Round | Modifications | Materials | Protocol | Data type | Output |
|---|---|---|---|---|---|
| 1 | Multimodal feedback (M9) | Paper prototypes of modifications created using Balsamiq Mockups41 | Think-aloud | Audio | Sentiment data (positive, negative, mixed/neutral responses to modifications) |
| Cognitive load (M10) | Sketches of report structure and different navigation options | Semistructured interviews | Observational notes | Insights into people and process | |
| Optional detail (M12) | |||||
| Patient voice (M16) | |||||
| 2 | Controllable actions (M2) | Semi-interactive, web-based prototypes of modifications and mock-ups of invitation e-mail published through Github Pages (Github, Inc., San Francisco, CA, USA) | Think-aloud | Audio and video | Sentiment data (positive, negative, mixed/neutral responses to modifications) |
| Specific actions (M3) | Semistructured interviews | Observational notes | Insights into people and process | ||
| Effective comparators (M7) | |||||
| Multimodal feedback (M9) | |||||
| Cognitive load (M10) | |||||
| Optional detail (M12) | |||||
| Patient voice (M16) | |||||
| 3 | Specific actions (M3) | Prototypes of interactive website, including landing pages, audit report, questionnaire page and thank you page built using Bootstrap (https://getbootstrap.com) and published on Github | Usability testing | Audio | Usability reports and change logs |
| Effective comparators (M7) | Scenarios | Observational notes | Sentiment data (positive, negative mixed/neutral responses to modifications) | ||
| Multimodal feedback (M9) | Think-aloud | Issue log | Insights into people and process | ||
| Cognitive load (M10) | Semistructured interviews | ||||
| Optional detail (M12) | Unmoderated team testing of rules/checks and randomisation | ||||
| Patient voice (M16) |
Four of the seven modifications required user interface-related design work only; the other three required the creation of audit-specific content. Round 1 included only the four user-interface-related modifications to reduce preparation time and session run-time. We created ON and OFF versions of each modification: ON versions where the modifications had been applied and OFF versions where the modifications had not been applied. We identified a list of possible design patterns and principles as starting points for operationalising the modifications.
Round 1: design and evaluation of sets of paper-based prototypes exploring the modifications and the design of the online audit report
Semistructured interviews gathered information about roles and typical audit report usage patterns, including familiar formats, navigational behaviour and attitudes to audit. Then, think-aloud interviews explored designs for an online audit report, including information architecture and navigational elements. Finally, think-aloud interviews evaluated prototypes of four of the seven selected modifications. We iterated content and designs between evaluation sessions.
Round 2: design and evaluation of sets of online prototypes refining modifications and the design of the study invitation e-mail, report iconography and terminology
Semistructured interviews gathered further information about roles, typical audit report usage patterns, including familiar formats, navigational behaviour and attitudes to audit. Think-aloud interviews gathered responses to online prototypes for all seven modifications. We also tested responses to a mock-up e-mail invitation, and a screen showing different icons paired with common audit terms.
Round 3: design and evaluation of a complete online prototype, refining the content, data, flow, and presentation of all screens in the experiment
We conducted ‘end-to-end’ usability testing of the prototype experiment to identify issues in the flow between screens, page interactions and content to ensure that the right information was passed between various components of the experiment.
Expert testing
Project team members, including those familiar with each national audit, undertook comprehensive ‘expert reviews’ of the live online experiment to identify programming bugs and usability issues and to ensure fidelity to modifications as intended ahead of the online launch. This involved several rounds of team testing of all aspects of the website, including rules and checks, randomisation and editorial content. Data were captured via self-reported issue logs and addressed by the web development team.
Data collection and analysis
We took observational notes and audio- or video-recorded, transcribed and anonymised all evaluation sessions with UCD participants. We thematically analysed these data using NVivo 12 (QSR International, Warrington, UK) to identify emergent themes, usability issues and design suggestions. We took a two-step approach to coding for each round of UCD. Step 1 consisted of initial a priori coding of participants’ responses to the modification versions, categorised by sentiment (mixed or neutral, negative, positive). Step 2 consisted of inductive coding to understand context of use (not reported here) and to inform the design and usability of the website that would host the online experiment. We undertook these analyses as integral elements to the development process to improve the designs in the subsequent round of UCD.
Results
We present integrated findings from the consensus and UCD processes for each of the 16 modifications. For each modification, we report its underpinning rationale, evidence base, need for further research, feasibility of incorporating it within NCAs, selection for online experiment and proposed application, and illustrations of final versions. Appendix 1 provides details of the three UCD rounds of the modifications selected for online development. Appendix 2 shows the final designs for the six selected modifications for all five audits. Table 3 summarises the first and second round median ratings from the consensus process.
| Suggested modification | Current evidence and need for further research, median score (range) | Feasibility of adoption by national clinical audit programmes, median score (range) | ||
|---|---|---|---|---|
| Round 1 | Round 2 | Round 1 | Round 2 | |
| 1: recommend actions consistent with established goals and prioritiesa | 7 (3–9) | 7 (3–9) | 7 (4–8) | 7.5 (6–8) |
| 2: recommend actions that can improve and are under the recipient’s controlb | 5 (4–8) | 6 (3–8) | 7 (5–9) | 7 (5–9) |
| 3: recommend specific actions | 6 (3–7) | 6 (4–7) | 7 (6–9) | 8 (6–9) |
| 4: provide multiple instances of feedbacka | 7 (3–8) | 7 (3–8) | 6 (4–8) | 7 (4–8) |
| 5: provide feedback as soon as possible and at a frequency informed by the number of new patient casesa | 5 (3–8) | 6 (4–8) | 7 (3–8) | 7 (4–8) |
| 6: provide individual rather than general dataa | 7 (3–8) | 7.5 (5–8) | 3 (1–8) | 4.5 (2–8) |
| 7: choose comparators that reinforce desired behaviour change | 8 (3–9) | 8 (7–9) | 8 (2–9) | 8 (7–9) |
| 8: closely link the visual display and summary messagea | 6 (3–9) | 6 (3–9) | 8 (5–9) | 8 (5–9) |
| 9: provide feedback in more than one way | 5 (3–8) | 6 (4–8) | 7 (4–9) | 7 (5–9) |
| 10: minimise extraneous cognitive load for feedback recipients | 6 (3–8) | 7 (3–8) | 6 (1–9) | 6 (3–9) |
| 11: address barriers to feedback usea | 6 (2–8) | 6 (4–8) | 3 (2–6) | 4.5 (3–6) |
| 12: provide short, actionable messages followed by optional detail | 7 (4–8) | 7 (4–8) | 7 (5–9) | 8 (7–9) |
| 13: address credibility of informationa | 6 (3–7) | 6.5 (5–7) | 7 (4–8) | 7 (5–8) |
| 14: prevent defensive reactionsa | 6 (3–8) | 6.5 (3–8) | 3 (3–7) | 3 (3–7) |
| 15: construct feedback through social interactiona | 7 (4–8) | 7 (5–8) | 6 (3–8) | 6 (3–8) |
| 16: incorporate the patient voice | 7 (2–9) | 8 (6–9) | 5 (2–9) | 7 (4–9) |
Recommend actions that are consistent with established goals and priorities
Rationale
Setting goals promotes behaviour change in various ways, such as priority setting, focusing attention and effort, and reinforcing commitment. 42 Subsequent intention (or motivation) is a reasonable predictor of behaviour. In contrast, individuals who do not intend to enact a given behaviour are less likely to enact the behaviour than those who do. Goals that are compatible with professional, team or organisational goals and priorities are more likely to be achieved than those that are not.
Evidence base
Feedback is more effective when it includes both explicit targets and an action plan, according to the Cochrane review metaregression. 11 For example, a Dutch randomised trial demonstrated that feedback accompanied by an implementation toolbox suggesting a range of actions improved pain management in intensive care units. 43
Need for further research
Although the reference panel rated the need for further research as relatively high (7, high agreement), the second UCD workshop considered the need for further research to be low; it is unlikely that an audit programme would ever not want to do this or that further research would produce novel findings.
Feasibility within national audits
The panel rated the feasibility of incorporating this feedback modification within a national audit programme as relatively high (7.5, high agreement). The panel also recognised a difference between having goals and setting action plans; feedback recipients might need more guidance and support to carry out effective action planning.
Selection for online experiment
No.
Recommend actions that can improve and are under the recipient’s control
Rationale
Feedback needs to target recipients who have control over the actions required to improve practice. The degree of control over an action may vary among recipients. For example, feedback that requires action at an organisational level or additional resources to improve performance might be better directed at a hospital clinical lead or senior manager than at individual clinicians, as clinicians are unlikely to have the power to make such changes. There should also be scope for improvement on existing levels of practice, although feedback can also help to maintain high levels of performance.
Evidence base
Feedback is more effective when baseline performance is low. 11
Need for further research
The need for further research was rated as moderate (6, high agreement). The second UCD workshop considered that the level of control of the recipient was of interest as the limited evidence suggests its importance.
Feasibility within national audits
Feasibility within national audits was rated as high (7, high agreement).
Shorthand reference
Controllable actions (M2).
Selection for online experiment
No. There were two components to this suggested modification: first, recommending actions that can improve (e.g. low as opposed to high performance at baseline) and, second, recommending actions under the control of recipients (e.g. processes of care as opposed to patient outcomes). We considered the latter to be of greater interest to the online experiment.
During an e-mail exchange with co-investigators, we agreed that process of care audit criteria might generally be under the control of clinicians targeted by feedback [e.g. if a general practitioner (GP) is asked to consider prescribing antihypertensive agents for blood pressure levels above a given threshold]. In this case, an outcome audit criterion such as the proportion of patients with adequately controlled blood pressure might be less under the control of the GP, given the variable patient physiological and behavioural responses to treatment. This issue was pertinent to the experiment because the perceived fairness of the audit criterion may affect recipient responses (e.g. recipients might disengage from acting on feedback for audit criteria that they consider outside their control). We planned to operationalise controllable actions (M2) by randomising recipients to either process of care or outcome indicators in the online experiment.
We encountered two practical problems with operationalising controllable actions (M2) in the online experiment:
-
Paired process of care and outcome indicators were not available for all five NCA programmes participating in the experiment.
-
Operationalising both process of care and outcome indicators would have prohibitively increased the complexity of content and programming for the online experiment (e.g. in requiring differently worded feedback excerpts and outcome measures).
We therefore dropped this modification during the UCD work and included only one audit criterion per national audit.
Recommend specific actions
Rationale
Specification of a desired behaviour can facilitate intentions to perform that behaviour and enhance the likelihood of subsequent action. 44 The action, actor, context, target, time (AACTT) framework45 can guide specification by defining the:
-
action required – a discrete observable behaviour (i.e. ‘what’ needs to be done)
-
actor(s) performing the behaviour (i.e. ‘who’)
-
context in which the behaviour is enacted (i.e. ‘where’)
-
individuals or population targeted by the behaviour (i.e. ‘to/with whom’)
-
required timing (period and duration) of the behaviour (i.e. ‘when’).
For example, a GP (actor) might offer brief smoking cessation advice (action) to a patient who smokes (target) when time permits in a consultation (context) during an annual review of asthma medicines (timing). There are a number of ways to promote specific actions, such as providing feedback that is linked to or automatically generates lists of patients requiring clinical action.
Evidence base
Two randomised trials indicated that feedback accompanied by patient-specific risk information or by specific action plans was more effective than feedback without this information. 43,46 One observational study found that vaguely worded clinical practice recommendations were associated with lower compliance. 47 A further observational study examining changes in compliance following feedback found no relationship with specificity of wording. 48
Need for further research
The need for further research was rated as moderate (6, high agreement). UCD workshop 2 considered that, although it is unlikely that an audit programme would ever not want to specify actions, further research could inform the value of explicitly operationalising this modification.
Feasibility within national audits
Feasibility within national audits was rated as high (8, high agreement).
Selection for online experiment
Yes. The panel acknowledged that defining specific and context-sensitive actions was often challenging in practice, especially within NCA programmes dealing with complex clinical behaviours performed by multiple ‘actors’.
We recognised that the relevance and specificity of recommended actions would vary by recipient (e.g. considering the different needs of clinicians responsible for delivering individual patient care and managers responsible for service delivery). In practice, these distinctions may be blurred given that senior clinicians, often targeted by NCA feedback, are also responsible for service delivery. We paid attention to this issue later when designing questionnaire items for the experiment.
We also noted that the ability to operationalise this modification in one way, by providing links to (fictional) names of patients requiring action, was contingent on the clinical context. This is feasible when managing patients with long-term conditions (e.g. diabetes), when clinical actions can be prompted within ongoing management, but is unlikely to be practical in acute management (e.g. for immediate trauma care).
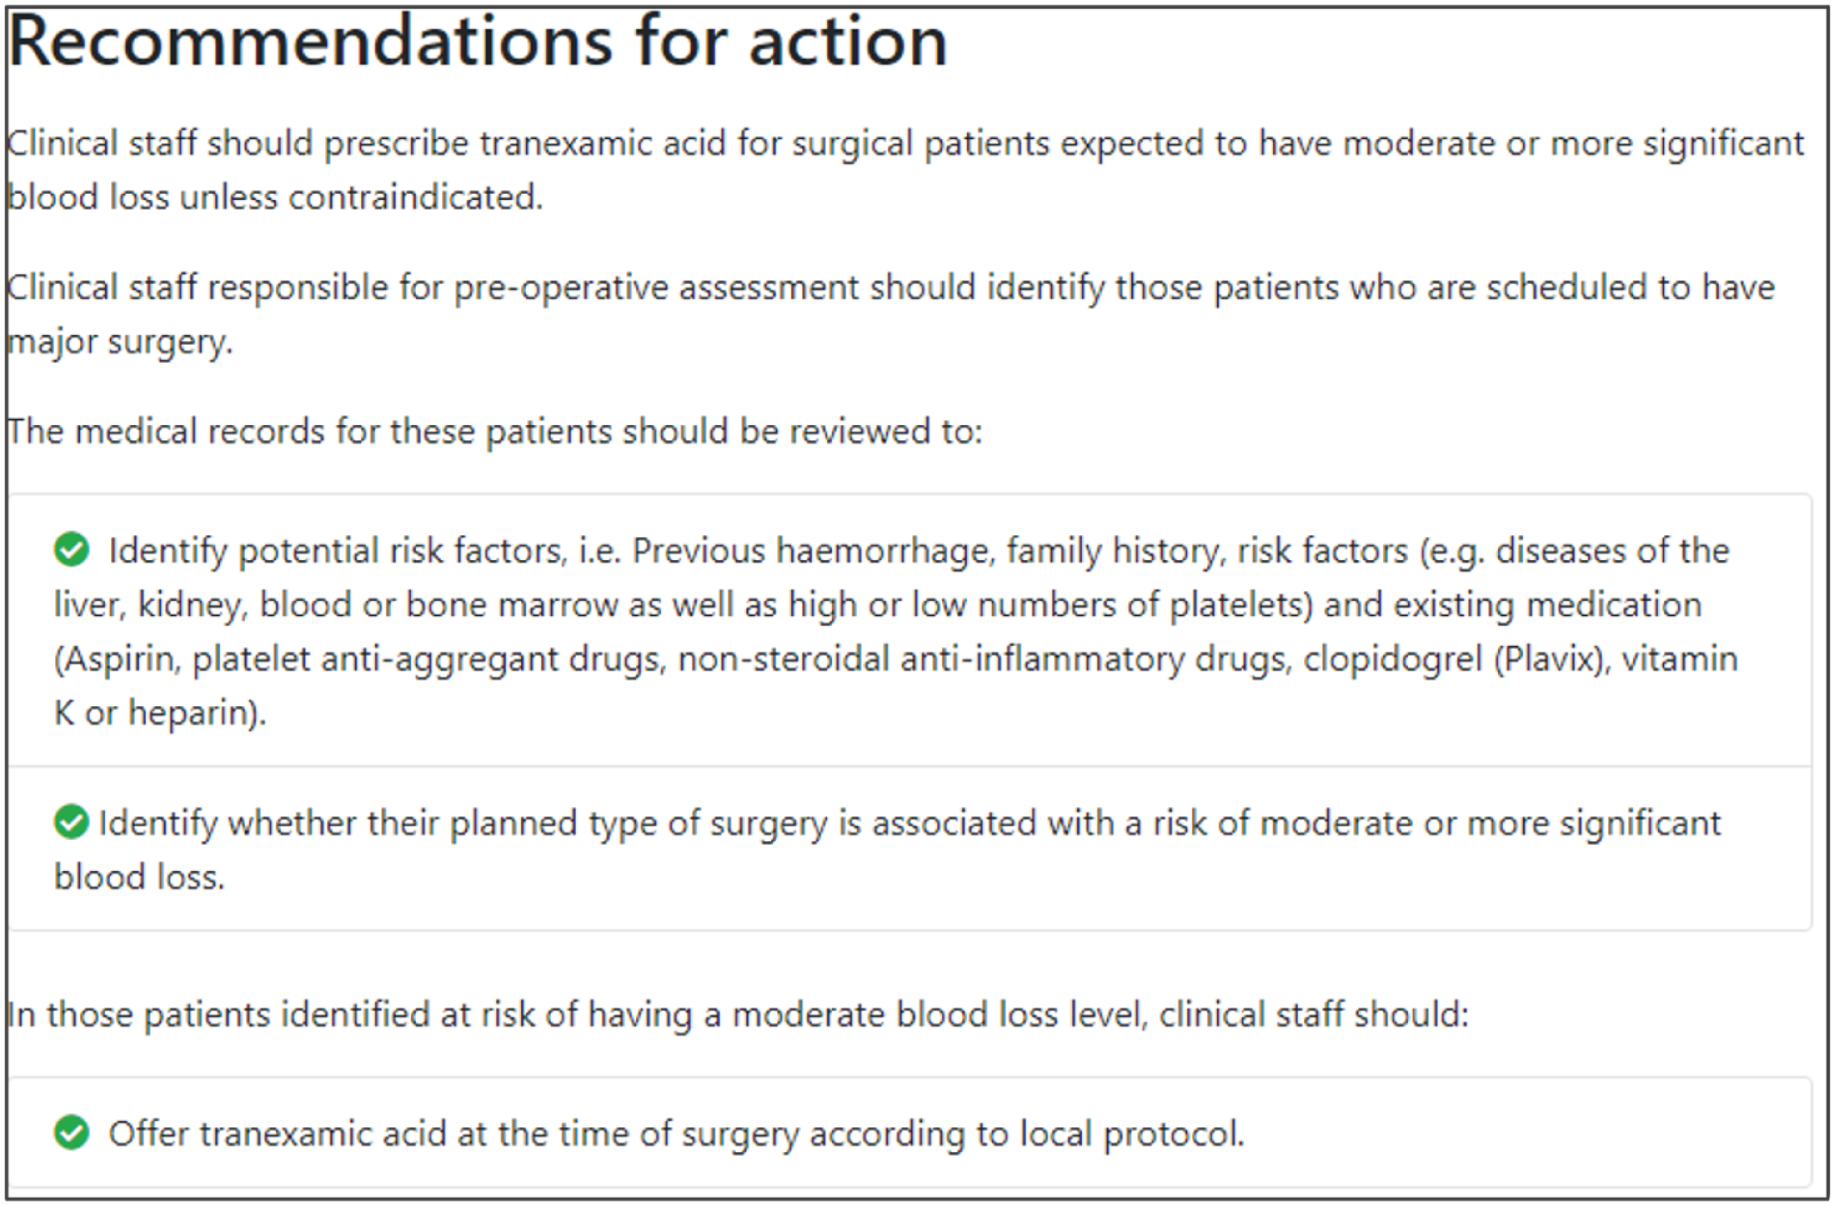
The modification would be ON if the feedback included recommendations for action that specified the action required, the actor(s) who should perform the action, the context in which the action is taken, the targeted individuals or population, and the required timing of the action. The modification would be OFF in the absence of these specifications, with any recommendations for action vaguely worded. Figure 2 illustrates the final design.
Shorthand reference
Specific actions (M3).
FIGURE 2.
Screenshot example of final ON version of modification specific actions (M3) (NCABT).
Provide multiple instances of feedback
Rationale
Multiple rounds of feedback encourage a feedback loop, wherein the recipient can receive the initial feedback, attempt a change in practice and then observe whether or not the change has been effective. 49 Consistency in feedback format over time fosters familiarity with the data format, increasing the likelihood of engagement where the data are considered useful.
Evidence base
Feedback may be more effective when it is provided more than once. 11
Need for further research
The need for further research was rated as high (7, high agreement).
Feasibility within national audits
Feasibility within national audits was rated as high (7, high agreement).
Selection for online experiment
No, as it would not be feasible to randomise participants so that one group received repeated instances of feedback.
Provide feedback as soon as possible and at a frequency informed by the number of new patient cases
Rationale
The interval between data collection and feedback should be as short as possible to reinforce the relevance of data to recipients; delays in providing feedback can allow recipients to discount findings as being no longer relevant to current practice. 50 However, the time between data collection and feedback needs to be long enough to allow a sufficient number of new cases to accumulate for audit (ensuring data reliability) and to allow time for recipients to have acted on previous feedback and observed the benefits of any such action.
Evidence base
One randomised trial found that immediate reminders were more effective than monthly feedback reports in promoting internal medicine specialists’ adherence to preventative care protocols. 51
Need for further research
The need for further research was rated as moderate (6, high agreement).
Feasibility within national audits
Feasibility within national audits was rated as high (7, high agreement).
Selection for online experiment
No, as it would not be feasible to operationalise within the online experiment.
Provide individual (e.g. practitioner-specific) rather than general data
Rationale
Providing individual feedback strengthens accountability and offers recipients fewer options for discounting performance data that they may initially disagree with. It facilitates corrective actions, such as reviewing the care of individual patients and reviewing decision-making. In practice, giving individual-level feedback is often not feasible because most health care is delivered by teams. However, feedback should generally be fed back at the lowest feasible level (e.g. team rather than organisation, organisation rather than system).
Evidence base
Feedback data specific to an individual recipient are usually more effective than those that apply to a group,52 although there is little evidence from health-care settings.
Need for further research
The need for further research was rated as high (7.5, high agreement).
Feasibility within national audits
Feasibility within national audits was rated as medium (4.5, moderate agreement). There is limited scope for changing practice as national audits already typically aim to give feedback at the most individual level (including team or organisation) feasible.
Selection for online experiment
No, as it would be difficult to include such a change within most current NCAs, which typically can collect data at team or organisational levels only.
Choose comparators that reinforce desired behaviour change
Rationale
Feedback is typically given in the context of a comparator. Comparators can include one or more of:
-
recipient performance, usually how performance changes over time
-
formal standards, such as a target level of achievement
-
a peer group, such as mean performance of similar individuals, teams or organisations.
Comparators should be selected according to their ability to change or reinforce the desired behaviour. However, care is needed in choosing or tailoring comparators. 53 For example, if providing feedback to high performers, positive feedback may either lead to reduced effort or increased motivation. Audit programmes may also consider switching attention to new topics where performance is poorer, but this risks inducing fatigue in higher performers. Yet attempts to improve already high levels of performance may be less fruitful than switching attention to alternative priorities. For many clinical actions, there is a ‘ceiling’ beyond which health-care organisations’ and clinicians’ margins for improvement are restricted because they are functioning at or near their maximum capabilities. Comparators are also challenging to set for low performers, who may be demotivated by feedback indicating that they are far below the average or top centile.
Evidence base
There is relatively little evidence about which comparators should be chosen under which circumstances. 13
Need for further research
The need for further research was rated as high (8, high agreement).
Feasibility within national audits
Feasibility within national audits was rated as high (8, high agreement).
Selection for online experiment
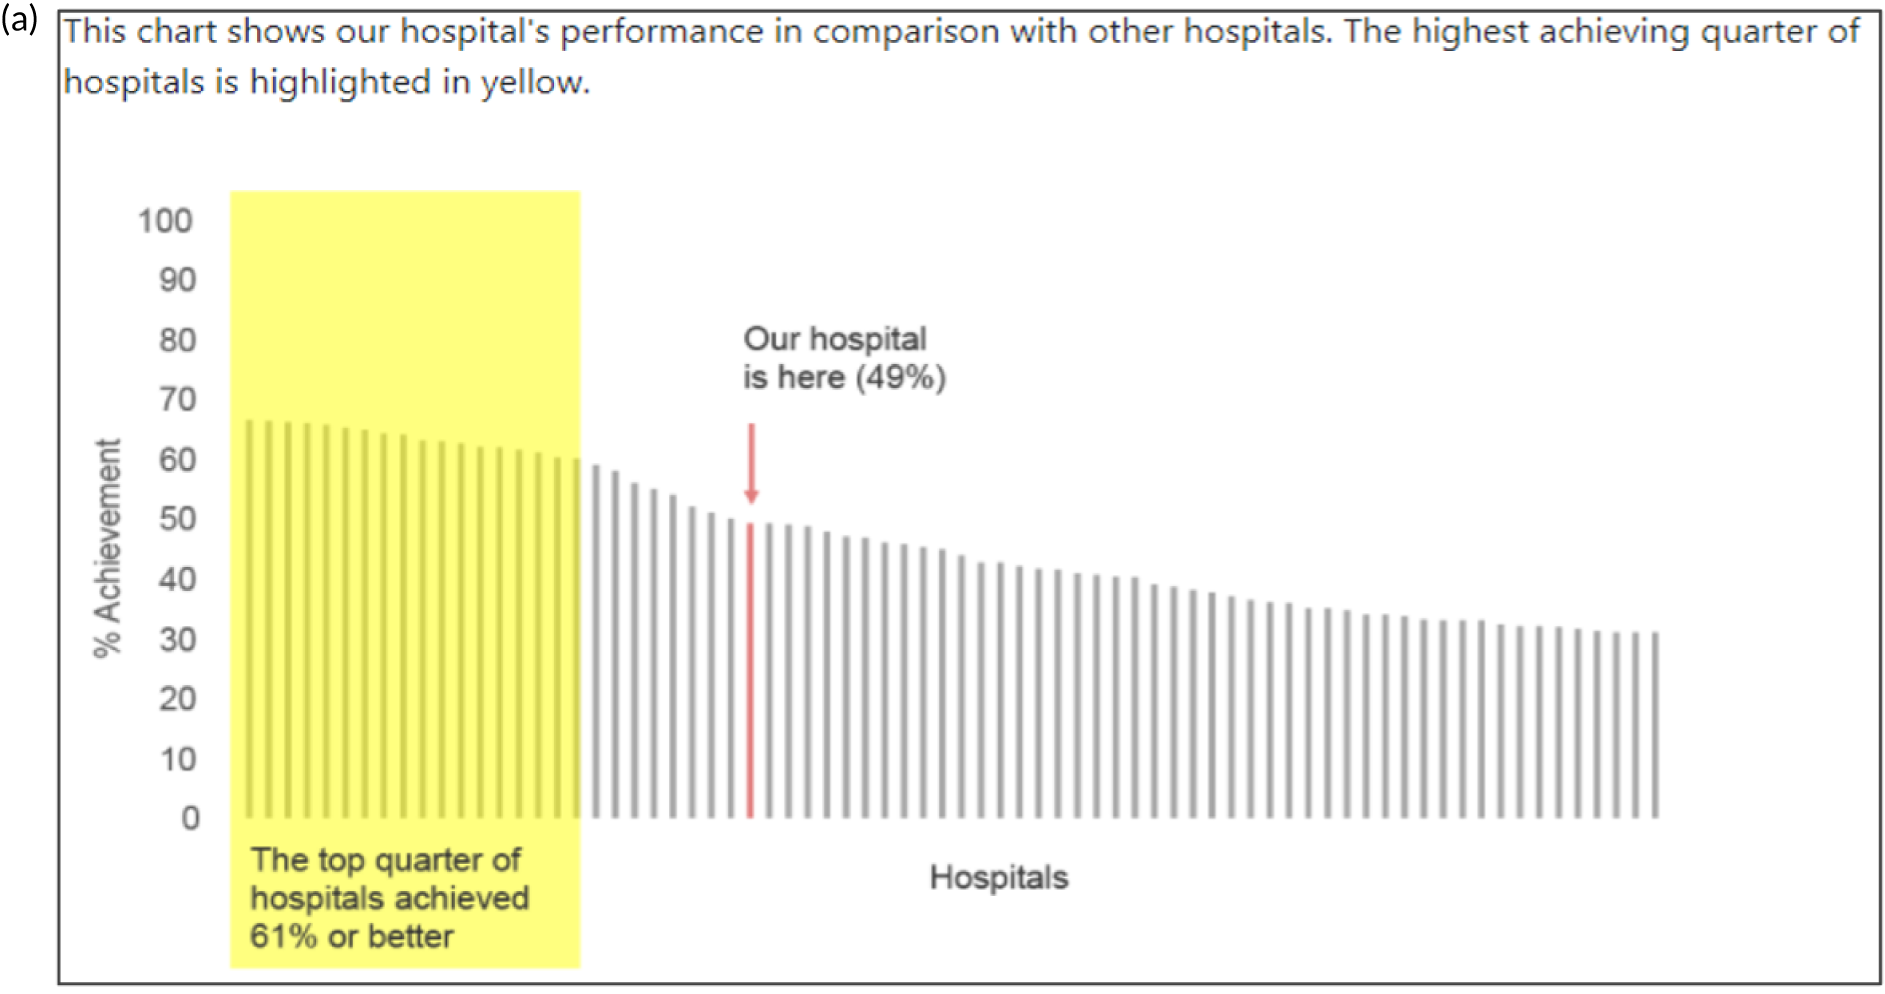
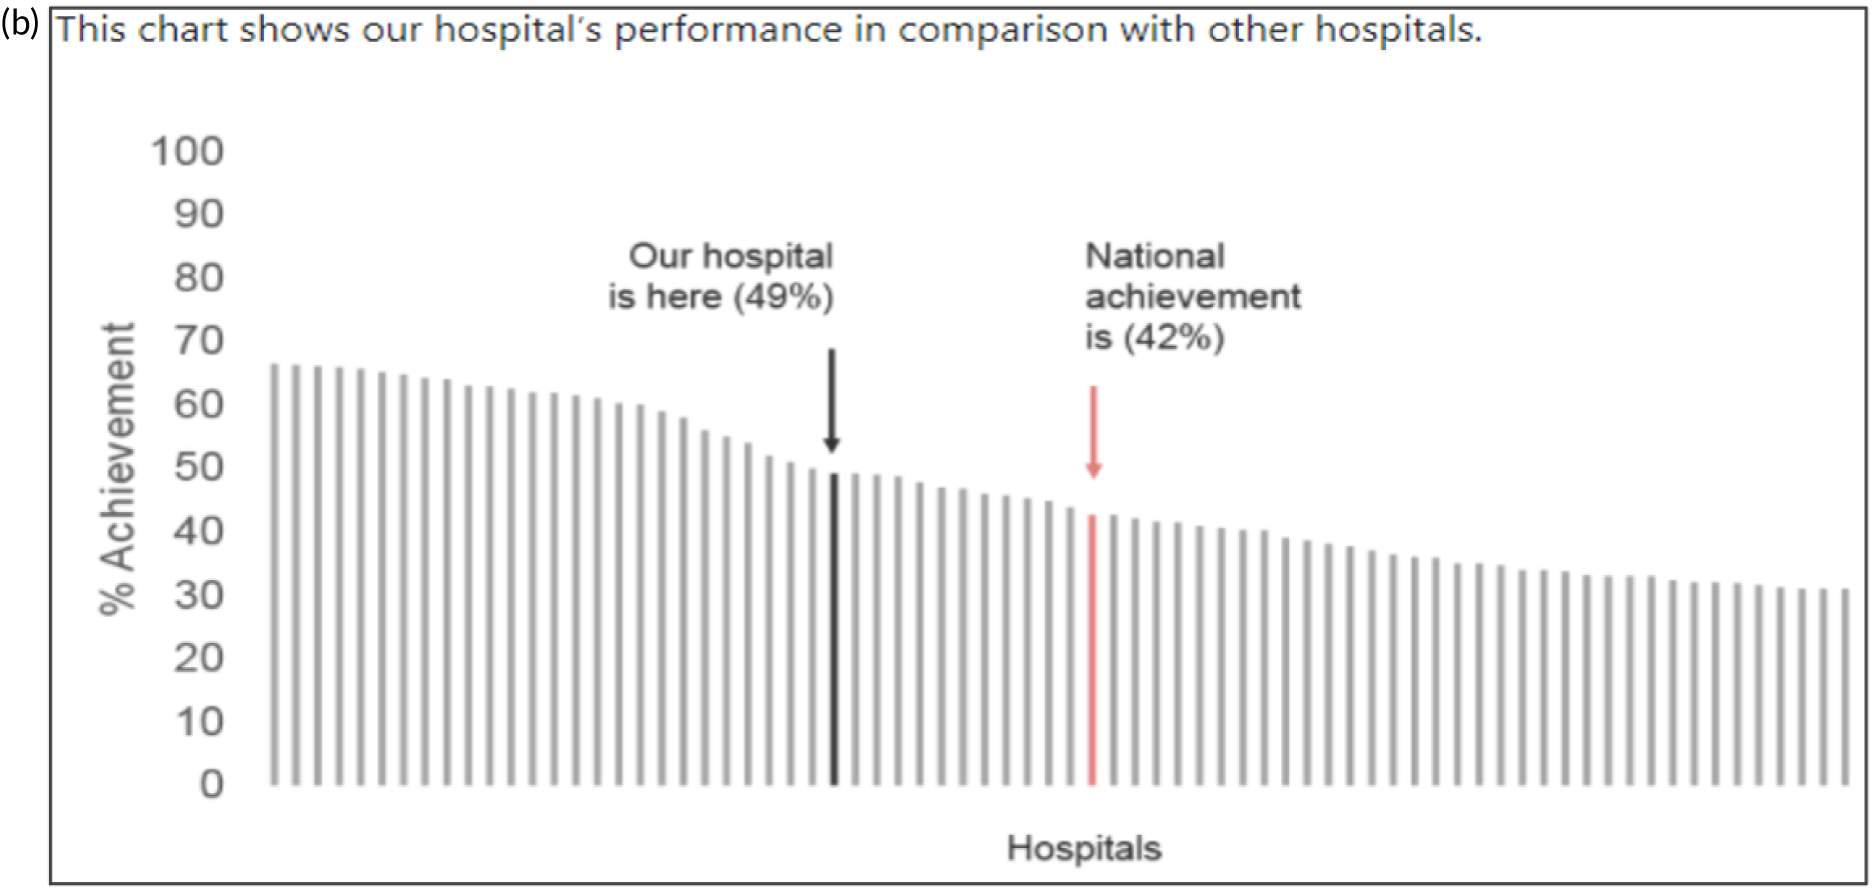
Yes. Effective comparators (M7) would be ON if the feedback comparator showed recipient performance against that of the top 25% nationally. The modification would be OFF if the feedback comparator showed recipient performance against the mean average.
There was a wide range of options for varying comparators, including several variants of each of recipient performance over time, formal targets and peer comparisons. Although using several comparators might risk creating mixed messages for recipients, it might also maximise impact if the comparators are thoughtfully aligned. For example, recipients may see progress over time, note how this compares to others and be further motivated by explicit targets. We generated a (non-exhaustive) range of questions:
-
Is a tailored approach (e.g. those below the mean see the mean, those above the mean see the top 10%) more effective than a standard approach (where all recipients see the same feedback)?
-
Is adding an explicit target to peer comparisons more effective than not?
-
Is adding individual peer performance scores (e.g. histogram in which the mean/top 10% is also marked) more effective than only the mean/top 10% summary statistics?
-
Are identifiable peers more effective than anonymous peers (given that comparison is a social process?)
-
Is feedback more effective if it is compared with summary statistics from one reference group (i.e. national) or multiple groups (e.g. national, regional)?
-
Is a comparator more effective than no comparator?
The key issue for any such variant is which best focuses attention for driving behaviour change. Figure 3 illustrates the final design.
FIGURE 3.
Screenshot examples of final ON and OFF versions of effective comparators (M7) (NCABT).


Shorthand reference
Effective comparators (M7).
Closely link the visual display and summary messages
Rationale
Summary text can be accompanied by graphical elements in close proximity, with both reinforcing the same message. The messages can also be linked stylistically.
Evidence base
There is little evidence from health-care settings. 19
Need for further research
The need for further research was rated as moderate (6, high agreement).
Feasibility within national audits
Feasibility within national audits was rated as high (8, high agreement).
Selection for online experiment
No, although the second UCD workshop recognised that this would be feasible.
Provide feedback in more than one way
Rationale
Presenting feedback in different ways may help recipients develop a more complete and memorable mental model of the information presented, allow them to interact with the feedback in a way that best suits them and reinforce memory by repetition. 19
Evidence base
Feedback may be more effective when it combines both written and verbal communication. 11
Need for further research
The need for further research was rated as moderate (6, high agreement).
Feasibility within national audits
Feasibility within national audits was rated as high (7, high agreement).
Selection for online experiment
Yes. The modification would be ON if the feedback included a graphical display of performance data along with the textual information for effective comparators (M7). The modification would be OFF in the absence of a graphical display of performance data. Figure 4 illustrates the final designs.
FIGURE 4.
Screenshot examples of final versions of multimodal feedback (M9) when effective comparators (M7) is switched (a) ON and (b) OFF (NCABT).
Shorthand reference
Multimodal feedback (M9).
Minimise extraneous cognitive load for feedback recipients
Rationale
Feedback recipients are generally time poor and need to cope with competing priorities for attention. Poorly presented and excessively complex feedback risks being misunderstood, discounted or ignored by recipients. 54 Reducing cognitive load entails minimising the effort required to process information and can be supported by prioritising key messages, reducing the number of data presented, improving readability and reducing visual clutter. Graphical elements should be as simple as possible and use features such as colour coding to amplify messages (e.g. ‘traffic lights’).
Evidence base
There is little evidence from health-care settings.
Need for further research
The need for further research was rated as high (7, high agreement). The second UCD workshop recognised that, although no national audit programme would deliberately attempt to add extraneous cognitive load to feedback reports, we had encountered variable content and format. 26
Feasibility within national audits
Feasibility within national audits was rated as moderate (6, high agreement).
Selection for online experiment
Yes. In the second UCD workshop and subsequent team discussions, we debated the feasibility of operationalising extraneous cognitive load within an online experiment, recognising issues in standardisation and interpretation. We decided to develop a modification for the online experiment in which the control condition would comprise feedback with extraneous cognitive load. However, we had to be careful to ensure that the control condition was not degraded so much as to be unrepresentative of typical practice. We were also limited by programming capacity in how much we could achieve; increasing or reducing cognitive effort might require having two versions (ON and OFF) of all feedback pages and modifications. We therefore focused on ways of changing the content to increase or decrease cognitive load.
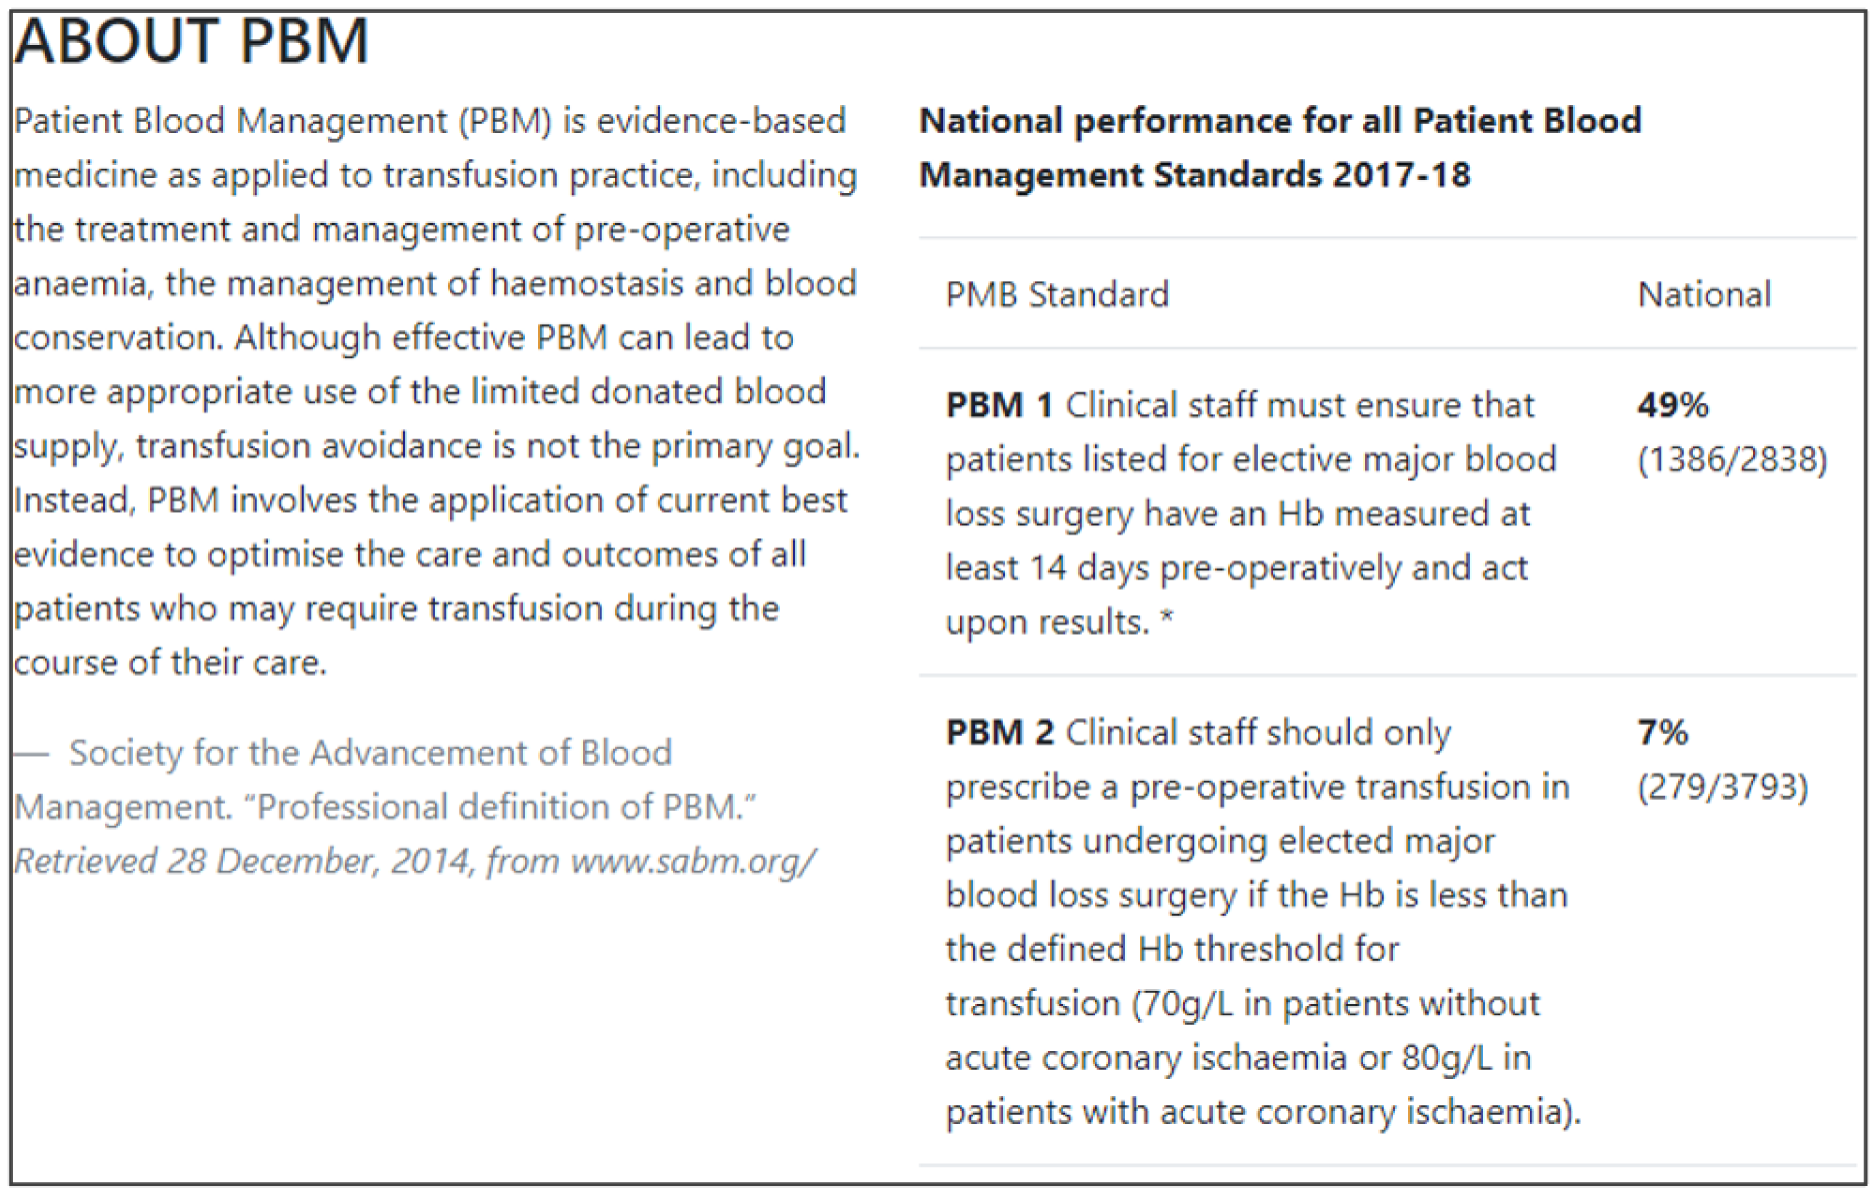
The modification would be ON in the absence of distracting detail. The modification would be OFF in the presence of distracting detail, such as additional general text not directly related to the audit criterion and feedback on other audit criteria. We recognised that this modification might interact with multimodal feedback (M9) and therefore anticipated a negative interaction in the analysis of the online experiment. Figure 5 illustrates the final design for the OFF version (high cognitive load).
FIGURE 5.
Screenshot example of a section of the final OFF version of cognitive load (M10) (NCABT).
Shorthand reference
Cognitive load (M10).
Address barriers to feedback use
Rationale
Although recipients may receive and read feedback, they may not feel or be able to act on it. Barriers to effective action may exist across individual (i.e. professional or patient), clinical team, organisation or system levels. 55 For example, a GP receiving feedback on prescribing anticoagulants for stroke prevention in patients with atrial fibrillation might be uncertain about how to initiate and monitor treatment in the absence of clearly defined local pathways for doing so. 56 Therefore, feedback may need to include specific advice on how to do this and be accompanied by organisational initiatives to define and disseminate recommended clinical pathways. Feedback effects may be enhanced by supported interventions based on systematically identified barriers to and enablers of recommended practice.
Evidence base
A Cochrane review57 suggests that tailored interventions to address identified determinants of practice can change professional practice, although they are not always effective and, when they are, the effect is small to moderate.
Need for further research
The need for further research was rated as moderate (6, high agreement).
Feasibility within national audits
Feasibility within national audits was rated as moderate (4.5, high agreement).
Selection for online experiment
No. The second UCD workshop suggested that addressing barriers to use would be most relevant following delivery of feedback.
Provide short, actionable messages followed by optional detail
Rationale
Feedback reports can be lengthy documents that are onerous for recipients and of uncertain value for changing behaviour. Providing short, actionable messages, with optional information available for interested recipients, allows those who only have the time or inclination to glean the main messages to do so. Other recipients may demand more detailed information to check the validity and relevance of feedback data or consider the evidence base underpinning a particular recommendation for action. Feedback credibility may be enhanced if recipients can ‘drill down’ to better understand their data.
Evidence base
Little research has addressed this in the context of feedback. One randomised experiment found that a ‘graded-entry’ approach improved clarity and accessibility for clinical guideline summaries. 58 A review of health technology assessments recommended ‘structured decision-relevant summaries’. 59 Interaction designers refer to this technique as progressive disclosure and use it to disguise system complexity and to declutter the user interface of higher-end functionality in a way that supports both casual and advanced users. 60
Need for further research
The need for further research was rated as high (7, high agreement).
Feasibility within national audits
Feasibility within national audits was rated as high (8, high agreement).
Selection for online experiment
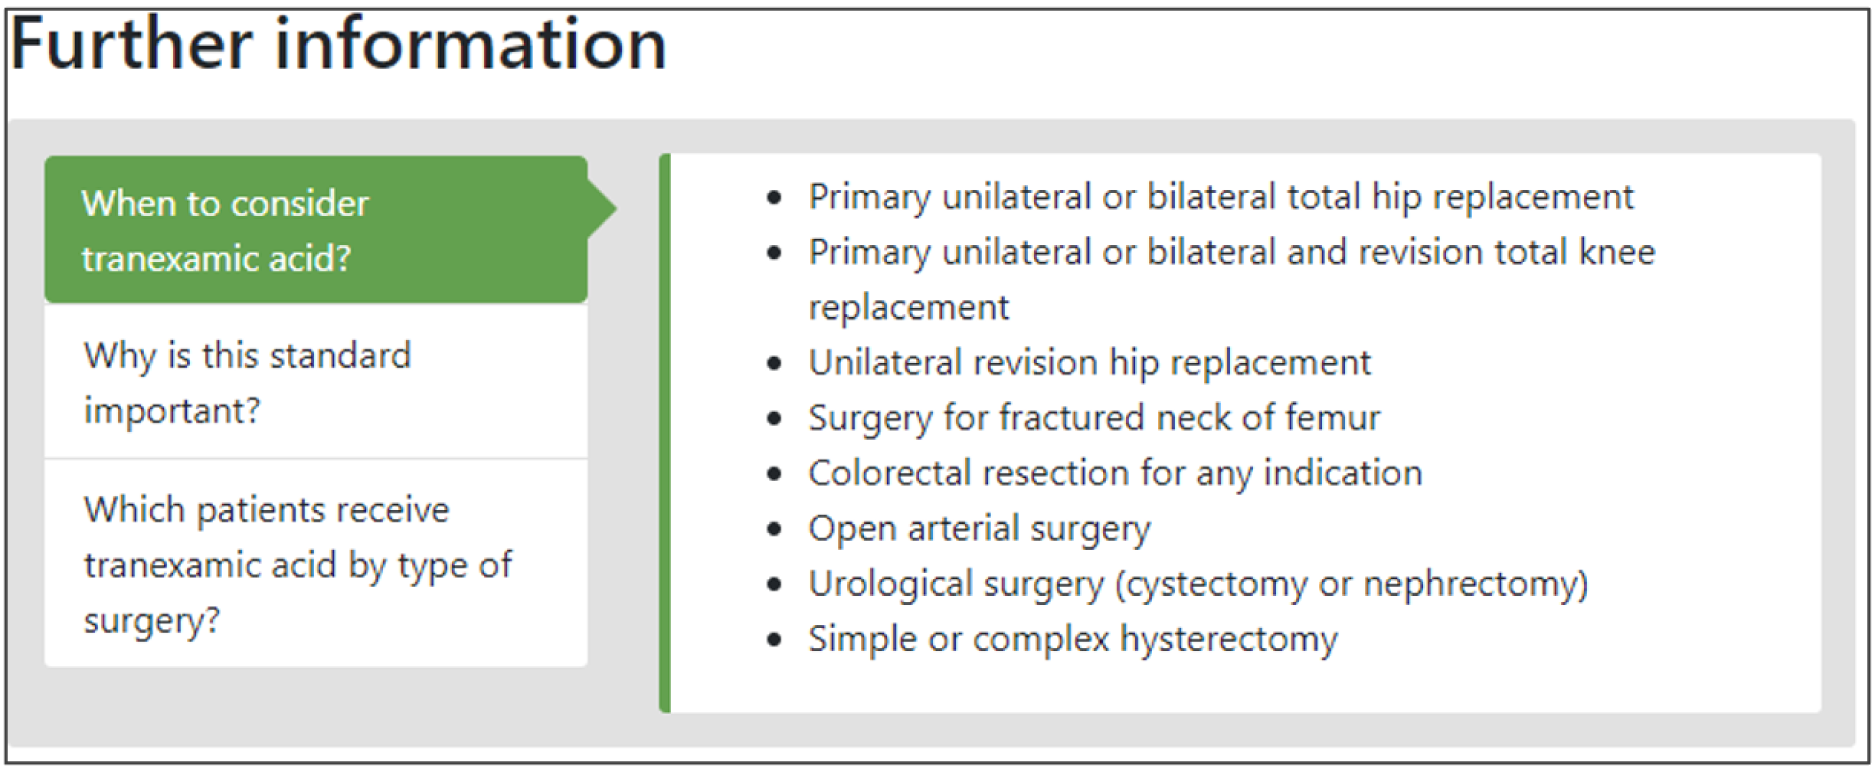
Yes. The modification would be ON if the feedback included short messages with links to explanatory detail related to the audit criterion. The modification would be OFF in the absence of links to explanatory detail. This modification partly overlaps with specific actions (M3) and we anticipated a negative interaction in the online experiment. Similarly, this modification might also negatively interact with cognitive load (M10), given that adding information might distract participants. Figure 6 illustrates the final design.
FIGURE 6.
Screenshot example of final ON version of modification 12 (NCABT).
Shorthand reference
Optional detail (M12).
Address the credibility of the information
Rationale
Feedback effects may be compromised if recipients consider the data erroneous or irrelevant to their own practice. Approaches to counter such beliefs include involving recipients in the selection of audit criteria and data collection, being transparent about the strengths and limitations of feedback data, and highlighting how the data are relevant to recipients’ practice and circumstances.
Evidence base
Feedback delivered by a supervisor or colleague is more effective than feedback delivered by other sources. 11
Need for further research
The need for further research was rated as moderate (6.5, high agreement).
Feasibility within national audits
Feasibility within national audits was rated as high (7, high agreement).
Selection for online experiment
No. We judged that most NCAs already take reasonable measures to explain the credibility of their data and it would not be feasible to embed additional delivery by a colleague or supervisor within the online experiment.
Prevent defensive reactions to feedback
Rationale
Negative feedback may naturally elicit defensive responses, especially if the targets set for improvement are perceived as unattainable. 61,62 Repeated negative feedback coupled with unattainable targets for change may demotivate and disengage recipients. Encouraging reflection on success with an emphasis on extending such success to other arenas (‘feedforward’) may be more motivating. 62,63 Actively guiding recipients’ reflections on the feedback away from defensive reactions may also be beneficial.
Evidence base
Few studies on feedforward for clinicians exist. 19
Need for further research
The need for further research was rated as moderate (6.5, high agreement).
Feasibility within national audits
Feasibility within national audits was rated as low (3, high agreement).
Selection for online experiment
No. The second UCD workshop noted that most national audits probably attempt such measures routinely, although we recognised the potential for experimental work framing messages in different (positive and negative) ways.
Construct feedback through social interaction
Rationale
Educational research suggests that social interaction offers opportunities for recipients to actively work with feedback and go beyond superficial responses. Approaches to increase such interaction include asking recipients to self-assess performance prior to feedback, promoting dialogue about the meaning and implications of feedback, and taking part in facilitated discussions to develop action plans. 64–66
Evidence base
There is little in the feedback literature about interaction between the feedback providers and recipients,19 although qualitative research suggests that approaches promoting self-assessment can be motivating. 67
Need for further research
The need for further research was rated as high (7, high agreement).
Feasibility within national audits
Feasibility within national audits was rated as moderate (6, high agreement).
Selection for online experiment
No. The second UCD workshop considered that this might be problematic to operationalise convincingly within an online experiment.
Incorporate ‘the patient voice’
Rationale
Patient and public involvement can help ensure the relevance of audit programmes to patient and public needs and provide alternative perspectives to those of health-care professionals. Healthcare Quality Improvement Partnership (HQIP) guidance for best practice in clinical audit recommends PPI throughout the audit process as a marker of quality. 68 Although none of the previous 15 suggestions for effective feedback specifically mentioned PPI, we proposed including it in the online experiment given its policy salience. We analysed 27 national audit reports in 2018 and found that five included sections directly written by patients about their experiences of care or the audit. None was specifically linked to audit criteria. Yet, in principle, such attempts to incorporate ‘the patient voice’ may highlight the importance of providing high-quality care to feedback recipients and, hence, increase their motivation to improve practice.
Evidence base
We were unaware of any research directly addressing this suggestion.
Need for further research
The need for further research was rated as high (8, high agreement).
Feasibility within national audits
Feasibility within national audits was rated as high (7, high agreement).
Selection for online experiment
Yes. The modification would be ON with the addition of a quotation from and a photograph of a fictional patient. The text would describe their experience of care, where possible, directly related to the audit criterion.
We aimed to embed one or more of the following behavioural change techniques69 in the quotation:
-
feedback on outcome(s) of behaviour (i.e. stating how the patient benefited from clinical care consistent with recommended clinical practice).
-
anticipated regret (i.e. suggesting that the feedback recipient might regret not following recommended practice).
-
vicarious consequences [i.e. prompting observation of consequences for others (including rewards and punishments) when recommended practice is or is not followed].
-
information about others’ approval (i.e. stating how the patient approves of the recipient following recommended practice).
The modification would be OFF in the absence of this information. Figure 7 illustrates the final design.
FIGURE 7.
Screenshot example of final ON version of M16: patient story (NCABT).

Designing the online experiment
System scope
The experiment was to be delivered as a custom-built website that participants would access by clicking on a link in an e-mail invitation. The core functionality was to present participants with an audit page composed of the audit standard and combinations of ON or OFF versions of the 6 modifications (Appendix 2), followed by a questionnaire to measure their response. We decided to embed this functionality within a linear series of pages in designing the experiment (Table 4).
| Step | Page description | Page type | Function |
|---|---|---|---|
| 1 | Welcome page | Static content | User orientation, study purpose, graphical overview and funders/collaborators |
| 2 | Consent form and participant information | Form | Capture informed electronic consent and present patient information sheet. Form including validation |
| 3 | Select your audit page | Form and patient information sheet | Allocate user identifier and modification combinations. Capture role and organisations type |
| 4 | Audit report page | Feedback display | User view of baseline and combined audit report content Page metrics, including Google Analytics ® (Google Inc., Mountain View, CA, USA) |
| 5 | Questionnaire | Form | Multiple-choice ratings scale capturing outcome data |
| 6 | Thank-you page | Form | Capture e-mail address for incentive fulfilment and unlinked name for certificate download. User view of ‘tips for effective feedback’ |
Requirements
The website was required to welcome the participant (step 1), obtain informed consent (step 2), allocate participants to one condition in the fractional factorial experiment (step 3), present feedback modifications (step 4), provide a questionnaire to collect outcome data for the experiment (step 5), allow participants to download ‘evidence-based tips’ for effective feedback and to claim a voucher and certificate upon completion (step 6). The website was also required to gather metrics, including time to completion and page visits. To maintain participant anonymity, the personal data required for making the voucher claim would not be linked to research data. We designed for anticipated behaviour, preventing user errors and a degree of misuse (e.g. we wanted to be able to detect repeat attempts from voucher request logs).
Evolution over user-centred design rounds
Round 1 sketches
We identified typical and salient content types from national reports published by our five collaborating national audits. We began to scope the information architecture for an interactive online version of the feedback excerpts (which effectively corresponded to a ‘mini-audit report’). We designed seven paper prototypes for ways of presenting an online audit report. We selected five sketches that best fulfilled our brief. The sketches illustrated ways that common online navigational design patterns could be applied to audit content. The sketches included a single scrollable web page with a hyperlinked table of contents, a website with a classic global navigation bar, one with a task-led dashboard, one with step navigation (‘next’ and ‘back’ buttons), and one with side tabs and ‘breadcrumb trail’ navigation. Breadcrumbs are a dynamic trail of links that allow users to traverse back through drilled content. We illustrated inline features to prioritise, sort and ‘bookmark’ recommendations, and buttons or links to related content (Table 5).
| UCD Round | Sketch version and description | Overall sentiment, by participant | ||||||||||||
|---|---|---|---|---|---|---|---|---|---|---|---|---|---|---|
| 01 | 02 | 03 | 04 | 05 | 06 | 07 | 08 | 09 | 10 | 11 | 12 | 13 | ||
| 1 | S1.0 single scrollable page, hyperlinked table of contents and pared-back content, i.e. a mini-report | n/c | N | M | M | M | N | M | – | – | – | – | – | – |
| 1 | S1.1 step navigation with guidelines first | N | N | N | M | N | P | M | – | – | – | – | – | – |
| 1 | S1.2 task-focused navigation and breadcrumb trail | N | N | M | N | N | P | M | – | – | – | – | – | – |
| 1 | S1.3 classic global navigation bar and left-hand secondary navigation, ‘add to basket’ recommendations and linked results/content | P | N | M | M | M | M | M | – | – | – | – | – | – |
| 1 | S1.4 side tabs and breadcrumb trail navigation, inline links to related content and ‘favourites’ | M | M | M | M | P | M | M | – | – | – | – | – | – |
| 2 | E-mail invitation | – | – | – | – | – | – | – | N | P | M | M | – | – |
Round 1 findings
We received a broad mix of responses relating to the styles of navigation presented. The single scrolling page was deemed to be typical but not necessarily user-friendly. Participants responded positively to task-focused navigation and the classic global navigation with side-tabs. Participants gave mixed responses to the step navigation owing to the lack of signposting or menu in our sketch. They could not see how deep the system was or what information it contained. Participants also reported suitable or expected names for sections in order of importance, with the most salient information, ‘results’, presented first. Participants reacted positively to prioritisation features.
Round 1 requirements
The website was designed to:
-
clearly convey the scope of the experiment and set respondent expectations before consent
-
give a clear indication of progress through the experiment, such as pages viewed versus pages remaining
-
use section titles that were familiar and easy to understand, such as ‘audit standard’, ‘results’, ‘recommendations’
-
prioritise salient feedback over less critical information, such as recommendations
-
present the audit report as a single page.
We were also able to draw on responses to the sketches to inform ways to operationalise certain modifications, such as optional detail (M12).
Round 2 prototypes
We built a Hypertext Markup Language (HTML) wireframe including the modification prototypes and two additional pages to evaluate the look and feel and wording of the e-mail invitation, appropriate pairing of icons with labels, and naming conventions for our information architecture. We published the HTML wireframe on Github Pages (GitHub Inc., San Francisco, CA, USA) to access during the evaluation session. We built and published a second standalone web-based mock-up of the audit report page with all modifications switched OFF. This mock-up included a range of designs for the overall look and feel and was shared with members of the project team only.
Round 2 findings
Positive comments from round 2 of the UCD concerned the clarity and simplicity of the e-mail wording. Mixed, neutral and negative comments oriented around issues of trust. Participants reported that the e-mail looked ‘too slick’ and ‘markety’. This raised questions about funding; one suggested that this was suspicious because it didn’t look like it was from the NHS. One participant felt that the question and answer format might be too conversational in tone and risk being dismissed by some clinicians. Participants suggested that increasing the prominence of collaborator and funder logos in the footer may increase trust. We also discussed the estimated completion time, considering that some would see a reduced amount of content. We were keen to set accurate expectations about the nature of the experiment and length of time to complete. We ultimately estimated the time to complete as 20–25 minutes. There was confusion around terminology, with some terms being used interchangeably, such as audit criteria and recommendations. The term ‘feedback’ was less clear than the term ‘results’. Participants reported a preference for naming conventions that followed standard scientific terminology, such as ‘results’.
Round 2 requirements
We provided consistent information between the e-mail invitation and the landing page and ensured that the funding body logo and collaborators were prominently presented. We simplified content (e.g. consistent use of ‘experiment’ versus ‘study’, avoiding repetition, removing question and answer format) and stipulated minimum system requirements. We chose to pair distinct blocks or sections of content, identified during round 1, to individual modifications to present them as part of a complete abridged version of an audit report. We defined baseline content in the report, including the report title, data period, audit criterion (named ‘audit standard’) and textual performance feedback in the ‘results’ section. This was the minimum viable amount of content that could be shown when all modifications were switched OFF.
Round 3 prototype
We built the final prototype (see Table 5), including the outcome questionnaire and peripheral pages such as the participant information sheet and ‘top tips’, using the popular bootstrap framework. Bootstrap is an open source toolkit for rapid development of responsive front-end prototypes using HTML, Cascading Style Sheets, and JavaScript. Responsive websites can detect and automatically fit a range of devices and screen resolutions. Although we did not design a platform that would be fully responsive to all devices, we were able to adapt to a broad range of screen sizes and resolutions. We designed the user interface to reduce differences in layouts between browsers to provide a comparable experience to all respondents. We optimised and tested the website in modern browsers [i.e. Firefox® web browser (Mozilla Corporation, San Fransisco, CA, USA), Google Chrome® browser, Microsoft Edge® (Microsoft Corporation, Redmond, WA, USA) and Safari® (Apple Inc., Cupertino, CA, USA)] and legacy browsers (i.e. Internet Explorer® 7, 8, 9, 10 and 11). This restricted our application of all best-practice web development techniques, such as progressive enhancement and accessible design. Progressive enhancement is recommended for delivering websites that deploy enhanced features to browsers that support them so that designers can maximise impact without compromising the experience in other browsers.
Round 3 findings
We tested each iteration of the web prototype sequentially with the six participants in UCD round 3. We conducted end-to-end usability testing of the prototype to identify issues in the flow of the screens, layout, content, and look and feel of the user interface. We captured audio data and took observational notes that we analysed for emergent themes, usability issues and design suggestions. We identified 74 instances of usability issues (38 low to moderate, 36 severe to critical). Participants reported multiple issues that we sought to address by providing clearer information pertaining to the scope and purpose of the website on the landing page. One participant reported that they had expected the experiment to be more involved and wished to go back and re-read everything properly. There was extensive discussion between the project team about the issues and implications for randomisation if users accessed the back button. Although we could not prevent users from navigating back to the point at which they were randomised, we could prevent them from being reallocated. Only the first set of answers would be saved. Respondents were alerted prior to randomisation to avoid using the browser’s back button.
Round 3 requirements
We designed the landing page to include a welcome message describing the experiment’s purpose, minimum browser requirements and expected time to complete. We designed the system to take account of users who wished to move back and forth between pages of the experiment. We designed a pictorial, annotated overview of the steps involved in completing the study. We incorporated a responsive, rather than step, progress tracker that included a percentage to clearly orient the user, reduce abandonment and increase questionnaire completion rates. We implemented a discrete left-hand menu so users could navigate quickly to specific sections to improve the usability of the overall report page. We aimed to provide sufficient signposting for participants to move back and forth between the report page and the questionnaire page. We selected criteria to be a single outcome audit criteria statement. The section was clearly titled ‘audit standard’ to address the issue, observed in round 2, of participants mistaking the statement as feedback.
Round 3 expert evaluation
Stephanie Wilson conducted a design review on the finalised prototype to assess it for visual consistency, typography and editorial content. The prototype and content were finalised and shared with the developer, along with front-end code and assets. The website was built using ASP.NET Razor Pages in Microsoft Visual Studio® (integrated development environment) with a Microsoft SQL Server® database. Content was uploaded to the database.
Round 3 testing and deployment
We tested the front-end of the live website with eight project team members over 2 months to identify browser inconsistencies and issues with the flow between screens, page interactions, content, exceptions, form validation and error messages. We also wanted to ensure that the right information (i.e. the randomisation process and participant allocation) was passed between various components of the experiment. Project team members logged a total of 139 issues over several rounds of testing. These were collated into a single document and passed to the development team to fix. The issues identified fell into three main categories: functionality (n = 40), editorial content (n = 56) and cosmetic (n = 43).
Discussion
We created and evaluated a total of 63 prototypes for six feedback modifications (Table 6). Eight of these prototypes were for the content-based modifications [specific actions (M3), effective comparators (M7)] and 55 for the user-interface modifications [multimodal feedback (M9), cognitive load (M10), optional detail (M12), patient voice (M16)]. Participants for the evaluation sessions were recruited from all five audits and a range of roles. Our rigorous thematic analysis yielded positive and negative findings regarding usability and feedback content that drove the UCD iterations.
| Modification | Round | ||
|---|---|---|---|
| 1 | 2 | 3 | |
| M3. Recommend specific actions | 0 | 2 | 1 |
| M7. Choose comparators that reinforce desired behaviour change | 0 | 4 | 1 |
| M9. Provide feedback in more than one way | 11 | 4 | 1 |
| M10. Minimise extraneous cognitive load for feedback recipients | 13 | 4 | 1 |
| M12. Provide short, actionable messages followed by optional detail | 6 | 6 | 1 |
| M16. Incorporate the patient voice | 4 | 3 | 1 |
| Total | 34 | 23 | 6 |
We aimed to maximise fidelity to suggestions for effective feedback,19 selecting those that were most amenable to evaluation within an online experiment and were priorities for further research. We used the AACTT framework to write recommendations for action. 45 We observed cognitive burden associated with visual redundancy when viewing the same feedback in more than one way graphically (i.e. graph plus table). Our interpretation of multimodal feedback (M9), therefore, supported user comprehension by providing a single piece of graphical feedback alongside baseline textual feedback. We chose to test the effects of cognitive load by altering extraneous content. We delivered actionable messages and optional detail in a way that would be amenable to a range of user behaviours.
We followed additional suggestions to improve user experience of the online experiment. We did this by ensuring that summary messages were closely linked to the visual display, providing supporting evidence to improve credibility and avoiding triggers for defensive reactions. We addressed credibility by including inline references, acknowledging that in ‘real-world’ feedback systems, users would expect these to be linked to online contemporaneous resources such as NICE guidance. The UCD provided insights into potential triggers for defensive reactions, guided us through all stages of our design process and is applicable to ‘real-world’ audit programmes.
Comparisons with existing research
We have demonstrated an approach to developing components for a screening experiment that has advantages over earlier paper-based versions70,71 in allowing participants to interact more with online materials. These earlier experiments, however, highlighted the importance of clarifying theoretical constructs and pathways to behaviour change. The suggestions for effective feedback that we worked with were mainly distilled from a wide body of empirical and theoretical work and expert opinion. However, while the suggestions were also practically focused, we discovered that we faced many choices in considering how to operationalise them. For example, the suggestion ‘recommend actions that can improve and are under the recipient’s control’ refers to two ways of changing feedback: focusing on clinical areas where there is scope for improvement and focusing on actions that recipients are able to directly influence. We faced similar, perhaps wider, ranges of choices in operationalising most other modifications, such as effective comparators (M7) and cognitive load (M10). This is unsurprising given that Colquhoun et al. 72 identified a total of 313 theory-informed hypotheses by interviewing experts from a wide range of behavioural and social science fields. Our formative work also lent insights into why key features are not consistently applied to NCAs. 73 For example, participants gave accounts of the difficulties generating tailored recommendations and disregarded generic ones.
Colquhoun et al. 74 designed and tested a paper prototype of a web-based A&F intervention with users to better understand the value of UCD methods applied to community and home health-care sectors. They found that recommendations or ‘opportunities for action’ were more meaningful to their users than performance comparisons. 74 Our participants, however, reported significant challenges with the recommendation actionability, especially during early design sessions. The introspective nature of early design collaboration means that participant responses may be more negative than those assessing future systems. We, therefore, experienced a broad range of responses to several aspects of the study, from the level of detail expected in a report to the complexity of features needed to address key tasks. Participants’ capacity to engage with content and features varied hugely, depending on resource capital, such as time or available technology (we found that a significant proportion of NHS organisations used outdated browsers); role; or technical ability. This reflects the breadth of the challenge in designing reports.
Limitations
We acknowledge several limitations. First, the design and delivery of the feedback modifications were somewhat constrained by the nature of the online experiment and information technology systems within the NHS. Our final designs, therefore, may not represent the fully optimised ways of delivering online feedback. However, we consider them faithful to the principles of the suggestions for effective feedback.
Second, round 1 of the UCD used low-fidelity prototypes and only the refined prototypes in round 3 allowed fully realistic interactions. The earlier prototype may not, therefore, have given participants a strong sense of the interaction, especially if they were expecting to see more complete designs. Notably, some participants perceived content in the prototypes to be ‘patchy’ and incomplete. However, our methods were in line with good UCD practice. The first round sufficiently provoked responses and identified user needs, with relatively few restrictions imposed.
Third, each prototype modification was seen by a limited number of participants. Some prototypes were seen by just one participant before our agile UCD process, typical of ‘in the wild’ methods, iterated to the next version. This may have skewed design decisions towards the preferences of individual participants and the needs of their associated roles and audits. Furthermore, some participants saw prototypes populated with content from an audit that was not the one with which they were associated, as it was not feasible to produce content for all audits for all prototypes.
Fourth, there was a tension between producing online feedback that credibly mimicked existing audit reports and had ecological validity, and an excerpt that could be read in its entirety in a time-limited experiment. Incorporating all randomised combinations of modifications in five full feedback reports would have been unfeasible in the UCD process. Furthermore, there was a risk that participating staff might miss or fail to work through full reports to see assigned modifications, thereby reducing exposure to the experimental interventions. This would hinder our ability to detect any effects in an experiment that was intended to be sensitive to such signals.
Implications for research
We faced challenges in developing a number of the modifications and hope that future research can improve on our methods. For example, we were unable to operationalise ‘recommend actions that can improve and are under the recipient’s control’ by comparing recipient responses to audit criteria based on process of care or patient outcomes. We had found that paired process of care and outcome indicators were not available for all five collaborating national audits and that including this modification would have caused problems for programming and experiment outcome measurement. However, NCAs generally use a range of process of care and outcome measures, with associated advantages and disadvantages. 75 On the one hand, process of care measures can be closely linked to evidence-based clinical actions, but are of less interest to policy-makers than patient outcomes. On the other hand, patient outcomes may not always well-reflect processes of care as they are influenced by a wide range of patient and contextual factors. It is still uncertain whether process of care or outcome measures are most likely to motivate feedback recipients to change behaviour.
We also welcome future work to improve on the modifications that we developed. For example, we addressed cognitive load (M10) by only varying feedback content, with some caution about excessively degrading the comparator feedback so it did not sufficiently represent current feedback practice. However, we were unable to develop and apply wider stylistic and formatting features that could also influence recipient responses to feedback.
Summary
We prioritised and developed a set of six modifications to feedback for an online experiment. We encountered challenges in operationalising the modifications so that they were sufficiently faithful to the intentions of evidence- and theory-based suggestions for effective feedback. UCD work with participants from a range of audit programmes helped ensure credibility and acceptability for the subsequent online experiment.
Chapter 3 A randomised fractional factorial screening experiment to predict effective features of audit and feedback (objective 1)
Parts of this chapter are reproduced or adapted with permission from Wright-Hughes et al. 76 This is an Open Access article distributed in accordance with the terms of the Creative Commons Attribution (CC BY 4.0) license, which permits others to distribute, remix, adapt and build upon this work, for commercial use, provided the original work is properly cited. See: https://creativecommons.org/licenses/by/4.0/. The text below includes minor additions and formatting changes to the original text.
Introduction
The previous chapter described the selection and development of six modifications of feedback for use within five different NCAs. This chapter sets out the methods and results of the online screening experiment to explore the effects of those feedback modifications on intended enactment, user comprehension, experience and engagement.
Methods
Study design
We conducted a randomised, online, fractional factorial screening experiment. Six modifications to feedback were operationalised in two versions (ON/OFF) and applied within audit report excerpts for five different national clinical audits.
Participants were randomised to receive one of 32 combinations of the modifications, stratified by audit. After studying the audit excerpt, participants completed a short questionnaire to generate all study outcomes. Appendix 3 provides a full example of the ENACT (Enhancing NAtional Clinical audiT and feedback) online experiment interface. This study is reported as per the Consolidated Standards of Reporting Trials (CONSORT) guidelines for randomised trials.
Setting and participants
We collaborated with our NCA programmes, which covered a range of clinical topics in primary and secondary care. Three of the audits (NCABT, MINAP and TARN) each cover more than 150 acute NHS trusts in England alone, as well as other hospital sites in the devolved nations. PICANet presently covers 34 specialist-commissioner admission sites and can provide multiple respondents per site. The NDA covers all (approximately 7500) general practices in England.
Each audit shared an invitation, containing the link to the online experiment, via e-mail with their existing distribution list. These lists contain the recipients of their reports (i.e. clinicians, managers, nurses and commissioners), all of whom were potentially eligible to participate as regular recipients of each audits’ communications.
Prior to entering the experiment, participants could access the information sheet and were required to confirm their consent. This page stated that we were interested in the views of anyone who received and acted on the audit report as part of their professional role. There were no other eligibility criteria.
Participants were offered a £25 voucher and certificate of completion in recognition of their time. At the end of the experiment, participants were offered the opportunity to view evidence-based guidance (‘top tips’) on how to improve their own A&F practice.
To obtain the voucher and certificate of completion, participants provided their e-mail address on completing the experiment; to maintain anonymity, voucher and certificate requests were not linked to experiment data.
Protocol violations
After opening to recruitment, a serious risk to the integrity of the study was identified in which repeated (i.e. duplicate) participant completion of the experiment took place. The experiment was subsequently and temporarily closed while security was enhanced. Additional experiment entry criteria, applied prior to randomisation, required participants to provide their NHS or Health and Social Care Northern Ireland (HSCNI) e-mail address. This was validated to confirm that the participant had not previously completed the experiment; the anonymity of experiment data was retained.
As participants were not uniquely identifiable within the experiment data (to maintain anonymity), we defined a ‘contamination period’ over which repeated (i.e. duplicate) participant completion was known to have taken place. We further explored the time spent on questionnaire and other indirect, objective criteria with the aim of identifying and excluding repeated participation, thus providing a data set of independent participants.
For information about the protocol violations, contamination period and how we maintained study integrity, see Populations and Appendix 5.
Intervention
Following consent, participants indicated which audit was relevant to them, their role and organisation from a predefined list. Participants were then randomised to be presented with one of 32 versions of the excerpt of a modified audit report. Participants were informed that the excerpt contained hypothetical but realistic data.
Modified audit report excerpts followed a basic template. The page was titled with the relevant audit (e.g. ‘National Diabetes Audit Report’) and a statement that the data were collected in 2018. The excerpt showed an audit standard taken from the appropriate audit [e.g. ‘Patients with type 2 diabetes whose haemoglobin A1c (HbA1c) level is ≥ 58 mmol/mol (7.5%) after 6 months with single-drug treatment are offered dual therapy’] and the result [e.g. ‘Our practice achieved this standard of care for 86% (318/370) of patients’]. Audit standards were selected with input from each relevant NCA collaborator to ensure that they were perceived as valid and credible by experiment participants.
The remaining content was dependent on the version of feedback to which the participant had been randomised, according to a combination of six modifications (Table 7). The six modifications are described in detail in Chapter 2; the implementation of the modifications in the experiment are briefly outlined below and further illustrated in Appendix 2:
| Modification | Description | Levels | |
|---|---|---|---|
| ON (+ 1) | OFF (–1) | ||
| A | Effective comparators: comparators that reinforce desired behaviour change | More specific feedback: top quarter of [sites] achieved the audit standard for xx% of patients | Less specific feedback: mean achievement across [sites] was xx% |
| B | Multimodal feedback: provide feedback in more than one way | With visual data output | Without visual data output |
| C | Specific actions: recommend specific actions | With recommendations | Without recommendations |
| D | Optional detail: provide short, actionable messages followed by optional detail | With progressive disclosure/‘further information’ section | Without progressive disclosure/‘further information’ section |
| E | Patient voice: incorporate patient voice | With patient voice | Without patient voice |
| F | Cognitive load: minimise extraneous cognitive load | Without inclusion of extraneous information | Inclusion of extraneous information |
-
Effective comparators: feedback is typically given in the context of a comparator, and comparators can be important motivators for improvement or for maintaining high performance. The modification was ON when showing the top 25% nationally as the comparator and OFF when showing the mean average.
-
Multimodal feedback: presenting feedback in different ways may help recipients develop a more complete and memorable mental model of the information presented, allow them to interact with the feedback in a way that best suits them and reinforce memory by repetition. 19 The modification was ON if the performance result text was accompanied by a graphical display of performance data and OFF when the graphical display was absent.
-
Specific actions: specification of a desired behaviour can facilitate intentions to perform that behaviour and enhance the likelihood of subsequent action. 44 The modification was ON if the feedback provided specific recommendations for action (i.e. who needs to do what, differently, with/to whom, where and when) and OFF when such recommendations were absent.
-
Optional detail: it is recommended that feedback designers provide short, actionable messages with optional information available for interested recipients. The credibility of feedback can be enhanced if recipients are able to ‘drill down’ to better understand their data. 19,68 The modification was ON if short messages with clickable, expanding links to explanatory detail were included and OFF when these links were absent.
-
Patient voice: HQIP guidance for best practice in clinical audit recommends that PPI be included throughout the audit process as a marker of quality. 68 In principle, explicitly linking patient experience to audit standards may highlight the importance of providing high-quality care and, hence, increase motivation to improve practice. The modification was ON when a text box including a quotation from and a photograph of a fictional patient was added and OFF when the text was absent. The text described their experience of care, where possible, directly related to the associated audit standard.
-
Cognitive load: poorly presented and excessively complex feedback risks being misunderstood, discounted or ignored by recipients. 54 The modification was ON when distracting detail was absent, reducing cognitive load. The modification was OFF if distracting detail was added (i.e. additional general text not directly related to the audit standard and feedback on other audit standards).
Experimental design
A full factorial design would require 26 = 64 combinations of the six modifications. We used a half fraction of the full design (i.e. 32 combinations) to maximise information while minimising complexity. This design allowed for the estimation of all main effects and two-factor interactions under the assumption that four-way and higher-order interactions are negligible. Three-way interactions were aliased (completely confounded). The design was near orthogonal to minimise the sample size required to detect the main effect of each modification.
We generated our fractional factorial design,77,78 denoted , using the defining relation I = ABCDEF and design generator F = ABCDE, with each level of the modifications (A, B, C, D, E, F) coded as –1 (OFF) or +1 (ON) (Table 8 and Box 3).

| Blocking factora | Combination ID | Number of modifications ‘ON’ | Modifications ON | Modification ON (+ 1) or OFF (–1) | |||||
|---|---|---|---|---|---|---|---|---|---|
| A | B | C | D | E | Fb | ||||
| B1 | C01 | 0 | (1) None | –1 | –1 | –1 | –1 | –1 | –1 |
| B1 | C02 | 2 | DE | –1 | –1 | –1 | 1 | 1 | –1 |
| B1 | C03 | 2 | CE | –1 | –1 | 1 | –1 | 1 | –1 |
| B1 | C04 | 2 | CD | –1 | –1 | 1 | 1 | –1 | –1 |
| B1 | C05 | 2 | BF | –1 | 1 | –1 | –1 | –1 | 1 |
| B1 | C06 | 4 | BDEF | –1 | 1 | –1 | 1 | 1 | 1 |
| B1 | C07 | 4 | BCEF | –1 | 1 | 1 | –1 | 1 | 1 |
| B1 | C08 | 4 | BCDF | –1 | 1 | 1 | 1 | –1 | 1 |
| B1 | C09 | 2 | AF | 1 | –1 | –1 | –1 | –1 | 1 |
| B1 | C10 | 4 | ADEF | 1 | –1 | –1 | 1 | 1 | 1 |
| B1 | C11 | 4 | ACEF | 1 | –1 | 1 | –1 | 1 | 1 |
| B1 | C12 | 4 | ACDF | 1 | –1 | 1 | 1 | –1 | 1 |
| B1 | C13 | 2 | AB | 1 | 1 | –1 | –1 | –1 | –1 |
| B1 | C14 | 4 | ABDE | 1 | 1 | –1 | 1 | 1 | –1 |
| B1 | C15 | 4 | ABCE | 1 | 1 | 1 | –1 | 1 | –1 |
| B1 | C16 | 4 | ABCD | 1 | 1 | 1 | 1 | –1 | –1 |
| B2 | C17 | 2 | EF | –1 | –1 | –1 | –1 | 1 | 1 |
| B2 | C18 | 2 | DF | –1 | –1 | –1 | 1 | –1 | 1 |
| B2 | C19 | 2 | CF | –1 | –1 | 1 | –1 | –1 | 1 |
| B2 | C20 | 4 | CDEF | –1 | –1 | 1 | 1 | 1 | 1 |
| B2 | C21 | 2 | BE | –1 | 1 | –1 | –1 | 1 | –1 |
| B2 | C22 | 2 | BD | –1 | 1 | –1 | 1 | –1 | –1 |
| B2 | C23 | 2 | BC | –1 | 1 | 1 | –1 | –1 | –1 |
| B2 | C24 | 4 | BCDE | –1 | 1 | 1 | 1 | 1 | –1 |
| B2 | C25 | 2 | AE | 1 | –1 | –1 | –1 | 1 | –1 |
| B2 | C26 | 2 | AD | 1 | –1 | –1 | 1 | –1 | –1 |
| B2 | C27 | 2 | AC | 1 | –1 | 1 | –1 | –1 | –1 |
| B2 | C28 | 4 | ACDE | 1 | –1 | 1 | 1 | 1 | –1 |
| B2 | C29 | 4 | ABEF | 1 | 1 | –1 | –1 | 1 | 1 |
| B2 | C30 | 4 | ABDF | 1 | 1 | –1 | 1 | –1 | 1 |
| B2 | C31 | 4 | ABCF | 1 | 1 | 1 | –1 | –1 | 1 |
| B2 | C32 | 6 | ABCDEF | 1 | 1 | 1 | 1 | 1 | 1 |
0 = ABCDEF, A = BCDEF, B = ACDEF, C = ABDEF, D = ABCEF, E = ABCDF, F = ABCDE.
AB = CDEF, AC = BDEF, AD = BCEF, AE = BCDF, AF = BCDE, BC = ADEF, BD = ACEF, BE = ACDF, BF = ACDE, CD = ABEF, CE = ABDF, CF = ABDE, DE = ABCF, DF = ABCE, EF = ABCD.
ABC = DEF, ABD = CEF, ABE = CDF, [B1] = ABF = CDE, ACD = BEF, ACE = BDF, ACF = BDE, ADE = BCF, ADF = BCE, AEF = BCD.
Under this design, the main effect of modification F is aliased (completely confounded) with the interaction between modifications A, B, C, D and E. It follows that each main effect is aliased with a fifth-order interaction, each two-factor interaction is aliased with a fourth-order interaction, and each three-factor interaction is aliased with another third-order interaction (see Box 3). To disentangle these effects, under the sparsity of effects principle,79 it is assumed that higher-order interactions are negligible.
We further partitioned the design, with 32 combinations of modifications, into two blocks of 16, using an additional alias pair, [B1] = ABF = CDE, to ensure that modifications were balanced (i.e. each modification has the same number participants at each level) and orthogonal (i.e. the sum of the product of any two or more modifications is 0) within each block of 16 participants (see Table 8 and Box 3).
Randomisation and masking
Participants were allocated to one of the 32 combinations of modifications to the audit report excerpt, with equal allocation using block randomisation, stratified by audit. The design was replicated in blocks of the 32 combinations, each partitioned into two blocks of 16. The randomisation lists were prepared by the statistician and incorporated into the website by the programmer. Remaining study personnel remained blind to allocation. Participants were, by nature of the experiment, exposed to the randomised audit report; however, they were not informed of the modifications or the combination of modifications to which they had been allocated.
Data collection
After studying the audit report excerpt, participants were asked to complete a short, one-page, 12-item questionnaire, displayed within the experiment. Participants were able to return to the excerpt, if desired. All 12 items were compulsory, and participants were unable to progress to the next page unless all questions had been answered, with the exception of an optional question eliciting a free-text response. Each item, with the exception of participants role in relation to the audit standard and optional further detail, was completed using a seven-point Likert scale (completely agree, strongly agree, somewhat agree, neither agree nor disagree, somewhat disagree, strongly disagree, completely disagree). Table 9 provides a summary of items within the questionnaire across audits, and Appendix 3 presents the questionnaire as displayed within the experiment for the NDA.
|
We are now going to ask you some questions about this audit report excerpt. Please feel free to look at the audit page again if you wish Some of the questions may seem similar; bear with us, this is deliberate for methodological rigour |
|
Our initial questions concern the audit standard:
|
|
|
Q1: which of these descriptions best describes your role in relation to this audit standard? [I have responsibilities for providing directing clinical care, I have responsibilities for the clinical care that my organisation or team provides, both of the above, neither of the above] |
|
|
Considering the time and resources available to you and other clinical priorities, please indicate how much you agree or disagree with the following statements [Completely agree, strongly agree, somewhat agree, neither agree nor disagree, somewhat disagree, strongly disagree, completely disagree] |
|
| Q2: over the next 3 months, I intend to ensure . . . |
|
| Q3: over the next 3 months, I want to ensure . . . | |
| Q4: over the next 3 months, I expect to ensure . . . | |
| Q5: I will bring this audit result to the attention of my colleagues within the next 3 months | |
| Q6: I will set goals to work towards our performance for this standard within the next 3 months | |
| Q7: I will formulate an action plan towards performance on this standard within the next 3 months | |
| Q8: I will review my performance in relation to this standard within the next 3 months | |
| Q9: are there any further steps or actions you will take in your hospital to meet this audit standard? [Free text and optional] | |
|
The following statements concern your experience of the audit report excerpt. Please indicate to what extent you agree or disagree with the following statements [Completely agree, strongly agree, somewhat agree, neither agree nor disagree, somewhat disagree, strongly disagree, Completely disagree] |
|
| Q10: I found the information in this audit report excerpt easy to understand | |
| Q11: this audit report excerpt met my information needs | |
| Q12: this online (interface) audit report excerpt was easy to use | |
The total time spent on both the audit report excerpt and the questionnaire, to the nearest half-second, was also recorded and constituted additional experiment diagnostic data. This included the cumulative time spent on each page should a participant move back and forth between the audit and questionnaire. The total number of ‘clicks’ made on the audit page was also available.
Appendix 2 provides screenshots of the different experimental conditions prepared for the five different NCAs; Appendix 3 provides screenshots of the website from landing to completion as presented to participants, using NDA content as an example.
We monitored responses to the experiment using a dashboard (see Appendix 8).
Outcomes
Primary outcome
The primary outcome was participant strength of intention in relation to the target behaviour80 specified in each of the audit-specific materials presented.
A systematic review of the literature on intention–behaviour relations demonstrated ‘a predictable relationship between the intentions of a health professional and their subsequent behaviour’. 81 We recognised that (1) there is almost no intention–behaviour gap when intention is low, (2) there will be an intention–behaviour gap when perceived control over the behaviour is low and (3) there is an intention–behaviour gap when intention to do the ‘right’ thing (i.e. social desirability) is high. Although intention has a limited ability to predict subsequent behaviourr,82 it can be informative in intervention development and early evaluation. 23
We anticipated social desirability bias in responses. The randomised design ensured that this was balanced across the different combinations of modifications to the audit report excerpts. We aimed to minimise unintended ‘loading’ of potential responses of intention due to social desirability bias by presenting the target behaviour in the context of other behaviours that would be appropriate,84 including the introductory statement, ‘Considering the time and resources available to you and other clinical priorities . . . ’, and anchoring items over ‘the next three months’.
Intention was measured using three items (Q2–4 in Table 9, beginning with the stem statements ‘I intend’, ‘I want’ and ‘I expect’). 81,83 Each item used the same template and was followed by the appropriate audit standard, for example ‘Over the next 3 months, I [intend/want/expect] to ensure that our patients with type 2 diabetes whose HbA1c level is 58 mmol/mol or above following 6 months with single-drug treatment are offered dual therapy’. Responses to each item followed a seven-point Likert scale and were scored –3 (completely disagree) through to +3 (completely agree); positive scores indicated greater intention.
Previous testing of these stems indicated that they measure the same concept, with Cronbach’s alpha values > 0.9. 84,85 We calculated the mean value across the three items to provide a measure of overall intention as the primary outcome.
Secondary outcomes
Proximal (‘upstream’) intention outcomes evaluated participants’ intention to undertake other actions in response to the feedback: bring the audit result to the attention of colleagues, set goals, formulate an action plan and review personal performance in relation to the audit standard. We defined these as ‘proximal’ outcomes on the assumption that they would generally precede actual enactment of the audit standard (i.e. the primary outcome). Responses to each item followed a seven-point Likert scale and were scored –3 (completely disagree) through to +3 (completely agree); positive scores indicated greater intention. Space was also provided for participants to report any further steps or actions that they would take to meet the audit standard.
Comprehension was evaluated using a single item (‘I found the information in this audit report excerpt easy to understand’) adapted from the website evaluation questionnaire (WEQ), a standardised questionnaire developed to evaluate website quality. 86 Responses followed a seven-point Likert scale and were scored –3 (completely disagree) through to +3 (completely agree); positive scores indicated higher comprehension.
User experience was defined as a ‘person’s perceptions and responses resulting from the use and/or anticipated use of a product’87 We use the positively worded two-item Lite version of the Usability Metric for User Experience questionnaire (UMUX-LITE)88 to evaluate whether or not the audit report and online interface were both useful and useable:
-
This audit report excerpt met my information needs.
-
This online audit report excerpt was easy to use.
These items were selected to minimise time, cost and user effort,89 while also providing a proxy for the longer and more commonly used System Usability Scale (SUS). 88,90
Responses followed a seven-point Likert scale and were scored –3 (completely disagree) through to +3 (completely agree); positive scores indicated better user experience. We calculated the mean value across the two items to provide a measure of overall user experience.
Additional outcomes
User engagement was measured by experiment diagnostics, including the length of time (in seconds) spent working through each combination of modifications and the number of ‘clicks’ within the audit report excerpt.
Sample size
Assuming similar effects of each modification across audits and roles, a total of 500 participants across the five NCAs provided 90% power to detect small to moderate main effects [i.e. 0.3 standard deviations (SDs)] for each modification (two-sided 5% significance test). This also provided approximately 80% power to detect main effects of 0.25 SDs and 70% to detect main effects of 0.22 SDs. No allowance for loss to follow-up was required, as data were collected at one time point only. Recruitment was permitted to exceed the 500 participant target, up to an overall maximum of 1200 participants and 480 participants per audit (15 replications of the 32 combinations of modifications). This increased the power to evaluate potential interaction effects within available resources. A 4-month recruitment period was originally planned.
Statistical analysis
All study data were extracted by City University, London (London, UK), and securely transferred to the Leeds Institute of Clinical Trials Research (Leeds, UK) for analysis. Analyses were conducted in SAS software, version 9.4 (SAS Institute Inc., Cary, NC, USA). The final version of a prespecified statistical analysis plan was approved prior to analysis commencing.
Populations
The intention-to-treat (ITT) population consisted of all randomised participants, grouped according to the combination of modifications they were randomised to receive, regardless of whether or not they completed the experiment.
Two modified ITT populations were defined owing to the detection of repeated participant experiment completion (see Appendix 4). As participants were not uniquely identifiable within the experiment data (to maintain anonymity), indirect, objective criteria were used to define the modified ITT populations, aiming to ensure the inclusion of unique participants.
The primary modified ITT population excluded all participants recruited during the contamination period. This is a conservative population, known to exclude a significant proportion of valid participants alongside repeated participation.
The secondary modified ITT population excluded participants who completed the experiment questionnaire in an unfeasibly fast time to allow for valid completion. A cut-off point of 20 seconds for questionnaire completion times was established according to a clear distinction in the distribution of questionnaire completion times for participants recruited within the contamination period (see Appendix 4, Table 30 and Figure 31).
Statistical considerations
Primary analysis was conducted on the primary modified ITT population, regardless of completion of the experiment or outcomes. An overall two-sided 5% significance level was used for all outcomes unless otherwise stated.
Distributional assumptions
Questionnaire responses followed a seven-point Likert scale, scored on an integer scale as –3 (completely disagree) through to +3 (completely agree); responses were quantitative with interval properties. Positive scores represented greater agreement with statements indicating intention, comprehension and user experience related to the audit report excerpt.
A continuous distribution was assumed for all outcomes; however, we anticipated that responses would likely be highly skewed because of social desirability bias. We explored the distribution of all outcomes using descriptive statistics and graphical display without reference to audit, participant role or randomised allocation.
We undertook appropriate model diagnostics to check the appropriateness of the distributional assumptions and validity of the statistical modelling. Based on the distribution of residuals within our analysis models, if approximate normality could not be assumed, we planned to dichotomise outcomes to form a meaningful binary outcome of agreement; however, diagnostic plots indicated approximate normality of residuals (see Appendix 6, Figure 46).
Covariates
Alongside the modifications under investigation, covariates for statistical analysis models included:
-
Audit – MINAP, NCABT, NDA, PICANet, TARN. The audit with the largest number of randomised participants (i.e. NDA) forms the reference category.
-
Randomised design block – block 1, block 2; using effect coding (–1, +1).
-
Role – clinical (allied health professional, fully trained doctor, manager, nurse or nurse specialist, training doctor) or non-clinical (manager, audit and administration staff). Clinical roles formed the reference category.
Audit and role are included as covariates to allow direct estimation of effects. A randomised design block, generated by [B1] = ABF = CDE, is included as a covariate to account for its role in the design of the experiment; it is therefore considered a ‘nuisance’ parameter, rather than one of direct interest.
Primary outcome analysis
To identify and screen for potentially active modifications, the six experimental modifications and covariates (audit, design block, role) were included as independent variables in a multivariable linear regression model for the primary outcome.
Effect coding (–1, +1) was used for each modification to ensure that parameter estimates for all modifications and their interactions provide the main effect (rather than simple pairwise effect), that is the effect averaged across all combinations of levels of the other modifications. Parameter estimates are therefore on the same scale, unbiased and represent half the main, two-way and three-way modification interaction effects.
Analysis used a multistage approach. Available complete data were used to identify important modifications and interactions. The resulting model from available complete data was then applied using the primary modified ITT population, with multiply imputed missing data.
Stage 1: model selection using available complete data
We included main effects and two-way interactions of modifications in an ‘initial’ model, alongside key covariates and randomised design factors as follows (Table 10): randomised design block, audit, role, modification and two-way modification interactions.
| df | Model parameters | Imputation model |
|---|---|---|
| Initial model | ||
| 1 | Intercept | ✓ |
| 1 | Randomised design block | ✓ |
| 4 | Audit (MINAP, NCABT, PICANet and TARN vs. NDA) | ✓ |
| 1 | Role (Non-clinical vs. Clinical) | ✓ |
| 6 | Modification main effects (A, B, C, D, E, F) | ✓ |
| 15 | Two-way modification interactions (A*B, A*C, . . .) | ✓ |
| Full model: potential additional interactions (if lack of fit present) | ||
| 24 | Modifications*Audit (A*MINAP, A*NCABT, . . .) | ✓ |
| 6 | Modifications*Role (A*Non-clinical, B*Non-clinical, . . .) | ✓ |
| 4 | Audit*Role (MINAP*Non-clinical, NCABT* Non-clinical, . . .) | ✓ |
| 9 | Three-way modification interactions (A*B*C, A*B*D, . . .) | ✓ |
| 60 | Two-way modification interactions*Audit (A*B*MINAP, A*B*NCABT, . . .) | ✓ |
| 15 | Two-way modification interactions*Role (A*B*Non-clinical, A*C*Non-clinical, . . .) | ✓ |
| 60 | Two-way modification interactions*Audit*Role (A*B*MINAP*Non-clinical, . . .) | |
| 36 | Three-way medication interactions*Audit (A*B*C*MINAP, . . .) | |
| 9 | Three-way modification interactions*Role (A*B*C*Non-clinical, . . .) | |
| 36 | Three-way modification interactions*Audit*Role (A*B*C* MINAP*Non-clinical, . . .) | |
As the experiment included replicated runs, we used the lack-of-fit test to obtain an unbiased, pure error estimate of the error variance and test the hypothesis that our ‘initial’ model was adequate.
Where lack of fit was observed, we used stepwise selection to identify additional important interactions (see Table 10) to include in a ‘full’ model. We used traditional entry and removal selection criteria based on a 15% significance level of the F statistic, reflecting the effect’s contribution to the model fit when it is added or removed, respecting the hierarchy of effects. The consistency of model selection using Akaike information criterion (AIC) and Bayesian information criterion (BIC) was explored.
Using the ‘initial’ or ‘full’ model as applicable, we identified the most important modifications78,91 by ranking the absolute standardised effect sizes of model parameters using Pareto and half-normal plots for each outcome. Based on the principle that a small number of parameters account for a large portion of the effect, Pareto plots provide a tool to separate the few vital factors from the many trivial ones.
A final ‘parsimonious’ model was obtained using backward selection (removal based on 15% significance level of the F statistic, respecting the hierarchy of effects) to simplify the model, while retaining important parameters identified via the Pareto plot, audit and randomised design block.
Type III sums of squares, mean squares and p-values are presented for overall effects and analysis of variance (model and lack of fit) in Results, informing the parameters included in the ‘initial’, ‘full’, and ‘parsimonious’ models.
Stage 2: primary intention-to-treat analysis
Primary analysis was based on the primary modified ITT population, using multiple imputation to account for missing outcome data.
We used the fully conditional specification (FCS), also known as multivariate imputation by chained equations,92,93 predictive mean-matching method of multiple imputation to impute missing data. A single missing data model was used to generate 50 imputations across all missing outcomes, with the following predictors (see Table 10): outcome, audit, role, audit*role interaction and modification (main effects, two- and three-way interactions). Additional interactions between modifications with audit and role were applied where model convergence allowed and included interactions between the modification main effects and two-way interactions, with audit and with role.
The models containing important effects identified via the analysis of available complete data were applied to the primary modified ITT population with multiply imputed missing data. Pareto plots from the ‘initial’ or ‘full’ model, as applicable, were compared to ensure that the appropriate parameters were included in the ‘parsimonious’ model. Where there were differences in the parameters meeting the threshold for inclusion from the analysis of available complete data and the primary modified ITT population, an inclusive approach was taken and parameters included from either analysis were included in the primary ITT ‘parsimonious’ model.
Presented parameter estimates, associated standard errors and p-values were calculated using Rubin’s rules. 94 Predicted plots are presented to illustrate the direction and strength of effect for identified main effects and interactions.
Secondary outcome analysis
The analysis strategy for secondary outcomes followed that of the primary outcome. Summary statistics were used to explore the length of time spent working through and engagement with the audit report by modifications and audit.
Sensitivity analysis
Sensitivity analysis using the available complete data in the secondary modified ITT population explored the consistency of findings across analysis populations for the primary outcome.
Results
Recruitment
A total of 1241 randomisations were carried out across two recruitment phases (see Figure 9): 967 (77.9%) from 10 to 30 April 2019, including the randomisations during the contamination period; and a further 274 (22.1%) from 5 September to 18 October 2019.
The primary modified ITT population comprised 638 (51.4%) randomisations and excluded all 603 (48.6%) from the contamination period (Figure 8 and Table 11, for a detailed breakdown, see Table A.6). A larger proportion of randomisations occurred within the contamination period for the NDA, 380 (65.1%), than for the other NCAs. The secondary modified ITT population comprised 961 (77.4%) randomisations and excluded 280 (22.6%) where the questionnaire was completed in < 20 seconds.
FIGURE 8.
Experiment summary: participant flow.
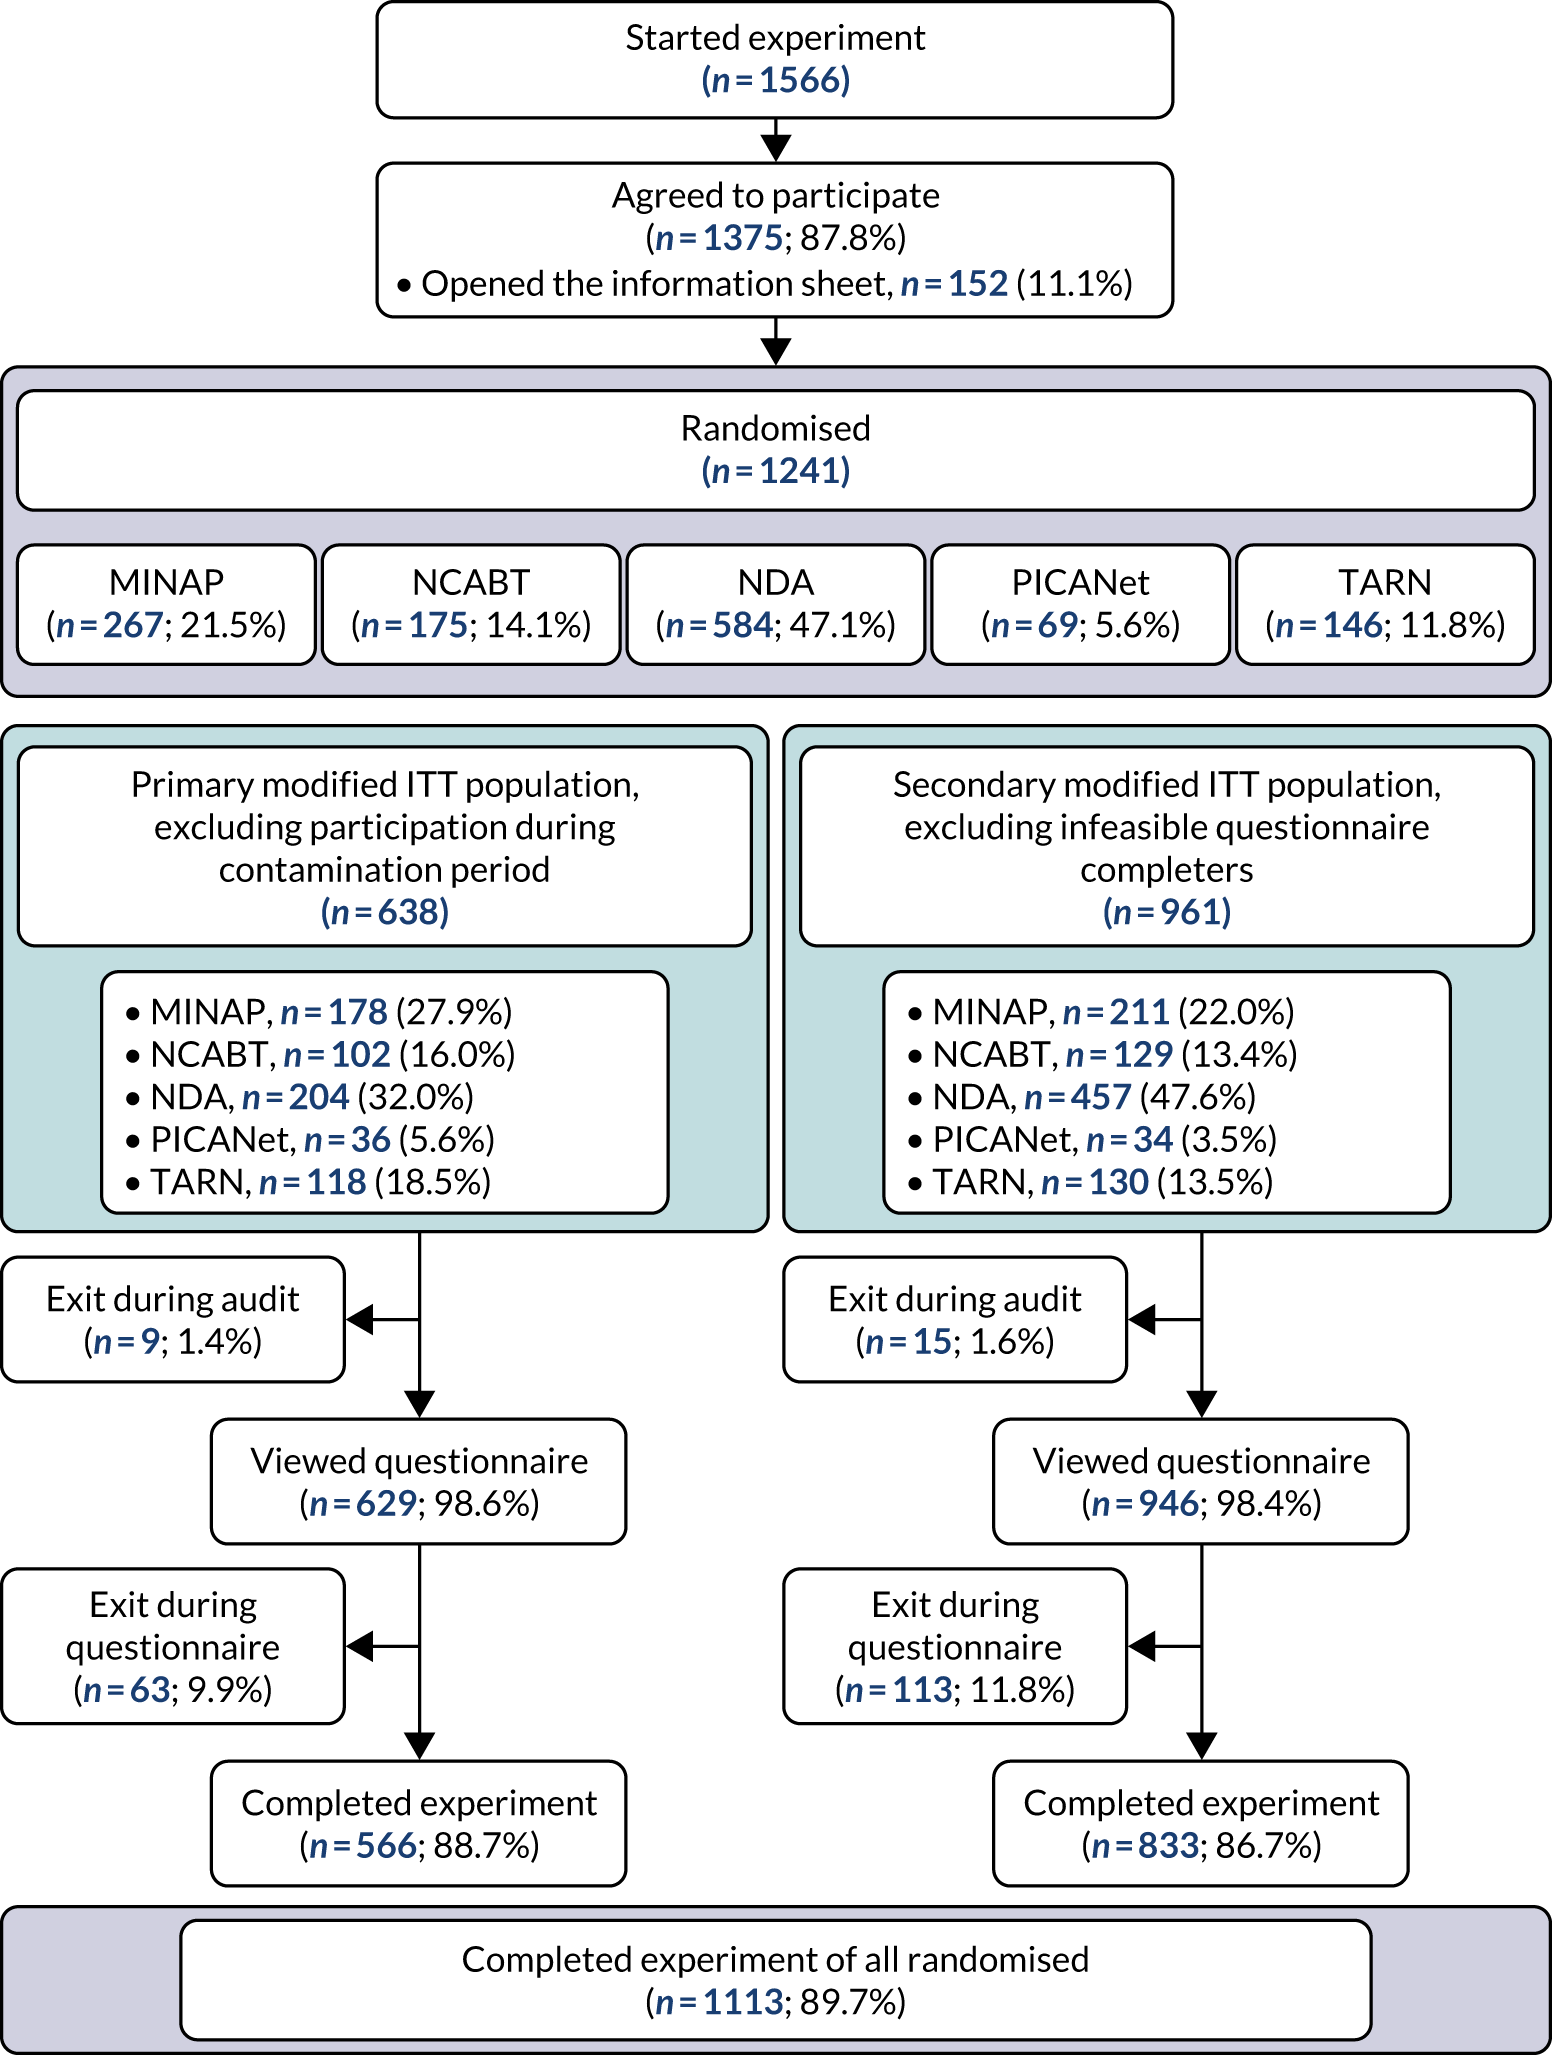
| Participants | Audit, n (%) | Total, n (%) | ||||
|---|---|---|---|---|---|---|
| MINAP | NCABT | NDA | PICANet | TARN | ||
| Participant in primary modified ITT population? | ||||||
| Yes | 178 (66.7) | 102 (58.3) | 204 (34.9) | 36 (52.2) | 118 (80.8) | 638 (51.4) |
| No (recruited during contamination period) | 89 (33.3) | 73 (41.7) | 380 (65.1) | 33 (47.8) | 28 (19.2) | 603 (48.6) |
| Participant in secondary modified ITT population? | ||||||
| Yes | 211 (79.0) | 129 (73.7) | 457 (78.3) | 34 (49.3) | 130 (89.0) | 961 (77.4) |
| No (completed questionnaire in < 20 seconds) | 56 (21.0) | 46 (26.3) | 127 (21.7) | 35 (50.7) | 16 (11.0) | 280 (22.6) |
| Total randomisations | 267 (100) | 175 (100) | 584 (100) | 69 (100) | 146 (100) | 1241 (100) |
Participation across audits in the primary and secondary modified ITT populations comprised, respectively, 204 (32%) and 457 (47.6%) randomisations in the NDA, 178 (27.9%) and 211 (22%) in MINAP, 118 (18.5%) and 130 (13.5%) in TARN, 102 (16%) and 129 (13.4%) in NCABT, and 36 (5.6%) and 34 (5.5%) in PICANet (Figure 9).
FIGURE 9.
Daily and cumulative online experiment recruitment.
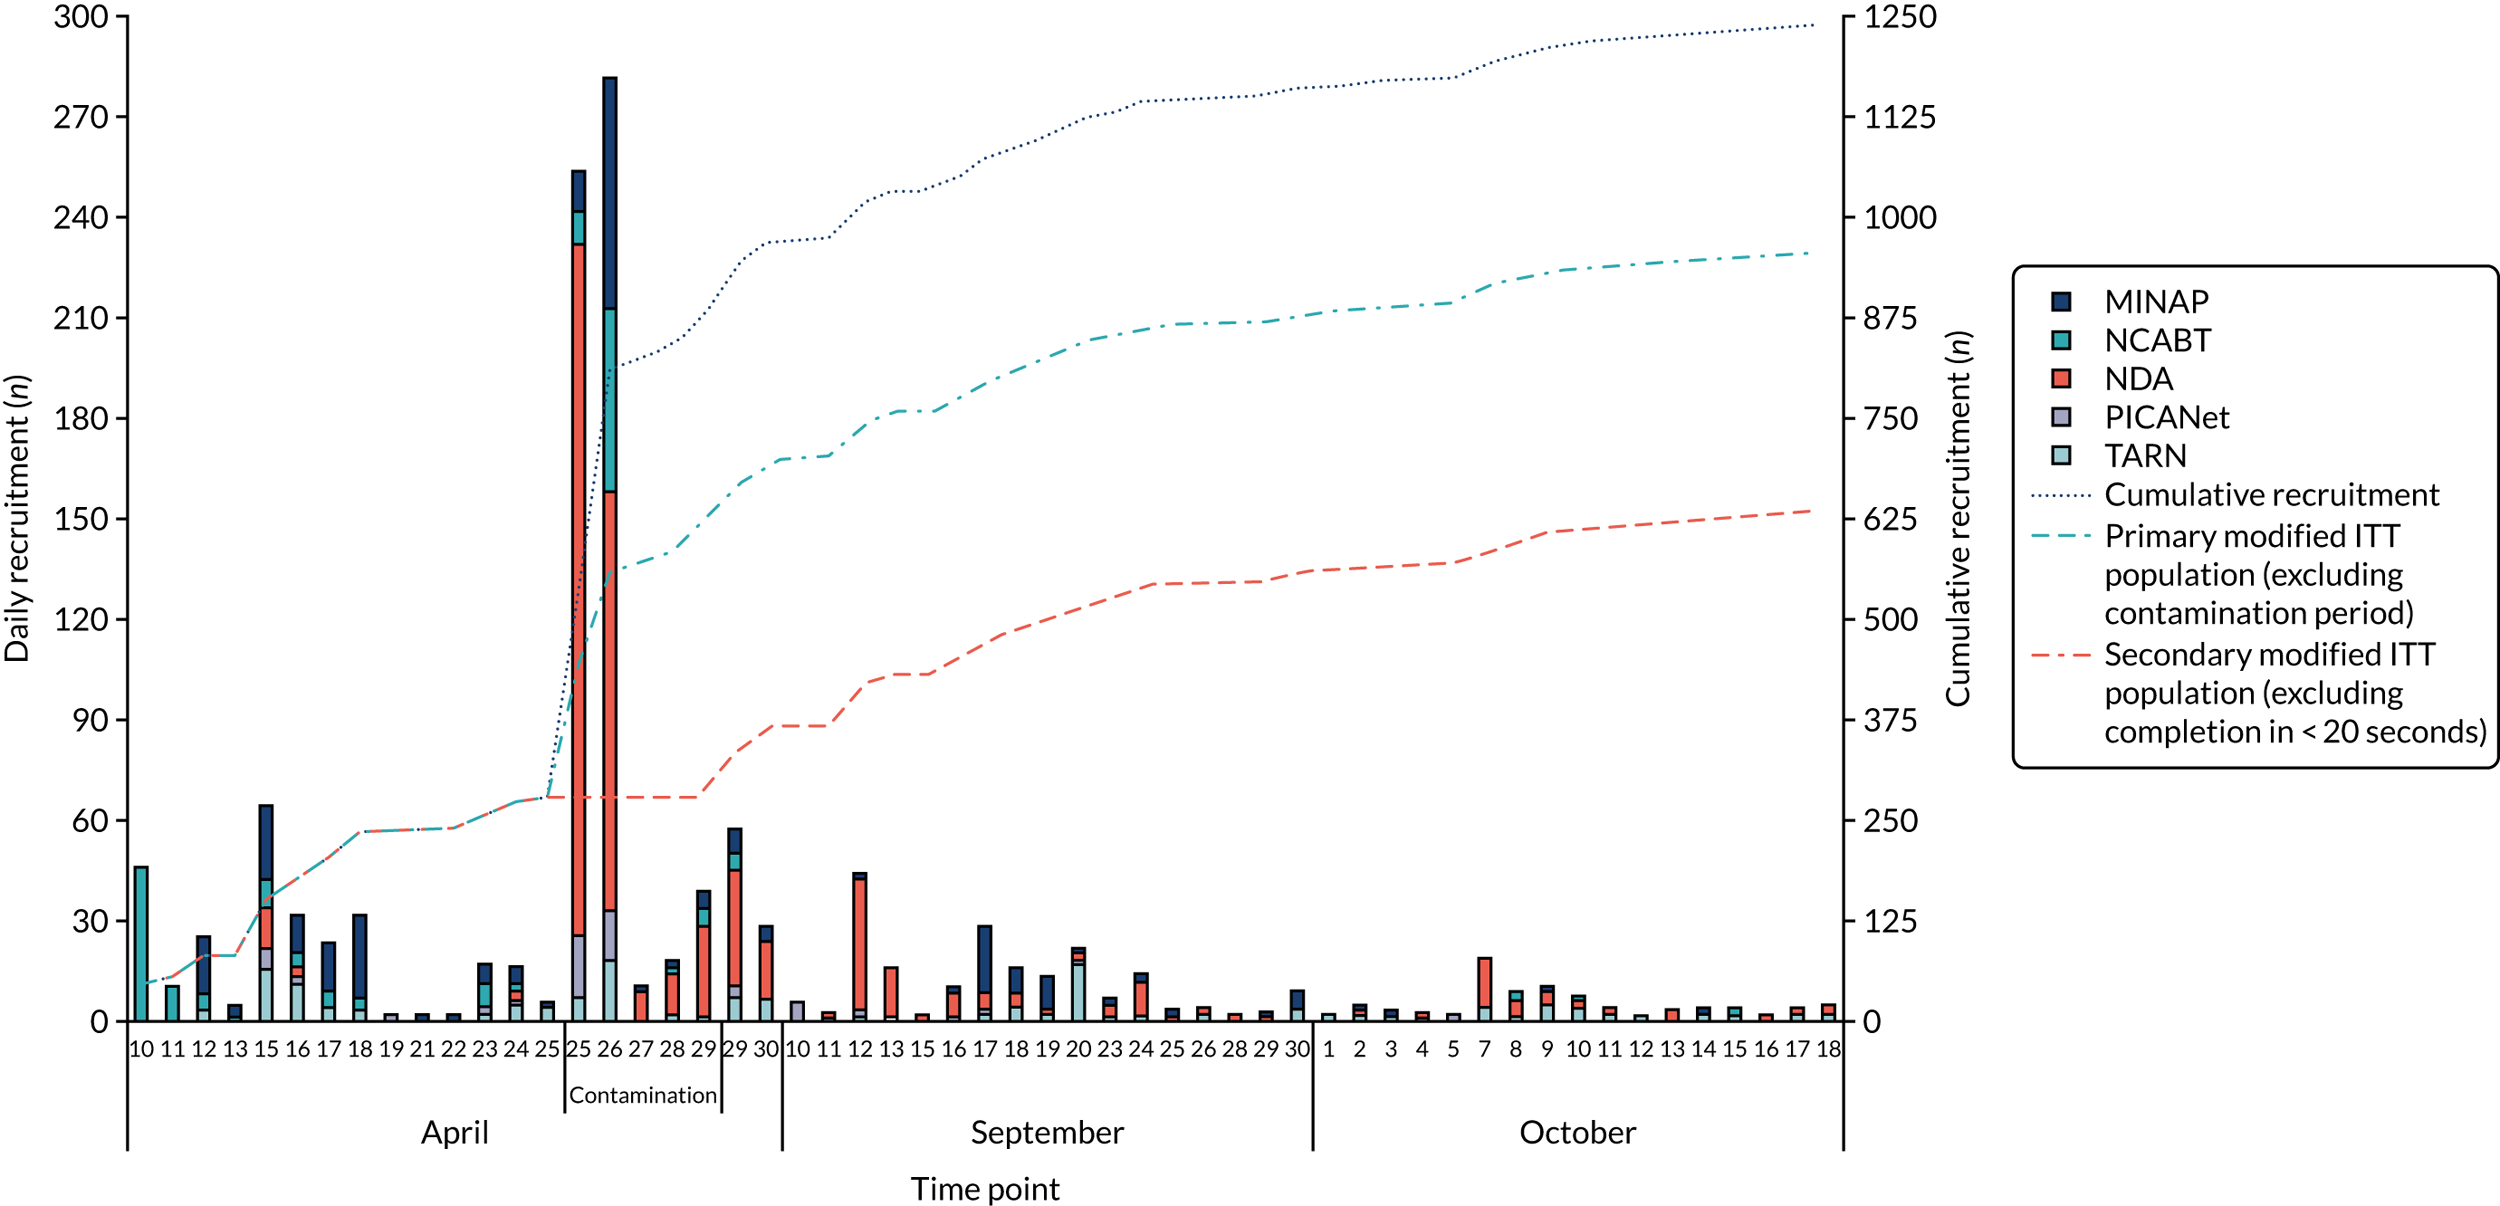
A total of 617 (49.7%) randomisations were included in both the primary and secondary modified ITT populations, and 259 (20.9%) were excluded from both populations (Appendix 5, Table A.5).
Participant characteristics
Primary modified intention-to-treat population
Most participants were from hospital trusts (64.9%) or general practices (29.6%), with < 5% being from commissioning and community health-care trusts (Table 12). Over 90% of participants from MINAP, NCABT, PICANet and TARN were from hospital trusts, whereas almost 90% of participants from the NDA were from a general practice.
| Audit, n (%) | Total (N = 638), n (%) | |||||
|---|---|---|---|---|---|---|
| MINAP (N = 178) | NCABT (N = 102) | NDA (N = 204) | PICANet (N = 36) | TARN (N = 118) | ||
| Organisation | ||||||
| Commissioning | 1 (0.6) | 0 (0.0) | 15 (7.4) | 1 (2.8) | 10 (8.5) | 27 (4.2) |
| Community health-care trust | 3 (1.7) | 2 (2.0) | 1 (0.5) | 1 (2.8) | 1 (0.8) | 8 (1.3) |
| General practice | 4 (2.2) | 1 (1.0) | 183 (89.7) | 1 (2.8) | 0 (0.0) | 189 (29.6) |
| Hospital trust | 170 (95.5) | 99 (97.1) | 5 (2.5) | 33 (91.7) | 107 (90.7) | 414 (64.9) |
| Role | ||||||
| Clinical | 85 (47.8) | 91 (89.2) | 86 (42.2) | 21 (58.3) | 69 (58.5) | 352 (55.2) |
| Allied health professional | 1 (0.6) | 30 (29.4) | 9 (4.4) | 0 (0.0) | 5 (4.2) | 45 (7.1) |
| Nurse or nurse specialist | 62 (34.8) | 59 (57.8) | 39 (19.1) | 3 (8.3) | 6 (5.1) | 169 (26.5) |
| Fully trained doctor | 19 (10.7) | 2 (2.0) | 37 (18.1) | 18 (50.0) | 58 (49.2) | 134 (21.0) |
| Training doctor | 3 (1.7) | 0 (0.0) | 1 (0.5) | 0 (0.0) | 0 (0.0) | 4 (0.6) |
| Manager | 27 (15.2) | 10 (9.8) | 107 (52.5) | 4 (11.1) | 26 (22.0) | 174 (27.3) |
| Audit and administration | 66 (37.1) | 1 (1.0) | 11 (5.4) | 11 (30.6) | 23 (19.5) | 112 (17.6) |
| Responsible for clinical care | ||||||
| Yes | 82 (51.9) | 68 (73.1) | 142 (82.6) | 25 (75.8) | 77 (70.0) | 394 (69.6) |
| Direct clinical care | 28 (17.7) | 2 (2.2) | 39 (22.7) | 10 (30.3) | 12 (10.9) | 91 (16.1) |
| Of organisation or team | 39 (24.7) | 63 (67.7) | 74 (43.0) | 6 (18.2) | 28 (25.5) | 210 (37.1) |
| Both | 15 (9.5) | 3 (3.2) | 29 (16.9) | 9 (27.3) | 37 (33.6) | 93 (16.4) |
| No | 76 (48.1) | 25 (26.9) | 30 (17.4) | 8 (24.2) | 33 (30.0) | 172 (30.4) |
| Missinga | 20 | 9 | 32 | 3 | 8 | 72 |
Over half of the participants reported having a clinical role, 27.3% were managers and 17.6% had an audit- or administration-related role. Almost 70% of participants completing the experiment reported responsibilities for providing clinical care. Almost 90% of participants in NCABT were in a clinical role, compared with around 50% in the MINAP, PICANet and TARN audits and one-third in the NDA.
Over half of participants in the NDA were managers, compared with 22% for TARN and < 15% for MINAP, NCABT and PICANet. Around one-third of participants were in audit and administration roles for the MINAP and PICANet audits, compared with 20% in TARN and < 10% in the NDA and NCABT audits.
Participant characteristics across populations
In the primary modified ITT population, the proportion of participants from hospital trusts (64.9%) was larger and the proportion of participants from general practice (29.6%) smaller than that in either the whole randomisation population (the corresponding figures being 41.3% and 45%, respectively) or the secondary modified ITT population (49.8% and 44.8%, respectively; Appendix 5, Table A.6). This was largely because the contamination period coincided with the distribution of the experiment for the NDA, of which GPs were the main recipients. A similar but less distinct pattern was observed by role, with the proportion of managers in the primary modified ITT population (27.3%) being smaller than that in both the total randomisation population (34.7%) and the secondary modified ITT population (36.2%).
Randomisation
Primary modified intention-to-treat population
A similar number and proportion of participants were randomised to each of the 32 combinations of modifications and, as a result, to each of the modifications (ON or OFF), both within and across audits (Figure 10, Appendix 5 ENACT Experiment Example Tables A.7–8). In the PICANet audit, owing to the small number of participants recruited and exclusions over the contamination period, only 6 of 32 combinations were replicated and there were six combinations with no participants.
FIGURE 10.
Randomly allocated modifications and modification combination by audit: (a) modification combination and (b) modification ON or OFF.
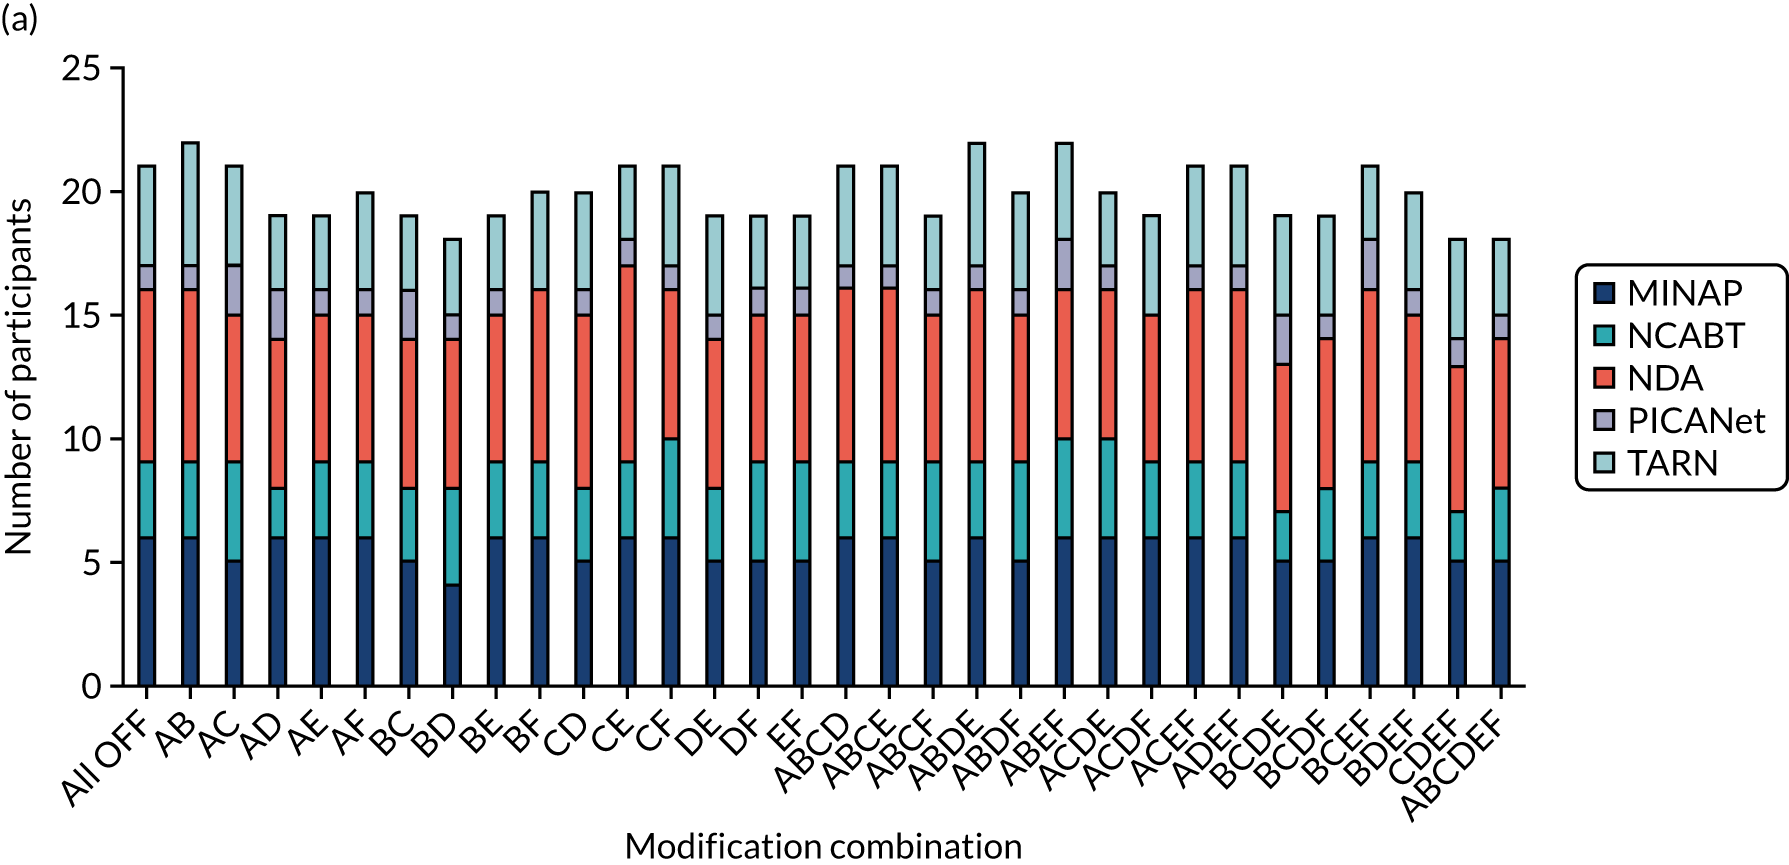
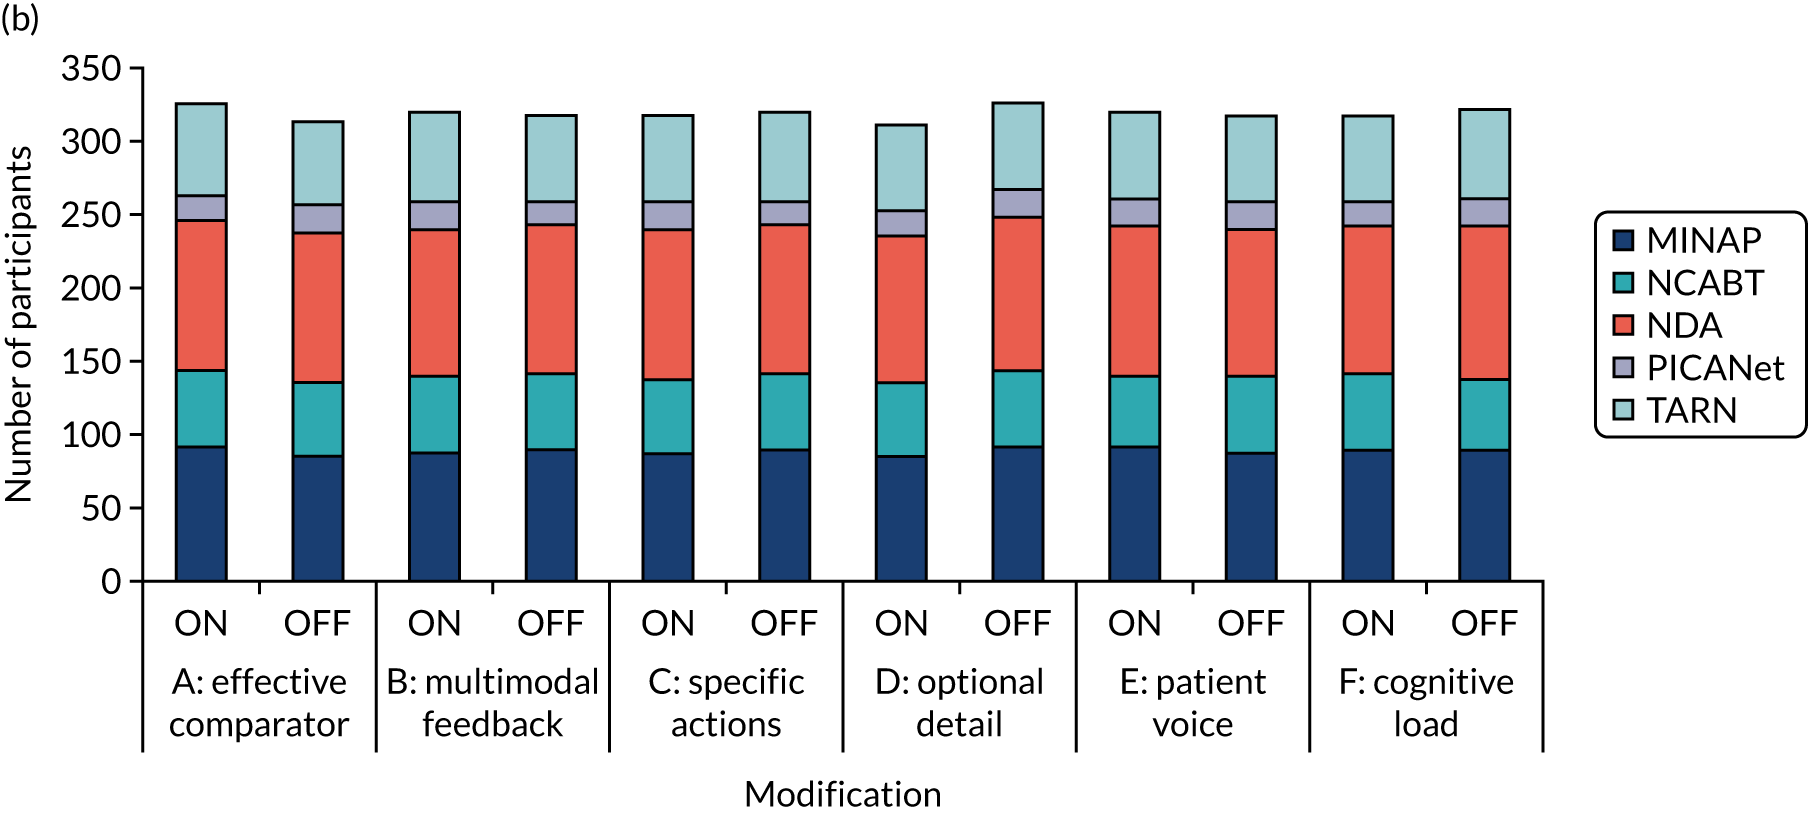
Randomisation across populations
Similar proportions of participants were allocated to each version of modifications and combination of modifications within audits across all populations. There was greater variability in the number of participants allocated to each of the 32 modification combinations within the secondary modified ITT population; however, the proportion of participants with each version of modifications (ON or OFF) was relatively stable across populations (Appendix 5, Tables A.7–8, Figures A.3–4).
Experiment completion
Primary modified intention-to-treat population
The experiment was completed for 566 (88.7%) participants; the majority dropped out when reaching the experiment questionnaire, rather than while viewing the audit report (see Figure 9).
Non-completers (n = 72, 11.3%) constituted a larger proportion of participants than completers in the NDA, in a manager role and in general practice (Table 13). Conversely, completers constituted a larger proportion of participants in the TARN audit, in clinical roles and in a hospital trust. Non-completion rates were similar overall across modifications (ON or OFF), ranging from 9.7% [when multimodal feedback (modification B) was included] to 12.5% [when optional detail (modification D) and patient voice (modification E) were included] (Appendix 5, Table 38 and Figure 35).
| Participant completed experiment | Total (N = 638) | ||
|---|---|---|---|
| Yes (N = 566) | No (N = 72) | ||
| Audit, n (%) | |||
| MINAP | 158 (27.9) | 20 (27.8) | 178 (27.9) |
| NCABT | 93 (16.4) | 9 (12.5) | 102 (16.0) |
| NDA | 172 (30.4) | 32 (44.4) | 204 (32.0) |
| PICANet | 33 (5.8) | 3 (4.2) | 36 (5.6) |
| TARN | 110 (19.4) | 8 (11.1) | 118 (18.5) |
| Role, n (%) | |||
| Allied health professional | 39 (6.9) | 6 (8.3) | 45 (7.1) |
| Nurse or nurse specialist | 156 (27.6) | 13 (18.1) | 169 (26.5) |
| Fully trained doctor | 128 (22.6) | 6 (8.3) | 134 (21.0) |
| Training doctor | 3 (0.5) | 1 (1.4) | 4 (0.6) |
| Manager | 141 (24.9) | 33 (45.8) | 174 (27.3) |
| Audit and administration | 99 (17.5) | 13 (18.1) | 112 (17.6) |
| Organisation, n (%) | |||
| Commissioning | 24 (4.2) | 3 (4.2) | 27 (4.2) |
| Community health care trust | 5 (0.9) | 3 (4.2) | 8 (1.3) |
| General practice | 160 (28.3) | 29 (40.3) | 189 (29.6) |
| Hospital trust | 377 (66.6) | 37 (51.4) | 414 (64.9) |
| Time on audit report (seconds) | |||
| N | 566 | 63 | 629 |
| Missing, n | 0 | 9 | 9 |
| Median (range) | 68.5 (0.5–6762.0) | 45.0 (2.5–70,512.0) | 66.5 (0.5–70,512.0) |
| IQR | 33.0–138.5 | 23.5–110.5 | 31.0–136.0 |
| Number of clicks on audit report | |||
| N | 566 | 63 | 629 |
| Missing, n | 0 | 9 | 9 |
| Mean (SD) | 2.3 (5.34) | 1.8 (1.50) | 2.2 (5.09) |
| Median (range) | 1.0 (1.0–99.0) | 1.0 (1.0–8.0) | 1.0 (1.0–99.0) |
| IQR | 1.0–2.0 | 1.0–2.0 | 1.0–2.0 |
| Time on questionnaire (seconds)a | |||
| N | 566 | – | 566 |
| Missing, n | 72 | – | 72 |
| Median (range) | 159.0 | – | 159.0 |
| IQR | 97.5–255.5 | – | 97.5–255.5 |
| > 20 seconds on questionnaire, n (%) | |||
| Yes | 545 (96.3) | – | 545 (96.3) |
| No | 21 (3.7) | – | 21 (3.7) |
Participants spent a median of 66.5 (IQR 31–136) seconds on the audit report and 159 (IQR 97.5–255.5) seconds completing the questionnaire. Participants who dropped out during the questionnaire spent a median of 45 (IQR 24–111) seconds on the audit report, compared with 69 (IQR 33–139) seconds in the case of those completing the experiment. Participants in the NDA spent the least amount of time on the audit report and questionnaire compared with other audits (Appendix 4, Tables 31 and 32).
Experiment completion across populations
A similar distribution of characteristics and completion rates across modifications was observed for each population (Appendix 4, Tables 31 and 32, and Appendix 5, Tables 37 and 38).
Outcomes
Primary modified intention-to-treat population
The distribution of participants’ responses was variable across the outcomes; however, a negative skew, due to a ceiling effect for higher levels of agreement, is present across all outcomes (Figures 11 and 12). A greater skew with higher levels of agreement can be seen for the ‘want to ensure’ component of the primary intention outcome, for the proximal intention outcome to bring the audit report to the attention of colleagues, comprehension and user experience.
FIGURE 11.
Distribution of primary intention outcome components.
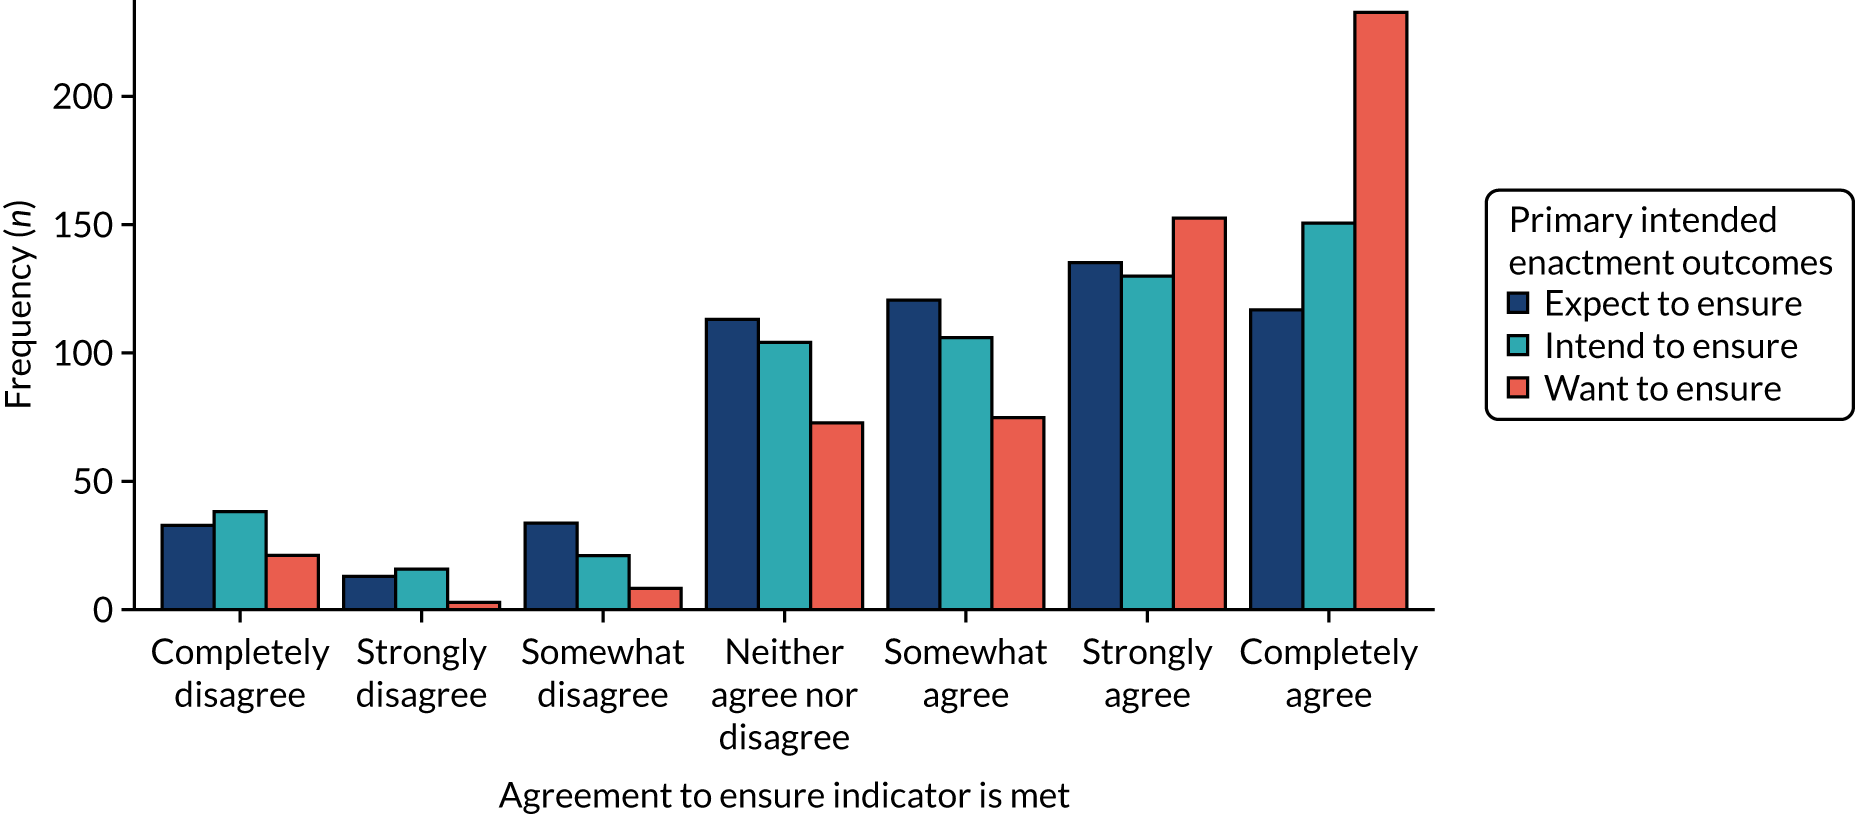
FIGURE 12.
Distribution of secondary outcomes on a scale of –3, completely disagree, to +3, completely agree: (a) attention; (b) goals; (c) action plan; (d) review performance; (e) comprehension; and (f) user experience.
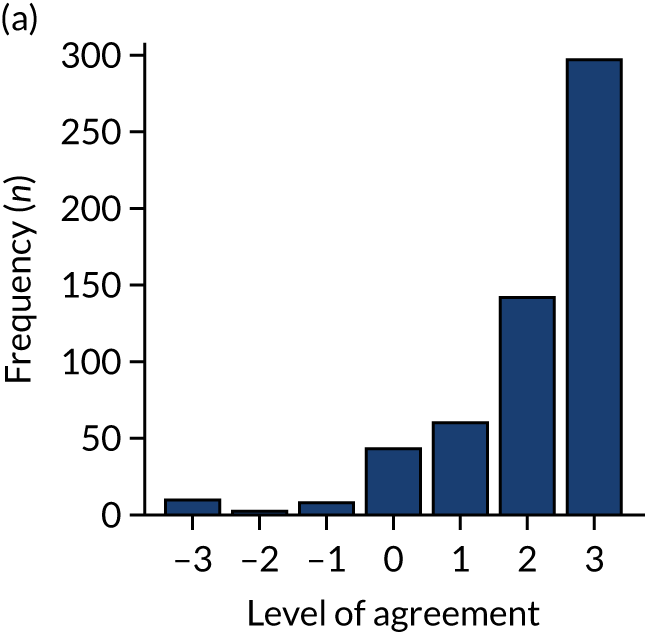
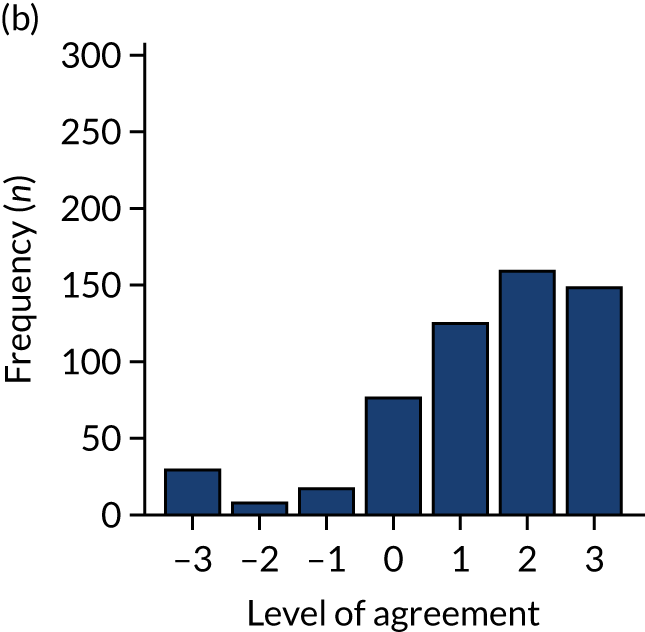
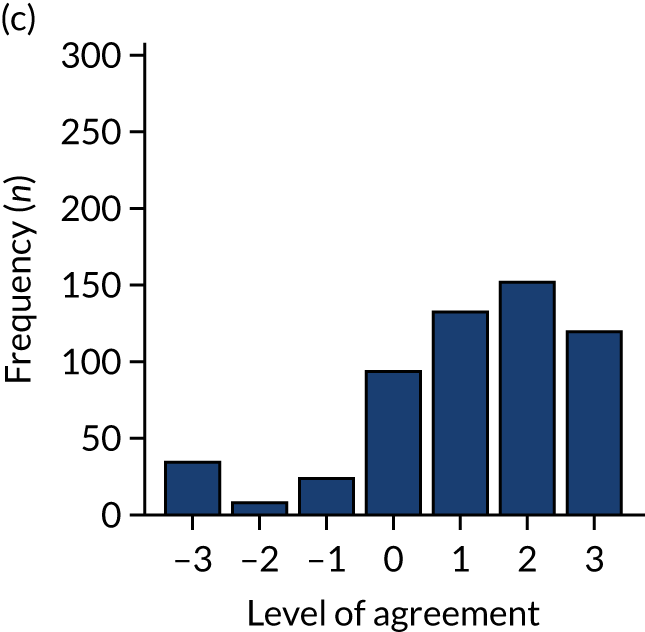
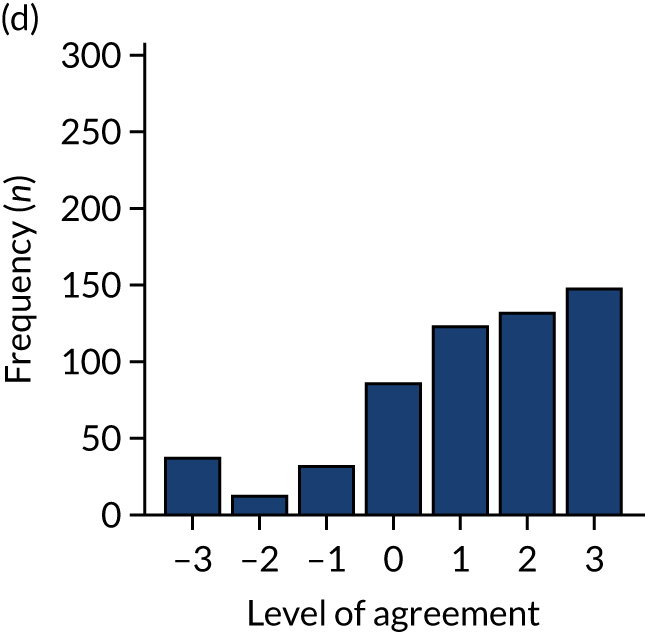
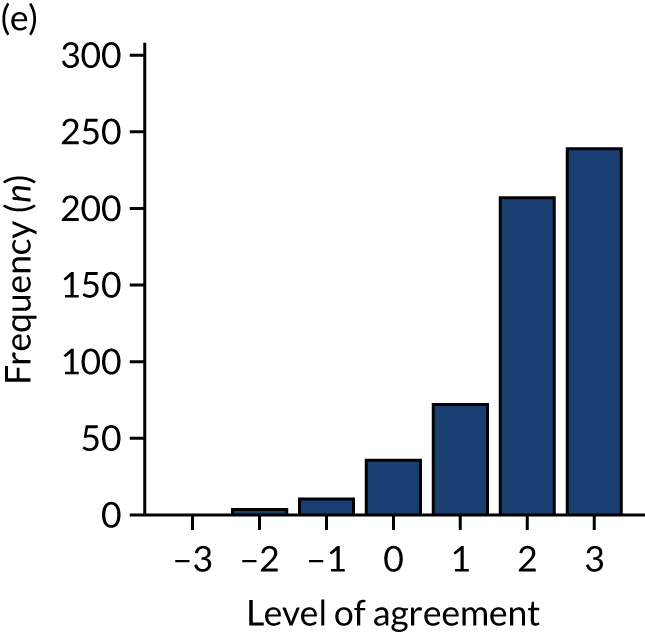
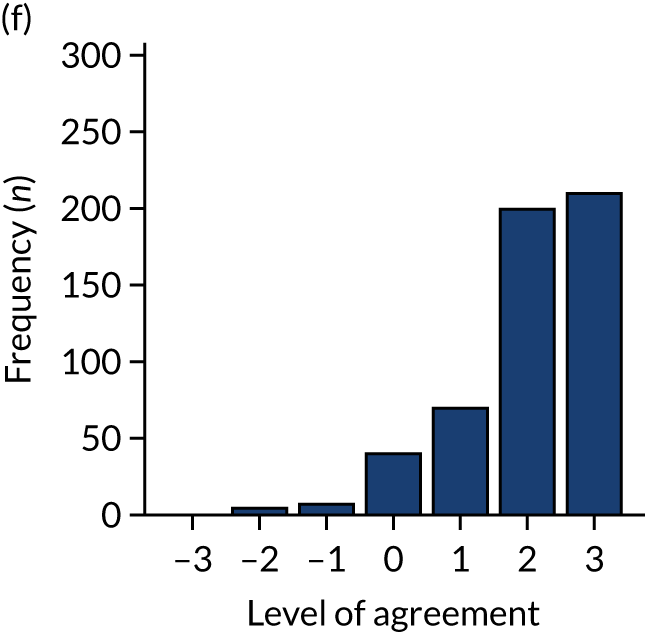
Responses for two user experience components, ‘information met needs’ and ‘report easy to use’, were fairly consistent, with a Cronbach’s alpha of 0.85 and correlation of 0.75, suggesting that there was adequate internal consistency and reliability across the components (Appendix 5, Figure 34).
Primary outcome
Responses for three primary components, ‘I intend’, ‘I want’ and ‘I expect’, were fairly consistent across all participants, with higher intention observed for ‘I want’ and a more uniform distribution of responses across the neutral and agreement end of the scale for ‘I intend’ and ‘I expect’ to ensure that the audit standard is met (see Figure 11). The Cronbach’s alpha value, 0.85, and pairwise correlation coefficients suggest that there was adequate internal consistency and reliability across the components (Figure 13).
FIGURE 13.
Internal consistency of primary outcome components. α, Cronbach’s alpha; r, pairwise Pearson correlation coefficient.
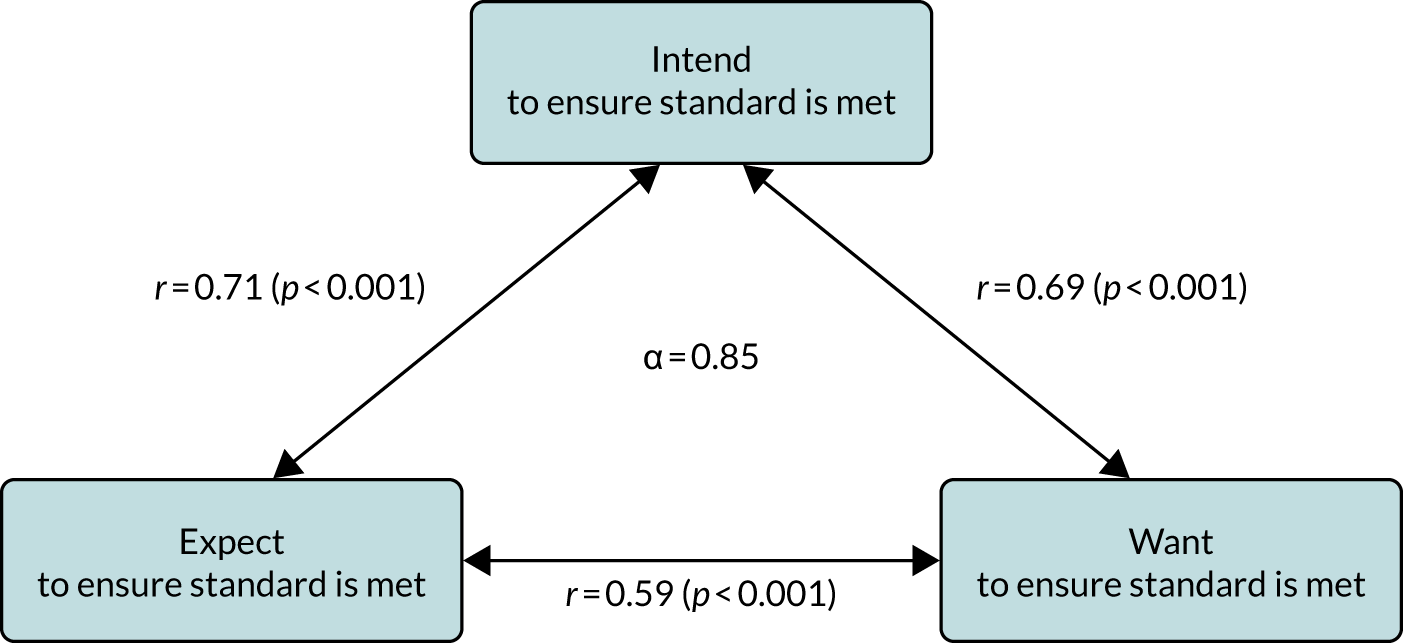
The distribution of the primary outcome (combined on a scale of –3, completely disagree, to +3, completely agree) by audit shows variability in responses across the audits, with a more similar distribution across NDA, TARN and MINAP, albeit with the greatest intention observed in MINAP (Table 14 and Figure 14). There were fewer participants reporting the highest levels of agreement in the NCABT audit and, owing to the low number of respondents from PICANet, the distribution is relatively sparse.
| N | Missing | Mean (SD) | Median (IQR) | |
|---|---|---|---|---|
| Audit | ||||
| MINAP | 158 | 20 | 1.4 (1.59) | 2.0 (0.3–2.7) |
| NCABT | 93 | 9 | 0.9 (1.31) | 1.0 (0.0–2.0) |
| NDA | 172 | 32 | 1.3 (1.30) | 1.7 (0.3–2.0) |
| PICANet | 33 | 3 | 1.6 (1.68) | 2.0 (1.0–2.7) |
| TARN | 110 | 8 | 1.5 (1.28) | 1.8 (0.7–2.3) |
| Total | 566 | 72 | 1.3 (1.41) | 1.7 (0.3–2.3) |
| Role | ||||
| Clinical | 326 | 26 | 1.6 (1.29) | 2.0 (1.0–2.3) |
| Manager | 141 | 33 | 1.1 (1.28) | 1.0 (0.0–2.0) |
| Audit and administration | 99 | 13 | 0.9 (1.77) | 1.0 (0.0–2.0) |
| Organisation | ||||
| Commissioning | 24 | 3 | 1.3 (1.62) | 1.5 (1.0–2.3) |
| Community health-care trust | 5 | 3 | 2.5 (0.77) | 3.0 (2.0–3.0) |
| General practice | 160 | 29 | 1.4 (1.24) | 1.7 (0.3–2.0) |
| Hospital trust | 377 | 37 | 1.3 (1.47) | 1.7 (0.3–2.3) |
| Responsible for clinical care | ||||
| Missing | 0 | 72 | ||
| Yes | 394 | 0 | 1.6 (1.15) | 2.0 (1.0–2.3) |
| No | 172 | 0 | 0.6 (1.68) | 0.7 (0.0–2.0) |
| Effective comparators (modification A) | ||||
| ON | 292 | 33 | 1.3 (1.41) | 1.7 (0.3–2.3) |
| OFF | 274 | 39 | 1.4 (1.42) | 2.0 (0.3–2.3) |
| Multimodal feedback (modification B) | ||||
| ON | 289 | 31 | 1.2 (1.51) | 1.7 (0.3–2.3) |
| OFF | 277 | 41 | 1.4 (1.31) | 1.7 (0.7–2.3) |
| Specific actions (modification C) | ||||
| ON | 284 | 34 | 1.4 (1.37) | 1.7 (0.7–2.3) |
| OFF | 282 | 38 | 1.2 (1.45) | 1.7 (0.3–2.0) |
| Optional detail (modification D) | ||||
| ON | 273 | 39 | 1.4 (1.39) | 1.7 (0.7–2.3) |
| OFF | 293 | 33 | 1.2 (1.43) | 1.3 (0.3–2.3) |
| Patient voice (modification E) | ||||
| ON | 280 | 40 | 1.4 (1.30) | 1.7 (0.3–2.3) |
| OFF | 286 | 32 | 1.3 (1.51) | 1.7 (0.3–2.3) |
| Cognitive load (modification F) | ||||
| ON | 278 | 39 | 1.3 (1.41) | 1.7 (0.3–2.3) |
| OFF | 288 | 33 | 1.3 (1.42) | 1.7 (0.3–2.3) |
| Number of modifications ON | ||||
| 0 | 18 | 3 | 1.1 (1.46) | 1.3 (0.3–2.0) |
| 2 | 264 | 32 | 1.3 (1.45) | 1.7 (0.3–2.3) |
| 4 | 268 | 35 | 1.4 (1.37) | 1.7 (0.7–2.3) |
| 6 | 16 | 2 | 1.3 (1.48) | 1.8 (0.2–2.3) |
FIGURE 14.
Distribution of the primary outcome by audit and role: (a) MINAP; (b) NCABT; (c) NDA; (d) PICANet; (e) TARN; (f) clinical; (g) manager; and (h) audit and administration.
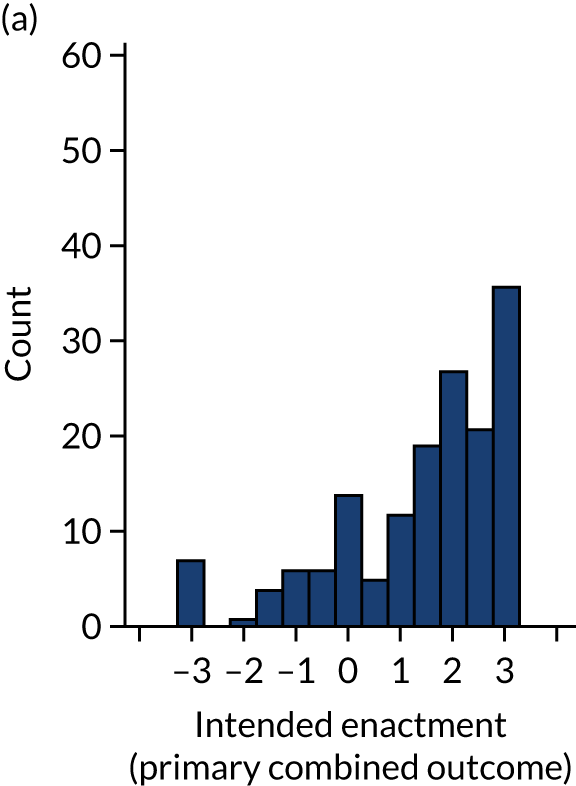
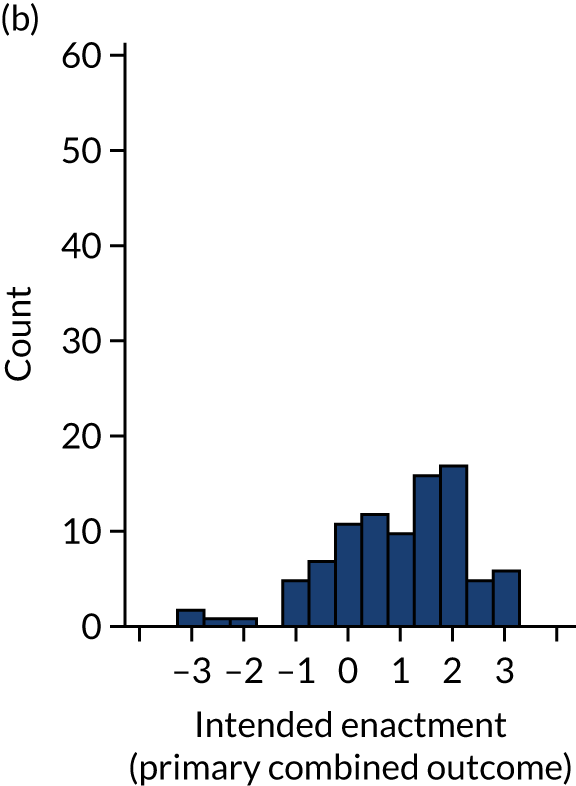
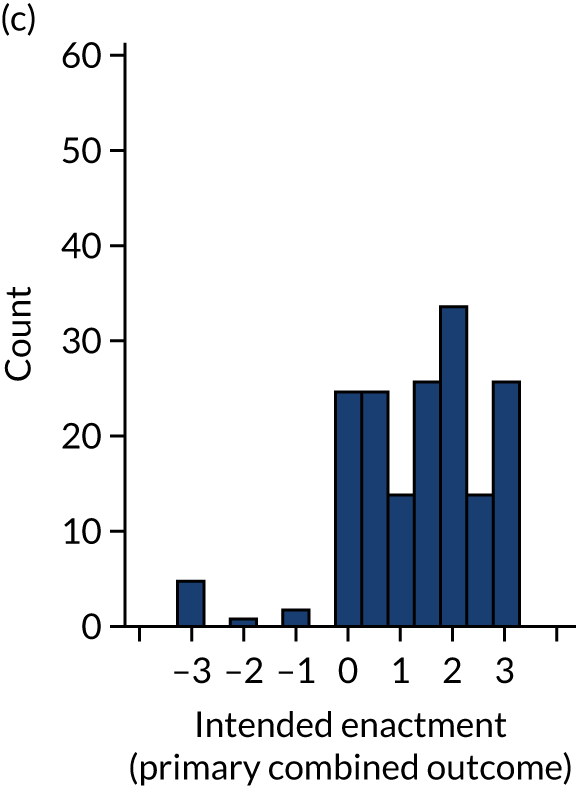
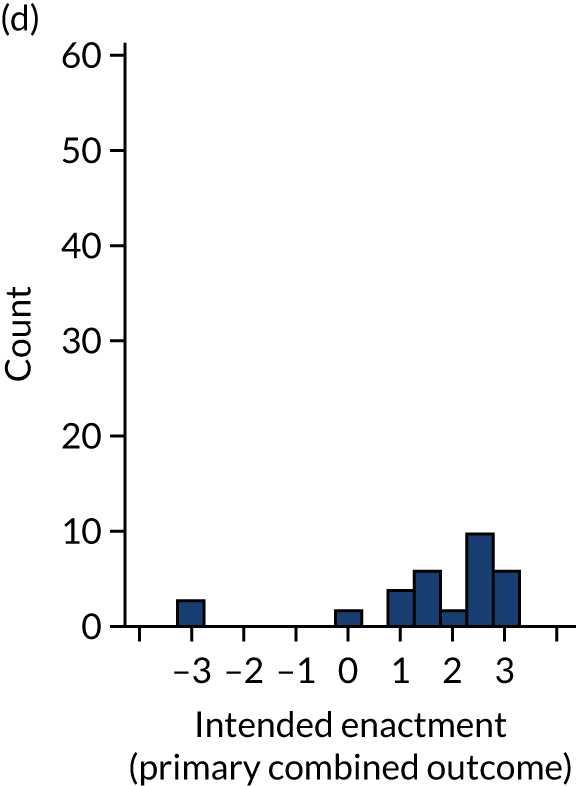
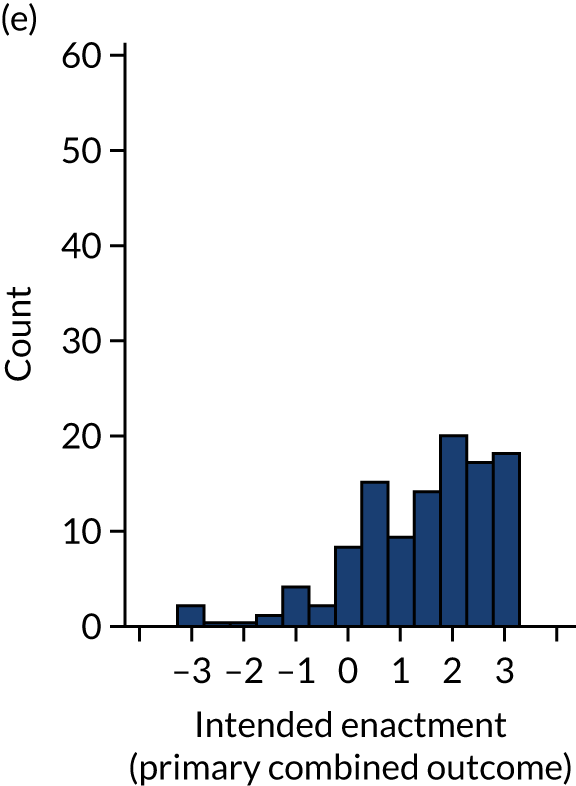
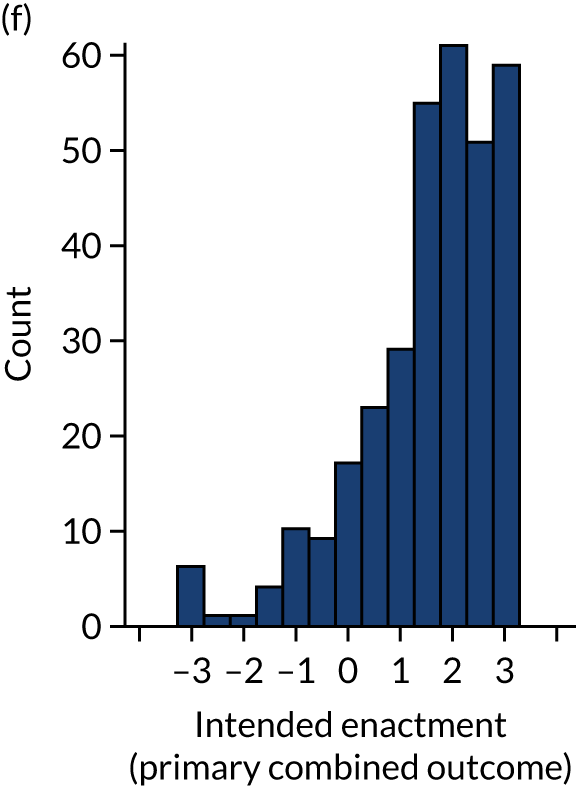
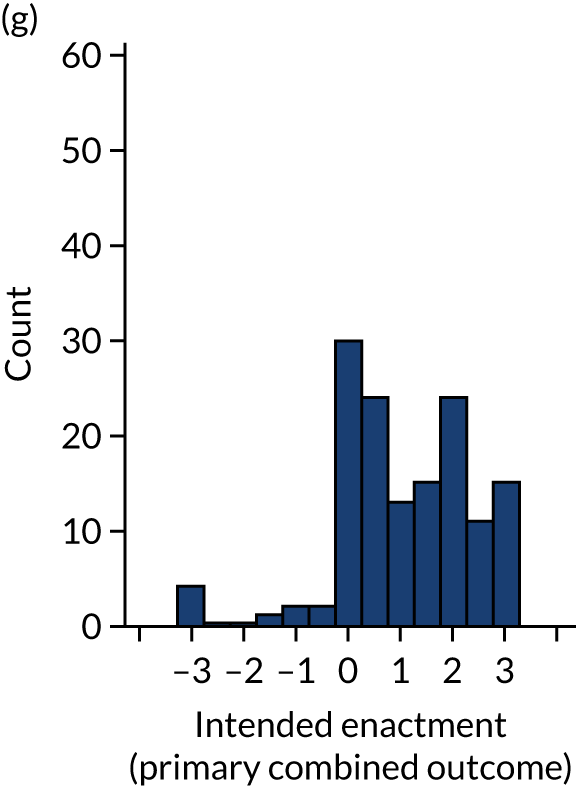
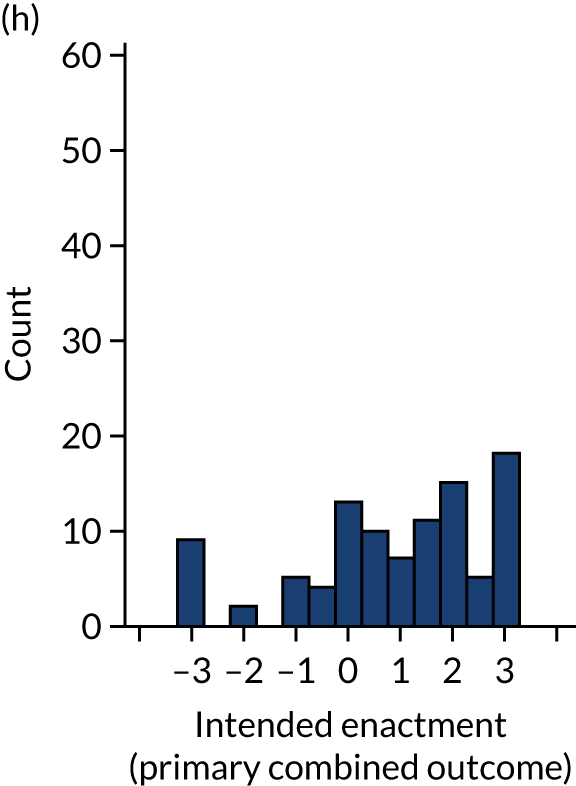
Clinical participants reported higher levels of intention than non-clinical participants in manager or audit and administration roles (see Table 14 and Figure 14).
The distribution of the primary outcome varied across the versions of the modifications (Figure 15; see also Table 14). The greatest differences in the median level of intention were observed for the modifications ‘effective comparators’ (modification A, with lower median intention when a more specific comparator was used) and ‘optional detail’ (modification D, with higher intention when optional details were provided).
FIGURE 15.
Box plot of the primary intention outcome by modifications, indicating the mean (+), median, upper and lower quartiles (25th/75th percentiles), minimum and maximum values [most extreme value within 1.5 (IQR) of the 25th/75th percentile] and outliers (*).
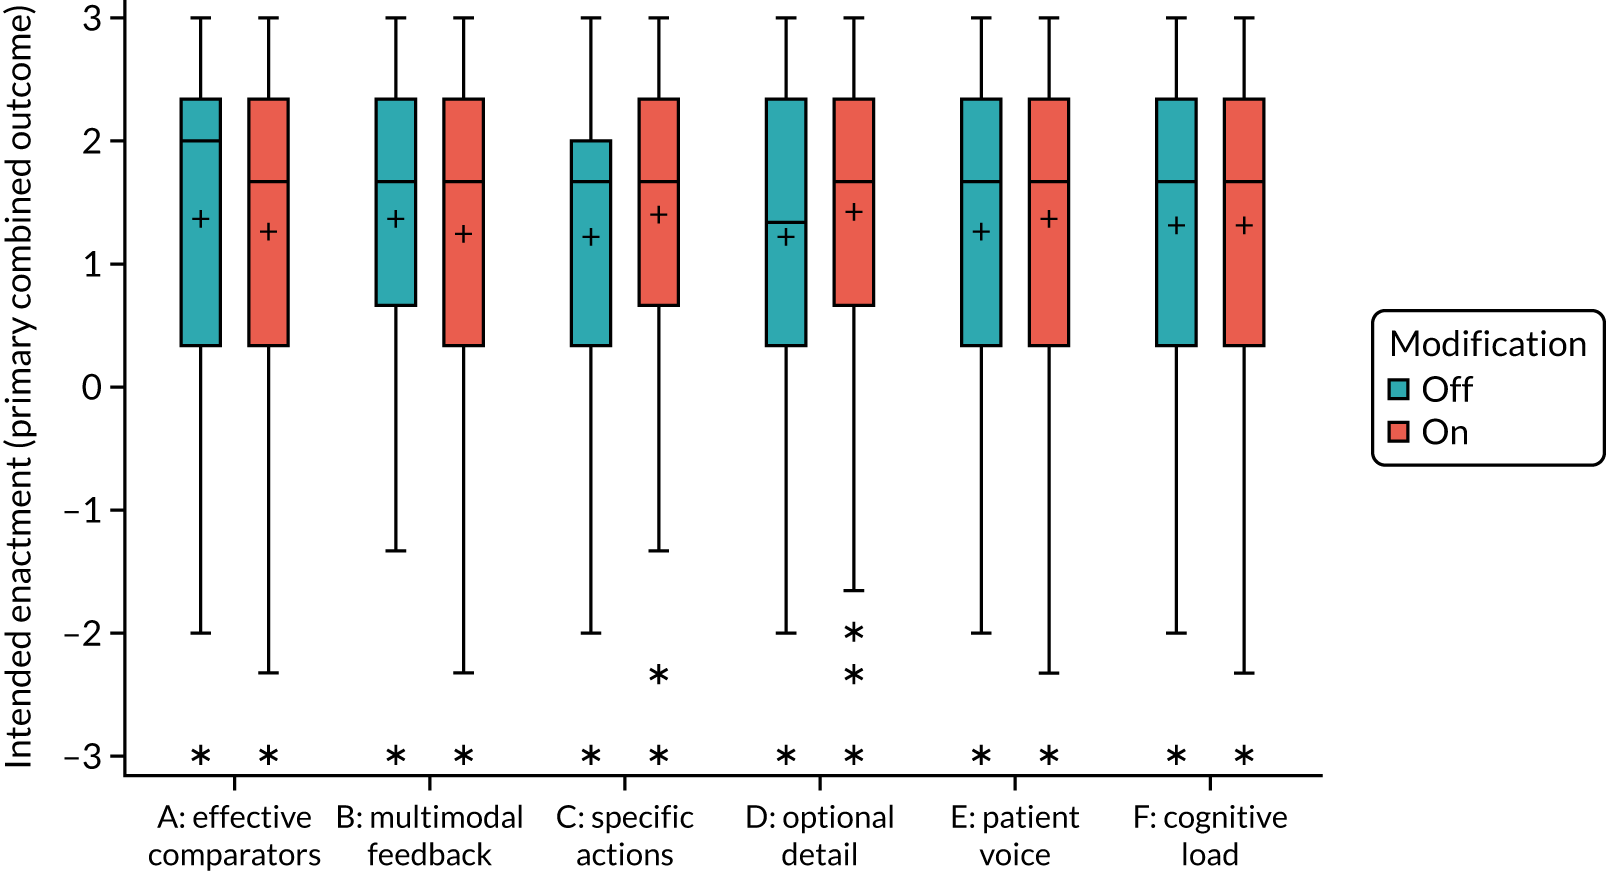
Primary outcome across populations
Across the populations, responses for the primary outcome were more uniform for the primary modified ITT population, with slightly increased skew in the secondary modified ITT population, and a clear peak of responses indicating complete agreement within the ‘all participants’ group (Appendix 5, Figure 36). Further details of the primary outcome across populations by audit and role are included in the sensitivity analysis in Appendix 7, Figure 47.
Primary intention-to-treat analysis: model selection
Full details of model building based on available complete data and applied within the primary modified ITT population are available in Appendix 6.
Residual diagnostic plots (Appendix 6, Figure 46) indicated that, given the nature of the questionnaire scales, residuals across models based on available complete data were sufficiently normally distributed and homoscedastic with respect to fitted values to retain continuous outcomes.
Pareto plots presenting the relative magnitude and direction of standardised effects for parameters in the ‘full’ model are provided for the primary outcome and primary modified ITT population in Figure 16 and in Appendix 6, Figure 37, using the complete available data. No modifications were found to have an independent overall effect on the primary outcome intended enactment (see Figure 16); however, important interactions were identified across modifications and according to role. Audit and role had the greatest dominant influence on intention, followed by the interaction between multimodal feedback and optional detail (B*D) (see Figure 16). Less of a distinction was observed between subsequent effects with the greatest influence. These included some evidence for an effect according to multimodal feedback dependent on role (B*Role); dependent effects of effective comparators, multimodal feedback, and patient voice (A*B*E); optional detail and specific actions, both dependent on cognitive load (D*F, C*F); and only very limited evidence for an effect according to optional detail dependent on role (D*Role).
FIGURE 16.
Primary outcome: Pareto plot of standardised effects (full model).
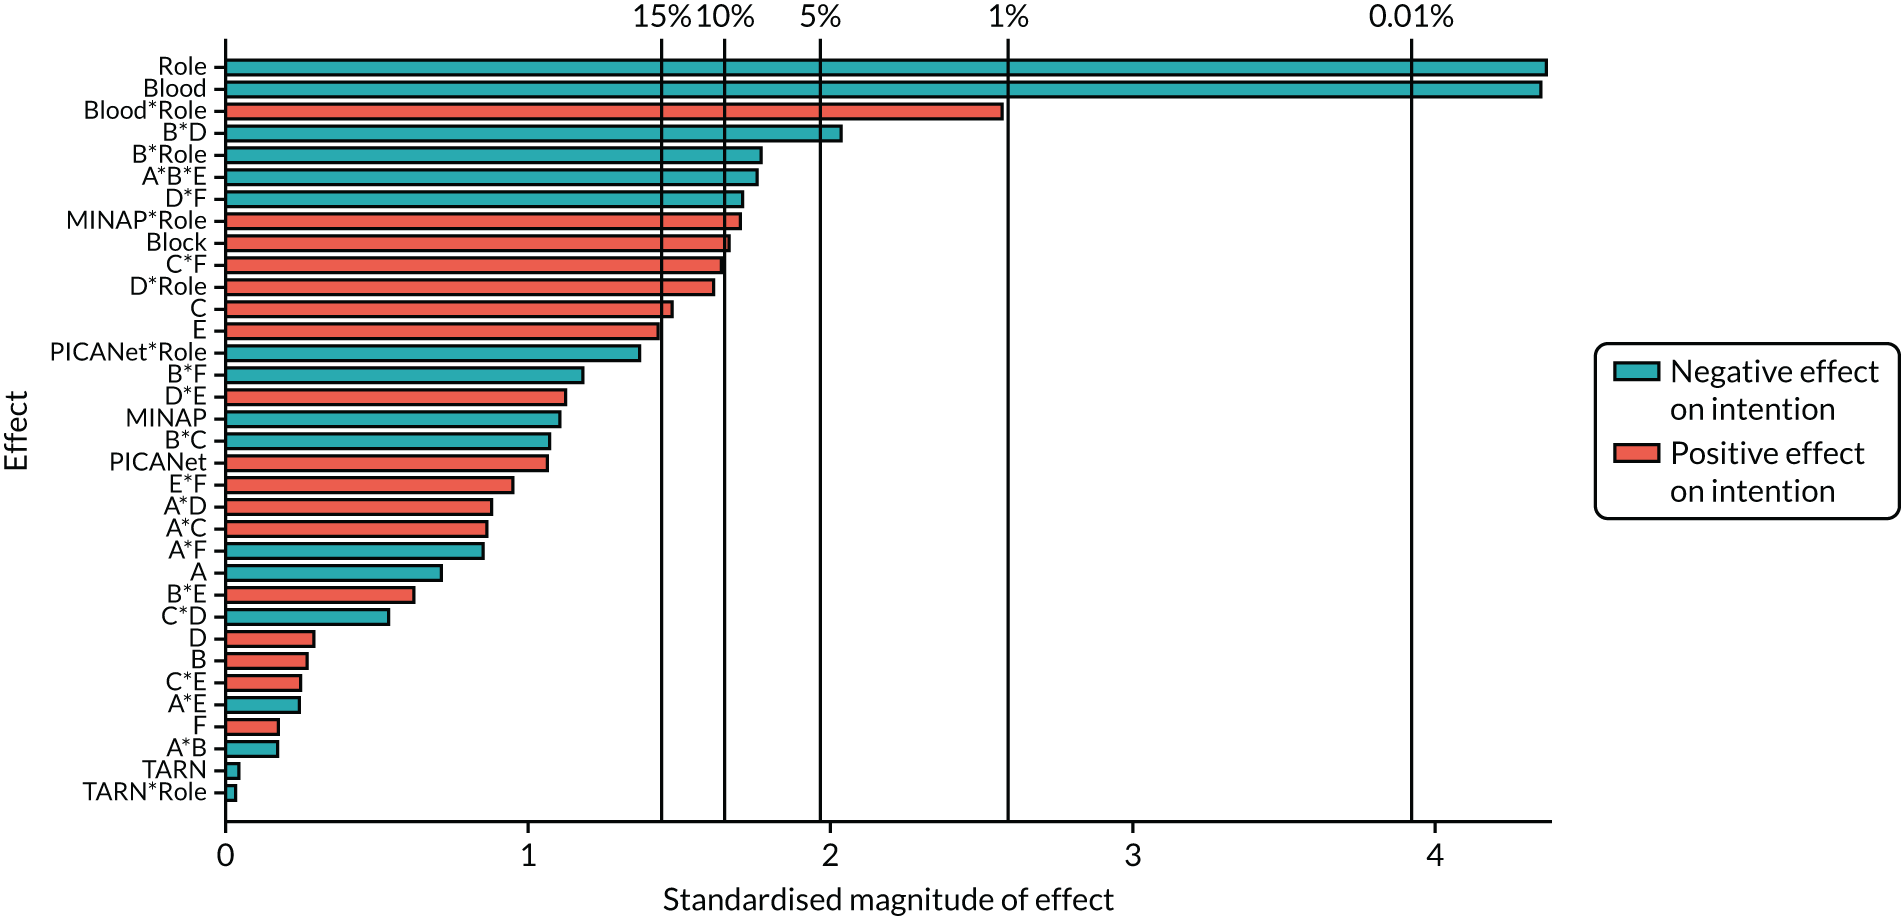
Pareto plots and details of model building for secondary outcomes are available in Appendix 6 (Figure 40 and Tables 41–52).
Primary intention-to-treat analysis: model effects
Interpretation of effects
Parameter estimates of effects retained in the final ‘parsimonious’ models for each outcome using the primary modified ITT population are presented in Table 15, alongside their associated p-value. The columns identify important detected effects for each outcome, and rows identify consistent effects identified across outcomes. Blank cells represent parameters not included in the final ‘parsimonious’ model, having been screened out during model building (no evidence of effect, p > 0.15), supported by the Pareto plots.
| Parameter | Primary outcome: intended enactment, estimate (p-value) | Proximal intention, estimate (p-value) | Comprehension, estimate (p-value) | User experience, estimate (p-value) | |||
|---|---|---|---|---|---|---|---|
| Attention | Goals | Action plan | Review performance | ||||
| Initial model | |||||||
| Intercept | 1.829 (< 0.001) | 1.812 (< 0.001) | 1.738 (< 0.001) | 1.608 (< .001) | 1.335 (< 0.001) | 2.011 (< 0.001) | 1.87 (< 0.001) |
| Block | 0.09 (0.107) | –0.082 (0.12) | 0.026 (0.681) | –0.017 (0.799) | –0.093 (0.176) | –0.036 (0.39) | –0.042 (0.31) |
| Audit (vs. NDA) | |||||||
| MINAP | –0.211 (0.317) | 0.521 (< 0.001) | –0.445 (0.069) | –0.482 (0.049) | 0.089 (0.607) | 0.14 (0.203) | 0.09 (0.407) |
| NCABT | –0.893 (< 0.001) | 0.253 (0.115) | –0.638 (0.006) | –0.603 (0.011) | –0.565 (0.008) | 0.135 (0.292) | 0.118 (0.356) |
| PICANet | 0.361 (0.27) | 0.755 (0.002) | 0.164 (0.657) | –0.263 (0.491) | 0.186 (0.548) | 0.312 (0.11) | 0.247 (0.206) |
| TARN | –0.003 (0.989) | 0.304 (0.05) | 0.005 (0.984) | –0.275 (0.291) | 0.246 (0.208) | 0.022 (0.858) | 0.014 (0.908) |
| Nonclinical (vs. Clinical) | –0.867 (<0.001) | –0.489 (0.03) | –0.571 (0.015) | –0.29 (0.043) | |||
| A: effective comparator | –0.038 (0.498) | 0.015 (0.778) | 0.082 (0.19) | –0.018 (0.837) | –0.019 (0.784) | –0.091 (0.029) | –0.087 (0.036) |
| B: multimodal feedback | 0.018 (0.807) | 0.016 (0.766) | –0.061 (0.575) | –0.064 (0.313) | –0.052 (0.436) | 0.054 (0.198) | 0.048 (0.251) |
| C: specific actions | 0.082 (0.141) | –0.044 (0.4) | 0.065 (0.285) | 0.075 (0.24) | 0.118 (0.075) | 0.017 (0.679) | |
| D: optional detail | 0.017 (0.816) | 0.050 (0.415) | 0.051 (0.434) | 0.093 (0.174) | 0.022 (0.603) | 0.056 (0.176) | |
| E: patient voice | 0.078 (0.161) | 0.059 (0.343) | 0.064 (0.327) | 0.088 (0.201) | –0.057 (0.172) | ||
| F: cognitive load | 0.008 (0.89) | 0.126 (0.016) | 0.049 (0.656) | 0.044 (0.708) | 0.042 (0.533) | 0.103 (0.014) | |
| A*B | –0.011 (0.844) | 0.083 (0.111) | 0.081 (0.19) | 0.073 (0.256) | 0.115 (0.089) | ||
| A*C | –0.041 (0.5) | –0.08 (0.21) | |||||
| A*D | 0.069 (0.266) | 0.095 (0.132) | 0.078 (0.068) | 0.085 (0.043) | |||
| A*E | –0.014 (0.798) | –0.046 (0.458) | –0.044 (0.496) | –0.096 (0.153) | |||
| A*F | –0.025 (0.696) | –0.032 (0.616) | |||||
| B*C | –0.078 (0.138) | ||||||
| B*D | –0.112 (0.047) | –0.114 (0.067) | –0.114 (0.008) | –0.115 (0.006) | |||
| B*E | 0.035 (0.537) | 0.013 (0.832) | 0.026 (0.69) | ||||
| B*F | 0.087 (0.089) | 0.057 (0.607) | –0.119 (0.085) | ||||
| C*D | –0.107 (0.099) | –0.119 (0.078) | |||||
| C*E | 0.066 (0.116) | ||||||
| C*F | 0.093 (0.09) | 0.059 (0.338) | 0.05 (0.438) | ||||
| D*E | 0.045 (0.469) | 0.085 (0.039) | |||||
| D*F | –0.093 (0.089) | –0.123 (0.065) | –0.073 (0.079) | ||||
| E*F | –0.008 (0.894) | ||||||
| Additional interactions | |||||||
| A*B*E | –0.101 (0.072) | –0.121 (0.053) | –0.137 (0.033) | ||||
| A*C*F | 0.099 (0.109) | 0.159 (0.015) | |||||
| A*D*E | 0.096 (0.136) | ||||||
| A*E*F | –0.092 (0.132) | ||||||
| Non-Clinical*MINAP | 0.453 (0.117) | 0.721 (0.03) | 0.695 (0.04) | ||||
| Non-Clinical*NCABT | 1.312 (0.011) | 0.817 (0.146) | 0.829 (0.16) | ||||
| Non-Clinical*PICA | –0.783 (0.141) | –1.360 (0.021) | –0.708 (0.248) | ||||
| Non-Clinical*TARN | –0.017 (0.959) | –0.310 (.406) | –0.135 (0.728) | ||||
| A*Non-Clinical | 0.185 (0.16) | ||||||
| B*Non-Clinical | –0.196 (0.083) | ||||||
| D*Non-Clinical | 0.195 (0.087) | ||||||
| B*NCABT | 0.218 (0.247) | ||||||
| B*MINAP | –0.101 (0.526) | ||||||
| B*PICANet | 0.607 (0.035) | ||||||
| B*TARN | –0.052 (0.775) | ||||||
| F*NCABT | –0.135 (0.477) | 0.038 (0.846) | |||||
| F*MINAP | –0.094 (0.561) | –0.022 (0.894) | |||||
| F*PICANet | –0.08 (0.782) | –0.461 (0.132) | |||||
| F*TARN | 0.357 (0.049) | 0.407 (0.033) | |||||
| B*F*NCABT | –0.17 (0.372) | ||||||
| B *F*MINAP | –0.4 (0.013) | ||||||
| B *F*PICANet | 0.569 (0.046) | ||||||
| B *F*TARN | –0.036 (0.84) | ||||||
| Parameter estimates | p-value | ||||||
|
p < 0.001 | p < 0.05 | p < 0.1 | ||||
Parameter estimates are all on the same scale and relative to the outcomes (intention, comprehension, user experience) on a scale of –3, ‘completely disagree’, to +3, ‘completely agree’.
The model intercept represents the overall predicted mean outcome in the NDA and clinical recipient reference groups, averaged across all possible combinations of modifications.
Parameter estimates for audit and role represent the deviation from the predicted mean outcome for the alternative audit and non-clinical recipients. Positive estimates represent an improvement in outcome compared with the reference NDA and clinical recipients, whereas a negative parameter estimate represents a detrimental effect on outcome.
Positive parameter estimates for the main effect of each modification represent an improvement in outcome when the modification is ON (+1) and a negative effect on outcome when the modification is OFF (–1). Conversely, negative parameter estimates represent a negative effect on outcome when the modification is ON (+1) and an improvement in outcome when the modification is OFF (–1).
Parameter estimates for interactions between modifications represent the additional deviation from the predicted mean outcome. When the interaction effect is positive, the interaction is synergistic and the effect of two modifications together is greater than the sum of their separate main effects; this scenario suggests improved outcomes if modifications are applied in synergy as they reinforce each other’s effects. When the interaction effect is negative, the interaction is antagonistic and the effect of the modifications together is less than the sum of their separate main effects; in this scenario, the modifications tend to limit or reverse each other’s effects, depending on the magnitude of the interaction relative to the main effects.
Owing to the complexity of interaction effects, predicted plots are presented for all identified effects.
Primary outcome
No modifications were found to have an independent effect on intended enactment (see Table 15). Audit and role had the greatest influence on intention, followed by a role-dependent interaction between multimodal feedback and optional detail (see Figure 16).
Intended enactment was lower in non-clinical participants than in clinical participants (–0.867, p < 0.001) in the NDA, with similar effects observed within MINAP, PICANet and TARN. This effect was not observed within NCABT, as intention was lower in clinical NCABT participants than in clinical participants in the NDA (–0.893, p < .001) and other audits (see Figure 18).
There was good evidence of an antagonistic interaction between multimodal feedback and optional detail (B*D, –0.112; p = 0.047); intention was reduced when both multimodal feedback and optional detail were applied (or not) in synergy, and improved when only one or the other was applied (see Figure 21). In non-clinical participants there was some evidence of a negative effect of multimodal feedback (B*Non-clinical, –0.196; p = 0.083), and a positive effect of optional detail (D*Non-clinical, 0.195; p = 0.087), with intention optimised when multimodal feedback was excluded and optional detail provided.
Predicted intended enactment of all 64 possible combinations of modifications ordered according to predicted intended enactment in clinical recipients is presented in Figure 17. As no interaction was detected between audit and modifications, the relative magnitude of effects of modification combinations is consistent across audits and predicted intended enactment is presented for the reference NDA only. Owing to interactions between participants’ role with multimodal feedback (B*Role) and optional detail (D*Role), the order of modification combinations differs for clinical (see Figure 17) and non-clinical recipients (Appendix 6, Figure 38).
FIGURE 17.
Predicted intended enactment for modification combinations ordered by recipients: (a) clinical; and (b) non-clinical.
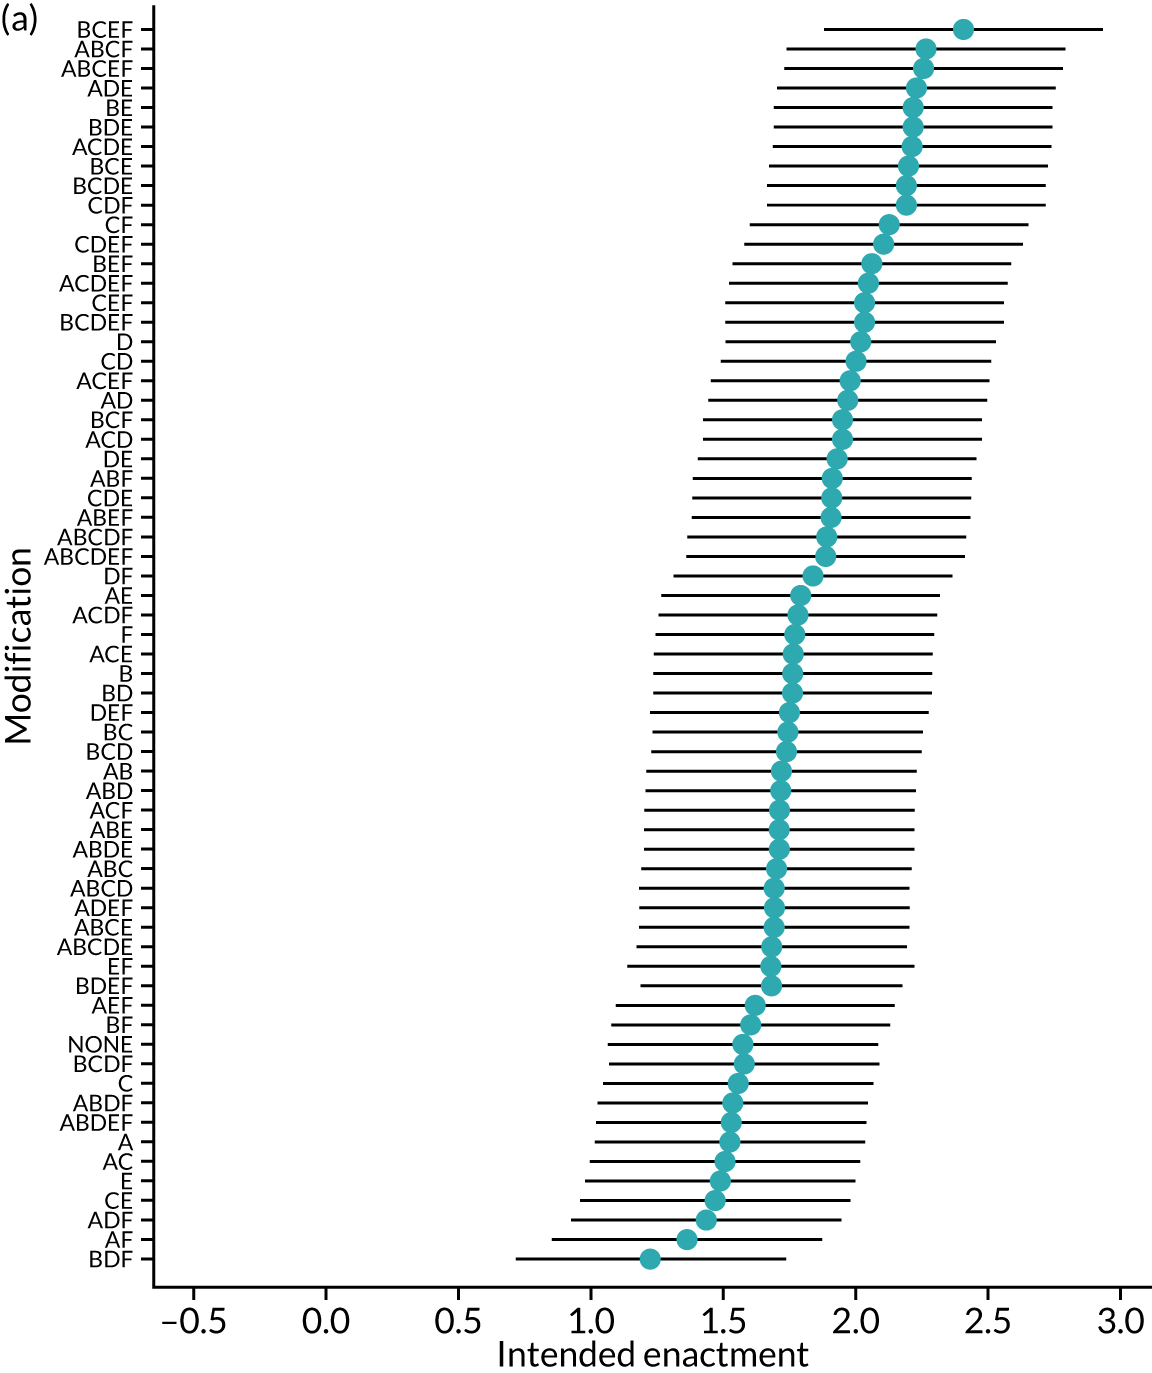
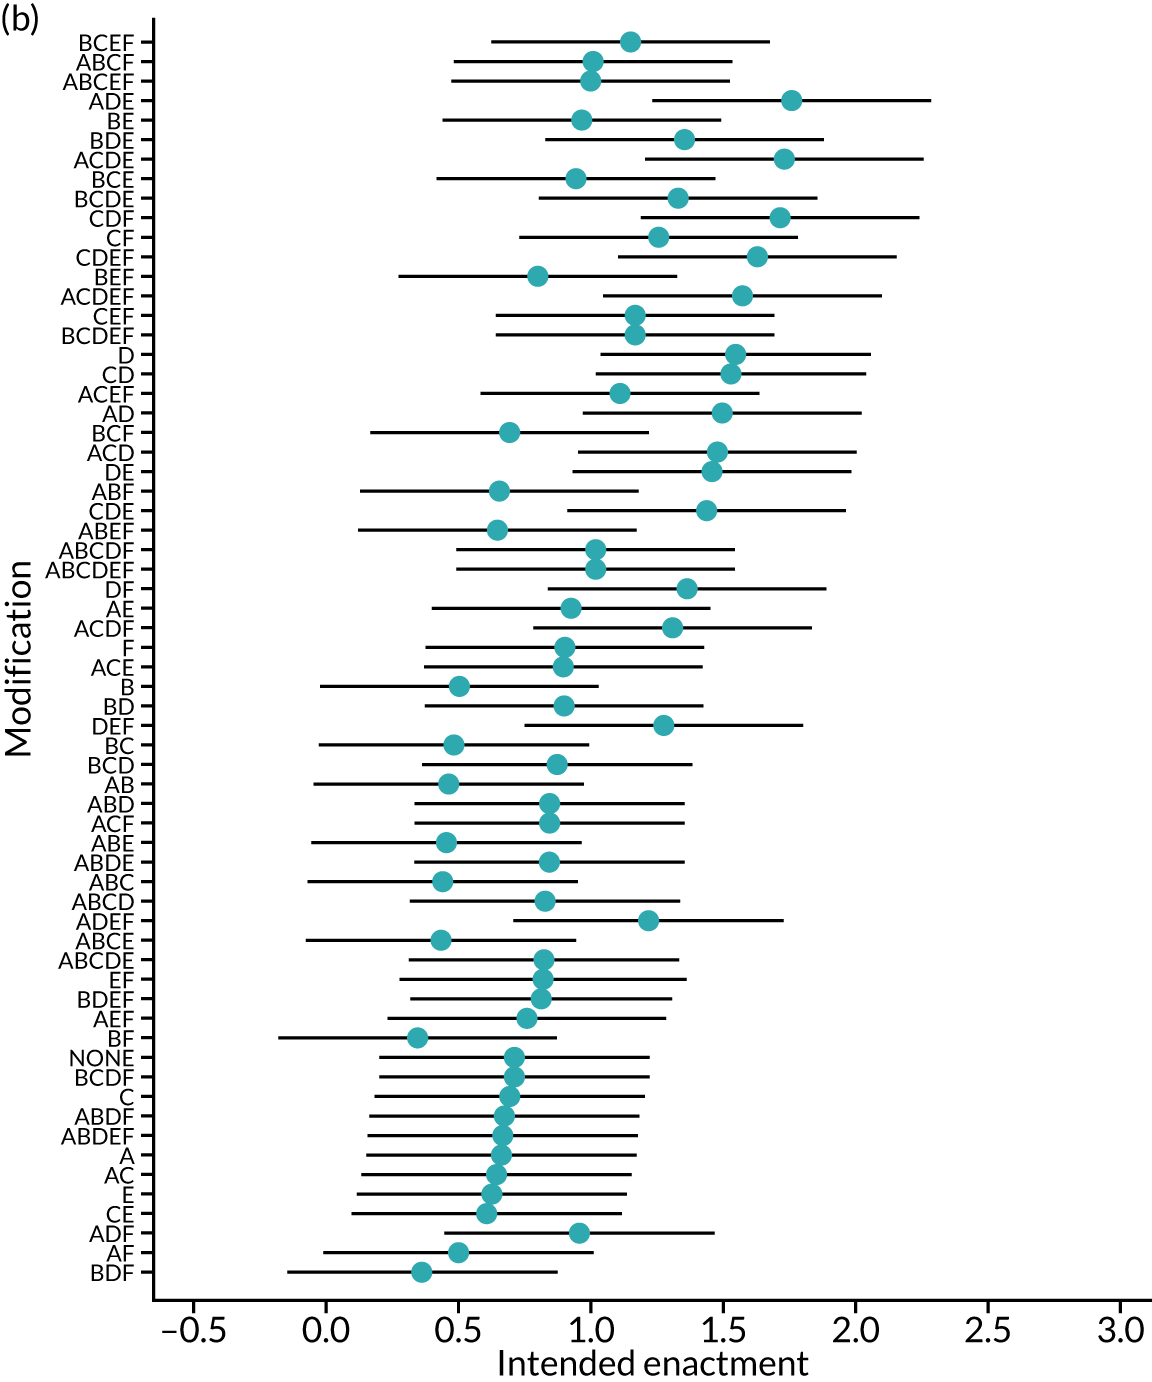
The most effective modification combination in clinical recipients was multimodal feedback, specific actions, patient voice and reduced extraneous cognitive load (BDEF), with predicted intended enactment of 2.40 (95% CI 1.88 to 2.93) in the NDA (Table 16). However, including multimodal feedback while reducing extraneous cognitive load also resulted in the least effective combination of modifications when optional detail was provided (BDF), with predicted intended enactment of 1.22 (95% CI 0.72 to 1.72).
| Clinical | Non-clinical | |||
|---|---|---|---|---|
| Least predicted intention (95% CI) | Highest predicted intention (95% CI) | Least predicted intention (95% CI) | Highest predicted intention (95% CI) | |
| Modifications | BDF | BCEF | BF | ADE |
| A: effective comparator | ✗ | ✗ | ✗ | ✓ |
| B: multimodal feedback | ✓ | ✓ | ✓ | ✗ |
| C: specific actions | ✗ | ✓ | ✗ | ✗ |
| D: optional detail | ✓ | ✗ | ✗ | ✓ |
| E: patient voice | ✗ | ✓ | ✗ | ✓ |
| F: cognitive load | ✓ | ✓ | ✓ | ✗ |
| Audit | ||||
| MINAP | 1.01 (0.49 to 1.53) | 2.19 (1.67 to 2.72) | 0.58 (0.06 to 1.10) | 1.99 (1.46 to 2.53) |
| NCABT | 0.33 (–0.17 to 0.83) | 1.51 (0.98 to 2.04) | 0.76 (–0.25 to 1.77) | 2.17 (1.18 to 3.17) |
| NDA | 1.22 (0.72 to 1.72) | 2.40 (1.88 to 2.93) | 0.34 (–0.17 to 0.84) | 1.75 (1.23 to 2.27) |
| PICANet | 1.58 (0.87 to 2.29) | 2.76 (2.04 to 3.49) | –0.08 (–0.99 to 0.82) | 1.33 (0.44 to 2.22) |
| TARN | 1.22 (0.69 to 1.75) | 2.40 (1.86 to 2.95) | 0.32 (–0.28 to 0.92) | 1.73 (1.16 to 2.31) |
Audit and role
The predicted primary and proximal intention outcomes across audits and recipients role, averaged across modifications, are presented in Figure 18. Comprehension and user experience are not presented, as there was no evidence of an effect according to audit or role for these outcomes.
FIGURE 18.
Predicted agreement by audit and role for primary outcome intended enactment and secondary proximal intention outcomes: (a) intended enactment; (b) attention; (c) set goals; (d) action plan; and (e) review performance.
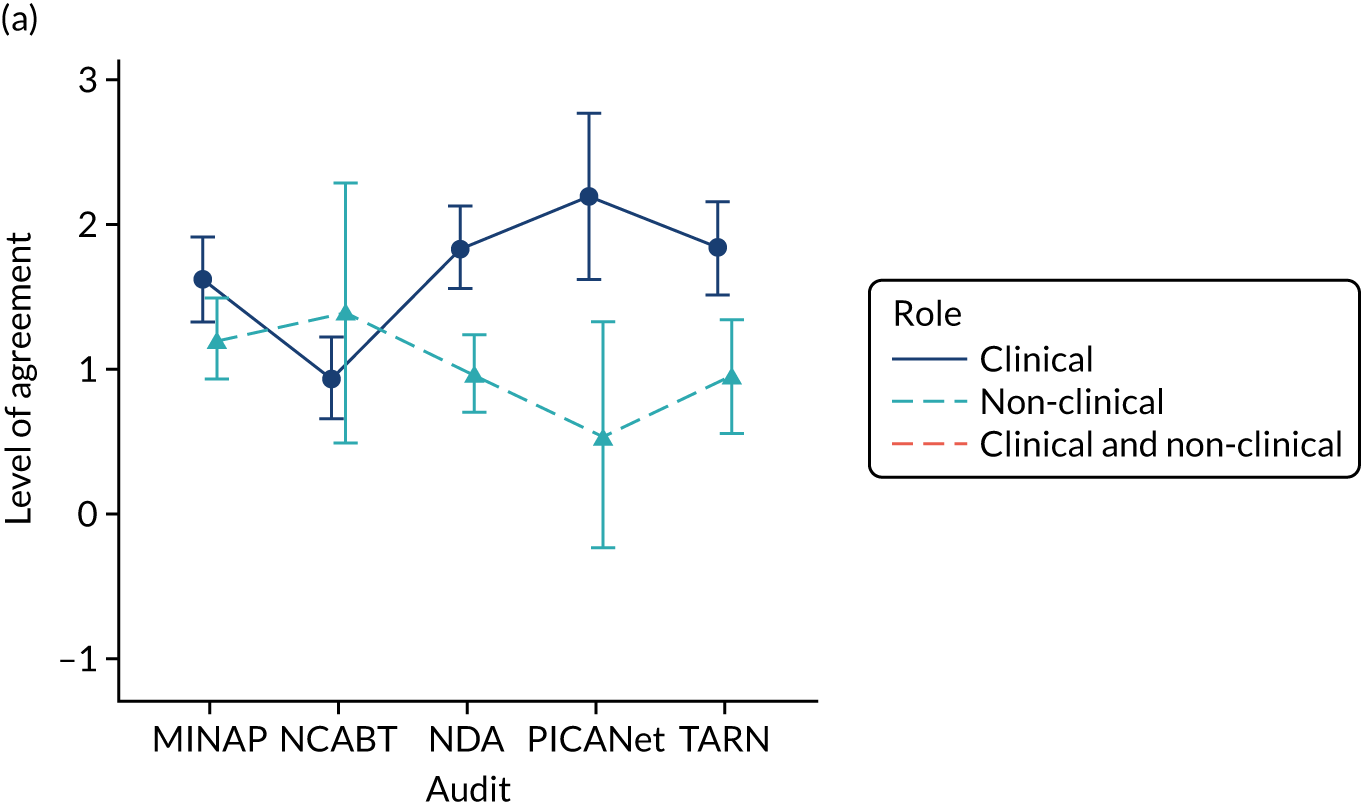
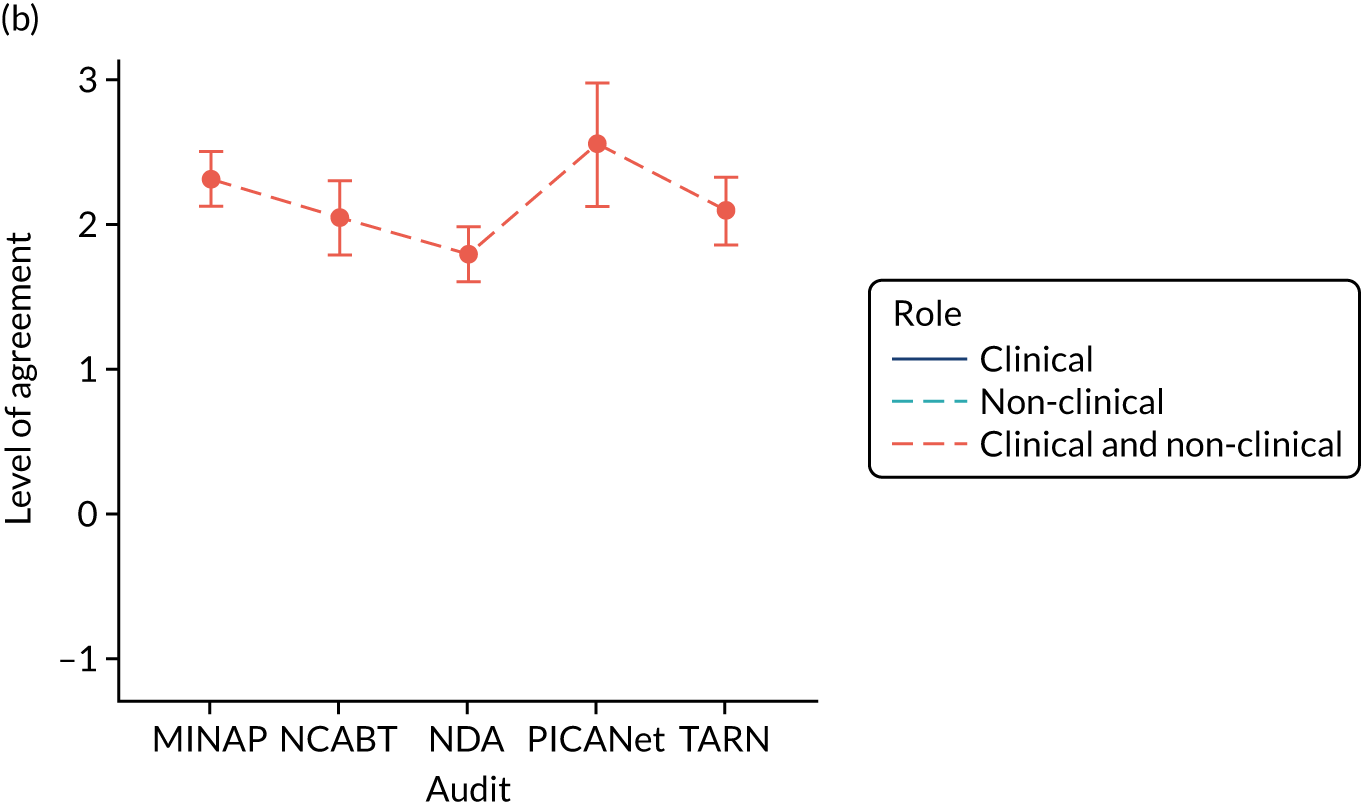
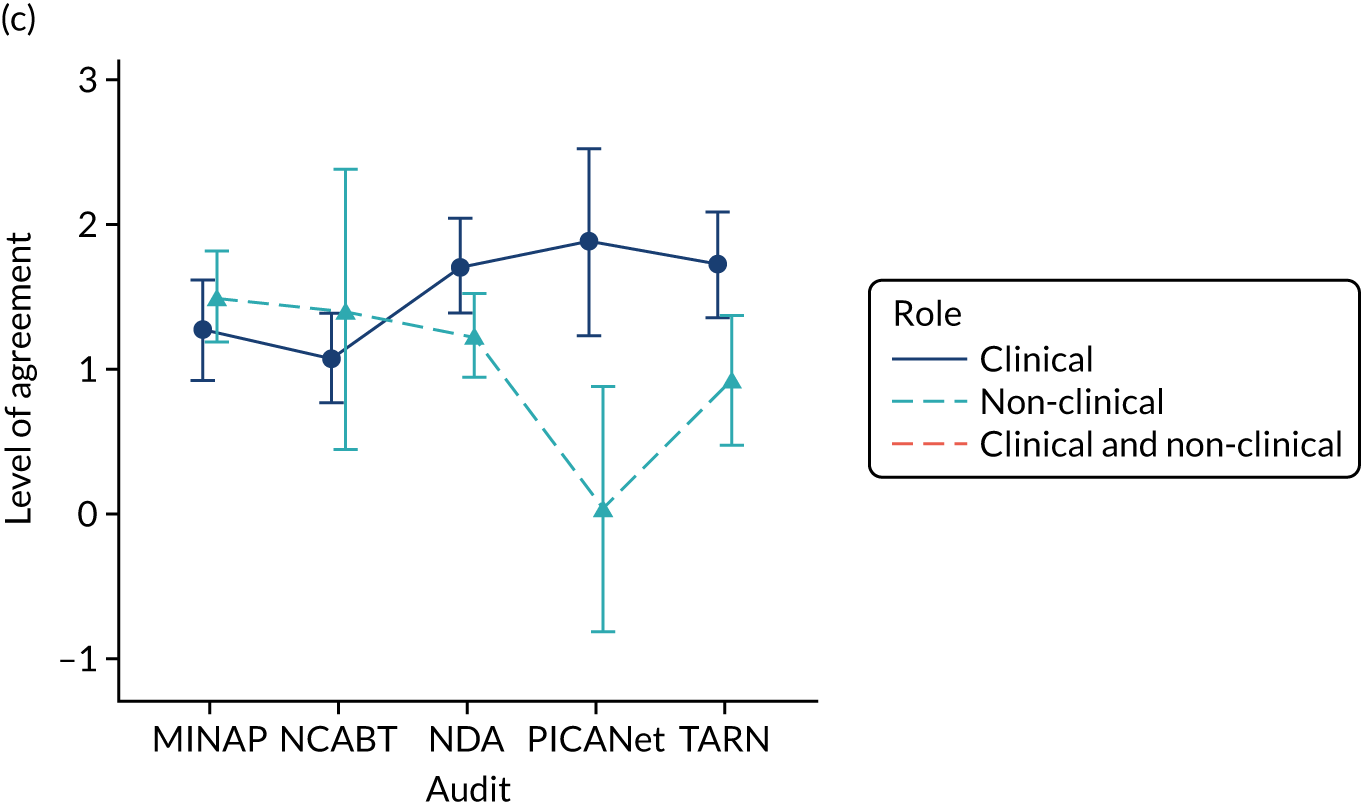
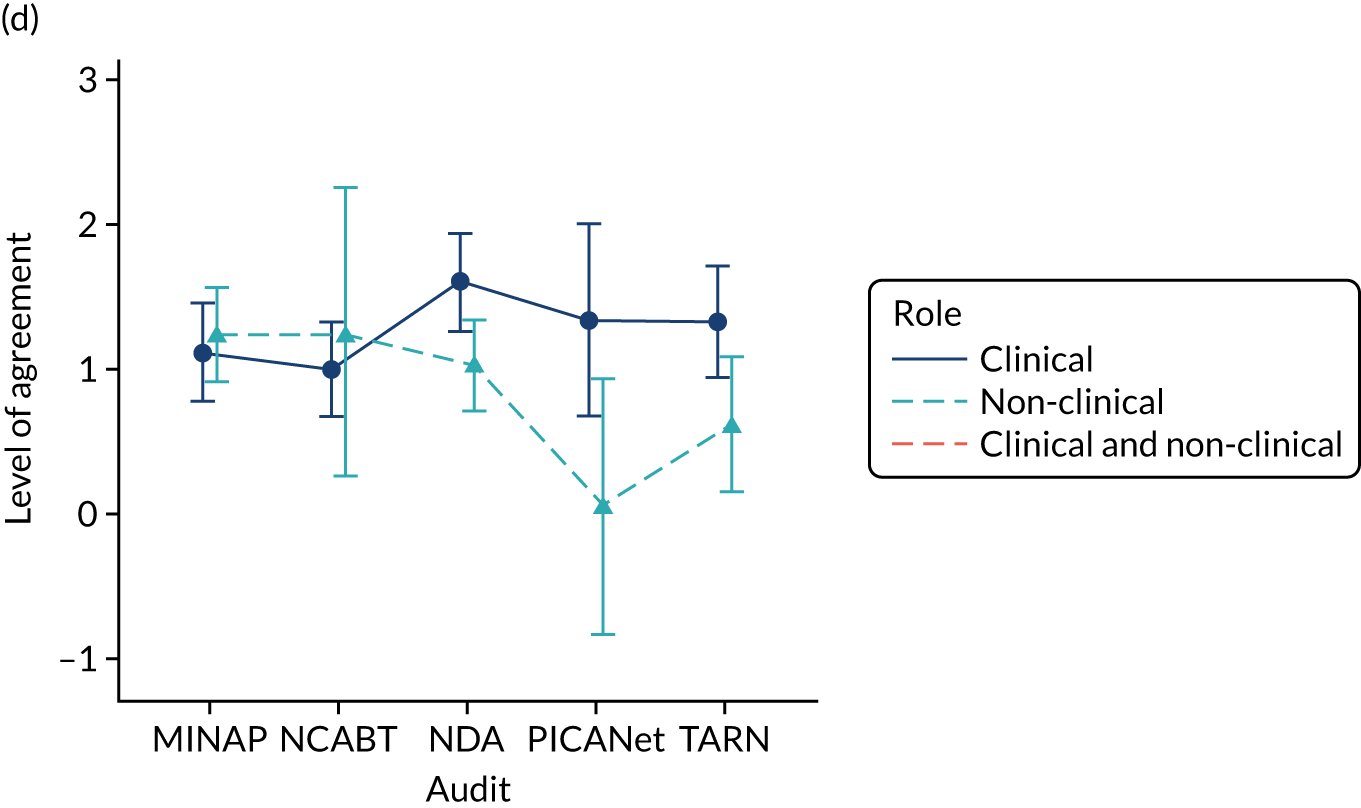
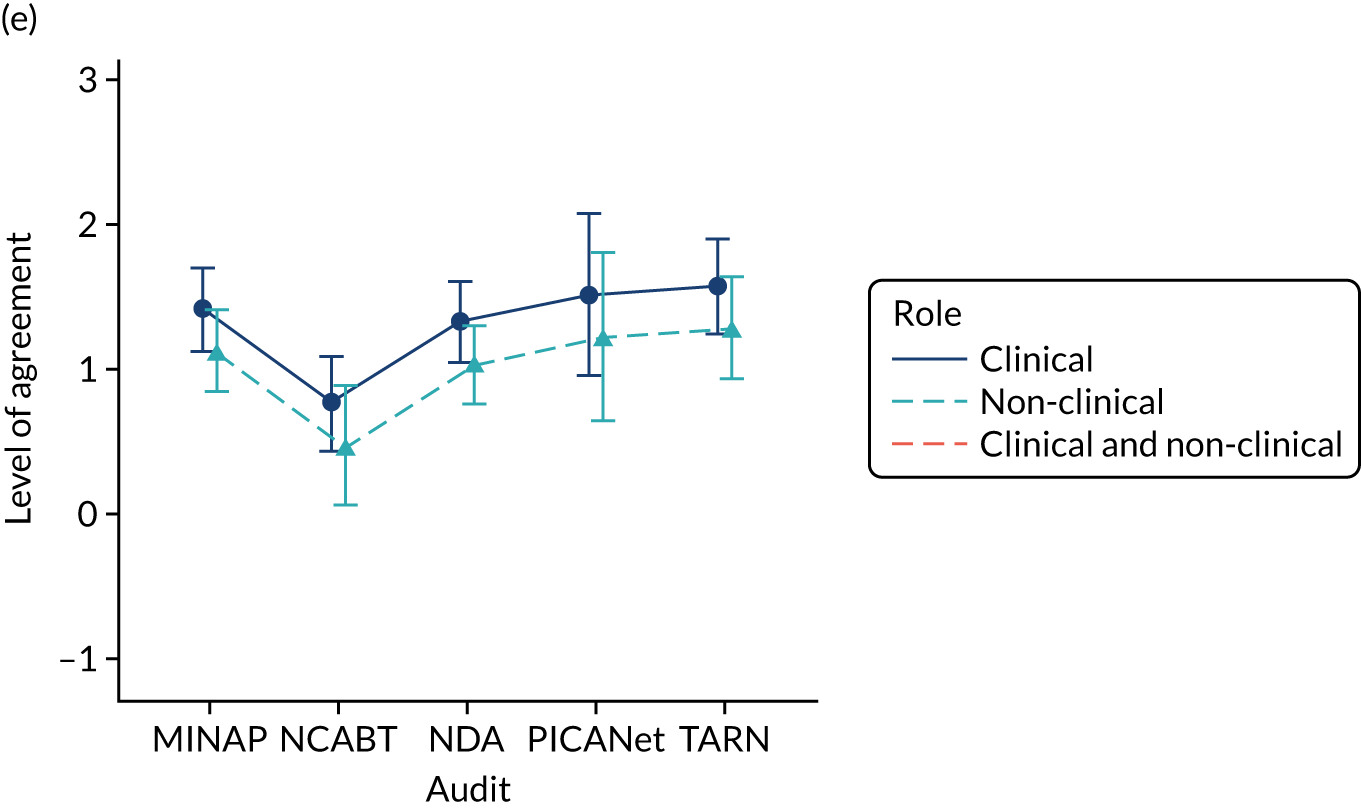
Intention for the primary outcome, intended enactment, was lower among non-clinical participants than among clinical participants (–0.867; p < 0.001), as was intention for the secondary outcomes of intention to formulate an action plan (–0.571; p = 0.015) and intention to set goals (–0.489; p = 0.03) in NDA, PICANet and TARN. There was reduced intention for the secondary outcome to review performance (–0.29; p = 0.043) for non-clinical recipients across all audits. There was no evidence of a difference in intention to bring the audit to the attention of colleagues according to role.
Among clinical participants, intention for the primary outcome, intended enactment, was lower in NCABT than in the NDA (–0.893; p < 0.001), as was intention for the secondary outcome intention of review performance (–0.565; p = 0.008). In the same group, intention was lower in both the MINAP and NCABT than in the NDA for the secondary outcomes intention to formulate an action plan (MINAP –0.482; p = 0.049; NCABT –0.603; p = 0.011) and intention to set goals (MINAP –0.445; p = 0.069; NCABT –0.638; p = 0.006). However, intention to bring the audit report to the attention of colleagues was higher in MINAP (0.521; p < 0.001), PICANet (0.755; p = 0.002) and TARN (0.304; p = 0.05) than in the NDA.
Effective comparators (modification A)
Using a comparator aiming to reinforce desired behaviour change, which showed recipient performance against the top quarter of performers, had no or minimal effect on the primary outcome, intended enactment and secondary proximal intention outcomes, including intention to bring the audit to the attention of colleagues, set goals, formulate an action plan and review performance.
On average, this modification did, however, reduce how easily participants understood the audit report (A, –0.091; p = 0.029) and their overall user experience (A, –0.087; p = 0.036). Synergistic interactions between the comparator and optional detail for these outcomes, comprehension (A*D, 0.078; p = 0.068) and overall user experience (A*D, 0.085; p = 0.043), meant that the negative comparator effect was not present when optional detail was provided (Figure 19).
FIGURE 19.
Predicted agreement by effective comparators and optional detail (A*D) for comprehension and user experience outcomes in NDA clinical recipients: (a) comprehension; and (b) user experience.
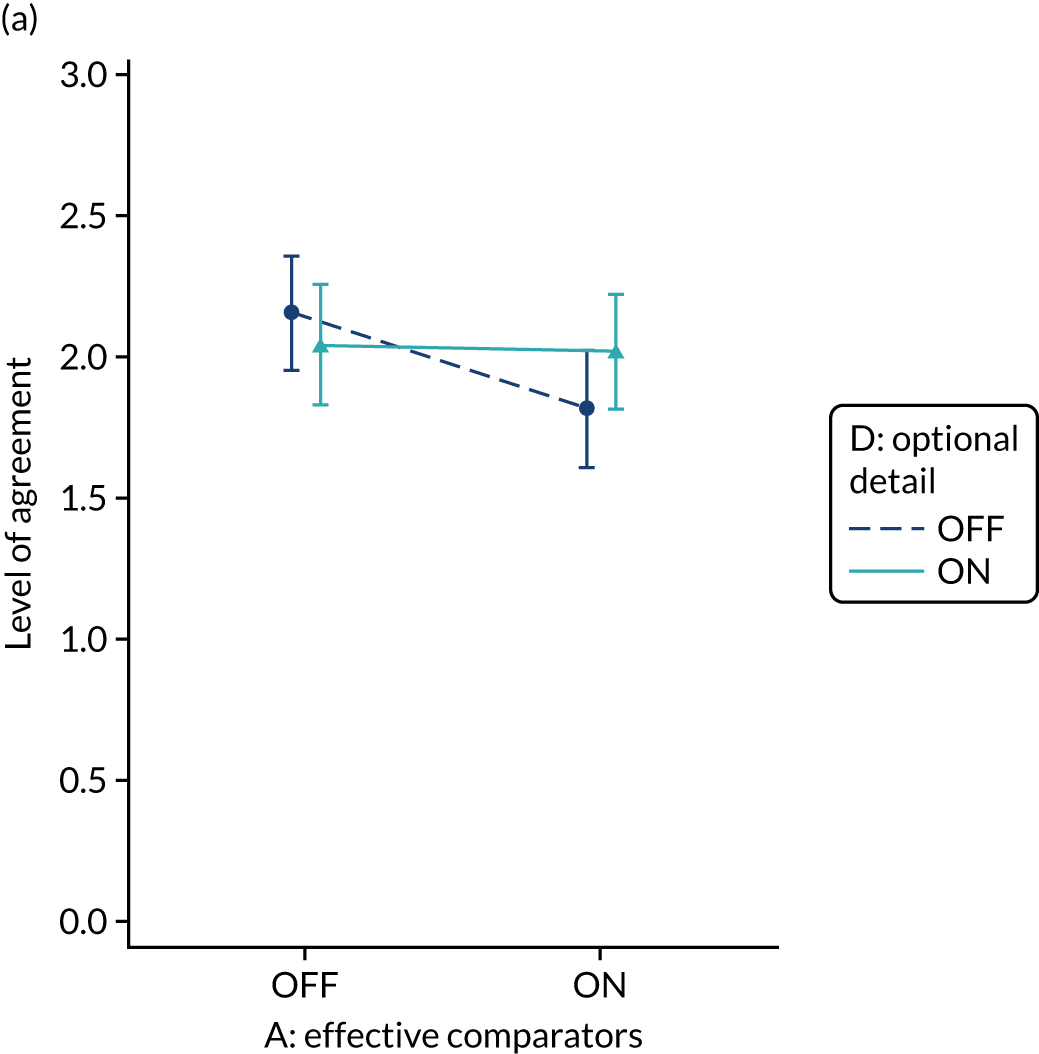
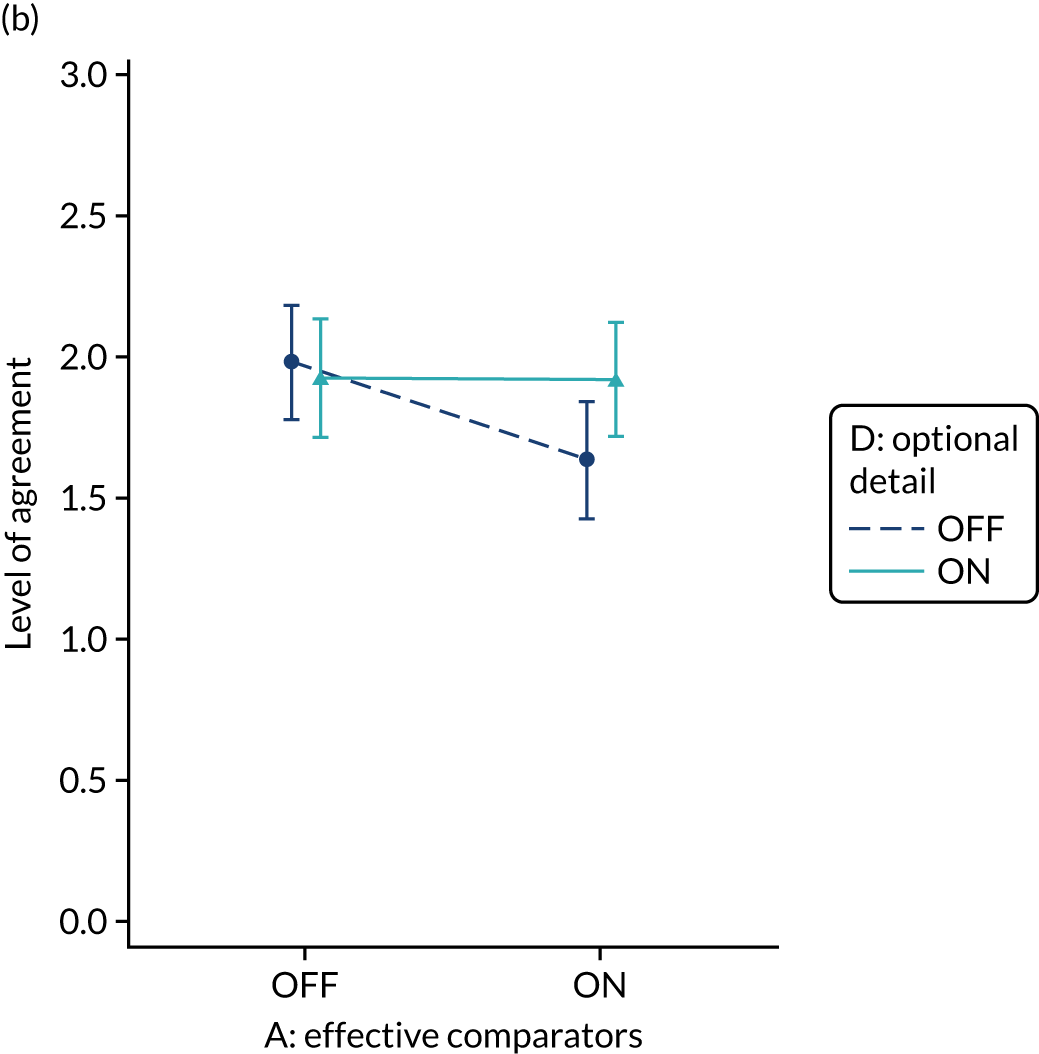
There was also weak evidence of a synergistic interaction with multimodal feedback (modification B) on intention to review performance (A*B, 0.115; p = 0.089), which suggested that multimodal feedback reduced intention unless accompanied by the effective comparators, but with optimal intention when neither modification was applied (Figure 20).
FIGURE 20.
Predicted agreement by effective comparators and multimodal feedback (A*B) for intention to review performance in NDA clinical recipients.
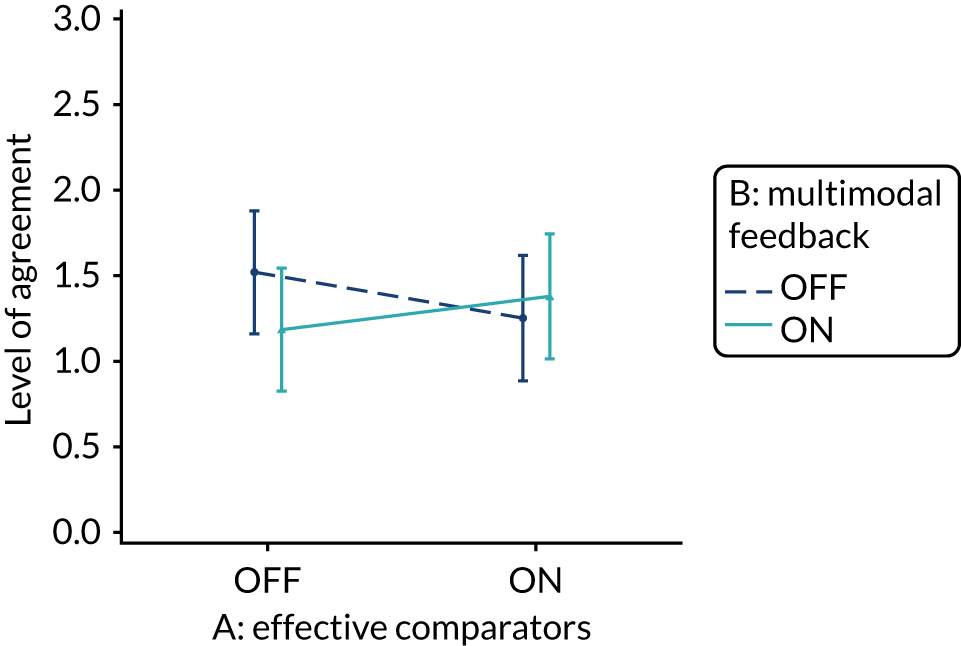
Higher-order three-way interactions detected between effective comparators, multimodal feedback and patient voice (A*B*E) and between effective comparators, specific actions and cognitive load (A*C*F) are described later, as are all other modification three-way interactions.
Multimodal feedback (modification B)
Using multimodal feedback to reinforce desired behaviour change, by including a graphical display of performance data alongside text, did not independently improve the primary outcome, intended enactment or the secondary outcomes of proximal intention, comprehension or user experience. Multimodal feedback did, however, interact with a number of other modifications, leading to variable effects on all outcomes.
A consistent antagonistic interaction was observed between multimodal feedback and optional detail, with good evidence of effect for the primary outcome, intended enactment (B*D, –0.112; p = 0.048), and secondary outcomes of user experience (B*D, –0.115; p = 0.006) and comprehension (B*D, –0.114; p = 0.008); and weak evidence for the secondary outcome of intention to set goals (B*D, –0.114; p = 0.067) (Figure 21). Outcomes were generally reduced when both multimodal feedback and optional detail were applied (or not) in synergy, and improved when only one of the modifications was applied. However, to improve the primary outcome, intended enactment, further interactions between multimodal feedback, optional detail and role (B*Non-clinical, –0.196; p = 0.083; D*Non-clinical, 0.195; p = 0.087) meant the effect was quite different in non-clinical participants than in clinical participants, and intention was optimised when multimodal feedback was excluded and optional detail provided (see Figure 21). There was also a positive interaction between multimodal feedback and the PICANet audit (B*PICANet, 0.607; p = 0.035), such that intention to set goals was improved when multimodal feedback was provided, irrespective of optional detail.
FIGURE 21.
Predicted agreement by multimodal feedback and optional detail (B*D) for outcomes: (a) intended enactment – clinical; (b) intended enactment – non-clinical; (c) comprehension – clinical and non-clinical; (d) user experience – clinical and non-clinical; (e) set goal – MINAP; (f) set goal – NCABT; (g) set goal – NDA; (h) set goal – PICANet; and (i) set goal – TARN.
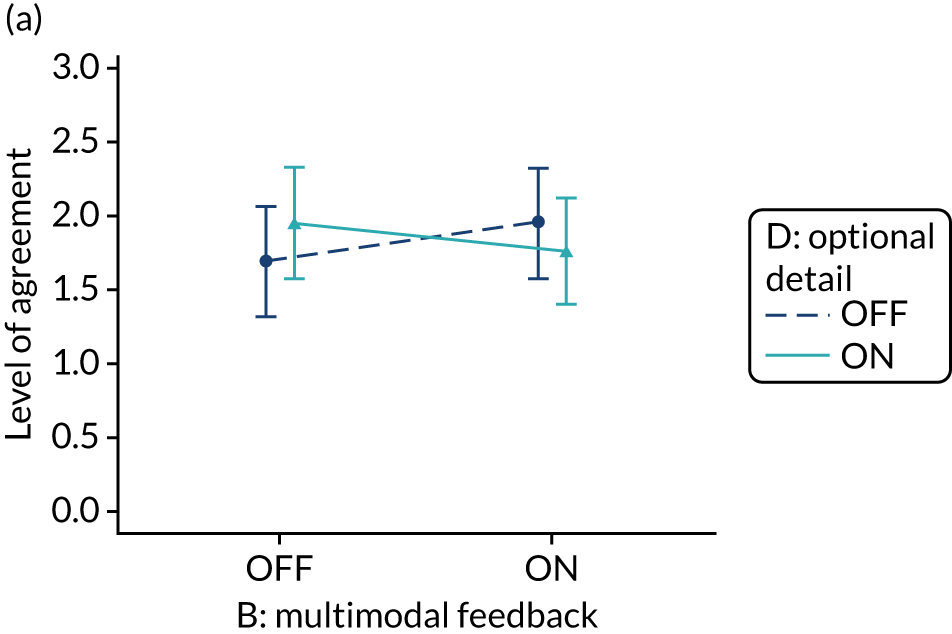
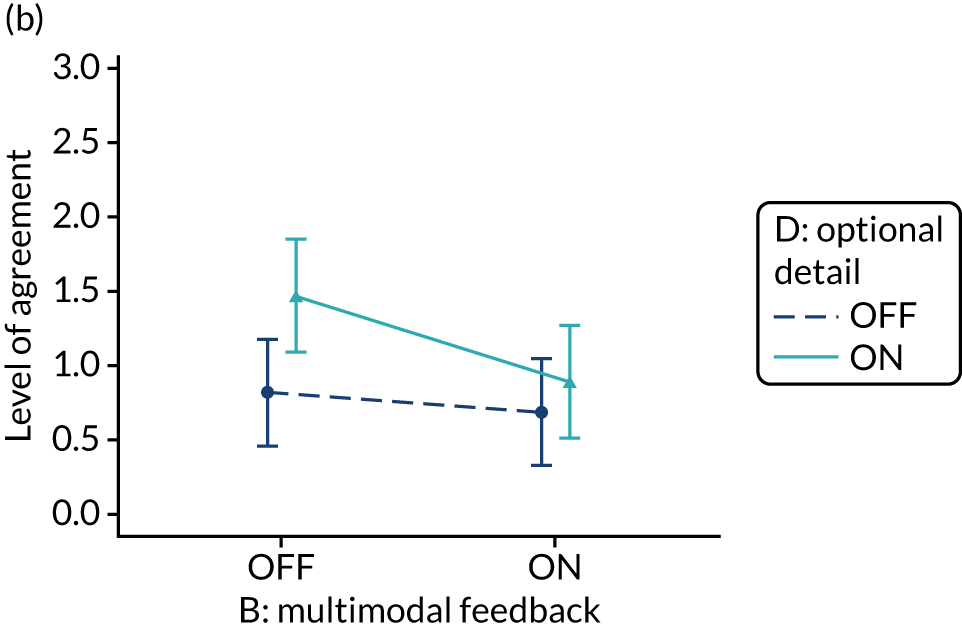
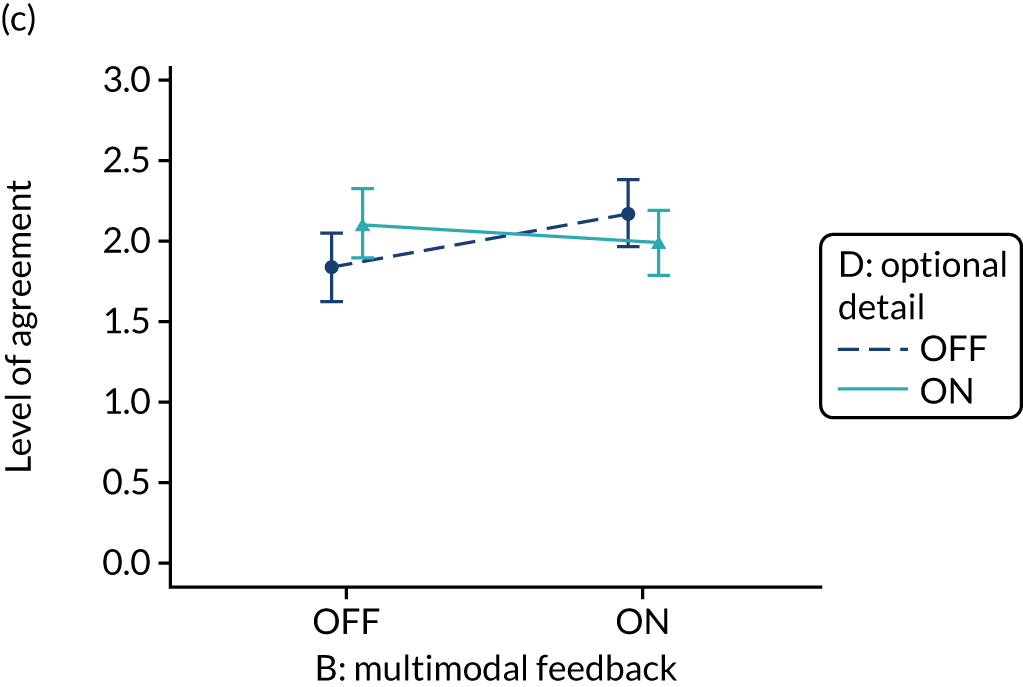
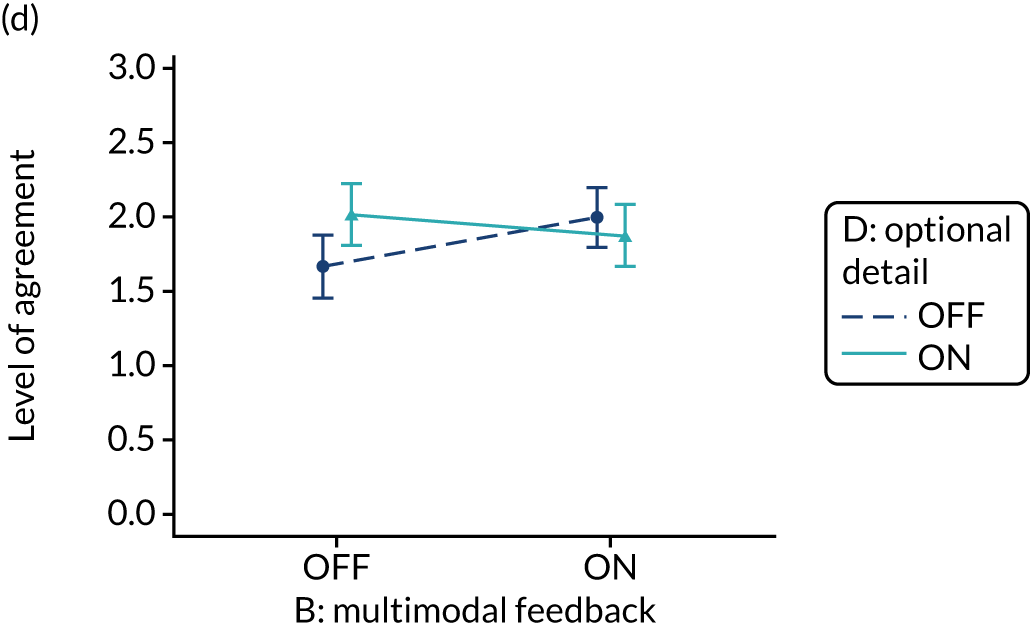
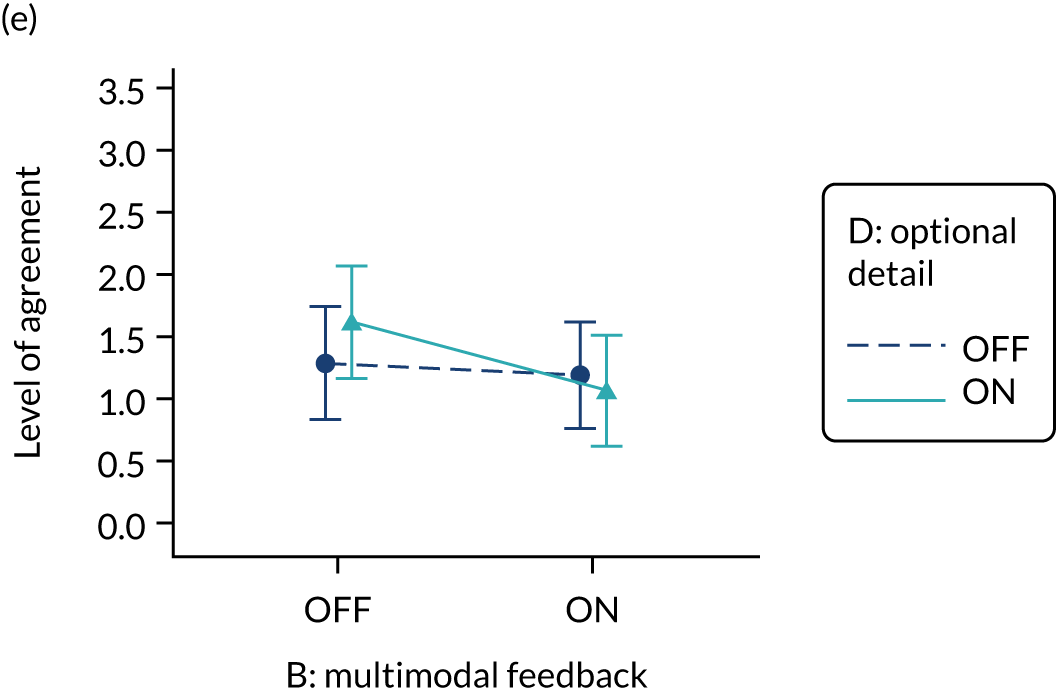
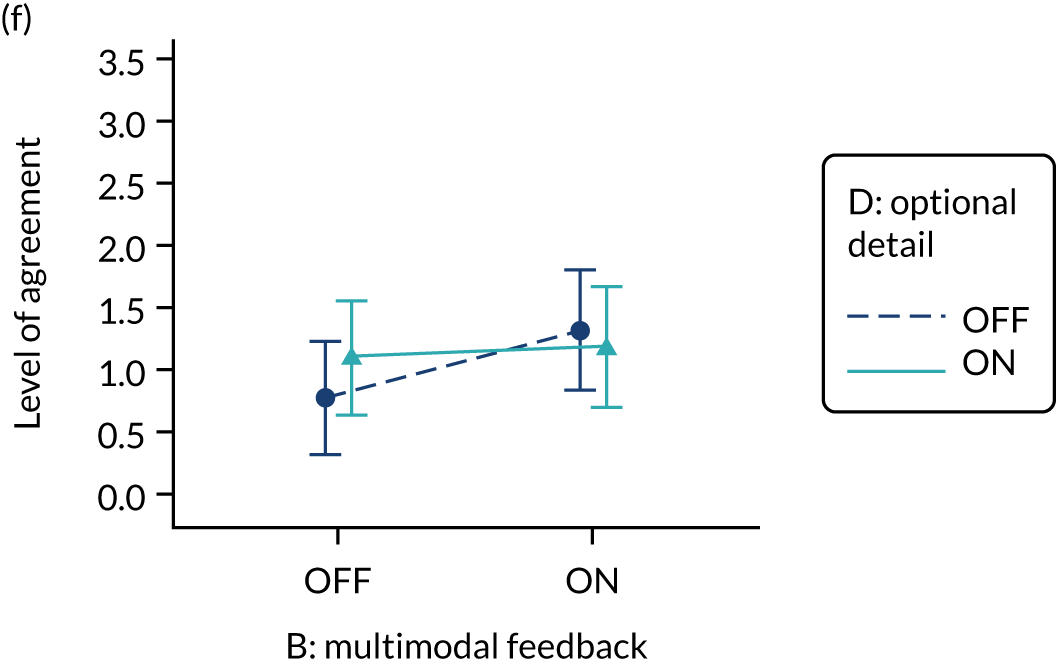
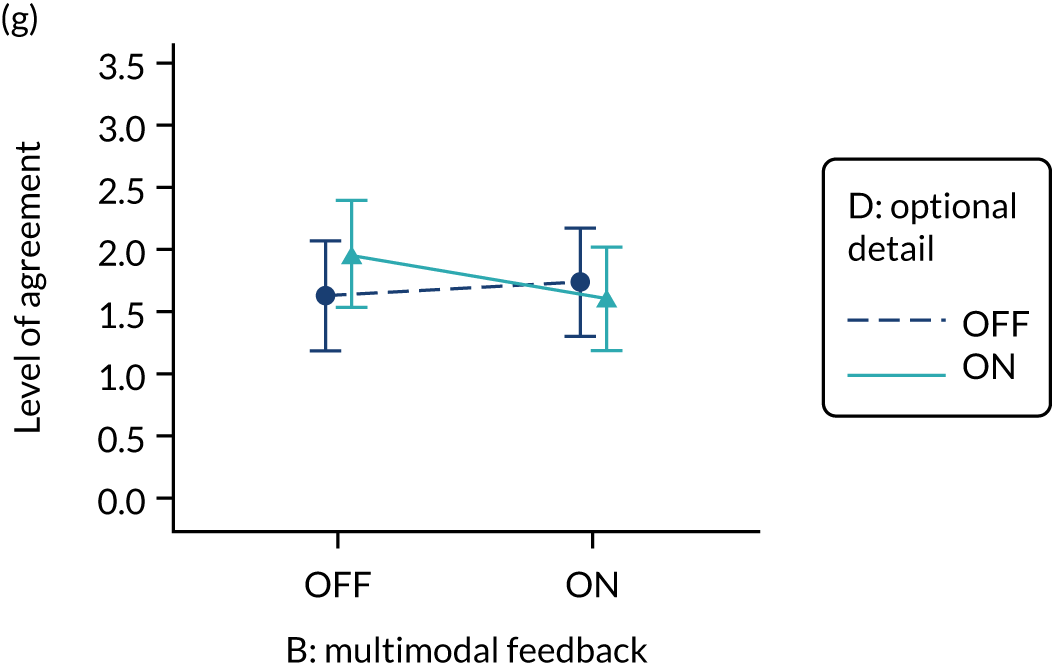
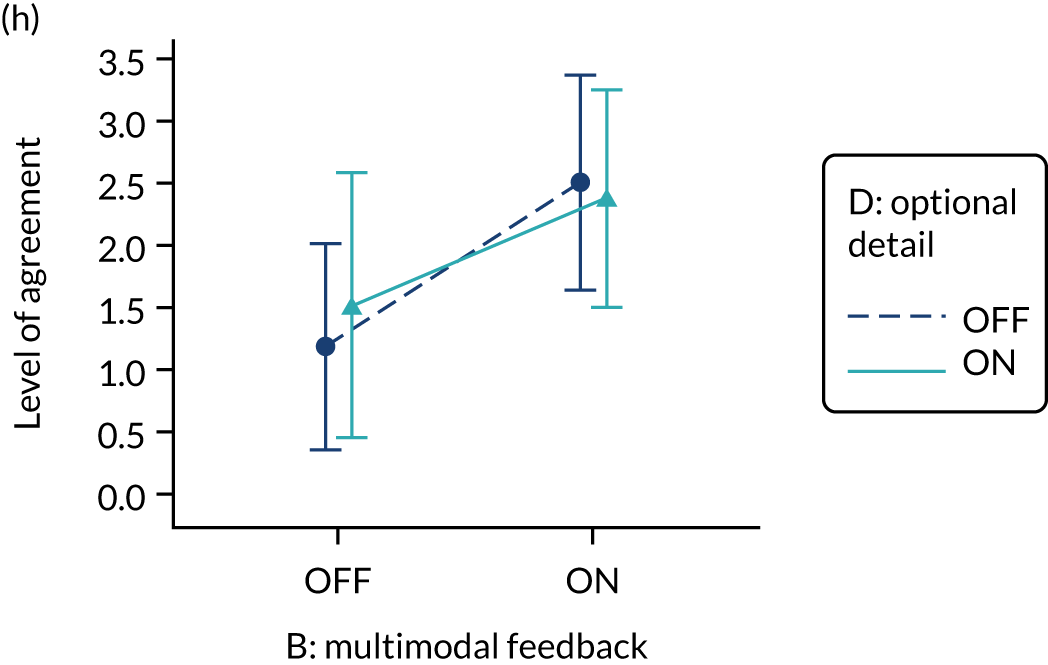
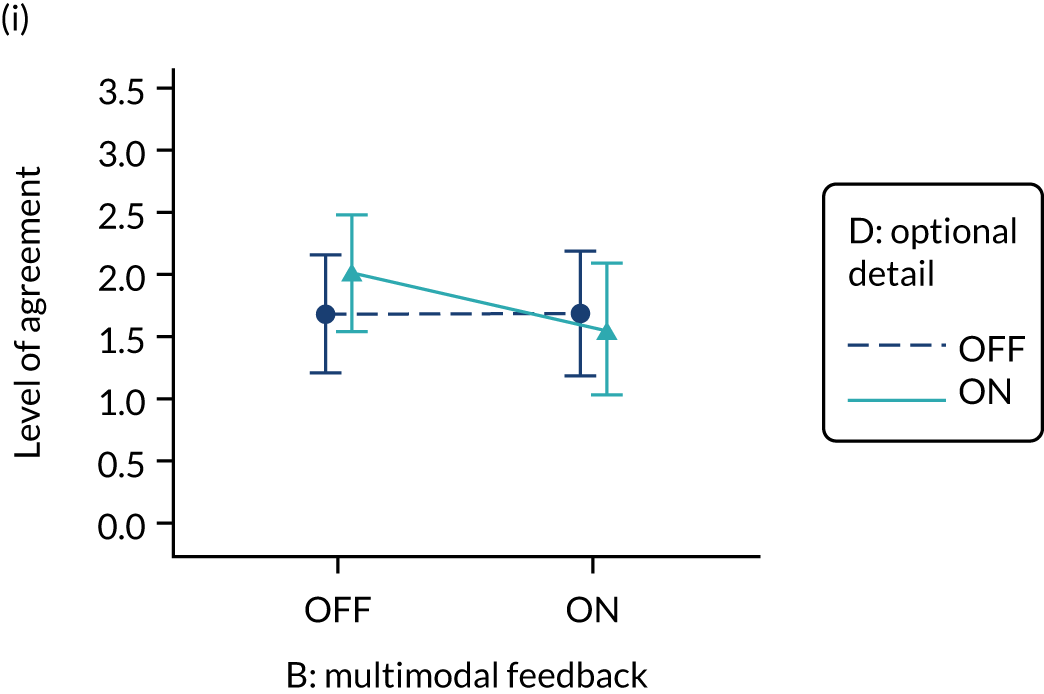
There was a synergistic interaction between multimodal feedback and cognitive load for secondary outcomes intention to bring the audit report to the attention of colleagues (F, 0.126; p = 0.016; B*F, 0.087; p = 0.089) and to set goals in the PICANet audit (B*F*PICANet, 0.569; p = 0.046), such that intention was optimised when cognitive load was reduced and multimodal feedback was provided (Figure 22). An opposite antagonistic interaction was, however, observed for intention to review performance (B*F, –0.119; p = 0.085) and intention to set goals in the MINAP audit (B*F*MNAP, –0.4; p = 0.013) such that intention was optimised when cognitive load was reduced and multimodal feedback was not provided.
FIGURE 22.
Predicted agreement by multimodal feedback and cognitive load (B*F) for intention to bring audit report to attention of colleagues and to review performance in NDA clinical recipients and intention to set goals accounting for B*F*audit interaction in clinical recipients: (a) attention; (b) review performance; (c) set goal – MINAP; (d) set goal – NCABT; (e) set goal – NDA; (f) set goal – PICANet; and (g) set goal – TARN.
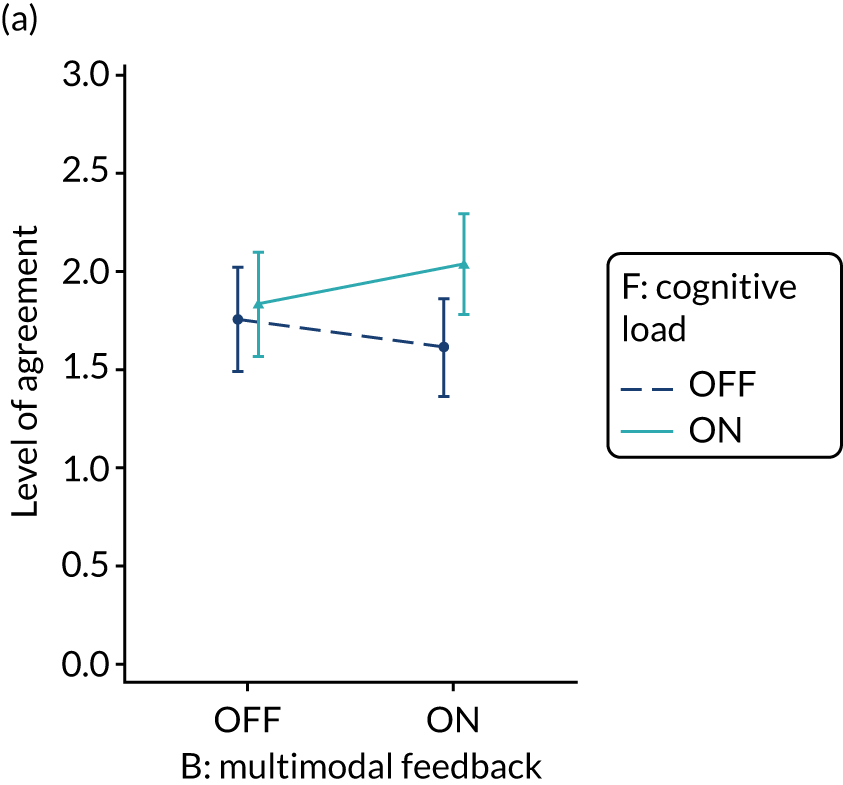
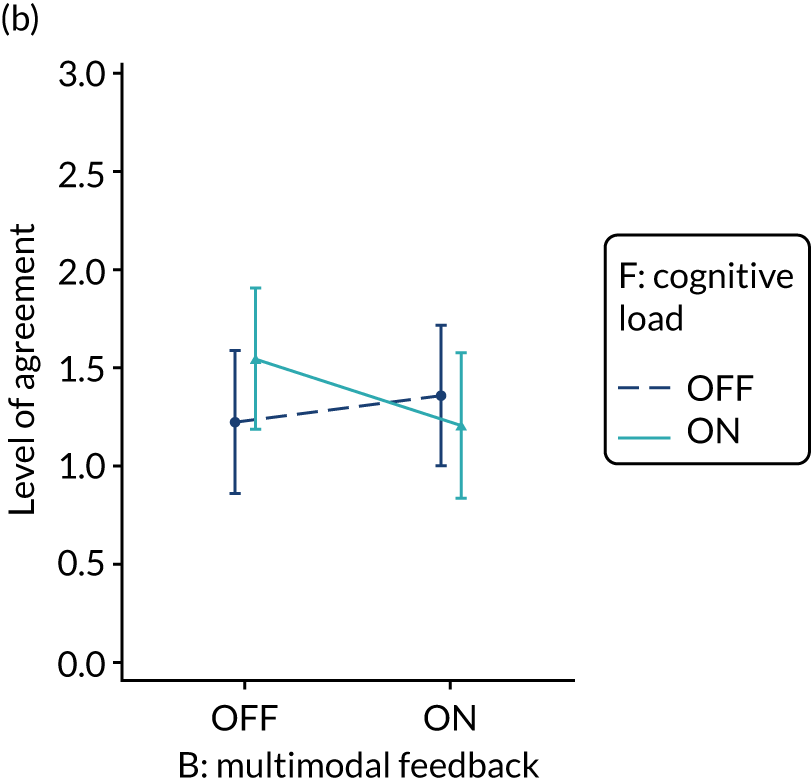
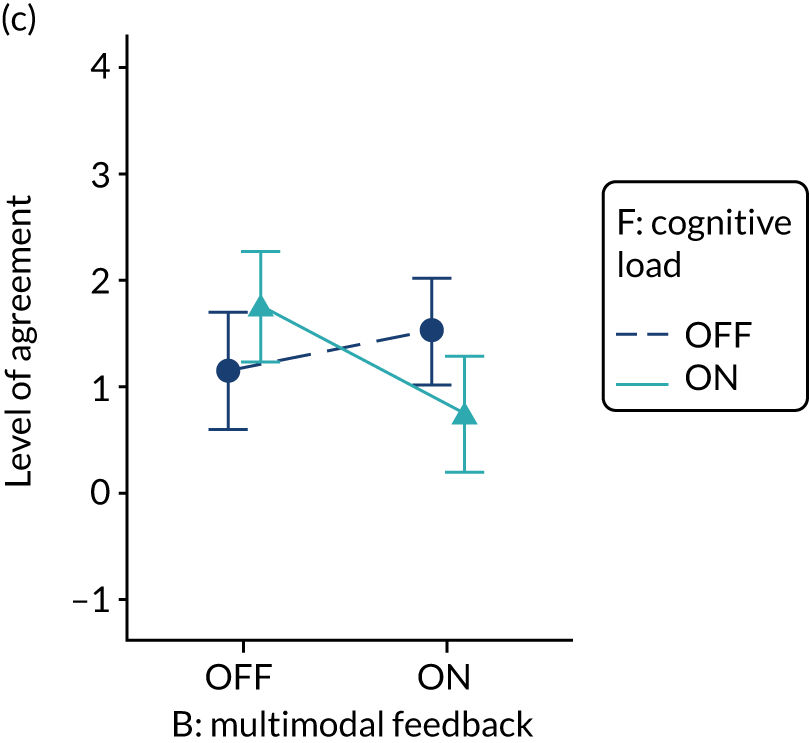
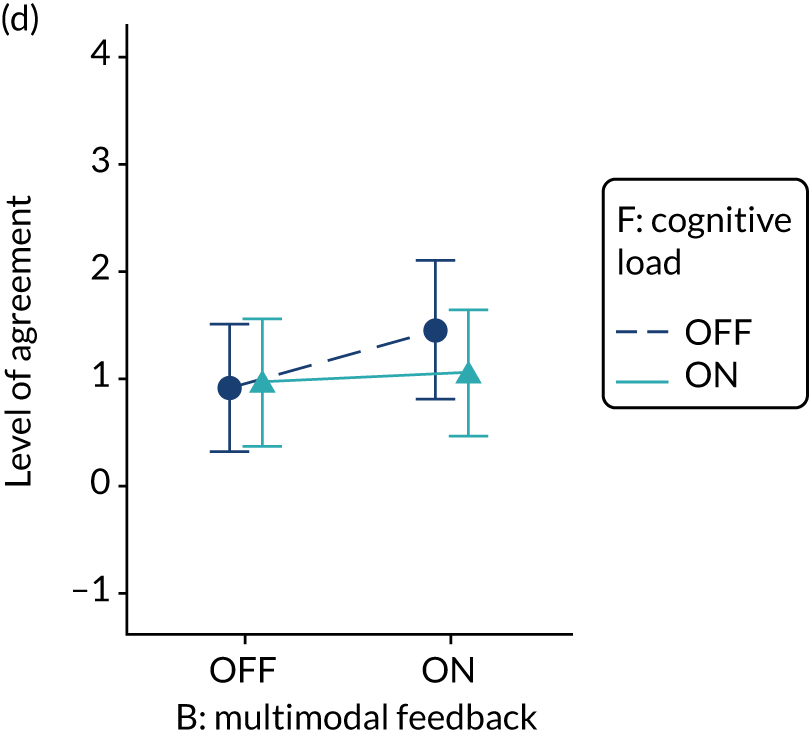
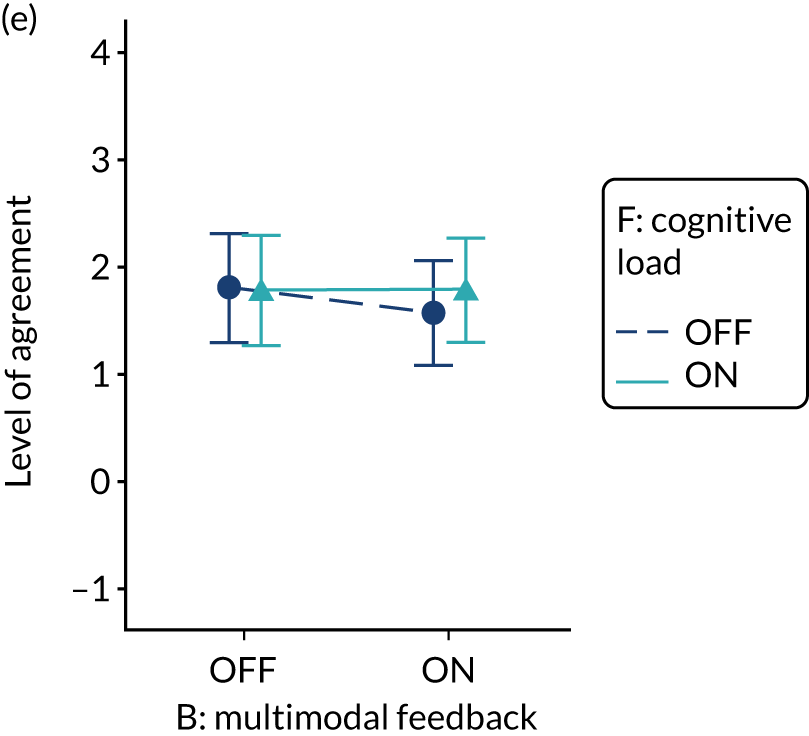
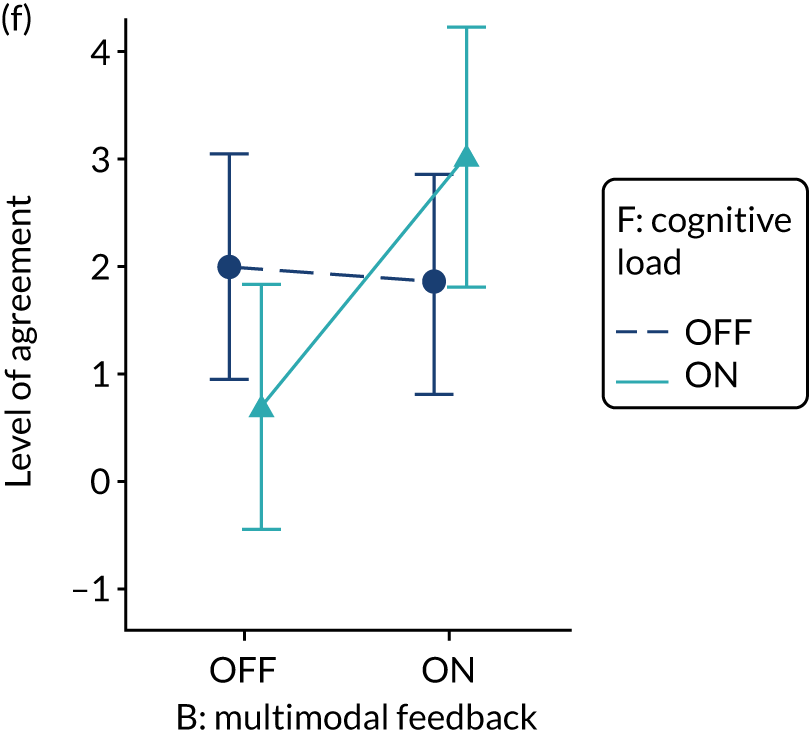
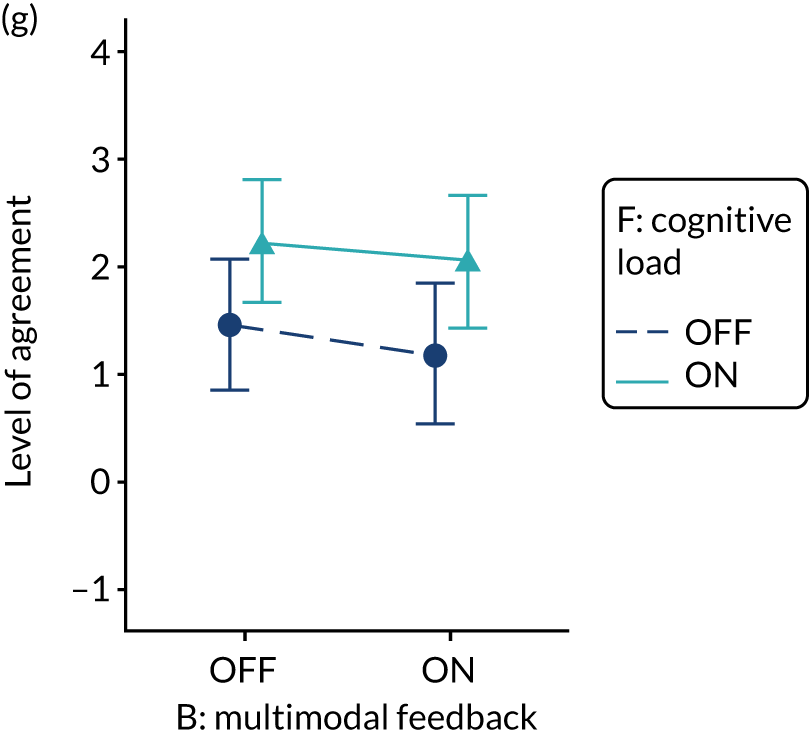
Specific actions (modification C)
Using specific actions to reinforce desired behaviour change, by including suggested specific recommendations, had no or minimal effect on secondary outcomes intention to bring the audit to the attention of colleagues and to set goals, or on comprehension.
Using specific actions to reinforce desired behaviour change improved the secondary outcomes intention to set an action plan and review performance, dependent on the inclusion of optional detail (modification D). The interaction between modifications was antagonistic for both intention to set an action plan (C*D, –0.107; p = 0.099) and intention to review performance (C, 0.118; p = 0.075; C*D, –0.119; p = 0.078), such that there was improved intention when specific actions were provided, but only when optional detail was not also provided (Figure 23). A weak synergistic interaction was also identified between specific actions and cognitive load (C*F, 0.093; p = 0.09) (Figure 24), for the primary outcome, such that intended enactment was optimised when both specific actions and reduced cognitive load were applied.
FIGURE 23.
Predicted agreement by specific actions and optional detail (C*D) for intention to make an action plan and review performance in NDA clinical recipients: (a) action plan; and (b) review performance.
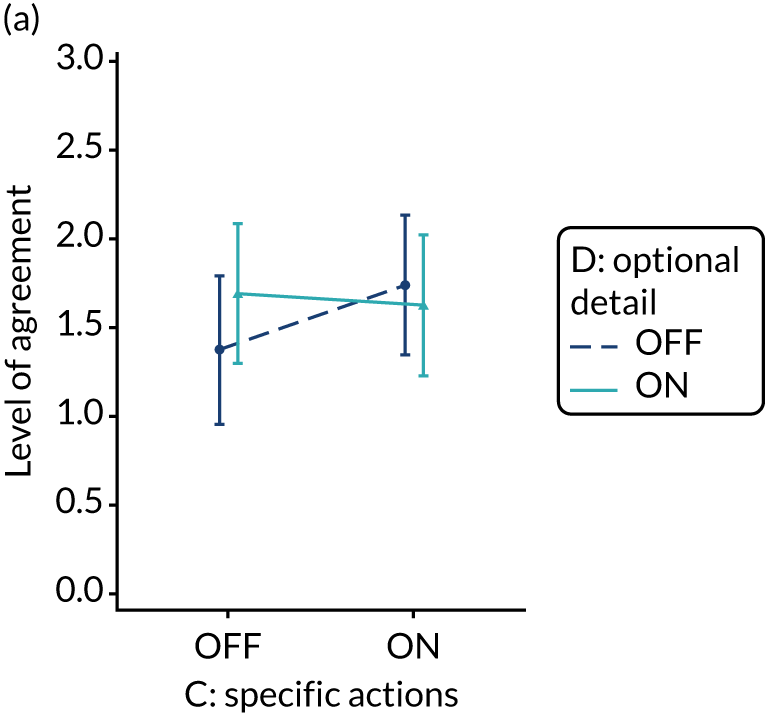
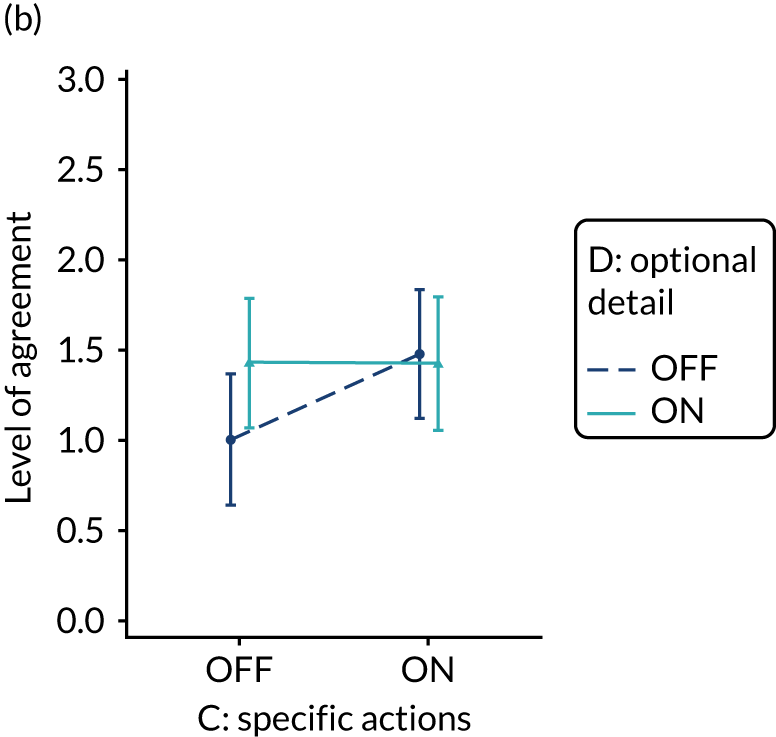
FIGURE 24.
Predicted agreement by specific actions and cognitive load (C*F) for intended enactment in NDA clinical recipients.
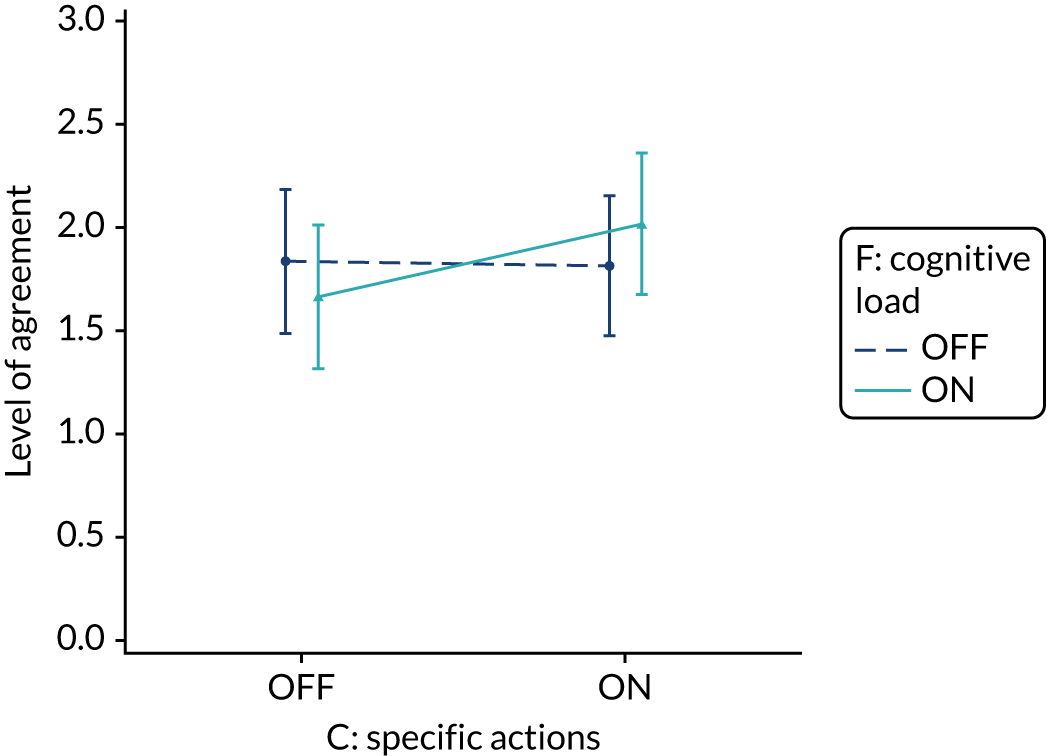
Optional detail (modification D)
Adding optional detail to reinforce desired behaviour change, by including short messages with clickable, expanding links to explanatory detail, interacted with other modifications and participant role, resulting in effects on the primary outcome, intended enactment; secondary outcomes intention to set goals, make an action plan and review performance; and comprehension and user experience. Optional detail had no effect on the secondary outcome of intention to bring the audit to the attention of colleagues.
A weak but consistent antagonistic interaction was observed between optional detail and cognitive load for the primary outcome, intended enactment (D*F, –0.093; p = 0.089); intention to review performance (D*F, –0.123; p = 0.065); and comprehension (D*F, –0.073; p = 0.079) (Figure 25). Outcomes were generally reduced when both optional detail and reduced cognitive load were applied (or not) in synergy, whereas outcomes were improved when only one of the modifications was applied. To improve comprehension it was better to reduce cognitive load rather than include optional detail. To improve the primary outcome, intended enactment, a further interaction between optional detail and role (D*Non-clinical, 0.195; p = 0.087) meant that the effect was quite different in non-clinical participants for whom intention was optimised when optional detail was provided and cognitive load was not reduced.
FIGURE 25.
Predicted agreement by optional detail and cognitive load (D*F) in the NDA for intended enactment, accounting for D*Role interaction; intention to review performance in clinical recipients; and comprehension across recipients: (a) intended enactment – clinical; (b) intended enactment – non-clinical; (c) review performance – clinical; and (d) comprehension – clinical and non-clinical.
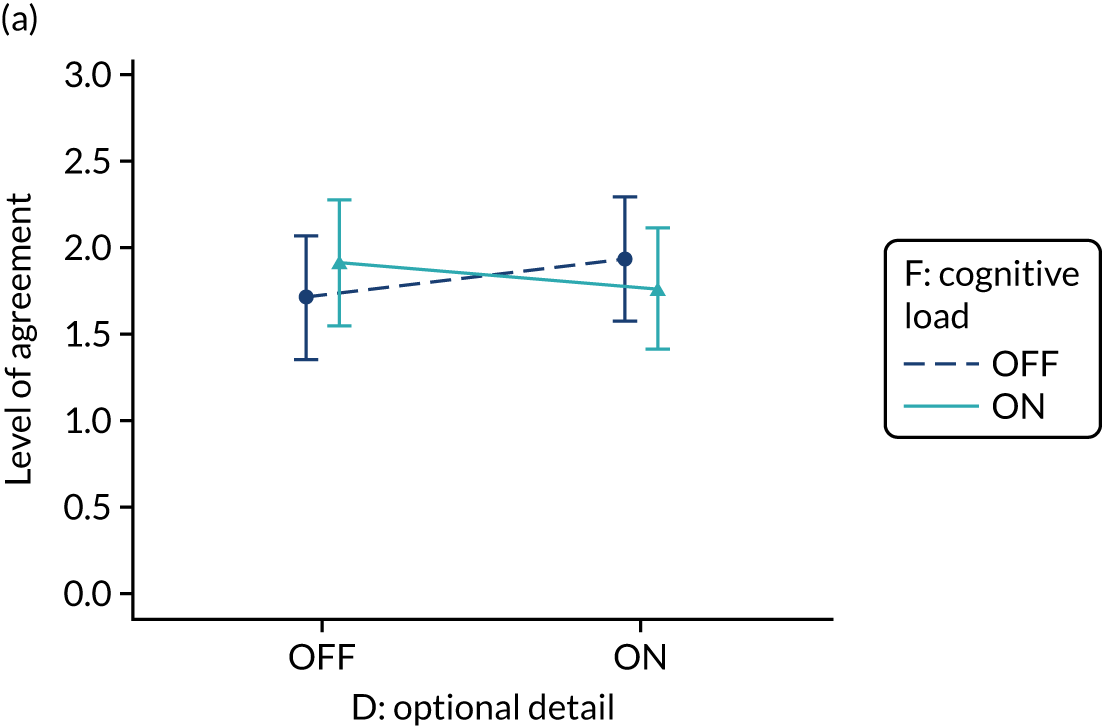
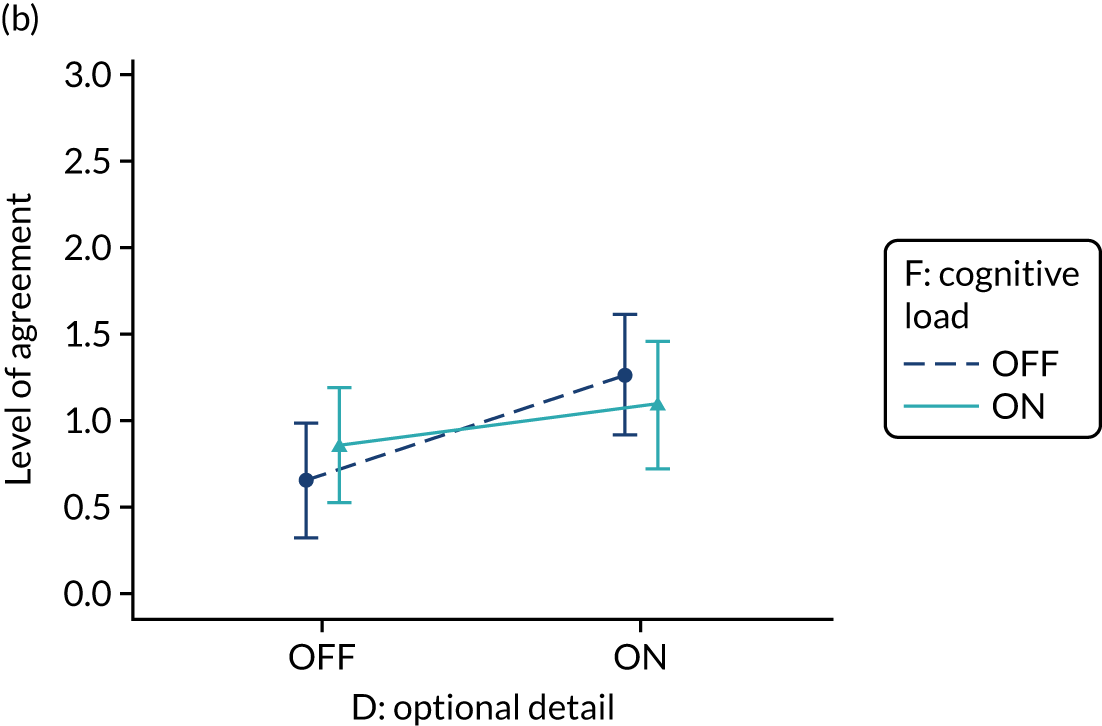
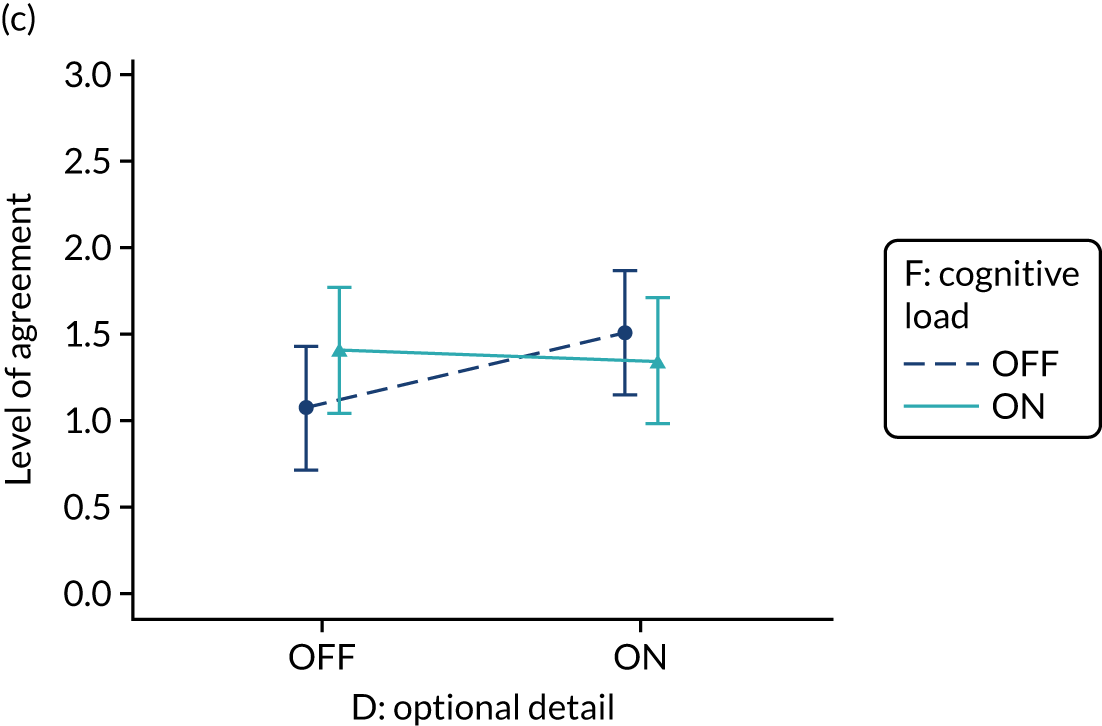
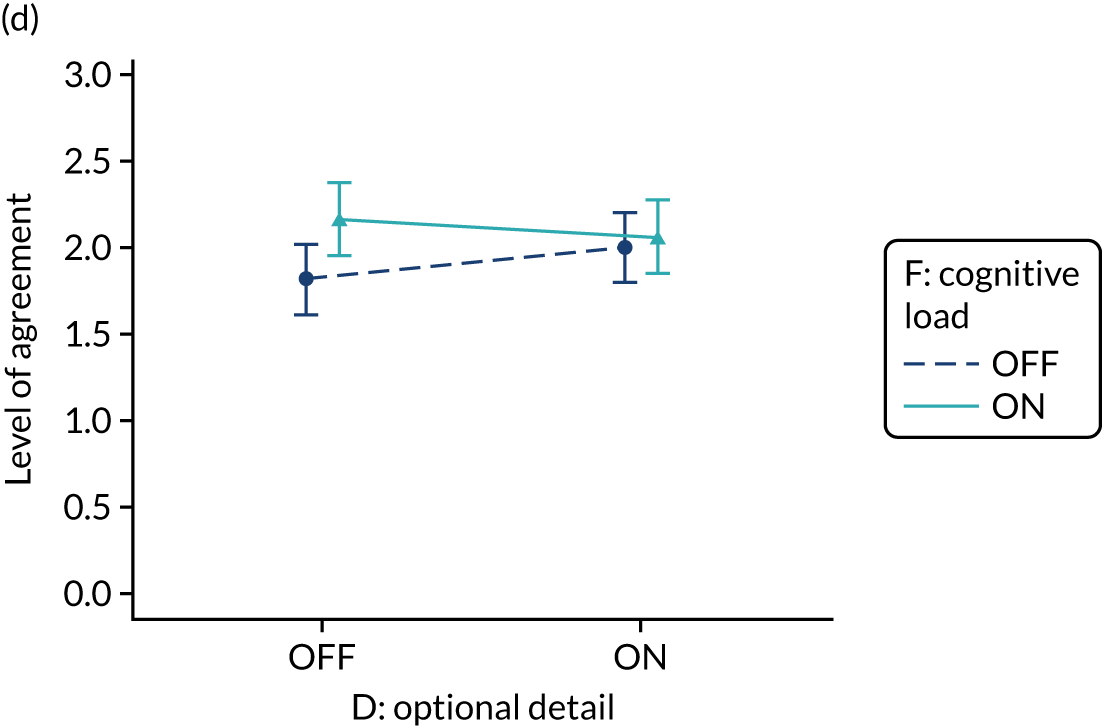
There was good evidence of a synergistic interaction between optional detail and patient voice such that including optional detail improved user experience when patient voice was included in the audit report, but including patient voice without optional detail reduced user experience (D*E, 0.085; p = 0.039) (Figure 26).
FIGURE 26.
Predicted agreement by optional detail and patient voice (D*E) in NDA clinical recipients for user experience.
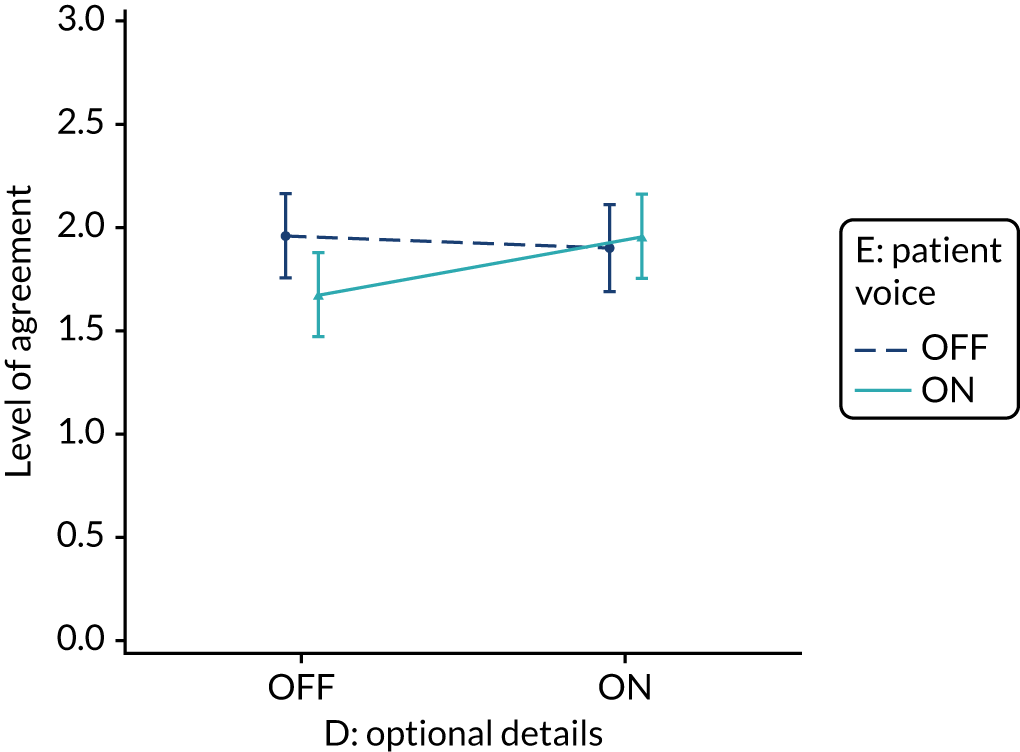
Interactions between optional detail and effective comparators; multimodal feedback and specific actions for the primary outcome, intended enactment (B*D, –0.112; p = 0.047); the secondary outcomes intention to set goals (B*D, –0.114; p = 0.067), intention to set an action plan (C*D, –0.107; p = 0.099) and intention to review performance (C, 0.118; p = 0.075; C*D –0.119; p = 0.078); comprehension (A*D, 0.078; p = 0.068; B*D, –0.114; p = 0.008) and user experience (A*D, 0.085; p = 0.043; B*D, –0.115; p = 0.006) have been described previously.
Patient voice (modification E)
Using the patient voice to reinforce desired behaviour change by including a quotation and photograph from a fictional patient describing their experience of care related to the associated audit standard had no or minimal effect on the primary outcome, intended enactment, secondary proximal intention outcomes or comprehension.
Good evidence, however, of a synergistic interaction between patient voice and optional detail on user experience (D*E, 0.085; p = 0.039) has been described previously (see Optional detail).
Cognitive load (modification F)
The reduction of cognitive load, to reinforce desired behaviour change by removing distracting detail and additional general text not directly related to the audit standard and feedback, interacted with other modifications and audit, resulting in effects on the primary outcome, intended enactment; the secondary outcomes of intention to bring the audit to the attention of colleagues, set goals, make an action plan and review performance; and comprehension. Cognitive load had no effect on the secondary outcome user experience.
There was good evidence that intention to set goals (F*TARN, 0.357; p = 0.049) and intention to make an action plan (F*TARN, 0.407; p = 0.033) were improved when cognitive load was reduced for participants in the TARN audit (Figure 27).
FIGURE 27.
Predicted agreement by cognitive load and audit in clinical recipients for intention to set goals, accounting for B*F interaction (multimodal feedback*cognitive load) and intention to set an action plan: (a) set goals – multimodal feedback OFF; (b) set goals – multimodal feedback ON; and (c) action plan – multimodal feedback ON or OFF.
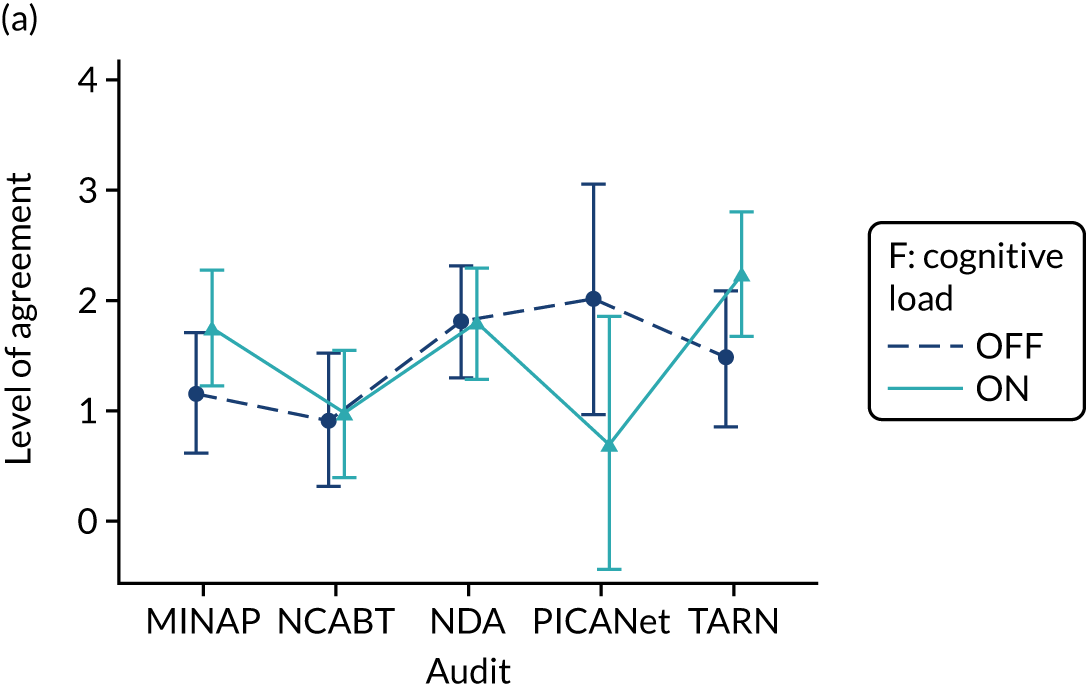
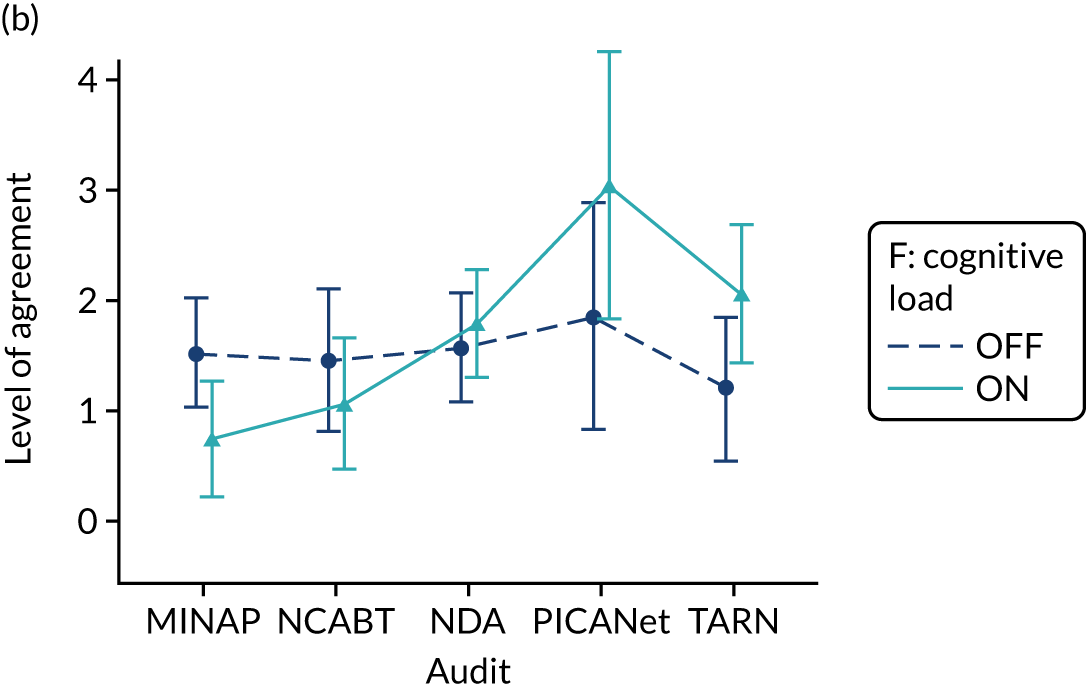
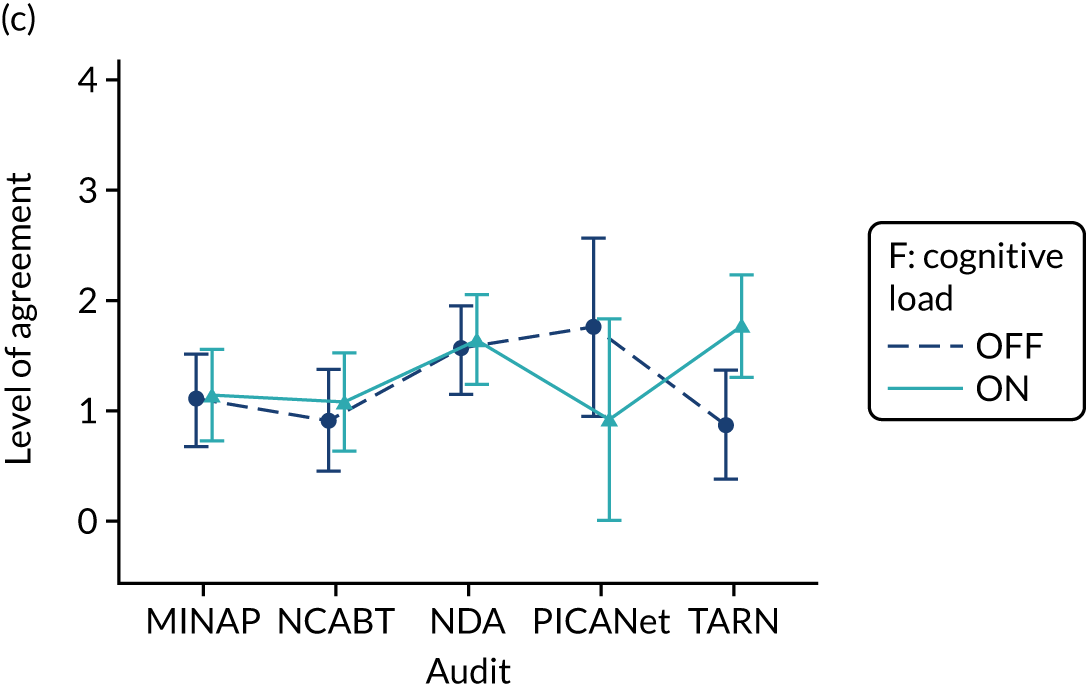
Interactions between cognitive load and other modifications are previously described. These include the interactions between cognitive load and:
-
specific actions with an effect on the primary outcome (C*F 0.093; p = 0.09);
-
multimodal feedback with an effect on intention to
-
bring the audit to the attention of colleagues (F 0.126, p = 0.016; B*F 0.087, p = 0.089)
-
review performance (B*F –0.119; p = 0.085),
-
set goals in the MINAP audit (B*F*MINAP –0.4; p = 0.013)
-
make an action plan in the PICANET audit (B*F*PICANet 0.569; p = 0.046
-
-
optional detail with an effect on comprehension (F 0.103, p = 0.014; D*F –0.073, p = 0.079).
Three-way modification interactions
There was consistent weak to good evidence of a negative three-way interaction between effective comparators, multimodal feedback and patient voice across the primary outcome, intended enactment (A*B*E, –0.101; p = 0.072), intention to set goals (A*B*E, –0.121; p = 0.053) and to formulate an action plan (A*B*E, –0.137; p = 0.033). There was also good evidence of a positive three-way interaction between effective comparators, specific actions and cognitive load on the secondary outcome intention to formulate an action plan (A*C*F, 0.159; p = 0.015).
Owing to our fractional factorial design, three-way modification interactions were confounded such that the effect of A*B*E was confounded with C*D*F, and the effect of A*C*F was confounded with B*D*E (see Box 3). As a result, the identification of the interaction between effective comparators, multimodal feedback and patient voice (A*B*E) may reflect an interaction between the confounded modifications of specific actions, optional detail and cognitive load (C*D*F). Similarly, the identification of the interaction between effective comparators, specific actions and cognitive load (A*C*F) may reflect an interaction between the confounded modifications of multimodal feedback, optional detail and patient voice (B*D*E).
Sensitivity analysis
Sensitivity analysis used available complete data for the secondary modified ITT population to explore the consistency of findings across analysis populations for the primary outcome. Comparative Pareto plots for parameters in the full models for each population are provided in Appendix 6, Figure 39, and estimates for parameters in the ‘parsimonious’ models for each population are provided in Table 17.
| Parameter | Primary modified ITT population | Secondary modified ITT population | ||||
|---|---|---|---|---|---|---|
| Estimate | Standard error | p-value | Estimate | Standard error | p-value | |
| Intercept | 1.829 | 0.147 | < 0.001 | 1.898 | 0.110 | < 0.0001 |
| Block | 0.090 | 0.056 | 0.107 | 0.037 | 0.045 | 0.4108 |
| MINAP | –0.211 | 0.211 | 0.317 | –0.258 | 0.179 | 0.1496 |
| NCABT | –0.893 | 0.206 | < 0.001 | –1.004 | 0.168 | < 0.0001 |
| PICANet | 0.361 | 0.327 | 0.270 | 0.101 | 0.319 | 0.7514 |
| TARN | –0.003 | 0.220 | 0.989 | –0.120 | 0.189 | 0.5256 |
| Role: non-clinical | –0.867 | 0.200 | < 0.001 | –0.790 | 0.139 | < 0.0001 |
| A: effective comparators | –0.038 | 0.056 | 0.498 | 0.125 | 0.066 | 0.0604 |
| B: multimodal feedback | 0.018 | 0.073 | 0.807 | 0.049 | 0.064 | 0.4419 |
| C: specific actions | 0.082 | 0.056 | 0.141 | 0.033 | 0.045 | 0.4622 |
| D: optional detail | 0.017 | 0.074 | 0.816 | 0.059 | 0.045 | 0.1932 |
| E: patient voice | 0.078 | 0.055 | 0.161 | 0.073 | 0.045 | 0.1051 |
| F: cognitive load | 0.008 | 0.055 | 0.890 | –0.095 | 0.063 | 0.1352 |
| A*B | –0.011 | 0.055 | 0.844 | –0.004 | 0.045 | 0.9322 |
| A*D | – | – | – | 0.020 | 0.045 | 0.6562 |
| A*E | –0.014 | 0.056 | 0.798 | – | – | – |
| B*D | –0.112 | 0.056 | 0.047 | –0.089 | 0.045 | 0.0491 |
| B*E | 0.035 | 0.057 | 0.537 | – | – | – |
| C*F | 0.093 | 0.055 | 0.090 | 0.071 | 0.045 | 0.1143 |
| D*F | –0.093 | 0.055 | 0.089 | –0.097 | 0.045 | 0.0319 |
| Role*MINAP | 0.453 | 0.290 | 0.117 | 0.258 | 0.237 | 0.2779 |
| Role*NCABT | 1.312 | 0.518 | 0.011 | 1.207 | 0.439 | 0.0061 |
| Role*PICA | –0.783 | 0.532 | 0.141 | –0.627 | 0.511 | 0.2200 |
| Role*TARN | –0.017 | 0.331 | 0.959 | 0.054 | 0.277 | 0.8464 |
| A*MINAP | – | – | – | –0.074 | 0.116 | 0.5267 |
| A*NCABT | – | – | – | –0.246 | 0.139 | 0.0774 |
| A*PICA | – | – | – | –0.342 | 0.248 | 0.1693 |
| A*TARN | – | – | – | –0.302 | 0.135 | 0.0261 |
| B*Non-clinical | –0.196 | 0.113 | 0.083 | –0.151 | 0.091 | 0.0947 |
| D*Non-clinical | 0.195 | 0.114 | 0.087 | – | – | – |
| F*Non-clinical | – | – | – | 0.156 | 0.090 | 0.0833 |
| A*B*D | – | – | – | –0.088 | 0.045 | 0.0520 |
| A*B*E | –0.101 | 0.056 | 0.072 | – | – | – |
Intended enactment is dominated by the effects of audit and role to a greater degree in the secondary modified ITT population (see Figure 50) than in the primary modified ITT population (Appendix 6, Figure 39), resulting in little relative input of modifications and no clear point at which to distinguish important modification effects.
Nevertheless, the modifications with the greatest influence and good evidence of an effect (p < 0.05) (see Table 17) include effective comparators (modification A) by audit (see Figure 51); the interaction between optional detail and cognitive load (D*F; see Figure 52); effective comparators, multimodal feedback and optional detail (A*B*D); multimodal feedback and optional detail (B*D; see Figure 53); and multimodal feedback and cognitive load by role (B*Role, F*Role).
Analysis of the primary modified ITT population did not detect an effect for effective comparators (modification A); the interaction between effective comparators, multimodal feedback and optional detail (A*B*D); or cognitive load by role (F*Role). There was also only some evidence of an interaction between optional detail and cognitive load (D*F; p < 0.1), rather than the stronger effect detected in the secondary modified ITT population; however, the magnitude and direction of effect were similar and this difference was probably due to the increased power that the larger sample size provided.
Analysis of the primary modified ITT population detected effects for optional detail by role (D*Role), and an interaction between effective comparators, multimodal feedback and patient voice (A*B*E); however, these effects were not detected within the secondary modified ITT population. There was also only very limited evidence of an effect for the interaction between specific actions and cognitive load (C*F; p < 0.15) (see Figure 54) within the secondary modified ITT population.
Secondary outcome: user engagement
User engagement measured through the length of time (in seconds) spent working through and the number of ‘clicks’ on the audit report excerpt showed a variable but skewed distribution across modifications and audits (Figure 28 and Appendix 7, Figure 55). Median time spent on the audit tended to be higher when each of the modifications were on, with the exception of reduced cognitive load. The greatest distinction in the number of clicks on the audit report was seen for the provision of optional detail with a greater number of clicks observed when this modification was ON than when it was OFF.
FIGURE 28.
Boxplot of user engagement – time on audit report – by (a) modification and (b) audit. Fourteen extreme outliers are not displayed.
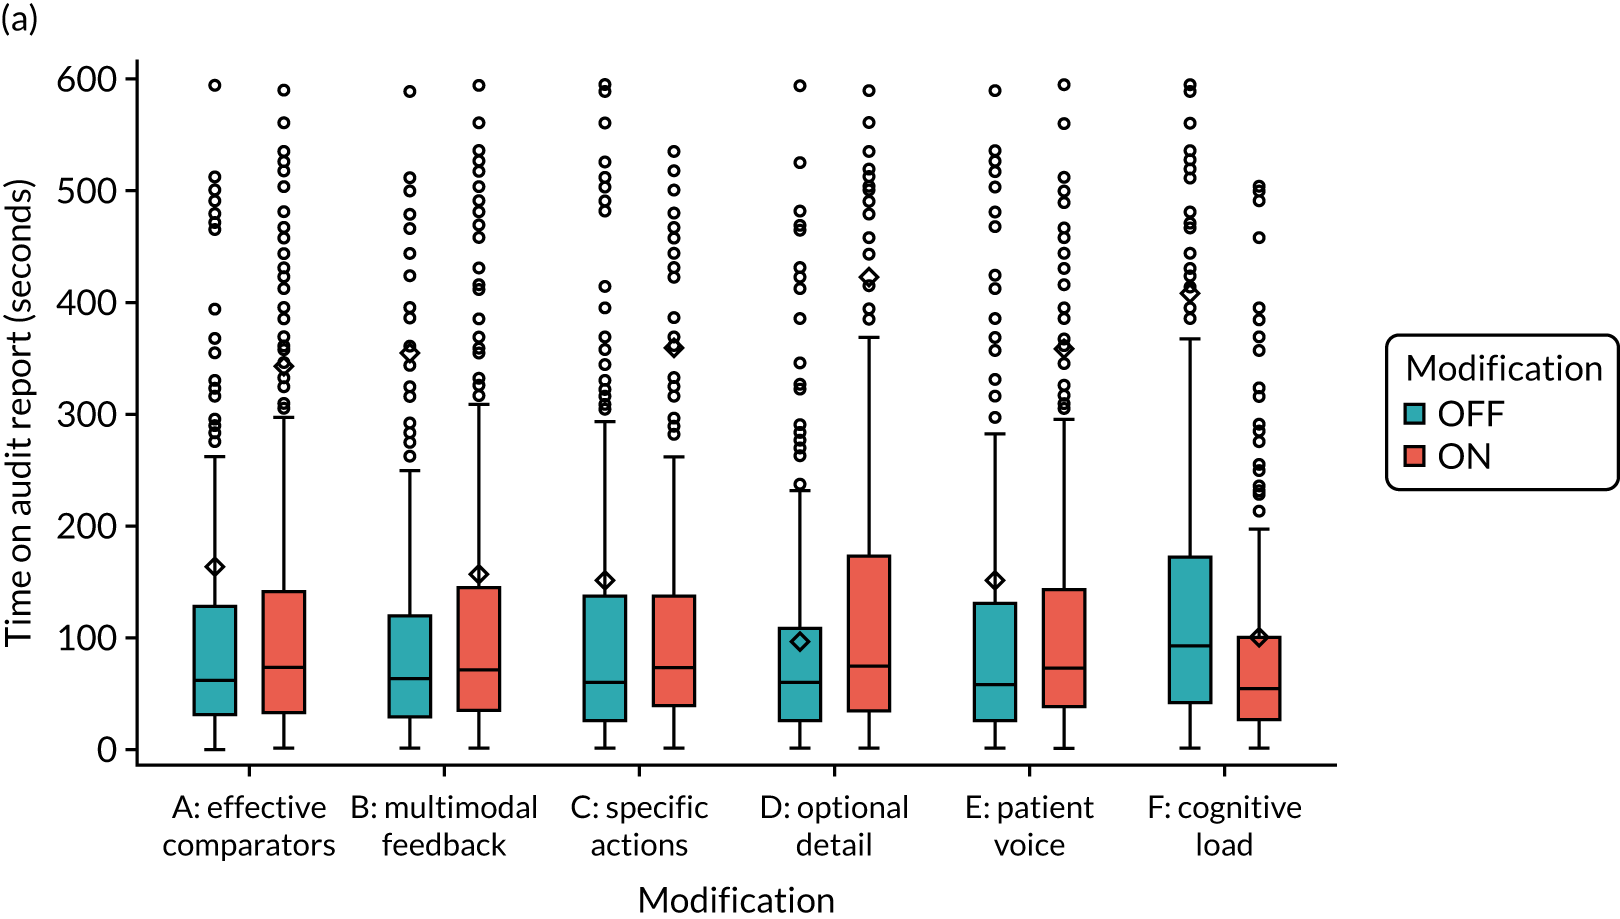
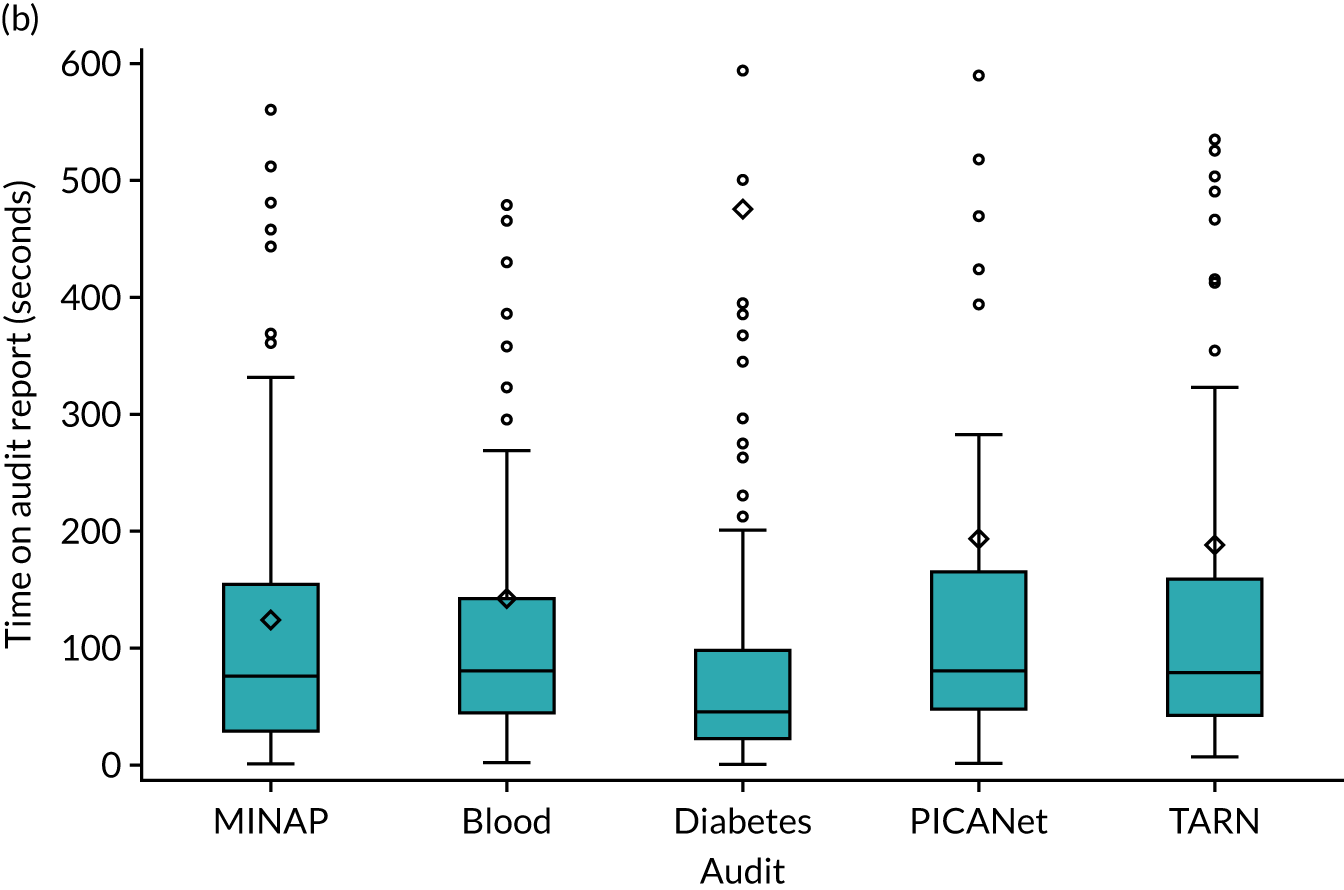
Discussion
This online experiment found that none of six feedback modifications independently increased the primary outcome of intended enactment to meet audit standards across clinical and non-clinical recipients of five NCAs. We did, however, observe both synergistic and antagonistic effects when modifications to feedback were combined across all outcomes, including the primary outcome and secondary outcomes of proximal intention, comprehension and user experience.
The magnitude of dependent effects of each modification on outcomes was generally small, but their combined cumulative effect, across all possible modification combinations and versions of feedback, show more substantial heterogeneity and greater effect on outcome. For example the main effects of modifications on the primary outcome, predicted intended enactment (on a scale of –3 to +3), were all of magnitude < 0.1 with no evidence of a statistically significant effect (see Table 15). In contrast, the most effective combination of modifications on the primary outcome resulted in predicted intended enactment of 2.40 (95% CI 1.88 to 2.93), compared with 1.22 (95% CI 0.72 to 1.72) for the least effective combination in clinical participants in the NDA, representing over a 10-fold increase in effect size (see Table 16). Furthermore, the relative magnitude of predicted intention across all possible modification combinations demonstrates the dependent effects of modifications. Intended enactment for clinical participants was optimised when multimodal feedback, specific actions and patient voice were provided while also reducing cognitive load; whereas including multimodal feedback while also reducing cognitive load led to the lowest intention when optional details were also provided.
Specific findings of synergistic and antagonistic effects may be particularly useful for NCA programmes. For example, given that recipients spend relatively brief periods assessing feedback, it is notable that minimising cognitive load was effective when optional detail was excluded (effectively further reducing cognitive load), improving intended enactment, intention to review performance and ease of understanding. Minimising cognitive load also improved intention to bring audit findings to colleagues’ attention when accompanied by multimodal feedback; whereas minimising cognitive load improved intention to review performance when multimodal feedback was excluded.
In addition to the effects of modifications, we found that the NCA programme itself and whether or not recipients had a clinical role had a dominant influence on recipients’ intended enactment and proximal intention. Participation in the NCABT was associated with lower intended enactment of audit standards relative to the NDA, as was having a non-clinical role, with the exception of non-clinical participants from the NCABT.
Interpretation
There is accumulated evidence that different ways of providing feedback can change clinical practice. 11 There are many potential modifications to feedback and ways of combining them, and a limited understanding of how to optimise these. Our online screening experiment was designed to understand how modifications work, both overall and in combination, to robustly and efficiently identify optimal combinations of modifications that may have the most promising effects when subsequently applied to ‘real-world’ practice.
We found that the factors with the greatest influence on intended enactment of audit standards were audit and role (see Figures 16 and 18). The reasons for variations in intention by audit are not immediately apparent, but may be indicative of differences in audit and specialty engagement with the audit programmes. For example, there was a trend towards higher intended enactment in PICANet; this is a highly specialised audit with a relatively small number of participating sites and may, therefore, be a more cohesive, engaged and responsive network than other national audits. With the exceptions of MINAP and NCABT, intended enactment was generally higher for clinical than managerial, audit or administrative roles. This may be expected given that clinicians often have more direct influence over achievement of audit standards and this is consistent with one of the hypotheses from CP-FIT: that feedback recipients will act on goals perceived as relevant to their jobs. 27
We observed synergistic and antagonistic effects of different combinations of feedback modifications and participant roles. Some of these interactions may have intuitive explanations. For example, both providing optional detail and multimodal feedback entail giving additional information to audit recipients and, consequently, combining them means that their overlapping functions led to the result (intended enactment) being less than the sum of their parts (i.e. an antagonistic interaction). We found similar, if weaker, evidence for an antagonistic interaction between optional detail and cognitive load; in this case, providing optional detail might be expected to counter any benefits of reduced cognitive load given that additional information might have distracted participants. We also found weak evidence of a synergistic interaction between recommending specific actions and reducing cognitive load; both of these may have worked together and focused participants to act on audit standards. However, other interactions were difficult to explain and sometimes counterintuitive, such as both synergistic and antagonistic interactions between multimodal feedback and cognitive load for different outcomes, audits and roles.
Such a range of findings reflect the exploratory nature of this screening experiment, which aimed to detect the most promising signals of effects. It is notable that we did not find evidence supporting several hypotheses concerning the effects of single feedback modifications on recipient intentions, as predicted by the theoretical literature. 19,27 We were, uniquely, able to explore interactions between modifications and demonstrate the interdependence of feedback hypotheses. Considering potential real-world application, we would base our advice on interactions with the strongest evidence (reflected in Implications for practice).
We interpret these findings further, considering (1) design of the online feedback modifications, (2) participant engagement with the online feedback modifications and (3) sensitivity and ceiling effects of intended enactment and proximal intention.
First, we prioritised and deliberately selected feedback modifications that would be relatively amenable to online experimentation and could be operationalised with sufficient fidelity to the original 15 suggestions for effective feedback. 19 Modifications were developed through UCD to understand user preferences and comprehension. We presented the feedback modifications within credible, if hypothetical, excerpts of audit reports. Nevertheless, where anticipated modification effects were not detected, we must consider whether or not the online feedback modifications were optimised to deliver a sufficient ‘dose’ to bring about changes in recipient responses and use these findings to pinpoint where additional work is needed to ‘enhance’ modifications. One case in point is multimodal feedback; although the Cochrane review11 indicated that feedback may be more effective when it combines both written and verbal communication, we were able to operationalise this modification only by adding graphical information to textual information. Another is that specific actions did not feature among the most dominant effects on intentions to set goals, as may have been expected.
Second, considering participant engagement, we noted that 11.3% of participants (most commonly managers) dropped out of the experiment prior to questionnaire completion. This suggests a modest degree of self-selection, so that those who completed the experiment may have perceived it as more relevant to their roles than those who did not. Most of our feedback modifications were designed with an assumption that limited exposures could influence responses (e.g. use of different comparators, recommending specific actions). We had originally estimated a completion time of 20–25 minutes for the audit excerpt and survey; participants in the primary analysis spent a much lower median time of < 5 minutes on the experiment. Specifically, they spent a median of 66.5 seconds (IQR 31–136 seconds) on the audit report excerpt, with NDA participants (mostly general practice staff) spending just over half as long as all others on the audit report (see Table 32). Although these short durations reflect only limited engagement, it is not known how long feedback recipients would typically spend examining feedback in actual practice settings; it may still be relatively brief given competing pressures on attention. Therefore, this aspect of our experiment may still have reasonable external validity, especially given that much NCA feedback is already presented online or sent electronically.
Third, we set out to design a screening experiment that would be relatively sensitive in detecting changes in proximal outcomes of behaviour change, primarily intended enactment of audit standards. We would expect some attenuation of any effect on intended enactment when the feedback modifications are applied in ‘real-world’ practice, largely because of many post-intentional influences on practice (e.g. time and resource constraints). Further considering possible ceiling effects, we had anticipated that the primary and secondary outcomes measuring intentions would exhibit skew towards higher intention, partly because of social desirability bias (i.e. participants would be reluctant to state that they did not want to perform recommended practice). We therefore attempted to neutralise some of this bias by offering statements that recognised that participants would have competing priorities in normal practice. However, our intention measures were still generally skewed towards higher intentions, which imposed a ceiling effect on our ability to detect change.
Comparison with existing literature
We briefly compare our methods and findings with those of similar studies modelling interventions to change professional practice. Three have assessed feedback interventions. In the first, a factorial trial, Bonetti et al. 35 randomised GPs twice to receive or not receive A&F and educational reminder messages regarding ordering of lumbar spine X-rays. Both paper-based interventions changed simulated behaviour (responses to vignettes), but not behavioural intention. The effect of A&F on simulated behaviour was mediated through perceived behavioural control. This finding is noteworthy given that we found the role of the recipient was associated with intended enactment; clinicians may have considered that they had greater control over their ability to implement audit standards than those in other roles. In the second study, Gude et al. 95 conducted an online before–after study with intensive care staff to assess the effect of feedback on intentions to change pain management across a set of indicators. Intentions to improve practice, consistent with actual gaps in performance, improved modestly following feedback. In the third study, Gude et al. 96 conducted an online before–after study to assess whether or not feedback changed intentions of cardiac rehabilitation staff to adhere to performance indicators. Intention outcomes were assessed according to whether or not an indicator was selected for improvement. Lower performance at baseline was associated with greater intentions to change practice after feedback.
Two further studies modelled different interventions targeting professional behaviour. Eccles et al. 36 randomised older people’s mental health teams to one of three paper-based interventions incorporating persuasive messaging to promote the disclosure of a diagnosis of dementia or to no intervention (control). 36 There were no significant differences in intention or simulated behaviour between the trial groups. Explanations considered for this null finding included that the paper-based self-administered nature of the intervention was not ‘potent’ enough and ceiling effects on intention. Bonetti et al. 70 randomised dentists to a paper-based intervention, rehearsing alternative actions, to change intention to implement evidence-based practice for third molar management or to no intervention (control). 70 This intervention significantly influenced intention to extract third molars in line with recommended practice.
Together, these studies found variable effects of simulated interventions on professionals’ behavioural intentions. These variable effects may, in part, reflect differences in how intentions were assessed.
Strengths and limitations
We have conducted a unique experiment in collaboration with five NCA programmes. Our fractional factorial randomised design increased confidence in the internal validity of our findings and allowed evaluation of a set of feedback modifications, in terms of both their individual average effects and in combination by exploring interactions.
The five NCAs provided diversity in audit methods, topics and targeted audiences, thereby increasing confidence that our findings are relevant to a wider range of clinical audits.
We were able to efficiently and simultaneously investigate the effects of six different modifications using a well-powered randomised design. Our primary and secondary analysis populations exceeded our sample size requirements of 500 participants, providing > 90% power to detect small to moderate main and interaction effects for each modification.
Our fractional factorial design enabled us to provide direct information on which modifications provide an active effect and whether or not there was any interaction between modifications, providing the gold-standard approach for developing multicomponent interventions. 78 Indeed, we identified multiple synergistic and antagonistic effects between modifications, which would not have been feasible within the standard parallel-designs framework for each modification or even particular combinations of modifications.
We highlight three limitations. First, as we have emphasised earlier, this was a screening experiment using proxy outcomes theorised to influence actual clinical behaviour. We have, therefore, identified feedback modifications and combinations of modifications worthy of further real-world evaluation in pragmatic trials before findings can directly inform widespread adoption in NCA programmes. However, our findings suggest that there are some practical considerations for the design and delivery of A&F programmes.
Second, we evaluated the effects of the feedback modifications on different audit standards across the five NCAs. These audit standards may have been of varying quality and familiarity with audit teams. We could not separate the effects of feedback modifications related to the audit standards chosen for the experiment from wider differences in the national audits and their participants. The levels of agreement with outcome statements related to audit standards and the distribution of agreement may have varied across outcomes according to the level of commitment or effort required to achieve each target audit standard. Indeed, outcomes related to audit standards and intention varied considerably by audit and role, whereas comprehension and user experience did not.
Third, the integrity of the experiment was threatened by a significant number of duplicative responses by a single participant. As a consequence of designing our experiment to maintain participant anonymity of responses, we were unable to identify the duplicative participant within the experiment data. We therefore minimised the impact that duplicative responses had by removing all 603 (49%) participants who took part during the contamination period to ensure that only genuine, independent responses were included in the primary analysis. This approach simultaneously discarded unidentifiable genuine responses, representing a waste of research resources and participant time.
We conducted sensitivity analysis on a secondary modified sample, excluding only participants who spent < 20 seconds completing the experiment questionnaire. This resulted in far fewer exclusions (280, 23%) and a greater proportion of participants included from general practice. Sensitivity analysis of the primary outcome largely supported the modification effects identified; however, additional effects not detected in the primary analysis were identified, in part due to the increased sample size but also due to differences in participants and responses between the populations.
Implications for practice
Our findings have some general and specific implications for the design and delivery of NCAs. In general, although the six feedback modifications we evaluated did not improve intended enactment of audit standards in isolation, they did all have effects on a range of intended actions, comprehension and user experience. Indeed, the relative magnitude of predicted intention across possible combinations of modifications demonstrates interdependent effects of the modifications. For example, predicted intention in clinical participants was both optimised and reduced when multimodal feedback was provided and cognitive load reduced owing to the inclusion and exclusion of other modifications working with and against these two modifications.
Our results need to be contextualised in the wider theoretical and empirical literature on A&F,11,19 and indicate the need for careful consideration before adopting widespread changes. For example, we observed both synergistic and antagonistic effects when a number of modifications to feedback were combined. This suggests that NCA programmes need to explicitly consider how different features of their feedback are likely to act together.
Partly because of the nature of the online experiment, the modifications we examined are unlikely to require major resources for them to be implemented in NCA programmes. Most audit leads may wish to user-test any feedback changes prior to national roll out and this would probably be the main implementation cost.
We observed differences between national audits in intended enactment of the audit standards used in the experiment. Although we cannot specify which aspects of the audit standards, audit organisation or targeted recipients account for these variations, our findings suggest that NCA programmes should explicitly review the strengths and weaknesses in their whole audit cycles to identify priorities for change. 27 We also found that clinical recipients were more likely to report higher intended enactment of audit standards than managers, administrative and audit staff; we acknowledge that national audits may already face considerable challenges in ensuring that feedback is disseminated to those who are most likely to be able to act on it. 26
We make some specific suggestions based on modification effects supported by good or consistent evidence for the combined analysis of five audits:
-
Using a comparator aiming to reinforce desired behaviour change (effective comparators), which shows recipient performance against the top quarter of performers rather than a comparison against overall mean performance, may reduce how easily recipients understand the audit report and their overall user experience unless accompanied by short, actionable messages with progressive disclosure of additional information (optional detail).
-
Combining optional detail and a quotation and photograph from a fictional patient describing their experience of care related to the associated audit standard (patient voice) may improve recipient experience.
-
Combining multimodal feedback with optional detail may reduce intentions to implement audit standards and set goals, and reduce comprehension and recipient experience.
-
Many recipients may invest a relatively brief time in digesting feedback. Minimising cognitive load, by removing distracting detail and additional general text not directly related to the audit standard and feedback, may improve comprehension and, especially when combined with multimodal feedback, intention to bring the audit report to the attention of colleagues.
-
The variations in effects by national audit programme suggest that such programmes can learn from one another in comparing how they design and deliver both audit and feedback methods.
Implications for research
Online screening experiments have an appeal in their potential to identify promising intervention components with relative efficiency prior to scaled-up definitive evaluations. We highlight one theoretical and one practical lesson respectively from our experience.
First, it is worth considering whether or not intention is the most appropriate primary outcome to use in screening experiments of A&F. CP-FIT hypothesises that a number of other factors both upstream and downstream to intention affect the ability of A&F to change clinical behaviour. 27 Upstream influences include interactions with and perceptions and verifications of feedback data. We found that reducing cognitive load improved comprehension of data and increased the self-reported intention to bring audit findings to the attention of colleagues when accompanied by multimodal feedback. Therefore, any future experiments could use a wider range of outcomes that reflect different aspects of the whole audit cycle. 27
Second, we have documented the protocol violations, contamination period and measures to protect study integrity (Appendix 4). We offer some practical suggestions to reduce the risk of deliberate or inadvertent duplicated participation in online experiments offering incentives:
-
Consider what is essential to meet ethical safeguards and data protection and whether or not there is a strong reason to remove linkage of personal and (non-sensitive) study data.
-
Assess the balance between study security and ease of participation. Requesting limited personal information, such as e-mail addresses, at study entry may not have an obvious effect on response rates.
-
Attempt to visualise problematic scenarios. Only one individual is necessary to exploit an existing vulnerability. Consider study vulnerabilities and how they might be exploited. Consider whether or not and how it would be possible to identify and exclude suspect data with confidence if a problem arose.
-
Regularly monitor aspects of collected data. Simple checking of recruitment totals may mask problems until it is too late.
-
Unless there is high confidence in study security, use manual rather than automated delivery of incentives.
-
Ensure that at least one person can access study systems and extract detailed monitoring data. Rapid responses can be critical in damage limitation.
Summary
Overall, although we recognise the limitations of our online experiment, we have demonstrated that it is feasible to conduct a large-scale study across different audit programmes and health-care settings. Doing so at scale allows the efficient evaluation of multiple features of feedback interventions, including the critical detection of synergistic and antagonistic effects. Our demonstration and lessons learned should therefore be of interest to the wider, international research community.
Chapter 4 A theory-guided evaluation of two national clinical audit programmes (objective 2)
Parts of this chapter are reproduced or adapted with permission from Willis et al. 97 This is an Open Access article distributed in accordance with the terms of the Creative Commons Attribution (CC BY 4.0) license, which permits others to distribute, remix, adapt and build upon this work, for commercial use, provided the original work is properly cited. See: https://creativecommons.org/licenses/by/4.0/. The text below includes minor additions and formatting changes to the original text.
Background
Our screening experiment allowed us to manipulate and assess the effects of six modifications to feedback simultaneously, in controlled conditions. This was an efficient way of gathering evidence about which interventions may be most promising in real-world conditions. However, only selected suggestions for effective feedback19 could be feasibly operationalised and tested in an online experiment (e.g. provide multiple instances of feedback).
We set out to explore how two NCAs were delivered, received and acted on by health-care organisations. We focused particularly on modifications being introduced by both audit programmes, drawing on a comprehensive theory of feedback (CP-FIT). 27 We had originally planned this investigation within NHS settings, interviewing and observing clinicians and decision-makers. The advent of COVID-19 meant that this was no longer possible and we, therefore, changed our design to work within pandemic constraints.
Methods
Original study design
We had planned a qualitative case study of four localities, with two purposively selected sites for each audit. We had intended to maximise diversity by recruiting sites on the basis of previously documented high and low performance in relation to audit criteria. Performance was selected as a sampling criterion because feedback may be more effective when baseline performance is low. 11
Data collection was to follow the trail from the receipt of feedback data through to any actions taken to improve clinical care over a 6-month period. We would have collected data through interviews, meeting observation and document review in the four localities, interviewing clinicians, managers, board members and lead commissioners (nine interviews per locality; 36 interviews in total).
Through discussions with our partner NCA programmes from objective 1, we became aware that two were in the process of introducing changes to their feedback delivery. Both changes aligned with suggestions for effective feedback:19
-
The NDA was increasing the frequency of data sharing with recipients. Its annual report was to be supplemented by quarterly data releases, a change that met the suggestion to provide feedback as soon as possible, particularly for outcomes with many patient cases (i.e. suggestion 5 in Box 1). We had been unable to operationalise this suggestion for effective feedback in our online experiment.
-
TARN had developed a new tool, ‘TARN Analytics’. It allowed feedback recipients to examine data in greater depth and ‘drill down’ beyond the headline messages. This aligned with the suggestion that key feedback messages are supported by optional detail to enhance credibility (suggestion 12 in Box 1).
Clinical Performance Feedback Intervention Theory
Clinical Performance Feedback Intervention Theory (Figure 29) resulted from a metasynthesis of qualitative studies of A&F interventions. 27 The model builds upon 30 existing theories and frameworks of behaviour change, including feedback intervention theory,98 the Capability, Opportunity, Motivation and Behaviour (COM–B) model,99 and the Consolidated Framework for Implementation Research. 100 It proposes that effective A&F is a cyclical process consisting of goal setting and audit, feedback message production, perception and acceptance of feedback message, recipient desire and intention to respond, action (at both individual and organisational levels) and, ultimately, quality improvement. The cycle will be weakened, and progress halted, if any individual process fails.
FIGURE 29.
Clinical Performance Feedback Intervention Theory. The diagram presents the theory’s variables and explanatory mechanisms, and their influence on the feedback cycle. Reproduced with permission from Brown et al. 27 This is an Open Access article distributed in accordance with the terms of the Creative Commons Attribution (CC BY 4.0) license, which permits others to distribute, remix, adapt and build upon this work, for commercial use, provided the original work is properly cited. See: https://creativecommons.org/licenses/by/4.0/. The figure below includes minor additions and formatting changes to the original figure.
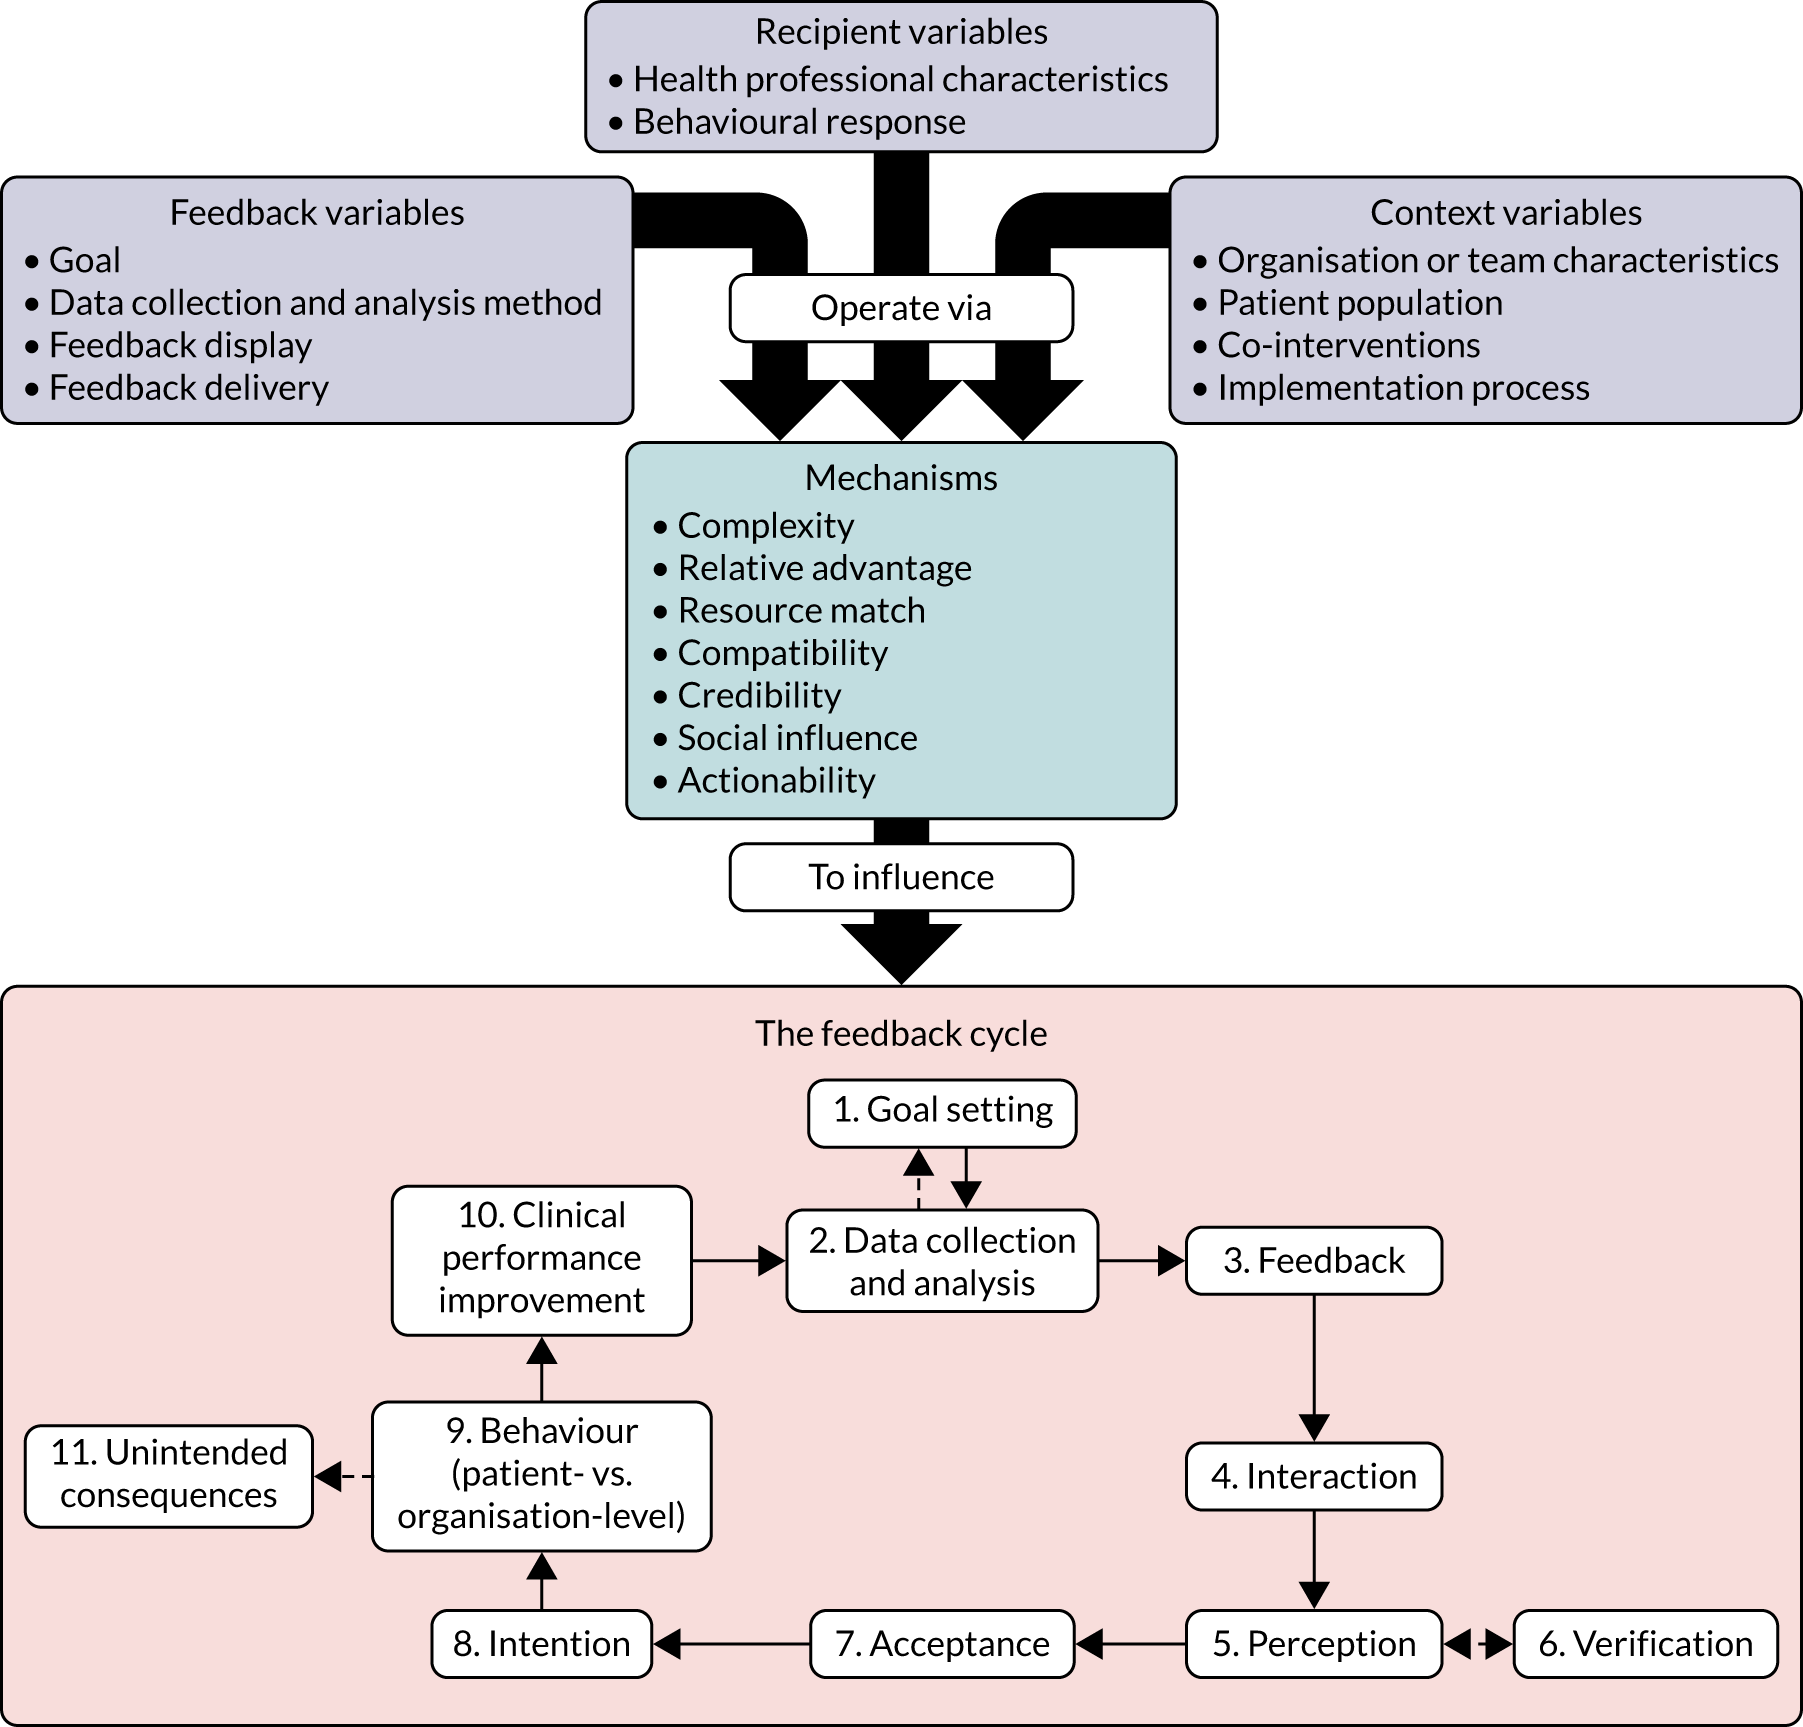
The authors offer 42 ‘high-confidence hypotheses’ based on the theory. These illustrate how CP-FIT variables and explanatory mechanisms influence the feedback cycle. These are all in the format of ‘Feedback interventions are more effective when . . .’. For example, for the variable, ‘importance’, the hypothesis is ‘. . . they focus on goals recipients believe to be meaningful and often do not happen in practice’.
Revised study
We halted the planned study in March 2020 following the emergence of the COVID-19 pandemic and the cessation of non-essential research in NHS settings. Consequently, we successfully adjusted our design to ensure that it could proceed with minimum disruption to the wider programme. Our revised study avoided any burden on the NHS and fully exploited the collective knowledge and experience of our project team and extended network of advisors and stakeholders. The audits, their modifications and the extent of their alignment with CP-FIT would all remain core elements of our study.
The revised study allowed us to partly address our original objective and make a contribution to the field. First, our revised sample incorporated a wider range of perspectives, reducing clinical and commissioning contributions by necessity and bringing different knowledge, experience and perspectives of A&F researchers, patient and public representatives, and clinicians with experience of managing and receiving audit in other clinical fields. Second, we delivered an innovative, rapid method of evaluating feedback against a comprehensive, integrated theory (CP-FIT).
We applied CP-FIT to identify strong and weak points in the A&F cycles for both the NDA and TARN and how those may be addressed by their intended innovations. Thus, we aimed to highlight good practice and identify evidence-based suggestions on how each audit could enhance its impact.
Design
This was a rapid, theory-informed interview study.
Participants
We invited our co-investigators, Project Steering Group members, PPI panel members, reference panel members (from objective 1) and selected nominees from TARN and the NDA to participate. We aimed for a sample of around 20 individuals, seeking representation across the various roles and backgrounds available.
Interview procedure
We sent participants a table of the CP-FIT feedback cycle processes prior to the discussion (Appendix 9). This was to improve familiarity with the theory, help to concentrate attention on specific feedback processes and frame discussion. We provided a question for each process to aid participant interpretation and understanding (e.g. for verification, the question was ‘Can the recipient interrogate the data?’).
Interviews lasted approximately 30–45 minutes and were conducted remotely. We structured our topic guide around CP-FIT and the individual processes of the feedback cycle. Some interviews covered the entire cycle, whereas others focused on specific processes, depending on interviewee experience and preferences. Where appropriate, follow-up questions were used to clarify understanding.
The first interviews were with audit managers from the NDA and TARN. These established understanding of how the audits worked, recent changes made and their reflections on the feedback cycles for their audit programmes. Their responses helped us to develop short summaries of both audits (Appendix 10) for subsequent participants who did not already possess a detailed knowledge of these audits.
We invited participants to discuss one or both of the audits, and to raise any issues related to the audit cycle that particularly interested them or that they wanted to discuss after reading the summaries. We also prompted participants on aspects of the audit cycle that had not been covered in other interviews. We were open to other findings that did not fit within the theory and disconfirming cases. Participants were given opportunities to indicate issues that did not clearly fall within CP-FIT. For instance, we asked ‘If you could change one thing about this audit, what would it be?’ or ‘Is there anything that you wish to discuss that has not been covered by the cycle?’. Interviews were audio-recorded and transcribed verbatim.
Analysis
We completed a rapid, structured content analysis of transcripts against CP-FIT. Rapid approaches to qualitative analysis are gaining recognition as a valid methodology within limited time frames and have been applied to other contexts. Comparative studies suggest that rapid analysis techniques can generate similar findings to more in-depth approaches, as well as provide actionable recommendations required in applied settings. 101–103 Using CP-FIT to structure the interviews meant that we explored individual feedback cycle processes with participants. Individual interviews were examined (by SWo and TAW) to ascertain whether or not the CP-FIT processes were achieved by the audits. Using Microsoft Excel®, we created a matrix for each of the two audits. These were populated with summaries of participants’ comments that mapped to each of the CP-FIT feedback cycle processes. Each matrix was divided into two sections, with one half including positive comments and the other detailing potential weaknesses and failed processes. Where appropriate, and to enhance meaning and understanding, illustrative quotations were extracted. To check reliability of coding and interpretation, Su Wood and Thomas A Willis began by independently coding two interviews, one focusing on the NDA and one on TARN. They checked that both had generated similar summaries and that these summaries had been mapped to the same CP-FIT cycle process. Following discussion, two further transcripts were coded independently and compared. Differences were resolved by discussion. The remaining transcripts were coded independently.
Results
We completed 18 interviews (one involved two people; thus, there were 19 participants) using our amended approach and present participant information in Table 18.
| Participant characteristics | n | Audit discussed | |
|---|---|---|---|
| NDA | TARN | ||
| Role | |||
| A&F researcher | 4 | 2 | 4 |
| A&F researcher and GP | 3 | 3 | 1 |
| Audit provider | 3 | 1 | 2 |
| Patient and public representative | 4 | 3 | 2 |
| Hospital consultant | 2 | 2 | 2 |
| Hospital consultant and audit lead | 2 | 1 | 1 |
| Major trauma network manager | 1 | – | 1 |
| Totala | 19 | 12 | 13 |
| Location of participant | |||
| Canada | 1 | ||
| England | 17 | ||
| Scotland | 1 | ||
| Sexb | |||
| Male | 11 | ||
| Female | 8 | ||
We have used the cycle as a loose structure to present our results; in some areas there is overlap between processes. We present the results first for the NDA, and then for TARN. The questions that we developed to aid reader understanding are provided for each process.
National Diabetes Audit
Goal setting (Are the standards of clinical performance clear?)
The NDA core audit is well established, and the clinical indicators it presents are of recognised public health importance. This relates to two of the high-confidence hypotheses arising from CP-FIT. Specifically, feedback interventions are more effective when they focus on goals that recipients (1) believe to be meaningful and (2) perceive as relevant to their role. A participant with leadership responsibility at another audit described his satisfaction at how his audit had worked to successfully ‘unify the measurement conversation’ (D9, hospital consultant and national audit lead). This referred to establishing consensus around the indicators used and their acceptance by that particular audit community. Such acceptance is an important foundation of any clinical audit and the NDA’s clear, evidence-based criteria were considered a real strength.
However, an associated weakness was that the inclusion of several of the same or similar diabetes indicators within the Quality and Outcomes Framework (QOF)104 undermined much of the need for the NDA. Some interviewees, typically those with experience of primary care, highlighted this overlap. For example, general practices can already access information on their achievement of the nine diabetes processes of care via their electronic health record systems (and, notably, these data are also available in real-time). Moreover, the fact that targets specified by NICE and QOF are not always in alignment can lead to confusion in practitioners and a tendency to aim for the target considered to be of greater importance, which is likely to be QOF, as achievement has financial implications for the practice:
I think it also competes with QOF . . . people tend to use QOF achievement more as their goals for treatment than necessarily using the audit because they don’t tend to see it and also in a way might duplicate some of the information that they are getting off them.
D17, A&F researcher and GP
Data collection and analysis (Who does the data collection?)
An important characteristic of the NDA is that the data collection process is automated and places no demands on practice staff in data collection or analysis. This relates to two of the high-confidence hypotheses arising from CP-FIT, that is that feedback interventions are more effective when they (1) do not require the recipient to collect or analyse the clinical performance data and (2) collect and analyse data automatically rather than manually. Other NCAs place greater demands on individuals and teams in terms of collecting, checking and submitting required data. Data collection and analysis that is performed manually or by the recipients themselves is often hindered by a lack of time or skills. 27
When developing CP-FIT, Brown et al. 27 identified seven explanatory mechanisms through which feedback, recipient and context variables influenced the feedback cycle. One of these, complexity, concerns how straightforward it was to undertake each feedback cycle process. In essence, the simpler a process, the more likely it is to be successfully completed. The NDA’s automated data collection reduces complexity and facilitates completion of this feedback cycle process.
‘Ownership’ is potentially relevant here. This refers to a sense that individuals are intrinsically motivated to engage with an intervention and do not feel that it has been imposed on them. The associated CP-FIT hypothesis states that feedback interventions are more effective when recipients feel that they ‘own’ them. 27 This may be considered to be in conflict with the automation hypothesis (i.e. greater involvement in the preparation and submission of data may be expected to promote a sense of engagement and ownership). Although automation reduces complexity and saves clinician resources, it may also detract from ownership.
Feedback (What feedback is communicated?)
Our interviews particularly focused on the NDA’s recent introduction of a quarterly data release. Current best evidence suggests that increasing the frequency of feedback is likely to make it more effective. 19 Our interview with a member of the NDA management team revealed that the change had been introduced partly in response to users’ request that they not wait so long for performance data. This is consistent with the CP-FIT hypothesis: feedback interventions are more effective when they use recent data to calculate recipients’ current performance. Use of recent data may increase acceptance, intention and behaviour because recipients are not being presented with events that are long past.
Participants from all backgrounds endorsed this initiative. For example, more frequent data will ‘help people to get on top of their data’ (D9, hospital consultant and audit lead), and:
More frequent feedback is good as lots can change in a year and you wouldn’t know if you were improving.
D17, A&F researcher and GP
Owing in part to delays around their preparation and sign-off from stakeholders, annual audit reports often contain data that may be 18 months old. The ability to access more recent data may result in poor performance being identified and acted on more quickly. Similarly, the impact of new improvement initiatives may also be detected more promptly. One of our PPI representatives identified this ability for an audit to be ‘reactive’ as an important feature (D14, PPI representative and retired national audit developer).
Another participant was more cautious, however, noting that increased frequency is not necessarily beneficial (D18, A&F researcher). The impact it has depends on the number of patients included in the feedback and time taken for any change to occur. It may also cause ‘alert fatigue’. Although there is good evidence for the importance of feedback being timely (i.e. using recent data), optimal frequency is less clear. 27
There was praise for two other aspects of the feedback: presenting data at the level of practice teams and making it publicly available. However, it is interesting that, although these elements were viewed positively by participants, they are not necessarily compatible with CP-FIT and conducive to effective feedback. First, one of the CP-FIT hypotheses concerns ‘specificity’: feedback interventions are more effective when they report the performance of individual health professionals rather than that of their wider team or organisation. Nevertheless, the fact that the NDA presents performance at the practice (team) level was considered to be appropriate, as diabetes care is typically the responsibility not of individuals but of several team members. Second, the CP-FIT review noted that sharing feedback with the public often drew negative reactions from health professionals, with little evidence of having an impact on clinical performance. The review cited one study suggesting that external reporting might be considered punitive if data are shared without first allowing the opportunity for action. 105 To our participants, however, and particularly the PPI representatives, the fact that the data were publicly accessible was welcomed, as patients may be interested in the performance of their practice.
Interviewees noted that recommendations on how to improve accompanying feedback may enhance effectiveness. Action planning and problem solving are thought to facilitate intention and behaviour by increasing actionability (a key explanatory mechanism in CP-FIT): the ease with which feedback recipients can take action in response to feedback, and consequently how directly that action influences patient care. 27 They may also serve to reduce complexity, by providing clear guidance to recipients and helping to reduce the effort required on their part in having to identify solutions. Two CP-FIT hypotheses specifically address this: feedback interventions are more effective when (1) they help recipients identify and develop solutions to reasons for suboptimal performance (problem solving) and (2) they provide solutions to suboptimal performance (action planning). The lack of any such recommendations may, therefore, undermine any potential gains resulting from more frequent data release [for further details see Intention (does the feedback elicit a planned response?) and Behaviour (is the behavioural response at patient or organisation level?)]:
If there’s a deficit, is it communicated with a sense of purpose, with a set of recommendations for action . . . and what we should prioritise . . . these are the areas that need most improvement?
D2, A&F researcher and GP
Interaction (How is the feedback received?)
The NDA circulates information and links to new publications to a distribution list of primary care contacts within England and Wales. This can be considered an example of ‘pushing’ feedback to the target audience; it helps to reduce complexity and facilitate progress through the cycle. However, even with this ‘push’, the feedback may not necessarily reach its intended audience. Our participants with primary care experience said that they had little awareness of the NDA and the reports were not discussed among their practice teams. Feedback from the NDA has to compete against other priorities for attention in primary care. One interviewee recognised that it would require considerable resources and a ‘sales job’ to raise the audit’s profile within primary care:
As a recipient, I think that’s probably been one of the key issues is that I’ve just not looked at it very much because it’s not really been pushed in my face or kind of promoted.
D16, A&F researcher and GP
Nevertheless, it was apparent from our interviews that the audit is not as widely known among its target audience as might be hoped. Efforts to promote the audit and engage the primary care community may prove beneficial. This would appear to highlight a critical flaw and a potential break in the feedback cycle: if the audit is having difficulty reaching its intended audience, then its content and messages will not be received and cannot be acted on:
It’s not just a matter of having the data and having it good quality, and giving it to the practitioners, you have to do more than that in order to get them to use it.
D18, A&F researcher
Perception (How is the feedback understood?)
Aside from the obstacle of target recipients not receiving the information, several interviewees were emphatic about what they considered to be the main flaw of the data release: the presentation of the data itself. This was described as ‘very dense’ (D7, hospital consultant), ‘overwhelming’ (D11, audit and feedback researcher) and ‘really quite dysfunctional and unappealing’ (D9, hospital consultant).
The quarterly data release is not the same as the full, annual report, which contains a range of visualisations and headline messages. Nevertheless, interviewees consistently observed that the data were practically impenetrable on first look, and few users would have the time or willingness to extract what was personally relevant for them:
[Quarterly data] is useful as long as it is decipherable data. If you are just sent a massive spreadsheet that you don’t read, it doesn’t really matter whether it is quarterly or annually, it’s still not going to be read.
D7, hospital consultant
One interviewee considered the cognitive effort necessary to progress from the data sheet to improved patient care:
They have to do a lot of work in order to take their one line from these data, from this [Microsoft] Excel sheet and turn it into useful information . . . the sort of cognitive steps that need to happen in order to take numbers and turn it into practice change . . . Unless it’s made dead easy, and people are interested and want to engage in it, then they won’t even make use of the easy to use displays, never mind the stuff where they actually have to go and do some work.
D18, A&F researcher
These findings are consistent with those of the systematic review of qualitative research on feedback27 and a high-confidence hypothesis: feedback interventions are more effective when they employ user-friendly designs. This reduces complexity by helping users to decide what aspects of their performance required attention, and facilitates the ‘perception’ stage of the feedback cycle. In the case of the NDA quarterly data release, our evidence suggests that, even if recipients overcome earlier barriers and interact with the feedback, they are highly likely to find the feedback too complex to continue through the audit cycle.
The lack of a comparator further hindered interpretation of feedback. The data shared by the NDA do permit users to compare their practice performance against that of others. However, this is not straightforward, and the user is required to navigate and manipulate a complex datasheet to produce their own comparisons. If performance is substandard, being able to easily see this in the light of previous achievement or that of others is necessary to highlight that change is required. The absence of a clear and meaningful comparator was identified by several interviewees:
What they really need to know, I think, might be how would they be performing compared to this time last year and how were they performing compared to others, so for example if I find that I am, you know, 30% lower than I was at the same time last year, that should set off alarm bells, or if I find that I’m 20% lower than where other people are just now that sets off alarm bells . . . On the other hand, if I’m doing 20%, 30% better than expected, actually that is really useful to know . . . I can say, OK, so that’s something I’m not going to worry about for the next 2 or 3 months.
D2, A&F researcher and GP
It could be improved by having your practice data sent to you including previous performance to show trends over time.
D7, hospital consultant
The numbers alone are not enough. They need to be accompanied by specific targets so that progress towards these can be assessed.
D13, PPI representative
These findings are consistent with evidence from both the Cochrane review11 and the systematic review of qualitative research. 27 Providing a comparator is considered to facilitate the perception, intention and behaviour processes of the feedback cycle via one or both of two key explanatory mechanisms. A meaningful comparator will decrease complexity by helping users comprehend what constitutes ‘good’ performance and increase social influence, stimulating a sense of competition. Comparators can be generally considered in three categories. 53 First, trend data present performance in relation to past achievement levels, allowing users to interpret current data in a historical context. Second, benchmarking involves presenting data relative to other health professionals or organisations, and prompts individuals to do better than their neighbours, for instance. Third, specific targets may be set as a level for recipients to attain. CP-FIT hypothesises that either trends or benchmarking will make feedback more effective, but there is less evidence to recommend the use of targets.
Verification (Can the recipients interrogate the data?)
In addition to access to more frequent data, a NDA manager reported that their users had also requested greater interactivity with their data. Our interviewees acknowledged that the data release did permit greater interactivity: the data were presented in a Microsoft Excel spreadsheet, as opposed to a portable document format (PDF) file, and this format was likely to be familiar to recipients:
The advantage of [Microsoft] Excel is that I think most GPs could open the file! Because I’ve learned a lot of GPs are not tech-savvy, and don’t wish to be.
D17, A&F researcher and GP
The data could be manipulated by users to create their own comparisons, such as with other local practices. However, as outlined above, participants were not convinced that recipients would utilise the functionality to interrogate and verify the data. Moreover, the level of interactivity might be considered rather superficial. Although it is possible to create comparisons between practices or Clinical Commissioning Groups (CCGs), it is not possible to explore the data in any finer detail. For example, to observe trend information, the user would have to locate and then compare their latest value(s) against previous data releases. Interviewees with experience of primary care described the desire to identify which of their patients were in need of review. Without this ability, it was difficult to see how the data could produce specific actions to enable improvement. For example:
There’s no point sending back data to practices if they can’t do anything about it. If they can’t run a similar search, find out who they need to see and review and where there’s gaps in care, then you’re making it very difficult for people to interact and actually achieve something different.
D17, A&F researcher and GP
Acceptance (Is there acceptance of the feedback?)
Interviewees indicated that the feedback – once it had been read – would be accepted by recipients. The organisations responsible were considered to be credible and the previously outlined association with QOF meant that the feedback presented would be recognised as important and valid. Acceptance is facilitated when recipients believe the data collection and analysis process produces a true representation of their clinical performance.
A potential complication here related to the aforementioned lack of comparator. One GP participant noted that there was no stratification or segmentation of the data. A possible consequence of this is that suboptimal performers may feel able to blame their performance on, for example, the demography of their patient population and downplay the responsibility of their practice team. This introduces the possibility that, although the feedback might be accepted, it may fail to prompt recognition that professional behaviour change is necessary. Consequently, progress through the cycle to intention and behaviour, and then clinical performance improvement, would be unlikely. It was suggested that acceptance might be improved and the feedback made more impactful by segmenting the data and providing comparisons with practices with similar populations.
Whether the audit prompts a sense of ownership may also be relevant here. Recipients may accept the feedback, but a lack of ownership and engagement with the data may result in shallow acceptance, at best:
As someone who has received or looked at the NDA, I don’t feel I have any ownership of it as a GP, so I do kind of feel that it’s been imposed.
D16, A&F researcher and GP
Intention (Does the feedback elicit a planned response?)
There was little evidence that participants believed that the feedback would produce an intention to change behaviour. Only one interviewee (D13, PPI representative with experience of CCG management) reported that the feedback would lead to intentions to change, by enabling recipients (both clinicians and managers) to look at their local picture and ask what they would do to change it:
It all has a good story to tell and I think that good story enables clinicians and managers to apply themselves to ‘this is how it works locally, this is what we’ve got, what are we doing about it?’.
D13, PPI representative with experience of CCG management
The provision of specific recommendations would probably strengthen this relationship. Another participant suggested that being presented with the information more frequently would serve to act as a reminder and increase intention to act. This perspective is consistent with CP-FIT; delivering more timely information is proposed to facilitate the feedback cycle processes of acceptance, intention and behaviour by making the feedback more credible and actionable.
The fact that the NDA covered regular GP behaviours was important. It was noted that several of the indicators (e.g. recommended processes of care for diabetes) did not require new learning or training to be achieved. Their focus on a practitioners’ regular role meant that nothing unusual was required of recipients, which meant that there ought to be few barriers preventing the completion of target behaviours.
However, where this was likely to fall down was in relation to the lack of recommended actions. One interviewee noted: ‘I don’t know what response they want to elicit, other than work harder?’ (D2, A&F researcher and GP). An implicit request to work harder is unlikely to be met with a positive response. Another participant made a similar point:
You know, you want to have ideally an action to, for someone to at least think about, and it’s not clear to me from this particular graph that there’s anything that they should be thinking about doing.
D18, A&F researcher
A further complication here concerns the level of feedback specificity. It was noted in relation to the feedback process of the cycle [see Feedback (what feedback is communicated?)] that diabetes care involves multiple members of practice teams. However, CP-FIT states that providing feedback at the level of individual clinicians will make it more effective. Failure to provide specific recommended actions may make it easier for individual staff to dismiss the feedback as not being relevant to them, and reduce the chances of intentions being formed.
Behaviour (Is the behavioural response at patient or organisation level?)
In the feedback cycle, feedback that has been received, understood and accepted by users, will ideally be followed by a planned behavioural response. An important problem with the NDA quarterly data release, identified by several interviewees, is that it is not made explicitly clear what is required of recipients in response to the audit, beyond a general call to ‘do better’. It has been discussed above (see Feedback and Intention) how the inclusion of specific actions can help to raise the likelihood that audit data are acted on.
The capacity to access patient-level information was noted in relation to the verification process of the feedback cycle and this is also pertinent when considering the desired behavioural response. CP-FIT hypothesises that feedback interventions are more effective when they show the details of patients used to calculate recipient clinical performance. This is based on evidence that feedback that detailed patient lists facilitated verification, perception, intention and behaviour by enabling users to understand how suboptimal care may have occurred, helping them take corrective action for those patients, and learn lessons for the future. In addition, such feedback facilitated acceptance by increasing transparency and understanding of the feedback methodology.
Thus, a particularly helpful addition to the feedback would be support to create lists of relevant patients so that they might be identified and invited for review, for example:
They don’t provide patient lists so I think that’s probably, you know, that’s a major downfall . . . you need patient-level change as well and patient-level change really only happens if you have those patient lists.
D16, A&F researcher and GP
Clearly, for an audit that covers every general practice in England and Wales, it would be impractical (even before considering the data protection implications) to generate patient lists for all recipients. However, this may be supported in several ways. For example, providing guidance to practices on how they might identify the patients on which to focus, or tools on how to create lists using different software systems. Many practices would be able to complete this exercise for themselves, but for audits to be as effective as possible they need to make actions as straightforward as possible for those that cannot or are not inclined to do so (i.e. reduce complexity and increase actionability). One interviewee described the NDA as ‘monolithic’, but did not suggest that it could not improve (D14, PPI representative and retired national audit developer).
Clinical performance improvement (Are there positive changes to patient care as a result of feedback?)
A distinction is made within CP-FIT between behavioural responses that are at the patient-level (i.e. relating to the care of individual patients) and those at the organisation-level with impacts across the wider health-care system. In relation to the NDA data release, a patient-level response might be to invite those patients with diabetes for a foot care review that had not been reviewed previously; an organisation-level approach would be to initiate a computerised decision support system that reminded clinicians to check whether or not eligible patients had been offered a foot care review during the current data collection period.
Organisation-level behaviours are associated with greater clinical performance improvement as they enable multiple patient-led behaviours by enhancing the clinical environment in which they occur.
We found little evidence of positive changes to patient care as a result of the NDA feedback. The clinical standards included were considered to be advisory, with positive change hoped for, but a mechanism for actually instigating this was lacking. One GP did consider the audit supportive of positive change in contrast to other approaches (e.g. inspection regimes) perceived as punishing underachievement (D16, A&F researcher and GP).
Our interviewees touched on an issue that CP-FIT terms ‘observability’: feedback interventions are more effective when they demonstrate their potential benefits to recipients. In this context, attention-grabbing messages could be used to highlight the population health benefits of greater adherence to recommended practice:
I think the thing that they need to do, or consider, would be something like, ‘Out of your 400 people with Type 2 diabetes, there are 100 with suboptimally controlled blood pressure. If you were to improve the blood pressure control for 50 of those, set a reasonable target over the next year, and maintain that improvement, that would translate into fewer strokes in the next 10 . . .’ They can’t see what the tangible benefits are for patients just now because it’s processes.
D2, A&F researcher and GP
This view that more could be done to disseminate audit messages to the wider population was reiterated by our PPI representatives. One interviewee (D13) questioned whether or not the audit led to any change in the conversation between GP and patient. They made the more general point that much audit work could be considered ‘tick box’, with benefits to the practice for completing particular activity (‘points scored’), but without any impact on patients themselves. This participant identified the potential for practices’ patient participation groups to contribute in line with an increasing expectation that audits should incorporate and demonstrate PPI. 68 Supporting wider patient awareness of the audit, its aims and the achievement of individual practices may improve ownership.
Unintended consequences
CP-FIT acknowledges the potential for both positive and negative unintended outcomes of feedback interventions. These include improved record-keeping, or manipulation of patient populations to ‘game’ the data and artificially improve performance. Our participants identified no such unintended consequences in relation to the NDA.
Trauma Audit Research Network
Goal-setting (Are the standards of clinical performance clear?)
CP-FIT hypothesises that feedback is more effective when the standards of clinical performance are considered important and relevant to recipient’s roles. Our interviewees were generally content that these requirements had been met. One participant (D5, trauma network manager) used TARN outputs within their professional role and was happy with what was being measured and its relevance to patient care. No concerns were raised about the acceptability and clarity of the standards.
Data collection (Who does the data collection?)
Each trauma unit has a TARN co-ordinator, responsible for the manual processing and submitting of the required data. The role can be time-consuming and requires particular expertise to ensure that data are accurate and processed within specified time frames. CP-FIT hypothesises that requiring recipients to collect data, and via manual processes, will inhibit the feedback cycle by introducing complexity and demands on resources (i.e. time, staff capacity and skills, finances). Ensuring that sufficient resources are available may facilitate progress through the audit cycle.
Two secondary care participants with experience of other audits identified manual data collection as a potential weakness in the cycle. One explained that manual processes were associated with ongoing questions about whether all of the data were necessary, who completes the work and, crucially, how that work is resourced. Nevertheless, they perceived TARN’s data collection to be an efficient, structured process, and one that their own audit could learn from. There was a recognised value in moving towards automated data collection:
We should be moving to a world in which the data is collected not essentially paper based, manually, but is collected more remotely, electronically, efficiently . . . I think there’s a lot of scope for doing that and I think that’s something important that we should be moving towards doing.
D12, hospital consultant
Those were the two things that struck me about it, you know, TARN has moved on and has tried to deal with the user end of things, you know, with the looking at the data, but they don’t appear to have solved the getting the data automatically, it’s still manual data entry.
D19, hospital consultant and audit lead
Participants with knowledge of TARN considered the checking and analysis of data to be a rigorous process. All data are checked and validated centrally before being included in analysis and incorporated into feedback. Where data fall outside of expected parameters, TARN contacts sites to check submissions and explore reasons for anomalies (which are typically explained by data entry issues rather than genuine problems with care). This rigour will support data accuracy, helping to ensure that the feedback is considered trustworthy and reliable. Feedback users are more likely to believe and engage with credible feedback27 that facilitates several steps of the feedback cycle: interaction, verification, acceptance, intention and behaviour.
Feedback (What data are communicated?)
Our interviewee with professional experience of working with TARN (D5, trauma network manager) strongly praised what is fed back to users. They considered that TARN had worked hard to provide accessible outputs and to balance the varying needs for information of all recipients, especially in developing TARN Analytics. Participants less familiar with TARN were also positive about the new tool. The dashboard was considered attractive and user-friendly, facilitating progress through the early stages of the feedback cycle by reducing complexity:
I can see that the visualisations that they use are quite simple, which is what people were asking for from [other audits].
D10, A&F researcher
The ‘function’ of feedback is the subject of a hypothesis in CP-FIT (i.e. is it perceived to support positive change or punish suboptimal performance?). Recipients often reject feedback perceived as punitive; it may undermine intrinsic motivation to improve care. However, feedback still has to stimulate change:
I think it comes across as neutral. I think that’s nice from TARN’s perspective because they’re not meant to be choosing to manage or lead in a carrot or stick format. I think that’s a choice for managers or clinical directors or chief execs or leaders as to what balance and proportion of carrot and stick they use in their day job, or in an area to, to make change happen. So there’s a positive element in that sense for when you first look at TARN Analytics that does appear relatively neutral. There’s a negative to that though, is that neutrality doesn’t help change anything.
D5, trauma network manager
Interaction (How is the feedback received?)
Perceptions of TARN Analytics were generally positive. However, this does not guarantee that it will actually be used. It may take time for users to adjust to new systems, and those who are familiar with their own tried and trusted methods may prefer to continue to work with an old system that they are confident in using. Our recognised user of TARN feedback described checking his data regularly, but did not actually use the new system:
I didn’t have a motivation to go in and teach myself how to do it . . . I’ve probably been in [the new system] in all truth probably less than half a dozen times between [getting access] and now because I keep going back to the old ways of working.
D5, trauma network manager
One participant with experience of developing a national audit also acknowledged the impressive functionality of TARN Analytics, but questioned how widely it would be used. At the time of the interviews, TARN Analytics had been available for only a matter of months:
I guess it would be interesting to know how well it was being used or if it was being used. Because I know in [another audit] there were some kind of very active units who were always requesting data and always wanting information. But there were other units who never, you know, they submitted data, but the staff, there wasn’t a culture, really, I think, of using information, you know, to examine and evaluate their practice.
D14, PPI representative and former national audit developer
Although the majority of participants considered the feedback to be user-friendly, there was scope for improving design and further reducing complexity:
What it lacks is sort of headlines, sort of labels to orient the viewer. [Presenting similar information in different ways] is adding to the overall sort of cognitive load of having to unpack it. So I think that, you know, there’s a trade-off between, in general, you want to present things in terms of words and graphs, present them in multiple ways, but there I think this probably goes a bit too far in trying to present it any number of ways.
D18, A&F researcher
A further issue here concerned the intended target audience for the feedback. Several participants raised questions around this, and whether or not there may be better signposting for different groups of users. For example:
I guess this appeals to people like me and what I’m seeing there on the TARN dashboard example and it will appeal to medical directors, but it might not be very, um, and it probably will be important in terms of influencing doctors perhaps and some nurses, but not everybody. . . . There’s definitely a thing for me about the difference in audiences. Whose performance you are actually trying to, whose behaviour are you trying to change?
D9, hospital consultant
This need to consider the varying needs of a range of recipients was echoed by another participant:
So they’ve got, you know, a massive amount of information. And the buttons on top of their website, I think it says research, but, you know, on the front it’s difficult to know who it is designed for, you know, the nurses in the trauma units or the clinical staff in the trauma units? Or is it, you know, if you’re a relative of a patient and you were told about the audit, you know, and you go there. . . . there should be avenues for clinical staff and for people who want a more general overview of what they do.
D14, PPI and former national audit developer
Perception (How is the feedback understood?)
Meaningful comparators are important in making feedback effective. 19,27 CP-FIT hypothesises that both trend (current performance in relation to past performance) and benchmarking (illustrating the performance of other teams or regions) information can aid the comprehension of feedback. Supporting recipients to appreciate what constitutes ‘good’ performance reduces complexity, and introducing a sense of competition (social influence) is likely to facilitate the cycle processes of intention and behaviour.
The TARN feedback presents performance against the national median and thus follows the recommendation to include a comparator. The question of which comparator is the most effective, however, remains uncertain, and this was an issue raised by our interviewee with experience of using TARN. For this user, a higher target was of more use than the national average:
You have got to understand the national average . . . and whether that national average is good or bad, and obviously that doesn’t come across in a doughnut or in a graph, it’s just the national average. . . . [Hospital X] is probably our lowest one in some areas and they are still above national average . . . we obviously don’t want them to focus and think, ‘well, we’re above national average, brilliant’. We have to repeatedly say, ‘look, you’re far worse than [Hospital Y] so you’d better be trying to get better . . . no one should be aspiring to be average, everyone should be aspiring to upper quartile . . . I would, if it was me, delete all average figures and only have where the upper quartile figure is.
D5, trauma network manager
Thus, although it remains unclear which specific comparator to use, feedback recipients may welcome some flexibility in selecting their own preferred comparators.
Verification (Can recipients interrogate the data?)
TARN Analytics is designed to enhance users’ ability to interrogate their data and, hence, may strengthen the ‘verification’ step of the feedback cycle. Indeed, our interviewees recognised the sophistication of the new tool. Those familiar with other audits considered the ability to ‘drill down’ into data to be important and a feature often requested by audit users:
I think that’s a good idea, I mean that’s almost the comment that comes back on [our] audit is that sites want to drill down their own data, they want to understand their own practice in more detail.
D12, Hospital consultant
What people were saying was that they would like a tool that enabled them to drill down so if they saw there was a problem or an anomaly, they could go in and see where it is.
D11, A&F researcher
TARN Analytics can be considered to be consistent with one suggestion for effective feedback:19 provide short, actionable messages followed by optional detail. Recipients who wish to do so are able to explore the data in more detail, and explore questions of interest. This functionality was described by one participant, who referred to ‘levels of access’ and the need to cater for different types of users:
You have a sort of vaguely interested person and then you have a person who is more interested, and then you have an expert, and you provide sort of different levels of information.
D19, hospital consultant and national audit lead
Our participant with professional experience of trauma care suggested that the new tool would have time-saving benefits. He described an occasion when his unit’s achievement on an indicator had suddenly and unexpectedly declined. Staff members then spent a considerable amount of time investigating the criteria used for the indicator, and what might explain the fall in performance. He hoped that the new tool would simplify such processes in future:
A TARN Analytics tool I would hope could help pinpoint faster that it is two outliers that have caused it, or it is four outliers that have caused it, or it is one month of the year that has caused it, because otherwise you spend, you waste a lot of time analysing, reanalysing everything to find the contributing factor that has changed the number.
D5, trauma network manager
This participant proceeded to describe a demonstration of the new tool and how it enabled the production of individual charts and figures that would aid the resolution of such queries far more quickly than the existing system:
That was brilliant and that was certainly a lot faster . . . it took [demonstrator] 10–15 seconds to do that in the new tool . . . it isolated the area for checking immediately to 1 month instead of 12, and to probably half a dozen patients instead of 200, and that took, you know, three mouse clicks.
D5, trauma network manager
The ability to access patient lists is hypothesised by CP-FIT to further strengthen feedback. Seeing which cases have been used to calculate performance helps to enhance credibility and actionability, and reduce complexity. This facilitates several processes within the cycle: verification, acceptance, perception, intention and behaviour.
Acceptance (Is there acceptance of the feedback?)
Whether or not recipients accept feedback is associated with the credibility of its source and perceptions of the accuracy of its content. Recipients who perceive feedback as trustworthy and reliable are likely to believe and engage with it, which in turn facilitates interaction, verification, acceptance, intention and behaviour. Acceptance is more likely when recipients believe that the data collection and analysis process produces an accurate reflection of their clinical performance. Our participants described the TARN organisation in positive terms, and it was clear that the audit was respected by both its target audience and clinicians working in different specialties.
A member of the TARN management team felt that their commitment to quality assurance processes had produced an audit that was valued, trusted and respected. TARN maintains an annual ‘Outliers Surveillance Programme’ that reviews hospitals and identifies outliers – both positive and negative:
We identify the outlier hospitals, we contact them and we work through the data. And I think that’s our key responsibility, is identifying not just poor, but also good practice.
D6, national audit provider
The consensus was that users considered TARN to be credible and the data would be accepted. Importantly, it was also noted that data were more likely to be accepted if they aligned with recipients’ expectations; users were considered less likely to interrogate feedback with which they agreed. This is consistent with evidence from CP-FIT, which states that if accuracy is perceived to be low, recipients are more likely to undertake verification.
Our interviewee with experience of using TARN confirmed that the data were an integral part of trauma care at all levels of the organisation: they were used by teams to assess the impact of quality improvement projects, featured in peer review visits within the local network and featured in meetings of local executives and directors.
Two other CP-FIT variables are considered to facilitate acceptance of feedback: ‘timeliness’ and ‘specificity’. The timeliness of the data included in the feedback (i.e. whether or not recent data are used to calculate achievement) is another factor found to influence acceptance. Feedback based on more recent data is generally considered credible and actionable. TARN achieves this goal: dashboard data are updated following validation of new patient cases, facilitating acceptance, intention and behaviour.
Specificity refers to the level of precision within the feedback; interventions that report the performance of individual health professionals are considered to be more effective than those reporting at the level of teams or organisations. Increased specificity makes feedback more actionable, again facilitating acceptance, intention and behaviour. TARN does not achieve this aspect of CP-FIT as it reports at the team level. However, a range of staff members contribute to patient care within trauma, particularly in complex cases, and it would therefore be inappropriate to report clinician-level performance.
Intention (Does the feedback elicit a planned response?)
Our participants identified that TARN feedback omitted specific recommendations for action. Supporting recipients in identifying and developing solutions to suboptimal performance (problem solving), or providing potential solutions (action planning) serves to facilitate the perception, intention and behaviour processes within the feedback cycle. This is achieved by reducing the burden on users (reducing complexity) and making it easier for them to act in response to the feedback (increasing actionability).
Our participants observed a lack of detail about what recipients might do in response to the feedback. Provision of a menu of actions would be a worthwhile target for improvement, but this was not apparent to our participants.
Behaviour (Is the behavioural response at the patient or organisation level?)
In CP-FIT’s hypothesised feedback cycle, intentions formed as a result of studying and understanding feedback will lead to a planned behavioural response. As noted earlier, an important problem concerning the TARN feedback is that it is not made clear to recipients what is required of them in response. Providing specific suggestions for action can help to facilitate the behaviour process, thereby stimulating progress through the cycle. The trauma network manager considered that responses were primarily required of clinicians:
For me the target audience is less people like me and more actually clinical, clinicians and surgeons and consultants.
D5, trauma network manager
It was interesting that the above trauma network manager did not consider themself the target audience, but more of an intermediary who could extract detail from the audit and share it with those responsible for taking action (e.g. executives, directors and clinicians). It was not specified if or how those individuals would take action.
Although specific recommendations may enhance the utility of feedback, they should be congruent with the appropriate level. For example, if organisational-level actions are required, then the instructions presented need to be for actions that suitable individuals or teams can deliver; it also needs to be understood by recipients at those levels that action is required of them. A potential lack of clarity regarding the target audience was outlined in relation to interaction, which is likely to affect multiple stages of the cycle. This awareness of targeted feedback, and then tailoring guidance appropriately, was outlined by a consultant with knowledge of another secondary care audit:
We’re trying to influence lots of different people and if we were trying to do that all with data, they might all need to see perhaps a slightly different version or at least a version that would ideally suit them.
D9, hospital consultant and national audit lead
Clinical performance improvement (Are there positive changes to patient care as a result of feedback?)
The trauma network manager stated that, via its original system at least, TARN had ‘transformed care’. This was not supported with any evidence of improved outcomes. However, his description of a local quality improvement initiative did indicate how TARN data can be used to corroborate such activity, and prompt conversations about sharing best practice. A team had committed to improving pain relief for rib fractures by completing an internal audit and introducing new processes to improve care:
6 months to a year later, the TARN graph also corroborated and said that their times for pain relief were the best in the network and they stood out as number one when we made the league table, and a different hospital who we knew had done very little or nothing about it stood out as being last. So it was then useful to put up the league table and go, ‘this is the league table in the network of who’s performing around that metric’, and turned to [team] to ask them, ‘what did you do, what do you think you did or what have you done that you think has put you first on this league table?’.
D5, trauma network manager
For others without direct involvement with TARN, it was less clear that TARN was demonstrating genuine impact. One interviewee considered this a common weakness across all audits. They had visited the TARN website to look for examples of performance improvement attributable to TARN, but had been unable to find any:
Where are the tangible benefits about change in practice, about how this information has actually benefited patients? . . . Not enough about how the database was exploited for patient benefit . . . There is a lot about feeding back to organisations . . . but I couldn’t grasp . . . why would you want to continue funding this database. What changes have, you know, are in evidence?
D14, PPI and former national audit developer
Demonstration of the benefits of feedback and the impact it has on patient care is specified in CP-FIT as something that can enhance the effectiveness of feedback. This is termed ‘observability’ and is believed to facilitate all processes within the feedback cycle. 27
Unintended consequences
Possible positive or negative unintended consequences are highlighted in CP-FIT. Improved record-keeping would be an example of a positive consequence, whereas ‘gaming’ of data to suggest that performance has improved is an example of a negative one. A suggested negative consequence of TARN feedback, albeit relevant to all clinical audits, concerned how they are portrayed, particularly in relation to the public:
I don’t think that we write these things for patients, and so I think unintended consequences are when people pick up in data that . . . if patients don’t have a statistical knowledge of what the data means then they miss – it’s the [British tabloid newspaper] approach isn’t it? You know, you have to have a sort of shock headline, you know, that always has to be something that’s gone wrong, rather than something that’s gone right . . . I think there’s a real challenge that if you’re, if you have public-facing national audit and you don’t present it in a way that people will understand then they’ll misinterpret it, so that’s an unintended consequence.
D19, consultant and former national audit lead
Discussion
We conducted a rapid, qualitative evaluation of two NCAs guided by a theory of feedback that is specific to health care. 27 We interviewed a range of experienced A&F researchers, health-care professionals and patient representatives about their observations of each audit and used CP-FIT’s detailed breakdown of causal pathways of feedback and explanatory mechanisms to assess the likely effectiveness of both audits. 27 For both NDA and TARN, we produced a detailed critique of how their feedback compared with the processes within the audit cycle. We identified key strengths and weaknesses of their audit cycles.
Comparison to existing literature
Brown et al. 27 specifically refer to how researchers can use CP-FIT to evaluate feedback interventions and explain their observed or predicted effects. In completing a rapid, framework-driven analysis, we have demonstrated an approach that others may use to evaluate other feedback interventions and identify both their strengths and weaknesses.
In our evaluation, we paid particular attention to two of the suggestions for effective feedback identified by Brehaut et al. 19 This work builds upon our online experiment (objective 1) to explore how two of the suggestions may work in practice and has highlighted some of the complexities involved. For example, releasing data more frequently is recommended, but our findings illustrate that this is likely to be insufficient to prompt clinical improvement on its own. Timely feedback is unlikely to offer any advantages if it struggles to reach its target audience and, if it does reach them, is considered incomprehensible.
Participants, particularly those with primary care roles, identified a potential conflict between the NDA and the performance management system for general practices, QOF. There are overlaps between the clinical standards included, and our results indicated that QOF was prioritised. Interventions that target processes of diabetes care must, therefore, account for QOF. We drew a similar conclusion in an earlier trial of an intervention including A&F that failed to improve diabetes management in primary care. 106 The associated process evaluation suggested that, although the intervention was aligned with existing priorities and initiatives, it was not sufficiently distinctive to stand out and engage clinical teams. Work around the monitoring and achievement of the QOF is often embedded within general practices and is therefore likely to be resistant to change. However, it is possible that making trend or benchmarking data more accessible within NDA outputs would offer practices valuable information that the QOF cannot provide.
Strengths and limitations
A particular strength of the study is our use of CP-FIT, enabling a state-of-the-science analysis of two NCAs. Furthermore, we drew upon wide-ranging participant experience of audit and research.
We acknowledge three main study limitations. First, this was a rapid study; we opted to modify our work in response to the COVID-19 pandemic. It was not possible to complete an in-depth, qualitative analysis of the interviews within our programme. However, rapid approaches to qualitative research are gaining recognition as a valid and viable methodology within a limited time frame. 101–103 They have been used successfully in other contexts, most recently in completing qualitative research into the COVID-19 pandemic. 103 This rapid approach therefore allowed us to identify meaningful, timely findings.
Second, pandemic restrictions limited our potential participant sample. In particular, we were prevented from approaching clinical teams, as per the original design. This was perhaps of greater significance regarding TARN: our wider network of collaborators included only one health professional with direct knowledge and experience of TARN outputs; by contrast, for the NDA, the sample included three GPs. Consequently, our analysis is weighted towards the perspectives of a single individual, although we have introduced external perspectives wherever relevant. A related issue is the risk of bias in our sample. We interviewed people with an interest in the use of A&F to improve health care. Further research with participants who are less interested in A&F and more typical of targeted recipients would be necessary before drawing firm conclusions from our results.
Third, several participants had no prior knowledge of both audits under consideration. To inform discussion we provided summaries of both audits and shared links to recent outputs. Most interviewees were experienced in A&F and familiar with the evidence around how to make it more effective, perhaps with more critical distance than those with direct stakes in both audits.
Implications for practice
Our findings have direct implications for both of the evaluated NCAs. We identified three strong features of their feedback likely to facilitate progress through the audit cycle, as well as three others requiring more attention to enhance feedback effectiveness. For the NDA, three strengths were:
-
The move to quarterly data release. The NDA’s recent move to increase the frequency of feedback was welcomed, appears to meet the needs of audit users and is in line with best evidence about improving feedback’s effectiveness. It is likely to have facilitated the acceptance and intention processes of the audit cycle.
-
Automated data collection. The routine extraction of data minimises the impact on primary care teams and helps to ensure a large and accurate data set. It also reduces complexity and strengthens the initial processes of the audit cycle.
-
Respected source and widely accepted indicators. The feedback is considered to come from a respected, credible source and the clinical indicators reported are recognised by users as relevant and concerning an important public health issue. There was no indication that users would question their worth, nor the need to monitor achievement.
We suggested three areas for further attention:
-
Delivery to target recipients. There were indications that the feedback is failing to reach much of its intended audience. The data may be publicly available, but our interviews suggested that GPs are often unaware of the feedback. Consequently, they will not discuss the data with their practice teams, and it is not surprising that the audit is not a prompt for clinical improvement. There were suggestions that the audit is overshadowed by QOF and has not done enough to define its own position and importance. Potential solutions might be to increase efforts to ‘push’ the information to CCGs and practices, and accompany this with messages highlighting the importance of the data (‘observability’).
-
Presentation. Following the cycle, when the feedback does reach its target audience, it is far from certain that it will be read and understood. Several interviewees commented on the impenetrability of the content and found the Microsoft Excel datasheet to be off-putting. Thus, consideration should be given to how the data might be made clearer for users with limited time and resources.
-
Interpretation. Although comparators are available within the feedback, participants felt that more could be done to make this process more straightforward and accessible. Inclusion of a meaningful comparator is recommended for effective feedback. In the feedback provided by the NDA, it was felt that too much was required of analysts and others skilled in manipulating data to produce the required comparators. Wherever possible, potential barriers to understanding should be removed, for example, providing more accessible comparator information [e.g. practice previous performance (trend), or performance of similar practices and CCGs (benchmarking)].
Similarly, for TARN, we identified three features consistent with best practice:
-
Enhanced interactivity. The new TARN Analytics tool was considered an important and useful addition, and aligned with recommended practice. The enhanced ability to interrogate and ‘drill down’ into the data (in some cases to the patient level) is likely to strengthen the verification and acceptance processes of the audit cycle.
-
Use of comparator. The presentation of comparative performance is consistent with evidence of how to enhance feedback effectiveness. Incorporating social influence helps to facilitate perception and can help to guide intention and behaviour.
-
Respected source. The feedback is considered to originate from a respected, credible source, and not just by those working within trauma. Audit commissioners and clinicians from other fields recognise TARN as an exemplar of good practice from which other audits could learn. A commitment to ensuring data accuracy and validity has contributed to this reputation.
We suggested three areas for further attention:
-
Action planning. Providing suggestions of specific actions to undertake to improve performance can enhance feedback effectiveness. Interviewees perceived the absence of such options in the TARN feedback, observing that merely showing achievement is not sufficient to bring about improvement. Recipients have the opportunity to explore a wealth of data, but action plans and guidance on what could be done to improve would probably prompt further achievement by making the feedback more actionable and facilitating intention and behaviour.
-
Greater flexibility around comparators. Although it remains uncertain whether or not particular types of comparator are more effective than others, providing a higher benchmark (e.g. the top quartile) could potentially serve as a greater spur for improvement than showing average national performance. This hypothesis is under investigation elsewhere,107 but our own objective 1 screening experiment failed to support it. Nevertheless, providing users with the ability to select their own comparators and benchmarks may be beneficial.
-
Evidence of impact. Participants generally believed that engagement with TARN had resulted in improvements to patient care. However, no specific examples of this were provided and participants who searched for such examples on the TARN website were unable to locate them. Clearer demonstration of the impact of TARN – including presenting this in a manner that is accessible to patients and the public – would likely strengthen the audit cycle, as well as support continued audit engagement and acceptance.
Clinical Performance Feedback Intervention Theory was developed with specific attention on feedback interventions in health care. We suggest that our findings are of interest to three stakeholder groups. First, we have identified aspects of audit programmes that attenuate the audit cycle, or even cause it to break down entirely. We gathered information from experts and audit recipients about how feedback innovations are perceived and acted on (or not). Some of our findings and lessons are likely to be applicable to other NCAs. Second, we have indicated features to consider in the external review and commissioning of national audit programmes, together with recommendations on how they might be made more effective. Third, patients’ groups and charities will be interested to learn how they might support audits and encourage improvement. We found demand for audits to make greater efforts to publicise the impact they had on health-care quality, including making this impact more accessible to the public.
Implications for research
We have demonstrated an approach to applying CP-FIT to two national audits. Further work could examine relationships between key features of A&F programmes, as delineated by CP-FIT, and their effects on clinical practice and outcomes.
Summary
To our knowledge, this is the first application of CP-FIT to evaluation of feedback delivered by individual NCAs. We considered two examples of feedback in relation to the audit cycle and associated high-confidence hypotheses. Such an application may be of value to other national audit programmes seeking ways to improve the impact that they have on patient care.
Chapter 5 Perspectives on embedding trials of audit and feedback within national clinical audits (objective 3)
Parts of this chapter have been reproduced or adapted with permission from Alderson et al. 108 This is an Open Access article distributed in accordance with the terms of the Creative Commons Attribution (CC BY 4.0) license, which permits others to distribute, remix, adapt and build upon this work, for commercial use, provided the original work is properly cited. See: http://creativecommons.org/licenses/by/4.0/. The text below includes minor additions and formatting changes to the original text.
Background
National clinical audit programmes, through their scale and reach, potentially offer a powerful means by which to embed experimentation. Such work would have two objectives: directly enhancing the audit’s impact and generating robust evidence on what works. 28,109,110 Audit programmes aim to continually enhance their impact – typically by making incremental changes over time, such as adjusting feedback displays or using different comparators. Given that such changes usually result in small to modest effects on patient care and outcomes, it is difficult to judge their effectiveness in the absence of rigorous experimental or quasi-experimental evaluations.
We have proposed ‘implementation laboratories’ as a means of exploiting this opportunity: the formation of a programme of systematic, iterative trials, embedded within national clinical audit programmes. 111 An example of an implementation laboratory, from UK secondary care, is the AFFINITIE partnership with NCABT. 24
Here, hospitals were randomised to two empirically and theoretically informed feedback interventions, which aimed to enhance either the content of feedback reports or follow-on support to help hospitals act on feedback. Audit data were used to assess effects on evidence-based blood transfusion practice. Another example, from Canadian primary care, is the Ontario Healthcare Implementation Laboratory. 112 This partnership with Health Quality Ontario aims to improve the impact of feedback reports delivered to nursing homes. The project includes randomising prescribers to different performance comparators (e.g. overall provincial average prescribing rate versus the top quartile) and using positive or negative framing of content (e.g. informing recipients that they have prescribed potentially harmful medications to 15% of their patients versus avoiding prescription-related harms in 85% of their patients).
These models provide the potential for significant returns on investment in their development. Incremental improvements associated with modifications to feedback (e.g. a 1% increase in effectiveness) can have a substantial impact at the population level. Establishing close partnerships with health-care systems delivering implementation strategies at scale holds the potential for a more systematic approach to identifying and addressing priorities, and the promotion of good methodological practice in both improvement methods and evaluation. This can enhance the generalisability of the research and demonstrate the impact of improvement programmes. However, the formation of implementation laboratories requires work in, for example, negotiating shared understandings, expectations and ground rules. 113 There is also a need for learning from other research–practice partnerships,114,115 developing necessary infrastructure and ways of working that will support collaborative action. 113
We completed a qualitative interview study with feedback researchers, audit programme staff and health-care professionals to explore the barriers to and enablers of embedding A&F experiments within NCA programmes.
Methods
Participants
We used purposive and snowball sampling to achieve a heterogeneous sample of participants encompassing three groups: A&F researchers, members of clinical audit programme staff and recipients of feedback (typically health professionals). We deliberately included participants with little or no experience of embedded experiments because their expectations and concerns are important to understand when planning new programmes. We aimed for 10 participants from each group and identified them through a combination of our contacts in this field and existing networks. 116 Participants possessed varying experience of involvement in research evaluating A&F. Participant recruitment was not limited to the UK as we wished to generate lessons relevant to an international audience. Several participants had contributed to an international meeting to establish a network for A&F research (The 4th Annual International Symposium of Advancing the Science and Impact of Audit & Feedback, 23–4 May 2019, Amsterdam, the Netherlands). 117 The final sample total was guided by evidence of data saturation. 118
Development of interview schedule
We used a semistructured interview schedule (Appendix 11), informed by our previous work in this field and existing literature on evaluations of major initiatives involving research–practice partnerships. Our AFFINITIE programme24 identified several influences on the participation of audit programmes in research. These included alignment of timelines and human resources, ensuring secure sharing of data and negotiation of an understanding of equipoise in experimenting with enhanced feedback interventions. We also considered the lessons generated from other relevant initiatives, such as UK National Institute for Health and Care Research Collaborations for Leadership in Applied Health Research and Care and the former Veteran’s Administration Quality Enhancement Research Initiative (VA-QUERI). 119–121
Our interview schedule drew upon the theoretical domains framework (TDF). 122 The TDF synthesises 33 behaviour change theories into 14 domains representing a range of individual (e.g. knowledge, beliefs about consequences), sociocultural (e.g. social influences, role and identity) and environmental (e.g. context and resources) barriers to and enablers of behaviour change. Use of the TDF helped to ensure that we would comprehensively identify and explore the potentially amenable behavioural influences on the planning and conduct of A&F research. The interview schedule was refined following input from our programme reference group. This group included patient representation and members with experience in behavioural science, clinical work and management of NCAs.
We (SLA, TAW, SWo) pilot tested the interview schedule to ensure comprehensibility and answerability of the questions. We independently coded the data from three pilot interviews, assigning initial codes and then allocating each code to a single TDF domain. We reviewed coding for agreement to TDF domains and resolved any differences through discussion with Robbie Foy and Fabiana Lorencatto. No further changes were made to the interview schedule.
Data collection and analysis
We (SLA, TAW, SWo) conducted interviews face to face, by video or by telephone, according to participant preference, from May 2019 to October 2019. All interviews were audio-recorded and transcribed verbatim. Transcriptions were imported into NVivo 12 and de-identified. We analysed data by coding transcripts into theoretical domains in a recursive process. 123 Specifically, Sarah L Alderson, Thomas A Willis and Su Wood independently coded data from interviews they had conducted themselves and assigned initial codes before assigning each code to a theoretical domain. All codes within each domain were reviewed and differences were resolved through discussion (with RF and FL). Finally, we conducted further inductive analysis of coding to populate each theoretical domain with content that described participants’ beliefs and to check for any further beliefs not accounted for by the framework. This generated overarching themes that encapsulated participants’ experiences of barriers to and enablers of embedding A&F research in NCAs. We made no changes to the interview guide after piloting three interviews and analyses.
Results
We completed interviews with 31 participants, including nine feedback researchers, 14 staff working on NCA programmes and eight health-care professionals. Many participants had dual roles, with both considered during analysis (e.g. health professionals who also had a role in the management of an NCA programme) (Table 19). Data saturation was reached after 27 interviews (Figure 30). All 14 domains from the TDF were reported by interviewees as perceived influences on embedding research within large-scale audits (Table 20).
| Characteristic | Number (%) |
|---|---|
| Location | |
| UK | 26 (83.9) |
| The Netherlands | 1 (3.2) |
| Canada | 2 (6.4) |
| USA | 1 (3.2) |
| Australia | 1 (3.2) |
| Role | |
| Feedback researcher | 8 (25.8) |
| Feedback researcher and audit staff | 1 (3.2) |
| Feedback researcher and health-care professional | 1 (3.2) |
| Audit staff | 13 (41.9) |
| Audit staff and health-care professional | 4 (12.9) |
| Health-care professional | 4 (12.9) |
| Experience of embedded experimentation | |
| Yes | 17 (54.8) |
| No | 14 (45.2) |
FIGURE 30.
Themes elicited per TDF domain for data saturation analysis.
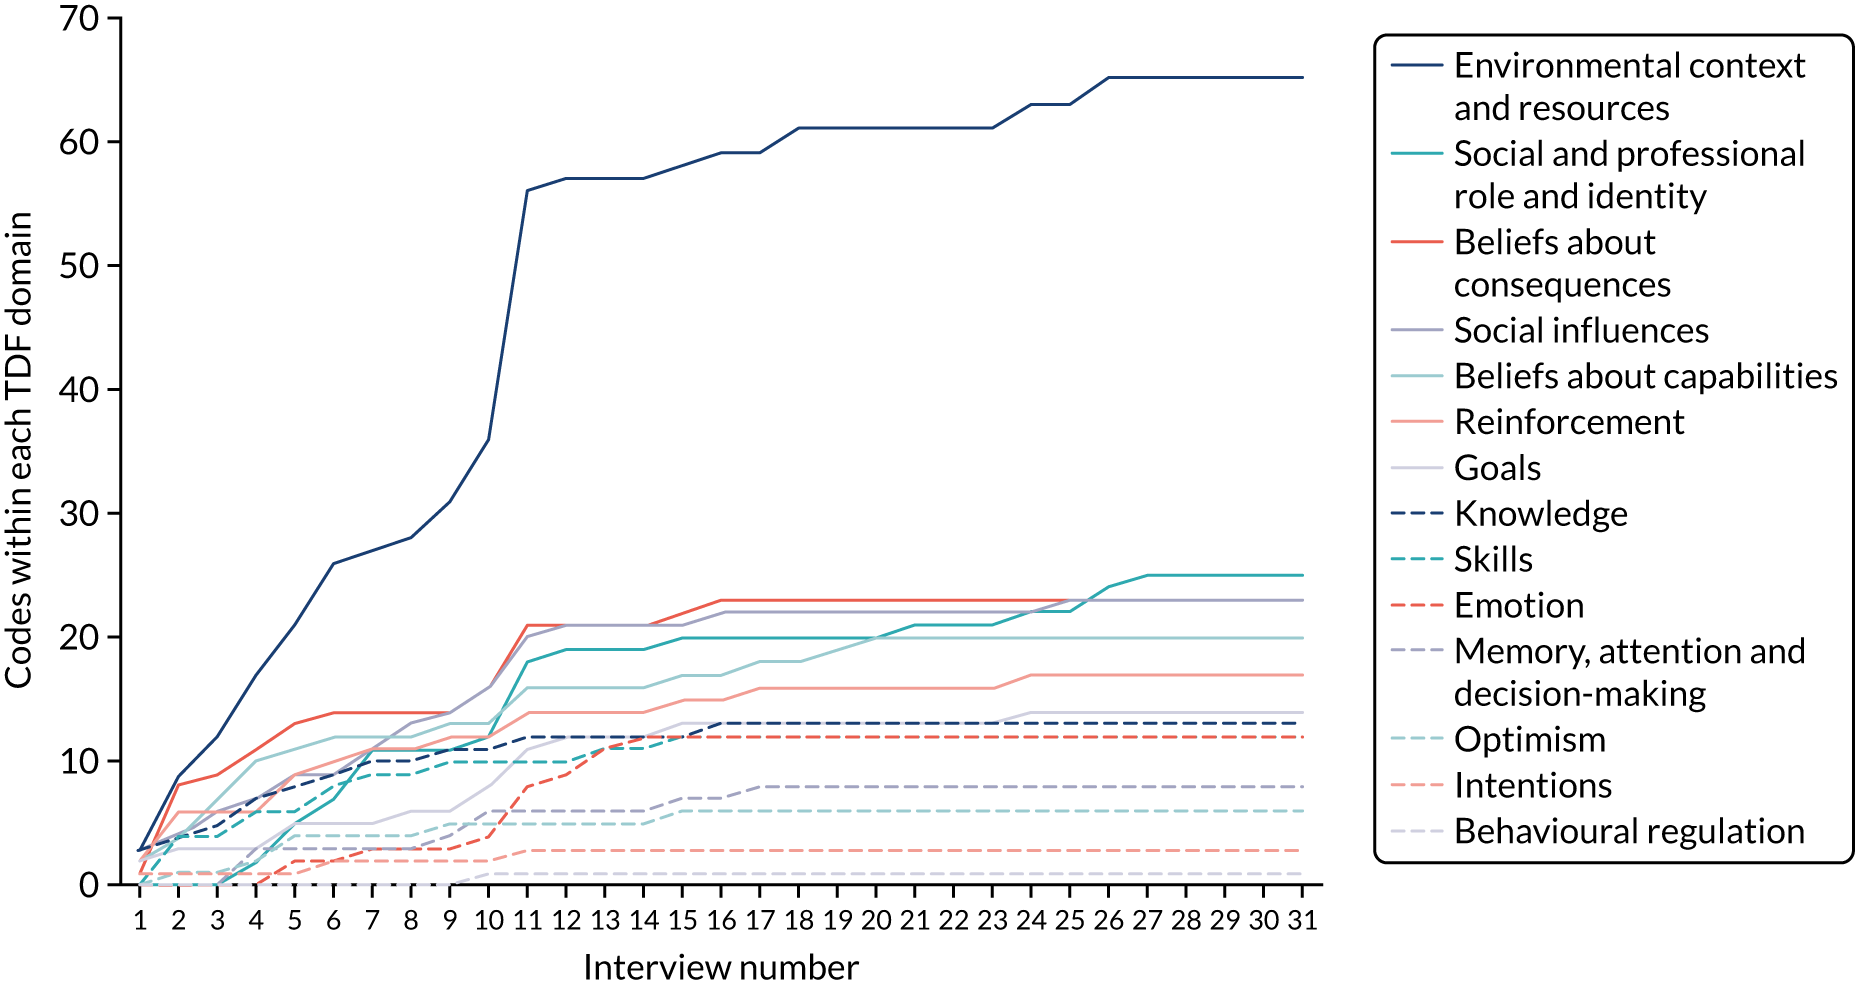
| Theoretical domain | 1. Knowledge | 2. Skills | 3. Social and professional role and identity | 4. Beliefs about capabilities | 5. Optimism |
|---|---|---|---|---|---|
| Themes contributed to | Resources | Resources | Resources | Resources | Leadership |
| Logistics | Logistics | Logistics | Logistics | Perceived risks | |
| Leadership | Leadership | Leadership | Leadership | Opportunities and benefits | |
| Opportunities and benefits | Relationships | Relationships | Relationships | ||
| Opportunities and benefits | Perceived risks | Opportunities and benefits | |||
| Opportunities and benefits | |||||
| Barrier to/enabler of embedded research | Enablers > barriers | Enablers > barriers | Mixed | Mixed | Mixed |
| Transcripts coded to domain | 27 | 22 | 24 | 27 | 19 |
| Quotations | I kinda realised there was a real evidence gap of like what actually is best practice audit reporting; and the needs of different people are very different . . .P23, health-care professional and audit staff | I like the idea of sort of em . . . advocating for providers and em . . . leveraging the fact that they, their information needs have to be met for, for a feedback report to be usefulP10, feedback researcher | I can imagine myself being really committed to it and saying actually the benefits do outweigh it. I’m prepared to put the effort in at the start. Or to get all the niggly annoying things done because I think that this, the fact that it would be more efficient, more nimble . . . improved outcomes is worth it. But I think you could just as equally find someone who says noP9, audit staff | I think the national clinic audits are an under exploited resource . . . I don’t think they’ve ever quite got the credit they should’ve had for the improvements that they’ve been doing; but it seems to me they provide an architecture for doing studies that um, have experimental designsP17, feedback researcher | So I think the benefits are that we’ll stop commissioning things that we think are great, and start commissioning more of what we know is workingP12, audit staff |
| It was a quite naive approach from the start, 25 years ago, just sending reports and thinking that something magical would happen. And since maybe 5–10 years we started to more thoroughly think about what can make it really happen that people will start erm improvement activitiesP9, feedback researcher | I would say the, the programs are, the strengths that they have are: they’ve mostly got good clinical leadership. They’ve got excellent understanding of their data, and they’ve got excellent statistical folk. They’ve often got good IT folk who can build a platform but they’ll build what they’re asked to build . . . umm . . . they have . . . they have a good instinctive grasp of umm, how people use data in practice. But I don’t think, I think the nuanced side of things can be, can be challengingP12, audit staff | I like doing this type of embedded research for a lot of different reasons that umm, it’s just what I’m passionate about is doing something with the NHS and doing something removed from service just wouldn’t, would not be interesting to me at all. I’m sort of really, I find that motivating personally and I can definitely see the benefitsP20, feedback researcher | I don’t think there’s anything lacking here to my knowledge, errm or ah in or that that they don’t have access to partnering with expertise if they needed to. So I’m imagining within the research field of audit feedback there are clearly experts in that niche; erm they may not be like permanently based at [audit programme] but they would need to be for that necessarilyP1, audit staff and health-care professional | I think to be honest based on that experience . . . that is my main concern that you know we, we’ve been trying to optimise all the feedback and I think we now know . . . how to do that more or less but em . . . if people simply don’t try sincerely to do anything then it’ll stop there but look, it will always look like all the feedback is not effective . . . That translation into action that’s, that could be a little challenge I findP18, feedback researcher | |
| Theoretical domain | 6. Beliefs about consequences | 7. Reinforcement | 8. Intentions | 9. Goals | 10. Memory, attention and decision-making processes |
| Themes contributed to | Logistics | Logistics | Relationships | Logistics | Resources |
| Leadership | Leadership | Opportunities and benefits | Relationships | Logistics | |
| Relationships | Relationships | Opportunities and benefits | Relationships | ||
| Perceived risks | Perceived risks | Opportunities and benefits | |||
| Opportunities and benefits | Opportunities and benefits | ||||
| Barrier to/enabler of embedded research | Mixed | Enablers > barriers | Mixed | Mixed | Barriers > enablers |
| Participants coded to domain | 31 | 27 | 5 | 19 | 11 |
| Quotations | They were very open about being worried about what we would find. They have pressures of their own around the commissioning of the audit and the reputation of their organisation . . . I think they were worried about was if we found that their audit wasn’t making a difference or if there was an early warning rejection of the auditsP11, feedback researcher | I think that that’s equally important about how we can improve patient care through our routinely collected data. Erm and so I think that in terms of overall resource allocation you know that it can be very cost-effective, erm compared to say doing a big randomised controlled trial of a certain drug or a certain ventilator or whatever it is. So if you are collecting routine data at scale across the service overall and then erm, feeding that back then that in itself has a potential to have great patient impactP1, health-care professional and audit staff | The way we choose a clinical audit lead you’d expect would be somebody with expertise, somebody with interest, somebody with time. No. The way we choose a clinical lead is: ‘Whose turn is it next?’ and it doesn’t matter what you know, what you do, what you can do. That’s not important. ‘Have you had a go yet?’ ‘No.’ ‘It’s your turn.’ So there’s that. Umm, we’ve already spoken about what is the intention, the focus is on the eye of the conference in Toronto. It’s not, ‘How can I make practice, practice better’P6, audit staff | So I would love to do more! Absolutely love to do more. Em and we have this em . . . as you may know, have some tentative discussions em with [A&F researcher] and, and colleagues about trying to do somethingP15, audit staff | We are spending across the program a lot of time at the moment developing new visualisations without, without to my knowledge a very strong evidence base in the real world. I’m sure there’s lots of theoretical stuff out there but . . . I, so for example for my, from my perspective, in my work, in my role, I can’t commission any sort of technical spec for data visualisation at the moment because I don’t have the evidence that says what a good example is this thingP12, audit staff |
| I look at the [audit programme] reports and there’s masses of data in there. So trying to present that in a slightly different way and trying to present it in a more intelligent way and perhaps filtering out a lot of the stuff that doesn’t necessarily need to be presented, I can see definitely be a benefit for practicesP16, health-care professional | Um, you could imagine if they establish highly effective collaborations with researchers and they’re beginning to show that you’re not only getting service improvement but you’re getting a contribution to scientific history that could help stabilise them a bit and have them make their own business case more effectivelyP17, feedback researcher | They think that they’ve found the . . . the, the learning valuable and I think it will carry onP3, feedback researcher and audit staff | So even an overall programme at [audit programme] if we look back and see a change of six or seven per cent that’s a pretty wildly successful programme, and so the idea that you can fairly simply once you’ve got it set up, erm tweak your, erm design to get it more and more and more effective even if it’s in the order of you know half a per cent or a per cent is actually to a programme like [Audit programme], not only is it successful in terms of it equals tens of millions of dollars over time, of impact. But also you know it does eventually equal health outcomes, you know if you do it rightP5, audit staff and feedback researcher | Officially I am not resourced to do the research part. So it is kind of finding a way to make some funding or resources erm available for doing the researchP9, feedback researcher | |
| Theoretical domain | 11. Environmental context and resources | 12. Social influences | 13. Emotion | 14. Behavioural regulation | |
| Themes contributed to | Resources | Logistics | Resources | Relationships | |
| Logistics | Leadership | Logistics | |||
| Relationships | Relationships | Leadership | |||
| Perceived risks | Perceived risks | Relationships | |||
| Opportunities and benefits | Opportunities and benefits | Perceived risks | |||
| Barrier to/enabler of embedded research | Barriers > enablers | Mixed | Barriers > enablers | Barrier | |
| Participants coded to domain | 31 | 28 | 11 | 1 | |
| Quotations | So I would put data-sharing agreements and data quality near the top of the list of challenges . . . To do a multicentre project where you are collecting data from many centres and sharing it and using that data for audit and feedback, every single centre requires a data-sharing agreement with a common repository of data and secondly the quality of the data may vary between centres which makes it very difficult for intercentre comparisons erm so that’s a major challengeP30, feedback researcher and health-care professional | . . . we need to have a continued brand awareness and we need to keep people happy to a degree. So a GP needs to go ‘oh yeah, I like that group, they do stuff that really resonates with me and they do stuff that I find acceptable and so therefore I’ll continue to engage with them’, so for example when I erm started talking about playing with the valence of the messages people were saying ‘what do you mean you’re gonna have a negative message?’ If people open up a report and they see a negative message they’ll never open up one of our reports againP5, audit staff | We have feedback theories that tell us you know feed, receiving feedback is emotional. Em there are you know harms however mild em . . . there are unintended consequences let’s say of feedback. And so I think it’s a new area where we have sorted through what is em . . . what the harms and benefits are to, to an adequate level em . . . and so maybe there’s some, just my own anxiety around you know what are we doing?P10, feedback researcher | And em . . . so there’s, there’s em I think . . . partly because I’m interested in the tailoring and the, and you know adapting feedback em . . . I’m, the challenge I notice, noticed myself focused on is this trade-off between you know customising, personalising and adapting . . . em everything versus developing something that’s efficient, standardised and useful em to other people. So that would be one, one challenge . . .P10, feedback researcher | |
| So I would be strongly in support of the idea of doing it without em . . . signed-up consent . . . or ethically necessary. I mean you’re right. It probably would be a trial killer as well. ’Cos em . . . it’s, it would be very difficult to manage thatP14, audit staff and healthcare professional | Sometimes it’s really hard to find that person though erm or that person is just like really busy or they change and somebody else comes in and they don’t know the thing so well and it’s erm, you know that’s the same in, whether it is national clinical audits or anything elseP25, feedback researcher | I mean actually it’s fun. We have, we have a really good time; it’s exciting, it’s . . . an environment, I think, that people can express ideas, umm, that are seriously considered and solutions are found to problems reallyP7, audit staff | |||
Our thematic analysis indicated no evidence of a relationship between TDF domains and participant role. The findings are presented in terms of higher-order themes, which are outlined and mapped to theoretical domains (presented in italics), and accompanied by example quotations. Our higher-order themes were:
-
resources
-
logistics
-
leadership
-
relationships
-
perceived risks
-
opportunities and benefits.
The barriers to embedding experimentation within audit programmes that were reported by participants fell mostly within the domains Memory, attention and decision processes; Environmental context and resources; and Emotion. Key enablers were associated with the domains Knowledge, Skills and Reinforcement. We found a high level of agreement across roles, including participants with dual roles, for all themes.
Resources
Interviewees who had roles within NCAs typically described their teams as small and under-resourced. This limited their ability to participate in A&F research (Environmental context and resources). Moreover, their practical and intellectual capacity was consumed by existing priorities (Memory, attention and decision-making processes). There was variation between different audit programmes’ funding models, with many staffed by volunteers (Beliefs about capabilities). Changes in practice (e.g. adjusting the format of reports) were often resource-intensive and there was a risk of overstretching the team in committing to new projects (Environmental context and resources and Emotion). Some audit programmes worked with clinicians and external parties for limited periods only, such as a single audit cycle, hindering the continuity necessary for research purposes (Environmental context and resources). In some cases, clinicians had a role in identifying audit criteria; this was often seen as an opportunity to further their own research and leadership profiles, rather than a chance to improve health care or audit programme effectiveness (Social and professional role and identity).
Audit staff often work to strict timelines for delivering feedback, and schedules are also informed by funding cycles. Therefore, collaborative research must understand and align with these constraints (Environmental context and resources). Research partners must be responsive to the needs of the collaborating audit programme (Skills) and additional costs associated with the research would likely need to be met by the research partner for collaboration to be possible (Environmental context and resources).
You are having to align fairly complex research governance processes with those external deadlines and that . . . is definitely a challenge!
P11, feedback researcher and audit staff
There’s a lot of audits that are running on a shoestring as well! So a lot of people that want to improve what they do, you know I’m talking about in terms of delivering their audit . . . but they’re running on a shoestring financially.
P15, audit staff
Logistics
Participants identified several logistical barriers to embedding research within audit programmes. Feedback researchers described how longer-term, programmatic funding was necessary to develop and test different ways of designing and delivering A&F over multiple audit cycles (Knowledge). However, there was a perception that this was not considered a ‘sexy’ topic, restricting the likelihood of obtaining research funding (Knowledge). Furthermore, the necessary research costs might be high, particularly with the involvement of a clinical trials unit (Environmental context and resources). Convincing funders of the need for research in this area was seen as one of the biggest barriers, despite the potential benefits for health-care quality (Goals and Environmental context and resources).
Issues around data quality were described by participants. One interviewee from a national audit programme explained how participating in embedded research had made the programme aware of their own data quality deficiencies (Social and professional role and identity). Some reported being aware of weaknesses and a lack of rigour in the processes of other audit programmes (Skills and Beliefs about capabilities). It was noted that there is variability in the credibility of the indicators used by audit programmes, and in the extent to which they are evidence based. In some cases, required standards had been set based on current achievement in care rather than an (non-existent) evidence base of best care. Some audit staff felt that further research in this area should be prioritised before embedding research within audits as any improvement shown would not necessarily equate to improved care (Goals).
Other logistical barriers included the constraints of the electronic health system used by health care providers (Environmental context and resources) and the risk of contamination between trial arms when participants share or compare feedback with one another (Social influences). Participants with a background in research considered organisational restructuring of health care, particularly UK primary care, to be a particular risk to trial feasibility (Environmental context and resources). To be successful, embedded research required stable organisations and relationships.
Ethics barriers were not considered an issue. Indeed, not conducting research in this context might be considered unethical, as changes were typically made to feedback methods without formal evaluation (Environmental context and resources). Several audit programmes had data-sharing agreements that permitted the use of data for research, although there was less certainty regarding data ownership in countries outside the UK (Environmental context and resources):
I don’t think any funders would consider it . . . maybe sexy, for instance? And might, well if not be aware on panels, I don’t think they often will be aware of . . . of the area . . .
P18, feedback researcher
No one knows what the, what a good induction rate is or a good elective caesarean section rate is so, . . . that’s quite tricky to then work with. Some would say well . . . the audit could pick one. But then I would anticipate we would have a lot of backlash from people. Some people would say you’re too high; some people, you’re too low and everything in-between.
P21, audit staff
Leadership
Feedback researchers and audit staff felt that the leadership skills of key individuals within audit programmes were very important to the potential success of a collaboration (Skills and Social and professional role and identity). An enthusiasm for research was necessary, together with an understanding of the equipoise surrounding the most effective design and methods in feeding back clinical performance to health-care providers (Knowledge). An ability to convince others of the importance of research was essential, particularly funders and key stakeholders (Optimism and Social and professional role and identity). Audit staff and health-care providers wanted reassurance that (assumed) beneficial content would not be removed, suggesting that there was a lack of equipoise in effective feedback design (Beliefs about consequences).
A personal interest in conducting embedded research was considered an important quality for audit leaders that would boost their team’s motivation towards the work. Team learning culture and inquisitiveness were thought to depend on their leader (Skills, Optimism and Social and professional role and identity). Health-care professionals felt encouraged to participate in feedback research that was led by an enthusiastic and respected audit programme team (Skills, Beliefs about capabilities and Social influences). The potential for conflict arose when audit staff believed recipients would not want to be in a control arm, given perceived reductions in the quality of feedback delivered (Beliefs about consequences). All participants described how a steer from lead commissioners and key local individuals may help to legitimise the research and increase involvement, bolstering the chances of successful collaboration (Skills and Social and professional role and identity):
So, you might have a clinical lead for [audit programme] locally in a trust who is loving a current data visualisation and, you know that person changes at exactly the time, you know you switch the visualisation; and the fact, the drop off isn’t that the visualisation has gone, the drop-off is that you’ve lost the key person locally.
P12, audit staff
They genuinely seem to have been interested and, and, and keen to learn from the findings.
P11, feedback researcher and audit staff
Relationships
Participants described how relationships and trust between audit programmes and researchers took time to develop (Reinforcement and Social influences). In particular, audit staff expressed a preference to begin with simple studies to establish benefits and procedures, rather than moving straight to a series of large-scale trials and jeopardising their ability to fulfil existing demands (Environmental context and resources, and Reinforcement).
Both feedback researchers and audit staff identified the need for diplomacy to maintain relationships when difficulties arose (Skills and Intention). There was also nervousness regarding loss of control; researchers wanted more control over data gathering and audit staff wanted to retain control over audit content (Beliefs about consequences and Memory, attention and decision-making processes). Patience was needed by all parties, particularly in the set-up phase (Skills and Social influences). Co-design and involving audit recipients in the research were identified as means of establishing trust between researchers, audit programmes and the health-care system (Goals and Social influences).
Participants were generally consistent in their view that audit programme involvement in embedded research should not be onerous, and balance was required between the ambitions of researchers and pragmatism (Beliefs about capabilities). If this was achieved, the ongoing partnership would be valuable and worthwhile (Reinforcement). All interviewees felt that the benefits of embedding experimentation with audit programmes outweighed the challenges (Intentions and Goals):
So the kind of skills I need are a bit of diplomacy, a bit of prompting, a bit of time management, a bit of sort of people management in that respect, but also the ability to step back and not say ‘this is what I think we should do’. Um, and then just tenacity er, in diplomacy again to smooth over some trouble waters, bits and pieces, keep going.
P6, audit staff
The clinical teams you know, may be interested in improvement, but often they’re interested in doing their clinical work and not being bothered too much. And the clinical audit leadership wants to demonstrate that the audit is, is worth it and that it’s producing value. So I can see that that would be one of the first tasks is umm, is reaching a shared understanding.
P17, feedback researcher
Perceived risks
The potential for negative unintended consequences was raised by audit staff and health-care professionals (Beliefs about consequences and Emotion). For example, failure of an experiment to show an improvement in audit programme effectiveness might jeopardise continued funding and recommissioning, as well as threaten job security of employed staff (Beliefs about consequences and Environmental context and resources). Some worried that a ‘ceiling effect’ on improvement would mean that trials would fail to show benefit.
There was also concern about the potential for damaging the relationship with an audit programme’s end-users in health-care delivery (Beliefs about consequences). It was feared that changing the format or design of a now-familiar audit would alienate recipients and lead to disengagement that would affect both the audit programme and experiment findings (Reinforcement and Beliefs about consequences). Audit staff in particular emphasised the importance of maintaining the audit programme ‘brand’ (Social influences). Most participants considered this type of research to be of low risk and low cost to health-care providers (Beliefs about consequences and Reinforcement); however, balancing the needs of all stakeholders was seen as a significant challenge (Social influences):
They were very open about being worried about what we would find. They have pressures of their own around . . . the commissioning of the audit and the reputation of their organisation.
P11, feedback researcher and audit staff
People get used to our reporting format. They get, they finally got, got that now! You know I understand what that’s showing me now! We go ‘Wee! We’ve changed it!, You know like, no, so what we might think is terribly good in their space, they might go ‘God, I don’t understand it now!’. You know back to square one!
P15, audit staff
Opportunities and benefits
All roles provided examples of how NCA programmes might benefit from embedded experimentation (Optimism and Beliefs about consequences). These included opportunities to gain new skills, new ideas and visions being shared with the audit team, as well as increased financial investment and new collaborations leading to further opportunities (Skills, Beliefs about consequences and Reinforcement).
It was considered that part of an audit programme’s role was to continually strive to increase its effectiveness. Thus, embedding research could be considered a strategic decision that would raise awareness of the programme, demonstrate to funders that improvement work was taking place, provide evidence of impact and help satisfy their objective of improving patient care (Social and professional role and identity and Goals).
All groups of participants saw a high potential for auditing to have an impact on health care and patient benefit, and considered audit programmes to be an underused research resource (Goals, Intentions and Beliefs about capabilities). Embedding research in existing structures was seen to be an efficient model of quality improvement and would enhance the evidence-base for optimising A&F (Reinforcement and Memory, attention and decision-making processes). Audit staff and health-care professionals were optimistic about the future of embedded experimentation and all groups expressed enthusiasm about being involved in such work (Goals, Emotion and Optimism):
When we retender for running the national clinical audits, it’s useful to have an evidence base on where we’re going for focus. We want to do lots of things, we’re limited in terms of capacity in what we can realistically implement. So knowing that we’re implementing something that’s going to make more of a difference and then have a knock on impact hopefully on patients.
P4, audit staff
It’s likely that the new discoveries are likely to plateau and really now the bigger challenges putting into effect the medicines and treatments that we know work . . . I think has gotta be the kind of highest priority really because there’s not really any point in developing new treatments if we’re not using the ones we’ve have currently as effectively as we could.
P23, audit staff and health-care professional
Discussion
We conducted interviews exploring the barriers to and enablers of establishing embedded experimentation within NCA programmes with the aim of improving feedback effectiveness. We interviewed participants, based in the UK and internationally, with experience in one or more of three roles: research on A&F, the management and delivery of audit programmes, and health-care. We identified four optimal conditions for sustainable collaboration between researchers and audit programmes, as well as the potential risks and benefits of such partnerships.
First, audit programmes need the capacity to participate in research. Adequate resources and staffing are required to enact the experimental changes to feedback, which need to occur in the context of existing programme constraints and timelines. Second, logistical issues regarding data sharing and quality, research funding, and protection against trial contamination must be acknowledged and resolved. We identified no major ethics barriers to embedded experimentation, however, with some interviewees arguing that it would be unethical not to conduct such research. Third, enthusiastic and engaged leaders of audit programmes who understand research equipoise and are able to motivate a research-interested team as well as engage key stakeholders are required. Last, collaborations between researchers and audit programmes must be underpinned by a trusting and sustained relationship. This can be encouraged by identifying shared priorities and balancing research ambitions with pragmatic imperatives.
Most of the theoretical domains identified in interviews contained both barriers to and enablers of embedding experiments in audit programmes. The majority of barriers were classified across three domains: Memory, attention and decision-making processes; Environmental context and resources; and Emotion. Three domains were identified mostly in terms of enablers: Knowledge, Skills and Reinforcement. Potential risks to audit programme participation included alienating end-users by introducing changes to feedback that undermined the programme brand and its potential to improve health care. Audit staff reported fears around putting future funding and recommissioning in jeopardy if ‘negative’ trial findings are perceived as disappointing rather than as opportunities to avoid wasteful, ineffective changes. A top-down expectation of experimentation from audit commissioners might increase participation. Potential benefits described by interviewees from all groups included improving population health, increased investment, and demonstrating impact to funders and commissioners. Overall, interviewees considered the potential benefits of collaboration to outweigh the associated risks. These findings have implications for the design and evaluation of proposed ‘implementation laboratories’. 28,111 Thus, our findings are of particular relevance to research funders, clinical commissioners, national audit programme leads and health-care quality improvement leads.
Although our study largely focused on UK NCA programmes, it has implications for audit programmes and health-care data benchmarking in other countries that aim to develop research–practice partnerships to enhance audits through embedded trials.
Comparison to existing literature
There is scarce literature on embedding research in implementation laboratory settings. The concept shares similarities with that of ‘learning health systems’, in which evidence is gathered from routine care and deployed quickly into practice via cycles of continuous learning and improvement. 124 Initial efforts to implement learning health systems have identified requirements for success that align with our findings: adequate funding, robust data systems, and an organisational culture that values quality improvement. 125 We suggest ensuring that audit programme partners are fully represented and involved from the initial stages of collaboration. This may help to increase the likelihood of success by helping to overcome institutional pressures in the design phase where audit programmes have considerable financial and organisational challenges.
Our research augments work on stakeholder perspectives regarding research–practice partnerships. Such collaborations may provide both structure and opportunity for developing a shared cognitive space around which collective action can be organised. A process of consensus building, although time-consuming, may support the alignment of shared priorities, formation of a trusting relationship through the relinquishing and sharing of power, and identification of the possible long-term benefits of embedded programmes of trials in quality improvement activities. 113 The barriers to achieving, and sustaining, a partnership are similar to those found in other contexts,114 with the need for appropriate structures (including leadership and establishing specific roles) and processes to facilitate optimal conditions for genuine and collaborative action. 113
Strengths and limitations
This is the first in-depth exploration of the feasibility issues, barriers and opportunities to embedding research within NCA programmes. Existing research has focused on the use of audit data in clinical research (e.g. epidemiological studies) or by clinicians to improve health care. 12 The qualitative nature of our study provides subjective evaluations of the potential impact of embedding research within audit programmes, but further work is necessary to objectively evaluate or observe research–practice partnerships to understand the associated challenges, risks and benefits more thoroughly. Our theory-guided approach allowed us to identify the cognitive, affective, social and environmental influences on behaviour and potential reasons for implementation problems in embedding research within NCA programmes.
We recognise several study limitations. The majority of health-care staff we recruited had some current or previous involvement with NCA programmes, potentially subjecting our findings to social desirability bias. Our links with the A&F ‘MetaLab’,110 an international collaboration, enabled us to leverage a reasonably diverse range of perspectives to draw upon international examples of embedded research. The health-care professionals we interviewed were mainly secondary care based. However, inclusion of staff from primary care, where audit programmes are limited, ensured that we captured insights from those not involved with audit programmes. All participant groups identified the same optimal conditions, potential risks and benefits, suggesting that when developing research–practice partnerships the majority of challenges are predictable and could be overcome through thoughtful planning and communication.
Implications for research, practice and policy
Implementation laboratories, in the form of embedded programmes of trials in NCA programmes, have been suggested as a means of enhancing the impact that A&F has and also producing generalisable knowledge about how to optimise effectiveness. 12,111 Sequential, head-to-head trials testing different feedback methods in a national audit programme provide a robust empirical driver for change. Modifications identified as more effective than the current standard become the new standard; those that are not are discarded. The testable recommendations for feedback modifications proposed by Brehaut et al. ,19 such as using a comparator based on the average or high performers, have minimal cost implications. However, our findings suggest that there are resource implications for audit programmes that are not currently met. Marginal gains in the effectiveness of A&F are likely to be worthwhile at a population level. Supported by adequate resources and funding, they would also be feasible to test within an implementation laboratory. 111
Our interviewees consistently stated that the benefits of embedding experimentation within audit programmes would outweigh the risks and challenges. We have demonstrated the willingness of audit staff and health-care professionals (i.e. the audit programme’s end-users) to participate in an implementation laboratory to enhance the effectiveness of A&F. Drawing on our findings, we have produced 10 ‘top tips’ to develop successful collaborations between researchers and audit programmes in a programme of trials (Table 21).
| Tip | Corresponding analysis theme |
|---|---|
| 1. Consider what extra resources the audit programme(s) will need | Resources |
| 2. Agree timelines with both research and audit team | |
| 3. Review and agree processes for data extraction, sharing, checking and cleaning | Logistics |
| 4. Identify an enthusiastic leader to engage audit team and health-care providers | Leadership |
| 5. Promote an understanding of equipoise to ensure that negative trial results are not misrepresented as research failures or lack of audit impact | |
| 6. Ensure and agree shared priorities for research and clinical audit programme | Relationships |
| 7. Start with small changes to avoid alienating end-users before tackling more complex or larger changes | |
| 8. Choose audit standards carefully for feedback research, ensuring that they are underpinned by a strong evidence base and that there is scope for improvement | Perceived risks |
| 9. Balance research ambitions with pragmatic actions | |
| 10. Recognise that small improvements may have significant population benefits – this message needs to be heard by funders, commissioners and health-care systems | Opportunities and benefits |
Summary
We applied the TDF to understand different perspectives of embedding experiments within national audit programmes. Overarching themes concerned resources, logistics, leadership, relationships, perceived risks, and opportunities and benefits. Considering these factors may help create the optimal conditions for sustainable collaboration between feedback researchers and clinical audit programmes.
Chapter 6 Patient and public involvement
We benefited from the contribution of our PPI panel throughout the programme. We have an established relationship with the PPI panel, which has worked alongside us for several years on related research. 106,126 The PPI panel met formally on five occasions during the programme to discuss progress; contribute to decision-making; and advise on methodology, interpretation of findings, and dissemination. Meetings originally took place in person but were conducted remotely as a result of the COVID-19 pandemic. We aimed to ensure that all members were able to join and contribute to these meetings. PPI was incorporated into our three objectives.
Objective 1
The consensus panel that guided our selection of feedback suggestions included two PPI representatives. All panel members’ ratings were weighted equally, meaning that patients’ views helped to inform which suggestions were selected for the trial. Our PPI panel members commented on draft versions of the online experiment and had a particular role in the development of the patient statements that formed one of the experimental conditions (‘patient voice’). The group helped to modify these statements and select their accompanying images.
We appreciated the input of our PPI panel and the patient representatives on our Project Steering Committee in relation to the suspected fraud incident. The PPI panel strongly endorsed our reporting of this incident to the appropriate bodies.
Objective 2
Our PPI panel had advised on the original design of the study. In the redesigned study, we interviewed members of our PPI panel as part of our sample. Their views were incorporated into our evaluation of the two audits.
Objective 3
The PPI panel discussed the themes emerging from the interviews and contributed to our interpretation and conclusions.
Beyond ENACT, our PPI panel members have expressed an interest in a sustained relationship and have contributed to further implementation research proposals in advisory and co-applicant roles. Thus, we expect to continue to build on and further develop our PPI partnership.
Chapter 7 Discussion
Key findings
There are three opportunities to improve the impact of NCA programmes on patient care and, hence, improve population outcomes. First, although feedback generally has modest, if worthwhile, effects on patient care, optimising its content, format and delivery may enhance effectiveness. We developed and evaluated the effects of modifications to feedback on intended enactment, user comprehension, experience and engagement in an online experiment (objective 1). This provided an efficient way of identifying leading candidate modifications for further ‘real-world’ application and further evaluation. Second, NCAs may have scope to improve the impact that they have by strengthening one or more parts of the audit cycle. We identified the strengths of the two NCA programmes, how their planned changes would strengthen their feedback cycles, and further scope for strengthening their feedback cycles (objective 2). Third, embedding randomised trials evaluating different ways of delivering feedback within NCA programmes offers an efficient, evidence-based approach to achieve cumulative improvements in impact. We explored the opportunities, costs and benefits of NCA participation in a long-term collaborative to improve audits through a programme of trials (objective 3).
We selected and developed six online feedback modifications through three rounds of user testing:
-
recommend specific actions
-
choose comparators that reinforce desired behaviour change
-
provide feedback in more than one way
-
minimise extraneous cognitive load for feedback recipients
-
provide short, actionable messages followed by optional detail
-
incorporate the patient voice.
We encountered challenges in operationalising the modifications so that they were sufficiently faithful to the intentions of evidence- and theory-based suggestions for effective feedback. UCD work with participants from a range of audit programmes helped ensure credibility and acceptability for the subsequent online experiment.
We randomised 1241 participants from five NCAs in an online fractional factorial screening experiment. During the response period, we detected suspicious activity associated with repeated (i.e. duplicate) participant completion during a defined ‘contamination period’. Our primary analysis population conservatively excluded 603 (48.6%) participants during the ‘contamination period’ and included 638 (51.4%) participants, with 566 (45.6%) having completed the outcome questionnaire.
We found that no feedback modification independently increased the primary outcome of intended enactment to meet audit standards across clinical and non-clinical recipients of five audits. However, all modifications contributed in some way and with different levels of magnitude, with both synergistic and antagonistic effects observed when modifications to feedback were combined across all outcomes. The magnitude of dependent effects of each modification on outcomes was generally small, but their combined cumulative effect, across all possible modification combinations and versions of feedback, showed more substantial heterogeneity and greater magnitude. In the NDA, for example, intended enactment for clinical participants was optimised when multimodal feedback, specific actions and patient voice were provided while also minimising extraneous cognitive load. In contrast, including multimodal feedback, minimising cognitive load and optional detail led to the lowest intention. In addition to the effects of modifications, we found that the national audit programme itself and whether recipients had a clinical role had a dominant influence on recipients’ intended enactment and other measures of intention.
Our analysis of two NCA programmes drew on interviews with 19 international co-investigators, reference panel members, PPI panel members and Project Steering Group members. We identified innovations likely to increase effectiveness, mainly moves towards more frequent data release and interactivity with feedback that enabled recipients to verify and accept data. These augmented existing strengths, such as automated data collection, the use of accepted indicators and recognised credibility of feedback sources. However, all aspects of the audit cycle are likely to be important in ensuring effectiveness. Suggested areas for improvement included better targeting of feedback recipients, incorporating specific action plans to guide improvement activities, considering whether or not comparators other than national averages might be more motivating and providing evidence that the audit has had demonstrable impacts on patient care and outcomes. To our knowledge, this was the first application of CP-FIT to evaluation of feedback delivered by individual NCAs.
Embedded randomised trials evaluating different ways of delivering feedback within clinical audit programmes offer an efficient approach to achieve cumulative, evidence-based improvements in impact. 28 However, few real-life examples of such ‘implementation laboratories’ exist and there is limited experience of how to develop and run them. 111 We applied the TDF to understand different perspectives on embedding experiments within national audit programmes. Our interviews with 31 feedback researchers, audit staff and health-care professionals identified four optimal conditions for sustainable collaboration between clinical audit programmes and researchers:
-
audit programmes having sufficient capacity to take part in research, with adequate resources and staffing to make changes to feedback within the constraints and timelines of both audit and research
-
understanding of logistical challenges, including data sharing and quality, sustained research funding and how to avoid methodological pitfalls in trials, such as contamination
-
audit programme leaders who understand research equipoise and can motivate a research-interested team, as well as engage local health-care leaders
-
underpinning trusting, sustained relationships based on identifying shared priorities and balancing research and pragmatic imperatives.
Considering these factors may help create the optimal conditions for sustainable collaboration between feedback researchers and clinical audit programmes. Perceived risks of embedded experiments in clinical audits include alienating end-users and fears of jeopardising future recommissioning with ‘negative’ experiments. Participants generally considered the benefits of participation to outweigh any risks. We identified no major ethics barriers to embedded experimentation, with some arguing that not embedding research may be unethical.
Comparison with existing literature
Our online experiment represents, to the best of our knowledge, the most comprehensive experiment yet conducted to evaluate the single and combined effects of different feedback modifications on predictors of professional behaviour. Our results need to be contextualised within the wider theoretical and empirical literature on A&F. 11,19 For example, we found that recommending specific actions along with feedback had no independent effect on intended enactment of audit standards. Real-world trial and observational studies indicate that feedback accompanied by patient-specific risk information or specific action plans is more effective in improving clinical care than feedback without this information or vaguely worded feedback. 43,46,47 It is possible that our online feedback modification was not sufficiently potent or that strategies to increase intention need to target other factors as well. There was good evidence that combining recommending specific actions with effective comparators and minimised cognitive load increased action planning.
We also found that a comparator aiming to reinforce desired behaviour change, by showing recipient performance against the top quarter of performers, reduced ease of understanding and user overall experience. These do not necessarily translate into reduced real-world effectiveness. However, our findings do suggest that both audit leaders and researchers need to consider how combining different means of delivering feedback may produce either synergistic or antagonistic effects. Brehaut et al. 19 cautioned that, although it may be tempting for audit programmes to provide feedback using multiple comparators, they risk creating mixed messages for recipients who appear to perform well on one comparator and badly on another. 19 A review of feedback trials suggests that there are considerable opportunities to improve the design of feedback comparators by providing tailored comparisons rather than benchmarking everyone against the mean and limiting the amount of comparators displayed. 53
One novel aspect of our experiment is that we evaluated a pragmatic means of incorporating the patient voice in feedback. We included a photograph of a fictional patient and a quotation describing their experience of care, directly related to the associated audit standard where possible. Guidance for national audit programmes recommends including PPI throughout the audit process. 68 Although we found no independent effects of including the patient voice, there was good evidence of a synergistic interaction with optional detail in improving recipient experience. One caution is that including the patient voice without optional detail reduced recipient experience, perhaps reflecting the importance of justifying the rationale and evidence underpinning feedback messages. 19 The new TARN data analytics tool we assessed offers such an enhanced ability to interrogate and ‘drill down’ into the data to strengthen feedback verification and acceptance. 27
Our exploration of different perspectives in establishing implementation laboratories drew on previous work and earlier experiences of research–practice partnerships. 24,119–121 There is little evidence on embedding research in implementation laboratory settings, but initial experience on the similar notion of the Learning Health System also suggests that there is a need for adequate funding, robust data systems and an organisational culture that values quality improvement. 125 Research–practice partnerships may provide both structure and opportunity for developing a shared cognitive space around which collective action can be organised. Although time-consuming, a process of consensus building can deliver several benefits: aligned priorities, a trusting relationship though the relinquishing and sharing of power, and recognition of potential long-term benefits of embedded trials within quality improvement programmes. 113 The difficulties of achieving, then sustaining, a partnership are similar in other contexts,114 with the need for appropriate structures (including leadership and establishing roles) and processes to facilitate optimal conditions for genuine and collaborative action.
Strengths and limitations
We have conducted a major experiment in collaboration with five NCA programmes. We systematically prioritised and developed a set of online feedback modifications. Our fractional factorial randomised design protected internal validity and allowed evaluation of single and combined feedback modifications. The five NCAs provided diversity in audit methods, topics and targeted audiences, thereby increasing confidence that our findings are relevant to a wider range of clinical audits. Limitations include:
-
The design and delivery of the feedback modifications were constrained by the nature of the online experiment and information technology systems within the NHS. Our final designs may, therefore, not represent the optimal ways of delivering feedback.
-
There was a tension between producing online feedback that credibly mimicked existing audit reports and had ecological validity and an excerpt that could be read in its entirety in a time-limited experiment. Incorporating all randomised combinations of modifications within five full feedback reports would have been unfeasible and diluted intervention exposure.
-
Our screening experiment used proximal (‘upstream’) outcomes that may only partly predict actual clinical behaviour. Despite our attempts to deliver feedback modifications and assess outcomes in a way which maximised signal strength, it was challenging to ensure that the online modifications delivered an optimal ‘dose’ and to mitigate some ceiling effects on intended enactment.
-
The audit standards we selected from five NCAs may have been of varying quality and familiarity with audit teams. We also could not separate out the effects of feedback modifications related to the audit standards chosen for the experiment from wider differences in the national audits and their respective participants.
-
The integrity of the whole experiment was threatened by a significant number of duplicate responses. We minimised the impact of those duplicate responses by removing all responses from the likely contamination period and conducting the primary analysis on those more likely to represent genuine, independent attempts at the experiment. We discarded an unknown number of genuine responses, which represents a waste of research resources and participant time, but did conduct an analysis on a secondary modified sample after excluding less feasible responses.
We successfully adapted our original objective 2 to deliver the first application of an empirically informed, health-care-specific theory of feedback, CP-FIT, within a rapid, qualitative evaluation of two NCAs. 27 We produced a detailed critique of their methods compared with an idealised audit cycle. Limitations include:
-
We could not examine how changes to the audit programmes worked in practice nor explore the experiences of clinicians and managers actually targeted by feedback.
-
We conducted a rapid analysis of interview findings to ensure completion within the overall programme timeline and our findings may, therefore, be less critical and nuanced than a more in-depth analysis.
We conducted the first in-depth exploration of issues around embedding implementation research within large-scale audit programmes. Our theory-guided approach allowed us to identify the cognitive, affective, social and environmental influences on the behaviour of key players. Limitations include:
-
Although interview participants were drawn from diverse roles and settings, they may reflect the perspectives of people relatively amenable to the notion of embedded research in national audits.
-
Interview responses may have been susceptible to social desirability bias.
Taken together, our three studies have contributed to the optimisation of feedback by demonstrating good practice and areas for improvement by NCAs, identifying promising combinations of feedback modifications for implementation and further evaluation, and delineating the necessary conditions for successful collaborations to advance the science and impact of A&F.
Implications for practice
None of the six feedback modifications evaluated in the online experiment improved intended enactment of audit standards in isolation. However, all modifications were found to contribute with potentially important synergistic and antagonistic effects in various combinations of feedback modifications, audit programmes and recipients. This suggests that national audit programmes need to explicitly consider how different features of their feedback are likely to act together.
The modifications we evaluated are likely to require relatively marginal additional resources to implement within national audit programmes. For example, many recipients may invest a relatively brief time in digesting feedback. Minimising cognitive load, by removing distracting detail not directly related to the audit standard, may improve comprehension and, especially when combined with multimodal feedback, intention to bring the audit report to the attention of colleagues.
We observed two dominant influences on intended enactment. The first was whether or not recipients had clinical roles. Nearly half of the recipients in the primary analysis for the online experiment had managerial, audit or administrative roles and were less likely to intend to act on feedback than clinical recipients. This may, at first, raise a question as to whether or not our experiment reached the right participants. However, our experiment was open to all people included in the distribution lists for the five national audit programmes and who would, therefore, typically be the initial recipients of feedback. Effective organisational responses to feedback are likely to need managerial and administrative support, but the overall impact it has may be enhanced by ensuring that feedback reaches the clinicians ultimately responsible for and able to improve the delivery of care.
The second dominant influence on intended enactment was the national audit itself. Considering the findings from objectives 1 and 2 together, modest changes to feedback delivery may enhance effectiveness, but attending to and strengthening all aspects of the audit cycle is likely to make a critical difference to impact. In objective 2, we found a number of ways by which two NCA programmes could achieve this by addressing specific gaps in audit cycles, such as making feedback data easier to understand, incorporating specific action plans to guide improvement activities and demonstrating programme impacts on patient care and outcomes. We earlier piloted an ‘audit’ tool to assess the extent to which a sample of UK national audit feedback reports met a set of good-practice criteria. 127 An updated version of this tool, incorporating key suggestions for improvement based on CP-FIT, may be of value for NCA programme self-assessment.
Box 4 offers suggestions for NCA programmes based on our research findings.
The audit cycle is only as strong as its weakest link; any breakdown at one or more points in the cycle undermines the ability of an audit programme to drive improvement. Identify and address weaknesses in the audit cycle, including setting criteria and standards, measuring performance, designing feedback, delivering feedback and implementing change.
Combining different ways of presenting feedback can have varying positive and negative effects on recipient motivations to meet audit standards. Ensure a clear rationale for any changes to feedback.
Minimise mental effort for feedback recipients by prioritising key messages, reducing the number of data presented, improving readability and reducing visual clutter. This can improve comprehension and intentions to bring audit findings to the attention of colleagues, especially when accompanied by text and graphs reinforcing the same message.
Pilot planned changes to feedback with recipients to look for any unintended consequences. For example, feedback combining all of text, graphs, actionable messages and progressive disclosure of additional information may actually reduce comprehension and motivations to act on audit findings.
Incorporate motivating comparators and targets for change rather than national averages. These should be accompanied by short, actionable messages, with progressive disclosure of additional information to help recipients understand feedback.
Consider combining actionable messages with incorporating the patient voice in feedback, ideally describing experiences of care related to a specific audit standard.
Include accessible summaries of key findings and priorities for change.
Motivate feedback recipients by providing evidence that the audit programme has had demonstrable impacts on patient care and outcomes.
Clarify channels to maximise the likelihood of feedback actually reaching intended recipients. In particular, identify and target feedback at the people who are able to act on findings, particularly key groups of clinicians and organisational leads.
Incorporate specific suggestions for action in feedback to guide improvement activities.
NCA programmes vary in their effectiveness to motivate change by feedback recipients. Encourage opportunities for programmes to learn from one another in comparing how they design and deliver feedback.
Where possible, embed evaluation to test changes to feedback and their impact.
Recommendations for research
There has been a variety of initiatives in UK and international health services to accelerate the uptake of effective practice through closer alignment of research and practice. 121,128 This may occur through, for example, ensuring research genuinely reflects service priorities and population needs or using research-informed implementation strategies. In such initiatives, research and implementation typically occur closely in parallel or sequence. Implementation laboratories take this one evolutionary step further. 28 In a NCA programme, this would entail embedding sequential trials evaluating different audit and feedback methods. Changes to feedback identified as more effective than the current standard become the new standard; those that are ineffective are discarded. 111 This offers a means of enhancing the impact of audit and feedback and also producing generalisable knowledge about how to optimise effectiveness. 12 There is limited experience of implementation laboratory approaches, and none yet that has embedded trials evaluating different interventions in sequence. 24,111 We found that national audit programmes and their recipients are willing to engage with further experimentation embedded within their audit programmes as a means of achieving cumulative improvements in impact. However, expectations about commitments, equipoise and timelines need to be managed. Successful collaborations are likely to depend on mutual compromises between researchers and audit programmes, logistical expertise and resources, leadership and trusting relationships.
Box 5 recommends embedded trials and includes further recommendations for research based on our study.
-
Embedded randomised trials evaluating different ways of delivering feedback in NCA programmes are acceptable to both the programmes and feedback recipients.
-
Among the different ways of enhancing feedback we examined, several show promise, individually or combined, including minimising cognitive load for feedback recipients and incorporating the patient voice in feedback.
-
Identifying and engaging key feedback recipients, such as clinicians and managers, is likely to be a major challenge for most NCA programmes and merits further investigation.
-
Although online screening experiments offer an appeal in their ability to test and optimise complex interventions efficiently and identify candidates for further real world application, further work is needed to amplify the effects of online interventions and delineate predictors of behaviour relevant throughout the whole audit and feedback cycle.
-
Our practical suggestions for protecting the integrity of online research include considering what is essential to meet ethics safeguards and data protection, assessing the balance between study security and ease of participation, regularly monitor aspects of collected data, using manual rather than automated delivery of incentives unless there is high confidence in study security, visualising problematic scenarios and being prepared to act rapidly to protect study integrity.
Chapter 8 Ethics review
The studies reported in objectives 1, 2 and 3 were approved by the University of Leeds School of Medicine Research Ethics Committee (reference 16–180, 18–051 and 18–047, respectively). The online trial was registered with the ISRCTN registry (reference ISRCTN41584028). The study in objective 2 was approved by the Health Research Authority (IRAS project ID: 258139).
Acknowledgements
There are several groups that supported and contributed to this programme.
Thank you to our Project Steering Committee: Paula Whitty, Paul Carder, Chris Dew, Roy Dudley-Southern, Steven Gilmour, Mirek Skrypak and Laurence Wood.
We thank our PPI panel: Pauline Bland, Allison Chin, Susan Hodgson, Gus Ibegbuna, Chris Pratt, Graham Prestwich, Martin Rathfelder, Kirsty Samuel and Laurence Wood.
Our reference panel provided important input into the selection of suggestions in objective 1 and included Jonathan Benn, Vicky Hiley, Tricia McKinney, Sam Oddie, Megan Rowley and Chris Wilkinson.
We are also grateful for the support of the five NCAs that featured in this research and particularly wish to thank Antoinette Edwards and Fiona Lecky from TARN. We also acknowledge the support of John Grant-Casey for support from NCABT.
We wish to thank additional members of the team for their important contribution: Murdi Althaf for completing the programming of the online experiment in objective 1; Roger Parslow for advising on programme management and PICANet’s involvement in objective 1; Wendy Hobson and Sabahi Juma for their administrative support; and Aamna Fardous and Taposhi Nath for editorial support in preparing this document.
Contributions of authors
Thomas A Willis (https://orcid.org/0000-0002-0252-9923) (Senior Research Fellow) was programme manager, led objective 2, contributed to objective 1 and conducted interviews and analysis in objective 3.
Alexandra Wright-Hughes (https://orcid.org/0000-0001-8839-6756) (Principal Statistician) prepared the statistical analysis plan, completed the randomisation process, contributed to the checking of the online study prior to launch and conducted the statistical analysis (objective 1) with guidance from Rebecca Walwyn (https://orcid.org/0000-0001-9120-1438) and (Associate Professor) Amanda Farrin (https://orcid.org/0000-0002-2876-0584) (Professor).
Ana Weller (https://orcid.org/0000-0001-6915-6095) (Researcher) completed the UCD work and programming of the online study, with support from Valentine Seymour (https://orcid.org/0000-0001-8264-3875) (Research Fellow).
Sarah L Alderson (https://orcid.org/0000-0002-5418-0495) (Associate Professor) provided clinical guidance in objective 1 and led objective 3.
Stephanie Wilson (https://orcid.org/0000-0001-6445-654X) (Professor) contributed to the intervention development work in objective 1 and supervised the UCD research.
Su Wood (https://orcid.org/0000-0003-3747-3672) (Research Fellow) conducted interviews in objectives 2 and 3, and contributed to their analysis.
Fabiana Lorencatto (https://orcid.org/0000-0003-4418-7957) (Honorary Research Fellow) contributed to the development of the online study and advised on analysis of objectives 2 and 3.
Suzanne Hartley (https://orcid.org/0000-0003-2346-9461) (Head of Trial Management) was responsible for the operational delivery of the trial (objective 1).
Jillian Francis (https://orcid.org/0000-0001-5784-8895) (Professor) contributed to the intervention development work in objective 1 and commented on a draft of the objective 3 chapter.
Jamie Brehaut (https://orcid.org/0000-0002-4213-1143) (Senior Scientist/Professor), Heather Colquhoun (https://orcid.org/0000-0002-6226-2511) (Associate Professor), Jeremy Grimshaw (https://orcid.org/0000-0001-8015-8243) (Professor), Noah Ivers (https://orcid.org/0000-0003-2500-2435) (Clinician Scientist/Assistant Professor), Benjamin C Brown (https://orcid.org/0000-0001-9975-4782) (Senior Academic GP/Honorary Consultant) and Justin Presseau (https://orcid.org/0000-0002-2132-0703)(Associate Professor) provided advice throughout the programme and commented on drafts of individual chapters.
Richard Feltbower (https://orcid.org/0000-0002-1728-9408) (Professor), Chris P Gale (https://orcid.org/0000-0003-4732-382X) (Professor) and Simon J Stanworth (https://orcid.org/0000-0002-7414-4950) (Consultant Haematologist) advised on national audit involvement and contributed to programme management.
Justin Keen (https://orcid.org/0000-0003-2753-8276) (Professor) advised on the original plans for objective 2.
Robbie Foy (https://orcid.org/0000-0003-0605-7713) (Professor) was principal investigator for the programme.
Robbie Foy, Thomas A Willis, Alexandra Wright-Hughes, Ana Weller, Stephanie Wilson and Sarah L Alderson led the drafting of the report.
All authors participated in programme management and provided a critical review and final approval of the report.
Publication
Alderson S, Willis TA, Wood S, Lorencatto F, Francis J, Ivers N, et al. Embedded trials within national clinical audit programmes: a qualitative interview study of enablers and barriers. J Health Serv Res Policy 2021;27:50–61.
Willis TA, Wood S, Brehaut J, Colquhoun H, Brown B, Lorencatto F, Foy R. Opportunities to improve the impact of two national clinical audit programmes: a theory-guided analysis. Implementation Sci Comm 2022;3:32.
Wright-Hughes A, Willis TA, Wilson S, Weller A, Lorencatto F, Althaf M, et al. A randomised fractional factorial screening experiment to predict effective features of audit and feedback. Implementation Sci 2022;17:34.
Data-sharing statement
Requests to access programme data should be made to CTRU-DataAccess@leeds.ac.uk in the first instance. Data (with any relevant supporting material, e.g. data dictionary, protocol, statistical analysis plan) may be made available following review by relevant stakeholders. Any approved data release will protect the confidentiality and privacy of individuals, and be in line with appropriate legal and ethics requirements.
Disclaimers
This report presents independent research funded by the National Institute for Health and Care Research (NIHR). The views and opinions expressed by authors in this publication are those of the authors and do not necessarily reflect those of the NHS, the NIHR, the HSDR programme or the Department of Health and Social Care. If there are verbatim quotations included in this publication the views and opinions expressed by the interviewees are those of the interviewees and do not necessarily reflect those of the authors, those of the NHS, the NIHR, the HSDR programme or the Department of Health and Social Care.
References
- NHS Right Care . NHS Atlas of Variation in Healthcare 2015.
- Seddon ME, Marshall MN, Campbell SM, Roland MO. Systematic review of studies of quality of clinical care in general practice in the UK, Australia and New Zealand. Qual Health Care 2001;10:152-8. https://doi.org/10.1136/qhc.0100152.
- Guthrie B, McCowan C, Davey P, Simpson CR, Dreischulte T, Barnett K. High risk prescribing in primary care patients particularly vulnerable to adverse drug events: cross sectional population database analysis in Scottish general practice. BMJ 2011;342. https://doi.org/10.1136/bmj.d3514.
- Foy R, Leaman B, McCrorie C, Petty D, House A, Bennett M, et al. Prescribed opioids in primary care: cross-sectional and longitudinal analyses of influence of patient and practice characteristics. BMJ Open 2016;6. https://doi.org/10.1136/bmjopen-2015-010276.
- Wu J, Zhu S, Yao GL, Mohammed MA, Marshall T. Patient factors influencing the prescribing of lipid lowering drugs for primary prevention of cardiovascular disease in UK general practice: a national retrospective cohort study. PLOS ONE 2013;8. https://doi.org/10.1371/journal.pone.0067611.
- Hall M, Dondo TB, Yan AT, Goodman SG, Bueno H, Chew DP, et al. Association of clinical factors and therapeutic strategies with improvements in survival following non-ST-elevation myocardial infarction, 2003–2013. JAMA 2016;316:1073-82. https://doi.org/10.1001/jama.2016.10766.
- Zeitlin J, Manktelow BN, Piedvache A, Cuttini M, Boyle E, van Heijst A, et al. Use of evidence based practices to improve survival without severe morbidity for very preterm infants: results from the EPICE population based cohort. BMJ 2016;354. https://doi.org/10.1136/bmj.i2976.
- Perry DC, Metcalfe D, Griffin XL, Costa ML. Inequalities in use of total hip arthroplasty for hip fracture: population based study. BMJ 2016;353. https://doi.org/10.1136/bmj.i2021.
- Gutacker N, Bloor K, Cookson R, Gale CP, Maynard A, Pagano D, et al. Hospital surgical volumes and mortality after coronary artery bypass grafting: using international comparisons to determine a safe threshold. Health Serv Res 2017;52:863-78. https://doi.org/10.1111/1475-6773.12508.
- Cooksey D. A Review of UK Health Research Funding. Norwich: HMSO; 2006.
- Ivers N, Jamtvedt G, Flottorp S, Young JM, Odgaard-Jensen J, French SD, et al. Audit and feedback: effects on professional practice and healthcare outcomes. Cochrane Database Syst Rev 2012;6. https://doi.org/10.1002/14651858.CD000259.pub3.
- Foy R, Skrypak M, Alderson S, Ivers NM, McInerney B, Stoddart J, et al. Revitalising audit and feedback to improve patient care. BMJ 2020;368. https://doi.org/10.1136/bmj.m213.
- Foy R, Eccles MP, Jamtvedt G, Young J, Grimshaw JM, Baker R. What do we know about how to do audit and feedback? Pitfalls in applying evidence from a systematic review. BMC Health Serv Res 2005;5. https://doi.org/10.1186/1472-6963-5-50.
- Mason J, Freemantle N, Nazareth I, Eccles M, Haines A, Drummond M. When is it cost-effective to change the behavior of health professionals?. JAMA 2001;286:2988-92. https://doi.org/10.1001/jama.286.23.2988.
- Hoomans T, Severens JL. Economic evaluation of implementation strategies in health care. Implement Sci 2014;9. https://doi.org/10.1186/s13012-014-0168-y.
- Grimshaw JM, Thomas RE, MacLennan G, Fraser C, Ramsay CR, Vale L, et al. Effectiveness and efficiency of guideline dissemination and implementation strategies. Health Technol Assess 2004;8. https://doi.org/10.3310/hta8060.
- Grimshaw JM, Eccles MP, Lavis JN, Hill SJ, Squires JE. Knowledge translation of research findings. Implement Sci 2012;7. https://doi.org/10.1186/1748-5908-7-50.
- Guthrie B, Kavanagh K, Robertson C, Barnett K, Treweek S, Petrie D, et al. Data feedback and behavioural change intervention to improve primary care prescribing safety (EFIPPS): multicentre, three arm, cluster randomised controlled trial. BMJ 2016;354. https://doi.org/10.1136/bmj.i4079.
- Brehaut JC, Colquhoun HL, Eva KW, Carroll K, Sales A, Michie S, et al. Practice feedback interventions: 15 suggestions for optimizing effectiveness. Ann Intern Med 2016;164:435-41. https://doi.org/10.7326/M15-2248.
- Ivers NM, Grimshaw JM, Jamtvedt G, Flottorp S, O’Brien MA, French SD, et al. Growing literature, stagnant science? Systematic review, meta-regression and cumulative analysis of audit and feedback interventions in health care. J Gen Intern Med 2014;29:1534-41. https://doi.org/10.1007/s11606-014-2913-y.
- Ivers NM, Sales A, Colquhoun H, Michie S, Foy R, Francis JJ, et al. No more ‘business as usual’ with audit and feedback interventions: towards an agenda for a reinvigorated intervention. Implement Sci 2014;9. https://doi.org/10.1186/1748-5908-9-14.
- The Improved Clinical Effectiveness through Behavioural Research Group (ICEBeRG) . Designing theoretically-informed implementation interventions. Implement Sci 2006;1. https://doi.org/10.1186/1748-5908-1-4.
- Craig P, Dieppe P, Macintyre S, Michie S, Nazareth I, Petticrew M. Developing and evaluating complex interventions: the new Medical Research Council guidance. BMJ 2008;337. https://doi.org/10.1136/bmj.a1655.
- Hartley S, Foy R, Walwyn REA, Cicero R, Farrin AJ, Francis JJ, et al. The evaluation of enhanced feedback interventions to reduce unnecessary blood transfusions (AFFINITIE): protocol for two linked cluster randomised factorial controlled trials. Implement Sci 2017;12. https://doi.org/10.1186/s13012-017-0614-8.
- Gould NJ, Lorencatto F, Stanworth SJ, Michie S, Prior ME, Glidewell L, et al. Application of theory to enhance audit and feedback interventions to increase the uptake of evidence-based transfusion practice: an intervention development protocol. Implement Sci 2014;9. https://doi.org/10.1186/s13012-014-0092-1.
- Gould NJ, Lorencatto F, During C, Rowley M, Glidewell L, Walwyn R, et al. How do hospitals respond to feedback about blood transfusion practice? A multiple case study investigation. PLOS ONE 2018;13. https://doi.org/10.1371/journal.pone.0206676.
- Brown B, Gude WT, Blakeman T, van der Veer SN, Ivers N, Francis JJ, et al. Clinical Performance Feedback Intervention Theory (CP-FIT): a new theory for designing, implementing, and evaluating feedback in health care based on a systematic review and meta-synthesis of qualitative research. Implement Sci 2019;14. https://doi.org/10.1186/s13012-019-0883-5.
- Ivers NM, Grimshaw JM. Reducing research waste with implementation laboratories. Lancet 2016;388:547-8. https://doi.org/10.1016/S0140-6736(16)31256-9.
- Wilkinson C, Weston C, Timmis A, Quinn T, Keys A, Gale CP. The Myocardial Ischaemia National Audit Project (MINAP). Eur Heart J Qual Care Clin Outcomes 2020;6:19-22. https://doi.org/10.1093/ehjqcco/qcz052.
- NHS Digital . National Diabetes Audit Programme 2020. https://digital.nhs.uk/data-and-information/clinical-audits-and-registries/national-diabetes-audit (accessed 14 June 2021).
- PICANet . The Paediatric Intensive Care Audit Network (PICANet) 2021. www.picanet.org.uk/ (accessed 14 June 2021).
- TARN . The Trauma Audit &Amp; Research Network 2021. www.tarn.ac.uk/ (accessed 14 June 2021).
- NHS . National Comparative Audit of Blood Transfusion 2021. https://hospital.blood.co.uk/audits/national-comparative-audit/ (accessed 14 June 2021).
- Collins LM, Collins LM. Optimization of Behavioral, Biobehavioral, and Biomedical Interventions. New York, NY: Springer; 2018.
- Bonetti D, Eccles M, Johnston M, Steen N, Grimshaw J, Baker R, et al. Guiding the design and selection of interventions to influence the implementation of evidence-based practice: an experimental simulation of a complex intervention trial. Soc Sci Med 2005;60:2135-47. https://doi.org/10.1016/j.socscimed.2004.08.072.
- Eccles MP, Francis J, Foy R, Johnston M, Bamford C, Grimshaw JM, et al. Improving professional practice in the disclosure of a diagnosis of dementia: a modeling experiment to evaluate a theory-based intervention. Int J Behav Med 2009;16:377-87. https://doi.org/10.1007/s12529-008-9023-3.
- Murphy MK, Black NA, Lamping DL, McKee CM, Sanderson CF, Askham J, et al. Consensus development methods, and their use in clinical guideline development. Health Technol Assess 1998;2. https://doi.org/10.3310/hta2030.
- Sharp H, Preece J, Rogers Y. Interaction Design: Beyond Human-Computer Interaction. Chichester: John Wiley & Sons; 2019.
- Rubin J, Chisnell D. Handbook of Usability Testing: How to Plan, Design and Conduct Effective Tests. Indianapolis: John Wiley & Sons; 2008.
- Maiden N, Robertson S. Integrating creativity into requirements processes: experiences with an air traffic management system. 13th IEEE International Conference on Requirements Engineering (RE'05) 2005;1:105-14. https://doi.org/10.1109/RE.2005.34.
- Balsamiq Studios . Balsamiq Desktop. 4.0.7 2019. https://balsamiq.com/ (accessed 22 June 2021).
- Godin G, Bélanger-Gravel A, Eccles M, Grimshaw J. Healthcare professionals’ intentions and behaviours: a systematic review of studies based on social cognitive theories. Implement Sci 2008;3. https://doi.org/10.1186/1748-5908-3-36.
- Roos-Blom MJ, Gude WT, de Jonge E, Spijkstra JJ, van der Veer SN, Peek N, et al. Impact of audit and feedback with action implementation toolbox on improving ICU pain management: cluster-randomised controlled trial. BMJ Qual Saf 2019;28:1007-15. https://doi.org/10.1136/bmjqs-2019-009588.
- Michie S, Johnston M. Changing clinical behaviour by making guidelines specific. BMJ 2004;328:343-5. https://doi.org/10.1136/bmj.328.7435.343.
- Presseau J, McCleary N, Lorencatto F, Patey AM, Grimshaw JM, Francis JJ. Action, actor, context, target, time (AACTT): a framework for specifying behaviour. Implement Sci 2019;14. https://doi.org/10.1186/s13012-019-0951-x.
- Mitchell E, Sullivan F, Grimshaw JM, Donnan PT, Watt G. Improving management of hypertension in general practice: a randomised controlled trial of feedback derived from electronic patient data. Br J Gen Pract 2005;55:94-101.
- Grol R, Dalhuijsen J, Thomas S, Veld C, Rutten G, Mokkink H. Attributes of clinical guidelines that influence use of guidelines in general practice: observational study. BMJ 1998;317:858-61. https://doi.org/10.1136/bmj.317.7162.858.
- Foy R, MacLennan G, Grimshaw J, Penney G, Campbell M, Grol R. Attributes of clinical recommendations that influence change in practice following audit and feedback. J Clin Epidemiol 2002;55:717-22. https://doi.org/10.1016/S0895-4356(02)00403-1.
- Carver CS, Scheier MF. Attention and Self-Regulation: A Control-Theory Approach to Human Behavior. New York, NY: Springer-Verlag; 1981.
- Veloski J, Boex JR, Grasberger MJ, Evans A, Wolfson DB. Systematic review of the literature on assessment, feedback and physicians’ clinical performance: BEME Guide No. 7. Med Teach 2006;28:117-28. https://doi.org/10.1080/01421590600622665.
- Tierney WM, Hui SL, McDonald CJ. Delayed feedback of physician performance versus immediate reminders to perform preventive care. Effects on physician compliance. Med Care 1986;24:659-66. https://doi.org/10.1097/00005650-198608000-00001.
- Archer-Kath J, Johnson DW, Johnson RT. Individual versus group feedback in cooperative groups. J Soc Psychol 1994;134:681-94. https://doi.org/10.1080/00224545.1994.9922999.
- Gude WT, Brown B, van der Veer SN, Colquhoun HL, Ivers NM, Brehaut JC, et al. Clinical performance comparators in audit and feedback: a review of theory and evidence. Implement Sci 2019;14. https://doi.org/10.1186/s13012-019-0887-1.
- Hibbard JH, Peters E, Slovic P, Finucane ML, Tusler M. Making health care quality reports easier to use. Jt Comm J Qual Improv 2001;27:591-604. https://doi.org/10.1016/s1070-3241(01)27051-5.
- Ferlie EB, Shortell SM. Improving the quality of health care in the United Kingdom and the United States: a framework for change. Milbank Q 2001;79:281-315. https://doi.org/10.1111/1468-0009.00206.
- Lawton R, Heyhoe J, Louch G, Ingleson E, Glidewell L, Willis TA, et al. Using the Theoretical Domains Framework (TDF) to understand adherence to multiple evidence-based indicators in primary care: a qualitative study. Implement Sci 2016;11. https://doi.org/10.1186/s13012-016-0479-2.
- Baker R, Camosso-Stefinovic J, Gillies C, Shaw EJ, Cheater F, Flottorp S, et al. Tailored interventions to address determinants of practice. Cochrane Database Syst Rev 2015;4. https://doi.org/10.1002/14651858.CD005470.pub3.
- Opiyo N, Shepperd S, Musila N, Allen E, Nyamai R, Fretheim A, et al. Comparison of alternative evidence summary and presentation formats in clinical guideline development: a mixed-method study. PLOS ONE 2013;8. https://doi.org/10.1371/journal.pone.0055067.
- Lavis JN, Wilson MG, Grimshaw JM, Haynes RB, Ouimet M, Raina P, et al. Supporting the use of health technology assessments in policy making about health systems. Int J Technol Assess Health Care 2010;26:405-14. https://doi.org/10.1017/S026646231000108X.
- Nielsen J. Progressive Disclosure 2006. www.nngroup.com/articles/progressive-disclosure/ (accessed 14 June 2021).
- Hysong SJ. Meta-analysis: audit and feedback features impact effectiveness on care quality. Med Care 2009;47:356-63. https://doi.org/10.1097/MLR.0b013e3181893f6b.
- Kluger AN, Van Dijk D. Feedback, the various tasks of the doctor, and the feedforward alternative. Med Educ 2010;44:1166-74. https://doi.org/10.1111/j.1365-2923.2010.03849.x.
- Cantillon P, Sargeant J. Giving feedback in clinical settings. BMJ 2008;337. https://doi.org/10.1136/bmj.a1961.
- Sargeant J, Lockyer J, Mann K, Holmboe E, Silver I, Armson H, et al. Facilitated reflective performance feedback: developing an evidence- and theory-based model that builds relationship, explores reactions and content, and coaches for performance change (R2C2). Acad Med 2015;90:1698-706. https://doi.org/10.1097/ACM.0000000000000809.
- Reiter HI, Rosenfeld J, Nandagopal K, Eva KW. Do clinical clerks provide candidates with adequate formative assessment during Objective Structured Clinical Examinations?. Adv Health Sci Educ Theory Pract 2004;9:189-99. https://doi.org/10.1023/B:AHSE.0000038172.97337.d5.
- Overeem K, Driessen EW, Arah OA, Lombarts KM, Wollersheim HC, Grol RP. Peer mentoring in doctor performance assessment: strategies, obstacles and benefits. Med Educ 2010;44:140-7. https://doi.org/10.1111/j.1365-2923.2009.03580.x.
- Ivanovic J, Anstee C, Ramsay T, Gilbert S, Maziak DE, Shamji FM, et al. Using surgeon-specific outcome reports and positive deviance for continuous quality improvement. Ann Thorac Surg 2015;100:1188-94. https://doi.org/10.1016/j.athoracsur.2015.04.012.
- Healthcare Quality Improvement Partnership . Best Practice in Clinical Audit 2016.
- Michie S, Wood CE, Johnston M, Abraham C, Francis JJ, Hardeman W. Behaviour change techniques: the development and evaluation of a taxonomic method for reporting and describing behaviour change interventions (a suite of five studies involving consensus methods, randomised controlled trials and analysis of qualitative data). Health Technol Assess 2015;19:1-188. https://doi.org/10.3310/hta19990.
- Bonetti D, Johnston M, Pitts NB, Deery C, Ricketts I, Bahrami M, et al. Can psychological models bridge the gap between clinical guidelines and clinicians’ behaviour? A randomised controlled trial of an intervention to influence dentists’ intention to implement evidence-based practice. Br Dent J 2003;195:403-7. https://doi.org/10.1038/sj.bdj.4810565.
- Eccles MP, Francis J, Foy R, Johnston M, Bamford C, Grimshaw JM, et al. Improving professional practice in the disclosure of a diagnosis of dementia: a modeling experiment to evaluate a theory-based intervention. Int J Behav Med 2009;16.
- Colquhoun HL, Carroll K, Eva KW, Grimshaw JM, Ivers N, Michie S, et al. Advancing the literature on designing audit and feedback interventions: identifying theory-informed hypotheses. Implement Sci 2017;12. https://doi.org/10.1186/s13012-017-0646-0.
- Brown B, Balatsoukas P, Williams R, Sperrin M, Buchan I. Interface design recommendations for computerised clinical audit and feedback: hybrid usability evidence from a research-led system. Int J Med Inform 2016;94:191-206. https://doi.org/10.1016/j.ijmedinf.2016.07.010.
- Colquhoun HL, Sattler D, Chan C, Walji T, Palumbo R, Chalmers I, et al. Applying user-centered design to develop an audit and feedback intervention for the home care sector. Home Health Care Manag Pract 2017;29:148-60. https://doi.org/10.1177/1084822317700883.
- Lilford RJ, Brown CA, Nicholl J. Use of process measures to monitor the quality of clinical practice. BMJ 2007;335:648-50. https://doi.org/10.1136/bmj.39317.641296.AD.
- Wright-Hughes A, Willis TA, Wilson S, Weller A, Lorencatto F, Althaf M, et al. A randomised fractional factorial screening experiment to predict effective features of audit and feedback. Implementation Sci 2022;17. https://doi.org/10.1186/s13012-022-01208-5.
- Box G, Hunter WC, Stuart JC. Statistics for Experimenters: An Introduction to Design, Data Analysis and Model Building. New York, NY: John Wiley & Sons; 1978.
- Chakraborty B, Collins LM, Strecher VJ, Murphy SA. Developing multicomponent interventions using fractional factorial designs. Stat Med 2009;28:2687-708. https://doi.org/10.1002/sim.3643.
- Wu CJ, Hamada MS. Experiments: Planning, Analysis, and Optimization. New York, NY; 2011.
- Francis J, Eccles MP, Johnston M, Walker A, Grimshaw JM, Foy R, et al. Constructing Questionnaires Based on the Theory of Planned Behaviour: A Manual for Health Services Researchers. Newcastle: University of Newcastle Centre for Health Services Research; 2004.
- Eccles MP, Hrisos S, Francis J, Kaner EF, Dickinson HO, Beyer F, et al. Do self- reported intentions predict clinicians’ behaviour: a systematic review. Implement Sci 2006;1. https://doi.org/10.1186/1748-5908-1-28.
- Trevena LJ, Zikmund-Fisher BJ, Edwards A, Gaissmaier W, Galesic M, Han PK, et al. Presenting quantitative information about decision outcomes: a risk communication primer for patient decision aid developers. BMC Med Inform Decis Mak 2013;13. https://doi.org/10.1186/1472-6947-13-S2-S7.
- Kortteisto T, Kaila M, Komulainen J, Mäntyranta T, Rissanen P. Healthcare professionals’ intentions to use clinical guidelines: a survey using the theory of planned behaviour. Implement Sci 2010;5. https://doi.org/10.1186/1748-5908-5-51.
- Presseau J, Johnston M, Heponiemi T, Elovainio M, Francis JJ, Eccles MP, et al. Reflective and automatic processes in health care professional behaviour: a dual process model tested across multiple behaviours. Ann Behav Med 2014;48:347-58. https://doi.org/10.1007/s12160-014-9609-8.
- Murphy ST, Frank LB, Chatterjee JS, Baezconde-Garbanati L. Narrative versus nonnarrative: the role of identification, transportation, and emotion in reducing health disparities. J Commun 2013;63:116-37. https://doi.org/10.1111/jcom.12007.
- Elling S, Lentz L, De Jong M. Website Evaluation Questionnaire: Development of a Research-Based Tool for Evaluating Informational Websites n.d. https://doi.org/10.1007/978-3-540-74444-3_25.
- The International Organisation for Standardisation . Ergonomics of Human-System Interaction—Part 11: Usability: Definitions and Concepts 2018. www.iso.org/obp/ui/#iso:std:iso: 9241:-11:en (accessed 22 June 2021).
- Lewis JR, Utesch BS, Maher DE. UMUX-LITE: When There’s No Time for the SUS n.d. https://doi.org/10.1145/2470654.2481287.
- Borsci S, Federici S, Bacci S, Gnaldi M, Bartolucci F. Assessing user satisfaction in the era of user experience: comparison of the SUS, UMUX, and UMUX-LITE as a function of product experience. Int J Hum Comput Interact 2015;31:484-95. https://doi.org/10.1080/10447318.2015.1064648.
- Lewis JR, Utesch BS, Maher DE. Measuring perceived usability: the SUS, UMUX-LITE, and AltUsability. Int J Hum Comput Interact 2015;31:496-505. https://doi.org/10.1080/10447318.2015.1064654.
- Collins LM, Murphy SA, Strecher V. The multiphase optimization strategy (MOST) and the sequential multiple assignment randomized trial (SMART): new methods for more potent eHealth interventions. Am J Prev Med 2007;32:S112-18. https://doi.org/10.1016/j.amepre.2007.01.022.
- van Buuren S. Multiple imputation of discrete and continuous data by fully conditional specification. Stat Methods Med Res 2007;16:219-42. https://doi.org/10.1177/0962280206074463.
- van Buuren S, Brand JP, Groothuis-Oudshoorn CG, Rubin DB. Fully conditional specification in multivariate imputation. J Stat Comput Simul 2006;76:1049-64. https://doi.org/10.1080/10629360600810434.
- Rubin DB. Inference and missing data. Biometrika 1976;63:581-92. https://doi.org/10.1093/biomet/63.3.581.
- Gude WT, Roos-Blom MJ, van der Veer SN, Dongelmans DA, de Jonge E, Francis JJ, et al. Health professionals’ perceptions about their clinical performance and the influence of audit and feedback on their intentions to improve practice: a theory-based study in Dutch intensive care units. Implement Sci 2018;13. https://doi.org/10.1186/s13012-018-0727-8.
- Gude WT, van Engen-Verheul MM, van der Veer SN, de Keizer NF, Peek N. How does audit and feedback influence intentions of health professionals to improve practice? A laboratory experiment and field study in cardiac rehabilitation. BMJ Qual Saf 2017;26:279-87. https://doi.org/10.1136/bmjqs-2015-004795.
- Willis TA, Wood S, Brehaut J, Colquhoun H, Brown B, Lorencatto F, et al. Opportunities to improve the impact of two national clinical audit programmes: a theory-guided analysis. Implementation Sci Comm 2022;3. https://doi.org/10.1186/s43058-022-00275-5.
- Kluger AN, DeNisi A. The effects of feedback interventions on performance: a historical review, a meta-analysis, and a preliminary feedback intervention theory. Psychol Bull 1996;119. https://doi.org/10.1037/0033-2909.119.2.254.
- Michie S, van Stralen MM, West R. The behaviour change wheel: a new method for characterising and designing behaviour change interventions. Implement Sci 2011;6. https://doi.org/10.1186/1748-5908-6-42.
- Damschroder LJ, Aron DC, Keith RE, Kirsh SR, Alexander JA, Lowery JC. Fostering implementation of health services research findings into practice: a consolidated framework for advancing implementation science. Implement Sci 2009;4. https://doi.org/10.1186/1748-5908-4-50.
- Gale RC, Wu J, Erhardt T, Bounthavong M, Reardon CM, Damschroder LJ, et al. Comparison of rapid vs in-depth qualitative analytic methods from a process evaluation of academic detailing in the Veterans Health Administration. Implement Sci 2019;14. https://doi.org/10.1186/s13012-019-0853-y.
- Taylor B, Henshall C, Kenyon S, Litchfield I, Greenfield S. Can rapid approaches to qualitative analysis deliver timely, valid findings to clinical leaders? A mixed methods study comparing rapid and thematic analysis. BMJ Open 2018;8. https://doi.org/10.1136/bmjopen-2017-019993.
- Vindrola-Padros C, Johnson GA. Rapid techniques in qualitative research: a critical review of the literature. Qual Health Res 2020;30:1596-604. https://doi.org/10.1177/1049732320921835.
- NHS Digital . Quality Outcomes Framework (QOF) 2020. https://digital.nhs.uk/data-and-information/data-tools-and-services/data-services/general-practice-data-hub/quality-outcomes-framework-qof (accessed 14 June 2021).
- Ross JS, Williams L, Damush TM, Matthias M. Physician and other healthcare personnel responses to hospital stroke quality of care performance feedback: a qualitative study. BMJ Qual Saf 2016;25:441-7. https://doi.org/10.1136/bmjqs-2015-004197.
- Foy R, Willis T, Glidewell L, McEachan R, Lawton R, Meads D, et al. Developing and evaluating packages to support implementation of quality indicators in general practice: the ASPIRE research programme, including two cluster RCTs. Programme Grants Appl Res 2020;8. https://doi.org/10.3310/pgfar08040.
- Ivers NM, Desveaux L, Presseau J, Reis C, Witteman HO, Taljaard MK, et al. Testing feedback message framing and comparators to address prescribing of high-risk medications in nursing homes: protocol for a pragmatic, factorial, cluster-randomized trial. Implement Sci 2017;12. https://doi.org/10.1186/s13012-017-0615-7.
- Alderson S, Willis TA, Wood S, Lorencatto F, Francis J, Ivers N, et al. Embedded trials within national clinical audit programmes: a qualitative interview study of enablers and barriers. J Health Serv Res Policy 2021;27:50-61. https://doi.org/10.1177/13558196211044321.
- Oakes AH, Patel MS. A nudge towards increased experimentation to more rapidly improve healthcare. BMJ Qual Saf 2020;29:179-81. https://doi.org/10.1136/bmjqs-2019-009948.
- Horwitz LI, Kuznetsova M, Jones SA. Creating a learning health system through rapid-cycle, randomized testing. N Engl J Med 2019;381:1175-9. https://doi.org/10.1056/NEJMsb1900856.
- Grimshaw JM, Ivers N, Linklater S, Foy R, Francis JJ, Gude WT, et al. Reinvigorating stagnant science: implementation laboratories and a meta-laboratory to efficiently advance the science of audit and feedback. BMJ Qual Saf 2019;28:416-23. https://doi.org/10.1136/bmjqs-2018-008355.
- McCleary N, Desveaux L, Reis C, Linklater S, Witteman HO, Taljaard M, et al. A multiple-behaviour investigation of goal prioritisation in physicians receiving audit and feedback to address high-risk prescribing in nursing homes. Implement Sci Commun 2020;1. https://doi.org/10.1186/s43058-020-00019-3.
- Martin GP, McNicol S, Chew S. Towards a new paradigm in health research and practice? Collaborations for Leadership in Applied Health Research and Care. J Health Organ Manag 2013;27:193-208. https://doi.org/10.1108/14777261311321770.
- Dickinson H, Glasby J. ‘Why partnership working doesn’t work’: pitfalls, problems and possibilities in English health and social care. Public Manag Rev 2010;12:811-28. https://doi.org/10.1080/14719037.2010.488861.
- Walwyn R, Hartley S, Foy R, Stanworth S, Farrin A. Challenges in Applying Clinical Trial Standards to Routine Data. A Case Study from a Randomised Controlled Trial Embedded in National Clinic Audit. n.d.
- The Ottawa Hospital Research Institute . The Audit &Amp; Feedback Metalab 2020. www.ohri.ca/auditfeedback/ (accessed 14 June 2021).
- The Audit &Amp; Feedback Metalab n.d.
- Francis JJ, Johnston M, Robertson C, Glidewell L, Entwistle V, Eccles MP, et al. What is an adequate sample size? Operationalising data saturation for theory-based interview studies. Psychol Health 2010;25:1229-45. https://doi.org/10.1080/08870440903194015.
- Rycroft-Malone J, Wilkinson J, Burton CR, Harvey G, McCormack B, Graham I, et al. Collaborative action around implementation in Collaborations for Leadership in Applied Health Research and Care: towards a programme theory. J Health Serv Res Policy 2013;18:13-26. https://doi.org/10.1177/1355819613498859.
- Soper B, Yaqub O, Hinrichs S, Marjanovich S, Drabble S, Hanney S, et al. CLAHRCs in practice: combined knowledge transfer and exchange strategies, cultural change, and experimentation. J Health Serv Res Policy 2013;18:53-64. https://doi.org/10.1177/1355819613499903.
- Stetler CB, Mittman BS, Francis J. Overview of the VA Quality Enhancement Research Initiative (QUERI) and QUERI theme articles: QUERI Series. Implement Sci 2008;3. https://doi.org/10.1186/1748-5908-3-8.
- Atkins L, Francis J, Islam R, O’Connor D, Patey A, Ivers N, et al. A guide to using the Theoretical Domains Framework of behaviour change to investigate implementation problems. Implement Sci 2017;12. https://doi.org/10.1186/s13012-017-0605-9.
- Braun V, Clarke V. Using thematic analysis in psychology. Qual Res Psychol 2006;3:77-101. https://doi.org/10.1191/1478088706qp063oa.
- Etheredge LM. A rapid-learning health system: what would a rapid-learning health system look like, and how might we get there?. Health Aff 2007;26:w107-w18. https://doi.org/10.1377/hlthaff.26.2.w107.
- Gould MK, Sharp AL, Nguyen HQ, Hahn EE, Mittman BS, Shen E, et al. Embedded research in the learning healthcare system: ongoing challenges and recommendations for researchers, clinicians, and health system leaders. J Gen Intern Med 2020;35:3675-80. https://doi.org/10.1007/s11606-020-05865-4.
- Gray-Burrows KA, Willis TA, Foy R, Rathfelder M, Bland P, Chin A, et al. Role of patient and public involvement in implementation research: a consensus study. BMJ Qual Saf 2018;27:858-64. https://doi.org/10.1136/bmjqs-2017-006954.
- Khan T, Alderson S, Francis JJ, Lorencatto F, Grant-Casey J, Stanworth SJ, et al. Repeated analyses of national clinical audit reports demonstrate improvements in feedback methods. Implement Sci Commun 2020;1. https://doi.org/10.1186/s43058-020-00089-3.
- Soper B, Hinrichs S, Drabble S, Yaqub O, Marjanovic S, Hanney S, et al. Delivering the aims of the Collaborations for Leadership in Applied Health Research and Care: understanding their strategies and contributions. Health Serv Del Res 2015;3. https://doi.org/10.3310/hsdr03250.
- Willis TA, Collinson M, Glidewell L, Farrin AJ, Holland M, Meads D, et al. An adaptable implementation package targeting evidence-based indicators in primary care: a pragmatic cluster-randomised evaluation. PLOS Med 2020;17. https://doi.org/10.1371/journal.pmed.1003045.
- Elshehaly M, Alvarado N, McVey L, Randell R, Mamas M, Ruddle R. From taxonomy to requirements: a task space partitioning approach. IEEE Evaluation and Beyond – Methodological Approaches for Visualisation (BELIV) 2018;1:19-27. https://doi.org/10.1109/BELIV.2018.8634027.
- National Institute for Health and Care Excellence . Diabetes – Type 2: Scenario: Management – Adults n.d. https://cks.nice.org.uk/topics/diabetes-type-2/management/management-adults/ (accessed 2 January 2022).
- National Institute for Health and Care Excellence . Unstable Angina and NSTEMI: Early Management n.d. www.nice.org.uk/guidance/cg94 (accessed 2 January 2022).
- National Institute for Health and Care Excellence . Trauma n.d. www.nice.org.uk/guidance/qs166 (accessed 8 February 2022).
- National Institute for Health and Care Excellence . Major Trauma: Assessment and Initial Management n.d. www.nice.org.uk/guidance/ng39 (accessed 2 January 2022).
- National Institute for Health and Care Excellence . Head Injury: Assessment and Early Management n.d. www.nice.org.uk/guidance/cg176 (accessed 2 January 2022).
Appendix 1 Findings from user centred design of feedback modifications selected for online development
Recommend actions that can improve and are under the recipient’s control
Round 1
Controllable actions (M2) was not included.
Round 2 prototypes
We designed and tested two prototypes with content from a hypothetical NDA report to explore responses to different audit criteria wording using process and outcome standards. Processes were those standards that related to a clinical process of care likely to be within a feedback recipient’s control. This represented the ON version of the modification. Outcomes were those standards that were not directly within the control of the recipient (e.g. patient outcomes following a given treatment). This represented the OFF version of the modification (Table 22).
| UCD round | Prototype version and description | Overall sentiment, by participant | ||||||||||||
|---|---|---|---|---|---|---|---|---|---|---|---|---|---|---|
| 01 | 02 | 03 | 04 | 05 | 06 | 07 | 08 | 09 | 10 | 11 | 12 | 13 | ||
| 2 | 2A-off (audit criteria with less control) | – | – | – | – | – | – | – | M | M | N | M | – | – |
| 2 | 2B-on (audit criteria with greater control) | – | – | – | – | – | – | – | M | M | M | M | – | – |
Round 2 findings
Participants struggled to make sense of the audit criteria statements in round 2. We observed confusion relating to the context and labelling of the criteria, and participants reported that they found both ON and OFF statements to be ambiguous.
We further encountered two practical problems with operationalising controllable actions (M2) in the online experiment:
-
Paired process of care and outcome indicators were not available for all five NCA programmes participating in the experiment.
-
Operationalising both process of care and outcome indicators would have prohibitively increased the complexity of content and programming for the online experiment (e.g. in requiring differently worded feedback excerpts and outcome measures).
We therefore dropped this modification later during the UCD work and included only one audit criterion per national audit.
Recommend specific actions
Round 1
Specific actions (M3) was not included in round 1.
Round 2 prototypes
We designed and tested two prototypes with content from a hypothetical NDA report to explore responses to different wording of recommendations (Table 23). We drew on the AACTT framework45 to develop specific recommendations. Below is an example recommendation developed for the NDA.
The general practitioner or nurse in the practice with a lead role in diabetes should review patients with type 2 diabetes at least quarterly if their HbA1c level is ≥ 58 mmol/mol and they have been treated with a single drug for ≥ 6 months. The lead general practitioner or nurse should ask reception to invite these patients for a consultation to discuss treatment options. During the consultation, clinicians should discuss treatment options with the patient and offer dual-therapy, if appropriate.
For further information on target levels and treatment options, see NICE guidance at URL: https://cks.nice.org.uk/diabetes-type-2#!scenario (accessed 2 January 2022).
| UCD round | Prototype version and description | Overall sentiment, by participant | ||||||||||||
|---|---|---|---|---|---|---|---|---|---|---|---|---|---|---|
| 01 | 02 | 03 | 04 | 05 | 06 | 07 | 08 | 09 | 10 | 11 | 12 | 13 | ||
| 2 | 3A-off (recommendation wording with reduced specificity) | – | – | – | – | – | – | – | N | N | M | N | – | – |
| 2 | 3B-on (recommendation wording with improved specificity) | – | – | – | – | – | – | – | M | M | M | P | – | – |
| 3 | Modification 3: recommendations section | – | – | – | M | – | – | P | P | N | – | – | N | M |
Round 2 findings
There was high agreement between participants relating to the OFF version, with all comments being mixed/neutral or negative. Participants reported that the recommendation wording was too long, too vague and predicted that it would be inaccessible to the average recipient. Participants reported that the visual appeal and legibility of the recommendations list would be improved by bullet points.
There was low agreement overall relating to the ON version. Participants reported that although they found the wording clearer and more specific, this may not always make it more effective. Participants alluded to tensions between the convenience and replicability of receiving instructional recommendations compared with the autonomy and advocacy associated with more general guidelines that ‘[get] you to think about it’ (P09), to design well-fitting actions. It was suggested that health professionals in more senior roles may prefer more control in this regard.
Round 3 prototypes
We decided to operationalise the ON version of specific actions (M3) as a list of recommendations formatted in a grid layout and the OFF version as the absence of recommended actions. We designed and tested six iterations of this design using content for the NDA, PICANet and TARN.
Round 3 findings
Participants liked that recommendations were succinct and appeared in a single screen. We identified one notable usability issue: one participant wished to access additional detail behind the recommendations, such as the source. However, it was not possible to implement within this section of the report given an overlap with optional detail (M12). We responded to this suggestion by including full and adequate references to support the recommended actions.
Final design
The final prototype of this modification provided a specific step-by-step actionable guide to achieve the standard provided (see Figure 2). This appeared within the body of the one-page report. We enhanced the bulleted list with positive green tick icons following participant feedback. We included a subscript to show the source of the recommendations. Participants found the icons visually appealing and eye-catching.
Choose comparators that reinforce desired behaviour change
Round 1
Effective comparators (M7) was not included in round 1.
Round 2 prototypes
We designed four prototypes populated with content from a hypothetical NDA report. The prototypes were bar graphs displaying different types of comparator (Table 24).
| UCD round | Prototype version and description | Overall sentiment, by participant | ||||||||||||
|---|---|---|---|---|---|---|---|---|---|---|---|---|---|---|
| 01 | 02 | 03 | 04 | 05 | 06 | 07 | 08 | 09 | 10 | 11 | 12 | 13 | ||
| 2 | 7A-off (graph with no comparator) | – | – | – | – | – | – | – | M | n/c | M | M | – | – |
| 2 | 7B-on (graph showing top 10% and national median average) | – | – | – | – | – | – | – | M | n/c | P | N | – | – |
| 2 | 7C-on (graph showing top 10%) | – | – | – | – | – | – | – | M | n/c | M | P | – | – |
| 2 | 7D-on (graph showing top 10%, national average and other units in your CCG) | – | – | – | – | – | – | – | M | P | N | N | – | – |
| 3 | Modification 7: a feedback statement that includes comparator data | – | – | – | N | – | – | P | M | n/c | – | – | M | n/c |
Round 2 findings
Participants reported that legends on graphs were too detailed, ran to too many lines and were too small to read. There were low levels of agreement relating to the types of comparator displayed. Participants were largely indifferent to the top 10% shading. We had a broader mix of responses relating to the prototype containing a CCG comparator for general practices. Participants were generally interested to know how they compared with their peers but for a national guideline felt that national comparison was most appropriate. Concerns about peer comparisons ranged from demotivation associated with poor performance when compared with peers (‘you don’t have to rub my nose in it’, P10) to concern that this level of reporting might risk ‘naming and shaming’ if recipients can identify sites in smaller CCGs.
Round 3 prototypes
We operationalised this modification as a textual comparator of results. This would serve two purposes: it would allow us to explore two modifications within one report section, ‘Results’, and would ensure that salient detail was included in the body of the experiment report rather than appended as a legend. We decided to broaden the target percentile performance to the top 25%, bringing together guidance from specialist team members, responses from UCD and from existing reporting. We aimed to strengthen the effect and validity of the content by using achievable comparators typical of collaborating audits. Participants in all rounds of UCD and all modifications expected to be presented with at least one comparator. We therefore selected to include national ‘mean average’ as a baseline comparator when OFF.
We designed and tested six iterations of this design using content for the NDA, PICANet and TARN. We presented effective comparators (M7) as a textual summary message above a chart for multimodal feedback (M9) in the ‘Results’ section of the report page. We included two versions of the bar chart, one for when M7 was OFF and one for when it was ON. This allowed us to retain the link between the visual display and the summary message, to be consistent with recommended best practice. 19
Round 3 findings
We identified one major usability issue early on in round 3 when testing the ON version of effective comparators (M7). The participant reported that the summary legend was lost below-the-fold and it would be more helpful to read this before viewing the graph to support comprehension when assessing the visual display. We received positive responses to the use of national upper quartile performance and describe this in more detail in relation to the visual display presented for multimodal feedback (M9).
Final design
The final prototype for this modification was a statement including either the ‘mean average’ or top 25% performance comparator:
-
ON: ‘The top quarter of hospitals achieved this for X of patients’.
-
OFF: ‘This compares to the national mean achievement of X’.
As well as changing the order of the effective comparators (M7) feedback statement and the multimodal feedback (M9) bar chart, we increased the font weight to emphasise the quality indicator as had been suggested in earlier UCD rounds. We subsequently presented effective comparators (M7) above the bar chart and this issue was no longer reported. We also decided to report audit performance as a percentage rather than a number, although for baseline feedback we included numerator and denominator data. This was supported by UCD participants, clinical members of the team and audit collaborators (see Figure 3).
Provide feedback in more than one way
Round 1 prototypes
We designed 10 prototypes with content from hypothetical MINAP, NCABT and TARN audit reports. The prototypes involved different combinations of textual and graphical feedback and explored combinations of bar, line and funnel charts, textual quality indicators and graphical icons to illustrate trend, based on designs from earlier feedback research programmes24,129 (Table 25).
| Stimuli, by UCD round | Overall sentiment, by participant | |||||||||||||
|---|---|---|---|---|---|---|---|---|---|---|---|---|---|---|
| Round | Prototype version and description | 01 | 02 | 03 | 04 | 05 | 06 | 07 | 08 | 09 | 10 | 11 | 12 | 13 |
| 1 | M9 general comments | – | M | M | – | – | N | N | – | – | – | – | – | – |
| 1 | M9.0 bar graph trend and multimedia | N | – | – | – | – | – | – | – | – | – | – | – | – |
| 1 | M9.1 bar graph or trend | N | – | – | – | – | – | – | – | – | – | – | – | – |
| 1 | M9.2 textual numerator denominator QI only | – | M | N | M | N | N | n/c | – | – | – | – | – | – |
| 1 | M9.3 textual percentage QI only | – | M | P | P | P | M | N | – | – | – | – | – | – |
| 1 | M9.4 textual percentage and numerator QI and table of results | – | n/c | N | – | N | – | – | – | – | – | – | – | – |
| 1 | M9.5 percentage and numerator QI and bar graph of results | – | P | P | – | M | – | – | – | – | – | – | – | – |
| 1 | M9.6 bar graph and table | – | n/c | N | M | N | M | M | – | – | – | – | – | – |
| 1 | M9.7 funnel plot | – | M | M | M | N | M | M | – | – | – | – | – | – |
| 1 | M9.8 coloured trend arrow and textual QI | – | P | – | M | – | N | M | – | – | – | – | – | – |
| 1 | M9.9 trends e.g. sparkline | – | – | – | N | – | M | M | – | – | – | – | – | – |
| 2 | 9A-off (textual and tabular feedback) | – | – | – | – | – | – | – | M | M | M | N | – | – |
| 2 | 9B-on (textual, tabular, bar graph and audio feedback) | – | – | – | – | – | – | – | M | M | M | P | – | – |
| 2 | 9C-on (textual, tabular, trend graph and audio feedback) | – | – | – | – | – | – | – | M | P | M | M | – | – |
| 2 | M9 general comments | – | – | – | – | – | – | – | n/c | N | n/c | M | – | – |
| 3 | M9 bar graph | – | – | – | N | – | – | M | n/c | M | – | – | N | P |
Round 1 findings
Positive responses related to the use of the bar graph as a universally liked and easy-to-understand data visualisation. Participants responded well to typographical emphasis on the textual quality indicator. Participants preferred a combination of denominators alongside percentage quality indicators in textual feedback, allowing users to validate the data and judge the direction and scale of change from one year’s figures to the next. We observed that modality and variety in feedback may support different user needs, providing that they do not negatively affect cognitive load. Participants suggested that we cater for the majority of users when choosing a mode of data presentation, such as delivering feedback as a bar chart rather than a funnel plot, or incorporating features to support multimodal data presentation to allow switching between different types of graphs. It was suggested that interactivity might also be useful for report users such as front-line staff, to alter variables and support them ‘playing with the data’, to make predictions or judgements about clinical interventions. Reduced scrolling was also relatively important.
Negative responses related to the over-simplistic OFF versions and the use of funnel plots. Funnel plots presented during round 1 were the most contentious of the data visualisations. They were reported to be visually appealing but open to misinterpretation:
[W]e know how to read them, you know the funnel plots, but whenever we put them up in boards or anything people really struggle to, to read them.
P07
The use of the word ‘We’ in the feedback caused some confusion when users had not been offered a means to select their unit, department or hospital.
First impressions of the use of colour were positive. Visual coding systems such as traffic light systems (red denoting bad, amber denoting a warning and green denoting good) are a familiar and favoured mechanism for reducing cognitive burden. Participants also reported that they were useful, to produce summary presentations of feedback for colleagues. We observed participant confusion and mixed sentiment relating to a visual indicator showing temporal change. Our prototype provided a prominent green trend arrow alongside the quality indicator but lacked labelling or a clear key, creating confusion:
[T]he green arrow, I guess is telling me that I’m good and I’m on my way up. So does that mean I don’t need to do anything; I’m not sure what that means. Umm, or does that mean I need to go up further, more?
P06
Round 2 prototypes
We shortlisted bar graphs and line graphs, plus an audio feature, to augment textual feedback in round 2. We designed and tested three prototypes using content from a hypothetical NDA report. These included textual, tabular, graphical and audio feedback (see Table 25).
Round 2 findings
We evaluated with four participants. There were mixed responses to all three prototypes. Participants were unanimously critical of the audio feature. There was minor discussion about what the audio content might contain and who it would be for but none of the participants thought it would be a feature they would use. Usability issues included the use of a small font for the legend and a lack of comparator in the graph.
Round 3 prototypes
We chose to present multimodal feedback (M9) using a bar graph including effective comparators (M7) quartile shading. Bar graphs were deemed most appropriate for implementing snapshots of aggregate overviews that recipients would be able to understand without expecting to be provided with additional detail. 73,130 Both modifications were ON during round 3 testing.
We designed and tested six versions using content for the NDA, PICANet and TARN. We incorporated effective comparators (M7) and multimodal feedback (M9) into the ‘Results’ section of the report.
Round 3 findings
We identified two usability issues relating to multimodal feedback (M9) display. Early testing revealed that the graph was too small and needed to be enlarged. Participants also reported that they needed clear legends to explain the marks on the graph. Participants responded positively to the familiarity of the bar graph, visual appeal of quartile shading on the graph and general ease of use of the ‘Results’ section.
Final design
In the final prototype, we used a bar chart and comparator markings for the ON version of multimodal feedback (M9) (see; Figure 4a). The quality indicator in the textual feedback was emboldened to emphasise headline figures. Owing to the interaction with effective comparators (M7), the quartile shading on the graph was only visible during certain combinations of randomised modifications. The bar chart was sized to ensure that font sizes were readable, and to prevent excess scrolling. We implemented a prominent and user-friendly key to describe the coloured marks. The bar chart was absent when the modification was OFF (see Figure 4b).
Minimise extraneous cognitive load for feedback recipients
Round 1 prototypes
We designed and iterated thirteen prototypes for cognitive load (M10) in round 1 populated with content from hypothetical audit reports for MINAP, NCABT and TARN (Table 26). Each participant saw up to a maximum of 10 prototypes. The prototypes incorporated features of reports that are known to load and ease mental processes. We tested a large information-heavy set of feedback, with poor formatting and no chunking compared with a range of chunking methods such as lists, tables, filterable lists, user-targeted content and filterable tables. We also explored different graph types, signposting elements such as a progress tracker and preferred hierarchy of the audit criterion compared to recommendations for action.
| UCD round | Prototype version and description | Overall sentiment, by participant | ||||||||||||
|---|---|---|---|---|---|---|---|---|---|---|---|---|---|---|
| 01 | 02 | 03 | 04 | 05 | 06 | 07 | 08 | 09 | 10 | 11 | 12 | 13 | ||
| 1 | M10.0 – excess content minimal formatting | N | N | N | P | N | P | M | – | – | – | – | – | – |
| 1 | M10.1 – excess content, graph with no shading | P | N | N | N | M | N | N | – | – | – | – | – | – |
| 1 | M10.2 – graph only | – | N | n/c | – | M | – | – | – | – | – | – | – | – |
| 1 | M10.3 – graph, quartile shading and standard | – | N | N | – | M | – | – | – | – | – | – | – | – |
| 1 | M10.4 – recommendations list grouped by role | n/c | P | P | – | M | – | – | – | – | – | – | – | – |
| 1 | M10.5 – ungrouped recommendations list | N | N | n/c | – | N | – | – | – | – | – | – | – | – |
| 1 | M10.6 – recommendations table, columns ordered by role | M | M | N | – | N | – | – | – | – | – | – | – | – |
| 1 | M10.7 – role specific recommendation list | P | N | N | – | N | – | – | – | – | – | – | – | – |
| 1 | M10.8 – table and sparkline or filterable results table | – | M | M | M | M | M | n/c | – | – | – | – | – | – |
| 1 | M10.9 – trends i.e. sparkline | – | – | – | M | – | n/c | n/c | – | – | – | – | – | – |
| 1 | M10.10 – progress bar, headline standard, numerator and percentage QI and recommendation | M | M | N | – | M | – | – | – | – | – | – | – | – |
| 1 | M10.11 – progress bar, headline recommendation, quality indicator (numerator and percentage) and standard | N | – | – | – | – | – | – | – | – | – | – | – | – |
| 1 | M10.12 – progress bar, quality indicator (%) and filterable results table | – | – | – | N | – | N | P | – | – | – | – | – | – |
| 2 | A-off (increased cognitive load, excessive and poorly laid out information not formatted to grid layout and small inconsistent font) | – | – | – | – | – | – | – | N | N | N | N | – | – |
| 2 | B-on (improved cognitive load by tabulating information, consistent font type and readable font size) | – | – | – | – | – | – | – | M | P | P | P | – | – |
| 2 | C-on (improving cognitive load by providing controls to filter information) | – | – | – | – | – | – | – | M | M | N | M | – | – |
| 2 | D-on (improving cognitive load by presenting feedback graphically and with headline figures as used in AFFINITIE) | – | – | – | – | – | – | – | M | P | M | N | – | – |
| 3 | Modification 10 – about this audit | – | – | – | N | – | – | n/c | N | – | – | – | N | P |
Round 1 findings
Participants agreed that too much text was overwhelming. They were reluctant to read content in small, dense fonts. We recorded two positive comments relating to the control/OFF versions, but these were in response to the graphical percentage shading in early iterations of feedback features. The shading was reported to add visual interest and helped to quickly convey context against which participants could judge their practice’s performance. This indicated that additional visual detail might help to reduce cognitive load. We also observed that ‘chunked’ information (in this case audit recommendations) improved visual appeal and readability.
Round 2 prototypes
We reduced the number of prototypes to exclude content types that were selected for other modifications. We explored different ways of presenting information from a single and comparable data set to assess features that might variably affect cognitive load.
We designed and tested four prototypes with content from a hypothetical NDA (see Table 26). We were at this point exploring a suitable ON and OFF version. Our prototypes presented a single information loaded data set containing process of care data, adjusted by degrees to reduce cognitive load. We compared the use of tables, filter features and typographical design elements from earlier feedback research programmes. 24,129
Round 2 findings
We evaluated with four participants. As in round 1, participants agreed that OFF versions containing small fonts and lots of information were ‘not user-friendly’ and reduced motivation: ‘Horrible . . . what is my motivation to try and go through all this?’ (P08). They suggested that headline information should provide key results as a ‘teaser’ at the top. There was limited agreement relating to additional controls to reduce cognitive load on tabular process of care data. These were felt to be more visually appealing and ‘easier to look at’ (P10), but problematic when applied to the data set. Participants reported that, for clarity, both denominator and percentage should be provided. This finding informed the implementation of baseline content in the wider experiment.
Round 3 prototype
We used extraneous text (e.g. audit background) and two small tables (e.g. patients not meeting the standard) as ‘background noise’, providing information that was not directly related to the audit criterion. We followed suggestions derived from team meetings, findings from the UCD and audit collaborators to use information that would promote intended behaviours. For the final prototype, we presented extraneous distracting detail for the OFF version.
We designed and tested six iterations of cognitive load (M10) with content for the NDA, TARN and PICANet. Distracting detail was presented as a section of supplementary information and data focused on the number and percentage of patients who receive or fail to receive care processes to achieve the standard. The modification was ON when this was not shown. We tested the OFF version, with extraneous detail being shown, in the context of all other modifications being ON.
Round 3 findings
We evaluated with six participants. There was a high level of agreement regarding the inclusion of extraneous content. Participants either neglected to read this content or were confused by its purpose in relation to the criteria and the feedback. Participants also reported navigational fatigue when all modifications were visible. The extended page length created excessive scrolling and there was a requirement to provide a means to navigate between sections within the page.
Final design
We fine-tuned content for this modification for all audits. The section title for cognitive load (M10) was iterated to ‘About the National Diabetes Audit’. This improved the clarity of the section, indicating to the user that this was additional general information not directly related to the audit criterion. We later finalised this section title as a generic ‘About this audit’ to simplify the programming (see Figure 5).
Provide short, actionable messages followed by optional detail
Round 1 prototypes
We designed and iterated five prototypes for optional detail (M12) populated with content from hypothetical audit reports for MINAP, NCABT and TARN (Table 27). The prototypes used features that support progressive disclosure such as hyperlinks, tabs and mouse activated dynamic annotations (tool tips). We iterated prototypes by modifying designs to include ideas that came out during testing, such as including higher fidelity content to get more value from the sessions.
| UCD round | Prototype version and description | Overall sentiment, by participant | ||||||||||||
|---|---|---|---|---|---|---|---|---|---|---|---|---|---|---|
| 01 | 02 | 03 | 04 | 05 | 06 | 07 | 08 | 09 | 10 | 11 | 12 | 13 | ||
| 1 | M12 – general comments | – | M | M | – | – | – | – | – | – | – | – | – | – |
| 1 | M12.0 – basic hyperlinked content | N | M | N | M | P | N | N | – | – | – | – | – | – |
| 1 | M12.1 – about this audit accordion | P | – | P | M | N | N | M | – | – | – | – | – | – |
| 1 | M12.2 – recommendations accordion | P | P | – | – | – | – | – | – | – | – | – | – | – |
| 1 | M12.3 – launchpad-style tooltips | M | N | M | N | N | M | N | – | – | – | – | – | – |
| 1 | M12.4 – side tabs | P | P | P | P | N | M | P | – | – | – | – | – | – |
| 2 | 12A-off – (all information displayed at once, i.e. no progressive disclosure) | – | – | – | – | – | – | – | N | P | P | N | – | – |
| 2 | 12B-on – (vertically stacked side tabs) | – | – | – | – | – | – | – | P | M | M | N | – | – |
| 2 | 12C-on – (horizontally stacked top tabs with audit criteria headline) | – | – | – | – | – | – | – | M | n/c | N | P | – | – |
| 2 | 12D-on – (horizontally stacked top tabs with recommendation headline) | – | – | – | – | – | – | – | M | n/c | M | M | – | – |
| 2 | 12E-on – (expanding ‘accordion’ with recommendation headline) | – | – | – | – | – | – | – | N | M | M | N | – | – |
| 2 | 12F-on – (wiki-style links in editorial) | – | – | – | – | – | – | – | N | N | N | N | – | – |
| 3 | Modification 12 – further information section | – | – | – | N | – | – | N | M | N | – | – | N | N |
Round 1 findings
We tested with seven participants. Overall, participants preferred the side tabs as a way of ‘drilling down’ into the content. Participants least liked the basic hyperlinks and launchpad with overlaid content activated by mouse hover or mouse click interaction. Participants reported that the ‘accordion’ of expanding and collapsing sections was familiar but prone to cluttering, with too many open sections. One participant reported that the information presented in the prototypes would not interest them, as it was missing key information to allow direct comparisons of feedback. Participants may, therefore, be less motivated to ‘drill down’ into supplementary content that they consider less relevant.
Round 2 prototypes
We reduced the range of prototypes. We designed and tested four prototypes during round 2 (see Table 27). We designed one interpretation of a possible control version for OFF as with other round 2 modifications. We designed five possible versions of ON, including the popular side tabs to switch between content, accordion, wiki-style hyperlinks and top tabs. Navigation tabs are user interface elements based on the desktop metaphor in which physical objects are emulated in the interface and are derived from the idea of folders in a filing cabinet.
Round 2 findings
We tested with four participants. There was high negative agreement relating to the expanding accordion and the wiki-style hyperlinks. These were felt to be overly complex and involve unnecessary user interaction. Participants disagreed about which of the remaining prototypes, including the OFF version and the side tabs, would be most (or least) user-friendly. We observed serious usability issues with side tabs that were not visually distinct from page content. Participants expressed concern about overlooking important detail if some was hidden. Participants reported that they typically search documents to find instances of key terms in their reports and would find navigating a website with multiple pages or hidden content more difficult. Participants who disliked the OFF version, favouring our enhancements, gave similar reasons to those expressing dislike for prototypes exploring excess cognitive load.
Round 3 prototype
Feedback content was further refined across all audits. We elected to operationalise this modification using side tabs. This user interface feature was generally popular for being a familiar, user-friendly and visually appealing design pattern. It also suited our choice of content for this modification. We were able to display key summary messages followed by a good level of optional detail. One participant summed up:
[R]emember I said you don’t want to go down the rabbit hole unless you know you’ll come back. So, you know . . . by keeping those as fixed, as your secure validation blocks, you know it-it-it’s like you’re fence posts on the side of the river bank – you don’t want to let go of them cause you might need to come back.
P07
We designed and tested six iterations of this modification populated with content from hypothetical NDA, PICANet and TARN reports.
Round 3 findings
We tested with six participants. We continuously refined the content and the appearance of the side tabs. Participants initially struggled to make sense of this section as we iterated on an appropriate section title. They also became frustrated with the patient lists and drug lists explored in early round 3 iterations. Participants felt that the medicine lists did not go into sufficient detail to be useful:
[I]t relies on me remembering which drug groups the names of drugs are in; so umm, and I find that really hard err, to remember which one’s the, the actual name and we prescribe by name so not, not drug group. So um, Metformin’s dead easy but the others aren’t.
P15
One participant incorrectly assumed that content from patient voice (M16) was dynamically driven by optional detail (M12). Usability and comprehension improved when we renamed the section ‘Further information’ and removed patient-level data.
Final design
We included a section in the report called ‘Further information’ when optional detail (M12) was switched ON (see Figure 6). This was absent when OFF. We were guided by team meetings, UCD findings and audit collaborators in selecting the content. This included a definition of the audit criterion and additional information to aid people in achieving the criterion. The tabs were designed to be visually clear and the content focused to encourage further exploration. References to NICE guidance, which would normally be hyperlinked, were static to discourage participants from exiting the experiment.
Incorporate ‘the patient voice’
Round 1 prototypes
We designed and iterated four prototypes for patient voice (M16) populated with content from hypothetical audit reports for MINAP, NCABT and TARN (Table 28). Prototypes were combinations of multimedia, pictorial and textual information about the patient experience.
Round 1 findings
We found low levels of agreement about the value of including the patient voice. Overall, participants least preferred the minimally enhanced patient quote, indicating that they would find multimedia elements such as a photograph or video more compelling than a quote alone. Participants reflected on how the recipient’s role might affect whether or not the impact that the patient voice had was negative or positive:
I’m thinking about how . . . senior managers work; how executive directors work and are they influenced by patients’ statements . . . they aren’t but the CQC [Care Quality Commission] are and . . . the exec[utive] directors are.
P03
Participants raised concerns about privacy implications, authenticity, difficulty in finding a relevant or representative quote and subsequent cost benefit and one cited the potential for bias when selecting a single polarised account.
Round 2 prototypes
We designed and tested three prototypes populated with content from a hypothetical NDA report (see Table 28). We reduced the number of prototypes to explore graduated levels of content focused on patient experience. We decided that video could not be included owing to uncontrollable factors such as browser settings that might affect the experience of participants in the experiment. We also decided to include a patient story alongside the quote, rather than a quote from a patient representative, given the concerns expressed about privacy and representativeness.
Round 2 findings
Participants preferred the patient story, quote and photograph. Participant responses were again polarised and often mixed. Participants reported that multimedia features such as images and videos improved visual and human interest by capturing attention, adding context and making feedback more memorable. To do this effectively, they should be authentic and relevant to the feedback. The story and quote were seen to complement one another. Once again, participants who responded negatively to ‘enhanced’ versions with visual content were concerned about issues relating to perceived value and privacy.
Around this stage, our PPI panel considered a prototype of this modification. They pointed out that it was obvious that the language and content were inauthentic; it was as if we were imposing medical knowledge and expertise onto the ‘patient’ in the quotation. The PPI panel suggested that this modification would be best placed adjacent to individual audit standards, with a clear link between them. They suggested a structure along the lines of, ‘This is how I feel, this is what happened to me, that’s why you should do’ with the ‘you should do’ specifying the recommended clinical behaviour. The PPI panel debated whether or not a photograph of a patient should be included, recognising a risk that an associated fully-informed quotation was unlikely to come from one individual and thereby could undermine credibility.
Round 3 prototypes
We improved the wording and specificity of the patient story, and sourced new images to make patient photographs look more realistic. We designed and tested six iterations of the prototype populated with content relevant to NDA, TARN and PICANet.
Round 3 findings
We observed consistently mixed results relating to the perceived value of incorporating the patient voice. We identified usability issues with participants also offering insights into the design, content and ordering of the sections.
Final design
We modified the content and the look and feel of the report (see Figure 7). We reordered the sections to place M16: patient story above cognitive load (M10) and below optional detail (M12), increased the size of the patient photograph to make it more prominent and renamed the section title ‘Patient Story’.
| UCD round | Prototype version and description | Overall sentiment, by participant | ||||||||||||
|---|---|---|---|---|---|---|---|---|---|---|---|---|---|---|
| 01 | 02 | 03 | 04 | 05 | 06 | 07 | 08 | 09 | 10 | 11 | 12 | 13 | ||
| 1 | M16.0 patient quote | N | N | M | N | M | N | N | – | – | – | – | – | – |
| 1 | M16.1 patient quote and photo | – | M | P | M | P | M | – | – | – | – | – | – | – |
| 1 | M16.2 patient quote and video | – | N | N | P | N | P | P | – | – | – | – | – | – |
| 1 | M16.3 patient representative quote | – | – | – | P | M | N | P | – | – | – | – | – | – |
| 2 | 16A-off (paragraph describing patient story) | – | – | – | – | – | – | – | M | N | M | N | – | – |
| 2 | 16B-on (quote and paragraph describing patient story) | – | – | – | – | – | – | – | P | M | P | P | – | – |
| 2 | 16C-on (image, quote and paragraph describing patient story) | – | – | – | – | – | – | – | M | P | N | P | – | – |
| 3 | Modification 16 patient story | – | – | – | M | – | – | M | P | N | – | – | N | M |
Appendix 2 Screenshots of the feedback modifications presented in the online experiment
Parallel versions of all feedback modifications were prepared for the five different NCAs. We present screenshots to illustrate each of these different versions.
Feedback modifications: National Diabetes Audit version
National Diabetes Audit: modification A – effective comparator
ON: (PDF download)
OFF: (PDF download)
National Diabetes Audit: modification B – provide feedback in more than one way (ON)
When modification A ON: (PDF download)
When modification A OFF: (PDF download)
National Diabetes Audit: modification C – recommend specific actions (ON)
National Diabetes Audit: modification D – provide short, actionable messages with optional detail (ON)
Tab 1: (PDF download)
Tab 2: see the NICE Clinical Knowledge Summary131(PDF download)
Tab 3: (PDF download)
Tab 4: (PDF download)
National Diabetes Audit: modification E – incorporate patient voice (ON)
National Diabetes Audit: modification F – minimise extraneous cognitive load (OFF)
Feedback modifications: Myocardial Ischaemia National Audit Project version
Myocardial Ischaemia National Audit Project: audit standard and results
Myocardial Ischaemia National Audit Project: modification A – effective comparator
ON: (PDF download)
OFF: (PDF download)
Myocardial Ischaemia National Audit Project: modification B – feedback in more than one way (ON)
When modification A on: (PDF download)
When modification A off: (PDF download)
Myocardial Ischaemia National Audit Project: modification C – recommend specific actions (ON)
Myocardial Ischaemia National Audit Project: modification D – provide short, actionable messages with optional detail (ON)
Tab 1: see NICE Clinical Guidance 94132
Tab 2: see NICE Clinical Guidance 94132
Tab 3:
Myocardial Ischaemia National Audit Project: modification E – incorporate patient voice (ON)
Myocardial Ischaemia National Audit Project: modification F – minimise extraneous cognitive load (OFF)
Feedback modifications: National Comparative Audit of Blood Transfusion version
National Comparative Audit of Blood Transfusion: audit standard and results
National Comparative Audit of Blood Transfusion: modification A – effective comparator
ON: (PDF download)
OFF: (PDF download)
National Comparative Audit of Blood Transfusion: modification B – feedback in more than one way
When modification A ON:
When modification A OFF:
National Comparative Audit of Blood Transfusion: modification C – recommend specific actions (ON)
National Comparative Audit of Blood Transfusion: modification D – provide short, actionable messages with optional detail (ON)
Tab 1:
Tab 2:
Tab 3:
National Comparative Audit of Blood Transfusion: modification E – incorporate patient voice (ON)
National Comparative Audit of Blood Transfusion: modification F – minimise extraneous cognitive load (OFF)
Feedback modifications: Paediatric Intensive Care Network version
Paediatric Intensive Care Network: modification A – effective comparator
ON: (PDF download)
OFF: (PDF download)
Paediatric Intensive Care Network: modification B – feedback in more than one way
When modification A ON:
When modification A OFF:
Paediatric Intensive Care Network: modification C – recommend specific actions (ON)
Paediatric Intensive Care Network: modification D – provide short, actionable messages with optional detail (ON)
Tab 1:
Tab 2:
Paediatric Intensive Care Network: modification E – incorporate patient voice (ON)
Paediatric Intensive Care Network: modification F – minimise extraneous cognitive load (OFF)
Feedback modifications: Trauma Audit & Research Network version
Trauma Audit & Research Network: audit standard and results
Trauma Audit & Research Network: modification A – effective comparator
ON: (PDF download)
OFF: (PDF download)
Trauma Audit & Research Network: modification B – feedback in more than one way
When modification A on: (PDF download)
When modification A off: (PDF download)
Trauma Audit & Research Network: modification C – recommend specific actions (ON)
Trauma Audit & Research Network: modification D – provide short, actionable messages with optional detail (ON)
Tab 1: see NICE Quality Standard QS166. 133 © NICE 2022 QS166. Available from www.nice.org.uk/guidance/qs166 All rights reserved. Subject to Notice of rights.
Tab 2: see NICE Guideline NG39134 and NICE Clinical Guideline CG176. 135
Tab 3
Trauma Audit & Research Network: modification E – incorporate patient voice (ON)
Trauma Audit & Research Network: modification F – minimise extraneous cognitive load (OFF)
Appendix 3 ENACT experiment web pages
We present screenshots illustrating progress through the website from landing to completion.
Landing page (top)
Landing page (bottom)
ENACT experiment consent page
ENACT experiment information sheet pop-out
ENACT experiment participant information
ENACT experiment entry confirmation
ENACT experiment audit report – National Diabetes Audit participant allocated to modification combination C19 “CF”*
*Modifications on specific actions (C) and reduced cognitive load (F). Modifications off: effective comparators (A), multimodal feedback (B), optional detail (D), patient voice (E).
ENACT experiment questionnaire – National Diabetes Audit (1)
ENACT experiment questionnaire – National Diabetes Audit (2)
ENACT experiment questionnaire – National Diabetes Audit (3)
ENACT experiment completion page, including voucher and certificate of completion request
Appendix 4 Detection of duplicate participant completions
Participant violations
Duplicate participant completion
Repeated (duplicate) participant completion of the experiment was identified during the first recruitment phase via e-mail addresses provided by participants to obtain a £25 voucher and certificate of completion. A number of e-mail addresses relating to the same individual, were found to have been used to complete the experiment multiple times and request a total of 268 vouchers. Repeated participation was linked to a single general practice which had received the experiment invitation via the NDA. Based on the timing of this invitation and cumulative voucher request listings extracted from the experiment, we identified the individuals repeated completion to have taken place between 2:50 p.m. on 25 April 2019 and 11:35 a.m. on 29 April 2019; defined as the contamination period. The voucher request from the general practice in question was not met.
Security enhancements to prevent repeated participation during the second recruitment phase required individuals to enter a unique NHS or HSCNI e-mail address to enter the experiment prior to randomisation. This e-mail address was validated against all previous e-mail addresses supplied (for voucher request or study entry) and the same e-mail address was required at voucher request.
By the end of the experiment there were a total 1241 randomisations and 1113 experiment completions, of which a total 1080 voucher requests had been made. Based on the provided e-mail address and name (where available), the 1080 voucher requests were found to originate from 767 individuals (Table 29). A total of 39 individuals were found to have completed the experiment and requested a voucher more than once. With the exception of the participant who requested 268 vouchers during the contamination period, these largely comprised 33 individuals with two voucher requests and a further five individuals with three to five voucher requests each.
| Number of voucher requests per individual | First recruitment period, n (%) | Second recruitment period, n (%) | Across recruitment periods, n (%) | Total, n (%) |
|---|---|---|---|---|
| 1 | 514 (95.9) | 214 (99.5) | – | 728 (94.9) |
| 2 | 17 (3.2) | 1 (0.5) | 15 (93.8) | 33 (4.3) |
| 3 | 2 (0.4) | 0 (0.0) | 1 (6.3) | 3 (0.4) |
| 4 | 1 (0.2) | 0 (0.0) | 0 (0.0) | 1 (0.1) |
| 5 | 1 (0.2) | 0 (0.0) | 0 (0.0) | 1 (0.1) |
| 268 | 1 (0.2) | 0 (0.0) | 0 (0.0) | 1 (0.1) |
| Total | 536 (100) | 215 (100)a | 16 (100)a | 767 (100) |
Detecting duplicate participants in the experiment data
Individual personal data collected to facilitate voucher provision and certification of completion were collected and held in a separate unlinked data set to retain anonymity of study data. It was therefore not possible to identify duplicate participants directly within the experiment data, and indirect, objective criteria were explored to define two modified ITT populations, aiming to ensure the inclusion of independent non-duplicate participants.
Contamination period
The contamination period, during which the most serious repeated experiment completion took place, included a total 597 randomisations, of which 268 (44.9%) related to the one individual completing the experiment 268 times to request vouchers. Given the separation of study and personal data, we were unable to separate the 268 duplicate entries from a possible 329 valid independent entries submitted during the same period. Given the magnitude of repeated experiment completion during this period, to protect the validity of the experiment we used the contamination period as a conservative criteria to exclude all participation during this period and define the primary modified ITT population.
Time spent on questionnaire
We compared experiment data collected during and outside the contamination period.
The median time spent completing the questionnaire was 159 seconds (IQR 98–256 seconds) outside the contamination period and 31 seconds (IQR 13–139 seconds) during the contamination period (Table 30). The distribution of time spent on questionnaire (Figure 31) showed a clear distinction between participants recruited in and out of the contamination period, with a peak in questionnaires completed in < 20 seconds during the contamination period. Of those completing the questionnaire, only 3.7% (21/566) spent < 20 seconds on the questionnaire outside of the contamination period; this rose to 47.3% (259/547) during it.
| Completion during the contamination period? | |||
|---|---|---|---|
| Yes (N = 597) | No (N = 629) | Total (N = 1226) | |
| Time on audit report (seconds) | |||
| Total randomised (n) | 597 | 629 | 1226 |
| Median (range) | 13.5 (0.5–14,302.5) | 66.5 (0.5–70,512.0) | 43.5 (0.5–70,512.0) |
| IQR | 2.0–60.5 | 31.0–136.0 | 7.0–98.5 |
| Time on questionnaire (seconds) | |||
| Total completing questionnaire (n) | 547 | 566 | 1113 |
| Median (range) | 31.0 (3.5–19,783.0) | 159.0 (2.5–16,320.0) | 113.5 (2.5–19,783.0) |
| IQR | 13.0–139.0 | 97.5–255.5 | 19.0–205.0 |
| > 20s on questionnaire, n (%) | |||
| Yes | 288 (52.7) | 545 (96.3) | 833 (74.8) |
| No | 259 (47.3) | 21 (3.7) | 280 (25.2) |
FIGURE 31.
Histogram of time spent on audit report and questionnaire. a, Time spent on audit report (first two quintiles); b, time spent on audit report (overall – note that the largest 20 outliers have been removed); c, time spent on questionnaire (first two quintiles); d, time spent on questionnaire (overall – note that the largest 20 outliers have been removed).
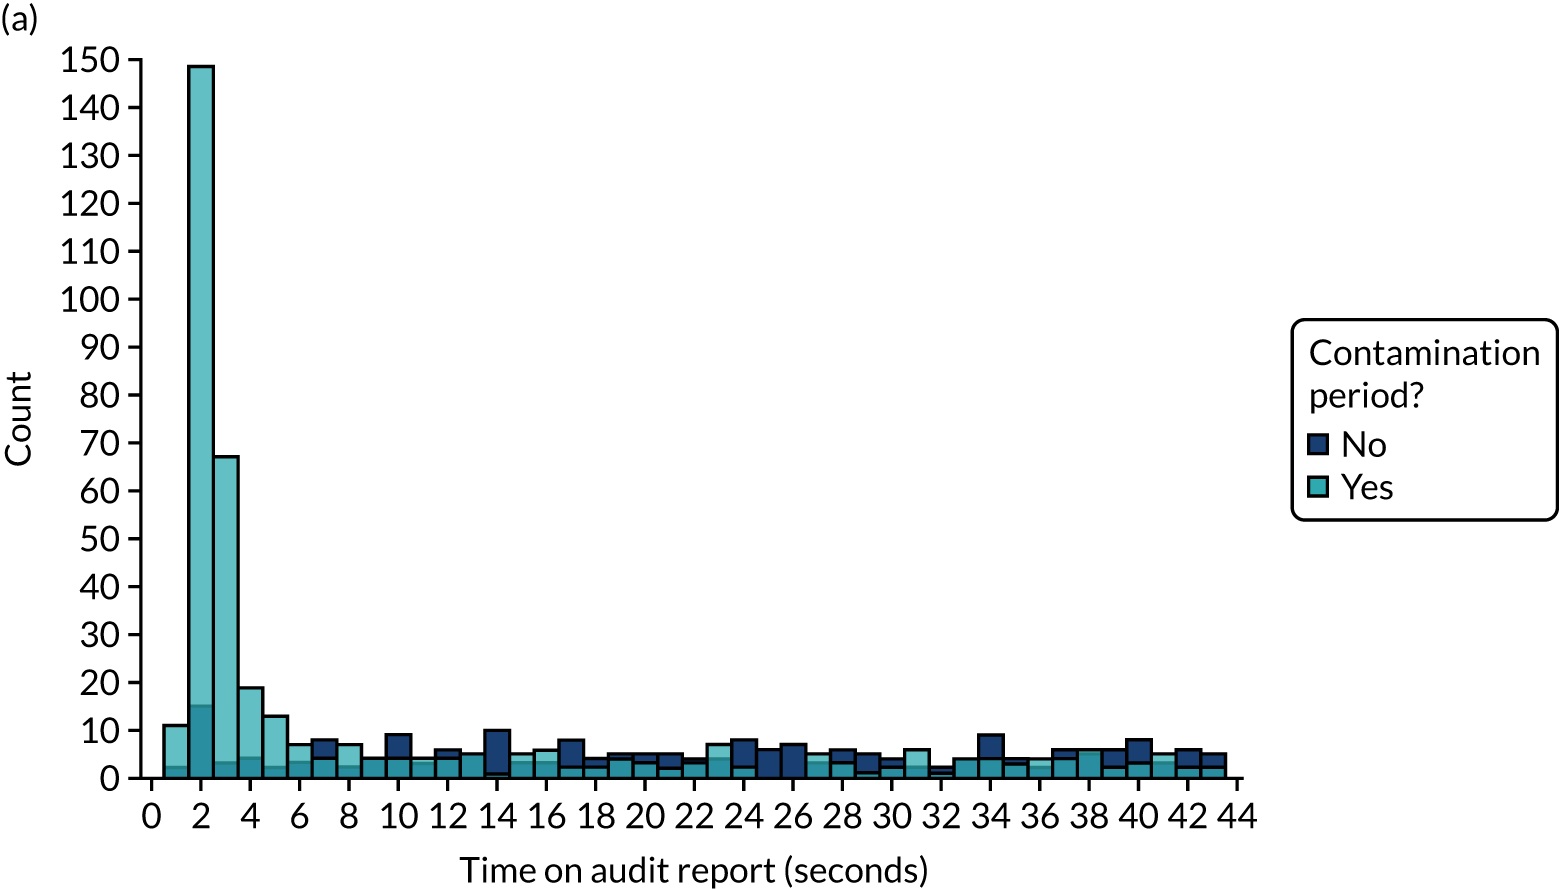
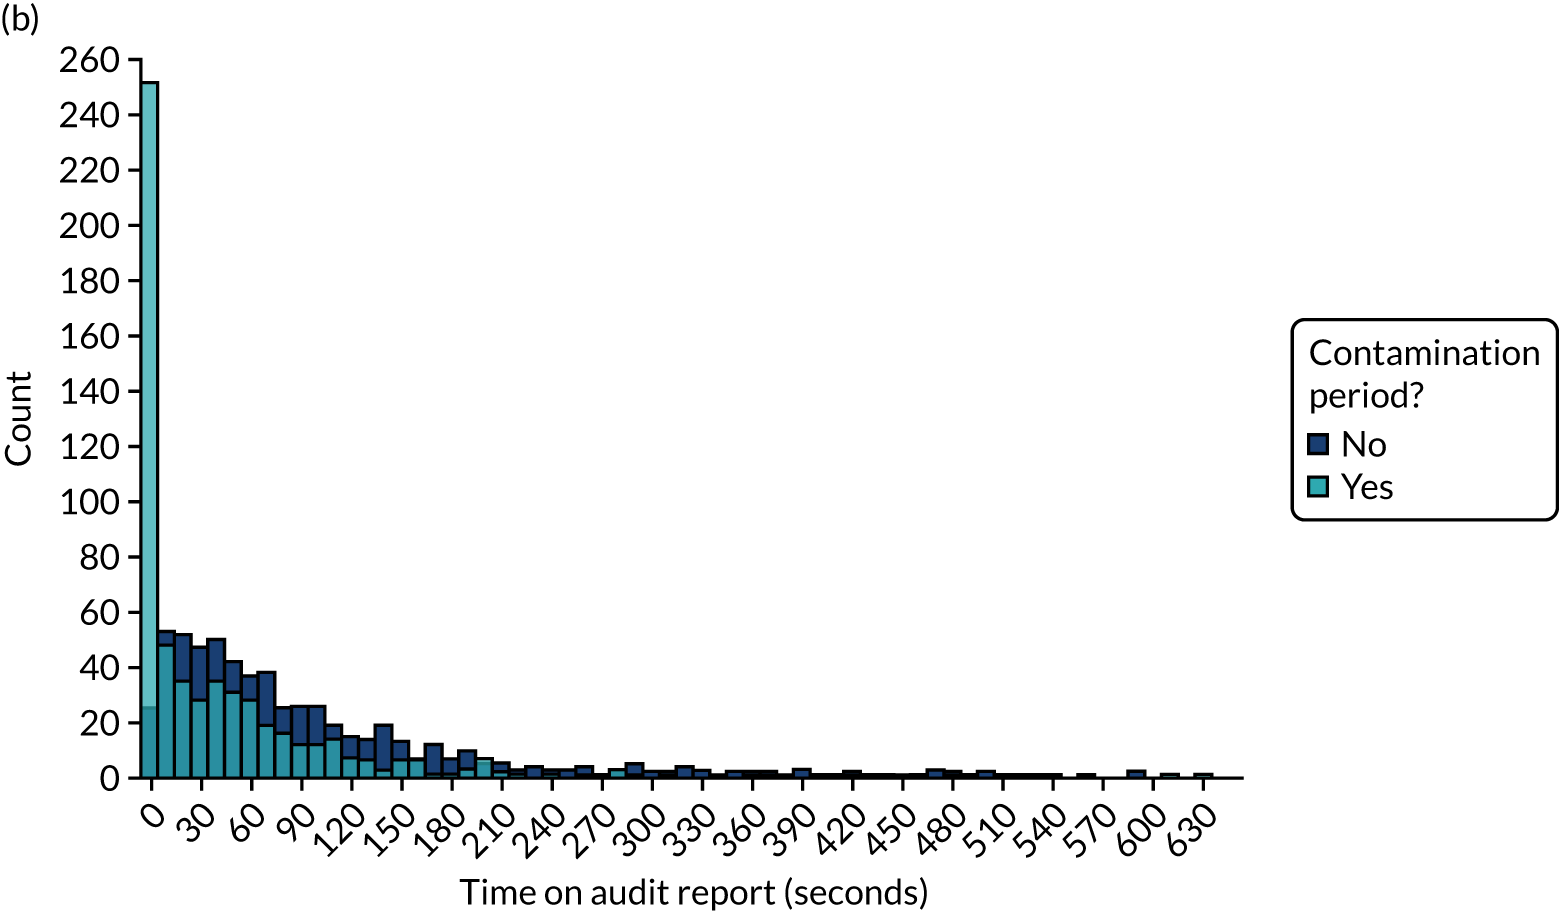
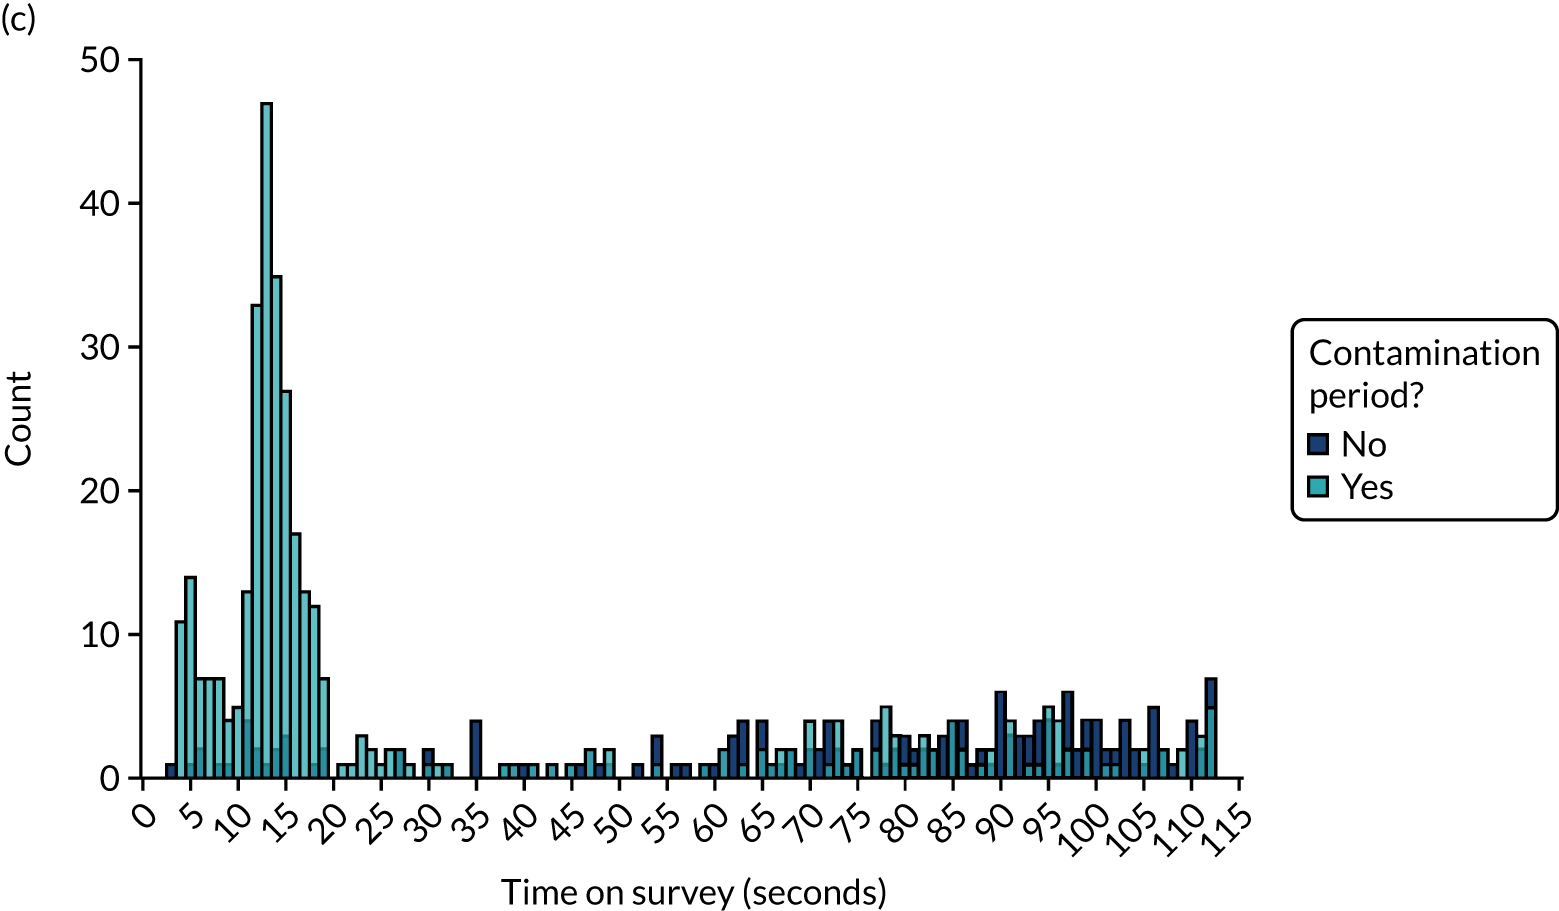
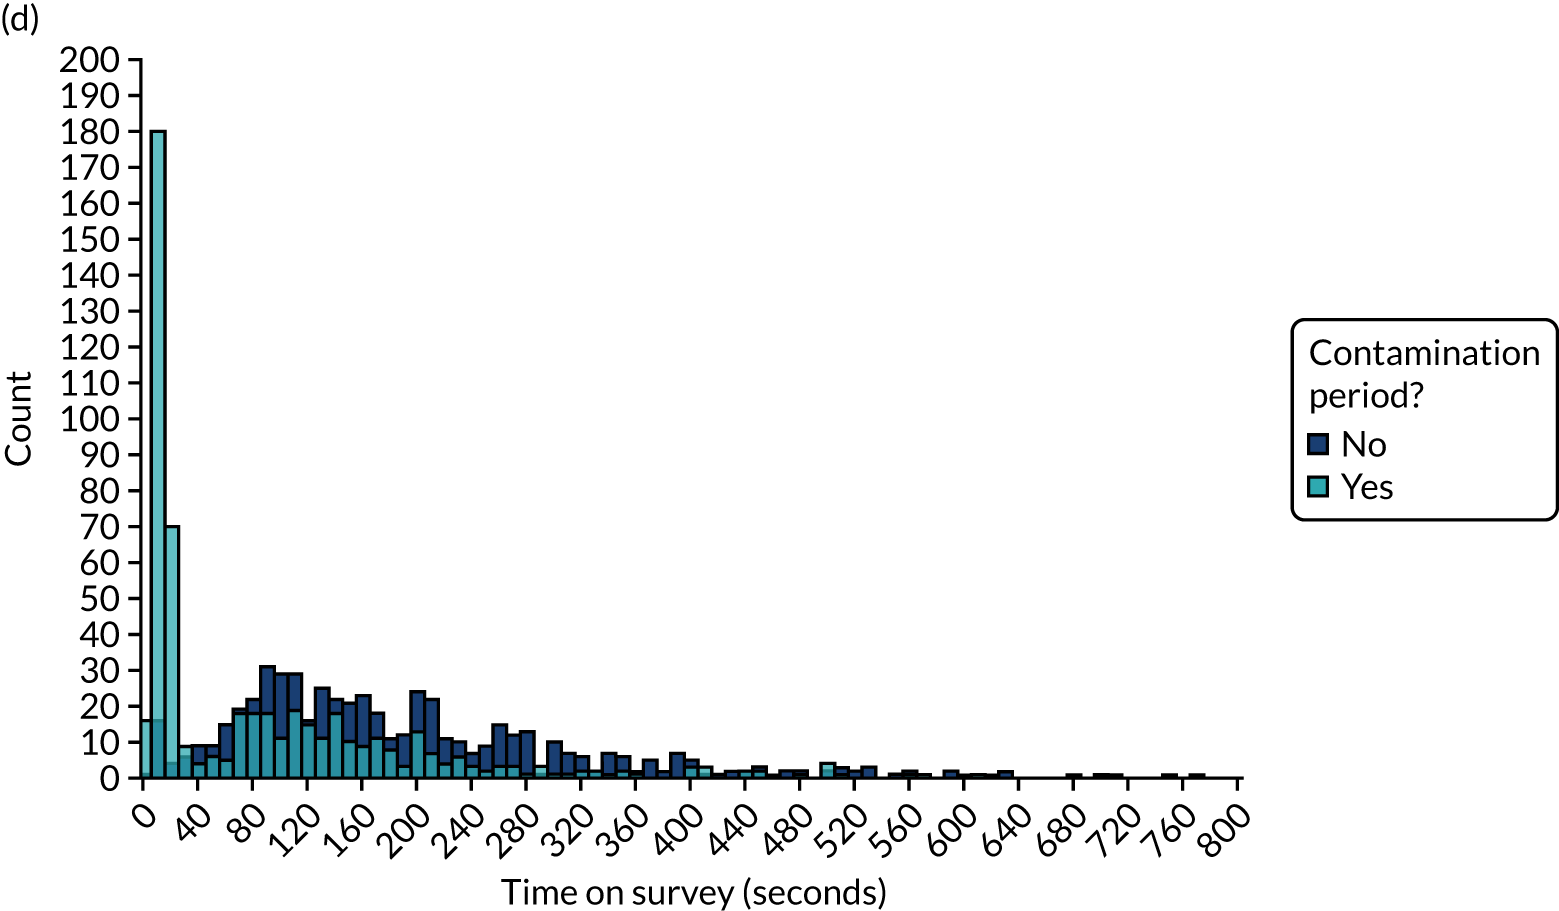
Based on the distribution of time spent completing the questionnaire (see Figure 31 and Table 30) and team consensus, we identified an appropriate cut-off of 20 seconds to exclude entries in which an infeasible short period of time was spent completing the questionnaire and define the secondary primary modified ITT population.
Other indicators
Other patterns were visible when comparing the two periods.
A reduction in the time spent on the audit report was apparent (see Table 30 and Figure 31). There was also a greater proportion of respondents selecting ‘completely agree’ to all questionnaire items, which was suggestive of respondents clicking quickly through the questionnaire without thinking (Figure 32). However, both the time spent on the audit report and the questionnaire response pattern could have feasibly been associated with the version of the audit that participants were randomised to receive: some versions included minimal content, which might therefore take less time to interpret. Consequently, we did not use these indicators to identify or exclude suspect responses.
FIGURE 32.
Questionnaire responses by completion during contamination period. (a) Intend to ensure indicator met; (b) want to ensure indicator met; (c) expect to ensure indicator met; (d) bring to colleague’s attention; (e) set goals; (f) review performance; (g) easy to understand; (h) met needs; and (i) easy to use.
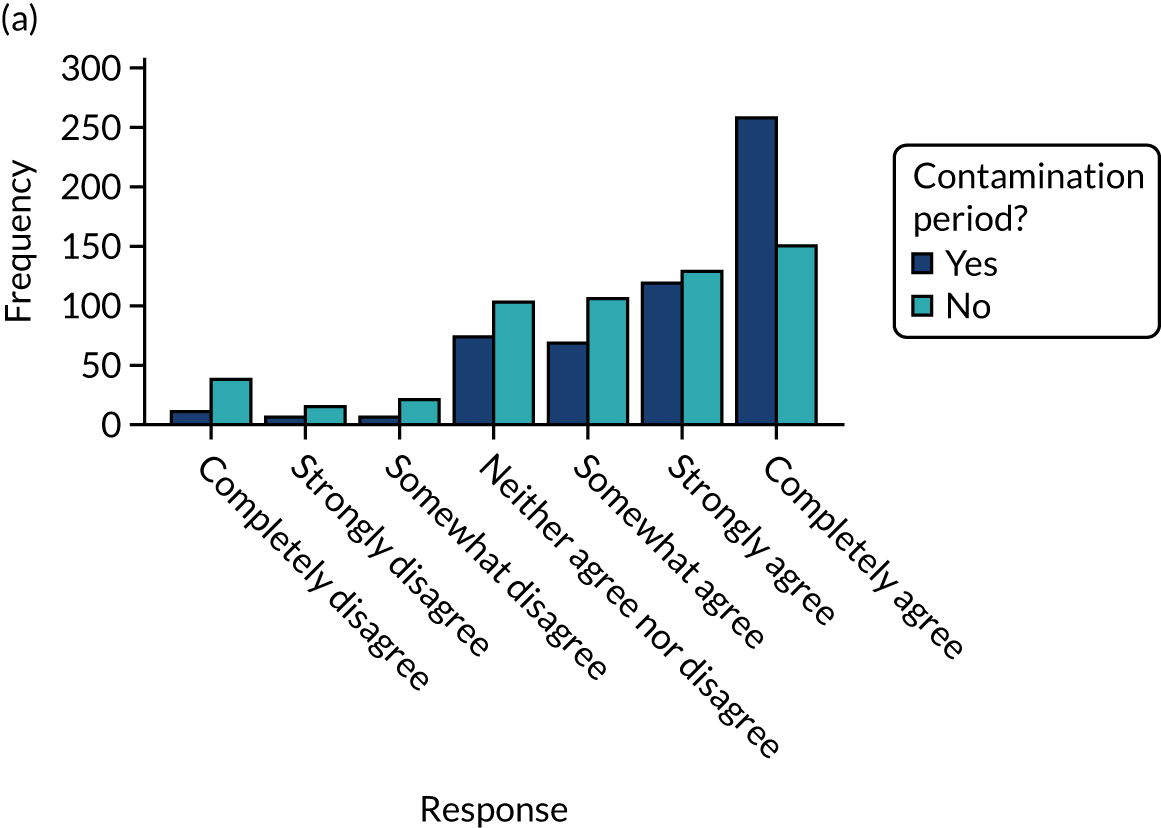
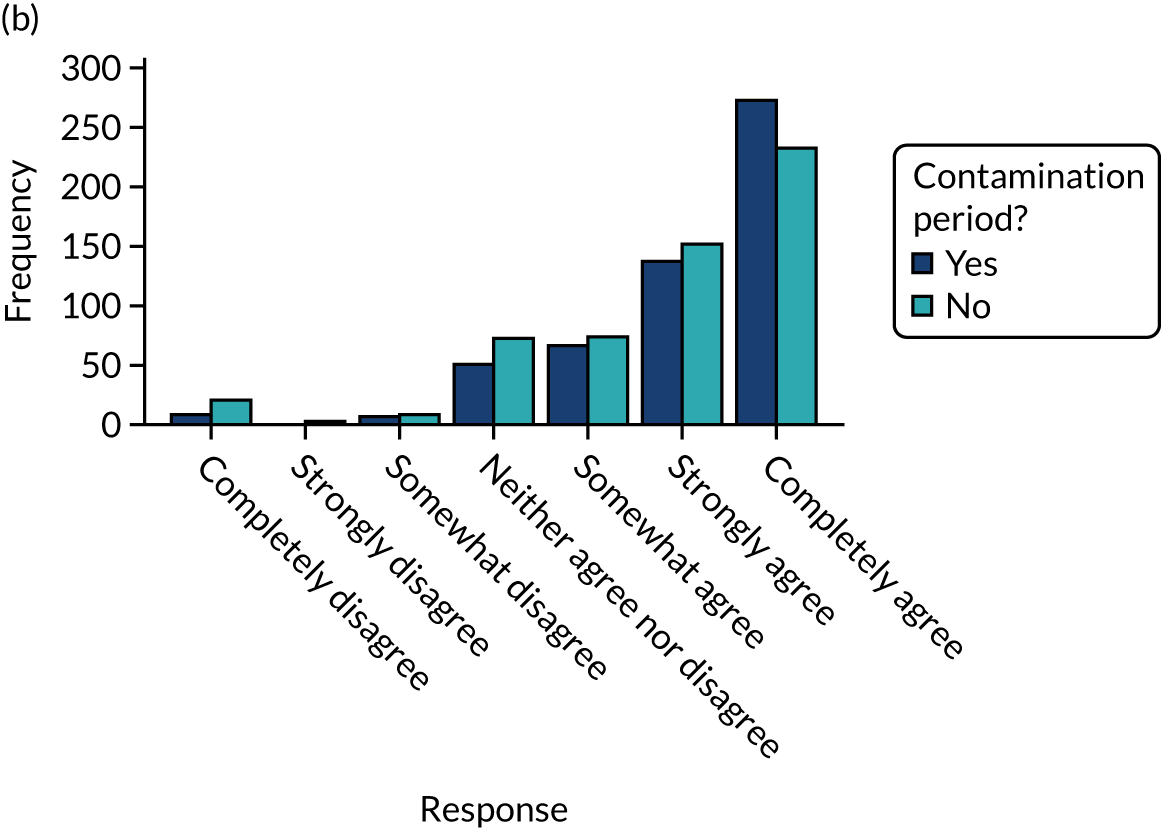
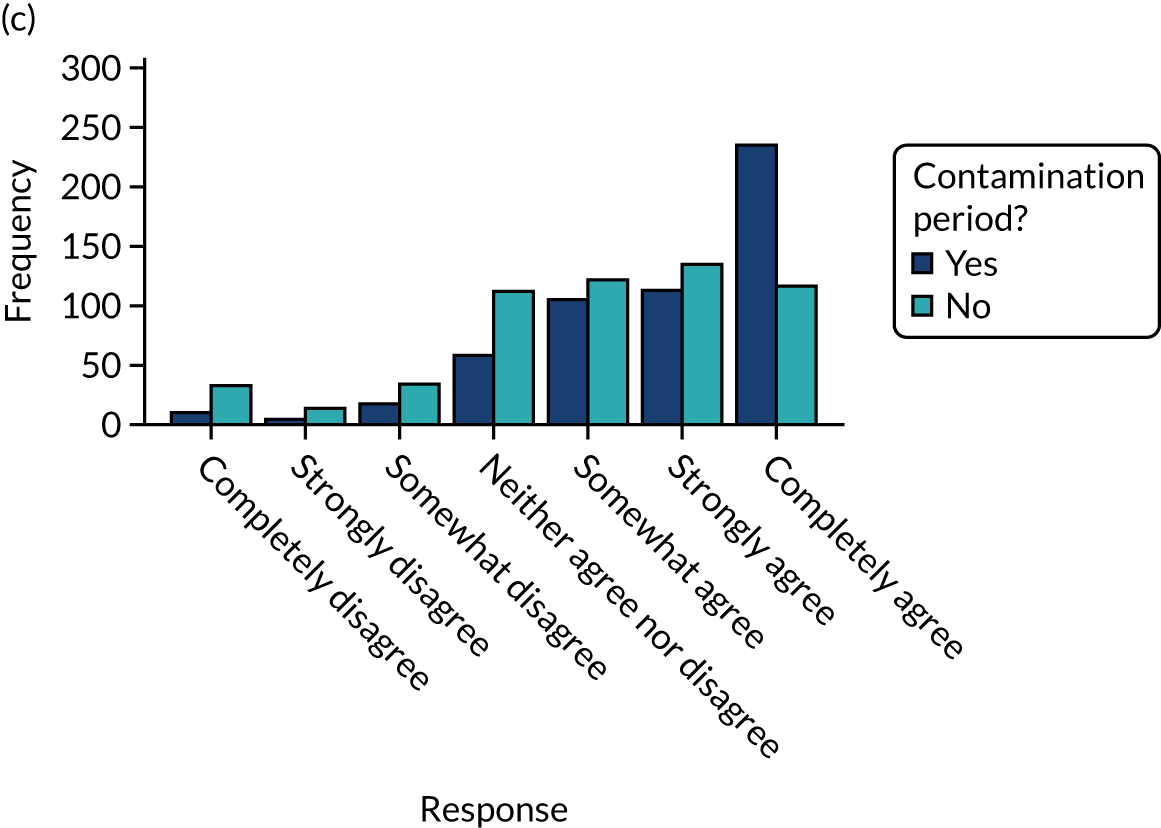
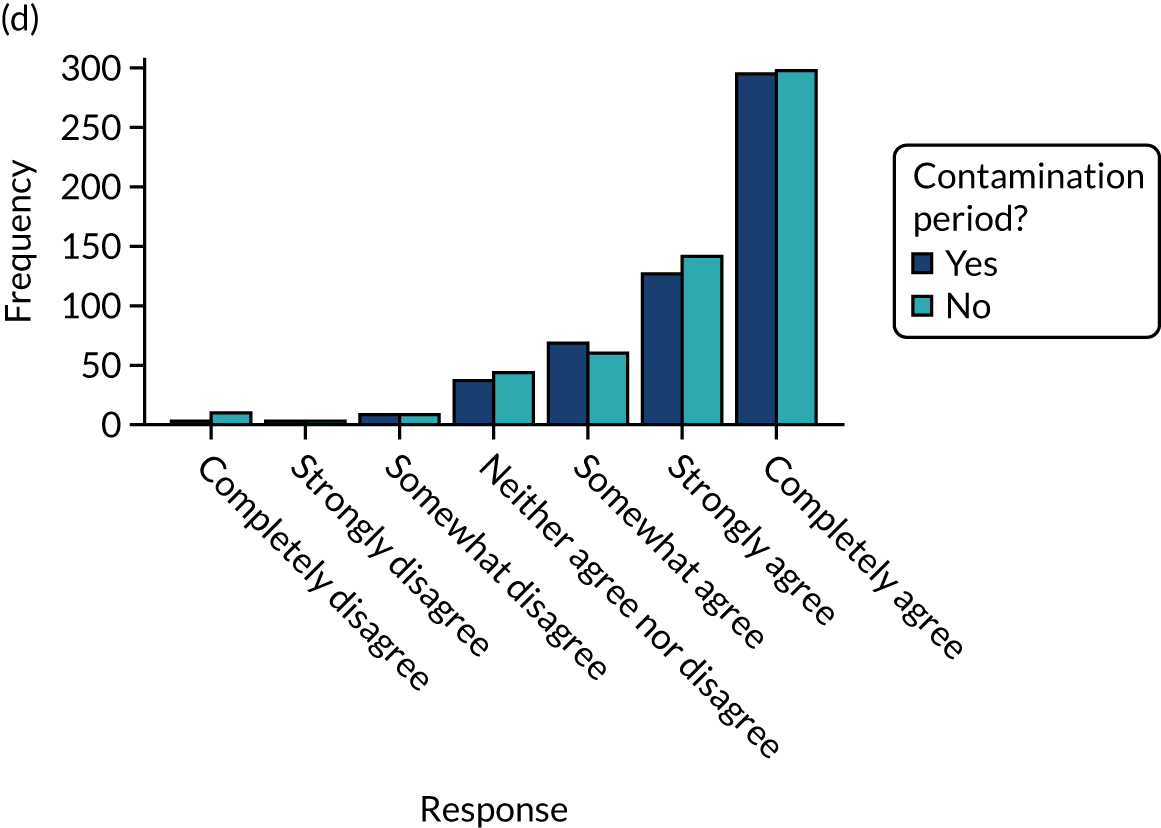
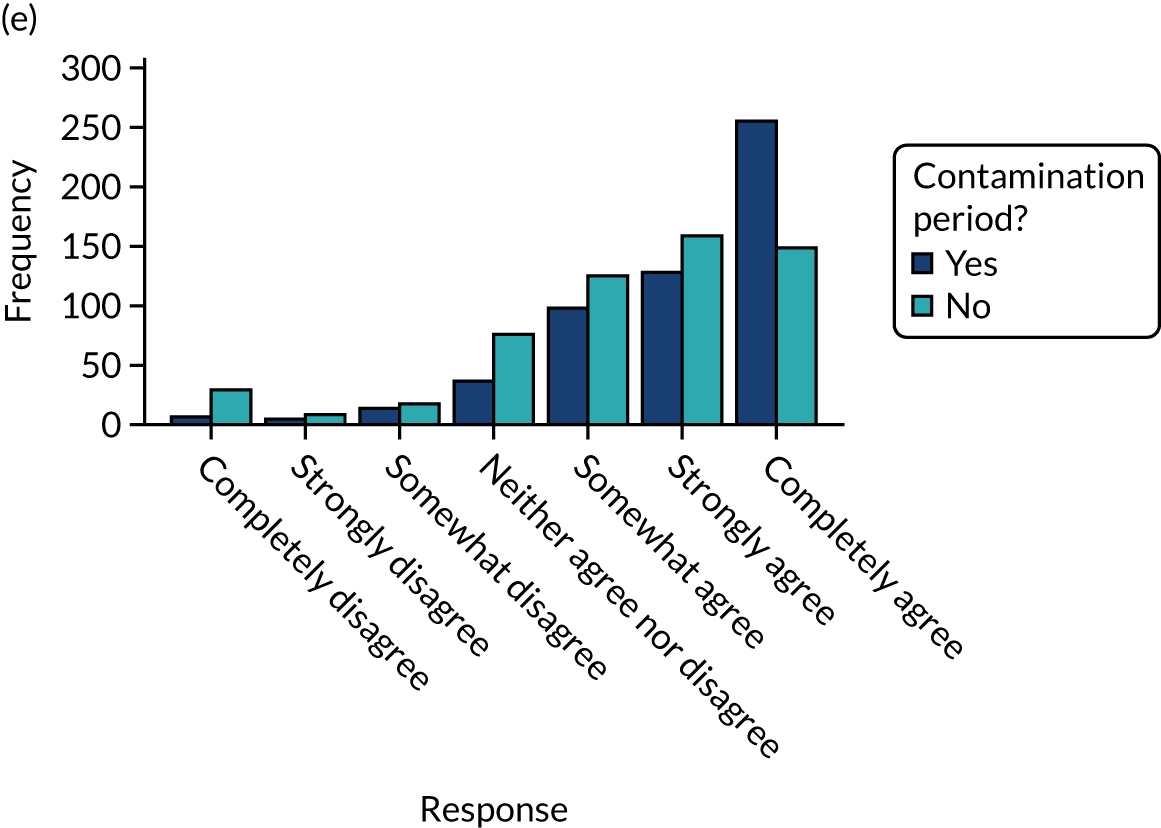
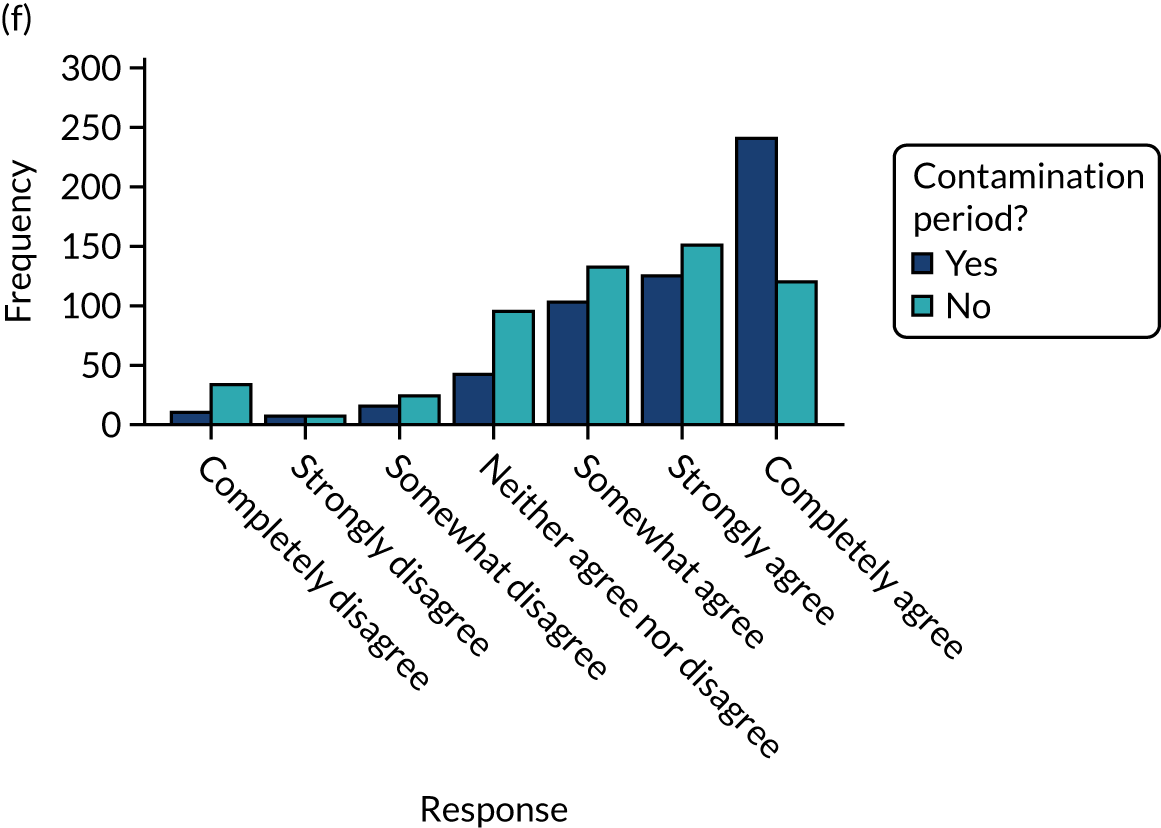
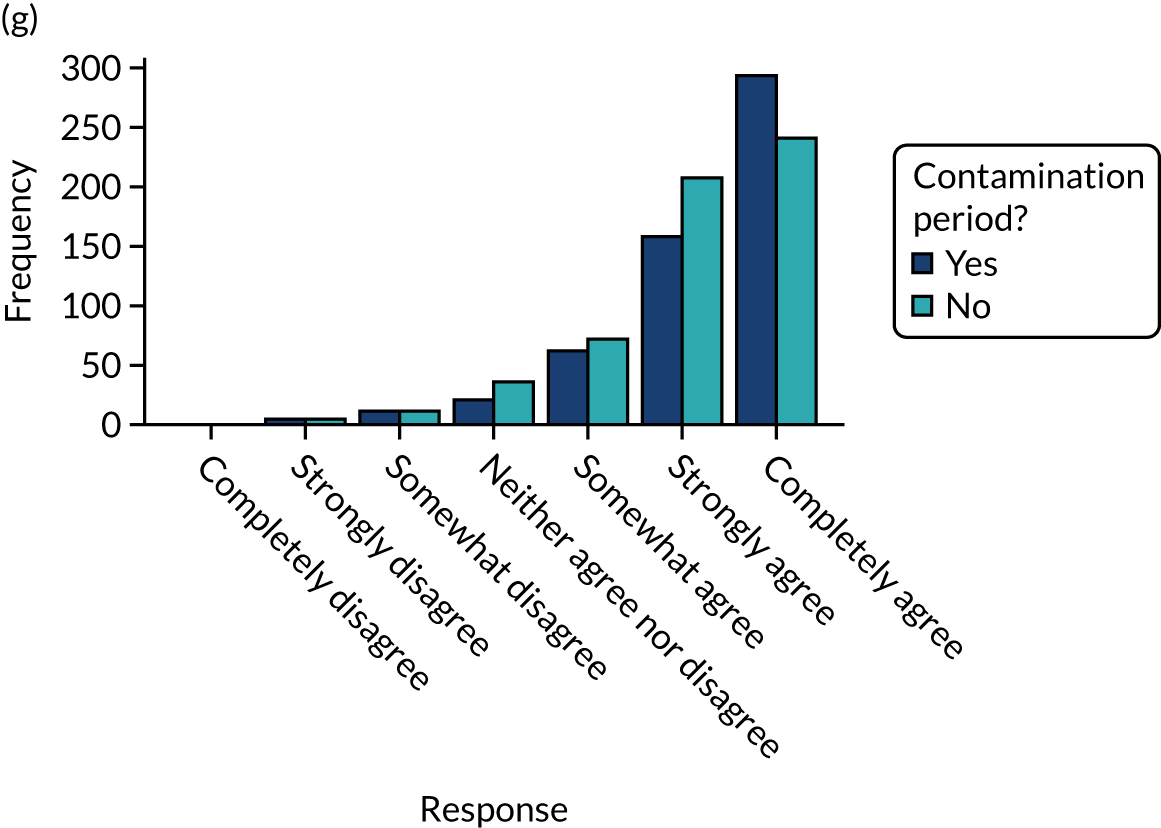
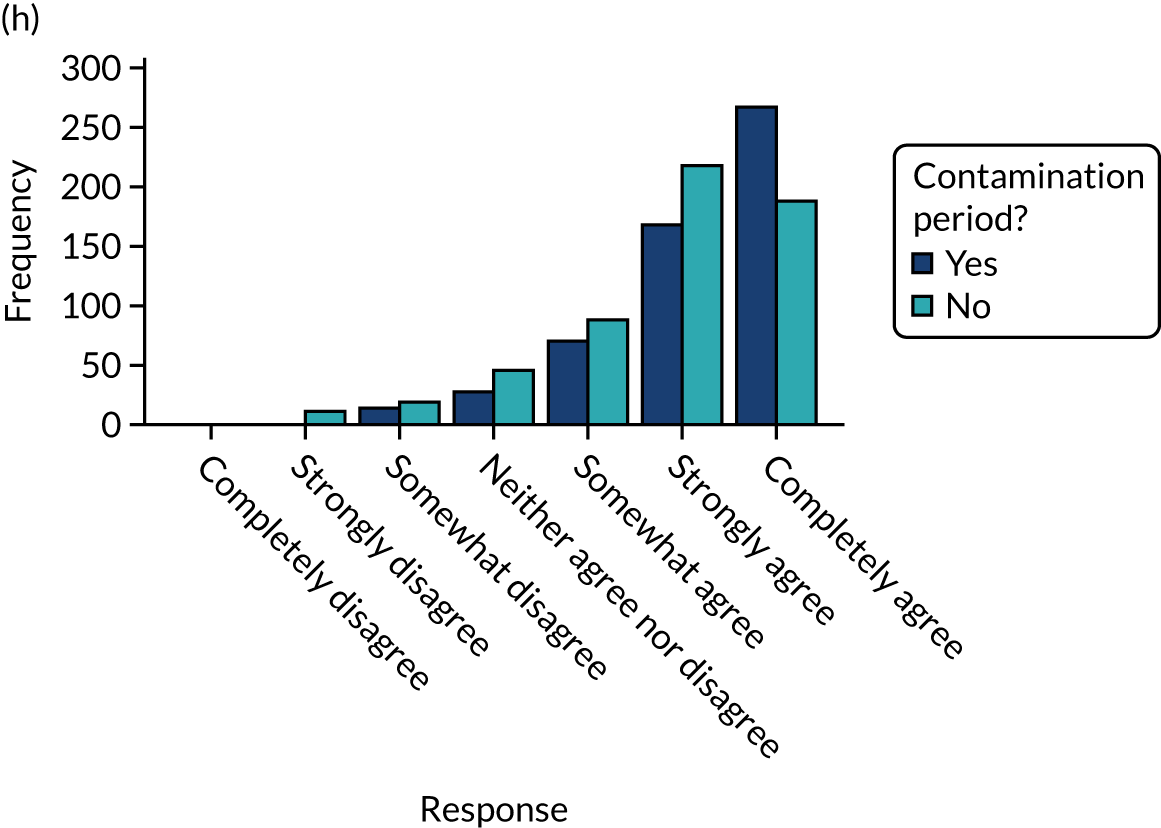
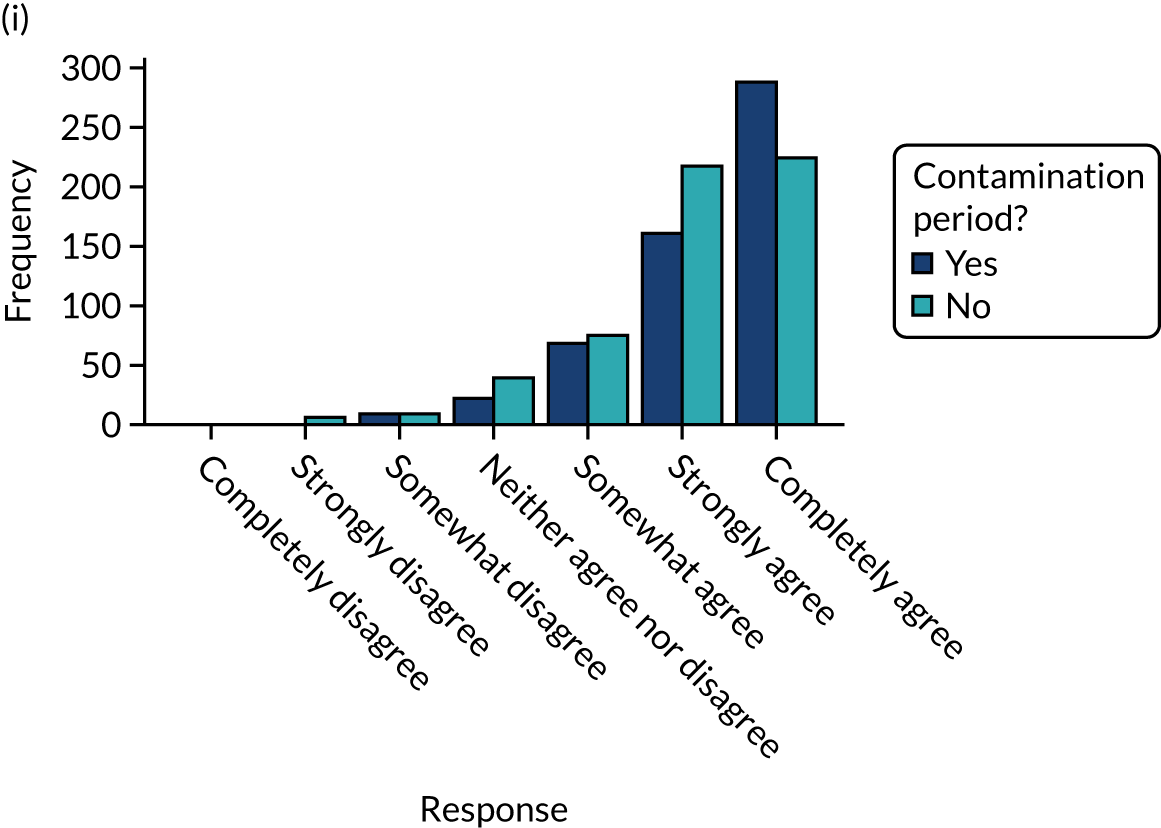
Tables 31 and 32 provide further information relating to the time spent on audit, number of clicks within the audit report and time spent on questionnaire by population and audit.
| MINAP | NCABT | NDA | PICANet | TARN | Total | |
|---|---|---|---|---|---|---|
| Randomisations | ||||||
| Time on questionnaire (seconds) | ||||||
| N | 243 | 160 | 507 | 66 | 137 | 1113 |
| Missing (n) | 24 | 15 | 77 | 3 | 9 | 128 |
| Median (range) | 137.0 (2.5–1053.5) | 137.0 (4.0–4669.0) | 95.5 (3.5–19,783.0) | 17.0 (4.0–868.0) | 137.0 (5.0–16,320.0) | 113.5 (2.5–19,783.0) |
| IQR | 43.0–252.5 | 14.8–244.0 | 19.0–178.0 | 12.5–156.0 | 92.0–206.5 | 19.0–205.0 |
| > 20 seconds on questionnaire, n (%) | ||||||
| Yes | 187 (77.0) | 114 (71.3) | 380 (75.0) | 31 (47.0) | 121 (88.3) | 833 (74.8) |
| No | 56 (23.0) | 46 (28.8) | 127 (25.0) | 35 (53.0) | 16 (11.7) | 280 (25.2) |
| Primary modified ITT population | ||||||
| Time on questionnaire (seconds) | ||||||
| N | 158 | 93 | 172 | 33 | 110 | 566 |
| Missing (n) | 20 | 9 | 32 | 3 | 8 | 72 |
| Median (range) | 191.8 (2.5–830.5) | 207.0 (12.0–4669.0) | 114.0 (5.0–1864.5) | 156.0 (11.0–868.0) | 147.5 (44.5–16,320.0) | 159.0 (2.5–16,320.0) |
| IQR | 120.0–281.5 | 136.5–302.5 | 70.0–192.5 | 105.5–233.0 | 102.5–232.0 | 97.5–255.5 |
| > 20 seconds on questionnaire, n (%) | ||||||
| Yes | 155 (98.1) | 92 (98.9) | 158 (91.9) | 30 (90.9) | 110 (100.0) | 545 (96.3) |
| No | 3 (1.9) | 1 (1.1) | 14 (8.1) | 3 (9.1) | 0 (0.0) | 21 (3.7) |
| Secondary modified ITT population | ||||||
| Time on questionnaire (seconds) | ||||||
| N | 187 | 114 | 380 | 31 | 121 | 833 |
| Missing (n) | 24 | 15 | 77 | 3 | 9 | 128 |
| Median (range) | 186.0 (20.5–1053.5) | 199.3 (23.0–4669.0) | 131.0 (22.5–19,783.0) | 163.5 (24.0–868.0) | 152.0 (44.5–16,320.0) | 153.5 (20.5–19,783.0) |
| IQR | 113.5–287.0 | 125.5–295.0 | 84.8–207.0 | 132.5–248.0 | 105.5–223.0 | 97.0–245.0 |
| > 20 seconds on questionnaire, n (%) | ||||||
| Yes | 187 (100.0) | 114 (100.0) | 380 (100.0) | 31 (100.0) | 121 (100.0) | 833 (100.0) |
| MINAP | NCABT | NDA | PICANet | TARN | Total | |
|---|---|---|---|---|---|---|
| Time spent on audit report (seconds) | ||||||
| Randomisations | ||||||
| N | 266 | 173 | 575 | 69 | 143 | 1226 |
| Missing (n) | 1 | 2 | 9 | 0 | 3 | 15 |
| Median (range) | 49.5 (1.0–1180.0) | 50.0 (1.0–4106.0) | 38.0 (0.5–70,512.0) | 7.5 (0.5–2209.5) | 66.0 (1.5–6762.0) | 43.5 (0.5–70,512.0) |
| IQR | 8.5–128.0 | 6.0–108.5 | 7.0–82.0 | 2.0–81.5 | 33.0–134.5 | 7.0–98.5 |
| Primary modified ITT population | ||||||
| N | 177 | 100 | 201 | 36 | 115 | 629 |
| Missing (n) | 1 | 2 | 3 | 0 | 3 | 9 |
| Median (range) | 76.0 (1.0–1180.0) | 80.5 (2.0–1914.0) | 45.5 (0.5–70,512.0) | 80.5 (1.5–2209.5) | 79.0 (7.0–6762.0) | 66.5 (0.5–70,512.0) |
| IQR | 29.0–154.5 | 44.5–142.3 | 22.5–98.0 | 47.8–165.3 | 42.5–159.0 | 31.0–136.0 |
| Secondary modified ITT population | ||||||
| N | 210 | 127 | 448 | 34 | 127 | 946 |
| Missing (n) | 1 | 2 | 9 | 0 | 3 | 15 |
| Median (range) | 68.8 (2.0–1180.0) | 77.5 (3.0–4106.0) | 52.5 (2.0–70,512.0) | 81.3 (2.0–2209.5) | 79.0 (4.5–6762.0) | 62.5 (2.0–70,512.0) |
| IQR | 28.5–151.0 | 38.0–141.0 | 27.3–98.0 | 52.0–173.5 | 42.5–145.0 | 32.5–123.0 |
| Number of clicks on audit report | ||||||
| Randomisations | ||||||
| N | 266 | 173 | 575 | 69 | 143 | 1226 |
| Missing (n) | 1 | 2 | 9 | 0 | 3 | 15 |
| Mean (SD) | 2.5 (7.48) | 1.8 (1.75) | 1.7 (1.94) | 1.2 (0.52) | 2.2 (2.18) | 1.9 (3.87) |
| Median (range) | 1.0 (1.0–99.0) | 1.0 (1.0–13.0) | 1.0 (1.0–25.0) | 1.0 (1.0–3.0) | 1.0 (1.0–17.0) | 1.0 (1.0–99.0) |
| IQR | 1.0–2.0 | 1.0–2.0 | 1.0–1.0 | 1.0–1.0 | 1.0–3.0 | 1.0–2.0 |
| Primary modified ITT population | ||||||
| N | 177 | 100 | 201 | 36 | 115 | 629 |
| Missing (n) | 1 | 2 | 3 | 0 | 3 | 9 |
| Mean (SD) | 3.0 (9.08) | 2.0 (1.78) | 1.7 (1.68) | 1.3 (0.62) | 2.4 (2.36) | 2.2 (5.09) |
| Median (range) | 1.0 (1.0–99.0) | 1.0 (1.0–10.0) | 1.0 (1.0–11.0) | 1.0 (1.0–3.0) | 2.0 (1.0–17.0) | 1.0 (1.0–99.0) |
| IQR | 1.0–3.0 | 1.0–3.0 | 1.0–1.0 | 1.0–1.0 | 1.0–3.0 | 1.0–2.0 |
| Secondary modified ITT population | ||||||
| N | 210 | 127 | 448 | 34 | 127 | 946 |
| Missing (n) | 1 | 2 | 9 | 0 | 3 | 15 |
| Mean (SD) | 2.8 (8.38) | 2.0 (1.97) | 1.9 (2.16) | 1.3 (0.64) | 2.3 (2.28) | 2.1 (4.37) |
| Median (range) | 1.0 (1.0–99.0) | 1.0 (1.0–13.0) | 1.0 (1.0–25.0) | 1.0 (1.0–3.0) | 1.0 (1.0–17.0) | 1.0 (1.0–99.0) |
| IQR | 1.0–2.0 | 1.0–3.0 | 1.0–2.0 | 1.0–1.0 | 1.0–3.0 | 1.0–2.0 |
Appendix 5 Participant characteristics, randomisation and experiment completion
| Participant in secondary m-ITT population? | Participant in primary m-ITT population? n (%) | Total, n (%) | |
|---|---|---|---|
| Yes | No | ||
| MINAP | |||
| Yes | 175 (65.5) | 36 (13.5) | 211 (79.0) |
| No | 3 (1.1) | 53 (19.9) | 56 (21.0) |
| Total | 178 (66.7) | 89 (33.3) | 267 (100.0) |
| NCABT | |||
| Yes | 101 (57.7) | 28 (16.0) | 129 (73.7) |
| No | 1 (0.6) | 45 (25.7) | 46 (26.3) |
| Total | 102 (58.3) | 73 (41.7) | 175 (100.0) |
| NDA | |||
| Yes | 190 (32.5) | 267 (45.7) | 457 (78.3) |
| No | 14 (2.4) | 113 (19.3) | 127 (21.7) |
| Total | 204 (34.9) | 380 (65.1) | 584 (100.0) |
| PICANet | |||
| Yes | 33 (47.8) | 1 (1.4) | 34 (49.3) |
| No | 3 (4.3) | 32 (46.4) | 35 (50.7) |
| Total | 36 (52.2) | 33 (47.8) | 69 (100.0) |
| TARN | |||
| Yes | 118 (80.8) | 12 (8.2) | 130 (89.0) |
| No | 0 (0.0) | 16 (11.0) | 16 (11.0) |
| Total | 118 (80.8) | 28 (19.2) | 146 (100.0) |
| Total | |||
| Yes | 617 (49.7) | 344 (27.7) | 961 (77.4) |
| No | 21 (1.7) | 259 (20.9) | 280 (22.6) |
| Total | 638 (51.4) | 603 (48.6) | 1241 (100.0) |
| Participant organisation and role | MINAP, n (%) | NCABT, n (%) | NDA, n (%) | PICANet, n (%) | TARN, n (%) | Total, n (%) |
|---|---|---|---|---|---|---|
| Randomisations | 267 (100.0) | 175 (100.0) | 584 (100.0) | 69 (100.0) | 146 (100.0) | 1241 (100.0) |
| Organisation | ||||||
| Commissioning | 14 (5.2) | 9 (5.1) | 37 (6.3) | 3 (4.3) | 13 (8.9) | 76 (6.1) |
| Community health care trust | 29 (10.9) | 23 (13.1) | 27 (4.6) | 11 (15.9) | 4 (2.7) | 94 (7.6) |
| General practice | 22 (8.2) | 15 (8.6) | 502 (86.0) | 9 (13.0) | 10 (6.8) | 558 (45.0) |
| Hospital trust | 202 (75.7) | 128 (73.1) | 18 (3.1) | 46 (66.7) | 119 (81.5) | 513 (41.3) |
| Role | ||||||
| Clinical | 146 (54.7) | 146 (83.4) | 234 (40.1) | 44 (63.8) | 89 (61.0) | 659 (53.1) |
| Allied health professional | 11 (4.1) | 48 (27.4) | 24 (4.1) | 3 (4.3) | 7 (4.8) | 93 (7.5) |
| Nurse or nurse specialist | 76 (28.5) | 73 (41.7) | 95 (16.3) | 9 (13.0) | 12 (8.2) | 265 (21.4) |
| Fully trained doctor | 55 (20.6) | 24 (13.7) | 111 (19.0) | 31 (44.9) | 67 (45.9) | 288 (23.2) |
| Training doctor | 4 (1.5) | 1 (0.6) | 4 (0.7) | 1 (1.4) | 3 (2.1) | 13 (1.0) |
| Manager | 43 (16.1) | 27 (15.4) | 316 (54.1) | 14 (20.3) | 31 (21.2) | 431 (34.7) |
| Audit and admin | 78 (29.2) | 2 (1.1) | 34 (5.8) | 11 (15.9) | 26 (17.8) | 151 (12.2) |
| Responsible for clinical care | ||||||
| Yes | 153 (63.0) | 131 (81.9) | 425 (83.8) | 58 (87.9) | 99 (72.3) | 866 (77.8) |
| Direct clinical care | 43 (17.7) | 13 (8.1) | 87 (17.2) | 12 (18.2) | 16 (11.7) | 171 (15.4) |
| Of organisation or team | 70 (28.8) | 100 (62.5) | 234 (46.2) | 20 (30.3) | 37 (27.0) | 461 (41.4) |
| Both | 40 (16.5) | 18 (11.3) | 104 (20.5) | 26 (39.4) | 46 (33.6) | 234 (21.0) |
| No | 90 (37.0) | 29 (18.1) | 82 (16.2) | 8 (12.1) | 38 (27.7) | 247 (22.2) |
| Missinga | 24 | 15 | 77 | 3 | 9 | 128 |
| Secondary m-ITT population | 211 (100.0) | 129 (100.0) | 457 (100.0) | 34 (100.0) | 130 (100.0) | 961 (100.0) |
| Organisation | ||||||
| Commissioning | 3 (1.4) | 1 (0.8) | 27 (5.9) | 0 (0.0) | 10 (7.7) | 41 (4.3) |
| Community health care trust | 4 (1.9) | 2 (1.6) | 3 (0.7) | 0 (0.0) | 1 (0.8) | 10 (1.0) |
| General practice | 7 (3.3) | 1 (0.8) | 422 (92.3) | 0 (0.0) | 1 (0.8) | 431 (44.8) |
| Hospital trust | 197 (93.4) | 125 (96.9) | 5 (1.1) | 34 (100.0) | 118 (90.8) | 479 (49.8) |
| Role | ||||||
| Clinical | 102 (48.3) | 113 (87.6) | 154 (33.7) | 19 (55.9) | 74 (56.9) | 462 (48.1) |
| Allied health professional | 2 (0.9) | 40 (31.0) | 15 (3.3) | 0 (0.0) | 5 (3.8) | 62 (6.5) |
| Nurse or nurse specialist | 70 (33.2) | 70 (54.3) | 70 (15.3) | 3 (8.8) | 8 (6.2) | 221 (23.0) |
| Fully trained doctor | 26 (12.3) | 3 (2.3) | 68 (14.9) | 16 (47.1) | 61 (46.9) | 174 (18.1) |
| Training doctor | 4 (1.9) | 0 (0.0) | 1 (0.2) | 0 (0.0) | 0 (0.0) | 5 (0.5) |
| Manager | 31 (14.7) | 14 (10.9) | 269 (58.9) | 4 (11.8) | 30 (23.1) | 348 (36.2) |
| Audit and admin | 78 (37.0) | 2 (1.6) | 34 (7.4) | 11 (32.4) | 26 (20.0) | 151 (15.7) |
| Responsible for clinical care | ||||||
| Yes | 100 (53.5) | 85 (74.6) | 301 (79.2) | 23 (74.2) | 83 (68.6) | 592 (71.1) |
| Direct clinical care | 31 (16.6) | 1 (0.9) | 70 (18.4) | 8 (25.8) | 12 (9.9) | 122 (14.6) |
| Of organisation or team | 47 (25.1) | 78 (68.4) | 176 (46.3) | 5 (16.1) | 32 (26.4) | 338 (40.6) |
| Both | 22 (11.8) | 6 (5.3) | 55 (14.5) | 10 (32.3) | 39 (32.2) | 132 (15.8) |
| No | 87 (46.5) | 29 (25.4) | 79 (20.8) | 8 (25.8) | 38 (31.4) | 241 (28.9) |
| Missinga | 24 | 15 | 77 | 3 | 9 | 128 |
| Modification | All randomised, n (%) | Primary modified ITT population, n (%) | Secondary modified ITT population, n (%) | |||||||||||||||
|---|---|---|---|---|---|---|---|---|---|---|---|---|---|---|---|---|---|---|
| MINAP (N = 267) | NCABT (N = 175) | NDA (N = 584) | PICANet (N = 69) | TARN (N = 146) | Total (N = 1241) | MINAP (N = 178) | NCABT (N = 102) | NDA (N = 204) | PICANet (N = 36) | TARN (N = 118) | Total (N = 638) | MINAP (N = 211) | NCABT (N = 129) | NDA (N = 457) | PICANet (N = 34) | TARN (N = 130) | Total (N = 961) | |
| A: effective comparators | ||||||||||||||||||
| On | 136 (50.9) | 87 (49.7) | 293 (50.2) | 35 (50.7) | 74 (50.7) | 625 (50.4) | 92 (51.7) | 52 (51.0) | 102 (50.0) | 18 (50.0) | 61 (51.7) | 325 (50.9) | 110 (52.1) | 64 (49.6) | 231 (50.5) | 18 (52.9) | 68 (52.3) | 491 (51.1) |
| Off | 131 (49.1) | 88 (50.3) | 291 (49.8) | 34 (49.3) | 72 (49.3) | 616 (49.6) | 86 (48.3) | 50 (49.0) | 102 (50.0) | 18 (50.0) | 57 (48.3) | 313 (49.1) | 101 (47.9) | 65 (50.4) | 226 (49.5) | 16 (47.1) | 62 (47.7) | 470 (48.9) |
| B: multimodal feedback | ||||||||||||||||||
| On | 134 (50.2) | 88 (50.3) | 292 (50.0) | 35 (50.7) | 74 (50.7) | 623 (50.2) | 88 (49.4) | 51 (50.0) | 102 (50.0) | 19 (52.8) | 60 (50.8) | 320 (50.2) | 106 (50.2) | 61 (47.3) | 229 (50.1) | 17 (50.0) | 67 (51.5) | 480 (49.9) |
| Off | 133 (49.8) | 87 (49.7) | 292 (50.0) | 34 (49.3) | 72 (49.3) | 618 (49.8) | 90 (50.6) | 51 (50.0) | 102 (50.0) | 17 (47.2) | 58 (49.2) | 318 (49.8) | 105 (49.8) | 68 (52.7) | 228 (49.9) | 17 (50.0) | 63 (48.5) | 481 (50.1) |
| C: specific actions | ||||||||||||||||||
| On | 134 (50.2) | 88 (50.3) | 291 (49.8) | 35 (50.7) | 72 (49.3) | 620 (50.0) | 88 (49.4) | 50 (49.0) | 103 (50.5) | 19 (52.8) | 58 (49.2) | 318 (49.8) | 104 (49.3) | 65 (50.4) | 229 (50.1) | 19 (55.9) | 63 (48.5) | 480 (49.9) |
| Off | 133 (49.8) | 87 (49.7) | 293 (50.2) | 34 (49.3) | 74 (50.7) | 621 (50.0) | 90 (50.6) | 52 (51.0) | 101 (49.5) | 17 (47.2) | 60 (50.8) | 320 (50.2) | 107 (50.7) | 64 (49.6) | 228 (49.9) | 15 (44.1) | 67 (51.5) | 481 (50.1) |
| D: optional detail | ||||||||||||||||||
| On | 132 (49.4) | 88 (50.3) | 291 (49.8) | 34 (49.3) | 73 (50.0) | 618 (49.8) | 86 (48.3) | 49 (48.0) | 100 (49.0) | 17 (47.2) | 60 (50.8) | 312 (48.9) | 103 (48.8) | 64 (49.6) | 225 (49.2) | 16 (47.1) | 65 (50.0) | 473 (49.2) |
| Off | 135 (50.6) | 87 (49.7) | 293 (50.2) | 35 (50.7) | 73 (50.0) | 623 (50.2) | 92 (51.7) | 53 (52.0) | 104 (51.0) | 19 (52.8) | 58 (49.2) | 326 (51.1) | 108 (51.2) | 65 (50.4) | 232 (50.8) | 18 (52.9) | 65 (50.0) | 488 (50.8) |
| E: patient voice | ||||||||||||||||||
| On | 133 (49.8) | 87 (49.7) | 292 (50.0) | 34 (49.3) | 73 (50.0) | 619 (49.9) | 91 (51.1) | 49 (48.0) | 103 (50.5) | 19 (52.8) | 58 (49.2) | 320 (50.2) | 108 (51.2) | 62 (48.1) | 235 (51.4) | 19 (55.9) | 64 (49.2) | 488 (50.8) |
| Off | 134 (50.2) | 88 (50.3) | 292 (50.0) | 35 (50.7) | 73 (50.0) | 622 (50.1) | 87 (48.9) | 53 (52.0) | 101 (49.5) | 17 (47.2) | 60 (50.8) | 318 (49.8) | 103 (48.8) | 67 (51.9) | 222 (48.6) | 15 (44.1) | 66 (50.8) | 473 (49.2) |
| F: Cognitive load | ||||||||||||||||||
| On | 133 (49.8) | 88 (50.3) | 291 (49.8) | 33 (47.8) | 72 (49.3) | 617 (49.7) | 89 (50.0) | 53 (52.0) | 100 (49.0) | 16 (44.4) | 59 (50.0) | 317 (49.7) | 105 (49.8) | 68 (52.7) | 231 (50.5) | 15 (44.1) | 63 (48.5) | 482 (50.2) |
| Off | 134 (50.2) | 87 (49.7) | 293 (50.2) | 36 (52.2) | 74 (50.7) | 624 (50.3) | 89 (50.0) | 49 (48.0) | 104 (51.0) | 20 (55.6) | 59 (50.0) | 321 (50.3) | 106 (50.2) | 61 (47.3) | 226 (49.5) | 19 (55.9) | 67 (51.5) | 479 (49.8) |
| Number of modifications on | ||||||||||||||||||
| 0 | 8 (3.0) | 5 (2.9) | 19 (3.3) | 2 (2.9) | 4 (2.7) | 38 (3.1) | 6 (3.4) | 3 (2.9) | 7 (3.4) | 1 (2.8) | 4 (3.4) | 21 (3.3) | 6 (2.8) | 4 (3.1) | 13 (2.8) | 1 (2.9) | 4 (3.1) | 28 (2.9) |
| 2 | 126 (47.2) | 83 (47.4) | 273 (46.7) | 33 (47.8) | 70 (47.9) | 585 (47.1) | 82 (46.1) | 49 (48.0) | 95 (46.6) | 17 (47.2) | 53 (44.9) | 296 (46.4) | 99 (46.9) | 61 (47.3) | 213 (46.6) | 15 (44.1) | 61 (46.9) | 449 (46.7) |
| 4 | 124 (46.4) | 81 (46.3) | 274 (46.9) | 32 (46.4) | 67 (45.9) | 578 (46.6) | 85 (47.8) | 47 (46.1) | 96 (47.1) | 17 (47.2) | 58 (49.2) | 303 (47.5) | 99 (46.9) | 61 (47.3) | 216 (47.3) | 17 (50.0) | 61 (46.9) | 454 (47.2) |
| 6 | 9 (3.4) | 6 (3.4) | 18 (3.1) | 2 (2.9) | 5 (3.4) | 40 (3.2) | 5 (2.8) | 3 (2.9) | 6 (2.9) | 1 (2.8) | 3 (2.5) | 18 (2.8) | 7 (3.3) | 3 (2.3) | 15 (3.3) | 1 (2.9) | 4 (3.1) | 30 (3.1) |
| Blocking factor | ||||||||||||||||||
| a | 128 (47.9) | 80 (45.7) | 296 (50.7) | 32 (46.4) | 66 (45.2) | 602 (48.5) | 93 (52.2) | 48 (47.1) | 108 (52.9) | 15 (41.7) | 64 (54.2) | 328 (51.4) | 100 (47.4) | 54 (41.9) | 218 (47.7) | 14 (41.2) | 64 (49.2) | 450 (46.8) |
| b | 139 (52.1) | 95 (54.3) | 288 (49.3) | 37 (53.6) | 80 (54.8) | 639 (51.5) | 85 (47.8) | 54 (52.9) | 96 (47.1) | 21 (58.3) | 54 (45.8) | 310 (48.6) | 111 (52.6) | 75 (58.1) | 239 (52.3) | 20 (58.8) | 66 (50.8) | 511 (53.2) |
| Modification | All randomised, n (%) | Primary modified ITT population, n (%) | Secondary modified ITT population, n (%) | |||||||||||||||
|---|---|---|---|---|---|---|---|---|---|---|---|---|---|---|---|---|---|---|
| MINAP (N = 267) | NCABT (N = 175) | NDA (N = 584) | PICANet (N = 69) | TARN (N = 146) | Total (N = 1241) | MINAP (N = 178) | NCABT (N = 102) | NDA (N = 204) | PICANet (N = 36) | TARN (N = 118) | Total (N = 638) | MINAP (N = 211) | NCABT (N = 129) | NDA (N = 457) | PICANet (N = 34) | TARN (N = 130) | Total (N = 961) | |
| All off | 8 (3.0) | 5 (2.9) | 19 (3.3) | 2 (2.9) | 4 (2.7) | 38 (3.1) | 6 (3.4) | 3 (2.9) | 7 (3.4) | 1 (2.8) | 4 (3.4) | 21 (3.3) | 6 (2.8) | 4 (3.1) | 13 (2.8) | 1 (2.9) | 4 (3.1) | 28 (2.9) |
| AB | 8 (3.0) | 5 (2.9) | 19 (3.3) | 2 (2.9) | 5 (3.4) | 39 (3.1) | 6 (3.4) | 3 (2.9) | 7 (3.4) | 1 (2.8) | 5 (4.2) | 22 (3.4) | 6 (2.8) | 3 (2.3) | 15 (3.3) | 1 (2.9) | 5 (3.8) | 30 (3.1) |
| AC | 9 (3.4) | 6 (3.4) | 18 (3.1) | 3 (4.3) | 5 (3.4) | 41 (3.3) | 5 (2.8) | 4 (3.9) | 6 (2.9) | 2 (5.6) | 4 (3.4) | 21 (3.3) | 8 (3.8) | 6 (4.7) | 14 (3.1) | 2 (5.9) | 5 (3.8) | 35 (3.6) |
| AD | 9 (3.4) | 6 (3.4) | 18 (3.1) | 3 (4.3) | 5 (3.4) | 41 (3.3) | 6 (3.4) | 2 (2.0) | 6 (2.9) | 2 (5.6) | 3 (2.5) | 19 (3.0) | 8 (3.8) | 4 (3.1) | 11 (2.4) | 2 (5.9) | 4 (3.1) | 29 (3.0) |
| AE | 9 (3.4) | 5 (2.9) | 18 (3.1) | 2 (2.9) | 5 (3.4) | 39 (3.1) | 6 (3.4) | 3 (2.9) | 6 (2.9) | 1 (2.8) | 3 (2.5) | 19 (3.0) | 8 (3.8) | 3 (2.3) | 17 (3.7) | 1 (2.9) | 4 (3.1) | 33 (3.4) |
| AF | 8 (3.0) | 5 (2.9) | 18 (3.1) | 2 (2.9) | 4 (2.7) | 37 (3.0) | 6 (3.4) | 3 (2.9) | 6 (2.9) | 1 (2.8) | 4 (3.4) | 20 (3.1) | 6 (2.8) | 4 (3.1) | 13 (2.8) | 1 (2.9) | 4 (3.1) | 28 (2.9) |
| BC | 9 (3.4) | 6 (3.4) | 18 (3.1) | 3 (4.3) | 5 (3.4) | 41 (3.3) | 5 (2.8) | 3 (2.9) | 6 (2.9) | 2 (5.6) | 3 (2.5) | 19 (3.0) | 6 (2.8) | 4 (3.1) | 13 (2.8) | 2 (5.9) | 4 (3.1) | 29 (3.0) |
| BD | 8 (3.0) | 6 (3.4) | 18 (3.1) | 2 (2.9) | 5 (3.4) | 39 (3.1) | 4 (2.2) | 4 (3.9) | 6 (2.9) | 1 (2.8) | 3 (2.5) | 18 (2.8) | 7 (3.3) | 4 (3.1) | 15 (3.3) | 0 (0.0) | 4 (3.1) | 30 (3.1) |
| BE | 9 (3.4) | 6 (3.4) | 18 (3.1) | 2 (2.9) | 5 (3.4) | 40 (3.2) | 6 (3.4) | 3 (2.9) | 6 (2.9) | 1 (2.8) | 3 (2.5) | 19 (3.0) | 6 (2.8) | 3 (2.3) | 14 (3.1) | 1 (2.9) | 5 (3.8) | 29 (3.0) |
| BF | 8 (3.0) | 5 (2.9) | 19 (3.3) | 2 (2.9) | 4 (2.7) | 38 (3.1) | 6 (3.4) | 3 (2.9) | 7 (3.4) | 0 (0.0) | 4 (3.4) | 20 (3.1) | 7 (3.3) | 4 (3.1) | 14 (3.1) | 0 (0.0) | 4 (3.1) | 29 (3.0) |
| CD | 8 (3.0) | 5 (2.9) | 18 (3.1) | 2 (2.9) | 4 (2.7) | 37 (3.0) | 5 (2.8) | 3 (2.9) | 7 (3.4) | 1 (2.8) | 4 (3.4) | 20 (3.1) | 6 (2.8) | 3 (2.3) | 14 (3.1) | 1 (2.9) | 4 (3.1) | 28 (2.9) |
| CE | 8 (3.0) | 5 (2.9) | 19 (3.3) | 2 (2.9) | 4 (2.7) | 38 (3.1) | 6 (3.4) | 3 (2.9) | 8 (3.9) | 1 (2.8) | 3 (2.5) | 21 (3.3) | 7 (3.3) | 3 (2.3) | 14 (3.1) | 1 (2.9) | 3 (2.3) | 28 (2.9) |
| CF | 9 (3.4) | 6 (3.4) | 18 (3.1) | 2 (2.9) | 5 (3.4) | 40 (3.2) | 6 (3.4) | 4 (3.9) | 6 (2.9) | 1 (2.8) | 4 (3.4) | 21 (3.3) | 7 (3.3) | 5 (3.9) | 16 (3.5) | 1 (2.9) | 4 (3.1) | 33 (3.4) |
| DE | 8 (3.0) | 5 (2.9) | 18 (3.1) | 2 (2.9) | 4 (2.7) | 37 (3.0) | 5 (2.8) | 3 (2.9) | 6 (2.9) | 1 (2.8) | 4 (3.4) | 19 (3.0) | 6 (2.8) | 4 (3.1) | 13 (2.8) | 1 (2.9) | 4 (3.1) | 28 (2.9) |
| DF | 8 (3.0) | 6 (3.4) | 18 (3.1) | 2 (2.9) | 5 (3.4) | 39 (3.1) | 5 (2.8) | 4 (3.9) | 6 (2.9) | 1 (2.8) | 3 (2.5) | 19 (3.0) | 5 (2.4) | 5 (3.9) | 15 (3.3) | 0 (0.0) | 3 (2.3) | 28 (2.9) |
| EF | 8 (3.0) | 6 (3.4) | 18 (3.1) | 2 (2.9) | 5 (3.4) | 39 (3.1) | 5 (2.8) | 4 (3.9) | 6 (2.9) | 1 (2.8) | 3 (2.5) | 19 (3.0) | 6 (2.8) | 6 (4.7) | 15 (3.3) | 1 (2.9) | 4 (3.1) | 32 (3.3) |
| ABCD | 8 (3.0) | 5 (2.9) | 19 (3.3) | 2 (2.9) | 4 (2.7) | 38 (3.1) | 6 (3.4) | 3 (2.9) | 7 (3.4) | 1 (2.8) | 4 (3.4) | 21 (3.3) | 6 (2.8) | 3 (2.3) | 14 (3.1) | 1 (2.9) | 4 (3.1) | 28 (2.9) |
| ABCE | 8 (3.0) | 5 (2.9) | 18 (3.1) | 2 (2.9) | 4 (2.7) | 37 (3.0) | 6 (3.4) | 3 (2.9) | 7 (3.4) | 1 (2.8) | 4 (3.4) | 21 (3.3) | 7 (3.3) | 3 (2.3) | 15 (3.3) | 1 (2.9) | 4 (3.1) | 30 (3.1) |
| ABCF | 9 (3.4) | 6 (3.4) | 18 (3.1) | 2 (2.9) | 5 (3.4) | 40 (3.2) | 5 (2.8) | 4 (3.9) | 6 (2.9) | 1 (2.8) | 3 (2.5) | 19 (3.0) | 7 (3.3) | 5 (3.9) | 15 (3.3) | 1 (2.9) | 4 (3.1) | 32 (3.3) |
| ABDE | 8 (3.0) | 5 (2.9) | 19 (3.3) | 2 (2.9) | 5 (3.4) | 39 (3.1) | 6 (3.4) | 3 (2.9) | 7 (3.4) | 1 (2.8) | 5 (4.2) | 22 (3.4) | 6 (2.8) | 3 (2.3) | 13 (2.8) | 1 (2.9) | 5 (3.8) | 28 (2.9) |
| ABDF | 9 (3.4) | 6 (3.4) | 18 (3.1) | 2 (2.9) | 5 (3.4) | 40 (3.2) | 5 (2.8) | 4 (3.9) | 6 (2.9) | 1 (2.8) | 4 (3.4) | 20 (3.1) | 7 (3.3) | 6 (4.7) | 16 (3.5) | 1 (2.9) | 5 (3.8) | 35 (3.6) |
| ABEF | 9 (3.4) | 6 (3.4) | 18 (3.1) | 3 (4.3) | 5 (3.4) | 41 (3.3) | 6 (3.4) | 4 (3.9) | 6 (2.9) | 2 (5.6) | 4 (3.4) | 22 (3.4) | 9 (4.3) | 5 (3.9) | 16 (3.5) | 2 (5.9) | 4 (3.1) | 36 (3.7) |
| ACDE | 9 (3.4) | 6 (3.4) | 18 (3.1) | 2 (2.9) | 5 (3.4) | 40 (3.2) | 6 (3.4) | 4 (3.9) | 6 (2.9) | 1 (2.8) | 3 (2.5) | 20 (3.1) | 6 (2.8) | 5 (3.9) | 15 (3.3) | 1 (2.9) | 4 (3.1) | 31 (3.2) |
| ACDF | 8 (3.0) | 5 (2.9) | 18 (3.1) | 2 (2.9) | 4 (2.7) | 37 (3.0) | 6 (3.4) | 3 (2.9) | 6 (2.9) | 0 (0.0) | 4 (3.4) | 19 (3.0) | 6 (2.8) | 4 (3.1) | 13 (2.8) | 0 (0.0) | 4 (3.1) | 27 (2.8) |
| ACEF | 8 (3.0) | 5 (2.9) | 19 (3.3) | 2 (2.9) | 4 (2.7) | 38 (3.1) | 6 (3.4) | 3 (2.9) | 7 (3.4) | 1 (2.8) | 4 (3.4) | 21 (3.3) | 6 (2.8) | 4 (3.1) | 14 (3.1) | 1 (2.9) | 4 (3.1) | 29 (3.0) |
| ADEF | 8 (3.0) | 5 (2.9) | 19 (3.3) | 2 (2.9) | 4 (2.7) | 38 (3.1) | 6 (3.4) | 3 (2.9) | 7 (3.4) | 1 (2.8) | 4 (3.4) | 21 (3.3) | 7 (3.3) | 3 (2.3) | 15 (3.3) | 1 (2.9) | 4 (3.1) | 30 (3.1) |
| BCDE | 8 (3.0) | 6 (3.4) | 18 (3.1) | 3 (4.3) | 5 (3.4) | 40 (3.2) | 5 (2.8) | 2 (2.0) | 6 (2.9) | 2 (5.6) | 4 (3.4) | 19 (3.0) | 7 (3.3) | 6 (4.7) | 16 (3.5) | 2 (5.9) | 4 (3.1) | 35 (3.6) |
| BCDF | 8 (3.0) | 5 (2.9) | 18 (3.1) | 2 (2.9) | 4 (2.7) | 37 (3.0) | 5 (2.8) | 3 (2.9) | 6 (2.9) | 1 (2.8) | 4 (3.4) | 19 (3.0) | 5 (2.4) | 3 (2.3) | 11 (2.4) | 1 (2.9) | 4 (3.1) | 24 (2.5) |
| BCEF | 8 (3.0) | 5 (2.9) | 18 (3.1) | 2 (2.9) | 4 (2.7) | 37 (3.0) | 6 (3.4) | 3 (2.9) | 7 (3.4) | 2 (5.6) | 3 (2.5) | 21 (3.3) | 6 (2.8) | 3 (2.3) | 14 (3.1) | 1 (2.9) | 3 (2.3) | 27 (2.8) |
| BDEF | 8 (3.0) | 5 (2.9) | 18 (3.1) | 2 (2.9) | 4 (2.7) | 37 (3.0) | 6 (3.4) | 3 (2.9) | 6 (2.9) | 1 (2.8) | 4 (3.4) | 20 (3.1) | 7 (3.3) | 3 (2.3) | 13 (2.8) | 1 (2.9) | 4 (3.1) | 28 (2.9) |
| CDEF | 8 (3.0) | 6 (3.4) | 18 (3.1) | 2 (2.9) | 5 (3.4) | 39 (3.1) | 5 (2.8) | 2 (2.0) | 6 (2.9) | 1 (2.8) | 4 (3.4) | 18 (2.8) | 7 (3.3) | 5 (3.9) | 16 (3.5) | 2 (5.9) | 4 (3.1) | 34 (3.5) |
| ABCDEF | 9 (3.4) | 6 (3.4) | 18 (3.1) | 2 (2.9) | 5 (3.4) | 40 (3.2) | 5 (2.8) | 3 (2.9) | 6 (2.9) | 1 (2.8) | 3 (2.5) | 18 (2.8) | 7 (3.3) | 3 (2.3) | 15 (3.3) | 1 (2.9) | 4 (3.1) | 30 (3.1) |
FIGURE 33.
Randomly allocated modifications by audit and population. (a) Randomisation; (b) secondary m-ITT population; (c) primary m-ITT population – and modification combination by audit and population; (d) randomisation; (e) secondary m-ITT population; and (f) primary m-ITT population.
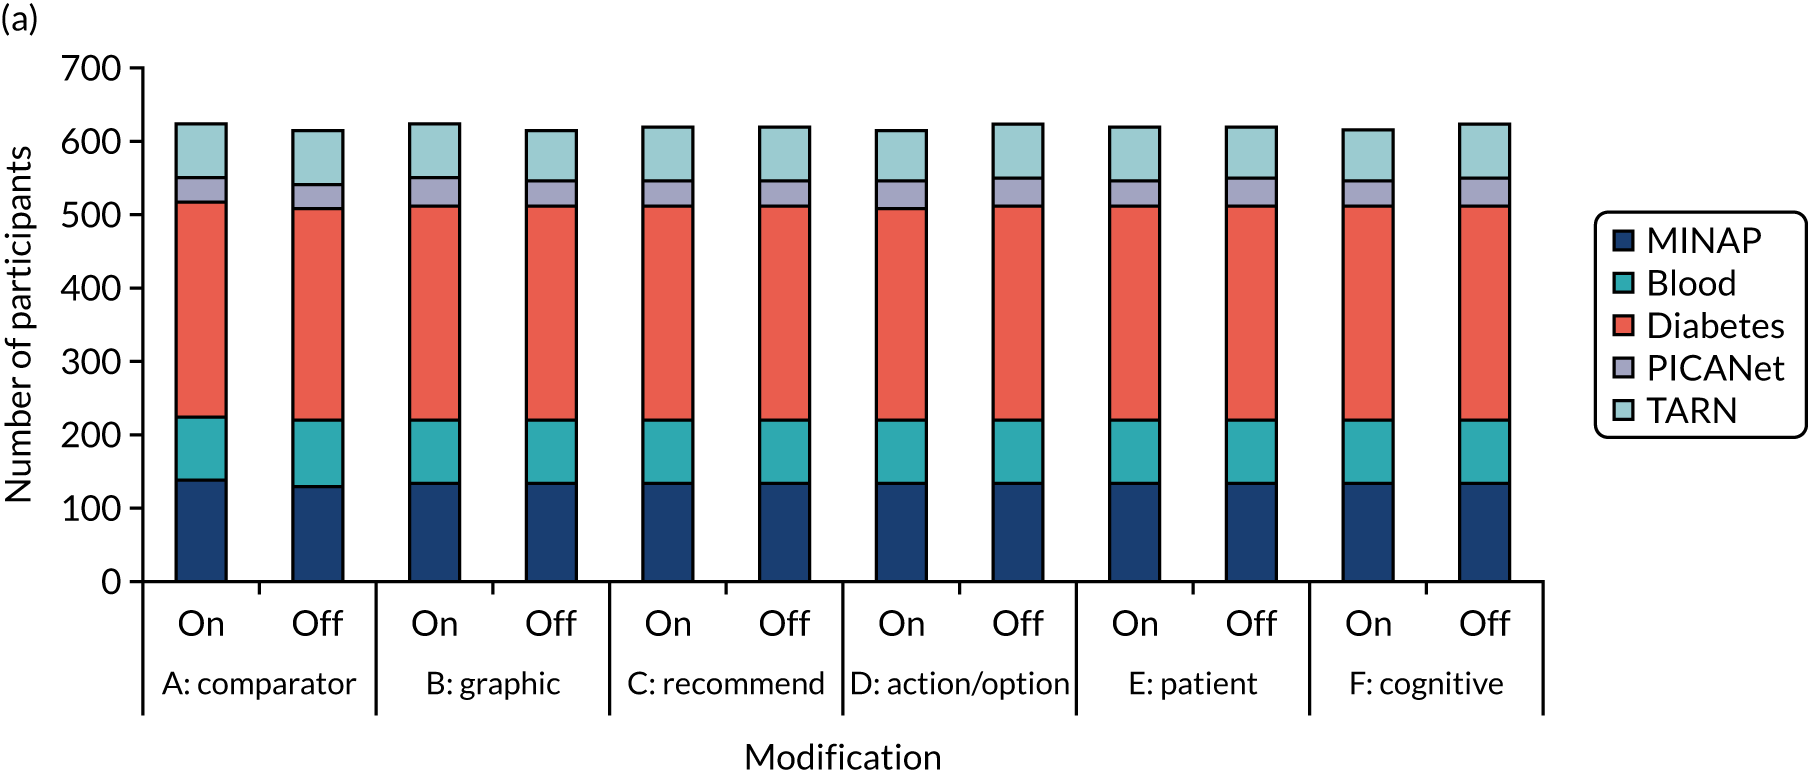
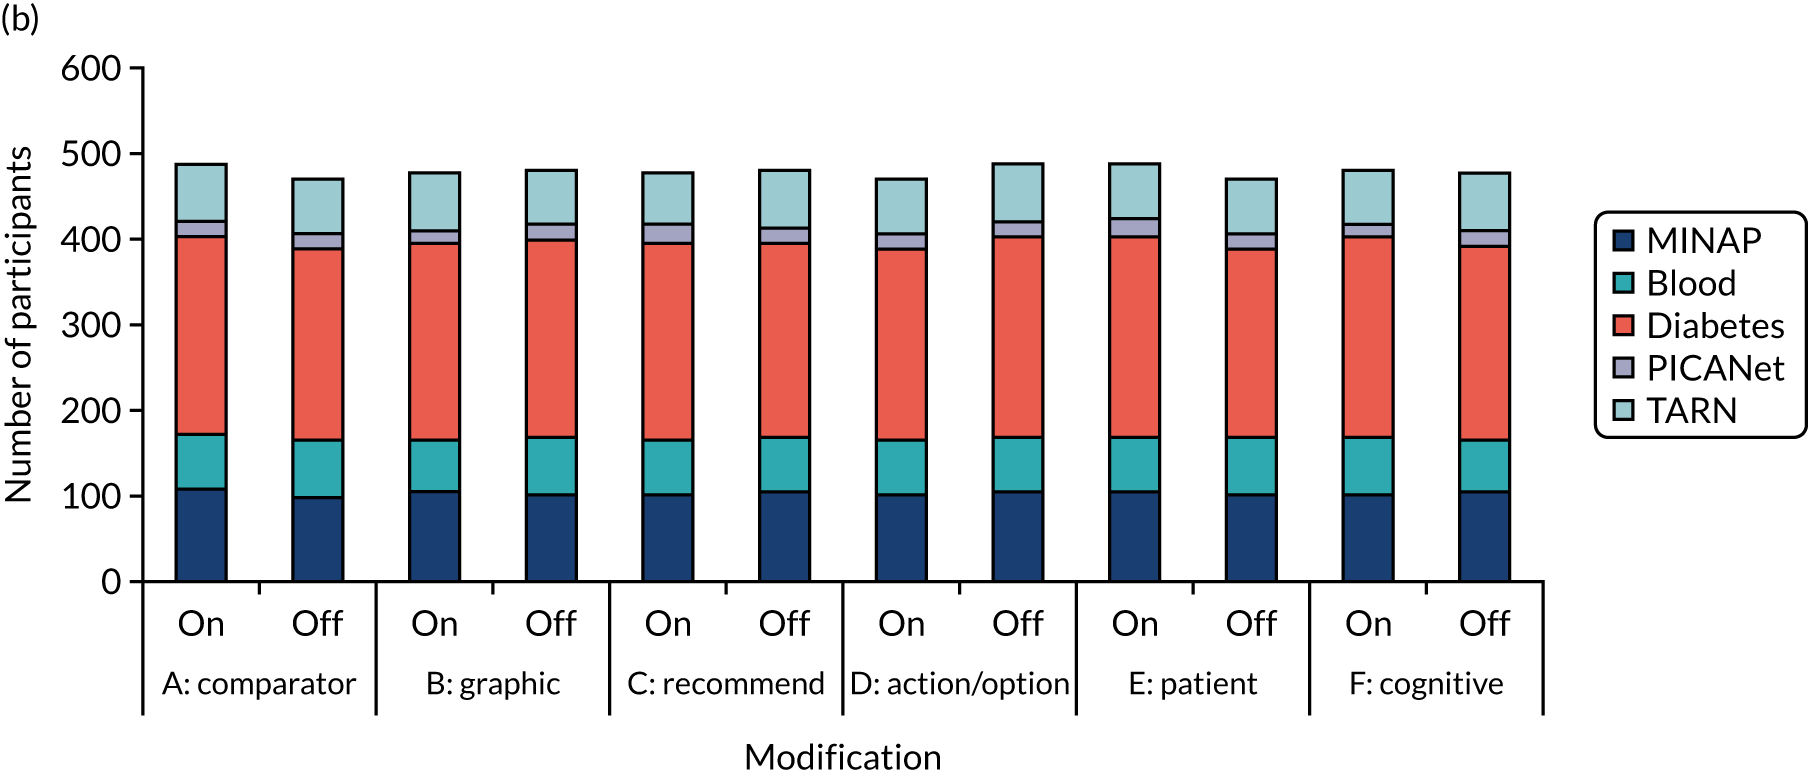
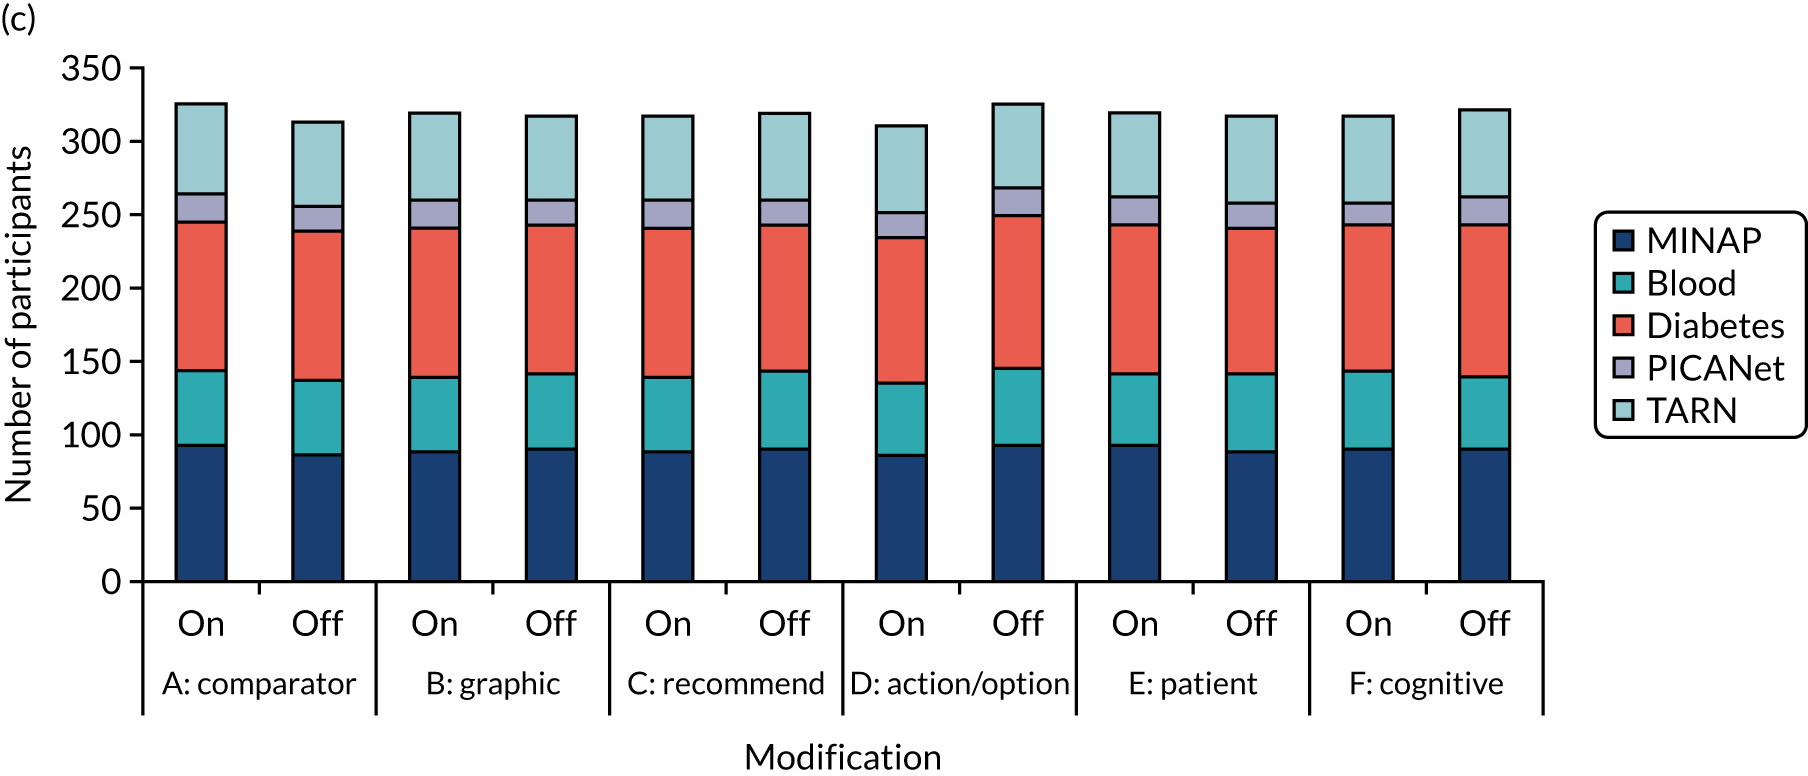
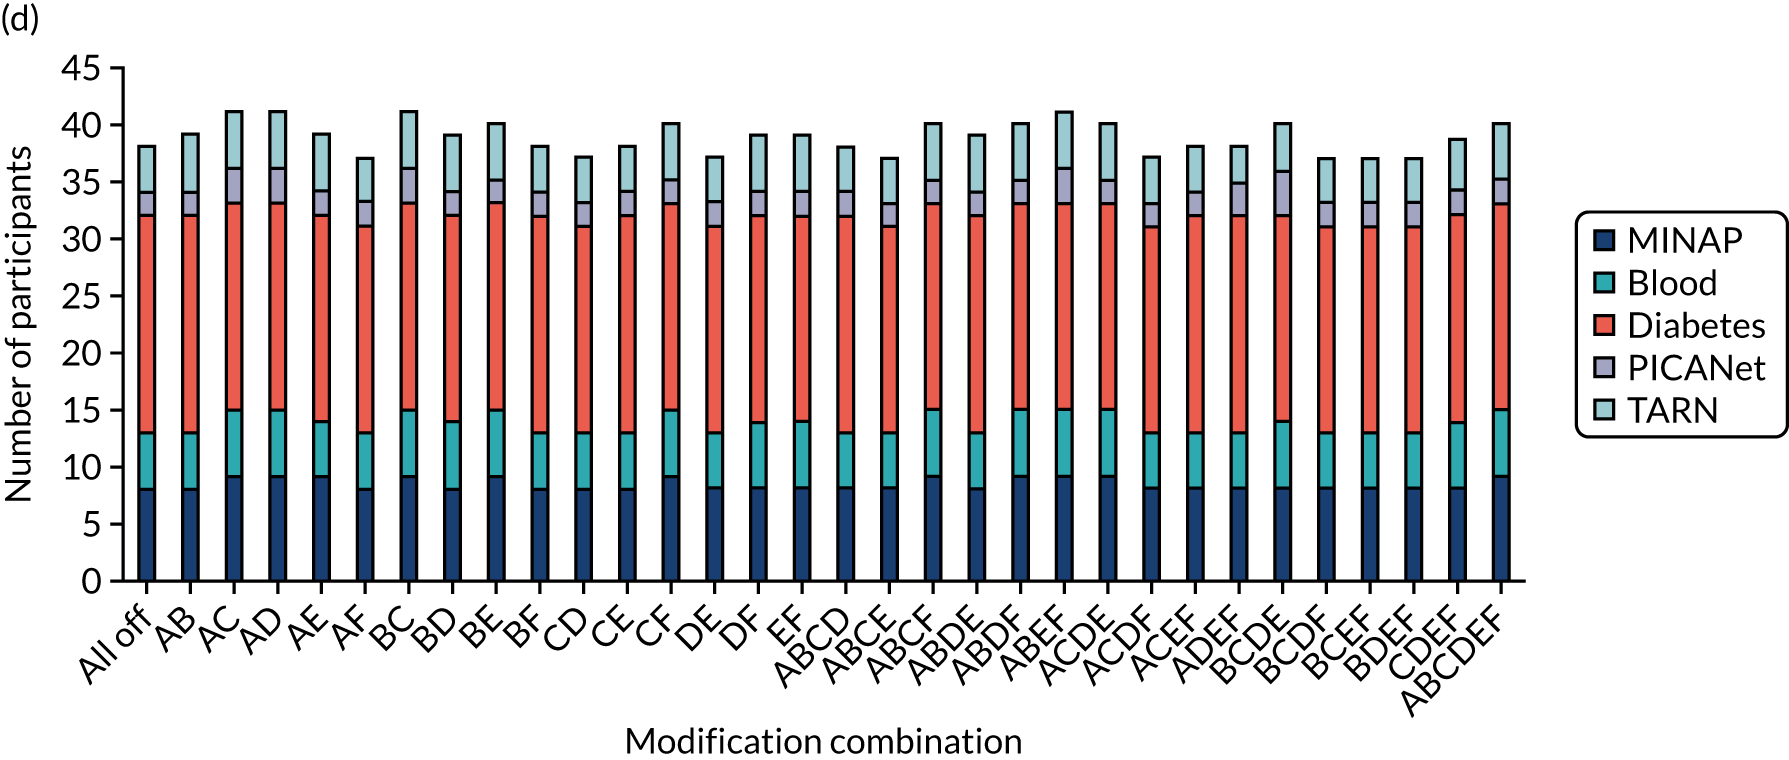
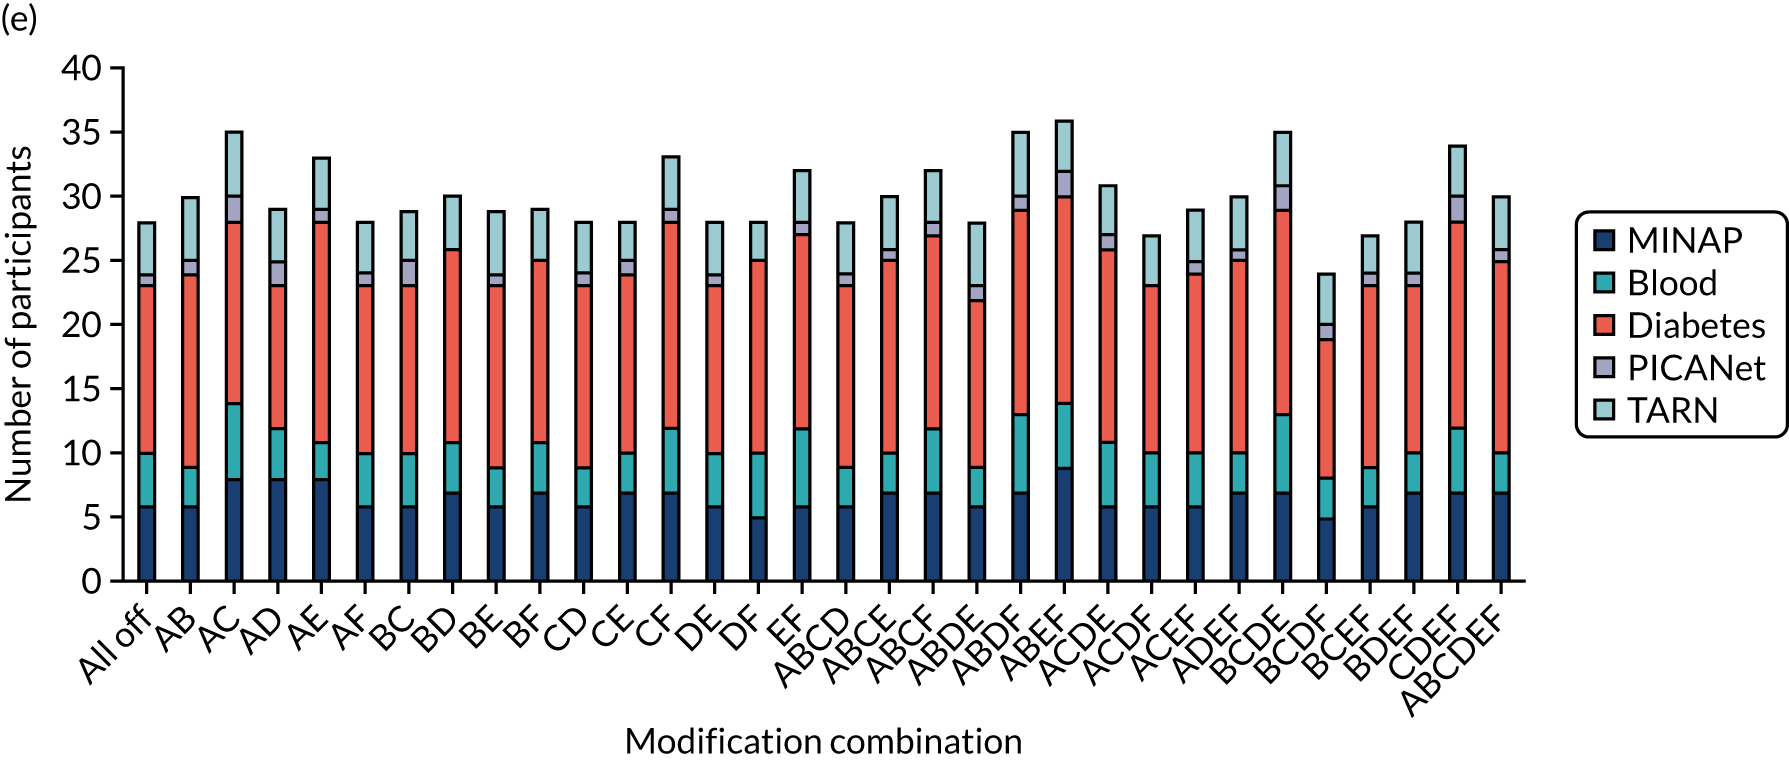
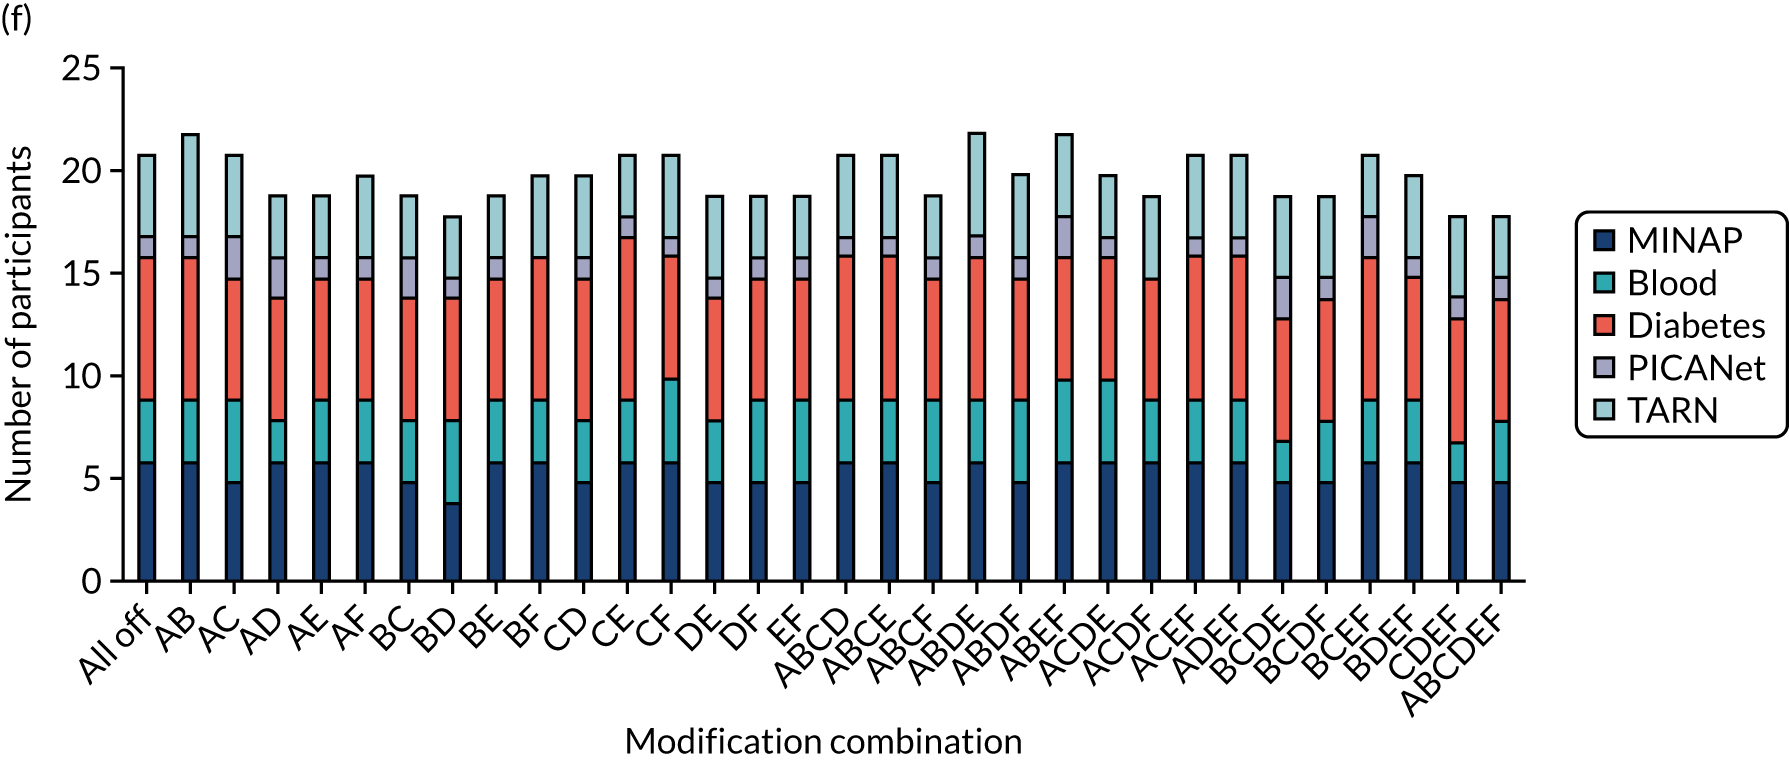
| Characteristic | All randomised | Secondary m-ITT population | ||||
|---|---|---|---|---|---|---|
| Participant completed experiment | Total (N = 1241) | Participant completed experiment | Total (N = 961) | |||
| Yes (N = 1113) | No (N = 128) | Yes (N = 833) | No (N = 128) | |||
| Audit, n (%) | ||||||
| MINAP | 243 (21.8) | 24 (18.8) | 267 (21.5) | 187 (22.4) | 24 (18.8) | 211 (22.0) |
| NCABT | 160 (14.4) | 15 (11.7) | 175 (14.1) | 114 (13.7) | 15 (11.7) | 129 (13.4) |
| NDA | 507 (45.6) | 77 (60.2) | 584 (47.1) | 380 (45.6) | 77 (60.2) | 457 (47.6) |
| PICANet | 66 (5.9) | 3 (2.3) | 69 (5.6) | 31 (3.7) | 3 (2.3) | 34 (3.5) |
| TARN | 137 (12.3) | 9 (7.0) | 146 (11.8) | 121 (14.5) | 9 (7.0) | 130 (13.5) |
| Role, n (%) | ||||||
| Allied health professional | 81 (7.3) | 12 (9.4) | 93 (7.5) | 50 (6.0) | 12 (9.4) | 62 (6.5) |
| Nurse or nurse specialist | 246 (22.1) | 19 (14.8) | 265 (21.4) | 202 (24.2) | 19 (14.8) | 221 (23.0) |
| Fully trained doctor | 278 (25.0) | 10 (7.8) | 288 (23.2) | 164 (19.7) | 10 (7.8) | 174 (18.1) |
| Training doctor | 12 (1.1) | 1 (0.8) | 13 (1.0) | 4 (0.5) | 1 (0.8) | 5 (0.5) |
| Manager | 365 (32.8) | 66 (51.6) | 431 (34.7) | 282 (33.9) | 66 (51.6) | 348 (36.2) |
| Audit and admin | 131 (11.8) | 20 (15.6) | 151 (12.2) | 131 (15.7) | 20 (15.6) | 151 (15.7) |
| Organisation, n (%) | ||||||
| Commissioning | 70 (6.3) | 6 (4.7) | 76 (6.1) | 35 (4.2) | 6 (4.7) | 41 (4.3) |
| Community health care trust | 90 (8.1) | 4 (3.1) | 94 (7.6) | 6 (0.7) | 4 (3.1) | 10 (1.0) |
| General practice | 487 (43.8) | 71 (55.5) | 558 (45.0) | 360 (43.2) | 71 (55.5) | 431 (44.8) |
| Hospital trust | 466 (41.9) | 47 (36.7) | 513 (41.3) | 432 (51.9) | 47 (36.7) | 479 (49.8) |
| Time spent on audit report (seconds) | ||||||
| n | 1113 | 113 | 1226 | 833 | 113 | 946 |
| Missing (n) | 0 | 15 | 15 | 0 | 15 | 15 |
| Median (range) | 43.0 (0.5–14,302.5) | 45.0 (2.5–70,512.0) | 43.5 (0.5–70,512.0) | 66.0 (2.0–14,302.5) | 45.0 (2.5–70,512.0) | 62.5 (2.0–70,512.0) |
| IQR | 5.0–99.0 | 23.5–82.5 | 7.0–98.5 | 33.5–127.5 | 23.5–82.5 | 32.5–123.0 |
| Number of clicks on audit report | ||||||
| n | 1113 | 113 | 1226 | 833 | 113 | 946 |
| Missing (n) | 0 | 15 | 15 | 0 | 15 | 15 |
| Mean (SD) | 1.9 (4.04) | 1.6 (1.23) | 1.9 (3.87) | 2.2 (4.63) | 1.6 (1.23) | 2.1 (4.37) |
| Median (range) | 1.0 (1.0–99.0) | 1.0 (1.0–8.0) | 1.0 (1.0–99.0) | 1.0 (1.0–99.0) | 1.0 (1.0–8.0) | 1.0 (1.0–99.0) |
| IQR | 1.0–2.0 | 1.0–2.0 | 1.0–2.0 | 1.0–2.0 | 1.0–2.0 | 1.0–2.0 |
| Modification | All randomisations, n (%) | Primary modified ITT population, n (%) | Secondary modified ITT population, n (%) | |||||||||||||||
|---|---|---|---|---|---|---|---|---|---|---|---|---|---|---|---|---|---|---|
| MINAP | NCABT | NDA | PICANet | TARN | Total | MINAP | NCABT | NDA | PICANet | TARN | Total | MINAP | NCABT | NDA | PICANet | TARN | Total | |
| A: effective comparator | ||||||||||||||||||
| On | 10 (7.4) | 6 (6.9) | 43 (14.7) | 2 (5.7) | 2 (2.7) | 63 (10.1) | 9 (9.8) | 3 (5.8) | 17 (16.7) | 2 (11.1) | 2 (3.3) | 33 (10.2) | 10 (9.1) | 6 (9.4) | 43 (18.6) | 2 (11.1) | 2 (2.9) | 63 (12.8) |
| Off | 14 (10.7) | 9 (10.2) | 34 (11.7) | 1 (2.9) | 7 (9.7) | 65 (10.6) | 11 (12.8) | 6 (12.0) | 15 (14.7) | 1 (5.6) | 6 (10.5) | 39 (12.5) | 14 (13.9) | 9 (13.8) | 34 (15.0) | 1 (6.3) | 7 (11.3) | 65 (13.8) |
| B: multimodal feedback | ||||||||||||||||||
| On | 8 (6.0) | 7 (8.0) | 33 (11.3) | 2 (5.7) | 7 (9.5) | 57 (9.1) | 5 (5.7) | 6 (11.8) | 12 (11.8) | 2 (10.5) | 6 (10.0) | 31 (9.7) | 8 (7.5) | 7 (11.5) | 33 (14.4) | 2 (11.8) | 7 (10.4) | 57 (11.9) |
| Off | 16 (12.0) | 8 (9.2) | 44 (15.1) | 1 (2.9) | 2 (2.8) | 71 (11.5) | 15 (16.7) | 3 (5.9) | 20 (19.6) | 1 (5.9) | 2 (3.4) | 41 (12.9) | 16 (15.2) | 8 (11.8) | 44 (19.3) | 1 (5.9) | 2 (3.2) | 71 (14.8) |
| C: specific actions | ||||||||||||||||||
| On | 9 (6.7) | 4 (4.5) | 44 (15.1) | 2 (5.7) | 5 (6.9) | 64 (10.3) | 8 (9.1) | 2 (4.0) | 17 (16.5) | 2 (10.5) | 5 (8.6) | 34 (10.7) | 9 (8.7) | 4 (6.2) | 44 (19.2) | 2 (10.5) | 5 (7.9) | 64 (13.3) |
| Off | 15 (11.3) | 11 (12.6) | 33 (11.3) | 1 (2.9) | 4 (5.4) | 64 (10.3) | 12 (13.3) | 7 (13.5) | 15 (14.9) | 1 (5.9) | 3 (5.0) | 38 (11.9) | 15 (14.0) | 11 (17.2) | 33 (14.5) | 1 (6.7) | 4 (6.0) | 64 (13.3) |
| D: optional detail | ||||||||||||||||||
| On | 14 (10.6) | 8 (9.1) | 39 (13.4) | 2 (5.9) | 7 (9.6) | 70 (11.3) | 11 (12.8) | 5 (10.2) | 14 (14.0) | 2 (11.8) | 7 (11.7) | 39 (12.5) | 14 (13.6) | 8 (12.5) | 39 (17.3) | 2 (12.5) | 7 (10.8) | 70 (14.8) |
| Off | 10 (7.4) | 7 (8.0) | 38 (13.0) | 1 (2.9) | 2 (2.7) | 58 (9.3) | 9 (9.8) | 4 (7.5) | 18 (17.3) | 1 (5.3) | 1 (1.7) | 33 (10.1) | 10 (9.3) | 7 (10.8) | 38 (16.4) | 1 (5.6) | 2 (3.1) | 58 (11.9) |
| E: patient voice | ||||||||||||||||||
| On | 17 (12.8) | 7 (8.0) | 43 (14.7) | 2 (5.9) | 5 (6.8) | 74 (12.0) | 14 (15.4) | 5 (10.2) | 15 (14.6) | 2 (10.5) | 4 (6.9) | 40 (12.5) | 17 (15.7) | 7 (11.3) | 43 (18.3) | 2 (10.5) | 5 (7.8) | 74 (15.2) |
| Off | 7 (5.2) | 8 (9.1) | 34 (11.6) | 1 (2.9) | 4 (5.5) | 54 (8.7) | 6 (6.9) | 4 (7.5) | 17 (16.8) | 1 (5.9) | 4 (6.7) | 32 (10.1) | 7 (6.8) | 8 (11.9) | 34 (15.3) | 1 (6.7) | 4 (6.1) | 54 (11.4) |
| F: cognitive load | ||||||||||||||||||
| On | 14 (10.5) | 6 (6.8) | 50 (17.2) | 2 (6.1) | 2 (2.8) | 74 (12.0) | 13 (14.6) | 3 (5.7) | 19 (19.0) | 2 (12.5) | 2 (3.4) | 39 (12.3) | 14 (13.3) | 6 (8.8) | 50 (21.6) | 2 (13.3) | 2 (3.2) | 74 (15.4) |
| Off | 10 (7.5) | 9 (10.3) | 27 (9.2) | 1 (2.8) | 7 (9.5) | 54 (8.7) | 7 (7.9) | 6 (12.2) | 13 (12.5) | 1 (5.0) | 6 (10.2) | 33 (10.3) | 10 (9.4) | 9 (14.8) | 27 (11.9) | 1 (5.3) | 7 (10.4) | 54 (11.3) |
FIGURE 34.
Distribution of secondary outcome user experience components.
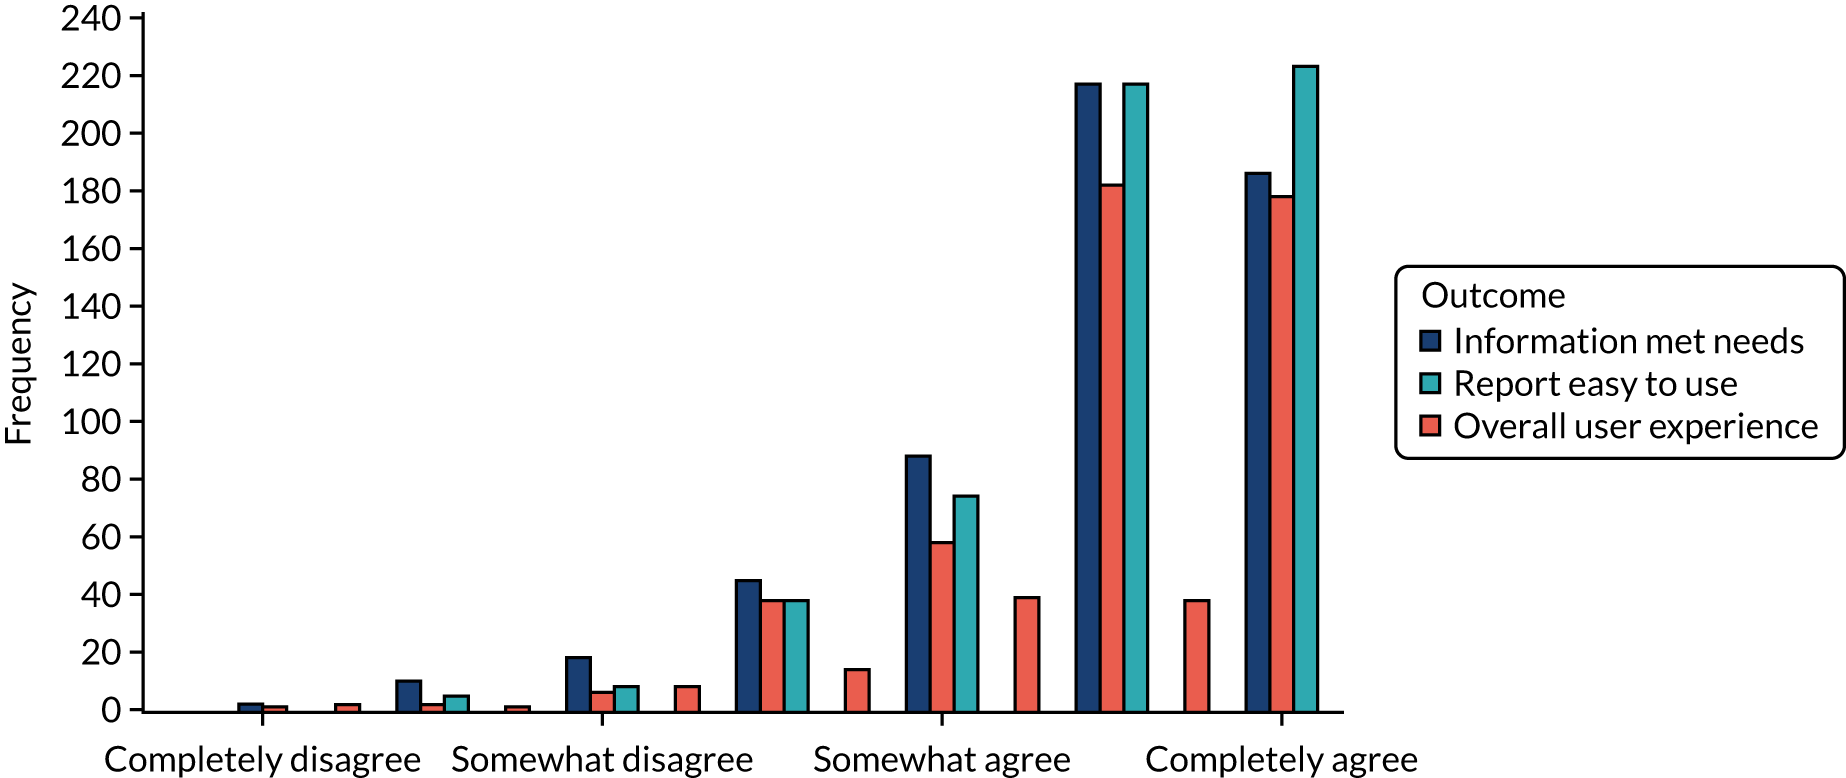
FIGURE 35.
Proportion of participants with missing data by modification (ON vs. OFF) and audit: (a) MINAP, (b) NCABT, (c) NDA, (d) PICANet, (e) TARN and (f) all audits.
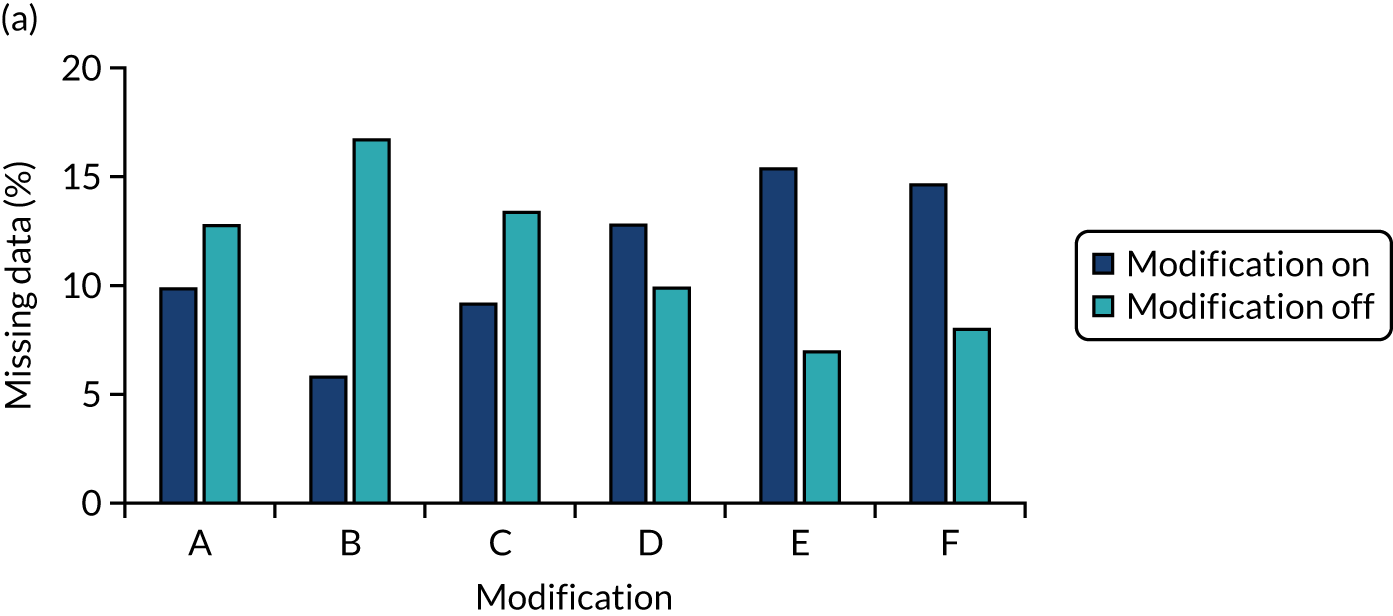
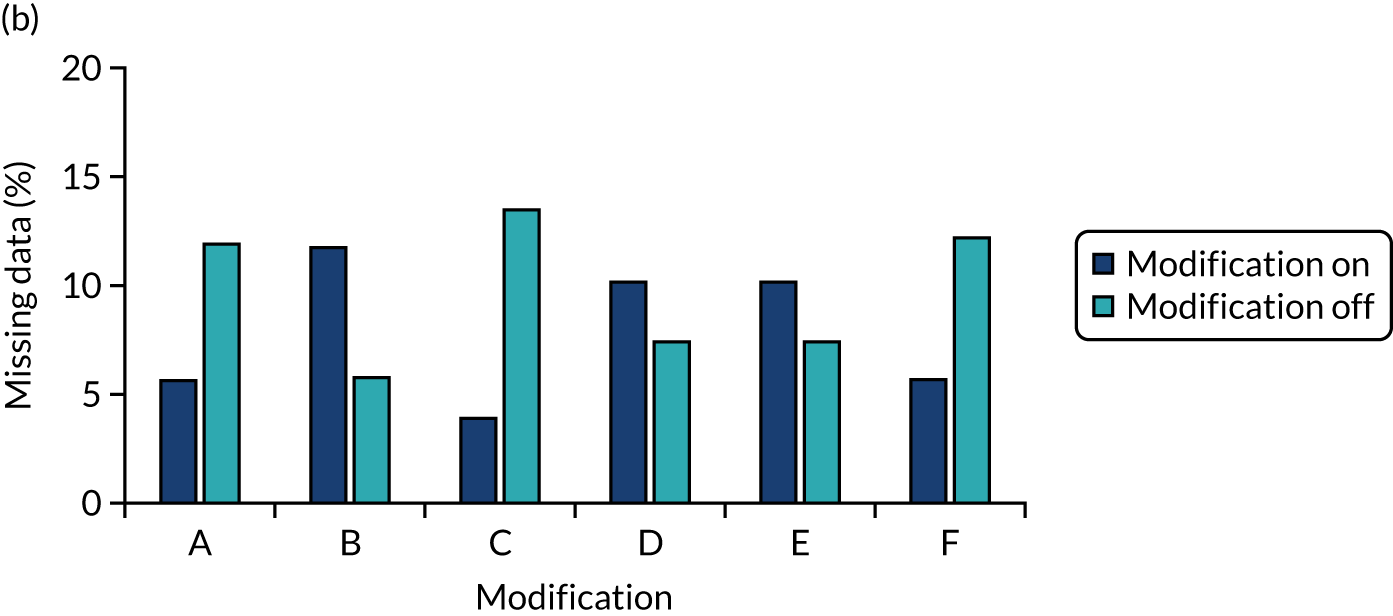
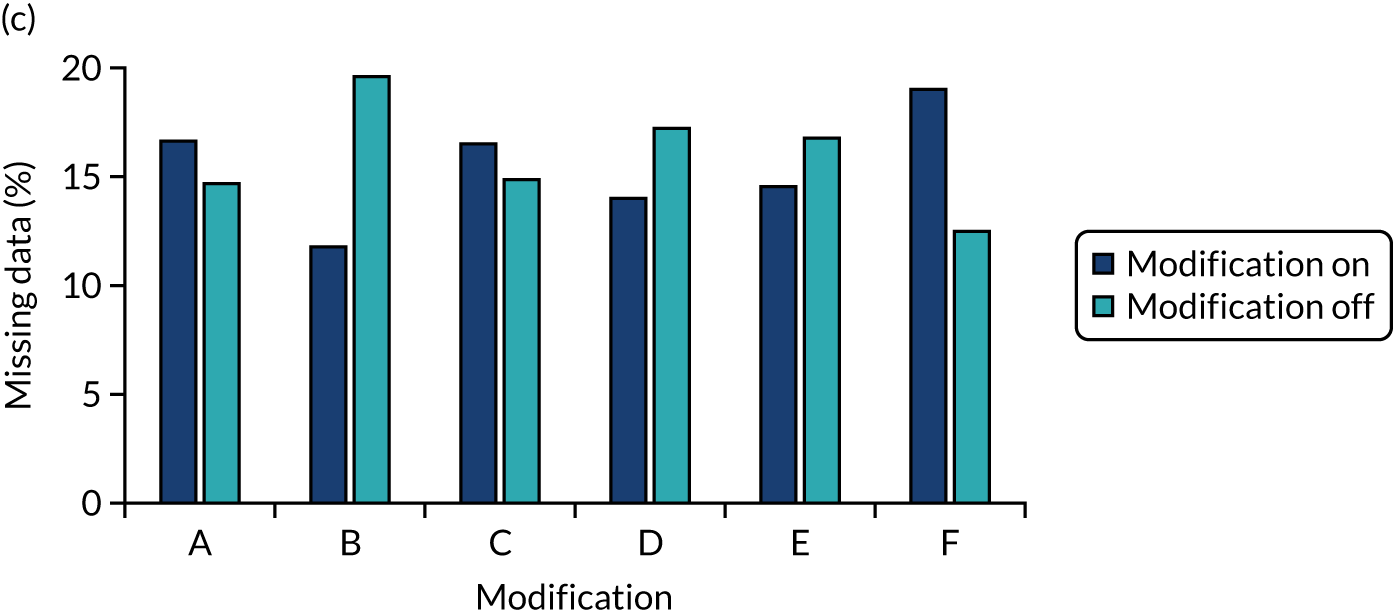
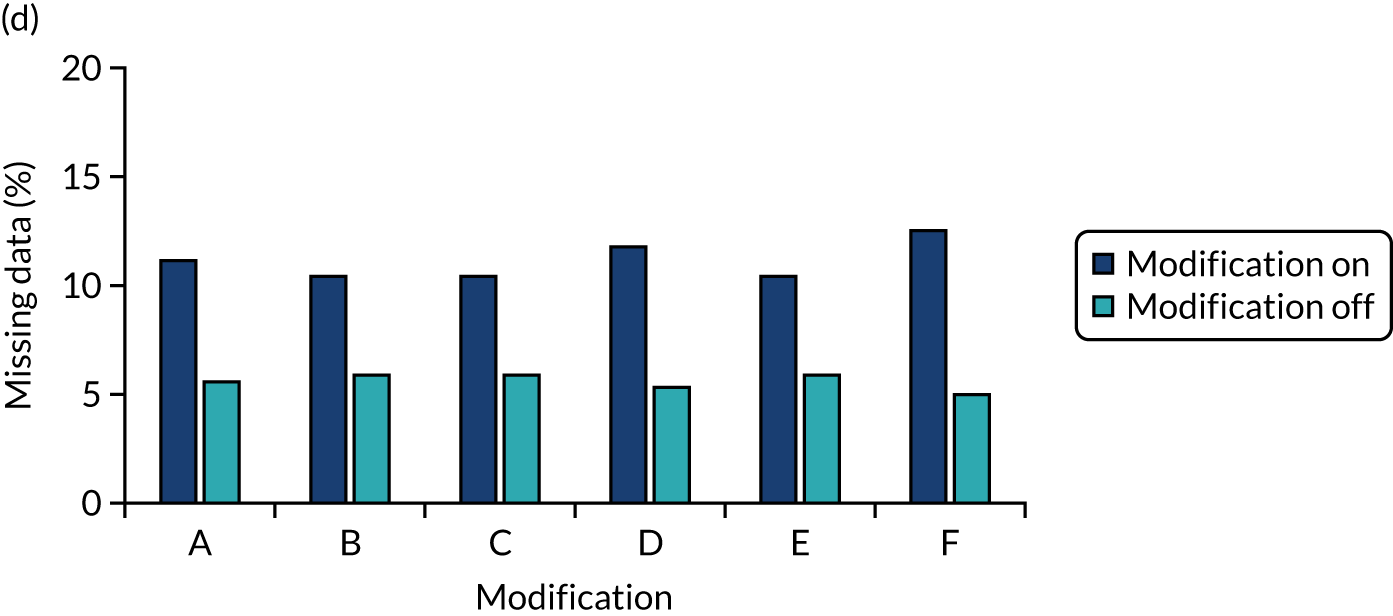
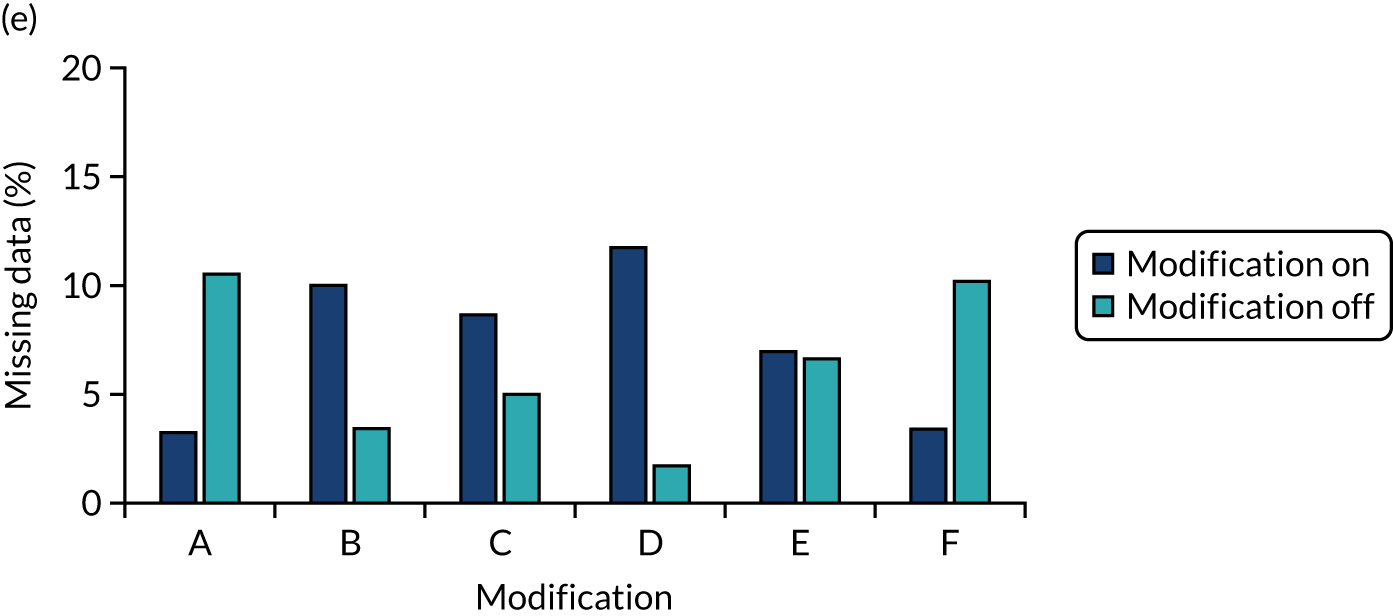
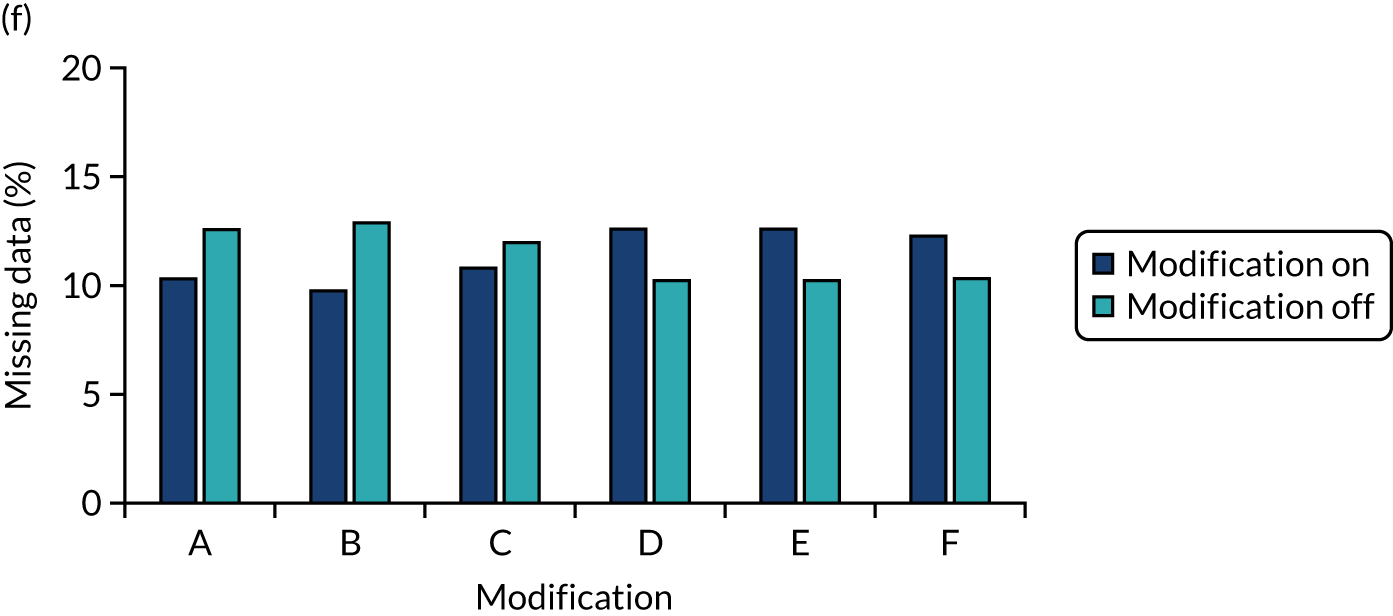
FIGURE 36.
Distribution of the combined primary intention outcome by population: (a) all participants, (b) primary modified-ITT population and (c) secondary modified-ITT population.
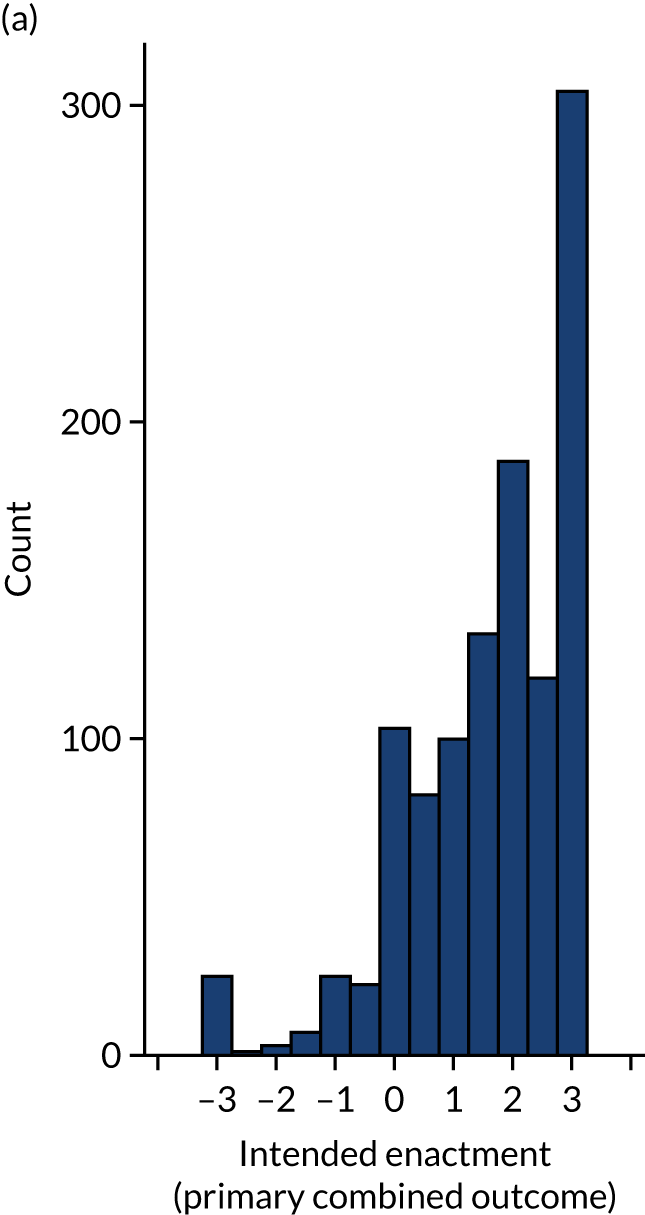
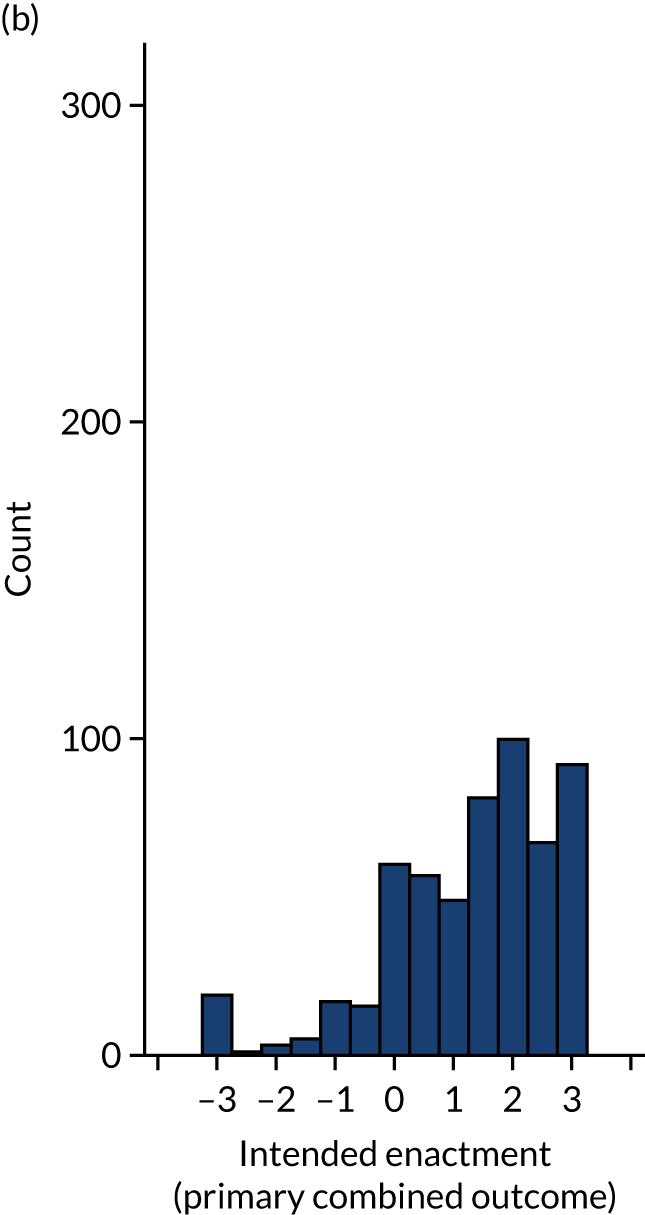
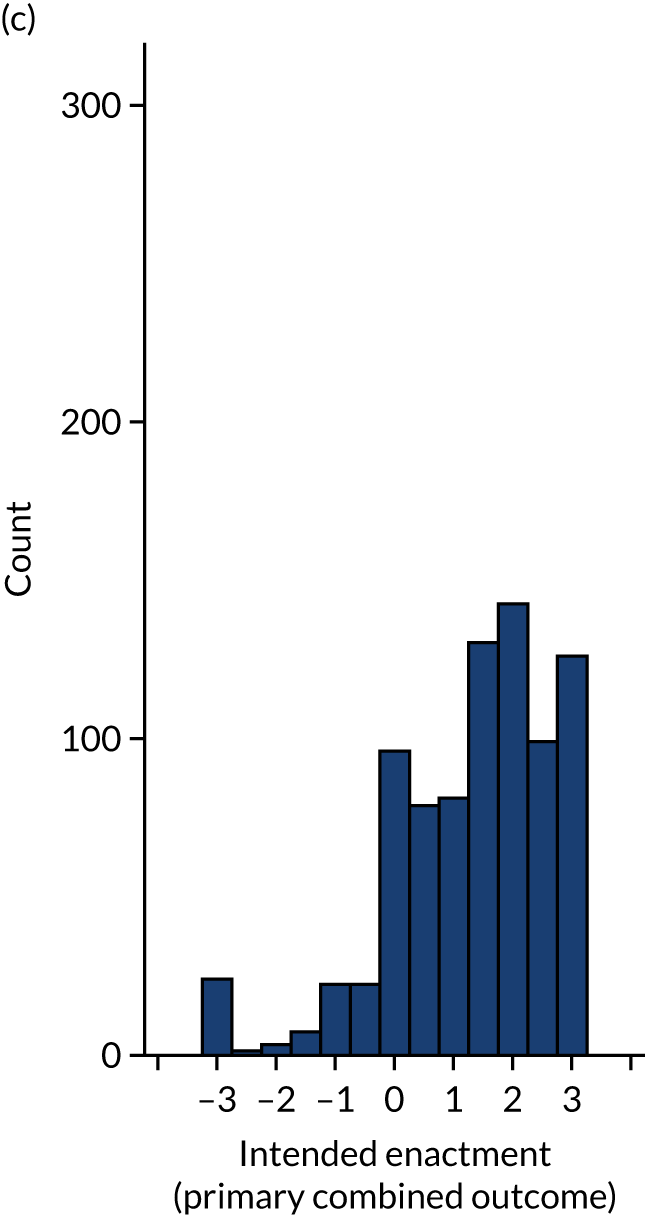
Appendix 6 Model selection
Parameters included in the final ‘parsimonious’ models were consistent across populations for the primary outcome intended enactment, secondary proximal intention outcomes for intention to set goals and an action plan, and secondary outcomes easy to understand and user experience. Additional parameters were included in the final ‘parsimonious’ models for the secondary proximal intention outcome bring to attention of colleagues (modification C, p = 0.4; B*C, p = 0.138), having met the threshold for inclusion using the primary modified ITT population but not available complete data; and for the outcomes review performance, having met the threshold for inclusion using available complete data (A*E, p = 0.153), but not the primary modified ITT population (see Table 10).
Primary outcome: intended enactment
Using available complete data, our ‘initial’ model, including main effects and two-way modification interactions explained a significant portion of variation in outcome (p < 0.001); however, significant lack of fit (p = 0.003) remained, suggesting that the model was missing important interactions (Table 39).
| Available complete data | |||
|---|---|---|---|
| Initial model | Full model | Parsimonious model | |
| ANOVA: model | |||
| df | 27 | 34 | 25 |
| Mean square | 4.98 | 4.99 | 6.32 |
| p-value | < 0.0001 | < 0.0001 | < 0.0001 |
| ANOVA: lack of fit | |||
| df | 223 | 216 | 225 |
| Mean square | 2.22 | 2.12 | 2.09 |
| p-value | 0.0028 | 0.0081 | 0.0108 |
| Adjusted r2 | 0.075 | 0.096 | 0.1 |
| AIC | 373.7 | 367.2 | 356 |
| BIC | 378.6 | 373.8 | 360.5 |
| Model parameters | |||
| Randomised design block | ✓ | ✓ | ✓ |
| Audit | ✓ | ✓ | ✓ |
| Role | ✓ | ✓ | ✓ |
| Modification main effects | ✓ | ✓ | ✓ |
| Two-way modification interactions | ✓ | ✓ | A*B, A*E, B*D, B*E, C*F, D*F |
| Additional interactions | ✗ | Role*Audit, A*B*E, Role*B, Role*D | Role*Audit, A*B*E, Role*B, Role*D |
Stepwise selection led to the inclusion of two-way interactions between Role and Audit, Role and modification B, and Role and modification D, and the three-way interaction between modifications A, B and E. Lack of fit remained (p = 0.008); however, no further interactions were valid for inclusion in the model (F-statistic p > 0.15) to further improve model fit.
The relative magnitude and direction of effects in the ‘Full’ model (Figure 37) showed the model to be dominated by the effect of audit and role. Further effects, identified at the 5% significance level include modification D and two-way interaction B*D, and at the 10% significant level, modifications B and D by Role, three-way interaction A*B*E and two-way interaction D*F. Consistent findings were observed in the full model using primary modified ITT population (with multiply imputed missing data; see Figure 11).
Backwards selection led to the removal of negligible interactions resulting in the ‘parsimonious model’ including all main effects, six of the two-way modification interactions from the ‘initial’ model, and additional interactions identified as important from the ‘Full model’. Significant lack of fit remains (p = 0.0108), albeit to a lesser degree than in the initial and full model.
The parsimonious models derived from available complete data and the primary modified ITT population provided consistent effects and parameter estimates (Table 40).
FIGURE 37.
Primary outcome: Pareto plot of standardised effects (full model – available complete data). Vertical lines provide reference to the significance level of the parameter estimates.
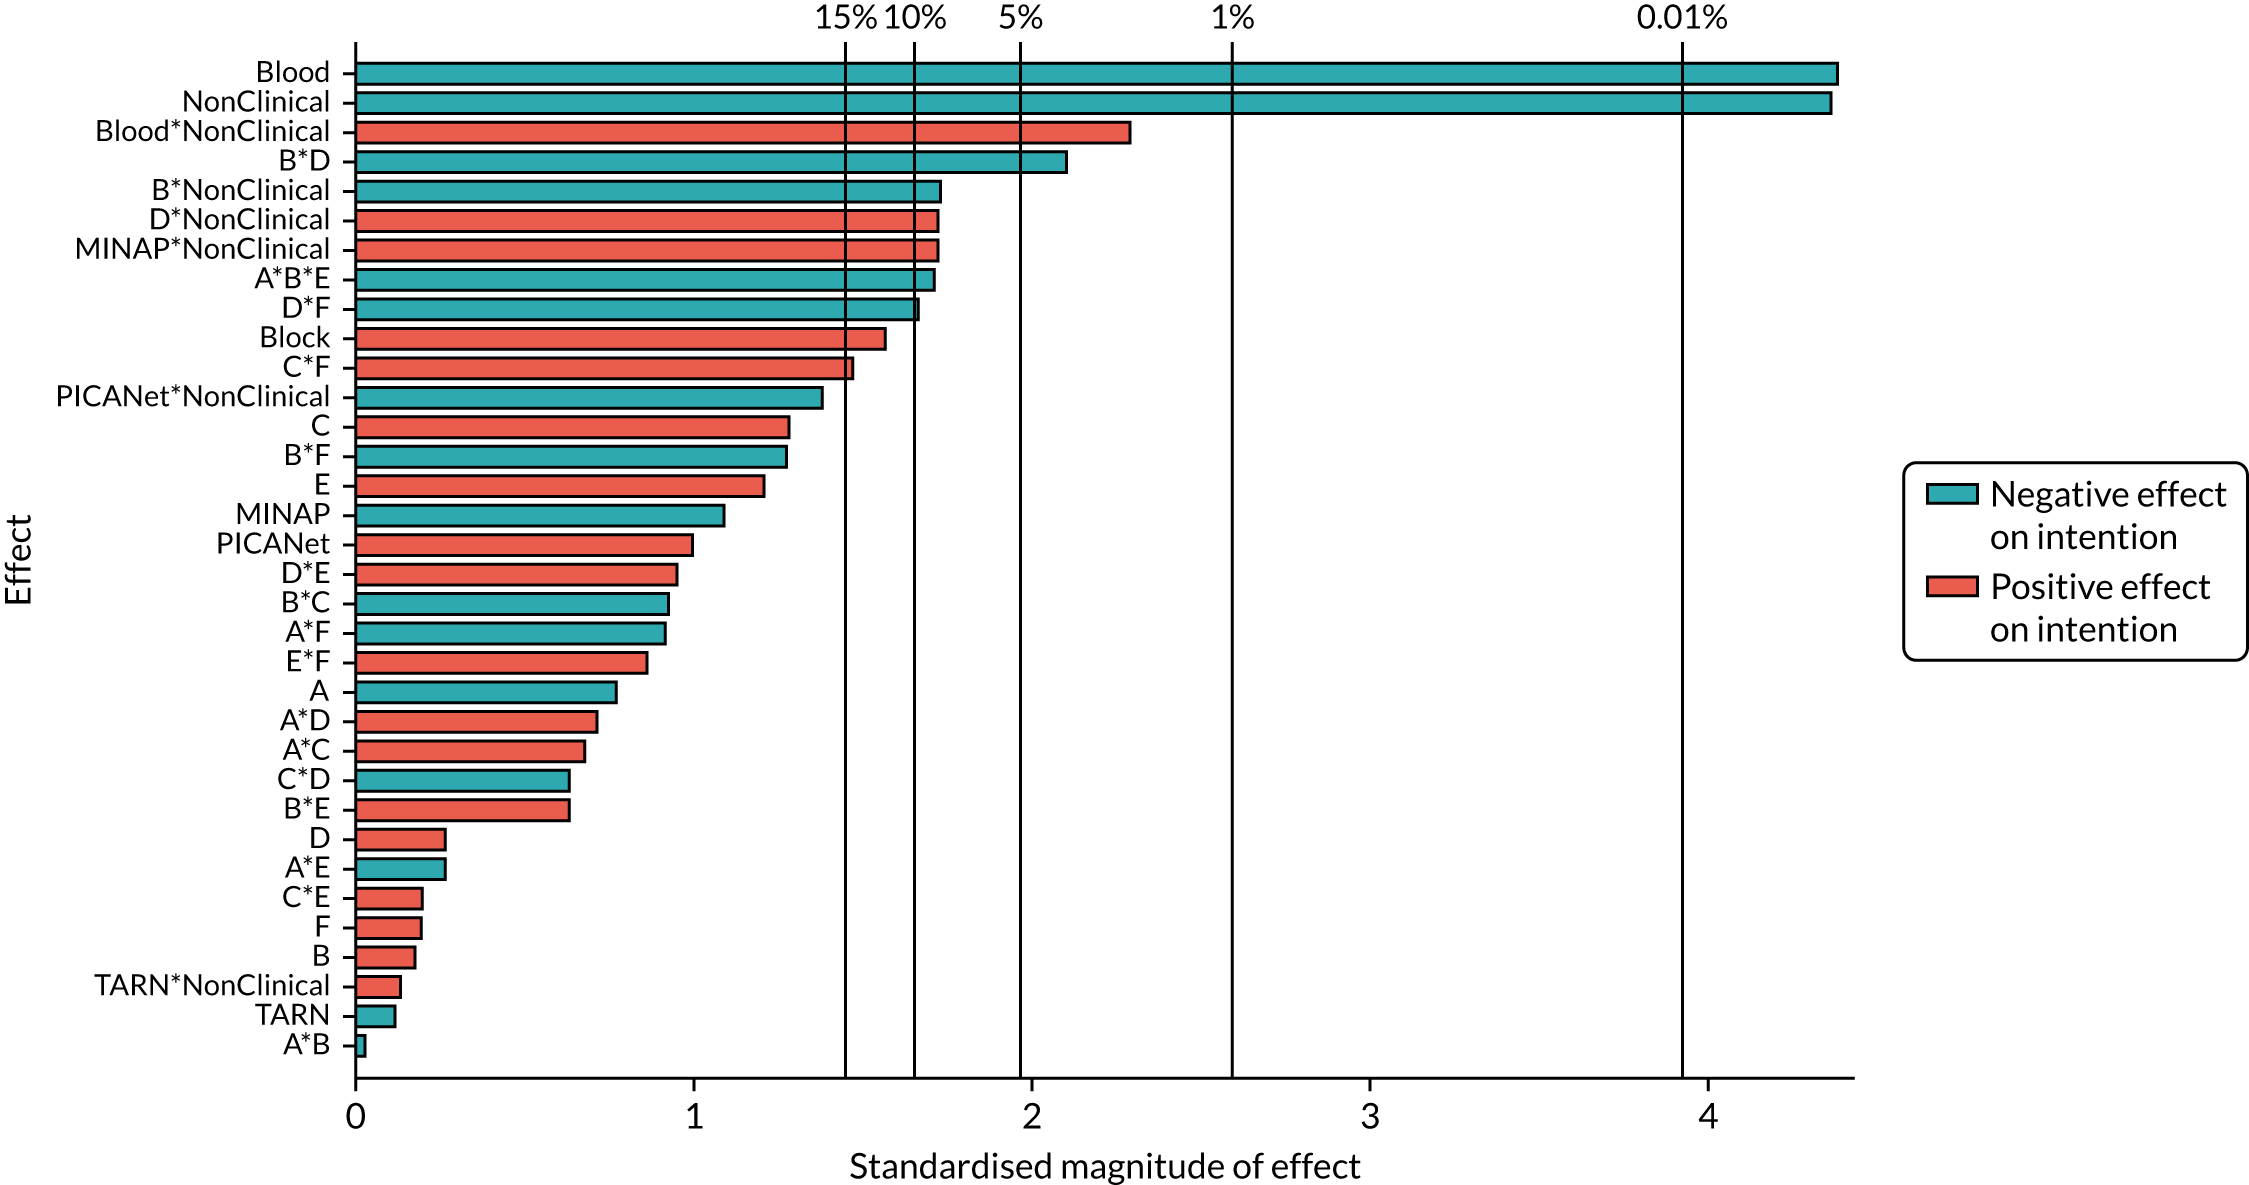
| Parameter | Available complete data | Primary modified ITT population | ||||
|---|---|---|---|---|---|---|
| Estimate | Standard error | p-value | Estimate | Standard error | p-value | |
| Intercept | 1.843 | 0.150 | < 0.001 | 1.829 | 0.147 | < 0.001 |
| Block | 0.088 | 0.057 | 0.121 | 0.090 | 0.056 | 0.107 |
| MINAP | –0.220 | 0.218 | 0.315 | –0.211 | 0.211 | 0.317 |
| NCABT | –0.922 | 0.210 | < 0.001 | –0.893 | 0.206 | < 0.001 |
| PICANet | 0.345 | 0.330 | 0.296 | 0.361 | 0.327 | 0.270 |
| TARN | –0.025 | 0.225 | 0.912 | –0.003 | 0.220 | 0.989 |
| Role: non-clinical | –0.904 | 0.207 | < 0.001 | –0.867 | 0.200 | < 0.001 |
| A: effective comparators | –0.039 | 0.057 | 0.496 | –0.038 | 0.056 | 0.498 |
| B: multimodal feedback | 0.009 | 0.075 | 0.907 | 0.018 | 0.073 | 0.807 |
| C: specific actions | 0.070 | 0.057 | 0.216 | 0.082 | 0.056 | 0.141 |
| D: optional detail | 0.011 | 0.075 | 0.879 | 0.017 | 0.074 | 0.816 |
| E: patient voice | 0.069 | 0.057 | 0.224 | 0.078 | 0.055 | 0.161 |
| F: cognitive load | 0.004 | 0.057 | 0.939 | 0.008 | 0.055 | 0.890 |
| A*B | –0.001 | 0.057 | 0.982 | –0.011 | 0.055 | 0.844 |
| A*E | –0.016 | 0.057 | 0.781 | –0.014 | 0.056 | 0.798 |
| B*D | –0.119 | 0.057 | 0.036 | –0.112 | 0.056 | 0.047 |
| B*E | 0.036 | 0.057 | 0.524 | 0.035 | 0.057 | 0.537 |
| C*F | 0.084 | 0.057 | 0.138 | 0.093 | 0.055 | 0.090 |
| D*F | –0.095 | 0.057 | 0.094 | –0.093 | 0.055 | 0.089 |
| Role*MINAP | 0.474 | 0.299 | 0.114 | 0.453 | 0.290 | 0.117 |
| Role*NCABT | 1.182 | 0.543 | 0.030 | 1.312 | 0.518 | 0.011 |
| Role*PICA | –0.791 | 0.531 | 0.137 | –0.783 | 0.532 | 0.141 |
| Role*TARN | 0.043 | 0.338 | 0.898 | –0.017 | 0.331 | 0.959 |
| B*non-clinical | –0.186 | 0.115 | 0.108 | –0.196 | 0.113 | 0.083 |
| D*non-clinical | 0.219 | 0.116 | 0.059 | 0.195 | 0.114 | 0.087 |
| A*B*E | –0.099 | 0.057 | 0.085 | –0.101 | 0.056 | 0.072 |
FIGURE 38.
Predicted intended enactment for modification combinations ordered by: (a) non-clinical recipients and (b) clinical recipients.
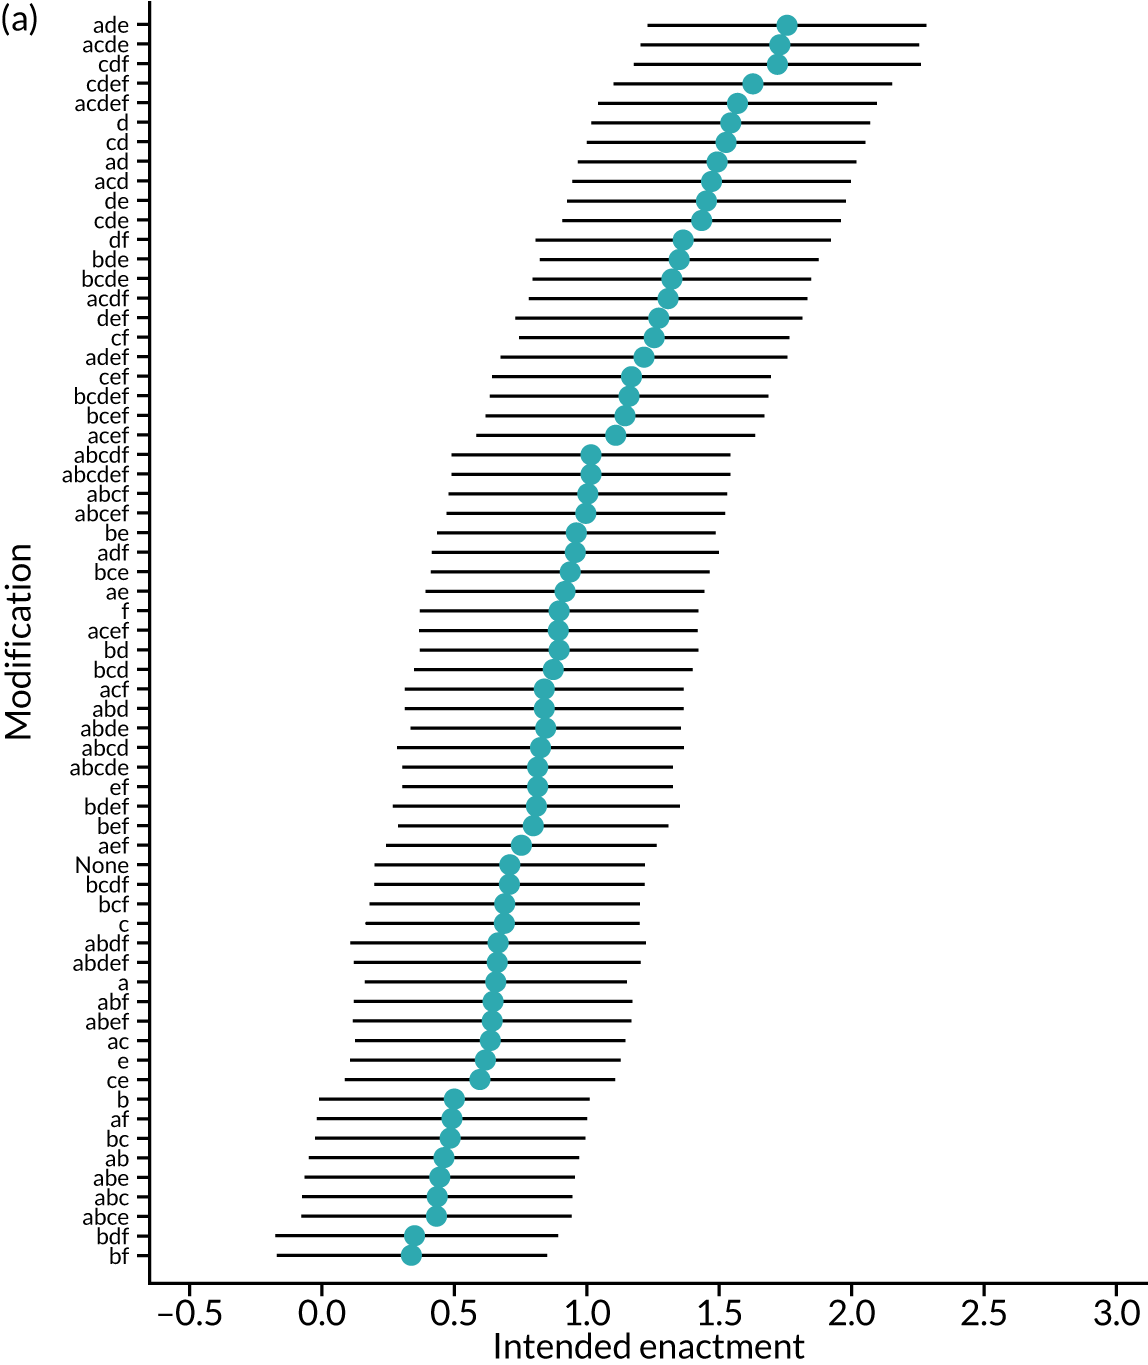
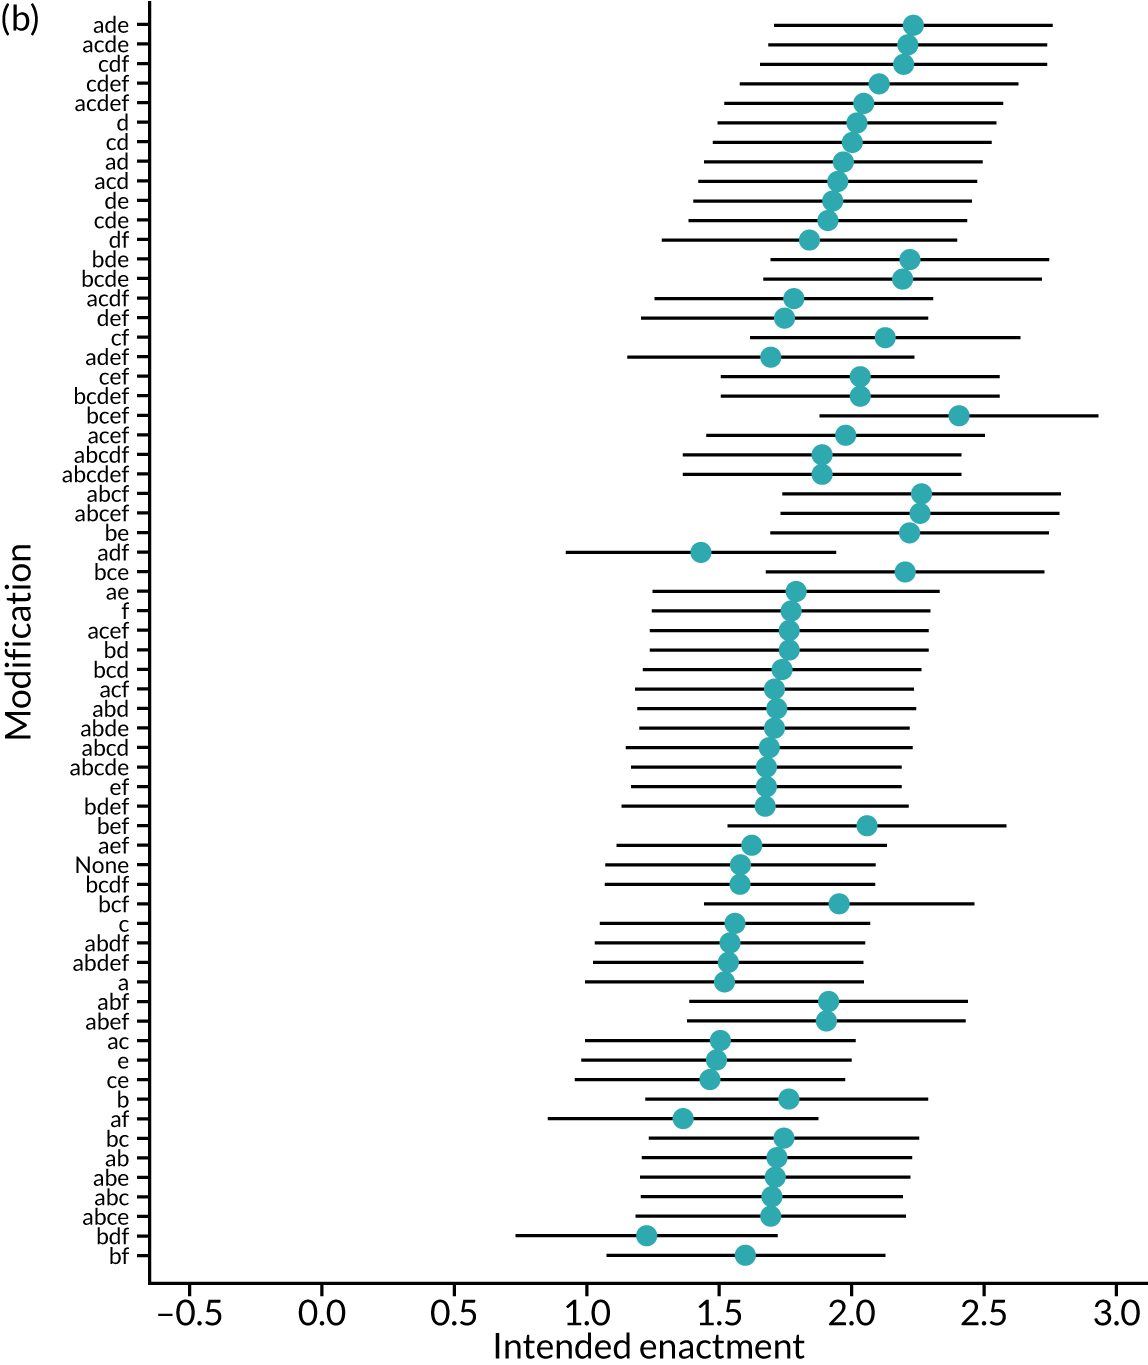
FIGURE 39.
Primary outcome: Pareto plot of standardised effects (full model): (a) primary modified ITT population and (b) secondary modified ITT population. Vertical lines provide reference to the significance level of the parameter estimates.
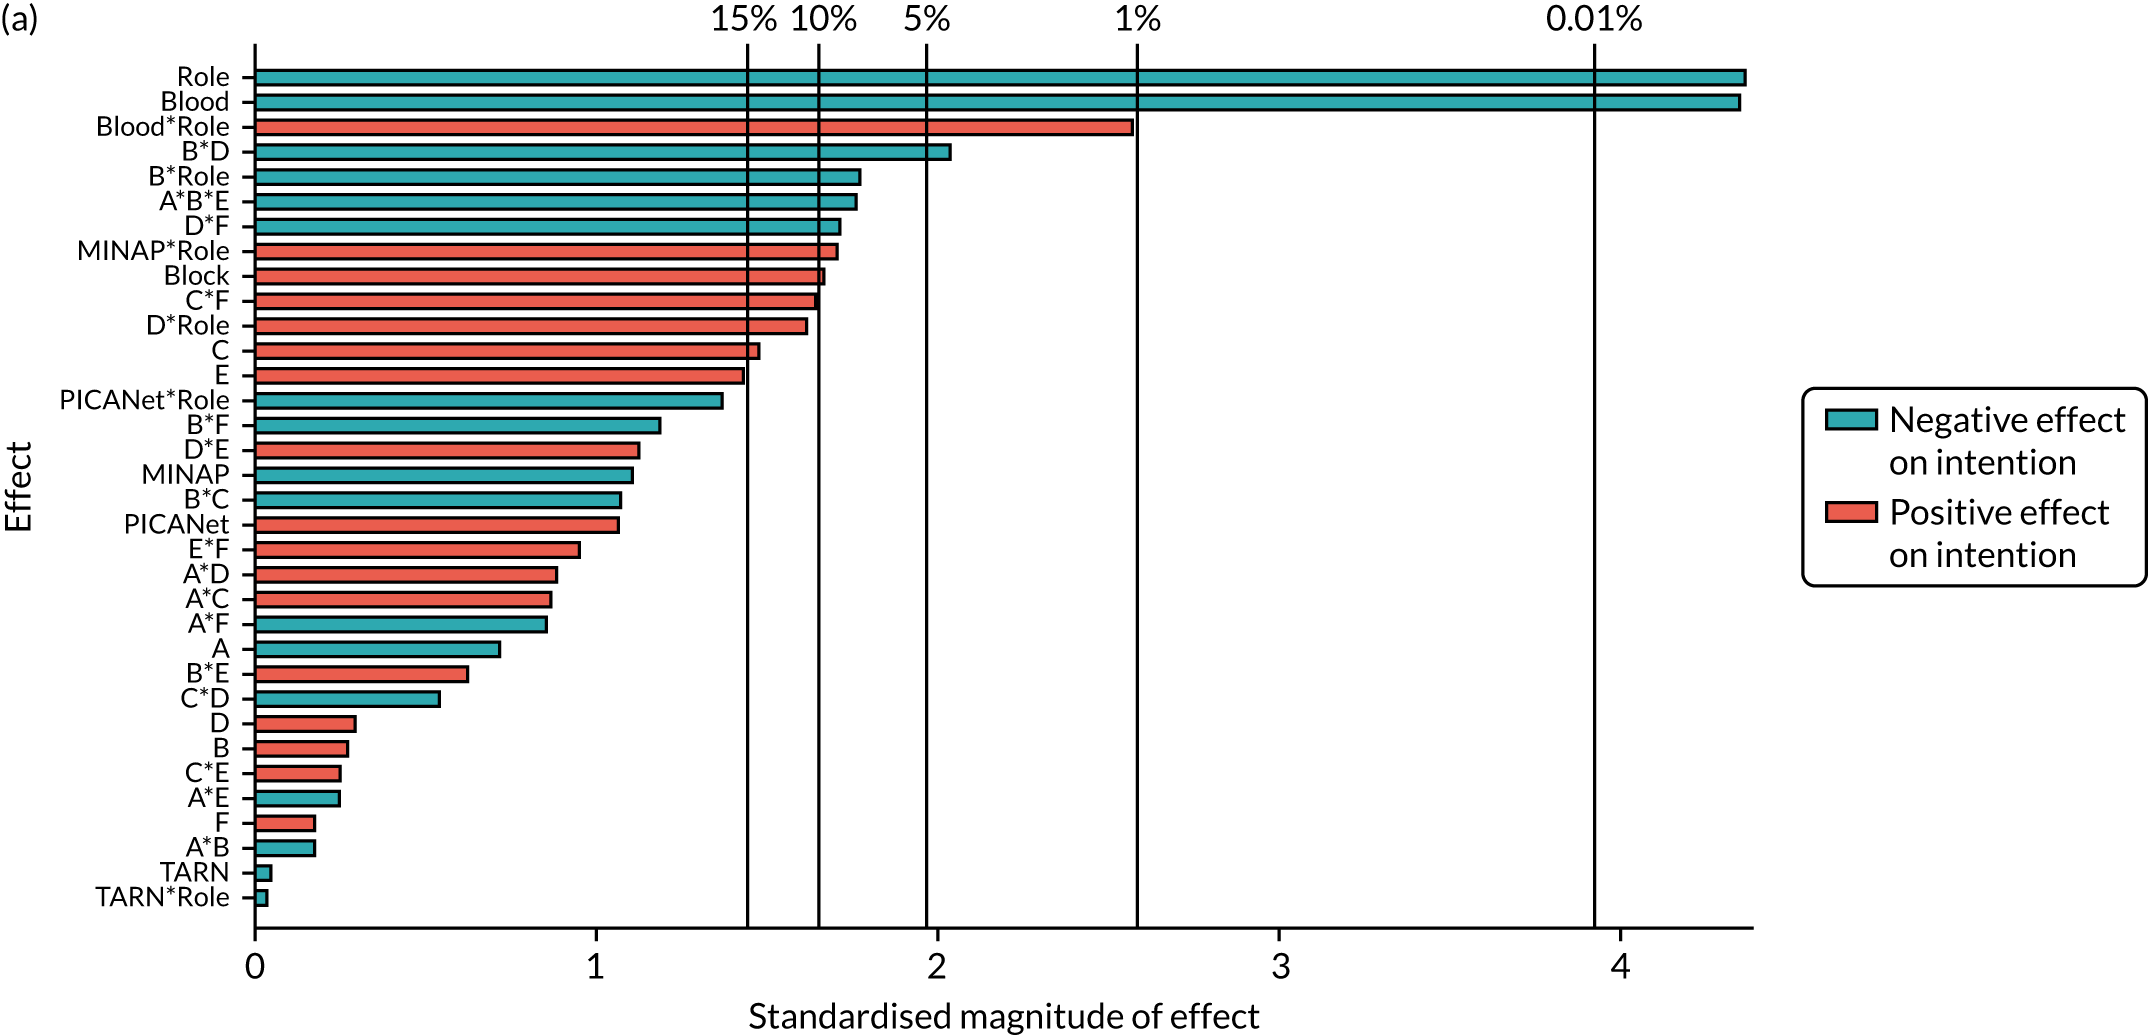
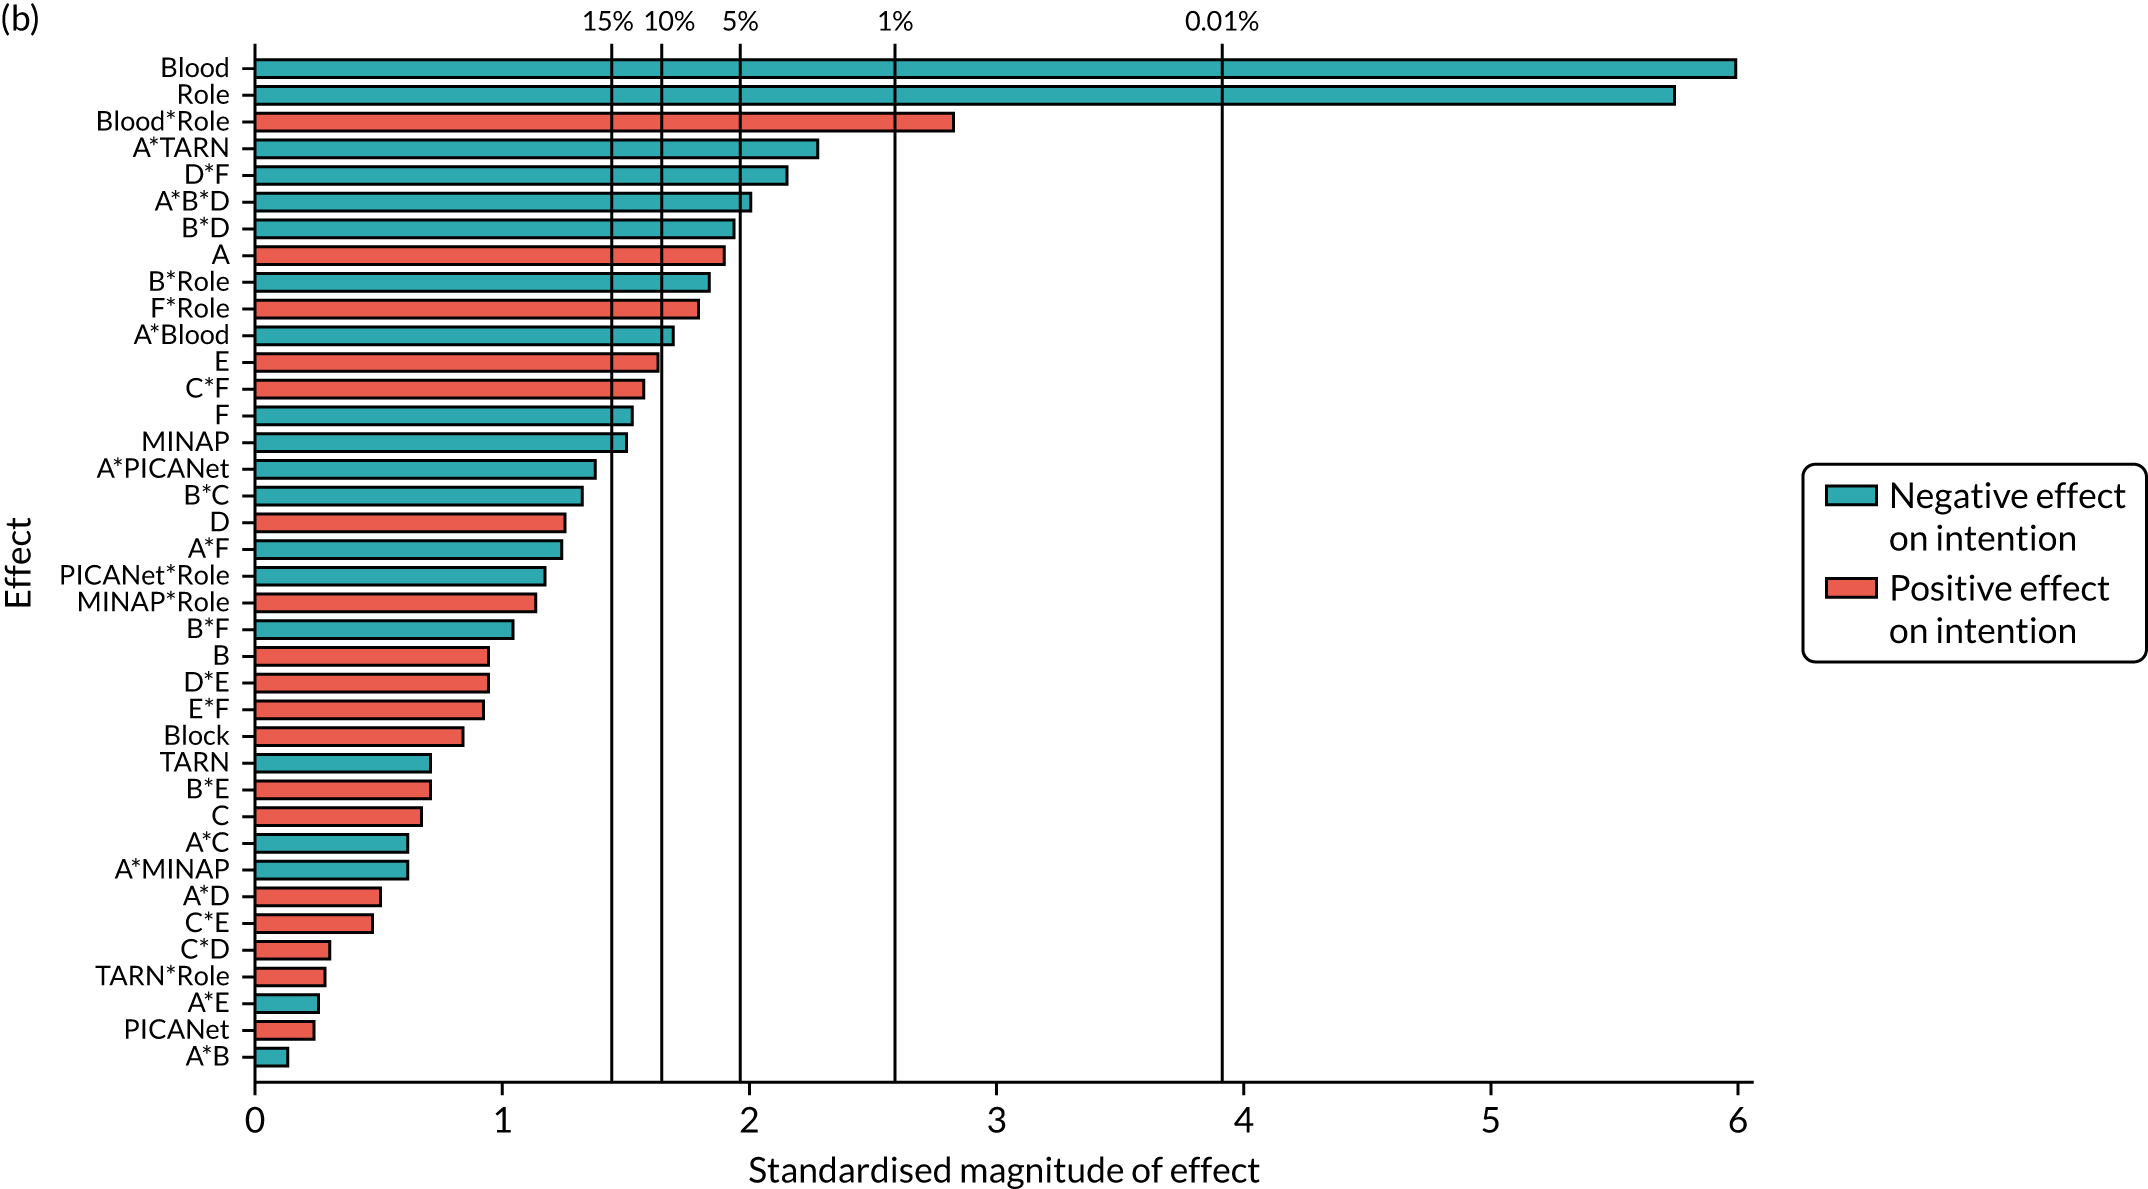
Secondary outcome: bring the audit report to the attention of colleagues
Most parameters removed from the full model, based on analysis of available complete data to form the parsimonious model, were appropriate when applied to the primary modified ITT population with multiply imputed missing data. However, the interaction B*C (and main effect of C) was retained in the parsimonious model for the primary modified ITT population.
| Initial model | Parsimonious model | |
|---|---|---|
| ANOVA: model | ||
| df | 27 | 10 |
| Mean square | 2.56 | 5.42 |
| p-value | 0.016 | < 0.001 |
| ANOVA: lack of fit | ||
| df | 223 | 29 |
| Mean square | 1.53 | 1.87 |
| p-value | 0.419 | 0.156 |
| Adjusted r2 | 0.032 | 0.045 |
| AIC | 260.7 | 237.1 |
| BIC | 265.7 | 239.5 |
| Model parameters | ||
| Randomised design block | ✓ | ✓ |
| Audit | ✓ | ✓ |
| Role | ✓ | ✗ |
| Modification main effects | ✓ | A, B, F |
| 2-way modification interactions | ✓ | A*B, B*F |
| Additional Interactions | ✗ | ✗ |
FIGURE 40.
Secondary outcome: attention – Pareto plot of standardised effects (full model). (a) Available complete data; and (b) primary modified ITT population (via multiple imputation). Vertical lines provide reference to the significance level of the parameter estimates.
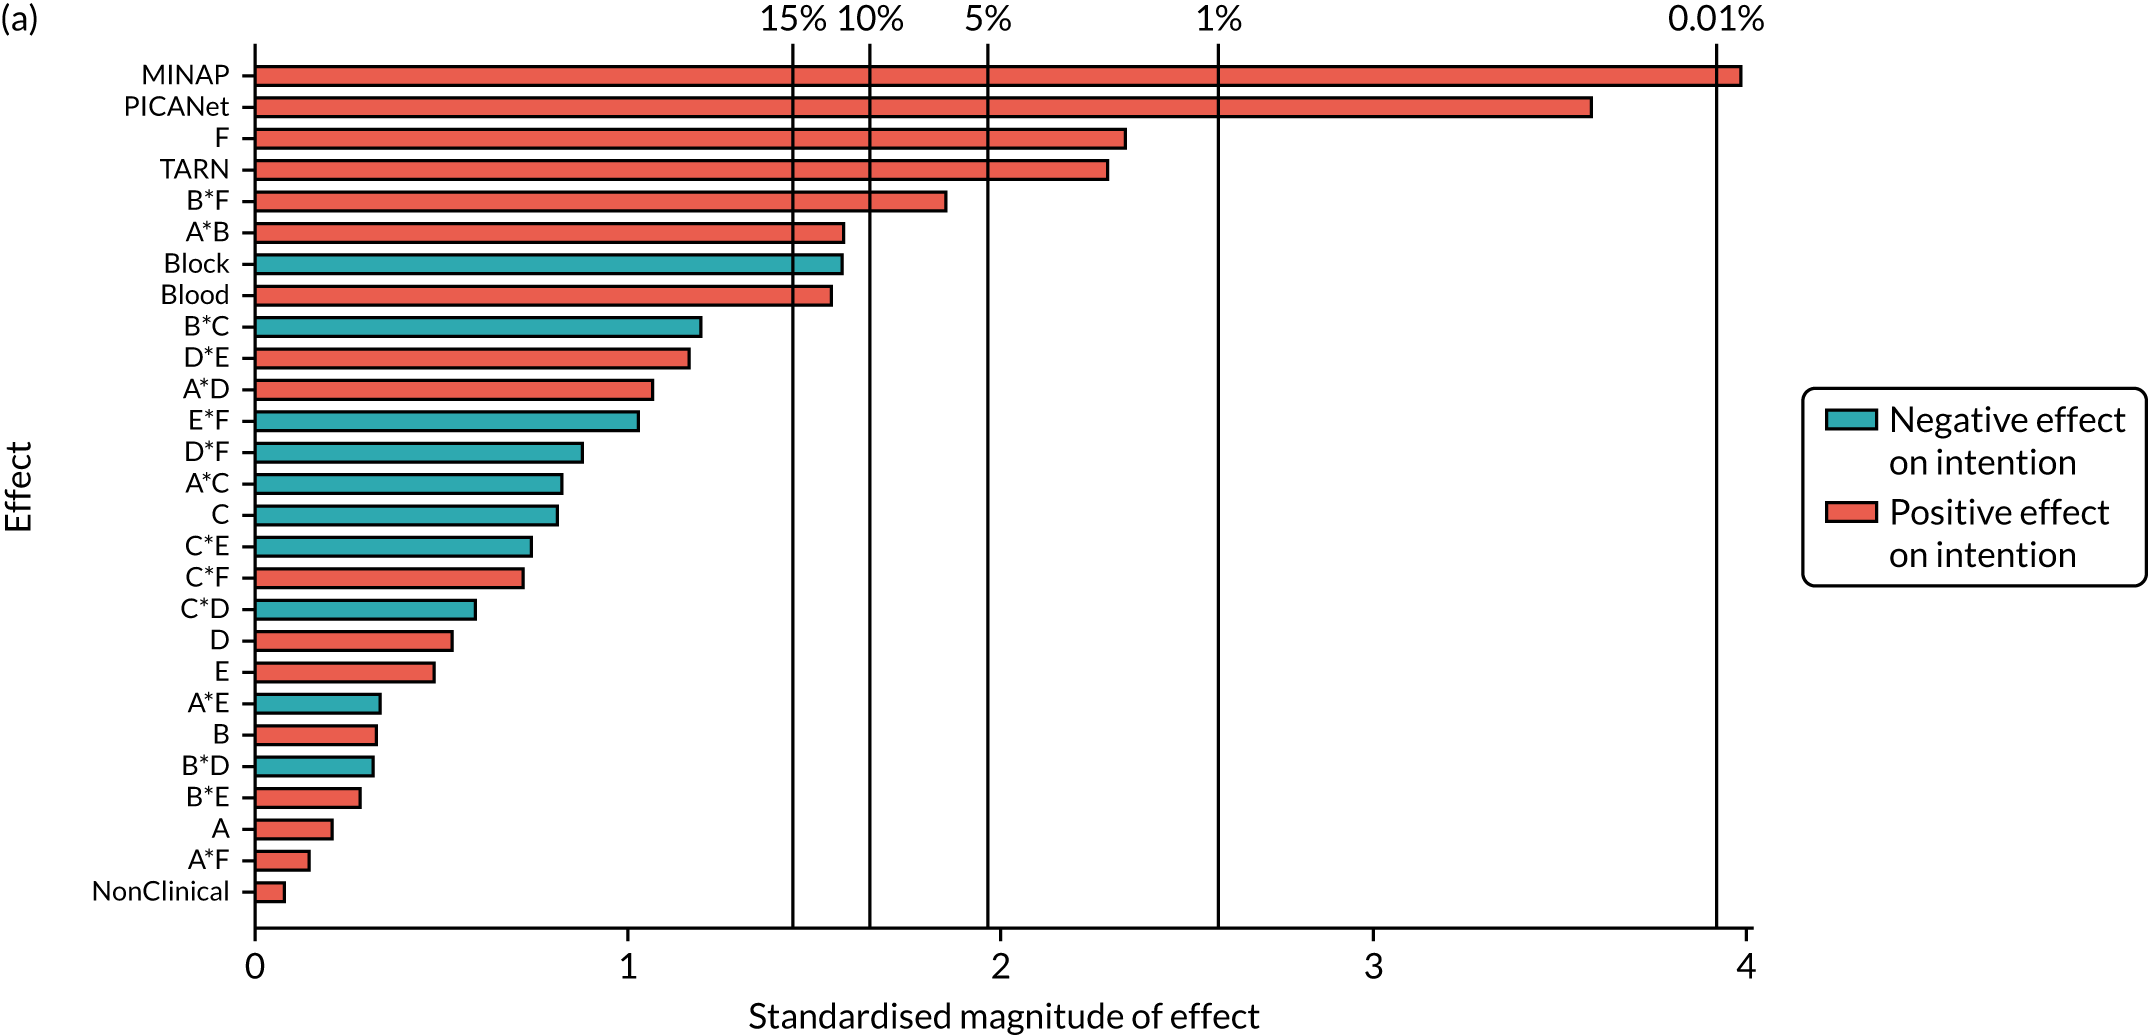
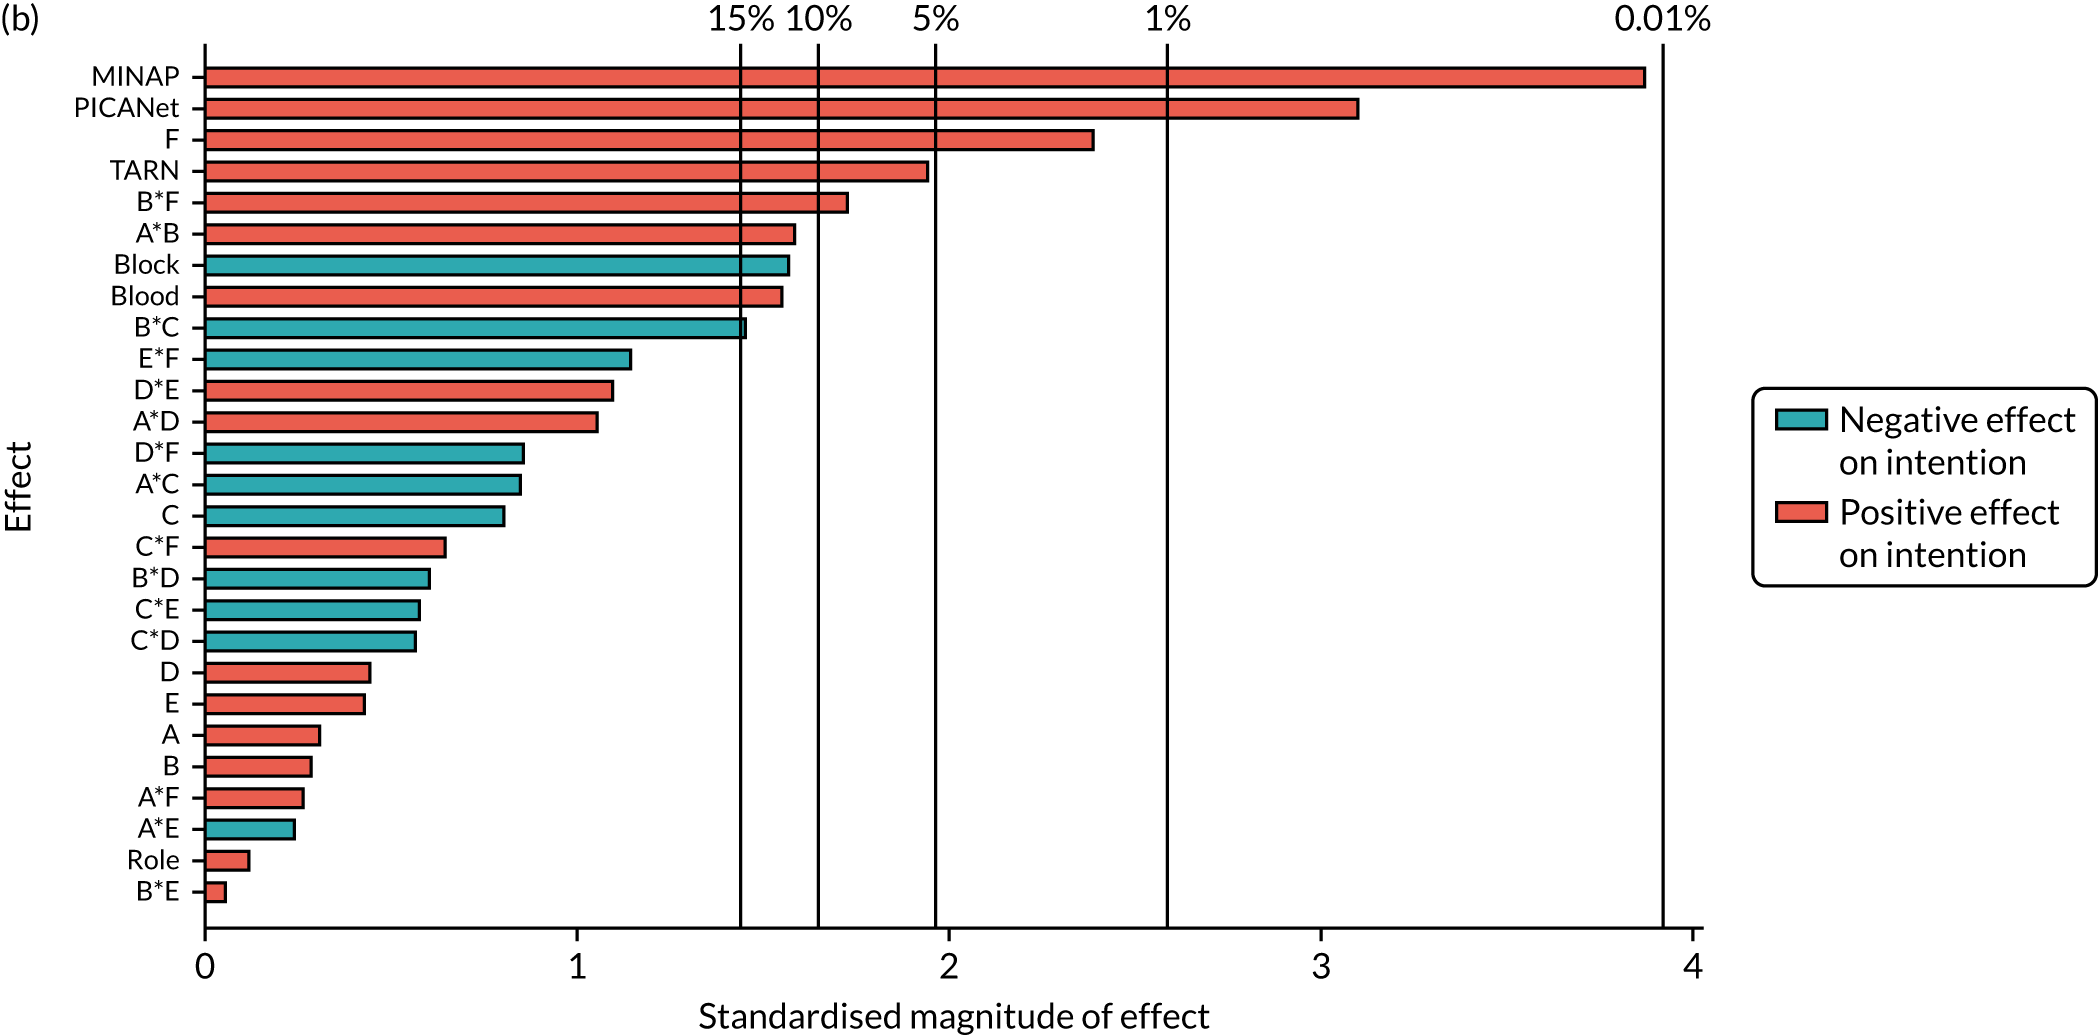
| Parameter | Available complete data | Primary modified ITT population | ||||
|---|---|---|---|---|---|---|
| Estimate | Standard error | p-value | Estimate | Standard error | p-value | |
| Intercept | 1.811 | 0.093 | < 0.001 | 1.812 | 0.097 | < 0.001 |
| Block | –0.082 | 0.052 | 0.111 | –0.082 | 0.053 | 0.120 |
| NCABT | 0.250 | 0.158 | 0.114 | 0.253 | 0.161 | 0.115 |
| MINAP | 0.540 | 0.135 | < 0.001 | 0.521 | 0.133 | < 0.001 |
| PICANet | 0.831 | 0.233 | < 0.001 | 0.755 | 0.243 | 0.002 |
| TARN | 0.346 | 0.149 | 0.021 | 0.304 | 0.155 | 0.050 |
| A: effective comparators | 0.012 | 0.051 | 0.814 | 0.015 | 0.052 | 0.778 |
| B: multimodal feedback | 0.019 | 0.051 | 0.716 | 0.016 | 0.052 | 0.766 |
| C: specific actions | – | – | – | –0.044 | 0.052 | 0.400 |
| F: cognitive load | 0.123 | 0.052 | 0.018 | 0.126 | 0.052 | 0.016 |
| A*B | 0.086 | 0.051 | 0.096 | 0.083 | 0.052 | 0.111 |
| B*C | – | – | – | –0.078 | 0.052 | 0.138 |
| B*F | 0.090 | 0.051 | 0.081 | 0.087 | 0.051 | 0.089 |
Secondary outcome: set goals
| Initial model | Full model | Parsimonious model | |
|---|---|---|---|
| ANOVA: model | |||
| df | 27 | 47 | 43 |
| Mean square | 2.59 | 4.15 | 4.4 |
| p-value | 0.359 | < 0.001 | < 0.001 |
| ANOVA: lack of fit | |||
| df | 223 | 203 | 207 |
| Mean square | 2.73 | 2.38 | 2.36 |
| p-value | 0.03 | 0.223 | 0.241 |
| Adjusted r2 | |||
| AIC | 0.004 | 0.066 | 0.068 |
| BIC | 522.9 | 505.2 | 499.9 |
| Model parameters | |||
| Randomised design block | ✓ | ✓ | ✓ |
| Audit | ✓ | ✓ | ✓ |
| Role | ✓ | ✓ | ✓ |
| Modification main effects | ✓ | ✓ | ✓ |
| Two-way modification interactions | ✓ | ✓ | A*B, A*C, A*D, A*E, A*F, B*D, B*E, B*F, C*F, D*E, E*F |
| Additional interactions | ✗ | Audit*Role, A*B*E, A*C*F, A*D*E, A*E*F, B*Audit, F*Audit, B*F*Audit | Audit*Role, A*B*E, A*C*F, A*D*E, A*E*F, B*Audit, F*Audit, B*F*Audit |
FIGURE 41.
Secondary outcome: goals – Pareto plot of standardised effects (full model). (a) Available complete data and (b) primary modified ITT population (via multiple imputation). Vertical lines provide reference to the significance level of the parameter estimates.
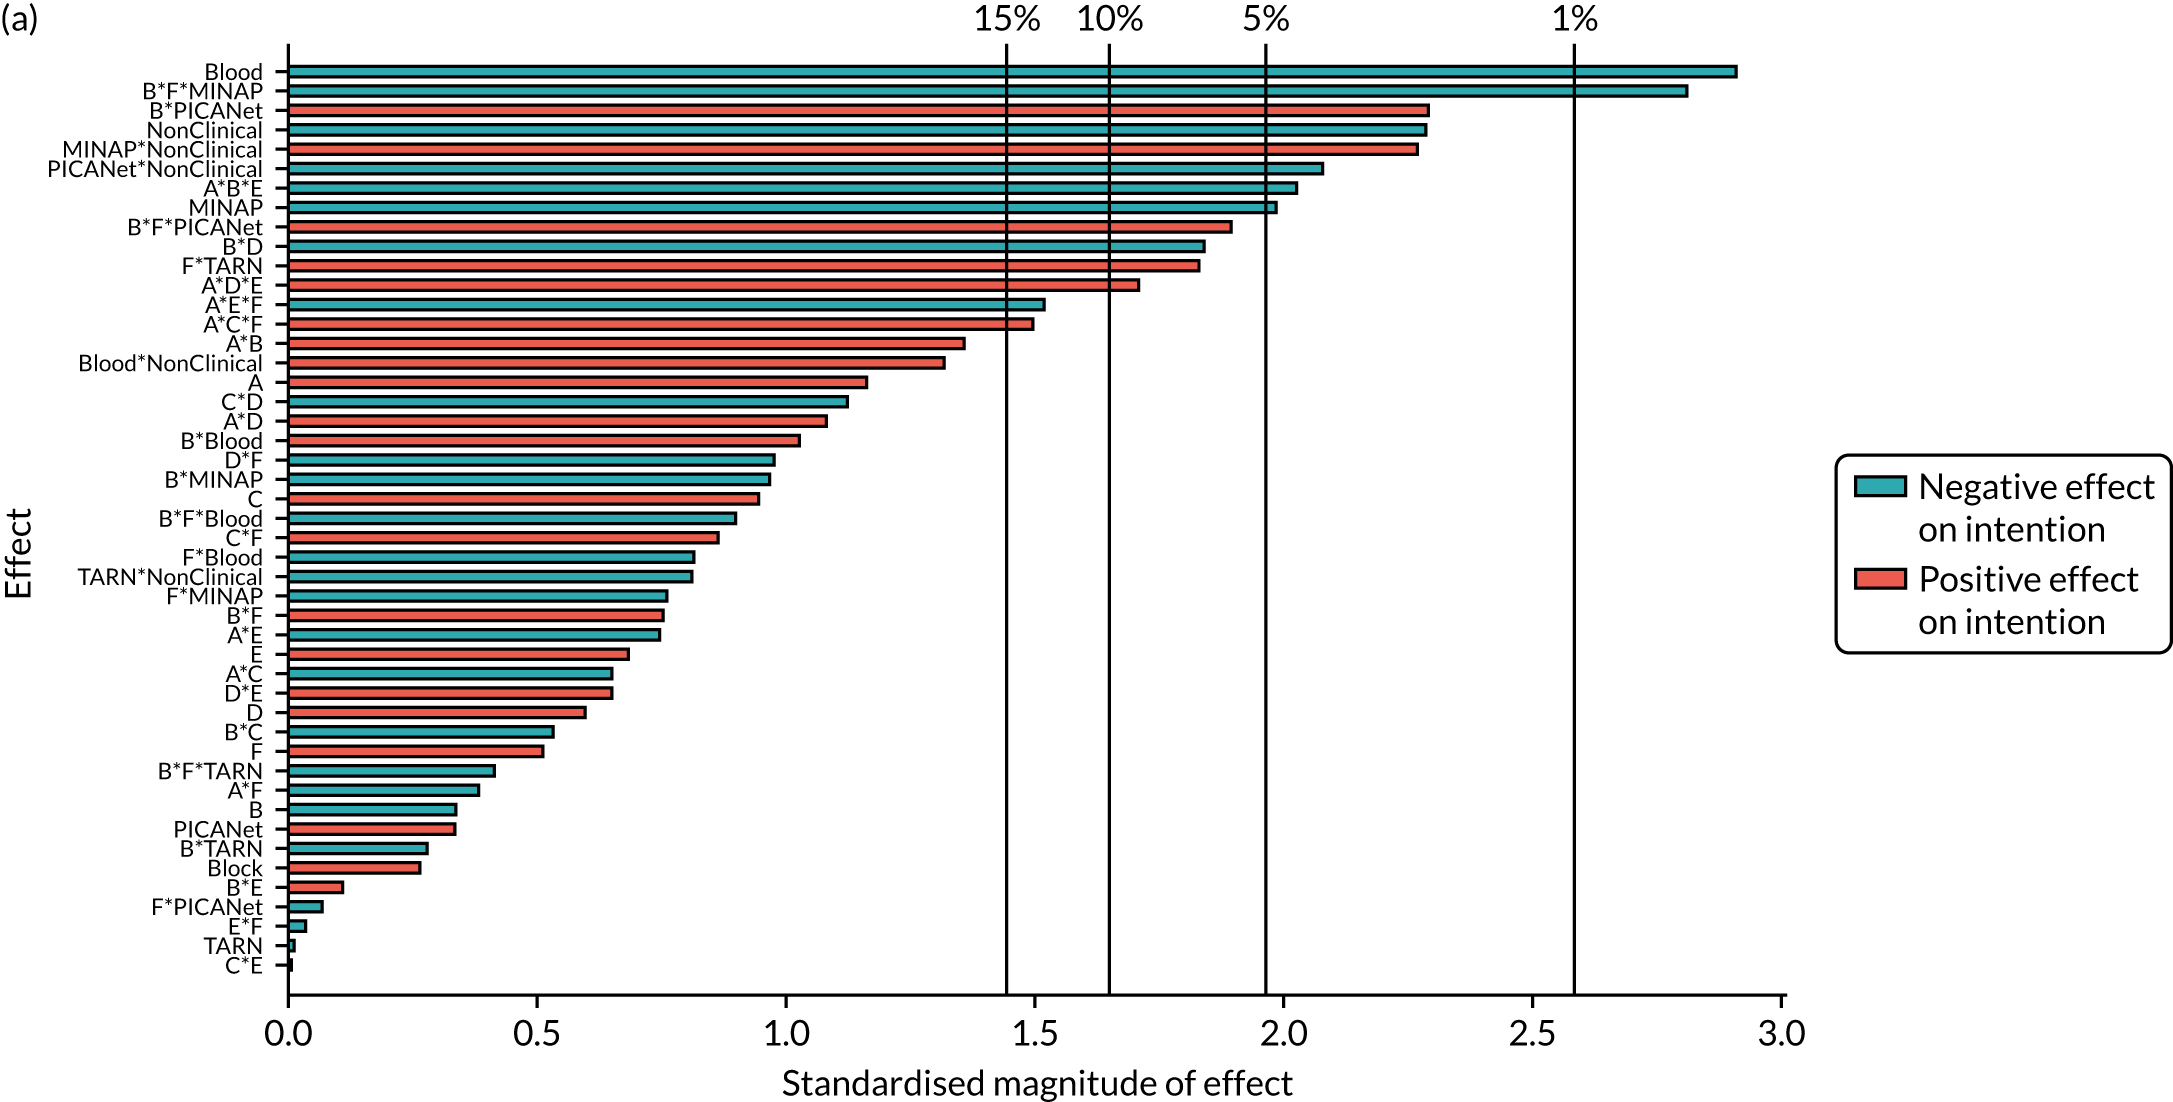
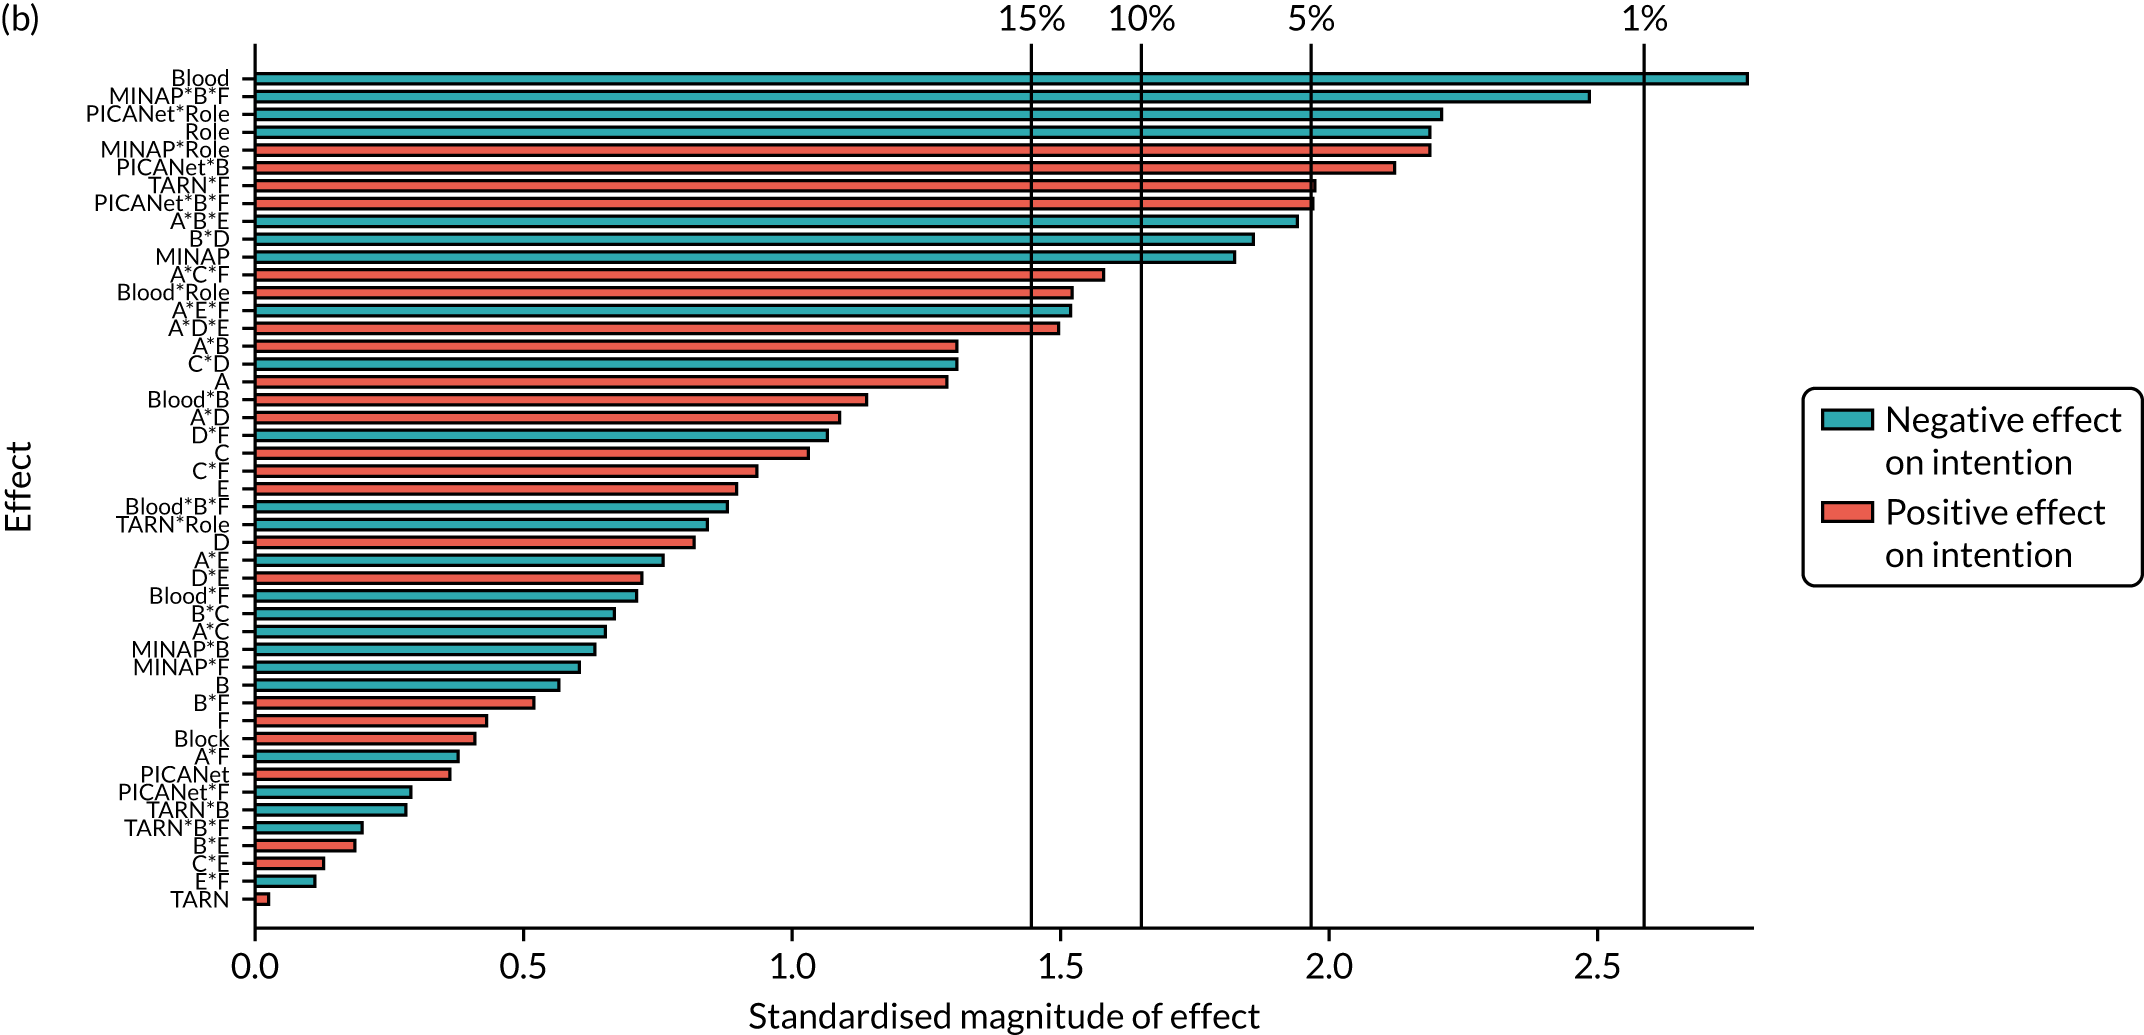
| Parameter | Available complete data | Primary modified ITT population | ||||
|---|---|---|---|---|---|---|
| Estimate | Standard error | p-value | Estimate | Standard error | p-value | |
| Intercept | 1.767 | 0.169 | < 0.001 | 1.738 | 0.168 | < 0.001 |
| Block | 0.018 | 0.064 | 0.781 | 0.026 | 0.062 | 0.681 |
| NCABT | –0.683 | 0.236 | 0.004 | –0.638 | 0.234 | 0.006 |
| MINAP | –0.483 | 0.246 | 0.050 | –0.445 | 0.245 | 0.069 |
| PICANet | 0.150 | 0.372 | 0.687 | 0.164 | 0.370 | 0.657 |
| TARN | –0.010 | 0.253 | 0.968 | 0.005 | 0.252 | 0.984 |
| Role | –0.548 | 0.234 | 0.020 | –0.489 | 0.226 | 0.030 |
| A: effective comparators | 0.076 | 0.064 | 0.236 | 0.082 | 0.062 | 0.190 |
| B: multimodal feedback | –0.038 | 0.115 | 0.739 | –0.061 | 0.109 | 0.575 |
| C: specific actions | 0.060 | 0.063 | 0.341 | 0.065 | 0.061 | 0.285 |
| D: optional detail | 0.039 | 0.064 | 0.545 | 0.050 | 0.062 | 0.415 |
| E: patient voice | 0.048 | 0.064 | 0.456 | 0.059 | 0.062 | 0.343 |
| F: cognitive load | 0.054 | 0.115 | 0.640 | 0.049 | 0.111 | 0.656 |
| A*B | 0.089 | 0.064 | 0.161 | 0.081 | 0.062 | 0.190 |
| A*C | –0.043 | 0.064 | 0.499 | –0.041 | 0.061 | 0.500 |
| A*D | 0.070 | 0.063 | 0.267 | 0.069 | 0.062 | 0.266 |
| A*E | –0.047 | 0.064 | 0.463 | –0.046 | 0.063 | 0.458 |
| A*F | –0.026 | 0.064 | 0.681 | –0.025 | 0.063 | 0.696 |
| B*D | –0.116 | 0.064 | 0.069 | –0.114 | 0.062 | 0.067 |
| B*E | 0.009 | 0.064 | 0.884 | 0.013 | 0.062 | 0.832 |
| B*F | 0.085 | 0.115 | 0.459 | 0.057 | 0.110 | 0.607 |
| C*F | 0.055 | 0.064 | 0.387 | 0.059 | 0.062 | 0.338 |
| D*E | 0.044 | 0.064 | 0.490 | 0.045 | 0.062 | 0.469 |
| E*F | –0.003 | 0.063 | 0.966 | –0.008 | 0.062 | 0.894 |
| NCABT*Role | 0.793 | 0.614 | 0.197 | 0.817 | 0.562 | 0.146 |
| MINAP*Role | 0.767 | 0.339 | 0.024 | 0.721 | 0.332 | 0.030 |
| PICANet*Role | –1.294 | 0.600 | 0.032 | –1.360 | 0.590 | 0.021 |
| TARN*Role | –0.293 | 0.383 | 0.445 | –0.310 | 0.373 | 0.406 |
| A*B*E | –0.129 | 0.064 | 0.045 | –0.121 | 0.063 | 0.053 |
| A*C*F | 0.098 | 0.064 | 0.124 | 0.099 | 0.062 | 0.109 |
| A*D*E | 0.111 | 0.064 | 0.083 | 0.096 | 0.065 | 0.136 |
| A*E*F | –0.098 | 0.063 | 0.125 | –0.092 | 0.061 | 0.132 |
| NCABT*B | 0.209 | 0.195 | 0.286 | 0.218 | 0.189 | 0.247 |
| MINAP*B | –0.163 | 0.166 | 0.326 | –0.101 | 0.158 | 0.526 |
| PICANet*B | 0.670 | 0.291 | 0.022 | 0.607 | 0.288 | 0.035 |
| TARN*B | –0.051 | 0.185 | 0.782 | –0.052 | 0.180 | 0.775 |
| NCABT*F | –0.156 | 0.196 | 0.427 | –0.135 | 0.190 | 0.477 |
| MINAP*F | –0.118 | 0.166 | 0.479 | –0.094 | 0.162 | 0.561 |
| PICANet*F | –0.004 | 0.289 | 0.989 | –0.080 | 0.288 | 0.782 |
| TARN*F | 0.343 | 0.184 | 0.063 | 0.357 | 0.182 | 0.049 |
| NCABT*B*F | –0.179 | 0.196 | 0.360 | –0.170 | 0.191 | 0.372 |
| MINAP*B*F | –0.465 | 0.166 | 0.005 | –0.400 | 0.162 | 0.013 |
| PICANet*B*F | 0.558 | 0.289 | 0.054 | 0.569 | 0.285 | 0.046 |
| TARN*B*F | –0.075 | 0.184 | 0.683 | –0.036 | 0.180 | 0.840 |
Secondary outcome: action plan
Most parameters removed from the full model based on analysis of available complete data to form the parsimonious model were appropriate when applied to the primary modified ITT population with multiply imputed missing data. However, the interaction A*D was retained in the parsimonious model for the primary modified ITT population.
| Initial model | Full model | Parsimonious model | |
|---|---|---|---|
| ANOVA: model | |||
| df | 27 | 38 | 30 |
| Mean square | 2.81 | 4.07 | 4.72 |
| p-value | 0.307 | 0.007 | 0.002 |
| ANOVA: lack of fit | |||
| df | 223 | 212 | 220 |
| Mean square | 3 | 2.78 | 2.74 |
| p-value | 0.004 | 0.02 | 0.026 |
| Adjusted r2 | |||
| AIC | 0.006 | 0.044 | 0.049 |
| BIC | 547.6 | 535.5 | 525.4 |
| Model parameters | |||
| Randomised design block | ✓ | ✓ | ✓ |
| Audit | ✓ | ✓ | ✓ |
| Role | ✓ | ✓ | ✓ |
| Modification main effects | ✓ | ✓ | ✓ |
| Two-way modification interactions | ✓ | ✓ | A*B, A*C, A*E, A*F, B*E, C*D, C*F |
| Additional interactions | ✗ | Audit*Role, A*B*E, A*C*F, F*Audit, A*Role | Audit*Role, A*B*E, A*C*F, F*Audit, A*Role |
FIGURE 42.
Secondary outcome: action plan – Pareto plot of standardised effects (full model). (a) Available complete data and (b) primary modified ITT population (via multiple imputation). Vertical lines provide reference to the significance level of the parameter estimates.
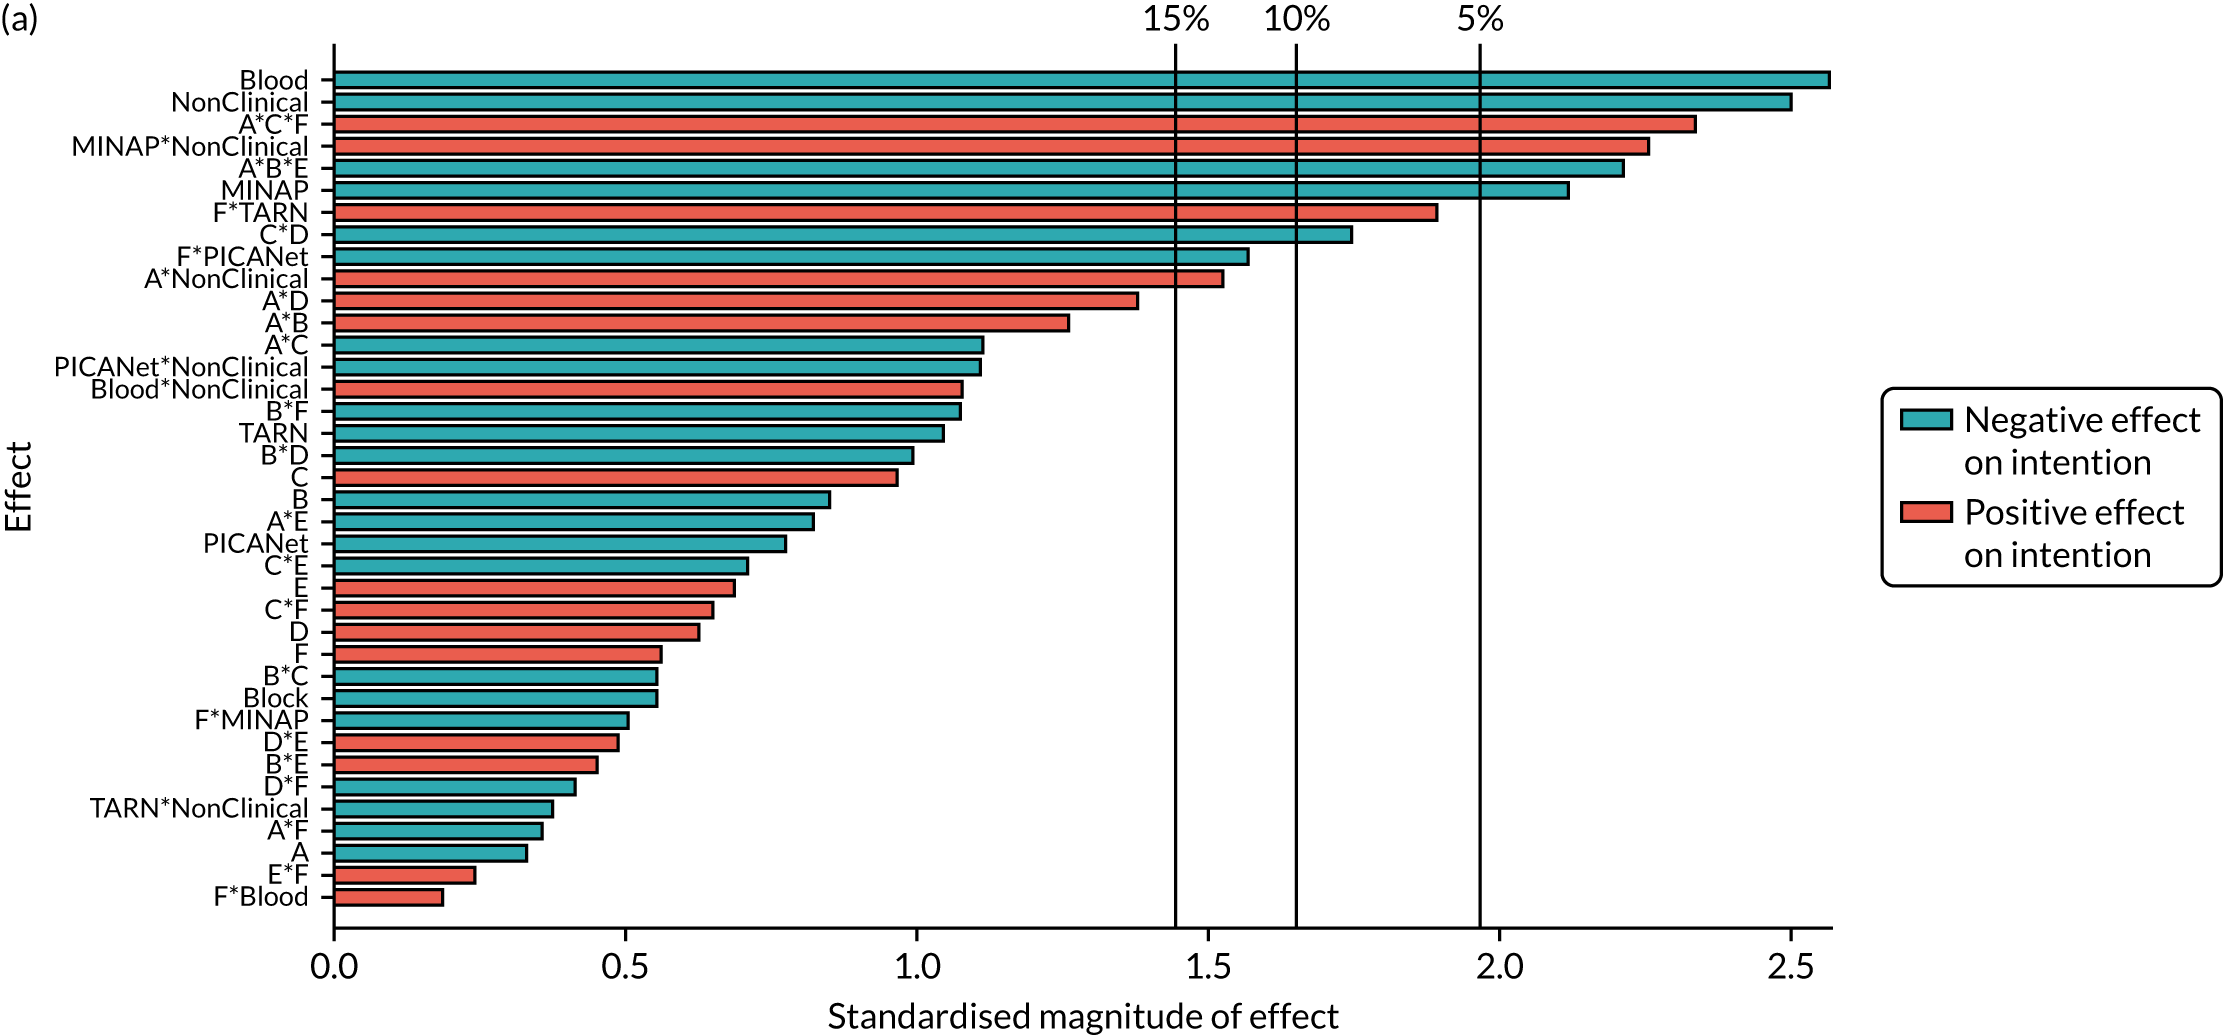
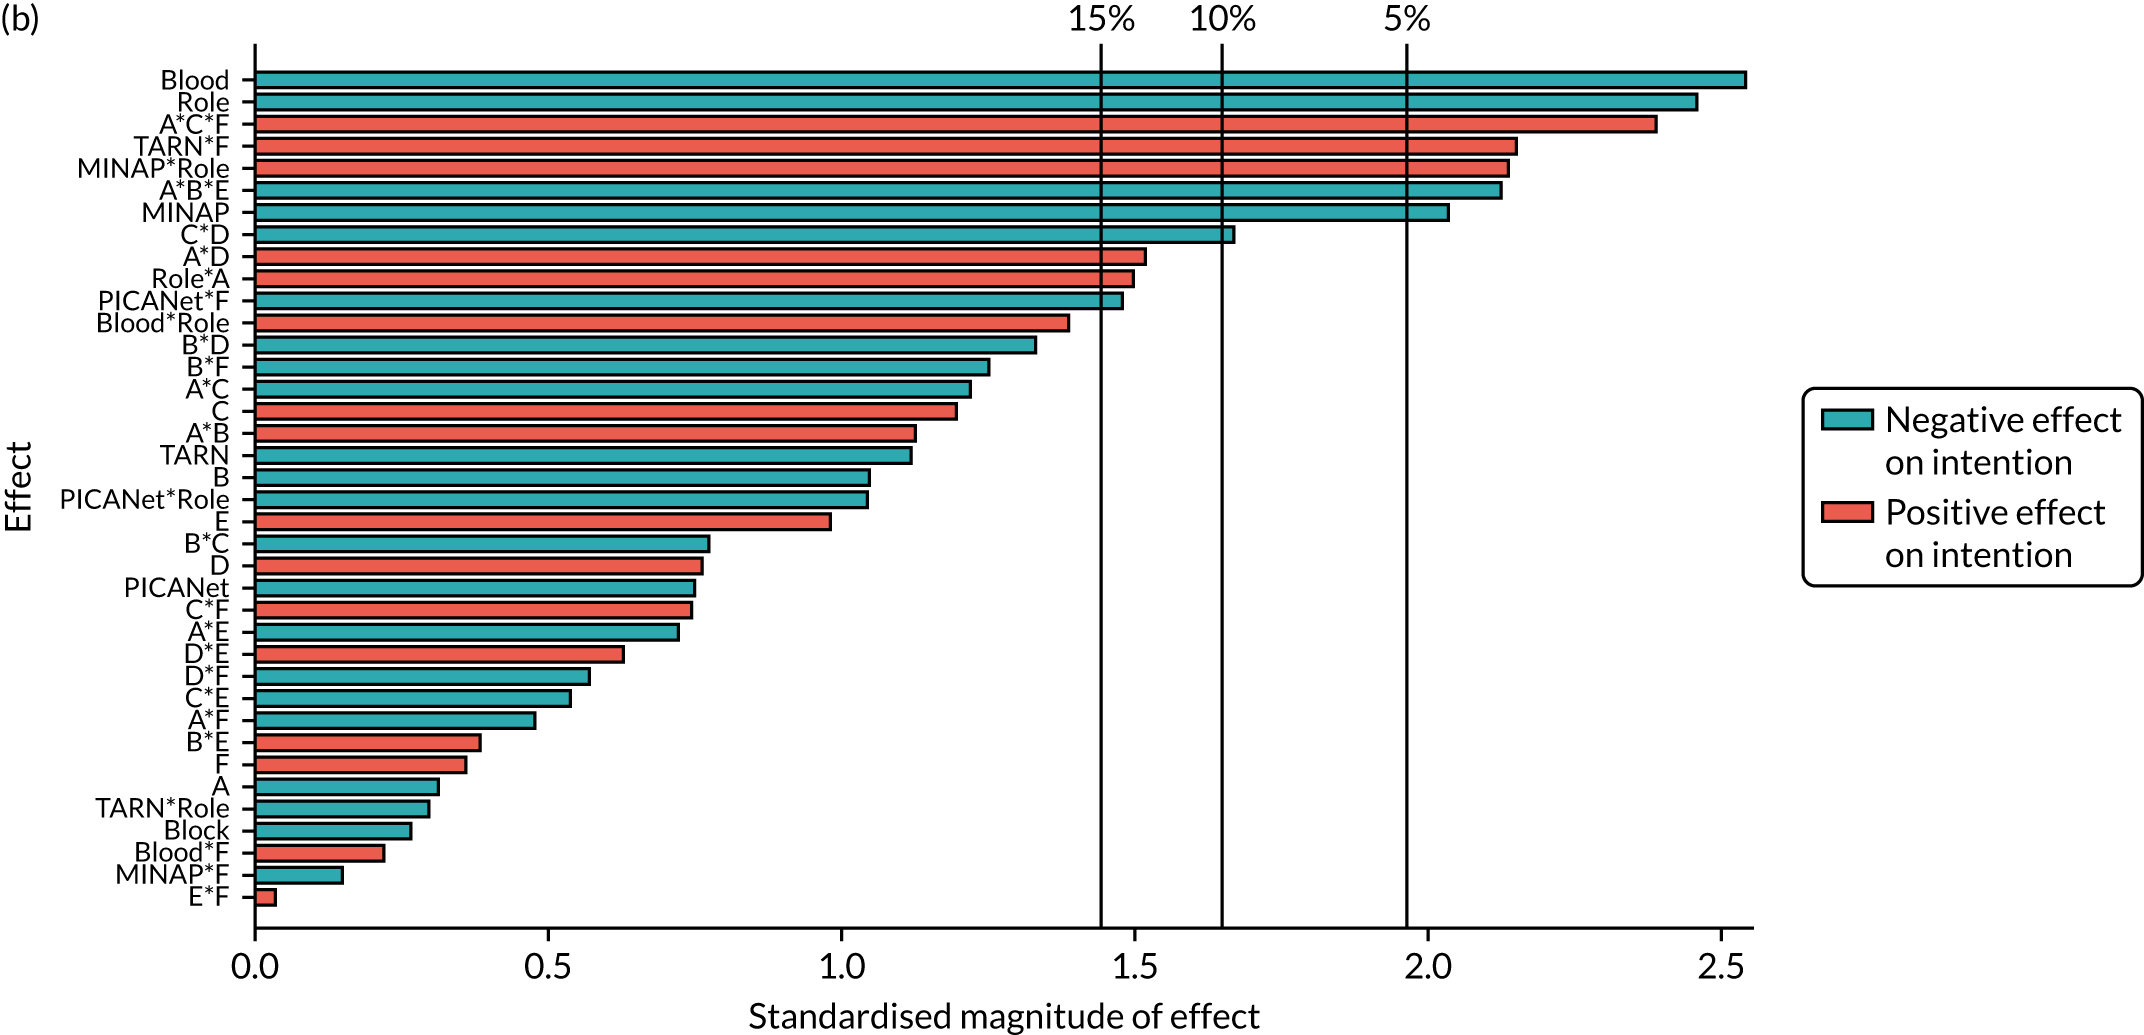
| Parameter | Available complete data | Primary modified ITT population | ||||
|---|---|---|---|---|---|---|
| Estimate | Standard error | p-value | Estimate | Standard error | p-value | |
| Intercept | 1.627 | 0.174 | < 0.001 | 1.608 | 0.171 | < 0.001 |
| Block | –0.036 | 0.066 | 0.581 | –0.017 | 0.065 | 0.799 |
| NCABT | –0.621 | 0.243 | 0.011 | –0.603 | 0.238 | 0.011 |
| MINAP | –0.510 | 0.253 | 0.044 | –0.482 | 0.245 | 0.049 |
| PICANet | –0.294 | 0.384 | 0.444 | –0.263 | 0.382 | 0.491 |
| TARN | –0.257 | 0.260 | 0.324 | –0.275 | 0.260 | 0.291 |
| Role | –0.591 | 0.241 | 0.014 | –0.571 | 0.235 | 0.015 |
| A: effective comparators | –0.028 | 0.087 | 0.749 | –0.018 | 0.086 | 0.837 |
| B: multimodal feedback | –0.052 | 0.066 | 0.425 | –0.064 | 0.064 | 0.313 |
| C: specific actions | 0.059 | 0.066 | 0.368 | 0.075 | 0.064 | 0.240 |
| D: optional detail | 0.047 | 0.066 | 0.477 | 0.051 | 0.065 | 0.434 |
| E: patient voice | 0.046 | 0.066 | 0.482 | 0.064 | 0.065 | 0.327 |
| F: cognitive load | 0.070 | 0.119 | 0.559 | 0.044 | 0.117 | 0.708 |
| A*B | 0.083 | 0.066 | 0.206 | 0.073 | 0.065 | 0.256 |
| A*C | –0.072 | 0.066 | 0.271 | –0.080 | 0.064 | 0.210 |
| A*D | – | – | – | 0.095 | 0.063 | 0.132 |
| A*E | –0.053 | 0.066 | 0.426 | –0.044 | 0.064 | 0.496 |
| A*F | –0.022 | 0.066 | 0.737 | –0.032 | 0.065 | 0.616 |
| B*E | 0.031 | 0.066 | 0.635 | 0.026 | 0.065 | 0.690 |
| C*D | –0.118 | 0.066 | 0.073 | –0.107 | 0.065 | 0.099 |
| C*F | 0.043 | 0.066 | 0.513 | 0.050 | 0.064 | 0.438 |
| NCABT*Role | 0.675 | 0.632 | 0.286 | 0.829 | 0.590 | 0.160 |
| MINAP*Role | 0.733 | 0.347 | 0.035 | 0.695 | 0.339 | 0.040 |
| PICANet*Role | –0.726 | 0.615 | 0.239 | –0.708 | 0.613 | 0.248 |
| TARN*Role | –0.188 | 0.392 | 0.631 | –0.135 | 0.388 | 0.728 |
| A*B*E | –0.149 | 0.066 | 0.025 | –0.137 | 0.064 | 0.033 |
| A*C*F | 0.161 | 0.066 | 0.015 | 0.159 | 0.066 | 0.015 |
| NCABT*F | 0.037 | 0.201 | 0.854 | 0.038 | 0.195 | 0.846 |
| MINAP*F | –0.093 | 0.172 | 0.588 | –0.022 | 0.166 | 0.894 |
| PICANet*F | –0.482 | 0.299 | 0.108 | –0.461 | 0.305 | 0.132 |
| TARN*F | 0.355 | 0.190 | 0.062 | 0.407 | 0.191 | 0.033 |
| Role*A | 0.206 | 0.135 | 0.128 | 0.185 | 0.132 | 0.160 |
Secondary outcome: review performance
Parameters removed from the full model based on analysis of available complete data to form the parsimonious model were appropriate when applied to the primary modified ITT population with multiply imputed missing data. The interaction A*E was retained in the parsimonious model for the primary modified ITT population because of inclusion in the parsimonious model for available complete data.
| Initial model | Parsimonious model | |
|---|---|---|
| ANOVA: model | ||
| df | 27 | 17 |
| Mean square | 4.75 | 7.07 |
| p-value | 0.013 | < 0.001 |
| ANOVA: lack of fit | ||
| df | 223 | 233 |
| Mean square | 2.96 | 2.87 |
| p-value | 0.13 | 0.19 |
| Adjusted r2 | ||
| AIC | 0.034 | 0.046 |
| BIC | 597.5 | 580.6 |
| Model parameters | ||
| Randomised design block | ✓ | ✓ |
| Audit | ✓ | ✓ |
| Role | ✓ | ✓ |
| Modification main effects | ✓ | ✓ |
| Two-way modification interactions | ✓ | A*B, A*E, B*F, C*D, D*F |
| Additional interactions | ✗ | ✗ |
FIGURE 43.
Secondary outcome: review performance – Pareto plot of standardised effects (full model). (a) Available complete data and (b) primary modified ITT population (via multiple imputation). Vertical lines provide reference to the significance level of the parameter estimates.
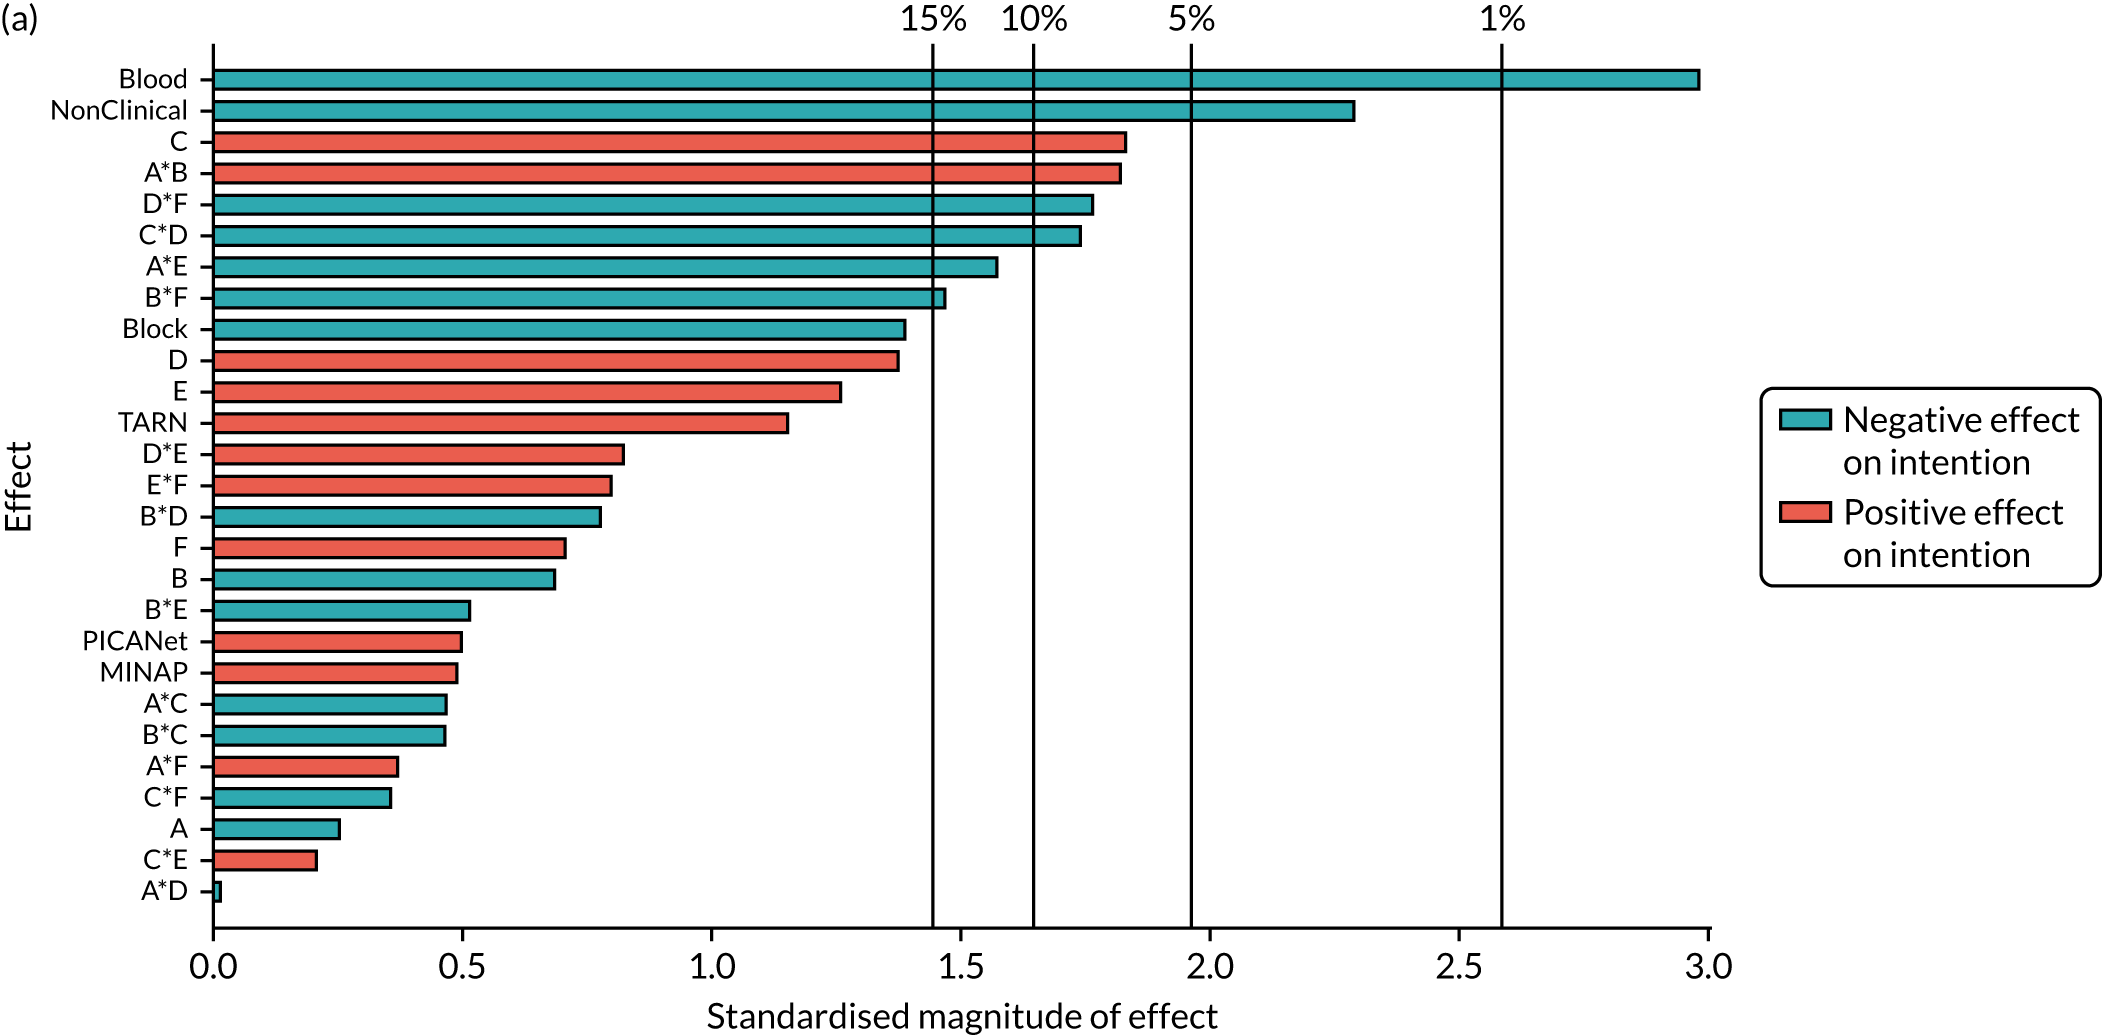
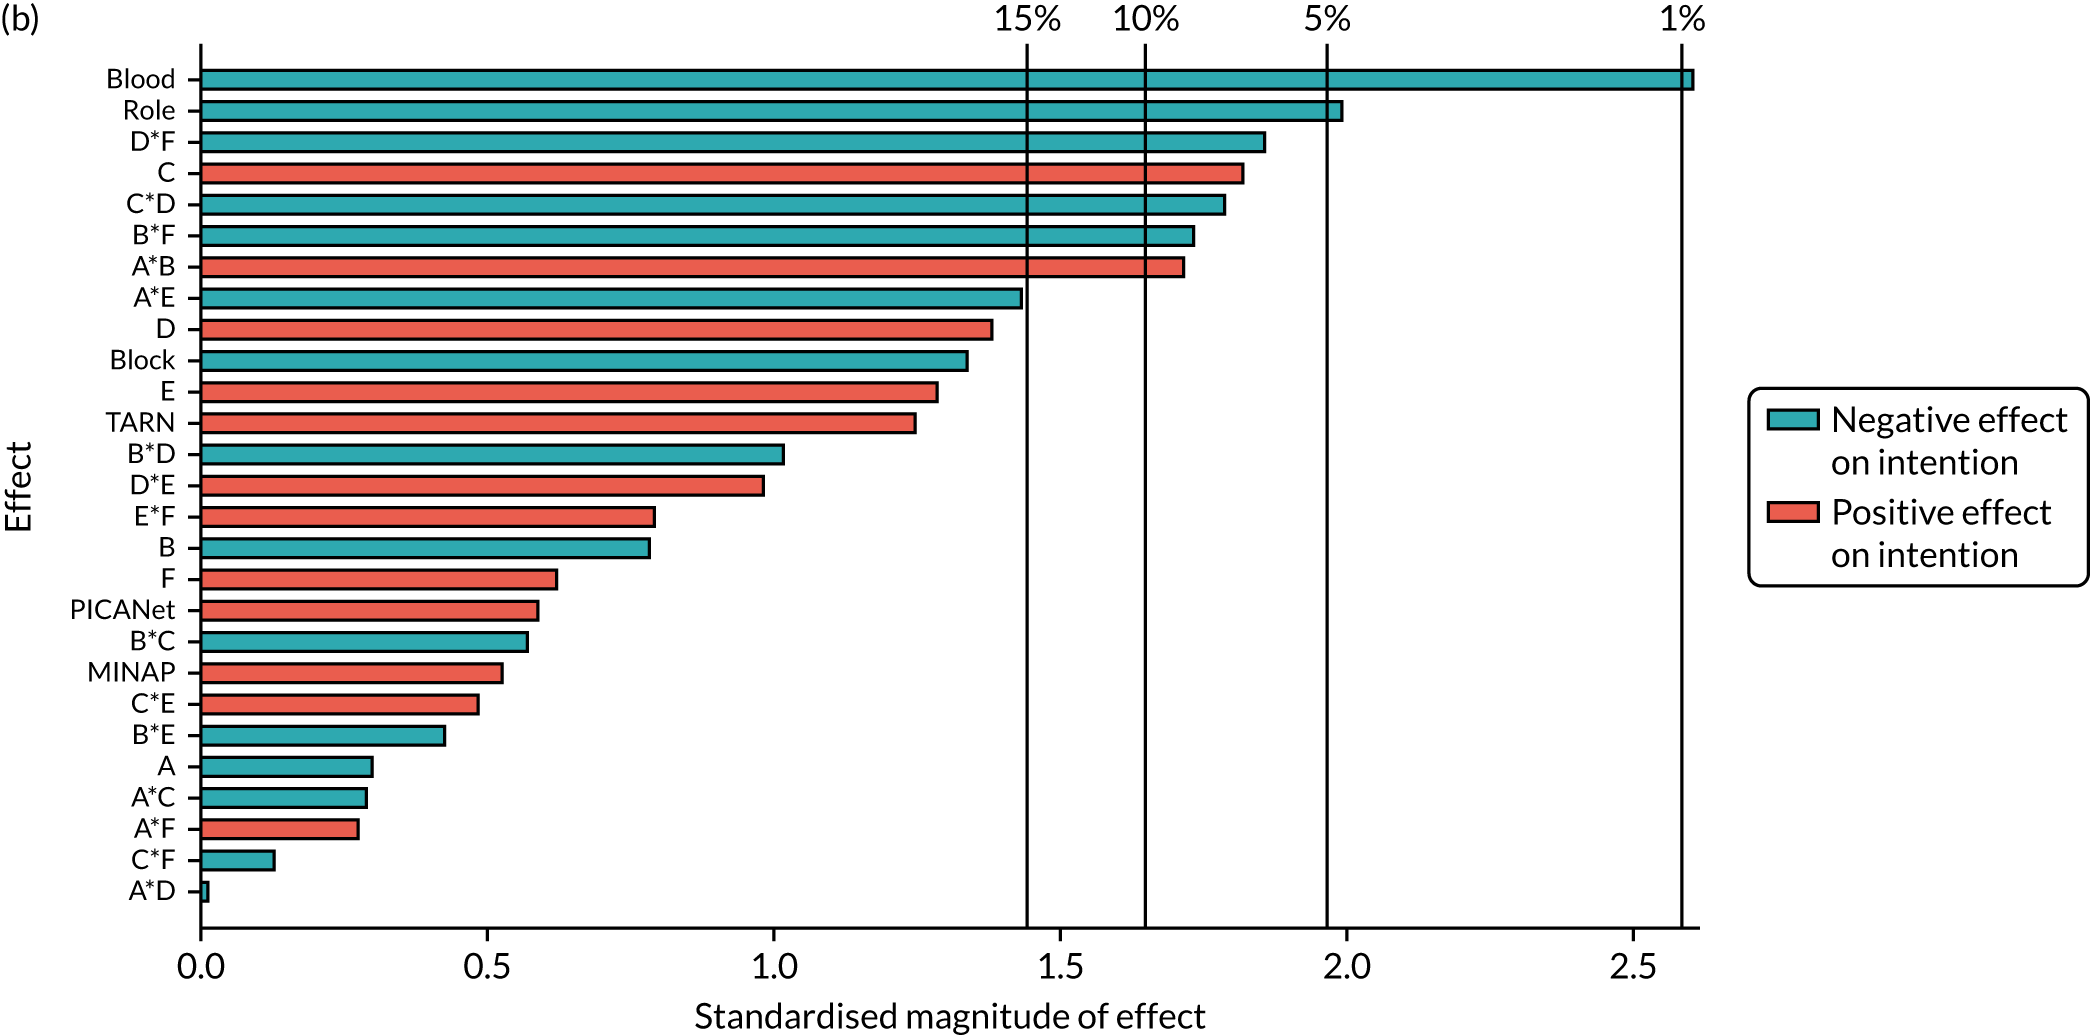
| Parameter | Available complete data | Primary modified ITT population | ||||
|---|---|---|---|---|---|---|
| Estimate | Standard error | p-value | Estimate | Standard error | p-value | |
| Intercept | 1.365 | 0.149 | < 0.001 | 1.335 | 0.143 | < 0.001 |
| Block | –0.095 | 0.070 | 0.173 | –0.093 | 0.069 | 0.176 |
| NCABT | –0.680 | 0.223 | 0.002 | –0.565 | 0.213 | 0.008 |
| MINAP | 0.082 | 0.181 | 0.650 | 0.089 | 0.173 | 0.607 |
| PICANet | 0.164 | 0.314 | 0.602 | 0.186 | 0.309 | 0.548 |
| TARN | 0.238 | 0.202 | 0.240 | 0.246 | 0.195 | 0.208 |
| Role | –0.350 | 0.150 | 0.020 | –0.290 | 0.143 | 0.043 |
| A: effective comparators | –0.018 | 0.069 | 0.793 | –0.019 | 0.068 | 0.784 |
| B: multimodal feedback | –0.048 | 0.069 | 0.486 | –0.052 | 0.067 | 0.436 |
| C: specific actions | 0.123 | 0.069 | 0.075 | 0.118 | 0.067 | 0.075 |
| D: optional detail | 0.093 | 0.069 | 0.178 | 0.093 | 0.069 | 0.174 |
| E: patient voice | 0.085 | 0.069 | 0.223 | 0.088 | 0.069 | 0.201 |
| F: cognitive load | 0.050 | 0.069 | 0.471 | 0.042 | 0.067 | 0.533 |
| A*B | 0.127 | 0.069 | 0.068 | 0.115 | 0.068 | 0.089 |
| A*E | –0.107 | 0.069 | 0.123 | –0.096 | 0.067 | 0.153 |
| B*F | –0.103 | 0.069 | 0.139 | –0.119 | 0.069 | 0.085 |
| C*D | –0.124 | 0.070 | 0.075 | –0.119 | 0.067 | 0.078 |
| D*F | –0.122 | 0.069 | 0.080 | –0.123 | 0.066 | 0.065 |
Secondary outcome: comprehension – easy to understand
Parameters removed from the full model based on analysis of available complete data to form the parsimonious model were appropriate when applied to the primary modified ITT population with multiply imputed missing data. The main effect of B was retained in the parsimonious model for the primary modified ITT population because of inclusion in the parsimonious model for available complete data.
| Initial model | Parsimonious model | |
|---|---|---|
| ANOVA: model | ||
| df | 27 | 12 |
| Mean square | 1.58 | 2.87 |
| p-value | 0.034 | < 0.001 |
| ANOVA: lack of fit | ||
| df | 223 | 67 |
| Mean square | 1.03 | 1.07 |
| p-value | 0.384 | 0.297 |
| Adjusted r2 | ||
| AIC | 0.027 | 0.039 |
| BIC | 29.9 | 8.5 |
| Model parameters | ||
| Randomised design block | ✓ | ✓ |
| Audit | ✓ | ✓ |
| Role | ✓ | ✗ |
| Modification main effects | ✓ | A, B, D, F |
| Two-way modification interactions | ✓ | A*D, B*D, D*F |
| Additional interactions | ✗ | ✗ |
FIGURE 44.
Secondary outcome: comprehension – Pareto plot of standardised effects (full model). (a) Available complete data and (b) primary modified ITT population (via multiple imputation). Vertical lines provide reference to the significance level of the parameter estimates.
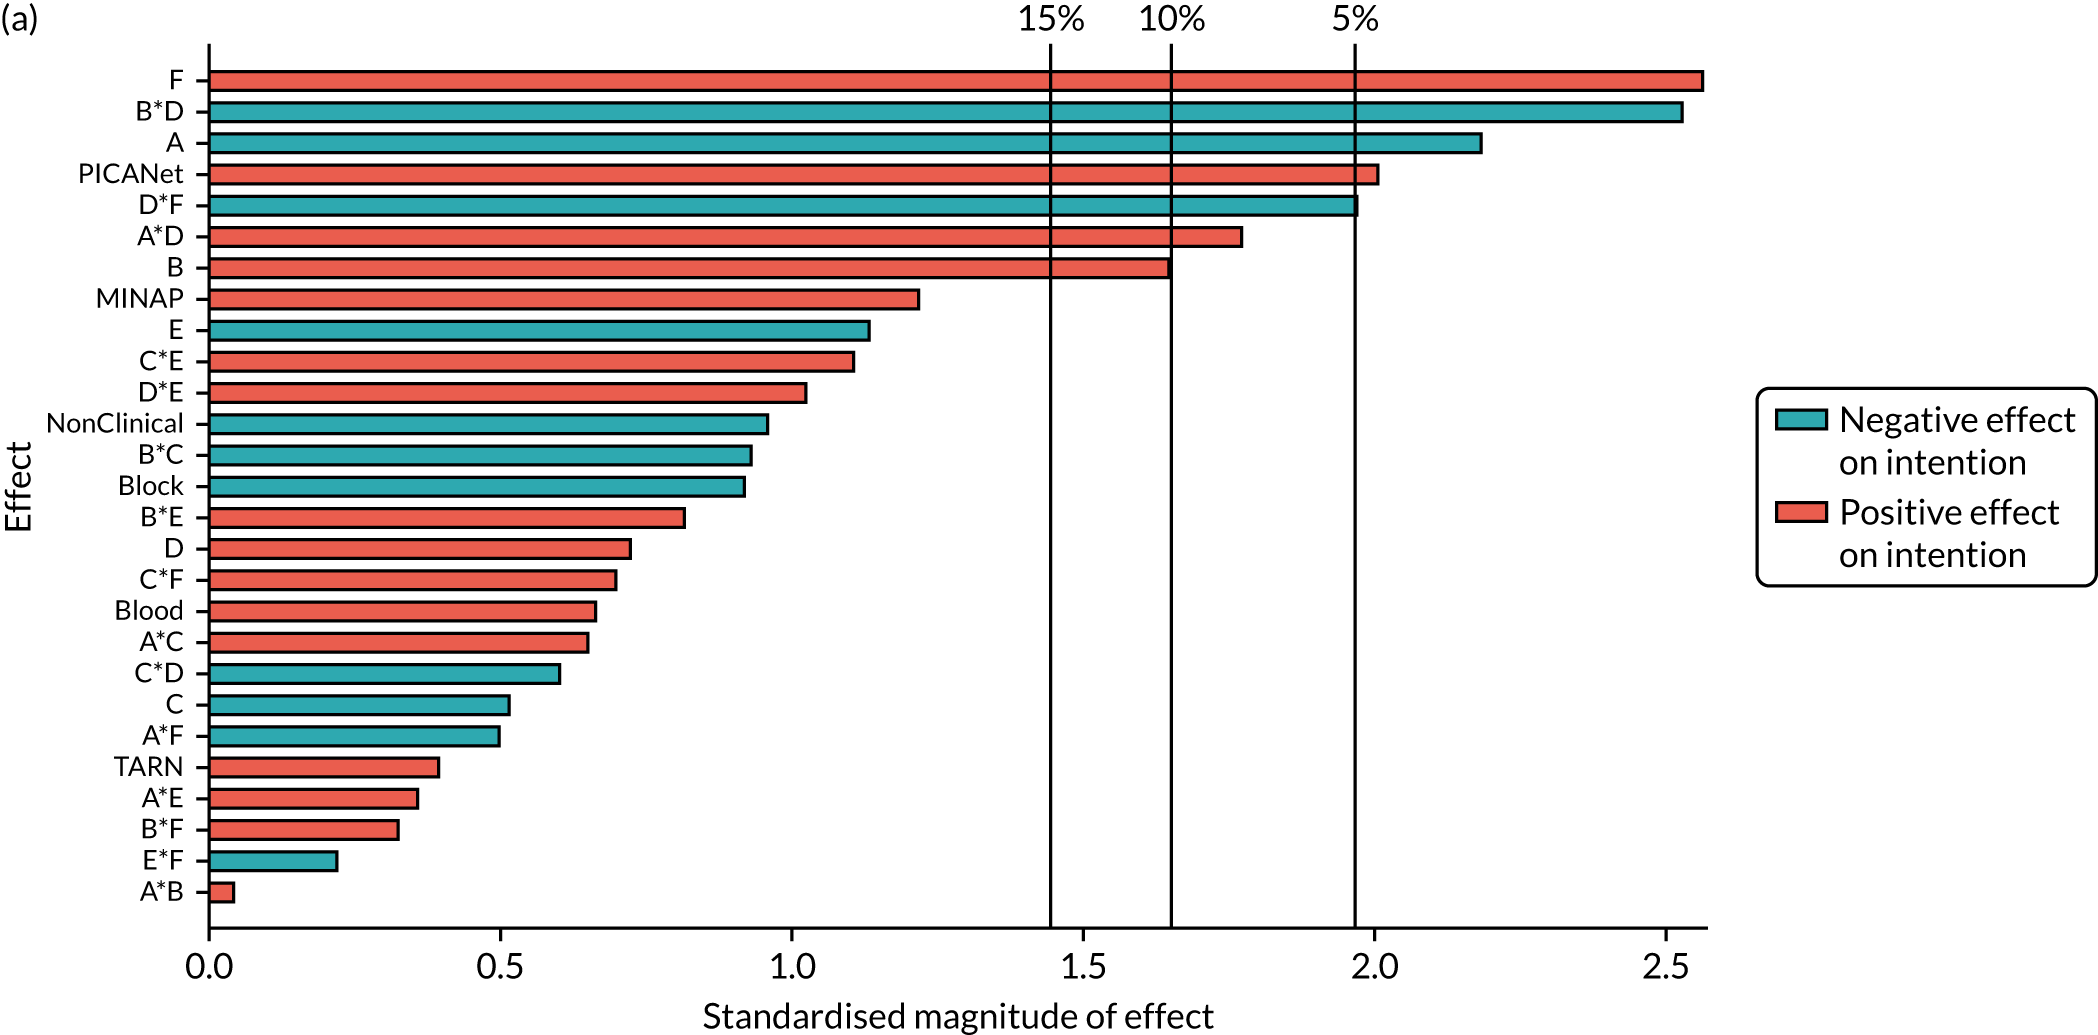
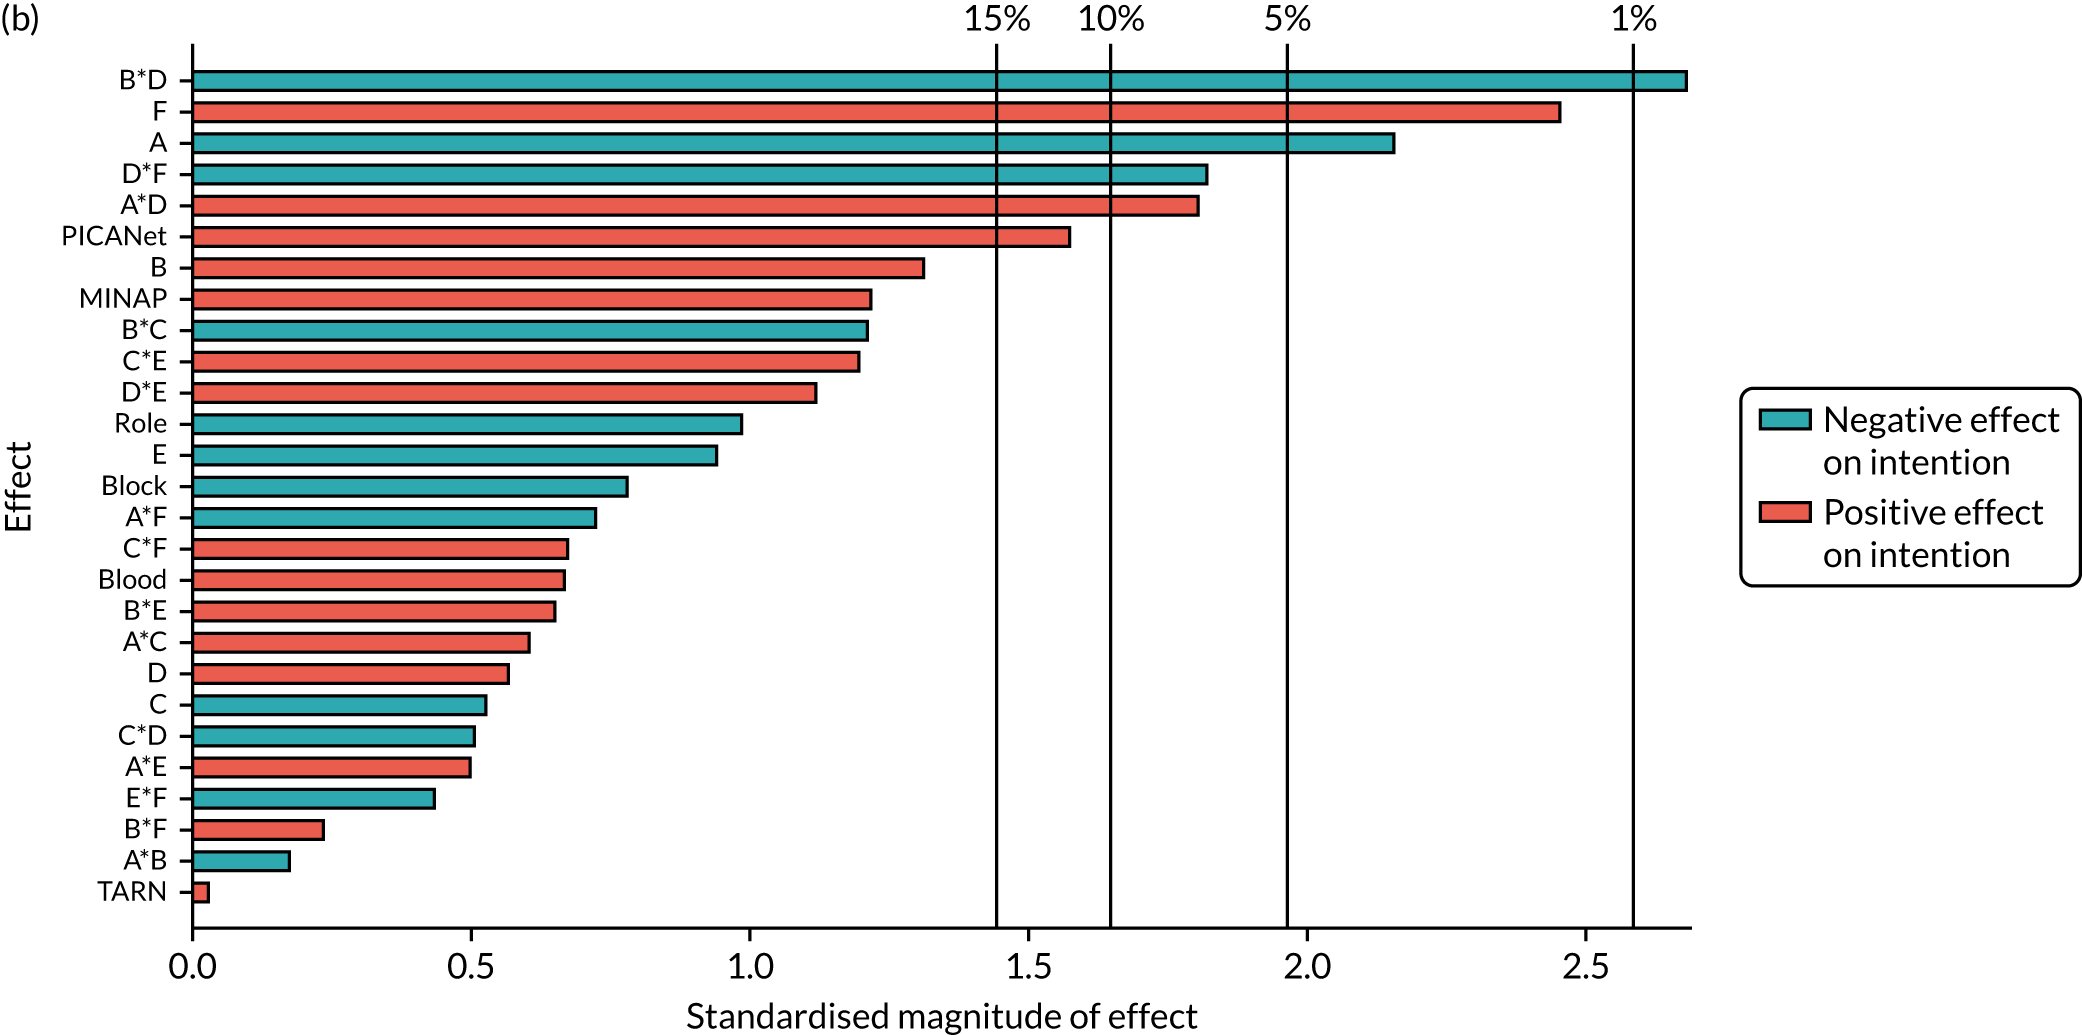
| Parameter | Available complete data | Primary modified ITT population | ||||
|---|---|---|---|---|---|---|
| Estimate | Standard error | p-value | Estimate | Standard error | p-value | |
| Intercept | 2.004 | 0.076 | < 0.001 | 2.011 | 0.076 | < 0.001 |
| Block | –0.044 | 0.042 | 0.302 | –0.036 | 0.042 | 0.390 |
| NCABT | 0.134 | 0.129 | 0.297 | 0.135 | 0.128 | 0.292 |
| MINAP | 0.141 | 0.110 | 0.201 | 0.140 | 0.110 | 0.203 |
| PICANet | 0.392 | 0.190 | 0.040 | 0.312 | 0.195 | 0.110 |
| TARN | 0.072 | 0.122 | 0.556 | 0.022 | 0.126 | 0.858 |
| A: effective comparators | –0.091 | 0.042 | 0.030 | –0.091 | 0.041 | 0.029 |
| B: multimodal feedback | 0.069 | 0.042 | 0.099 | 0.054 | 0.042 | 0.198 |
| D: optional detail | 0.027 | 0.042 | 0.520 | 0.022 | 0.042 | 0.603 |
| F: cognitive load | 0.107 | 0.042 | 0.011 | 0.103 | 0.042 | 0.014 |
| A*D | 0.076 | 0.042 | 0.072 | 0.078 | 0.043 | 0.068 |
| B*D | –0.105 | 0.042 | 0.013 | –0.114 | 0.043 | 0.008 |
| D*F | –0.084 | 0.042 | 0.045 | –0.073 | 0.042 | 0.079 |
Secondary outcome: user experience
| Initial model | Parsimonious model | |
|---|---|---|
| ANOVA: model | ||
| df | 27 | 14 |
| Mean square | 1.6 | 2.38 |
| p-value | 0.057 | 0.007 |
| ANOVA: lack of fit | ||
| df | 223 | 142 |
| Mean square | 1.1 | 1.12 |
| p-value | 0.409 | 0.322 |
| Adjusted r2 | ||
| AIC | 0.023 | 0.029 |
| BIC | 71.7 | 55.4 |
| Model parameters | ||
| Randomised design block | ✓ | ✓ |
| Audit | ✓ | ✓ |
| Role | ✓ | ✗ |
| Modification main effects | ✓ | A, B, C, D, E |
| Two-way modification interactions | ✓ | A*D, B*D, C*E, D*E |
| Additional interactions | ✗ | ✗ |
FIGURE 45.
Secondary outcome: user experience – Pareto plot of standardised effects (full model). (a) Available complete data and (b) primary modified ITT population (via multiple imputation). Vertical lines provide reference to the significance level of the parameter estimates.
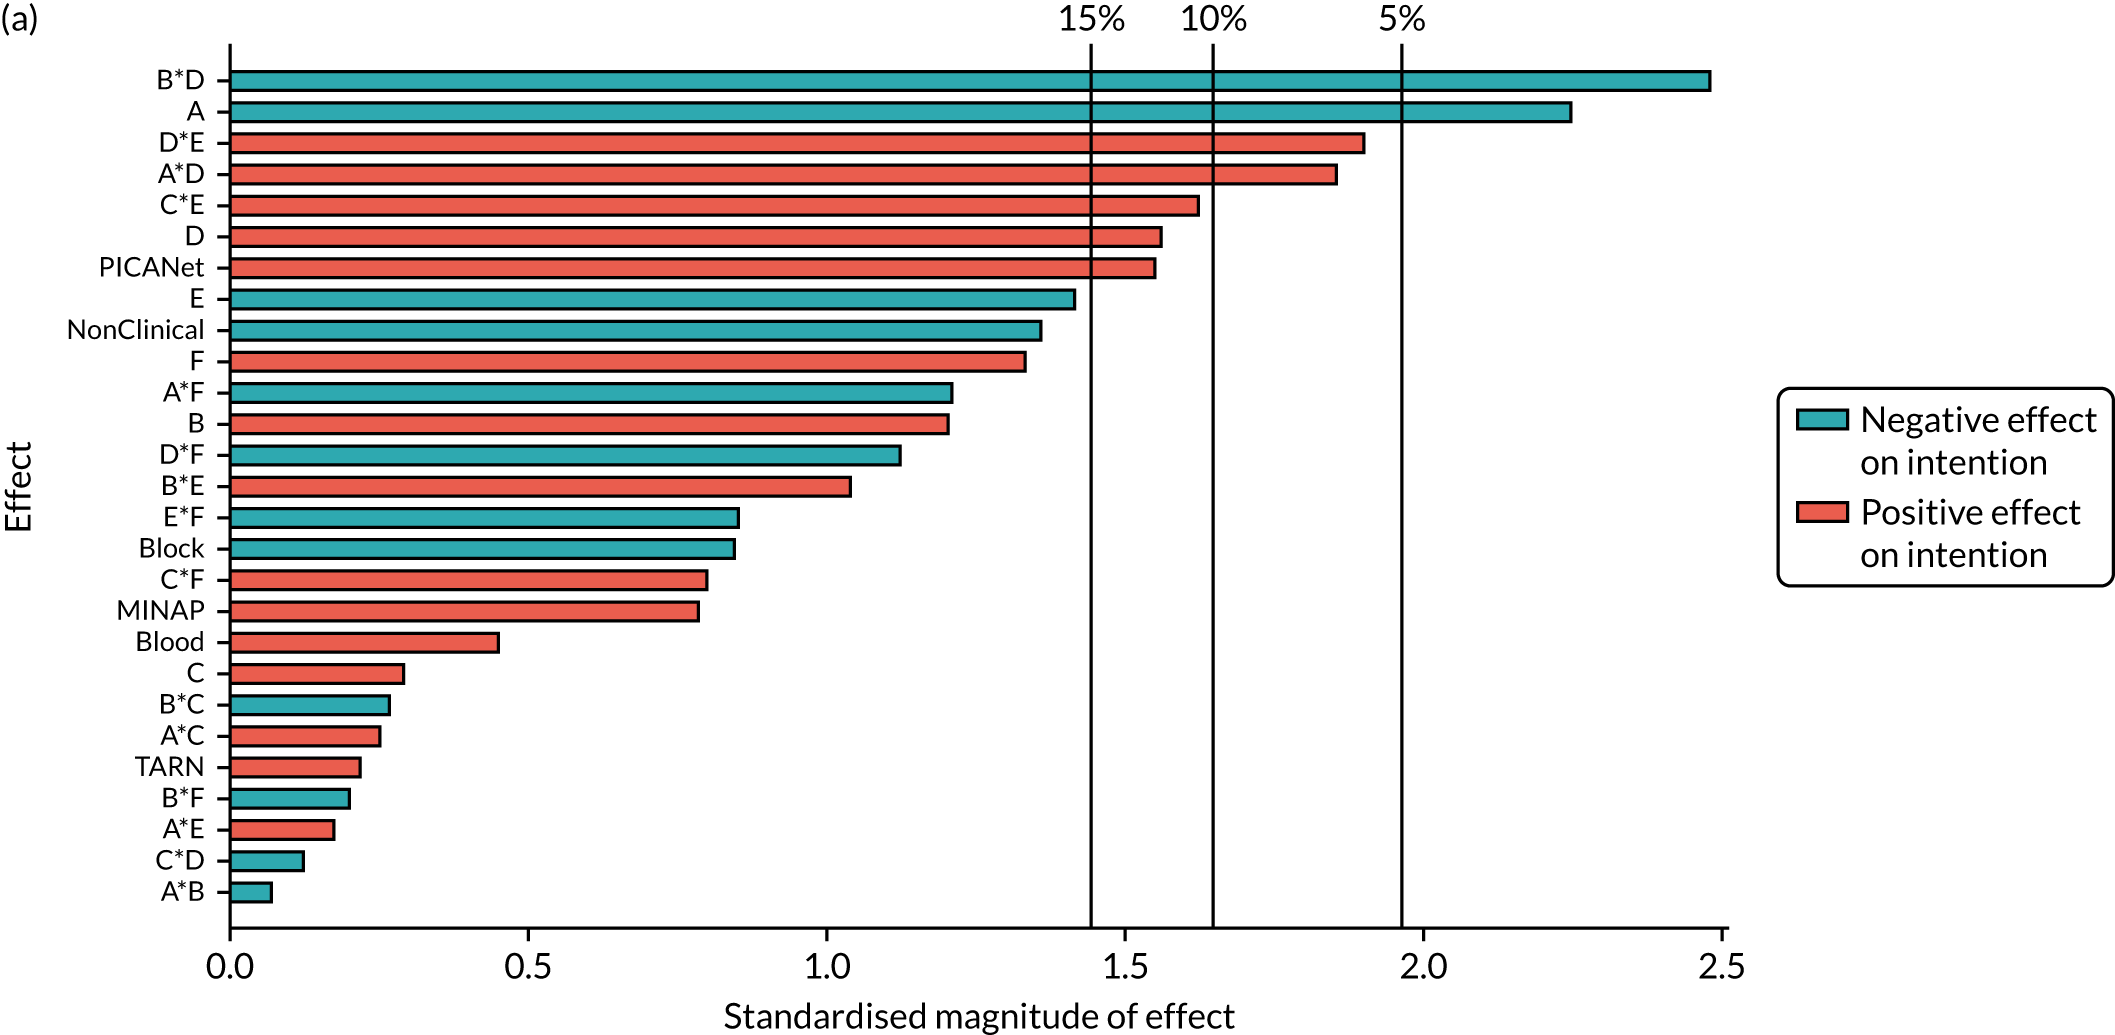
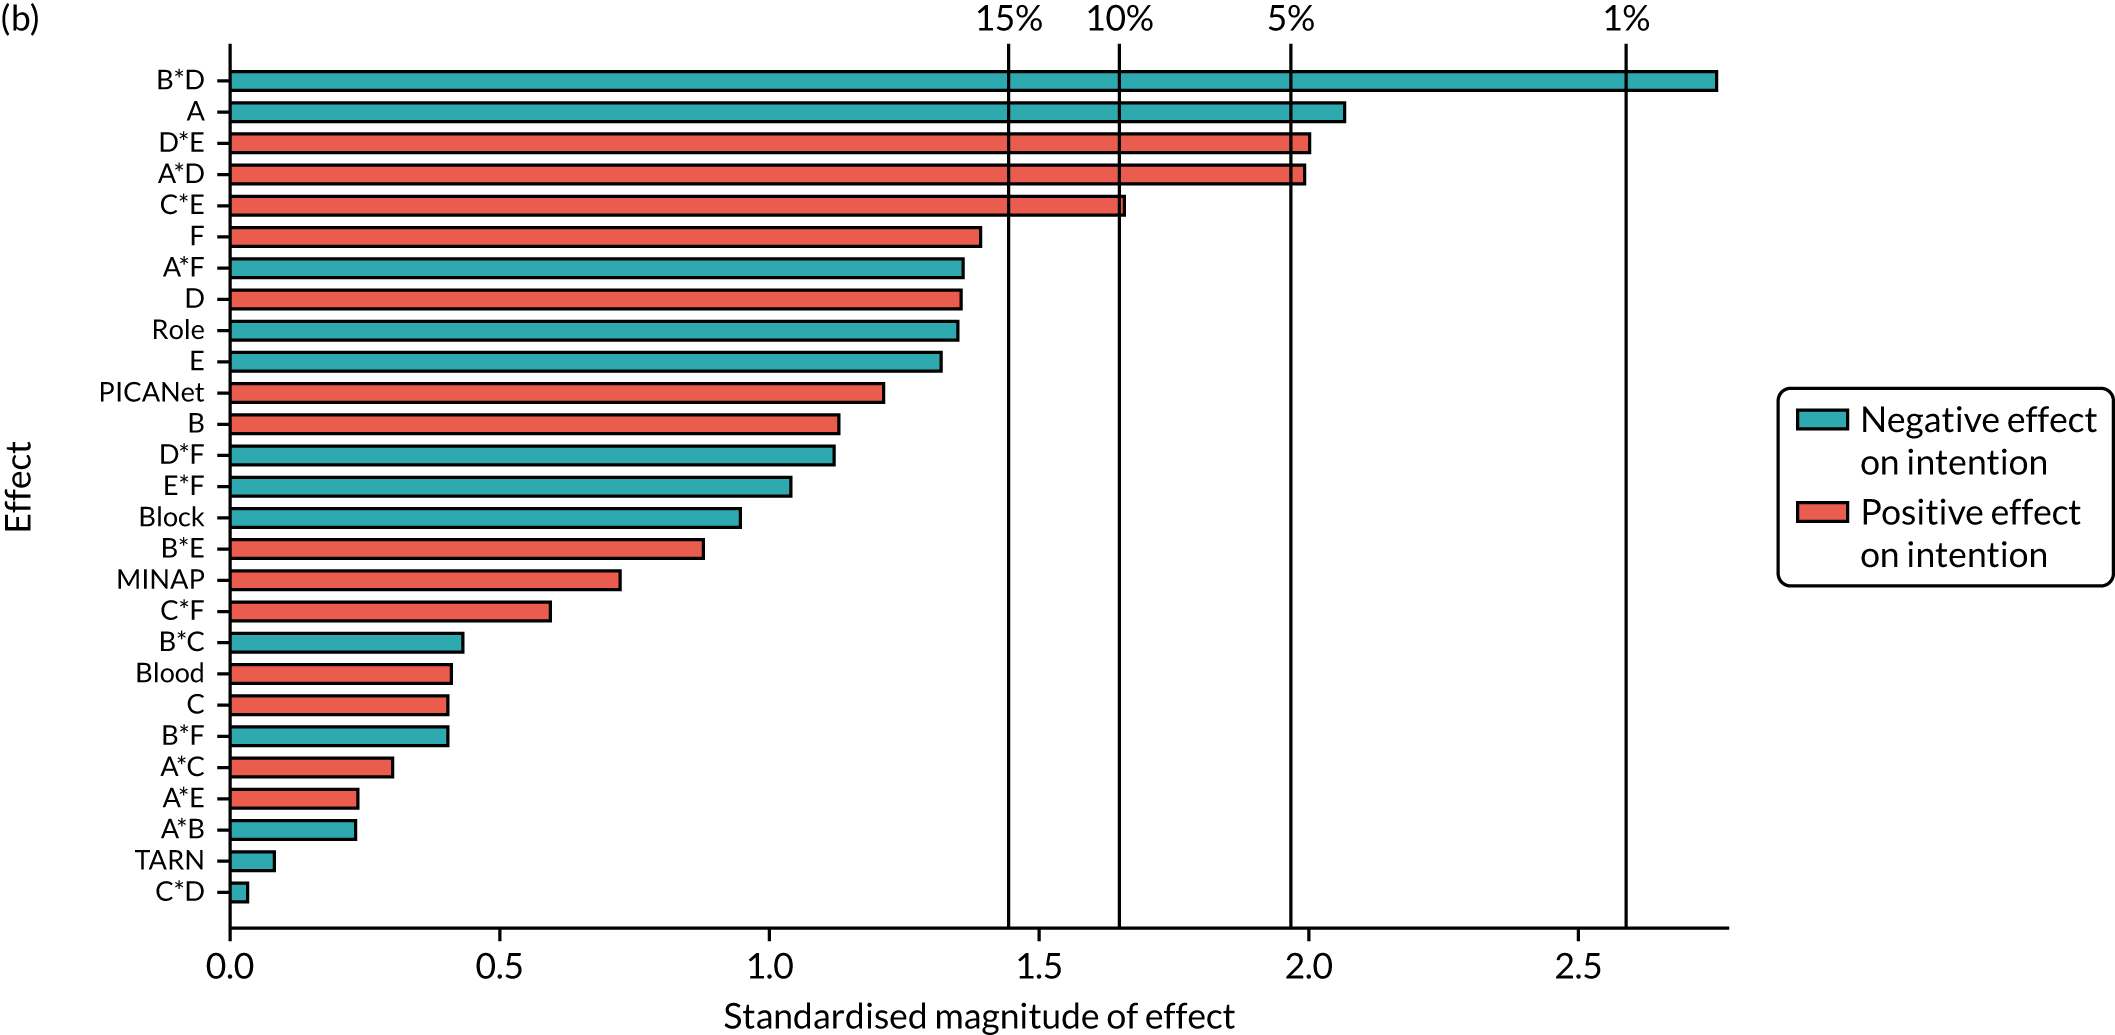
| Parameter | Available complete data | Primary modified ITT population | ||||
|---|---|---|---|---|---|---|
| Estimate | Standard error | p-value | Estimate | Standard error | p-value | |
| Intercept | 1.859 | 0.079 | < 0.001 | 1.870 | 0.076 | < 0.001 |
| Block | –0.045 | 0.044 | 0.308 | –0.042 | 0.042 | 0.310 |
| NCABT | 0.135 | 0.134 | 0.313 | 0.118 | 0.128 | 0.356 |
| MINAP | 0.102 | 0.114 | 0.374 | 0.090 | 0.109 | 0.407 |
| PICANet | 0.322 | 0.198 | 0.103 | 0.247 | 0.195 | 0.206 |
| TARN | 0.055 | 0.127 | 0.663 | 0.014 | 0.122 | 0.908 |
| A: effective comparators | –0.097 | 0.044 | 0.027 | –0.087 | 0.041 | 0.036 |
| B: multimodal feedback | 0.055 | 0.044 | 0.211 | 0.048 | 0.042 | 0.251 |
| C: specific actions | 0.012 | 0.044 | 0.788 | 0.017 | 0.042 | 0.679 |
| D: optional detail | 0.069 | 0.044 | 0.113 | 0.056 | 0.042 | 0.176 |
| E: patient voice | –0.063 | 0.044 | 0.150 | –0.057 | 0.042 | 0.172 |
| A*D | 0.083 | 0.044 | 0.058 | 0.085 | 0.042 | 0.043 |
| B*D | –0.107 | 0.044 | 0.015 | –0.115 | 0.042 | 0.006 |
| C*E | 0.068 | 0.044 | 0.119 | 0.066 | 0.042 | 0.116 |
| D*E | 0.085 | 0.044 | 0.051 | 0.085 | 0.041 | 0.039 |
FIGURE 46.
Parsimonious model diagnostics (available complete data): (a) primary outcome, (b) attention, (c) goals, (d) action plan, (e) review performance, (f) comprehension and (g) user experience.


Appendix 7 Sensitivity analyses
Primary outcome by audit, role and modifications across populations
FIGURE 47.
Primary outcome by audit across populations: (a) MINAP, (b) blood, (c) diabetes, (d) PICANet and (e) TARN.


FIGURE 48.
Primary outcome by role across populations: (a) clinical, (b) manager and (c) audit and admin.
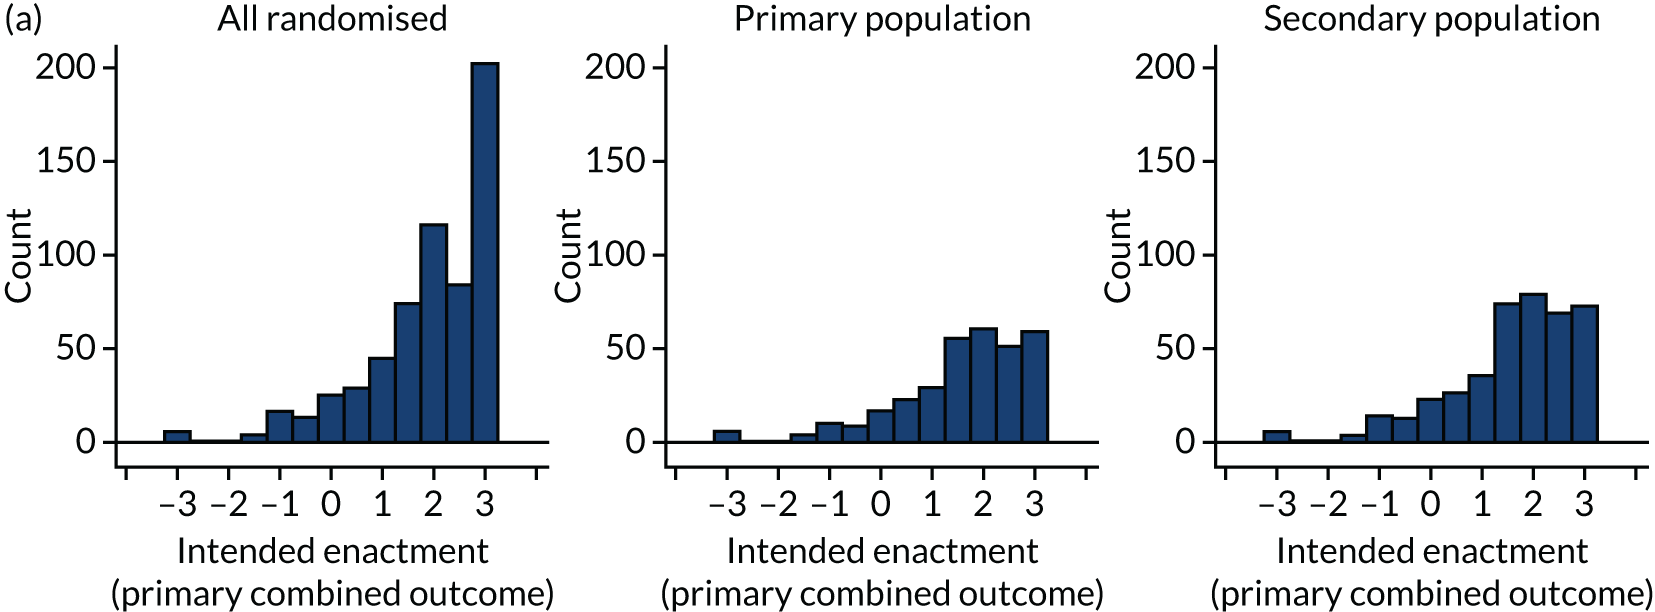
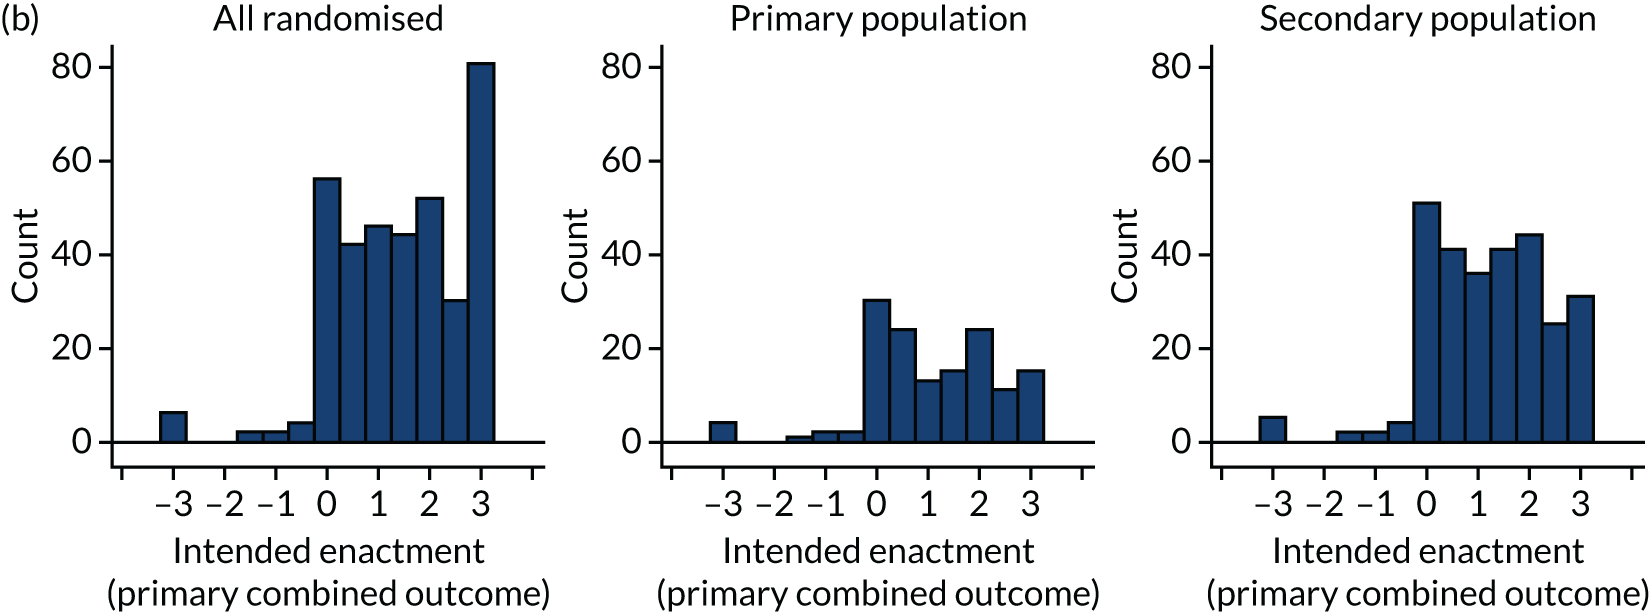
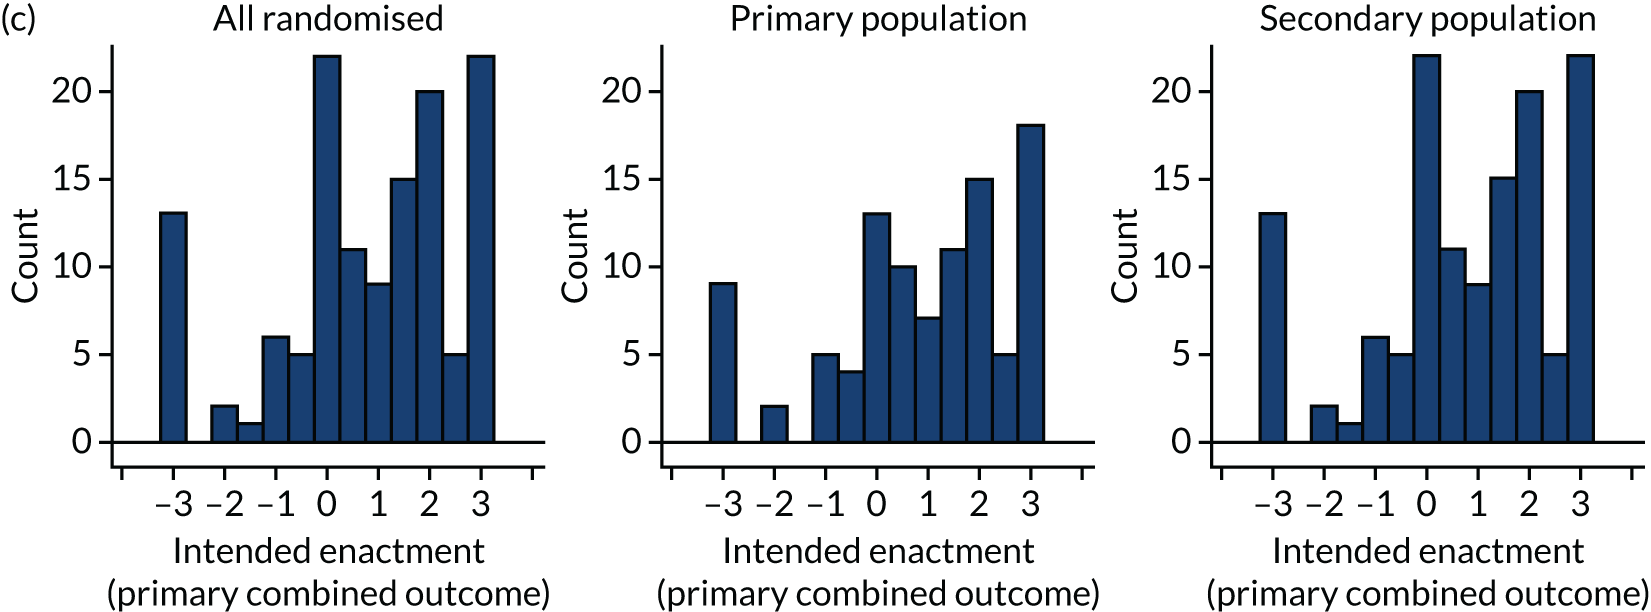
FIGURE 49.
Primary outcome by modifications across populations: (a) all randomised, (b) primary population and (c) secondary population.
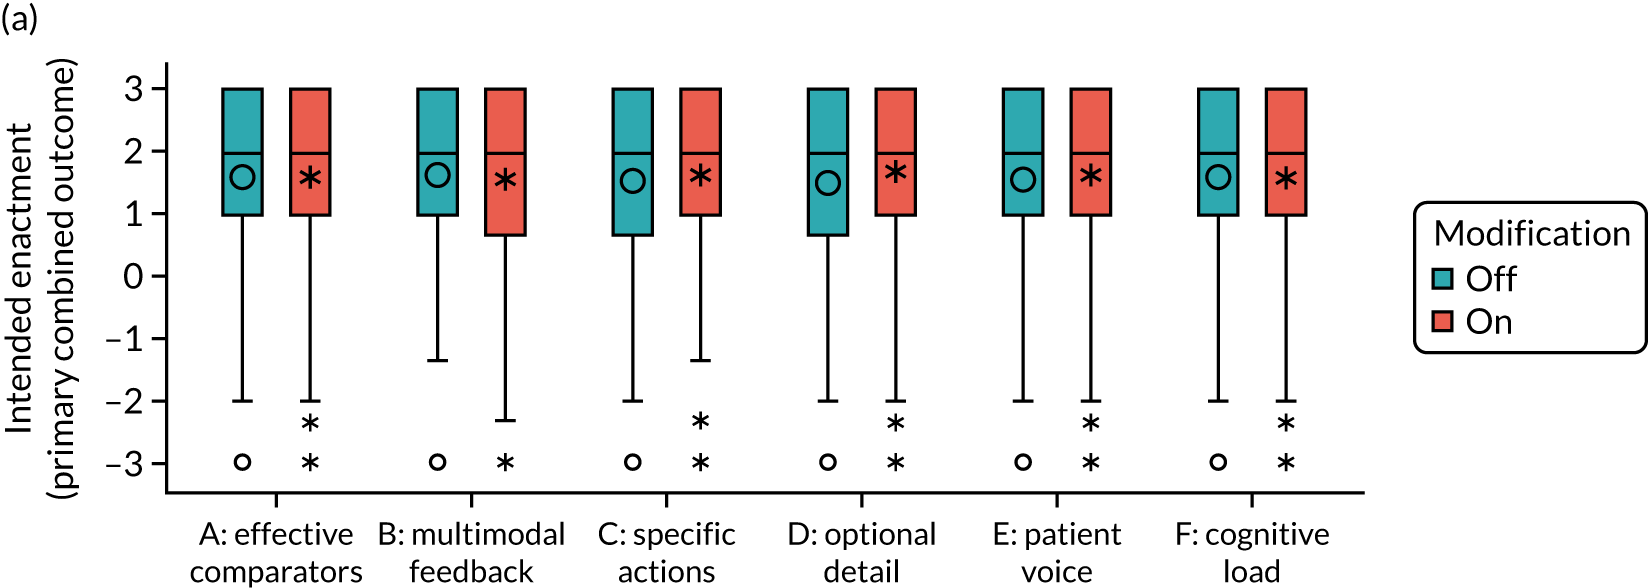
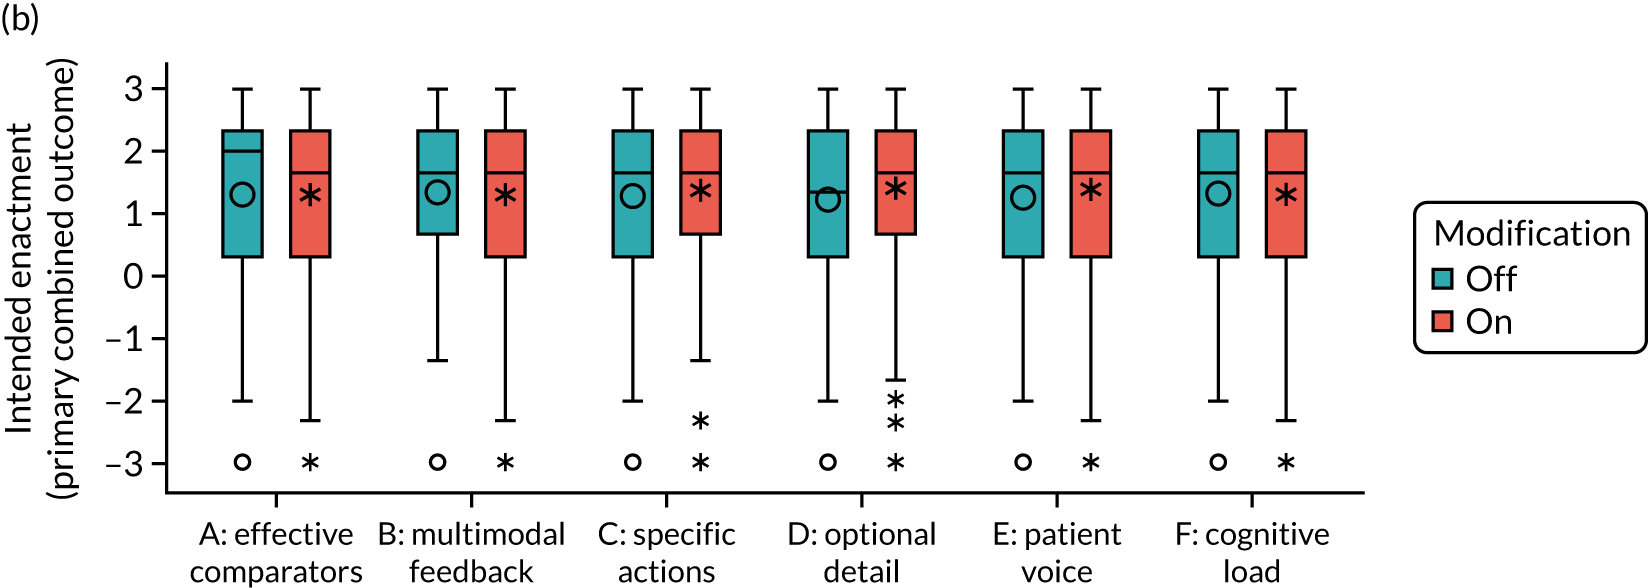
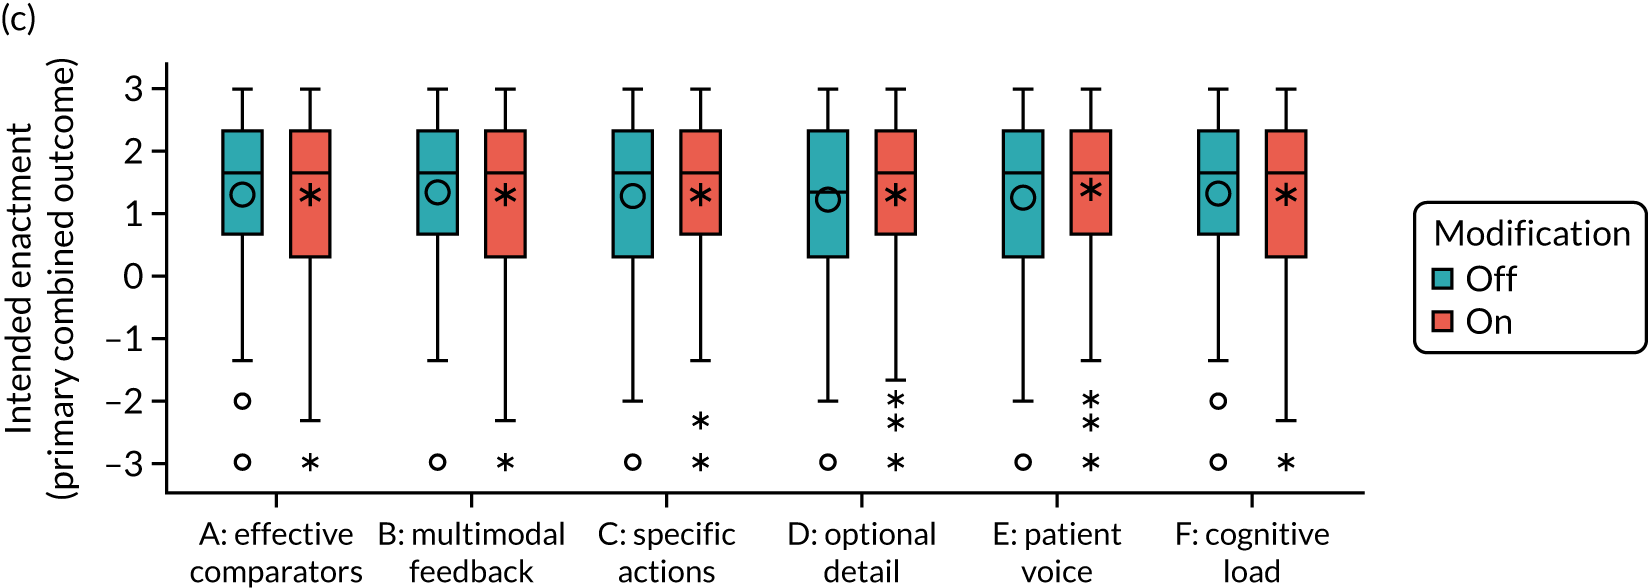
Secondary modified intention-to-treat population: predicted primary outcome
FIGURE 50.
Audit and role.
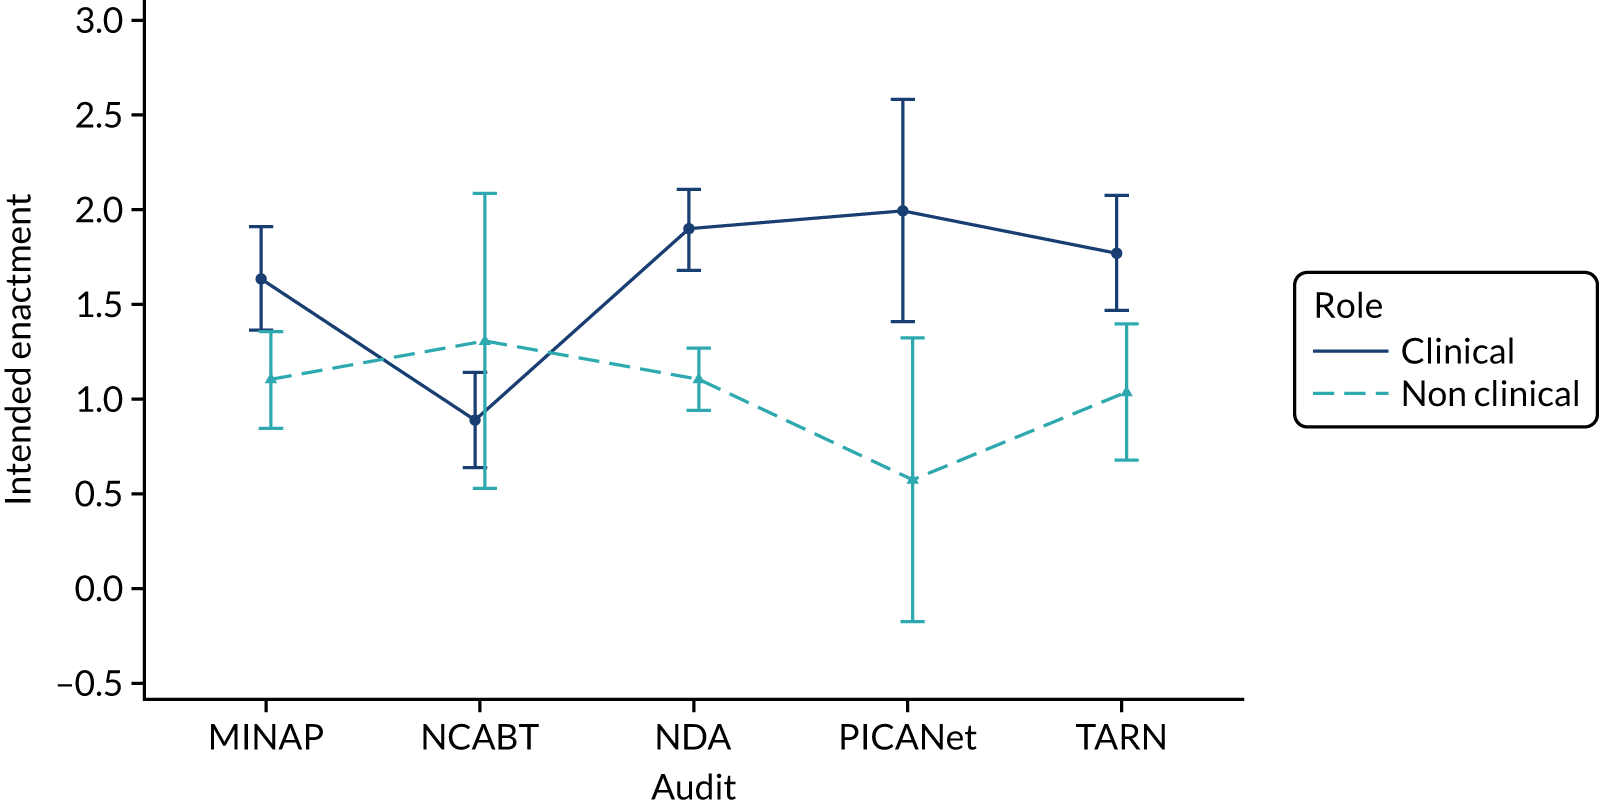
FIGURE 51.
Effective comparators (A) and audit.
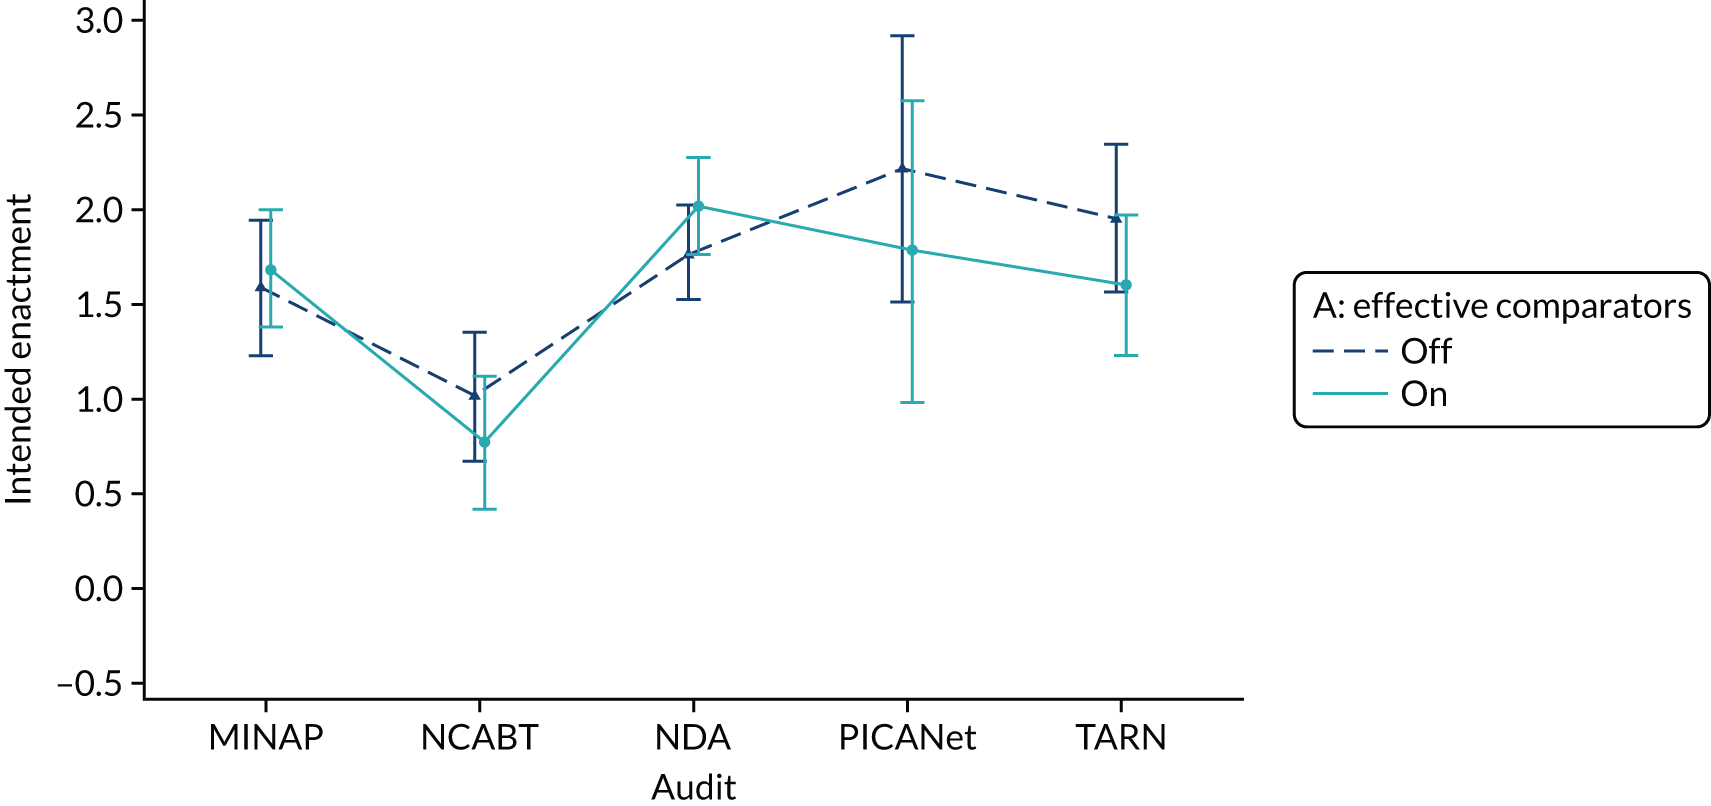
FIGURE 52.
Optional detail and cognitive load (D*F) accounting for interactions with role: (a) clinical; and (b) non-clinical.
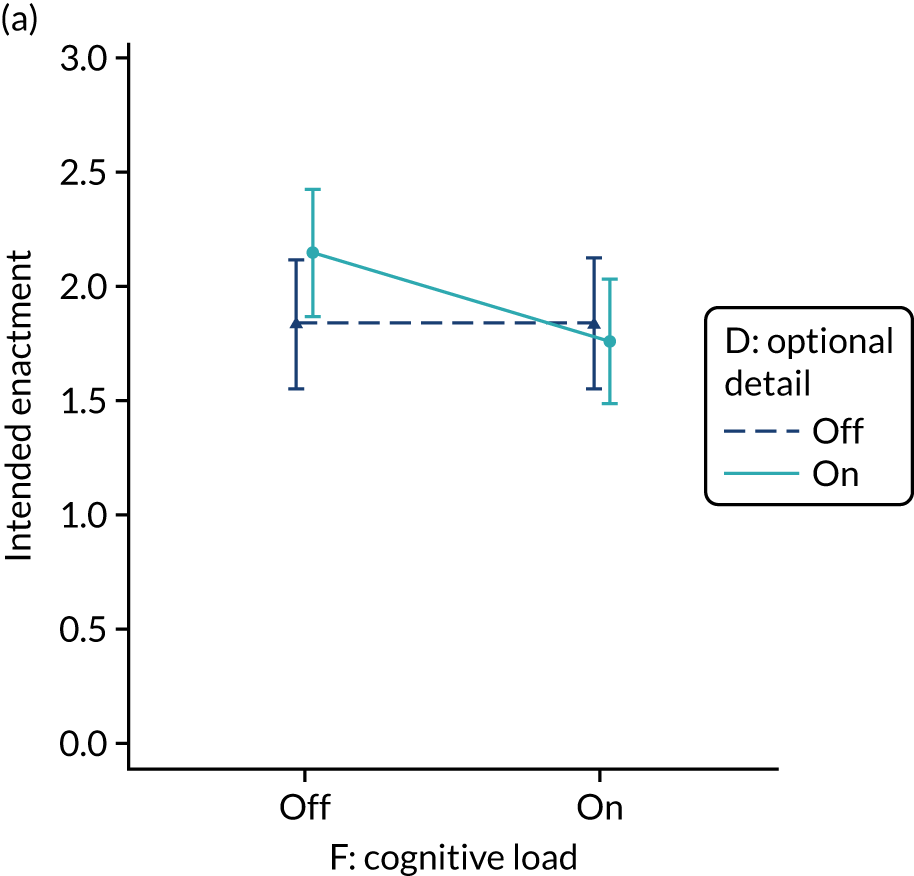
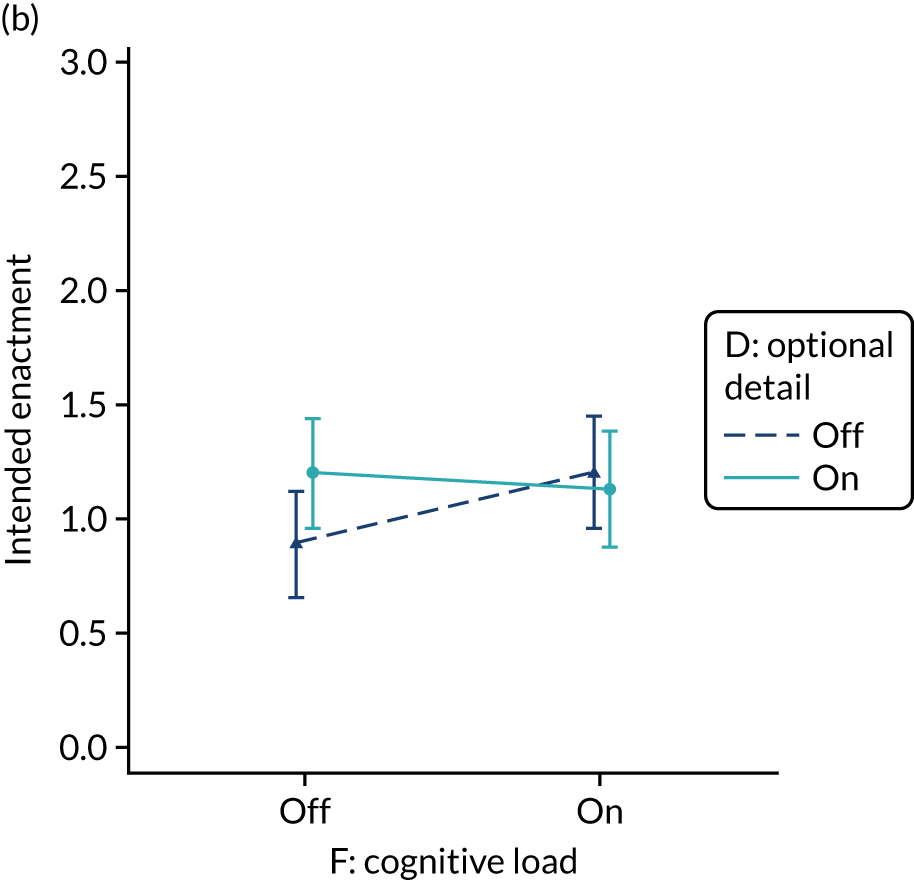
FIGURE 53.
Multimodal feedback and optional detail (B*D) accounting for interactions with role: (a) clinical and (b) non-clinical.
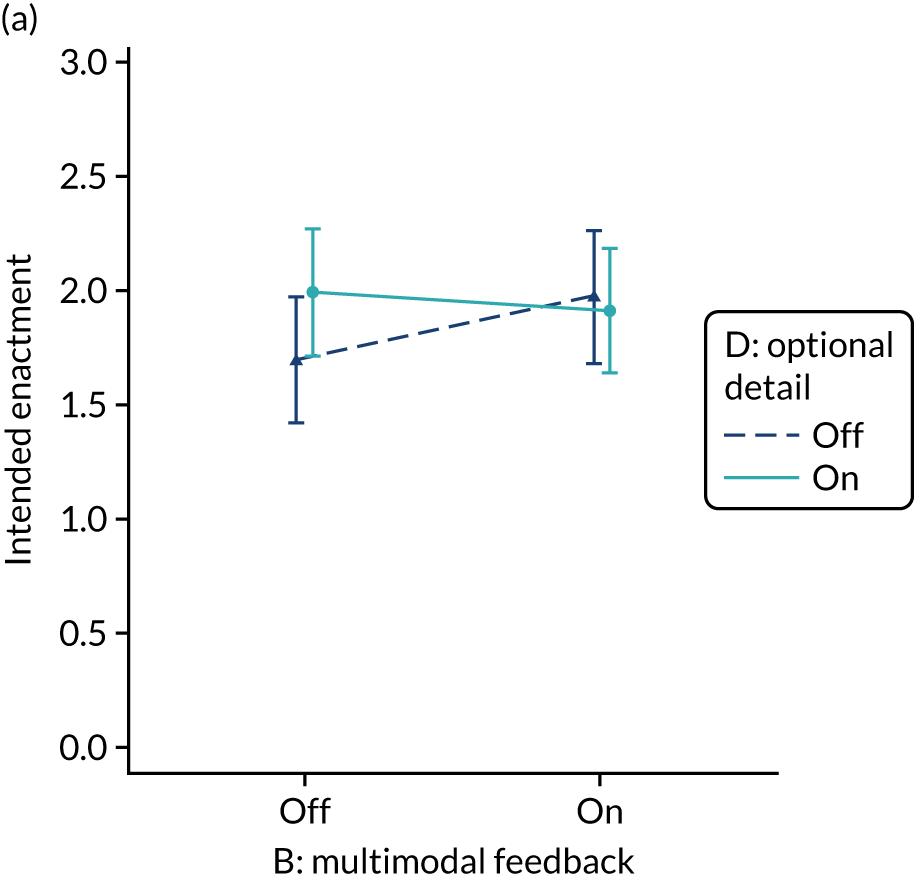
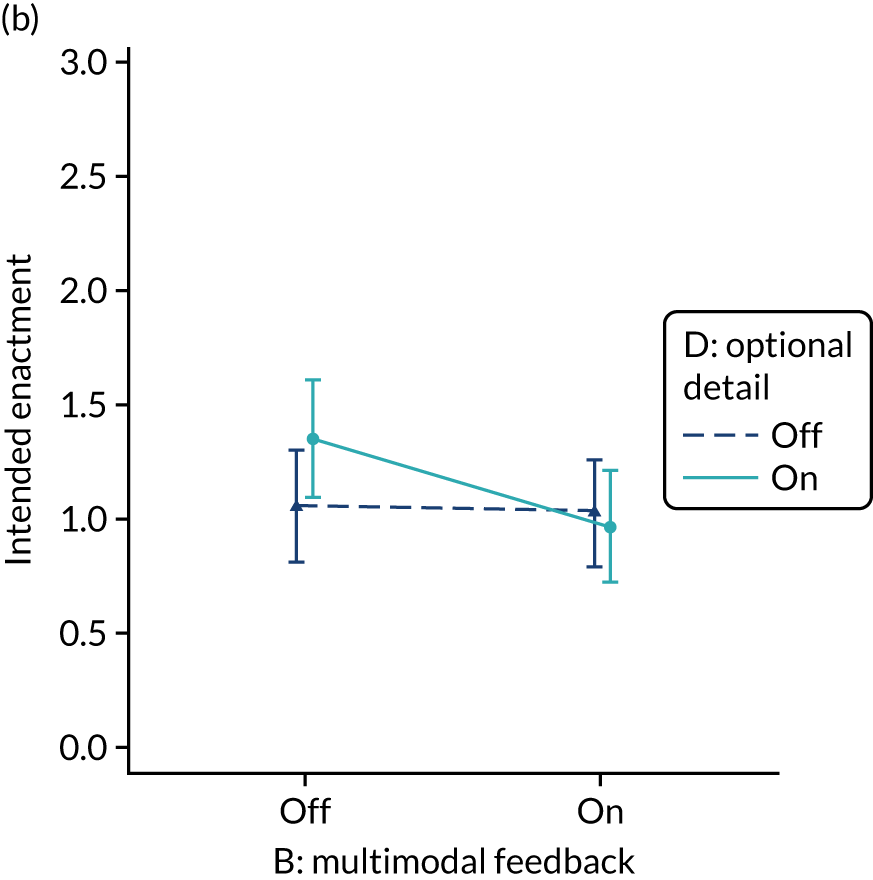
FIGURE 54.
Specific actions and cognitive load (C*F).
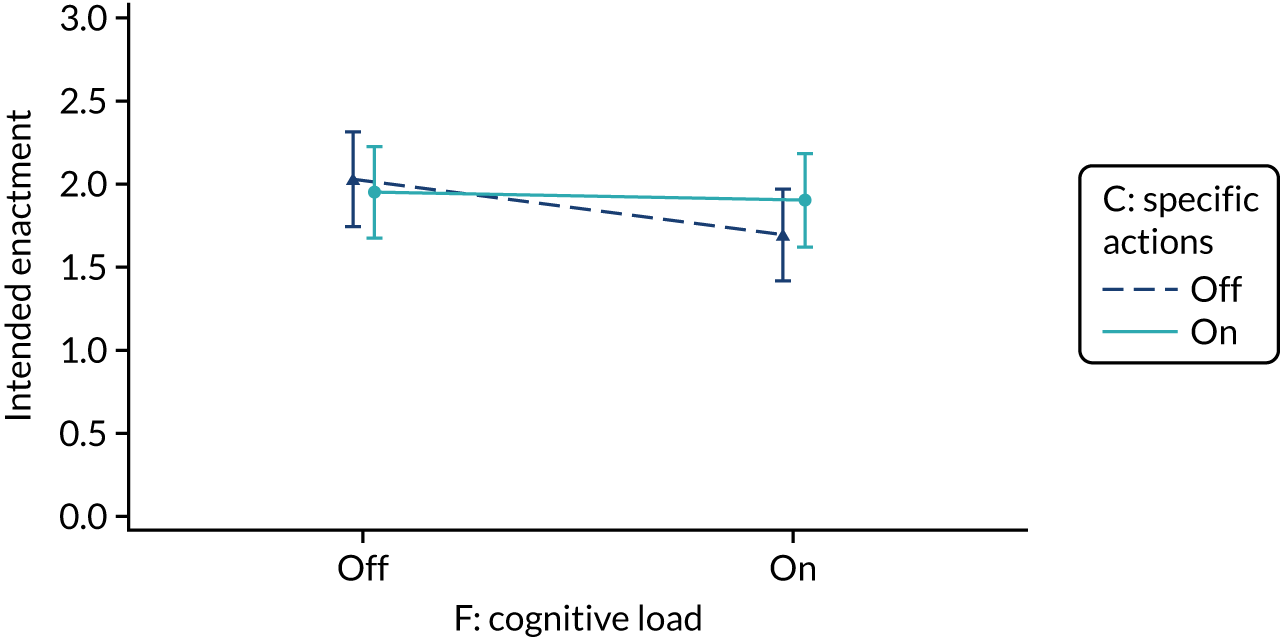
FIGURE 55.
Boxplot of user engagement – clicks on audit report by (a) modification and (b) audit. Five extreme outliers are not displayed.
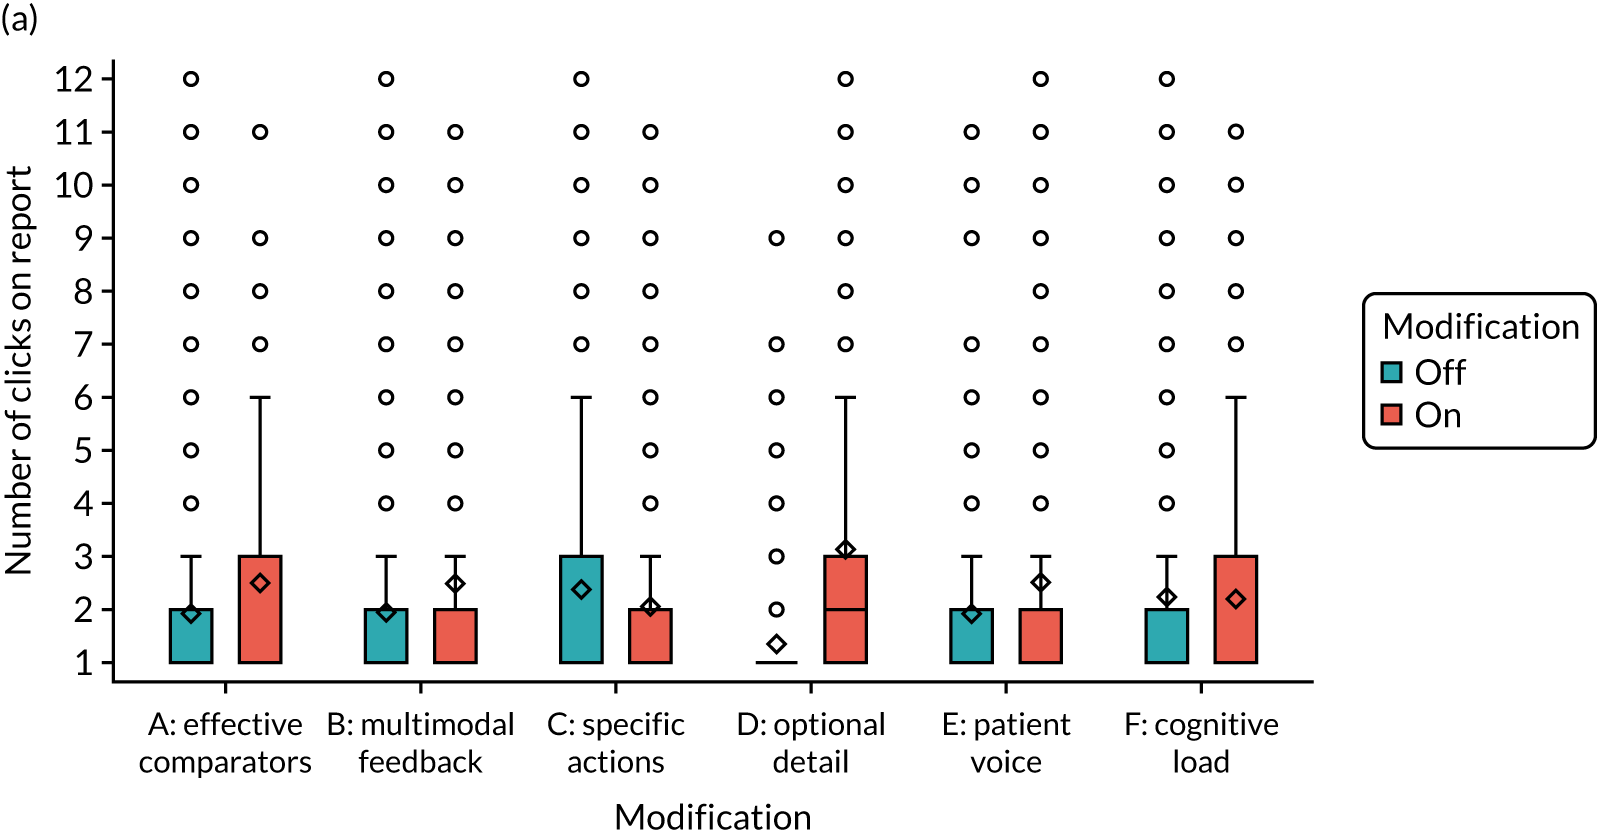
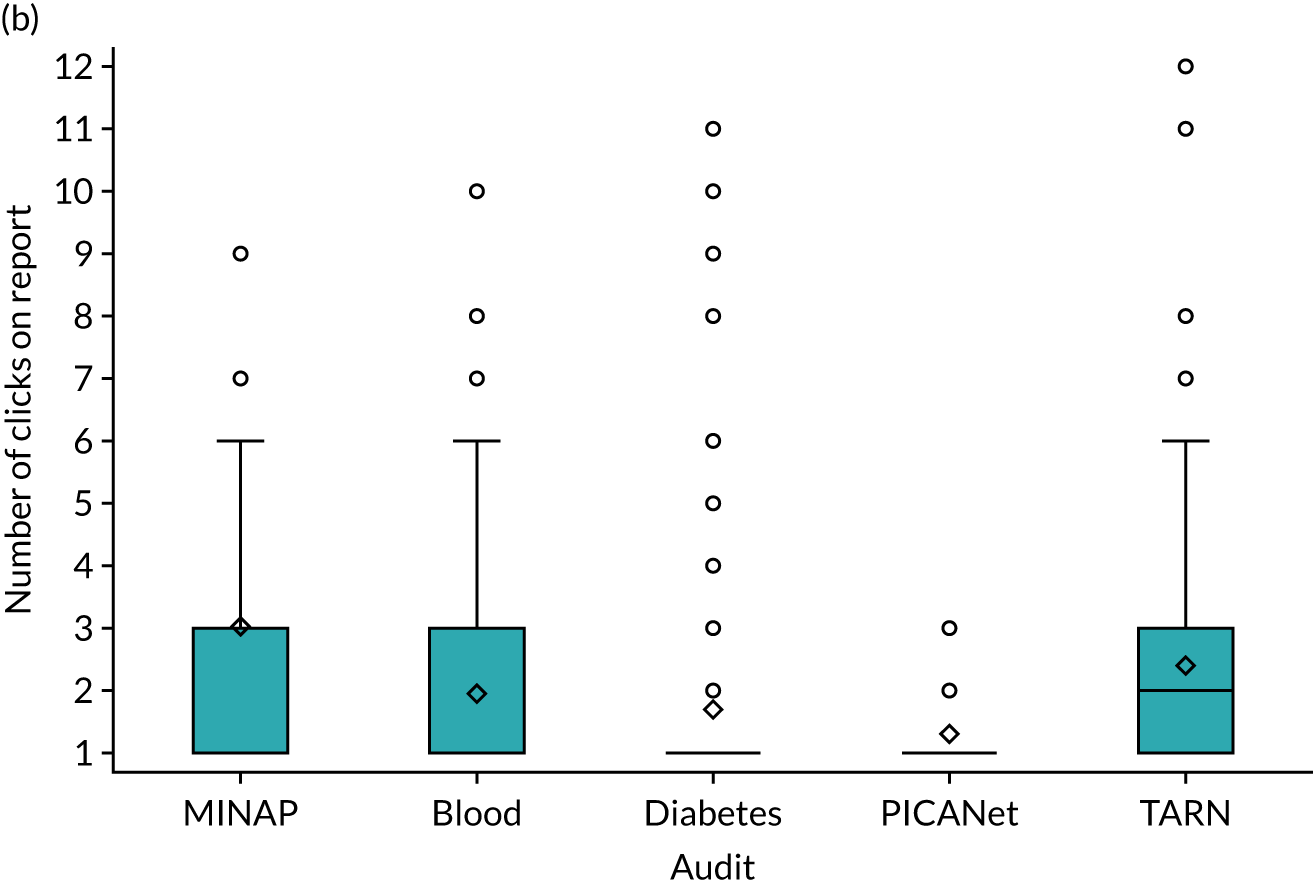
Appendix 8 Screenshots of the online experiment admin dashboard
This appendix contains material reproduced with permission from City, University of London © 2018–2019.
Trial runs
Trial responses
Admin users
Combinations
Study limits 1
Study limits 2
Modification content 1
Modification content 2
Appendix 9 Table of CP-FIT processes shared with participants prior to interview (objective 2)
| Feedback cycle process | Example question to ask of the audit | Comments |
|---|---|---|
| Goal setting | Are the standards of clinical performance clear? | |
| Data collection | Who does the data collection? | |
| Feedback | What feedback is communicated? | |
| Interaction | How is the feedback received? | |
| Perception | How is the feedback understood? | |
| Verification | Can the recipients interrogate the data? | |
| Acceptance | Is there acceptance of the feedback? | |
| Intention | Does the feedback elicit a planned response? | |
| Behaviour | Is the behavioural response at patient or organisation level? | |
| Clinical performance improvement | Are there positive changes to patient care as a result of feedback? | |
| Unintended consequences | Are there any unintended consequences as a result of the feedback? |
Appendix 10 Summaries of NDA and TARN provided to participants ahead of interview (objective 2)
Appendix 11 Interview topic guide (objective 3)
List of abbreviations
- A&F
- audit and feedback
- AFFINITIE
- Audit and feedback interventions to increase evidence-based transfusion practice
- AIC
- Akaike information criterion
- BIC
- Bayesian information criterion
- CCG
- Clinical Commissioning Group
- CI
- confidence interval
- CP-FIT
- Clinical Performance Feedback Intervention Theory
- ENACT
- Enhancing NAtional Clinical audiT and feedback
- GP
- general practitioner
- HbA1c
- haemoglobin A1c
- HQIP
- Healthcare Quality Improvement Partnership
- HSCNI
- Health and Social Care Northern Ireland
- HTML
- Hypertext Markup Language
- IQR
- interquartile range
- ITT
- intention to treat
- MINAP
- Myocardial Ischaemia National Audit Project
- MOST
- Multiphase Optimisation Strategy
- NCA
- National Clinical Audit
- NCABT
- National Comparative Audit of Blood Transfusion
- NDA
- National Diabetes Audit
- NICE
- National Institute for Health and Care Excellence
- PICANet
- Paediatric Intensive Care Network
- PPI
- patient and public involvement
- QOF
- Quality and Outcomes Framework
- SD
- standard deviation
- SUS
- System Usability Scale
- TARN
- Trauma Audit & Research Network
- TDF
- theoretical domains framework
- UCD
- user-centred design
- UMUX-LITE
- Usability Metric for User Experience
- WEQ
- website evaluation questionnaire
