Notes
Article history
This themed issue of the Health Technology Assessment journal series contains a collection of research commissioned by the NIHR as part of the Department of Health’s (DH) response to the H1N1 swine flu pandemic. The NIHR through the NIHR Evaluation Trials and Studies Coordinating Centre (NETSCC) commissioned a number of research projects looking into the treatment and management of H1N1 influenza. NETSCC managed the pandemic flu research over a very short timescale in two ways. Firstly, it responded to urgent national research priority areas identified by the Scientific Advisory Group in Emergencies (SAGE). Secondly, a call for research proposals to inform policy and patient care in the current influenza pandemic was issued in June 2009. All research proposals went through a process of academic peer review by clinicians and methodologists as well as being reviewed by a specially convened NIHR Flu Commissioning Board.
Declared competing interests of authors
JEE has received consultancy fees from GlaxoSmithKline and performed paid work for the Department of Health, England. KGN has received H5 avian influenza vaccines from Novartis and H1N1 pandemic influenza vaccines from GlaxoSmithKline and Baxter to facilitate MRC- and NIHR-funded trials. In addition, he has received consultancy fees from Novartis and GlaxoSmithKline and lecture fees from Baxter. A colleague of KGN at the University Hospitals of Leicester NHS Trust was principal investigator and recipient of research funding from Roche on antiviral resistance, and from Novartis on pandemic H1N1 vaccines. JSNVT has received funding to attend influenza-related meetings, lecture and consultancy fees and research funding from several influenza antiviral drug and vaccine manufacturers, including GlaxoSmithKline and Hoffmann La Roche. He is a former employee of SmithKline Beecham p.l.c. (now GlaxoSmithKline), Roche Products Ltd and Sanofi Pasteur MSD.
Permissions
Copyright statement
© 2010 Queen’s Printer and Controller of HMSO. This journal is a member of and subscribes to the principles of the Committee on Publication Ethics (COPE) (http://www.publicationethics.org/). This journal may be freely reproduced for the purposes of private research and study and may be included in professional journals provided that suitable acknowledgement is made and the reproduction is not associated with any form of advertising. Applications for commercial reproduction should be addressed to: NETSCC, Health Technology Assessment, Alpha House, University of Southampton Science Park, Southampton SO16 7NS, UK.
2010 Queen’s Printer and Controller of HMSO
Chapter 1 Introduction
As pandemic mitigation strategies have been developed over recent years it has become very clear that influenza transmission is one area that is poorly understood and hotly debated. Distinguishing the relative importance of the various modes of transmission (Box 1) is critical for the development of infection control precautions in health-care settings and in the home.
Airborne transmission has generally been used to refer to infections that spread over long distances through particles in the air, for example tuberculosis. Only bioaerosols (aerosols that contain living organisms) suspended in the air can travel over long distances but some confusion can arise because:
-
droplets could also be considered to be airborne, although only for a short period of time and over short distances
-
bioaerosols can transmit infection over short distances as well as long; in fact, because bioaerosols are more concentrated nearer their source, they are more likely to transmit over short distances than long
Because of this confusion, we prefer the terms respiratory and contact transmission to ‘airborne transmission’ when discussing influenza.
Respiratory transmission can include:
-
Bioaerosol transmission Bioaerosols are particles typically < 5 µm in diameter, which carry microorganisms and are capable of both remaining suspended for long periods and travelling distances greater than 6 ft. They can be generated by coughing, talking and even breathing and may transmit infection on being inhaled into the respiratory tract (reviewed by Tellier1)
-
Droplet transmission Respiratory droplets are larger particles (≥ 20 µm) that fall out of circulation typically within 3–4 ft. They are generated by coughing and sneezing, and transmit infection on coming into contact with the respiratory tract, often the mucous membranes of the nose and mouth (reviewed by Nicas et al. 31)
It should be recognised that there is no absolute cut-off between aerosols and droplets; particles lie on a continuum, with larger particles tending towards droplet behaviour
Contact transmission concerns physical contact with respiratory secretions, for example hands coming into contact with contaminated fomites or person-to-person contact, such as a handshake. We recognise that traditionally this type of contact has been referred to as ‘indirect contact’ and that droplets have been regarded as a form of direct contact transmission, but we find the term ‘contact transmission’ more intuitive
If contact transmission is dominant then hand hygiene becomes the most critical intervention. However, if respiratory droplet transmission is significant, surgical face masks that provide a barrier against droplets may be important, and the safe distance away from an infected person without a mask might be as close as 4 feet (ft), because droplets fall out of the air quickly and do not travel far. At present, opinions are sharply divided on the importance of bioaerosol transmission. 1,2 Tellier1 in particular, argues that the potential of short-range bioaerosol transmission has largely been ignored. At present, the UK recommends droplet precautions as opposed to bioaerosol precautions (surgical masks rather than respirators) for most forms of contact with patients with pandemic influenza,3 based on the current balance of limited evidence; however, this is contested by some frontline health-care workers who believe that these safeguards are inadequate, and there is little evidence with which to reassure them.
In parallel, the dynamics of viral shedding in relation to symptom onset and severity are important factors, highly relevant to estimates of the period of infectivity and to therapeutic management. In all previous research on influenza virus excretion, shedding has been determined by measurement of the quantity of virus recoverable from the patient’s nasopharynx, i.e. virus has been recovered by a deliberately performed invasive technique. These so called ‘viral shedding’ studies measure virus shed from infected cells; they do not actually measure virus that is deposited into the touched or respired environment; i.e. they do not define environmental contamination and the hazard posed to others. While such data are useful, if they could be linked to near-patient environmental sampling, estimates of the extent to which infectious virus is deposited on to surfaces and into the air in the patient’s immediate vicinity could be made.
Background data
It is well established that viral titres in nasopharyngeal samples taken from adults are proportional to symptom severity and decline steadily from symptom onset. 4–7 Studies in the community of patients who are infected with influenza A show that the mean duration of viral shedding [as measured by polymerase chain reaction (PCR)] for seasonal influenza A viruses is 5–6 days from symptom onset6,7 compared with culture methods that are normally negative by day 6. 4,5 It is also well documented that children, patients with chronic illnesses and the immunocompromised can shed live virus for longer periods. 8–11 Published data are now available that describe viral shedding from patients with pandemic H1N1 virus infection. Shedding (as determined by nasal sampling) detectable by PCR lasts for approximately 6 days,12–15 but culture-positive specimens, i.e. detecting viable virus, appear rare after 5 days of illness. 15,16
While PCR is almost certainly more sensitive because it detects both viable and non-viable virus, its interpretation is far more problematic because it is not possible to determine the presence of viable (transmissible) virus from this technique; it can be used only to illustrate the potential for viable virus to be present. However, there have also been difficulties in deciphering studies looking at live virus because of the range of techniques used for detection (cell lines, animal models and human subjects) and variation in sensitivities between, and even within, such methods, for example a human infectious dose is likely to differ from a tissue culture infectious dose (TCID).
Fomites
A role for fomites, including surfaces, in the transmission of influenza A appears widely accepted but limited data are available to directly support the possibility of contact transmission of influenza. In contrast, studies of rhinovirus17 and respiratory syncitial virus (RSV)18 have shown contact transmission to be significant. Furthermore, there is a paucity of scientific data on virus survival on fomites. An experimental study of influenza virus survival on a range of porous and non-porous surfaces is often cited, but was conducted over 25 years ago. 19 In this study both influenza A (H1N1) and B viruses could be cultured from experimentally contaminated, non-porous surfaces, such as steel and plastic, for between 24 and 48 hours. However, they survived for < 12 hours on porous materials such as cloth, paper and tissues. Viable virus could be transferred from non-porous surfaces to hands for 24 hours, and from tissues to hands for 15 minutes, but live viruses could be recovered from hands only within 5 minutes of their transfer. Banknotes have been experimentally contaminated with influenza A viruses, and live virus has been shown to be present for up to 3 days, although this period of time was dependent on the concentration of inocula. Interestingly, the presence of respiratory mucus significantly increased survival times. 20 Other studies have looked at fomite contamination in the environment of individuals with acute respiratory infections (ARIs), but they have either not looked for or not found viable influenza virus. 21,22
Air
If influenza virus can transmit via bioaerosols then we would expect to be able to detect virus in such aerosols, and we might expect to find evidence of long-range transmission of infection. Studies performed over 40 years ago showed that artificially aerosolised influenza could be recovered (by using infection in animals as a detection method) for up to 24 hours after release,23,24 and that aerosolised virus is able to infect humans. 25 More recently, influenza virus was detected by PCR in aerosol samples taken from medical facilities. 26,27 Despite the above, the detection of live virus in aerosols, generated by humans has not been demonstrated before. In addition, there is a striking absence of robust epidemiological proof for the long-range transmission of influenza. Studies that have reported such an occurrence28,29 are confounded by the fact that droplet and contact transmission cannot be excluded. However, it must also be said that literature claiming that bioaerosols are unlikely to play a significant role have often ignored the potential for short-range bioaerosol transmission. 2,30
Assimilating the available evidence leads us to conclude that infectious virus is not typically released from adults after 5 days of illness (slightly longer in children), and that little is known about deposition patterns and persistence of virus released into the environment or its ability to infect new hosts. The generation of information about the presence of viable influenza virus in the environment is fundamental to our understanding of the routes and mechanisms of transmission. This study was therefore conducted to collect data on conventional virus shedding and environmental contamination (fomites and air), and to investigate the relationships between them.
Chapter 2 Methods
This multicentre, prospective, observational descriptive cohort study recruited subjects between 14 September 2009 and 25 January 2010, in accordance with the principles of the Declaration of Helsinki and UK regulatory requirements. It was approved by Leicestershire, Northamptonshire & Rutland Research Ethics Committee 1 (09/H0406/94).
Research objectives
The primary objectives were to correlate the amount of virus detected in a patient’s nose with:
-
that recovered from the environment around them
-
symptom duration, and
-
symptom severity.
Secondary objectives were to describe virus shedding and duration according to important patient subgroups: adults versus children, and those with mild illness (community patients) versus those with more severe disease (hospitalised patients). An additional secondary objective concerned the environmental deposition of virus in association with aerosol-generating procedures.
A number of ‘policy’ objectives were also stated, which included: (1) ‘safety distances’ around patients with pandemic and seasonal influenza; (2) appropriate use of respiratory personal protective equipment (PPE) and infection control practices for pandemic and seasonal influenza, according to patient type, illness severity and time since symptom onset; and (3) antiviral treatment duration for patients with pandemic influenza. Due to a lack of data, these points cannot be adequately addressed and are therefore not discussed further in this report.
Participants
Subjects were recruited from the following groups:
-
adults in hospital (AH)
-
children in hospital (CH): age range 1 month–16 years
-
adults in the community (AC)
-
children in the community (CC): age range 1 month–16 years.
Recruiting centres were Nottingham University Hospitals NHS Trust (AH + CH), Nottingham City Primary Care Trust (PCT) (AC + CC), Nottingham County PCT (AC + CC), Leicester University Hospitals NHS Trust (AH) and Sheffield Teaching Hospitals NHS Trust (AH). [Note: the designation AH and CH denote that the patient (adult or child, respectively) was enrolled during hospital admission. However, subjects discharged from hospital before the end of follow-up were then seen in the community; so, while initial environmental specimens will have been taken in hospital, later ones will be from the subject’s home. No subjects initially enrolled in the community were subsequently admitted to hospital.]
Sampling frames
-
Hospital All cases of suspected pandemic H1N1 influenza identified to researchers by clinical care teams who had agreed to be approached by a researcher. Hospitals involved in recruitment were: Queens Medical Centre and City Hospital, Nottingham; Leicester Royal Infirmary; and Royal Hallamshire Hospital, Sheffield.
-
Community Individuals living in the Nottingham area, who had symptoms of pandemic H1N1 virus infection, received an invitation to take part in the research and had use of a telephone. Invitations were given by the following methods: local newspapers, posters sited in community areas, 3000 leaflets posted in the NG2 area, 15,000 letters given to parents via schools, and 3000 invitations given out at antiviral collection points in areas covered by Nottingham City and Nottinghamshire County PCTs.
A formal sampling fraction was not used to identify cases.
Eligibility criteria
Subjects were eligible to take part if they fulfilled our definition of influenza-like illness (ILI):
-
fever (or recent history of fever) plus any one of cough, sore throat, runny nose, fatigue or headache
or
-
any two of cough, sore throat, runny nose, fatigue or headache.
Exclusions
Subjects were excluded if they: had experienced illness for > 48 hours (community cases) or > 96 hours (hospital cases); were PCR-negative for pandemic H1N1 (as part of NHS care); had taken part in influenza research involving an investigational medicinal product within the last 3 months (including vaccination). See Appendix 4, Eligibility checklist.
Enrolment
Informed consent was obtained and an influenza rapid antigen test (Quidel QuickVue® Influenza A+B test) was performed on a nasal swab. A positive rapid antigen test was initially an inclusion criterion, but it was abandoned as an entry requirement after 2 weeks because of perceived low sensitivity (see Discussion, below).
A subject was defined as a case if:
-
he/she met our criteria for ILI, and
-
tested PCR-positive on a nasal swab for pandemic H1N1.
It had not been our intention to recruit and follow up patients who were pandemic H1N1-negative, but this did occur. Data on these subjects are presented below (see Results).
Study procedures
Adult subjects were followed for up to 10 days from the start of symptoms and children < 13 years of age were followed for up to 12 days. In addition to collecting initial symptom data to confirm a subject’s eligibility, daily records of were taken of symptoms, temperature readings, medications, bioaerosol-generating procedures (if hospitalised), room temperature and humidity. A symptom diary was completed by each subject on a daily basis; symptoms were given a severity score on a scale of 0–3 (see Appendix 1, Symptom diary card). The following samples were collected:
-
Daily nasal swabs A dry cotton swab with a polystyrene shaft (FB57835, Fisherbrand) was passed around one nostril in a circular motion three times and then immersed in viral transport medium (VTM).
-
Surface swabs Samples were taken approximately every other day during the period of follow-up. Three surfaces were swabbed in hospital rooms: patient table; Patientline® console or nurse call button and window sill. In the home, samples were taken from the dining table, kettle handle, TV remote control, bedside table, bathroom tap and bathroom door handle. Cotton swabs with polystyrene shafts (FB57835) were moistened with VTM and then rubbed across a maximum area of 4 × 5 cm2 in three different directions, applying even pressure. The same part of any fomite was swabbed each day. This sampling method was validated during a previous study (B Killingley, University of Nottingham, May 2010, personal communication). In addition to using swabs, the use of sponges was trialled to sample the patient or bedside tables. The sponges (TS/15-B:PBS, Technical Service Consultants) were 50 cm2 in size, sterile, and dosed with 10 ml of a neutralising buffer. They were wiped over a 4 × 5-cm2 area (a different area to that sampled by swab) and then sealed in a sterile medical grade plastic bag. No specific cleaning instructions were given to households, and hospital cleaning continued as normal during follow-up of any subjects. If other household members became ill during the period of follow-up, sampling of the original participant continued, and the age and symptoms of any potential secondary cases were recorded.
Swabs (in VTM) and sponges were kept on ‘wet’ ice for no longer than 3 hours before being frozen at –80°C.
Air particles were collected using a National Institute for Occupational Safety and Health (NIOSH) two-stage cyclone bioaerosol sampler, which has been validated for use with influenza. 26 The first stage of the sampler has a 3-mm inlet, a 6-mm outlet and a disposable 15-ml collection tube (35–2096, Falcon). The second stage has a 1.3-mm inlet, a 2.5-mm outlet and a disposable 1.5-ml tube (02 681–339, Fisher Scientific). The samples then pass through a 37-mm polytetrafluoroethylene (PTFE) filter with 2-mm pores (225–27–07, SKC). At 3.5 l/min, the first stage will collect particles with a diameter > 4 µm, the second stage collects particles with a diameter of 1–4 µm, and the filter collects particles with a diameter of < 1 µm. The sampler conforms to the American Conference of Governmental Industrial Hygienists/International Organization for Standardization criteria for respirable particle sampling. The flow rate through each sampler was set with a flow calibrator (Model 4143, TSI) before use. Samplers were mounted on tripods at a height of 150 cm, were placed at distances of either 3 ft or 7 ft from the subject, and ran for either 1, 2 or 3 hours. Not all subjects were stationary during the sampling period (though they were asked to remain in the same position if they could), so the distance from the subject to the sampler may have varied a little over time. Sampling was performed on just one follow-up day. After sampling, intact samplers were taken straight to a laboratory, where 750 µl of VTM was added to both stage-one and stage-two tubes, and the filter paper was immersed in a 15-ml tube, also containing 750 µl of VTM. These procedures were carried out in sterile conditions, under a microbiological safety hood. Samples were then stored at –80°C.
Laboratory methods
The following sample-processing ‘rules’ were instituted:
-
Nasal swabs from day 4 onwards were not tested if days 1–3 were all PCR-negative.
-
Culture was only performed on PCR-positive samples.
-
Environmental swabs were not processed if nasal swabs, taken on the three previous days from a case, were PCR-negative.
-
Sponges were tested on day 1 only.
Laboratory work was carried out at Health Protection Agency (HPA) and University of Cambridge virology laboratories at Addenbrooke’s Hospital, Cambridge, UK. Each sample was defrosted and split into six aliquots – three for PCR and three for culture – and then refrozen at –70°C. On the day of testing, the sponges were defrosted and the liquid removed by squeezing the sponge within its bag. The liquid was separated into aliquots for testing. PCR was performed once the RNA was extracted and samples for potential culture were refrozen at –80°C.
Polymerase chain reaction
Nucleic acid was extracted from the samples using the Qiagen Symphony SP extractor mini kits, including onboard lysis and a bacteriophage (MS2) as internal control. A novel influenza A H1N1 pentaplex assay was devised to detect virus genome in the samples. The assay was designed to detect novel H1N1 influenza A, seasonal H1 influenza A, seasonal H3 influenza A, influenza B, and the internal control, MS2. Details of the primers, probes and protocol used can be found in Appendix 6 (see PCR protocol). Reactions were carried out on a Rotorgen™ 6000 (Corbett Research) real-time DNA detection system. Viral load data were generated using the PCR assay and plasmids containing the gene target to create a standard curve, such that the concentration of genome present in each sample could be calculated.
Culture
Cultures were performed from the last day of nasal swab PCR positivity, for example if a swab was PCR positive on day 5, cultures were performed in the following order: day 5, 4, 3, 2 and 1. If a culture was positive on any given day then an assumption was made that previous days would also have been culture-positive and no further testing was done. Pandemic H1N1 did not form plaques readily and gave only a weak cytopathic effect, the latter meant that the TCID of 50 was difficult to calculate. Consequently, immunofluorescence to detect the influenza A nucleoprotein was used to demonstrate the presence of live replicating virus in the nuclei of cultured nasopharyngeal cells. See Appendix 6 (Culture protocol) for further details.
Genomic sequencing was performed by Geneservice™.
Outcome measures
-
Virus shedding (nose swab) and environmental deposition (fomites and air) as measured by PCR and virus culture techniques Laboratory confirmation was defined as a positive result of any specimen tested for pandemic H1N1 virus. The duration of viral shedding was defined as the time between symptom onset and the last day that a positive specimen was taken. Because patients were seldom recruited on the day symptoms began, an assumption has been made that they were shedding virus from the first day of symptoms to the last positive specimen.
-
Daily symptom scores Each symptom score within a category is summed to give an overall category score, for example cough – 2, shortness of breath – 1 = lower respiratory tract (LRT) score of 3.
-
upper respiratory tract (URT) score – stuffy nose, runny nose, sneezing, sore throat, sinus tenderness, earache
-
LRT score – cough, shortness of breath
-
systemic score – fatigue, myalgia, headache
-
total symptom score is the sum of URT, LRT and systemic symptom scores, plus a score for diarrhoea and a score for vomiting.
-
-
Medication logs If the day symptoms began is assigned as day 1, then we have assumed that patients received oseltamivir within 48 hours if they received it on or before day 3.
Statistical methods
The recruitment target was 100 subjects in total, comprising approximately 25 patients in each of the four groups. Statistical analysis was planned to examine correlations between virus shedding and virus deposition in the environment. Subgroup sizes of 25 [which allow pooling of data by adults or children (50 per group) or the whole population] gives high statistical power (> 80%) to detect correlations of > 0.55 in groups of size n = 25, 0.4 in groups of size n = 50, and 0.3 in groups of size n = 100. Viral shedding data is primarily descriptive, but it was important to be able to make formal statistical comparisons of the duration of shedding between adults and children. By pooling data into adults versus children (n = 50 per group), a difference of one day (two tailed-test) could be detected with power > 80%, provided that the coefficient of variation in shedding was ≤ 0.3. For larger differences, for example 2 or 3 days, the study was well powered to coefficients of variation up to 0.6.
A detailed descriptive analysis of the data is presented. The Student’s t-test was used to compare mean values. The Pearson’s product–moment correlation test was used to test associations between variables. Fisher’s exact test was used to test the significance of risk ratios.
Changes to protocol
Minor amendments to protocol 1.0:
-
application of corrected document version numbers to adult and parent/guardian consent forms
-
creation of a new study document: ‘letter to ward managers’
-
abandonment of a positive influenza rapid antigen test as an inclusion criterion.
Substantial amendment resulting in protocol version 1.1:
-
addition of stool sample collection for a substudy involving The Centre for Ecology & Hydrology. (Note, this substudy did not ultimately take place.)
-
clarification of the role of clinical teams in recruiting patients.
Minor amendment to protocol 1.1:
-
creation of new study documents: ‘letter to parent/guardians’, ‘study poster’ and ‘study leaflet’
-
extended study duration to 31 August 2010
-
extended virology testing on samples already collected.
Chapter 3 Results
One hundred and fifty subjects were screened between 14 September 2009 and 25 January 2010; 107 were ineligible, and 43 were enrolled and followed up. Reasons for exclusion at screening included: symptoms being present for too long (48%), influenza PCR test (as part of medical care)-negative (15%), declined to take part (9%). Pandemic H1N1 virus was detected in 19 subjects. The group of 24 pandemic-negative cases consisted of: RSV = 5 (all children); rhinovirus = 5; corona virus = 2; rhinovirus + corona virus = 1; NHS-pandemic H1N1 test-positive, study laboratory pandemic H1N1 test-negative = 2; unknown = 9. In the final analyses, one subject was excluded on the basis of having received pandemic H1N1 vaccine prior to enrolment, and three subjects were removed (all of whom tested negative for pandemic H1N1 according to the study laboratory); two because clinical (as part of medical care) and study pandemic H1N1 2009 PCR tests did not agree; and one because study documents were lost. Recruitment by group of the 39 remaining subjects was as follows: 9 AC, 12 AH, 15 CC and 3 CH (Figure 1).
FIGURE 1.
Participant flow diagram.

Of the remaining 39 subjects, 19 (49%) tested positive for pandemic H1N1 virus and 20 (51%) were negative. Follow-up of at least 8 days occurred in 16/19 positives and 12/20 negatives. The numbers enrolled, along with a demographic description of pandemic H1N1 cases, is shown in Table 1.
| AC | AH | CC | CH | Total (%) | |
|---|---|---|---|---|---|
| Enrolled | 9 | 14 | 16 | 4 | 43 |
| Excluded/removed from analyses | 0 | 2 | 1 | 1 | 4 |
| Pandemic H1N1-positive subjects | 2 | 6 | 9 | 2 | 19 (49) |
| Pandemic H1N1 subjects only | |||||
| Male sex (%) | 0 | 2 | 7 | 0 | 9 (47) |
| Median age (years), range | 24.5, 21–28 | 28.5, 19–34 | 6, 2–12 | 7.5, 0–15 | 12, 0–34 |
| Ethnic group | |||||
| White | 0 | 1 | 6 | 2 | 9 (47) |
| Black | 1 | 1 | 0 | 0 | 2(11) |
| Asian | 1 | 4 | 2 | 0 | 7 (37) |
| Mixed | 0 | 0 | 1 | 0 | 1 (5) |
| Mean time from symptom start to enrolment (days) | 1.5 | 2.2 | 1.3 | 2.5 | 1.7 |
Pandemic H1N1 cases
Of the 19 cases recruited, 10 (53%) were female, 11 (58%) were children and 11 (58%) were community cases. Seven subjects reported comorbidities and in six cases these were respiratory conditions. Table 2 lists the 19 cases of pandemic H1N1 recruited into the study and shows some of the key outcome measures for each. No recruited cases needed high-dependency care or died during follow-up.
| Subject | Age (years) | Sex (M/F) | Ethnicity | Comorbidity | Time from symptom onset to enrolment (days) | Peak total symptom score (day of follow-up) | Peak viral load (day of follow-up) | Duration of viral shedding by PCR (daysa) | Last day culture-positive by IFa | Day oseltamivir begunb |
|---|---|---|---|---|---|---|---|---|---|---|
| AC01 | 21 | F | Asian | Nil | 2 | 6 (1) | 4.2 × 10⁵ (1) | 6 | 5 | – |
| AC04 | 28 | F | Black | Asthma | 1 | 13 (1) | 1.3 × 10⁵ (1c) | 3 | 3 | – |
| AH01 | 19 | F | White | Cystic fibrosis | 2 | 13 (1) | 1.8 × 10⁵ (6) | 9 | – | 2 |
| AH03 | 27 | F | Asian | Nil | 2 | 28 (1) | 1.0 × 10⁶ (1) | 9 | 4 | 3 |
| AH04 | 30 | F | Asian | Nil | 2 | 17 (1) | 1.6 × 10⁷ (6) | 10 | 8 | 3 |
| AH05 | 24 | F | Asian | Nil | 3 | 12 (1) | N/A | 5 | – | – |
| AH07 | 34 | M | Asian | Nil | 2 | 20 (6) | N/A | 5 | 4 | N/A |
| AH08 | 33 | M | Black | Asthma | 2 | 25 (1) | 3.9 × 10⁴ (1c) | 3 | – | 2 |
| CC01 | 12 | M | Mixed | Asthma | 2 | 18 (1) | 1.8 × 10⁵ (1) | 5 | – | 2 |
| CC02 | 11 | M | Asian | Nil | 2 | 18 (1) | 3.4 × 10⁶ (1) | 8 | – | – |
| CC03 | 6 | M | Asian | Nil | 2 | 5 (2) | 4.7 × 10⁵ (1) | 6 | 4 | 4 |
| CC04 | 2 | M | White | Nil | 1 | 10 (1) | 3.5 × 10⁵ (3c) | 4 | – | – |
| CC05 | 9 | M | White | Asthma | 1 | 23 (1) | 2.1 × 10⁷ (1) | 7 | 3 | 2 |
| CC06 | 4 | M | White | Eczema | 0 | 8 (2) | 1.0 × 10⁵ (1) | 6 | 5 | – |
| CC07 | 3 | F | White | Nil | 1 | 8 (1) | 1.2 × 10³ (2) | 3 | 3 | 2 |
| CC14 | 6 | M | White | Nil | 1 | 12 (1) | 5.3 × 10⁹ (1) | 7 | 6 | – |
| CC15 | 2 | F | White | Nil | 2 | 10 (4) | 2.3 × 10¹¹ (3) | 8 | – | – |
| CH01 | 15 | F | White | Nil | 2 | 10 (1) | 3.3 × 10⁶ (1) | 6 | 6 | 3 |
| CH03 | 0 | F | White | Cystic fibrosis | 3 | 4 (1) | 3.1 × 10⁷ (1) | 7 | 5 | 4 |
Symptoms
The most frequently reported symptoms in our subjects with pandemic H1N1 were: stuffy nose (100%), runny nose (100%), cough (100%), fatigue (95%) and sneezing (89%) (Table 3). Fever was reported on the day illness began in 13/19 (68%) cases, and was measured as high (≥ 38°C) during follow-up in 7/19 (37%) of cases.
| No. of patients, n (%) | ||
|---|---|---|
| Pandemic H1N1 subjects (n = 19) | Others (n = 20) | |
| Fever (on day of onset)a | 13 (68) | 12 (57) |
| Runny nose | 19 (100) | 20 (95) |
| Sore throat | 12 (63) | 17 (81) |
| Cough | 19 (100) | 21 (100) |
| Shortness of breath | 14 (74) | 20 (95) |
| Stuffy nose | 19 (100) | 18 (86) |
| Sneezing | 17 (89) | 17 (81) |
| Earache | 3 (16) | 8 (38) |
| Sinus tenderness | 12 (63) | 15 (71) |
| Diarrhoea | 6 (32) | 8 (38) |
| Vomiting | 10 (53) | 10 (48) |
| Fatigue | 18 (95) | 20 (95) |
| Headache | 15 (79) | 12 (57) |
| Myalgia | 14 (74) | 15 (71) |
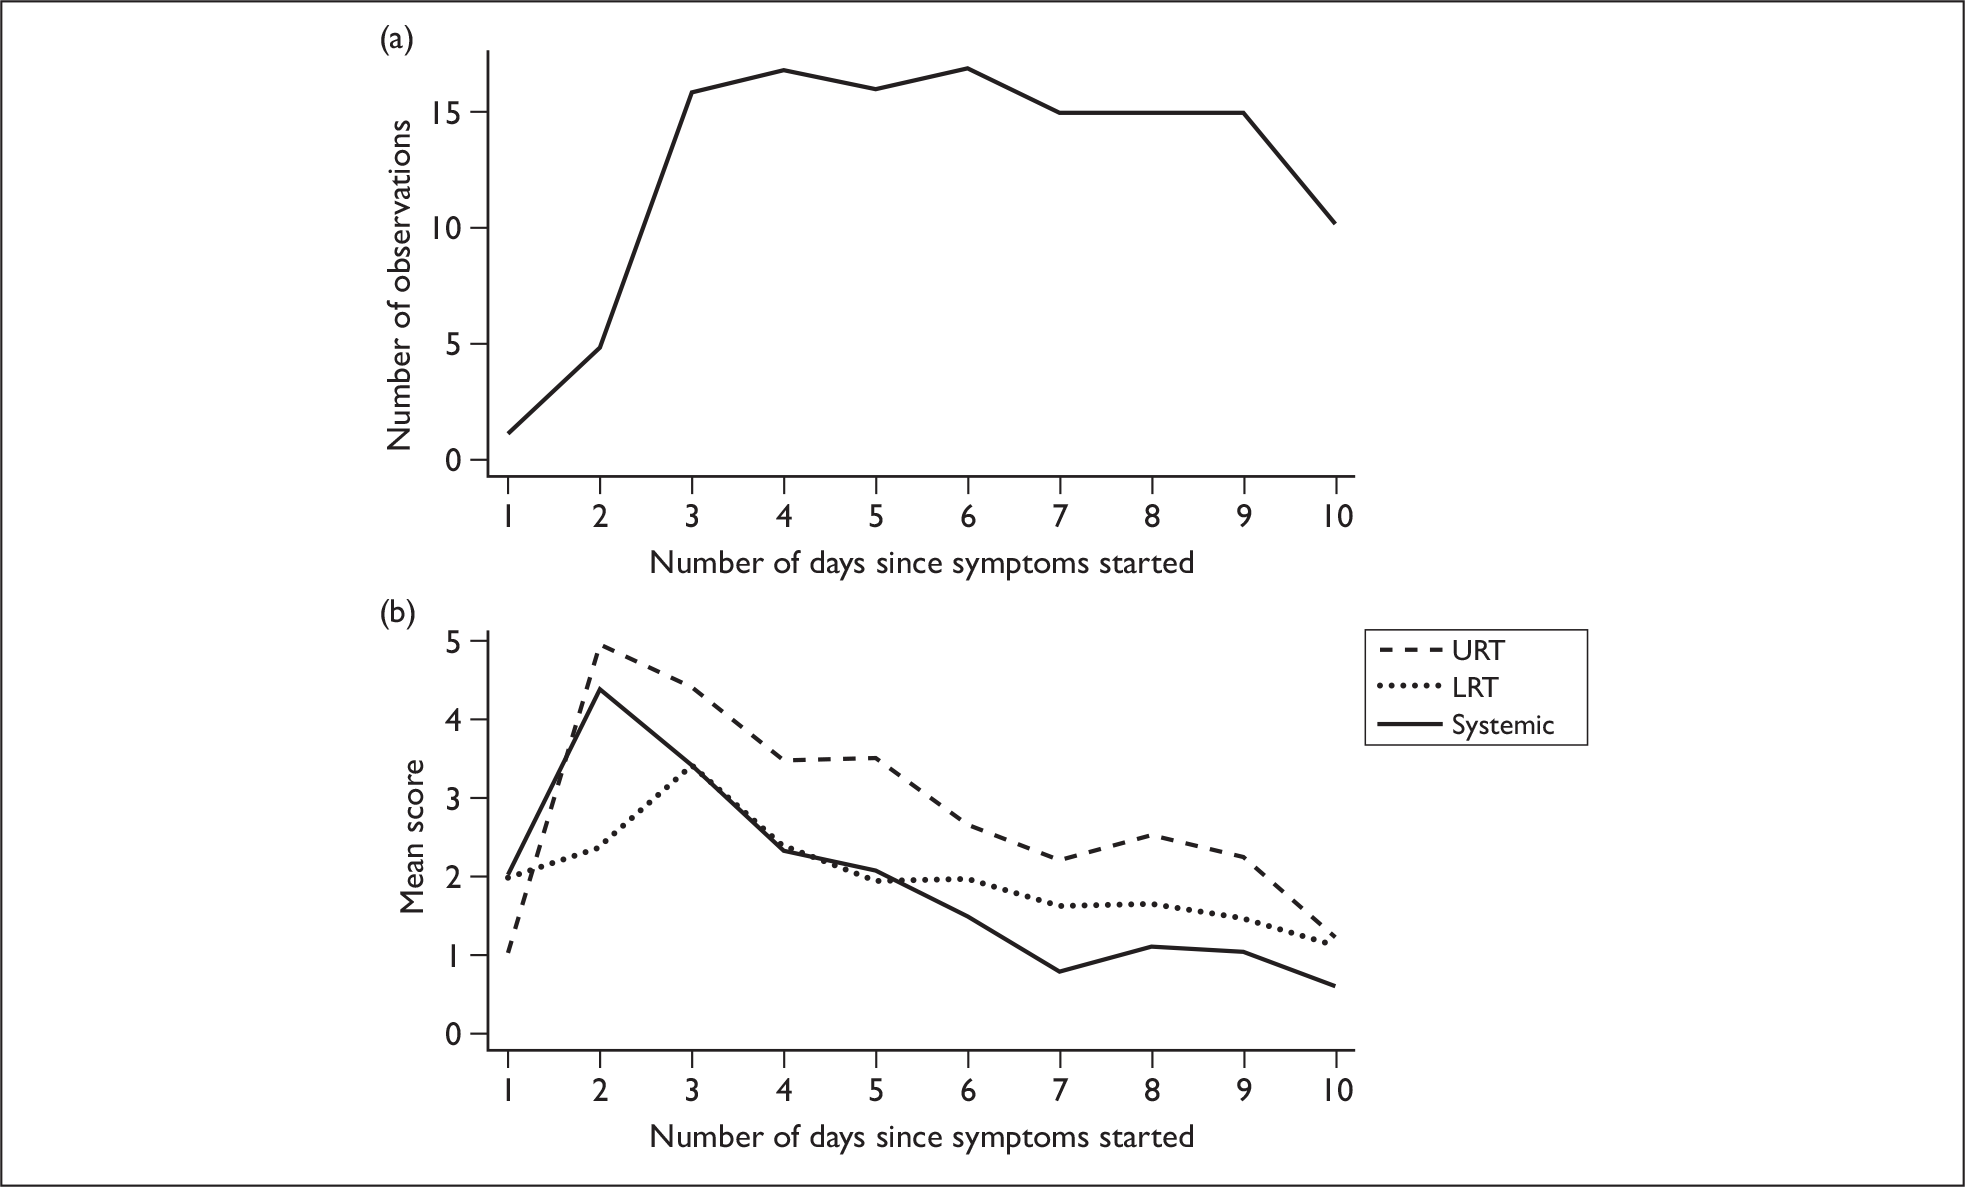
In general, symptom scores declined over time. URT and systemic symptoms peaked on day 2 of illness and LRT symptoms peaked on day 3. However, it should be noted that most subjects were recruited > 36 hours after illness onset, which may give misleading information on maximal symptom scores; there was only one patient with information available on day 1, and only five for day 2 (Figure 2a). Figure 2b shows mean symptom scores of subjects with pandemic H1N1 influenza as a function of the number of days since illness onset.
FIGURE 2.
Mean symptom scores of pandemic H1N1 cases over time. (a) Number of observations (subject data) available for each day. Day 1 is the day of symptom onset. (b) Mean symptom scores of subjects with pandemic H1N1 as a function of the number of days since symptoms started.
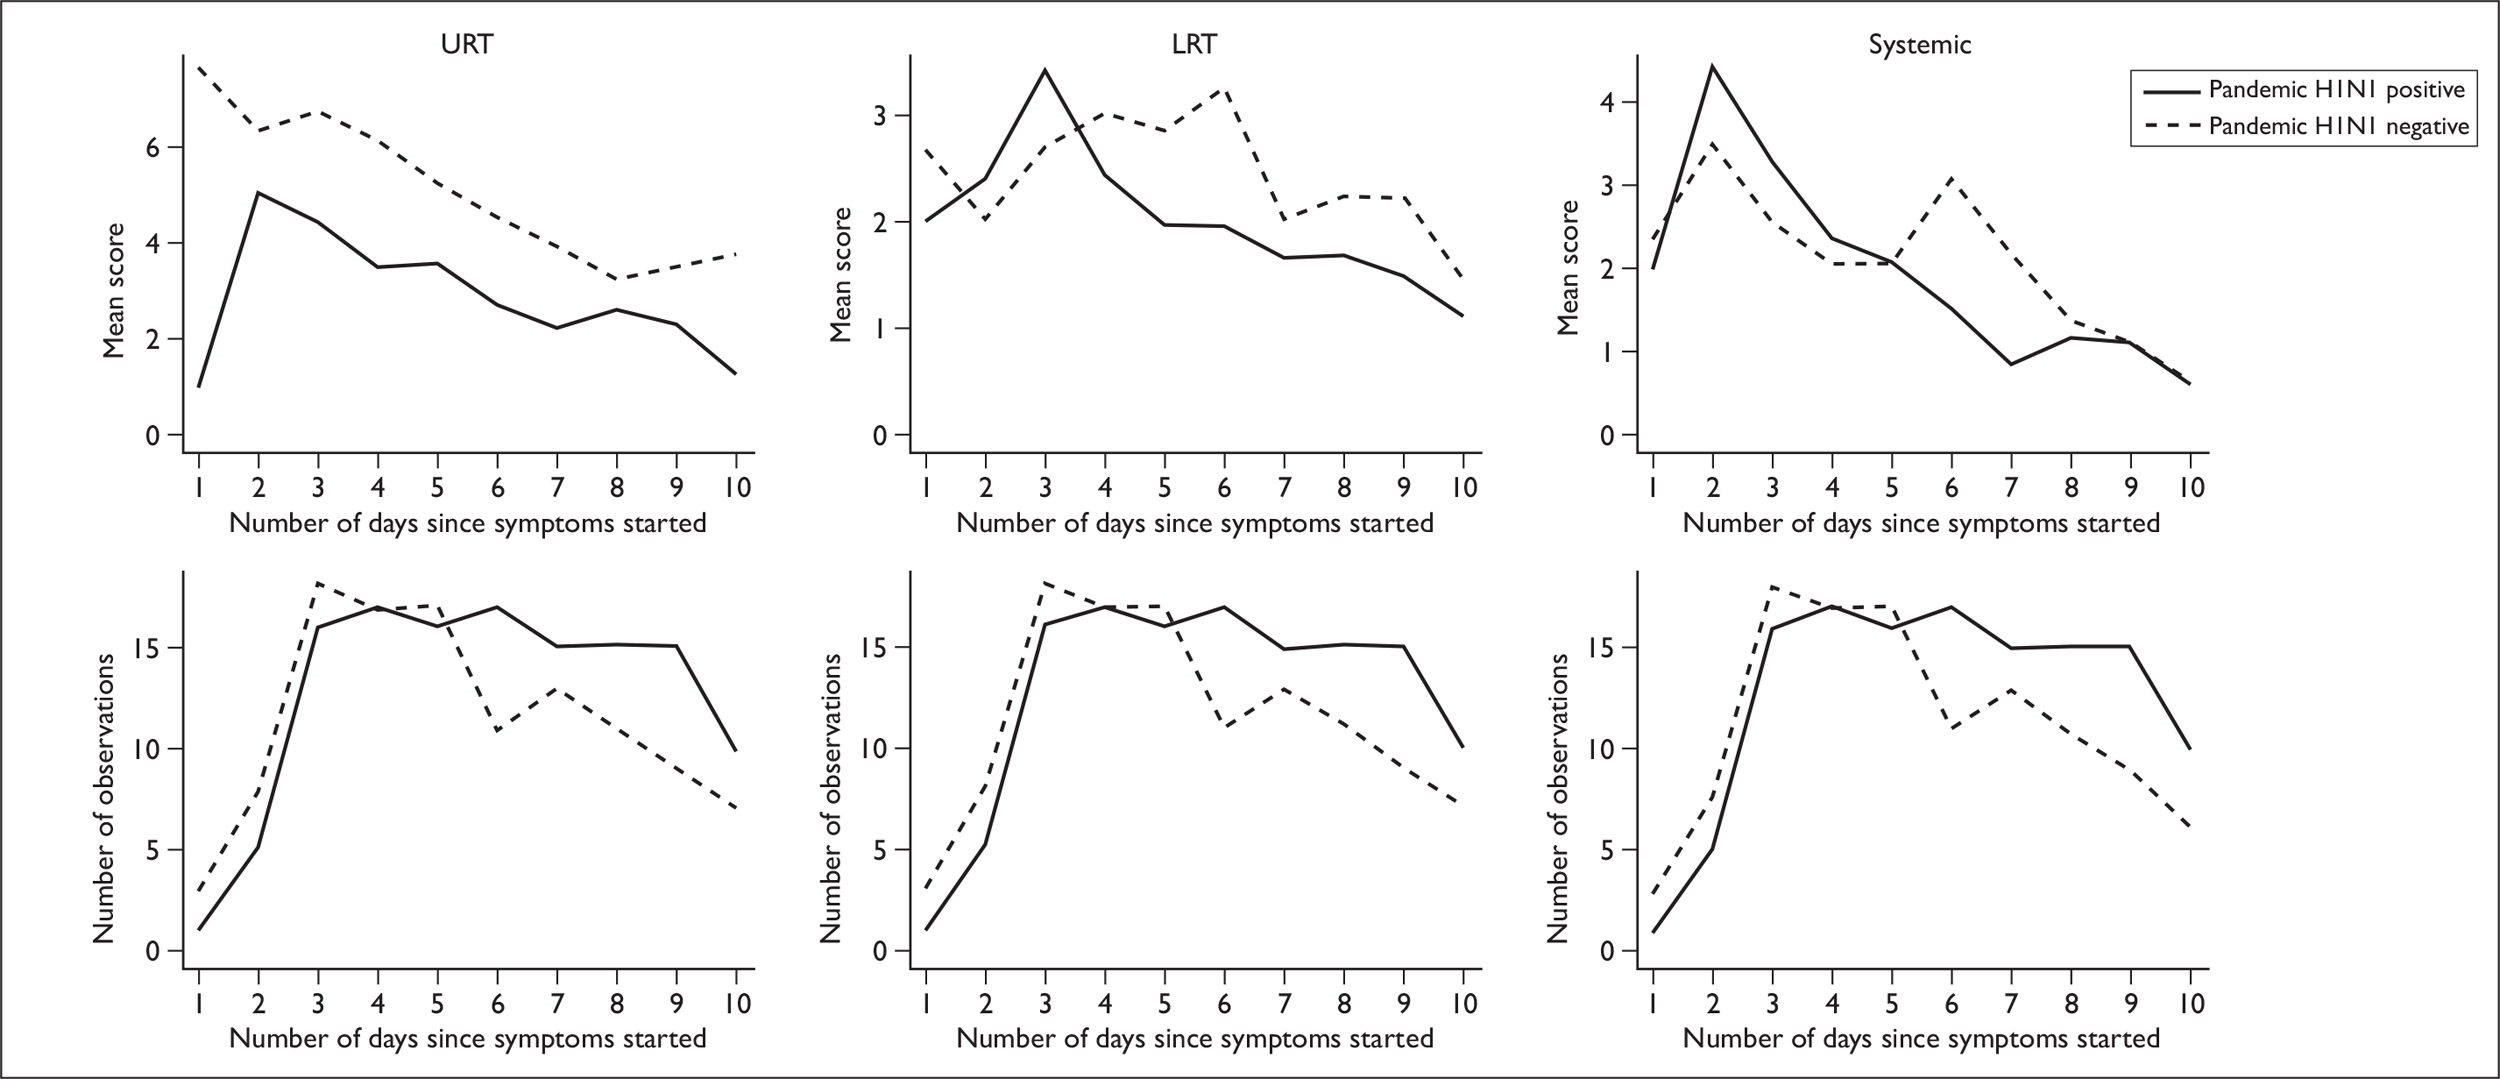
In a comparison of subjects who were positive for pandemic H1N1 infection with others recruited, no significant difference was seen in the average time from symptom onset to recruitment: positive cases (1.7 days), others (1.7 days) (p = 0.90). Visual inspection of plots showing mean symptom scores (broken down into categories) over time suggests that subjects who were negative for pandemic H1N1 infection had higher URT symptom scores and LRT symptoms that peaked 3 days after pandemic H1N1-positive subjects (Figure 3). However, no significant differences between these two groups were detected when comparing symptoms scores on the day of recruitment (URT p = 0.11, LRT p = 0.18 or systemic symptoms p = 0.20) or in the total mean symptom score over time (46.5 for subjects with pandemic H1N1 vs 52.3 for others, p = 0.54).
FIGURE 3.
Upper respiratory tract, lower respiratory tract and systemic symptom scores over time. First row: mean symptom scores for positive pandemic H1N1 cases (solid line) and negative cases (dashed line) as a function of the number of days since symptoms started. Second row: number of observations available for each day; pandemic H1N1 cases (solid line) and negative cases (dashed line). Day 1 is the day of symptom onset.
Antiviral drugs
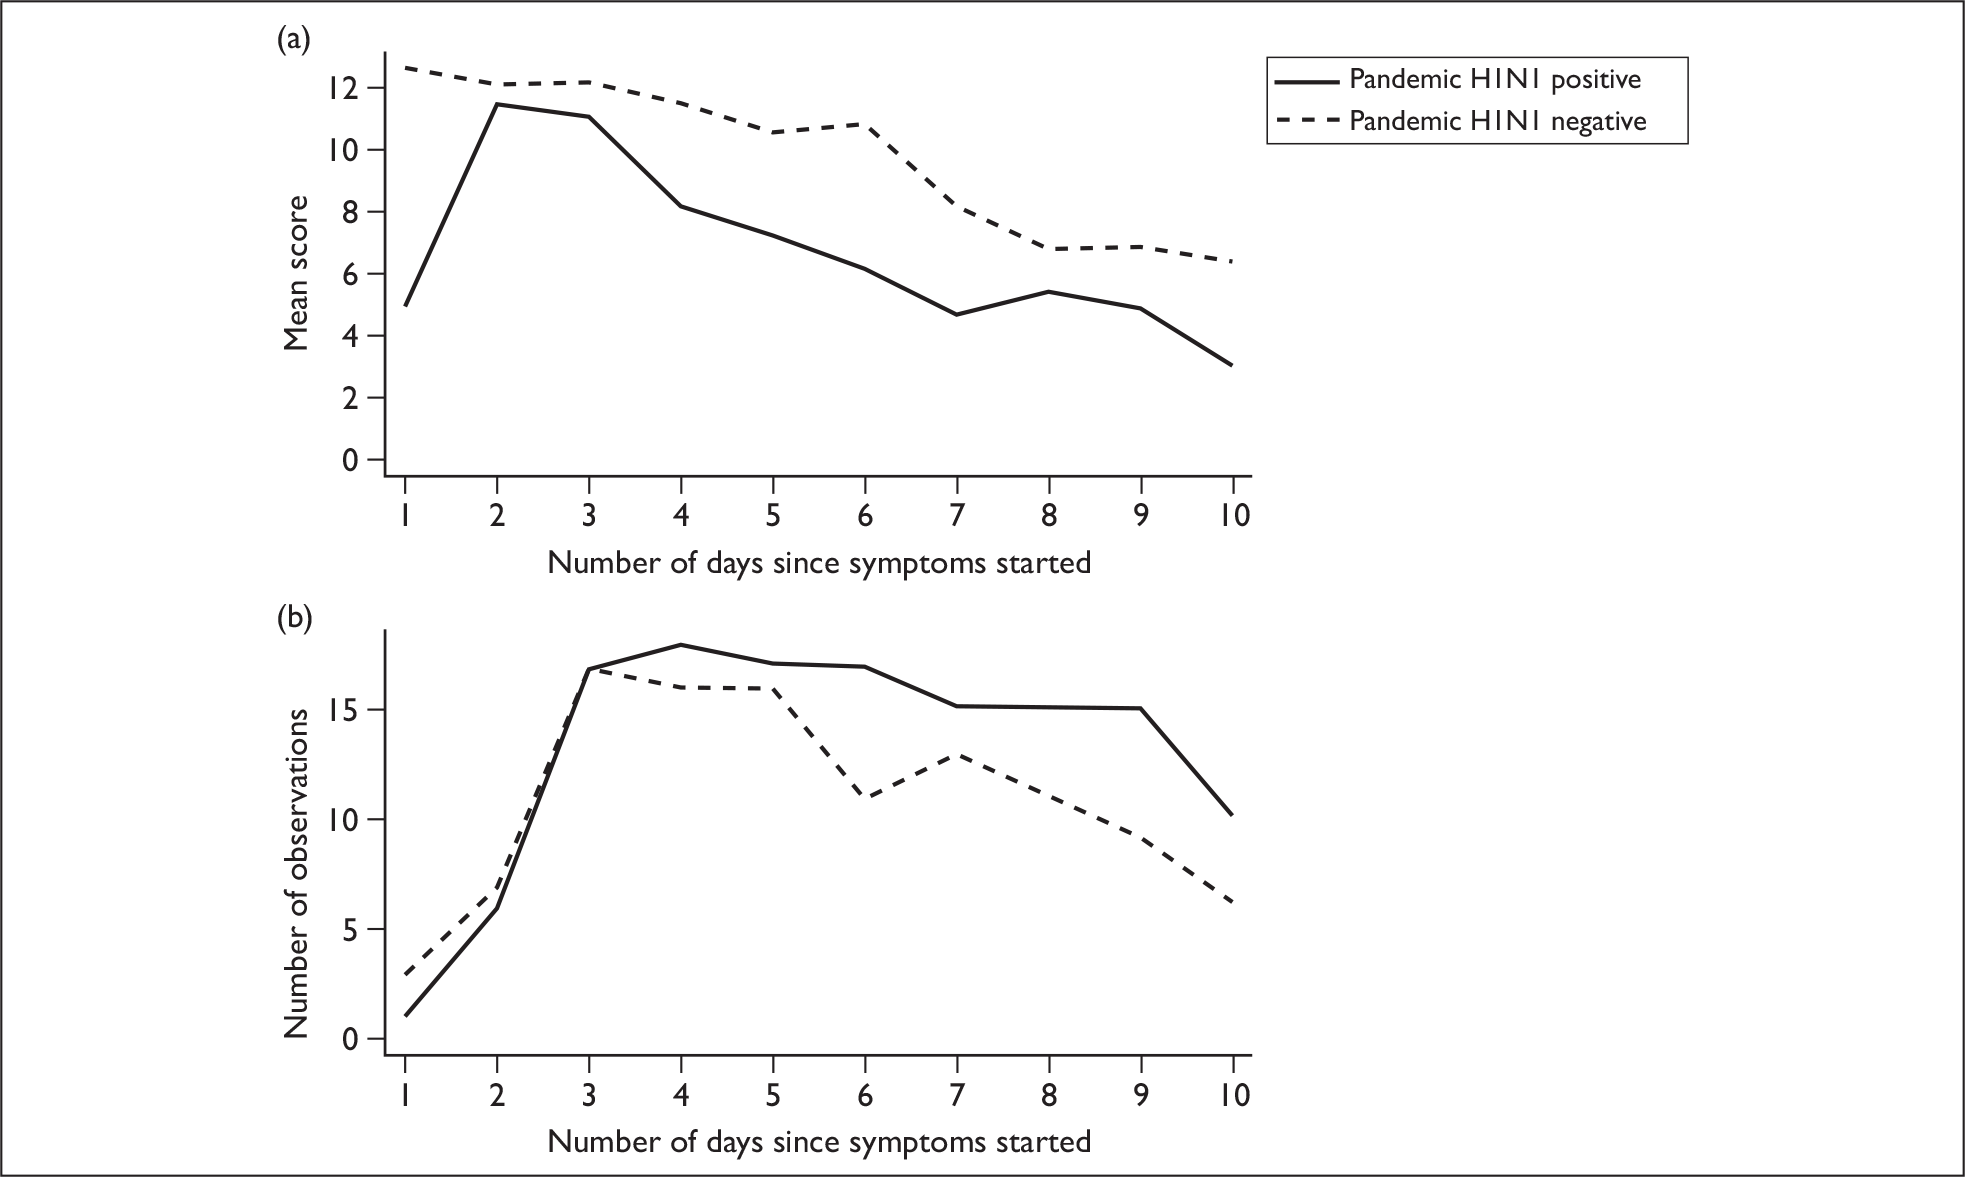
Overall, 21/39 (54%) of enrolled subjects took an antiviral drug [either oseltamivir (20/21) or zanamivir (1/21)] and this occurred within 2 days of illness onset in 12/17 cases (71%) for which data are available. Of the pandemic H1N1-positive cases, 11/19 (58%) received an antiviral drug (all oseltamivir); hospital cases 7/8 (88%) and community cases 4/11 (36%). A total of 44% of pandemic H1N1 cases took oseltamivir within 48 hours, and the average time from symptom onset to treatment initiation in these subjects was 1.7 days (data on when treatment was begun for one patient is not available). The mean total symptom score on the first day of enrolment in the study was significantly higher for subjects with pandemic H1N1 who received antiviral drugs within 48 hours of symptom onset (mean score 16.6) than subjects with pandemic H1N1 who either did not take oseltamivir or did so after 48 hours of illness onset (8.6) (p = 0.018) (Figure 4a).
FIGURE 4.
Symptom scores over time for pandemic H1N1 cases who took antiviral drugs within 48 hours and those who did not. (a) Mean total symptom score as a function of the number of days since symptom onset for pandemic H1N1 subjects who received antivirals within 48 hours of symptoms onset (solid line) and those with pandemic H1N1 who did not (dashed line). (b) Number of observations available for each day.
Viral load
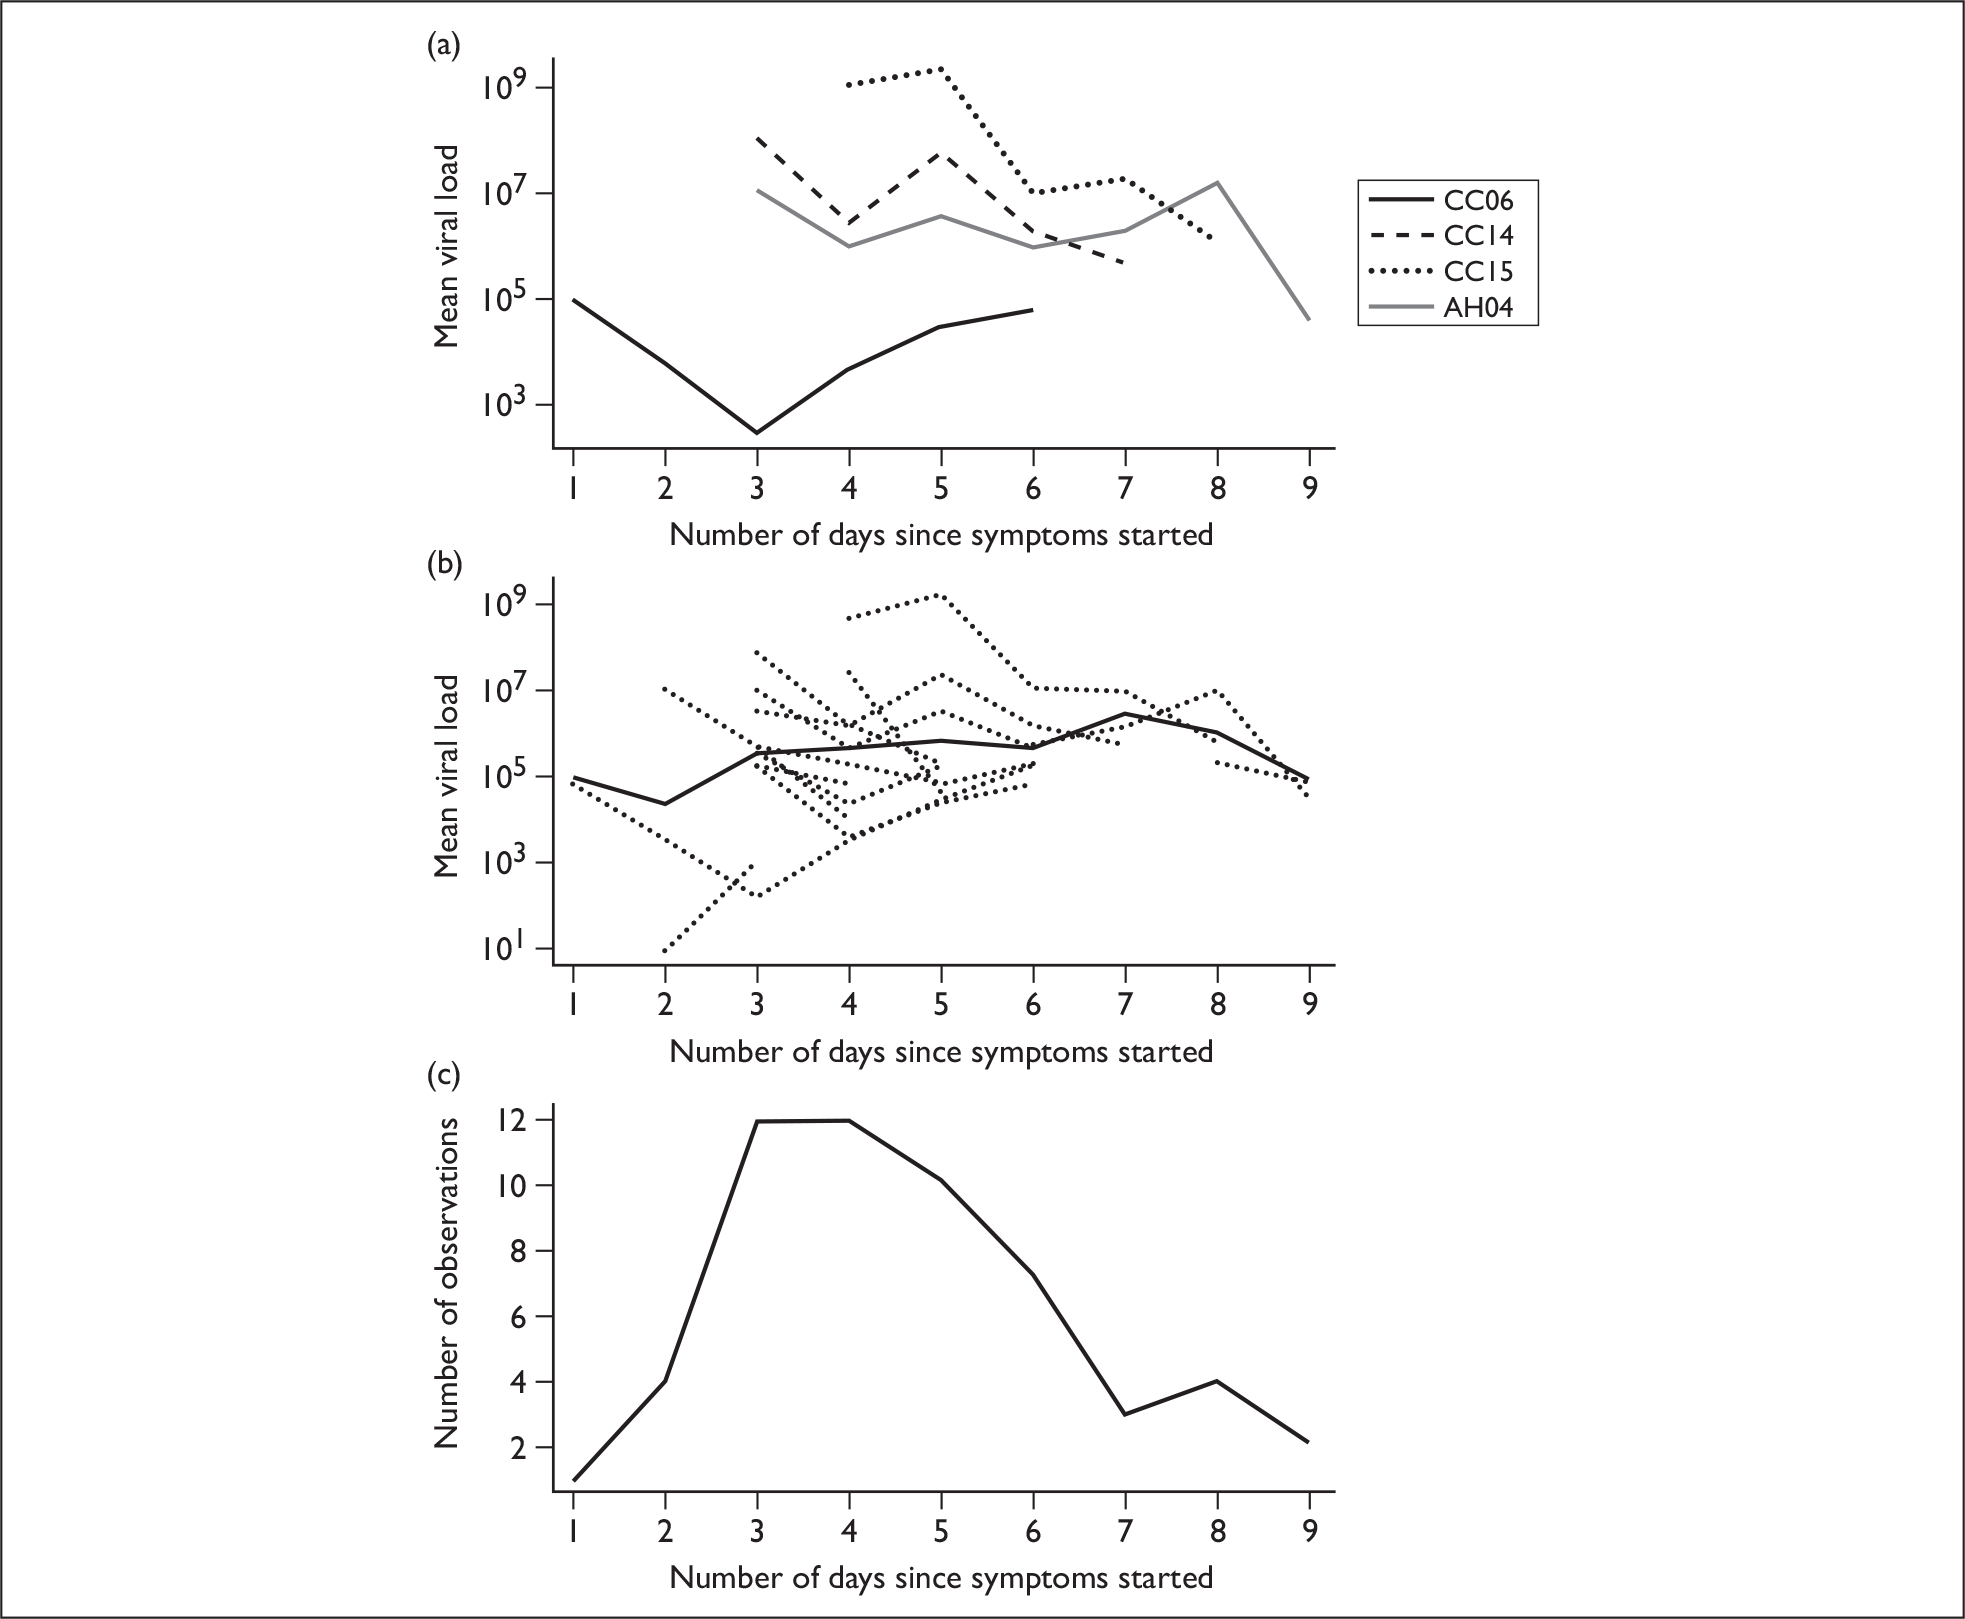
Subject viral loads were examined over time and in relation to symptom scores. Nasal swab viral loads, measured by PCR, varied widely across our pandemic H1N1-positive subjects, ranging from 0.9 × 101 to 1.7 × 10¹¹ copies/ml. Viral loads plotted over time are shown for four subjects from whom the most complete data were obtained (Figure 5a). All subject viral loads over time are shown in Figure 5b, which illustrates the heterogeneity of the data; for each individual trajectory, viral loads tend to decrease with time, but there is an apparent increase in the mean value, because individuals with high viral loads tend to shed for longer.
FIGURE 5.
Viral loads plotted over time. (a) Viral loads from selected subjects are shown. (b) All viral load data are shown. Subject trajectories are shown as dashed lines and the mean of these is shown as a solid line. (c) Number of observations available for each day. Day 1 is the day of symptom onset.
The mean peak viral loads of the four recruitment groups were 5.9 × 10⁵ for AH, 2.4 × 10⁵ for AC, 1.0 × 10⁷ for CH and 1.6 × 10⁶ for CC. No significant differences were detected between any of the groups, although there was a trend towards higher peak loads in children (Figure 6). The mean peak viral load of adults was 4.4 × 10⁵, and that of children was 2.2 × 10⁶, with no significant difference detected between them (p = 0.28).
FIGURE 6.
Peak viral loads of subjects categorised into their recruitment groups.

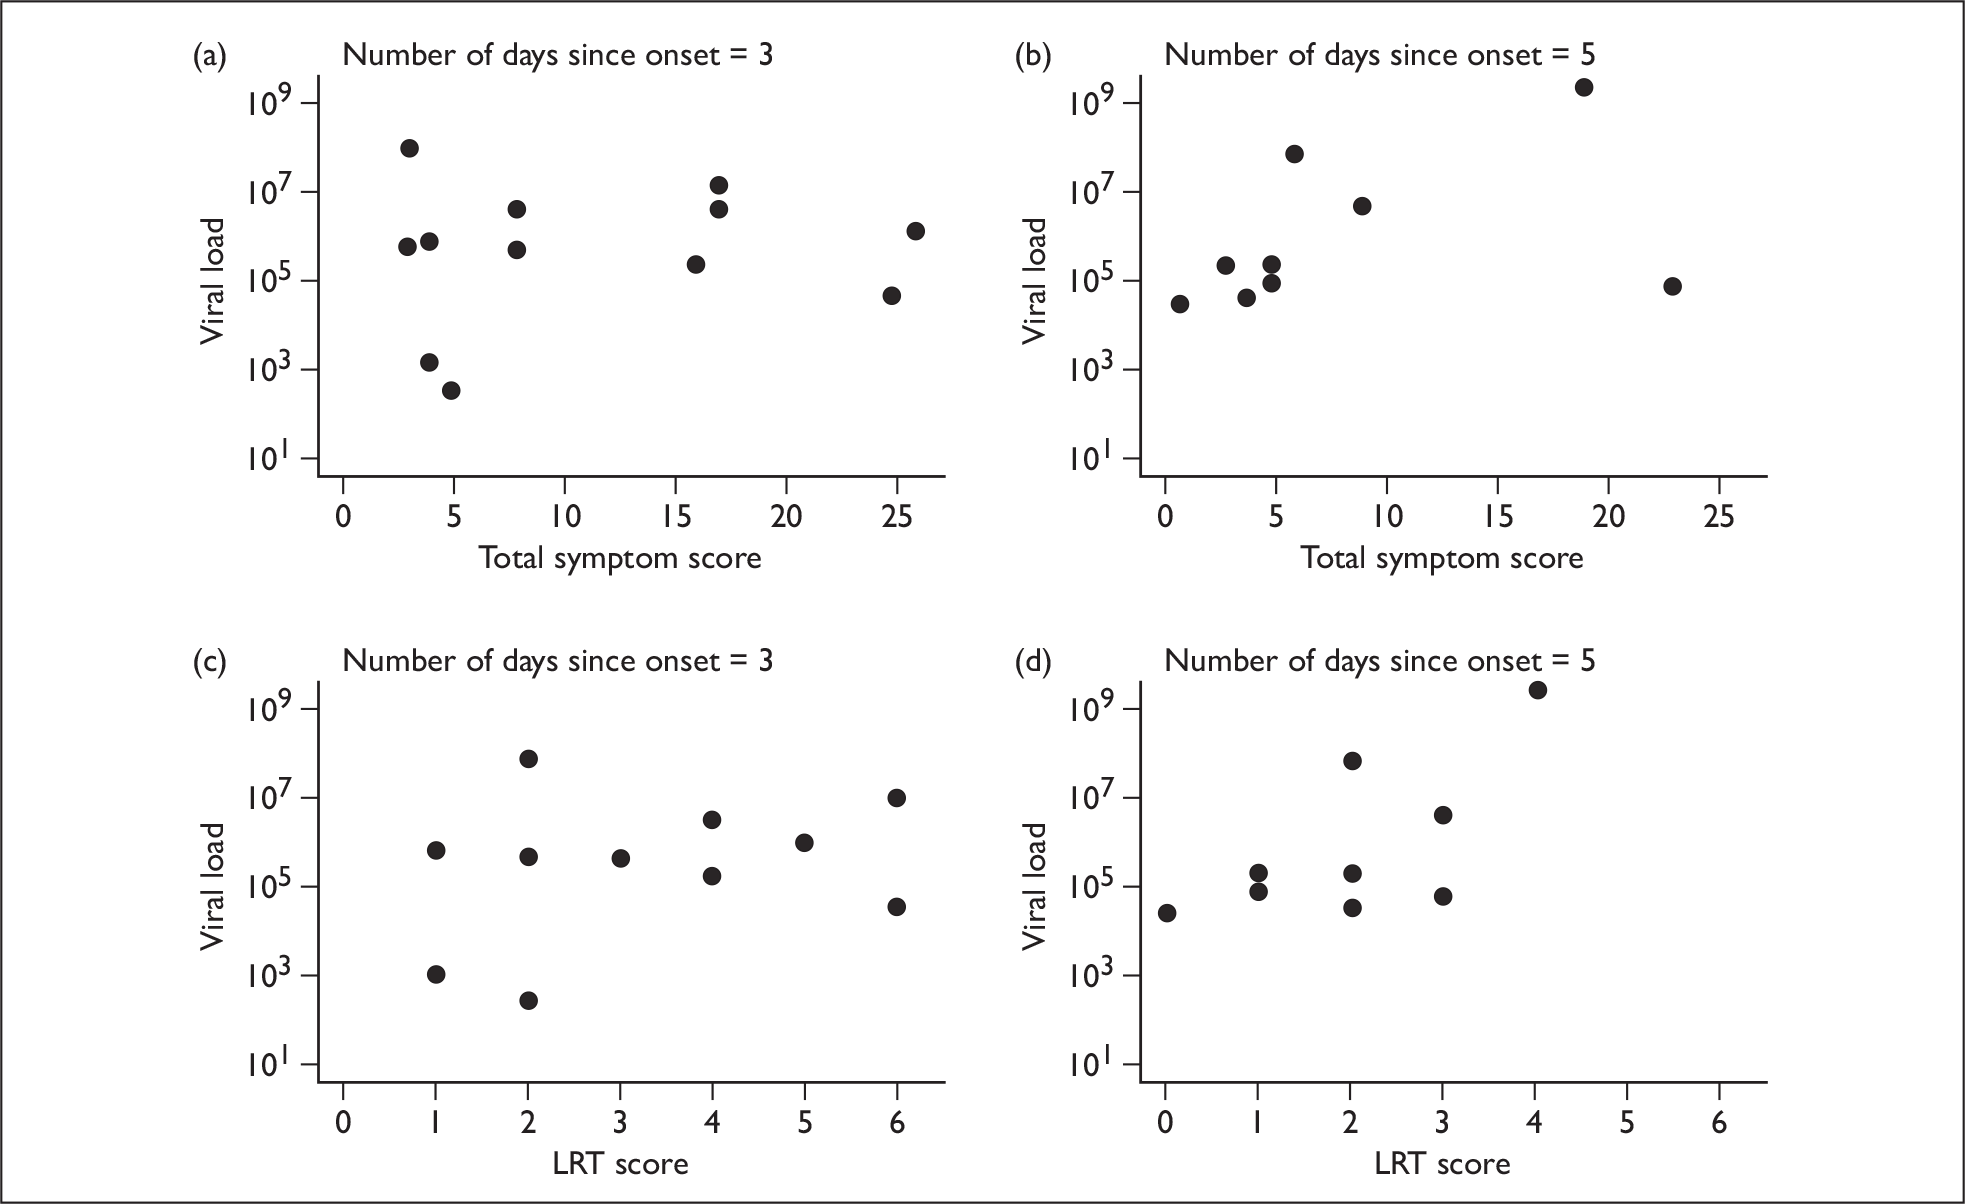
Neither total, URT or systemic symptom scores correlated with viral loads at different points in time. However, the LRT symptoms score on day 5 was significantly correlated (p = 0.049) (Figure 7).
FIGURE 7.
Scatter plots showing symptom scores and viral loads over time. (a) and (b) Total symptom score versus viral load as a function of the number of days since illness onset. (c) and (d) LRT score versus viral load as a function of the number of days since symptom onset.
Rapid antigen tests
Overall, 10/19 (53%) of subjects with pandemic H1N1 influenza were antigen test-positive: 2/8 (25%) adults and 8/11 (73%) children. No pandemic H1N1-negative patients were antigen test-positive. There were no significant differences in symptom scores on the first day of the study between subjects who had a positive rapid antigen test and those who had a negative one. For URT, LRT and systemic symptoms, the mean symptom score on the first days of study were 5, 3.2 and 4.2, respectively, for those with a positive test, and 6, 3.0 and 3.7 for those with a negative test (p-values 0.53, 0.72 and 0.67, respectively). Among the 13 subjects who had a viral load measurement performed on the first day of the study, eight (62%) had a positive rapid test. The mean viral load on the first day of study was larger for the eight patients with a positive rapid test (198 × 104 copies/ml) than for the five patients with a negative rapid test (4 × 10⁴ copies/ml), although the difference was not statistically significant (p = 0.15).
Virus shedding
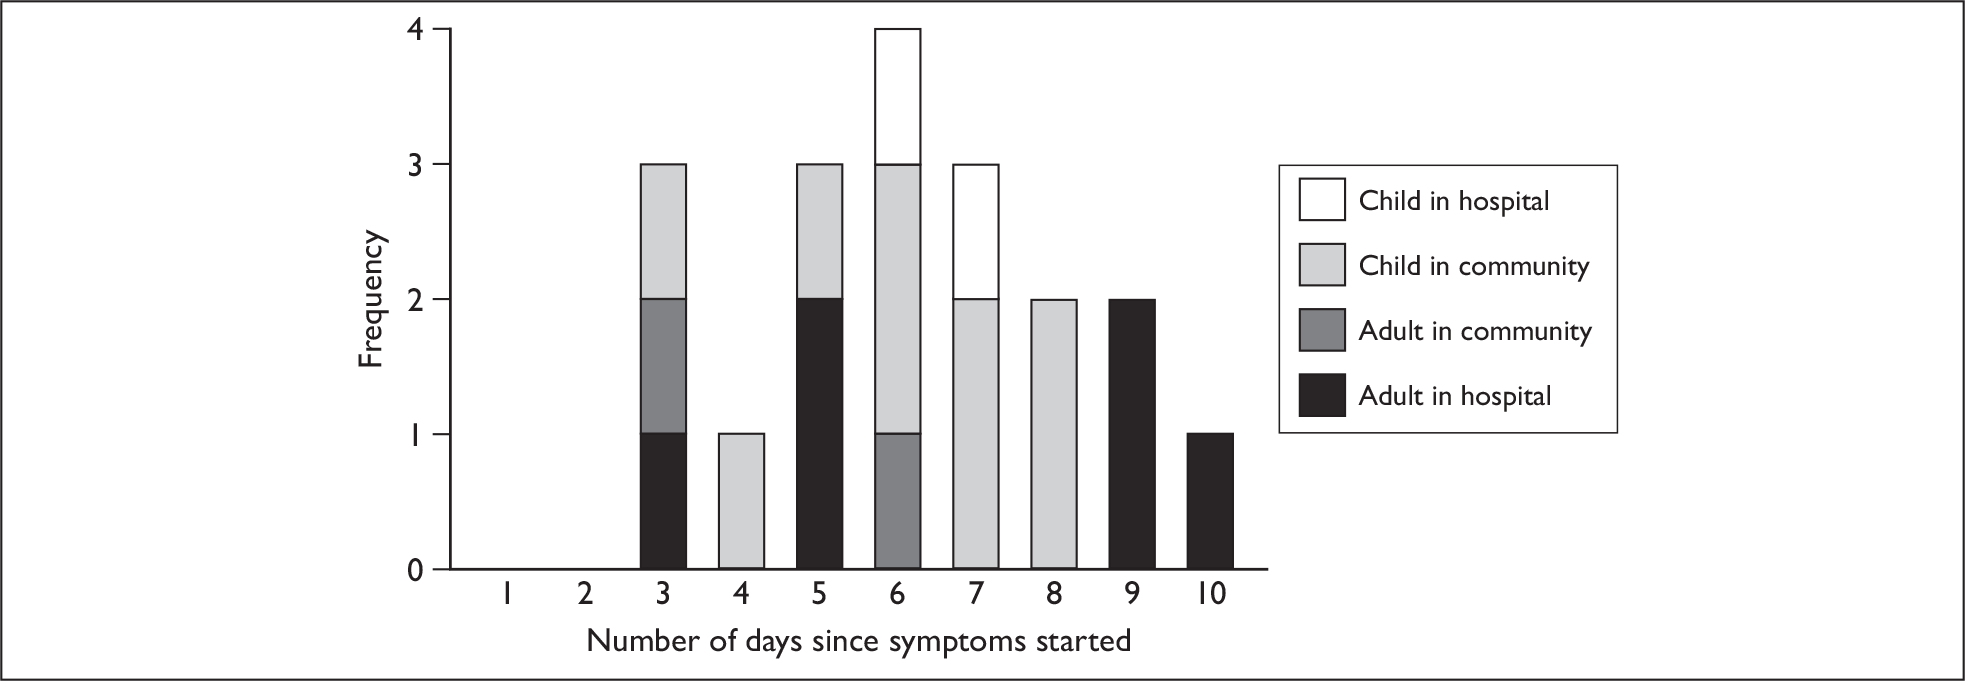
The duration of virus shedding measured by PCR had mean of 6.2 days and a range of 3–10 days. There was no difference between children (mean 6.1 days) and adults (mean 6.3 days) (p = 0.89). Based on the numbers involved, the power to detect a difference was 19% if adult shedding was 6 days and child shedding was 7 days. The duration of shedding of hospital cases (mean 6.8 days) was slightly longer than that of community cases (mean 5.7 days), although the difference was not significant (p = 0.33) (Figure 8).
FIGURE 8.
Distribution of the duration of virus shedding by PCR. The duration of viral shedding is defined as the time between symptom onset and the last day that a positive specimen was taken. Because patients were seldom recruited on the day symptoms began, an assumption has been made that they were shedding virus from the first day of symptoms to the last positive specimen.
No substantial correlation between the duration of shedding and symptom score on the day of recruitment was detected, with coefficients of correlation with URT symptoms of 6% (p = 0.8), with LRT symptoms 19% (p = 0.43) and with systemic symptoms 8% (p = 0.75).
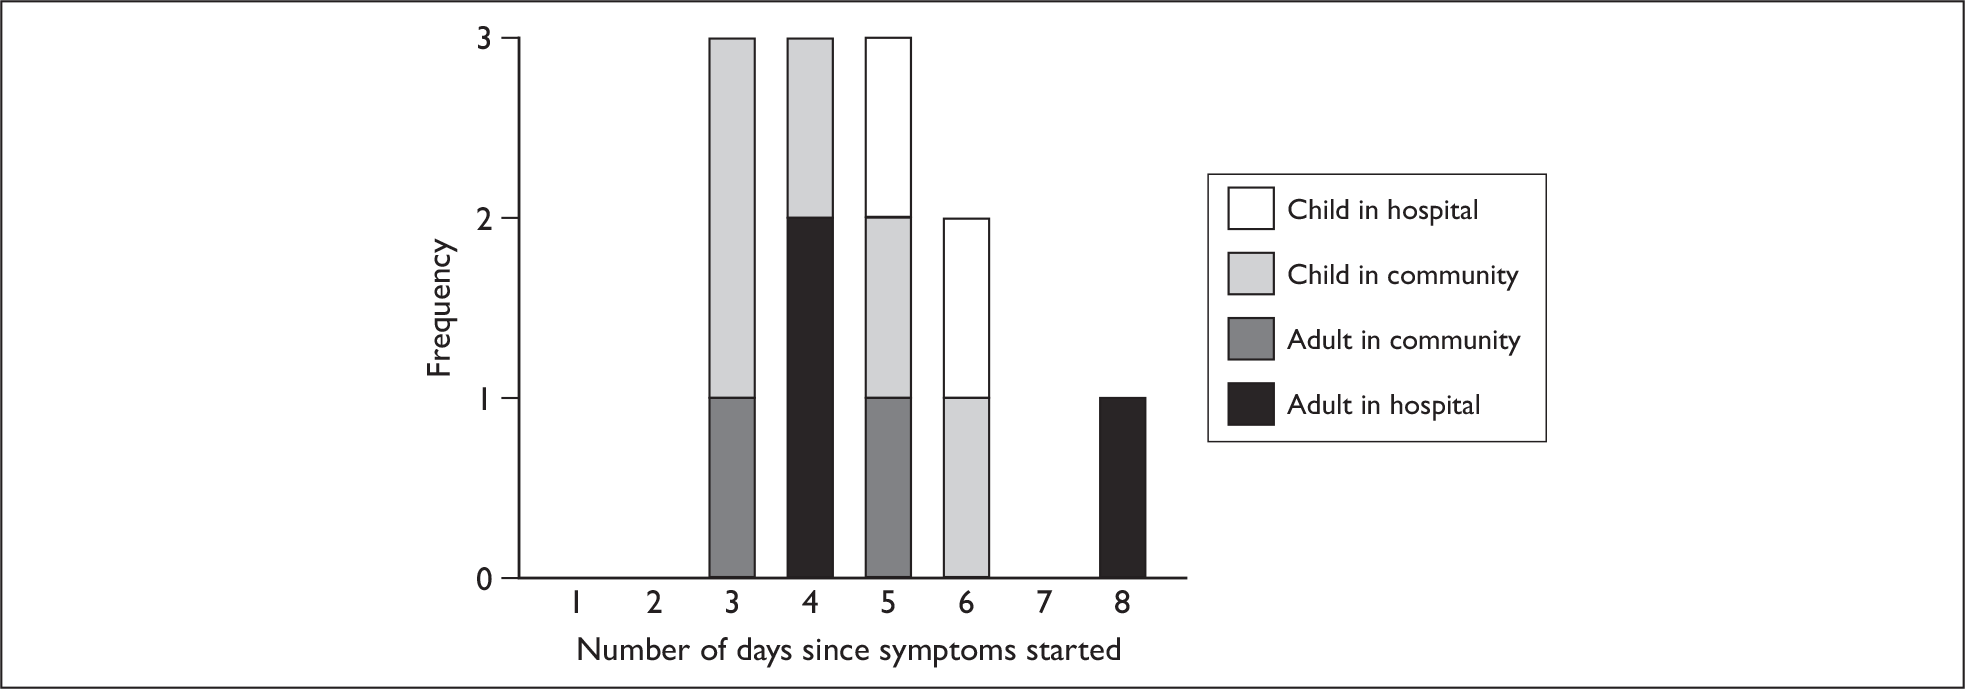
A total of 12/19 cases (63%) were culture positive for pandemic H1N1. The mean duration of live virus shedding from these 12 cases was 4.7 days (range 3–8 days). However, because cases with no positive culture were excluded (durations too short to be observed or false-negative testing), this represents an upper bound for the duration of shedding. To obtain a lower bound for the duration, the calculation was repeated with the assumption that ‘negative’ patients do not shed live virus (duration of shedding = 0). This gives a mean duration of 2.9 days (range 0–8). The median value when all 19 subjects were included was 3 days, and 6/19 (31%) subjects shed live virus for at least 5 days from the onset of illness.
Figure 9 shows the distribution of live virus shedding for the 12 positive cases, and highlights the recruitment group to which each subject belongs. There was no significant correlation between the duration of the live virus shedding and total symptom score of these 12 cases on the day of recruitment [correlation coefficient –0.09, 95% confidence interval (CI) –0.63 to 0.51, p = 0.78] or the sum of total symptom scores during the whole follow-up (correlation coefficient –0.22, 95% CI –0.71 to 0.40, p = 0.48).
FIGURE 9.
Distribution of the duration of virus shedding by culture positivity (n = 12). The duration of viral shedding is defined as the time between symptom onset and the last day that a positive culture was obtained. Cultures were performed from the last day of nasal swab PCR positivity. If a culture was positive on any given day then it was assumed that previous days’ would also have been culture-positive.
The mean duration of shedding determined by both PCR and culture was not significantly different for subjects who received antivirals within 48 hours and those who received them after 48 hours or not at all [PCR: 6.4 days vs 5.9 days, p = 0.61; culture-positives: 4.6 days vs 4.8 days, p = 0.88). All culture results (assuming six have 0 days): 3.4 days vs 2.4 days, p = 0.43].
Box 2 summarises symptom and virus shedding findings.
-
Symptoms decline over time
-
Initial symptom scores were similar in subjects positive or negative for pandemic H1N1 influenza
-
Subjects with pandemic H1N1 had fewer URT symptoms and an earlier peak in LRT symptoms than other subjects
-
Viral load was highly variable between subjects; children had higher peak viral loads than adults but this difference was not statistically significant
-
No clear relationship was evident between symptom scores and viral load
-
No clear distinction was shown in the duration of virus shedding between adults and children
-
Mean duration of PCR-detectable virus shedding was 6.2 days (maximum was 10 days)
-
Median duration of viable virus shedding was 3 days (maximum was 8 days)
-
Total duration of virus shedding detectable by PCR or culture was unrelated to initial symptom severity
-
No obvious relationship between shedding of viable virus and any particular symptom(s) was identified
Environmental deposition
Surfaces
In total, 414 community swabs (+ 52 sponges) and 45 hospital swabs (+ seven sponges) were taken, of which 397 swabs and 12 sponges were tested (not all swabs were tested because of sample processing rules, see Chapter 2, Laboratory methods). Pandemic H1N1 virus was detected by PCR on two occasions on surfaces from around one patient in the community (following discharge from hospital), giving a swab positivity rate of 0.5%. Quantitative PCR could only be performed on one sample because the amount of sample available in the other was insufficient. Live virus was recovered from one of these surfaces. The subject from around whom the swabs were taken was found to be shedding virus from the nose on the same day, although other household members were also unwell on these days; a 5-year-old was unwell with cough and fever on day 4, and a 2-year-old was unwell with cough and fever on day 10 (Table 4).
| Specimen no. | ||
|---|---|---|
| 1 | 2 | |
| Subject ID | AH04 | AH04 |
| Surface (setting) | Kettle handle (home) | Bathroom tap (home) |
| Surface material | Plastic | Metal |
| Swab method | Cotton swab | Cotton swab |
| Number of days after symptoms began that swab was taken | 4 | 10 |
| Viral load from surface swab (copies/ml) | 91,205 | N/A |
| Viral load from nose on day swab collected (copies/ml) | 902,703 | N/A |
| Culture | Positive | Negative |
Air
Air samples were collected from the immediate environment of five subjects (all of whom were rapid antigen test positive): three while in hospital and two in the community. Seventeen separate collections were undertaken, generating 51 samples (although one could not be processed because of insufficient sample volume). Air samples were positive from four out of five subjects. Eight out of 17 (47%) collections and 22/50 (44%) samples were positive for PCR. No samples were confirmed to contain live virus (Table 5).
| Subject | |||||||||||||||||
|---|---|---|---|---|---|---|---|---|---|---|---|---|---|---|---|---|---|
| AH03 | AH04 | CC05 | CC15 | CH03 | |||||||||||||
| Subject setting (+ infected others) | Hospital bed in side room | Hospital bed in side room | Playing in bedroom | Playing in living room (6-year-old infected child also present) | Cot on neonatal unit (two infected neonates also present) | ||||||||||||
| Room temperature (°C) | 21.6 | 23.3 | 20.0 | 18.0 | 24.0 | ||||||||||||
| Room humidity (relative %) | 50 | 50 | 64 | 60 | 40 | ||||||||||||
| No. of days after symptoms began that sample was taken | 4 | 3 | 3 | 3 | 5 | ||||||||||||
| Viral load from nose on day sample collected (copies/ml) | 238,091 | 10,625,714 | 699,723 | 178,923,317,453 | 24,208 | ||||||||||||
| Virus cultured in the nose on sampling day? | Yes | Yes | Yes | No | Yes | ||||||||||||
| Duration of sampling (hours) | 1 | 1 | 3 | 3 | 1 | 1 | 2 | 1 | 1 | 3 | 3 | 1 | 1 | 3 | 3 | 3 | 3 |
| Approximate distance from subject (ft) | 3 | 7 | 3 | 7 | 3 | 7 | 7 | 3 | 7 | 3 | 7 | 3 | 7 | 3 | 7 | 3 | 7 |
| Pandemic H1N1 virus detected by PCR | + | – | + | – | + | – | – | – | – | – | – | + | + | + | + | + | + |
| Particle size virus detected in µm | < 1 | – | < 1 | – | – | – | – | – | – | – | – | < 1 | < 1 | N/A | < 1 | < 1 | < 1 |
| – | – | 1–4 | – | 1–4 | – | – | – | – | – | – | 1–4 | 1–4 | 1–4 | 1–4 | 1–4 | 1–4 | |
| – | – | > 4 | – | – | – | – | – | – | – | – | > 4 | > 4 | > 4 | > 4 | > 4 | > 4 | |
Quantitative PCR demonstrated a range of values between 238 and 24,231 copies/ml; higher values were recorded in instances when more than one infected person was present in the sampling room. Samples collected over a 1-hour period generated 8/24 PCR-positives (33%), those over a 2-hour period zero out of three positives, and those over a 3-hour period 14/23 positives (61%). The risk ratio for a sample to be positive over a 3-hour period relative to a 1-hour period was 1.83 (95% CI 0.95 to 3.51, p = 0.082). Samples collected at a distance close to the subject (approximately 3 ft) generated 13/23 PCR-positives (57%), whereas those collected further away (at least 7 ft) generated 9/27 PCR-positives (33%). The risk ratio for a sample to be PCR positive at a distance of 3 ft versus ≥ 7 ft was 1.70 (95% CI 0.89 to 3.22, p = 0.15). Virus was detected in all particle sizes collected: particles < 1 µm gave 7/16 positives (44%); particles 1–4 µm gave 8/17 positives (47%) and particles > 4 µm gave 7/17 positives (41%). Among particles of size 1–4 µm and > 4 µm, the relative risk of obtaining a positive sample relative to particles of size < 1 µm was 1.08 (95% CI 0.51 to 2.28, p > 0.99) and 0.94 (95% CI 0.43 to 2.08, p > 0.99), respectively (Table 5).
Initially it appeared that 3 samples were culture positive for virus. To verify that the cultured virus in the air samples was the same as that from subject’s nose, PCR was carried out on the harvested virus to confirm the presence of pandemic H1N1. However, as well as the clear presence of pandemic H1N1 there was a signal that indicated the presence of another virus. Work was then undertaken to try and identify this virus though it is important to note the following: (1) there were no original samples left to reanalyse; (2) the signal was detected only in harvested, amplified virus; and (3) this signal was not seen in the air sample on which the initial PCR was done.
-
PCR assays were performed (see Appendix 6, PCR protocol), which confirmed the contaminating virus to be influenza A, H1. Plaque assay on the harvested air sample virus was strongly positive (titre 30 × 107 × 2.5/ml = 7.5 × 10⁸ plaque-forming units (pfu)/ml). (Note: pandemic H1N1 does not plaque in these cells.)
-
Contamination with another influenza virus did not preclude there being live pandemic H1N1 virus in the cells as well. Therefore, an experiment was performed whereby diluted virus was cultured and an attempt made to quantify the amount of virus by PCR. If live pandemic H1N1 was present in the original sample, we postulated that extracted nucleic acid should be at higher concentration in the re-amplified aliquots. Harvested virus was diluted in 10-fold steps from neat to 10–7. Each dilution was split into two aliquots: one frozen and the other inoculated into fresh MDCK (Madin–Darby Canine Kidney) cells. The MDCK cells were incubated for 48 hours before the virus was again harvested. Results indicate that there was no live pandemic H1N1 virus in these samples (at least by these methods). Three out of 11 dilutions were positive for pandemic H1N1 influenza prior to reamplification, but none of the dilutions was positive post re-amplification.
-
Finally, in an attempt to determine conclusively the identity of the contaminating virus, samples of the matrix gene amplicons were sequenced. Results show that influenza A PR8 was the contaminating isolate (undoubtedly from the laboratory).
Findings from the environmental sampling are summarised in Box 3.
-
Almost no fomite contamination was found (0.5% of all specimens taken)
-
Five subjects had samples of the air around them taken and virus was detected by PCR from four of them; PCR positive specimens were equally well represented across all of the particle size ranges measured
-
Although viable virus was recovered from three samples, we were unable to prove that this virus was pandemic H1N1, as opposed to a contaminant
Composite charts
In order to best demonstrate the information we have generated for each subject, charts integrating data from nasal swabs and environmental samples are shown below for selected patients (Figure 10). All patient charts are shown in Appendix 7.
FIGURE 10.
Composite charts for subjects. (a) AH04; (b) AH03; (c) CC15; (d) CH01. The ‘symptom’ bar shows the number of days for which symptoms were present. The ‘nasal swab’ bar shows the last day that a swab was either PCR-positive or culture-positive. The ‘surface’ and ‘air’ bars show days up to the time that a positive sample was obtained. Arrows show the days when oseltamivir was started and when follow-up ended. ‘Day 1’ is the day of illness onset.

Chapter 4 Discussion
This is the first study that has attempted to assess actual viral shedding from patients with influenza, by examining the near-patient environment for virus as opposed to simply taking respiratory specimens. Sampling virus, particularly live virus, in the environment is challenging; getting to the subject in time, executing optimal sampling while preserving virus viability and performing sensitive detection tests in the laboratory are all key factors that necessitate very extensive and complex logistic arrangements. An attempt to overcome this first problem was carried out by targeting recruitment in the community, as well as in hospital (when presentation is often delayed), enabling an approach to subjects early in their illness when virus shedding is usually at its highest. In addition, the use of a bioaerosol sampler, designed and validated by collaborators at NIOSH enabled us to sample air around infected subjects.
Subjects’ with pandemic H1N1 experienced a range of symptoms, but a mild illness was evident in the majority of cases, as has been reported elsewhere. 32 There were no significant differences with respect to symptom type or duration between those positive for pandemic H1N1 virus and those who were non-confirmed (negative). Although the non-confirmed cases included some individuals who were infected with other respiratory viruses, undoubtedly some were falsely negative on pandemic H1N1 virus testing.
Viral loads, in general, declined over time, although a lack of data hinders further interpretation. Only 5/19 subjects had data available at four or more time points. The wide range of results seen may in part be reflected by differences in sample quality. The peak viral load was found to be higher in children than adults, in line with other studies,12,15 although this was not significant. There was a significant association, however, found between viral load and LRT symptoms on day 5 of a subject’s illness, suggesting that persistent LRT symptoms might be a clinical marker for prolonged shedding. However, cautious interpretation of this result is necessary, given the lack of data.
Our findings on virus shedding, as conventionally described, are broadly in agreement with other published findings relating to pandemic H1N1 virus (Table 5). The median duration of virus shedding from the 19 infected cases was 6 days when detection was performed by PCR, and 3 days when detection was performed by a culture technique. Forty-four per cent of these subjects received oseltamivir within 2 days of illness onset. Fifty-eight per cent of subjects were recruited directly from the community, and these cases shed virus for a shorter period of time than the hospital cases (5.7 vs 6.8 days). Although this finding was not significant it accords, nevertheless, with data suggesting that hospitalised influenza cases shed virus for longer,9,10 with potential infection control implications for health-care institutions.
When comparing studies (Table 6), it should be borne in mind that differences in study populations may exist (children vs adults, hospital vs community cases), a variety of sampling methods are used and that the proportions of cases receiving antiviral drugs (particularly whether they received them within 48 hours) may differ. In a Vietnamese hospitalised cohort of 292 pandemic H1N1 cases, PCR detected virus in combined nose and throat swabs in the following proportion of patients: after 1 day of treatment 86% (165/192); day 2 59% (45/76); day 3 38% (27/72); day 4 25% (34/138); and day 5 14% (11/76). After 5 days of treatment, 7% (12/179) were still positive, although no positive cultures were obtained after day 5. 17 Laboratory findings from a study of 70 cases in Singapore gave a mean duration of viral shedding of 6 days, with shedding > 7 days in 37% of patients. The mean duration of positive culture results on six patients was 4 days. 13 Finally, in a Canadian study, 43 community patients with pandemic H1N1 had a nasopharyngeal specimen collected on day 8 of their illness: 74% were PCR-positive and 19% were culture-positive. 33
| UK (this study) | China13 | Hong Kong16 | Singapore14 | Germany15 | |
|---|---|---|---|---|---|
| Setting | Hospital and community | Hospital | Hospital | Hospital | Community |
| No. of cases | 19 | 421 | 22 | 70 | 15 |
| Adults and children | Yes | Yes | Yes | Yes | Yes |
| Percentage who received oseltamivir within 48 hours | 44 | 72.4 | 95 | 51 | 40 (three were given prophylactically) |
| Duration of viral shedding by PCR | 6.2 (mean) | 6 (median) | 4 (median) | 6 (mean) | 6.6 (mean) |
| Duration of viral shedding by culture |
3 (median) Range 0–8 |
– |
– Range 1–5 |
4 (mean, n = 6) | – |
| Risk factors for prolonged shedding | – | Age < 14 years, male sex, delayed oseltamivir | Younger age | – | – |
One subject from our study who demonstrated the shedding of live virus up to day 8 will be considered further. She was a 34-year-old woman, of South-Asian origin, who had no comorbidities, and did not take regular medicine. She spent one night in hospital on the first day of her illness and began taking oseltamivir on day 2 (the subject reported taking oseltamivir each day and, while there is no reason to suspect non-compliance, this cannot be excluded). Prominent symptoms early in her illness were fever, cough, sore throat and fatigue. The virus was sequenced across the HA gene during the period of time that it was shed, and no changes were detected. In addition, no common oseltamivir resistance mutations were detected. All of the other household family members subsequently developed symptoms of cough and fever; a 5-year-old daughter became unwell on day 4 of the mother’s illness, followed by a 2-year-old son on day 5 and her 30-year-old husband on day 6. Thus, a high secondary attack rate in this family was associated with high levels and prolonged shedding of virus, despite the index case being treated with oseltamivir.
It is interesting to note that no difference was found in the duration of viral shedding (PCR or culture) between those who took oseltamivir within 48 hours and those who did not, although our numbers are small (10 vs 8), and it is impossible to draw conclusions because a sample size of at least several hundred subjects would have been needed. Other studies have demonstrated a shortened duration or suppressed levels of shedding in association with oseltamivir when it is given early. 13,34,35 Subjects with pandemic H1N1 who did receive antiviral drugs had significantly higher initial symptom scores than those who did not, perhaps indicating that patients with more severe symptoms were more likely to access to early treatment. This difference might mask any effect of antiviral drugs on duration of shedding. In addition, it may explain why symptom scores were consistently lower among those who received no or late treatment than among those who received early treatment.
Our findings relating to the duration of live virus shedding have infection control implications. They suggest that over 30% of cases remain potentially infectious for at least 5 days and, given that live virus may persist in the environment for up to 48 hours,19 viable virus may be present for 7 days after an index case first develops symptoms. These data are consistent with other recent studies that suggest that pandemic H1N1 may be contagious for a longer period of time than seasonal flu. 13,33 This has clear implications for pandemic infection control and self-isolation guidelines.
However, despite finding that live virus shedding continued for over 4 days in most subjects, fomites contaminated with virus were found in only two instances, involving only one subject. Therefore, only 0.5% of all community fomites, and none of the hospital fomites, swabbed revealed virus, although on one occasion live virus was found. This instance occurred in a household where, at the time of taking the surface swab, a 5-year-old child was also experiencing her first day of symptoms, but the surface contamination was from a kettle handle and so is unlikely to have been directly handled by the secondary case. These findings are in contrast with those of Boone and Gerba,21 who detected influenza virus (by PCR) on over 50% of all swabs taken from a number of fomites in the home and in child-care centres. They also differ from the findings of a study that involved subjects who were experimentally infected with influenza virus. Swabs taken from fomites in subjects’ rooms (two subjects shared a room) revealed influenza (detected by PCR) in 9/48 swabs (19%), although no live virus was found (B Killingley, University of Nottingham, May 2010, personal communication). It is also likely that more than one individual contributed to virus deposition in Boone and Gerba’s study. 21 This contrasts with the circumstances of the current study, where only one individual was ill when the vast majority of swabs were taken. In addition, the homes used in Boone and Gerba’s study21 contained a symptomatic child 100% of the time compared with 79% of homes in the current study. It is also worth noting that no specific cleaning instructions were given during the follow-up of our subjects, so, for example, daily cleaning of hospital rooms would have continued, which may have contributed to the low positive swab rate. A more speculative suggestion would be that pandemic H1N1 is less stable in the environment than other influenza strains, and indeed there is some evidence to suggest that some influenza viruses may be more robust than others. In experimental conditions an avian virus survived for up to 6 days on some surfaces36 and unpublished observations (J Greatorex, HPA, May 2010, personal communication) suggest a laboratory-adapted PR8 (H1N1) virus is more hardy than seasonal wild-type strains. The finding of influenza RNA on fomites on its own does not prove that disease can be spread via the contact route – demonstration of live virus transmitted in an infectious dose would be required for this. Despite an isolated discovery of live virus, our findings overall suggest that the contact route of transmission for pandemic H1N1 may well play a more minor role in the transmission of influenza than hitherto suggested by experts, and by the current emphasis placed on hand hygiene as a means of interrupting transmission.
A noteworthy finding of this study is the demonstration of virus in particles collected from the air around subjects who have influenza; this has not previously been attempted in a community setting. Five subjects had samples of the air around them taken, and virus was detected by PCR from four of them. In two instances there were additional patients with pandemic H1N1 (children) present in the room as well as the study subject during air sampling, and it was these samples that revealed the most virus. All particle sizes collected contained virus detectable by PCR, including the < 1-µm and 1–4-µm fraction sizes, which are bioaerosols of a respirable size, i.e. they can reach the distal airways of the respiratory tract. 37 Sampling for a longer time period, and nearer to the subject, led to the detection of more virus as one might expect, although analyses did not reveal any statistical significance because numbers were small.
Unfortunately, we have been unable to conclusively demonstrate the presence of live pandemic H1N1 in any samples. Initial culture results indicated the presence of live virus in three samples from one subject (AH03) and PCR detected only pandemic H1N1 in the original samples. However, following amplification of the virus to permit further analysis, it appears that the sample became contaminated with a laboratory influenza strain. It was not possible to go back to the original sample (as none remained) or subsequently prove that the live virus detected was pandemic H1N1 as opposed to the contaminant.
There were no unusual room temperature or humidity readings recorded during sampling, but there are insufficient data to study the effects of these variables further.
It is unclear why it was not possible to culture live virus from specimens when most subjects had live virus detected on nasal swabs, although detecting live virus in samples is challenging and the techniques are still relatively new. Difficulties include the fragility of the virus particle (especially its susceptibility to desiccation) and the fact that sufficient virus needs to be collected to enable culture. Because the amount and concentration of virus being sampled in air is much lower than that from nasal swabs, detection is more difficult. The use of VTM during sample collection (as opposed to its addition afterwards) to help preserve virus has been cited as a necessity by some,38 and with sound reason. But, as has demonstrated in other unpublished laboratory work (B Killingley, University of Nottingham, May 2010, personal communication), this does not appear to be an absolute requirement with the samplers used.
Evidence backing up at least the potential for bioaerosol transmission of influenza infection has recently been reviewed;39 supporting evidence comes from the detection of influenza virus (by PCR) in the air around patients,26,27 the demonstration of bioaerosol transmission in animal models,40,41 and increasingly sophisticated mathematical modelling techniques, which suggest a role for bioaerosol spread. 42 Detecting the presence of influenza in the air is the first step in a chain of evidence needed to confirm that influenza viruses – emitted from an infected individual and existing as bioaerosols – can initiate infection in a person exposed to them. The other steps in this sequence are (1) confirming that live, i.e. infectious, virus is present and (2) confirming that sufficient live virus exists that can be inhaled by an individual to initiate infection. Couch et al. 43 conducted a series of experiments in 1966, culminating in a human-to-human transmission study attempting to follow this line of evidence for coxsackie virus, and came to the conclusion that bioaerosol transmission ‘unquestionably occurred’. Similar data on influenza are lacking and it remains that the human infectious dose of influenza in natural conditions is not known for any route. Alford et al. 25 showed that three times the TCID50 was needed to infect volunteers via bioaerosols; this compares to other studies showing that 127–320 TCID50 are needed to initiate infection by the intranasal route. 44 Using these data, attempts have been made to estimate the risk of infection attributable to the different routes of infection,45 but the outputs of such models are only ever as good as the input assumptions. However, if Alford et al. ’s25 supposition is true then even small quantities of viable virus expressed via bioaerosols might have significant infectious potential.
Detection of virus by PCR was seen from air samples collected at close range (3 ft) to subjects, well within the contact distance of an attending health-care worker suggesting that the theory of short range bioaerosol transmission advanced by Tellier39 cannot be dismissed. Although clearly based on extremely limited data, these finding are of sufficient importance to justify further efforts to reproduce them including further attempts to detect of live virus.
There are several limitations to this study. First, the numbers of subjects recruited was well below target. The study began recruiting just prior to the beginning of the second wave of the pandemic in England, but the overall number of people infected during the second wave was well below what had been predicted46 and seroconversions during the first wave were far higher than expected. 47 In addition a mild illness, including a high asymptomatic infection rate47 contributed to our difficulty. It is also evident that enrolling people early in the course of their illness is challenging. Over one-half of the volunteers we saw were ineligible because symptoms had been present for too long. A further problem was difficulty in identifying subjects as having influenza as opposed to other ARIs. It has been shown that the standard definition of ILI cannot be relied upon to distinguish pandemic H1N1 from other ARIs,48,49 and the low numbers of people with illness in the local population made the positive predictive value of even our modified definition of ILI low (48%). A near-patient rapid antigen test was used to help reveal influenza cases, but our original inclusion criteria that required a positive antigen test were modified because the sensitivity of the test in our hands (with a nasal swab) was low. Overall, 10/19 (53%) of our cases were antigen test-positive; the sensitivity in adults was 25% and in children 73%. These findings concur with a number of other reports about the low sensitivity of these tests to detect pandemic H1N1. 50–52 This resulted in a difficulty in reliably recruiting only subjects with pandemic H1N1, such that we followed up subjects who had other ARI. For technical and logistic reasons, the capacity to generate PCR results on samples quickly enough to limit this follow-up in most cases did not exist. The modest recruitment of pandemic H1N1 cases limits the study in several ways, including the generalisability of our findings and because of a lack of data the ability to address our primary aim – to correlate virus shedding on nose swabs with environmental samples.
Second, the sampling methods used require further consideration, as care is needed during interpretation of the results:
-
Nasal swab Although a nasopharyngeal aspirate (NPA) is considered to be the best specimen for detecting influenza A viruses,53–55 this procedure causes more discomfort and is more difficult to perform, particularly in children. Indeed, studies attempting to collect daily NPA samples from subjects have reported problems with subjects’ tolerance and compliance with the procedure. 15 A nasal swab, however, has been shown to be an acceptable alternative that is not statistically less sensitive than a NPA,54–56 although suboptimal sampling (caused by interoperator variation in technique) can still occur.
-
Fomite swabbing Despite adopting a similar swabbing technique to other comparable studies,22,23 and validating this in advance using experimentally deposited virus (B Killingley, University of Nottingham, May 2010, personal communication), virus was rarely isolated from fomites. Furthermore, the fomites sampled were similar, except that four of our nine chosen surfaces (bedside table, dining table, patient table and window sill) are not items that are actually picked up or grasped by the hand. Virus may well be transferred to, or settle on, such surfaces, but sampling was performed from only a small proportion of the surface area. Furthermore, many of these surfaces were made of wood, a material that does not support virus survival (J Greatorex, HPA, May 2010, personal communication). In future, consideration will be given to alternative sampling methods, for example using a sponge (wiping a surface may collect more material and can cover a larger surface area) and increasing our focus on ‘grasped’ items. We used and tested the sponge too infrequently during this study to draw any firm conclusions about its performance compared with a cotton swab.
Finally, all subjects from whom air samples were obtained tested positively on rapid antigen testing. This may have biased the group somewhat, as a positive rapid antigen test has been associated with higher viral loads in nasal samples. 50 On the other hand, our intention was to prove whether viable virus deposition on surfaces or in the air was possible in practice; so selection of these individuals was important. Also no measurements or estimates of room air flow patterns or ventilation were made when collecting samples. Such parameters are likely to have an influence on the ability to detect virus in the air.
Chapter 5 Conclusion
Despite limitations resulting in an inability to fully address the primary aims of the study, important observations have been made. Our findings show that live pandemic H1N1 virus can be found in the noses of over 30% of infected individuals for at least 5 days after symptoms begin. The evidence for the significance of both contact and bioaerosol routes of transmission, depends upon demonstrating that viable virus is deposited from an infected patient. This has been shown for touched surfaces, although the data suggest that contact transmission via fomites may be less important than hitherto emphasised. Transmission via bioaerosols at short range is not ruled out; virus was detected by PCR in aerosols, but we were unable to conclusively demonstrate the presence of live virus.
Implications for health care/recommendations for research
As the current data are inconclusive further work is being undertaken to consolidate these findings, as they have important potential implications for PPE requirements in health-care workers, nationally and internationally. In order to address recruitment difficulties, involvement of specific groups (for example university students) and targeting contacts of index cases who present to a general practitioner or hospital will be attempted during the influenza season 2010–11.
Acknowledgements
We extend our thanks to the individuals (and parents) who took part in this study and are grateful for the clinical and administrative assistance of the Department of Health (DH), the National Institute of Health Research, the Leicestershire, Northamptonshire & Rutland Research Ethics Committee 1, Division of Epidemiology and Public Health at Nottingham University, Trent Comprehensive Local Research network, Trent Local Children’s Research Network, East Midlands Primary Care Research Network, Nottingham University Hospitals NHS Trust, Nottingham City Primary Care Trust, Nottingham County PCT, Leicester University Hospitals NHS Trust, Sheffield Teaching Hospitals NHS Trust and to the HPA at Addenbrooke’s Hospital and the Health and Safety Laboratory for laboratory support. Particular thanks are extended to Sheila O’Malley, Penny Scardifield, Maria Benitez, Raquel Velos, Joanna Tyrrell, Pradhib Venkatesan, Harsha Varsani, Fayna Garcia, Paul Digard and Catherine Makison.
We are grateful to William Lindsley and Donald Beezhold at NIOSH for the loan of the air samplers and to the Centers for Disease Control and Prevention, Atlanta, for facilitating this.
BK is funded by a Medical Research Council clinical research training fellowship.
Contributions of authors
Professor Jonathan Nguyen-Van-Tam (Professor of Health Protection) contributed to study design, data interpretation and was chief investigator.
Dr Ben Killingley (MRC Clinical Research Fellow) contributed to study design, data collection, patient enrolment and data interpretation, as well as being responsible for project management, including co-ordination across sites, study logistics, data management and preparation of regulatory submissions. He drafted the study protocol and this report, which were both reviewed by all authors.
Dr Jane Greatorex (Senior Research Scientist) contributed to study design and data interpretation, and was responsible for laboratory analysis.
Dr Simon Cauchemez (Research Councils UK Research Fellow) contributed to data interpretation and was responsible for statistical analysis.
Ms Joanne Enstone (Research Co-ordinator) contributed to study design and data interpretation.
Dr Martin Curran (Head of Molecular Diagnostic Microbiology) contributed to study design, data interpretation and laboratory analysis.
Professor Robert Read (Professor, Infectious Diseases) contributed to study design and data interpretation and was the principal investigator at the Sheffield site.
Dr Wei Shen Lim (Consultant, Respiratory Medicine) contributed to study design and data interpretation, and was the principal investigator at the Nottingham site.
Dr Andrew Hayward (Senior Lecturer, Infection and Population Health) contributed to study design and data interpretation.
Professor Karl Nicholson (Professor, Infectious Diseases) contributed to study design and data interpretation, and was the principal investigator at the Leicester site.
Disclaimers
The authors have been wholly responsible for all data collection, analysis and interpretation, and for writing up their work. The HTA editors and publisher have tried to ensure the accuracy of the authors’ report and would like to thank the referees for their constructive comments on the draft document. However, they do not accept liability for damages or losses arising from material published in this report. The views expressed in this publication are those of the authors and not necessarily those of the NIHR or the Department of Health.
References
- Tellier R. Review of aerosol transmission of influenza A virus. Emerg Infect Dis 2006;12:1657-62.
- Brankston G, Gitterman L, Hirji Z, Lemieux C, Gardam M. Transmission of influenza A in human beings. Lancet Infect Dis 2007;7:257-65.
- Department of Health . Influenza: A Summary of Guidance for Infection Control in Healthcare Settings 2009. www.dh.gov.uk/prod_consum_dh/groups/dh_digitalassets/@dh/@en/@ps/documents/digitalasset/dh_110899.pdf.
- Boivin G, Goyette N, Hardy I, Aoki F, Wagner A, Trottier S. Rapid antiviral effect of inhaled zanamivir in the treatment of naturally occurring influenza in otherwise healthy adults. J Infect Dis 2000;181:1471-4.
- Lau LL, Cowling BJ, Fang VJ, Chan KH, Lau EH, Lipsitch M, et al. Viral shedding and clinical illness in naturally acquired influenza virus infections. J Infect Dis 2010;201:1509-16.
- Ng S, Cowling BJ, Fang VJ, Chan KH, Ip DK, Cheng CK, et al. Effects of oseltamivir treatment on duration of clinical illness and viral shedding and household transmission of influenza virus. Clin Infect Dis 2010;50:707-14.
- Treanor JJ, Hayden FG, Vrooman PS, Barbarash R, Bettis R, Riff D, et al. Efficacy and safety of the oral neuraminidase inhibitor oseltamivir in treating acute influenza: a randomized controlled trial. US Oral Neuraminidase Study Group. JAMA 2000;283:1016-24.
- Frank AL, Taber LH, Wells CR, Wells JM, Glezen WP, Paredes A. Patterns of shedding of myxoviruses and paramyxoviruses in children. J Infect Dis 1981;144:433-41.
- Lee N, Chan PK, Hui DS, Rainer TH, Wong E, Choi KW, et al. Viral loads and duration of viral shedding in adult patients hospitalized with influenza. J Infect Dis 2009;200:492-500.
- Leekha S, Zitterkopf NL, Espy MJ, Smith TF, Thompson RL, Sampathkumar P. Duration of influenza A virus shedding in hospitalized patients and implications for infection control. Infect Control Hosp Epidemiol 2007;28:1071-6.
- Sato M, Hosoya M, Kato K, Suzuki H. Viral shedding in children with influenza virus infections treated with neuraminidase inhibitors. Pediatr Infect Dis J 2005;24:931-2.
- Cao B, Li XW, Mao Y, Wang J, Lu HZ, Chen YS, et al. Clinical features of the initial cases of 2009 pandemic influenza A (H1N1) virus infection in China. N Engl J Med 2009;361:2507-17.
- Ling LM, Chow AL, Lye DC, Tan AS, Krishnan P, Cui L, et al. Effects of early oseltamivir therapy on viral shedding in 2009 pandemic influenza A (H1N1) virus infection. Clin Infect Dis 2010;50:963-9.
- Suess T, Buchholz U, Dupke S, Grunow R, Matthias An der H, Heider A, et al. Shedding and transmission of novel influenza virus A/H1N1 infection in households: Germany 2009. Am J Epidemiol 2010;71:1157-64.
- To KK, Chan KH, Li IW, Tsang TY, Tse H, Chan JF, et al. Viral load in patients infected with pandemic H1N1 2009 influenza A virus. J Med Virol 2010;82:1-7.
- van Doorn RH. Influenza Pandemic (H1N1) 2009 (68): Viet Nam, Virus Clearance 2009. www.promedmail.org/pls/apex/f?p=2400: 1001: 1739427750156980::NO:: F2400_P1001_BACK_PAGE,F2400_P1001_PUB_MAIL_ID: 1004,79587.
- Reed SE. An investigation of the possible transmission of Rhinovirus colds through indirect contact. J Hyg 1975;75:249-58.
- Hall CB, Douglas RG. Modes of transmission of respiratory syncytial virus. J Pediatr 1981;99:100-3.
- Bean B, Moore BM, Sterner B, Peterson LR, Gerding DN, Balfour HH. Survival of influenza viruses on environmental surfaces. J Infect Dis 1982;146:47-51.
- Thomas Y, Vogel G, Wunderli W, Suter P, Witschi M, Koch D, et al. Survival of influenza virus on banknotes. Appl Environ Microbiol 2008;74:3002-7.
- Boone SA, Gerba CP. The occurrence of influenza A virus on household and day care center fomites. J Infect 2005;51:103-9.
- Pappas DE, Hendley JO, Schwartz RH. Respiratory viral RNA on toys in pediatric office waiting rooms. Pediatr Infect Dis J 2010;29:102-4.
- Loosli CG, Lemon HM, Robertson OH, Appel E. Experimental airborne influenza infection.I. Influence of humidity on survival of virus in air. Proc Soc Exp Biol Med 1943;53:205-6.
- Wells WF, Brown HW. Recovery of influenza virus suspended in air. Science 1936;84:68-9.
- Alford RH, Kasel JA, Gerone PJ, Knight V. Human influenza resulting from aerosol inhalation. Proc Soc Exp Biol Med 1966;122:800-4.
- Blachere FM, Lindsley WG, Pearce TA, Anderson SE, Fisher M, Khakoo R, et al. Measurement of airborne influenza in a hospital emergency department. Clin Infect Dis 2009;48:438-40.
- Lindsley WG, Blachere FM, Davis KA, Pearce TA, Fisher MA, Khakoo R, et al. Distribution of airborne influenza virus and respiratory syncytial virus in an urgent care medical clinic. Clin Infect Dis 2010;50:693-8.
- McLean RL. The effect of ultraviolet radiation upon the transmission of epidemic influenza in long term hospitals. Am Rev Respir Dis 1961;83:36-8.
- Moser MR, Bender TR, Margolis HS, Noble GR, Kendal AP, Ritter DG. An outbreak of influenza aboard a commercial airliner. Am J Epidemiol 1979;110:1-6.
- Han K, Zhu X, He F, Liu L, Zhang L, Ma H, et al. Lack of airborne transmission during outbreak of pandemic (H1N1) 2009 among tour group members: China, June 2009. Emerg Infect Dis 2009;15:1578-81.
- Nicas M, Nazaroff WW, Hubbard A. Toward understanding the risk of secondary airborne infection: emission of respirable pathogens. J Occup Environ Hyg 2005;2:143-54.
- Writing Committee of the WHO Consultation on Clinical Aspects of Pandemic Influenza . Clinical Aspects of Pandemic 2009 Influenza A (H1N1) Virus Infection. N Engl J Med 2010;362:1708-19.
- De Serres G, Rouleau I, Hamelin ME, Quach C, Skowronski D, Flamand L, et al. Contagious period for pandemic (H1N1) 2009. Emerg Infect Dis 2010;16:783-8.
- Li IW, Hung IF, To KK, Chan KH, Wong SS, Chan JF, et al. The natural viral load profile of patients with pandemic 2009 influenza A(H1N1) and the effect of oseltamivir treatment. Chest 2010;137:759-68.
- Schutten M, Lina CBB, Monto A, Osterhaus A, Nguyen Van-Tam J, Whitley RJ. Neuraminidase inhibitor (NAI) treatment in a 2009–H1N1 influenza A-infected patient population: The IRIS Study. Options for the Control of Influenza VII 2010.
- Tiwari A, Patnayak DP, Chander Y, Parsad M, Goyal SM. Survival of two avian respiratory viruses on porous and nonporous surfaces. Avian Dis 2006;50:284-7.
- Hinds WC. Aerosol technology. New York, NY: John Wiley and Sons; 1999.
- Fabian P, McDevitt JJ, Houseman EA, Milton DK. Airborne influenza virus detection with four aerosol samplers using molecular and infectivity assays: considerations for a new infectious virus aerosol sampler. Indoor Air n.d.:433-41.
- Tellier R. Aerosol transmission of influenza A virus: a review of new studies. J R Soc Interface 2009;6:S783-90.
- Mubareka S, Lowen AC, Steel J, Coates AL, Garcia-Sastre A, Palese P. Transmission of influenza virus via aerosols and fomites in the guinea pig model. J Infect Dis 2009;199:858-65.
- Munster VJ, de Wit E, van den Brand JM, Herfst S, Schrauwen EJ, Bestebroer TM, et al. Pathogenesis and transmission of swine-origin 2009 A (H1N1) influenza virus in ferrets. Science 2009;325:481-3.
- Nicas M, Sun G. An integrated model of infection risk in a health-care environment. Risk Anal 2006;26:1085-96.
- Couch RB, Cate TR, Douglas RG, Jr, Gerone PJ, Knight V. Effect of route of inoculation on experimental respiratory viral disease in volunteers and evidence for airborne transmission. Bacteriol Rev 1966;30:517-29.
- Douglas R, Kilbourne ED. The influenza viruses and influenza. New York, NY: Academic Press; 1975.
- Nicas M, Jones RM. Relative contributions of four exposure pathways to influenza infection risk. Risk Anal 2009;29:1292-303.
- Colthart DG. Pandemic Influenza and Swine Flu 2009. www.parliament.uk/briefingpapers/commons/lib/research/briefings/snsc-05059.pdf.
- Miller E, Hoschler K, Hardelid P, Stanford E, Andrews N, Zambon M. Incidence of 2009 pandemic influenza A H1N1 infection in England: a cross-sectional serological study. Lancet 2010;375:1100-8.
- Chan M, Chen MI, Chow A, Lee CP, Tan AS, Lye DC, et al. Pandemic (H1N1) 2009: clinical and laboratory findings of the first fifty cases in Singapore. Ann Acad Med Singapore 2010;39:267-72.
- Nguyen-Van-Tam J, Openshaw P, Hasim A, Gadd E, WS L, Semple M, et al. Risk factors for hospitalisation and poor outcome with pandemic A/H1N1 influenza: United Kingdom first wave (May–September 2009). Thorax 2010;65:645-51.
- Evaluation of rapid influenza diagnostic tests for detection of novel influenza A (H1N1) virus: United States 2009. MMWR Morb Mortal Wkly Rep 2009;58:826-9.
- Ginocchio CC, Zhang F, Manji R, Arora S, Bornfreund M, Falk L, et al. Evaluation of multiple test methods for the detection of the novel 2009 influenza A (H1N1) during the New York City outbreak. J Clin Virol 2009;45:191-5.
- Vasoo S, Stevens J, Singh K. Rapid antigen tests for diagnosis of pandemic (Swine) influenza A/H1N1. Clin Infect Dis 2009;49:1090-3.
- Ngaosuwankul N, Noisumdaeng P, Komolsiri P, Pooruk P, Chokephaibulkit K, Chotpitayasunondh T, et al. Influenza A viral loads in respiratory samples collected from patients infected with pandemic H1N1, seasonal H1N1 and H3N2 viruses. Virol J 2010;7.
- Spyridaki IS, Christodoulou I, de Beer L, Hovland V, Kurowski M, Olszewska-Ziaber A, et al. Comparison of four nasal sampling methods for the detection of viral pathogens by RT-PCR-A GA(2)LEN project. J Virol Methods 2009;156:102-6.
- Sung RY, Chan PK, Choi KC, Yeung AC, Li AM, Tang JW, et al. Comparative study of nasopharyngeal aspirate and nasal swab specimens for diagnosis of acute viral respiratory infection. J Clin Microbiol 2008;46:3073-6.
- Heikkinen T, Salmi AA, Ruuskanen O. Comparative study of nasopharyngeal aspirate and nasal swab specimens for detection of influenza. BMJ 2001;322.
Appendix 1 Protocol, version 1.1, 8 October 2009
Appendix 2 Consent forms
Appendix 3 Information sheets
Adult
Parent/guardian
Children 0–8 years
Children 9–15 years
Appendix 4 Eligibility checklist
Eligibility checklist
Appendix 5 Recruitment leaflet
Appendix 6 PCR protocol and culture protocol
PCR protocol
PCR
Nucleic acid was extracted from the samples using the Qiagen Symphony SP extractor mini kits, including onboard lysis and a bacteriophage (MS2) as internal control. A novel influenza A H1N1 pentaplex assay was devised to detect virus genome in the samples. The assay was designed to detect novel H1N1 influenza A, seasonal H1 influenza A, seasonal H3 influenza A, influenza B and the internal control, MS2. Reactions were carried out on a RotorgeneTM 6000 (Corbett Research) real-time DNA detection system. Viral load data were generated using the PCR assay and plasmids containing the gene target to create a standard curve, such that the concentration of genome present in each sample could be calculated.
The primers and probes used were as shown below.
Primers
Novel H1N1 influenza A (Metabion):
-
H1FORSW: 5′–TCA ACA GAC ACT GTA GAC ACA GTA CT–3′
-
H1REVSW: 5′–GTT TCC CGT TAT GCT TGT CTT CTA G–3′
Seasonal H1 influenza A (MWG Biotech):
-
AH1 Forward: 5′–GGA ATA GCC CCC CTA CAA TTG–3′
-
AH1 Reverse: 5′–AAT TCG CAT TCT GGG TTT CCT A–3′
Seasonal H3 influenza A (MWG Biotech):
-
AH3 Forward: 5′–CCT TTT TGT TGA ACG CAG CAA–3′
-
AH3 Reverse: 5′–CGG ATG AGG CAA CTA GTG ACC TA–3′
Influenza B (Metabion):
-
BNP-F: 5′–GCA GCT CTG ATG TCC ATC AAG CT–3′
-
BNP-R: 5′–CAG CTT GCT TGC TTA RAG CAA TAG GTC T–3′
MS2 control (MWG Biotech):
-
MS2 Forward: 5′–TGG CAC TAC CCC TCT CCG TAT TCA CG –3′
-
MS2 Reverse: 5′–GTA CGG GCG ACC CCA CGA TGT=A C–3′
Probes
Novel H1N1 influenza A (Metabion):
-
H1SWp3: 5′–Cy5-AAT GTA ACA GTA ACA CAC T CTG TTA ACC BHQ-3
Seasonal H1 influenza A (ABI):
-
AH1 Probe: 5′–6FAM CGT TGC CGG ATG GA-MGBNFQ–3′
Seasonal H3 influenza A (ABI):
-
AH3 Probe: 5′–VIC-CCT ACA GCA ACT GTT ACC-MGBNFQ–3′
Influenza B (Biosearch Technologies):
-
Flu-B Probe: 5′–Quasar 705-CCA GAT CTG GTC ATT GGR GCC CAR AAC TG-BHQ-2–3′
MS2 control (Metabion):
-
MS2 Probe: 5′–ROX-CAC ATC GAT AGA TCA AGG TGC CTA CAA GC-BHQ-2–3′
Culture protocol
Cultures were performed from the last day of nasal swab PCR positivity. If a culture was positive on any given day then an assumption was made that previous days would also have been culture positive.
Technique
Pandemic H1N1 did not form plaques readily and gave only a weak cytopathic effect, the latter meaning that the tissue culture infectious dose (TCID) 50 was difficult to calculate. Consequently, immunofluorescence to detect the influenza A nucleoprotein was used to demonstrate the presence of live replicating virus in the nuclei of infected cells.
| Stock concentration (pmol/µl) | Volume of stock/reaction (µl) | For 80 reactions (µl) |
|---|---|---|
| H1FORSW (20) | 0.5 | 40 |
| H1REVSW (20) | 0.5 | 40 |
| AH1 Forward (50) | 0.45 | 36 |
| AH1 Reverse (50) | 0.45 | 36 |
| AH3 Forward (50) | 0.45 | 36 |
| AH3 Reverse (50) | 0.45 | 36 |
| BNP-F (20) | 0.25 | 20 |
| BNP-R (20) | 0.25 | 20 |
| MS2 Forward (20) | 0.1 | 8 |
| MS2 Reverse (20) | 0.1 | 8 |
| H1SWp3 (10) | 0.2 | 16 |
| AH1 Probe (10) | 0.1 | 8 |
| AH3 Probe (10) | 0.1 | 8 |
| Flu-B Probe (10) | 0.2 | 16 |
| MS2 Probe (10) | 0.2 | 16 |
| 2 RT platinum buffer (Invitrogen) | 12.5 | 1000 |
| Superscript III platinum enzyme | 0.5 | 40 |
| Water | 2.7 | 216 |
| Total volume | 20 | 1600 |
Madin–Darby Canine Kidney (MDCK) cells were used to propagate the virus. Initially, cells were plated on to six-well tissue culture dishes (Corning), at a concentration of 7.5 × 10⁵/well. Following 24 hours’ incubation, the samples were defrosted. The cells were washed ×2 in serum-free medium [SFM – Dulbecco’s Modified Eagle’s Medium (DMEM)] and 400 µl of each sample was applied to the respective well. After 30 minutes the cells were overlaid with 2 ml of SFM containing 0.14% fetal calf serum (FCS) and 0.1% Worthington’s trypsin. Dilutions (1 : 10) of influenza A (H1N1 human influenza virus A/PuertoRico/8/34) and a novel H1N1 influenza A isolate (A H1N1 Cambridge AHO4/2009) were also inoculated on to cells as positive controls. The cells were then incubated for 48 hours at 37°C. The following day, 24-well tissue culture dishes were seeded with 1 × 10⁵ MDCK cells per well. Then, 48 hours after infection the virus was harvested. Two dilutions were made in SFM: 1 : 2 and 1 : 10. After washing the cells in the 24-well dishes ×2 in SFM, 250 µl of each dilution was added to the appropriate well. Following 30 minutes’ incubation at 37°C, 1 ml of overlay (as before) was added to each well and the cells were incubated overnight. After overnight incubation, the virus dilutions were aspirated off the cells. The cells were washed ×2 with phosphate-buffered saline (PBS) and then fixed with 250 µl of 4% formaldehyde at room temperature for 20 minutes. The fix was aspirated off and the cells were washed ×3 with blocking solution (1% FCS in PBS). The cells were permeabilised in detergent (0.2% Triton 100 in PBS) and then washed ×2 in block. Then 250 µl of a mouse monoclonal antibody (anti-NP, Abcam, ab43821) was added to each well and the plates were incubated for 60 minutes before washing ×3 with block. The secondary antibody (goat anti-mouse 488 IgG2a, Molecular Probes) was diluted 1 : 1000 in block, and 4′,6 diamino-2-phenylindole (DAPI) diluted 1 : 2000. Then 250 µl of this mix was added to the cells. Incubation was in the dark for 30–45 minutes. Cells were washed thoroughly with block, left in PBS and examined on the fluorescence microscope.
Appendix 7 Composite subject charts
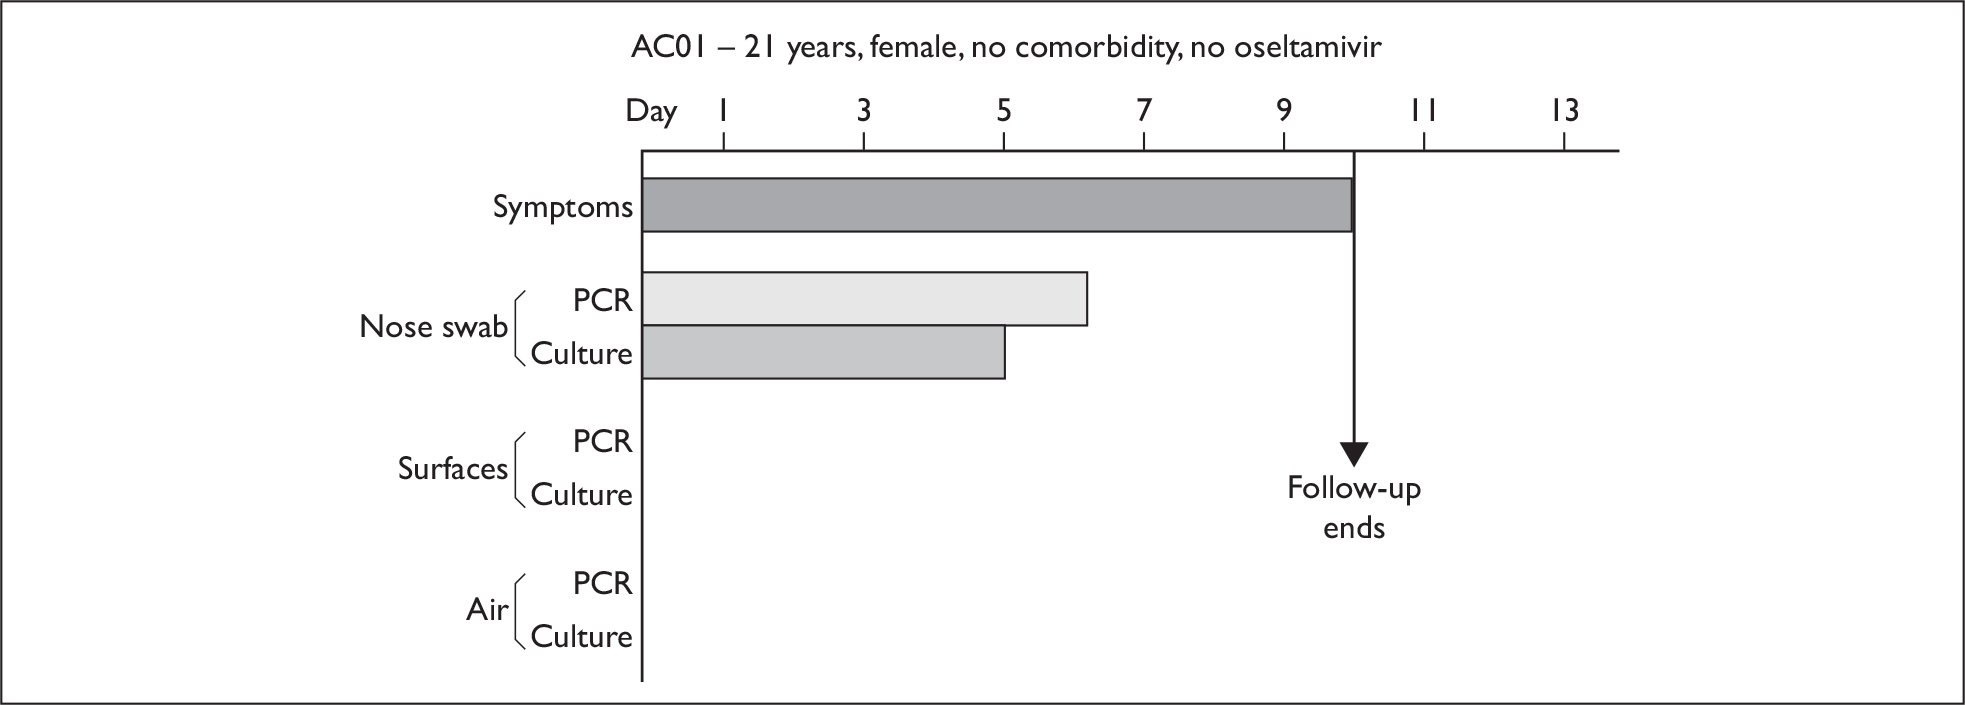
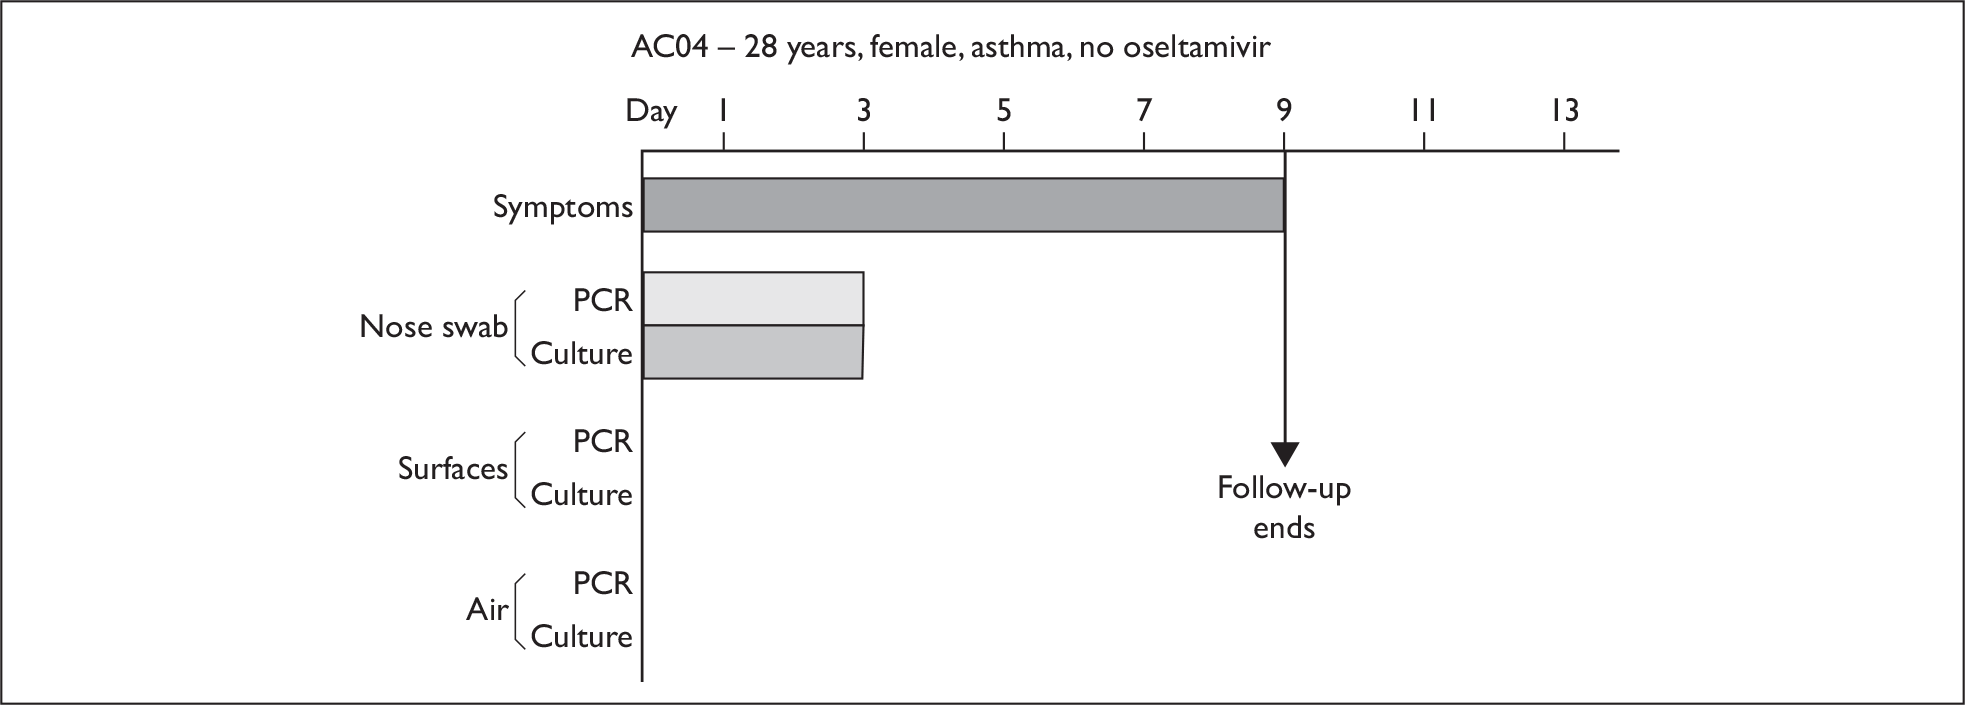
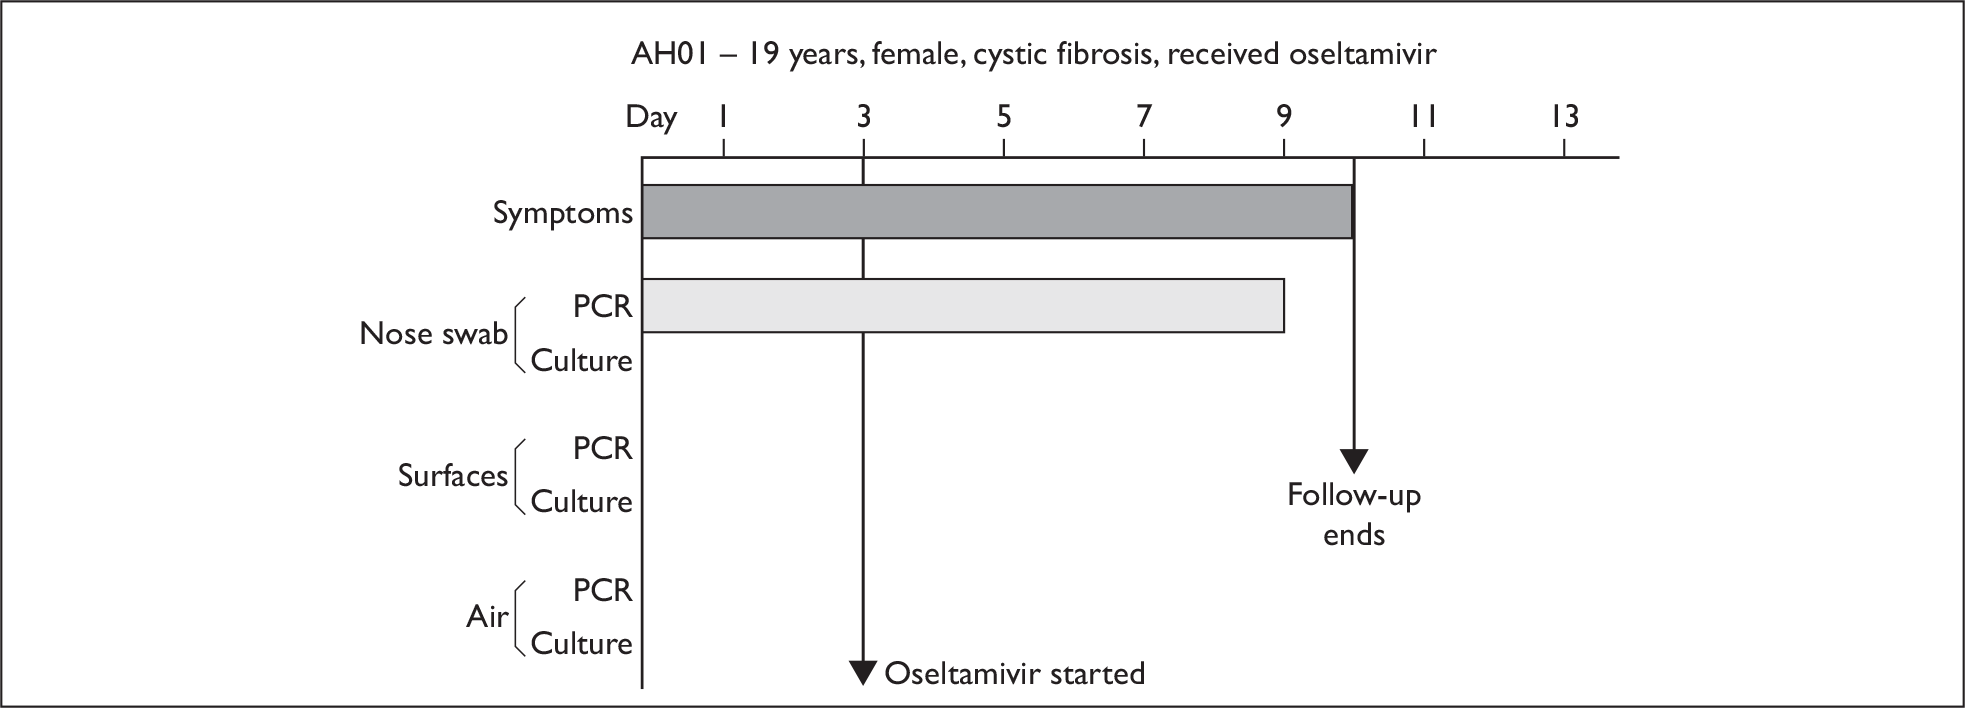
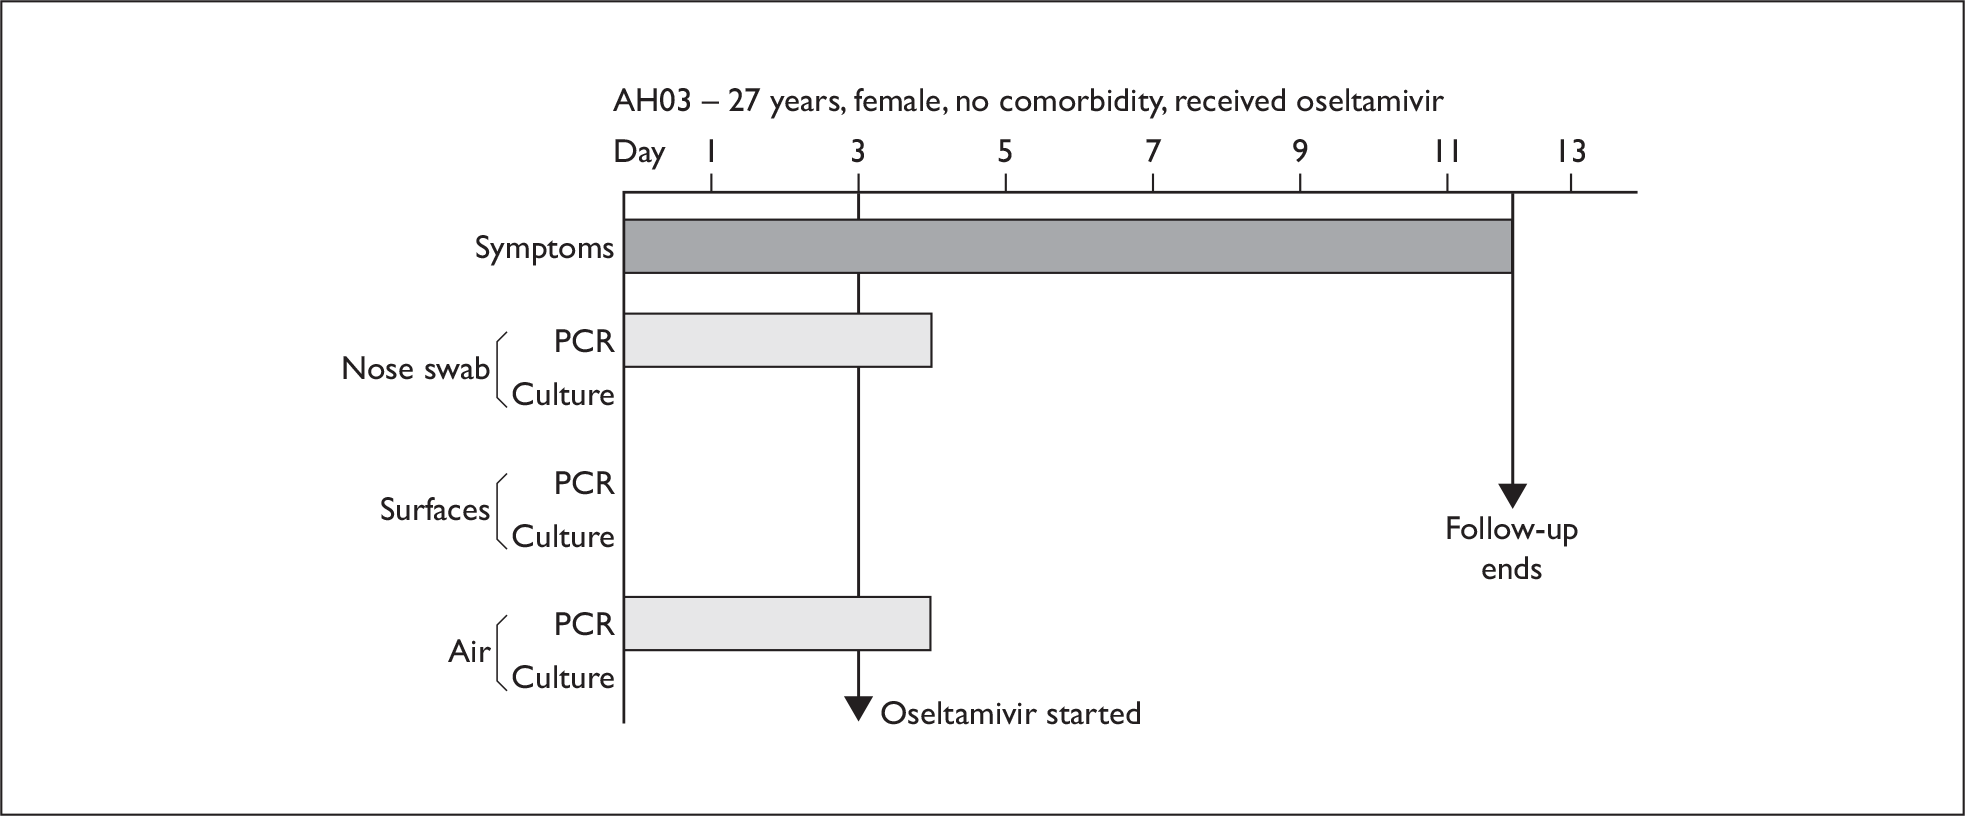

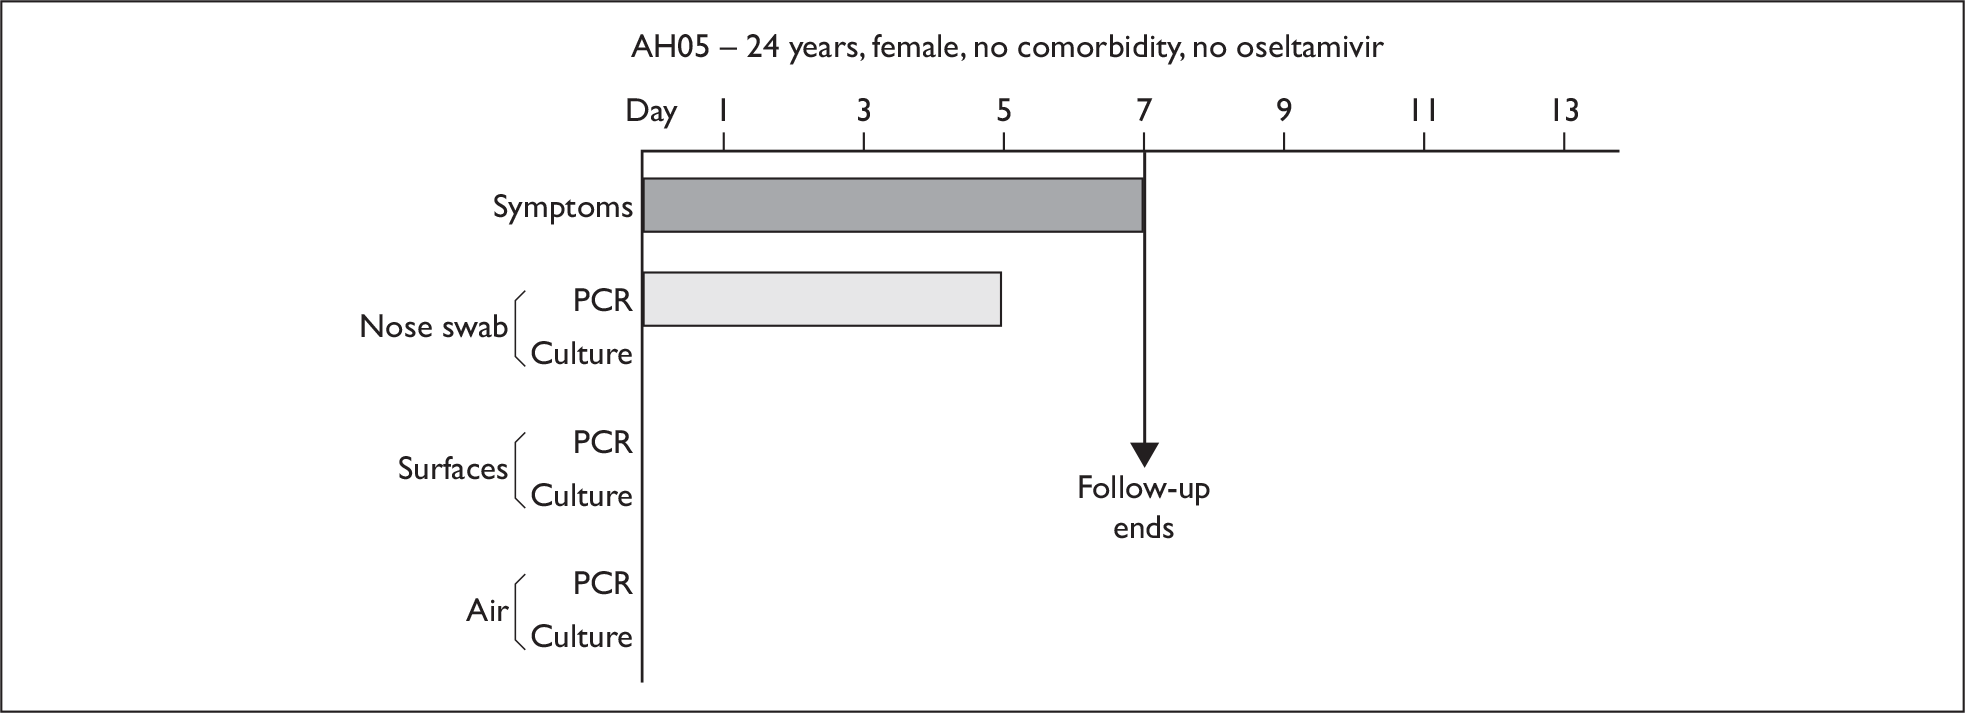


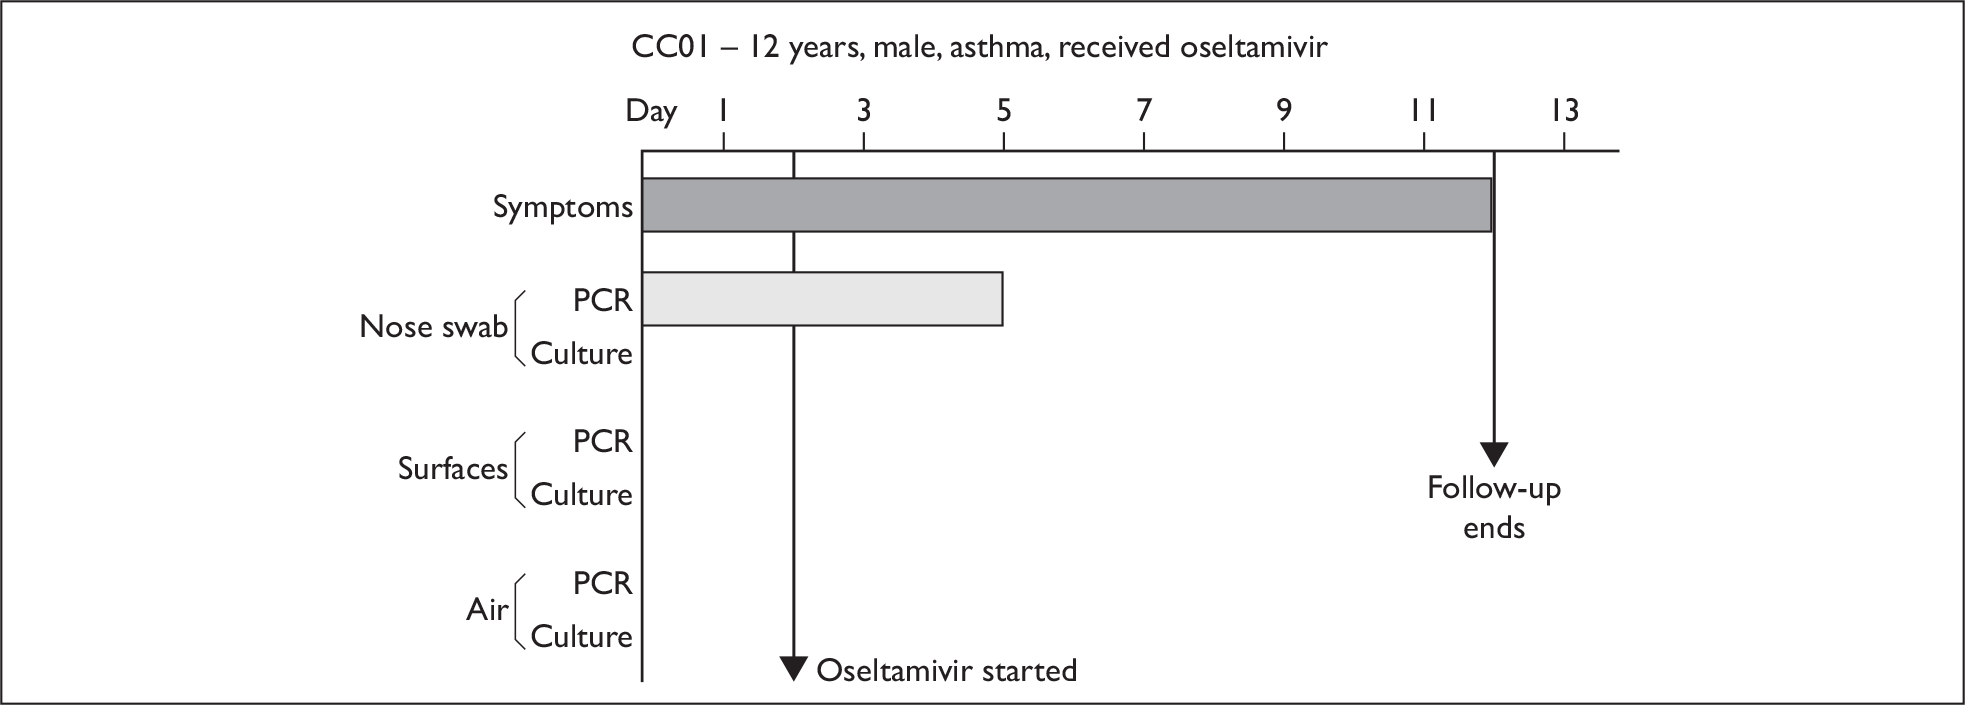


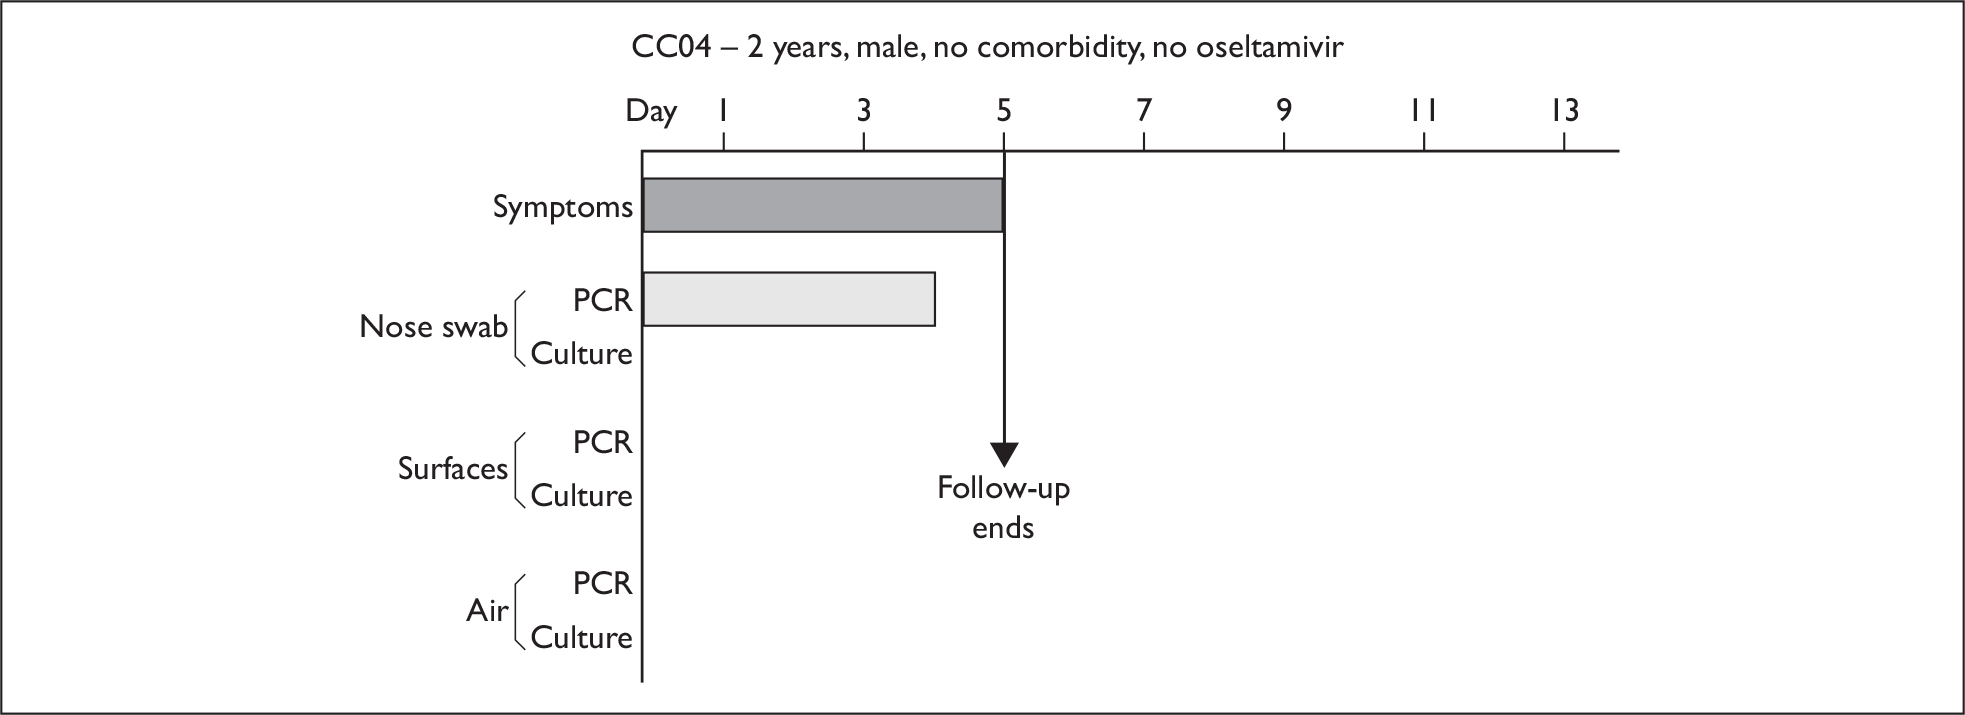

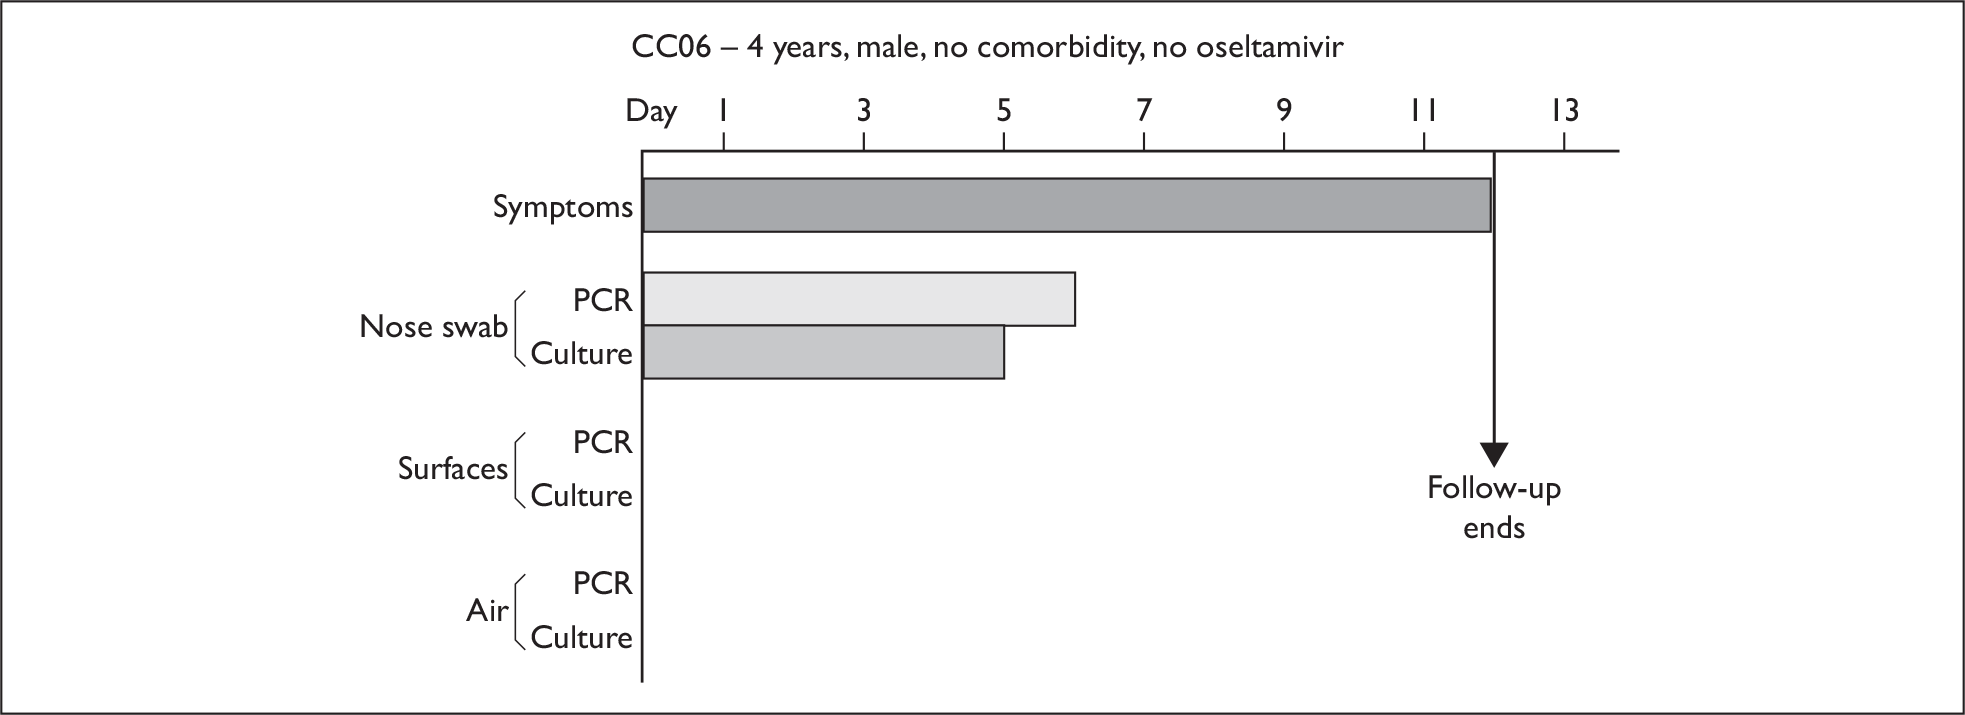

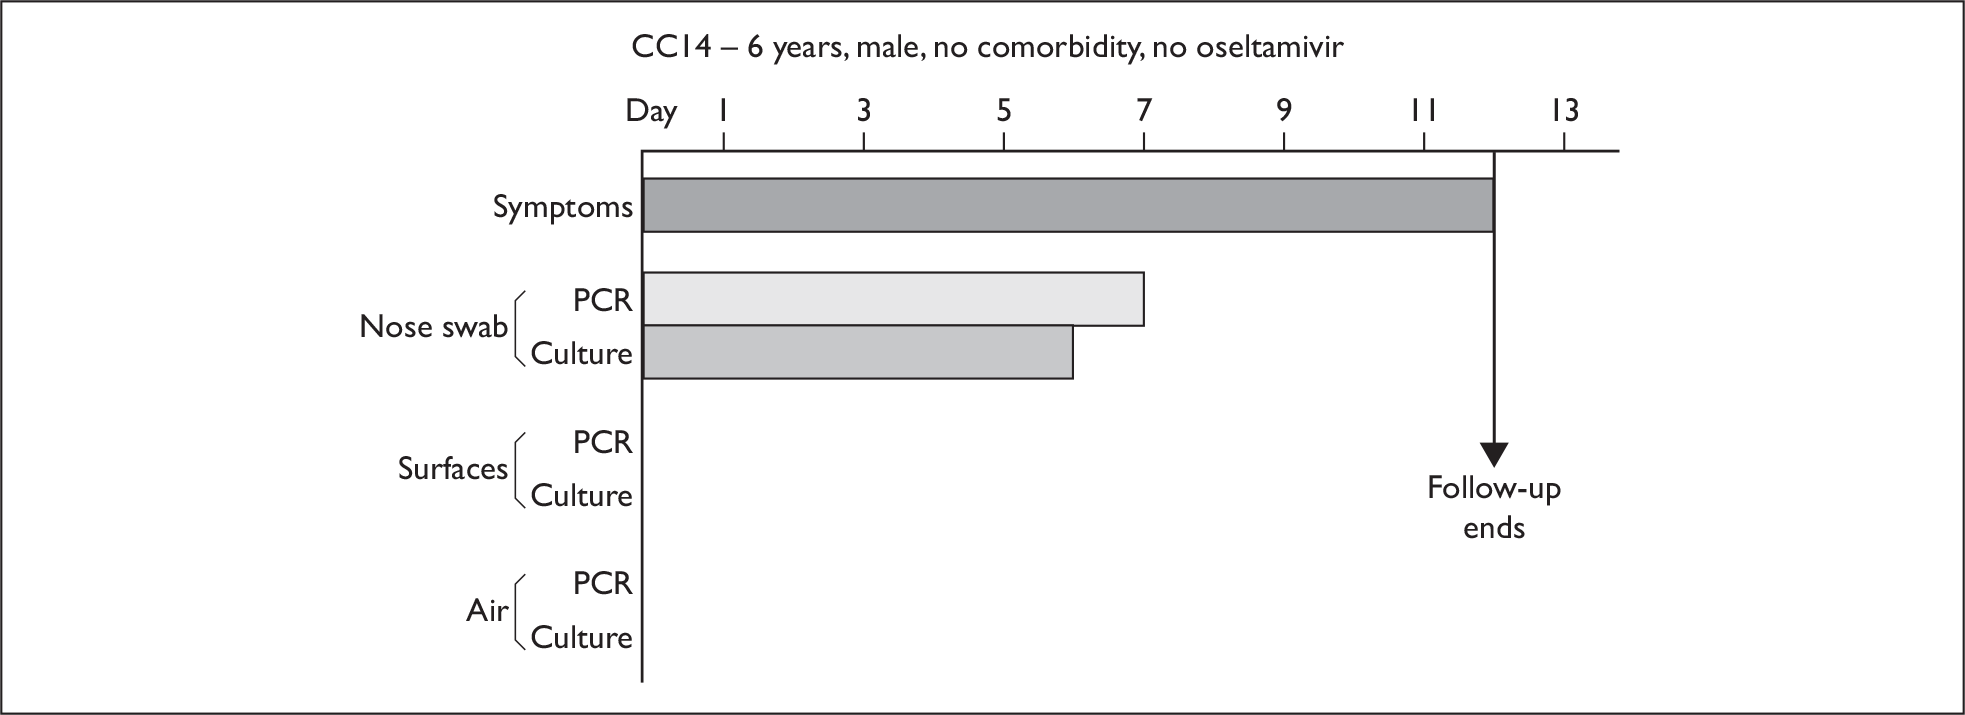
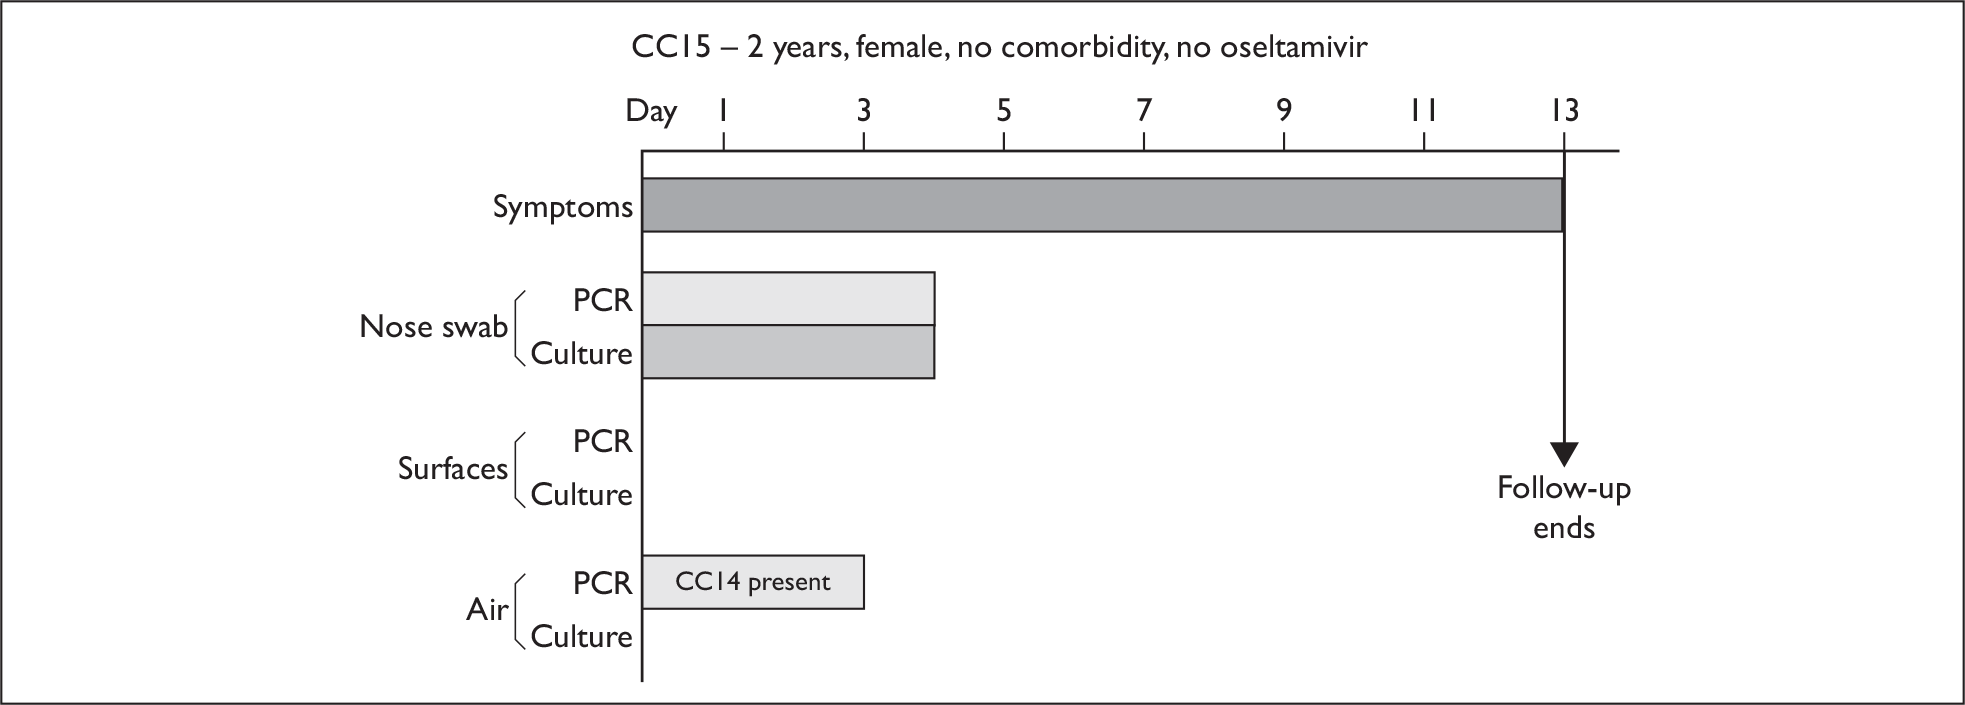
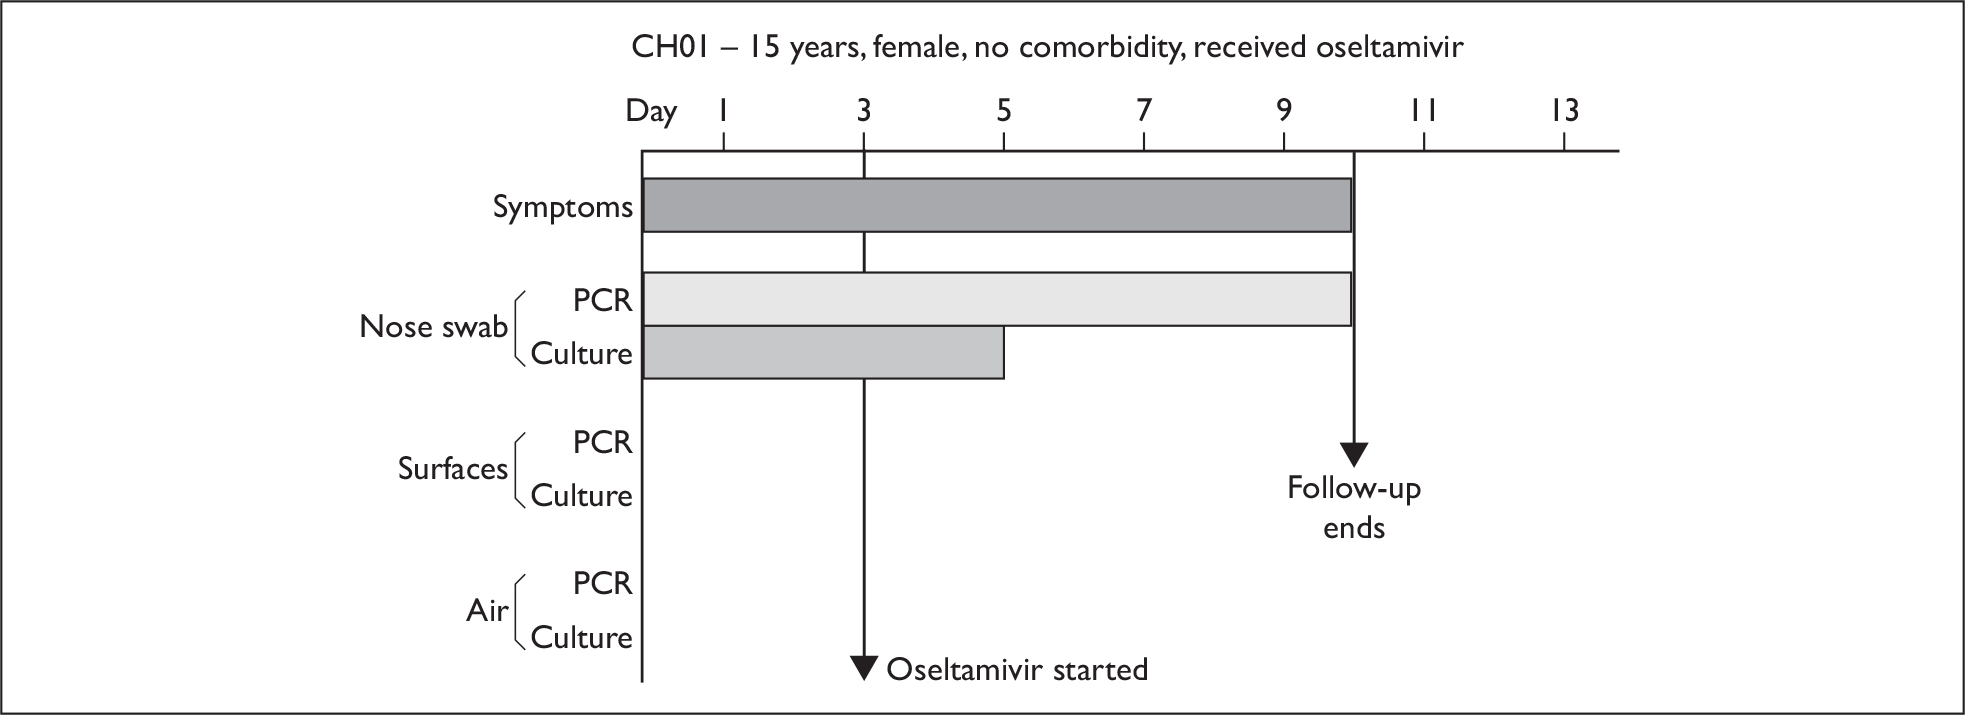
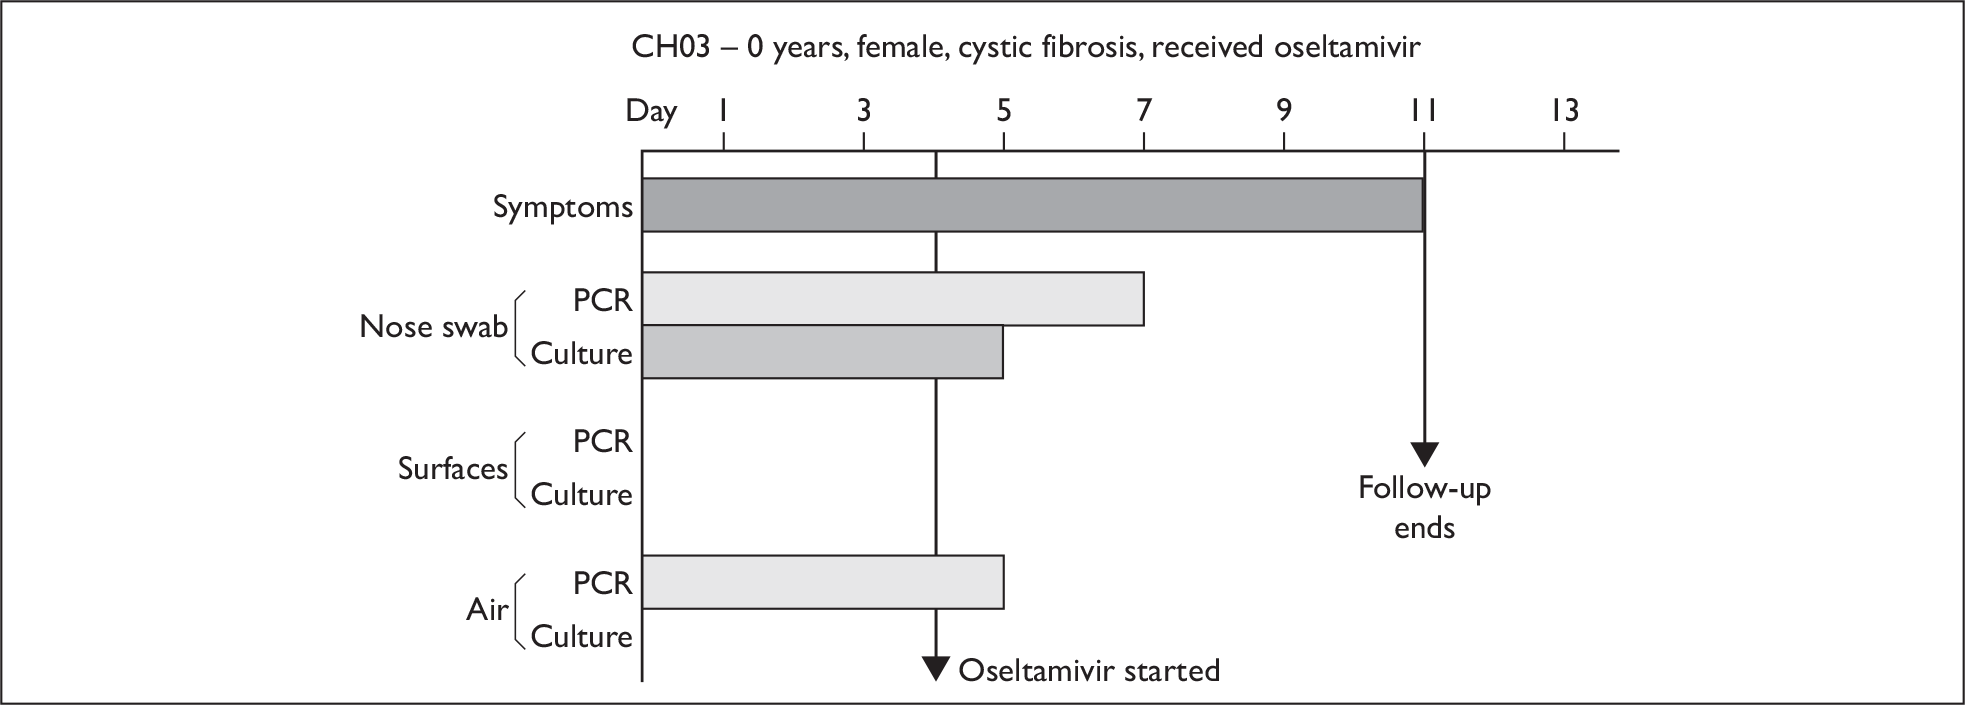
List of abbreviations
- AC
- adult in the community
- AH
- adult in hospital
- ARI
- acute respiratory infection
- CC
- child in the community
- CH
- child in hospital
- CI
- confidence interval
- HA
- haemaglutinin
- HPA
- Health Protection Agency
- ILI
- influenza-like illness
- LRT
- lower respiratory tract
- MDCK
- Madin–Darby Canine Kidney
- NIHR
- National Institute for Health Research
- NIOSH
- National Institute of Occupational Safety and Health
- NPA
- nasopharyngeal aspirate
- PCR
- polymerase chain reaction
- PCT
- Primary Care Trust
- PPE
- personal protective equipment
- RSV
- respiratory syncitial virus
- SFM
- serum-free medium
- TCID
- tissue culture infectious dose
- URT
- upper respiratory tract
- VTM
- viral transport medium
All abbreviations that have been used in this report are listed here unless the abbreviation is well known (e.g. NHS), or it has been used only once, or it is a non-standard abbreviation used only in figures/tables/appendices, in which case the abbreviation is defined in the figure legend or in the notes at the end of the table.