Notes
Article history
The research reported in this issue of the journal was funded by the HS&DR programme or one of its preceding programmes as project number 13/157/34. The contractual start date was in June 2015. The final report began editorial review in March 2018 and was accepted for publication in August 2018. The authors have been wholly responsible for all data collection, analysis and interpretation, and for writing up their work. The HS&DR editors and production house have tried to ensure the accuracy of the authors’ report and would like to thank the reviewers for their constructive comments on the final report document. However, they do not accept liability for damages or losses arising from material published in this report.
Declared competing interests of authors
Jeremy Dawson is a board member of the National Institute for Health Research Health Service and Delivery Research programme. Amanda Forrest is a board member of Sheffield Clinical Commissioning Group.
Permissions
Copyright statement
© Queen’s Printer and Controller of HMSO 2019. This work was produced by Dawson et al. under the terms of a commissioning contract issued by the Secretary of State for Health and Social Care. This issue may be freely reproduced for the purposes of private research and study and extracts (or indeed, the full report) may be included in professional journals provided that suitable acknowledgement is made and the reproduction is not associated with any form of advertising. Applications for commercial reproduction should be addressed to: NIHR Journals Library, National Institute for Health Research, Evaluation, Trials and Studies Coordinating Centre, Alpha House, University of Southampton Science Park, Southampton SO16 7NS, UK.
2019 Queen’s Printer and Controller of HMSO
Chapter 1 Introduction and background
Introduction
This report describes a study aimed at designing a measure of productivity for general practices providing NHS services in England. It uses a two-stage process of developing a measure [using the Productivity Measurement and Enhancement System (ProMES)] and then testing and evaluating the measure’s use in a range of general practices. In this chapter, the context for the measure is introduced, including the role of general practice and what measures are currently available, and then the study aims and objectives are outlined.
The context of general practice in England
Since the formation of the NHS in 1948, general practitioners (GPs) have always existed on the periphery of the main NHS structure, in the sense that the majority are not employed directly by NHS organisations, but are either independent contractors, being partners in small businesses (general practices) that receive payments for providing NHS services, or employed by such practices. General practices are a key element of the provision of primary care, which can be defined as the first point of contact for health care for most people, mainly provided by GPs, but also by community pharmacists, opticians and dentists. 1 GPs do not work in isolation, but generally in multidisciplinary teams (MDTs) comprising nurses, allied health professionals and other clinical and administrative staff. Critically, GPs often act as the gatekeeper to other NHS services, and provide key links to other parts of the health and social care system.
Each general practice has a list of patients for whom it provides primary medical services, including (but not limited to) patient-led consultations with GPs, practice nurses and other clinical staff; prescriptions; treatment for certain ailments; referrals to specialists; screening and immunisations; management of long-term conditions; and health promotion. The variety and scope of tasks undertaken by general practices is huge, and in recent times there has been greater encouragement towards integrated care, and to prevention rather than cure. 2 The nature of the employment relationship, however, in addition to the variety and complexity of the task performed by GPs in providing primary care, means that even defining productivity and effectiveness, let alone collecting data to measure such concepts, is far from straightforward.
Since 2004, there have been two major changes in the management of primary care provision in England that have had significant implications for both the role of the general practice and the data available. First, in 2004, new GP contracts were introduced: the General Medical Services (GMS) contract, used by ≈60% of practices, and the Personal Medical Services (PMS) contract, used by ≈40% of practices. 3 The funding methods are not straightforward, but depend on a combination of core payments for delivering essential services to registered patients, and various additional payments for meeting particular targets and delivering enhanced services (which may be commissioned locally). In particular, a major route for determining extra payments is the Quality and Outcomes Framework (QOF), which will be discussed in greater detail in Overview of measurement of productivity and effectiveness in general practice.
The other significant recent change is the Health and Social Care Act 2012,4 which led to the creation of Clinical Commissioning Groups (CCGs). These replaced the primary care trusts that had previously been responsible for commissioning services for patients as well as providing some community-based care. CCGs were designed to be led by clinicians, principally GPs operating within the relevant geographical area, who would have the best idea of the health needs of the local population. The manner in which CCGs are led by GPs, and the extent of external assistance, varies substantially from one CCG to another, and in some CCGs a far greater proportion of GPs will play an active role in the CCG than in others. 5 At the same time, many general practices have sought to improve efficiency and manage demand better by developing networks or federations including multiple practices. These would typically share some services, but, again, the extent and formality of this arrangement will vary from one network to another. Some practices are owned by a parent company; typically, such companies will employ GPs and other staff working within their practices.
The role of general practice within the NHS is paramount. It has been estimated that ≈90% of NHS contacts take place in general practice. 3 As of December 2017, there are 6601 general practices on either GMS or PMS contracts within England, covering over 58 million registered patients. There are a total of 41,817 GPs, with a full-time equivalent (FTE) of 33,782 GPs. One year previously, these numbers were 41,589 GPs and 34,126 FTE GPs. As of March 2017, there were 132,430 other staff employed by general practices (90,984 FTE), including 22,737 nurses (15,528 FTE), 17,585 other clinicians involved in direct patient care (11,413 FTE), 11,147 practice managers or management partners (9784 FTE) and 81,258 other administrative and non-clinical staff (54,259 FTE). 6–8
At the same time, general practice is facing unprecedented challenges. 9 The number of people aged ≥ 65 years is increasing sharply in all areas of the country, and the number of people with long-term conditions, most which are managed within general practice, is increasing. The number of consultations in general practice between 2010/11 and 2014/15 grew by over 15%, whereas funding has remained relatively stable, placing practices under massively increasing pressure. In conjunction with a workforce that is failing to keep up with rising demand, this suggests that an emphasis on productivity, efficiency and effectiveness is needed. 10 The General Practice Forward View,11 discussed more fully in the next section, provides some processes setting out how this may be achieved. Improving access in order to improve outcomes for some patient groups is a priority and new data from the British Social Attitudes survey12 published in February 2018 has shown that public satisfaction with the services provided by GPs is at its lowest level since the survey began in 1983. 13,14
Overview of measurement of productivity and effectiveness in general practice
Productivity and effectiveness are terms that are used in myriad ways. A classical definition of productivity is simply the ratio of outputs to inputs, and is often defined in simple financial terms. However, in health care this definition is not sufficient – the simple measurement of financial outputs does not usually take account of the quality of care delivered. Productivity in health care should measure ‘how much health for the pound, not how many events for the pound’. 15 Therefore, a definition often used within health is ‘the ratio of outputs to inputs, adjusted for quality’. 16 (Reproduced from Appleby et al. 16 © The King’s Fund 2010. This is an Open Access article distributed in accordance with the terms of the Creative Commons Attribution (CC BY-NC-ND 4.0) license, which permits others to copy and redistribute the work, provided the original work is properly cited. See: https://creativecommons.org/licenses/by-nc-nd/4.0/). However, the nature of this adjustment is a matter of debate: it is not generally possible to assess the financial effects of quality directly, as to do this would require assessment of the services’ marginal contributions to social welfare,17 and identifying and isolating these contributions would be difficult if not impossible (although, in principle, identifying the financial inputs should be easier).
Although attempts have been made to measure quality-adjusted outputs directly (e.g. Dawson et al. 18 and Castelli et al. 19), these have tended to focus on secondary care, and do not generally account for the wide range of potential data, but instead rely on routinely collected outcome data. Quality can refer to a mixture of things, including health outcomes, safety and patient experience. Here, it is argued that, particularly for primary care, the full extent of quality cannot be measured without taking into account a broader set of indicators, for example the views of patients. 20
Given the importance of primary care and general practice within the NHS more widely, it is perhaps surprising that there have not been more attempts to provide a more specific definition and measurement of productivity – or other forms of performance, such as effectiveness – that can be applied at the practice level. There have, however, been various attempts to capture the performance of general practice for other, more specific, purposes.
The widest-known current method for assessing general practice outputs is the QOF. This sets payments to practices based on their activity against a number of indicators across two principal domains. Practices report on their performance on these indicators in accordance with clearly defined criteria; each indicator has a different weighting, so that the total QOF score is composed of a weighted sum of all the indicators together. Specifically, in 2017/18, there were 63 clinical indicators (across 19 specific clinical conditions or groupings of condition) and 12 public health indicators. 21
Despite the growing demands of a larger population, more older people and more people with multiple chronic conditions requiring management in primary care, the share of NHS spending on general practice has fallen in recent years. There are plans to redress this problem, and in April 2016 NHS England announced a 5-year plan to increase investment in general practice. 11 The funds allocated to each practice each year include a global sum calculated to adjust for workloads and features of the patient population (age, morbidity, mortality, population turnover), and pay for performance elements made up of the QOF and enhanced services, some of which may be determined locally. On the basis of these payment streams, in 2014–15 practices received a median of £105.79 (interquartile range £96.35–121.38) per patient. In recent work,22 however, it has been shown that population factors related to health needs were, overall, poor predictors of variations in adjusted total practice payments and in the payment component designed to compensate for workload.
The precise content has varied from year to year. Notably, all of the ‘quality and productivity’ indicators and the one ‘patient experience’ indicator from earlier years were discontinued from 2014/15 onwards, giving the impression that only clinical outcomes, rather than other areas of effectiveness and patient experience, are being prioritised. QOF has been criticised for many reasons, including being arbitrary in its setting of targets, being influenced by contractual negotiations, being subject to regular changes and creating tensions between patient-centred consulting and management. 23,24 These arguments will be expanded in the next section, which reviews the literature on the topic. Other output measures, such as those used by the Office for National Statistics (ONS) and the National Institute for Health and Care Excellence (NICE), likewise do not cover all activity or focus on a different level (e.g. the NHS Outcomes Framework, which focuses on the CCG level). 25
The importance of primary care quality is further indicated by the fact that the Care Quality Commission (CQC) now inspects general practices, including out-of-hours (OOH) services. These inspections ask the key questions about whether or not services are safe, effective, caring, responsive and well led. This brings together quality and safety, but does not directly address productivity, and leads to a broad-brush rating at one of four levels between ‘inadequate’ and ‘outstanding’. 26
Any comprehensive measure of general practice productivity or effectiveness would, however, need to consider the wide range of outcomes from primary care, including elements relating to public health and health improvement. In order to capture the range of outcomes, but also the differing importance of them, a model is needed that addresses both of these factors. The model used in this study does this. This approach, explored in greater depth in the following section, provides a method of capturing a range of different objectives and assigning them different weights, and is driven by the users on the ground: in this case, general practice staff and patients. 27
Performance measurement: literature review
Overall performance measurement
The measurement of performance in health care has long been a contentious issue. The pressures of competing priorities mean that there is often no consensus over the definition of what constitutes high-quality performance. 28 In health systems that operate for profit, profitability of a unit may provide one suitable measure of performance; however, in the NHS and other systems that do not operate on a for-profit basis, the measurement of financial performance is both more complex and less appropriate.
To capture overall performance in health care (whether of a single organisation or the system as a whole), a range of different indicators is undoubtedly necessary. Often these will take the form of a ‘balanced scorecard’ – a set of measures designed to capture all the main areas of performance. For example, areas covered may include indicators relating to patient health, mortality, safety, patient satisfaction and the extent to which targets are met. The precise types of measures will depend on the context and nature of the units being studied; however, there should certainly be alignment between the objectives of the unit and the measurements used. 29,30
Productivity is a particularly difficult area of performance measurement. It is always a challenge for health-care providers and administrators to be able to produce as much as possible with the resources available. In the NHS, for example, the Wanless report31 identified that in future years the NHS would need to be able to make better use of its resources in order to maintain the same level of service – and that was at a time of relative prosperity and growth in the NHS. In times of relative austerity and uncertainty, the necessity becomes even greater.
A classical definition of productivity is simply the ratio of outputs to inputs, and is often defined in simple financial terms. However, in health care this definition is not sufficient: the simple measurement of financial outputs does not usually take account of the quality of care delivered. The most common definition used in health care is the ratio of outputs to inputs, adjusted for quality.
Although attempts have been made to measure quality-adjusted outputs directly, these have tended to focus on secondary care, and do not generally account for the wide range of potential data, but instead prefer routinely collected outcome data. 18,19 Quality can refer to a mixture of things, including health outcomes, safety and patient experience. It seems evident that, particularly for primary care, the full extent of quality cannot be measured without taking into account the views of patients. 20
Performance measurement in primary care
Primary care in general (and general practice in particular) covers a huge range of activity, with practitioners needing a wide enough scope of knowledge to be able to deal with all presenting problems, whether these are dealt with directly within the primary care setting or referred on to secondary care or other services. 2,32 Some models of overall primary care effectiveness do exist, although they do not focus on productivity, and are not geared towards the NHS situation in particular. However, the dimensions identified by Kringos et al. 33 in particular (i.e. primary care processes determined by access in addition to continuity, co-ordination and comprehensiveness of care, and outcomes determined by quality of care, efficiency of care and equity in health) give a useful benchmark for comparison.
The role of the GP within this setting is key to its success, and the nature of the consultation between GP and patient has itself been the subject of much scrutiny, particularly with regard to its potential to explore broader health concerns than that initially presented by the patient. For example, Stott and Davis34 presented a four-point framework to help GPs achieve greater breadth in consultations, covering management of presenting problems, modification of help-seeking behaviour, management of continuing problems and opportunistic health promotion. By engaging in all four of these aspects, rather than merely dealing with the primary issue, GPs can seek to improve general health and avoid future concerns. Mehay35 went further than this, describing 15 separate models of doctor–patient consultation, and Pawlikowska et al. 36 undertook an analysis of a variety of consultation types. Although they36 did not advocate any one particular model, their analysis suggested some key themes including establishing a rapport, appropriate questioning style, active listening, empathy, summarising, reflection, appropriate language, silence, responding to cues, patient’s ideas, concerns and expectations, sharing information, social and psychological context, clinical examination, partnership, honesty, safety netting/follow-up and housekeeping. In particular, Pawlikowska et al. 36 concluded that excellent communication skills alone are not enough. In general, GPs also have a key role in managing patients’ uncertainty, and act as a key operator at the boundary between different agencies. 37
With this in mind, the measurement of performance in general practice needs to embrace this complexity and reflect the broad activity undertaken by GPs and other practice staff, including the work of practice nurses and other clinicians working under the umbrella of the general practice; however, this is far from straightforward. One attempt to do so is the provision of profiles of general practices by Public Health England. However, these include only certain areas of performance and are updated infrequently. A 2015 review38 conducted by the Health Foundation examined indicators that were then in use in the NHS. Although there were a multiplicity of sources of indicators available, the over-riding conclusion was that the accessibility of these indicators was poor, particularly from the patients’ perspective. Considering that the rationale for publication of indicators may include improvement, patient choice/voice, and accountability, it recommended that a single web location be developed to provide access to these indicators (rather than relying on very different web sources, such as NHS Choices, CQC ratings, MyNHS, Public Health England and NHS Digital), but, even then, there would be significant areas of performance that were not covered by reliable indicators. The review also suggested that composite indicators should not be developed and gave six reasons for this: (1) aggregation masks aspects of quality of care, (2) it was suggested that a composite index would provide little value over and above the CQC ratings, (3) patients and service users are not a homogeneous group, (4) any selection and weighting of indicators would be highly contentious, (5) the number of robust indicators available is extremely small and not comprehensive and (6) there would not be enough detail for professionals to pinpoint areas for improvement. 38
Some of these arguments are more persuasive than others. It is certainly true that aggregation can mask specific aspects of care, but this does not imply that overall performance is not a meaningful concept. In particular, if an overall performance index can be developed that also allows examination of specific areas within it, it could service both needs. We disagree that no value can be added to the CQC ratings with other composite indicators; as discussed later in this section, CQC inspections (leading to ratings) are made too infrequently and do not offer the detail that could be given by a more comprehensive index. It is also true that patients and service users are a very varied group, and any attempt to measure overall performance of a practice should not imply that the performance is the same for all groups. The contentious nature of the choice of indicators, particularly in the light of the small number of robust indicators, is a critical issue. This suggests that any specific choice of indicators might favour one type of practice over another. The difficulty of balance in performance measurement is something discussed by multiple authors. 39–41 For this reason, any overall performance index may not be so useful as a direct comparison between practices, but instead as a longitudinal tracker within practices – more as an improvement tool than a performance management tool.
Baker and England42 have presented a framework covering many of these outcomes: both final outcomes (including mortality, morbidity, disease episodes, quality of life, adverse incidents, equity, patient satisfaction, costs and time off work/school) and intermediate outcomes (e.g. clinical outcomes, such as immunisation/screening, health behaviours, resource utilisation and patient experience, and practitioner-related outcomes, such as work satisfaction). For each outcome (or type of outcome) there is both a degree of importance of the outcome to the overall perception of effectiveness, and a degree of influence that the general practice can have over it. For example, mortality is a very important final outcome, and, although primary care can influence mortality, the influence is small, with the characteristics of patients being very much the most powerful predictors of mortality rates. On the other hand, patient satisfaction with care is increasingly seen as an important outcome, and the delivery of primary care will certainly influence it much more directly.
One of the greatest challenges for general practice is in the effective allocation of resources. A 2017 study by Watson et al. 43 used a value-based health-care framework to propose how resources can be allocated more effectively. As well as quality, safety, efficiency and cost-effectiveness, it includes optimality (balancing of improvements in health against cost of improvement). Optimality requires evidence and shared decision-making with individual patients. The authors argue that primary care has an essential role in delivering optimality and, therefore, value. However, they also point to the lack of readiness currently within the primary care system: ‘primary care measurement systems need to be developed to generate data that can assist with the identification of optimality’. 43 Of interest, among its suggestions for things to do more/less of, it suggests fewer health checks and fewer unnecessary appointments. It does, however, recommend more social prescribing, more patient self-care, better integration of services and a higher overall allocation of resources into primary care.
This is closely tied to the area of efficiency, which has had its own section of literature within health care generally and primary care in particular. Of particular note here is the work using data envelopment analysis, which uses multidimensional geometric methods to compare the inputs and outputs of a unit and to establish a comparative index of efficiency. In particular, Pelone et al. 44–46 have undertaken to do this in different primary care settings. However, this method is simply one of using other indicators to create a composite measure of efficiency (or productivity); it does not calculate a specific index, but instead depends on the comparability of units. Therefore, the choice of appropriate indicators is still of paramount importance.
The nature of primary care means that a certain number of clinical and patient activity indicators are inevitable, and these should cover as many of the major conditions and patient types as possible, including public health priorities. However, there are other, more general areas that also need to be considered. One of these is patient safety. However, patient safety within primary care is not something that is measured in any standard form. Lydon et al. 47 conducted a systematic review of measurement tools for the proactive assessment of patient safety in general practice. Of the 56 studies identified by this systematic review, 34 used surveys/interviews, 14 used a form of patient chart audit and 7 used practice assessment checklists; there were a handful of other tools that were not repeated across studies. Nothing was discovered that was either commonplace or appropriately sophisticated. Similarly, Hatoun et al. 48 undertook a systematic review of patient safety measures in adult primary care. They found 21 articles, including a total of 182 safety measures, and classified these into six dimensions: (1) medication management, (2) sentinel events, (3) care co-ordination, (4) procedures and treatment, (5) laboratory testing and monitoring and (6) facility structures/resources. However, the types of measures were not dissimilar to those found by Lydon et al. 47 An earlier review by Ricci-Cabello et al. 49 undertook a similar exercise and reached similar conclusions (albeit on a smaller scale). Therefore, the inclusion of patient safety within a broader index will pose a significant challenge.
It also seems important, following on from the Baker and England42 and Dixon et al. 38 frameworks, that the experience of the patient is given a key place within any overall index. Patient satisfaction and experience measures are commonplace in health care, but are used to a different extent in different scenarios; in the NHS, routine data collection is common, with the annual GP patient survey and all practices using a (minimal) Friends and Family Test (FFT) on an ongoing basis, as well as gathering qualitative feedback via patient reference groups (PRGs). Moreover, the advent of technology has started to change how these data are collected. A recent National Institute for Health Research (NIHR) Programme Grants for Applied Research study examined patient survey scores in detail, aiming to understand the data and how general practices respond to low scores, looked at some specifics [e.g. black and minority ethnic (BME) patient scores and OOH care] and carried out a randomised controlled trial (RCT) of an intervention to improve patient experience. This intervention involved real-time feedback via a touchscreen on exit; encouragement of patients boosted response rates hugely. The major conclusions were that a variety of feedback mechanisms should be used, and certainly not reliance on postal surveys. In addition to satisfaction with the care provided, access is a key issue for patients, but it is increasingly under pressure. 50
Overall, a wide variety of measures of performance have been used in general practice settings (both in the NHS and elsewhere), and these continue to evolve without there yet being much in the way of definitive best practice. However, it is important to consider next what is currently used in the NHS at a national stakeholder level, and to determine in what ways these do and do not satisfy the needs of practices, patients and other stakeholders.
General practice performance in the NHS
As with much of the NHS, there has been significant emphasis on measuring performance in primary care, even though this is sometimes less straightforward than for other parts of the service (such as the acute sector). Since the introduction of the GMS and PMS contracts for general practice in 2004, the main vehicle for measuring the performance of practices, and for determining at least part of the payments due to practices, has been the QOF.
Under the QOF, each practice needs to submit data annually as evidence of how they are meeting various targets. Detailed rules are provided about how each score should be calculated, with most being derived directly from clinical information systems. For example, one of the indicators under the area ‘secondary prevention of coronary heart disease (CHD)’ is the percentage of patients with CHD in whom the last blood pressure reading (measured in the preceding 12 months) was ≤ 150/90 mmHg. This percentage, which can be extracted using a specific query from the practice’s clinical system, is worth up to 17 points (out of a possible 45 points for the domain, or 558 QOF points in total) and is maximised when the percentage is between 53% and 93%. The sum for all 77 indicators (across 25 areas in two domains) is calculated for a practice and this is converted to a payment made to the practice as part of their overall funding. Thus, the financial incentive for practices to perform well on QOF is strong.
In one sense, therefore, this already provides an overall index of performance for a practice. However, the content of the QOF indicators is a matter of some contention. Table 1 summarises the domains, areas and indicators in use in the NHS year 2017/18, although this detail has changed somewhat over the years. Originally, the QOF indicators were developed by the Department of Health and Social Care, with a total of 146 indicators across four domains: clinical, organisational, patient experience and additional services. Since 2009, the changes made to the QOF have been the responsibility of NICE. As with much of NICE’s work, this was supposed to ensure that decisions were based on a strong evidence base. However, within general practice this is not always straightforward, and the evidence (or lack of evidence) underlying changes to QOF scores has been criticised as relying too much on expert opinion. 52
| QOF area | Number of indicators | Points available |
|---|---|---|
| Clinical domain | ||
| Atrial fibrillation | 3 | 29 |
| Secondary prevention of CHD | 4 | 35 |
| Heart failure | 4 | 29 |
| Hypertension | 2 | 26 |
| Peripheral arterial disease | 3 | 6 |
| Stoke and transient ischaemic heart attack | 5 | 15 |
| Diabetes mellitus | 11 | 85 |
| Asthma | 4 | 45 |
| Chronic obstructive pulmonary disease | 6 | 35 |
| Dementia | 3 | 50 |
| Depression | 1 | 10 |
| Mental health | 7 | 26 |
| Cancer | 2 | 11 |
| Chronic kidney disease | 1 | 6 |
| Epilepsy | 1 | 1 |
| Learning disability | 1 | 4 |
| Osteoporosis: secondary prevention of fragility fractures | 3 | 9 |
| Rheumatoid arthritis | 2 | 6 |
| Palliative care | 2 | 6 |
| Public health domain | ||
| Cardiovascular disease: primary prevention | 1 | 10 |
| Blood pressure | 1 | 15 |
| Obesity | 1 | 8 |
| Smoking | 4 | 64 |
| Cervical screening | 3 | 20 |
| Contraception | 2 | 7 |
| Total | 77 | 558 |
In particular, there have been major changes to the structure of the QOF. Of the initial four domains, the clinical domain has been substantially expanded, but the organisational and patient-experience domains have been removed, principally because of a lack of good-quality data in these areas, rather than because of a perceived lack of importance. This, therefore, represents a significant weakness within the current QOF; it is often perceived as being imbalanced (either in terms of what is perceived as most important or in terms of the actual work of general practices). 53 In addition, and probably less controversially, the additional services domain has been subsumed within a broader public health domain.
Even more contentious, however, is the effectiveness of the QOF as an index and its usefulness as a methodology. This has attracted a substantial level of research and comment in recent years. Forbes et al. 54 undertook a review of research examining the effects of the QOF. They found that the introduction of the QOF was associated with a modest slowing of both the increase in emergency admissions and the increase in consultations in severe mental illness, and modest improvements in diabetes mellitus care. However, there was no clear evidence of causality. Furthermore, there was no evidence of any effect on mortality, on integration or co-ordination of care, on holistic care, self-care or patient experience. The work of this research team in the field of CHD confirms the lack of evidence of an effect on mortality and offers a potential explanation in that the QOF has concentrated clinical attention on the management of patients with diagnosed conditions instead of a population approach to primary care that actively identifies patients with undiagnosed conditions. 55 Specifically, levels of detection of hypertension predict premature mortality, greater detection being associated with lower mortality, whereas QOF indicators did not predict mortality. 56
Marshall and Roland57 argued that the QOF is highly divisive and has become increasingly unpopular with GPs. Using financial incentives has diverted focus from the interpersonal elements that are important in consultations, and care for single diseases has been prioritised over holistic care. Their review57 of observational studies suggested that there had been modest improvements in some areas and a small decrease in emergency admissions in the incentivised areas, but no overall effect on patient mortality. Counterbalancing the limited evidence of improvements is a rising administrative workload associated with the QOF. They conclude that although the QOF may have had some benefits, it has failed to achieve what was intended in terms of driving improvements in health. 57 In a similar vein, Ryan et al. 58 performed a longitudinal population study on data from 1994 to 2010 using a difference-in-difference analysis, studying mortality in areas that had been prioritised by the QOF. They found that the introduction of the QOF was not associated with any improvement in mortality, either in specific conditions or overall. This is perhaps unsurprising given the marginal link between general practice and mortality overall.
Thorne10 revealed that health inequalities had not been reduced by the introduction of the QOF. Ashworth and Gulliford59 used findings from QOF-based research to argue that an increase in funding for general practice was needed, and that a salaried GP workforce could assist in improving the situation.
Ruscitto et al. 60 studied the issue of payments for individual diseases by modelling possible scenarios in which comorbidities attracted different payments. They found that, although there were substantial differences in the resulting payments, the existing system favours more deprived areas, because of the higher number of patients with multiple morbidities, which therefore attracts multiple payments. Kontopantelis et al. 61 examined a different problematic area within the QOF: that of exemptions (patients who could be excluded from QOF calculations). They found that, across 644 practices, there was evidence that the odds of exemption increased with age, deprivation and multimorbidity. At the same time, exempted patients were more likely to die in the following year. Thus, combining these findings with those of Ruscitto et al. ,60 it appears that the QOF system may favour practices in more deprived areas, but not necessarily to the benefit of the patients in those areas. The fidelity of QOF reporting has also been called into question: Martin et al. 62 uncovered differences in the monitoring of physical health conditions for patients with major mental illness.
Overall, the research into the effects of the QOF is somewhat inconclusive. There is certainly little clear evidence that it is effective in improving population health, and yet there is substantial evidence about unintended consequences. Combined with the concerns about the coverage of the QOF (in particular its current lack of any patient experience, access or organisational indicators), the research points to a system that is, at best, imperfect and, at worst, a wasteful exercise. Indeed, even Simon Stevens, Chief Executive of NHS England, stated in October 2016 that the usefulness of QOF was nearing its end, and would be phased out in new GP contracts. 63 However, as yet, there have been no firm plans announced about how QOF will be replaced or altered in future years.
Given that the QOF cannot be relied on to measure the effectiveness of practices, it is unsurprising that national bodies, particularly regulators, have turned to different measures. In 2014, the CQC embarked on a series of in-depth inspections of general practices. Inspections are conducted by independent teams that always include a GP, as well as various other people, often including an ‘expert by experience’ (patient/service user). As of May 2017, on the most recent inspection, 86% of practices were rated as ‘good’ and 4% as ‘outstanding’; 8% were rated as ‘requires improvement’ and 2% as ‘inadequate’.
Within this overall rating, however, there are five dimensions rated: safe, effective, caring, responsive to people’s needs and well led. Six different population groups are considered separately: older people; people with long-term conditions; families, children and young people; working-age people; people whose circumstances make them vulnerable; and people experiencing poor mental health. Safety is the main concern: on this dimension, 13% of practices were rated as ‘requires improvement’ and 2% as ‘inadequate’ (although this is a substantial improvement from the first inspection, when these figures were 27% and 6%, respectively). Often, these failings were found to stem from poor systems, processes or governance. 9
Although CQC inspections may be viewed as broader than QOF (especially given the focus on safety, more holistic care, and good leadership), they cannot provide regular feedback to (or about) practice teams, as in normal circumstances there would be multiple years between inspections. Practices wanting more regular feedback therefore require other tools. Examples of these have been provided by the Royal College of General Practitioners (RCGP), which introduced a suite of quality improvement (QI) tools. In particular, it described a QI ‘wheel’ for general practice. The hub of the wheel represents context and culture in QI. The inner wheel comprises QI tools (diagnosis, planning and testing, implementing and embedding, sustaining and spreading), and the supporting rings represent patient involvement, engagement and improvement science. However, although tools for diagnosis are suggested, and other techniques such as plan, do, study, act (PDSA) cycles, run charts and statistical process control charts are discussed, the implementation is largely left to practices’ own priorities, and some of the outer aspects of the wheel are less well developed. 64
However, practices are not operating in a vacuum. Efforts to ameliorate the continually increasing pressures on the NHS in general, and general practice in particular, create specific difficulties. The 2014 NHS Five Year Forward View65 presented a vision for the NHS that required a transformation in the way services are delivered, and primary care is a key aspect of this. 65–67 The evolving sustainability and transformation partnerships (STPs) (formerly known as sustainability and transformation plans) for each of 44 localities in England, and the forthcoming integrated care systems (ICSs) that will be formed from these, are an effort to create more efficient, integrated, patient-focused services that respond to the needs of a particular local population, and, unsurprisingly, most place general practice at their heart. 68 Health Education England has produced a report69 on developing the skill mix of primary care teams and allowing GPs to concentrate on more complex clinical problems. Ongoing reforms mean that practices need to be more productive, serving increasing numbers of patients with more complex health needs while making better use of resources; therefore, efficiencies are needed across the service, and the General Practice Forward View11 presented a vision of how this would be achieved, with five major elements:
-
Increasing investment – accelerating funding of primary care by investing an additional £2.4B per year, representing a 14% real-terms increase on 2015/16 levels by 2020/21.
-
Increasing the workforce – expanding and supporting GPs and wider primary care staffing, with plans to double the rate of growth of the medical workforce, leading to an overall net growth of 5000 GPs by 2020; this would also require additional international recruitment.
-
Reducing workload – lowering practice burdens and releasing staff time.
-
Improving practice infrastructure – developing primary care estate and investing in better technology [including an increase of > 18% in allocations to CCGs for provision of information technology (IT) services/technology for general practice].
-
Improving care design – providing a major programme of improvement support to practices (including greater integration and, in particular, involvement in ICSs).
The extent to which these objectives are achievable is unclear; in particular, the increase in workforce is not currently supported by increases in training, and the specific approaches to increasing the number of GPs are ambitious. Reform in other areas, such as expanding the roles of pharmacists, will need careful examination also. Because of this, greater attention is needed towards initiatives to increase efficiency and lower waste. In some regions, groups of practices have joined together as federations – effectively acting as one organisation, but still providing care across the same locations. 63 In other areas, looser networks have been formed. A report published by the NHS Alliance in 2015, Making Time in General Practice,70 identified 10 high-impact actions that practices could take to improve the time available for care. These are summarised as follows:
-
Active signposting – provides patients with a first point of contact who directs them to the most appropriate source of help. Web- and app-based portals can provide self-help and self-management resources as well as signposting to the most appropriate professional.
-
New consultation types – introduce new communication methods for some consultations, such as telephone and e-mail, improving continuity and convenience for the patient and reducing clinical contact time.
-
Reduce did not attends (DNAs) – maximise the use of appointment slots and improve continuity by reducing DNAs. Changes may include redesigning the appointment system, encouraging patients to write appointment cards themselves, issuing appointment reminders by text message and making it quick for patients to cancel or rearrange an appointment.
-
Develop the team – broaden the workforce in order to reduce demand for GP time and connect the patient directly with the most appropriate professional.
-
Productive work flows – introduce new ways of working that enable staff to work smarter, not harder.
-
Personal productivity – support staff to develop their personal resilience and learn specific skills that enable them to work in the most efficient way possible.
-
Partnership working – create partnerships and collaborations with other practices and providers in the local health and social care system.
-
Social prescribing – use referral and signposting to non-medical services in the community that increase wellbeing and independence.
-
Support self-care – take every opportunity to support people to play a greater role in their own health and care with methods of signposting patients to sources of information, advice and support in the community.
-
Develop QI expertise – develop a specialist team of facilitators to support service redesign and continuous QI.
However, most of these are entirely unrelated to what is captured by the QOF and, although some overlap with CQC inspection domains (particularly the ‘well-led’ domain), it seems appropriate that any overall effort to capture the effectiveness and/or productivity of general practices should include the areas mentioned in these 10 high-impact actions.
Overall, therefore, there is much room for improvement in the measurement of performance in general practice. One of the principal objectives of this study was to rectify this, which the research team have attempted to do using a specific method of measure development, ProMES. 27 In the following section, the literature on this method is reviewed.
Productivity Measurement and Enhancement System
The ProMES was initially developed in the 1980s as a way to enable teams or work units to identify the factors that contribute to their productivity (or effectiveness), and to track this productivity over time, with feedback creating the motivation to improve. 71 It involves four stages:
-
Develop objectives (called ‘products’ in the original terminology): things that the unit (in this case, the general practice) is expected to do or produce. These would normally be determined by a series of meetings between members of the unit. Typically, between three and six objectives might be identified, although this can vary depending on the type of work the unit does (this number was expected to be greater for general practices).
-
Develop indicators of the objectives: a way of measuring how well the unit is doing on each particular objective. These are developed by the same personnel who identify the objectives, and involve thinking of ways of identifying the extent to which the unit was doing well on a particular objective, by either using existing data or collecting new data. Each objective would have at least one indicator, but may have more than one.
-
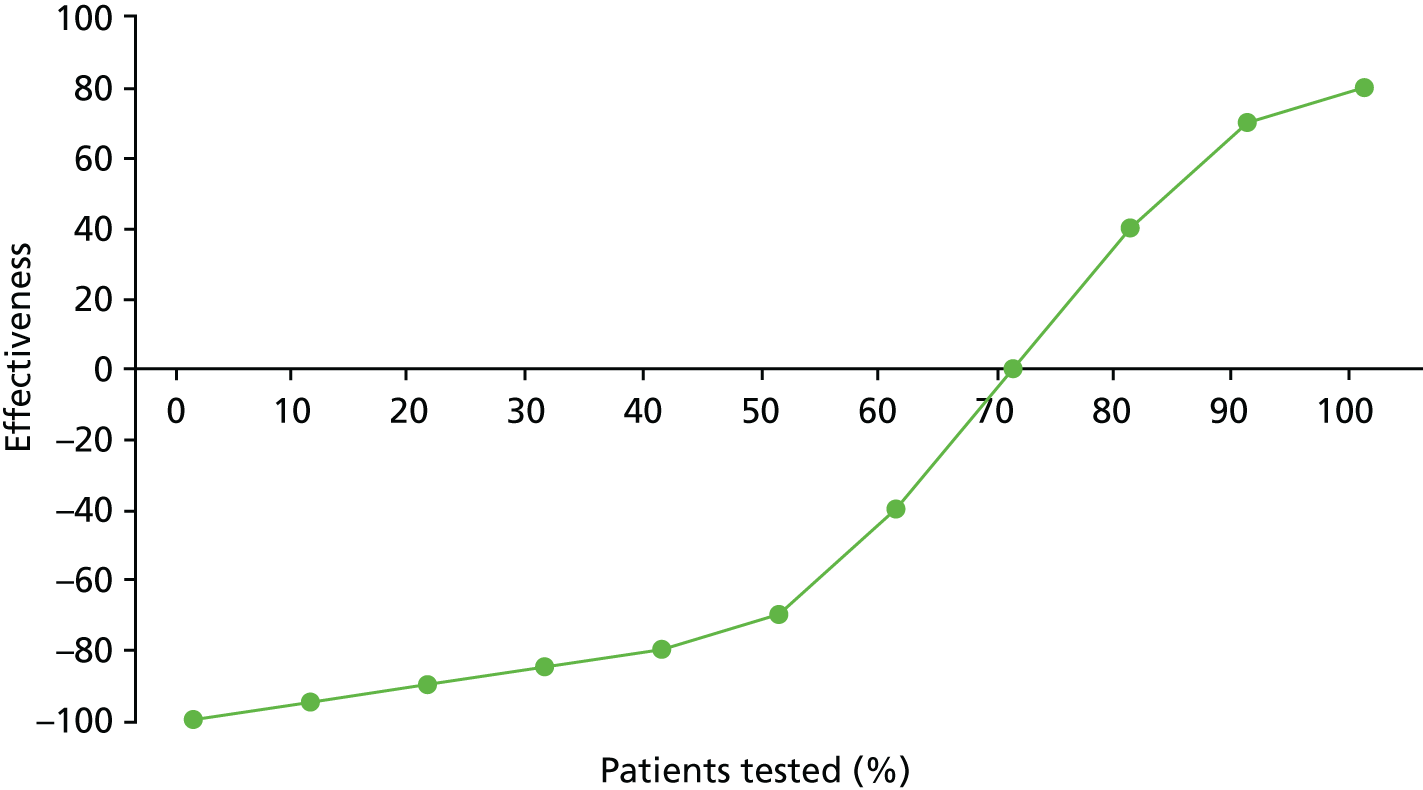
Identify contingencies: a method of weighting the different objectives. For each indicator, the contingency is a way of converting the actual value of the indicator into a score used for the overall productivity measure, in other words, saying just how good or bad particular values would be. These are set with a value of zero at the ‘neutral’ point, with maximum and minimum values of up to ±100 for the most important indicators, or proportionally less for less important indicators. These can be non-linear and asymmetrical (so that small changes can mean more at one point of the scale than at others). The setting of contingencies is also done as a collaborative effort between different unit members, although not necessarily the same ones as those who set the objectives and indicators. An example of a contingency is shown in Figure 1.
-
Finally, the system runs by collecting the indicator data over a designated period of time (e.g. 1 month), with an effectiveness score being calculated for each indicator at the end of that period, converted via the relevant contingency. These can then be summed to give an overall effectiveness score.
FIGURE 1.
Example of a ProMES contingency.
This comprises the measurement part of the process. The score produced is alternatively referred to as a productivity score and an effectiveness score. The underlying framework for ProMES somewhat conflates these two concepts, as its definition of productivity involves both effectiveness and efficiency,27 rather than being a ratio-based measure of productivity, as has been defined more clearly elsewhere in the literature and described earlier in this chapter. Therefore, this is referred to hereafter as the effectiveness score.
The overall effectiveness score, as well as individual indicator effectiveness scores, are then fed back to unit members, leading to the enhancement part of the process: based on the theory of feedback and motivation, the knowledge of not only the unit’s overall effectiveness, but effectiveness on different objectives, creates a motivation to improve effectiveness. 72 This has been shown to work with ProMES on many occasions: a meta-analysis73 of 83 field studies using ProMES found that there was a large and statistically significant improvement in performance following the beginning of ProMES feedback, with an average improvement of 1.16 standard deviations (SDs) – although Bly74 showed that this depends on the type of effect size used, by any estimate it was still a standardised score of > 1 – this represents a large effect by any standard metrics, and certainly larger than most organisational interventions. Other review articles72–77 have concluded that ProMES has been more successful in Europe than in the USA, that favourable attitudes towards productivity improvement are associated with faster improvements, and that higher-quality feedback was also associated with faster improvements.
The popularity of ProMES shows no sign of abating, with recent discussion demonstrating how it can be used effectively. 78,79 Within the specific field of primary care, one study is using ProMES in patient-aligned care teams, created from former primary care clinics. 80
The original ProMES methodology is designed to undertake this process with one team or work unit only. However, with the objective of developing an effectiveness measure that can apply to multiple teams, this specific method does not work. Therefore, some previous studies have adapted the methodology for use in multiple teams, in which representative members are brought together to undertake stages 1 to 3 of the ProMES approach, as described above. Large-scale adaptations have been used before in the NHS. 81–83 Most relevant to the current study is West et al. ,82 who used 10 workshops across three phases (one for each stage of the ProMES approach) to develop a measure of effectiveness for Community Mental Health Teams (CMHTs). The first and last stages brought together care professionals and service users in four large workshops (two per stage), whereas the second stage involved six smaller homogeneous workshops to develop indicators. This was found to be a successful method in generating consensus between two potentially different groups of participants, and the final measure had good face validity for all involved. 82
Research aims and objectives
Following all of the background and literature described in this chapter, the main aim of this study was to develop and evaluate a measure of productivity (a ratio of quality-adjusted effectiveness to inputs) that can be applied across all typical general practices in England, and that may result in improvements in practice, leading to better patient outcomes.
Specifically, the objectives were to:
-
develop a standardised, comprehensive measure of general practice productivity via a series of workshops with primary care providers and patients, based on the ProMES methodology
-
test the feasibility and acceptability of the measure by piloting its use in 50 general practices over a 6-month period
-
evaluate the success of this pilot, leading to recommendations about the wider use of the measure across primary health care in consultation with key stakeholders at local and national level.
The methods for doing this are described in Chapter 3. First, however, the literature linking features of general practices with outcomes is examined.
Chapter 2 Factors affecting performance in general practice: a mapping review
In this chapter, a mapping review, conducted during the study, is presented of empirical research into features and processes within the control of practices, and the methods used to evaluate their effect on productivity, quality or effectiveness. A mapping review is a specific type of systematic literature review that uses a systematic search to identify key literature about a specific question, and then produces an evidence map to show what is known and what is not known about that topic. It does not provide as much depth of analysis as a full systematic review.
Aims of the review and review question
The first aim of the mapping review was to describe the current picture of empirical research measuring productivity, quality and effectiveness of general practice. The second aim was to understand how the research compares features and processes that general practices can adapt with outcomes related to productivity, quality or effectiveness.
A mapping review can be performed with or without the use of a question framework; however, its use can aid locating the correct terms for search. The sample, phenomenon of interest, design, evaluation, research type (SPIDER) framework has been used in previous systematic mapping reviews and is suitable for mixed methods. 84–86 Table 2 shows the research question formulated with the SPIDER framework.
| Study characteristic | Scope of included studies |
|---|---|
| Sample | General practices in countries of relevance to the UK |
| Phenomenon of interest | Features, processes or interventions that are controlled at the level of an individual practice |
| Design | Any |
| Evaluation | The productivity, quality or effectiveness of health care provided by the practice |
| Research type | Empirical research. Quantitative and qualitative |
| Other | English language only |
Methods
Defining the map parameters
A mapping review is typically used for broad questions; therefore, an important first step to ensure that the topic and definitions are matched to the available resources is to define the map parameters.
The map parameters used were set using the methods outlined in the Social Care Institute for Excellence (SCIE) guidance. 87 These involved (1) discussion of the review topic between members of the research team, (2) pre-map scoping of the literature, (3) operationalising the parameters into inclusion and exclusion criteria and (4) developing a search strategy. These steps were used iteratively so that, with each process, the findings were used to make suitable changes to parameters.
Scoping searches were conducted using MEDLINE. Initially, these consisted of free-text terms, then corresponding terms were found using a search engine for medical subject headings (MeSHs). Numbers of hits for these searches were recorded and titles scanned to check their relevance.
Inclusion and exclusion criteria were developed and trialled with title and abstract screening on the results from scoping searches. This was also used to check the search terms were retrieving studies pertinent to the review question. In early searches, this was done by simply asking whether or not the paper fitted with the broad review question. Reasons why papers did not fit the review question were recorded and these recordings were used to make a more comprehensive list for inclusion and exclusion criteria. The screening was conducted by one author, but another author also screened a random 10% sample of the articles to assess inter-rater agreement.
This process was iterated three times before the relevant search terms and eligibility criteria were finalised. Finally, an information specialist was consulted to maximise the sensitivity of the search strategy while maintaining a manageable volume of hits.
Search strategy
Databases searched were MEDLINE, EMBASE, the Cumulative Index to Nursing and Allied Health Literature (CINAHL) and Emerald Insight. No date range was specified (i.e. it was unlimited) and the final search was conducted on 1 August 2017. These databases were chosen as research in the fields of medicine, nursing and management was considered relevant.
Full searches were carried out in August 2017. The full list of terms can be found in Appendix 1. The agreed search strategy used thesaurus and free-text entries with Boolean logic, combining terms relating to the general practice setting, practice-level phenomena, and quality, effectiveness or productivity. Search terms were added with the Boolean phrase ‘NOT’ to exclude phenomena relating to policy or QOF, as these would be beyond the scope of the review. Searches were limited to English-language articles.
Reference tracking was performed on included studies identified through database searching. Hand-searching was used on the most recent issues of a select range of journals, to capture any relevant articles that may not yet have entered the database records. These were the British Journal of General Practice, the Canadian Family Physician, the New Zealand Family Physician, the Scandinavian Journal of Primary Health Care and the Australian Family Physician.
As the review was focused on mapping the empirical evidence, grey literature searching was limited and focused on finding the referenced empirical evidence. This consisted of searching the NHS network for materials related to the 10 high-impact actions and compiling these,88 and tracking the references of the main report70 for these actions.
Study selection
The inclusion and exclusion criteria that were finalised after scoping searches are given in Table 3, alongside the justification for the parameters set.
| Study characteristic | Inclusion | Exclusion | Justification |
|---|---|---|---|
| Sample | General practice: staff or service users | Other primary care services, including dental surgeries, optometry, community pharmacies, A&E direct access services, walk-in centres and minor injuries units | The sample criteria are deliberately wide, as the GP effectiveness tool considers how the practice works for the whole practice population |
| High-income countries, similar to the UK | Hospital-based services | Specialist services and other forms of primary services are beyond the scope of this review | |
| Secondary and tertiary care | |||
| Low- or middle-income countries | In order to maintain relevance to UK general practice, low- or middle-income countries were excluded because they face different resource issues | ||
| US based | US system significantly different from the UK system | ||
| Phenomenon of interest | Practice-level adaptations in features or processes related to management, organisation and clinical care | Features controlled at a level higher than the practice itself including policy and funding changes | The tool is designed to help practices evaluate where resources should be allocated, so any interventions or exposures should be controlled at the level of the GP practice |
| Features a practice could not feasibly adapt such as geographic location or socioeconomic deprivation of practice population | |||
| Interventions or features relating to general practice staffing, including doctors, nurses, practice managers and reception staff | Interventions or features of care specific to single clinical group, for example substance-misuse patients or diabetics | The aim is to identify research into areas concentrated on the general practice service as a whole, so initiatives specific to a single condition or therapies for individuals are not considered here | |
| Interventions randomised at an individual level, not practice level | |||
| Academic programmes for training the individual professional, for example students or trainee GPs | This would be a high-level phenomenon and not of interest in this review | ||
| Design | Systematic reviews and meta-analyses | Protocols | A mapping review is deliberately wide in the included designs of studies to gain an understanding of the scope and form of current research on the topic |
| RCTs | Non-systematic reviews | ||
| Cohort studies | Editorials | ||
| Case–control studies | Letters | The review is focused on empirical evidence | |
| Observational studies | |||
| Ecological studies | |||
| Evaluation | Measures of quality, effectiveness or productivity of services for the practice population | Not evaluating productivity, quality or effectiveness of the practice | The criteria are deliberately wide, as the scope of the question is wide and there are a multitude of methods of evaluating quality, effectiveness or productivity |
| Evaluation of academic training programmes | The evaluation of large-scale vocational training programmes are not of interest | ||
| Evaluation of change management; a measure of how well an intervention has been implemented as opposed to its impact | Change management evaluation would not reflect the quality, effectiveness or productivity of a practice | ||
| Research type | Quantitative research | Non-empirical research | Scope set wide owing to the methods of the mapping review. Empirical research |
| Qualitative research | |||
| Other | English language | Not English language | As a result of the scope and resources of the review |
Titles and abstracts were screened using the eligibility criteria. A random sample of 10% of those excluded at this stage were checked by a different member of the research team to ensure consistent application of the exclusion criteria. Full papers of those not yet excluded were then assessed for eligibility and reasons for excluding papers were provided.
Data extraction
A formalised data extraction form was used, which can be found in Appendix 2. This was designed using the examples given by James et al. 86 and following guidance provided for mapping reviews by the SCIE. 87 As the aim of a mapping review is to provide a description of the current body of research, and not to evaluate the results, data extraction focuses on metadata, such as methods, sample characteristics and country of study. Brief data regarding the results were extracted and quality assessment was recorded so that this could be taken into account when performing data synthesis. 86,87
Quality assessment
Commonly, the hierarchy of evidence scale alone is used to describe the level of quality of studies within mapping reviews. However, this is considered a rudimentary form of assessment in which study designs vary (e.g. a mixture of observational and experimental designs) in accordance with the phenomenon of interest or a broad-based question is applied. Although not an essential component of a systematic mapping review, use of a quality assessment tool helps provide a more detailed description of the validity of the current research body on the review topic. For this reason, criteria created by Kmet et al. 89 were used. These were first designed for a systematic review with a broad question, for assessing internal validity of diverse study designs. There are two checklists in the criteria: one for quantitative studies and one for qualitative studies. The criteria can be found as part of the data extraction form in Appendix 2. For each item, studies are given a score from 0–2 depending on whether or not the study answers the criterion (no, partial or yes). As there are a variable number of questions that apply to a given study, the total score is turned into a percentage of the maximum score from all of the applicable questions. This can then be used to compare the quality with that of other included studies. 86,89
Data synthesis
The generic data were summarised into a table of studies, including year of publication, country of study, design and methods, population of interest and sample size. Studies were then synthesised into a map, to demonstrate the current areas of research into the review topic.
The methods of evaluation were classified as concerning productivity, quality or effectiveness. As there is considerable crossover in terminology, three broad definitions were used to group outcomes as assessing effectiveness, quality or productivity. Productivity referred to any studies assessing how the practice was performing with consideration of resources (either monetary or human). Studies were ascribed as studying quality if they assessed standards of practice in terms of safety, adherence to best practice guidelines, or patient experience. Effectiveness was said to be assessed when measures of how a service was functioning (provision of care processes or achievement of outcomes) were used. The methods of evaluation were then summarised in accordance with whether they were processes, or intermediate or final outcomes as described by Baker and England. 42
Studies were grouped by the phenomena they investigated. These were grouped in accordance with their relationship to infrastructure, personnel or governance, and any patterns in topics that emerged were considered. A narrative overview of the findings in each of these areas was presented briefly, but with the caution that conclusion on effects could not be drawn.
Results
Search results
Figure 2 depicts the results from the search strategy using a Preferred Reporting Items for Systematic Reviews and Meta-Analyses (PRISMA) flow diagram. Initially, database searches returned 2834 results. Once duplicates were removed, 1693 results were identified from database searches. A further 37 studies were identified using reference tracking, once duplicates were removed. Searching of the grey literature identified six relevant empirical titles. A total of 1736 records were screened at title and abstract level and 1521 were excluded at this stage. There were 215 full texts assessed for their eligibility. Of these, 39 papers met the criteria for inclusion in the systematic map, referring to 37 distinct studies. 90–128 The primary reasons for excluding the 176 studies are given in the PRISMA flow diagram (see Figure 2).
FIGURE 2.
The PRISMA flow diagram. (See text for explanation of papers that were eligible, but are not included in the map.)
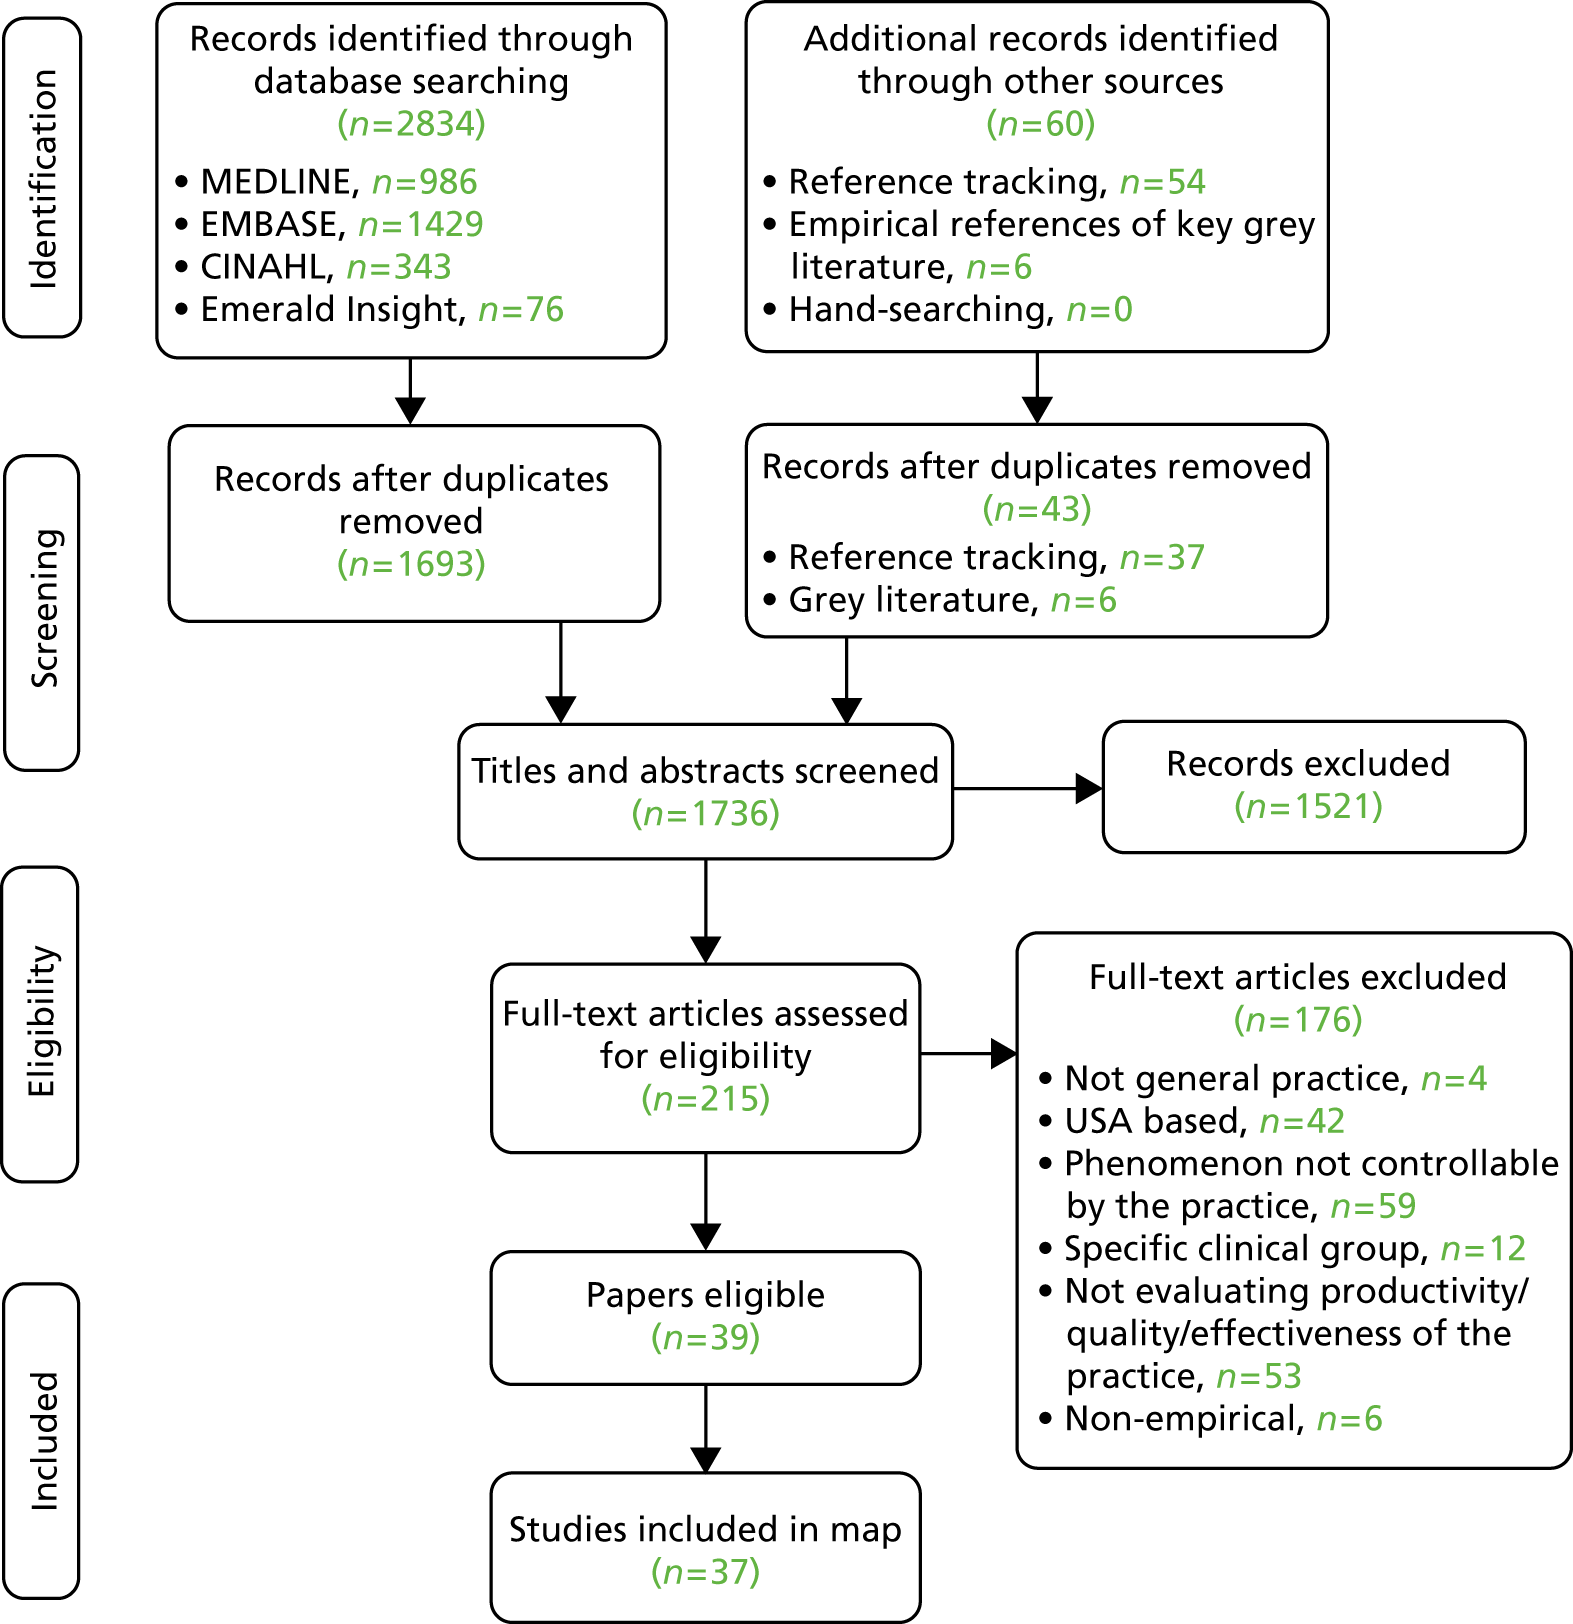
In two cases, multiple papers referred to samples from the same study. Bower et al. 95 and Campbell et al. 96 report results from a mutual sample using the same independent variables, with Bower et al. 95 reporting an additional outcome: team effectiveness. Ludt et al. 117 and Petek and Mlakar. 120 both drew data from the European Practice Assessment of Cardiovascular risk management (EPA-Cardio) study, considering the same dependent and independent variables. In both cases, the more recent papers (2013117 and 2016120) were included in the map, as they reported in more detail. Klemenc-Ketis et al. 114 also drew data from the EPA-Cardio study, but examined a different population (those with established disease and healthy participants, in addition to those with a high cardiovascular risk), and reported on a different dependent variable (patient satisfaction). Therefore, it has been considered as a separate study.
Study designs
The characteristics of the included studies can be found in Appendix 3. The majority (n = 15) were based in the UK, with others being set in Canada (n = 6), Australia (n = 4), New Zealand (n = 3) and Europe (the Netherlands, n = 5; Slovenia, n = 2; multiple countries, n = 2). Publication dates ranged from 1978 to 2017.
A quantitative design was used by 26 studies,90–95,97,98,103,106–110,112–114,116,117,119–122,124–126,128 four studies used a qualitative design102,105,115,127 and five studies used mixed methods. 99–101,118,123
Two systematic reviews were included: Goh and Eccles104 focused on primary studies of any design, whereas Irwin et al. 111 used tertiary synthesis – reviewing systematic reviews. The individual systematic reviews in this tertiary synthesis were not considered as separate entities as they assessed interventions tailored for specific clinical groups or drew from populations wider than just primary care. However, at a tertiary level, this review drew together areas of QI that were highly relevant to this project and so justified inclusion.
Of those using quantitative data, the majority (n = 19) were cross-sectional. Three studies used a retrospective cohort design98,112,120 and four used experimental designs (one non-RCT,110 two RCTs113 and one pre- and post-intervention study97). This was anticipated, as the features and processes of interest were not likely to be pragmatic topics for RCTs or longitudinal assessment.
Of the qualitative studies, Grant et al. 105 and Swinglehurst et al. 127 used an ethnographic approach involving observations of practice, whereas Fisher et al. 102 and Lawton et al. 115 used face-to-face or telephone interviews.
Mixed-method designs were used for two studies examining a cross-section of general practice,99,101 and three studies100,118,123 in which phenomena were studied longitudinally, with the implementation of a change in practice being evaluated.
Quality assessment
The quality assessment scores for the studies can be found in Appendix 3. The checklist did not translate well for use when assessing systematic reviews so was not applied to Goh and Eccles104 or Irwin et al. 111 As quality assessment is not a requirement of a mapping review, this was considered an acceptable decision.
Scores for the remaining 35 studies ranged from 45% to 100%, of which 26 scored ≥ 75%. This suggests that, overall, the quality of the studies was quite high. See Appendix 3, Figures 17–19, for the areas in which the studies scored yes, no or partial on the quality criteria for quantitative, qualitative and mixed-methods studies.
Of 26 quantitative studies, 22 scored ≥ 75%. Areas in which studies scored well were the research question and aims, methods of analysis, results reporting and conclusions drawn. Areas in which quality was particularly poor were in the measurement of outcomes and exposures, controlling for confounding variables and sample size. All four qualitative studies scored > 75%. Each study lost points on a different component of quality, with all studies performing well on the question/objectives, design, context, data collection methods and analysis. Of those using mixed methods, none of the studies scored > 75%. They tended to score poorly on questions relating to the quantitative elements, especially regarding sample size and controlling for confounders, and on the reflexivity of the account, suggesting that the blending of the two methodologies was not, on the whole, sufficient.
Data synthesis: study mapping
Appendix 4 provides a summary of the phenomena adaptable by general practices that were investigated in the included studies. The methods used to evaluate their impact on practice outcomes are also summarised as effectiveness, quality or productivity, along with references to the corroborating papers. Appendix 4 represents all practice-adaptable features identified in the studies, regardless of results.
Means of evaluating productivity, quality and effectiveness
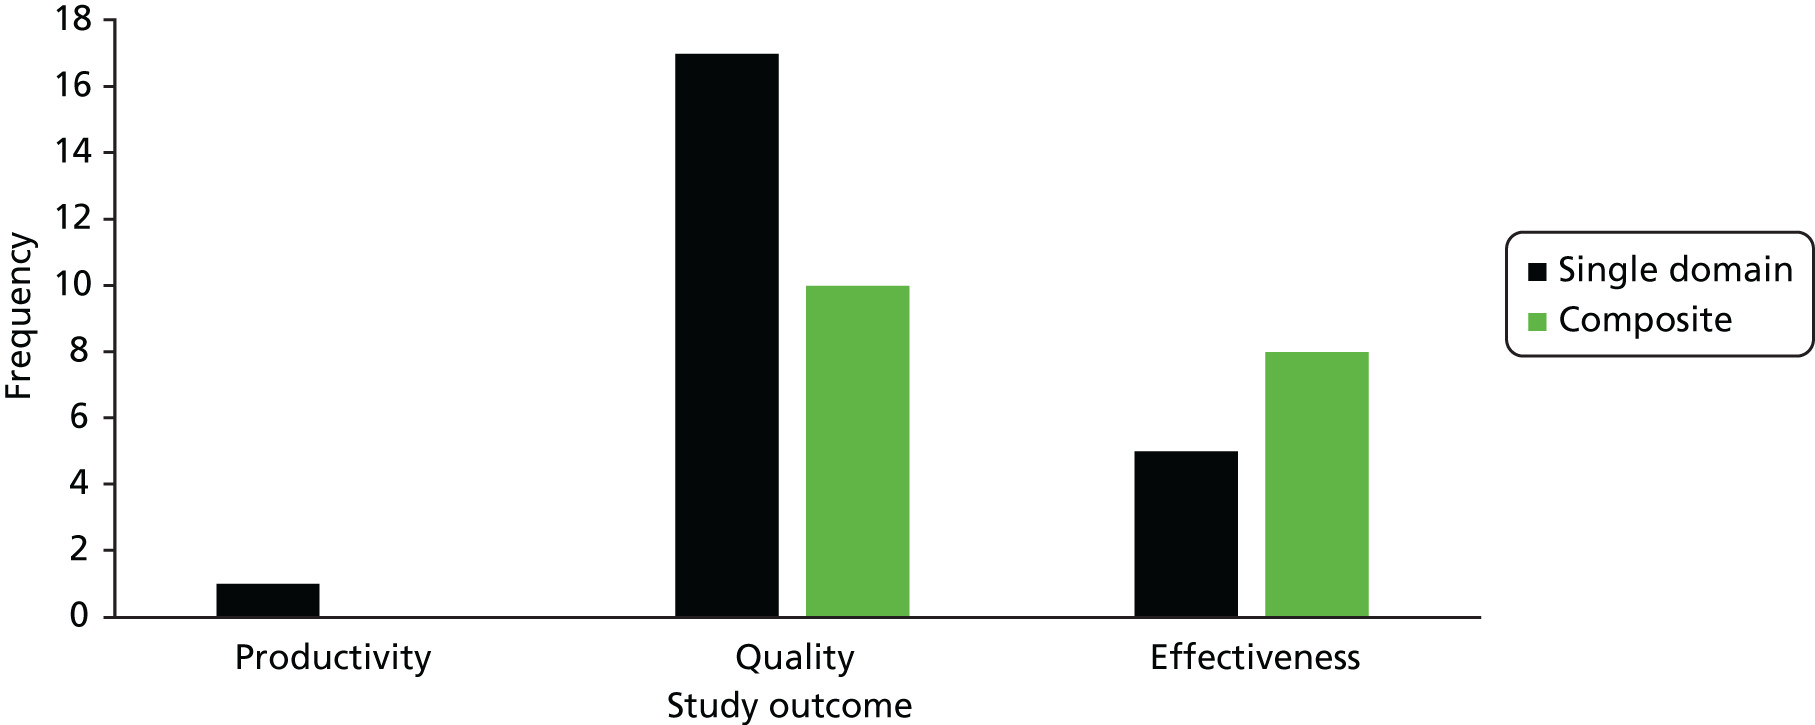
Figure 3 demonstrates the number of studies identified as relating to effectiveness, quality or productivity, and, of those, the number of studies that covered a single aspect of these outcomes compared with the number using a composite of objectives. As some studies used outcomes that were classified as effectiveness and quality, the sum of the bars in the graph is > 37. Of note is the fact that only Fisher et al. 102 identified an outcome related to productivity, and this was qualitatively evaluated. Most studies assessed a single objective relating to quality (n = 17), whereas five studies assessed a single objective relating to the effectiveness of a practice. Twelve studies measured effectiveness and/or productivity using multiple objectives. The review by Goh and Eccles104 was also concerned with both effectiveness or quality from multiple domains, whereas the review by Irwin et al. 111 examined quality in three categories: process improvement, physiological markers and other patient outcomes.
FIGURE 3.
Classification of study outcomes.
Features and processes adaptable at practice level
The independent variables studied that a practice could adapt are discussed in Infrastructure and Personnel. Beyond the remit of the study were many variables relating to features that a practice could not feasibly adapt. One grey area that emerged was the size of the practice. A variety of methods to measure this was used in the papers, but there was often overlap with features that the practice could not feasibly adapt, such as the size of the practice population. Although potentially relevant, these measures were excluded from the map as it was felt that selection bias could occur when dividing the measures into those that a practice could adapt and those that were not adaptable.
Infrastructure
In investigating characteristics of general practice, studies touched on four adaptable areas relating to infrastructure: (1) the physical environment, (2) use of IT systems, (3) the organisation of appointments, patient lists and access, and (4) the provision of clinical services and resources. Physical environment was investigated in two studies. 99,103 Desborough et al. 99 qualitatively identified adequate rooms as a facilitator of practice nurse consultations’ impact on patient satisfaction and enablement. Gaal et al. ,103 on the other hand, assessed staff perceptions of their working environment and found that the only dimension of quality outcomes that was associated with perceptions of working environment was building safety.
A practice’s use of IT systems was a phenomenon researched in seven studies98,102,109,114,117,124,127 and the review of systematic reviews,111 with varying evidence of use. Investigating its use generally, Harris et al. 109 found no significant impact on patients’ ability to access same- or next-day appointments, although it was associated with after-hours access. IT use in electronic prescribing was assessed in the tertiary review,111 in two qualitative studies102,127 and in a cross-sectional study. 114 Irwin et al. 111 found evidence of its effect for QI using intermediate outcomes (drug dosage), but not final outcomes (mortality). Fisher et al. 102 qualitatively identified IT systems as useful for reducing workload, and ethnographic observations by Swinglehurst et al. 127 identified an improvement in the quality and safety of prescribing practices. On the other hand, Klemenc-Ketis et al. 114 found IT use in medication review had a negative association with patient satisfaction. IT use in prevention services was assessed by de Koning et al. ,98 who found a non-statistically significant reduction in the odds of suboptimal stroke care quality. The use of electronic patient records was not found to be a significant variable for the quality of cardiovascular prevention117 or chronic disease management. 124
Nine studies90,93,95,100,102,107,125,128,129 considered the infrastructure surrounding appointments. Longer appointments were identified in a focus group as a facilitator of more effective chronic care management and patient self-care. 101 In two cross-sectional studies, allotting more time for appointments was associated with the quality of chronic illness care: for Beaulieu et al. ,90 this was only seen for practices providing very long (i.e. > 30 minutes) appointments for emergencies or follow-up, whereas Bower et al. 95 found significant associations for 10-minute appointments over shorter (i.e. 7.5- or 5-minute) intervals. Use of personal or pooled list systems was studied by Baker and Streatfield,93 personal lists being significantly associated with higher patient satisfaction and experience of care (accessibility and availability). The use of telephones in relation to appointments or advice had a variable influence. Qualitatively, Fisher et al. 102 found mixed opinions on whether telephone triage and appointments were facilitators of or barriers to productivity, whereas Smits et al. 125 found that availability of telephone appointments showed no significant association with use of OOH care. Of a variety of variables related to telephone access measured in this study, only average telephone waiting times were associated with use of OOH care, an indicator of unmet need. 125 Access to telephone lines 24 hours per day was also found to have a small but statistically significant effect on patient experience of care. 107 The same study was the only one to investigate evening and weekend access and found a very weak influence of walk-in availability only on patient experience of care. 107 Thomas et al. 128 similarly looked at consultation by appointment and found that walk-in availability decreased the odds of patient movement to another practice, which was used as a marker of patient dissatisfaction. 128 Appointment access was also considered by Dixon et al. ,100 who looked at the correlations between implementing on-the-day booking and access, and found that, on average, the time to the third available appointment decreased. However, in the study’s100 qualitative exploration, stakeholders raised concerns about the effectiveness of new advanced-access appointment systems for patients with chronic illness and had variable views on their effect on staff. 100
The clinical resources of practices were investigated in three studies. Two studies assessed the practice-reported provision of certain clinics or procedures and found associations with the technical quality of both chronic care and prevention, and patient satisfaction, as measured through patient movement. 90,128 Amoroso et al. 91 was the only study to look at clinical linkages as a resource, by developing a physician- or manager-reported measure. They found an association with aspects of patient experience, namely access, reception services and continuity of care. 91
Governance
Clinical governance relates to the structures, processes and culture needed for the quality of health-care organisations. 130 Five distinct themes emerged relating to the clinical governance: (1) record keeping and protocols, (2) audit and feedback, (3) the use of QI models and initiatives, (4) continuing professional development and education and (5) the working dynamics of primary care teams.
Five studies98,105,114,115,117 investigated the use of protocols and record keeping. The use of systematic records was incorporated into the features assessed, and compared with clinical quality. Ludt et al. 117 did not study the variable discreetly, instead incorporating it with other governance features of preventative services that, together, were associated with higher cardiovascular quality scores. De Koning et al. ,98 on the other hand, divided the measure by different recording activities, finding that only systems for diabetes information reduced the odds of suboptimal care delivery. Klemenc-Ketis et al. 114 also considered systematic records, but found no association with patient satisfaction scores. Formularies adapted by practices for prescribing protocol were identified by Grant et al. 105 as a facilitator of safety. Formal communication protocols and systems were seen by Lawton et al. 115 as a way of improving clinical indicator outcomes, but de Koning et al. 98 did not find an association between such systems and stroke prevention quality.
The use of audit and feedback was a feature seen in three quantitative studies, one qualitative study and the tertiary review. It was identified by Irwin et al. 111 as an initiative with a positive effect for process improvement and patient outcomes. Klemenc-Ketis et al. 114 reported that audits or reviewing clinical outcome data was associated with better patient experience, and Harris et al. 109 found an association with access, but Ludt et al. 117 found no association with cardiovascular care quality. Ethnographic observations105 also found these processes to be a facilitator of prescribing quality.
Quality improvement was the topic of five studies. 110,111,113,116,118 Three experimental studies110,116,118 examined facilitated implementation of QI initiatives, as a method for improving the quality of the practice. Hulscher et al. 110 focused on the effect on processes and found significant effects on adherence to best practice guidelines for prevention processes and team processes, although they found no effect on team meeting performance. Lemelin et al. 116 also found a significant improvement in prevention process performance in the practices receiving facilitated QI compared with controls, and Palmer et al. 118 found significant differences between pre- and post-intervention measures for the organisation of chronic care services, namely, effectiveness of the delivery system (i.e. numbers of patients not getting appointments, numbers not attending scheduled appointments and numbers invited for chronic disease management), community linkages and promotion of self-management. Irwin et al. 111 identified one systematic review131 in the tertiary synthesis looking at outreach visits for QI, with evidence of effect for compliance with processes and improved prescribing. In addition, the use of multifaceted QI techniques was identified in the tertiary synthesis, but, although six reviews131–136 suggested that there was a positive impact, the evidence was ‘not conclusive’. 111 Kennedy et al. 113 also used a multifaceted QI initiative for long-term condition care in a pragmatic RCT, but did not find any impact on intermediate or final outcomes relating to long-term condition care.
Professional development was featured in eight studies. 90,92,93,98,99,114,117,125 Again, there was a mixed picture for the effects of supporting professionals’ education. Providing continuing medical education or training was not found to have a significant effect on stroke quality,98 nor on the use of OOH services. However, Beaulieu et al. 90 found that it had a positive association with overall clinical quality. Once again, Ludt et al. 117 did not consider the feature in isolation, instead grouping it with other processes for prevention services that, together, were associated with higher-quality cardiovascular care. Qualitatively, Desborough et al. 99 identified that the level of support and educational opportunities given to nursing staff improved their contribution to the patient experience of care. Conversely, Klemenc-Ketis et al. 114 found a negative association between access to medical literature and patient satisfaction. Practices with training status tended to have higher standards, but, although this was not associated with patient dissatisfaction in general, it was in larger practices.
The dynamics of the primary health-care team were common phenomena studied, with team climate and culture appearing in eight studies. 90,94,95,103,104,108,121,122 The Team Climate Inventory137 covers the vision, participative safety, task orientation and support for innovation demonstrated by a team and comes in a long and a short form. The systematic review by Goh and Eccles104 identified UK-based studies also identified in this review95,108,121 and four other studies138–141 that did not assess the effect on quality. In their narrative synthesis, Goh and Eccles104 found a small association with patient satisfaction and team effectiveness. The other studies identified in the map were from mainly outside the UK, with Gaal et al. 103 sampling from the UK alongside other European countries. In these studies, no association was seen94,103 or very modest effects90,122 were seen between team climate and a range of outcomes, concerning clinical care, patient safety or patient and staff satisfaction.
Team meetings were explored qualitatively in three studies99,105,115 as facilitators of safe prescribing practices; as a marker of better interprofessional working to promote nursing care and patient satisfaction; and as a source of support, facilitating achievement of quality care indicators.
Personnel
Of clinical staff, nurses or nurse practitioners were the most studied group. When considering the levels of staffing, three studies found no significant effects on outcomes. 95,125,126 However, there was evidence of an association with quality of care,97,106,124 practice effectiveness112 and a patient’s movements to practices with nurses. 128 Using mixed methods, increases in the autonomy and scope of nurses’ practice were seen to improve patient satisfaction,99 with nurse practitioners having a community focus that can affect the practice’s effectiveness. 123 Delegation of tasks to nurses was seen as a way of improving workload by GPs. 102 The role of nurses in quality and effectiveness in preventative care was a feature measured in one study,117 whereas another study119 examined the implementation of nurses in charge of chronic patient registers and found that quality process, but not intermediate outcomes, improved.
Harris et al. 109 investigated the use of allied health professionals generally, with an association between availability of after-hours access and practices where routine telephone check-ups of patients were delegated to allied health professionals. Of other allied health-care professionals studied, physician-assistant staffing and task delegation showed some association with quality for stroke care and the use of OOH care, but not with mental health care quality. No other allied health professionals were quantitatively associated with better practice outcomes, but pharmacists were identified qualitatively as important for practice safety and easing workload for productivity. 98,105,109,125,126
Non-clinical staff were considered in four studies. 92,93,102,127 Baker92 found an association between the presence of a practice manager and the development of a practice, but Baker and Streatfield93 found no association between the presence of a practice manager and patient satisfaction. Two qualitative studies102,127 examined the work done by other administrative staff. Fisher et al. 102 reported that GPs considered that training reception staff for certain tasks (e.g. in systems of screening incoming letters) could alleviate workload pressures. The ethnographic work by Swinglehurst et al. 127 highlighted a large amount of ‘hidden’ work done by reception staff in ensuring that repeat prescriptions are dispensed safely, bridging the gap between the model systems and the real-world performance of clinical staff.
Implications
The very broad scope of this review means that much detail is lacking in specific areas, and the lack of more explicit search terms means that research into specific phenomena may not have been identified. Using more focused questions concerning a particular aspect identified here could yield a larger body of evidence, as the search strategy could be much more sensitive. The purpose of this review was not to draw conclusions on effect, but to provide an overview of factors that should probably be taken into account when considering practice performance in general practice. A systematic review104 on team climate in UK general practice was identified, but there is scope for further synthesis focusing on appointments or nursing staff.
An issue identified during the mapping process was the tautological relationship between the features of interest and the outcomes used to evaluate their effectiveness or quality, for example the crossover between processes such as audit and feedback being studied, and the appearance of these features in the tools. There was still a heavy focus on processes in the methods of evaluation; however, this may relate to the difficulties of attributing more final outcomes to specific aspects of service.
As the majority of studies focused on quality within a single objective, this suggests that evaluating multiple aspects of primary care to gain an overall picture of performance is still novel in empirical research. Given the broad scope of general practice discussed in Chapter 1, this presents a real opportunity for the development of such an index. Productivity was not identified in the review as a common method of evaluation, which has an implication when considering the effects that the features and processes identified may have on the current pressures in primary care. Patient experience was a common theme to arise in the evaluation methods.
Conclusions
Understanding the functioning of general practice is a timely issue, as the service in England faces mounting pressures. This systematic map of empirical evidence gives a surface-level overview of the current body of research in adapting practices to improve productivity, quality or effectiveness.
Features studied related to a wide range of topics: the physical environment of the practice, computers and IT systems, appointment and lists systems, clinical services and resources, records and protocols, audit and feedback, QI initiatives, continuing professional development, teamworking, nursing staff, other allied health-care professionals, and managerial and administrative staff. Results were heterogeneous and conclusions on effects cannot be drawn from a mapping review with such a broad focus.
The focus of studies on evaluating chronic illness care and prevention reflects the large role primary care has in the provision of these services. Patient experience of care was identified as an important part of evaluating the quality of primary care. Taken as a whole, these findings support the aim to generate a broad measure of general practice performance, using a variety of perspectives including those of both practitioners and patients.
Chapter 3 Overall methods
Research objectives
As stated in Chapter 1, the main aim of this research was to develop and evaluate a measure of productivity (a ratio of quality-adjusted effectiveness to inputs) that can be applied across all typical general practices in England, and that may result in improvements in practice, leading to better patient outcomes.
Specifically, the objectives were to:
-
develop, via a series of workshops based on the ProMES methodology with primary care providers and patients, a standardised, comprehensive measure of general practice productivity
-
test the feasibility and acceptability of the measure by piloting its use in 50 general practices over a 6-month period
-
evaluate the success of this pilot, leading to recommendations about the wider use of the measure across primary health care in consultation with key stakeholders at local and national levels.
The remainder of this chapter outlines the overall approach taken in terms of research methods to achieve these objectives. Further detail is given in Chapters 4 and 5.
Overall study design
The study followed a sequential design, ordered to meet objectives 1–3 in turn.
Stage 1 covered the development of the new measure. This used an adapted form of the ProMES methodology (adapted to allow development of a more generic measure across a large number of teams), with a series of workshops with general practice staff and public representatives (stage 1a), followed by a consensus exercise to finalise some details of this measure and create an online tool for its use (stage 1b).
Stage 1a: ProMES-based workshops
The ProMES methodology was introduced in Chapter 2, Methods. In its traditional form, it involves a series of facilitated workshops with members of a team, in three broad stages: (1) definition/clarification of team objectives, (2) identification of indicators of these objectives and (3) the formation of contingencies to convert these indicators into effectiveness scores. In this study, the traditional ProMES methodology was adapted to be used across an entire sector (general practice) rather than a single team. This followed the approach used successfully in a different NIHR project,82 which used an equivalent design to develop a measure of effectiveness for CMHTs.
The design involved three phases of workshops.
Phase 1
Two large, full-day workshops (one in Sheffield and one in London), each aiming to include 30–40 participants (15–20 general practice staff and 15–20 members of the public). These workshops featured a series of group exercises – some kept staff and public separate, and others mixed them up – designed to tease out what the objectives of a general practice are. The findings from these workshops were collated and coded, and thematic analysis was used to derive a set of objectives that broadly represented the different views expressed in the workshops.
Phase 2
Six smaller, half-day workshops, spread across multiple locations, each involving six to eight participants. Each workshop’s participants would be more homogeneous in nature (two workshops of GPs, two of practice managers, one of practice nurses and one of public representatives), and would consider potential indicators to measure up to four of the objectives identified in phase 1. Overall, each objective would be considered in at least two different workshops. Participants were strongly recommended to consider using existing data as far as possible. The collation of findings from these workshops would then result in a set of potential indicators, that would be put forward for the phase 3 workshops.
Phase 3
Two large, full-day workshops (again, one in Sheffield and one in London). These were similar in size to phase 1 (30–40 participants, split between general practice staff and members of the public). These workshops would undertake a range of activities with three main aims: (1) to review the indicators proposed in phase 2, (2) to weight the importance of each of the objectives in order to allow creation of an overall index, and (3) to derive contingencies for each indicator, the ProMES term for functions that convert values of the raw indicator into points contributing to an overall effectiveness score. This effectiveness score would then form the numerator (quality-adjusted outputs) of the overall productivity index, with the denominator (inputs) being represented by the extent of financial resource available to a practice over the period in question.
Precise methods used for each of these phases of workshops are given in Chapter 4.
Stage 1b: finalisation of the measure
There were two main elements to this phase: a consensus exercise, and the creation of an online version of the tool that could be used for piloting:
-
Consensus exercise. The aim of the consensus exercise was to build agreement on the weightings of the different indicators/objectives chosen, and to determine whether or not the measure appeared feasible (in terms of the data collection required) and valid (i.e. that it appears to measure something that is accepted as a measure of productivity). This included an initial meeting, to which representatives from relevant NHS, regulatory, professional and patient bodies were invited. This was followed by a series of online communications, including both e-mails and an online questionnaire, to finalise details.
-
Creation of an online tool. The tool used an online platform named Effecteev® designed for ProMES applications by the specialist German company Feedbit Software GmbH (Nürnberg, Germany), to assist teams with the ProMES process. This software was used during stage 1a also, to help develop the contingencies. As part of this process, guidance (both online and in document form) was developed to instruct/assist practices in using the tool.
In reality, the precise methods for stage 1 deviated somewhat from the above for a combination of practical reasons. These variations, and their implications, are detailed in Chapter 4.
Stage 2 involved the piloting of this measure. The aim was to recruit 50 general practices from a variety of CCGs and regions to use the measurement tool over a 6-month period (stage 2a). This would then be evaluated (stage 2b) to test whether or not the tool worked in a way that was feasible for practices, whether or not it was perceived to be useful and whether or not there was any evidence of improvements being made with its use.
Stage 2a: piloting of the measure
A target was set for 50 practices to be recruited to trial the measure and online tool over a 6-month period. The aim was that the 50 practices should be spread across 8–10 CCGs, some of which would also have participated in stage 1 of the study. CCGs were recruited purposively, so that those involved in stage 1 were invited first, and then others selected to ensure a balance across regions of England and a balance between those that were more urban or more rural in nature. CCGs that agreed to participate sent out a request to their general practices for expressions of interest in the study. Practices that had participated in stage 1 were also contacted directly by the researchers.
A total of 51 practices agreed to participate. These were targeted to ensure that these practices had a good spread in terms of location, size and characteristics of the local population. Each of these 51 practices was visited by a member of the research team or a trained Clinical Research Network (CRN) representative, and at least one member of staff in the practice was trained in using the online tool, including details of the data collection required, and retrieving and interpreting monthly reports.
Each practice would then use the tool for a period of 6 months: collating and entering data on a monthly basis, and generating a report to indicate how indicators, objectives and overall effectiveness were changing over time. This would be followed by the evaluation. Following completion, practices were each paid £500 in compensation for the time spent piloting the tool.
Stage 2b: evaluation of the measure
At the end of the 6-month period, the measure was evaluated. The evaluation took three forms:
-
Analysis of effectiveness data. A statistical analysis of monthly practice data was conducted to determine whether or not there was any evidence of change over time overall, change over time for specific objectives or change over time for specific indicators, and whether the extent of change was related to characteristics of the practice.
-
Interviews with practice representatives. Telephone interviews were conducted with representatives from each practice. These were, in some cases, the same practice managers who had responded to the questionnaire, but, in other cases, GPs or other practice staff were interviewed (this was spread out to give a more balanced view). Interviews covered the perceived usefulness of the measure (including how widely results were discussed in practice meetings), whether or not there were any areas not covered, and what might be done to improve the usability of the tool. In some cases, interviews (and two focus groups) were conducted with patient representatives; these only covered the usefulness and coverage of the measure, particularly focusing on those sections most relevant to patient experience.
-
Practice manager questionnaire. An online survey was sent to all practice managers, covering three principal areas: (1) their experience of using the tool (including the amount of time it took, the mechanics of using the online platform and the availability of data required), (2) their perceptions of its usefulness and how well it could be used to improve practice effectiveness and (3) contextual information about the practice including major changes to staffing and overall practice expenditure over the period.
Data from the interviews and open-ended question data from the practice manager questionnaire were coded and analysed using thematic analysis. Findings from all three strands were then collated to draw overall conclusions about the tool.
This design is summarised in Figure 4.
FIGURE 4.
Overall summary of the research design.
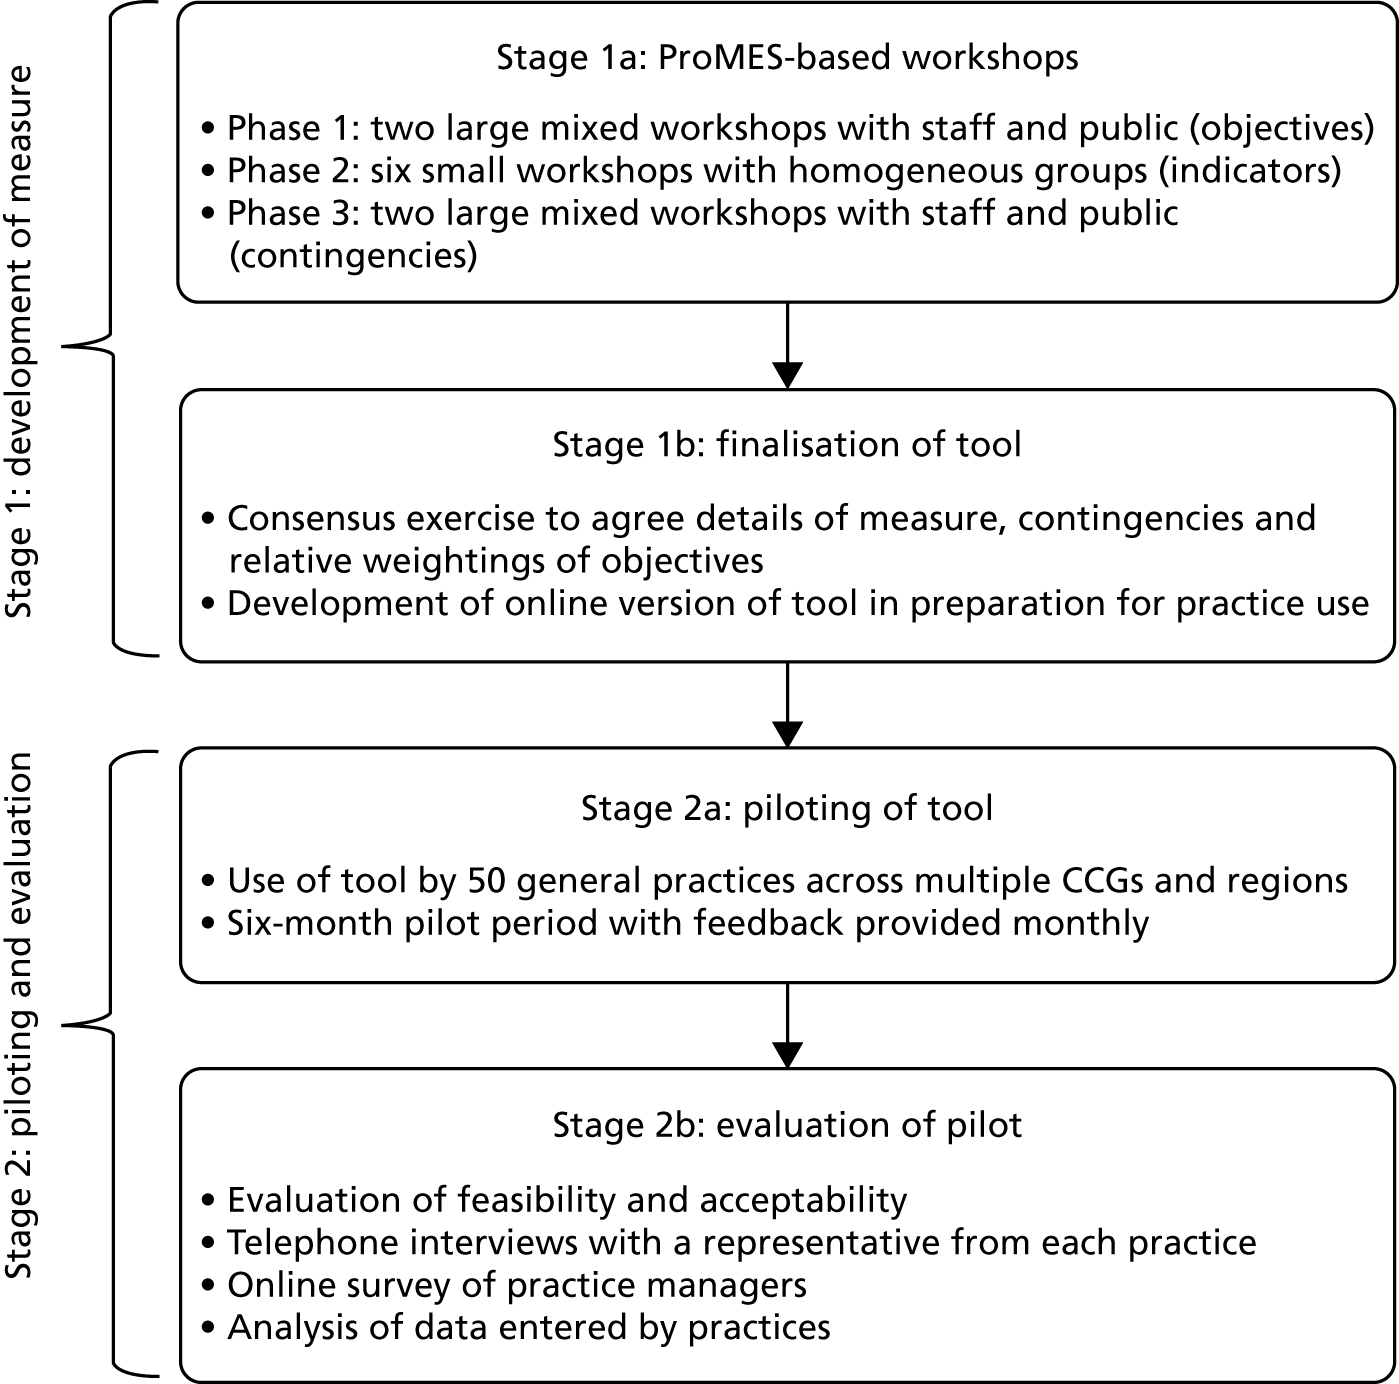
Chapter 4 Stage 1: developing the measure
Overall plan for stage 1
Stage 1 of the study was intended initially to last 15 months, and included two main substages:
-
Stage 1a (June 2015–May 2016, including set-up time) used 10 ProMES-based workshops across three phases to determine what should be included within the measure of effectiveness (the outputs that would eventually feed into the productivity index).
-
Stage 1b (July–September 2016, with set-up during stage 1a) used a consensus exercise (including both a large consensus meeting and an online exercise) to finalise the content and weighting of the measure, and then develop an online platform that could be used by practices to pilot the measure.
In reality, there were several reasons why this overall structure, and the detailed methods, had to be amended when the project was in progress, with the result that stage 1 took substantially longer than had been anticipated. The detailed methods, and the amendments that were necessary, are described in the following section.
Detailed workshop methods
As described in earlier chapters, the ProMES approach involves the identification of objectives, indicators of those objectives and contingencies to convert indicators into meaningful effectiveness scores. Although in the original version of the ProMES process only one team at a time would do this, it has been successfully adapted to larger-scale settings, in which representatives from larger groups of teams work jointly to develop a common measure. 27,82
Stage 1, therefore, was designed around 10 workshops in three phases, in a similar format to earlier work adapting ProMES for larger settings.
Phase 1 workshops
Planned approach
The first phase involved two large, full-day workshops, each involving a mixture of participants (the aim was to include up to 40 in each), including members of the public (representing patients), GPs and other practice staff (both clinical and non-clinical), and other stakeholders. One workshop was held in Sheffield, the other in central London. Although the plan was for workshops to be held between December 2015 and May 2016, the first two workshops were both held in January 2016, as arranging large workshops in December was considered too much of a risk.
Six CCGs from different parts of the country (comprising London, the South East, Yorkshire and the Midlands) had expressed an interest in being involved in the research at the proposal phase. In each of these CCGs, an open invitation was sent out to general practices to register their interest in the study as a practice (at this point they were not committing to being involved throughout the study, but would be given the option to participate in each phase of stage 1, and also to participate in stage 2.
In addition, CRNs were approached in six different regions where there was under-representation from practices. These CRNs also put out an invitation to practices in their area. For the two phase 1 workshops, using these methods, 25 practice staff were recruited (10 practice managers, 13 GPs and 2 other staff). Professional participants were offered travel expenses for their participation, and one of the CCGs offered resources to enable the backfill of time spent by practice staff at the workshops.
To recruit members of the public, local Healthwatch organisations and community anchor and infrastructure groups in eight CCG areas were approached. Public participants were offered a high-street shopping voucher worth £60, in addition to travel expenses. In total, 25 members of the public participated in the phase 1 workshops.
As the phase 1 workshops were intended to elicit participants’ understanding of the objectives of general practices, at each there was a series of exercises designed to uncover these objectives through brainstorming, conversation and discussion. Specifically, the pattern of each workshop was as follows:
-
An introduction to the project, and definitions of productivity and effectiveness.
-
Group exercise: discussion on the question ‘how would you know when your general practice team was being effective?’. Groups of 6–8 participants, divided into some professional groups and some public/patient groups; each group had a facilitator from the project team.
-
Plenary: feedback from each group.
-
Group exercise: previous groups mixed up, with a mixture of professional and public participants in each new group, and each group considered in turn the following questions –Each group started with a different question, and after 20 minutes its flip chart (and question) was moved around to a new group, for that group to consider and build on the previous answers; each group, therefore, considered all three questions during the hour allowed.
-
What does an effective practice do?
-
What does an effective practice achieve?
-
What do practices need to change or improve?
-
-
(Lunch break.)
-
Summary of answers to questions on previous group exercises, having been collated by facilitators.
-
Group exercise (in original groups) answering two questions:
-
What do you think are the top challenges to achieving an effective and productive general practice?
-
How could each of these be resolved?
-
-
Plenary session involving feedback from each group, followed by a summary of the day.
Data from each section of each workshop were recorded, collated and coded using thematic analysis.
Variations to approach
The phase 1 workshops worked essentially as planned, although the numbers of participants were slightly smaller than planned. Owing to the pressures on general practice, most CCGs could not offer backfill for staff time out of the practice and some planned attenders had to cancel at short notice. However, there were certainly sufficient participants to create high-quality discussion across the range of groups and topics as anticipated.
Phase 2 workshops
Planned approach
It was anticipated that phase 1 would generate approximately six to eight overall objectives. The aim of phase 2 was to develop a number of indicators for each of these objectives. Therefore, six half-day workshops were planned; in each, three objectives were considered. This way, each objective would be considered by two or three separate workshops. Workshops were held during February and March 2016.
For each workshop, four to eight participants were recruited using similar methods to phase 1. However, recruitment was more focused because of the need to have specific types of participants in each workshop; therefore, invitations were tailored to specific groups in different regions. All participants were refunded travel expenses, and members of the public were offered a high-street shopping voucher worth £20.
The six workshops were designed to have the following participants:
-
two workshops with GPs
-
two workshops with practice managers
-
one workshop with other general practice staff
-
one workshop with members of the public.
These were held in different parts of the country (i.e. Yorkshire, London, the South East and the Midlands).
At each workshop, ≈1 hour was given over to each of three objectives, chosen so that they would be most appropriate for the specific group, but so that each objective would be covered two or three times in total. Participants were given an overview of the study, and the following criteria for what makes a good ProMES indicator were shared and discussed to ensure understanding:27
-
indicators must be consistent with the objectives of primary care
-
if the indicator was maximised, primary care and/or patients would benefit
-
indicators must validly measure the objective
-
all important aspects of each objective must be covered by the set of indicators
-
indicators must be largely under the control of the practice
-
indicators must be understandable and meaningful to practice staff
-
it must be possible to provide information on the indicator in a timely manner
-
accurate indicator data must be cost-effective to collect
-
the information provided by the indicator must be neither too general nor too specific.
After an objective was described (using findings from phase 1), participants were asked to work alone for ≈10–15 minutes, and think about indicators that would be a measure of that objective in some way. Each participant was given a set of blank cards with the following sections, and asked to complete for each indicator they could think of:
-
description of indicator
-
source of data
-
expected minimum/norm/maximum values of indicator
-
red/amber/green rating for how likely it is that the data could be collected.
After this initial brainstorming, each proposed indicator was handed to the facilitator and discussed in turn (with similar or overlapping indicators discussed together). The discussion focused on whether or not the indicator was a good indicator for that objective, whether or not the data were likely to be available and/or equivalent for all practices and what the expected values of the indicator would be (this was in preparation for the phase 3 workshops). In particular, it was attempted to reach a consensus between participants about whether the indicator would have a green rating (data should be available for all practices), an amber rating (data probably not currently available, but could probably be collected), or a red rating (data unlikely to be available for most practices). Those with green ratings would be taken forward to phase 3, those with amber ratings would be given further consideration (e.g. suggested to a future workshop, and/or considered for feasibility by the research team) and those with red ratings would not be taken forward but considered as possible optional indicators if seen as desirable.
Results from different workshops were collated and, when similar indicators were proposed, a decision was taken by the research team to either (1) choose one of the indicators based on appropriateness and/or availability of data, or (2) take two (or more) indicators forward to phase 3, for further decisions about which was the most appropriate.
Variations to approach
As will be shown in Phase 1 workshops: findings, there were nine objectives identified, a slightly higher number than anticipated. In addition, one of these objectives in particular was vastly more complicated than could be captured in indicators using the planned methods for phase 2. Further problems arose when attendances at one workshop were highly compromised by the junior doctors’ strike in May 2016.
As a result, the six workshops planned for phase 2 were insufficient to develop indicators in the way that had been planned. More workshops were required; however, owing to the prior planning necessary for the larger phase 3 workshops, these had already had to be arranged before this finding was known. Therefore, the two phases were combined. The resulting methods for the combined workshops will be presented in Phase 3 workshops, Variations to approach.
Phase 3 workshops
Planned approach
Phase 3 was designed around two large, full-day workshops, with similar constitutions to phase 1, and recruitment was performed similarly. However, the nature of the workshops was very different from phase 1. The workshops were held during April and May 2016.
The day started with a description of the study and a summary of the first two phases, in particular the objectives identified.
The first exercise involved providing a weighting of the objectives. To achieve this, flip chart sheets representing each objective were placed around the room, and each participant was given 30 stickers. Participants were asked to place stickers on the flip chart sheets to represent how much of a team’s effort should be directed towards that objective compared with the others. If they perceived all objectives to be equally important, for example, this would mean putting three stickers on each of nine objectives, and leaving three unused. In an extreme situation, if they only considered one of the objectives worth any effort, they would place all their stickers on that objective.
Professional participants and public participants were given different coloured stickers, so that the views of these two groups could be compared. The findings were collated by the research team and fed back to the participants; some time was given for reflections on these before the rest of the day’s exercises began. These totals were fed into the overall weightings of the objectives in the final measure via the consensus exercise.
The main exercises for the day involved deriving contingencies for each of the indicators. Each workshop was split into six smaller groups, aligned along professional/patient groups (so that there would be a group of GPs, a group of practice managers, etc.), with a facilitator from the research team. Indicators were divided up between these groups and considered in turn.
For each indicator given a green rating in phase 2, and those given an amber rating that were subsequently chosen to be carried forward, at least one group undertook the following process:
-
The definition and availability of data were considered further, as a check on the sense of using that indicator. (When multiple similar indicators were suggested in phase 2, each was considered and the most appropriate one chosen.)
-
A discussion was held about whether or not the minimum, norm and maximum values chosen in phase 2 were appropriate, and these values were amended when necessary. (A norm value is one considered to be neither good nor bad, but where an average practice would expect to be on that indicator.)
-
A discussion was held about the relative effects of achieving the minimum or maximum. This was to enable a starting point to be given for the number of effectiveness points available for these values. Under ProMES, a norm value is worth 0 effectiveness points, a maximum value up to 100 points and a minimum value up to –100 points. Therefore, if it were suggested that achieving the minimum would be twice as bad as achieving the maximum would be good, then the number of points initially set for achieving the minimum would be –100, and the number of points for achieving the maximum would be 50.
-
A draft contingency was then shown on a screen, using the ProMES-based software, Effecteev (a custom-built programme to enable teams to use the ProMES process). At first, each contingency was a straight line, based on these minimum and maximum values. The precise shape of this contingency was then altered by discussion with the group. This was undertaken by choosing intermediate values of the indicator and discussing how good (or bad) this would be compared with the minimum, norm and maximum. This eventually formed a contingency such as that shown in Figure 5.
-
The indicators for each objective were then given different weightings based on the perceived importance of that particular indicator in the context of the whole objective. For example, this might result in a contingency for one indicator being rescaled so that it had a maximum of 30 effectiveness points, rather than a maximum of 60 effectiveness points, if that indicator was judged to have only half the importance of another indicator with a maximum of 60 effectiveness points.
FIGURE 5.
An example of contingency in the GPET. GPET, General Practice Effectiveness Tool.
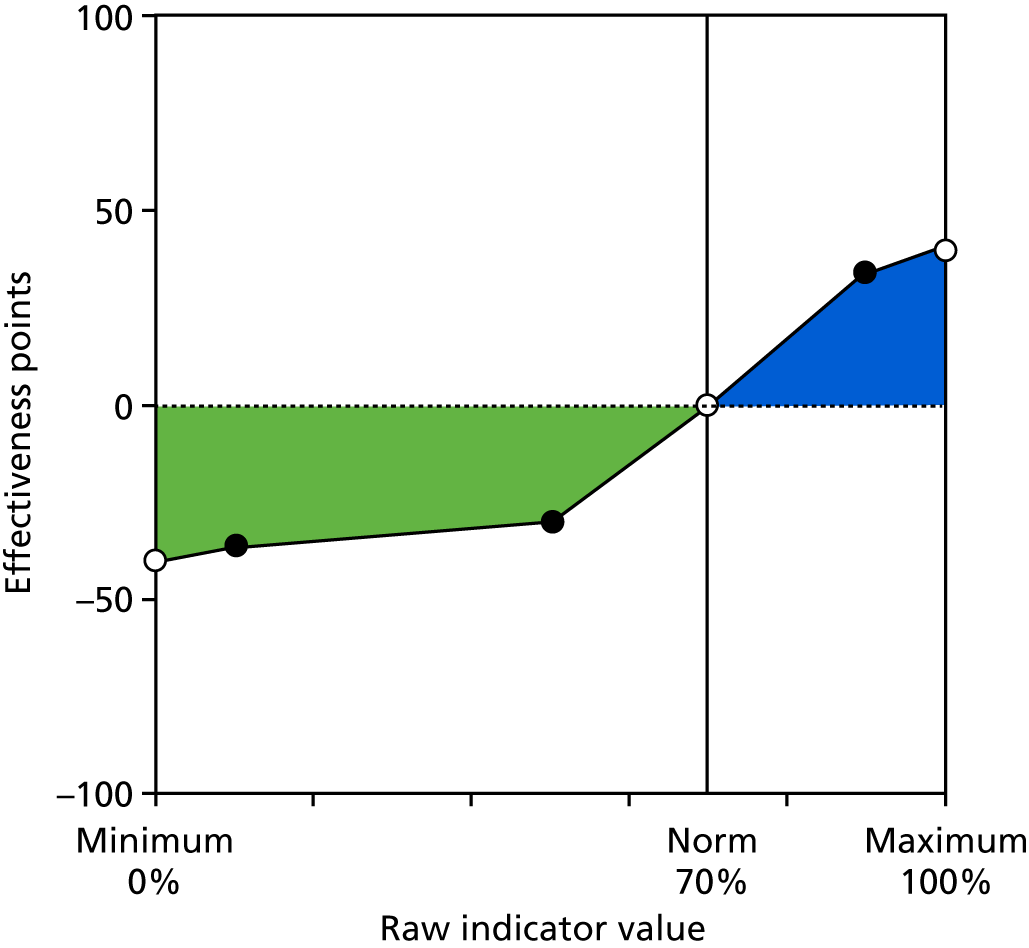
Variations to approach
As already mentioned, the six workshops planned for phase 2 were insufficient to develop indicators in the way that had been planned, and more workshops were required. As a result of the prior planning necessary for the larger phase 3 workshops, these had already had to be arranged before this finding was known. Therefore, the two phase 3 workshops became joint phase 2/phase 3 workshops (with some groups working more on the identification of indicators themselves, rather than the contingencies), and a further six workshops were set up over subsequent months in order to complete the phase 2 work and much of the phase 3 work (with some of this instead going into the consensus exercise phase; see Consensus exercise methods).
In total, therefore, the following workshops were run in phases 2 and 3:
-
the original six phase 2 workshops – 21 staff and 10 members of the public
-
the planned two phase 3 workshops – 11 staff and 27 members of the public
-
six additional phase 2/3 workshops – 23 staff and 10 members of the public.
The final workshops were held in September 2016, 4 months later than initially planned, leading to some subsequent delays and the retimetabling of part of the remainder of the project.
The output of these workshops, however, was a set of indicators within objectives that could be taken forward to the consensus exercise.
Consensus exercise methods
The original plan was to present a final version of the measure to a large consensus meeting, including representatives from a large number of national bodies, as well as representatives from CCGs and patient groups, in July 2016. This would then be followed up by an online exercise (to include people who were not able to attend the meeting), which would follow up on areas of uncertainty and gather quantitative data when appropriate (e.g. for weighting different objectives).
However, the fact that the phase 2/3 workshops had not finished by this point, and the fact that additional questions had been raised by the workshops that had been completed, meant that this consensus exercise meeting could not be run in July 2016. In addition, the Study Steering Committee, comprising a wide variety of stakeholders, posed additional questions about the nature of the tool and what it should be used for. On advice from the Steering Committee, therefore, it was decided to proceed with a meeting at the appointed time (July 2016) with stakeholders who had already agreed to the planned date, to answer some broader questions about the study and the measure.
This meeting was held in central London across the middle of the day (11.00–15.00), and was attended by 16 participants representing organisations including NHS England, RCGP, Royal College of Nursing, Healthwatch and the Faculty of Public Health. Those in attendance were given a draft version of the measure as it stood at that time. In addition to some plenary sessions, most of the day was built around four group discussions (attenders being divided into three groups, each with a facilitator). The group discussions were based on the following questions, formed following an in-depth discussion with the Steering Committee:
-
What sort of tool will be most useful to practices (e.g. areas covered, frequency of data entry and feedback)? What unique selling point might make it most attractive for use in the future?
-
How should we weigh up comprehensiveness and usability? What is the right balance between covering core work and more aspirational performance?
-
How can it be ensured that the tool is best suited for use 5–10 years into the future? How can best use within federations (e.g. practice-level or federation-level data) be ensured? How can it be ensured that the Five Year Forward View and STPs are taken into account?
-
Regarding the content of the tool, which of the following areas should be included/expanded? Are there any other areas that should be covered? How can best use be made of existing data?
-
public health
-
social care
-
self-care/prevention
-
integration of physical and mental health
-
child-specific issues
-
esteem/loneliness
-
issues for BME patients, specifically
-
transparency and accountability.
-
Findings from the day were collated and used to feed into the remaining workshops and consensus exercise. In particular, public health was thought to be a major area of weakness in the version of the tool presented, and so a specific phase 2/3 workshop for public health experts was arranged. This workshop consisted mainly of directors of public health, plus experienced public health officers from NHS England.
The main consensus exercise, therefore, was conducted somewhat later, between October and December 2016. This took the form of an online exercise [a survey conducted via the survey software Qualtrics (Provo, UT and Seattle, WA, USA)] in two parts. The first part was specifically for GPs, as it relied on knowledge of the clinical indicators. The second part was more general, relating to overall weighting of the different objectives and some specific issues about non-clinical indicators. Specifically, the concerns of the questions were as follows.
Part 1: general practitioners only
-
Questions to elicit contingencies for 20 clinical indicators (estimates of low, medium and high levels).
-
Questions about relative weightings of all indicators within an objective.
-
Questions about relative weightings of all clinical objectives.
Part 2: all respondents
-
Questions to elicit contingencies for six non-clinical indicators (that had been developed or amended since the phase 2/3 workshops).
-
Questions about relative weightings of all non-clinical indicators within each objective.
-
Questions about relative weightings of all objectives and performance areas.
-
Questions about any other areas that were missing from the tool, or any other comments that respondents may have.
All participants from the consensus exercise meeting, along with other invitees who could not make that meeting, were invited to complete this online exercise. Responses were received from 27 participants, including 8 GPs (the other 19 respondents included at least 4 from national bodies with an interest in general practice, including NHS England, the Royal College of Nursing and the RCGP, at least 3 from patient organisations, including Healthwatch, and 12 who did not specify their organisation or role in their response).
Responses were examined for outliers; any extreme outliers were removed before findings were summarised by calculating mean levels. These mean levels were then used as the basis for final contingencies and weightings in the piloted version of the tool.
Phase 1 workshops: findings
The outputs from the two phase 1 workshops were initially collected on flip charts, collated and transcribed into summary statements. A total of 484 summary statements from the two workshops were transcribed; these were then coded thematically.
Initially, 19 themes were recorded. These are shown in Table 4.
| Theme | Examples/further detail |
|---|---|
| Access to care | Timely and appropriate access; right person/practitioner; equitable, based on need |
| Managing demand | Methods to use resources and manage patient expectations |
| Appointments | Longer or more flexible appointments in accordance with need, better use of technology, multidisciplinary staff, reduced duplication |
| Practice staff | Good team meetings, staff morale, retention, appropriate training |
| Reception | Use of triage; good training, sensitive to confidentiality; pleasant, customer-service focused |
| Patients’ experience | Confidence, expectation, satisfaction |
| Signposting/referrals | Patients seen by right person at right time for their need/condition; appropriate referrals to other services |
| Continuity of care | Ability for patients to see same practitioner |
| Environment | Quality of premises (e.g. poor buildings) |
| PPGs | Effective use of groups; communication with groups; support for groups; representation of population engagement |
| Communication and engagement | Increase patient confidence and expectation; appropriate use of technology to engage with community; planning effective services and sharing learning; using a range of methods. It was clear that many public representatives felt that they were not being communicated with effectively |
| Transparency and accountability | Good, clear, appropriate information (about what is on offer, missed appointments, what to expect, specific conditions) |
| Shared teamworking and reflective practice | Effective meetings; integration and connectivity; learning from others |
| Health outcomes | All, but especially with key groups |
| Technology | Optimising IT systems; using a range of methods for communication; use for making appointments; test results |
| Personalised, holistic care | A range of services offered in practice |
| Social prescribing/integration | Care integrated with other local organisations |
| Choice | Choice of practice; choice of type of care |
| Type of care | Decisions between continuity of care and care tailored to specific need |
These themes, and the statements that led to them, were then discussed by several members of the research team. Following this discussion, the themes were arranged into nine objectives that were agreed to cover all of the themes with appropriate separation, keeping all areas included, but limiting overlap to a minimum (a certain level of overlap was considered inevitable).
The nine objectives formed are shown in Table 5.
| Objective | Description/examples |
|---|---|
| Better clinical care | Effective consultations, health outcomes for key groups, appropriate prescribing, safety, public health indicators |
| Effective use of IT systems | Quality of coding, audits, call-back systems, appropriate communication with patients |
| Good partnership working | Liaisons with other key constituents (local authority, voluntary services, other NHS organisations), co-ordination with and learning from other practices |
| High levels of patient satisfaction with services | Quality of consultation, availability of information, range of services offered |
| Ease of access and ability to book appointments | Waiting times, equity, flexibility, effective triage systems, opening hours, continuity of care |
| Engagement with public | Effective use of PPG, good sharing of information, communication with wider community, informative website |
| Good physical environment | Quality of premises, confidentiality of information sharing with receptionists, etc., disabled access |
| Motivated and effective practice team | Team member satisfaction, well-being, retention, interprofessional co-ordination, appropriate roles, training |
| Good practice management | Leadership, financial sustainability, workforce planning, meeting regulatory requirements |
These were the objectives taken forward into the phase 2 workshops. However, it became clear during the phase 2 workshops (backed up by the Study Steering Committee and initial consensus exercise meetings) that the first of these objectives, better clinical care, was too broad and complex to be represented by a small number of indicators (the expectation had been up to five or six indicators per objective). It was likely that around 20 or more indicators would be necessary to capture even the most important aspects of this objective. After careful consideration, therefore, it was decided that this should be split into three different areas, representing the areas suggested by the phase 2/3 workshops: (1) general health and preventative medicine, (2) management of long-term conditions and (3) clinical management.
Perhaps unsurprisingly, ‘better clinical care’, as an objective, was considered by almost all participants as one of the top objectives of the general practice. Therefore, this additional weighting by tripling the number of indicators was viewed as appropriate by participants in the phase 2/3 workshops. However, this also left a total of 11 objectives, clearly more than the six to eight considered ideal by ProMES experts. The focus on 11 different areas was also likely to be a source of confusion for practices. Therefore, it was decided to create a superordinate level of objectives, termed ‘performance areas’. Discussion between members of the research team, and the Study Steering Committee, resulted in four performance areas: (1) clinical care, (2) external focus, (3) patient focus and (4) practice management. Each objective would then contribute to one of these performance areas. The alignment between performance areas and objectives is shown in Table 6 and Figure 6.
| Performance area | Objective |
|---|---|
| Clinical care | General health and preventative medicine |
| Management of long-term conditions | |
| Clinical management | |
| External focus | Good partnership working |
| Engagement with public | |
| Patient focus | High levels of patient satisfaction with services |
| Ease of access and ability to book appointments | |
| Practice management | Effective use of IT systems |
| Good physical environment | |
| Motivated and effective practice team | |
| Good overall practice management |
FIGURE 6.
Performance areas and objectives.
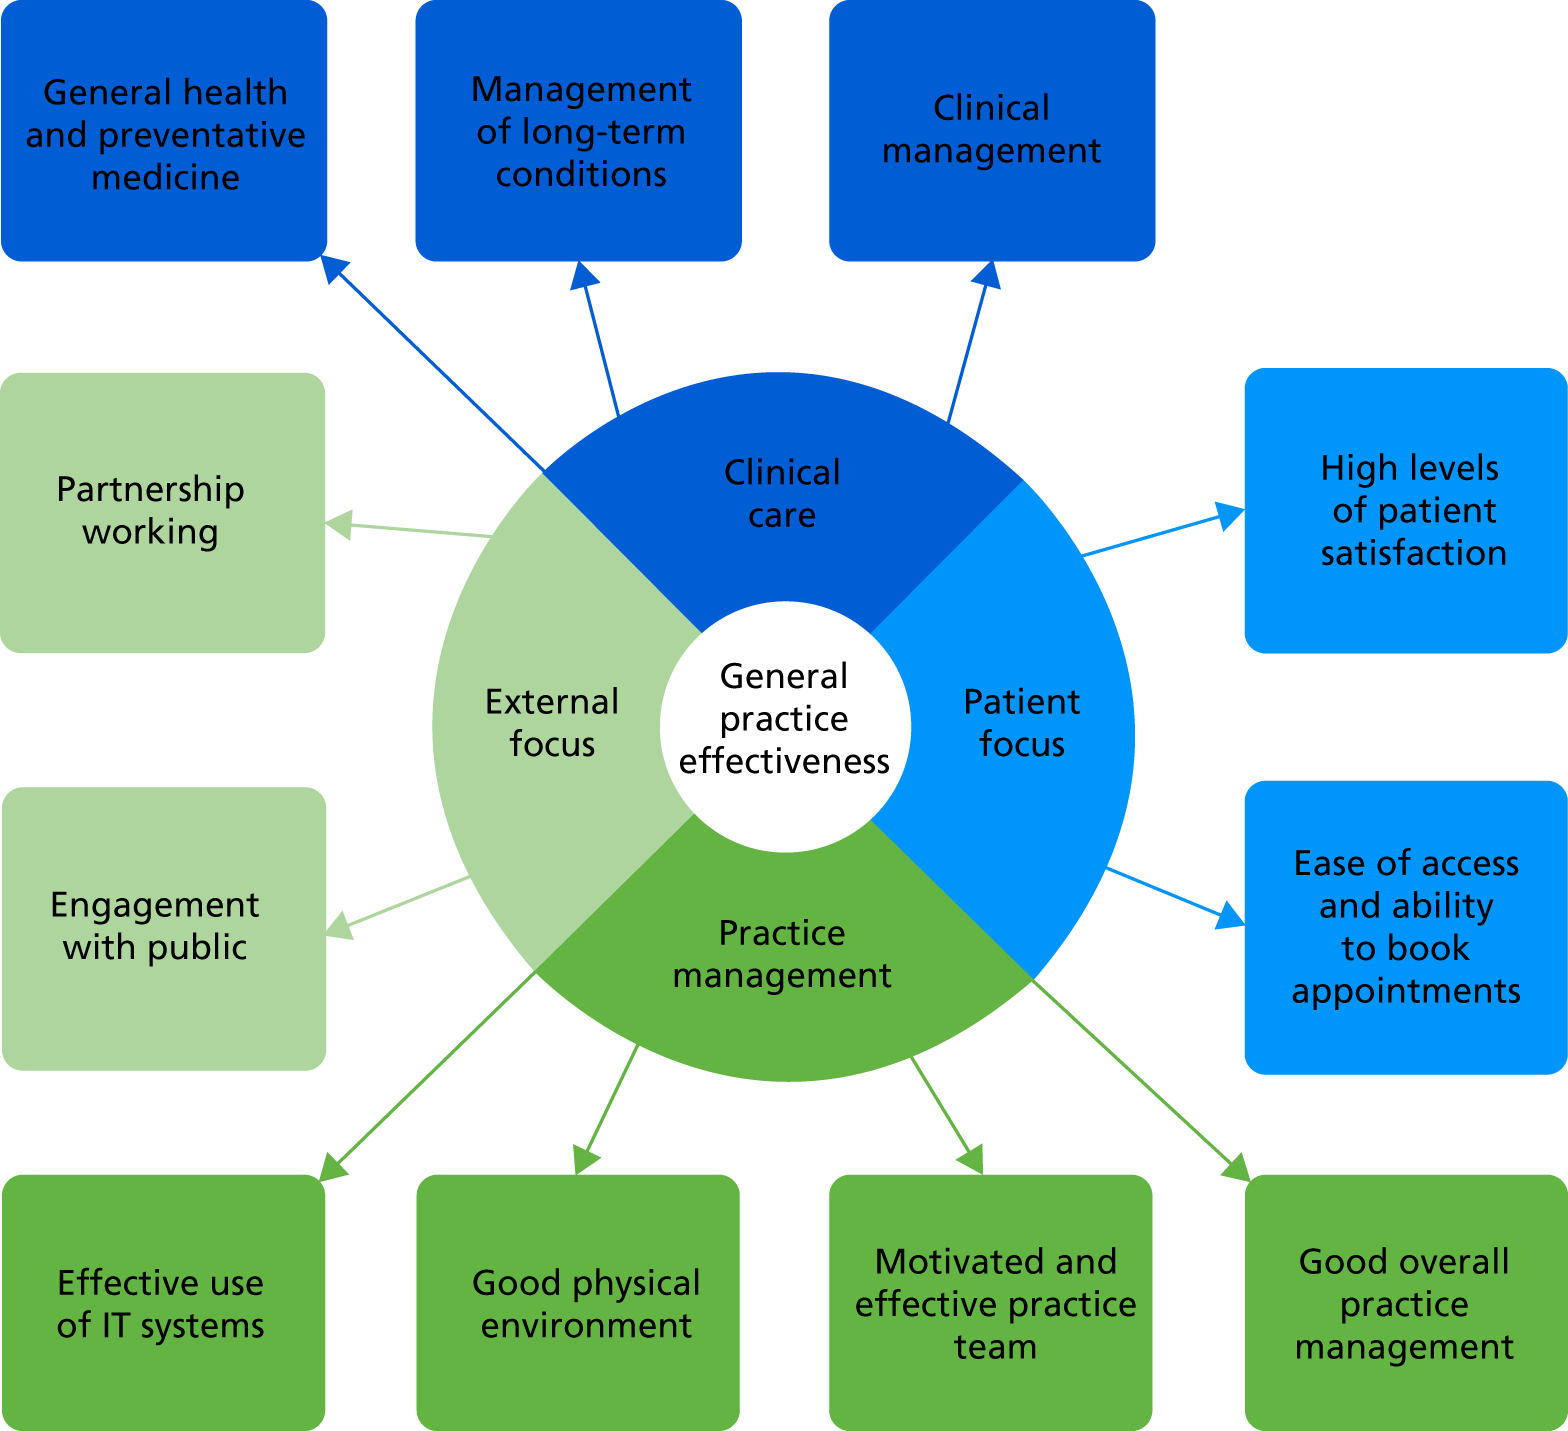
Although the decision to adopt these performance areas was not taken until well into the phase 2/3 workshops, it is reported here so that the reporting of the findings from phases 2 and 3 (in the following section) is made clearer for the reader.
Phases 2 and 3 workshops: findings
There were some common themes across many of the workshops in terms of the engagement with the process of generating indicators. Often, ideas were generated that were not at all specific: a general topic area rather than a defined indicator. An example of this might be the engagement with public objective, for which a suggested indicator was ‘responsiveness to feedback’, without any more specific suggestion about how this should be measured. In addition, participants often found it easier to identify desirable sources of information than actual sources of information.
These initial ideas, although they clearly did not meet the criteria for a ProMES indicator, often prompted useful discussion that sometimes led to an actual measurable indicator. Therefore, in each of the following four sections (one for each performance area), the initial suggested indicators are listed (collated and duplicates removed), but without mention of specific data sources. Following this, the discussion and amendment process is described, and the final set of indicators arising from the workshops are summarised.
Clinical care
Four specific workshops focused on clinical care objectives and indicators, as well as subgroups of the two larger phase 3 workshops. The initial collection of suggested indicators included the following:
-
healthier population [including reduced smoking, reduced alcohol consumption, reduced body mass index (BMI), increased activity]
-
focus on wellness and prevention (including patient engagement regarding prevention, such as number of sessions offered by the practice to help patients learn about prevention)
-
specific health outcomes – diabetes, dementia, other mental health, chronic obstructive pulmonary disease (COPD), heart disease, chronic pain
-
significant events and complaints (including how are they used within the practice to improve care)
-
medication reviews (used to promote ideal timely review and expected outcomes per review)
-
prescription safety monitoring
-
effective consultations (effective for patient, effective for practitioner)
-
safeguarding (showing evidence of safe and effective safeguarding procedures and ability to care for vulnerable groups; evidence of contacting vulnerable groups specifically)
-
prescribing errors
-
referrals (appropriate referring to hospital, matching of symptom to outcome; proportion of referrals not out of area)
-
availability of specialist services [including specialist staff to deal with chronic illness (e.g. diabetes, COPD, heart disease), children, mental health/learning disabilities, stroke]
-
percentage of the population having NHS health checks
-
percentage of the population not seeing a GP
-
sick notes and fit notes issued
-
immunisations performed (including influenza and age-appropriate immunisations for children)
-
complaints (number upheld, reviews conducted)
-
percentage of unnecessary consultations
-
percentage of appointments not attended (DNAs).
As there were six separate workshops involved in developing these indicators, discussion at the earlier ones had more of a focus on becoming more specific about the indicators suggested, whereas discussions at later workshops took a more holistic view of the complete set of indicators. (It was during this later phase that the need to separate into three different objectives became clearer.)
The discussion around the clinical care indicators was particularly informed by existing indicators, such as those used in the QOF. Therefore, for each clinical indicator, there was a discussion around whether or not an existing QOF indicator would suffice, either in its existing form or adapted in some way. Several were adapted when it was felt that the QOF indicator(s) did not cover the most desirable clinical outcomes.
The general feeling was that the QOF indicators would cover many of the specific clinical conditions (particularly long-term conditions), as well as various public health/preventative medicine areas; however, the number of QOF indicators was far too large for this purpose. Instead, there should be (preferably) one indicator for each of a carefully selected number of specific clinical conditions (it was seen as crucial that common health conditions viewed as particularly important were measured by separate indicators). The most important aspects of preventative medicine should be covered and also it was important to cover aspects of clinical care that would not necessarily be included in individual patient records, but were reflective of the practice’s approach to clinical care as a whole.
One finding that became clear early on in these workshops was that, particularly for non-QOF indicators based on clinical data, practices would be unlikely to have the resources to design the queries to extract the data themselves; the majority of GPs and other practice staff who commented on this said that if they were asked to, that would probably rule them out of participating in the pilot phase. Therefore, it was decided that data extraction queries would have to be written centrally by the research team. In order to achieve this, the services of PRIMIS at the University of Nottingham were engaged; this is described further in Development of the online tool.
Overall, therefore, the indicators chosen here were designed to strike a balance between usable specificity (so that areas could be targeted and improvements could be made) and broad coverage of most of a practice’s clinical work, while not including too many separate indicators. Inevitably this means that some specific conditions are not directly covered (e.g. chronic kidney disease), but there was broad consensus that the conditions covered were the most relevant and important ones for general practice. (For most long-term conditions, a single indicator was chosen, although, for COPD, it was determined that a single indicator could not cover what was needed, and three indicators were formed – between them contributing the appropriate weight for COPD.)
An overall summary of the topics of the indicators chosen is presented in the following sections. This is merely indicative of the topics and number of indicators; full details of the descriptions of these indicators are provided in Final tool for piloting.
General health and preventative medicine (nine indicators)
-
Health checks for those aged > 75 years.
-
Health checks for patients aged 40–74 years.
-
Smoking cessation.
-
Alcohol consumption.
-
Reduction in BMI.
-
Immunisations (four indicators).
Management of long-term conditions (nine indicators)
-
Dementia care.
-
Diabetes management.
-
Mental health care (two indicators).
-
Heart disease care.
-
COPD care (three indicators).
-
Provision of advice on health behaviour.
Clinical management (five indicators)
-
Availability of enhanced services.
-
Medication reviews.
-
Audits.
-
Safeguarding.
-
Extent of DNAs.
Practice management
Five specific workshops looked at practice management objectives and indicators, as well as subgroups at the two large phase 3 workshops. The initial collection of indicators suggested included the following.
Effective use of information technology systems
-
Training in place for use of IT systems.
-
Maximal use of all software functionality; mix of staff using functions.
-
Reduction of paper records.
-
Recall systems to enable patients to be called in for follow-up.
-
Reduction in face-to-face appointments [e.g. using Skype™ (Microsoft Corporation, Redmond, WA, USA), questionnaires, telephone].
-
Risk stratification to target population for use before something happens, namely prioritise care.
-
Electronic prescribing.
-
Using IT to redirect or recall patients to the appropriate practitioner or self-help safely and securely, automatically.
-
Comprehensive assessment of patient problems so nothing is missed, for example risk assessment templates completed.
-
Clear list of problems and medications in each person’s notes.
-
Number of completed episodes of care following e-referrals.
-
Consistency of coding (use of coding templates).
-
Live data across practices understanding what is and what is not working.
-
One financial/audit reporting system that directly downloads accurate data.
-
One system that integrates across providers and sectors and supports models of care provision and commissioning.
-
Use of multiple methods to communicate well with patients (including percentage of appointments booked online, percentage of patients with a record of consent to use electronic means of communication, utilisation of social media for patient engagement, comprehensive website).
-
Use of prompts (e.g. call backs; ‘must do’s’, e.g. QOF, key performance indicators; drug guidelines).
Good physical environment
-
Number of patient complaints about reception.
-
Compliance with Disability Discrimination Act (DDA)142 checklist regarding disabled access.
-
Number of patient complaints about parking.
-
Cleanliness of facilities.
-
Appropriateness of clinical areas.
Motivated and effective team
-
Proportion of staff attending regular practice meetings.
-
Proportion of staff with relevant/professional development training needs met.
-
Proportion of annual appraisals completed.
-
Proportion of staff who received an induction to the practice in the first month of commencing their role.
-
Percentage of staff awarded promotion in the preceding year.
-
Percentage of responses to requests for 360-degree feedback at annual appraisal.
-
Percentage of hours lost to sickness/absenteeism.
-
Number of unplanned sick days.
-
Percentage of staff reporting high satisfaction with work environment.
-
Proportion of staff who would recommend the practice as a place to work.
-
Proportion of practice staff leaving the practice in the previous 12 months.
Good practice management
-
Appropriate workforce. It is important for the smooth running of the practice that there is a good skill mix of highly trained staff. A workforce audit would be the source of these data and measuring whether or not this was in place could be an indicator.
-
Proportion of FTE posts vacant for > 12 months.
-
Proportion of staff that have been in post for > 12 months.
-
Number of staff shared across general practice groups to meet Local Enhanced Service requirements.
-
Proportion of staff who have had their review in the previous 12 months.
-
Time taken to respond to complaints.
-
Appropriate financial management.
-
Suitable risk assessments.
Discussions around these objectives and indicators were more straightforward than some other performance areas, but still voluminous in quantity. For effective use of IT systems, many indicators were considered but consensus was reached that the most appropriate way to collect the information would be via checklists, as many of the variables were simple yes/no options for whether or not practices had adopted particular IT solutions. For good physical environment, similar use of appropriate checklists was considered the best way forward. For the other two objectives, specific ideas for indicators were more plentiful; therefore, the main aspects of the discussion were around keeping the number of indicators small enough to be manageable, while still covering the maximum content and keeping new data collection to a minimum.
The indicators for this performance area were as follows (again, this is merely indicative of the topics and number of indicators; full details of the descriptions of these indicators are provided in Final tool for piloting).
Effective use of information technology systems (two indicators)
-
Extent of use of IT tools.
-
Extent of use of paperless systems.
Good physical environment (two indicators)
-
Appropriate consulting room environment.
-
Compliance with DDA.
Motivated and effective practice team (six indicators)
-
Staff attendance at meetings.
-
Training needs being met (two indicators).
-
Staff retention.
-
Sickness absence.
-
Quality of teamworking.
Good overall practice management (six indicators)
-
Staff appraisals.
-
Learning from complaints.
-
Workforce planning.
-
Financial management.
-
Management of significant events.
-
Reviewing procedures and services.
Patient focus
Two specific workshops, as well as subgroups at the two large phase 3 workshops, concentrated on objectives and indicators with a patient focus. The initial collection of suggested indicators included the following.
Patient satisfaction with service
-
Percentage of patients willing to recommend service (FFT).
-
Number of complaints recorded.
-
Satisfaction with quality of consultation.
-
Complaints received and recorded by practice manager.
-
Successful resolution of complaints.
-
Percentage of patients waiting ≥ 20 minutes past appointment time.
-
Range of services available to patients.
-
Availability of information in surgery.
-
Ease of making/cancelling an appointment.
-
Variety of consultations offered at surgery rather than referral to hospital, for example diabetic retinal checks.
-
Patient reference group attended by patients and staff.
-
Patients feeling sufficiently involved in practice.
Ease of access and ability to book appointments
-
Number of days waiting to see GP of choice.
-
Patient satisfaction with reception staff.
-
Number of minutes waiting past scheduled appointment time.
-
Interval until next available routine appointment.
-
Time taken to answer telephone when ringing practice.
-
Proportion of routine care appointments available within 48 hours.
-
Proportion of appointments booked online.
-
Proportion of appointments booked by text message.
-
Proportion of appointments cancelled online.
-
Proportion of appointments cancelled by text message.
-
Patient satisfaction with booking system.
-
Proportion of appointments that are OOH (9.00–17.00, weekdays).
-
Proportion of consultations that are not face to face or proportion that are telephone consultations.
-
Patient satisfaction with booking system.
In discussion, it was noted that many of these overlapped; therefore, priority was given to creating the smallest number of indicators that covered the maximum quantity of content. In addition, several of the proposed indicators above overlapped with indicators across different objectives (outside this performance area). One of the key criteria was that any extra data collected should involve the minimum extra burden. In total, therefore, five indicators were chosen for this performance area, including three that would be collected via an ongoing patient questionnaire – to be asked alongside the existing FFT question(s).
These indicators were as follows (again, this is merely indicative of the topics and number of indicators, and full details of the descriptions of these indicators are provided in Final tool for piloting).
High levels of patient satisfaction with service (two indicators)
-
Willingness to recommend service.
-
Satisfaction with reception staff.
Ease of access and ability to book appointments (three indicators)
-
Hours of clinical appointments.
-
Late appointments.
-
Satisfaction with booking system.
External focus
Two specific workshops, as well as subgroups at the two large phase 3 workshops, focused on objectives and indicators with an external focus. In addition, the extra public health expert workshop contributed particularly to this performance area. As this workshop had a slightly specialised remit, it is described in more detail in this section.
Participants in this workshop understood that some aspects of medical public health were already included in the clinical care section of indicators. In addition, aspects of public health relating to community participation were covered already. Therefore, the group focused their discussion on health needs and root causes of ill health. A range of possible indicators was discussed, including social assessment and prescribing, setting out that the majority of consultations ideally include assessments of social circumstances and inequalities affecting health, as well as medical assessment and follow-up. Subsequently, this was reduced to social prescribing because of the requirements for ProMES indicators.
Another area considered desirable to include was related to the state of health in a practice area. It was suggested that an indicator could include a quarterly review of practice/neighbourhood population health, a well-being profile and, relating this, to the practice plan. Ultimately this was not included, as it was thought that the data would not be available on a regular enough basis (e.g. the Public Health England general practice profiles do provide this information, but only annually, which is not sufficient for this type of measurement).
Some aspects of the discussion were included in the indicators relating to the voluntary sector in partnership and engagement areas, although it was not possible to include activities undertaken by volunteers.
Overall, for this performance area, the initial collection of indicators suggested included the following.
Good partnership working
-
Evidence of clinical or business improvement as an outcome of patient participation group (PPG) suggestions.
-
Housing liaison.
-
Peer-to-peer sharing and learning: working collaboratively with other local practices to share best practice/learn/share staff/hit collective targets.
-
Social prescribing: how the practice works with other local support and community networks to provide a more holistic/social care. Which networks are being used?
-
Arrangements for record-sharing with other agencies (e.g. OOH/ambulance/hospital/community).
-
Regular MDT meetings attended by all stakeholders who are invited?
-
Recognising strength of local support groups: up-to-date information in practice?
Engagement with the public
-
Number of referrals to local support groups/voluntary groups/community groups.
-
Proportion of patients informed of waiting time in minutes from scheduled appointment time.
-
Enabling involvement of patients/public.
-
Responsiveness to feedback.
This performance area proved one of the most challenging for producing indicators. Although most participants in the workshops (professionals and members of the public) thought that they would recognise good partnership working and engagement when they saw it, they found it very difficult to apply specific criteria to convert these to actual indicators; thus, some of the more ill-defined suggestions above (e.g. housing liaison) were not easy to convert into formal indicators. This was particularly the case for public health-related indicators.
However, in discussions in the workshops it was decided that various lists could be formed of activities that would generally be considered good practice in these areas. Therefore, several of the indicators created for this performance area relied on checklists, for which practices would tick yes for all those criteria that were met, and the software would automatically generate a score, calculated as the number of positive responses there were for that particular list.
The indicators for this performance area were as follows (again, this is merely indicative of the topics and number of indicators; full details of the descriptions of these indicators are provided in Final tool for piloting).
Good partnership working (two indicators)
-
Attendance at regular MDT meetings.
-
Extent of working with external partners.
Engagement with the public (six indicators)
-
Number of PPG meetings.
-
Resources provided to PPG.
-
Application of learning from PPG.
-
Outreach to public.
-
Outreach to local community.
-
Use of varied communication methods.
Overall, therefore, 11 objectives across the four performance areas were taken forward, with 52 indicators representing these objectives (i.e. between two and nine indicators per objective).
In addition, a small number of other objectives were considered useful but not practical for most general practices because of the non-standard nature of the data collection. It was decided (following the consensus exercise meeting, described in the following section) to offer these as optional objectives for practices: they would not contribute towards the overall effectiveness score, but could be used to track data over time in those specific practices. These are shown in detail in Final tool for piloting.
Consensus exercise: findings
Initial meeting
As described in Consensus exercise methods, there were four principal sets of discussion questions considered during this meeting:
-
What sort of tool will be most useful to practices (e.g. areas covered, frequency of data entry and feedback)? What unique selling point might make it most attractive for use in the future?
-
How should comprehensiveness and usability be weighed up? What is the right balance between covering core work and more aspirational performance?
-
How can it be ensured that the tool is best suited for use 5–10 years into the future? How can best use within federations be ensured (e.g. practice-level or federation-level data)? How can it be ensured that the Five Year Forward View65 and STPs are taken into account?
-
Regarding the content of the tool, which areas should be included/expanded? Are there any other areas that should be covered? How can best use be made of existing data?
A summary of the responses and discussion for each question is given in the following sections.
Question 1
The consensus among participants was that the tool should be considered primarily as a tool to allow practices to measure and improve their own productivity, rather than something for broader performance measurement. It was thought to be very unlikely that standardisation could be applied that would make it directly (and fairly) comparable across different types/sizes of practice.
There was also consensus that the tool should emphasise actionable outcomes, as practices would want to see benefits at little or no cost or extra effort. Feedback should be provided at an appropriately broken-down level to ensure that they can identify the right areas to focus on.
One suggestion was that practices might be able to set their own targets. This might improve a practice’s feel of how in control they are. They could also set their own contingencies.
The process of collecting and entering data must be as straightforward as possible, and take as little time as is feasible. Having the right infrastructure around the tool would be important (e.g. providing automatic extraction of clinical data).
All staff would need to be on board to make it a success, but particularly practice managers and GPs. Some staff (particularly GPs) might need to be convinced about the importance of focusing on some non-clinical or non-core areas.
It is worth noting that the data could, in the future, be used to underpin inspection processes (perhaps under the ‘well-led’ self-submission for CQC). However, the tool needs to be aligned to the vision for the future of general practice overall; it needs to be part of a coherent, consistent picture.
Concerns were raised about data being used by other bodies; sensitivity is required for practices to use the tool in a meaningful, honest way. However, it could be a very useful tool to help CCGs work with practices (or to compare practices within federations). This points towards a real tension.
It was suggested that in the future it could involve an Indicator Assurance Group, which would have legal responsibility to provide assurance on indicators; this could include involvement from all key national organisations.
Overall, for this question, the key themes that emerged were the need to:
-
focus on the measure as a tool for practices to track and improve their own productivity
-
enable data collection without much extra burden
-
convince practitioners of the value of the tool and enable them to use feedback effectively
-
ensure that the tool is situated within the broader, changing context of the NHS, and the health of populations in general.
Question 2
It was felt that focusing on a small number of indicators might highlight areas that are more important to some types of practices than others. Focusing on a subset might introduce biases. Therefore, comprehensiveness of coverage is important.
It was suggested that perhaps practices themselves could add on aspirational measures. However, it would not be wise to demotivate practices at the lower end of performance that might not be able to do well on aspirational performance. Such aspirational measures might be helpful for future-proofing the tool also.
Question 3
One important consideration is the availability of data, and how this might change. In particular, changes in the use of codes by general practice clinical data systems was a concern: the advent of new Systematized Nomenclature of Medicine (SNOMED) codes to replace the current Read codes in these systems might compromise the future of the version of the tool developed here.
It would be important to review the content of the tool regularly, possibly on an annual or biennial basis, so that indicators retain usability (this would be similar to the QOF annual review, supported by NICE).
The question around whether the tool should be aimed at practice federations is a complex one. Federations are not necessarily legal entities currently, but this could change at some point. The tool should have flexibility to adapt to this. Ideally, it was felt that the tool should be focused at the individual practice level, but with the option to aggregate to the federation level.
The tool also needs to have sufficient adaptability to fit practices in different contexts: rural and urban practices are not necessarily comparable. Similarly, single-handed practices, large practices and other subgroupings also are not necessarily comparable.
To ensure that the tool can be used at the practice level, it needs continuity for tool users; therefore, it requires the sharing of information between users.
The tool also needs to be able to adapt to the integration of health and social care, including new models of care (such as those put forward in the General Practice Forward View). 11 However, services in the GP contract need to be at the heart of such integration. 11,66
Overall, for this question, the key themes emerging were the:
-
need to adapt to future technological and organisational changes in the NHS
-
desire to be applicable to all types of practice, but also to federations and other groupings
-
need to keep the tool updated in the future.
Question 4
One key area that was seen as weak in the tool was public health. This is split between two performance areas, (1) clinical care and (2) external focus, with no clear objectives related to many aspects of public health besides the purely clinical. However, as in the workshops, participants at the meeting did not find it easy to suggest indicators of public health performance that were both available and appropriate. Public Health England data sources were suggested, as was the Public Health Observatory, but no timely, practice-level indicators were identified as being relevant for this tool.
Other areas that were discussed as possible expansion areas were screening (e.g. cervical smears), measures for specialised populations (e.g. homeless), social care, end-of-life care, referrals and emergency admissions. Broader discussion around these did not result in any clear suggestions for different objectives besides those already included, or any firm suggestions for different indicators.
Overall conclusions from meeting
The main findings from the meeting were that there was broad general agreement that the tool (as it was at the time) was covering the right areas, although additional public health input in particular was desirable. It was also clear that the emphasis on easily collected (or preferably pre-existing) data was essential. Efforts should be made to engage practitioners in using the tool, and it should be promoted largely as a tool to help practices measure and improve their own productivity rather than a performance measurement tool. Steps should be taken to ensure its usability and relevance in the short- to medium-term future.
Online survey
The methods for the survey were given in Consensus exercise methods; the major output from this was the full contingencies for many of the indicators in the tool. These contingencies are shown in detail in Final tool for piloting. However, the other main aspect of the survey was to provide weightings for the different objectives within each performance area, and for the different performance areas overall.
Therefore, data from the 27 respondents were collated; the relative weightings for each performance area and objective were as shown in Table 7. It is notable that, within clinical care (which itself has the largest overall weighting, at 37% of the total), the three objectives were viewed as equally important by respondents. These weights superseded those found in the phase 3 workshops, because of the change in structure of the tool after that point (i.e. the introduction of performance areas and the splitting of clinical care into three objectives). However, the theme of the importance of both clinical care and practice management, which was evident from both professional and public participants in the phase 3 workshop, was retained in the consensus exercise also.
| Performance area | Weighting within overall measure (%) | Objective | Weighting within performance area (%) |
|---|---|---|---|
| Clinical care | 37 | General health and preventative medicine | 33 |
| Management of long-term conditions | 33 | ||
| Clinical management | 33 | ||
| External focus | 15 | Good partnership working | 44 |
| Engagement with public | 56 | ||
| Patient focus | 18 | High level of patient satisfaction with services | 50 |
| Ease of access and ability to book appointments | 50 | ||
| Practice management | 30 | Effective use of IT systems | 21 |
| Good physical environment | 19 | ||
| Motivated and effective practice team | 31 | ||
| Good overall practice management | 29 |
Therefore, these weightings were joined with the findings from the workshops (which balanced indicators within objectives) to create the total weighting of indicators within the tool to form an overall effectiveness index, using the following steps:
-
The four performance areas were given a total number of points in accordance with the weights in column 2 of Table 7 (4920 points were available in total, so, for example, for patient focus, the number of points was approximately 18% of 4920 = 900 points).
-
Within each performance area, the objectives were given a number of points in accordance with the weights in the final column of Table 7, using a similar mechanism.
-
Within each objective, the weightings from the phase 3 workshops were used to divide the points available for each indicator.
Development of the online tool
Software: Effecteev
Effecteev is the name of a piece of software developed by BlackBox/Open, a German company, to assist teams with the ProMES process. It requires the entry of objectives and indicators, and then helps with the development of contingencies by enabling users to view them and alter them manually, directly on the graph itself. After being set up, it then prompts team members for data entry on a regular (e.g. monthly) basis and allows the download of a regular report for the team, showing progress overall, as well as on each objective and indicator.
The research team worked with the developers of this software to adapt it for the needs of this study. The development of the contingencies could be done in the workshops using the existing form of the software, but there were three areas for which a significant change was needed:
-
An extra level needed to be built into the software because of the adoption of performance areas in addition to objectives and indicators.
-
The system then also needed to be fixed for all teams in the sample, so that only the central research team could change the performance areas, objectives, indicators and contingencies, and only the central research team could view all of the data, but then individual ‘systems’ (teams) could be accessed by different practices. Therefore, for each practice, the process of entering data and receiving reports was as normal, but no changes to the central elements of the tool could be made by individual practices.
-
On the other hand, practices were free to select one or more of the optional indicators to include in their data collection if they so desired, even though these would not contribute to the overall effectiveness score.
As described in Chapter 5, each participating team was given access to the online tool on this basis, and trained by a member of the research team or a research nurse in using it.
Involvement of PRIMIS
As identified during the workshops and in the consensus exercise, practices would not have the resources to create the extraction of data from their clinical systems. The only feasible way of ensuring that a sufficient number of practices would be able to use the tool, therefore, was to provide them with the means to extract these clinical indicators automatically on a monthly basis.
To do this, the research team sought to develop Morbidity Information Query and Export Syntax (MIQUEST) queries (automated software to extract the correct information from practices’ clinical systems) that could be shared with the practices. However, the expertise to create these was not within the research team; therefore, PRIMIS (a business unit at the University of Nottingham, specialising in extraction of general practice data) was approached to explore ways to do this.
Having had initial discussions and obtained an estimate of the cost for PRIMIS to write these queries on our behalf, it was requested from NIHR that existing funds could be reallocated within the study to allow for this cost, which was agreed.
The research team subsequently worked closely with PRIMIS, via several telephone conversations and one half-day face-to-face workshop, to specify exactly what the indicators should be measuring, including precise definitions of populations, timescales and exceptions. This covered the 19 indicators that were measured from clinical systems.
At the time, all of the practices that had expressed an interest in participating in the pilot study used one of the two most common clinical data systems: EMIS (EMIS Health, Leeds, UK) or SystmOne [The Phoenix Partnership (TPP), Leeds, UK]. Therefore, we proceeded on the basis that queries written would be compatible with both these systems, and added the use of one of these systems as an inclusion criterion for participation in the pilot. PRIMIS then wrote and tested the queries on these two systems.
The net result was automated software that practices would be able to run, so that each month all of the necessary data would be outputted into a single document, for entering into the Effecteev system when prompted.
Although highly successful in one way, the added time taken meant that the queries were not finally ready until month 21 of the study. This had the net effect of compressing the remainder of the timescale for the study. The detail and implications of this are discussed in Chapter 5.
Final tool for piloting
Table 8 shows the final version of the tool that was piloted, including details of each indicator, the expected source of that indicator and the indicator number that was used within Effecteev. There were 52 indicators in total; the sources of these indicators can be summarised as follows:
-
19 of the indicators were gathered from clinical information systems, with MIQUEST queries developed to extract these data automatically from EMIS and SystmOne
-
14 indicators came from practice records (including staff records, meeting minutes and attendance records)
-
15 were based on checklists (questionnaires) answered by the data inputter (each could include several yes/no questions)
-
3 indicators came from patient views, collected as part of an enhanced regular FFT questionnaire
-
1 indicator came from a very brief (five-item) questionnaire to practice staff.
| Performance area | Objective | Indicator | Source | Indicator number |
|---|---|---|---|---|
| Clinical care | General health and preventative medicine | Percentage of those aged > 75 years having a health check in the previous 6 months | MIQUEST | 1.1 |
| Percentage of people having NHS health checks (aged 40–74 years) in previous 5 years | MIQUEST | 1.2 | ||
| Smoking cessation (percentage of smokers who have been offered smoking cessation advice or treatment in the previous 12 months) | MIQUEST | 1.3 | ||
| Alcohol consumption (percentage of new patients registering with practice in previous 12 months having an AUDIT-C score of > 8 recorded who are offered an intervention) | MIQUEST | 1.4 | ||
| BMI reduction (percentage of patients aged ≥ 18 years with a BMI reading of ≥ 30 kg/m2 in the previous 12 months who have had any weight-reduction intervention) | MIQUEST | 1.5 | ||
| Immunisations for influenza (percentage of those in clinical risk groups, including pregnant women, receiving influenza immunisation since August 2016) | MIQUEST | 1.6 | ||
| Childhood influenza immunisations (percentage of children aged 2–4 years having influenza vaccinations in the previous 12 months) | MIQUEST | 1.7 | ||
| Immunisations for children (percentage of children aged < 5 years who have received their age-relevant immunisations) | MIQUEST | 1.8a | ||
| Immunisations for babies (percentage of babies aged 6 months who have received their age-relevant immunisations) | MIQUEST | 1.8b | ||
| Management of long-term conditions | Dementia care (percentage of patients with dementia for whom an annual dementia care review has been recorded within the previous 12 months) | MIQUEST | 2.1a | |
| Diabetes management [percentage of diabetes patients (types 1 and 2) aged ≥ 18 years for whom nine specified checks were accomplished in the previous 12 months] | MIQUEST | 2.2 | ||
| Initial care of mental health conditions [percentage of patients with new a diagnosis of a mental health condition (e.g. schizophrenia, bipolar disorder, psychosis, depression) with a post-diagnostic review between 10 and 56 days later] | MIQUEST | 2.3 | ||
| Ongoing care of mental health conditions [percentage of patients with serious mental health conditions (including schizophrenia, psychosis, bipolar disorder and depression) for whom an annual dementia care review has been recorded in the previous 12 months] | MIQUEST | 2.4a | ||
| Heart disease care [percentage of patients with CHD in whom the last blood pressure reading (measured in the preceding 12 months) was ≤ 140/90 mmHg] | MIQUEST | 2.5 | ||
| COPD care (care plan) (percentage of patients on the COPD register who have an agreed care plan and whose medication is in accordance with MRC grading) | MIQUEST | 2.6a | ||
| COPD spirometry (percentage of patients on the COPD register with evidence of a spirometry reading in the previous 24 months) | MIQUEST | 2.6b | ||
| COPD care medication (percentage of patients on the COPD register whose medication is in accordance with NICE guidelines) | MIQUEST | 2.6c | ||
| Lifestyle of people with long-term conditions: diabetes, COPD, (serious) mental health conditions (including depression), ischaemic heart disease, dementia (percentage of patients with a review in the previous year for whom BMI, alcohol consumption and smoking status have been recorded and exercise advice given) | MIQUEST | 2.7 | ||
| Clinical management | Availability of enhanced services: ‘Does your practice provide the following enhanced services, led by a trained professional?’ (sum of ‘yes’ responses) – diabetes; respiratory conditions; palliative care and pain; learning disabilities; heart disease and anticoagulation; mental health; minor surgery; dermatology; substance misuse; smoking cessation; immunisation; and family planning | Questionnaire in ProMES tool | 3.1 | |
| Medication review (of patients taking at least four repeat medications, the percentage for whom there has been a medication review in the previous 12 months) | MIQUEST | 3.2 | ||
Audits in last quarter: questionnaire covering audits (seven questions rated from 0 to 4):
|
Questionnaire in ProMES tool | 3.3 | ||
Safeguarding: the extent to which key vulnerable groups are identified, and have particular policies associated with them. For each of the following groups:
|
Questionnaire in ProMES tool | 3.4 | ||
| Proportion of DNAs | Practice records | 3.5 | ||
| Practice management | Effective use of IT systems | Use of IT tools (14 yes/no questions) | Questionnaire in ProMES tool | 4.1 |
| Use of paperless systems (six yes/no questions): How many of the following non-paper-based systems does your practice use? Referrals, clinical pathology results, electronic discharge, OOH, mobile IT solutions, pre-appointment tools for patients to inform staff of their health issues | Questionnaire in ProMES tool | 4.2 | ||
| Good physical environment | Appropriate environment in consulting rooms (checklist of five items) | Visual inspection | 5.1 | |
| Compliance to DDA142 checklist (checklist of six items) | Questionnaire in ProMES tool | 5.2 | ||
| Motivated and effective practice team | Proportion of staff attending monthly practice meetings | Practice records | 6.1 | |
| Proportion of clinical staff with training needs met | Practice records | 6.2 | ||
| Proportion of non-clinical staff with training needs met | Practice records | 6.3 | ||
| Staff retention (percentage of staff from 12 months ago who are still in post) | Practice records | 6.4 | ||
| Staff well-being (percentage of working days lost to unplanned absence) | Practice records | 6.5 | ||
| Quality of teamworking | Short questionnaire to practice staff | 6.6 | ||
| Good overall practice management | Staff appraisals (percentage of staff who have had an appraisal or equivalent performance review in past 12 months) | Practice records | 7.1 | |
| Learning from complaints: five yes/no questions | Practice records | 7.2 | ||
| Workforce planning: four yes/no questions | Questionnaire in ProMES tool | 7.3 | ||
| Financial management: six yes/no questions | Questionnaire in ProMES tool | 7.4 | ||
| Management of significant events: five yes/no questions | Questionnaire in ProMES tool | 7.5 | ||
| Reviewing practice procedures or services to reflect changing needs or demographics in the practice population | Questionnaire in ProMES tool | 7.6 | ||
| Patient focus | High levels of patient satisfaction with services | Percentage of patients willing to recommend practice | FFT | 8.1 |
| Patient satisfaction with (reception) staff | Question administered with FFT | 8.2 | ||
| Ease of access and ability to book appointments | Hours of clinical appointments per 1000 patients per week | Practice records | 9.1 | |
| Percentage of patients waiting > 15 minutes past appointment time | Practice records | 9.2 | ||
| Percentage of patients satisfied with booking system | Question administered with FFT | 9.3 | ||
| External focus | Partnership working | Percentage of attendance at MDT meetings | Meeting minutes | 10.1 |
| Working with different partners | Questionnaire in ProMES tool | 10.4 | ||
| Engagement with public | Enabling involvement: number of meetings with PPG/PRG in last quarter | Practice records | 11.1 | |
| Resourcing of the PPG/PRG: three yes/no questions | Questionnaire in ProMES tool | 11.2 | ||
| Learning from the PPG/PRG: five yes/no questions | Questionnaire in ProMES tool | 11.3 | ||
| Practice staff outreach to the public: amount of time staff spend in face-to-face contact with the public at appropriate external groups (e.g. schools) | Practice records | 11.4 | ||
| Outreach and partnerships with local population and community: six yes/no questions | Questionnaire in ProMES tool | 11.5 | ||
| Use of various access routes to communicate with public: four yes/no questions | Questionnaire in ProMES tool | 11.6 | ||
| Optional Indicators | Management of long-term conditions | Dementia (carers) (percentage of patients with dementia in receipt of support from a carer) | MIQUEST | O2.1c |
| Dementia (nutritional assessment) (percentage of patients with dementia who have a recorded nutritional assessment in the previous 12 months) | MIQUEST | O2.1d | ||
| Dementia (benefits review) (percentage of patients with dementia who have a recorded assessment of their benefits within the previous 12 months) | MIQUEST | O2.1b | ||
| Ongoing mental health conditions (suicide risk) [percentage of patients with serious mental health conditions (including schizophrenia, psychosis and bipolar disorder) for whom an assessment of suicide risk has been recorded within the previous 12 months] | MIQUEST | O2.4b | ||
| Ongoing mental health conditions (general health check) [percentage of patients with serious mental health conditions (including schizophrenia, psychosis and bipolar disorder) for whom a general health check has been recorded within the previous 12 months] | MIQUEST | O2.4c | ||
| Ongoing mental health conditions (mental health crisis plan) [percentage of patients with serious mental health conditions (including schizophrenia, psychosis and bipolar disorder) for whom a mental health crisis plan has been recorded within the previous 12 months] | MIQUEST | O2.4d | ||
| Ongoing mental health conditions (care plan) [percentage of patients with serious mental health conditions (including schizophrenia, psychosis and bipolar disorder) for whom a care plan has been recorded within the previous 12 months] | MIQUEST | O2.4e | ||
| Partnership working | Social assessment and prescribing: consultations assess for social and economic issues affecting well-being as well as clinical issues | Practice records | O10.2 | |
| Health and work: proportion of consultations that pick up on occupational or underemployment-related sickness and ill health, and that provide support, treatment and/or referral to other agencies | Practice records | O10.3 | ||
| Systems to enable patients to be active partners in their health | Questionnaire in ProMES tool | O12.1 |
Figures 7–13 show the final versions of the contingencies for these indicators that were taken forward to the tool to be piloted. (For a description of how to understand these contingencies, see Chapter 1, Productivity Measurement and Enhancement System.) The relative weighting of each indicator is shown by the average (absolute) value of positive and negative effectiveness points available for that indicator compared with others within the same objective. When interpreting this, it is worth noting that the contingencies are shown so that the highest point of the graph represents 100 points and the lowest point represents –100 points. Contingencies in which the maximum value is only 30% of the way between the central line and the highest point, therefore, have a maximum of 30 points. The weighting of each indicator relative to other indicators that are part of the same objective is given by the difference between the maximum and minimum number of points available. For example, if an objective included two indicators, and the first had a maximum of 100 points and a minimum of –50 points, but the second had a maximum of 50 points and a minimum of –50 points, then the first indicator would have 60% (150/250) of the weight. The difference in maximum and minimum values would imply that achieving a maximum in the first indicator would be twice as beneficial as achieving a maximum in the second; however, achieving the lowest score in each would be equally bad (hence the same lowest scores for both). For scores in between the maximum and minimum, the position of the line relative to the vertical axis shows the number of effectiveness points that would be achieved. The point where the line crosses the middle horizontal line (representing zero points) is what is considered a ‘normal’ score, one that is neither especially good, nor especially concerning. It is the weightings combined with the requirement that the maximum possible score on any one indicator is 100 points that determine the total number of points available to a practice; this could hypothetically vary anywhere between –2395 points and 2525 points, namely a range of 4920 points.
FIGURE 7.
Contingencies for clinical care indicators 1.1–1.8a. (a) Those aged > 75 years having a health check (1.1); (b) Those aged 40–74 years having NHS health checks (1.2); (c) smoking cessation (1.3); (d) alcohol consumption (1.4); (e) reduced BMI (1.5); (f) immunisations for influenza (1.6); (g) childhood influenza immunisations (1.7); and (h) immunisations for children (1.8a).
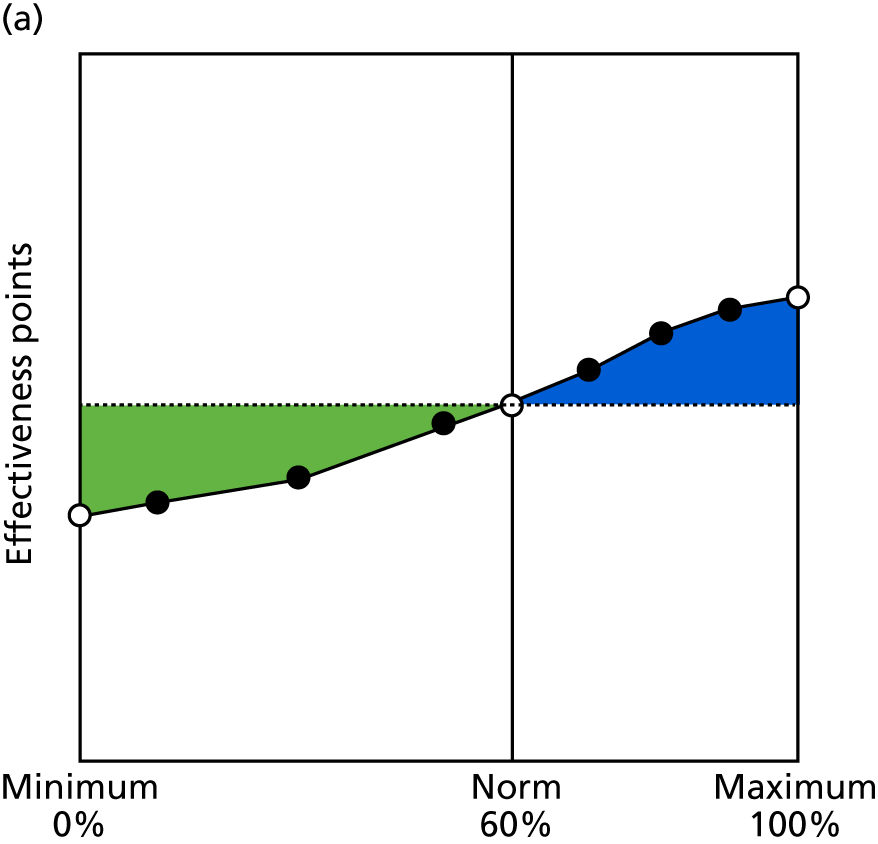
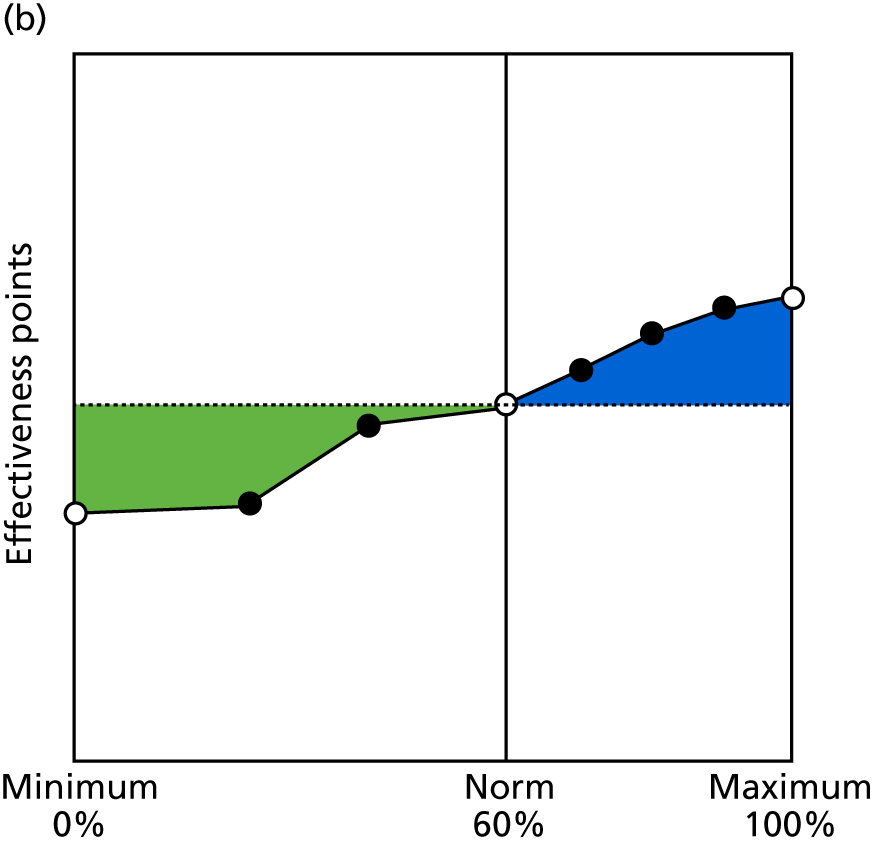
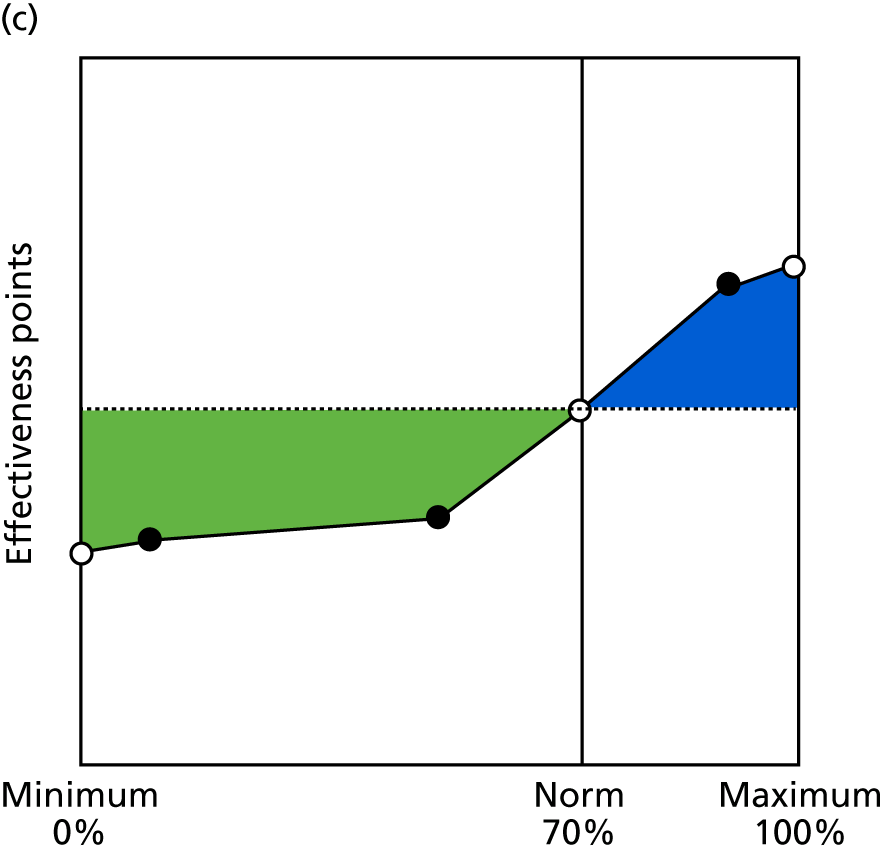
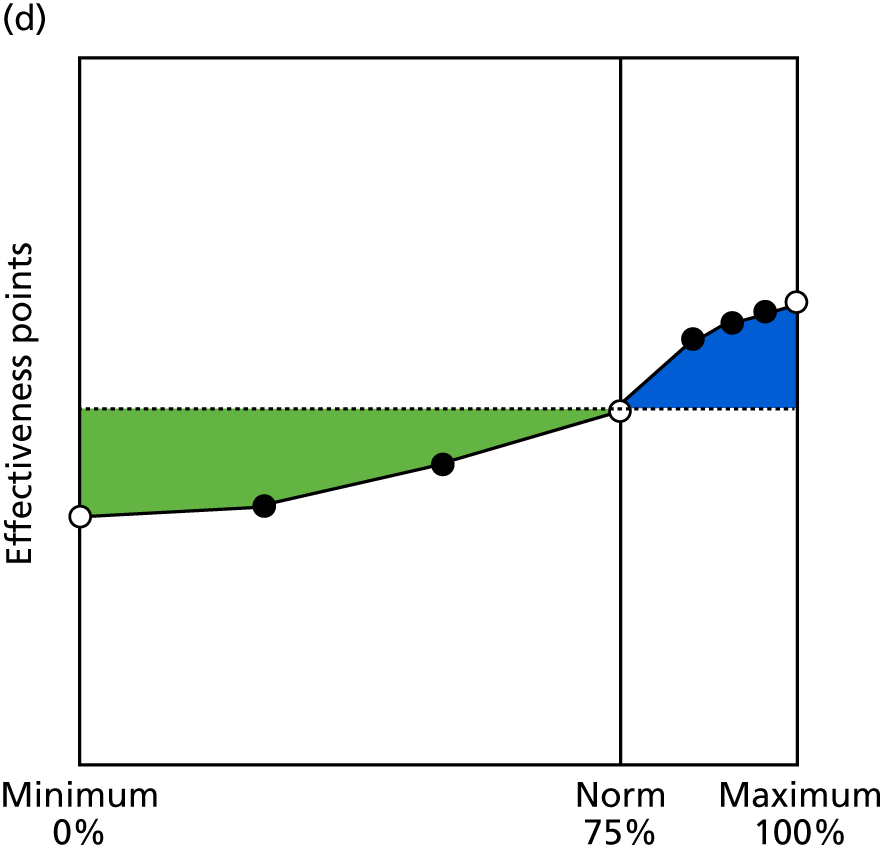
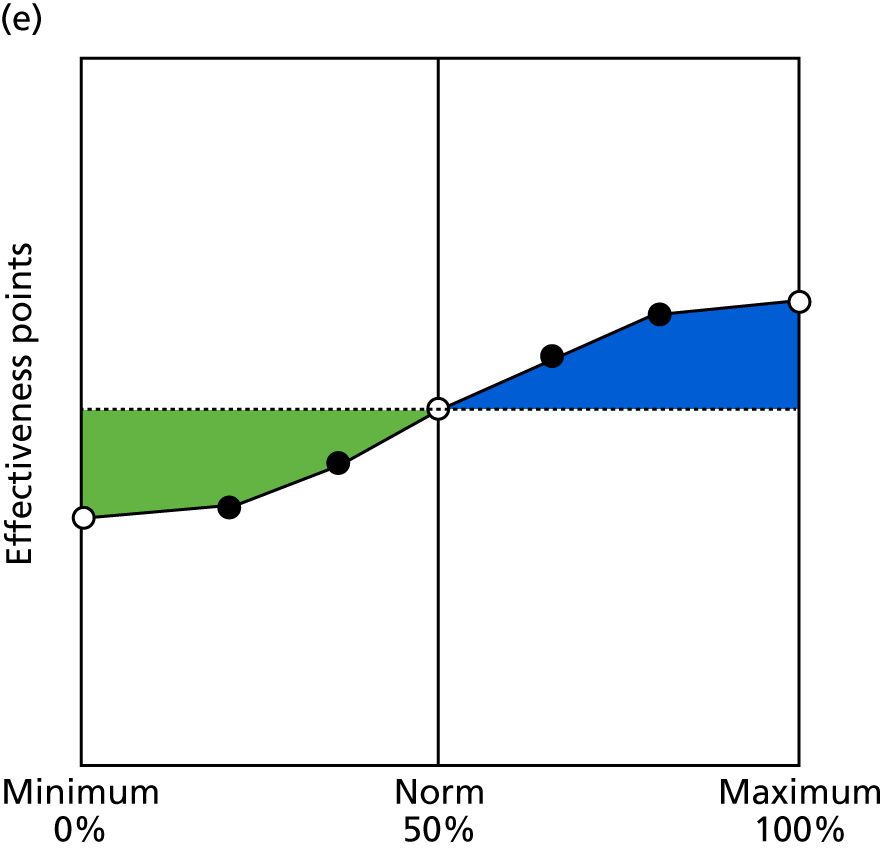
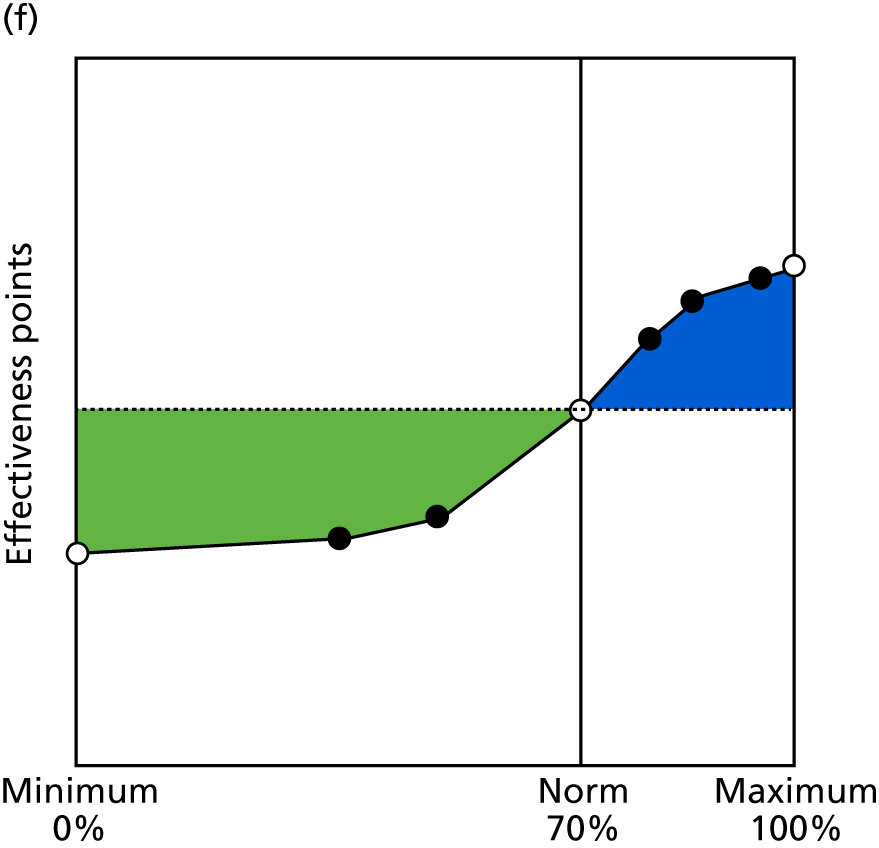
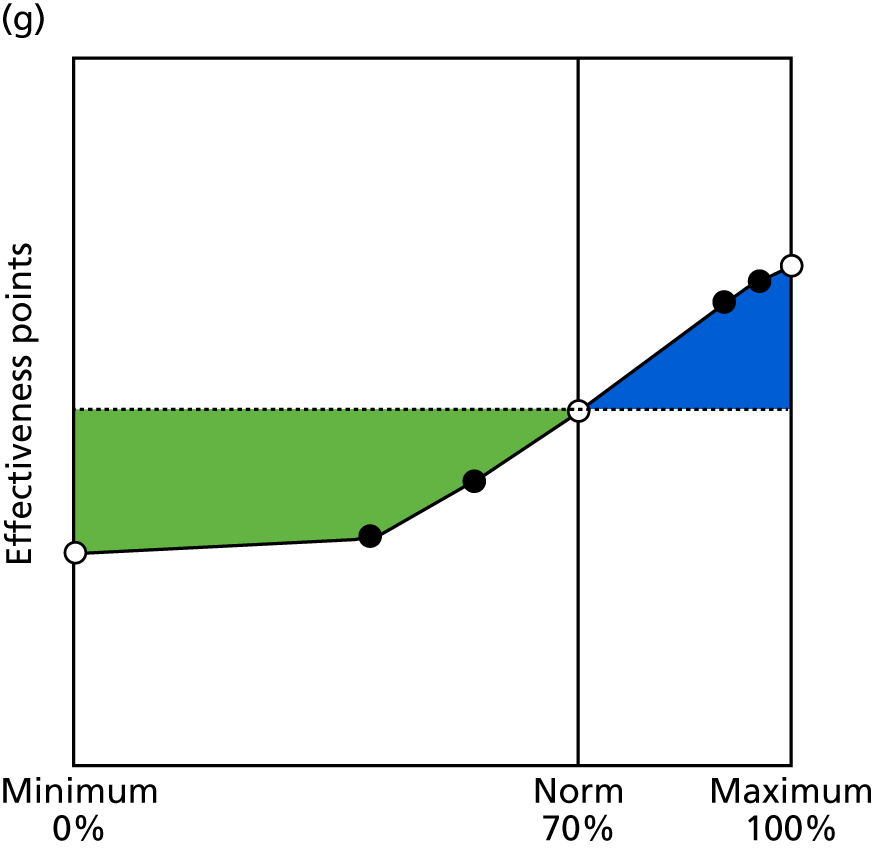
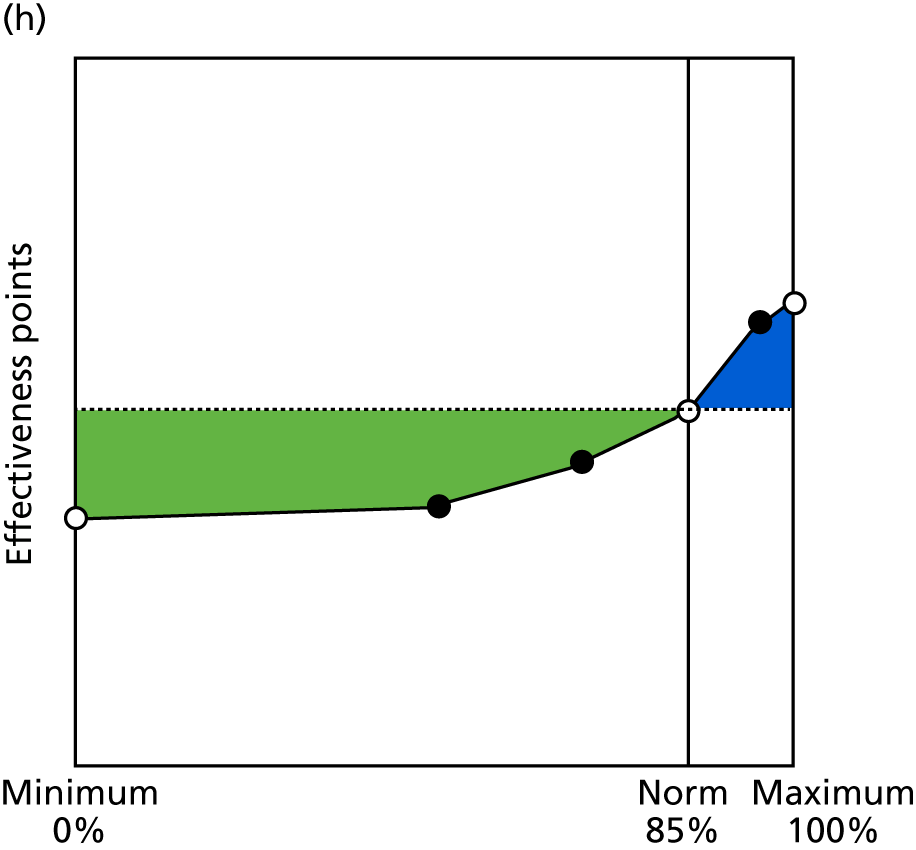
FIGURE 8.
Contingencies for clinical care indicators 1.8b–2.6b. (a) Immunisations for babies (1.8b); (b) dementia care (2.1a); (c) diabetes management (2.2); (d) initial care of mental health conditions (2.3); (e) ongoing care of mental health conditions (2.4a); (f) heart disease care (2.5); (g) COPD care (care plan) (2.6a); and (h) COPD spirometry (2.6b).
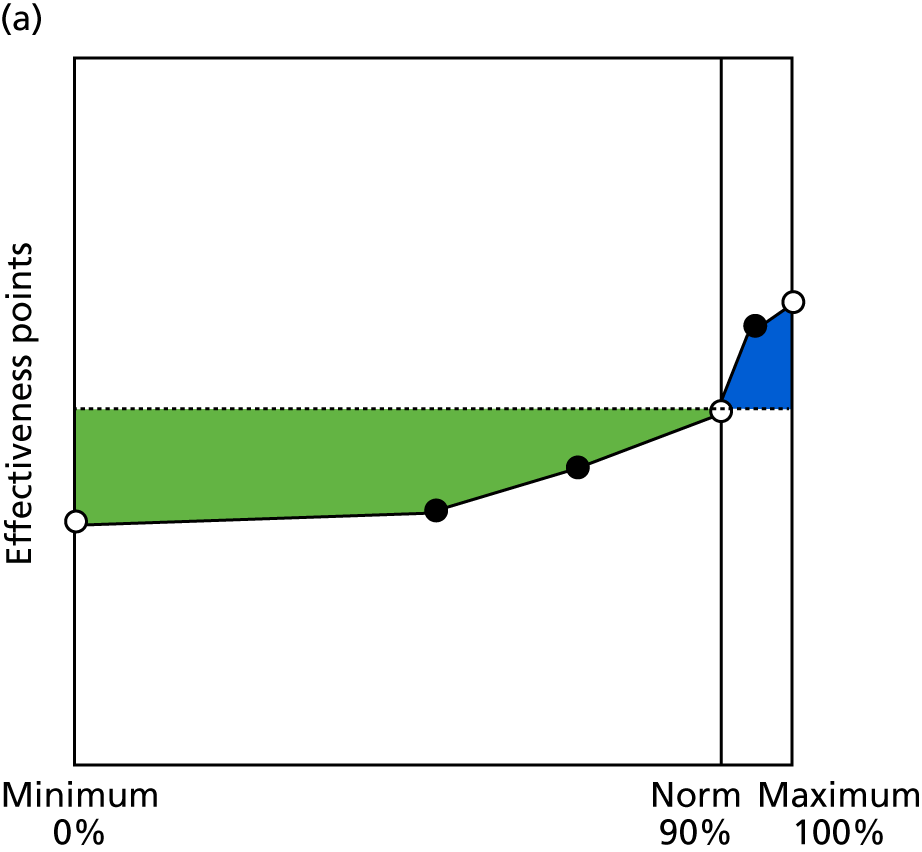
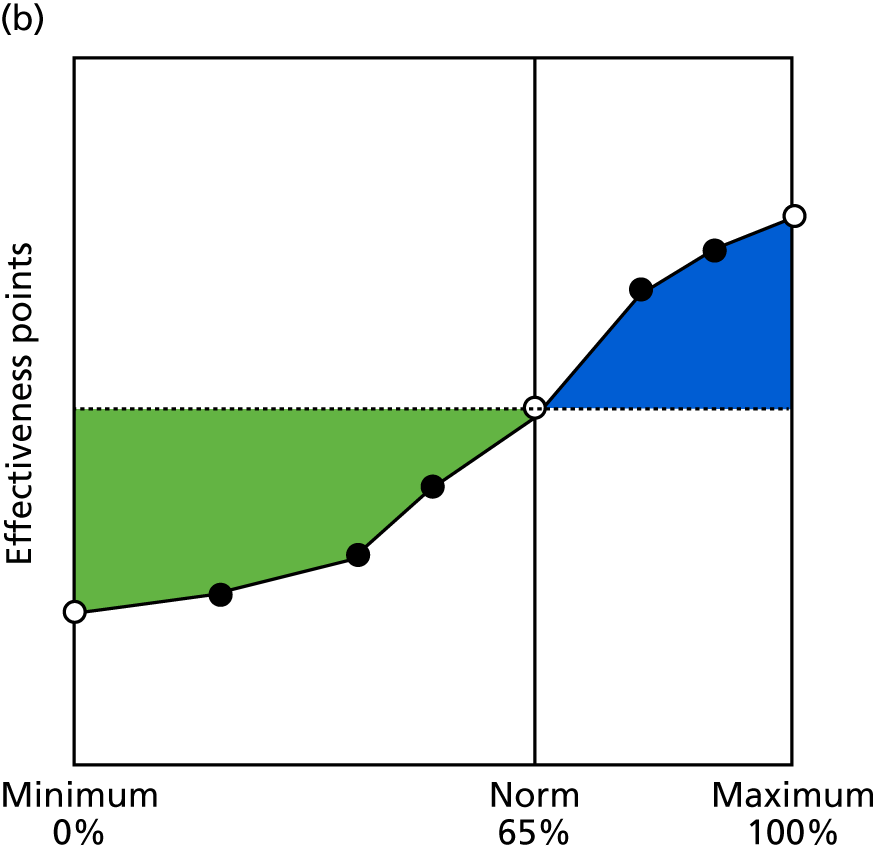
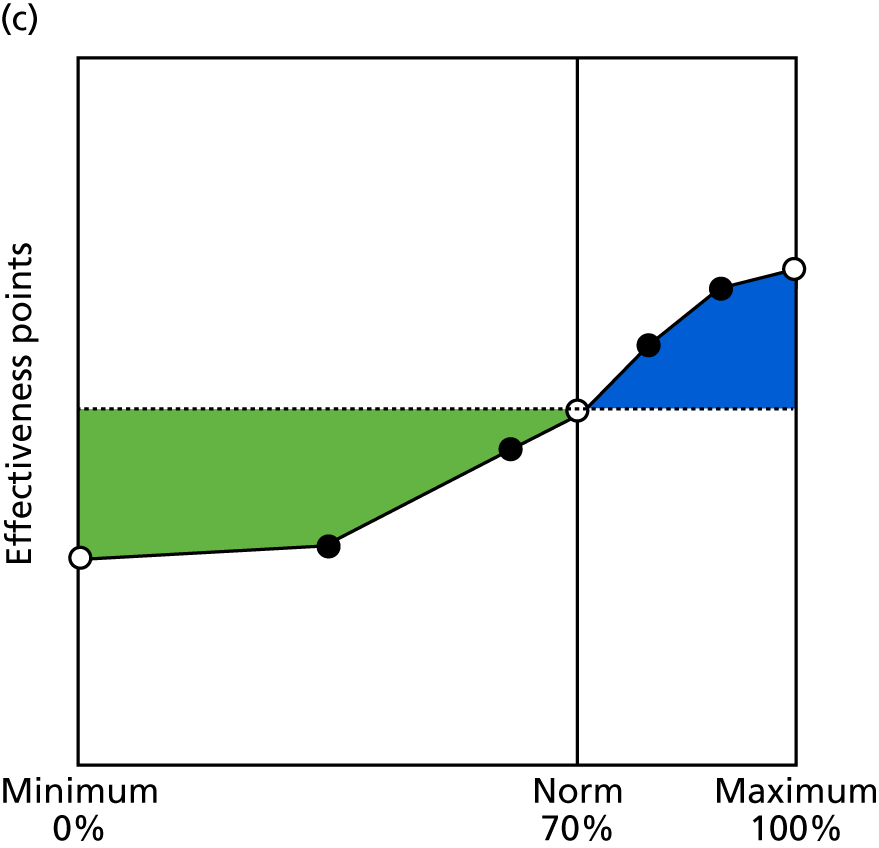
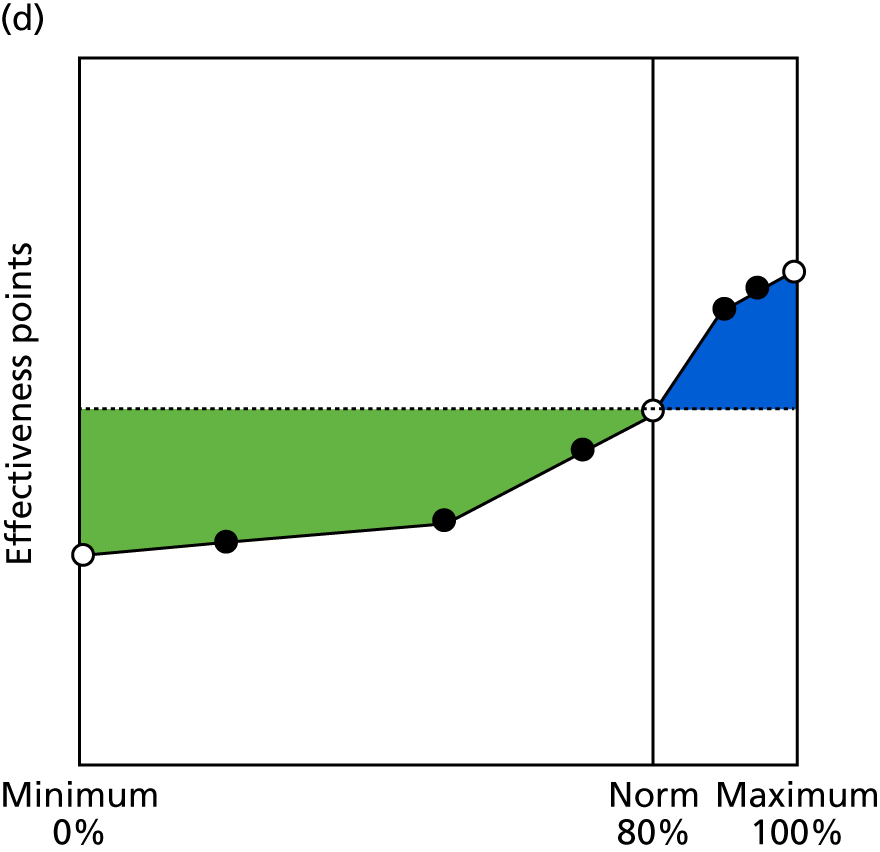
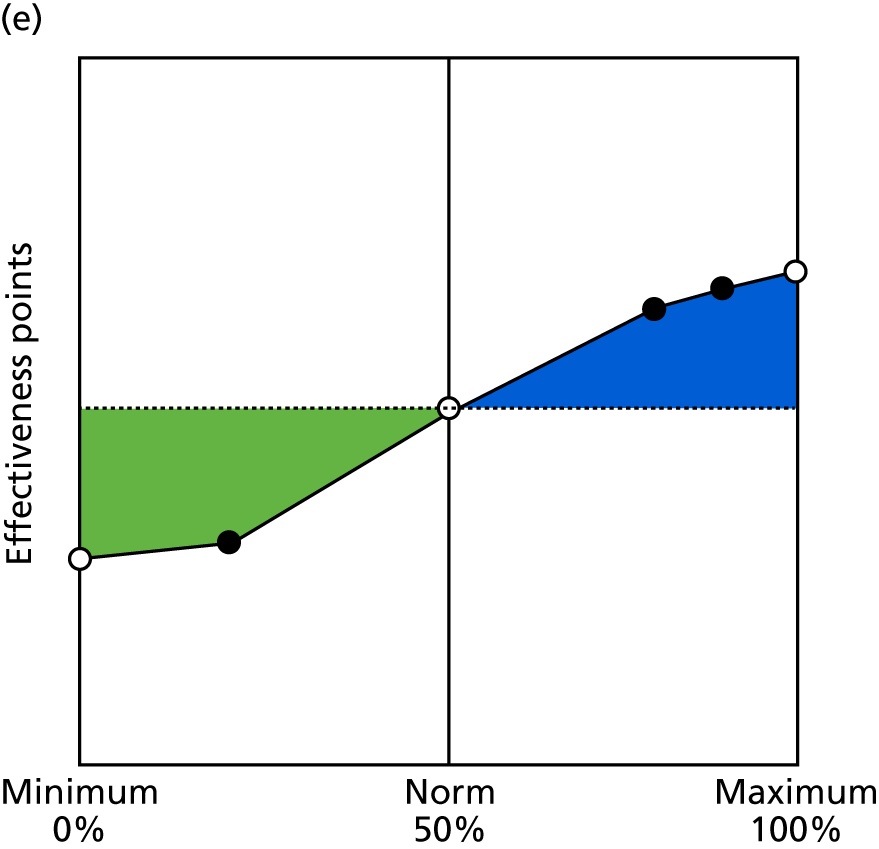
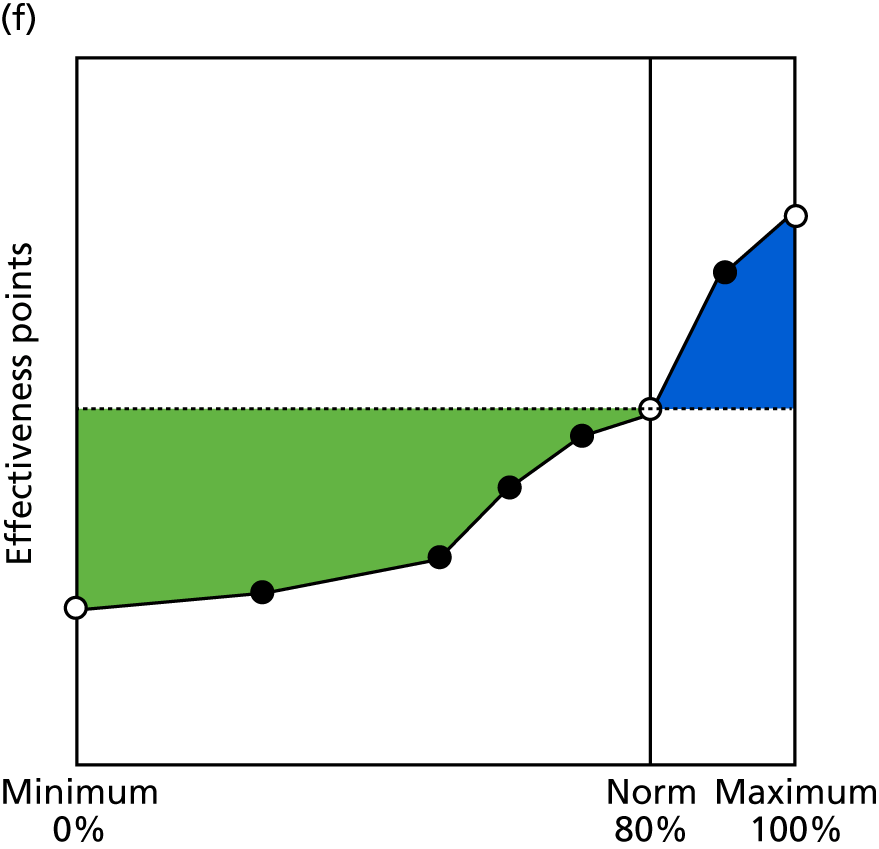
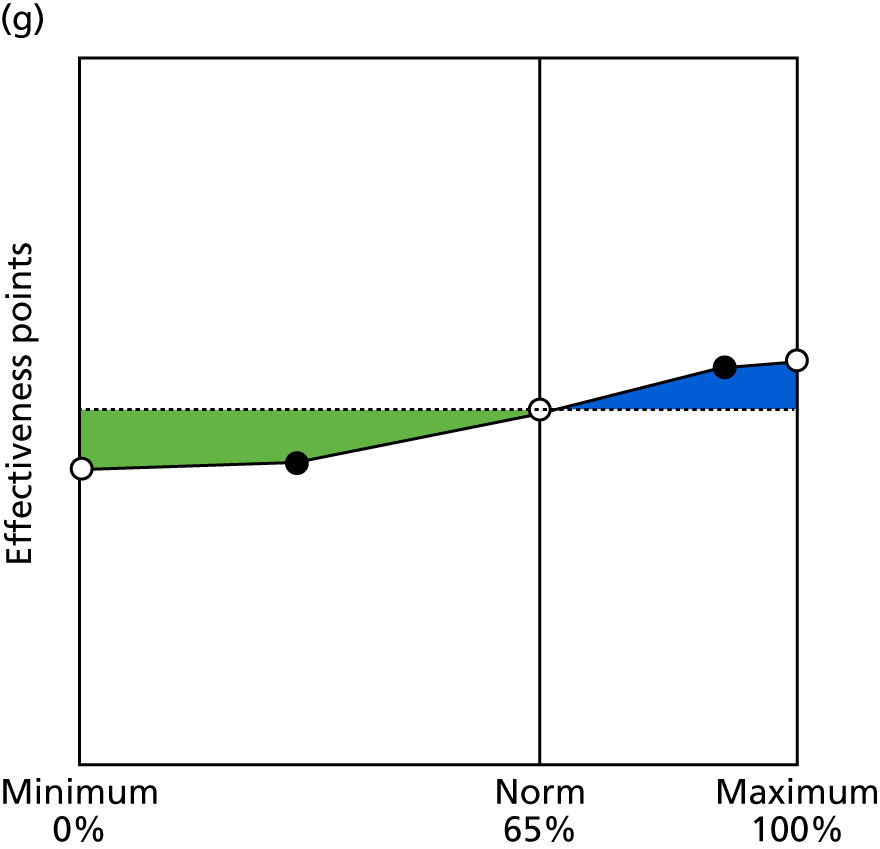
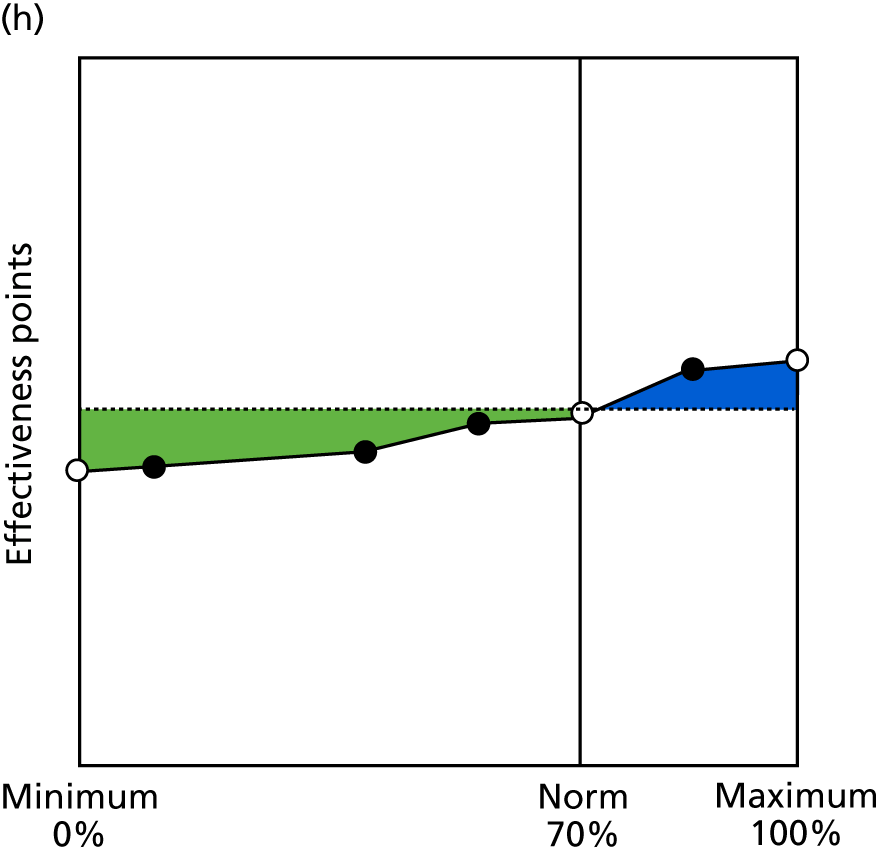
FIGURE 9.
Contingencies for clinical care indicators 2.6c–3.5. (a) COPD care medication (2.6c); (b) lifestyle of people with long-term conditions (2.7); (c) availability of enhanced services (3.1); (d) medication review (3.2); (e) audits in last quarter (3.3); (f) safeguarding (3.4); and (g) DNAs (3.5).
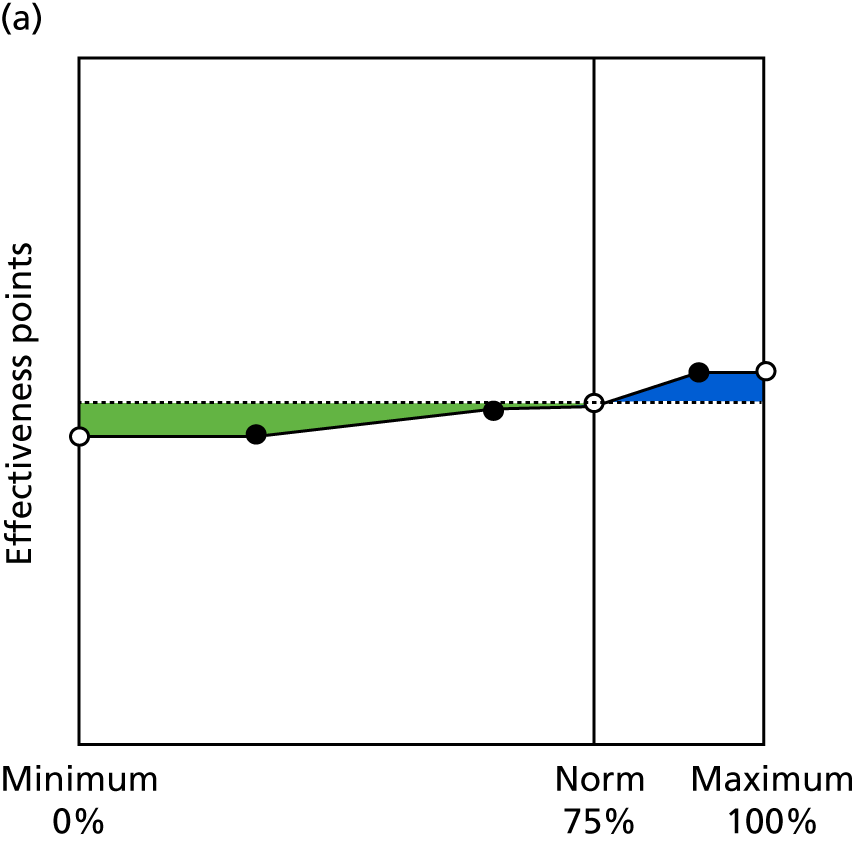
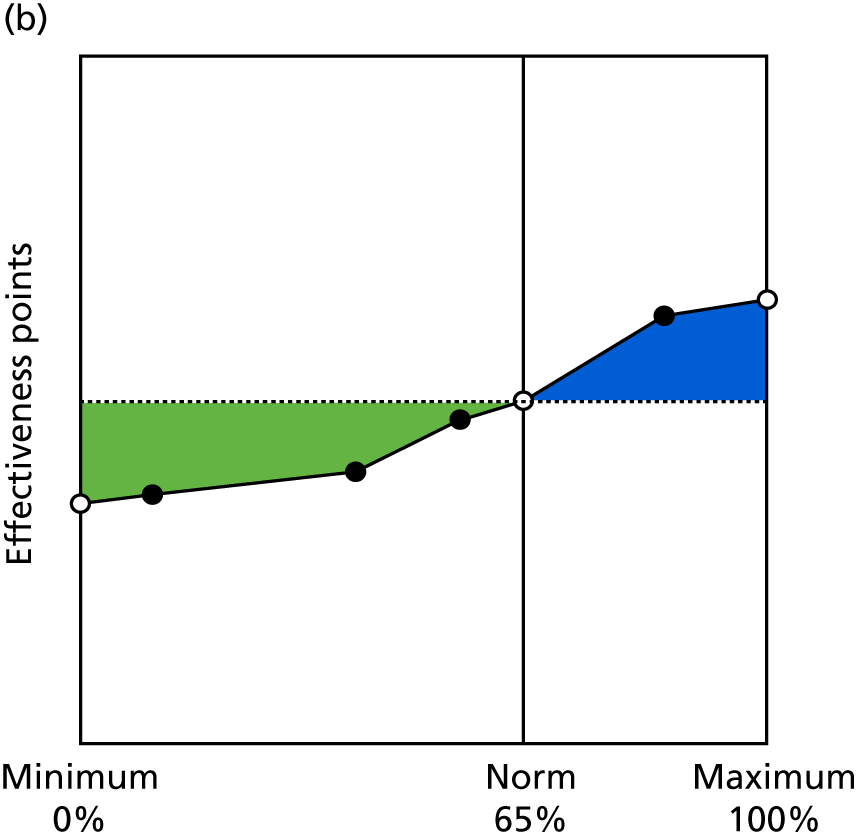
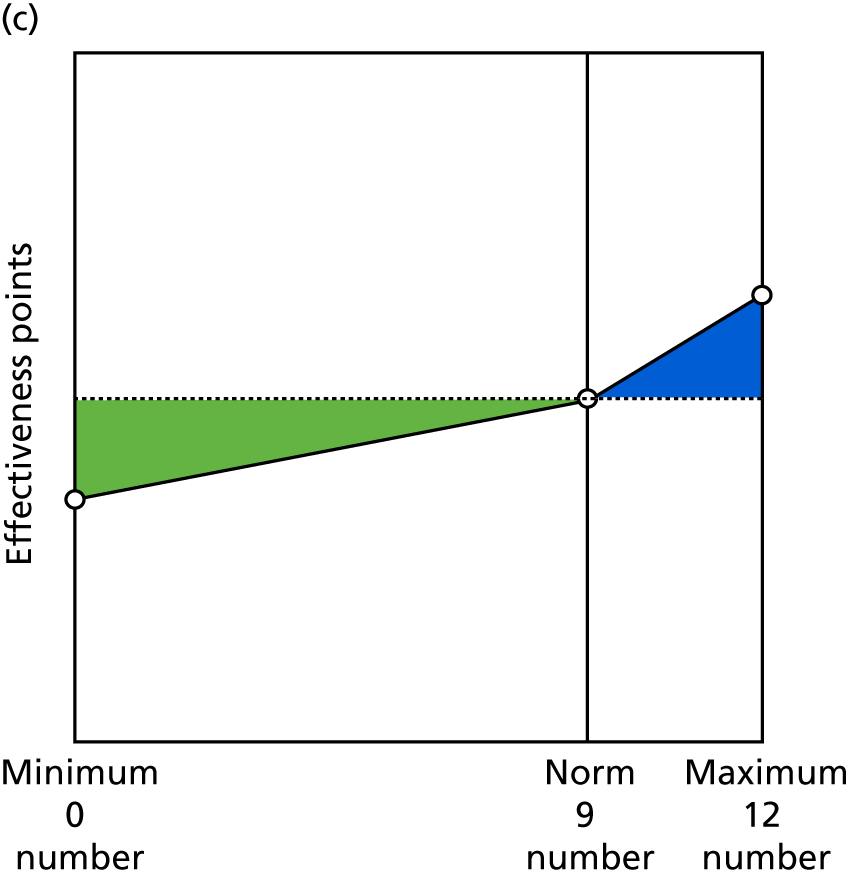
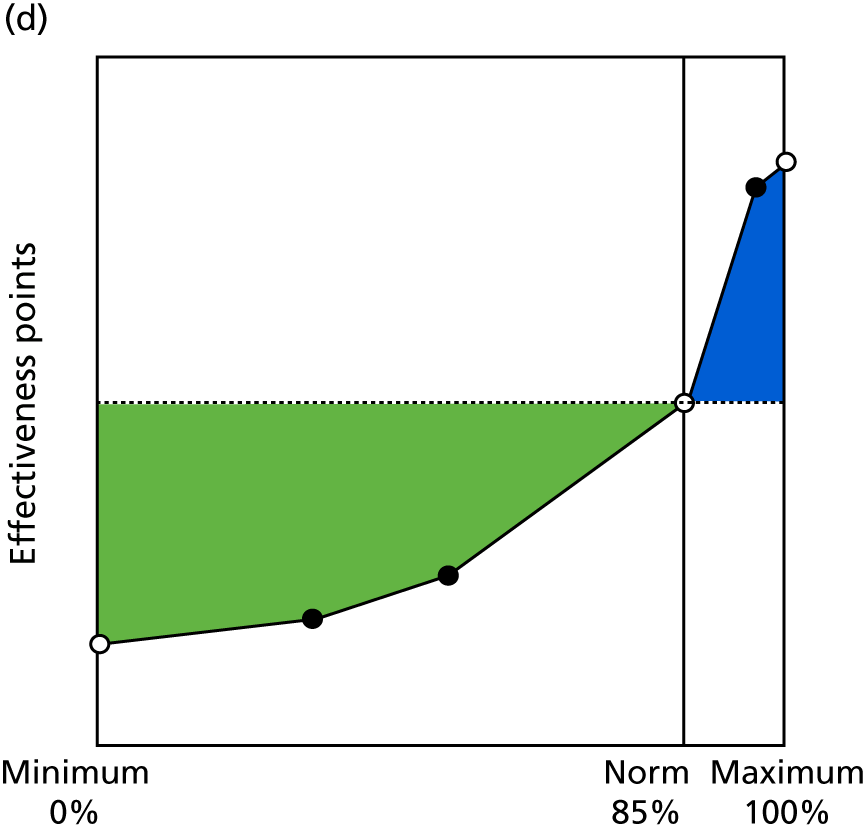
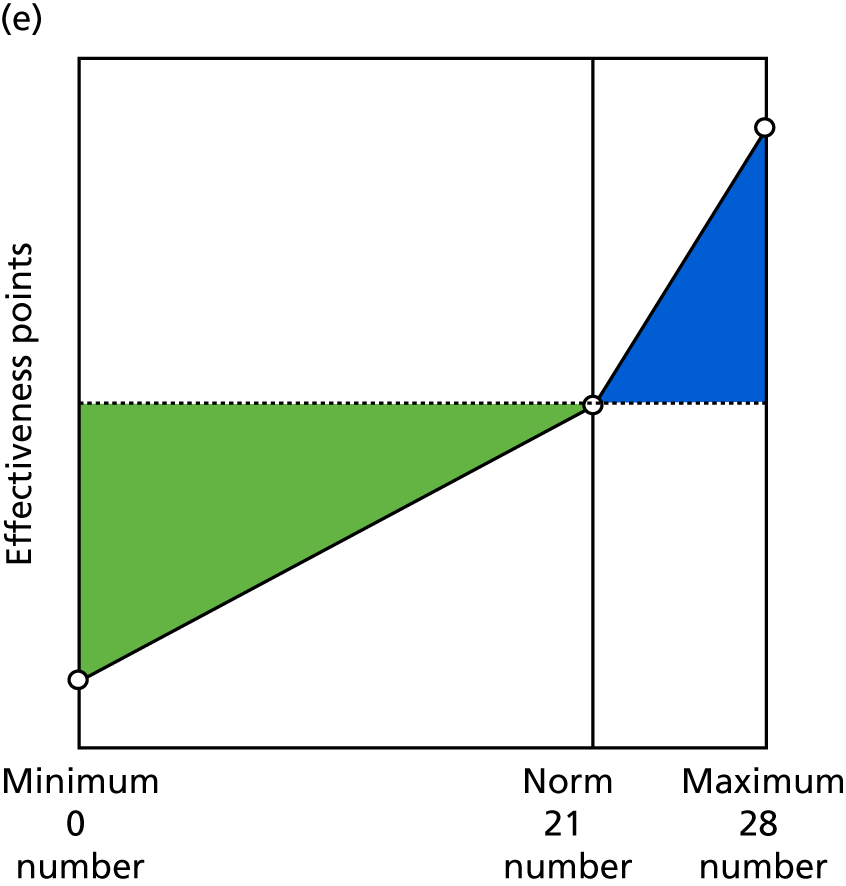
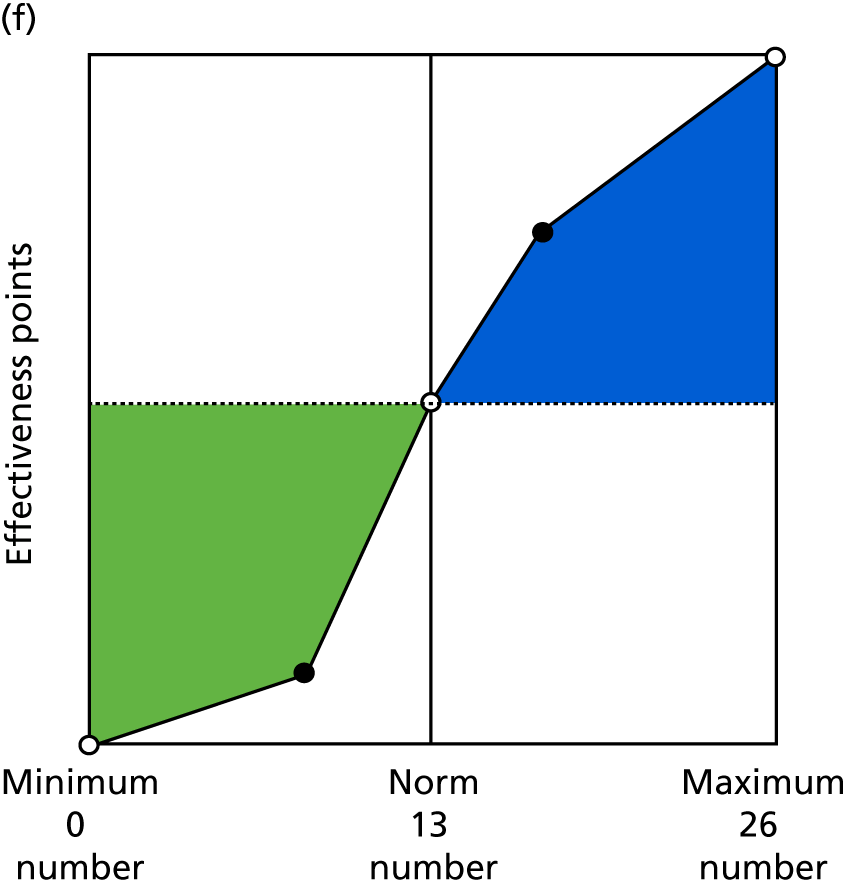
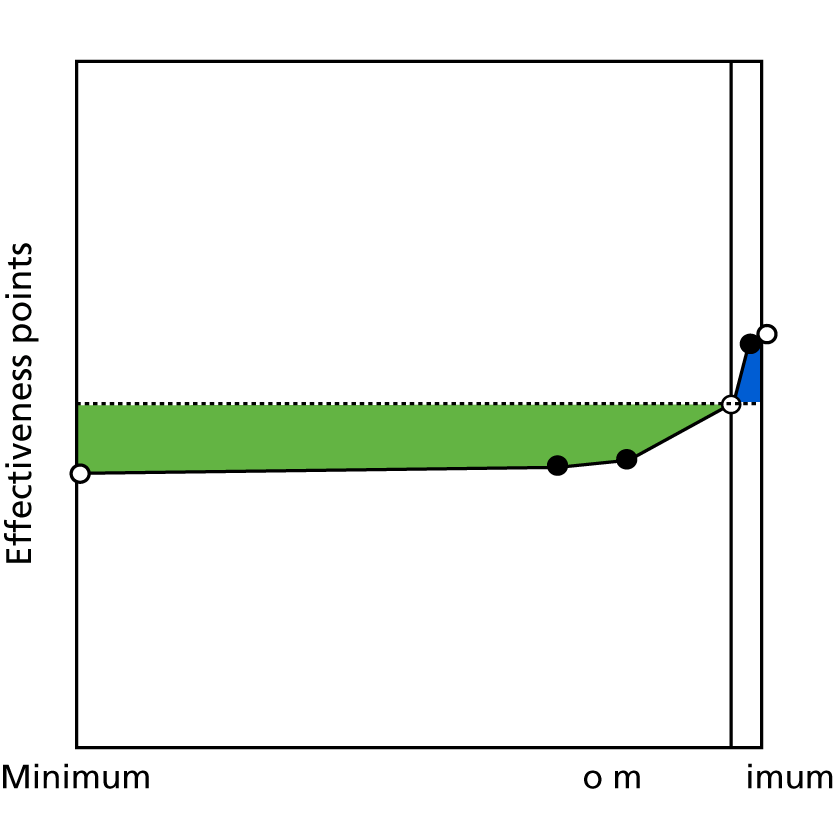
FIGURE 10.
Contingencies for practice management indicators 4.1–6.4. (a) Use of IT tools (4.1); (b) use of paperless systems (4.2); (c) appropriate environment in consulting rooms (5.1); (d) compliance to DDA checklist (5.2); (e) proportion of staff attending monthly practice meetings (6.1); (f) proportion of clinical staff with training needs met (6.2); (g) proportion of non-clinical staff with training needs met (6.3); and (h) staff retention (6.4).
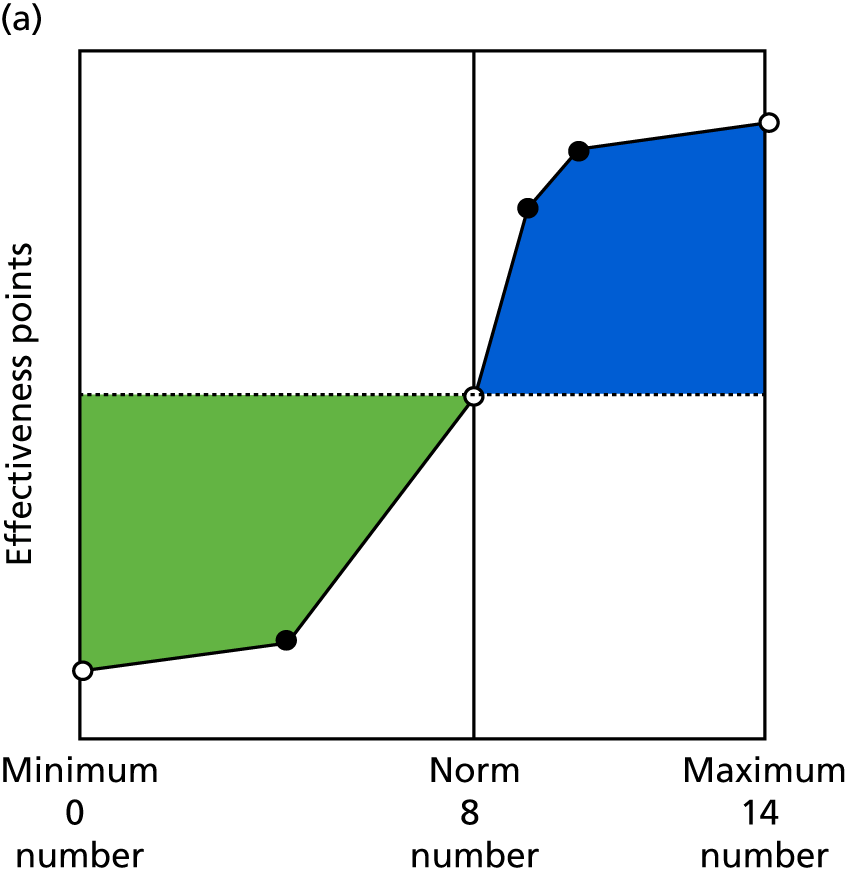
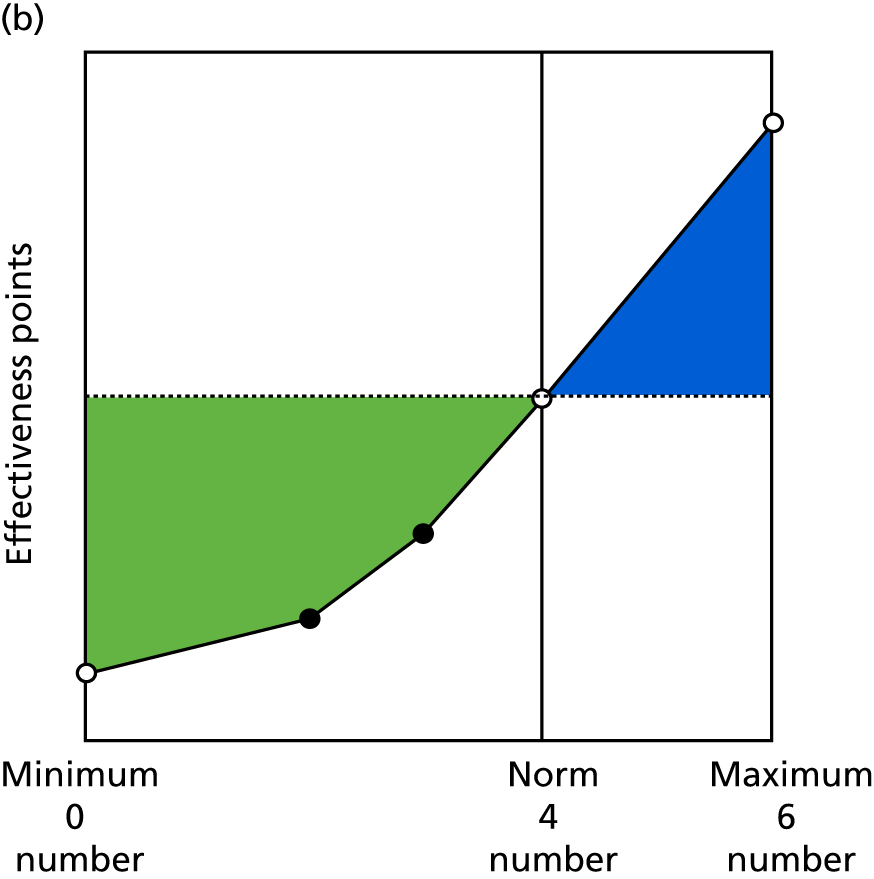
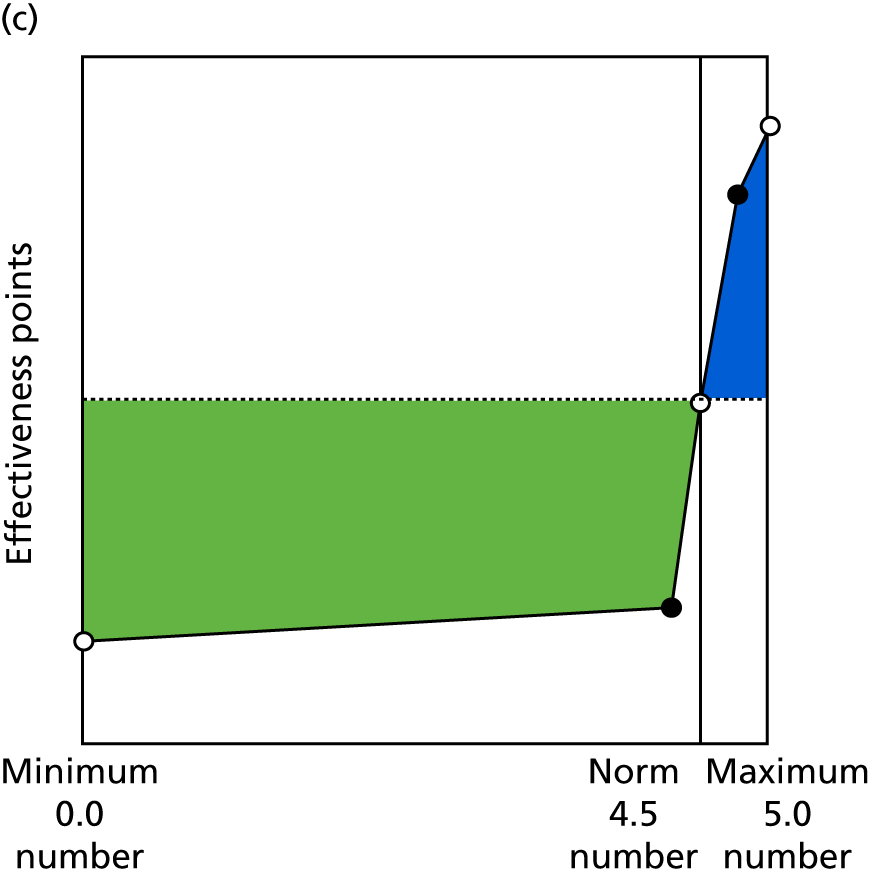
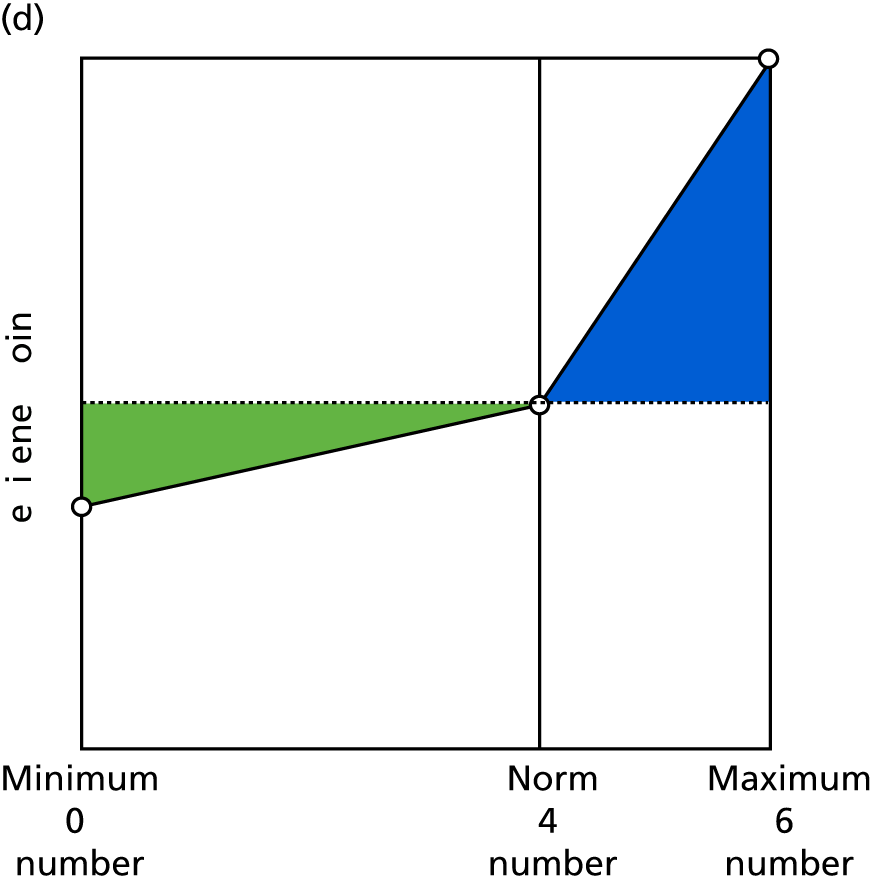
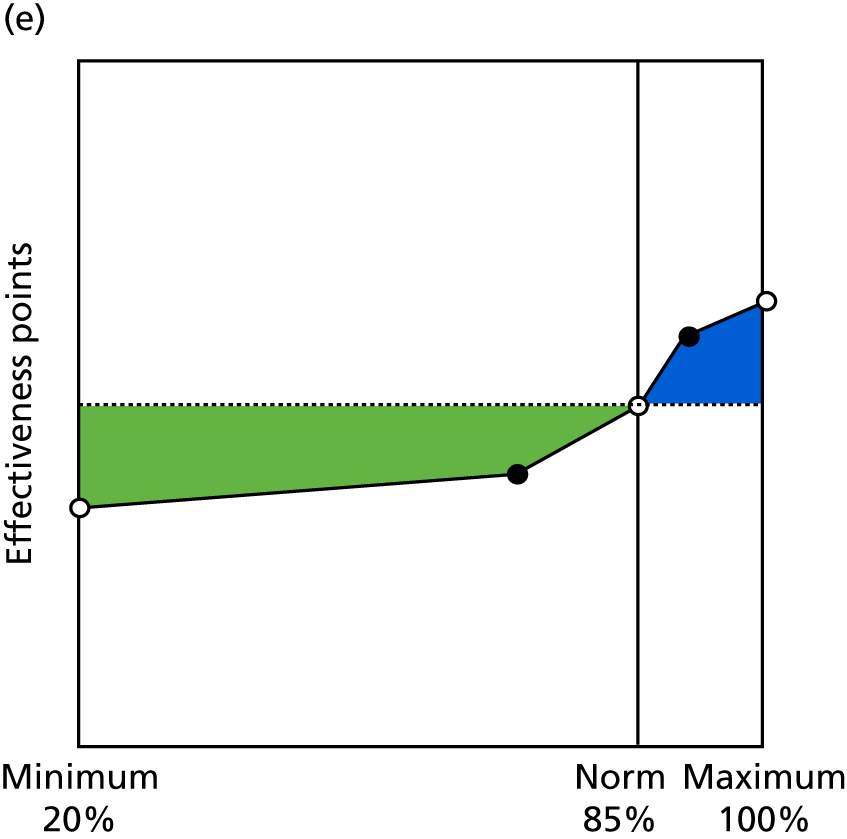
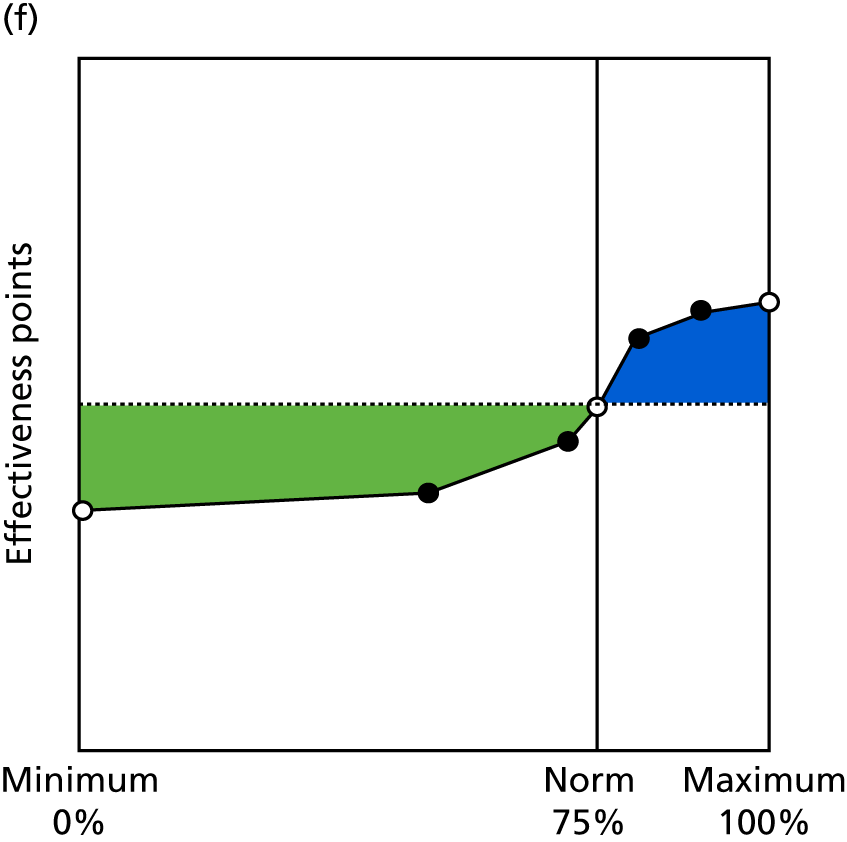
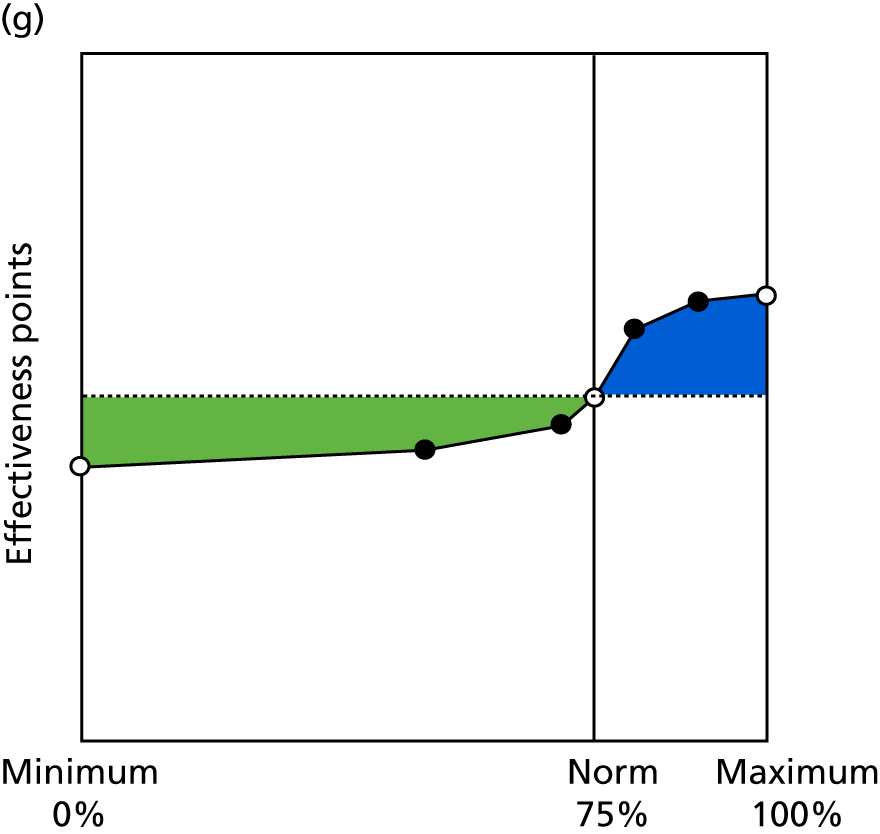
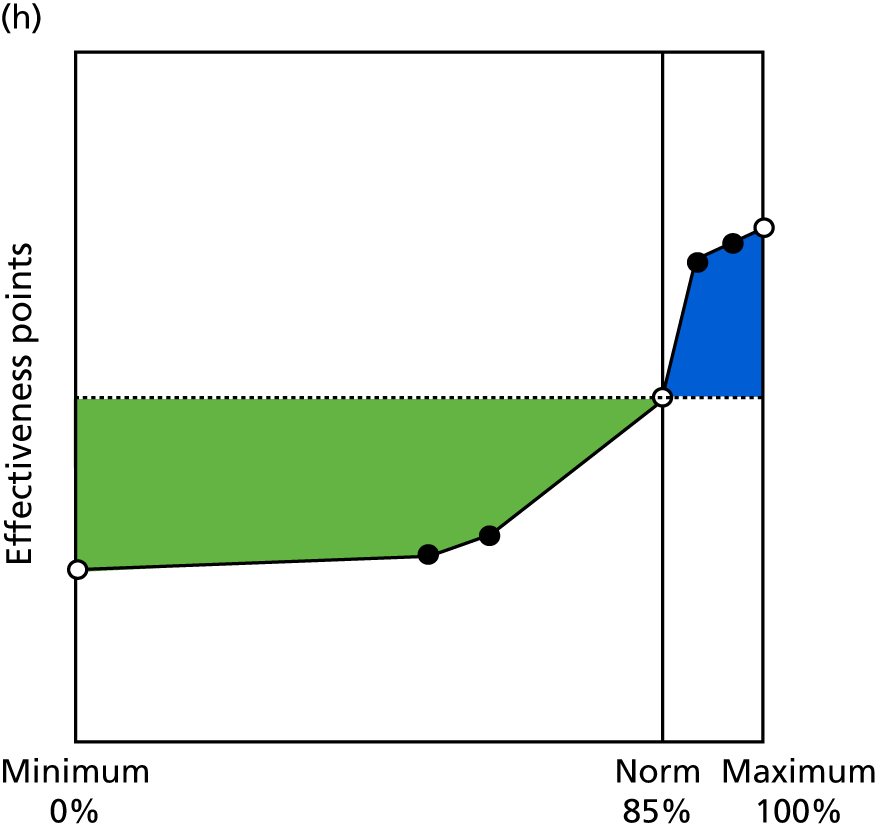
FIGURE 11.
Contingencies for practice management indicators 6.5–7.6. (a) Staff well-being (6.5); (b) quality of teamworking (6.6); (c) staff appraisals (7.1); (d) learning from complaints (7.2); (e) workforce planning (7.3); (f) financial management (7.4); (g) management of significant events (7.5); and (h) reviewing practice procedures or services (7.6).
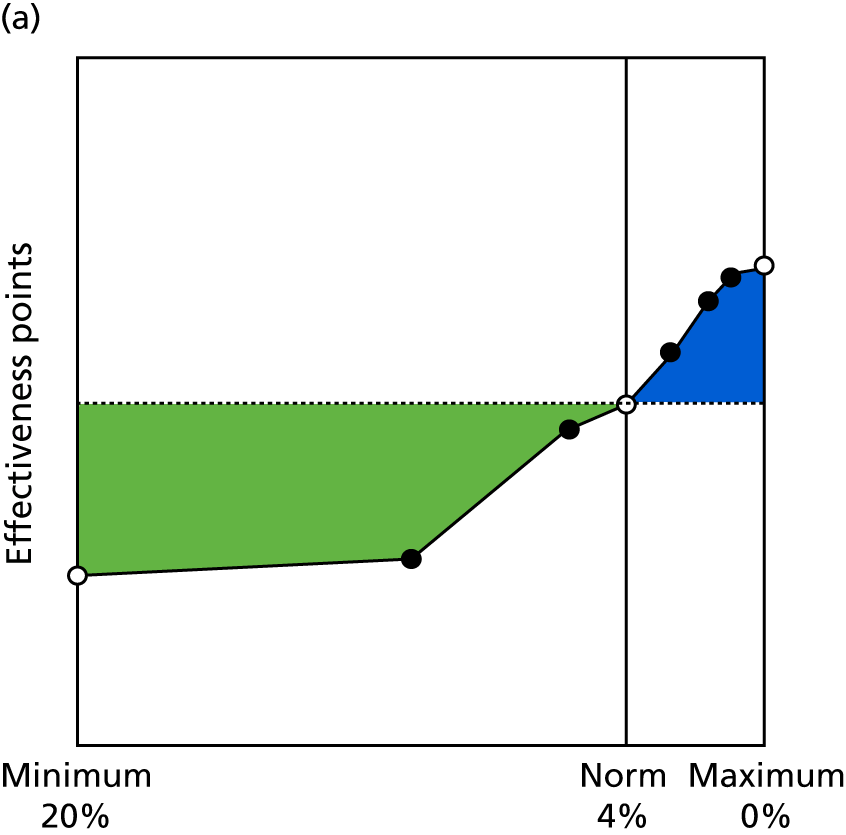
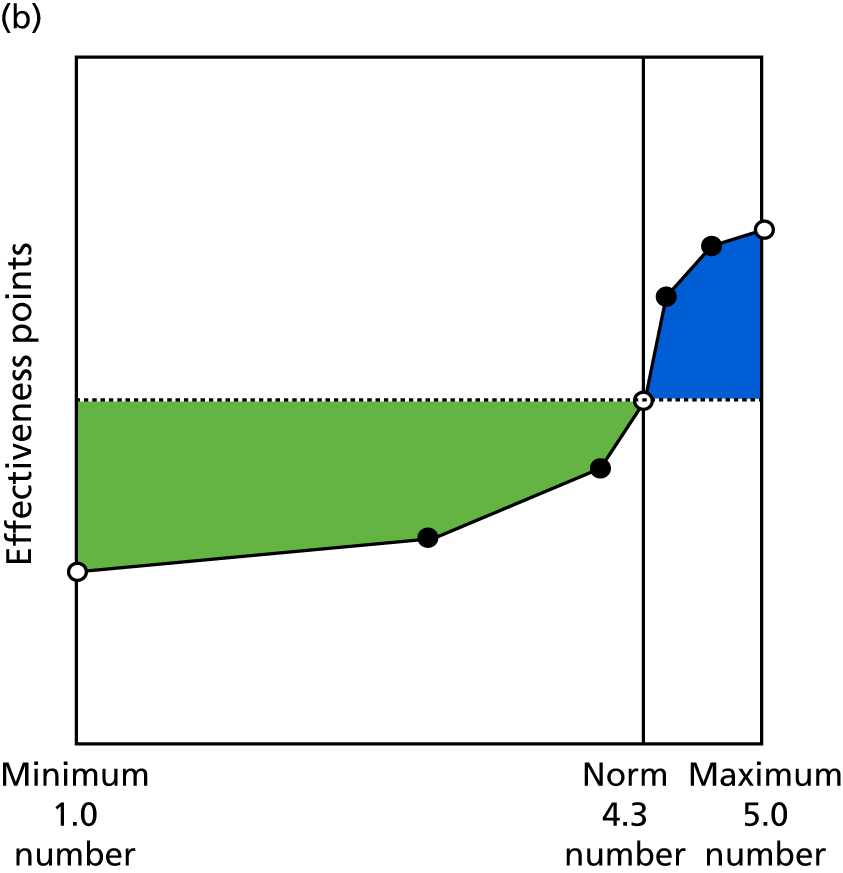
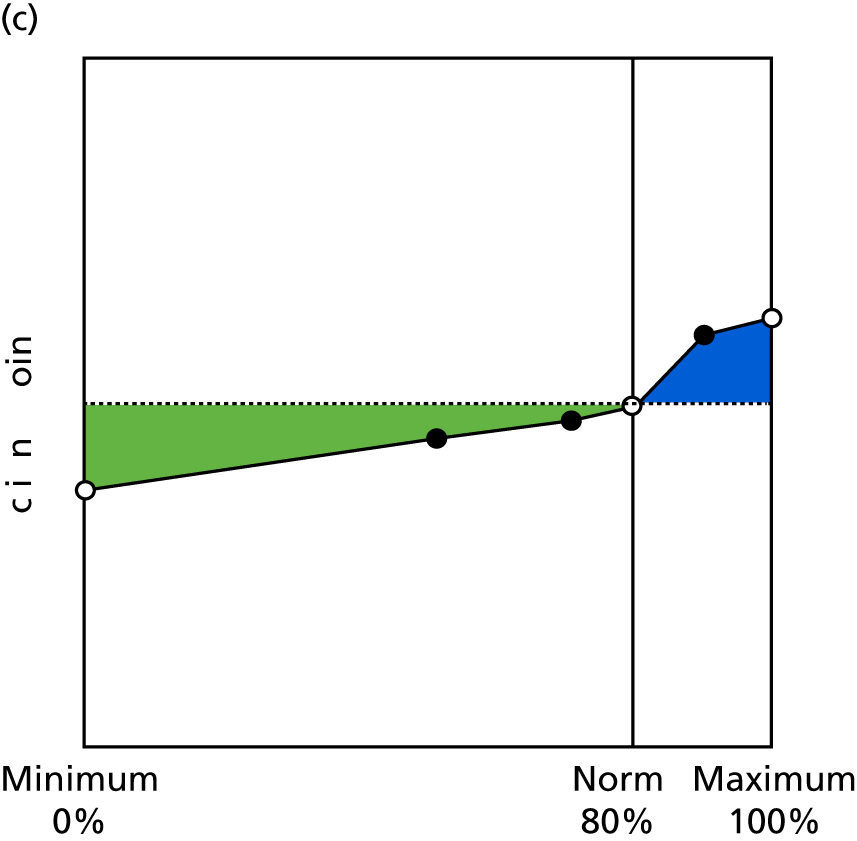
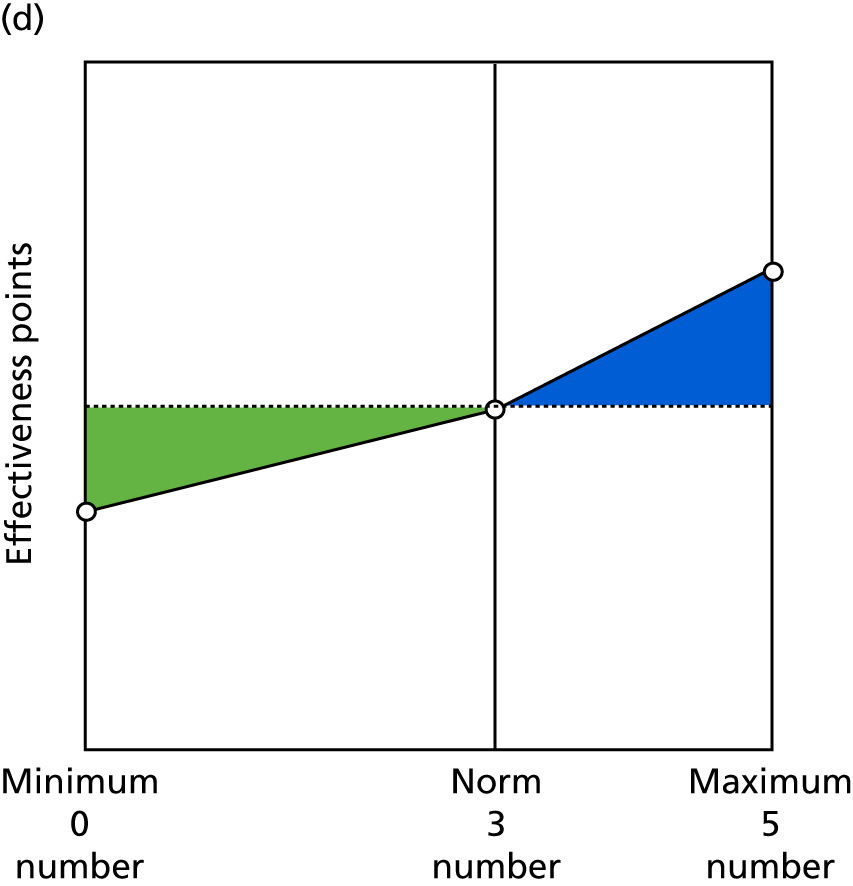
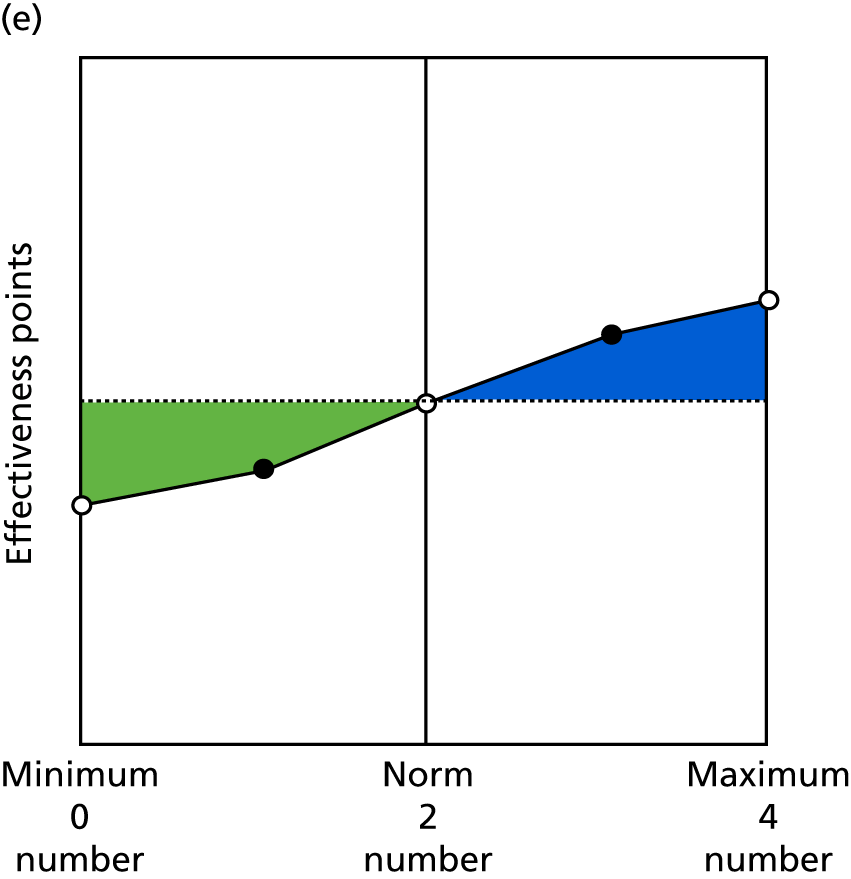
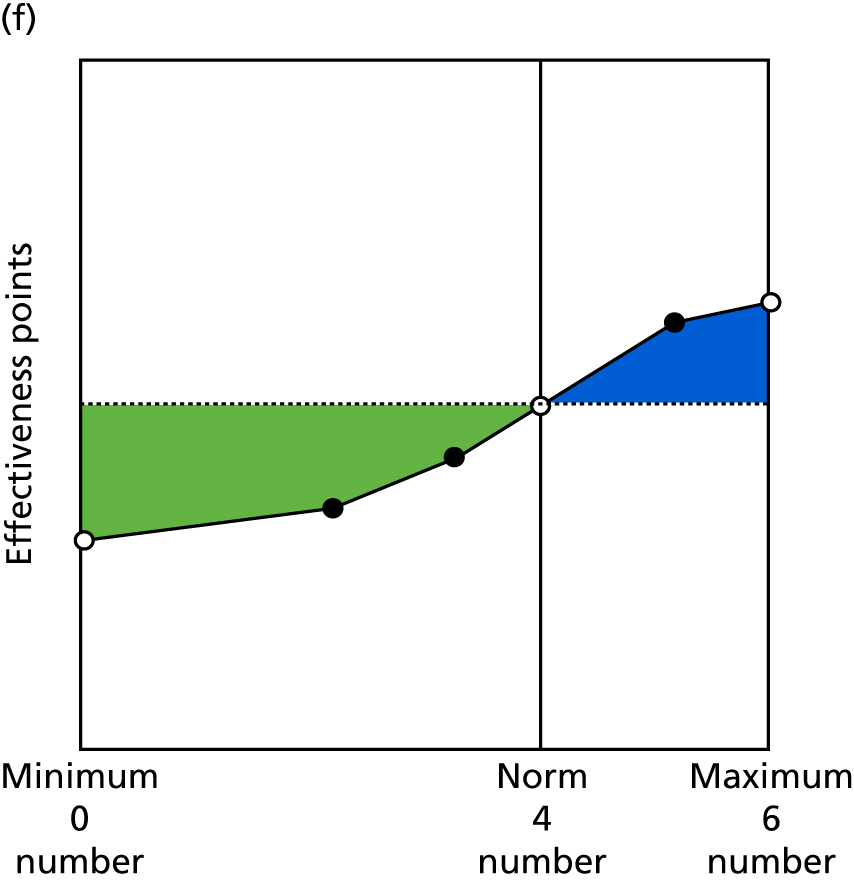
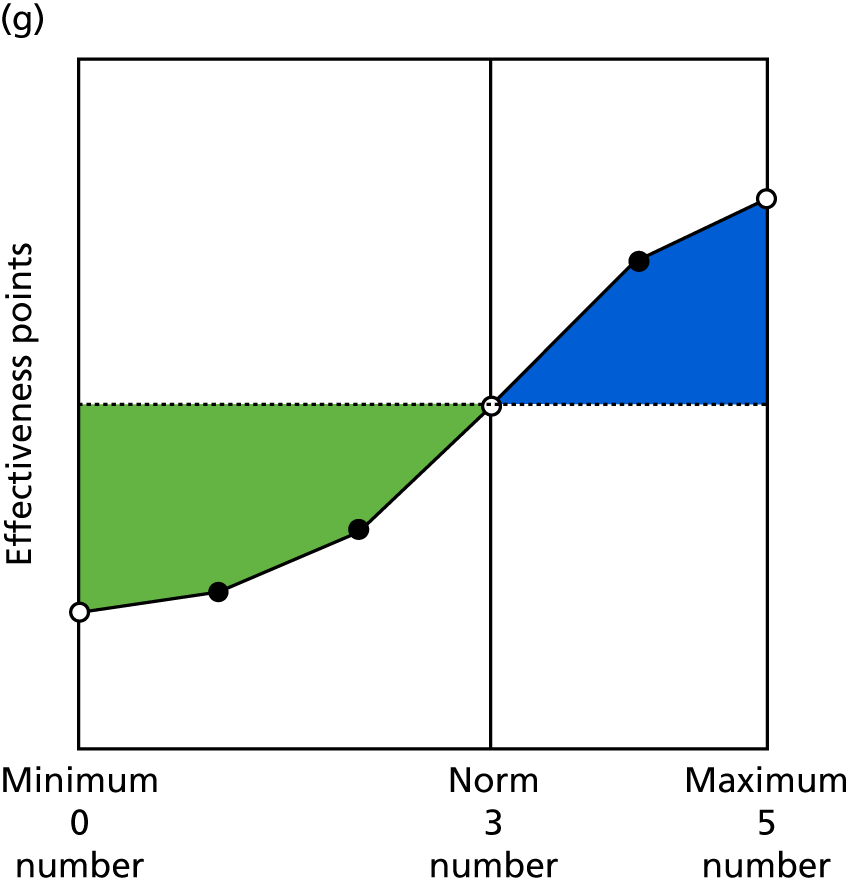
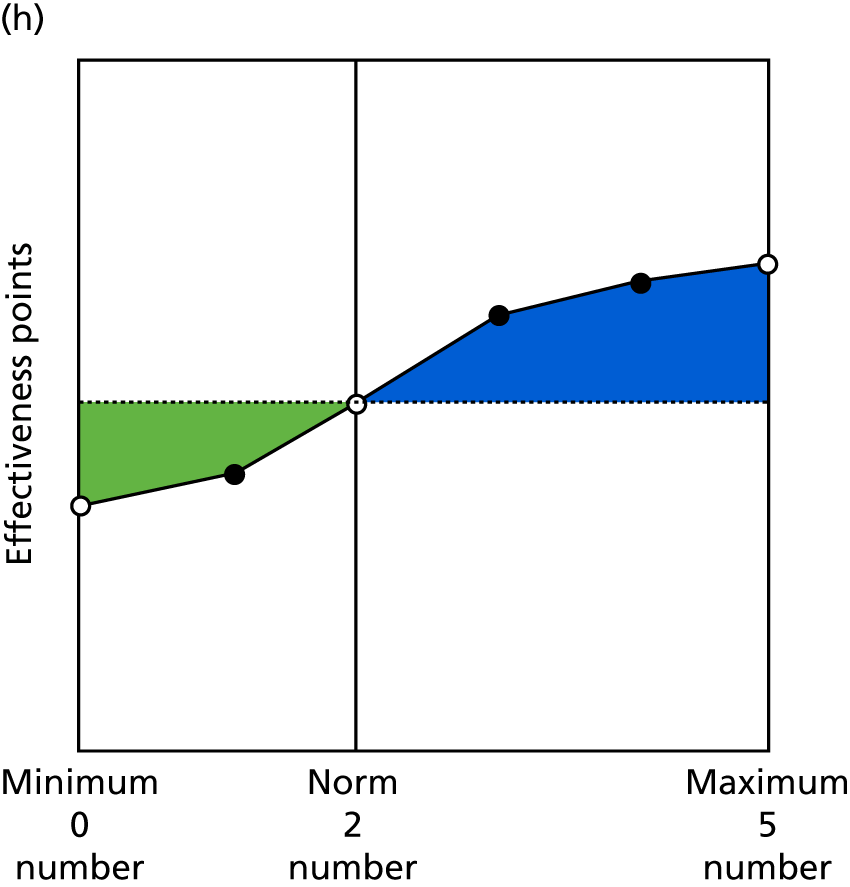
FIGURE 12.
Contingencies for patient focus indicators. (a) Patients willing to recommend practice (8.1); (b) patient satisfaction with (reception) staff (8.2); (c) hours of clinical appointments per 1000 patients per week (9.1); (d) patients waiting > 15 minutes past appointment time (9.2); and (e) patients satisfied with booking system (9.3).
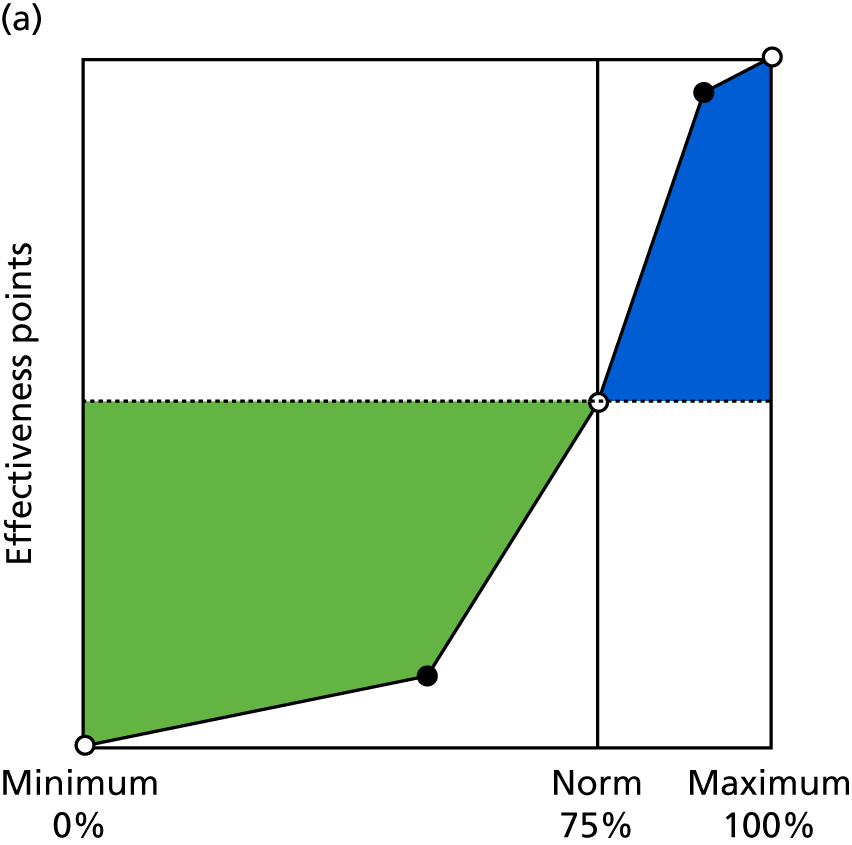
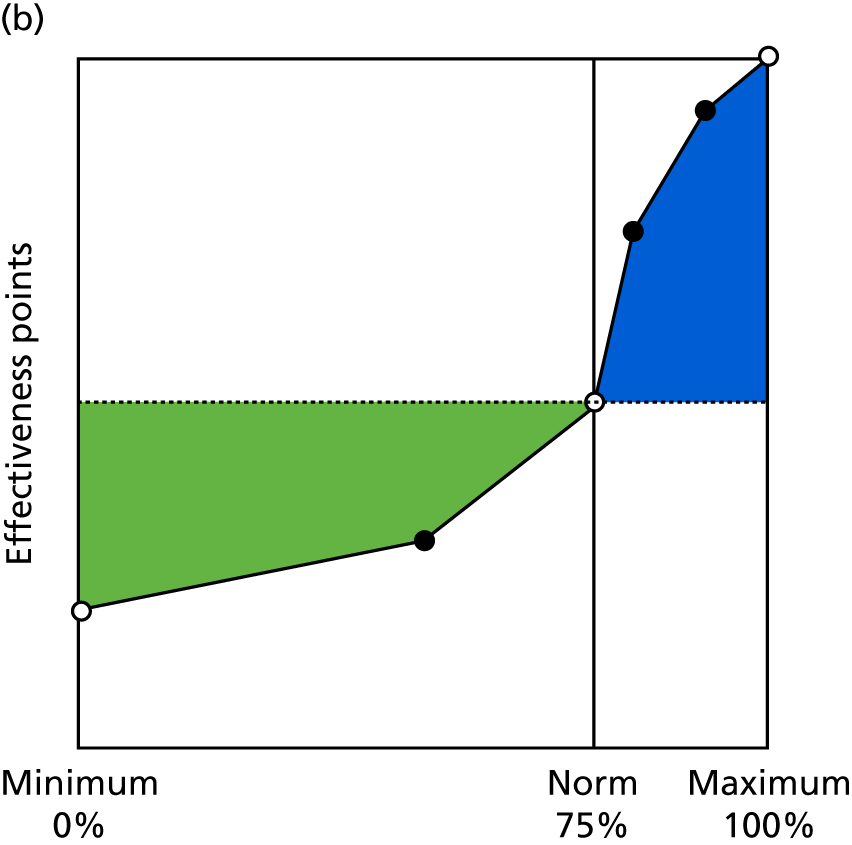
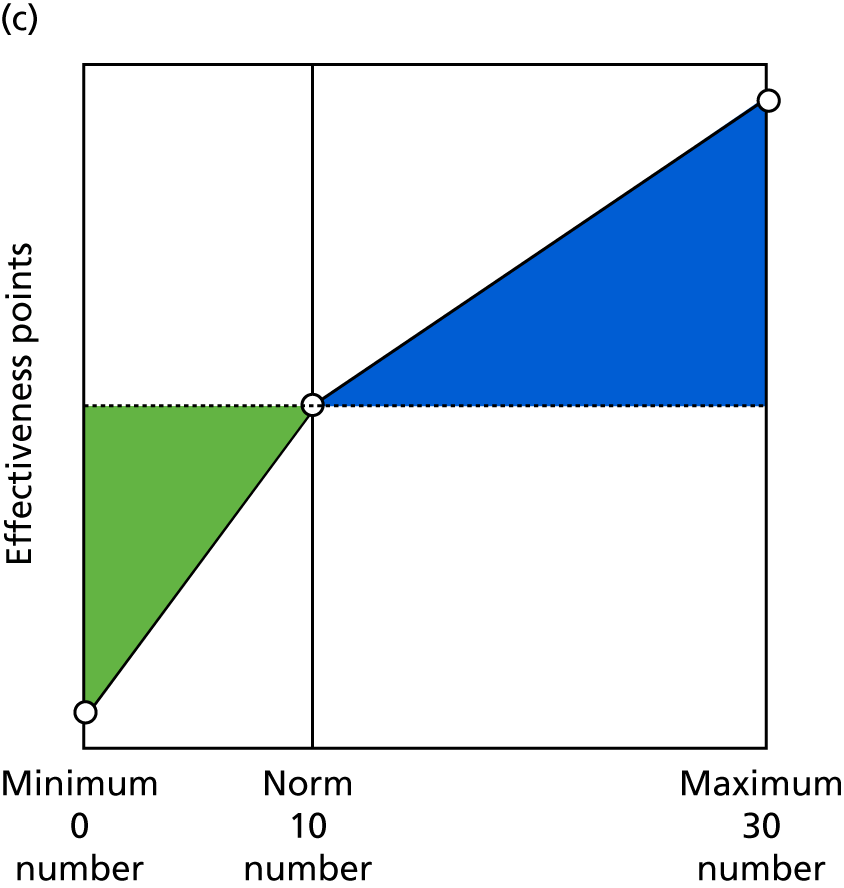
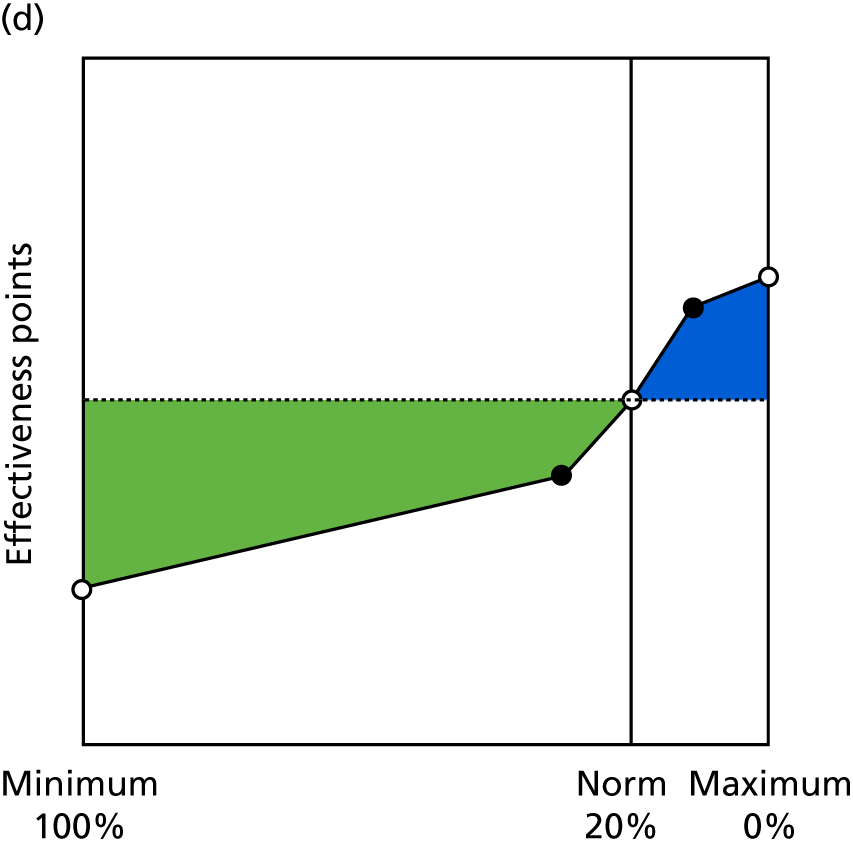
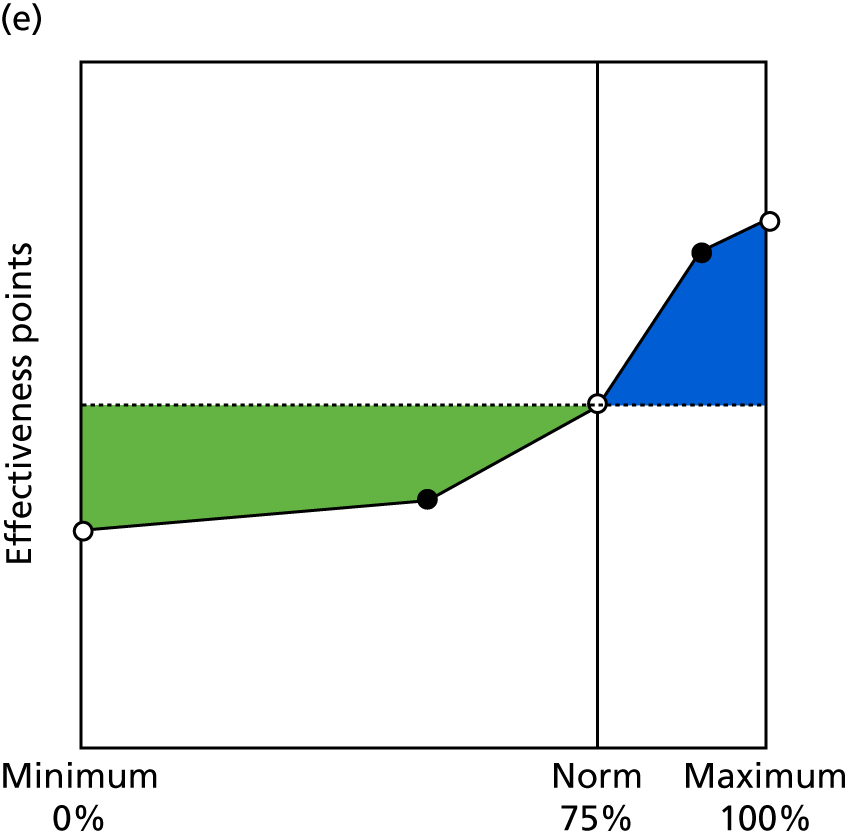
FIGURE 13.
Contingencies for external focus indicators. (a) Regular MDT working (10.1); (b) working with different partners (10.4); (c) enabling involvement (11.1); (d) resourcing of the PPG (11.2); (e) learning from the PPG (11.3); (f) practice staff outreach to the public (11.4); (g) outreach and partnerships with local population and community (11.5); and (h) use of various access routes to communicate with public (11.6).
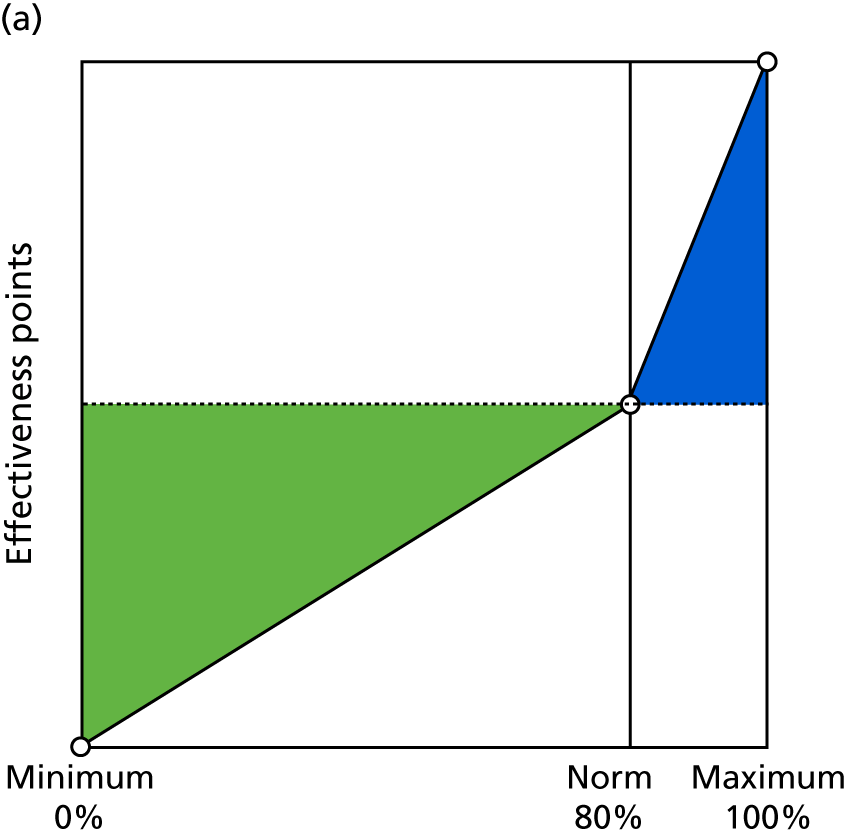
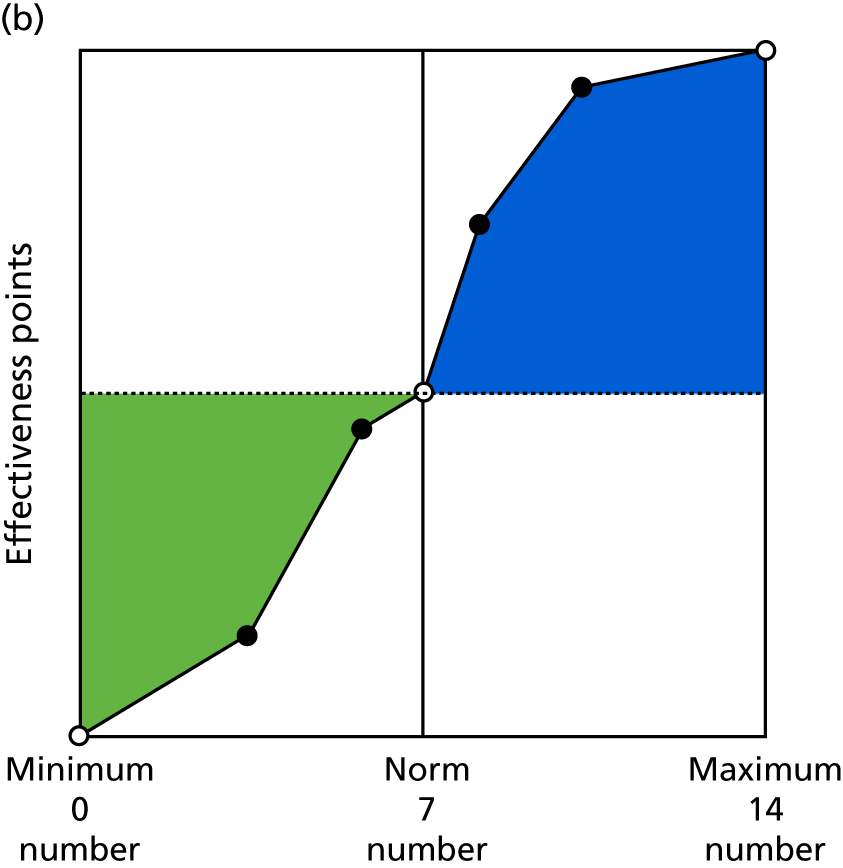
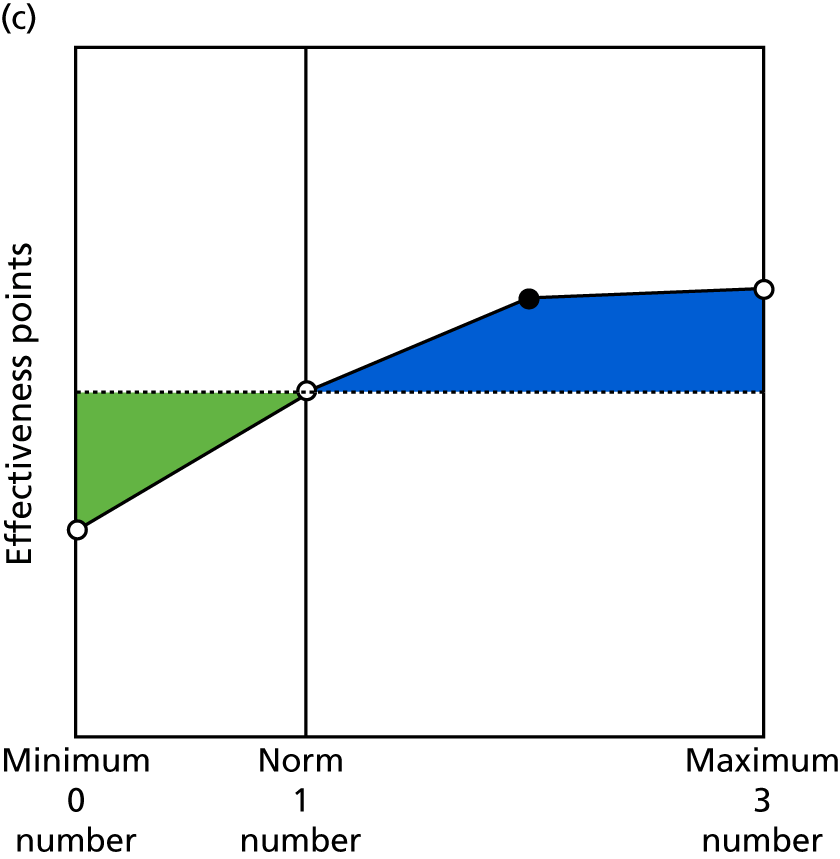
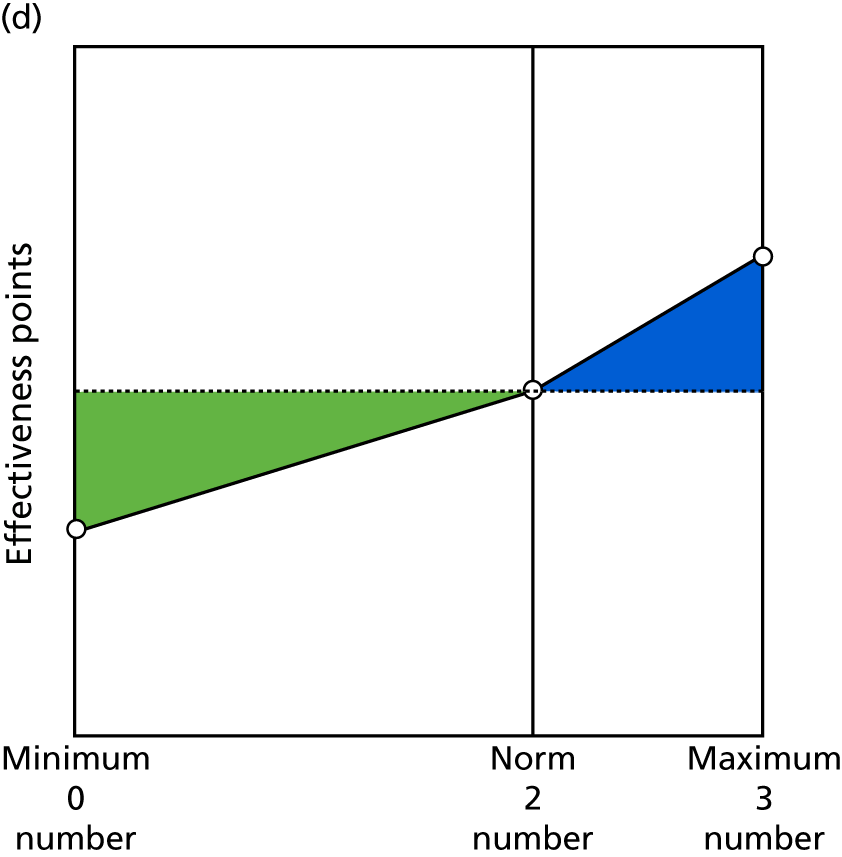
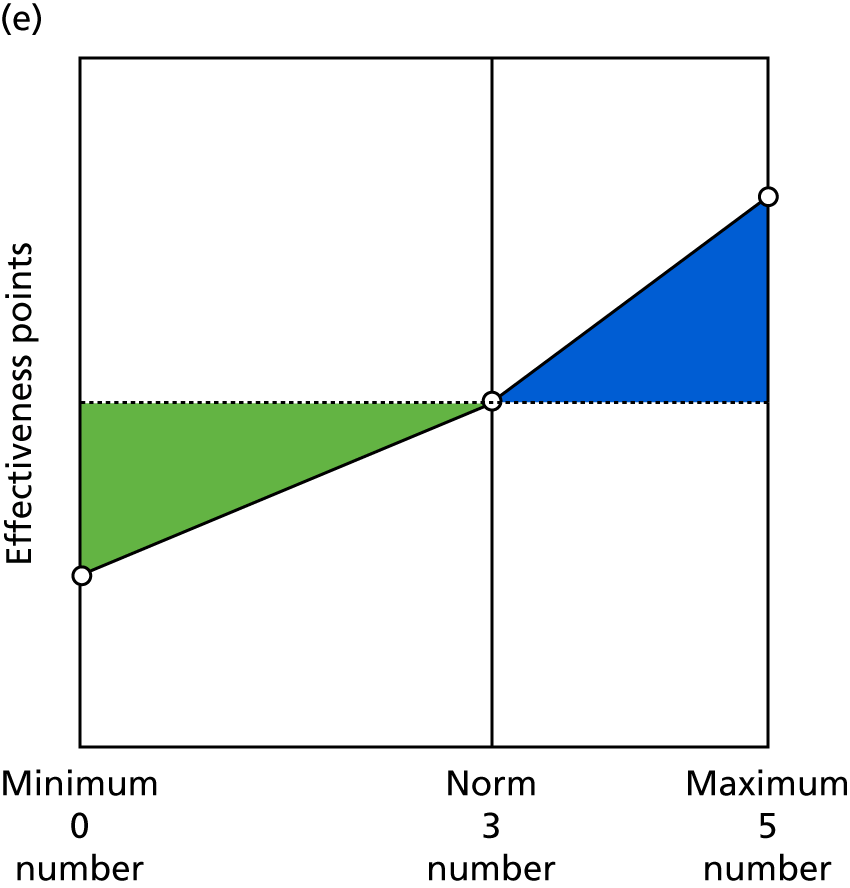
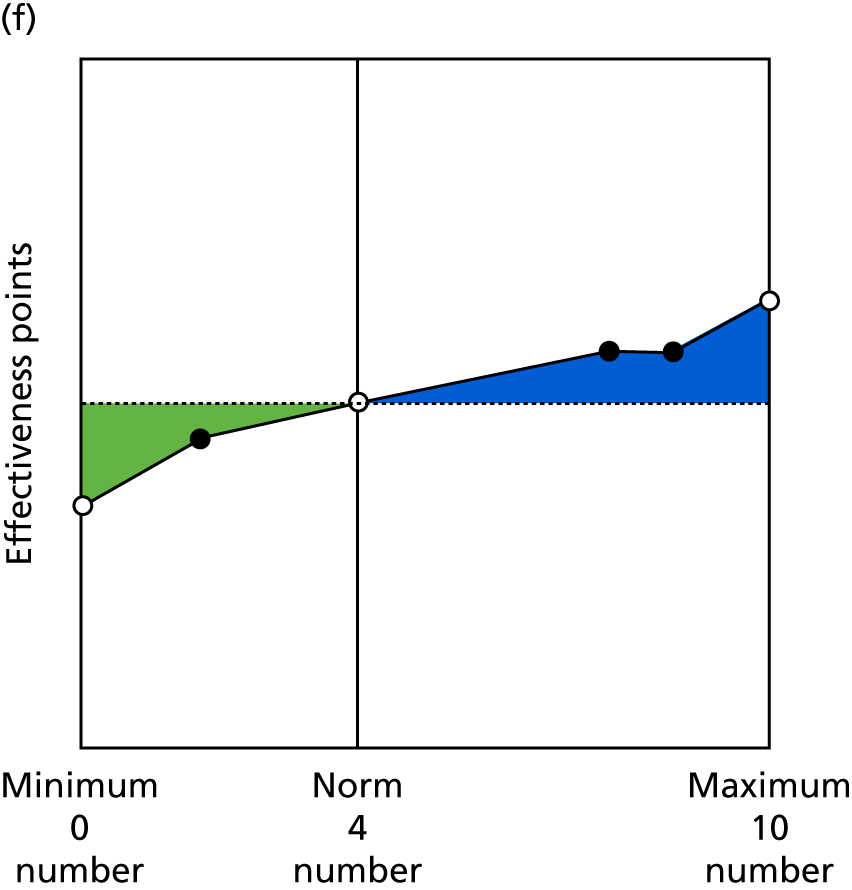
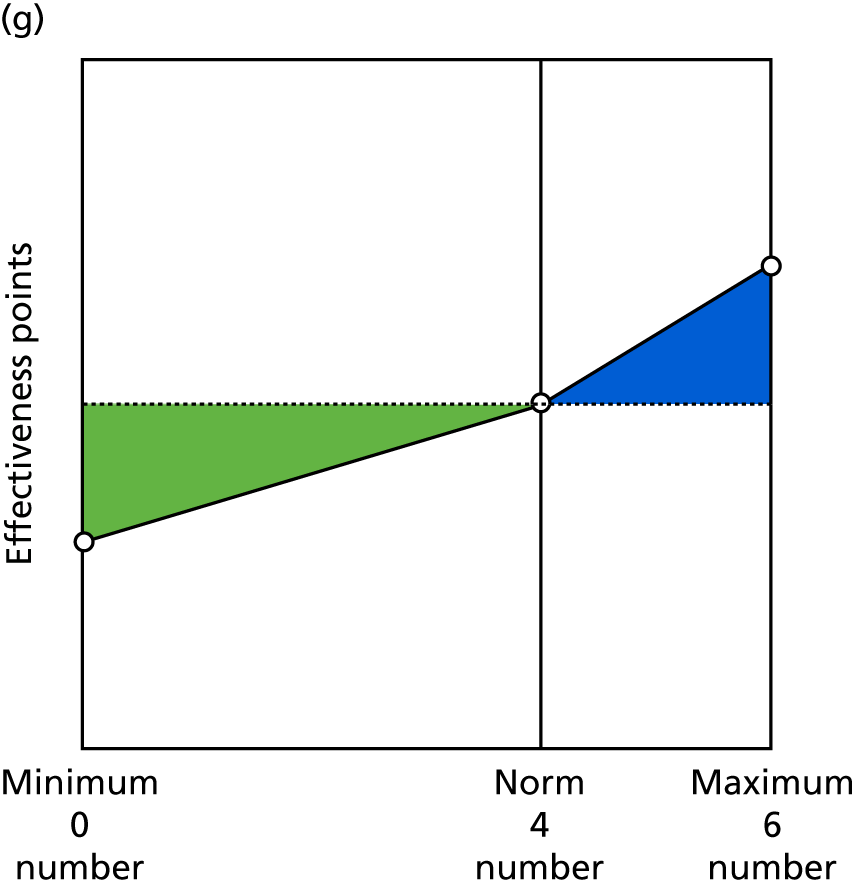
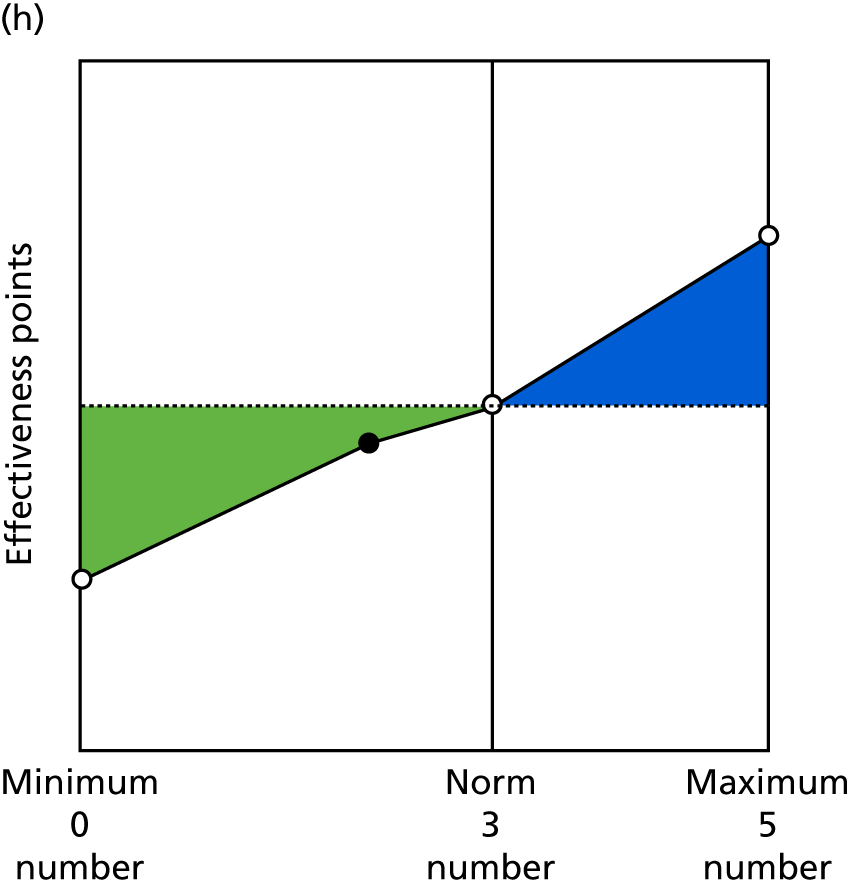
Chapter 5 Stage 2: piloting and evaluating the measure
Overall plan for stage 2
The main aims of stage 2 were to:
-
test the feasibility and acceptability of the measure by piloting its use in 50 general practices over a 6-month period
-
evaluate the success of this pilot, leading to recommendations about the wider use of the measure across primary health care in consultation with key stakeholders at local and national level.
To achieve these aims, 50 practices from across 14 CCG areas were recruited and trained. The practices were then given access to the tool [called the General Practice Effectiveness Tool (GPET)], as well as detailed instructions about the data that were needed (including MIQUEST queries for the clinical indicators, see Chapter 4 for details of these); the practices had access to the GPET for at least 6 months.
The evaluation of the pilot took four forms. A quantitative evaluation examined the extent to which practices used all aspects of the GPET, and to what extent their effectiveness (overall and on specific areas) improved over the 6 months. Telephone interviews were conducted with representatives from each practice (i.e. practice managers, GPs or other individuals involved in the use of the GPET), as well as with some patient representatives; additional patient representative views were sought in two focus groups. An online survey of practice managers gathered further details about specific aspects of the practices and their use of the tool, using a mixture of quantitative and qualitative questions. The details of all of these methods are shown in the next section.
Detailed stage 2 methods
Pilot study in general practices
The aim of the pilot was to examine how practical and useful the GPET is, by testing it in 50 practices. The plan was that the 50 practices should be spread across 8–10 CCGs, some of which would also have participated in stage 1 of the study.
In total, 51 practices agreed to participate. After an initial opening invitation, follow-up requests for participation were targeted towards areas and types of practice that had lower representation in the sample, to ensure that the overall set of practices had a good spread in terms of location, size and characteristics of the local population. Each of these 51 practices was visited by a member of the research team or a trained CRN representative, and at least one member of staff in the practice was trained in using the online tool, including the details of the data collection required and retrieving and interpreting monthly reports.
Each practice would then use the tool for a period of 6 months: collating and entering data on a monthly basis, and getting a report to indicate how indicators, objectives and overall effectiveness were changing over time. This would be followed by the evaluation. Following completion, practices were each paid £500 in compensation for the time spent piloting the tool.
Recruitment of practices
Initially, all CCGs and practices who had participated in stage 1 were invited; the offer of involvement in the pilot had been part of the incentive for participation in stage 1. As expected, a reasonable subset of those that had been involved in stage 1 (13 practices) also wished to participate in stage 2. To recruit the other practices, a three-part strategy was used. First, CCGs involved in stage 1 were asked to send an invitation to other practices in their region. Second, CCGs that had previously expressed an interest in involvement, but had not actually participated in stage 1, were invited to ask their practices. Third, the areas of the country that were already represented, and the balance between urban and rural settings, were examined and other areas/CCGs were purposively targeted via CRNs.
In total, 55 practices agreed to participate. Four withdrew before the pilot commenced as a result of illness or changes in practice staff, leaving these practices unable to participate. The 51 remaining pilot sites were spread across 18 CCGs in total and distributed across six NHS regions (as measured by the former Strategic Health Authority areas) as follows:
-
Yorkshire and the Humber, n = 21
-
South East, n = 17
-
East Midlands, n = 5
-
London, n = 4
-
South Central, n = 3
-
West Midlands, n = 1.
The two regions with the highest representation were spread across several CCGs in different areas. For example, in Yorkshire and the Humber, the 21 practices were spread across four CCGs: one primarily urban, one primarily rural and the other two mixed urban/rural.
The 51 practices were diverse in terms of levels of deprivation: they were spread across all 10 deciles of the Index of Multiple Deprivation as calculated in 2015. 143 Twenty-eight practices were classed as urban, 14 as rural and nine as mixed urban/rural; 31 practices used EMIS as their clinical information system and the remaining 20 used SystmOne.
Training of practices
Each practice was visited by a member of the research team, or a clinical studies officer who had been trained by the research team, for training in using the GPET. The training session would normally take ≈2 hours and comprised an overview of the study and the GPET, an introduction to the online software (including being given individual log-in details) and instructions on how to enter data on a monthly basis, as well as how to extract and interpret reports about practice performance.
Most practices had one representative being trained (often, but not always, a practice manager or assistant practice manager), although some had more than one to enable sharing of responsibility more easily. Each practice was given a manual that fully explained the process, including details of each indicator that was to be collected. The collection of these indicators was discussed (often at length) during the training and practice representatives were given the opportunity to ask as many questions about this process as they wanted. For the data to be collected via questionnaires completed by others (i.e. three questions for patients using the FFT method and five questions for practice team members), practices were given templates of data collection tools that could be either used directly or amended to fit with a practice’s existing communications.
Practices were offered support from the research team throughout the process via telephone and e-mail. Many practices contacted the research team at least once; sometimes this was to ask questions that could have been answered from the manual, but there was either a desire to speak to a human or an inability to find the right answer in the right place. Some queries were related to asking for help in accessing the system, entering data or resetting passwords. It appeared that the most important support given was to provide help in understanding what data needed to be collected for certain indicators.
Once a practice was trained in using the GPET, it was considered to be in the study.
Gathering and entry of data
As described in Chapter 4, the software had been specifically tailored for the use of the GPET. One feature of this amended software was that the performance areas, objectives and indicators within the tool were set centrally (as a result of stage 1 of the study). Therefore, the only requirements for a practice using the software were as follows:
-
Set up accounts and activate the tool (this was typically done during the training visit).
-
Receive and respond to monthly e-mail alerts. A named individual within each practice was allocated to each indicator (this could be the same individual for every indicator or divided up among staff so that multiple individuals each had responsibility for some indicators). The online tool would send an e-mail to this named person 5 days before the end of the month and required data input within 10 days (i.e. before 5 days into the next month). The e-mail included a direct link to the correct page of the online tool for the individual to enter the data directly. The data, once entered, would be visible to that practice and to the members of the central research team only.
-
Gather data. As noted in Chapter 4, Final tool for piloting, there were four main sources of data: (1) data automatically extracted on a monthly basis from the clinical systems, (2) data from practice records, (3) checklists and (4) questionnaires for patients and staff. Clinical system data would be produced in a form that allowed relatively simple entry into the online tool. Practices would set up their own systems for ensuring practice record data were in an appropriate form. Checklists would be allocated to individuals who should know the answers to the questions (or be able to achieve those answers very easily). Practices would devise their own procedures for administering and entering questionnaire data, usually based on the templates provided by the research team.
-
Read, extract and/or print feedback reports. Each month, after data entry was completed, the online tool would provide an updated feedback report. This was largely graphical in nature and provided feedback on overall performance, as well as effectiveness in each performance area, objective and indicator. Feedback was provided in terms of effectiveness points and as a percentage of available points. Although the primary presentation was graphical, the data were also available in tabular form and could be downloaded as a Microsoft Excel® (Microsoft Corporation, Redmond, WA, USA) spreadsheet. Practices could then decide how to use the feedback; they were strongly encouraged during the training to discuss it in team meetings.
The original plan was to start training practices in September 2016. Owing to the delays in stage 1, described in Chapter 4, training could not actually begin until February 2017, with some practices not trained until May 2017. Thus, the timescale for the pilot, and its evaluation, was considerably tighter than initially planned. In consequence, not all practices were able to complete their 6 months’ worth of data collection before participating in the evaluation.
Analysis of data
There were several key questions that were answered by examining the raw data:
-
To what extent were practices able to complete all data fields every month?
-
Did practices enter data for the whole 6-month period, or for part of it?
-
Was the completeness of data entry within a given month, and/or completion of all 6 months, related to practice characteristics such as size, region, deprivation of population, clinical system used and stage of recruitment to the study?
-
Was there evidence that effectiveness scores, as measured by the GPET, improved over time?
-
If so, was this improvement in specific areas or across all areas?
-
Was the extent of change shown by practices related to practice characteristics such as size, region, deprivation of population, clinical system used and stage of recruitment to the study?
Questions 1 and 2 were examined using descriptive statistics. Question 3 was examined via non-parametric correlations.
Questions 4 and 5 were answered using multilevel growth models (with the month of data collection predicting the number of effectiveness points within practices); this way, practices that did not enter data for all 6 months could still be included. Question 6 was answered using similar models, but with practice characteristics as cross-level predictors of change over time.
Interviews with practice staff and members of the public
The interviews with practice staff had three main aims. The first was to discover the perceived usefulness of the GPET. In particular, this was concerned with whether or not the feedback provided was useful; whether or not practices discussed this feedback in team meetings and what was done with the information; and whether or not practices would be interested in continuing to use the tool beyond the pilot. The second aim was to get views on the content of the tool using the following questions: ‘did it cover the areas that were perceived as important, useful and relevant?’; ‘was there anything missing or superfluous?’; and ‘were the indicators easy/feasible to collect?’. The third aim was to examine the usability of the tool, in terms of how easy the online platform was to use.
In total, 38 semistructured interviews were conducted with practice staff. Each practice was asked to nominate a member of staff who had been involved in the use of the tool; this included 26 practice managers, nine GPs, two practice or research nurses and one data manager. The interviews, typically of about 40 minutes’ duration, were audio-recorded, anonymised and transcribed. The interview schedule for these interviews is shown in Appendix 5.
It was also planned to interview patient representatives from 10–15 practices. The aim of these interviews was to assess the content of the tool in a similar way to the second aim of the interviews with practice staff. The interview schedule for these interviews is shown in Appendix 6.
It proved difficult to interview patients because, at the time of the interviews, the majority of participating practices had not yet shared information about the study with their PPG and practices felt that their patients would therefore be unable to answer the questions; consequently, only four interviews were arranged via this route. Therefore, to add to the four interviews, two focus groups were also arranged. These were held in London and Sheffield and were attended by seven members of the public. Each focus group lasted 2 hours; the session plan is shown in Appendix 7.
Focus group participants were sent a Microsoft Word (Microsoft Corporation, Redmond, WA, USA) version of the GPET at least 7 days prior to the focus group (see Appendix 8). They were asked to think about the following questions:
-
Do these objectives and indicators reflect what is important to the patient population?
-
Do you think the data held by the practice will give a true reflection of how the practice is performing?
-
Are there any other indicators that should be included?
-
Would the patient population understand this information (e.g. PPG/Healthwatch)?
Practice manager questionnaire
In addition to the interviews, an online survey of all practice managers was conducted at practices that had participated in the pilot (including those that had not submitted data independently). This survey offered an opportunity to cover some of the same ground as the interviews, but with a different emphasis. In particular, there was the opportunity for respondents to comment on each performance area, objective and indicator; it also asked for quantitative responses about Likert-type scales about views on ease of use, usefulness of the tool and usefulness of feedback.
In addition, there was a section in the survey on practice expenditure, which was designed to measure the practice ‘inputs’ for comparison with the outputs (the effectiveness measured by the GPET) to form a productivity measure. The main question in this section asked practices to identify expenditure on four categories (staff, premises, bills and other) for each of the 6 months of the pilot phase. They were also asked whether or not anything had changed during the pilot that may have had an impact on expenditure or productivity.
The full questionnaire used is shown in Appendix 9.
Practice managers were e-mailed with a link to the survey [which was hosted by Qualtrics (Provo UT and Seattle, WA, USA)] towards the end of the 6-month period. Up to three reminders were sent to non-responders; ultimately, responses were received from 41 practice managers.
Findings from the pilot study
Of the 51 practices that were trained, 13 (25%) did not submit any monthly data subsequent to the training (some submitted part or all of their monthly data during the training session). This is an important finding in itself: given that these practices had originally volunteered to participate, the fact that slightly over one-quarter did not engage further with the study when left to their own devices suggests that the burden on practices could seem relatively high (a finding that was confirmed by some of these practices in the other sections of the evaluation).
Reasons given by the 13 practices that did not subsequently enter any data included a lack of time, staffing issues or illness, problems activating the system and problems with the online searches. The final reason included issues that arose following the NHS cyberbug that occurred during the period between training and provision of searches and log-in details.
Of the 38 practices that did submit further data, there was considerable variety in terms of the extent of data submission, shown in Table 9.
| Month | Number of practices submitting any data | Mean percentage of indicators submitted across all 38 practices | Mean percentage of indicators submitted across those submitting data |
|---|---|---|---|
| 1 | 38 | 76 | 76 |
| 2 | 36 | 75 | 79 |
| 3 | 33 | 72 | 72 |
| 4 | 29 | 64 | 83 |
| 5 | 28 | 61 | 84 |
| 6 | 18 | 39 | 83 |
As can be seen, there was a gradual tendency for practices to drop out after the first month, with 10 practices (26% of those who submitted data in month 1) failing to complete 5 months of data entry. The sharper drop off in month 6 is mainly because some practices did not complete their first month until May 2017, which meant that their month 6 would have been after the data collection period ended; therefore, the 28 practices completing 5 months is a better indicator of medium-term use. However, the average number of indicators submitted by each practice active in the study remained relatively constant, and even went up slightly; this was because those practices that remained in the study were more likely to develop methods and procedures for collecting more indicators as the months went on.
However, it can be seen that even when all 38 practices submitted the data, the level of completeness of data entry was lower than desirable at just 76%. In some cases, practices struggled to get data collection procedures for certain indicators in place at the very start; some of these practices subsequently sorted these out effectively, but others did not.
To examine further the extent to which practices submitted data on specific indicators, we looked at data from month 3 (to allow practices a bit more time to get data collection procedures in place). Of those practices who submitted data in month 3, the level of data entry fell below 80% (i.e. fewer than 27 of 33 practices submitted data) on the following indicators:
-
Clinical care indicators –
-
1.1 (percentage of those aged > 75 years who had a health check in the previous 6 months): 28%
-
1.4 (alcohol consumption): 69%
-
2.3 (initial care of mental health conditions): 31%
-
2.6a [COPD care (care plan)]: 28%
-
2.7 (lifestyle of people with long-term conditions): 56%.
-
-
Practice management indicators –
-
6.5 (staff well-being): 50%
-
-
Patient focus indicators –
-
8.1 (percentage of patients willing to recommend practice): 75%
-
8.2 [patient satisfaction with (reception) staff]: 69%
-
9.3 (percentage of patients satisfied with booking system): 69%.
-
-
External focus indicators –
-
10.1 (percentage of attendance at MDT meetings): 75%
-
11.1 (number of meetings with PPG/PRG in last quarter): 75%
-
11.4 (amount of time staff spend in face-to-face contact with the public at appropriate external groups): 19%
-
11.5 (outreach and partnerships with local population and community): 72%.
-
This suggests that there are problems in some practices with the MIQUEST searches for certain indicators (1.1, 1.4, 2.3, 2.6a and 2.7) and that a substantial number of practices had difficulty accessing records for some of the other indicators.
Table 10 shows how the level of completion (in terms of number of months completed) was associated with a number of practice characteristics.
| Practice characteristic | Spearman’s correlation | p-value |
|---|---|---|
| Participated in stage 1?a | 0.315 | 0.054 |
| Index of Multiple Deprivation ranking | 0.015 | 0.928 |
| Rural/urban settingb | –0.295 | 0.072 |
| Practice list size | 0.102 | 0.544 |
| Clinical system usedc | –0.454 | 0.004 |
| Early vs. late starter in study | –0.211 | 0.203 |
| Effectiveness points in month 1 | 0.008 | 0.963 |
| Payments per registered patient | –0.125 | 0.455 |
The p-values are shown for indicative purposes, as no formal hypotheses are being tested here. However, it is clear that there is a correlation between the clinical system used and months of completion, with practices that use EMIS more likely to complete more months of data. This is likely to be in part because those practices using EMIS were trained first (as the MIQUEST queries became available earlier) and, therefore, had more opportunity to complete more months. There was also some indication that practices participating in stage 1 may have been more likely to complete more months, in keeping with the ProMES approach (these practices felt that they had a larger stake in the tool). There may also be some link with the rural/urban setting, with those in urban settings completing more months, on average.
Actual monthly effectiveness scores varied from –2083 to 1161, with a mean of 309 and a SD of 692 (so there was a negative skew to the scores overall). The overall average effectiveness scores by month are shown in Figure 14.
FIGURE 14.
Average effectiveness points by month.

It appears that there was a significant change between months 1 and 2 in particular; however, much of this was due to the incompleteness of data in month 1, which negatively biases these scores. Therefore, subsequent quantitative analysis on change over time is based on months 2–6 only. To control for dropout, multilevel longitudinal (growth) models were used, in which time (month) predicted effectiveness within each practice, and the effect of time was allowed to vary by practices (so some practices will have improved, some stayed roughly the same, etc.).
Findings from these models for the overall scores, and for each performance area, are shown in Table 11. The estimate represents the average monthly change in effectiveness points. The percentage change represents this average monthly change as a percentage of the total number of effectiveness points available for that area and the standardised effect size shows this estimate divided by the SD for the area in question.
| Objective | Estimate (95% CI) | p-value | Estimate (%) | Standardised estimate |
|---|---|---|---|---|
| Overall effectiveness | 64.7 (13.1 to 116.3) | 0.014 | 1.3 | 0.09 |
| Clinical care | 3.0 (–9.0 to 14.9) | 0.624 | 0.2 | 0.02 |
| Practice management | 30.5 (6.4 to 54.6) | 0.014 | 2.0 | 0.10 |
| Patient focus | 25.5 (6.8 to 44.3) | 0.008 | 3.5 | 0.12 |
| External focus | 5.8 (–9.6 to 21.3) | 0.457 | 0.6 | 0.03 |
It can be seen that there are significant improvements in overall effectiveness, in two of the performance areas in particular: practice management and patient focus. The effects appear modest at first glance: the average monthly improvement of 64.7 overall effectiveness points accounts for 1.3% of the total points available and a standardised estimate of 0.09 (conventionally, 0.2 represents a small effect, 0.5 a moderate effect and 0.8 a large effect). However, across 5 months (four monthly changes), this would represent a change of 5.2% of the total points and a standardised estimate of 0.36: solidly between a conventional small and moderate effect. Therefore, there is evidence that practices using the GPET displayed a modest but significant improvement in effectiveness.
When examining the individual performance areas, there was no evidence of improvement in either clinical care or external focus. However, there were improvements in both practice management and patient focus, at slightly larger effect sizes than for the overall effectiveness score. Therefore, it appears that improvements in these areas are driving the overall increase in effectiveness among the practices.
To understand more about these changes, it is worth looking at the objectives separately. Findings for each of the eleven objectives are shown in Table 12.
| Objective | Estimate (95% CI) | p-value | Estimate (%) | Standardised estimate |
|---|---|---|---|---|
| General health and preventative medicine | –1.6 (–7.1 to 3.8) | 0.556 | –0.3 | –0.03 |
| Management of long-term conditions | –1.5 (–6.6 to 3.6) | 0.559 | –0.3 | –0.02 |
| Clinical management | 6.2 (–2.3 to 14.7) | 0.150 | 1.0 | 0.06 |
| Effective use of IT systems | 8.5 (1.2 to 15.8) | 0.023 | 2.7 | 0.13 |
| Good physical environment | 5.4 (–1.2 to 11.9) | 0.108 | 1.9 | 0.07 |
| Motivated and effective practice team | 10.0 (2.5 to 17.5) | 0.009 | 2.2 | 0.09 |
| Good overall practice management | 7.6 (–1.3 to 16.6) | 0.095 | 1.7 | 0.08 |
| High levels of patient satisfaction with services | 16.6 (3.4 to 29.9) | 0.014 | 4.6 | 0.13 |
| Ease of access and ability to book appointments | 8.9 (0.7 to 17.1) | 0.035 | 2.5 | 0.09 |
| Good partnership working | 2.6 (–6.5 to 11.7) | 0.567 | 0.7 | 0.02 |
| Engagement with public | 3.2 (–5.8 to 12.2) | 0.481 | 0.6 | 0.03 |
Unsurprisingly, for the clinical care and external focus objectives, there were no significant changes. Within the practice management area, however, two objectives showed significant improvements: effective use of IT systems and motivated and effective practice team. It is possible that the improvement in the use of IT systems is connected with the use of the GPET itself; therefore, although this is a worthwhile finding, it is maybe less surprising. For motivated and effective practice team, however, this is extremely encouraging: the effect size is still small, but there is certainly clear evidence of a change, which may be prompted by the motivation provided by using the GPET.
For the patient focus objectives, both showed significant increases. This suggests that there is a knock-on effect of using the tool for patients in a way that may not translate immediately into clinical improvements, but still does affect patient experience.
The changes over time for each indicator are too specific to warrant substantial interpretation, as the indicators are designed to measure an objective between them, rather than individually. However, for the sake of completeness, these are shown in Appendix 10.
The same practice characteristics as in Table 10 were examined to see whether or not these would be associated with the level of change over time (by building a cross-level moderator into the growth analysis). In most cases, there was no evidence that this would be the case. However, for practice list size, there was a significant difference across overall effectiveness (and for three of the four performance areas, the exception being clinical care). The effect was positive (with an interaction estimate of 0.0167). This suggests that larger practices are likely to improve at a higher rate. For each extra 1000 patients a practice has, this would result in an extra increase, on average, of 16.7 effectiveness points per month. Therefore, this suggests that larger practices are more likely to be able to show improvements when using the GPET.
Finally, it is worth examining how much the optional indicators were used by practices. In total, 25 practices chose to enter at least one of the 11 optional indicators, with eight being the highest number used by any one practice. The number of practices choosing each indicator is shown in Table 13.
| Indicator | Number of practices |
|---|---|
| Dementia (carers): percentage of patients with dementia in receipt of support from a carer | 7 |
| Dementia (nutritional assessment): percentage of patients with dementia that have a recorded nutritional assessment in the previous 12 months | 16 |
| Dementia (benefits review): percentage of patients with dementia who have a recorded assessment of their benefits within the previous 12 months | 2 |
| Ongoing mental health conditions (suicide risk): percentage of patients with serious mental health conditions (including schizophrenia, psychosis and bipolar disorder) for whom an assessment of suicide risk has been recorded within the previous 12 months | 12 |
| Ongoing mental health conditions (general health check): percentage of patients with serious mental health conditions (including schizophrenia, psychosis and bipolar disorder) for whom a general health check has been recorded within the previous 12 months | 16 |
| Ongoing mental health conditions (mental health crisis plan): percentage of patients with serious mental health conditions (including schizophrenia, psychosis and bipolar disorder) for whom a mental health crisis plan has been recorded within the previous 12 months | 1 |
| Ongoing mental health conditions (care plan): percentage of patients with serious mental health conditions (including schizophrenia, psychosis and bipolar disorder) for whom a care plan has been recorded within the previous 12 months | 18 |
| Social assessment and prescribing: consultations assessing for social and economic issues affecting well-being, as well as clinical issues | 2 |
| Health and work: proportion of consultations that pick up on occupational- or underemployment-related sickness or ill health, and provide support, treatment and/or referral to other agencies | 5 |
| Systems to enable patients to be active partners in their health | 24 |
This level of use suggests that there would be some appetite among practices to use indicators that are not part of the core tool, but it is more helpful when the data are readily available. Most of the indicators in Table 13 were gathered using MIQUEST queries; the final one was a straightforward checklist in the online tool. The other two (social assessment and prescribing, and health and work) needed particular records to be kept in a specific way that most practices would not do; for this reason, very few practices (2 and 5, respectively) chose to use them.
Findings from interviews
Interviews with staff
A thematic approach was used to identify, analyse, and report the patterns (themes) that emerged based on a thorough and comprehensive coding of the interview data. 144 An exploratory method would not have been appropriate as there were some specific questions to be addressed that were relevant to the evaluation process.
One of the four interviewers developed an initial coding system that was then applied to a sample of the data. A colleague from one of the organisations conducting the study also analysed a sample of the transcripts for objectivity. The list of codes was modified after successive readings of the transcripts and was reapplied to the full set. The codes were arranged into an initial thematic map, which was reviewed and refined. A final structured representation of themes, and the relationships between them, that adequately reflected the whole data set is shown in Figure 15.
FIGURE 15.
Staff interview thematic map.
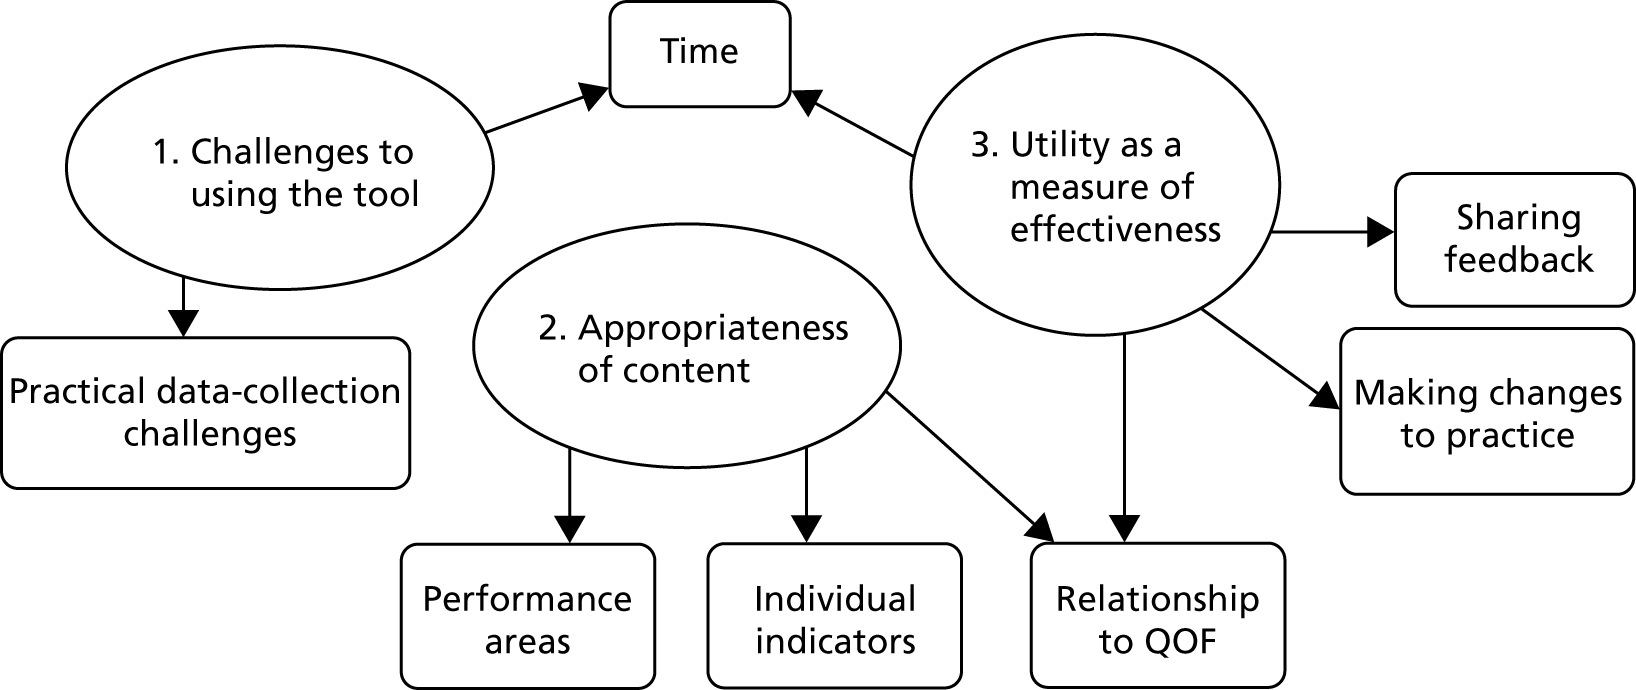
Theme one: challenges to using the tool
Overall, this theme emerged from discussion of the practical, operational challenges of implementing the GPET in busy surgeries on a monthly basis.
Time
Time was a key challenge mentioned by almost all participants in the interviews and survey. One practice manager was frustrated:
I find it’s really a thorough system in principle, it was just a time factor really.
Practice Manager 77
Interviewees reported a range of time taken each month to enter the data, from as little as 30 minutes to several members of staff working together for a half-day. The amount of time taken was certainly linked to how much of the tool was being utilised and how far into the pilot the site was at the time of the interview. It was clear that it took longer to enter data in the initial months as staff got used to the online interface and the data collection requirements. It became clear that the data entry time could be reduced as several interviewees reported that monthly collection was not appropriate for some indicators that were unlikely to change this frequently. Appendix 11 gives more detail on suggested improvements made during the evaluation. The following quotation summarises the views of several participants:
I think that the non-clinical things that you are talking about, like staff and the rooms, etc., I think probably every 3 months would be better, especially for us, and it would give us more time to actually get all the figures, get what we needed to do. Every month seems quite a lot for us to deal with, but I think every 3 months from our perspective would be better.
Practice Manager 77
Practical data collection challenges
The following specific and practical challenges faced in collecting data were mentioned by many participants. These issues are not intrinsic to the tool and can easily be overcome.
Automatic searches were developed to pull data required for the clinical indicators out of practice clinical systems on a monthly basis. This was identified as a need by the project steering committee; these automatic searches were not finalised until the end of March 2017. This delay in the availability of searches led to a challenge for sites trained in February 2017 and one trained site dropped out of the project. This was unfortunate but unavoidable as the automated searches took longer to finalise than anticipated. All of the practices trained early commented on this, so a clear theme around the searches emerged. It was particularly an issue for practices using SystmOne, as highlighted by Practice Manager 55: ‘One of the things for me that was tricky was we had a bit of a delay between the training and actually getting started because the SystmOne searches weren’t ready’. The project team addressed this delay as much as possible by keeping practices engaged in the interim and offering telephone support or a further site visit once data collection had commenced.
Another challenge that was mentioned several times was that the online version of the tool used in the pilot evaluation required a member of practice staff to look at the search results pulled from the clinical system and enter them manually each month to the corresponding indicator. Practices were provided with a one-page mapping document to ensure that they were entering each search result into the appropriate indicator. This was seen as a time-consuming element of data collection and entry by several interviewees:
Yes, I mean, once you get into it it’s a really good tool. It’s just having to look at the paperwork and the screen and cross-referencing that’s the tricky part, the time-consuming part really.
Practice Manager 77
It became clear that there was some idiosyncratic use of Read codes in the pilot sites that led to incomplete or incorrect data being pulled from clinical systems by the searches. The Read codes used for the searches will need to be reviewed following the pilot because of the changes to SNOMED. However, this provided valuable learning and highlights the need for accurate recording of clinical activity in practice systems for a tool like the GPET to function to its full potential.
Theme two: appropriateness of the content of the tool
Performance areas
Overall, participants felt that the four performance areas offered a broad and comprehensive summary of elements required for an effective general practice, while the objectives and indicators provided useful prompts to monitor how they were performing. No additional performance areas were needed.
The model encourages a team approach to gathering data and reflecting on feedback; interviewees felt that this was the easiest and most beneficial way of using the GPET. Practice Manager 27 utilised the approach well, with a GP focusing on the clinical care elements of the tool:
The way it’s organised is good, where some people have particular responsibilities, we can have different people looking at different areas that they are responsible for.
Practice Manager 27
Interviewees did suggest additional conditions that could be included as indicators within the clinical care performance area, for example asthma, epilepsy and breast screening. However, no suggestion was made on more than one occasion and it was acknowledged that it was impossible to include everything while maintaining usability. With flexibility built into the tool, this performance area could encourage individual practice innovation by focusing on indicators of particular interest. The following quotation highlights this:
We are monitored on many things at present and it’s hard to draw a line on what to measure, so smear updates would be useful and breast screening too, tool should be tailored to the practice need and preferences.
Practice Manager 35
The practice management performance area was highlighted as useful many times, which may reflect the large number of practice managers in the interview sample. In particular, indicators within the motivated and effective team objective were felt to be useful, as illustrated by the following quotations from two practice managers:
The area I quite liked in [GPET], was more around thinking about staff retention and well-being, training needs, because that’s constantly ongoing and changing and sometimes you can get into routines of, like, doing annual things and not necessarily looking at impact . . . so for me it was just, every time I filled it in it was a reminder, ‘are we doing what we need to be doing? Do we need to be thinking of things differently?’, you know, it was like just a prompt really; I really liked that.
Practice Manager 40
I think staff, the staff retention and the staff wellbeing, wasn’t something I recorded in that way so it’s given me a different way of looking at it because we were looking at individual staff absence percentages rather than looking at total number of days lost, so that was interesting.
Practice Manager 10
The patient focus performance area comprised three questions administered to patients via an enhanced FFT-type questionnaire and two indicators that required collecting data from patient records. Practices that used the enhanced FFT found it very useful and felt that the indicators relating to patient satisfaction with reception staff and booking systems were very relevant and useful:
So, as a practice, we sort of looked at those, because we are very fortunate that we get positive comments from patients so I was able to feed that back to the staff as well because there were certain staff mentioned by name.
Practice Manager 80
The indicators from practice records required the reporting of number of hours of clinical appointments per 1000 patients per week and the percentage of patients waiting > 15 minutes past their appointment time; both of these were found to be challenging and time-consuming to collect, although this practice manager still found the former to be useful:
I thought the hours of clinical appointments per 1000 patients per week was good. It’s a nightmare to calculate it but it is good and it would be good to benchmark, if practices could use the tool to benchmark themselves against others. Because I know there’s a big push going forward for minimum numbers of appointments to be, to be given and things, so that was good.
Practice Manager 10
The following quotation illustrates a challenge found by some participants in collecting data for the external focus performance area. A key criterion for the GPET indicators is that they must be able to be controlled by the practice themselves; the quotation below highlights that some were felt not to meet this criterion:
The difficulty with the external focus [area] is that often it’s dependent on other organisations. So, we can offer meetings to people but whether or not they attend or if there’s that service available in the area isn’t really down to us. So there’s one [indicator], working with different partners I think it’s called, and it asks about you know do you [have] kind of meetings with, with social workers? Well, we would love that but trying to find one is completely impossible where we are so that’s more of a reflection on the local health, well, the local kind of social services than it is on us and ‘cause they feel us out so yeah I mean overall they’re all important areas but, but some are dependent on what we can do.
General Practitioner 25
Relationship to Quality and Outcomes Framework
This part of the interview raised discussions of duplication of data and overlap with the content of the GPET and other statutory requirements, for example the QOF. There was an intentional overlap with existing QOF indicators built into the tool, so this is not a surprising finding. During development, many clinical areas that were felt to be important were already collected so the group felt that there was no need to ‘reinvent the wheel’ at this stage. However, it was a source of frustration for some participants:
As I say, a lot of the clinical stuff was duplicated in that we already are aware of a lot of that information through other data collection methods.
General Practitioner 52
The main source of frustration is captured in the following quotation. Those entering data into the online tool felt that this was a waste of resources and that it would be better if this process could be more automated:
. . . Some of it we’re already getting. So certainly for those clinical things that, you know, alcohol, BMI [body mass index], flu jabs and things like that we already get that information so it’s a little bit of duplication. Diabetes management, dementia, COPD, all that’s part of our QOF so it’s already there, we’re just taking it from one and putting it in another, so it seemed a little bit pointless.
Practice Manager 10
Several practices highlighted that the GPET included non-clinical management indicators that have been removed from QOF that are actually helpful in looking at the quality aspect of the service provided and working to maximum effectiveness in providing that service:
QOF used to be our monitoring tool, that would be our bible for checking things, but it has reduced now. So things around like med[icine] reviews, and what level we’re at, is helpful . . . because it brings together some data that we can get and go for but having it in one place is useful because, like I say, it gives you an overview of where we’re at.
Practice Manager 40
The overall message from participating practices was that a streamlined, integrated system was needed:
We know QOF needs tweaking and amending as all things do on an ongoing basis and some of these elements could be incorporated as part of that and whatever it needs to be smart working because everybody’s tight for time and it needs to be helpful, easy to produce and helpful in what it comes out with.
Practice Manager 69
Individual indicators
Interviewees were encouraged to comment on individual indicators in term of their usefulness; a summary of suggestions that were made on more than one occasion can be found in Appendix 11.
In general, many of these discussions were idiosyncratic to an individual practice, but the fact that some indicators were not applicable to all practices did emerge as a consistent theme, illustrated by Practice Manager 27: ‘It [GPET] still needs further defining before it’s useful. A lot of indicators don’t apply to us due to our demographic’ and a GP from another practice in the following quotation:
There are some things that just we don’t have the codes for and again we’re not locally commissioned so we scored zero for percentage of over-75s having a health check. That’s not a service that we are commissioned for, we do something slightly different which is a[n] over-80s holistic health assessment but it’s a different kind of coding to the one you’ve put on there.
General Practitioner 25
Interviewees felt that they would not have ‘activated’ indicators that were not directly relevant to their practice (i.e. switched them on in the online portal) if using the tool outside the pilot evaluation, as gaining a zero value on these led to an unrepresentative Effectiveness Score. This could have affected how useful these participants found the tool as a measure of effectiveness overall and may have led to less change in these objectives than if the option to exclude these indicators had been available.
When discussing the content of the tool, interviewees gave feedback on which indicators that they felt had led to benefits during the pilot. The staff survey included within the tool was particularly positively received and led to attempts to improve effectiveness within several practices:
In fact the staff survey, we looked at, and were surprised by the results. I was quite disappointed with some areas of it. On the back of that, we have done our own survey so we can see, fine tune where and what we can do to improve it. So from the point of view of the practice, I thought it was very useful. I’m glad we’ve done the study. Very glad.
General Practitioner 81
Two patient satisfaction measures were included in the GPET and were administered in the same style as the FFT, mostly on paper. Some practices did not have the time to collect data for these but those that did generally found them to be a positive addition. This practice fed back positive comments in team meetings as staff were mentioned by name:
Yes, we did those. We did actually have a bit of a, a sort of promotion so I printed off the form for patient satisfaction with the appointment system and the reception staff. And I also, within that document, put the FFT form on, so I sort of, we had a sort of push for that so we got quite a decent response there.
Practice Manager 80
Some indicators were highlighted as currently being too broad and requiring further, clearer definition to provide accurate data collection. Clearer definition of some indicators would certainly be required if the tool were to be used for benchmarking across sites, highlighted by this practice manager:
MDT meetings and things like that, staff meetings where it was the proportion of staff attending monthly practice meetings it was felt that there should be specific meetings. So if each practice was doing it for themselves, you’d maybe think, ‘oh staff meetings or department meetings’ but, but if you were comparing a group of practices or a federation they, they would put in different meetings, maybe.
Practice Manager 50
Theme three: utility as an effectiveness measure
Sharing of feedback
Participating practices varied, at the time of interview, in terms of how many months they had been using the tool, how engaged they had been able to become in using the reports and feedback elements to allow them to understand their current level of effectiveness, and in what areas they could make improvements. There was a clear message that a minimum of 6 months is required to fully engage with the GPET:
So it is good as an overall ‘Where are we at?’ initially and now, it’s going to get more refined as we’re starting to look at it a little bit more . . . [At] our next practice meeting we’re hoping to share where we are at after this 6 months, because that gives a better picture, if you just do it over a few months, it’s not robust enough.
Practice Manager 40
Practices who were early on in the process tended to focus on the clinical searches and data quality. One practice that had a data manager involved in the pilot (Data Manager 56) stated that ‘It’s been good at looking at NHS health checks, things like that and making sure that we’re entering Read codes correctly’.
All practices stated that it took them some time to get used to entering data into the tool and interpreting the reports. Until they were confident that the data collection was accurate, they did not share it with the wider team or patients. Of those who had not yet shared data, the response was positive overall that they would share it in future. For example:
I’ve not shared the data with anyone else as not clear myself about it as yet nor shared with patients or colleagues. However, we would use it in future with staff and patients.
Practice Manager 35
Generally, the longer they had been using it and the more they had used the tools’ facilities to feed back progress to the team, the more positive the experience. General Practitioner 81 was particularly pleased: ‘When we presented that we had made a 2% improvement in our GP effectiveness, everyone was like “Yes!” It’s only 2% but that’s still progress isn’t it?’.
Some practices highlighted the potential for sharing the GPET information with the CQC, for example:
I’m a big believer in sort of these tools and being able to get information out and also being able to show reports specifically for, like, CQC: they like evidence-based things like this.
Practice Manager 50
Making changes to the practice
Not all practices had made changes at the time of interview:
It’s picked up a few areas that we’d like to look at but to be honest we haven’t, so far, used it for practice improvement purposes.
General Practitioner 25
Yeah, so I’ll have to say we haven’t translated anything into practice from filling this in, I guess that’s the bottom line.
Practice Manager 45
However, it was felt that some benefits could be seen early on just by having all of the information in one place:
It is helpful as a starting point to start to unpick other areas and to build upon, perhaps using it for future thinking, or for thinking about, you know, areas you might want to change or develop in, or just get better at really.
Practice Manager 40
As the interviews took place before the end of the pilot, often practices talked about how they planned to use the tool to make changes, rather than discussing any changes that had been made:
My plan is to present a highlight report with some screenshots at a partners’ meeting and more detail to the staff, including clinical outcomes. Put it into context that as a team we are doing well for our patients but this is what we could improve on. What can we do collectively to make this indicator better and then break up into teams and come up with some solutions, hopefully.
General Practitioner 58
One practice manager discussed using the tool for motivation by comparing how they were doing with the norm scores in the system:
It’s sort of comforting knowing that you’re within the, at least the average, working towards improving. You know hopefully you’re doing something right.
Practice Manager 50
As discussed in Theme one: challenges to using the tool, time, or lack of it, was a major barrier to using the tool. These practice managers had a positive experience with the GPET but highlighted that the time is required for team members to reflect on the scores and enable changes to be made:
Just really time, you know, it’s one of those nice things that you’d like to do and spend time on but then having other things to do in the practice on a day-to-day basis you don’t feel like you’ve got all the time to put in that you’d like to, and the more you put in, the more you obviously get out of it, so that was an obstacle.
Practice Manager 50
We’ve mainly just used it for producing the reports. We haven’t, or I haven’t, spent an awful lot of time looking at reviewing how we could improve those statistics for time reasons and reasons of other needs, so it’s probably not been used to that degree.
Practice Manager 69
Participants acknowledged that the fact that this was a pilot had an impact on their ability or motivation to input the required data to make changes. For example, these practice managers would need a contractual requirement to use the tool fully:
Now if, going forward, that became a contractual thing, then we would have to change our ways so somebody might be saying, ‘Oh, this would be really good information if we could have it’ but from our point of view we have no contractual reason to do that.
Practice Manager 10
And it comes down to things like QOF and stuff, you know, you sit there and watch it like a hawk because it’s related to money.
Practice Manager 45
Those practices who had only one person entering data struggled the most:
I think our problem is it’s literally been me that’s been gathering all the information together because we don’t have the time within our team of people to be able to do it all, you know, separately, so it’s been quite hard really reminding people and asking people to fill the forms in and you kind of feel you’re nagging people a lot.
Practice Nurse 48
Practices who engaged more members of the team in the process found using the GPET easier and more helpful and this whole team engagement would be essential for the tool to reach its full potential in improving the effectiveness of a practice:
Yeah I think it’s good to use for resources and if you are trying to make changes as a team it would be good to look at because it’s quite a visual tool. Do you know, when you are getting the team on board, it’s quite a simple tool.
Practice Manager 72
However, some practices did not feel the time and effort required to enter data and use the tool made it worthwhile. This could have been because of the duplication of data that many practices discussed or the fact that, unless financial incentives are attached to this type of activity, it is a challenge for practices to prioritise it.
Feedback from patients and the public
In total, 11 members of the public were asked for feedback on the GPET. As explained in Interviews with practice staff and members of the public, four members of the public were interviewed and seven participated in two focus groups. Owing to the small sample size of interviews, these were not thematically analysed but responses from both were combined and are summarised in this section.
Overall, participants responded favourably to the tool. They particularly felt that it would be useful to share with the CQC during inspections to show that a practice is ‘thoughtful and willing to learn and develop’. They felt that it would be useful if the tool correlated with the CQC framework in looking for safe, responsive and effective practices.
Participants then reviewed the content of the tool; views are summarised here by each objective in turn. Those objectives with a greater relevance to patient experience were given greater weight in the discussion.
Objective 1: general health and preventative medicine
It was felt important that this section included health checks and screening programmes that are under the control of primary care. The indicator ‘BMI reduction’ was felt to give no information of relevance to a person’s health.
Objective 2: management of long-term conditions
Participants wondered why cancer was not included in this objective and several questions were raised: ‘how do we measure if the GP has a holistic view of patients, not just their conditions?’, ‘how do we measure if primary care is acting as a single contact point for terminal care?’ and ‘how would we measure continuity of GP care – seeing the same GP?’.
Objective 3: clinical management
During discussion of this objective, participants raised again the importance and cost-effectiveness of screening programmes and felt that all conditions under the responsibility of primary care should be included, for example shingles.
Participants felt that the indicator ‘availability of enhanced services’ was useful to help to see if the services provided are holistic, and indicated forward-thinking of practices beyond core contract. Discussions on the indicator ‘safeguarding’ raised that this indicator should perhaps include the ability to communicate with risk groups.
Objective 4: effective use of information technology systems
The indicator ‘effective use of IT tools’ in this objective was of interest to participants who felt particularly that the part of this checklist that asks if > 10% of a practice’s patients have online access to their records was less useful than asking what percentage of patients use this online access.
Objective 5: good physical environment
Participants felt that it was important to capture privacy in the reception area under this objective and that the indicator ‘appropriate environment consulting rooms’ should include a check that every room meets minimum size requirements.
Objective 6: motivated and effective practice team
Public participants also commented that the indicator ‘quality of teamworking’ should not be measured on a monthly basis and wondered if it was possible to also capture other teams’ (e.g. attached nurses employed elsewhere) views of team quality.
Objective 7: good overall practice management
Participants wondered if the following questions should be included in the checklist: ‘do they have a complaints policy?’, ‘do they have a complaints log?’ and ‘how many complaints have they had in reporting periods?’, although it is likely that all practices do have these. They were pleased to see succession planning included in the indicator ‘workforce planning’ and also felt that what is meant by a significant event needed to be clearer in the indicator ‘management of significant events’. (However, this was partly because they had not seen the detailed guidance given to practices.)
Objective 8: high levels of patient satisfaction with services
Participants felt that the indicator ‘percentage of patients willing to recommend practice’ offered diminishing returns and wondered if there are other ways to test this. They felt that whether or not staff would be willing to recommend the practice would be useful and that having tools to enable patients to get the most out of their appointment would be particularly beneficial. They also felt that the norm should be high for the indicator ‘patient satisfaction with reception staff’ as ‘reception is the first port of call for the practice’.
Objective 9: ease of access and ability to book appointments
Participants wondered if there was a benchmark for the indicator ‘hours of clinical appointments per 1000 patients’.
From a patient perspective, the indicator ’percentage of patients waiting beyond 15 minutes’ was less meaningful than how well waiting times were communicated. All participants appreciated that some appointments do run over with valid reasons and it was about ‘how long until you get impatient and what can the receptionists do about this’.
Objective 10: partnership working
The indicator ‘working with different partners’ was seen as very valuable, with one participant highlighting that ‘the GP Five Year Forward View wants GPs to work collectively and with others, if they aren’t doing this, it sends a warning bell to themselves.’ It was also felt that this should be linked to social prescribing.
Objective 11: engagement with public
This objective led to detailed discussions; the assumption that every practice would have a PPG (as this is a current CQC requirement) was highlighted. It was felt that if a PPG could not be evidenced, then points should perhaps be lost in the GPET.
For the indicator ‘enabling involvement’, participants were not clear whether the meetings have been physically or virtually held and one participant raised the point that ‘a virtual meeting is not an e-mail sent to one or two people.’ There was, therefore, a need to define what is meant by ‘virtual’ in this indicator. An indicator noting how many PPG meetings were cancelled was raised as useful.
A useful comment on possible improvements to the indicator ‘resourcing the PPG’ was as follows: ask if PPG is chaired by a patient or GP/staff member and what staff time is given, not just is there a member of staff. Other suggested improvements to this objective were to include the number of members of the PPG and the average numbers attending meetings and whether the PPG was representative of practice demographics. It was felt to be important that patients contributed to this indicator: ‘ask the PPG. After all, it’s the satisfaction of the patients which counts’.
When discussing the outreach elements of this objective, it was felt that one member of staff should be responsible for this; examples of peer support, for example health champions, were recorded. The indicator ‘outreach and partnership with local population and community’ was seen as very valuable and highlighted by this participant: ‘One of the things we do get, because the practice is trying to stimulate things, they get people to come and talk to us. People from voluntary organisations, particular services or the diabetes clinic.’
Findings from the practice manager questionnaire
This section examines responses to each question in the practice manager questionnaire separately (with a few exceptions, e.g. when the data could be brought together or was for identification purposes only).
On average, how much time (in hours) would you estimate was spent on using the tool per month? This can include data entry, getting feedback, troubleshooting, etc.
This question was answered by 39 practices, stating that it took between 1 and 10 hours per month to use the tool (estimated mean 3.41 hours). Those who took less time were just entering the minimum data required. Several stated that the first few months took longer.
Two practices stated that this was much less time than anticipated, two a bit less than anticipated, 10 about the same as anticipated, 17 a bit more than anticipated and 10 much more than anticipated. Twenty practices highlighted gathering data as an aspect that had taken longer than anticipated, and 11 practices highlighted that entering data had taken longer. Other reasons were quoted by a small number of practices.
Usefulness and ease of use
Views on usefulness and ease of use were varied. On a scale from 0 to 10, the mean for ease of use was 5.6 (SD 2.1). For usefulness of the tool, the mean was 4.5 (SD 2.4). For usefulness of feedback, the mean was 4.7 (SD 2.6). This suggests that there was a substantial range of opinions. It is important to remember that this included responses from some practices that had not gone on to use the GPET after being trained in using it.
What, if any, additional resources were needed to use the tool?
This question was answered by 24 practices. Fourteen practices referred to the challenge of finding the time to use the tool. Most felt that it was a typical challenge of finding dedicated time for any non-day-to-day activity, whereas others referred specifically to the time needed to enter data required from practice records. Although the automated searches facilitated this, three practices stated that they had to amend the searches to be suitable for use within their practice.
Three practices commented specifically on the time taken to use the tool, referring to the need to have two screens to check the search results on the clinical system while inputting and that the tool may have been too long and overcomplicated.
Did you experience difficulties in using the software itself?
No difficulties were experienced by 25 practices. Fifteen said that they experienced a few difficulties and one said that it experienced considerable difficulties.
Please describe briefly the difficulties you encountered
Fourteen practices responded to the question asking about difficulties in using the software itself. Five practices felt that the tool was difficult to navigate, describing it as ‘clunky’, or ‘not intuitive’. One practice manager stated that it ‘felt like I was relearning it each month’. Two respondents referred to the data input process and offered suggestions for improvements, for example ‘It would have been better if having saved one [indicator response], it opened up the next automatically,’ and highlighted that activating each individual indicator could be a challenge that may best be done centrally.
Were there any performance areas missing from the General Practice Effectiveness Tool? If so, what were these?
According to 27 practices, there were no missing performance areas; it was stated that the tool was ‘very comprehensive’. One practice did think that ‘QOF indicators and enhanced services could be included’.
Were there any objectives missing from the General Practice Effectiveness Tool? If so, what were these, and under which performance area(s) should they fall?
This question was answered by 26 practices; 24 of which stated that no objectives were missing. Three practices felt that ‘an effective team is a productive team’ and that more measures on teamworking or workload management would have been beneficial.
Were any of the indicators problematic to gather? If so, please state which indicators these were
This question was answered by 36 practices, which provided useful suggestions for improvements. Fourteen practices highlighted problems with indicator 9.1 (hours of clinical appointments per 1000 patients per week). This was mainly because of the time it took to calculate. However, one practice stated that, ‘The results would only really be useful if this was split into doctor appointments, nurse appointments, HCA [health-care assistant] appointments, etc. to ascertain where any problems were’.
Nine practices also highlighted indicator 9.2 (percentage of patients waiting > 15 minutes past appointment time) for reasons similar to those for 9.1.
Six practices stated that gathering data for indicator 10.1 (percentage of attendance at MDT meetings) was difficult and/or time-consuming.
Three practices stated that data for indicator 3.5 (DNAs) was difficult to collect and that they could not complete indicator 6.5 [staff well-being (sick days)] as the information was not recorded in the way in which it was being asked for.
Some indicators were identified as needing to be collected less frequently than monthly, with quarterly collections being suggested. These, and all further information on improvements to be made for specific indicators, can be found in Appendix 11.
Were any of the indicators problematic to interpret? If so, please state which indicators these were
Responses to this question were received from 28 practices.
Twelve practices stated that the indicators were not difficult to interpret and one stated that they did not interpret the indicators. The remaining 15 practices commented on some ambiguity or subjectivity that was present; the mention of individual indicators is recorded in Appendix 11, as it highlights the importance of ensuring the clarity of the indicator descriptions.
Discussion of feedback
Seventeen practices said that they discussed feedback at team meetings, whereas 12 discussed it at individual meetings. Six practices said that they made other use of the feedback, including informal chats or sharing it with their patient representatives. In 13 of the practices, GPs had been involved in this discussion. Practice management staff had been involved in almost all discussions, and patient representatives had been involved in five practices (with other clinical and administrative staff involved in many practices also).
Did the feedback/data lead to any actions taken to improve effectiveness? If so, please summarise these briefly
Responses to this question were received from 29 practices. Sixteen practices stated that no action had been taken to improve effectiveness as a result of using the tool. One practice manager highlighted that, as there was no money attached to this, it was difficult to get GPs to make changes. One practice stated that they had not yet taken action but planned to and 12 highlighted how the feedback had led to actions within their practices. Four practices implemented more audits. Several practices amended templates to improve data capture and introduced care plans that had not previously been used effectively. The searches highlighted that some data were not Read coded properly by some clinical staff. Several practices stated that they found the ‘quality of team working’ questionnaire useful and would continue to use this (often it was referred to as the staff satisfaction survey).
If you have any other comments about the General Practice Effectiveness Tool, please state these here
Further comments about the tool were offered by 21 practices. Only three were predominantly negative:
It was clunky, took up a lot of time and didn’t give me any info[rmation] that was particularly of use to me as I already know what our focus/priorities are and how we are doing; at times it was demotivating because it highlighted we weren’t moving forward in some areas but then I had to remind myself they may not have been areas we needed to move forward in. I would not want to use this tool long term.
I wouldn’t use the tool voluntarily in its current format as it doesn’t serve to provide me with any information I don’t already have.
It was quite time-consuming and largely irrelevant to day-to-day work. An added pressure in an already busy day.
Six practices offered suggestions for improvements that would facilitate their use of the tool in future:
Could be a very useful benchmarking tool, but needs to have better report displays and options for manipulating the data to be more user friendly.
Entering the data manually is time-consuming, time is not something we have a lot of in general practice. There’s a lot of indicators that do not need to be asked every month; also some indicators would be better entered by clinical staff.
Financial part of this survey is not prescriptive enough and could be interpreted in different ways by different practices, e.g. ‘bills’ too loose a term.
I would not use the tool in its current form but can see a lot of benefits gathering some of the data. Collecting the data on a less frequent basis, e.g. 6 monthly, would make it more attractive and changes in results would be more apparent. I will use some of the categories in the future to monitor how various areas are progressing.
Nine practices offered comments that were partly or wholly positive:
It is quite a simple tool once you understand it but certain of the questions are difficult to get accurate answers for.
It offers opportunity for having a[n] overview from which practices can use to then consider areas for improvement and change. It enables discussions to take place with all levels of staff and with patients and provides a regular trend report on which any changes can begin to be measured against.
It was interesting to see another perspective on the surgery’s performances and is a good way to help motivate improvements where needed. Thank you.
Re[garding] my response to Q16, the tool would be useful but only if it replaced some of the existing tools. We are very stretched and adding yet another tool, regardless of how good it is, would be an additional burden on the team.
Something like this may be very helpful but having time to review results is absent.
The concept of the tool is very good and it helped to highlight and quantify some areas where we are below national averages. It also highlighted where we are doing well. To complete the same amount of data each month was more time-consuming than we had expected and, as some of it doesn’t change, I would like to have some more flexibility in how the tool or modules are set up so that you can track what is of interest to you and flag other items as unchanged or not priority to focus on for the practice.
We were able to see at a glance the areas that needed to improve and action them.
We would consider using again in the future but feel a much longer period of time needs to be looked at, especially for areas such as appraisals as these are done [at a] certain time of year, so much would be time specific.
Financial data
The financial data were asked for so that a productivity index could be derived, using financial resources as a denominator in a formula with effectiveness points used to calculate the numerator (as described in Chapter 3).
Unfortunately, however, many practices found it impossible to provide the data, despite agreeing in principle to do so before beginning the pilot. In total, only six practices were able to provide the monthly expenditure data that would have been used in this way. Clearly, this was insufficient to provide any useful productivity index development or analysis.
As described in Findings from the pilot study, the payment per registered patient was used as a practice characteristic variable to analyse alongside other practice characteristics. This was designed to pick up whether or not practices with a higher level of resources were more likely to complete, or perform better, on the GPET. However, there was no evidence that practices with greater financial resources per patient were more likely to participate, record higher effectiveness, or improve effectiveness than practices with lower financial resources per patient.
Conclusions
Overall, the picture presented here is mixed. There was considerable variation in the extent to which practices would use the tool as planned, and in their perceptions of its usefulness and ease of use. Although some practices were very positive about it (i.e. 55% found it easier to use and 40% thought that it was more useful than average) and could highlight changes brought about through its use, others could not see such a benefit (i.e. 45% rated it less useful than average). The time needed for its use was not seen by many as a good investment. The three different sources of evaluation data all pointed towards this conclusion.
The content of the tool itself was, broadly, seen positively: participants tended to agree that it included the right areas, although this was not unanimous. There were more problems brought up about specific indicators, especially those that relied on practice records where practices would not have collected or stored data in a uniform way. Therefore, any future use of the GPET will need to consider which indicators may need some refinement or more standardised methods of data collection.
Unfortunately, most practices were not able to provide the monthly expenditure data that had been planned to formulate an index of productivity from the effectiveness measure. Therefore, this productivity calculation could not take place.
On a more positive note, however, there was some clear evidence that practices using the GPET had improvements over the period of the pilot. In particular, there were significant improvements in the practice management and patient focus performance areas over time. Although, without a control group, we cannot be certain that this was linked to the use of the GPET; there was some evidence provided by the interviews that practices did indeed make changes based on the results. This ties in with the finding that practice managers and administrative staff were far more likely to be involved in discussions about the GPET and its feedback than clinical staff.
The findings from different sections of this chapter, together with those in earlier chapters, will be brought together and discussed more generally in Chapter 6.
Chapter 6 Discussion
Overall summary of research findings
The three overall objectives of this study were to:
-
develop, via a series of workshops with primary care providers and patients based on the ProMES methodology, a standardised, comprehensive measure of general practice productivity
-
test the feasibility and acceptability of the measure by piloting its use in 50 general practices over a 6-month period
-
evaluate the success of this pilot, leading to recommendations about the wider use of the measure across primary health care in consultation with key stakeholders at local and national levels.
Each of these three objectives was met to some extent, although there were some changes in emphasis along the way; practical difficulties and areas for future development in relation to the measure were also identified. An overall measure of general practice effectiveness, the GPET, was developed, with broad consensus over its content (particularly across four performance areas: clinical care, practice management, patient focus and external focus), although there were some specific areas considered important for which no satisfactory indicators could be found using existing and accessible data. Unfortunately, the GPET was not a productivity measure of the type that had been initially envisaged. There were two reasons for this. First, it became clear in the first stage of the research that, although a measure could be produced that was standardised as far as possible, it would never be able to be standardised to the extent that it provided a fair comparison between all practices. Differences in practice population, services provided and commissioning arrangements, and other local differences, meant that some practices would probably always score more highly on some indicators regardless of any changes made, owing, in part, to the approach taken (which required the use of predominantly existing data that could be collected on a regular basis). It was decided that a measure of productivity could still be produced, but it would have more benefit for comparing performance within practices than between practices. Second, however, this measure of productivity would rely on having data on the inputs to practices (measured by monthly financial spend). Unfortunately, very few practices were able to provide these data. This left us with a measure (GPET) that was still considered a useful measure of practice effectiveness by many, but did not meet the definition chosen for a productivity index.
Reactions in relation to the feasibility and acceptability of the measure were mixed. Although 51 practices began the process, being trained in using the measure, only 38 independently proceeded to use it to enter their own data. Of these, 10 practices did not fulfil 5 months’ full data entry. Thus, 28 of 51 practices engaged sufficiently to use the GPET to its full extent.
In general, measured across several strands of the evaluation, there was broad support among these practices for the concept behind the GPET, although a number of operational difficulties prevented it being as useful as it might have been. However, there was evidence that the levels of effectiveness in the participating practices showed modest improvements over the course of the pilot study.
There were also varied reactions to the usefulness of the GPET, with practices having a range of views about how much it helped them and in their estimates of the resources it took to implement the GPET. There was enough encouragement from a substantial number of practices to suggest that the GPET could be useful to other practices in the future; however, this was far from unanimous.
It was also not possible to generate a true measure of productivity (as opposed to effectiveness), because of the inability of practices to supply financial expenditure data for each month.
Overall, therefore, there was a mixture of positive and negative findings regarding the measure. These are explored in more detail in the following sections.
The overall effectiveness model
The ProMES has been well established as a method for generating tools to measure effectiveness. 73 The overlap and distinction between effectiveness and productivity is an important issue that will be discussed in more detail in How feasible is it to measure general practice productivity?, but for the purposes of this study, the ProMES exercise was designed to develop a measure of quality-adjusted outputs: that is, neither simply an assessment of activity nor of quality, but a combination of the two.
The large-scale ProMES process used in this study was based primarily on the approach taken by West et al. 82 in their study of CMHTs. The three-stage process consisted of two large workshops used to derive the objectives, six smaller workshops to formulate indicators and two further large workshops to refine, weight and assign contingencies to the indicators. This process proved to be very successful in CMHTs. However, in the context of general practices, it was more challenging for a variety of reasons.
First, the sheer range of clinical practice is vastly greater in general practices than in CMHTs, covering all types of patient and condition and with a huge volume of core activity. Thus, although nine objectives were generated initially, some of these, particularly in relation to clinical care, were found to be massive in scope and could not be measured by a small number of indicators (e.g. up to six), as is traditional in ProMES processes. As a result of this, the scheduled sessions proved insufficient to develop the measure, and several extra sessions needed to be added. It was important that a balance was struck between attempting to be comprehensive in what the measure would cover, and being realistic in terms of what practices could not only gather data on, but also respond to feedback on. Therefore it was imperative that this stage was not rushed.
Second, although there was much interest in the project in principle, because of the nature of GPs’ employment, it proved more difficult to attract GPs to the workshops, given that each workshop attended would have resulted in most of a day, or a whole day, lost from the workplace. Therefore, although many general practice staff did attend these workshops, only 15 GPs participated across the different workshops. As a result, the focus on clinical care, in particular, was left to a relatively small (albeit highly engaged and informed) group. In contrast to this, the level of interest from patients and public representatives was very high, with many very informed participants contributing to the workshops.
Third, the types of data that were suggested for the indicators were highly varied, and many needed very careful definition. This contrasted with the West et al. 82 study, in which the final measure was collected via employee questionnaires. The amount and range of objective data available within primary care means that there were many indicators that could be extracted from clinical systems (albeit with very careful definition and centrally constructed data queries). However, some other areas relied on practice records and, although there were some specific indicators that participants thought practices should have available, it was far from certain that practices would gather or store the information in the required form. Other areas were thought to be too difficult to measure.
The nine objectives that were derived from the first phase of workshops were considered to be valid at all stages of the study. In subsequent workshops, in the consensus exercise and in the implementation and evaluation of the pilot study, the over-riding impression was that these objectives successfully captured the broad activities of general practices. However, there was equal consensus that the clinical care objective was too big to be covered by a single objective and merited more of the content in an overall measure. Therefore, the separation of this one objective into three objectives, which relied on careful analysis of the suggestions made about clinical care indicators in the workshops, and the grouping together of similar objectives, produced an overall model with four performance areas and 11 objectives, as shown in Figure 16.
FIGURE 16.
Performance areas and objectives.
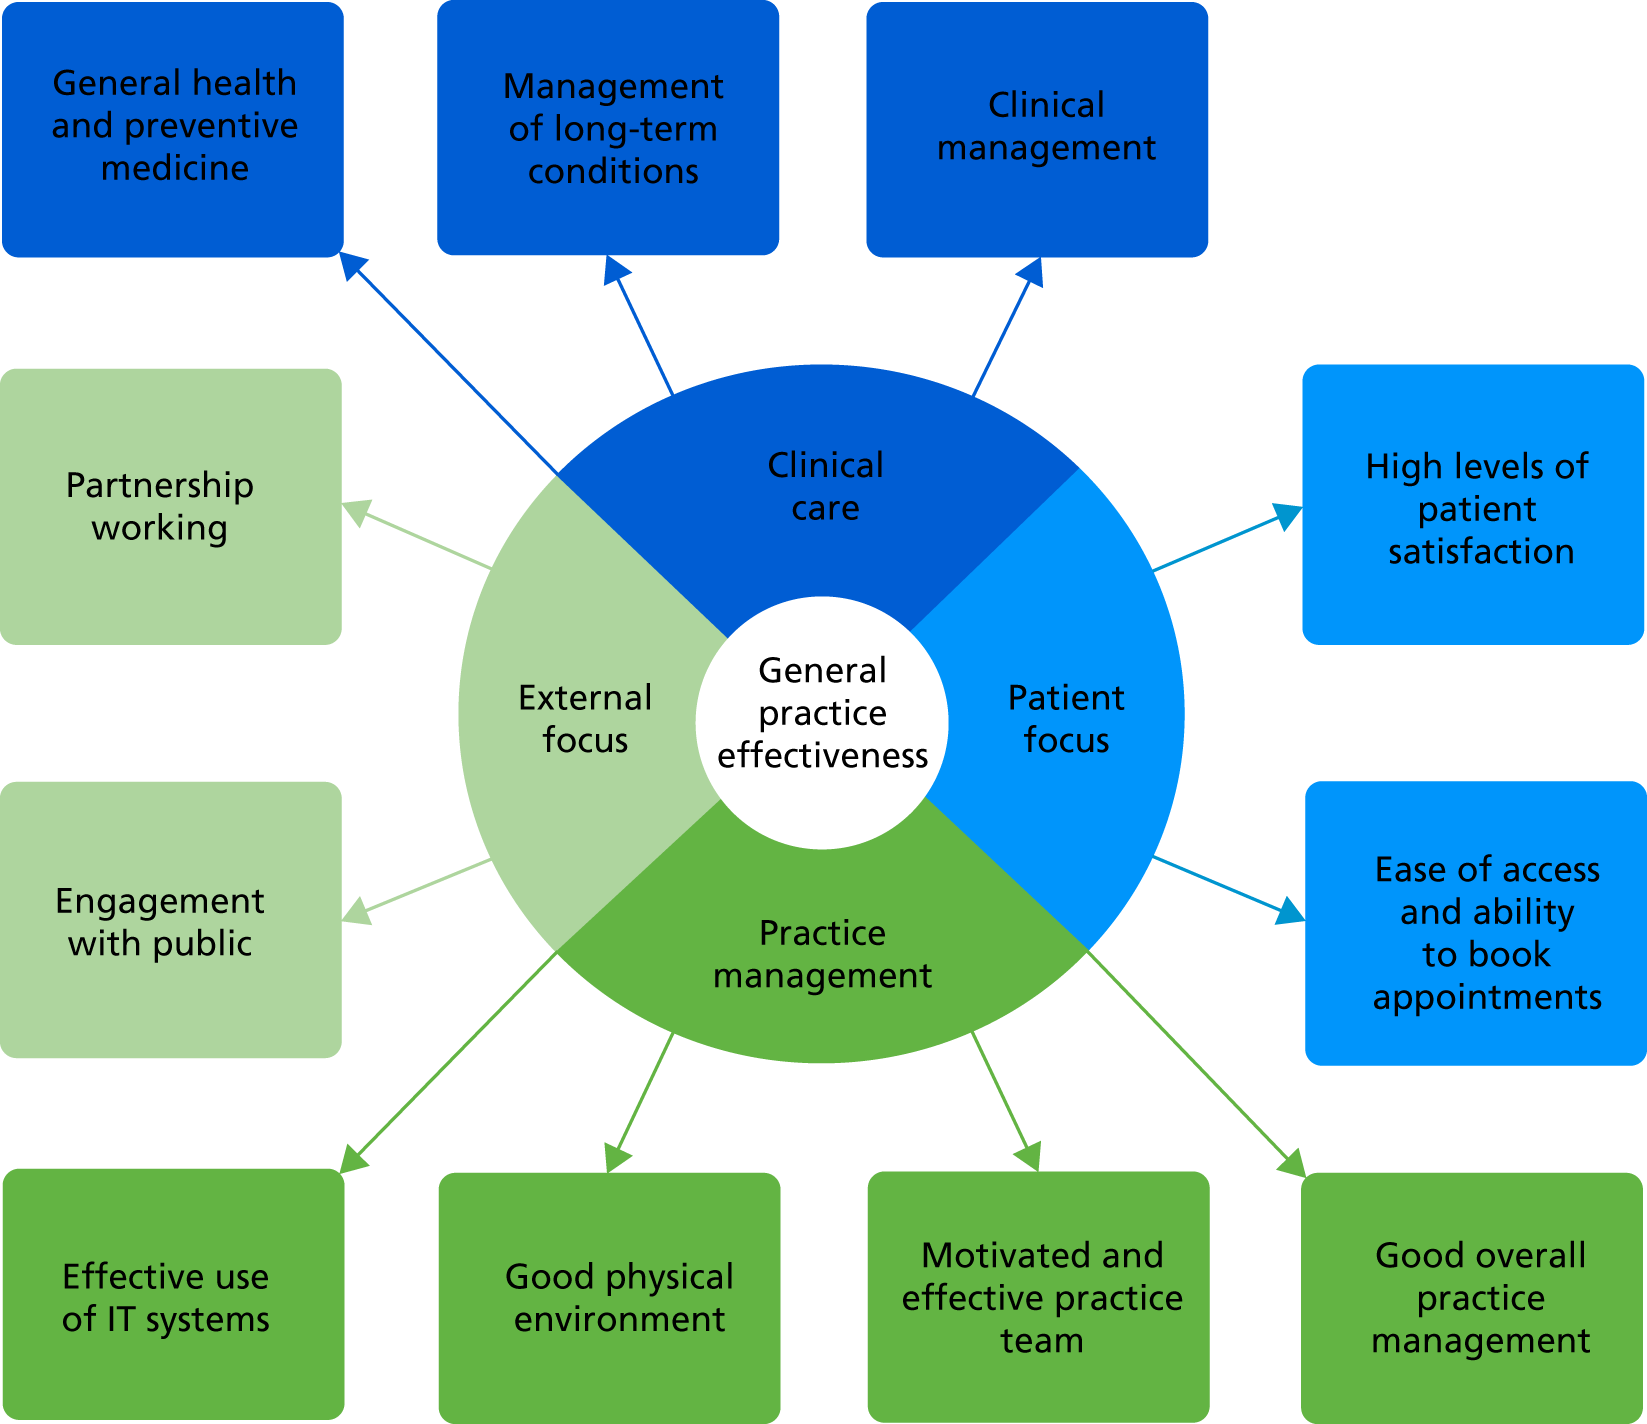
It was notable that, although there were concerns over some specific indicators, there was no significant dissent from this model when it was presented in the consensus exercise, or in the evaluation of the pilot itself. There was an acknowledgement that a tool such as this could never achieve both completeness and usability; therefore, the absence of some specific clinical areas was not seen as a major impediment. In addition, if the tool is to be further developed in the future, there would be flexibility to include some of these additional areas should it be deemed appropriate. There are, of course, some links with Kringos et al. ’s33 broader model for primary care effectiveness, in which they define the dimensions of processes as access, continuity of care, co-ordination of care and comprehensiveness of care (which broadly corresponds to the patient focus and external focus areas, with some elements of practice management, too), and outcomes determined by quality and efficiency of care and equity in health (broadly, the clinical care area).
It is to be expected that there would be some overlap with existing indicators of general practice performance. The clinical care performance area is closely related to the QOF, with several of the indicators overlapping (although sometimes defined slightly differently). The CQC inspection areas of ‘safe’, ‘effective’, ‘caring’, ‘responsive to people’s needs’ and ‘well-led’ clearly map on to the following performance areas: ‘safe’ primarily to clinical care, ‘effective’ to most (but particularly to clinical care), ‘caring’ to clinical care and patient focus, ‘responsive to people’s needs’ to patient focus and external focus and ‘well-led’ primarily to practice management. The advantage of this model over the CQC measure, however, is that it allows for far more regular feedback.
It is also notable how closely this model maps onto the 10 high-impact actions for making time in general practice. 13 These were described in full in Chapter 1, Overview of measurement of productivity and effectiveness in general practice. Table 14 demonstrates how well these align.
| High-impact action | Performance area/objective most closely linked |
|---|---|
| Active signposting |
|
| New consultation types |
|
| Reduce DNAs |
|
| Develop the team |
|
| Productive work flows |
|
| Personal productivity |
|
| Partnership working |
|
| Social prescribing |
|
| Support self care |
|
| Develop QI expertise |
|
As discussed in Chapter 1, the fact that this is quite far removed from what is measured by the QOF suggests that there is a need to expand the model of general practice beyond what is included in the QOF. The fact that almost all sections of the effectiveness model produced by this research map closely onto either the QOF or these 10 high-impact actions further suggests that it is producing good and broad coverage of the most important areas of performance for general practice.
There are limitations with the ProMES approach, however, as there would be with any bottom-up approach. The precise formulation of the measure (both in terms of the specific indicators chosen, and the relative importance given to each) would probably vary depending on who was taking part in the exercise. It is also possible that some higher-level strategic viewpoints may be missed. The research team sought to minimise these limitations by including large enough numbers of participants to get a wide variety of viewpoints and by ensuring that enough experienced experts were included (e.g. several GPs and people who had held senior leadership positions within the NHS) among the workshop participants and contributors to the consensus exercise.
How feasible is it to measure general practice productivity?
The initial objective was to develop a standardised, comprehensive measure of general practice productivity, with productivity defined as a quality-adjusted ratio of outputs to inputs. Specifically, it was intended to develop a measure of quality-adjusted outputs (which might also be thought of as a measure of effectiveness), and use this measure as the numerator in a formula with practice inputs as the denominator.
In two respects, this objective was not fully met. First, the numerator measure (which became the GPET) was standardised to some extent and was judged to be comprehensive enough, but the standardisation was not sufficient to allow direct comparison between all practices. For example, some practices would inevitably score lower on some indicators, because local commissioning arrangements meant that certain services would not be provided in those practices. It was not possible to develop a model that would account for all possible commissioning arrangements in a fair way. Likewise, practices with higher proportions of older or unemployed patients, or patients from a lower socioeconomic background, would be disadvantaged on some indicators. The issue of comparability between practices is explored in greater depth later in this section. Therefore, although the measure would allow fair comparison between similar practices, or for tracking the same practice over time, it was not considered to be a measure of productivity that would be appropriate for performance measurement. In the researchers’ view, it would be almost impossible to create such a measure.
Second, an actual productivity metric could not be calculated because of the scarcity of financial data that practices were able to provide. Unlike the previous difficulty, this is one that should be surmountable given time and resources: practices should be able to record their monthly expenditure, although some clear definitions would have to be given. There was always likely to be a question of whether a straight ratio would be appropriate or whether some adjustment would be necessary (bearing in mind that the numerator of the equation is measured on a very different scale, ‘effectiveness points’, from the financial scale of the denominator). However, there was insufficient data even to examine this in any meaningful way. Instead, whether or not there was any link between effectiveness (the outputs) and resources was examined, as measured by payments per registered patient. There was no evidence of any link, although, of course, the sample size was small. It could be that a parallel ProMES exercise to determine measurements of resources would be an appropriate way to examine this more closely.
The primary outcome of this study, the GPET, should therefore not be considered a measure of productivity. Despite this, it is worth noting that the ProMES approach is based around productivity, as its full name suggests. However, ‘productivity’, as defined by the ProMES approach, is not the same as the classical definition of productivity, namely a ratio of outputs to inputs. Indeed, Pritchard et al. 27 define productivity as a mixture of effectiveness and efficiency. Although there are clear links between this and the often-used health-care-based definition of productivity (a quality-adjusted ratio of outputs to inputs), they are not one and the same. 16,27
Therefore, although it was not possible to get a full productivity measure, by some definitions the numerator alone – the effectiveness points as defined by the ProMES methodology, captured by the GPET – could be considered to capture one definition of productivity. 27 Indeed, examination of the specific indicators reveals a combination of those that are based around volume of activity, those that are based around quality of outcomes and those that combine both. Therefore, it could be that, in the absence of a true measure of productivity, this could be considered as a viable alternative.
An important question, however, is about the extent to which it allows comparability between practices. This is a more complex and nuanced question than it might at first appear. First, there is the question of whether or not all of the indicators are available at all practices. The selection criteria used for the indicators (described in Chapter 4, Detailed workshop methods) were such that this should indeed be the case, although some rely on completeness of practice records on areas as diverse as waiting times, missed appointments, staff training and sickness absence. Although, in principle, all practices should be able to measure and retain data for all of these, the fidelity with which they can do so varies. Second, some indicators may favour larger practices. For example, the ‘availability of enhanced services’ indicator includes 12 specialist services, many of which are more likely to be provided by larger practices with more resources. Does this make those practices more effective or productive? It could be argued that it does, but equally it could be argued that this results in an unfair comparison between two practices of very different sizes (at least, if a smaller practice is not part of a federation or other grouping of practices). Third, many of the indicators, particularly those in the clinical care performance area, will be affected by the specific local population. Although care was taken during the indicator generation phase to make the indicators as fair as possible (e.g. for ‘smoking cessation’, the indicator is the percentage of smokers who have been offered smoking cessation advice or treatment in the previous 12 months, rather than the percentage of patients who are smokers), there are still likely to be significant differences in such an indicator between a practice in a more deprived area where a greater proportion of patients are smokers, and a practice in a wealthier area where fewer patients smoke.
Overall, therefore, although the tool does give an effectiveness score that represents a real difference between practices, that is not to say that a practice with a higher score is necessarily a better practice, all things considered, as this may, in part, be a function of the practice size, local population and other external variables (although little evidence of this was seen in the data analysis). Thus, although such a score can provide useful information, it does not provide a fair comparison of the effectiveness of practices in different regions or of different sizes; to some extent, this could be overcome by ensuring that any comparisons are made only between practices of similar types, although that may be more limiting. Just as previous attempts to create a measure of overall performance have been limited for reasons such as narrow data (e.g. QOF) or irregular measurement (e.g. CQC inspections), a limitation in the tool produced here is that it cannot provide a fair comparison across all practices.
However, the GPET certainly does produce data that is comparable within a practice over time. Therefore, its use as a measurement of effectiveness to be tracked longitudinally could offer real value for practices, and may serve as a contribution to the call from the RCGP for QI tools. 64 However, this is not a QI tool in the traditional sense: to derive such a tool would have required a different approach and framework.
The extent to which this would happen in practice depends on the willingness of practices to use the tool to its full extent. From the evaluation, it appeared that willingness varied: some practices were not convinced of the benefit of the tool; far more could see its potential usefulness but could not spare the resources to make full use of it; whereas others found it very useful and were keen to continue using the tool if they could.
Successful use of the tool
The majority of practices participating in the study managed to use the tool successfully, although the extent of successful use was mixed. Fifty-one practices began the process, being trained in using the measure, and 38 practices independently proceeded to use it to enter their own data. Of these, 10 practices did not fulfil 5 months’ full data entry (and a further 10 did not fulfil the sixth month, but this was largely because of delays in starting its use, taking the start point to beyond April 2017).
Thus, 28 of 51 practices engaged sufficiently (i.e. included at least 5 months’ worth of data) for them to be considered to have used the GPET to its full extent. This is obviously lower than would have been desired, and suggests that there were particular problems in some circumstances with being able to use it effectively. Some of this related to specific data collection methods, which are explored in Specific areas for future development. However, many practices indicated that the time taken was a major factor in this, with 27 of out 39 practices who answered this question saying that it took more time than had been anticipated.
The ease of use was also considered mixed: the mean of 5.6 on a scale from 0 to 10 suggests that there were only slightly more positive than negative views on this (although this included practices that had not gone on to use the tool independently after being trained). In terms of usefulness, this figure crept below the mid-point to 4.5, suggesting that some practices did not see the value in investing the time necessary, although, as will be discussed in subsequent sections, those who did often saw more benefit.
Overall, therefore, it was found that not all practices were able to put in the time and effort to make best use of the tool, but a majority still did comply on the whole. It is certainly the case that, with the learning from this study, the time and effort involved could be reduced; therefore, the fact that this was the major barrier for many is somewhat encouraging.
It is important to note that this assessment was based on a relatively straightforward evaluation that was not based on any particular theoretical framework. This was designed to elicit relatively basic responses. A more thorough, theoretically grounded evaluation could have produced a more rigorous understanding of the issues faced by practices when using the GPET.
Changes in effectiveness
An interesting angle of the use of the GPET by practices in the pilot study was what would happen to their effectiveness over the course of the study. The analysis showed that the overall effectiveness score increased significantly over the months that practices participated. Even if the first month was ignored (to allow for practices getting used to gathering and entering data), there was an average monthly increase of 64.7 effectiveness points [95% confidence interval (CI) 13.1 to 116.3 points]. This represents 1.3% of total effectiveness points that were available, or a standardised estimate (change divided by SD) of 0.09. Although this is a fairly modest change – even over the course of 3-monthly changes, this represents a difference of 0.27 SDs, which is still close to what is traditionally thought of as a small effect (a change of 0.2) – the fact that there is any significant change at all deserves attention.
It should be noted that, not only is the change small in standardised terms, it is small in comparison with other studies that have used the ProMES approach. Pritchard et al. ’s73 meta-analysis found, across 83 field studies, an average improvement of 1.16 SDs. Although this was, typically, over a far larger number of periods (a mean of 19.8 periods across different studies), it was also the case that the effects tended to dissipate over time. 73 Thus, a relatively small change, such as the one witnessed in this study, is a long way short of what has been shown elsewhere. There are probably two main reasons for this. One is the added complexity of general practice (requiring 52 indicators in the GPET, compared with 8–12 indicators, typically, in the studies in the meta-analysis); this means improvements are averaged over far more scores, and it is not realistic for practices to improve on that many at once, especially as many indicators are actually measured over the course of a year, and some are unlikely to change much at all in a short period. Thus, the short time scale for the study was far from ideal for making an evaluation of the extent to which scores could be improved.
The other reason is that, in a typical ProMES exercise, many team members will be involved in the creation of objectives and indicators and this will increase the team members’ motivation, allowing the processes of feedback, goal-setting and participation to have a greater effect. 73 Most of the practice members involved in the pilot study had not themselves been involved in the development of the tool, and even though some representatives from practices had been, there was no evidence that this involvement was related to improvements in effectiveness (although there was some evidence that practices participating in the development of the tool were more likely to submit more months’ data).
If anything, therefore, it is remarkable that there was any significant improvement, and substantial caution is needed in its interpretation. Although the theory behind the ProMES process, that goal-setting, feedback and participation drive improvements, may explain this in part (or in full), it is worth considering other possible explanations of this. Of course, practices participating in the pilot were self-selecting, meaning that they may have been particularly geared towards improvement, or some may have chosen to be involved because they were aware that their performance was poor. It is also notable that of the 38 practices to enter data, over one-quarter (n = 10) did not complete 5 months’ data entry. Although this in itself should not have led to the differences seen, as the changes quoted are average within-practice changes, it does remain possible that those practices that dropped out were those where improvements were less likely. The analysis showed no association between number of months’ data entered and deprivation, practice size or initial effectiveness points, but there was no systematic method to capture a practice’s ability or willingness to improve.
It is important to note also that this was a straightforward longitudinal study with no control group. We cannot be certain how practices would have performed over this time period if they had not been using the GPET. Importantly, data were collected over the period of a few months, primarily between February and September 2017. There could easily be seasonal changes during this period that would affect the outcomes, either because of comparatively lower activity over the summer months, or because of the impact of needing to submit QOF data at the end of March. In addition, it could be that some practices collected (or entered) data with more fidelity and accuracy as the study went on. Therefore, the improvements seen need to be viewed with some caution. Further insight may be gained by looking at specific performance areas or objectives in this way.
There was no evidence of changes to the clinical care or external focus performance areas. Within the clinical care area, it is worth noting that most of the indicators relate to activity over the previous 12 months, and some over longer periods, with only a small number relating to shorter periods; specifically, one over 6 months, one over 3 months, one over 1 month (DNAs), and two that relate to current policies (availability of enhanced services and safeguarding, both of which require more significant effort to change). Therefore, to make substantial improvements within a month on these seems a very tall order, and it is not surprising that no significant change was seen. In addition, because of the overlap of several of these indicators with those in the QOF, it is likely that practices are already well aware of data in these areas and are trying to maximise their performance on these.
For external focus, there were far fewer indicators, and given the nature of these (requiring working together with external organisations, and/or the PPG/PRG), it is also not surprising that change would be slow. Whether practices would be sufficiently motivated to change these based on feedback from the GPET remains an unanswered question. This was the performance area for which the development of indicators was most problematic, largely owing to the availability of relevant data, and so a greater focus on capturing important indicators of externally facing work would be beneficial if improvement in this area is to be achieved.
For the other two performance areas (practice management and patient focus), however, there were significant improvements, not just overall, but on five out of the six objectives. The only objective that did not show significant change was good physical environment; again, this is something that would be likely to require considerable investment and/or time to change substantially. However, there were significant improvements in effective use of IT systems, motivated and effective practice team and good overall practice management among the practice management objectives, and both of the patient focus objectives (high levels of patient satisfaction with services and ease of access and ability to book appointments). This was particularly promising in the light of recent research showing that public satisfaction with GP services has been decreasing. 14
Many of these areas can be addressed by more modest changes; for example among the motivated and effective practice team objective, the proportion of staff with training needs met increased significantly, suggesting that, by examining this indicator, practices were able to identify and make improvements in this area. However, it is also notable that the amount of sickness absence among staff decreased; this could either be because of improvements in weather (and subsequent decreases in illnesses) over the summer months or because action was taken to try to reduce this in practices (or a combination of both). Likewise, improvements in patient satisfaction may be due to responsiveness to prior feedback, but may also be due to less pressure on services and more availability of appointments later in the process.
Overall, therefore, there is evidence that improvements were made, but it would need a more rigorous, controlled trial in order to determine whether or not these were as a result of the use of the GPET.
Specific areas for future development
In this section, each element of the GPET is considered, and what the evaluation suggested would be needed to make them fit for purpose in the future is discussed.
Performance area: clinical care
The content of this performance area included many indicators that were extracted automatically from clinical systems (using MIQUEST queries), and several that overlapped with the QOF. Participants found this unsurprising and helpful in many ways, although several commented that a more joined-up, automated system would be helpful. Some of the indicators in this area were similar to indicators that had previously been part of QOF and these were found to be particularly useful by some participants, as these were no longer automatically monitored.
It was noted that there are some conditions that are not explicitly covered by the indicators included in the GPET. For example, asthma, epilepsy and cancer were all brought up as conditions with no explicit indicators. Nevertheless, it was acknowledged that a tool of this nature could not reasonably cover every condition, even QOF does not do that, and that the conditions included would cover the majority of the important activity. Conditions such as those mentioned above (i.e. asthma, epilepsy and cancer) certainly have substantial overlaps with existing indicators; therefore, the coverage of the tool appears to meet the needs of practices.
One specific area that was suggested for inclusion, which does not substantially overlap with existing indicators, is women’s health (e.g. smear updates and breast screening). Consideration may be given as to whether or not this should be included in the future. Another area that was brought up by patient respondents was that of continuity of care. In particular, in the case of long-term conditions, it was felt there should be some measurement of whether or not a GP has a holistic overview of a patient.
Some of the services included did not apply to all practices. For example, several practices were not commissioned to provide a health check for patients aged > 75 years, resulting in a zero score for that indicator (meaning a negative effectiveness score: –30 effectiveness points). Consideration will need to be given as to whether or not all indicators belong as part of this performance area (or, at least, whether it should be optional), although it should be noted that if the comparisons made are largely to be within-practice, or between practices commissioned for the same services, this should not matter hugely.
One area that was considered by patients to be of less importance was the indicator of BMI reduction. This view was not shared by practitioners, however. There were four other indicators for which the extent of data entry was low: ‘alcohol consumption’ (31% of entries missed), ‘initial care of mental health conditions’ (69% of entries missed), ‘COPD care (care plan)’ (72% missed), and ‘lifestyle of people with long-term conditions’ (44% missed).
This may, in part, be due to the specific clinical system codes (Read codes) that were used, resulting in the queries being captured inconsistently in different practices; one practice respondent indicated that they ran their own searches to get a more accurate answer.
In any case, any future use of the tool will require an adjustment of the MIQUEST queries because of the change in clinical system codes from Read to SNOMED, which is now in progress. The adjustment of the indicators above, as well as more general changes, would need to be reviewed as new queries are written.
Performance area: practice management
This performance area is another for which it was generally considered that the GPET covers the main areas well. In particular, within the ‘motivated and effective practice team’ objective, the issues of staff retention and sickness absence were mentioned as useful indicators.
Only one indicator was flagged as being particularly problematic during the evaluation: this was the ‘staff well-being’ indicator, measured as the proportion of working-time lost due to sickness absence. Some respondents indicated that they did not previously collect the data in this way, and there were significant discrepancies in the apparent values that practices entered; although they were given instructions for calculating the percentage of working time lost in a month, there were several practices for which values of ≥ 20% were entered each month. This seems unrealistic, although there is no easy way of verifying this. (It should be stated that the significant changes in effectiveness scores persisted even if this indicator was excluded.)
The inclusion of the staff questionnaire on teamworking was viewed very positively by many practices, and was thought to illuminate areas of concern that had not previously been made known. However, it was questioned whether or not this needed to be conducted on a monthly basis.
Performance area: patient focus
Three of the five indicators for this performance area were gathered using questions asked as part of the FFT feedback exercise. Although some practices found this difficult to gather (25% of responses to the main FFT question were left blank and 31% of responses to each of the other two questions were left blank), many practices found this a very positive experience; in general, these were felt to be good indicators (with practices saying that they thought that these were more useful questions than the original FFT question). The fact that there was a significant improvement over time in this performance area (and in both objectives within it) further suggests that this area was useful. Some patient respondents felt that the FFT question offered diminishing returns, however, and wondered about having a staff FFT question instead.
One indicator was found to be slightly problematic: the hours of clinical appointments per thousand patients per week. This was found to be difficult to calculate, and a future iteration of the tool could ask for the elements separately (i.e. total hours of appointments and number of patients) and perform the calculation automatically. One practice thought that this would be more useful if split into different types of appointments (e.g. GP, practice nurse, health-care assistant appointments).
Although the indicator ‘percentage of patients waiting > 15 minutes past appointment time’ was generally viewed positively by practices, some patients indicated that communication about waiting times would be more relevant. However, nine practices indicated that this information was difficult or impossible to collect accurately.
Performance area: external focus
In many ways this performance area was the most difficult, in terms of generating appropriate indicators for the objectives and in terms of gathering accurate data.
One of the key indicators chosen for external focus was ‘attendance at MDT meetings’. Given that this involved partners from different organisations, it was felt by some participants that this was out of a practice’s control and, therefore, seemed unfair. To a lesser extent, the same can be said for the ‘working with different partners’ indicator. A counterview here could be that a proactive practice might be able to forge and encourage links, and attendance at meetings, with external organisations. However, the ‘attendance at MDT meetings’ indicator was not completed in 25% of cases, suggesting that record-keeping may be a problem in this context.
Likewise, there also appeared to be a record-keeping issue for the ‘number of meetings with PPG/PRG in the last quarter’ (25% incomplete), ‘amount of time staff spend in face-to-face contact with the public at appropriate external groups’ (81% incomplete), and ‘outreach and partnerships with local population and community’ (28% incomplete). However, in some cases, the lack of records could be indicative of little or no activity in the area.
With all of the problematic indicators discussed here, it is not the case that such information should be difficult to gather; however, the main problem is gathering the data retrospectively. If sufficient forewarning is given in advance of future use of the tool, the acquisition of such information would be less difficult.
Patients’ views on the PPG/PRG indicators were particularly interesting. The definition of a ‘virtual’ meeting could be problematic, for example respondents were adamant that an e-mail sent to a couple of people should not count, whereas the ‘resourcing of the PPG/PRG’ indicator could benefit from asking about the seniority of staff present and how much staff time was given to this. Another suggestion for inclusion was asking about the extent of representativeness of the PPG/PRG in terms of population demographics, although this would be difficult in practice. In addition, it was suggested that these indicators should be completed by patient representatives rather than staff. This would represent a departure from the approach used in the rest of the tool, but would be worth considering for future administrations, although it would provide other challenges, such as ensuring that there were sufficient members of the PPG (or other representatives) available to complete this section of the tool.
Another issue that was brought up with this performance area was the lack of good public health indicators. The public health responsibilities of general practices are varied, and the clinical care performance area includes many indicators that GPs considered (during the workshops) to be a measure of some aspects of public health. However, during the specific public health workshop, it was made clear that the public health remit of practices should go beyond this individualised, medical-based approach. Two indicators that were suggested were ‘social assessment and prescribing’ (the proportion of consultations including an assessment for social and economic issues affecting well-being, as well as clinical issues) and ‘health and work’ (the proportion of consultations that pick up on occupational or underemployment related sickness or ill health and provide support, treatment and/or referral to other agencies). Unfortunately, no common data sources could be found for these, and it became clear during subsequent workshops that most practices would not be able to gather such data. Therefore, these were left as optional indicators, and only two and five practices, respectively, chose to use them (with no guarantee about the quality of the data).
Therefore, an important issue for this performance area in the future would be the development of indicators that did capture this side of the public health responsibility of general practice.
The online General Practice Effectiveness Tool
The online GPET was adapted from an existing tool for ProMES systems, but designed so that the indicators (and objectives and performance areas) were fixed centrally, as were the contingencies which mapped indicator scores to effectiveness points, and could then be used across multiple practices. Each month, participants would get e-mails asking them to enter data on the relevant indicators, which would include a hyperlink to take them to the relevant page of the tool.
Overall, views about the online tool were positive, with many comments about its usefulness. However, there were a number of issues. One was the nature of data entry – there was a disconnect between the output from the MIQUEST searches and the data that needed to be entered (the ordering not being obvious); some respondents wished that it were possible to automate the procedure of entering the MIQUEST search results into the online tool.
All practices stated that it took them some time to get used to entering data into the tool and interpreting the reports. Until they were confident that the data collection was accurate, they did not share it with the wider team or patient groups.
Views on the tool itself were mixed, with some appreciating the ease of data entry, but others described it as clunky and not intuitive, with some relearning being necessary each month. A system whereby data enterers could move directly from one indicator to the next would have been an improvement, as would clearer on-screen descriptions of what was required.
There were some technical teething problems in some practices; these mainly related to the access to the tool (both getting past firewalls and in use of passwords). Important learning here was that initial e-mails need to be followed up to ensure that they do get through to practices; in some cases, formal access to the tool had to be granted by the network administrator.
Many participants suggested that monthly data entry was too frequent for some indicators and, for things that change less often, a quarterly or biannual data gathering would be more appropriate. This would ease the burden on data gathering, certainly, but would offer less opportunity (or less frequent opportunity) for genuine improvement and may decrease the level of familiarity with the process.
Use of feedback
Feedback from the tool was provided to practices in a number of ways, primarily visually, in the form of charts. For overall effectiveness, and for each performance area, each objective and each indicator, line charts showing how performance had changed over time were produced. In addition, pie charts indicating the percentage of available points achieved for each indicator, as well as charts showing how each score compared with the contingency, were produced. In particular, these latter charts helped practices identify on which indicators they would be able to make gains with relatively small changes. Furthermore, data were available to download in tabular format. Feedback was produced electronically via the online portal and could then be copied into other formats if desirable.
The longer that practices used the tool, and the more they had used the tool’s facilities to feed back progress to the team, the more positive they found the experience. When teams found that they had made an improvement in overall effectiveness, this contributed to their positive view of the tool.
Practices commented on the benefits of having all of the information in one place to identify key issues to work on. In many cases, practices had not yet managed to make the changes that would lead to improvements, but did plan to do so. The people involved in discussing the feedback varied significantly: 17 practices said that they discussed it at team meetings, although in only 13 of these had GPs been involved in the discussion. Most discussion had involved practice management staff, in either team or individual meetings. In five practices, at least some feedback had been shared with patient representatives.
Twelve practices said that they had taken some specific actions as a result of feedback, including increases of audits, amendments of templates for data capture and introduction of new care plans. Practices also liked the idea of being able to use the reports for other purposes (e.g. CQC) to show improvement, as well as being able to evidence their willingness to learn, develop and improve.
Some practices, however, said that they took the decision not to spend more time using the tool (including using and discussing feedback) as they considered it a lower priority than other issues, such as QOF, which would be more important to them in terms of financial incentives.
There were relatively few comments about the nature of the feedback provided, although some commented on the simple visual display being effective. One practice did suggest that an improvement would be to allow more manipulation of data and feedback, as well as an easier way of printing the graphs.
Overall, the experience of using the feedback was generally positive, and was more limited by available time than by the software itself.
Implications for practices
One of the most interesting findings from the study is that, by using the GPET, practices generally improved their effectiveness (at least inasmuch as it is measured by the GPET). The changes may have been modest, but this aligns with previous studies in teams that have used a similar approach, which have demonstrated that the use of such a tool is associated with improvements. 73 More pertinently, most of these improvements came in the areas of practice management and patient focus: areas that are not currently measured in the QOF and are not directly measured in any other regular data gathering exercise.
Therefore, a key implication for practice of the GPET is that the monitoring of data, overall and in these areas in particular, appears to be a catalyst for improvement. Whether it is via the GPET (in its current or a revised form) or via a different data monitoring exercise, the actual measurement of key indicators, and reflection on these, is a process that appears to help drive change. It is therefore suggested that practices take steps to collect, monitor and reflect on these indicators, and, when applicable, take necessary actions.
To enable this, practices will also need to ensure that data collection procedures and record-keeping methods are fit for purpose. Based on the findings in the study, the areas for which this seems most problematic are in keeping appropriate track of staff sickness absence (in aggregate, rather than for individual staff members), waiting times for appointments (especially those going beyond 15 minutes after the scheduled time), available appointment hours, records relating to the PPG/PRG, and records of working with external organisations.
Implications for the wider system
The GPET has various potential uses beyond its potential as an improvement tool for individual practices. One of the key concerns for the wider general practice system is the future of the QOF. As has been demonstrated, the value of the QOF is widely questioned, and its future uncertain. 10,37,54,62,63 However, if the QOF is to be replaced, it is not yet clear what will replace it.
The GPET, as developed in this study, would probably not work as a replacement for QOF: it has limitations in its current form, largely described in Specific areas for future development, that mean that it is not (yet) in a state that would be acceptable to all practices and other stakeholders, and perhaps never could be. Moreover, given some of the concerns about some indicators not being applicable to all practices (e.g. because of different commissioning arrangements), it may prove impossible to create a version of the tool that would provide a fair comparison between all practices, but this would certainly be worth exploring further.
One aspect of the findings from the study that achieved very wide consensus was the broad model underpinning the GPET. Based on input from a wide cross-section of clinicians, managers and patients, it produced a set of four performance areas, including (in total) 11 objectives:
-
clinical care (general health and preventative medicine, management of long-term conditions, and clinical management)
-
practice management (effective use of IT systems, good physical environment, motivated and effective practice team and good overall practice management)
-
patient focus (high levels of patient satisfaction with services, and ease of access and ability to book appointments)
-
external focus (partnership working and engagement with the public).
There was no dissent from this overall model either in the consensus exercise conducted at the end of stage 1 of the research or in the evaluation of the GPET. Therefore, it is believed that this model would serve as a useful basis for future measurement of performance in general practice, including any replacement for the QOF, as well as developments in regulatory activities such as those conducted by NHS England or the CQC, even if the indicators themselves differ. At the very least, it seems important that the four different performance areas are captured; otherwise, the breadth of general practice activity would not be represented. Ideally, each of the areas covered by the 11 objectives would also be included.
The broader changes within the NHS, particularly the development of STPs and the advent of ICSs to take these forward, possibly offers a suitable avenue for the development and use of a revised version of the GPET. Of course, this changing structure in its own right might lead to requirements for further changes in the content of the tool.
Limitations and future directions
As with any research study, there are various ways in which the nature of the methods and findings were limited, with the implication that caution must be taken in drawing conclusions.
The use of ProMES as the principal method does carry with it some limiting factors and, therefore, needs to be considered in context. The nature of ProMES is that it is a bottom-up approach, with decisions about measurement driven by those closest to the activity being measured. Generally, this is a sensible strategy, but there can sometimes be a benefit in viewing from afar. Although the workshops attempted to get participants to take a step back to consider the objectives and indicators involved in general practice, it is unlikely that they would ever be able to present a truly independent view. There is certainly also a potential limitation caused by the non-random nature of the participants. Although it was ensured that the sample came from a wide variety of geographical locations and types of practice, the participants were still self-selecting and there is no way of knowing how a different group of participants (whether professionals or patients) may have come to their conclusions. This was mitigated to some extent by having at least two different workshops looking at each set of questions; there was generally good agreement between them. However, it is impossible to know how those who could not participate might have differed in their views.
In addition, the large-scale implementation of ProMES that was used in this study, with representatives of multiple teams contributing to the process, is less well tested than the implementation in a single team (although this has been done successfully multiple times before). There was no reason to suggest that this did not work appropriately, but there is more likely to be some bias introduced by the fact that a relatively small number of self-selecting participants (relative to everyone working in general practice in England) were responsible for making the decisions. The additional complexity of the general practice task and working environment means that the resulting tool needs to be subject to extra scrutiny and comparison. The researchers attempted to mitigate for this by using a further consensus exercise and a detailed evaluation of the pilot study, but further consensus work might be needed before the GPET is implemented on a larger scale. In particular, it may be useful to carry out similar exercises within a single team (or a range of teams) to examine what differences, if any, would result.
The sheer scale of activity in general practice required a much larger number of indicators to be needed than had been anticipated. This had several knock-on effects, as extra workshops needed to be arranged, and the consensus exercise condensed into a shorter timescale.
The nature of indicators needed for such a tool was also a limiting factor. As a result of the requirements of the ProMES process, indicators needed to be collectable using little or no extra effort (otherwise practices would not have been willing to participate) and needed to be measurable on a regular basis, preferably monthly, or at least quarterly. Moreover, less regular data could be included, but this would limit the ability to change over a shorter period of time. Although practices might, in principle, have been willing to put more effort into data collection for a helpful result, the reality of the situation is that most practices cannot spare many hours on such a regular basis with current pressures. Therefore, it seems essential that any future versions of this tool (or other similar tools) are designed in such a way as to reduce the burden on practices to the greatest possible extent, to give it the maximum chance of success.
The regular nature of this data collection certainly caused some issues. There are a number of indicators that are collected annually or biannually (e.g. Public Health England practice profiles or General Practice Patient Survey data) that could not be included as a result. This particularly limited the options for indicators in one area: public health. In addition, many of the indicators that were included, even though measurable monthly, were not likely to change very much (if at all) in a short timescale. Therefore, future iterations of the GPET might consider a range of different timescales for indicators. This would mean that effectiveness scores would be likely to change less on a regular basis, but that might be a price worth paying for the increased inclusion.
A different approach entirely would have been to determine what components an ideal measurement of productivity should include, and then develop ways to measure these. Although that may have been more successful in producing a standardised, comprehensive measure of productivity, as per the original objective, it would have necessitated a completely different research design, and it is not possible to know how successful that might have been.
As discussed earlier in this chapter, some of the indicators that were included were not gathered with complete fidelity (or at all) by all practices. There were a variety of reasons for this, with the single biggest reason being accuracy of practice records in some areas. In the future, the use of such a tool should be accompanied by very clear advice about what data to collect and how such data can be stored to enable easier use of the tool.
As a result of the first stage of the study being longer than anticipated, the second stage (the pilot study) was compressed to a significant degree. This meant that not all practices could complete the full 6 months and it also meant that the evaluation overlapped with the pilot period itself. Although this was beneficial in some respects (i.e. it meant that more current responses could be given to many of the questions), it did mean that practices did not have the benefit of reflecting from a distance on the usefulness of the GPET. In addition, the short time scale meant that practices had only a few months to make changes that could affect their effectiveness. In reality, many such changes could take longer to make, and far longer still to take effect. Therefore, to evaluate how changes might actually make more of a difference, a greater time horizon would be needed: tracking change over the course of at least 1 year, and preferably longer, would ensure that there was more scope for this.
The short time scale (even without the compression) meant that it was not possible to take stock after the consensus exercise as much as might be done. Given the findings, one option at this point would have been to reframe the tool as a QI tool; with added time and input, and a different theoretical framework, this may have led to an improved tool. The findings that may have led to this conclusion were not anticipated when designing the study, but, in future, other studies using a similar approach may build in this opportunity more clearly from the start.
Likewise, the lack of a control group was a significant limitation. There is no way of knowing to what extent the practices in the evaluation would have improved on the chosen indicators over this time period anyway; to some extent, this may be plausible because of the time of year (in particular with many practices starting the pilot at the end of the winter period, and continuing into the summer months), natural maturation or an observation effect (i.e. being aware of being studied). Although it is tempting to suggest that another study, involving a control group, would be beneficial here, such a study would have to be very carefully designed, as the process of gathering the data itself (some of which would need to come from within the practice) could be seen as an intervention in its own right. Therefore, it is likely to remain impossible to estimate the true effect of the use of the GPET on effectiveness, although the combination of the effectiveness changes observed, the evidence on changes made from the evaluation and the prior literature on changes made by teams using a ProMES process suggest that it is likely that at least some of the change can be attributed to participation in the study.
The incompleteness of evaluation data also meant that there was a limited view of outcomes, overall. For most of the evaluation questions, most practices did provide data via both the telephone interviews and the practice manager questionnaire; however, for some there was less good data, and some practices did not find it easy to provide financial data, meaning that it was not possible to construct a productivity index (ratio of quality-adjusted outputs to inputs) from the data. Any future efforts to gather such data might try alternative methods of extracting this separately, for example working with practices to give clearer advice on which financial data should be included, and doing this separately rather than as a section of a longer questionnaire.
Recommendations for research
The implications for practices and the system, combined with the limitations mentioned in the previous section, give rise to some suggestions about how future research might be able to progress this agenda further.
First, it is recommended that some additional research is conducted to refine this GPET by updating indicators produced from clinical systems to the new SNOMED codes (which have been introduced more widely since the study and are replacing the Read codes that have been used for several years), as well as by refining the indicators that were identified as problematic, either via clearer guidance on data collection or by appropriately altering the indicator itself. It is also likely that improvements to the online system could make it easier for practices to use.
Second, it is recommended that an enhanced testing of the tool by comparing its use in practices receiving feedback (such as those in the study) with a control sample of practices that do not view the results of their performance. This would enable a test of the hypothesis that it is specifically the use of the tool that has led to improvements in performance, as would be predicted by the theories underlying the ProMES process.
Third, it is advised that the model produced is validated by a wider sample. Although the participants in this study were wide-ranging and numbered in the hundreds, the nature of such a self-selecting sample is that they might have some lack of representativeness; therefore, validation/confirmation by a broader national sample would allow greater confidence in the model being used elsewhere.
Fourth, it is suggested that this study provides supporting evidence of the usefulness of the large-scale ProMES process, at least in terms of developing measurements that have good face validity and use predominantly existing data, and that future research considers this as a possible approach for measure development in the NHS.
Overall conclusions
In summary, the ProMES-based workshops produced a model of 11 general practice objectives across four performance areas: clinical care, practice management, patient focus and external focus. This model was positively viewed by all. It was measured via 52 indicators, collected from a variety of sources, that together formed the GPET, and tested in a pilot study over 6 months, which began with 51 practices involved.
The indicators had mixed value: some were extremely useful and others were more difficult to collect accurately, but despite these problems, practices using the tool did demonstrate a significant improvement in effectiveness over the course of the pilot study.
There were mixed views about how useful it was, with some practices finding it extremely helpful and others less so. However, as a measure it is more aligned to standard conceptions of effectiveness than productivity.
Overall, the research suggests that there is a demand for a tool that can be used by practices as an improvement tool, and there may be the scope for developing the GPET, or at least the model underlying it, into a larger tool that might provide a meaningful comparison between practices. For the former use, some minor changes would be necessary, and for the latter, some more significant development work may be needed. Larger systemic changes in the future, or vastly differing types of care, would necessitate further examination. However, the potential to use the GPET and its underlying model to inform improvements in general practice in the near future seems genuine.
Acknowledgements
Our thanks go to all of the GPs, practice staff and members of the public who contributed to this research. Without their input none of it would have been possible. We would also like to thank the staff at BlackBox Open, particularly Dr Colin Roth, whose input to the design of the ProMES procedure and the redevelopment of the Effecteev software was essential to the success of the study, and the staff at PRIMIS (University of Nottingham), who assisted us greatly in the writing of automated data extraction queries for general practices to use.
We are particularly grateful to the steering committee for their guidance and support throughout the study. The members of the steering committee were Nikita Kanani (chairperson; NHS Bexley), Amanda Hutchinson (CQC), William Taylor (RCGP), Marie-Therese Massey (Royal College of Nursing), Chris Bojke (Centre for Health Economics, The University of York), Andy Knox (NHS Carnforth/Lancashire North), Graham Atkinson (NHS Carnforth/Lancashire North), Nicky Normanton (NHS Sheffield), Mark Smith (NHS England) and patient participation experts – Mandy Wilson, Roz Davies, Paula Lloyd Knight and Patrick Vernon. In addition, Paul Foggitt and Marc Thomas (both NHS England) and Joanna Bircher (RCGP) attended some meetings and contributed as substitutes for/associates of Mark Smith and William Taylor.
Contributions of authors
Jeremy Dawson (Professor of Health Management) was the principal investigator. He led the overall study design, managed the research team and undertook data collection and analysis and the writing of the final report.
Anna Rigby-Brown (Research Associate) conducted much of the day-to-day management of the study; contributed to detailed study design; led on recruitment, large sections of the data collection and training of general practices; led the qualitative analysis; supervised the research student; and was responsible for writing some sections of final report.
Lee Adams (Independent Researcher) provided specialist public health knowledge throughout the study; played a significant role in the design and facilitation of workshops; and contributed to training, data collection and the writing of the final report.
Richard Baker (Professor of Quality in Health Care and GP) provided specialist GP knowledge throughout, contributed to study design, gave significant input to the development of clinical indicators and the interpretation of general practice data, and contributed to the writing of the final report.
Julia Fernando (previously Research Manager) contributed to the collection and analysis of workshop data and helped with design, recruitment and training for the pilot study.
Amanda Forrest (patient and public involvement representative) led on all patient and public involvement-related aspects of study, including the recruitment of public participants, writing of materials for the public, running of public workshops and analysis of data, as well as more general contributions to study design, data collection and writing of the final report.
Anna Kirkwood (medical student) conducted and wrote up the systematic mapping review in Chapter 2.
Richard Murray (Director of Policy) helped with the design of the evaluation tools, data collection and analysis of evaluation data. He led on other public-facing dissemination plans via The King’s Fund and contributed to the writing of the final report.
Michael West (Senior Visiting Fellow) played a large role in study design, particularly ProMES elements; contributed to the interpretation of findings and the writing of the final report; and provided mentorship to the principal investigator.
Paul Wike (Practice and Locality Manager) provided specialist general practice input throughout the study and contributed to the design, recruitment of participants, interpretation of data and writing of the final report.
Michelle Wilde (Practice and Locality Manager) provided specialist general practice input throughout and contributed to the design, recruitment of participants, interpretation of data and writing of the final report.
Data-sharing statement
All data requests should be submitted to the corresponding author for consideration. Access to available anonymised data may be granted following review.
Patient data
This work uses data provided by patients and collected by the NHS as part of their care and support. Using patient data is vital to improve health and care for everyone. There is huge potential to make better use of information from people’s patient records, to understand more about disease, develop new treatments, monitor safety, and plan NHS services. Patient data should be kept safe and secure, to protect everyone’s privacy, and it’s important that there are safeguards to make sure that it is stored and used responsibly. Everyone should be able to find out about how patient data are used. #datasaveslives You can find out more about the background to this citation here: https://understandingpatientdata.org.uk/data-citation.
Disclaimers
This report presents independent research funded by the National Institute for Health Research (NIHR). The views and opinions expressed by authors in this publication are those of the authors and do not necessarily reflect those of the NHS, the NIHR, NETSCC, the HS&DR programme or the Department of Health and Social Care. If there are verbatim quotations included in this publication the views and opinions expressed by the interviewees are those of the interviewees and do not necessarily reflect those of the authors, those of the NHS, the NIHR, NETSCC, the HS&DR programme or the Department of Health and Social Care.
References
- What is Primary Healthcare?. Bristol: Centre for Academic Primary Care; 2018.
- Baird B, Charles A, Honeyman M, Maguire D, Das P. Understanding Pressures in General Practice. London: The King’s Fund; 2016.
- General Practice in England. An Overview (Briefing). London: The King’s Fund; 2009.
- Health and Social Care Act 2012. London: The Stationery Office; 2012.
- Holder H, Robertson R, Ross S, Bennett L, Gosling J, Curry N. Risk or Reward? The Changing Role of CCGs in General Practice. London: Nuffield Trust and The King’s Fund; 2015.
- General and Personal Medical Services England as at 31 December 2017, Provisional Experimental Statistics. Leeds: NHS Digital; 2018.
- General and Personal Medical Services England as at 31 March 2017 Experimental Statistics. Leeds: NHS Digital; 2017.
- GP Contract Services England, 2017–2018. Leeds: NHS Digital; 2018.
- The State of Care in General Practice 2014 to 2017. Newcastle upon Tyne: CQC; 2017.
- Thorne T. How could the quality and outcomes framework (QOF) do more to tackle health inequalities?. London J Prim Care 2016;8:80-4. https://doi.org/10.1080/17571472.2016.1215370.
- General Practice Forward View. Leeds: NHS England; 2016.
- Phillips D, Curtice J, Phillips M, Perry J. British Social Attitudes: The 35th Report. London: The National Centre for Social Research; 2018.
- Improving Access for All. Reducing Inequalities in Access to General Practice Services. Leeds: NHS England; 2017.
- Westbrook I. Satisfaction with GP Services at Record Low. London: BBC; 2018.
- Berwick DM. Measuring NHS productivity. How much health for the pound, how many events for the pound?. BMJ 2005;330:975-76. https://doi.org/10.1136/bmj.330.7498.975.
- Appleby J, Ham C, Imison C, Jennings M. Improving NHS Productivity. More with the Same Not More of the Same. London: The King’s Fund; 2010.
- Bojke C, Castelli A, Street A, Ward P, Laudicella M. Regional variation in the productivity of the English National Health Service. Health Econ 2013;22:194-211. https://doi.org/10.1002/hec.2794.
- Dawson D, Gravelle H, Kind P, O’Mahony M, Street A, Weale M, et al. Developing New Approaches to Measuring NHS Outputs and Activity. York: Centre for Health Economics, University of York; 2005.
- Castelli A, Dawson D, Gravelle H, Jacobs R, Kind P, Loveridge P, et al. A new approach to measuring health system output and productivity. Natl Insti Econ Rev 2007;200:105-17. https://doi.org/10.1177/00279501072000011201.
- Appleby J, Devlin N. Measuring Success in the NHS. Using Patient-Assessed Health Outcomes to Manage the Performance of Healthcare Providers. London: Dr Foster Ethics Committee; 2004.
- Quality and Outcomes Framework Indicators. London: NICE; 2018.
- Levene LS, Baker R, Wilson A, Walker N, Boomla K, Bankart MJ. Population health needs as predictors of variations in NHS practice payments: a cross-sectional study of English general practices in 2013–2014 and 2014–2015. Br J Gen Pract 2017;67:e10-e19. https://doi.org/10.3399/bjgp16X688345.
- Chew-Graham CA, Hunter C, Langer S, Stenhoff A, Drinkwater J, Guthrie EA, et al. How QOF is shaping primary care review consultations: a longitudinal qualitative study. BMC Fam Pract 2013;14. https://doi.org/10.1186/1471-2296-14-103.
- Doran T, Kontopantelis E, Reeves D, Sutton M, Ryan AM. Setting performance targets in pay for performance programmes: what can we learn from QOF?. BMJ 2014;348. https://doi.org/10.1136/bmj.g1595.
- Massey F. Public Service Productivity Estimates. Healthcare 2010. London: Office for National Statistics; 2012.
- A Fresh Start for the Regulation and Inspection of GP Practices and GP Out-Of-Hours Services: Working Together to Change How we Inspect and Regulate GP Practices and GP Out-Of-Hours Services. London: CQC; 2014.
- Pritchard R, Weaver S, Ashwood E. Evidence-Based Productivity Improvement. A Practical Guide to the Productivity Measurement and Enhancement System (ProMES). New York, NY: Routledge; 2012.
- Dixon-Woods M, McNicol S, Martin G. Ten challenges in improving quality in healthcare: lessons from the Health Foundation’s programme evaluations and relevant literature. BMJ Qual Saf 2012;21:876-84. https://doi.org/10.1136/bmjqs-2011-000760.
- Porter ME, Lee TH. The strategy that will fix health care. Harv Bus Rev 2013;91:1-19.
- Grigoroudis E, Orfanoudaki E, Zopounidis C. Strategic performance measurement in a healthcare organisation: a multiple criteria approach based on balanced scorecard. Omega 2012;40:104-19. https://doi.org/10.1016/j.omega.2011.04.001.
- Wanless D. Securing Our Future Health. Taking a Long-Term View. London: HM Treasury; 2002.
- Starfield B, Shi L, Macinko J. Contribution of primary care to health systems and health. Milbank Q 2005;83:457-502. https://doi.org/10.1111/j.1468-0009.2005.00409.x.
- Kringos DS, Boerma WG, Hutchinson A, van der Zee J, Groenewegen PP. The breadth of primary care: a systematic literature review of its core dimensions. BMC Health Serv Res 2010;10. https://doi.org/10.1186/1472-6963-10-65.
- Stott NC, Davis RH. The exceptional potential in each primary care consultation. J R Coll Gen Pract 1979;29:201-5.
- Mehay R. The Essential Handbook for GP Training and Education. London: Radcliffe Publishing; 2012.
- Pawlikowska T, Leach J, Lavallee P, Charlton R, Piercy J, Charlton R. Learning to Consult. Oxford: Radcliffe Publishing Ltd; 2007.
- Marshall M. Redefining quality: valuing the role of the GP in managing uncertainty. Br J Gen Pract 2016;66:e146-8. https://doi.org/10.3399/bjgp16X683773.
- Dixon J, Spencelayh E, Howells A, Mandel A, Gille F. Indicators of Quality of Care in General Practices in England. An Independent Review for the Secretary of State for Health. London: The Health Foundation; 2015.
- Rogan L, Boaden R. Understanding performance management in primary care. Int J Health Care Qual Assur 2017;30:4-15. https://doi.org/10.1108/IJHCQA-10-2015-0128.
- O’Malley AS, Rich EC. Measuring comprehensiveness of primary care: challenges and opportunities. J Gen Intern Med 2015;30:568-75. https://doi.org/10.1007/s11606-015-3300-z.
- Porter ME, Pabo EA, Lee TH. Redesigning primary care: a strategic vision to improve value by organizing around patients’ needs. Health Aff 2013;32:516-25. https://doi.org/10.1377/hlthaff.2012.0961.
- Baker R, England J. Should we use outcomes data to help manage general practice?. Br J Gen Pract 2014;64:e804-6. https://doi.org/10.3399/bjgp14X683005.
- Watson J, Salisbury C, Jani A, Grey M, McKinstry B, Rosen R. Better value primary care is needed now more than ever. BMJ 2017;359. https://doi.org/10.1136/bmj.j4944.
- Pelone F, Kringos DS, Valerio L, Romaniello A, Lazzari A, Ricciardi W, et al. The measurement of relative efficiency of general practice and the implications for policy makers. Health Policy 2012;107:258-68. https://doi.org/10.1016/j.healthpol.2012.05.005.
- Pelone F, Kringos DS, Spreeuwenberg P, De Belvis AG, Groenewegen PP. How to achieve optimal organization of primary care service delivery at system level: lessons from Europe. Int J Qual Health Care 2013;25:381-93. https://doi.org/10.1093/intqhc/mzt020.
- Pelone F, Kringos DS, Romaniello A, Archibugi M, Salsiri C, Ricciardi W. Primary care efficiency measurement using data envelopment analysis: a systematic review. J Med Syst 2015;39. https://doi.org/10.1007/s10916-014-0156-4.
- Lydon S, Cupples ME, Murphy AW, Hart N, O’Connor P. A systematic review of measurement tools for the proactive assessment of patient safety in general practice [published online ahead of print April 4 2017]. J Patient Saf 2017. https://doi.org/10.1097/PTS.0000000000000350.
- Hatoun J, Chan JA, Yaksic E, Greenan MA, Borzecki AM, Shwartz M, et al. A systematic review of patient safety measures in adult primary care. Am J Med Qual 2017;32:237-45. https://doi.org/10.1177/1062860616644328.
- Ricci-Cabello I, Gonçalves DC, Rojas-García A, Valderas JM. Measuring experiences and outcomes of patient safety in primary care: a systematic review of available instruments. Fam Pract 2015;32:106-19. https://doi.org/10.1093/fampra/cmu052.
- Burt J, Campbell J, Abel G, Aboulghate A, Ahmed F, Asprey A, et al. Improving patient experience in primary care: a multimethod programme of research on the measurement and improvement of patient experience. Programme Grants Appl Res 2017;5.
- QOF 2017/18 Results. Leeds: NHS Digital; 2018.
- Moberly T. QOF Review Committee Criticised Over Choice of Indicators 2009. www.gponline.com/qof-review-committee-criticised-choice-indicators/article/936513 (accessed 30 June 2018).
- Gill PJ, O’Neill B, Rose P, Mant D, Harnden A. Primary care quality indicators for children: measuring quality in UK general practice. Br J Gen Pract 2014;64:e752-7. https://doi.org/10.3399/bjgp14X682813.
- Forbes LJ, Marchand C, Doran T, Peckham S. The role of the Quality and Outcomes Framework in the care of long-term conditions: a systematic review. Br J Gen Pract 2017;67:e775-e784. https://doi.org/10.3399/bjgp17X693077.
- Levene L, Baker R, Khunti K, Bankart M. Variations in coronary mortality rates between English primary care trusts. Observational study 1993–2010. J Public Health 2015;38:e455-63. https://doi.org/10.1093/pubmed/fdv162.
- Baker R, Honeyford K, Levene LS, Mainous AG, Jones DR, Bankart MJ, et al. Population characteristics, mechanisms of primary care and premature mortality in England: a cross-sectional study. BMJ Open 2016;6. https://doi.org/10.1136/bmjopen-2015-009981.
- Marshall M, Roland M. The future of the Quality and Outcomes Framework in England. BMJ 2017;359. https://doi.org/10.1136/bmj.j4681.
- Ryan AM, Krinsky S, Kontopantelis E, Doran T. Long-term evidence for the effect of pay-for-performance in primary care on mortality in the UK: a population study. Lancet 2016;388:268-74. https://doi.org/10.1016/S0140-6736(16)00276-2.
- Ashworth M, Gulliford M. Funding for general practice in the next decade: life after QOF. Br J Gen Pract 2017;67:4-5. https://doi.org/10.3399/bjgp17X688477.
- Ruscitto A, Mercer SW, Morales D, Guthrie B. Accounting for multimorbidity in pay for performance: a modelling study using UK Quality and Outcomes Framework data. Br J Gen Pract 2016;66:e561-7. https://doi.org/10.3399/bjgp16X686161.
- Kontopantelis E, Springate DA, Ashcroft DM, Valderas JM, van der Veer SN, Reeves D, et al. Associations between exemption and survival outcomes in the UK’s primary care pay-for-performance programme: a retrospective cohort study. BMJ Qual Saf 2016;25:657-70. https://doi.org/10.1136/bmjqs-2015-004602.
- Martin JL, Lowrie R, McConnachie A, McLean G, Mair F, Mercer SW, et al. Physical health indicators in major mental illness: analysis of QOF data across UK general practice. Br J Gen Pract 2014;64:e649-56. https://doi.org/10.3399/bjgp14X681829.
- British Medical Association . BMA Response to NHS England Chief Executive, Simon Stevens’s Comments on QOF 2016.
- Quality Improvement for General Practice a Guide for GPs and the Whole Practice Team. London: RCGP; 2015.
- NHS Five Year Forward View. London: NHS England; 2014.
- The Forward View Into Action: Planning for 2015/16. London: NHS England; 2014.
- Ham C, Murray R. Implementing the NHS Five Year Forward View: Aligning Policies With the Plan. London: The King’s Fund; 2015.
- Refreshing NHS Plans for 2018/19. London: NHS England; 2018.
- The Future of Primary Care. Creating Teams for Tomorrow. Leeds: Health Education England; 2015.
- Clay H, Stern R. Making Time in General Practice. Birmingham: NHS Alliance; 2015.
- Pritchard R, Jones S, Roth P, Stuebing K, Ekeberg S. The effects of feedback, goal setting, and incentives on organizational productivity. J Appl Psychol 1988;73:337-58. https://doi.org/10.1037/0021-9010.73.2.337.
- Ilgen D, Fisher C, Taylor M. Consequences of individual feedback on behavior in organizations. J App Psychol 1979;64:349-71. https://doi.org/10.1037/0021-9010.64.4.349.
- Pritchard RD, Harrell MM, DiazGranados D, Guzman MJ. The productivity measurement and enhancement system: a meta-analysis. J Appl Psychol 2008;93:540-67. https://doi.org/10.1037/0021–9010.93.3.540.
- Bly PR. Understanding the Effectiveness of ProMES: An Analysis of Indicators and Contingencies. Ann Arbour, MI: ProQuest Information & Learning; 2001.
- Paquin AR, Roch SG, Sanchez-Ku ML. An investigation of cross-cultural differences on the impact of productivity interventions: the example of ProMES. J Appl Behav Sci 2007;43:427-48. https://doi.org/10.1177/0021886307307346.
- David JH. Identifying the Factors that Contribute to the Effectiveness of the Productivity Measurement and Enhancement System (ProMES). College Station, TX: Texas A&M University; 2004.
- Paquin AR. A Meta-analysis of the Productivity Measurement and Enhancement System. Ann Arbour, MI: ProQuest Information & Learning; 1998.
- Scaduto A, Hunt B, Schmerling D. A performance management solution: productivity measurement and enhancement system (ProMES). Ind Organ Psycho 2015;8:93-9. https://doi.org/10.1017/iop.2015.4.
- Schmerling D, Scaduto A. Use the best; leave the rest: the Productivity Measurement and Enhancement System (ProMES) for performance ratings. Ind Organ Psychol 2016;9:305-09. https://doi.org/10.1017/iop.2016.15.
- Hysong SJ, Che X, Weaver SJ, Petersen LA. Study protocol: identifying and delivering point-of-care information to improve care coordination. Implement Sci 2015;10. https://doi.org/10.1186/s13012-015-0335-9.
- Poulton BC, West MA. Primary health care team effectiveness: developing a constituency approach. Health Soc Care Community 1994;2:77-84. https://doi.org/10.1111/j.1365-2524.1994.tb00152.x.
- West M, Alimo-Metcalfe B, Dawson J, El Ansari W, Glasby J, Hardy G, et al. Effectiveness of Multi-Professional Team Working (MPTW) in Mental Health Care. Final Report. Southampton: NIHR Service Delivery and Organisation programme; 2012.
- Richards A, Rees A. Developing criteria to measure the effectiveness of community mental health teams. Mental Health Care 1998;2:14-7.
- Cooke A, Smith D, Booth A. Beyond PICO: the SPIDER tool for qualitative evidence synthesis. Qual Health Res 2012;22:1435-43. https://doi.org/10.1177/1049732312452938.
- Kenny A, Hyett N, Sawtell J, Dickson-Swift V, Farmer J, O’Meara P. Community participation in rural health: a scoping review. BMC Health Serv Res 2013;13. https://doi.org/10.1186/1472-6963-13-64.
- James K, Randall N, Haddaway N. A methodology for systematic mapping in environmental sciences. Environ Evid 2016;5. https://doi.org/10.1186/s13750-016-0059-6.
- Clapton J, Rutter D, Sharif N. Systematic Mapping Guidance. Social Care Institute for Excellence; 2009.
- NHS Networks . Releasing Capacity in General Practice (10 High Impact Actions) 2017. www.networks.nhs.uk/nhs-networks/releasing-capacity-in-general-practice/messageboard/general/611331738 (accessed 4 March 2019).
- Kmet L, Lee R, Cook L. Standard Quality Assessment Criteria for Evaluating Primary Research Papers from a Variety of Fields. Edmonton, AB: Alberta Heritage Foundation for Medical Research; 2004.
- Beaulieu MD, Haggerty J, Tousignant P, Barnsley J, Hogg W, Geneau R, et al. Characteristics of primary care practices associated with high quality of care. CMAJ 2013;185:E590-6. https://doi.org/10.1503/cmaj.121802.
- Amoroso C, Proudfoot J, Bubner T, Jayasinghe UW, Holton C, Winstanley J, et al. Validation of an instrument to measure inter-organisational linkages in general practice. Int J Integr Care 2007;7. https://doi.org/10.5334/ijic.216.
- Baker R. General practice in Gloucestershire, Avon and Somerset: explaining variations in standards. Br J Gen Pract 1992;42:415-18.
- Baker R, Streatfield J. What type of general practice do patients prefer? Exploration of practice characteristics influencing patient satisfaction. Br J Gen Pract 1995;45:654-9.
- Bosch M, Dijkstra R, Wensing M, van der Weijden T, Grol R. Organizational culture, team climate and diabetes care in small office-based practices. BMC Health Serv Res 2008;8. https://doi.org/10.1186/1472-6963-8-180.
- Bower P, Campbell S, Bojke C, Sibbald B. Team structure, team climate and the quality of care in primary care: an observational study. Qual Saf Health Care 2003;12:273-9. https://doi.org/10.1136/qhc.12.4.273.
- Campbell SM, Hann M, Hacker J, Burns C, Oliver D, Thapar A, et al. Identifying predictors of high quality care in English general practice: observational study. BMJ 2001;323:784-7. https://doi.org/10.1136/bmj.323.7316.784.
- Chambers LW, Burke M, Ross J, Cantwell R. Quantitative assessment of the quality of medical care provided in five family practices before and after attachment of a family practice nurse. Can Med Assoc J 1978;118:1060-4.
- de Koning JS, Klazinga N, Koudstaal PJ, Prins AD, Borsboom GJ, Mackenbach JP. Quality of stroke prevention in general practice: relationship with practice organization. Int J Qual Health Care 2005;17:59-65. https://doi.org/10.1093/intqhc/mzi004.
- Desborough J, Bagheri N, Banfield M, Mills J, Phillips C, Korda R. The impact of general practice nursing care on patient satisfaction and enablement in Australia: a mixed methods study. Int J Nurs Stud 2016;64:108-19. https://doi.org/10.1016/j.ijnurstu.2016.10.004.
- Dixon S, Sampson FC, O’Cathain A, Pickin M. Advanced access: more than just GP waiting times?. Fam Pract 2006;23:233-9. https://doi.org/10.1093/fampra/cmi104.
- Eggleton K, Kenealy T. What makes Care Plus effective in a provincial primary health organisation? Perceptions of primary care workers. J Prim Health Care 2009;1:190-7. https://doi.org/10.1071/HC09190.
- Fisher RF, Croxson CH, Ashdown HF, Hobbs FR. GP views on strategies to cope with increasing workload: a qualitative interview study. Br J Gen Pract 2017;67:e148-e156. https://doi.org/10.3399/bjgp17X688861.
- Gaal S, van den Hombergh P, Verstappen W, Wensing M. Patient safety features are more present in larger primary care practices. Health Policy 2010;97:87-91. https://doi.org/10.1016/j.healthpol.2010.03.007.
- Goh TT, Eccles MP. Team climate and quality of care in primary health care: a review of studies using the Team Climate Inventory in the United Kingdom. BMC Res Notes 2009;2. https://doi.org/10.1186/1756-0500-2-222.
- Grant A, Sullivan F, Dowell J. An ethnographic exploration of influences on prescribing in general practice: why is there variation in prescribing practices?. Implement Sci 2013;8. https://doi.org/10.1186/1748-5908-8-72.
- Griffiths P, Murrells T, Dawoud D, Jones S. Hospital admissions for asthma, diabetes and COPD: is there an association with practice nurse staffing? A cross sectional study using routinely collected data. BMC Health Serv Res 2010;10. https://doi.org/10.1186/1472-6963-10-276.
- Haggerty JL, Pineault R, Beaulieu MD, Brunelle Y, Gauthier J, Goulet F, et al. Practice features associated with patient-reported accessibility, continuity, and coordination of primary health care. Ann Fam Med 2008;6:116-23. https://doi.org/10.1370/afm.802.
- Hann M, Bower P, Campbell S, Marshall M, Reeves D. The association between culture, climate and quality of care in primary health care teams. Fam Pract 2007;24:323-9. https://doi.org/10.1093/fampra/cmm020.
- Harris MF, Davies PG, Fanaian M, Zwar NA, Liaw ST. Access to same day, next day and after-hours appointments: the views of Australian general practitioners. Aust Health Rev 2012;36:325-30. https://doi.org/10.1071/AH11080.
- Hulscher ME, van Drenth BB, van der Wouden JC, Mokkink HG, van Weel C, Grol RP. Changing preventive practice: a controlled trial on the effects of outreach visits to organise prevention of cardiovascular disease. Qual Health Care 1997;6:19-24. https://doi.org/10.1136/qshc.6.1.19.
- Irwin R, Stokes T, Marshall T. Practice-level quality improvement interventions in primary care: a review of systematic reviews. Prim Health Care Res Dev 2015;16:556-77. https://doi.org/10.1017/S1463423615000274.
- Keenan R, Amey J, Lawrenson R. The impact of patient and practice characteristics on retention in the diabetes annual review programme. J Prim Health Care 2013;5:99-104. https://doi.org/10.1071/HC13099.
- Kennedy A, Bower P, Reeves D, Blakeman T, Bowen R, Chew-Graham C, et al. Implementation of self management support for long term conditions in routine primary care settings: cluster randomised controlled trial. BMJ 2013;346. https://doi.org/10.1136/bmj.f2882.
- Klemenc-Ketis Z, Petek D, Kersnik J. Association between family doctors’ practices characteristics and patient evaluation of care. Health Policy 2012;106:269-75. https://doi.org/10.1016/j.healthpol.2012.04.009.
- Lawton R, Heyhoe J, Louch G, Ingleson E, Glidewell L, Willis TA, et al. Using the Theoretical Domains Framework (TDF) to understand adherence to multiple evidence-based indicators in primary care: a qualitative study. Implement Sci 2016;11. https://doi.org/10.1186/s13012-016-0479-2.
- Lemelin J, Hogg W, Baskerville N. Evidence to action: a tailored multifaceted approach to changing family physician practice patterns and improving preventive care. CMAJ 2001;164:757-63.
- Ludt S, Campbell SM, Petek D, Rochon J, Szecsenyi J, van Lieshout J, et al. Which practice characteristics are associated with the quality of cardiovascular disease prevention in European primary care?. Implement Sci 2013;8. https://doi.org/10.1186/1748-5908-8-27.
- Palmer C, Bycroft J, Healey K, Field A, Ghafel M. Can formal collaborative methodologies improve quality in primary health care in New Zealand? Insights from the EQUIPPED Auckland Collaborative. J Prim Health Care 2012;4:328-36. https://doi.org/10.1071/HC12328.
- Petek D, Ferligoj A, Platinovsek R, Kersnik J. Predictors of the quality of cardiovascular prevention – a multilevel cross-sectional study. Croat Med J 2011;52:718-27. https://doi.org/10.3325/cmj.2011.52.718.
- Petek D, Mlakar M. Quality of care for patients with diabetes mellitus type 2 in ‘model practices’ in Slovenia – first results. Zdr Varst 2016;55:179-84. https://doi.org/10.1515/sjph-2016-0023.
- Poulton B, West M. The determinants of effectiveness in primary health care teams. J Interprof Care 1999;13:7-18. https://doi.org/10.3109/13561829909025531.
- Proudfoot J, Jayasinghe UW, Holton C, Grimm J, Bubner T, Amoroso C, et al. Team climate for innovation: what difference does it make in general practice?. Int J Qual Health Care 2007;19:164-9. https://doi.org/10.1093/intqhc/mzm005.
- Roots A, MacDonald M. Outcomes associated with nurse practitioners in collaborative practice with general practitioners in rural settings in Canada: a mixed methods study. Hum Resour Health 2014;12. https://doi.org/10.1186/1478-4491-12-69.
- Russell GM, Dahrouge S, Hogg W, Geneau R, Muldoon L, Tuna M. Managing chronic disease in Ontario primary care: the impact of organizational factors. Ann Fam Med 2009;7:309-18. https://doi.org/10.1370/afm.982.
- Smits M, Peters Y, Broers S, Keizer E, Wensing M, Giesen P. Association between general practice characteristics and use of out-of-hours GP cooperatives. BMC Fam Pract 2015;16. https://doi.org/10.1186/s12875-015-0266-1.
- Smolders M, Laurant M, Verhaak P, Prins M, van Marwijk H, Penninx B, et al. Which physician and practice characteristics are associated with adherence to evidence-based guidelines for depressive and anxiety disorders?. Med Care 2010;48:240-8. https://doi.org/10.1097/MLR.0b013e3181ca27f6.
- Swinglehurst D, Greenhalgh T, Russell J, Myall M. Receptionist input to quality and safety in repeat prescribing in UK general practice: ethnographic case study. BMJ 2011;343. https://doi.org/10.1136/bmj.d6788.
- Thomas K, Nicholl J, Coleman P. Assessing the outcome of making it easier for patients to change general practitioner: practice characteristics associated with patient movements. Br J Gen Pract 1995;45:581-6.
- Hwang J, Plante T, Lackey K. The development of the Santa Clara Brief Compassion Scale: an abbreviation of Sprecher and Fehr’s Compassionate Love Scale. Pastoral Psychol 2008;56:421-28. https://doi.org/10.1007/s11089-008-0117-2.
- Clinical Governance Guidance. London: Department of Health and Social Care; 2011.
- Gillaizeau F, Chan E, Trinquart L, Colombet I, Walton R, Rege-Walther M, et al. Computerized advice on drug dosage to improve prescribing practice. Cochrane Database Syst Rev 2012;11.
- Ivers N, Jamtvedt G, Flottorp S, Young J, Odgaard-Jensen J, French S, et al. Audit and feedback: effects on professional practice and healthcare outcomes. Cochrane Database Syst Rev 2012;6. https://doi.org/10.1002/14651858.CD000259.pub3.
- O’Brien M, Rogers S, Jamtvedt G, Oxman A, Odgaard-Jensen J, Kristoffersen D, et al. Educational outreach visits: effects on professional practice and health care outcomes. Cochrane Database Syst Rev 2007;4. https://doi.org/10.1002/14651858.CD000409.pub2.
- Shojania K, Jennings A, Mayhew A, Ramsay C, Eccles M, Grimshaw J. The effects of on-screen, point of care computer reminders on processes and outcomes of care. Cochrane Database Syst Rev 2009;3. https://doi.org/10.1002/14651858.CD001096.pub2.
- Smith S, AllWright S, O’Dowd T. Effectiveness of shared care across the interface between primary and specialty care in chronic disease management. Cochrane Database Syst Rev 2007;3.
- Smith S, Soubhi H, Fortin M, Hudon C, O’Dowd T. Interventions for improving outcomes in patients with multimorbidity in primary care and community settings. Cochrane Database Syst Rev 2012;4. https://doi.org/10.1002/14651858.CD006560.pub2.
- Anderson N, West MA. The Team Climate Inventory: development of the TCI and its applications in teambuilding for innovativeness. Eur J Work Organ Psychol 1996;5:53-66. https://doi.org/10.1080/13594329608414840.
- West MA, Poulton BC. A failure of function: teamwork in primary health care. J Interprof Care 1997;11:205-16. https://doi.org/10.3109/13561829709014912.
- Williams G, Laugani P. Analysis of teamwork in an NHS community trust: an empirical study. J Interprof Care 1999;13:19-28. https://doi.org/10.3109/13561829909025532.
- Haynes R, Hand CH, Pearce S. Teamwork after introduction of interprofessional services in a general practice. J Interprof Care 2000;14:409-10. https://doi.org/10.1080/13561820020003964.
- Ross F, Rink E, Furne A. Integration or pragmatic coalition? An evaluation of nursing teams in primary care. J Interprof Care 2000;14:259-67. https://doi.org/10.1080/713678569.
- Disability Discrimination Act (DDA) 1995. London: The Stationery Office; 1995.
- Smith T, Noble M, Noble S, Wright G, McLennan D, Plunkett E. The English Indices of Deprivation 2015. London: Department for Communities and Local Government; 2015.
- Braun V, Clarke V. Using thematic analysis in psychology. Qual Res Psychol 2006;3:77-101. https://doi.org/10.1191/1478088706qp063oa.
- Grant AM, Franklin J, Langford P. The self-reflection and insight scale: a new measure of private self-consciousness. J Soc Behav Pers 2002;30:821-35. https://doi.org/10.2224/sbp.2002.30.8.821.
Appendix 1 Database search strategies
MEDLINE
Date range searched: no date restrictions used.
Date searched: 31 August 2017.
Search strategy
-
exp General Practice/
-
exp Family Practice/
-
Primary Health Care/
-
(primary adj (healthcare or care)).mp.
-
(general adj practice$).mp.
-
(family adj practice$).mp.
-
1 or 2 or 3 or 4 or 5 or 6
-
(practice$ adj3 character$).mp.
-
(practice$ adj3 level$).mp.
-
(practice$ adj3 modif$).mp.
-
8 or 9 or 10
-
“Outcome and Process Assessment (Health Care)”/
-
effective$.mp.
-
Efficiency, Organizational/ or Efficiency/
-
productiv$.mp.
-
Quality Control/ or Quality Assurance, Health Care/ or “Quality of Health Care”/
-
qualit$.mp.
-
12 or 13 or 14 or 15 or 16 or 17
-
7 and 11 and 18
-
Policy Making/ or Fiscal Policy/ or Policy/
-
(quality adj outcome$ adj framework$).mp.
-
QOF.mp.
-
(pay adj3 performance$).mp.
-
20 or 21 or 22 or 23
-
19 not 24
-
limit 25 to english
EMBASE
Date range searched: no date restrictions used.
Date searched: 31 August 2017.
Search strategy
-
exp general practice/
-
primary medical care/
-
(general adj practice$).mp.
-
(family adj practice$).mp.
-
(primary adj (healthcare or care)).mp.
-
(practice$ adj3 character$).mp.
-
(practice$ adj3 level$).mp.
-
(practice$ adj3 modif$).mp.
-
outcome assessment/
-
productivity/
-
quality control/or health care quality/
-
qualit$.mp.
-
productiv$.mp.
-
effective$.mp.
-
1 or 2 or 3 or 4 or 5
-
6 or 7 or 8
-
9 or 10 or 11 or 12 or 13 or 14
-
15 and 16 and 17
-
fiscal policy/or policy/
-
(quality adj outcome$ adj framework$).mp.
-
QOF.mp.
-
(pay adj3 performance$).mp.
-
19 or 20 or 21 or 22
-
18 not 23
-
limit 24 to english
Cumulative Index to Nursing and Allied Health Literature
Date range searched: no date restrictions used.
Date searched: 31 August 2017.
Search strategy
(MH “Family Practice”) OR (MH “Primary Health Care”) OR “general practice*” OR “family practice*” OR “primary healthcare” OR “primary care”
AND
(practice* N3 level) OR (practice* N3 character*) OR (practice* N3 modif*)
AND
(MH “Quality of Health Care”) OR (MH “Outcomes (Health Care)”) OR (MH “Quality Assurance”) OR (MH “Quality Control (Technology)”) OR (MH “Organizational Efficiency”) OR (MH “Productivity”) OR qualit* OR productiv* OR effective*
NOT
(MH “Policy Making”) OR “quality outcomes framework” or QOF or (pay N3 performance)
Emerald Insight
Date range searched: no date restrictions used.
Date searched: 31 August 2017.
Search strategy
general practice* or family practice* or primary care or primary healthcare
AND
practice* level or practice* modif* or practice character*
AND
productiv* or qualit* or effective*
NOT
policy or policies or QOF or “quality outcomes framework” or “pay for performance”
AND
limit to english
Appendix 2 Mapping review data extraction form
Publication details
-
Author.
-
Year.
-
Journal.
-
Volume.
-
Issue.
-
Pages.
-
Title.
-
Notes.
Study details
-
Geographic location: UK, ROI, CAN, AUS, NZ, EUR (non UK/ROI) and specify, SCAN and specify, other and specify.
-
Dates of study.
-
Research type: QUANT, QUAL or MIXED.
-
Data source: primary or secondary.
-
Study design: systematic review, secondary analysis, RCT, experimental, case–control, longitudinal/cohort, cross-sectional, other (specify).
-
Phenomenon of interest/exposures.
-
Evaluation/outcomes.
Sample details
-
Study population: practices.
-
Study population: patients.
-
Notes.
-
Drawn from: two or more countries, national databases, multicentre, two settings, selected from records of a practice, location not clear, other, N/A.
-
Recruitment methods: practices.
-
Recruitment methods: patients.
-
Sampling strategy.
-
Sample sizes.
-
Service users: no involvement, as subjects only, in design, data collection, authorship, other.
-
Does the study report views and experiences of service users? (all/most of paper).
Phenomena of interest
-
List all exposures/phenomena studied.
-
Which are adaptable by a practice?
-
Any controls/confounders measured?
-
Phenomenon of interest 1 [insert these fields for each phenomenon adaptable by a practice].
-
Intervention? Measure (specify)? Qualitative?
-
Description.
-
Reported how created or previous validation?
-
Is it related to personnel/governance/infrastructure?
Evaluation
-
List all outcomes/methods of evaluation.
-
Description of measures.
-
Productivity/effectiveness/quality?
-
[For the following domains, which are evaluated in this study?]
-
Patient satisfaction.
-
Ease of access/booking ability.
-
Practice management.
-
Motivated/effective team.
-
Physical environment.
-
IT system use.
-
Public engagement.
-
Partnership working.
-
General health/preventative medicine.
-
Chronic condition care.
-
Clinical management.
-
Other (please state).
-
-
Are these process/intermediate/final outcomes?
-
For the phenomena adaptable by a practice, any significant results?
Quality assessment: quantitative
-
Question/objective sufficiently described?
-
Study design evident and appropriate?
-
Method of subject/comparison group selected OR source of information/input variables described as appropriate?
-
Subject (and comparison if applicable) characteristics sufficiently described?
-
If interventional and random allocation possible, was it described?
-
If interventional and blinding of investigators was possible, was it reported?
-
If interventional and blinding of subjects was possible, was it reported?
-
Outcome and (if applicable) exposure measures well defined and robust to measurement/misclassification bias? Means of assessment reported?
-
Sample size appropriate?
-
Analytic methods described/justified and appropriate?
-
Some estimate of variance is reported for the main results?
-
Controlled for confounding?
-
Results reported in sufficient detail?
-
Conclusions supported by the results?
Quality assessment: qualitative
-
Question/objective sufficiently described?
-
Study design evidence and appropriate?
-
Context for the study clear?
-
Connection to a theoretical framework/wider body of knowledge?
-
Sampling strategy described, relevant and justified?
-
Data collection methods clearly described and systematic?
-
Data analysis clearly described and systematic?
-
Use of verification procedures to establish credibility?
-
Conclusions supported by the results?
Appendix 3 Mapping review quality assessment
| First author and year of publication | Design and methods | Country | Phenomena (exposures) studied | Evaluation (outcomes) | Population of interest | Variables reported by | Sample sizes analysed | QAS (%) |
|---|---|---|---|---|---|---|---|---|
| Amoroso 200791 |
|
Australia | Practices’ linkages with external services | Patient-reported experience of care | GP surgeries, the patients on the practice lists |
Exposures: GPs or practice managers Outcomes: patients |
97 practices; 7505 patients | 77 |
| Baker 199292 |
|
UK | Organisational features of the practice | Development scores | GP surgeries in Gloucestershire, Avon and Somerset health authorities | One GP per practice | 287 practices | 77 |
| Baker 199593 |
|
UK | Organisational features of the practice | Patient satisfaction | GP practices in South West England, patients visiting the practice |
Exposures: named GP partner or practice manager Outcomes: patients |
89 practices; 16,015 patient responses | 95 |
| Beaulieu 201390 |
|
Canada | Organisational features of the practice | Quality of care for chronic illness, episodic illness and preventative health | Primary care practices in Québec |
Exposures: physician in charge Outcomes: medical chart abstraction |
37 practices; 1457 patient charts | 91 |
| Bosch 200894 |
|
The Netherlands | Team climate and organisational culture | Quality of diabetes care | Primary care practices and their members (GPs, practice nurses, practice assistants) |
Exposures: GPs, practice nurses, practice assistants Outcomes: electronic medical record extraction |
30 practices; 83 practice members; 752 patient records | 77 |
| Bower 200395 |
|
UK | Structure of GP teams and their practices, team climate | Quality of chronic care, patient evaluation of care, team reported effectiveness |
GP practices in six health authorities in England, all staff employed Adult patients Adult patient records on practice disease registers (asthma, angina, diabetes) |
Exposures: practice staff Outcomes: patients, practice staff and patients’ electronic medical records |
42 practices; 387 staff members; 3106 patient responses; up to 20 patient records per practice | 95 |
| Chambers 197897 |
|
Canada | Attachment of family nurse to the practice | Quality of clinical care for indicator conditions, prescribing quality | Primary care practices in Newfoundland, Canada | Abstraction of medical records | 4 practices | 64 |
| de Koning 200598 |
|
The Netherlands | Organisational features and structural adaptations of general practices | Quality of performance of stroke prevention measures |
Patients presenting to two referral hospitals with first time stroke The practices they were registered to |
Exposures: GP reported Outcomes: GP reporting from patient records |
186 patients, 69 GPs | 86 |
| Desborough 201699 |
|
Australia | Practice nurse involvement | Patient satisfaction and enablement |
Practices in Australian Capital Territory, employing at least one practice nurse Patients consulting a nurse, aged < 5 years (parent reported) or > 16 years |
Exposures: qualitative interviews with nurses, descriptive questionnaire from practices Outcomes: patients |
21 practices, 16 nurse interviews 678 patient surveys 23 patient interviews |
71 |
| Dixon 2006100 |
|
UK | Implementing advanced access model: same-day appointment booking | Change in time to third appointment; patients seen on day of choice; qualitative exploration of effects on patients, staff and working culture | Practices in the national primary care collaborative; staff |
Outcomes: quantitative element unclear how reported by practice Qualitative interviews with key stakeholder staff and postal surveys sent to all staff |
462 primary care practices, 371 staff surveys, interviews with staff from 14 practices | 77 |
| Eggleton 2009101 |
|
New Zealand | Nurse-, GP- and practice-level factors | Expert opinion on improvement in CarePlus (chronic care) outcomes | Key staff stakeholders involved in CarePlus delivery in North Island Primary Health Organisation |
Exposures: focus group, followed by questionnaire using the themes Outcomes: opinions from focus group |
Focus group of 5 practice nurses, 1 CarePlus coordinator, 1 GP Questionnaire to 18 nurses |
60 |
| Fisher 2017102 |
|
UK | Patient-, GP-, practice- and systems-level strategies | GP perception of workload | GPs working in NHS England | Qualitative reports from GP interviews | 34 GPs | 100 |
| Gaal 2010103 |
|
UK, Austria, Belgium, France, Germany, Israel, the Netherlands, Slovenia, Switzerland | Practice characteristics, team climate and working roles, and systems | Patient safety | Single-handed, dual or group primary care practices in selected countries | Secondary analysis using post hoc measures for outcomes from data collected in EPA study | 271 practices | 95 |
| Goh 2009104 |
|
UK | Team climate | Quality of care | Primary care in the UK |
Exposures: team climate reported by primary care team members Outcomes: quality reported by patients (three studies) and team self-report (one study) |
8 studies measuring Team Climate Inventory of which four measured quality. Number of teams analysed in included studies ranged from 2–68, with 40 to 720 individuals (when reported) | N/A |
| Grant 2013105 |
|
UK | Macro and micro influences on prescribing processes | Performance on Audit Scotland indicators of prescribing quality | NHS GP practices in Tayside, Scotland | Social scientist observations, GP and practice pharmacist interviews | Two high-quality practices, one low quality practice | 85 |
| Griffiths 2010106 |
|
UK | Practice nurse staffing | Non-elective hospital admissions for chronic illnesses (asthma, COPD, diabetes mellitus) | Patients non-electively admitted in England for asthma, COPD or diabetes and the practices they were registered to | Data extraction from Dr Foster Intelligence, Office for National Statistics, NHS Workforce Projects Benchmarking database | 56,311 asthma admissions; 101,782 COPD admissions; 33,552 diabetes mellitus admissions | 95 |
| Haggerty 2008107 |
|
Canada | Practice and physician characteristics | Patient experience of care | Primary care practices in Québec; GPs and patients |
Exposures: up to four physicians per practice Outcomes: patients attending the clinics |
100 practices, 221 physicians, 2725 patients | 91 |
| Hann 2007108 |
|
UK | Team climate and culture | Chronic care quality, patient satisfaction and experience of care | GP practices in England, staff and patients |
Exposures: practice professionals Outcomes: patients |
38 practices, 492 professionals, not reported how many patients | 59 |
| Harris 2012109 |
|
Australia | Processes and systems of care, practice characteristics | Perceived quality of access (same-/next-day appointments, after-hours access) | Australian GPs (drawn from national list) | Exposures and outcomes reported by GPs | 1016 GP responses | 82 |
| Hulscher 1997110 |
|
The Netherlands | Nurse facilitation of practice-level QI initiatives, compared with feedback | Quality of cardiovascular care (adherence to guidelines) | Two regions of the Netherlands | Questionnaire and observation of written records | 95 practices (33 in facilitation, 31 in feedback, 31 in control groups) | 73 |
| Irwin 2015111 |
|
UK | Practice-level QI interventions | Biomedical markers, patient outcomes, professional performance/compliance with practice |
Literature from UK or relevant countries: Republic of Ireland, the Netherlands, Finland, Denmark, Sweden, New Zealand, Norway, Spain, Italy and Portugal Primary care setting |
Not reported | 23 systematic reviews included, with a range of 1–235 studies included per review | N/A |
| Keenan 2013112 |
|
New Zealand | Patient and practice characteristics | Retention in diabetic annual review | Practices in the Midlands Health Network | Information from database | 78 practices, 6610 patients | 91 |
| Kennedy 2013113 |
|
UK | Reorganisation of systems to promote self-management for chronic illnesses | Patients’ experience of care and health outcomes | General practices in a primary care trust in northwest England; patients with diabetes mellitus, COPD or irritable bowel syndrome | Outcomes reported by patients |
19 practices in intervention group, 22 in control. 4533 patients at 6-month follow-up, 4076 at 12 months |
96 |
| Klemenc-Ketis 2012114 |
|
Slovenia | Practice procedures, practice characteristics, patient characteristics | Patient satisfaction | General practices; patients on the lists comprised:
|
Exposures: patients and practices Outcomes: patients |
36 practices, 2482 patients | 95 |
| Lawton 2016115 |
|
UK | Personal- and practice-level determinants | Perceived ability to implement high-impact indicators of clinical care in practices | Practices participating in a larger study in West Yorkshire; GPs, practice nurses and practice managers | Interviews with staff | 31 practices, 29 GPs, 17 nurses, 14 practice managers | 95 |
| Lemelin 2001116 |
|
Canada | Nurse-facilitated practice-level QI | Performance of preventative care | Primary care practices in Ontario | Outcomes: medical chart audit and patient telephone interviews | 23 practices intervention, 23 control practices | 92 |
| Ludt 2013117 |
|
UK, Austria, Belgium, France, Germany, the Netherlands, Slovenia, Spain, Switzerland | Structural and organisational characteristics | Quality of cardiovascular risk management | Generals practices across selected countries, patients with a high risk of cardiovascular disease but not diagnosed with CHD |
Exposures: not clear which staff members in practice Outcomes: patient medical records abstraction |
240 practices, 3700 patient records | 95 |
| Palmer 2012118 |
|
New Zealand | Facilitated QI programme | System redesign, quality of chronic care and self-management support | Practices in the Auckland District Health Board | Electronic audit tools used by practice, patient reporting assessment of chronic illness care | 15 practices, four practices reporting patient assessment of care, 30 staff members for interviews | 61 |
| Petek 2016120 |
|
Slovenia | Implementation of ‘model practices’ (employment of nurse practitioner and implementation of protocols) | Quality of diabetic care | Practices across a primary care centre implementing the new model; patients diagnosed with type II diabetes mellitus | Outcomes from patient records | Three practices, 132 patients | 73 |
| Poulton 1999121 |
|
UK | Team structures and team processes (team climate) | Team effectiveness (patient-centred care, health-care practice, teamwork, efficiency) | Primary care teams attending team workshops |
Exposures: all team members Outcomes: one GP, one nurse and one senior administration personnel per practice |
46 practices | 82 |
| Proudfoot 2007122 |
|
Australia | Team climate | Job satisfaction, patient satisfaction | General practices across six Australian states; the staff (GPs and other), and adult patients with type II diabetes mellitus, ischaemic heart disease/hypertension or asthma |
Exposure: staff Outcomes: staff and patients |
93 practices, 654 members of staff, 7505 patients | 100 |
| Roots 2014123 |
|
Canada | Embedding nurse practitioner into service delivery | Emergency and hospital admissions, qualitative assessment of practice organisation, community and health system effectiveness | Rural practices in British Columbia | Health authority data and qualitative reports from key stakeholder staff | Three practices, eight GPs, three nurse practitioners, seven other staff, seven community based healthcare providers, three health authority representatives | 45 |
| Russell 2009124 |
|
Canada | Organisational features of practices | Quality of chronic disease care (diabetes, coronary artery disease, chronic heart failure, hypertension) | Practices in Ontario |
Exposures: practices/physicians Outcome: patient charts |
137 practices, 363 health clinicians, 514 patients with chronic diseases and 899 with hypertension | 86 |
| Smits 2015125 |
|
The Netherlands | Practice features and processes | Use of OOH services | General practices related to five OOH co-operatives |
Exposures: staff, records, telephone accessibility Outcome: each of the co-operatives identified practices with relatively high and low use of OOH care |
51 practices with high patient use of OOH care, 49 low-use practices | 91 |
| Smolders 2010126 |
|
The Netherlands | Practice characteristics, personal and professional characteristics | Quality of mental health care |
Practices, unclear which area Patients attending in previous 4 months |
Exposures: practice assistant/nurse, physicians, patients Outcomes: adherence to guidelines, appropriate treatment, referral to specialised mental health care |
62 GPs, 655 patients | 100 |
| Swinglehurst 2011127 |
|
UK | Organisational routines (formal and informal) for repeat prescribing | Qualitative assessment of safety and quality | General practices in UK using electronic patient records supporting semi-automated repeat prescribing | Field notes and observations by researchers | 4 practices, 25 doctors, 16 nurses, 4 health-care assistants, 6 managers, 56 reception/administration staff | 95 |
| Thomas 1995128 |
|
UK | Practice organisational features | Patient movement as a marker for satisfaction | Practices from six health authorities across England | Health service authority-collected data | 374 practices | 91 |
FIGURE 17.
Quality assessment for quantitative studies (n = 26).
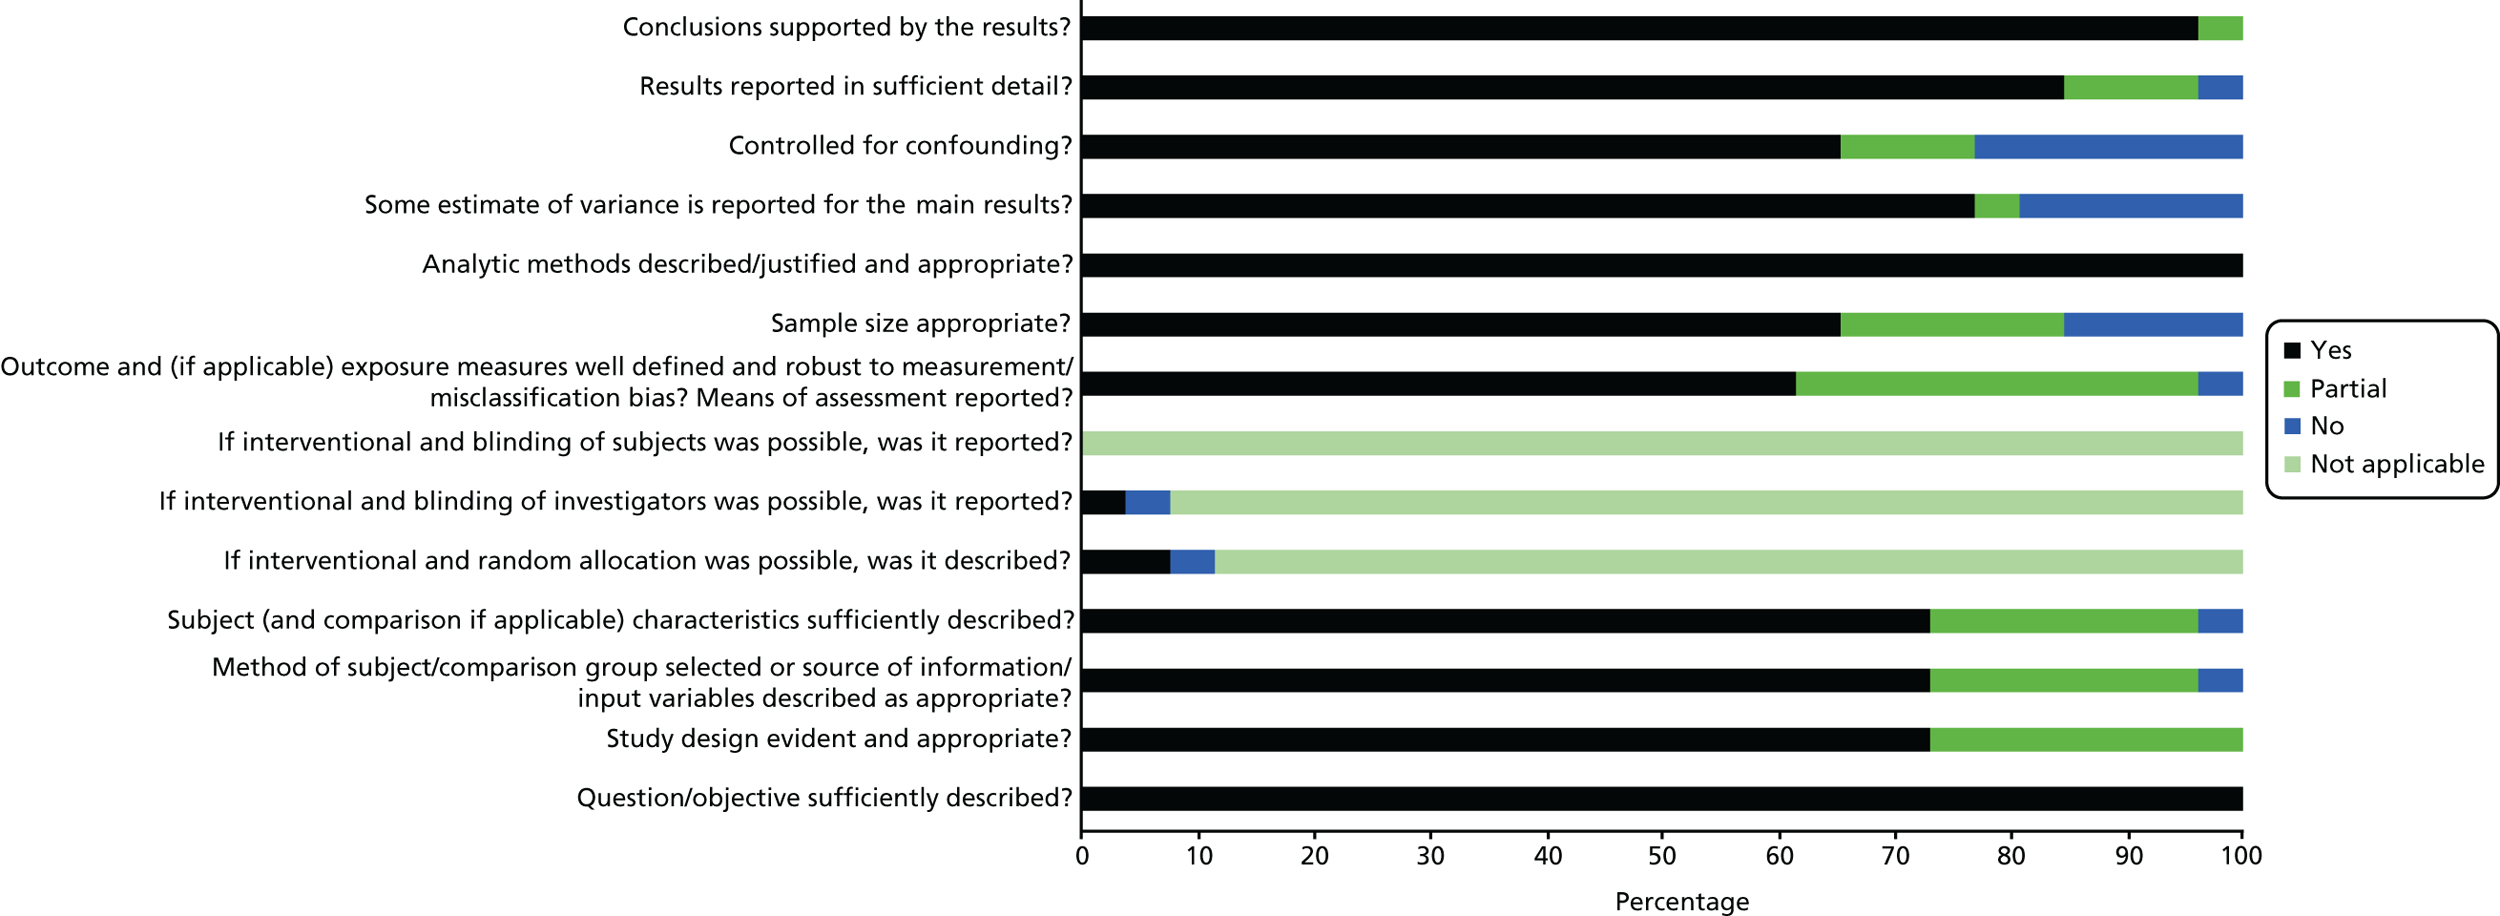
FIGURE 18.
Quality assessment for qualitative studies (n = 4).
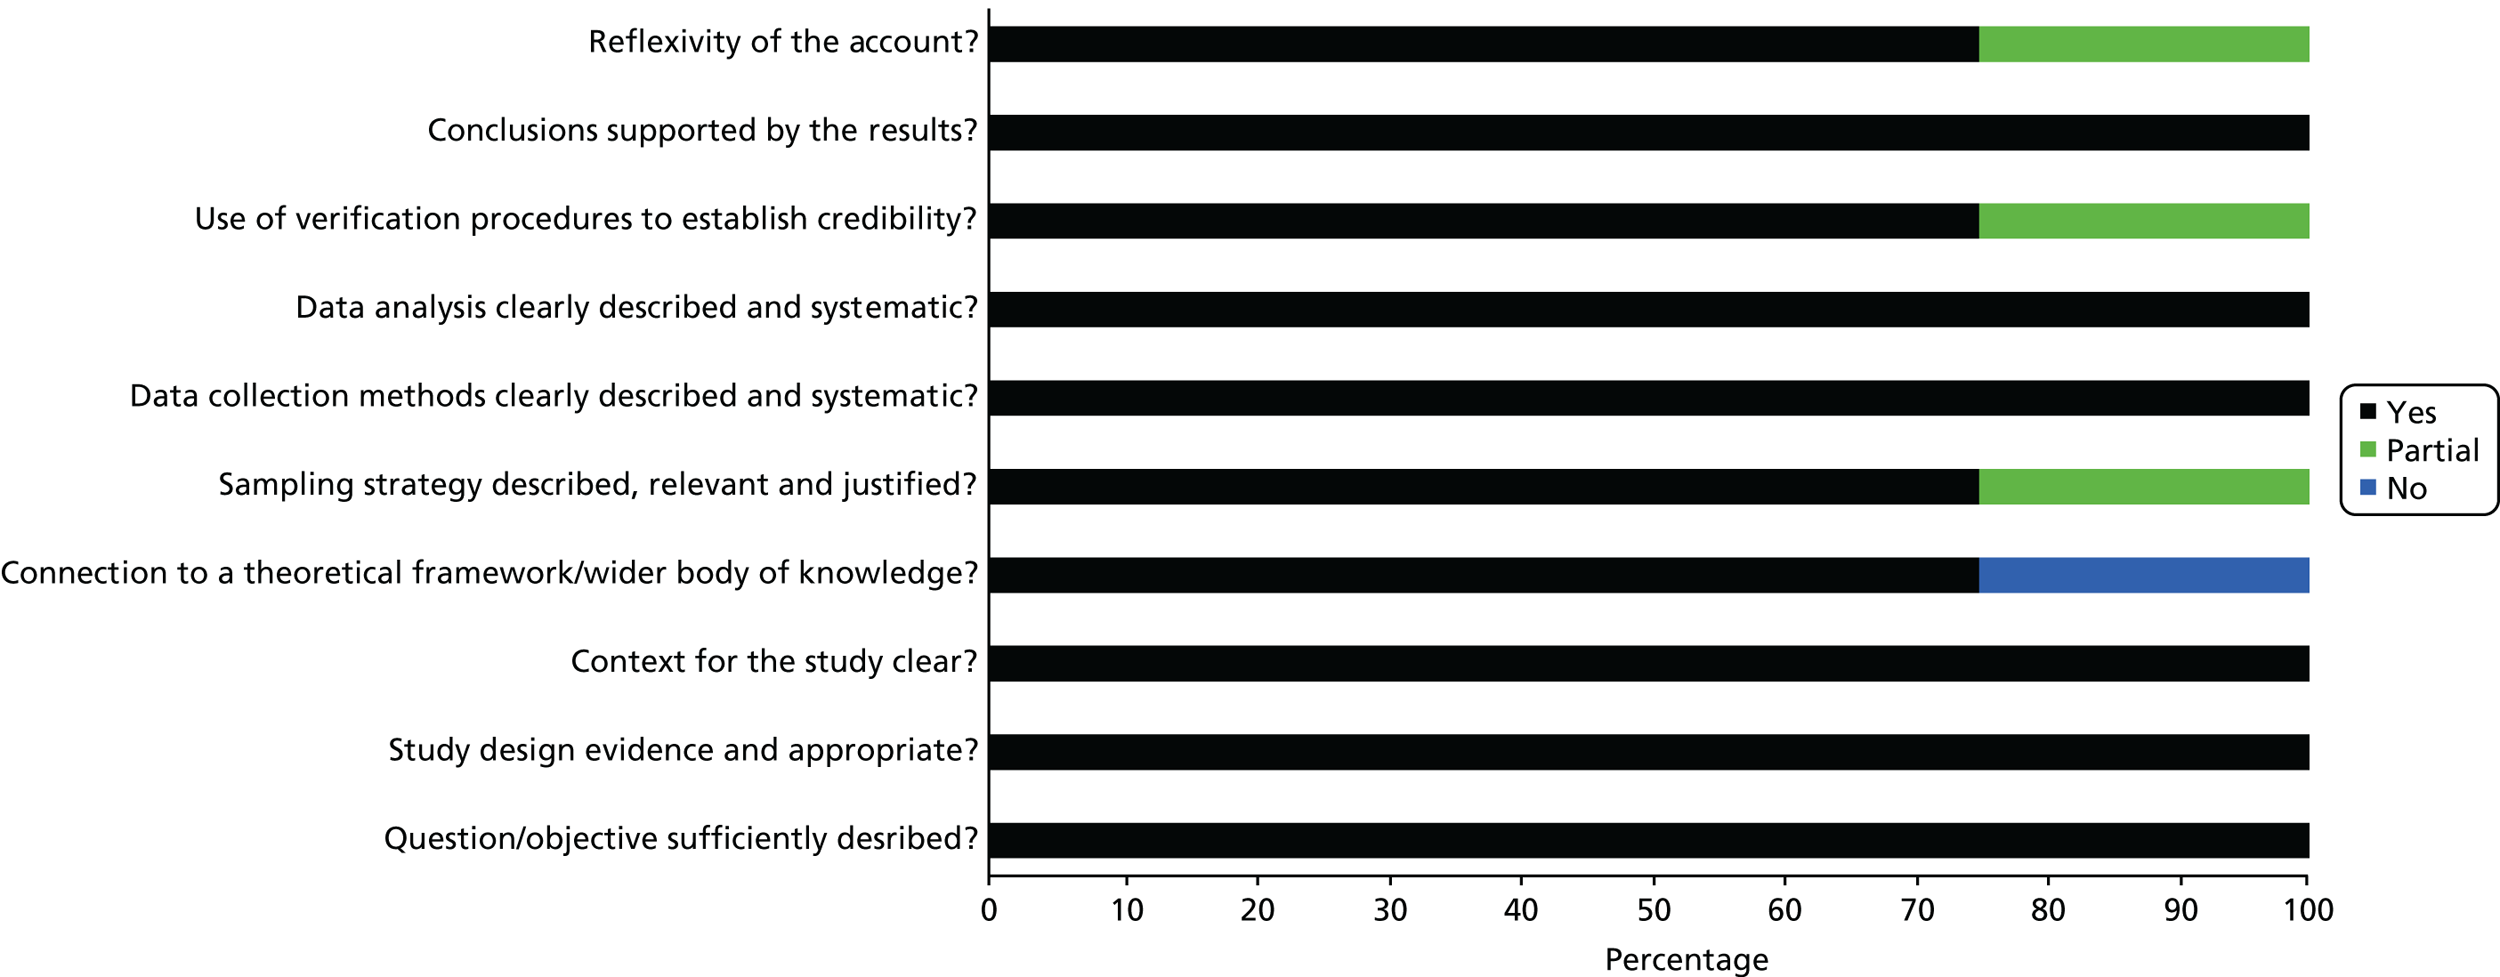
FIGURE 19.
Quality assessment for mixed-methods studies (n = 5).
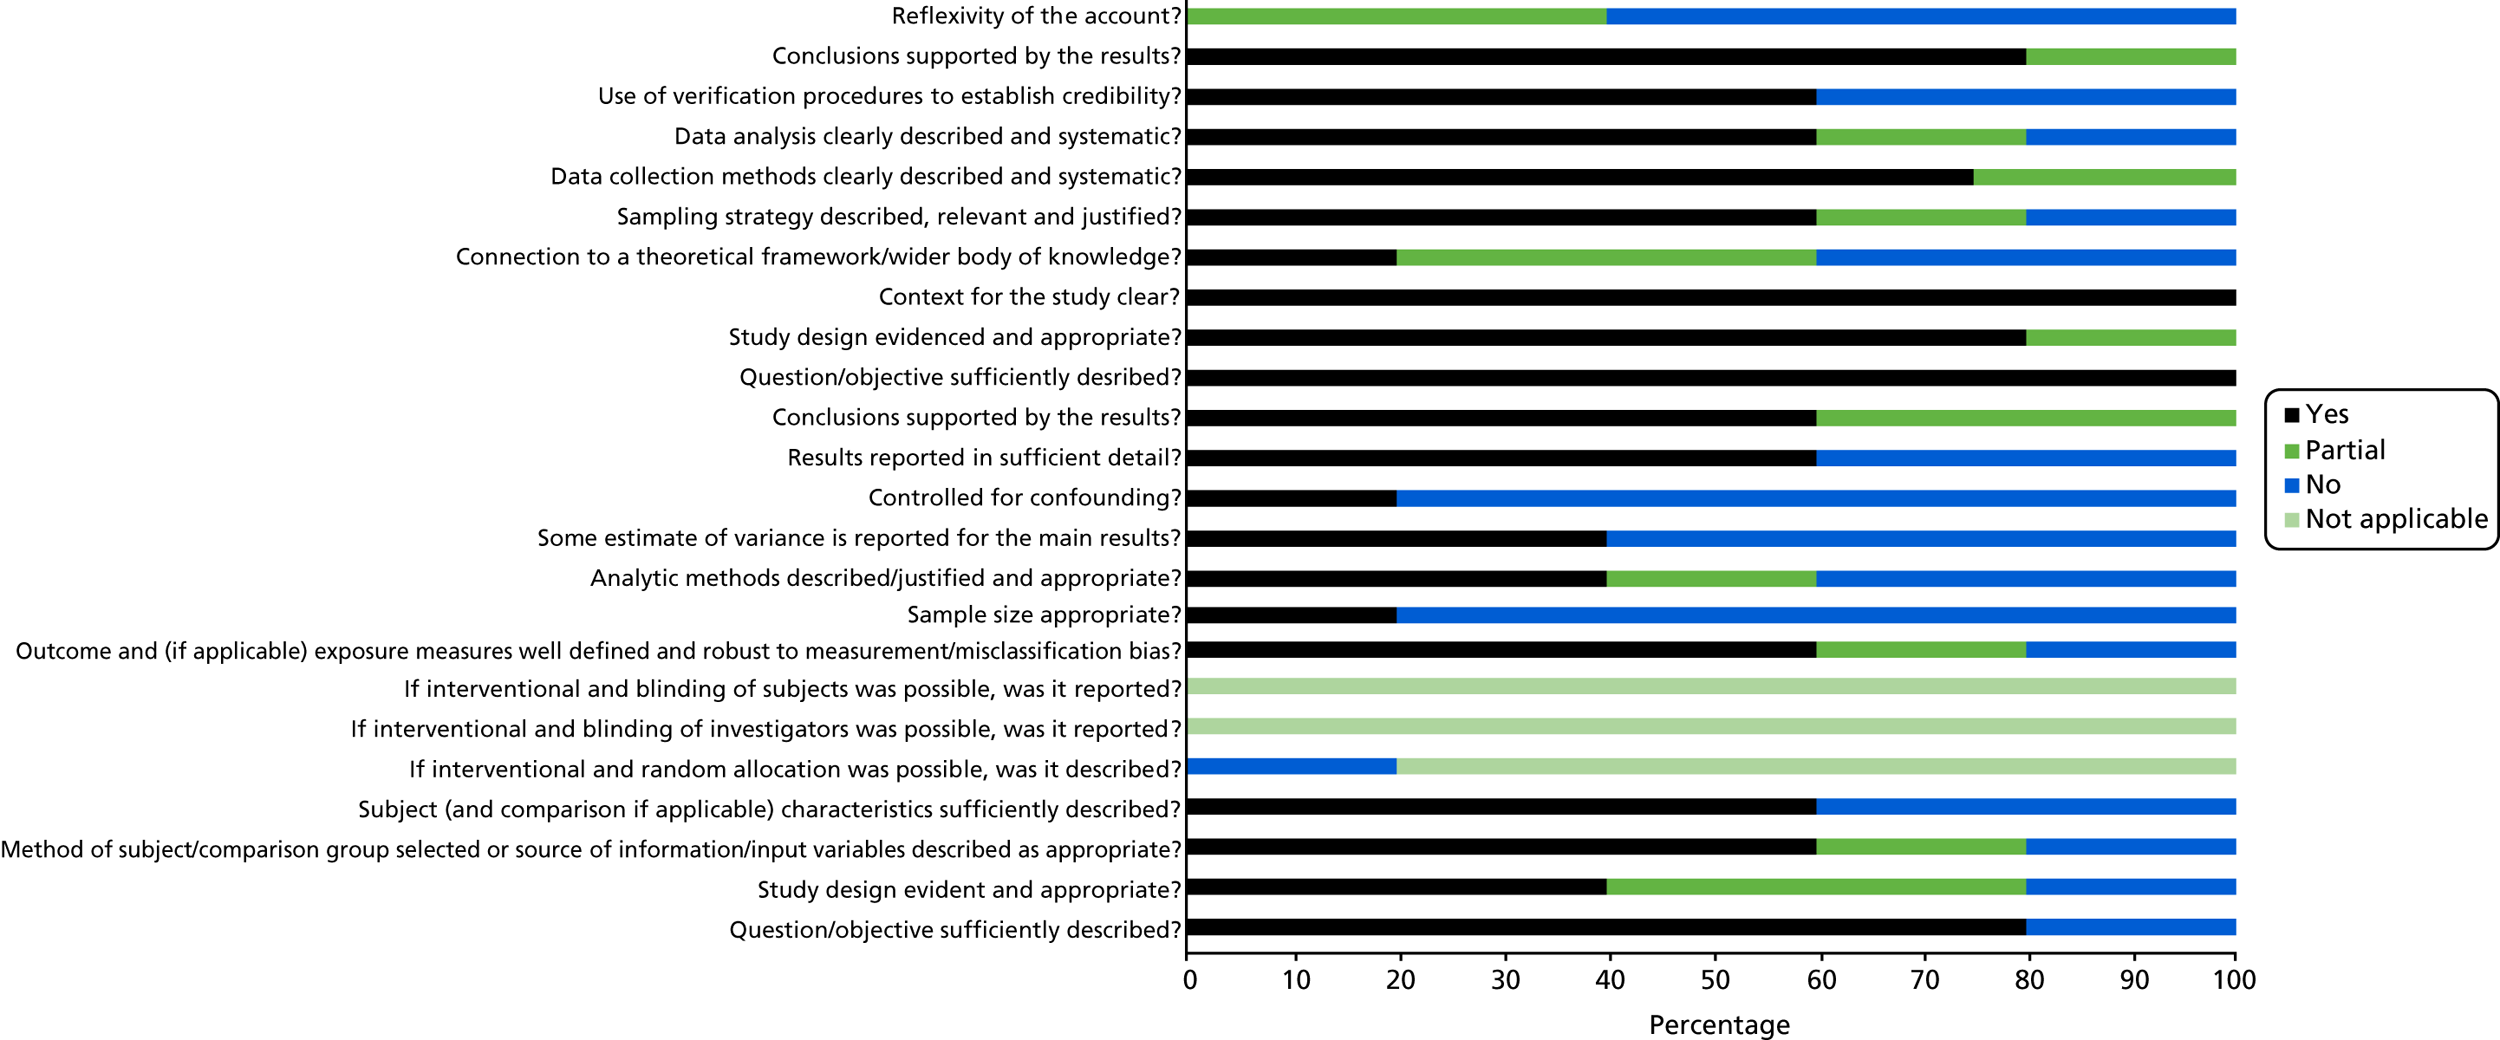
Appendix 4 Mapping review data synthesis study mapping
| Adaptable feature | Subgroup | Description of phenomena | Studied by (first author and year of publication) | Measurement | Evaluating impact on quality/effectiveness/productivity |
|---|---|---|---|---|---|
| Infrastructure |
Physical environment Use of IT systems |
Adequate space/working conditions Electronic prescribing Use in prevention services Electronic patient records Overall use |
Desborough 201699 | Qualitative | Quality (patient experience) |
| Gaal 2010103 | Questionnaire items; specifics not reported | Quality (safety) | |||
| Fisher 2017102 | Qualitative | Productivity (workload) | |||
| Klemenc-Ketis 2012114 | Semistructured interview questions | Quality (patient experience) | |||
| Swinglehurst 2011127 | Qualitative, observations | Quality (safety) | |||
| Irwin 2015111 | Reviews assessing use for QI | Quality (best practice) | |||
| de Koning 200598 | Pre-structured questions of practice organisation (total: 77 items) | Quality (best practice) | |||
| Ludt 2013117 | EPA practice management instrument | Quality (best practice) | |||
| Russell 2009124 | Clinician questionnaire items modified from Primary Care Assessment Tool | Quality (best practice) | |||
| Harris 2012109 | Questionnaire items relating to clinical information system functionality | Effectiveness (access) | |||
| Appointments, list systems and access | Length/intervals of time allotted for appointments | Beaulieu 201390 | Items in the Organisational Questionnaire | Quality (best practice) | |
| Bower 200395 | Categorical intervals: 5, 7.5 or 10 minutes | Effectiveness (team), quality (best practice and patient experience) | |||
| Eggleton 200995 | Qualitative | Quality (best practice) | |||
| List systems – pooled/partly pooled/individual | Baker 199593 | Categorical item in questionnaire | Quality (patient experience) | ||
| Telephone access, triage and appointments | Fisher 2017102 | Qualitative | Productivity (workload) | ||
| Haggerty 2008107 | Items in a questionnaire relating to organisation | Quality (patient experience) | |||
| Smits 2015125 | Structured questionnaire | Effectiveness (unmet demand) | |||
| Evening/weekend opening | Haggerty 2008107 | Items in a questionnaire relating to organisation | Quality (patient experience) | ||
|
Appointment access systems Appointment access |
Dixon 2006100 | Intervention: implementing on the day booking | Effectiveness (access, meeting health need, team effectiveness) | ||
| Haggerty 2008107 | Items relating to organisation: walk-in offered? | Quality (patient experience) | |||
| Thomas 1995128 | Dichotomous item: does your practice offer consultations by appointment only? | Quality (patient experience) | |||
| Clinical services and resources | Provision of clinics/procedures | Beaulieu 201390 | Items in the Organisational Questionnaire | Quality (best practice) | |
| Thomas 1995128 | Dichotomous items relating to clinics and procedures provided | Quality (patient experience) | |||
| Linkages with external health-care providers | Amoroso 200791 | Clinical Linkages Inventory | Quality (patient experience) | ||
| Governance | Record-keeping and protocols | Systematic record-keeping | de Koning 200598 | Pre-structured questions of practice organisation (total 77 items) | Quality (best practice) |
| Klemenc-Ketis 2012114 | Semistructured interview questions | Quality (patient experience) | |||
| Ludt 2013117 | EPA practice management instrument | Quality (best practice) | |||
| Formularies | Grant 2013105 | Qualitative | Quality (safety) | ||
| Formalised communication | de Koning 200598 | Pre-structured questions of practice organisation (total: 77 items) | Quality (best practice) | ||
| Lawton 2016115 | Qualitative | Quality (best practice) | |||
| Audit and feedback | Use of practice data and reports for audit and feedback | Grant 2013145 | Qualitative | Quality (safety) | |
| Harris 2012109 | Yes/no items on use of health outcome/patient experience/satisfaction data and reviews | Effectiveness (access) | |||
| Klemenc-Ketis 2012114 | Semistructured interview questions | Quality (patient experience) | |||
| Ludt 2013117 | EPA practice management instrument | Quality (best practice) | |||
| Irwin 2015111 | Reviews assessing use for QI | Quality (best practice) | |||
| QI models and initiatives | Facilitated QI | Hulscher 1997110 | Intervention | Quality (best practice), effectiveness (team) | |
| Lemelin 2001116 | Intervention | Quality (best practice) | |||
| Palmer 2012118 | Intervention | Effectiveness (variety of processes/outcomes), quality (best practice) | |||
| Irwin 2015111 | Reviews assessing facilitated QI visits | Quality (best practice) | |||
| Use of QI techniques for system redesign | Kennedy 2013113 | Intervention | Effectiveness (patient outcomes) | ||
| Irwin 2015111 | Reviews assessing multifaceted interventions | Quality (best practice) | |||
| Continuing professional development and education | Access to medical literature | Klemenc-Ketis 2012114 | Semistructured interview questions | Quality (patient experience) | |
| Supporting staff education | Beaulieu 201390 | Items in the Organisational Questionnaire | Quality (best practice) | ||
| de Koning 200598 | Pre-structured questions of practice organisation (total: 77 items) | Quality (best practice) | |||
| Desborough 201699 | Qualitative | Quality (patient experience) | |||
| Ludt 2013117 | EPA practice management instrument | Quality (best practice) | |||
| Smits 2015125 | Structured questionnaire | Effectiveness (met/unmet need) | |||
| Practice training status | Baker 199292 | Dichotomous questionnaire item | Effectiveness (practice development) | ||
| Baker 199593 | Dichotomous questionnaire item | Quality (patient experience) | |||
| Working dynamics | Team climate and culture | Goh 2009104 | Team Climate Inventory | Quality (patient experience or best practice) or effectiveness (team or access) | |
| Beaulieu 201390 | Team Climate Inventory | Quality (best practice) | |||
| Bosch 200894 | Team Climate Inventory and Competing Values Framework | Quality (best practice) | |||
| Bower 200395 | Team Climate Inventory | Quality (best practice and patient experience), effectiveness (team) | |||
| Gaal 2010103 | Measure used not reported | Quality (safety) | |||
| Hann 2007108 | Team Climate Inventory and Competing Values Framework | Quality (best practice) | |||
| Poulton 1999121 | Team Climate Inventory | Effectiveness (team) | |||
| Proudfoot 2007122 | Team Climate Inventory | Effectiveness (team), quality (patient experience) | |||
| Use of team meetings | Desborough 201699 | Qualitative | Quality (patient experience) | ||
| Grant 2013105 | Qualitative | Quality (safety) | |||
| Lawton 2016115 | Qualitative | Quality (best practice) | |||
| Personnel | Nurses or nurse practitioners | Presence/staffing levels | Bower 200395 | Ratio of doctors-to-nurses | Effectiveness (team), quality (best practice and patient experience) |
| Chambers 197897 | Intervention: employment | Quality (best practice) | |||
| Griffiths 2010106 | Estimate of number per practice from national dates | Effectiveness (health outcomes) | |||
| Keenan 2013112 | Ratio of nurses-to-doctors | Effectiveness (clinical performance) | |||
| Russell 2009124 | Clinician questionnaire: nurse practitioner present | Quality (best practice) | |||
| Smits 2015125 | Structured questionnaire: presence in the practice | Effectiveness (met/unmet demand) | |||
| Smolders 2010126 | Questionnaire reported presence | Quality (best practice) | |||
| Thomas 1995128 | Dichotomous measure: yes/no employing nurse | Quality (patient experience) | |||
| Delegation of jobs, scope of practice and autonomy | Desborough 201699 | Qualitative | Quality (patient experience) | ||
| Fisher 2017102 | Qualitative | Productivity (perceptions of workload) | |||
| Roots 2014123 | Intervention | Effectiveness (composite) | |||
| Use in chronic and preventative care | Ludt 2013117 | EPA practice management instrument | Quality (best practice) | ||
| Petek 2016120 | Implementation as part of delivery model | Quality (best practice) | |||
| Other allied health-care professionals | Physician assistants | de Koning 200598 | Pre-structured questions of practice organisation (total 77 items) – delegation of work | Quality (best practice) | |
| Smits 2015125 | Structured questionnaire: presence in the practice | Effectiveness (unmet demand) | |||
| Smolders 2010126 | Questionnaire reported presence | Quality (best practice) | |||
| Pharmacists | Fisher 2017102 | Qualitative | Productivity (perceptions of workload) | ||
| Grant 2013105 | Qualitative | Quality (safety) | |||
| Other | de Koning 200598 | Pre-structured questions of practice organisation (total 77 items) – dietitians and diabetic nurse | Quality (best practice) | ||
| Smolders 2010126 | Questionnaire-reported use of psychologists | Quality (best practice) | |||
| Harris 2012109 | International Survey General Practitioners | Quality (safety) | |||
| Non-clinical/administrative staff | Practice manager | Baker 199292 | Dichotomous: yes/no present | Effectiveness (practice development) | |
| Baker 199593 | Dichotomous: yes/no present | Quality (patient satisfaction) | |||
| Other | Bower 200395 | Ratio of clinical to non-clinical staff | Effectiveness (team), quality (best practice and patient experience) | ||
| Fisher 2017102 | Qualitative | Productivity (perceptions of workload) | |||
| Swinglehurst 2011127 | Qualitative: routines and roles of administration staff | Effectiveness (access) |
Appendix 5 Interview schedule (practice staff)
Appendix 6 Interview schedule (patients)
Appendix 7 Measuring General Practice Productivity public focus group schedule
Appendix 8 The General Practice Effectiveness Tool
Appendix 9 Practice manager questionnaire and quantitative results
Appendix 10 Change over time by indicator
| Indicator | Estimate (95% CI) | p-value | Estimate (%) | Standardised estimate |
|---|---|---|---|---|
| 1.1 Percentage of those aged > 75 years having a health check | 0.5 (–1.0 to 2.0) | 0.490 | 0.9 | 0.05 |
| 1.2 Percentage having NHS health checks (aged 40–74 years) | 0.2 (–1.2 to 1.5) | 0.785 | 0.3 | 0.02 |
| 1.3 Smoking cessation | 0.7 (–1.1 to 2.5) | 0.449 | 0.9 | 0.04 |
| 1.4 Alcohol consumption | 3.1 (0.8 to 5.4) | 0.009 | 5.2 | 0.22 |
| 1.5 Reduced BMI | 0.5 (–2.3 to 3.3) | 0.714 | 0.9 | 0.03 |
| 1.6 Immunisations for influenza | –2.4 (–4.1 to -0.8) | 0.003 | –3.1 | –0.15 |
| 1.7 Childhood influenza immunisations | –0.7 (–2.2 to 0.9) | 0.400 | –0.8 | –0.07 |
| 1.8a Immunisations for children | –0.3 (–2.2 to 1.7) | 0.794 | –0.4 | –0.01 |
| 1.8b Immunisations for babies | –0.1 (–1.9 to 1.8) | 0.936 | –0.1 | 0.00 |
| 2.1a Dementia care | 1.9 (–1.7 to 5.5) | 0.286 | 1.8 | 0.07 |
| 2.2 Diabetes management | 0.6 (–2.1 to 3.2) | 0.678 | 0.7 | 0.03 |
| 2.3 Initial care of mental health conditions | 0.5 (–0.2 to 1.2) | 0.171 | 0.6 | 0.04 |
| 2.4a Ongoing care of mental health conditions | 0.7 (–1.9 to 3.4) | 0.571 | 0.9 | 0.03 |
| 2.5 Heart disease care | 0.0 (–2.0 to 2.1) | 0.968 | 0.0 | 0.00 |
| 2.6a COPD care (care plan) | 0.4 (–0.1 to 1.0) | 0.089 | 1.5 | 0.10 |
| 2.6b COPD spirometry | 0.7 (–0.4 to 1.8) | 0.201 | 2.3 | 0.07 |
| 2.6c COPD care medication | 0.3 (–0.2 to 0.7) | 0.219 | 1.4 | 0.05 |
| 2.7 Lifestyle of people with long-term conditions | 2.0 (–0.4 to 4.4) | 0.104 | 3.4 | 0.12 |
| 3.1 Availability of enhanced services | 0.2 (–1.7 to 2.1) | 0.813 | 0.4 | 0.02 |
| 3.2 Medication review | 1.9 (–0.9 to 4.7) | 0.180 | 1.4 | 0.05 |
| 3.3 Audits in last quarter | 3.3 (–1.7 to 8.2) | 0.198 | 2.0 | 0.07 |
| 3.4 Safeguarding | 14.3 (7.5 to 21.1) | 0.000 | 7.1 | 0.18 |
| 3.5 DNAs | 1.8 (0.1 to 3.5) | 0.044 | 4.4 | 0.11 |
| 4.1 Use of IT tools | 5.9 (0.4 to 11.5) | 0.035 | 3.7 | 0.11 |
| 4.2 Use of paperless systems | 7.3 (–1.5 to 16.2) | 0.102 | 4.6 | 0.13 |
| 5.1 Appropriate environment in the consulting room | 14.7 (–4.9 to 34.3) | 0.137 | 9.8 | 0.21 |
| 5.2 Compliance to DDA checklist | –3.4 (–20.2 to 13.5) | 0.690 | –2.6 | –0.08 |
| 6.1 Proportion of staff attending monthly practice meetings | 2.4 (–0.6 to 5.4) | 0.114 | 4.0 | 0.11 |
| 6.2 Proportion of clinical staff with relevant training needs met | 5.5 (0.0 to 11.1) | 0.052 | 9.2 | 0.20 |
| 6.3 Proportion of non-clinical staff with relevant training needs met | 4.0 (0.7 to 7.3) | 0.017 | 8.0 | 0.17 |
| 6.4 Staff retention | 4.9 (–0.6 to 10.3) | 0.082 | 4.9 | 0.11 |
| 6.5 Staff well-being | 7.4 (2.1 to 12.7) | 0.007 | 8.2 | 0.18 |
| 6.6 Quality of teamworking | 4.5 (–1.9 to 10.8) | 0.161 | 4.5 | 0.11 |
| 7.1 Staff appraisals | 1.5 (–1.2 to 4.3) | 0.271 | 3.0 | 0.07 |
| 7.2 Learning from complaints | –1.3 (–4.9 to 2.4) | 0.493 | –1.8 | –0.05 |
| 7.3 Workforce planning | –0.2 (–3.6 to 3.3) | 0.912 | –0.3 | –0.01 |
| 7.4 Financial management | 2.9 (–0.1 to 5.9) | 0.060 | 4.1 | 0.12 |
| 7.5 Management of significant events | –3.8 (–9.7 to 2.1) | 0.201 | –3.2 | –0.09 |
| 7.6 Reviewing practice procedures or services to reflect changing needs or demographics in the practice population | 3.0 (0.0 to 6.0) | 0.048 | 4.3 | 0.12 |
| 8.1 Percentage of patients willing to recommend service | 18.9 (10.6 to 27.1) | 0.000 | 9.4 | 0.22 |
| 8.2 Patient satisfaction with (reception) staff | 16.6 (8.0 to 25.1) | 0.000 | 10.3 | 0.22 |
| 9.1 Hours of clinical appointments per 1000 patients per week | 9.0 (1.8 to 16.2) | 0.014 | 5.0 | 0.12 |
| 9.2 Percentage of patients waiting > 15 minutes past appointment time | 6.3 (1.9 to 10.7) | 0.005 | 7.0 | 0.16 |
| 9.3 Percentage of patients satisfied with booking system | 7.3 (3.4 to 11.3) | 0.000 | 8.1 | 0.21 |
| 10.1 Regular MDT-working | 9.7 (–3.7 to 23.0) | 0.151 | 4.8 | 0.11 |
| 10.4 Working with different partners | 3.8 (–3.6 to 11.2) | 0.308 | 1.9 | 0.06 |
| 11.1 Enabling Involvement | 0.0 (–4.8 to 4.9) | 0.990 | 0.0 | 0.00 |
| 11.2 Resourcing the PPG | –1.7 (–5.4 to 1.9) | 0.350 | –2.2 | –0.07 |
| 11.3 Learning from the PPG | –0.5 (–6.5 to 5.6) | 0.882 | –0.4 | –0.01 |
| 11.4 Practice staff outreach to the public | 4.4 (–1.9 to 10.6) | 0.168 | 7.3 | 0.27 |
| 11.5 Outreach and partnerships with local population and community | –0.2 (–3.8 to 3.3) | 0.894 | –0.3 | –0.01 |
| 11.6 Use of various access routes to communicate with public | 1.7 (–2.3 to 5.7) | 0.398 | 1.7 | 0.07 |
Appendix 11 Improvements to the General Practice Effectiveness Tool suggested during evaluation
Glossary
- Allied health professionals
- Professionals aligned to medicine, excluding nurses. These professionals include arts therapists, chiropodists, dietitians, occupational therapists, orthoptists, paramedics, physiotherapists, prosthetists and orthotists, psychologists, psychotherapists, radiographers, and speech and language therapists.
- Contingencies
- A term used in Productivity Measurement and Enhancement System for the functions that show how much each score on the indicators is worth in effectiveness points.
- EMIS (EMIS Health, Leeds, UK)
- A clinical system used in some general practices.
- Medical Research Council grading
- Medical Research Council grading scales for clinical conditions.
- MIQUEST
- Queries to extract data from clinical systems.
- Preferred Reporting Items for Systematic Reviews and Meta-Analyses
- An evidence-based minimum set of items for reporting in systematic reviews and meta-analyses.
- PRIMIS
- A health informatics organisation based at the University of Nottingham.
- Qualtrics (Provo, UT and Seattle, WA, USA)
- Online survey software.
- Read codes
- A structured clinical vocabulary for use in an electronic patient health record.
- SNOMED (SNOMED International, London, UK)
- A structured clinical vocabulary for use in an electronic patient health record.
- SPIDER
- A tool to develop effective search strategies of qualitative and mixed-methods research.
- SystmOne [The Phoenix Partnership (TPP), Leeds, UK]
- A clinical system used in some general practices.
List of abbreviations
- BME
- black and minority ethnic
- BMI
- body mass index
- CCG
- Clinical Commissioning Group
- CHD
- coronary heart disease
- CI
- confidence interval
- CMHT
- Community Mental Health Team
- COPD
- chronic obstructive pulmonary disease
- CQC
- Care Quality Commission
- CRN
- Clinical Research Network
- DDA
- Disability Discrimination Act
- DNA
- did not attend
- EPA-Cardio
- European Practice Assessment of Cardiovascular risk management
- FFT
- Friends and Family Test
- FTE
- full-time equivalent
- GMS
- General Medical Services
- GP
- general practitioner
- GPET
- General Practice Effectiveness Tool
- ICS
- integrated care system
- IT
- information technology
- MDT
- multidisciplinary team
- MIQUEST
- Morbidity Information Query and Export Syntax
- NICE
- National Institute for Health and Care Excellence
- NIHR
- National Institute for Health Research
- OOH
- out of hours
- PMS
- Personal Medical Services
- PPG
- patient participation group
- PRG
- patient reference group
- PRISMA
- Preferred Reporting Items for Systematic Reviews and Meta-Analyses
- ProMES
- Productivity Measurement and Enhancement System
- QI
- quality improvement
- QOF
- Quality and Outcomes Framework
- RCGP
- Royal College of General Practitioners
- RCT
- randomised controlled trial
- SCIE
- Social Care Institute for Excellence
- SD
- standard deviation
- SNOMED
- Systematized Nomenclature of Medicine
- SPIDER
- sample, phenomenon of interest, design, evaluation, research type
- STP
- sustainability and transformation partnership
