Notes
Article history
The research reported in this issue of the journal was commissioned by the HTA programme as project number 07/85/02. The contractual start date was in January 2009. The draft report began editorial review in February 2011 and was accepted for publication in June 2011. As the funder, by devising a commissioning brief, the HTA programme specified the research question and study design. The authors have been wholly responsible for all data collection, analysis and interpretation, and for writing up their work. The HTA editors and publisher have tried to ensure the accuracy of the authors’ report and would like to thank the referees for their constructive comments on the draft document. However, they do not accept liability for damages or losses arising from material published in this report.
Declared competing interests of authors
KK has received funds for research or acted on advisory boards for Novartis, Novo Nordisk, Sanofi-Aventis, Eli Lilly and Merck Sharp & Dohme. He has received grants in support of investigator and investigator-initiated trials from Novartis, Novo Nordisk, Sanofi-Aventis, Eli Lilly, Pfizer, Boehringer Ingelheim and Merck Sharp & Dohme. MJD has received funds for research and honoraria for speaking at meetings and has served on advisory boards for Eli Lilly, Sanofi-Aventis, Merck Sharp & Dohme and Novo Nordisk.
Permissions
Copyright statement
© Queen’s Printer and Controller of HMSO 2012. This work was produced by Ara et al. under the terms of a commissioning contract issued by the Secretary of State for Health. This journal is a member of and subscribes to the principles of the Committee on Publication Ethics (COPE) (http://www.publicationethics.org/). This journal may be freely reproduced for the purposes of private research and study and may be included in professional journals provided that suitable acknowledgement is made and the reproduction is not associated with any form of advertising. Applications for commercial reproduction should be addressed to: NETSCC, Health Technology Assessment, Alpha House, University of Southampton Science Park, Southampton SO16 7NS, UK.
2012 Queen’s Printer and Controller of HMSO
Chapter 1 Background
Description of health problem
Prevalence
The increasing prevalence of obesity in the UK represents a considerable public health problem. The prevalence of obesity [defined as a body mass index (BMI) ≥ 30 kg/m2] in England is reported to have increased between 1993 and 2004 from 13.6% to 24.0% among men and from 16.9% to 24.4% among women. 1 When waist circumference was measured in a UK adult primary care sample in 2005, 38.8% of men and 51.2% of women were classed as abdominally obese (waist circumference > 102 cm and > 88 cm, respectively). 2 It has been estimated that, among young people aged 20 years and under in England, 10% of females and 8% of males are obese. 3 Should increases in the prevalence of obesity continue at the same rate, Zaninotto et al. 1 predicted that the prevalence of obesity in 2012 would be 32% in men and 31% in women, with a likely higher prevalence among adults in manual social classes (43%) than in non-manual social classes (35%). Projections by the UK government’s Foresight programme have postulated that by 2025 40% of Britons may be classed as obese. 3,4
The World Health Organization (WHO) estimated in 2005 that, internationally, there were over 1.6 billion overweight adults, of whom at least 400 million were obese. They also projected that, by 2015, approximately 2.3 billion adults would be overweight and over 700 million would be obese. 5
The estimated prevalence of overweight and obesity among male and female adults in 2010 demonstrated considerable differences by geographical region, with several hotspots of prevalence exceeding 80%, including the USA, Barbados, Dominica, Kuwait and the South Pacific islands. 5
Groups at risk of obesity
A number of population groups are considered at increased risk of obesity. Variation in obesity by ethnic group has been described in a report published by the NHS Information Centre. 6 Data relating to obesity and overweight among ethnic minority groups were drawn from the Health Survey for England (HSE) 2004. The survey applied the definition of overweight and obesity as used in the general population. It was reported that the prevalence of obesity was higher among black Caribbean men and women, black African women, Pakistani women and Irish men than among the general population. Obesity was lower among Chinese, Indian and Bangladeshi men and women than among the general population. Groups at risk of becoming obese also include children with overweight or obese parents7–9 and individuals giving up smoking. 10 A high prevalence of obesity has been observed in adults and children with intellectual disabilities. 11–13 An association also exists between low socioeconomic status in early life and adult obesity. 9 Data from the HSE 2007 indicated that, among women, the age-standardised prevalence of obesity and raised waist circumference increased as the quintile of equivalised household income decreased, but these measures were not related to income in men. 6
Aetiology
Previous work by the Foresight group indicated that the energy imbalance that precedes obesity (whereby energy intake exceeds energy expenditure) is governed by what was described as a ‘complex multifaceted system of determinants’. 14–16 These factors include biological propensity (such as genetic risk and the influence of early life experiences), the generation of an obesogenic external environment (based on, for example, changes in food production and lifestyle, such as increased wealth, increased sedentary lifestyle and increased availability of energy-dense foods), a life course component (whereby the risks of becoming obese may be present at an early stage of life) and a generational dimension (in which parental obesity is known to act as a significant predictor of childhood obesity). 17
Comorbidities associated with obesity
Overweight and obesity are associated with a significant range of comorbidities, including type 2 diabetes (T2DM), hypertension, dyslipidaemia, coronary artery disease, stroke, osteoarthritis, reproductive problems, respiratory and liver conditions and cancers. 18–20 Obstructive sleep apnoea is also associated with obesity, with a potential predisposition among Asian individuals. 21,22 The National Audit Office23 estimated the increased relative risk of the development of comorbidities among obese individuals, which is shown in Table 1.
| Condition | Relative risk among females | Relative risk among males |
|---|---|---|
| T2DM | 12.7 | 5.2 |
| Hypertension | 4.2 | 2.6 |
| Myocardial infarction | 3.2 | 1.5 |
| Colon cancer | 2.7 | 3.0 |
| Angina | 1.8 | 1.8 |
| Gall bladder disease | 1.8 | 1.8 |
| Ovarian cancer | 1.7 | NA |
| Osteoarthritis | 1.4 | 1.9 |
| Stroke | 1.3 | 1.3 |
Increased levels of overweight and obesity are linked with increases in mortality, with subjects who have never smoked and with no history of disease but a BMI > 40 kg/m2 having a relative risk of death 2.7 times higher for men and 1.9 times higher for women than that among subjects with a lower BMI (between 23.5 and 24.9 kg/m2). 24 Obesity is also associated with psychological stigma. 25 The proportion of chronic disease attributable to obesity has been predicted to undergo a considerable increase by 2050, particularly for T2DM, stroke and coronary heart disease (CHD). 3 It has been suggested that adults in the upper half of the healthy weight category (22.0 kg/m2 < BMI < 24.9 kg/m2) are more likely to develop health problems than their leaner counterparts and that adults should attempt to maintain a BMI of between 18.5 kg/m2 and 21.9 kg/m2 to minimise their risk of disease. 20
Measurements of obesity
Obesity is frequently reported in terms of BMI. BMI is a measurement of body weight relative to height. Based on the WHO criteria, overweight is classed as a BMI of 25–29.9 kg/m2, while obesity is defined as a BMI > 30 kg/m2. 5 The current National Institute for Health and Clinical Excellence (NICE) clinical guideline for obesity26 states that waist circumference may also be used in addition to BMI in adults with a BMI < 35 kg/m2 and may be used to provide additional information on the risk of the development of comorbidities in children. Among adults, waist circumference can be used as an indicator of health risk, with increased risk being identified based on a waist circumference of ≥ 94 cm in men and ≥ 80 cm in women and greatly increased risk with a waist circumference of ≥ 102 cm in men and ≥ 88 cm in women. 27 Other measurements of obesity include body weight, percentage over ideal body weight, waist–hip ratio and skinfold thickness. It is worth noting that a lower cut-off point has been suggested for certain ethnic groups including South Asians. 28
A report suggested that debate surrounded the use of standard BMI cut-offs among some ethnic groups on the basis that variation exists in the association between BMI and body fat according to ethnicity. 6 Dhaliwal and Welborn29 and Kumar et al. 30 proposed that waist–hip ratio be used as a measure of central obesity because of its high precision and no bias across ethnic groups. 29,30
Impact of health problem and significance for the NHS
Most obesity management is undertaken in primary care settings. Hospital admissions for people with obesity-related conditions place a significant burden on the health service, particularly in relation to circulatory diseases, musculoskeletal disorders and endocrine disorders including diabetes. 31
Allender and Rayner32 produced a new estimate of the burden of overweight- and obesity-related disease in the UK. The authors estimated that, when the rates for the burden of overweight-attributable disease were applied to mortality figures for 2003–4, over 203,000 deaths occurred in the UK as a result of diseases associated with overweight and obesity. The authors stated that it was further estimated that approximately 66,737 deaths were directly attributable to overweight and obesity, over half (54%) of these being due to CHD and 31% to stroke.
Current service provision
Management of obesity
The primary aim of the management of obesity is to achieve weight reduction in the interests of health. The Royal College of Physicians33 described the clinical benefits of weight loss (based on a scenario of an individual weighing 100 kg losing 10% of their body weight), estimates of which included decreased blood pressure, a 10% decrease in cholesterol, a > 50% reduction in the risk of developing diabetes, reductions of 30–40% and 40–50% in diabetes-related deaths and obesity-related cancer deaths, respectively, and a 20–25% reduction in total mortality. Non-pharmacological methods for the management of obesity include dietary modification, exercise, structured education and weight management programmes. For obese patients who cannot achieve or maintain a healthy weight by non-pharmacological means, a number of pharmacological interventions exist to aid weight reduction, including sibutramine (Reductil®, Abbott), orlistat (Xenical®, Roche; Alli®, GlaxoSmithKline) and rimonabant (Acomplia®, Sanofi-Aventis). Drug therapy has been shown to be most effective when combined with dietary modification, physical exercise and behaviour change34 and is recommended for use in the management of obesity in combination with non-pharmacological interventions. Surgical procedures, such as gastric bypass and banding, also play a role in the management of obesity.
Current service cost
The treatment of obesity and its complications is associated with significant health and social care costs, in addition to wider societal financial costs. The House of Commons Select Committee estimated that the direct health-care costs arising from the treatment of obesity and its complications ranged from £991M to £1124M in 2002. This level of expenditure represented approximately 2.3–2.6% of the total NHS spending for the period 2001–2. 35 Allender and Rayner32 estimated the direct cost of overweight and obesity to the NHS to be £3.2B, of which the greatest proportion was attributable to stroke (£983M), followed by CHD (£773M), hypertensive disease (£576M) and diabetes (£533M). The costs arising from overweight and obesity are likely to escalate (from the estimate for 2007 of £4.2B) in the forthcoming years if current increasing trends in the prevalence of obesity continue, with a predicted overall annual total cost to the NHS of overweight and obesity of £9.7B (based on today’s prices) by 2050, representing an increase in the projected percentage of NHS costs (at £70B) from 6.0% in 2007 to 13.9% in 2050. 3
Variation in services and/or uncertainty about best practice
The management of obesity in primary care has been described as being uncoordinated and inconsistent. 36 The Counterweight Project Team (2004) undertook a series of structured interviews with general practitioners (GPs) and practice nurses and analysed patient records from primary care settings across England and Scotland in order to investigate the range of approaches to obesity management utilised by primary care professionals. Although the majority of GPs (83%) and practice nurses (97%) reported that they would raise weight as an issue with obese patients, only 15% of GPs would spend up to 10 minutes in a weight-related consultation compared with 76% of nurses (p < 0.001). BMI was recorded for 64.2% of patients. GPs and practice nurses reported making patient referrals to a dietician (58% vs 59%), exercise referral schemes (50% vs 56%) and commercial weight loss agencies (41% vs 68%). Audit of obese patients’ records showed the use of practice-based diet counselling (20%), dietetic (4%) and obesity centre (1%) referrals and any anti-obesity medication (2%) recorded over 18 months. Patients prescribed anti-obesity medication were more likely to be female (p < 0.01) and more obese (p < 0.01) than, but with a similar prevalence of comorbidities to, patients who were not prescribed medication.
Relevant national guidelines
Healthy Weight, Healthy Lives is a cross-government strategy for England involving a range of programmes across a number of sectors, including schools and food, physical activity, transport and the health service. 17 The strategy is focused on five areas: the healthy growth and development of children; promoting healthier food choices; promoting physical activity; creating incentives for better health; and personalised advice and support. The development of strategies for the management of obesity is also linked to requirements under the national service frameworks for CHD and diabetes.
NICE issued clinical guideline 4326 to provide guidance on the prevention, identification, assessment and management of overweight and obese adults and children. The guidance superseded previous pieces of guidance on orlistat,38 sibutramine39 and surgery for morbid obesity. 40 The clinical guideline recommended that dietary changes and physical exercise should be the first options in the management of obesity before the use of pharmacological interventions is considered. Bariatric surgery was recommended if all of the following criteria were fulfilled: a BMI of ≥ 40 kg/m2 (or between 35 kg/m2 and 40 kg/m2 in the presence of other significant disease that could be improved in the event of weight loss); all appropriate non-surgical measures have been attempted and been unsuccessful; person has or will receive intensive management in a specialist obesity service; patient is generally fit for anaesthesia and surgery; and the patient commits to requirement for long-term follow-up. In addition, bariatric surgery can be considered as a first-line option when appropriate in adults who have a BMI of ≥ 50 kg/m2. Surgical intervention was not generally recommended for children or young people. In 2008, NICE guidance was issued relating to the use of rimonabant. 41 However, the marketing authorisation for this drug has since been suspended. 42
The NHS Health Checks Programme was launched in April 2009. Designed to address health inequalities, the vascular risk assessment programme consists of systematic screening of individuals aged 40–74 years of age for cardiovascular and T2DM risk with lifestyle interventions offered to those considered to be at risk. 43
Description of technology under assessment
Summary of interventions
Orlistat functions by inhibiting the uptake of dietary fats by the gastrointestinal tract, whereas both sibutramine and rimonabant are centrally acting appetite suppressants. The following sections summarise the product characteristics of each of these interventions using the Summary of Product Characteristics (SPC) for each drug (obtained from the Electronic Medicine Compendium at www.medicines.org.uk; SPC not available for rimonabant) and information from the British National Formulary (BNF).
Sibutramine
Description of intervention
Sibutramine is a centrally acting appetite suppressant that acts as an inhibitor of the reuptake of noradrenaline and serotonin.
Licensed indications
The marketing authorisation for sibutramine was suspended following a review by the European Medicines Agency in 2010. 44 The agency concluded that the benefits of treatment with sibutramine did not outweigh the associated cardiovascular risks and that prescriptions should not be issued and that the treatment of patients receiving sibutramine should be reviewed.
Dosage and administration
Reductil was available as blue/yellow capsules containing 10 mg of sibutramine hydrochloride or as blue/white capsules containing 15 mg of sibutramine hydrochloride.
Adverse events
Possible side effects included dry mouth, taste disturbances, abdominal pain, diarrhoea, constipation, nausea, vomiting, gastrointestinal haemorrhage, haemorrhoid aggravation, tachycardia, palpitations, hypertension, insomnia, hot flushes, lightheadedness, paraesthesia, anxiety and panic attacks, depression, seizures, transient memory disturbance, blurred vision, sexual dysfunction, menstrual disturbances and cramps, urinary retention, thrombocytopenia, sweating, alopecia, cutaneous bleeding disorders, hypersensitivity reactions including Henoch–Schönlein purpura, rash, urticaria, angioedema and anaphylaxis, interstitial nephritis and glomerulonephritis. The following were reported rarely: headache and increased appetite on withdrawal, angle-closure glaucoma and cardiovascular events. The adverse events potentially relating to the withdrawal of the intervention are highlighted in bold.
Orlistat
Description of intervention
Orlistat is a lipase inhibitor that reduces the absorption of dietary fat in the gastrointestinal tract. Orlistat is available in the UK without prescription.
Licensed indications
Orlistat is indicated in combination with a mildly hypocaloric diet in the management of obesity in patients with a BMI ≥ 30 kg/m2 or in overweight patients with a BMI ≥ 28 kg/m2 with associated risk factors.
Dosage and administration
Xenical is available as turquoise hard capsules containing 120 mg of orlistat. Alli is available as 60-mg turquoise/dark blue hard capsules.
The recommended dose of Xenical in adults aged > 18 years is one 120-mg capsule to be taken with water immediately before, during or up to 1 hour after each main meal (up to a maximum dose of 360 mg daily).
The recommended dose of Alli is one 60-mg capsule taken three times daily with water immediately before, during or up to 1 hour after each main meal.
If a meal is missed or does not contain fat, the dose of orlistat should not be taken. Treatment should be continued beyond 12 weeks only if weight loss since the start of treatment exceeds 5% of the initial body weight (the target for initial weight loss may be lower in people with T2DM). Treatment should not exceed 6 months (Alli). Use in children aged > 12 years should be initiated by a specialist only (unlicensed use). If a multivitamin supplement is required, this should be taken at least 2 hours after the orlistat dose or at bedtime.
Contraindications
Orlistat is contraindicated in patients who:
-
have chronic malabsorption syndrome
-
have cholestasis
-
are breastfeeding
-
are undergoing concurrent treatment with ciclosporin (Alli)
-
are undergoing concurrent treatment with warfarin or other anticoagulants (Alli).
Cautions
The effects of orlistat in children, the elderly and patients with hepatic or renal impairment have not been studied. Orlistat may impair the absorption of fat-soluble vitamins. Other cautions include epilepsy and pregnancy. Interactions may occur with ciclosporin, acarbose, oral anticoagulants and amiodarone.
Adverse events
Adverse events associated with the use of orlistat include the following gastrointestinal effects: oily leakage from the rectum, flatulence, liquid or oily stools, faecal urgency and incontinence, and abdominal pain/discomfort. Such gastrointestinal effects may be minimised by reducing fat intake in the diet. Other side effects include headache, tooth and gingival disorders, respiratory infections, fatigue, anxiety, menstrual disturbances, urinary tract infection and hypoglycaemia. The following have also been reported rarely: rectal bleeding, hypothyroidism, diverticulitis, cholelithiasis, hepatitis, bullous eruptions and oxalate nephropathy.
Rimonabant
Description of intervention
Rimonabant is a centrally acting appetite suppressant that acts as a cannabinoid receptor antagonist.
Licensed indications
The European Medicines Agency reported that the marketing authorisation for rimonabant was suspended across the European Union following a review by the Committee for Medicinal Products for Human Use in 2008, which concluded that the benefits of rimonabant treatment did not outweigh the risks of psychiatric adverse reactions. 42 Therefore, it was stipulated that prescriptions should not be issued and the treatment of patients who are taking rimonabant should be reviewed.
Dosage and administration
Rimonabant was available as tablets containing 20 mg of rimonabant.
Adverse events
Reported side effects included nausea, vomiting, diarrhoea, dry mouth, anorexia, depression, anxiety, irritability, nervousness, sleep disorders, impaired memory, dizziness, paraesthesia, hypoaesthesia, sciatica, hot flush, asthenia, impaired attention, tendonitis, muscle cramp, pruritus and hyperhidrosis. The following were reported less commonly: hiccups, anger, aggression, suicidal ideation and hallucinations. The adverse events potentially relating to the withdrawal of the intervention are highlighted in bold.
The BNF stated that combination therapy involving more than one anti-obesity drug is contraindicated until additional information about efficacy and long-term safety is available. 45
A previous systematic review of randomised controlled trial (RCT) evidence found considerable differences between orlistat, sibutramine and rimonabant in terms of discontinuation due to adverse events and underlying causes of such discontinuations. 46 Higher risk ratios for discontinuation due to adverse events were observed for patients who were treated with rimonabant and orlistat but not sibutramine in this review. The most common adverse events associated with discontinuation were gastrointestinal for orlistat (40%) and psychiatric for rimonabant (47%) (information stated as not being available for sibutramine).
Current usage in the NHS
The NICE clinical guideline for obesity26 recommended that dietary changes and physical exercise should be the first options in the management of obesity. The use of pharmacological interventions for weight loss was not generally recommended for children younger than 12 years but the guideline stated that such measures may be used in exceptional circumstances (e.g. the presence of severe comorbidities). In children aged ≥ 12 years, treatment with orlistat or sibutramine was recommended only in the presence of severe physical or psychological comorbidities. In adults, it was recommended that orlistat be prescribed as part of an overall obesity management plan in patients with a BMI of ≥ 28.0 kg/m2 (with associated risk factors) or ≥ 30.0 kg/m2. It was recommended that orlistat therapy should be continued beyond 3 months only if the patient had lost at least 5% of his or her initial body weight since commencing therapy. Treatment with orlistat beyond 12 months should be made after discussing the potential benefits and limitations with the patient. The guideline also recommended that sibutramine be prescribed as part of a weight reduction plan in patients meeting one of the following criteria: a BMI of ≥ 27.0 kg/m2 (with associated risk factors) or a BMI of ≥ 30.0 kg/m2, with careful monitoring of weight loss and adverse events. Therapy with sibutramine was to be continued beyond 3 months only if the patient had lost at least 5% of initial body weight while taking the drug. Treatment with sibutramine was not recommended beyond the licensed duration of 12 months. Co-prescribing of pharmacological interventions for weight reduction was not recommended. As noted above, the marketing authorisations for rimonabant and sibutramine have been suspended following reviews by the European Medicines Agency. 42,44
Anticipated costs associated with intervention
Using the latest data available,47 Figure 1 shows the number of items prescribed annually from 1999 to 2008 in the treatment of obesity in England. There was a substantial increase in prescribing rates for both orlistat and sibutramine following publication of guidance from NICE in March 200138 and October 2001,39 respectively. After a period of relatively steady use, prescription numbers started to increase again after the publication of revised guidance in 2004. 48
FIGURE 1.
Annual number of prescription items for the treatment of obesity.
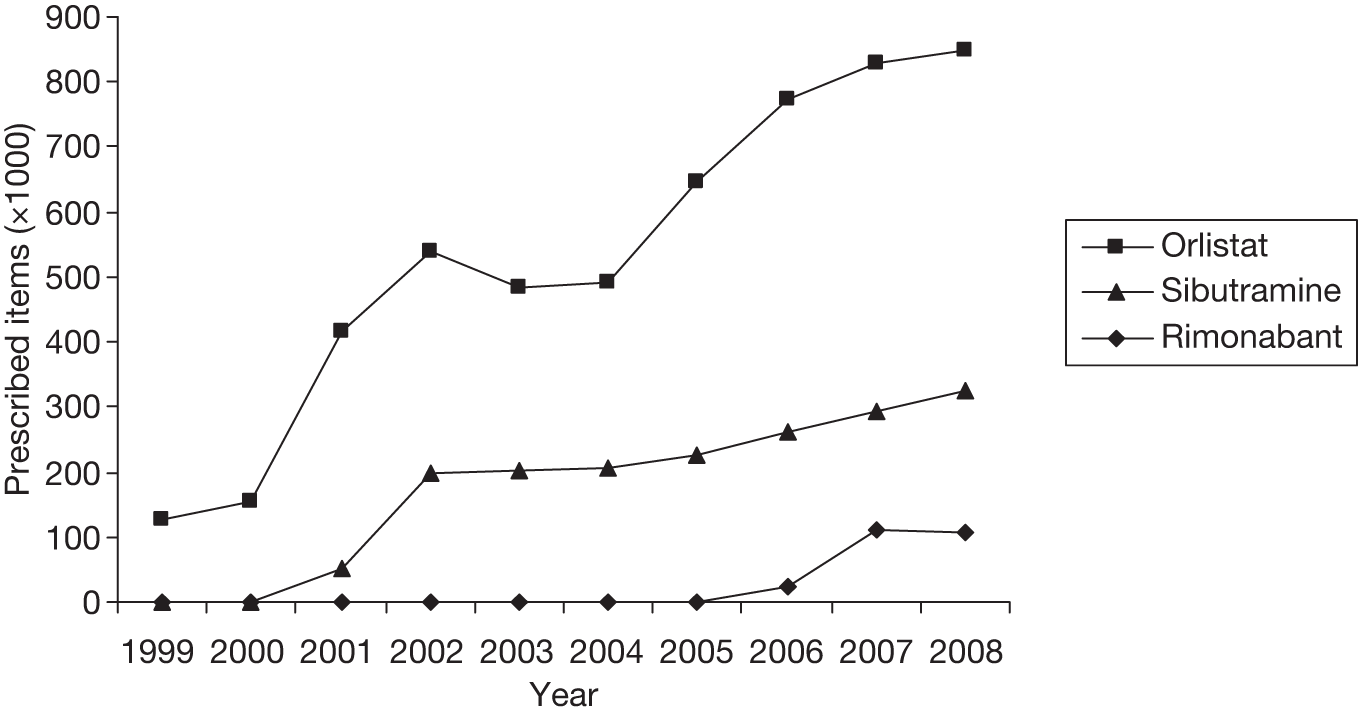
Table 2 shows the number of items and associated net ingredient cost (NIC) of drugs for the treatment of obesity prescribed in primary care. Rimonabant became available on prescription in July 2006; thus, the figure for that year reflects just 6 months of data. In 2008, there were 1.28 million prescription items for the treatment of obesity. Overall, the total number of prescription items in 2008 was ten times the number in 1999, and the current trend is an increase of around 14% per year.
| 1999 | 2000 | 2001 | 2002 | 2003 | 2004 | 2005 | 2006 | 2007 | 2008 | |
|---|---|---|---|---|---|---|---|---|---|---|
| Prescription items (thousands) | ||||||||||
| Orlistat | 127 | 156 | 415 | 540 | 484 | 492 | 654 | 774 | 827 | 848 |
| Sibutramine | – | – | 53 | 196 | 203 | 208 | 226 | 263 | 294 | 325 |
| Rimonabant | 23 | 112 | 106 | |||||||
| Total | 127 | 157 | 469 | 737 | 688 | 699 | 871 | 1060 | 1233 | 1278 |
| Net ingredient cost (£000) | ||||||||||
| Orlistat | 4863 | 6573 | 17,575 | 23,401 | 21,036 | 21,391 | 21,020 | 32,476 | 32,047 | 29,980 |
| Sibutramine | – | – | 2030 | 7752 | 8458 | 9314 | 10,984 | 13,654 | 13,093 | 9595 |
| Rimonabant | – | – | – | – | – | – | – | 1411 | 6440 | 5237 |
| Total | 4863 | 6613 | 19,659 | 31,203 | 29,532 | 30,706 | 38,004 | 47,541 | 51,580 | 44,812 |
The total NIC for drugs for the treatment of obesity increased from £4.9M in 1999 to £51.6M in 2007, but fell in 2008 to £44.8M. Correspondingly, the NIC per item increased from £38 in 1999 to £42 in 2007 and then fell to £35 in 2008.
Following the withdrawal of rimonabant in 2008 and the suspension of sibutramine prescribing in 2010, it is reasonable to expect that the uptake of orlistat will increase as patients switch treatments and the alternatives available for new patients decrease. As orlistat was already the main treatment, accounting for two-thirds of all prescriptions, and the NICs per item for sibutramine (£30) and rimonabant (£50) are similar to that for orlistat (£35), it is not expected that this change in prescribing patterns will affect the observed trend in total costs. If total prescribing rates for orlistat increase at 14% (5–20%) per annum, the total annual net cost for prescriptions directly related to obesity treatment is estimated to be approximately £57.8M in 2010 and over £109M in 2015.
Chapter 2 Definition of the decision problem
The aim of this study was to evaluate the clinical effectiveness and cost-effectiveness of using drugs in treating obese patients in primary care. The purpose of the project was to apply rigorous methods of systematic reviewing, evidence synthesis and decision-analytic modelling to evaluate the clinical effectiveness and cost-effectiveness of the three pharmacological treatments, orlistat, sibutramine and rimonabant, compared with each other and with usual care.
Aims and objectives of assessment
The specific objectives are to:
-
analyse an existing database of clinical information from primary care
-
conduct a full systematic review of the published evidence on the clinical effectiveness of orlistat, sibutramine and rimonabant
-
undertake a full synthesis of the available evidence using network meta-analysis methods
-
undertake a full systematic review of the published evidence of the cost-effectiveness of the agents
-
use decision-analytic modelling and probabilistic sensitivity analysis (PSA) to assess the relative cost-effectiveness of the three agents in terms of the incremental cost per quality-adjusted life-year (QALY) gained
-
use expected value of information techniques to determine the potential benefits of future head-to-head trials of the agents.
Since the research question was formulated, two of the three pharmacological treatments have been withdrawn for safety reasons. Although the data for all three have been retained in the clinical and economic analyses, the value of information analyses exploring the potential benefits of future head-to-head trials for the agents have not been conducted as we believe that conducting further studies in this area would not be possible.
Chapter 3 Assessment of clinical effectiveness
Methods for reviewing effectiveness
Literature search
The following electronic databases were searched. Searches were carried out in January 2009. Examples of the search strategies used are given in Appendix 1. Where completed trials were yet to be published, we the contacted the principal investigator.
-
MEDLINE
-
MEDLINE In-Process & Other Non-Indexed Citations
-
Cumulative Index to Nursing and Allied Health Literature (CINAHL)
-
Health Technology Assessment Database
-
EMBASE
-
Cochrane Database of Systematic Reviews
-
Database of Abstracts of Reviews of Effects (DARE)
-
NHS Economic Evaluation Database (NHS EED)
-
Cochrane Controlled Trials Register
-
Web of Science Proceedings
-
Science Citation Index
-
Current Controlled Trials
-
BIOSIS.
Management of references
The results of the literature search were imported into EndNote reference managing software version X5 (Thomson Reuters, CA, USA). Duplicates were removed. Where multiple papers reported data from the same study, these were grouped together and only included once in the analysis.
Inclusion and exclusion of studies
Studies were excluded if they were not reported in English.
Study design
Only studies using a RCT design were included. Both parallel and crossover designs were included. Non-randomised studies were excluded.
Patient population
Studies with adults who were overweight or obese or at high cardiovascular disease (CVD) risk were included. High CVD risk was defined as having one or more of the following conditions: hypertension, T2DM, gestational diabetes, polycystic ovary syndrome, high cholesterol, metabolic syndrome, angina, coronary artery disease and non-alcoholic steatohepatitis. Studies were excluded if they included those with mental illness, for example binge eating, or if they included children or adolescents.
Interventions
Studies were included if they compared orlistat, sibutramine or rimonabant with lifestyle and/or exercise advice (standard care), placebo or metformin. The anti-obesity treatments had to be given at the recommended dose: orlistat 120 mg three times daily (maximum 360 mg daily), sibutramine 10 mg, 15 mg or 10 mg increasing to 15 mg once daily, rimonabant 20 mg once daily. Studies were also included if they gave orlistat and sibutramine in combination or if orlistat, sibutramine or rimonabant were given in combination with other active interventions. We excluded trials with a treatment period of < 12 weeks. We also included head-to-head comparisons of the pharmacological agents.
Outcome measures
Trials had to include one or more of the following outcome measures, measured at 3, 6 or 12 months:
-
weight change from baseline
-
BMI change from baseline
-
number losing ≥ 5% body weight
-
number losing ≥ 10% body weight.
Assessing relevancy of included studies
The titles and abstracts of all studies identified by the electronic searches were screened for inclusion by two reviewers, who each assessed half of the identified articles. The full texts of all studies found to be potentially relevant were sought and were assessed for inclusion by two independent reviewers, using the inclusion criteria outlined above. Disagreements were discussed with the project steering committee.
Data extraction
Data were extracted using a standard form by one reviewer. See Appendix 2 for the data extraction form.
The data extracted included author, year of publication, country, population included (diabetic, with comorbidities, obese but otherwise healthy, or other), trial design, treatment length, follow-up length, study quality, interventions used, level of lifestyle/exercise advice, whether or not a wash-in period was used, if so how long and whether or not it used an active intervention, and baseline characteristics by group.
Lifestyle and/or exercise advice was categorised using the following criteria:
-
standard – one visit with general dietary/exercise advice given or patients given a lifestyle leaflet
-
enhanced – more than one visit or patient given more than just advice.
Because of the poor reporting of the lifestyle components of the interventions we assumed that standard advice was given if lifestyle and/or exercise advice was not mentioned, as this is standard care for overweight and obese patients. We also assumed that if diet (or exercise) advice had been given this also included advice on exercise (or diet) and therefore did not extract data on diet and exercise separately.
Outcome data were extracted in a number of formats depending on how the data were presented: data could be presented either at the arm level or as trial-level differences. For the continuous outcomes (weight and BMI change) the following data were extracted:
-
arm based (data given for each intervention):
-
– mean weight at baseline and follow-up with standard deviation (SD), standard error or significance levels and confidence intervals (CIs)
-
– mean change from baseline with SD, standard error or significance levels and Cis
-
– mean change from baseline adjusted for baseline value (ANCOVA) with SD, standard error or significance levels and CIs.
-
-
trial based (data given as difference between interventions)
-
– mean difference between interventions at follow-up with SD, standard error or significance levels and CIs.
-
For the binary outcomes (5% and 10% weight loss) the number achieving the target was extracted for each intervention. For all outcomes the number of participants included was also extracted.
Where possible, data from intention-to-treat analyses were extracted. If data were presented by subgroup only (e.g. data for those with and without hypertension given separately) then these were meta-analysed to give the results for the entire study population. Data were extracted only from either the manuscript text or tables (no attempt was made to extract from figures). Where data were incomplete the corresponding author of the study was contacted.
Quality assessment
All studies were assessed for quality. The quality tool used was based on that developed by Jadad et al. 49 with the addition of a score for allocation concealment, as suggested in Schulz et al. 47 The tool is described in Table 3.
| Term | None | Mentioned | Described and adequate |
|---|---|---|---|
| Randomisation | (Study excluded) | 1 | 2 |
| Double blinding | 0 | 1 | 2 |
| Flow of participants | 0 | 1 | 2 |
| Allocation concealment | 0 | 1 | 1 |
Plan of analysis
For each outcome at each time point, pair-wise meta-analysis was initially carried out followed by a mixed-treatment comparison (MTC) (network meta-analysis).
To enable analysis, missing outcome data were derived from related statistics where feasible. Where SDs for means were not reported these were estimated from ranges, p-values or 95% CIs using methods reported in the Cochrane Handbook. 37 Where data on baseline and follow-up weight/BMI were reported rather than the change from baseline, change was calculated by deducting the baseline mean value from the follow-up mean value. SD for the change was imputed using the method described in the Cochrane Handbook and the correlation coefficient measurements on the same individuals were derived by taking the mean correlation for those studies that report baseline, follow-up and change SDs for weight. All SDs were converted into standard errors; those studies reporting much smaller/larger standard errors than the majority of studies were then reassessed to see if there had been errors in the reporting, that is, SDs being reported as standard errors and vice versa. Where it was not clear which methodology had been used, the more conservative estimate (i.e. the one with the largest standard error) was taken.
Pair-wise meta-analysis
Studies were pooled using random-effects models for each treatment comparison for which data were available for each of the outcomes outlined in Outcome measures at the time points 3, 6 and 12 months. Random-effects models were used as studies were expected to be heterogeneous. Heterogeneity was assessed using the I2 and χ2 statistics. Forest plots were constructed for all comparisons. All analysis was carried out in Stata version 11.0 (StatCorp LP, College Station, TX, USA).
Mixed-treatment comparison
Mixed-treatment comparison methods were used to compare all treatments under investigation for obesity and their comparators within a single model, which allowed us to make both direct and indirect comparisons (where no head-to-head trials are available). 50 Initially, all outcome measures and time points (as described for the pair-wise meta-analyses above) were checked to make sure they formed closed networks. Placebo was used as the reference category throughout. We used a logistic regression model for the binary outcomes and a linear regression model for the continuous outcomes. In all cases a burn-in of 10,000 simulations was discarded and the results are presented based on a further 40,000 simulations. Convergence was checked visually using the history plots. The goodness of fit was checked using the residual deviance. Vague priors were used for all parameters. For each treatment the percentage of times that treatment gained the highest rank across all of the simulations was also calculated. All MTC analysis was conducted using a Bayesian Markov chain Monte Carlo method using the Bayesian software WinBUGS version 1.4.3. (MRC Biostatistics Unit, Cambridge, UK). 51
We compared the results of the pair-wise meta-analysis with the MTC and defined these as inconsistent when the MTC estimate did not fall within the 95% CI from the pair-wise meta-analysis.
Covariate analysis
For the 12-month weight change outcome we also considered exploring the effect of two covariates on the treatment effect: the proportion of participants with T2DM and the level of lifestyle advice given. Each covariate was modelled separately. The treatment covariate interactions were modelled as a separate regression coefficient for each treatment.
Sensitivity analysis
We carried out a sensitivity analysis for the 12-month weight change outcome according to the following variables: intention to treat (excluding those in which intention to treat had not been used or it was not clear which method had been used) and wash-in (excluding those studies that had used a wash-in phase). A wash-in is defined as a pretrial practice whereby all eligible patients are given an intervention (either active or placebo) for a period to test compliance; only those who comply are then randomised into the trial.
Publication bias
Publication bias was assessed visually using contour-enhanced funnel plots for all comparisons that contained five or more studies.
Clinical results
Study selection
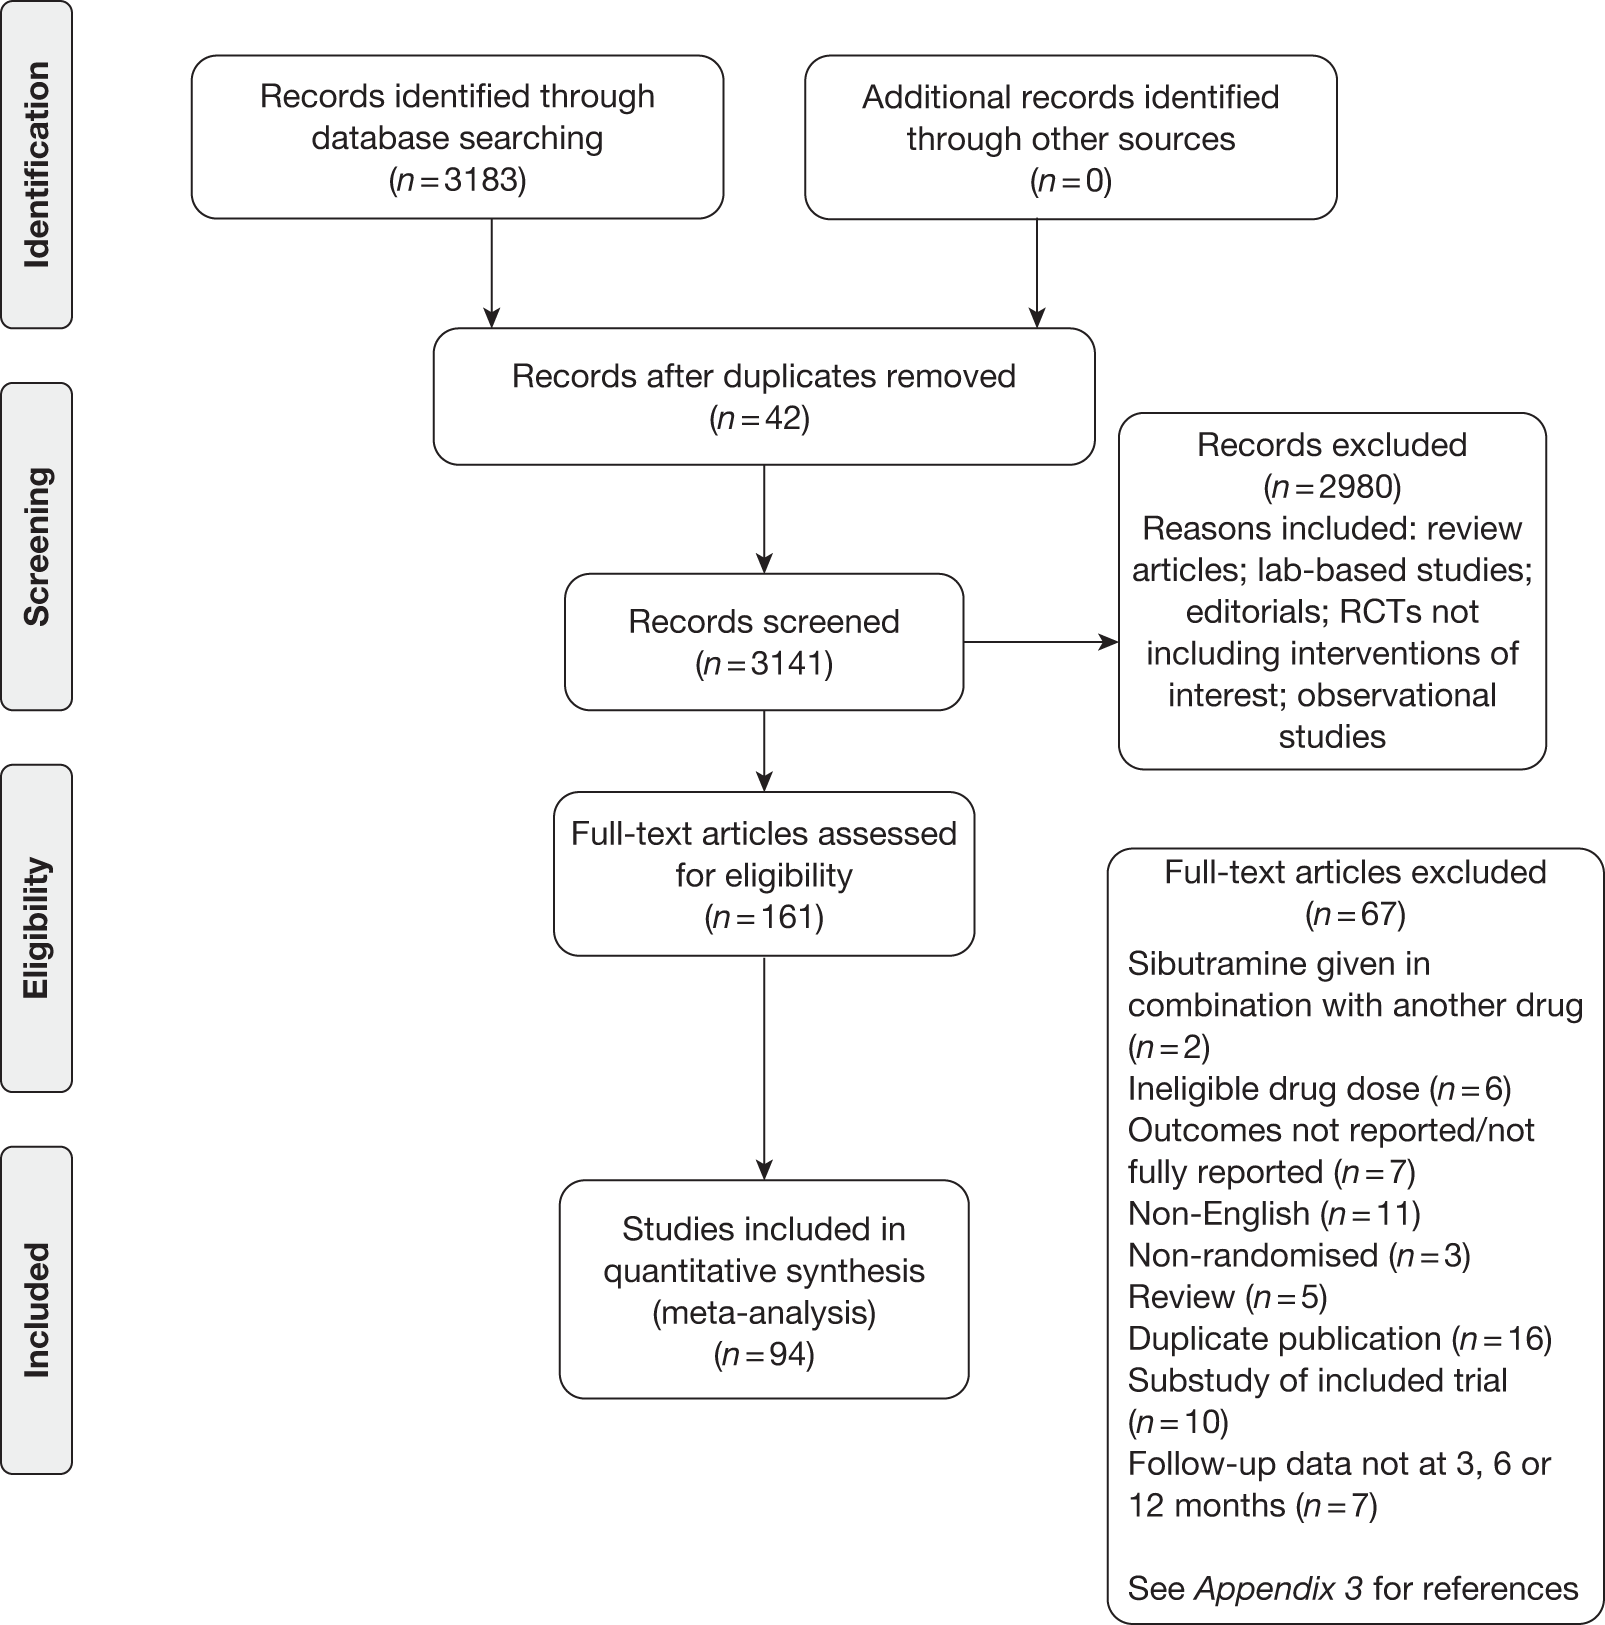
Figure 2 shows the flow of studies. The electronic searches identified 3183 potentially relevant articles. After removing duplicates and those that were not eligible after reading the title and abstract, 161 full texts were assessed. Of these, 67 were excluded (see Appendix 3, Reference list). Overall, 94 studies were included in the meta-analysis. Orlistat was assessed in 54 studies, 44 studies included sibutramine and five studies assessed rimonabant.
FIGURE 2.
Flow diagram.
Study characteristics
The majority of trials were carried out in North America and Europe from 1995 to 2008 (Table 4). Overall, 24,808 individuals were included. The mean trial size was 264, ranging from 14 to 3277, and 55 trials (58.5%) included ≥ 100 participants. Two crossover trials were included, with all other trials having a parallel design. The mean length of intervention was 8.3 months (range 3–48 months). A total of 45 studies (47.9%) used enhanced lifestyle advice, with the remainder giving standard advice (49, 52.1%). A wash-in period was used in 44 (46.8%) of the studies.
| ID | Study | Interventions | Country | Type of RCT | Intervention length (months) | Randomisationa | Allocation concealmentb | Double blindingc | Participant flowd | Diete | T2DM (%)f | Wash-ing | LOCFh |
|---|---|---|---|---|---|---|---|---|---|---|---|---|---|
| 5 | Apfelbaum 199952 | Placebo | France | Parallel | 12 | 1 | 0 | 1 | 2 | E | NR | Y | L |
| Sibutramine 10 mg | NR | ||||||||||||
| 6 | Audikovszky 200753 | Standard care | Hungary | Parallel | 6 | 1 | 0 | 0 | 0 | S | NR | N | NR |
| Orlistat | NR | ||||||||||||
| 7 | Aydin 200454 | Standard care | Turkey | Parallel | 3 | 1 | 0 | 0 | 0 | S | 0 | Y | NR |
| Sibutramine 10 mg | 0 | ||||||||||||
| Orlistat | 0 | ||||||||||||
| 8 | Bakris 200255 | Placebo | USA | Parallel | 12 | 1 | 0 | 1 | 2 | E | 8.0 | N | L |
| Orlistat | 8.0 | ||||||||||||
| 9 | Beck-da-Silva 200556 | Standard care | Canada | Parallel | 3 | 1 | 0 | 0 | 1 | S | 40.0 | N | L |
| Orlistat | 8.0 | ||||||||||||
| 10 | Berne 200557 | Placebo | Sweden | Parallel | 12 | 2 | 1 | 1 | 2 | E | NR | Y | L |
| Orlistat | NR | ||||||||||||
| 11 | Bloch 200358 | Standard care | Brazil | Parallel | 3 | 2 | 1 | 0 | 2 | E | 38.8 | N | L |
| Orlistat | 3.8 | ||||||||||||
| 12 | Borges 200759 | Standard care | Brazil | Parallel | 4 | 1 | 0 | 0 | 1 | E | 0 | N | NR |
| Orlistat | 0 | ||||||||||||
| 13 | Bray 199960 | Placebo | USA | Parallel | 6 | 2 | 0 | 1 | 1 | E | NR | Y | C |
| Sibutramine 15 mg | NR | ||||||||||||
| Sibutramine 10 mg | NR | ||||||||||||
| 14 | Broom 200261 | Placebo | UK | Parallel | 6 | 1 | 0 | 1 | 2 | E | 19.8 | N | NR |
| Orlistat | 30.3 | ||||||||||||
| 15 | Broom 200262 | Placebo | UK | Parallel | 12 | 2 | 1 | 2 | 1 | S | NR | Y | L |
| Orlistat | NR | ||||||||||||
| 16 | Chou 200763 | Orlistat | Taiwan | Crossover | 3 | 1 | 0 | 0 | 2 | S | 100 | N | NR |
| Sibutramine 10 mg | 100 | ||||||||||||
| 17 | Cocco 200564 | Placebo | Switzerland | Parallel | 6 | 2 | 0 | 1 | 1 | E | 100 | N | NR |
| Orlistat | 100 | ||||||||||||
| 18 | Cuellar 200065 | Placebo | Mexico | Parallel | 6 | 2 | 1 | 1 | 2 | E | 17.6 | N | C |
| Sibutramine 15 mg | 22.9 | ||||||||||||
| 19 | Davidson 199966 | Placebo | USA | Parallel | 12 | 2 | 0 | 1 | 2 | E | 4.5 | N | L |
| Orlistat | 4.0 | ||||||||||||
| 20 | Derosa 200367 | Placebo | Italy | Parallel | 12 | 2 | 1 | 2 | 1 | E | NR | Y | C |
| Orlistat | NR | ||||||||||||
| 21 | Derosa 200468 | Orlistat | Italy | Parallel | 12 | 2 | 1 | 2 | 2 | E | 100 | Y | L |
| Sibutramine 10 mg | 100 | ||||||||||||
| 22 | Derosa 200569 | Orlistat | Italy | Parallel | 12 | 2 | 1 | 2 | 2 | E | 0 | Y | NR |
| Sibutramine 10 mg | 0 | ||||||||||||
| 23 | De Simone 200570 | Placebo | Italy | Parallel | 3 | 1 | 0 | 1 | 2 | S | 0 | N | C |
| Sibutramine 15 mg | 0 | ||||||||||||
| 24 | Despres 200571 | Placebo | Australia, Canada, Finland, Italy, Spain, Sweden, Switzerland, USA | Parallel | 12 | 1 | 0 | 1 | 1 | E | 100 | Y | L |
| Rimonabant | 100 | ||||||||||||
| 25 | Di Francesco 200772 | Placebo | Italy | Parallel | 6 | 2 | 1 | 1 | 2 | S | NR | N | L |
| Sibutramine 10 mg | NR | ||||||||||||
| 26 | Didangelos 200473 | Standard care | Greece | Parallel | 6 | 1 | 0 | 0 | 1 | S | 100 | N | NR |
| Orlistat | 100 | ||||||||||||
| 27 | Dixon 200874 | Standard care | England/UK | Parallel | 12 | 1 | 0 | 0 | 1 | E | 0 | N | NR |
| Orlistat | 0 | ||||||||||||
| 28 | Drent 199575 | Placebo | Holland | Parallel | 3 | 1 | 0 | 1 | 1 | S | NR | Y | NR |
| Orlistat | NR | ||||||||||||
| 29 | Drent 199576 | Placebo | Denmark, Germany, the Netherlands, Sweden | Parallel | 3 | 1 | 0 | 1 | 0 | S | NR | Y | NR |
| Orlistat | NR | ||||||||||||
| 30 | Erdmann 200477 | Placebo | Germany | Parallel | 6 | 2 | 1 | 1 | 1 | S | 7.8 | Y | NR |
| Orlistat | 9.9 | ||||||||||||
| 31 | Erondu 200778 | Placebo | NR | Parallel | 6 | 1 | 0 | 2 | 2 | S | 0 | Y | L |
| Sibutramine 10 mg | 0 | ||||||||||||
| Orlistat | 0 | ||||||||||||
| 32 | Fanghanel 200079 | Placebo | Mexico | Crossover | 6 | 2 | 1 | 2 | 1 | S | NR | Y | L |
| Sibutramine 10 mg | NR | ||||||||||||
| 33 | Fanghanel 200380 | Placebo | Mexico | Parallel | 6 | 2 | 1 | 2 | 1 | S | NR | Y | L |
| Sibutramine 10 mg | NR | ||||||||||||
| 34 | Faria 200581 | Placebo | Brazil | Parallel | 6 | 2 | 0 | 1 | 1 | S | NR | Y | C |
| Sibutramine 10 mg | NR | ||||||||||||
| 35 | Finer 200082 | Placebo | UK | Parallel | 12 | 2 | 0 | 2 | S | 0 | Y | L | |
| Orlistat | 0 | ||||||||||||
| 36 | Finer 200083 | Placebo | UK | Parallel | 3 | 1 | 0 | 1 | 1 | S | 100 | Y | Y |
| Sibutramine 15 mg | 100 | ||||||||||||
| 37 | Florakis 200884 | Standard care | Greece | Parallel | 6 | 2 | 1 | 0 | 2 | S | NR | Y | C |
| Sibutramine 10 mg | NR | ||||||||||||
| 38 | Garcia 200685 | Standard care | Parallel | 12 | 1 | 0 | 0 | 1 | E | 9.0 | N | C | |
| Orlistat | 26.0 | ||||||||||||
| 39 | Gokcel 200286 | Sibutramine 10 mg | Turkey | Parallel | 6 | 1 | 0 | 0 | 0 | S | 8.0 | N | NR |
| Orlistat | 10.0 | ||||||||||||
| Metformin | 12.0 | ||||||||||||
| 40 | Grudell 200887 | Placebo | USA | Parallel | 3 | 1 | 0 | 1 | 1 | E | NR | N | NR |
| Sibutramine 10 mg | NR | ||||||||||||
| Sibutramine 15 mg | NR | ||||||||||||
| 41 | Guimaraes 200688 | Placebo | Brazil | Parallel | 3 | 1 | 0 | 0 | 0 | S | 0 | Y | NR |
| Sibutramine 15 mg | 0 | ||||||||||||
| Metformin | 0 | ||||||||||||
| 42 | Guy-Grand 200489 | Placebo | France | Parallel | 6 | 2 | 1 | 2 | 2 | E | 19.0 | N | L |
| Orlistat | 19.4 | ||||||||||||
| 43 | Halpern 200290 | Placebo | Brazil | Parallel | 6 | 1 | 0 | 1 | 1 | S | NR | Y | C |
| Sibutramine 10 mg | NR | ||||||||||||
| 44 | Halpern 200391 | Placebo | Brazil | Parallel | 6 | 2 | 1 | 2 | 2 | S | 100 | Y | L |
| Orlistat | 100 | ||||||||||||
| 45 | Hanefeld 200292 | Placebo | Germany | Parallel | 12 | 1 | 0 | 1 | 2 | S | 100 | Y | L |
| Orlistat | 100 | ||||||||||||
| 46 | Hanotin 199893 | Placebo | France | Parallel | 3 | 1 | 0 | 2 | 2 | S | NR | Y | L |
| Sibutramine 10 mg | NR | ||||||||||||
| Sibutramine 15 mg | NR | ||||||||||||
| 47 | Hauner 200494 | Placebo | Germany | Parallel | 12 | 1 | 0 | 1 | 2 | E | 0 | N | L |
| Sibutramine 15 mg | 0 | ||||||||||||
| 48 | Hauptman 200095 | Placebo | USA | Parallel | 24 | 1 | 0 | 1 | 2 | S | NR | Y | L |
| Orlistat | NR | ||||||||||||
| 49 | Hazenberg 200096 | Placebo | Netherlands | Parallel | 3 | 1 | 0 | 1 | 2 | S | NR | Y | L |
| Sibutramine 10 mg | NR | ||||||||||||
| 50 | Hill 199997 | Placebo | USA | Parallel | 12 | 1 | 0 | 1 | 2 | S | 0 | Y | L |
| Orlistat | 0 | ||||||||||||
| 51 | Hollander 199898 | Placebo | USA | Parallel | 12 | 2 | 0 | 1 | 2 | S | 100 | Y | L |
| Orlistat | 100 | ||||||||||||
| 52 | Hung 200599 | Placebo | Taiwan | Parallel | 6 | 1 | 0 | 1 | 0 | S | 100 | N | NR |
| Sibutramine 15 mg | 100 | ||||||||||||
| 53 | Kaya 2004100 | Standard care | Turkey | Parallel | 3 | 1 | 0 | 0 | 1 | S | 0 | N | NR |
| Sibutramine 10 mg | 0 | ||||||||||||
| Orlistat | 0 | ||||||||||||
| Orlistat and sibutramine | 0 | ||||||||||||
| 54 | Kelley 2002101 | Placebo | USA | Parallel | 12 | 1 | 0 | 1 | 2 | E | 100 | N | NR |
| Orlistat | 100 | ||||||||||||
| 55 | Kelley 2004102 | Placebo | USA | Parallel | 6 | 1 | 0 | 1 | 1 | E | 100 | N | C |
| Orlistat | 100 | ||||||||||||
| 56 | Kiortsis 2008103 | Standard care | Greece | Parallel | 3 | 2 | 0 | 0 | 1 | S | 0 | N | C |
| Orlistat | 0 | ||||||||||||
| Sibutramine 10 mg | 0 | ||||||||||||
| 57 | Krempf 2003104 | Placebo | France | Parallel | 18 | 1 | 0 | 1 | 1 | E | 0 | Y | L |
| Orlistat | 0 | ||||||||||||
| 58 | Kuo 2006105 | Placebo | China | Parallel | 3 | 1 | 0 | 2 | 1 | S | 100 | N | C |
| Orlistat | 100 | ||||||||||||
| 59 | Lindgarde 2000106 | Placebo | Sweden | Parallel | 12 | 2 | 0 | 1 | 2 | E | 24.0 | Y | NR |
| Orlistat | 28.0 | ||||||||||||
| 60 | Lindholm 2008107 | Placebo | Sweden | Parallel | 6 | 2 | 1 | 2 | 1 | E | NR | N | C |
| Sibutramine 15 mg | NR | ||||||||||||
| 61 | Mathus-Vliegen 2006108 | Placebo | Netherlands | Parallel | 12 | 1 | 0 | 1 | 0 | S | 0 | Y | C |
| Orlistat | 0 | ||||||||||||
| 62 | McNulty 2003109 | Placebo | Belgium, Canada, UK | Parallel | 12 | 1 | 0 | 1 | 1 | E | 100 | N | NR |
| Sibutramine 15 mg | 100 | ||||||||||||
| 63 | Miles 2002110 | Placebo | Canada, USA | Parallel | 12 | 2 | 0 | 1 | 1 | E | 100 | N | NR |
| Orlistat | 100 | ||||||||||||
| 64 | Muls 2001111 | Placebo | Belgium | Parallel | 6 | 1 | 0 | 0 | 2 | E | 0 | Y | NR |
| Orlistat | 0 | ||||||||||||
| 65 | Ozcelik 2004112 | Placebo | Turkey | Parallel | 3 | 1 | 0 | 1 | 0 | E | NR | N | NR |
| Orlistat | NR | ||||||||||||
| 66 | Ozcelik 2005113 | Standard care | Turkey | Parallel | 3 | 1 | 0 | 0 | 0 | E | 0 | N | C |
| Orlistat | 0 | ||||||||||||
| 67 | Pathan 2004115 | Standard care | Bangladesh | Parallel | 6 | 1 | 0 | 0 | 0 | S | 100 | N | L |
| Orlistat | 100 | ||||||||||||
| 68 | Pi-Sunyer 2006115 | Placebo | Canada, USA | Parallel | 12 | 2 | 0 | 1 | 2 | E | 0 | Y | L |
| Rimonabant | 0 | ||||||||||||
| 69 | Porter 2004116 | Standard care | USA | Parallel | 12 | 2 | 0 | 0 | 0 | E | 7.3 | N | L |
| Sibutramine 15 mg | 10.7 | ||||||||||||
| 70 | Poston 2003117 | Standard care | USA | Parallel | 12 | 1 | 0 | 0 | 2 | E | 9.6 | N | L |
| Orlistat | 12.7 | ||||||||||||
| 71 | Poston 2006118 | Standard care | USA | Parallel | 12 | 1 | 0 | 0 | 1 | E | NR | N | L |
| Orlistat | NR | ||||||||||||
| 72 | Redmon 2003119 | Standard care | USA | Parallel | 12 | 2 | 1 | 0 | 1 | E | 100 | N | L |
| Sibutramine 15 mg | 100 | ||||||||||||
| 73 | Rossner 2000120 | Placebo | Europe | Parallel | 24 | 2 | 0 | 1 | 2 | S | 0 | Y | L |
| Orlistat | 0 | ||||||||||||
| 74 | Sarac 2006121 | Placebo | Turkey | Parallel | 3 | 1 | 0 | 1 | 0 | S | NR | N | L |
| Sibutramine 10 mg | NR | ||||||||||||
| 75 | Sari 2004122 | Orlistat | Turkey | Parallel | 6 | 1 | 0 | 0 | 1 | E | 0 | N | C |
| Sibutramine 15 mg | 0 | ||||||||||||
| Sibutramine and orlistat | 0 | ||||||||||||
| 76 | Sari 2004123 | Orlistat | Turkey | Parallel | 3 | 1 | 0 | 0 | 0 | E | 0 | Y | NR |
| Metformin | 0 | ||||||||||||
| 77 | Sathyapalan 2008124 | Metformin | UK | Parallel | 3 | 2 | 0 | 0 | 1 | S | NR | Y | L |
| Rimonabant | NR | ||||||||||||
| 78 | Scheen 2006125 | Placebo | Worldwide | Parallel | 12 | 2 | 0 | 1 | 2 | S | 100 | Y | L |
| Rimonabant | 100 | ||||||||||||
| 79 | Scholze 2007126 | Placebo | Germany | Parallel | 4 | 1 | 0 | 1 | 1 | S | 16.7 | Y | L |
| Sibutramine 15 mg | 12.6 | ||||||||||||
| 80 | Serrano-Rios 2002127 | Placebo | European | Parallel | 6 | 1 | 0 | 1 | 2 | S | 100 | N | L |
| Sibutramine 15 mg | 100 | ||||||||||||
| 81 | Shechter 2006128 | Standard care | Israel | Parallel | 4 | 2 | 0 | 0 | 0 | S | 40.0 | N | L |
| Sibutramine 10mg | 40.0 | ||||||||||||
| 82 | Shi 2005129 | Placebo | China | Parallel | 6 | 1 | 0 | 1 | 2 | S | NR | N | L |
| Orlistat | NR | ||||||||||||
| 83 | Smith 2001130 | Placebo | UK | Parallel | 12 | 2 | 1 | 2 | 2 | S | 0 | Y | L |
| Sibutramine 10 mg | 0 | ||||||||||||
| Sibutramine 15 mg | 0 | ||||||||||||
| 84 | Swinburn 2005131 | Placebo | Australia, New Zealand | Parallel | 12 | 2 | 0 | 1 | 1 | E | 8.3 | Y | L |
| Orlistat | 8.2 | ||||||||||||
| 85 | Tambascia 2003132 | Placebo | Brazil | Parallel | 6 | 2 | 0 | 1 | 1 | S | 0 | Y | C |
| Sibutramine 10 mg | 0 | ||||||||||||
| 86 | Tankova 2004133 | Standard care | Bulgaria | Parallel | 3 | 1 | 0 | 0 | 0 | S | 49.0 | N | L |
| Sibutramine 15 mg | 47.0 | ||||||||||||
| 87 | Tiikkainen 2004134 | Placebo | Finland | Parallel | 6 | 1 | 0 | 1 | 0 | S | 0 | N | L |
| Orlistat | 0 | ||||||||||||
| 88 | Torgerson 2004135 | Placebo | Sweden | Parallel | 48 | 2 | 1 | 2 | 0 | E | NR | N | NR |
| Orlistat | NR | ||||||||||||
| 89 | Turker 2006136 | Standard care | Turkey | Parallel | 3 | 1 | 0 | 0 | 2 | S | 0 | N | C |
| Orlistat | 0 | ||||||||||||
| 90 | Van Gaal 1998137 | Placebo | Austria, Belgium, Brazil, Germany, Italy, Sweden, Switzerland, UK | Parallel | 6 | 1 | 0 | 2 | 2 | E | NR | Y | L |
| Orlistat | NR | ||||||||||||
| 91 | Van Gaal 2005138 | Placebo | Europe and USA | Parallel | 24 | 2 | 1 | 1 | 2 | E | 0 | Y | NR |
| Rimonabant | 0 | ||||||||||||
| 92 | Vazquez Roque 2007139 | Placebo | USA | Parallel | 3 | 2 | 1 | 2 | 2 | E | NR | N | L |
| Sibutramine 15 mg | NR | ||||||||||||
| 93 | Wadden 200534 | Standard care | USA | Parallel | 12 | 1 | 0 | 0 | 1 | E | 0 | N | NR |
| Sibutramine 15 mg | 0 | ||||||||||||
| 94 | Walsh 1999140 | Placebo | UK | Parallel | 3 | 1 | 0 | 1 | 2 | E | NR | N | NR |
| Sibutramine 15 mg | NR | ||||||||||||
| 95 | Wang 2005141 | Placebo | Taiwan | Parallel | 3 | 1 | 1 | 2 | 1 | E | 100 | N | C |
| Sibutramine 15 mg | 100 | ||||||||||||
| 96 | Wirth 2001142 | Placebo | Germany | Parallel | 12 | 1 | 0 | 1 | 1 | S | NR | Y | L |
| Sibutramine 15 mg | NR | ||||||||||||
| 97 | Wirth 2006143 | Placebo | Germany | Parallel | 11 | 2 | 1 | 2 | 2 | S | NR | N | NR |
| Sibutramine 15 mg | NR | ||||||||||||
| 98 | Zannad 2002144 | Placebo | France | Parallel | 6 | 1 | 0 | 1 | 2 | E | NR | N | NR |
| Sibutramine 10 mg | NR |
Risk of bias within studies
The results of the bias assessment are given in Table 4. Overall, the quality of the studies included is generally low. All included studies were randomised but in only 40% of studies was the randomisation procedure described fully and adequately. In total, 22 (23.4%) studies concealed allocation. The majority of studies were double blind: 50% mentioned double blinding and 20% described their blinding adequately. Participant flow was not described in 17 (18.1%) studies.
Results of individual studies
Individual study results are given in Table 5. In total, 83 trials included data on weight change, 41 on BMI change and 45 and 36 on 5% and 10% body weight loss respectively. A total of 33 trials measured outcome at 3 months, 38 at 6 months and 35 at 1 year.
| Study | Arms | n | 3 months | 6 months | 12 months | |||||||||
|---|---|---|---|---|---|---|---|---|---|---|---|---|---|---|
| 5% (n) | 10% (n) | Weight loss (kg) | BMI loss (kg/m2) | 5% (n) | 10% (n) | Weight loss (kg) | BMI loss (kg/m2) | 5% (n) | 10% (n) | Weight loss (kg) | BMI loss (kg/m2) | |||
| Apfelbaum 199952 | Placebo | 78 | 10 | 43 | 18 | +0.5 (0.65) | ||||||||
| Sibutramine 10 mg | 82 | 32 | 71 | 44 | –5.2 (0.83) | |||||||||
| Audikovszky 200753 | Standard care | 61 | –4.10 (0.49) | –2.24 (0.23) | ||||||||||
| Orlistat | 78 | –6.90 (0.58) | –3.47 (0.18) | |||||||||||
| Aydin 200454 | Standard care | 19 | –2.50 (0.30) | |||||||||||
| Sibutramine 10 mg | 22 | –4.40 (0.28) | ||||||||||||
| Orlistat | 25 | –3.60 (0.20) | ||||||||||||
| Bakris 200255 | Placebo | 265 | 60 | –2.70 (0.39) | –0.90 (0.14) | |||||||||
| Orlistat | 267 | 122 | –5.40 (0.39) | –1.90 (0.14) | ||||||||||
| Beck-da-Silva 200556 | Standard care | 10 | –4.39 (2.34) | –1.45 (0.69) | ||||||||||
| Orlistat | 11 | –4.65 (2.95) | –1.66 (1.00) | |||||||||||
| Berne 200557 | Placebo | 109 | 12 | 3 | ||||||||||
| Orlistat | 111 | 51 | 15 | |||||||||||
| Bloch 200358 | Standard care | 101 | 20 | –2.00 (0.32) | ||||||||||
| Orlistat | 105 | 33 | –3.70 (0.32) | |||||||||||
| Borges 200759 | Standard care | 10 | –3.00 (0.77) | |||||||||||
| Orlistat | 14 | –2.90 (0.51) | ||||||||||||
| Bray 199960 | Placebo | 148 | 29 | 0 | ||||||||||
| Sibutramine 15 mg | 152 | 102 | 53 | |||||||||||
| Sibutramine 10 mg | 150 | 89 | 26 | |||||||||||
| Broom 200261 | Placebo | 71 | 13 | 3 | –2.60 (0.46) | |||||||||
| Orlistat | 66 | 29 | 5 | –4.40 (0.51) | ||||||||||
| Broom 200262 | Placebo | 266 | 65 | 29 | –2.30 (0.39) | |||||||||
| Orlistat | 265 | 147 | 52 | –5.80 (0.52) | ||||||||||
| Chou 200763 | Orlistat | 29 | ||||||||||||
| Sibutramine 10 mg | 27 | –1.2 (0.71)b | ||||||||||||
| Cocco 200564 | Placebo | 45 | –2.48 (0.20) | –1.86 (0.10) | ||||||||||
| Orlistat | 45 | –5.41 (0.21) | –3.33 (0.18) | |||||||||||
| Cuellar 200065 | Placebo | 34 | –2.07 (1.36) | –1.37 (0.51) | 5 | 0 | –0.90 (0.88) | –0.40 (0.34) | ||||||
| Sibutramine 15 mg | 35 | –6.86 (0.71) | –3.14 (0.26) | 26 | 19 | –14.20 (1.40) | –5.60 (0.57) | |||||||
| Davidson 199966 | Placebo | 223 | 97 | 55 | –5.81 (0.67) | |||||||||
| Orlistat | 657 | 432 | 256 | –8.76 (0.37) | ||||||||||
| Derosa 200367 | Placebo | 23 | –4.20 (0.60) | –1.30 (0.32) | –7.60 (0.70) | |||||||||
| Orlistat | 27 | –5.10 (0.70) | –1.10 (0.47) | –8.60 (1.00) | ||||||||||
| Derosa 200468 | Orlistat | 71 | –1.80 (0.70) | –2.70 (1.10) | –3.90 (1.50) | |||||||||
| Sibutramine 10 mg | 70 | –1.70 (0.60) | –2.70 (1.00) | –3.60 (1.40) | ||||||||||
| Derosa 200569 | Orlistat | 55 | –4.60 (0.24) | –1.60 (0.60) | –5.50 (0.28) | –1.90 (0.80) | –8.40 (0.48) | –2.90 (1.00) | ||||||
| Sibutramine 10 mg | 58 | –4.50 (0.20) | –1.50 (0.20) | –5.40 (0.25) | –1.80 (0.40) | –8.30 (0.42) | –2.80 (0.60) | |||||||
| De Simone 200570 | Placebo | 15 | –5.10 (1.73) | –1.70 (0.45) | ||||||||||
| Sibutramine 15 mg | 14 | –9.00 (1.51) | –3.30 (0.35) | |||||||||||
| Despres 200571 | Placebo | 342 | 67 | 25 | –1.50 (0.27) | |||||||||
| Rimonabant | 346 | 202 | 113 | –6.90 (0.33) | ||||||||||
| Di Francesco 200772 | Placebo | 155 | 43 | 22 | ||||||||||
| Sibutramine 10 mg | 154 | 97 | 62 | |||||||||||
| Didangelos 200473 | Standard care | 32 | 6 | –3.90 (0.81) | ||||||||||
| Orlistat | 94 | 63 | –5.60 (0.50) | |||||||||||
| Dixon 200874 | Standard care | 22 | –1.00 (0.82) | –0.50 (0.26) | ||||||||||
| Orlistat | 18 | –3.10 (0.92) | –1.20 (0.24) | |||||||||||
| Drent 199575 | Placebo | 7 | –3.00 (0.72) | |||||||||||
| Orlistat | 7 | –4.20 (1.32) | ||||||||||||
| Drent 199576 | Placebo | 46 | –2.98 (0.38) | |||||||||||
| Orlistat | 47 | –4.74 (0.38) | ||||||||||||
| Erdmann 200477 | Placebo | 192 | –4.90 (0.34) | |||||||||||
| Orlistat | 192 | –7.40 (0.35) | ||||||||||||
| Erondu 200778 | Placebo | 101 | –2.10 (0.52) | |||||||||||
| Sibutramine 10 mg | 100 | –5.80 (0.51) | ||||||||||||
| Orlistat | 99 | –5.10 (0.42) | ||||||||||||
| Fanghanel 200079 | Placebo | 54 | 4 | –3.56 (0.57) | –1.46 (0.23) | |||||||||
| Sibutramine 10 mg | 55 | 19 | –7.52 (0.68) | –3.14 (0.28) | ||||||||||
| Fanghanel 200380 | Placebo | 28 | 11 | 5 | –3.40 (0.76) | –1.30 (0.32) | ||||||||
| Sibutramine 10 mg | 29 | 19 | 7 | –5.50 (0.80) | –2.20 (0.32) | |||||||||
| Faria 200581 | Placebo | 43 | 10 | –2.40 (0.64) | ||||||||||
| Sibutramine 10 mg | 43 | 27 | –6.80 (0.35) | |||||||||||
| Finer 200082 | Placebo | 114 | 23 | 6 | ||||||||||
| Orlistat | 114 | 38 | 11 | –1.99 (0.82)b | ||||||||||
| Finer 200083 | Placebo | 44 | 0 | –0.10 (0.07) | ||||||||||
| Sibutramine 15 mg | 47 | 9 | –2.40 (0.30) | |||||||||||
| Florakis 200884 | Standard care | 28 | –8.90 (1.12) | –3.40 (0.35) | 9 | –5.60 (1.21) | ||||||||
| Sibutramine 10 mg | 56 | –11.60 (0.64) | –4.30 (0.30) | 34 | –7.60 (0.70) | |||||||||
| Garcia 200685 | Standard care | 23 | –0.50 (0.89) | |||||||||||
| Orlistat | 25 | –3.30 (1.30) | ||||||||||||
| Gokcel 200286 | Sibutramine 10 mg | 50 | –13.00 (0.11) | –5.22 (0.31) | ||||||||||
| Orlistat | 50 | –8.00 (0.07) | –3.20 (0.19) | |||||||||||
| Metformin | 50 | –9.00 (0.10) | –3.75 (0.93) | |||||||||||
| Grudell 200887 | Placebo | 62 | –1.60 (1.04) | –0.10 (0.25) | ||||||||||
| Sibutramine 10 mg | 58 | –5.10 (1.05) | –1.80 (0.58) | |||||||||||
| Sibutramine 15 mg | 61 | –1.80 (1.13) | –0.90 (0.25) | |||||||||||
| Guimaraes 200688 | Placebo | 10 | –1.00 (1.07) | –0.40 (0.35) | ||||||||||
| Sibutramine 15 mg | 8 | –5.80 (1.59) | –2.20 (0.31) | |||||||||||
| Metformin | 8 | –3.60 (0.80) | –1.50 (0.66) | |||||||||||
| Guy-Grand 200489 | Placebo | 505 | –1.73 (0.19) | |||||||||||
| Orlistat | 499 | –4.90 (0.63) | ||||||||||||
| Halpern 200290 | Placebo | 31 | 13 | 1 | ||||||||||
| Sibutramine 10 mg | 30 | 12 | 8 | |||||||||||
| Halpern 200391 | Placebo | 174 | 30 | 5 | –2.58 (1.46) | |||||||||
| Orlistat | 164 | 49 | 11 | –4.24 (0.23) | ||||||||||
| Hanefeld 200292 | Placebo | 180 | 57 | –3.40 (0.40) | ||||||||||
| Orlistat | 189 | 97 | –5.30 (0.37) | |||||||||||
| Hanotin 199893 | Placebo | 59 | 11 | 3 | ||||||||||
| Sibutramine 10 mg | 59 | 29 | 12 | |||||||||||
| Sibutramine 15 mg | 62 | 34 | 11 | |||||||||||
| Hauner 200494 | Placebo | 182 | 72 | 33 | –5.10 (0.51) | |||||||||
| Sibutramine 15 mg | 180 | 109 | 71 | –8.10 (0.59) | ||||||||||
| Hauptman 200095 | Placebo | 212 | –4.70 (0.60) | 65 | 24 | –4.14 (0.56) | ||||||||
| Orlistat | 210 | –8.00 (0.58) | 106 | 60 | –7.94 (0.57) | |||||||||
| Hazenberg 200096 | Placebo | 59 | 10 | |||||||||||
| Sibutramine 10 mg | 54 | 24 | –2.2 (0.71)b | |||||||||||
| Hill 199997 | Placebo | 188 | –5.93 (0.69) | |||||||||||
| Orlistat | 181 | –7.24 (0.52) | ||||||||||||
| Hollander 199898 | Placebo | 159 | 36 | 14 | –4.31 (0.57) | |||||||||
| Orlistat | 163 | 79 | 29 | –6.19 (0.51) | ||||||||||
| Hung 200599 | Placebo | 24 | –0.70 (0.51) | –0.20 (0.19) | ||||||||||
| Sibutramine 15 mg | 24 | –2.50 (0.80) | –0.60 (0.23) | |||||||||||
| Kaya 2004100 | Standard care | 27 | –6.24 (0.80) | –2.52 (0.26) | ||||||||||
| Sibutramine 10 mg | 27 | –11.72 (0.71) | –4.41 (0.24) | |||||||||||
| Orlistat | 29 | –9.35 (0.52) | –3.64 (0.18) | |||||||||||
| Orlistat and sibutramine | 21 | –13.68 (0.95) | –5.12 (0.31) | |||||||||||
| Kelley 2002101 | Placebo | 269 | 35 | 10 | –1.27 (0.28) | |||||||||
| Orlistat | 266 | 87 | 27 | –3.89 (0.27) | ||||||||||
| Kelley 2004102 | Placebo | 22 | –9.40 (1.30) | –3.30 (0.40) | ||||||||||
| Orlistat | 17 | –10.10 (1.40) | –3.60 (0.50) | |||||||||||
| Kiortsis 2008103 | Standard care | 20 | –1.80 (0.91) | –1.50 (0.47) | ||||||||||
| Orlistat | 20 | –8.30 (0.72) | –3.20 (0.32) | |||||||||||
| Sibutramine 10 mg | 20 | –8.60 (0.85) | –3.30 (0.36) | |||||||||||
| Krempf 2003104 | Placebo | 350 | 102 | 54 | –3.30 (0.50) | |||||||||
| Orlistat | 346 | 170 | 85 | –6.30 (0.50) | –1.00 (0.30)b | |||||||||
| Kuo 2006105 | Placebo | 30 | –0.40 (0.30) | –0.20 (0.20) | ||||||||||
| Orlistat | 30 | –2.50 (0.60) | –1.60 (0.30) | |||||||||||
| Lindgarde 2000106 | Placebo | 186 | 76 | 27 | –4.60 (0.40) | |||||||||
| Orlistat | 190 | 103 | 36 | –5.90 (0.40) | ||||||||||
| Lindholm 2008107 | Placebo | 20 | –2.8 (1.50) | |||||||||||
| Sibutramine 15 mg | 21 | –7.8 (1.28) | ||||||||||||
| Mathus-Vliegen 2006108 | Placebo | 14 | –14.60 (1.98) | –3.40 (0.70) | ||||||||||
| Orlistat | 14 | –11.90 (1.44) | –4.00 (0.46) | |||||||||||
| McNulty 2003109 | Placebo | 64 | 8 | 0 | –0.20 (0.50) | –0.10 (0.20) | ||||||||
| Sibutramine 15 mg | 68 | 31 | 10 | –5.10 (0.59) | –2.00 (0.19) | |||||||||
| Miles 2002110 | Placebo | 254 | 40 | 10 | –1.80 (0.30) | |||||||||
| Orlistat | 250 | 97 | 35 | –4.70 (0.30) | ||||||||||
| Muls 2001111 | Placebo | 143 | 56 | 19 | –1.88 (0.37) | |||||||||
| Orlistat | 147 | 94 | 34 | –4.66 (0.31) | ||||||||||
| Ozcelik 2004112 | Placebo | 10 | –9.00 (1.37) | –3.90 (0.47) | ||||||||||
| Orlistat | 14 | –8.50 (1.07) | –3.40 (0.38) | |||||||||||
| Ozcelik 2005113 | Standard care | 8 | –9.00 (1.68) | –3.60 (0.68) | ||||||||||
| Orlistat | 8 | –11.50 (1.73) | –4.70 (0.70) | |||||||||||
| Pathan 2004115 | Standard care | 15 | –1.10 (1.53) | |||||||||||
| Orlistat | 21 | –3.10 (0.84) | ||||||||||||
| Pi-Sunyer 2006115 | Placebo | 607 | 121 | 52 | ||||||||||
| Rimonabant | 1214 | 317 | 129 | –1.30 (0.30) | ||||||||||
| Porter 2004116 | Standard care | 220 | –3.10 (0.36) | –1.10 (0.11) | 42 | –2.30 (0.41) | ||||||||
| Sibutramine 15 mg | 281 | –6.80 (0.33) | –2.40 (0.12) | 133 | –6.20 (0.43) | |||||||||
| Poston 2003117 | Standard care | 52 | –1.00 (0.69) | –0.40 (0.23) | –0.30 (0.68) | –0.10 (0.23) | ||||||||
| Orlistat | 56 | –5.20 (0.74) | –2.00 (0.27) | –5.60 (0.77) | –2.20 (0.27) | |||||||||
| Poston 2006118 | Standard care | 85 | 5 | –0.60 (0.28) | 8 | +1.70 (0.46) | ||||||||
| Orlistat | 82 | 26 | –2.90 (0.51) | 22 | –1.70 (0.70) | |||||||||
| Redmon 2003119 | Standard care | 29 | –0.80 (0.90) | |||||||||||
| Sibutramine 15 mg | 30 | –7.30 (1.30) | ||||||||||||
| Rossner 2000120 | Placebo | 237 | 46 | –6.60 (0.44) | ||||||||||
| Orlistat | 242 | 93 | –9.70 (0.40) | |||||||||||
| Sarac 2006121 | Placebo | 20 | –1.99 (0.58) | –1.10 (0.26) | ||||||||||
| Sibutramine 10 mg | 20 | –5.21 (0.66) | –2.60 (0.36) | |||||||||||
| Sari 2004122 | Orlistat | 30 | 15 | 7 | –5.50 (1.06) | |||||||||
| Sibutramine 15 mg | 29 | 22 | 14 | –10.10 (1.04) | ||||||||||
| Sibutramine and orlistat | 30 | 23 | 15 | –10.80 (0.77) | ||||||||||
| Sari 2004123 | Orlistat | 30 | –4.80 (0.53) | –0.90 (0.23) | ||||||||||
| Metformin | 27 | –5.77 (0.48) | –2.30 (0.25) | |||||||||||
| Sathyapalan 2008124 | Metformin | 10 | –1.60 (1.31) | –0.61 (0.55) | ||||||||||
| Rimonabant | 10 | –6.20 (1.50) | –2.34 (0.35) | |||||||||||
| Scheen 2006125 | Placebo | 348 | 50 | 7 | –1.40 (0.19) | |||||||||
| Rimonabant | 339 | 166 | 55 | –5.30 (0.28) | ||||||||||
| Scholze 2007126 | Placebo | 84 | 12 | –1.50 (0.50) | –0.50 (0.20) | |||||||||
| Sibutramine 15 mg | 87 | 48 | –5.70 (0.50) | –2.00 (0.20) | ||||||||||
| Serrano-Rios 2002127 | Placebo | 65 | 19 | 4 | –1.70 (0.50) | –0.60 (0.20) | ||||||||
| Sibutramine 15 mg | 69 | 34 | 11 | –4.50 (0.50) | –1.90 (0.20) | |||||||||
| Shechter 2006128 | Standard care | 40 | –0.70 (0.16) | |||||||||||
| Sibutramine 10 mg | 40 | –3.30 (0.16) | ||||||||||||
| Shi 2005129 | Placebo | 123 | 33 | 6 | ||||||||||
| Orlistat | 124 | 75 | 25 | –3.00 (0.41)b | ||||||||||
| Smith 2001130 | Placebo | 163 | 32 | 11 | –1.60 (0.56) | |||||||||
| Sibutramine 10 mg | 161 | 60 | 30 | –4.40 (0.51) | ||||||||||
| Sibutramine 15 mg | 161 | 87 | 52 | –6.40 (0.54) | ||||||||||
| Swinburn 2005131 | Placebo | 169 | –0.90 (0.32) | |||||||||||
| Orlistat | 170 | –4.70 (0.59) | ||||||||||||
| Tambascia 2003132 | Placebo | 14 | +0.90 (1.03) | |||||||||||
| Sibutramine 10 mg | 17 | –5.60 (0.82) | ||||||||||||
| Tankova 2004133 | Standard care | 80 | 12 | –2.69 (0.77) | ||||||||||
| Sibutramine 15 mg | 93 | 73 | –7.99 (0.55) | |||||||||||
| Tiikkainen 2004134 | Placebo | 24 | –7.40 (0.20) | |||||||||||
| Orlistat | 23 | –7.30 (0.20) | ||||||||||||
| Torgerson 2004135 | Placebo | 1637 | 738 | 340 | ||||||||||
| Orlistat | 1640 | 1194 | 672 | |||||||||||
| Turker 2006136 | Standard care | 9 | –0.90 (0.80) | –0.60 (0.30) | ||||||||||
| Orlistat | 18 | –6.00 (0.20) | –2.40 (0.10) | |||||||||||
| Van Gaal 1998137 | Placebo | 123 | 23 | |||||||||||
| Orlistat | 120 | 45 | ||||||||||||
| Van Gaal 2005138 | Placebo | 305 | 59 | 22 | –1.80 (0.37) | |||||||||
| Rimonabant | 599 | 305 | 164 | –6.60 (0.29) | ||||||||||
| Vazquez Roque 2007139 | Placebo | 23 | +0.90 (0.90) | |||||||||||
| Sibutramine 15 mg | 25 | –5.40 (0.80) | –0.51 (0.35)b | |||||||||||
| Wadden 200534 | Standard care | 55 | –6.70 (1.07) | |||||||||||
| Sibutramine 15 mg | 60 | –12.10 (1.27) | ||||||||||||
| Walsh 1999140 | Placebo | 9 | –5.10 (1.47) | |||||||||||
| Sibutramine 15 mg | 10 | –8.10 (1.20) | ||||||||||||
| Wang 2005141 | Placebo | 30 | –0.40 (0.30) | –0.20 (0.20) | ||||||||||
| Sibutramine 15 mg | 30 | –2.50 (0.60) | –1.60 (0.30) | |||||||||||
| Wirth 2001142 | Placebo | 201 | 70 | 26 | +0.20 (0.39) | |||||||||
| Sibutramine 15 mg | 405 | 263 | 130 | –3.80 (0.31) | ||||||||||
| Wirth 2006143 | Placebo | 49 | –2.10 (0.60) | –0.70 (0.20) | ||||||||||
| Sibutramine 15 mg | 144 | –6.90 (0.30) | –2.40 (0.10) | |||||||||||
| Zannad 2002144 | Placebo | 60 | 27 | 6 | –4.60 (0.56) | –1.70 (0.21) | ||||||||
| Sibutramine 10 mg | 64 | 53 | 33 | –9.30 (0.72) | –3.50 (0.26) | |||||||||
At baseline, participants had an average age of 45.5 years (SD 6.97 years), 25.7% were male, 33.2% were diabetic and the mean BMI was 34.92 kg/m2 (SD 2.58 kg/m2).
Results of the evidence synthesis
Pair-wise meta-analysis
5% weight loss
Five pair-wise comparisons could be made, including between one and three studies each. All showed an increased odds of achieving a 5% weight loss at 3 months if taking an active drug compared with either placebo or standard care. For example, those taking sibutramine 15 mg had a sixfold increased odds of achieving this target compared with those taking placebo [number of studies = 3, odds ratio (OR) 6.65, 95% CI 3.87 to 11.43]. There was no statistically significant difference between 10 mg and 15 mg sibutramine (number of studies = 1, OR 1.26, 95% CI 0.62 to 2.57). There was no significant statistical heterogeneity for any of the comparisons. (See Figure 14a and Table 7a.)
Eight pair-wise comparisons could be made, including between one and six studies each. As at 3 months, taking an active drug was superior to either placebo or standard care. Taking orlistat and sibutramine in combination increased the odds of a good outcome compared with both orlistat and sibutramine 15 mg (OR 4.60, 95% CI 1.25 to 16.97 and OR 1.31, 95% CI 0.31 to 5.51 respectively). One study compared sibutramine 15 mg with orlistat and found that sibutramine 15 mg increased the odds of having a 5% weight loss (OR 3.52, 95% CI 1.03 to 12.07). Significant heterogeneity was seen for the sibutramine 10 mg versus placebo (I2 58.0%) and sibutramine 15 mg versus placebo (I2 81.6%) comparisons. (See Figure 14b and Table 7b.)
Seven pair-wise comparisons could be made, including between 1 and 13 studies each. As with the 3- and 6-month data, the active drugs showed an increased odds of reaching the 5% weight loss outcome compared with placebo or standard care. For example, a threefold increase in the odds was seen for orlistat compared with placebo (number of studies =13, OR 2.81, 95% CI 2.42 to 3.27), although there was significant heterogeneity for this comparison (I2 51.7%). The 12-month data include a comparison of rimonabant against placebo, which shows an increased odds of a good outcome for those taking rimonabant (number of studies = 4, OR 3.73, 95% CI 1.77 to 7.88); again, significant heterogeneity was seen for this comparison (I2 95.6%). (See Figure 14c and Table 7c.)
10% weight loss
One three-arm trial only gave data on 10% weight loss at 3 months comparing placebo, sibutramine 10 mg and sibutramine 15 mg. The trial showed that both 10 mg and 15 mg of sibutramine were superior to placebo and there was no difference between the two sibutramine doses. (See Figure 14d and Table 7d.)
Eight pair-wise comparisons could be made, including between one and seven studies each. Comparable to the 5% weight-loss data, active treatment was better than placebo or standard care, with combination treatment (orlistat and sibutramine) being better than orlistat and similar to sibutramine 15 mg (OR 3.57, 95% CI 1.13 to 11.25, and OR 1.16, 95% CI 0.40 to 3.39 respectively). No heterogeneity was seen for any of the comparisons, apart from the sibutramine 15 mg versus placebo comparison (I2 84.8%). (See Figure 14e and Table 7e.)
Five pair-wise comparisons could be made, including between 1 and 12 studies each. Orlistat, rimonabant, sibutramine 10 mg and sibutramine 15 mg all gave an increased odds of a good outcome compared with placebo. There was significant statistical heterogeneity for the rimonabant versus placebo comparison (I2 93.5%). (See Figure 14f and Table 7f.)
Weight change from baseline
Fifteen pair-wise comparisons could be made, including between 1 and 12 studies each. Statistically significant reductions in body weight were seen for rimonabant versus metformin, orlistat and sibutramine versus orlistat, orlistat versus placebo, sibutramine 10 mg versus placebo, sibutramine 15 mg versus placebo, orlistat versus standard care, orlistat and sibutramine versus standard care, sibutramine 10 mg versus standard care, sibutramine 15 mg versus standard care and sibutramine 10 mg versus sibutramine 15 mg. As with the 5% and 10% body weight loss outcomes, active drugs were superior to placebo or standard care and combination treatment was better than orlistat alone. There was significant heterogeneity for three of the comparisons: sibutramine 10 mg versus orlistat, sibutramine 15 mg versus placebo and orlistat versus standard care. (See Figure 14g and Table 7g.)
Twelve pair-wise comparisons could be made, including between 1 and 10 studies each. The majority of studies compared orlistat with placebo, showing that orlistat reduces weight by 2.23 kg from baseline compared with placebo (95% CI –3.10 kg to –1.36 kg). For the other comparisons comparable results to the 3-month data were seen. Significant heterogeneity was seen for a number of the comparisons: orlistat versus sibutramine 10 mg (I2 90.0%), orlistat versus placebo (I2 87.0%) and sibutramine 15 mg versus placebo (I2 92.4%). (See Figure 14h and Table 7h.)
Eight pair-wise comparisons could be made, including between 1 and 16 studies each. As previously found, all active drug comparisons with either placebo or standard care were found to result in significant weight changes, three of which showed significant heterogeneity. At this time point, sibutramine 15 mg showed a greater weight loss than sibutramine 10 mg. (See Figure 14i and Table 7i.)
Body mass index change from baseline
Fourteen pair-wise comparisons could be made, including between one and nine studies each. Statistically significant reductions in BMI were seen for nine of the comparisons (rimonabant vs metformin, metformin vs orlistat, orlistat and sibutramine vs orlistat, sibutramine 10 mg vs orlistat, sibutramine 10 mg vs placebo, sibutramine 15 mg vs placebo, orlistat vs standard care, orlistat and sibutramine vs standard care and sibutramine 10 mg vs standard care). In line with the previous findings, active drug seemed to reduce weight compared with a non-active control. Data comparing sibutramine 10 mg with orlistat show that those taking sibutramine 10 mg lose on average half a kilogram more than those taking orlistat. Significant heterogeneity was present for two of the comparisons (orlistat vs placebo and sibutramine 10 mg vs standard care). (See Figure 14j and Table 7j.)
Eight pair-wise comparisons could be made, including between one and three studies each. Given a lack of studies and heterogeneity of results, statistically significant differences were not observed for sibutramine 10 mg versus orlistat, orlistat versus placebo and sibutramine 10 mg versus placebo. Sibutramine 15 mg versus placebo, orlistat versus standard care and sibutramine 15 mg versus standard care followed the previous results with the active comparator showing a bigger weight loss than the inactive. (See Figure 14k and Table 7k.)
Four pair-wise comparisons could be made, including either one or two studies each. Orlistat was shown to be superior to placebo and standard care. No difference was seen between orlistat and sibutramine 10 mg (OR 0.15, 95% CI –1.84 to 2.14). (See Figure 14l and Table 7l.)
Contour-enhanced funnel plots were constructed for pair-wise comparisons where there were five or more studies included (see Appendix 3, Figure 15). Visual inspection of these plots is somewhat inconclusive; however, there would not appear to be any strong suggestion of systematic suppression of results based on statistical significance.
Mixed-treatment comparison meta-analysis
Table 6 shows a summary of the results of the MTC meta-analysis, with placebo as the reference group. Figure 3 shows the network diagrams for each of the outcomes considered. Figure 16 in Appendix 3 shows the percentage best plots for each treatment at each time point (this is the percentage of simulations in which each treatment option came out as having the largest treatment effect).
| Outcome | Treatment | 3 months | 6 months | 12 months | ||||||
|---|---|---|---|---|---|---|---|---|---|---|
| OR | 95% CrI | % best ranking | OR | 95% CrI | % best ranking | OR | 95% CrI | % best ranking | ||
| 5% weight loss | Placebo | Reference | 0 | Reference | 0 | Reference | 0 | |||
| Orlistat | 3.86 | 0.06 to 15.11 | 2.5 | 2.95 | 1.62 to 4.97 | 0.1 | 2.89 | 2.22 to 3.72 | 2.0 | |
| Sibutramine 10 mg | 5.87 | 1.46 to 17.65 | 16.0 | 4.24 | 2.39 to 6.84 | 2.2 | 3.25 | 1.56 to 6.22 | 16.1 | |
| Sibutramine 15 mg | 9.95 | 3.10 to 32.71 | 81.4 | 6.90 | 3.49 to 12.99 | 21.5 | 4.06 | 2.51 to 6.29 | 47.3 | |
| Rimonabant | – | – | – | – | – | – | 3.78 | 2.39 to 5.79 | 34.5 | |
| Orlistat and sibutramine | – | – | – | 16.99 | 2.45 to 62.01 | 76.1 | – | – | – | |
| Standard care | 0.90 | 0.05 to 4.02 | 0.01 | 0.39 | 0.10 to 1.04 | 0 | 1.01 | 0.42 to 2.06 | 0 | |
| 10% weight loss | Placebo | Reference | 4.2 | Reference | 0 | Reference | 0 | |||
| Orlistat | – | – | – | 3.10 | 1.44 to 6.14 | 0 | 2.43 | 1.72 to 3.39 | 0.3 | |
| Sibutramine 10 mg | 16.41 | 0.34 to 93.23 | 55.1 | 6.57 | 3.28 to 12.97 | 1.3 | 3.38 | 1.39 to 7.13 | 10.7 | |
| Sibutramine 15 mg | 14.34 | 0.28 to 77.43 | 40.7 | 18.83 | 6.70 to 48.1 | 54.3 | 5.02 | 2.63 to 9.12 | 57.9 | |
| Orlistat and sibutramine | – | – | – | 22.96 | 2.82 to 88.08 | 43.3 | – | – | – | |
| Rimonabant | – | – | – | – | – | – | 4.25 | 2.35 to 7.31 | 31.2 | |
| Standard care | – | – | – | 2.76 | 0.21 to 12.1 | 1.0 | – | – | – | |
| Outcome | Treament | Mean difference | 95% CrI | % best ranking | Mean difference | 95% CrI | % best ranking | Mean difference | 95% CrI | % best ranking |
| Weight change | Placebo | Reference | 0 | Reference | 0 | Reference | 0 | |||
| Orlistat | –2.65 | –4.00 to –1.31 | 0 | –3.08 | –4.20 to –2.03 | 0 | –4.12 | –5.07 to 3.15 | 0.2 | |
| Metformin | –4.63 | –7.46 to –1.68 | 0 | –3.15 | –6.51 to 0.29 | 0.4 | – | – | – | |
| Sibutramine 10mg | –4.88 | –6.40 to –3.43 | 0 | –5.08 | –6.55 to –3.62 | 1.3 | –5.42 | –7.36 to –3.42 | 16.6 | |
| Sibutramine 15mg | –5.37 | –6.59 to –4.10 | 0 | –6.11 | –8.11 to –4.23 | 5.3 | –6.35 | –8.06 to –4.63 | 78.2 | |
| Rimonabant | –11.23 | –17.17 to –5.15 | 62.6 | – | – | – | –4.55 | –6.20 to –2.92 | 5.0 | |
| Orlistat and sibutramine | –10.18 | –13.82 to –6.59 | 37.7 | –9.67 | –14.32 to –5.04 | 93.1 | – | – | – | |
| Standard care | –1.36 | –3.23 to 0.48 | 0 | –1.95 | –3.83 to –0.11 | 0 | –2.89 | –4.90 to –0.84 | 0 | |
| BMI change | Placebo | Reference | 0 | Reference | 0.1 | Reference | – | 0 | ||
| Orlistat | –1.56 | –2.54 to –0.58 | 0 | –0.59 | –2.60 to 1.39 | 7.5 | –1.43 | –2.67 to –0.18 | 1.8 | |
| Metformin | –3.50 | –5.02 to –1.87 | 0.6 | 0.18 | –4.05 to 4.37 | 13.2 | – | – | – | |
| Sibutramine 10 mg | –2.43 | –3.33 to –1.54 | 0.1 | –0.95 | –2.89 to 1.02 | 16.4 | –2.27 | –5.08 to 0.59 | 33.0 | |
| Sibutramine 15 mg | –2.25 | –2.97 to –1.54 | 0 | –1.81 | –4.25 to 0.61 | 60.6 | –2.91 | –5.45 to –0.62 | 62.4 | |
| Rimonabant | –6.24 | –9.07 to –3.33 | 95.5 | – | – | – | – | – | – | |
| Orlistat and sibutramine | –3.16 | –5.22 to –1.11 | 3.7 | – | – | – | – | – | – | |
| Standard care | 0.50 | –0.51 to 1.48 | 0 | 0.79 | –2.04 to 3.72 | 1.3 | –1.02 | –3.11 to 1.12 | 2.8 | |
FIGURE 3.
Network diagrams, showing the number of direct comparisons for each MTC analysis: (a) 5% weight loss 3 months, (b) 5% weight loss 6 months, (c) 5% weight loss 12 months, (d) 10% weight loss 3 months, (e) 10% weight loss 6 months, (f) 10% weight loss 12 months, (g) weight change 3 months, (h) weight change 6 months, (i) weight change 12 months, (j) BMI change 3 months, (k) BMI change 6 months, (l) BMI change 12 months.
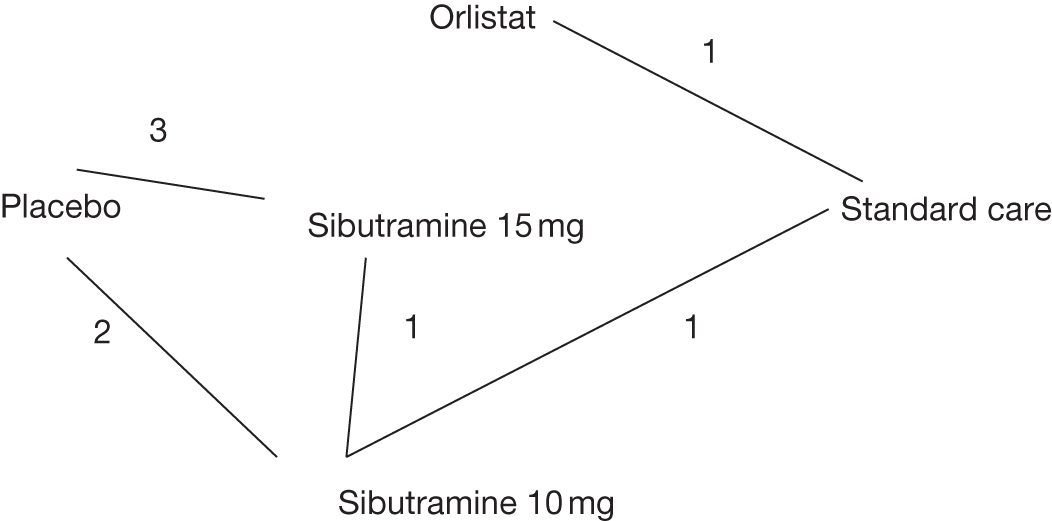
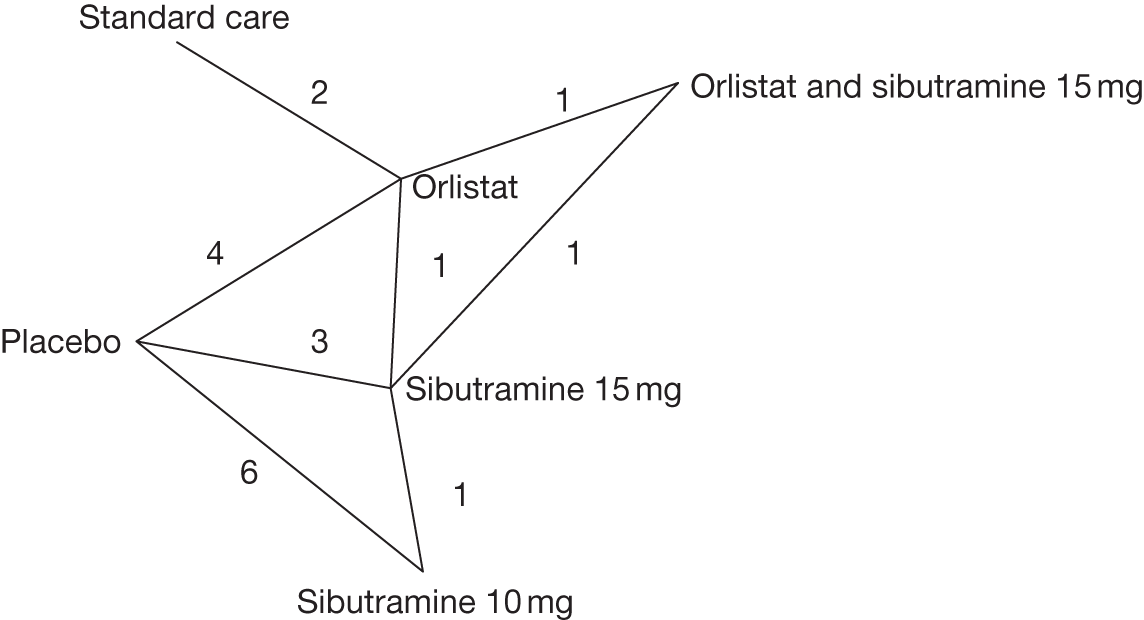
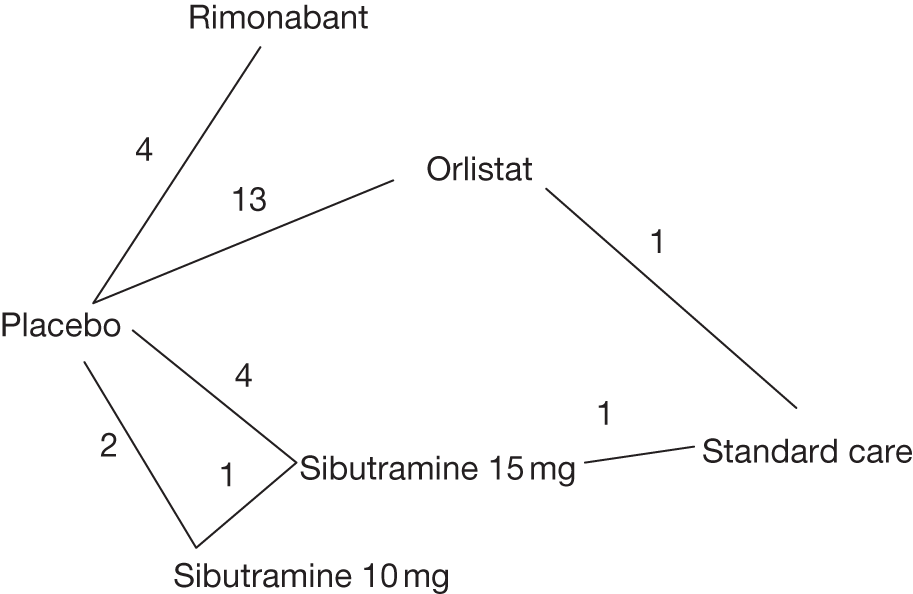
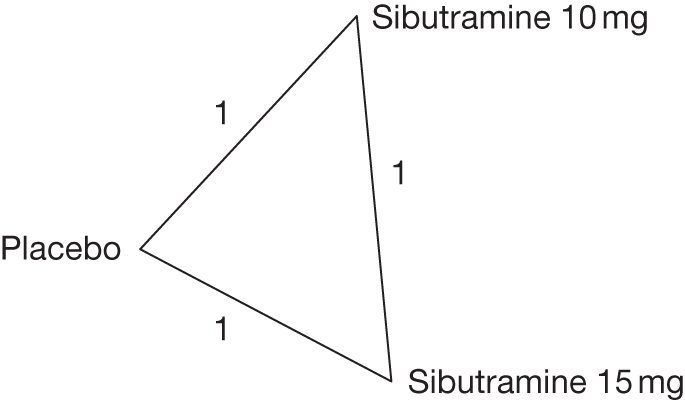
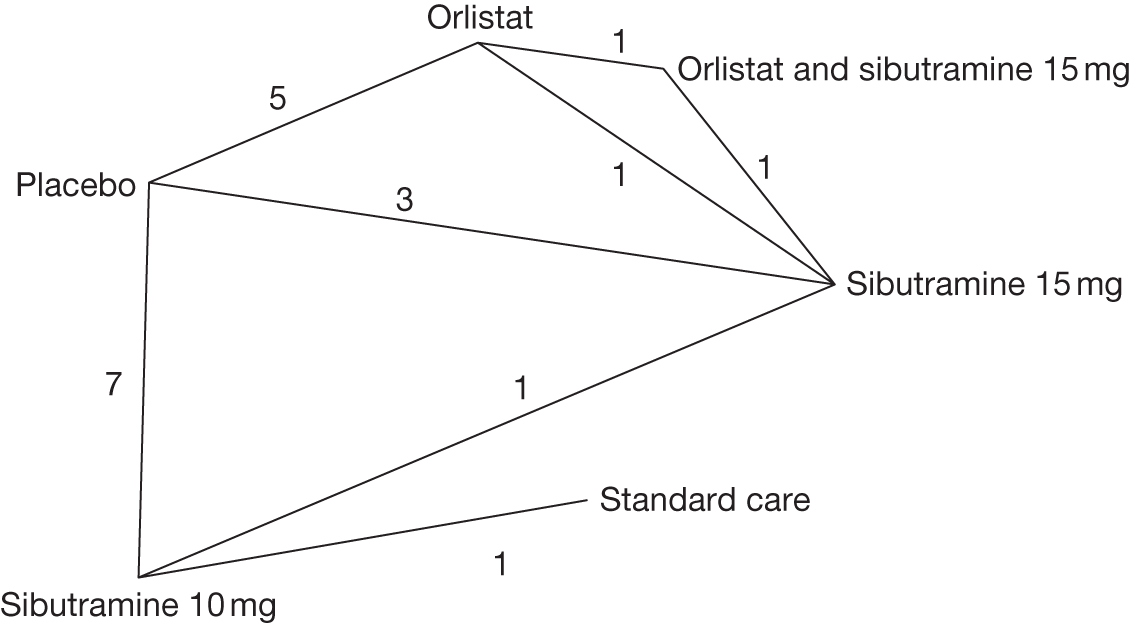
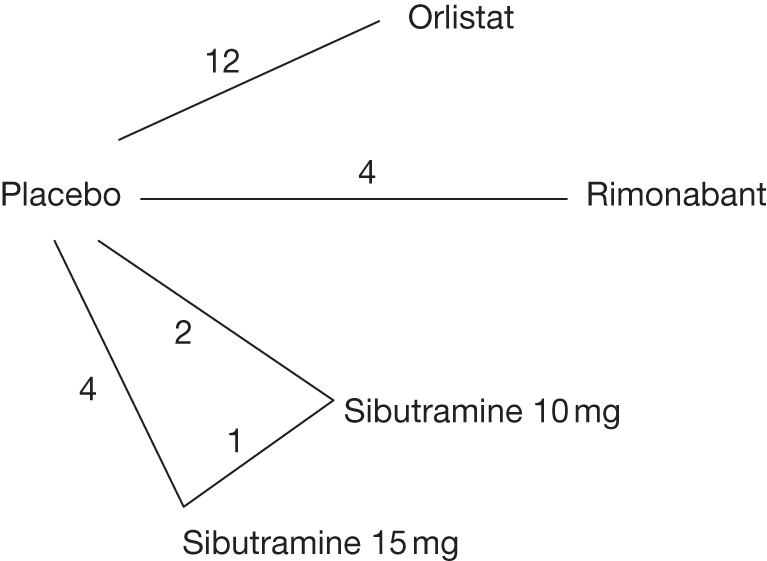
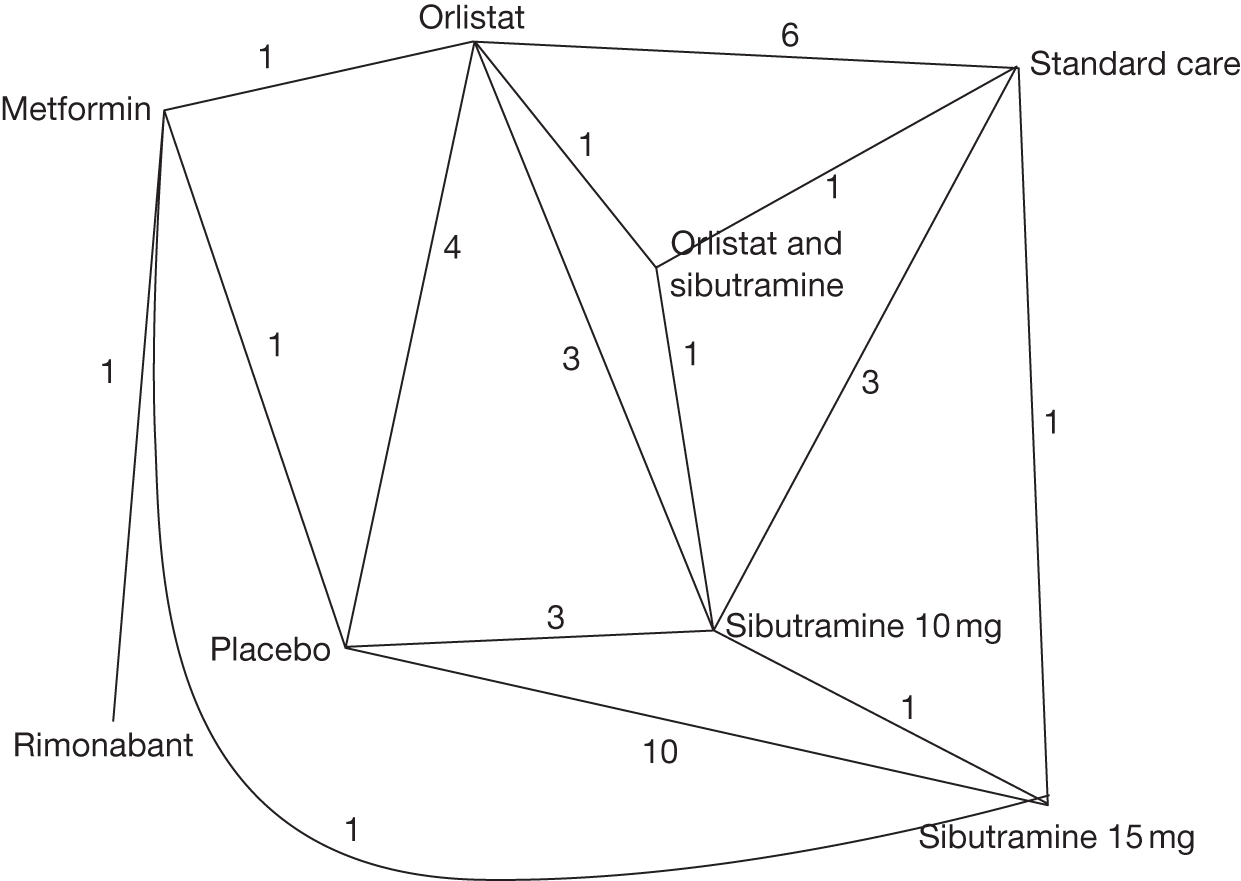
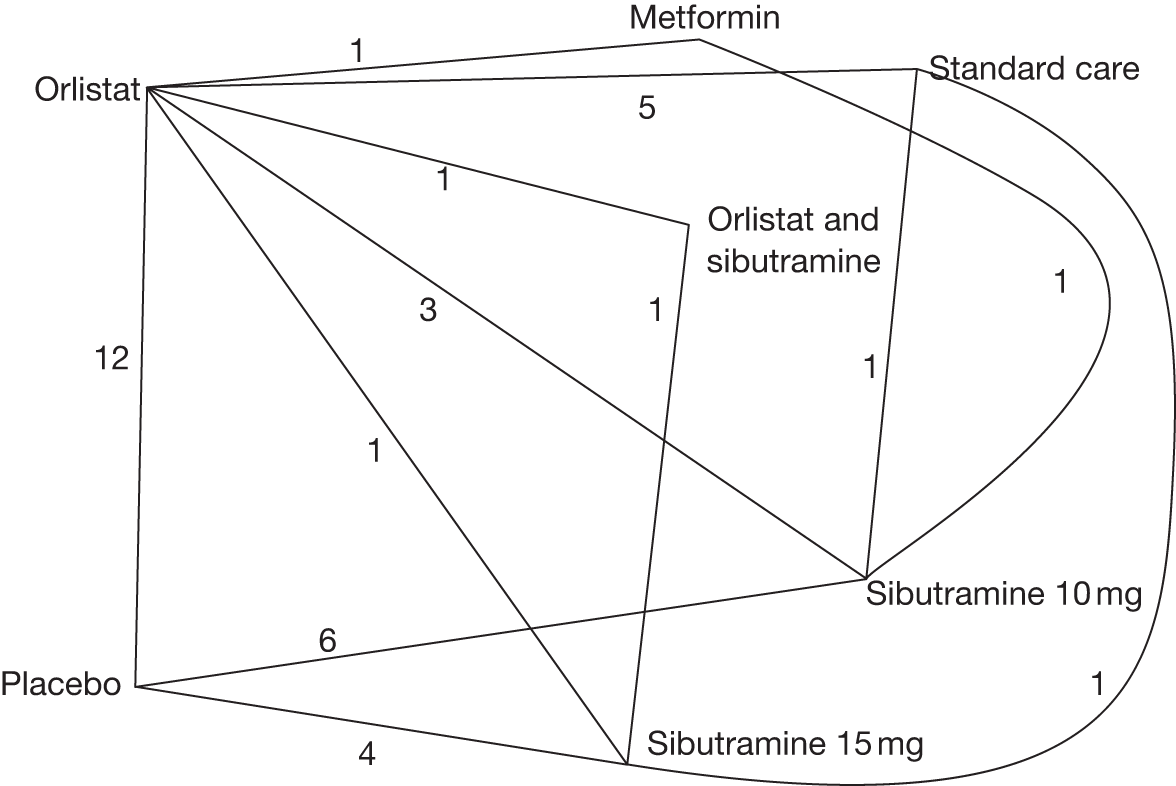
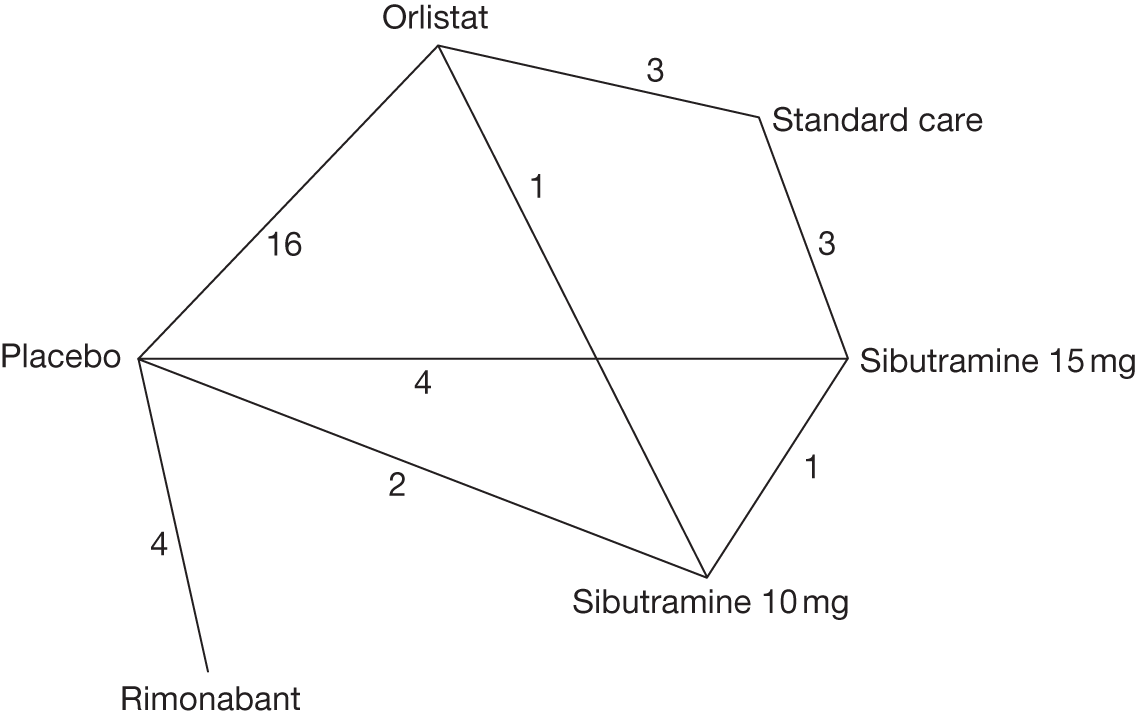
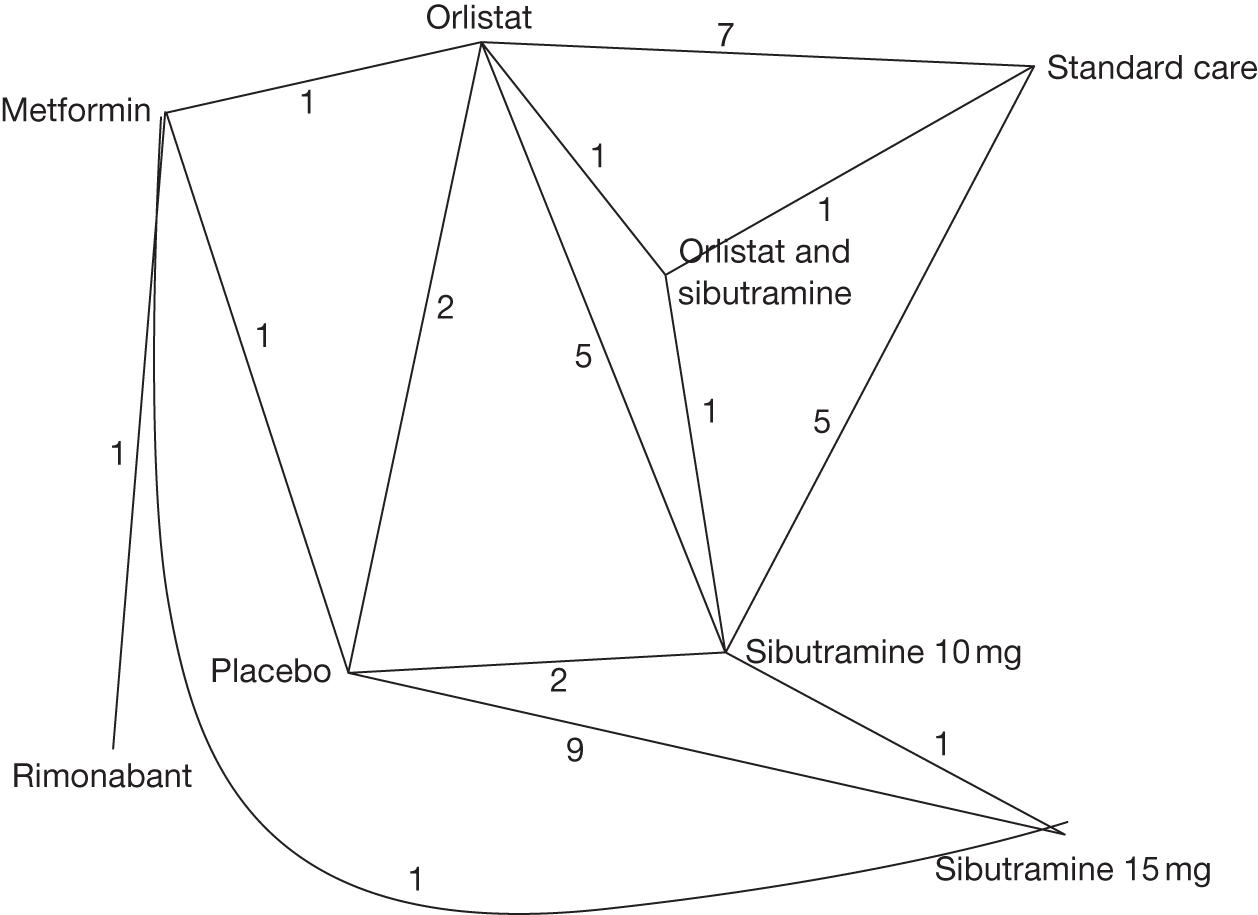
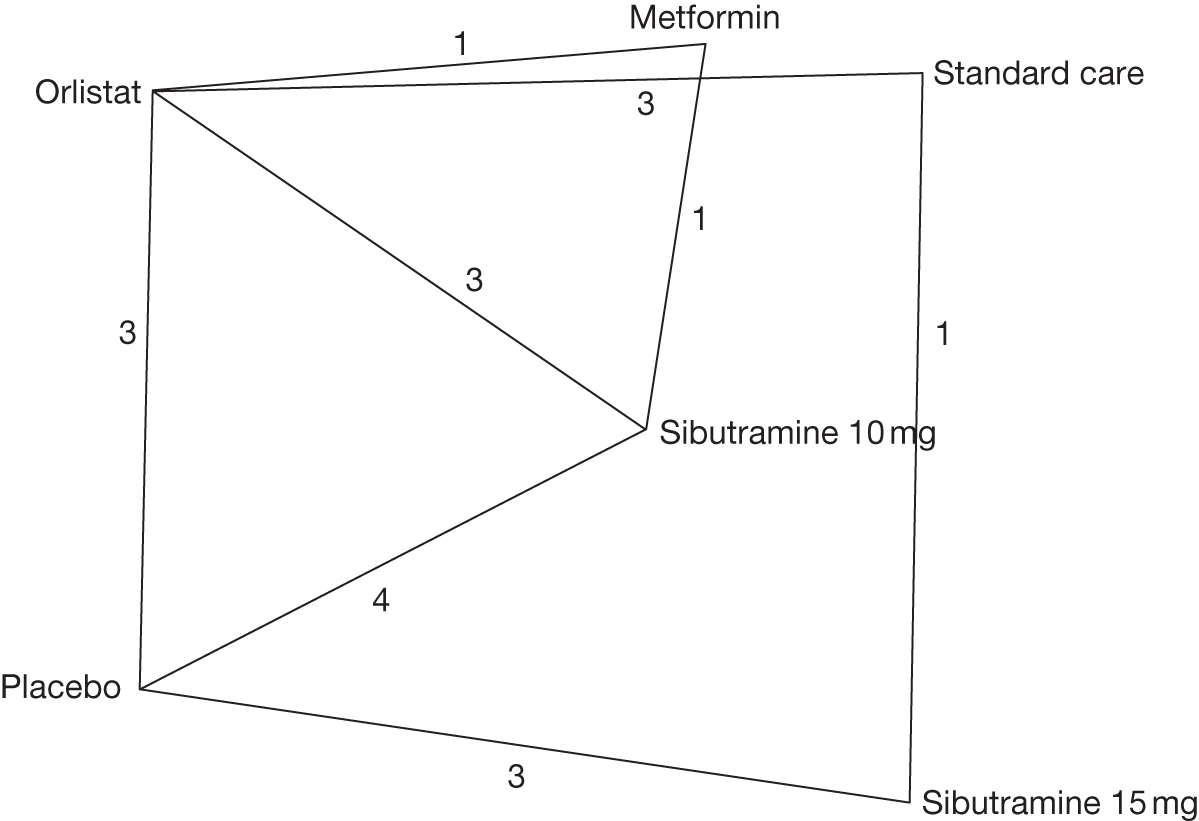
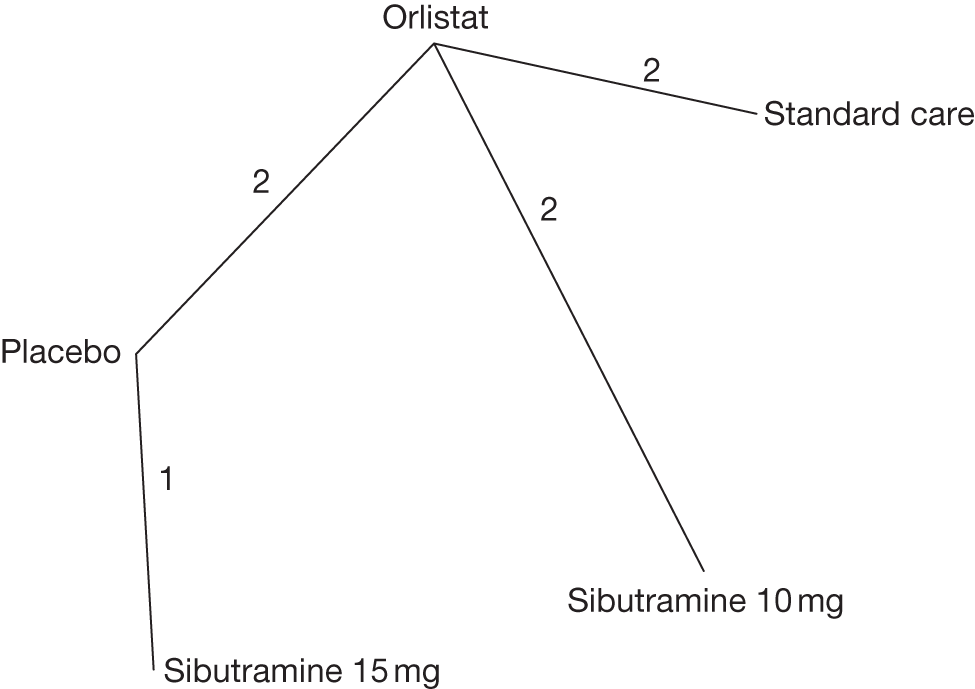
5% weight loss
Sibutramine 15 mg had the largest probability (81.4%) of being the best intervention in terms of having a 5% body weight loss, with a 10-fold odds of having a good outcome compared with placebo [OR 9.95, 95% credible interval (CrI) 3.10 to 32.71]. No statistically significant difference was found between orlistat and placebo and standard care and placebo.
At 6 months the combination of orlistat and sibutramine was the most efficacious intervention compared with placebo (OR 16.99, CrI 2.45 to 62.01). No difference was found between standard care and placebo. Orlistat, sibutramine 15 mg and sibutramine 10 mg were all more beneficial than placebo.
Compared with placebo, similar results were seen at 12 months to those at 3 and 6 months. With the addition of rimonabant, all active treatments were significantly better than placebo, with no difference seen between placebo and standard care.
10% weight loss
Only one three-arm trial reported data on 10% weight loss at 3 months. No statistically significant differences between placebo and sibutramine 10 mg or sibutramine 15 mg were seen.
The active treatments (orlistat, sibutramine 10 mg, sibutramine 15 mg and a combination of orlistat and sibutramine) were all superior to placebo. No statistically significant difference was seen between placebo and standard care (OR 2.76, 95% CrI 0.21 to 12.1).
Comparable results to those seen for 5% weight loss at 12 months were seen for 10% weight loss at this time point. Sibutramine 15 mg had the largest probability (57.9%) of being the best intervention, followed by rimonabant (31.2%) and sibutramine 10 mg (10.7%).
Weight change from baseline
In comparison with placebo, the active drugs were all associated with greater weight loss, ranging from a mean change of –2.65 kg (95% CrI –4.00 kg to –1.31 kg) for orlistat to –11.23 kg (95% CrI –17.17 kg to –5.15 kg) for rimonabant. No statistically significant difference was seen between placebo and standard care.
As previously seen, all active treatments were associated with greater weight loss than placebo, with the combination of orlistat and sibutramine producing the greatest weight loss (–9.67 kg compared with placebo) and the largest probability (93.1%) of being the best intervention. Standard care was also more effective than placebo at 6 months (–1.95 kg, 95% CrI –3.83 kg to –0.11 kg).
All treatments (orlistat, sibutramine 10 mg and 15 mg, and rimonabant) and standard care were superior to placebo at 12 months, with mean weight change in comparison with placebo ranging from –6.35 kg (sibutramine 15 mg) to –2.89 kg (standard care).
Body mass index change from baseline
In line with the results for weight change at 3 months, all active treatments were associated with significant reductions in BMI compared with placebo. No difference was seen between standard care and placebo (0.50 kg/m2, 95% CrI –0.51 kg/m2 to 1.48 kg/m2).
At 6 months none of the active treatments or standard care was significantly better than placebo. For example, metformin was associated with an increase in BMI compared with placebo (0.18 kg/m2, 95% CrI –4.05 kg/m2 to 4.37 kg/m2).
At 12 months orlistat and sibutramine 15 mg resulted in significantly greater BMI loss than placebo. No difference was seen between sibutramine 10 mg and placebo or standard care. Sibutramine 15 mg had the largest probability (62.4%) of being the best intervention in terms of BMI loss.
Comparison with pair-wise meta-analysis
The pair-wise and MTC analyses generally agreed for the two binary outcomes – 5% and 10% body weight loss. Across all outcomes, where inconsistency was seen the intervention effect size was generally in the same direction but with a different magnitude. For the continuous outcomes there was more disagreement. For example, for weight change at 3 months, there were 15 pair-wise comparisons, eight of which were consistent with the MTC results and seven of which were not, with the MTC results showing greater weight loss for the drug interventions than the pair-wise results (Table 7a–l).
| OR (95% CI) | |||||
|---|---|---|---|---|---|
| Placebo | Orlistat | Sibutramine 10 mg | Sibutramine 15 mg | Standard care | |
| Placebo | – | 4.07 (2.24 to 7.42) | 6.65 (3.87 to 11.43) | – | |
| Orlistat | 3.86 (0.06 to 15.11) | – | – | 0.52 (0.28 to 0.99) | |
| Sibutramine 10 mg | 5.87 (1.46 to 17.65) | 32.31 (0.29 to 102.70) | 1.26 (0.62 to 2.57) | – | |
| Sibutramine 15 mg | 9.95 (3.10 to 32.71) | 35.04 (0.87 to 140.90) | 2.33 (0.47 to 8.55) | 0.05 (0.02 to 0.11) | |
| Standard care | 0.90 (0.05 to 4.02) | 0.83 (0.08 to 3.07) | 0.21 (0.01 to 0.96) | 0.07 (0.01 to 0.28) | |
| OR (95% CI) | ||||||
|---|---|---|---|---|---|---|
| Placebo | Orlistat | Sibutramine 10 mg | Sibutramine 15 mg | Orlistat and sibutramine | Standard care | |
| Placebo | 2.93 (2.14 to 4.00) | 4.05 (2.52 to 6.52) | 6.45 (2.28 to 18.24) | – | – | |
| Orlistat | 2.95 (1.62 to 4.97) | – | 3.52 (1.03 to 12.07) | 4.60 (1.25 to 16.97) | 0.12 (0.06 to 0.25) | |
| Sibutramine 10 mg | 4.25 (2.39 to 6.84) | 1.55 (0.67 to 3.01) | 1.40 (0.87 to 2.24) | – | – | |
| Sibutramine 15 mg | 6.90 (3.88 to 12.99) | 2.50 (1.06 to 5.35) | 1.72 (0.77 to 3.64) | 1.31 (0.31 to 5.51) | – | |
| Orlistat and sibutramine | 16.99 (2.45 to 62.01) | 5.90 (0.88 to 21.45) | 4.28 (0.57 to 16.18) | 2.58 (0.36 to 9.41) | – | |
| Standard care | 0.39 (0.10 to 1.04) | 0.13 (0.04 to 0.32) | 0.10 (0.02 to 0.28) | 0.06 (0.01 to 0.18) | 0.04 (0.004 to 0.18) | |
| OR (95% CI) | ||||||
|---|---|---|---|---|---|---|
| Placebo | Orlistat | Sibutramine 10 mg | Sibutramine 15 mg | Rimonabant | Standard care | |
| Placebo | 2.81 (2.42 to 3.27) | 3.58 (1.58 to 8.09) | 3.68 (2.54 to 5.33) | 3.73 (1.77 to 7.88) | – | |
| Orlistat | 2.89 (2.22 to 3.72) | – | – | – | 0.28 (0.12 to 0.68) | |
| Sibutramine 10 mg | 3.25 (1.56 to 6.22) | 1.14 (0.52 to 2.24) | 2.07 (1.31 to 3.26) | – | – | |
| Sibutramine 15 mg | 4.06 (2.51 to 6.29) | 1.42 (0.83 to 2.92) | 1.38 (0.62 to 2.69) | – | 0.26 (0.17 to 0.40) | |
| Rimonabant | 3.78 (2.39 to 5.79) | 1.33 (0.78 to 2.15) | 1.31 (0.52 to 2.71) | 0.99 (0.49 to 1.77) | – | |
| Standard care | 1.01 (0.42 to 2.06) | 0.35 (0.15 to 0.72) | 0.35 (0.11 to 0.83) | 0.25 (0.11 to 0.50) | 0.28 (0.10 to 0.62) | |
| OR (95% CI) | |||
|---|---|---|---|
| Placebo | Sibutramine 10 mg | Sibutramine 15 mg | |
| Placebo | 4.77 (1.27 to 17.90) | 4.03 (1.06 to 15.25) | |
| Sibutramine 10 mg | 16.41 (0.34 to 93.23) | 0.85 (0.34 to 2.10) | |
| Sibutramine 15 mg | 14.48 (0.28 to 77.41) | 2.20a (0.06 to 11.46) | |
| OR (95% CI) | ||||||
|---|---|---|---|---|---|---|
| Placebo | Orlistat | Sibutramine 10 mg | Sibutramine 15 mg | Orlistat and sibutramine | Standard care | |
| Placebo | 2.54 (1.78 to 3.61) | 5.52 (3.16 to 9.65) | 28.28 (1.01 to 792.12) | – | – | |
| Orlistat | 3.10 (1.44 to 6.14) | – | 3.08 (0.98 to 9.67) | 3.57 (1.13 to 11.25) | – | |
| Sibutramine 10 mg | 6.57 (3.28 to 12.97) | 2.40 (0.02 to 5.81) | 2.55 (1.49 to 4.38) | – | 0.27 (0.08 to 0.90) | |
| Sibutramine 15 mg | 18.83 (6.70 to 48.10) | 6.69 (2.01 to 17.94) | 3.09 (0.98 to 7.94) | 1.16 (0.40 to 3.39) | – | |
| Orlistat and sibutramine | 22.96 (2.82 to 88.08) | 7.67 (0.98 to 5.02) | 3.79 (0.41 to 14.77) | 1.30 (0.17 to 4.63) | – | |
| Standard care | 2.76 (0.21 to 12.10) | 1.03 (0.06 to 4.57) | 0.41 (0.04 to 1.67) | 0.18 (0.01 to 0.79) | 0.29 (0.01 to 1.44) | |
| OR (95% CI) | |||||
|---|---|---|---|---|---|
| Placebo | Orlistat | Sibutramine 10 mg | Sibutramine 15 mg | Rimonabant | |
| Placebo | 2.30 (1.92 to 2.74) | 3.59 (2.18 to 5.92) | 3.96 (2.46 to 6.36) | 4.21 (1.64 to 10.79) | |
| Orlistat | 2.43 (1.72 to 3.39) | – | – | – | |
| Sibutramine 10 mg | 3.38 (1.39 to 7.13) | 1.44 (0.54 to 3.14) | 2.13 (1.27 to 3.58) | – | |
| Sibutramine 15 mg | 5.02 (2.63 to 9.12) | 2.13 (1.00 to 4.10) | 1.70 (0.65 to 3.78) | – | |
| Rimonabant | 4.25 (2.35 to 7.31) | 1.80 (0.89 to 3.32) | 1.49 (0.49 to 3.57) | 0.93 (0.37 to 1.95) | |
| Mean difference (95% CI) | ||||||||
|---|---|---|---|---|---|---|---|---|
| Placebo | Orlistat | Metformin | Sibutramine 10 mg | Sibutramine 15 mg | Rimonabant | Orlistat and sibutramine | Standard care | |
| Placebo | –1.72 (–2.49 to –0.95) | –2.60 (–6.36 to 1.16) | –2.71 (–3.73 to –1.70) | –3.60 (–4.67 to –2.53) | – | – | – | |
| Orlistat | –2.65a (–4.00 to –1.31) | –0.97 (–2.37 to 0.43) | –0.83 (–1.99 to 0.34) | – | – | –4.33 (–6.46 to –2.20) | 3.62 (1.71 to 5.53) | |
| Metformin | –4.63 (–7.46 to –1.68) | –1.98 (–4.75 to 0.91) | – | –2.20 (–5.68 to 1.28) | –4.60 (–8.50 to –0.70) | – | – | |
| Sibutramine 10 mg | –4.88a (–6.40 to –3.43) | –2.23a (–3.52 to –0.99) | –0.24 (–3.34 to 2.68) | 3.30 (0.28 to 6.33) | – | –1.96 (–4.28 to 0.36) | 5.03 (2.80 to 7.27) | |
| Sibutramine 15 mg | –5.37a (–6.59 to –4.10) | –2.73 (–4.36 to –1.07) | –0.74 (–3.65 to 2.06) | –0.50a (–2.20 to 1.29) | – | – | 5.30 (3.44 to 7.16) | |
| Rimonabant | –11.23 (–17.17 to –5.15) | –8.58 (–14.47 to –2.54) | –6.59 (–11.79 to –1.28) | –6.35 (–12.34 to –0.20) | –5.85 (–11.79 to 0.22) | – | – | |
| Orlistat and sibutramine | –10.18 (–13.82 to –6.59) | –7.53a (–10.62 to –4.50) | –5.55 (–9.91 to –1.36) | –5.30a (–8.68 to –1.91) | –4.81 (–8.53 to –1.14) | 1.05 (–5.87 to 7.69) | 7.44 (5.02 to 9.86) | |
| Standard care | –1.36 (–3.23 to 0.48) | 1.29 (–0.30 to 2.82) | 3.27 (0.09 to 6.36) | 3.52 (1.78 to 5.26) | 4.02 (2.01 to 5.97) | 9.87 (3.64 to 15.91) | 8.82 (5.34 to 12.28) | |
| Mean difference (95% CI) | |||||||
|---|---|---|---|---|---|---|---|
| Placebo | Orlistat | Sibutramine 10 mg | Sibutramine 15 mg | Orlistat and sibutramine | Metformin | Standard care | |
| Placebo | –2.23 (–3.10 to –1.36) | –4.13 (–5.02 to –3.24) | –5.54 (–9.69 to –1.39) | – | – | – | |
| Orlistat | –3.08 (–4.20 to –2.03) | –1.90 (–5.82 to 2.02) | –4.60 (–7.51 to –1.69) | –5.30 (–7.80 to –2.73) | –1.00 (–1.24 to –0.76) | 2.58 (1.84 to 3.31) | |
| Sibutramine 10 mg | –5.08a (–6.55 to –3.62) | –2.00 (–3.57 to –0.42) | – | – | 4.04 (3.75 to 4.33) | 2.00 (0.74 to 4.74) | |
| Sibutramine 15 mg | –6.11 (–8.11 to –4.23) | –3.03 (–5.10 to –1.06) | –1.03 (–3.39 to 1.27) | –0.70 (–3.23 to 1.83) | – | 3.70 (2.74 to 4.66) | |
| Orlistat and sibutramine | –9.67 (–14.32 to –5.04) | –6.59 (–11.05 to –2.17) | –4.59 (–9.43 to 0.17) | –3.56a (–8.08 to 1.02) | – | – | |
| Metformin | –3.15 (–6.51 to 0.29) | –0.07a (–3.27 to 3.27) | 1.93a (–1.10 to 5.04) | 2.96 (–0.77 to 6.89) | 6.52 (1.10 to 12.15) | – | |
| Standard care | –1.95 (–3.83 to –0.11) | 1.14a (–0.51 to 2.75) | 3.14 (1.00 to 5.26) | 4.17 (1.91 to 6.49) | 7.73 (2.90 to 12.54) | 1.21 (–2.47 to 4.78) | |
| Mean difference (95% CI) | ||||||
|---|---|---|---|---|---|---|
| Placebo | Orlistat | Sibutramine 10 mg | Sibutramine 15 mg | Rimonabant | Standard care | |
| Placebo | –2.55 (–2.98 to –2.12) | –4.16 (–6.99 to –1.32) | –4.14 (–4.91 to –3.38) | –3.83 (–5.76 to –1.91) | – | |
| Orlistat | –4.12a (–5.07 to –3.15) | –0.10 (–1.36 to 1.16) | – | – | 3.67 (1.99 to 5.35) | |
| Sibutramine 10 mg | –5.42 (–7.36 to –3.42) | –1.30 (–3.30 to 0.74) | –2.00 (–3.45 to –0.55) | – | – | |
| Sibutramine 15 mg | –6.35a (–8.06 to –4.63) | –2.23 (–4.03 to –2.23) | –0.94 (–2.96 to 1.08) | – | 4.75 (3.26 to 6.24) | |
| Rimonabant | –4.55 (–6.20 to –2.92) | –0.43 (–2.31 to 1.41) | 0.87 (–1.70 to 3.42) | 1.80 (–0.57 to 4.14) | – | |
| Standard care | –2.89 (–4.90 to –0.85) | 1.23a (–0.69 to 3.17) | 2.52 (0.06 to 5.03) | 3.46 (1.50 to 5.45) | 1.66 (–0.87 to 4.26) | |
| Mean difference (95% CI) | ||||||||
|---|---|---|---|---|---|---|---|---|
| Placebo | Orlistat | Metformin | Rimonabant | Sibutramine 10 mg | Sibutramine 15 mg | Standard care | Orlistat and sibutramine | |
| Placebo | –0.51 (–2.37 to 1.35) | –1.10 (–2.55 to 0.35) | – | –1.57 (–2.27 to –0.86) | –1.38 (–1.67 to –1.09) | – | – | |
| Orlistat | –1.56 (–2.54 to –0.58 | –3.20 (–3.86 to –2.54) | – | –0.56 (–0.93 to –0.19) | – | 1.36 (0.93 to 1.79) | –1.48 (–2.19 to –0.77) | |
| Metformin | –3.50a (–5.02 to –1.87) | –1.94a (–3.42 to –0.28) | –1.73 (–3.02 to –0.45) | – | 0.70 (–0.72 to 2.12) | – | – | |
| Rimonabant | –6.24 (–9.07 to –3.34) | –4.68 (–7.47 to –1.76) | –2.74 (–5.20 to –0.37) | – | – | – | – | |
| Sibutramine 10 mg | –2.43 (–3.33 to –1.54) | –0.87 (–1.52 to –0.23) | 1.07 (–0.63 to 2.59) | 3.81 (0.87 to 6.64) | 0.90 (–0.34 to 2.14) | 1.89 (1.30 to 2.48) | –0.71 (–1.48 to 0.06) | |
| Sibutramine 15 mg | –2.25a (–2.97 to –1.54) | –0.69 (–1.75 to 0.38) | 1.25 (–0.37 to 2.78) | 3.99 (1.09 to 6.80) | 0.18 (–0.81 to 1.18) | – | – | |
| Standard care | 0.49 (–0.51 to 1.47) | 2.05a (1.30 to 2.81) | 3.99 (2.26 to 5.57) | 6.74 (3.74 to 9.58) | 2.93a (2.12 to 3.74) | 2.75 (1.63 to 3.85) | –2.60 (–3.40 to –1.80) | |
| Orlistat and sibutramine | –3.16 (–5.22 to –1.11) | –1.60 (–3.53 to 0.37) | 0.34 (–2.17 to 2.67) | 3.08 (–0.40 to 6.44) | –0.72 (–2.64 to 1.22) | –0.91 (–3.03 to 1.20) | –3.65a (–5.56 to –1.71) | |
| Mean difference (95% CI) | ||||||
|---|---|---|---|---|---|---|
| Placebo | Orlistat | Metformin | Sibutramine 10 mg | Sibutramine 15 mg | Standard care | |
| Placebo | –0.62 (–1.78 to 0.54) | – | –0.62 (–4.44 to 3.19) | –2.19 (–4.15 to –0.23) | – | |
| Orlistat | –0.59 (–2.60 to 1.39) | 0.55 (–1.32 to 2.42) | –0.92 (–2.59 to 0.75) | – | 1.41 (0.97 to 1.84) | |
| Metformin | 0.18 (–4.05 to 4.37) | 0.77 (–3.03 to 4.57) | –1.47 (–3.41 to 0.47) | – | – | |
| Sibutramine 10 mg | –0.95 (–2.89 to 1.02) | –0.36 (–2.43 to 1.80) | –1.13 (–4.64 to 2.38) | – | – | |
| Sibutramine 15 mg | –1.81 (–4.25 to 0.61) | –1.22 (–4.07 to 1.61) | –1.99 (–6.65 to 2.68) | –0.86 (–3.86 to 2.11) | 1.30 (0.98 to 1.62) | |
| Standard care | 0.79 (–2.04 to 3.72) | 1.38 (–1.04 to 3.81) | 0.61 (–3.80 to 5.13) | 1.74 (–1.29 to 4.75) | 2.60a (–0.49 to 5.84) | |
| Mean difference (95% CI) | |||||
|---|---|---|---|---|---|
| Placebo | Orlistat | Sibutramine 10 mg | Sibutramine 15 mg | Standard care | |
| Placebo | –0.98 (–1.35 to –0.61) | – | –1.90 (–2.45 to –1.35) | – | |
| Orlistat | –1.43a (–2.67 to –0.18) | –0.15 (–2.14 to 1.84) | – | 1.40 (0.03 to 2.77) | |
| Sibutramine 10 mg | –2.27 (–5.08 to 0.59) | –0.84 (–3.42 to 1.74) | – | – | |
| Sibutramine 15 mg | –2.91a (–5.45 to –0.62) | –1.49 (–4.33 to 1.11) | –0.64 (–4.42 to 2.95) | – | |
| Standard care | –1.01 (–3.11 to 1.12) | 0.41 (–1.26 to 2.04) | 1.25 (–1.80 to 4.27) | 1.90 (–1.19 to 5.20) | |
Sensitivity analysis
Sensitivity analyses were carried out on the 12-month weight change outcome only.
Last observation carried forward
This analysis involved excluding those studies that used a per-protocol/completers analysis, or in which the method of analysis was not clear. The results including only the last observation carried forward (LOCF) studies were comparable to the main analysis including all studies (see Appendix 3, Table 27).
Wash-in
In this analysis we excluded those studies that had used a wash-in period to preselect people to be included in the trial. This led to smaller average weight reductions compared with placebo. For example, the main analysis showed that on average those taking sibutramine 15 mg lost 6.35 kg more than those taking placebo; this was reduced to 3.83 kg when the wash-in studies were excluded (see Appendix 3, Table 27).
Covariate adjusted analysis
Both the proportion of people with T2DM in the study and the level of diet and exercise advice given were added as covariates.
Type 2 diabetes
Those with T2DM lost more weight on each intervention than those without T2DM at 12 months. In those with T2DM, orlistat (mean difference –5.53 kg, 95% CrI –7.97 kg to –3.06 kg), sibutramine 15 mg (–7.17 kg, 95% CrI –11.24 kg to –3.00 kg) and lifestyle advice (–7.19 kg, 95% CrI –12.98 kg to –2.17 kg) were associated with greater weight change than placebo. For those with T2DM, the interventions with the largest probabilities of being the best were lifestyle advice (34.4%) and sibutramine 15 mg (33.9%) (Table 8).
| T2DM | No T2DM | ||||||
|---|---|---|---|---|---|---|---|
| Mean difference | 95% CrI | % best ranking | Mean difference | 95% CrI | % best ranking | ||
| Weight change | Placebo | Reference | 0 | Reference | 0 | ||
| Orlistat | –5.53 | –7.97 to –3.06 | 9.2 | –2.44 | –4.23 to –0.60 | 0.5 | |
| Sibutramine 10 mg | –3.91 | –13.41 to 7.55 | 13.7 | –2.61 | –6.16 to 0.86 | 1.8 | |
| Sibutramine 15 mg | –7.17 | –11.24 to –3.00 | 33.9 | –6.21 | –9.77 to –2.74 | 86.6 | |
| Rimonabant | –4.71 | –9.09 to 0.04 | 8.7 | –3.43 | –6.63 to –0.36 | 10.5 | |
| Standard care | –7.19 | –12.98 to –2.17 | 34.4 | –2.47 | –5.66 to 0.77 | 0.6 | |
Diet and exercise advice
Table 9 shows the estimates for those given standard diet and exercise advice and those given enhanced diet and exercise advice. Overall, no differences were seen between the types of diet and exercise advice. In addition, for many of the interventions (sibutramine 10 mg, rimonabant and standard care) no difference was seen between them and placebo for the standard advice.
| Enhanced diet and/or exercise advice | Standard diet and/or exercise advice | ||||||
|---|---|---|---|---|---|---|---|
| Mean difference | 95% CrI | % best ranking | Mean difference | 95% CrI | % best ranking | ||
| Weight change | Placebo | Reference | 0 | Reference | 0 | ||
| Orlistat | –3.49 | –5.22 to –1.74 | 0.2 | –4.38 | –6.37 to –2.37 | 9.6 | |
| Sibutramine 10 mg | –5.39 | –9.17 to –1.71 | 31.9 | –1.26 | –5.62 to 3.02 | 0.1 | |
| Sibutramine 15 mg | –5.99 | –8.92 to –3.15 | 46.6 | –6.49 | –10.91 to –2.17 | 60.1 | |
| Rimonabant | –4.96 | –8.15 to –1.75 | 21.0 | –4.16 | –8.69 to 0.41 | 13.7 | |
| Standard care | –3.23 | –5.97 to –0.47 | 0.2 | –2.74 | –13.36 to 8.42 | 16.5 | |
Model fit
Table 10 shows the residual deviance for each of the models fitted above. Overall, all models had an acceptable level of fit, with the residual deviance being roughly equal to the number of unconstrained data points in all cases.
| Outcome | Time point | Residual deviance | Data points |
|---|---|---|---|
| 5% weight loss | 3 | 13.437 | 13 |
| 6 | 34.562 | 32 | |
| 12 | 48.981 | 49 | |
| 10% weight loss | 3 | 3.097 | 3 |
| 6 | 41.919 | 34 | |
| 12 | 44.607 | 43 | |
| Weight change | 3 | 59.516 | 61 |
| 6 | 67.301 | 64 | |
| 12 | 63.079 | 63 | |
| Weight change – T2DM covariate | 12 | 51.348 | 51 |
| Weight change – diet covariate | 12 | 63.156 | 63 |
| Weight change – LOCF only | 12 | 38.999 | 39 |
| Weight change – wash-in | 12 | 63.156 | 24 |
| BMI change | 3 | 55.614 | 53 |
| 6 | 34.600 | 35 | |
| 12 | 14.227 | 15 |
Chapter 4 Epidemiological model of natural history
Introduction
To appropriately populate the economic decision model described in Chapter 5 a UK epidemiological model of the natural history of how changes in BMI affect the risk of major clinical events [development of diabetes, myocardial infarction (MI), stroke and death] is required together with a model of how BMI levels change as a population ages.
Although a number of research studies have explored the relationship between BMI and the development of diabetes, CVD or mortality, they have had a number of limitations. They have (1) been of a retrospective or cross-sectional design145 and therefore have only established an association or (2) used categorised BMI, for example overweight, obese, etc.,146–150 or (3) have been conducted primarily outside the UK. 151
Therefore, this section describes the development of both a BMI risk model for the development of diabetes, MI, stroke and death and a natural history model of BMI using the General Practice Research Database (GPRD). The use of the GPRD will enable risk to be estimated at specific levels of BMI and age. Similarly, age-specific BMI levels can be estimated. This also allows the adjustment for potentially important confounding factors in both models.
Background to the General Practice Research Database
The GPRD was established in 1987 and contains anonymised longitudinal primary care records from over 12 million patients in the UK. Of these, over 10 million are useable for research purposes, representing over 63 million person-years of observation. 152
Patients and data preparation
The initial study population comprised 100,000 individuals drawn randomly from the GPRD subject to them (1) being ≥ 18 years of age and (2) having three or more BMI readings of over 27 kg/m2. All patient data prior to 1980 were removed, as were any observations with missing dates. BMI readings during a pregnancy (and for the following 6 months) were removed, as were any BMI readings outside the range 25–60 kg/m2.
The occurrence of any of four clinical events [death from any cause – all-cause mortality (ACM), MI, stroke and onset of T2DM] was then identified for each individual using Oxford Medical Information Systems (OXMIS) and READ codes. 153 As patient data were not available for all outcomes, separate patient cohorts were created for each outcome. If no events occurred, the date of an individual’s last BMI reading was taken as the censoring date. Each of the ACM, MI and stroke cohorts were then subdivided into diabetic and non-diabetic cohorts. Each cohort consisted only of patients who were either diabetic or non-diabetic for their entire follow-up period. This aimed to reduce ‘carry-over’ effects from comorbidities occurring when, for example, a patient was non-diabetic but then became diabetic. This also negates the issue of a reliable diagnosis of diabetes. A patient may be diagnosed as diabetic; however, his or her GPRD record may not reflect this for a significant period of time.
This resulted in seven overlapping cohorts, allowing the development of diabetic- and non-diabetic-specific survival models for each of the four time-to-event outcomes. Clearly, only a non-diabetic cohort was used when the time-to-event outcome was development of T2DM.
Event numbers and follow-up times are summarised in Table 11. Typical examples of the distribution of follow-up times for diabetic and non-diabetic cohorts can be seen in Figures 4 and 5 respectively. In total, 90.38% of patients in the diabetic cohort, shown in Figure 4, had follow-up of up to 15 years. When applying the survival models in Time-to-event analysis (below) it is therefore unwise to apply the results beyond this range.
| Outcome | Censored/event | Diabetic | Non-diabetic | ||||||
|---|---|---|---|---|---|---|---|---|---|
| No. of patients | Follow-up time (years) | No. of patients | Follow-up time (years) | ||||||
| n | % | Median | Maximum | n | % | Median | Maximum | ||
| MI | Censored | 4404 | 94.95 | 5.38 | 23.99 | 66,556 | 96.81 | 9.17 | 27.96 |
| Event | 234 | 5.05 | 6.09 | 19.01 | 2192 | 3.19 | 7.51 | 24.45 | |
| Stroke | Censored | 4400 | 94.16 | 5.39 | 23.99 | 66,688 | 96.62 | 9.17 | 27.96 |
| Event | 273 | 5.84 | 5.14 | 18.57 | 2332 | 3.38 | 6.66 | 23.32 | |
| ACM | Censored | 4264 | 87.47 | 5.34 | 23.99 | 65,376 | 94.02 | 9.34 | 27.96 |
| Event | 611 | 12.53 | 7.78 | 19.55 | 4156 | 5.98 | 10.36 | 26.35 | |
| T2DM | Censored | – | – | – | – | 69,280 | 85.04 | 9.22 | 27.96 |
| Event | – | – | – | – | 12,186 | 14.96 | 7.89 | 25.93 | |
FIGURE 4.
Distribution of follow-up time for the diabetic cohort with outcome ACM.
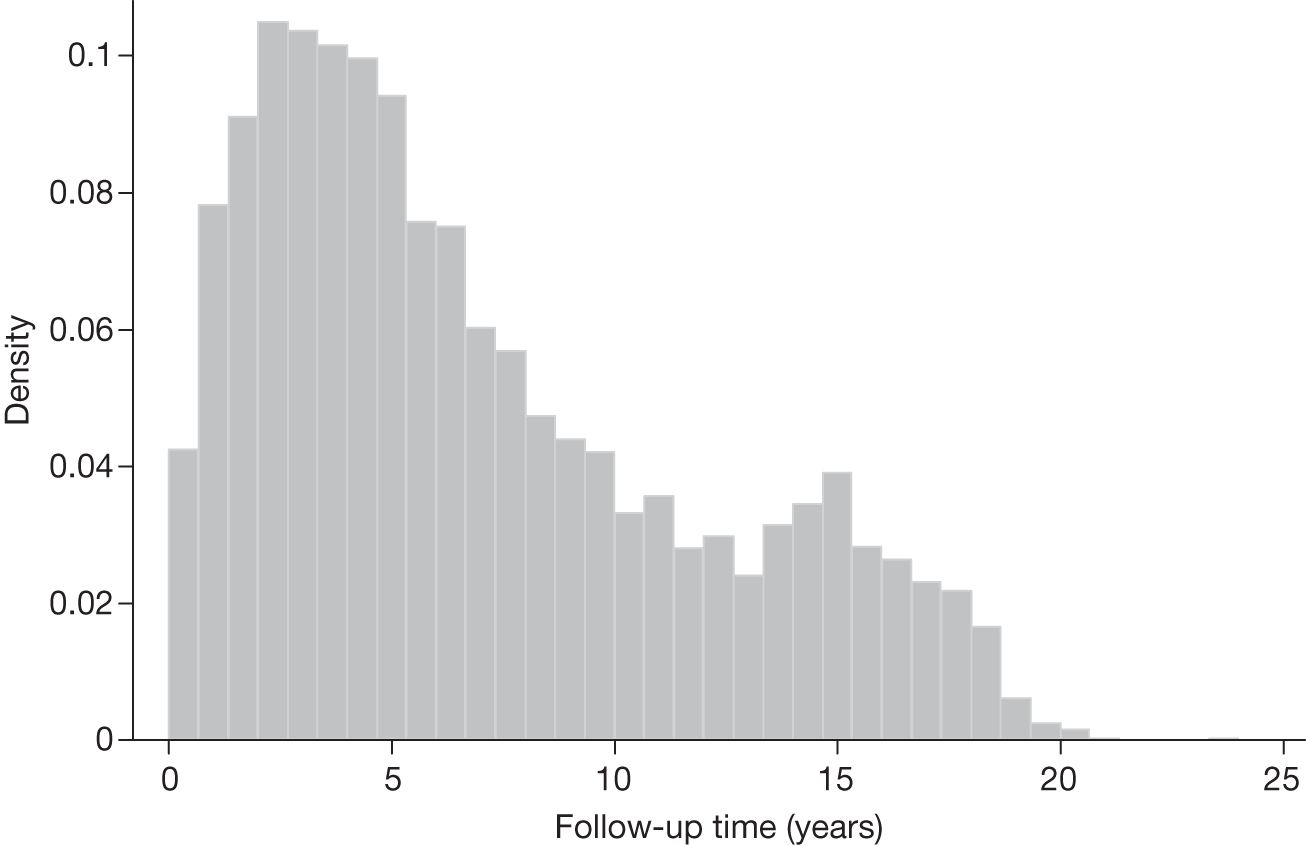
FIGURE 5.
Distribution of follow-up time for the non-diabetic cohort with outcome ACM.
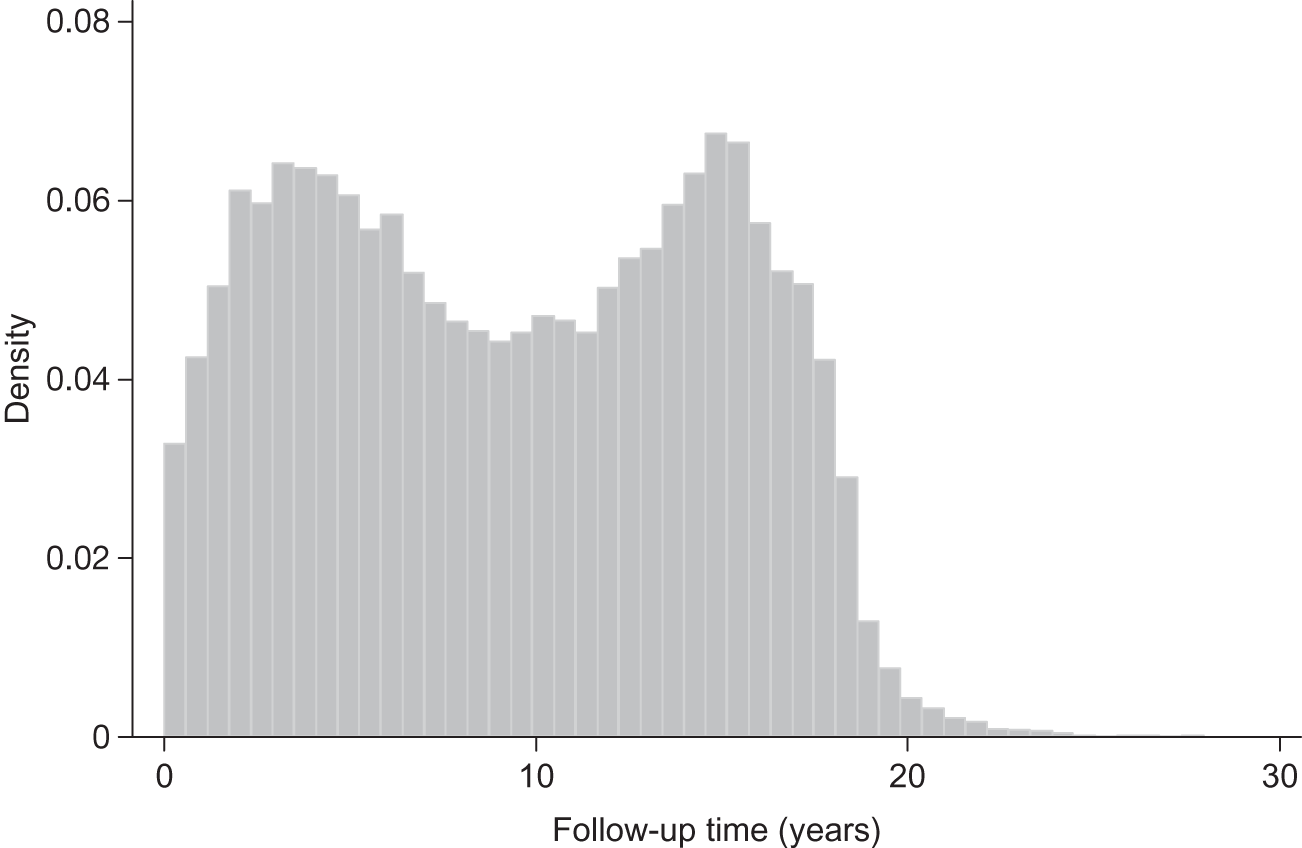
Covariates available for analyses included repeated measurements of BMI (kg/m2), baseline age (years) and categorical variables (reference levels of categorical covariates are listed first): sex (female/male), aspirin treatment (no/yes), statin treatment (no/yes), blood pressure (BP)-lowering treatment (no/yes) and smoking status (non-smoker, ex-smoker and current smoker). Diabetic cohorts also included insulin treatment (no/yes) as a covariate.
Based on previous large-scale cohort studies150,154 it was deemed sufficient to use only baseline BMI in the survival analyses (see Time-to-event analysis). Covariate summary statistics for each of the seven cohorts are shown in Tables 12–18.
| Variable | Censored | Died | ||
|---|---|---|---|---|
| n | % | n | % | |
| Baseline BMI (kg/m2)a | 31 | 25 to 60 | 30.1 | 25 to 52.2 |
| Baseline age (years)b | 58.65 | 58.28 to 59.01 | 68.03 | 67.28 to 68.79 |
| Gender | ||||
| Female | 1821 | 87.17 | 268 | 12.83 |
| Male | 2443 | 87.69 | 343 | 12.31 |
| Insulin | ||||
| No | 2975 | 87.09 | 441 | 12.91 |
| Yes | 1289 | 88.35 | 170 | 11.65 |
| Aspirin | ||||
| No | 3284 | 88.35 | 433 | 11.65 |
| Yes | 980 | 84.63 | 178 | 15.37 |
| Statins | ||||
| No | 704 | 71.04 | 287 | 28.96 |
| Yes | 3560 | 91.66 | 324 | 8.34 |
| BP treatment | ||||
| No | 608 | 88.89 | 76 | 11.11 |
| Yes | 3656 | 87.23 | 535 | 12.77 |
| Variable | Censored | Died | ||
|---|---|---|---|---|
| n | % | n | % | |
| Baseline BMI (kg/m2)a | 29.8 | 25 to 60 | 30.00 | 25 to 57.4 |
| Baseline age (years)b | 45.12 | 45.00 to 45.24 | 63.82 | 63.46 to 64.18 |
| Gender | ||||
| Female | 40,580 | 95.46 | 1931 | 4.54 |
| Male | 24,796 | 91.77 | 2225 | 8.23 |
| Aspirin | ||||
| No | 59,524 | 94.91 | 3189 | 5.09 |
| Yes | 5852 | 85.82 | 967 | 14.18 |
| Statins | ||||
| No | 47,072 | 94.30 | 2844 | 5.70 |
| Yes | 18,304 | 93.31 | 1312 | 6.69 |
| BP treatment | ||||
| No | 29,826 | 97.47 | 774 | 2.53 |
| Yes | 35,550 | 91.31 | 3382 | 8.69 |
| Variable | Censored | MI | ||
|---|---|---|---|---|
| n | % | n | % | |
| Baseline BMI (kg/m2)a | 31 | 25 to 60 | 29.4 | 25.1 to 52.2 |
| Baseline age (years)b | 59.44 | 59.08 to 59.81 | 61.97 | 60.56 to 63.37 |
| Gender | ||||
| Female | 1940 | 95.76 | 86 | 4.24 |
| Male | 2464 | 94.33 | 148 | 5.67 |
| Insulin | ||||
| No | 3150 | 96.45 | 116 | 3.55 |
| Yes | 1254 | 91.40 | 118 | 8.60 |
| Aspirin | ||||
| No | 3415 | 96.36 | 129 | 3.64 |
| Yes | 989 | 90.40 | 105 | 9.60 |
| Statins | ||||
| No | 945 | 96.53 | 34 | 3.47 |
| Yes | 3459 | 94.53 | 200 | 5.47 |
| BP treatment | ||||
| No | 673 | 98.97 | 7 | 1.03 |
| Yes | 3731 | 94.26 | 227 | 5.74 |
| Variable | Censored | MI | ||
|---|---|---|---|---|
| n | % | n | % | |
| Baseline BMI (kg/m2)a | 29.8 | 25 to 60 | 29.1 | 25 to 53.3 |
| Baseline age (years)b | 45.65 | 45.53 to 45.77 | 57.29 | 56.81 to 57.78 |
| Gender | ||||
| Female | 41,684 | 98.34 | 704 | 1.66 |
| Male | 24,872 | 94.36 | 1488 | 5.64 |
| Aspirin | ||||
| No | 60,916 | 97.93 | 1286 | 2.07 |
| Yes | 5640 | 86.16 | 906 | 13.84 |
| Statins | ||||
| No | 49,542 | 99.40 | 301 | 0.60 |
| Yes | 17,014 | 90.00 | 1891 | 10.00 |
| BP treatment | ||||
| No | 30,512 | 99.83 | 51 | 0.17 |
| Yes | 36,044 | 94.39 | 2141 | 5.61 |
| Variable | Censored | Stroke | ||
|---|---|---|---|---|
| n | % | n | % | |
| Baseline BMI (kg/m2)a | 30.9 | 25 to 60 | 30.3 | 25 to 48 |
| Baseline age (years)b | 59.26 | 58.90 to 59.62 | 63.97 | 62.74 to 65.20 |
| Gender | ||||
| Female | 1865 | 93.34 | 133 | 6.66 |
| Male | 2535 | 94.77 | 140 | 5.23 |
| Insulin | ||||
| No | 3114 | 94.71 | 174 | 5.29 |
| Yes | 1286 | 92.85 | 99 | 7.15 |
| Aspirin | ||||
| No | 3416 | 95.42 | 164 | 4.58 |
| Yes | 984 | 90.03 | 109 | 9.97 |
| Statins | ||||
| No | 882 | 92.26 | 74 | 7.74 |
| Yes | 3518 | 94.65 | 199 | 5.35 |
| BP treatment | ||||
| No | 654 | 97.18 | 19 | 2.82 |
| Yes | 3746 | 93.65 | 254 | 6.35 |
| Variable | Censored | Stroke | ||
|---|---|---|---|---|
| n | % | n | % | |
| Baseline BMI (kg/m2)a | 29.8 | 25 to 60 | 29.6 | 25 to 55 |
| Baseline age (years)b | 45.59 | 45.47 to 45.70 | 60.42 | 59.94 to 60.90 |
| Gender | ||||
| Female | 41,172 | 97.29 | 1147 | 2.71 |
| Male | 25,516 | 95.56 | 1185 | 4.44 |
| Aspirin | ||||
| No | 60,879 | 97.60 | 1498 | 2.40 |
| Yes | 5809 | 87.45 | 834 | 12.55 |
| Statins | ||||
| No | 48,955 | 98.58 | 707 | 1.42 |
| Yes | 17,733 | 91.61 | 1625 | 8.39 |
| BP treatment | ||||
| No | 30,290 | 99.26 | 225 | 0.74 |
| Yes | 36,398 | 94.53 | 2107 | 5.47 |
| Variable | Censored | T2DM | ||
|---|---|---|---|---|
| n | % | n | % | |
| Baseline BMI (kg/m2)a | 29.8 | 25 to 60 | 31 | 25 to 59.3 |
| Baseline age (years)b | 46.22 | 46.10 to 46.33 | 53.47 | 53.24 to 53.69 |
| Gender | ||||
| Female | 42,400 | 88.49 | 5513 | 11.51 |
| Male | 26,880 | 80.11 | 6673 | 19.89 |
| Aspirin | ||||
| No | 62,495 | 86.96 | 9371 | 13.04 |
| Yes | 6785 | 70.68 | 2815 | 29.32 |
| Statins | ||||
| No | 49,814 | 95.45 | 2372 | 4.55 |
| Yes | 19,466 | 66.48 | 9814 | 33.52 |
| BP treatment | ||||
| No | 30,545 | 94.47 | 1787 | 5.53 |
| Yes | 38,735 | 78.84 | 10,399 | 21.16 |
Time-to-event analysis
To obtain transition probabilities for the economic decision model developed in Chapter 5 a series of time-to-event analyses were conducted.
Methods
Weibull proportional hazards regression models were applied to each of the seven cohorts defined in Patients and data preparation, in order to obtain the estimated hazard of each event of interest. The hazard function of the Weibull model is given by:
where λ = exp (xTβ), γ = exp (zTα) and z is a subset of the covariate vector x. Each β is the effect on the scale parameter, λ, with each α the effect on the shape of the hazard function, γ. Covariates investigated are defined in Patients and data preparation.
The scale parameter of the hazard function, λ, was allowed to depend on all covariates listed above, irrespective of statistical significance. Higher-order polynomial terms (up to power 5) of BMI and age were also investigated, based on statistical significance at the 5% level. This defined the covariate set x. The shape parameter of the hazard function, γ, was then allowed to depend on z, a subset of x, based on statistical significance at the 5% level.
All analyses were conducted in Stata version 11.0.
Results
Tables 19–22 show the results from applying Weibull proportional hazard regression models to each event of interest: ACM, MI, stroke and T2DM respectively. Tables 19–21 contain results applied separately to both diabetic and non-diabetic cohorts, whereas Table 22 contains the results from applying a Weibull regression model to the non-diabetic cohort, with outcome T2DM. All regression coefficients and associated 95% CIs are on the log scale.
| Covariates | Diabetic cohort | Non-diabetic cohort | ||
|---|---|---|---|---|
| Coefficient | 95% CI | Coefficient | 95% CI | |
| ln(λ) | ||||
| BMI | 0.277 | 0.060 to 0.495 | 6.123 | 3.032 to 9.213 |
| BMI2 | –3.38E-03 | –6.62 × 10⁻³ to –1.54 × 10⁻³ | –0.214 | –0.336 to –0.092 |
| BMI3 | – | – | 3.43 × 10⁻³ | 1.30 × 10⁻³ to 5.56 × 10⁻³ |
| BMI4 | – | – | –2.100 × 10⁻⁵ | –3.490 × 10⁻⁵ to –7.080 × 10⁻⁶ |
| Age (years) | 0.090 | 0.081 to 0.100 | 0.079 | 0.055 to 0.103 |
| Age2 | – | – | 3.987 × 10⁻⁴ | 2.345 × 10⁻⁴ to 5.628 × 10⁻⁴ |
| Sex | 0.410 | 0.236 to 0.584 | 1.411 | 1.159 to 1.663 |
| Aspirin treatment | –0.026 | –0.202 to 0.150 | –0.620 | –0.966 to –0.273 |
| Insulin treatment | –0.103 | –0.289 to 0.082 | ||
| Statin treatment | –0.806 | –0.981 to –0.631 | –1.301 | –1.636 to –0.966 |
| BP drug treatment | –0.208 | –0.459 to 0.042 | –0.797 | –1.113 to –0.481 |
| Smoker type | ||||
| Ex-smoker | –0.130 | –0.314 to 0.054 | –1.196 | –1.501 to –0.891 |
| Smoker | 0.326 | 0.084 to 0.568 | 0.338 | 0.001 to 0.674 |
| Constant | –17.258 | –20.962 to –13.554 | –80.781 | –110.005 to –51.556 |
| ln(γ) | ||||
| BMI | – | – | –0.085 | –0.125 to –0.045 |
| BMI2 | – | – | 1.035 × 10⁻³ | 4.651 × 10⁻⁴ to 1.605 × 10⁻³ |
| Age | – | – | –0.002 | –0.004 to –0.001 |
| Sex | – | – | –0.108 | –0.143 to –0.074 |
| Aspirin treatment | – | – | 0.098 | 0.053 to 0.142 |
| Statin treatment | – | – | 0.095 | 0.051 to 0.139 |
| BP drug treatment | – | – | 0.114 | 0.064 to 0.164 |
| Smoker type | ||||
| Ex-smoker | – | – | 0.156 | 0.114 to 0.197 |
| Smoker | – | – | 0.041 | –0.009 to 0.091 |
| Constant | 0.785 | 0.727 to 0.844 | 2.600 | 1.917 to 3.284 |
| Covariates | Diabetic cohort | Non-diabetic cohort | ||
|---|---|---|---|---|
| Coefficient | 95% CI | Coefficient | 95% CI | |
| ln(λ) | ||||
| BMI | –0.003 | –0.035 to 0.029 | 0.026 | 0.014 to 0.037 |
| Age (years) | 0.044 | 0.029 to 0.058 | –1.141 | –2.585 to 0.303 |
| Age2 | – | – | 0.060 | 0.001 to 0.118 |
| Age3 | – | – | –1.36 × 10⁻³ | –2.50 × 10⁻³ to 0.–2.14 × 10⁻⁴ |
| Age4 | – | – | 1.41 × 10⁻⁵ | 3.27 × 10⁻⁶ to 2.5 × 10⁻⁵ |
| Age5 | – | – | –5.51 × 10⁻⁸ | –9.51 × 10⁻⁸ to –1.50 × 10⁻⁸ |
| Sex | 1.206 | 0.544 to 1.868 | 1.296 | 1.022 to 1.571 |
| Aspirin treatment | 0.638 | 0.374 to 0.902 | 1.150 | 0.893 to 1.406 |
| Insulin treatment | 0.609 | 0.337 to 0.881 | – | – |
| Statin treatment | 2.119 | 0.914 to 3.323 | 3.086 | 2.616 to 3.556 |
| BP drug treatment | 0.980 | 0.219 to 1.740 | 2.816 | 1.950 to 3.682 |
| Smoker type | ||||
| Ex-smoker | –0.478 | –0.787 to –0.169 | –0.820 | –1.131 to–0.508 |
| Smoker | 0.329 | –0.039 to 0.697 | 1.072 | 0.792 to 1.353 |
| Constant | –11.921 | –14.045 to –9.797 | –6.722 | –20.759 to 7.315 |
| ln(γ) | ||||
| Age | – | – | –0.010 | –0.031 to 0.011 |
| Age2 | – | – | 1.80 × 10⁻⁴ | 5.30 × 10⁻⁷ to 3.59 × 10⁻⁴ |
| Sex | –0.207 | –0.394 to –0.019 | –0.084 | –0.155 to –0.014 |
| Aspirin treatment | –0.139 | –0.211 to –0.067 | ||
| Statin treatment | –0.506 | –0.766 to –0.246 | –0.328 | –0.426 to –0.230 |
| BP drug treatment | –0.242 | –0.407 to –0.076 | ||
| Smoker type | ||||
| Ex-smoker | – | – | 0.082 | 0.003 to 0.160 |
| Smoker | – | – | –0.094 | –0.175 to –0.013 |
| Constant | 0.795 | 0.551 to 1.040 | 0.903 | 0.321 to 1.485 |
| Covariates | Diabetic cohort | Non-diabetic cohort | ||
|---|---|---|---|---|
| Coefficient | 95% CI | Coefficient | 95% CI | |
| ln(λ) | ||||
| BMI | 0.015 | –0.014 to 0.044 | 0.030 | 0.019 to 0.040 |
| Age (years) | 0.052 | 0.039 to 0.065 | 0.073 | 0.069 to 0.077 |
| Sex | 0.051 | –0.215 to 0.318 | 0.664 | 0.427 to 0.901 |
| Aspirin treatment | 1.144 | 0.539 to 1.749 | 1.176 | 0.927 to 1.426 |
| Insulin treatment | 0.146 | –0.119 to 0.411 | – | – |
| Statin treatment | –0.331 | –0.622 to –0.041 | 0.606 | 0.346 to 0.866 |
| BP drug treatment | 0.246 | –0.243 to 0.735 | 0.450 | 0.299 to 0.600 |
| Smoker type | ||||
| Ex-smoker | –0.400 | –0.690 to –0.111 | –1.627 | –1.939 to –1.316 |
| Smoker | 0.376 | 0.040 to 0.711 | 0.121 | –0.173 to 0.415 |
| Constant | –9.410 | –11.033 to –7.787 | –12.140 | –12.639 to –11.642 |
| ln(γ) | ||||
| Sex | –0.080 | –0.147 to –0.012 | ||
| Aspirin treatment | –0.211 | –0.415 to –0.007 | –0.186 | –0.260 to –0.111 |
| Statin treatment | – | – | 0.099 | 0.022 to 0.176 |
| Smoker type | ||||
| Ex-smoker | – | – | 0.255 | 0.172 to 0.338 |
| Smoker | – | – | 0.100 | 0.012 to 0.189 |
| Constant | 0.325 | 0.200 to 0.449 | 0.220 | 0.150 to 0.291 |
| Covariates | Non-diabetic cohort | |
|---|---|---|
| Coefficient | 95% CI | |
| ln(λ) | ||
| BMI | 0.607 | 0.392 to 0.822 |
| BMI2 | –0.010 | –0.016 to –0.004 |
| BMI3 | 5.92E-05 | 8.14E-06 to 1.10E-04 |
| Age (years) | 0.357 | 0.225 to 0.488 |
| Age2 | –7.166E-03 | –1.119E-02 to –3.146E-03 |
| Age3 | 8.160E-05 | 2.900E-05 to 1.343E-04 |
| Age4 | –3.500E-07 | –6.000E-07 to –1.010E-07 |
| Sex | 0.796 | 0.705 to 0.886 |
| Aspirin treatment | –0.193 | –0.301 to –0.084 |
| Statin treatment | 1.111 | 0.996 to 1.226 |
| BP drug treatment | –0.382 | –0.510 to –0.253 |
| Smoker type | ||
| Ex-smoker | –0.637 | –0.738 to –0.536 |
| Smoker | 0.288 | 0.178 to 0.398 |
| Constant | –24.356 | –27.403 to –21.309 |
| ln(γ) | ||
| BMI | –0.011 | –0.014 to –0.009 |
| Age | –0.018 | –0.019 to –0.017 |
| Sex | –0.101 | –0.127 to –0.076 |
| Aspirin treatment | 0.066 | 0.036 to 0.096 |
| Statin treatment | 0.177 | 0.141 to 0.214 |
| BP drug treatment | 0.140 | 0.100 to 0.180 |
| Smoker type | ||
| Ex-smoker | 0.082 | 0.054 to 0.110 |
| Smoker | –0.039 | –0.071 to –0.007 |
| Constant | 1.320 | 1.219 to 1.421 |
To illustrate the findings of the time-to-event analyses, we present Table 23, which shows the probability of experiencing each event of interest, across diabetic/non-diabetic cohort, within 5, 10 and 15 years, for a selection of covariate combinations. From Table 23 we see that the probability of experiencing an event is higher across all covariate combinations if a patient is diabetic compared with non-diabetic.
| Outcome | BMI (kg/m2) | p (event in first 5 years) | p (event in first 10 years) | p (event in first 15 years) | |||
|---|---|---|---|---|---|---|---|
| D | ND | D | ND | D | ND | ||
| Women, aged 40 years, no treatments, non-smoker | |||||||
| ACM | 30 | 0.00779 | 0.00134 | 0.03514 | 0.00717 | 0.08337 | 0.01909 |
| 40 | 0.01163 | 0.00346 | 0.05209 | 0.01517 | 0.12206 | 0.03577 | |
| MI | 30 | 0.00122 | 0.00014 | 0.00564 | 0.00062 | 0.01379 | 0.00152 |
| 40 | 0.00118 | 0.00018 | 0.00545 | 0.00081 | 0.01334 | 0.00197 | |
| Stroke | 30 | 0.00936 | 0.00181 | 0.02422 | 0.00428 | 0.04206 | 0.00709 |
| 40 | 0.01084 | 0.00243 | 0.02803 | 0.00576 | 0.04859 | 0.00952 | |
| T2DM | 30 | – | 0.01273 | – | 0.03088 | – | 0.05158 |
| 40 | – | 0.03544 | – | 0.07727 | – | 0.12060 | |
| Women, aged 40 years, no treatments, smoker | |||||||
| ACM | 30 | 0.01078 | 0.00220 | 0.04836 | 0.01267 | 0.11364 | 0.03494 |
| 40 | 0.01608 | 0.00560 | 0.07145 | 0.02599 | 0.16506 | 0.06300 | |
| MI | 30 | 0.00169 | 0.00029 | 0.00783 | 0.00116 | 0.01911 | 0.00260 |
| 40 | 0.00164 | 0.00037 | 0.00757 | 0.00150 | 0.01849 | 0.00337 | |
| Stroke | 30 | 0.01359 | 0.00252 | 0.03507 | 0.00653 | 0.06065 | 0.01140 |
| 40 | 0.01574 | 0.00339 | 0.04054 | 0.00878 | 0.06996 | 0.01530 | |
| T2DM | 30 | – | 0.01566 | – | 0.03666 | – | 0.05994 |
| 40 | – | 0.04383 | – | 0.09234 | – | 0.14109 | |
| Women, aged 40 years, statin treatment, non-smoker | |||||||
| ACM | 30 | 0.00349 | 0.00054 | 0.01585 | 0.00342 | 0.03812 | 0.01006 |
| 40 | 0.00521 | 0.00133 | 0.02360 | 0.00678 | 0.05647 | 0.01752 | |
| MI | 30 | 0.00245 | 0.00110 | 0.00618 | 0.00330 | 0.01060 | 0.00627 |
| 40 | 0.00237 | 0.00143 | 0.00598 | 0.00427 | 0.01025 | 0.00811 | |
| Stroke | 30 | 0.00673 | 0.00408 | 0.01745 | 0.01055 | 0.03038 | 0.01836 |
| 40 | 0.00779 | 0.00548 | 0.02020 | 0.01417 | 0.03513 | 0.02462 | |
| T2DM | 30 | – | 0.05658 | – | 0.15598 | – | 0.27158 |
| 40 | – | 0.14547 | – | 0.33584 | – | 0.51140 | |
We further illustrate this in Figure 6, showing the predicted survival probability curve for a woman aged 40 years who is a non-smoker and on no treatments, comparing across diabetic status and whether the patient had a BMI of 30 kg/m2 or 40 kg/m2 at baseline.
FIGURE 6.
Survival probability for a women, aged 40 years, non-smoker and on no treatments.
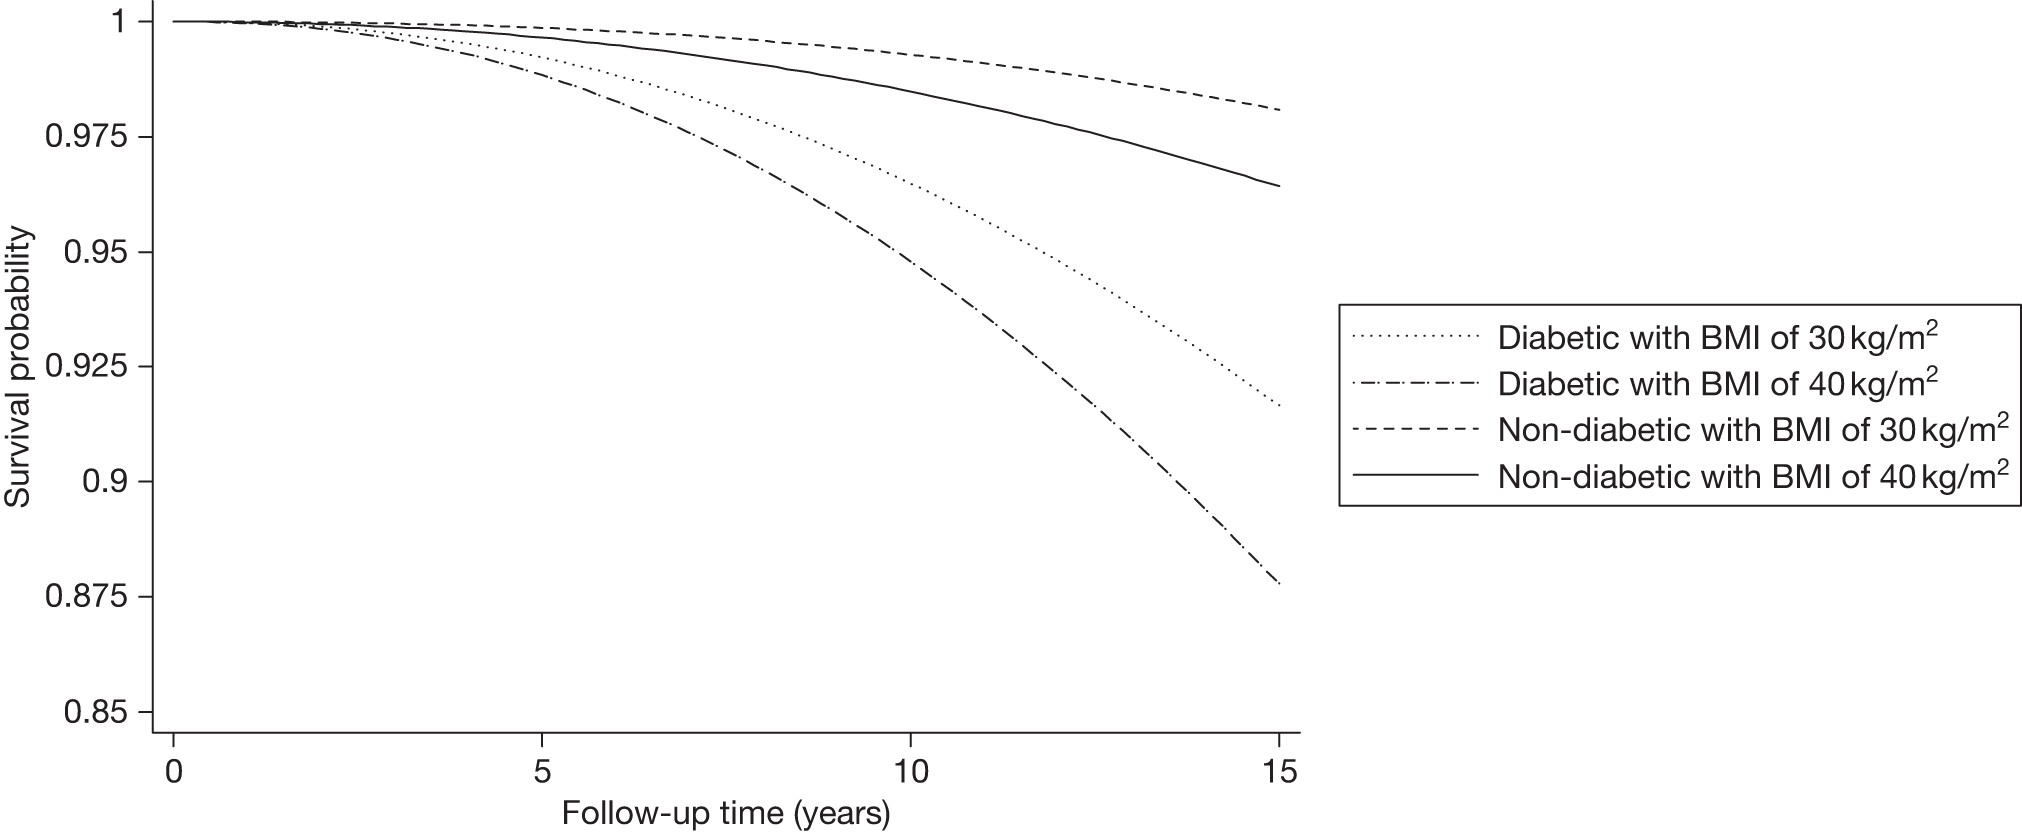
Sensitivity analyses
The models described and reported in the two previous sections make a number of assumptions, the most important of which are the assumption of a baseline Weibull hazard and the fact that covariates act linearly on a log-hazard scale.
The validity of both of these assumptions was assessed by using a flexible baseline hazard function155 and restricted cubic splines156 to model continuous terms.
For example, Figure 7 shows predicted versus observed time to death for the diabetic cohort. Figure 7a shows predictions using a Weibull survival model, whereas Figure 7b shows predictions using a flexible parametric model with three degrees of freedom to model the baseline hazard. We observed only a minor improvement in prediction when using a more flexible baseline model.
FIGURE 7.
(a) Predicted vs observed time of death for diabetic patients who died, using a Weibull model. (b) Predicted vs observed time of death for diabetic patients who died, using a flexible parametric model.
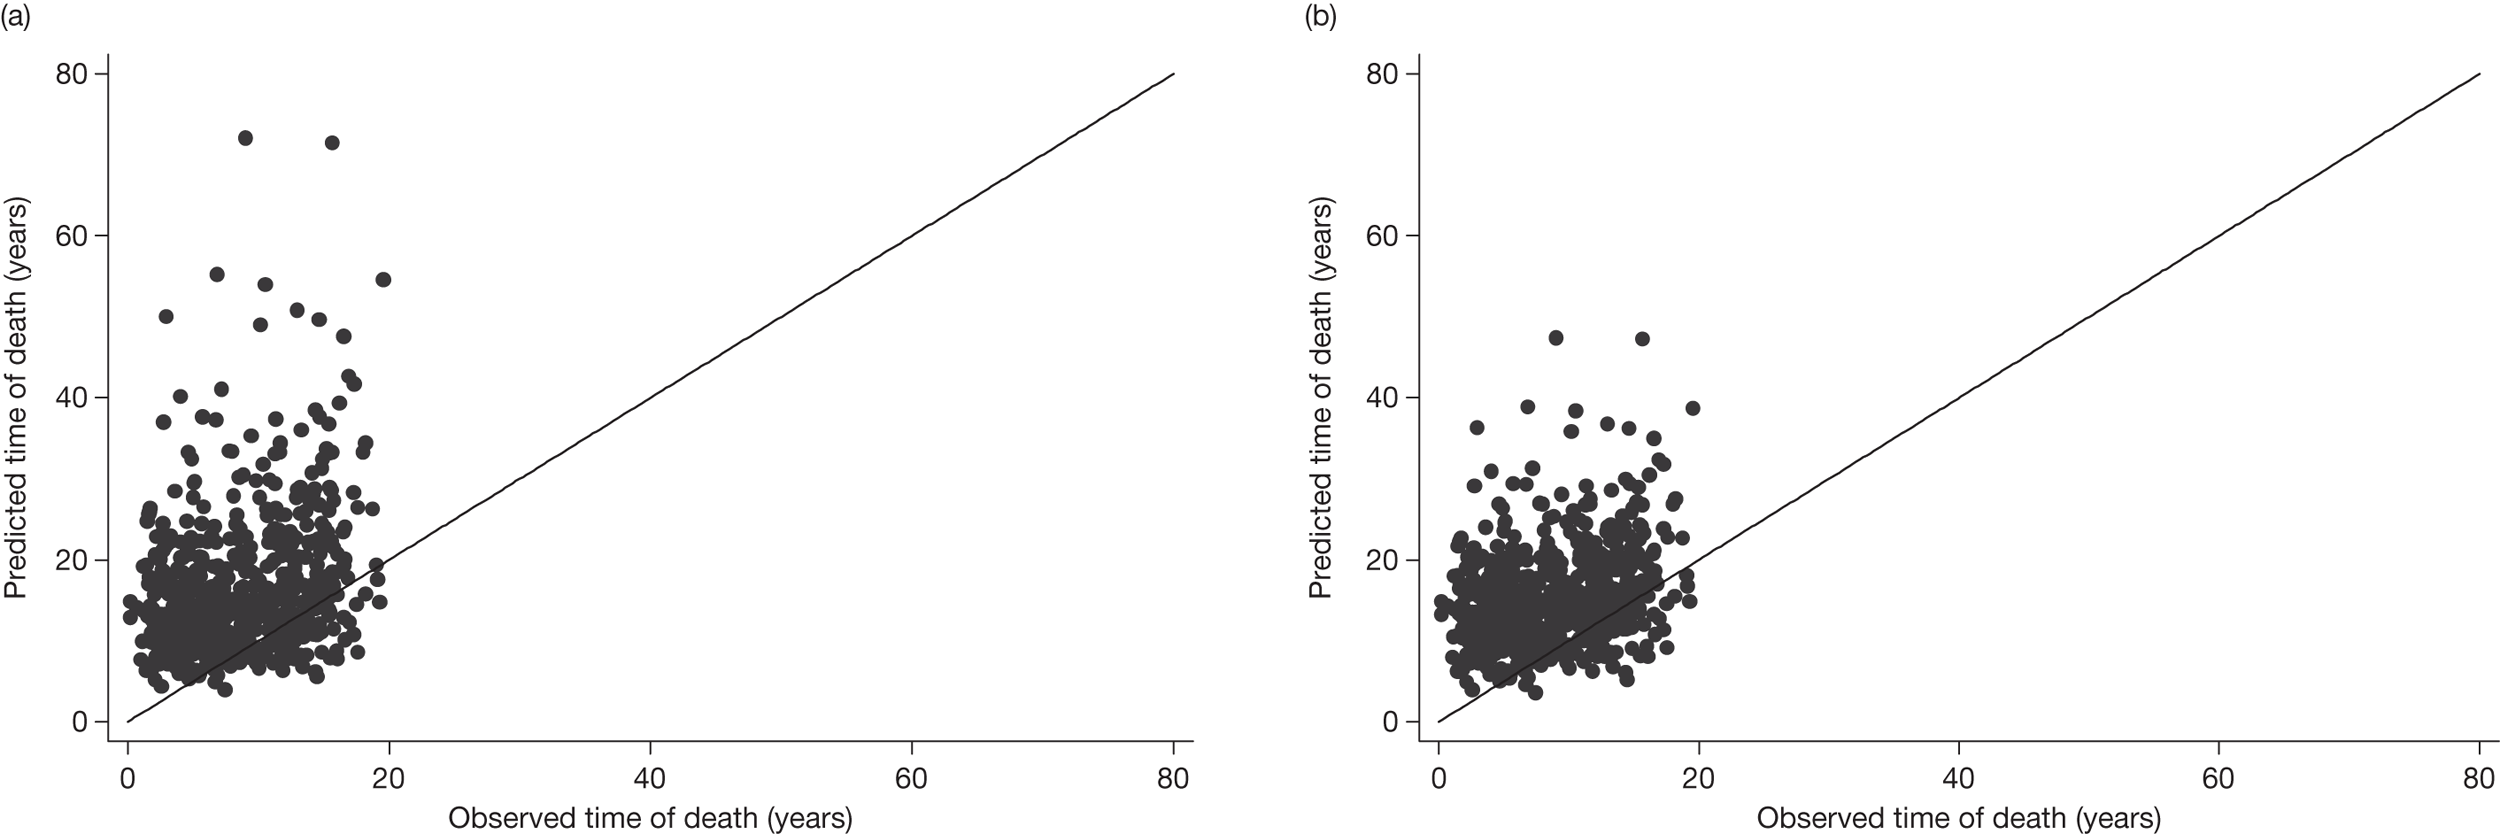
Furthermore, Figure 8 shows the hazard ratio for the age term, against age, comparing the use of splines to model age, as opposed to a log-linear term in age. Good agreement can be seen between the models, with some minor variation in the tails, indicating that linearity was satisfied.
FIGURE 8.
Comparing the use of restricted cubic splines and a linear term to model age. Both methods within a Weibull model.
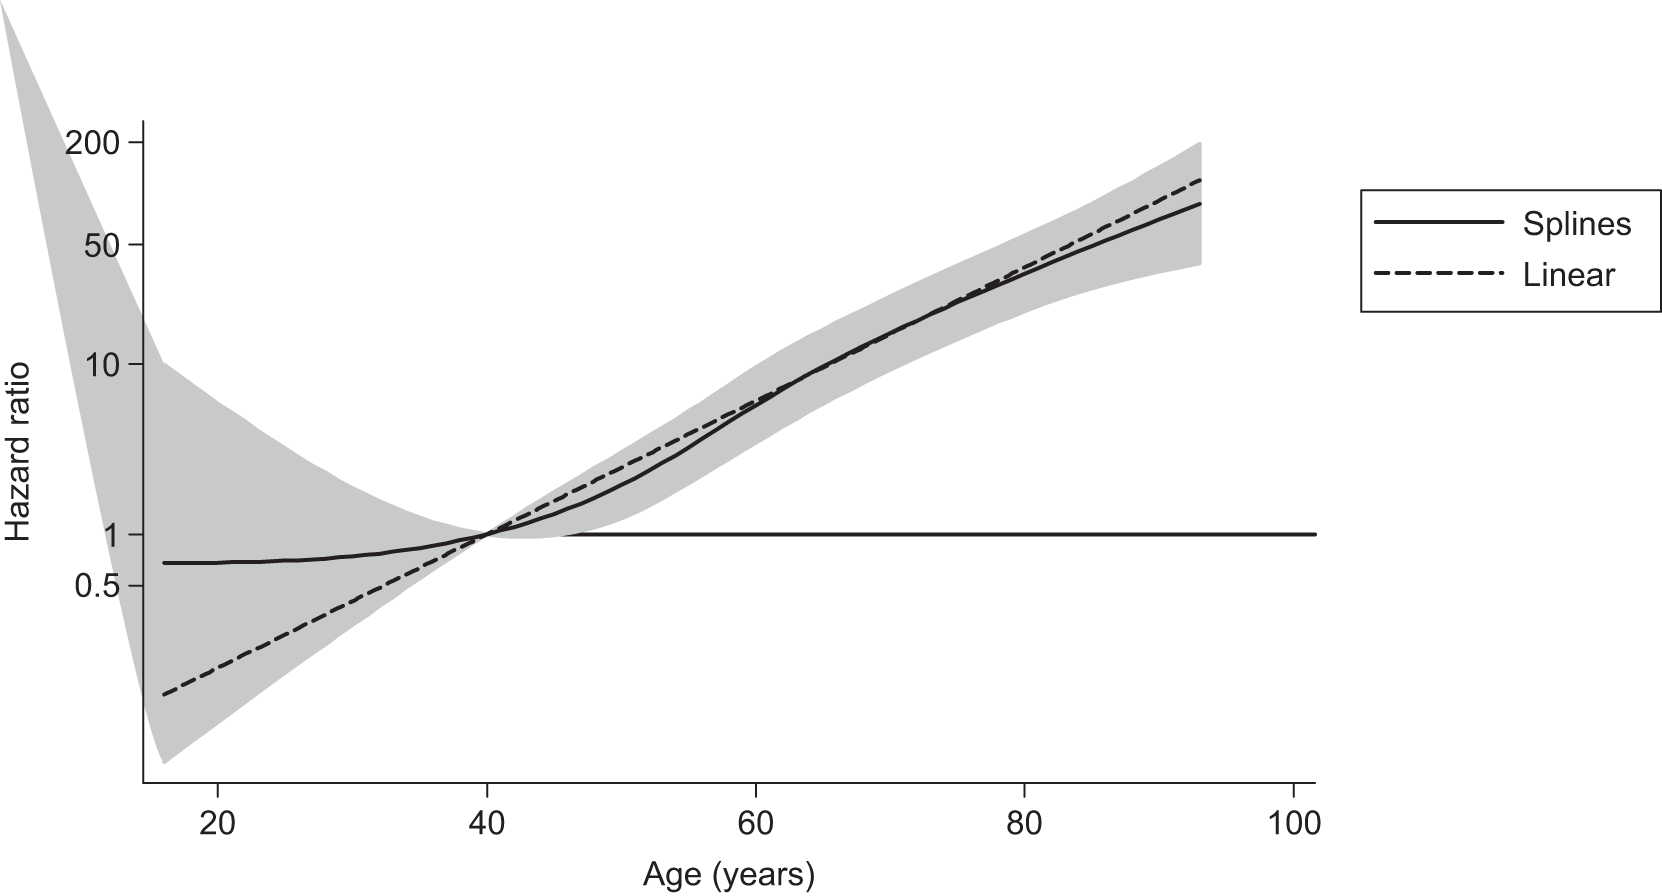
Body mass index trajectory analysis
To investigate how BMI changes with time, we conducted multilevel modelling of the repeated measures of BMI, with age as the timescale. Trajectories were needed for both a diabetic cohort and a non-diabetic cohort so that values of BMI can be sampled from an overweight and obese population for men and women at specific ages.
Methods
Analyses were conducted using the ACM cohorts, as sample size was greatest in these data sets. Diabetic and non-diabetic cohorts were prepared as in Patients and data preparation; however, the repeated measures were not reduced to the baseline measurement. We excluded all patients who had a BMI measurement < 25 kg/m2 or > 60 kg/m2 at any point in their trajectory history.
Age at each BMI recording was calculated using date of measurement and year of birth. Day and month of birth were unavailable so all patients were assumed to be born on 1 July for consistency.
Initially, exploratory trajectory plots were constructed of a random sample of patients for diabetic and non-diabetic cohorts. Multilevel models were then applied. The need for random intercepts and slopes, and the correlation between them, was investigated through likelihood ratio tests. The models were restricted to allow only a linear trajectory. Each model was adjusted for sex and the interaction between age and sex, based on statistical significance at the 5% level. Age was centred at 45 years.
The model investigated for each cohort can be written for the ith observation of the jth patient:
All analyses were conducted in Stata version 11.0.
Results
Example trajectory plots for women/men who are diabetic/non-diabetic can be seen in Figure 9, with the BMI trajectory for samples of 25 patients shown in each category. Figure 9 illustrates the heterogeneity in length of GPRD history for different patients, and the potentially high level of within-subject variability seen.
FIGURE 9.
Example trajectory plots for women/men who are diabetic/non-diabetic: (a) 25 diabetic women, (b) 25 diabetic men, (c) 25 non-diabetic women, (d) 25 non-diabetic men.
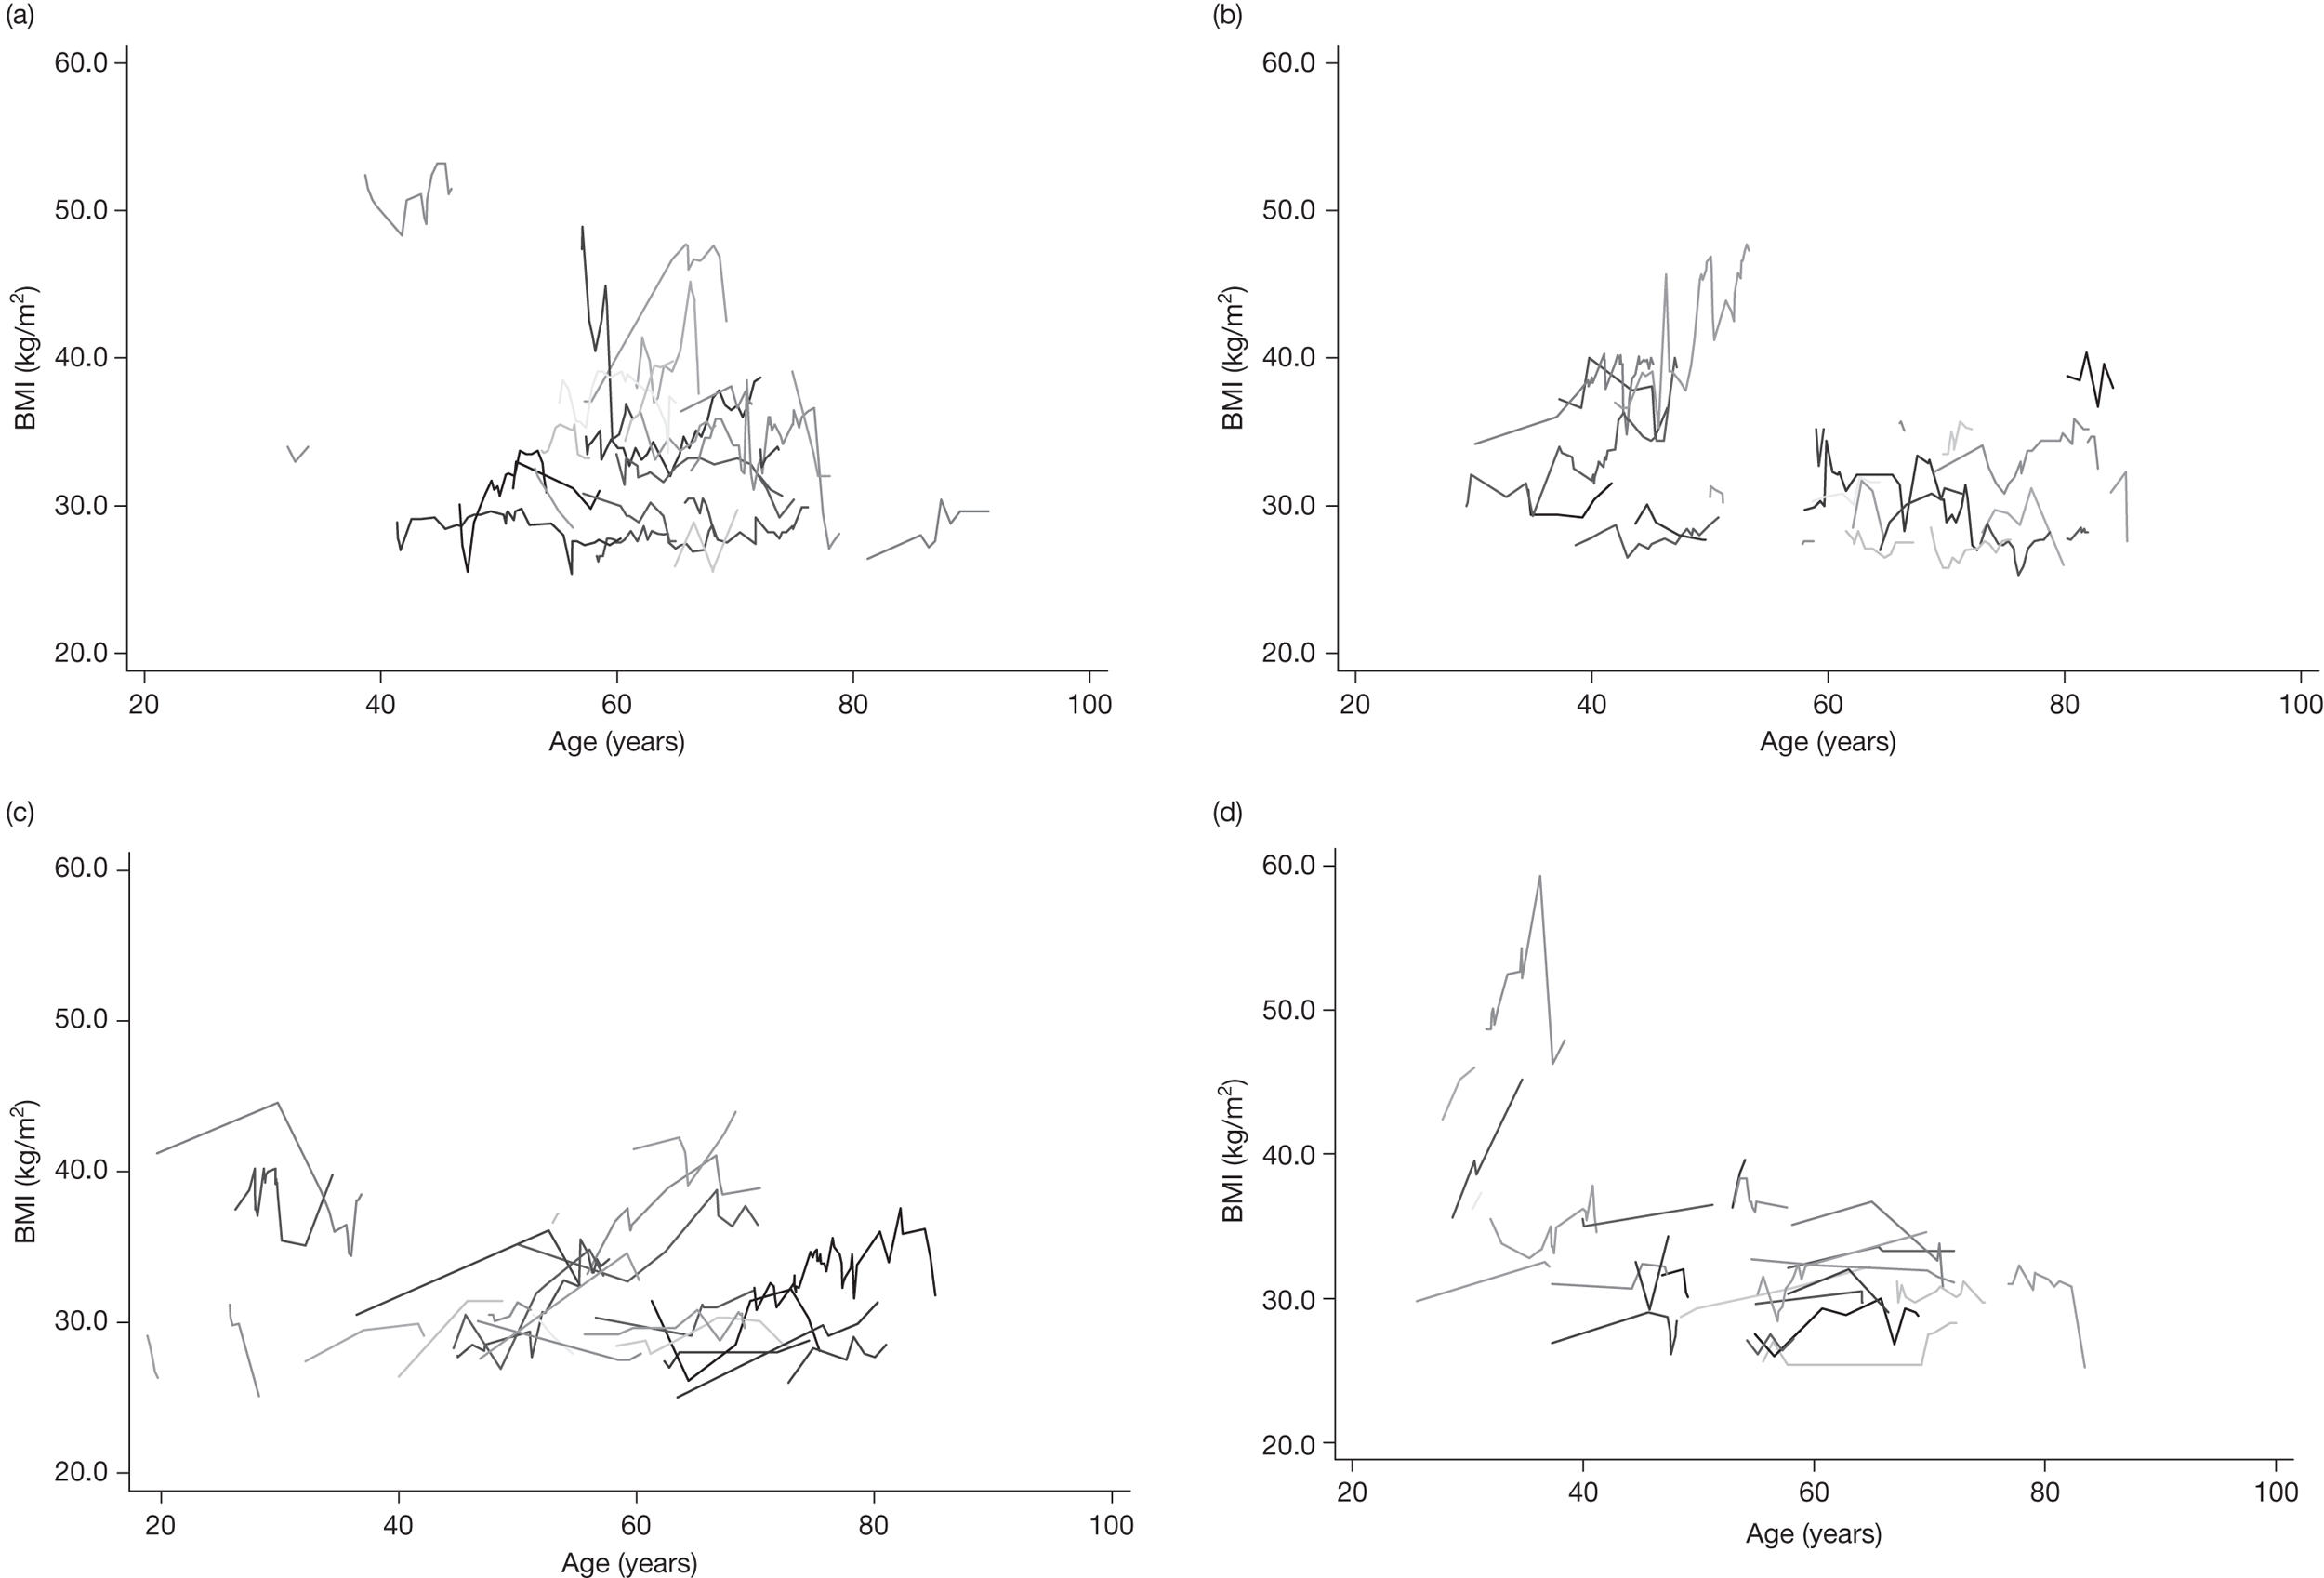
Results from applying a multilevel model to each cohort can be seen in Table 24. Interpreting the trajectory model for the diabetic cohort, we see on average an estimated BMI score of 33.176 kg/m2 (95% CI 32.843 kg/m2 to 33.509 kg/m2) for a woman aged 45 years. For a 1-year increase in age, we observe a 0.040 kg/m2 (95% CI 0.028 kg/m2 to 0.052 kg/m2) increase in BMI, with sex held constant. Men, on average, have a –2.061 kg/m2 (95% CI –2.400 kg/m2 to –1.721 kg/m2) lower BMI than women of the same age. The estimated correlation between slope and intercept is –0.728 (95% CI –0.746 to –0.709), indicating a decrease in slope as the intercept increases.
| Covariate | Diabetic cohort | Non-diabetic cohort | ||
|---|---|---|---|---|
| Coefficient | 95% CI | Coefficient | 95% CI | |
| Fixed effects | ||||
| Constant | 33.176 | 32.843 to 33.509 | 33.132 | 33.071 to 33.193 |
| Age (years) | 0.040 | 0.028 to 0.052 | 0.175 | 0.172 to 0.178 |
| Sex | –2.061 | –2.400 to –1.721 | –2.381 | –2.478 to –2.284 |
| Age*Sex | – | – | –0.030 | –0.035 to –0.025 |
| Random effects | ||||
| Level 2 | ||||
| SD(Age) | 0.337 | 0.327 to 0.348 | 0.241 | 0.239 to 0.243 |
| SD(Constant) | 7.562 | 7.337 to 7.793 | 5.590 | 5.552 to 5.628 |
| Corr(Age, Constant) | –0.728 | –0.746 to –0.709 | 0.204 | 0.193 to 0.215 |
| Level 1 | ||||
| SD(Residual) | 1.466 | 1.456 to 1.476 | 1.692 | 1.688 to 1.696 |
Summary
Results from the seven BMI risk models showed consistent increases in risk due to an increasing BMI. This pattern was evident across all models except for the diabetic cohort with outcome MI, for which a non-statistically significant (p = 0.838) reduction in risk for outcome MI was observed. Adjustments for key confounders such as age, sex and smoking status were found to be statistically significant at the 5% level in all seven risk models. More flexible survival models were investigated; however, the added complexity was deemed unnecessary.
Large variation in BMI trajectories was observed. Applying linear trajectory models showed an increase in BMI, on average, of 0.040 kg/m2 per year for the diabetic cohort for both men and women. The equivalent non-diabetic cohort model showed an increase in BMI of 0.175 kg/m2 per year for women; however, a statistically significant (at the 5% level) interaction between age and sex was observed, resulting in a slightly reduced increase in BMI of 0.145 kg/m2 per year for men. Baseline estimates (age 45 years) of BMI were similar across cohorts.
Chapter 5 Assessment of cost-effectiveness
Systematic review of existing cost-effectiveness evidence
Summary of studies included in this review
A systematic review of published literature describing the cost-effectiveness of pharmaceutical interventions for obesity was conducted. Searches were conducted on the following databases: MEDLINE and MEDLINE In-Process & Other Non-Indexed Citations, EMBASE, CINAHL, NHS EED, Health Technology Assessment (HTA) and Science Citation Index. Where necessary methodological search filters were used to identify literature relating to economics and cost. Examples of search strategies used can be seen in Appendix 1.
From a total of 676 possible studies, 16 satisfied our inclusion criteria (see Appendix 5). The 16 studies (see Appendix 4) consisted of 14 published articles describing the results of individual cost-effectiveness evaluations, plus two reviews that included unpublished evaluations. Of these two, one was an industry submission in a single technology appraisal process and the other was a model constructed to inform a NICE obesity guideline. The studies were predominantly conducted in European settings26,41,157–167 with two168,169 set in the USA and one170 in Canada. Of those studies using European settings, seven26,41,157,159,160,163,167 were based in the UK. Discount rates for costs and benefits varied according to setting (see Appendix 4, Table 28) and one study169 included indirect costs. Two studies164,170 presented results in terms of cost per life-year gained, while the others presented the cost per QALY.
Ten of the studies26,160–166,169,170 examined the costs and benefits associated with orlistat, three41,159,168 examined rimonabant and three157,158,167 examined sibutramine. Only one study41 included more than one pharmacological intervention. All individuals received some form of diet and exercise or lifestyle intervention in addition to the active treatment, and two studies166,168 also compared the pharmacological treatment with no treatment. The duration of treatment modelled was generally 1 year, although one study41 used a lifetime of treatment, and one169 used 6 months of orlistat weight loss followed by a 6-month maintenance period.
Ten studies26,157,158,160–163,167–169 used obese cohorts with no comorbidities at baseline. Three studies164,165,170 presented results for overweight cohorts with T2DM at baseline. Two studies41,159 presented results for both of these, and one study166 presented results for obese individuals aged between 20 and 70 years not previously treated for obesity.
Two of the studies161,168 used a decision tree to extrapolate beyond the duration of the clinical data, three157,158,167 used a life-table approach, six41,159,162,164,165,170 used a Markov model and one model166 was described as a dynamic population model. Only one evaluation160 did not extrapolate effectiveness beyond the clinical data, and the time horizons used in the other studies ranged from 5 years168 to a lifetime. 26,41,157–159,161,166,167,170
Clinical pathway
Weight loss and responders to treatments
There was a wide range in the data used to represent the effectiveness of the treatments in the models. Mean weight losses for lifestyle, or diet and exercise, ranged from 1.4 kg165 to 17.3 kg. 160 Mean weight losses for pharmacological interventions ranged from 2.89 kg for a cohort receiving orlistat166 to 18.91 kg for responders to orlistat. 160 Mean reductions in BMI, for lifestyle, or diet and exercise, ranged from 0.5 kg/m2 to 2.55 kg/m2. 159,169 Mean reductions in BMI following pharmacological interventions ranged from 1.9 kg/m2 for a cohort with T2DM receiving rimonabant159 to 8.49 kg/m2 for a cohort also receiving rimonabant. 168
Natural changes in weight over time
The majority of studies assumed that the natural trajectory of weight for obese individuals not receiving a weight-loss intervention remained constant over time. The exceptions included Roux,168 who modelled an age-related increase in BMI of 0.26 units per annum based on Canadian health insurance registration data (n = 29,855),171 and the three sibutramine models,157,158,167 in which a natural increase of 1 kg per annum was assumed based on a 5-year study of 660 obese subjects. 172
Weight maintenance and regain following cessation of treatment
As all studies correlated weight losses with health-related quality of life (HRQoL), morbidity and/or mortality, the length of weight maintenance and the rate of weight regain are influential variables in the models. The three sibutramine studies157,158,167,173 modelled a monthly weight regain after cessation of treatment of 0.370 kg for the lifestyle cohort and 0.385 kg for initial responders to treatment. It was assumed that non-responders returned to the trajectory of natural history immediately after cessation of treatment. One study158 performed a sensitivity analysis whereby weight losses for responders to treatment were maintained for 6 months after cessation of treatment, based on an open-label extension study (n = 374). 174 Two studies166,169 assumed that approximately 20% of the 12-month weight loss would be maintained in the long term, while one41 assumed that the full 12-month weight loss would be maintained over the full horizon, with a 12-month linear reduction for those who discontinued treatment. Two studies159,168 assumed a linear rate of regain over a 1-year period, based on data from RIO trials that showed a 1-year period to reach baseline weight after re-randomisation to placebo following rimonabant. 115 Four studies161,163,165,170 modelled a linear regain over a 3-year period, based on a NICE recommendation,38 whereas one164 assumed a 5-year period for regain. 175
Comorbidities modelled
With the exception of Foxcroft,160 who used a 1-year horizon, all models included at least one obesity-related comorbidity such as CHD/CVD or onset of T2DM (see Appendix 4, Table 30). Two161,163 included only T2DM, whereas one166 included additional comorbidities such as osteoarthritis, low back pain and some cancers.
Quality of life
Detail on the quality-of-life (QoL) instruments, the design of the QoL studies, the baseline utility for obese patients and the technique used to combine the QoL data in the models was limited, or not reported, in many of the studies (see Appendix 4, Table 31). Three studies157,158,167 used a relationship between change in weight and change in QoL, whereas the rest used relationships between BMI and QoL. The latter ranged from a gain of 0.014 per unit BMI, obtained from European Quality of Life-5 Dimensions (EQ-5D) data,159 to 0.0264 per unit BMI, obtained from a visual analogue scale (VAS). 161
Results from published cost-effectiveness evaluations
There was a large variation in the results reported, and mean incremental cost-effectiveness ratios (ICERs) ranged from £970 to £59,174 per QALY (Figure 10). Compared with lifestyle advice, the mean ICERs for orlistat (sibutramine, rimonabant) ranged between £970 (£6941, £9303) and £59,174 (£10,042, £35,876). The variable reported to have the largest effect on the results in the majority of the models was the period of weight regain modelled. 157,159,161,163,165,166,168–170 Many of the models were also sensitive to changes in the values used to estimate the QoL benefits attributed to weight changes41,157,168,169 and the discount rates used. 41,157,159,170 Only one study41 reported results comparing the pharmacological interventions. In this study, rimonabant was cost-effective when compared with either orlistat or sibutramine.
FIGURE 10.
Mean ICERs in published studies. The ICERs were converted to UK£ and inflated to 2008 for comparison. R vs L, rimonabant vs lifestyle; R vs O, rimonabant vs orlistat; R vs S, rimonabant vs sibutramine.
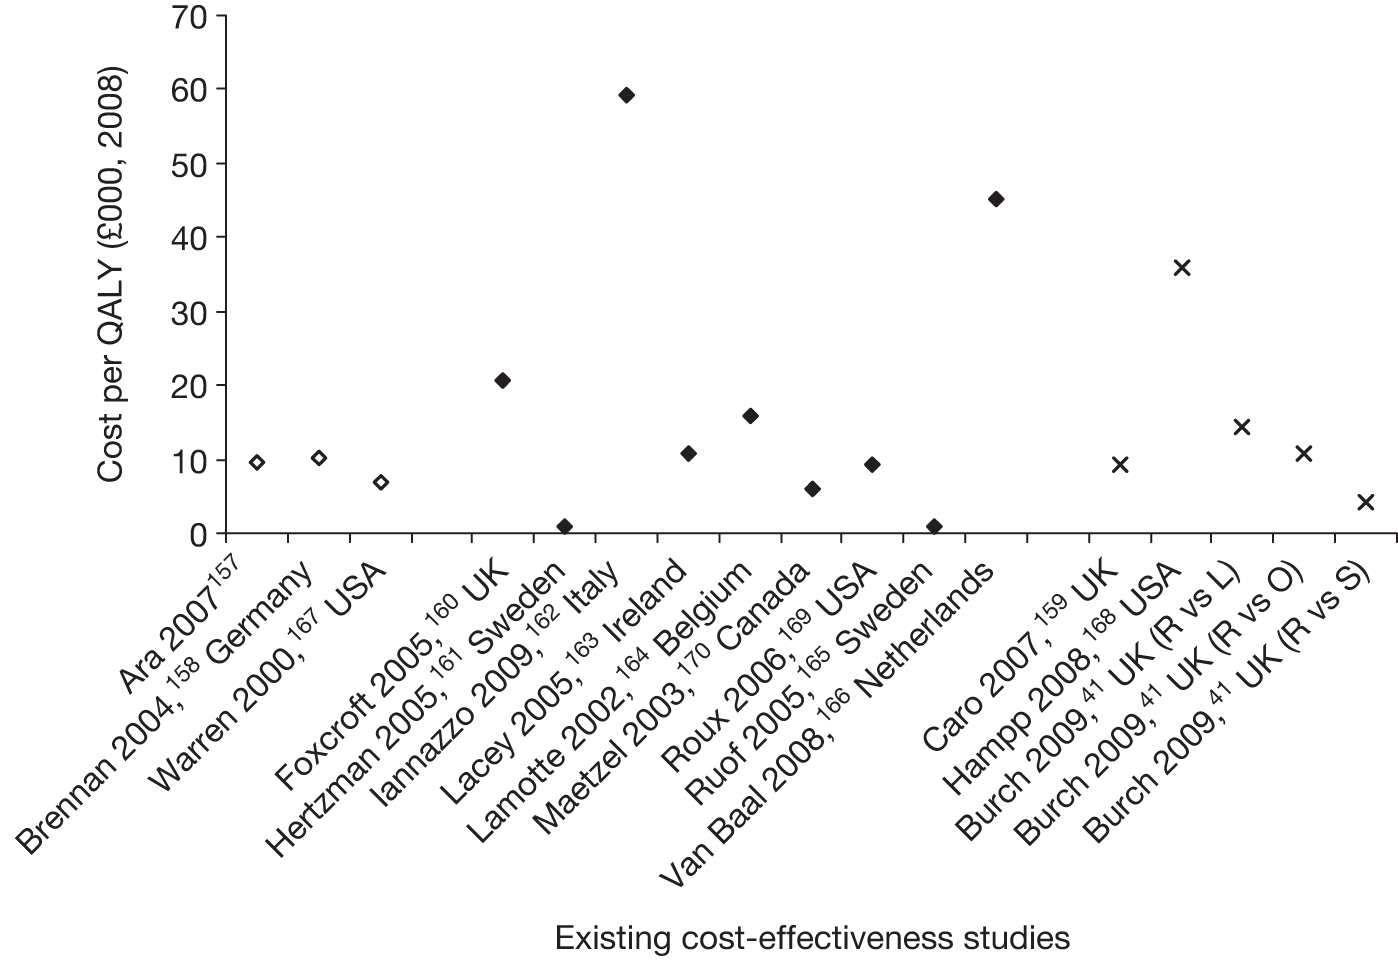
Independent economic evaluation
Methods
Model structure
A cohort simulation model (Figure 11) was developed in Simul8 version 17.0 build 2277 (Simul8 Corporation, Boston, MA, USA) to explore the potential benefits of pharmaceutical treatments for obesity. The pharmacological interventions (plus diet and exercise advice) were compared with standard care (plus diet and exercise advice). The time to death (ACM), primary MI, primary stroke and onset of T2DM were estimated using the results of the GPRD analyses (see Chapter 4). Taking into account current health status, age and time since previous event, annual Markov transitions to subsequent fatal and non-fatal MIs and strokes were estimated using data from the Nottingham Heart Attack Register and South London Stroke Register respectively (see Appendix 5). 176 Postevent health states were used to incorporate changes in HRQoL and costs associated with event-free years after the initial event.
FIGURE 11.
Simulation model. All are at risk of a fatal CVD death or death from other causes. DM, diabetes mellitus.
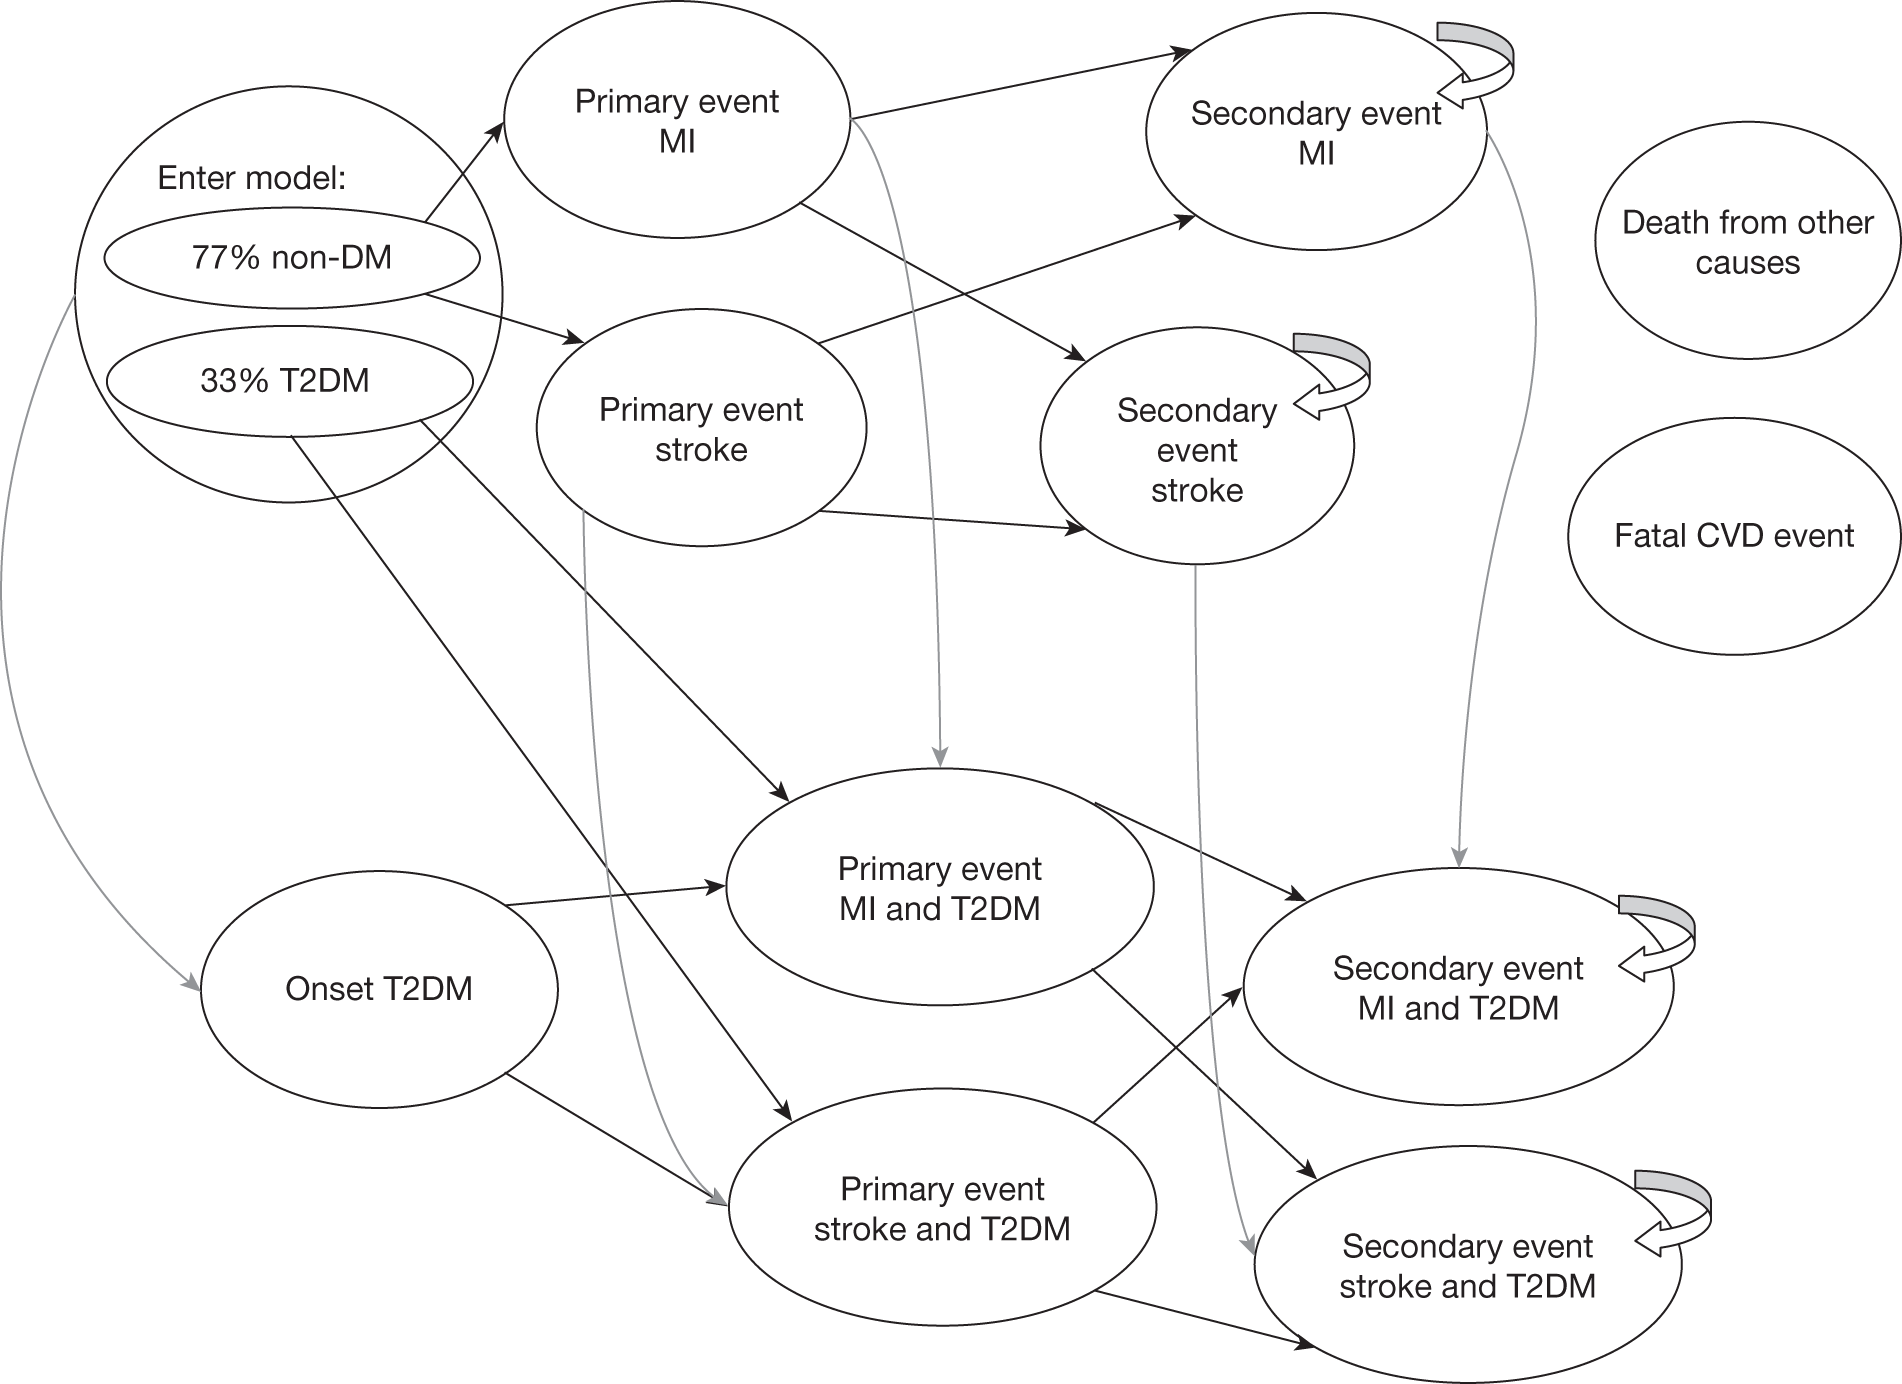
Horizon
A lifetime horizon was used to accrue the costs and benefits associated with the alternative interventions. 177
Discount rate
Both costs and benefits were discounted at 3.5%. 177 A NHS and Personal Social Services perspective was taken; hence, only direct health-care costs were used. 177
Cohort characteristics
Patients entered the model with the demographic characteristics observed in the patients recruited to the clinical studies used in the MTC (see Chapter 3). Hence, they had an average age of 45.5 years and a mean BMI of 34.92 kg/m2 and 33.2% were diabetic.
Treatment alternatives
The treatments modelled were diet and exercise advice plus one of the following: no active treatment (assumed equivalent to placebo), orlistat 120 mg three times a day, sibutramine 10 mg once a day, sibutramine 15 mg once a day, rimonabant 20 mg once a day. The correlated changes in BMI at months 3, 6 and 12 from the MTC (see Chapter 3) informed the effectiveness of the interventions. As the full data were not available for rimonabant, the change at 12 months (–2.98 kg/m2) was derived from the literature and the value at 6 months was interpolated. 168
Body mass index changes
At the end of the active treatment period (i.e. at 1 year) it was assumed that any benefit of treatment was lost in a linear fashion and that BMI returned to the baseline value at 3 years after treatment cessation. 38 Sensitivity analyses were used to explore the effect on the model of using a faster rate of regain, and of assuming that BMI returned to the trajectory of natural history at 3 years after cessation of treatment.
Long-term natural changes in body mass index
After the initial 12-month period, and for anyone not receiving an active treatment, excluding the period of weight regain after stopping active treatment, BMI increased naturally over time as observed in the GPRD analyses (see Chapter 4).
Health measurement estimation
Life-years were weighted using the EQ-5D preference-based measure. 178 Utility measures were derived using EQ-5D data collected during the HSE. 179 Almost 60% of respondents indicated that they had no reduction in HRQoL on the EQ-5D index. An adjusted censored mixture model (ACMM), which is particularly suited for censored and non-normally distributed data,180 was used to explore the relationship between EQ-5D scores and BMI (see Appendix 5).
After controlling for age, gender and health status (history and time since heart attack, stroke, angina, diabetes), the results of the regression showed an independent relationship between BMI and EQ-5D score (see Appendix 5). Using the individual patient-level data (see Appendix 5, Table 34), the mean error [mean absolute error (MAE), root mean squared error (RMSE)] in the full set of predicted scores was 0.0008 (0.1204, 0.1806). Subgrouping by health status, the MAEs ranged from 0.0752 (no history of any health condition) to 0.3224 (T2DM and stroke within the previous 12 months).
Health state and monitoring costs
Monitoring costs during active treatment include a surgery visit every month. Visits at baseline, 3, 6 and 12 months were with the GP, while the intervening months were with the practice nurse. Blood samples were costed for baseline and 3 months. Because of the higher risk of vascular events for sibutramine recipients, an additional extra visit for each of the first 3 months was included for BP monitoring with the practice nurse. 181 Costs were inflated to 2009 where required. 88 For the comparator cohort we assumed a meeting with the nurse at baseline.
Stroke
The costs associated with a fatal or non-fatal stroke were taken from a UK study. 182 The data were derived from a large randomised prospective trial of stroke care in the UK and resource use included hospital, primary care, health-care contacts and social services. The cost of a non-fatal stroke is dependent on the severity of the event, and so a weighted average cost was derived based on the distribution of mild, moderate and severe strokes. The cost of continuing care in the years subsequent to a stroke is based on the costs associated with discharge location (home or institution). Again, a weighted average cost was derived based on the severity of the stroke and location. 176
Myocardial infarction
When a person experiences a heart attack, the bulk of the associated costs are incurred by their treatment in hospital. These hospital costs depend largely on whether or not a patient undergoes a surgical procedure, and on the nature of that procedure. An average cost was calculated based on the distribution of treatments received and their associated costs from the NHS reference costs. 181 It was assumed that half of patients do not undergo surgery and incur the average cost of an admission for actual or suspected MI. 183 For the remainder, it was assumed that two-thirds had coronary artery bypass surgery, and one-third a percutaneous coronary intervention. Following hospital treatment, further costs are incurred in monitoring a patient’s condition and administering drug treatments. It was assumed that each patient would have outpatient visits consisting of two (three) consultations with a GP (practice nurse), and that the total annual cost for prescribed drugs would be £396.60. 176 In the years subsequent to experiencing a MI, monitoring costs were estimated to be an average of £315.11 per year, which included two GP appointments, three nurse consultations and continuing drug treatment (£131.24). 183
Diabetes
The costs of CVD events in individuals with a history of T2DM are based on resource use in diabetic patients. 184 The annual cost of individuals with T2DM and no history of CVD includes the cost of clinical appointments, glucose tests, proteinuria and eye screening, and drug treatments. 185
Analyses
The base case examines the costs and benefits of each intervention for a cohort of obese patients. Incremental analyses were used to identify any interventions that were dominated. An intervention is dominated if it is less effective and more expensive than its comparator and extendedly dominated when the ICER for a treatment is higher than that of the next most effective comparator. A sample size of 1,000,000 is used for the deterministic analyses (see Appendix 5). Because of computational limitations, 200 simulations and a sample size of 400,000 are used in the stochastic analyses. A list of assumptions used in the model is provided in Appendix 5. The assumptions relating to monitoring, weight regain and duration of active treatment were informed by discussions during our Advisory Group meeting, which involved potential recipients of obesity pharmacological treatments and practising clinicians.
There are insufficient data in the literature to accurately model the potential number of fatal events induced by the active treatment for either sibutramine or orlistat. Consequently, we use the estimated average costs and QALYs to determine the proportion of patients who would need to die to obtain a cost per QALY over a threshold of £20,000 per QALY.
Net benefit
Results are also presented in terms of the net benefit of the treatments. Because of potential difficulties in interpreting cost per QALY values when more than two treatments are being compared, the use of ‘net benefit’ is becoming more widespread. Although these results are analogous to those presented in the more traditional cost per QALY format, there is less scope for mistakes when interpreting the data as net benefit values can be directly compared across interventions. Net benefit is calculated using the formula NB = λ × QALY – cost, where λ denotes the maximum cost that society is prepared to pay. When net benefit is positive, the treatment is cost-effective; when net benefit is negative the treatment is not cost-effective; and when net benefit is zero the cost per QALY is equal to the maximum cost per QALY that society is prepared to pay. The intervention with the highest net benefit is the most cost-effective at a given threshold.
Probabilistic sensitivity analysis
Probabilistic sensitivity analyses are applied to the following input parameters (Table 25) to represent the uncertainty around the model inputs when parameter values are varied simultaneously:
-
change in BMI at 3, 6 and 12 months
-
Weibull survival curves
-
transitions to subsequent vascular events
-
health-state costs
-
health-state utility values
-
ratio of MI to stroke deaths.
| Parameters | Mean | Distribution (parameters) | Source |
|---|---|---|---|
| Baseline | |||
| Age (years) | 45.5 | Normal (SD 6.97 years) | Clinical review (see Chapter 3) |
| BMI (kg/m2) | 34.92 | Normal (SD 2.58 kg/m2) | |
| T2DM | 33.2% | Beta | |
| Male | 25.7% | Beta | |
| Discount rate (costs and utilities) | 3.5% | Fixed | Earnshaw 2008177 |
| Change in BMI (orlistat) | |||
| Change in BMI (week 13) | The joint posterior distribution from the random-effects network meta-analysis analysed in WinBUGS | ||
| Change in BMI (week 26) | |||
| Change in BMI (week 52) | |||
| Non-diabetic survival curves | |||
| ACM | See Table 19 | Variance–covariance matrices | GPRD (see Chapter 4) |
| Primary MI | See Table 20 | ||
| Primary stroke | See Table 21 | ||
| T2DM onset | See Table 22 | ||
| T2DM survival curves | |||
| ACM | See Table 19 | Variance–covariance matrices | GPRD (see Chapter 4) |
| Primary MI | See Table 20 | ||
| Primary stroke | See Table 21 | ||
| Transitions to subsequent cardiovascular events | |||
| Events following primary MI | Multiple (see Appendix 5) | multinorminv | Ara 2009183 |
| Events following primary stroke | multinorminv | Ara 2009183 | |
| Natural history of BMI annual progression | |||
| Men | 0.1447 | GPRD (see Chapter 4) | |
| Women | 0.1747 | ||
| Men T2DM | 0.0398 | ||
| Women T2DM | 0.0398 | ||
| HRQoL | |||
| EQ-5D scores adjusted for age, health status, BMI and sex | Multiple (see Appendix 5) | multinorminv | HSE179 (see Chapter 5) |
| Drug costs (per unit) | |||
| Orlistat 120 mg | £0.38 | Fixed | BNF 200945 |
| Sibutramine 10 mg | £0.89 | Fixed | |
| Sibutramine 15 mg | £0.89 | Fixed | |
| Rimonabant 20 mg | £1.57 | Fixed | Burch 200941 |
| Monitoring costs (per annum) | |||
| Orlistat and rimonabant | £205.00 | Fixed | Curtis 2007181 |
| Sibutramine | £220.00 | Fixed | |
| No active treatment | £7.50 | Fixed | |
| Health-state costs | |||
| MI (year 1) | £3835.79 | Gamma | Ara 2009183 |
| MI (year 1+) | £315.11 | Gamma | |
| Stroke (year 1) | £8638.36 | Gamma | |
| Stroke (year 1+) | £2426.92 | Gamma | |
| T2DM (year 1) | £171.35 | Gamma | Gillett 2009185 |
| MI plus T2DM (year 1) | £4783.96 | Gamma | Clarke 2002184 |
| MI plus T2DM (year 1+) | £545.40 | Gamma | |
| Stroke plus T2DM (year 1) | £2782.22 | Gamma | |
| Stroke plus T2DM (year 1+) | £4298.51 | Gamma | |
| Fatal stroke | £7899.72 | Gamma | Ara 2009183 |
| Fatal MI | £1266.95 | Gamma | |
| Ratio of fatal CHD to stroke | |||
| Appendix 5 | Multiple (see Appendix 5, Table 36) | Beta | Scarborough 2010186 |
A cost-effectiveness acceptability curve (CEAC) and a cost-effectiveness plane are included to give a measure of the uncertainly reflected by the model. Table 25 provides the input parameters and their base-case mean values and distributions used in the model.
Univariate sensitivity analysis
The following univariate sensitivity analyses are performed to explore the sensitivity of the model results to changes in key parameters and assumptions:
SA1: Weight regain rate
For the base case we assume that at the end of the active treatment period all patients revert to their baseline BMI value in a linear fashion over a 3-year period. 38 After this they follow the trajectory of natural history. It is possible that the rate of regain would be much faster than this and we conduct a sensitivity analysis to look at the effect on the results if all patients revert to their baseline BMI by 12 months, again using a linear weight regain.
SA2: Weight regain to trajectory of natural history
The base case assumes that at the end of the active treatment period all patients revert to their baseline BMI value in a linear fashion over a 3-year period, after which they follow the trajectory of natural history. 38 It is possible that the regain would be larger than the absolute reduction achieved by the intervention, and that individuals would regain more weight than they lost. We conduct a sensitivity analysis to look at the effect on the model results if all patients revert to the trajectory of natural history over a 3-year period, again using a linear weight regain.
SA3: Longer time horizon for treatment
In the base case we assume that all patients are withdrawn from active treatment at 12 months as this is the end point for our evidence. It is possible that some individuals might continue to receive treatment beyond this period. We assume that patients continue to receive treatment for an additional 12-month period and that their BMI is maintained at the value achieved at 12 months. At month 24 they are removed from treatment and their weight reverts back to the baseline value in a linear fashion over a 3-year period.
SA4: Alternative starting age
In the base case the cohort enter the model with a starting age of 45.5 years. We perform sensitivity analyses to examine the effect on the results if the cohort enter the model at the age of 20 (60) years.
SA5: Gender
The base case uses a distribution of 74.3% women and 25.7% men as observed in the clinical data used in the MTC. We conduct sensitivity analyses using a cohort of all women (men), maintaining all other characteristics used in the base case.
SA6: Starting body mass index
In the base case, patients enter the model with a BMI of 34.92 kg/m2 as observed in the clinical data used in the MTC. We conduct a sensitivity analysis to explore the effect on the results when patients enter the model with a lower (30 kg/m2) or higher (40 kg/m2) baseline BMI, maintaining all other characteristics used in the base case.
Results
Deterministic results
With an average cost per QALY of £557 compared with placebo, the results of the deterministic analyses suggest that sibutramine 15 mg dominates (average costs are lower and average QALYs are higher) the other three active interventions (Table 26).
| Intervention | Life-years | Cost (£) | QALYs | Cost per QALY (vs placebo) (£) | ||
|---|---|---|---|---|---|---|
| Undiscounted | Discounted | Undiscounted | Discounted | |||
| Placebo | 75.495 | 5286 | 2806 | 25.123 | 15.128 | |
| Orlistat | 75.758 | 5547 | 3097 | 25.468 | 15.303 | 1665a |
| Rimonabant | 75.783 | 5923 | 3478 | 25.499 | 15.317 | 3553a |
| Sibutramine 10 mg | 75.934 | 5438 | 3011 | 25.637 | 15.376 | 827a |
| Sibutramine 15 mg | 76.038 | 5372 | 2967 | 25.735 | 15.418 | 557 |
However, both sibutramine and rimonabant have been withdrawn because of safety concerns relating to serious adverse events that could potentially increase the mortality rate of recipients while on treatment. With no robust data to model this increase, we explore the percentage of lives that would need to be lost for each active intervention to be considered not cost-effective compared with placebo when using a threshold of £20,000 per QALY. Using sibutramine 15 mg (see Table 26) as an example, a loss of > 0.2816 QALYs per person receiving sibutramine 15 mg would increase the ICER to > £20,000 per QALY [i.e. (£2967 – £2806)/(15.418 – 0.2816 – 15.128) = £20,000]. Assuming that the adverse event occurs during the first year of the model (i.e. while on treatment), if the proportion of patients who experienced a fatal adverse event was > 1.8%, the treatment would no longer be considered cost-effective when using a threshold of £20,000 per QALY {i.e. (£2967 – £2806)/[15.418 × (1 – 1.83%) – 15.128] = £20,000}. For sibutramine 10 mg and rimonabant the percentage of patients would be 1.5% and 1.0% respectively (see Appendix 5, Table 38).
Probabilistic results
The cost-effectiveness plane (Figure 12) shows the individual results for each of the treatments compared with placebo, with each point representing the result of one of the Monte Carlo samples. As can be seen, each treatment would be considered cost-effective when using a cost per QALY threshold of £20,000. There is markedly less uncertainty in the QALY gain associated with rimonabant because of the different source of effectiveness data used to model changes in BMI at 6 and 12 months.
FIGURE 12.
Cost-effectiveness plane.
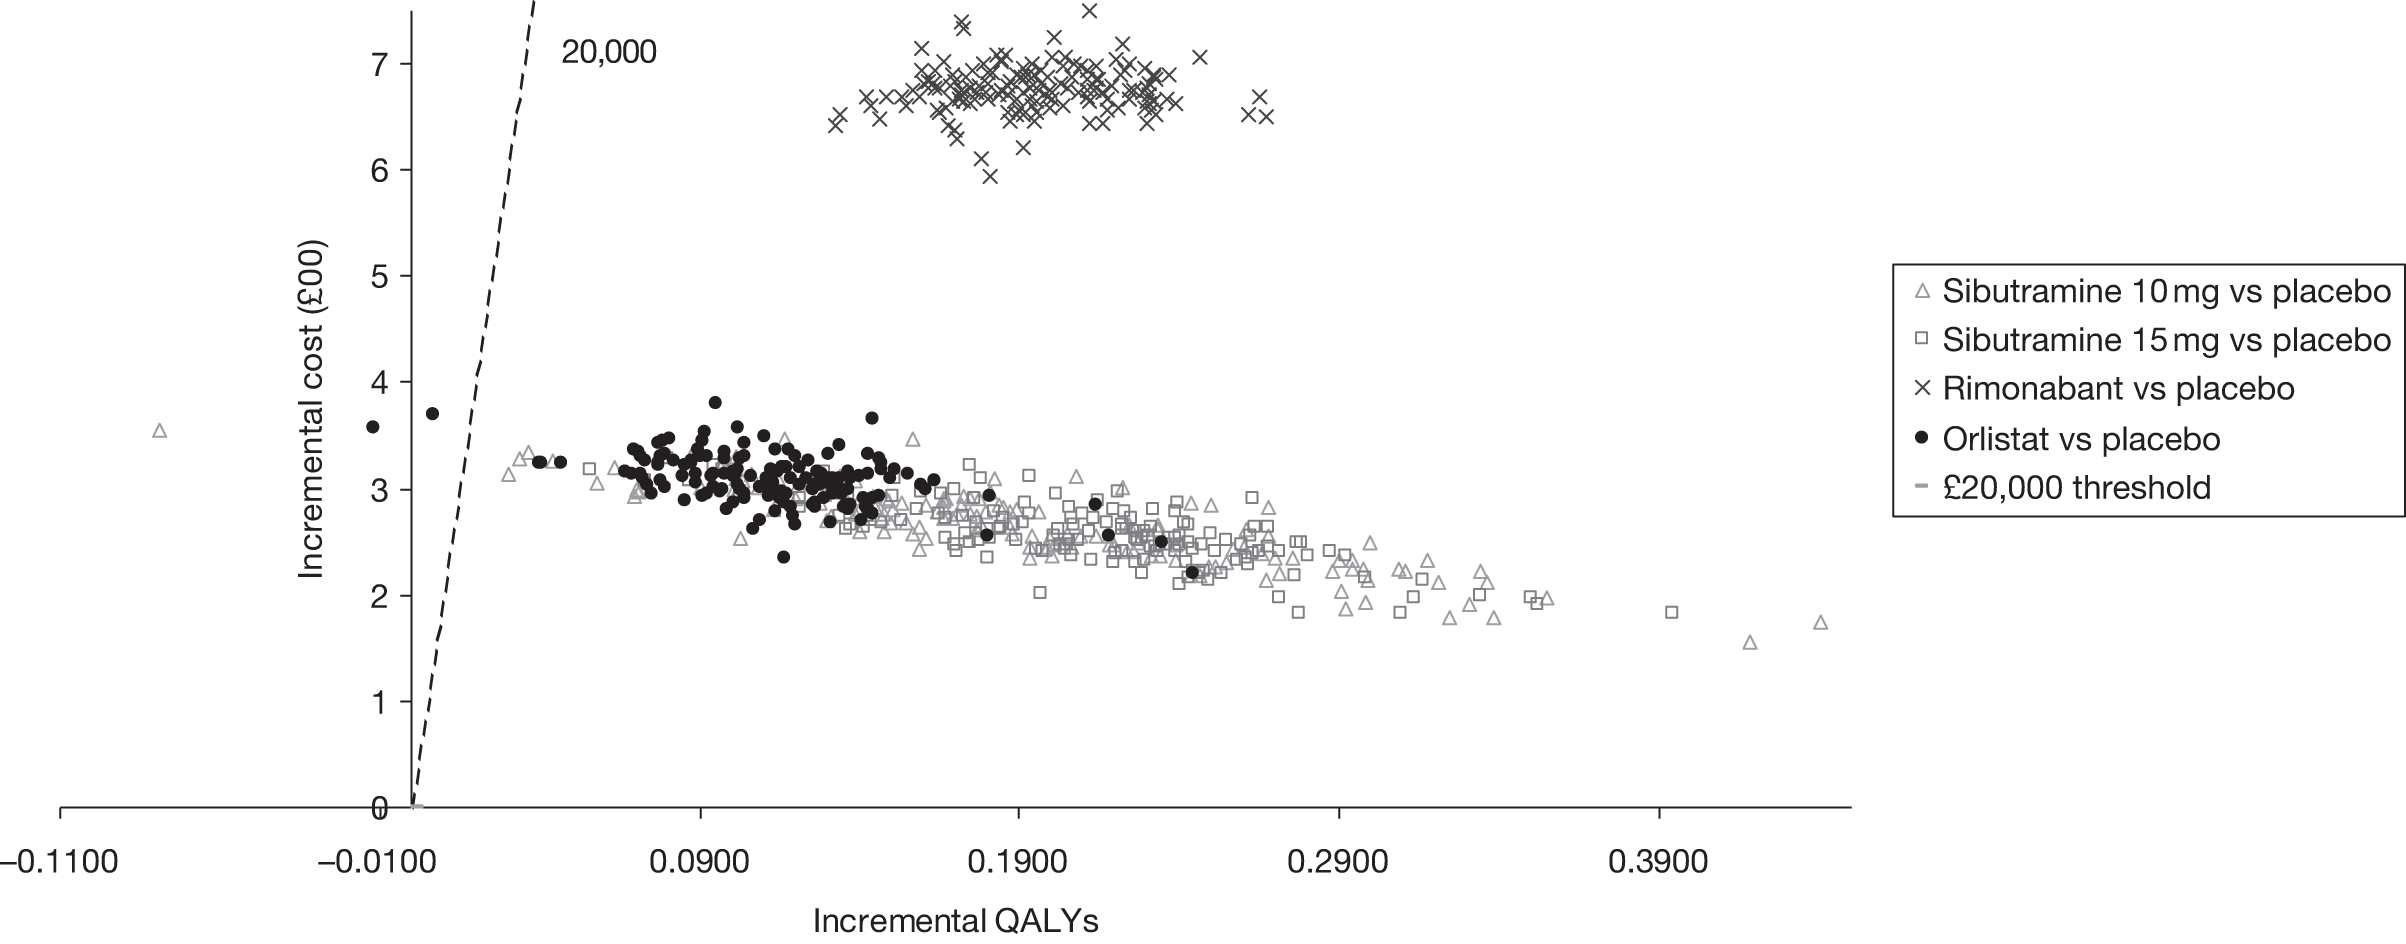
Net benefit
When assessing the net benefit of the interventions (Figure 13), sibutramine 15 mg is the most cost-effective alternative for thresholds > £2000 per QALY.
FIGURE 13.
Cost-effectiveness acceptability curve.
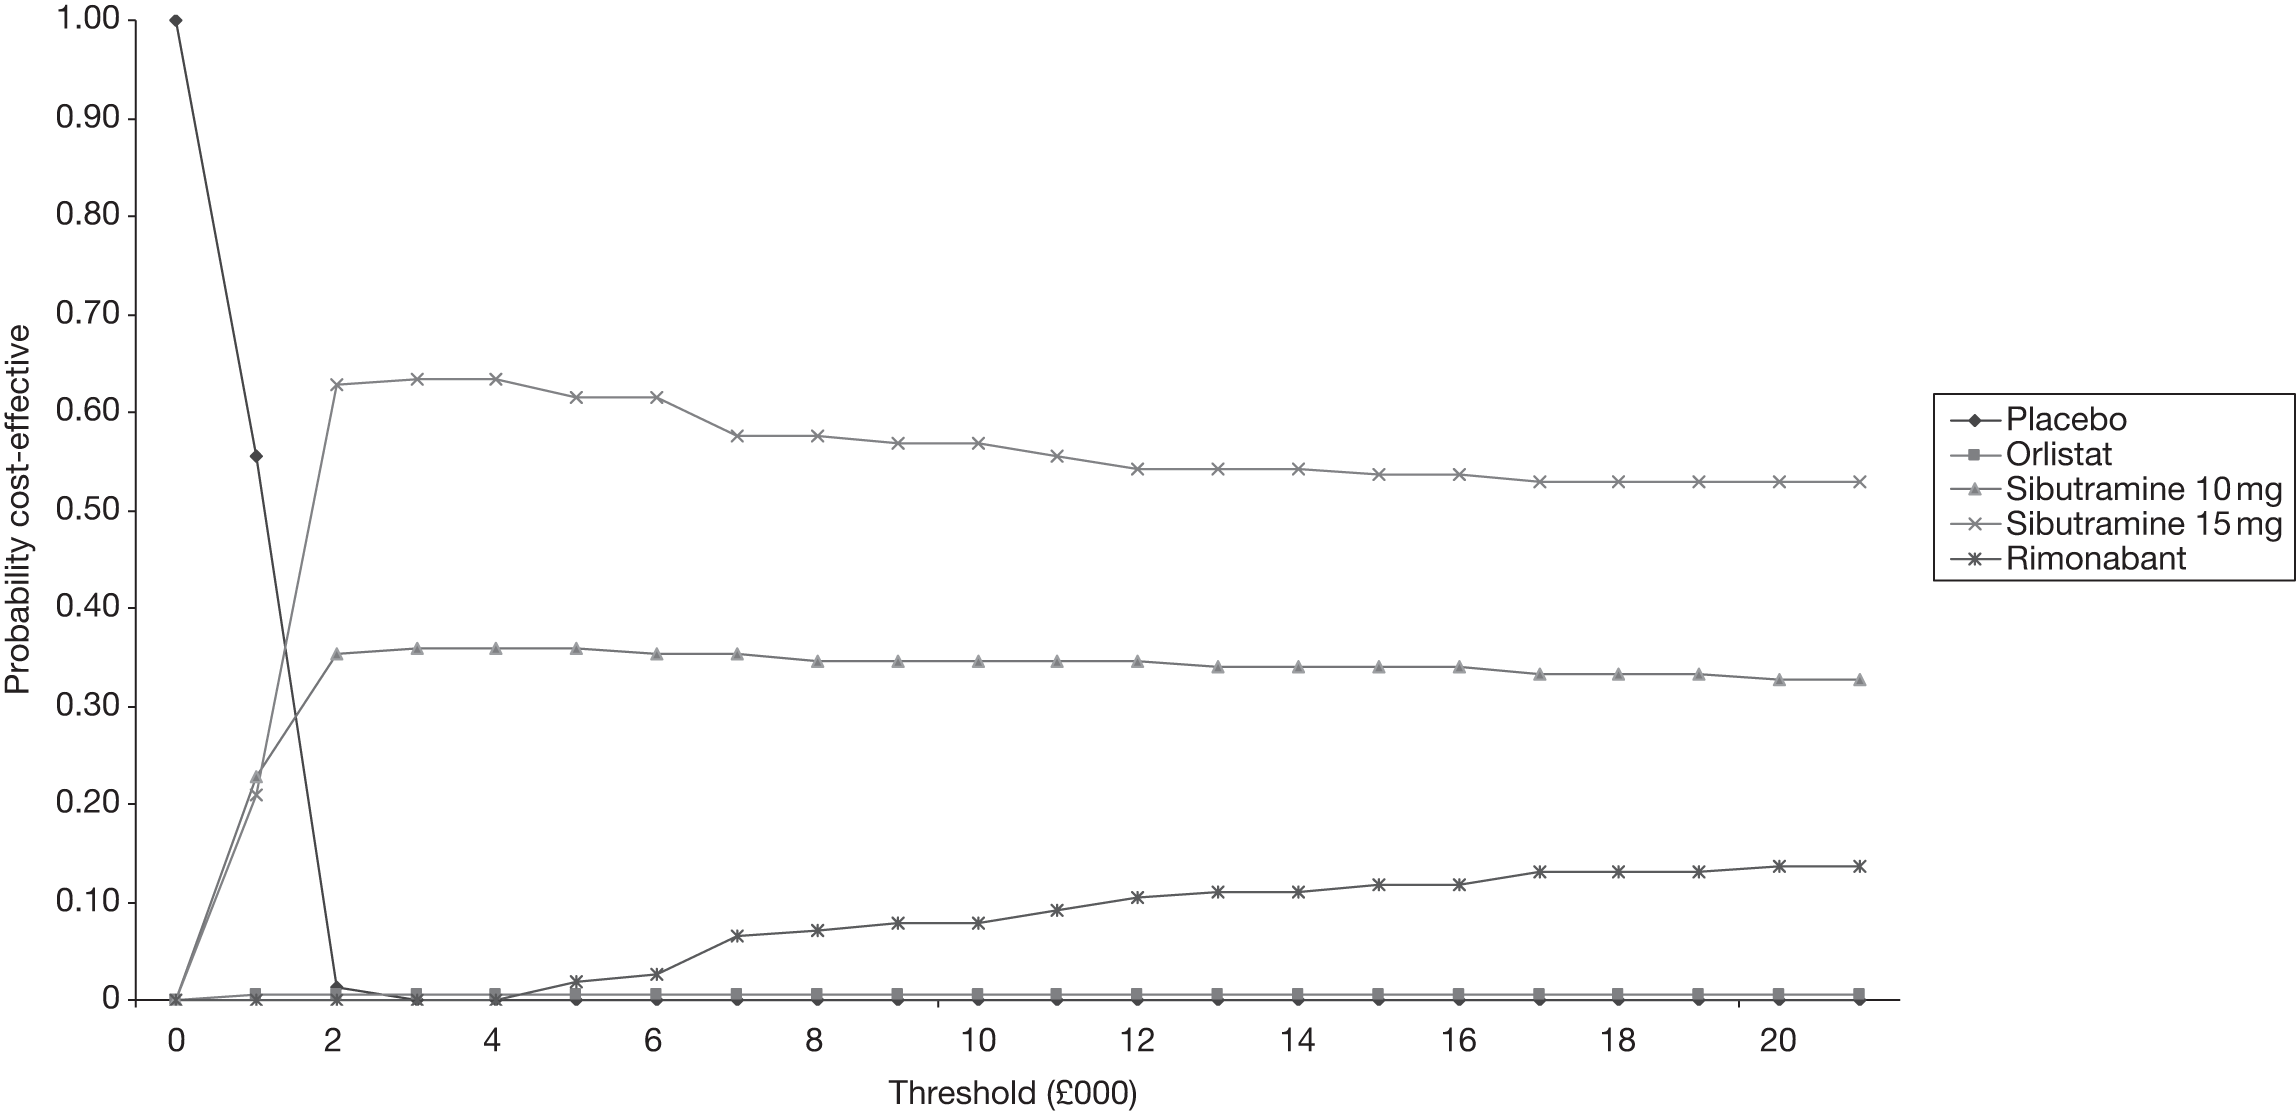
Sensitivity analyses
As sibutramine and rimonabant have been withdrawn, the univariate sensitivity analyses are generated comparing orlistat with placebo (see Appendix 5, Table 39). The variable that has the greatest effect on the results is the baseline BMI for the cohort (SA6). For a cohort with a baseline BMI of 30kg/m2, the ICER increases from £1.6k to £24k per QALY. This is due to the marked decrease in QALY gain as this cohort are at a lower risk of fatal or non-fatal cardiovascular events and T2DM than those in the base-case cohort who enter the model with a mean BMI of 34.9 kg/m2. The model results are robust to changes in the other variables tested.
Summary of cost-effectiveness
There was a large variation in the results reported in the 16 identified published economic evaluations with ICERs ranging from £970 to £59,174 per QALY when comparing the active interventions with lifestyle advice. Only one study compared the active pharmacological interventions and the reported results suggested that rimonabant would be considered cost-effective compared with either orlistat or sibutramine. These analyses were conducted before the withdrawal of both rimonabant and sibutramine.
The results of the deterministic analyses conducted for the current study show that, compared with placebo, sibutramine 15 mg dominates (the average costs are lower and the average QALYs are higher) the other three active interventions. However, sibutramine and rimonabant have both been withdrawn because of safety concerns relating to potential treatment-induced fatal adverse events. When considering the potential increase in mortality, the treatments would no longer be considered cost-effective using a threshold of £20,000 per QALY if the proportion of patients who experienced a fatal adverse event was > 1.8% (1.5%, 1.0%) for sibutramine 15 mg (sibutramine 10 mg, rimonabant).
Comparing orlistat with placebo, orlistat would be considered cost-effective when using a threshold of £20,000 per QALY and the model is robust to variations in the key parameter values tested with the exception of the baseline BMI value.
Chapter 6 Discussion
Statement of principal findings
This is the first MTC of anti-obesity treatments to have been carried out. It utilises cutting-edge statistical methodology to compare treatments for which no head-to-head trials have been carried out. Overall, the results show that the active drug interventions are all effective at reducing weight and BMI compared with placebo. For sibutramine the higher dose (15 mg) gave a greater reduction than the lower dose (10 mg). Although data were limited, the combination of orlistat and sibutramine also ranked highly. Interestingly, those interventions that have now been withdrawn from use (sibutramine and rimonabant) seem to be the most effective; however, their effectiveness is outweighed by the increased adverse events.
A specific review of adverse events was not undertaken for a combination of reasons. First, we underestimated the size of the trial evidence base on this topic and thus the review of efficacy took much longer than we had anticipated, which had serious resource implications. Second, a preliminary assessment of the reporting of adverse event data indicated that it was very patchy and inconsistent across trials. Thus, we decided that a review of the published information only would not have been comprehensive and would have been potentially misleading. Finally, given the detailed adverse event analyses that were carried out relating to the withdrawal of two of the drugs, we felt that this aspect of the project plan had been somewhat superseded by the time we came to consider it
Results from the seven BMI risk models showed consistent increases in risk as a result of an increasing BMI. This pattern was evident across all models except for the diabetic cohort with outcome MI, for which a non-statistically significant (p = 0.838) reduction in risk for outcome MI was observed. Adjustments for key confounders such as age, sex and smoking status were found to be statistically significant at the 5% level in all seven risk models. More flexible survival models were investigated; however, the added complexity was deemed unnecessary.
Large variation in BMI trajectories was observed. Applying linear trajectory models showed an increase in BMI, on average, of 0.040 kg/m2 per year for the diabetic cohort for both men and women. The equivalent non-diabetic cohort model showed an increase in BMI of 0.175 kg/m2 per year for women; however, a statistically significant (at the 5% level) interaction between age and sex was observed, resulting in a slightly reduced increase in BMI of 0.145 kg/m2 per year for men. Baseline estimates (age 45 years) of BMI were similar across cohorts.
The literature review identified 16 economic evaluations describing the costs and benefits associated with the three interventions. Compared with lifestyle advice, the mean ICER for orlistat (sibutramine, rimonabant) ranged between £970 (£6941, £9303) and £59,174 (£10,042, £35,876). Only one study directly compared the pharmacological interventions, and the authors reported that rimonabant was cost-effective compared with either orlistat or sibutramine.
With an average cost per QALY of £557 compared with placebo, the results of the deterministic analyses suggest that sibutramine 15 mg dominates (the average costs are lower and the average QALYs are higher) the other three active interventions. The model is robust to variations in the key parameter values tested with the exception of the baseline BMI value. Although the probabilistic results show a larger range of uncertainty in the incremental QALY gain associated with both sibutramine treatments than in the QALY gain associated with orlistat, the net benefit analyses show that sibutramine 15 mg is the most cost-effective alternative for thresholds > £2000 per QALY. However, both sibutramine and rimonabant have been withdrawn because of safety concerns relating to potential treatment-induced fatal adverse events. Assuming that the adverse event occurs while on treatment, if the proportion of patients who experienced a fatal adverse event was > 1.8% (1.5%, 1.0%) for sibutramine 15 mg (sibutramine 10 mg, rimonabant) the treatment would no longer be considered cost-effective when using a threshold of £20,000 per QALY.
Strengths and limitations of the assessment
Inconsistency was seen between the results of the MTC and the pair-wise comparisons, with a higher level of inconsistency seen for the continuous outcomes. There are many possible reasons for this. The difference in the level of inconsistency between the binary and continuous outcomes might be explained by differences in the scale on which the data are collected; the binary outcome uses percentage weight change, whereas the continuous outcome uses the absolute change. Also the binary outcomes were recorded in the same way across all trials; thus, data quality was higher and less imputation and fewer assumptions were required. The level of publication bias could also add to the level of inconsistency seen and may have positively skewed the results found.
Although this analysis has included data from 94 trials, generally the data quality of the trials included was low. Overall, there was generally poor reporting of standard errors and SDs. Many studies had reported using SDs in the methods, but had reported very low numbers in comparison with other studies and vice versa. Studies with outlying SDs/errors were reassessed and where possible data were corrected. If the publication did not make it clear which measure of variability had been used, the more conservative estimate was used. This could affect the results of the MTC, but giving larger variability to those studies that reported ambiguous results would underestimate rather than overestimate any treatment effects. The way that data were reported also varied by study. For the MTC we required change from baseline with standard error either for each treatment or between treatments. Many studies had reported absolute weight by treatment at baseline and follow-up; in these cases change from baseline was calculated and the standard error was imputed. The imputed standard error uses a correlation coefficient that was calculated using trials in which both the absolute and the change in weight had been given. No such data were available for BMI; therefore, we assumed that the change correlation for BMI would be the same as for weight.
Another limitation of this work is that we did not consider all possible comparators and therefore this is not a complete MTC analysis. Studies were limited to those that included one of the active drugs against a limited number of comparators; therefore, studies comparing lifestyle interventions alone were not included. Additionally we also excluded all studies not reported in English (11 studies); although this could have biased the results, a number of studies have suggested that excluding non-English studies has minimal impact. For example, a retrospective analysis of 50 meta-analyses including both English and non-English studies found that non-English trials tended to be smaller and of lower quality, were more likely to produce significant results and were more likely to show benefit. 187 The authors found that excluding non-English studies had a < 5% effect on the result found for around 60% of the studies assessed and led to an overall less beneficial effect in 32% of the studies. Therefore, although 11 studies were excluded from this review on language grounds, this will probably have had either little effect or a conservative effect on the results found.
Since the initiation of this project the Sibutramine Cardiovascular Outcomes (SCOUT) trial has been published. 188 This trial found that long-term use of sibutramine in those at high risk of CVD was associated with an increased risk of non-fatal MI and non-fatal stroke and this led to the suspension of the drug. This trial was not included in the MTC analysis because it did not provide weight loss data at the time points of interest. However, the weight-loss results of this trial are broadly in line with the results of the MTC and therefore the inclusion of this trial is unlikely to have changed the conclusions.
A strength of the work relative to previous evaluations in obesity is the use of UK-specific data obtained from the GPRD, which are used to determine the relationship between BMI and comorbidities in the economic models. In previous models the probabilities of comorbidities have been estimated using published algorithms,189,190 which in general are not based on UK populations and have required assumptions and modifications to determine the links between BMI and event rates. Another strength of the work relating to the analyses of the GRPD data is the incorporation of natural changes in BMI over time. The majority of previous evaluations assumed that BMI for the comparator arm remains constant over time, the exceptions being an increase in BMI of 0.26 units per annum based on Canadian health insurance registration data (n = 29,855)171 or an increase of 0.833 kg per month based on a 5-year study of 660 obese subjects. 172
Conversely, there are clearly limitations to the GPRD analyses presented here. Baseline values of BMI were used in the modelling of time to clinical events rather than BMI trajectories. Although in theory the joint modelling of both BMI trajectories and time to clinical events could have enabled an estimate of how changing BMI levels (also allowing for measurement error and within-subject correlation), rather than BMI levels per se, changed the risk of the different clinical events,191 there were a number of issues with adopting such an approach. The complexity of such a modelling approach, although in theory potentially attractive, requires considerable computing resources for a data set as large as this. It also relies on the validity of the BMI trajectories – something discussed with respect to the GPRD below – and ultimately such models have been shown to provide only small incremental benefits over simpler risk models. For these reasons, and as adopted by others,150,154 we used baseline BMI levels within relatively simple Weibull parametric survival regression models to estimate the BMI risk relationships. Although more complex models could have been used, and in particular ones that relaxed the assumption of a Weibull baseline hazard and a log-linear effect of covariates, the trade-off between the added extra complexity (especially as the results of such analyses were to be used specifically as inputs into the economic decision model described in Chapter 5) and the very small benefit, in terms of statistical adequacy of the model, meant that a simpler approach was adopted.
Although other authors have considered the validity of diagnoses (and in particular those related to CVD) within the GPRD, and found them to be acceptable,192 the work reported here relied not only on diagnoses, but also on both the time that such diagnoses were made and BMI levels. Both BMI levels and the recorded times of events and diagnoses were found to be highly variable, both within and between patients. Patients could have multiple BMI levels recorded on the same day that were considerably different to one another, or indeed have BMI levels recorded on different occasions but which were clinically implausible, for example BMI readings changing by over 25% within a couple of weeks. Therefore, despite extensive data cleaning and preparation as described in Chapter 4 (see Patients and data preparation), such features of the GPRD, and of BMI readings in particular, should serve as a caveat for the results presented here.
A limitation of the analyses was that we were unable to explore the effects of the interventions in minority ethnic groups. Prevalence of obesity can be higher in these subgroups and their absolute risk of obesity-related comorbidities is higher than in the general UK population. Similarly, we were unable to explore the effects of the interventions in cohorts with or without T2DM at onset of treatment as there were insufficient data to differentiate between potential changes in weight (BMI) for these subgroups.
In routine clinical practice it is unlikely that doctors will continue to prescribe treatment if patients do not respond. A limitation of the work is that we were unable to analyse changes in weight (BMI) for subgroups who responded or who failed to respond to treatment because of a lack of detailed outcomes. It is possible that this would make a difference to the cost-effectiveness results, which are estimated using the average change in BMI for a cohort irrespective of whether they respond to treatment or not.
A strength of the work is the incorporation of a function that enables us to control for health status (event free, cardiovascular events, T2DM), age, gender and BMI when estimating the HRQoL values used to determine the QALYs. The published studies exploring the costs and benefits of the obesity interventions have estimated these values using data derived from disparate sources and frequently these have involved different utility measures because of a paucity of evidence available at the time.
Chapter 7 Conclusions
Currently, orlistat is the only licensed medication for the management of obesity. In clinical practice orlistat should be considered to aid weight reduction with lifestyle interventions in those individuals who have not been successful in reducing their weight with lifestyle alone.
Our MTC of anti-obesity treatments shows that all of the active treatments are effective at reducing weight and BMI. The economic results show that compared with placebo the treatments are all cost-effective when using a threshold of £20,000 per QALY and, within the limitations of the data available, sibutramine 15 mg dominates the other three interventions. However, if the proportion of patients who experienced a fatal adverse event was > 1.8% (1.5%, 1.0%) for sibutramine 15 mg (sibutramine 10 mg, rimonabant), the treatment would no longer be considered cost-effective when using a threshold of £20,000 per QALY.
Suggested research priorities
There are many avenues of further work that could be explored but which are beyond the scope of this project. Novel methods are now available to fully assess the inconsistencies within a network193 and could be used to explore the differences found between the pair-wise and MTC analyses. Meta-regression methods could also be used to look for effect modifiers, for example baseline weight might interact with the treatment effect seen. The effect of the level of publication bias on the results found could also be assessed. From a clinical point of view a long-term clinical trial of orlistat with a similar design to the SCOUT trial may be needed to detect long-term adverse events of this drug.
Given the high levels of variation in consistency and accuracy found in the BMI recordings from the GPRD data, it would be prudent to investigate and compare risk models based on more robust data obtained from observational studies. As discussed earlier, inclusion of ethnicity into risk models would allow further tailoring of subgroup risk profiles. Furthermore, unlimited computing resources would enable the investigation of joint models to model the repeated measures of BMI (with error) and the time-to-event processes simultaneously. Of course, as stated previously, such models may provide relatively small benefits.
In addition, clinical studies of at least 12 months’ duration in subgroups with high prevalence rates of obesity would be informative for future economic evaluations, as would observational data describing the effect on BMI after cessation of treatment. Although this is the first evaluation to examine the comparative costs and benefits of the three interventions directly, given the growing prevalence of obesity, as evidence becomes available on new interventions in this area their cost-effectiveness should be compared to determine the optimal intervention.
Acknowledgements
We would like to acknowledge the assistance from our advisory team who discussed the use and relevance of the active interventions in a primary care practice from a user and provider perspective. KA is partly supported by the UK National Institute for Health Research (NIHR) as a Senior Investigator (NI-SI-0508-10061). MC is funded by a NIHR Research Methods Fellowship.
Contributions of authors
RA, KA, NC, MD, LG, AD, KK and AS contributed to the selection and inclusion of studies and the criteria used in the clinical review. LG, AD and FW extracted the clinical data, while NC, LG and AS conducted the clinical analyses including the MTC. KA, MC, and MH analysed the GPRD data set liaising with RA, LB and MS for direction relating to the economic model. RA and LB performed the cost-effectiveness review and RA, LB and MS constructed the economic model. MH conducted the HRQoL analyses. RA, KA, LB, MC, NC, LG, RJ, KK, AS and MS contributed to the report writing. AR conducted all of the literature searches.
Disclaimers
The views expressed in this publication are those of the authors and not necessarily those of the HTA programme or the Department of Health.
References
- Zaninotto P, Head J, Stamatakis E, Wardle H, Mindell J. Trends in obesity among adults in England from 1993 to 2004 by age and social class and projections of prevalence to 2012. J Epidemiol Community Health 2009;63:140-6.
- Morrell J, Fox KA. Prevalence of abdominal obesity in primary care: the IDEA UK study. Int J Clin Pract 2009;63:1301-7.
- McPherson K, Marsh T, Brown M. Modelling future trends in obesity and the impact on health. Foresight Tackling Obesities: Future Choices; 2007.
- National Obesity Observatory n.d. www.noo.org.uk (accessed January 2010).
- World Health Organization Global Infobase . Obesity and Overweight Fact Sheet September 2006 n.d. www.who.int (accessed 1 February 2010).
- NHS . Statistics on Obesity, Physical Activity and Diet: England n.d. www.ic.nhs.uk/ (accessed January 2010).
- Guillaume M, Lapidus L, Beckers F, Lambert A, Bjorntorp P. Familial trends of obesity through three generations: the Belgian–Luxembourg child study. Int J Obes Relat Metab Disord 1995;19:5-9.
- Grio R, Porpiglia M. Obesity: internal medicine, obstetric and gynecological problems related to overweight. Panminerva Med 1994;36:138-41.
- Parsons TJ, Power C, Logan S, Summerbell CD. Childhood predictors of adult obesity: a systematic review. Int J Obes Relat Metab Disord 1999;23:1-107.
- Flegal KM, Troiano RP, Pamuk ER, Kuczmarski RJ, Campbell SM. The influence of smoking cessation on the prevalence of overweight in the United States. N Engl J Med 1995;333:1165-70.
- Stewart L, Van de Ven L, Katsarou V, Rentziou E, Doran M, Jackson P, et al. High prevalence of obesity in ambulatory children and adolescents with intellectual disability. J Intellect Disabil Res 2009;53:882-6.
- Gale L, Naqvi H, Russ L. Asthma, smoking and BMI in adults with intellectual disabilities: a community-based survey. J Intellect Disabil Res 2009;53:787-96.
- Bhaumik S, Watson JM, Thorp CF, Tyrer F, McGrother CW. Body mass index in adults with intellectual disability: distribution, associations and service implications: a population-based prevalence study. J Intellect Disabil Res 2008;52:287-98.
- Vandenbroeck IP, Goossens J, Clemens M. Building the obesity system map. Foresight tackling obesities: future choices; 2007.
- Vandenbroeck IP, Goossens J, Clemens M. Obesity System Atlas. Foresight Tackling Obesities: Future Choices Date 2003. www.foresight.gov.uk (accessed January 2010).
- Gami AS, Caples SM, Somers VK. Obesity and obstructive sleep apnea. Endocrinol Metab Clin North Am 2003;32:869-94.
- Scarborough P, Bhatnagar P, Wickramasinghe K, Smolina K, Mitchell C, Rayner M. Coronary heart disease statistics 2010 edition. London: British Heart Foundation; 2010.
- Kopelman P. Health risks associated with overweight and obesity. Obes Rev 2007;8:13-7.
- Wilson PW, D’Agostino RB, Sullivan L, Parise H, Kannel WB. Overweight and obesity as determinants of cardiovascular risk: the Framingham experience. Arch Intern Med 2002;162:1867-72.
- Field AE, Coakley EH, Must A, Spadano JL, Laird N, Dietz WH, et al. Impact of overweight on the risk of developing common chronic diseases during a 10-year period. Arch Intern Med 2001;161:1581-6.
- Li KK, Kushida C, Powell NB, Riley RW, Guilleminault C. Obstructive sleep apnea syndrome: a comparison between Far-East Asian and white men. Laryngoscope 2000;110:1689-93.
- Ong KC, Clerk AA. Comparison of the severity of sleep-disordered breathing in Asian and Caucasian patients seen at a sleep disorders center. Respir Med 1998;92:843-8.
- Bourn J. Controller and Auditor General . Tackling Obesity in England 2001. www%20nao.org%20uk/publications/nao_reports (accessed September 2010).
- Calle EE, Thun MJ, Petrelli JM, Rodriguez C, Heath CW. Body-mass index and mortality in a prospective cohort of US adults. N Engl J Med 1999;341:1097-105.
- Bray GA. Obesity: a time bomb to be defused. Lancet 1998;352:160-1.
- Brown TJ. Obesity: guidance on the prevention, identification, assessment and management of overweight and obesity in adults and children. National Institute for Health and Clinical Excellence; 2006.
- Lean ME, Han TS, Morrison CE. Waist circumference as a measure for indicating need for weight management. BMJ 1995;311:158-61.
- Barba C, Cavalli-Sforza T, Cutter J, Darnton-Hill I, Deurenberg P, Deurenberg-Yap M, et al. Appropriate body-mass index for Asian populations and its implications for policy and intervention strategies. Lancet 2004;363:157-63.
- Dhaliwal SS, Welborn TA. Measurement error and ethnic comparisons of measures of abdominal obesity. Prev Med 2009;49:148-52.
- Kumar S, Hanif W, Zaman J, Sattar N, Patel K, Khunti K. Lower thresholds for diagnosis and management of obesity in British South Asians. Int J Clin Pract 2011;64:378-9.
- Dr Foster n.d. www.drfosterhealth.co.uk/ (accessed September 2010).
- Allender S, Rayner M. The burden of overweight and obesity-related ill health in the UK. Obes Rev 2007;8:467-73.
- Royal College . Royal College of Physicians of Edinburgh Consensus Conference on Medical Management of Stroke, 26–27 May 1998. Age Ageing 1998;27:665-6.
- Wadden TA, Berkowitz RI, Womble LG, Sarwer DB, Phelan S, Cato RK, et al. Randomized trial of lifestyle modification and pharmacotherapy for obesity. N Engl J Med 2005;353:2111-20.
- House of Commons Health Committee . Obesity: Third Report of Session 2003 04 2004.
- Epstein L, Ogden J. A qualitative study of GPs’ views of treating obesity. Br J Gen Pract 2005;55:750-4.
- Higgins JPT, Green S. Cochrane Handbook for Systematic Reviews of Interventions n.d. www.cochrane-handbook.org/ (accessed January 2010).
- O’Meara S, Riemsma R, Shirran L, Mather L, ter Riet G. A rapid and systematic review of the clinical effectiveness and cost-effectiveness of orlistat in the management of obesity. Health Technol Assess 2001;5.
- O’Meara S, Riemsma R, Shirran L, Mather L, ter Riet G. The clinical effectiveness and cost-effectiveness of sibutramine in the management of obesity: a technology assessment. Health Technol Assess 2002;6.
- Clegg A, Colquitt J, Sidhu M, Royle P, Walker A. Clinical and cost effectiveness of surgery for morbid obesity: a systematic review and economic evaluation. Int J Obes 2003;27:1167-77.
- Burch J, McKenna C, Palmer S, Norman G, Glanville J, Sculpher M, et al. Rimonabant for the treatment of overweight and obese people. Health Technol Assess 2008;13:13-22.
- n.d. www.emea.europa.eu/humandocs/PDFs/EPAR/acomplia/53777708en.pdf (accessed January 2010).
- The NHS Health Checks Programme n.d. www.healthcheck.nhs.uk/ (accessed January 2010).
- European Medicines Agency . European Medicines Agency Recommends Suspension of Marketing Authorisation for Sibutramine Year 2010 n.d. www.ema.europa.eu/docs/en_GB/document_library/Referrals_document/Sibutramine_107/WC500094238.pdf (accessed January 2010).
- British Medical Association and Royal Pharmaceutical Society of Great Britain . British National Formulary 2009.
- Johansson K, Neovius K, DeSantis SM, Rossner S, Neovius M. Discontinuation due to adverse events in randomized trials of orlistat, sibutramine and rimonabant: a meta-analysis. Obes Rev 2009;10:564-75.
- Schulz KF, Chalmers I, Hayes RJ, Altman DG. Empirical evidence of bias. Dimensions of methodological quality associated with estimates of treatment effects in controlled trials. JAMA 1995;273:408-12.
- Avenell A, Broom J, Brown TJ, Poobalan A, Aucott L, Stearns SC, et al. Systematic review of the long-term effects and economic consequences of treatments for obesity and implications for health improvement. Health Technol Assess 2004;8.
- Jadad AR, Moore RA, Carroll D, Jenkinson C, Reynolds DJ, Gavaghan DJ, et al. Assessing the quality of reports of randomized clinical trials: is blinding necessary?. Control Clin Trials 1996;17:1-12.
- Salanti G, Higgins JP, Ades A, Ionnidis JP. Evaluation of networks of randomized trials. Stat Methods Med Res 2008;17:279-301.
- Spiegelhalter DJ, Thomas A, Best NG. WinBUGS version 1.4 user manual. Cambridge: Cambridge MRC Biostatistics Unit; n.d.
- Apfelbaum M, Vague P, Ziegler O, Hanotin C, Thomas F, Leutenegger E. Long-term maintenance of weight loss after a very-low-calorie diet: a randomized blinded trial of the efficacy and tolerability of sibutramine. Am J Med 1999;106:179-84.
- Audikovszky M, Pados G, Seres I, Harangi M, Fulop P, Katona E, et al. Orlistat increases serum paraoxonase activity in obese patients. Nutr Metab Cardiovasc Dis 2007;17:268-73.
- Aydin N, Topsever P, Kaya A, Karasakal M, Duman C, Dagar A, et al. Orlistat, sibutramine, or combination therapy: which performs better on waist circumference in relation with body mass index in obese patients?. Tohoku J Exp Med 2004;202:173-80.
- Bakris G, Calhoun D, Egan B, Hellmann C, Dolker M, Kingma I, et al. Orlistat improves blood pressure control in obese subjects with treated but inadequately controlled hypertension. J Hypertens 2002;20:2257-67.
- Beck-da-Silva L, Higginson L, Fraser M, Williams K, Haddad H, Beck-da-Silva L, et al. Effect of orlistat in obese patients with heart failure: a pilot study. Congest Heart Fail 2005;11:118-23.
- Berne C. the Orlistat Swedish Type 2 Diabetes Study Group . A randomized study of orlistat in combination with a weight management programme in obese patients with type 2 diabetes treated with metformin. Diabet Med 2005;22:612-18.
- Bloch KV, Salles GF, Muxfeldt ES. Orlistat in hypertensive overweight/obese patients: results of a randomized clinical trial. J Hypertens 2003;21:2159-65.
- Borges RL, Ribeiro-Filho FF, Carvalho KM, Zanella MT, Borges RL, Ribeiro-Filho FF, et al. Impact of weight loss on adipocytokines, C-reactive protein and insulin sensitivity in hypertensive women with central obesity. Arq Bras Cardiol 2007;89:409-14.
- Bray GA, Blackburn GL, Ferguson JM, Greenway FL, Jain AK, Mendel CM, et al. Sibutramine produces dose-related weight loss. Obes Res 1999;7:189-98.
- Broom I, Hughes E, Dodson P, Reckless J. on behalf of the Orlistat UK Study Group . The role of orlistat in the treatment of obese patients with mild to moderate hypercholesterolaemia: consequences for coronary risk. Br J Cardiol 2002;9:460-8.
- Broom I, Wilding J, Stott P, Myers N. UK Multimorbidity Study Group . Randomised trial of the effect of orlistat on body weight and cardiovascular disease risk profile in obese patients: UK multimorbidity study. Int J Clin Pract 2002;56:494-9.
- Chou KM, Huang BY, Fanchiang JK, Chen CH. Comparison of the effects of sibutramine and orlistat on obese, poorly-controlled type 2 diabetic patients. Chang Gung Med J 2007;30:538-46.
- Cocco G, Pandolfi S, Rousson V. Sufficient weight reduction decreases cardiovascular complications in diabetic patients with the metabolic syndrome: a randomized study of orlistat as an adjunct to lifestyle changes (diet and exercise). Heart Drug 2005;5:68-74.
- Cuellar GE, Ruiz AM, Monsalve MC, Berber A. Six-month treatment of obesity with sibutramine 15 mg; a double-blind, placebo-controlled monocenter clinical trial in a Hispanic population. Obes Res 2000;8:71-82.
- Davidson MH, Hauptman J, DiGirolamo M, Foreyt JP, Halsted CH, Heber D, et al. Weight control and risk factor reduction in obese subjects treated for 2 years with orlistat: a randomized controlled trial. JAMA 1999;281:235-42.
- Derosa G, Mugellini A, Ciccarelli L, Fogari R, Derosa G, Mugellini A, et al. Randomized, double-blind, placebo-controlled comparison of the action of orlistat, fluvastatin, or both on anthropometric measurements, blood pressure, and lipid profile in obese patients with hypercholesterolemia prescribed a standardized diet. Clin Ther 2003;25:1107-22.
- Derosa G, Cicero AF, Murdolo G, Ciccarelli L, Fogari R, Cicero AFG. Comparison of metabolic effects of orlistat and sibutramine treatment in type 2 diabetic obese patients. Diabetes Nutr Metab 2004;17:222-9.
- Derosa G, Cicero AF, Murdolo G, Piccinni MN, Fogari E, Bertone G, et al. Efficacy and safety comparative evaluation of orlistat and sibutramine treatment in hypertensive obese patients. Diabetes Obes Metab 2005;7:47-55.
- de Simone G, Romano C, De Caprio C, Contaldo F, Salanitri T, di Luzio PU, et al. Effects of sibutramine-induced weight loss on cardiovascular system in obese subjects. Nutr Metab Cardiovasc Dis 2005;15:24-30.
- Despres JP, Golay A, Sjöström L. Rimonabant in Obesity-Lipids Study Group . Effects of rimonabant on metabolic risk factors in overweight patients with dyslipidemia. N Engl J Med 2005;353:2121-34.
- Di Francesco V, Sacco T, Zamboni M, Bissoli L, Zoico E, Mazzali G, et al. Weight loss and quality of life improvement in obese subjects treated with sibutramine: a double-blind randomized multicenter study. Ann Nutr Metab 2007;51:75-81.
- Didangelos TP, Thanopoulou AK, Bousboulas SH, Sambanis CL, Athyros VG, Spanou EA, et al. The ORLIstat and CArdiovascular risk profile in patients with metabolic syndrome and type 2 DIAbetes (ORLICARDIA) Study. Curr Med Res Opin 2004;20:1393-401.
- Dixon AN, Valsamakis G, Hanif MW, Field A, Boutsiadis A, Harte A, et al. Effect of the orlistat on serum endotoxin lipopolysaccharide and adipocytokines in South Asian individuals with impaired glucose tolerance. Int J Clin Pract 2008;62:1124-9.
- Drent ML, Popp-Snijders C, Ader HJ, Jansen JB, van der Veen EA. Lipase inhibition and hormonal status, body composition and gastrointestinal processing of a liquid high-fat mixed meal in moderately obese subjects. Obes Res 1995;3:573-81.
- Drent ML, Larsson I, William-Olsson T, Quaade F, Czubayko F, von Bergmann K, et al. Orlistat (Ro 18-0647), a lipase inhibitor, in the treatment of human obesity: a multiple dose study. Int J Obes Rel Metab Disord 1995;19:221-6.
- Erdmann J, Lippl F, Klose G, Schusdziarra V. Cholesterol lowering effect of dietary weight loss and orlistat treatment – efficacy and limitations. Aliment Pharmacol Ther 2004;19:1173-9.
- Erondu N, Addy C, Lu K, Mallick M, Musser B, Gantz I, et al. NPY5R antagonism does not augment the weight loss efficacy of orlistat or sibutramine. Obesity 2007;15:2027-42.
- Fanghanel G, Cortinas L, Sanchez-Reyes L, Berber A. A clinical trial of the use of sibutramine for the treatment of patients suffering essential obesity. Int J Obes Rel Metab Disord 2000;24:144-50.
- Fanghanel G, Cortinas L, Sanchez-Reyes L, Gomez-Santos R, Campos-Franco E, Berber A, et al. Safety and efficacy of sibutramine in overweight Hispanic patients with hypertension. Adv Ther 2003;20:101-13.
- Faria AN, Ribeiro Filho FF, Kohlmann NE, Gouvea F, Zanella MT, . Effects of sibutramine on abdominal fat mass, insulin resistance and blood pressure in obese hypertensive patients. Diabetes Obes Metab 2005;7:246-53.
- Finer N, James WP, Kopelman PG, Lean ME, Williams G. One-year treatment of obesity: a randomized, double-blind, placebo-controlled, multicentre study of orlistat, a gastrointestinal lipase inhibitor. Int J Obes Rel Metab Disord 2000;24:306-13.
- Finer N, Bloom SR, Frost GS, Banks LM, Griffiths J. Sibutramine is effective for weight loss and diabetic control in obesity with type 2 diabetes: a randomised, double-blind, placebo-controlled study. Diabetes Obes Metab 2000;2:105-12.
- Florakis D, Diamanti-Kandarakis E, Katsikis I, Nassis GP, Karkanaki A, Georgopoulos N, et al. Effect of hypocaloric diet plus sibutramine treatment on hormonal and metabolic features in overweight and obese women with polycystic ovary syndrome: a randomized, 24-week study. Int J Obes 2008;32:692-9.
- Garcia JM, Iyer D, Poston WS, Marcelli M, Reeves R, Foreyt J, et al. Rise of plasma ghrelin with weight loss is not sustained during weight maintenance. Obesity 2006;14:1716-23.
- Gokcel A, Gumurdulu Y, Karakose H, Melek EE, Tanaci N, BascilTutuncu N, et al. Evaluation of the safety and efficacy of sibutramine, orlistat and metformin in the treatment of obesity. Diabetes Obes Metab 2002;4:49-55.
- Grudell AB, Sweetser S, Camilleri M, Eckert DJ, Vazquez-Roque MI, Carlson PJ, et al. A controlled pharmacogenetic trial of sibutramine on weight loss and body composition in obese or overweight adults. Gastroenterology 2008;135:1142-54.
- Guimaraes C, Pereira LR, Iucif JN, Cesarino EJ, de Almeida CA, de Carvalho D, et al. Tolerability and effectiveness of fluoxetine, metformin and sibutramine in reducing anthropometric and metabolic parameters in obese patients. Arq Brasil Endocrinol Metabol 2006;50:1020-5.
- Guy-Grand B, Drouin P, Eschwege E, Gin H, Joubert JM, Valensi P. Effects of orlistat on obesity-related diseases – a six-month randomized trial. Diabetes Obes Metab 2004;6:375-83.
- Halpern A, Leite CC, Herszkowicz N, Barbato A, Costa AP, Halpern A, et al. Evaluation of efficacy, reliability, and tolerability of sibutramine in obese patients, with an echocardiographic study. Rev Hosp Clin Fac Med São Paulo 2002;57:98-102.
- Halpern A, Mancini MC, Suplicy H, Zanella MT, Repetto G, Gross J, et al. Latin-American trial of orlistat for weight loss and improvement in glycaemic profile in obese diabetic patients. Diabetes Obes Metab 2003;5:180-8.
- Hanefeld M, Sachse G. The effects of orlistat on body weight and glycaemic control in overweight patients with type 2 diabetes: a randomized, placebo-controlled trial. Diabetes Obes Metab 2002;4:415-23.
- Hanotin C, Thomas F, Jones SP, Leutenegger E, Drouin P. Efficacy and tolerability of sibutramine in obese patients: a dose-ranging study. Int J Obes Rel Metab Disord 1998;22:32-8.
- Hauner H, Meier M, Wendland G, Kurscheid T, Lauterbach K, Study G, et al. Weight reduction by sibutramine in obese subjects in primary care medicine: the SAT Study. Exp Clin Endocrinol Diabetes 2004;112:201-7.
- Hauptman J, Lucas C, Boldrin MN, Collins H, Segal KR. Orlistat in the long-term treatment of obesity in primary care settings. Arch Fam Med 2000;9:160-7.
- Hazenberg BP. Randomized, double-blind, placebo-controlled, multicenter study of sibutramine in obese hypertensive patients. Cardiology 2000;94:152-8.
- Hill JO, Hauptman J, Anderson JW, Fujioka K, O’Neil PM, Smith DK, et al. Orlistat, a lipase inhibitor, for weight maintenance after conventional dieting: a 1-y study. Am J Clin Nutr 1999;69:1108-16.
- Hollander PA, Elbein SC, Hirsch IB, Kelley D, McGill J, Taylor T, et al. Role of orlistat in the treatment of obese patients with type 2 diabetes. A 1-year randomized double-blind study. Diabetes Care 1998;21:1288-94.
- Hung YJ, Chen YC, Pei D, Kuo SW, Hsieh CH, Wu LY, et al. Sibutramine improves insulin sensitivity without alteration of serum adiponectin in obese subjects with type 2 diabetes. Diabetic Med 2005;22:1024-30.
- Kaya A, Aydin N, Topsever P, Filiz M, Ozturk A, Dagar A, et al. Efficacy of sibutramine, orlistat and combination therapy on short-term weight management in obese patients. Biomed Pharmacother 2004;58:582-7.
- Kelley DE, Bray GA, Pi-Sunyer FX, Klein S, Hill J, Miles J, et al. Clinical efficacy of orlistat therapy in overweight and obese patients with insulin-treated type 2 diabetes: a 1-year randomized controlled trial. Diabetes Care 2002;25:1033-41.
- Kelley DE, Kuller LH, McKolanis TM, Harper P, Mancino J, Kalhan S. Effects of moderate weight loss and orlistat on insulin resistance, regional adiposity, and fatty acids in type 2 diabetes. Diabetes Care 2004;27:33-40.
- Kiortsis DN, Tsouli S, Filippatos TD, Konitsiotis S, Elisaf MS. Effects of sibutramine and orlistat on mood in obese and overweight subjects: a randomised study. Nutr Metab Cardiovasc Dis 2008;18:207-10.
- Krempf M, Louvet JP, Allanic H, Miloradovich T, Joubert JM, Attali JR. Weight reduction and long-term maintenance after 18 months treatment with orlistat for obesity. Int J Obes Rel Metab Disord 2003;27:591-7.
- Kuo C, Pei D, Yao C, Hsieh M, Kuo S. Effect of orlistat in overweight poorly controlled Chinese female type 2 diabetic patients: a randomised, double-blind, placebo-controlled study. Int J Clin Pract 2006;60:906-10.
- Lindgarde F. The effect of orlistat body weight and coronary heart disease risk profile in obese patients: the Swedish multimorbidity study. J Intern Med 2000;248:245-54.
- Lindholm A, Bixo M, Bjorn I, Wolner-Hanssen P, Eliasson M, Larsson A, et al. Effect of sibutramine on weight reduction in women with polycystic ovary syndrome: a randomized, double-blind, placebo-controlled trial. Fertil Steril 2008;89:1221-8.
- Mathus-Vliegen EM, van Ierland-van Leeuwen ML, Bennink RJ. Influences of fat restriction and lipase inhibition on gastric emptying in obesity. Int J Obes 2006;30:1203-10.
- McNulty SJ, Ur E, Williams G. Multicenter Sibutramine Study Group . A randomized trial of sibutramine in the management of obese type 2 diabetic patients treated with metformin. Diabetes Care 2003;26:125-31.
- Miles JM, Leiter L, Hollander P, Wadden T, Anderson JW, Doyle M, et al. Effect of orlistat in overweight and obese patients with type 2 diabetes treated with metformin. Diabetes Care 2002;25:1123-8.
- Muls E, Kolanowski J, Scheen A, Van Gaal L. ObelHyx Study Group . The effects of orlistat on weight and on serum lipids in obese patients with hypercholesterolemia: a randomized, double-blind, placebo-controlled, multicentre study. Int J Obes 2001;25:1713-21.
- Ozcelik O, Dogan H, Kelestimur H. Effects of a weight-reduction program with orlistat on serim leptin levels in obese women: a 12-week, randomized, placebo-controlled study. Curr Ther Res 2004;65:127-37.
- Ozcelik O, Dogan H, Celik H, Ayar A, Serhatlioglu S, Kelestimur H. Effects of different weight loss protocols on serum leptin levels in obese females. Physiol Res 2005;54:271-7.
- Pathan MF, Latif ZA, Nazneen NE, Mili SU. Orlistat as an adjunct therapy in type 2 obese diabetic patients treated with sulphonylurea: a Bangladesh experience. Bangladesh Med Res Counc Bull 2004;30:1-8.
- Pi-Sunyer FX, Aronne L J, Heshmati HM, Devin J, Rosenstock J. Effect of rimonabant, a cannabinoid-1 receptor blocker, on weight and cardiometabolic risk factors in overweight or obese patients – RIO-North America: a randomized controlled trial. JAMA 2006;295:761-75.
- Porter JA, Raebel M A, Conner DA, Lanty FA, Vogel EA, Gay EC, et al. The long-term outcomes of sibutramine effectiveness on weight (LOSE weight) study: evaluating the role of drug therapy within a weight management program in a group-model health maintenance organization. Am J Manag Care 2004;10:369-76.
- Poston WS, Reeves RS, Haddock CK, Stormer S, Balasubramanyam A, Satterwhite O, et al. Weight loss in obese Mexican Americans treated for 1-year with orlistat and lifestyle modification. Int J Obes 2003;27:1486-93.
- Poston WS, Haddock CK, Pinkston MM, Pace P, Reeves RS, Karakoc N, et al. Evaluation of a primary care-oriented brief counselling intervention for obesity with and without orlistat. J Intern Med 2006;260:388-98.
- Redmon JB, Raatz SK, Reck KP, Swanson JE, Kwong CA, Fan Q, et al. One-year outcome of a combination of weight loss therapies for subjects with type 2 diabetes: a randomized trial. Diabetes Care 2003;26:2505-11.
- Rossner S, Sjostrom L, Noack R, Meinders AE, Noseda G. Weight loss, weight maintenance, and improved cardiovascular risk factors after 2 years treatment with orlistat for obesity. European Orlistat Obesity Study Group. Obes Res 2000;8:49-61.
- Sarac F, Pehlivan M, Celebi G, Saygili F, Yilmaz C, Kabalak T. Effects of sibutramine on thermogenesis in obese patients assessed via immersion calorimetry. Adv Ther 2006;23:1016-29.
- Sari R, Balci MK, Cakir M, Altunbas H, Karayalcin U, Sari R, et al. Comparison of efficacy of sibutramine or orlistat versus their combination in obese women. Endocr Res 2004;30:159-67.
- Sari R, Balci MK, Coban E, Yazicioglu G. Comparison of the effect of orlistat vs orlistat plus metformin on weight loss and insulin resistance in obese women. Int J Obes Rel Metab Disord 2004;28:1059-63.
- Sathyapalan T, Cho LW, Kilpatrick ES, Coady AM, Atkin SL. A comparison between rimonabant and metformin in reducing biochemical hyperandrogenaemia and insulin resistance in patients with polycystic ovary syndrome (PCOS): a randomized open-label parallel study. Clin Endocrinol 2008;69:931-5.
- Scheen AJ, Finer N, Hollander P, Jensen MD, Van Gaal LFR. IO-Diabetes Study Group . Efficacy and tolerability of rimonabant in overweight or obese patients with type 2 diabetes: a randomised controlled study. Lancet 2006;368:1660-72.
- Scholze J, Grimm E, Herrmann D, Unger T, Kintscher U. Optimal treatment of obesity-related hypertension: the hypertension–obesity–sibutramine (HOS) study. Circulation 2007;115:1991-8.
- Serrano-Rios M, Melchionda N, Moreno-Carretero E. Spanish Investigators . Role of sibutramine in the treatment of obese type 2 diabetic patients receiving sulphonylurea therapy. Diabet Med 2002;19:119-24.
- Shechter M, Beigel R, Freimark D, Matetzky S, Feinberg MS. Short-term sibutramine therapy is associated with weight loss and improved endothelial function in obese patients with coronary artery disease. Am J Cardiol 2006;97:1650-3.
- Shi YF, Pan CY, Hill J, Gao Y. Orlistat in the treatment of overweight or obese Chinese patients with newly diagnosed type 2 diabetes. Diabet Med 2005;22:1737-43.
- Smith IG, Goulder MA. Sibutramine, Clinical Study Group . Randomized placebo-controlled trial of long-term treatment with sibutramine in mild to moderate obesity. J Fam Pract 2001;50:505-12.
- Swinburn BA, Carey D, Hills AP, Hooper M, Marks S, Proietto J, et al. Effect of orlistat on cardiovascular disease risk in obese adults. Diabetes Obes Metab 2005;7:254-62.
- Tambascia MA, Geloneze B, Repetto EM, Geloneze SR, Picolo M, Magro DO. Sibutramine enhances insulin sensitivity ameliorating metabolic parameters in a double-blind, randomized, placebo-controlled trial. Diabetes Obes Metab 2003;5:338-44.
- Tankova T, Dakovska G, Lazarova M, Dakovska L, Kirilov G, Koev D. Sibutramine in the treatment of obesity in type 2 diabetic patients and in nondiabetic subjects. Acta Diabetol 2004;41:146-53.
- Tiikkainen M, Bergholm R, Rissanen A, Aro A, Salminen I, Tamminen M, et al. Effects of equal weight loss with orlistat and placebo on body fat and serum fatty acid composition and insulin resistance in obese women. Am J Clin Nutr 2004;79:22-30.
- Torgerson JS, Hauptman J, Boldrin MN, Sjostrom L, Torgerson JS, Hauptman J, et al. XENical in the prevention of diabetes in obese subjects (XENDOS) study: a randomized study of orlistat as an adjunct to lifestyle changes for the prevention of type 2 diabetes in obese patients. Diabetes Care 2004;27:155-61.
- Turker I, Demirag NG, Tanaci N, Tutar NU, Kirbas I. Effects of orlistat plus diet on postprandial lipemia and brachial artery reactivity in normolipidemic, obese women with normal glucose tolerance: a prospective, randomized, controlled study. Curr Ther Res 2006;67:159-73.
- Van Gaal LFB. Efficacy and tolerability of orlistat in the treatment of obesity: a 6-month dose-ranging study. Eur J Clin Pharmacol 1998;54:125-32.
- Van Gaal LF, Rissanen AM, Scheen AJ, Ziegler O, Rössner S. Effects of the cannabinoid-1 receptor blocker rimonabant on weight reduction and cardiovascular risk factors in overweight patients: 1-year experience from the RIO-Europe study. Lancet 2005;365:1389-97.
- Vazquez Roque MI, Camilleri M, Clark MM, Tepoel DA, Jensen MD, Graszer KM, et al. Alteration of gastric functions and candidate genes associated with weight reduction in response to sibutramine. Clin Gastroenterol Hepatol 2007;5:829-37.
- Walsh KM, Leen E, Lean ME. The effect of sibutramine on resting energy expenditure and adrenaline-induced thermogenesis in obese females. Int J Obes Rel Metab Disord 1999;23:1009-15.
- Wang T, Pei D, Li J, Tsai W, Tsai C, Yao C, et al. Effects of sibutramine in overweight, poorly controlled Chinese female type 2 diabetic patients: a randomised, double-blind, placebo-controlled study. Int J Clin Pract 2005;59:746-50.
- Wirth AK, Krause J. Long-term weight loss with sibutramine: a randomized controlled trial. JAMA 2001;286:1331-9.
- Wirth A, Scholze J, Sharma AM, Matiba B, Boenner G. Reduced left ventricular mass after treatment of obese patients with sibutramine: an echocardiographic multicentre study. Diabetes Obes Metab 2006;8:674-81.
- Zannad F, Gille B, Grentzinger A, Bruntz JF, Hammadi M, Boivin JM, et al. Effects of sibutramine on ventricular dimensions and heart valves in obese patients during weight reduction. Am Heart J 2002;144:508-15.
- Kolberg JA, Jorgensen T, Gerwien RW, Hamren S, McKenna MP, Moler E, et al. Development of a type 2 diabetes risk model from a panel of serum biomarkers from the Inter99 cohort. Diabetes Care 2009;32:1207-12.
- Cox BD, Wichelow MJ, Prevost AT. The development of cardiovascular disease in relation to anthropometric indices and hypertension in British adults. Int J Obes 1998;22:966-73.
- Meigs JB, Wilson PWF, Fox CS, Vasan RS, Nathan DM, Sullivan LM, et al. Body mass index, metabolic syndrome, and risk of type 2 diabetes or cardiovascular disease. J Clin Endocrinol Metab 2006;91:2906-12.
- Bogers RP, Bemelmans WJE, Hoogenveen RT, Boshuizen HC, Woodward M, Knekt P, et al. Association of overweight with increased risk of coronary heart disease partly independent of blood pressure and cholesterol levels – a meta-analysis of 21 cohort studies including more than 300,000 persons. Arch Intern Med 2007;167:1720-8.
- Delaney JS, Daskalopoulou SS, Brophy JM, Steele RJ, Opatrny L, Suissa S. Lifestyle variables and the risk of myocardial infarction in the general practice research database. BMC Cardiovasc Disord 2007;18:7-38.
- Whitlock G, Lewington S, Sherliker P, Clarke R, Emberson J, Halsey J, et al. Body-mass index and cause-specific mortality in 900 000 adults: collaborative analyses of 57 prospective studies. Lancet 2009;373:1083-96.
- Song YQ, Manson JE, Meigs JB, Ridker PM, Buring JE, Liu SM. Comparison of usefulness of body mass index versus metabolic risk factors in predicting 10-year risk of cardiovascular events in women. Am J Cardiol 2007;100:1654-8.
- GPRD . General Practice Research Database 2011. www.gprd.com (accessed January 2011).
- Chrisholm J. The READ clinical classification. BMJ 1990;300:1092-6.
- de Gonzalez AB, Hartge P, Cerhan JR, Flint AJ, Hannan L, MacInnis RJ, et al. Body-mass index and mortality among 1.46 million white adults. N Engl J Med 2010;363:2211-19.
- Lambert PC, Royston P. Further development of flexible parametric models for survival analysis. Stata J 2009;9:265-90.
- Durrelman S, Simon R. Flexible regression-models with cubic-splines. Stat Med 1989;8:551-61.
- Ara R, Brennan A. The cost-effectiveness of sibutramine in non-diabetic obese patients: evidence from four Western countries. Obes Rev 2007;8:363-71.
- Brennan A, Ara R, Sterz R, Matiba B, Bergemann R. Assessment of clinical and economic benefits of weight management with sibutramine in general practice in Germany. Eur J Health Econ 2006;7:276-84.
- Caro JJ, Stillman IO, Danel A, Getsios D, McEwan P. Cost effectiveness of rimonabant use in patients at increased cardiometabolic risk: estimates from a Markov model. J Med Econ 2007;10:239-54.
- Foxcroft DR. Orlistat for the treatment of obesity: cost utility model. Obes Rev 2005;6:323-8.
- Hertzman P. The cost effectiveness of orlistat in a 1-year weight-management programme for treating overweight and obese patients in Sweden: a treatment responder approach. Pharmacoeconomics 2005;23:1007-20.
- Iannazzo S, Zaniolo O, Pradelli L. Economic evaluation of treatment with orlistat in Italian obese patients. Curr Med Res Opin 2008;24:63-74.
- Lacey LA, Wolf A, O’Shea D, Erny S, Ruof J. Cost-effectiveness of orlistat for the treatment of overweight and obese patients in Ireland. Int J Obes 2005;29:975-82.
- Lamotte M, Annemans L, Lefever A, Nechelput M, Masure J. A health economic model to assess the long-term effects and cost-effectiveness of orlistat in obese type 2 diabetic patients. Diabetes Care 2002;25:303-8.
- Ruof J, Golay A, Berne C, Collin C, Lentz J, Maetzel A. Orlistat in responding obese type 2 diabetic patients: meta-analysis findings and cost-effectiveness as rationales for reimbursement in Sweden and Switzerland. Int J Obes 2005;29:517-23.
- van Baal PH, Hoeymans N, Hoogenveen RT, de Wit GA, Westert GP. Disability weights for comorbidity and their influence on health-adjusted life expectancy. Popul Health Metr 2006;4:1-7.
- Warren E, Brennan A, Akehurst R. Cost-effectiveness of sibutramine in the treatment of obesity. Med Decis Making 2004;24:9-19.
- Hampp C, Hartzema AG, Kauf TL. Cost-utility analysis of rimonabant in the treatment of obesity. Value Health 2008;11:389-99.
- Roux L, Kuntz KM, Donaldson C, Goldie SJ. Economic evaluation of weight loss interventions in overweight and obese women. Obesity 2006;14:1093-106.
- Maetzel A, Rouf J, Covington M, Wolf A. Economic evaluation of orlistat in overweight and obese patients with type 2 diabetes mellitus. Pharmacoeconomics 2003;21:501-12.
- Macdonald SM, Reeder BA, Chen Y, Despres JP. Obesity in Canada: a descriptive analysis. Canadian Heart Health Surveys Research Group. CMAJ 1997;157:3-9.
- Heitman BL, Garby L. Patterns of long-term weight changes in overweight developing Danish men and women aged between 30 and 60 years. Int J Obes 1999;23:1074-8.
- James WP, Astrup A, Finer N, Hilsted J, Kopelman P, Rossner S, et al. Effect of sibutramine on weight maintenance after weight loss: a randomised trial. STORM Study Group. Sibutramine Trial of Obesity Reduction and Maintenance. Lancet 2000;356:2119-25.
- Wirth A. Sustained weight reduction after cessation of obesity treatment with sibutramine. Dtsch Med Wochenschr 2004;129:1002-5.
- Oster G, Thompson D, Edelsberg J, Bird AP, Colditz GA. Lifetime health and economic benefits of weight loss among obese persons. Am J Public Health 1999;89:1536-42.
- Ward S, Jones ML, Pandor A, Holmes M, Ara R, Ryan A, et al. A systematic review and economic evaluation of statins for the prevention of coronary events. Health Technol Assess 2007;11.
- Earnshaw J, Lewis G. NICE guide to the methods of technology appraisal – pharmaceutical industry perspective. Pharmacoeconomics 2008;26:725-7.
- Kind P, Dolan P, Gudex C, Williams A. Variations in population health status: results from a United Kingdom national questionnaire survey. BMJ 1998;316:736-41.
- Department of Health . Health Survey for England 1998: Cardiovascular Disease 1998.
- Hernández Alava M, Wailoo AJ, Ara R. Tails from the Peak District: Adjusted Censored Mixture Models of EQ-5D Health State Utility Values n.d. http://eprints%20whiterose%20ac%20uk/ (accessed 1 October 2010).
- Curtis L, Netten A. Unit Costs of Health and Social Care 2007.
- Youman P, Wilson K, Harraf F, Kalra L. The economic burden of stroke in the United Kingdom. Pharmacoeconomics 2003;21:43-50.
- Ara R, Pandor A, Stevens J, Rees A, Rafia R. Early high-dose lipid-lowering therapy to avoid cardiac events: a systematic review and economic evaluation Introduction. Health Technol Assess 2009;13.
- Clarke P, Gray A. Estimating utility values for health states of type 2 diabetes patients using the EQ-5D(UKPDS 62). Med Decis Making 2002;22:340-9.
- Gillett M, Dallosso HM, Dixon S, Brennan A, Carey ME, Campbell MJ, et al. Cost effectiveness of the DESMOND structured education programme for patients newly diagnosed with type 2 diabetes. Diabetologia 2009;52.
- Scarborough P, Bhatnagar P, Wickramasinghe K, Smolina K, Mitchell C, Rayner M. Coronary heart disease statistics 2010 edition. London: British Heart Foundation; 2010.
- Juni P, Holenstein F, Sterne J, Bartlett C, Egger M. Direction and impact of language bias in meta analysis of controlled tirlas, empirical study. Int J Epidemiol 2002;31:115-23.
- James WP, Caterson ID, Coutinho W, Finer N, Van Gaal LF, Maggioni AP, et al. Effect of sibutramine on cardiovascular outcomes in overweight and obese subjects. N Engl J Med 2010;363:905-17.
- Anderson KM, Wilson PWF, Odell PM, Kannel WB. An updated coronary risk profile: a statement for health professionals. Circulation 1991;83:356-62.
- D’Agostino RB, Russell MW, Huse DM, Ellison RC, Silbershatz H, Wilson PWF, et al. Primary and subsequent coronary risk appraisal: new results from the Framingham Study. Am Heart J 2000;139:272-81.
- Ibrahim JG, Chu HT, Chen LM. Basic concepts and methods for joint models of longitudinal and survival data. J Clin Oncol 2010;28:2796-801.
- Herrett E, Thomas SL, Schoonen WM, Smeeth L, Hall AJ. Validation and validity of diagnoses in the General Practice Research Database: a systematic review. Br J Clin Pharmacol 2010;69:4-14.
- Dias S, Welton NJ, Caldwell DM, Ades AE. Checking consistency in mixed treatment comparison meta-analysis. Stat Med 2010;29:932-44.
- Patschan SS. Obesity-related hypertension. Cardiol Rev 2007;24:32-5.
- Anderson KM, Odell PM, Wilson PWF. Cardiovascular disease risk profiles. Am Heart J 1990;121:293-8.
- Clarke PM, Gray AM, Briggs A, Farmer AJ, Fenn P, Stevens RJ, et al. A model to estimate the lifetime health outcomes of patients with type 2 diabetes: the United Kingdom Prospective Diabetes Study (UKPDS) Outcomes Model (UKPDS no. 68). Diabetologia 2004;47:1747-59.
- Stratton IM, Adler AI, Neil HA, Matthews DR, Manley SE, Cull CA, et al. Association of glycaemia with macrovascular and microvascular complications of type 2 diabetes (UKPDS 35): prospective observational study. BMJ 2000;321:405-12.
- Downey W, Beck P, McNutt M, Stang MR, Osei W, Nichol J, et al. Pharmacoepidemiology. Chichester: Wiley; 2000.
- Caro JJ, Ishak K, Migliaccio-Walle K. Estimating survival for cost effectiveness analyses: a case study in atherothrombosis. Value Health 2004;7:627-35.
- Caro JJ, Migliaccio-Walle K. Generalizing the results of clinical trials to actual practice: the example of clopidogrel therapy for the prevention of vascular events. CAPRA (CAPRIE Actual Practice Rates Analysis) Study Group. Clopidogrel versus Apirin in Patients at Risk of Ischaemic Events. J Med 1999;107:568-72.
- Colditz GA, Walter MBBS, Willcott C. Weight gain as a risk factor for clinical diabetes mellitus in women. Ann Intern Med 1995;122:481-6.
- Sjostrom CD, Lissner L, Wedel H, Sjostrom L. Reduction in incidence of diabetes, hypertension and lipid disturbances after intentional weight loss induced by bariatric surgery: the SOS Intervention Study. Obes Res 1999;7:477-84.
- Gorsky RD, Pamuk E, Williamson DF, Shaffer PA, Koplan JP. The 25-year health care costs of women who remain overweight after 40 years of age. Am J Prev Med 1996;12:388-94.
- Gregg EW, Cadwell BL, Cheng YJ, Cowie CC, Williams DE, Geiss L, et al. Trends in the prevalence and ratio of diagnosed to undiagnosed diabetes according to obesity levels in the US. Diabetes Care 2004;27:2806-12.
- Wannamethee SG, Shaper AG, Walker M. Overweight and obesity and weight change in middle aged men: impact on cardiovascular disease and diabetes. J Epidemiol Community Health 2005;59:134-9.
- Hu FB, Manson JE, Stampfer MJ, Colditz G, Liu S, Solomon CG, et al. Diet, lifestyle, and the risk of type 2 diabetes mellitus in women. N Engl J Med 2001;345:790-7.
- Lalonde L, Clarke AE, Joseph L, Mackenzie T, Grover SA. Health-related quality of life with coronary heart disease prevention and treatment. J Clin Epidemiol 2001;54:1011-18.
- Currie CJ, Morgan C, Dixon S. The financial costs of hospital care for people with diabetes who have single and multiple macrovascular complications. Diabetes Res Clin Pract 2005;67:144-51.
- Hakim Z, Wolf A, Garrison L. Estimating the effect of changes in body mass index on health state preferences. Pharmacoeconomics 2002;20:393-404.
- Engel SG, Crosby RD, Kolotkin RL, Hartley GG, Williams GR, Wonderlich SA, et al. Impact of weight loss and regain on quality of life: mirror image or differential effect?. Obes Res 2003;11:1207-13.
- Fryback DG, Dasbach EJ, Klein R, Klein BE, Dorn N, Peterson K, et al. The Beaver Dam Health Outcomes Study: initial catalog of health-state quality factors. Med Decis Making 1993;13:89-102.
- Mark DB, Hlatky MA, Califf RM, Naylor CD, Lee KL, Armstrong PW, et al. Cost effectiveness of thrombolytic therapy with tissue plasminogen activator as compared with streptokinase for acute myocardial infarction. N Engl J Med 1995;332:1418-24.
- Hiatt MD. Thrombolytic therapy with streptokinase and tissue plasminogen activator in a patient with suspected acute myocardial infarction: a decision analysis. Cardiology 1999;91:243-9.
- Sullivan SD, Lew DP, Devine EB, Hakim Z, Reiber GE, Veenstra DL. Health state preference assessment in diabetic peripheral neuropathy. Pharmacoeconomics 2002;20:1079-89.
- Churchill DN, Torrance GW, Taylor DW, Barnes CC, Ludwin D, Shimizu A, et al. Measurement of quality of life in end-stage renal disease: the time trade-off approach. Clin Invest Med 1987;10:14-20.
- Melse JM, Essink-Bot ML, Kramers PG, Hoeymans N. A national burden of disease calculation: Dutch disability-adjusted life-years. Dutch Burden of Disease Group. Am J Public Health 2000;90:1241-7.
- Kuntz KM, Tsevat J, Goldman L, Weinstein MC. Cost-effectiveness of routine coronary angiography after acute myocardial infarction. Circulation 1996;94:957-65.
Appendix 1 Literature search strategies
A search strategy was constructed using a combination of Medical Subject Headings (MeSH) and free-text terms. Vocabulary was identified to describe both the condition (obesity) and the interventions (rimonabant, orlistat and sibutramine). The vocabulary was devised by the information specialist in conjunction with the research team. All synonyms, brand drug names, etc. were included.
The electronic databases searched were MEDLINE, MEDLINE In-Process & Other Non-Indexed Citations (for latest publications), EMBASE, Cochrane Database of Systematic Reviews, Cochrane Controlled Trials Register, CINAHL, DARE, NHS EED, HTA Database, Web of Science Proceedings, Science Citation Index and Current Controlled Trials. Searches were primarily conducted to identify evidence of clinical effectiveness (RCTs, systematic reviews) and cost-effectiveness. Methodological filters were used to identify these specific study designs where available.
Further searches were conducted to provide background information for the review including adverse events relating to the drugs and systematic reviews of lifestyle and exercise. Examples of all search strategies are provided below.
Randomised controlled trials: MEDLINE
-
orlistat/
-
sibutramine/
-
sibutramine.ti,ab.
-
orlistat.ti,ab.
-
4 or 1 or 3 or 2
-
exp obesity/
-
obese.ti,ab.
-
obesity.ti,ab.
-
8 or 6 or 7
-
9 and 5
-
xenical.tw.
-
96829-58-2.rn,tw.
-
reductil.tw.
-
meridia.tw.
-
106650-56-0.rn,tw.
-
rimonabant.tw.
-
sr141716.tw.
-
acomplia.tw.
-
bethin.tw.
-
(monaslim or remonabent or riobant or slimona or rimoslim or zimulti).tw.
-
158681-13-1.rn,tw.
-
11 or 21 or 17 or 12 or 20 or 15 or 14 or 18 or 19 or 13 or 16 or 5
-
22 and 9
-
Randomized controlled trials as Topic/
-
Randomized controlled trial/
-
Random allocation/
-
Double blind method/
-
Single blind method/
-
Clinical trial/
-
exp Clinical Trials as Topic/
-
(clinic$ adj trial$1).tw.
-
{singl$ or doubl$ or treb$ or tripl$) adj (blind$3 or mask$3)).tw.
-
Placebos/
-
Placebo$.tw.
-
Randomly allocated.tw.
-
(allocated adj2 random).tw.
-
35 or 27 or 25 or 33 or 32 or 28 or 36 or 26 or 34 or 24 or 30 or 29 or 31
-
37 and 23
Randomised controlled trials: EMBASE
-
orlistat/
-
sibutramine/
-
sibutramine.ti,ab.
-
orlistat.ti,ab.
-
4 or 1 or 3 or 2
-
exp obesity/
-
obese.ti,ab.
-
obesity.ti,ab.
-
8 or 6 or 7
-
clinical trial/
-
randomised controlled trial/
-
randomization/
-
single blind procedure/
-
double blind procedure/
-
crossover procedure/
-
placebo/
-
randomi?ed controlled trial$.tw.
-
rct.tw.
-
random allocation.tw.
-
randomly allocated.tw.
-
allocated randomly.tw.
-
(allocated adj2 random).tw.
-
single blind$.tw.
-
double blind$.tw.
-
{treble or triple) adj blind$).tw.
-
PLACEBO$.tw.
-
prospective study/
-
or/10-27
-
case study/
-
case report.tw.
-
abstract report/ or letter/
-
or/29-31
-
28 not 32
-
exp cohort analysis/
-
exp longitudinal study/
-
exp prospective study/
-
exp follow up/
-
cohort$.tw.
-
exp case control study/
-
(case$ and control$).tw.
-
or/34-40
-
9 and 5
-
33 or 41
-
42 and 43
-
xenical.tw.
-
96829-58-2.rn,tw.
-
reductil.tw.
-
meridia.tw.
-
106650-56-0.rn,tw.
-
rimonabant.tw.
-
sr141716.tw.
-
acomplia.tw.
-
bethin.tw.
-
monaslim.tw.
-
remonabent.tw.
-
riobant.tw.
-
slimona.tw.
-
rimoslim.tw.
-
zimulti.tw.
-
158681-13-1.rn,tw.
-
53 or 48 or 46 or 55 or 50 or 57 or 51 or 58 or 47 or 52 or 59 or 60 or 49 or 56 or 45 or 54 or 5
-
61 and 43 and 9
Randomised controlled trials and systematic reviews: Cumulative Index to Nursing and Allied Health Literature
-
S61 S59 not S49
-
S60 S58 and S25
-
S59 S58 and S23
-
S58 S57 or S47
-
S57 S56 or S55 or S54 or S53 or S52 or S51 or S50
-
S56 cohort*
-
S55 (MH “cohort studies”)
-
S54 control* or perspective* or volunteer*
-
S53 (MH “Prospective Studies”)
-
S52 (MH “follow up studies”)
-
S51 (MH “Evaluation Research+”)
-
S50 (MH “comparative study”)
-
S49 S47 and S23
-
S48 S47 and S25
-
S47 S46 or S45 or S44 or S43 or S42 or S41 or S40 or S39 or S38 or S37
-
S46 allocat* random*
-
S45 (MH “Quantitative studies”)
-
S44 placebo* Search modes – Boolean/Phrase
-
S43 random allocat*
-
S42 (MH “random assignment”)
-
S41 randomised controlled trial*
-
S40 (single or double or treble or triple) and (blind* or mask*)
-
S39 clinical trial*
-
S38 trial* Limiters – Publication Type: Clinical Trial
-
S37 (MH “Clinical Trials”)
-
S26 S17 and S25
-
S25 S24 and S18
-
S24 orlistat or sibutramine
-
S23 S22 and S18
-
S22 S21 or S20 or S19
-
S21 rimonabant or SR141716 or acomplia or bethin or monaslim OR remonabent OR riobant OR slimona OR rimoslim OR zimulti OR 158681-13
-
S20 sibutramine OR reductil OR meridia OR 106650-56-0
-
S19 orlistat OR xenical OR 96829-58-2
-
S18 obesity or obese
-
S17 S12 NOT S15
-
S16 S12 NOT S15
-
S15 S13 or S14
-
S14 (MH “Animals”)
-
S13 PT commentary OR comment OR letter OR editorial
-
S12 (S6 or S7 or S8 or S9 or S10)
-
S11 (systematic review OR systematic overview) and (S6 or S7 or S8 or S9 or S10)
-
S10 systematic review OR systematic overview
-
S9 (MH “Literature Review+”)
-
S8 metaanaly*
-
S7 meta analy*
-
S6 (MH “Meta Analysis”)
Randomised controlled trials or systematic reviews or economics: The Cochrane Library
-
#1 (orlistat):ti,ab,kw
-
#2 (sibutramine):ti,ab,kw
-
#3 (#1 OR #2)
-
#4 obese or obesity
-
#5 MeSH descriptor Obesity explode all trees
-
#6 (#4 OR #5)
-
#7 (#6 AND #3)
-
#8 xenical or 96829-58-2
-
#9 reductil or meridia or 106650-56-0
-
#10 rimonabant or sr141716 or acomplia or bethin or monaslim or remonabent or riobant or slimona or rimoslim or zimulti or 158681-13-1
-
#11 (#8 OR #9 OR #10 OR #3)
-
#12 (#11 AND #6)
Randomised controlled trials or systematic reviews: Science Citation Index and ISI Conference Proceedings
-
#11 #10 AND #7
-
#10 #9 OR #4
-
#9 ts=(xenical or reductil or meridia or rimonabant or acomplia or bethinmonaslim or remonabent or riobant or slimona or rimoslim or zimulti)
-
#8 #7 AND #4
-
#7 #5 OR #6
-
#6 ts=obesity
-
#5 ti=obesity
-
#4 #3 OR #2 OR #1
-
#3 ti=orlistat
-
#2 ti=sibutramine
-
#1 ti=orlistat
Systematic reviews: MEDLINE
-
Meta-Analysis as Topic/
-
meta analy$.tw.
-
metaanaly$.tw.
-
Meta-Analysis/
-
(systematic adj (review$1 or overview$1)).mp.
-
exp Review Literature as Topic/
-
or/1-6
-
exp *Obesity/
-
8 and 7
Systematic reviews: EMBASE
-
exp *Obesity/
-
Meta Analysis/
-
{meta adj analy$) or metaanalys$).tw.
-
(systematic adj (review$1 or overview$1)).tw.
-
or/2-4
-
cancerlit.ab.
-
cochrane.ab.
-
embase.ab.
-
(psychlit or psyclit).ab.
-
(psychinfo or psycinfo).ab.
-
(cinal or cinahl).ab.
-
science citation index.ab.
-
bids.ab.
-
or/6-13
-
reference lists.ab.
-
bibliograph$.ab.
-
hand-search$.ab.
-
manual search$.ab.
-
relevant journals.ab.
-
or/15-19
-
data extraction.ab.
-
selection criteria.ab.
-
21 or 22
-
review.pt.
-
23 and 24
-
letter.pt.
-
editorial.pt.
-
animal/
-
human/
-
28 not (28 and 29)
-
or/26-27,30
-
5 or 14 or 20 or 25
-
32 not 31
-
33 and 1
Economics: MEDLINE
-
exp “costs and cost analysis”/
-
economics/
-
exp economics hospital/
-
exp economics medical/
-
exp economics nursing/
-
economics pharmaceutical/
-
exp “fees and charges”/
-
exp budgets/
-
budget$.tw.
-
cost$.ti.
-
(cost$ adj2 (effective$ or utilit$ or benefit$ or minim$)).ab.
-
(economic$ or pharmacoeconomic$ or pharmaco-economic$).ti.
-
(price or pricing$).tw.
-
(financial or finance or finances or finanaced).tw.
-
(fee or fees).tw.
-
or/1-15
-
orlistat/
-
sibutramine/
-
sibutramine.ti,ab.
-
orlistat.ti,ab.
-
20 or 17 or 19 or 18
-
exp obesity/
-
obese.ti,ab.
-
obesity.ti,ab.
-
24 or 22 or 23
-
25 and 21
-
xenical.tw.
-
96829-58-2.rn,tw.
-
reductil.tw.
-
meridia.tw.
-
106650-56-0.rn,tw.
-
rimonabant.tw.
-
sr141716.tw.
-
acomplia.tw.
-
bethin.tw.
-
(monaslim or remonabent or riobant or slimona or rimoslim or zimulti).tw.
-
158681-13-1.rn,tw.
-
27 or 37 or 33 or 28 or 36 or 31 or 30 or 34 or 35 or 29 or 32 or 21
-
38 and 25
-
39 and 16
-
(value adj2 (money or monetary)).tw.
-
value of life/
-
quality adjusted life year/
-
quality adjusted life.tw.
-
(qaly$ or qald$ or qale$ or qtime$).tw.
-
disability adjusted life.tw.
-
daly$.tw.
-
health status indicators/
-
(sf36 or sf 36 or short form 36 or shortform 36 or sf thirtysix or sf thirty six or shorform thirtysix or shortform thirty six or short form thirtysix or short form thirty six).tw.
-
(sf 6 or sf6 or short form 6 or shortform 6 or sf six or sfsix or shortform six or short form six).tw.
-
(sf12 or sf 12 or short form 12 or shortform 12 or sf twelve or sftwelve or shortform twelve or short form twelve).tw.
-
(sf16 or sf 16 or short form 16 or shortform 16 or sf sixteen or sfsixteen or shortfrom sixteen or short form sixteen).tw.
-
(sf20 or sf 20 or short form 20 or shortform 20 or sf twenty or sftwenty or shortform twenty or short form twenty).tw.
-
(euroqol or euro qol or eq5d or eq 5d).tw.
-
(hql or hqol or h qol or hrqol or hr qol).tw.
-
(hye or hyes).tw.
-
health$ year$ equivalent$.tw.
-
health utilit$.tw.
-
(hui or hui1 or hui2 or hui3).tw.
-
disutilit$.tw.
-
rosser.tw.
-
quality of wellbeing.tw.
-
qwb.tw.
-
willingness to pay.tw.
-
standard gamble$.tw.
-
time trade off.tw.
-
time tradeoff.tw.
-
tto.tw.
-
exp models economic/
-
*models theoretical/
-
*models organizational/
-
economic model$.tw.
-
markov chains/
-
markov$.tw.
-
monte carlo method/
-
monte carlo.tw.
-
exp decision theory/
-
(decision$ adj2 (tree$ or analy$ or model$)).tw.
-
or/41-78
-
letter.pt.
-
orial.pt.
-
comment.pt.
-
or/80-82
-
79 not 83
-
84 or 16
-
85 and 39
Adverse events: MEDLINE
-
orlistat/
-
sibutramine/
-
sibutramine.ti,ab.
-
orlistat.ti,ab.
-
4 or 1 or 3 or 2
-
exp obesity/
-
obese.ti,ab.
-
obesity.ti,ab.
-
8 or 6 or 7
-
9 and 5
-
xenical.tw.
-
96829-58-2.rn,tw.
-
reductil.tw.
-
meridia.tw.
-
106650-56-0.rn,tw.
-
rimonabant.tw.
-
sr141716.tw.
-
acomplia.tw.
-
bethin.tw.
-
(monaslim or remonabent or riobant or slimona or rimoslim or zimulti).tw.
-
158681-13-1.rn,tw.
-
11 or 21 or 17 or 12 or 20 or 15 or 14 or 18 or 19 or 13 or 16 or 5
-
22 and 9
-
drug toxicity/
-
ae.fs.
-
(safe or safety or side effect*).tw.
-
(undesirable effect* or treatment emergent*).tw.
-
(tolerability or toxicity or adrs).tw.
-
(adverse adj2 (event or events or effect or effects or reaction or reactions or outcome*)).tw.
-
27 or 25 or 28 or 24 or 26 or 29
-
30 and 23
Adverse events: EMBASE
-
orlistat/
-
sibutramine/
-
sibutramine.ti,ab.
-
orlistat.ti,ab.
-
4 or 1 or 3 or 2
-
exp obesity/
-
obese.ti,ab.
-
obesity.ti,ab.
-
8 or 6 or 7
-
9 and 5
-
xenical.tw.
-
96829-58-2.rn,tw.
-
reductil.tw.
-
meridia.tw.
-
106650-56-0.rn,tw.
-
rimonabant.tw.
-
sr141716.tw.
-
acomplia.tw.
-
bethin.tw.
-
(monaslim or remonabent or riobant or slimona or rimoslim or zimulti).tw.
-
158681-13-1.rn,tw.
-
11 or 21 or 17 or 12 or 20 or 15 or 14 or 18 or 19 or 13 or 16 or 5
-
22 and 9
-
ae.fs.
-
(safe or safety or side effect*).tw.
-
(undesirable effect* or treatment emergent*).tw.
-
(tolerability or toxicity or adrs).tw.
-
(adverse adj2 (event or events or effect or effects or reaction or reactions or outcome*)).tw.
-
Adverse Drug Reaction/
-
exp side effect/
-
27 or 25 or 28 or 30 or 24 or 26 or 29
-
23 and 31
Adverse events: The Cochrane Library
-
#1 adverse NEAR/2 (effect or effects or event or events or reaction or reactions or outcome*)
-
#2 MeSH descriptor Drug Toxicity, this term only
-
#3 safe or safety or side effect*
-
#4 underirable effect or treatment emergent
-
#5 tolerability or toxicity or adrs
-
#6 (#1 OR #2 OR #3 OR #4 OR #5)
-
#7 orlistat or sibutramine or rimonabant
-
#8 xenical or reductil or meridia or acomplia or bethin or monaslim or remonabent or riobant or slimona or rimoslim or zimulti
-
#9 7 or 8 269674
-
#10 MeSH descriptor Obesity, this term only
-
#11 MeSH descriptor Obesity, Morbid, this term only
-
#12 (#10 OR #11)
-
#13 (#6 AND #9 AND #12)
Adverse events: Science Citation Index and ISI Conference Proceedings
-
#16 #15 AND #11
-
#15 #12 OR #13
-
#13 ts=(adverse SAME (event or events or effect or effects or reaction or reactions or outcome*))
-
#12 ts=(drug toxicity or safe or safety or side effect* or undesirable effect* or treatment emergent* or tolerability or toxicity or adrs)
-
#11 #10 AND #7
-
#10 #9 OR #4
-
#9 ts=(xenical or reductil or meridia or rimonabant or acomplia or bethinmonaslim or remonabent or riobant or slimona or rimoslim or zimulti)
-
#8 #7 AND #4
-
#7 #5 OR #6
-
#6 ts=obesity
-
#5 ti=obesity
-
#4 #3 OR #2 OR #1
-
#3 ti=orlistat
-
#2 ti=sibutramine
-
#1 ti=orlistat
Lifestyle and exercise systematic reviews: MEDLINE
-
Life Style/
-
(lifestyle* or life style*).mp. [mp = title, original title, abstract, name of substance word, subject heading word]
-
exercise.mp. [mp = title, original title, abstract, name of substance word, subject heading word]
-
*Exercise/
-
4 or 1 or 3 or 2
-
Meta-Analysis as Topic/
-
meta analy$.tw.
-
metaanaly$.tw.
-
Meta-Analysis/
-
(systematic adj (review$1 or overview$1)).mp. [mp = title, original title, abstract, name of substance word, subject heading word]
-
exp Review Literature as Topic/
-
or/6-11
-
12 and 5
-
*lifestyle/
-
(exercise* or lifestyle* or life style*).ti.
-
4 or 15 or 14
-
16 and 12
Lifestyle and exercise systematic reviews: EMBASE
-
(exercise* or lifestyle* or life style*).ti.
-
*”lifestyle and related phenomena”/ or *lifestyle/ or *lifestyle modification/
-
exp *Exercise/
-
1 or 2 or 3
-
Meta Analysis/
-
{meta adj analy$) or metaanalys$).tw.
-
(systematic adj (review$1 or overview$1)).tw.
-
or/5-7
-
cancerlit.ab.
-
cochrane.ab.
-
embase.ab.
-
(psychlit or psyclit).ab.
-
(psychinfo or psycinfo).ab.
-
(cinal or cinahl).ab.
-
science citation index.ab.
-
bids.ab.
-
or/9-16
-
reference lists.ab.
-
bibliograph$.ab.
-
hand-search$.ab.
-
manual search$.ab.
-
relevant journals.ab.
-
or/18-22
-
data extraction.ab.
-
selection criteria.ab.
-
24 or 25
-
review.pt.
-
26 and 27
-
letter.pt.
-
orial.pt.
-
animal/
-
human/
-
31 not (31 and 32)
-
or/29-30,33
-
8 or 17 or 23 or 28
-
35 not 34
-
4 and 36
Lifestyle and exercise systematic reviews: Cumulative Index to Nursing and Allied Health Literature
-
S17 (S12 NOT S15) and (S5 and S16)
-
S16 S12 NOT S15
-
S15 S13 or S14
-
S14 (MH “Animals”)
-
S13 PT commentary OR comment OR letter OR editorial
-
S12 (S6 or S7 or S8 or S9 or S10)
-
S11 (systematic review OR systematic overview) and (S6 or S7 or S8 or S9 or S10)
-
S10 systematic review OR systematic overview
-
S9 (MH “Literature Review+”)
-
S8 metaanaly*
-
S7 meta analy*
-
S6 (MH “Meta Analysis”)
-
S5 (S1 or S2 or S3)
-
S4 {MM “Life Style”) or (MM “Life Style Changes”)) and (S1 or S2 or S3)
-
S3 (MM “Life Style”) or (MM “Life Style Changes”)
-
S2 (MM “Exercise+”)
-
S1 TI exercise* OR lifestyle* or life style*
Lifestyle and exercise: Cochrane Database of Systematic Reviews
-
#1 (exercise* or lifestyle* or life style*):ti
-
#2 MeSH descriptor Exercise, this term only
-
#3 MeSH descriptor Life Style, this term only
-
#4 (#1 OR #2 OR #3)
Economics: EMBASE
-
orlistat/
-
sibutramine/
-
sibutramine.ti,ab.
-
orlistat.ti,ab.
-
4 or 1 or 3 or 2
-
exp obesity/
-
obese.ti,ab.
-
obesity.ti,ab.
-
8 or 6 or 7
-
xenical.tw.
-
96829-58-2.rn,tw.
-
reductil.tw.
-
meridia.tw.
-
106650-56-0.rn,tw.
-
rimonabant.tw.
-
sr141716.tw.
-
acomplia.tw.
-
bethin.tw.
-
monaslim.tw.
-
remonabent.tw.
-
riobant.tw.
-
slimona.tw.
-
rimoslim.tw.
-
zimulti.tw.
-
158681-13-1.rn,tw.
-
18 or 13 or 11 or 20 or 15 or 22 or 16 or 23 or 12 or 17 or 24 or 25 or 14 or 21 or 10 or 19 or 5
-
exp SOCIOECONOMICS/
-
exp “Cost Benefit Analysis”/
-
exp “Cost Effectiveness Analysis”/
-
exp “Cost of Illness”/
-
exp “Cost Control”/
-
exp Economic Aspect/
-
exp Financial Management/
-
exp “Health Care Cost”/
-
exp Health Care Financing/
-
exp Health Economics/
-
exp “Hospital Cost”/
-
(financial or fiscal or finance or funding).tw.
-
exp “Cost Minimization Analysis”/
-
(cost adj estimate$).mp.
-
(cost adj variable$).mp.
-
(unit adj cost$).mp.
-
or/27-42
-
43 and 26 and 9
-
26 and 9
-
9 and 5
-
46 and 43
Economics: Cumulative Index to Nursing and Allied Health Literature
-
orlistat/
-
sibutramine/
-
sibutramine.ti,ab.
-
orlistat.ti,ab.
-
4 or 1 or 3 or 2
-
exp obesity/
-
obese.ti,ab.
-
obesity.ti,ab.
-
8 or 6 or 7
-
exp Financial Management/
-
exp *economics/
-
exp financial support/
-
exp financing organized/
-
exp business/
-
(cost or costs or economic$ or pharmacoeconomic$ or price$ or pricing$).tw.
-
Health resource allocation.sh.
-
Health resource utilization.sh.
-
orial or letter or news).pt.
-
(10 or 11 or 12 or 13 or 15 or 16 or 17) not (14 or 18)
-
19 and 9 and 5
Economics: Science Citation Index and ISI Conference Proceedings
-
#3 #2 AND #1
-
#2 ts=(cost* or price* economic* or budget* or fiscal* or fees* OR utilit* or value* or quality adjusted life year OR qaly)
-
#1 ts=(orlistat OR sibutramine OR xenical OR 96829-58-2 OR reductil OR meridia OR 106650-56-0 OR rimonabant OR sr141716 OR acomplia OR bethin OR monaslim OR remonabent OR riobant OR slimona OR rimoslim OR zimulti OR 158681-13-1)
Appendix 2 Clinical review
Data extraction form
For greater than two-arm trials use multiple sheets
Baseline data
Data should be converted to units given in table.
| Arm 1 | Arm 2 | |
|---|---|---|
| No. of participants | ||
| Age, mean | ||
| Sex, n (%) male | ||
| Systolic BP (mmHg) | ||
| Diastolic BP (mmHg) | ||
| Total cholesterol (mmol/l) | ||
| LDL (mmol/l) | ||
| HDL (mmol/l) | ||
| Triglycerides (mmol/l) | ||
| HbA1c (%) | ||
| Comorbidities | ||
| Diabetes | ||
| Previous CVD | ||
Withdrawals/adverse events
| Arm 1 | Arm 2 | |
|---|---|---|
| Total withdrawals | ||
| Discontinuation due to AE | ||
| Heart rate for sibutramine trials | ||
| Mean (SD) | ||
| No. high heart rate | ||
Primary outcomes
Complete one form per follow-up time per comparison Time point (months)
Appendix 3 Clinical review analyses
Reference list
Full-text articles excluded from the review (n = 67).
Sibutramine given in combination with another drug (n = 2)
-
Derosa G, D’Angelo A, Salvadeo SA, Ferrari I, Gravina I, Fogari E, et al. Sibutramine effect on metabolic control of obese patients with type 2 diabetes mellitus treated with pioglitazone. Metab Clin Exp 2008;57:1552–7.
-
Sanchez-Reyes L, Fanghanel G, Yamamoto J, Martinez-Rivas L, Campos-Franco E, Berber A. Use of sibutramine in overweight adult Hispanic patients with type 2 diabetes mellitus: a 12-month, randomized, double-blind, placebo-controlled clinical trial. Clin Ther 2004;26:1427–35.
Ineligible drug dose (n = 6)
-
Bougoulia M, Triantos A, Koliakos G. Effect of weight loss with or without orlistat treatment on adipocytokines, inflammation, and oxidative markers in obese women. Hormones 2006;5:259–69.
-
Gentile S, Guarino G, Padovano B, Buonocunto F, Gruppo Campano Obesità. Efficacia e sicurezza di impiego di un trattamento a breve termine con orlistata in soggetti obesi. Ann Ital Med Int 2005;20:90–6.
-
James WP, Astrup A, Finer N, Hilsted J, Kopelman P, Rossner S, et al. Effect of sibutramine on weight maintenance after weight loss: a randomised trial. STORM Study Group. Sibutramine Trial of Obesity Reduction and Maintenance. Lancet 2000;356:2119–25.
-
LeCheminant JD, Jacobsen D, Hall MA, Donnelly JE. A comparison of meal replacements and medication in weight maintenance after weight loss. J Am Coll Nutr 2005;24:347–53.
-
McMahon FG, Fujioka K, Singh BN, Mendel CM, Rowe E, Rolston K, et al. Efficacy and safety of sibutramine in obese white and African American patients with hypertension: a 1-year, double-blind, placebo-controlled, multicenter trial. Arch Intern Med 2000;160: 2185–91.
-
Wadden TA, Berkowitz RI, Sarwer DB, Prus-Wisniewski R, Steinberg C. Benefits of lifestyle modification in the pharmacologic treatment of obesity: a randomized trial. Arch Intern Med 2001;161:218–27.
Outcomes not reported/not fully reported (n = 7)
-
Bach DS, Rissanen AM, Mendel CM, Shepherd G, Weinstein SP, Kelly F, et al. Absence of cardiac valve dysfunction in obese patients treated with sibutramine. Obes Res 1999;7:363–9.
-
Halpern A, Leite CC, Herskowicz N, Barbato A, Costa AP. Evaluation of efficacy, reliability, and tolerability of sibutramine in obese patients, with an echocardiographic study. Rev Hosp Clin Fac Med Sao Paulo 2002;57:98–102.
-
James WP, Avenell A, Broom J, Whitehead J. A one-year trial to assess the value of orlistat in the management of obesity. Int J ObesRel Metab Disord 1997;21(Suppl. 3):24–30.
-
Kaukua JK, Pekkarinen TA, Rissanen AM. Health-related quality of life in a randomised placebo-controlled trial of sibutramine in obese patients with type II diabetes. Int J ObesRel Metab Disord 2004;28:600–5.
-
Quilliot D, Bohme P, Zannad F, Ziegler O. Sympathetic–leptin relationship in obesity: effect of weight loss. Metab Clin Exp 2008;57:555–62.
-
Sjostrom L, Rissanen A, Andersen T, Boldrin M, Golay A, Koppeschaar HP, et al. Randomised placebo-controlled trial of orlistat for weight loss and prevention of weight regain in obese patients. European Multicentre Orlistat Study Group. Lancet 1998;352:167–72.
-
Toornvliet AC, Pijl H, Frolich M, Westendorp RG, Meinders AE. Insulin and leptin concentrations in obese humans during long-term weight loss. Neth J Med 1997;51:96–102.
Non-English (n = 11)
-
Demidova TI, Selivanova AV, Ametov AS. [The role of fat tissue in development of metabolic disorders in patients with diabetes mellitus type 2 and obesity]. [Russian]. Ter Arkh 2006;78:64–9.
-
Gao X, Sun X, Zhao N, Pan B, Jiang S, Yi D, Lu Z. Level of free fat acid could be decreased in obese subjects after 6 months’ treatment with sibutramine. Fudan Univ J Med Sci 2002;29:239–43.
-
Hajdukovic Z, Jovelic A, Zivotic-Vanovic M, Raden S. [Influence of orlistat therapy on serum insulin level and morphological and functional parameters of peripheral arterial circulation in obese patients.] [Serbian.] Vojnosanit Pregl 2005;62:803–10.
-
Ivleva AI, Spiridonova IA, Maksimenko OK, Sivkova EB, Arutiunov AG. [Efficacy of orlistat in the treatment of constitutional-alimentary obesity in patients with high risk of cardiovascular complications.] [Russian.] Kardiologiia 2002;42:58–61.
-
Li R, Li Q, Luo R, Zhou B, Zhang S, Lui Z, et al. Effect of sibutramine in reducing body mass and its influencing factors. Chin J Clin Rehabil 2005;9:16–19.
-
Naumov VG, Lupanov VP, Dotsenko IuV, Tvorogova MG. [Six-month xenical (orlistat) therapy of patients with stable angina pectoris concomitant with obesity and hyperlipidemia.] [Russian.] Ter Arkh 2002;74:47–51.
-
Tong NW, Ran XW, Li QF, Tang BD, Li R, Yang FY, et al. [Effects of sibutramine on blood glucose and lipids, body fat mass and insulin resistance in obese patients: a multi-center clinical trial.] [Chinese.] Chung-Hua Nei Ko Tsa [ChihChinJ Intern Med] 2005;44:659–63.
-
Wang J-P, Yan Xg, Zhu X-P. Efficacy and safety of sibutramine in simple over-weighted and obese subjects. Bull Hunan Med Univ 2003;28:527–30.
-
Wu J, Lei M-X, Chen H-Ling. Serum leptin and insulin resistance in obesity and effects of sibutramine on them. Bull Hunan Med Univ 2003;28:605–7.
-
Wu J, Zhu C-L, Shao X-H, Zou D-J. Pharmacotherapeutic weight loss in treatment of overweight type 2 diabetes patients. Acad J Second Mil Med Univ 2006;27:531–4.
-
Zhao Y, Wang X, Yan Z. [A randomized, double-blind, placebo-controlled, multicenter study on sibutramine in over-weighted and obese subjects.] [Chinese.] Chung-Hua Yu Fang i Hsueh Tsa Chih [Chin J Prev Med] 2001;35:329–32.
Non-randomised (n = 3)
-
Lazurova I, Dravecka I, Kraus V, Petrovicova J. Metformin versus sibutramine in the treatment of hyperinsulinemia in chronically anovulating women. Bratisl Lek Listy 2004;105:207–10.
-
Pomara F, Gravante G, Russo G, Amato G. Diet associated with regular physical activity or drugs: a longitudinal study on obesity management. Minerva Gastroenterol Dietol 2003;49:141–5.
-
Sabuncu T, Nazligul Y, Karaoglanoglu M, Ucar E, Kilic FB. The effects of sibutramine and orlistat on the ultrasonographic findings, insulin resistance and liver enzyme levels in obese patients with non-alcoholic steatohepatitis. Rom J Gastroenterol 2003;12:189–92.
Review (n = 5)
-
Anderson JW. Orlistat enhances the hypocholesterolemic effects of an energy-restricted diet. Future Lipidol 2007;2:109–13.
-
Bray GA. Lifestyle and pharmacological approaches to weight loss: efficacy and safety. J Clin Endocrinol Metab 2008;93(Suppl. 1):81–8.
-
Heymsfield SB, Segal KR, Hauptman J, Lucas CP, Boldrin MN, Rissanen A, et al. Effects of weight loss with orlistat on glucose tolerance and progression to type 2 diabetes in obese adults. Arch Intern Med 2000;160:1321.
-
Hollander P, Hollander P. Endocannabinoid blockade for improving glycemic control and lipids in patients with type 2 diabetes mellitus. Am J Med 2007;120(Suppl. 1):18–28.
-
Leopold K, Wechsler JG. [Obesity: gradual-schedule therapy and long-term results.] [German.] MMW Fortschr Med 2001;143:I–VIII.
Duplicate publication (n = 16)
-
Bray GA, Ryan DH, Gordon D, Heidingsfelder S, Cerise F, Wilson K. A double-blind randomized placebo-controlled trial of sibutramine. Obes Res 1996;4:263–70.
-
Frey UH, Hauner H, Jockel KH, Manthey I, Brockmeyer N, Siffert W. A novel promoter polymorphism in the human gene GNAS affects binding of transcription factor upstream stimulatory factor 1, Galphas protein expression and body weight regulation. Pharmacogenet Genomics 2008;18:141–51.
-
Hansen D, Astrup A, Toubro S, Finer N, Kopelman P, Hilsted J, et al. Predictors of weight loss and maintenance during 2 years of treatment by sibutramine in obesity. Results from the European multi-centre STORM trial. Sibutramine Trial of Obesity Reduction and Maintenance. Int J ObesRel Metab Disord 2001;25:496–501.
-
Hauner H, Meier M, Jockel KH, Frey UH, Siffert W. Prediction of successful weight reduction under sibutramine therapy through genotyping of the G-protein beta3 subunit gene (GNB3) C825T polymorphism. Pharmacogenetics 2003;13:453–9.
-
Hollanders P. Orlistat enhances weight loss in obese patients with diabetes. Am Fam Physician 1997;56:566.
-
Karhunen L, Franssila-Kallunki A, Rissanen P, Valve R, Kolehmainen M, Rissanen A, et al. Effect of orlistat treatment on body composition and resting energy expenditure during a two-year weight-reduction programme in obese Finns. Int J ObesRel Metab Disord 2000;24:1567–72.
-
Levinson PD. Commentary. Evid Base Med 2001;6:54.
-
Mathus-Vliegen EM, Van Ierland-Van Leeuwen ML, Terpstra A. Lipase inhibition by orlistat: effects on gall-bladder kinetics and cholecystokinin release in obesity. Aliment Pharmacol Ther 2004;19:601–11.
-
Patschan S, Scholze J. Obesity-related hypertension. Cardiol Rev 2007;24:32–5.
-
Phelan S, Wadden TA, Berkowitz RI, Sarwer DB, Womble LG, Cato RK et al. Impact of weight loss on the metabolic syndrome. Int J Obes 2007;31:1442–8.
-
Reaven G, Segal K, Hauptman J, Boldrin M, Lucas C. Effect of orlistat-assisted weight loss in decreasing coronary heart disease risk in patients with syndrome X. Am J Cardiol 2001;87:827–31.
-
Rissanen P, Vahtera E, Krusius T, Uusitupa M, Rissanen A. Weight change and blood coagulability and fibrinolysis in healthy obese women. Int J ObesRel Metab Disord 2001;25:212–18.
-
Sibutramine significantly decreases body weight in women with PCOS. Nature Clin Pract Endocrinol Metab 2008;4:478–9.
-
Sjöström L. Analysis of the XENDOS study (Xenical in the Prevention of Diabetes in Obese Subjects). Endocr Pract 2006;12(Suppl. 1):31–3.
-
Toubro S, Hansen DL, Hilsted JC, Porsborg PA, Astrup AV. [The effect of sibutramine for the maintenance of weight loss. A randomized controlled clinical trial.] [Danish.] Ugeskr Laeger 2001;163:2935–40.
-
Vidgren HM, Agren JJ, Valve RS, Karhunen LJ, Rissanen AM, Uusitupa MI. The effect of orlistat on the fatty acid composition of serum lipid fractions in obese subjects. Clin Pharmacol Ther 1999;66:315–22.
Substudy of included trial (n = 10)
-
Audikovszky M, Pados G, Seres I, Harangi M, Fulop P, Katona E, et al. [Changes in lipid profile and paraoxonase activity in obese patients as a result of orlistat treatment.] [Hungarian.] Orv Hetil 2001;142:2779–83.
-
Fabricatore AN, Wadden TA, Womble LG, Sarwer DB, Berkowitz RI, Foster GD, et al. The role of patients’ expectations and goals in the behavioral and pharmacological treatment of obesity. Int J Obes 2007;31:1739–45.
-
Gotfredsen A, Westergren A, Hendel H, Andersen T. Influence of orlistat on bone turnover and body composition. Int J ObesRel Metab Disord 2001;25:1154–60.
-
Madsen EL, Rissanen A, Bruun JM, Skogstrand K, Tonstad S, Hougaard DM, et al. Weight loss larger than 10% is needed for general improvement of levels of circulating adiponectin and markers of inflammation in obese subjects: a 3-year weight loss study. Eur J Endocrinol 2008;158:179–87.
-
Malone DC, Raebel MA, Porter JA, Lanty FA, Conner DA, Gay EC, et al. Cost-effectiveness of sibutramine in the LOSE Weight Study: evaluating the role of pharmacologic weight-loss therapy within a weight management program. J Manag Care Pharm 2005;11:458–68.
-
Pinkston MM, Poston WS, Reeves RS, Haddock CK, Taylor JE, Foreyt JP. Does metabolic syndrome mitigate weight loss in overweight Mexican American women treated for 1 year with orlistat and lifestyle modification? Eat Weight Disord 2006;11:e35–41.
-
Rosenfalck AM, Hendel H, Rasmussen MH, Almdal T, Anderson T, Hilsted J, et al. Minor long-term changes in weight have beneficial effects on insulin sensitivity and beta-cell function in obese subjects. Diabetes Obes Metab 2002;4:19–28.
-
Samuelsson L, Gottsater A, Lindgarde F. Decreasing levels of tumour necrosis factor alpha and interleukin 6 during lowering of body mass index with orlistat or placebo in obese subjects with cardiovascular risk factors. Diabetes Obes Metab 2003;5:195–201.
-
Svendsen M, Rissanen A, Richelsen B, Rossner S, Hansson F, Tonstad S. Effect of orlistat on eating behavior among participants in a 3-year weight maintenance trial. Obesity 2008;16:327–33.
-
Wadden TA, Berkowitz RI, Womble LG, Sarwer DB, Arnold ME, Steinberg CM. Effects of sibutramine plus orlistat in obese women following 1 year of treatment by sibutramine alone: a placebo-controlled trial. Obes Res 2000;8:431–7.
Follow-up data not at 3, 6 or 12 months (n = 7)
-
Early JL, Apovian CM, Aronne LJ, Fernstrom MH, Frank A, Greenway FL, et al. Sibutramine plus meal replacement therapy for body weight loss and maintenance in obese patients. Obesity 2007;15:1464–72.
-
Gursoy A, Erdogan MF, Cin MO, Cesur M, Baskal N. Comparison of orlistat and sibutramine in an obesity management program: efficacy, compliance, and weight regain after noncompliance. Eat Weight Disord 2006;11:e127–132.
-
Hainer V, Kabrnova K, Aldhoon B, Kunesova M, Wagenknecht M. Serotonin and norepinephrine reuptake inhibition and eating behavior. Ann N Y Acad Sci 2006;1083:252–69.
-
Nissen SE, Nicholls SJ, Wolski K, Rodes-Cabau J, Cannon CP, Deanfield E, et al. Effect of rimonabant on progression of atherosclerosis in patients with abdominal obesity and coronary artery disease: the STRADIVARIUS randomized controlled trial. JAMA 2008;299:1547–60.
-
Redmon JB, Reck KP, Raatz SK, Swanson JE, Kwong CA, Ji H, et al. Two-year outcome of a combination of weight loss therapies for type 2 diabetes. Diabetes Care 2005;28:1311–15.
-
Richelsen B, Tonstad S, Rossner S, Toubro S, Niskanen L, Madsbad S, et al. Effect of orlistat on weight regain and cardiovascular risk factors following a very-low-energy diet in abdominally obese patients: a 3-year randomized, placebo-controlled study. Diabetes Care 2007;30:27–32.
-
Torgerson JS, Hauptman J, Boldrin MN, Sjöström L. XENical in the Prevention of Diabetes in Obese Subjects (XENDOS) Study: a randomized study of orlistat as an adjunct to lifestyle changes for the prevention of type 2 diabetes in obese patients. Diabetes Care 2004;27:155–61.
FIGURE 14.
Forest plots for pair-wise meta-analysis: (a) 3-month 5% weight-loss data, (b) 6-month 5% weight-loss data, (c) 12-month 5% weight-loss data, (d) 3-month 10% weight-loss data, (e) 6-month 10% weight-loss data, (f) 12-month 10% weight-loss data, (g) 3-month weight change data, (h) 6-month weight change data, (i) 12-month weight change data, (j) 3-month BMI change data, (k) 6-month BMI change data, (l) 12-month BMI change data. Note: weights are from random-effects analysis. ES, estimate of mean difference.


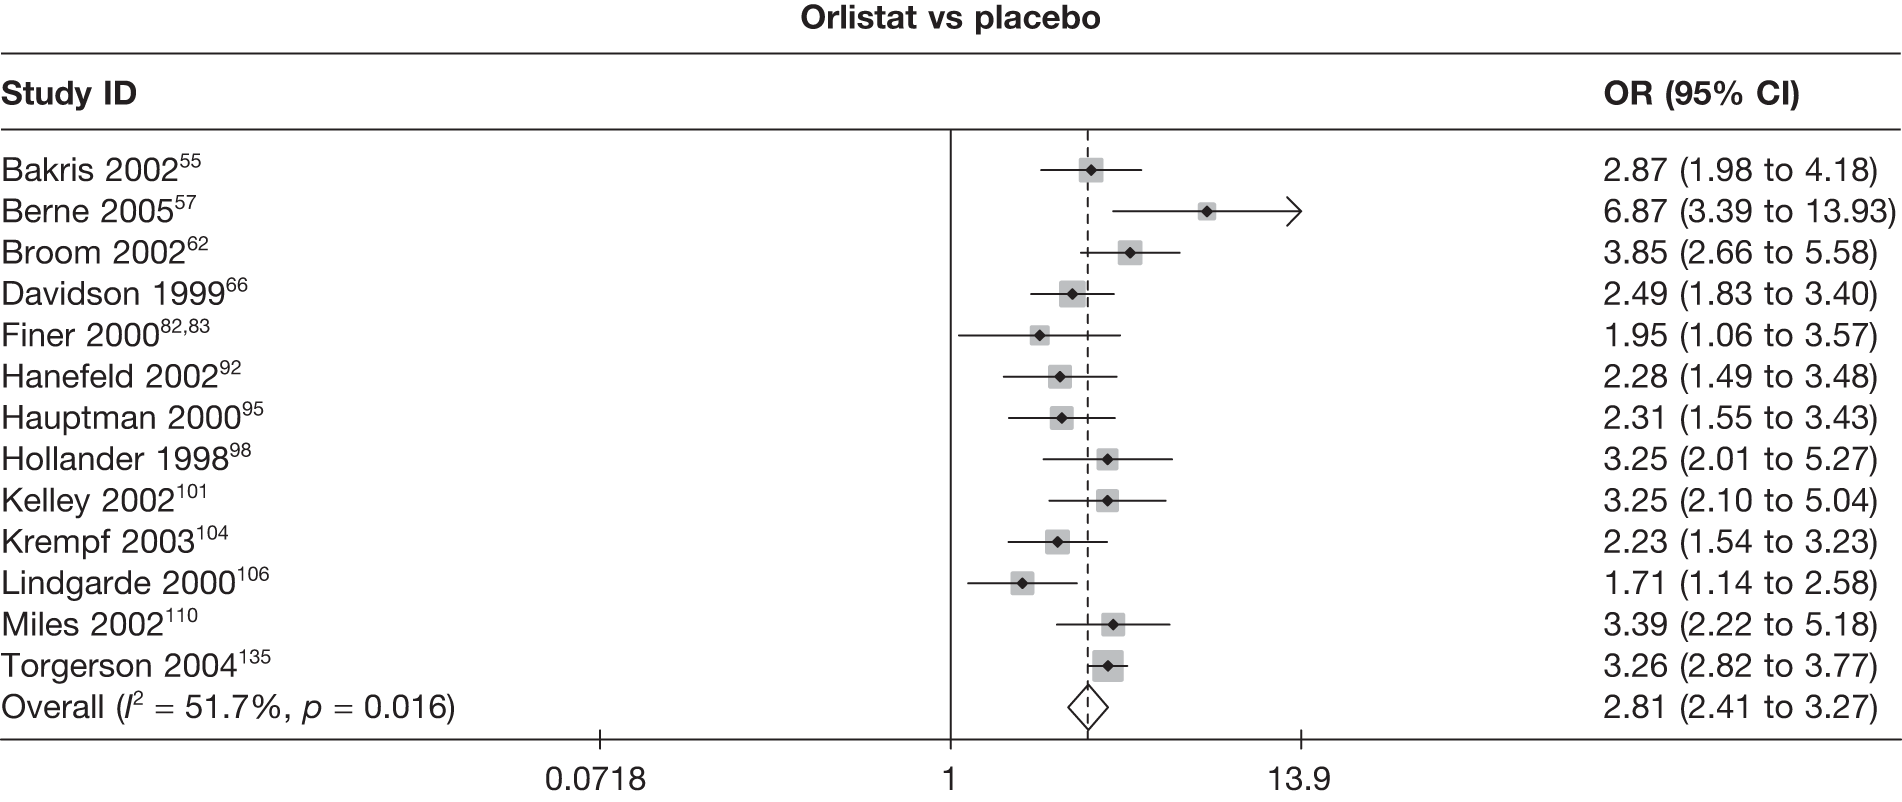


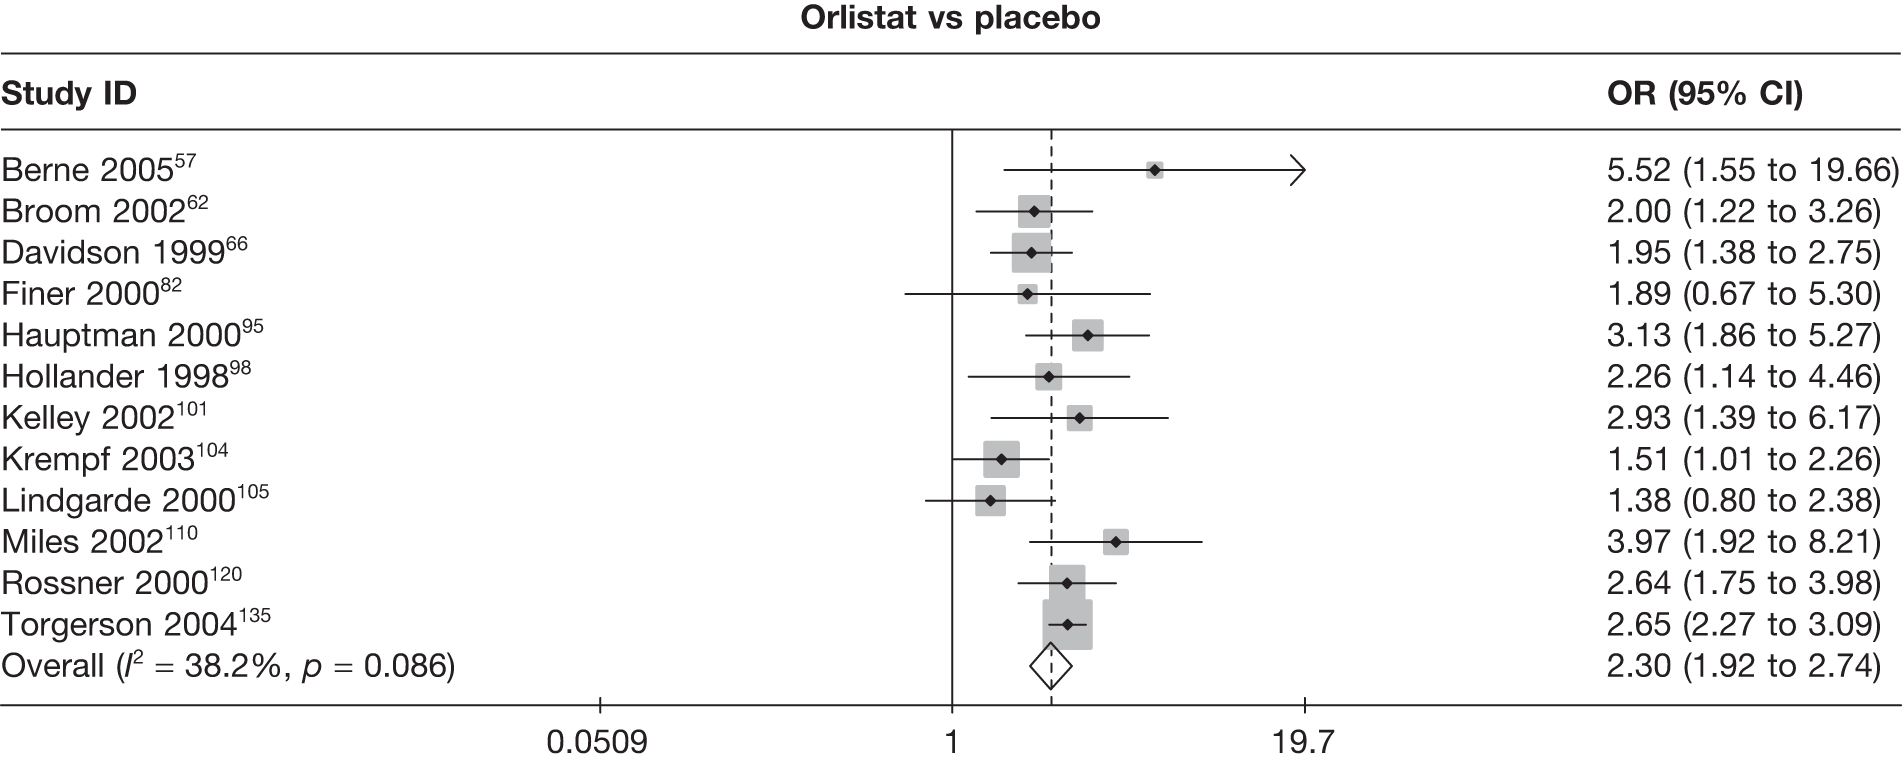


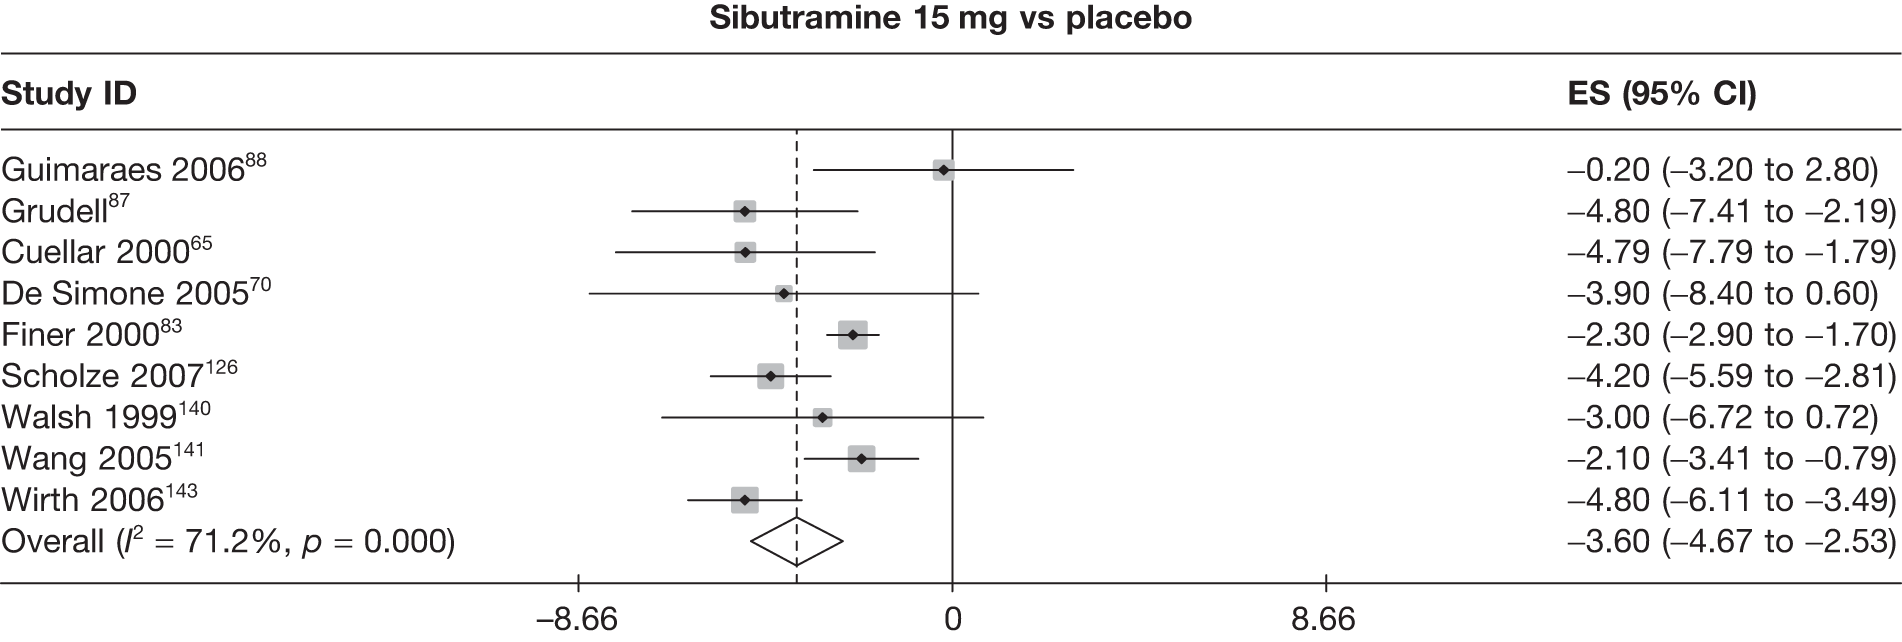


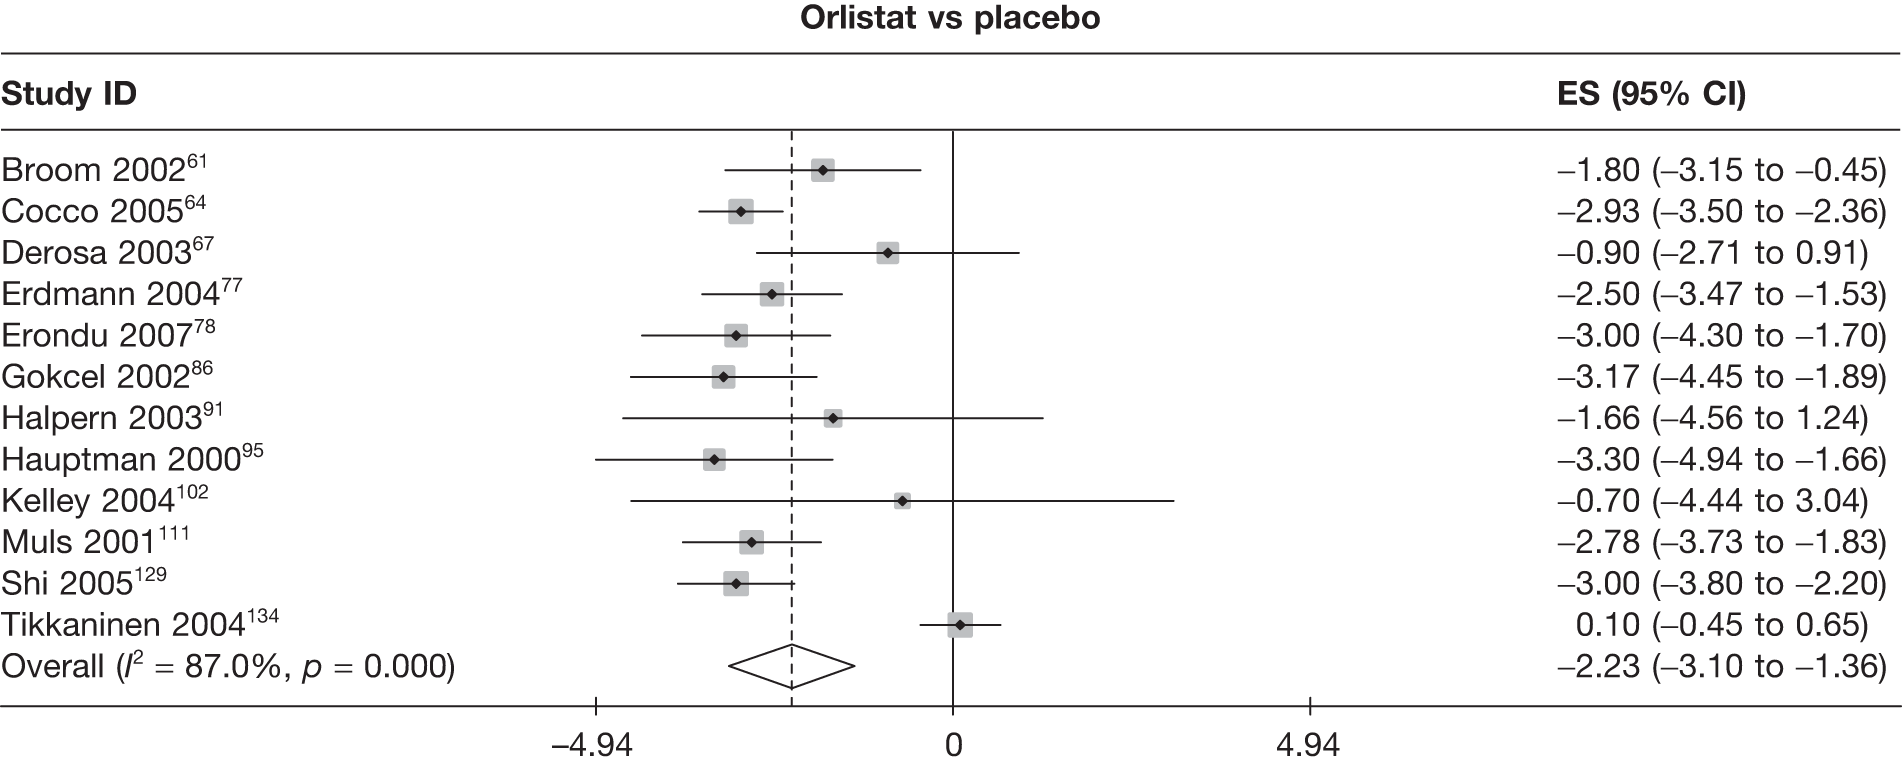


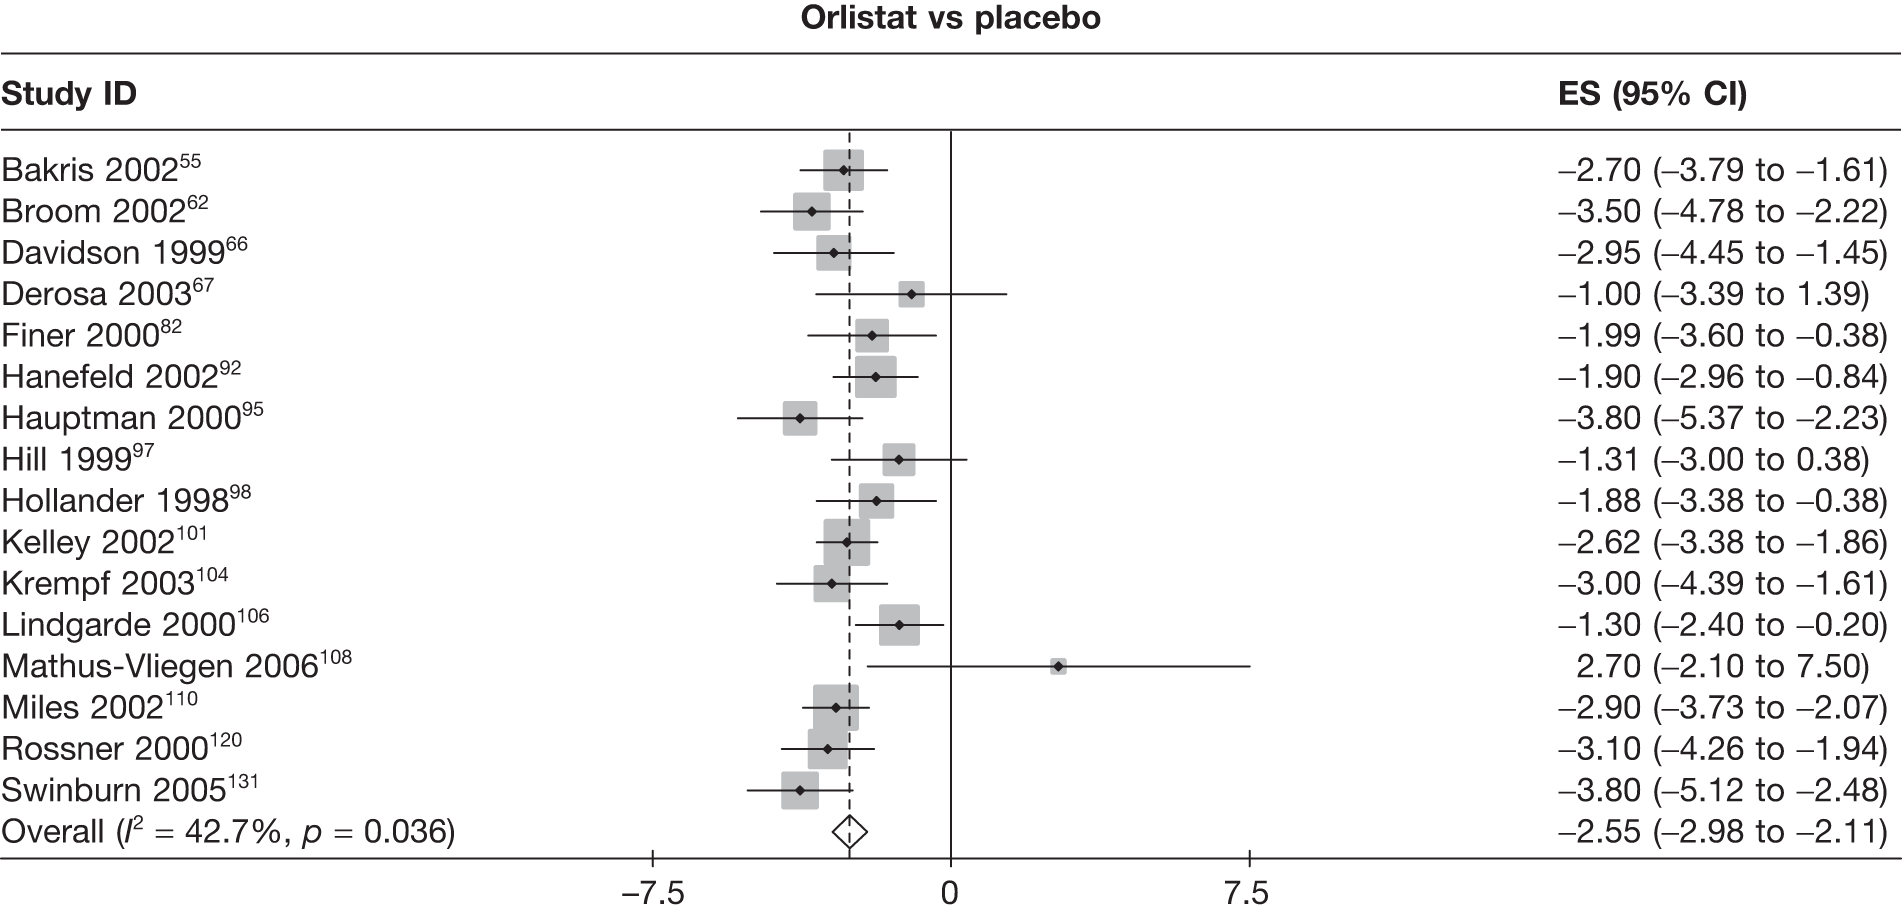


FIGURE 15.
Funnel plots. Funnel plots shown only for those comparisons with five or more studies included. (a) Sibutramine vs placebo, 6-month 5% weight loss – log-OR. (b) Orlistat vs placebo, 12-month 5% weight loss – log-OR. (c) Orlistat vs placebo, 6-month 10% weight loss – log-OR. (d) Sibutramine 10 mg vs placebo, 6-month 10% weight loss – log-OR. (e) Orlistat vs placebo, 12-month 10% weight loss – log-OR. (f) Sibutramine 15 mg vs placebo, 3-month weight change. (g) Orlistat vs standard care, 3-month weight change. (h) Orlistat vs placebo, 6-month weight change. (i) Orlistat vs standard care, 6-month weight change. (j) Orlistat vs placebo, 12-month weight change. (k) Sibutramine 10 mg vs orlistat, 3-month BMI change. (l) Sibutramine 15 mg vs placebo, 3-month BMI change. (m) Orlistat vs standard care, 3-month BMI change. (n) Sibutramine 10 mg vs standard care, 3-month BMI change.
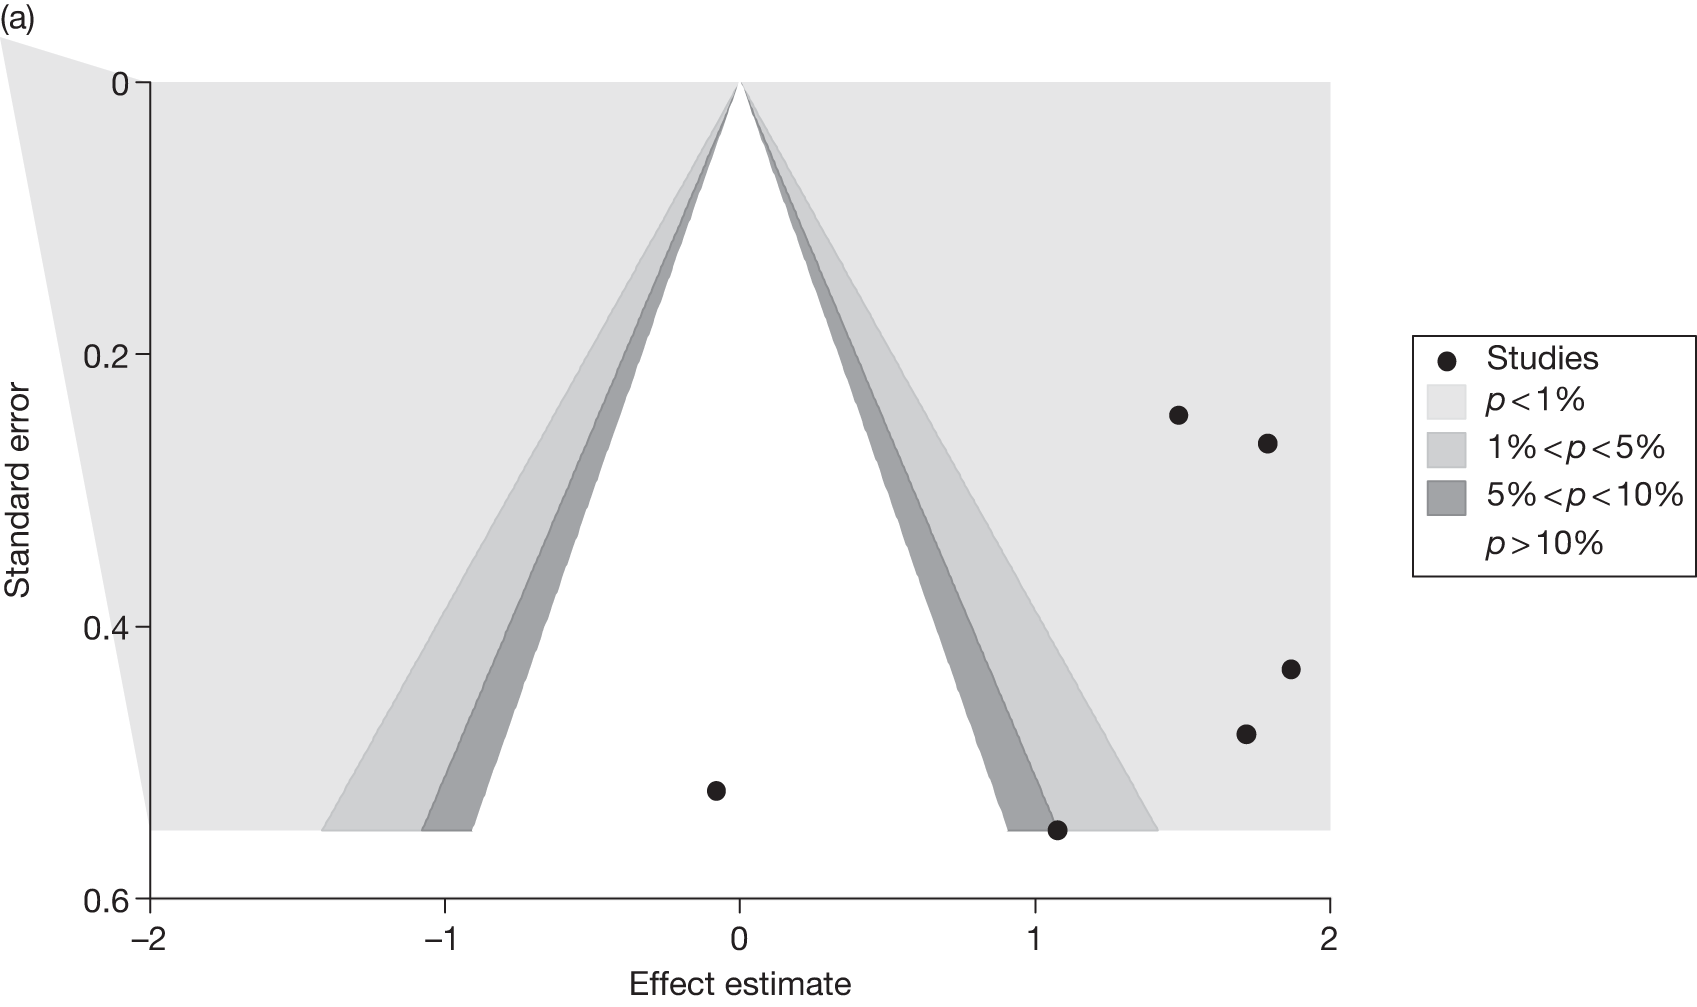
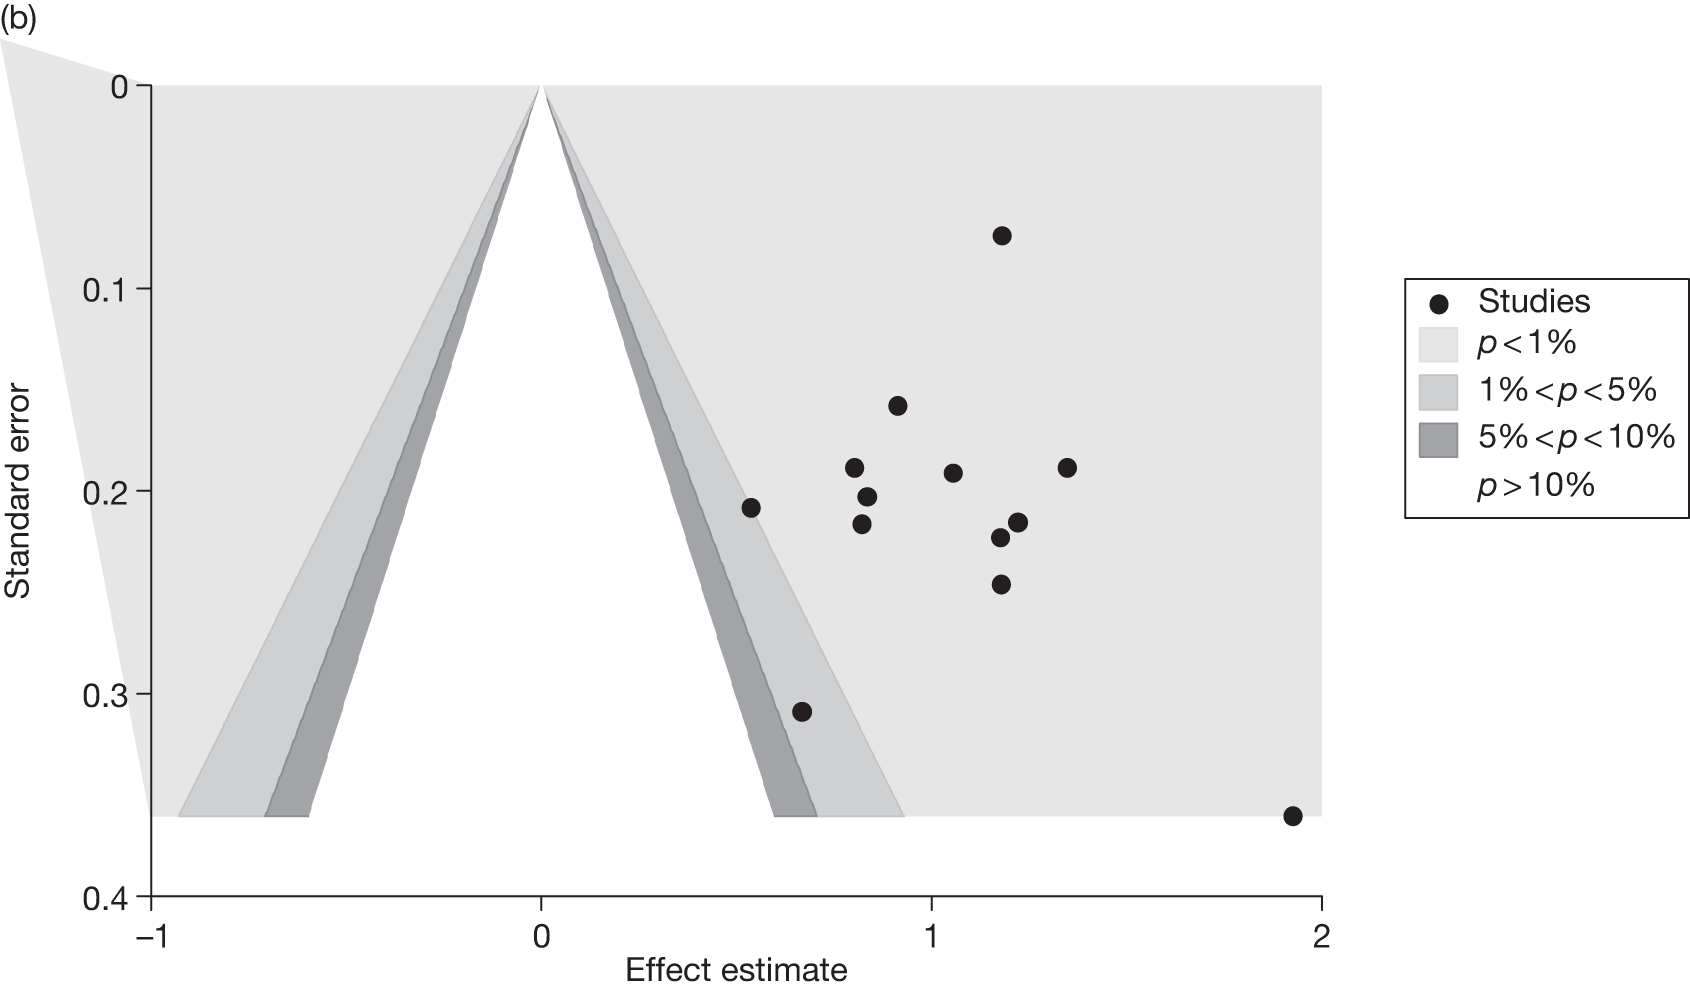
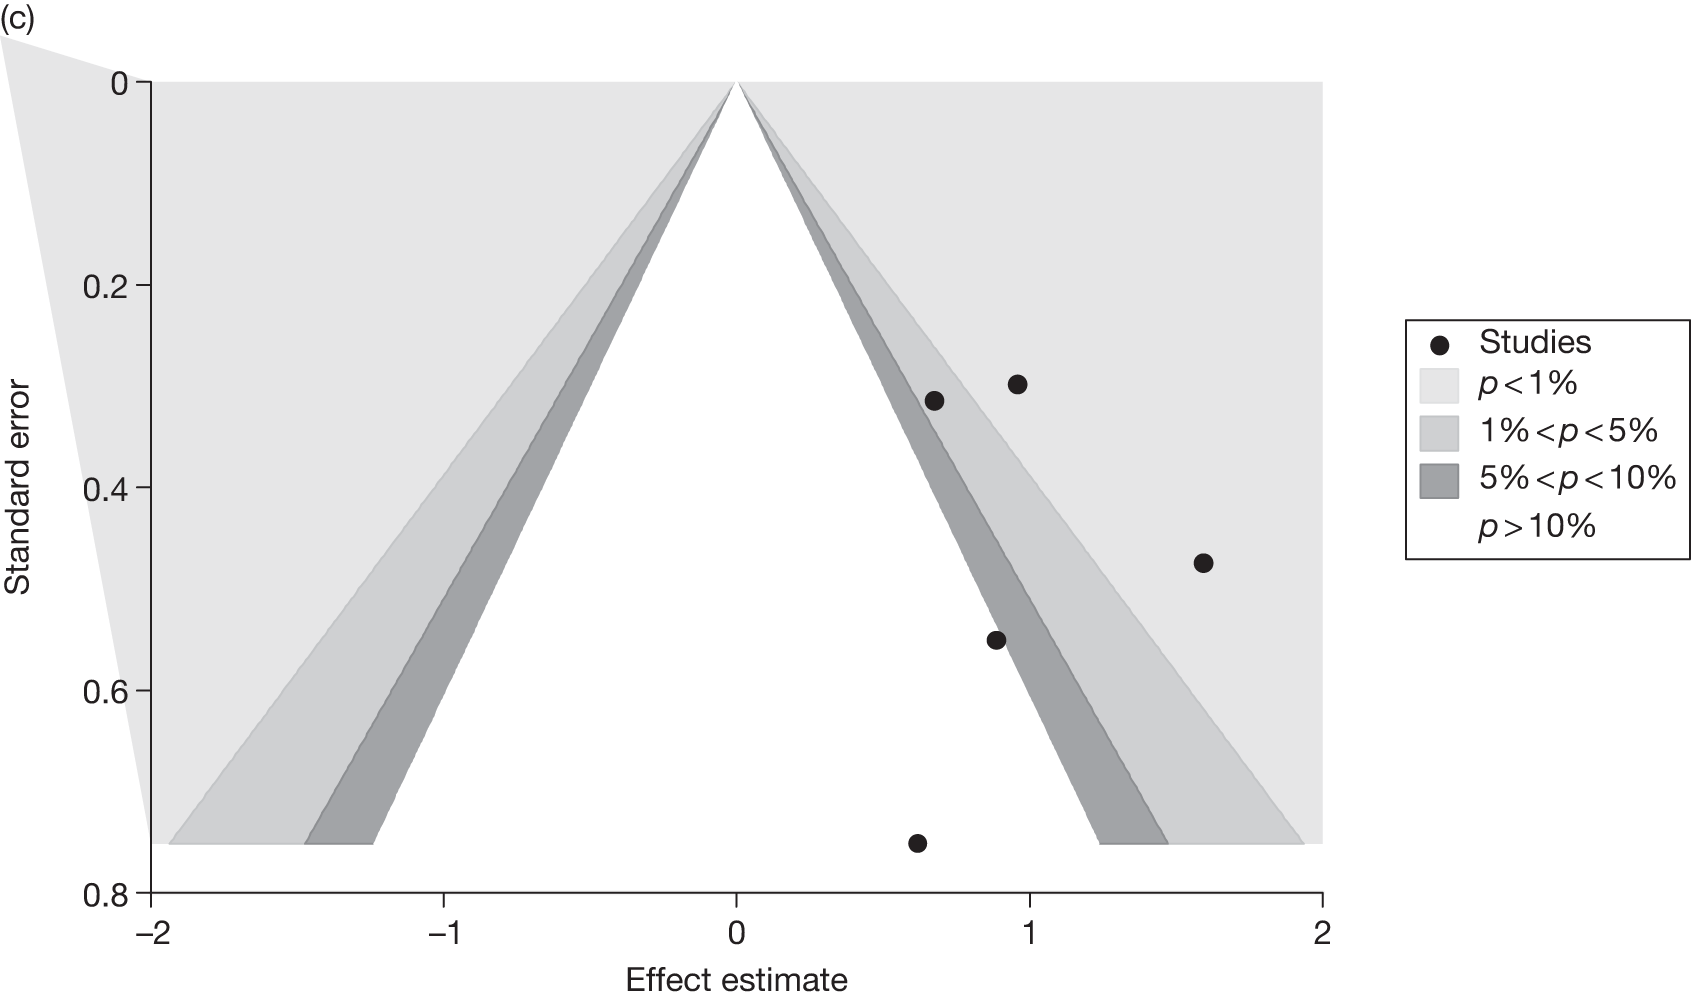
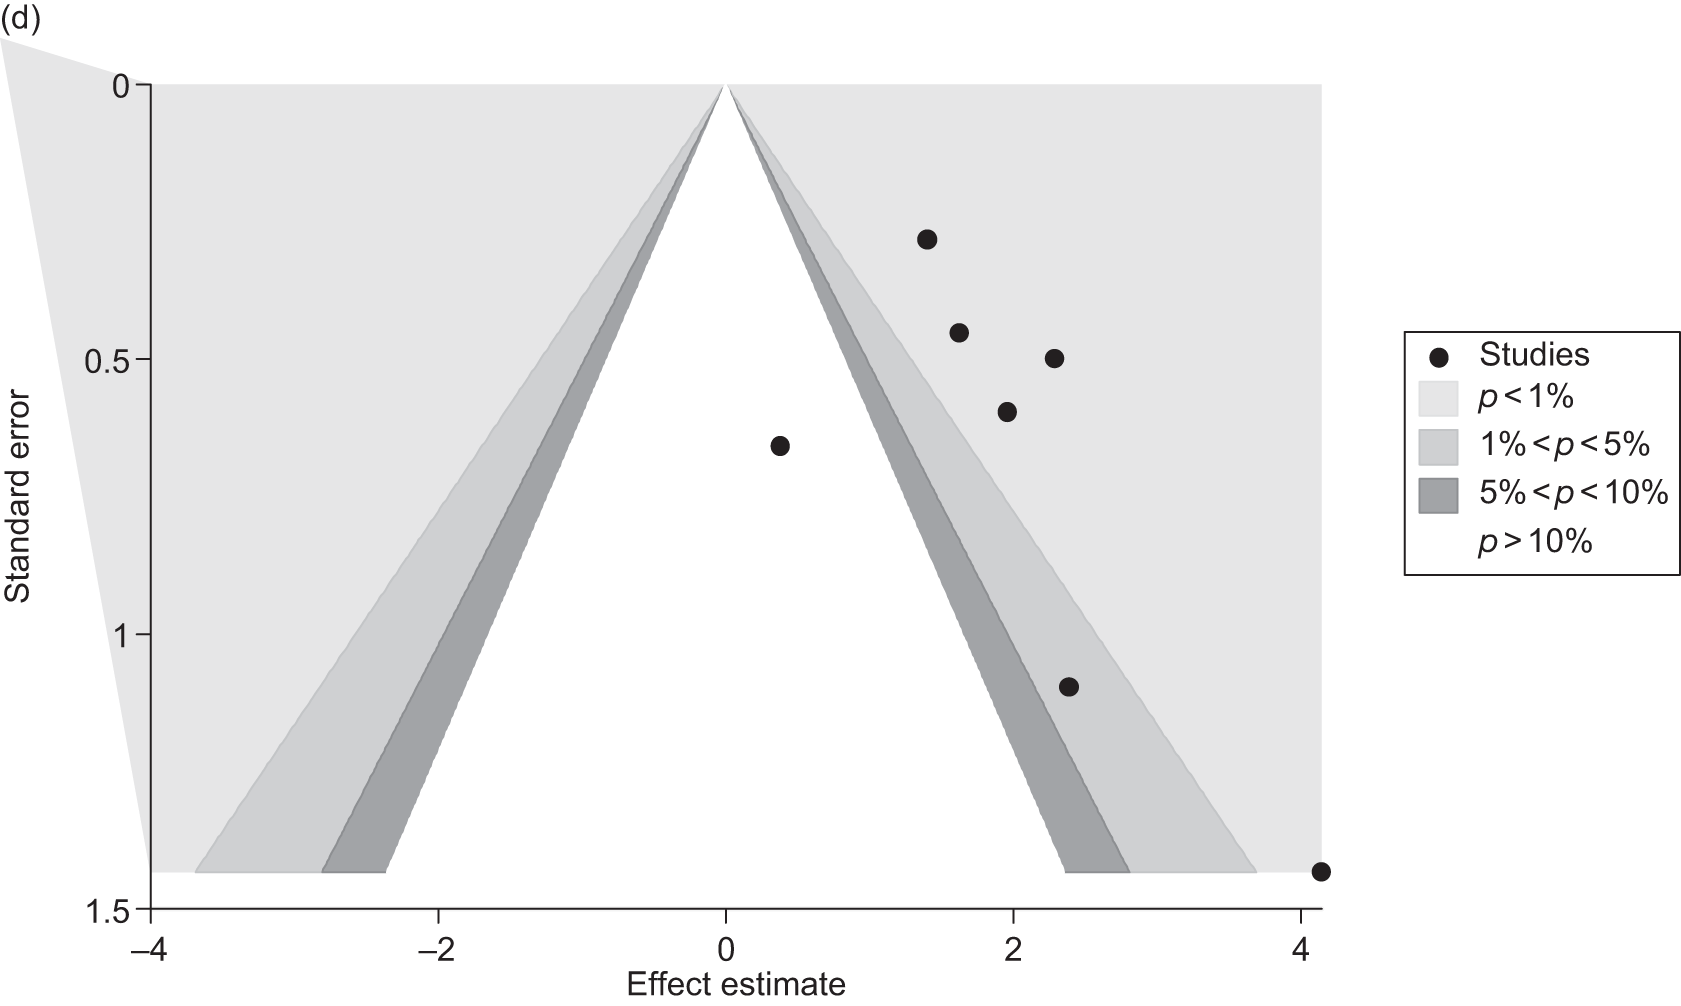
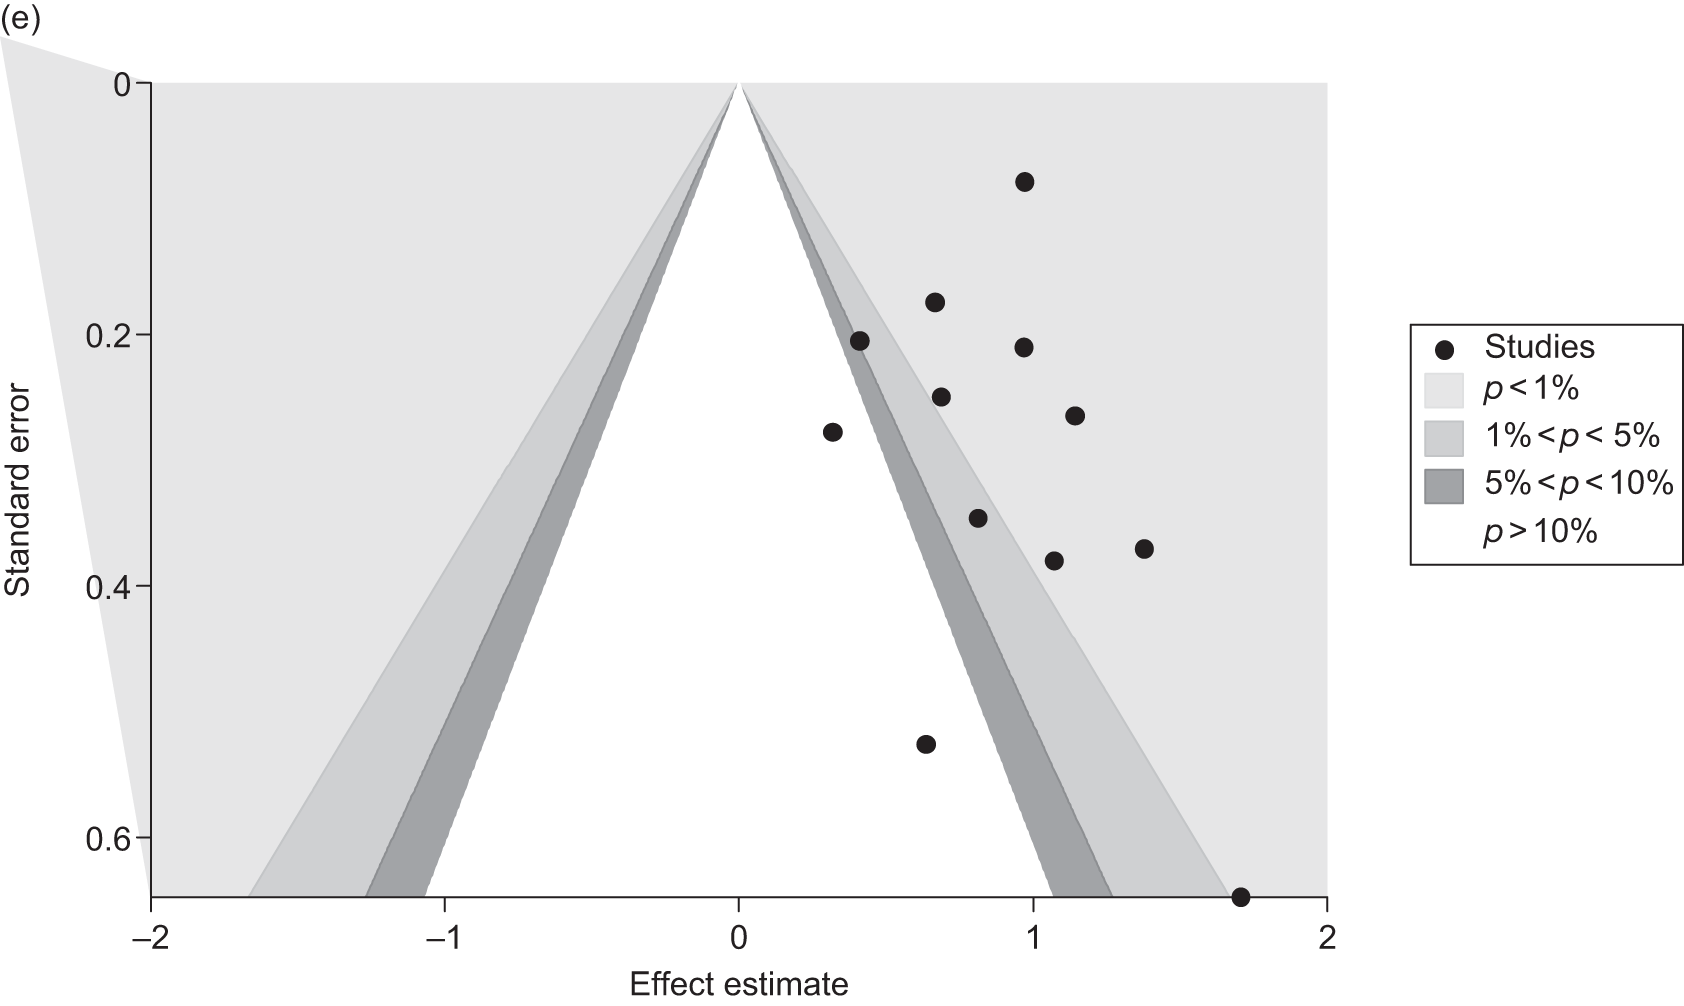
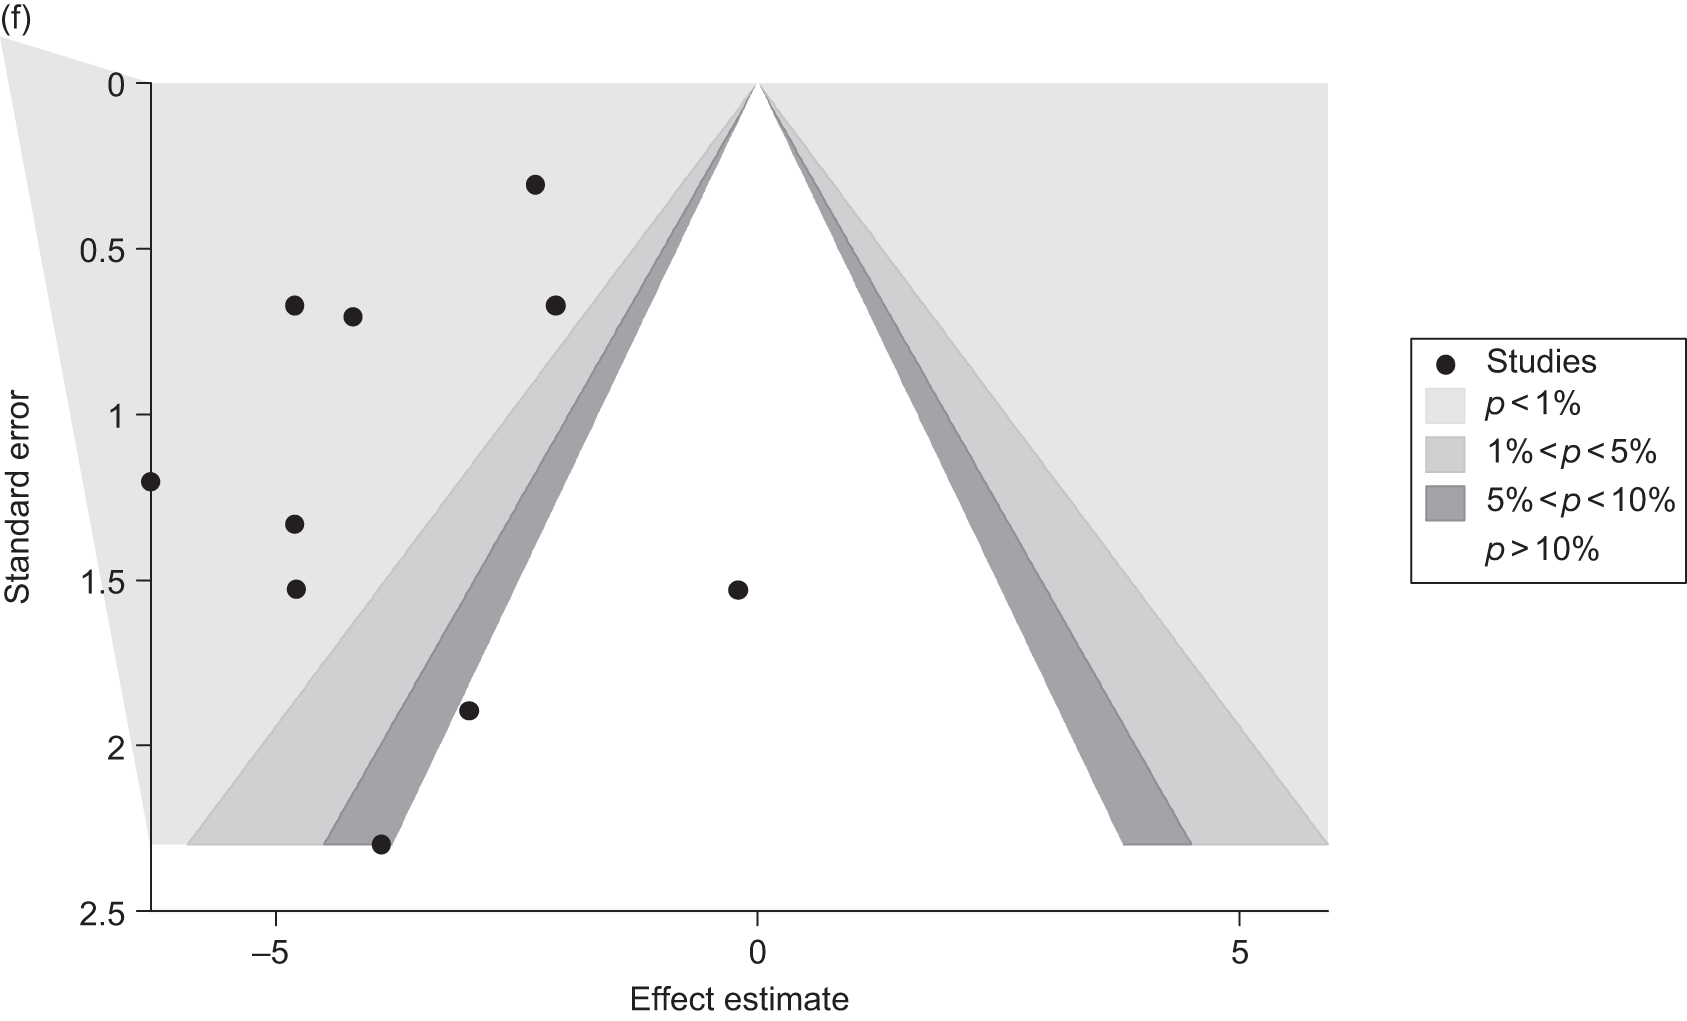
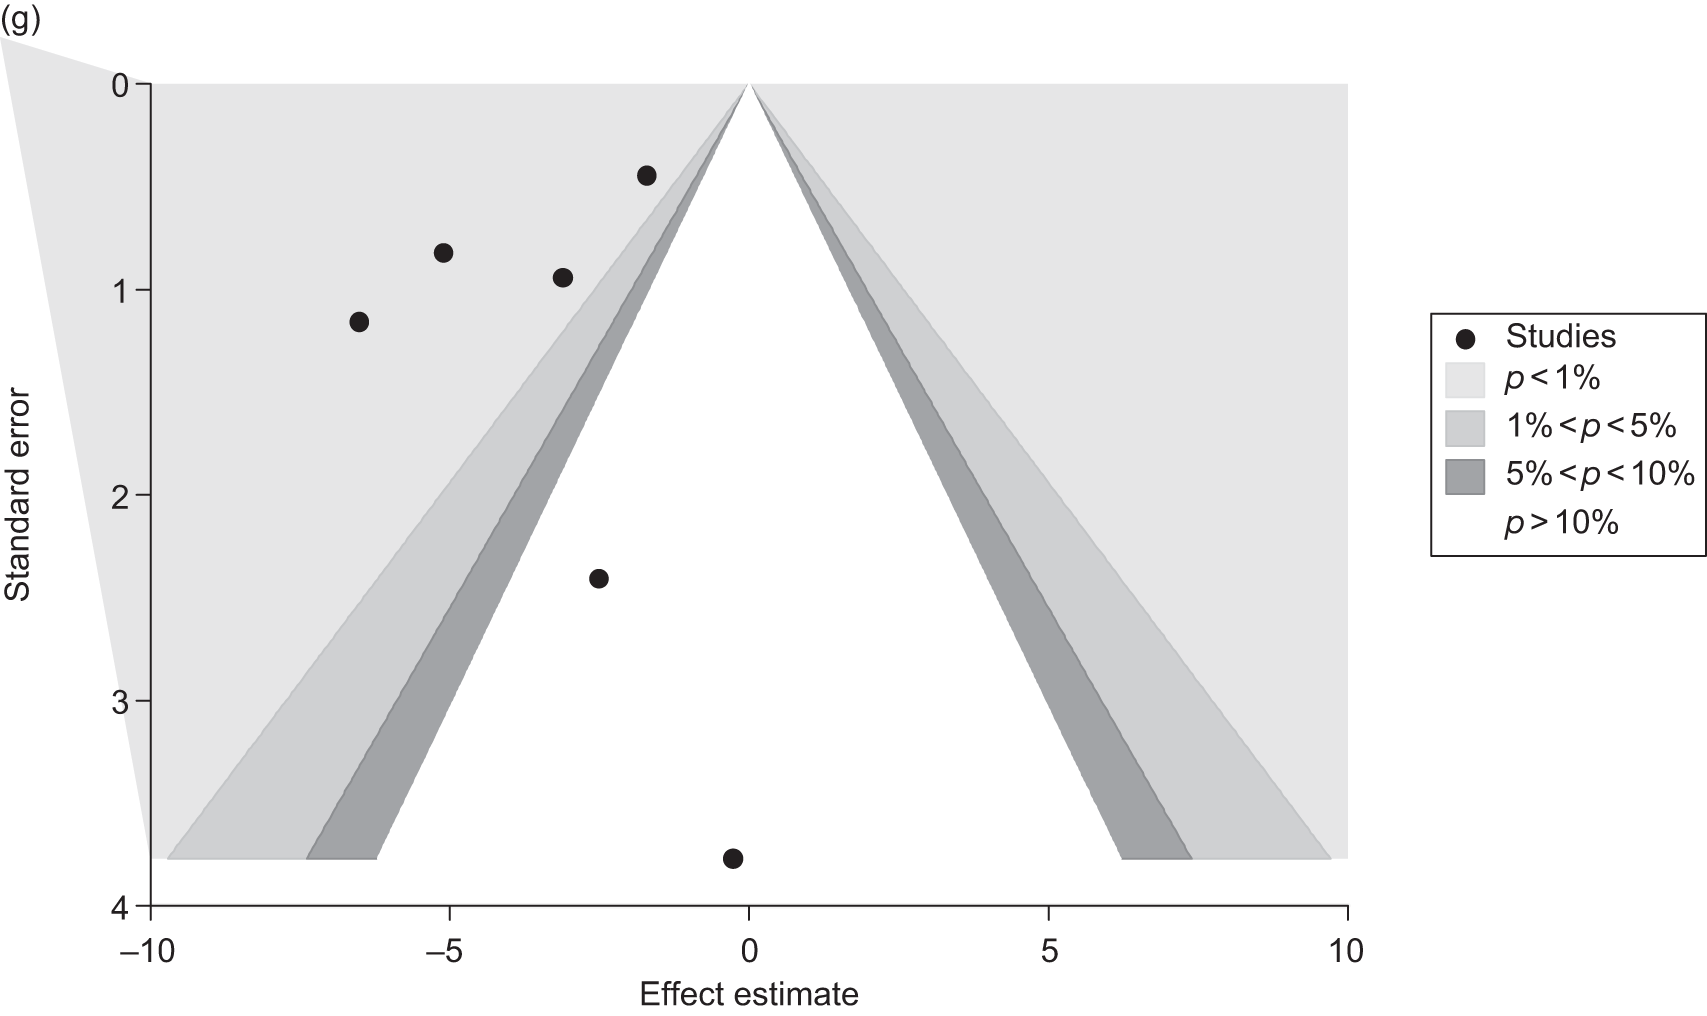
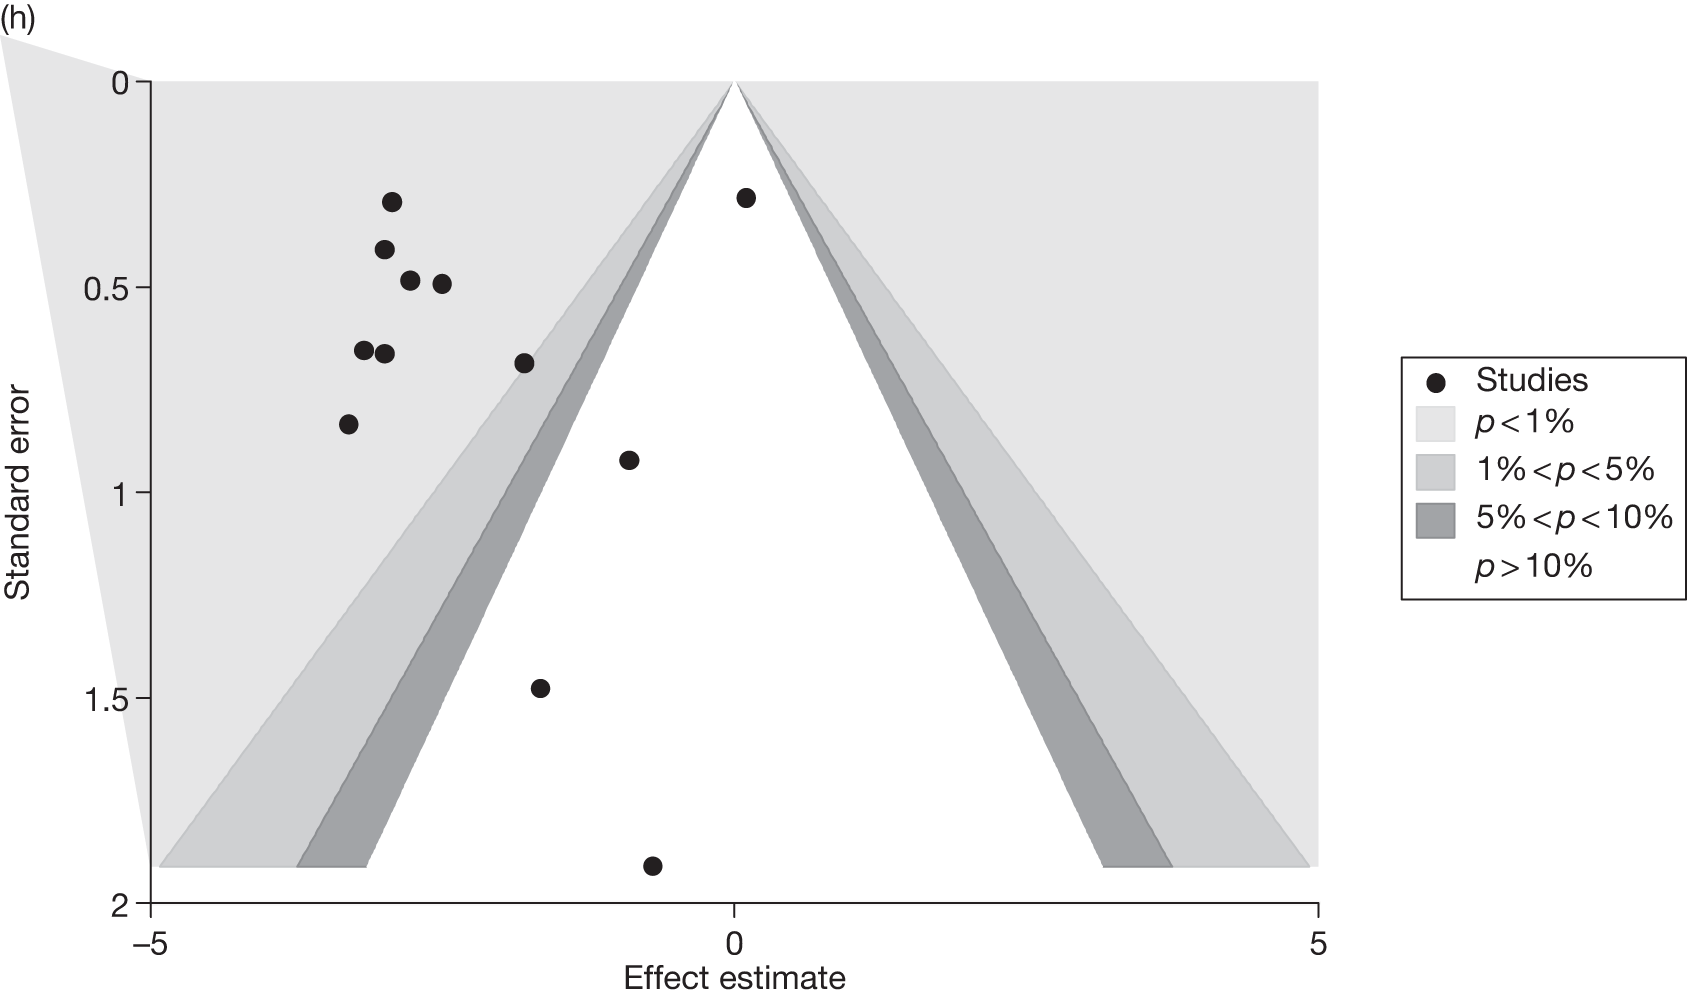
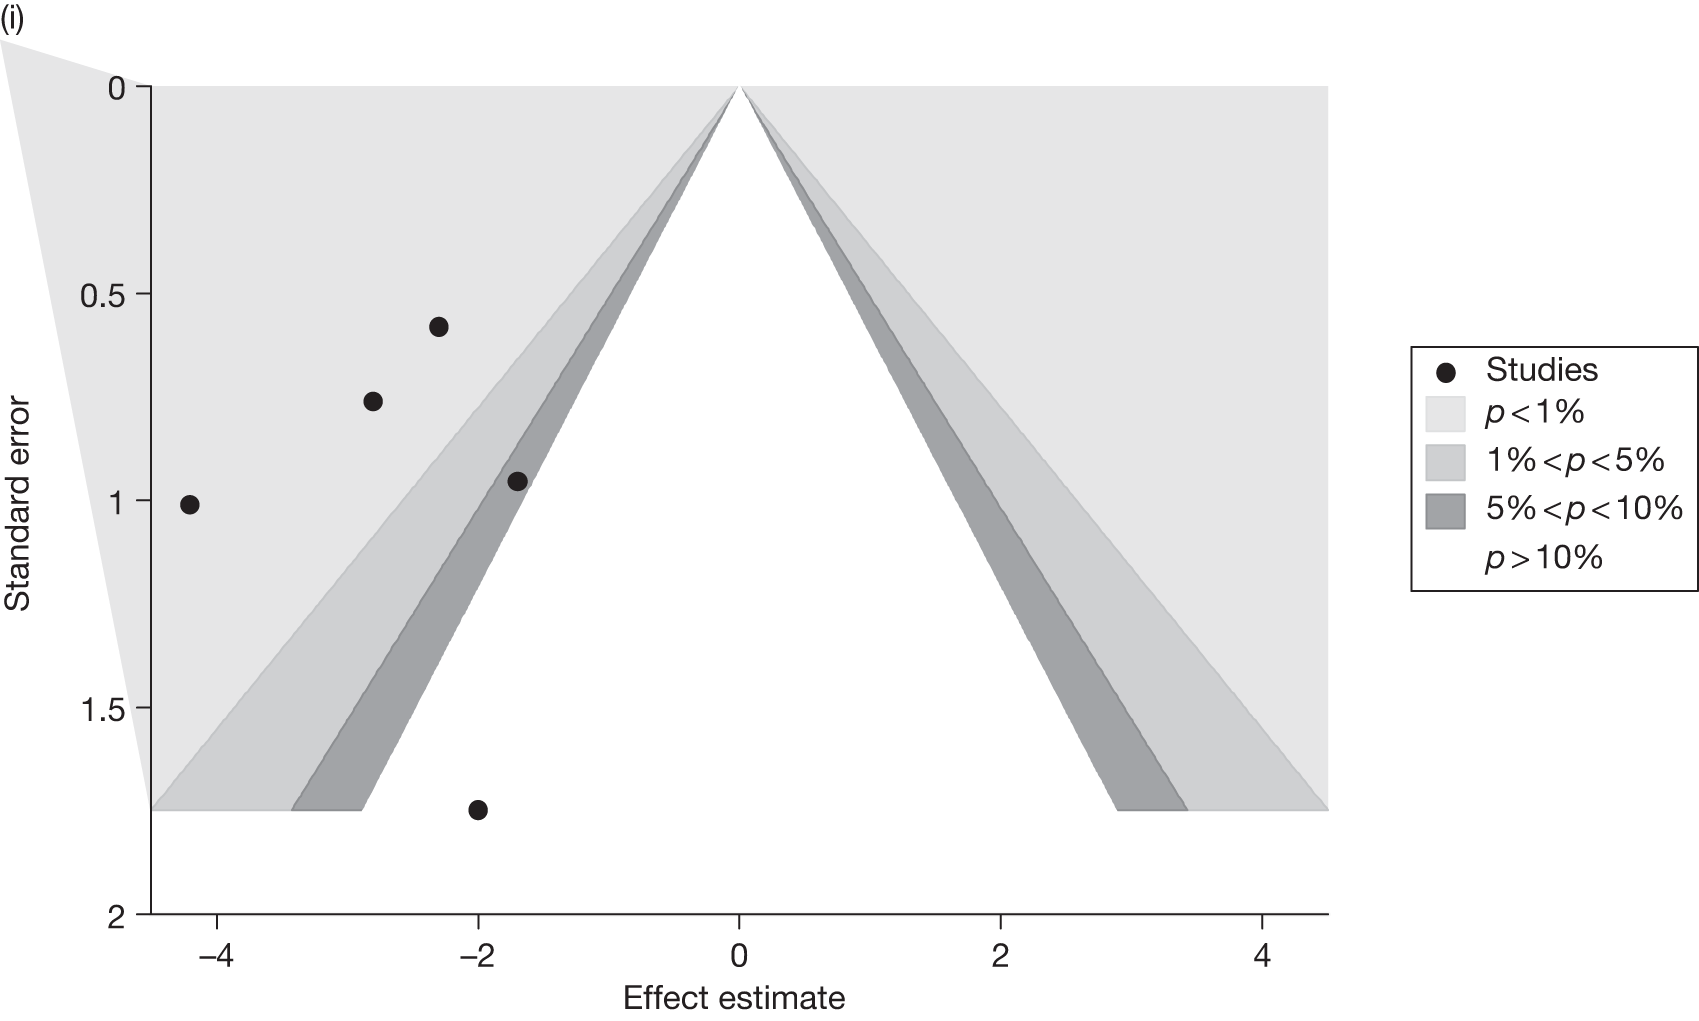
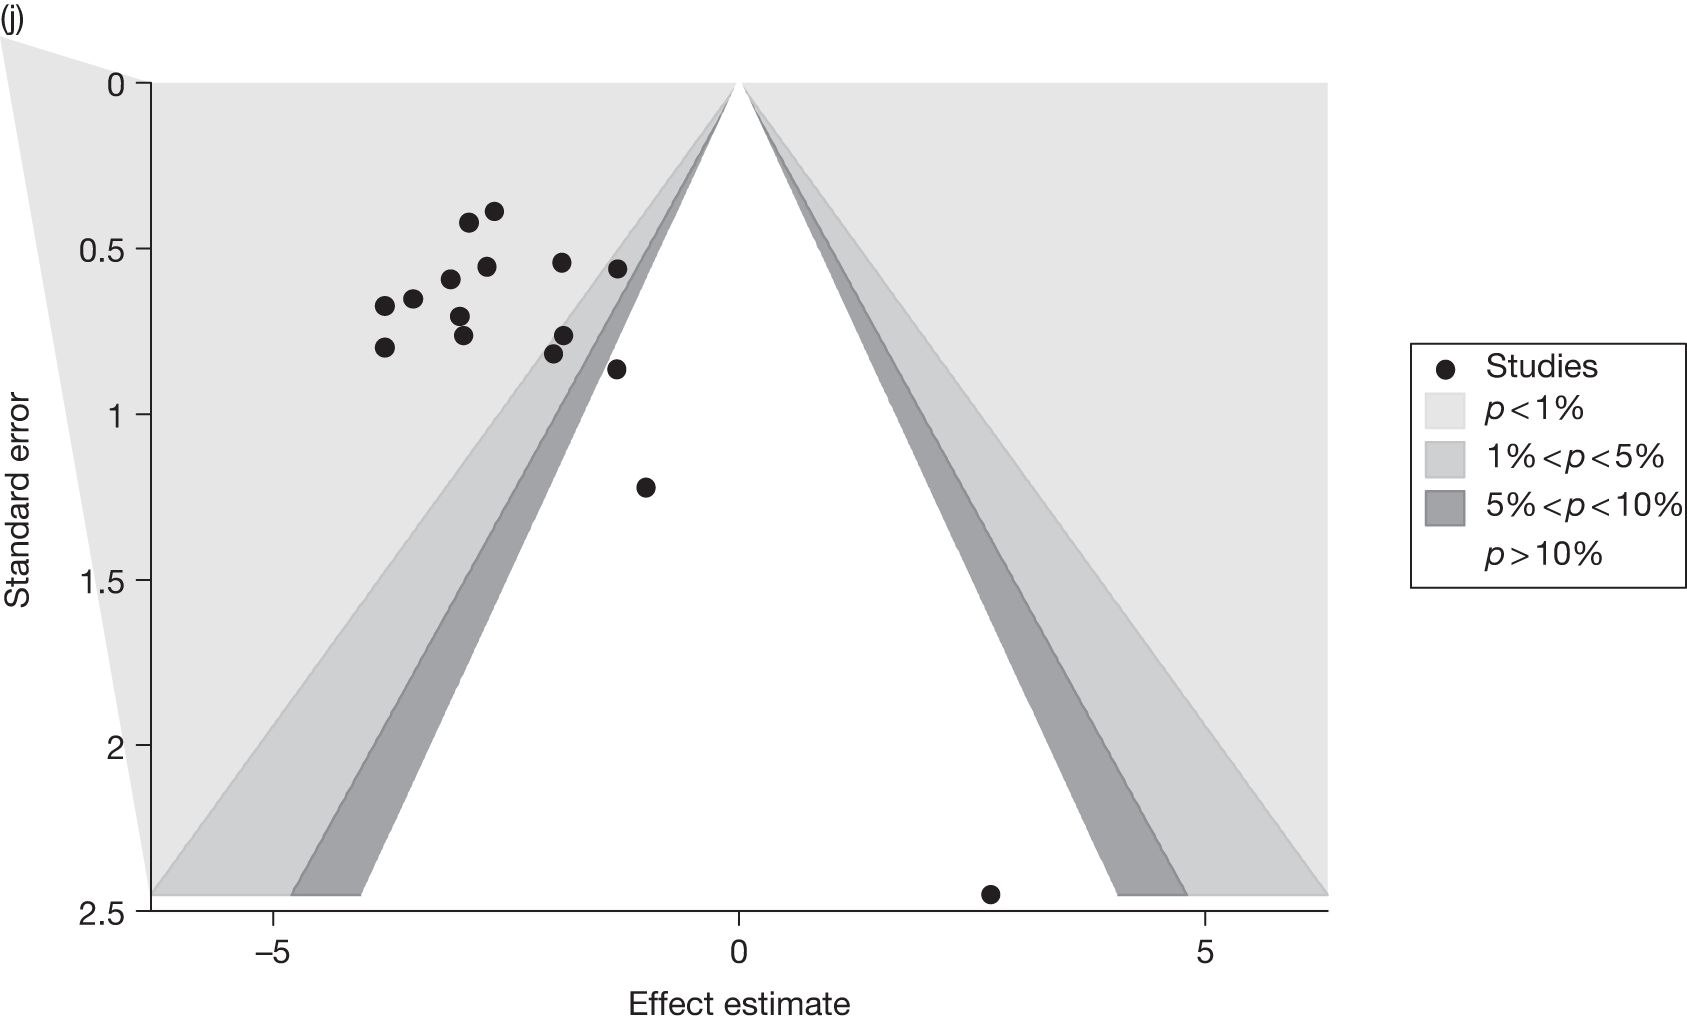
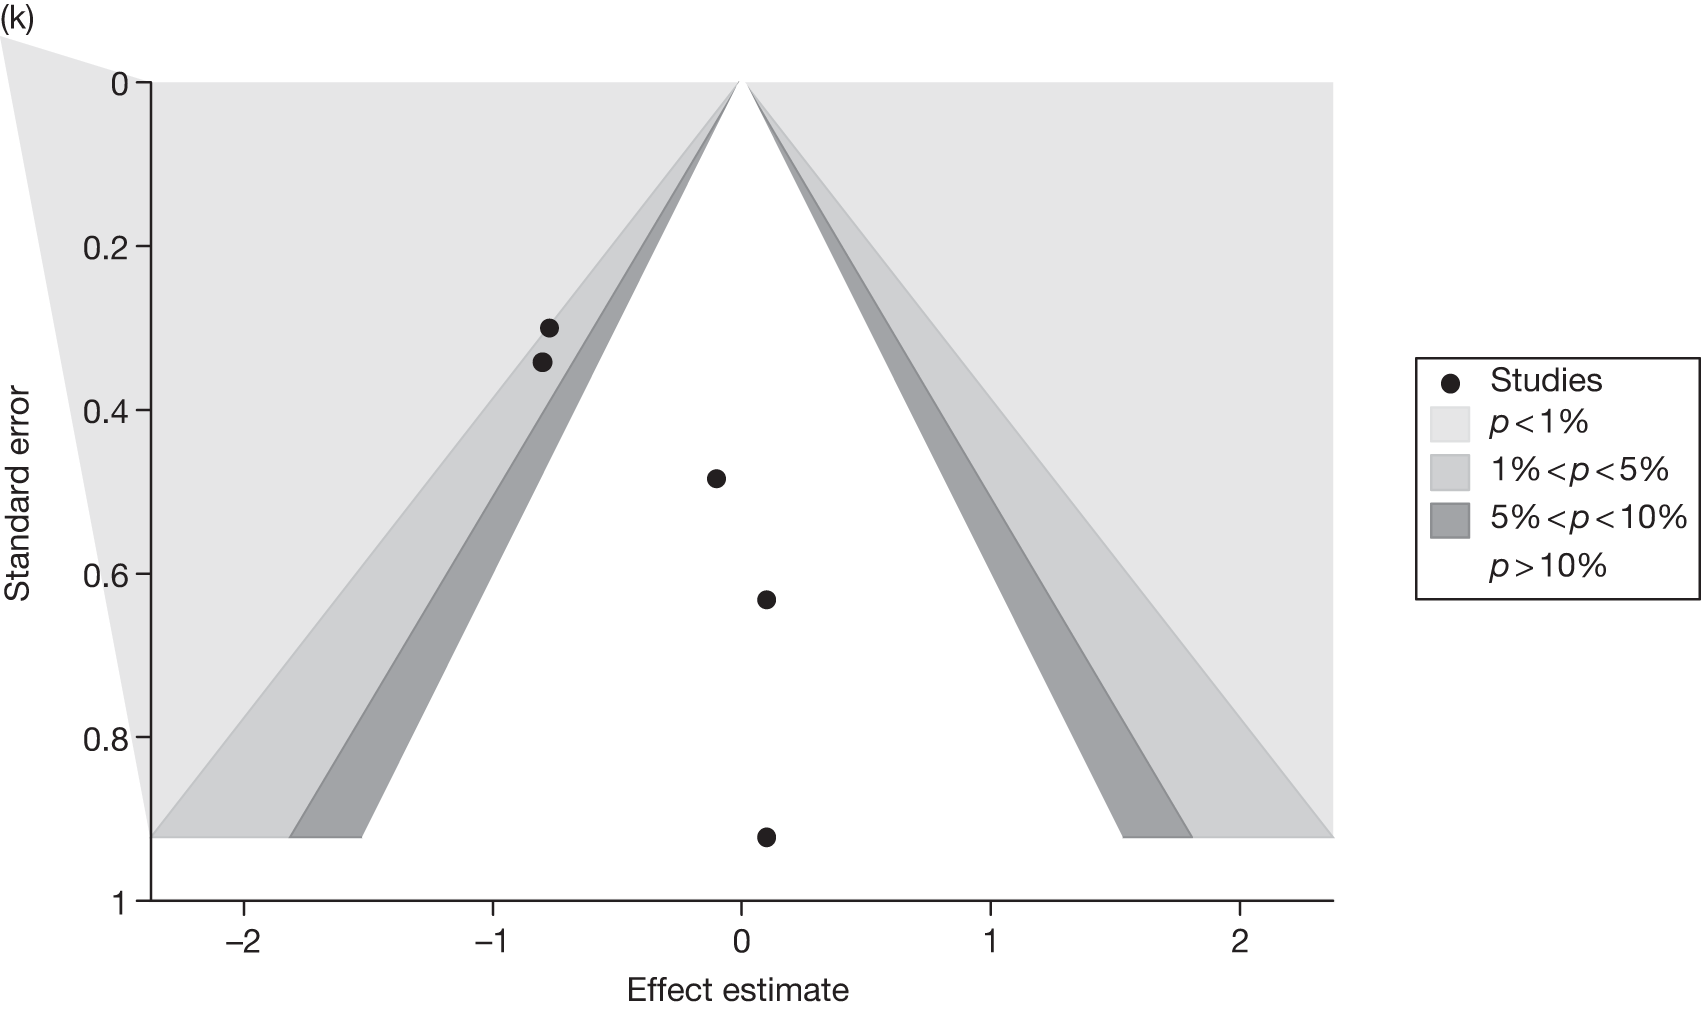
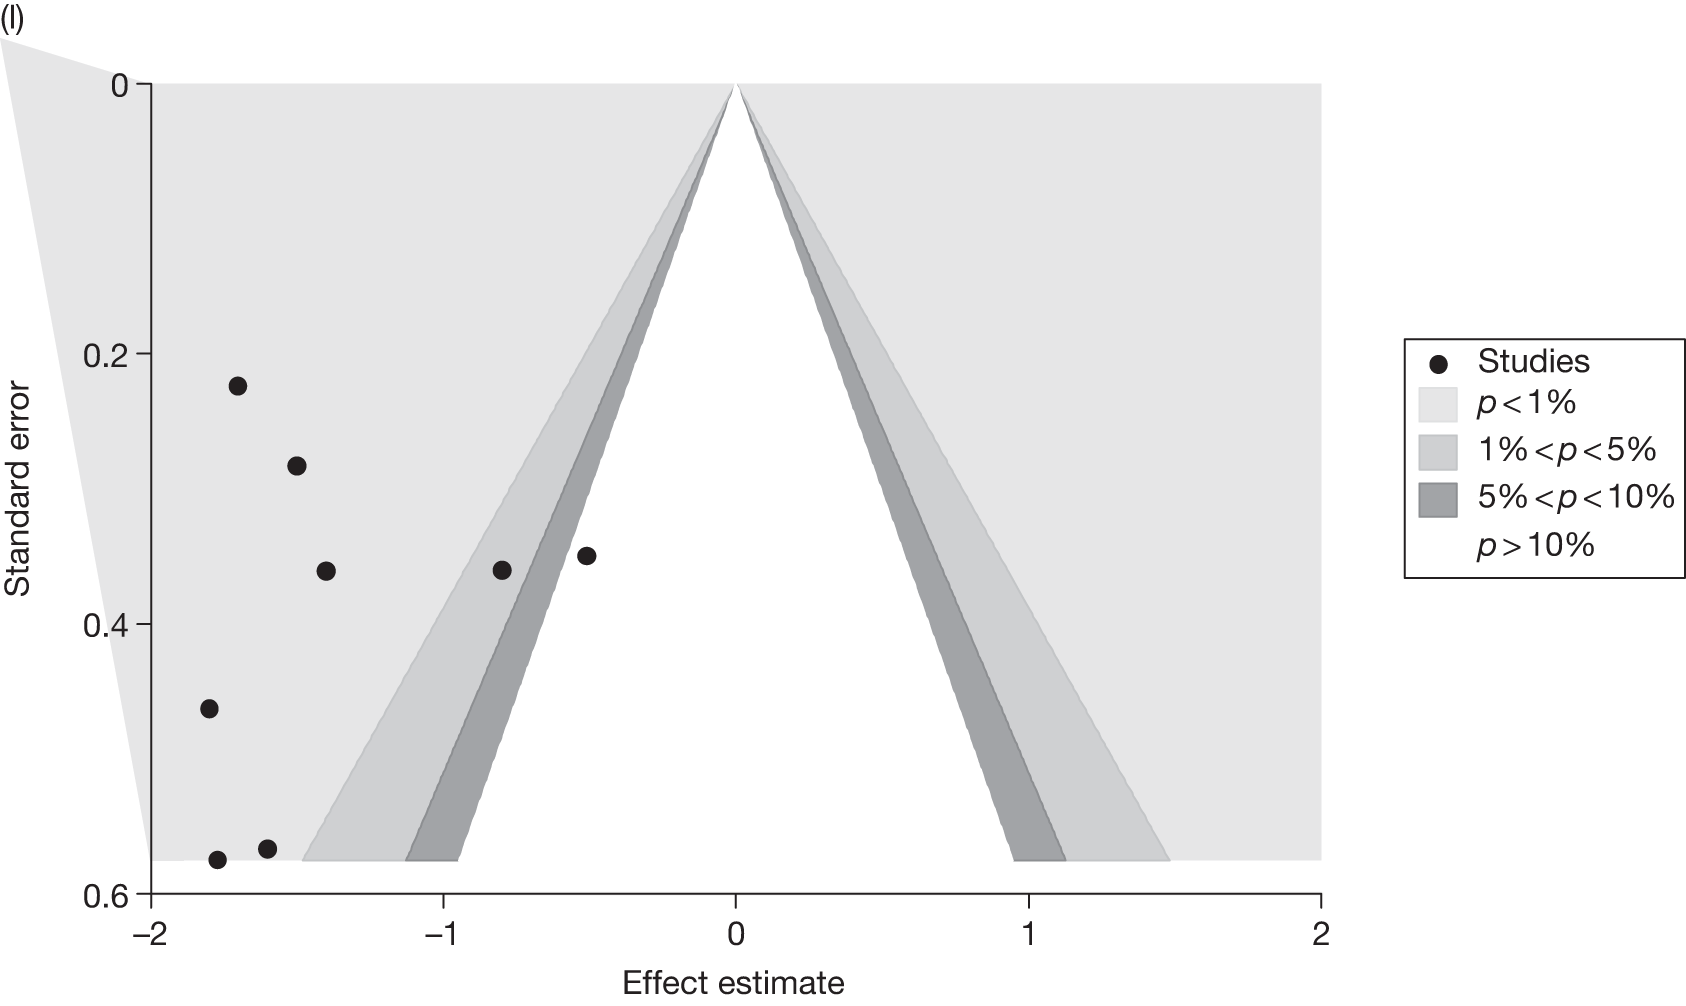
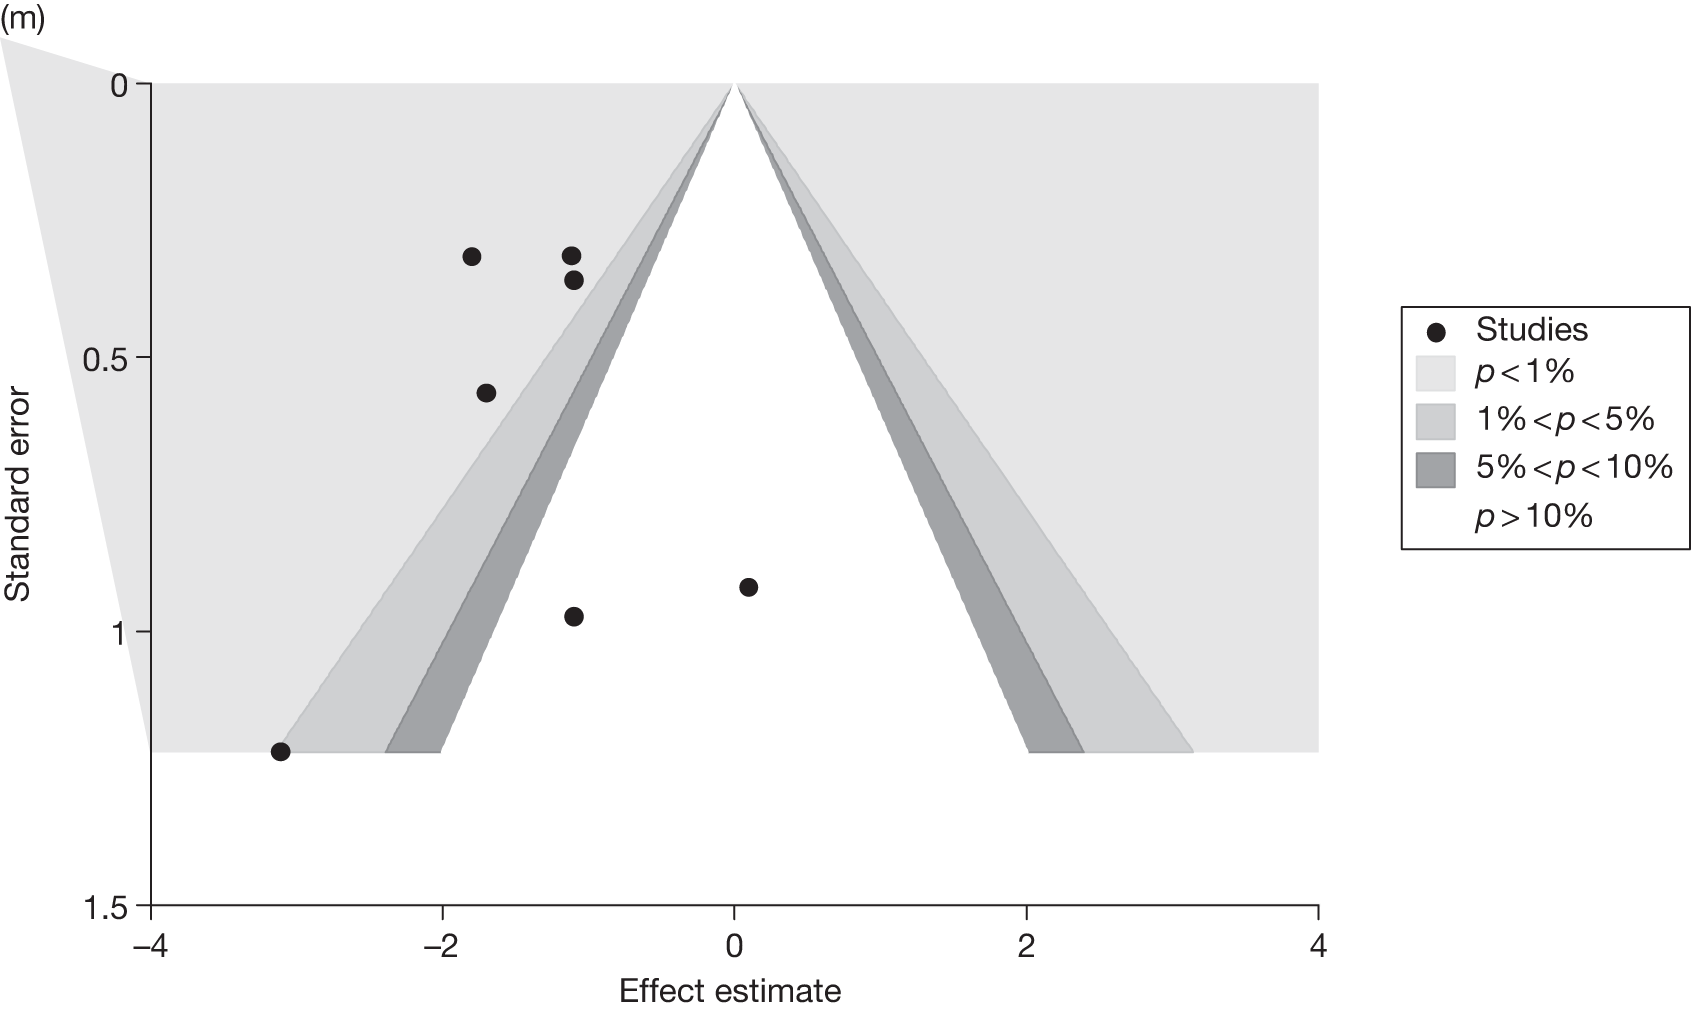
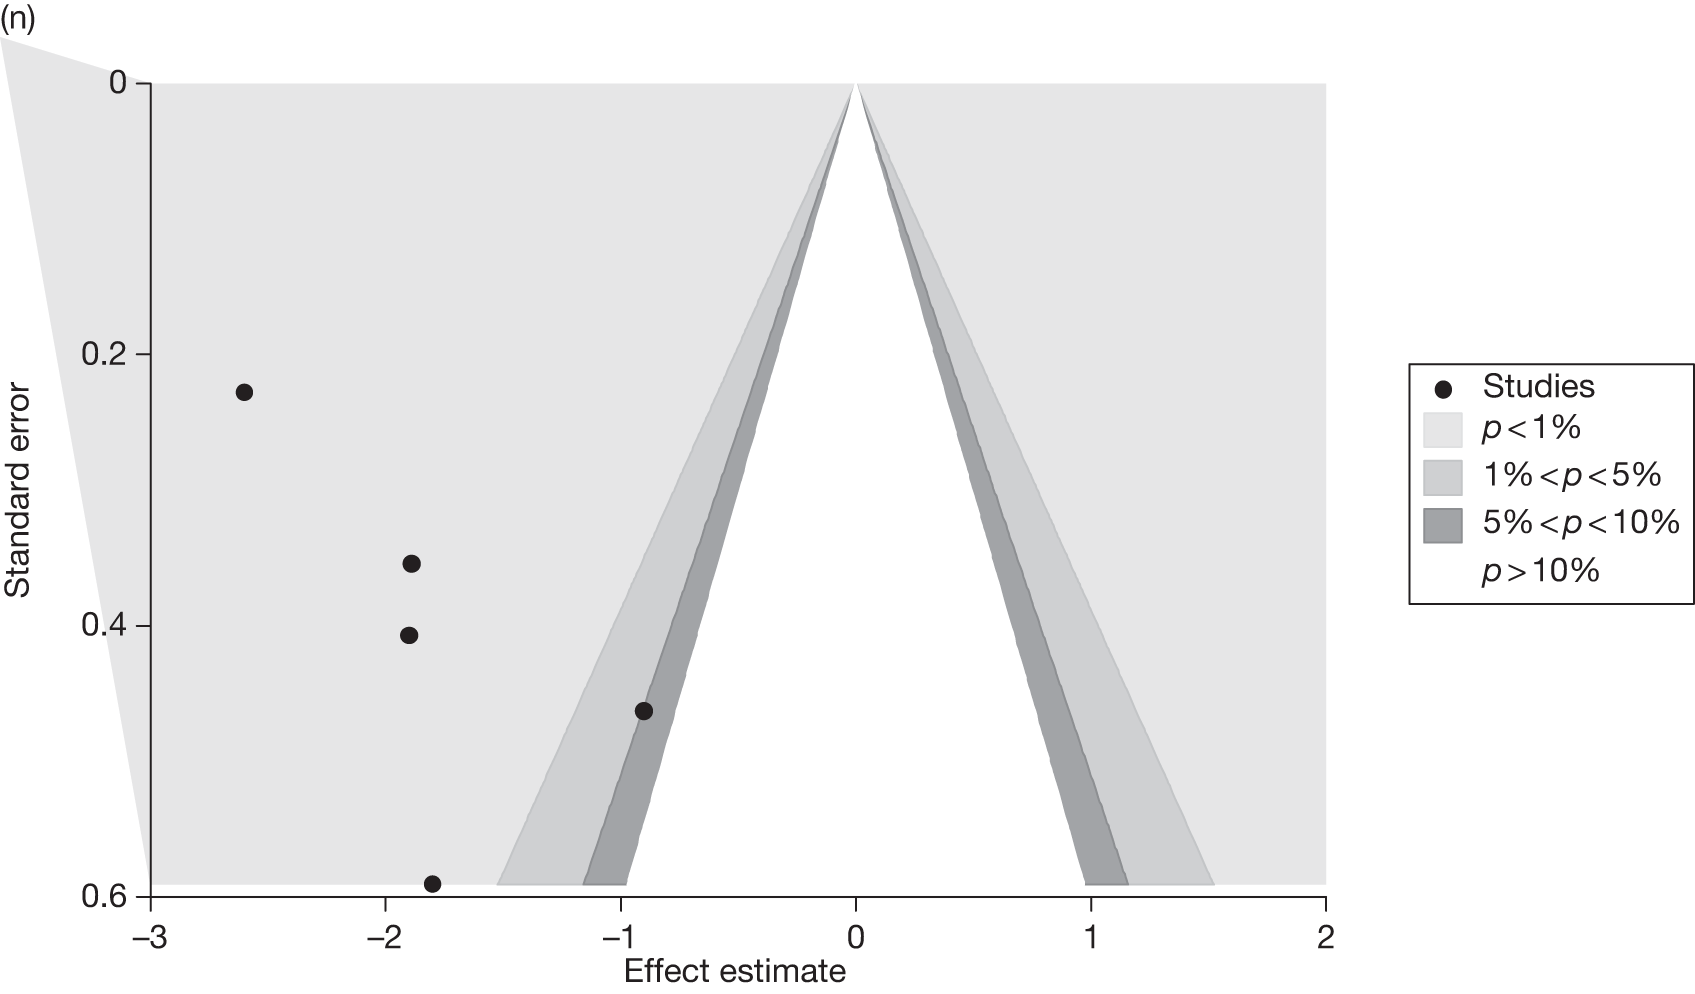
FIGURE 16.
Plots showing the probability that each treatment (including placebo) is best (represented by the bar at 1 on the horizontal axis): (a) 3-month 5% weight loss, (b) 6-month 5% weight loss, (c) 12-month 5% weight loss, (d) 3-month 10% weight loss, (e) 6-month 10% weight loss, (f) 12-month 10% weight loss, (g) 3-month weight change, (h) 6-month weight change, (i) 12-month weight change, (j) 12-month weight change – T2DM, (k) 12-month weight change – no T2DM, (l) 12-month weight change – enhanced diet, (m) 12-month weight change – standard diet, (n) 3-month BMI change, (o) 6-month BMI change, (p) 12-month BMI change.
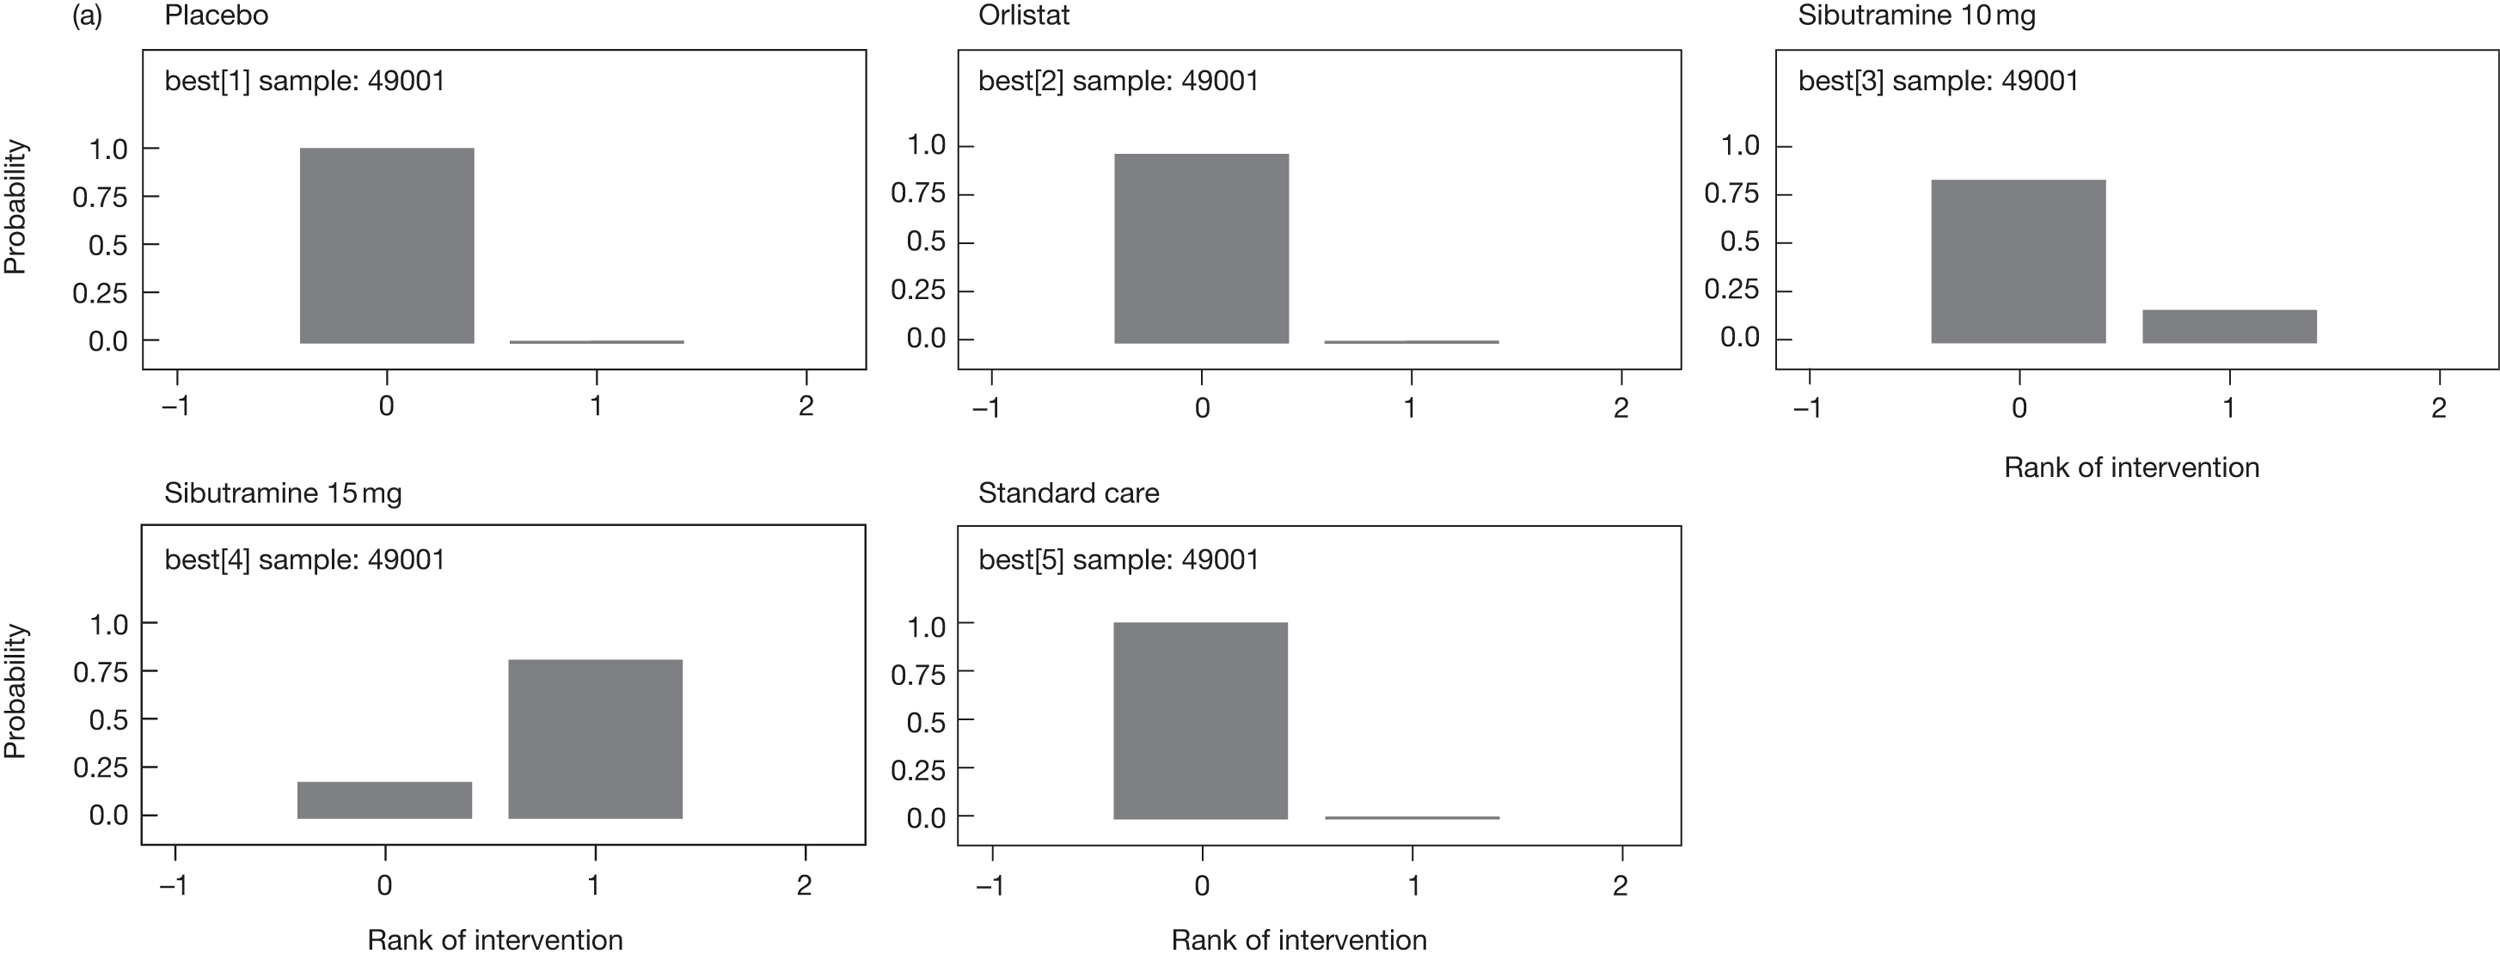
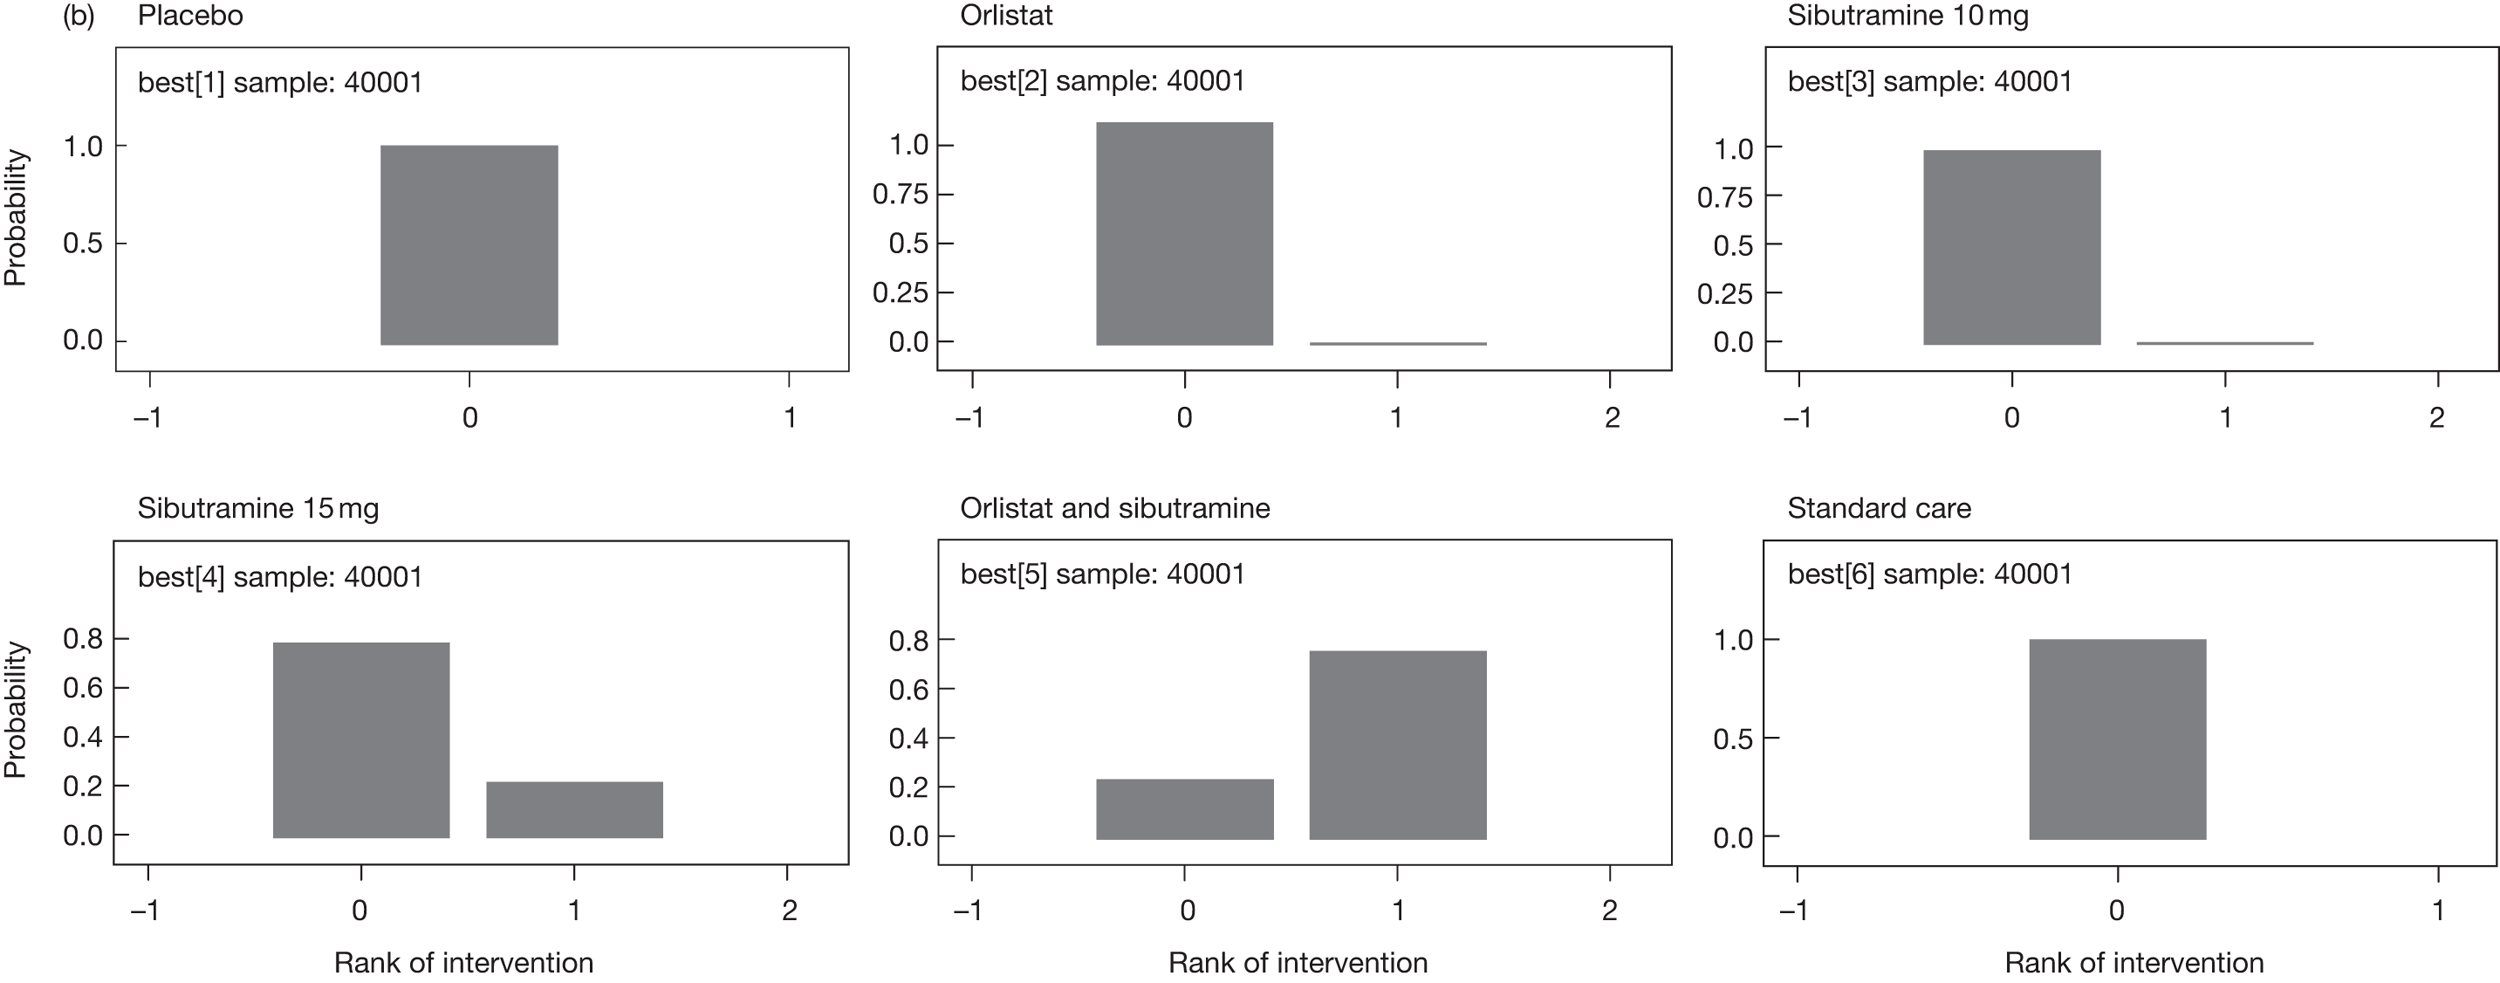
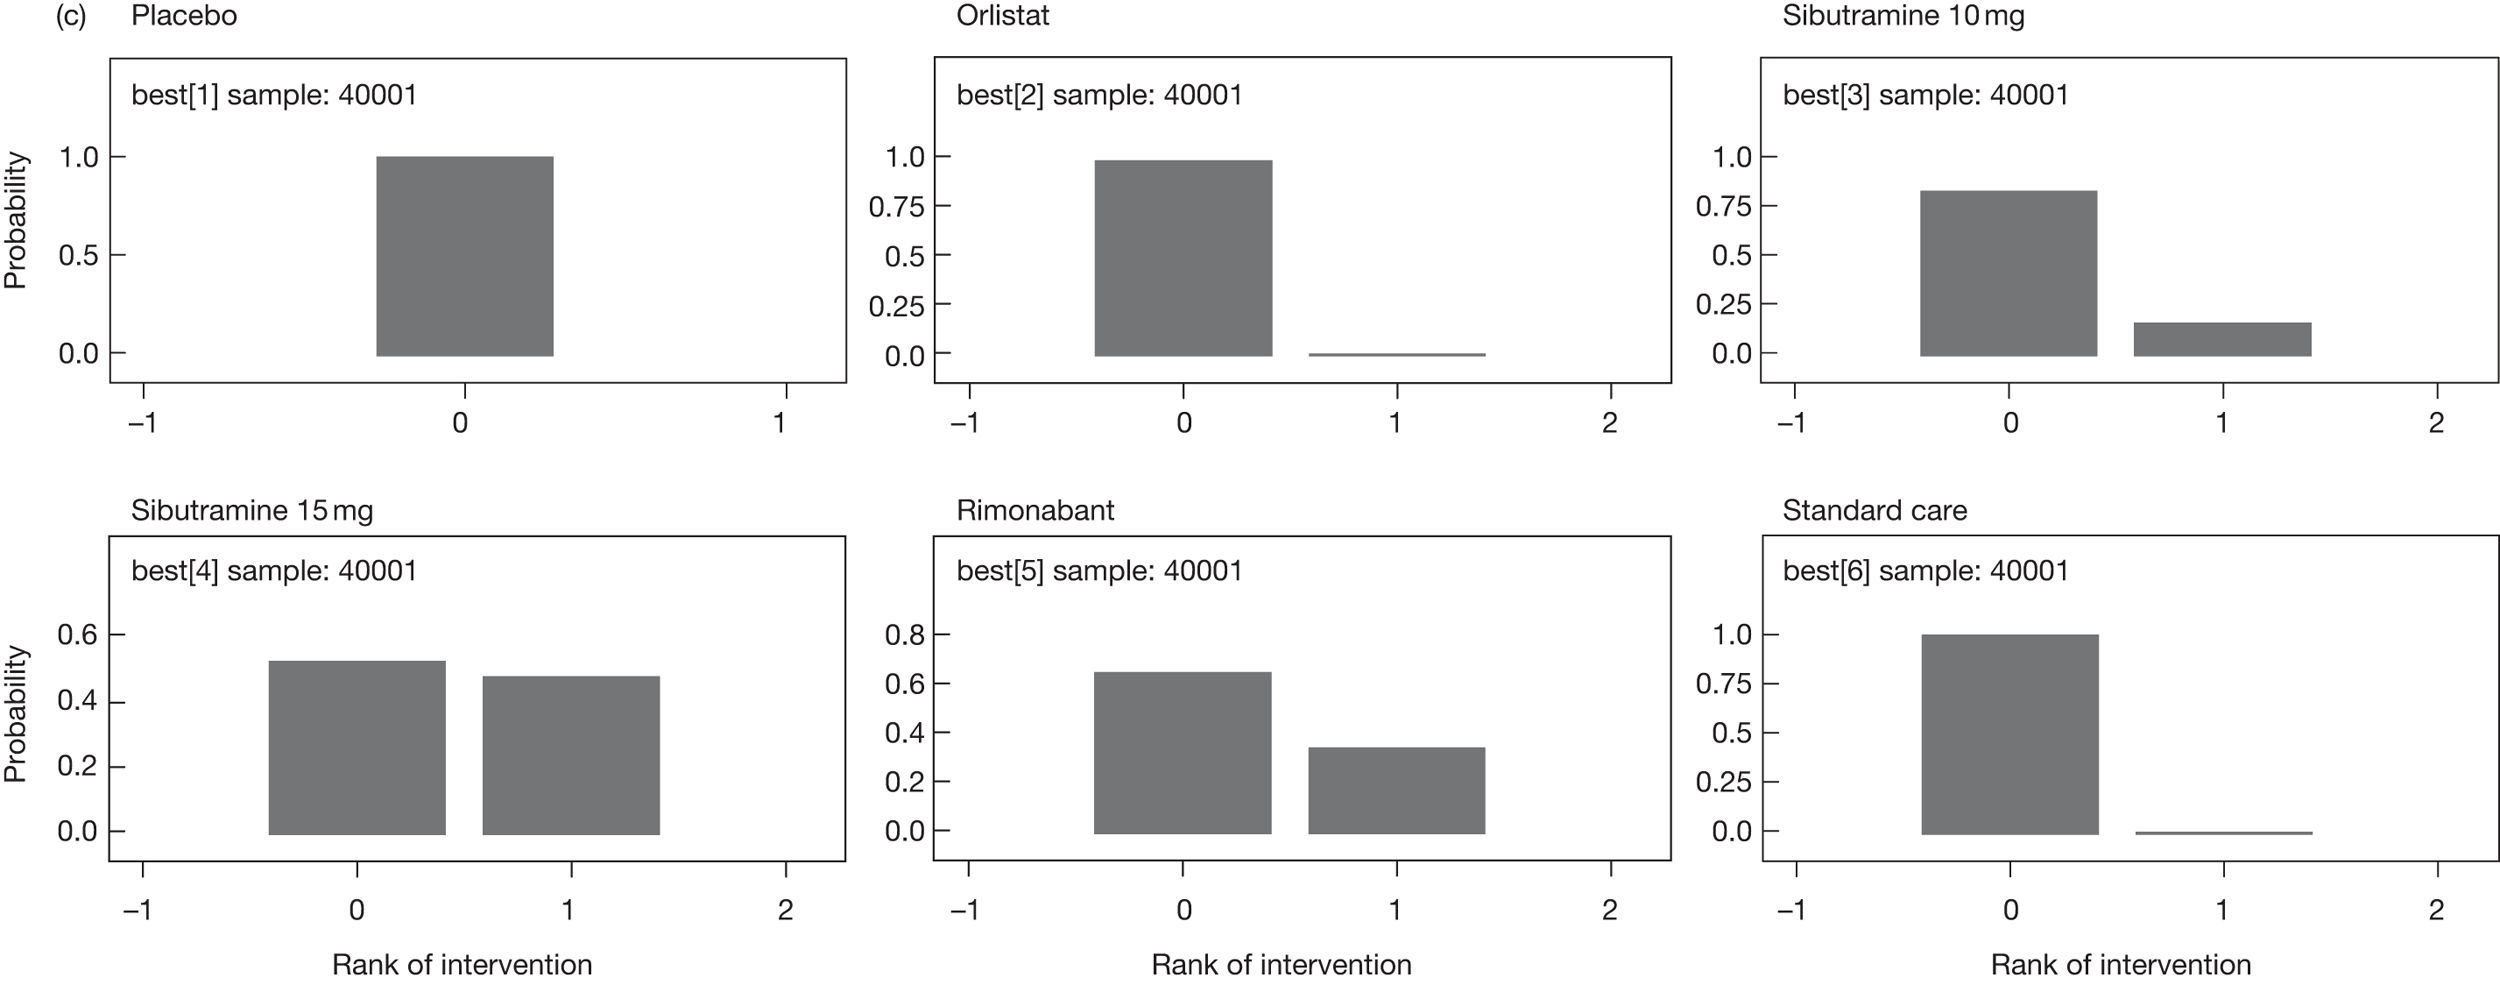

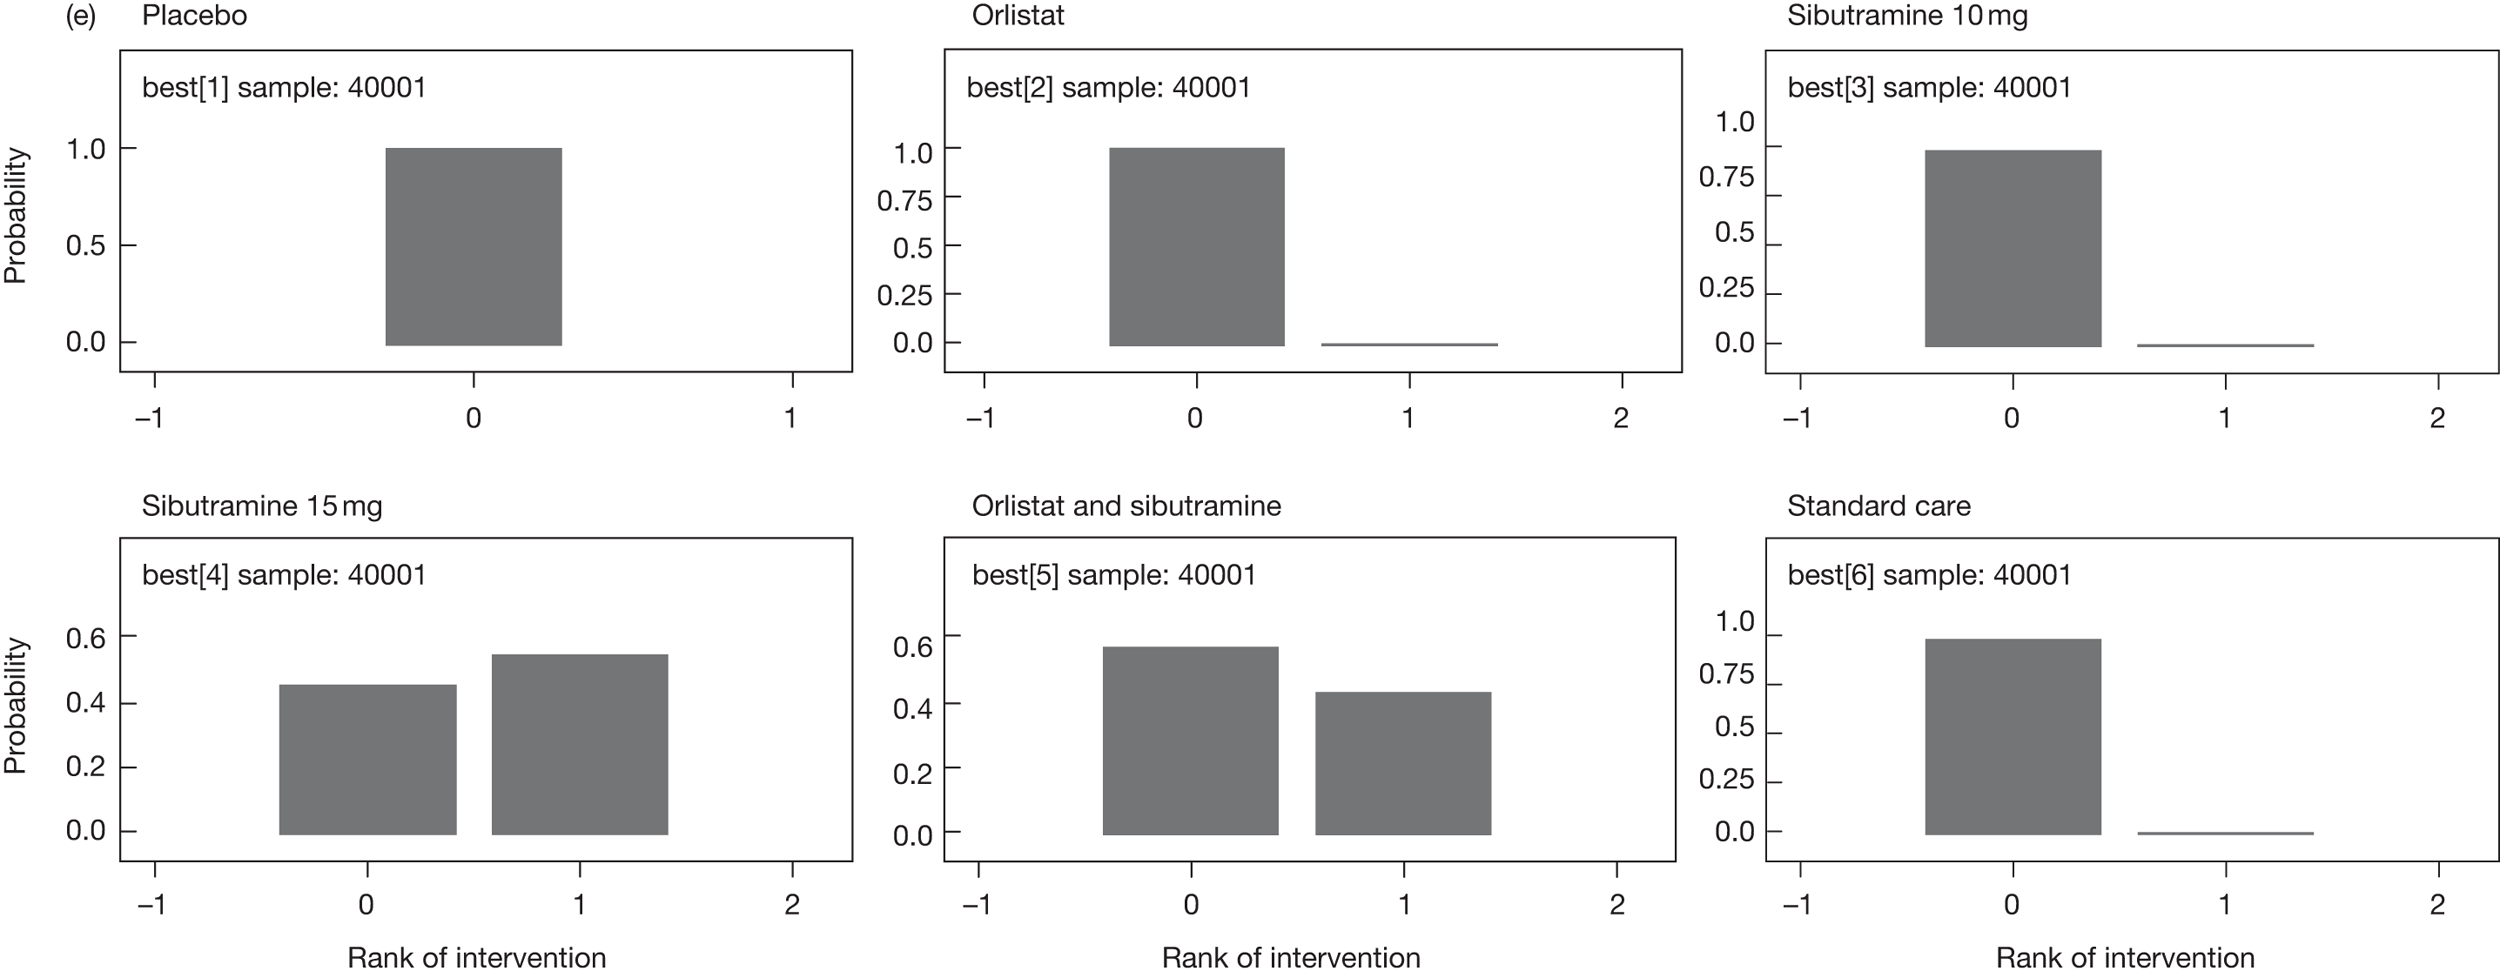
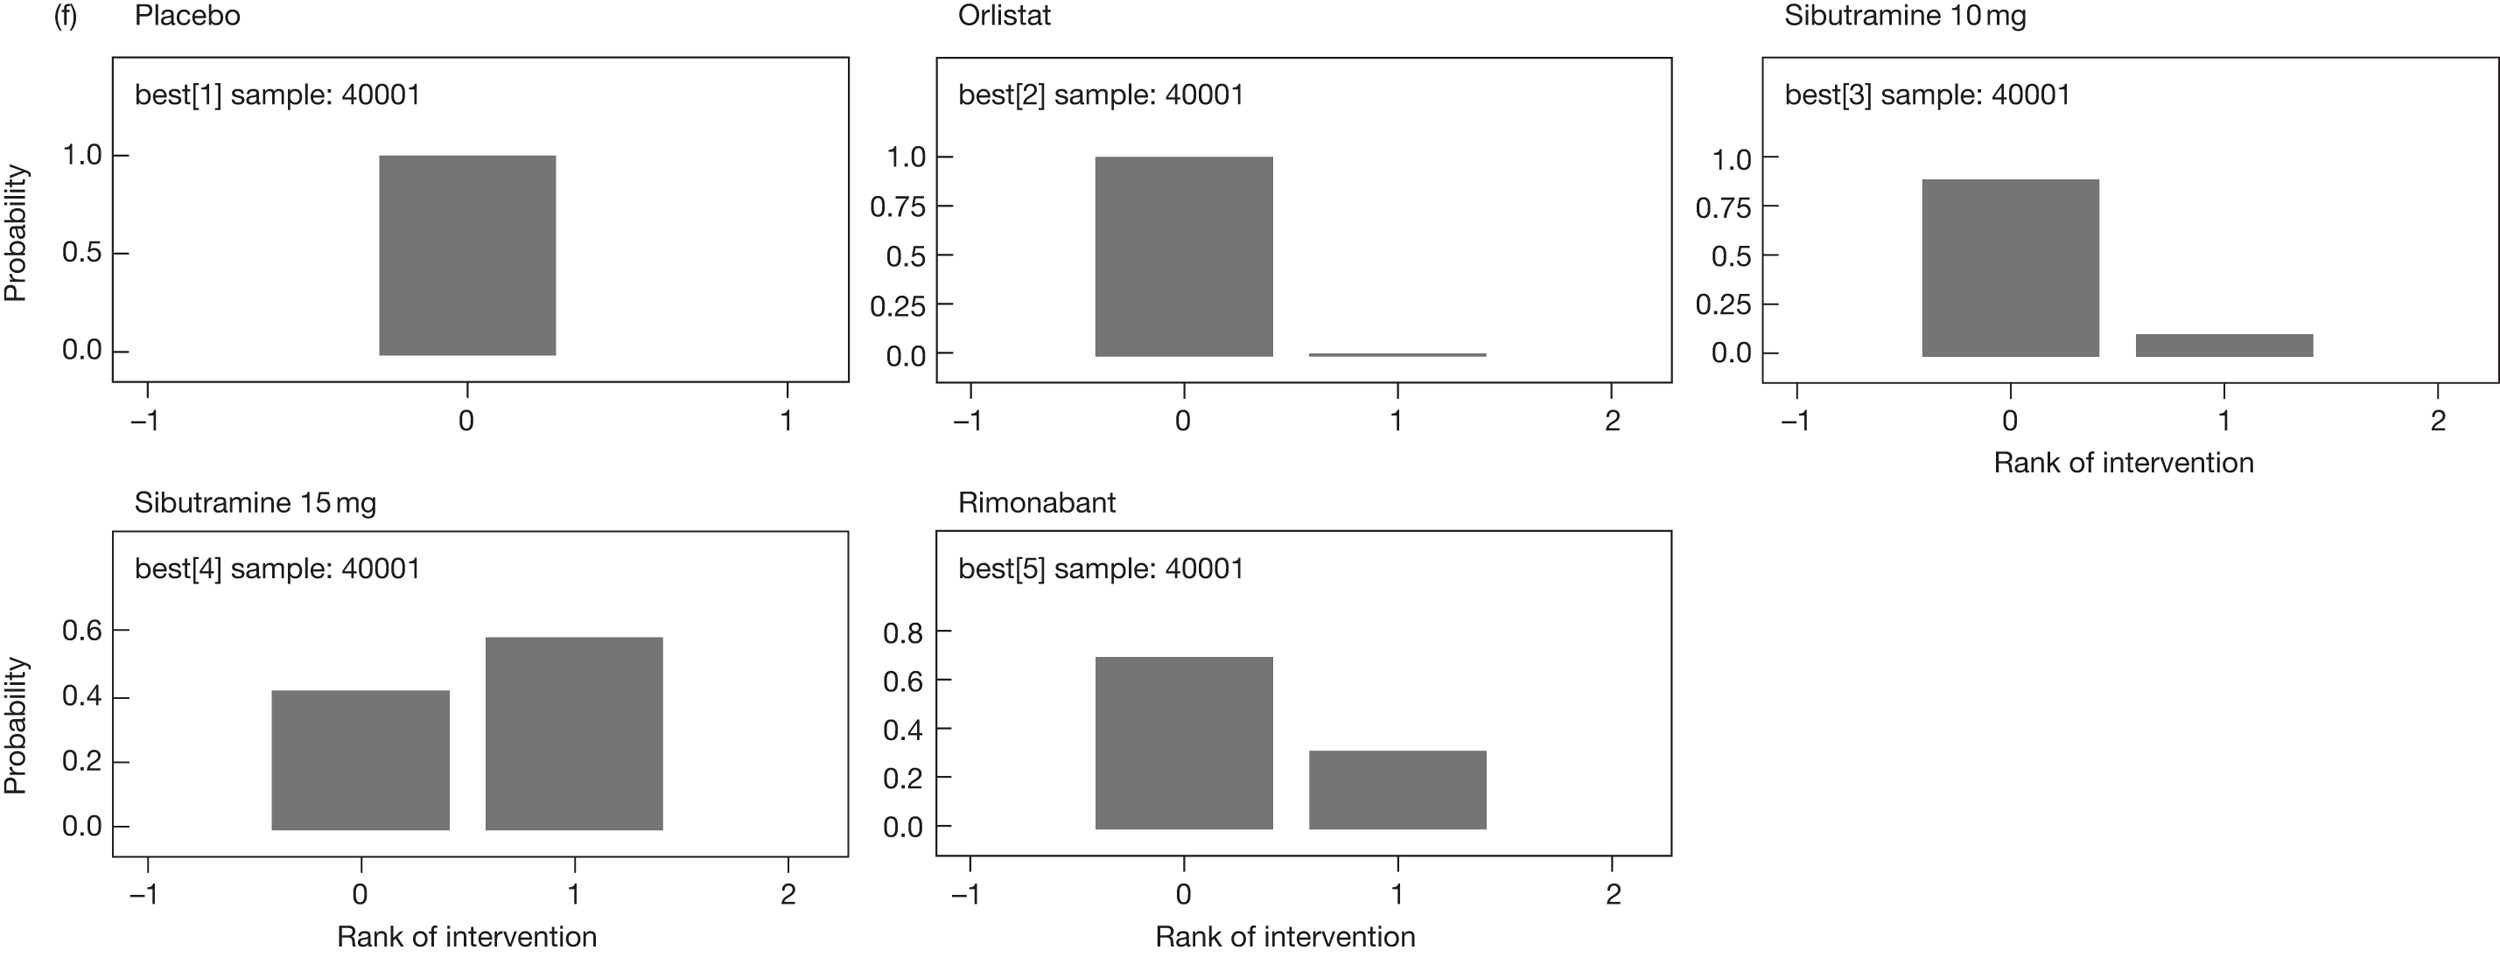
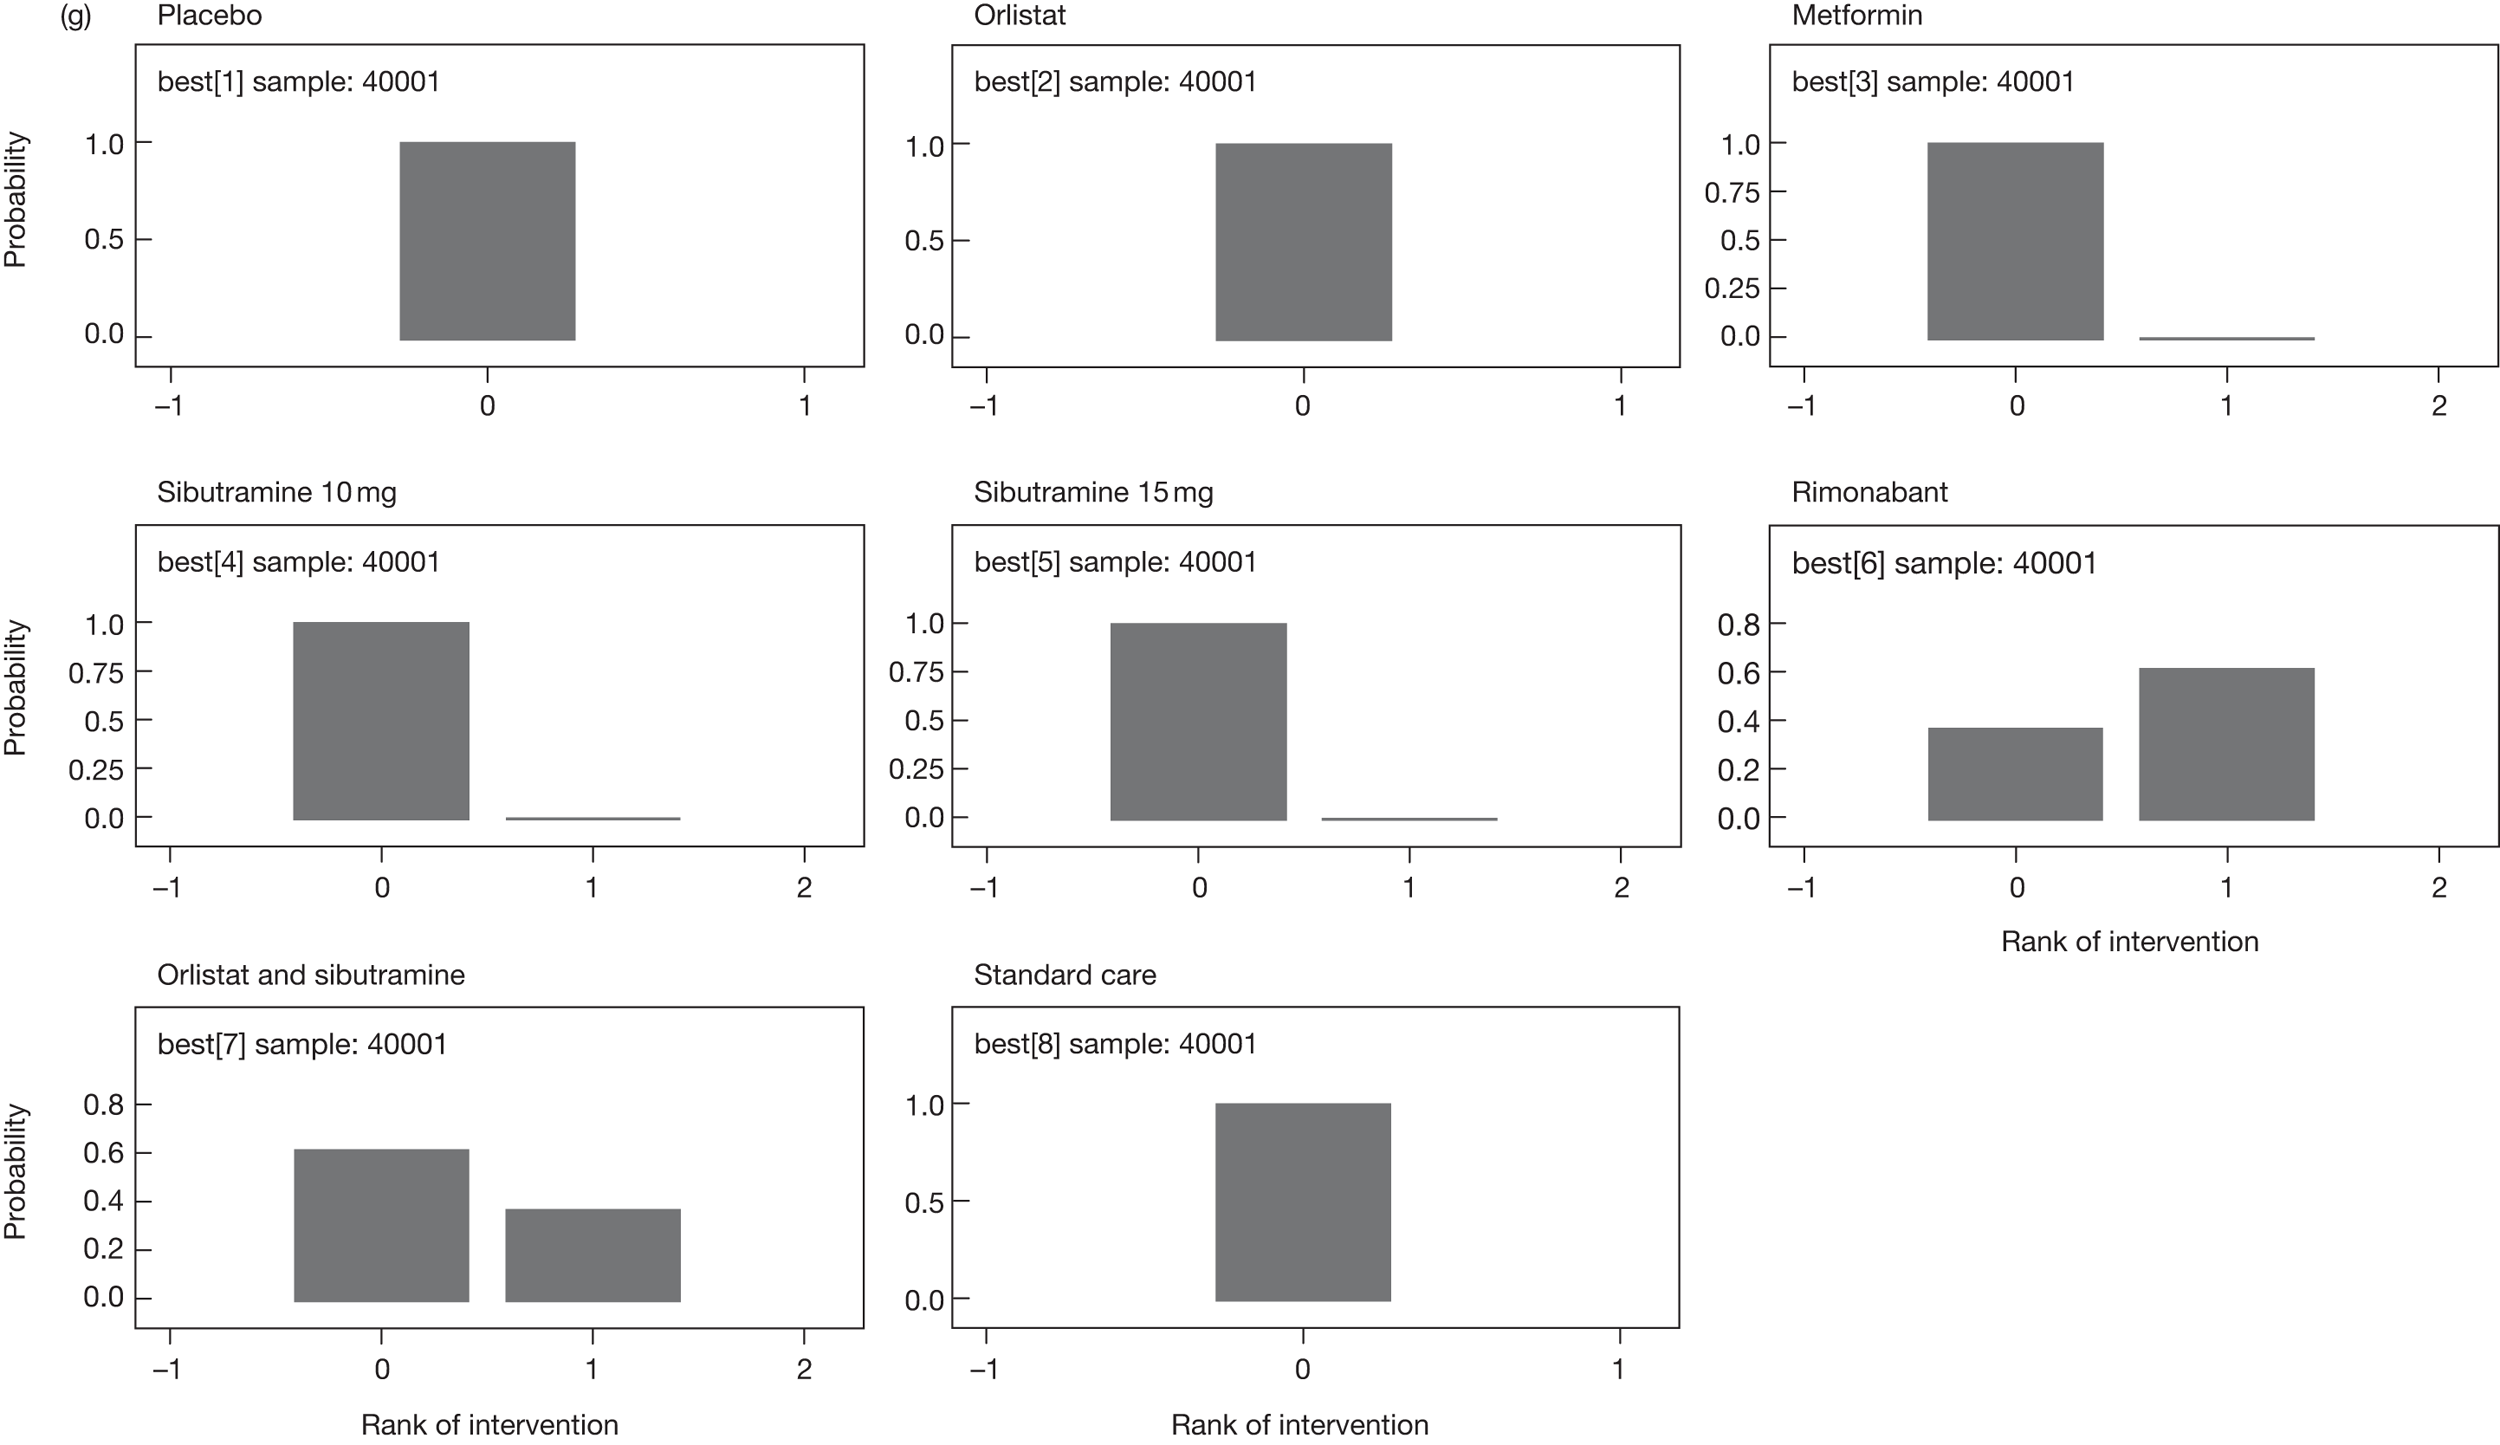
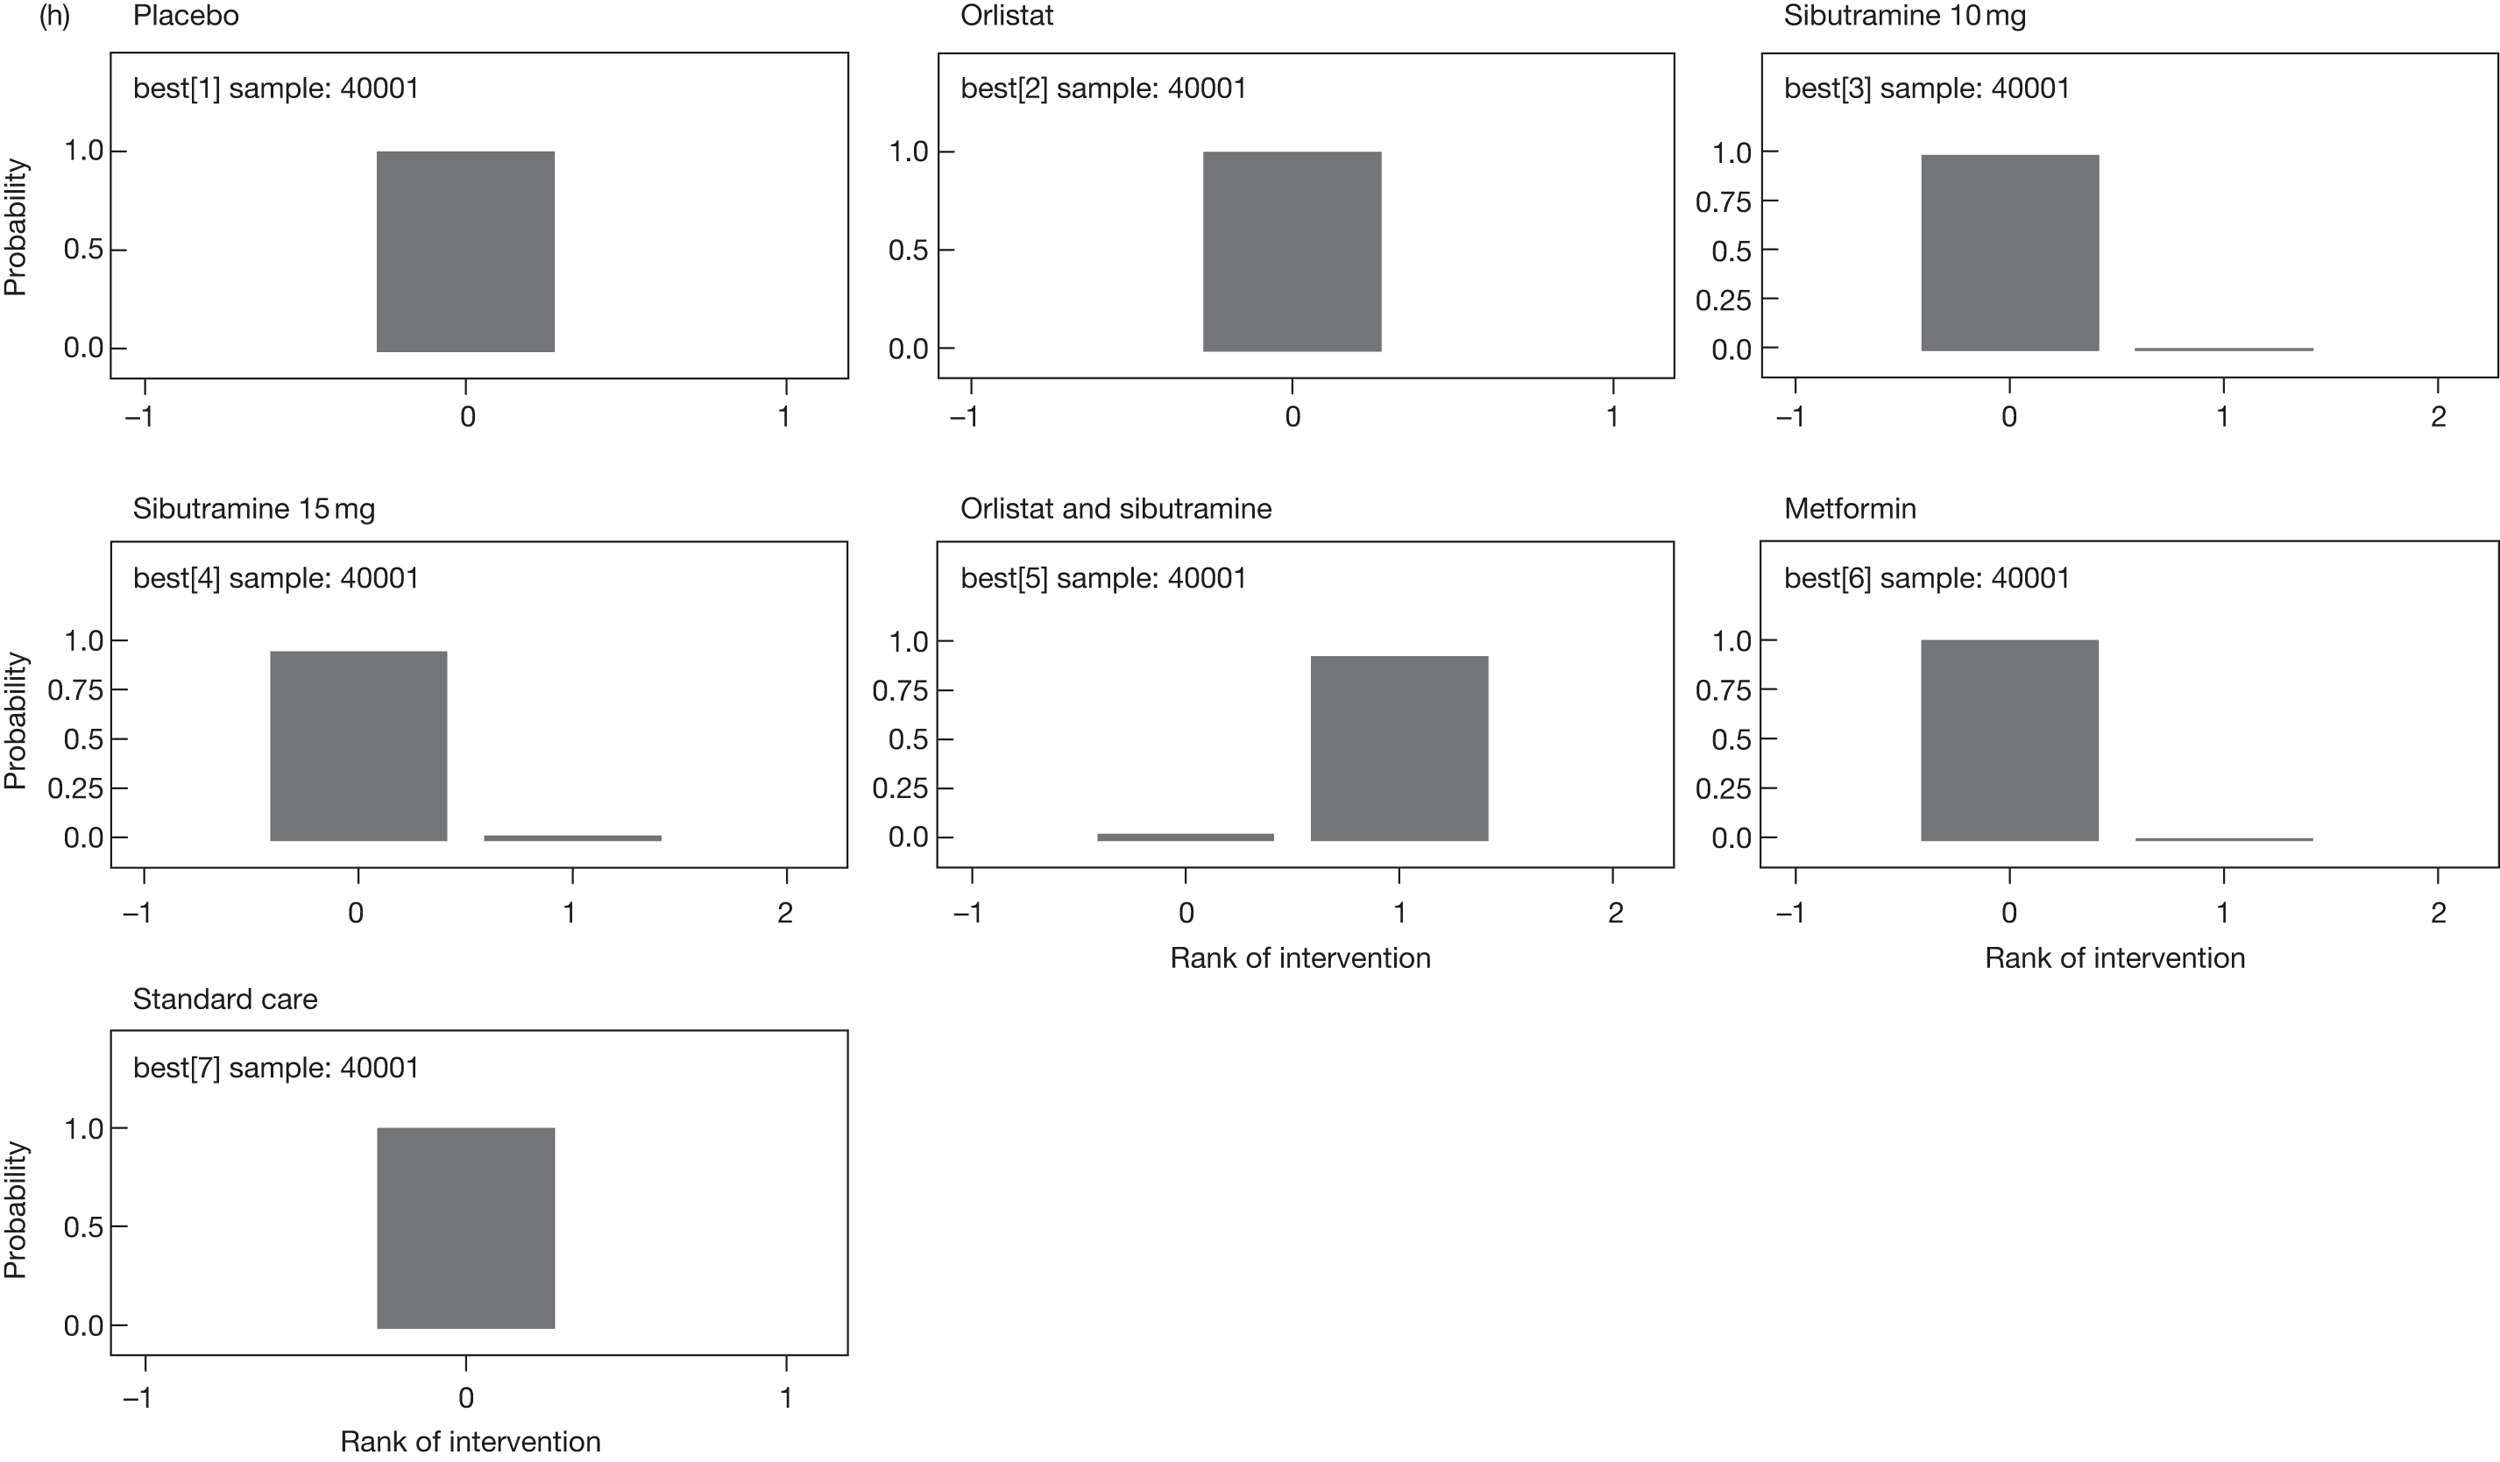
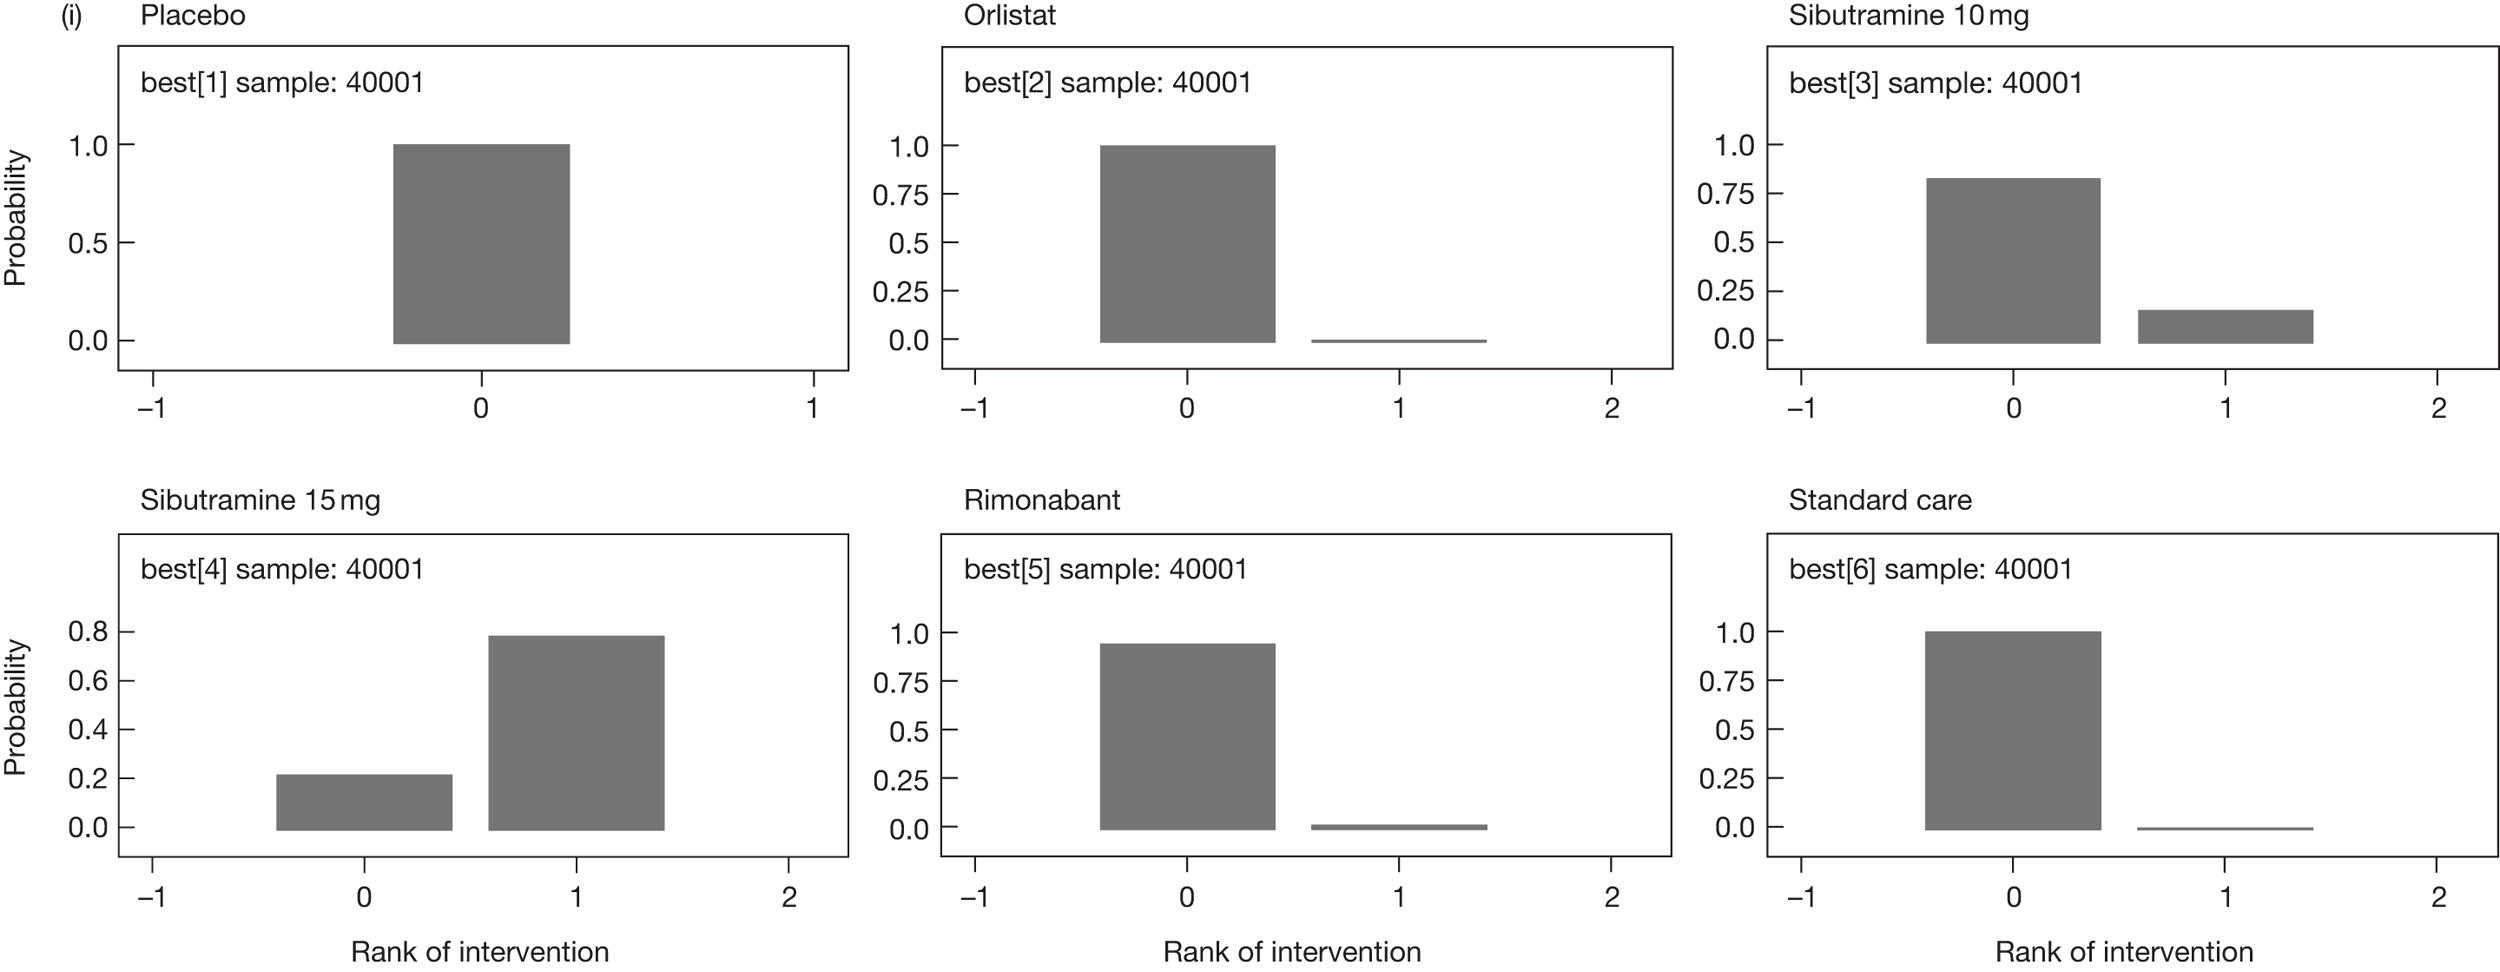
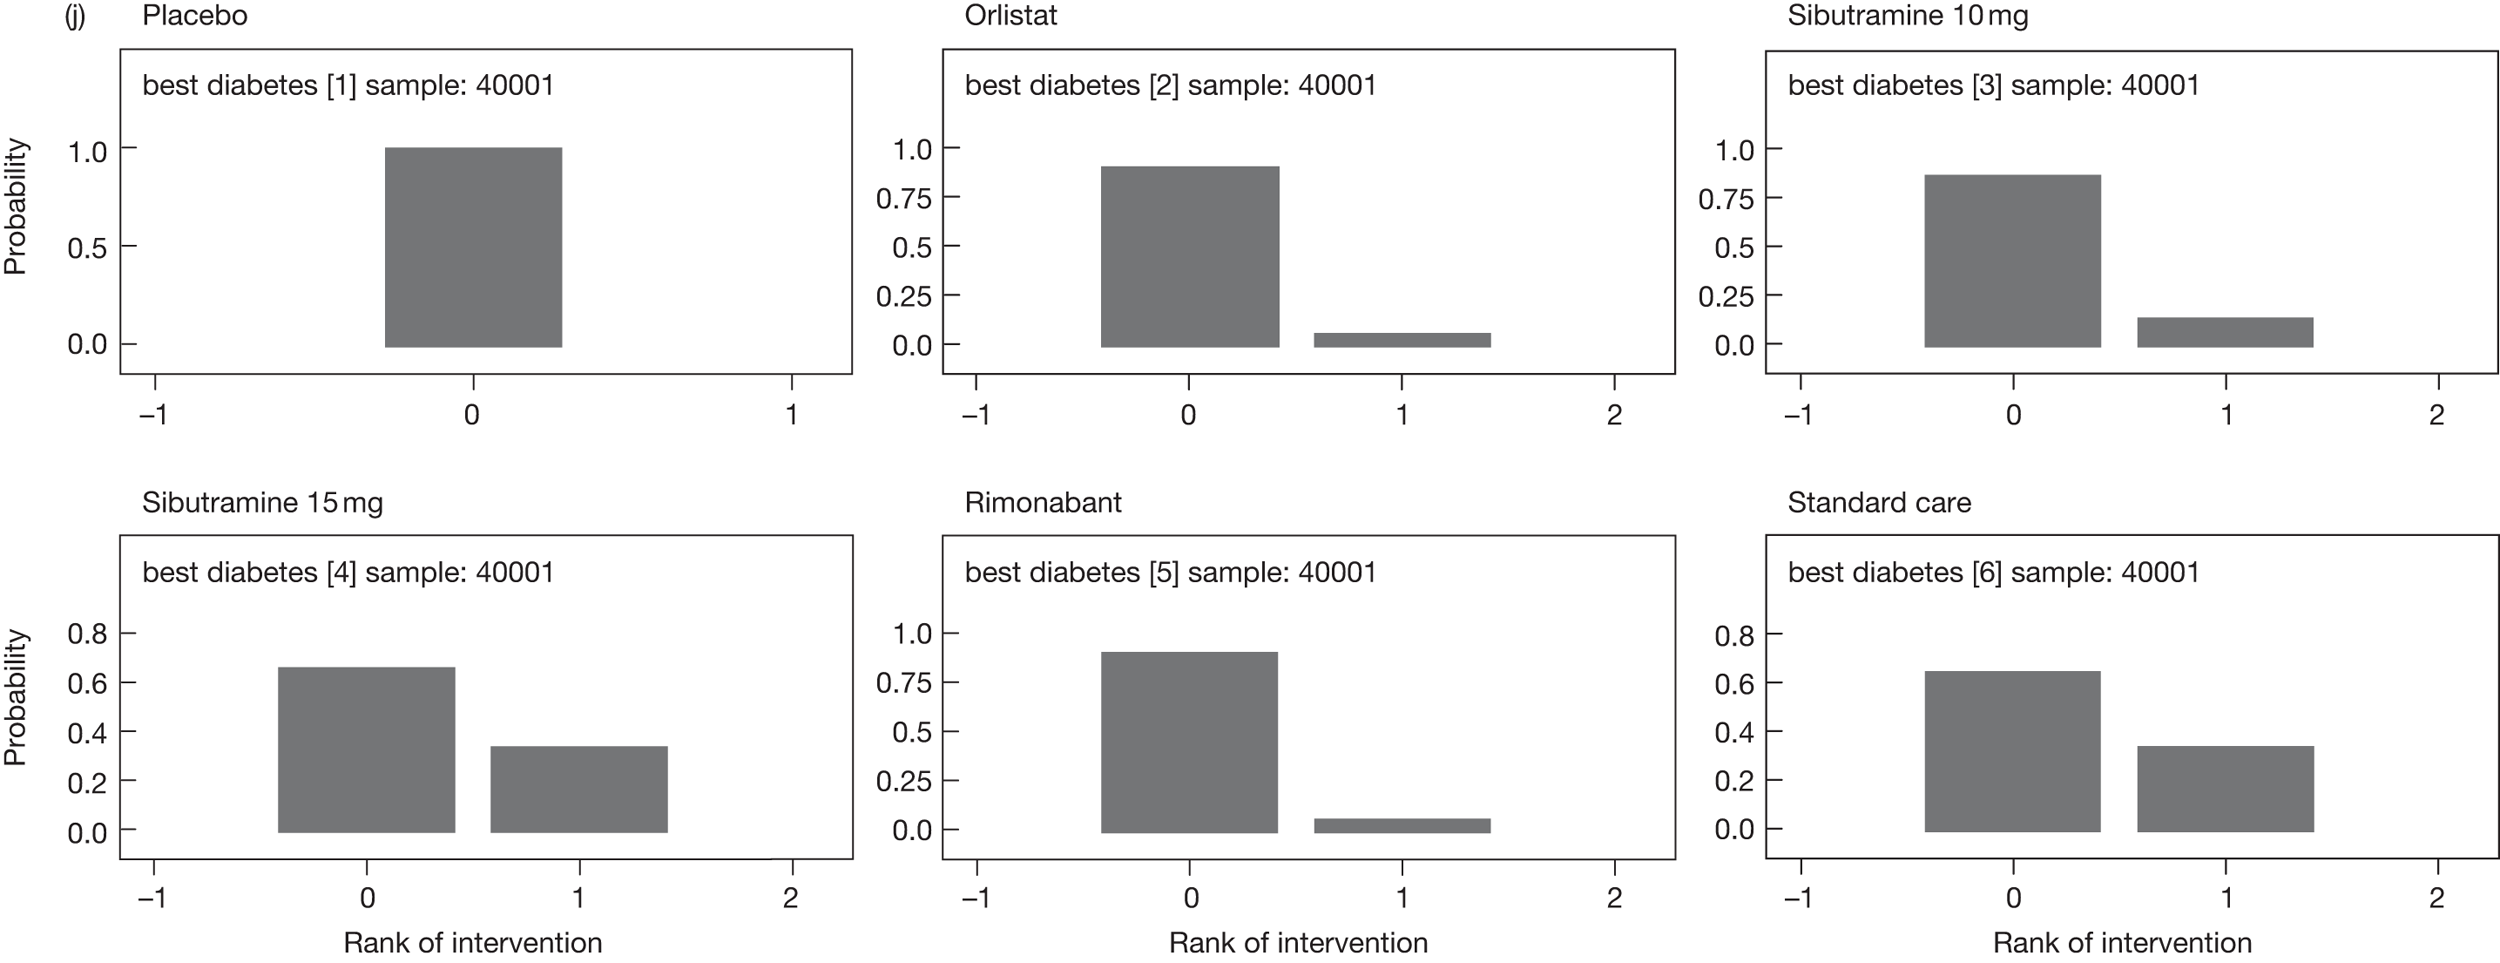
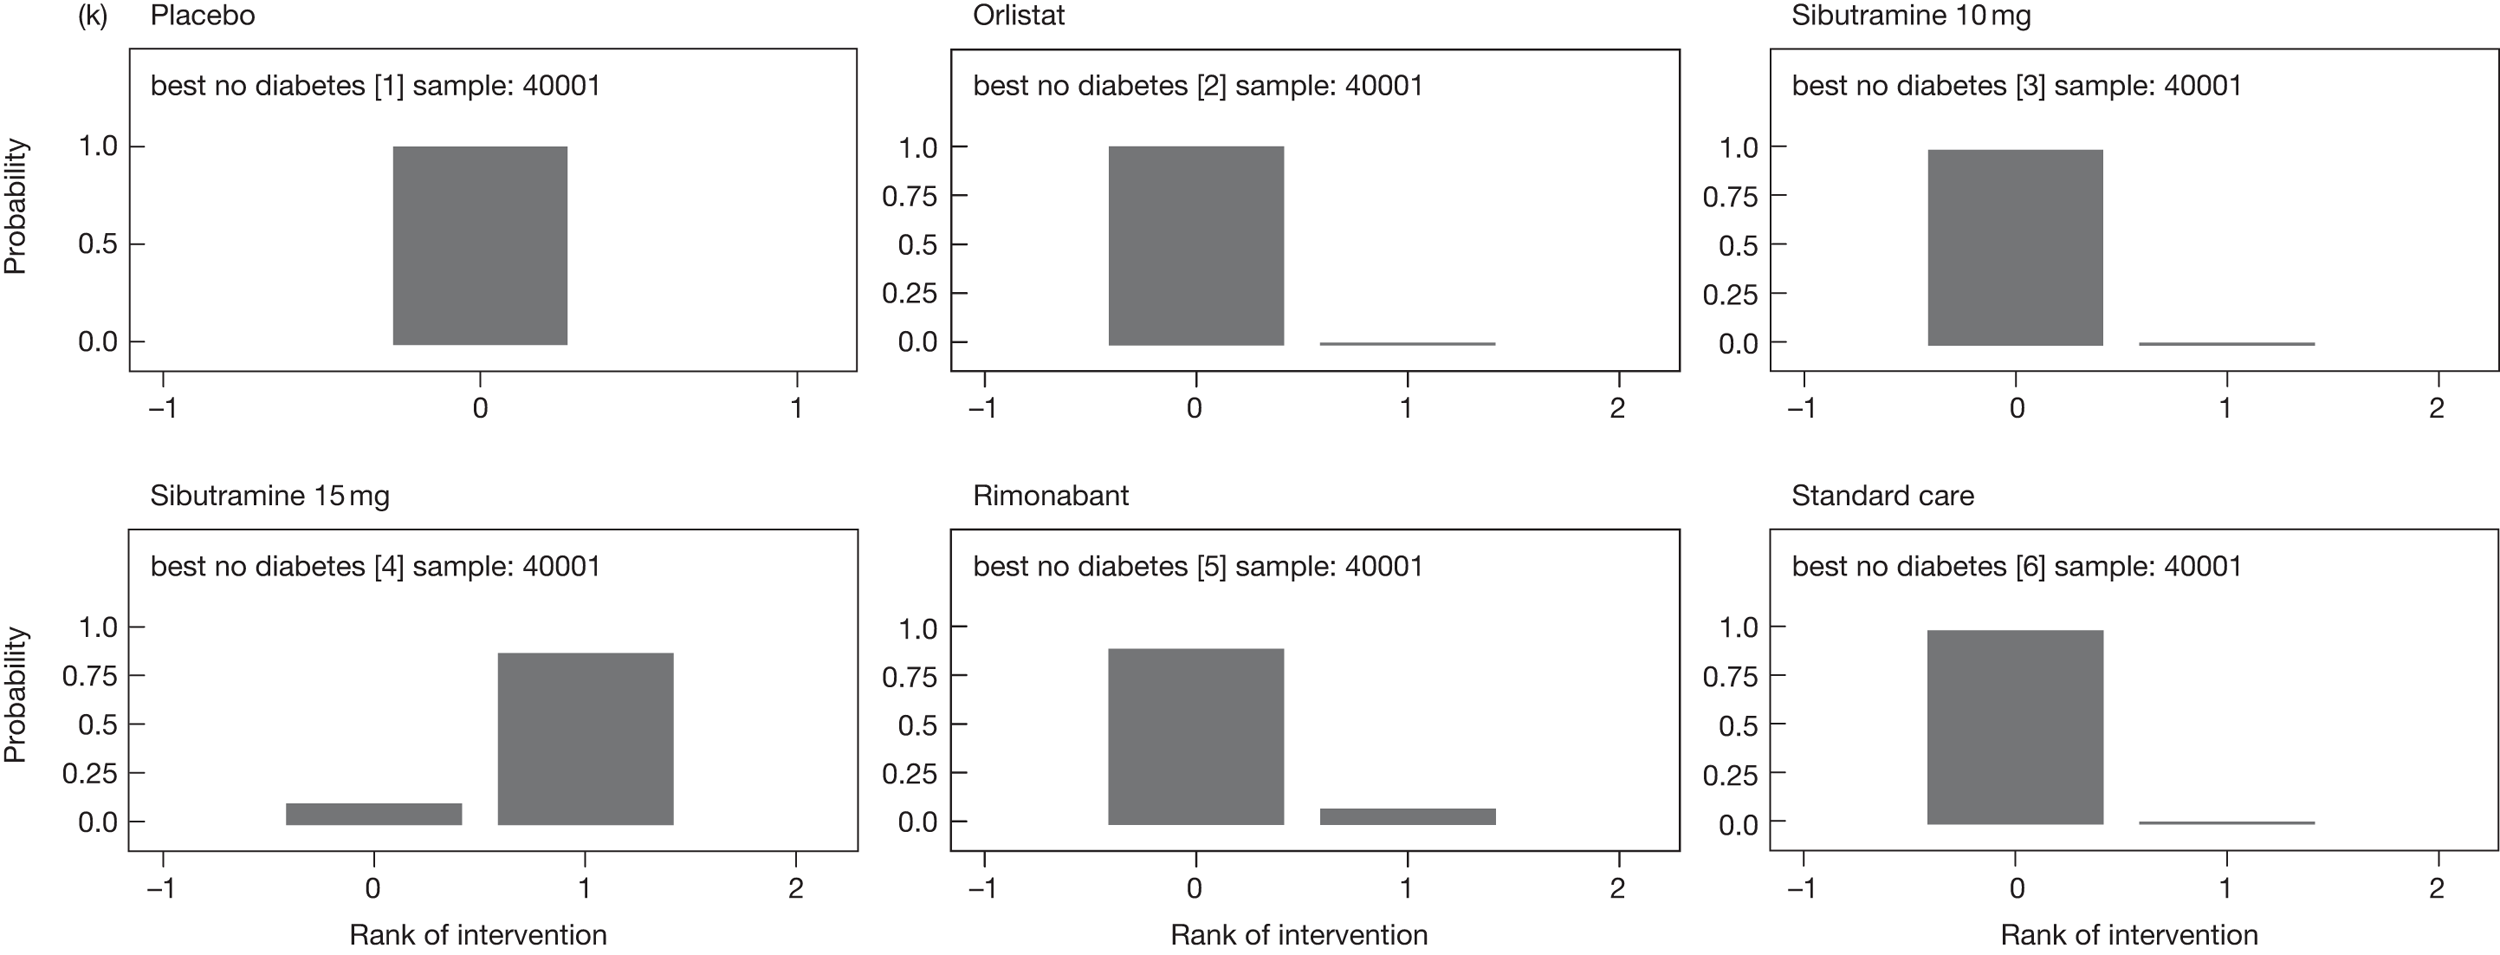
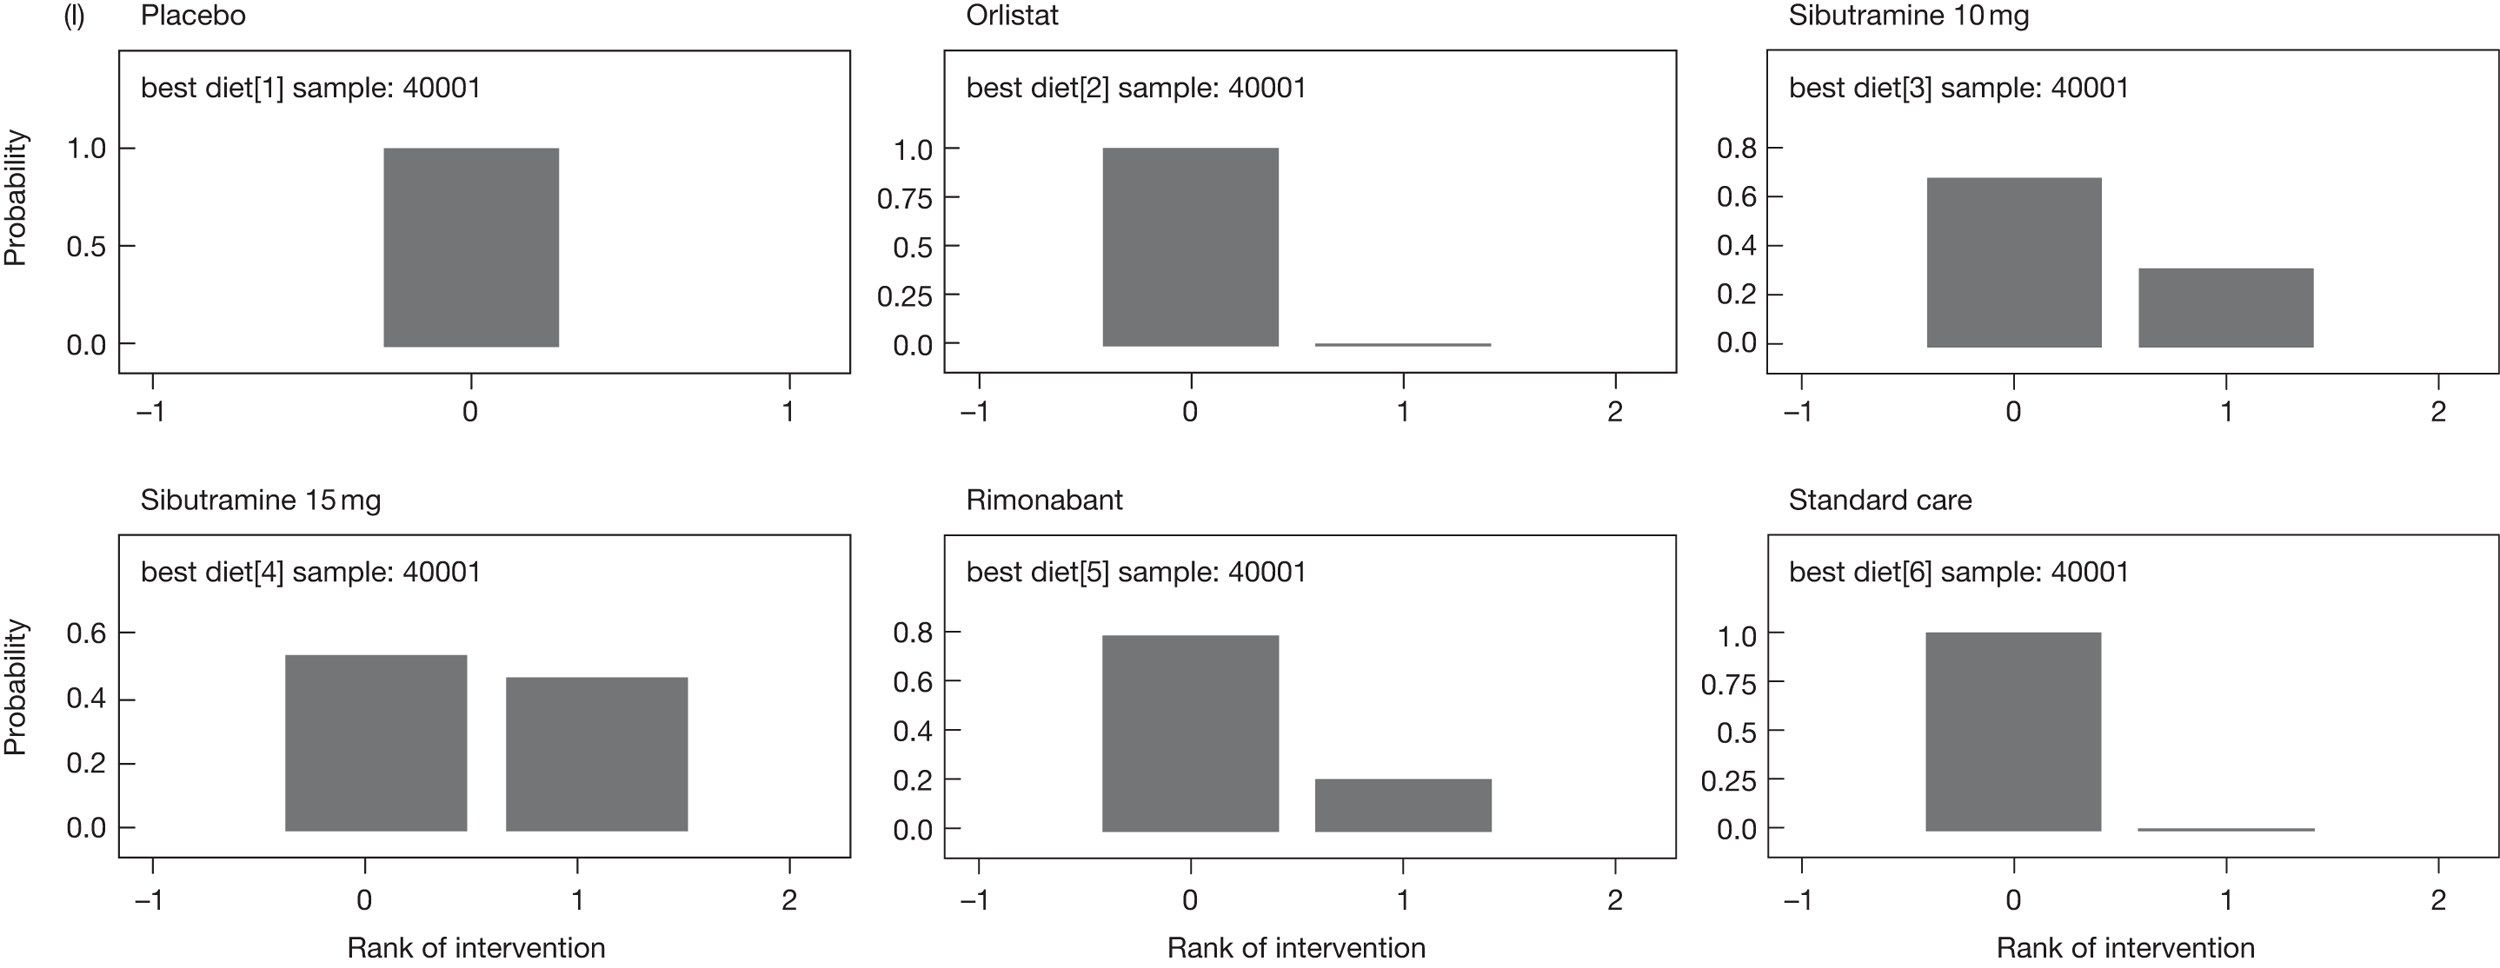
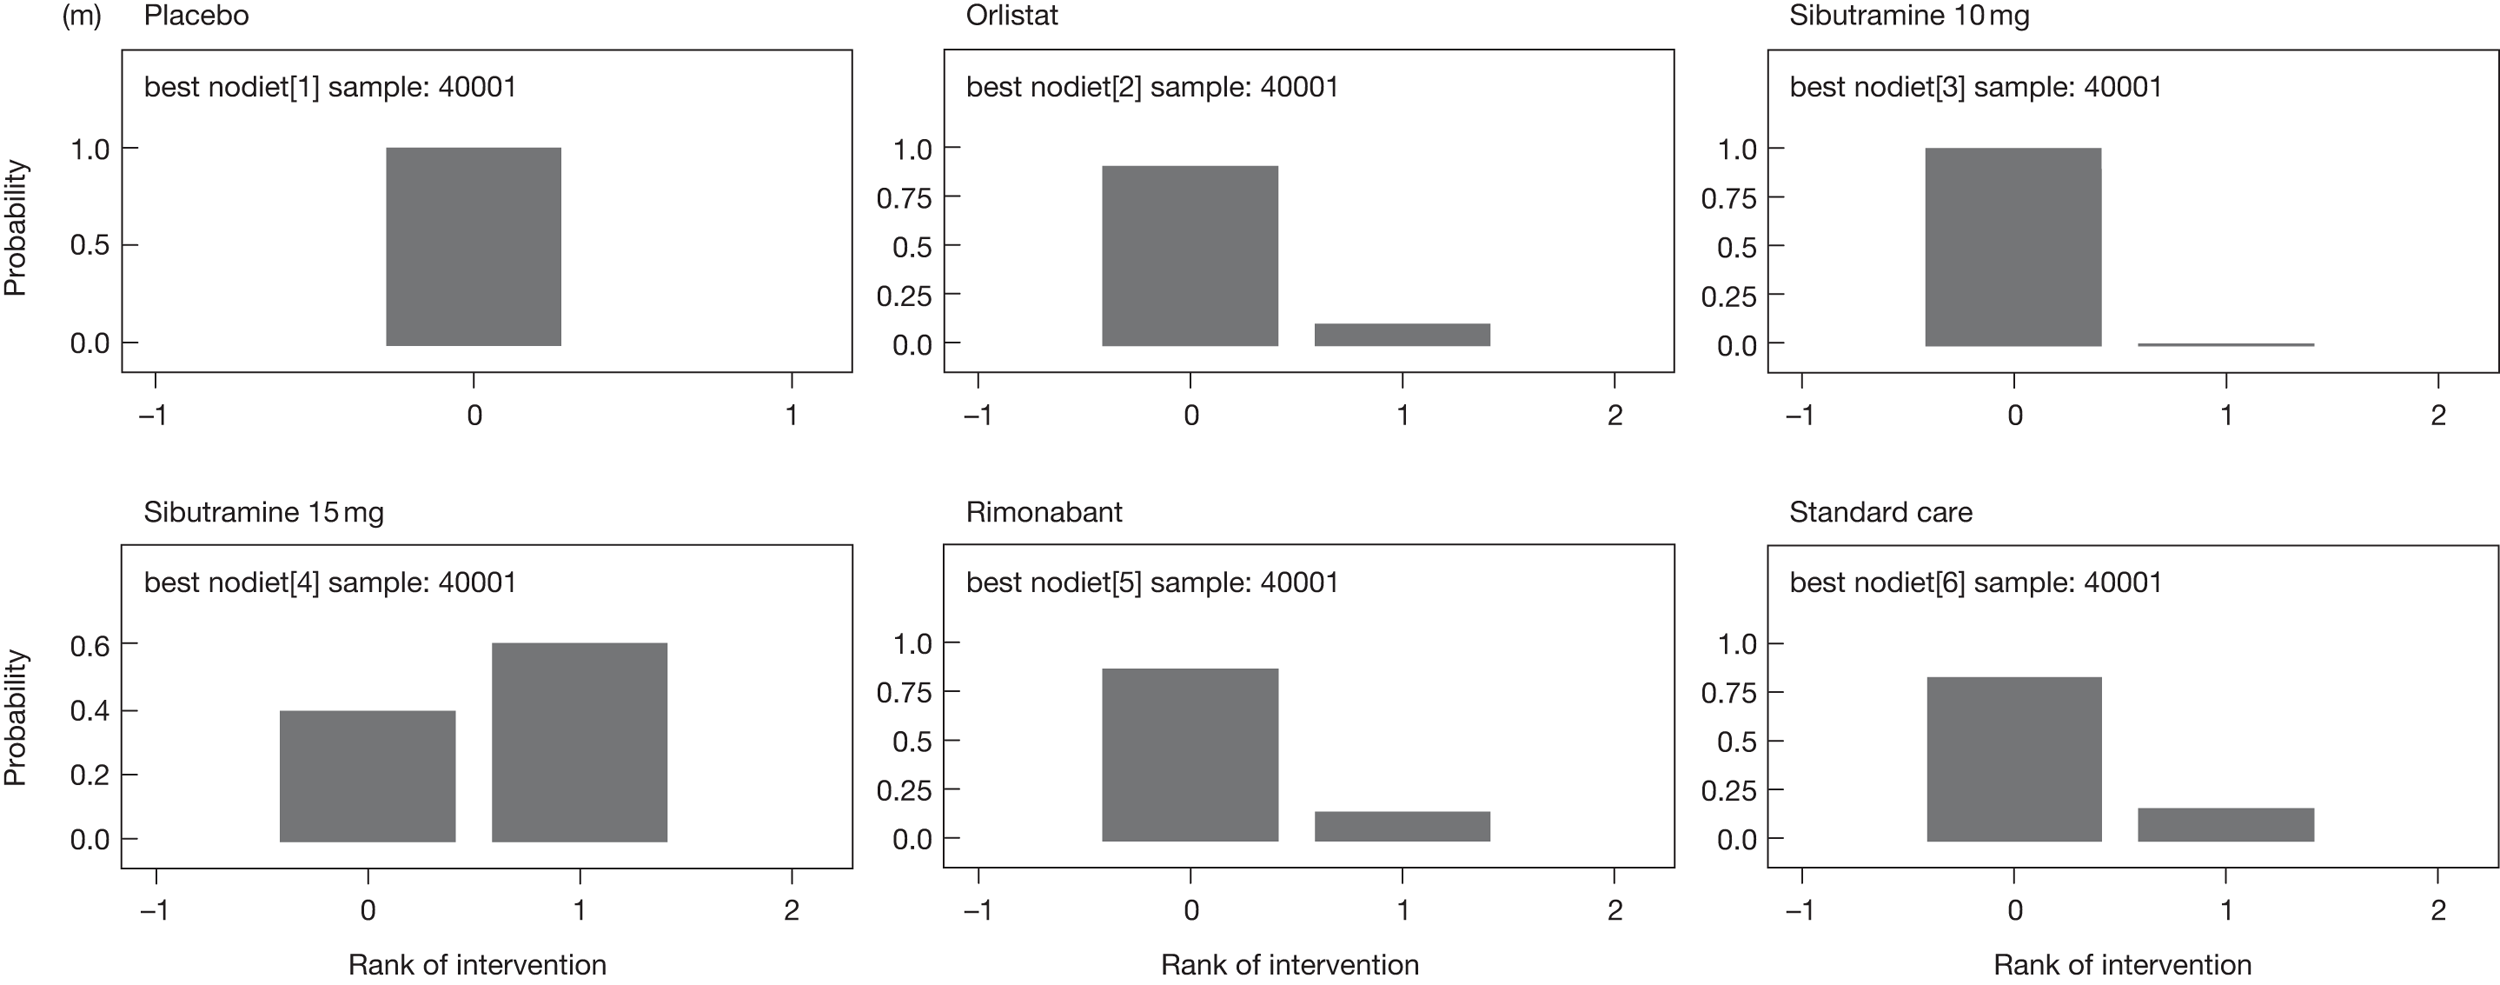
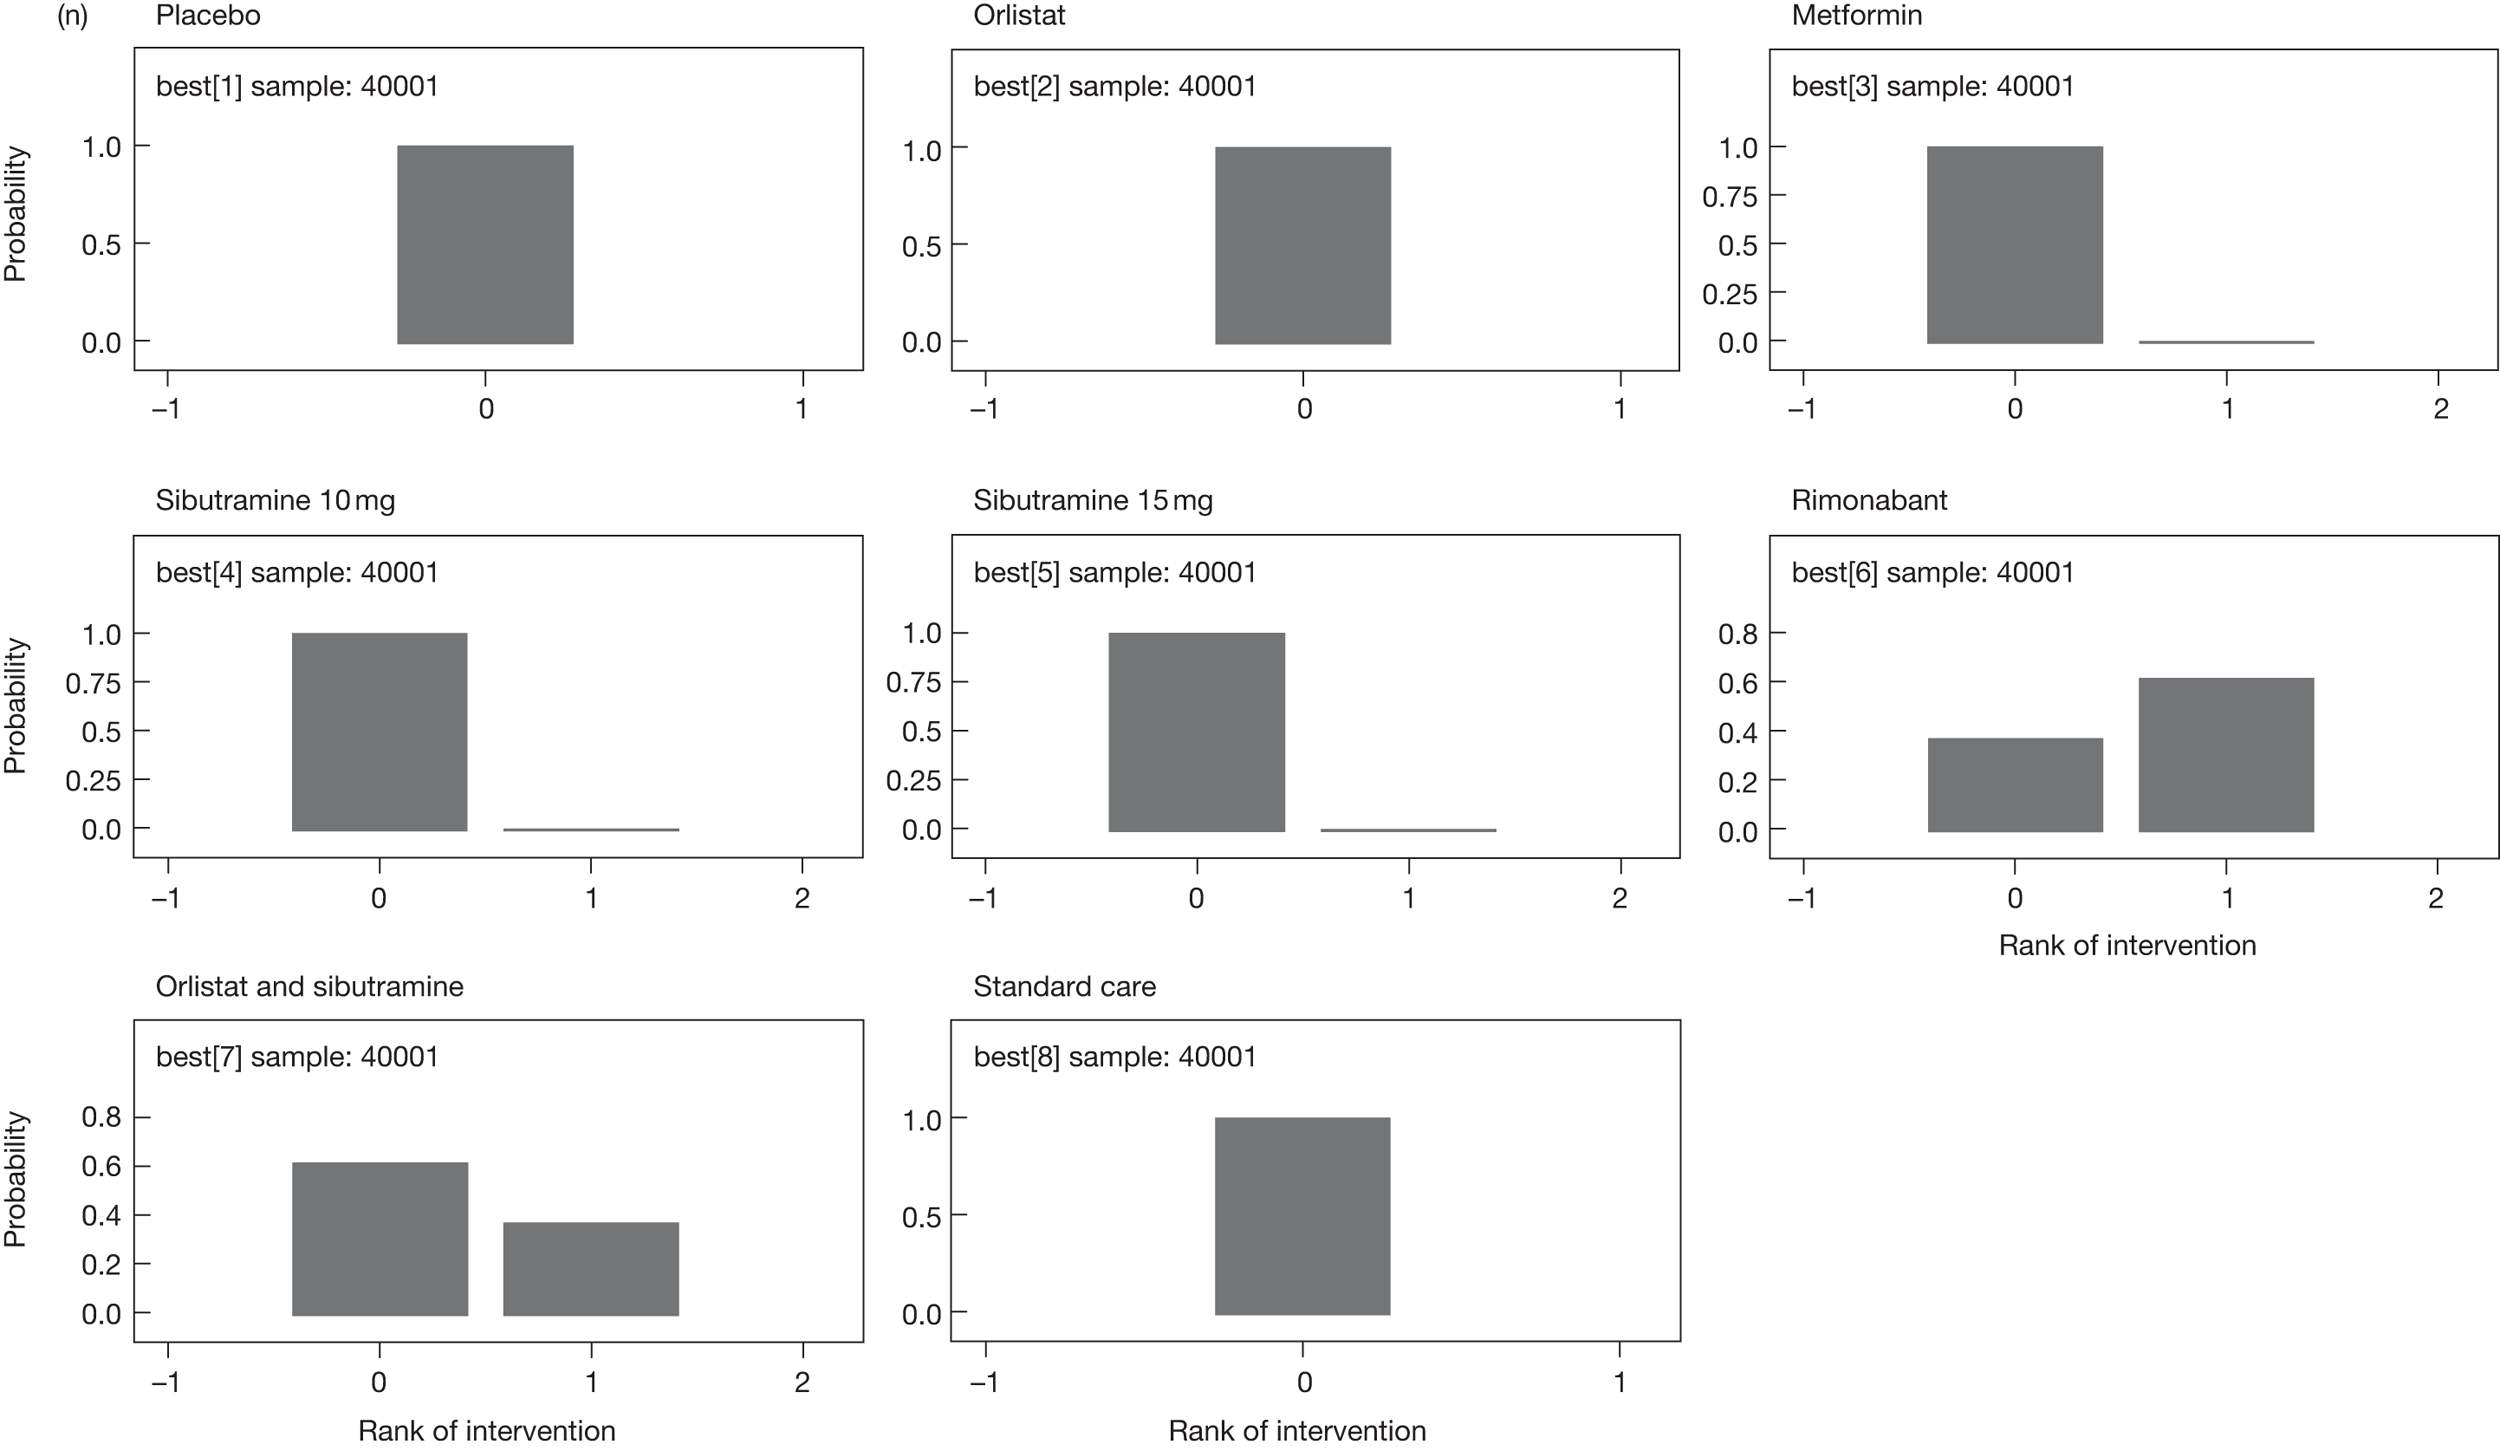
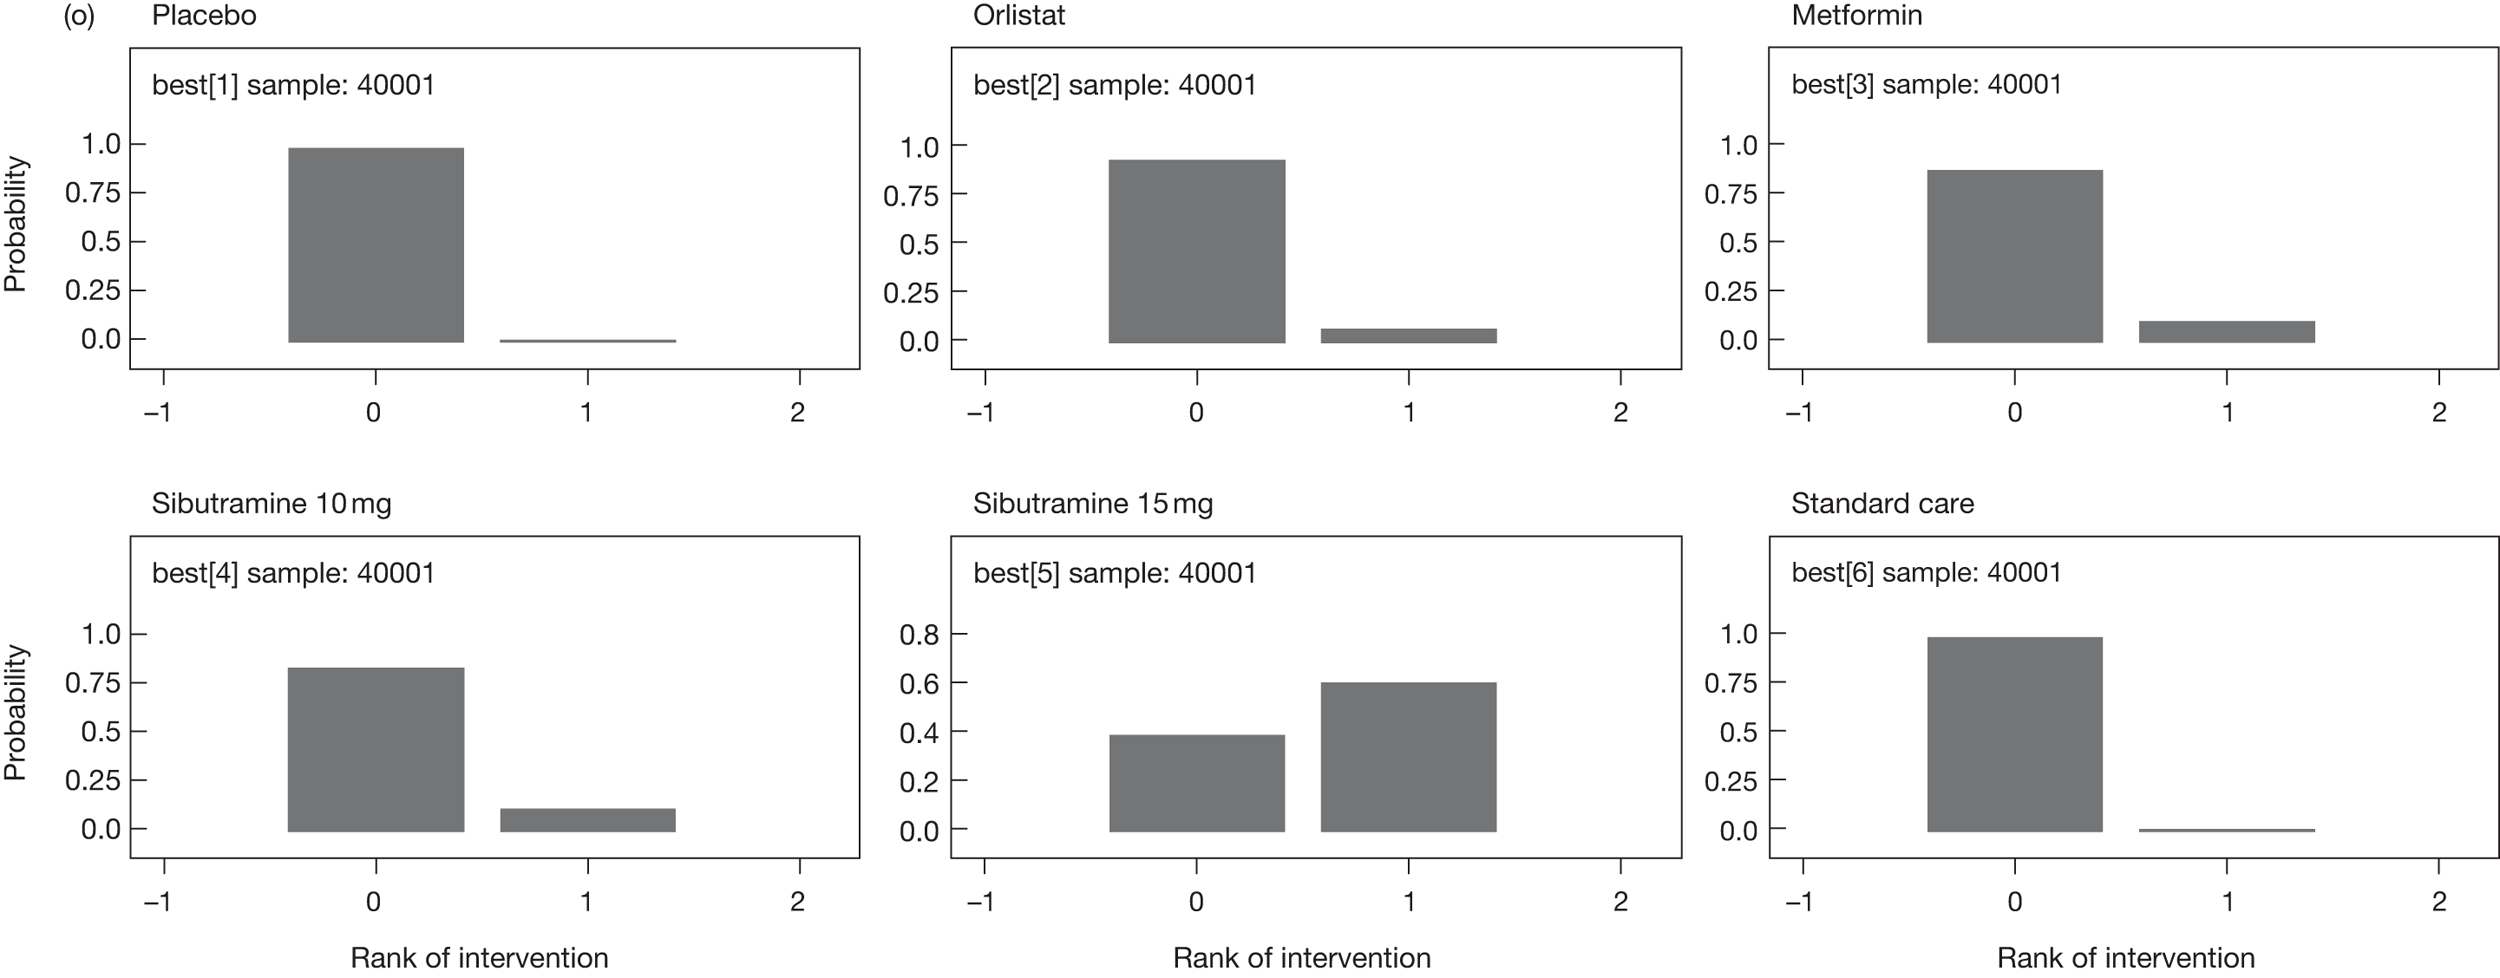
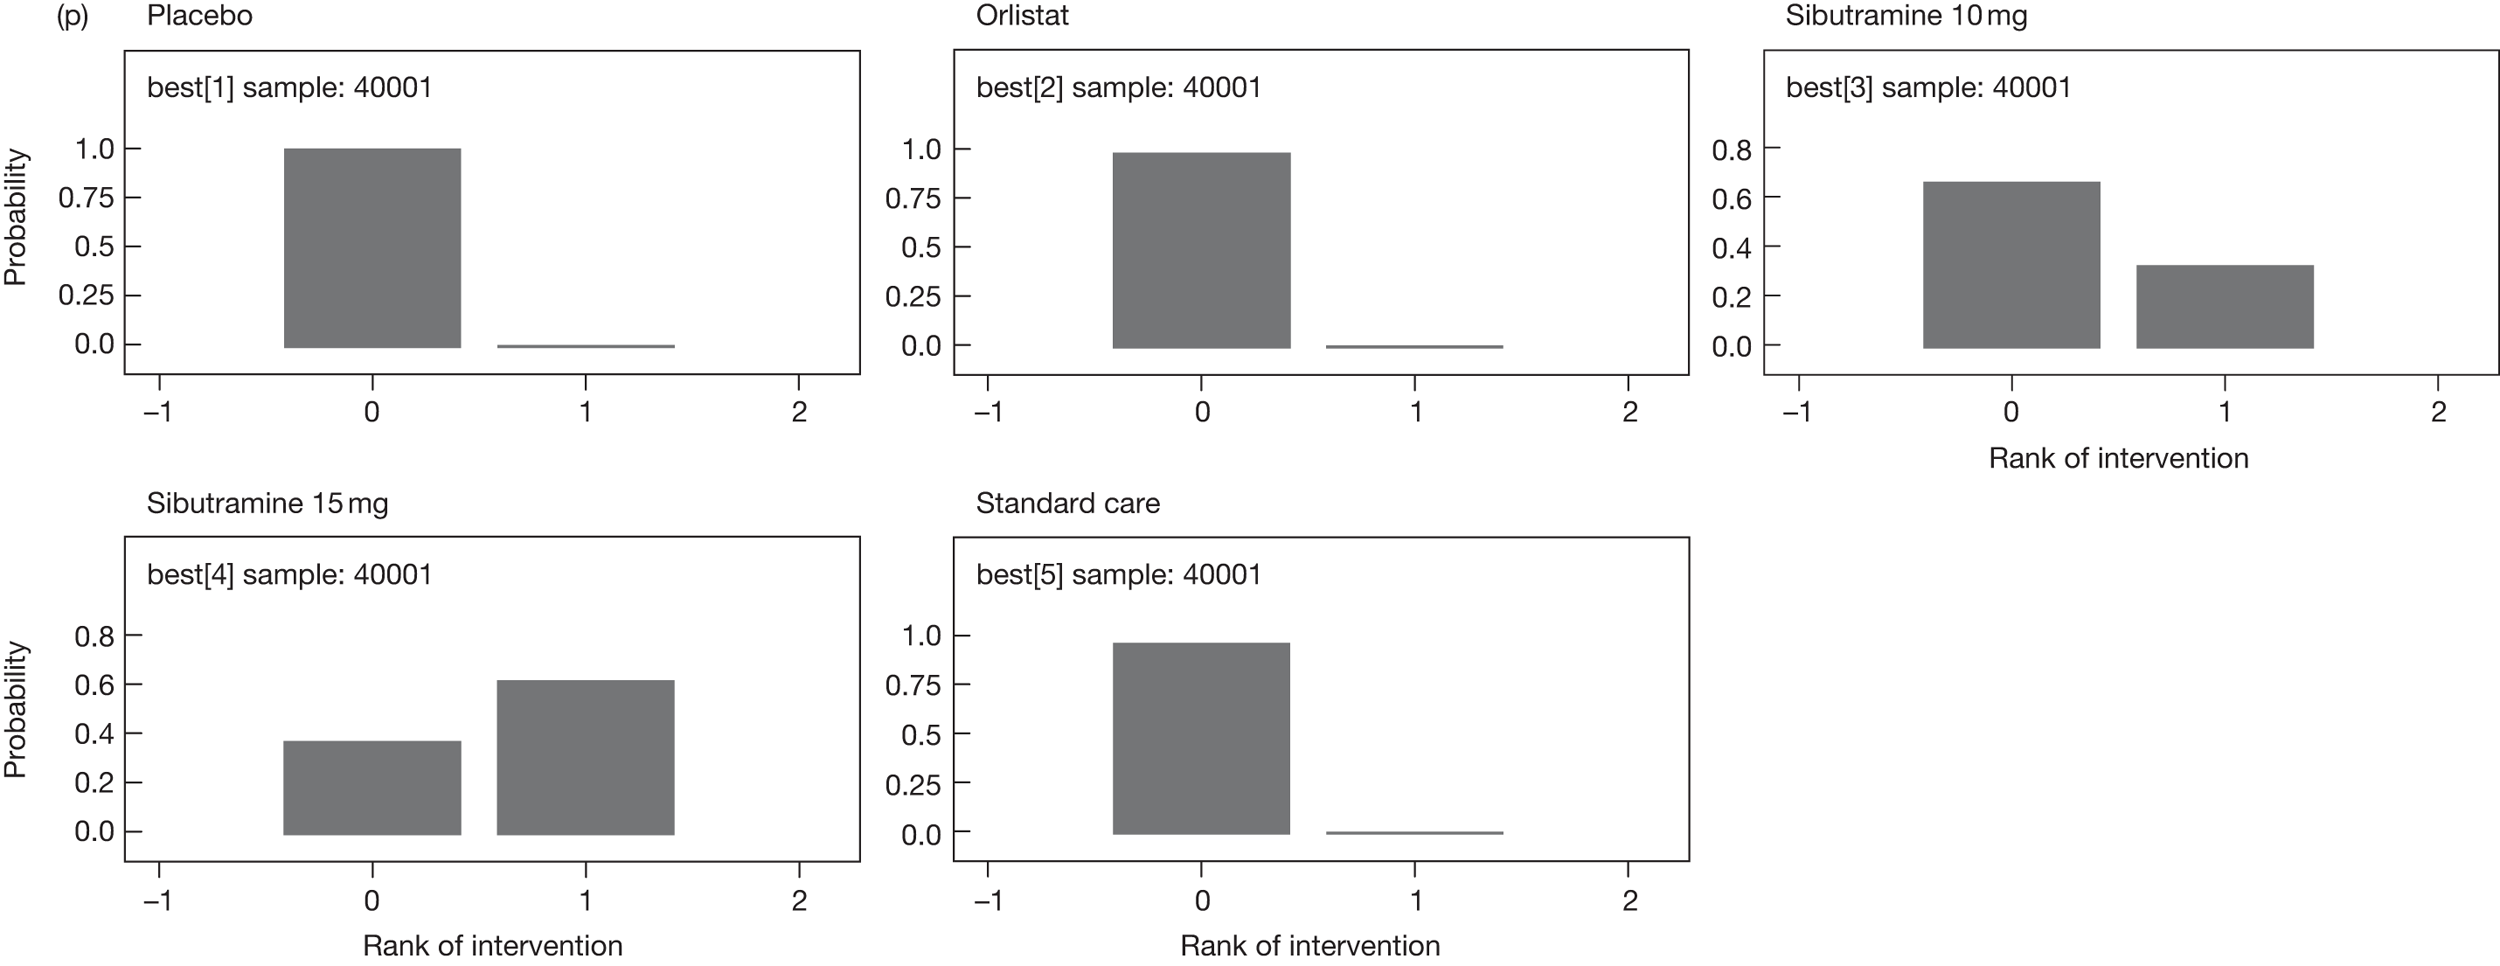
| Treatment | Mean difference | 95% CI | % best ranking | |
|---|---|---|---|---|
| All studies | Placebo | Reference | 0 | |
| Orlistat | –4.12 | –5.07 to –3.15 | 0.2 | |
| Sibutramine 10 mg | –5.42 | –7.36 to –3.42 | 16.6 | |
| Sibutramine 15 mg | –6.35 | –8.06 to –4.63 | 78.2 | |
| Rimonabant | –4.55 | –6.20 to –2.92 | 5.0 | |
| Standard care | –2.89 | –4.90 to –0.84 | 0 | |
| Excluding wash-in studies | Placebo | Reference | 0 | |
| Orlistat | –2.79 | –3.56 to –2.04 | 5.0 | |
| Sibutramine 10 mg | – | – | – | |
| Sibutramine 15 mg | –3.83 | –5.06 to –2.68 | 95.0 | |
| Rimonabant | – | – | – | |
| Standard care | 0.82 | –0.40 to 2.06 | 0 | |
| LOCF only | Placebo | Reference | 0 | |
| Orlistat | –4.23 | –5.52 to –2.92 | 2.1 | |
| Sibutramine 10 mg | –5.44 | –7.67 to –3.13 | 17.2 | |
| Sibutramine 15 mg | –6.49 | –8.89 to –4.09 | 73.5 | |
| Rimonabant | –3.94 | –6.04 to –1.75 | 3.5 | |
| Standard care | –1.99 | –7.73 to 3.67 | 3.8 |
Appendix 4 Cost-effectiveness review
Economic literature review inclusion and exclusion criteria
Inclusion criteria
-
Cost-effectiveness study with active treatment orlistat, sibutramine or rimonabant compared with diet and exercise or lifestyle advice or no treatment.
-
Cost-effectiveness study comparing any of the active treatments.
-
Results presented in terms of cost per QALY or cost per life-year.
-
Adults aged 18 years or over.
-
Full report of modelling methods provided.
Exclusion criterion
-
Studies reported in abstract form only.
Cardiovascular events
Of the 13 studies with non-diabetic cohorts at baseline, three160,161,163 did not model CV events. Eight applied the Framingham Heart Study (FHS) equations to predict coronary157,158,167,169 or cardiovascular26,41,159,162 risk for both treatment arms. 19,190,196 One study169 incorporated BMI changes indirectly into the FHS equations through estimating natural changes in blood pressure and lipids by BMI category. Another168 estimated CHD risk using changes in waist circumference and one166 used incidence data from registries for no treatment, applying relative risks per BMI change, obtained from observational studies.
Of the six studies with diabetic cohorts at baseline, two concentrated on just CVD events. They considered MI, stroke, angina and transient ischaemic attack (TIA),41 and MI, ischaemic heart disease, stroke and congestive heart failure. 159 Three studies164,165,170 included both micro- and macrovascular events (MI, stroke, peripheral vascular disease, heart failure, cataract extraction), and the sixth166 included CHD and stroke. Five studies41,159,164,165,170 used evidence from the UK Prospective Diabetes Study (UKPDS) to predict cardiovascular risk, based on treatment-induced changes in age, gender, lipids, blood pressure, smoking status and glycaemic control. 184,196,197 One study166 used the same approach as for cardiovascular events, that is, baseline risks of events were obtained from GP registries, national registries and population surveys, and relative risks sourced from observational studies were then applied to the baseline risks. Another study41 apportioned the risk across event types using prevalence data from Health Outcomes Data Repository (HODAR), and estimated risks of subsequent CHD events using data from Saskatchewan,198–201 and one164 increased the baseline risk observed in the UKPDS data by applying a correction factor for obese patients. 184,197
Incidence of type 2 diabetes mellitus
Obese persons have a higher than average risk of developing T2DM. Of the 13 studies modelling obese cohorts with no comorbidities at baseline, 1226,41,157–159,161–163,166–169 examined reductions in incidence rates of T2DM, and one used the observed 4-year incidence rates from the treatment and control arms of the XENDOS study (n = 3305). 162 The remaining studies used incidence rates categorised by BMI level, and two studies41,159 also included fasting plasma glucose level. These two studies used algorithms from the San Antonio study to predict annual incidence rates, taking into account treatment-induced changes in both BMI and fasting plasma glucose.
| Study | Setting | Cost yeara | Treatmentb | Comparatorb | Baseline condition | Model | Horizon treatment | Horizon model | Discount (%), cost (benefit) |
|---|---|---|---|---|---|---|---|---|---|
| Ara 2007157 |
Finland Germany Switzerland UK |
2005 € | Sibutramine 10 or 15 mg q.d. + lifestyle | Lifestyle |
Obese: BMI ≥ 30 kg/m2 No comorbidity |
Life table | 1 year | Lifetime |
Finland 5 (5) Germany 5 (5) Switzerland 5 (5) UK 3.5 (3.5) |
| Brennan 2006158 | Germany | 2004 € | Sibutramine 10 or 15 mg q.d. + lifestyle | Lifestyle |
Obese: BMI ≥ 30 kg/m2 No comorbidity |
Life table | 1 year | Lifetime | 5 (5) |
| Brown 200626 | UK | NR UK£ | Orlistat (1 year) ≤ 120 mg t.i.d. + lifestyle | Orlistat (4 years) ≤ 120 mg t.i.d + lifestyle | Obese: mean BMI = 33 kg/m2 | NR | 1 year vs 4 years | Lifetime | 3.5 (3.5)c |
| Burch 200941 | UK | 2005 UK£ | Rimonabant 20 mg q.d. + diet and exercise |
a) Diet and exercise b) Orlistat 120 mg t.i.d. + diet and exercise c) Sibutramine 10–15 mg q.d. + diet and exercise |
(a) Obese: BMI ≥ 30 kg/m2 with or without DM (b) Overweight: BMI ≥ 27 kg/m2 with treated T2DM (c) Overweight: BMI ≥ 27 kg/m2 with untreated dyslipidaemia and without T2DM |
Markov model |
Rimonabant is lifetime Orlistat is lifetime Sibutramine is 1 year |
Lifetime | 3.5 (3.5) |
| Caro 2007159 | UK | 2005 UK£ | Rimonabant 20 mg q.d. | Diet and exercise advice |
Obese: mean, BMI = 36.5 kg/m2 T2DM: mean, BMI = 33.7 kg/m2 |
Markov | 1 year | 10 years | 3.5 (3.5) |
| Foxcroft 2005160 | UK | 2005 UK£ | Orlistat ≤ 120 mg t.i.d. + low-calorie diet | Low-calorie diet | Obese: BMI = 28–47 kg/m2 | excel | 1 year | 1 year | NA |
| Hampp 2008168 | USA | 2006 US$ | Rimonabant 20 mg q.d. + lifestyle |
a) No treatment b) Placebo + lifestyle |
Obese: mean BMI = 37.1 kg/m2 | Decision tree |
a) 1 year b) 2 years c) 1 year + 1 year placebo |
5 years | 3 (3) |
| Hertzman 2005161 | Sweden | 2003 € | Orlistat ≤ 120 mg t.i.d. + low-calorie diet | Low-calorie diet |
Obese: mean BMI = 36 kg/m2 No DM and > 2.5 kg weight loss prior to orlistat |
Decision tree | 1 year | Lifetime | 3 (3) |
| Iannazzo 2008162 | Italy | NR € | Orlistat 120 mg t.i.d. + lifestyle | Lifestyle | Obese: BMI ≥ 30 kg/m2 | Markov | 4 years | 10 years | 3.5 (3.5) |
| Lacey 2005163 | Ireland | 2003 € | Orlistat ≤ 120 mg t.i.d + low-calorie diet | Low-calorie diet |
Overweight: BMI ≥ 28 kg/m2 No T2DM and > 2.5 kg weight loss prior to orlistat |
1 year | 11 years | 3 (3) | |
| Lamotte 2002164 | Belgium | 2000 € | Orlistat, no dose stated + low-calorie diet | Low-calorie diet | Obese: BMI ≥ 30 kg/m2 with T2DM | Markov state transition | 2 years | 10-year horizon | 3 (0) |
| Maetzel 2003170 | Canada | 2001 US$ | Orlistat 120 mg t.i.d. + diet and exercise + T2DM medication | Diet and exercise + T2DM medication | Overweight or obese with T2DM | Markov state transition | 1 year | 11 years | 3 (3) |
| Roux 2006169 | USA | 2001 US$ |
(a) Diet only (b) Diet and orlistat 120 mg t.i.d. (c) Diet and exercise (d) Diet, exercise and behaviour modification |
For maintenance orlistat reduced to 50% | Non-pregnant, 35-year-old overweight and obese women | Decision-analytic model | 6-month intervention + 6-month maintenance | Lifetime | 3 (3) |
| Ruof 2005165 |
Sweden Switzerland |
NR € | Orlistat 120 mg t.i.d. + diet and exercise | Diet and exercise | Overweight or obese with T2DM | Markov model | 1 year | 11 years | 3 (3) |
| Van Baal 2006166 | Netherlands | 2005 € | Orlistat 120 mg t.i.d. + low-calorie diet | Low-calorie diet (or nothing) |
Individuals aged 20–70 years in the Netherlands with BMI ≥ 30 kg/m2 Not treated for obesity |
Population model | 1 year | Lifetime | 4 (1.5) |
| Warren 2004167 |
UK USA |
2000 € | Sibutramine 10 or 15 mg q.d. + lifestyle | Lifestyle |
Obese: BMI > 30 kg/m2 No comorbidity |
Life table | 1 year | Lifetime |
UK 6 (1.5) USA 3 (3) |
| Study | Description |
|---|---|
| Ara 2007157 | No treatment, natural weight increase: 0.08333 kg/month |
| Warren 2004167 |
Lifestyle regain: 0.36964 kg/month Non-responders to active treatment: rebound to trajectory of natural history Responders to active treatment regain: 0.38486 kg/month |
| Brennan 2006158 | As Ara 2007.157 Sensitivity analysis: responders maintain weight loss for 6 months after cessation of treatment |
| Caro 2007159 | Weight regain for all: linear over 1 year |
| Foxcroft 2005160 | NA (1-year horizon) |
| Brown 200626 | NR |
| Hampp 2008168 |
Weight maintained at 12-month value during second year on rimonabant Active treatment regain: linear over 1 year Duration modified in sensitivity analyses: 6 months to 3 years |
| Hertzman 2005161 | Active treatment regain: linear over 3 years |
| Iannazzo 2008162 | Assume 6 years regain to reach placebo level (4 years treatment plus 6 years regain) |
| Lacey 2005163 | Weight regain for all: linear over 3 years |
| Lamotte 2002164 | Active treatment regain: linear over 5 years |
| Maetzel 2003170 | Active treatment: 3-year sustained effect |
| Roux 2006169 |
No treatment: increase in BMI of +0.26 units/annum Active treatment: in the base case 20% of treatment benefit is maintained long term |
| Ruof 2005165 | Active treatment: regain is linear over 3 years |
| Burch 200941 | Active treatment: weight is maintained at 12-month level over the full lifetime horizon |
| Van Baal 2006166 | Active treatment: in the base case 23% of treatment benefit is maintained long term |
| Study | Comorbidities modelled |
|---|---|
| Ara 2007157 | T2DM, CHD |
| Brennan 2006158 | T2DM, CHD |
| Caro 2007159 |
(a) T2DM, CVD (b) CVD |
| Foxcroft 2005160 | Not modelled (1-year horizon) |
| Brown 200626 | T2DM, CVD, colorectal cancer |
| Hampp 2008168 | T2DM, CHD |
| Hertzman 2005161 | T2DM (no CHD) |
| Iannazzo 2008162 | T2DM, CVD |
| Lacey 2005163 | T2DM (no CHD) |
| Lamotte 2002164 | Micro/macro vascular |
| Maetzel 2003170 | Micro/macro vascular |
| Roux 2006169 | Hypertension, T2DM, hypercholesterolaemia, CHD |
| Ruof 2005165 | Micro/macrovascular |
| Burch 200941 |
T2DM, CVD CVD T2DM, CVD |
| Van Baal 2006166 | CHD, stroke, T2DM, osteoarthritis, low back pain, cancer |
| Warren 2004167 | T2DM, CHD |
Ara and Brennan,157 Brennan et al. 158 and Warren et al. 167 used the same evidence to model incidence rates according to one-unit BMI bands, with values ranging from 0.05% for BMI of 23 kg/m2 to 2.50% for BMI of 42 kg/m2. 201,202 Roux et al. 169 and Brown26 modelled incidence rates by BMI category using published data,201,203,204 but neither reported sufficient detail to determine the values used per category. Hampp et al. 168 used a baseline annual incidence of 1.1013% for a mean BMI of 37 kg/m2, and modelled a 0.098% and 0.073% reduction per decrease in unit BMI for men and women respectively. 205,206 Hertzman161 used a baseline incidence rate of 2.08% for men and 0.85% for women for a BMI of 36 kg/m2, applying gender- and BMI-specific relative risks from published evidence. 206 Lacey et al. 163 assumed that a 10% reduction in BMI was associated with a 30% reduction in T2DM using baseline incidence rates of 0.04% (0.13%) and 1.40% (0.61%) for BMI levels of 25 kg/m2 and 35 kg/m2, respectively, for men (women). 20 Finally, van Baal et al. 166 used a similar technique to model T2DM rates as employed for the CVD events, using incidence rates from registries, and applying relative risks obtained from observational studies.
Six studies provide sufficient detail to estimate the annual incidence rates of T2DM modelled (Figure 17). Lacey et al. 163 and Hertzman161 modelled gender-specific rates while the other four assumed equal rates for men and women. There was a considerable difference in the annual incidence rates for the higher BMI bands (44 kg/m2), with values ranging from 1.042% for women163 to 3.20% for men. 161 Ara and Brennan,157 Brennan et al. 158 and Warren et al. 167 modelled a non-linear relationship with absolute reduction per unit change in BMI ranging from 0.02% (BMI = 26 kg/m2) to 0.325% (BMI = 44 kg/m2). The other three studies161,163,168 assumed a linear relationship, and reductions ranged from 0.079%168 to 0.140%161 per unit change in BMI.
FIGURE 17.
Comparing modelled incidence rates by BMI category.
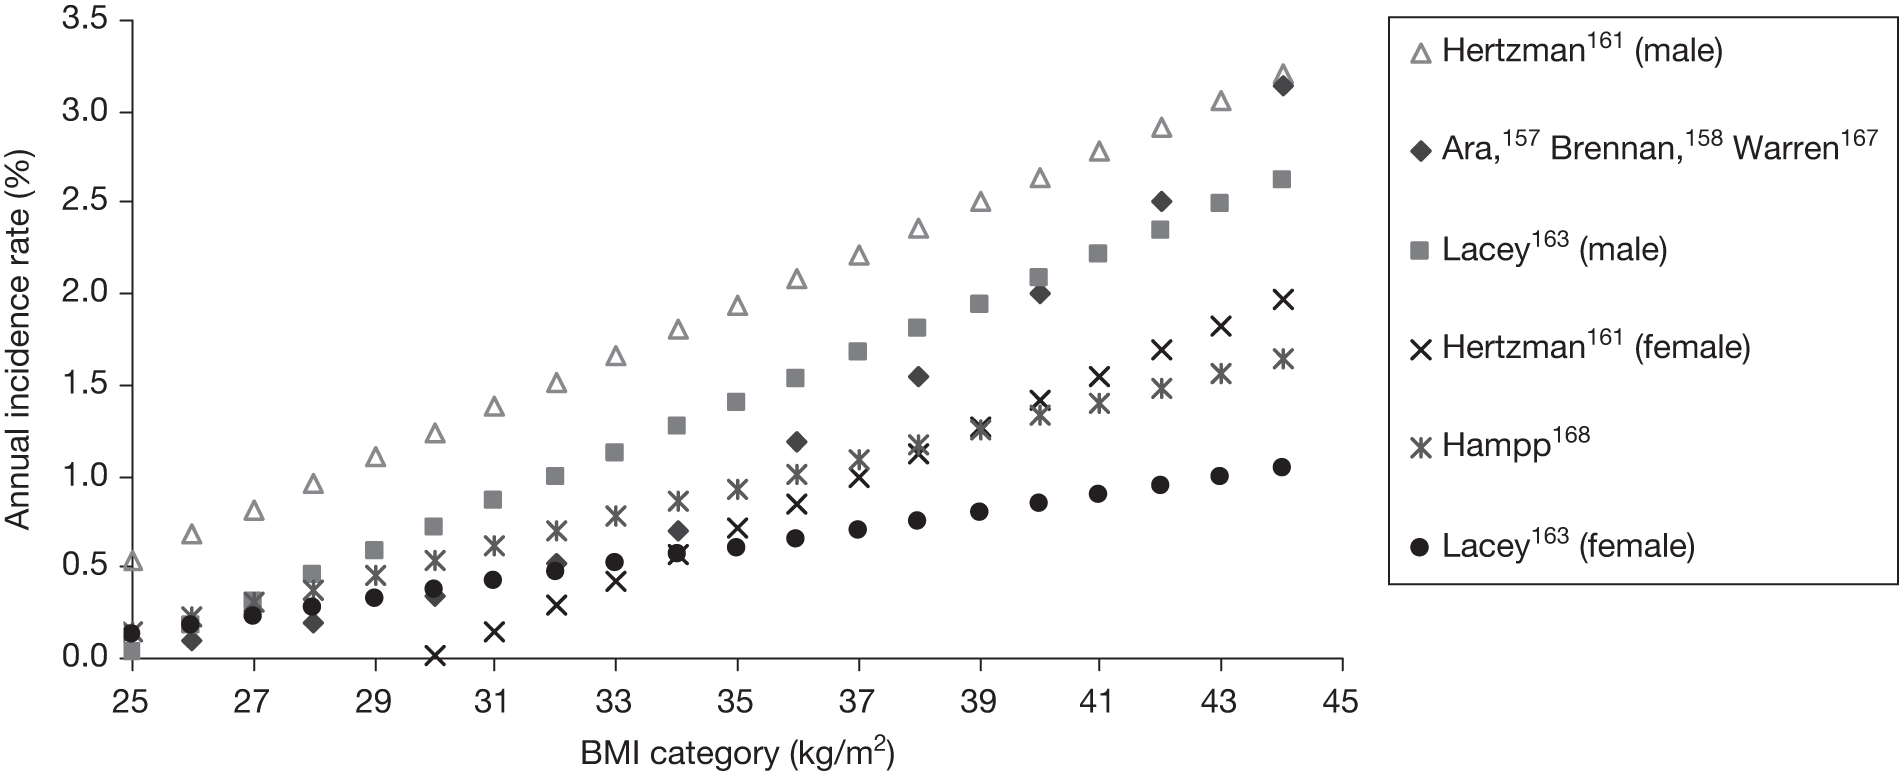
| Study | Baseline | Weight/BMI | T2DM | CVD |
|---|---|---|---|---|
| Ara 2007157 | Age adjusted178 | SF-6D disutility 0.00375/kg79 | T2DM multiplier = 0.95207 |
EQ-5D CHD multiplier = 0.85184 |
| Brennan 2006158 | Age adjusted178 | SF-6D disutility 0.00375/kg174 | T2DM multiplier = 0.95207 |
EQ-5D CHD multiplier = 0.85184 |
| Caro 2007159 |
EQ-5D Age adjusted |
EQ-5D disutility 0.014/BMI (per unit increase/decrease)208 |
EQ-5D disutility T2DM = –0.041208 |
EQ-5D disutility MI = – 0.072 Stroke = – 0.185 TIA = – 0.088 Angina = – 0.126208 |
| Foxcroft 2005160 | Utility = 1 | Disutility 0.017/BMI209 | Nm | Nm |
| Hampp 2008168 | Utility = 1 |
VAS and Torrance transformation Disutility 0.0179/BMI209 Increase/decrease equal210 |
Nm | Nm |
| Hertzman 2005161 | Utility = 1 |
VAS and Torrance transformation Disutility 0.01655/BMI, women 0.0264/BMI |
Nm | Nm |
| Iannazzo 2008162 |
Obese men 0.79 Obese women 0.75 |
Not modelled | T2DM multiplier = 0.79 |
Multiplier MI = 0.80 Stoke = 0.79 |
| Lacey 2005163 | Utility = 1 | Disutility 0.017/BMI209 | Nm | Nm |
| Lamotte 2002164 | Nm | Nm | Nm | Nm |
| Maetzel 2003170 | Nm | Nm | Nm | Nm |
| Roux 2006169 |
SF-36 Age adjusted117 |
SF-36 Multiplicative Obese = 0.87211 |
SF-36 Multiplicative T2DM = 0.75211 |
SF-36 Multiplicative CHD = 0.75211 |
| Ruof 2005165 | Utility = 1 |
VAS disutility Obese = 0.017209 |
VAS disutility Obese and T2DM = 0.0285209 |
Disutility MI = –0.08212 Stroke = –0.30213 Amputation = –0.11214 Microvascular = –0.25215 Heart failure = –0.18 Cataract = –0.04 |
| Burch 200941 |
EQ-5D Age adjusted Utility114 |
0.014 per unit change in BMI208 |
EQ-5D208 Additive T2DM = –0.041 |
EQ-5D208 Additive Stroke = –0.185 TIA = –0.088 MI = –0.072 Angina = –0.126 |
| Van Baal 2006166 |
Person trade-off Age adjusted216 |
Not modelled explicitly | No values provided | |
| Warren 2004167 |
EQ-5D Age adjusted178 |
T2DM multiplier = 0.95 | CHD multiplier = 0.85217 |
Appendix 5 De novo cost-effectiveness model
Subsequent vascular events
UK-specific data are used to ensure that event rates match the likely distribution in the UK. The probabilities of further MIs, strokes and vascular deaths for individuals with a history of MI are derived from patients on the Nottingham Heart Attack Register, whereas the probabilities of subsequent strokes and vascular deaths for patients with a history of a stroke are derived from patients on the South London Stroke Register. 176
Logistic and multivariate regression analyses were used to estimate the probability of experiencing secondary events within 1 year of a qualifying primary event. First, a logistic regression was used to estimate the probability of experiencing a secondary event of any type, that is, the combined rate of non-fatal MI, non-fatal stroke and vascular death. Multivariate regression analysis was then used to determine the distribution of secondary events between each type, should an event occur. The results confirm the importance of accounting for age in the model. For patients experiencing an MI, the probability of a secondary event within 1 year is strongly correlated with age (mean probability of 14.7% at age 45 years and 29.5% at age 85 years). Similarly, for patients experiencing a stroke, the probability of a secondary event within 1 year increases with age (mean probability of 5.4% at age 45 years and 29.8% at age 85 years), while patients with unstable angina have a mean probability of a secondary event of 8.7% at age 45 years compared with 31.3% at age 85 years.
Similar analyses were performed to estimate the probabilities of subsequent events in subsequent years. In the absence of data from individuals with a history of multiple events, these results are used to inform all subsequent events. This is a conservative approach as the application of these data implies that there is no additive effect on fatal or non-fatal event rates from previous events. Uncertainty in these event rates is explored using multivariate distributions.
List of assumptions used in the economic model
-
For individuals in the event-free health state, the Weibull curves derived from the GPRD are used to predict the time to ACM. These curves are valid for up to a maximum of 15 years, after which standard life tables are used.
-
Individuals enter the model with the mean characteristics of the patients in the MTC; thus, they have an average age of 45.5 years and a mean BMI of 34.92 kg/m2, 25.7% are male and 33.2% are diabetic.
-
At the end of the active treatment period, BMI reverts to the baseline value in a linear fashion over a 3-year period. 38
-
For rimonabant, as changes in BMI at 6 and 12 months were not available for inclusion in our MTC, we use the average of 1.76 kg/m2 (relative to placebo change) as reported in a previous economic evaluation. 168
-
For the comparator arm (no active treatment), we assume just one visit with the practice nurse at baseline and no additional monitoring.
| Logistic regression coefficients – probability of event type given event | ||||||
|---|---|---|---|---|---|---|
| eventype | Coefficient | SE | z | p > z | 95% CI | |
| 2 | Age | 0.077705 | 0.034652 | 2.242 | 0.025 | 0.009789 to 0.145622 |
| _cons | –7.17201 | 2.523846 | –2.842 | 0.004 | –12.1187 to –2.22536 | |
| 3 | Age | 0.047496 | 0.017134 | 2.772 | 0.006 | 0.013914 to 0.081079 |
| _cons | –3.24095 | 1.176916 | –2.754 | 0.006 | –5.54767 to –0.93424 | |
| age | _cons | age | _cons | |||
| 2 | age | 0.001201 | ||||
| _cons | –0.08667 | 6.3698 | ||||
| 3 | age | 0.000165 | –0.01093 | 0.000294 | ||
| _cons | –0.01085 | 0.733099 | –0.01993 | 1.38513 | ||
| Any event assuming exponential, given survived to end of year 1 | ||||||
| _t | Coefficient | SE | z | p > z | 95% CI | |
| age | 0.025344 | 0.013465 | 1.882 | 0.06 | –0.00105 to 0.051735 | |
| _cons | –4.95663 | 0.912665 | –5.431 | 0 | –6.74542 to –3.16784 | |
| age | _cons | |||||
| age | 0.000181 | |||||
| _cons | –0.01213 | 0.832958 | ||||
| ACS year 1 mlogit | ||||||
| eventype | Coefficient | SE | z | p > z | 95% CI | |
| age | 0.003234 | 0.012312 | 0.263 | 0.793 | –0.0209 to 0.027366 | |
| _cons | –3.05907 | 0.80604 | –3.795 | 0 | –4.63888 to –1.47926 | |
| age | 0.05624 | 0.009014 | 6.239 | 0 | 0.038572 to 0.073907 | |
| _cons | –5.71398 | 0.648273 | –8.814 | 0 | –6.98457 to –4.44338 | |
| 01:00 | 02:00 | |||||
| age | _cons | age | _cons | |||
| 1 | age | 0.000152 | ||||
| _cons | –0.00974 | 0.649701 | ||||
| 2 | age | 8.50 × 10⁻⁶ | –0.00054 | 0.000081 | ||
| _cons | –0.00054 | 0.035984 | –0.00577 | 0.420258 | ||
| ACS exponential post year 1 | ||||||
| _t | Coefficient | SE | z | p > z | 95% CI | |
| age | 0.051546 | 0.006256 | 8.24 | 0 | 0.039285 to 0.063807 | |
| _cons | –5.93184 | 0.45102 | –13.152 | 0 | –6.81582 to –5.04785 | |
| _t | age | _cons | ||||
| age | 0.000039 | |||||
| _cons | –0.00279 | 0.203419 | ||||
| ACS post year 1 mlogit | ||||||
| Coefficient | SE | z | p > z | 95% CI | ||
| age | –0.04179 | 0.017595 | –2.375 | 0.018 | –0.07627 to –0.0073 | |
| _cons | 1.089838 | 1.205898 | 0.904 | 0.366 | –1.27368 to 3.453354 | |
| age | _cons | |||||
| age | 0.00031 | |||||
| _cons | –0.0209 | 1.45419 | ||||
| Year 1: mlogit all events | ||||||
|---|---|---|---|---|---|---|
| eventype | Coefficient | SE | z | p > z | 95% CI | |
| 1 | Age | 0.008007 | 0.009213 | 0.869 | 0.385 | –0.01005 to 0.026063 |
| _cons | –3.45027 | 0.651183 | –5.298 | 0 | –4.72657 to –2.17398 | |
| 2 | Age | 0.08874 | 0.009097 | 9.755 | 0 | 0.070911 to 0.106569 |
| _cons | –8.61813 | 0.717794 | –12.006 | 0 | –10.025 to –7.21128 | |
| (Outcome eventype = = 0 is the comparison group) | ||||||
| age | _cons | age | _cons | |||
| 1 | Age | 0.000085 | ||||
| _cons | –0.00589 | 0.424039 | ||||
| 2 | Age | 4.90 × 10⁻⁶ | –0.00033 | 0.000083 | ||
| _cons | –0.00034 | 0.02368 | –0.00648 | 0.515229 | ||
| Year 2: Exponential any event | ||||||
| eventype | Coefficient | SE | z | p > z | 95% CI | |
| age2 | 0.04211 | 0.00684 | 6.157 | 0 | 0.028705 to 0.055515 | |
| _cons | –5.88035 | 0.503282 | –11.684 | 0 | –6.86676 to –4.89393 | |
| age2 | _cons | |||||
| age2 | 0.000047 | |||||
| _cons | –0.0034 | 0.253293 | ||||
| Mlogit event 1–2 | ||||||
| eventype2 | Coefficient | SE | z | p > z | 95% CI | |
| age2 | –0.05784 | 0.016193 | –3.572 | 0 | –0.08958 to –0.0261 | |
| _cons | 3.825288 | 1.177901 | 3.248 | 0.001 | 1.516645 to 6.133931 | |
| (Outcome evtypey2 = = 2 is the comparison group) | ||||||
| age2 | _cons | |||||
| age2 | 0.000262 | |||||
| _cons | –0.01888 | 1.38745 | ||||
| beta1 | beta2 | beta3 | beta4 | |
|---|---|---|---|---|
| BMI/10 | 0.104753 | –0.00471 | 0.102937 | 0 |
| (BMI/10)2 | –0.02088 | –0.00084 | –0.01708 | 0 |
| Female | 0.20566 | 0.068761 | 0.103689 | 0 |
| Female*BMI/10 | –0.13659 | –0.04906 | –0.05964 | 0 |
| (Female*BMI/10)2 | 0.021341 | 0.00906 | 0.008154 | 0 |
| Age/10 | –0.08175 | –0.01526 | –0.01037 | 0 |
| (Age/10)2 | 0.007236 | 0.001087 | 0.000396 | 0 |
| Heart attack | –0.04154 | 0.009891 | –0.03533 | 0 |
| Stroke | –0.03844 | 0.005964 | –0.0539 | 0 |
| T2DM | –0.00378 | –0.00042 | –0.01102 | 0 |
| Angina | –0.04846 | –0.00895 | –0.02194 | 0 |
| Other DM | –0.04612 | –0.00347 | –0.00403 | 0 |
| Condition 1 | –0.12236 | –0.01034 | –0.03467 | 0 |
| Condition 2 | –0.16814 | –0.01196 | –0.05323 | 0 |
| Condition 3 | –0.19991 | –0.00558 | –0.06245 | 0 |
| Condition 4 | –0.19227 | –0.01002 | –0.09421 | 0 |
| Recent angina | –0.02555 | 0.007781 | –0.01335 | 0 |
| Recent heart attack | 0.036931 | 0.081802 | –0.0108 | 0 |
| Recent stroke | –0.02441 | 0.011257 | 0.019356 | 0 |
| Gamma | 0.388339 | 0.886923 | 0.669692 | 15 |
| Var_e | 0.02373 | 0.000681 | 0.006051 | 0.1 |
| delta1 | delta2 | delta3 | delta4 | |
| Constant | –5.88849 | –2.21162 | –3.74868 | 0 |
| BMI/10 | 0.428433 | 0.000379 | 0.296133 | 0 |
| Female | 0.31338 | 0.185129 | 0.438441 | 0 |
| Age/10 | 0.040898 | 0.041858 | 0.197627 | 0 |
| Heart attack | 1.664323 | 0.497866 | 0.949695 | 0 |
| Stroke | 1.978217 | 0.833343 | 1.033395 | 0 |
| T2DM | 0.676831 | –0.00932 | 0.523042 | 0 |
| Angina | 0.846194 | 0.403626 | 0.762616 | 0 |
| Other DM | 1.131596 | 0.271272 | 0.359836 | 0 |
| Condition 1 | 2.381369 | 0.796365 | 1.42458 | 0 |
| Condition 2 | 3.39744 | 1.235271 | 2.027874 | 0 |
| Condition 3 | 4.503202 | 1.319402 | 2.780812 | 0 |
| Condition 4 | 4.943372 | 1.661351 | 2.994708 | 0 |
| Recent angina | 1.606556 | 0.532913 | 0.945333 | 0 |
| Recent heart attack | 8.146078 | 7.967091 | 7.593918 | 0 |
| Recent stroke | 1.183494 | 0.491454 | 0.921231 | 0 |
| Beta coefficientsa | Mean EQ-5D | Mean errors | < MID (%) | ||||
|---|---|---|---|---|---|---|---|
| Actual | ACMM | ME | MAE | RMSE | |||
| All | 24,169 | 0.8715 | 0.8707 | 0.0008 | 0.1204 | 0.1806 | 53 |
| No condition | 12,884 | 0.9514 | 0.9493 | 0.0021 | 0.0752 | 0.1027 | 74 |
| At least one condition | 11,285 | 0.7804 | 0.7811 | –0.0007 | 0.1720 | 0.2404 | 29 |
| Angina ≥ 12 months | 965 | 0.6853 | 0.6832 | 0.0021 | 0.1937 | 0.2578 | 26 |
| Angina < 12 months | 515 | 0.6151 | 0.6135 | 0.0016 | 0.2184 | 0.2802 | 25 |
| MI ≥ 12 months | 648 | 0.6934 | 0.6900 | 0.0034 | 0.1964 | 0.2603 | 26 |
| MI < 12 months | 64 | 0.6197 | 0.6200 | –0.0003 | 0.2156 | 0.2749 | 20 |
| Stroke ≥ 12 months | 470 | 0.6857 | 0.6823 | 0.0034 | 0.2090 | 0.2654 | 21 |
| Stroke < 12 months | 85 | 0.6482 | 0.6457 | 0.0026 | 0.2138 | 0.2693 | 22 |
| T2DM | 903 | 0.7618 | 0.7603 | 0.0015 | 0.1719 | 0.2351 | 27 |
| T2DM and angina ≥ 12 months | 141 | 0.6223 | 0.6282 | –0.0059 | 0.1934 | 0.2578 | 29 |
| T2DM and angina < 12 months | 78 | 0.5346 | 0.5575 | –0.0229 | 0.2195 | 0.2747 | 21 |
| T2DM and MI ≥ 12 months | 105 | 0.6456 | 0.6459 | –0.0003 | 0.1936 | 0.2551 | 31 |
| T2DM and MI < 12 months | 8 | 0.5075 | 0.5665 | –0.0590 | 0.2578 | 0.3306 | 13 |
| T2DM and stroke ≥ 12 months | 63 | 0.6240 | 0.6224 | 0.0015 | 0.2195 | 0.2766 | 22 |
| T2DM and stroke < 12 months | 8 | 0.5813 | 0.6813 | –0.1000 | 0.3224 | 0.3894 | 25 |
| Age (years) | |||||||
| < 35 | 5838 | 0.9304 | 0.9289 | 0.0015 | 0.0870 | 0.1371 | 66 |
| 34.9–45.0 | 5134 | 0.9014 | 0.9021 | –0.0007 | 0.1076 | 0.1661 | 61 |
| 44.9 – 55 | 4240 | 0.8678 | 0.8721 | –0.0043 | 0.1259 | 0.1878 | 52 |
| 54.9 – 65 | 4228 | 0.8333 | 0.8373 | –0.0039 | 0.1448 | 0.2102 | 44 |
| 64.9 – 75 | 2892 | 0.8239 | 0.8025 | 0.0214 | 0.1454 | 0.2026 | 38 |
| 75+ | 1837 | 0.7727 | 0.7799 | –0.0072 | 0.1540 | 0.2110 | 32 |
| Age (years) | CHD | Stroke | ||||||
|---|---|---|---|---|---|---|---|---|
| Men | Women | Men | Women | |||||
| n | % | n | % | n | % | n | % | |
| < 35 | 118 | 51 | 23 | 21 | 113 | 49 | 84 | 79 |
| 35–44 | 787 | 78 | 192 | 51 | 223 | 22 | 183 | 49 |
| 45–54 | 2739 | 83 | 590 | 56 | 570 | 17 | 463 | 44 |
| 55–64 | 6317 | 84 | 1742 | 65 | 1244 | 16 | 949 | 35 |
| 65–74 | 10,889 | 78 | 4861 | 67 | 3004 | 22 | 2413 | 33 |
| 75+ | 28,815 | 65 | 31,163 | 63 | 15,203 | 35 | 18,693 | 37 |
| 1–3 months | 4–6 months | 7–12 months | |
|---|---|---|---|
| Sibutramine | £65.00 | £50.00 | £105.00 |
| Orlistat | £55.00 | £50.00 | £100.00 |
| Rimonabant | £55.00 | £50.00 | £100.00 |
| Unit | Total | Source | |
| Sibutramine | |||
| GP 4 × 10 minutes | £35.00 | £140.00 | Curtis and Netten 2007180 |
| Nurse 8 × 15 minutes | £7.50 | £60.00 | Curtis and Netten 2007180 |
| Blood 4 × 10 minutes | £5.00 | £20.00 | Curtis and Netten 2007180 |
| Total | £220.00 | ||
| Orlistat and rimonabant | |||
| GP 4 × 10 minutes | £35.00 | £140.00 | Curtis and Netten 2007180 |
| Nurse 8 × 15 minutes | £7.50 | £60.00 | Curtis and Netten 2007180 |
| Blood 1 × 10 minutes | £5.00 | £5.00 | Curtis and Netten 2007180 |
| Total | £205.00 | ||
Cohort size
The number of individuals required to capture the individual patient variation in a typical cohort was determined by examining the average costs and QALYs derived from cohorts of increasing numbers of patients. With a sample size of 200,000, there is still a small amount of variation in the estimated average costs (Figure 18) and QALYs (Figure 19). These variations have stabilised when using sample size of 400,000.
FIGURE 18.
Stability analyses for cohort size, average discounted cost per patient.
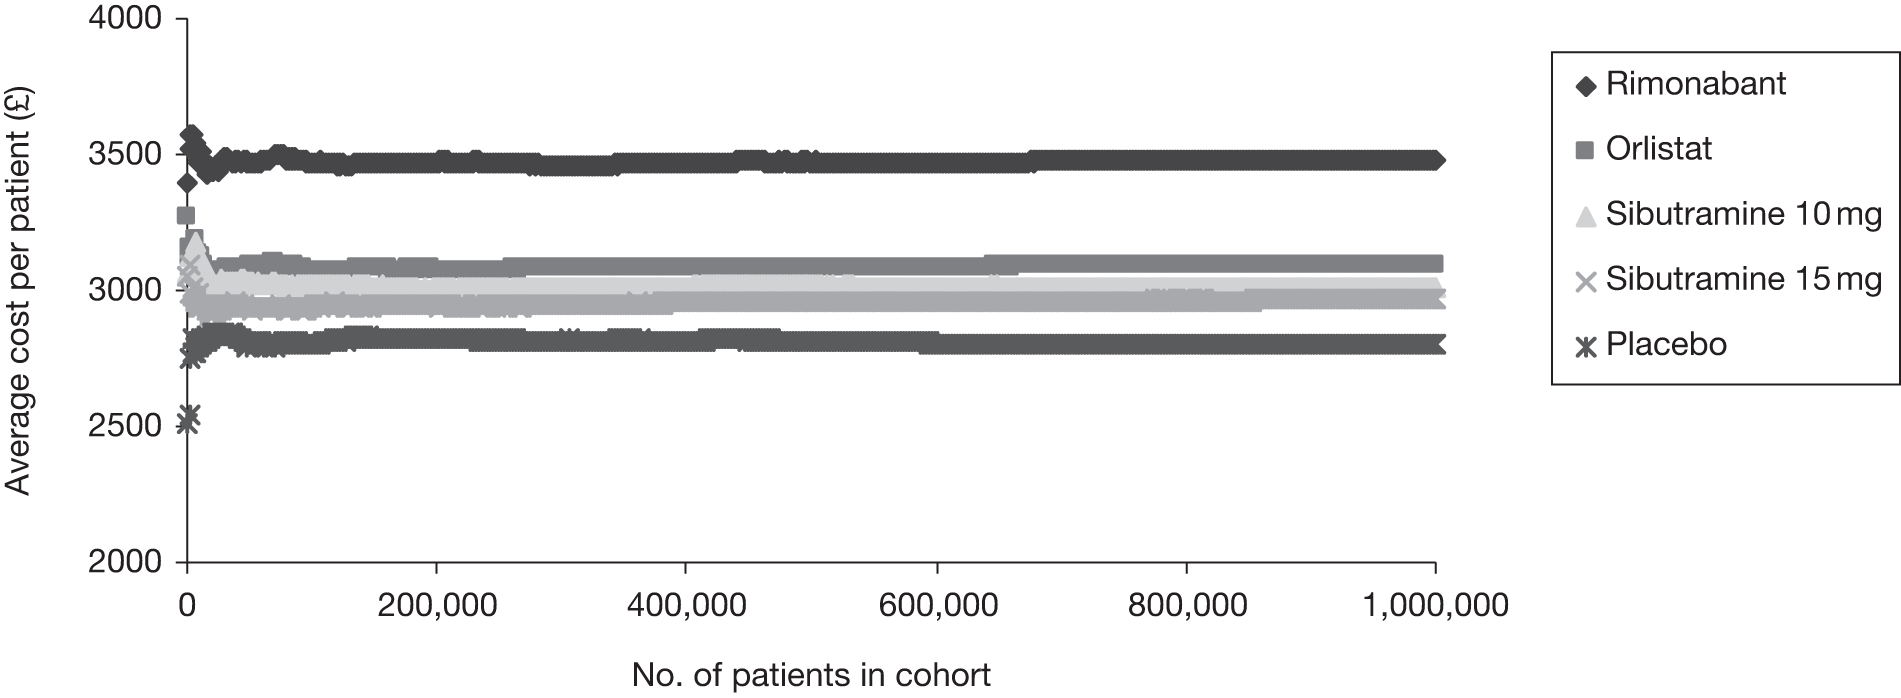
FIGURE 19.
Stability analyses for cohort size, average discounted QALYs per patient.
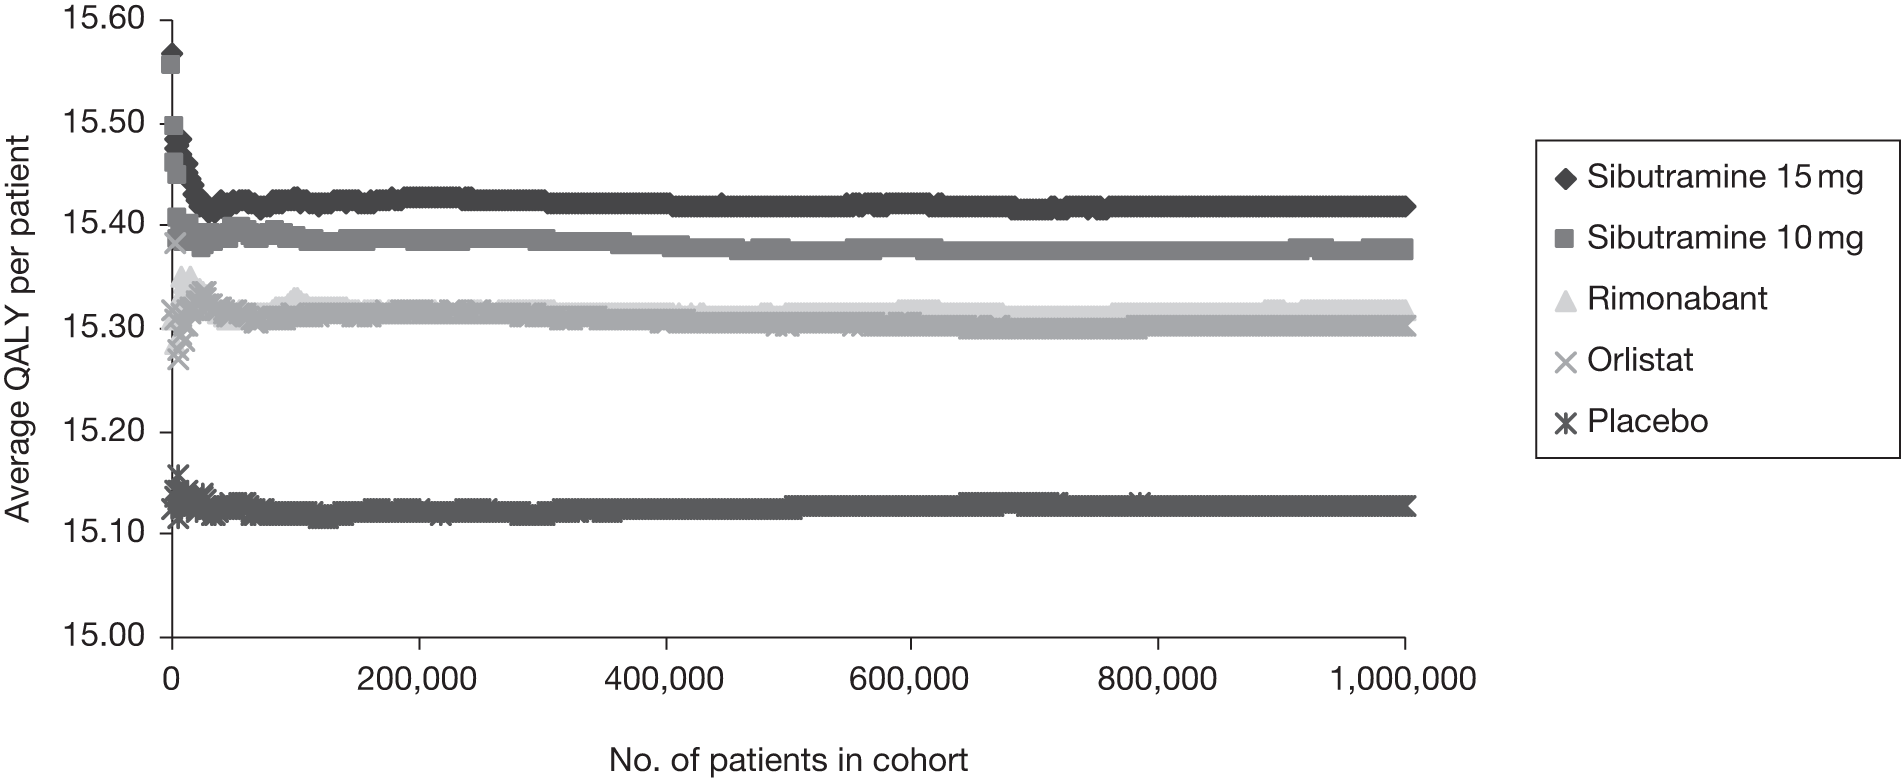
To ensure that our results represent those of an average cohort, we use a sample size of 1,000,000 for the deterministic analyses. However, because of computational limitations, we use a sample size of 400,000 and 200 Monte Carlo simulations in the stochastic analyses.
| Treatment | Incremental cost (£) | Incremental QALYs | ICER vs placebo (£) | QALY loss per person to make drug not cost-effectivea | Percentage of lives needed to be lost to tip cost-effectivenessb |
|---|---|---|---|---|---|
| Orlistat | 291 | 0.17498 | 1665 | 0.16041 | 1.05 |
| Rimonabant | 672 | 0.18907 | 3553 | 0.15548 | 1.02 |
| Sibutramine 10 mg | 205 | 0.24779 | 827 | 0.23754 | 1.54 |
| Sibutramine 15 mg | 161 | 0.28972 | 557 | 0.28165 | 1.83 |
| Sensitivity analysis | Base case | Variable | Life-years | Cost (£) | Discounted cost (£) | QALYs | Discounted QALYs | Incremental cost (£) | Incremental QALYs | ICER (£) | |
|---|---|---|---|---|---|---|---|---|---|---|---|
| Base case | Placebo | 75.495 | 5286 | 2806 | 25.12 | 15.13 | |||||
| Orlistat | 75.758 | 5547 | 3097 | 25.47 | 15.30 | 291 | 0.1750 | 1665 | |||
| SA1 | Weight regain period 36 months | Weight regain period 12 months | Placebo | 75.163 | 5373 | 2942 | 24.86 | 14.99 | |||
| Orlistat | 75.440 | 5606 | 3211 | 25.14 | 15.10 | 269 | 0.1130 | 2379 | |||
| SA2 | BMI regain to baseline BMI | BMI regain to trajectory of natural history | Placebo | 74.880 | 6090 | 3209 | 22.72 | 13.82 | |||
| Orlistat | 75.115 | 6406 | 3530 | 22.95 | 13.91 | 321 | 0.0927 | 3466 | |||
| SA3 | Treatment duration 12 months | Treatment duration 24 months | Placebo | 75.454 | 5342 | 2846 | 25.09 | 15.12 | |||
| Orlistat | 75.714 | 5562 | 3115 | 25.35 | 15.21 | 270 | 0.0951 | 2835 | |||
| SA4 | Starting age 45.5 years | Starting age 20 years | Placebo | 67.860 | 10,266 | 4130 | 41.74 | 20.10 | |||
| Orlistat | 68.056 | 10,421 | 4396 | 41.95 | 20.15 | 266 | 0.0508 | 5240 | |||
| SA4 | Starting age 45.5 years | Starting age 60 years | Placebo | 79.557 | 3748 | 2441 | 15.89 | 10.98 | |||
| Orlistat | 79.733 | 4082 | 2775 | 16.05 | 11.07 | 334 | 0.0878 | 3798 | |||
| SA5 | Base case uses a distribution of 74.3% women and 25.7% men | All female | Placebo | 73.960 | 6564 | 3564 | 23.77 | 14.47 | |||
| Orlistat | 74.382 | 6871 | 3865 | 24.11 | 14.60 | 301 | 0.1336 | 2257 | |||
| SA6 | Baseline BMI 34.92 kg/m2 | Baseline BMI 30 kg/m2 | Placebo | 79.339 | 1085 | 524 | 29.62 | 17.11 | |||
| Orlistat | 79.343 | 1436 | 887 | 29.65 | 17.13 | 363 | 0.0153 | 23,720 | |||
| SA6 | Baseline BMI 34.92 kg/m2 | Baseline BMI 40 kg/m2 | Placebo | 74.257 | 6105 | 3300 | 23.73 | 14.54 | |||
| Orlistat | 74.440 | 6368 | 3599 | 23.85 | 14.59 | 299 | 0.0485 | 6155 |
Appendix 6 Protocol
1) PROJECT TITLE
Evaluating Anti-obesity Treatments (EAT) in primary care
2) PLANNED INVESTIGATION
This project will evaluate the clinical and cost-effectiveness of using drugs in treating obese adults in a primary care setting. The purpose of the study is to apply rigorous methods of systematic reviewing, evidence synthesis and decision analytic modelling to evaluate the comparative clinical and cost-effectiveness of the three pharmaceutical treatments: Orlistat, Sibutramine and Rimonabant.
-
Population: Clinically obese adults
-
Interventions: Orlistat, Sibutramine, Rimonabant anti-obesity drugs
-
Comparators: Orlistat vs. Sibutramine vs. Rimonabant vs. No treatment
-
Outcomes: Long term weight loss, adverse events, quality of life, cardiovascular risk, lipid profiles, co-morbidity and cost effectiveness
-
Setting: Primary care
-
Perspective: NHS and Personal and Social Service (PSS)
2.1 Research aims and objectives
-
Analyse an existing routine data base of clinical information from primary care to determine the impact of obesity on mortality and morbidity.
-
Compare the characteristics of patients and effectiveness of anti-obesity agents in the general population with those in clinical trials.
-
Conduct a full systematic review of the published evidence on the clinical effectiveness of Orlistat, Sibutramine and Rimonabant.
-
Undertake a full synthesis of the available evidence. This will include the use of a higher-level synthesis of the data using Bayesian methodologies to account for indirect comparison.
-
Undertake a full systematic review of the published evidence of the cost-effectiveness of the agents. This will include a systematic review of published economic evaluations in the area and identification of other evidence needed to populate an economic model.
-
Use decision-analytic modelling and probabilistic sensitivity analysis to assess the relative cost-effectiveness of the three agents in terms of the incremental cost per quality adjusted life year (QALY) gained.
-
Use expected value of information techniques to determine the value of collecting further data on input parameters, and the potential benefits of future head to head trials of the agents.
2.2 Existing research
The authors of the recent NICE obesity clinical guidelines estimate that more than 12 million adults in England will be obese (BMI ≥ 30 kg/m2) by 2010 if the increasing trend in prevalence continues.{CG43} The guidelines suggest that a large proportion of obese individuals fail to achieve and maintain weight losses without clinical support. The guideline also states that the majority of PCOs did not monitor the effectiveness of drug treatments for obesity and advocated that every necessary step is taken to tackle obesity, recommending that preventing and managing obesity is a priority and that systems should be in place to implement local obesity strategies. The guideline included a full systematic review of the clinical and economic evidence for the two pharmaceutical treatments (i.e. Orlistat and Sibutramine) available on prescription in the UK at the time.
A recently published meta-analysis which included the newer treatment, Rimonabant, found that all three agents modestly reduce weight providing on average less than 5 kg more weight loss compared with placebo.{Rucker, 2007} They found the original weight differential between the placebo and active arms was maintained for up to four years as weight regain was consistent in both groups. A recent retrospective cohort study reported persistence rates to Orlistat or Sibutramine were smaller than 2% at two years; much lower than reported in clinical trials{Padwal, 2007} and the authors suggest that the lack of adherence to treatment is a major factor limiting the efficacy of anti-obesity drugs.
The three agents have unique adverse effects profiles. The evidence on secondary end points suggests they also have differing effects on cardiovascular risk profiles. However, due to absence of data on the effects on mortality or cardiovascular morbidity the exact benefits are uncertain. Of major concern are the generalisability of the results from clinical studies to primary care settings, and as Rucker et al. mention, with very high attrition rates, the internal validity of many of the clinical studies is potentially compromised.{Rucker 2007}
There have been a number of UK economic evaluations exploring the cost-effectiveness of Sibutramine and Orlistat compared with placebo.{CG43, TAP 22, TAP 31} An ongoing NICE STA submission on behalf of Sanofi-Aventis includes an economic evaluation of the three interventions within the same modelling framework using pair-wise comparisons of primary outcomes.{ACD Rimonabant} The technology assessment group expressed concerns with discrepancies in the data presented for Orlistat and Sibutramine.{ACD Rimonabant} They also stated a major limitation in the economics is the lack of response hurdles in the clinical pathways modelled for Sibutramine and Orlistat and highlight further research is required on head to head studies and relationships between weight losses and quality of life measurements.
The current proposal describes a study of the clinical benefits and cost-effectiveness of using drugs in treating obese patients in primary care to inform future policy initiatives and primary care clinicians. The study will also identify areas in which further research would be most valuable and in particular the potential net benefits associated with future head to head trials of the three drugs.
2.3 Methods for the systematic identification of evidence
a) Scoping search
A brief scoping literature search combining search terms related to Orlistat, Sibutramine and Rimonabant retrieved the following: 544 citations from MEDLINE 1966–present; 499 citations from EMBASE 1980–present, 99 citations from CINAHL 1982–present, 241 citations from the Cochrane Library various dates–present and 501 from Web of Science 1900–present.
b) Detailed searching techniques
The search strategies will be conducted in separate stages:
i) Search strategy for identification of studies providing information on clinical effectiveness
A search for relevant studies on clinical effectiveness will be conducted by means of electronic searches of key databases including MEDLINE, EMBASE, Science Citation Index and Biological Abstracts.
Searching for clinical information as contained in systematic reviews, meta-analyses or clinical trials. This will focus on the above key databases with the addition of the Cochrane library and specific trials registers. Published methods of searching specifically for systematic reviews and clinical trials as developed by the McMaster University Health Information Research Unit will be used. Specific concepts to be included in the literature searches will include terms relating to obesity (obesity.tw, obese, obesity (subject heading), obesity, morbid (subject heading)), and terms relating to agents (orlistat, sibutramine, rimonabant, anti-obesity agents (subject heading), Tetrahydrolipstatin (subject heading), sibutramine (subject heading), rimonabant (subject heading)). References will also be located through review of references for relevant articles and through citation search facilities via the Web of Science’s Science Citation Index and Social Science Citation Index. Where systematic reviews already exist, these will be used to identify relevant studies and to inform subsequent analyses. In addition systematic searches of the Internet using various search engines will be used to identify unpublished materials and work in progress. Key authors and commercial organisations involved in the investigation of pharmaceutical agents will be contacted and asked for unpublished materials.
We will utilise a varied range of sources and search techniques to identify relevant literature. A comprehensive literature search will be undertaken in the major medical, health-related, science and health economic electronic bibliographic databases (i.e. CDSR, NHS DARE, NHS HTA, MEDLINE, EMBASE, CINAHL, Science Citation Index, PreMEDLINE, NHS EED, HEED, CENTRAL, Pascal, ASSIA, Social Care Online, Social Science Citation Index). In addition, various health service research and guideline producing bodies (e.g. SIGN, National Guidelines Clearinghouse, etc.) will be consulted via the internet and key organisations (e.g. National Obesity Forum) will be contacted. We will utilise the expertise within the group and consult with national and international experts in research and practice in obesity. Ongoing and recently completed research in the field will be identified through searching the National Research Register, ReFeR, Current Controlled Trials and its links, HSRProj and Index to Theses. Grey literature will be identified from searches of databases including Dissertation Abstracts and Inside Conferences. Finally, the reference lists of included studies will be examined for additional relevant references and, where appropriate, the citation facility in Web of Science will be used to search for specific papers and authors.
ii) Search strategy for identification of studies providing information on adverse effects
Supplementary searches will be conducted for data on adverse effects. No study restrictions will be utilised. Specific pharmacological databases will be used at this stage of the review. Reference will be made to published work on retrieval of adverse effects literature from the NHS Centre for Reviews and Dissemination.{Golder 2006, Golder 2006} We will also write to the manufacturers of these drugs to obtain any data on file.
iii) Search strategy for identification of studies providing information on adherence to treatment
Given that primary research suggests that lack of adherence to treatment is a major factor limiting the efficacy of anti-obesity drugs it would be valuable in answering the effectiveness-related questions to examine what we know on patients’ perceptions of anti-obesity drugs. Ogden and Sidhu (2006) are among the first to examine specifically the qualitative experience of patients on obesity medication. {Ogden 2006} Other qualitative research on perceptions of obesity treatments will also be valuable. We therefore propose to conduct a tightly focused qualitative evidence synthesis using accepted methods of evidence interpretation and integration.{Pope, Mays and Popay, 2007} This review will complement the effectiveness review and modelling work and provide added value by identifying the main variables that can impact on the anticipated effectiveness of anti-obesity medication.
iv) Search strategy for identifying economic evidence
In addition to the search strategies identified above systematic searches will take place of the specialist health economic data sources such as DARE, HTA Database (University of York), NHS EED and the Office for Health Economics HEED database. Economics filters used by the NHS CRD to populate the NHS EED database will be adapted to other databases.
2.4 Epidemiological modelling
A key component of the project is the identification and development of an epidemiological model for the natural history (in terms of diabetes, CVD, colorectal cancer, etc. and their sequelae) of individuals who are obese. Whilst there have been a number of meta-analyses published which have considered the risk of these outcomes in obese individuals, use of Individual Patient Data (IPD) is required so that (a) the risk can be estimated at all levels of BMI, and not just the categorisations often reported, e.g. 25–29.9, 30+ etc., and (b) the risks of specific outcomes may be estimated within a competing risks framework, whilst at the same time taking account of the expected correlation between the various outcomes.
The development of a statistical model relating BMI to clinical outcomes will be undertaken using the General Practice Research Database (GPRD – www.grpd.com). Figure 1 shows an illustrative model (this may be either Markov or semi-Markov – see section 2.6 below) of a patient pathway for Otherwise Healthy Obese (OHO) individuals, and with the underling transition rates (λ1,. . .,λ5) estimated from GPRD as a function of BMI (and time if semi-Markov).
FIGURE 1.
Illustrative Markov model for Otherwise Healthy Obese (OHO) individuals.
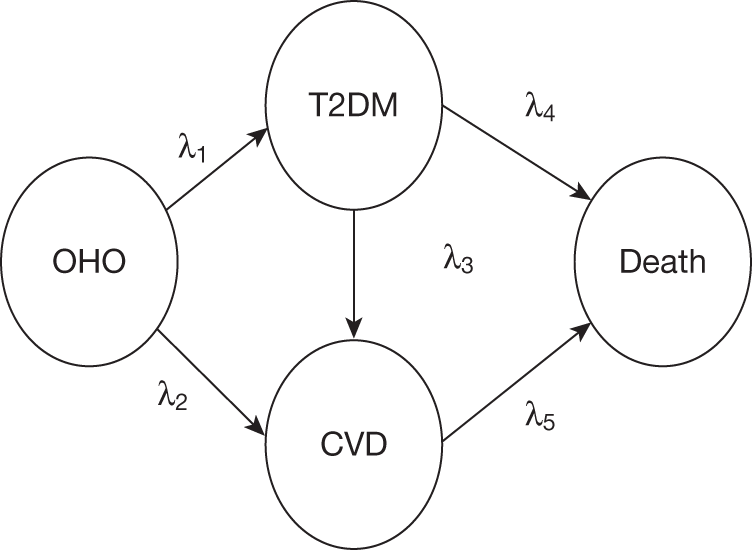
However, there is also existing evidence (from IPD analyses) available regarding the risk of various clinical events in relationship to BMI (especially CVD and diabetes) {Bogerset al2007} and synthesis of the results from GPRD and reported summary data will also be undertaken {Sutton & Abrams 2001; Sutton et al 2007}.
The GPRD will also be used to explore the effect of the three drugs in general practice – both in terms of clinical effectiveness (which will then be compared to the results of the systematic review), but also the effect of patients stopping treatment, i.e. to determine the rate at which they return to their original BMI trajectory or otherwise.
The Health Survey for England (HSE) will be used to establish the distribution of BMI in those individuals who are obese (BMI > 30), and to which the risk models developed via GPRD will be applied in order to populate the initial transitions from an obese state to the various health states (representing the clinical events) in the cost-effectiveness model (see Section 2.6 below), and to which the clinical effectiveness estimates (derived from the systematic review) may then be applied. For example, in Figure 2, applying the estimated clinical effect (in terms of reduction in BMI) δBMI obtained from the systematic review and meta-analysis to individuals will enable the corresponding change in the risk of the various events being considered to be estimated, i.e. πk.
FIGURE 2.
Relationships between BMI and probability of an event k.
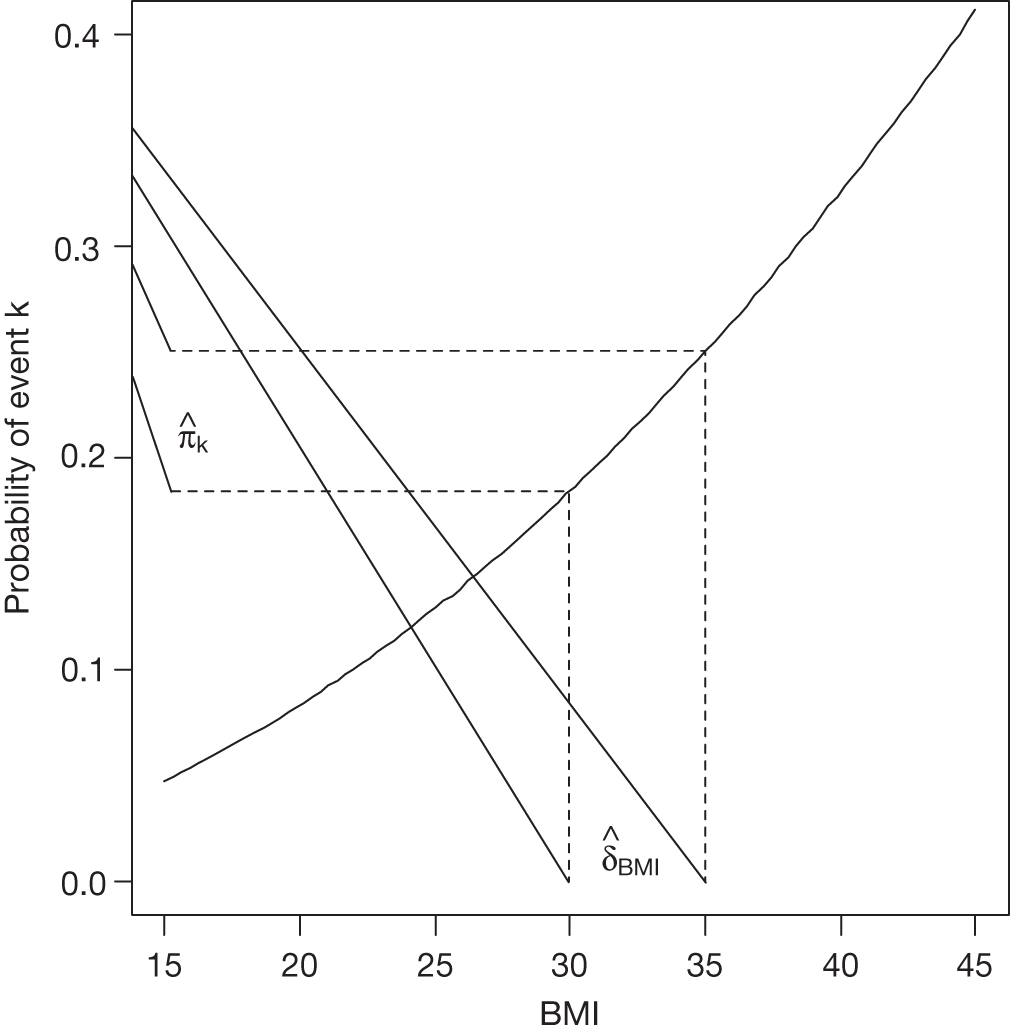
2.5 Systematic review methods
A) Clinical data
A key objective of the proposed study is to conduct a systematic review of the published evidence on the pharmacological agents Orlistat, Sibutramine and Rimonabant. This will also include a detailed systematic review of evidence on the adverse event profile of each agent.
The reviews of clinical effectiveness will update those contained in the systematic reviews of Sibutramine and Orlistat {HTA 31, HTA 22} and the industry submission for Rimonabant.{ACD Rimonabant} Obesity impacts on a wide range of health and social care professionals in a wide variety of settings. While the emphasis will be on UK clinical practice, non-UK evidence on effectiveness and outcomes will also be considered.
a) Search strategy (example from EMBASE):
The search strategy will use the following terms:
1, obesity.tw, 2, obese.tw 3, obesity/4, obesity, morbid/5, or/1–4 6, orlistat 7, sibutramine 8, rimonabant 9, anti-obesity agents/10, Tetrahydrolipstatin/11, sibutramine/12, rimonabant/13, or/6–12 14, 5 and 13
Plus methodological filters as described above to locate high quality clinical effectiveness and cost-effectiveness studies. The results of the searches will be stored in a Reference Manager database.
b) Inclusion/exclusion criteria
-
Types of studies: Randomised controlled trials (RCTs), incorporating any duration of therapy and any length of follow-up will be considered for inclusion in the review.
-
Participants: i) RCTs recruiting adults (aged 18 years) defined as being overweight or obese. ii) RCTs recruiting adults wishing to maintain weight loss, having been previously overweight or obese. iii) Trials involving specific patient groups such as those with diabetes, hypertension or hyperlipidaemia will be included in the review, provided they meet the above criteria.
-
Interventions: i) Evaluations of Orlistat, Sibutramine or Rimonabant used to treat overweight/obese patients or to maintain weight loss in previously overweight or obese patients. ii) Orlistat, Sibutramine or Rimonabant may be combined with other strategies such as dietary restriction or behavioural programmes. iii) Participants in control groups may receive placebo, an alternative anti-obesity pharmacological agent or an alternative anti-obesity intervention (e.g. based on dietary regimen, physical activity or behavioural modification).
-
Studies recruiting people with eating disorders such as anorexia nervosa and bulimia nervosa will be excluded.
-
In trials where overweight/obese participants were recruited as well as those with the above eating disorders, only those where results were presented separately for the overweight/obese participants will be included.
c) Outcomes
The primary outcome of the review will be an assessment of obesity/overweight status as measured by changes in body weight, fat content or fat distribution:
-
Measures of weight change include absolute weight change and percentage weight change relative to baseline.
-
Measures of fat content include BMI, ponderal index, skinfold thickness, fat-free mass, body percentage and fat change relative to baseline.
-
Measures of fat distribution including changes in waist size, waist–hip ratio and girth–height ratio relative to baseline.
Secondary outcomes of the review will be a) physiological changes occurring in association with changes in body weight/fat content/fat distribution such as changes in lipid profiles, glycaemic control among those with diabetes, and blood pressure, b) patient-related quality of life, c) information on adverse effects and d) costs.
d) Review methods
-
References identified by the literature searches will be sifted in three stages. They will first be screened for relevance by title. The abstracts of those which are not excluded at this stage will then be read and finally, all manuscripts which seem to be potentially relevant will be obtained for a more detailed appraisal. Sifting will be undertaken by one reviewer, and to ensure consistency a sample of references will be checked by a second reviewer. All decisions will be coded and recorded in the Reference Manager database.
-
Studies will be categorised according to the type of participant (see inclusion criteria). Data extraction will be undertaken by one reviewer, using customised data extraction forms, and checked by a second reviewer. Discrepancies will be discussed, and any which cannot be resolved will be referred for discussion to the study team. Data extraction will cover the design and conduct of trials, characteristics of participants and interventions, and outcomes.
-
Quality checklists will be used to appraise each article included. The quality of randomised controlled trials will be assessed according to criteria based on those proposed by the NHS Centre for Reviews and Dissemination. Non-randomised forms of evidence of clinical effectiveness such as observational studies will be assessed using the Downs and Black checklist.{Tooth 2005} Attrition rates will be assessed and discussed as previous reviews have noted high attrition rates.
-
Heterogeneity among the results will be explored with consideration given to the following: patient characteristics, study setting, patient selection, and outcome measures.
-
Summary statistics will be derived for each study and a weighted average of the summary statistics will be computed across the studies. Statistical heterogeneity will be assessed using the I-squared measurement. The studies will be assessed clinically and methodologically to assess whether it is reasonable to meta-analyse the data. If so, the more conservative random-effects model will be used to account for small clinical and methodological variations between very similar high quality trials. Data from studies that score poorly on the quality assessment; or studies that are found to be statistically heterogeneous will not be combined. In these cases further investigation will be undertaken to identify factors that could potentially explain the heterogeneity. In addition, sensitivity analyses will be conducted to assess the impact of including these studies.
As no ‘head-to-head’ RCTs are expected (of the three drugs under consideration), a synthesis of the available evidence using indirect meta-analysis methods will be used {Caldwellet al2005}. However, in elaborating the network to include other interventions (used either as a control intervention in pharmacological trials or as additional arms in such trials) Bayesian Mixed Treatment Comparison methods will almost certainly have to be used.{Salantiet al2007;Lu & Ades, 2004} The analysis will incorporate both direct and indirect evidence to enable comparisons to be made between treatments, including not only estimation of all pair-wise comparisons, but also ranking of treatments in terms of clinical effectiveness. As part of the MTC analysis further issues will need to be addressed, including outcomes reported at multiple and different time points,{Luet al2007}, the fact that there will be heterogeneity in reporting, both in terms of outcome, e.g. BMI, weight change, hip-to-waist ratio {Nam 2007; Riley 2007}, change from baseline or otherwise {Abrams 2005}, extension of the network of evidence to include other comparators that have been evaluated in obese patients {Salanti 2007} and consistency of evidence {Lu & Ades 2006}. In addition there will be an assessment of publication bias (Sutton 2000) and exploration of whether clinical effectiveness varies with baseline obesity, e.g. BMI. The analysis will be done by the Department of Health Sciences at the University of Leicester, using the freely available software WinBUGS {Spiegelhalter, 2002}.
B) Cost-effectiveness data
A systematic review of cost-effectiveness literature will be performed with the objective of identifying and critically reviewing all English language economic evaluations of Orlistat, Sibutramine or Rimonabant. The studies identified will be used to inform assumptions concerning the structure and data sources employed within the decision-analytic model.
a) Search strategy
The search strategy will use the following terms: cost benefit, cost effectiveness, cost utility, cost consequences, cost minimisation, economic evaluation, quality of life, utility, incremental cost effectiveness analysis, incremental cost effectiveness ratio, net present value, incremental net benefit; combined with the search terms used in the effectiveness literature search strategy. Sensitive searching (e.g. economics [ec] as a floating subheading) will be used to pick up costs associated with the health conditions. The results of the searches will be stored in a Reference Manager database.
b) Inclusion criteria
English language papers reporting cost-effectiveness results in terms of cost per QALY or cost per life year gained for the three interventions Orlistat, Sibutramine or Rimonabant.
c) Screening strategy
All abstracts obtained by the computer search will be reviewed for relevance by the two economic analysts. Any disagreement will be resolved by discussion. All papers identified as relevant at the end of the abstract screening process will be obtained and entered into the quality assessment process. The results of the abstract screening will be recorded in the Reference Manager database, including the reason for excluding any paper from the quality assessment stage of the review.
Once papers selected for inclusion in the review have been obtained, a hand search of the reference lists will be undertaken to identify any potentially relevant papers not identified by the search of the literature databases. Any additional papers will be obtained and subjected to the abstract review process prior to inclusion or exclusion from the quality assessment process.
d) Quality assessment
Relevant studies will be critically appraised using the standard economic evaluation and modelling checklists.{Drummond, Eddy 1985} For papers reporting economic evaluations alongside clinical trials, the Drummond checklist will be supplemented with reference to the Good Practice Guidance produced by the ISPOR Task Force on Economic evaluations alongside clinical trials.{Weinstein 2003}
Additional searches will be conducted to identify evidence on quality of life (QoL) in obese individuals, natural history of weight gains, weight regain and relationships between weight changes and co-morbidities such as CHD and diabetes.
2.6 Decision analytic modelling
a) Analyses of an existing database of clinical information from primary care
An existing database of clinical information from primary care will be analysed (spss versions 12) using usual statistical techniques. Demographics and clinical characteristics will be discussed using the main descriptive statistics: mean standard deviation, median and range. Correlations and associations between variables will be explored using the Pearson correlation coefficient with significance set at p < 0.01. (see Section 2.4 above).
b) Proposed model structure
The aim will be to examine the cost-effectiveness of the three anti-obesity agents currently licensed in the UK in terms of the incremental quality adjusted life years (QALY) gained. The systematic review of published cost-effectiveness studies together with the MTC synthesis and epidemiological modelling will be used to inform the development of a cost-effectiveness model. The form of the model will be determined by the specification of the patient pathway, the evidence from the literature reviews and the results from the GPRD and HSE evaluations. The exact clinical pathway will be determined through discussions with the clinical experts within the study team. It is likely that a Markov will be appropriate and the model structure and modelling techniques will draw on the team’s experience in performing economic evaluations involving populations who are obese, and populations with diabetes and/or CVD.{Galani 2007, Ward 2007, Ara 2007, Ara 2008, Waugh 2007; Whitfield 2006} The results from the GPRD risk models will be integrated within the model structure. Where evidence permits, treatment specific transitions to co-morbidities such as cardiovascular events and diabetes will be incorporated to reflect their differing adverse effect profiles.
i) Parameter estimates: A full list of parameters will be constructed and the clinical and cost-effectiveness literature will be searched for evidence on each parameter. The relationships between changes in BMI and co-morbidities such as CVD and diabetes will be informed by the epidemiological model using the results of the GPRD and the HSE analyses while the results of the Bayesian Mixed Treatment Comparison will inform clinical efficacy. Health related quality of life evidence will be sought for each health state. Data on cost parameters will be obtained from national data sources such as the NHS Reference cost data set and the PSSRU Costs of Health and Social Care.{Netten, Reference costs} Only direct costs relevant to the NHS and PSS will be included in the health economic analysis. All costs and benefits will be discounted at 3.5%. Additional searches will be undertaken for key parameters in addition to those listed above.
ii) Valuation of health outcomes: A recently published review of utility values for obesity found that, while studies showed a negative relationship between Body Mass Index and utility, there was a wide variation in the estimates.{Dixon 2004} Dixon et al. concluded the choice of utility measure can be instrumental in whether the cost per quality adjusted life year estimate falls above or below a funding threshold. The scoping search indicated that published studies do not always use the generic preference-based measures of health required to meet the proposed NICE reference case for economic evaluations (the EQ-5D). The utility review will be updated and where possible non EQ-5D quality of life values will be mapped onto the EQ-5D generic preference-based index using published relationships of standard mapping techniques.{Ara 2008}{Brazier 2004}
c) Presentation of model results
The model results will be presented both in terms of the costs and consequences of each individual agent prescribed in conjunction with lifestyle advice such as diet and exercise as currently offered in primary care within the UK. Results will also be presented in terms of incremental cost per life year and incremental cost per QALY for Orlistat vs. Sibutamine vs. Rimonabant.
i) Cost–consequence analyses: The model will be constructed to evaluate the differential impact on clinically relevant outcomes such as cardiovascular events and diabetes incidence rates based on the surrogate trial outcomes such as lipid and glucose profiles and HbA1c levels. The impact of adherence and compliance for each of the treatments will be estimated using the results of the literature searches. The differing adverse event profiles will be quantified using the data from the literature searches supported by the clinical experts in the team.
ii) Uncertainty analyses: Uncertainty surrounding the health effects and costs will be explored. Simple one-way/multi-way sensitivity analysis will be undertaken to identify key determinants of cost-effectiveness. In addition, parameter uncertainty will be examined through probabilistic sensitivity analysis. Uncertainty regarding the value of each parameter in a model will be expressed as a probability distribution, and the impact of this uncertainty will be propagated through the model using Monte Carlo simulation. The results of the analysis will be presented as incremental cost-effectiveness ratios, scatterplots on the cost-effectiveness plane, and cost-effectiveness acceptability curves.
d) Analysis of value of information
The value of information (or expected value of information EVI) approach describes the costs of the current uncertainty in the results. It can be used to provide information concerning the benefits which may be foregone as a result of withdrawing treatment. The difference between the estimated costs of uncertainty can then be compared to the relevant costs of undertaking primary data collection to estimate the net benefits associated with prospective research. Global and Partial Value of Information will be conducted using the methods described by Felli and Hazen {Felli 1998; Felli 1999} and Brennan and Kharroubi {Brennan 2007} respectively. The analysis will assume lambda = £20,000 based upon the NICE Methods of Health Technology Appraisal.
Project timescales
July 2008
First project team meeting
July 2008 – December 2008
Establish systematic review protocol
Literature searches and document acquisition for systematic reviews
Critical appraisal of literature retrieved from systematic reviews
Data extraction and meta-analysis
Produce reports from systematic reviews and meta-analysis
September 2008
Obtain database of clinical practice from primary care
October 2008 – December 2008
Analyse existing database of clinical practice from primary care
Finalise decision analytic model structure
December 2008
Produce progress report
January 2009 – April 2009
Develop decision analytic model
Assesscost-effectiveness and cost–utility of the three comparators
Undertake expected value of information analyses
April 2009
Produce draft report
May 2009 – June 2009
Peer review and final amendments to report
31st July 2009
Submit final report to NCCHTA
Preliminary findings to be presented at the 17th European Conference on Obesity (May 2009)
EXPERTISE
This is a collaborative project between a wide range of experts, intended to ensure that findings are valid, reliable and feasible in the NHS clinical setting. Our team includes clinical health experts in diabetes and obesity from primary care backgrounds and methodological experts in systematic reviewing, economics, health services research, public health medicine and information retrieval. Many of the team have a strong history of working together on collaborative reviews funded by HTA, NHS Service Delivery and Organisation (SDO) and National Co-ordinating Centre for Research Methodology (NCCRM) programmes. Together they will form a panel to guide study design, literature searching and model development; to provide independent review of articles for the literature review; and to assist in writing up and disseminating the results.
Both the School of Health and Related Research (ScHARR) at the University of Sheffield and the Department of Health Sciences at the University of Leicester are multidisciplinary health services research units carrying out a full range of primary and secondary research for major funding agencies such as the Department of Health, the former NHS Executive Trent, the NHS HTA Programme, the NHS SDO Programme and the Medical Research Council. The ScHARR staff involved in this project will be Roberta Ara (project lead), John Brazier (Health Economics), Michael Gillett (Economic Modeller), and Andrew Booth (Information Resources). The Leicester staff will include: Keith Abrams (Medical Statistics), Alex Sutton (Medical Statistics), Nicola Cooper (Health Economics), Kamlesh Khunti (Clinical expert) and Melanie Davies (Clinical expert).
Team members
Roberta Ara (RA) is a research fellow and has project managed a number of HTA and consultancy studies. She has experience of modelling the cost-effectiveness of an obesity treatment (sibutramine), and several cardiovascular treatments, leading reports for NICE and the HTA. RA will be directly responsible for supervising the project and building the mathematical model and has access to the full range of technical support and experience offered by ScHARR.
John Brazier (JB) is a Professor in Health Economics and is a leading expert in health related quality of life measurements with a particular interest in preference based measures. John has extensive experience in health economics and in particular in the quality of life and has published extensively in this area. He has led and contributed to numerous HTA reviews and lectures worldwide on quality of life evidence used in economic evaluations.
Keith Abrams (KA) is a Professor of Medical Statistics and is a leading expert in the development and use of Bayesian methods in healthcare evaluation (clinical trials, meta-analyses, and comprehensive decision modelling). He has been involved in numerous HTA evidence synthesis/modelling projects, and has published extensively in both the methodological and clinical literature, and has co-authored two books on Methods for Meta-Analysis in Medical Research and Bayesian Approaches to Clinical Trials and Health-care Evaluation, together with co-editing one of the first texts on Methods in Evidence-Based Healthcare.
Alex Sutton (AS) is a Reader in Medical Statistics and a leading expert in meta-analysis with a particular interest in synthesis for decision modelling. Alex has published extensively both methodological and substantive papers on evidence synthesis and is an author on the following two well regarded books: “Meta-analysis in medical research” and “Publication bias in meta-analysis: Prevention, assessment and adjustment”.
Nicola Cooper (NC) is a senior research fellow with expertise in both health economics and medical statistics, and her research focuses on the interface of the two. She is currently undertaking an MRC fellowship in ‘The use of evidence synthesis and uncertainty modelling in economic evidence-based health related decision models’ and has applied these methods in numerous publications. Together with AS and KA, Nicola has developed and delivered many advanced 3- and 5-day courses on evidence synthesis for decision modelling worldwide.
Andrew Booth (AB) is Director of the Information Resources at ScHARR, a specialist information resource designed to support the needs of evidence based healthcare clinical effectiveness and systematic reviews. AB has extensive experience undertaking comprehensive literature searches, and has contributed to numerous systematic reviews, including various HTA reviews and NICE rapid appraisals.
Kamlesh Khunti (KK) and Melanie Davies(MD) lead a research group in the Department of Health Sciences and Cardiovascular Sciences undertaking important research into the early identification and intervention in people with diabetes and pre-diabetes. KK and MJD are co-directors of the South East Midlands Diabetes Network and are PIs on several major studies including the Leicester Ethnic Atherosclerosis and Diabetes Risk (LEADER) Study, one of the world’s largest epidemiological cohort studies of diabetes. Data from this study has informed the recent proposals by the Department of Health on Vascular Screening in primary care. They are also PIs on a NIHR funded programme grant on prevention of type 2 diabetes in high risk populations. They will bring clinical expertise in metabolic syndromes (obesity, diabetes and cardiovascular disease).
Michael Gillett (MG) is a research fellow in health economic modelling and has led numerous economic evaluations for both diabetic and cardiovascular populations.
Angie Rees is an up and coming researcher in information studies. She has undertaken the searches for a number of prominent reviews and will work under the supervision of AB.
JUSTIFICATION OF SUPPORT REQUIRED
The budget will be based at a higher education institution and will attract full economic costs, so 80% support is requested. It will support 60% of the Principal Investigator’s (RA) time. She will be responsible for day-to-day running of the project, the economic evaluation, writing of reports and dissemination of the findings. Keith Abrams (Medical Statistician) will co-ordinate the research at Leicester and will be involved in advising on the clinical review, the epidemiology model and the synthesis of the evidence (9%). Alex Sutton and Nicola Cooper will be involved advising on the clinical review, the epidemiology model and the synthesis of the evidence from the GPRD database (4%, 4%). A part time researcher will be employed to conduct the clinical review and epidemiological reviews (83%). Kamlesh Khunti (5%) and Melanie Davies (2%) will provide expert clinical advice during the project and will provide access to the GPRD database. Andrew Booth will advise on the design and conduct of searches and the design and conduct of the qualitative elements of the systematic review (1%). John Brazier will advise on quality of life evidence and Michael Gillett (economic modeller) will be involved in the project in an advisory capacity for the diabetes economic components (5%). Angie Rees will design and conduct the literature searches (4%). Clerical support (Andrew Tattersall) is required to co-ordinate inter-library loans (2%). Clerical staff (to be appointed) will provide administration duties (20%).
Office costs comprise of: computing consumables £339; stationary £407; postage £203; photocopying £271. The budget will cover PCs (£1,751); contributions to bibliographic database subscriptions not currently available through the University of Sheffield (either connection or to pay external providers) £200; and inter-library loans (obtaining articles from other libraries) £1,300. Also included is £15,000 for the GPRD database. The budget will also cover travel and subsistence for members of the team (£1,000) for eight meetings over the project (either in Sheffield or in Leicester). Also included are conference and travel costs for 2 members of the team to present preliminary findings at the 17th European Conference in Amsterdam (£2,400).
References
- Abrams KR, Gillies CL, Lambert PC. Meta-analysis of heterogeneously reported trials assessing change from baseline. Stat Med 2005;24:3823-44.
- Ara R, Brazier J. Deriving an algorithm to convert the 8 mean SF-36 dimension scores into a mean EQ-5D preference-based score from published studies. Value in Health 2008.
- Ara R, Brennan A. The cost-effectiveness of sibutramine in obese patients: evidence from 5 Western countries. Obesity Reviews 2007.
- Ara R, Tumur I, Pandor A, Duenas A, Williams R, Paisley S, et al. Ezetimibe for the treatment of hypercholesterolaemia – a systematic review and economic evaluation. Heath Technology Assessment 2008;12.
- Bogers RP, Bemelmans WJ, Hoogenveen RT, Boshuizen HC, Woodward M, Knekt P, et al. for the BMI-CHD Collaboration Investigators . Association of overweight with increased risk of coronary heart disease partly independent of blood pressure and cholesterol levels. Arch Intern Med 2007;167:1720-8.
- Brazier JE, Kolotkin RL, Crosby RD, Williams GR. Estimating a preference-based single index for the impact of weight on quality of life-lite (IWQOL-Lite) instrument from the SF-6D. Value in Health 2004;7:490-8.
- Brennan A, Kharroubi SA. Efficient computation of partial expected value of sample information using Bayesian approximation. Health Economics 2007;26:122-48.
- Caldwell DM, Ades AE, Higgins JP. Simultaneous comparison of multiple treatments: combining direct and indirect evidence. BMJ 2005;331:897-900.
- Cooper NJ, Sutton AJ, Abrams KR, Turner D, Wailoo A. Comprehensive decision analytical modelling in economic evaluation: a Bayesian approach. Health Econ 2004;13:203-26.
- Curtis L, Netten A. Unit costs of health and social care 2007. Internet 2007. PSSRU Bulletin 16; n.d.
- Dansinger ML, Tatsioni A, Wong JB, Chung M, Balk EM. Meta-analysis: the effect of dietary counseling for weight loss. Ann Intern Med 2007;147:41-50.
- Department of Health Reference costs 2006–2007. Internet; n.d.
- Dixon S, Currie CJ, McEwan P. Utility values for obesity and preliminary analysis of the Health Outcomes Data Repository. Expert Rev Pharmacoeconomics Outcomes Res 2004;4.
- Drummond MF, O’Brien BJ, Stoddart GL, Torrance GW. Methods for the economic evaluation of health care programmes. Oxford: Oxford University Press; n.d.
- Drummond MF, Sculpher MJ, Torrance GW, O’Brien BJ, Stoddart GL. Methods for the Economic Evaluation of Health Care Programmes 2005.
- Eddy DM. Technology Assessment: The role of mathematical modelling. Assessing medical technology. Washington DC: National Academy Press; 1985.
- Felli JC, Hazen GB. A Bayesian approach to sensitivity analysis. Health Economics 1999;8:263-8.
- Felli JC, Hazen GB. Sensitivity analysis and the expected value of perfect information. Medical Decision Making 1998;18:95-109.
- Galani C, Al M, Schneider H, Rutten FF. Uncertainty in decision-making: value of additional information in the cost-effectiveness of lifestyle intervention in overweight and obese people. Value Health 2007.
- Golder S, McIntosh HM, Loke Y. Indentifying systematic reviews of the adverse effects of health care interventions. BMC Med Res Methodol 2006;6.
- Golder S, McIntosh HM, Duffy S, Glancille J. Centre for Reviews and Dissemination and UK Cochrane Centre Search Filters Design Group . Developing efficient search strategies to identify reports of adverse effects in MEDLINE and EMBASE. Health Info Libr J 2006;23:3-12.
- Hampp C, Hartzema AG, Kauf TL. Cost–utility analysis of rimonabant in the treatment of obesity. Value Health 2007.
- Levri KM, Slaymaker E, Last A, Yeh J, Ference J, D’Amico F, et al. Metformin as treatment for overweight and obese adults: a systematic review. Ann Fam Med 2005;3:457-61.
- Lu G, Ades AE, Sutton AJ, Cooper NJ, Briggs AH, Caldwell DM. Meta-analysis of mixed treatment comparisons at multiple follow-up times. Stat Med 2007;26:3681-99.
- Lu G, Ades AE. Assessing evidence inconsistency in mixed treatment comparisons. JASA 2006;101:447-59.
- Lu G, Ades AE. Combination of direct and indirect evidence in mixed treatment comparisons. Stat Med 2004;23:3105-24.
- Nam IS, Mengersen K, Garthwaite P. Multivariate meta-analysis. Stat Med 2003;22:2309-33.
- National Institute for Clinical Excellence (2001) . Guidance on the Use of Orlistat for the Treatment of Obesity in Adults n.d.
- National Institute for Clinical Excellence (2001) . Guidance on the Use of Sibutramine for the Treatment of Obesity in Adults n.d.
- National Institute for Health and Clinical Excellence . CG43 Obesity: Full Guideline, Section 1-Introduction, Methods and Recommendations 2006. URL: http://guidance.nice.org.uk/.
- Ogden J, Sidhu S. Adherence, behaviour change, and visualization: a qualitative study of the experiences of taking an obesity medication. J Psychosom Res 2006;61:545-52.
- Padwal RS, Majumdar SR. Drug treatments for obesity: orlistat, sibutramine and rimonabant. Lancet 2007;369:71-7.
- Pope C, Mays N, Popay J. (2007) Synthesising qualitative and quantitative health evidence. A Guide to Methods; Open University n.d.
- Riley RD, Abrams KR, Lambert PC, Sutton AJ, Thompson JR. An evaluation of bivariate random-effects meta-analysis for the joint synthesis of two correlated outcomes. Stat Med 2007;26:78-97.
- Rimonabant for the Treatment of Overweight and Obese Patients (Appraisal Consultation Document) n.d. URL: http://www.nice.org.uk/nicemedia/pdf/ObesityRimonabantERGReport.pdf.
- Rucker D, Padwal R, Li SK, Curioni C, Lau DCW. Long term pharmacotherapy for obesity and overweight: updated meta-analysis. BMJ 2007;335:1194-9.
- Salanti G, Higgins J, Ades AE, Ioannidis JP. Evaluation of networks of randomized trials. Stat Methods Med Res 2007.
- Spiegelhalter DJ, Thomas A, Best N, Lunn D. WinBUGS UserManual: Version 1.4. MRC Biostatistics Unit. Cambridge; 2002.
- Sutton AJ, Song F, Gilbody SM, Abrams KR. Modelling publication bias in meta-analysis: a review. Stat Methods Med Res 2000;9:421-45.
- Sutton AJ, Abrams KR. Bayesian methods in meta-analysis and evidence synthesis. Stat Methods Med Res 2001;10:277-303.
- Sutton AJ, Kendrick D, Coupland CA. Meta-analysis of individual- and aggregate-level data. Stat Med 2008;27:651-69.
- Tooth L, Ware R, Bain C, Purdie DM, Dobson A. Quality reporting of observational longitudinal research. Am J Epidemiol 2005;161:280-8.
- Wannamethee SG, Shaper AG. Overweight and obesity and weight change in middle aged men: impact on cardiovascular disease and diabetes. J Epidemiol Community Health 2005;59:134-9.
- Ward S, . Statins for the prevention of cardiovascular events: an analysis of the clinical and cost effectiveness of statins. Health Technology Assessment 2007;11.
- Waugh N, Scotland G, McNamee P, Gillett M, Brennan A, Goyder E, et al. Screening for type 2 diabetes: literature review and economic modelling. Health Technology Assessment 2007;11:1-144.
- Weinstein MC, O’Brien B, Hornberger J, Jackson J, Johannesson M, McCabe C, et al. Principles of good practice for decision analytic modeling in health-care evaluation: report of the ISPOR Task Force on Good Research Practices – Modeling Studies. Value in Health 2003;6:9-17.
- Whitfield MD, Gillett M, Holmes M, Ogden E. Predicting the impact of population level risk reduction in cardio-vascular disease and stroke on acute hospital admission rates. Public Health 2006;120:1140-8.
Glossary
- Dominated (simple)
- When an intervention is less effective and more expensive than its comparator.
- Dominated (extended)
- When the incremental cost-effectiveness ratio for a given treatment alternative is higher than that of the next more effective comparator.
- Meta-analysis
- A statistical method by which the results of a number of studies are pooled to give a combined summary statistic.
- Odds ratio
- The ratio of the odds of an event occurring in one group to the odds of it occurring in another group.
- Posterior distribution
- A representation of the knowledge associated with the true value of a population parameter after combining the prior distribution with sample data.
- Prior distribution
- A representation of the knowledge associated with the true value of a population parameter in addition to any sample data.
- Relative risk
- Ratio of the probability of an event occurring in an exposed group relative to the probability of it occurring in a non-exposed or control group.
- Variance–covariance matrix
- The variance for a variable is a measure of the dispersion or spread of scores. Covariance indicates how two variables vary together. The variance–covariance matrix presents the variances on the diagonal and the covariances above or below the diagonal.
List of abbreviations
- ACM
- all-cause mortality
- ACMM
- adjusted censored mixture model
- BMI
- body mass index
- BNF
- British National Formulary
- BP
- blood pressure
- CEAC
- cost-effectiveness acceptability curve
- CHD
- coronary heart disease
- CI
- confidence interval
- CrI
- credible interval
- CVD
- cardiovascular disease
- EQ-5D
- European Quality of Life-5 Dimensions
- GP
- general practitioner
- GPRD
- General Practice Research Database
- HRQoL
- health-related quality of life
- HSE
- Health Survey for England
- HTA
- Health Technology Assessment
- ICER
- incremental cost-effectiveness ratio
- LOCF
- last observation carried forward
- MAE
- mean absolute error
- MI
- myocardial infarction
- MTC
- mixed-treatment comparison
- NIC
- net ingredient cost
- NICE
- National Institute for Health and Clinical Excellence
- OR
- odds ratio
- PSA
- probabilistic sensitivity analysis
- QALY
- quality-adjusted life-year
- QoL
- quality of life
- RCT
- randomised controlled trial
- RMSE
- root mean squared error
- SCOUT
- Sibutramine Cardiovascular Outcomes Trial
- SD
- standard deviation
- SPC
- Summary of Product Characteristics
- T2DM
- type 2 diabetes
- TIA
- transient ischaemic attack
- VAS
- visual analogue scale
- WHO
- World Health Organization
All abbreviations that have been used in this report are listed here unless the abbreviation is well known (e.g. NHS), or it has been used only once, or it is a non-standard abbreviation used only in figures/tables/appendices, in which case the abbreviation is defined in the figure legend or in the notes at the end of the table.
Notes
Health Technology Assessment programme
-
Director, NIHR HTA programme, Professor of Clinical Pharmacology, University of Liverpool
-
Professor of Dermato-Epidemiology, Centre of Evidence-Based Dermatology, University of Nottingham
Prioritisation Group
-
Director, NIHR HTA programme, Professor of Clinical Pharmacology, University of Liverpool
-
Professor Imti Choonara, Professor in Child Health, Academic Division of Child Health, University of Nottingham
Chair – Pharmaceuticals Panel
-
Dr Bob Coates, Consultant Advisor – Disease Prevention Panel
-
Dr Andrew Cook, Consultant Advisor – Intervention Procedures Panel
-
Dr Peter Davidson, Director of NETSCC, Health Technology Assessment
-
Dr Nick Hicks, Consultant Adviser – Diagnostic Technologies and Screening Panel, Consultant Advisor–Psychological and Community Therapies Panel
-
Ms Susan Hird, Consultant Advisor, External Devices and Physical Therapies Panel
-
Professor Sallie Lamb, Director, Warwick Clinical Trials Unit, Warwick Medical School, University of Warwick
Chair – HTA Clinical Evaluation and Trials Board
-
Professor Jonathan Michaels, Professor of Vascular Surgery, Sheffield Vascular Institute, University of Sheffield
Chair – Interventional Procedures Panel
-
Professor Ruairidh Milne, Director – External Relations
-
Dr John Pounsford, Consultant Physician, Directorate of Medical Services, North Bristol NHS Trust
Chair – External Devices and Physical Therapies Panel
-
Dr Vaughan Thomas, Consultant Advisor – Pharmaceuticals Panel, Clinical
Lead – Clinical Evaluation Trials Prioritisation Group
-
Professor Margaret Thorogood, Professor of Epidemiology, Health Sciences Research Institute, University of Warwick
Chair – Disease Prevention Panel
-
Professor Lindsay Turnbull, Professor of Radiology, Centre for the MR Investigations, University of Hull
Chair – Diagnostic Technologies and Screening Panel
-
Professor Scott Weich, Professor of Psychiatry, Health Sciences Research Institute, University of Warwick
Chair – Psychological and Community Therapies Panel
-
Professor Hywel Williams, Director of Nottingham Clinical Trials Unit, Centre of Evidence-Based Dermatology, University of Nottingham
Chair – HTA Commissioning Board
Deputy HTA Programme Director
HTA Commissioning Board
-
Professor of Dermato-Epidemiology, Centre of Evidence-Based Dermatology, University of Nottingham
-
Department of Public Health and Epidemiology, University of Birmingham
-
Professor of Clinical Pharmacology, Director, NIHR HTA programme, University of Liverpool
-
Professor Ann Ashburn, Professor of Rehabilitation and Head of Research, Southampton General Hospital
-
Professor Peter Brocklehurst, Professor of Women’s Health, Institute for Women’s Health, University College London
-
Professor Jenny Donovan, Professor of Social Medicine, University of Bristol
-
Professor Jonathan Green, Professor and Acting Head of Department, Child and Adolescent Psychiatry, University of Manchester Medical School
-
Professor John W Gregory, Professor in Paediatric Endocrinology, Department of Child Health, Wales School of Medicine, Cardiff University
-
Professor Steve Halligan, Professor of Gastrointestinal Radiology, University College Hospital, London
-
Professor Freddie Hamdy, Professor of Urology, Head of Nuffield Department of Surgery, University of Oxford
-
Professor Allan House, Professor of Liaison Psychiatry, University of Leeds
-
Dr Martin J Landray, Reader in Epidemiology, Honorary Consultant Physician, Clinical Trial Service Unit, University of Oxford
-
Professor Stephen Morris, Professor of Health Economics, University College London, Research Department of Epidemiology and Public Health, University College London
-
Professor Irwin Nazareth, Professor of Primary Care and Head of Department, Department of Primary Care and Population Sciences, University College London
-
Professor E Andrea Nelson, Professor of Wound Healing and Director of Research, School of Healthcare, University of Leeds
-
Professor John David Norrie, Chair in Clinical Trials and Biostatistics, Robertson Centre for Biostatistics, University of Glasgow
-
Dr Rafael Perera, Lecturer in Medical Statisitics, Department of Primary Health Care, University of Oxford
-
Professor Barney Reeves, Professorial Research Fellow in Health Services Research, Department of Clinical Science, University of Bristol
-
Professor Martin Underwood, Professor of Primary Care Research, Warwick Medical School, University of Warwick
-
Professor Marion Walker, Professor in Stroke Rehabilitation, Associate Director UK Stroke Research Network, University of Nottingham
-
Dr Duncan Young, Senior Clinical Lecturer and Consultant, Nuffield Department of Anaesthetics, University of Oxford
-
Dr Tom Foulks, Medical Research Council
-
Dr Kay Pattison, Senior NIHR Programme Manager, Department of Health
HTA Clinical Evaluation and Trials Board
-
Director, Warwick Clinical Trials Unit, Warwick Medical School, University of Warwick and Professor of Rehabilitation, Nuffield Department of Orthopaedic, Rheumatology and Musculoskeletal Sciences, University of Oxford
-
Professor of the Psychology of Health Care, Leeds Institute of Health Sciences, University of Leeds
-
Director, NIHR HTA programme, Professor of Clinical Pharmacology, University of Liverpool
-
Professor Keith Abrams, Professor of Medical Statistics, Department of Health Sciences, University of Leicester
-
Professor Martin Bland, Professor of Health Statistics, Department of Health Sciences, University of York
-
Professor Jane Blazeby, Professor of Surgery and Consultant Upper GI Surgeon, Department of Social Medicine, University of Bristol
-
Professor Julia M Brown, Director, Clinical Trials Research Unit, University of Leeds
-
Professor Alistair Burns, Professor of Old Age Psychiatry, Psychiatry Research Group, School of Community-Based Medicine, The University of Manchester & National Clinical Director for Dementia, Department of Health
-
Dr Jennifer Burr, Director, Centre for Healthcare Randomised trials (CHART), University of Aberdeen
-
Professor Linda Davies, Professor of Health Economics, Health Sciences Research Group, University of Manchester
-
Professor Simon Gilbody, Prof of Psych Medicine and Health Services Research, Department of Health Sciences, University of York
-
Professor Steven Goodacre, Professor and Consultant in Emergency Medicine, School of Health and Related Research, University of Sheffield
-
Professor Dyfrig Hughes, Professor of Pharmacoeconomics, Centre for Economics and Policy in Health, Institute of Medical and Social Care Research, Bangor University
-
Professor Paul Jones, Professor of Respiratory Medicine, Department of Cardiac and Vascular Science, St George‘s Hospital Medical School, University of London
-
Professor Khalid Khan, Professor of Women’s Health and Clinical Epidemiology, Barts and the London School of Medicine, Queen Mary, University of London
-
Professor Richard J McManus, Professor of Primary Care Cardiovascular Research, Primary Care Clinical Sciences Building, University of Birmingham
-
Professor Helen Rodgers, Professor of Stroke Care, Institute for Ageing and Health, Newcastle University
-
Professor Ken Stein, Professor of Public Health, Peninsula Technology Assessment Group, Peninsula College of Medicine and Dentistry, Universities of Exeter and Plymouth
-
Professor Jonathan Sterne, Professor of Medical Statistics and Epidemiology, Department of Social Medicine, University of Bristol
-
Mr Andy Vail, Senior Lecturer, Health Sciences Research Group, University of Manchester
-
Professor Clare Wilkinson, Professor of General Practice and Director of Research North Wales Clinical School, Department of Primary Care and Public Health, Cardiff University
-
Dr Ian B Wilkinson, Senior Lecturer and Honorary Consultant, Clinical Pharmacology Unit, Department of Medicine, University of Cambridge
-
Ms Kate Law, Director of Clinical Trials, Cancer Research UK
-
Dr Morven Roberts, Clinical Trials Manager, Health Services and Public Health Services Board, Medical Research Council
Diagnostic Technologies and Screening Panel
-
Scientific Director of the Centre for Magnetic Resonance Investigations and YCR Professor of Radiology, Hull Royal Infirmary
-
Professor Judith E Adams, Consultant Radiologist, Manchester Royal Infirmary, Central Manchester & Manchester Children’s University Hospitals NHS Trust, and Professor of Diagnostic Radiology, University of Manchester
-
Mr Angus S Arunkalaivanan, Honorary Senior Lecturer, University of Birmingham and Consultant Urogynaecologist and Obstetrician, City Hospital, Birmingham
-
Dr Diana Baralle, Consultant and Senior Lecturer in Clinical Genetics, University of Southampton
-
Dr Stephanie Dancer, Consultant Microbiologist, Hairmyres Hospital, East Kilbride
-
Dr Diane Eccles, Professor of Cancer Genetics, Wessex Clinical Genetics Service, Princess Anne Hospital
-
Dr Trevor Friedman, Consultant Liason Psychiatrist, Brandon Unit, Leicester General Hospital
-
Dr Ron Gray, Consultant, National Perinatal Epidemiology Unit, Institute of Health Sciences, University of Oxford
-
Professor Paul D Griffiths, Professor of Radiology, Academic Unit of Radiology, University of Sheffield
-
Mr Martin Hooper, Public contributor
-
Professor Anthony Robert Kendrick, Associate Dean for Clinical Research and Professor of Primary Medical Care, University of Southampton
-
Dr Nicola Lennard, Senior Medical Officer, MHRA
-
Dr Anne Mackie, Director of Programmes, UK National Screening Committee, London
-
Mr David Mathew, Public contributor
-
Dr Michael Millar, Consultant Senior Lecturer in Microbiology, Department of Pathology & Microbiology, Barts and The London NHS Trust, Royal London Hospital
-
Mrs Una Rennard, Public contributor
-
Dr Stuart Smellie, Consultant in Clinical Pathology, Bishop Auckland General Hospital
-
Ms Jane Smith, Consultant Ultrasound Practitioner, Leeds Teaching Hospital NHS Trust, Leeds
-
Dr Allison Streetly, Programme Director, NHS Sickle Cell and Thalassaemia Screening Programme, King’s College School of Medicine
-
Dr Matthew Thompson, Senior Clinical Scientist and GP, Department of Primary Health Care, University of Oxford
-
Dr Alan J Williams, Consultant Physician, General and Respiratory Medicine, The Royal Bournemouth Hospital
-
Dr Tim Elliott, Team Leader, Cancer Screening, Department of Health
-
Dr Joanna Jenkinson, Board Secretary, Neurosciences and Mental Health Board (NMHB), Medical Research Council
-
Professor Julietta Patrick, Director, NHS Cancer Screening Programme, Sheffield
-
Dr Kay Pattison, Senior NIHR Programme Manager, Department of Health
-
Professor Tom Walley, CBE, Director, NIHR HTA programme, Professor of Clinical Pharmacology, University of Liverpool
-
Dr Ursula Wells, Principal Research Officer, Policy Research Programme, Department of Health
Disease Prevention Panel
-
Professor of Epidemiology, University of Warwick Medical School, Coventry
-
Dr Robert Cook, Clinical Programmes Director, Bazian Ltd, London
-
Dr Colin Greaves, Senior Research Fellow, Peninsula Medical School (Primary Care)
-
Mr Michael Head, Public contributor
-
Professor Cathy Jackson, Professor of Primary Care Medicine, Bute Medical School, University of St Andrews
-
Dr Russell Jago, Senior Lecturer in Exercise, Nutrition and Health, Centre for Sport, Exercise and Health, University of Bristol
-
Dr Julie Mytton, Consultant in Child Public Health, NHS Bristol
-
Professor Irwin Nazareth, Professor of Primary Care and Director, Department of Primary Care and Population Sciences, University College London
-
Dr Richard Richards, Assistant Director of Public Health, Derbyshire County Primary Care Trust
-
Professor Ian Roberts, Professor of Epidemiology and Public Health, London School of Hygiene & Tropical Medicine
-
Dr Kenneth Robertson, Consultant Paediatrician, Royal Hospital for Sick Children, Glasgow
-
Dr Catherine Swann, Associate Director, Centre for Public Health Excellence, NICE
-
Mrs Jean Thurston, Public contributor
-
Professor David Weller, Head, School of Clinical Science and Community Health, University of Edinburgh
-
Ms Christine McGuire, Research & Development, Department of Health
-
Dr Kay Pattison, Senior NIHR Programme Manager, Department of Health
-
Professor Tom Walley, CBE, Director, NIHR HTA programme, Professor of Clinical Pharmacology, University of Liverpool
External Devices and Physical Therapies Panel
-
Consultant Physician North Bristol NHS Trust
-
Reader in Wound Healing and Director of Research, University of Leeds
-
Professor Bipin Bhakta, Charterhouse Professor in Rehabilitation Medicine, University of Leeds
-
Mrs Penny Calder, Public contributor
-
Dr Dawn Carnes, Senior Research Fellow, Barts and the London School of Medicine and Dentistry
-
Dr Emma Clark, Clinician Scientist Fellow & Cons. Rheumatologist, University of Bristol
-
Mrs Anthea De Barton-Watson, Public contributor
-
Professor Nadine Foster, Professor of Musculoskeletal Health in Primary Care Arthritis Research, Keele University
-
Dr Shaheen Hamdy, Clinical Senior Lecturer and Consultant Physician, University of Manchester
-
Professor Christine Norton, Professor of Clinical Nursing Innovation, Bucks New University and Imperial College Healthcare NHS Trust
-
Dr Lorraine Pinnigton, Associate Professor in Rehabilitation, University of Nottingham
-
Dr Kate Radford, Senior Lecturer (Research), University of Central Lancashire
-
Mr Jim Reece, Public contributor
-
Professor Maria Stokes, Professor of Neuromusculoskeletal Rehabilitation, University of Southampton
-
Dr Pippa Tyrrell, Senior Lecturer/Consultant, Salford Royal Foundation Hospitals’ Trust and University of Manchester
-
Dr Nefyn Williams, Clinical Senior Lecturer, Cardiff University
-
Dr Kay Pattison, Senior NIHR Programme Manager, Department of Health
-
Dr Morven Roberts, Clinical Trials Manager, Health Services and Public Health Services Board, Medical Research Council
-
Professor Tom Walley, CBE, Director, NIHR HTA programme, Professor of Clinical Pharmacology, University of Liverpool
-
Dr Ursula Wells, Principal Research Officer, Policy Research Programme, Department of Health
Interventional Procedures Panel
-
Professor of Vascular Surgery, University of Sheffield
-
Consultant Colorectal Surgeon, Bristol Royal Infirmary
-
Mrs Isabel Boyer, Public contributor
-
Mr Sankaran Chandra Sekharan, Consultant Surgeon, Breast Surgery, Colchester Hospital University NHS Foundation Trust
-
Professor Nicholas Clarke, Consultant Orthopaedic Surgeon, Southampton University Hospitals NHS Trust
-
Ms Leonie Cooke, Public contributor
-
Mr Seumas Eckford, Consultant in Obstetrics & Gynaecology, North Devon District Hospital
-
Professor Sam Eljamel, Consultant Neurosurgeon, Ninewells Hospital and Medical School, Dundee
-
Dr Adele Fielding, Senior Lecturer and Honorary Consultant in Haematology, University College London Medical School
-
Dr Matthew Hatton, Consultant in Clinical Oncology, Sheffield Teaching Hospital Foundation Trust
-
Dr John Holden, General Practitioner, Garswood Surgery, Wigan
-
Dr Fiona Lecky, Senior Lecturer/Honorary Consultant in Emergency Medicine, University of Manchester/Salford Royal Hospitals NHS Foundation Trust
-
Dr Nadim Malik, Consultant Cardiologist/Honorary Lecturer, University of Manchester
-
Mr Hisham Mehanna, Consultant & Honorary Associate Professor, University Hospitals Coventry & Warwickshire NHS Trust
-
Dr Jane Montgomery, Consultant in Anaesthetics and Critical Care, South Devon Healthcare NHS Foundation Trust
-
Professor Jon Moss, Consultant Interventional Radiologist, North Glasgow Hospitals University NHS Trust
-
Dr Simon Padley, Consultant Radiologist, Chelsea & Westminster Hospital
-
Dr Ashish Paul, Medical Director, Bedfordshire PCT
-
Dr Sarah Purdy, Consultant Senior Lecturer, University of Bristol
-
Dr Matthew Wilson, Consultant Anaesthetist, Sheffield Teaching Hospitals NHS Foundation Trust
-
Professor Yit Chiun Yang, Consultant Ophthalmologist, Royal Wolverhampton Hospitals NHS Trust
-
Dr Kay Pattison, Senior NIHR Programme Manager, Department of Health
-
Dr Morven Roberts, Clinical Trials Manager, Health Services and Public Health Services Board, Medical Research Council
-
Professor Tom Walley, CBE, Director, NIHR HTA programme, Professor of Clinical Pharmacology, University of Liverpool
-
Dr Ursula Wells, Principal Research Officer, Policy Research Programme, Department of Health
Pharmaceuticals Panel
-
Professor in Child Health, University of Nottingham
-
Senior Lecturer in Clinical Pharmacology, University of East Anglia
-
Dr Martin Ashton-Key, Medical Advisor, National Commissioning Group, NHS London
-
Dr Peter Elton, Director of Public Health, Bury Primary Care Trust
-
Dr Ben Goldacre, Research Fellow, Division of Psychological Medicine and Psychiatry, King’s College London
-
Dr James Gray, Consultant Microbiologist, Department of Microbiology, Birmingham Children’s Hospital NHS Foundation Trust
-
Dr Jurjees Hasan, Consultant in Medical Oncology, The Christie, Manchester
-
Dr Carl Heneghan, Deputy Director Centre for Evidence-Based Medicine and Clinical Lecturer, Department of Primary Health Care, University of Oxford
-
Dr Dyfrig Hughes, Reader in Pharmacoeconomics and Deputy Director, Centre for Economics and Policy in Health, IMSCaR, Bangor University
-
Dr Maria Kouimtzi, Pharmacy and Informatics Director, Global Clinical Solutions, Wiley-Blackwell
-
Professor Femi Oyebode, Consultant Psychiatrist and Head of Department, University of Birmingham
-
Dr Andrew Prentice, Senior Lecturer and Consultant Obstetrician and Gynaecologist, The Rosie Hospital, University of Cambridge
-
Ms Amanda Roberts, Public contributor
-
Dr Gillian Shepherd, Director, Health and Clinical Excellence, Merck Serono Ltd
-
Mrs Katrina Simister, Assistant Director New Medicines, National Prescribing Centre, Liverpool
-
Professor Donald Singer, Professor of Clinical Pharmacology and Therapeutics, Clinical Sciences Research Institute, CSB, University of Warwick Medical School
-
Mr David Symes, Public contributor
-
Dr Arnold Zermansky, General Practitioner, Senior Research Fellow, Pharmacy Practice and Medicines Management Group, Leeds University
-
Dr Kay Pattison, Senior NIHR Programme Manager, Department of Health
-
Mr Simon Reeve, Head of Clinical and Cost-Effectiveness, Medicines, Pharmacy and Industry Group, Department of Health
-
Dr Heike Weber, Programme Manager, Medical Research Council
-
Professor Tom Walley, CBE, Director, NIHR HTA programme, Professor of Clinical Pharmacology, University of Liverpool
-
Dr Ursula Wells, Principal Research Officer, Policy Research Programme, Department of Health
Psychological and Community Therapies Panel
-
Professor of Psychiatry, University of Warwick, Coventry
-
Consultant & University Lecturer in Psychiatry, University of Cambridge
-
Professor Jane Barlow, Professor of Public Health in the Early Years, Health Sciences Research Institute, Warwick Medical School
-
Dr Sabyasachi Bhaumik, Consultant Psychiatrist, Leicestershire Partnership NHS Trust
-
Mrs Val Carlill, Public contributor
-
Dr Steve Cunningham, Consultant Respiratory Paediatrician, Lothian Health Board
-
Dr Anne Hesketh, Senior Clinical Lecturer in Speech and Language Therapy, University of Manchester
-
Dr Peter Langdon, Senior Clinical Lecturer, School of Medicine, Health Policy and Practice, University of East Anglia
-
Dr Yann Lefeuvre, GP Partner, Burrage Road Surgery, London
-
Dr Jeremy J Murphy, Consultant Physician and Cardiologist, County Durham and Darlington Foundation Trust
-
Dr Richard Neal, Clinical Senior Lecturer in General Practice, Cardiff University
-
Mr John Needham, Public contributor
-
Ms Mary Nettle, Mental Health User Consultant
-
Professor John Potter, Professor of Ageing and Stroke Medicine, University of East Anglia
-
Dr Greta Rait, Senior Clinical Lecturer and General Practitioner, University College London
-
Dr Paul Ramchandani, Senior Research Fellow/Cons. Child Psychiatrist, University of Oxford
-
Dr Karen Roberts, Nurse/Consultant, Dunston Hill Hospital, Tyne and Wear
-
Dr Karim Saad, Consultant in Old Age Psychiatry, Coventry and Warwickshire Partnership Trust
-
Dr Lesley Stockton, Lecturer, School of Health Sciences, University of Liverpool
-
Dr Simon Wright, GP Partner, Walkden Medical Centre, Manchester
-
Dr Kay Pattison, Senior NIHR Programme Manager, Department of Health
-
Dr Morven Roberts, Clinical Trials Manager, Health Services and Public Health Services Board, Medical Research Council
-
Professor Tom Walley, CBE, Director, NIHR HTA programme, Professor of Clinical Pharmacology, University of Liverpool
-
Dr Ursula Wells, Principal Research Officer, Policy Research Programme, Department of Health
Expert Advisory Network
-
Professor Douglas Altman, Professor of Statistics in Medicine, Centre for Statistics in Medicine, University of Oxford
-
Professor John Bond, Professor of Social Gerontology & Health Services Research, University of Newcastle upon Tyne
-
Professor Andrew Bradbury, Professor of Vascular Surgery, Solihull Hospital, Birmingham
-
Mr Shaun Brogan, Chief Executive, Ridgeway Primary Care Group, Aylesbury
-
Mrs Stella Burnside OBE, Chief Executive, Regulation and Improvement Authority, Belfast
-
Ms Tracy Bury, Project Manager, World Confederation of Physical Therapy, London
-
Professor Iain T Cameron, Professor of Obstetrics and Gynaecology and Head of the School of Medicine, University of Southampton
-
Professor Bruce Campbell, Consultant Vascular & General Surgeon, Royal Devon & Exeter Hospital, Wonford
-
Dr Christine Clark, Medical Writer and Consultant Pharmacist, Rossendale
-
Professor Collette Clifford, Professor of Nursing and Head of Research, The Medical School, University of Birmingham
-
Professor Barry Cookson, Director, Laboratory of Hospital Infection, Public Health Laboratory Service, London
-
Dr Carl Counsell, Clinical Senior Lecturer in Neurology, University of Aberdeen
-
Professor Howard Cuckle, Professor of Reproductive Epidemiology, Department of Paediatrics, Obstetrics & Gynaecology, University of Leeds
-
Professor Carol Dezateux, Professor of Paediatric Epidemiology, Institute of Child Health, London
-
Mr John Dunning, Consultant Cardiothoracic Surgeon, Papworth Hospital NHS Trust, Cambridge
-
Mr Jonothan Earnshaw, Consultant Vascular Surgeon, Gloucestershire Royal Hospital, Gloucester
-
Professor Martin Eccles, Professor of Clinical Effectiveness, Centre for Health Services Research, University of Newcastle upon Tyne
-
Professor Pam Enderby, Dean of Faculty of Medicine, Institute of General Practice and Primary Care, University of Sheffield
-
Professor Gene Feder, Professor of Primary Care Research & Development, Centre for Health Sciences, Barts and The London School of Medicine and Dentistry
-
Mr Leonard R Fenwick, Chief Executive, Freeman Hospital, Newcastle upon Tyne
-
Mrs Gillian Fletcher, Antenatal Teacher and Tutor and President, National Childbirth Trust, Henfield
-
Professor Jayne Franklyn, Professor of Medicine, University of Birmingham
-
Mr Tam Fry, Honorary Chairman, Child Growth Foundation, London
-
Professor Fiona Gilbert, Consultant Radiologist and NCRN Member, University of Aberdeen
-
Professor Paul Gregg, Professor of Orthopaedic Surgical Science, South Tees Hospital NHS Trust
-
Bec Hanley, Co-director, TwoCan Associates, West Sussex
-
Dr Maryann L Hardy, Senior Lecturer, University of Bradford
-
Mrs Sharon Hart, Healthcare Management Consultant, Reading
-
Professor Robert E Hawkins, CRC Professor and Director of Medical Oncology, Christie CRC Research Centre, Christie Hospital NHS Trust, Manchester
-
Professor Richard Hobbs, Head of Department of Primary Care & General Practice, University of Birmingham
-
Professor Alan Horwich, Dean and Section Chairman, The Institute of Cancer Research, London
-
Professor Allen Hutchinson, Director of Public Health and Deputy Dean of ScHARR, University of Sheffield
-
Professor Peter Jones, Professor of Psychiatry, University of Cambridge, Cambridge
-
Professor Stan Kaye, Cancer Research UK Professor of Medical Oncology, Royal Marsden Hospital and Institute of Cancer Research, Surrey
-
Dr Duncan Keeley, General Practitioner (Dr Burch & Ptnrs), The Health Centre, Thame
-
Dr Donna Lamping, Research Degrees Programme Director and Reader in Psychology, Health Services Research Unit, London School of Hygiene and Tropical Medicine, London
-
Professor James Lindesay, Professor of Psychiatry for the Elderly, University of Leicester
-
Professor Julian Little, Professor of Human Genome Epidemiology, University of Ottawa
-
Professor Alistaire McGuire, Professor of Health Economics, London School of Economics
-
Professor Neill McIntosh, Edward Clark Professor of Child Life and Health, University of Edinburgh
-
Professor Rajan Madhok, Consultant in Public Health, South Manchester Primary Care Trust
-
Professor Sir Alexander Markham, Director, Molecular Medicine Unit, St James’s University Hospital, Leeds
-
Dr Peter Moore, Freelance Science Writer, Ashtead
-
Dr Andrew Mortimore, Public Health Director, Southampton City Primary Care Trust
-
Dr Sue Moss, Associate Director, Cancer Screening Evaluation Unit, Institute of Cancer Research, Sutton
-
Professor Miranda Mugford, Professor of Health Economics and Group Co-ordinator, University of East Anglia
-
Professor Jim Neilson, Head of School of Reproductive & Developmental Medicine and Professor of Obstetrics and Gynaecology, University of Liverpool
-
Mrs Julietta Patnick, Director, NHS Cancer Screening Programmes, Sheffield
-
Professor Robert Peveler, Professor of Liaison Psychiatry, Royal South Hants Hospital, Southampton
-
Professor Chris Price, Director of Clinical Research, Bayer Diagnostics Europe, Stoke Poges
-
Professor William Rosenberg, Professor of Hepatology and Consultant Physician, University of Southampton
-
Professor Peter Sandercock, Professor of Medical Neurology, Department of Clinical Neurosciences, University of Edinburgh
-
Dr Philip Shackley, Senior Lecturer in Health Economics, Sheffield Vascular Institute, University of Sheffield
-
Dr Eamonn Sheridan, Consultant in Clinical Genetics, St James’s University Hospital, Leeds
-
Dr Margaret Somerville, Director of Public Health Learning, Peninsula Medical School, University of Plymouth
-
Professor Sarah Stewart-Brown, Professor of Public Health, Division of Health in the Community, University of Warwick, Coventry
-
Dr Nick Summerton, GP Appraiser and Codirector, Research Network, Yorkshire Clinical Consultant, Primary Care and Public Health, University of Oxford
-
Professor Ala Szczepura, Professor of Health Service Research, Centre for Health Services Studies, University of Warwick, Coventry
-
Dr Ross Taylor, Senior Lecturer, University of Aberdeen
-
Dr Richard Tiner, Medical Director, Medical Department, Association of the British Pharmaceutical Industry
-
Mrs Joan Webster, Consumer Member, Southern Derbyshire Community Health Council
-
Professor Martin Whittle, Clinical Co-director, National Co-ordinating Centre for Women’s and Children’s Health, Lymington