Notes
Article history
The research reported in this issue of the journal was funded by the HTA programme as award number 15/102/04. The contractual start date was in November 2016. The draft manuscript began editorial review in April 2023 and was accepted for publication in May 2024. The authors have been wholly responsible for all data collection, analysis and interpretation, and for writing up their work. The HTA editors and publisher have tried to ensure the accuracy of the authors’ manuscript and would like to thank the reviewers for their constructive comments on the draft document. However, they do not accept liability for damages or losses arising from material published in this article.
Permissions
Copyright statement
Copyright © 2024 Dias et al. This work was produced by Dias et al. under the terms of a commissioning contract issued by the Secretary of State for Health and Social Care. This is an Open Access publication distributed under the terms of the Creative Commons Attribution CC BY 4.0 licence, which permits unrestricted use, distribution, reproduction and adaptation in any medium and for any purpose provided that it is properly attributed. See: https://creativecommons.org/licenses/by/4.0/. For attribution the title, original author(s), the publication source – NIHR Journals Library, and the DOI of the publication must be cited.
2024 Dias et al.
Chapter 1 Introduction
Background
Dupuytren’s contracture
Dupuytren’s contracture (DC) is a fibro-proliferative disease, characterised by the excessive accumulation of connective tissue in the hand. 1,2 The connective tissue organises into cords which shorten, causing the finger to bend. This condition interferes with hand function and dexterity over time as the affected individual loses the ability to straighten one or more affected fingers. It can have a multifaceted, detrimental effect on quality of life. Individuals living with DC need to adapt to or avoid certain daily activities, and experience embarrassment and anxiety regarding contracture recurrence. 3–5
About 2–2.5 million UK adults are affected, with greater prevalence in males aged over 50 years old, and of northern European descent. 6–8 Smoking and occupations that involve manual labour or forceful stretching of the fascia are associated with increased risk of developing DC. 6
Dupuytren’s contracture is first detected as firm nodules in the palm. These nodules can generate cords which span from the palm to the fingers. When this cord crosses the metacarpophalangeal (MCP) joint and/or proximal interphalangeal (PIP) joint and gradually shortens, the finger is pulled in towards the palm (see Appendix 1, Figure 31). 2,9 The cord contracts over a period of months or years. The most widely used method to establish the severity of this contracture is measurement of the affected joints in both extension (total active extension and passive extension deficit) and flexion (total active flexion), using a goniometer. 10 Medical treatment is usually offered following this, given the cord is mostly irreversible. 2
There is no cure for Dupuytren’s disease, even if the associated skin is radically excised and replaced with a graft, and so the cord can recur. Recurrence has been defined as a change in extension deficit of 6 degrees between 3 and 6 months after treatment or 20 degrees between 3 months and 1 year after correction of the contracture, again assessed using goniometric measurement. 11,12 The rate of recurrence depends on treatment given and certain risk factors. These include occurrence of DC before the age of 50, male gender, presence of Ledderhose disease (see Appendix 1, Figure 32), contractures in both hands (see Appendix 1, Figure 32) and a family history of Dupytren’s. 13–17
Treatments
A comprehensive range of options are used to treat DC, including surgical, pharmacological, and radiotherapy. Physical therapies such as splinting, massage, and ultrasound have no evidence of efficacy. Radiotherapy, which impairs the cells that create the contracting fibrous tissue,18 is occasionally used to manage early-stage DC or as concomitant therapy to other surgical or pharmacological interventions for more aggressive disease. 18
Surgical and pharmacological interventions, such as limited fasciectomy surgery (LF), collagenase injection, and percutaneous needle fasciotomy (PNF) aim to remove, break, or dissolve fibrous tissue of the cord to correct or improve the joint contracture. 2,9 The relative benefits and risks of each of these interventions relate to differences in recovery time, number and severity of treatment complications, and DC recurrence. However, current data on risks and benefits is derived from low-quality, non-randomised studies largely. 19
Surgical correction
Surgical correction for DC involves excision of the cord(s). There are four levels of surgical correction: the least invasive is fasciotomy; followed by very limited or segmental fasciectomy; next is LF; and the most invasive is dermo-fasciectomy. 9 The type of surgery recommended to a patient depends on disease severity. Fasciotomy or very LF is recommended for cases where the cord is discrete and usually causing only MCP contracture. Dermo-fasciectomy is normally reserved for patients with a high risk of recurrence as it has a higher risk of complications. 9,20 If the contracture is very severe and cannot be corrected by fasciectomy, the only way to improve hand function may be to fuse the contracted joint or amputate the affected digit. 2
Limited fasciectomy is the most frequently used method for correction of DC in the UK and Europe. 21,22 It is estimated that about 73% of patients see a full correction immediately following LF. However, 6% of patients will experience moderate complications, such as numbness, reduced movement, or stiffness, swelling or nerve injury. Recurrence after 2–3 years occurs in approximately 12% of patients, rising at 5 years to approximately 21–32% of patients. 23,24 Recurrence is reported to be more likely if the PIP joint was treated than the MCP joint or where severe contractures are present in both joints. 25,26
Collagenase injection
Collagenase Clostridium histolyticum (CCH) is an enzyme that weakens a Dupuytren’s cord by breaking down collagen. It is injected directly into the cord and after a few days the weakened cord can be snapped (by manipulation) to straighten the contracted joint. 27 The benefit of collagenase treatment is potential quicker recovery time as compared to LF. Also, it can be delivered in clinic, rather than in an operating theatre, thus reducing cost. 27–29
It is estimated that about 53% of patients have full correction immediately following injection and manipulation. Approximately 2% of patients will experience moderate complications, such as numbness, reduced movement, or stiffness, swelling, or nerve injury. Tendon or sheath rupture after injection is possible but rare. Recurrence after 2–3 years occurs in approximately 38% of patients, rising to 51% of patients within 5 years of treatment. 11,30,31 Recurrence is more likely if the PIP joint was treated than the MCP joint. 31
Collagenase was withdrawn from the market, except in the USA, for commercial reasons on 29 February 2020. 28 There were no safety concerns, as the Medicines and Healthcare products Regulatory Agency (MHRA) confirmed that stocks already available within the UK could continue to be used for the same indication. At the time of writing, there was no information on whether the supplier would reinstate supply to Europe.
Percutaneous needle fasciotomy
A needle aponeurotomy, also called percutaneous needle fasciotomy, is a technique that uses a needle to puncture or cut a section of the cord at multiple points to weaken it. The weakened cord is then snapped so that the finger can straighten. 32 This is an outpatient procedure with a short recovery period. 32 However, there are drawbacks. Firstly, this method is less suitable for PIP joints as these are more difficult to treat and there is greater risk of damage to digital nerves9,32 and tendons. Secondly, the recurrence rate is high at between 74% and 85% after 5 years. 23,24 This method is typically reserved for patients with MCP contractures of < 20°. 21 It is less effective than LF at correcting contractures. 33
Percutaneous needle fasciotomy was not assessed within the Dupuytren's interventions surgery versus collagenase (DISC) trial, the effectiveness and cost-effectiveness of PNF compared to LF is currently being undertaken in a separate National Institute for Health and Care Research (NIHR)-funded study (HAND-2: https://doi.org/10.1186/ISRCTN12525655), following an earlier feasibility study. 34
Rationale
The DISC trial was designed in response to a NIHR commissioned call to compare the most common form of surgery for moderate DC to collagenase. Collagenase has several benefits compared to LF, including a shorter recovery35 and no dependency on theatre space, therefore reducing waiting lists. 27 Additionally, collagenase may be beneficial in terms of cost to the NHS. According to UK Hospital Episode Statistics data, collagenase injection costs about £1287 per patient, compared to £4807 for LF. However, the overall cost-effectiveness, considering the efficacy and need for subsequent intervention to treat recurrence, remains unknown. We also do not know patients’ experiences and preferences for these treatments. The DISC trial aims to answer these important questions.
The clinical impact of the results of this study is high. If the trial identifies that collagenase is not inferior to LF in terms of efficacy and patient experience, and is less expensive, this will make it the preferred treatment for the NHS and for Dupuytren’s patients (subject to the return of collagenase to the European market). Conversely, if collagenase proves to be inferior to LF, this information can be used to protect patients from a procedure which is less effective and potentially save the NHS money by reducing the number of subsequent treatments needed for recurrence.
Current evidence
The quality of currently published evidence on the efficacy of collagenase compared to LF is low. Collagenase is suspected to be more cost-effective; however, the evidence is limited to small retrospective studies. 35,36 A meta-analysis of cohort studies found that the short-term efficacy was similar between the two treatments, although collagenase had a four times greater risk of minor complications. 37 There is no information available from completed randomised controlled trials (RCTs). 35,36 One ongoing RCT, the DupuytrEn Treatment EffeCtiveness Trial, aims to compare effectiveness of LF, collagenase and PNF, including follow-up for recurrence up to 10 years after treatment. 38 Another RCT looking specifically at collagenase treatment and LF secondary to recurrence is also ongoing. 39
Research objectives
The primary objective was to determine whether collagenase injection is not inferior to LF in the treatment of DC, as determined by patient-reported hand function 1 year after treatment.
The secondary objectives were to:
-
investigate contracture recurrence at 1 and 2 years after treatment
-
investigate the cost-effectiveness [from the NHS and Personal Social Services (PSS) perspectives] of collagenase injections compared to LF at 1 and 2 years after treatment
-
investigate if active extension and flexion measurements obtained from photographs taken remotely by patients are comparable to goniometric measurements taken by a medical professional (photography substudy)
-
explore patient’s views on collagenase injections compared to LF related to their experiences and preferences (qualitative substudy).
Chapter 2 Trial design and methods
This chapter describes the trial design and methods used to address the aforementioned clinical effectiveness. The trial protocol has been published. 40
Trial design
The DISC trial was a multicentre, parallel-group, pragmatic, individually randomised controlled non-inferiority trial comparing collagenase injection and manipulation versus LF for the correction of DC of the hand in adult patients referred to hospital care in the UK. The trial included a cost-effectiveness evaluation (see Chapter 4), a qualitative substudy (see Chapter 5), and a photography substudy (see Appendix 2), the methods for which are detailed in their respective chapters, along with an internal pilot study during the first 6 months of recruitment (see Chapter 3).
Minor methodological changes were made following trial commencement in consultation with and approval from the independent oversight committees, the funder, sponsor, Research Ethics Committee (REC), and Health Research Authority, and where applicable from the UK Competent Authority – MHRA (see Appendix 3, Tables 61–63). The final trial methods are described below.
Participants
Patients with DC meeting the trial inclusion/exclusion criteria were identified from clinician referral letters, surgery, and general practitioner (GP) lists and reviews of patients attending orthopaedic, plastic surgery, or musculoskeletal clinics. Patients identified in private practice could be approached if transferred to NHS facilities for treatment.
Inclusion criteria
Patients were eligible if they met the following criteria (and none of the exclusion criteria):
-
Male or female and aged 18 years or over.
-
Presence of discrete, palpable, contracted cord involving the MCP and/or PIP joint of a finger.
-
Degree of contracture ≥ 30 degrees in either joint that is patient cannot put the palm of the hand flat on a table (Hueston’s tabletop test).
-
Able to identify a predominant cord for treatment, which would not require more than one collagenase injection as treatment to the joint.
-
Appropriate for LF surgery and collagenase injection for DC [i.e. cords suitable for collagenase injection and LF and not requiring skin grafting or PNF (e.g. discrete MCP joint cords in elderly)].
-
Willing and able to give informed consent for participation in the study.
Exclusion criteria
-
Severe contractures of the MCP and/or PIP joint (Tubiana Grade 4 – total extension deficit > 135 degrees). 41
-
History of previous treatment for DC (e.g. surgery, collagenase injection or needle fasciectomy) to the study reference digit.
-
History of any other pre-existing disorder of the hand causing significant restriction of movement and/or pain and affecting hand function, for example, post-traumatic stiffness, stiffness due to other causes, infection or arthritis.
-
Non-English-speaking because of the need to complete multiple questionnaires which have not been validated in multiple languages.
-
Resident in a location where attendance for follow-up at one of the recruiting centres would not be possible.
-
Contraindicated for use of collagenase including:
-
Hypersensitivity to: collagenase, sucrose, ketorolac trometamol, hydrochloric acid, calcium chloride dehydrate, and sodium chloride.
-
-
Diagnosis of a coagulation disorder.
-
Any other significant disease or disorder (including autoimmune disorders) which, in the opinion of the investigator, may put the participant at risk because of participation in the study, or may influence the result of the study, or the participant’s ability to participate in the study.
-
Participation in another research study involving an investigational product in the past 12 weeks.
-
Female participants who were pregnant or breastfeeding.
Setting
The trial recruited from 31 secondary-care hand units in NHS hospitals in the UK. One further site agreed to participate in the study but was unable to open to recruitment. The British Society for Surgery of the Hand (BSSH) helped to identify study sites. Details of participating sites are provided in the results section in relation to recruitment.
Interventions
The study required participants to be scheduled for collagenase injection or LF within 18 weeks of randomisation (recommended referral to treatment time). Where possible, sites were encouraged to complete treatment within 12 weeks of randomisation.
Separate cords could be treated (injection or LF) at the same treatment visit. However, a reference joint was identified prior to randomisation, with follow-up assessments (e.g. for recurrence) based primarily on the reference cord. The type, concentration and volume of anaesthetic used during treatment was determined by the clinical team at treating sites. Treatments were delivered by trained professionals familiar with relevant procedures. Details of the participants’ treatment were collected within the relevant case report forms (CRFs) (see Report Supplementary Material 16).
Collagenase Clostridium histolyticum (intervention)
Collagenase was supplied through routine hospital stocks at participating study sites and stored in accordance with the current approved summary of product characteristics (SmPC) for CCH. 28 The investigator used a trial prescription to request this medication from the local site pharmacy department. Once selected for use with a study participant, the intervention was handled as an investigational medicinal product (IMP).
For treatment, either 0.25 ml (MCP joint) or 0.20 ml (PIP joint) of reconstituted solution (0.58 mg CCH) was injected as three aliquots at set anatomical points in accordance with the current approved SmPC. 28 After an interval of 1–7 days, the participant returned to clinic and, under local anaesthetic, the cord was snapped correcting the contracture. This extended period for manipulation, was approved by the MHRA.
When the DISC trial commenced, collagenase was manufactured by Auxilium and marketed by Sobi, in Sweden. However, marketing authorisation for collagenase use within Europe was withdrawn in March 2020 by the parent company (Endo) for commercial reasons. 28 The DISC trial team worked extensively with Sobi to facilitate availability of sufficient vials to enable completion of the study to the contracted target. These efforts were driven by a clear steer by clinicians [site principal investigators (PIs) and co-applicants] that results of this study would have an important bearing on treatment options offered to patients. These efforts were reviewed and supported by the funder (NIHR) and DISC trial oversight committees.
Most treatments were delivered in the same NHS hospital where participants were recruited. However, in a small number of cases treatment occurred elsewhere, in line with local and national guidance and treatment pathways during the COVID-19 pandemic. For example, in line with UK government guidance on non-emergency operations and COVID-19 ‘Green Patient Pathways’, a small number of participants were treated at other UK sites (NHS or private). 42 In addition, to maximise recruitment and treatment following marketing authorisation withdrawal, where supplies at the recruiting site were depleted, if necessary participants could be referred onto other trial sites for collagenase treatment subject to local NHS pathways and approval.
Limited fasciectomy (control)
Under anaesthesia, the diseased fascia, nodule and cord, or a part of it, are removed to correct the joint contracture. 25,43 Following LF, as determined by clinical need, the skin was left to heal by secondary intention, closed directly, closed with a Z-plasty, or using a full thickness skin graft.
Following LF, participants were reviewed at a routine wound check appointment.
Concomitant and care following the trial
Further assessment, interventions and treatments, including collagenase injections, and prescribing of concomitant medications were determined by clinical need and were recorded in follow-up CRFs (see Report Supplementary Material 17). Following completion of study follow-up, participants returned to the care of their treating healthcare professional for any re-intervention if required.
Outcomes
The data collection schedule for the study is detailed in Table 1. All outcomes are as originally proposed; no changes were made to outcomes after the trial commenced.
| Procedures | Baseline | Treatment delivery | Week 2 after treatment | Week 6 after treatment | 3 months after treatment | 6 months after treatment | 1 years after treatment | 2 years after treatment |
|---|---|---|---|---|---|---|---|---|
| Informed consent | x | |||||||
| Demographics | x | |||||||
| Condition history | x | |||||||
| Compliance | x | |||||||
| Joint measurements (goniometry) | x | x | x | x | x | x | ||
| Diathesis indicators | x | |||||||
| Comorbidity index | x | |||||||
| Clinical assessment of cords | x | |||||||
| Treatment delivered | x | |||||||
| Concomitant medications | x | x | x | x | x | |||
| Hand photographs | x | x | x | x | x | x | ||
| Patient Evaluation Measure (PEM) | x | x | x | x | x | x | ||
| Unité Rhumatologique des Affections de la Main (URAM) scale | x | x | x | x | x | |||
| Michigan Hand Outcomes Questionnaire | x | x | x | |||||
| EuroQol-5 Dimensions, five-level version | x | x | x | x | x | x | x | |
| Further treatments (further care and/or re-intervention) and complications | x | x | x | x | ||||
| Resource use | x | x | x | x | ||||
| Adverse event assessments | x | x | x | x | ||||
| Single Assessment Numeric Evaluation (SANE) | x | x | x | x | x | x | x |
Data collection time points were fixed to the date of treatment as opposed to randomisation.
Details of the scoring procedures for included outcomes are given in the Statistical Analysis Plan (available at: www.isrctn.com/ISRCTN18254597) and in Report Supplementary Material 1.
Primary outcome
The primary end point was the score obtained for the 11 items in part 2 of the Patient Evaluation Measure (PEM) 44 at 1 year after treatment (0–100, with higher scores indicating worse outcome).
The PEM is a validated 19-item patient-reported outcome measure comprised of three parts: Part 1 – treatment (5 items), part 2 – hand health profile (11 items) and part 3 – overall assessment (3 items). The score for part 2 (hand health profile) was used as the primary outcome, with the scores for part 1 (treatment) and parts 2 and 3 combined (hand health profile and overall assessment) serving as secondary outcomes The PEM was collected at baseline, just prior to treatment delivery and at 3 and 6 months, and 1 and 2 years (see Report Supplementary Materials 18 and 19).
The inclusion of a patient-reported primary outcome was stipulated by the NIHR commissioned funding call. The PEM was chosen as the primary end point as opposed to other validated measurement tools for the hand, given this can fully capture changes in a patient’s hand health after treatment. The other validated measures were included as secondary outcomes. 45 The primary outcome time point was set as 1 year after treatment to ensure that any associated complications had subsided sufficiently prior to outcome assessment.
Secondary outcomes
Both patient-reported and clinical outcomes were included as secondary outcomes. Patient representatives specifically noted the importance of a return to function as soon as possible following treatment and given the limited available evidence comparing recurrence rates following collagenase injection and LF, relevant measures for each were included and prioritised to allow treatment effectiveness in the context of these key elements to be assessed.
Unité Rhumatologique des Affections de la Main patient-rated outcome measure
The Unité Rhumatologique des Affections de la Main (URAM) was included as a validated, nine-item, six-interval disease-specific disability scale, with higher scores indicating greater difficulty. 46 This outcome was collected at baseline and at 3 and 6 months, and 1 and 2 years.
Michigan Hand Outcomes Questionnaire
The Michigan Hand Outcomes Questionnaire (MHQ), validated for use in this patient group, assesses each hand individually via 63 questions across 6 domains (overall hand function; activities of daily living; work performance; pain; aesthetics; and patient satisfaction with hand function). 47,48 The function and pain domains refer to patient symptoms while work and activities of daily living refer to disability and handicap. Higher scores indicate better overall functioning and satisfaction. This outcome was collected at baseline and at 1 and 2 years.
Objective measures (recurrence, extension deficit and total active movement)
Goniometric measurements of the joints of the reference digit were taken at baseline, immediately prior to treatment delivery and at 3 and 6 months, and 1 and 2 years by qualified NHS practitioners. At baseline and the time points after treatment, sites were asked to provide three repeated goniometric measurements of the active extension, passive extension, and flexion of the joints of the reference digit (i.e. 18 measurements at each time point if the reference digit was the thumb, and 27 measurements if the reference digit was not the thumb). The arithmetic means of the three repeated measurements were used for analysis. At treatment delivery, sites were asked to provide a single goniometric measurement of active and passive extension for each joint of the reference digit (i.e. four measurements in total if the reference digit was the thumb, and six measurements if the reference digit was not the thumb).
These goniometric measurements were used to derive several outcomes: recurrence, passive and active range of movement (RoM), and passive and active extension deficit and stiffness (maximal flexion). For the study, recurrence was defined as a change in extension deficit (as measured by passive extension) of 6 degrees between 3 and 6 months, or 20 degrees from 3 months to 1 year after treatment12,29 at the reference joint. At each time point, RoM for each joint was calculated as the difference between the mean total active flexion measurement and the mean total active extension or extension deficit measurement.
A study-specific manual for performing joint measurements was provided (see Report Supplementary Material 2) and goniometers were required to meet pre-specified criteria (permits measurement of up to 30 degrees of hyperextension; measures flexion to 120 degrees; measures in at least 2-degree increments), to ensure that assessments were standardised.
In addition to goniometric measurements, photographs of the participant’s reference hand (extension, flexion, and anterior-posterior views) were taken. A study-specific manual was used to standardise the images (see Report Supplementary Material 3). If willing, participants also took and returned a photograph of their hand. A study-specific procedure and video were provided to participants to assist with standardisation of these images (see Report Supplementary Materials 4 and 5). The photographs afforded the opportunity for further quality assurance of joint measurements. Clinical members of the team used these images to undertake validation measurements using OsiriX software (Geneva, Switzerland).
Further treatment
All relevant treatment required for the participants’ DC were collected and documented at each follow-up assessment.
Ongoing hand therapy and/or physiotherapy appointments to treat chronic regional pain syndrome, stiffness, swelling or scar problems were referred to as further care. Participants who underwent more than six outpatient follow-up visits for hand therapy and/or physiotherapy had the details of these appointments reviewed on an individual basis to determine whether this extended duration of therapy should be considered further care or routine care.
For the purposes of this report, if participants underwent further collagenase injection, LF, dermo-fasciectomy or PNF to the reference digit at any point during follow-up, then this was counted as further intervention for contracture correction and deemed re-intervention.
Complications
Complications relating to the intervention and control treatments were recorded. Expected complications for the collagenase group are listed in the SmPC. 28 Complications which were expected for the LF group are listed later in Chapter 2 in relation to adverse events (AE).
Complications were reviewed and graded on their severity using an 8-level ordinal classification system from 0 (no complications) to 8 (death). Two clinical observers independently completed grading, with conflicts in grading resolved through discussion.
EuroQol
The EuroQol-5 Dimensions, five-level version (EQ-5D-5L)49 assesses 5 dimensions of health (mobility, self-care, usual activities, pain/discomfort and anxiety/depression) on 5 severity levels (no problems, slight problems, moderate problems, severe problems and unable/extreme problems). A visual analogue scale (VAS) from 100 (best imaginable health) to 0 (worst imaginable health),49 also records participants’ overall evaluation of their health.
This validated, generic, patient-reported health status measure was included to enable assessment of health-related utility and quality-of-life outcomes as required for the cost-effectiveness evaluation (see Chapter 4).
Resource use
Resource use data were collected from hospital records and through participant self-report and documented in study-specific forms. Data collected included health resource use [treatment delivery, inpatient episodes, outpatient visits, emergency hospital admissions, and primary care visits (e.g. GP, nurse and physiotherapy)] in addition to return-to-work and out- of-pocket expenses. Resources were utilised for the cost-effectiveness evaluation detailed in Chapter 4.
Time to recovery of function
Time to recovery of function was assessed using a Single Assessment Numeric Evaluation (SANE) measure,50 a single-question, patient-reported measure, which assesses patient hand functionality. This outcome was collected at baseline, 2 and 6 weeks (see Report Supplementary Material 20), 3 and 6 months, and 1 and 2 years.
Overall hand assessment
At 3 and 6 months, and 1 and 2 years, participants were asked a single global question about the problems they experienced with the hand that was treated compared with the problems they experienced prior to treatment. Responses were given on a seven-item ordered scale from terrible to cured.
Sample size
The primary outcome for DISC was the score (0–100) obtained for the 11 items in part 2 of the PEM at 1 year. There were no planned interim analyses for the trial or stopping guidelines, hence the sample size calculation was based on the number of participants required for a single test of the difference (δ = collagnase – surgery) in expected PEM score at 1 year using all available follow-up data.
Previous survey data collected from a representative sample of 880 patients with DC suggested a population standard deviation (SD) of about 22 points for part 2 PEM scores. 51 Using methods of predictive value against an anchor question for functional improvement, we estimate that a 6-point difference on the PEM at 1 year represents the threshold at which treatment differences become important, and which would represent an appropriate non-inferiority margin.
Assuming a non-inferiority margin of 6 points and a SD of 22 points, an effective sample size of 568 participants (284 per arm) was required to obtain 90% power for 1-sided independent samples t-test of size 2.5%, of H0:δ≥6 versus H1:δ<6, ignoring any precision gained by conditioning on informative baseline covariates. Assuming 20% attrition at the 1-year follow-up, the total target sample size was 710.
Recruitment
Potential participants were identified using:
-
clinician referrals
-
surgery and clinic lists
-
allied clinics and centres (e.g. musculoskeletal and physiotherapy clinics, musculoskeletal triage centres)
-
private practice
-
GP settings.
The central trial team also worked with the British Dupuytren’s Society, which publicised the study to its members through newsletters and social media. Interested individuals contacted the trial team for more information and were informed of the nearest recruiting site to request referral by their GP if appropriate.
A delegated clinician at the recruiting hospital assessed potential participants and confirmed eligibility before completing the study eligibility CRF (see Report Supplementary Material 6).
Eligible patients were then approached, provided with an information sheet (see Report Supplementary Material 7) and infographic (see Report Supplementary Material 8), and were given the opportunity to ask questions about the study. If willing to participate, a suitably qualified, experienced, and delegated research nurse or clinician obtained informed consent (see Report Supplementary Material 9), following which baseline CRFs (participant and investigator) were completed (see Report Supplementary Materials 10 and 11).
Patients who consented to participate in the main DISC trial were also eligible to participate in the photography and/or qualitative substudies. Separate consent forms were completed for these substudies (see Chapter 5, Appendix 2, and Report Supplementary Materials 12 and 13).
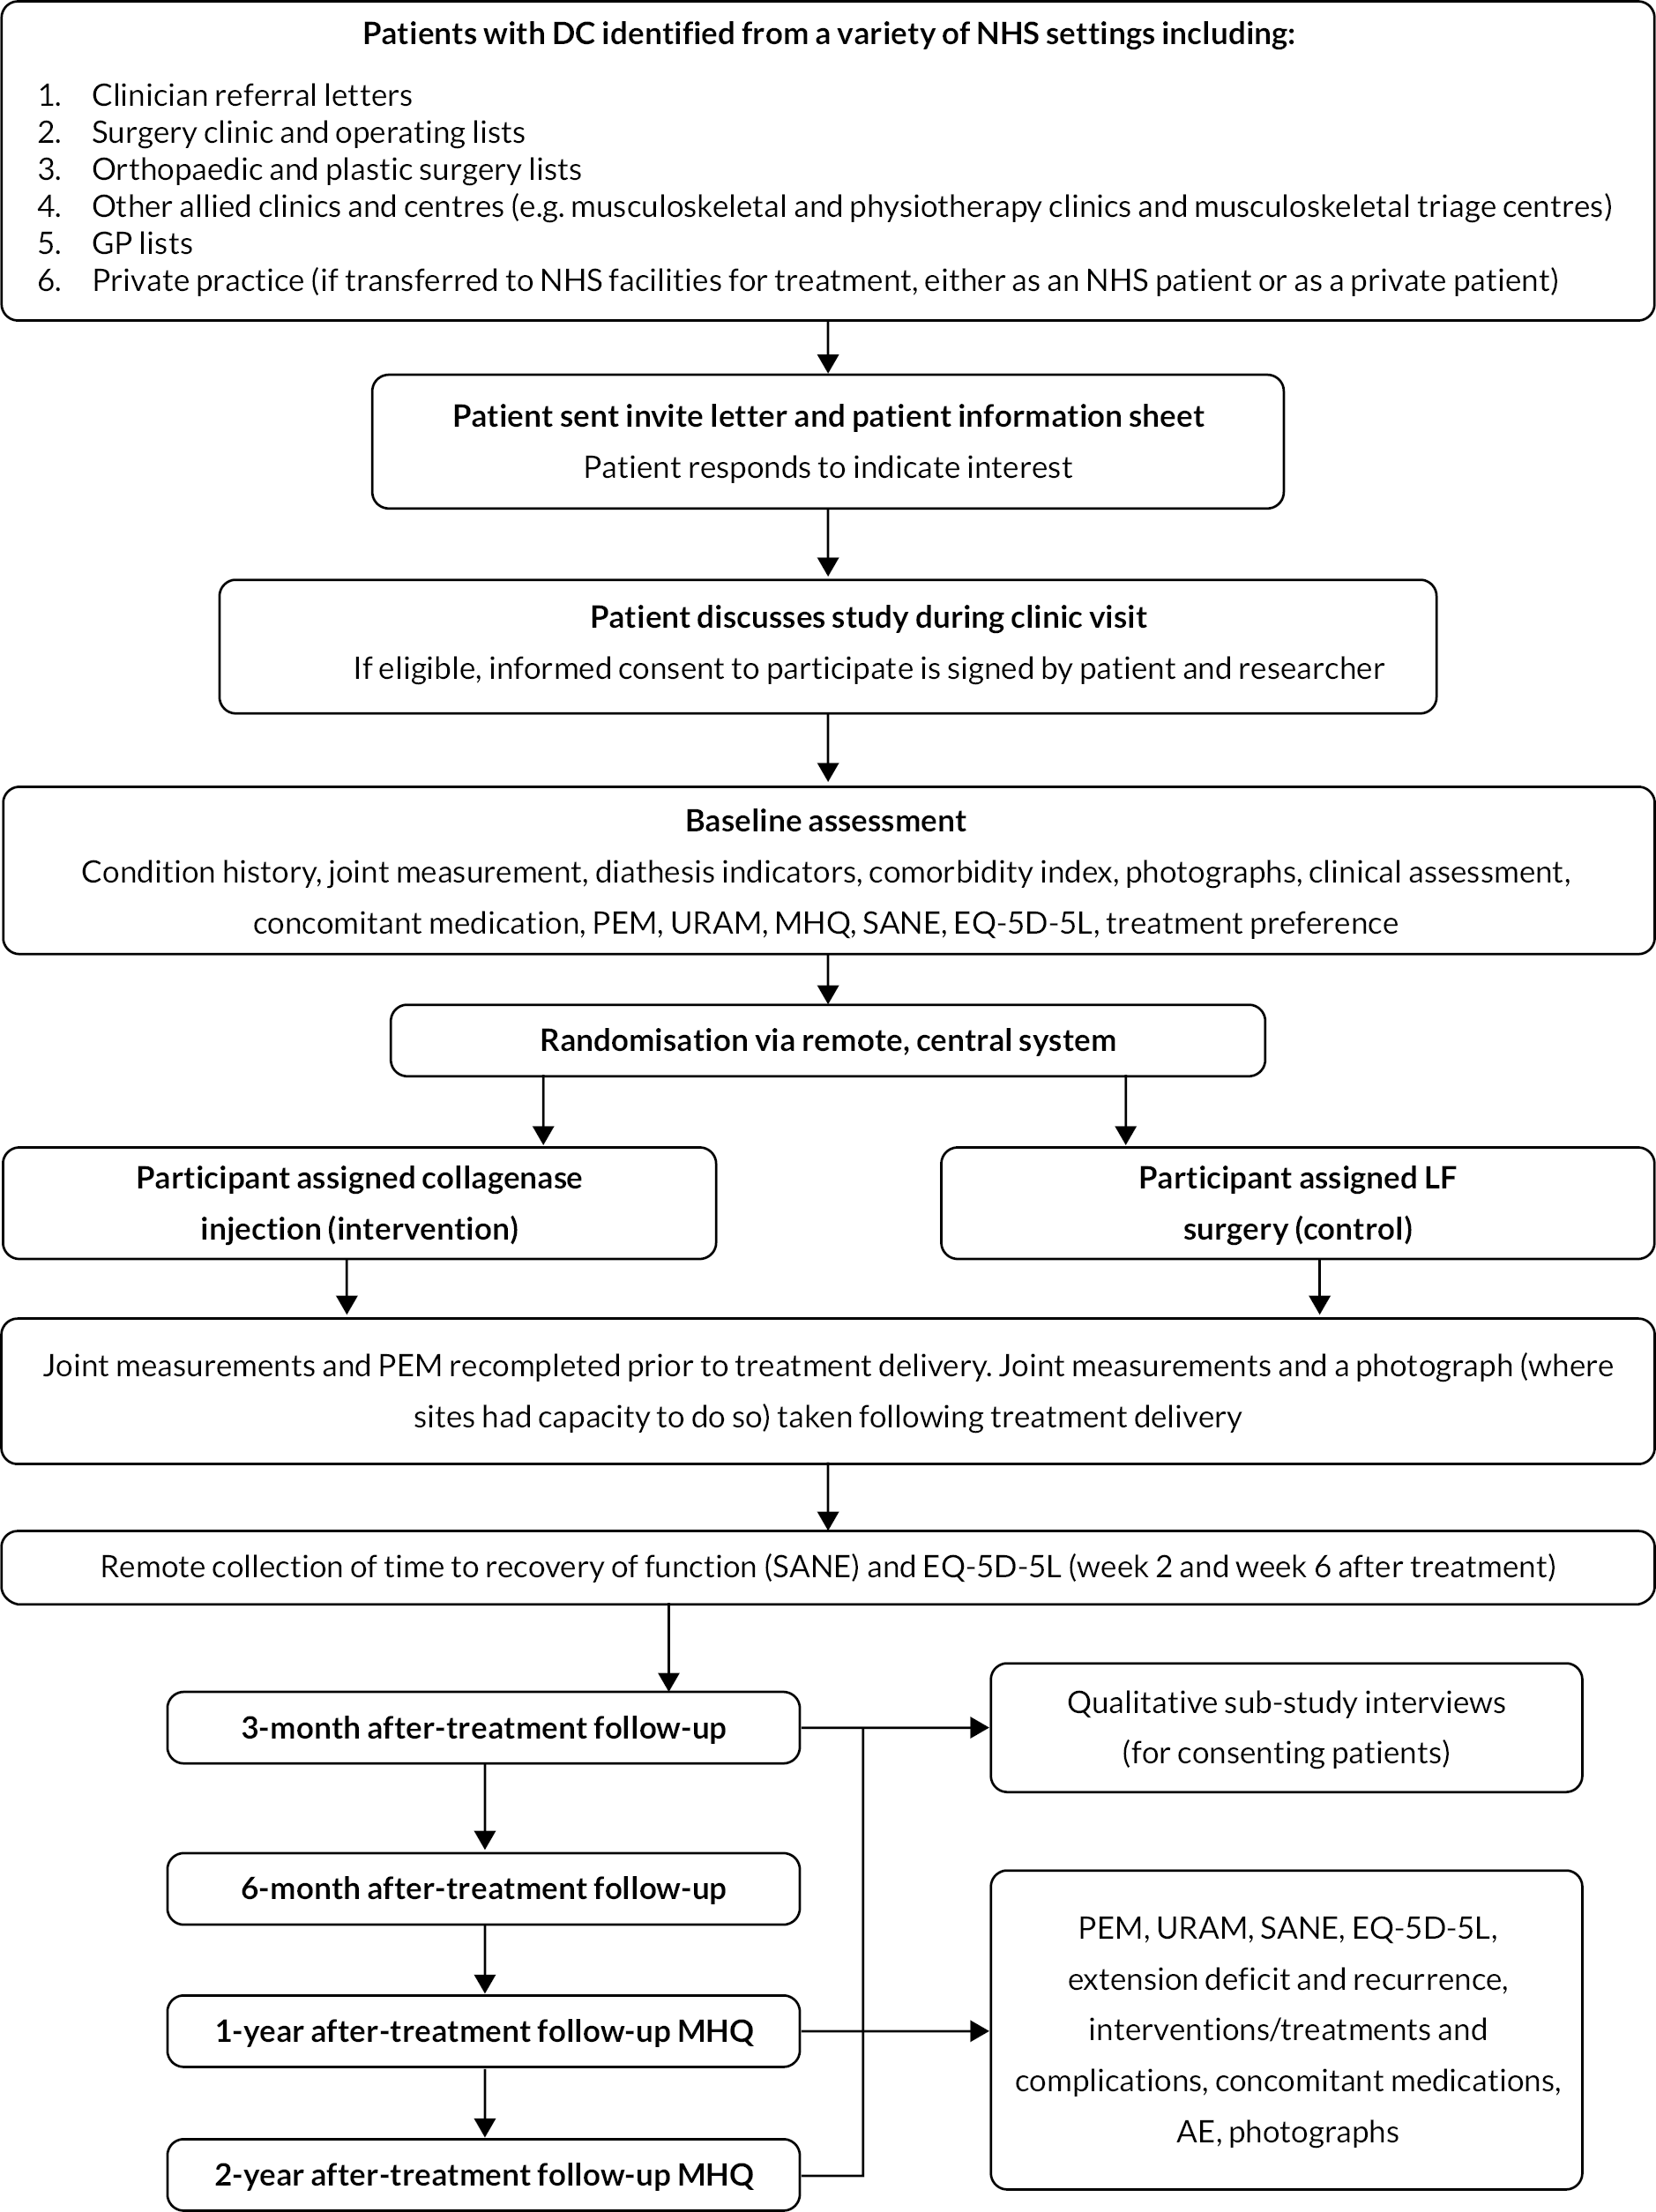
Due to the COVID-19 pandemic, in the later stages of the study, clinic visits could be completed by video appointment if required and patients were provided with guidance on using the relevant software prior to the appointment to facilitate this. Where a video appointment was completed for baseline, the consent form was required to be signed by both the participant and the delegated clinician prior to treatment delivery. Figure 1 shows participant recruitment and follow-up.
Strategies for achieving adequate participant recruitment included seeking advice from our patient focus group and completion of recruitment evaluation interviews with site teams. Trial training and discussions in relation to key study elements were implemented through face-to-face meetings with site PIs at BSSH conferences and routine site investigator meetings.
Training was provided to research teams through a site initiation visit (SIV) and a trial manual was also provided to ensure adherence to trial processes. Ongoing support and guidance were provided to staff as required (e.g. when new staff join or replace existing site staff) with clinical guidance from the chief investigator when necessary.
Participant timeline
Randomisation
Participants were randomly allocated 1 : 1 to one of the two study arms (collagenase injection or LF) using blocked randomisation, with randomly varying block sizes (four or six allocations) and stratification by the designated reference joint (MCP or PIP). The randomisation sequence was amended, with effect from 21 January 2020, to include stratification by centre to account for the limited availability of collagenase following marketing authorisation withdrawal. The study statistician, independent of participating NHS hospitals, generated the randomisation sequence.
To ensure adequate allocation concealment for the study, randomisation was carried out, following completion of baseline assessments, via the internet using a secure, central service hosted by Sealed Envelope Ltd (London, UK). This centralised system recorded information to identify all potential participants and to confirm their eligibility to avoid inappropriate entry of participants into the trial.
Blinding
Given the pragmatic nature of the trial, and the surgical and injection interventions used, it was not possible to blind clinicians or participants to study allocation. It was also not possible to blind the analysing statistician to trial allocation due to the way in which data were collected. To mitigate any impact of this, a statistical analysis plan (available at: www.isrctn.com/ISRCTN18254597) pre-specified all analyses and any changes made to the data set prior to analysis were documented appropriately.
Statistical methods
Internal pilot phase analysis
An internal 6-month pilot study was conducted at the start of the recruitment period to check the initial assumptions about recruitment and feasibility of the trial. A summary of the data were provided to the independent Data Monitoring and Ethics Committee (DMEC – described later in Chapter 2), which reviewed the pilot data and made a recommendation to the Trial Steering Committee (TSC – described later in Chapter 2) and Trial Management Group (TMG) to recommend any changes required to the study team and the funding body.
The success of the internal pilot phase was based on the following objectives:
-
To set up 6 pilot sites, with a target to recruit 48 participants from these sites
-
To ensure that set-up of a further nine sites (inclusive of pilot sites) had been completed
-
To monitor closely operational aspects of the trial, including training, eligibility and time to consent, study activity, and participant adherence.
FIGURE 1.
Participant flow diagram.
Findings from the internal pilot study are detailed in Internal pilot.
Statistical methods
A detailed analysis plan was written and agreed with the DMEC prior to completion of recruitment. Brief details of the analyses undertaken are given below (please refer to the analysis plan available at www.isrctn.com/ISRCTN18254597 for further details), and any deviations from the planned analyses are detailed and justified below. All analyses were undertaken at the end of the follow-up period using all available data; hence no stopping rules or associated adjustments for multiplicity were required. All analyses included all participants with data available for the relevant outcome in the groups that they were allocated to, except for the imputed data analyses that included all randomised participants. Analyses were conducted using Stata/SE v17.0 (StataCorp LP, College Station, TX, USA).
Baseline data were summarised by allocation and overall, both as-randomised and as-analysed. The as-randomised set comprised all randomised participants, excluding any ineligible patients randomised in error. The as-analysed set comprised all participants included in the primary analysis (i.e. all participants with primary outcome data available for at least one time point after treatment).
For all outcomes/time points, continuous outcome data were summarised in terms of the non-missing sample size, mean, SD, median, interquartile range and range, and categorical data in terms of frequencies and proportions. A Consolidated Standards of Reporting Trials diagram was used to summarise participant flow and data completeness. 52
Primary analysis
All participants with at least one PEM Hand Health Questionnaire measurement after treatment were included in the primary analysis. A covariance pattern model, with all PEM measurements taken after treatment included as outcomes, was used to estimate the group differences (collagenase – LF) in expected PEM score at each time point after treatment. Treatment groups, time points, and their interactions were included as fixed effects. This model also included fixed effects for study reference joint (the stratification factor) and baseline PEM score (modelled via a single linear term) and a random intercept for study recruitment site. The correlation between the repeated measurements was accounted for using an unstructured covariance matrix. This model was fitted using restricted maximum likelihood, with the Kenward‒Roger method53 used to calculate degrees of freedom for the interval estimates and statistical tests reported. The null hypothesis that collagenase is inferior to LF was rejected if the upper bound of the two-sided 95% confidence interval (CI) for the difference (collagenase – LF) in expected score for the primary end point (PEM at 1 year) was less than the non-inferiority margin of 6 points.
Further analyses of primary outcome
The primary analysis assumed missing outcome data were missing at random (MAR) conditional on the baseline covariates and non-missing outcomes included in the primary analysis model. Multiple imputation (MI) was used to obtain treatment effect estimates (at each time point) under a slightly weaker MAR assumption, by imputing missing outcomes conditional on additional relevant pre- and post-randomisation variables. The sensitivity of the results of the primary analysis to various systematic departures from MAR54 was explored, using a delta-based sensitivity analysis implemented via a pattern mixture model. We also undertook further sensitivity analyses to investigate the robustness of the results of the primary analysis to differential delays in time to receipt of treatment across groups, and departures from the planned timing of follow-up assessments.
Treatment compliance was reported descriptively, and an instrumental variable estimator (with random allocation as the instrument) used to estimate the complier-average causal effect (CACE; i.e. the average causal effect of collagenase compared to LF within the ‘complier’ principal stratum).
We undertook two subgroup analyses to investigate heterogeneity of treatment effects across subgroups defined by baseline characteristics, one planned and one post hoc. The planned subgroup analysis investigated treatment effect heterogeneity associated with baseline treatment preference (preferred collagenase, preferred LF or no preference). The post hoc subgroup analysis investigated treatment effect heterogeneity associated with designated study reference joint (MCP or PIP).
Secondary outcomes
Covariance pattern models like those used for the primary analysis were used to analyse continuous secondary outcomes (e.g. URAM, MHQ, SANE, and active/passive extension deficit and RoM), except for the PEM Overall Assessment and Treatment Questionnaire score, which were reported descriptively.
Appropriate binary or original logistic regression models were used to analyse the categorical outcomes (e.g. recurrence, re-intervention, further care, overall hand assessment, and severity of reported treatment complications). A partial proportional odds model was used to analyse the complication outcome, with the effects of allocation unconstrained across levels of the outcome and effects of all other predictors constrained to be equal across the levels of outcome.
A Cox proportional hazards regression model was used to estimate the relative hazard of further treatment (further care and/or re-intervention) to the reference digit and obtain estimates of the absolute differences in risk of further treatment by 2 years conditional on representative patterns of the baseline covariates. As non-inferiority margins were not pre-specified for most of the secondary outcomes [except for recurrence for which an absolute risk difference (RD) of 10% was used], the secondary analyses focused primarily on interval estimation, as opposed to hypothesis testing under either a non-inferiority or superiority framework.
Data management
Data collection, case report form processing and data checks
A comprehensive data management plan was generated at the outset of the trial to document details of the data processing.
Receipt of completed CRFs at the United Kingdom Clinical Research Collaboration-registered University of York Trials Unit (YTU) were recorded in a bespoke research data management system.
Data from completed CRFs were entered using an automated, electronic system (Teleform, Waterloo, Canada) in accordance with the licence held by the YTU. Computerised data cleaning checks and validation rules were applied to review for completion and accuracy of key variables required for the statistical analysis, check for discrepancies, and ensure consistency of the data.
Where discrepancies were identified, these were raised with the local research teams and changes made in accordance with good clinical practice (GCP).
An electronic audit trail system was maintained to track all database data changes and regular backups of the electronic data were also performed.
Promoting participant retention and follow-up completion
Participants received £40 following completion of each of the 1- and 2-year participant outcome questionnaires given this has found to have an effect in improving participant retention and questionnaire response rates. 55,56
Participants were also sent a study newsletter 4 weeks before the 1-year time point to maintain trial engagement and to encourage attendance at the 1-year study visit. This was accompanied by a cover letter from the study chief investigator to thank them for their continued contribution to the study.
Trial sites were contacted by the YTU to ensure that visits for the 1-year primary outcome time point were arranged accordingly. Where a visit could not be arranged within 4 weeks of the visit due date, a postal questionnaire was sent to the participant. If there was still no response after a further 4 weeks, the participants were telephoned to collect their data.
Pressures on the NHS due to the COVID-19 pandemic and associated national restrictions and guidelines had significant implications on research. Cancelling/delaying of clinic appointments, patient concerns about COVID-19 risk and attending hospital, and NHS research capacity strains meant that remote data collection methods were implemented on DISC to ensure that follow-up data could be collected during this time. 57 Remote methods were used to collect site-reported (telephone or video consultations) and participant-reported (postal or telephone questionnaires) data. At sites where COVID-19 burden meant that research nurses were redeployed, follow-ups were temporarily supported by the YTU.
Two nested, randomised retention studies within a trial were undertaken to ascertain effectiveness of retention strategies: one evaluated the effectiveness of a thank you card, the other the effectiveness of a festive greetings card (implemented December 2019). Details of these studies will be reported separately.
Discontinuation or withdrawals of participants
Trial participants had the right to withdraw from the study at any time. In addition, the investigator could discontinue a participant from the study at any time if they considered it necessary for any reason. The reason for withdrawal was recorded in the relevant CRF (see Report Supplementary Material 14).
Participants who requested to withdraw during a study visit were asked if they were willing to complete the questionnaires prior to withdrawal. Where a participant requested to withdraw fully outside of a scheduled study visit, no further follow-up questionnaires were completed.
Unless the participant specifically withdrew consent for their data to be stored, all data collected from them continued to be stored as per the original participant consent. At a participant’s request, their data collected up to the point of withdrawal could however be withdrawn from the trial and would not be used in the final analysis.
Where participants requested remote follow-up (i.e. follow-up without clinic visits), the research nurse contacted the participant at each visit time point to complete a safety assessment (AE reporting).
Confidentiality and data protection
The DISC trial was conducted in accordance with the Declaration of Helsinki, relevant regulations, International Council for Harmonisation Guidelines for GCP, the Data Protection Act 2018, and the General Data Protection Regulations in place during the trial.
To ensure participant confidentiality, participants and associated data were identified by initials and a unique four-digit participant ID number.
All documents were stored securely, accessible only by delegated trial staff and authorised personnel.
For the photography substudy, photographs of participants’ hands were anonymised prior to electronic transfer between sites, the YTU and the University Hospitals of Leicester NHS Trust. Similar processes were also used for the qualitative substudy. Details on confidentiality for these components are available in Chapter 5 and Appendix 2.
In accordance with applicable regulations, authorised persons could review data at any time during the study to verify that the study was being carried out correctly. However, this was not required during the study.
All study documentation will be retained in accordance with UK law, following which data will be disposed of securely.
Adverse event management
Serious adverse events (SAEs) were defined in accordance with the standardised criteria for SAE. 58 Both SAE and non-serious adverse events (NSAE) were defined as any untoward medical occurrence related to either the affected digit or hand, or to the study medication or procedure (intervention or control). Adverse reactions (ARs) were a response to any dose of medicinal product (intervention) where a causal relationship was at least a reasonable possibility. Any AR, where the nature or severity was not consistent with the applicable product information was a suspected unexpected serious adverse reaction (SUSAR).
For the purposes of reporting, specific reasons for hospitalisation were deemed to not be a SAE within the DISC trial, and instead were reported as NSAE.
These included hospitalisation for:
-
A procedure required by the protocol
-
A routine procedure followed by the centre (e.g. stent removal after LF)
-
A pre-existing condition that had not worsened
-
Routine treatment or monitoring of the studied indication not associated with any deterioration in condition
-
Treatment, which was elective or pre-planned, for a pre-existing condition not associated with any deterioration in condition, for example, a pre-planned hip replacement operation which does not lead to further complications
-
Treatment on an emergency, outpatient basis for an event not fulfilling any of the definitions of serious.
Expected AE (SAE and NSAE) were derived from the SmPC for the intervention. 28 For the control group, expected AE (as detailed in Table 2) were agreed by consensus prior to the study commencing.
| Amputation | Scar pain |
|---|---|
| Arterial injury | Scar-related complications (including hypertrophy) |
| Bleeding | Stiffness |
| Complex regional pain syndrome (CRPS) | Swelling |
| Delayed healing | Tendon injury |
| Infection | Edge necrosis |
| Instability | Carpal tunnel syndrome (starting within 6 weeks of LF) |
| Nerve injury | Other – tenosynovitis (starting within 6 weeks of LF) |
| Pain | Other – trigger finger (starting within 6 weeks of LF) |
| Paraesthesia (including dysaesthesia, burning and hyperaesthesia) |
In accordance with the SmPC,28 any pregnancy occurring during the clinical study, and the outcome of the pregnancy, was recorded and followed up for congenital abnormality or birth defect. In line with routine practice, the local research nurse or clinician questioned participants about their pregnancy status throughout the trial.
Adverse event reporting
Information regarding event description, onset and end date, relationship to study medication, and action taken were recorded on study-specific reporting forms (see Report Supplementary Material 21–23). NSAE were required to be reported within 5 days and SAE within 24 hours of being made aware of the event.
Events related to the study medication or procedures were followed up until resolution or the event was considered stable. Related events which resulted in participant withdrawal from the study were followed until a satisfactory resolution was achieved.
The relationship of SAEs/NSAEs to the study medication was assessed by a medically qualified investigator. For SAEs event details, causality and expectedness were reviewed by the chief investigator or other delegated medic.
Should any event have been deemed to be a SUSAR, then these would have been reported to the MHRA and REC within 7 days for fatal or life-threatening SUSARs, and 15 days for all other SUSARs.
All events were routinely reported to the TSC, DMEC and sponsor. Annually throughout the trial, a Developmental Safety Update Report was submitted to the MHRA and REC, detailing patient safety considerations.
Ethics approval and monitoring/governance
The DISC trial was approved by the Yorkshire and Humber – Leeds West REC on 22 May 2017 (Reference: 17/YH/0120). The study was also approved by the MHRA on 21 April 2017 (Reference: 21275/0293/001-0001). NHS permission was given by each participating site prior to study activity commencing locally. Any amendments to the study were approved by the REC, MHRA and sites prior to implementation.
The study was prospectively registered with the ISRCTN (Reference: ISRCTN18254597; Registered 11 April 2017) and with European Union Drug Regulating Authorities Clinical Trials (Reference: 2016-004251-76; Registered: 21 October 2016).
Trial Management Group
The TMG met quarterly to oversee the management of the trial. The group included the chief investigator, co-investigators, and members of the YTU and the Academic Team of Musculoskeletal Surgery (AToMS) responsible for the day-to-day management of the study. A representative of the sponsor also attended when available.
The TMG meetings monitored the progress of the DISC trial in relation to recruitment (e.g. enrolment, consent, and eligibility), allocation to study groups, adherence of the trial interventions to the protocol, retention of trial participants, monitoring of (S)AEs and reasons for participant withdrawal.
Trial Steering Committee
An independent TSC was appointed by the funding body (NIHR) to provide overall supervision of the trial and to advise on its continuation. Meetings were held on a bi-annual basis during the study. The TSC comprised two independent members (one clinician and one methodologist) and a patient and public representative. Membership is detailed in the Additional information section.
Data Monitoring and Ethics Committee
An independent DMEC was appointed by the funding body (NIHR) to monitor trial data in respect of any ethical or safety reasons why the trial should not continue. Access to unblinded data to facilitate this review was provided if required.
Meetings were held on a bi-annual basis during the study. The DMEC comprised three independent members (two clinicians, one statistician) and a patient and public representative. Membership is detailed in the Additional information section.
Site monitoring
In accordance with regulatory approvals, regular monitoring was required for the DISC trial, and a monitoring plan was prepared accordingly.
A combination of onsite and remote SIVs, including comprehensive study training, were conducted prior to study activity commencing at each site. During onsite visits, the pharmacy department storage facilities were reviewed. Where visits were completed remotely, the pharmacy team provided confirmation of temperature monitoring arrangements and imaging of storage arrangements (if the IMP was to be held outside of the main site pharmacy).
An initial on-site monitoring visit was completed with all sites (except one due to COVID-19 restrictions) following recruitment of three participants, or once 8–12 weeks had elapsed since the study opened to recruitment at the site. Scheduling was amended once three participants had been recruited and treated or at 18 weeks after recruitment activity commencing (with an interim review at 8–12 weeks) to enable a review of pharmacy activity at the visit. Source data verification (about 20% of CRF data), a review of AE, pharmacy processes and accountability, and the investigator site file were completed.
A second monitoring visit was completed remotely using self-completed checklists to confirm investigator site file maintenance and provision of relevant information in participants’ medical records.
Centralised monitoring included CRF completion checks (with a specific focus on the confirmation of eligibility CRF) and a 100% check of consent.
Study closure was completed remotely using a close-out checklist to confirm investigator site file contents and documentation in participants’ medical records.
Chapter 3 Results
Internal pilot
The internal pilot phase was originally due to run for 6 months but ran for 11 months (1 May 2017 and 31 March 2018).
At the end of the internal pilot, eight recruiting sites opened to recruitment with a further three sites in advanced set-up (i.e. SIV completed) and eight sites in the early stages of set-up. The mean time from SIV to recruitment green light was 75 days, with the mean time to first participant recruited being 55 days after green light.
During the internal pilot, 52 participants were recruited and randomised to DISC, which equated to an average of 1.5 participants per site per month.
The internal pilot enabled assessment of additional secondary feasibility objectives in relation to site training and engagement, documentation, participant ineligibility and non-consent reasons, and adherence to treatment. The information collected during this time informed changes to the study during the main trial phase as required.
Recruitment and retention
Between 31 July 2017 and 28 September 2021, a total of 1269 patients were screened for inclusion in the DISC trial, of which 540 patients were deemed to be ineligible and 57 were eligible but non-consenting. Detailed reasons for ineligibility and non-consent are provided in Appendix 4, Tables 64 and 65. This resulted in 672 participants (94.6% of the target of 710) being randomised into the DISC trial (336 to each group). The planned target of 710 was to account for 20% attrition. The actual required number of valid end points needed for a well-powered study was 568, which was achieved. Recruitment stopped in September 2021 given follow-up for the primary outcome would not have been possible within the funded period. Recruitment progress and trial treatment delivery over time are illustrated in Appendix 4, Figure 73 and Table 66
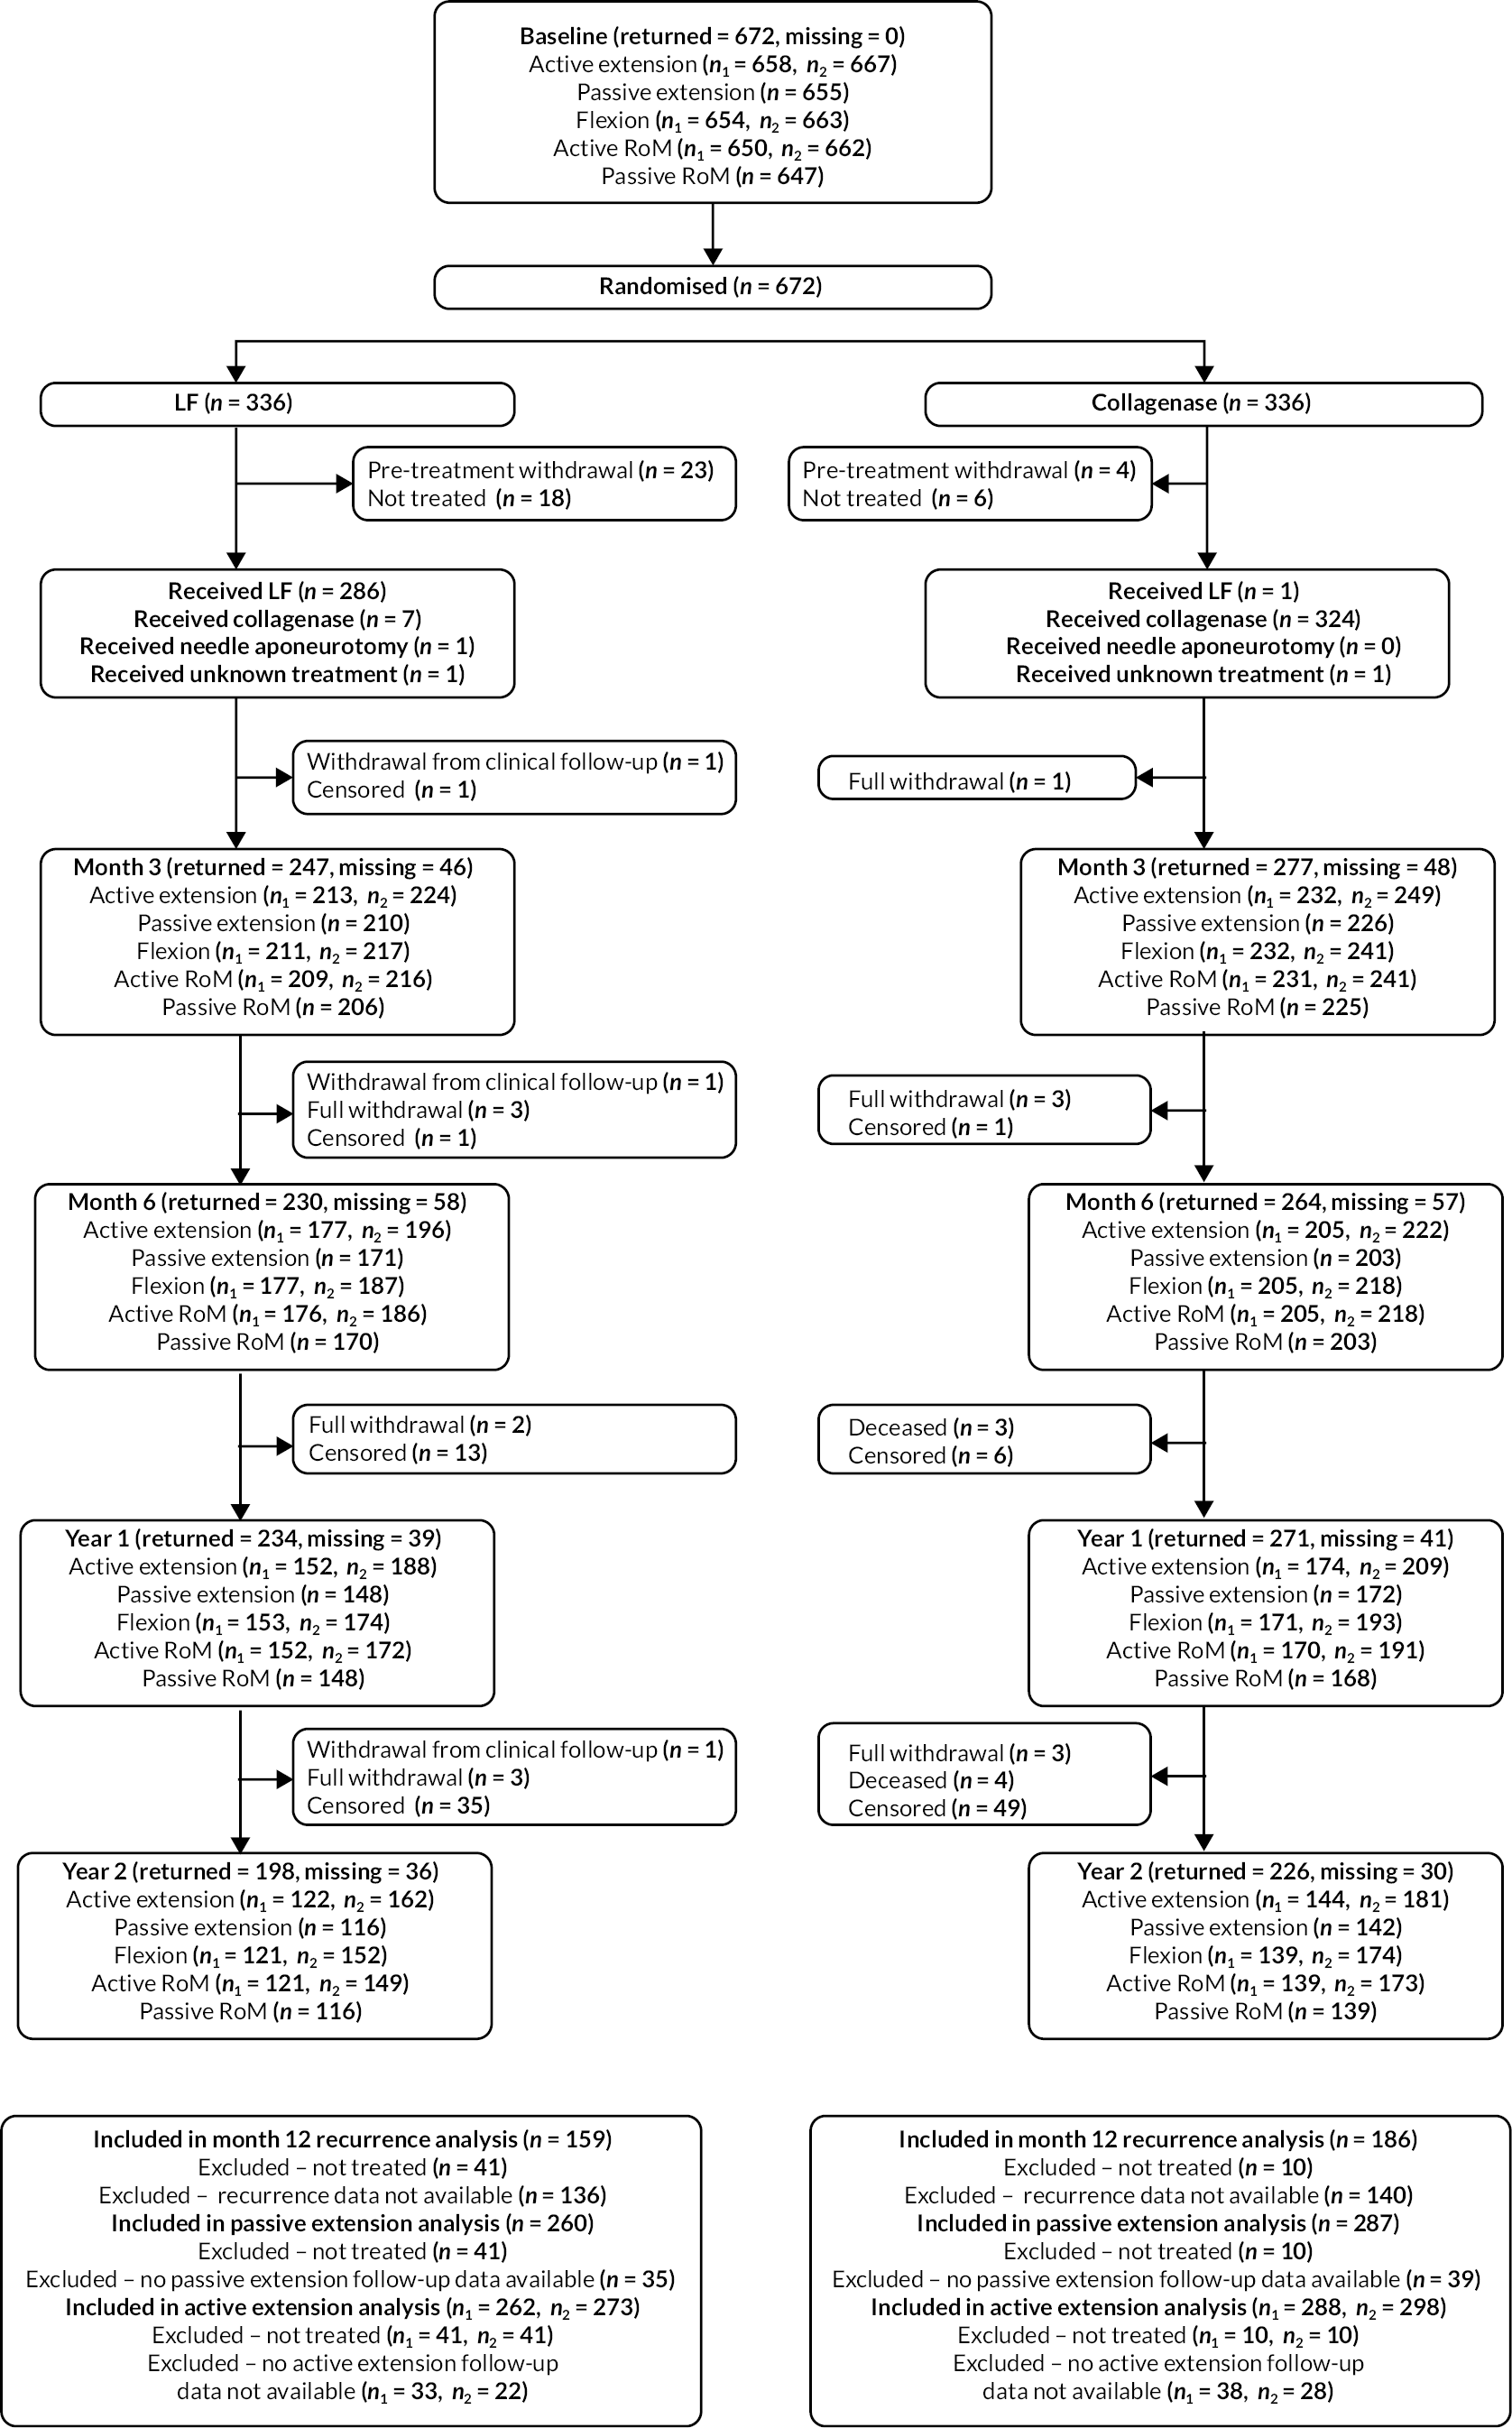
As shown in Figures 2 and 3, a significantly larger proportion of the participants in the LF group did not receive treatment as part of the trial, compared with the collagenase group (12.2% LF vs. 3.0% collagenase). Detailed reasons for pre-treatment withdrawals are provided in Appendix 4, Table 67. This discrepancy in treatment delivery explains the imbalance in the number of follow-ups expected and completed subsequently, although the proportion of treated participants that were followed up is similar across groups at all time points.
FIGURE 2.
Participant completed data flow diagram (‘censored’ means that the trial follow-up period finished prior to the subsequent follow-up time points being due/completed).
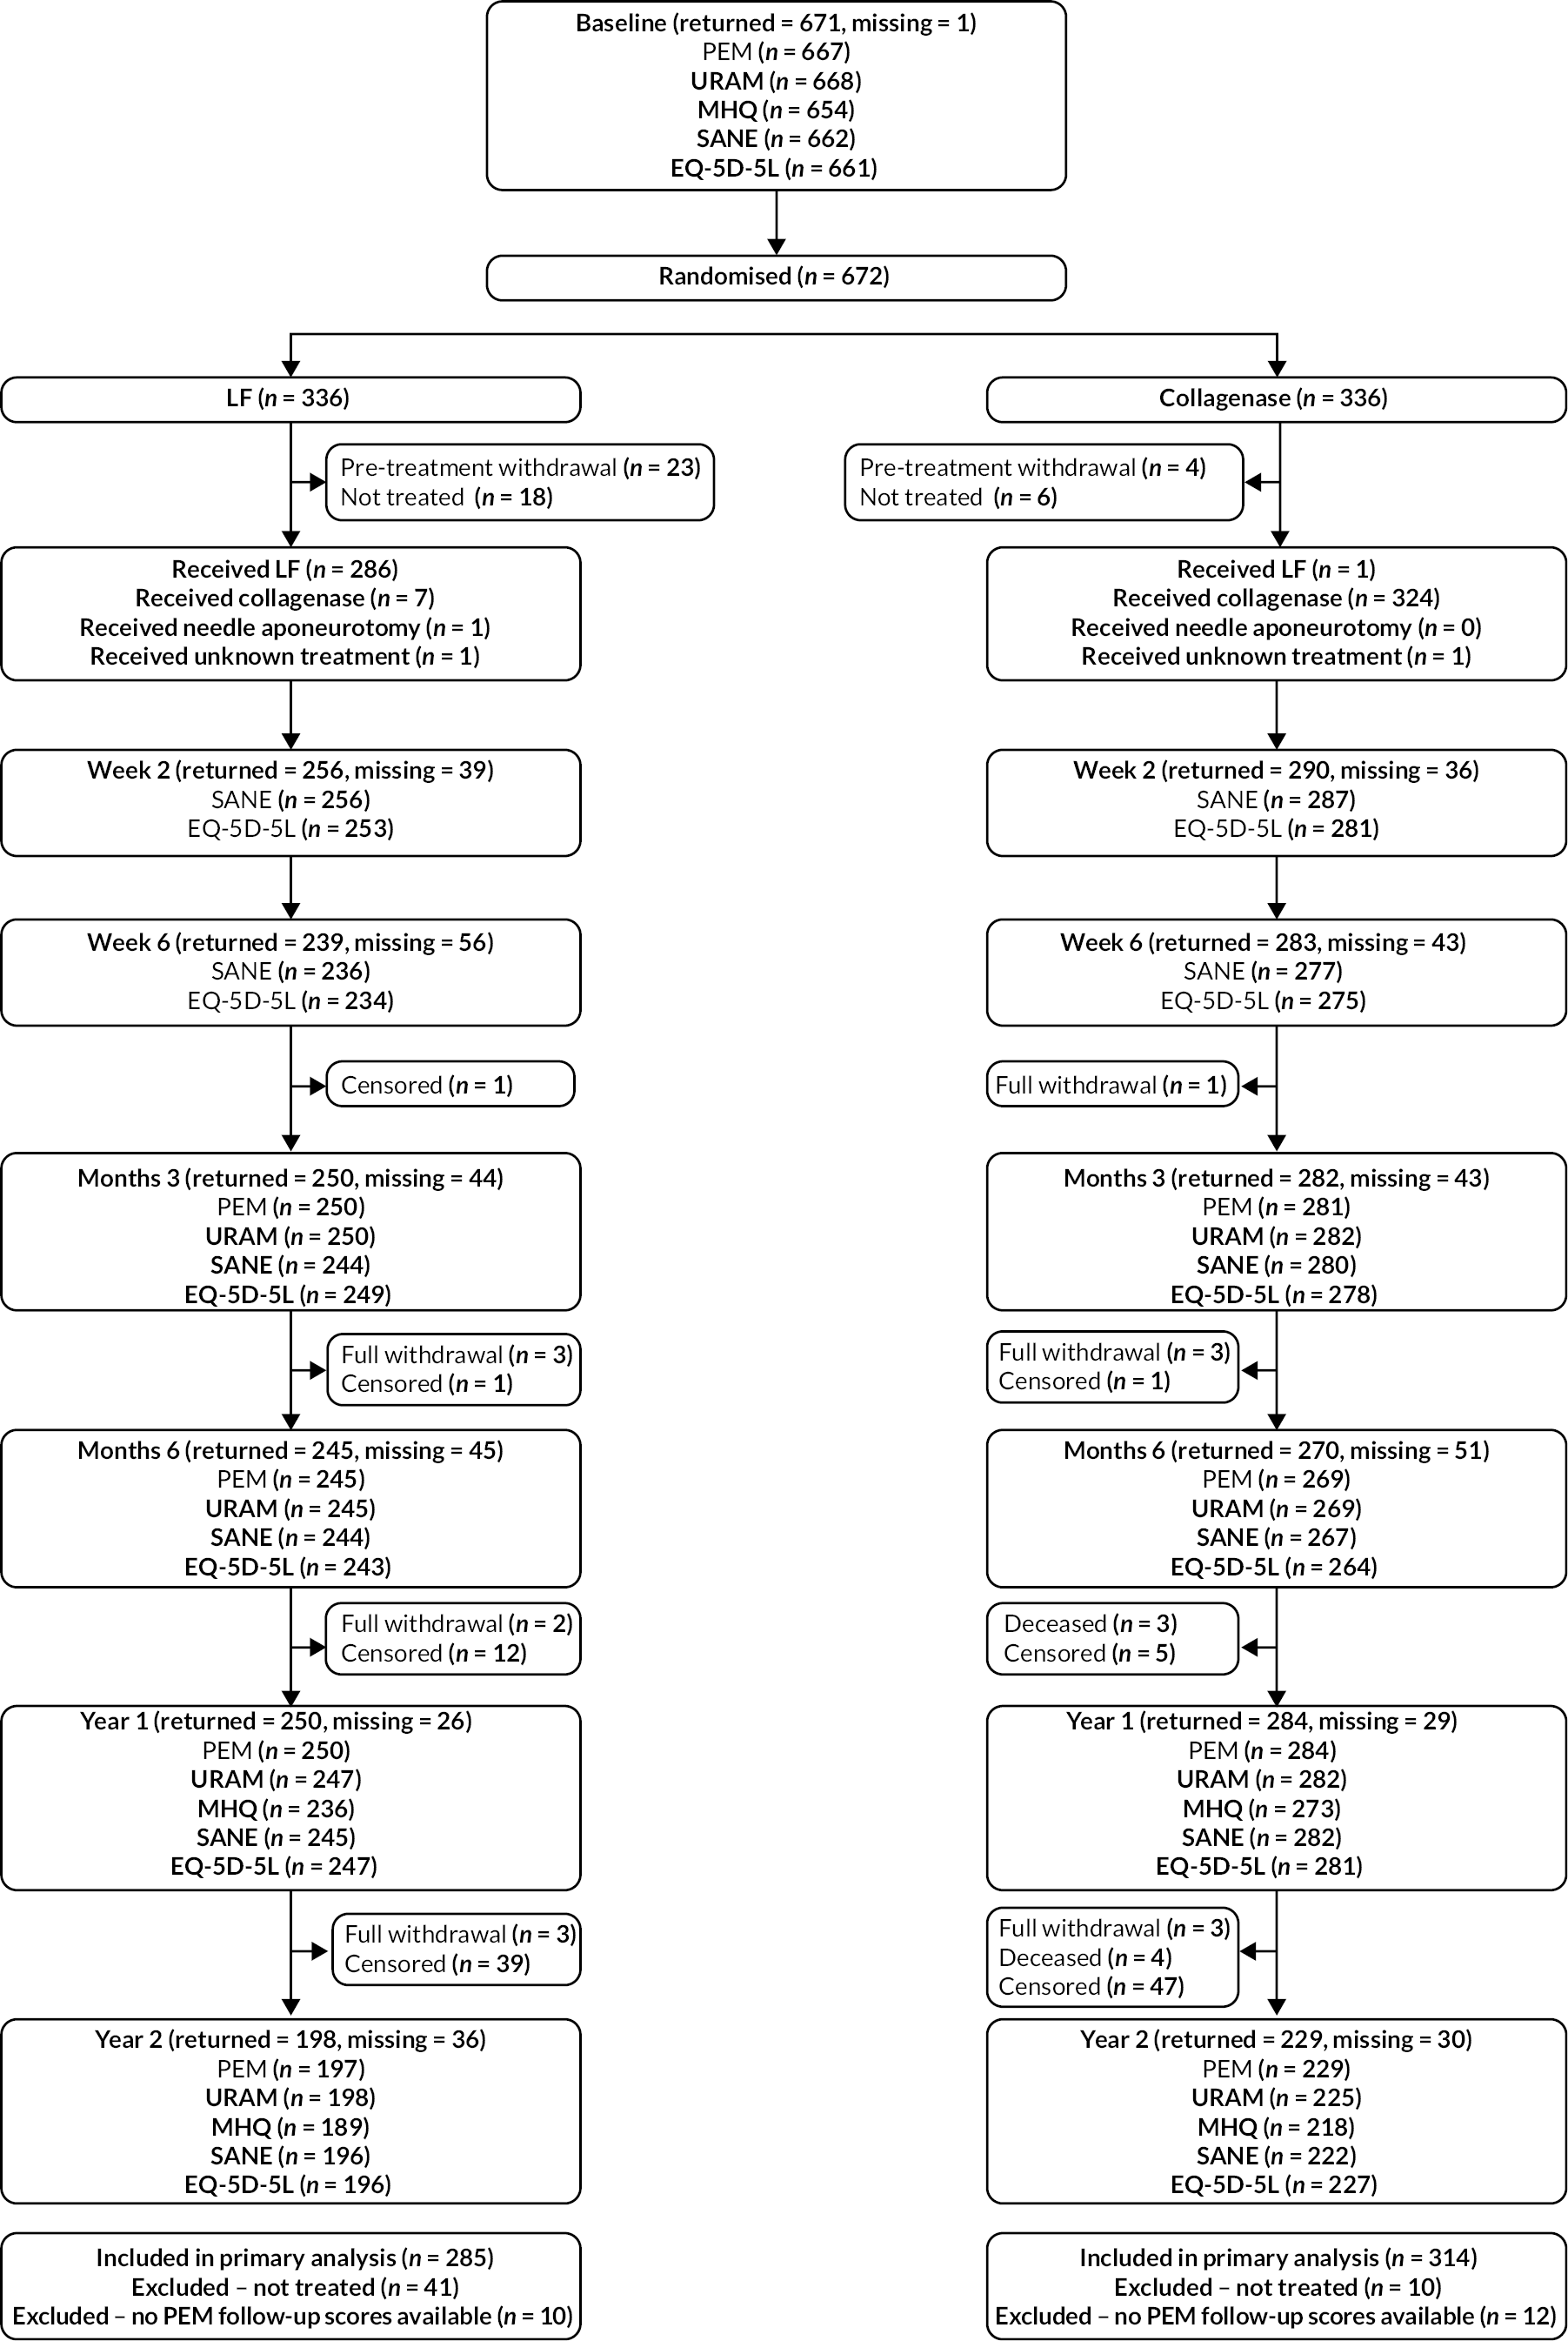
FIGURE 3.
Investigator/clinician completed follow-up data (‘censored’ means that the trial follow-up period finished prior to the subsequent time points being due/completed). For active extension and flexion measurements, n1 denotes the number of participants with the relevant measurement available (for the reference joint) based on data collected using goniometry only, and n2 denotes the number of participants with the relevant measurement available based on data collected using goniometry and photography.
Baseline data
Of the 672 participants randomised, 672 (100%) had an investigator-completed baseline CRF and 671 (99.9%) had a participant-completed baseline CRF available for analysis. This CRF data is summarised (by allocation) for both the randomised population, and the population included in the primary analysis in Tables 3–7. Baseline data by allocation for the population excluded from the primary analysis (i.e. those that were not treated, or were treated but had no available follow-up primary outcome data – see Appendix 5, Tables 68–72).
| Randomised (N = 672) |
Included in primary analysis (N = 599) |
|||
|---|---|---|---|---|
| LF N = 336 |
Collagenase N = 336 |
LF N = 285 |
Collagenase N = 314 |
|
| Age (years) | ||||
| N | 336 | 336 | 285 | 314 |
| Mean (SD) | 66.5 (9.2) | 66.4 (8.8) | 66.4 (8.9) | 66.2 (8.9) |
| Median (Q1, Q3) | 66.9 (61.3, 72.8) | 67.4 (61.0, 72.7) | 66.8 (61.7, 72.6) | 66.8 (60.3, 72.6) |
| Minimum, maximum | 31.1, 89.0 | 38.6, 89.1 | 31.1, 87.2 | 38.6, 89.1 |
| Gender, n (%) | ||||
| Male | 263 (78.3) | 270 (80.4) | 219 (76.8) | 256 (81.5) |
| Female | 73 (21.7) | 66 (19.6) | 66 (23.2) | 58 (18.5) |
| Ethnicity, n (%) | ||||
| White | 333 (99.1) | 332 (98.8) | 283 (99.3) | 310 (98.7) |
| Mixed race | 1 (0.3) | 1 (0.3) | 0 (0.0) | 1 (0.3) |
| Asian/Asian British | 1 (0.3) | 3 (0.9) | 1 (0.4) | 3 (1.0) |
| Missing | 1 (0.3) | 0 (0.0) | 1 (0.4) | 0 (0.0) |
| Smoking status, n (%) | ||||
| Never | 159 (47.3) | 143 (42.6) | 137 (48.1) | 136 (43.3) |
| Current | 37 (11.0) | 39 (11.6) | 31 (10.9) | 38 (12.1) |
| Previous | 137 (40.8) | 152 (45.2) | 115 (40.4) | 138 (43.9) |
| Missing | 3 (0.9) | 2 (0.6) | 2 (0.7) | 2 (0.6) |
| Drinks alcohol, n (%) | ||||
| Yes | 285 (84.8) | 282 (83.9) | 247 (86.7) | 263 (83.8) |
| No | 46 (13.7) | 52 (15.5) | 34 (11.9) | 49 (15.6) |
| Missing | 5 (1.5) | 2 (0.6) | 4 (1.4) | 2 (0.6) |
| Randomised (N = 672) |
Included in primary analysis (N = 599) |
|||
|---|---|---|---|---|
| LF N = 336 |
Collagenase N = 336 |
LF N = 285 |
Collagenase N = 314 |
|
| Age of onset (years) | ||||
| N | 262 | 277 | 232 | 266 |
| Mean (SD) | 55.9 (12.4) | 57.2 (11.1) | 55.9 (12.3) | 57.3 (10.9) |
| Median (Q1, Q3) | 57.0 (49.0, 64.0) | 58.0 (50.0, 65.0) | 57.0 (49.5, 64.0) | 58.0 (50.0, 65.0) |
| Minimum, maximum | 2.0, 85.0 | 18.0, 82.0 | 2.0, 85.0 | 18.0, 82.0 |
| History of bilateral disease, n (%) | ||||
| Yes | 170 (50.6) | 174 (51.8) | 140 (49.1) | 163 (51.9) |
| No | 151 (44.9) | 151 (44.9) | 130 (45.6) | 141 (44.9) |
| Missing | 15 (4.5) | 11 (3.3) | 15 (5.3) | 10 (3.2) |
| Received LF previously, n (%) | ||||
| Yes | 84 (25.0) | 79 (23.5) | 71 (24.9) | 74 (23.6) |
| No | 250 (74.4) | 252 (75.0) | 212 (74.4) | 235 (74.8) |
| Missing | 2 (0.6) | 5 (1.5) | 2 (0.7) | 5 (1.6) |
| Received collagenase injection previously, n (%) | ||||
| Yes | 13 (3.9) | 16 (4.8) | 10 (3.5) | 15 (4.8) |
| No | 321 (95.5) | 317 (94.3) | 273 (95.8) | 297 (94.6) |
| Missing | 2 (0.6) | 3 (0.9) | 2 (0.7) | 2 (0.6) |
| Known family history of DC, n (%) | ||||
| Yes | 126 (37.5) | 112 (33.3) | 107 (37.5) | 107 (34.1) |
| No | 209 (62.2) | 221 (65.8) | 177 (62.1) | 204 (65.0) |
| Missing | 1 (0.3) | 3 (0.9) | 1 (0.4) | 3 (1.0) |
| History of Garrods pads, n (%) | ||||
| Yes | 54 (16.1) | 43 (12.8) | 50 (17.5) | 41 (13.1) |
| No | 224 (66.7) | 238 (70.8) | 182 (63.9) | 221 (70.4) |
| Missing | 58 (17.3) | 55 (16.4) | 53 (18.6) | 52 (16.6) |
| History of Peyronie’s disease, n (%) | ||||
| Yes | 11 (3.3) | 14 (4.2) | 7 (2.5) | 14 (4.5) |
| No | 208 (61.9) | 212 (63.1) | 172 (60.4) | 199 (63.4) |
| Not applicable | 73 (21.7) | 66 (19.6) | 66 (23.2) | 58 (18.5) |
| Missing | 44 (13.1) | 44 (13.1) | 40 (14.0) | 43 (13.7) |
| History of Ledderhose disease, n (%) | ||||
| Yes | 24 (7.1) | 18 (5.4) | 19 (6.7) | 16 (5.1) |
| No | 251 (74.7) | 262 (78.0) | 211 (74.0) | 245 (78.0) |
| Missing | 61 (18.2) | 56 (16.7) | 55 (19.3) | 53 (16.9) |
| Randomised (N = 672) |
Included in primary analysis (N = 599) |
|||
|---|---|---|---|---|
| LF N = 336 |
Collagenase N = 336 |
LF N = 285 |
Collagenase N = 314 |
|
| Hands currently affected, n (%) | ||||
| Left only | 105 (31.3) | 114 (33.9) | 87 (30.5) | 109 (34.7) |
| Right only | 119 (35.4) | 113 (33.6) | 107 (37.5) | 104 (33.1) |
| Both | 112 (33.3) | 109 (32.4) | 91 (31.9) | 101 (32.2) |
| Dominant hand currently affected, n (%) | ||||
| Yes | 232 (69.0) | 227 (67.6) | 197 (69.1) | 210 (66.9) |
| No | 104 (31.0) | 109 (32.4) | 88 (30.9) | 104 (33.1) |
| Study reference digit, n (%) | ||||
| Thumb | 1 (0.3) | 1 (0.3) | 1 (0.4) | 1 (0.3) |
| Index | 4 (1.2) | 0 (0.0) | 4 (1.4) | 0 (0.0) |
| Middle | 24 (7.1) | 17 (5.1) | 15 (5.3) | 15 (4.8) |
| Ring | 109 (32.4) | 111 (33.0) | 91 (31.9) | 105 (33.4) |
| Little | 198 (58.9) | 207 (61.6) | 174 (61.1) | 193 (61.5) |
| Study reference joint, n (%) | ||||
| MCP | 207 (61.6) | 221 (65.8) | 172 (60.4) | 204 (65.0) |
| PIP | 129 (38.4) | 115 (34.2) | 113 (39.6) | 110 (35.0) |
| Study reference digit/joint on dominant hand, n (%) | ||||
| Yes | 180 (53.6) | 175 (52.1) | 154 (54.0) | 160 (51.0) |
| No | 156 (46.4) | 161 (47.9) | 131 (46.0) | 154 (49.0) |
| Number of digits affected (total), n (%) | ||||
| 1 | 166 (49.4) | 177 (52.7) | 147 (51.6) | 165 (52.5) |
| 2 | 94 (28.0) | 101 (30.1) | 76 (26.7) | 95 (30.3) |
| 3 | 36 (10.7) | 36 (10.7) | 33 (11.6) | 35 (11.1) |
| 4 | 25 (7.4) | 14 (4.2) | 19 (6.7) | 12 (3.8) |
| 5 | 8 (2.4) | 4 (1.2) | 6 (2.1) | 3 (1.0) |
| 6 | 4 (1.2) | 2 (0.6) | 2 (0.7) | 2 (0.6) |
| 7 | 2 (0.6) | 1 (0.3) | 1 (0.4) | 1 (0.3) |
| 8 | 1 (0.3) | 1 (0.3) | 1 (0.4) | 1 (0.3) |
| Number of digits affected (reference hand), n (%) | ||||
| 1 | 231 (68.8) | 245 (72.9) | 201 (70.5) | 227 (72.3) |
| 2 | 73 (21.7) | 78 (23.2) | 59 (20.7) | 75 (23.9) |
| 3 | 27 (8.0) | 9 (2.7) | 24 (8.4) | 8 (2.5) |
| 4 | 5 (1.5) | 3 (0.9) | 1 (0.4) | 3 (1.0) |
| 5 | 0 (0.0) | 1 (0.3) | 0 (0.0) | 1 (0.3) |
| Number of joints affected (total), n (%) | ||||
| 1 | 110 (32.7) | 120 (35.7) | 96 (33.7) | 114 (36.3) |
| 2 | 108 (32.1) | 108 (32.1) | 91 (31.9) | 99 (31.5) |
| 3 | 47 (14.0) | 54 (16.1) | 39 (13.7) | 52 (16.6) |
| 4 | 32 (9.5) | 27 (8.0) | 29 (10.2) | 24 (7.6) |
| 5 | 14 (4.2) | 12 (3.6) | 11 (3.9) | 11 (3.5) |
| 6 | 8 (2.4) | 6 (1.8) | 7 (2.5) | 6 (1.9) |
| 7 | 9 (2.7) | 2 (0.6) | 6 (2.1) | 2 (0.6) |
| 8 | 5 (1.5) | 4 (1.2) | 4 (1.4) | 3 (1.0) |
| 9 | 1 (0.3) | 2 (0.6) | 1 (0.4) | 2 (0.6) |
| 10 | 1 (0.3) | 0 (0.0) | 1 (0.4) | 0 (0.0) |
| 11 | 0 (0.0) | 0 (0.0) | 0 (0.0) | 0 (0.0) |
| 12 | 1 (0.3) | 1 (0.3) | 0 (0.0) | 1 (0.3) |
| Number of joints affected (reference hand), n (%) | ||||
| 1 | 149 (44.3) | 161 (47.9) | 127 (44.6) | 150 (47.8) |
| 2 | 118 (35.1) | 123 (36.6) | 101 (35.4) | 116 (36.9) |
| 3 | 36 (10.7) | 27 (8.0) | 30 (10.5) | 27 (8.6) |
| 4 | 19 (5.7) | 20 (6.0) | 18 (6.3) | 16 (5.1) |
| 5 | 10 (3.0) | 2 (0.6) | 7 (2.5) | 2 (0.6) |
| 6 | 2 (0.6) | 2 (0.6) | 2 (0.7) | 2 (0.6) |
| 7 | 1 (0.3) | 0 (0.0) | 0 (0.0) | 0 (0.0) |
| 8 | 0 (0.0) | 0 (0.0) | 0 (0.0) | 0 (0.0) |
| 9 | 1 (0.3) | 1 (0.3) | 0 (0.0) | 1 (0.3) |
| Randomised (N = 672) |
Included in primary analysis (N = 599) |
|||
|---|---|---|---|---|
| LF N = 336 |
Collagenase N = 336 |
LF N = 285 |
Collagenase N = 314 |
|
| Active extension deficit of reference joint (°), goniometry only | ||||
| N | 329 | 329 | 279 | 307 |
| Mean (SD) | 52.5 (15.2) | 51.8 (16.4) | 52.9 (15.4) | 51.8 (16.6) |
| Median (Q1, Q3) | 51.7 (40.0, 63.3) | 50.7 (39.3, 63.3) | 51.7 (40.0, 64.0) | 50.7 (39.3, 63.3) |
| Minimum, maximum | 11.7, 91.3 | 2.3, 90.7 | 11.7, 91.3 | 2.3, 90.7 |
| Active extension deficit of reference joint (°), goniometry and photography | ||||
| N | 333 | 334 | 282 | 312 |
| Mean (SD) | 52.3 (15.4) | 51.5 (16.7) | 52.7 (15.6) | 51.5 (16.8) |
| Median (Q1, Q3) | 51.7 (40.0, 62.7) | 50.7 (39.0, 63.3) | 51.7 (40.0, 63.3) | 50.7 (39.3, 63.3) |
| Minimum, maximum | 10.0, 91.3 | 2.3, 90.7 | 10.0, 91.3 | 2.3, 90.7 |
| Passive extension deficit of reference joint (°) | ||||
| N | 327 | 328 | 278 | 306 |
| Mean (SD) | 45.9 (16.4) | 45.8 (17.3) | 46.1 (16.9) | 45.7 (17.4) |
| Median (Q1, Q3) | 44.7 (34.0, 58.0) | 45.3 (32.0, 58.7) | 44.7 (34.0, 59.3) | 45.3 (32.0, 58.7) |
| Minimum, maximum | 0.0, 90.0 | −10.0, 84.7 | 0.0, 90.0 | −10.0, 84.7 |
| Flexion of reference joint (°), goniometry only | ||||
| N | 328 | 326 | 279 | 305 |
| Mean (SD) | 87.2 (10.5) | 86.2 (11.2) | 87.3 (10.8) | 86.3 (11.3) |
| Median (Q1, Q3) | 88.0 (80.7, 93.3) | 87.5 (80.7, 92.0) | 88.0 (80.7, 94.0) | 88.0 (80.7, 92.0) |
| Minimum, maximum | 31.3, 113.3 | 10.0, 130.0 | 31.3, 113.3 | 10.0, 130.0 |
| Flexion of reference joint (°), goniometry and photography | ||||
| N | 331 | 332 | 282 | 310 |
| Mean (SD) | 87.1 (10.4) | 86.2 (11.3) | 87.2 (10.8) | 86.4 (11.4) |
| Median (Q1, Q3) | 88.0 (80.7, 93.3) | 87.3 (80.7, 92.0) | 88.0 (81.0, 94.0) | 87.8 (80.7, 92.0) |
| Minimum, maximum | 31.3, 113.3 | 10.0, 130.0 | 31.3, 113.3 | 10.0, 130.0 |
| Active RoM of reference joint (°), goniometry only | ||||
| N | 326 | 324 | 277 | 303 |
| Mean (SD) | 34.7 (15.6) | 34.6 (15.3) | 34.5 (15.7) | 34.6 (15.5) |
| Median (Q1, Q3) | 34.0 (23.3, 46.0) | 34.7 (22.7, 46.0) | 34.0 (22.7, 45.3) | 34.7 (22.7, 46.3) |
| Minimum, maximum | 0.0, 86.0 | 0.0, 79.3 | 0.0, 86.0 | 0.0, 79.3 |
| Active RoM of reference joint (°), goniometry and photography | ||||
| N | 330 | 332 | 281 | 310 |
| Mean (SD) | 34.7 (15.8) | 34.6 (15.7) | 34.6 (15.9) | 34.8 (15.7) |
| Median (Q1, Q3) | 34.0 (23.3, 46.0) | 34.7 (22.7, 46.2) | 34.0 (22.7, 45.3) | 34.7 (22.7, 46.7) |
| Minimum, maximum | 0.0, 86.0 | −12.3, 79.3 | 0.0, 86.0 | 0.0, 79.3 |
| Passive RoM of reference joint (°) | ||||
| N | 324 | 323 | 276 | 302 |
| Mean (SD) | 41.2 (17.0) | 40.5 (16.9) | 41.2 (17.3) | 40.6 (17.1) |
| Median (Q1, Q3) | 41.8 (29.0, 52.7) | 40.7 (28.0, 51.3) | 41.3 (29.0, 52.8) | 41.0 (28.0, 52.0) |
| Minimum, maximum | 3.3, 90.0 | 0.0, 92.7 | 3.3, 90.0 | 0.0, 92.7 |
| Total active extension deficit of reference digit (°), goniometry only | ||||
| N | 314 | 314 | 267 | 294 |
| Mean (SD) | 64.3 (31.4) | 62.5 (31.8) | 65.0 (30.9) | 61.9 (31.6) |
| Median (Q1, Q3) | 59.3 (40.0, 87.0) | 56.8 (40.7, 80.7) | 59.7 (40.0, 88.7) | 56.7 (40.0, 80.0) |
| Minimum, maximum | 4.7, 151.7 | 0.0, 160.0 | 4.7, 151.7 | 0.0, 160.0 |
| Total active extension deficit of reference digit (°), goniometry and photography | ||||
| N | 326 | 330 | 278 | 310 |
| Mean (SD) | 64.0 (31.1) | 62.6 (31.9) | 64.8 (30.7) | 62.0 (31.7) |
| Median (Q1, Q3) | 59.3 (40.0, 86.3) | 56.8 (40.0, 80.7) | 59.4 (40.0, 87.3) | 56.7 (40.0, 80.0) |
| Minimum, maximum | 4.7, 151.7 | 0.0, 160.0 | 4.7, 151.7 | 0.0, 160.0 |
| Total passive extension deficit of reference digit (°) | ||||
| N | 308 | 308 | 262 | 287 |
| Mean (SD) | 43.1 (36.3) | 42.8 (35.7) | 43.6 (36.2) | 41.7 (35.6) |
| Median (Q1, Q3) | 37.7 (18.8, 63.7) | 39.3 (20.0, 64.7) | 37.3 (20.0, 64.0) | 38.7 (18.7, 63.0) |
| Minimum, maximum | −91.7, 175.0 | −65.0, 144.0 | −91.7, 175.0 | −65.0, 144.0 |
| Randomised (N = 672) |
Included in primary analysis (N = 599) |
|||
|---|---|---|---|---|
| LF N = 336 |
Collagenase N = 336 |
LF N = 285 |
Collagenase N = 314 |
|
| PEM Hand Health Questionnairea | ||||
| N | 333 | 334 | 283 | 312 |
| Mean (SD) | 34.1 (19.7) | 34.2 (20.2) | 33.9 (19.7) | 33.8 (19.8) |
| Median (Q1, Q3) | 31.8 (18.2, 48.5) | 31.8 (18.2, 47.0) | 31.8 (18.2, 48.5) | 31.8 (18.2, 45.5) |
| Minimum, maximum | 0.0, 87.9 | 0.0, 93.9 | 0.0, 86.4 | 0.0, 93.9 |
| URAM total scoreb | ||||
| N | 335 | 333 | 284 | 311 |
| Mean (SD) | 17.2 (9.5) | 17.0 (9.3) | 16.9 (9.4) | 16.9 (9.2) |
| Median (Q1, Q3) | 16.9 (10.0, 24.0) | 16.0 (10.0, 23.0) | 16.4 (10.0, 23.0) | 15.8 (10.0, 23.0) |
| Minimum, maximum | 0.0, 43.0 | 0.0, 44.0 | 0.0, 43.0 | 0.0, 44.0 |
| MHQ total scorec | ||||
| N | 328 | 326 | 279 | 306 |
| Mean (SD) | 67.5 (17.7) | 67.6 (17.1) | 68.1 (17.3) | 67.8 (17.0) |
| Median (Q1, Q3) | 70.4 (55.2, 81.1) | 70.1 (56.4, 81.1) | 70.7 (55.3, 81.8) | 70.5 (56.5, 81.4) |
| Minimum, maximum | 21.3, 100.0 | 15.5, 99.0 | 23.1, 100.0 | 15.5, 99.0 |
| SANE scored | ||||
| N | 328 | 334 | 278 | 312 |
| Mean (SD) | 61.6 (21.7) | 62.0 (21.8) | 62.0 (21.4) | 62.2 (21.6) |
| Median (Q1, Q3) | 65.0 (49.0, 80.0) | 65.0 (49.0, 80.0) | 65.0 (50.0, 80.0) | 65.0 (49.5, 80.0) |
| Minimum, maximum | 10.0, 100.0 | 0.0, 100.0 | 10.0, 100.0 | 0.0, 100.0 |
| EuroQol-5 Dimensions – general health VAS e | ||||
| N | 331 | 335 | 281 | 313 |
| Mean (SD) | 83.8 (15.4) | 85.3 (14.8) | 84.2 (14.7) | 85.6 (14.7) |
| Median (Q1, Q3) | 90.0 (80.0, 95.0) | 90.0 (80.0, 95.0) | 90.0 (80.0, 95.0) | 90.0 (80.0, 95.0) |
| Minimum, maximum | 5.0, 100.0 | 5.0, 100.0 | 5.0, 100.0 | 5.0, 100.0 |
| Treatment preference | ||||
| Collagenase injection | 134 (39.9) | 148 (44.0) | 108 (37.9) | 135 (43.0) |
| Surgical intervention | 29 (8.6) | 18 (5.4) | 25 (8.8) | 16 (5.1) |
| No preference | 168 (50.0) | 164 (48.8) | 148 (51.9) | 158 (50.3) |
| Missing | 5 (1.5) | 6 (1.8) | 4 (1.4) | 5 (1.6) |
The groups as randomised were similar at baseline with regard to the demographic (Table 3) and clinical variables collected (Tables 4 and 5), measurements of the designated reference joint/digit (Table 6), and the baseline scores for the various patient-reported outcomes (Table 7).
The measures of location/scale, and frequencies/proportions observed across both groups for the randomised population, appear similar to those observed for the subset of participants that are included in the primary analysis.
Treatment delivery
Of the 672 participants randomised, 621 received treatment as part of the trial (see Table 8). Notably more participants allocated to collagenase received treatment (97%) than participants allocated to LF (88%). This is partly driven by the differences in pre-treatment withdrawals (6.8% LF group vs. 1.2% collagenase group), and partly by delays leading to treatment not being delivered by the end of the scheduled follow-up period (5.4% LF group vs. 1.8% collagenase group). The differences in pre-treatment withdrawals (see Appendix 4, Table 67) are likely to be at least partly explained by treatment preferences at baseline, with about 86% of the participants that reported a treatment preference for collagenase (see Table 7). The overall preference for collagenase treatment (from those expressing a baseline treatment preference) may also explain the higher number of crossovers in/from the LF group (2.1% vs. 0.3% in the collagenase group). However, the overall number of treatment crossovers was small relative to the number of participants treated and is unlikely to have materially affected the clinical effectiveness results.
| LF N = 336 |
Collagenase N = 336 |
Total N = 672 |
|
|---|---|---|---|
| Treatment received, n (%) | |||
| LF | 286 (85.1) | 1 (0.3) | 287 (42.7) |
| Collagenase | 7 (2.1) | 324 (96.4) | 331 (49.3) |
| Needle aponeurotomy | 1 (0.3) | 0 (0.0) | 1 (0.1) |
| Unknown treatment received | 1 (0.3) | 1 (0.3) | 2 (0.3) |
| Withdrew prior to treatment | 23 (6.8) | 4 (1.2) | 27 (4.0) |
| Did not receive treatment | 18 (5.4) | 6 (1.8) | 24 (3.6) |
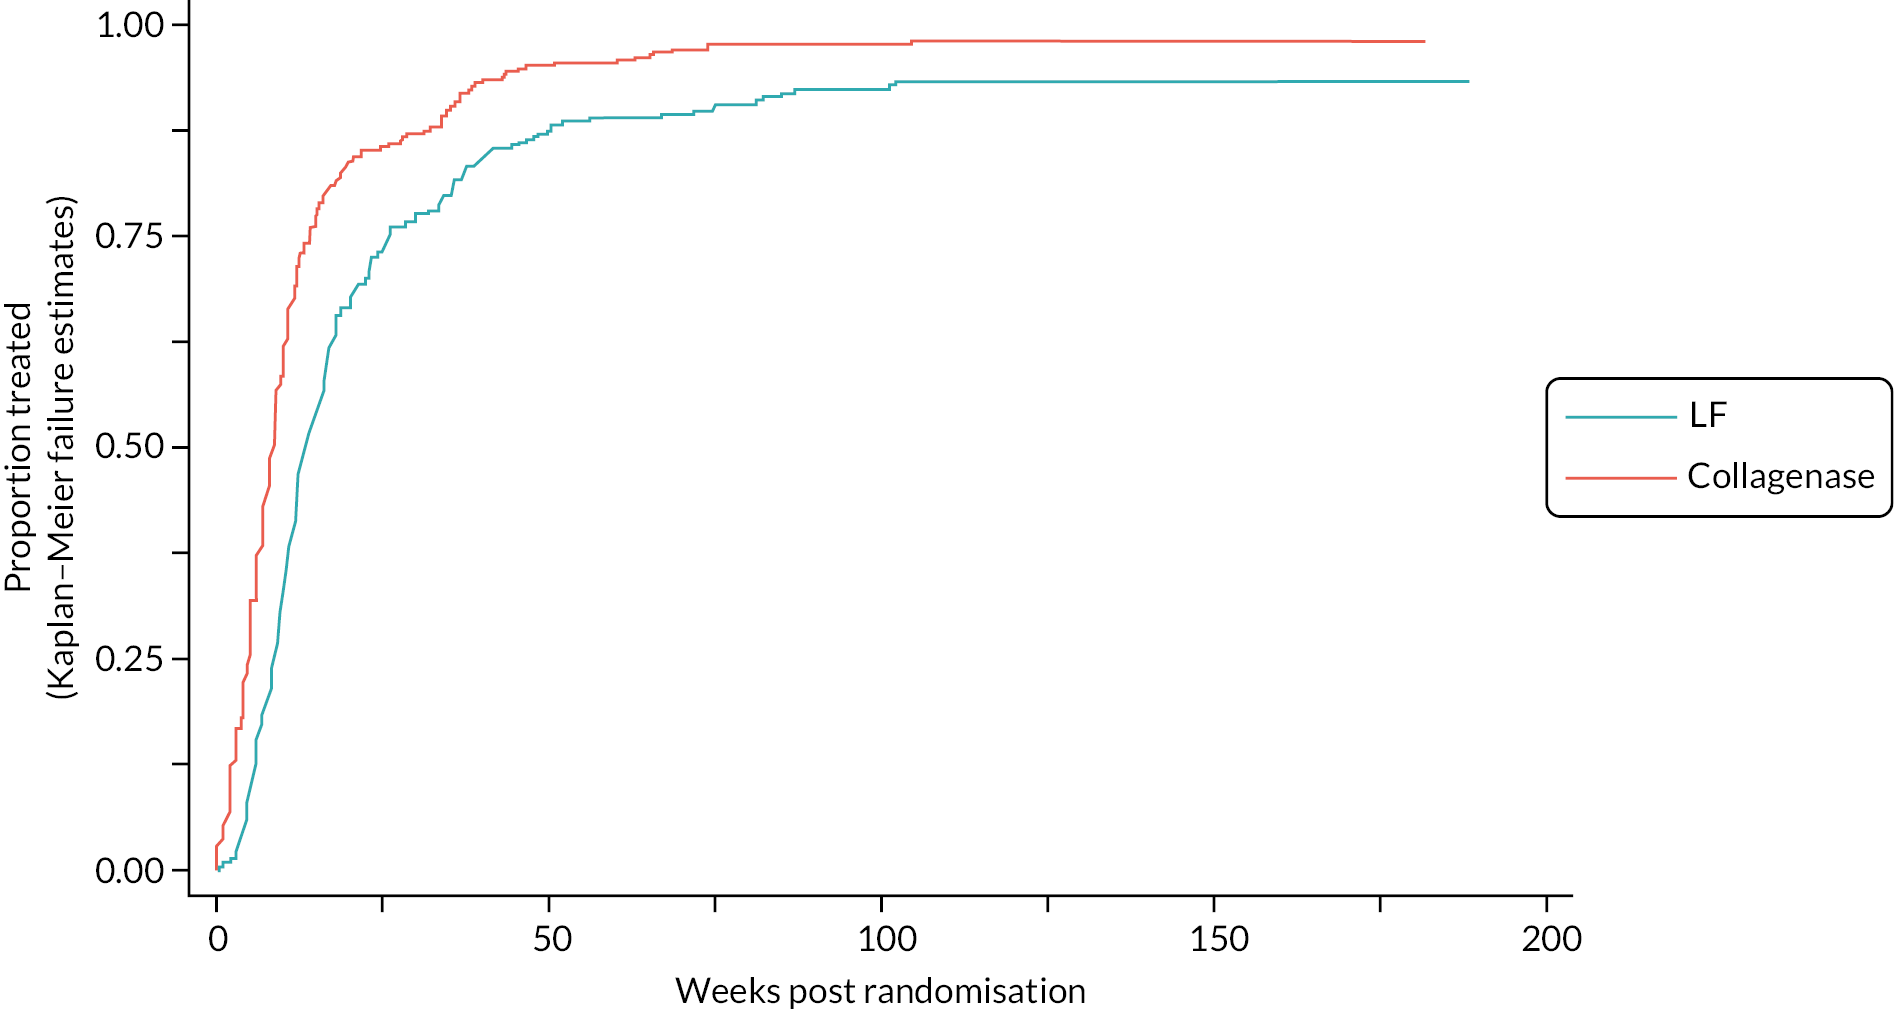
Table 9 and Figure 4 illustrate the large degree of variation in time to treatment delivery within groups, but also show systematic differences between groups. On average, participants allocated to LF received treatment 4–8 weeks later than participants allocated to collagenase. Given the slow nature of the disease, this difference is unlikely to have resulted in material differences between groups in severity of disease/contracture at the point of treatment delivery. This is consistent with the figures in Table 10, and patterns of change illustrated in Figure 5, with further details available in Appendix 5, Figures 74 and 75. While there was a slight worsening of contracture (as measured by PEM and active/passive extension deficit measurements) between baseline and treatment delivery, there is little evidence that the extent of this deterioration differed by group.
| LF N = 295 |
Collagenase N = 326 |
Total N = 621 |
|
|---|---|---|---|
| Time between randomisation and treatment delivery (weeks) | |||
| N | 295 | 326 | 621 |
| Mean (SD) | 17.7 (16.5) | 12.1 (13.7) | 14.7 (15.3) |
| Median (Q1, Q3) | 12.1 (8.3, 20.4) | 8.0 (4.6, 12.6) | 10.0 (5.9, 16.7) |
| Minimum, maximum | 0.3, 102.0 | 0.0, 104.4 | 0.0, 104.4 |
FIGURE 4.
Time (weeks) elapsed between randomisation and treatment delivery (Kaplan–Meier failure estimates).
| LF N = 295 |
Collagenase N = 326 |
Total N = 621 |
|
|---|---|---|---|
| Increase in PEM Hand Health Questionnaireascore between baseline and treatment | |||
| N | 271 | 321 | 592 |
| Mean (SD) | 1.0 (14.4) | 1.5 (13.5) | 1.3 (13.9) |
| Median (Q1, Q3) | 1.5 (−8.3, 8.0) | 1.5 (−6.1, 9.1) | 1.5 (−6.1, 9.1) |
| Minimum, maximumb | −43.5, 46.0 | −48.5, 36.7 | −48.5, 46.0 |
| Increase in active extension deficit (°) between baseline and treatment | |||
| N | 279 | 316 | 595 |
| Mean (SD) | 1.7 (10.7) | 1.2 (9.4) | 1.5 (10.0) |
| Median (Q1, Q3) | 1.3 (−3.3, 8.0) | 0.7 (−2.7, 5.7) | 0.7 (−3.3, 6.7) |
| Minimum, maximumb | −43.8, 35.0 | −49.3, 36.7 | −49.3, 36.7 |
| Increase in passive extension deficit (°) between baseline and treatment | |||
| N | 260 | 304 | 564 |
| Mean (SD) | 3.9 (11.7) | 2.7 (10.0) | 3.3 (10.8) |
| Median (Q1, Q3) | 3.5 (−2.0, 10.0) | 2.0 (−2.7, 9.3) | 2.2 (−2.3, 9.3) |
| Minimum, maximumb | −39.3, 45.3 | −32.7, 44.7 | −39.3, 45.3 |
FIGURE 5.
Increase (worsening) in PEM score between baseline and treatment against time elapsed (weeks) between randomisation and treatment delivery.
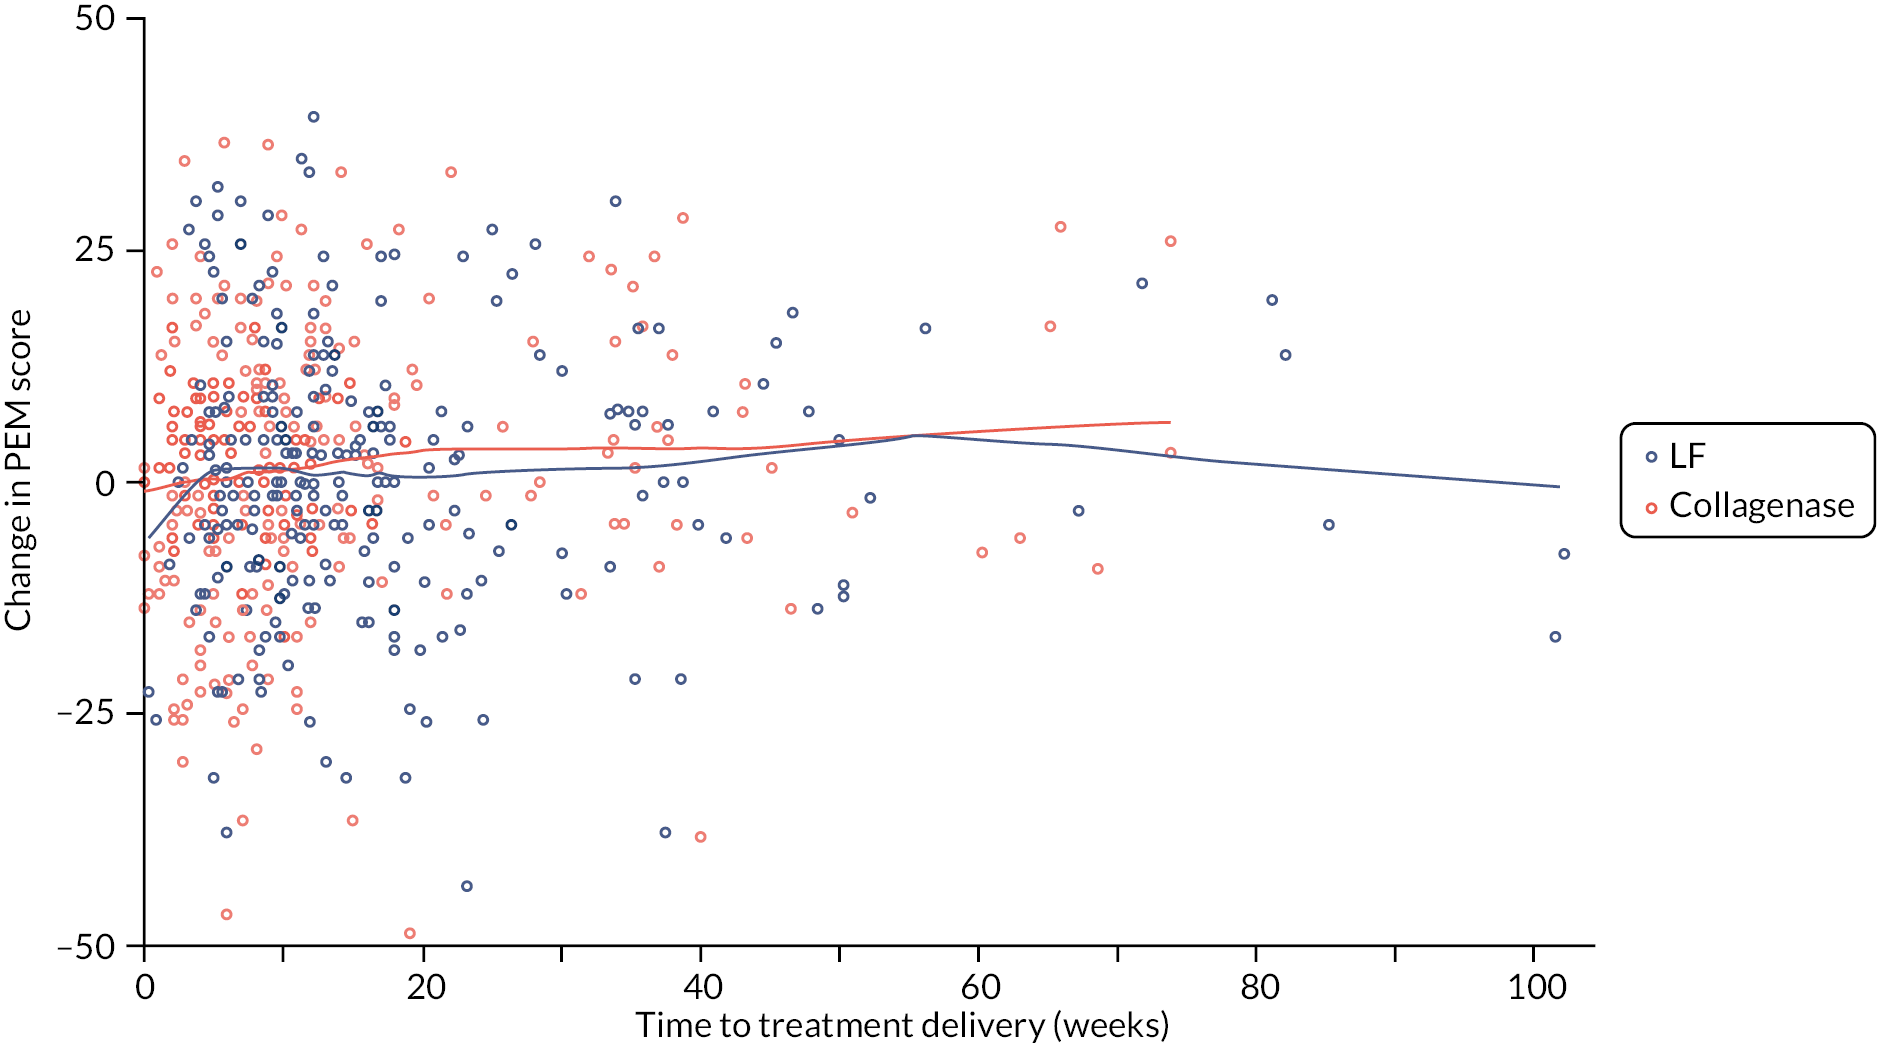
Of the 331 DISC trial participants that received collagenase, 95% had just one digit treated and all received treatment to the designated study reference joint as planned (see Table 11). No participants required unplanned inpatient admissions following injection. Most participants underwent manipulation (or attended their planned manipulation appointment) within 1 week of injection, with about half undergoing manipulation within 2 days. Just over a third of the participants receiving collagenase had some form of partial or complete spontaneous correction between injection and manipulation, although the vast majority of these were partial corrections which still required some additional manipulation. About 60% of participants treated with collagenase were reported as having full correction of the reference digit following manipulation, with a further 30% reported as having almost full correction. Just one participant (0.3%) was reported as having had no correction following manipulation. The generally full/good correction of the reference digit following manipulation is reflected by the extension deficit measurements of the reference joint taken following manipulation. Over 50% of the participants treated with collagenase are reported as having zero extension deficit (i.e. hyperextension, or extension deficit measurements of 0) for the reference joint, with about 54% having < 5 degrees of extension deficit.
| LF N = 7 |
Collagenase N = 324 |
Total N = 331 |
|
|---|---|---|---|
| Number of digits treated, n (%) | |||
| 1 | 7 (100.0) | 308 (95.1) | 315 (95.2) |
| 2 | 0 (0.0) | 16 (4.9) | 16 (4.8) |
| Number of joints treated, n (%) | |||
| 1 | 7 (100.0) | 278 (85.8) | 285 (86.1) |
| 2 | 0 (0.0) | 44 (13.6) | 44 (13.3) |
| 3 | 0 (0.0) | 2 (0.6) | 2 (0.6) |
| Study reference joint treated, n (%) | |||
| Yes | 7 (100.0) | 324 (100.0) | 331 (100.0) |
| No | 0 (0.0) | 0 (0.0) | 0 (0.0) |
| Unplanned inpatient admission following intervention, n (%) | |||
| Yes | 0 (0.0) | 0 (0.0) | 0 (0.0) |
| No | 7 (100.0) | 319 (98.5) | 326 (98.5) |
| Missing | 0 (0.0) | 5 (1.5) | 5 (1.5) |
| Time elapsed between injection and manipulation (days) | |||
| N | 7 | 324 | 331 |
| Mean (SD) | 5.6 (3.3) | 3.4 (2.4) | 3.4 (2.4) |
| Median (Q1, Q3) | 7.0 (2.0, 9.0) | 2.0 (1.0, 6.0) | 2.0 (1.0, 6.0) |
| Minimum, maximum | 1.0, 9.0 | 1.0, 14.0 | 1.0, 14.0 |
| Spontaneous correction prior to manipulation, n (%) | |||
| No spontaneous correction | 2 (28.6) | 203 (62.7) | 205 (61.9) |
| Partial spontaneous correction | 4 (57.1) | 102 (31.5) | 106 (32.0) |
| Complete spontaneous correction | 1 (14.3) | 17 (5.2) | 18 (5.4) |
| Missing | 0 (0.0) | 2 (0.6) | 2 (0.6) |
| Degree of correction following manipulation, n (%) | |||
| Full | 3 (42.9) | 201 (62.0) | 204 (61.6) |
| Almost full | 4 (57.1) | 96 (29.6) | 100 (30.2) |
| Partial | 0 (0.0) | 25 (7.7) | 25 (7.6) |
| None | 0 (0.0) | 1 (0.3) | 1 (0.3) |
| Missing | 0 (0.0) | 1 (0.3) | 1 (0.3) |
| Reference joint extension following manipulation (°) | |||
| N | 6 | 283 | 289 |
| Mean (SD) | 5.8 (6.6) | 6.8 (12.4) | 6.8 (12.3) |
| Median (Q1, Q3) | 5.0 (0.0, 10.0) | 0.0 (0.0, 10.0) | 0.0 (0.0, 10.0) |
| Minimum, maximum | 0.0, 15.0 | −30.0, 60.0 | −30.0, 60.0 |
| Reference joint corrected to ≤ 5° extension deficit following manipulation, n (%) | |||
| Yes | 3 (42.9) | 174 (53.7) | 177 (53.5) |
| No | 3 (42.9) | 109 (33.6) | 112 (33.8) |
| Missing | 1 (14.3) | 41 (12.7) | 42 (12.7) |
Of the 287 participants that received LF as part of the DISC trial, the majority (83%) had just 1 digit treated, although a larger proportion had 2 or 3 digits treated, compared with the participants treated with collagenase (see Table 12). The vast majority (99%) were reported as having had the designated study reference joint treated, with this information being missing for the remaining few participants. Most participants received surgical treatment as a day case, although there were four cases of participants being admitted [both planned (n = 3) and unplanned admissions (n = 1)]. Similarly, to the participants treated with collagenase, most participants treated surgically had full or almost full correction following surgery, and at their first wound clinic appointment.
| LF N = 286 |
Collagenase N = 1 |
Total N = 287 |
|
|---|---|---|---|
| Number of digits treated, n (%) | |||
| 1 | 236 (82.5) | 1 (100.0) | 237 (82.6) |
| 2 | 40 (14.0) | 0 (0.0) | 40 (13.9) |
| 3 | 6 (2.1) | 0 (0.0) | 6 (2.1) |
| 4 | 1 (0.3) | 0 (0.0) | 1 (0.3) |
| Missing | 3 (1.0) | 0 (0.0) | 3 (1.0) |
| Number of joints treated, n (%) | |||
| 1 | 172 (60.1) | 1 (100.0) | 173 (60.3) |
| 2 | 87 (30.4) | 0 (0.0) | 87 (30.3) |
| 3 | 17 (5.9) | 0 (0.0) | 17 (5.9) |
| 4 | 4 (1.4) | 0 (0.0) | 4 (1.4) |
| 5 | 2 (0.7) | 0 (0.0) | 2 (0.7) |
| 6 | 1 (0.3) | 0 (0.0) | 1 (0.3) |
| Missing | 3 (1.0) | 0 (0.0) | 3 (1.0) |
| Study reference joint treated, n (%) | |||
| Yes | 283 (99.0) | 1 (100.0) | 284 (99.0) |
| No | 0 (0.0) | 0 (0.0) | 0 (0.0) |
| Missing | 3 (1.0) | 0 (0.0) | 3 (1.0) |
| Surgery administered as, n (%) | |||
| Day case | 280 (97.9) | 0 (0.0) | 280 (97.6) |
| Inpatient admission | 3 (1.0) | 1 (100.0) | 4 (1.4) |
| Missing | 3 (1.0) | 0 (0.0) | 3 (1.0) |
| Degree of correction following surgery, n (%) | |||
| Full | 224 (78.3) | 1 (100.0) | 225 (78.4) |
| Almost full | 52 (18.2) | 0 (0.0) | 52 (18.1) |
| Partial | 7 (2.4) | 0 (0.0) | 7 (2.4) |
| Missing | 3 (1.0) | 0 (0.0) | 3 (1.0) |
| Degree of correction at wound clinic appointment, n (%) | |||
| Full | 131 (45.8) | 0 (0.0) | 131 (45.6) |
| Almost full | 106 (37.1) | 1 (100.0) | 107 (37.3) |
| Partial | 24 (8.4) | 0 (0.0) | 24 (8.4) |
| Missing | 25 (8.7) | 0 (0.0) | 25 (8.7) |
| Reference joint extension at wound clinic appointment (°) | |||
| N | 201 | 1 | 202 |
| Mean (SD) | 10.9 (13.4) | 22.0 (-) | 11.0 (13.4) |
| Median (Q1, Q3) | 10.0 (0.0, 20.0) | 22.0 (22.0, 22.0) | 10.0 (0.0, 20.0) |
| Minimum, maximum | −36.0, 74.0 | 22.0, 22.0 | −36.0, 74.0 |
| Reference joint corrected to ≤ 5° at first wound clinic appointment, n (%) | |||
| Yes | 86 (30.1) | 0 (0.0) | 86 (30.0) |
| No | 115 (40.2) | 1 (100.0) | 116 (40.4) |
| Missing | 85 (29.7) | 0 (0.0) | 85 (29.6) |
Primary outcome: Patient Evaluation Measure Hand Health Questionnaire score
Primary outcome: completeness and timelines
Of the 672 participants randomised, 621 received treatment as part of the DISC trial, 295 (88%) in the LF group and 326 (97%) in the collagenase group. Of these, 531 (85.5%) had primary outcome data (PEM Hand Health Questionnaire) available at 3 months, 514 (82.8%) at 6 months, 534 (86.0%) at 1 year (the primary end point) and 426 (68.6%) at 2 years. Overall, there were 599 participants with primary outcome data available for at least one time point after treatment (89.1% of randomised, 96.5% of treated), all of which are included in the primary analysis model. The main difference between groups in terms of completeness of follow-up data was driven by participants in the surgery arm having only baseline data, primarily due to more of these participants not receiving treatment. Once participants were treated, the broad patterns of follow-up data completeness were similar across groups (see Appendix 6, Tables 73 and 74 for details regarding the baseline data completeness and Appendix 6, Tables 75–78 and Figures 76–79 for time frames for PEM completion at each time point). There is some evidence that rates of primary outcome completion were higher among participants that had complications reported than among participants that had no complications reported (see Appendix 6, Table 79). Reported of complications being associated with higher rates of retention is not surprising given that complications would have been reported only for participants attending follow-ups, during which they would also generally have provided a response for the primary outcome.
Primary outcome: descriptive summaries
Summaries of the available PEM scores (the primary outcome) at each time point are given in Table 13. The marginal distributions of the PEM scores at 1 year (the primary end point) in each group are shown in Figure 6. Finally, the (raw/unadjusted) mean PEM score trajectories by time point and allocation are shown in Figure 7.
| LF N = 336 |
Collagenase N = 336 |
Total N = 672 |
|
|---|---|---|---|
| Baseline | |||
| N | 333 | 334 | 667 |
| Mean (SD) | 34.1 (19.7) | 34.2 (20.2) | 34.2 (19.9) |
| Median (Q1, Q3) | 31.8 (18.2, 48.5) | 31.8 (18.2, 47.0) | 31.8 (18.2, 48.5) |
| Minimum, maximum | 0.0, 87.9 | 0.0, 93.9 | 0.0, 93.9 |
| Pre-treatment | |||
| N | 274 | 322 | 596 |
| Mean (SD) | 34.9 (19.0) | 35.5 (20.2) | 35.2 (19.7) |
| Median (Q1, Q3) | 34.8 (19.7, 48.5) | 33.3 (19.7, 50.0) | 34.1 (19.7, 48.5) |
| Minimum, maximum | 0.0, 84.8 | 0.0, 95.5 | 0.0, 95.5 |
| Month 3 | |||
| N | 250 | 281 | 531 |
| Mean (SD) | 16.2 (16.6) | 12.7 (14.3) | 14.3 (15.5) |
| Median (Q1, Q3) | 10.6 (3.0, 22.7) | 9.1 (1.5, 19.7) | 9.1 (3.0, 21.2) |
| Minimum, maximum | 0.0, 83.3 | 0.0, 81.8 | 0.0, 83.3 |
| Month 6 | |||
| N | 245 | 269 | 514 |
| Mean (SD) | 13.0 (16.4) | 14.6 (16.9) | 13.9 (16.7) |
| Median (Q1, Q3) | 7.6 (1.5, 16.7) | 9.1 (1.5, 21.2) | 8.3 (1.5, 19.7) |
| Minimum, maximum | 0.0, 86.4 | 0.0, 90.9 | 0.0, 90.9 |
| 1 year | |||
| N | 250 | 284 | 534 |
| Mean (SD) | 12.4 (16.3) | 16.8 (19.3) | 14.7 (18.1) |
| Median (Q1, Q3) | 6.1 (0.0, 18.2) | 9.1 (1.5, 24.2) | 7.6 (1.5, 22.7) |
| Minimum, maximum | 0.0, 87.9 | 0.0, 95.0 | 0.0, 95.0 |
| 2 years | |||
| N | 197 | 229 | 426 |
| Mean (SD) | 12.2 (18.0) | 19.2 (20.7) | 15.9 (19.8) |
| Median (Q1, Q3) | 4.5 (0.0, 15.2) | 12.1 (3.0, 30.0) | 7.6 (1.5, 22.7) |
| Minimum, maximum | 0.0, 84.8 | 0.0, 95.5 | 0.0, 95.5 |
FIGURE 6.
Patient Evaluation Measure Hand Health Questionnaire scores at 1 year by allocation. Kernel density estimates, available cases only.
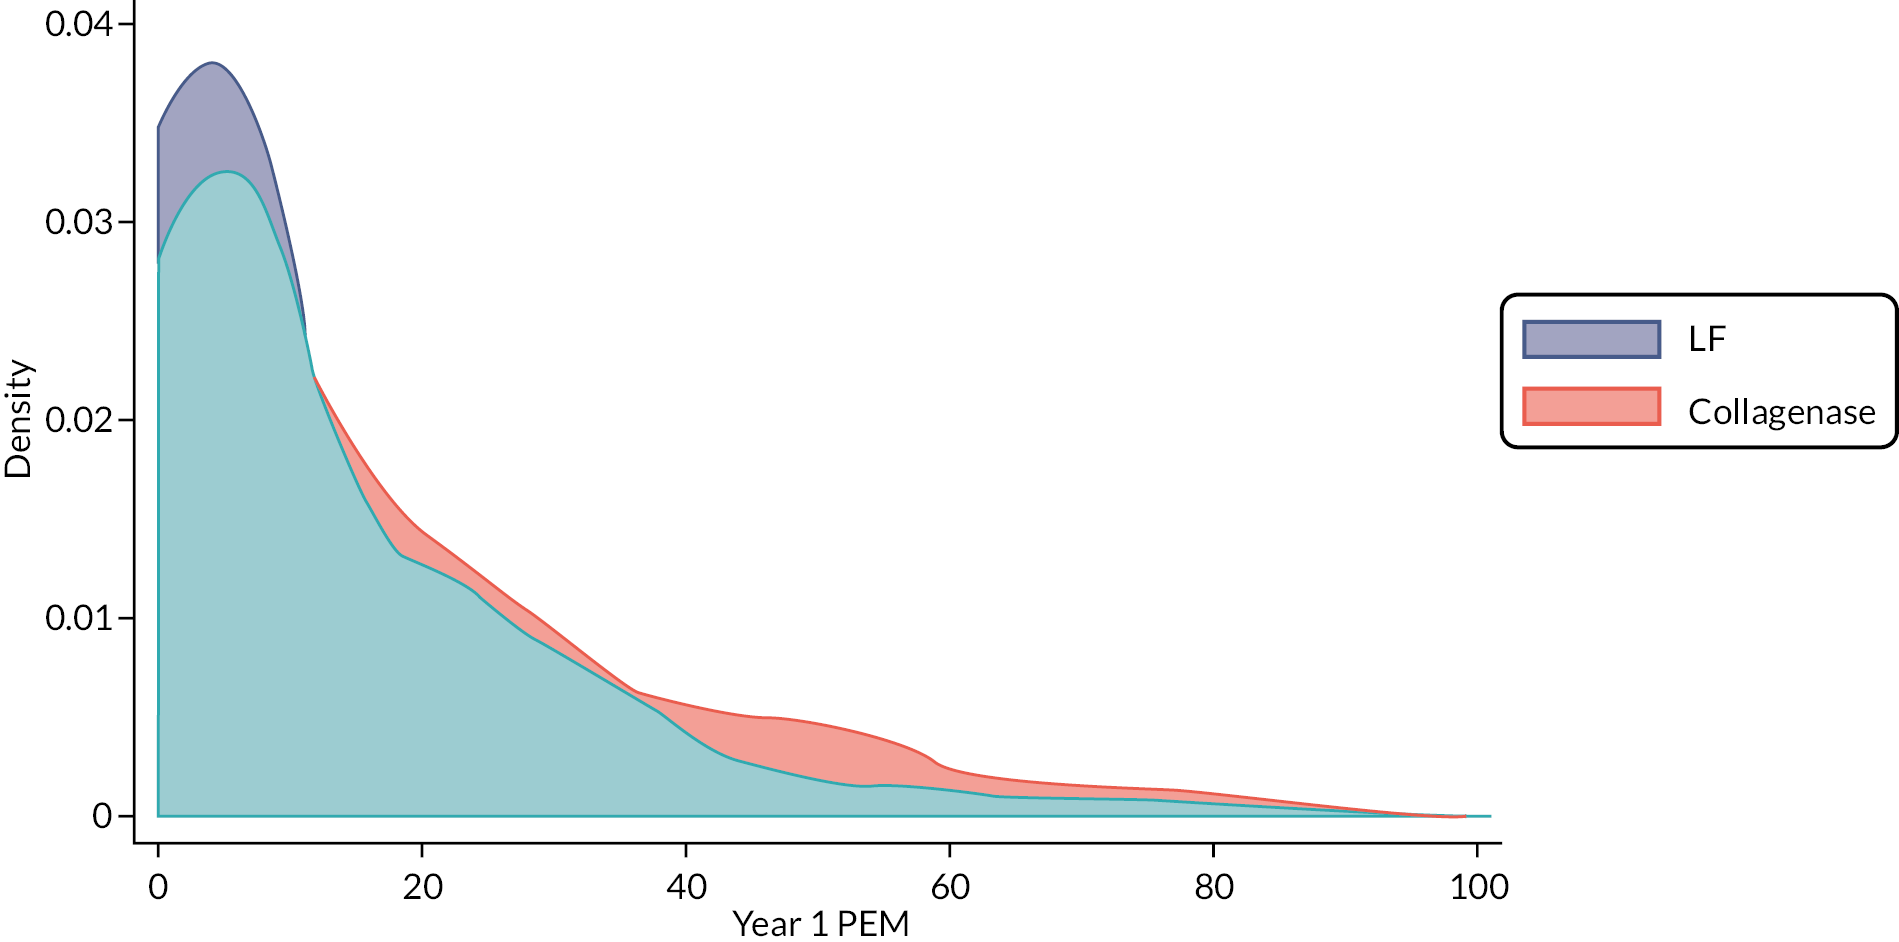
FIGURE 7.
Patient Evaluation Measure mean score profiles by allocation. Vertical dashed line plotted at the median time between randomisation and treatment with subsequent follow-ups referenced to this time point.
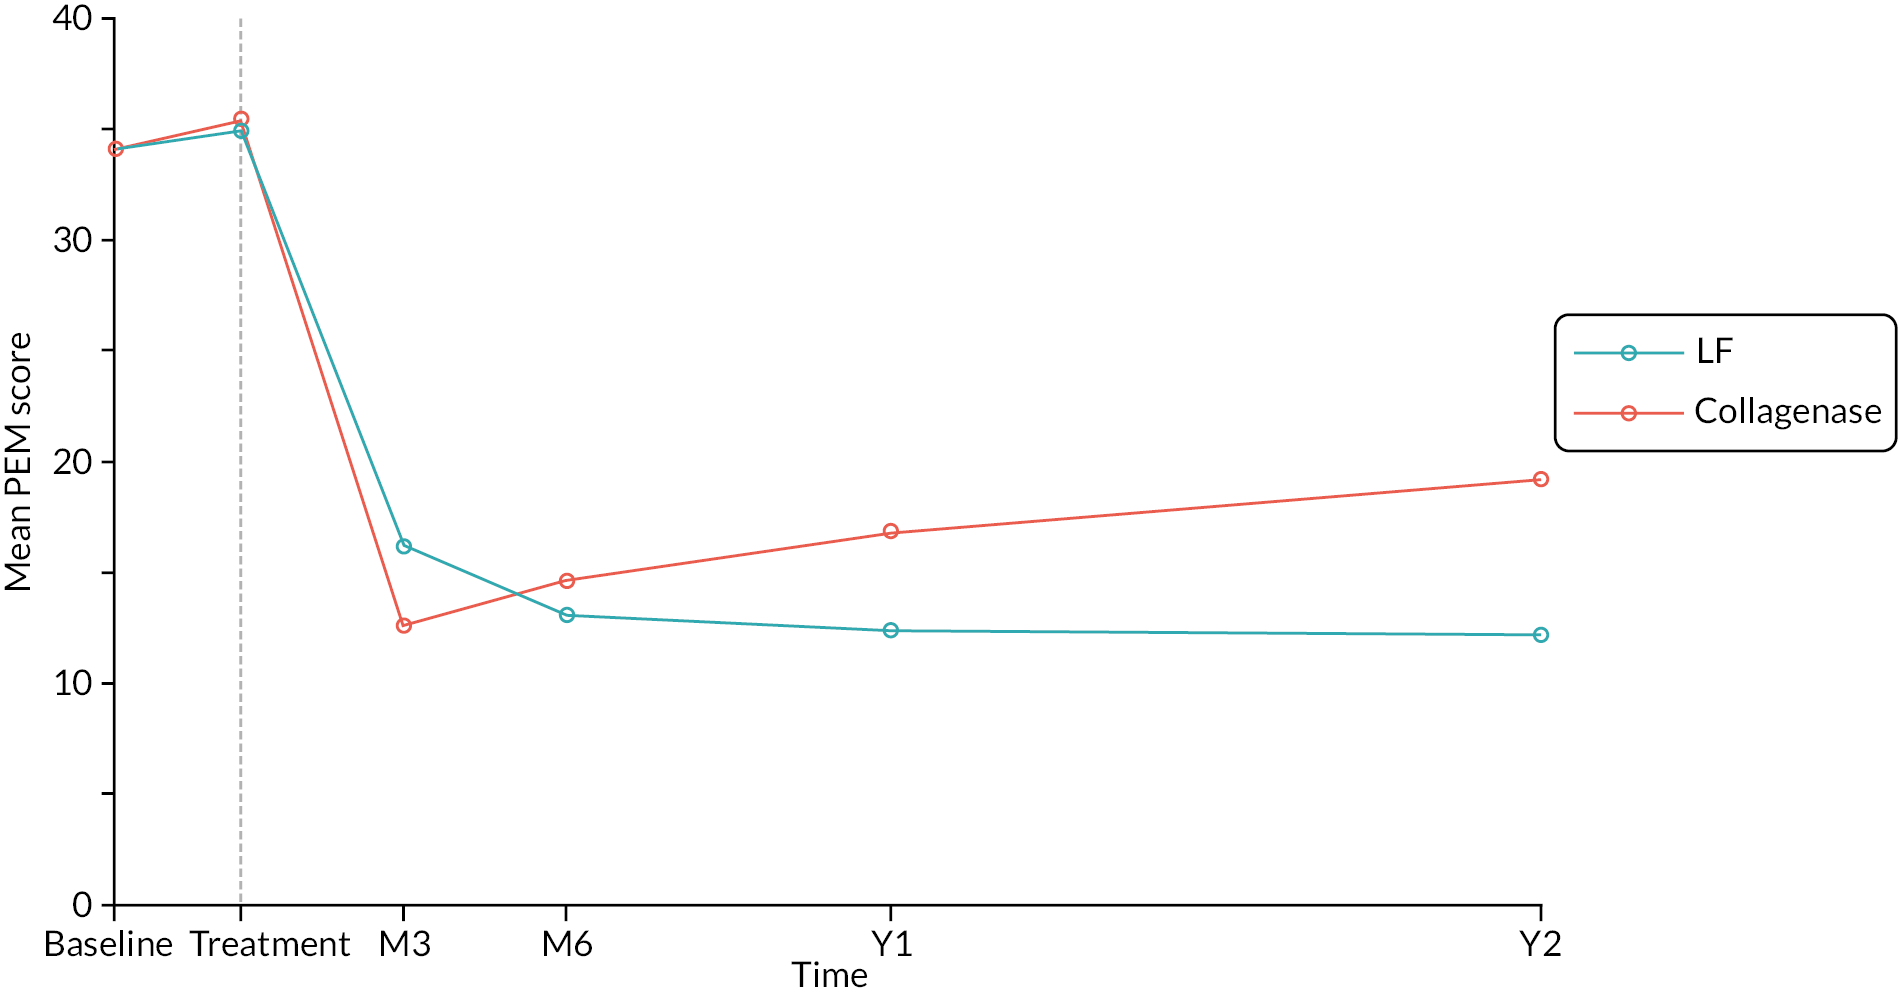
Both Table 13 and Figure 6 clearly show the similarity of the mean/expected PEM scores at both baseline and immediately prior to treatment, albeit with some evidence of a slight increase (worsening) of PEM scores between these time points (in both groups). Following treatment, the means of the available scores in both groups are smaller (better) than at baseline and pre-treatment. In general, the scores at all follow-up time points are towards the lower (i.e. better) end of the PEM scoring scale, with approximately 75% of participants having scores between 0 and 20 (out of 100) at each time point after treatment and over 25% of available cases in the surgery group having scores of zero at 1 and 2 years. This abundance of scores at or near zero is evident as skew in the marginal distribution of the 1-year scores in Figure 6, and is indicative of poor discrimination of different levels of DC-related disability at this more favourable end of the scale (i.e. a ceiling effect).
Primary outcome: primary analysis
While the ceiling effects noted above mean the primary outcome data show some departure from the assumptions of the planned primary analysis, we believe the benefits of adhering to the pre-specified analysis outweigh the statistical limitations resulting from using a poorly specified analysis model. We therefore report the estimates and tests based on the planned primary analysis in the first instance. However, we also report results from a series of univariate semiparametric analyses (based on ordinal regression) that are more robust to the ceiling effects observed. These analyses were specified as contingencies in the Statistical Analysis Plan.
The point and interval estimates of the treatment effects at 3 and 6 months, and 1 and 2 years from the planned primary analysis are given in Table 14, together with two-sided p-values for tests of H0:δ=0 [where δ denotes the true, unknown difference (collagenase – LF) in expected PEM score at the relevant time point]. Also given is the p-value for the planned non-inferiority comparison of the primary end point – that is the p-value for a one-sided test of H0:δ≥6 at 1 year [with 6 points (6%) being the pre-specified non-inferiority margin used to plan the trial]. The point and interval estimates from the planned primary analysis, and the pre-specified non-inferiority margin are also illustrated in Figure 8. The estimates and relevant tests from the univariate semiparametric analyses are given in Appendix 6, Table 80.
| Estimated difference (collagenase – LF) (95% CIa) |
p-valuea H0: δ = 0 |
p-valueb H0: δ ≥ 6 |
|
|---|---|---|---|
| Month 3 | −3.91 (−6.25 to −1.34) | 0.0025 | – |
| Month 6 | 1.43 (−1.22 to 4.07) | 0.2903 | – |
| 1 year | 5.95 (3.12 to 8.77) | < 0.00005 | 0.4855 |
| 2 years | 7.53 (4.18 to 10.88) | < 0.00005 | 0.8147 |
FIGURE 8.
Treatment effect estimates at 3 months, 6 months, 1 year and 2 years obtained from the primary analysis. Vertical dashed line plotted at median time to treatment delivery.
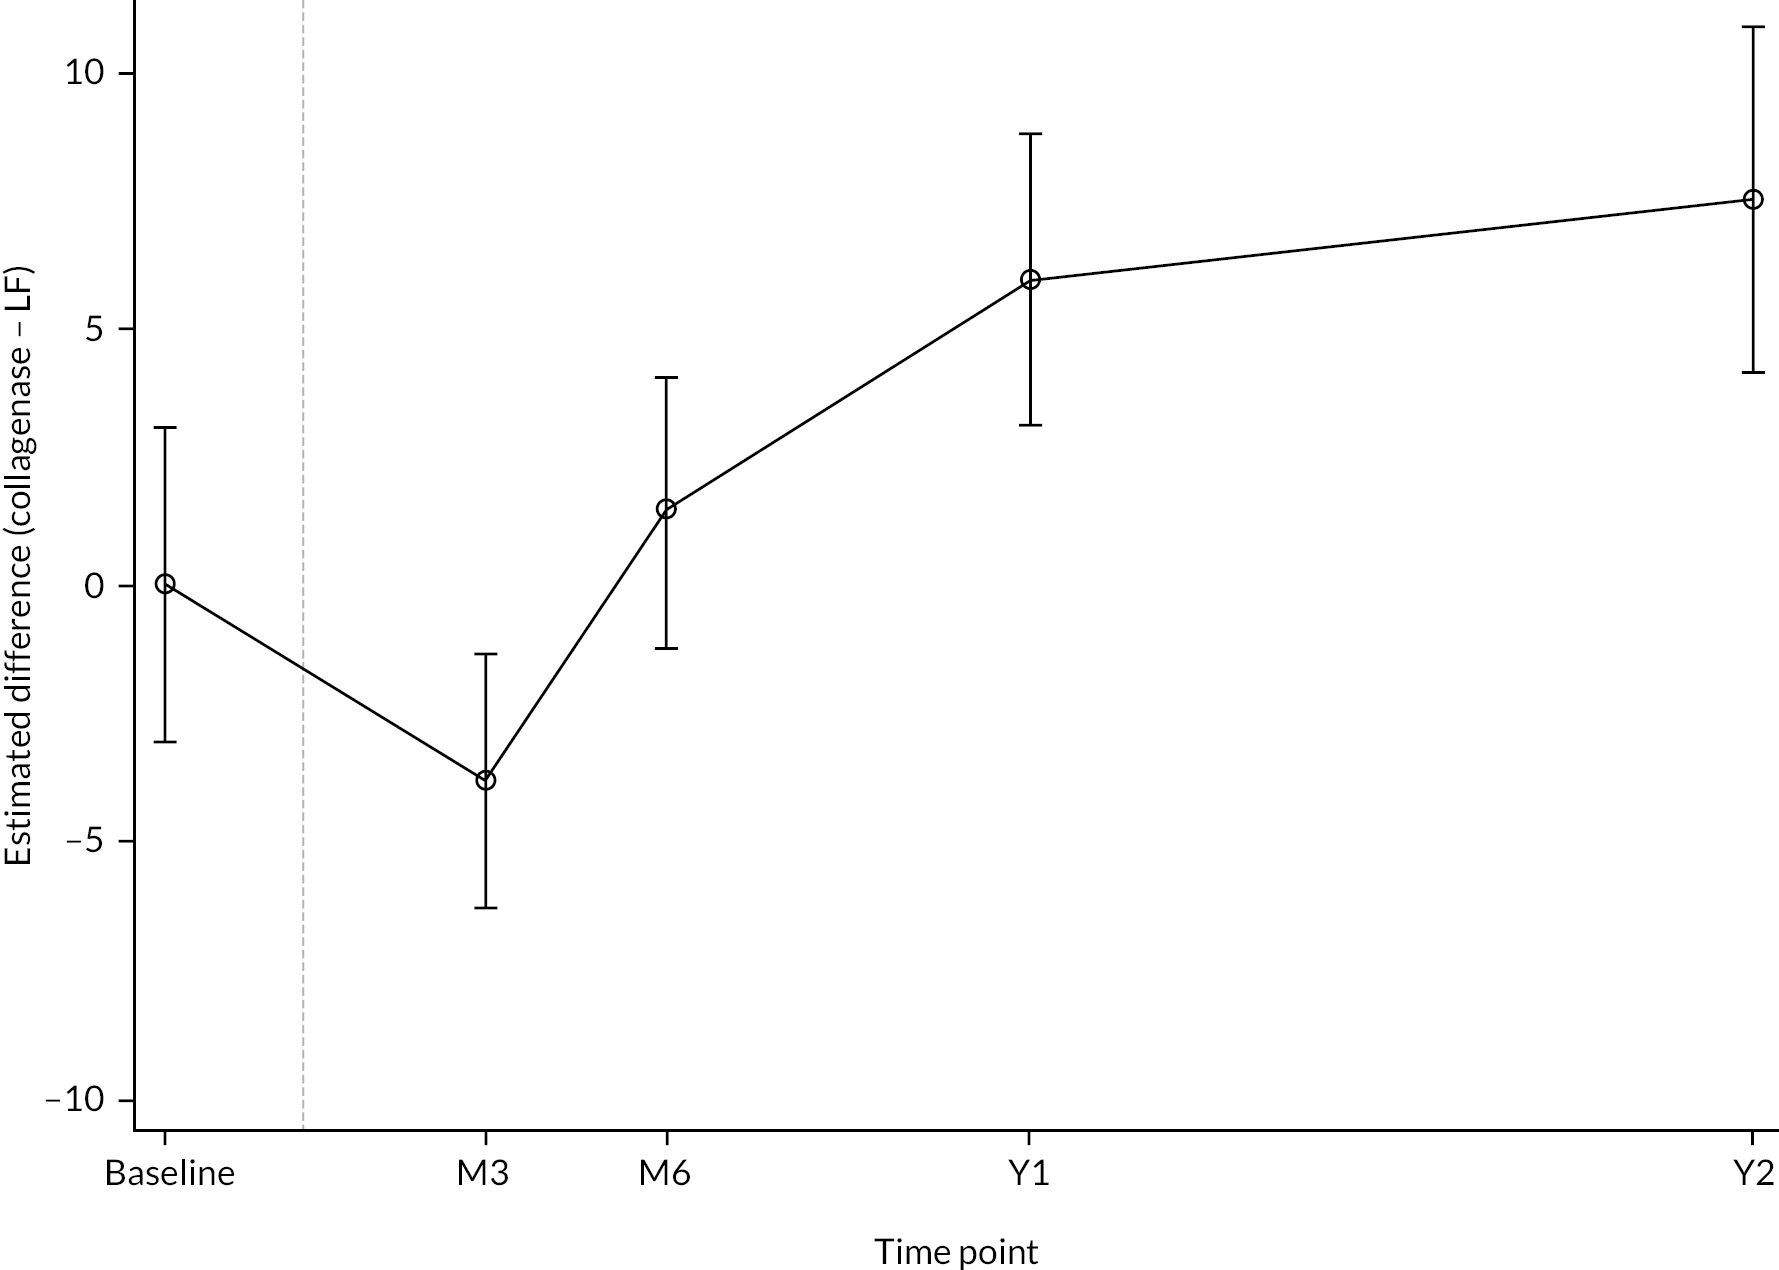
The estimates in Table 14 and Figure 8 indicate substantial variation in treatment effect across the four follow-up time points. Broadly they suggest there was some initial benefit of collagenase over LF in the short term (up to about 3–6 months after treatment), but that LF provided greater benefit in the longer term. This aligns with the profiles plotted in Figure 7.
At 3 months there appears to have been a small-to-moderate treatment effect in favour of collagenase, with the participants allocated to this treatment having PEM scores about 1–6 points lower (‘better’) on average than those allocated to LF. The p-value of 0.003 for the test of H0:δ=0 suggests substantial discrepancy between the test hypothesis (i.e. that allocation had no impact on expected PEM score at 3 months) and the data observed. By 6 months, the initial additional benefit of collagenase waned, and there is little evidence of any important differences between the groups at this time point. The supplementary semiparametric analyses of the data from these time points yield similar results to those from the planned primary analysis.
The primary end point was the difference in PEM scores at 1 year after treatment, with this end point being used to test the hypothesis that collagenase is inferior to LF by a clinically relevant amount (≥ 6 points). The results in Table 14 suggest the data provide little evidence to reject the hypothesis that collagenase is inferior to LF (with regard to the primary end point). In other words, the observed data are compatible with collagenase being worse than LF (with respect to the primary end point) by a clinically relevant margin. For example, the point estimate for the difference in expected PEM score at 1 year is approximately equal to the non-inferiority margin of 6 points, and the upper tail of the interval estimate nearly covers values as large as 9 points, 1.5 times the magnitude at which differences are hypothesised to be of clinical importance. The p-value for the relevant test of inferiority (i.e. H0:δ≥6) is about 0.49, again showing that there is almost no information in the data to support rejection of the hypothesis that collagenase is inferior to LF (with respect to the primary end point). The estimates from the supplementary semiparametric analysis of the 1-year primary outcome data are slightly attenuated compared with those from the planned primary analysis, but the tests reach the same conclusions (at least at a 5% two-sided or 2.5% one-sided significance level), and the substantive findings are practically identical.
The apparent benefit of LF over collagenase appears to have continued to increase slightly between 1 and 2 years. By the later time point, participants allocated to LF appear to have scores that are about 4–11 points better on average than participants allocated to collagenase. This interval estimate again encompasses differences that are likely to be of clinical importance (e.g. the upper limit is close to double the non-inferiority margin used for the primary end point). Hence there is again little evidence to support rejection of the hypothesis that collagenase is inferior to LF with regard to PEM Hand Health Questionnaire scores at 2 years. The estimates and p-value from the supplementary semiparametric analysis of the 2-year primary outcome data are like those from the planned primary analysis, and the conclusions remain the same.
In conclusion, our primary analysis shows that there is little evidence to support rejection of the hypothesis that collagenase is inferior to LF at 1 and 2 years post treatment. Indeed, the observed data are highly compatible LF being superior to collagenase with regard to the primary outcome measure at both these time points.
Primary outcome: missing data sensitivity analyses
The primary analysis reported in the previous section is valid under the assumption that any missing primary outcome data (at any follow-up after treatment) is MAR with respect to the predictors included in the analysis model (i.e. allocation, study reference joint type, baseline score, and recruitment site) and any observed primary outcome data. In this section, we report the results from several planned analyses to investigate the sensitivity of results to variation in, and departures from, the MAR assumption outlined above.
A summary of the overall patterns of missing primary outcome data is provided in Appendix 6, Table 81. The main differences in primary outcome data completeness at follow-up are driven by differences in receipt of treatment (12% lost prior to treatment in the LF group vs. 3% in the collagenase group). Hence, allocation clearly affected the probability of receiving treatment. If there were other baseline characteristics X (e.g. baseline disease severity, sex, age, etc.) that also affected the probability of receiving treatment and affected outcomes after treatment, then analysing only those that were treated (as in the primary analysis) would result in confounding of the relationship between random allocation and outcome (through a back-door path between allocation and outcome via X induced by selection on treatment receipt). We investigated the possible impact of selection on treatment receipt by repeating the primary analysis, including additional baseline predictors of treatment receipt (as well as outcome missingness) as covariates. We also imputed primary outcome data for those that were not treated under different MAR and MNAR scenarios.
Empirical cumulative distribution functions (ECDF) of the baseline PEM scores are shown in Figure 9, stratified by primary analysis inclusion status (included or not included) and allocation.
FIGURE 9.
Empirical cumulative distribution functions for baseline PEM scores by inclusion/exclusion from primary analysis and allocation.
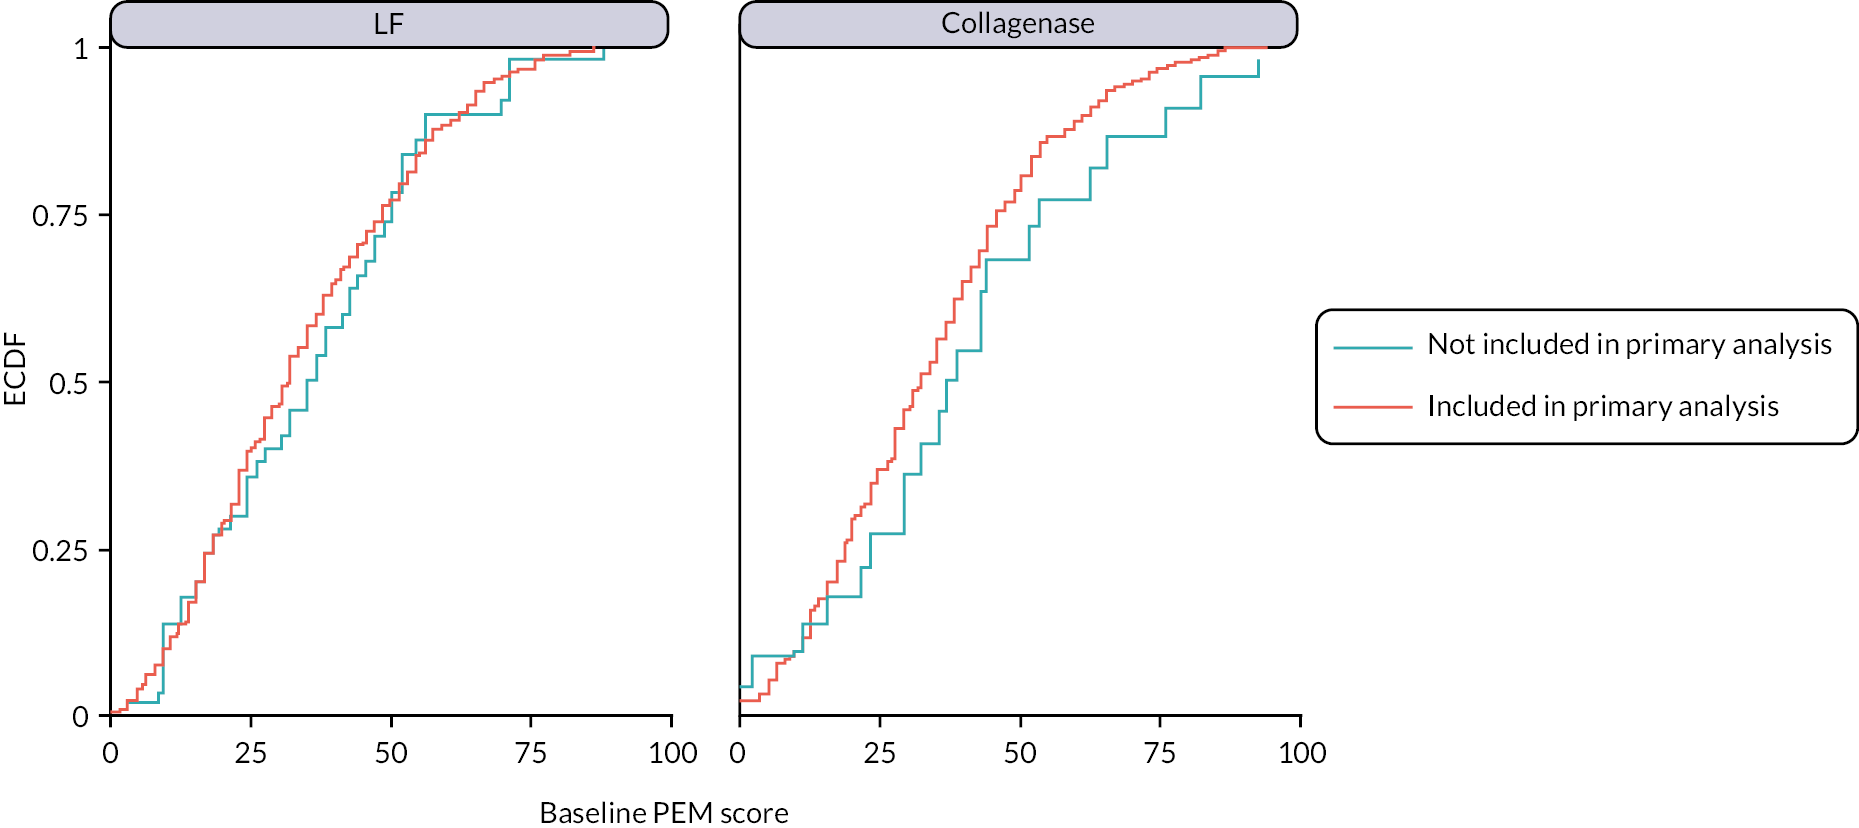
The left-hand panel of Figure 9 suggests that participants in the surgery group who were not included in the primary analysis had a similar distribution of baseline PEM scores to those that were. In contrast, the right-hand panel suggests that collagenase participants that were excluded from the primary analysis had slightly higher (worse) baseline PEM scores than those that were included. Given the sparse data (particularly with regard to collagenase participants excluded from the primary analysis), it is difficult to draw any firm conclusions about differing selection mechanisms across the randomised groups. However, overall these plots suggest that the LF participants included in the primary analysis are representative of those excluded in terms of their baseline disability/disease severity, whereas those excluded from the primary analysis in the collagenase group may be those with slightly poorer prognosis than those included.
Figures 10 and 11 illustrate the distributions of the available PEM scores at 3 and 6 months stratified by whether primary outcome data were available at 1 year (the primary end point) or not. In the collagenase group, both 3- and 6-month PEM scores were generally higher (worse) for participants who were missing 1-year PEM scores, whereas in the LF group the distributions of these earlier measurements were about the same across the two subgroups.
FIGURE 10.
Empirical cumulative distribution functions of the available PEM scores at 3 months by presence/absence of primary end-point data and allocation.
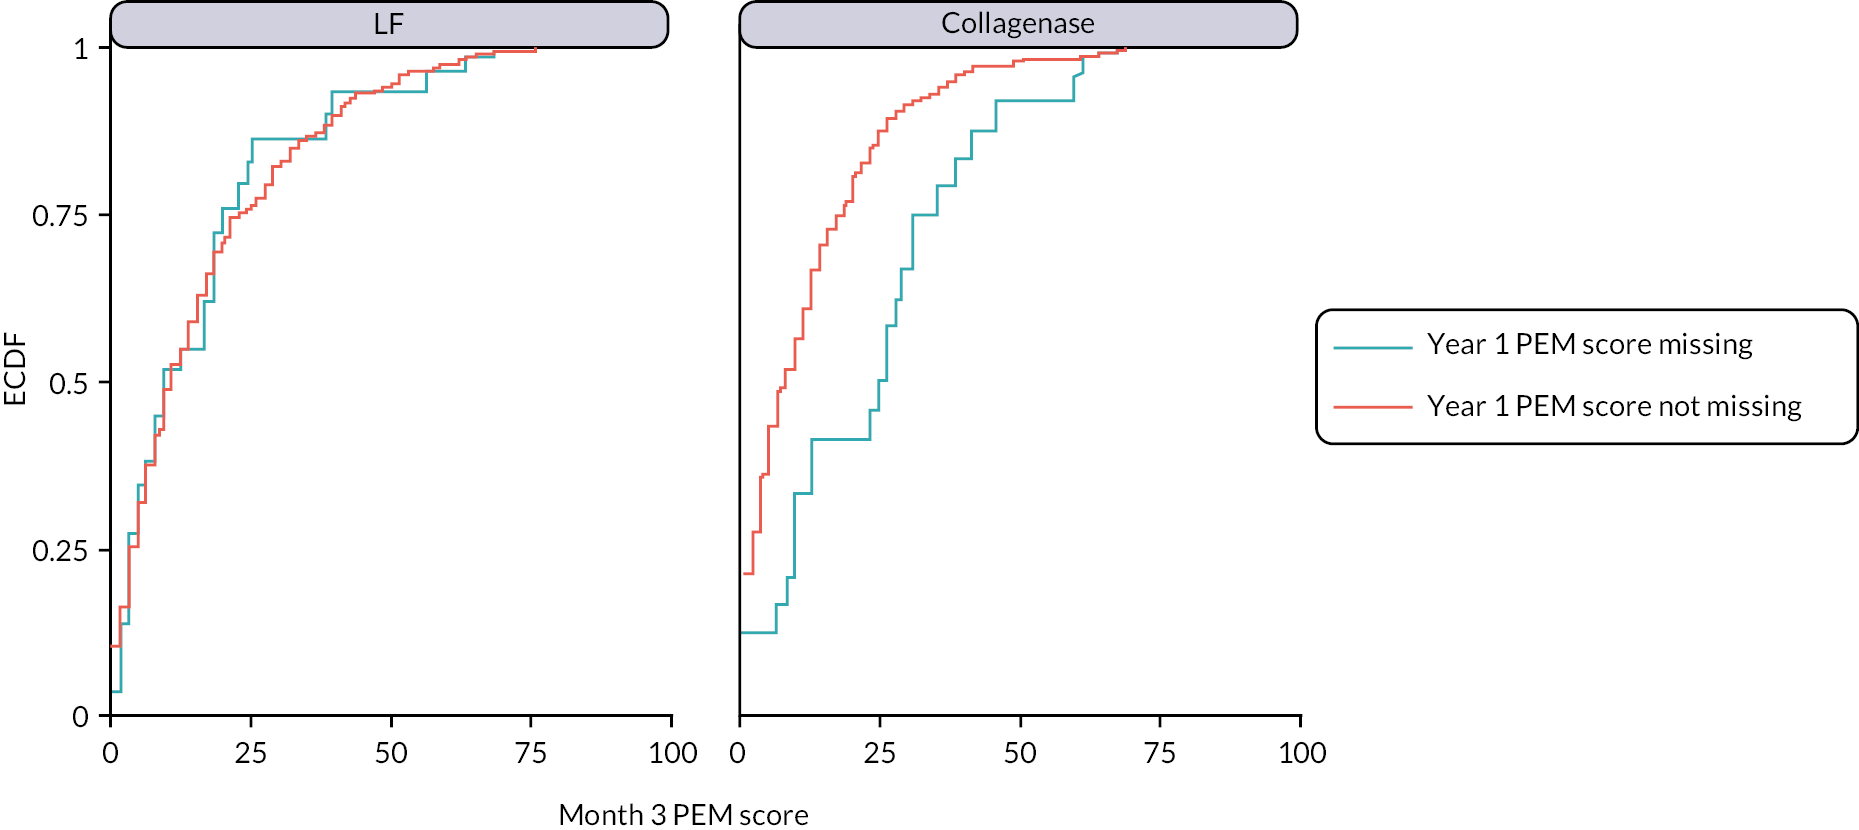
FIGURE 11.
Empirical cumulative distribution functions of the available PEM scores at 6 months by presence/absence of primary end-point data and allocation.
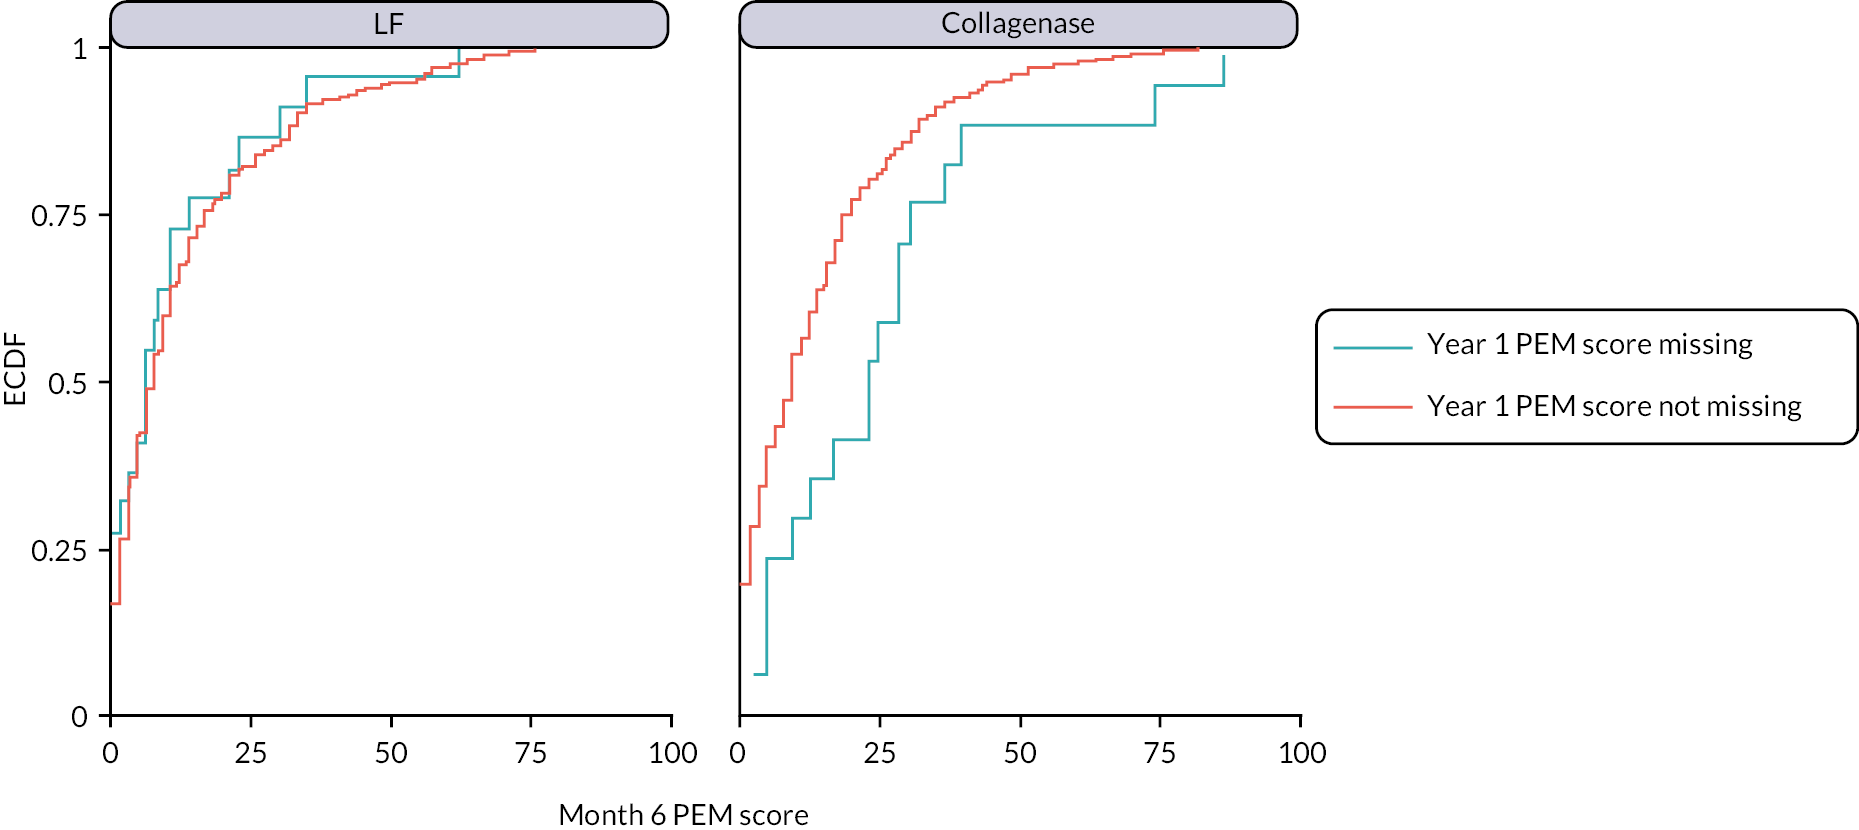
The following baseline variables were assessed for association with different patterns of missing data: age; number of digits affected by DC; alcohol consumption (binary); comorbidities (binary); sex (binary); smoking status (never, previous, current); previous treatment for DC using surgery or collagenase (binary); general health (as measured by the EQ-5D-5L VAS), MHQ score and URAM score. The following variables were found to be at least weakly associated with one or more of the missing data patterns assessed: age; number of digits affected; sex; smoking status and EQ-5D-5L general health VAS.
The estimates from a re-analysis of the primary outcome including these additional predictors of missingness are reported in Table 15. Compared with the planned primary analysis results (see Table 14), it is evident that the inclusion of these additional baseline covariates has made little difference to the estimated treatment effects (all are within about 0.1 of each other). The estimate for the primary end point is very slightly larger than obtained for the primary analysis, suggesting slightly greater additional benefit from LF, but the substantive conclusions are identical.
| Estimated difference (collagenase – LF) (95% CIa) |
p-valuea H0: δ = 0 |
p-valueb H0: δ ≥ 6 |
|
|---|---|---|---|
| Month 3 | −3.76 (−6.22 to −1.31) | 0.0027 | – |
| Month 6 | 1.51 (−1.12 to 4.15) | 0.2605 | – |
| 1 year c | 6.02 (3.22 to 8.81) | < 0.00005 | 0.5047 |
| 2 years | 7.38 (4.04 to 10.71) | < 0.00005 | – |
The results of the analyses using multiply imputed data are reported in Table 16. Again, these are broadly in line with those obtained for the primary analysis, albeit suggesting slightly greater additional benefit of surgery at 6 months, 1 and 2 years, and slightly smaller additional benefit from collagenase at 3 months. Overall, the substantive conclusions of the primary analysis seem insensitive to slightly weaker MAR assumptions, with these analyses suggesting even less discrepancy between the hypothesis of inferiority and the observed data.
| Estimated difference (collagenase – LF) (95% CIa) |
p-valuea H0: δ = 0 |
p-valueb H0: δ ≥ 6 |
|
|---|---|---|---|
| Month 3 | −3.32 (−5.69 to −0.95) | 0.0061 | |
| Month 6 | 2.15 (−0.35 to 4.64) | 0.0917 | |
| 1 year | 6.52 (3.89 to 9.15) | < 0.00005 | 0.3499 |
| 2 years | 7.53 (4.49 to 10.57) | < 0.00005 |
To investigate the sensitivity of the primary analysis to various systematic departures from MAR at 1 year, we undertook a sensitivity analysis using a mean score and pattern mixture modelling approach. The estimated differences in PEM score at 1 year, under different departures from MAR (i.e. γ=E[Y|X,missing]−E[Y|X,notmissing]) are illustrated in Figure 12. All missing not at random (MNAR) scenarios considered assume that missingness is associated with poorer (i.e. higher) responses for the primary outcome (conditional on the covariates in the substantive analysis – reference joint and baseline PEM score). Figure 12 shows that for the range of γ considered, the impact of the primary outcome data being MNAR is limited if the MNAR assumption is across randomised groups (see dark blue line in figure). For example, the upper limit of the two-tailed 95% CI estimate is > 6 (the non-inferiority margin) across all scenarios considered, meaning the hypothesis that collagenase is inferior to LF (with regard to the primary end point) is not rejected even under quite extreme departures from MAR (provided these are identical across groups). The conclusions of the primary analysis are also relatively unaffected by the outcome data being MNAR in just the collagenase arm (for the range of δ considered) as would be expected. If the primary end-point data are assumed to be MNAR in the LF group, but MAR in the collagenase arm, then the outcome of the test of non-inferiority would only result in rejection of the null hypothesis (that collagenase is inferior to surgery with respect to the primary end point) if γ≥7.5. While a discrepancy in conditional expectation between those with/without missing primary end-point data is possible, it is highly implausible that this discrepancy would occur only in the surgery arm. Overall, the results in Figure 12 provide no compelling reason to seriously doubt the results of the primary analysis.
FIGURE 12.
Estimates of the difference in expected PEM score at 1 year under various departures from MAR.
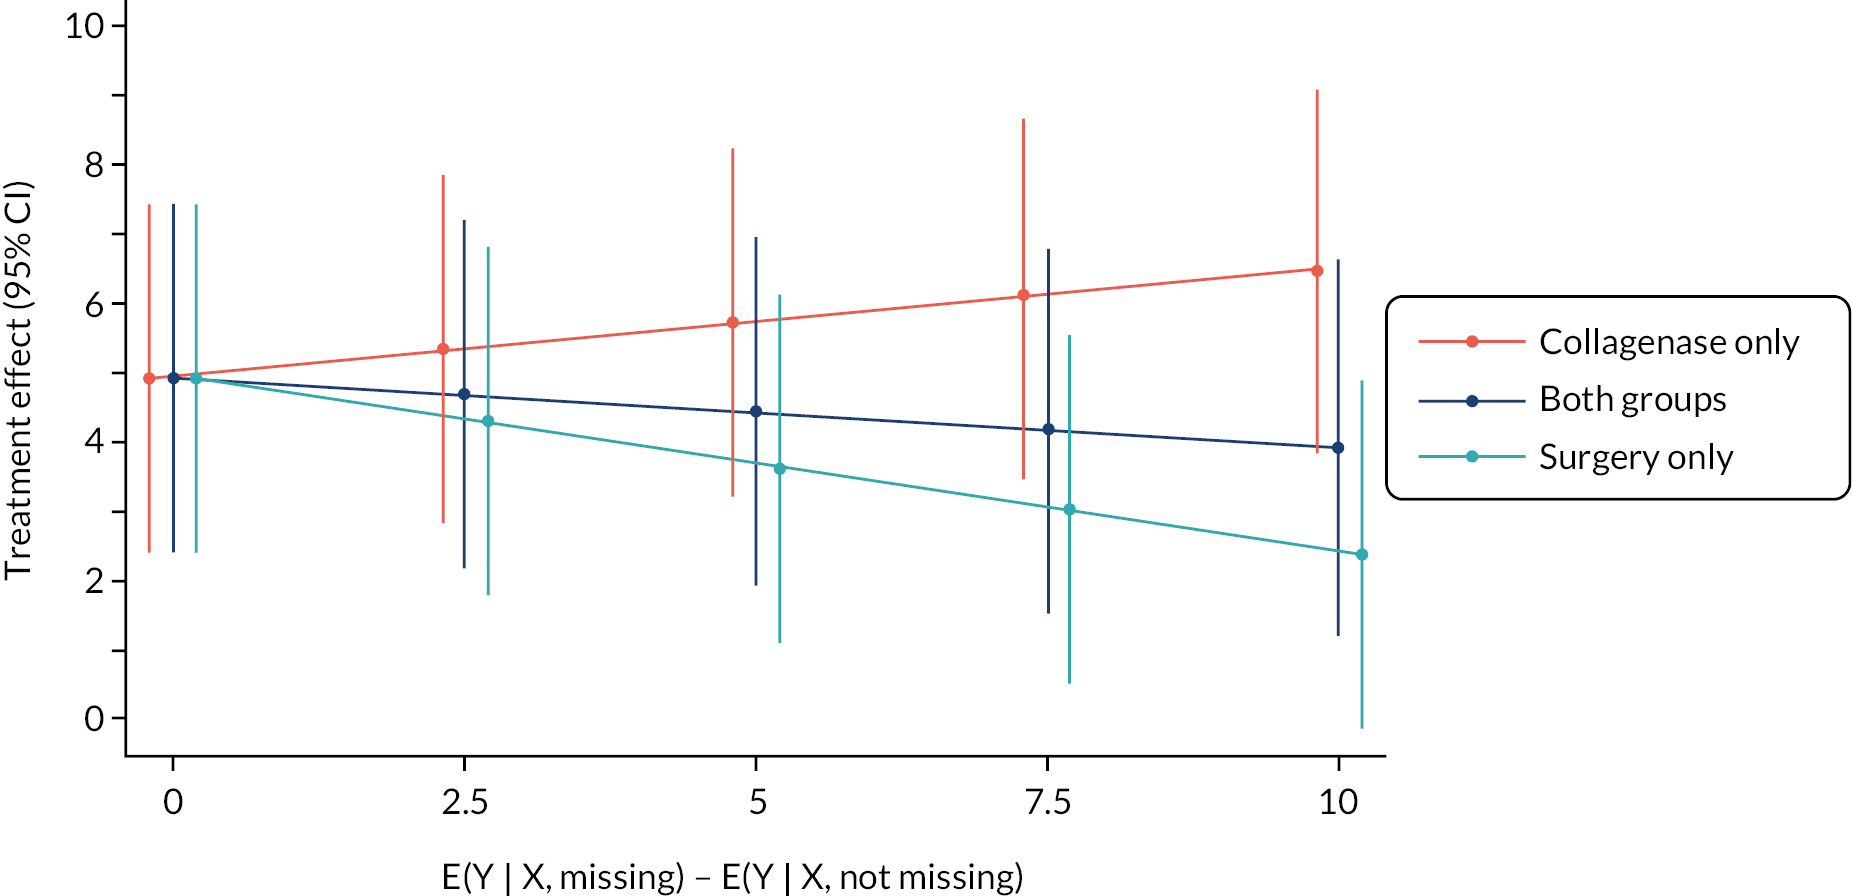
Primary outcome: further sensitivity analyses
We undertook several pre-specified further analyses of the primary outcome to investigate the sensitivity of the primary analysis results to differences in time to treatment between groups and departures from the planned follow-up schedule.
Delays between randomisation and treatment delivery
We repeated the primary analysis conditioning on the pre-treatment measurements in place of the baseline measurements (with all other aspects of the analyses being kept the same). This analysis included the same 599 participants as were included in the primary analysis (285 LF and 314 collagenase). The results of this analysis are reported in Table 17. The estimates at each time point are similar to those obtained for the primary analysis, and all tests reach the same conclusions.
| Estimated difference (collagenase – LF) (95% CIa) |
p-valuea H0: δ = 0 |
p-valueb H0: δ ≥ 6 |
|
|---|---|---|---|
| Month 3 | −3.84 (−6.27 to −1.41) | 0.0020 | – |
| Month 6 | 1.38 (−1.22 to 3.98) | 0.2980 | – |
| 1 year | 5.87 (3.11 to 8.62) | < 0.00005 | 0.4624 |
| 2 years | 7.47 (4.18 to 10.76) | < 0.00005 | – |
Departures from planned follow-up schedule
To assess the sensitivity of the results of the primary analysis to departures from the planned follow-up schedule, we undertook 2 additional analyses of the primary outcome data, 1 pre-specified and 1 post hoc. The pre-specified analysis was to repeat the primary analysis including only primary outcome data collected within the protocol specified windows for completion. The results of this analysis are reported in Table 18. The post hoc analysis (see Appendix 6, Table 82) aimed to directly model the effects of time from treatment using generalised least squares (with a random intercept for recruitment site). This analysis modelled the effects of time from treatment using a four-knot restricted cubic spline (knots placed at 3 and 6 months and 1 and 2 years), and within patient correlation using an exponential covariance structure for the residual errors. This model was used to derive point and interval estimates at 3 and 6 months and 1 and 2 years to facilitate comparison with the results of the primary analysis (see Table 14), as well as estimates of the treatment effect over all time points up to 27 months (see Figure 13).
FIGURE 13.
Point estimates and pointwise two-sided 95% confidence band for the difference in expected PEM score. Positive values indicate greater benefit from LF than collagenase. The red diamond denotes the non-inferiority margin for the primary end point.
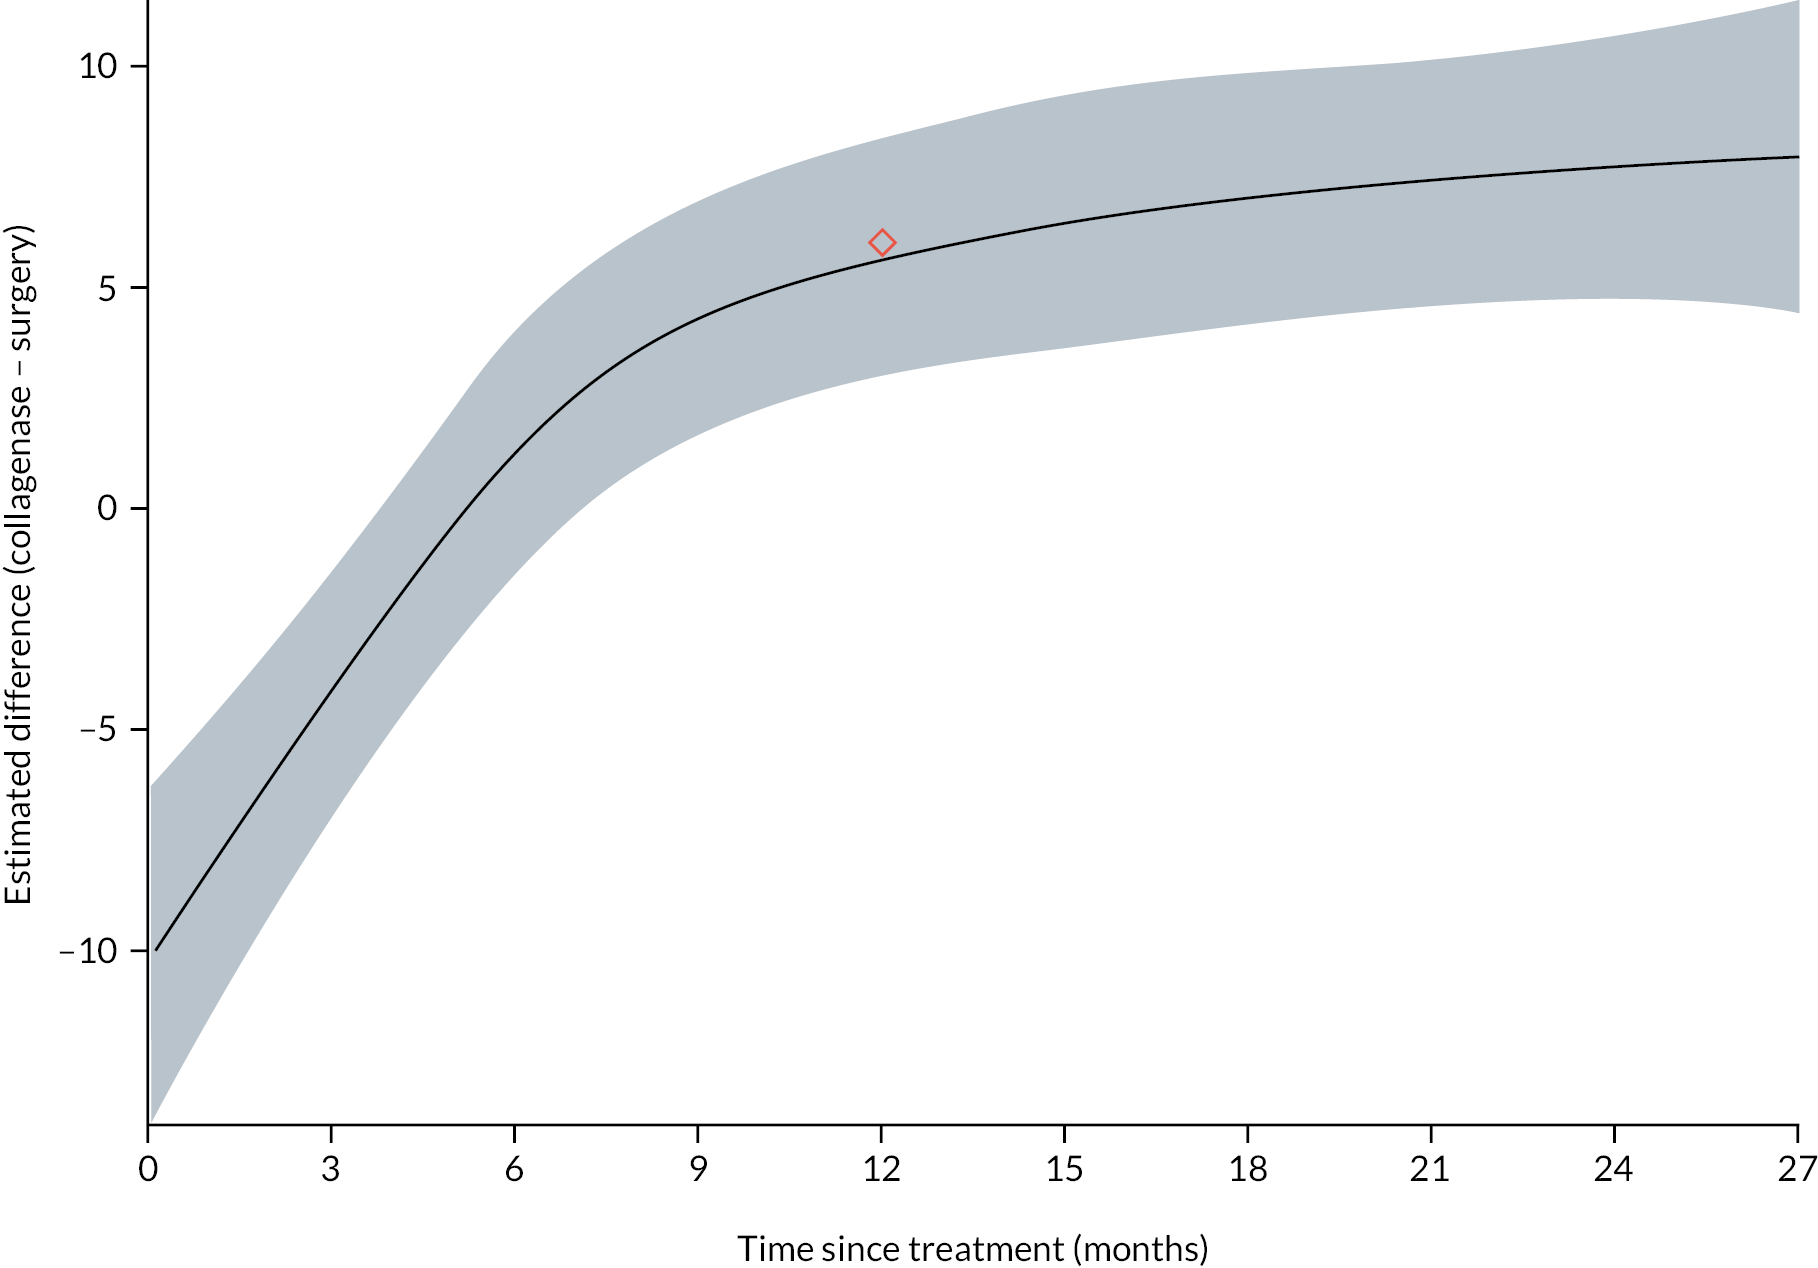
| Estimated difference (collagenase – LF) (95% CIa) |
p-valuea H0: δ = 0 |
p-valueb H0: δ ≥ 6 |
|
|---|---|---|---|
| Month 3 | −4.30 (−7.08 to −1.51) | 0.0025 | – |
| Month 6 | 2.41 (−0.61 to 5.43) | 0.1174 | – |
| 1 year | 6.09 (3.29 to 8.89) | < 0.00005 | 0.5252 |
| 2 years | 8.33 (5.00 to 11.66) | < 0.00005 | – |
The treatment effect estimates in Table 18 (i.e. those obtained from the analysis excluding primary outcome data collected out of window) are similar to those obtained from the primary analysis (see Table 14), albeit slightly larger in absolute value at all time points, and the various tests all result in the same inferences. The estimates in Figure 13 and Appendix 6, Table 82 (from the model treating time from treatment as a continuous predictor) are again pretty similar to those obtained from the primary analysis. Estimates from a similar analysis with a different placement of the spline knots gave similar results. The extrapolated plot in Figure 13 suggests substantial short-term benefit from collagenase that quickly disappears and is eventually reversed at about 5–6 months after treatment. In fact, the upper limit of the two-sided 95% confidence band exceeds the pre-specified non-inferiority margin of 6 points from about 7 months after treatment onwards, with the difference in favour of LF continuing to steadily grow until the end of the follow-up period. Overall, these analyses suggest that the impacts of mistimed measurements of the primary outcome are minor and are unlikely to be important in driving the substantive conclusions of the primary analysis.
Primary outcome: further analyses
Additional predictors of recurrence
Summaries of several baseline predictors of recurrence (including the extent of missing responses) are given in Appendix 6, Table 83 for the subset of 599 participants that were included in the primary analysis (i.e. those with primary outcome data for at least on time point). Some participants were missing data relating to either diathesis indicators (i.e. Garrod’s pads, Peyronie’s disease and Ledderhose disease), or age of onset, due to an error in the collection of these variables for an early version of the baseline CRF.
We undertook a further analysis of the primary outcome conditioning on these additional baseline predictors of recurrence (despite the substantial number excluded due to partially missing baseline data). This analysis included all 389 participants that had complete data on the predictors of recurrence and primary outcome data available for at least one time point following treatment. The results of this analysis are given in Appendix 6, Table 84. Despite the loss of precision, the estimates are like those obtained for the primary analysis and the substantive conclusions remain unaffected.
Complier-average causal effect
Table 8 provides brief details regarding the treatments received in each group. This shows that among participants treated as part of DISC, the vast majority received the treatment they were allocated, although crossovers were more common in the LF group than in the collagenase group.
Summaries of key baseline characteristics stratified by compliance status (received allocated treatment vs. did not receive allocated treatment) for the 619 participants where the treatment received is known (99.7% of those treated) are presented in Appendix 6, Table 85. There are no obvious patterns or relationships between baseline characteristics and receipt/non-receipt of baseline characteristics across groups (except possibly for treatment preferences as might be expected), but the sparseness of the data in the ‘non-compliant’ strata severely limits any inference in this regard.
To estimate the CACE [i.e. the average causal effect of treatment on the partially latent subgroup of participants that would have received treatment with collagenase (or surgery) if and only if they were allocated it], we used random allocation as an instrument in a two-stage least-squares regression of the primary end point (PEM score at 1 year after treatment) on treatment received and the same baseline covariates as in the primary analysis model. The second-stage estimates of the CACE from this analysis are reported in Appendix 6, Table 86. While the point and interval estimates for the CACE are slightly smaller than the estimates obtained for the primary analysis, they are comparable, and the hypothesis that collagenase is inferior to surgery (based on the pre-specified non-inferiority margin) is not rejected at any reasonable significance level. Hence, the conclusions of the primary analysis appear to apply similarly to participants in the complier principal stratum as to the whole treated population.
Primary outcome: subgroup analyses
We undertook two subgroup analyses to investigate the presence and extent of treatment effect heterogeneity associated with baseline treatment preference (preferred collagenase, preferred surgery, no preference), and designated study reference joint (MCP or PIP). Brief summaries of these baseline variables for the participants with primary outcome data for at least one time point after treatment are given in Appendix 6, Tables 87 and 88.
Treatment effects by subgroup and time point were estimated via addition of: the main effects of the subgroup variable to the primary analysis model (if not already present), the two-way interactions between subgroup and treatment group, and the three-way interactions between subgroup, treatment group and time point. Estimates by preference subgroup (and time point) are given in Appendix 6, Table 89 and Figure 80 and estimates by study reference joint subgroup (and time point) are given in Appendix 6, Table 90 and Figure 81.
The data provide little information regarding the effects of allocation in the subgroup of participants that preferred LF at baseline (due the small number of participants that reported preference for surgery at baseline). There are no clear differences in the treatment effects observed in this group compared with the other two baseline preference subgroups, but at the same time the observed data do little to rule out anything but large effects in the opposite direction to those of the other subgroups. The estimates for the two larger subgroups (prefers collagenase and no preference) appeared consistent with one another, despite the effects in the group that preferred collagenase being consistently smaller (i.e. slightly more in favour of collagenase) than those in the no preference subgroup. However, the interval estimates show considerable uncertainty regarding the subgroup specific effects even in these larger subgroups, and important differences between these groups cannot be ruled out based on the data alone.
The data are most compatible with the treatment effects in each reference joint subgroup being similar across all time points (and following a similar pattern across time points to those obtained on average for the whole sample) (see Appendix 6, Figure 81 and Table 90). However, the interval estimates cover a wide range of treatment effects (particularly those for the PIP stratum), and overall these data do little to rule out small-to-moderate variation in treatment effects across reference joint strata.
Secondary outcomes
For secondary outcome analyses, where patient-reported outcome measure scores showed substantial positive skew and ceiling effects at all time points, an approach similar to that used for the analysis of the primary outcome was used and results are provided for both the planned analyses and the alternative semiparametric analyses based on proportional odds models. 59
Patient Evaluation Measure Overall Assessment Questionnaire
Summaries of the available PEM Overall Assessment scores at 3 and 6 months and 1 and 2 years are given in Appendix 7, Figure 82 and Table 91. These show a similar pattern to the PEM Hand Health Questionnaire (primary outcome) scores with a small difference in favour of collagenase at 3 months, a small difference in favour of LF at 6 months, and moderate-to-large differences in favour of LF at 1 and 2 years.
Patient Evaluation Measure Treatment Questionnaire
Summaries of the available PEM Treatment Questionnaire scores at 3 and 6 months and 1 and 2 years are given in Appendix 7, Figure 83 and Table 92. These show that almost all participants reported that their overall treatment process was broadly positive with regard to the constructs measured, with almost all participants having a score < 5 (equivalent to giving the best or second-best response for all items). As such, there are no obvious or important trends or differences across groups, suggesting participants had a similarly positive experience regardless of the treatment they were allocated.
Unité Rheumatologique des Affections de la Main
Summaries of the available URAM scores are reported in Table 19 by time point and allocation. The approximate distributions of the available URAM scores are plotted in Figure 14 by time point and allocation. The profiles of the mean PEM, URAM, MHQ, and SANE scores (based on the available responses) over time are plotted in Figure 15.
| LF N = 336 |
Collagenase N = 336 |
Total N = 672 |
|
|---|---|---|---|
| Baseline (randomised participants) | |||
| N | 335 | 333 | 668 |
| Mean (SD) | 17.2 (9.5) | 17.0 (9.3) | 17.1 (9.4) |
| Median (Q1, Q3) | 16.9 (10.0, 24.0) | 16.0 (10.0, 23.0) | 16.0 (10.0, 23.0) |
| Minimum, maximum | 0.0, 43.0 | 0.0, 44.0 | 0.0, 44.0 |
| Baseline (treated participants) | |||
| N | 294 | 323 | 617 |
| Mean (SD) | 17.1 (9.5) | 16.8 (9.2) | 17.0 (9.3) |
| Median (Q1, Q3) | 16.8 (10.0, 23.1) | 16.0 (10.0, 23.0) | 16.0 (10.0, 23.0) |
| Minimum, maximum | 0.0, 43.0 | 0.0, 44.0 | 0.0, 44.0 |
| Month 3 | |||
| N | 250 | 282 | 532 |
| Mean (SD) | 3.8 (6.1) | 4.8 (6.7) | 4.3 (6.5) |
| Median (Q1, Q3) | 1.0 (0.0, 6.0) | 2.0 (0.0, 7.0) | 1.0 (0.0, 6.0) |
| Minimum, maximum | 0.0, 32.0 | 0.0, 38.0 | 0.0, 38.0 |
| Month 6 | |||
| N | 245 | 269 | 514 |
| Mean (SD) | 3.2 (5.6) | 5.5 (7.1) | 4.4 (6.5) |
| Median (Q1, Q3) | 1.0 (0.0, 4.0) | 2.0 (0.0, 9.0) | 1.0 (0.0, 7.0) |
| Minimum, maximum | 0.0, 35.0 | 0.0, 40.0 | 0.0, 40.0 |
| 1 year | |||
| N | 247 | 282 | 529 |
| Mean (SD) | 3.9 (6.7) | 6.6 (8.5) | 5.4 (7.8) |
| Median (Q1, Q3) | 1.0 (0.0, 6.0) | 3.0 (0.0, 10.0) | 2.0 (0.0, 8.0) |
| Minimum, maximum | 0.0, 45.0 | 0.0, 42.0 | 0.0, 45.0 |
| 2 years | |||
| N | 198 | 225 | 423 |
| Mean (SD) | 3.9 (7.2) | 8.8 (9.7) | 6.5 (8.9) |
| Median (Q1, Q3) | 0.0 (0.0, 4.0) | 6.0 (0.0, 14.0) | 2.0 (0.0, 10.0) |
| Minimum, maximum | 0.0, 39.0 | 0.0, 42.0 | 0.0, 42.0 |
FIGURE 14.
Kernel density estimates – URAM scores.
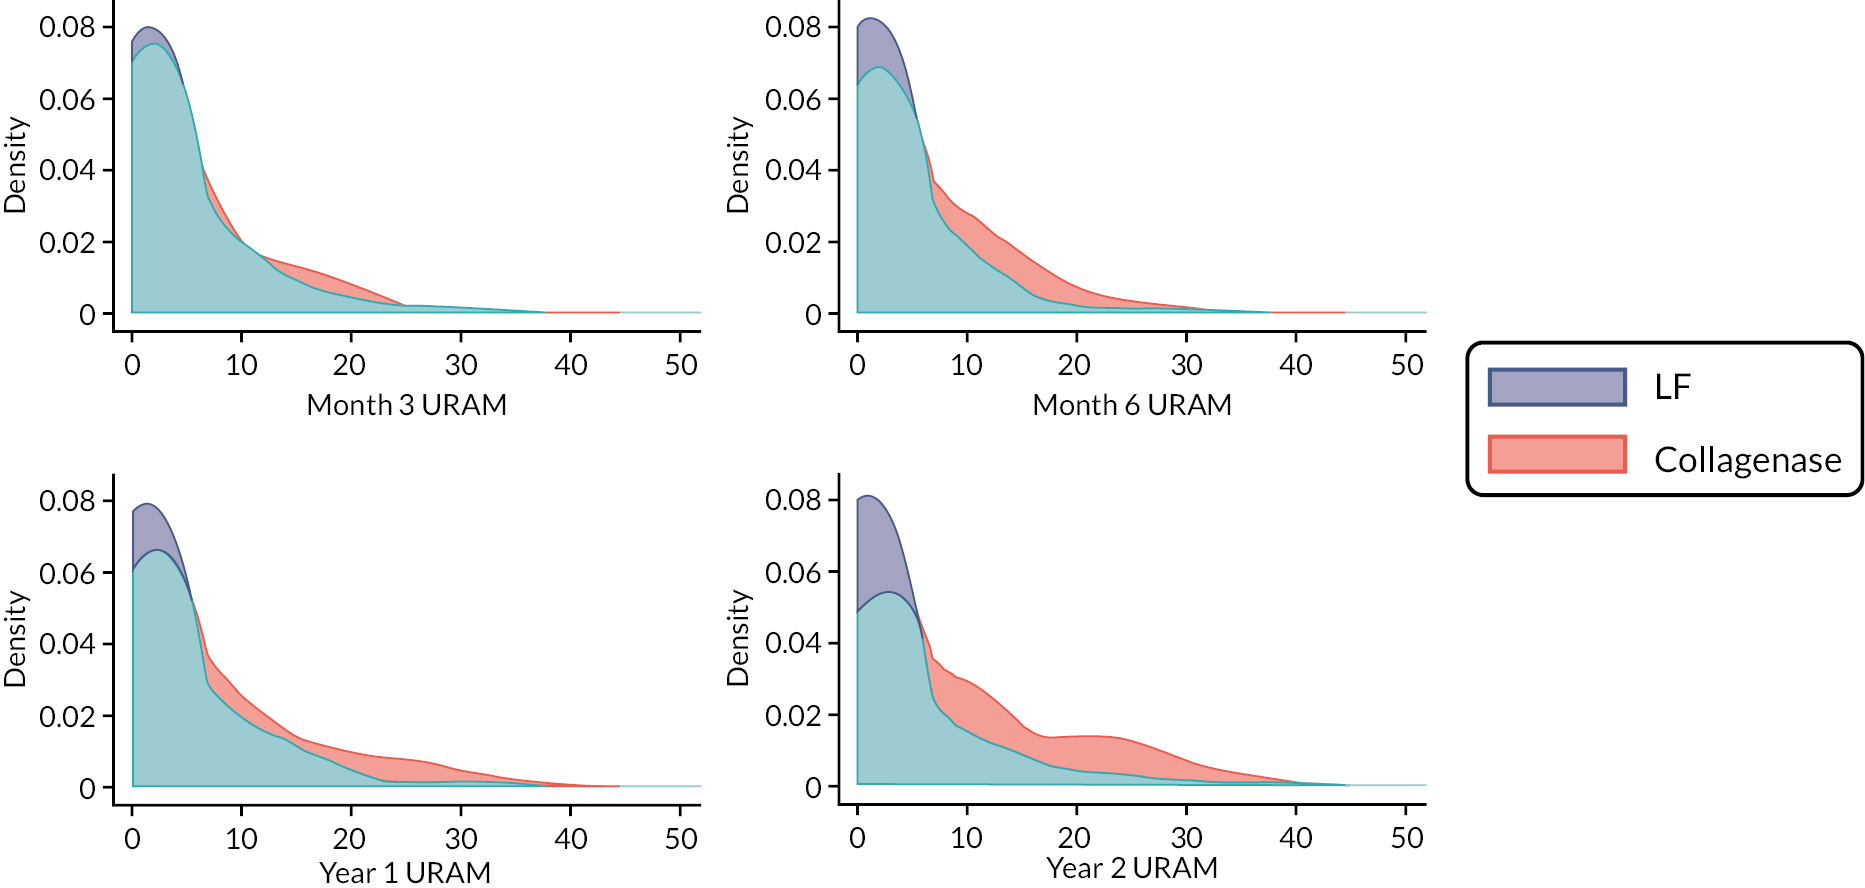
FIGURE 15.
Mean PEM, URAM, MHQ and SANE score profiles by allocation. Vertical dashed line plotted at the median delay between baseline and treatment, with all subsequent time points referenced to this. For the PEM (a), higher scores indicate greater disability/poorer hand health; URAM (b), higher scores indicate greater difficulties/poorer function; MHQ (c), higher scores indicate better function, less pain and greater satisfaction; and SANE (d) higher scores indicate better function.
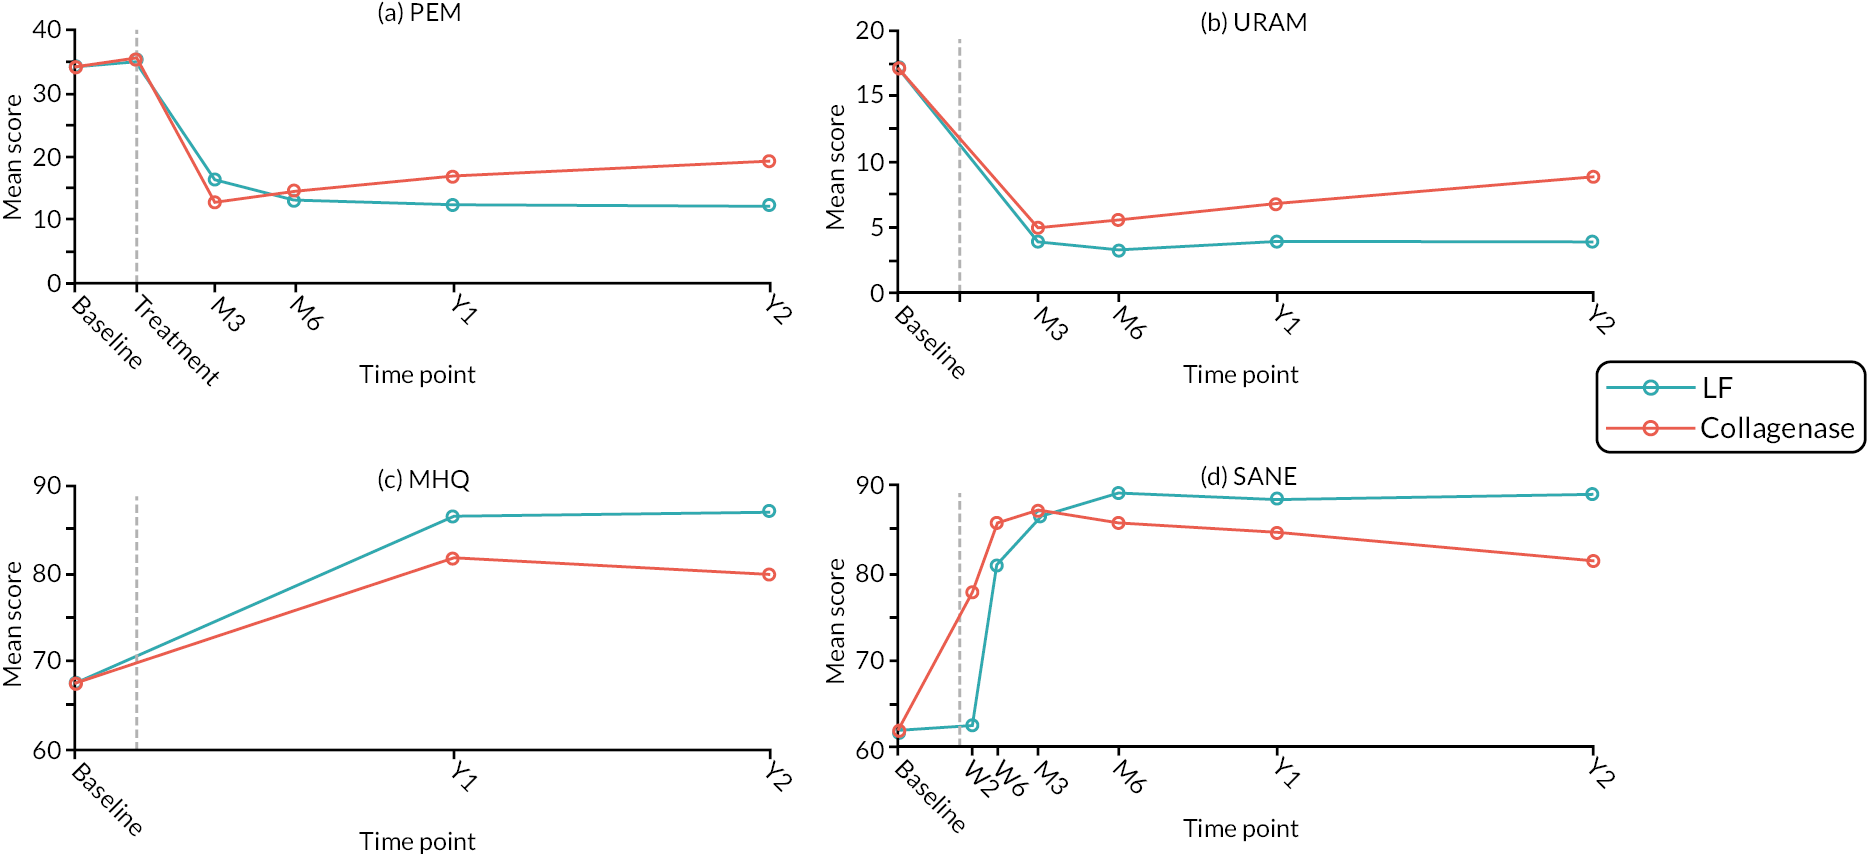
Estimates from the planned analysis of the URAM are given in Table 20 and illustrated in Figure 16. The point estimates suggest greater benefit (on average) from LF than from collagenase at all time points, with this additional benefit steadily increasing over time.
| Estimated difference (collagenase – LF) (95% CIa) |
p-valuea H0: δ = 0 |
|
|---|---|---|
| Month 3 | 0.82 (−0.21 to 1.84) | 0.1199 |
| Month 6 | 2.12 (1.05 to 3.19) | 0.0001 |
| 1 year | 3.42 (2.18 to 4.66) | < 0.00005 |
| 2 years | 5.37 (3.85 to 6.88) | < 0.00005 |
FIGURE 16.
Treatment effect estimates (point estimates and two-sided 95% CIs) at 3 and 6 months and 1 and 2 years. Values above zero indicate greater benefit from LF than from collagenase. Vertical dashed line plotted at the median time between randomisation and treatment delivery with subsequent time points referenced to this.
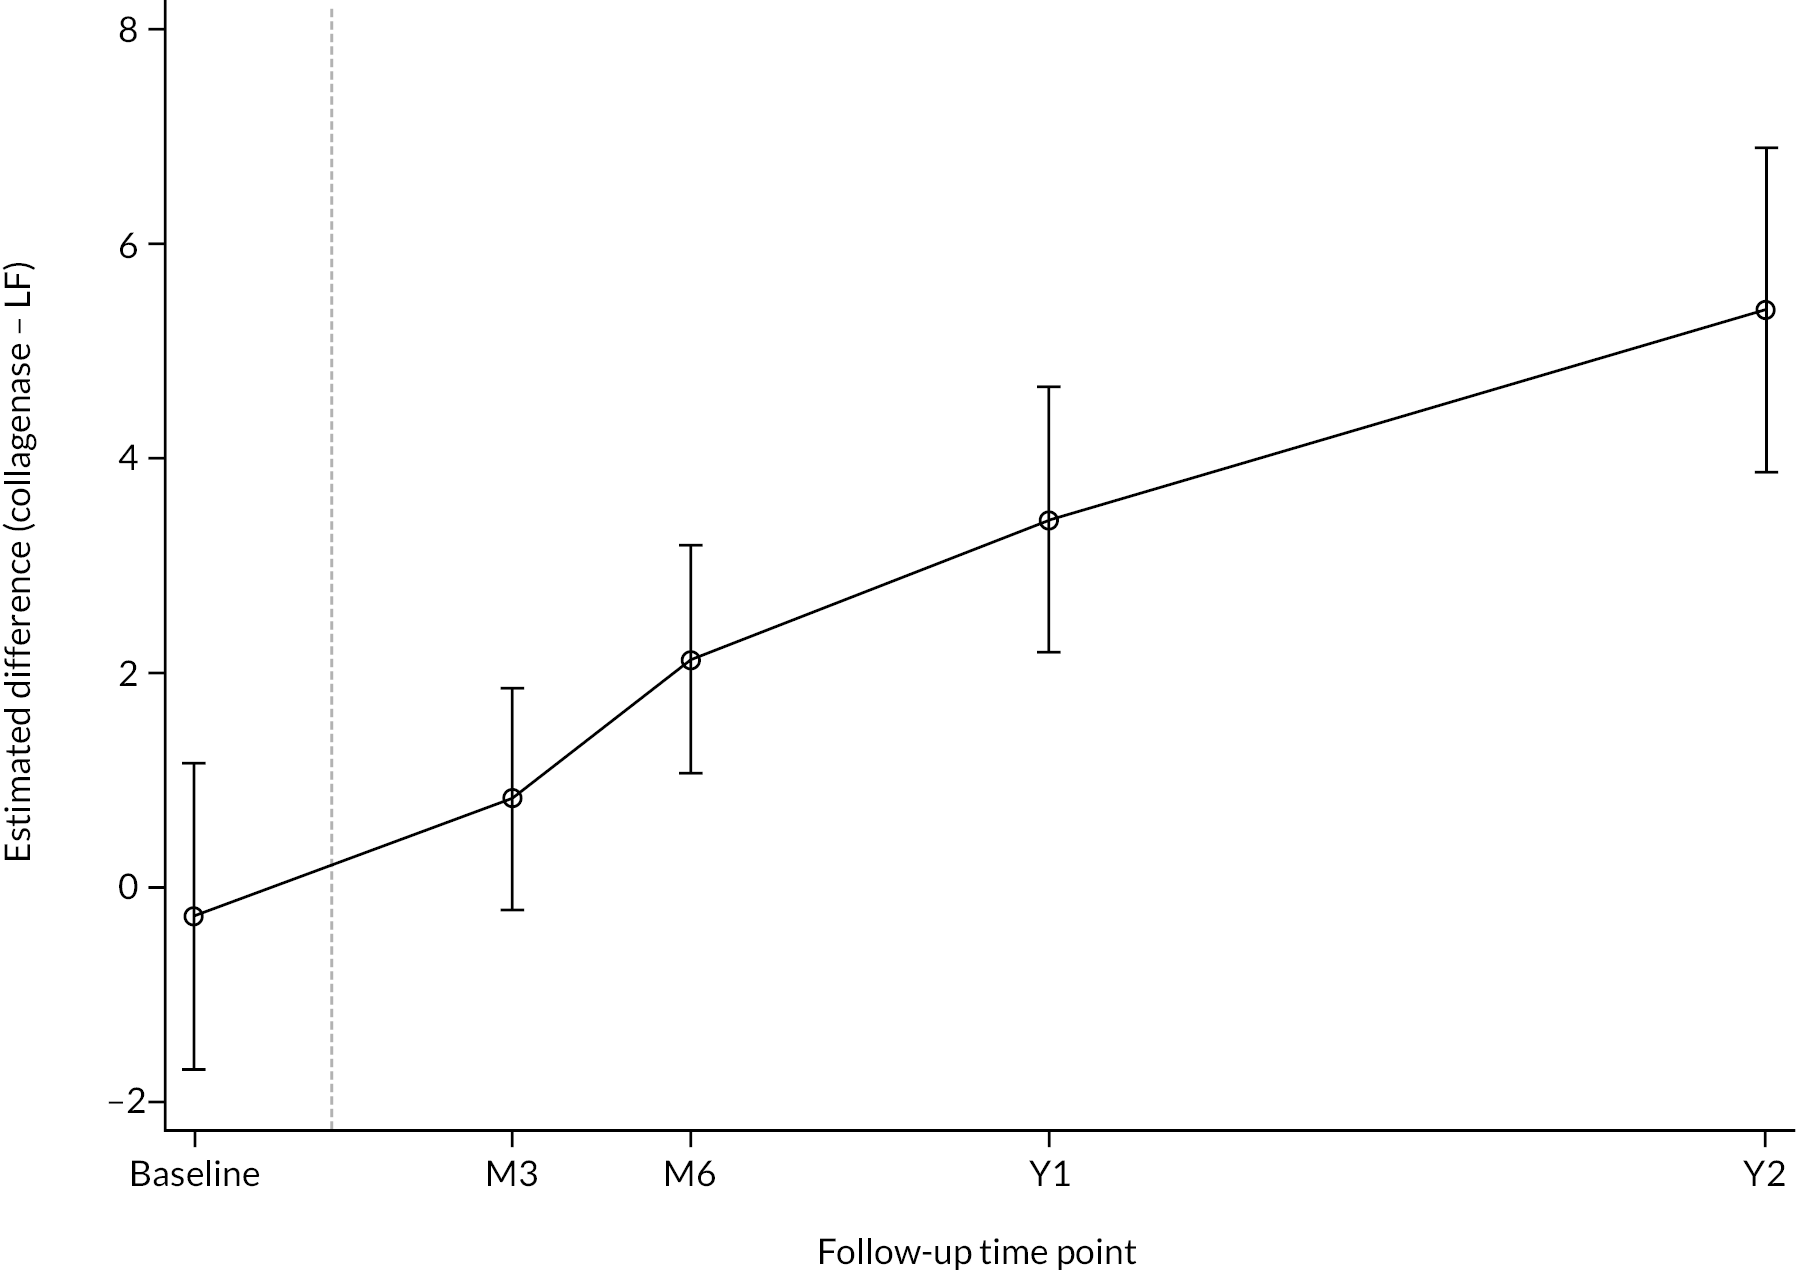
At 3 months there is relatively weak evidence of any important differences between groups. The upper limit of the interval estimate (i.e. 1.84) is considerably smaller than the published point estimate of the minimal clinically important difference for this instrument of 2.9 points (± 2.6)46 and the p-value suggests the observed difference would be relatively unsurprising even if there were truly no difference between groups. At 6 months there is reasonably strong evidence that LF is superior to collagenase, with the hypothesis of no difference being rejected at around the 0.01% level. However, there is no clear evidence of a difference of clinically important magnitude, with much of the interval estimate falling below the estimated minimal clinically important difference of 2.9. That said, hypotheses positing differences as large as 2.9 are reasonably compatible with the observed data, and important differences at 6 months cannot be ruled out. By 1 year there is strong evidence of greater benefit from surgery, with hypotheses positing no difference being highly incompatible with the observed data. In addition, much of the 95% CI estimate lies above or around 2.9, suggesting little discrepancy between the observed data and true differences of clinically important magnitude. By 2 years there is clear evidence of the superiority of surgery over collagenase, in terms of both statistical criteria (i.e. differences of zero are strongly rejected) and substantive criteria (i.e. differences of a clinically immaterial magnitude are strongly rejected).
The results from the semiparametric analyses (reported in Appendix 7, Table 93). The estimates and tests of H0:δ=0 [where δ denotes the true difference (collagenase – LF) in expected score] from these analyses broadly align with those from the planned analysis.
Michigan Hand Outcomes Questionnaire
Summaries of the available MHQ scores (total scores obtained for the reference hand) are reported in Table 21 by time point and allocation. Further information regarding the distribution of the 1- and 2-year follow-up scores is illustrated in Figure 17. The profiles of the mean MHQ scores (based on the available responses) over time are plotted in Figure 15. See Appendix 7, Tables 94–96 for summaries of the MHQ data at each time point broken down by subscale.
| LF N = 336 |
Collagenase N = 336 |
Total N = 672 |
|
|---|---|---|---|
| Baseline (randomised participants) | |||
| N | 328 | 326 | 654 |
| Mean (SD) | 67.5 (17.7) | 67.6 (17.1) | 67.6 (17.4) |
| Median (Q1, Q3) | 70.4 (55.2, 81.1) | 70.1 (56.4, 81.1) | 70.3 (55.6, 81.1) |
| Minimum, maximum | 21.3, 100.0 | 15.5, 99.0 | 15.5, 100.0 |
| Baseline (treated participants) | |||
| N | 288 | 316 | 604 |
| Mean (SD) | 67.8 (17.3) | 67.8 (17.0) | 67.8 (17.1) |
| Median (Q1, Q3) | 70.6 (55.3, 81.1) | 70.3 (56.5, 81.3) | 70.5 (55.7, 81.3) |
| Minimum, maximum | 23.1, 100.0 | 15.5, 99.0 | 15.5, 100.0 |
| 1 year | |||
| N | 236 | 273 | 509 |
| Mean (SD) | 86.5 (15.1) | 81.8 (17.9) | 84.0 (16.8) |
| Median (Q1, Q3) | 91.6 (78.7, 98.8) | 87.5 (70.3, 96.7) | 88.8 (74.8, 97.9) |
| Minimum, maximum | 26.2, 100.0 | 14.5, 100.0 | 14.5, 100.0 |
| 2 years | |||
| N | 189 | 218 | 407 |
| Mean (SD) | 87.2 (15.8) | 79.9 (18.5) | 83.3 (17.7) |
| Median (Q1, Q3) | 93.2 (83.3, 99.0) | 86.1 (67.1, 95.2) | 89.0 (73.7, 97.9) |
| Minimum, maximum | 30.2, 100.0 | 22.4, 100.0 | 22.4, 100.0 |
FIGURE 17.
Kernel density estimates by allocation – MHQ scores at 1 and 2 years post treatment.
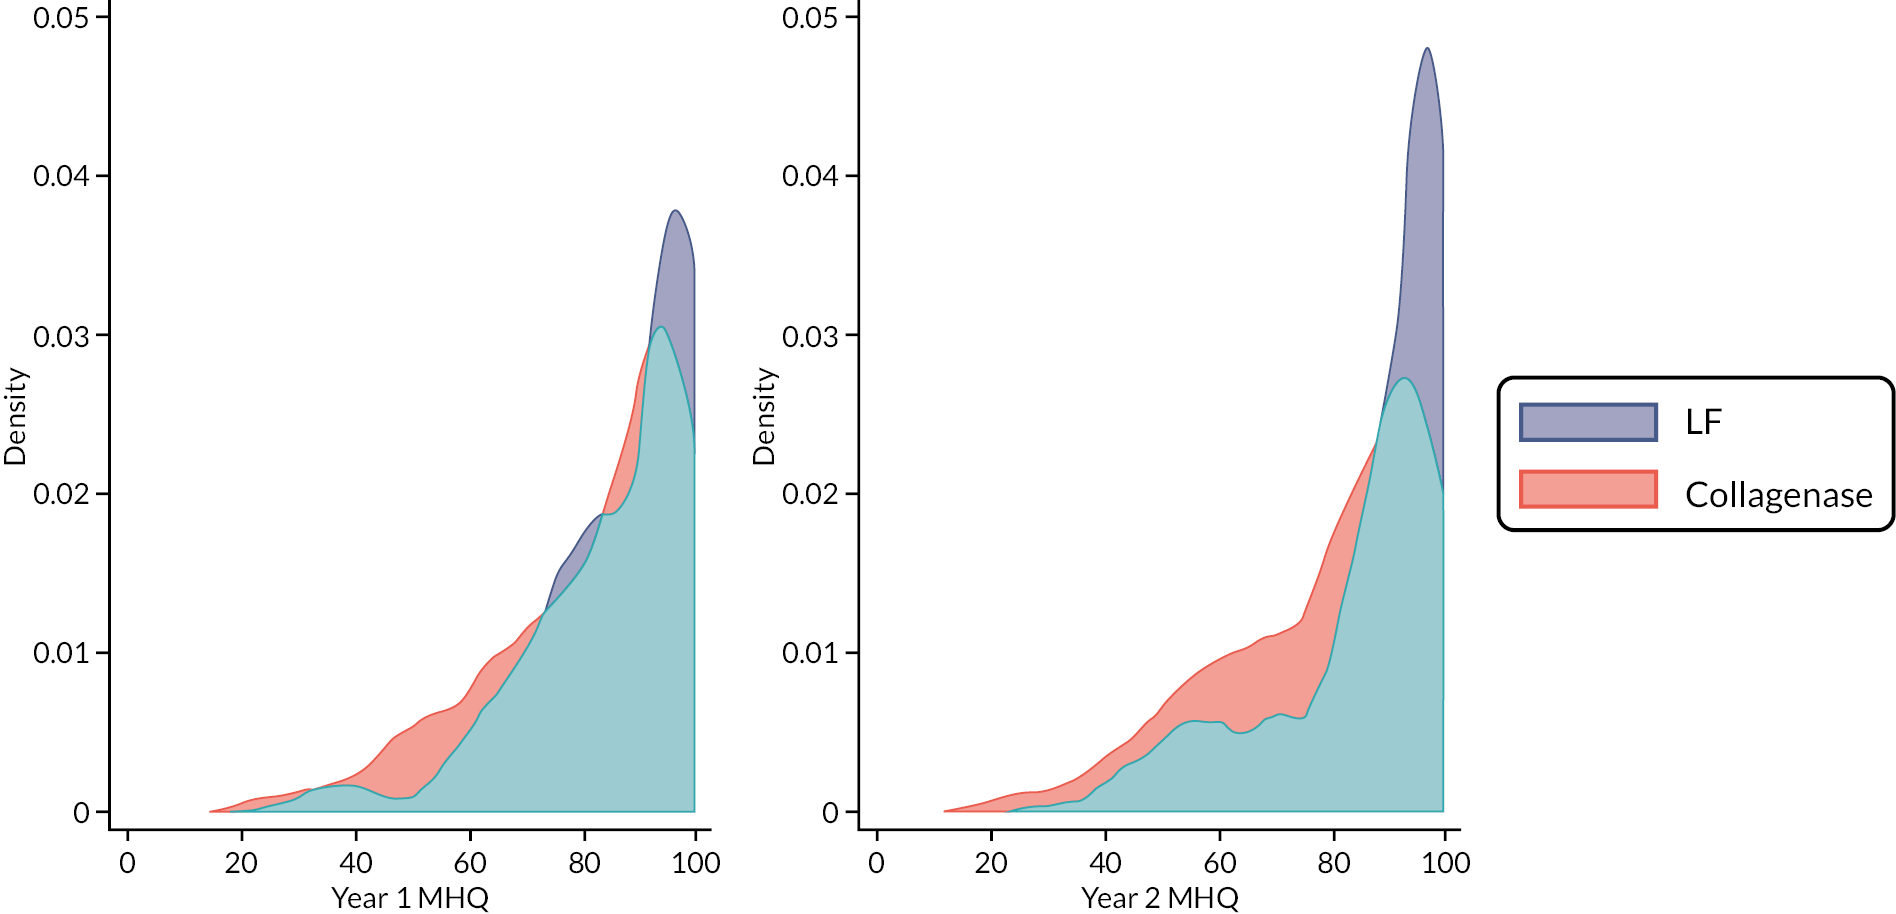
As with the URAM scores, the MHQ scores at baseline are similar across groups for both the randomised and treated populations, and as with the other PROMs, the overall post-treatment measurements are considerably better than the baseline measurements. At 1 year post treatment the scores are generally higher (better) in the LF group compared to the collagenase group. Like both the PEM and the URAM, this gap appears to grow between 1 and 2 years, with the mean score in the collagenase group decreasing slightly between 1 and 2 years, while remaining stable in the LF group. The ceiling effects seen for the PEM and URAM are also evident for the MHQ scores.
Estimates from the planned analysis of the MHQ scores are reported in Table 22 and illustrated in Figure 18. These show evidence of better outcomes in the LF group at 1 and 2 years post treatment, with mean scores in the LF group being about 2–7 points higher at 1 year, and about 4–10 points higher at 2 years, compared with the mean scores of the collagenase group. The p-values suggest substantial discrepancy between the observed data and hypotheses posting no difference. Previous studies suggest the minimum clinically important difference for the MHQ is about 1–2 points. 60 Hence the estimates in Table 21 suggest little discrepancy between the observed data and hypotheses positing clinically important differences in outcomes at 1 and 2 years post treatment (i.e. the data do little to refute claims that there exists a clinically important difference between treatment with regard to these outcomes).
| Estimated difference (collagenase – LF) (95% CIa) |
p-valuea H0: δ = 0 |
|
|---|---|---|
| 1 year | −4.69 (−7.27 to −2.12) | 0.0004 |
| 2 years | −6.71 (−9.60 to −3.82) | < 0.00005 |
FIGURE 18.
Treatment effect estimates (point estimates and two-sided 95% CIs) at 1 and 2 years post treatment. Values below zero indicate greater benefit from LF than from collagenase. Vertical dashed line plotted at the median time between randomisation and treatment delivery with subsequent time points referenced to this.
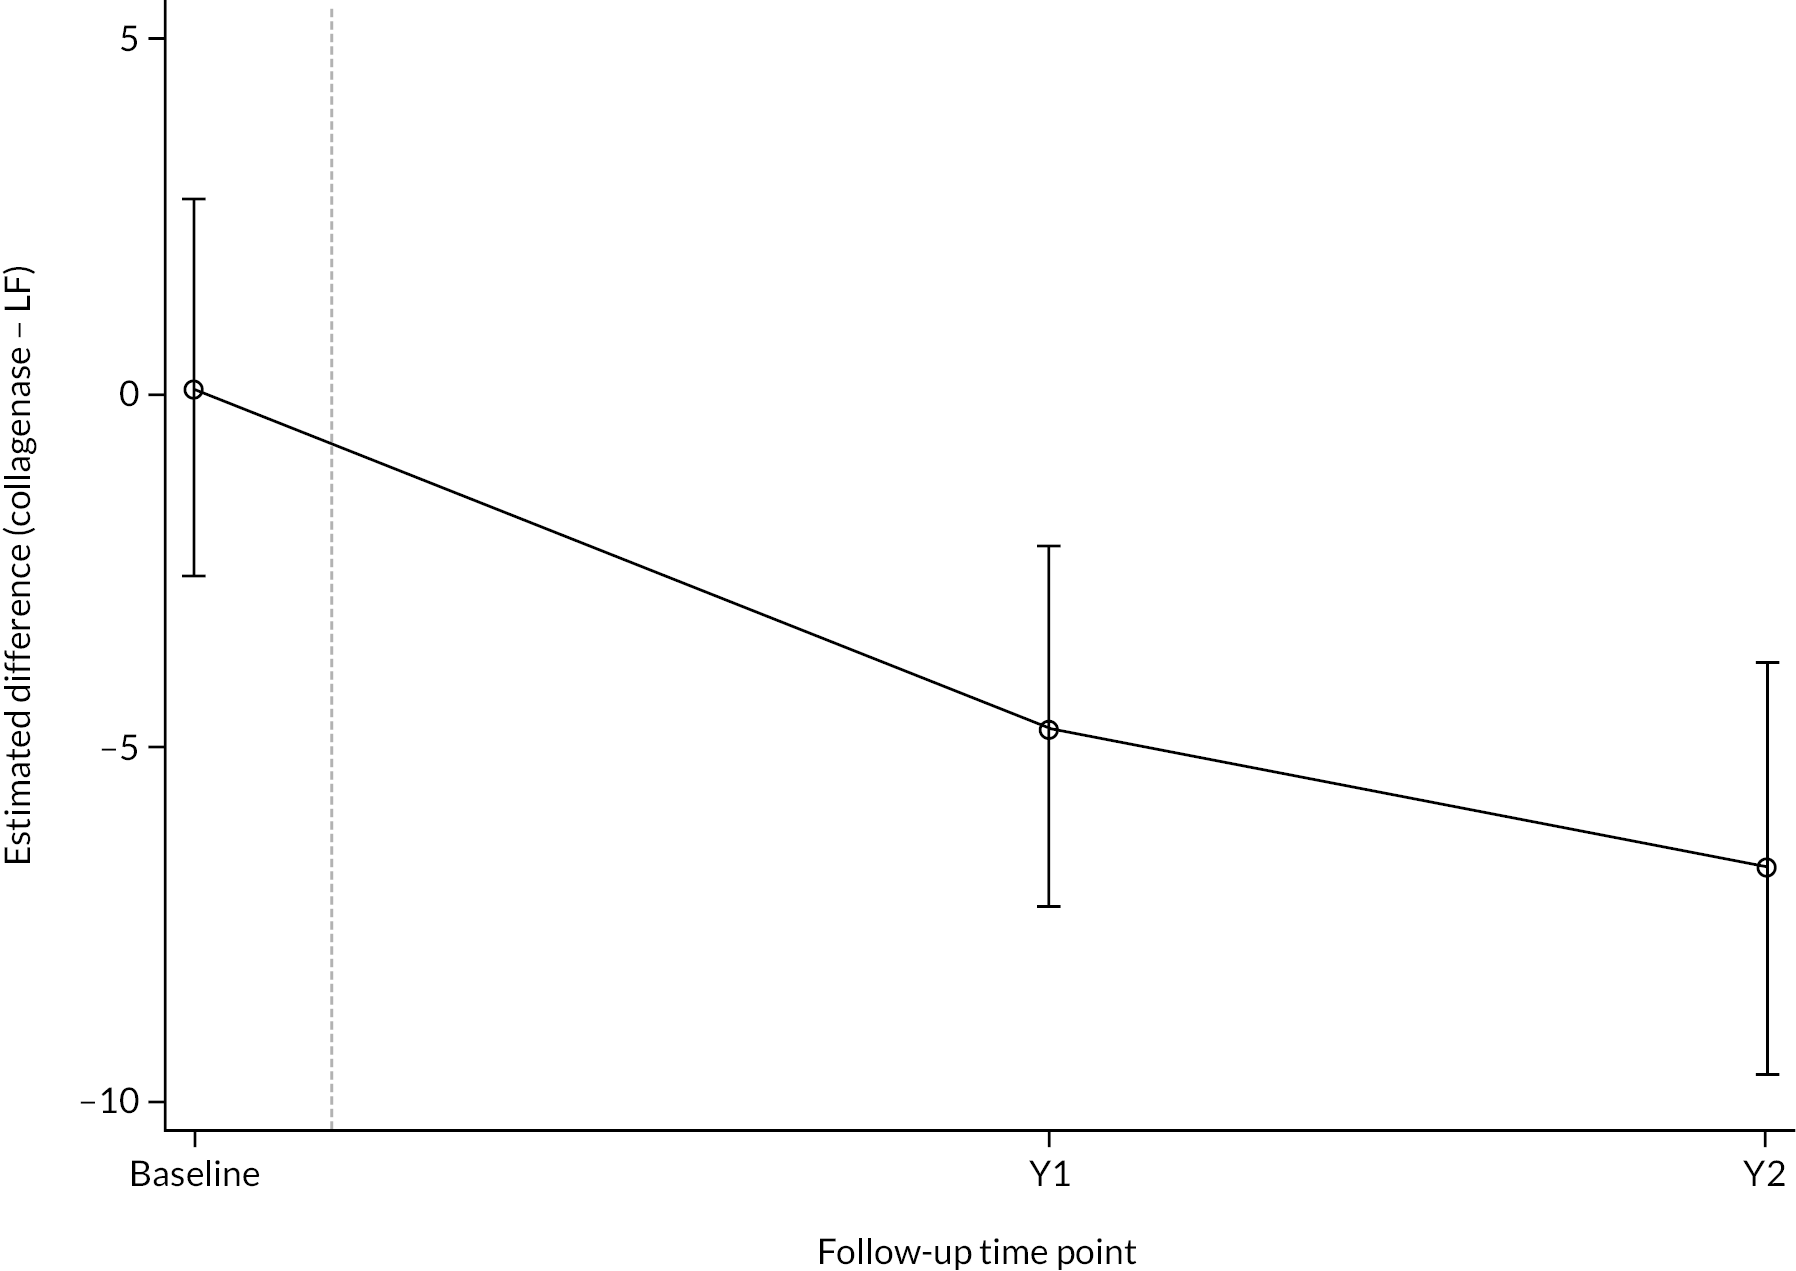
The results from the contingency semiparametric analysis (reported in Appendix 7, Table 97). These results paint a similar picture to those of the planned analysis, albeit with slightly larger point estimates at 2 years, and the overall conclusions remain consistent under this alternative approach/analysis.
Single assessment numeric evaluation
Summaries of the available SANE scores are given in Appendix 7, Table 98 by time point and allocation.
The estimates from the planned analysis of the SANE outcome are reported in Table 23 and plotted in Figure 19. Functional outcomes are better in the short term among those allocated to collagenase, with this initial benefit quickly waning and reversing at about 3–6 months. From about 6 months post treatment onwards, the apparent additional benefit of LF over collagenase continues to grow, resulting in estimates at 1 and 2 years that strongly suggest LF to be the superior treatment with regard to longer-term functional outcomes.
| Estimated difference (collagenase – LF) (95% CIa) |
p-valuea H0: δ = 0 |
|
|---|---|---|
| Week 2 | 14.93 (11.66 to 18.19) | < 0.00005 |
| Week 6 | 5.00 (2.29 to 7.70) | 0.0003 |
| Month 3 | 1.07 (−1.64 to 3.78) | 0.4385 |
| Month 6 | −3.28 (−5.96 to −0.59) | 0.0168 |
| 1 year | −4.93 (−7.63 to −2.22) | 0.0004 |
| 2 years | −8.65 (−11.80 to −5.50) | < 0.00005 |
FIGURE 19.
Treatment effect estimates (point estimates and two-sided 95% CIs) at 2 and 6 weeks, 3 and 6 months, and 1 and 2 years post treatment. Positive values indicate greater benefit from collagenase than from LF. The vertical dashed line is plotted at the median time between randomisation and treatment delivery with subsequent time points referenced to this.
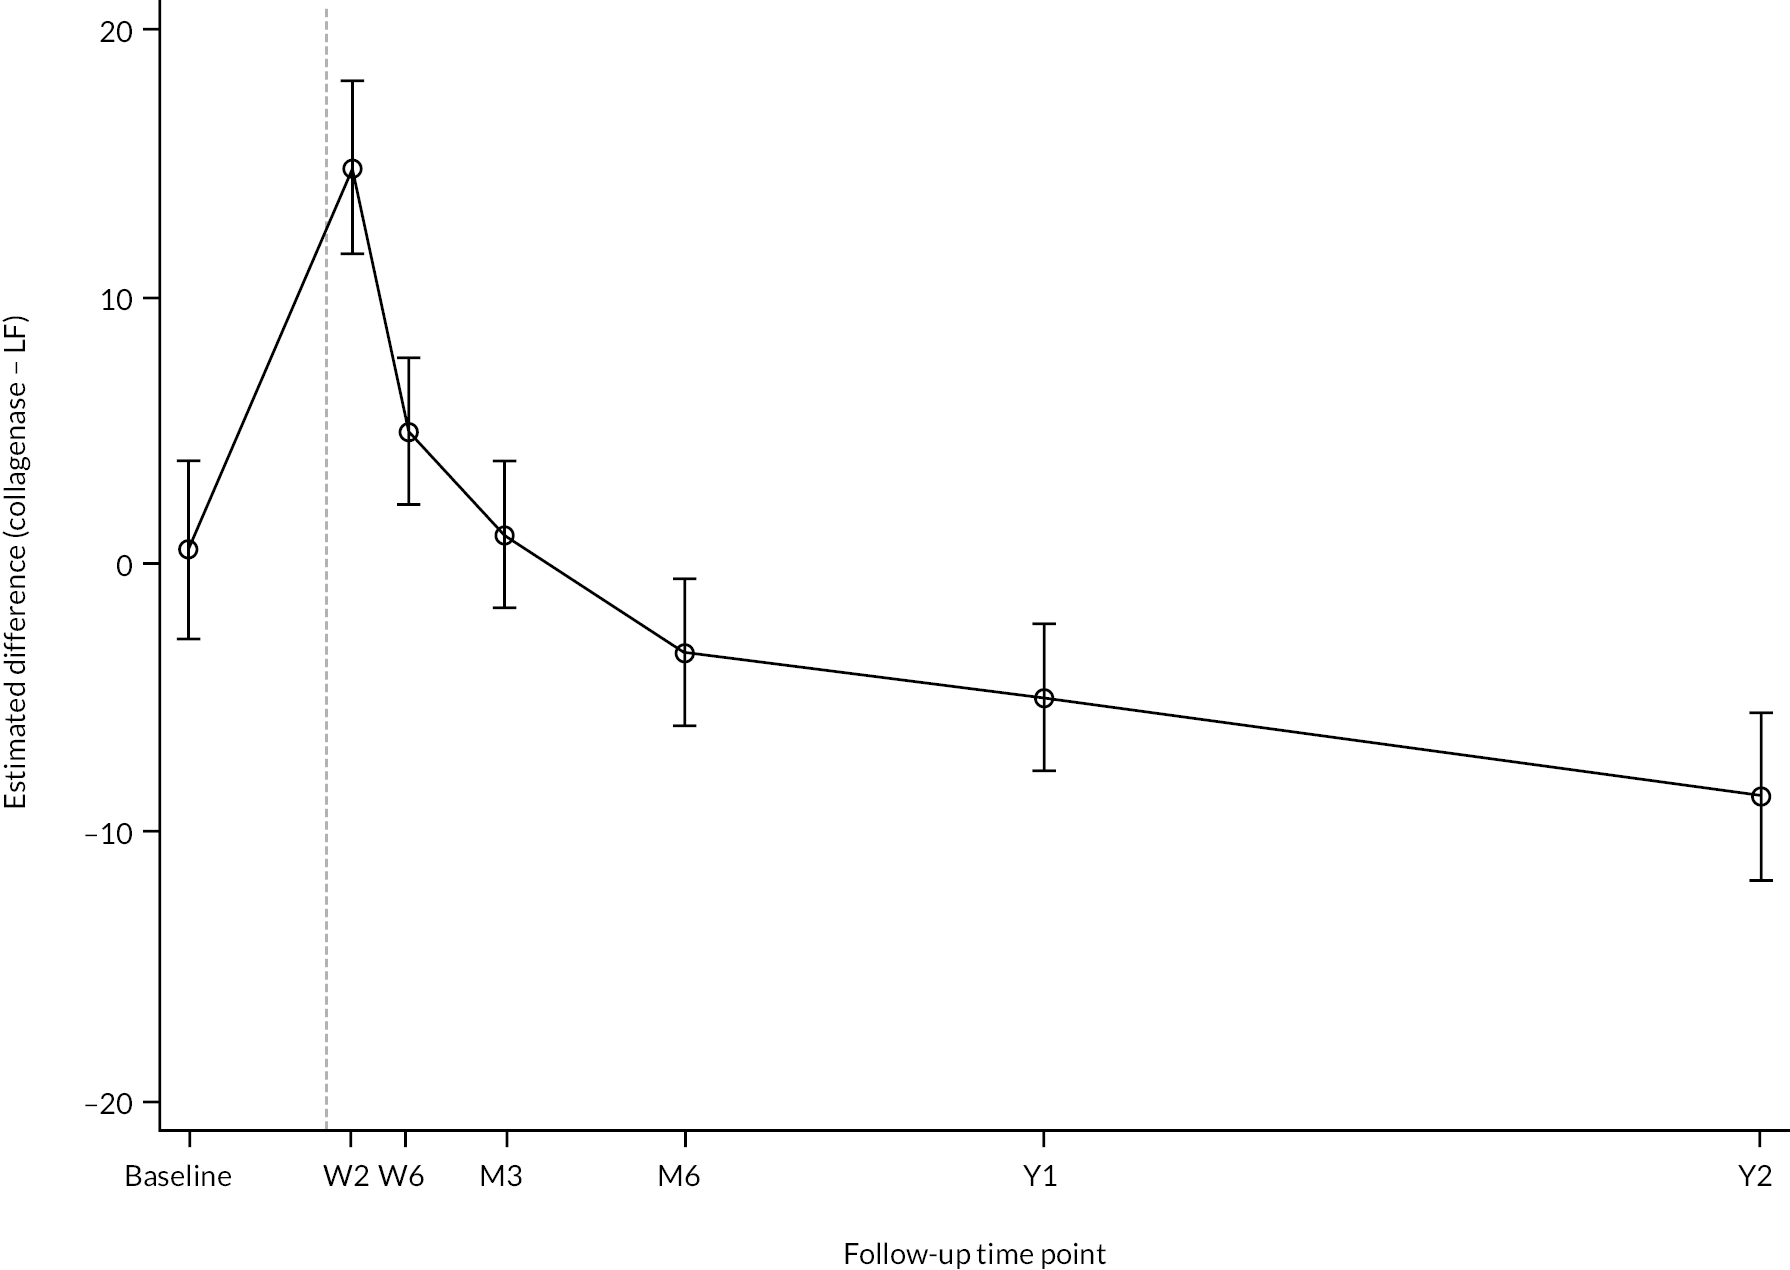
The estimates at 2 and 6 weeks provide strong evidence that treatment with collagenase results in more rapid recovery of function compared with LF. However, the additional benefit of collagenase over LF is not sustained beyond about 3 months post treatment, and important differences between groups are evident from about 1 year post treatment onwards. Similar conclusions applied when semiparametric analyses were conducted (see Appendix 7, Table 99).
Overall hand assessment
Descriptive summaries of the responses by time point and allocation are given in Appendix 7, Table 100 and in Figure 20.
FIGURE 20.
Overall hand assessment responses by time point and allocation.
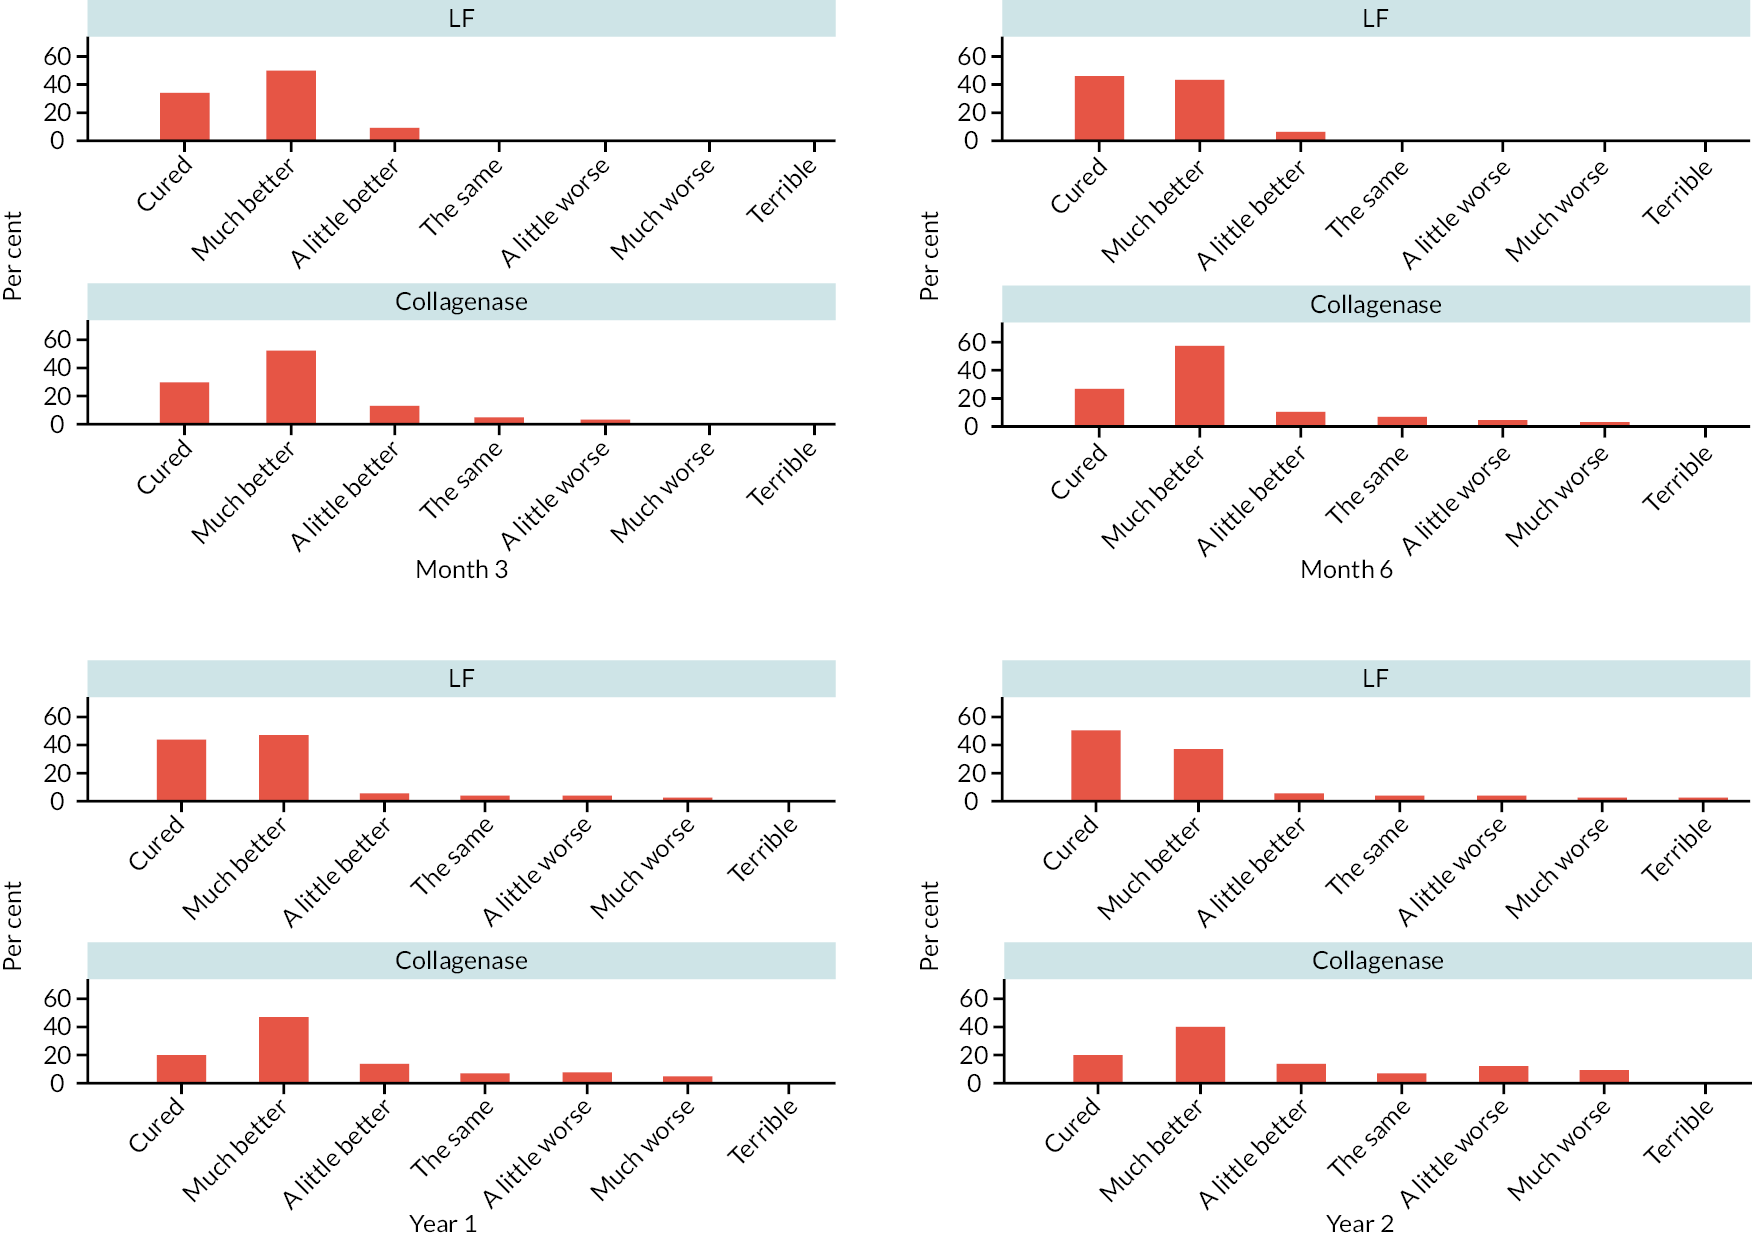
We used a proportional odds model to estimate the effect of allocation on the log-odds of being in the ‘higher’ (worse) category for each natural (i.e. order respecting) dichotomisation of the ordinal scale. We used this model to estimate the absolute difference (between randomised groups) in the probability of providing a response of ‘Cured’ or ‘Much better’ at 1 year. The results of the planned analyses of this outcome at 1 year post treatment are reported in Table 24. There was limited evidence of any important departures from proportional odds with regard to the treatment effect (p = 0.22), hence just the results in Table 24 are reported for this outcome.
| Summary of treatment effect | Covariates (X) | Estimate (95% CIa) | p-valuea |
|---|---|---|---|
| OR | – | 3.01 (2.15 to 4.23) | < 0.00005 |
| RD[Pr(Y = Cured or Much better | X)] | Joint = MCP Baseline PEM = mean |
−0.13 (−0.18 to −0.09) | < 0.00005 |
| RD[Pr(Y = Cured or Much better | X)] | Joint = PIP Baseline PEM = mean |
−0.24 (−0.31 to −0.17) | < 0.00005 |
As expected, based on the raw summary data (see Appendix 7, Table 100), the results in Table 24 show strong evidence that participants allocated to LF were more likely to respond with more positive response than similar participants allocated to collagenase. The estimates of the odds ratio (OR) suggest that for any natural (i.e. order preserving) dichotomisation of the ordinal scale, allocation to collagenase increases the odds of being in the worse category (of the dichotomy) by about two- to fourfold, compared to the odds of the same outcome following allocation to LF.
This apparent shift toward poorer outcomes/less benefit following allocation to collagenase results in substantial differences in the ‘risk’ of a response of ‘Cured’ or ‘Much better’ when mapped to the absolute risk scale. For example, a participant with MCP joint designated as the study reference joint, and baseline PEM score equal to the mean of the observed baseline PEM scores, that is allocated to LF, is estimated to be about 9–18% more likely (in absolute terms) to provide a response of ‘Cured’ or ‘Much better’ at 1 year post treatment than a similar participant allocated to collagenase. Even larger treatment effects are apparent for participants with the PIP joint designated as the study reference joint (and baseline PEM score equal to the mean of the observed baseline PEM scores). For such a participant, this analysis suggests that allocation to collagenase would reduce their probability of providing a response of ‘Cured’ or ‘Much better’ at 1 year by 17–31% (in absolute terms). Hence these results provide strong evidence that allocation to collagenase reduced the probability of more positive overall hand assessments at 1 year post treatment compared with allocation to LF.
Passive extension
Passive extension deficit of the reference joint
Summaries of the passive extension measurements of the reference joint are given in Table 25 by time point and allocation for the subset of 621 participants who were treated as part of the trial. Mean profiles for the available measurements are plotted by randomised group in Figure 21. One feature of the summaries in Table 25 is the number of missing cases (across both groups) at the post-treatment time points (particularly from 6 months onwards). Aside from the losses to follow-up and administrative censoring that affected collection of all outcomes, the collection of the passive extension measurements was particularly impacted by the COVID-19 pandemic. Passive extension can only be measured in clinic by research staff, and therefore could not be collected when participants were followed-up remotely (as was necessitated by lockdowns and/or precautions regarding participant safety).
| LF N = 295 |
Collagenase N = 326 |
Total N = 621 |
|
|---|---|---|---|
| Baseline – passive extension deficit of reference joint (°) | |||
| N (% of treated) | 288 | 318 | 606 |
| Mean (SD) | 46.0 (16.7) | 45.6 (17.2) | 45.8 (17.0) |
| Median (Q1, Q3) | 44.7 (34.0, 59.0) | 45.2 (32.0, 58.3) | 44.7 (32.7, 58.7) |
| Minimum, maximum | 0.0, 90.0 | −10.0, 84.7 | −10.0, 90.0 |
| Pre-treatment – passive extension of reference joint (°) | |||
| N | 265 | 309 | 574 |
| Mean (SD) | 49.5 (17.8) | 48.3 (17.1) | 48.9 (17.4) |
| Median (Q1, Q3) | 50.0 (38.0, 62.0) | 46.0 (38.0, 60.0) | 48.0 (38.0, 60.0) |
| Minimum, maximum | 0.0, 91.0 | −10.0, 92.0 | −10.0, 92.0 |
| Month 3 – passive extension deficit of reference joint (°) | |||
| N | 210 | 226 | 436 |
| Mean (SD) | 5.6 (19.9) | 9.5 (21.0) | 7.6 (20.5) |
| Median (Q1, Q3) | 0.7 (−7.3, 18.3) | 2.7 (−3.3, 23.3) | 1.7 (−5.2, 20.0) |
| Minimum, maximum | −35.0, 70.7 | −42.7, 74.0 | −42.7, 74.0 |
| Month 6 – passive extension of reference joint (°) | |||
| N | 171 | 203 | 374 |
| Mean (SD) | 5.1 (22.8) | 11.4 (22.5) | 8.5 (22.8) |
| Median (Q1, Q3) | 0.0 (−10.0, 16.0) | 6.0 (−0.7, 25.0) | 2.0 (−5.0, 20.7) |
| Minimum, maximum | −30.7, 78.0 | −48.0, 80.0 | −48.0, 80.0 |
| 1 year – passive extension deficit of reference joint (°) | |||
| N | 148 | 172 | 320 |
| Mean (SD) | 4.0 (23.6) | 13.0 (25.3) | 8.8 (24.9) |
| Median (Q1, Q3) | 0.0 (−11.3, 18.7) | 7.7 (−5.2, 29.3) | 1.0 (−7.7, 25.5) |
| Minimum, maximum | −72.0, 73.3 | −38.0, 78.7 | −72.0, 78.7 |
| 2 years – passive extension deficit of reference joint (°) | |||
| N | 116 | 142 | 258 |
| Mean (SD) | 5.4 (26.6) | 16.5 (27.9) | 11.5 (27.9) |
| Median (Q1, Q3) | 0.0 (−12.3, 18.8) | 11.0 (−3.3, 38.7) | 6.0 (−9.3, 30.7) |
| Minimum, maximum | −40.0, 90.0 | −50.0, 88.7 | −50.0, 90.0 |
FIGURE 21.
Mean extension deficit profiles by allocation. Passive extension deficit is plotted in (a) and active extension deficit in (b). For both plots, larger values indicate poorer extension. Vertical dashed line plotted at median time elapsed between randomisation and treatment with subsequent time points referenced to this.
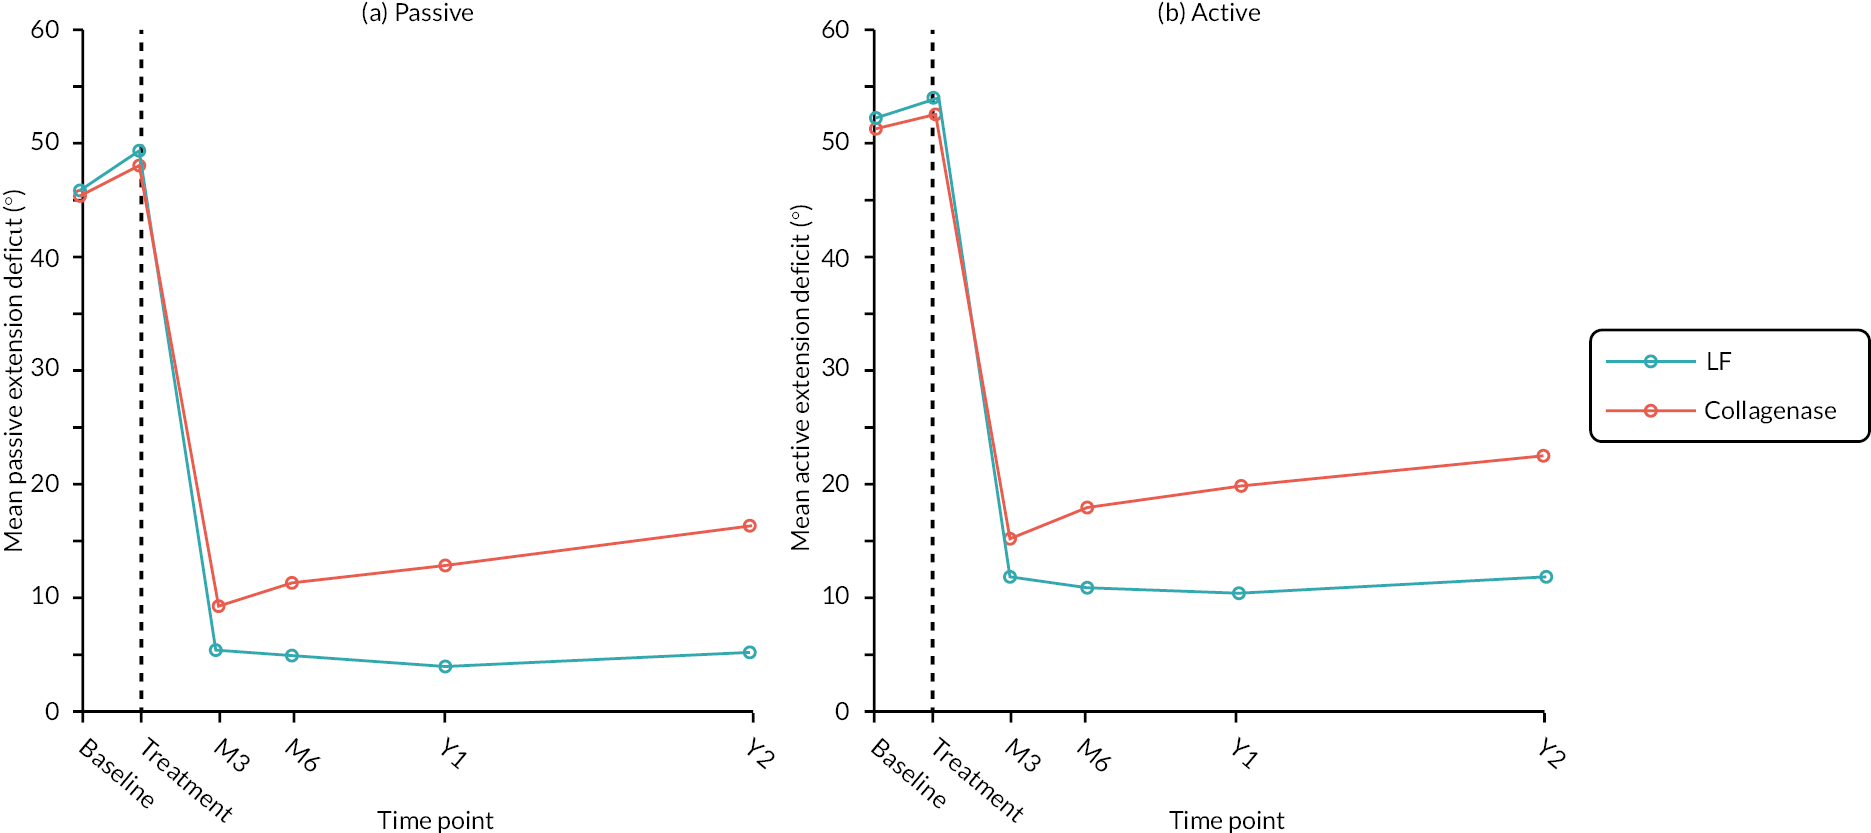
On average, the measurements are similar across groups at baseline (even when considering just treated participants), with the majority having about 30‒60 degrees passive extension deficit. The mean and median of the available pre-treatment measurements are slightly larger than the analogous summaries of the baseline data, but there is little evidence that this increase in passive extension deficit between baseline and treatment differed by group. Following treatment, both groups have reduced passive extension deficit (i.e. greater passive extension) on average, with most participants having measurements between about −5 degrees (i.e. 5 degrees hyperextension) and 20 degrees at 3 and 6 months post treatment (based on the available cases). Despite the improvements following treatment in both groups, the data in Table 25 and profiles in Figure 21 suggest that even at these early time points passive extension deficit was greater (i.e. passive extension was poorer) on average in the collagenase group compared to the LF group. This difference appears to have grown by 1 and 2 years, with mean extension deficit remaining at < 5 degrees in the surgery group, but gradually increasing in the collagenase group from about 11 degrees at 6 months, to about 17 degrees at 2 years post treatment.
Estimated differences in passive extension deficit from the planned analysis of the available data are reported in Table 26. We also repeated this analysis using multiply imputed data. The results from this analysis are reported in Table 27. Note the estimates (from both analyses) can be interpreted as the difference in expected outcome (at each time point), or differences in expected change from baseline (at each time point).
| Estimated differencea (collagenase – LF) (95% CIb) |
p-valueb H0: δ = 0 |
|
|---|---|---|
| Month 3 | 5.73 (2.88 to 8.59) | 0.0001 |
| Month 6 | 9.48 (6.19 to 12.77) | < 0.00005 |
| 1 year | 10.10 (6.46 to 13.73) | < 0.00005 |
| 2 years | 12.92 (8.38 to 17.46) | < 0.00005 |
| LF N = 295 |
Collagenase N = 326 |
Total N = 621 |
|
|---|---|---|---|
| Recurrence, n (%) | |||
| No | 137 (46.4) | 154 (47.2) | 291 (46.9) |
| Yes | 22 (7.5) | 32 (9.8) | 54 (8.7) |
| Missing | 136 (46.1) | 140 (42.9) | 276 (44.4) |
The apparent additional benefits of surgery over collagenase discussed above is reflected in the estimates in Table 26. Extension deficit appears to be worse (on average) following allocation to collagenase at all post-treatment time points. In particular, the p-values at each time point suggest significant differences between groups at the 0.1% level or less. Hence there is strong evidence (on statistical grounds) that LF results in superior outcomes for passive extension deficit in the short term and even more so in the longer term. The results for the imputed data (see Appendix 8, Table 101) are generally similar (as expected given the absence of any a priori reason to seriously doubt the MAR assumption of the planned analysis), and inference is unaffected.
Recurrence
A total of 255 participants (41.1% of those treated) had passive extension deficit measurements of the reference joint available at both 3 months and 1 year post treatment. Of these, 21 had recurrence (i.e. an increase of ≥ 20 degrees between 3 months and 1 year) and 234 did not show recurrence (according to the definition used for the purposes of this study). If the 1-year measurement was missing, but the 3-month and 2-year measurements were available, then participants were assumed to have not had recurrence if the increase in passive extension deficit between 3 months and 2 years was < 20 degrees (59 participants). If a participant was missing the recurrence outcome based on their available 3-month and 1- and 2-year measurements, then they were assumed to have had recurrence if they had an increase in passive extension deficit of ≥ 6 degrees between 3 and 6 months post treatment (31 participants).
A summary of recurrence including the extent of missing cases is given by allocation in Table 27. Approximately 44% of treated participants were missing the recurrence outcome. As discussed in Chapter 3, Passive extension deficit of the reference joint, the collection of passive extension measurements was particularly affected by the COVID-19 pandemic (in addition to usual loss to follow-up mechanisms and administrative censoring). These issues are further compounded by recurrence being defined in terms of a change in measurement between two time points, as both are required to be non-missing to derive the outcome.
When the recurrence outcome was restricted to just the available/complete cases, the majority (84.3%) of complete cases did not meet the definition of recurrence, although a substantial minority (15.7%) did. Recurrence was higher in the collagenase group (17.2% collagenase vs. 13.8% LF). This aligns broadly with the finding from the analysis of the raw measurements, that passive extension deficit tended to increase steadily over the four post-treatment time points in the collagenase group, while remaining stable in the LF group.
Recurrence was analysed twice; firstly, using the 345 cases with non-missing recurrence outcome, and secondly using multiply imputed data (with the recurrence outcome derived based on the observed and imputed passive extension deficit measurements in these imputed data sets). Given the relative sparsity of the outcome data (with respect to the pre-specified variables included in the model), we compared the CI estimates for the effect of allocation (on the log-odds scale) obtained via the Wald method with those obtained via profile likelihood. These were almost identical, so Wald method CIs are reported for the analyses of both the complete cases and the multiply imputed data. The results of these analyses are reported in Table 28 (complete cases) and Appendix 8, Table 102 (multiply imputed data).
| Summary of treatment effect | Covariate pattern X | Estimate (95% CIa) | p-valuea H0: δ = 0 |
p-valueb H0: δ ≥ 0.1 |
|---|---|---|---|---|
| OR | – | 1.39 (0.74 to 2.63) | 0.3104 | – |
| RD[Pr(Recurrence | X)] | Joint = MCP Digit = Ring Baseline PEM = Sample mean Baseline passive ext. = Sample mean |
0.03 (−0.03 to 0.08) | 0.3262 | 0.0032 |
| RD[Pr(Recurrence | X)] | Joint = PIP Digit = Ring Baseline PEM = Sample mean Baseline passive ext. = Sample mean |
0.06 (−0.05 to 0.16) | 0.3174 | 0.2117 |
| RD[Pr(Recurrence | X)] | Joint = MCP Digit = Little Baseline PEM = Sample mean Baseline passive ext. = Sample mean |
0.03 (−0.03 to 0.08) | 0.3213 | 0.0040 |
| RD[Pr(Recurrence | X)] | Joint = PIP Digit = Little Baseline PEM = Sample mean Baseline passive ext. = Sample mean |
0.06 (−0.05 to 0.17) | 0.3114 | 0.2182 |
The results in Table 28 provide weak evidence that recurrence (as defined above) is more probable at 1 year following allocation to collagenase compared with allocation to LF. The point estimate of the OR suggests that a participant allocated to collagenase had about 1.4 times the odds of recurrence compared to a similar participant allocated to LF. Furthermore, the interval estimate suggests the observed data indicate a doubling of the odds of recurrence when allocated to collagenase. In fact, the observed data contain a similar amount of refutational information against the hypothesis H0 : OR = 2 (p = 0.26), as they do against the hypothesis H0 : OR = 1 (p = 0.31). That said, the hypothesis that allocation has no effect on recurrence is not falsified by these data at any conventional level of significance, and the observed data are indeed also compatible with hypotheses positing modest reduction in the odds of recurrence after allocation to collagenase. Hence, the available data taken alone are inconclusive with regard to the presence of a non-zero treatment effect on the OR scale. The available taken data alone do not conclusively demonstrate a difference between groups.
Broadly speaking, the analyses of the complete case data (see Table 28) suggest some evidence that recurrence is more probable following allocation to collagenase, but also provide some weak evidence that the difference may lie within a small margin. As expected, the estimates based on the imputed data (see Appendix 8, Table 102) do not drastically differ.
Total passive extension deficit of the reference digit
The overall patterns of the available total passive extension deficit measurements both within and between groups are similar to those observed for the passive extension deficit of the reference joint (albeit shifted by about −10 degrees at the post-treatment time points) (see Appendix 8, Figure 84 and Table 103). Both treatments provided good initial correction (on average), but extension deficit gradually increased over time among those allocated to collagenase, while remaining approximately the same for those allocated to LF.
In keeping with the results for the passive extension deficit of the reference joint, estimated differences in expected total passive extension deficit (see Appendix 8, Table 104) suggest clear differences in outcome (favouring LF) at all post-treatment time points (at least on statistical grounds).
Passive range of movement of the reference joint
Passive RoM measurements of the reference joint (see Appendix 8, Figure 85 and Table 105) suggest substantial and near identical increase in passive RoM in both groups following treatment. From 3 months onwards, mean passive RoM appears to gradually increase in the LF group, while decreasing by a similar amount in the collagenase group, resulting in clear differences at 6 months, 1 year and 2 years post treatment.
The estimated differences in passive RoM (see Appendix 8, Tables 106 and 107) suggest any differences in passive RoM at 3 months post treatment are likely to be modest, despite the point estimates suggesting slightly greater additional benefit from LF surgery. From 6 months onwards, there is strong evidence (from both analyses) that allocation to collagenase resulted in poorer passive RoM compared with LF. Overall, these results provide reasonably strong evidence that LF results in better passive RoM in the longer term (i.e. 6 months + post treatment) than collagenase, and little evidence to reject hypotheses positing clinically relevant differences between groups with respect to this outcome.
Active extension
Active extension deficit of the reference joint
Like the passive extension measurements, there are a substantial number of missing active extension deficit goniometric measurements (in both groups) (see Appendix 8, Table 108) driven by the move to remote visits during the COVID-19 pandemic (meaning that goniometric measurements of active extension could not be undertaken). In contrast to the passive extension measurements that cannot be obtained remotely, active extension deficit (and flexion) can be measured using photographs of the relevant digit. Hence there are several participants missing a goniometric measurement of the active extension deficit of the reference joint but for whom a measurement could be obtained using available photographs. This facilitates the construction of a second more complete set of measurements at each time point. For the ‘goniometry & photography’ set (see Appendix 8, Figure 86 and Table 109), the proportion of measurements obtained using photography was relatively small (< 10%) up to 6 months post treatment but increases to about 15–25% at 1 and 2 years. Importantly, the proportions are similar across groups at each time point, although slightly higher in the LF group at 1 and 2 years (by about 3–4%).
Baseline active extension deficit measurements are similar across groups for both the ‘goniometry only’ and ‘goniometry & photography’ sets of measurements, with most participants having about 40–65 degrees active extension deficit. There is some evidence of a very slight worsening of active extension between baseline and treatment (e.g. mean active extension deficit measurements are about 2 degrees larger at treatment), but there is no evidence of important differences in progression between groups (for either set of measurements). Following treatment both groups have greater active extension (i.e. reduced extension deficit), although extension deficit is slightly greater in the collagenase arm by 3 months. From this point onwards the apparent difference in favour of LF continues to grow for both sets of measurements, albeit with slightly smaller differences observed for the ‘goniometry & photography’ set than for the ‘goniometry only’ set.
The estimated differences in active extension deficit based on the available data and the multiply imputed data (generated as described in Chapter 3, Primary outcome: missing data sensitivity analyses),) shows active extension deficit appears to be worse (on average) following allocation to collagenase at all post-treatment time points (see Appendix 8, Tables 109 and 110). The p-values at each time point suggest considerable departure between the observed data and hypotheses positing that allocation has no effect on this outcome at that time point. Hence there is strong evidence (on statistical grounds) that LF results in superior outcomes with regard to active extension deficit in the short term and even stronger evidence that it does so in the longer term. Overall, these results would be characterised as providing scant evidence to reject hypotheses that collagenase is inferior by a clinically relevant margin (with regard to this outcome), despite the absence of any pre-specified non-inferiority margin for these analyses.
A post hoc analysis using just the photographic measurements (obtained using researcher taken photographs) (see Appendix 8, Figure 87 and Table 111) to check if conclusions are different based on this alternative set of measurements found similar overall patterns, with LF surgery showing potentially important benefit over collagenase at 1 to 2 years post treatment.
Total active extension deficit of the reference digit
The overall patterns of total active extension deficit measurements both within and between groups are similar to those observed for the active extension deficit of the reference joint (see Appendix 8, Figure 88 and Table 112). Both treatments provided good initial correction (on average), although there is some indication that extension was better in the LF group by 3 months. Following this, extension deficit gradually increased over time among those allocated to collagenase, while remaining approximately the same for those allocated to LF.
The data refute hypotheses positing no effect of allocation on expected total active extension deficit in the short term, and strongly refute no effect of allocation on this outcome in the longer term (see Appendix 8, Table 113). For example, even at 3 months post treatment, the refutational information against H0:δ=0 (measured in bits) is around twice as strong as it is against H0:δ=10. No non-inferiority margin was specified for this outcome, hence the evidence against hypotheses positing differences of clinically relevant magnitude is less clear. However, it would be reasonable to postulate that the interval estimates cover values that reflect clinically important differences in this outcome. For example, the upper limits of the interval estimates at 1 and 2 years are > 20 degrees, which itself corresponds to standardised mean difference of about 0.65. Overall, the data provide little-to-no evidence to support rejection of the hypothesis that collagenase is inferior to LF in terms of the total active extension of the treated digit in the medium to long term.
Active range of movement of the reference joint
As for the active extension deficit measurements of the reference joint (see Appendix 8, Table 108), both sets of active RoM measurements (i.e. those obtained via goniometry only and those obtained via goniometry and photography) are similar across groups at baseline (see Appendix 8, Table 114 and Figure 89). There is a substantial increase in active RoM following treatment, with the mean measurement at 3 months in both groups being approximately double the mean measurement at baseline. Active RoM appears to increase slightly (on average) between 3 and 6 months in the LF group and decrease slightly in the collagenase group. From 6 months onwards measurements in the LF group remain stable (on average), while those for participants allocated to collagenase tend to decrease slightly, resulting in quite substantial differences in RoM by 2 years post treatment. These observations regarding the trends in average RoM over time apply equally to both sets of measurements (i.e. those obtained via goniometry only and those obtained via goniometry and photography). In addition, there is no clear patterns with regard to the proportion of participants in each group that had measurements obtained using photography due to missing goniometric measurements (for the ‘goniometry & photography’ set of measurements).
From the estimated differences in expected active RoM (see Appendix 8, Tables 115 and 116), there appears to be relatively limited evidence of any important effect of allocation on active RoM at 3 months post treatment. Differences in outcome appear to increase substantially between 3 and 6 months and continue to do so between 6 months and 1 year, with interval estimates for the difference in active RoM at 1 year post treatment (from both analyses) indicating the data are reasonably compatible with hypotheses positing a true difference in favour of LF of 16 degrees. Assuming a minimal clinically important difference of 13.5 degrees,61 it would be reasonable to conclude that the data provide limited evidence to reject hypotheses positing that collagenase is inferior to LF by a clinically relevant margin (since any non-inferiority margin that might be entertained could not reasonably be any larger in absolute terms than 13.5 degrees). By 2 years post treatment, the point estimate for the difference in expected active RoM is very close to the published minimal clinically important difference (for both analyses), meaning the data are compatible with hypotheses positing clinically relevant differences between collagenase and LF. Overall, there is strong evidence refuting the claim that medium- to long-term active RoM is unaffected by allocation, and reasonably strong evidence refuting the claim that collagenase is inferior only by a clinically irrelevant amount (with regard to long-term active RoM).
Treatment complications
Overall, there were 177 treatment complications reported for participants in the LF group (0.60 complications per treated participant), and 267 for participants in the collagenase group (0.82 complications per treated participant). Of the 295 participants allocated to LF that received treatment as part of the trial, 106 (36%) had at least one treatment complication reported. Of the 326 participants allocated to collagenase (and treated as part of the trial) 135 (41%) had at least one treatment complication reported.
A detailed summary of the complications reported among the 621 treated participants is provided in Table 29.
| LF N = 295 |
Collagenase N = 326 |
Total N = 621 |
|
|---|---|---|---|
| None, n (%a) | 189 (64.1) | 191 (58.6) | 380 (61.2) |
| Amputation, n (%a) | 1 (0.3) | 0 (0.0) | 1 (0.2) |
| Bleeding, n (%a) | 7 (2.4) | 2 (0.6) | 9 (1.4) |
| Blood blister, n (%a) | 1 (0.3) | 19 (5.8) | 20 (3.2) |
| CRPS algodystrophy, n (%a) | 2 (0.7) | 0 (0.0) | 2 (0.3) |
| Carpal tunnel syndrome, n (%a) | 1 (0.3) | 0 (0.0) | 1 (0.2) |
| Cubital tunnel syndrome, n (%a) | 1 (0.3) | 2 (0.6) | 3 (0.5) |
| Dizziness, n (%a) | 1 (0.3) | 1 (0.3) | 2 (0.3) |
| Ecchymosis, n (%a) | 3 (1.0) | 31 (9.5) | 34 (5.5) |
| Erythema, n (%a) | 1 (0.3) | 4 (1.2) | 5 (0.8) |
| Haematoma, n (%a) | 1 (0.3) | 0 (0.0) | 1 (0.2) |
| Headache, n (%a) | 0 (0.0) | 1 (0.3) | 1 (0.2) |
| Instability, n (%a) | 0 (0.0) | 1 (0.3) | 1 (0.2) |
| Joint pain (arthralgia), n (%a) | 0 (0.0) | 5 (1.5) | 5 (0.8) |
| Joint swelling, n (%a) | 3 (1.0) | 9 (2.8) | 12 (1.9) |
| Lymphangitis, n (%a) | 0 (0.0) | 2 (0.6) | 2 (0.3) |
| Lymphadenopathy, n (%a) | 0 (0.0) | 3 (0.9) | 3 (0.5) |
| Musculoskeletal discomfort or stiffness, n (%a) | 28 (9.5) | 4 (1.2) | 32 (5.2) |
| Nausea, n (%a) | 0 (0.0) | 1 (0.3) | 1 (0.2) |
| Nerve dysesthesia, n (%a) | 6 (2.0) | 5 (1.5) | 11 (1.8) |
| Nerve hypoesthesia, n (%a) | 9 (3.1) | 3 (0.9) | 12 (1.9) |
| Nerve injury, n (%a) | 10 (3.4) | 2 (0.6) | 12 (1.9) |
| Nerve paraesthesia, n (%a) | 19 (6.4) | 12 (3.7) | 31 (5.0) |
| Other, n (%a) | 1 (0.3) | 0 (0.0) | 1 (0.2) |
| Pain, n (%a) | 16 (5.4) | 47 (14.4) | 63 (10.1) |
| Pain or swelling tenderness, n (%a) | 12 (4.1) | 29 (8.9) | 41 (6.6) |
| Pruritus, n (%a) | 1 (0.3) | 3 (0.9) | 4 (0.6) |
| Raynaud's, n (%a) | 5 (1.7) | 2 (0.6) | 7 (1.1) |
| Retained suture, n (%a) | 1 (0.3) | 0 (0.0) | 1 (0.2) |
| Scar pain, n (%a) | 13 (4.4) | 0 (0.0) | 13 (2.1) |
| Scar related, n (%a) | 8 (2.7) | 2 (0.6) | 10 (1.6) |
| Skin laceration, n (%a) | 2 (0.7) | 59 (18.1) | 61 (9.8) |
| Wound (dehiscence), n (%a) | 5 (1.7) | 0 (0.0) | 5 (0.8) |
| Wound (delayed healing), n (%a) | 10 (3.4) | 0 (0.0) | 10 (1.6) |
| Wound (infection), n (%a) | 6 (2.0) | 0 (0.0) | 6 (1.0) |
The number and proportion of the 621 treated participants that experienced a complication at each grade (or not at all) are reported by allocation in Table 30. Brief details of the complications graded as ‘Moderate’ or ‘Severe’ are provided (see Appendix 8, Table 117). From Table 36, it is apparent that a larger proportion of participants in the collagenase group experienced at least one complication (36% in the LF group vs. 41% in the collagenase group). However, we again see that a higher proportion of participants in the LF group experienced ‘Moderate’ or ‘Severe’ complications (5% in the LF group vs. 2% in the collagenase group), and a lower proportion experienced ‘Very minor’ complications (7% in the LF group vs. 18% in the collagenase group). Together these tables suggest that while incidence of complications was higher in the collagenase group, they tended to be somewhat less severe than those in the LF group.
| LF N = 295 |
Collagenase N = 326 |
Total N = 621 |
|
|---|---|---|---|
| None, n (%a) | 189 (64.1) | 191 (58.6) | 380 (61.2) |
| Very minor, n (%a) | 20 (6.8) | 58 (17.8) | 78 (12.6) |
| Mild, n (%a) | 90 (30.5) | 105 (32.2) | 195 (31.4) |
| Moderate, n (%a) | 13 (4.4) | 6 (1.8) | 19 (3.1) |
| Severe, n (%a) | 3 (1.0) | 0 (0.0) | 3 (0.5) |
| Devastating, n (%a) | 0 (0.0) | 0 (0.0) | 0 (0.0) |
| Death, n (%a) | 0 (0.0) | 0 (0.0) | 0 (0.0) |
A breakdown of the severity of the worst single complication experienced by each participant is given in Table 31. This restricted set of complications exhibits similar patterns to the full set, with more complications overall among participants allocated to collagenase, but more complications deemed to be ‘Moderate’ or ‘Severe’ among those allocated to LF.
| LF N = 295 |
Collagenase N = 326 |
Total N = 621 |
|
|---|---|---|---|
| Worst treatment complication grade, n (%) | |||
| No complications | 189 (64.1) | 191 (58.6) | 380 (61.2) |
| Very minor | 8 (2.7) | 26 (8.0) | 34 (5.5) |
| Mild | 83 (28.1) | 103 (31.6) | 186 (30.0) |
| Moderate | 12 (4.1) | 6 (1.8) | 18 (2.9) |
| Severe | 3 (1.0) | 0 (0.0) | 3 (0.5) |
| Devastating | 0 (0.0) | 0 (0.0) | 0 (0.0) |
| Death | 0 (0.0) | 0 (0.0) | 0 (0.0) |
The planned analysis of this outcome (i.e. most severe single complication) was using a proportional odds model (i.e. ordinal logistic regression with a single term for the treatment effect to capture overall shifts in outcomes across all levels of the ordinal scale), with a secondary analysis using a partial proportional odds model (with the proportional odds assumption relaxed for the effect of allocation but retained for all other variables in the model). However, Table 31 suggests any effects of allocation show considerable departure from proportional odds, with allocation to collagenase seemingly shifting participants toward worse grades at the lower end of the scale (compared to LF), while simultaneously shifting participants toward less-severe grades at the top end of the scale. We therefore consider only the results of analyses based on the partial proportional odds model (since any single-number summary of treatment effect is unlikely to be appropriate for the data at hand).
Table 32 provides treatment effect estimates (conditional on covariates X) on both the RD (RR; collagenase – LF) and risk ratio (collagenase/LF) scales based on the fitted partial proportional odds model. The risks being contrasted in each case are the risk of a complication at least as bad as grade y, where y takes the values ‘Very minor’, ‘Mild’ or ‘Moderate’. It should be noted that the effect of allocation on experiencing a complication graded ‘Severe’ (or worse) cannot be reasonably estimated based on the data alone due to the sparseness of the cells at this upper end of the scale (three events in the LF group and zero events in the collagenase group). Hence based on the data alone, there is little evidence to refute any plausible hypotheses regarding the effect of allocation on the incidence of severe (or worse) complications, except those that posit any strong favourable effects of allocation to LF.
| Grade (y) | Reference joint | RD[Pr(Y ≥ y | X)] Estimate (95% CIa); p-valueb |
RR[Pr(Y ≥ y | X)] Estimate (95% CIa); p-valueb |
|---|---|---|---|
| Very minor | MCP | 0.052 (−0.012 to 0.116); p = 0.1106 | 1.079 (0.990 to 1.176); p = 0.0827 |
| PIP | 0.049 (−0.010 to 0.108); p = 0.1065 | 1.070 (0.990 to 1.156); p = 0.0889 | |
| Mild | MCP | 0.003 (−0.069 to 0.075); p = 0.9380 | 1.004 (0.904 to 1.115); p = 0.9377 |
| PIP | 0.003 (−0.065 to 0.070); p = 0.9379 | 1.004 (0.915 to 1.101); p = 0.9377 | |
| Moderate | MCP | −0.077 (−0.202 to 0.049); p = 0.2311 | 0.920 (0.796 to 1.063); p = 0.2561 |
| PIP | −0.066 (−0.179 to 0.047); p = 0.2518 | 0.931 (0.819 to 1.058); p = 0.2742 |
As expected, based on the frequencies and proportions given in Table 31, the data are most compatible with hypotheses positing that treatment with collagenase causes a small increase in the risk of having a complication (of any severity). This appears to apply similarly to participants in both reference joint strata (at least for those with average baseline passive extension deficit). However considerable uncertainty remains, with the data providing little refutational information against hypotheses positing both small reductions in risk of any complication following allocation to collagenase, as well as substantial increases. There appears to be little impact of allocation on the incidence of complications graded ‘Mild’ or worse, although again there is little information in the data to refute important differences (e.g. 7% on the absolute risk scale) in either direction. The data alone are again relatively uninformative with regard to the effect of allocation on the incidence of complications graded ‘Moderate’ or worse, due to the small number of participants that had complications assigned these grades. The data are most compatible with allocation to collagenase resulting in a lower incidence of complications graded ‘Moderate’ or worse (e.g. 7% reduction in absolute risk and 8–9% reduction in relative risk), and reasonably compatible with large reductions in the risk of these more serious complications (e.g. 18–20% reduction in absolute risk and 20% reduction in relative risk). However, the data are also not particularly at odds with the frequencies that might occur if allocation to collagenase truly had no effect on the incidence of complications of moderate severity or worse, or even slightly increased the incidence of such complications (compared to LF).
On the suggestion of the trial data monitoring committee, we pre-specified and undertook an analysis of the complications data excluding skin tears sustained during manipulation following treatment using collagenase. The rationale for this supplementary analysis is that skin tears are an expected and easily managed aspect of the procedure, and therefore could justifiably be discounted as treatment complications (see Appendix 8, Figure 90 and Table 118 for results of these analyses).
Further treatment
Overall summaries relating to the delivery of further treatments (i.e. further care and/or re-intervention) by 1 and 2 years post treatment and are given in Tables 33 and 34, respectively.
| LF N = 295 |
Collagenase N = 326 |
Total N = 621 |
|
|---|---|---|---|
| Extended course of physiotherapy, n (%) | |||
| No | 180 (61.0) | 224 (68.7) | 404 (65.1) |
| Yes | 12 (4.1) | 1 (0.3) | 13 (2.1) |
| Missing | 103 (34.9) | 101 (31.0) | 204 (32.9) |
| Collagenase injection, n (%) | |||
| No | 191 (64.7) | 223 (68.4) | 414 (66.7) |
| Yes | 0 (0.0) | 2 (0.6) | 2 (0.3) |
| Missing | 104 (35.3) | 101 (31.0) | 205 (33.0) |
| LF, n (%) | |||
| No | 189 (64.1) | 217 (66.6) | 406 (65.4) |
| Yes | 2 (0.7) | 10 (3.1) | 12 (1.9) |
| Missing | 104 (35.3) | 99 (30.4) | 203 (32.7) |
| Dermo-fasciectomy, n (%) | |||
| No | 191 (64.7) | 225 (69.0) | 416 (67.0) |
| Missing | 104 (35.3) | 101 (31.0) | 205 (33.0) |
| PNF, n (%) | |||
| No | 189 (64.1) | 222 (68.1) | 411 (66.2) |
| Yes | 2 (0.7) | 3 (0.9) | 5 (0.8) |
| Missing | 104 (35.3) | 101 (31.0) | 205 (33.0) |
| Any re-intervention, a n (%) | |||
| No | 187 (63.4) | 212 (65.0) | 399 (64.3) |
| Yes | 4 (1.4) | 15 (4.6) | 19 (3.1) |
| Missing | 104 (35.3) | 99 (30.4) | 203 (32.7) |
| All additional treatment,b n (%) | |||
| No | 176 (59.7) | 211 (64.7) | 387 (62.3) |
| Yes | 16 (5.4) | 16 (4.9) | 32 (5.2) |
| Missing | 103 (34.9) | 99 (30.4) | 202 (32.5) |
| LF N = 295 |
Collagenase N = 326 |
Total N = 621 |
|
|---|---|---|---|
| Extended physiotherapy, n (%) | |||
| No | 140 (47.5) | 169 (51.8) | 309 (49.8) |
| Yes | 12 (4.1) | 1 (0.3) | 13 (2.1) |
| Missing | 143 (48.5) | 156 (47.9) | 299 (48.1) |
| Collagenase injection, n (%) | |||
| No | 148 (50.2) | 167 (51.2) | 315 (50.7) |
| Yes | 0 (0.0) | 2 (0.6) | 2 (0.3) |
| Missing | 147 (49.8) | 157 (48.2) | 304 (49.0) |
| LF, n (%) | |||
| No | 146 (49.5) | 155 (47.5) | 301 (48.5) |
| Yes | 2 (0.7) | 20 (6.1) | 22 (3.5) |
| Missing | 147 (49.8) | 151 (46.3) | 298 (48.0) |
| Dermo-fasciectomy, n (%) | |||
| No | 148 (50.2) | 169 (51.8) | 317 (51.0) |
| Yes | 0 (0.0) | 1 (0.3) | 1 (0.2) |
| Missing | 147 (49.8) | 156 (47.9) | 303 (48.8) |
| PNF, n (%) | |||
| No | 146 (49.5) | 168 (51.5) | 314 (50.6) |
| Yes | 3 (1.0) | 3 (0.9) | 6 (1.0) |
| Missing | 146 (49.5) | 155 (47.5) | 301 (48.5) |
| Any re-intervention,a n (%) | |||
| No | 144 (48.8) | 152 (46.6) | 296 (47.7) |
| Yes | 5 (1.7) | 26 (8.0) | 31 (5.0) |
| Missing | 146 (49.5) | 148 (45.4) | 294 (47.3) |
| All additional treatment,b n (%) | |||
| No | 136 (46.1) | 152 (46.6) | 288 (46.4) |
| Yes | 17 (5.8) | 27 (8.3) | 44 (7.1) |
| Missing | 142 (48.1) | 147 (45.1) | 289 (46.5) |
From Table 33 we see that about 35% of the 295 treated participants in the LF group and about 30% of the 326 treated participants in the collagenase group are missing these data due to having wholly or partially incomplete follow-up to 1 year post treatment. Most of these participants have incomplete measurement histories due to dropping out before 1 year post treatment or having their follow-up histories administratively censored before 1 year, although there are a minority of participants that have been followed up at 1 year, but have interval censored follow-up histories (e.g. they have a 1-year follow-up, but are missing data at 3 and 6 months). Among the available cases, we see that the vast majority (92%) had not undergone any further treatment by 1 year, with an even higher proportion (95%) not having undergone any re-intervention by 1 year. Overall, the most common type of further treatment received by 1 year was an extended course of physiotherapy (approximately 3% of those with these data available), followed closely by LF (approximately 3% of available cases). A handful of participants underwent re-intervention of the reference digit using collagenase and PNF by 1 year, and none received dermo-fasciectomy by this time point. Extended physiotherapy to the reference digit predominantly occurred in the LF group, while other further care generally occurred more among those allocated to collagenase. Hence the proportions of participants receiving any further treatment by 1 year are similar across groups, while the proportion of participants receiving a re-intervention is higher in the collagenase group.
From Table 34 we see that about 45–50% of participants were missing data relating to further treatments received between treatment and 2 years post treatment. This increase in proportion of missing cases is primarily driven by administrative censoring of follow-up times between 1 and 2 years post treatment, as well as a small amount of loss to follow-up between these time points. The overall patterns of further treatment in the observed cases are fairly similar to those at 1 year, with most participants not receiving further treatment to the reference digit. However, LF had overtaken extended physiotherapy as the leading type of further treatment by 2 years, with 10 additional cases occurring in the collagenase arm (and no additional cases in the LF group). It follows that the proportion receiving any sort of further treatment by 2 years is lower in the LF group, in contrast with the proportions seen for the 1-year end point. Furthermore, the proportion receiving re-intervention by 2 years in the LF group is appreciably lower than the proportion in the collagenase group.
The results from the analyses of the 1- and 2-year binary further treatment outcomes are given in Table 35. In line with the frequencies and proportions in Table 33, the results in Table 35 suggest that the data provide some evidence to refute the hypothesis that the incidence of further treatments and re-intervention during the first year following treatment is unaffected by allocation. For example, the lower limit of the 95% CI estimate is about 1.2, which (given that the event is relatively rare in all relevant strata) suggests allocation to collagenase likely caused at least a 20% increase in the relative risk of re-intervention by 1 year compared to allocation to LF. However, the substantial differences on the relative odds (or risk) of re-intervention translate into small differences in absolute terms due to the overall rarity of the event. For participants allocated to collagenase, the slightly higher rate of re-intervention reflects slightly greater rates of early recurrence in this group, whereas the similar rates of further treatment (including extended physio for the reference digit) reflects a greater need for after-care/rehabilitation following LF.
| Outcome | OR (95% CI); p-valuea,b | Covariate pattern (X) | RD (95% CI); p-valuea,b |
|---|---|---|---|
| Re-interventionc by 1 year | 3.88 (1.18 to 12.76); 0.0256 | Ref. joint = MCP Ref. digit = Ring Baseline PEM = mean |
0.026 (−0.009 to 0.061); 0.1485 |
| Ref. joint = MCP Ref. digit = Little Baseline PEM = mean |
0.046 (−0.005 to 0.096); 0.0750 | ||
| Ref. joint = PIP Ref. digit = Ring Baseline PEM = mean |
0.036 (−0.020 to 0.091); 0.2096 | ||
| Ref. joint = PIP Ref. digit = Little Baseline PEM = mean |
0.062 (−0.008 to 0.132); 0.0834 | ||
| Further treatmentd by 1 year | 0.87 (0.40 to 1.88); 0.7187 | Ref. joint = MCP Ref. digit = Ring Baseline PEM = mean |
−0.008 (−0.053 to 0.037); 0.7214 |
| Ref. joint = MCP Ref. digit = Little Baseline PEM = mean |
−0.008 (−0.052 to 0.036); 0.7222 | ||
| Ref. joint = PIP Ref. digit = Ring Baseline PEM = mean |
−0.011 (−0.074 to 0.051); 0.7205 | ||
| Ref. joint = PIP Ref. digit = Little Baseline PEM = mean |
−0.011 (−0.071 to 0.049); 0.7202 | ||
| Re-interventionc by 2 years | 5.71 (1.98 to 16.47); 0.0013 | Ref. joint = MCP Ref. digit = Ring Baseline PEM = mean |
0.056 (−0.003 to 0.115); 0.0635 |
| Ref. joint = MCP Ref. digit = Little Baseline PEM = mean |
0.147 (0.041 to 0.253); 0.0065 | ||
| Ref. joint = PIP Ref. digit = Ring Baseline PEM = mean |
0.070 (−0.014 to 0.155); 0.1025 | ||
| Ref. joint = PIP Ref. digit = Little Baseline PEM = mean |
0.178 (0.046 to 0.311); 0.0083 | ||
| Further treatmentd by 2 years | 1.60 (0.78 to 3.25); 0.1977 | Ref. joint = MCP Ref. digit = Ring Baseline PEM = mean |
0.041 (−0.025 to 0.107); 0.2260 |
| Ref. joint = MCP Ref. digit = Little Baseline PEM = mean |
0.059 (−0.033 to 0.151); 0.2063 | ||
| Ref. joint = PIP Ref. digit = Ring Baseline PEM = mean |
0.048 (−0.033 to 0.128); 0.2449 | ||
| Ref. joint = PIP Ref. digit = Little Baseline PEM = mean |
0.068 (−0.038 to 0.174); 0.2113 |
The results for these outcomes at the 2-year time point show similar trends as those for the 1-year time point. There is a reasonably clear signal of superiority (in favour of LF) with regard to the incidence of re-intervention, but a less clear signal with regard to further treatment overall (i.e. including post-treatment rehabilitation and physiotherapy). The stronger signal in favour of LF with regard to incidence of re-intervention by 2 years is likely driven by higher rates of short- to medium-term recurrence of contracture in the collagenase group. However, for the overall further treatment outcome, any influence that higher rates of recurrence might be having is being offset to some degree by higher rates of post-treatment rehabilitation following LF.
Kaplan–Meier failure estimates for the proportion of at-risk participants that had received further treatment over time are given by allocation in Figure 22. These clearly suggest a higher rate of re-intervention in the collagenase group, and suggest that by 2 years post treatment, nearly 10% of collagenase participants (that were still being followed-up) had undergone a re-intervention, compared to just 2.5% of LF participants (corroborating the findings of the analyses of the binary incidence of re-intervention outcomes above).
FIGURE 22.
Time to re-intervention (following initial correction) by allocation (Kaplan–Meier failure estimates).
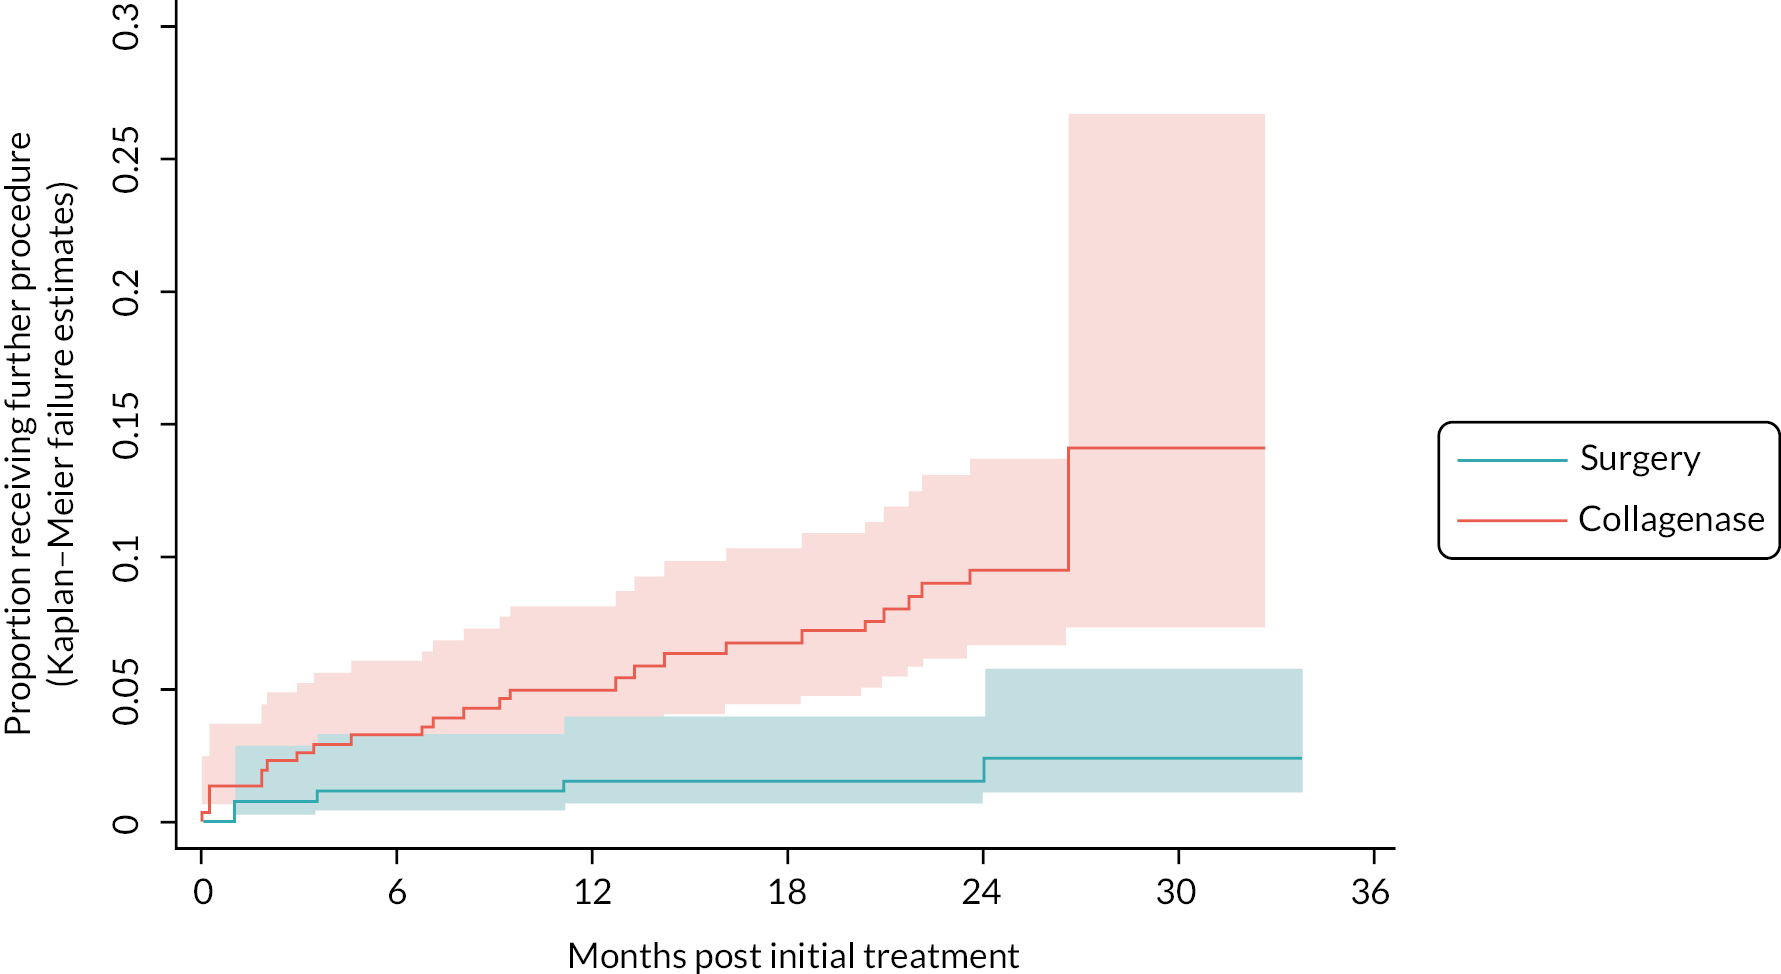
Estimates of the conditional hazard ratio (HR) for allocation are given in Table 36, together with a p-value for a two-sided test of H0 : HR = 1. Estimates of the difference (collagenase – LF) in cumulative incidence of re-intervention by 2 years post treatment (conditional on each level of reference joint and baseline PEM score equal to the mean of the observed scores) are given in Table 37.
| Reference joint type | RD (95% CIa) | p-valuea H0 : RD = 0 |
|---|---|---|
| MCP | 0.076 (−0.013 to 0.165) | 0.0930 |
| PIP | 0.110 (−0.038 to 0.258) | 0.1452 |
The estimated HR and associated test of H0 : HR = 1 suggest the data show considerable departure from what would be expected if the hazard of re-intervention across groups were equal. Similarly, to the analyses above, the apparent impact of LF on the HR scale does not translate to huge impact on the absolute risk scale due to the relatively small risk of re-intervention by 2 years. For example, true differences in absolute risk of 0–10% (in favour of LF) are reasonably compatible with the observed data for both reference joint strata (although the interval estimates also suggest relatively limited incompatibility between the observed data and true differences of 15–20%). Overall, these analyses offer strong evidence to refute hypotheses positing that rates of re-intervention are lower or the same following treatment with collagenase, compared to treatment with LF.
Photography substudy
Reporting of the photography substudy is fully contained in Appendix 2 (including Appendix 2, Tables 50–60 and Figures 33–72).
Chapter 4 Cost-effectiveness evaluation
Introduction
Cost-effectiveness analysis (CEA) was conducted alongside the DISC trial to establish the value for money of collagenase compared with LF. 40
The objectives of the economic evaluation were to:
-
Estimate cost of collagenase and LF using a micro-costing approach.
-
Identify and cost primary and secondary healthcare resource use after the interventions for both groups.
-
Compare participants’ health using quality-adjusted life-years (QALYs).
-
Conduct within-trial incremental CEA by comparing the difference in costs and QALYs between the collagenase group and LF group and present the results as incremental cost-effectiveness ratios (ICERs) and net health benefit (NHB).
-
Use a self-resampling bootstrapping approach accounting for the uncertainty around the point estimate of ICERs and present the results in cost-effectiveness planes (CEPs) and cost-effectiveness acceptability curves (CEACs).
-
Use MI with chained equations to handle missing data and use the imputed data for base-case analysis. Explore the impact of missing data by conducing sensitivity analysis using only complete cases.
-
Evaluate the lifetime cost-effectiveness using a Markov model adapted from the literature.
-
Conduct a secondary analysis using a wider societal perspective.
-
Conduct a series of sensitivity analyses to examine the robustness of the results.
Methods
Overview
The main question addressed in this economic evaluation is the cost-effectiveness of collagenase compared with LF. The within-trial analysis covered a 2-year time horizon post treatment and followed the principle of intention to treat (ITT), with participants analysed as randomised. An NHS and PSS perspective was adopted in the CEA. Costs were expressed in Great British pounds (£) at a 2019–20 price base, and costs from other years were adjusted to the 2019–20 level using the NHS Cost Inflation Index. 62 Analyses were conducted following the manual of National Institute for Health and Care Excellence (NICE) health technology evaluations63 and in accordance with the detailed health economic analysis plan (available at: www.isrctn.com/ISRCTN18254597). Within-trial CEA was conducted in Stata 17, and economic modelling in Microsoft Excel 365 (Microsoft Corporation, Redmond, WA, USA). Differences are reported as collagenase – LF unless otherwise stated.
Intervention cost
A micro-costing approach was used to generate cost estimations by multiplying the quantity of detailed resource utilisation and corresponding unit cost. 64 Table 38 lists all the unit costs used.
| Resource item | Unit cost (2019–20) | Source |
|---|---|---|
| Intervention-related cost items | ||
| Staff | ||
| Consultant surgeon | £114/hour | 62 |
| Trainee surgeon | £50/hour | 62 |
| Nurse | £46/hour | 62 |
| Healthcare assistant | £27/hour | 62 |
| Operating department practitioner | £46/hour | 62 |
| Anaesthesia | ||
| Anaesthesia — general anaesthetic | £193/session | 65 |
| Anaesthesia — local anaesthetic | £124/session | 65 |
| Anaesthesia — regional block | £124/session | 65 |
| Anaesthesia — Entonox | £124/session | 65 |
| Anaesthesia — sedation | £193/session | 65 |
| Anaesthesia — other | £124/session | 65 |
| Theatre cost | £15/minute | 66 |
| Inpatient cost | £996/night | 65,67 |
| Antibiotics | ||
| Cephalosporins | £3.4/item | 68 |
| Teicoplanin | £61.5/item | 68 |
| Macrolides (erythromycin) | £5.8/item | 68 |
| Co-amoxiclav (Augmentin) | £3.0/item | 68 |
| Vancomycin hydrochloride | £239.7/item | 68 |
| Other antibiotics | £23.1/item | 68 |
| Other medication | £8.55/item | 68 |
| Collagenase | ||
| Collagenase before 31 August 2018 | £650/vial | 69 |
| Collagenase after 1 September 2018 | £572/vial | 70 |
| Healthcare resource use | ||
| Primary care | ||
| Visit to GP | £39/consultation | 62 |
| Visit to GP nurse | £11/consultation | 62 |
| Physiotherapist | £57/session | 62 |
| Occupational therapist | £84/session | 62 |
| Secondary care | ||
| Outpatient visit | ||
| Pain clinic | £182/session | 65 |
| Trauma and orthopaedics | £122/session | 65 |
| Occupational therapy | £72/session | 65 |
| Trauma and orthopaedics | £122/session | 65 |
| Plastic surgery | £117/session | 65 |
| Rheumatology | £146/session | 65 |
| Physiotherapy | £62/session | 65 |
| Splinting of finger | £84/session | DISC |
| Wound care | £15/session | DISC |
| Collagenase injection | £1143/session | 65 |
| LF surgery | £2936/session | 65 |
| Dermo-fasciectomy | £2936/session | 65 |
| PNF | £1143/session | 65 |
| Accident and emergency | £182/attendance | 65 |
| Hospital inpatient | £996/night | 65,67 |
| Day case | £812/episode | 65 |
| Emergency ambulance | £213/use | 65 |
The cost of LF included staff, theatre, anaesthesia, medication, and wound clinic appointment costs. Several healthcare professionals are involved in LF surgery (e.g. consultant surgeons, trainee surgeons, nurses, healthcare assistants, and operating-department practitioners) and costs were calculated by multiplying the PSS Research Unit (PSSRU) unit cost by the procedure duration (time from participants’ entry to the anaesthetic room until the time they left the operation theatre). 62 An additional cost was estimated by combining the unit cost of the operation theatre (£15 per minute at the 2019–20 price) with the time that the theatre was in use. 66 The cost of inpatient nights was included if inpatient admission was required after the operation. 65,67 The cost of subsequent wound-clinic appointments after LF were estimated based on the staff types and duration collected in the treatment delivery CRF.
The intervention cost of collagenase consisted of two parts: collagenase administration and joint manipulation. Based on the British National Formulary, the price of collagenase was £650 per vial prior to September 2018 and £572 per vial thereafter. 69,70 The staff cost was estimated using the staff members present during the procedure and the duration of the procedure. For joint manipulation, staff, anaesthesia and medication costs were calculated using the data collected alongside the appointments. Premises and service cost for procedures that took place in clinic rather than operation theatre were assumed to be covered in the PSSRU unit cost. 62
Healthcare resource costs
Community health and social care visits were valued by attaching unit costs from PSSRU. Outpatient attendance without specified treatment information were treated as a 10-minute average reassurance or observation appointment. Inpatient admissions during the follow-up periods were recorded along with the treatment received and length of stay. The cost of accident and emergency (A&E) attendance was also included if the number of visits was available. The number of prescription items was counted and multiplied by the national average cost per item (£8.55 in 2020). 68
Health-related quality of life
The primary health outcome measure for the CEA was QALYs. QALYs integrate both the length and health-related quality of life (HRQoL) and was recommended in the manual of NICE health technology evaluations. 63 The results collected in EQ-5D-5L were converted into a single index value (health utility) via mapping onto the EuroQol-5 Dimensions, three-level version UK population valuation set. 71 The utility scores at baseline and each follow-up appointment were then used to calculate QALYs using the ‘area under the curve’ method. 72 In addition, overall self-rated health status was measured via the EuroQol VAS. 73 Descriptive statistics of the utility scores, EQ-VAS at each time point and the overall QALYs for the two trial groups were presented and compared in the analysis.
Incremental cost-effectiveness analysis
The incremental CEA was conducted for both within-trial analysis and the long-term model-based analysis. 64
The calculated ICERs were compared to the NICE-recommended maximum acceptable ICERs [or willingness-to-pay (WTP) thresholds] of £20,000–£30,000 per QALY to determine whether collagenase is cost-effective. 63 Results were also presented in terms of NHB,64 which is particularly informative when the intervention generates fewer health benefits but, at the same time, is less costly; that is, it generates cost savings. 63,64 Positive NHB indicates an increase in overall population health and the new intervention should be considered to be funded.
To control for possible baseline imbalance, the differences in cost and QALYs were adjusted for the baseline cost and EuroQol-5 Dimensions (EQ-5D) score. 74 The costs of prescribed medications recorded on the baseline CRF, were utilised to represent baseline healthcare costs. The mean differences in costs and QALYs were estimated using seemingly unrelated regression equations with 95% confidence intervals (CIs) estimated using bootstrap methods. 75 The variables included in the regression model were selected based on a combination of clinical theories, empirical evidence, and statistical considerations. The model adjusted for the following covariates: baseline utilities and costs, treatment factor (intervention group), demographic factor (age), and clinical factor (PEM). For hypothesis testing, differences were considered as statistically significant at p < 0.05.
Analysis of uncertainty
To assess the degree of uncertainty surrounding the estimated incremental costs and QALYs, a non-parametric self-resampling bootstrap technique was adopted. 76,77 The results of the 5000 replicated samples generated by bootstrapping were depicted in CEPs and CEACs to illustrate the probability of collagenase being cost-effective over different maximum acceptable ICERs.
Missing data
The level of missing data in trial-based economic evaluation is usually high. 78 The base-case analysis was conducted using an imputed data set, under the assumption that data were MAR and was imputed using Rubin’s MI method. 79 Although the MAR assumption theoretically cannot be tested due to its dependence on unobserved data, we employed certain strategies to make this assumption more plausible. This included checking missing data patterns and carrying out a series of logistic regressions that analysed the missingness of costs and QALYs against baseline variables, such as age, gender, baseline PEM score, and baseline EQ-5D utility scores. 75
Multiple imputation by chained equation was performed to impute missing outcomes with 25 imputations. 80 The selection of variables for the imputation model was based on expert knowledge, prior research, and current data set observations. All variables used in the CEA were included in the imputation model, along with several additional auxiliary variables to provide further information about the missing values. These auxiliary variables included variables that were found to be predictive of missingness and those that were correlated with the variable that had missing values. The imputation model included primary outcomes (costs and utility scores at baseline and each follow-up point), demographics (age, gender), condition severity (number of cords affected), participant trial status (e.g. participation, withdrawal or deceased) and hand-related outcomes (PEM). In the CEA, for deceased participants where the date of death was prior to the scheduled follow-up appointment, a zero utility score and zero cost were imputed by definition. 81 To examine the impact of missing data, sensitivity analyses were conducted using only complete cases, where data on both costs and QALYs were available simultaneously.
Secondary analysis
Evidence indicates that more than half of participants diagnosed with DC have functional limitations impacting both their work and leisure activities. 82–84 To explore the impact of lost time from work and normal activities on the cost-effectiveness results, we conducted a secondary analysis from a wider societal perspective. Information about sick days and lost time from normal activities (e.g. housework, caring duties or voluntary work) was obtained from participant CRFs. Applying a human capital approach, the time off work and away from normal activities were calculated using the national mean weekly wage of £710 for full-time work and £248 for part-time work in 2020. 85 For participants not in paid employment, the national minimum wage of £8.72 per hour was applied. Participants’ private treatments received during the trial period were also considered in the secondary analysis.
Sensitivity analyses
In addition to the complete-case analysis, several additional sensitivity analyses were performed to test the robustness of the results obtained in the base-case analysis.
Several published cost-effectiveness studies on treatments for DC use standardised costs of procedures instead of the micro-costing method. In the UK setting, the Health Resource Group (HRG) reference cost has often been adopted. 86,87 HRG codes for the procedures included in the DISC trial were identified using the HRG4+ code to group workbook. 88 To facilitate the comparison of our results with previous studies, a sensitivity analysis was performed using the HRG unit cost to compute the intervention cost. The HRG codes used for LF, collagenase injection, wound care, and manipulation were HN43B (unit cost £2936), HN45A (£1143), HN46Z (£196) and HN46Z (£196), respectively. 65
Compared to LF, collagenase administration has the advantage that instead of occupying a highly costly operating theatre, treatment can take place in a clinic or recovery room. 66 The location of the treatment can also impact the staffing required as well as the waiting time for patients. 89 To examine whether treatment location is a determining factor in the cost-effectiveness of treatment with collagenase, a sensitivity analysis was conducted by assuming that either 50% or 100% of collagenase injections were performed in an operating theatre.
The unit cost of trainee surgeons is less than half that of consultant surgeons, at £50 per hour versus £114 per hour. 62 Training less experienced trainee surgeons to deliver LF could potentially reduce the overall cost of this expensive surgery. 66,90 Thus, a further sensitivity analysis was conducted, assuming all LFs were delivered by trainee surgeons.
Threshold analysis
Baltzer et al. and Chen et al. reported that the price of collagenase is a determinant in CEA, and collagenase would only be considered cost-effective at a price lower than a certain threshold. 91,92 A threshold analysis was performed to explore the maximum acceptable price that would result in collagenase being considered cost-effective. Given collagenase has been withdrawn from the UK market since March 2020, this additional analysis provides information for further decision-making should collagenase be reintroduced into the UK market in the future.
Long-term Markov decision analytic model
The within-trial time horizon was not long enough to capture the entire costs and benefits of collagenase and LF especially since the trial period included the COVID-19 pandemic which meant that some participants who had recurrent issues did not have the chance for re-treatment. 57 Therefore, a decision analytical model was constructed (Figure 23 and Table 39) to project the lifetime cost-effectiveness of collagenase compared with the LF by incorporating recurrence, further treatments, long-term costs and QALYs.
FIGURE 23.
Long-term Markov model structure.
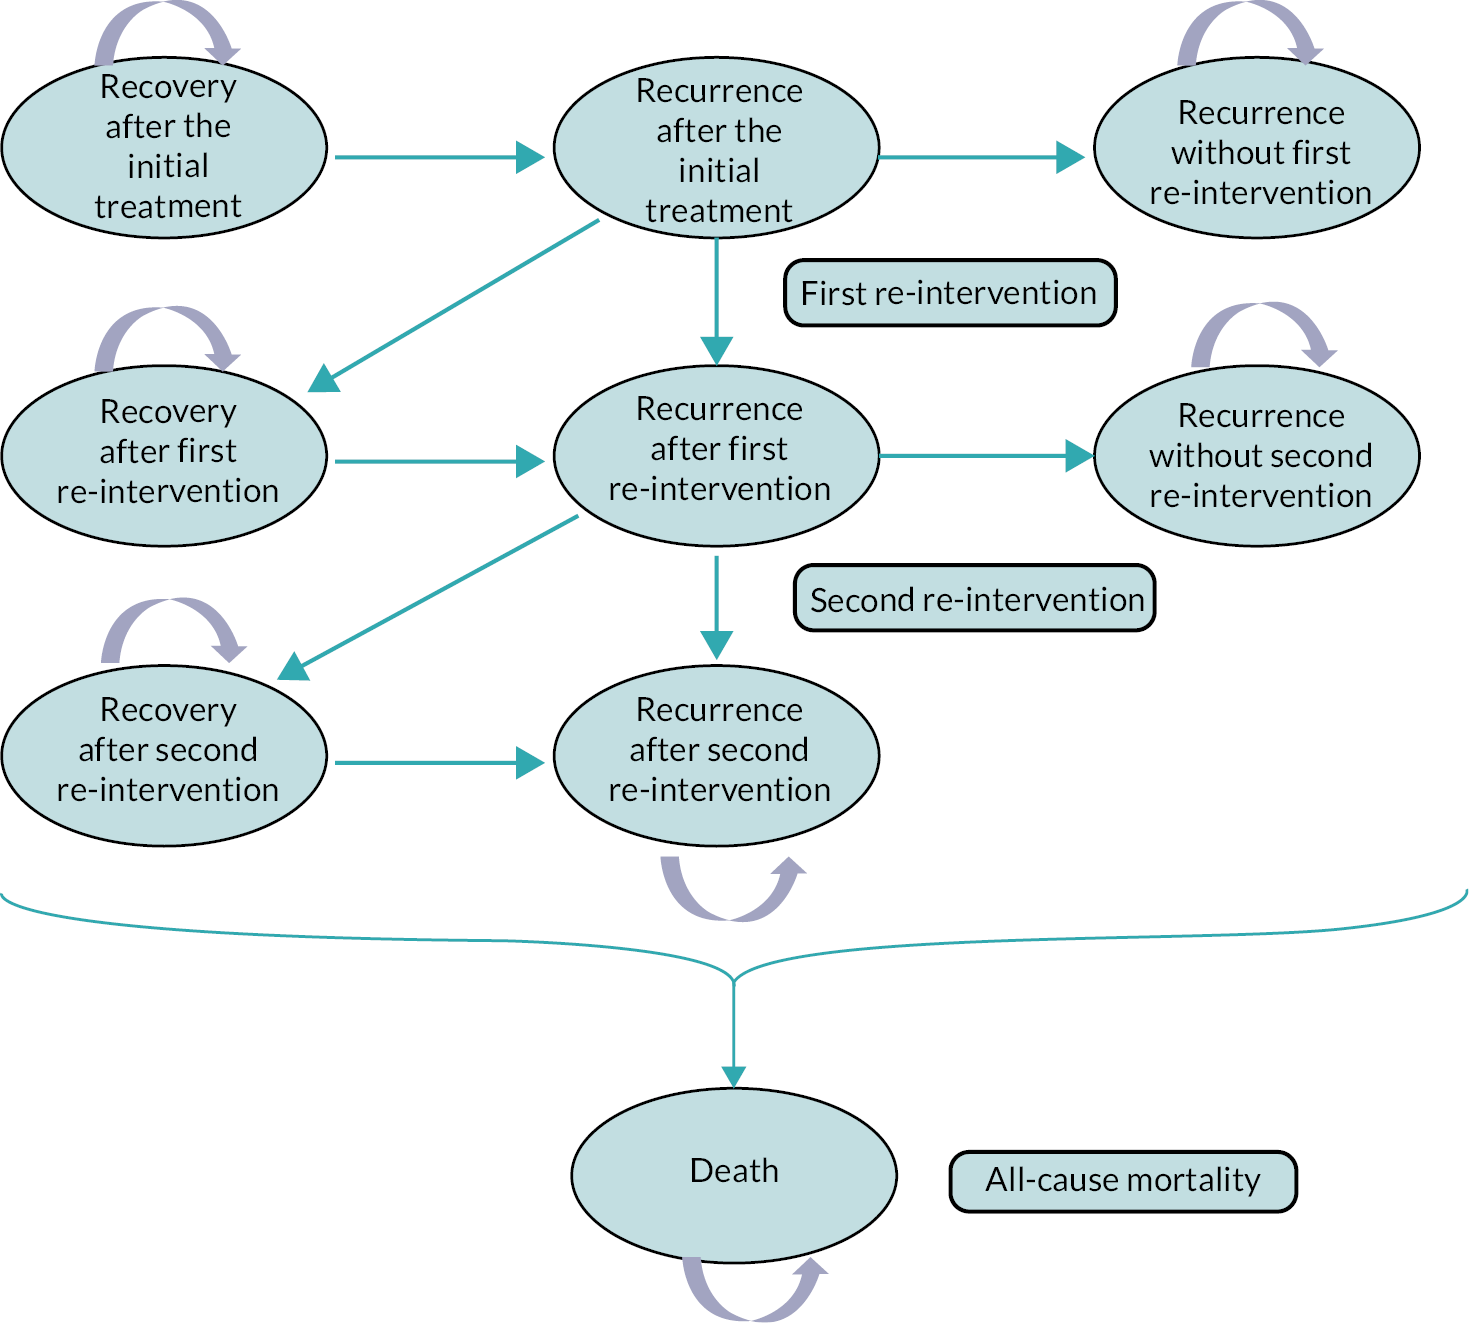
| Variable | LF group | Collagenase group | Distribution | Source |
|---|---|---|---|---|
| Baseline demographics | ||||
| Mean age | 66 | 66 | DISC | |
| Male (%) | 76.8% | 81.5% | DISC | |
| Transition probabilities | ||||
| Recurrence rate (first year post treatment) | 13.8% | 17.2% | β | DISC |
| Recurrence rate (second year and beyond post treatment) | 5.4% | 11.8% | β | 11,23,25,29,43 |
| First re-intervention rate | 40% | 40% | β | 23,36 |
| Second re-intervention rate | 40% | 40% | β | |
| Mortality | ||||
| 65–69 (males) | 1.60% | 1.60% | 93 | |
| 70–74 (males) | 2.48% | 2.48% | ||
| 75–79 (males) | 4.32% | 4.32% | ||
| 80–84 (males) | 7.70% | 7.70% | ||
| 65–69 (females) | 1.00% | 1.00% | ||
| 70–74 (females) | 1.62% | 1.62% | ||
| 75–79 (females) | 2.91% | 2.91% | ||
| 80–84 (females) | 5.46% | 5.46% | ||
| Mean costs and QALYs | ||||
| Treatment cost | £2510 | £1008 | γ | DISC |
| First year post-treatment cost of healthcare source use (recovery) | £620 | £578 | γ | DISC |
| First year post-treatment cost of healthcare source use (recurrence) | £323 | £281 | γ | DISC |
| Second year post-treatment cost of healthcare source use (recovery) | £340 | £239 | γ | DISC |
| Second year post-treatment cost of healthcare source use (recurrence) | £267 | £166 | γ | DISC |
| First year post-treatment QALY (recovery) | 0.847 | 0.836 | β | DISC |
| First year post-treatment QALY (recurrence) | 0.841 | 0.831 | β | DISC |
| Second year post-treatment QALY (recovery) | 0.865 | 0.819 | β | DISC |
| Second year post-treatment QALY (recurrence) | 0.852 | 0.806 | β | DISC |
Model structure and population
A Markov model was constructed by adapting previously published models that compared treatment modalities for patients with DC. The Markov model consists of nine mutually exclusive health states and the structure of the model is depicted in Figure 23. 36,94 The target population considered in the Markov model was aligned with the DISC trial.
Patients entered the model in either the ‘recovery after initial correction’ or ‘recurrence after initial correction’ state, based on the recurrence rates for the corresponding treatment at the end of 1 year post treatment. The cohort of patients could then transition to other health states or remain in the same state, with a cycle length of 1 year, until they reached age 85. The arrows in Figure 23 indicate the range of possible transitions, the probabilities of which are listed in Table 40.
| Mean cost | SD | Range | |
|---|---|---|---|
| LF | |||
| Number of participants who received LF (N = 288) | |||
| Theatre cost | £1657 | £580 | (£531–£3900) |
| Inpatient cost | £14 | £143 | (£0–£1992) |
| Staff cost (surgery) | £560 | £237 | (£101–£1776) |
| Anaesthetic cost | £213 | £87 | (£124–£441) |
| Antibiotics cost | £2 | £7 | (£0–£62) |
| Additional meds | £0 | £1 | (£0–£9) |
| Staff cost (wound care) | £64 | £61 | (£0–£483) |
| Total LF cost | £2510 | £818 | (£866–£5935) |
| Collagenase | |||
| Number of participants who received collagenase (N = 332) | |||
| Staff cost (injection) | £143 | £51 | (£64–£395) |
| Collagenase cost | £581 | £25 | (£572–£650) |
| Additional meds | £0 | £1 | (£0–£9) |
| Total collagenase administration | £725 | £58 | (£636–£967) |
| Staff cost (manipulation) | £167 | £50 | (£38–£342) |
| Anaesthetic (manipulation) | £116 | £30 | (£0–£124) |
| Total joint manipulation | £283 | £59 | (£95–£466) |
| Total collagenase cost | £1008 | £94 | (£743–£1433) |
For patients in the ‘recurrence after initial treatment’ state, some received their first re-intervention at the end of the model cycle. If patients did not receive the re-intervention, they transferred to the ‘recurrence without first re-intervention’ state. Those who received a first re-intervention had some prospect of recovery or recurrence. Patients with a recurrence after the first re-intervention (in the ‘recurrence after first re-intervention’ state) had a proportion receiving re-intervention at the end of the cycle. After the second re-intervention, patients did not receive any further treatment. Patients in the ‘recurrence after second re-intervention’ state remained in a state of recurrence until the end of the trial or until death. For patients in any of the three ‘recovery’ states, there is a risk of recurrence every year. The recurrence rates for these patients are based on the long-term recurrence rates derived from the literature. Patients in every health state were at risk of dying at the end of each cycle based on all-cause mortality rates for specific characteristics, such as age, gender, and treatment group. 93
Model inputs
In the Markov model, the short-term (1 year) transition probabilities were obtained from the DISC trial, while the long-term (2 years and beyond) probabilities were derived from the literature (see Table 45).
One of the major determinants of treatment effectiveness for DC is recurrence after treatment. As reported in Chapter 3, Recurrence, the trial-based 1-year recurrence rates post treatment were 13.8% (LF) and 17.2% (collagenase). Recurrence rates after 1 year for LF were derived from a large multicentre study conducted by Dias et al. , who reported a 3-year recurrence rate of 15% and a 5-year recurrence rate of 19%. 25,43 Other LF studies with longer follow-up periods, but smaller sample sizes, have reported similar recurrence rates. 23 The post-treatment recurrence rates for collagenase in the second year and beyond were derived from the Collagenase Option for Reduction of Dupuytren Long-Term Evaluation of Safety Study (CORDLESS) studies, which followed participants with DC for 5 years and reported a 47% recurrence rate at the end of the study. 11,29
The long-term probabilities were converted into an annual probability. 95,96 The corresponding probabilities of recurrence for collagenase and LF in the second year and beyond post treatment were 11.8% and 5.4%, respectively.
Previous studies have also suggested that recurrent patients may undergo re-intervention. For instance, Brazzelli et al. assumed that 40% of patients initially treated with collagenase received re-intervention after recurrence. Of these, 62% received LF and 19% received additional collagenase treatment. 23,36 To simplify the model, a one-off re-intervention rate of 40% was adopted for both first and second re-intervention instead of being converted into an annual rate, as was done for the recurrence rate. Meanwhile, given the uncertain availability of collagenase in the UK market, all participants were assumed to receive their original treatment for re-intervention. Namely, participants who received collagenase as the initial intervention in the trial would receive a maximum of two further collagenase injections, while participants who underwent LF as the trial treatment would be offered LF as a re-intervention after recurrence.
All costs and QALYs used in the model were obtained from the DISC trial, where the estimates were categorised according to the time horizon: mean healthcare costs and utilities from the first year of the trial were used as inputs for the first year after any treatment and re-intervention, while values from the second year of the trial period were assigned to participants beyond 1 year post treatment. We assumed that the second-year post-treatment data represented a long-term stable status if no re-intervention occurred. The costs for the re-intervention were assumed to be the same as for the initial intervention.
Cost-effectiveness analysis and sensitivity analyses
Incremental CEA was conducted in line with the within-trial analysis. The lifetime cost-effectiveness of collagenase compared to LF was evaluated from an NHS/PSS perspective. All costs and QALYs were discounted at a 3.5% annual discount rate. The model and subsequent analyses were performed following relevant guidelines. 63,97 To assess the parameter uncertainty, a probabilistic sensitivity analysis was performed using Monte Carlo simulation; we generated 10,000 iterations of lifetime costs and QALYs based on the values of parameters randomly selected around predetermined distributions (see Table 40) and the results were presented in the CEACs. In addition, multivariable (two-way) sensitivity analyses were conducted to examine the impact of clinically important parameters, such as recurrence rates and re-intervention rates on the lifetime cost-effectiveness of the treatments.
Results
Intervention cost
A summary of the breakdown of the costs by treatment delivered is presented in Table 40 for the 288 participants who underwent LF and the 332 who received collagenase. Only one participant in the LF group received PNF, which was costed using the reference cost rather than micro-costing. The 41 LF participants and 10 collagenase participants who did not receive treatment as part of the trial had associated intervention costs of zero. The average cost per participant for LF was £2510 (SD £818), with the operating theatre being the most expensive component. In contrast, the average cost for the collagenase treatment was £1008 (SD £94), with the cost of the collagenase itself being the largest expense (see Table 40).
Appendix 9, Tables 119 and 120 provide a summary of the staff costs associated with the trial interventions. On average, LF involved 5.5 staff members and took about 109 minutes, costing £630 per patient in staff time. The collagenase treatment needed fewer staff, about three for both the injection and joint manipulation, and took about 90 minutes total. This resulted in a lower average staff cost of £310 per patient for the collagenase treatment. Proportions of each staff cost by intervention component are illustrated in Appendix 9, Figure 91.
Healthcare resource use cost
Appendix 9, Tables 121–124 summarise the mean costs associated with healthcare resource use among available cases by cost item at 3 and 6 months and 1 and 2 years post treatment. Appendix 9, Figure 92 shows the overall mean costs for the five main categories of healthcare resource use.
For each time point, costs of resource use were considered missing if none of the cost categories were captured. For accumulative costs over various time points, for instance, 1- and 2-year costs used in the following CEA, costs of resource use were considered missing for a participant if any of the time points were missing. The estimated costs of medication at baseline were estimated at £23.0 (SD £23.7) in the LF group and £22.8 (SD £22.3) in the collagenase group (mean difference: −0.2, 95% CI −£3.7 to £3.3).
For the three categories of secondary care, more details were gathered concerning whether the resources used were related to the reference hand and treatment complications or AE. Appendix 9, Tables 125–127 summarise the responses for each cost category to these questions.
The overall mean healthcare cost was higher in the collagenase group (£313, SD £502) compared with the LF group £248 (£832; mean difference: −£65, 95% CI −£181 to £52) during the first 3 months post treatment (see Appendix 9, Table 121). A significantly higher frequency of primary care and outpatient visits was observed after receiving LF than collagenase. The number of visits the patients paid to both community and outpatient physiotherapists as well as occupational therapists in the LF group was at least 2.5 times larger than the collagenase group. Participants in the LF group also reported a higher use of wound care and splinting. The level of utilisation of these physical therapies was reduced to a more similar level between the two groups at the 6-month and 1-year follow-up (see Appendix 9, Tables 122 and 123). For the 2-year follow-up, higher costs can be observed in these cost items in the collagenase group during the second year post intervention, but the differences were not statistically significant (see Appendix 9, Table 124).
The results also show that the proportion of outpatient visits related to the designated reference hand reduced in the LF group with time: from 98% at 3 months follow-up to 29% at 2 years follow-up (see Appendix 9, Table 125). However, in the collagenase group, the proportion related to the reference hand dropped from 92% at 3 months to 61% at 6 months and stayed at that level until the end of the trial. Consequently, compared to the LF group, we detected a significantly lower proportion (92% vs. 98%, p < 0.01) of reference hand-related outpatient visits in the collagenase group at 3 months and a significantly higher proportion (61% vs. 29%, p < 0.01) at 6 months. No significant differences in costs were detected in A&E attendance throughout the trial period (see Appendix 9, Table 126).
The number of hospital inpatient admissions is also reflected in Appendix 9, Table 127. During the second year post treatment, 21 and 18 hospital admissions were recorded in the LF and collagenase groups, respectively. The average length of stay was longer in the LF group, with four participants staying in the hospital more than five nights. The longest stay for LF participants was 20 nights, whereas the longest stay was only four nights in the collagenase group. The shortened stay contributed to a lower overall mean healthcare cost in the collagenase group compared to the LF group at the 2-year follow-up (£79 vs. £332, mean difference: −£253, 95% CI −£489 to −£17). Approximately 80% of the participants were admitted for reasons unrelated to their hands, such as laparotomy surgery, aortic valve replacement, or knee replacement. Although we did not detect lengthy hospital stays in the collagenase group, more deaths were recorded than in the LF group (8 vs. 1).
During the 2-year trial period, some participants received further surgical and pharmacological interventions for DC after the initial trial intervention. Appendix 9, Table 128 shows the number of further treatments in both outpatient and inpatient settings for all available cases. To capture the total cost of further treatments from an NHS perspective, all interventions were included in the costing regardless of whether they were related to the reference digit.
In general, participants in the collagenase group received more treatments for DC during the trial period. Three sessions of further collagenase injection were recorded in the collagenase group during the first year following treatment, but none were found in the LF group. No injections were recorded in both groups during the second year post treatment, mostly because collagenase was withdrawn from the UK market since March 2020, and most participants (95 out of 504) had their 1-year visit thereafter. Roughly four times more (31 vs. 8) LFs were given to participants in the collagenase group during the 2-year follow-up period. This increased number of treatments was a major contributor to hospital inpatient costs, which resulted in a much higher inpatient cost in the collagenase group in all follow-ups, except the 2-year costs.
Health-related quality of life
Baseline utility scores were slightly higher in the LF group as compared to the collagenase group (mean of 0.794 and SD of 0.170 vs. mean of 0.791 and SD of 0.174, respectively), but the difference was not statistically significant (95% CI −0.029 to 0.024) (Table 41). In the following analyses, the baseline utility scores were used as pre-treatment values, as we did not collect EQ-5D-5L in the pre-treatment CRF. It is assumed that the participants’ HRQoL does not change much without receiving treatment.
| Time point | LF group | Collagenase group | Mean difference (95% CI) | ||
|---|---|---|---|---|---|
| Available cases | Mean (SD) | Available cases | Mean (SD) | ||
| Baseline | 329 | 0.794 (0.170) | 332 | 0.791 (0.174) | −0.003 (−0.029 to 0.024) |
| 2 weeks | 253 | 0.715 (0.146) | 281 | 0.776 (0.139) | 0.061 (0.037 to 0.085) |
| 6 weeks | 234 | 0.792 (0.138) | 275 | 0.822 (0.144) | 0.03 (0.005 to 0.055) |
| 3 months | 249 | 0.859 (0.131) | 278 | 0.848 (0.168) | −0.011 (−0.037 to 0.015) |
| 6 months | 243 | 0.871 (0.149) | 264 | 0.858 (0.159) | −0.013 (−0.040 to 0.014) |
| 1 year | 247 | 0.865 (0.158) | 281 | 0.839 (0.178) | −0.026 (−0.055 to 0.003) |
| 2 years | 196 | 0.861 (0.166) | 227 | 0.817 (0.183) | −0.044 (−0.077 to −0.010) |
The mean EQ-5D utility scores and relative marginal distributions at each time point by allocation are illustrated in Figure 24 and Appendix 9, Figure 93. Soon after treatment for DC, participants in both groups experienced a decline in utility scores, especially those who received LF. Two weeks after the treatment, the EQ-5D utility scores reduced from 0.794 to 0.715 in the LF group and from 0.791 to 0.776 in the collagenase group. Six weeks after the treatment, the utility scores started to increase back as the participants recovered. At both the 2- and 6-week follow-ups, the mean utility scores were significantly higher in the collagenase group than in the LF group (mean difference at 2 weeks: 0.061, 95% CI 0.037 to 0.085; at 6 weeks: 0.03, 95% CI 0.005 to 0.055).
FIGURE 24.
Mean EQ-5D scores at baseline and follow-up points.
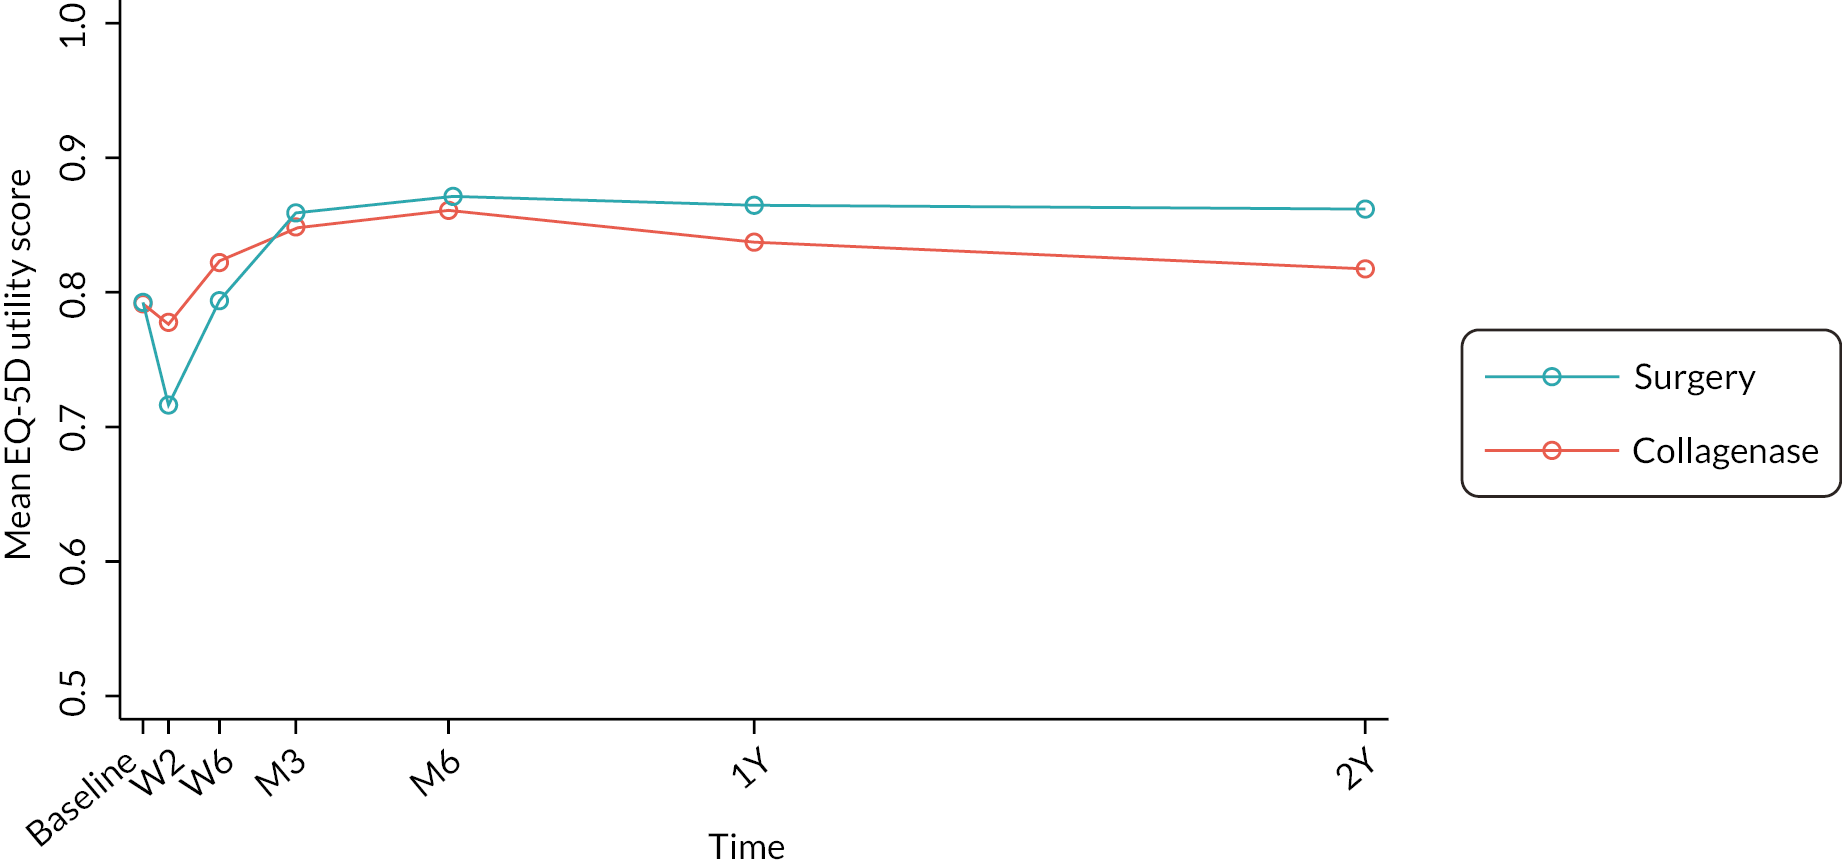
Three months after the treatment, the utility scores in both groups had reverted to the baseline level, and participants in both groups reported improved HRQoL as compared to before treatment. By the end of 2 years, the mean difference in utility scores between the groups was estimated to be −0.044 (95% CI −0.077 to −0.010). It should be noted that the figures reported in this section are unadjusted EQ-5D utility scores generated from all the available cases. In the following CEA, the utilities adjusted for the baseline are used instead.
The percentages of participant responses to each EQ-5D-5L dimension at each timepoint are presented in Appendix 9, Figures 94–98. Among all five EQ dimensions, the proportion of participants who reported ‘no problems’ was the lowest (ranging from 34.3% to 55.1%) in the pain/discomfort dimension throughout the trial. Furthermore, the largest change of responses was detected at 2 weeks after treatment, especially for the dimensions of self-care, usual activities, and pain/discomfort. In contrast, neither DC nor the interventions exhibited much impact on participants’ mobility and mental health (anxiety/depression dimension). For most EQ-5D dimensions, the proportion of participants who reported ‘no problems’ returned to a similar or even higher level than the baseline at 6 weeks’ follow-up. The only exception was the pain/discomfort domain, where the proportion of participants without problems was lower at 6 weeks than the baseline in both groups. In addition, a significant difference was detected between the LF group and the collagenase group in terms of the percentage of participants without any problems in pain/discomfort at 6 weeks (18.6% vs. 29.8%, p = 0.03). This indicates that compared to the collagenase injection, participants who received LF took a longer time to recover from the associated pain and discomfort.
At 2 weeks, a significantly higher proportion of participants in the LF group reported having problems with self-care as compared to the collagenase group (57.1% vs. 23.9%, p < 0.001) and usual activities (79.1% vs. 50.3%, p < 0.001; Appendix 9, Figures 94 and 95). From 3 months and after, the percentage of reported problems had reduced, and participants experienced fewer issues in self-care, usual activities and pain/discomfort as compared to their pre-treatment status.
At the baseline, the mean EQ-VAS scores were 83.8 (SD 14.8) and 85.3 (SD 15.1) in the LF and collagenase groups, respectively (see Appendix 9, Figure 99 and Table 129); however, the difference between the two groups was not statistically significant (1.45, 95% CI −0.85 to 3.75). At 2 weeks, LF participants reported statistically significantly lower (worse) EQ-VAS scores than collagenase participants (83.4 vs. 86.3, mean difference: 2.98, 95% CI 0.75 to 5.12). At 6 weeks, the EQ-VAS score was still higher in the collagenase group (mean difference: 1.8, 95% CI −0.43 to 4.03), but it was not statistically significant. There was little difference in the EQ-VAS scores between the two trial groups at any of the time points from 3 months onwards.
Base-case cost-effectiveness analysis
Tables 42 and 43 combine the mean cost and QALY gains in the two trial groups and the results of the base-case CEA based on the imputed data. Appendix 9, Table 130 summarises the level of missing data at each time point, categorised by treatment group. The pattern of missing data is non-monotonic, where patients with missing data at one follow-up may have data in the subsequent follow-ups. Apart from age at randomisation, all logistic regressions exploring the correlation between missingness and baseline characteristics yielded statistically insignificant results (p-value > 0.05). These results imply that the MAR assumption is reasonably justified for proceeding with our analysis.
| LF group (N = 336) | Collagenase group (N = 336) | Mean differencea,b,c | ||
|---|---|---|---|---|
| Intervention cost, mean (95% CI) | £2166 (£2142 to £2191) | £984 (£979 to £988) | −£1183 (−£1208 to −£1159) | |
| Healthcare resource use cost, mean (95% CI) | £521 (£502 to £540) | £613 (£576 to £650) | £91 (£50 to £133) | |
| Total cost, mean (95% CI) | £2688 (£2656 to £2719) | £1596 (£1559 to £1634) | −£1090 (−£1139 to −£1042) | |
| Effect (QALY), mean (95% CI) | 0.838 (0.835 to 0.840) | 0.833 (0.830 to 0.836) | −0.003 (−0.006 to 0.000) | |
| ICER | Collagenase is less costly and less effective. | |||
| NHB | 0.052 (at £20,000/QALY) | 0.033 (at £30,000/QALY) | ||
| Probability of collagenase being cost-effective | 100.0% (at £20,000/QALY) | 99.9% (at £30,000/QALY) | ||
| LF group (N = 336) | Collagenase group (N = 336) | Mean differencea,b,c | ||
|---|---|---|---|---|
| Intervention cost, mean (95% CI) | £2166 (£2142 to £2191) | £984 (£979 to £988) | −£1183 (−£1208 to −£1159) | |
| Healthcare resource use cost, mean (95% CI) | £914 (£872 to £956) | £884 (£842 to £926) | −£28 (−£87 to £30) | |
| Total cost, mean (95% CI) | £3081 (£3032 to £3129) | £1868 (£1825 to £1910) | −£1212 (−£1276 to −£1147) | |
| Effect (QALY), mean (95% CI) | 1.687 (1.682 to 1.693) | 1.636 (1.629 to 1.643) | −0.048 (−0.055 to −0.040) | |
| ICER | Collagenase is less costly and less effective | |||
| NHB | 0.013 (at £20,000/QALY) | −0.007 (at £30,000/QALY) | ||
| Probability of collagenase being cost-effective | 71.9% (at £20,000/QALY) | 37.0% (at £30,000/QALY) | ||
The results indicate that treating participants with collagenase resulted in a decrease in total cost and QALY gains at both 1- and 2-year follow-ups compared with LF. Instead of presenting ICERs for a less-costly and less-effective intervention, NHBs were calculated to demonstrate the cost-effectiveness of collagenase compared to LF.
After adjustment for baseline costs and utilities, participants assigned to receive collagenase showed a statistically insignificant decrease in QALY gains of −0.003 QALYs (95% CI −0.006 to 0.0004 QALYs) and experienced a significantly reduced total cost of −£1090 (95% CI −£1139 to −£1042) compared to the LF group in the first year post treatment (Table 42). The cost difference was mainly attributable to significantly higher intervention cost in the LF group, whereas the estimated healthcare costs were similar in the two groups. The NHB of collagenase were estimated to be 0.052 and 0.033 at the maximum acceptable ICERs of £20,000 and £30,000 per QALY gained.
Bootstrapping was used to quantify uncertainty around the cost-effectiveness estimates. The majority of the 5000 bootstrap iterations were in the South-West quadrant of the CEP (see Figure 25), indicating collagenase was cheaper and less effective than LF. The CEACs (see Figure 26) showed that the probability of collagenase being decrementally cost-effective exceeded 99% at WTP thresholds ranging from £20,000 to £30,000 per QALY at 1 year.
FIGURE 25.
Cost-effectiveness analysis plane (MI) at 1 year. The x-axis represents the 1-year difference in QALY gains between the collagenase and LF groups (collagenase – LF), while the y-axis represents the difference in cost. The lines represent the £20,000 (in red) and £30,000 (in blue) per QALY WTP thresholds. Points in the North-East quadrant suggest that collagenase is more effective but also more costly than LF. Points located below the WTP threshold lines in this quadrant indicate that collagenase is incrementally cost-effective compared to LF. In the South-East quadrant, collagenase is both more effective and less costly than LF, making it the clearly cost-effective intervention. Similarly, the North-West quadrant is where LF is the cost-effective choice. However, in the South-West quadrant, where most points are located in this figure, collagenase is less effective and less costly than LF. Points that lie below the WTP lines in this quadrant indicate that collagenase is decrementally cost-effective compared to LF.
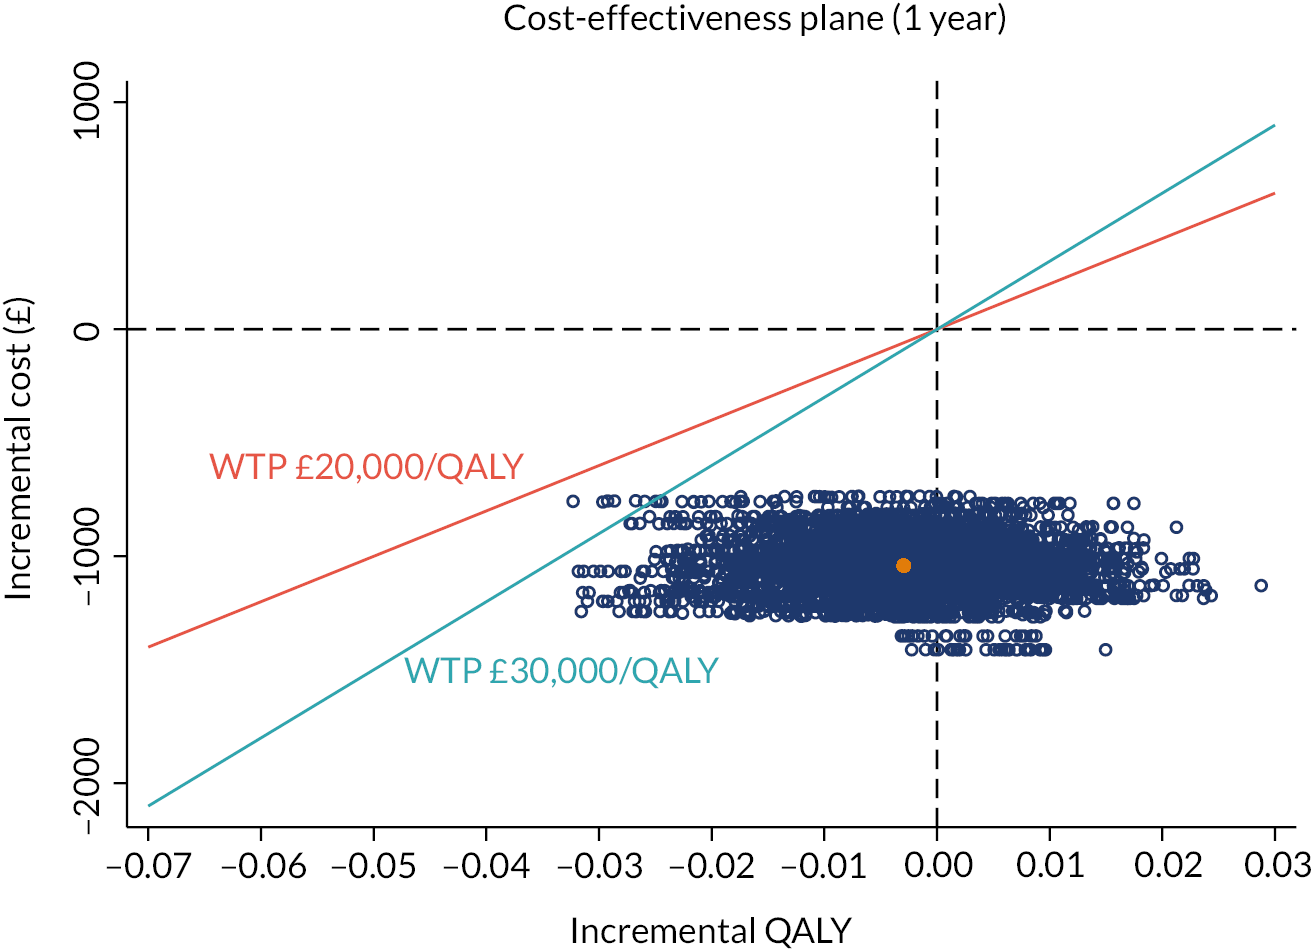
FIGURE 26.
Cost-effectiveness acceptability curve (MI) at 1 year. The CEAC plots the probability that collagenase (in blue) or LF (in red) is cost-effective (y-axis) against various WTP thresholds (x-axis). In the WTP thresholds range of £20,000–£30,000 per QALY, the curve indicates a 99% probability that collagenase is decrementally cost-effective.
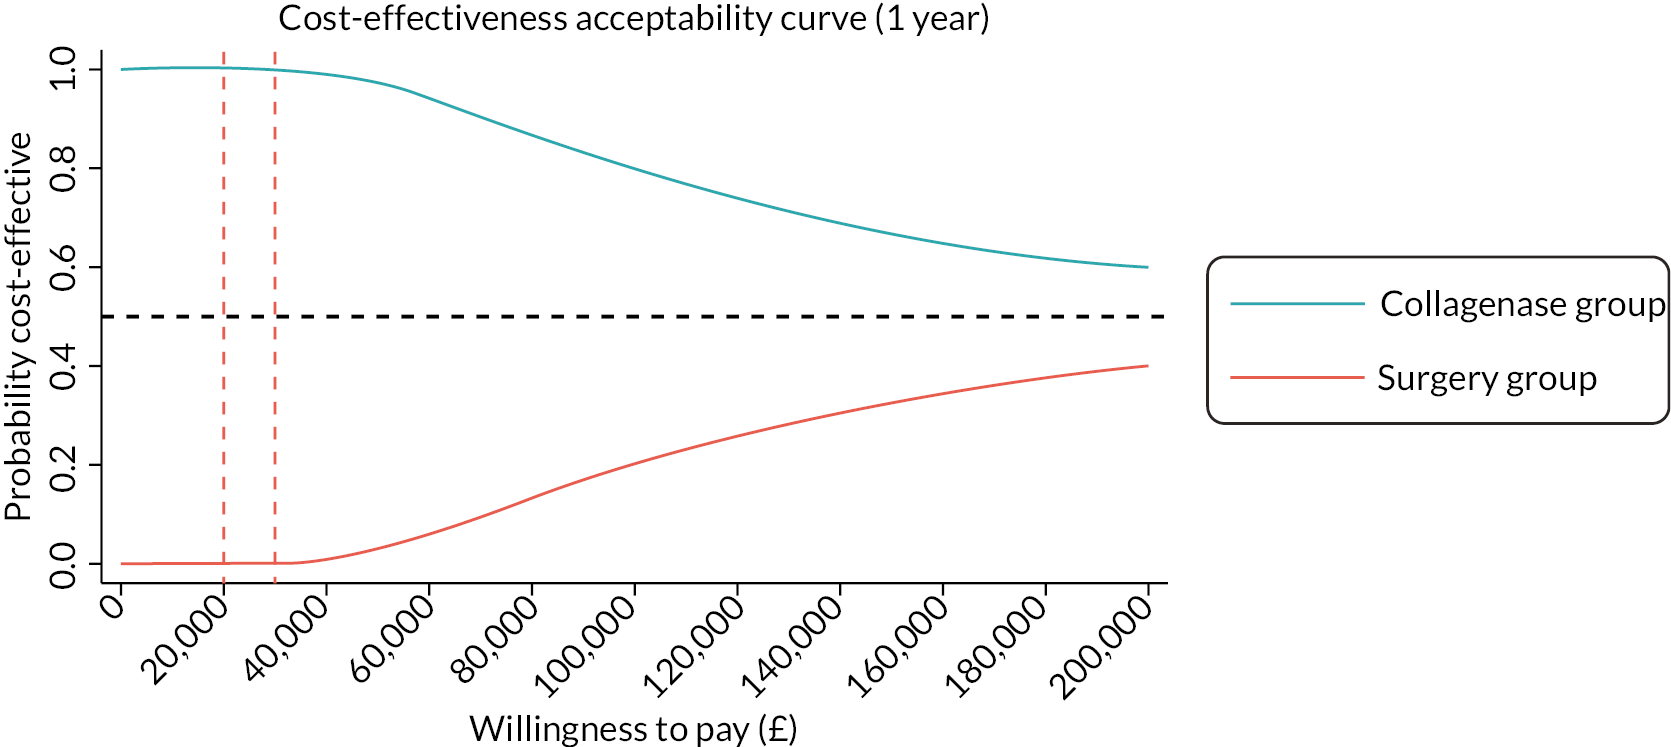
At 2 years post treatment, collagenase continued to be significantly less costly (mean difference: −£1212, 95% CI −£1276 to −£1147) and became significantly less effective (mean difference: −0.048, 95% CI −0.055 to −0.040) (Table 43). Compared to the 1-year results, the overall cost-effectiveness of collagenase was reduced given the consistently worsened HRQoL in the collagenase group compared to the LF group after 3 months post treatment (see Figure 24). The NHBs associated with the collagenase group were estimated to be 0.013 at £20,000 per QALY gained. Figures 27 and 28 demonstrate that the probability of collagenase being cost-effective compared to LF was 72% at a WTP of £20,000 per QALY. At a WTP threshold of £30,000 per QALY, the results were more in favour of more expensive alternative (LF) and the NHBs gained in the collagenase group was lower than the LF group with a negative estimate of −0.007 QALY. In this case, the probability that collagenase would be considered cost-effective was only 37% and LF became the optimal treatment strategy. The intersection point of the two curves in Figure 27 represents the decision-making turning point, that is, LF became the cost-effective treatment strategy when the WTP threshold is higher than £25,488.
FIGURE 27.
Cost-effectiveness analysis plane (MI) at 2 years.
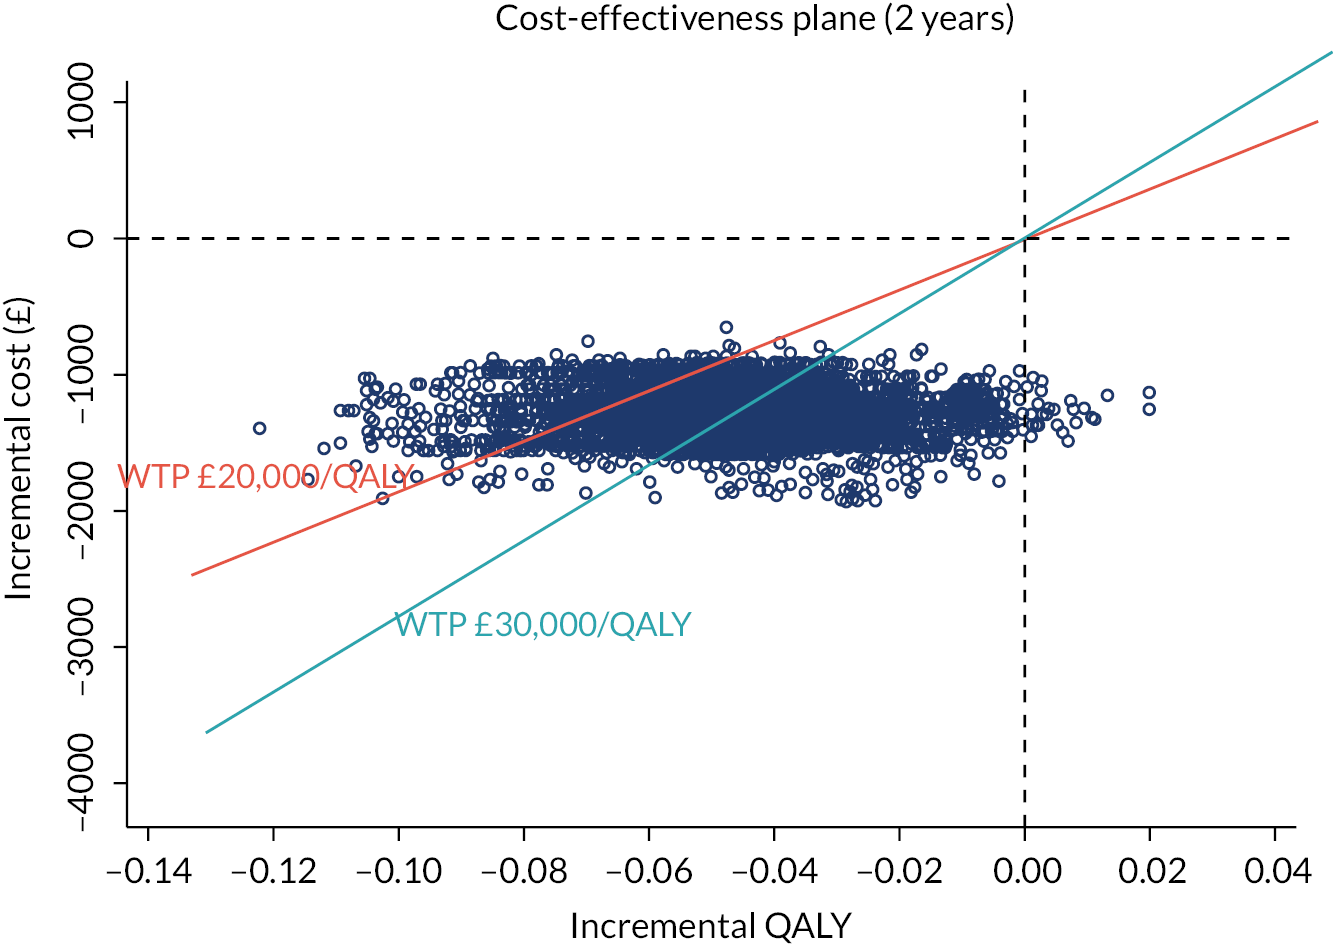
FIGURE 28.
Cost-effectiveness acceptability curve (MI) at 2 years.
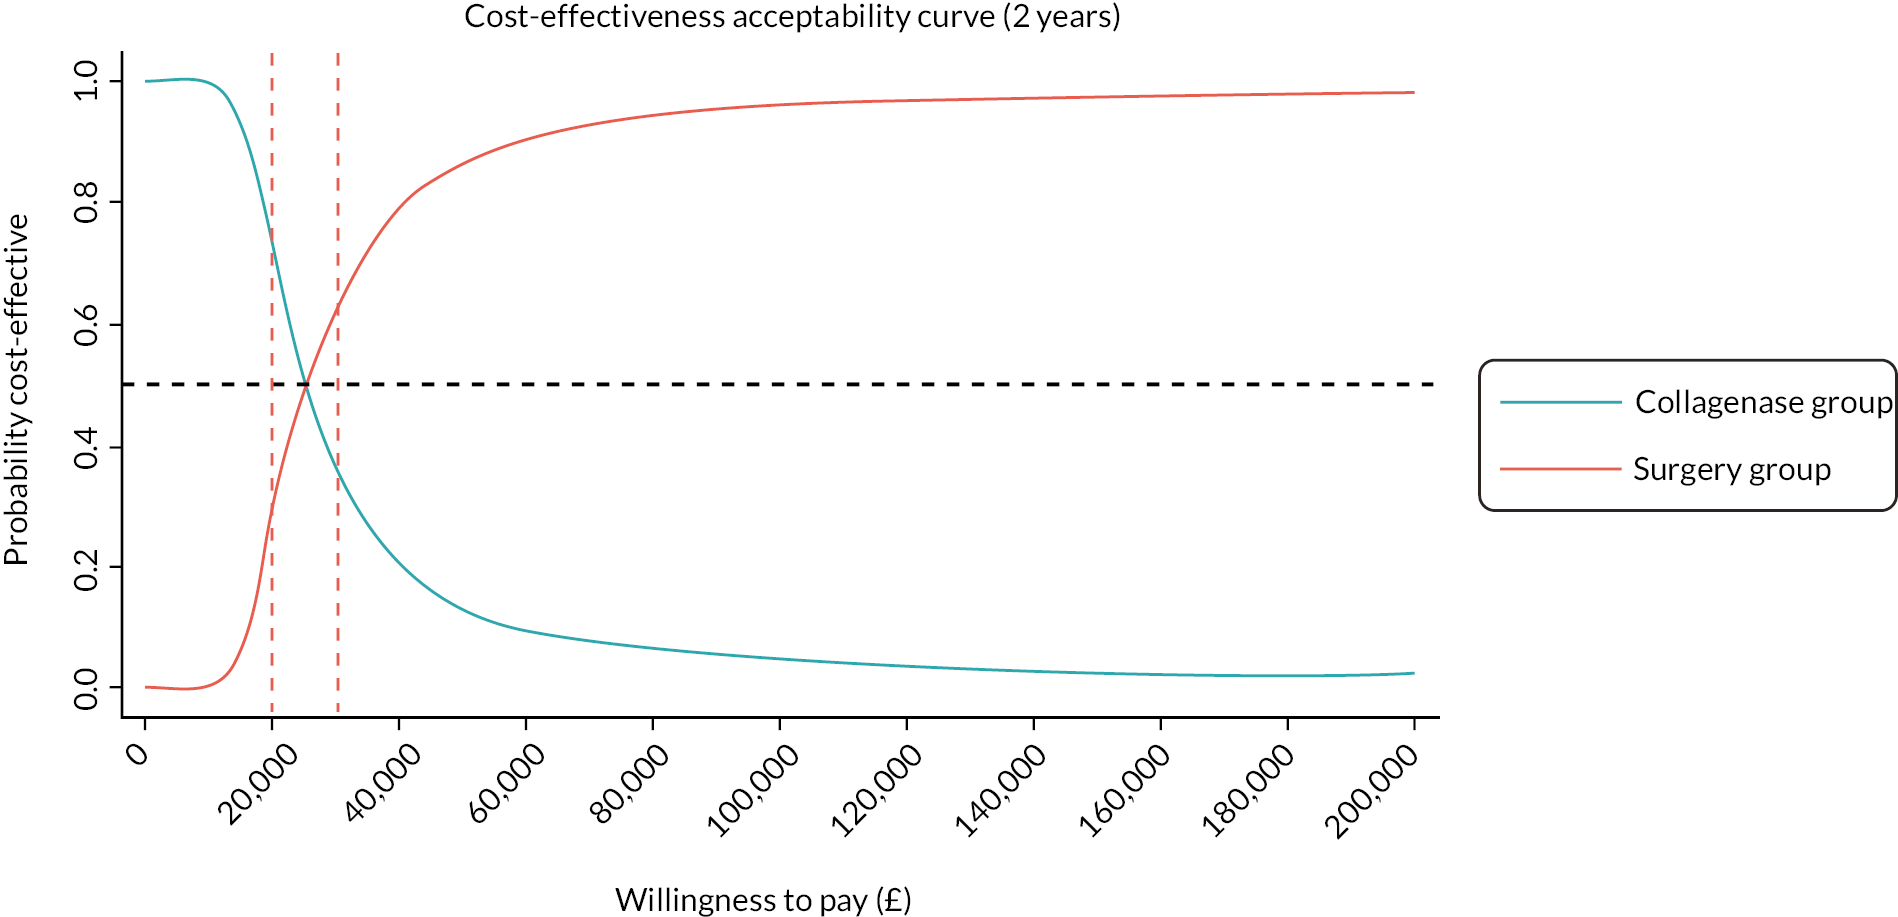
Secondary analysis
The mean costs of sick leave and time lost from normal activities reported by participants at each follow-up point on all available cases are listed in Table 44. Participants allocated to the LF group took more time off from work and normal activities in the first 3 months after treatment. The productivity loss due to absence from work is significantly higher in the LF group compared to the collagenase group (£487 vs. £138, mean difference: −£350, 95% CI −£537 to −£162). No significant differences were detected in productivity lost from normal activities or in the cost of private health care.
| Time point | LF group | Collagenase group | Mean difference (95% CI) | ||
|---|---|---|---|---|---|
| Available cases | Mean (SD) | Available cases | Mean (SD) | ||
| Productivity loss (work) | |||||
| 3 months | 243 | £487 (£1453) | 280 | £138 (£620) | −£350 (−£537 to −£162) |
| 6 months | 239 | £21 (£191) | 266 | £26 (£279) | £4 (−£38 to £47) |
| 1 year | 247 | £3 (£36) | 280 | £62 (£774) | £59 (−£38 to £156) |
| 2 years | 194 | £24 (£306) | 224 | £45 (£441) | £21 (−£53 to £95) |
| Productivity loss (normal activities) | |||||
| 3 months | 218 | £76 (£506) | 251 | £17 (£72) | −£60 (−£123 to £4) |
| 6 months | 171 | £8 (£70) | 221 | £2 (£17) | −£6 (−£15 to £4) |
| 1 year | 168 | £1 (£14) | 229 | £3 (£27) | £2 (−£3 to £6) |
| 2 years | 122 | £5 (£50) | 175 | £1 (£10) | −£4 (−£12 to £4) |
| Cost of private health care | |||||
| 3 months | 237 | £0 (£0) | 271 | £31 (£498) | £31 (−£33 to £95) |
| 6 months | 238 | £0 (£0) | 261 | £0 (£1) | £0 (£0 to £0) |
| 1 year | 236 | £22 (£277) | 279 | £11 (£177) | −£12 (−£51 to £28) |
| 2 years | 192 | £0 (£0) | 222 | £26 (£394) | £26 (−£29 to £82) |
The estimated mean total societal costs based on MI were £607 per participant in the LF group and £363 in the collagenase group at 2 years (mean difference: −£245, 95% CI −£293 to −£196). The probability that collagenase would be considered cost-effective was higher than the base-case analysis at both £20,000 and £30,000 WTP thresholds (72% vs. 92% and 37% vs. 64%, respectively) (Table 45). This means that collagenase is the optimal treatment for DC at both 1- and 2-year time horizons.
| Analysis | Collagenase vs. LF | ICER | Probability of collagenase being cost-effective at specified WTP threshold per QALY` | NHB associated with collagenase at specified WTP threshold per QALY | |||
|---|---|---|---|---|---|---|---|
| Incremental cost | Incremental QALYs | ||||||
| Mean (95% CI)a,b,c | Mean (95% CI)a,b,c | £20,000 | £30,000 | £20,000 | £30,000 | ||
| Base-case analysis (MI) | |||||||
| 1 year (N = 672) | −£1090 (−£1139 to −£1042) | −0.003 (−0.006 to 0.000) | 100.0% | 99.9% | 0.052 | 0.033 | |
| 2 years (N = 672) | −£1212 (−£1276 to −£1147) | −0.048 (−0.055 to −0.040) | 71.9% | 37.0% | 0.013 | −0.007 | |
| Secondary analysis (wider societal perspective) | |||||||
| 1 year (N = 672) | −£1363 (−£1431 to −£1295) | −0.001 (−0.004 to 0.003) | 100.0% | 100.0% | 0.067 | 0.045 | |
| 2 years (N = 672) | −£1458 (−£1543 to −£1374) | −0.041 (−0.048 to −0.033) | 91.9% | 64.3% | 0.032 | 0.008 | |
| Sensitivity analyses | |||||||
| Complete cases (deaths included) | |||||||
| 1 year (N = 361) | −£1374 (−£1640 to −£1109) | −0.009 (−0.030 to 0.011) | 100.0% | 99.9% | 0.059 | 0.036 | |
| 2 years (N = 285) | −£1505 (−£1988 to −£1022) | −0.060 (−0.113 to −0.007) | 69.7% | 37.0% | 0.015 | −0.010 | |
| Complete cases (deaths excluded) | |||||||
| 1 year (N = 360) | −£1373 (−£1639 to −£1106) | −0.008 (−0.028 to 0.012) | 100.0% | 99.9% | 0.061 | 0.038 | |
| 2 years (N = 281) | −£1565 (−£2036 to −£1094) | −0.042 (−0.091 to 0.008) | 90.5% | 65.6% | 0.037 | 0.011 | |
| HRG cost | |||||||
| 1 year (N = 672) | −£1320 (−£1367 to −£1273) | −0.0001 (−0.003 to −0.003) | 100.0% | 100.0% | 0.066 | 0.044 | |
| 2 years (N = 672) | −£1434 (−£1496 to −£1371) | −0.042 (−0.050 to −0.035) | 91.8% | 60.8% | 0.029 | 0.006 | |
| Collagenase injections in theatre | |||||||
| 1 year (N = 672) | −£528 (−£576 to −£480) | −0.003 (−0.006 to 0.000) | 98.9% | 94.6% | 0.023 | 0.014 | |
| 2 years (N = 672) | −£648 (−£712 to −£584) | −0.048 (−0.055 to −0.041) | 29.6% | 14.0% | −0.015 | −0.026 | |
| 50% collagenase injections in theatre | |||||||
| 1 year (N = 672) | −£811 (−£860 to −£763) | −0.0001 (−0.003 to 0.003) | 100.0% | 99.7% | 0.040 | 0.027 | |
| 2 years (N = 672) | −£919 (−£982 to −£855) | −0.040 (−0.048 to −0.033) | 60.6% | 31.6% | 0.006 | −0.010 | |
| LF delivered by trainees | |||||||
| 1 year (N = 672) | −£985 (−£1033 to −£938) | −0.002 (−0.006 to 0.001) | 100.0% | 99.9% | 0.047 | 0.030 | |
| 2 years (N = 672) | −£1108 (−£1172 to −£1044) | −0.046 (−0.053 to −0.038) | 66.3% | 34.5% | 0.010 | −0.009 | |
Sensitivity analyses
The results of all sensitivity analyses showed that the collagenase group incurred lower costs and generated less QALY compared to the LF group both 1 year and 2 years after treatment. The cost-effectiveness analysis indicated that treatment with collagenase was consistently associated with positive NHBs, and the probability of decremental cost-effectiveness was always over 95% more cost-effective at 1 year, and this was robust for all the sensitivity analyses performed.
By contrast, the 2-year results were more sensitive to the varying assumptions.
The distributions of both 2-year costs and QALYs before and after imputation were plotted in Appendix 9, Figure 100. The first complete-case analysis comprised deceased participants and the results were consistent with the base-case cost-effectiveness findings (Table 45). A second sensitivity analysis treated deaths as missing, which is consistent with the statistical analysis. However, in this case, the QALYs for the collagenase group were overestimated as deceased participants with extremely low utility score (zero) were not included. As a result, the 2-year probability of collagenase being cost-effective increased from 37% in the base analysis at a WTP threshold of £30,000 per QALY to 66%.
The sensitivity analysis based on the HRG reference cost impacted both the difference in cost between the two groups and the cost-effectiveness conclusions. The adjusted mean cost difference changed from −£1212 to −£1434 making collagenase even more cost-saving. Consequently, the probability of collagenase being decrementally cost-effective increased to 92% (WTP threshold £20,000), and 61% (£30,000) at 2 years.
We investigated the potential impact of alternative locations for collagenase administration in a sensitivity analysis. We tested the assumptions where either 50% or 100% of injections were performed in an operating theatre. The results indicate that if all collagenase injections were performed in theatre, the cost advantage of the intervention would no longer be enough to cover the benefit lost, given the high cost of running a theatre. As a result, collagenase treatment becomes less cost-effective at 2 years. However, if only half of the injections were conducted in an operating theatre, the conclusions would remain unchanged from the base-case analysis.
We performed another sensitivity analysis to determine if replacing consultant surgeons with trainees would increase the cost-effectiveness of LF. However, changing the staff category did not affect the results, and so the findings remained unchanged.
Threshold analysis
The results of the threshold analysis exploring the impact of the price of collagenase on the cost-effectiveness of collagenase compared to LF over a 2-year time horizon are shown in Figure 29.
FIGURE 29.
Threshold analysis of price of collagenase at 2 years. A positive NHB indicates an improvement in overall population health achieved by adopting collagenase over LF, whereas a negative incremental NHB suggests that replacing LF with collagenase would reduce overall population health.
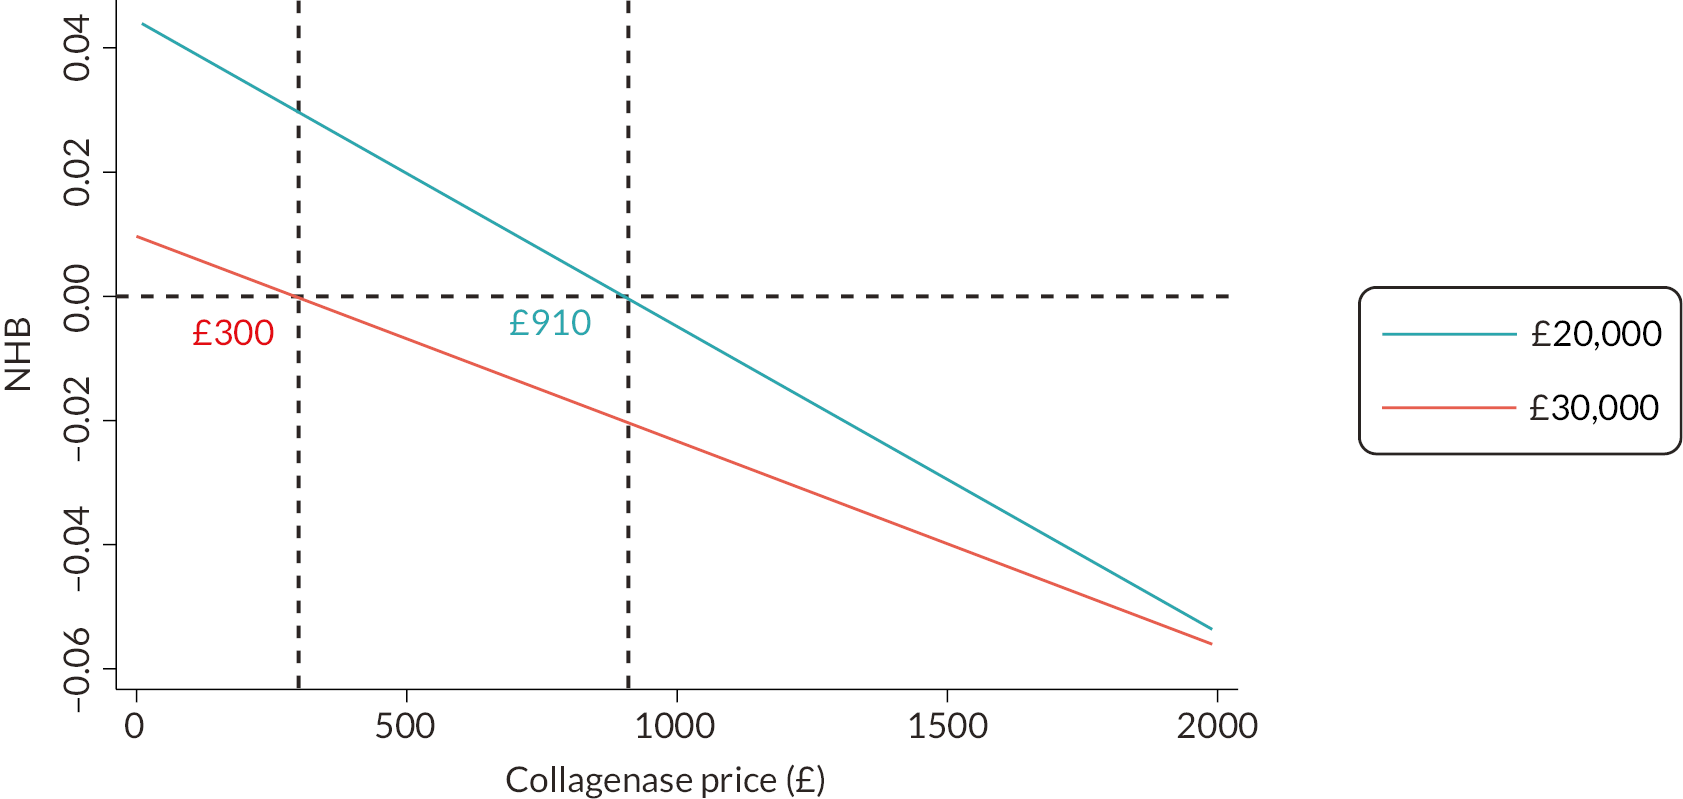
The base-case analysis demonstrates that, compared to LF, collagenase is a less-costly and less-effective intervention in treating DC. Therefore, for the given amount of effects derived from the treatment, the advantage of collagenase stems from its relatively low cost. The result of the threshold analysis suggests that, at 2 years, collagenase should be considered as cost-effective when the price of collagenase is < £910 per vial at the maximum acceptable ICERs of £20,000 per QALY. If decision-makers are willing to pay £30,000 for an additional QALY, collagenase would be a cost-effective option only if the drug price is < £300 per vial.
Long-term Markov decision analytic model
To investigate the cost-effectiveness over different time horizons, a Markov model was used based on the 345 participants who had 1-year recurrent status recorded. The mean costs, QALY gains, NHB, and probability of collagenase being cost-effective over 1-year, 2-year, 3-year, 4-year and lifetime time horizons are listed in Table 46. Consistent with the within-trial findings, 1 year after the initial intervention, collagenase was associated with a positive incremental NHB compared to LF, with a high probability (> 99%) of being decrementally cost-effective.
| Time | LF | Collagenase | Incremental costa | Incremental QALYsa | ICER | Probability of collagenase being cost-effective at specified WTP threshold per QALY | NHB associated with collagenase at specified WTP threshold per QALY | ||||
|---|---|---|---|---|---|---|---|---|---|---|---|
| Mean cost | Mean QALY | Mean cost | Mean QALY | £20,000 | £30,000 | £20,000 | £30,000 | ||||
| 1 year (N = 345) | £3025 | 0.846 | £1535 | 0.835 | −£1490 | −0.011 | 100.0% | 99.7% | 0.064 | 0.039 | |
| 2 years (N = 345) | £3479 | 1.688 | £1838 | 1.633 | −£1641 | −0.054 | 94.3% | 69.3% | 0.028 | 0.0005 | |
| 3 years (N = 345) | £3897 | 2.481 | £2112 | 2.386 | −£1784 | −0.096 | Collagenase less costly and less effective | 64.1% | 36.7% | −0.007 | −0.036 |
| 4 years (N = 345) | £4275 | 3.230 | £2357 | 3.095 | −£1918 | −0.135 | 45.1% | 25.2% | −0.039 | −0.071 | |
| Lifetime (N = 345) | £7008 | 9.610 | £4040 | 9.126 | −£2968 | −0.484 | 21.9% | 16.2% | −0.335 | −0.385 | |
Among the participants with recurrent data available, 54 were recurrent; a recurrence rate of 15.7% (13.8% LF group and 17.2% collagenase group). Of these participants, 40 had healthcare resources use data available at the 2-year follow-up point, and only 12 participants received re-intervention for DC. Only one participant received re-intervention for the recurrent digit within the second year of treatment; one participant received a PNF (LF group). This is much lower compared to the revision rate reported in the literature, and the reduced numbers of re-interventions were primarily attributed to the impact of the COVID-19 pandemic.
Therefore, in the Markov model, re-intervention options were introduced for recurrent participants 1 year after the initial intervention. Offering timely re-intervention to 40% of recurrent participants in both groups led to an increase in the probability of collagenase being the optimal strategy over 2 years, rising from 72% (within-trial results) to 94% (model-based results) at a WTP threshold of £20,000 per QALY (see Figure 30). At a WTP threshold of £30,000 per QALY, the probability of collagenase being cost-effective also increased, from 37% to 69%, resulting in a shift in the optimal strategy from LF to collagenase (Figure 30).
FIGURE 30.
Cost-effectiveness acceptability curve (lifetime).
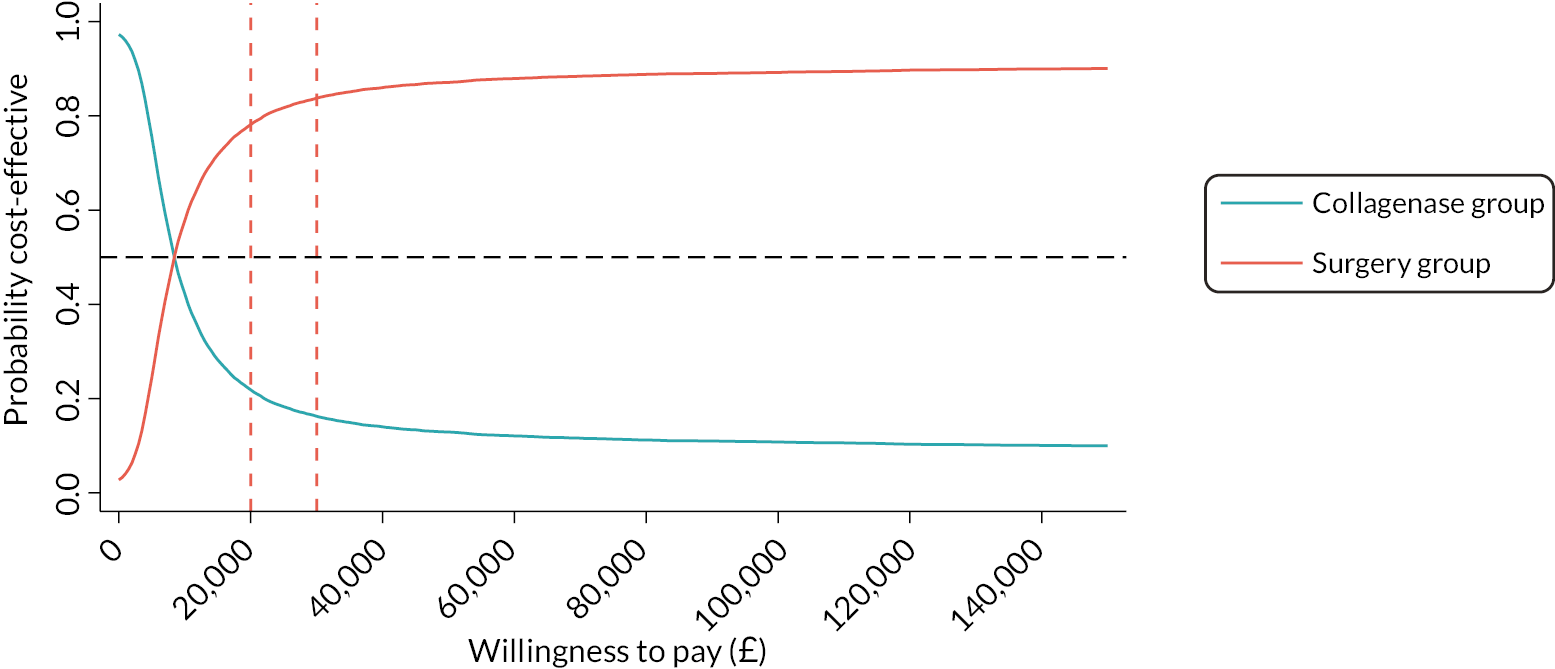
In line with the within-trial analysis, the incremental NHB of collagenase and the probability of it being cost-effective decreased over time, as shown in the last four columns of Table 46. Over the lifetime horizon, collagenase was associated with an estimated total cost savings of £2968 per participant compared with LF, and this corresponded to a mean QALY loss of −0.484. At WTP thresholds of £20,000 and £30,000 per QALY, the probability that collagenase is cost-effective compared with LF at the lifetime horizon fell below 22% and 16%, respectively.
The results of the two-way sensitivity analyses, which tested the impact of recurrence rates and re-intervention rates on cost-effectiveness at different time point, are shown in Appendix 9, Figure 101. The results indicate that, at 1 year, collagenase was always the optimal strategy, regardless of how the recurrence or re-intervention rates changed. Similarly, when the time horizon extended beyond 4 years, LF consistently remained the cost-effective treatment. The decision however changed in response to the variation of recurrence or re-intervention rates for time horizons with higher levels of uncertainty in the base-case analysis, that is 2–3 years after the initial intervention. The results in Appendix 9, Figure 102 indicate that the 2-year within-trial cost-effectiveness of collagenase might have changed if not for the impact of the COVID-19 pandemic, which affected the opportunities for re-intervention.
Discussion
Collagenase is a relatively new treatment option for DC, current evidence on cost-effectiveness of collagenase compared to other treatment modalities is limited. 98–100 Recent systematic reviews have shown that most studies identify collagenase as a less-expensive treatment for DC compared with LF. 35,99 However, these reviews have also acknowledged that the high level of heterogeneity in study design and the nature of costs captured result in inconsistent conclusions regarding the cost-effectiveness of the two treatments. 35,99 There is a need for high-quality CEA conducted using prospective randomised studies. 100
In this study, the results demonstrate that the cost-effectiveness of the two trial interventions changed over time. At 1 year, collagenase was insignificantly less effective but with significant cost savings, resulting in a probability of over 99% of being decrementally cost-effective at WTP thresholds between £20,000 and £30,000 per QALY. The NHBs associated with collagenase and the probability of it being cost-effective decreased at 2 years. LF became the cost-effective treatment strategy when the WTP threshold is higher than £25,488 per QALY. Additionally, the long-term modelling projection indicates that collagenase becomes even less cost-effective at the lifetime horizon. At WTP thresholds of £20,000 and £30,000 per QALY, the probability that collagenase is cost-effective compared with LF at the lifetime horizon ranged only from 22% to 16%.
One potential factor for the divergent findings on cost-effectiveness of collagenase and LF among studies is the time horizon inspected. 101 Fitzpatrick et al. 99 found that only 2 of the 17 studies included in their systematic review identified LF as being cost-effective compared to collagenase. Both are model-based studies with a study time horizon of 5 and 10 years, respectively. 36,102 Another two model-based cost-effectiveness studies indicated that collagenase should only be considered cost-effective under the condition of reduced drug price of collagenase. 91,92 The remaining two Markov-decision analyses reported collagenase to be cost-effective; however detailed data were not available. 103,104 On the other hand, findings from retrospective studies are more in favour of collagenase, but the majority of them are cost analyses with relatively shorter time horizons. 66,84,105–107 Trial-based evidence on the cost-effectiveness of collagenase and LF however is very limited. 99,100
The EQ-5D data show that the participants who received LF reported a poorer health status during the first few weeks’ post treatment resulting in a dramatic reduction in the overall QALY gains over the first 3 months in the LF group. From 3 months to 1 year, participants in the LF group had slightly higher utility scores compared to the collagenase group; however, this difference was not statistically significant. Overall, there was a small and insignificant difference in QALYs (−0.003, 95% CI −0.006 to 0.0004), favouring LF during the first year post treatment. Meanwhile, the mean cost associated with collagenase was significantly lower than LF (mean difference: −£1090, 95% CI −£1139 to −£1042) at 1 year with differences largely attributable to the substantial savings in intervention cost in the collagenase group (mean difference: −£1183, 95% CI −£1208 to −£1159). Therefore, collagenase was shown to be decrementally cost-effective when combining the significant cost savings and insignificantly fewer QALYs gained at 1 year.
A micro-costing method based on data collected alongside the DISC trial was used; however, literature indicates other approaches to costing and highlights several key cost drivers that impact the cost-effectiveness of collagenase and LF. In some UK-based studies, the HRG reference cost was used for both collagenase and LF treatments36,86,87 and some studies focused on only direct health costs, whereas others also considered productivity losses due to absence from work after treatment. 83,84 There were also studies mentioned that staff requirements for different treatments vary66 and some studies highlighted the advantage of performing collagenase injections on an outpatient basis, reducing use of operating theatres. 27,66 We tested these alternative approaches in the secondary analysis and sensitivity analyses. The 1-year findings were robust to all these additional analyses and collagenase constantly had a > 95% probability of being decrementally cost-effective.
However, the analysis of the 2-year time horizon indicated that participants in the collagenase group demonstrated consistently lower utility scores after 3 months post treatment and generated significantly fewer 2-year QALYs (mean difference: −0.048, 95% CI −0.055 to −0.040). The improved health status in the second half of the trial period for LF resulted in an increased probability of it being cost-effective from < 1% at 1 year to 28% at 2 years (WTP threshold £20,000) and to 63% at a WTP threshold of £30,000 per QALY. In this case, for collagenase to be considered cost-effective, it must compensate for the loss of health benefits with significant cost savings. However, our results reveal that, in the second year, the cost of healthcare resource use was similar between the two groups (£914 vs. £884, mean difference: −£28, 95% CI −£87 to £30).
Compared to 1 year, the level of uncertainty around the results at 2 years was much higher and the base-case conclusions were sensitive to changes in costing methods at 2 years. The results of the secondary analysis and sensitivity analyses demonstrate that alternative costing approaches in favour of collagenase (i.e. either reducing the costs in the collagenase group or increasing the costs in the LF group) were associated with an increased probability of collagenase being cost-effective.
For example, LF is shown to be associated with higher societal costs in terms of lost productivity and private healthcare cost. This is primarily the results of increased costs associated with absence from work in the first 3 months after treatment. This finding is consistent with previously published studies, where patients who received LF were found to need a longer time to return to work and incurred higher total costs than those who underwent collagenase injection. 83,84,107 Similarly, the sensitivity analysis using the HRG reference cost had a significant impact on the cost difference where collagenase generated more cost savings. Both sensitivity analyses (societal costs and HRG reference cost) led to a higher likelihood of collagenase being cost-effective at 2 years, with a probability of over 50% at both the WTP thresholds of £20,000 and £30,000 per QALY, compared to only 37% at £30,000 per QALY in the base-case analysis. These sensitivity analyses revealed a different outcome compared to the base-case analysis, with collagenase emerging as the optimal strategy at both 1 and 2 years after the initial intervention, based on the NICE decision-making thresholds of £20,000–£30,000 per QALY gained.
By contrast, the sensitivity analyses indicated that a reduction in cost of LF (e.g. LF delivered by trainee surgeons instead of consultant surgeons) or an increase in cost of collagenase (e.g. collagenase injections administered in the operating theatre) reduced the probability of collagenase being cost-effective. Except for situations in which it was assumed that all injections were performed in an operating theatre, the conclusions of the other sensitivity analyses for this group remained unchanged from the base-case analysis. This suggests that the location of the treatment may impact the cost-effectiveness of the trial interventions. 66,89 Overall, the sensitivity analyses at 2 years produced inconclusive findings regarding cost-effectiveness, although they did offer valuable insights into the potential approaches for reducing costs and improving the cost-effectiveness of the preferred intervention in future, whether it is collagenase or a LF.
Both collagenase and LF have their strengths and limitations regarding resource utilisation. For instance, participants treated with LF had significantly more outpatient visits for physical therapy post treatment, and they also incurred higher productivity loss due to absences from work and other activities66,84 whereas participants in the collagenase group had higher in-hospital costs due to the increased number of additional hand treatments. Higher societal costs, such as the costs of sick leave and time lost from normal activities after the surgery were observed in the LF group. 82–84 We also found that most participants (86.1% of the 331 patients) treated with collagenase had only one joint treated, while 44 (13.3%) had 2 digits treated, and only 2 (0.6%) participants received treatment for 3 digits. In contrast, participants who underwent LF had a higher proportion of multiple digits treated during a single surgery, with 30.3% having 2 digits treated and 9.4% having more than 3 digits treated at once. Because there are fixed costs associated with the surgical operation regardless of the number of digits treated, the marginal cost for treating additional digits would be lower than the cost of treating the first digit. 108
Dupuytren’s contracture is known to significantly impair patients’ HRQoL. 3,27,35 Results show that DC has the greatest impact on the EQ-5D-5L pain/discomfort dimension, with the lowest proportion of patients reporting ‘no problems’ across baseline and all follow-up points compared to the other dimensions. Moreover, LF participants took longer to recover from pain and discomfort as compared to those who received collagenase. During the first few weeks after treatment, a significantly higher proportion of participants in the LF group reported experiencing problems with the self-care, usual activities, and pain/discomfort dimensions than in the collagenase group. In contrast, mobility, and mental health status (anxiety/depression) were less affected by the disease and the treatments. Three months after treatment, the utility scores in both groups had returned to the baseline level, and participants in both groups reported an improved HRQoL as compared to before treatment. These findings suggest that timely and effective treatments can improve health outcomes and reduce the burden of the disease.
The model-based CEA comparing collagenase to LF in treating DC also showed a time-dependent trend; the results at 1 year favoured collagenase, which was consistent with the within-trial findings. In the model, we also accounted for the possibility of recurrence in the longer term, beyond the observation period of the trial. In addition, the prognosis of patients may also be influenced by a timely re-intervention after recurrence. 23,36 However, during the DISC trial, only 12 participants received re-intervention, likely due to the impact of the COVID-19 pandemic. 57 Therefore, the model incorporated a 40% re-intervention rate for recurrent participants, which better reflects the in-clinic realities before and after the pandemic. With these assumptions, the model results showed an increased probability of collagenase being cost-effective at 2 years compared to the within-trial 2-year findings. However, the base case findings for this time horizon were sensitive to variations in recurrence rates and re-intervention rates in both trial groups. Given the potential implications for clinical practice and healthcare policy, it would be beneficial to extend the current study to follow up participants for a longer term, to gather long-term recurrence and re-intervention rates and to evaluate their impact on effectiveness and cost-effectiveness.
The long-term projections show that the probability of collagenase being the optimal strategy and the incremental NHB associated with collagenase both decreased over time. One potential explanation for this trend is that the model inputs were primarily dependent on the trial-based findings. The costs and QALYs from the second year were extrapolated to all participants in the model, except those who had just received re-intervention. As a result, the model propagates the significantly higher effectiveness observed in the LF group during the second year to a long-term horizon. The model was constructed based on certain assumptions to simplify reality and facilitate the analysis. While it provides valuable insights into the long-term cost-effectiveness of collagenase compared with LF, it is also important to acknowledge that the projections are subject to uncertainty. To improve the model’s validity and generalisability, it would be worthwhile to conduct a follow-up study to assess the real-world long-term outcomes of the two treatments.
In conclusion, in this study, collagenase was found to be a cost-saving strategy compared to LF but was associated with less effectiveness in terms of QALYs. The cost-effectiveness of collagenase was demonstrated to have a time-dependent manner. The transient decreased HRQoL and the temporarily raised cost of primary and outpatient visits after LF had a clear impact on the short-term cost-effectiveness. At 1 year, collagenase had a probability over 95% of being decrementally cost-effective, and this finding remained robust across all additional analyses. However, with the improving quality of life 3 months after surgery, the probability of LF being cost-effective gradually increased, especially with higher WTP thresholds. At 2 years, LF became the cost-effective strategy when the WTP threshold exceeded £25,488. Although the long-term Markov model provided some projections after a 2-year trial period and found LF had a higher probability of being cost-effective than collagenase at a lifetime horizon, this was based on a range of assumptions and simplifications and using the second-year trial data as the basis to project lifetime health cost and QALYs. Further research is required from clinical trials with a longer follow-up to capture the real-world long-term cost-effectiveness of collagenase and LF.
Chapter 5 Qualitative substudy
Introduction
People living with DC report functional limitations associated with their disease, leading to adapting or avoiding everyday tasks;3,4 they also describe consequences for emotional or psycho-social well-being. Individuals living with DC have reported embarrassment about the appearance of their hands,3,4 concerns about ageing,4 and consequences for interpersonal relations (in intimacy or even acts, such as handshaking). 3 Anxiety about progression or recurrence of disease have been reported. 5
Assessment of treatment satisfaction similarly shows that the lived experience of DC is marked by more than practical limitations. Hand appearance and satisfaction with function (independent of objective change to contracture) have both been shown to be important markers of treatment success for people living with DC. 109,110 Complete contracture correction and low recurrence rates have been shown to be important treatment outcomes (more so than rapid convalescence). 111 However, once again research demonstrates a wide range of individual treatment preferences and suggests that patient characteristics and preference may ultimately be most important in treatment decisions. 111
Satisfaction with LF surgery is generally good109,110 and a limited qualitative literature provides detail about the experience of surgery. This shows that both practical and emotional support are required during treatment and recovery4 and that prior treatment may shape how surgery is experienced. 112 Patient circumstances4 and even character type (e.g. the eager patient/the tolerant patient)112 may shape how surgery is viewed. A broader review of how patients consider quality in hand surgery (not restricted to DC) recognises a similar mix of physical, psychological, economic and practical factors. 113
Non-surgical treatments for DC include physiotherapy, radiological, pharmacological treatments and collagenase. 19 The relative benefits and difficulties of surgical and non-surgical treatments are manifest in differing recovery time, treatment complications, and contracture recurrence. 19 A good level of satisfaction with collagenase has also been demonstrated; a survey of 213 patients demonstrated 73% were satisfied or very satisfied114 and an interview study of 12 participants reported that non-surgical treatment is acceptable and considered to offer benefit in the management of DC. 115 Elsewhere, the need for more good quality information about the experience of treatment for this condition has been recognised. 5,116
Understanding how non-surgical treatments are viewed and experienced by those living with DC will support the interpretation and implementation of the findings of trials in this area. Insight about patient experiences can also support improved patient-centred care117,118 and shared decision-making119 for patients with DC.
This study investigates the lived experience of individuals treated for DC within the DISC trial. It considers and reports their knowledge, views, and lived experience of DC treatments.
Study aims
The aim of this nested, qualitative study was to explore participants’ experiences of DC treatment and to consider factors which may shape preference for various treatment modalities.
Study objectives
-
To explore participants’ experience of DC.
-
To explore participants’ experience of surgical and non-surgical treatment of DC.
-
To consider patients’ preference for treatment options, and those factors which might be pertinent in this.
Methods
This is a qualitative interview study, typified by the constant comparative method120 where data collection and analysis are integrated, and where emergent issues may subsequently inform ongoing data collection and analysis.
This work was covered by the DISC trial approvals from Yorkshire and Humber – Leeds West REC (Reference: 17/YH/0120).
Participants
Participants were selected purposively121 from those DISC participants who indicated a willingness to take part in a qualitative interview.
Initial sampling focused on ‘typical cases’ where treatment had been successful and uncomplicated (interview batch 1, n = 6–10 interviewees). Subsequent sampling, in batches of five interviews, sought to include more working age and female participants, and to balance instances of PIP and MCP joint being affected. Sampling ceased when data saturation had been achieved, that is no new emergent issues were evident in the data. Saturation was established by the two qualitative interviewers and confirmed with the DISC TMG.
Written informed consent was obtained for all participants at the initial DISC consent stage and was reconfirmed prior to interview.
Data collection
Participants were invited to take part in a single, standalone interview between 3 and 6 months post treatment to ensure that experience immediately post treatment could be captured. Interviews could be face to face or via telephone dependent on participant preference and were carried out by two experienced qualitative researchers (PL and MA).
Interviews were semistructured and organised to allow participants to focus on areas that they felt most important, and to introduce new topics that they felt relevant. 122,123 As a general foundation four broad topic areas were discussed: (1) Lived experience of DC; (2) Knowledge about DC treatments; (3) Experience of collagenase treatment and (4) Expectations for the future (recovery/recurrence).
All data were digitally recorded and transcribed in full. Transcriptions were handled using Nvivo (v.11, QSR International Pty Ltd NVivo, 11 ed; 2015).
Data analysis
Data were analysed using an inductive, thematic approach. 124 In fitting with the constant comparative method, data were analysed in batches and this process integrated alongside data collection in an iterative fashion. 120
Points of interest in transcripts were coded with a descriptive label; these labels reviewed, refined, and organised within broader themes. Themes were reviewed for internal and external coherence; their utility in addressing the research questions considered. Themes were finalised and prioritised.
Coding was led by the one qualitative interviewer with another reviewing and validating interpretations.
Study development
Data collection and data analysis were informed by an iterative process of stakeholder engagement and consultation.
In the early stages of data collection, the interview topic guide was considered at a public and patient involvement (PPI) meeting (April 2018). At this meeting participants encouraged a focus on the experience of the collagenase injection. They also demonstrated a concern for aspects such as pain, discomfort and potential treatment side-effects.
At a parallel meeting with clinicians (May 2018), it was considered important to compare how the different treatments are understood and experienced. Clinicians were specifically interested to understand how a potential trade-off between invasiveness and recurrence might be understood and assessed.
Following these meetings, the interview topic guide was finalised (see Appendix 10), with further prompts added to reflect the concerns of the PPI meeting and explicit questions about a trade-off between treatments added to reflect the interests of the clinicians.
At various points in the study, interview data and its analysis were reported to the TMG, interpretation of themes were considered and their utility in understanding treatment assessed. Additionally, a review of data analysis was undertaken with the DISC PPI group (at a dedicated analysis meeting in April 2019) and with the recruiting site PIs (October 2019). In these meetings, the construction of themes was considered (i.e. how various coded data is connected to form overarching ideas and explanations) and themes were revised and finalised. In these meetings, stakeholders were challenged to identify the key questions or uncertainties about DC treatment that they would like answered.
Following these meetings, the DISC code book was finalised, and the focus of the thematic explanations revised to reflect the concerns of clinicians and those living with DC.
Results
Forty-five interviews were undertaken. Interviews took place between April 2018 and November 2019. Participant demographics are shown in Table 47.
| ID | Treatment | Gender | Reference hand/digit/joint | Age |
|---|---|---|---|---|
| 1079 | LF | Male | Right little PIP | 53 |
| 1102 | LF | Female | Left little PIP | 56 |
| 1103 | Collagenase injection | Female | Right little PIP | 63 |
| 1104 | Collagenase Injection | Female | Right little PIP | 69 |
| 1106 | LF | Male | Right little PIP | 55 |
| 1107 | Collagenase injection | Male | Left little PIP | 52 |
| 1108 | LF | Male | Right little PIP | 57 |
| 1110 | Collagenase injection | Male | Left ring PIP | 77 |
| 1111 | Collagenase injection | Male | Left little MCP | 72 |
| 1150 | Collagenase injection | Male | Left little MCP | 59 |
| 1151 | LF | Male | Right little PIP | 73 |
| 1152 | LF | Male | Right little MCP | 72 |
| 1153 | Collagenase injection | Male | Left middle MCP | 73 |
| 1155 | LF | Female | Right little PIP | 67 |
| 1200 | Collagenase injection | Male | Left ring PIP | 56 |
| 1201 | Collagenase injection | Male | Left little PIP | 74 |
| 1203 | LF | Female | Right ring MCP | 74 |
| 1204 | Collagenase injection | Male | Left little PIP | 62 |
| 1210 | Collagenase injection | Male | Left ring MCP | 70 |
| 1262 | LF | Male | Right ring MCP | 72 |
| 1263 | LF | Male | Right ring MCP | 67 |
| 1319 | LF | Male | Right little MCP | 65 |
| 1353 | Collagenase injection | Male | Right little MCP | 66 |
| 1431 | LF | Male | Left ring MCP | 58 |
| 1433 | Collagenase injection | Male | Right little MCP | 65 |
| 1512 | LF | Female | Left little PIP | 79 |
| 1662 | LF | Male | Right little MCP | 69 |
| 1665 | Collagenase injection | Female | Right middle PIP | 60 |
| 1731 | LF | Female | Left little MCP | 64 |
| 1733 | Collagenase injection | Male | Right ring MCP | 67 |
| 1780 | Collagenase injection | Male | Left ring MCP | 73 |
| 3177 | LF | Male | Right little MCP | 58 |
| 3232 | LF | Female | Right little MCP | 80 |
| 3233 | LF | Male | Right ring MCP | 69 |
| 3243 | LF | Male | Left little PIP | 54 |
| 3244 | Collagenase injection | Male | Left ring MCP | 67 |
| 3286 | Collagenase injection | Male | Left ring PIP | 76 |
| 3407 | LF | Male | Left ring PIP | 65 |
| 3438 | Collagenase injection | Male | Right ring MCP | 62 |
| 3462 | Collagenase injection | Male | Right little PIP | 57 |
| 3487 | Collagenase Injection | Male | Right little PIP | 67 |
| 3623 | Collagenase injection | Female | Left little PIP | 73 |
| 3782 | LF | Male | Right little PIP | 77 |
| 3790 | LF | Male | Right ring PIP | 81 |
| 4022 | Collagenase injection | Female | Left little MCP | 76 |
Prior to treatment, approximately one-third of participants (16/43) expressed an explicit preference – 12 preferring collagenase, four preferring LF. Twenty-seven indicated that they had no treatment preference.
Interviews varied in length, typically ranging from 20 to 40 minutes long.
Four core topics and 15 themes were identified in the data; these are shown in Table 48.
| Topic | Theme | Subtheme |
|---|---|---|
| Lived experience | Normalised | Extended period without health care |
| Manageable – workarounds | ||
| Manageable – limited impact | ||
| A nuisance | ||
| Functional impact | At work | |
| In leisure | ||
| Everyday things (small things) | ||
| Variation | Dominant/non-dominant | |
| Type of job | ||
| Psych-social impact | Embarrassment | |
| Appearance | ||
| Other peoples’ reactions | ||
| Treatment knowledge | Surgical push | Invasive (unwanted) |
| Anaesthesia (general) | ||
| Extended recovery | ||
| Perceived equivalence | Inclusion indicates effectiveness | |
| Outcome – reduced contracture | ||
| Outcome – immediate, short-medium term | ||
| Information | Lack of awareness/ understanding | |
| Information seeking | ||
| Information sources | ||
| Treatment experience – LF treatment | Procedure | Local anaesthetic |
| Duration (too long) | ||
| Satisfied | ||
| Post-surgery | Extended recovery period | |
| Rehabilitation measures (restrictive) | ||
| Pain | ||
| Scarring | ||
| Satisfaction | ||
| Outcome | Satisfied | |
| Improvements | ||
| Complications | ||
| Treatment experience – collagenase injection treatment | Procedure | Quick and easy |
| Compared to surgery | ||
| Pain | ||
| Visceral experience | ||
| Post injection | Inconvenience (less) | |
| Compared to surgery | ||
| Satisfied | ||
| Outcome | Satisfied | |
| Improvements | ||
| Immediate benefit | ||
| Complications and recurrence | ||
| Looking to the future | Recurrence | Immediate recurrence |
| Potential for recurrence | ||
| Recurrence understanding (low) | ||
| Recurrence linked to treatment success | ||
| Age | ||
| Dupuytren’s slow acting | ||
| Trade-off | Recognised/not recognised | |
| Acceptable – surgery better | ||
| Acceptable – injection better | ||
| Negative treatment outcome |
Assessment of treatment options for DC is informed by three distinct fields: (1) knowledge of treatment options; (2) direct experience of the treatment processes and (3) assessment of treatment outcomes. It is worth noting that outcome alone does not adequately explain how non-surgical treatments are considered.
Theme 1: Lived experience of Dupuytren’s contracture
Most participants described periods when their DC impacted on the things that they could practically do; however, some also described feeling self-conscious about how their hand looked. In both these cases this included participants who were diagnosed with DC for the first time, and those that had an existing diagnosis.
Given the progressive, and recurrent, nature of DC, many participants described a changing relationship where their ability and willingness to live with a contracture changed over time. Periods where contractures were liveable with or normalised were common, as were recognitions of deterioration which prompted medical consultation.
Dupuytren’s contracture normalised: something that can be lived with
Among those diagnosed for the first time it was common for participants to describe an extended period of living with minor symptoms before seeking medical advice. For a few participants this period was a decade or more: ‘I would say probably about 15 years, it’s slowly been creeping on’ (1151); ‘It’s about 10 years or more, it’s just slowly happened on both of my hands’ (1204) and ‘I noticed it first probably about 10 years ago but is possible that it was affecting me more before … so probably 15 years or so, something like that’ (1353), although living with symptoms for 5 years or less was more common (e.g. 1079, 1103, 1107, 1110, 1112, 1203, 1262, 3233, 3408).
During these periods (and for periods following treatment for those with a diagnosis) DC was more often considered a nuisance than a serious disability. Symptoms were manageable either due to their lack of severity, or because they did not impact practically (e.g. they affected the non-dominant hand).
You don’t adjust your day around Dupuytren’s if you like it’s just part of like anything else you’ve got … You don’t notice.
1210
There was obviously somwwe contracture on my left hand, but it wasn’t too important on my left hand, so I didn’t bother with that.
1780
I just lived with it for a couple of years … It was more a case of a general nuisance … you seem to adapt to it somehow to a certain extent.
1102
In some cases, contractures were thought to be the consequence of some other incident or accident and not a distinct condition: ‘at first I thought it was an old sports injury’ (1665); ‘I thought it was scar tissue, the consequence of dropping a heavy object on [my] finger’ (1107); and ‘I used to work with my hands so lot of the time and over the years I thought that this problem was more associated to the type of work I had done’ (1262). Even when raising concerns with doctors some participants did not consider their contracture to be a distinct medical condition: ‘when I was seeing the doctor, I just mentioned it’ (P1665); and ‘I went in for something else and my doctor said it’s not arthritis’ (1200).
In all cases, however, comments from friends and family about the appearance of the hand or, more commonly, increased curvature, stiffness, pain, swelling and lack of flexibility led to a recognition that medical attention was required, and that this was not normal or liveable.
My right ring finger was beginning to curl, and it gradually became worse over time until I couldn’t put my hand down flat because of the curl in my finger. If I was washing myself, I would stick it up my nose or stick it in my eye or something. It began to interfere with the way, you know, I was living … that’s when I went to see the doctors about it.
3790
Functional impact of Dupuytren’s contracture
All participants reported some degree of practical limitations associated with their DC, with increased practical difficulties commonly recognised as the key factor in deciding to seek medical advice.
For those where work involved manual strength or dexterity a worsening contracture had significant consequences: ‘I do plumbing and things like that and I realised that I didn’t have the strength in my hands that I used to have’ (3233); ‘I paint furniture and I do upholstery and the thing [bent finger] tends to get in the way’ (1103) and ‘It was kind of difficulty at work, I couldn’t grip things as well as I could’ (P1433). Those who worked in office settings were less affected, although even here contractures might impact on computer work or shaking clients’ hands:
Yes, it was starting to interfere. At the time I was working and the job I was doing, you’re shaking a lot of hands which if people caught it wrong, it wasn’t painful, but it was just a bit of a strange handshake for them … I mentioned shaking hands, that was unfortunate, but there were times in any walk of work that you need straight fingers.
1319
It tended to get a little bit of a nuisance when you were shaking hands you know.
1151
Participants also described how contractures impacted leisure pursuits: ‘I play bowls during the summer, and it was beginning to interfere with that, I couldn’t grasp the woods properly’ (3790); ‘I play the piano and then I couldn’t stretch my finger out completely to reach the whole octave anymore. So it did start to affect that’ (1102); ‘I like playing the guitar and without that finger, it sounds silly but the very end finger is really very important for fifth, sixth and seventh on guitars’ (1201); ‘I wasn’t able to knit, because I couldn’t grasp the knitting needle properly’ (4022) and ‘I [can’t] put my hand down … it’s kind of demotivated me to do yoga and things like that’ (1107)
Despite limitations in these areas being important to participants, it was impact on more mundane and everyday things that was more often described as the trigger for seeking medical advice. Driving, gripping, writing, clapping, washing, opening doors, wearing gloves, and putting hands in pockets (among other things) were commonly cited as the critical moment when a DC became less manageable.
When I started to not be able to wear gloves … that’s the only thing my gloves so I thought I would go and see a doctor.
1512
[It] started really curling up so I was having, I couldn’t get my hands in my pocket and get things out and I had problem.
1780
We used to fly to America and when you go to America you have to fingerprint, and handprint and I couldn’t do it – I couldn’t put my hand flat to do a palm print or the full fingers together.
3438
Initially it was ok, quite manageable but at later stages of it became difficult to do some everyday tasks, like washing, washing your hair washing your body, opening door with a flat palm.
1431
That these smaller tasks and activities are harder to work around might be a reason why they become a trigger for seeking medical attention: ‘you eventually get around a problem if you are using tools … activities you seem to adapt to it somehow to a certain extent … [but] how awkward to get your hands in your jean’s pocket’ (1262).
Variation in functional impact
While all participants described practical limitations, these varied markedly across the sample interviewed.
Where contracture was in the non-dominant hand impact might be less: ‘[does it impact?] No not at all. Well, when I say none at all, I would perhaps say 1%’ (1153). Where fewer fingers were affected, or little finger only, again the practical impact of a DC might be less: ‘it’s on my little finger so it did not stop me really doing anything it just things where I needed a flat hand where it [would] catch something’ (1104). Occupation might also influence the extent to which practical limitations are experienced: ‘Well I am fortunate really because although I used to have a manual technical job, I have now progressed to the office side [so] just use lap-top and PC’ (1107) and ‘Then I retired, and I didn’t take a lot more notice of it’ (3487).
Psycho-social impact of Dupuytren’s contracture
Few participants identified that practical limitations associated with a contracture impacted on them socially. A small number described no longer participating in hobbies and a small number recognised that they were more reliant on people around them for practical help, once again this was primarily focused on small, everyday things: ‘every now and again … believe it or not, I couldn’t open a jar of pickle or something like that … and I’d have to get someone else to open it for me’ (3233); ‘I did [need help] for things like taking lids off things, or sometimes carrying shopping’ (4022) and ‘I was [more reliant on my wife] … if I was trying to wipe something down in the kitchen … I couldn’t do it very well’ (3790). More commonly, however, respondents indicated that their DC did not make them more reliant on others.
More than one-third of participants (17/43) did make explicit comment about the appearance of their hand and how this made them feel. More extreme examples suggested that the DC was having a significant impact on an individual’s sense of well-being and quality of life:
I never liked my hand, I don’t really look at it as part of my body, to me is ugly, horrible … I sort of hang it down, I don’t really like it to me it’s not like part of my body.
1731
It has definitely impacted on my sense of well-being and quality of life, there is no doubt about that you know. It caused me moments of reflection and thinking I wish it wasn’t here.
1107
More commonly participants spoke about the embarrassment associated with how other people might react:
I mean, this is a silly thing, but I had a massage, and the young lady was massaging my hand and then I said look don’t touch that hand if you don’t want to … I was more concerned of her being embarrassed because it wouldn’t have felt very nice.
1155
I have concerns now about appearance, I never used to, I have now because when I shake people’s hands, I am very conscious that it sticks out and I apologize.
1103
Other people seemed to find it a bit of a shock that your finger is bent like that.
1433
In one case it was the reaction of other people that ultimately acted as a prompt to seek medical advice:
I suppose I went to do something about it when people started to make comments about it, so they would say why can’t you straighten your finger? Or that my finger was a bit odd … when comments were made about the fact that it was bent … I thought oh well actually I might go and see actually whether it can be straightened.
1102
Theme 2: Treatment knowledge
Participants’ prior experience and knowledge of DC and its treatment was influential in how they understood and considered the potential and appeal of treatments.
Surgical ‘push’ factors
Several ‘push’ factors associated with surgical treatment were recognised, including those that were associated with the intervention itself and those related to the subsequent rehabilitation and the recovery period. That surgery (by its nature) is invasive was problematic for some, especially those that had not previously experienced surgery. In these cases, the perceived magnitude of surgery was considered incommensurate with their experience of DC:
I’ve been warned by a previous GP not to have the procedure. He said it wasn’t serious enough condition to have the procedure.
3286
[In surgery] you could have all this damage to the tendons I would have thought, somebody in there with a knife, I don’t know (laughs) … cause I’ve never had the procedure, but I was pleased that I qualified for the injection … without a doubt.
1433
Several participants were uncomfortable that surgical treatment could involve a general anaesthetic:
The hand surgeon had a look, and he was very keen to do the open hand surgery, basically where they cut the cord out and he said that I would have the general anaesthetic for it … I said I don’t really want to have a general anaesthetic just for this, so I am gonna turn it down.
1107
Some of those who had previously been treated surgically focused on the extended recovery period associated with it. In these cases, a ‘lengthy healing process’ (1201) with a wound to manage was an important factor in their assessment of the relative benefits of the treatment options:
[Previously] I had the operation [and] it was bandaged up for weeks and weeks, I couldn’t use my right hand, I couldn’t have a wash … I couldn’t work because my hand was cut open.
1204
[With the operation] it’s a longer recovery period because of the stitches and the soreness of the palm … even though the fingers were [healed] the palm of the hand was very sore for a few months.
1780
Perceived equivalence
While it was recognised that surgery might offer an advantage in the actual removal of tissue from the hand, the general assessment was that surgical and non-surgical treatments are likely to offer quite similar outcomes: ‘I think they both have the same outcome, eventually’ (1733) and ‘I imagine it would straighten it in a similar way’ (1665). That surgery might be more expensive was raised by some participants, and some perceived collagenase as a ‘newer form of treatment’ (C1353) in comparison to an ‘old-fashioned operation from the early days’ (1201).
Views about the relative risk of DC recurrence with non-surgical treatment was discussed in the interviews. Often this was not considered a critical issue with three broad responses offered. Some were either not aware or not concerned about the potential for recurrence: ‘If there is a higher chance of recurrence I don’t mind’ (1200); ‘I’m not concerned at all’ (3438) and ‘I’m not even thinking about recurrence’ (C1353). For some age was a factor in this assessment: ‘taking into account my age now I am not too bothered about recurrence in the future’ (1780) and ‘this treatment will last hopefully around 4-6 years so by the time I get to a certain age … that will be the final one. I’m ok with that’ (1103).
A small number of participants offered a third perspective on recurrence. That the convenience of collagenase treatment means that the risk of recurrence is less important than if surgery was the only option.
I mean I have no doubt it will come back again in the future but … because of the nature of it [collagenase] it is just something that I will have to go back and do it again […] the injection treatment seems ok for that.
1210
Well, if it does [recur], then it does. As I say I would certainly try to get the injections done to sort it out rather than having the operation. I would rather catch it earlier.
1773
If it does [recur] I will probably have the same treatment again. it was quick, it was simple, and the recovery period was you know almost immediate.
3244
Information
More than a third of those interviewed described that they had no prior knowledge of treatments before entering the research. Among others there was some understanding of LF, but little awareness of collagenase treatment:
At the time I did not know about the injection, I didn’t know that there was a choice until they asked me … I didn’t know anything about this the injection.
1104
They were running this trial to compare injection against surgery until that point I had no idea that injection was possible, I thought it was [all] surgery.
1110
Appreciation of the cause of DC and the action of collagenase varied among those interviewed, with some demonstrating limited understanding of disease and treatment:
I just thought it was scar tissue or something just an inevitable consequence of dropping [a] heavy object on your finger joint.
1107
I didn’t realize that it was an actual cord in there causing the contraction.
1780
I was under the impression that [collagenase] shrank the hard thing that was in the palm of my hand heading to the finger, but he said no, it broke it up … my perception was wrong in that case.
1153
Despite this lack of detailed knowledge, half of those interviewed reported that they did not seek additional information about DC or collagenase beyond that offered by their doctors, or as part of the trial – ‘No, no I am not that kind of person. Just let me go on with it’ (1111). Those that did seek additional information pointed to the internet with the NHS website mentioned on several occasions – ‘I usually just stick to the NHS website ‘cause I don’t necessarily believe all the other websites are accurate’ (3623).
Most participants in this study were satisfied with the information offered by their doctors as part of the DISC trial.
Theme 3: Treatment experience
Theme 3a: Treatment experience – limited fasciectomy
Assessment of LF was generally positive with most participants treated in this way content with the outcome of surgery as well as their experience of the intervention and recovery. Experiences did of course vary with some individuals more or less satisfied with the outcome, some more or less affected during recovery, and some experiencing more or fewer side effects. However, there is no indication in this data that LF is fundamentally unacceptable to those living with DC, indeed for some it remains the preferred treatment choice.
Limited fasciectomy procedure
Participants offered few comments about their actual surgical procedure, with only the experience of local anaesthesia a topic sometimes discussed. This was variously considered as efficient, interesting or as the most stressful aspect. One participant described ‘it was fascinating watching everybody around me’ (1155), although more commonly participants associated local anaesthesia with a shorter intervention, ‘surgery was quick … done and dusted’ (1512), with less chance of having to stay in hospital.
It was a bit of a bonus to get the op without having to have a general anaesthetic. That was a bit of an experience, having the nerve block but obviously it allowed me to go in, get the op done and go home the same day so I was quite happy with that as well.
3177
They did freeze the arm which I think that was the most stressful part … [I thought] it was all going to be frozen by sort of sound waves but in reality, they used [that] to look at the nerves to actually inject and then they froze the whole arm … it wasn’t too bad, everybody was excellent. Everybody was excellent and afterwards as well I managed to walk out on the same day … get a taxi home and a cup of tea and there you go.
1262
Where interventions had taken longer, local anaesthesia and fasciectomy were considered less positively: ‘I wouldn’t touch the surgery. It took them 3 hours to do it’ (3782); ‘I thought it might have been a quicker procedure … it took about 2 and a half hours’ (1203). In one case a participant felt that more information about the anaesthesia would have been helpful, although this was exceptional with most participants feeling supported and well informed:
[I]n hindsight I would have felt happier if they’d told me how the sensation comes back into your hand, so I got a bit worried that my hand was very hot and even when I was moving it about it would feel like pins and needles and I was expecting to get more of a sensation in my hand quicker … if someone said that these things could happen then I would have been happier … at the point I was thinking is this right?
1102
Post-surgery experience
Perspectives on the post-surgical experience while broadly positive did demonstrate some variation, most notably regarding the duration of recovery and rehabilitation required. For some, an extended period of recovery and rehabilitation was understandable: ‘it did seem to take a while. It was an operation … you can’t expect healing in five minutes’ (2162). Some even pointed to a positive assessment of the time recovering: ‘six weeks and I am already doing active staff again, I’ve been rock climbing and I can do DIY stuff … very quick’ (1106); ‘Eight, nine weeks after surgery it had healed so fast it was unbelievable’ (3233). But, more often the duration of recovery and the number of rehabilitation appointments was considered a drawback of surgery:
The only downside to surgery is the recovery time.
1431
It does drag on. When it’s you it does sort of go on, you think yourself I’ve had that for eight weeks and it is still hurting … but the simple fact is it healed very well.
1151
I am not a patient man … the aftercare was excellent and all in all I was pleased with it [but] It was more intrusive than I expected … I am not a patient, I expected things to back to normal automatically but clearly it was not going to happen in this case.
1662
Alongside this the inconvenience of wearing a cast or a splint was also recognised, ‘my hand in a big bandage in a boxing glove’ (1263), ‘I had this sort of splint on … it restricted me, I couldn’t drive or anything’ (1079). In some cases, this was a surprise to participants:
I thought I would just come out with something strapped to my hand, but my wrist as well was kept stiff, which I can understand [now].
1079
They did explain to me that yes you’d be in a splint, yes you’d have a bandage [but] when it actually happened, I was surprised.
1662
Despite the impression of an inconvenient period of recovery, explicit complaints about difficulties were uncommon with participants generally able to follow rehabilitation advice and maintain proposed exercise and wound/scar management regimens. Some participants did describe the challenge of keeping their wound dressing clean and dry: preventing it from ‘getting a bit ragged’ (1263); ‘and I have quite a dirty job … I went back to work-it was just a question of having applied enough dressings [to keep it clean]’ (1431). In one case a participant complained about difficulties with post-operative wound care:
In my view they left the dressings on too long before changing them and I had to go to my own GP to search for the nurse to change them after about a week … I mentioned it in clinic [and got an appointment for 2½ weeks’ time] that was far too long the dressings to go unchanged. So, one thing that I would say they really want more to think about … this is something that needs attention within a week.
1151
Limited fasciectomy outcome
In the main, participants were satisfied with the outcome of their treatment, 16/22 reporting an improvement in appearance and/or functionality: ‘my hand function is now 100%’ (3790); ‘massively improved’ (1152); ‘it’s very good indeed’ (3790) and ‘really pleased with how it looks’ (1102). Among these a smaller number (6/16) indicated that LF would be their choice should they require re-intervention in the future: ‘this one has done the job so I would say this one [for the future]’ (1106); ‘I would go with the surgery’ (1431) and ‘I have no problem going for the same treatment’ (1319). Of the others some would not consider any treatment in the future (due to age), some would rather their doctor chose their treatment, and some would be open to alternative treatments. Few expressly indicated that they would prefer non-surgical treatment in the future, indicating that they were unsure about LF and the likely outcome. Where surgery was not considered to have been successful participants indicated that they would not have surgery again in the future.
Some participants reported increased sensitivity (1151, 1079, 3790, 3232), stiffness (1108, 3233, 1353, 3243) or numbness (3177, 3487). A number indicated that they were experiencing pain following surgery: ‘you get a bit of pain and when it is a bit cold I seem to get a sort of ache in my hand’ (1102); ‘painful I think is a fair description … feeling pain every day you tend to think that it’s not doing well’ (1151) and ‘it hurt, hurt, hurt’ (3407).
A concern for scarring, and for managing scar tissue, was a common focus:
I can just feel a bit of sensitivity where the scar is, but I think again with time that will toughen up.
1079
If there was a way to get less scar tissue? … I felt like I was moving it to keep it keep moving but, on the downside, it felt like I was opening scars, so it was creating holes in the wound.
1108
My hand is a little bit tender, and the scar tissue area is still also a bit tender but then all is it expected I think.
1151
I’m getting a slight ridge on my hand, but I need to keep massaging that so that the scar tissue doesn’t build up under there.
3233
Theme 3b: Treatment experience – collagenase injection
Assessment of the collagenase injection was positive, with most participants treated in this way indicating that they would prefer it in the future. The collagenase injection was described as quick and as offering quick results. Some described it as very painful, but most indicated that any pain and inconvenience were easily tolerated. Rehabilitation exercises and the use of splints to support the hand were seemingly normalised quickly by participants, with neither considered a barrier to successful outcome.
Collagenase injection
Approximately a third of participants (8/23) expressed surprise at how quick, easy and simple collagenase injection had been: ‘the whole procedure was really quite simple and straight forward’ (1103); ‘it was quick, it was simple’ (3244) and ‘it was over as quick as you were thinking about it’ (3487). Whereas surgery might have been considered too invasive (see Theme 2 – Surgical push), at least one participant admitted thinking that collagenase injection might not be invasive enough:
Well I didn’t expect it to work, I don’t know, it’s just me, I’m probably a bit pessimist … I thought, well how can something so simple work on straightening this finger out … I couldn’t see this working … I was really, really surprised that it worked.
3438
Pain was commonly discussed as a feature of collagenase injection and manipulation. Approximately one-third of participants described experiencing no pain at all: ‘I didn’t feel anything’ (3623); ‘it was painless and quick’ (1103) and ‘I didn’t feel the popping, I didn’t feel the injection’ (3438). A further one-third described pain that they felt was manageable: ‘it’s just a prick’ (3286); ‘momentary pain but nothing you can’t handle’ (1107) and ‘the injection was like a bee sting’ (1201). For others, pain had been a more significant aspect of their treatment experience:
Yes, oh God, I’ve never experienced pain like it. The injections were exceedingly painful but luckily being a man and with two nurses watching, I had to grin and bear it. But I think points out of 10 on pain, it must have been about 8 or 9.
1153
[The manipulation] was painful. Not to the extent where you’re screaming or anything, but you know, it was on the edge, shall we say. I wouldn’t have wanted it to be any more painful … I appreciate you’ve got to force it, but it did get it rather painful, but it was over as quick as you were thinking about it, type of thing.
3487
Other comments about the collagenase injection focused on the sight and sound of a finger being manipulated to break a DC cord. Participants were sometimes alarmed at this potential and surprised by the noise made when a cord is broken.
I knew I should be feeling pain because it went click, click, click, but it was quite interesting because I was looking at it … imagining the pain but I couldn’t feel any.
1200
The noise when he actually cracked it and sort of break it was a bit of a surprise really. I didn’t recognise that it would make that noise, that was un-painful I didn’t feel anything … the only thing that surprised me was the noise when they straightened, it just clicked.
1433
I was a bit concerned when he said, ‘I’m going to pull your finger and you’re going to hear a popping sound’, I thought oh my finger’s going to break, but nothing at all, it’s just like a pop. And that’s all you hear. And that was it, it was done, over and done with, I thought wow!
3438
Post-treatment experience
For some with prior experience of surgery for a contracture, their assessment of the post-treatment period demonstrated less inconvenience and fewer actions to take: ‘[With surgery] my hand was out of commission more, lengthy period’ (1210); ‘[Rehabilitation] is much less important this time’ (1200) and ‘[Following surgery] for a long period I wore cycling gloves so that I had pads on the palms of my hand … I haven’t had to do that obviously this time’ (1780). Discussion of rehabilitation and aftercare exposed no complaints or significant difficulties, participants describing the use of splints to support treated fingers and exercises to stretch fingers.
Participants described using a splint for varying amounts of time, ranging from a few weeks to a few months, some using it all the time, some just at night, and some as when they thought about it or felt it beneficial: ‘I wore it in the daytime, and then I didn’t wear it at night sometimes … if I was just watching television then I put my splint on’ (1665). Most were satisfied with their experience: ‘very good and it was made to measure and everything’ (1665) and ‘to me, it’s perfect, well I’m quite happy’ (3438). A few suggested that it might be restrictive or intrusive but not in a significant fashion.
Had the splint on then for, I would have thought it must have been a couple of months when I used to wear at night. It was a little bit intrusive. It woke me up a couple of times when I was more or less poking myself in the face with it. But then again it was nothing, nothing that you couldn’t live with.
3487
Just as the use of a splint was normalised, participants similarly described exercises to stretch their fingers as becoming routine: ‘I do them when I am just sitting down, not thinking about anything else or watching television I’m just doing exercises on my fingers’ (1780). Some described purchasing stress balls or other grip things off the internet to support their exercise; one described playing the guitar as part of rehabilitation exercises:
[Playing] the guitar in one way enhanced the movement because by moving the fingers, the little finger, all over the guitar … I was able to manipulate and maybe do a lot more good to it if you know what I mean … I do actually believe that by being able to manipulate the finger in such a way it does help.
201
Collagenase injection outcome
In the main, participants were satisfied with the outcome of their treatment, 17/23 reporting an improvement in appearance and/or functionality. Furthermore, several participants described these improvements as immediate: ‘I mean you can see a vast improvement straight away’ (3487); ‘I could see the results … immediately after a couple of weeks’ (1780) and ‘it has been quickly visibly improving’ (1110).
It was commonly acknowledged that outcomes were not always perfect, but that they offered sufficient aesthetic or functional improvement: ‘I haven’t poked myself in the eye since it’s been done’ (1204). Those with prior experience of surgical treatment were able to contextualise their level of satisfaction:
I say the outcome is fine, I am very happy. It’s not perfect but I didn’t expect it to get perfect because having [previously] had the operation [and] that finger is [still] slightly bent. So, it reached if you say my expectations.
1780
I say that the operation was 100% right and the injection treatment was about 95%. That is the only difference but that 95% is still non-problematic at all for anything. I still use it as normal.
1210
Among other participants some described a recurrence of their contracture (3/23): ‘a week later it was back to where it was’ (P 1103); ‘the straightness didn’t last very long it’s starting to bend again’ (3623) and ‘it’s bent back almost as bad as it was before so … more or less straight away’ (1104). Others indicated that collagenase treatment had not worked for them (3/23): ‘it’s got worse, I think it’s worse than it was before’ (1150) and ‘much worse … I can’t hold a fork properly … the irony is the finger itself has gone back but [it will] only bend 50‒60%, before was a 100% so it’s stiffened up’ (3286).
Most participants indicated that collagenase would be their preferred treatment in the future (15/23). This included two participants (1103 and 1104) who had experienced an early recurrence of their contracture, and those who described an imperfect treatment outcome (such as 1204 and 1780 quoted above). Some of those indicating they would choose collagenase in the future also suggested that they would seek clinical advice earlier next time due to convenience (see also Theme 2 – Perceived equivalence).
Of those not preferring collagenase, three offered no preference – ‘not sure’ (1110), ‘would leave it’ due to age (3286), ‘a redundant choice’ due to disease complications (1107) – and five preferred surgery. Concerns about recurrence were offered on three of these occasions with one participant citing a poor clinical outcome as their reason: ‘I am not doing injections again no way because it’s got worse, I think it’s worse than it was before’ (1150).
Theme 4: Looking to the future
Where treatment experience and clinical outcome had been positive, most participants both normalised the risk of DC recurrence and diminished the magnitude of any trade-off between experience and outcome. Of those treated with collagenase, most were unconcerned by the potential for recurrence or any perceived compromise to clinical efficacy.
Some participants felt that their age made recurrence unlikely, or unimportant. Understanding the relative merits of treatment was inconsistent, especially among those treated surgically and those with a first diagnosis of DC.
Concerns about recurrence
In a quarter of interviews, an explicit concern about deterioration or recurrence was described. These cases were typically those where experience of treatment had been poor and/or clinical outcomes poor, for some signs of deterioration were already manifest:
I am concerned [about recurrence] because the pitting and the nodules are starting to move from the edge of my palm and my little finger … so, I am obviously concerned that it could progress, and I could lose function of my ring finger.
1107
I think it [the chance of recurrence] will be quite high. You know, if I don’t put the splint on or if forget about my hand for a couple of days and I don’t do my exercises … [then] I do feel that it’s wanting to pull. It’s trying to pull where it was before.
3233
More commonly participants described an awareness of the potential for recurrence but demonstrated a lack of concern about this. For some this was due to a lack of appreciation of how likely a recurrence is: ‘I know there is a chance, but I don’t know what the likelihood is’ (3232) and ‘I don’t really know. I know that it can happen, but I don’t really know’ (1155). Others offered their own assessment of the risk which informed their level of concern: ‘I would think it’s unlikely’ (1263 – unconcerned about recurrence); ‘I was told 20% chance’ (1662 – unconcerned); ‘probably about 30% [chance]’ (1079 – concerned); ‘50/50 I would say’ (3243 – unconcerned); ‘I would expect that it’s going come back at some point’ (1431 – unconcerned). Across the sample there was a degree of acceptance that contractures may recur at some point in the future:
It happens doesn’t it, there’s not much to do about it. I mean, I presume different people would react differently … some may get it quick within a year, some might take 10 years I don’t know.
1210
The success of correction and adherence to rehabilitation were presented as important factors in lessening the risk of a contracture recurring. Where treatment was considered a success, the risk of recurrence was acknowledged but thought to be more likely in another finger or joint: ‘I would have thought that after it being broken up … that was the final part of it’ (1153) and ‘probably not a recurrence of that finger, the finger what’s just been done, but … I might end up with having other Dupuytren’s in the future’ (3438). Doing exercises or wearing a splint as prescribed were also thought to lessen the chance of a contracture recurring: ‘I think if I can do what the doctor told me to do … it’s less likely to come back … you need to do your job … if I keep doing [the exercises] it’s less likely to come back’ (1203).
A final factor considered pertinent to the possibility of recurrence, or its potential impact, was an individual’s age and the assumption that recurrence would take time to develop. Some indicated that if their DC took as long to recur as it had originally taken to develop, then it was of little consequence to them: ‘it took 70 years for that to occur now I certainly wouldn’t be here if it occurs in another 70 years you know what I mean?’ (1262) and ‘if it happens in 10–20 years, I probably wouldn’t do anything about it’ (1353). Others pointed more straightforwardly to their age: ‘I’m 76 now, I could be dead’ (4022) and ‘I am eighty this year, so I am not worrying about it’ (1512).
A trade-off: intervention vs. outcome
It was evident that not all participants appreciated the potential trade-off between treatment experience (collagenase injection easier/quicker), the potential for treatment complications (greater risk with surgery), and clinical outcome (recurrence less likely with surgery). Among those who had surgery in particular, a number felt unable to comment on any relative benefits or difficulties (8/22): ‘I am not satisfied just simply because I really don’t know’ (1151); ‘I can’t compare the two, I don’t know. If I’d had both then I would know which I was happiest with, but I haven’t’ (3232) and ‘I don’t think I can really say because I haven’t experienced or I have no knowledge of the injection treatment’ (3790). A small number when asked about a possible trade-off influencing their choice of treatment indicated that next time, they would want the other treatment to have knowledge about it.
More commonly those who reported satisfaction with their clinical outcome also reported a willingness to accept the potential difficulties associated with their treatment. Among those who had collagenase injection most (16/23) were willing to accept the trade-off of a less perfect outcome or earlier recurrence for easier procedure:
I thought that the injection treatment was safer than surgery … [it] might have been a more complete treatment by surgery but of course I can’t be certain but as I say it has gone back sufficiently far it not to be a problem at all. So, I am happy with the injection route.
1110
[The chance of recurrence] Yeh, I think that is something, yeh, I am comfortable with that.
3244
By contrast, where outcomes had not been satisfactory the inconvenience of surgery was reassessed: ‘I would agree to surgery despite its problems’ (3623); ‘I would have asked for surgery’ (3487) and ‘the way I’m feeling now I would go for surgery’ (1150).
Among those that had surgery, 9 (of 22) indicated that they were accepting of a slower recovery and greater risk of complications given the clinical improvements that they had experienced. In these cases, some suggested that their recovery had been quicker and easier than expected: ‘It hasn’t been a big problem the recovery I mean it really hasn’t’ (1155). Some felt that recurrence was not certain: ‘[Recurrence], that isn’t the case in everybody … so I can get it [surgery] done’ (3177). One participant indicated that surgery was more reassuring: ‘I would think that psychologically the one that I had would last longer’ (1203).
Several participants, from both sides of the trial, offered the viewpoint that concerns for treatment experience should always necessarily be secondary to clinical outcomes. For these individuals’ treatment should be allocated by a doctor and should be guided by disease severity, with surgery often considered more appropriate for severe or advanced disease:
I don’t think you have a choice to you because If your finger is so bad then you have to have the operation as far as I know the injection is too late.
1200
If she says that the problem, I have with the other hand is just a bit more serious than just needing a needle … you know if I had left it too long … if you wait too long then you end up with a surgery job.
1262
In parallel, a small number of participants felt that their age, more so than their views on treatment, would shape their future experience: ‘Well what I’ve been advised that they don’t do any surgical procedure after the age of 80’ (1103).
Discussion
Summary of key results
It was evident among those interviewed that individuals often live for extended periods with DC, accepting the limitations of a contracture and establishing workarounds for practical tasks. It was often the appearance of the hand or an inability to do mundane tasks (e.g. wear gloves, put hands in pocket, etc.) that triggered seeking medical advice. Knowledge of the causes and consequences of DC varied with many of those seeking treatment for the first time, demonstrating limited awareness about the condition, its treatment, or prognosis.
That both LF and collagenase injection are included in DISC led many to presume an equivalence of clinical outcome, by which they conceived an equivalence in the potential to straighten the finger and return function. Most of those interviewed reported an improvement in both contracture and function, although some treated with collagenase suggested that the outcome was not perfect; but that it was acceptable. DC recurrence was rarely considered as a function of treatment type but was more commonly normalised as a part of the condition. Concerns about recurrence were restricted to those reporting poor clinical outcomes or poor treatment experience.
Consequently, the relative assessment of treatments often focused on immediate experiences more so than the risk of recurrence (presuming of course similar clinical outcomes). Most of those treated with collagenase (15/23) indicated that they would prefer this in the future, with the ease of intervention and speed of recovery considered significant advantages over surgery. Of those treated surgically fewer (6/22) indicated that it would be their first choice in future, with many pointing to an extended recovery as off-putting.
Reflections on the results
This work contributes to the limited literature on patient experience of DC and its treatment, it offers insight about (1) how DC is experienced, (2) how treatment is experienced and (3) how the relative benefits of treatment are conceived.
Experience of Dupuytren’s contracture
Prior research has recognised that DC impacts on individuals in various practical ways and that it also has psycho-social consequences. 3,4 Interviewees here offered similar insights about the functional impact of DC and similarly described embarrassment about the appearance and functioning of their hand. However, data generated here would suggest that individuals normalise these effects and are willing to live with them for extended periods, delaying seeking medical attention until contractures are so pronounced as to garner comment from others or to impact on very ordinary actions (washing, hands in pockets, etc.).
An anxiety about contracture recurrence described elsewhere5,111 was less pronounced here. Interviewees were generally aware of the potential for recurrence but often normalised this as an inevitable aspect of the condition that should be lived with. Only those reporting poor clinical outcomes were explicitly activated by a concern about future deterioration. Recurrence was not considered an immediate concern, and some felt it irrelevant due to their age.
Normalising the limitations associated with a contracture, delaying medical treatment, and accepting recurrence without consideration illustrate a more general feature, that many of those interviewed acknowledged that they had only limited awareness and understanding of DC. Others have previously recognised a need for high-quality information for patients about DC and its treatment. 5,116 The information provided as part of the DISC was generally viewed positively and could be an important foundation for the development of future patient facing information.
Experience of Dupuytren’s contracture treatment
Previous studies have demonstrated that the experience of DC treatment can be an important factor in an individual’s assessment of success – that is, independent of contracture reduction and/or functional recovery. 109,110,112 The presumed clinical equivalence of collagenase injection and LF described here would seemingly reinforce this perspective.
Interviewee assessment of both treatments was superficially positive. Few explicitly complained about their allocated treatment and most reported positive outcomes ‒ 33/45 were satisfied with the improvement to appearance and/or functionality. Looking beyond this, however, treatment experience was presented in markedly different ways; and while fasciectomy might be considered acceptable by most, for many collagenase injection was considered more appealing.
Detailed description of treatment experience reinforces the benefits of collagenase treatment previously identified qualitatively. 115 Participants here were similarly surprised by the speed and ease of treatment and found the shorter rehabilitation period beneficial (especially those that had previous experience of surgery). Pain associated with the intervention was described by some (as in previous research)115 but not to an extent so as to diminish the broader appeal of the treatment. Few of those interviewed described immediate complications associated with injection, this reflects the findings of a previous survey of collagenase patients. 114
Quantitative assessment that convalescence period is relatively unimportant in DC111 is not borne out here with the description of LF often focused on an extended period of recovery and rehabilitation. Comments about how long recovery takes map more closely to concerns about the physical and psychological challenges of recovery that other researchers have identified in hand-surgery. 113 Regaining function without complications is also stressed in relation to hand-surgery. 113 Among those interviewees treated, surgically sensitivity, stiffness, numbness and concerns about scarring were all described.
Treatment assessment
Assessment of outcome is an important and obvious factor which shapes how DC treatments are conceived. 111,114 For many of those interviewed, satisfaction with outcome was sufficient to inform a future preference for the treatment they had received in DISC – and this was evident for both collagenase injection and LF. Stronger still, a poor outcome led to a rejection of the treatment received and a preference for the other. This would seem to reinforce a general point in the literature that prior experience of treatment is important in how DC treatments are conceived and experienced. 112,115 It reinforces survey research that shows poor initial outcome is associated with a rejection of treatment type. 114
Considering this in more detail, we can see that while assessment of improvement was comparable [LF (16/22)/collagenase injection (17/23)], explicit preference varied: fasciectomy was preferred by 6 of those who experienced it in DISC, while collagenase was preferred by 15 of those who received it. Collagenase patients were also more likely to be accepting of the trade-off between treatment experience and outcome: 16 collagenase patients found the trade-off appealing while only 9 fasciectomy patients thought it worthwhile. This repeated pattern reinforces previous research which suggests that treatment experience is important over and above clinical outcome. 110 Here the speed of the collagenase injection and recovery (specifically) were presented as offering significant benefit over surgery.
That a number of those treated with collagenase explicitly indicated that their repair was not perfect further cements this and demonstrates the appeal of an easier intervention and shorter recovery time. Moreover, it demonstrates that complete contracture correction is not always of paramount importance, but rather that many patients are content with adequate aesthetic or functional improvements. 109,110
Data generated here would support previous research which has suggested that individuals need support and information about when to seek medical care in the management of their DC. 125 The assessment offered here by some that surgery was incommensurate with the impact of their condition, and that in at least one case that a GP had advised against surgery, helps us to understand why people delayed seeking help. By contrast, assessment by patients that collagenase is quicker, easier and less inconveniencing may help in reducing treatment delay by encouraging earlier seeking of medical care.
Conclusion
This study offers detailed, qualitative insight into the experiences of DC and its treatment. It complements the clinical and other data generated elsewhere in DISC and provides an additional perspective to support the implementation of trial findings. The qualitative data generated here provide a valuable, subjective viewpoint which will aid clinicians in understanding their patients’ experiences and in shaping their discussions about clinical options.
This work marks the largest qualitative study of DC treatment and is distinctive in enabling a comparison of the lived experience of surgical and non-surgical treatments. It reinforces and extends previous qualitative insight about fasciectomy and collagenase treatments; the focus on lived experience of collagenase injection is particularly important in the context of DISC and other studies, such as HAND-2. This study demonstrates the acceptability and broad appeal of non-surgical treatment for DC, illustrating the pragmatic approach to treatment that many people living with the condition display.
An iterative approach to data generation and analysis has ensured a productive focus in all data collection; the involvement of public and clinical stakeholders has ensured that analysis has been meaningful and well focused.
We should of course acknowledge that interviewees are to some extent self-selected – not all DISC participants were willing to take part in an additional research interview. We should also acknowledge that these stand-alone interviews merely represent a snapshot of individuals’ experiences at one point in time – it may be that views on treatment change as recovery becomes more established or contractures recur. Future research should consider engaging with individuals at multiple time points to establish a fuller and clearer appreciation of the experience of treatment, recovery and monitoring.
Future research should also consider engaging with specific DC populations in a way that was not possible in this study where a broad sample of patients was sought. Future research focused on those of working age, or those experiencing PIP joint or MCP joint contractures, will provide clinicians with more specific insight with which to guide treatment discussions.
Chapter 6 Discussion
Main findings
Primary outcome: Patient Evaluation Measure Hand Health Questionnaire score
The DISC trial showed that collagenase was inferior to LF surgery with regard to PEM scores at 1 year post treatment based on a pre-specified 6-point non-inferiority margin. All sensitivity analyses investigating differential delays between randomisation and treatment, mistimed follow-up measurements and the potential influence of missing data, reached similar conclusions.
Treatment effect estimates at 3 and 6 months, and 2 years post treatment from both the primary analysis and sensitivity analyses show a similar trend. Treatment with collagenase provided some initial benefit over LF, but this was short-lived with LF providing progressively greater benefits at 6 months, 1 year and 2 years post treatment. Analyses (see Departures from planned follow-up schedule) confirm a difference of 6 points favouring surgery from about 7 months post treatment onwards.
The number of participants preferring LF at baseline was smaller than those having no preference or preferring collagenase. Baseline treatment preference was not associated with clear variation in treatment effect at any time point. This may warrant further research to assess how patients with a preconception in favour of collagenase consider their hand function post treatment, as this also reflects DISC qualitative substudy findings.
Further primary outcome analysis conditioning on additional baseline predictors of recurrence (bilateral disease, diathesis indicators, family history, age at onset) reached the same conclusions as the primary analysis. This would be expected given the independence of treatment allocation and diathesis. This aligns with a recent systematic review concluding that traditional diathesis factors are not associated with poor outcome after intervention. 14
Secondary outcomes
A range of secondary outcomes were included to ensure a comprehensive data set for clinicians and policy-makers. These included a range of PROMs to complement the primary outcome (PEM) and important objective clinical measurements which guide clinical decision-making. Detail and rationale for the inclusion of these outcomes is in Chapter 2, Outcomes.
All secondary PROM outcomes, including the PEM Overall Assessment Questionnaire, URAM and MHQ, showed a similar trend to that seen with PEM HHQ with scores in favour of LF after the immediate post-treatment period, and differences increasing consistently thereafter due to worsening of scores in the collagenase arm. This is reflected in the better rating of change after LF at each post-treatment time point.
The SANE at 2 and 6 weeks provides strong evidence that treatment with collagenase results in quicker recovery of function compared with LF, but later the outcomes reflect other PROMs.
The PEM Treatment Questionnaire confirmed that most participants had a positive experience with no differences between study arms.
-
Objective clinical outcomes (goniometry and recurrence)
There was a significant proportion of missing cases across both groups at the post-treatment time points (particularly from 6 months onwards). Aside from the losses to follow-up and administrative censoring that affected collection of all outcomes, collection of measurements was particularly impacted by the COVID-19 pandemic. Measurements that could only be carried out in clinic by research staff, such as passive extension, could not be collected when patients were followed-up remotely as required by lockdowns and/or precautions regarding patient safety.
-
Passive extension
Measurements were similar across groups at baseline, with the majority having about 30–60 degrees passive extension deficit.
The correction obtained following treatment was good. Immediately after manipulation, 62% of collagenase patients had achieved full correction, compared to 78% after surgery.
Extension deficit was worse following allocation to collagenase at all post-treatment time points. Most participants had between about −5 degrees (hyperextension) and 20 degrees at 3 and 6 months after treatment. This difference had grown by 1 and 2 years, with mean extension deficit remaining at < 5 degrees in the LF group, but gradually increasing in the collagenase group from about 11 degrees at 6 months, to about 17 degrees at 2 years post treatment.
-
Total passive extension deficit and other measurements of the reference digit
Total passive extension deficit of the reference digit, passive RoM of the reference joint, active extension deficit of the reference joint, active extension deficit of the reference digit, and active RoM of the reference joint all reflect the findings of total passive extension deficit of the reference joint remaining approximately the same or improving for those allocated to surgery but gradually worsening over time in those allocated to collagenase.
-
Recurrence
The majority (84.3%) of complete cases did not meet the definition of recurrence, although a substantial minority (15.7%) did. Based on the binary definition of recurrence used in this study, there is weak evidence that recurrence is more likely following treatment with collagenase. However, the raw measurements provide strong evidence that contractures are on average worse following treatment with collagenase. This apparent discrepancy between the trajectories of the raw measurements and the binary recurrence outcome could be explained by two factors. Firstly, the raw measurement provides much greater statistical information regarding the comparative effectiveness of the two treatments, meaning true differences between groups are more easily distinguished from noise. Secondly, the recurrence outcome was defined in terms of increase in extension deficit between 3 months and 1 year. However, the analysis of raw measurements suggests that passive extension deficit was already larger in the collagenase group at 3 months. Hence the definition of recurrence used effectively discounts some of the initial benefit of surgery (in contrast with the analysis of the raw measurements which does not).
-
Treatment complications
Complications were experienced by 36% in the LF group compared to 41% in the collagenase group. Treatment complications were graded based on severity to provide a meaningful comparison. It is reassuring overall that over half of participants (61%) had no complications, and among those who did, the vast majority reported ‘mild’ or ‘very minor’ complications. Reported complication rates are high after collagenase treatment. 27,126 These are usually mild and quickly resolve with minimal treatment (e.g. pain at the injection site, skin tears or swelling). More than twice as many ‘moderate’ and ‘severe’ complications occurred in the LF group compared to collagenase, and although uncommon could influence a patient’s decision to undergo LF.
-
Further care and re-intervention
Around a third of treated participants did not have complete data on post-treatment rehabilitation (further care) and re-interventions up to 1 year. This figure rose to about 45–50% by 2 years post initial correction. Most of these participants had incomplete treatment histories up to 1 or 2 years due to dropping out prior to the relevant time point or due to administrative censoring, although there are a small number of cases with interval censored data. These missing cases impact the precision of the estimates, and likely introduce some selection bias (e.g. those that have complete data might be those that on average have a higher propensity for seeking re-intervention). However, there is no reason to suspect that these incomplete cases would result in material bias with regard to the effect of allocation on these outcomes.
Further care that is extended physiotherapy/rehabilitation following treatment was more common in the surgery group; however, the proportion of participants requiring re-intervention by 1 and 2 years post treatment was higher in the collagenase group, with the vast majority of this being further LF.
Based on the available cases, participants allocated to collagenase were at least twice as likely to undergo re-intervention during the 2 years following treatment, and the data are quite compatible with collagenase causing a fivefold increase in the risk of re-intervention by 2 years. Evidence of important differences in the absolute risk of re-intervention are less clear, primarily due to the overall rarity of re-intervention by 1–2 years post treatment. These results align with the results for the extension deficit and recurrence outcomes. The baseline incidence of recurrence was quite low (likely explaining the relatively low incidence of re-intervention), but a clear difference in extension deficit is evident by 12 and 24 months (explaining the higher rate of re-intervention in the collagenase group).
There is reasonable evidence that rates of re-intervention during the first 2 years after initial correction are higher following treatment with collagenase than treatment with LF (although the impact on absolute risk is less clear). The need for re-intervention after treatment with LF may be partly offset in the short term by greater care and physiotherapy required soon, although this could be overwhelmed in the longer term if more patients treated with collagenase require re-intervention to correct recurrence of contracture.
Health economics
Collagenase was found to be a cost-saving strategy compared to LF but was less effective in terms of QALYs. This was time dependent within the 2-year follow-up for the DISC trial. The shift to LF potentially becoming cost-effective occurs between 1 and 2 years, with LF becoming clearly cost-effective at a WTP threshold of £30,000. Given the fading effect of the cost-effectiveness of collagenase with time data collection at further time points of 3 and 5 years is needed to verify trends of sustained cost-effectiveness of LF in the longer term, as determined by the Markov model developed as part of the DISC trial analysis.
Qualitative substudy
Timing of qualitative interviews may help us understand the positive assessment of collagenase treatment that was commonly offered. In the 3–6-month window following treatment participants would have experienced the benefits of collagenase (quicker treatment, quicker recovery) without some of the difficulties (earlier recurrence). However, the appeal of quicker treatment and quicker recovery that this illuminates should not be ignored. Treatment experience is important to those living with DC and most of those treated with collagenase indicated that a trade-off of less positive outcomes for a better treatment experience was acceptable. Some of those interviewed here recognised a less than perfect outcome without complaint.
Clinicians should recognise the appeal of non-surgical treatments for patients in the future, even when recognising that clinical outcomes might not be as good as with LF. Establishing patient priorities about treatment experience and clinical outcome could inform better and more engaged shared decision-making.
The priority offered here to easier treatment and quicker recovery is not surprising and reflects a perspective seen previously in hand injury. 127,128 As with scaphoid fractures, we might subsequently recognise that irrespective of treatment type, that greater attention should be paid to supporting rehabilitation and reinforcing a sense that progress is being made in recovery. 127,128 A useful approach to consider for the future is to move away from regimented aftercare to supported self-care.
Underpinning both these recommendations is a further question that it is pertinent to reflect on regarding DC management: how much improvement is enough improvement? Participants interviewed here were largely content with the improvement that they experienced at the 3-month time point irrespective of treatment, and clinical data demonstrates improvement in the contracture at 2 years for both collagenase and LF surgery. Clinical improvement is better maintained for surgical treatment which might lead us to recommend LF surgery as a better treatment, but this does not imply that collagenase is an unacceptable treatment. Future research should explore participant experience of collagenase longitudinally – is the acceptability and appeal of collagenase identified here maintained beyond 6 months? Do participants find sufficient benefit even when clinical improvement is deteriorating and/or contracture recurring? Is there a threshold at which the ease of treatment and recovery no longer trumps clinical outcome?
Photography substudy
As reported in Appendix 2, the use of photography for ongoing assessment of patients post intervention could provide more flexibility with follow-up and timely assessment of recurrence. The substudy investigating agreement between joint measurements obtained by an investigator using a goniometer in clinic and measurements obtained using the photographs taken by 100 participants at home showed that there was generally poor agreement between the two methods. Substantial variation remained after systematic trends in the differences between the two methods of measurement were accounted for. This leads to 95% limits of agreement (i.e. the range around the estimated mean difference within which we would expect 95% of differences between the two methods to lie) that are considerably wider than the standard error of measurement associated with goniometry used alone. For example, the 95% limits of agreement for the MCP joint are about ± 30 degrees, suggesting measurements of the same joint contracture by each method are reasonably likely to differ by as much as 30 degrees. Goniometric and photographic measurement methods both had wide limits of agreement when measurements were repeated.
The quality of patient taken photographs in extension was high with the vast majority graded as definitely measurable. The quality of photographs in flexion was lower, usually due to patients not fully flexing the MCP joints. Agreement between goniometric measurements and investigator completed photography was similar to agreement between goniometric measurements and patient taken photographs. This suggests patients can provide photographs of comparable quality to investigators.
Photography is low cost, safe and sustainable. It allows re-measurement and remote assessment of DC. As agreement is poor measurements taken by the two techniques should generally not be used interchangeably for clinical decision-making.
Equality, diversity and inclusion
Distribution of recruitment sites
Sites were well distributed throughout England and Scotland, being located both in larger urban areas with a diverse population, and more remote areas (see Table 3). There were no sites in Wales or Northern Ireland. The mix of sites provided a good basis for recruiting from a representative demographic of the UK population.
Research team
The representativeness of the research team should not affect participation of patients with DC in the DISC trial. The handling of patients at recruiting sites was via standard NHS care pathways and no departure from standard clinical practice which might have impacted representativeness of the sample was implemented. The demographic most affected by DC is predominantly white males, though site staff were encouraged to ensure they made the study available to all presenting with the condition. No additional recruitment or retention training or preparation in relation to recruiting a diverse sample was provided to site staff on the DISC trial.
Participants
Most randomised participants in the DISC trial were recruited in England. The Midlands contributed over a third of the total sample.
To monitor equality and diversity in the DISC trial, data were collected for all participants at baseline on age, sex, ethnicity and smoking status. Data on employment status were collected at the 3-month follow-up. As DISC started prior to publication of the INCLUDE framework, other equality and diversity criteria were not included.
Age
In line with the NIHR guidance, individuals under 18 and over 75 are examples of under-served groups in general. DISC included adults over 18 only; however, this is unlikely to have prevented anyone from participating as DC occurs most commonly after the age of 50. The age of DISC participants was from 31 to 89.1 years. Of the total study sample, 104 participants (15.5%) were aged 75 years or over. UK Census data from 2021 (England and Wales) indicate 8.6% of the population were aged 75 years and over. 129 Therefore, this group are over-represented in the DISC sample compared to the general population.
Ethnicity
The ethnicity of the recruited population was 99% white, with just 0.6% Asian/Asian British and 0.3% mixed race. No other ethnicities were reported, although data were missing for one participant. This does not reflect the general UK population, as 82% are white;130 however, DC is most common in the Caucasian population so this is as expected. 6
Sex
Dupuytren’s contracture is up to six times more common in men;8 therefore, it is not unexpected that the DISC population comprised 79.3% men.
Employment status
Most DISC participants were retired (57.9%), which is expected given the average age in the trial sample. A quarter were in full-time employment, 9.4% were in part-time employment and 5.8% were not in paid employment. Depending on the patient group, either people in full time employment or unemployed people can be examples of under-served groups. Given that the unemployment rate in the UK at the start of 2022 was 3.8%,131 the higher rate in the DISC population suggests this group was more likely to participate in DISC, also reflecting how DC affects the employment status of an individual due to reduced hand function. Given the significant numbers of employed participants, this reinforces the need to take a societal perspective in the economic evaluation.
Socioeconomic status
The socioeconomic status of DISC participants was assessed by mapping the participants residence postcodes to the indices of multiple deprivation. 132,133 There was a roughly even split of participants living in five highest and lowest areas of deprivation (48.4% highest, 51.3% lowest), although there were almost twice as many participants living in the lowest area of deprivation (n = 89, 13.2%) compared with the highest area of deprivation (n = 51, 7.6%). Similarly to the education status of participants, this suggests that those living in areas of lower deprivation were more likely to participate in DISC.
Smoking status
In DISC, 11.3% of participants reported being smokers at baseline. A study in 2019 found that 14.7% of UK residents smoked. 134 The proportion of smokers in the UK has been decreasing over time with 13.3% of the UK population reported as smokers in 2021,135 with a relatively even split between genders (3.9 million males, 56.1%). The DISC sample is therefore representative of the overall UK population. There is conflicting evidence in relation to the links between smoking status and DC and this was not further explored in the trial. 136,137
Patient and public involvement
A PPI group of 14 members, all with experience of DC, was set up during study development. The PPI group was representative of the DC patient population with more males than females (12 male, 2 female). The PPI group members were solely based in the Leicester area, which limited the geographical representation of the group.
Patient contributions were also included in the DISC trial TMG, TSC and DMC each with a dedicated PPI member. During these meetings, the PPI members’ opinions and questions were engaged with and valued. Particularly of importance was their input and advice on strategies to maximise recruitment and retention. The committee PPI members were sent the progress reports in advance and offered a call to discuss the report and any questions ahead of the meeting.
A total of seven PPI meetings were held; four in person at University Hospital Leicester, with subsequent meetings held virtually or in a hybrid approach due to COVID-19 restrictions. At least six members of the PPI group (five male and one female) consistently attended the meetings. Anonymous questionnaires were provided to the PPI group at the end of an initial meeting to ensure that the meeting format, time, and location suited the group, and to feedback any suggestions of improvements or changes.
Initial meetings held prior to the DISC study commencing allowed PPI feedback on plans for the study outcomes, patient questionnaires, study materials and documents, including providing comments on the patient information sheet and informed consent form wording. The group provided advice about the trial requirements and procedures to ensure what was being asked of participants would be acceptable.
The PPI group also contributed to the development and refinement of study documentation including:
-
Study infographic.
-
Photography substudy templates, guidance explaining how to submit and a reminder letter to encourage photograph return.
-
Additional strategies to facilitate recruitment and follow-up during the COVID-19 pandemic.
-
Qualitative interview schedules.
-
One member of the group helped to develop key video resources for sites (to help with clinician equipoise and to standardise measurements) and patients (frequently asked questions).
The PPI group met, prior to trial analysis, to provide feedback on what key findings would be important to them. The points raised by the group included information on return to function (time to recovery), how long each treatment lasts before recurrence and information on treatment success, presented by age and severity. The PPI group contributed to the interpretation of the qualitative interview findings and the key DISC findings. This has ensured that the interpretation of the findings represents patient priorities alongside those of the trial team and clinicians.
The PPI group have also been key contributors to the development of a proposed longer-term follow-up study for DISC. They provided input on what would be important for patients for the longer term (e.g. level of recurrence before re-seeking treatment, when to seek advice, and advice for GPs on when to refer). The group provided benefits and drawbacks to participants taking part in a longer-term study and discussed the logistics of how the follow-up study would work (e.g. taking photographs at home, video calls, and GP involvement). One PPI member provided a written statement in support of the longer-term follow-up study.
The PPI group had been strong in their advice on the importance of dissemination of the results of the DISC study, to both participants and GPs, which has been incorporated into the DISC dissemination plan. A PPI member was also included as a co-author, given their involvement in report writing, specifically the plain language summary, to ensure that dissemination to patients and the public is the most meaningful and can be easily understood.
Strengths and limitations
Strengths
Collagenase continues to be produced and marketed in the US for treatment of DC, and this study provides reliable information on which to base the reintroduction for clinical use in Europe after market withdrawal in early 2020. A similar study cannot be commissioned in the UK or Europe, given the current market withdrawal, making the DISC trial the only opportunity for a study in this region to collect reliable long-term data in relation to the effectiveness of collagenase compared with LF.
The results also provide a key component to comprehensive assessment of treatment options for DC. A plan of research for this is already underway with funding secured as part of the UK National Institute for Health Research-funded HAND2 trial [NIHR: 127393; ISRCTN: 18254597], which includes a package of work to combine all treatment comparisons for DC in an individual patient data network meta-analysis.
The trial recruited from 31 hospitals across the UK, which ensures that the data incorporate any variations in the routine practice of DC care and treatment, and has resulted in the trial sample being representative of the UK patient population for DC, both of which ensure generalisability of the results.
The current evidence on the cost-effectiveness of collagenase compared to LF is limited. The high level of heterogeneity in study design and the nature of costs captured have resulted in inconsistent conclusions in the literature. We therefore conducted a full health economic evaluation alongside the DISC trial to evaluate the short-term cost-effectiveness of collagenase versus LF. Additionally, a decision analytical model was developed to capture the long-term cost-effectiveness of the two treatments. Our analysis of the costs and QALYs over different time frames reveals that the cost-effectiveness of collagenase compared to LF varies depending on the time horizon considered.
To provide a comprehensive understanding of the costs associated with collagenase and LF, a micro-costing method was used to estimate the costs of delivering the treatments and the costs of follow-up healthcare resource use, from NHS/PSS perspectives and a wider societal perspective. A variety of sensitivity analyses, secondary analysis, and threshold analysis investigated how certain factors (such as location, collagenase price, recurrence rate and re-intervention rate) affect the results. Our findings offer valuable insights into the potential approaches for reducing costs and improving the cost-effectiveness of the preferred intervention in future, whether it is collagenase or LF.
Public contributors advised and guided the research plan during development and delivery of the DISC trial. Public contributors and clinical investigators at recruiting sites actively developed the discussion points on interpretation and applicability of results and implications for health care.
Limitations
There were substantive changes to provision of care for patients with DC during the trial. A key change was changes in prioritisation for intervention and setting for delivery of DC treatment in various regions of the UK. This meant longer waits ahead of treatment for some participants in the DISC trial.
The onset of the COVID-19 pandemic led to a suspension of DC treatment and recruitment to the DISC trial, which meant a proportion of participants could not be followed up for 2 years (as per protocol) within the funded period for the study.
Re-intervention rates were low in both groups; however, the reassignment of research staff during the pandemic is likely to have resulted in omissions in data collection on recurrence and re-intervention for participants in follow-up. We also did not collect information on participants who were either in consultation or on a list for further intervention at the end of study follow up which may have resulted in an underestimation of re-intervention rates. The planned analysis models however maximized the available data which we suggest provides robust findings and to assist with planning for future research.
As noted above, several participants could not be followed up for 2 years post treatment, which may have led to an underestimation in the numbers of DC recurrence and/or need for re-intervention. This may therefore have limited both the clinical effectiveness and long-term Markov model. Longer-term follow-up of participants recruited to the DISC trial would allow more accurate assessment of recurrence and re-intervention accordingly. The long-term Markov model developed in this study offers valuable insights into the long-term cost-effectiveness of collagenase in comparison to LF. But the projections are subject to uncertainty as the model was developed based on certain assumptions to simplify reality and highly depended on the trial-based findings. To improve the model’s validity and generalisability, conducting a longer-term follow-up study to evaluate the actual long-term outcomes of the two treatments would be worthwhile.
The main limitations of the photography substudy relate to the weaknesses of both techniques. Photography relies on patients correctly following instructions to provide adequate, standardised photographs and accurate techniques of measurement. Goniometry is widely used and thought to be the gold standard, but our findings question its accuracy in both research and clinical practice. Problems with goniometric measurements include what is measured, how it is defined, the technique of and variation between measurements, and that measurement cannot be checked. Force applied by the investigator influences passive movement and this is difficult to control and standardise.
Applicability of trial findings
The holistic nature of the DISC trial has ensured that we are able to generate findings that relevant to both patients and the UK heath and care system. As discussed in Chapter 6, Strengths and limitations, the trial sample is representative of the UK patient population for DC.
The internal validity of the DISC trial was guaranteed via robust procedure, as detailed in Chapter 2, Statistical methods and Data management.
The clinical effectiveness findings suggests that collagenase is inferior to LF surgery in the 1- to 2-year period after correction when considered based on patient assessment of improvement and sustained function. However, this does not diminish the role of collagenase might have in the management of many patients who might need quick return to function (under 6 months) as reflected alongside the qualitative findings of the DISC trial. Collagenase also has a role to play for those who cannot undergo LF surgery for fear of complications or other concerns.
The clinical findings also present interesting implications for practice when considered alongside the cost-effectiveness trends observed at 1 year and 2 years after treatment. In particular, the cost-effectiveness of collagenase as compared to LF within this period is dependent on its cost if reintroduced and CE thresholds set by NICE and the NHS. This is important for future planning.
Future trends
This trial shows a clear trend with all patient-rated outcome measures significantly improving for both treatment methods initially. From about 6 months there is divergence, with scores for LF remaining broadly similar but progressive worsening of those in the collagenase group. Similar trends are seen for all measures of contracture. There is weak evidence at 1 year that recurrence is more likely with collagenase, although the difference in defined recurrence between the groups is small. Large studies have reported a recurrence rate of 35% at 3 years and 47% at 5 years following collagenase treatment. 11,29 Randomised trials comparing fasciectomy with or without a firebreak skin graft and LF with PNF have reported 19% and 21% recurrence respectively at 5 years following fasciectomy. 23,43 The gradually increasing progression of extension deficit we have demonstrated in the collagenase group compared to relative stability after surgery suggests longer term assessment of recurrence may be consistent with these findings. It is known that a relatively mild worsening of contracture of more than 6 degrees between 3 and 6 months after surgery predicts progressive re-contracture at 5 years. 43 Evaluation at later time points is therefore important. Longer-term assessment of cost-effectiveness capturing later recurrence may demonstrate different findings to those we reported at 1 year. Our qualitative analysis showed collagenase was extremely popular with patients, but interviews were conducted at 3–6 months following intervention. A later assessment may reveal different findings.
This trial should have identified most complications as they usually occur soon after treatment. Without clinicians fully appreciating and understanding the full harms and consequences of complications, it is not possible to have a clear and transparent discussion with patients about their treatment options. The lack of homogeneity in complication reporting has been recognised as a wider concern within musculoskeletal studies. 138 Categorisation of complications can be challenging. Recommendations have been made to standardise complication reporting following surgical procedures. 139 We reviewed and carefully graded all complications. This prevents minor complications with short-term and reversible impacts being given equal importance to major complications, with long-term or permanent impacts during analysis and reporting. We would recommend standardised reporting of complications and incorporating the grading in the analysis plan.
Pathways to impact and recommendations for future research
The results from the DISC trial provide strong indicators for the planning of care of DC patients in the UK. As a result of the DISC trial, the following further research priorities are suggested:
-
What are the longer-term clinical and cost-effectiveness outcomes for patients who received collagenase versus LF?
The comprehensive nature of the clinical and cost-effectiveness data collected in the DISC trial provides initial data which, subject to longer-term follow-up studies and data from other ongoing studies, should facilitate NICE in the UK to update its recommendation on the treatment options for DC. In particular, the case can be strengthened for how to situate the use of collagenase if it is reintroduced for use in the NHS.
Follow-up in the DISC trial was only for 2 years and so follow-up of patients over a longer period may be beneficial. Recurrence and re-intervention occur after 1 year primarily, and therefore, follow-up to 5 years or more could provide more definitive data on planning services for patients with DC. Also, the data collection in the DISC trial has been used as the template for the data collection in the ongoing HAND-2 trial [NIHR: 127393; ISRCTN: 18254597], which will allow for a network meta-analysis of all key interventions for DC.
-
How much correction of DC is good enough and acceptable to patients?
Additional qualitative interviews at time points beyond the 6 months post treatment may be warranted to enable assessment of the longer-term impacts of treatment alongside better quantifying the level of correction that patients find acceptable and how this links to their quality of life in the immediate versus long term.
-
What are the optimal follow-up methods for monitoring DC after intervention?
In relation to future planning of care provision for patients with DC, a key aspect that can be further investigated is the way in which remote assessment and follow-up can be established. The DISC photography substudy provides an indication of how patient-taken photographs can complement clinic measurements if processes are streamlined further. The study suggests that patient-taken photographs may act as an option to document contracture.
-
What are the barriers and facilitators for patients to seek care for DC?
The role of patients in understanding their disease progression and seeking care initially, and after first intervention, is an important aspect, as is the role of primary care services in ensuring timely referral of patients with DC and awareness of disease progression to make first diagnosis. The results from the overall hand assessment and qualitative substudy provides direction on planning of further research to understand behavioural trends that influence a patient’s decision to seek care and return to care after initial intervention. Similarly, the results of the DISC trial provide a good basis to engage further with primary care providers to improve referral thresholds.
Conclusion
The findings from the DISC trial show that collagenase delivered in an outpatient setting improved contracture less but was more cost-saving than LF surgery at 1 year. Complications were experienced by participants in both groups; for most, these were mild or very minor. While there were more ‘moderate’ and ‘severe’ complications in the LF group compared to the collagenase group, these were relatively uncommon.
Improvements from LF stabilise from 6 months after treatment and while the improvements for those patients’ receiving collagenase were less than the improvements in the LF group at 2 years, there was still an improvement on baseline patient-reported outcome measures scores and degree of contracture up to 2 years.
The findings of the DISC trial are similar to those observed in the CORDLESS studies11,29 given that the trajectories of effectiveness diverge over time. We still do not know how much divergence there will be, over what duration this may stabilise, what happens in the longer term or if initial correction is good enough and further research is therefore recommended.
Additional information
Contributions of authors
Joseph Dias (https://orcid.org/0000-0001-5360-4543) (Professor of Orthopaedic and Hand Surgery) was the chief investigator and lead applicant of the trial. He contributed widely to the design and conduct of the trial from its inception, including ongoing development and grant application, and had responsibility for the overall management of the trial throughout its duration, co-ordinating and reviewing imaging and overseeing analyses, in addition to writing and overseeing reports for publication.
Puvan Tharmanathan (https://orcid.org/0000-0001-9196-0207) (Senior Research Fellow – Trial Manager) was a co-applicant and contributed to the design, set-up and conduct of the trial throughout the duration of the study and contributed to and commented on all drafts of the report.
Catherine Arundel (https://orcid.org/0000-0003-0512-4339) (Research Fellow – Trial Manager/Coordinator) contributed to the set-up, conduct and co-ordination of the trial throughout the duration of the study and contributed to and commented on all drafts of the report.
Charlie Welch (https://orcid.org/0000-0002-2421-5538) (Statistician) led the preparation of the statistical analysis plan, conducted the final analysis and contributed to and commented on the final report.
Qi Wu (https://orcid.org/0000-0002-8281-7799) (Health Economist) conducted the final health economic analysis and contributed to and commented on the final report.
Paul Leighton (https://orcid.org/0000-0001-5208-0274) (Senior Research Fellow – Applied Health Services Research) was a co-applicant and contributed to the design and conduct of the qualitative interview substudy and contributed to and commented on the final report.
Maria Armaou (https://orcid.org/0000-0003-1547-253X) (Qualitative Research Fellow) contributed to the design and conduct of the qualitative interview substudy and contributed to and commented on the final report.
Belen Corbacho (https://orcid.org/0000-0002-2359-0379) (Senior Health Economist) was a co-applicant and contributed to the design and conduct of the economic analysis of the trial, led the preparation of the health economic analysis plan and contributed to and commented on the final report.
Nick Johnson (https://orcid.org/0000-0002-5543-6384) (Consultant Hand and Wrist Surgeon) contributed to the co-ordination and reviewing the photography substudy and provided clinical input to and commented on the final report.
Sophie James (https://orcid.org/0000-0003-1878-2779) (Research Fellow – Trial Coordinator) contributed to the day-to-day running of the trial and contributed to and commented on the final report.
John Cooke (Patient and Public Involvement Member) contributed a patient and public viewpoint to the conduct of the trial and contributed to and commented on the plain language summary for the final report.
Christopher Bainbridge (https://orcid.org/0000-0001-7987-2845) (Professor of Hand Surgery) was a co-applicant and contributed to the design and conduct of the trial, was principal investigator for a participating site and contributed to and commented on the final report.
Michael Craigen (https://orcid.org/0009-0001-4052-0807) (Consultant Orthopaedic Surgeon) was a co-applicant and contributed to the design and conduct of the trial, was principal investigator for a participating site and contributed to and commented on the final report.
David Warwick (https://orcid.org/0000-0003-3030-442X) (Consultant Hand Surgeon) was a co-applicant and contributed to the design and conduct of the trial, was principal investigator for a participating site and contributed to and commented on the final report.
Samantha Brady (https://orcid.org/0000-0001-7763-2776) (Research Fellow – Trial Coordinator, Trial Management and Methodology) contributed to the day-to-day running of the trial and contributed to and commented on the final report.
Lydia Flett (https://orcid.org/0000-0002-8280-826X) (Research Fellow – Trial Coordinator, Trial Management and Methodology) contributed to the day-to-day running of the trial and contributed to and commented on the final report.
Judy Jones (https://orcid.org/0009-0009-0492-102X) (Research Fellow – Trial Coordinator, Trial Management and Methodology) coordinated the photography substudy image review and commented on the final report.
Catherine Knowlson (https://orcid.org/0000-0001-5783-2690) (Research Fellow – Trial Coordinator, Trial Management and Methodology) contributed to the day-to-day running of the trial and contributed to and commented on the final report.
Michelle Watson (https://orcid.org/0000-0002-1790-9953) (Research Fellow – Trial Coordinator, Trial Management and Methodology) contributed to the day-to-day running of the trial and contributed to and commented on the final report.
Ada Keding (https://orcid.org/0000-0002-1182-887X) (Lecturer of Statistics) was a co-applicant and contributed to the design and conduct of the statistical analysis of the trial and contributed to and commented on all drafts of the report.
Catherine Hewitt (https://orcid.org/0000-0002-0415-3536) (Director of YTU, Trial Management and Methodology) was a co-applicant and helped to design the study and the statistical analysis. She commented on all drafts of the report.
David Torgerson (https://orcid.org/0000-0002-1667-4275) (Director of YTU, Trial Management and Methodology) was a co-applicant and helped to design the study. He commented on all drafts of the report.
Acknowledgements
Firstly, we thank the patients participating in this trial. This research would not have been possible without their participation.
Secondly, we thank the contributions of our patient and public involvement group members who contributed to many of the discussions regarding study delivery, patient documentation and processes: Richard Blackmore, Peter Green, Mary Lowles and Rod Page.
The contributions of the following individuals in the supporting the delivery of the study are also gratefully acknowledged: Matthew Bailey, Sally Baker, Emma Brooks, Chris Bunce, Sarah Gardner, Sue Heslop, Elaine James, Simon Jones, Carolyn Maloney, Priya Radia, Val Wadsworth and Laura Wiley.
We also kindly acknowledge the principal investigators (Mr L Ajekiigbe, Mr D Avis, Mr H Bella, Ms A Bremner-Smith, Mr D Brown, Mr N Cahoon, Mr C Coapes, Ms R Dunlop, Ms S Fullilove, Mr J Hobby, Ms R Johnson, Mr K Karuppaiah, Mr C Kelly, Mr A Mahon, Mr J Malal, Mr W Mason, Ms S Phillips, Mr H Ridha, Ms G Rose, Mr P Sauve, Mr N Shah, Mr S Talwalkar and Mr F Younis), and the wider teams of surgical colleagues and research nurses who supported the study locally. We also thank Ms S Kerr, who was a registered NIHR associate principal investigator for the study.
Finally, we thank the independent members of the Data Monitoring and Trial Steering Committees for their continued support and input to the oversight of the study: Trial Steering Committee Members – Professor Wendy Baird (Chair), Professor Frank Burke and Professor Bryan Woodward and Data Monitoring and Ethics Committee Members – Professor Andrew Judge (Chair), Mr Richard Pinder, Mr Simon Knight, and Mr Paul Gibson.
Patient data statement
This work uses data provided by patients and collected by the NHS as part of their care and support. Using patient data is vital to improve health and care for everyone. There is huge potential to make better use of information from people’s patient records, to understand more about disease, develop new treatments, monitor safety and plan NHS services. Patient data should be kept safe and secure, to protect everyone’s privacy, and it’s important that there are safeguards to make sure that they are stored and used responsibly. Everyone should be able to find out about how patient data are used. #datasaveslives You can find out more about the background to this citation here: https://understandingpatientdata.org.uk/data-citation
Data–sharing statement
All data requests should be submitted to the corresponding author for consideration. Access to anonymised data may be granted following review by the chief investigator.
Ethics statement
Ethical approval for this study was sought and received from Leeds West Research Ethics Committee on 22 May 2017 (REC Ref: 17/YH/0120). Written informed consent was obtained from all participants in the trial.
Information governance statement
The University Hospitals of Leicester NHS Trust and York Trials Unit, University of York are committed to handling all personal information in line with the UK Data Protection Act (2018) and the General Data Protection Regulation (EU GDPR) 2016/679.
Under the Data Protection legislation, the University Hospitals of Leicester NHS Trust is the Data Controller, and the York Trials Unit, University of York is the Data Processor. The York Trials Unit processed personal data in accordance with the Data Controller’s instructions. You can find out more about how we handle personal data, including how to exercise your individual rights and the contact details for the University Hospitals of Leicester NHS Trust’s Data Protection Officer here: www.leicestershospitals.nhs.uk/aboutus/about-this-website/privacy/data-protection/
Disclosure of interests
Full disclosure of interests: Completed ICMJE forms for all authors, including all related interests, are available in the toolkit on the NIHR Journals Library report publication page at https://doi.org/10.3310/KGXD8528.
Primary conflicts of interest: In addition to the grant funding associated with this trial (NIHR HTA 15/102/04), the following authors declare the following disclosures of interest:
Joseph Dias has been awarded other NIHR HTA grants for other (non-Dupuytren’s) musculoskeletal studies. He is Chair of the University Hospitals of Leicester NHS Trust Senate and Head of the Academic Team of Musculoskeletal Surgery (AToMS) based at the University Hospitals of Leicester NHS Trust. He has received costs from Copenhagen University to facilitate attendance to examine a PhD.
Charlie Welch declares involvement in data safety monitoring or advisory boards for NIHR HTA projects 17/23/02 and 17/18/02 and NIHR RfPB project PG-0817-20045.
David Torgerson declares membership of the NIHR CTU Board 2021.
David Warwick is currently working with Nota Pharma to develop a new injectable treatment for Dupuytren’s contracture. He has received funding in relation to his role as advisor to Fidia Farma for the development of a molecular treatment for Dupuytren’s contracture for which he currently chairs the Data Monitoring Board. He has also received funding to support attendance as a guest lecturer at the Italian Hand Society meeting in 2021. He was President for the British Society for Surgery of the Hand in 2020 and is currently a member of the Secretary General International Federation for Societies for Surgery of the Hand (2022–5).
Catherine Hewitt is a member of the NIHR HTA commissioning committee and held the position of Deputy Chair during the study for which payments were made to the employing institution. She is also a member of the NIHR CTU Standing Advisory Committee, NIHR HTA Post-Funding Committee and NIHR HTA Funding Committee Policy Group (formally CSG).
Publications
Dias J, Arundel C, Tharmanathan P, Keding A, Welch C, Corbacho B, et al. Dupuytren’s interventions surgery versus collagenase (DISC) trial: study protocol for a pragmatic, two-arm parallel-group, non-inferiority randomised controlled trial. Trials 2021;22:671. https://doi.org/10.1186/s13063-021-05595-w
Knowlson C, Tharmanathan P, Arundel C, James S, Flett L, Gascoyne S, et al. Can learnings from the COVID-19 pandemic improve trial conduct post-pandemic? A case study of strategies used by the DISC trial. Res Methods Med Health Sci 2022. https://doi.org/10.1177/26320843221128296
Dias J, Tharmanathan P, Arundel C, Welch C, Wu Q, Leighton P, et al. Collagenase Injection versus Limited Fasciectomy for Dupuytren’s Contracture. N Engl J Med 2024;391:1499–510. https://doi.org/10.1056/NEJMoa2312631
Disclaimers
This article presents independent research funded by the National Institute for Health and Care Research (NIHR). The views and opinions expressed by authors in this publication are those of the authors and do not necessarily reflect those of the NHS, the NIHR, the HTA programme or the Department of Health and Social Care. If there are verbatim quotations included in this publication the views and opinions expressed by the interviewees are those of the interviewees and do not necessarily reflect those of the authors, those of the NHS, the NIHR, the HTA programme or the Department of Health and Social Care.
References
- Huang C, Ogawa R. Fibroproliferative disorders and their mechanobiology. Connect Tissue Res 2012;53:187-96. https://doi.org/10.3109/03008207.2011.642035.
- Townley WA, Baker R, Sheppard N, Grobbelaar AO. Dupuytren’s contracture unfolded. BMJ 2006;332:397-400. https://doi.org/10.1136/bmj.332.7538.397.
- Wilburn J, McKenna SP, Perry-Hinsley D, Bayat A. The impact of Dupuytren disease on patient activity and quality of life. J Hand Surg Am 2013;38:1209-14. https://doi.org/10.1016/j.jhsa.2013.03.036.
- Turesson C, Kvist J, Krevers B. Experiences of men living with Dupuytren’s disease-Consequences of the disease for hand function and daily activities. J Hand Ther 2020;33:386-93. https://doi.org/10.1016/j.jht.2019.04.004.
- Pratt AL, Byrne G. The lived experience of Dupuytren’s disease of the hand. J Clin Nurs 2009;18:1793-802. https://doi.org/10.1111/j.1365-2702.2008.02692.x.
- Gudmundsson KG, Arngrímsson R, Sigfússon N, Björnsson A, Jónsson T. Epidemiology of Dupuytren’s disease: clinical, serological, and social assessment. The Reykjavik Study. J Clin Epidemiol 2000;53:291-6. https://doi.org/10.1016/S0895-4356(99)00145-6.
- Dakin H, Rombach I, Dritsaki M, Gray A, Ball C, Lamb SE, et al. Cost-effectiveness of adalimumab for early-stage Dupuytren’s disease: an economic evaluation based on a randomized controlled trial and individual-patient simulation model. Bone Jt Open 2022;3:898-906. https://doi.org/10.1302/2633-1462.311.BJO-2022-0103.R2.
- National Institute for Health and Care Excellence . Dupuytren’s Disease: How Common Is It? 2022. https://cks.nice.org.uk/topics/dupuytrens-disease/background-information/prevalence/#:~:text=Dupuytren’s%20disease%20is%20up%20to,than%2060%20years%20of%20age (accessed 9 December 2022).
- Rodrigues JN, Becker GW, Ball C, Zhang W, Giele H, Hobby J, et al. Surgery for Dupuytren’s contracture of the fingers. Cochrane Database Syst Rev 2015;2015. https://doi.org/10.1002/14651858.CD010143.pub2.
- Ellis B, Bruton A, Goddard JR. Joint angle measurement: a comparative study of the reliability of goniometry and wire tracing for the hand. Clin Rehabil 1997;11:314-20. https://doi.org/10.1177/026921559701100408.
- Peimer CA, Blazar P, Coleman S, Kaplan FT, Smith T, Lindau T. Dupuytren contracture recurrence following treatment with collagenase Clostridium histolyticum [CORDLESS (Collagenase Option for Reduction of Dupuytren Long-Term Evaluation of Safety Study)]: 5-year data. J Hand Surg Am 2015;40:1597-605.
- Felici N, Marcoccio I, Giunta R, Haerle M, Leclercq C, Pajardi G, et al. Dupuytren contracture recurrence project: reaching consensus on a definition of recurrence. Handchir Mikrochir Plast Chir 2014;46:350-4. https://doi.org/10.1055/s-0034-1394420.
- Degreef I, De Smet L. Risk factors in Dupuytren’s diathesis: is recurrence after surgery predictable?. Acta Orthop Belg 2011;77:27-32.
- Geoghegan L, Man J, Jain A, Price A, Gibbons E, Jerosch-Herold C, et al. Factors associated with the development, progression, and outcome of Dupuytren disease treatment: a systematic review. Plast Reconstr Surg 2021;148:753e-63e. https://doi.org/10.1097/PRS.0000000000008420.
- Abe Y, Rokkaku T, Ofuchi S, Tokunaga S, Takahashi K, Moriya H. An objective method to evaluate the risk of recurrence and extension of Dupuytren’s disease. J Hand Surg Br 2004;29:427-30. https://doi.org/10.1016/j.jhsb.2004.06.004.
- Vigroux JP, Valentin P. A natural history of Dupuytren’s contracture treated by surgical fasciectomy: the influence of diathesis (76 hands reviewed at more than 10 years). Ann Chir Main Memb Super 1992;11:367-74. https://doi.org/10.1016/s0753-9053(05)80272-8.
- Hindocha S, Stanley JK, Watson S, Bayat A. Dupuytren’s diathesis revisited: evaluation of prognostic indicators for risk of disease recurrence. J Hand Surg Am 2006;31:1626-34. https://doi.org/10.1016/j.jhsa.2006.09.006.
- Ball C, Izadi D, Verjee LS, Chan J, Nanchahal J. Systematic review of non-surgical treatments for early dupuytren’s disease. BMC Musculoskelet Disord 2016;17. https://doi.org/10.1186/s12891-016-1200-y.
- Denkler KA, Park KM, Alser O. Treatment options for Dupuytren’s disease: tips and tricks. Plast Reconstr Surg Glob Open 2022;10. https://doi.org/10.1097/gox.0000000000004046.
- Rodrigo JJ, Niebauer JJ, Brown RL, Doyle JR. Treatment of Dupuytren’s contracture. Long-term results after fasciotomy and fascial excision. J Bone Joint Surg Am 1976;58:380-7.
- Dahlin LB, Bainbridge C, Leclercq C, Gerber RA, Guerin D, Cappelleri JC, et al. Dupuytren’s disease presentation, referral pathways and resource utilisation in Europe: regional analysis of a surgeon survey and patient chart review. Int J Clin Pract 2013;67:261-70. https://doi.org/10.1111/ijcp.12099.
- Dias J, Bainbridge C, Leclercq C, Gerber RA, Guerin D, Cappelleri JC, et al. Surgical management of Dupuytren’s contracture in Europe: regional analysis of a surgeon survey and patient chart review. Int J Clin Pract 2013;67:271-81. https://doi.org/10.1111/ijcp.12106.
- van Rijssen AL, ter Linden H, Werker PMN. Five-Year results of a randomized clinical trial on treatment in Dupuytren’s disease: percutaneous needle fasciotomy versus limited fasciectomy. Plast Reconstr Surg 2012;129:469-77. https://doi.org/10.1097/PRS.0b013e31823aea95.
- Selles RW, Zhou C, Kan HJ, Wouters RM, van Nieuwenhoven CA, Hovius SER. Percutaneous aponeurotomy and lipofilling versus limited fasciectomy for Dupuytren’s contracture: 5-Year results from a randomized clinical trial. Plast Reconstr Surg 2018;142:1523-31. https://doi.org/10.1097/PRS.0000000000004982.
- Dias JJ, Braybrooke J. Dupuytren’s contracture: an audit of the outcomes of surgery. J Hand Surg Br 2006;31:514-21. https://doi.org/10.1016/j.jhsb.2006.05.005.
- Bergovec M, Jelicic J, Oljaca A, Bilic R. Hand function and recurrence after limited fasciectomy for Dupuytren’s contracture: long-term follow-up. J Orthop Surg (Hong Kong) 2018;26. https://doi.org/10.1177/2309499018762195.
- Hurst LC, Badalamente MA, Hentz VR, Hotchkiss RN, Kaplan FTD, Meals RA, et al. CORD I Study Group . Injectable collagenase Clostridium histolyticum for Dupuytren’s contracture. N Engl J Med 2009;361:968-79. https://doi.org/10.1056/NEJMoa0810866.
- European Medicines Agency . Xiapex: Summary of Product Characteristics 2011:1-34.
- Peimer CA, Blazar P, Coleman S, Kaplan FT, Smith T, Tursi JP, et al. Dupuytren contracture recurrence following treatment with collagenase Clostridium histolyticum (CORDLESS study): 3-year data. J Hand Surg Am 2013;38:12-2.
- Göransson I, Brudin L, Irbe A, Turesson C. Hand function 5 years after treatment with collagenase Clostridium histolyticum injection for Dupuytren’s disease. J Hand Surg Eur Vol 2021;46:985-94. https://doi.org/10.1177/17531934211002383.
- Werlinrud JC, Hansen KL, Larsen S, Lauritsen J. Five-year results after collagenase treatment of Dupuytren disease. J Hand Surg Eur Vol 2018;43:841-7. https://doi.org/10.1177/1753193418790157.
- Strömberg J. Percutaneous needle fasciotomy for Dupuytren contracture. JBJS Essent Surg Tech 2019;9. https://doi.org/10.2106/JBJS.ST.18.00047.
- van Rijssen AL, Gerbrandy FS, Ter Linden H, Klip H, Werker PM. A comparison of the direct outcomes of percutaneous needle fasciotomy and limited fasciectomy for Dupuytren’s disease: a 6-week follow-up study. J Hand Surg Am 2006;31:717-25. https://doi.org/10.1016/j.jhsa.2006.02.021.
- Davis TRC, Tan W, Harrison EF, Hollingworth W, Karantana A, Mills N, et al. A randomised feasibility trial comparing needle fasciotomy with limited fasciectomy treatment for Dupuytren’s contractures. Pilot Feasibility Stud 2020;6. https://doi.org/10.1186/s40814-019-0546-y.
- Smeraglia F, Del Buono A, Maffulli N. Collagenase Clostridium histolyticum in Dupuytren’s contracture: a systematic review. Br Med Bull 2016;118:149-58. https://doi.org/10.1093/bmb/ldw020.
- Brazzelli M, Cruickshank M, Tassie E, McNamee P, Robertson C, Elders A, et al. Collagenase Clostridium histolyticum for the treatment of Dupuytren’s contracture: systematic review and economic evaluation. Health Technol Assess 2015;19:1-202. https://doi.org/10.3310/hta19900.
- Sanjuan-Cerveró R, Carrera-Hueso FJ, Vazquez-Ferreiro P, Ramon-Barrios MA. Efficacy and adverse effects of collagenase use in the treatment of Dupuytren’s disease: a meta-analysis. Bone Joint J 2018;100-B:73-80. https://doi.org/10.1302/0301-620X.100B1.BJJ-2017-0463.R1.
- Räisänen MP, Karjalainen T, Göransson H, Reito A, Kautiainen H, Malmivaara A, et al. DupuytrEn Treatment EffeCtiveness Trial (DETECT): a protocol for prospective, randomised, controlled, outcome assessor-blinded, three-armed parallel 1:1:1, multicentre trial comparing the effectiveness and cost of collagenase Clostridium histolyticum, percutaneous needle fasciotomy and limited fasciectomy as short-term and long-term treatment strategies in Dupuytren’s contracture. BMJ Open 2018;8. https://doi.org/10.1136/bmjopen-2017-019054.
- Nordenskjöld J, Lauritzson A, Waldén M, Kopylov P, Atroshi I. Surgical fasciectomy versus collagenase injection in treating recurrent Dupuytren disease: study protocol of a randomised controlled trial. BMJ Open 2019;9. https://doi.org/10.1136/bmjopen-2018-024424.
- Dias J, Arundel C, Tharmanathan P, Keding A, Welch C, Corbacho B, et al. Dupuytren’s interventions surgery versus collagenase (DISC) trial: study protocol for a pragmatic, two-arm parallel-group, non-inferiority randomised controlled trial. Trials 2021;22. https://doi.org/10.1186/s13063-021-05595-w.
- Tubiana R, Michon J, Thomine JM. Scheme for the assessment of deformities in Dupuytren’s disease. Surg Clin North Am 1968;48:979-84. https://doi.org/10.1016/s0039-6109(16)38630-3.
- UK Health Security Agency 2022. www.gov.uk/government/publications/wuhan-novel-coronavirus-infection-prevention-and-control/covid-19-guidance-for-maintaining-services-within-health-and-care-settings-infection-prevention-and-control-recommendations (accessed 8 February 2022).
- Dias JJ, Singh HP, Ullah A, Bhowal B, Thompson JR. Patterns of recontracture after surgical correction of Dupuytren disease. J Hand Surg Am 2013;38:1987-93. https://doi.org/10.1016/j.jhsa.2013.05.038.
- Dias JJ, Bhowal B, Wildin CJ, Thompson JR. Assessing the outcome of disorders of the hand. Is the patient evaluation measure reliable, valid, responsive and without bias?. J Bone Joint Surg Br 2001;83:235-40. https://doi.org/10.1302/0301-620x.83b2.10838.
- Dias J, Ullah A. International Conference on Dupuytren Disease and Related Disorders. Groningen, Netherlands; 2015.
- Beaudreuil J, Allard A, Zerkak D, Gerber RA, Cappelleri JC, Quintero N, et al. URAM Study Group . Unité Rhumatologique des Affections de la Main (URAM) scale: development and validation of a tool to assess Dupuytren’s disease-specific disability. Arthritis Care Res (Hoboken) 2011;63:1448-55. https://doi.org/10.1002/acr.20564.
- Chung KC, Pilsbury MS, Walters MR, Hayward RA. Reliability and validity testing of the Michigan Hand Outcomes Questionnaire. J Hand Surg Am 1998;23:575-87. https://doi.org/10.1016/S0363-5023(98)80042-7.
- Chung K, Hamill J, Walters M, Hayward RA. The Michigan Hand Outcomes Questionnaire (MHQ): assessment of responsiveness to clinical change. Ann Plast Surg 1999;42:619-22. https://doi.org/10.1097/00000637-199906000-00006.
- EuroQol Group . EuroQol - a new facility for the measurement of health-related quality of life. Health Policy 1990;16:199-208. https://doi.org/10.1016/0168-8510(90)90421-9.
- Williams GN, Gangel TJ, Arciero RA, Uhorchak JM, Taylor DC. Comparison of the Single Assessment Numeric Evaluation method and two shoulder rating scales. Outcomes measures after shoulder surgery. Am J Sports Med 1999;27:214-21. https://doi.org/10.1177/03635465990270021701.
- Dias JJ. Dupuytren Disease and Related Diseases - The Cutting Edge. Switzerland: Springer; 2016.
- Schulz KF, Altman DG, Moher D. CONSORT Group . CONSORT 2010 Statement: updated guidelines for reporting parallel group randomised trials. Trials 2010;11. https://doi.org/10.1186/1745-6215-11-32.
- Kenward MG, Roger JH. Small sample inference for fixed effects from restricted maximum likelihood. Biometrics 1997;53:983-97. https://doi.org/10.2307/2533558.
- White IR, Carpenter J, Horton NJ. A mean score method for sensitivity analysis to departures from the missing at random assumption in randomised trials. Sta Sin 2018;28:1985-2003. https://doi.org/10.5705/ss.202016.0308.
- Brueton VC, Tierney J, Stenning S, Harding S, Meredith S, Nazareth I, et al. Strategies to improve retention in randomised trials. Cochrane Database Syst Rev 2013. https://doi.org/10.1002/14651858.MR000032.pub2.
- Edwards PJ, Roberts I, Clarke MJ, DiGuiseppi C, Wentz R, Kwan I, et al. Methods to increase response to postal and electronic questionnaires. Cochrane Database Syst Rev 2007. https://doi.org/10.1002/14651858.MR000008.pub4.
- Knowlson C, Tharmanathan P, Arundel C, James S, Flett L, Gascoyne S, et al. Can learnings from the COVID-19 pandemic improve trial conduct post-pandemic? A case study of strategies used by the DISC trial. Res Methods Med Health Sci 2023;4:50-6. https://doi.org/10.1177/26320843221128296.
- European Medicines Agency . Clinical Safety Data Management: Definitions and Standards for Expedited Reporting n.d.
- Liu Q, Shepherd BE, Li C, Harrell FE. Modeling continuous response variables using ordinal regression. Stat Med 2017;36:4316-35. https://doi.org/10.1002/sim.7433.
- Bradet-Levesque I, Audet J, Roy JS, Flamand VH. Measuring functional outcome in Dupuytren’s disease: a systematic review of patient-reported outcome measures. J Hand Ther 2021;35:613-27.
- Witthaut J, Bushmakin AG, Gerber RA, Cappelleri JC, Le Graverand-Gastineau MP. Determining clinically important changes in range of motion in patients with Dupuytren’s Contracture: secondary analysis of the randomized, double-blind, placebo-controlled CORD I study. Clin Drug Investig 2011;31:791-8. https://doi.org/10.1007/BF03256918.
- Curtis LA, Burns A. Unit Costs of Health and Social Care. Kent: PSSRU, University of Kent; 2020.
- National Institute for Health and Care Excellence . NICE Health Technology Evaluations: The Manual 2022. www.nice.org.uk/process/pmg36/chapter/introduction-to-health-technology-evaluation (accessed May 2024).
- Drummond M, Sculpher M, Claxton K, Stoddart GL, Torrance GW. Methods for the Economic Evaluation of Health Care Programmes. Oxford: Oxford University Press; 2015.
- NHS England and NHS Improvement . 2019/20/National/Cost/Collection/Data/Publication./22/June/2021/Ed. 2021. www.england.nhs.uk/publication/2019-20-national-cost-collection-data-publication (accessed May 2024).
- Mehta S, Belcher HJ. A single-centre cost comparison analysis of collagenase injection versus surgical fasciectomy for Dupuytren’s contracture of the hand. J Plast Reconstr Aesthet Surg 2014;67:368-72. https://doi.org/10.1016/j.bjps.2013.12.030.
- NHS Digital . Hospital Admitted Patient Care Activity 2019–20. 17 Sep 2020 Ed. 2020. https://digital.nhs.uk/data-and-information/publications/statistical/hospital-admitted-patient-care-activity (accessed May 2024).
- NHS Business Services Authority . Prescription Cost Analysis – England 2020 21. 10 June 2021 Ed. 2021. www.nhsbsa.nhs.uk/statistical-collections/prescription-cost-analysis-england (accessed May 2024).
- BNF . BNF 74 (British National Formulary) September 2017 2018.
- BNF . BNF 76 (British National Formulary) September 2018 2018.
- van Hout B, Janssen MF, Feng YS, Kohlmann T, Busschbach J, Golicki D, et al. Interim scoring for the EQ-5D-5L: mapping the EQ-5D-5L to EQ-5D-3L value sets. Value Health 2012;15:708-15. https://doi.org/10.1016/j.jval.2012.02.008.
- Richardson G, Manca A. Calculation of quality adjusted life years in the published literature: a review of methodology and transparency. Health Econ 2004;13:1203-10. https://doi.org/10.1002/hec.901.
- Feng Y, Parkin D, Devlin NJ. Assessing the performance of the EQ-VAS in the NHS PROMs programme. Qual Life Res 2014;23:977-89. https://doi.org/10.1007/s11136-013-0537-z.
- Manca A, Hawkins N, Sculpher MJ. Estimating mean QALYs in trial-based cost-effectiveness analysis: the importance of controlling for baseline utility. Health Econ 2005;14:487-96. https://doi.org/10.1002/hec.944.
- Willan AR, Briggs AH, Hoch JS. Regression methods for covariate adjustment and subgroup analysis for non-censored cost-effectiveness data. Health Econ 2004;13:461-75. https://doi.org/10.1002/hec.843.
- Efron B, Tibshirani R. An Introduction to the Bootstrap. Monographs on Statistics and Applied Probability. New York: Chapman & Hall; 1993.
- Cameron AC, Gelbach JB, Miller DL. Bootstrap-based improvements for inference with clustered errors. Rev Econ Stat 2008;90:414-27. https://doi.org/10.1162/rest.90.3.414.
- Faria R, Gomes M, Epstein D, White IR. A guide to handling missing data in cost-effectiveness analysis conducted within randomised controlled trials. PharmacoEconomics 2014;32:1157-70. https://doi.org/10.1007/s40273-014-0193-3.
- Rubin DB. Multiple Imputation for Nonresponse in Surveys. New York: Wiley; 1987.
- White IR, Royston P, Wood AM. Multiple imputation using chained equations: issues and guidance for practice. Stat Med 2011;30:377-99. https://doi.org/10.1002/sim.4067.
- Dolan P. Modeling valuations for EuroQol health states. Med Care 1997;35:1095-108. https://doi.org/10.1097/00005650-199711000-00002.
- Bainbridge C, Dahlin LB, Szczypa PP, Cappelleri JC, Guérin D, Gerber RA. Current trends in the surgical management of Dupuytren’s disease in Europe: an analysis of patient charts. Eur Orthop Traumatol 2012;3:31-4. https://doi.org/10.1007/s12570-012-0092-z.
- Blake SN, Poelstra R, Andrinopoulou ER, Obdeijn MC, van de Oest MJW, Feitz R, et al. Return to work and associated costs after treatment for Dupuytren’s disease. Plast Reconstr Surg 2021;148:580-90. https://doi.org/10.1097/PRS.0000000000008224.
- Atroshi I, Strandberg E, Lauritzson A, Ahlgren E, Waldén M. Costs for collagenase injections compared with fasciectomy in the treatment of Dupuytren’s contracture: a retrospective cohort study. BMJ Open 2014;4. https://doi.org/10.1136/bmjopen-2013-004166.
- Office for National Statistics 2022. www.ons.gov.uk/employmentandlabourmarket/peopleinwork/earningsandworkinghours/datasets/ashe1997to2015selectedestimates (accessed 12 December 2022).
- Sahemey RS, Dhillon GS, Sagoo KS, Srinivas K. Cost-effectiveness and patient outcomes of injectable collagenase to treat Dupuytren’s contracture. Cureus 2021;13. https://doi.org/10.7759/cureus.20530.
- Gerber RA, Perry R, Thompson R, Bainbridge C. Dupuytren’s contracture: a retrospective database analysis to assess clinical management and costs in England. BMC Musculoskelet Disord 2011;12. https://doi.org/10.1186/1471-2474-12-73.
- NHS Digital . HRG4 + 2021/22/Local/Payment/Grouper/Application,/Code/to/Group/Workbook 2022. https://digital.nhs.uk/services/national-casemix-office/downloads-groupers-and-tools/hrg4-2021-22-local-payment-grouper#:~:text=HRG4%2B%202021%2F22%20Local%20Payment%20Grouper%20application,-Download%20the%20HRG4%2B&text=The%20updated%20Grouper%20should%20be,Specialty%20and%20Treatment%20Function%20codes (accessed 29 June 2022).
- Noureddine H, Vejsbjerg K, Harrop JE, White MJ, Chakravarthy J, Harrison JWK. Fasciectomy under local anaesthetic and adrenaline for Dupuytren’s contracture in a community setting in the UK with a cost analysis. Bone Joint J 2020;102-B:1354-8. https://doi.org/10.1302/0301-620X.102B10.BJJ-2019-1685.R2.
- Drinane JJ, Gemoets D, Hoftiezer YAJ, Hoehn J, Eberlin KR. Initial treatment choice affects cost-effectiveness and reintervention rates for Dupuytren contracture: a national census among veterans affairs patients. Hand (N Y) 2022;18:885-90. https://doi.org/10.1177/15589447211072251.
- Baltzer H, Binhammer PA. Cost-effectiveness in the management of Dupuytren’s contracture. A Canadian cost-utility analysis of current and future management strategies. Bone Joint J 2013;95-B:1094-100. https://doi.org/10.1302/0301-620X.95B8.31822.
- Chen NC, Shauver MJ, Chung KC. Cost-effectiveness of open partial fasciectomy, needle aponeurotomy, and collagenase injection for dupuytren contracture. J Hand Surg Am 2011;36:1826-34.e32. https://doi.org/10.1016/j.jhsa.2011.08.004.
- Office for national statistics . Deaths Registered in England and Wales: 2020 Edition 2020. www.ons.gov.uk/peoplepopulationandcommunity/birthsdeathsandmarriages/deaths/datasets/deathsregisteredinenglandandwalesseriesdrreferencetables (accessed 12 December 2022).
- Yoon AP, Kane RL, Hutton DW, Chung KC. Cost-effectiveness of recurrent Dupuytren contracture treatment. JAMA Netw Open 2020;3:e2019861-e2019861. https://doi.org/10.1001/jamanetworkopen.2020.19861.
- Miller DK, Homan SM. Determining transition probabilities: confusion and suggestions. Med Decis Making 1994;14:52-8. https://doi.org/10.1177/0272989X9401400107.
- Sonnenberg FA, Beck JR. Markov models in medical decision making: a practical guide. Med Decis Making 1993;13:322-38. https://doi.org/10.1177/0272989X9301300409.
- Briggs A, Sculpher M, Claxton K. Decision Modelling for Health Economic Evaluation. New York: Oxford University Press; 2006.
- Dritsaki M, Rivero-Arias O, Gray A, Ball C, Nanchahal J. What do we know about managing Dupuytren’s disease cost-effectively?. BMC Musculoskelet Disord 2018;19. https://doi.org/10.1186/s12891-018-1949-2.
- Fitzpatrick AV, Moltaji S, Ramji M, Martin S. Systematic Review Comparing Cost Analyses of Fasciectomy, Needle Aponeurotomy, and Collagenase Injection for Treatment of Dupuytren’s Contracture: Une analyse de couts systematique comparant la fasciectomie, l’aponevrotomie percutanee a l’aiguille et l’injection de collagenase pou traiter la maladie de Dupuytren. Plast Surg (Oakv) 2021;29:257-64. https://doi.org/10.1177/2292550320963111.
- Zah V, Stanicic F, Ruby J, Vukicevic D, Hurley D. Real-world medicare healthcare costs of patients with Dupuytren’s contracture treated with collagenase or fasciectomy. Plast Reconstr Surg Glob Open 2022;10. https://doi.org/10.1097/GOX.0000000000004480.
- Wong CR, Huynh MNQ, Fageeh R, McRae MC. Outcomes of management of recurrent Dupuytren contracture: a systematic review and meta-analysis. Hand (N Y) 2022;17:1104-13. https://doi.org/10.1177/1558944721994220.
- Sau C, Bounthavong M, Tran JN, Wilson RL. PMS29 Cost-utility analysis of collagenase Clostridium histolyticum, limited fasciectomy, and percutaneous needle fasciotomy in Dupuytren’s contracture. Value Health 2011;14:A128-214. https://doi.org/10.1016/j.jval.2011.02.714.
- Wagner M, Lavoie L, Hensen M, Postema R, Welner S. Economic evaluation of collagenase Clostridium histolyticum injection for the treatment of Dupuytren’s contracture in Canada. J Popul Ther Clin Pharmacol 2014;1.
- Malone DC, Armstrong EP. PMS29 cost-effectiveness of collagenase Clostridium histolyticum, limited fasciectomy, and percutaneous needle fasciotomy in the treatment of Dupuytren’s contracture. Value Health 2012;15:A38-9. https://doi.org/10.1016/j.jval.2012.03.218.
- Zah V, Pelivanovic J, Tatovic S, Vukicevic D, Imro M, Ruby J, et al. Healthcare costs and resource use of patients with Dupuytren contracture treated with collagenase Clostridium histolyticum or fasciectomy: a propensity matching analysis. Clinicoecon Outcomes Res 2020;12:635-43. https://doi.org/10.2147/ceor.S269957.
- Donga P, DeKoven M, Kaplan FT, Tursi JP, Lee WC. Costs of collagenase Clostridium histolyticum and fasciectomy for Dupuytren’s contracture. Am J Pharm Ben 2015;7:24-31.
- Yamamoto M, Yasunaga H, Kakinoki R, Tsubokawa N, Morita A, Tanaka K, et al. CeCORD J study Group . The CeCORD-J study on collagenase injection versus aponeurectomy for Dupuytren’s contracture compared by hand function and cost effectiveness. Sci Rep 2022;12. https://doi.org/10.1038/s41598-022-12966-z.
- Camper SB, Divino V, Hurley D, DeKoven M. Cost per episode of care with collagenase Clostridium histolyticum versus fasciectomy for Dupuytren contracture: a real-world claims database analysis. J Hand Surg Glob Online 2019;1:57-64. https://doi.org/10.1016/j.jhsg.2018.12.005.
- Zhou C, Hovius SER, Slijper HP, Zuidam MJ, Smit X, Feitz R, et al. Predictors of patient satisfaction with hand function after fasciectomy for Dupuytren’s contracture. Plast Reconstr Surg 2016;138:649-55. https://doi.org/10.1097/prs.0000000000002472.
- Poelstra R, van Kooij YE, van der Oest MJW, Slijper HP, Hovius SER, Selles RW. Hand-Wrist Study Group . Patient’s satisfaction beyond hand function in Dupuytren’s disease: analysis of 1106 patients. J Hand Surg Eur Vol 2019;45:280-5. https://doi.org/10.1177/1753193419890284.
- Kan HJ, de Bekker-Grob EW, van Marion ES, van Oijen GW, van Nieuwenhoven CA, Zhou C, et al. Patients' preferences for treatment for Dupuytren’s disease: a discrete choice experiment. Plast Reconstr Surg 2016;137:165-73. https://doi.org/10.1097/PRS.0000000000001878.
- Engstrand C, Kvist J, Krevers B. Patients’ perspective on surgical intervention for Dupuytren’s disease – experiences, expectations and appraisal of results. Disabil Rehabil 2016;38:2538-49. https://doi.org/10.3109/09638288.2015.1137981.
- Eppler SL, Kakar S, Sheikholeslami N, Sun B, Pennell H, Kamal RN. Defining quality in hand surgery from the patient’s perspective: a qualitative analysis. J Hand Surg Am 2019;44:311-20.e314. https://doi.org/10.1016/j.jhsa.2018.06.007.
- Bradley J, Warwick D. Patient satisfaction with collagenase. J Hand Surg Am 2016;41:689-97. https://doi.org/10.1016/j.jhsa.2016.03.003.
- Winberg M, Turesson C. Patients’ perspectives of collagenase injection or needle fasciotomy and rehabilitation for Dupuytren disease, including hand function and occupational performance. Disabil Rehabil 2022;45:986-96. https://doi.org/10.1080/09638288.2022.2046188.
- Zuk G, Reinisch KB, Raptis DA, Fertsch S, Guggenheim M, Palma AF. Dupuytren disease: is there enough comprehensive patient information on the internet?. Interact J Med Res 2017;6. https://doi.org/10.2196/ijmr.7822.
- Zeh S, Christalle E, Zill JM, Härter M, Block A, Scholl I. What do patients expect? Assessing patient-centredness from the patients’ perspective: an interview study. BMJ Open 2021;11. https://doi.org/10.1136/bmjopen-2020-047810.
- Vennedey V, Hower KI, Hillen H, Ansmann L, Kuntz L, Stock S. Cologne Research and Development Network (CoRe-Net) . Patients’ perspectives of facilitators and barriers to patient-centred care: insights from qualitative patient interviews. BMJ Open 2020;10. https://doi.org/10.1136/bmjopen-2019-033449.
- Coulter A, Stilwell D, Kryworuchko J, Mullen PD, Ng CJ, van der Weijden T. A systematic development process for patient decision aids. BMC Med Inform Decis Mak 2013;13. https://doi.org/10.1186/1472-6947-13-s2-s2.
- Boeije H. A purposeful approach to the constant comparative method in the analysis of qualitative interviews. Qual Quant 2002;36:391-409. https://doi.org/10.1023/A:1020909529486.
- Lavrakas PJ. Purposive Sampling. Encyclopedia of Survey Research Methods. Thousand Oaks, CA: SAGE Publications Ltd; 2008.
- DeJonckheere M, Vaughn LM. Semistructured interviewing in primary care research: a balance of relationship and rigour. Fam Med Community Health 2019;7. https://doi.org/10.1136/fmch-2018-000057.
- DiCicco-Bloom B, Crabtree BF. The qualitative research interview. Med Educ 2006;40:314-21. https://doi.org/10.1111/j.1365-2929.2006.02418.x.
- Braun V, Clarke V. Using thematic analysis in psychology. Qual Res Psychol 2006;3:77-101. https://doi.org/10.1191/1478088706qp063oa.
- Turesson C, Kvist J, Krevers B. Patients’ needs during a surgical intervention process for Dupuytren’s disease. Disabil Rehabil 2019;41:666-73. https://doi.org/10.1080/09638288.2017.1402095.
- Krefter C, Marks M, Hensler S, Herren DB, Calcagni M. Complications after treating Dupuytren’s disease. A systematic literature review. Hand Surg Rehabil 2017;36:322-9. https://doi.org/10.1016/j.hansur.2017.07.002.
- Leighton PA, Brealey SD, Dias JJ. Patient experiences of scaphoid waist fractures and their treatment: a qualitative investigation. Bone Jt Open 2022;3:641-7. https://doi.org/10.1302/2633-1462.38.Bjo-2022-0042.R1.
- Dias J, Brealey S, Cook L, Fairhurst C, Hinde S, Leighton P, et al. Surgical fixation compared with cast immobilisation for adults with a bicortical fracture of the scaphoid waist: the SWIFFT RCT. Health Technol Assess 2020;24:1-234. https://doi.org/10.3310/hta24520.
- Office for National Statistics . Demography and Migration Data, England and Wales: Census 2021 2022. www.ons.gov.uk/peoplepopulationandcommunity/populationandmigration/populationestimates/articles/demographyandmigrationdatacontent/2022-11-02 (accessed 10 January 2023).
- UK Government . Ethnicity Facts and Figures 2021. www.ethnicity-facts-figures.service.gov.uk/#:~:text=Government%20data%20about%20the%20UK’s,group%20(2021%20Census%20data (accessed 9 December 2022).
- Office for National Statistics . Employment in the UK: April 2022 2022. www.ons.gov.uk/employmentandlabourmarket/peopleinwork/employmentandemployeetypes/bulletins/employmentintheuk/april2022 (accessed 9 December 2022).
- Ministry of Housing Communities and Local Government . English Indices of Deprivation 2019. https://imd-by-postcode.opendatacommunities.org/imd/2019 (accessed 9 January 2023).
- Scottish Government . Scottish Index of Multiple Deprivation 2020. www.gov.scot/collections/scottish-index-of-multiple-deprivation-2020/#lookupfiles (accessed 10 January 2023).
- Action on Smoking and Health (ASH) . Smoking Statistics 2021. https://ash.org.uk/resources/view/smoking-statistics (accessed 9 December 2022).
- Office for National Statistics . Adult Smoking Habits in the UK: 2021 2021. www.ons.gov.uk/peoplepopulationandcommunity/healthandsocialcare/healthandlifeexpectancies/bulletins/adultsmokinghabitsingreatbritain/2021#:~:text=.xlsx-,Characteristics%20of%20current%20cigarette%20smokers%20in%20the%20UK,million)%20reported%20be (accessed 10 January 2023).
- Burge P, Hoy G, Regan P, Milne R. Smoking, alcohol and the risk of Dupuytren’s contracture. J Bone Joint Surg Br 1997;79:206-10. https://doi.org/10.1302/0301-620x.79b2.6990.
- Descatha A, Carton M, Mediouni Z, Dumontier C, Roquelaure Y, Goldberg M, et al. Association among work exposure, alcohol intake, smoking and Dupuytren’s disease in a large cohort study (GAZEL). BMJ Open 2014;4. https://doi.org/10.1136/bmjopen-2013-004214.
- Goldhahn S, Sawaguchi T, Audigé L, Mundi R, Hanson B, Bhandari M, et al. Complication reporting in orthopaedic trials. A systematic review of randomized controlled trials. J Bone Joint Surg Am 2009;91:1847-53. https://doi.org/10.2106/JBJS.H.01455.
- Martin RC, Brennan MF, Jaques DP. Quality of complication reporting in the surgical literature. Ann Surg 2002;235:803-13. https://doi.org/10.1097/00000658-200206000-00007.
- McVeigh KH, Murray PM, Heckman MG, Rawal B, Peterson JJ. Accuracy and validity of goniometer and visual assessments of angular joint positions of the hand and wrist. J Hand Surg Am 2016;41:e21-35. https://doi.org/10.1016/j.jhsa.2015.12.014.
- Pratt AL, Ball C. What are we measuring? A critique of range of motion methods currently in use for Dupuytren’s disease and recommendations for practice. BMC Musculoskelet Disord 2016;17. https://doi.org/10.1186/s12891-016-0884-3.
- Witthaut J, Jones G, Skrepnik N, Kushner H, Houston A, Lindau TR. Efficacy and safety of collagenase Clostridium histolyticum injection for Dupuytren contracture: short-term results from 2 open-label studies. J Hand Surg Am 2013;38:2-11. https://doi.org/10.1016/j.jhsa.2012.10.008.
- Lee H, Eo S, Cho S, Jones NF. The surgical release of Dupuytren’s contracture using multiple transverse incisions. Arch Plast Surg 2012;39:426-30. https://doi.org/10.5999/aps.2012.39.4.426.
- Draviaraj KP, Chakrabarti I. Functional outcome after surgery for Dupuytren’s contracture: a prospective study. J Hand Surg Am 2004;29:804-8. https://doi.org/10.1016/j.jhsa.2004.05.005.
- Denkler K. Dupuytren’s fasciectomies in 60 consecutive digits using lidocaine with epinephrine and no tourniquet. Plast Reconstr Surg 2005;115:802-10. https://doi.org/10.1097/01.prs.0000152420.64842.b6.
- Hsieh C, Yun D, Bhatia AC, Hsu JT, Ruiz de Luzuriaga AM. Patient perception on the usage of smartphones for medical photography and for reference in dermatology. Dermatol Surg 2015;41:149-54. https://doi.org/10.1097/dss.0000000000000213.
- Zhao JZ, Blazar PE, Mora AN, Earp BE. Range of motion measurements of the fingers via smartphone photography. Hand (N Y) 2020;15:679-85. https://doi.org/10.1177/1558944718820955.
- Smith RP, Dias JJ, Ullah A, Bhowal B. Visual and computer software-aided estimates of Dupuytren’s contractures: correlation with clinical goniometric measurements. Ann R Coll Surg Engl 2009;91:296-300. https://doi.org/10.1308/003588409x359259.
- Georgeu GA, Mayfield S, Logan AM. Lateral digital photography with computer-aided goniometry versus standard goniometry for recording finger joint angles. J Hand Surg Br 2002;27:184-6. https://doi.org/10.1054/jhsb.2001.0692.
- Martos-Pérez F, Martín-Escalante MD, Olalla-Sierra J, Prada-Pardal JL, García-de-Lucas MD, González-Vega R, et al. The value of telephone consultations during COVID-19 pandemic. An observational study. QJM 2021;114:715-20. https://doi.org/10.1093/qjmed/hcab024.
- Ignatowicz A, Atherton H, Bernstein CJ, Bryce C, Court R, Sturt J, et al. Internet videoconferencing for patient-clinician consultations in long-term conditions: a review of reviews and applications in line with guidelines and recommendations. Digit Health 2019;5. https://doi.org/10.1177/2055207619845831.
- Abimbola S, Keelan S, Everett M, Casburn K, Mitchell M, Burchfield K, et al. The medium, the message and the measure: a theory-driven review on the value of telehealth as a patient-facing digital health innovation. Health Econ Rev 2019;9. https://doi.org/10.1186/s13561-019-0239-5.
- Irvine E, Sayed L, Johnson N, Dias J. The ability of patients to provide standardized, patient-taken photographs for the remote assessment of Dupuytren disease. Hand (N Y) 2021;18:139-44. https://doi.org/10.1177/15589447211006834.
- Rosset A, Spadola L, Ratib O. Osirix: an open-source software for navigating in multidimensional dicom images. J Digit Imaging 2004;17:205-16. https://doi.org/10.1007/s10278-004-1014-6.
- van Kooij YE, Fink A, Nijhuis-van der Sanden MW, Speksnijder CM. The reliability and measurement error of protractor-based goniometry of the fingers: a systematic review. J Hand Ther 2017;30:457-67. https://doi.org/10.1016/j.jht.2017.02.012.
- Bland JM, Altman DG. Measuring agreement in method comparison studies. Stat Methods Med Res 1999;8:135-60. https://doi.org/10.1177/096228029900800204.
Appendix 1 Dupuytren’s contracture severity and diathesis
FIGURE 31.
Dupuytren’s contracture severity. This figure illustrates the progressive severity of joint contracture caused by the disease involving the MCP joints (a, b) PIP joints (c, d) and combined involvement of the MCP and PIP joints (e‒h). Figures b, g and h, for example, illustrate involvement of more than one digit. In DISC when both the MCP and PIP joints were involved one joint, usually with the more severe contracture, was designated as the study joint. For example, in f the PIP joint was more severe and was designated as the study joint while in g the MCP joint was designated.
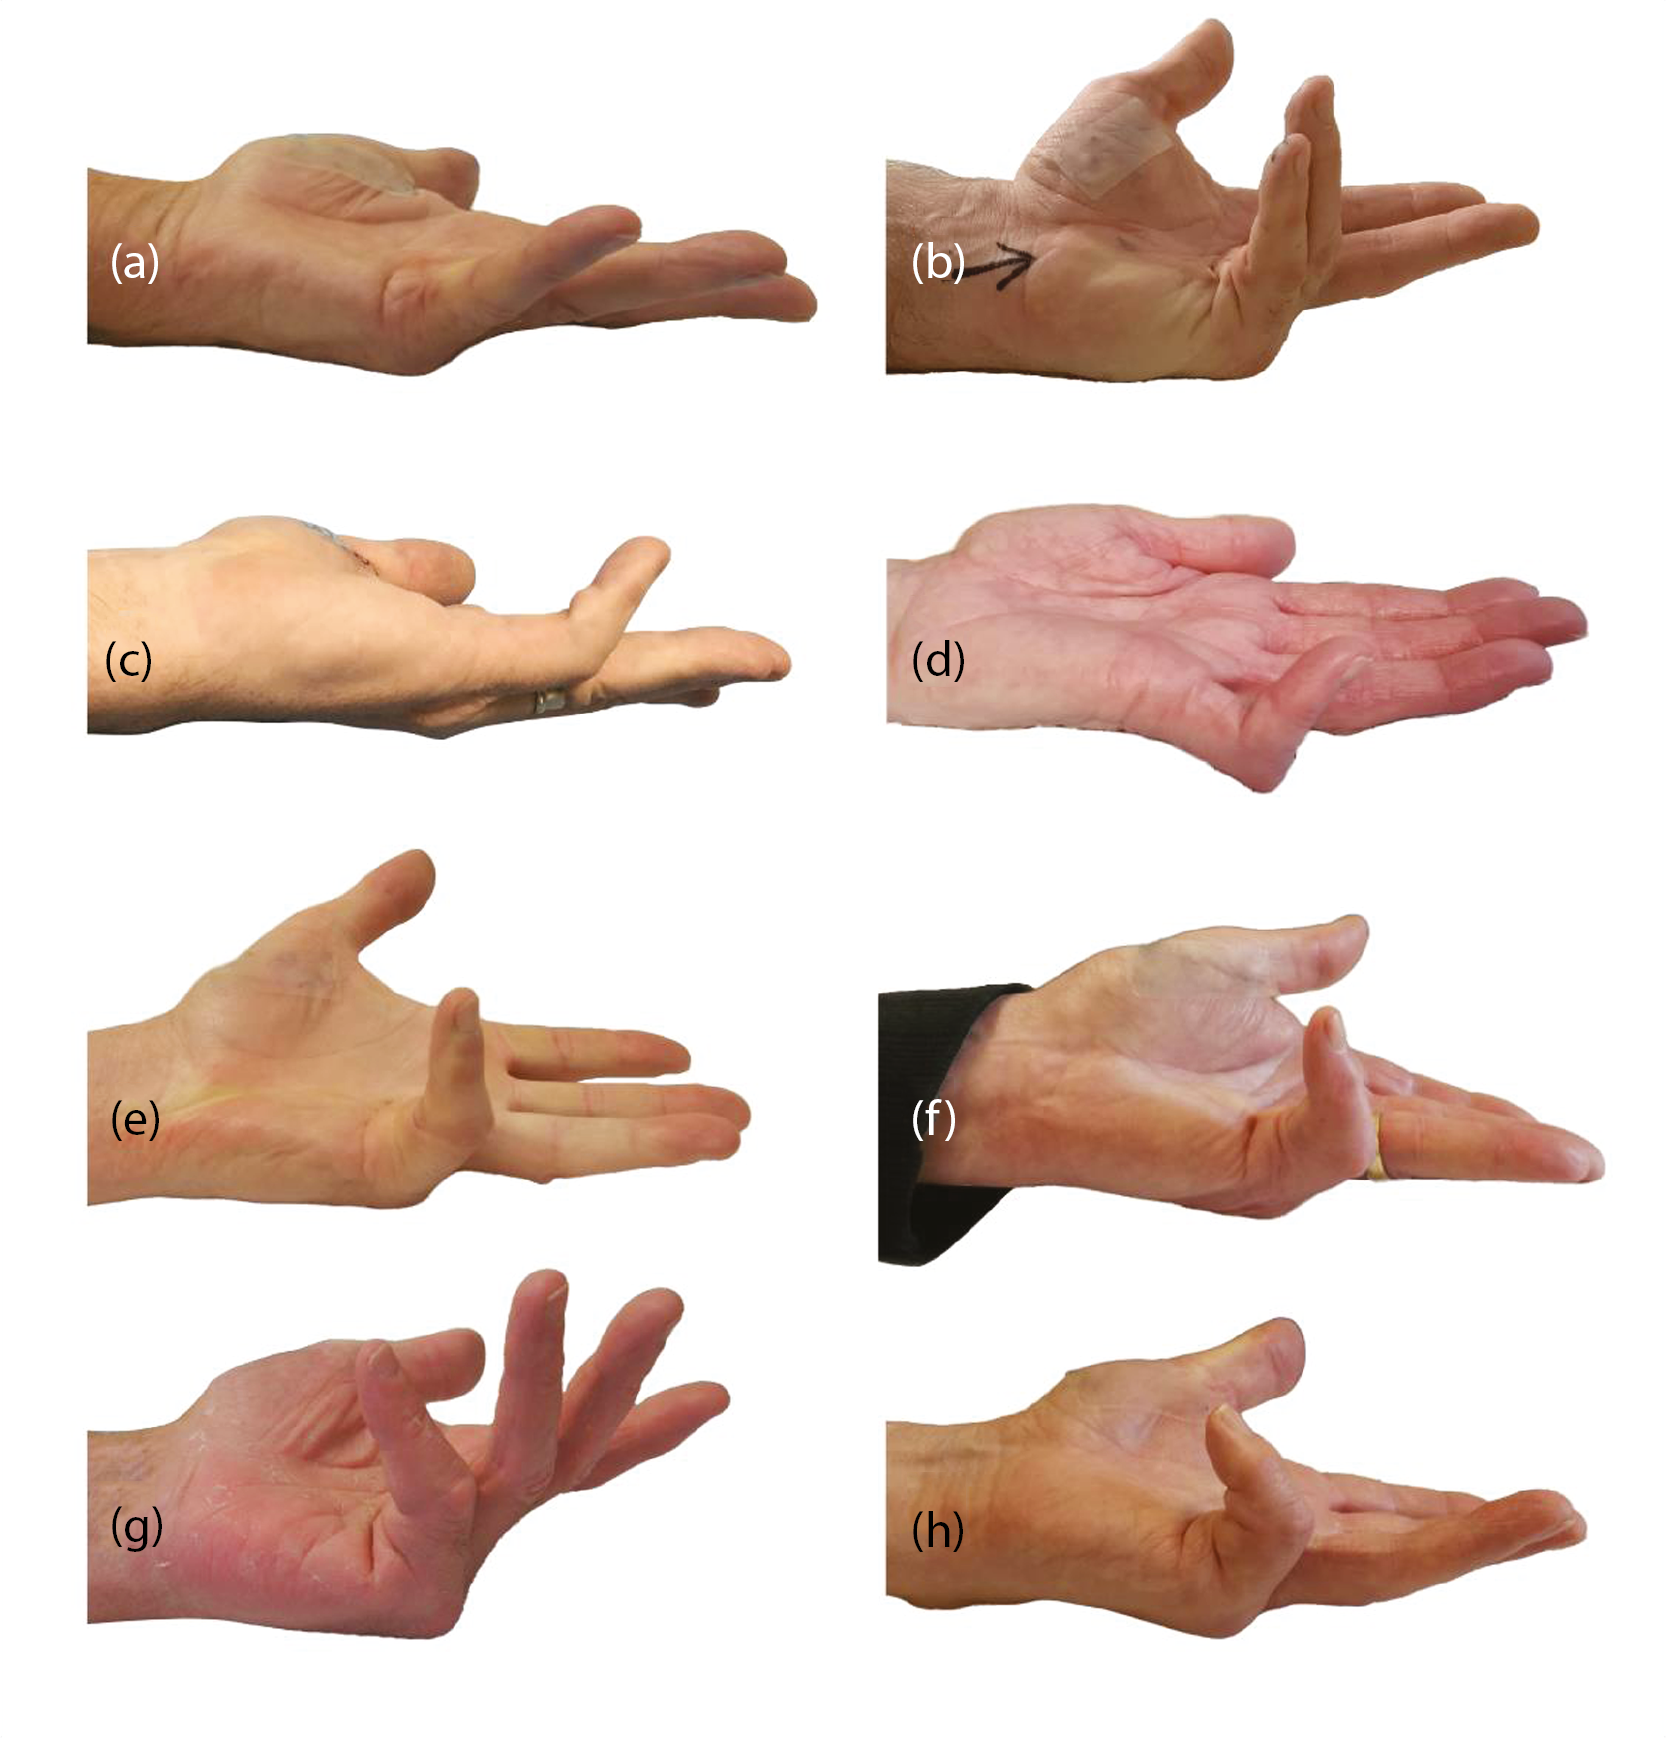
FIGURE 32.
Examples of Dupuytren’s diathesis. (a) Shows Garrod’s pads over the dorsum of the PIP joints. (b) Demonstrates ectopic disease creating nodules in the plantar fascia in the instep of the foot (Ledderhose’s disease). (c) Demonstrates bilateral disease and a surrogate measure reported in this monograph presents data on bilateral disease, number of digits with disease and number of joints involved. These factors along with age of onset of the disease give an assessment of the expression of the disease in each patient.
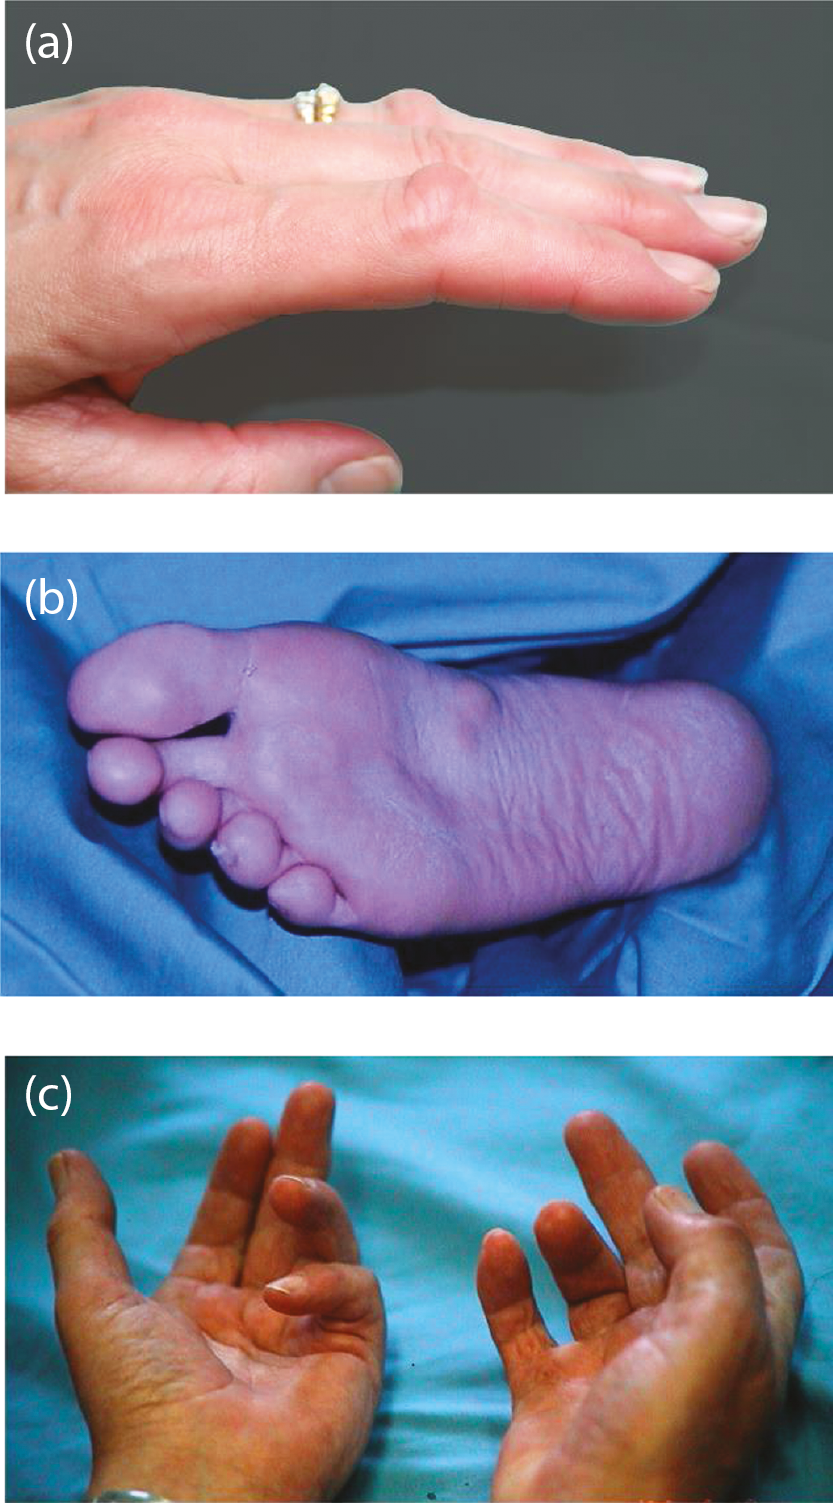
Appendix 2 Photography substudy
Introduction
When assessing interventions for DC, it is important to accurately measure contractures to define and evaluate important outcomes such as severity, correction and recurrence. Numerous methods have been described for measuring finger range of motion including manual goniometry, visual estimation, photographic goniometry, diagrammatic recordings, goniometric gloves and radiographic imaging.
Manual goniometry is a widely used technique and the commonest measurement method for the assessment of contractures in patients with DC. 10 Some studies have shown high interrater reliability but its accuracy has been questioned. 140 Several problems have been identified including how measurements are defined and taken and what is measured. 141 Some authors have defined full extension as 0 degrees whereas others have described it as 180 degrees. 142,143 Hyperextension is usually recorded as a minus value but this can cause confusion and some authors have used different methods. 144,145 Many studies do not define if measurements were active or passive and this was highlighted in a Cochrane review. 9 Passive motion can be useful to record changes following surgery but active motion may more accurately reflect functional outcome. Passive extension may also be influenced by the amount of force used when extending the finger.
The widespread use of smartphones has resulted in patient-taken images increasingly being used across a range of healthcare specialties including dermatology, general practice, plastic surgery and paediatrics and has been found to be an acceptable process to patients. 146 Smartphone photography provides contracture measurements equivalent to the accepted error of a finger goniometer. 147 The correlation of software measurements with clinical goniometry has been validated. Georgeu et al. reported a high correlation between clinical and computer-aided goniometry (0.975) and Smith et al. found the correlation of goniometric measurements significantly improved with Image J computer-aided measurements compared to visual estimates. 148,149 Furthermore, the use of a standard photography protocol and computer analysis allows for less inter-user variation and is a rapid and cost-effective process. 148,149
Remote clinical consultations are also becoming increasingly common. They are efficient, sustainable, low cost, and reduce coronavirus infection risk. 150–152 In addition, the use of remote consultations allows for long-term assessment of outcomes, which has implications for research as it may reduce loss to follow up if the assessments can be made with ease from the patient’s own home. To enable remote assessment of DC, a useful method of evaluating contractures is required. In a previous study, we provided patients at our unit with instructions on how to take standardised photographs of their diseased hand(s). Of 222 patients who supplied photographs for analysis, 158 patients (71.2%) were able to take the photographs as instructed. 153 There were no significant differences between those able to take the photographs compared with those who took them incorrectly when compared by gender, age or severity of disease. This suggested patient-taken photography and computer software-aided estimates of disease make an efficient and reliable method of assessing and monitoring patients remotely.
The aim of this substudy was to see if patient-taken photographs provided a useful assessment of contracture by evaluating the agreement between patient taken photographs and goniometric measurements. The agreement between clinician taken photographs and goniometric measurements was also assessed.
Methods
Participants
All participants who consented to participate in the DISC trial had the option of participating in the photography substudy. Consent to the photography substudy did not affect inclusion in the main trial.
Design
Participants who consented to participate in the substudy were shown by the site research teams how to take the required photographs of their hand at baseline and were provided with a card template to aid placement of the participant’s hand and an instructions leaflet. The paper template folds into a triangular shape and the participant places the affected hand at the tip of the triangle with the camera lens held at the other end of the template. This standardises the distance and angle of the camera from the study digit. The instructions provided were designed with input from the PPI group with language amended to explain how to fold and place the template more clearly (see Report Supplementary Material 4). Example photographs were also included on the instructions for the participants to see how these should look when taken correctly. Participants were also provided with a link to a video, made with PPI group involvement, showing how to take photographs. Participants were provided with a guidance document of how to submit the photographs by e-mail, post or electronic transmission once they had taken them. Documentation was reviewed and approved by the PPI group prior to use in the study.
Participants were sent a letter to remind them to return photographs to the study team. Research teams were also requested to remind any participants who were in the photography substudy at their study follow-up visits to take and send their images. Participants then sent their photographs by e-mail, post or text message transmission. Participants who did not send required photographs were contacted by post or by the research team directly.
Study size
The substudy aimed to recruit sufficient participants to provide 100 photograph sets before treatment delivery and collect as many photograph sets as possible at 3 months, 6 months, 1 year, and 2 years post treatment. Substudy participants were therefore asked to take standardised photographs of their study reference hand at home at baseline, and all subsequent time points.
Data transfer and processing
Photographs of participants’ hands were anonymised prior to electronic transfer by sites to the University of York. Images were then stored in an encrypted and password protected drive and transferred via secure and encrypted systems to the University Hospitals of Leicester NHS Trust for processing. Two observers measured all photographs independently. Measurements were carried out using open-source Osiris software (Pixmeo SARL, Geneva, Switzerland154) and in accordance with a standardised process developed for the study.
A dynamic angle tool was used to measure the angle of the MCP, PIP and distal interphalangeal (DIP) joints on flexion and extension view photographs. Hyperextension was recorded as a negative value. A conflict was defined as a difference of more than 6 degrees between the two observers’ measurements. All conflicts were remeasured by a clinical member of the team to resolve the query. The resolver remeasured the joints for which there was conflict. The measurements were compared to the original two measurements. If the resolver’s measurement was within 10 degrees of either of the original measurements the resolver’s measurement and the original measurement within 10 degrees was accepted. 155 If there was still conflict following the resolver’s measurement the conflicts were reviewed and remeasured by two senior members of the clinical team.
The quality of the image was assessed for the clarity of the image and for the position to the camera in reference to the hand (panning, elevation, and distance). From this the ability to measure the joint extension and flexion was categorised as ‘definite’, ‘measurable’, ‘just measurable’, or ‘not measurable’/Not available to account for the measurement errors due to panning and elevation.
Data sources
Participants consenting to participation in the photography sub study submitted photographs taken at home for the reference hand and joint at baseline and at 3 and 6 months and 1 and 2 years post treatment.
Three sets of measurements, collected as part of the main study at the same time points, were used for substudy analysis; measurements obtained using a goniometer, measurements obtained using photographs taken in clinic, and measurements obtained using photographs taken by participants at home.
Many participants had additional pre-operative goniometric and photographic measurements. These were used to assess reproducibility of each measurement method.
Outcomes
The primary goal of the photography substudy was to assess the agreement between measurements obtained using a goniometer and measurements obtained using the photographs taken by participants at home, to determine whether the two methods of measurement might feasibly be used interchangeably. The photography substudy also includes additional analyses investigating agreement between goniometric measurements and measurements obtained using photographs taken in clinic, agreement between repeated goniometric and photographic measurements (baseline and pre-operative) and predictors of agreement (image quality and time elapsed between each type of measurement).
Statistical methods
Primary analysis
The primary substudy analysis investigated the agreement between the mean of the three measurements obtained using goniometer at baseline, and the measurement obtained using participant photographs at baseline (or participant photographs taken prior to treatment if baseline photographs were unavailable).
Separate 95% limits of agreement for the MCP, PIP, and DIP joints of participants’ reference digits were calculated. A range of plots were used to assess the extent to which the assumptions of the analyses were met. If there was evidence of a relationship between the differences of the two measurements and their magnitude, then steps were taken to account for this relationship using regression methods. 156 The calculation of the limits of agreement assumed that the differences were approximately normally distributed. The extent to which this assumption was met was assessed by inspection of a normal quantile–quantile plot. Should there be extreme departures from normality then a non-parametric approach was used as described by Bland and Altman. 156
The differences between the two types of measurement were plotted against their average (an estimate of the magnitude of the contracture), with the estimated limits of agreement overlaid. The extent to which agreement varied by digit was investigated graphically as was the extent to which agreement varied according to image quality. The possible influence of time elapsed between the two measurements on agreement was also explored graphically.
Secondary analyses
Secondary analyses of the photography sub study used similar techniques as described for the primary substudy analysis to assess the agreement between goniometric measurements and measurements obtained using photographs taken in clinic at baseline (or pre-treatment in the absence of baseline photographs), agreement between baseline photography and pre-operative photography, and agreement between baseline goniometry and pre-operative goniometry.
Results
Agreement between baseline goniometry and baseline participant- completed photography
Active extension deficit: metacarpophalangeal joint
Of the 100 participants that had at least one pair of measurements to use for the primary substudy analyses, 97 (97%) had available goniometric measurements of the active extension of the MCP joint, and 96 (96%) had available photographic measurements. Brief summaries of the available substudy cases for each type of measurement, and the within-participant differences (photography – goniometry) between measurements are given in Appendix 2, Table 49 and panels 1, 2 and 3 of Appendix 2, Figure 33.
| Active extension deficit MCP (°) – goniometry | |
| N | 97 |
| Mean (SD) | 31.8 (30.5) |
| Median (Q1, Q3) | 35.3 (6.3, 50.3) |
| Minimum, maximum | −30.0, 90.0 |
| Active extension deficit MCP (°) – participant photography | |
| N | 96 |
| Mean (SD) | 20.7 (26.3) |
| Median (Q1, Q3) | 21.0 (3.8, 35.8) |
| Minimum, maximum | −36.0, 86.0 |
| Active extension deficit MCP – participant photograph measurable, n (%) | |
| Definitely | 84 (87.5) |
| Yes | 7 (7.3) |
| Just | 4 (4.2) |
| No | 1 (1.0) |
| Active extension deficit MCP – difference (photography – goniometry) (°) | |
| N | 93 |
| Mean (SD) | −9.7 (16.2) |
| Median (Q1, Q3) | −11.3 (−19.7, 0.3) |
| Minimum, maximum | −54.2, 24.5 |
| Active extension deficit MCP – time between goniometric measurement and photograph (days) | |
| N | 93 |
| Mean (SD) | 20.3 (53.9) |
| Median (Q1, Q3) | 1.0 (0.0, 6.0) |
| Minimum, maximum | 0.0, 283.0 |
Both sets of measurements had a similar range, but the measurements obtained via photography were on average about 10 degrees smaller than those obtained via goniometry. The extent to which differences in measurements were associated with the time elapsed between the goniometric measurements and photographs used to obtain photographic measurements is illustrated in panel 4 of Appendix 2, Figure 33. Given most photographs were taken soon after the goniometric measurements were completed, the power of this plot to reveal associations between differences and time elapsed between measurements is limited. That said, this plot provides little indication that agreement varied according to time elapsed between measurements.
FIGURE 33.
Graphical summaries of the baseline active extension deficit measurements of the MCP joint. Panel 1, distribution of the goniometric measurements; panel 2, distribution of the photographic measurements; panel 3, distribution of the within participant differences in measurements; and panel 4, differences against time elapsed between measurements.
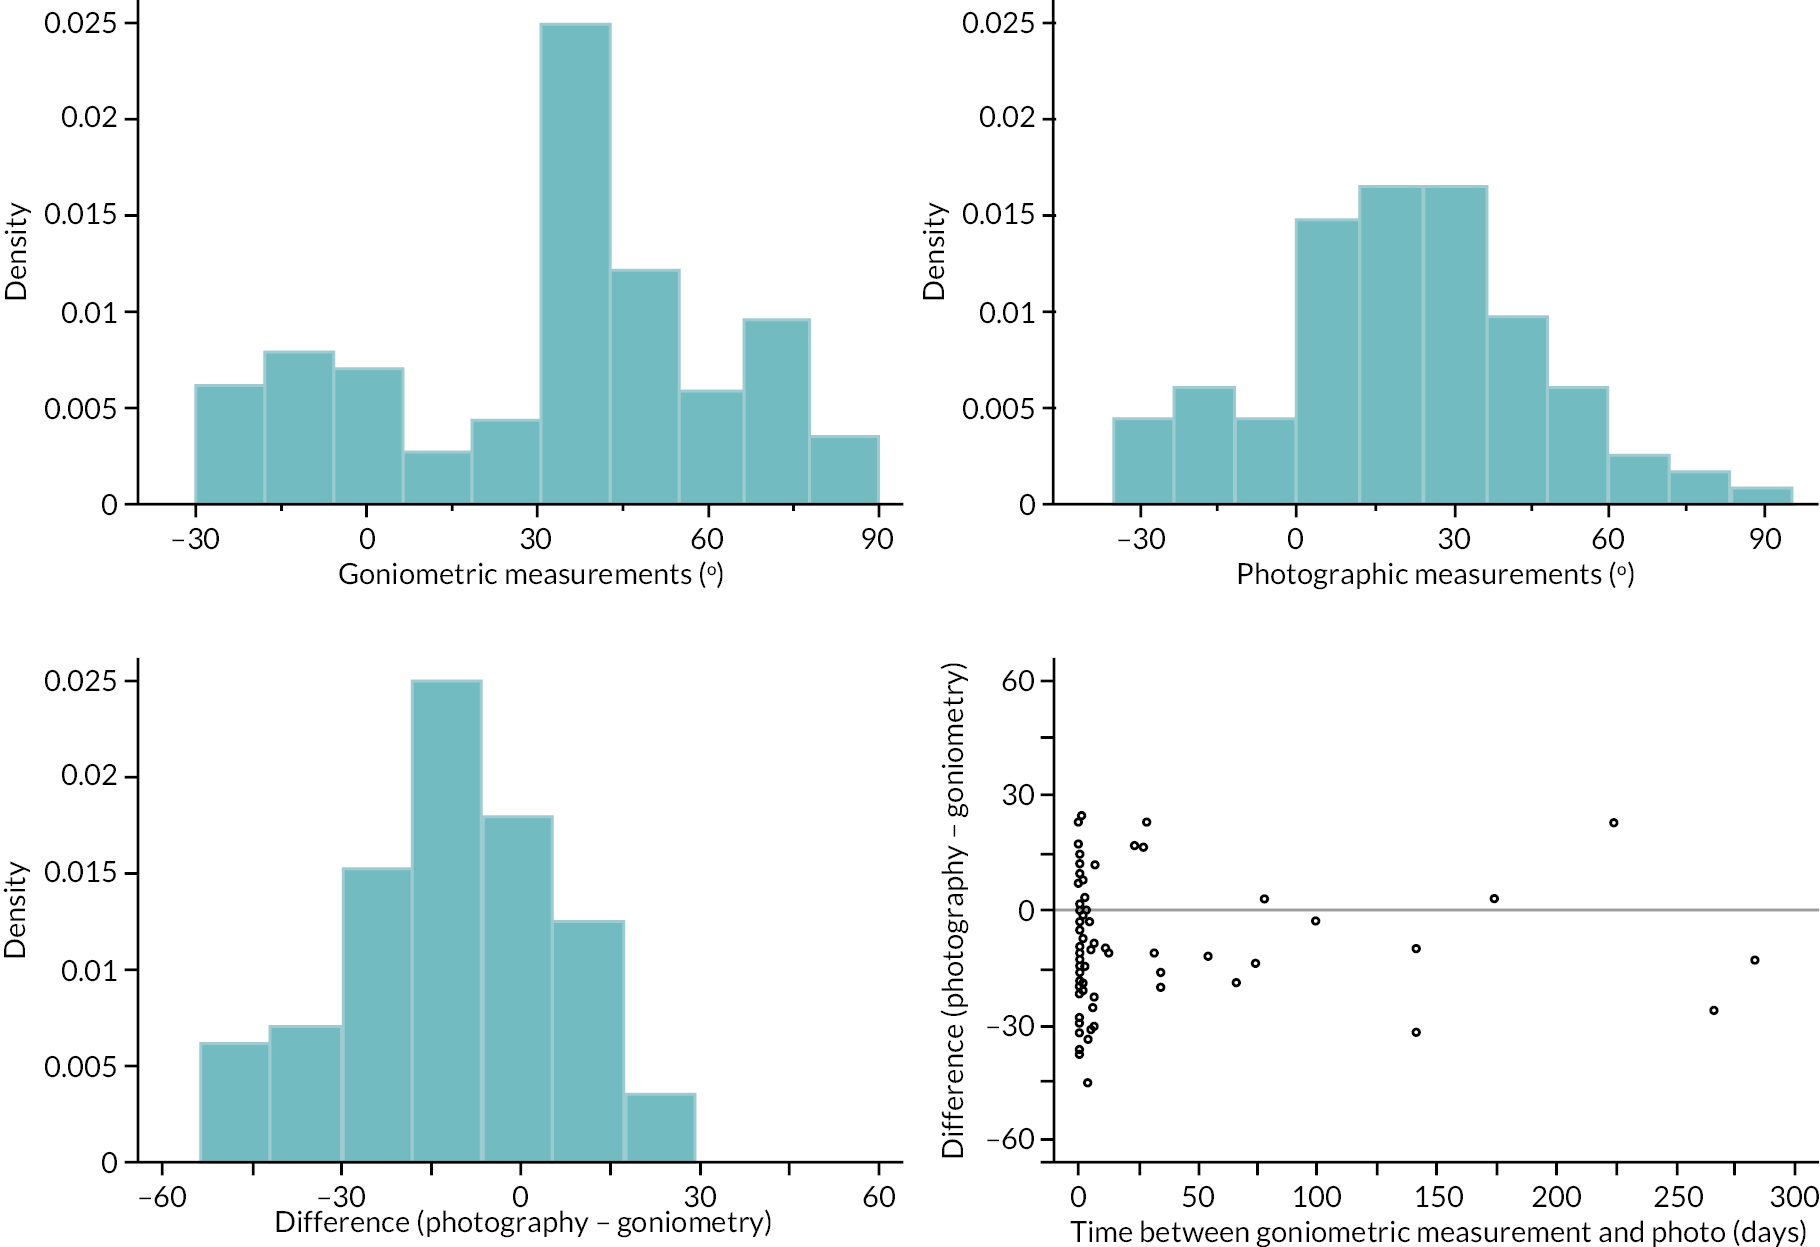
The within-participant differences between goniometric and photographic measurements (of active extension deficit of the MCP joint) suggest that the average difference [manifested in this case as larger (i.e. more contracted) goniometric measurements] increased as the magnitude of extension deficit (as estimated by the means of the available measurements) increased (see Appendix 2, Figure 34).
FIGURE 34.
Metacarpophalangeal extension deficit measurements – difference (photography – goniometry) vs. magnitude (mean of the two measurements), with estimated mean difference and 95% limits of agreement conditional on magnitude overlaid.
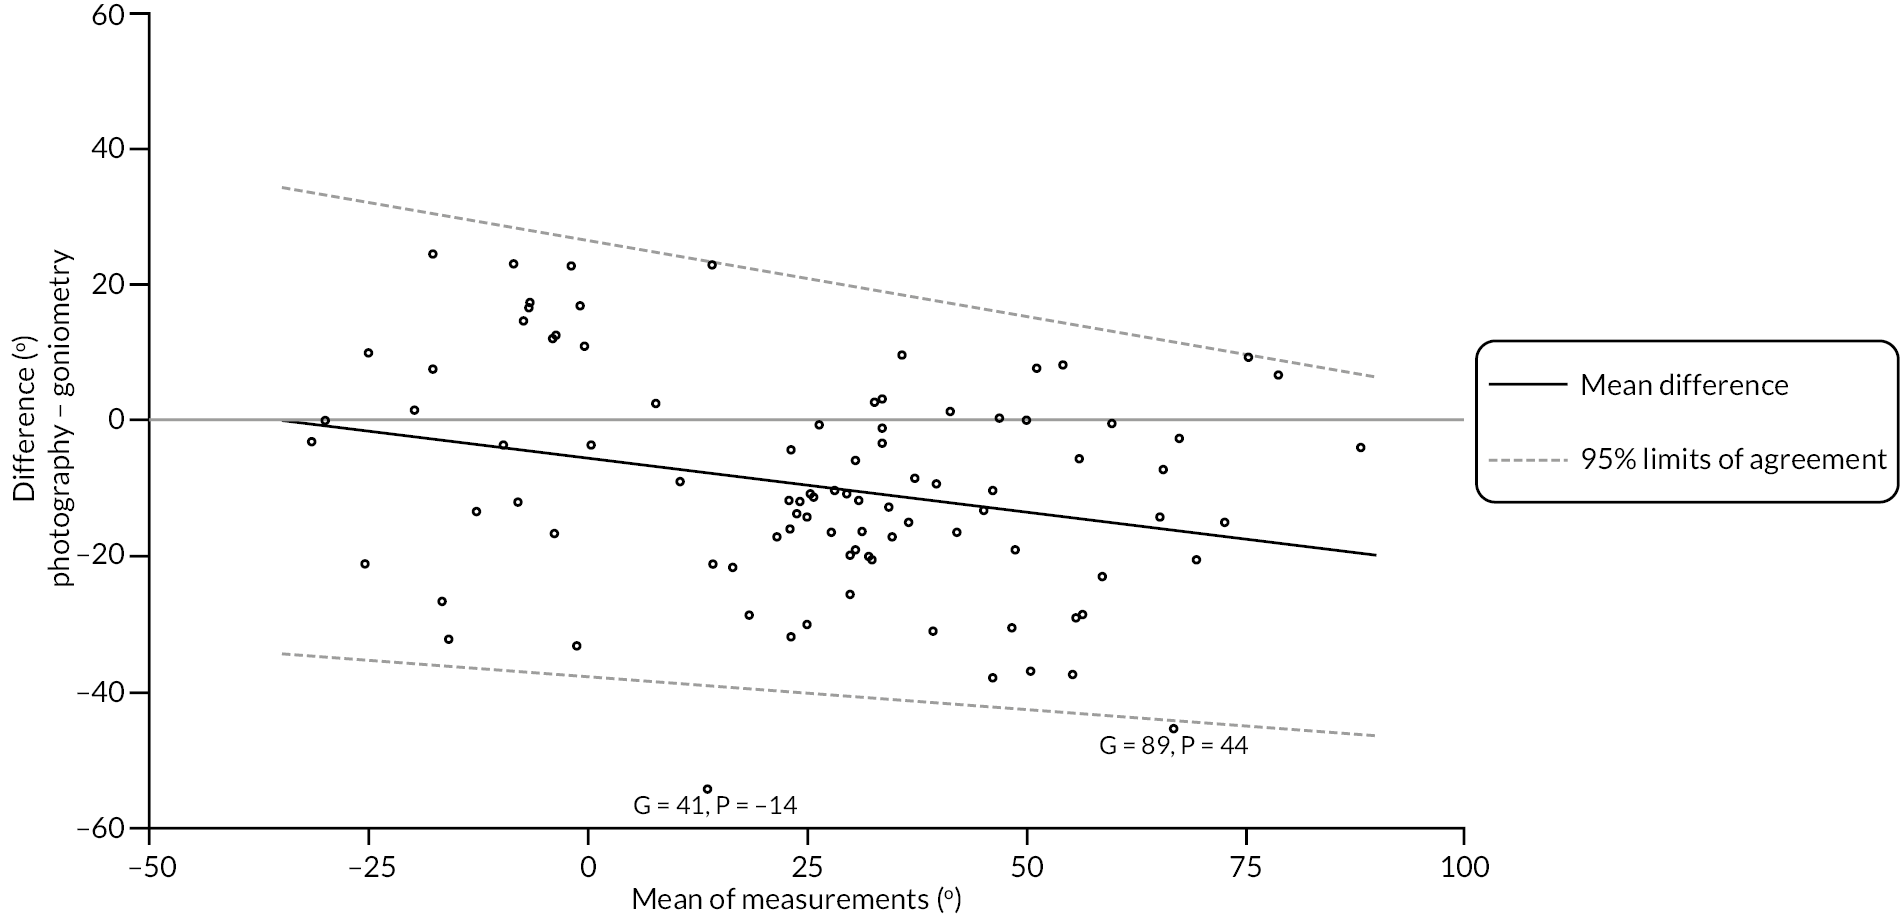
We used linear regression of the observed differences on the magnitude of extension deficit (estimated by the mean of the 2 measurements) to estimate the expected difference between the 2 methods of measurement over the range of observed magnitudes (further details in Report Supplementary Material 15 Item 1). The estimated mean difference and 95% limits of agreement show the negative relationship between the difference and magnitude, but also suggest that agreement is relatively stable over the range of measurements once the relationship between expected difference and magnitude is accounted for. While the agreement appears to be relatively stable, it is quite poor. For example, the estimated 95% limits of agreement are about ± 34 degrees for participants with an estimated 30-degree hyper-extension at the MCP joint of the reference digit. Agreement is slightly better for more severe contractures, but even for active extension deficits of 60–90 degrees, the 95% limits of agreement are about ± 30 degrees, considerably greater than the estimated measurement error associated with goniometry alone.
Neither of the plots (see Appendix 2, Figure 35) stratified by reference digit and photograph measurability suggest any strong variation in agreement, although there is some suggestion that the point exhibiting the most severe disagreement may be at least partially explained by the submitted photograph showing substantial departures from the instructions/guidance provided.
FIGURE 35.
Metacarpophalangeal extension deficit measurements – difference (photography – goniometry) vs. magnitude (mean of the two measurements), with estimated mean difference and 95% limits of agreement conditional on magnitude overlaid. Left panel, points are stratified by reference digit type. Right panel, points are stratified by the measurability of the available participant completed photograph.
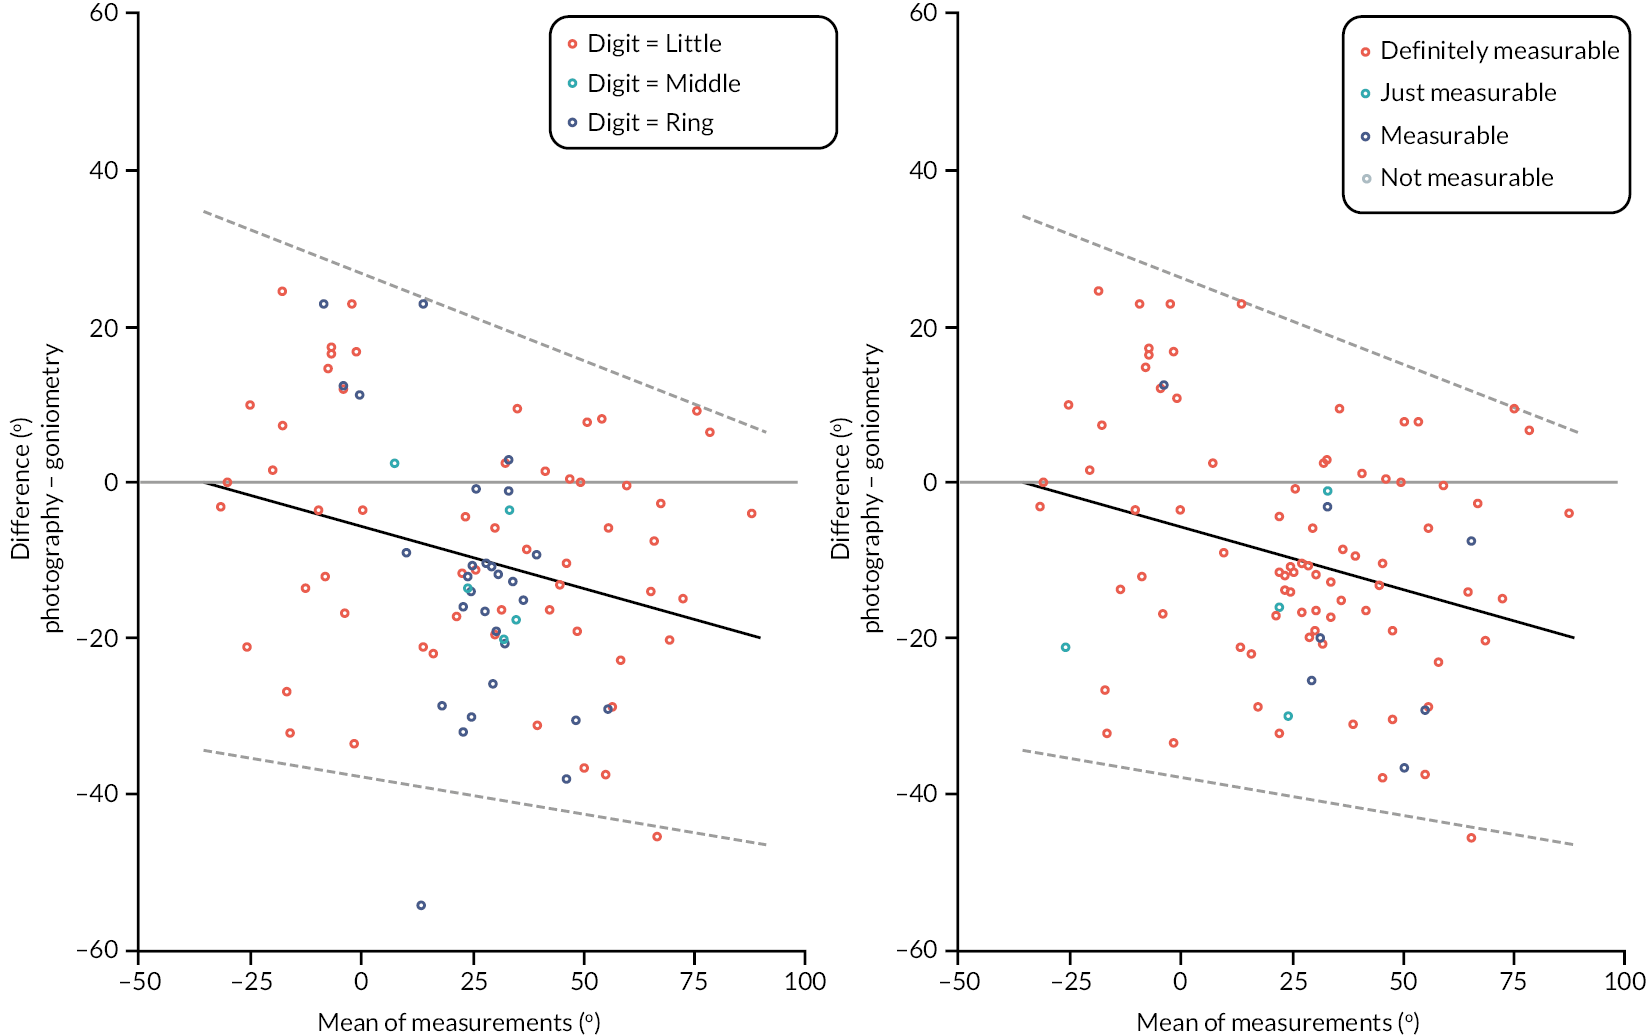
Active extension deficit: proximal interphalangeal joint
Of the 100 participants that had at least one pair of PIP active extension deficit measurements (for the reference digit) to use for the primary substudy analyses, 99 (99%) had available goniometric measurements, and 97 (97%) had available photographic measurements.
Brief summaries of the available cases for each type of measurement, and the within-participant differences (photography – goniometry) between measurements are given in Appendix 2, Table 50 and panels 1, 2 and 3 of Appendix 2, Figure 36. Both sets of measurements had a similar range (approximately −15 to 90 degrees), although there are a few more cases with photographic measurements > 90 degrees, than cases with goniometric measurement > 90 degrees. In contrast with the MCP active extension deficit measurements, the PIP measurements obtained via photography were about 5–10 degrees larger on average than those obtained via goniometry. The association between the time elapsed between the goniometric measurements and photographs used to obtain photographic measurements is illustrated in panel 4 of Appendix 2, Figure 36. As before, the power of this plot to visually reveal associations between the variables is limited, but again there is not any compelling evidence that differences varied according to time elapsed between measurements.
| Active extension deficit PIP (°) – goniometry | |
| N | 99 |
| Mean (SD) | 29.0 (29.9) |
| Median (Q1, Q3) | 19.3 (0.7, 58.0) |
| Minimum, maximum | −17.3, 90.7 |
| Active extension deficit PIP (°) – photography | |
| N | 97 |
| Mean (SD) | 37.5 (28.7) |
| Median (Q1, Q3) | 32.0 (10.5, 60.0) |
| Minimum, maximum | −7.0, 103.0 |
| Active extension deficit PIP – photograph measurable, n (%) | |
| Definitely | 84 (86.6) |
| Yes | 7 (7.2) |
| Just | 4 (4.1) |
| No | 2 (2.1) |
| Active extension deficit PIP – difference (photography – goniometry) (°) | |
| N | 96 |
| Mean (SD) | 8.0 (15.1) |
| Median (Q1, Q3) | 7.4 (0.4, 16.0) |
| Minimum, maximum | −39.7, 70.7 |
| Active extension deficit PIP – time between goniometric measurement and photograph (days) | |
| N | 96 |
| Mean (SD) | 19.1 (53.1) |
| Median (Q1, Q3) | 1.0 (0.0, 5.5) |
| Minimum, maximum | 0.0, 283.0 |
FIGURE 36.
Graphical summaries of the baseline active extension deficit measurements of the PIP joint. Panel 1, distribution of the goniometric measurements; panel 2, distribution of the photographic measurements; panel 3, distribution of the within participant differences in measurements; and panel 4, differences against time elapsed between measurements.
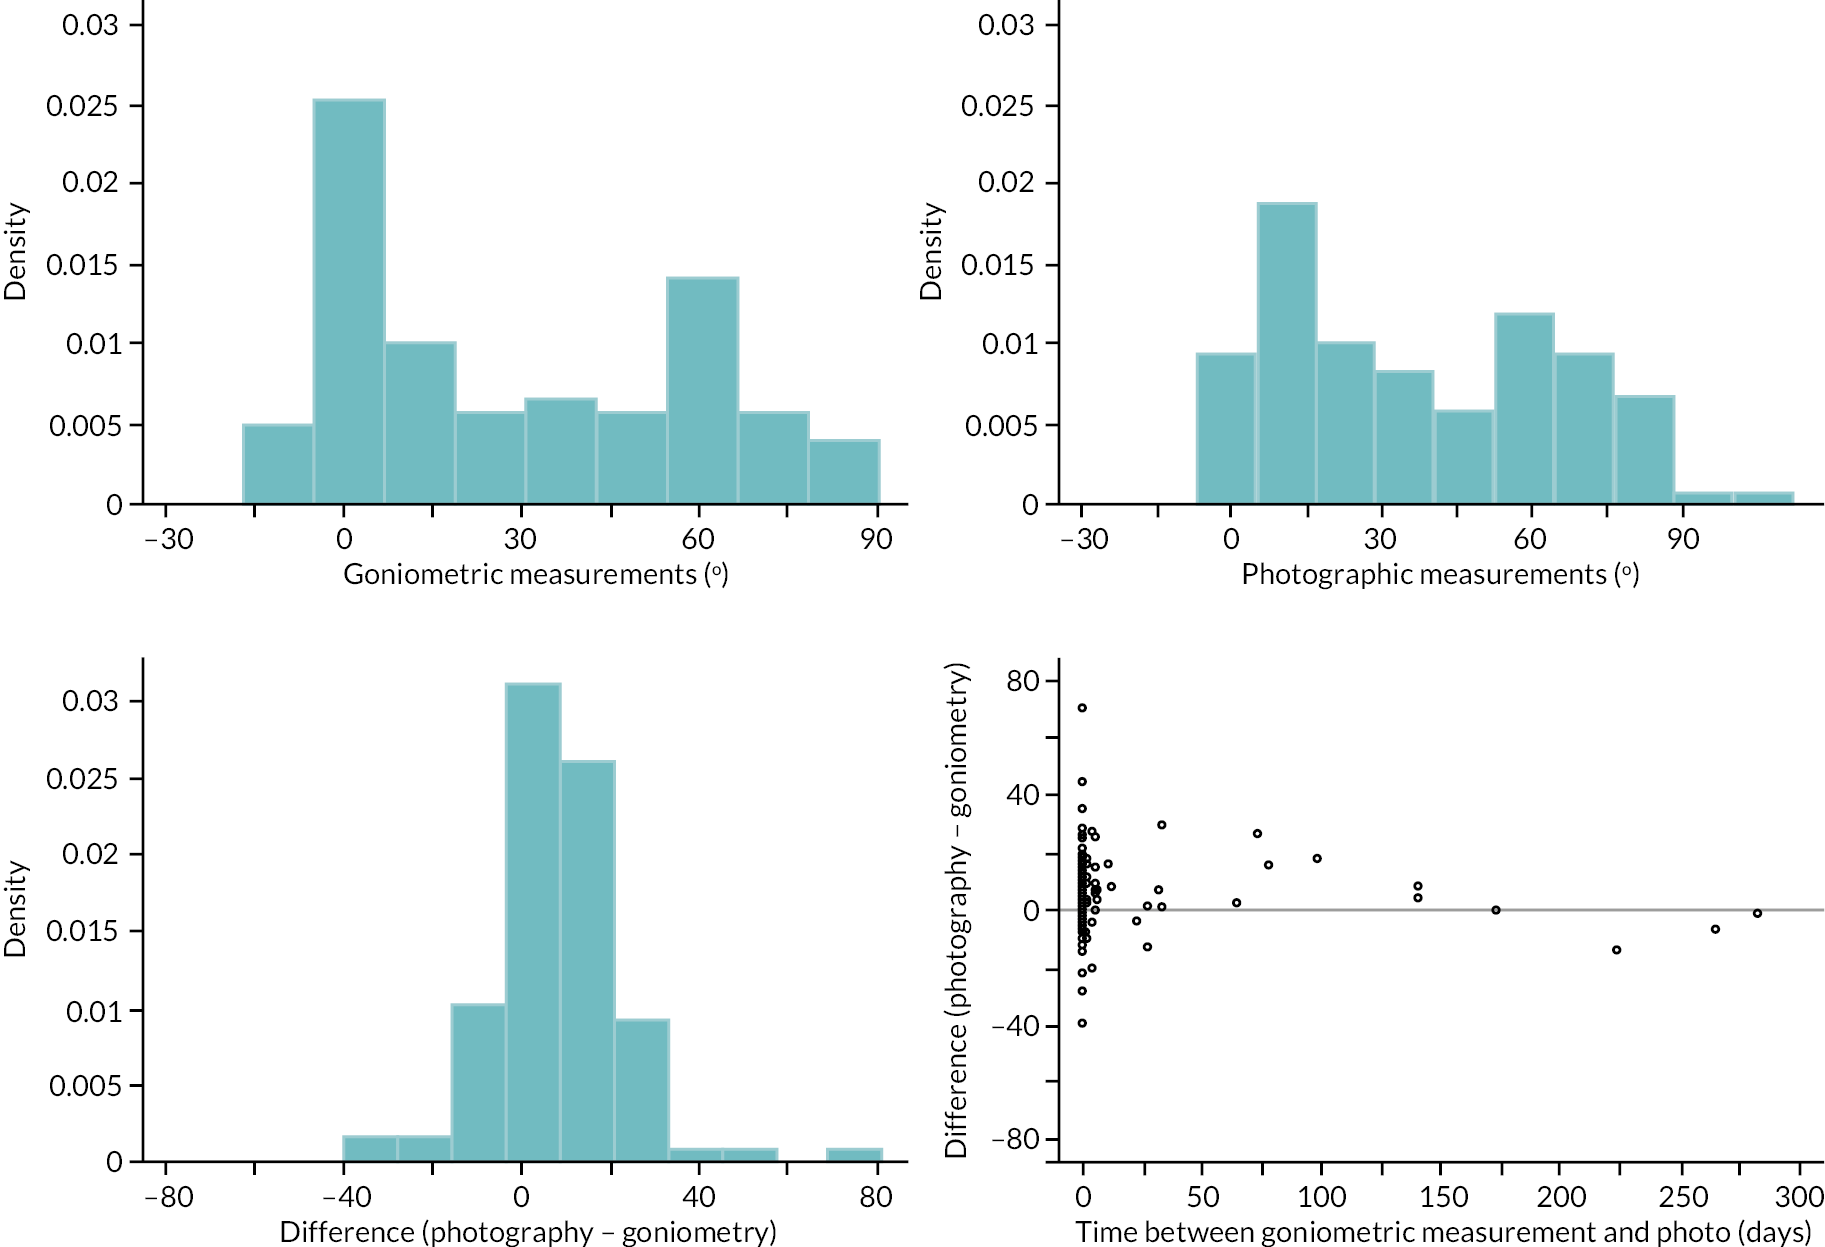
The within-participant differences between goniometric and photographic measurements (of the active extension deficit of the PIP joint of the reference digit) are shown in Appendix 2, Figure 37 In contrast to the analogous plot for the MCP extension measurements, the plot suggests that the average difference (in this case manifested as larger photographic measurements) is stable over the range of measurement, but that agreement is not and is poorer for larger values (i.e. greater disagreement between measurements of more severe contractures) (further details in Report Supplementary Material 16 Item 2).
FIGURE 37.
Proximal interphalangeal extension deficit measurements – difference (photography – goniometry) vs. magnitude (mean of the two measurements), with estimated mean difference and 95% limits of agreement conditional on magnitude overlaid.
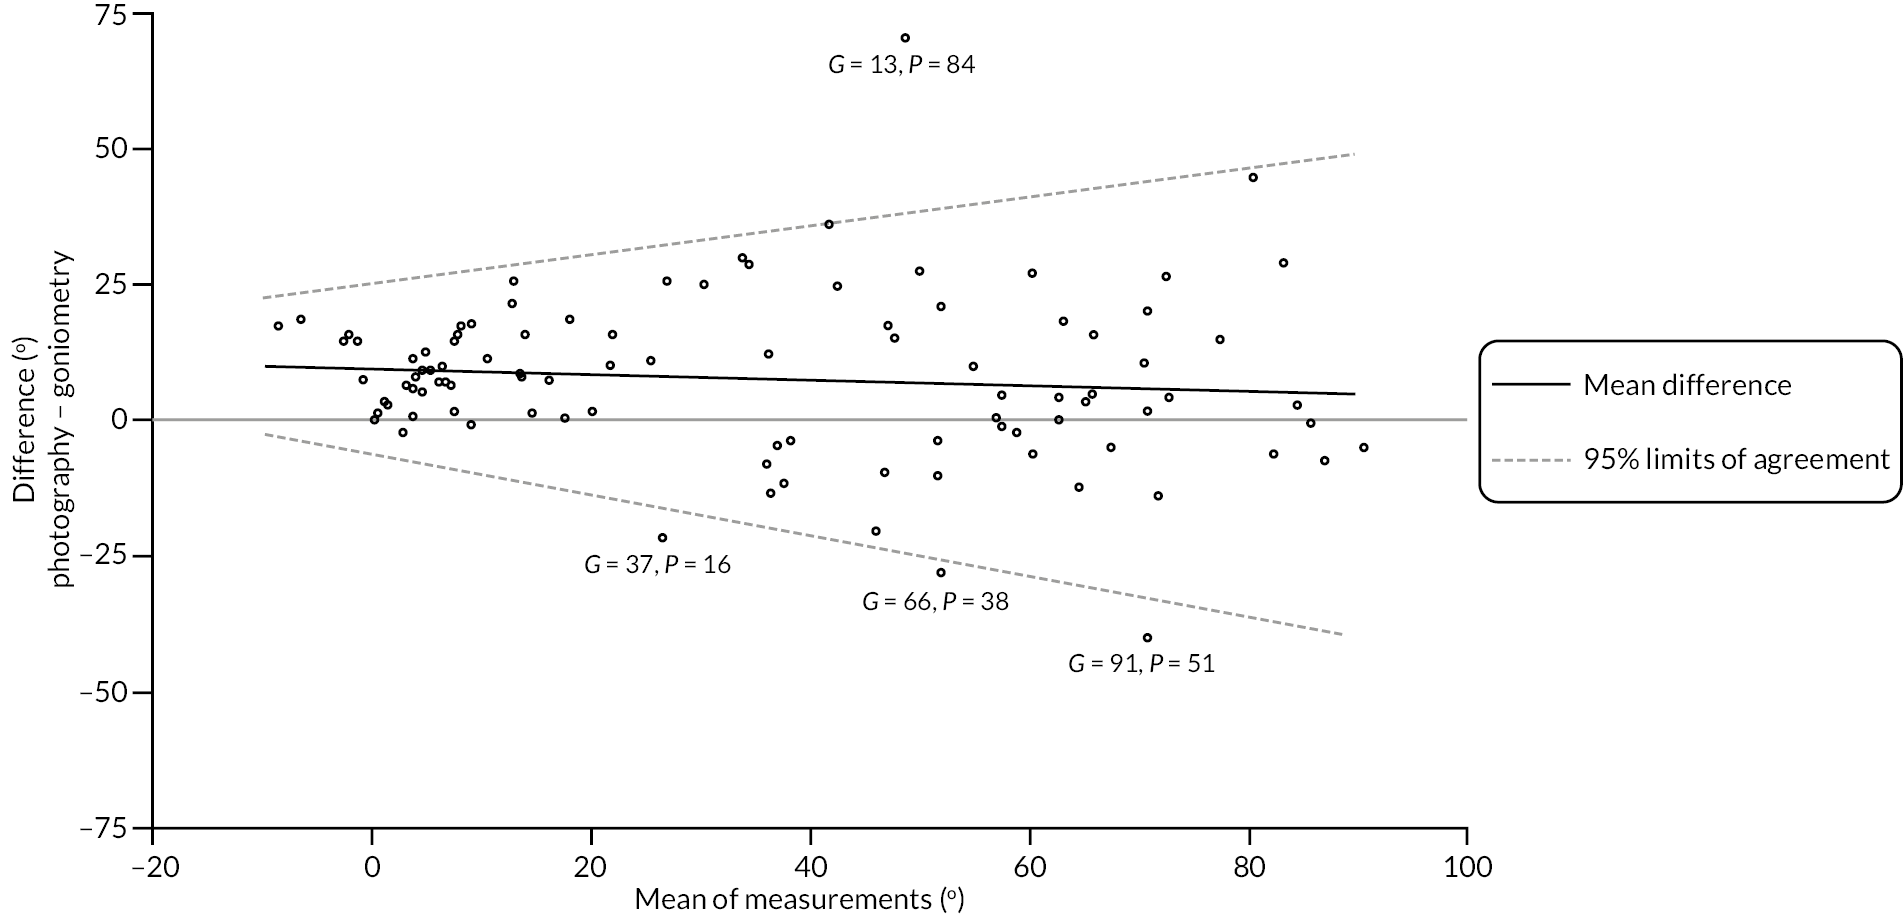
We again used two simple linear regressions to account for this relationship between agreement and magnitude. These show the roughly constant average difference between the two methods of measurement, but also clearly show the increase in disagreement (as manifested by variation around the estimated mean difference) associated with increases in magnitude of extension deficit. For example, the estimated 95% limits of agreement for active PIP extension measurements in the range (−10 to 0) degrees are roughly ± 12 degrees to ± 15 degrees (once the systematic difference of approximately 10 degrees between the two methods is accounted for). Disagreement of this magnitude may be sufficiently small to use the two methods of measurement interchangeable for some purposes. However, when it comes to measuring more severe contractures, the agreement is considerably poorer, to the extent that the two methods could not be used interchangeably. For example, the estimated 95% limits of agreement for a contracture of 45 degrees is about ± 30 degrees.
Neither of the plots (see Appendix 2, Figure 38) stratified by reference digit and photograph measurability reveal any strong relationships between these factors and the extent of agreement between the two methods.
FIGURE 38.
Proximal interphalangeal extension deficit measurements – difference (photography – goniometry) vs. magnitude (mean of the two measurements), with estimated mean difference and 95% limits of agreement conditional on magnitude overlaid. Left panel, points are stratified by reference digit type. Right panel, points are stratified by the measurability of the available participant completed photograph.
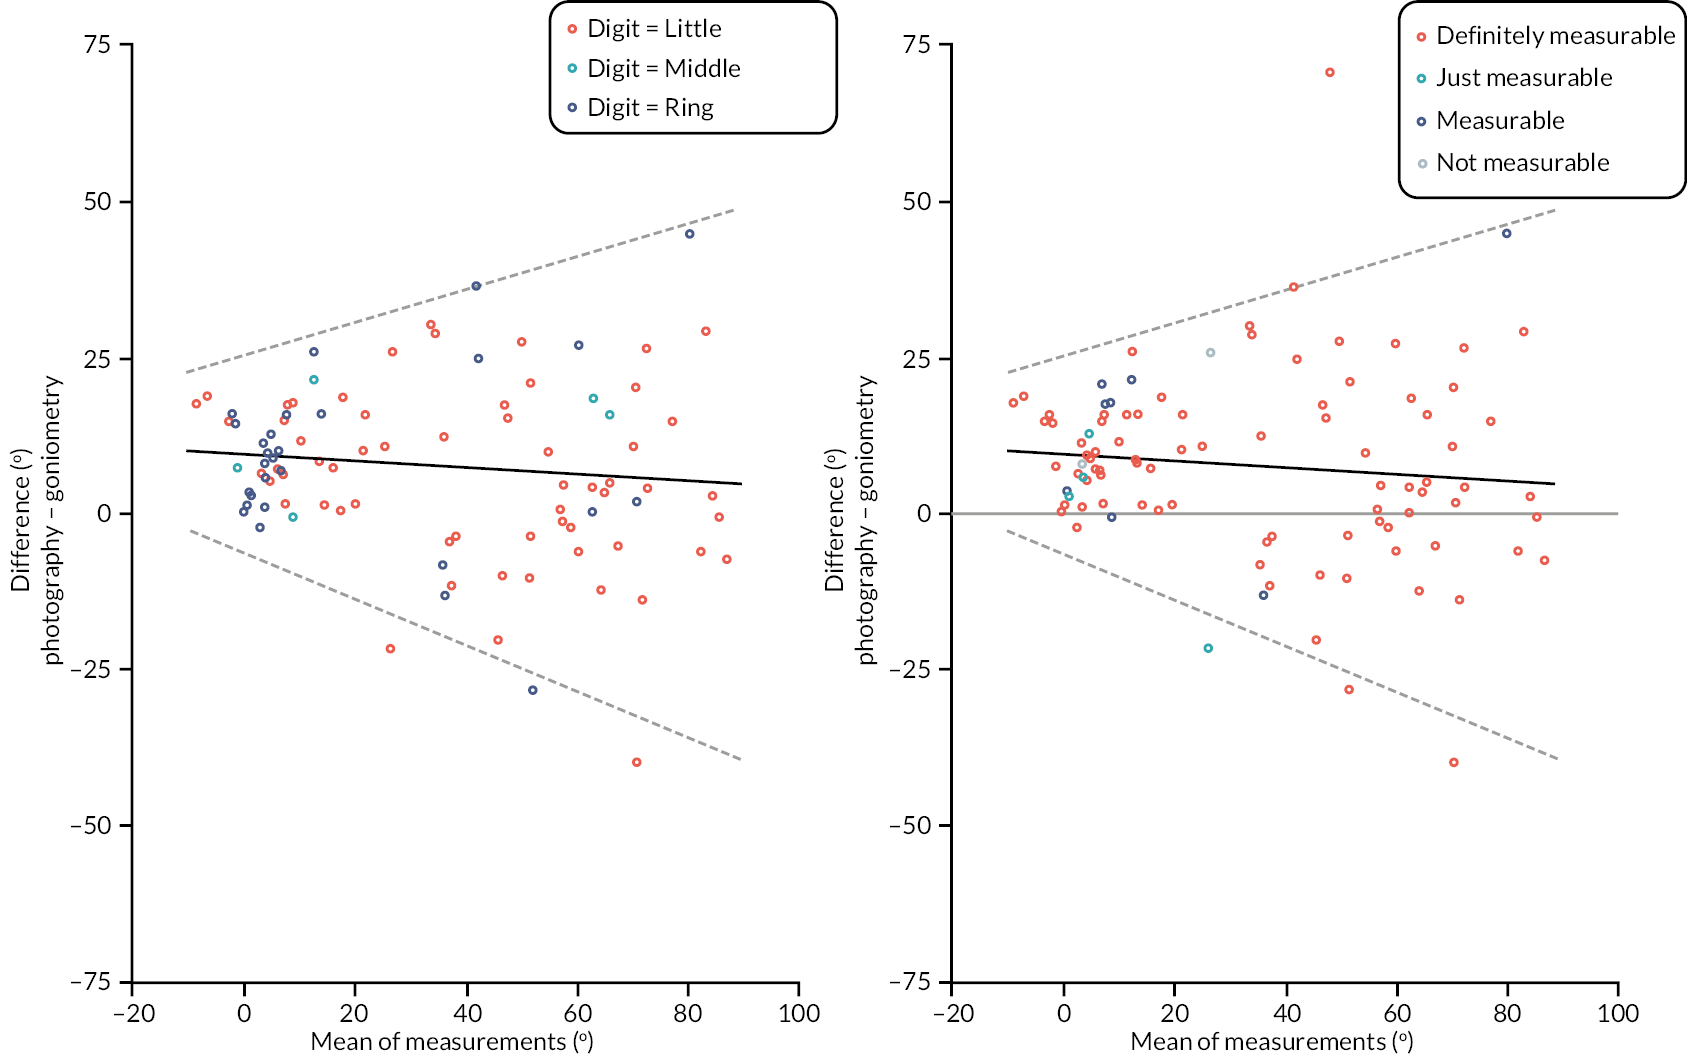
Active extension deficit: distal interphalangeal joint
Of the 100 substudy participants, 97 (97%) had available goniometric measurements of the active extension of the DIP joint (of the reference digit), and 97 (97%) had available photographic measurements.
Brief summaries of the available cases for each type of measurement, and the within- participant differences (photography – goniometry) between measurements are given in Appendix 2, Table 51 and panels 1, 2 and 3 of Appendix 2, Figure 39. Both sets of measurements had a similar range (approximately −15 degrees to 60 degrees) and similar SD. The DIP measurements obtained via photography were about 5 degrees larger on average than those obtained via goniometry. The extent to which differences in measurements were associated with the time elapsed between the goniometric measurements and photographs used to obtain photographic measurements is illustrated in panel 4 of Appendix 2, Figure 39. As above, there is limited evidence that agreement was strongly associated to time elapsed between measurements.
| Active extension deficit DIP (°) – goniometry | |
| N | 97 |
| Mean (SD) | −1.1 (14.1) |
| Median (Q1, Q3) | −1.3 (−10.0, 0.0) |
| Minimum, maximum | −21.7, 62.0 |
| Active extension deficit DIP (°) – photography | |
| N | 97 |
| Mean (SD) | 4.3 (12.9) |
| Median (Q1, Q3) | 3.0 (0.0, 8.0) |
| Minimum, maximum | −21.0, 47.5 |
| Active extension deficit DIP – photograph measurable, n (%) | |
| Definitely | 84 (86.6) |
| Yes | 7 (7.2) |
| Just | 4 (4.1) |
| No | 2 (2.1) |
| Active extension deficit DIP – difference (photography – goniometry) (°) | |
| N | 94 |
| Mean (SD) | 5.0 (9.5) |
| Median (Q1, Q3) | 5.1 (0.5, 11.0) |
| Minimum, maximum | −24.0, 32.0 |
| Active extension deficit DIP – time between goniometric measurement and photograph (days) | |
| N | 94 |
| Mean (SD) | 19.5 (53.6) |
| Median (Q1, Q3) | 1.0 (0.0, 6.0) |
| Minimum, maximum | 0.0, 283.0 |
FIGURE 39.
Graphical summaries of the baseline active extension deficit measurements of the DIP joint. Panel 1, distribution of the goniometric measurements; panel 2, distribution of the photographic measurements; panel 3, distribution of the within participant differences in measurements; and panel 4, differences against time elapsed between measurements.
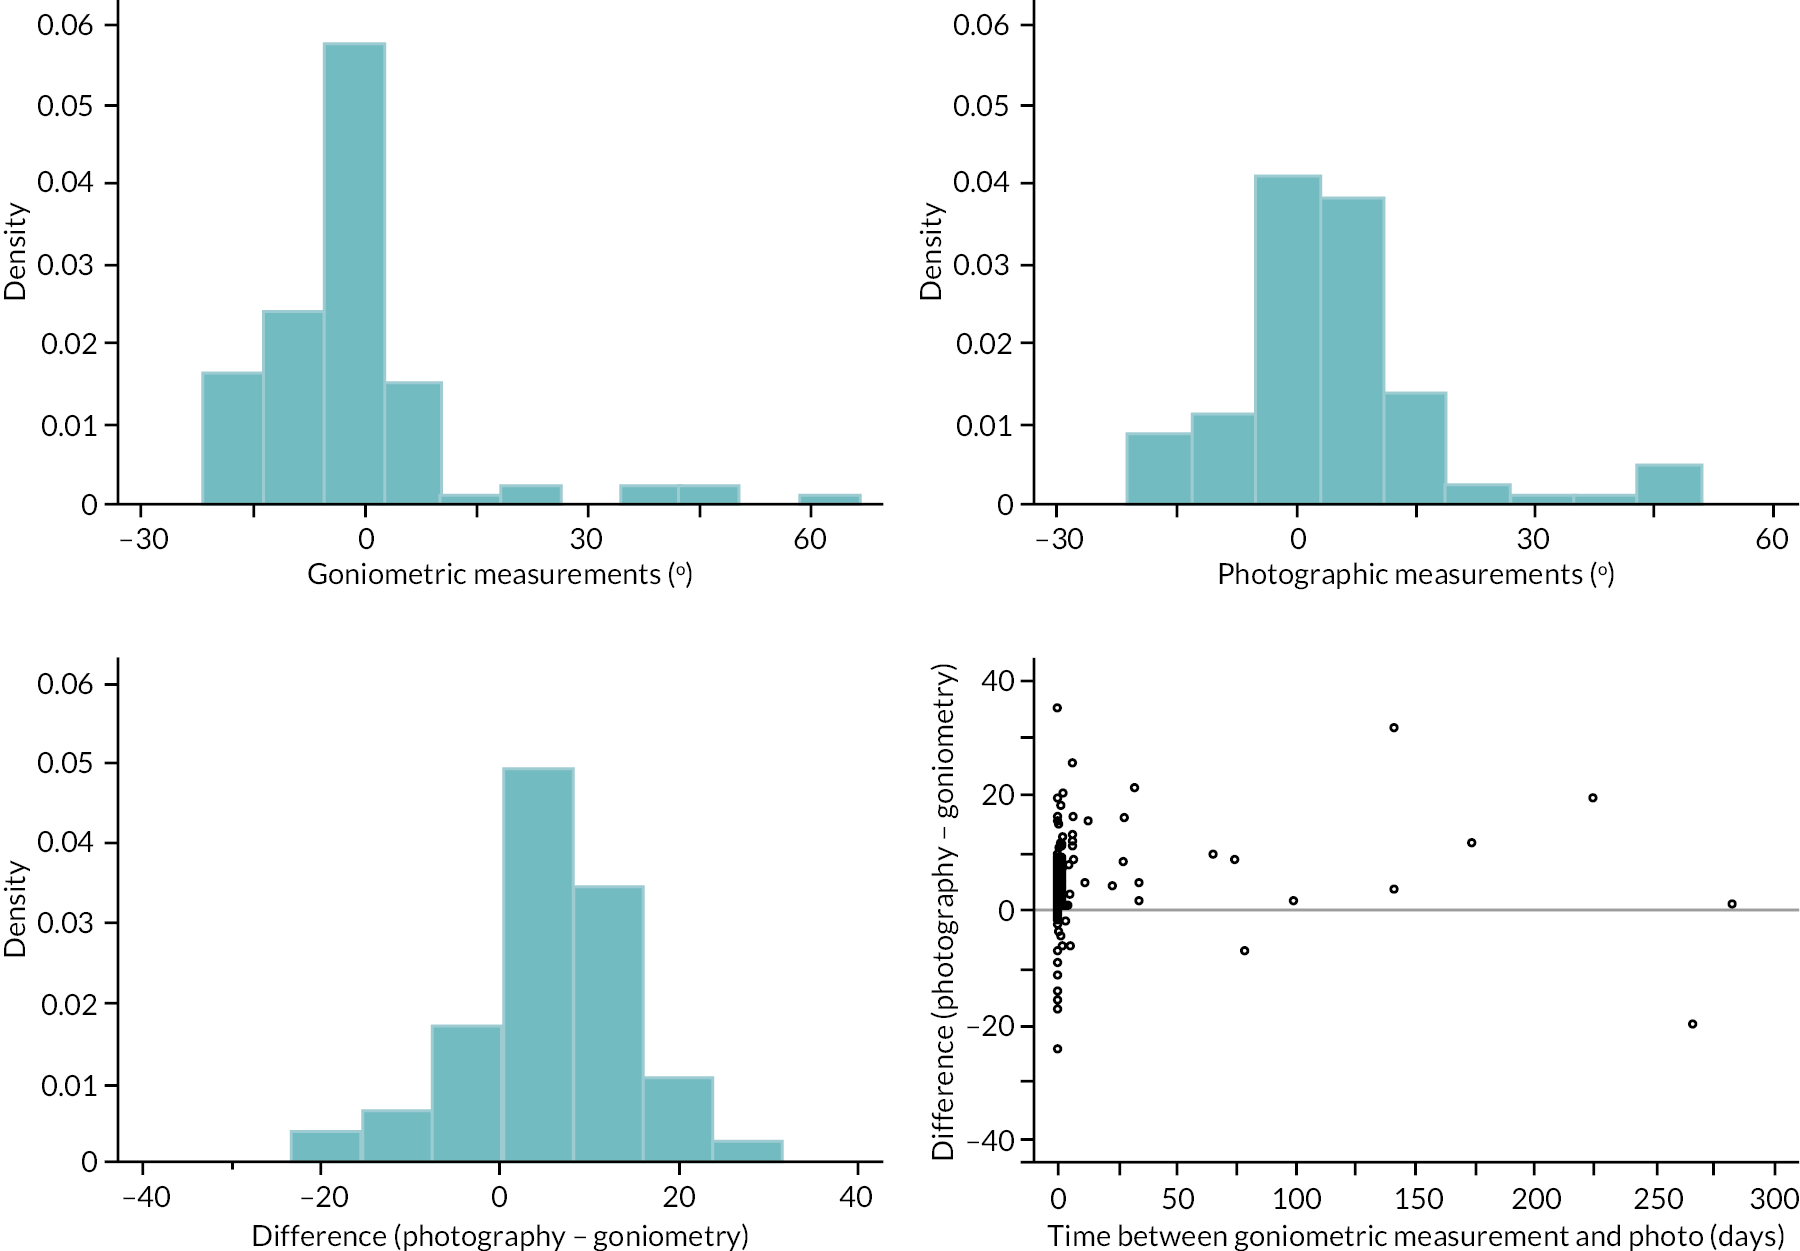
Within-participant differences between goniometric and photographic measurements, plotted against the mean of the two measurements (see Appendix 2, Figure 40). Similarly, to the plot for the PIP measurements (see Appendix 2, Figure 37), this plot suggests that the average difference (in this case manifested as larger photographic measurements) is stable over the range of measurements. However, in contrast with the PIP measurements, the plot in Appendix 2, Figure 40 does not suggest any variation in agreement over this range (although the sparsity of data on the far right of the plot does limit the power to reliably detect the presence of said variation). Given the apparent lack of association between the expected difference between measurements and their magnitude, and the apparent lack of association between the variation of the differences and their magnitude, we calculated 95% limits of agreement marginally with respect to magnitude (i.e. neither the estimated mean difference, nor the estimated 95% limits of agreement vary over the range of observed measurements). The estimated mean difference and 95% limits of agreement for the DIP active extension deficit measurements are:
These 95% limits of agreement are plotted in Appendix 2, Figure 40. These suggest that once the average difference between goniometry and photography is accounted for (i.e. 5 degrees are subtracted from photographic measurements, or added to the goniometric measurements), approximately 95% of the differences between measurement methods would be expected to be within ± 18 degrees of each other.
FIGURE 40.
Distal interphalangeal extension deficit measurements – difference (photography – goniometry) vs. magnitude (mean of the two measurements), with estimated mean difference and 95% limits of agreement overlaid.
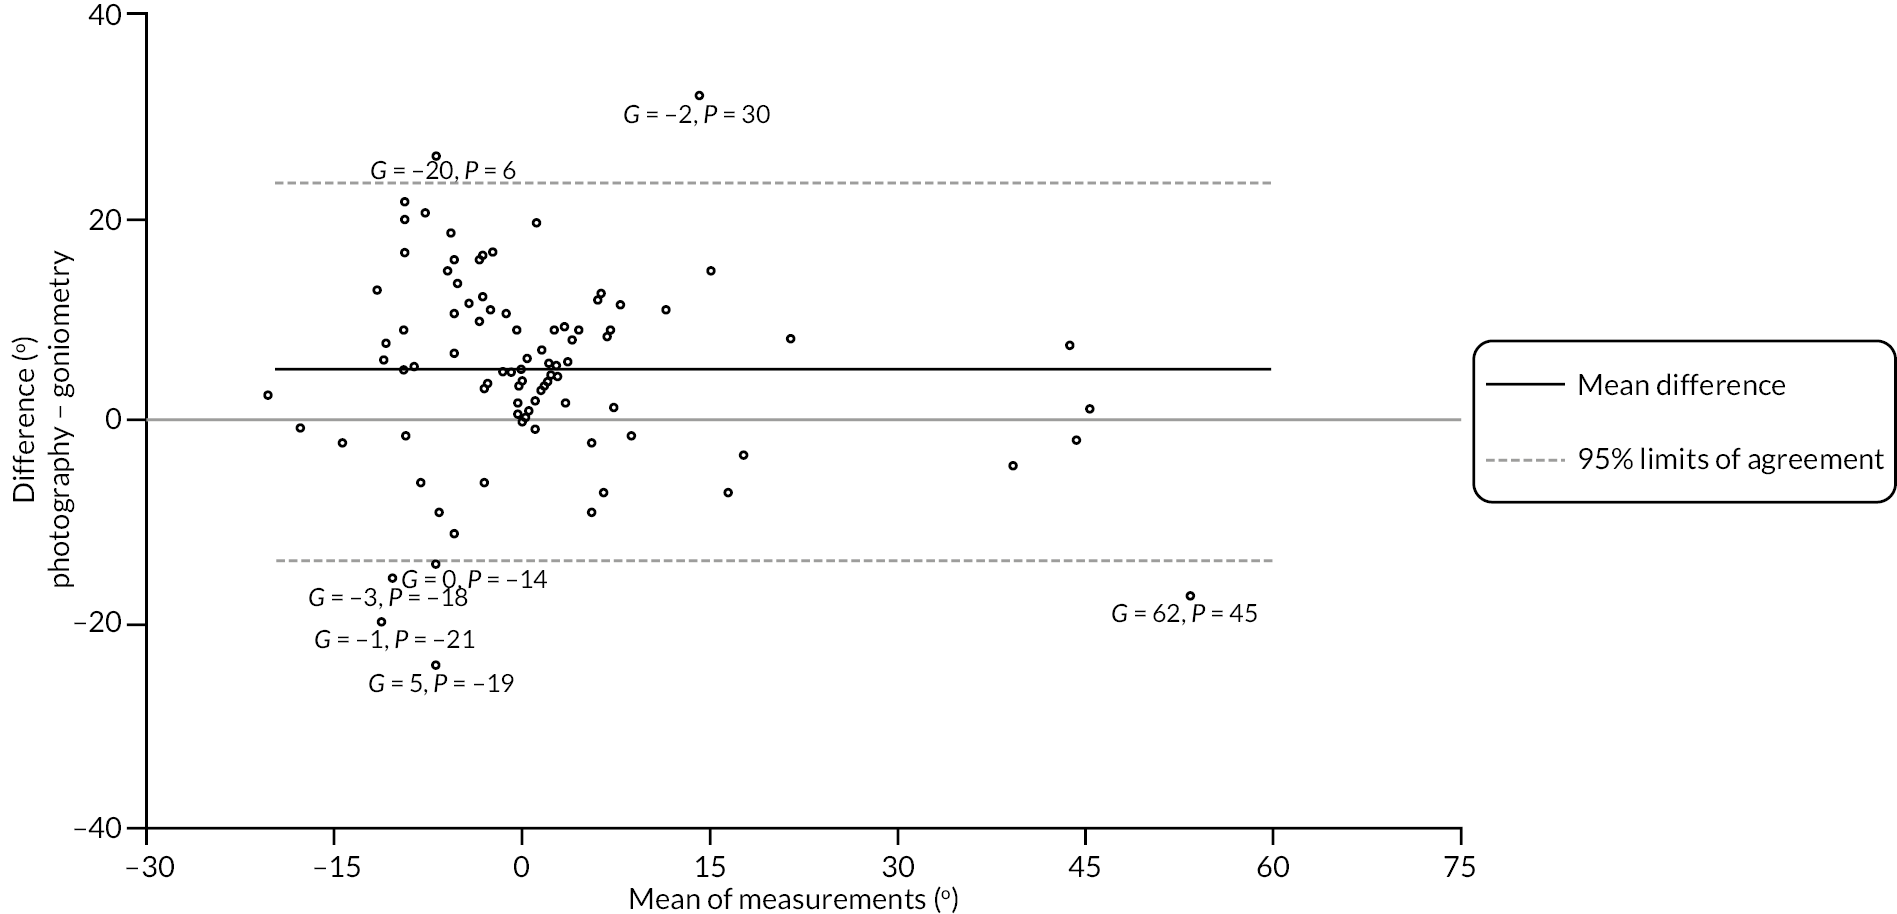
Neither of the plots (see Appendix 2, Figure 41) stratified by reference digit and photograph measurability reveal any strong relationships between these factors and the extent of agreement between the two methods.
FIGURE 41.
Distal interphalangeal extension deficit measurements – difference (photography – goniometry) vs. magnitude (mean of the two measurements), with estimated mean difference and 95% limits of agreement conditional on magnitude overlaid. Left panel, points are stratified by reference digit type. Right panel, points are stratified by the measurability of the available participant completed photograph.
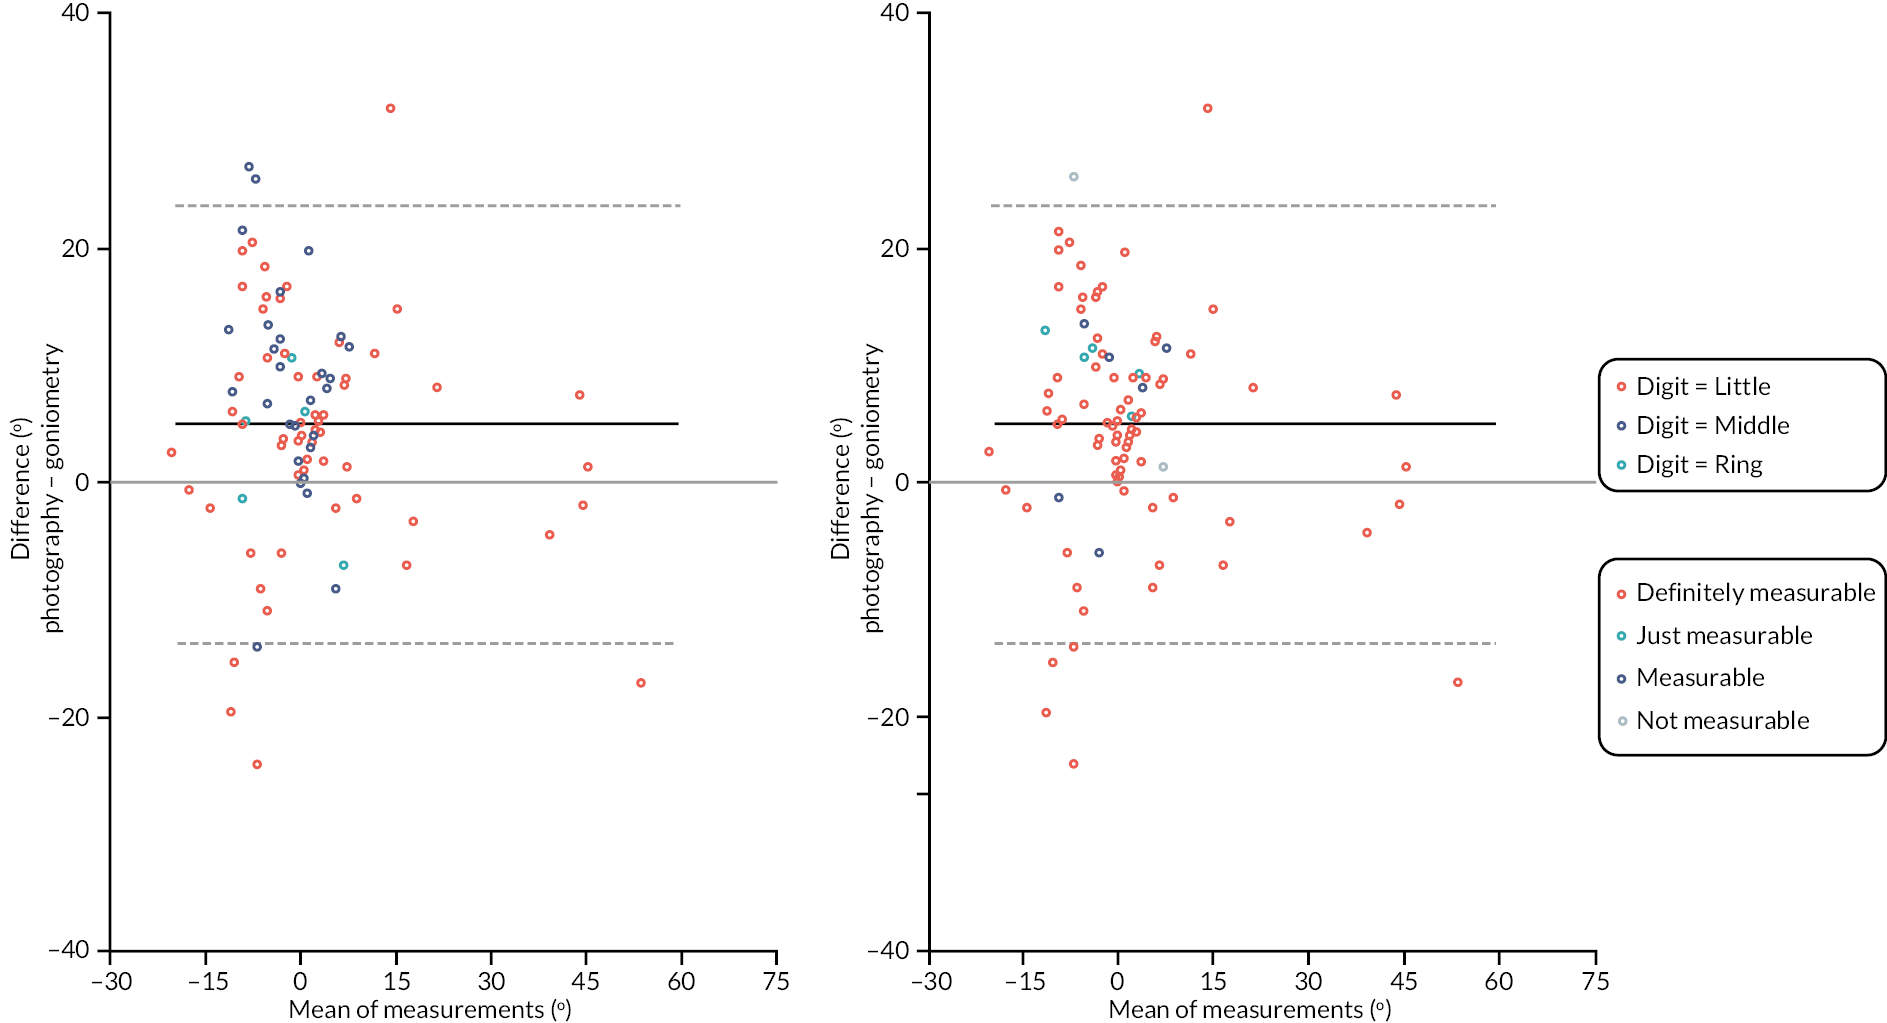
Flexion: metacarpophalangeal joint
Of the 100 substudy participants, 97 (97%) had available goniometric measurements of flexion of the MCP joint of the reference digit, and 90 (90%) had available photographic measurements (of flexion of the MCP joint).
Brief summaries of the available cases for each type of measurement, and the within participant differences (photography – goniometry) between measurements are given in Appendix 2, Table 52 and panels 1, 2, and 3 of Appendix 2, Figure 42. The photographic measurements have a greater range, and overall scale (as measured by their SD), although the interquartile ranges are quite similar across the two methods of measurement. Despite the apparent differences in scale, the two sets of measurements were quite similar in terms of their central tendencies, with the majority of the within participant differences being close to zero. That said, there are some quite extreme negative differences (i.e. goniometric measurements considerably larger than the photographic measurements), suggesting quite severe disagreement between methods for a small minority (three participants had differences with absolute value > 50 degrees). On review of these, they are all cases where there was some uncertainty about the MCP joint measurements due to this joint not being fully clenched for the purposes of the photograph, which would likely explain these large differences. The extent to which differences in measurements were associated with the time elapsed between the goniometric measurements and photographs used to obtain photographic measurements is illustrated in panel 4 of Figure 42. Again, this plot does not suggest any particularly strong relationship between the difference between methods, or the variability of these differences, and the time gap between them.
| Active flexion deficit MCP (°) – goniometry | |
| N | 97 |
| Mean (SD) | 83.5 (8.7) |
| Median (Q1, Q3) | 84.0 (77.3, 90.0) |
| Minimum, maximum | 56.7, 100.3 |
| Active flexion deficit MCP (°) – photography | |
| N | 90 |
| Mean (SD) | 82.7 (19.6) |
| Median (Q1, Q3) | 83.0 (74.0, 92.0) |
| Minimum, maximum | 12.5, 128.0 |
| Active flexion deficit MCP – photograph measurable, n (%) | |
| Definitely | 60 (66.7) |
| Yes | 22 (24.4) |
| Just | 8 (8.9) |
| Active flexion deficit MCP – difference (photography – goniometry) (°) | |
| N | 87 |
| Mean (SD) | −0.8 (19.3) |
| Median (Q1, Q3) | 1.7 (−9.3, 11.0) |
| Minimum, maximum | −70.2, 45.0 |
| Active flexion deficit MCP – time between goniometric measurement and photograph (days) | |
| N | 87 |
| Mean (SD) | 14.4 (37.7) |
| Median (Q1, Q3) | 1.0 (0.0, 6.0) |
| Minimum, maximum | 0.0, 224.0 |
FIGURE 42.
Graphical summaries of the baseline flexion measurements of the MCP joint. Panel 1, distribution of the goniometric measurements; panel 2, distribution of the photographic measurements; panel 3, distribution of the within participant differences; and panel 4, differences against time elapsed between measurements.
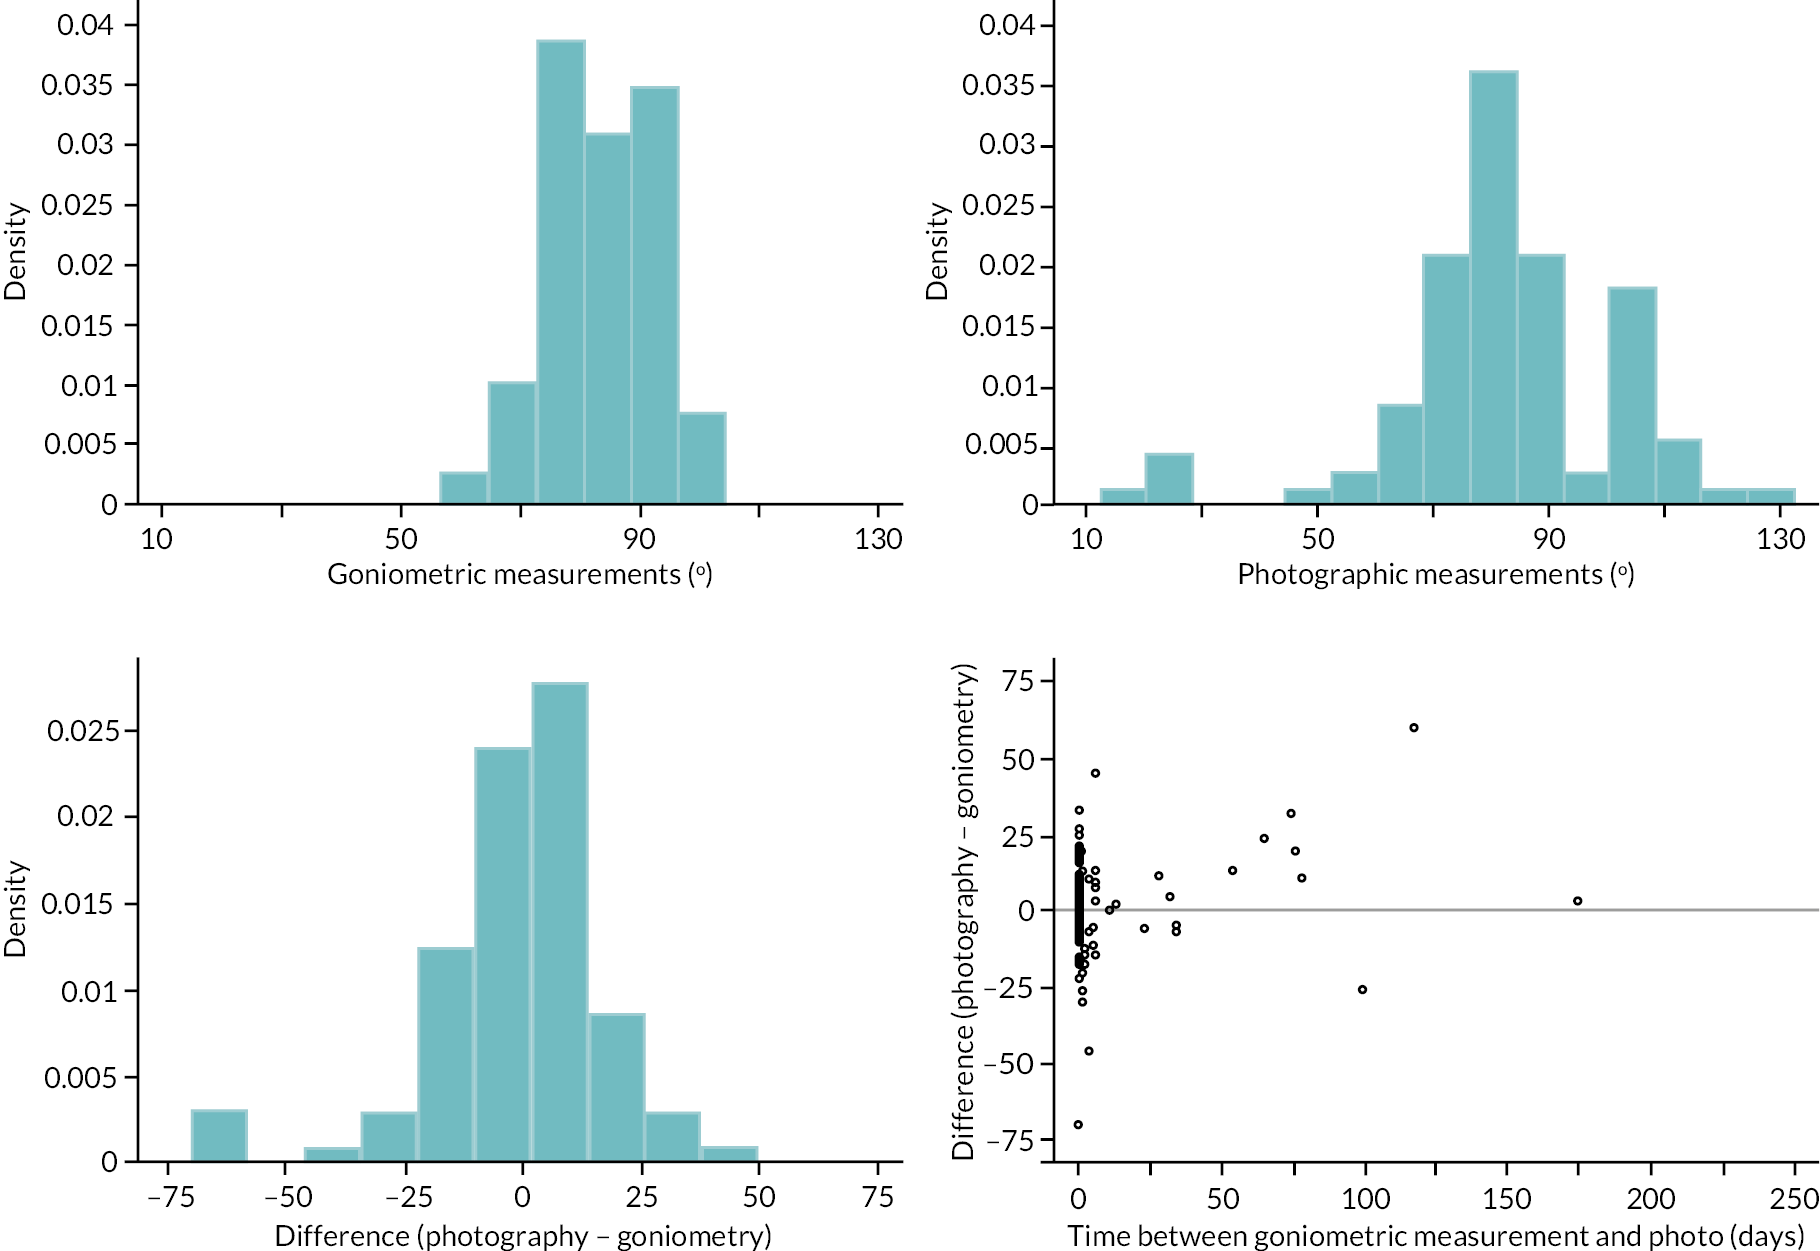
The within-participant differences between MCP flexion measurements made by each method are plotted against the mean of the two measurements in Appendix 2, Figure 43. This suggests a positive and potentially non-linear association between expected difference and magnitude and suggests agreement (as manifested by the variance of the differences) may have been slightly better for more flexed joints (i.e. those about 90 degrees). We used two linear regressions to account for these apparent relationships between difference and magnitude, and agreement and magnitude (further details in Report Supplementary Material 16 Item 3).
FIGURE 43.
Metacarpophalangeal flexion measurements – difference (photography – goniometry) vs. magnitude (mean of the two measurements), with estimated mean difference and 95% limits of agreement conditional on magnitude overlaid.
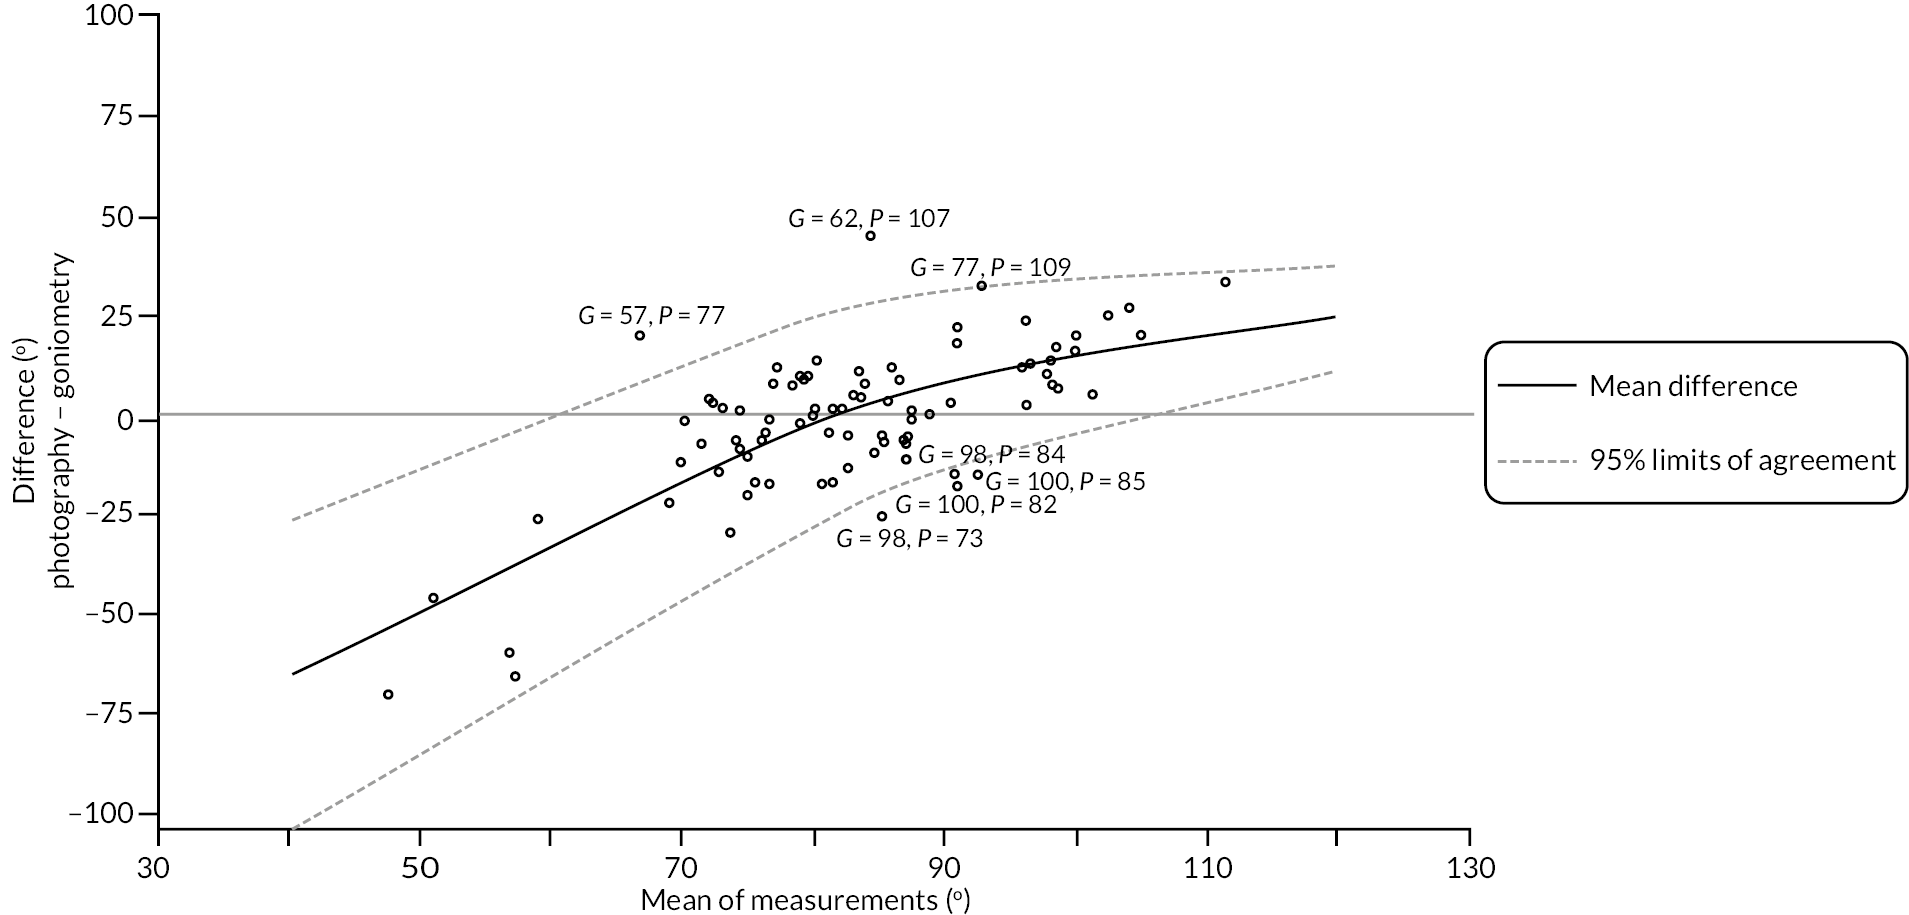
The estimated limits of agreement in Appendix 2, Figure 43 show both a strong relationship between expected difference and magnitude, as well as evidence of a reasonably strong relationship between agreement and magnitude even once the expected difference between methods is accounted for. For example, the estimated 95% limits of agreement for MCP flexion measurements of approximately 50 degrees are roughly ± 36 degrees (once the expected difference between the two methods is accounted for). Disagreement of this magnitude is likely to cast considerable doubt on the interchangeability of the two methods for MCP flexion in this range. The estimated 95% limits of agreement are smaller for flexion measurements of 90 degrees and beyond. For example, at 100 degrees, the estimated 95% limits of agreement are roughly ± 20 degrees. Such disagreement may be within an acceptable range with regard to using the measurement methods interchangeably, since this margin of error for flexion measurements of this magnitude is unlikely to materially alter clinical decision-making regarding the need for treatment. A further consideration that potentially limits interchangeable use of these two methods of measurement is that the limits of agreement above are based on a data-driven and relatively complex estimated relationship between the expected difference (between the two methods of measurement) and their magnitude. Hence the ‘correction factor’ required to make measurements from the two methods comparable on average is (a) difficult to calculate and apply in practice, and (b) may not perform particularly well out of sample due to potential overfitting. Even if a reasonable correction factor can be applied, agreement between the methods is still poor across a substantial range of flexion measurements. Hence overall there is little evidence to support interchangeable use of the two measurement methods when assessing MCP joint flexion.
Neither of the plots (see Appendix 2, Figure 44) stratified by reference digit and photograph measurability suggests any patterns or variation in agreement across the strata considered.
FIGURE 44.
Metacarpophalangeal flexion measurements – difference (photography – goniometry) vs. magnitude (mean of the two measurements), with estimated mean difference and 95% limits of agreement conditional on magnitude overlaid. Left panel, points are stratified by reference digit type. Right panel, points are stratified by photograph measurability.
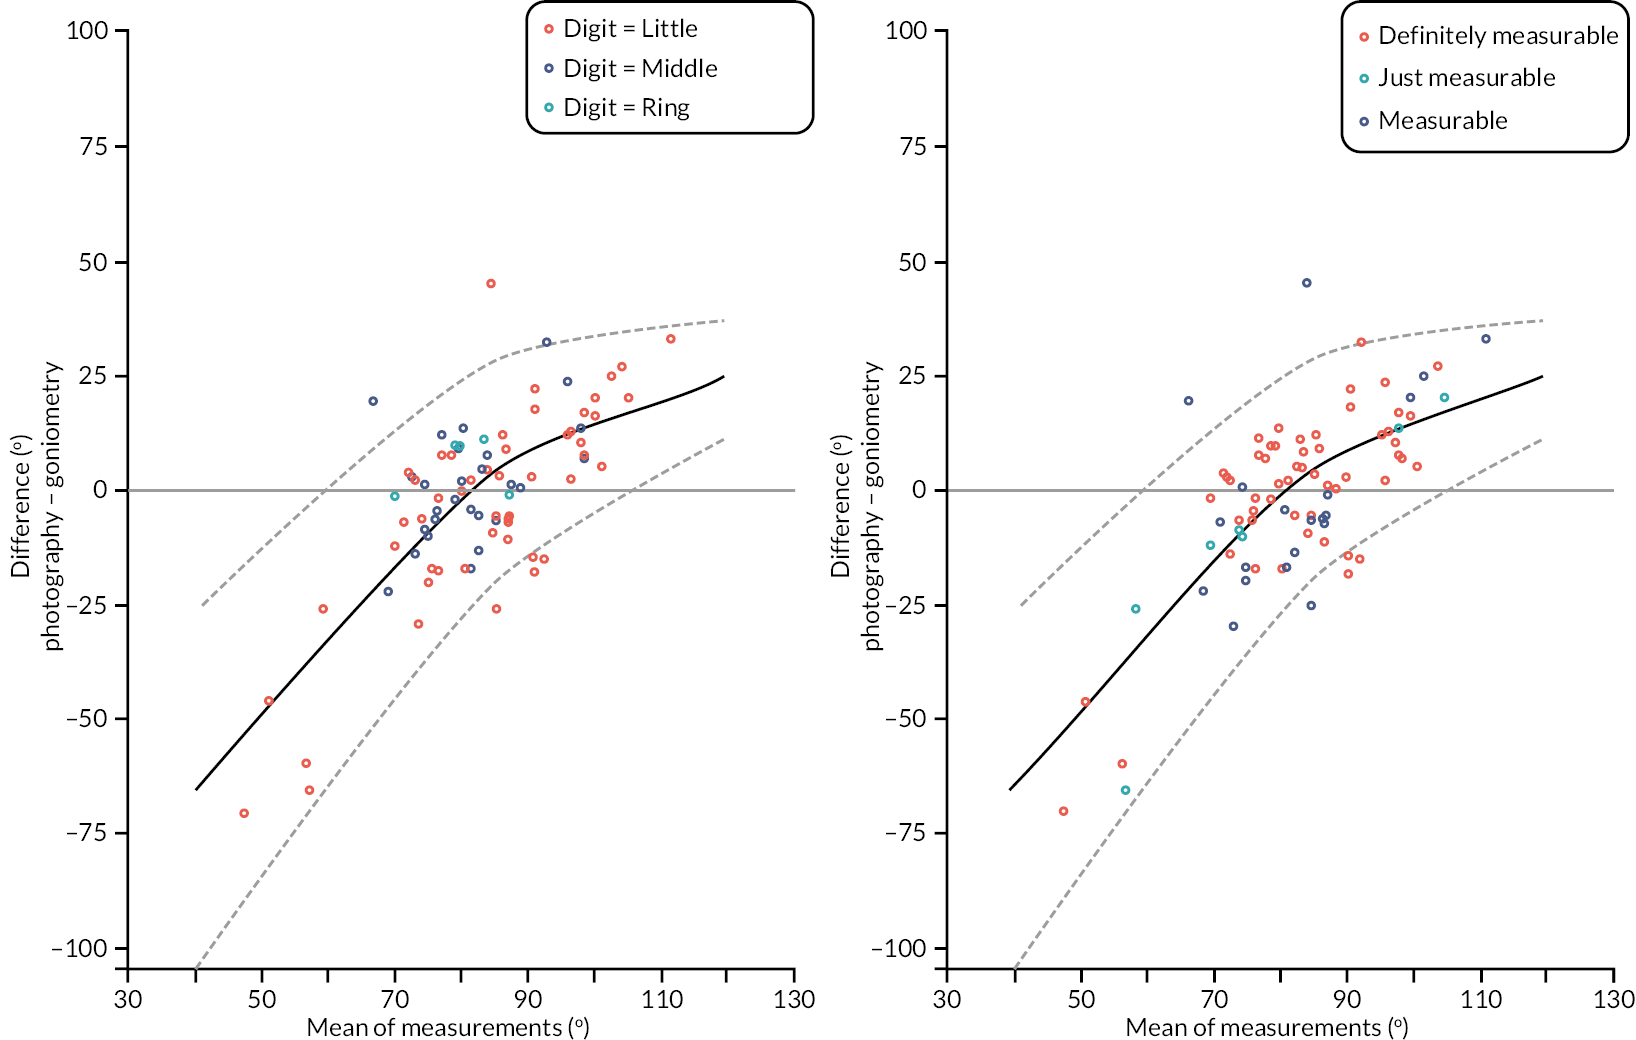
Flexion: proximal interphalangeal joint
Of the 100 substudy participants, 98 (98%) had available goniometric measurements of flexion of the PIP joint of the reference digit, and 90 (90%) had available photographic measurements (of flexion of the PIP joint).
Brief summaries of the available cases for each type of measurement, and the within participant differences (photography – goniometry) between measurements are given in Appendix 2, Table 53 and panels 1, 2 and 3 of Appendix 2, Figure 45. The photographic measurements have a greater range, and overall scale (as measured by the SD). Despite the apparent differences in scale, the two sets of measurements were quite similar in terms of their central tendencies, with the majority of the within participant differences being close to zero (although a handful of cases with considerably larger photographic measurements than goniometric measurements are present). The extent to which differences in measurements are associated with the time elapsed between the goniometric measurements and photographs used to obtain photographic measurements is illustrated in panel 4 of Appendix 2, Figure 45. This plot does not show any clear association between the extent of disagreement and the time elapsed between the two measurements.
| Active flexion deficit PIP (°) – goniometry | |
| N | 98 |
| Mean (SD) | 89.3 (10.3) |
| Median (Q1, Q3) | 90.0 (85.3, 94.7) |
| Minimum, maximum | 43.3, 110.0 |
| Active flexion deficit PIP (°) – photography | |
| N | 90 |
| Mean (SD) | 87.6 (17.2) |
| Median (Q1, Q3) | 86.3 (80.0, 102.5) |
| Minimum, maximum | 28.0, 130.0 |
| Active flexion deficit PIP – photograph measurable, n (%) | |
| Definitely | 60 (66.7) |
| Yes | 22 (24.4) |
| Just | 8 (8.9) |
| Active flexion deficit PIP – difference (photography – goniometry) (°) | |
| N | 88 |
| Mean (SD) | −1.6 (14.5) |
| Median (Q1, Q3) | −3.5 (−9.9, 7.7) |
| Minimum, maximum | −39.3, 49.3 |
| Active flexion deficit PIP – time between goniometric measurement and photograph (days) | |
| N | 88 |
| Mean (SD) | 13.6 (37.3) |
| Median (Q1, Q3) | 1.0 (0.0, 5.0) |
| Minimum, maximum | 0.0, 224.0 |
FIGURE 45.
Graphical summaries of the baseline flexion measurements of the PIP joint. Panel 1, distribution of the goniometric measurements; panel 2, distribution of the photographic measurements; panel 3, distribution of the within-participant differences; and panel 4, differences against time elapsed between measurements.
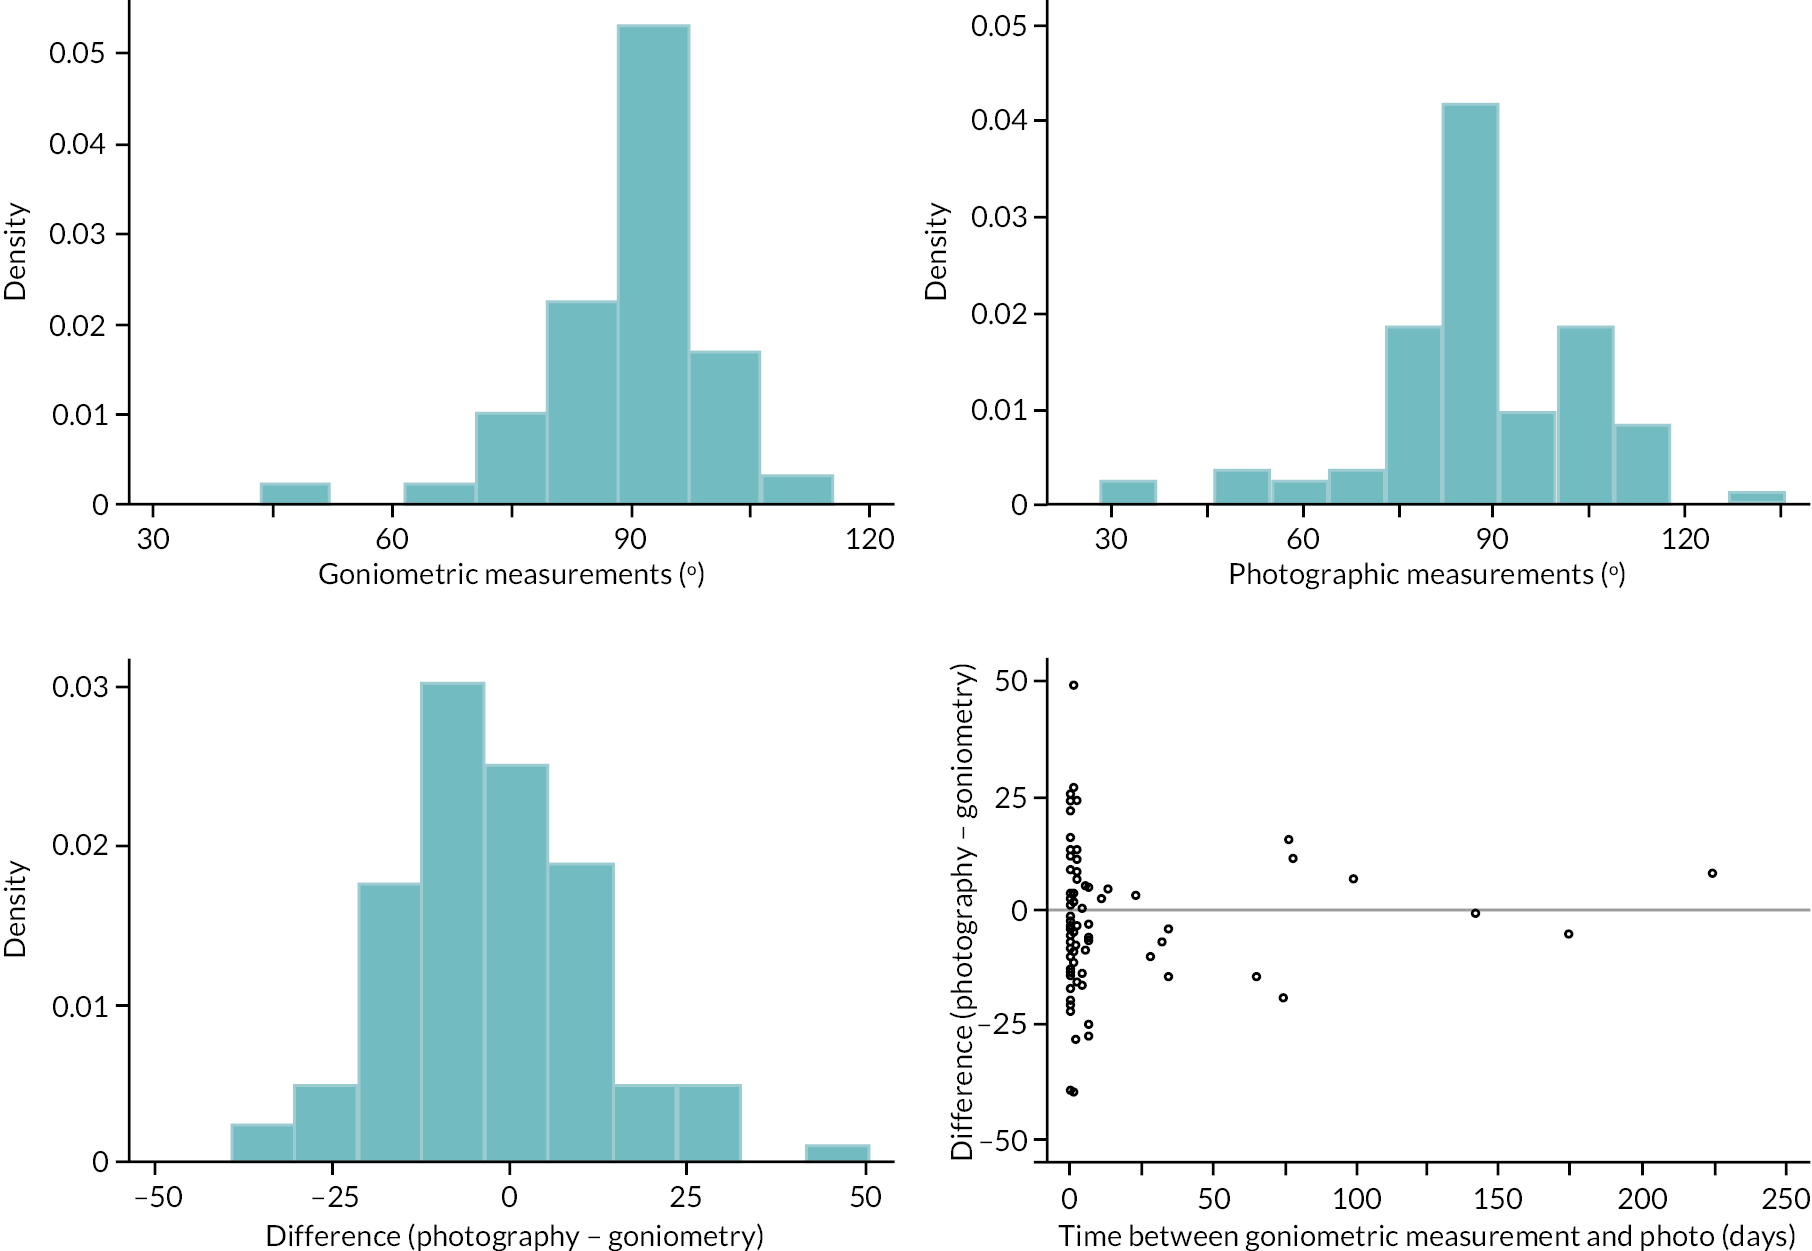
The within-participant differences (between goniometric and photographic measurements) are plotted against the mean of the two measurements in Appendix 2, Figure 46. This suggests a positive and association between difference and magnitude. Evidence of association between agreement and magnitude, once the expected difference as a function of magnitude is accounted for, is less clear. We used two linear regressions to account for potential relationships between expected difference and magnitude and agreement (further details in Report Supplementary Material 16 Item 3).
FIGURE 46.
Proximal interphalangeal flexion measurements – difference (photography – goniometry) vs. magnitude (mean of the two measurements), with estimated mean difference and 95% limits of agreement conditional on magnitude overlaid.
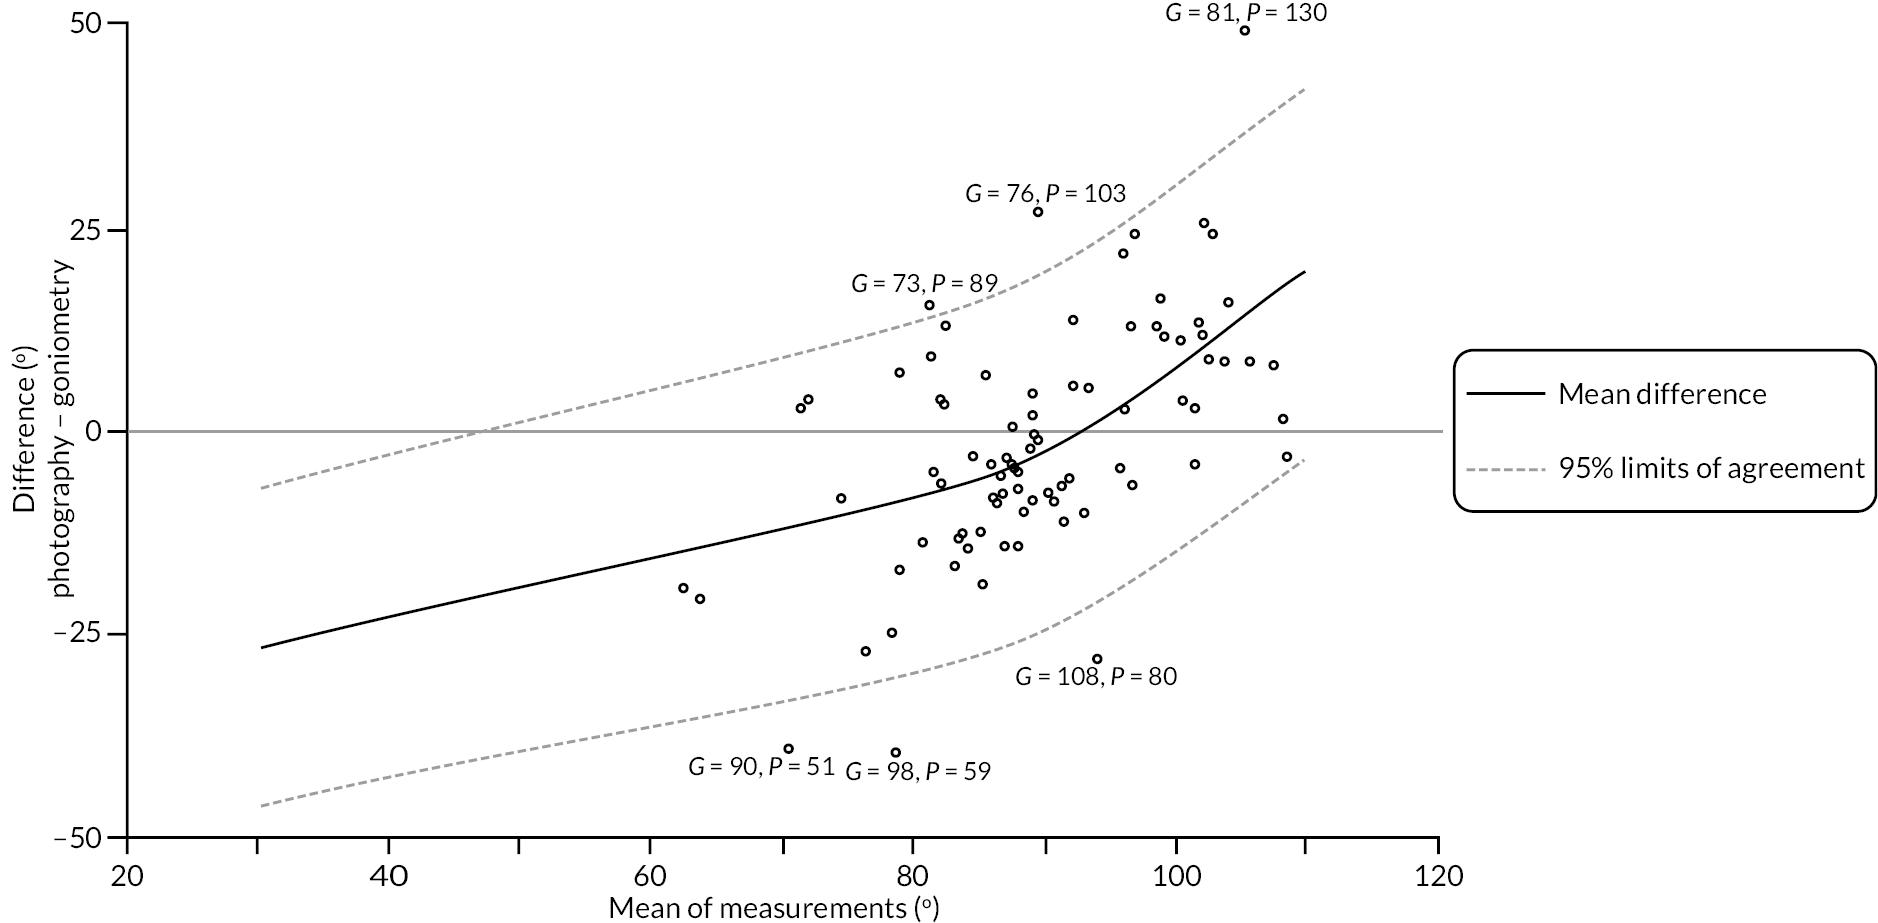
The estimated limits of agreement in Appendix 2, Figure 46 show a strong relationship between expected difference and magnitude, but little evidence of any strong relationship between agreement and magnitude once the expected difference between methods is accounted for. The estimated 95% limits of agreement (conditional on the fitted relationship between expected difference and magnitude) are roughly ± 20 degrees over the whole range of measurement. In the context of quantifying and monitoring DC such disagreement in flexion measurements may be deemed acceptable since change/reduction in flexion is not a particularly important marker of disease severity and would not be used as a basis for recommending treatment/re-treatment. That said, these limits of agreement are based on first removing the reasonably complex fitted relationship between expected difference and magnitude, and therefore inherit similar practical and methodological issues to those discussed in the context of the MCP flexion measurements.
Neither of the plots (see Appendix 2, Figure 47) stratified by reference digit and photograph measurability suggests any patterns or variation in agreement across the strata considered.
FIGURE 47.
Proximal interphalangeal flexion measurements – difference (photography – goniometry) vs. magnitude (mean of the two measurements), with estimated mean difference and 95% limits of agreement conditional on magnitude overlaid. Left panel, points are stratified by reference digit type. Right panel, points are stratified by photograph measurability.
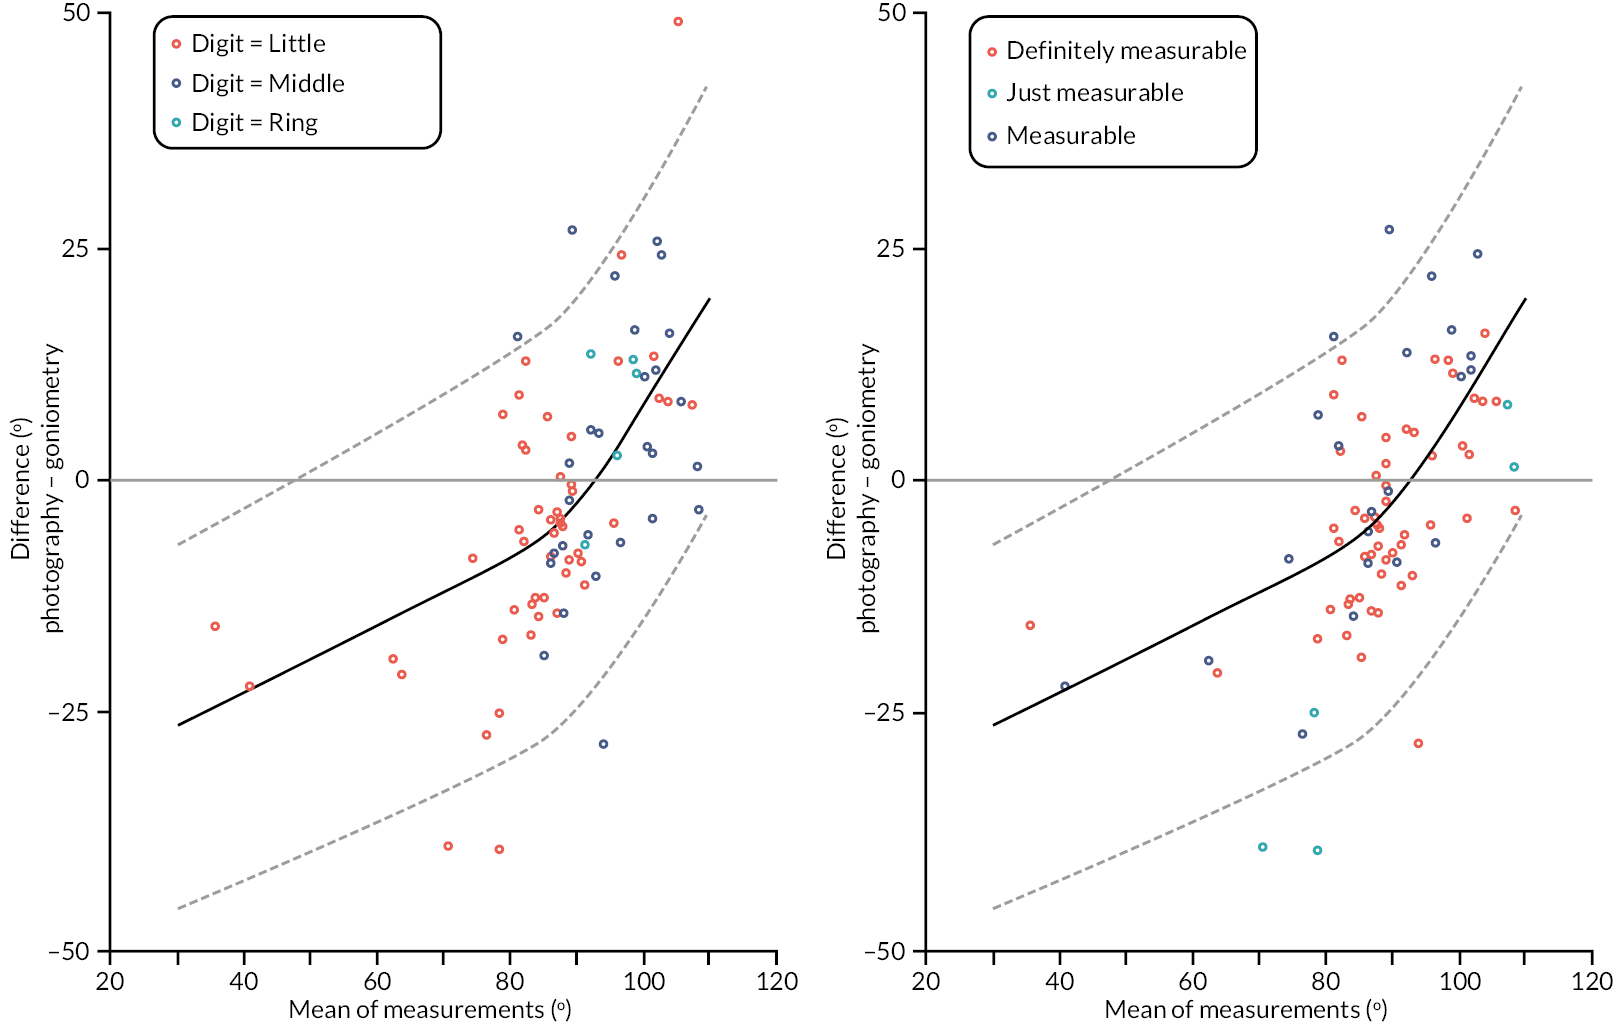
Flexion: distal interphalangeal joint
Of the 100 substudy participants, 95 (95%) had available goniometric measurements of the active extension of the DIP joint of the reference digit, and 90 (90%) had available photographic.
Brief summaries of the available cases for each type of measurement, and the within participant differences (photography – goniometry) between measurements are given in Appendix 2, Table 54 and panels 1, 2 and 3 of Appendix 2, Figure 48. Both sets of measurements had a similar range (approximately 5–90 degrees), although the SD of the photography measurements is slightly higher. On average, the measurements were quite similar for each method of measurement, with the mean and median of the differences being about −2 degrees. The extent to which differences in measurements were associated with the time elapsed between the goniometric measurements and photographs used to obtain photographic measurements is illustrated in panel 4 of Appendix 2, Figure 48. As for previous type of measurement, there is limited evidence that agreement varied according to time elapsed between measurements.
| Active flexion deficit DIP (°) – goniometry | |
| N | 95 |
| Mean (SD) | 59.9 (15.9) |
| Median (Q1, Q3) | 61.3 (50.7, 72.7) |
| Minimum, maximum | 9.3, 87.3 |
| Active flexion deficit DIP (°) – photography | |
| N | 90 |
| Mean (SD) | 57.1 (18.8) |
| Median (Q1, Q3) | 60.3 (44.5, 72.0) |
| Minimum, maximum | 5.0, 88.5 |
| Active flexion deficit DIP – photograph measurable, n (%) | |
| Definitely | 60 (66.7) |
| Yes | 22 (24.4) |
| Just | 8 (8.9) |
| Active flexion deficit DIP – difference (photography – goniometry) (°) | |
| N | 85 |
| Mean (SD) | −2.7 (13.5) |
| Median (Q1, Q3) | −2.0 (−12.3, 7.5) |
| Minimum, maximum | −34.3, 31.5 |
| Active flexion deficit DIP – time between goniometric measurement and photograph (days) | |
| N | 85 |
| Mean (SD) | 14.0 (37.8) |
| Median (Q1, Q3) | 1.0 (0.0, 5.0) |
| Minimum, maximum | 0.0, 224.0 |
FIGURE 48.
Graphical summaries of the baseline flexion measurements of the DIP joint. Panel 1, distribution of the goniometric measurements; panel 2, distribution of the photographic measurements; panel 3, distribution of the within participant differences; and panel 4, differences against time elapsed between measurements.
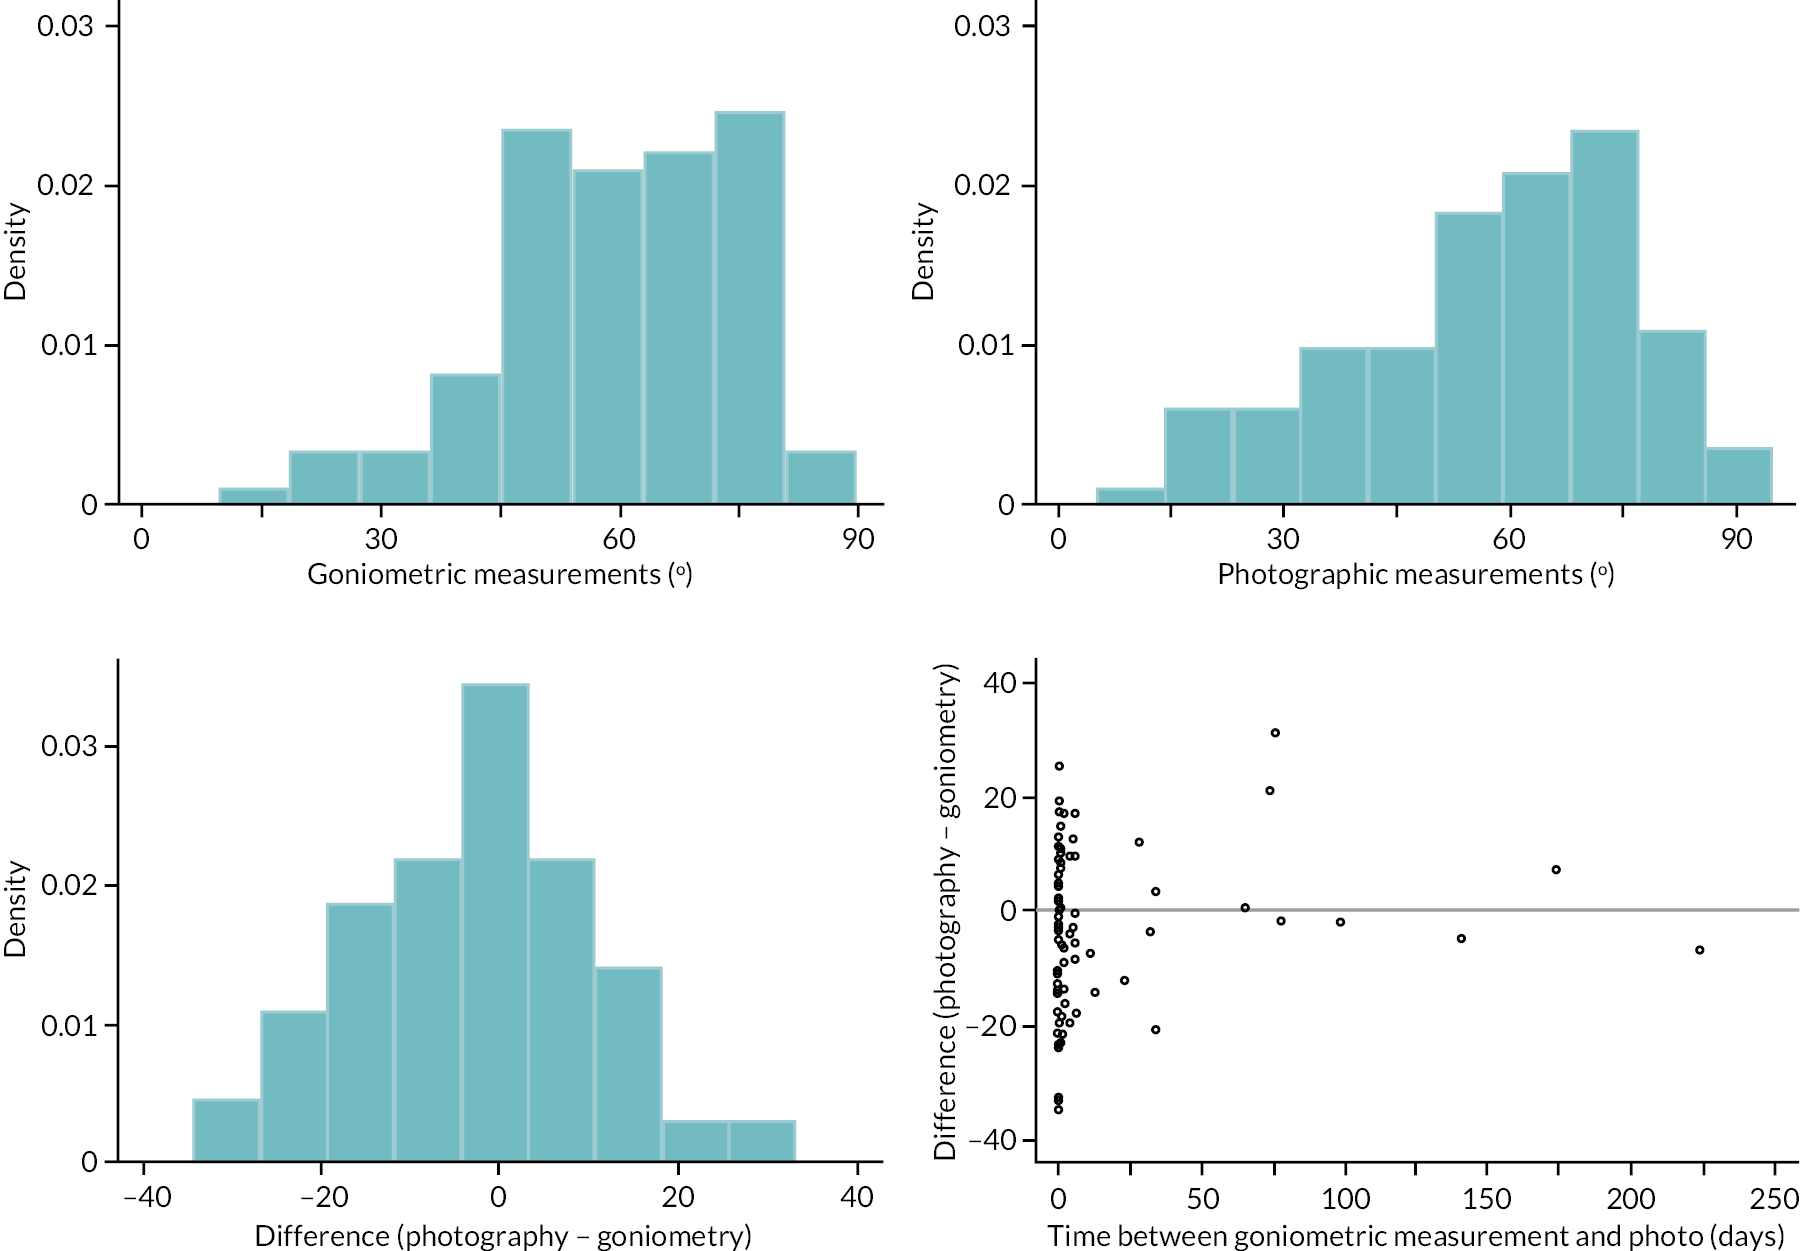
The within-participant differences between goniometric and photographic measurements (of the active extension deficit of the PIP joint of the reference digit) are plotted against the mean of the two measurements in Appendix 2, Figure 49. This plot suggests a weak positive relationship between the expected difference between measurements and magnitude, and some evidence that the variation around this expected difference decreased with increasingly larger magnitudes of flexion. We again used two simple linear regressions to account for this relationship between agreement and magnitude (further details are provided in Report Supplementary Material 16 Item 4).
FIGURE 49.
Distal interphalangeal flexion measurements – difference (photography – goniometry) vs. magnitude (mean of the two measurements), with estimated mean difference and 95% limits of agreement conditional on magnitude overlaid.
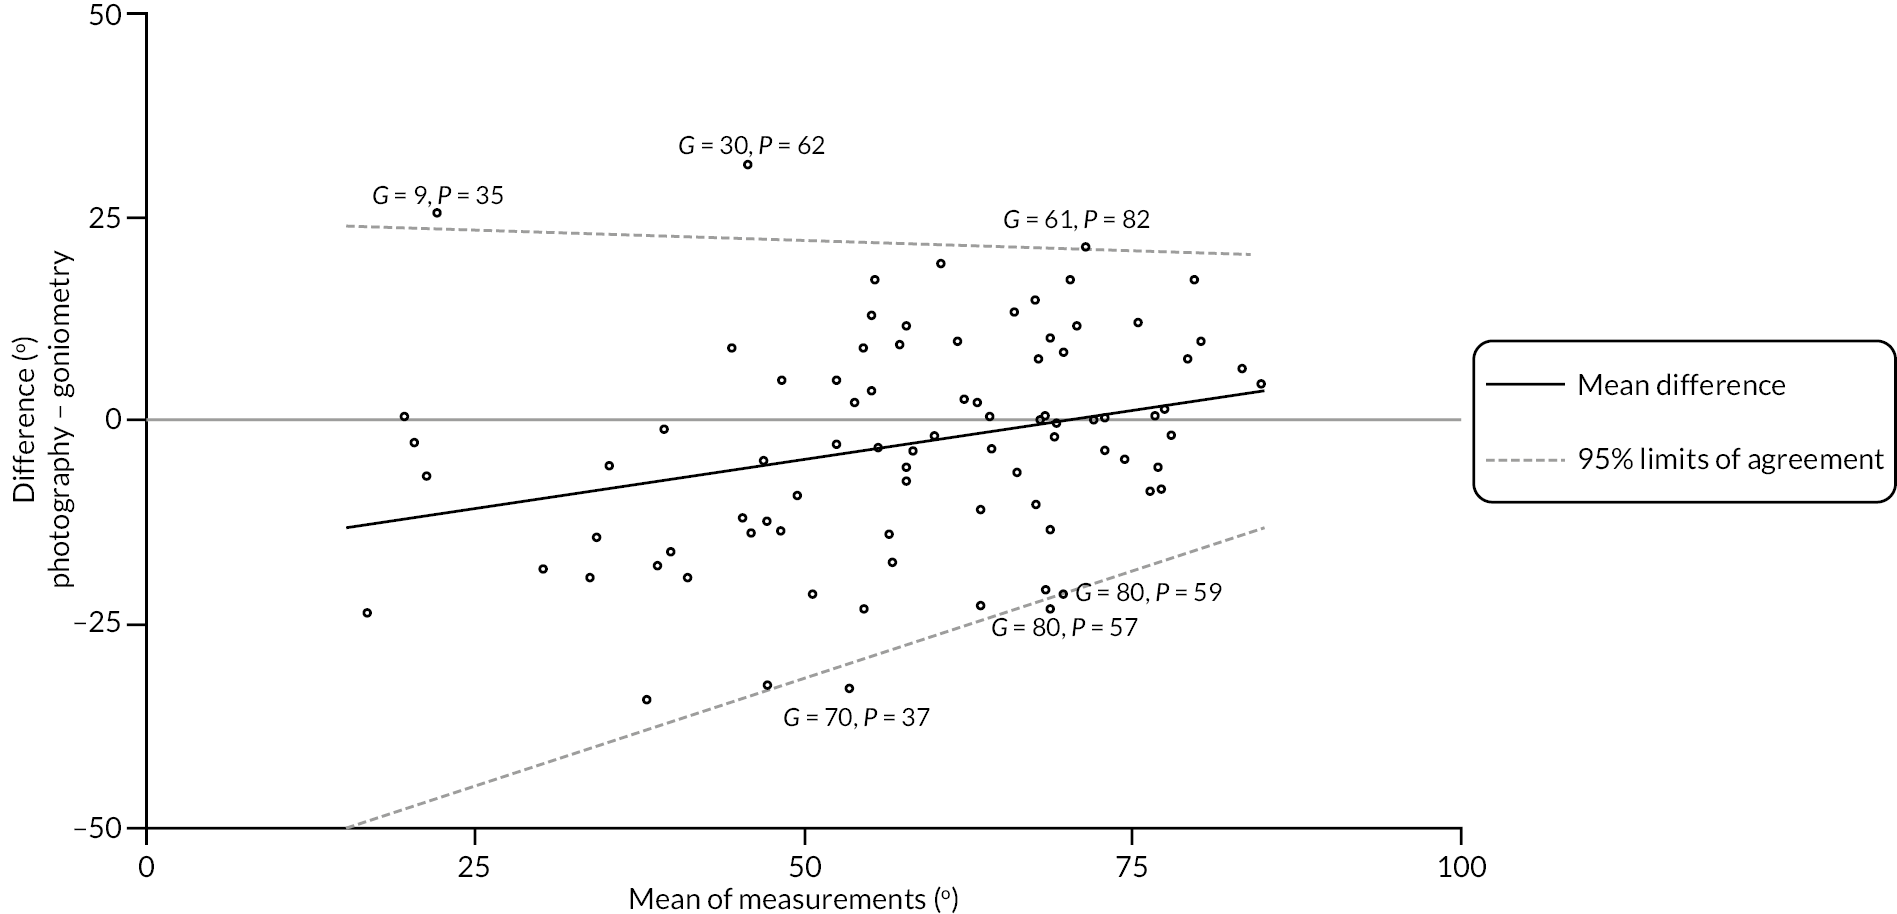
The estimated limits of agreement in Appendix 2, Figure 49 show the apparent positive relationship between expected difference and estimated magnitude. For flexion measurements of relatively small, estimated magnitude (e.g. 25–60 degrees), we see that within each pair of measurements, the goniometry measurements were generally larger than the photography measurements (although there are a few clear exceptions to this). However, for flexion measurements of larger estimated magnitude (e.g. > 60 degrees), we see that within each pair the goniometric measurements are the same as or very slightly smaller than those obtained via photography. The estimated 95% limits of agreement suggest agreement between the two methods was better for measurements of larger magnitude, being about ± 33 degrees at estimated magnitudes about 30 degrees, but about ± 24 degrees at magnitudes about 60 degrees. However, even among measurements of larger magnitude (and accounting for the expected difference), these limits of suggest poor agreement between the two methods.
Neither of the plots (see Appendix 2, Figure 50) stratified by reference digit and photograph measurability reveals any strong relationships between these factors and the extent of agreement between the two methods.
FIGURE 50.
Distal interphalangeal flexion measurements – difference (photography – goniometry) vs. magnitude (mean of the two measurements), with estimated mean difference and 95% limits of agreement conditional on magnitude overlaid. Left panel, points are stratified by reference digit type. Right panel, points are stratified by measurability of the submitted photo.
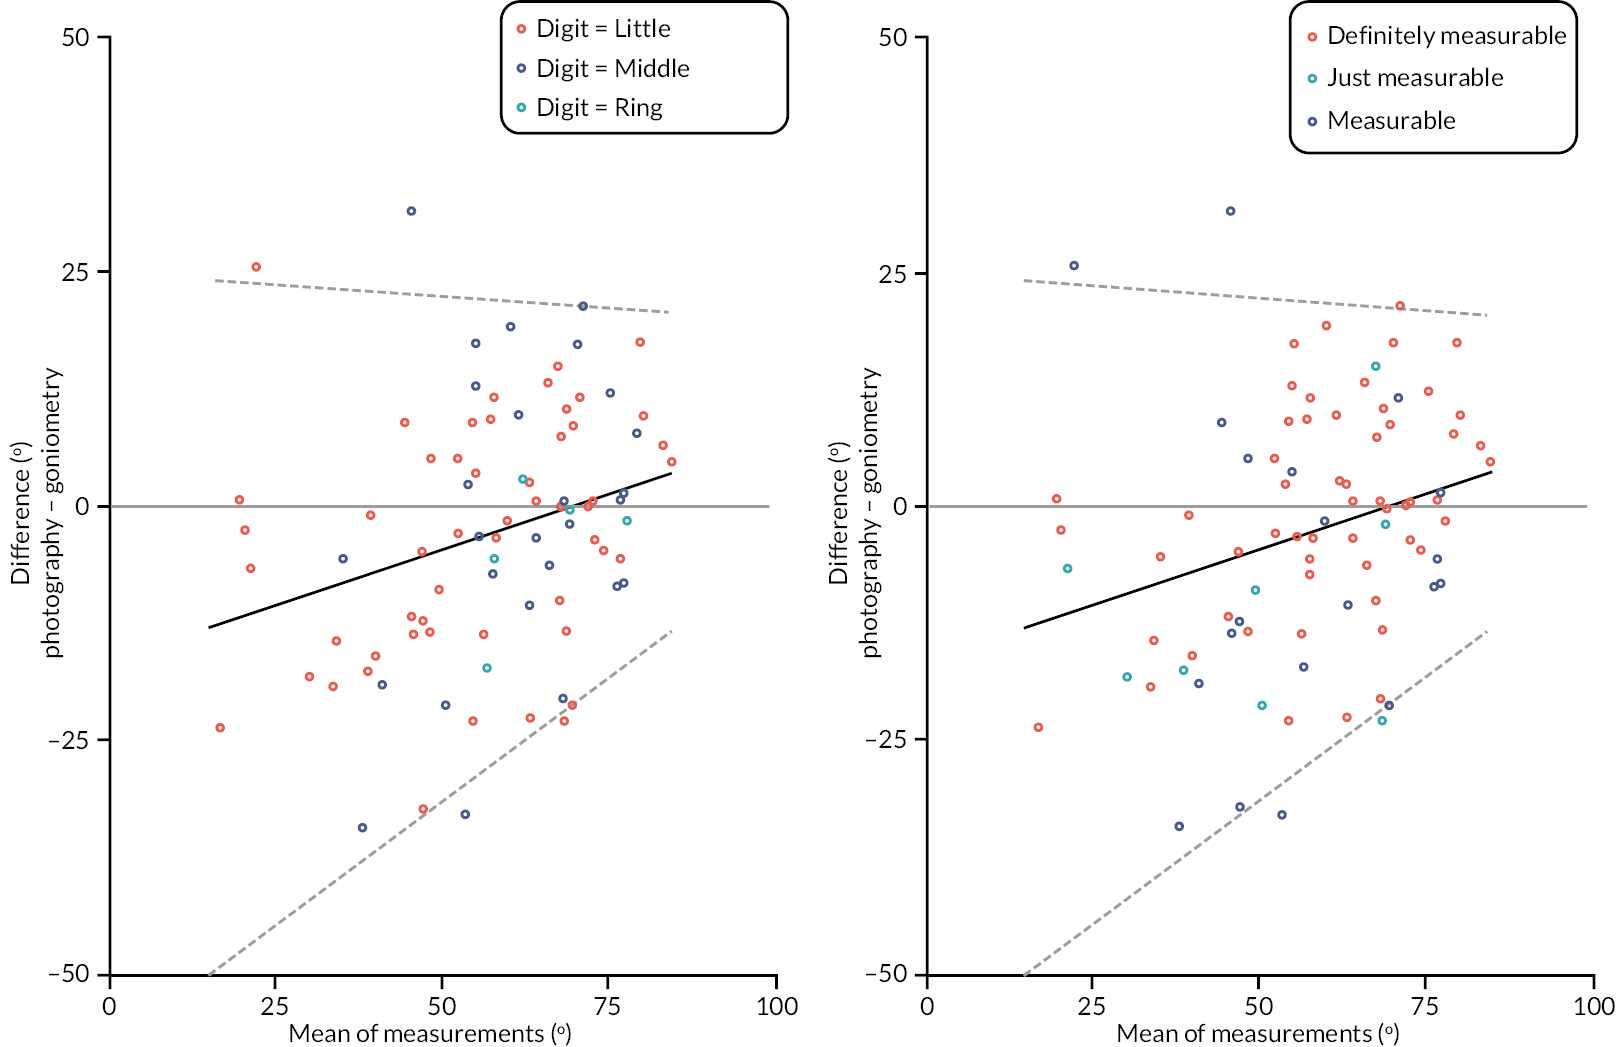
Agreement between baseline goniometry and investigator completed photography
Active extension deficit: metacarpophalangeal joint
Of the 611 participants that had at least one active extension deficit measurement of the MCP joint, 602 (99%) had a goniometric measurement and 611 (100%) had a photographic measurement. The distributions of these measurements are given in Appendix 2, Figure 51. The two sets of measurements both have a similar range, although the goniometric measurements are about 10 degrees larger on average. The goniometric measurements also show greater variation around their mean (the SD of the goniometric measurements is 29.7 degrees compared with 23.3 degrees for the photographic measurements) and show some evidence of bi-modality, with one local mode about −15 degrees and another about + 40 degrees. This apparent bi-modality is unsurprising given the sample contains a mixture of digits; those with MCP joint involvement (which will have positive measurements), and participants with little-to-no involvement at the MCP joint (which will generally be close to zero or slightly negative). Interestingly, this bimodality does not appear to be present among the photographic measurements, which are unimodal and roughly symmetric around their mean value of 22 degrees.
FIGURE 51.
Graphical summaries of the baseline active extension deficit measurements of the MCP joint. Panel 1, distribution of the goniometric measurements; panel 2, distribution of the photographic measurements; panel 3, distribution of the within-participant differences; and panel 4, Bland–Altman plot.
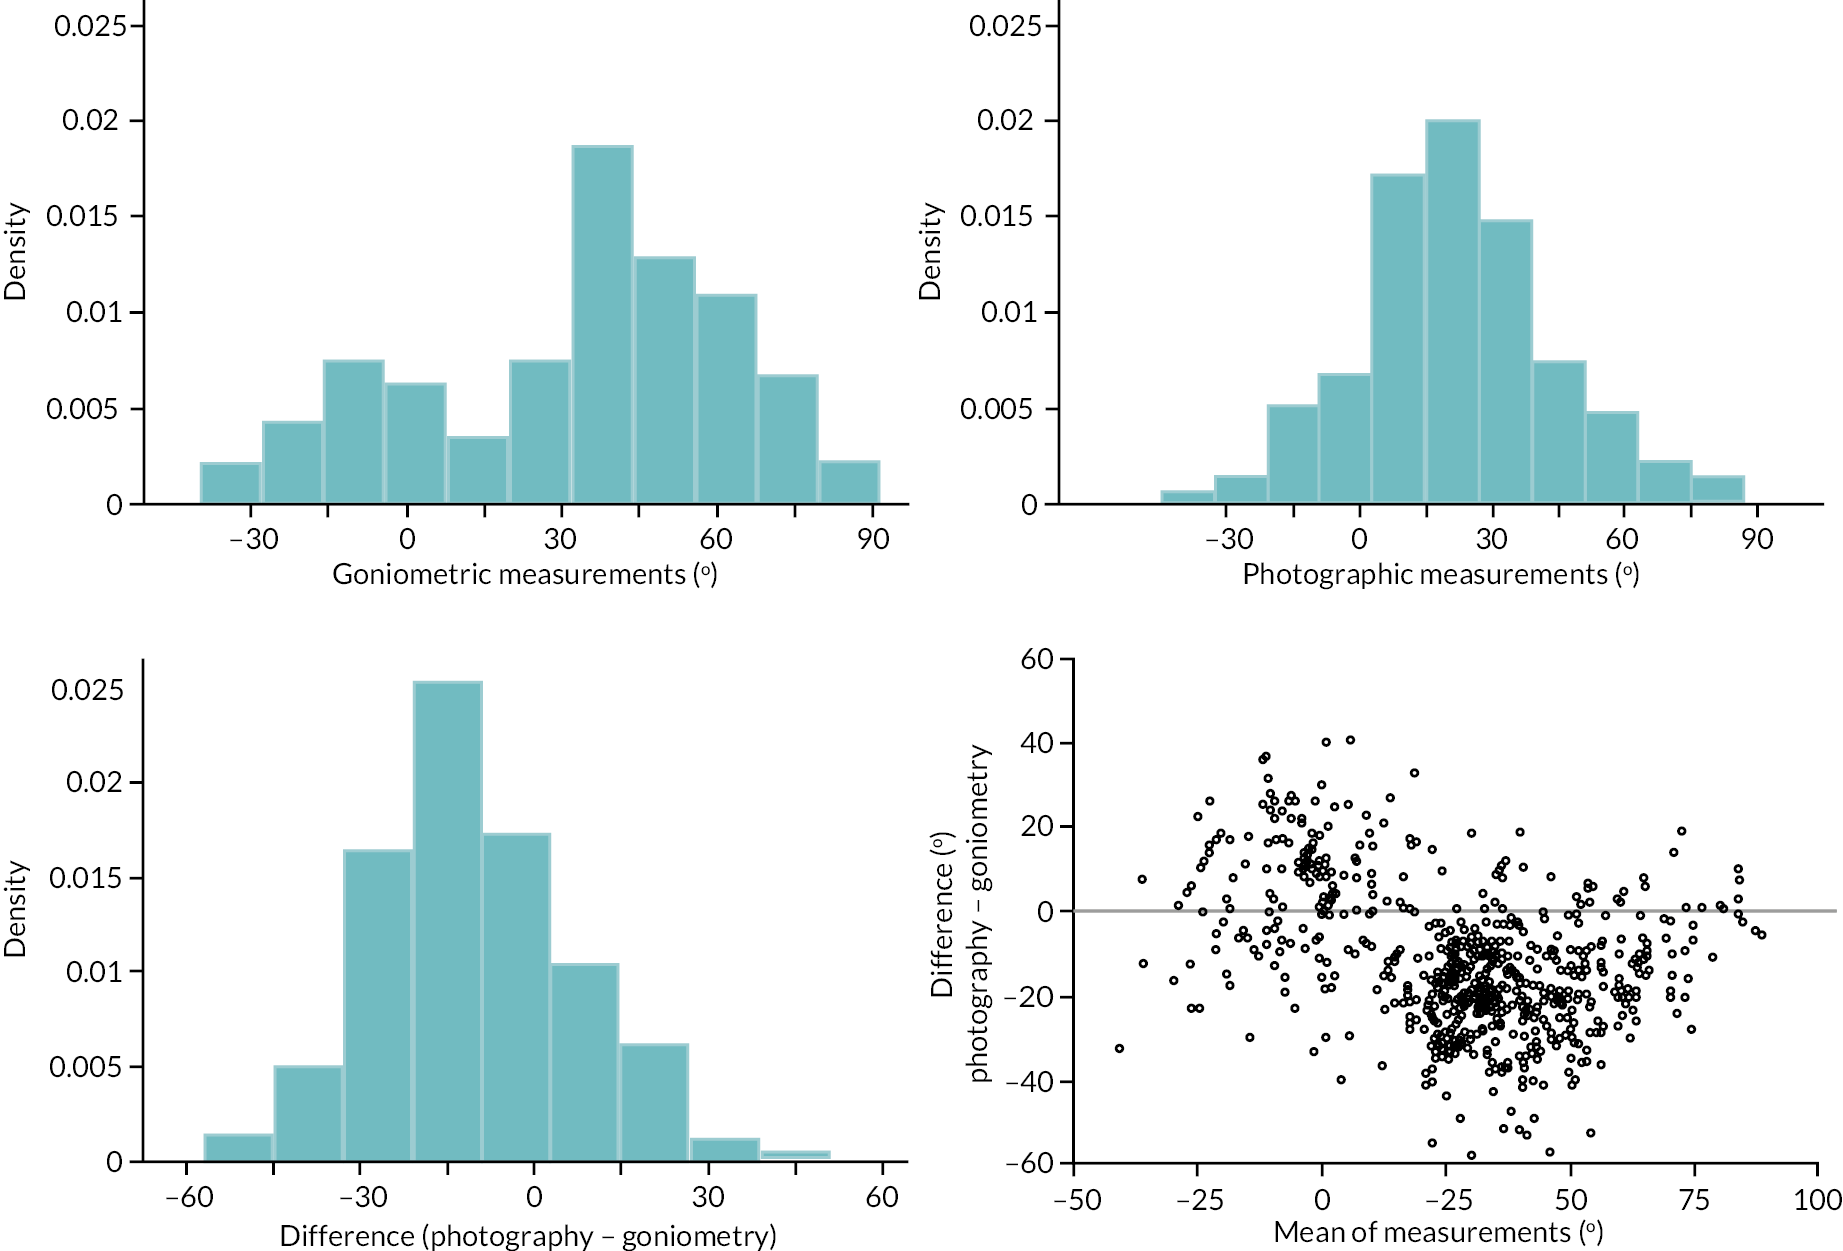
The contrasting shapes of the distributions of the two sets of measurements is evident in the Bland–Altman plot in panel 4 of Appendix 2, Figure 51. There appears to be some clustering of points around differences of about 20 degrees (i.e. photographic measurement 20 degrees larger) for measurements of a smaller magnitude (i.e. those about −20 to 0 degrees), and some clustering around differences of about −20 degrees (i.e. goniometric measurement 20 degrees larger) for measurements of a larger magnitude (i.e. 25–50 degrees). This plot also suggests that measurements by each method also tend to be quite similar for very severe contractures (e.g. those greater than about 75-degree extension deficit). Overall, this plot suggests that there is a reasonably strong and possibly non-linear association between the expected difference between the two methods and the magnitude of the contracture being measured. There is also some indication that the variability of the differences is associated with magnitude, with variation decreasing slightly as the mean of the two measurements increases.
We used two linear regressions to account for the apparent relationships between difference and magnitude, and agreement and magnitude (further details in Report Supplementary Material 16 Item 5).
The estimated expected difference between measurements and 95% limits of agreement conditional on magnitude are plotted in Appendix 2, Figure 52. The expected difference is slightly larger than zero (i.e. photography larger) for joints with little or no contracture, less than zero (i.e. goniometry larger) for moderately contracted joints, and roughly equal to zero for severely contracted joints. Substantial disagreement (as manifested by the large variance of points around the expected difference) is evident over the whole range of measurement, although appears to be slightly smaller for severe contractures compared with less severely contracted joints. However, even among the most severe contractures the estimated 95% limits of agreement are approximately ± 20 degrees, somewhat larger than the measurement error associated with goniometry used alone. Furthermore, these limits are based on the residual variability of the within participant differences once the expected difference between the two measurements (conditional on magnitude) is accounted for. However, the analyses above suggest the relationship between expected difference and magnitude is reasonably complex, meaning any systematic ‘correction factor’ added to/subtracted from one set of measurements to make them comparable with the other would necessarily be quite a complex function of the estimated magnitude of the measurement. This further reduces the scope for using the two methods interchangeably, since any simple correction factor that might be applied in practice would likely result in even larger disagreement than the 20–30 degrees shown in Appendix 2, Figure 52.
FIGURE 52.
Metacarpophalangeal extension deficit measurements – difference (photography – goniometry) vs. magnitude (mean of the two measurements), with estimated mean difference and 95% limits of agreement conditional on magnitude overlaid.
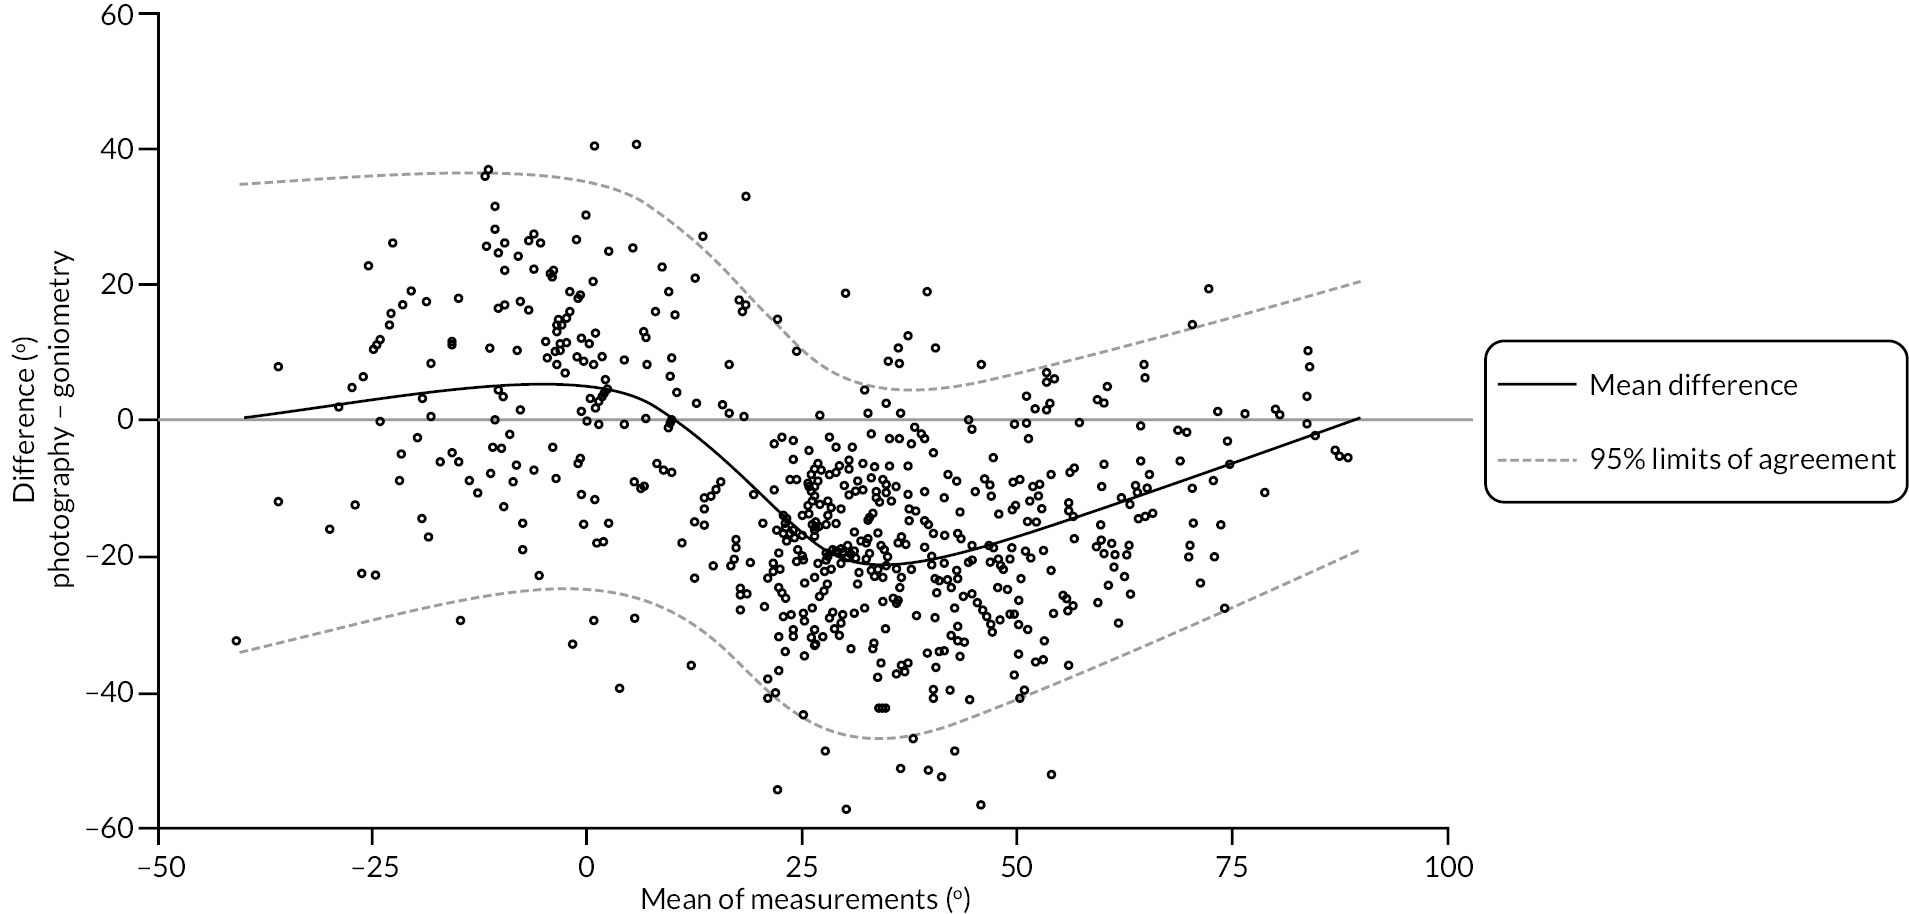
Active extension deficit: proximal interphalangeal joint
Of the 611 participants that had at least one pair of active extension deficit measurements 608 (99%) had a goniometric measurement of the PIP joint and 610 (100%) had a photographic measurement of the PIP joint. The distributions of these measurements are given in Appendix 2, Figure 53. Both have a similar range, although the photographic measurements are about 4 degrees larger on average. Similarly, to the MCP measurements, some bimodality is evident for the goniometric measurements, with local modes at approximately 0 degrees and 50 degrees. As before bimodality is unsurprising given the mixture of affected and unaffected joints in the sample. Again, this bimodality does not appear to be present to the same degree among the photographic measurements, although the overall shapes of the two distributions (i.e. the goniometric and photographic measurements) are not as contrasting as those of the MCP measurements. The Bland–Altman plot in panel 4 of Appendix 2, Figure 53 suggests that any relationship between the expected within participant differences and magnitude is quite weak. There is some indication that the variance around the expected difference increases slightly as the magnitude of the measurement (as estimated by the mean of the two available measurements) increases, but again this relationship is quite weak.
FIGURE 53.
Graphical summaries of the baseline active extension deficit measurements of the PIP joint. Panel 1, distribution of the goniometric measurements; panel 2, distribution of the photographic measurements; panel 3, distribution of the within participant differences; and panel 4, Bland–Altman plot.
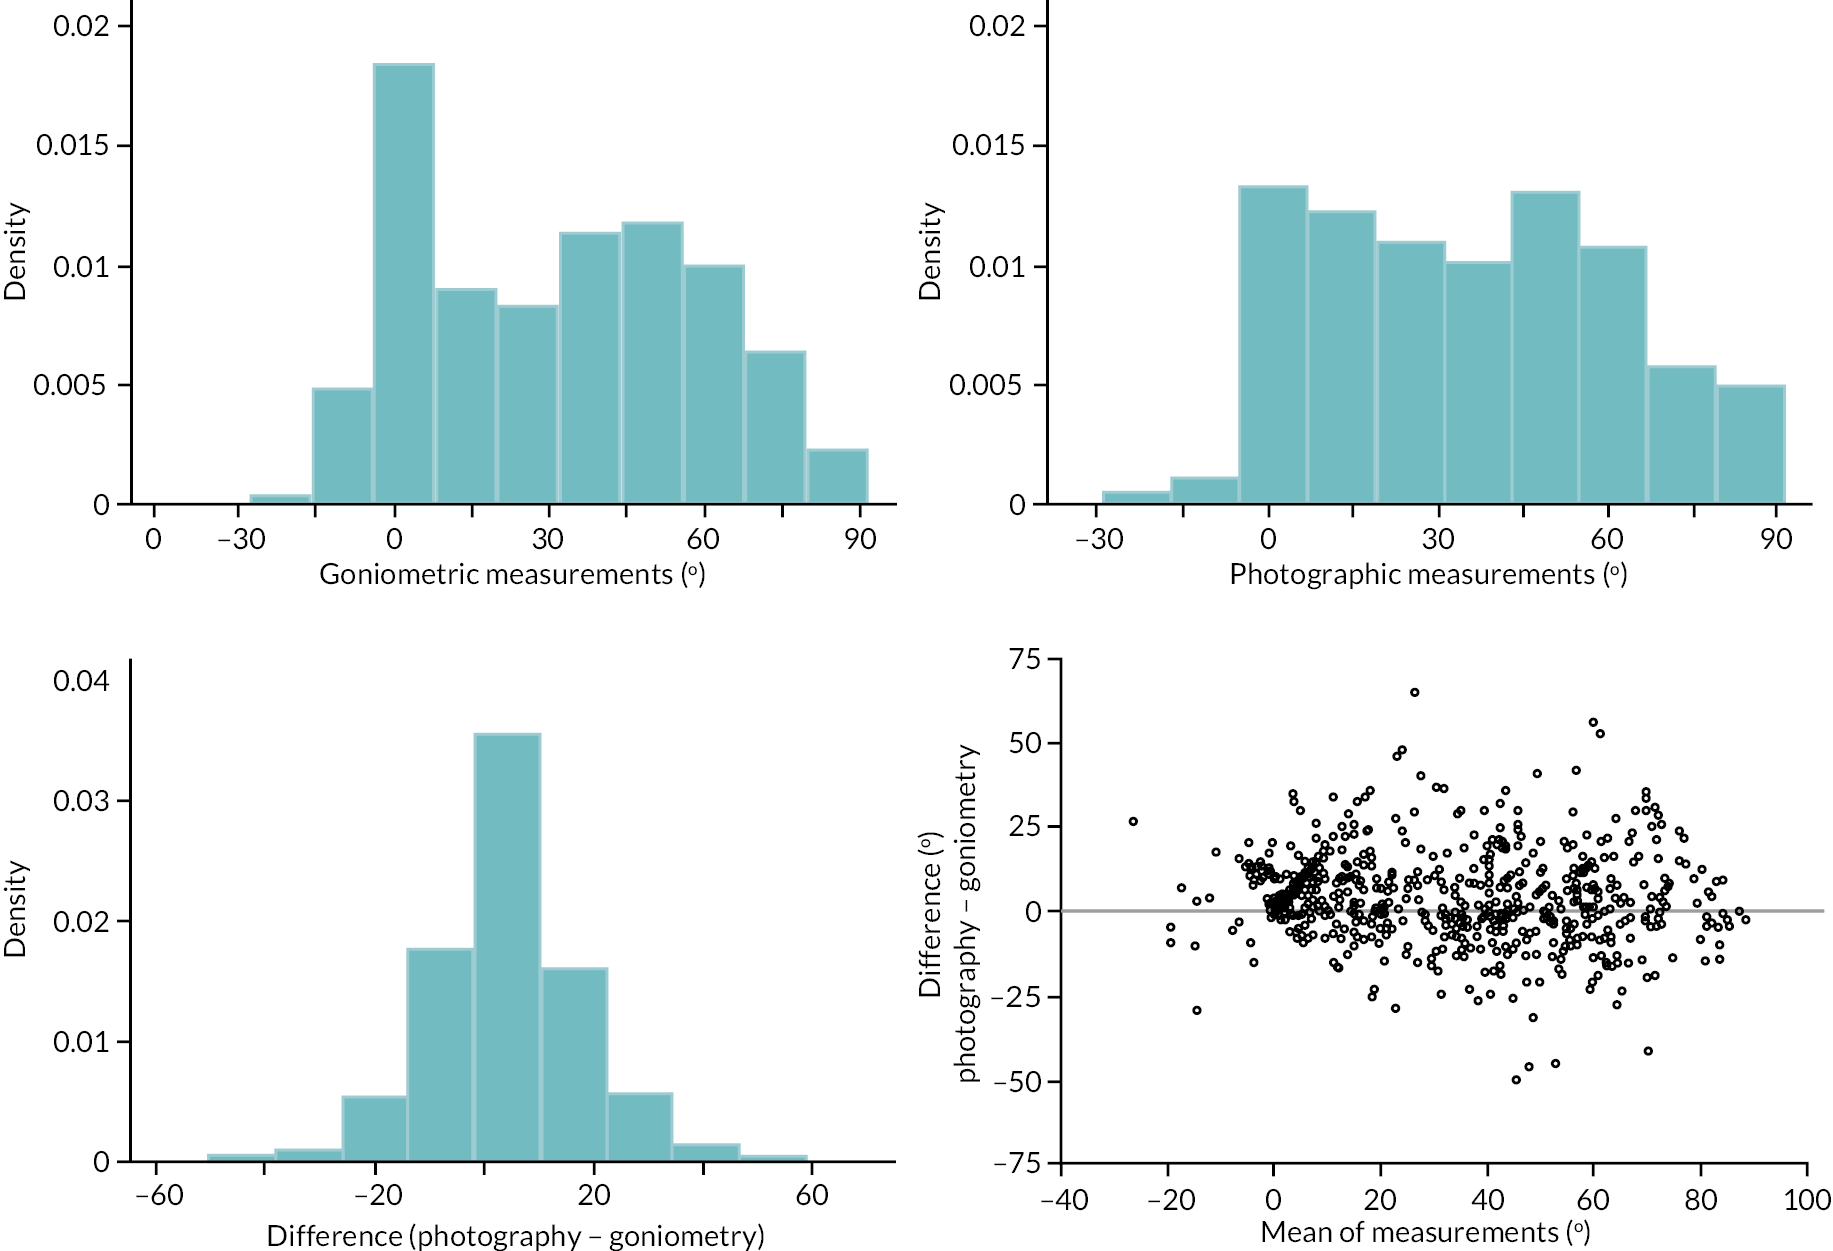
Given the apparent lack of any strong relationship between the expected difference and magnitude we estimated the expected difference between methods using the sample mean of the observed within participant differences (i.e. without any conditioning on magnitude). To allow for variation in agreement over the range of observed magnitudes we estimated the 95% limits of agreement conditional on a linear term for magnitude (further details in Report Supplementary Material 16 Item 6).
These 95% limits of agreement are plotted in Appendix 2, Figure 54. Once the small systematic difference between the two measurement methods is accounted for (e.g. subtracting 4.5 degrees from the photographic measurements), then the agreement between the two methods is perhaps acceptable for uncontracted or hyper-extended joints. For example, when the joint is in a roughly neutral position (i.e. A = 0°), differences between the two methods would mostly be within the range ± 20 degrees. However, for PIP joints that are affected by DC, agreement will generally be poorer. For example, when the magnitude of contracture is 60 degrees, the estimated 95% limits of agreement are roughly ± 29 degrees, considerably larger than the estimated measurement error associated with goniometry alone. Such disagreement limits the interchangeability of the two methods when applied to patients with moderate to severe contracture of the PIP joint, as measurements of the same degree of contracture may differ depending on the measurement method used.
FIGURE 54.
Proximal interphalangeal extension deficit measurements – difference (photography – goniometry) vs. magnitude (mean of the two measurements), with estimated mean difference and 95% limits of agreement conditional on magnitude overlaid.
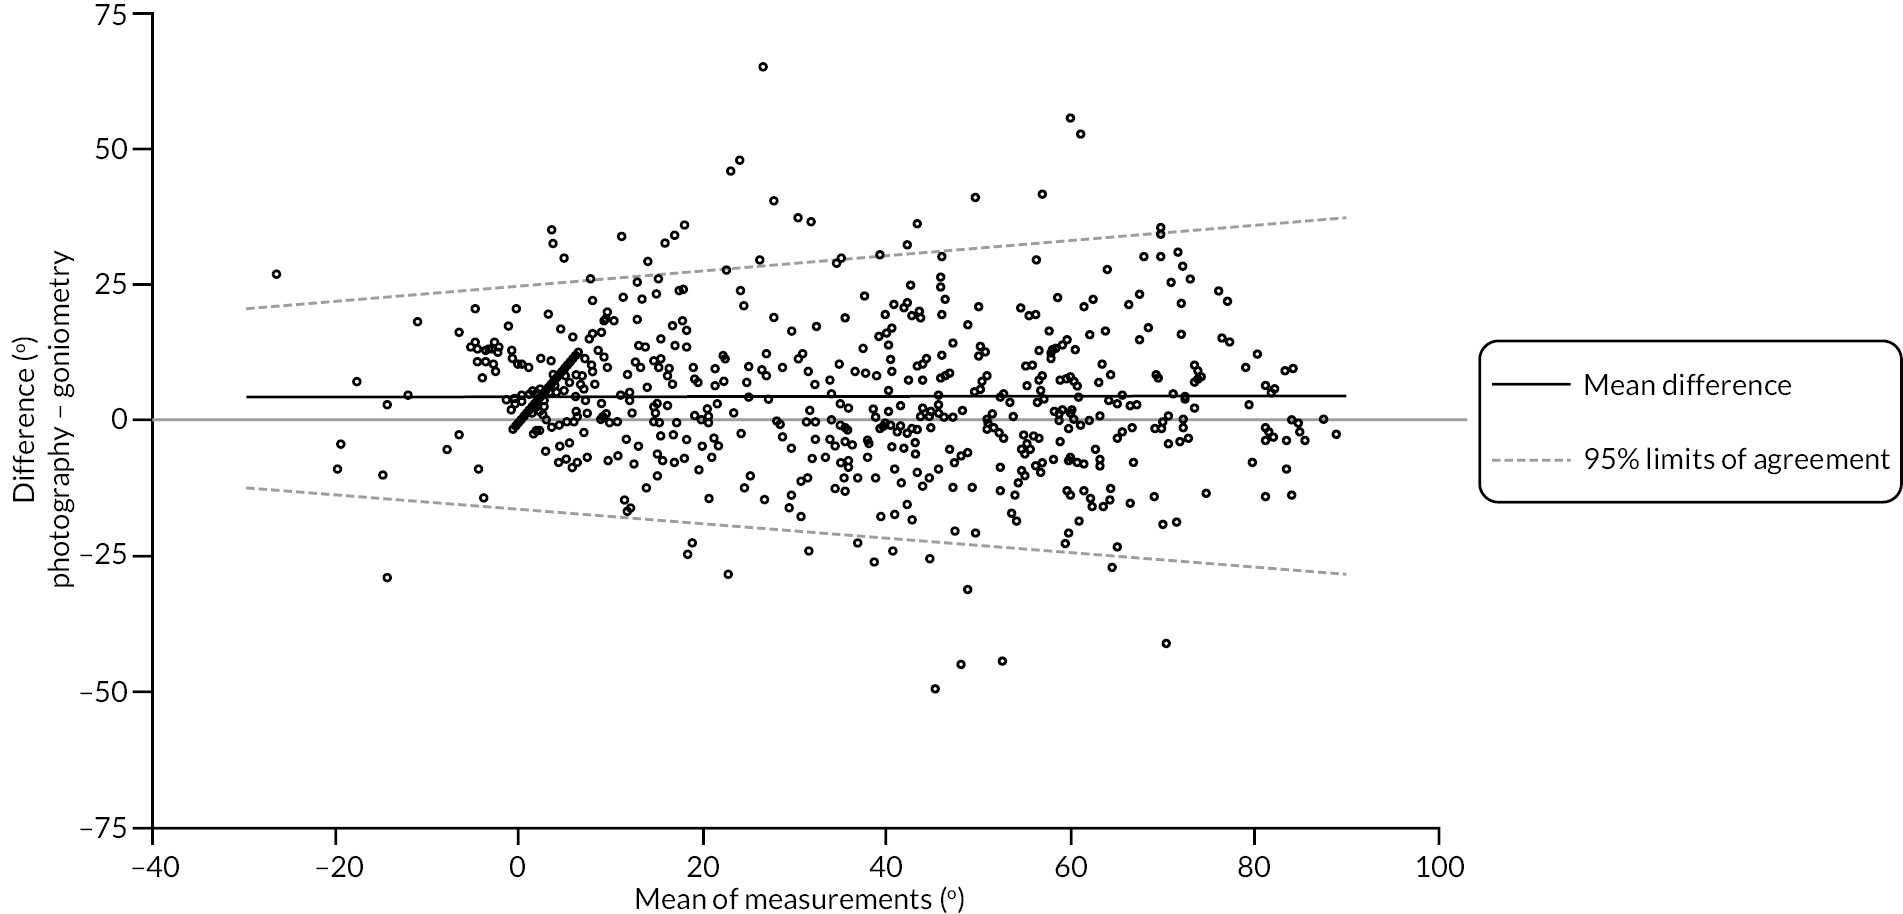
Active extension: distal interphalangeal joint
Of the 611 participants that had at least one pair of active extension deficit measurements 587 (96%) had a goniometric measurement of the DIP joint and 609 (100%) had a photographic measurement of the DIP joint. The distributions of these measurements are given in Appendix 2, Figure 55. The photographic measurements are about 5 degrees larger on average, with a larger proportion of measurements above zero (indicating contracture of some degree). The Bland–Altman plot in panel 4 of Appendix 2, Figure 55 suggests that any relationship between the expected within participant differences and magnitude is likely to be quite weak. There is also no clear indication that the variance around this expected difference varies with the magnitude of the measurement (as estimated by the mean of the two available measurements).
FIGURE 55.
Graphical summaries of the baseline active extension deficit measurements of the DIP joint. Panel 1, distribution of the goniometric measurements; panel 2, distribution of the photographic measurements; panel 3, distribution of the within participant differences; and panel 4, Bland–Altman plot.
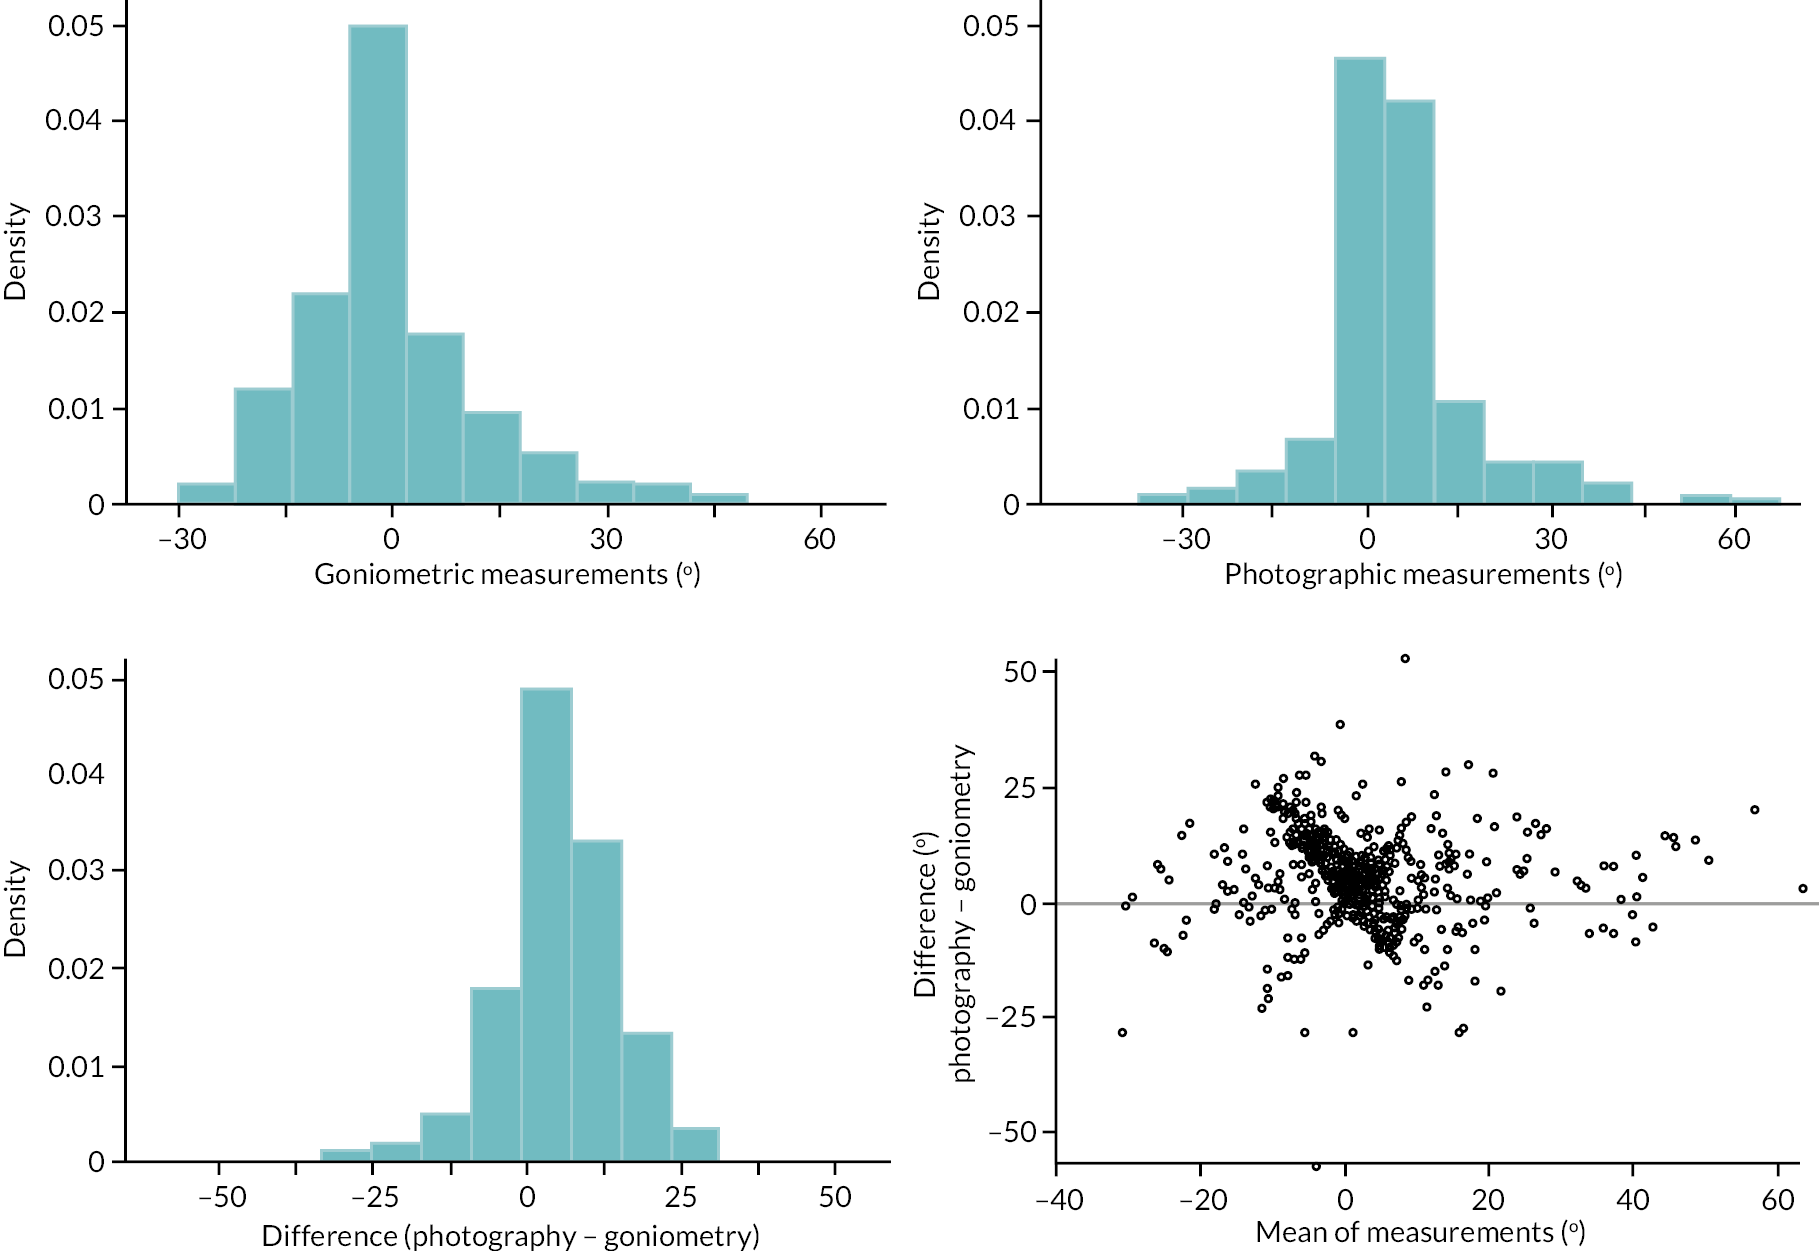
We estimated the expected difference between methods using the mean of the observed within participant differences, and the 95% limits of agreement using the SD of these differences, meaning that neither the estimated expected difference nor limits of agreement depend on magnitude. The estimated expected difference and 95% limits of agreement are
and are plotted in Appendix 2, Figure 56. These suggest that once the 5 degrees expected difference between measurements is accounted for (e.g. by adding 5 degrees to any goniometric measurements), most measurements are within ± 20 degrees. Again, this is somewhat greater than the standard error of measurement associated with goniometry and casts some doubt on the extent to which the two methods of measurement might be used interchangeably in practice (although errors in DIP extension measurements of this magnitude are unlikely to result in drastically different decisions regarding patient care).
FIGURE 56.
Distal interphalangeal extension deficit measurements – difference (photography – goniometry) vs. magnitude (mean of the two measurements), with estimated mean difference and 95% limits of agreement conditional on magnitude overlaid.
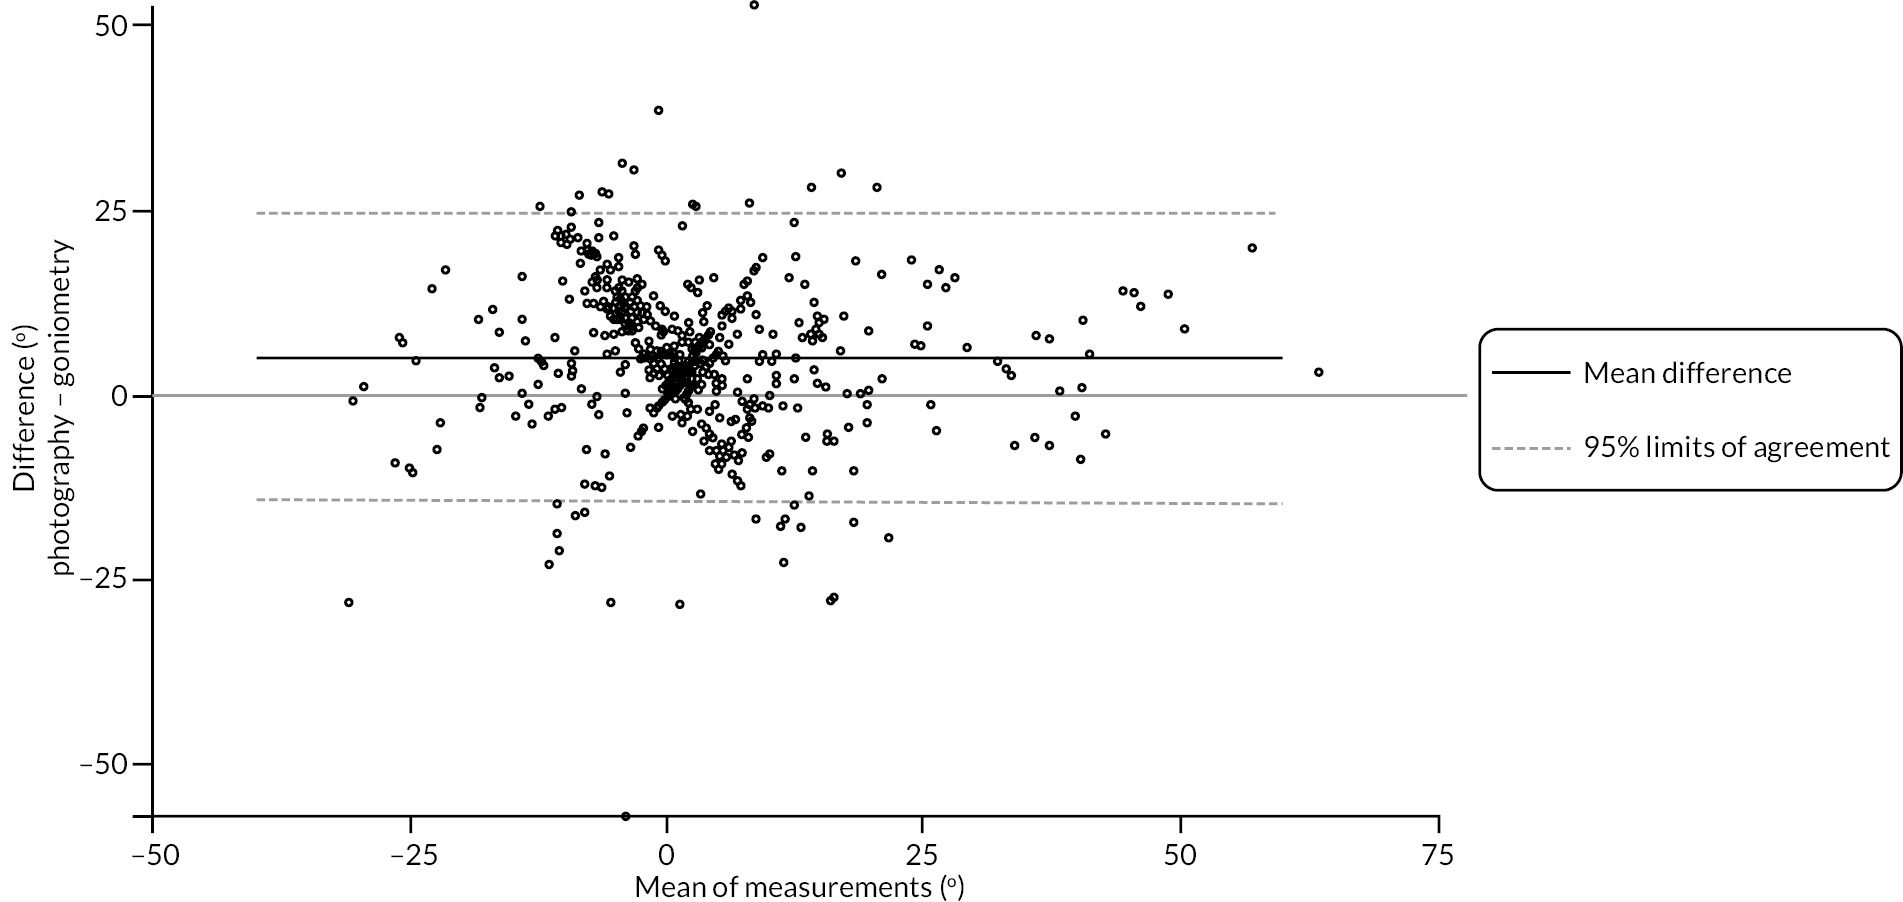
Active extension: reference joint
There were 611 participants that had both goniometric and photographic measurements of the active extension deficit of the reference joint at baseline. The distributions of the measurements of each type, as well as the distribution of the within participant differences are illustrated in panels 1–3 of Appendix 2, Figure 57. The range of the two sets of measurements is similar, although the photographic measurements have a slightly higher SD. Furthermore, the goniometric measurement is about 10–12 degrees larger on average, with a mean of about 52 degrees compared with about 41 degrees for the photographic measurements. The Bland–Altman plot in panel 4 of Appendix 2, Figure 57, suggests a positive association between the difference between methods and the estimated magnitude of active extension deficit, although there is no clear indication that the agreement between the two methods is strongly associated with magnitude once the relationship between expected difference and magnitude is accounted for.
FIGURE 57.
Graphical summaries of the baseline active extension deficit measurements of the reference joint (MCP or PIP). Panel 1, distribution of the goniometric measurements; panel 2, distribution of the photographic measurements; panel 3, distribution of the within-participant differences; and panel 4, Bland–Altman plot.
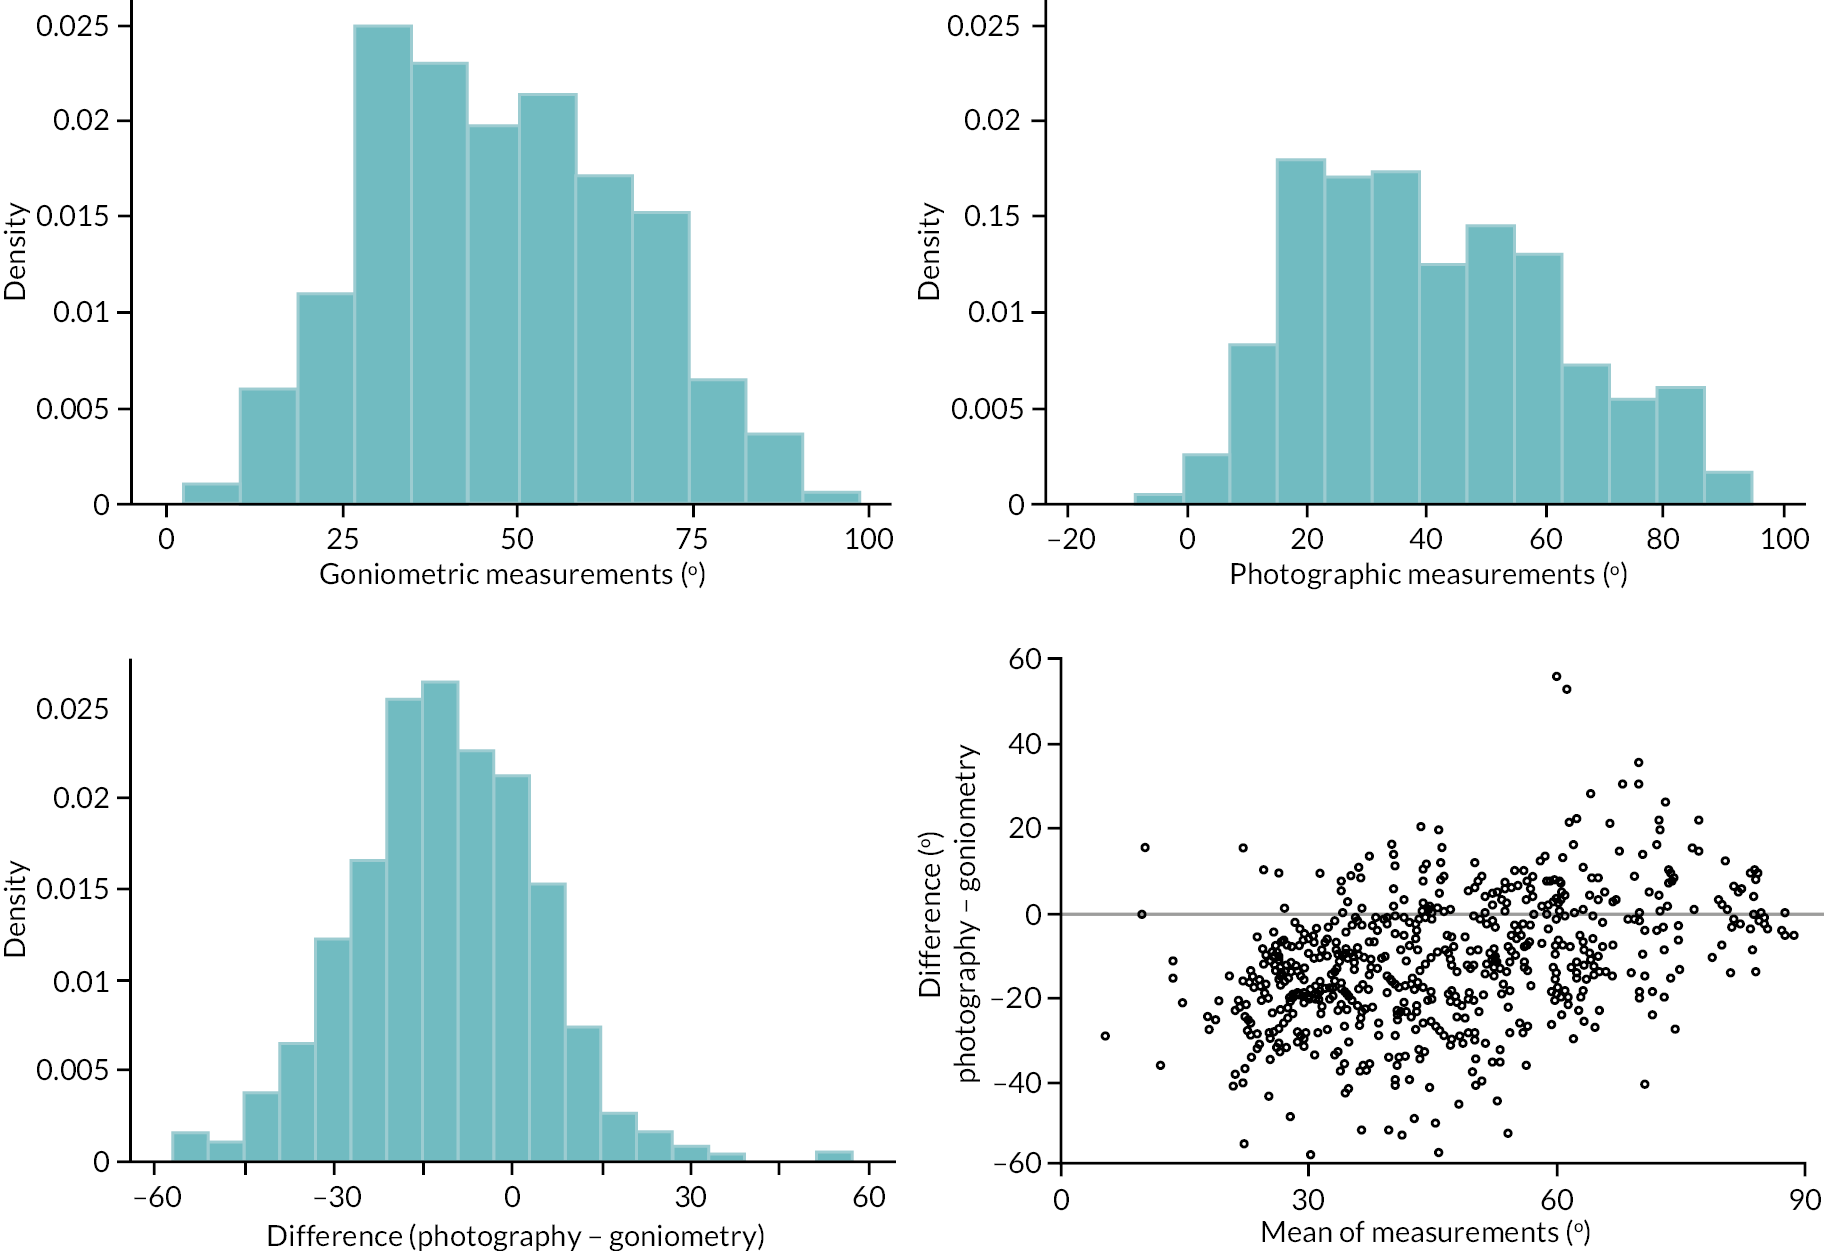
To address the relationship between expected difference and magnitude we used two linear regressions (further details in Report Supplementary Material 16 Item 7).
These limits of agreement are illustrated in Appendix 2, Figure 58. These show a clear positive relationship between difference and magnitude, with the expected difference between methods being approximately −20 degrees (i.e. goniometry 20 degrees larger) for extension deficit measurements of about 20 degrees, and about 0 degrees for extension deficit measurements of about 75 degrees. Despite the strong relationship between difference and magnitude, the extent of agreement (as manifested by the scatter of points around the estimated expected difference between methods) is similar over the range of measurements, being approximately ± 26 degrees for contractures of about 20 degrees and approximately ± 28 degrees for contractures about 80 degrees.
FIGURE 58.
Reference joint extension deficit measurements – difference (photography – goniometry) vs. magnitude (mean of the two measurements), with points stratified by joint type, and the estimated mean difference and 95% limits of agreement conditional on magnitude overlaid.
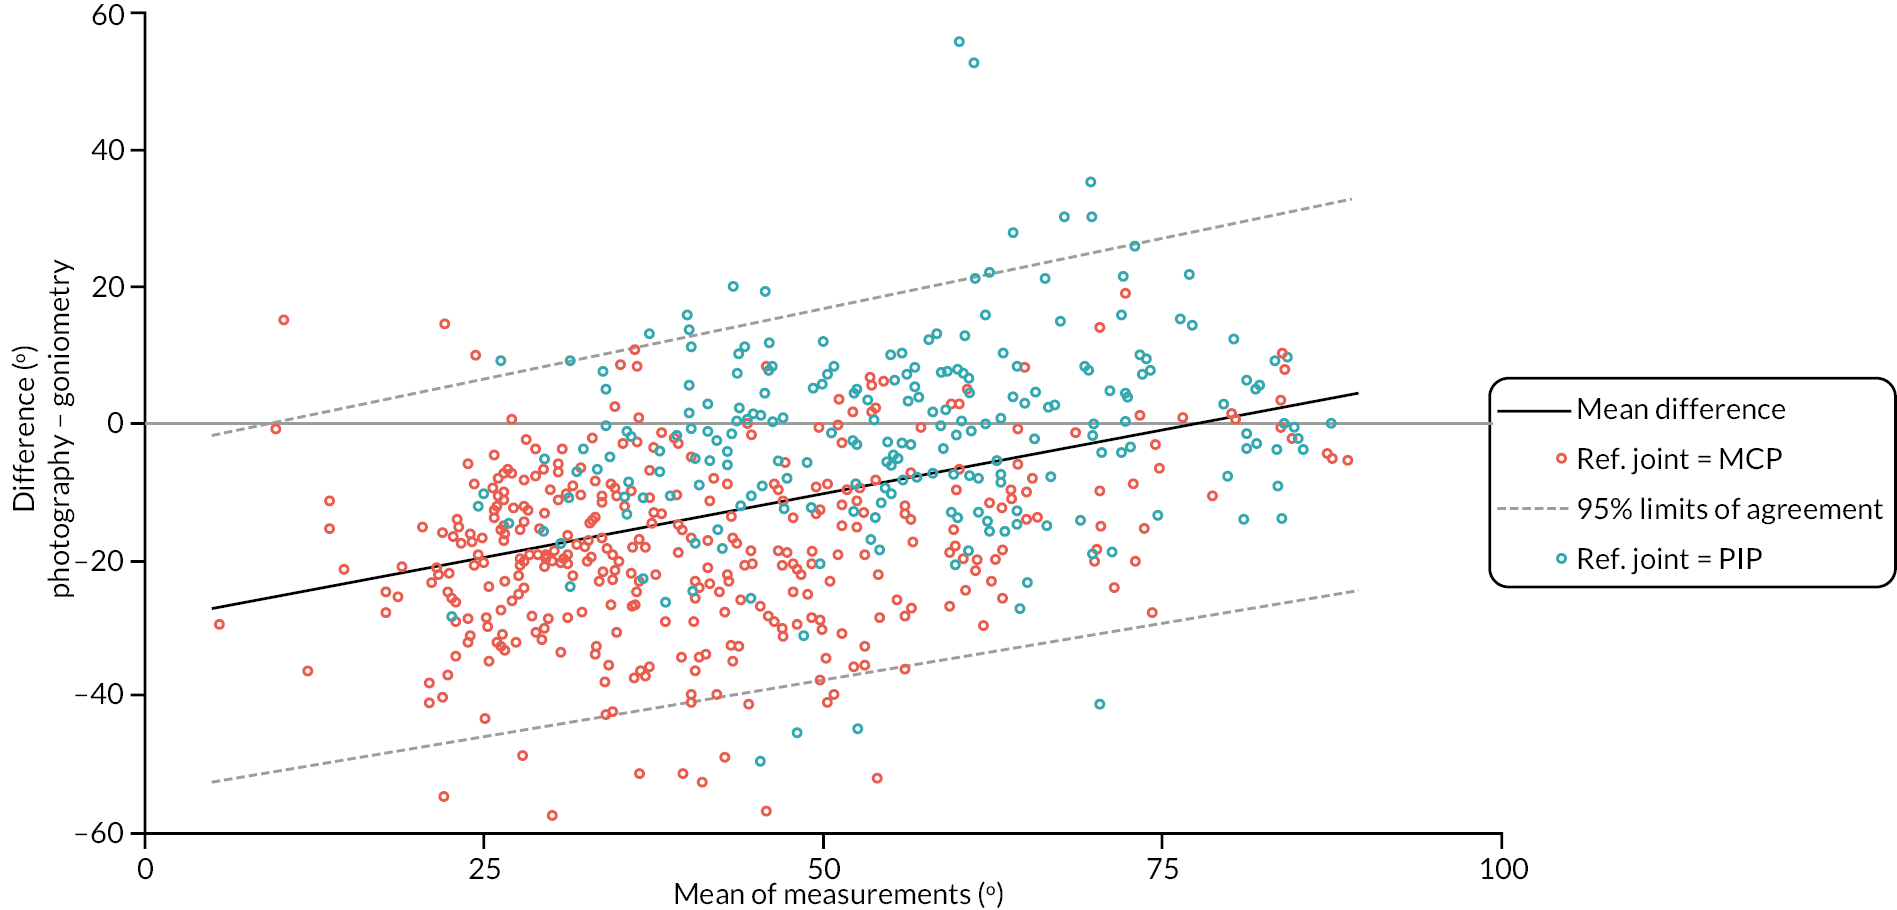
One clear feature of the plot in Appendix 2, Figure 58 is the clustering of points by joint type (MCP or PIP). Measurements of MCP joints are generally smaller in magnitude, with differences between the two methods of measurement tending to be quite negative on average (i.e. goniometric measurements considerably larger on average), while measurements of PIP joints tend to be larger in magnitude, with differences between measurements that are in general closer to zero. We therefore provide limits of agreement for the reference joint conditional on both the estimated magnitude of extension deficit and reference joint type. These are illustrated in Appendix 2, Figure 59. This plot clearly shows the difference in expected difference across the two joint types, but also suggests that agreement was generally similar for the two types of joint, being about ± 20–25 degrees for both joint types over the range of measurements.
FIGURE 59.
Reference joint extension deficit measurements – difference (photography – goniometry) vs. magnitude (mean of the two measurements), with points stratified by joint type, and the estimated mean difference and 95% limits of agreement conditional on magnitude and joint type.
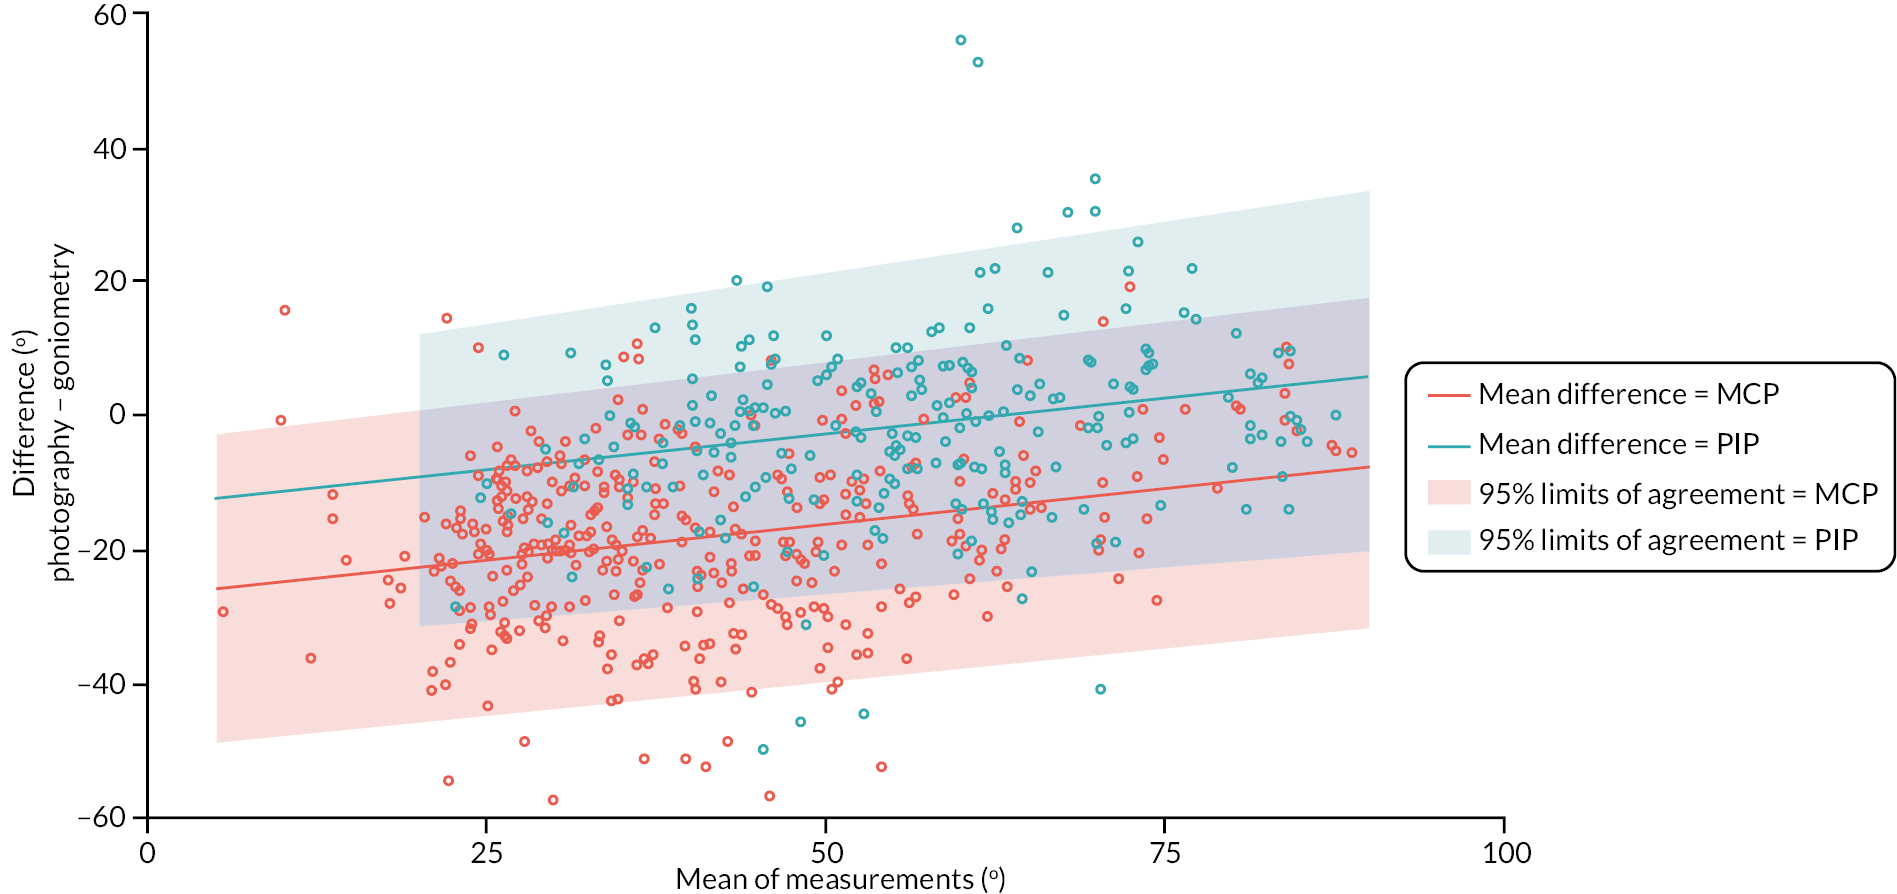
Given that goniometric measurements were undertaken by investigators at the participating recruitment sites, it follows that there could be some clustering of differences (between methods of measurement) by site. As a post hoc exploratory analysis we estimated the site-level intraclass correlation coefficient (ICC) by modelling the within participant differences conditional on a fixed effect for reference joint type and a random intercept for recruitment site (with estimation performed via restricted maximum likelihood). The point estimate and two-sided 95% confidence interval for the site level ICC from this analysis was 0.026 (0.006–0.112), suggesting clustering of differences by site was relatively limited (at least once the joint type being measured is accounted for). The empirical predictions of the site-level random intercepts from this analysis are illustrated in Appendix 2, Figure 60. Overall, there is relatively limited evidence of important variation in agreement across sites.
FIGURE 60.
Empirical best linear unbiased predictions of site level random intercepts (from mixed-effect model for within participant differences between measurement methods conditional on a fixed effect for joint type and a random intercept for recruitment site).
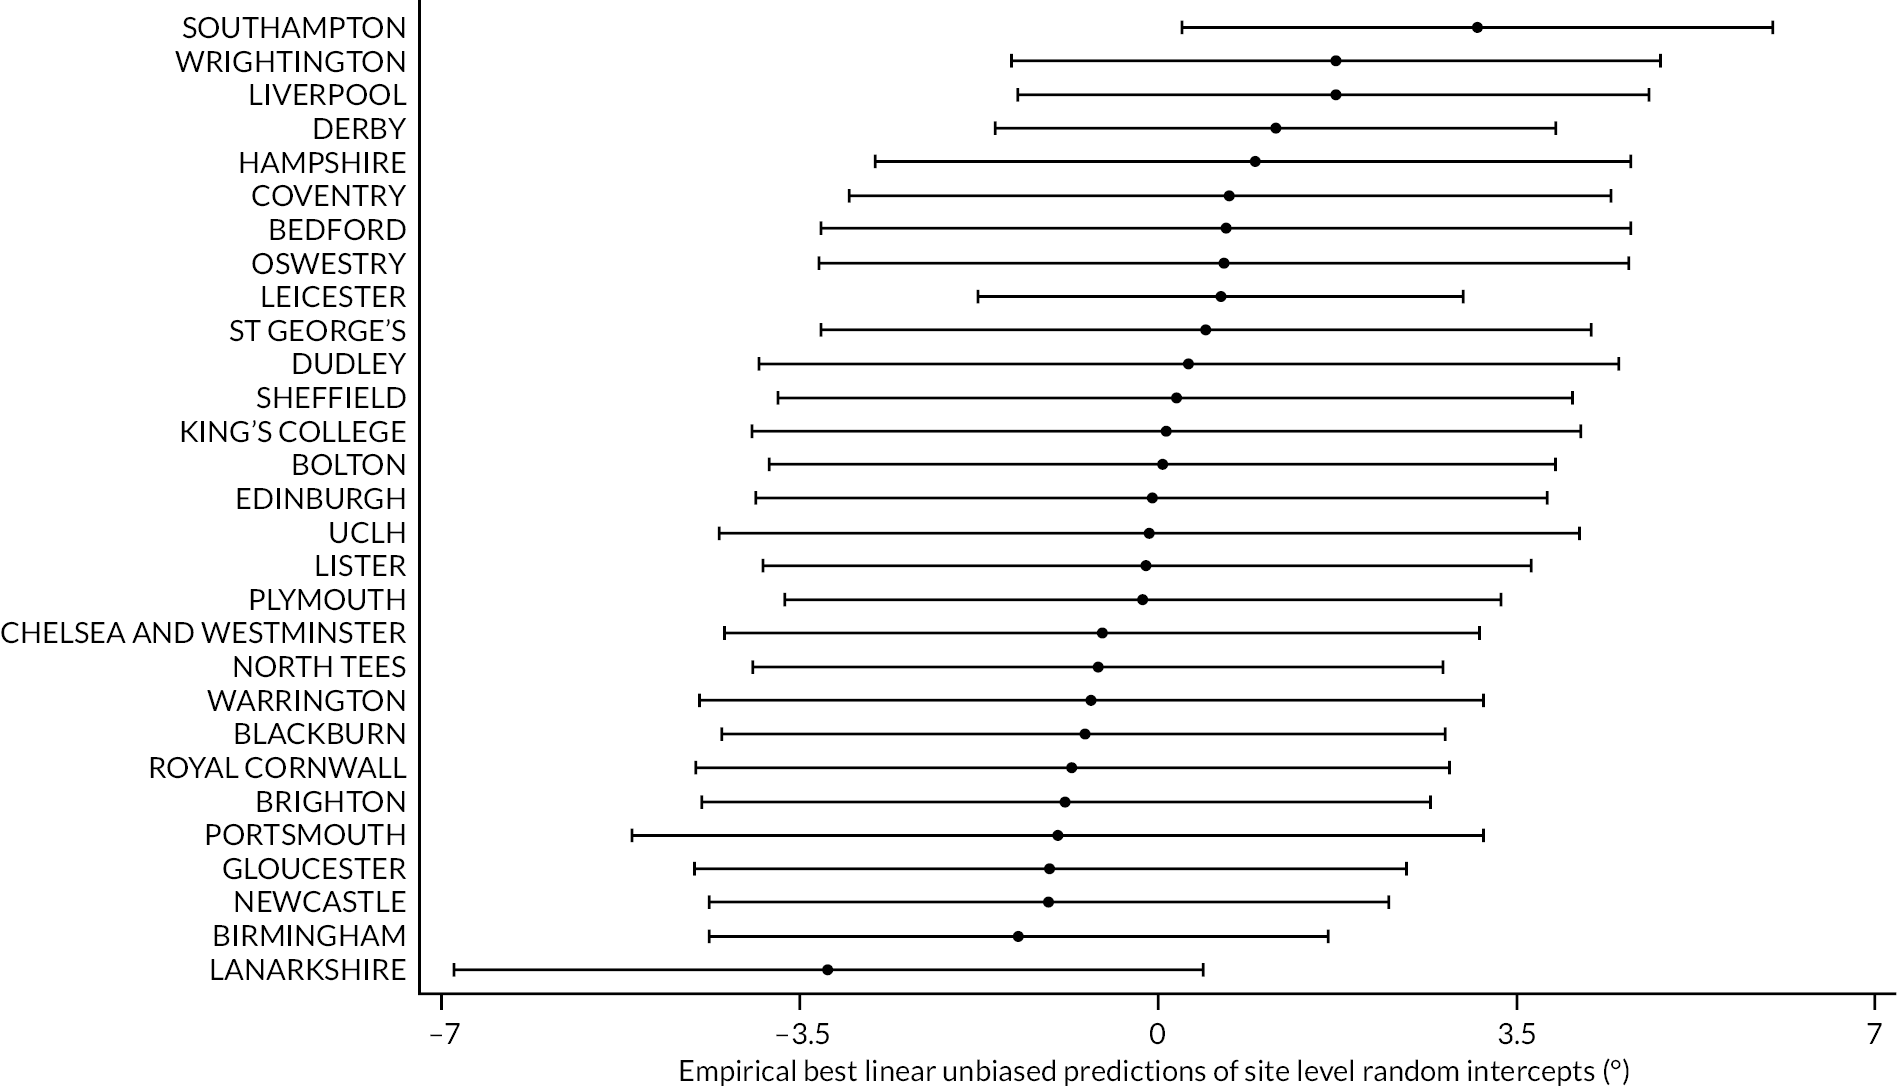
Agreement between baseline and pre-operative goniometric extension measurements
Tables 55–57 and Figures 61–66 show the baseline and pre-operative goniometric active extension deficit measurements for the DISC trial participants that received treatment within 12 weeks of baseline and had at least one pair of measurements available.
| Goniometric active extension deficit MCP (°) – baseline | |
| N | 374 |
| Mean (SD) | 33.7 (29.8) |
| Median (Q1, Q3) | 40.0 (11.3, 56.7) |
| Minimum, maximum | −40.0, 91.3 |
| Goniometric active extension deficit MCP (°) – pre-operative | |
| N | 363 |
| Mean (SD) | 33.1 (30.6) |
| Median (Q1, Q3) | 40.0 (10.0, 54.0) |
| Minimum, maximum | −40.0, 85.0 |
| Goniometric active extension deficit MCP (°) – difference (pre-operative – baseline) | |
| N | 350 |
| Mean (SD) | 0.1 (9.8) |
| Median (Q1, Q3) | 0.0 (−4.7, 5.0) |
| Minimum, maximum | −49.3, 57.3 |
| Time between goniometric measurements at baseline and pre-operative (weeks) | |
| N | 350 |
| Mean (SD) | 6.7 (3.2) |
| Median (Q1, Q3) | 7.0 (4.3, 9.6) |
| Minimum, maximum | 0.1, 12.0 |
| Goniometric active extension deficit PIP (°) – baseline | |
| N | 378 |
| Mean (SD) | 30.8 (26.4) |
| Median (Q1, Q3) | 32.0 (5.7, 51.7) |
| Minimum, maximum | −40.0, 90.7 |
| Goniometric active extension deficit PIP (°) – pre-operative | |
| N | 365 |
| Mean (SD) | 32.0 (27.6) |
| Median (Q1, Q3) | 36.0 (4.0, 54.0) |
| Minimum, maximum | −38.0, 90.0 |
| Goniometric active extension deficit PIP (°) – difference (pre-operative – baseline) | |
| N | 354 |
| Mean (SD) | 1.0 (8.8) |
| Median (Q1, Q3) | 0.0 (−2.7, 5.0) |
| Minimum, maximum | −38.3, 48.7 |
| Time between goniometric measurements at baseline and pre-operative (weeks) | |
| N | 354 |
| Mean (SD) | 6.8 (3.2) |
| Median (Q1, Q3) | 7.0 (4.3, 9.6) |
| Minimum, maximum | 0.1, 12.0 |
| Goniometric active extension deficit DIP (°) – baseline | |
| N | 364 |
| Mean (SD) | −0.0 (13.4) |
| Median (Q1, Q3) | 0.0 (−8.7, 3.3) |
| Minimum, maximum | −30.0, 62.0 |
| Goniometric active extension deficit DIP (°) – pre-operative | |
| N | 356 |
| Mean (SD) | 1.0 (13.5) |
| Median (Q1, Q3) | 0.0 (−5.0, 2.0) |
| Minimum, maximum | −30.0, 62.0 |
| Goniometric active extension deficit DIP (°) – difference (pre-operative – baseline) | |
| N | 338 |
| Mean (SD) | 1.0 (10.4) |
| Median (Q1, Q3) | 0.0 (−3.3, 4.0) |
| Minimum, maximum | −26.0, 61.3 |
| Time between goniometric measurements at baseline and pre-operative (weeks) | |
| N | 338 |
| Mean (SD) | 6.8 (3.2) |
| Median (Q1, Q3) | 7.0 (4.6, 9.6) |
| Minimum, maximum | 0.1, 12.0 |
FIGURE 61.
Graphical summaries of the goniometric MCP extension measurements at baseline and pre-operative.
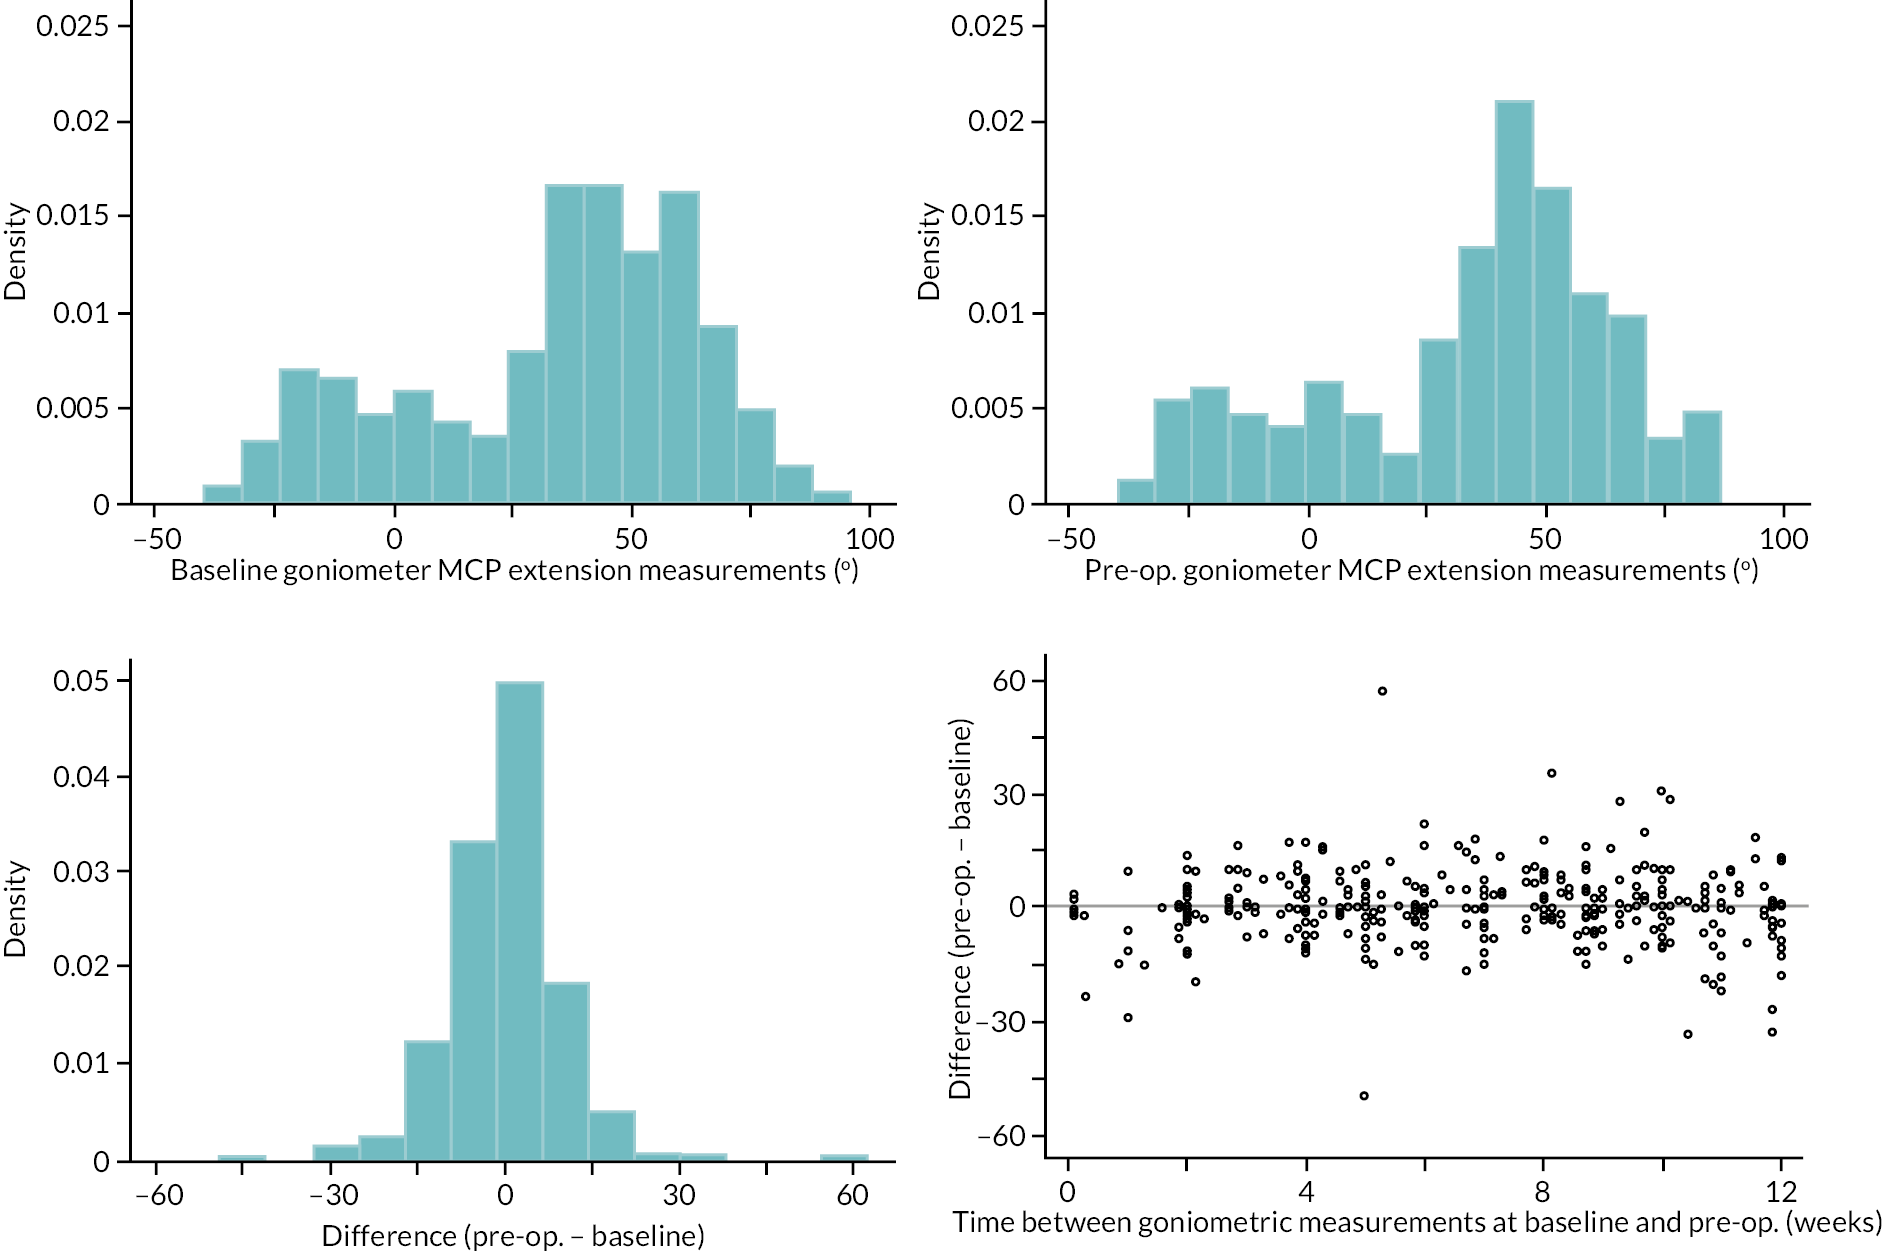
FIGURE 62.
Limits of agreement for the baseline and pre-operative. goniometric MCP extension measurements.
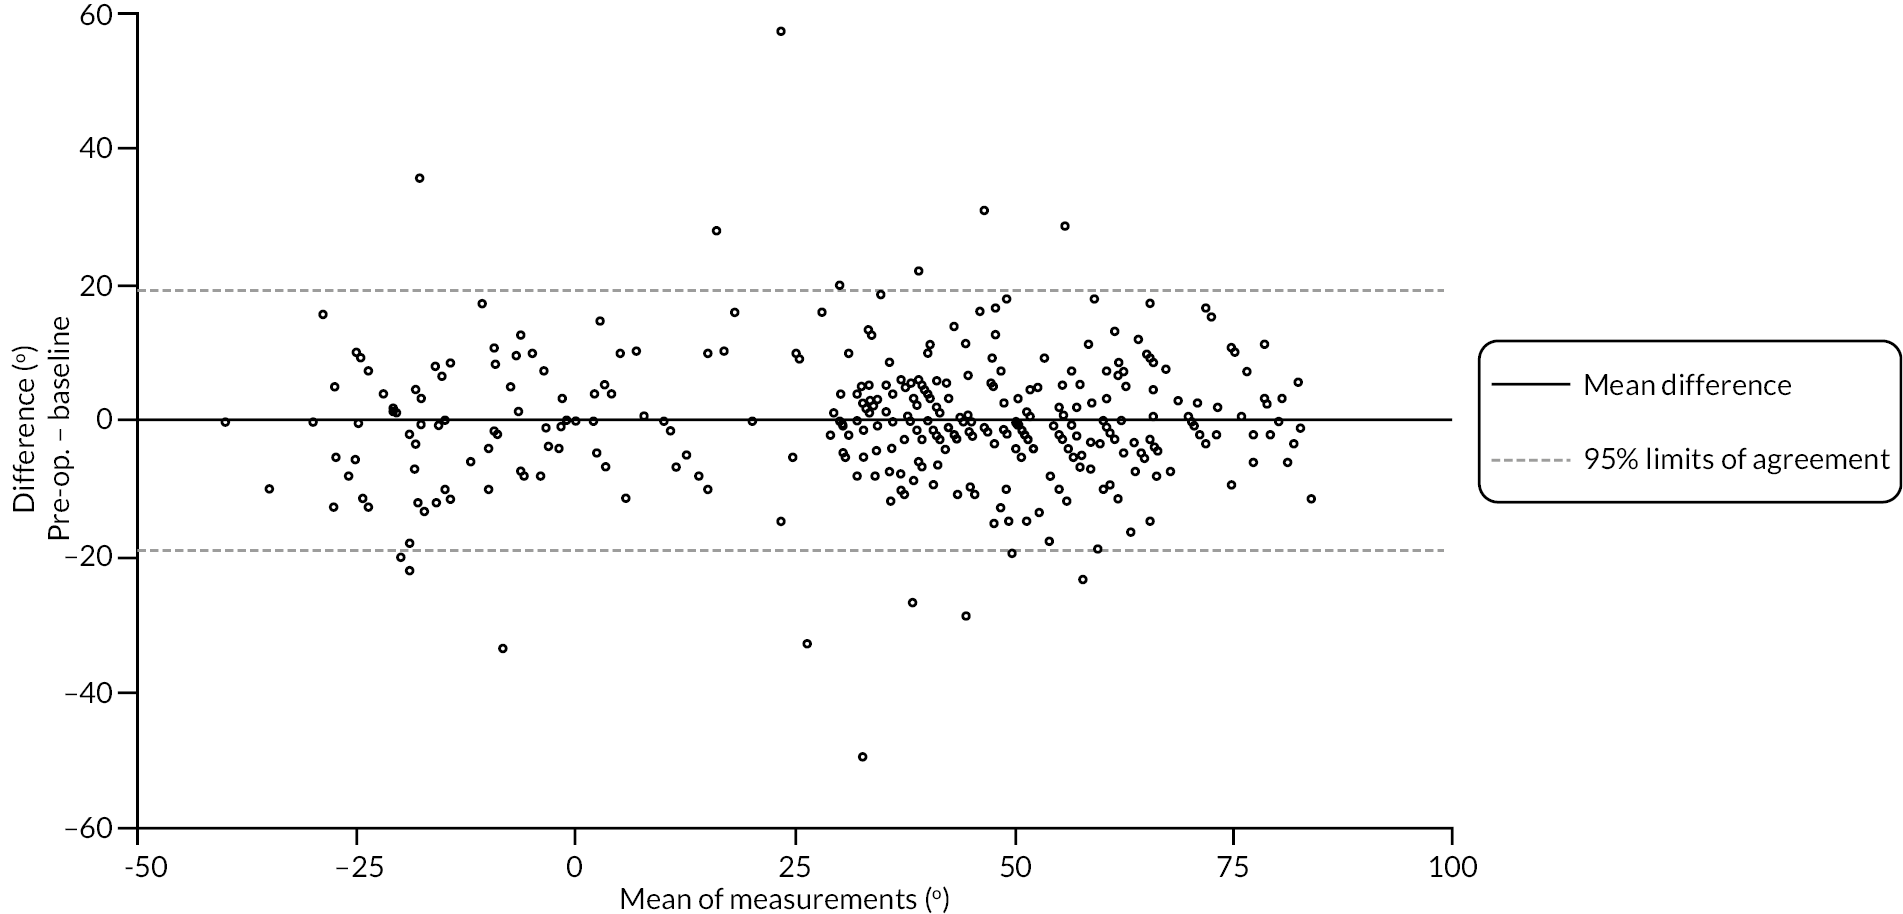
FIGURE 63.
Graphical summaries of the goniometric PIP extension measurements at baseline and pre-operative.
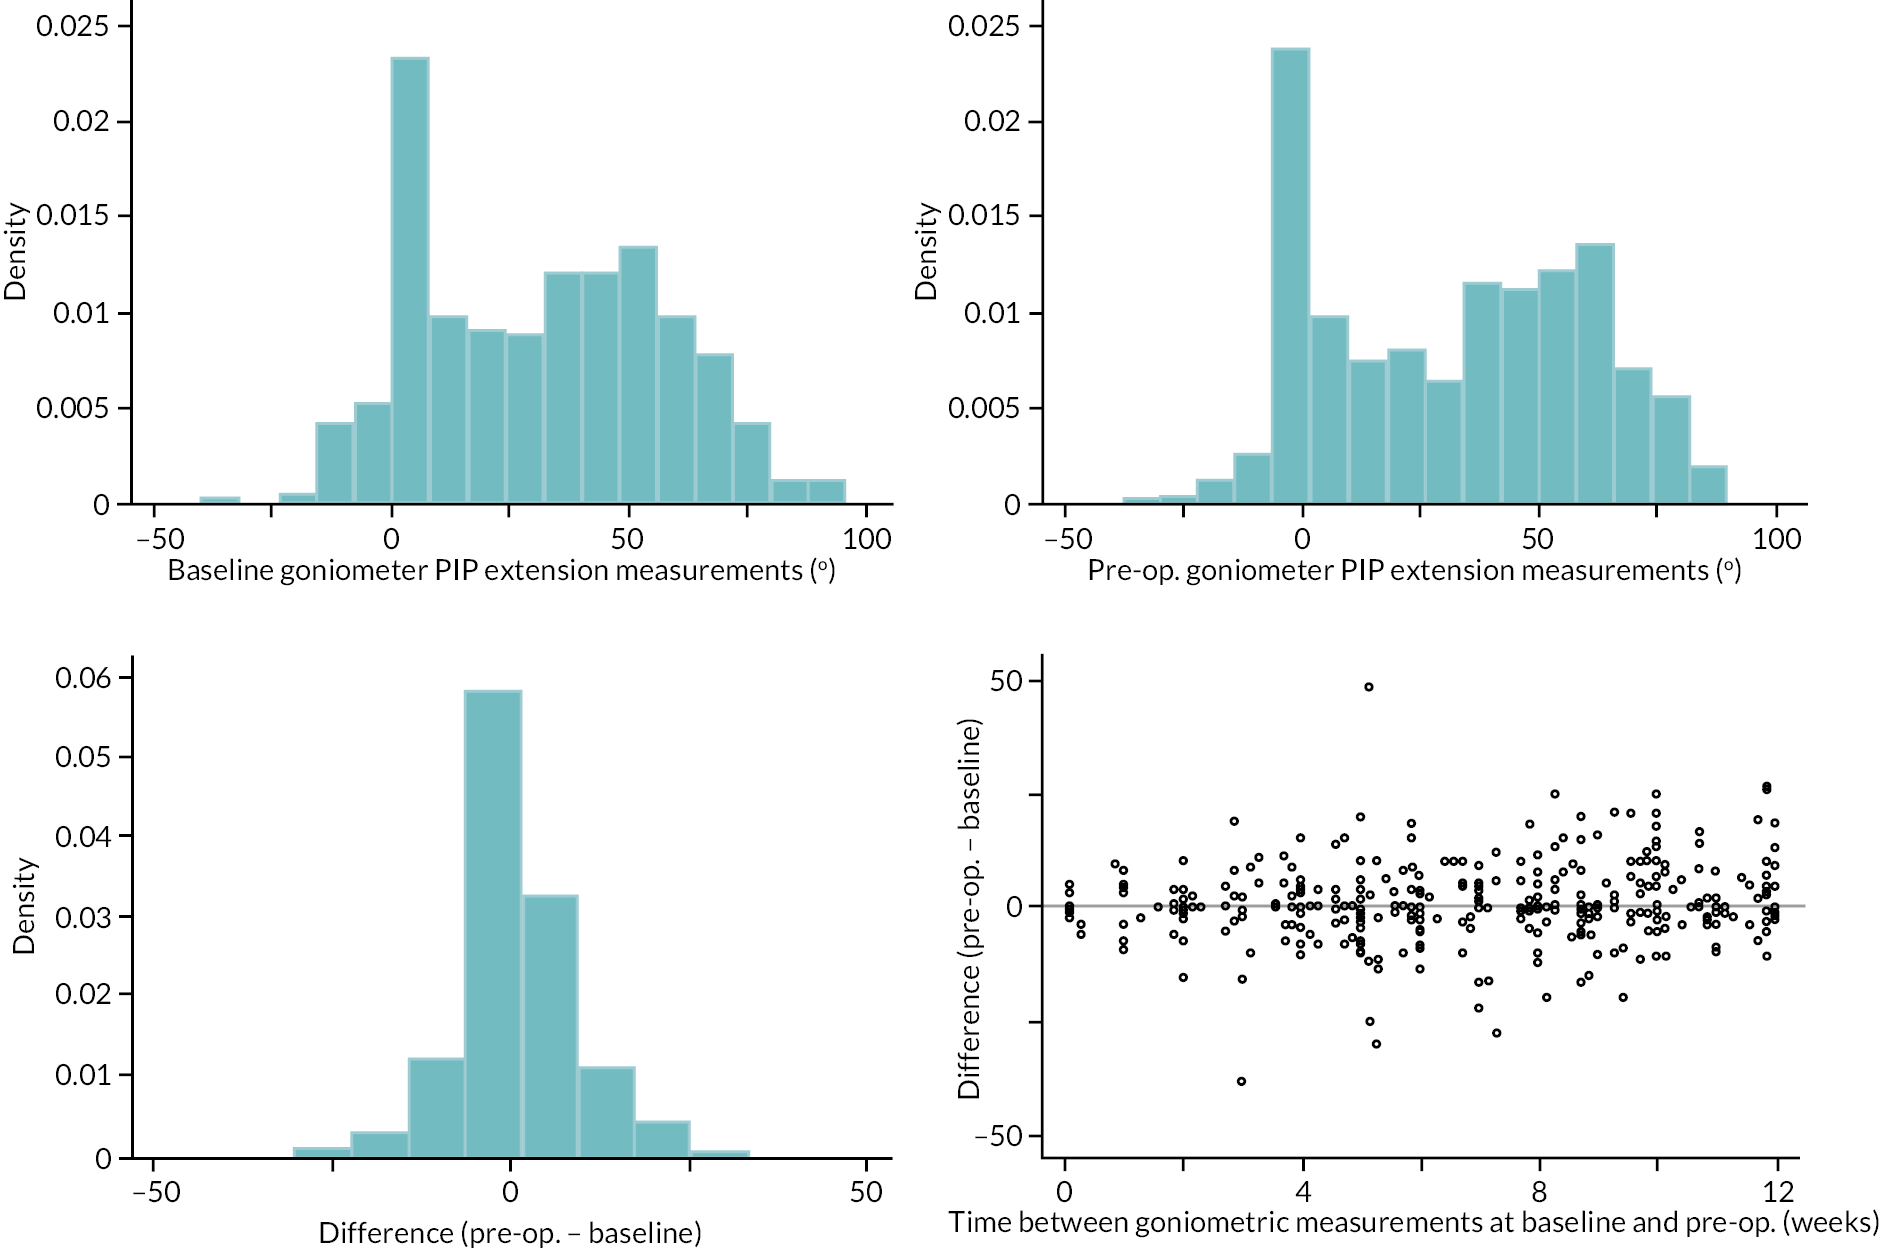
FIGURE 64.
Limits of agreement for the baseline and pre-operative goniometric PIP extension measurements.
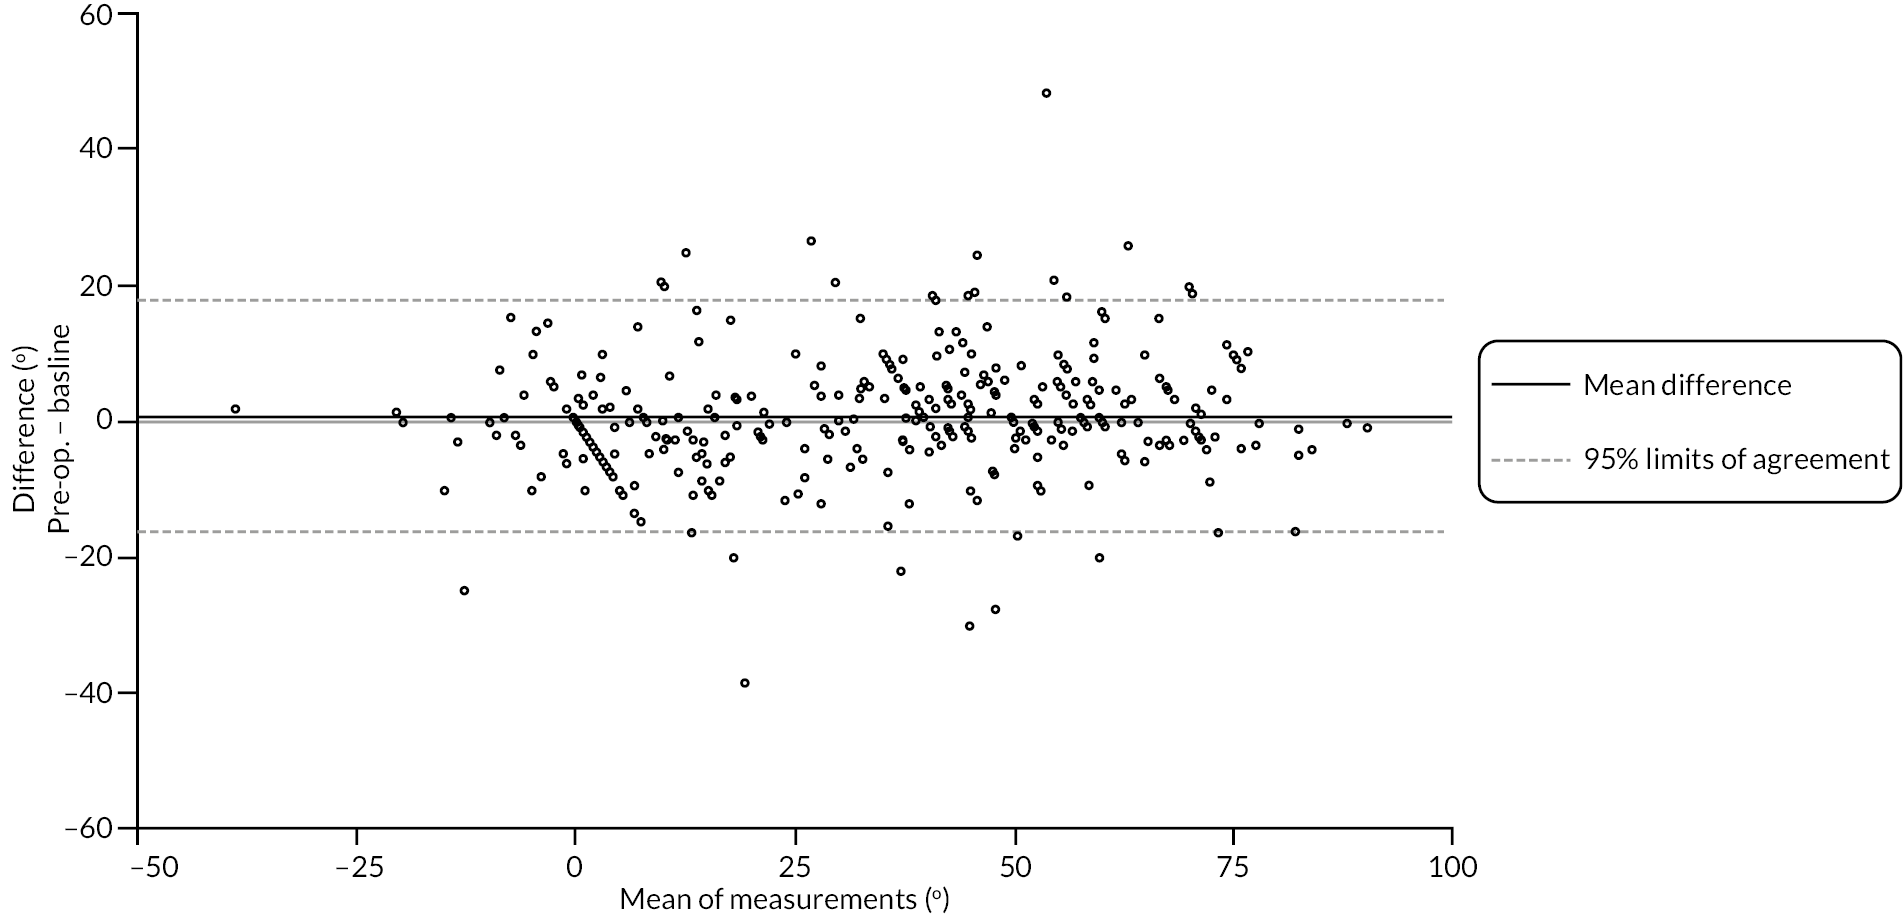
FIGURE 65.
Graphical summaries of the goniometric DIP extension measurements at baseline and pre-operative.
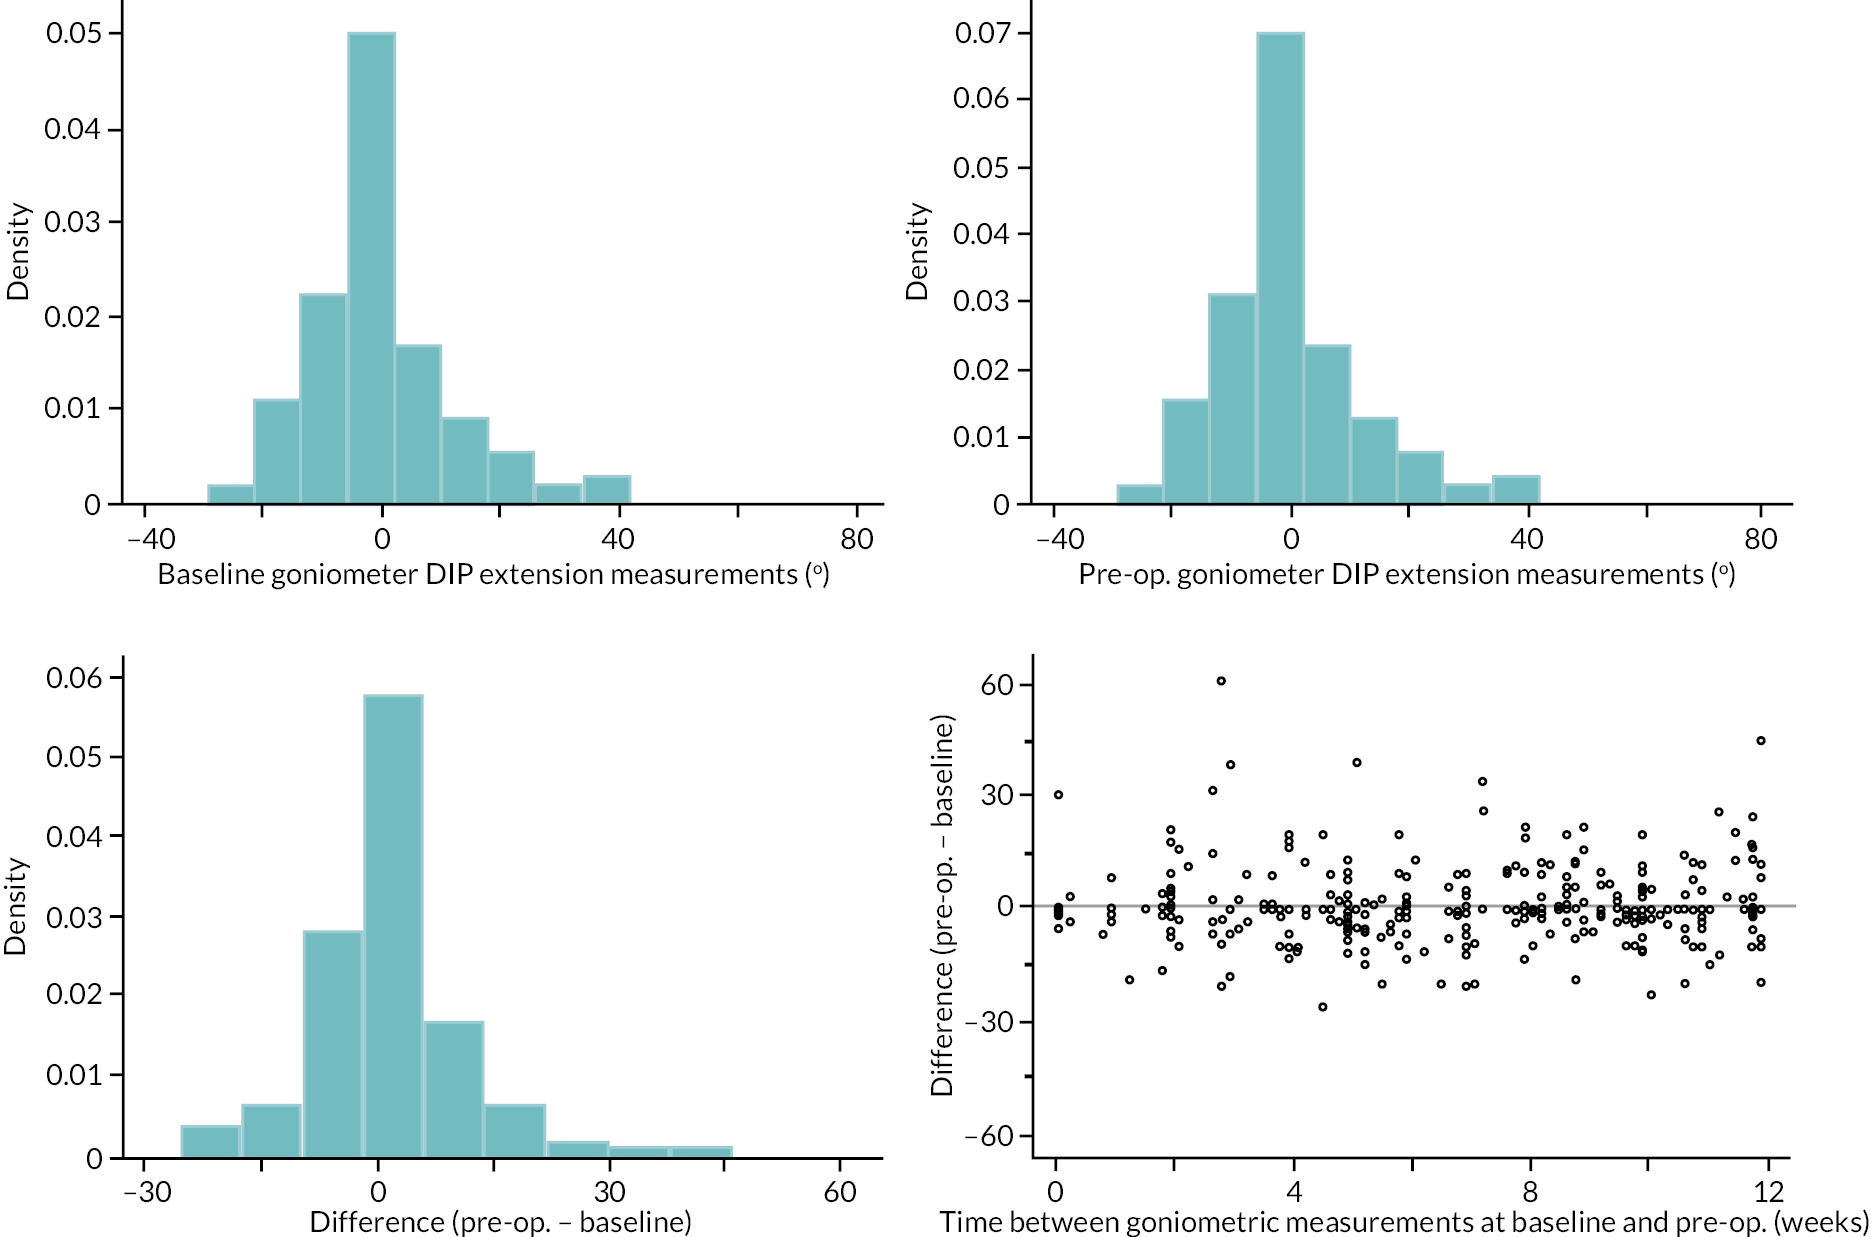
FIGURE 66.
Limits of agreement for the baseline and pre-operative goniometric DIP extension measurements.
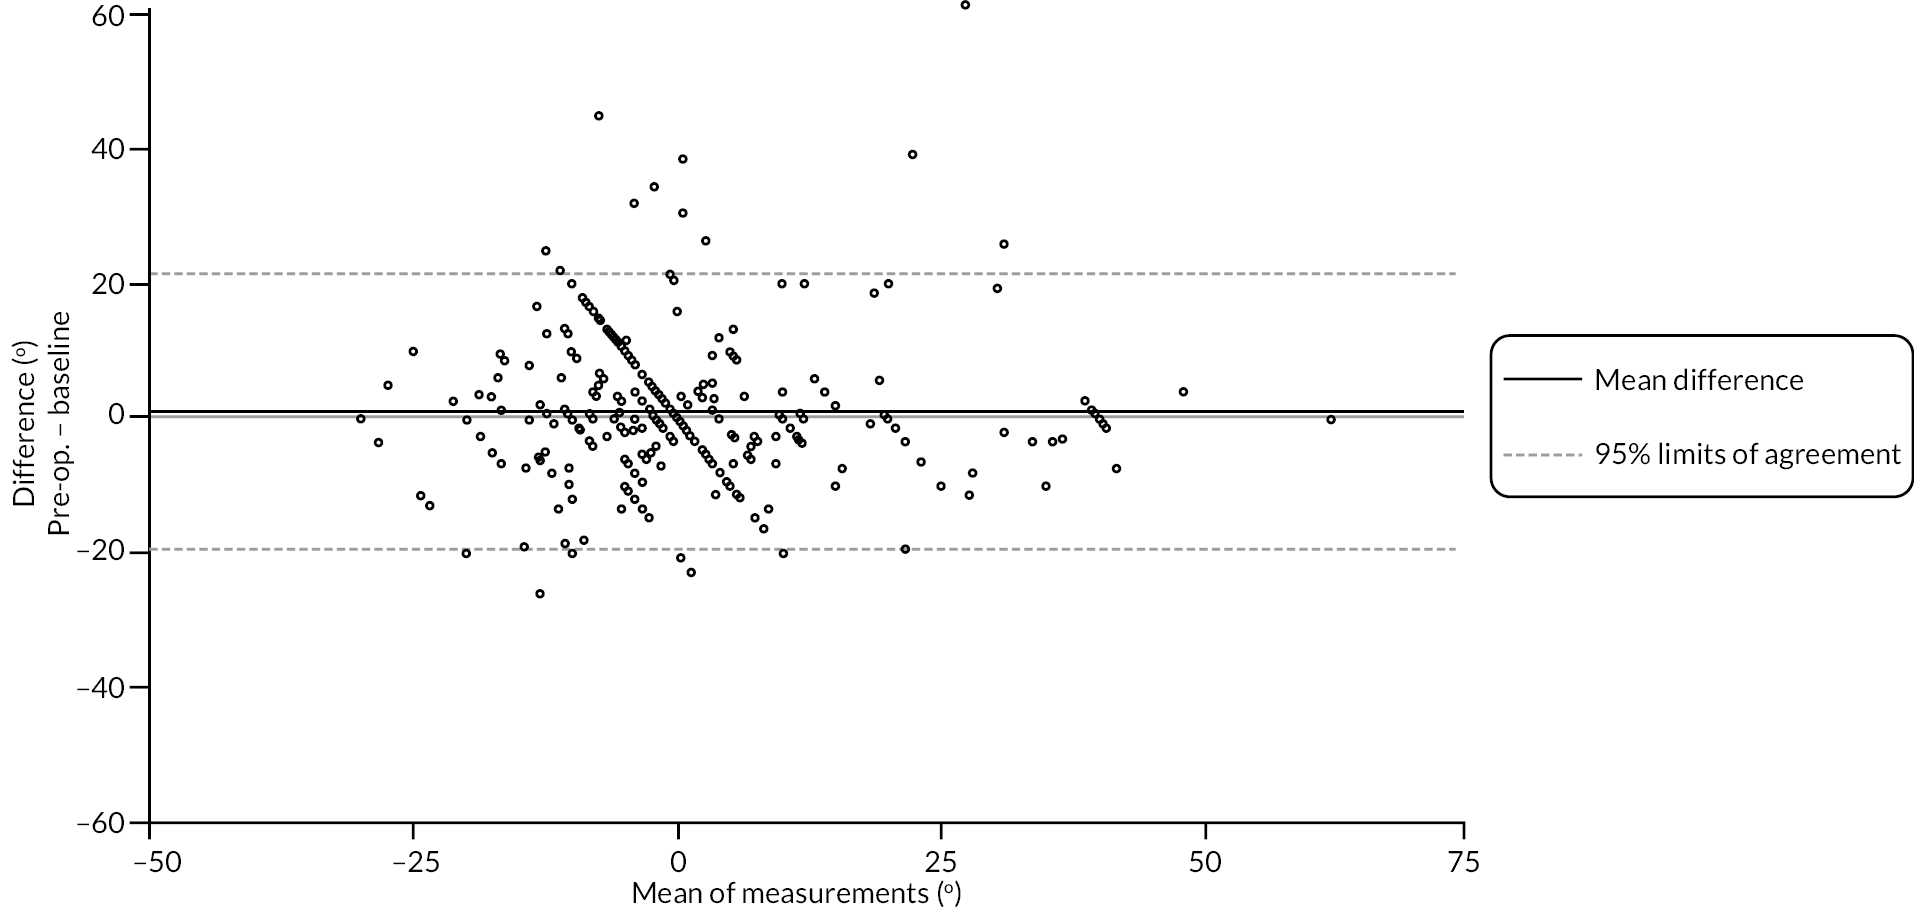
The mean difference between goniometric MCP measurements at each time point was close to zero across the range of contracture severities. The 95% limits of agreement were approximately ± 20 degrees, with little evidence to suggest important variation in agreement over the range of contracture severities (see Table 55 and Figures 61 and 62).
Similarly for the PIP measurements, mean difference between the measurements was close to zero and stable over the observed range of contracture severities. The agreement between measurements made at each time point was roughly constant across the range of contracture severities, with estimated 95% limits of agreement of about ± 18 degrees (see Table 56 and Figures 63 and 64).
The mean difference between goniometric DIP measurements at each time point was again close to zero, with little evidence of any systematic relationship between agreement and contracture magnitude. The 95% limits of agreement were approximately ± 20 degrees, with little evidence to suggest important variation in agreement over the range of contracture severities (see Table 57 and Figures 65 and 66).
Agreement between baseline and pre-operative photographic extension measurements
Tables 58–60 and Figures 67–72 show the baseline and pre-operative photographic active extension deficit measurements for the DISC trial participants who received treatment within 12 weeks of baseline and had at least one pair of measurements (at baseline and treatment delivery) available.
| Photographic active extension deficit MCP (°) – baseline | |
| N | 252 |
| Mean (SD) | 23.6 (24.6) |
| Median (Q1, Q3) | 23.0 (8.3, 37.5) |
| Minimum, maximum | −57.0, 89.0 |
| Photographic active extension deficit MCP (°) – pre-operative | |
| N | 247 |
| Mean (SD) | 23.0 (25.0) |
| Median (Q1, Q3) | 22.0 (7.0, 40.0) |
| Minimum, maximum | −55.0, 90.0 |
| Photographic active extension deficit MCP (°) – difference (pre-operative – baseline) | |
| N | 240 |
| Mean (SD) | −1.0 (13.4) |
| Median (Q1, Q3) | −0.5 (−6.5, 5.5) |
| Minimum, maximum | −56.5, 43.5 |
| Time between photographic measurements at baseline and pre-operative (weeks) | |
| N | 240 |
| Mean (SD) | 6.9 (3.1) |
| Median (Q1, Q3) | 6.9 (4.6, 9.6) |
| Minimum, maximum | 0.0, 12.0 |
| Photographic active extension deficit PIP (°) – baseline | |
| N | 252 |
| Mean (SD) | 36.5 (26.5) |
| Median (Q1, Q3) | 36.5 (10.5, 57.0) |
| Minimum, maximum | −14.0, 89.0 |
| Photographic active extension deficit PIP (°) – pre-operative | |
| N | 247 |
| Mean (SD) | 37.4 (27.8) |
| Median (Q1, Q3) | 36.0 (10.0, 61.0) |
| Minimum, maximum | −8.0, 89.0 |
| Photographic active extension deficit PIP (°) – difference (pre-operative – baseline) | |
| N | 241 |
| Mean (SD) | 1.2 (13.5) |
| Median (Q1, Q3) | 0.5 (−6.0, 7.0) |
| Minimum, maximum | −57.5, 52.0 |
| Time between photographic measurements at baseline and pre-operative (weeks) | |
| N | 241 |
| Mean (SD) | 6.9 (3.1) |
| Median (Q1, Q3) | 7.0 (4.7, 9.6) |
| Minimum, maximum | 0.0, 12.0 |
| Photographic active extension deficit DIP (°) – baseline | |
| N | 253 |
| Mean (SD) | 4.9 (12.6) |
| Median (Q1, Q3) | 2.5 (0.5, 8.0) |
| Minimum, maximum | −45.0, 65.0 |
| Photographic active extension deficit DIP (°) – pre-operative | |
| N | 247 |
| Mean (SD) | 3.9 (11.8) |
| Median (Q1, Q3) | 3.5 (0.5, 7.0) |
| Minimum, maximum | −50.0, 47.0 |
| Photographic active extension deficit DIP (°) – difference (pre-operative – baseline) | |
| N | 241 |
| Mean (SD) | −0.5 (7.5) |
| Median (Q1, Q3) | 0.0 (−4.0, 3.0) |
| Minimum, maximum | −27.0, 25.5 |
| Time between photographic measurements at baseline and pre-operative (weeks) | |
| N | 241 |
| Mean (SD) | 6.9 (3.1) |
| Median (Q1, Q3) | 7.0 (4.7, 9.6) |
| Minimum, maximum | 0.0, 12.0 |
FIGURE 67.
Graphical summaries of the photographic MCP extension measurements at baseline and pre-operative.
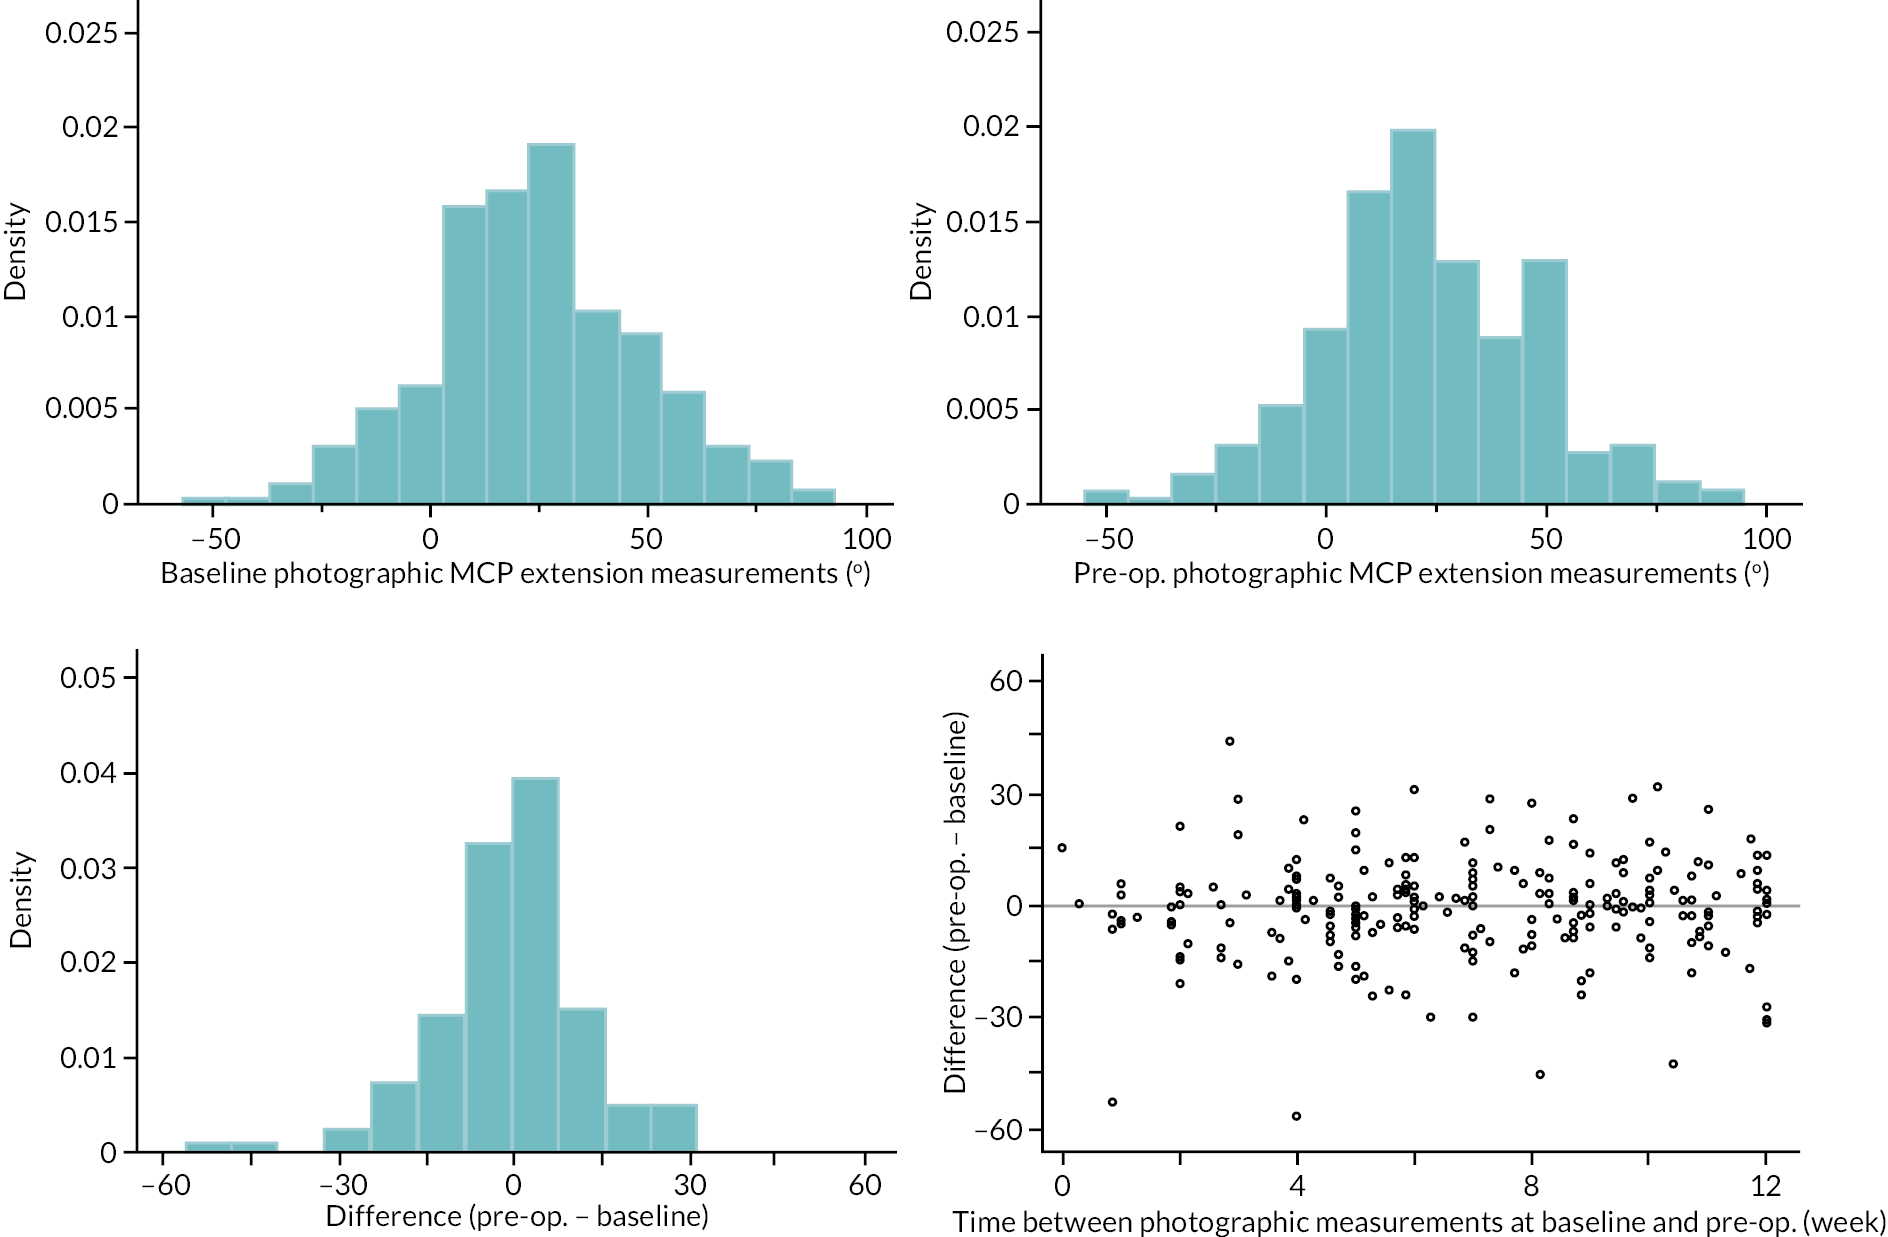
FIGURE 68.
Limits of agreement for the baseline and pre-operative photographic MCP extension measurements.
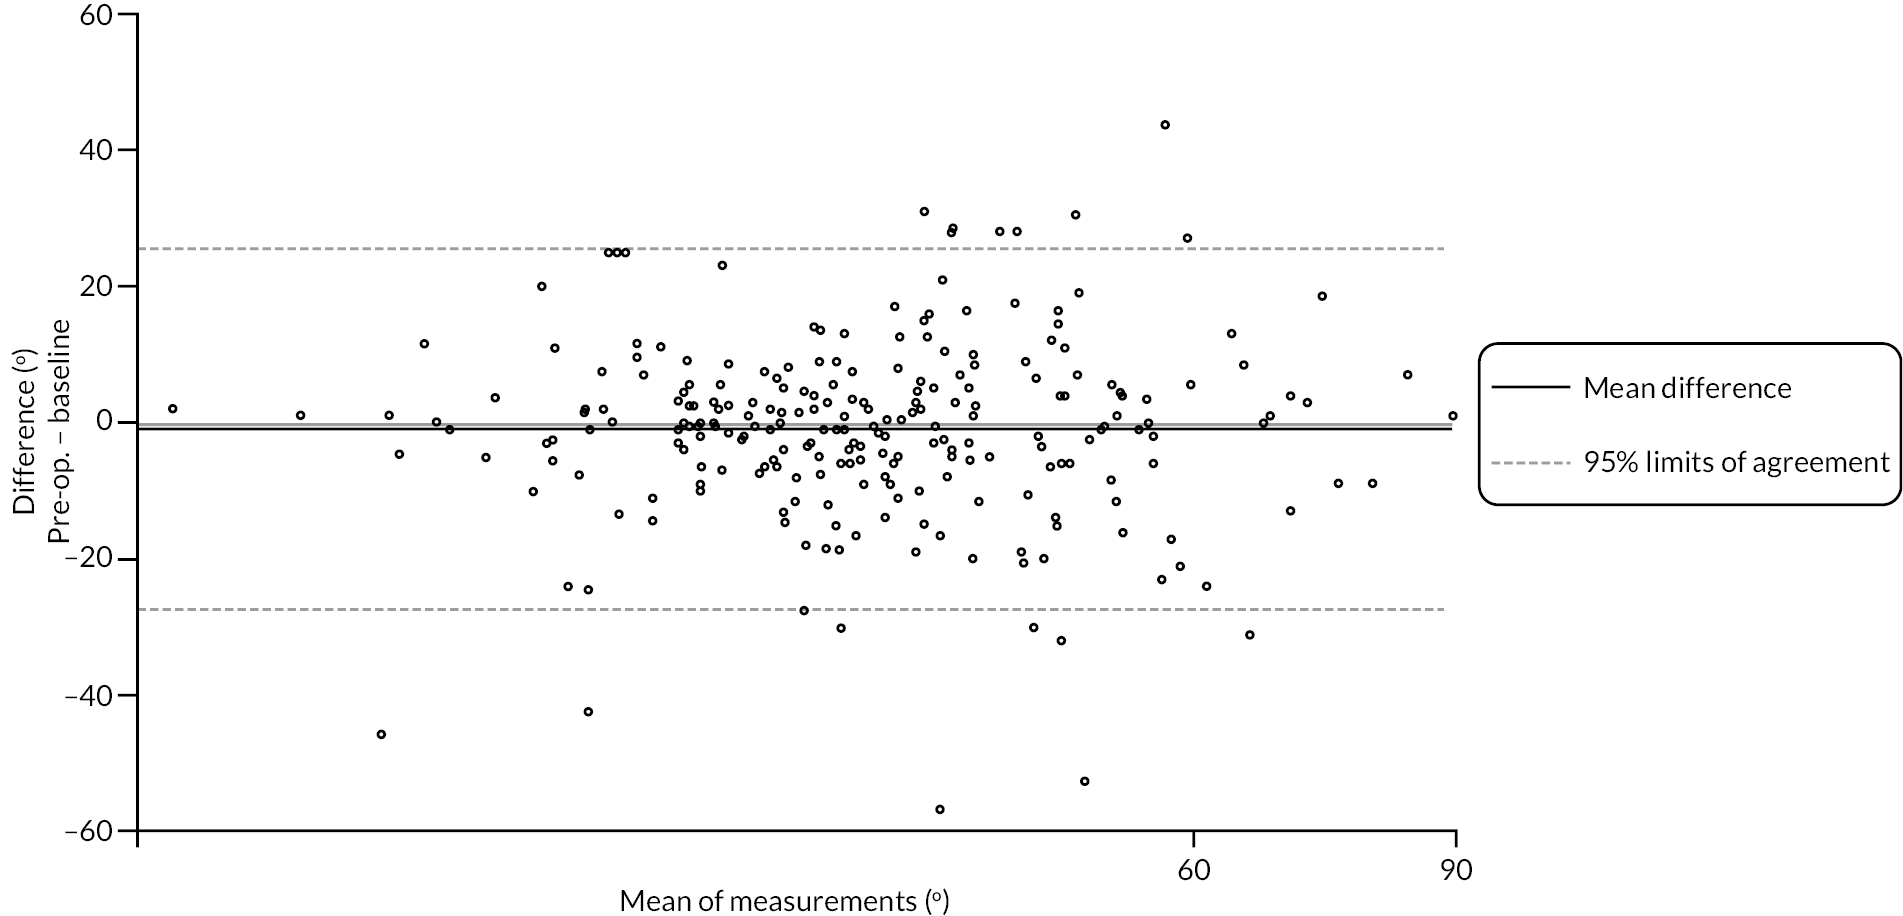
FIGURE 69.
Graphical summaries of the photographic PIP extension measurements at baseline and pre-operative.
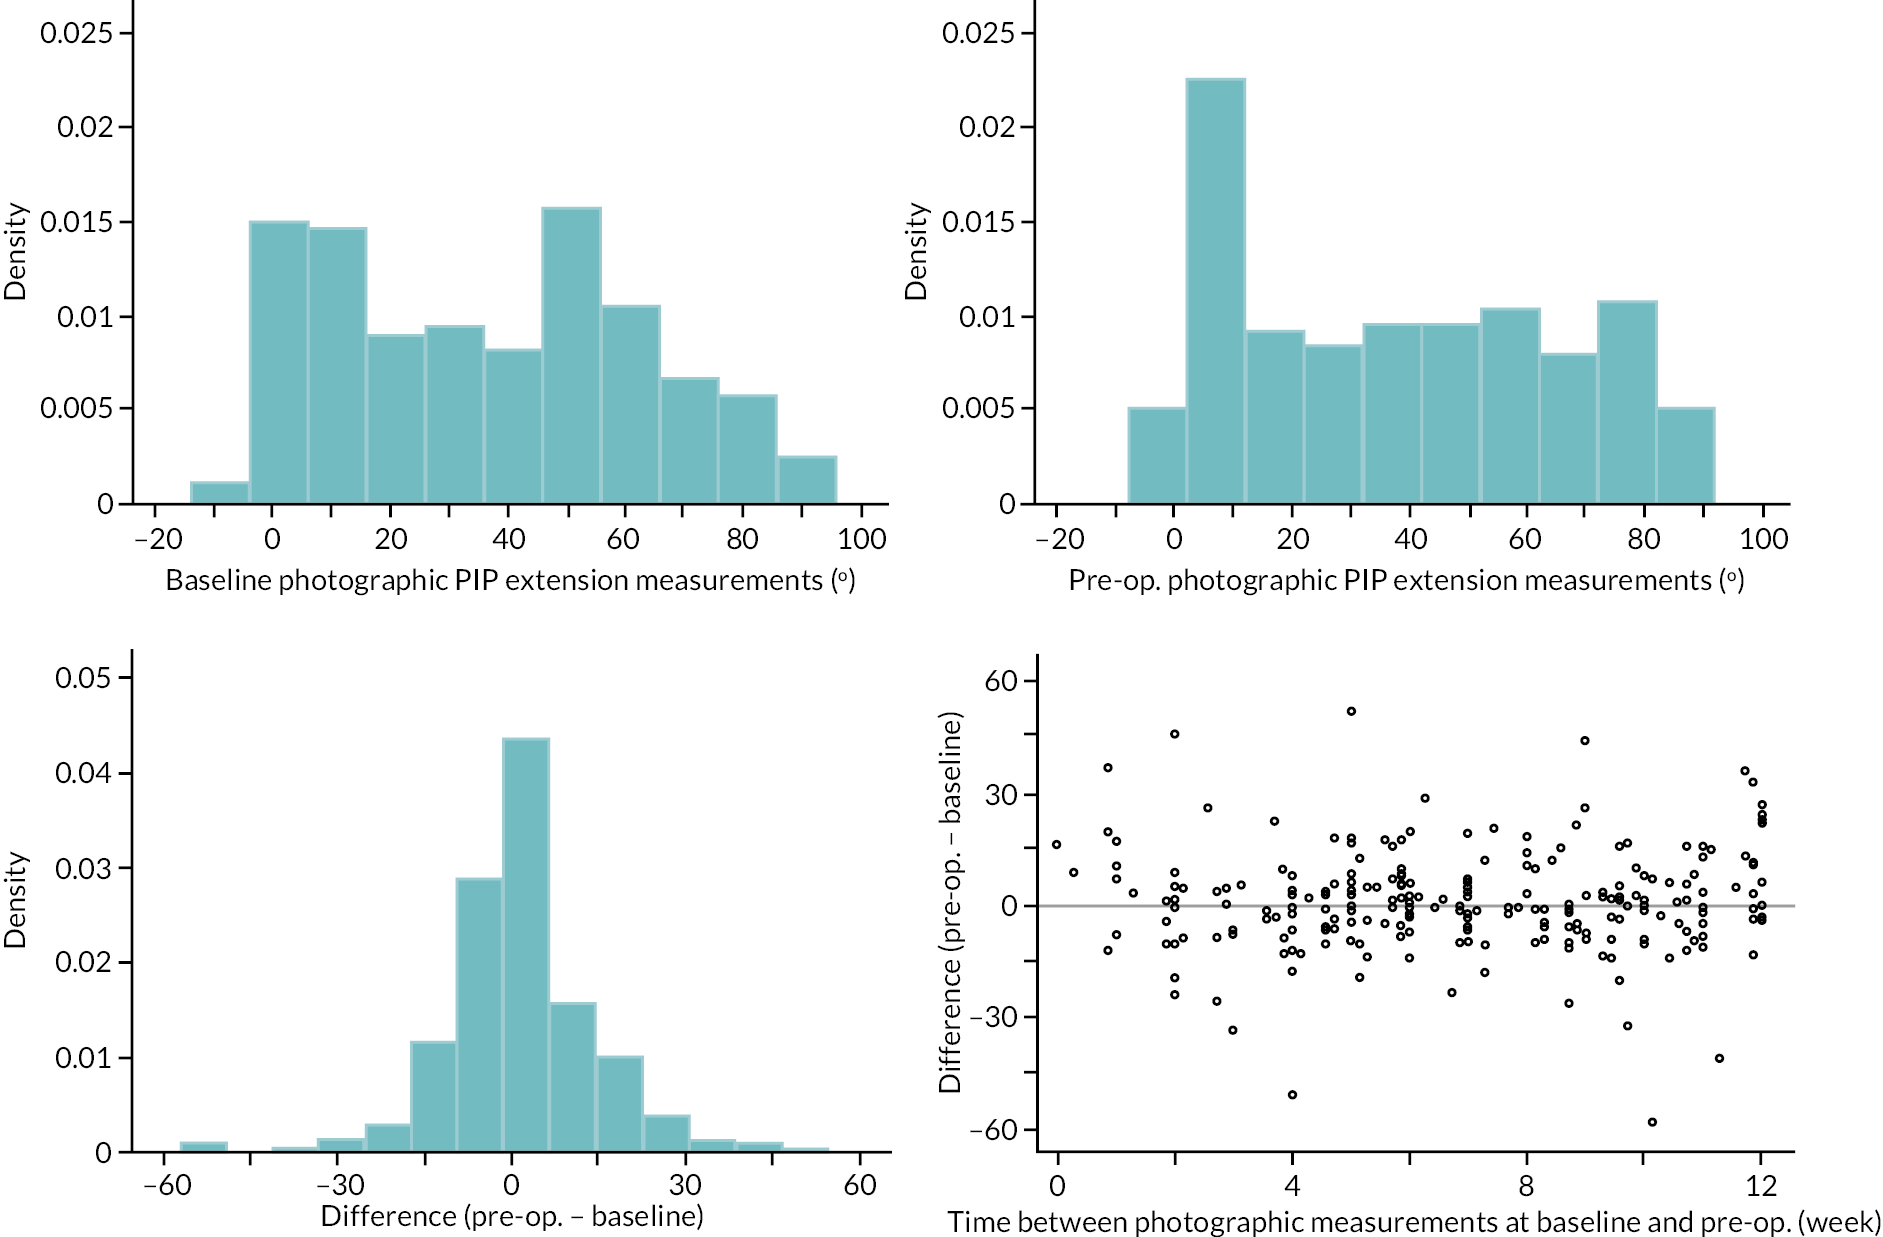
FIGURE 70.
Limits of agreement for the baseline and pre-operative photographic PIP extension measurements.
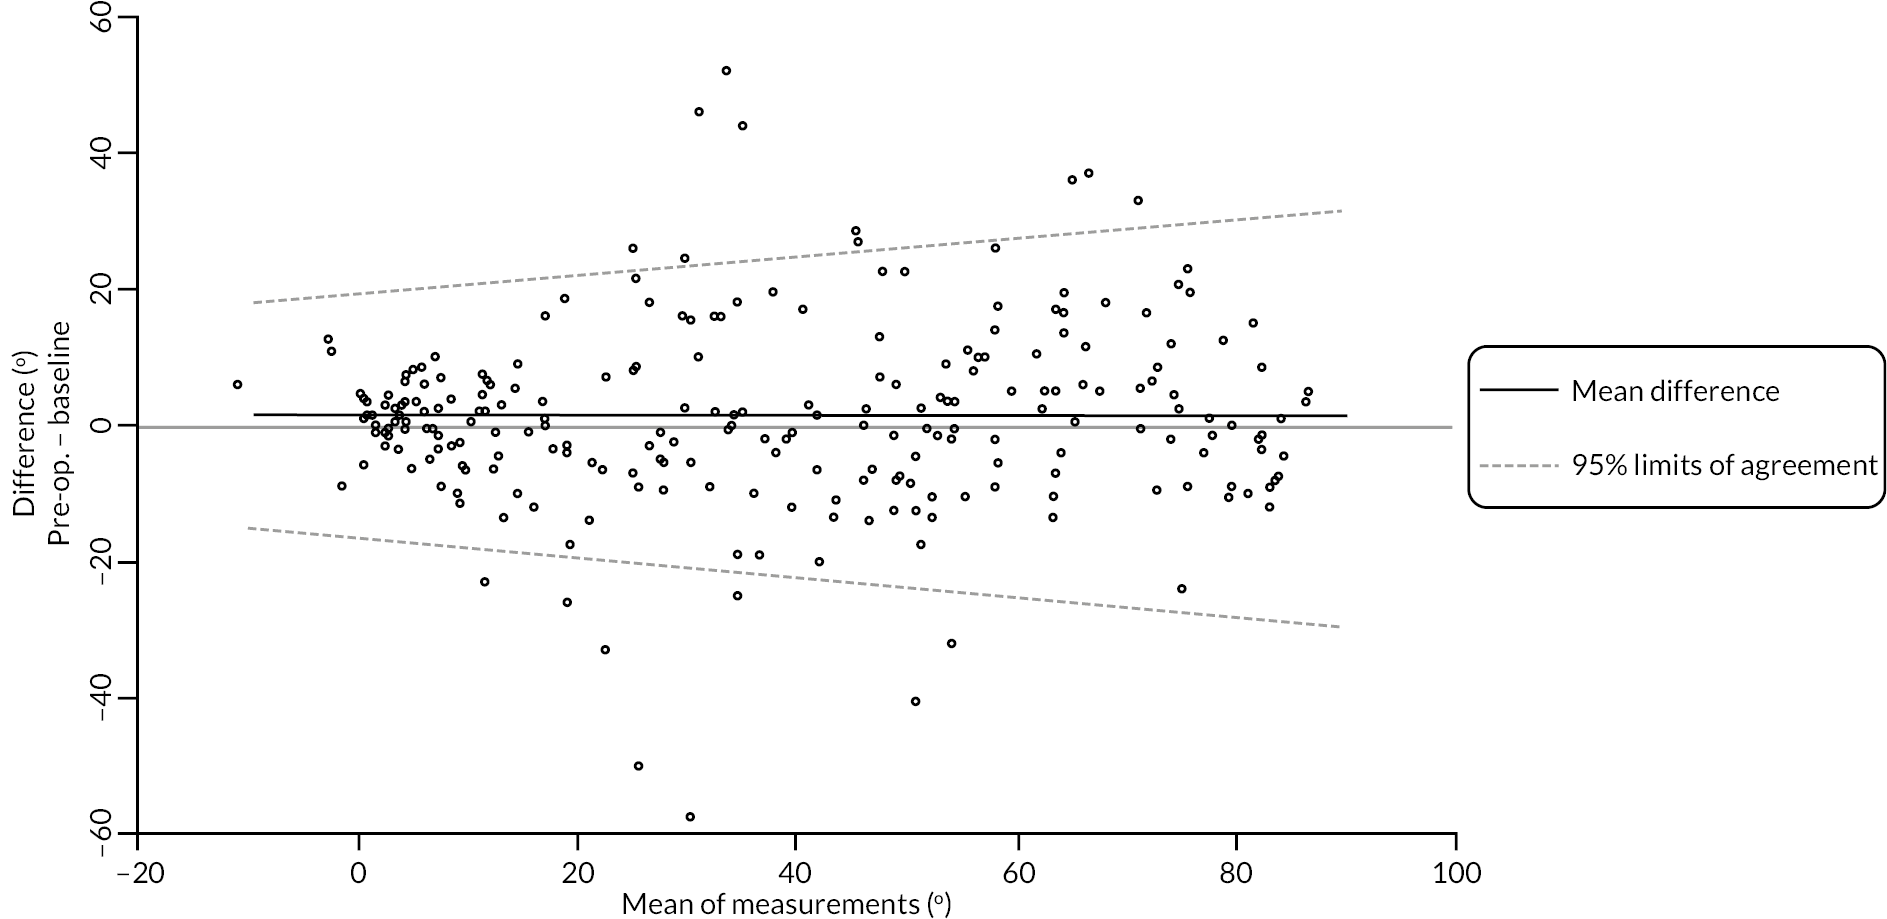
FIGURE 71.
Graphical summaries of the photographic DIP extension measurements at baseline and pre-operative.
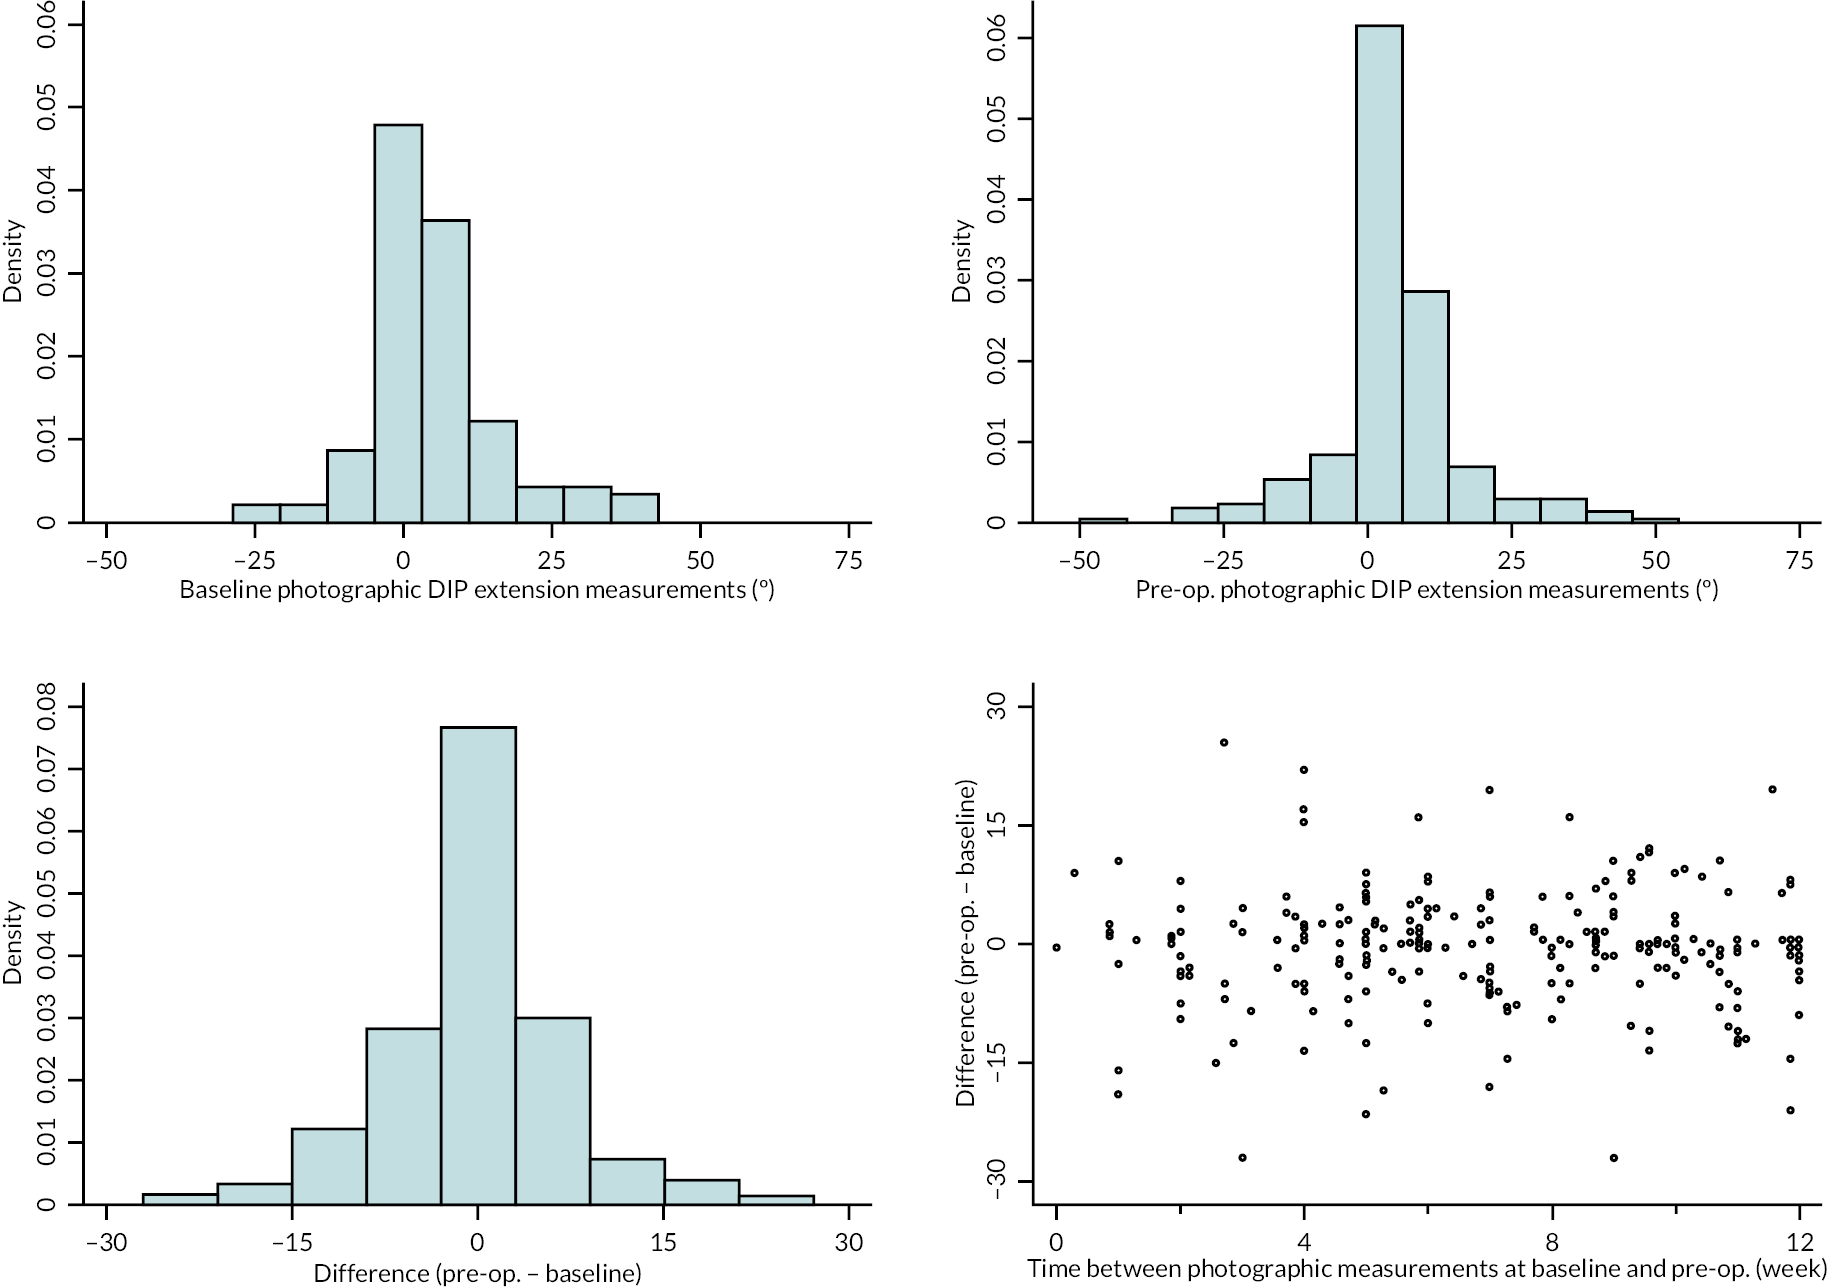
FIGURE 72.
Limits of agreement for the baseline and pre-operative photographic DIP extension measurements.
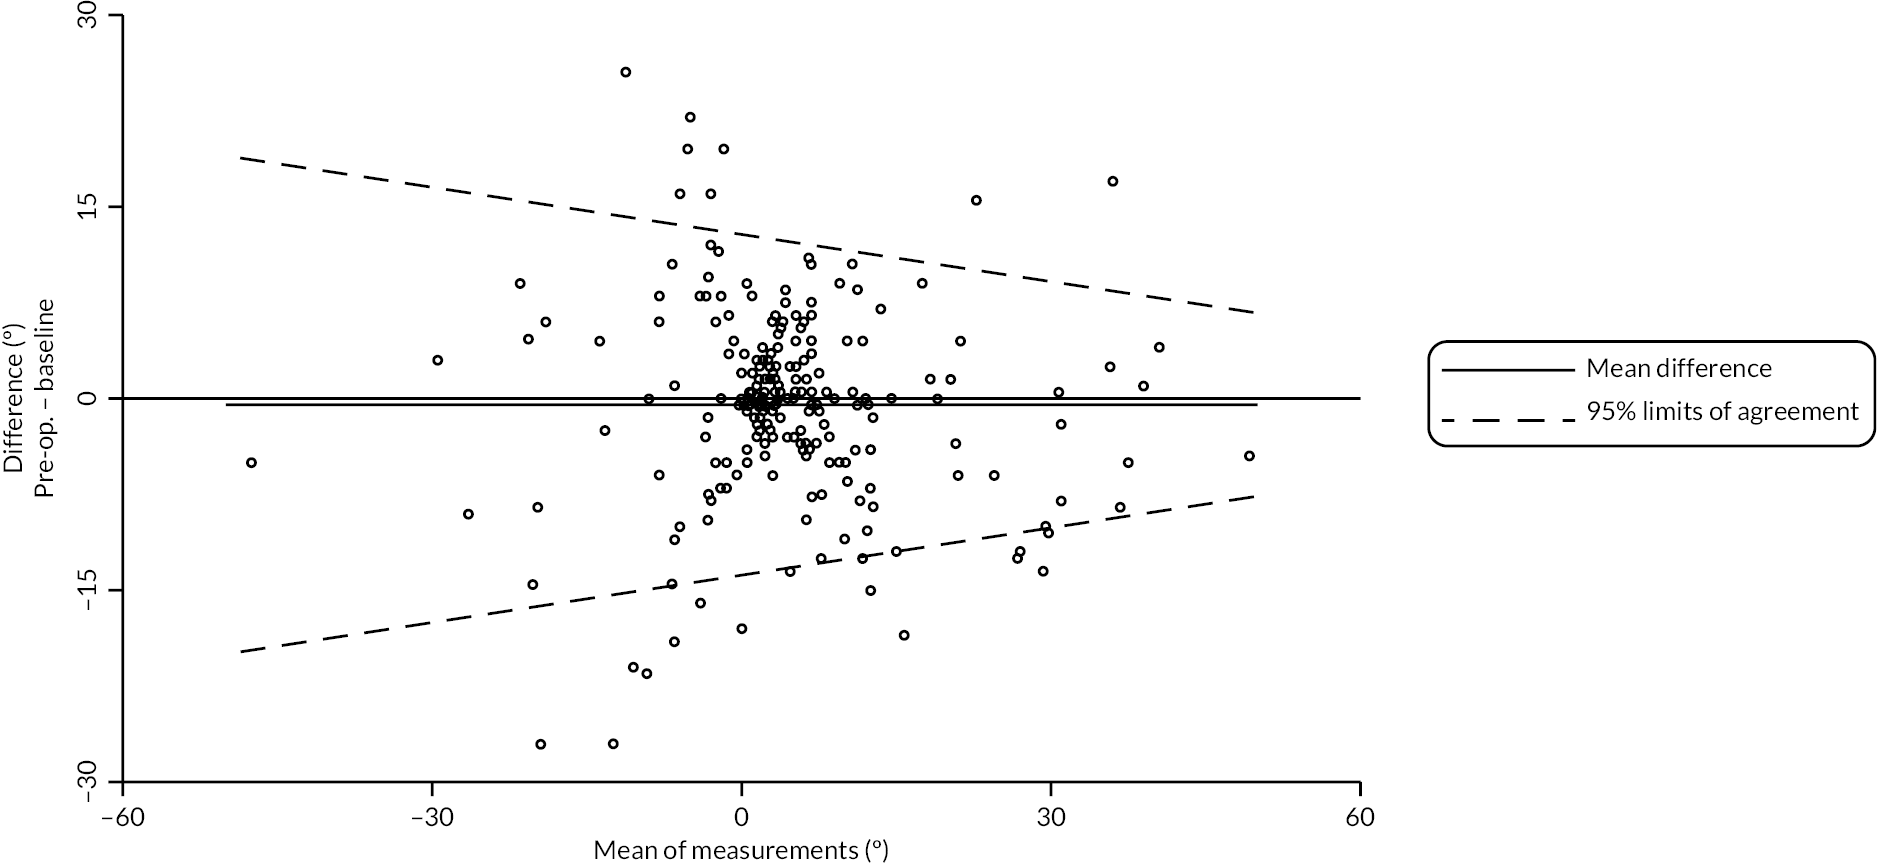
The mean difference between MCP measurements at each time point was minimal, and roughly constant over the range of estimated contracture magnitudes. The extent of agreement was stable over the range of contracture magnitudes, with 95% limits of agreement of approximately ± 25 degrees (see Table 58 and Figures 67 and 68).
The mean difference between PIP measurements at each time point was minimal and approximately stable across the range of observed magnitudes of contracture. The estimated 95% limits of agreement were about ± 20 degrees for contractures of about 0 degrees, but got wider with increasing severity of joint contracture (see Table 59 and Figures 69 and 70).
The mean difference between DIP measurements at each time point was again small and roughly constant across the range of contracture magnitudes. The estimated 95% limits of agreement suggest agreement between the measurements made at each time point was better for more severely contracted joints (about ± 12 degrees for contractures of about 30 degrees), with slightly poorer agreement apparent as extension deficit decreased (see Table 60 and Figures 71 and 72).
Discussion
This substudy showed that there was generally poor agreement between the two methods of measurement and even after systematic trends in the differences are accounted for, substantial variation remains. This leads to 95% limits of agreement (i.e. the range around the estimated mean difference within which we would expect 95% of differences between the two methods to lie) that are considerably wider than the standard error of measurement associated with goniometry used alone. For example, the 95% limits of agreement for the MCP joint are about ± 30 degrees, suggesting measurements of the same joint contracture by each method are reasonably likely to differ by as much as 30 degrees. Agreement (between the two methods) for extension measurements of the PIP joint appears to depend strongly on the magnitude of the contracture being measured. However, for contractures of 45 degrees or more, the 95% limits of agreement are at least ± 30 degrees, which again suggests poor agreement between the two methods when measuring PIP joint contracture in DC patients with PIP joint involvement. Goniometric and photographic measurement methods both had wide limits of agreement when measurements were repeated.
Most extension measurements were based on photographs that were deemed measurable (86–87%) with only 4–5% of measurements being based on photographs that showed substantial departure from the guidance/instructions provided. A smaller majority of flexion measurements were based on photographs that were deemed measurable (64%) with 9% of measurements being based on photographs that showed substantial departure from the guidance/instructions provided. All joints measured showed broad limits of agreement.
Photographs in extension are taken with the affected hand in supination with the dorsum of the hand and wrist flat on a table, which limits hyperextension of the hand and wrist joints. Goniometry is usually performed with the patient’s hand in pronation with the investigator supporting the hand. This enables movement at the wrist during measurements, allowing for better assessment of hyperextension. The fasciodesis effect from wrist extension likely influences goniometric assessments as the wrist position is less controlled than with photographs. It will increase contractures measured at the MCP and PIP joints and may explain the larger extension deficit at the MCP joint with goniometry.
Photographs in extension measure active extension. The participants other hand is holding the camera and they cannot passively stretch the joint further. Goniometric measurement often involves some passive extension with the investigator stretching the finger against the goniometer. This may account for the larger extension deficit seen with measurement of the PIP and DIP joints from photographs. The difference between techniques suggests they cannot be used interchangeably to assess contractures in DC and thresholds that may trigger intervention based on repeated goniometry measurements over time cannot be applied to values obtained from a mixture of goniometric and photographic measurements over time.
The quality of participant taken photographs in extension was high with the vast majority graded as definitely measurable. This was higher than our previous study where 71% of participants returned suitable photographs. 153 The quality of photographs in flexion was lower, frequently due to participants not making a tight fist, with the MCP joints not being fully flexed. Agreement between goniometric measurements and investigator completed photography was similar to agreement between goniometric measurements and participant-taken photographs. This suggests patients can provide photographs of comparable quality to investigators. There was limited evidence of any important variation in agreement between participating sites indicating broadly similar quality photographs from investigators across the trial sites.
Dupuytren’s contracture is a common, slowly progressive condition which often recurs after treatment and requires long-term monitoring and multiple clinic visits. An effective remote assessment method would have large benefits for patients, clinicians, and the NHS. The use of photography for the evaluation of contractures has many obvious advantages. It is low cost, safe, and sustainable. It can enable the remote assessment of DC. Virtual consultations are increasingly common and are popular with patients. 150,152 They are convenient, avoid travel and reduce infection risk to patients. Photographs can be stored as a permanent record to refer to and assess response to treatment and monitor disease progression. This photographic record allows re-measurement, and some correction can be made for suboptimal panning and rotation whereas with goniometric assessment there is no capacity to check for, or correct, errors of measurement.
Photography measures active movements. These are more important to patients than passive movements as they have a greater influence on hand function. Accurate photographs of active movements rely on the participant applying maximum effort when the photograph is taken. Some patients may wish to exaggerate a deformity by not making maximum effort or not completing the hand positioning instructions fully for photographs but the numbers likely to benefit from this would be expected to be small. Goniometric measurements would seem more prone to bias as some amount of passive extension is inevitably applied by the investigator while conducting the measurement and this is difficult to control and standardise.
Evaluation of hand joint measurement methods can be assessed in various ways such as measurement error, limits of agreement and reliability. A systematic review of the reliability and measurement error of goniometry concluded there was limited evidence for good reliability and an unknown level of evidence for measurement error. 155 The authors noted that several studies mentioned the commonly accepted margin of error for goniometry is 5 degrees, but it is not clear what research this is based on or how it was calculated. Our assessment of two repeated goniometric measures of contracture before intervention (baseline and pre-operative time points) showed wide limits of agreement of about ± 20 degrees. Measurements were conducted by several investigators at each site, but all had goniometric training and followed instructions in the trial finger goniometry manual (see Report Supplementary Material 2).
Limitations of this substudy largely relate to the fact that we are comparing two methods with multiple inherent weaknesses. Goniometry is widely used, but its accuracy is uncertain. 140 Our findings question its accuracy in research and clinical practice. Problems include how measurements are defined, what is measured and the technique of measurement. 141 The amount of force applied during goniometry will also influence the amount of passive movement. Photography relies on good quality, standardised photographs, with the hand positioned correctly and accurate measurement techniques. In 9% of flexion photographs participants did not adequately follow the instructions for hand positioning. Refinement of the literature and instructions provided to participants regarding hand placement may improve this.
This substudy has shown that joint contractures measured by participant taken photography have low agreement with those measured by goniometry. Measurements taken by the two techniques should not be used interchangeably to monitor disease progression or response to treatment. Thresholds for intervention based on goniometric measurements of contracture should not be applied to photographic measurements. Limits of agreement are wide for both measurement techniques. Patients can provide high-quality photographs and the use of serial photographs is likely to provide an efficient and acceptable method for remote monitoring of DC.
Appendix 3 Protocol changes and amendments
| Protocol version | Amendment reference | Brief description of amendment |
|---|---|---|
| v1.2 | Non substantial amendment 2 |
|
| V2.0 | Substantial amendment 6 |
|
| V2.1 | Substantial amendment 9 | Clarification on photography post treatment |
| V2.2 | Substantial amendment 14 |
|
| Reference | Approval date | Brief description of amendment |
|---|---|---|
| Substantial amendment 1 | 17 October 2017 | Addition of a further six recruiting sites |
| Substantial amendment 2 | 9 April 2018 | Addition of a further five recruiting sites |
| Substantial amendment 3 | 6 June 2018 | Addition of a further 16 recruiting sites |
| Substantial amendment 4 | 20 July 2018 |
|
| Substantial amendment 5 | 6 September 2018 | Addition of a further four recruiting sites |
| Substantial amendment 6 | 25 October 2018 |
|
| Substantial amendment 7 | 11 January 2019 | Change to PI at one study site |
| Substantial amendment 8 | 24 January 2019 | Change to PI at one study site |
| Substantial amendment 9 | 2 April 2019 | Clarification on photography post treatment and introduction of a thank you card for participants |
| Substantial amendment 10 | 31 May 2019 | Change of PI at one study site |
| Substantial amendment 11 | 20 June 2019 | Addition of a further site |
| Substantial amendment 12 | 22 August 2019 | Change of PI at one study site |
| Substantial amendment 13 | 08 January 2020 |
|
| Substantial amendment 14 | 20 August 2020 |
|
| Substantial amendment 15 | 28 April 2021 | Change to PI at one study site |
| Reference | Approval date | Brief description of amendment |
|---|---|---|
| Non-substantial amendment 1 | 03 July 2017 | Rectification of omission of MHQ in the baseline participant CRF (as provided to HRA for initial review). |
| Non-substantial amendment 2 | 30 October 2017 |
|
| Non-substantial amendment 3 | 11 June 2018 | Approval of participant details form (intended for researcher completion) following query from site during set-up |
| Non-substantial amendment 4 | 26 July 2018 | Revision to SPC for Xiapex |
| Non-substantial amendment 5 | 19 December 2018 | Approval of a form to enable participants to be paid incentive payments by the sponsor for their involvement in the study, in instances where research sites are unable to facilitate this |
| Non-substantial amendment 6 | 18 January 2019 | Amendment to DISC trial A4 1 cm grid to include images to provide visual clarifications for participants in photography substudy. Addition of patient facing equipoise video. Addition of automated text response to request photography substudy images are resent when inadequate quantity or quality of images are sent. Addition of brief postal reminder to be sent to participants who consent to take part in photography substudy to remind them to take and submit images. Addition of documentation required to conduct stakeholder engagement activities (brief interviews) in relation to recruitment activity. |
| Non-substantial amendment 7 | 29 August 2019 |
|
| Non-substantial amendment 8 | 24 March 2020 | Move to remote follow-up of participants to support study activity due to the impact of the COVID-19 pandemic |
| Non-substantial amendment 9 | 14 July 2020 | Update of SmPC |
| Non-substantial amendment 10 | 04 January 2021 | Approve a compliments slip (v1.0 8 December 2020) advising of an alternate e-mail address for participants to send their photographs to |
| Non-substantial amendment 11 | 21 January 2021 | Change the e-mail address in the reminder e-mail and SMS message for photography substudy participants, and the cover letter for non-substudy participants taking photographs as part of remote follow-up |
| Non-substantial amendment 12 | 02 July 2021 | Change in PI at one site |
| Non-substantial amendment 13 | 10 September 2021 | Change in PI at one site |
| Non-substantial amendment 14 | 18 October 2021 | Change to study end date (last patient last visit) from 31 October 2021 to 31 July 2022. Change does not affect participant follow-up processes and can be accommodated within existing resources |
| Non-substantial amendment 15 | 26 November 2021 | Change to PI at one site |
Appendix 4 Recruitment, ineligibility, non-consent, pre-treatment withdrawals and retention
| Reason for exclusiona | Number of patients |
|---|---|
| 1. Not aged 18 years or over | 0 |
| 2. No presence of discrete, palpable, contracted cord involving the MCP joint and/or PIP joint of a finger | 58 |
| 3. Degree of contracture < 30 degrees in either joint, that is patient can put the palm of the hand flat on a table (Hueston’s tabletop test) | 129 |
| 4. Not able to identify a predominant cord for treatment which would not require more than one collagenase injection as treatment | 53 |
| 5. Not appropriate for LF surgery and collagenase injection for DC [i.e. cords unsuitable for CCH and LF and/or require skin grafting or PNF (e.g. discrete MCP cords in elderly)] | 103 |
| 6. Severe contractures of both MCP joint and/or PIP joints (Tubiana Grade 4) | 43 |
| 7. History of previous intervention for DC (e.g. surgery, collagenase injection or needle fasciectomy) on the study reference digit | 91 |
| 8. History of any other pre-existing disorder of the hand causing restriction of movement and/or pain and affecting hand function, for example, post-traumatic stiffness, stiffness due to other causes (infection, arthritis, etc.) | 53 |
| 9. Non-English-speaking because of the need to complete multiple questionnaires which have not been validated in multiple languages | 2 |
| 10. Resident in a location where attendance for follow-up at one of the study recruiting centres will not be possible | 9 |
11. Contraindicated for use of collagenase including:
|
9 |
| 12. Any other significant disease or disorder (including autoimmune disorders) which, in the opinion of the investigator, may put the participant at risk because of participation in the study, or may influence the result of the study, or the participant’s ability to participate in the study | 12 |
| 13. Participation in another research study involving an investigational product in the past 12 weeks | 0 |
| 14. Female participants who report to be pregnant or breastfeeding | 0 |
| 15. Otherb | 35 |
| Reasons for non-consent (up to 9 August 2021) | |
|---|---|
| Reason for non-consent | Number of patients |
| Patient is not willing and able to give informed consent for participation in the study | 114 |
| Patient not willing to receive control treatment (LF surgery) | 85 |
| Patient not willing to receive intervention treatment (collagenase injection) | 65 |
| Concerns over COVID-19 | 0 |
| Patient did not respond to invitation | 57 |
| Patient did not attend appointment | 16 |
| Othera | 95 |
FIGURE 73.
Trial recruitment and treatment delivery over time.
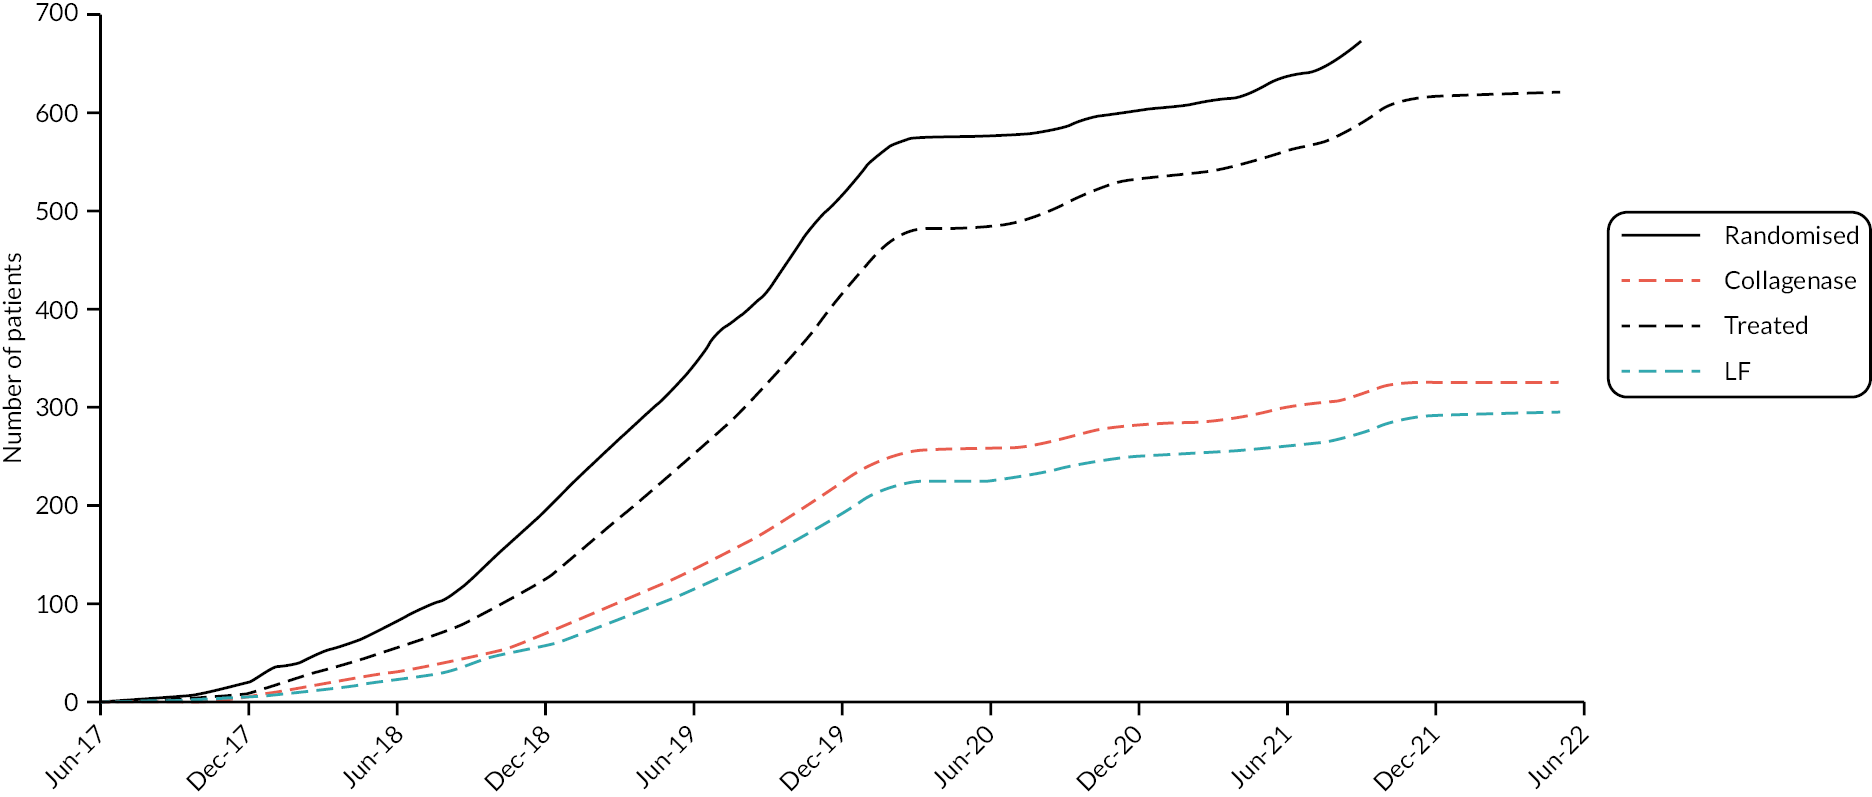
| Randomised | Not treated N (% of randomised) |
Treated N (% of randomised) |
In primary analysis N (% of randomised) |
|
|---|---|---|---|---|
| Leicester | 115 | 3 (2.6) | 112 (97.4) | 110 (95.7) |
| Derby | 67 | 4 (6.0) | 63 (94.0) | 63 (94.0) |
| Southampton | 54 | 2 (3.7) | 52 (96.3) | 52 (96.3) |
| Newcastle | 28 | 3 (10.7) | 25 (89.3) | 25 (89.3) |
| Birmingham | 49 | 5 (10.2) | 44 (89.8) | 43 (87.8) |
| Liverpool | 39 | 3 (7.7) | 36 (92.3) | 32 (82.1) |
| North Tees | 28 | 3 (10.7) | 25 (89.3) | 24 (85.7) |
| Blackburn | 23 | 1 (4.3) | 22 (95.7) | 22 (95.7) |
| Hampshire | 15 | 1 (6.7) | 14 (93.3) | 13 (86.7) |
| Plymouth | 21 | 0 (0.0) | 21 (100.0) | 21 (100.0) |
| University College London Hospitals | 1 | 0 (0.0) | 1 (100.0) | 1 (100.0) |
| St George’s | 12 | 2 (16.7) | 10 (83.3) | 10 (83.3) |
| Royal Cornwall | 15 | 0 (0.0) | 15 (100.0) | 14 (93.3) |
| Wrightington | 39 | 9 (23.1) | 30 (76.9) | 28 (71.8) |
| Warrington | 11 | 0 (0.0) | 11 (100.0) | 11 (100.0) |
| Dudley | 4 | 0 (0.0) | 4 (100.0) | 4 (100.0) |
| Oswestry | 8 | 1 (12.5) | 7 (87.5) | 7 (87.5) |
| King’s College | 5 | 0 (0.0) | 5 (100.0) | 4 (80.0) |
| Bedford | 9 | 2 (22.2) | 7 (77.8) | 6 (66.7) |
| Chelsea and Westminster | 13 | 1 (7.7) | 12 (92.3) | 11 (84.6) |
| Bolton | 11 | 2 (18.2) | 9 (81.8) | 8 (72.7) |
| Sheffield | 9 | 1 (11.1) | 8 (88.9) | 8 (88.9) |
| Gloucester | 24 | 1 (4.2) | 23 (95.8) | 21 (87.5) |
| Sunderland | 2 | 0 (0.0) | 2 (100.0) | 2 (100.0) |
| Lister | 12 | 0 (0.0) | 12 (100.0) | 12 (100.0) |
| Portsmouth | 2 | 1 (50.0) | 1 (50.0) | 0 (0.0) |
| Brighton | 18 | 3 (16.7) | 15 (83.3) | 15 (83.3) |
| Edinburgh | 8 | 0 (0.0) | 8 (100.0) | 8 (100.0) |
| Coventry | 14 | 3 (21.4) | 11 (78.6) | 10 (71.4) |
| South Tees | 1 | 0 (0.0) | 1 (100.0) | 0 (0.0) |
| Lanarkshire | 15 | 0 (0.0) | 15 (100.0) | 14 (93.3) |
| Total | 672 | 51 (7.6) | 621 (92.4) | 599 (89.1) |
| Case | Allocation | Treatment preference | Time between randomisation and withdrawal | Details |
|---|---|---|---|---|
| 1 | Surgery | Collagenase | 0 | Withdrew from the study on randomisation to the surgery group. Participant believes the collagenase treatment would provide faster return to work |
| 2 | Surgery | 0 | The participant fully withdrew once they had been informed of what they had been randomised to | |
| 3 | Surgery | Collagenase | 0 | Patient decided to withdraw from study due to deciding to have surgery on another DC on the same hand. They wanted both surgeries done at the same time for convenience |
| 4 | Surgery | Collagenase | 1 | Patient called and said that they had changed their mind not to participate in the trial and decided to completely withdraw from the study |
| 5 | Surgery | No preference | 3 | Clinic letter details that ‘the participant’s husband had contacted the research trial team at the site to disclose that the participant is suffering from memory loss and is now on a 2- week wait investigation for malignancy and is therefore not eligible for the DISC trial’ |
| 6 | Surgery | Collagenase | 15 | Patient did not want to receive allocated treatment or to be followed up |
| 7 | Surgery | No preference | 28 | The patient has decided they would have to attend too many appointments in the coming 2 years of the trial |
| 8 | Surgery | Collagenase | 43 | No longer wishes to have treatment for DC |
| 9 | Surgery | Collagenase | 51 | Patient is fully committed to their new command post and cannot go ahead with the surgery they were randomised to. Thus, patient is being withdrawn from the study |
| 10 | Surgery | Collagenase | 57 | Due to recent diagnosis of malignant neoplasm of prostate patient has chosen to come off the surgery waiting list for their Dupuytren’s and withdraw from the study |
| 11 | Collagenase | Collagenase | 98 | Patient declined to continue with planned procedure on because we could not give them 100% guarantee that they will not react to collagenase |
| 12 | Collagenase | No preference | 126 | Full withdrawal prior to treatment delivery due to their recent diagnosis and treatment for cancer |
| 13 | Surgery | Surgery | 127 | The patient did not attend the pre-assessment. After many attempts to contact by phone and letter sent by the secretary, still no response. Surgical team decided to remove them from the waiting list. The research nurse has made many attempts to call and also wrote a letter; but still not responded. The sponsors also have been informed by e-mail by the research nurse about participant being non-contactable |
| 14 | Surgery | Collagenase | 134 | Opted to have a needle fasciotomy instead |
| 15 | Surgery | Collagenase | 139 | After further discussion with treating clinician the patient decided that they no longer required any intervention/further treatment |
| 16 | Surgery | No preference | 141 | Patient decided on the day of surgery that they no longer wanted treatment and would withdraw from the trial |
| 17 | Surgery | No preference | 183 | Patient has decided that they no longer want anything done to their hand |
| 18 | Surgery | No preference | 185 | Patient was allocated surgery; unable to find a surgery date that was convenient to the patient who travels a lot for their work. Patient has subsequently paid to have the injection privately and wishes for no further involvement in the DISC trial |
| 19 | Collagenase | No preference | 223 | Participant stated pre-treatment that they wanted to withdraw from the study |
| 20 | Surgery | Collagenase | 232 | Participant no longer wants to be included in the study |
Appendix 5 Additional baseline and pre-treatment data
| Surgery N = 51 |
Collagenase N = 22 |
Total N = 73 |
|
|---|---|---|---|
| Age (years) | |||
| N | 51 | 22 | 73 |
| Mean (SD) | 67.0 (10.7) | 69.8 (6.6) | 67.8 (9.7) |
| Median (Q1, Q3) | 68.9 (60.7, 74.1) | 70.5 (63.5, 74.9) | 70.0 (62.4, 74.3) |
| Minimum, maximum | 40.1, 89.0 | 56.1, 80.0 | 40.1, 89.0 |
| Gender, n (%) | |||
| Male | 44 (86.3) | 14 (63.6) | 58 (79.5) |
| Female | 7 (13.7) | 8 (36.4) | 15 (20.5) |
| Ethnicity, n (%) | |||
| White | 50 (98.0) | 22 (100.0) | 72 (98.6) |
| Mixed race | 1 (2.0) | 0 (0.0) | 1 (1.4) |
| Smoking status, n (%) | |||
| Never | 22 (43.1) | 7 (31.8) | 29 (39.7) |
| Current | 6 (11.8) | 1 (4.5) | 7 (9.6) |
| Previous | 22 (43.1) | 14 (63.6) | 36 (49.3) |
| Missing | 1 (2.0) | 0 (0.0) | 1 (1.4) |
| Drinks alcohol, n (%) | |||
| Yes | 38 (74.5) | 19 (86.4) | 57 (78.1) |
| No | 12 (23.5) | 3 (13.6) | 15 (20.5) |
| Missing | 1 (2.0) | 0 (0.0) | 1 (1.4) |
| Surgery N = 51 |
Collagenase N = 22 |
Total N = 73 |
|
|---|---|---|---|
| Age of onset (years) | |||
| N | 30 | 11 | 41 |
| Mean (SD) | 55.9 (13.5) | 54.1 (15.5) | 55.4 (13.9) |
| Median (Q1, Q3) | 57.0 (46.0, 65.0) | 52.0 (45.0, 68.0) | 56.0 (46.0, 65.0) |
| Minimum, maximum | 19.0, 80.0 | 20.0, 72.0 | 19.0, 80.0 |
| History of bilateral disease, n (%) | |||
| Yes | 30 (58.8) | 11 (50.0) | 41 (56.2) |
| No | 21 (41.2) | 10 (45.5) | 31 (42.5) |
| Missing | 0 (0.0) | 1 (4.5) | 1 (1.4) |
| Received LF surgery previously, n (%) | |||
| Yes | 13 (25.5) | 5 (22.7) | 18 (24.7) |
| No | 38 (74.5) | 17 (77.3) | 55 (75.3) |
| Received collagenase injection previously, n (%) | |||
| Yes | 3 (5.9) | 1 (4.5) | 4 (5.5) |
| No | 48 (94.1) | 20 (90.9) | 68 (93.2) |
| Missing | 0 (0.0) | 1 (4.5) | 1 (1.4) |
| Known family history of Dupuytren’s disease, n (%) | |||
| Yes | 19 (37.3) | 5 (22.7) | 24 (32.9) |
| No | 32 (62.7) | 17 (77.3) | 49 (67.1) |
| History of Garrods pads, n (%) | |||
| Yes | 4 (7.8) | 2 (9.1) | 6 (8.2) |
| No | 42 (82.4) | 17 (77.3) | 59 (80.8) |
| Missing | 5 (9.8) | 3 (13.6) | 8 (11.0) |
| History of Peyronie’s disease, n (%) | |||
| Yes | 4 (7.8) | 0 (0.0) | 4 (5.5) |
| No | 36 (70.6) | 13 (59.1) | 49 (67.1) |
| Not applicable | 7 (13.7) | 8 (36.4) | 15 (20.5) |
| Missing | 4 (7.8) | 1 (4.5) | 5 (6.8) |
| History of Ledderhose disease, n (%) | |||
| Yes | 5 (9.8) | 2 (9.1) | 7 (9.6) |
| No | 40 (78.4) | 17 (77.3) | 57 (78.1) |
| Missing | 6 (11.8) | 3 (13.6) | 9 (12.3) |
| Surgery N = 51 |
Collagenase N = 22 |
Total N = 73 |
|
|---|---|---|---|
| Hands currently affected, n (%) | |||
| Left only | 18 (35.3) | 5 (22.7) | 23 (31.5) |
| Right only | 12 (23.5) | 9 (40.9) | 21 (28.8) |
| Both | 21 (41.2) | 8 (36.4) | 29 (39.7) |
| Dominant hand currently affected, n (%) | |||
| Yes | 35 (68.6) | 17 (77.3) | 52 (71.2) |
| No | 16 (31.4) | 5 (22.7) | 21 (28.8) |
| Study reference digit, n (%) | |||
| Middle | 9 (17.6) | 2 (9.1) | 11 (15.1) |
| Ring | 18 (35.3) | 6 (27.3) | 24 (32.9) |
| Little | 24 (47.1) | 14 (63.6) | 38 (52.1) |
| Study reference joint, n (%) | |||
| MCP | 35 (68.6) | 17 (77.3) | 52 (71.2) |
| PIP | 16 (31.4) | 5 (22.7) | 21 (28.8) |
| Study reference digit/joint on dominant hand, n (%) | |||
| Yes | 26 (51.0) | 15 (68.2) | 41 (56.2) |
| No | 25 (49.0) | 7 (31.8) | 32 (43.8) |
| Number of digits affected (total), n (%) | |||
| 1 | 19 (37.3) | 12 (54.5) | 31 (42.5) |
| 2 | 18 (35.3) | 6 (27.3) | 24 (32.9) |
| 3 | 3 (5.9) | 1 (4.5) | 4 (5.5) |
| 4 | 6 (11.8) | 2 (9.1) | 8 (11.0) |
| 5 | 2 (3.9) | 1 (4.5) | 3 (4.1) |
| 6 | 2 (3.9) | 0 (0.0) | 2 (2.7) |
| 7 | 1 (2.0) | 0 (0.0) | 1 (1.4) |
| Number of digits affected (reference hand), n (%) | |||
| 1 | 30 (58.8) | 18 (81.8) | 48 (65.8) |
| 2 | 14 (27.5) | 3 (13.6) | 17 (23.3) |
| 3 | 3 (5.9) | 1 (4.5) | 4 (5.5) |
| 4 | 4 (7.8) | 0 (0.0) | 4 (5.5) |
| Number of joints affected (total), n (%) | |||
| 1 | 14 (27.5) | 6 (27.3) | 20 (27.4) |
| 2 | 17 (33.3) | 9 (40.9) | 26 (35.6) |
| 3 | 8 (15.7) | 2 (9.1) | 10 (13.7) |
| 4 | 3 (5.9) | 3 (13.6) | 6 (8.2) |
| 5 | 3 (5.9) | 1 (4.5) | 4 (5.5) |
| 6 | 1 (2.0) | 0 (0.0) | 1 (1.4) |
| 7 | 3 (5.9) | 0 (0.0) | 3 (4.1) |
| 8 | 1 (2.0) | 1 (4.5) | 2 (2.7) |
| 12 | 1 (2.0) | 0 (0.0) | 1 (1.4) |
| Number of joints affected (reference hand), n (%) | |||
| 1 | 22 (43.1) | 11 (50.0) | 33 (45.2) |
| 2 | 17 (33.3) | 7 (31.8) | 24 (32.9) |
| 3 | 6 (11.8) | 0 (0.0) | 6 (8.2) |
| 4 | 1 (2.0) | 4 (18.2) | 5 (6.8) |
| 5 | 3 (5.9) | 0 (0.0) | 3 (4.1) |
| 7 | 1 (2.0) | 0 (0.0) | 1 (1.4) |
| 9 | 1 (2.0) | 0 (0.0) | 1 (1.4) |
| Surgery N = 51 |
Collagenase N = 22 |
Total N = 73 |
|
|---|---|---|---|
| Active extension deficit of reference joint – goniometry only (°) | |||
| N | 50 | 22 | 72 |
| Mean (SD) | 50.6 (14.2) | 51.4 (15.3) | 50.8 (14.5) |
| Median (Q1, Q3) | 50.0 (40.0, 60.0) | 50.7 (38.0, 64.0) | 50.0 (39.3, 60.3) |
| Minimum, maximum | 14.7, 84.0 | 32.7, 80.0 | 14.7, 84.0 |
| Active extension deficit of reference joint – goniometry and photography (°) | |||
| N | 51 | 22 | 73 |
| Mean (SD) | 50.1 (14.5) | 51.4 (15.3) | 50.5 (14.6) |
| Median (Q1, Q3) | 50.0 (39.7, 60.0) | 50.7 (38.0, 64.0) | 50.0 (39.0, 60.0) |
| Minimum, maximum | 14.7, 84.0 | 32.7, 80.0 | 14.7, 84.0 |
| Passive extension deficit of reference joint (°) | |||
| N | 49 | 22 | 71 |
| Mean (SD) | 44.9 (13.9) | 46.4 (16.3) | 45.4 (14.6) |
| Median (Q1, Q3) | 43.3 (35.0, 56.0) | 49.3 (33.3, 59.3) | 44.0 (34.7, 57.3) |
| Minimum, maximum | 20.0, 76.7 | 13.3, 76.0 | 13.3, 76.7 |
| Flexion of reference joint – goniometry only (°) | |||
| N | 49 | 21 | 70 |
| Mean (SD) | 86.6 (8.3) | 85.0 (8.6) | 86.1 (8.4) |
| Median (Q1, Q3) | 87.3 (80.0, 93.3) | 86.0 (80.7, 90.0) | 86.7 (80.0, 90.7) |
| Minimum, maximum | 71.3, 105.3 | 64.0, 100.0 | 64.0, 105.3 |
| Flexion of reference joint – goniometry and photography (°) | |||
| N | 49 | 22 | 71 |
| Mean (SD) | 86.6 (8.3) | 83.8 (10.0) | 85.7 (8.9) |
| Median (Q1, Q3) | 87.3 (80.0, 93.3) | 85.3 (80.0, 90.0) | 86.7 (80.0, 90.7) |
| Minimum, maximum | 71.3, 105.3 | 60.0, 100.0 | 60.0, 105.3 |
| Active RoM of reference joint – goniometry only (°) | |||
| N | 49 | 21 | 70 |
| Mean (SD) | 35.8 (15.0) | 34.5 (12.7) | 35.4 (14.3) |
| Median (Q1, Q3) | 35.3 (27.3, 48.0) | 36.0 (24.0, 42.7) | 35.7 (26.7, 45.0) |
| Minimum, maximum | 4.7, 63.3 | 10.0, 57.7 | 4.7, 63.3 |
| Active RoM of reference joint – goniometry and photography (°) | |||
| N | 49 | 22 | 71 |
| Mean (SD) | 35.8 (15.0) | 32.4 (15.9) | 34.7 (15.2) |
| Median (Q1, Q3) | 35.3 (27.3, 48.0) | 34.7 (22.7, 42.7) | 35.3 (26.0, 45.0) |
| Minimum, maximum | 4.7, 63.3 | −12.3, 57.7 | −12.3, 63.3 |
| Passive RoM of reference joint (°) | |||
| N | 48 | 21 | 69 |
| Mean (SD) | 41.3 (15.3) | 38.9 (13.5) | 40.5 (14.7) |
| Median (Q1, Q3) | 43.7 (29.3, 52.0) | 38.7 (30.0, 44.0) | 41.3 (30.0, 50.7) |
| Minimum, maximum | 8.0, 70.0 | 16.0, 77.0 | 8.0, 77.0 |
| Surgery N = 51 |
Collagenase N = 22 |
Total N = 73 |
|
|---|---|---|---|
| PEM Hand Health Questionnairea | |||
| N | 50 | 22 | 72 |
| Mean (SD) | 35.6 (20.0) | 40.0 (24.7) | 36.9 (21.5) |
| Median (Q1, Q3) | 35.6 (18.2, 50.0) | 37.3 (22.7, 53.0) | 36.4 (19.8, 50.8) |
| Minimum, maximum | 6.1, 87.9 | 0.0, 92.4 | 0.0, 92.4 |
| URAM total scoreb | |||
| N | 51 | 22 | 73 |
| Mean (SD) | 18.7 (10.2) | 19.0 (11.0) | 18.8 (10.4) |
| Median (Q1, Q3) | 18.0 (10.0, 27.0) | 18.0 (13.0, 25.0) | 18.0 (11.0, 27.0) |
| Minimum, maximum | 2.0, 41.0 | 0.0, 40.0 | 0.0, 41.0 |
| MHQ total scorec | |||
| N | 49 | 20 | 69 |
| Mean (SD) | 64.6 (19.4) | 63.8 (18.2) | 64.3 (19.0) |
| Median (Q1, Q3) | 65.4 (49.2, 79.5) | 64.6 (47.1, 76.1) | 65.3 (49.2, 78.8) |
| Minimum, maximum | 21.3, 96.9 | 33.9, 97.7 | 21.3, 97.7 |
| SANE scored | |||
| N | 50 | 22 | 72 |
| Mean (SD) | 59.2 (23.2) | 59.7 (24.8) | 59.4 (23.5) |
| Median (Q1, Q3) | 62.5 (40.0, 80.0) | 55.5 (40.0, 77.0) | 60.0 (40.0, 80.0) |
| Minimum, maximum | 15.0, 90.0 | 20.0, 100.0 | 15.0, 100.0 |
| EQ-5D – General health VASe | |||
| N | 50 | 22 | 72 |
| Mean (SD) | 81.5 (18.9) | 81.1 (16.3) | 81.4 (18.0) |
| Median (Q1, Q3) | 90.0 (80.0, 95.0) | 85.0 (75.0, 95.0) | 90.0 (75.0, 95.0) |
| Minimum, maximum | 20.0, 100.0 | 50.0, 100.0 | 20.0, 100.0 |
| Treatment preference | |||
| Collagenase injection | 26 (51.0) | 13 (59.1) | 39 (53.4) |
| Surgical intervention | 4 (7.8) | 2 (9.1) | 6 (8.2) |
| No preference | 20 (39.2) | 6 (27.3) | 26 (35.6) |
| Missing | 1 (2.0) | 1 (4.5) | 2 (2.7) |
FIGURE 74.
Increase in active extension deficit between baseline and treatment against time elapsed (days) between randomisation and treatment delivery.
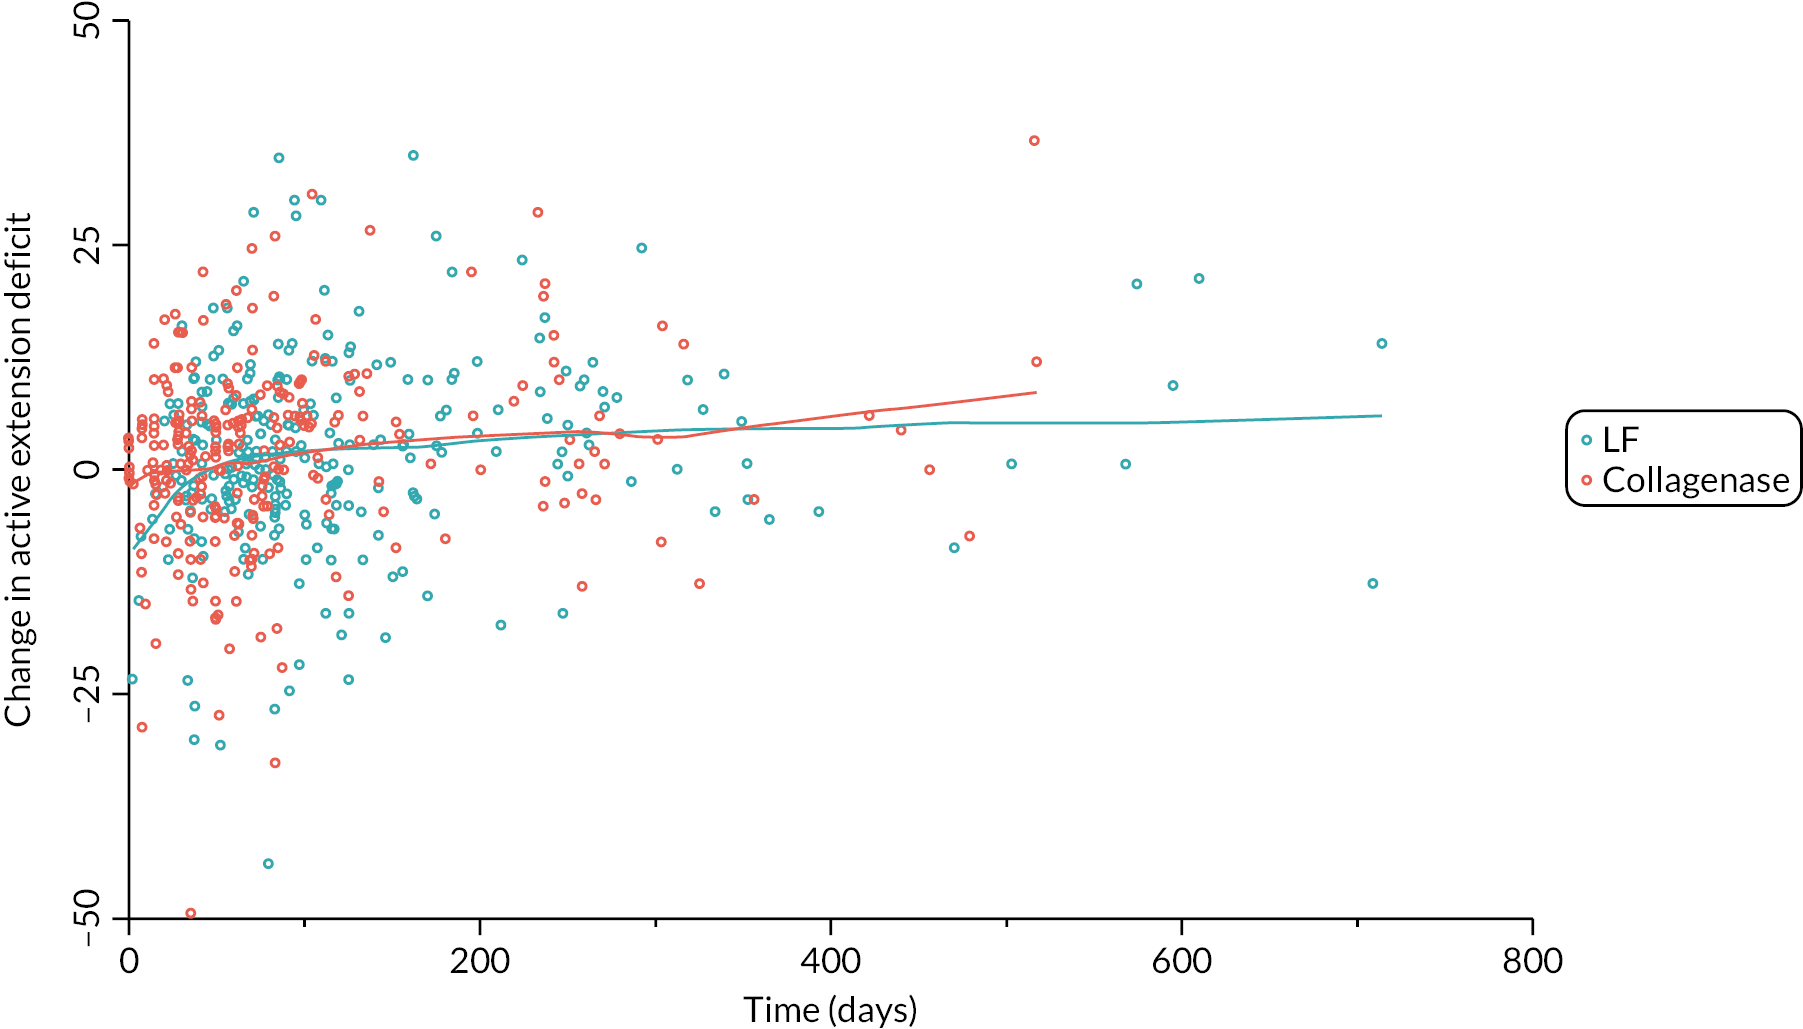
FIGURE 75.
Increase in passive extension deficit between baseline and treatment against time elapsed (days) between randomisation and treatment delivery.
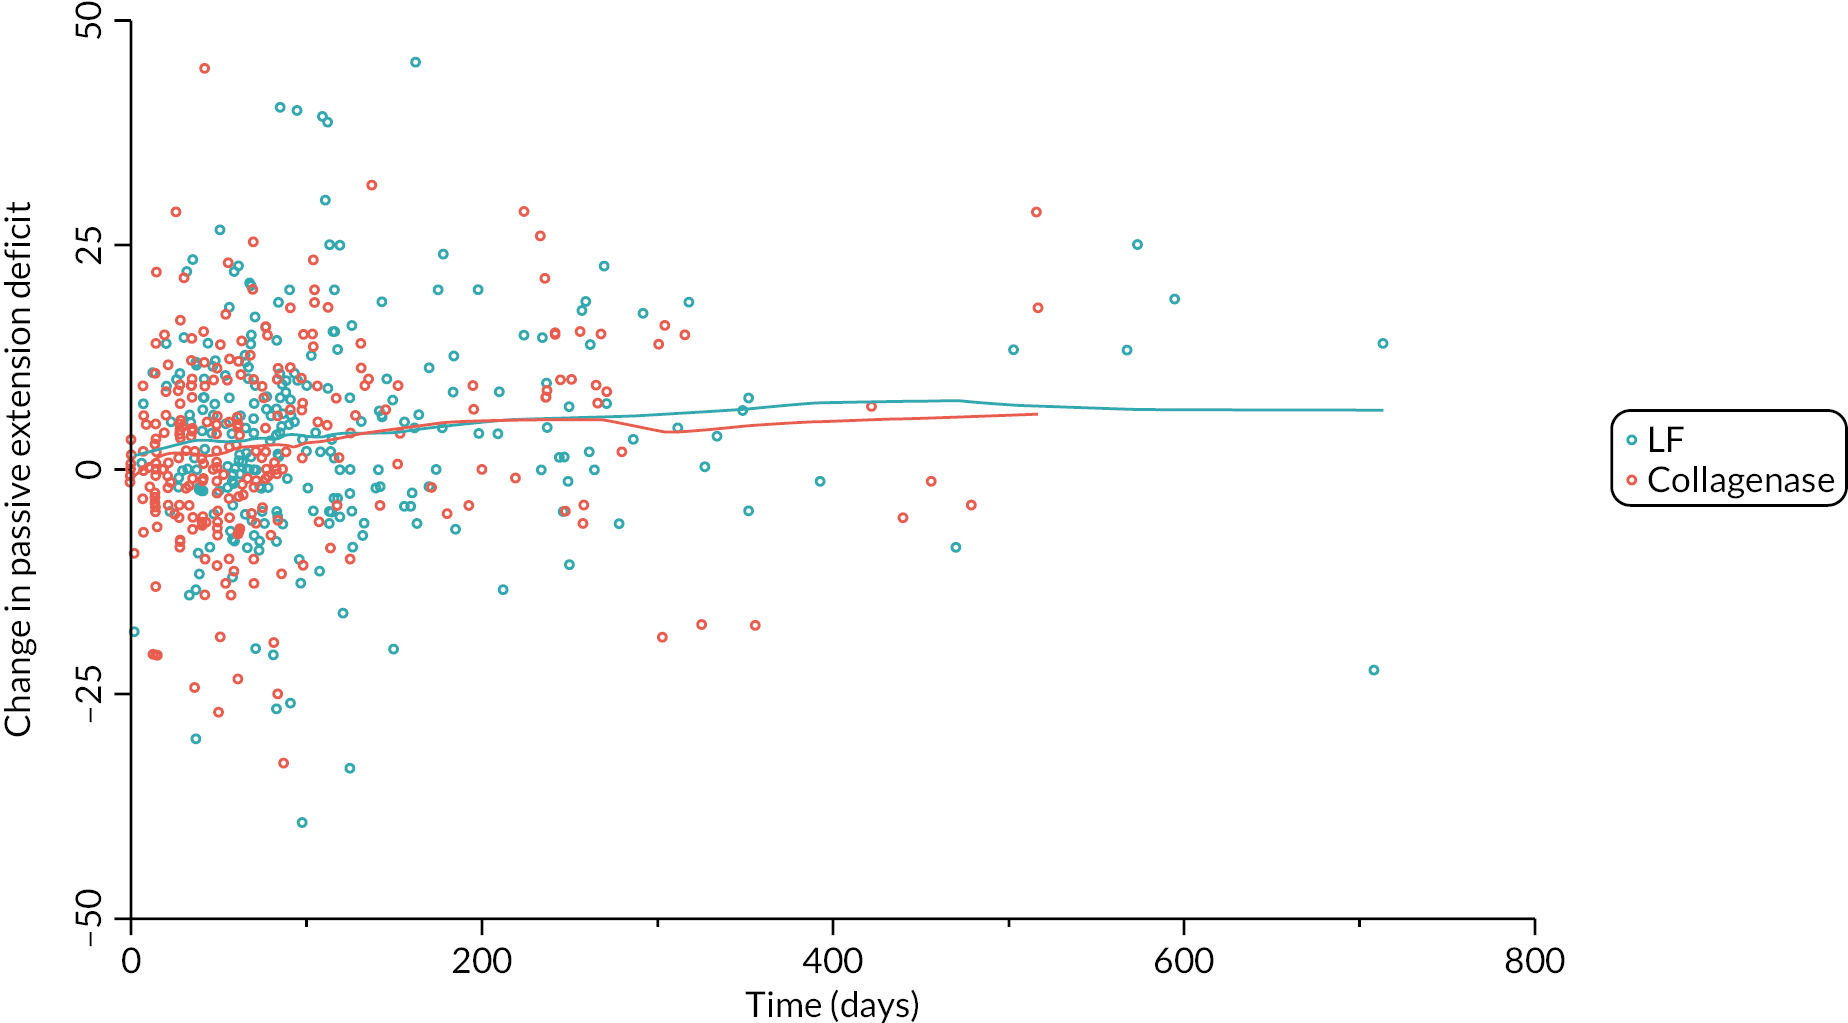
Appendix 6 Primary outcome analyses
| LF (N = 336) |
Collagenase (N = 336) |
|
|---|---|---|
| Complete baseline and follow-up data | 158 (47.0%) | 177 (52.7%) |
| Partially complete baseline and follow-up data | 127 (37.8%) | 137 (40.8%) |
| Baseline data only | 50 (14.9%) | 22 (6.5%) |
| No baseline or outcome data | 1 (0.3%) | 0 (0.0%) |
| LF (N = 295) |
Collagenase (N = 326) |
|
|---|---|---|
| Complete baseline and follow-up data | 158 (53.6%) | 177 (54.3%) |
| Partially complete baseline and follow-up data | 127 (43.1%) | 137 (42.0%) |
| Baseline data only | 10 (3.4%) | 12 (3.7%) |
| Surgery N = 250 |
Collagenase N = 281 |
Total N = 531 |
|
|---|---|---|---|
| Time elapsed between treatment and month 3 follow-up (months) | |||
| N | 249 | 281 | 530 |
| Mean (SD) | 3.2 (0.6) | 3.2 (0.5) | 3.2 (0.6) |
| Median (Q1, Q3) | 3.2 (2.9, 3.5) | 3.2 (3.0, 3.4) | 3.2 (2.9, 3.4) |
| Minimum, maximum | 1.4, 8.2 | 1.8, 6.0 | 1.4, 8.2 |
| Inside month 3 visit window (± 14 days), n (%) | |||
| No | 82 (32.8) | 70 (24.9) | 152 (28.6) |
| Yes | 167 (66.8) | 211 (75.1) | 378 (71.2) |
| Missing | 1 (0.4) | 0 (0.0) | 1 (0.2) |
FIGURE 76.
Time elapsed between treatment and completion of the PEM at the 3-month post-treatment follow-up (vertical dashed lines denote the protocol specified visit window).
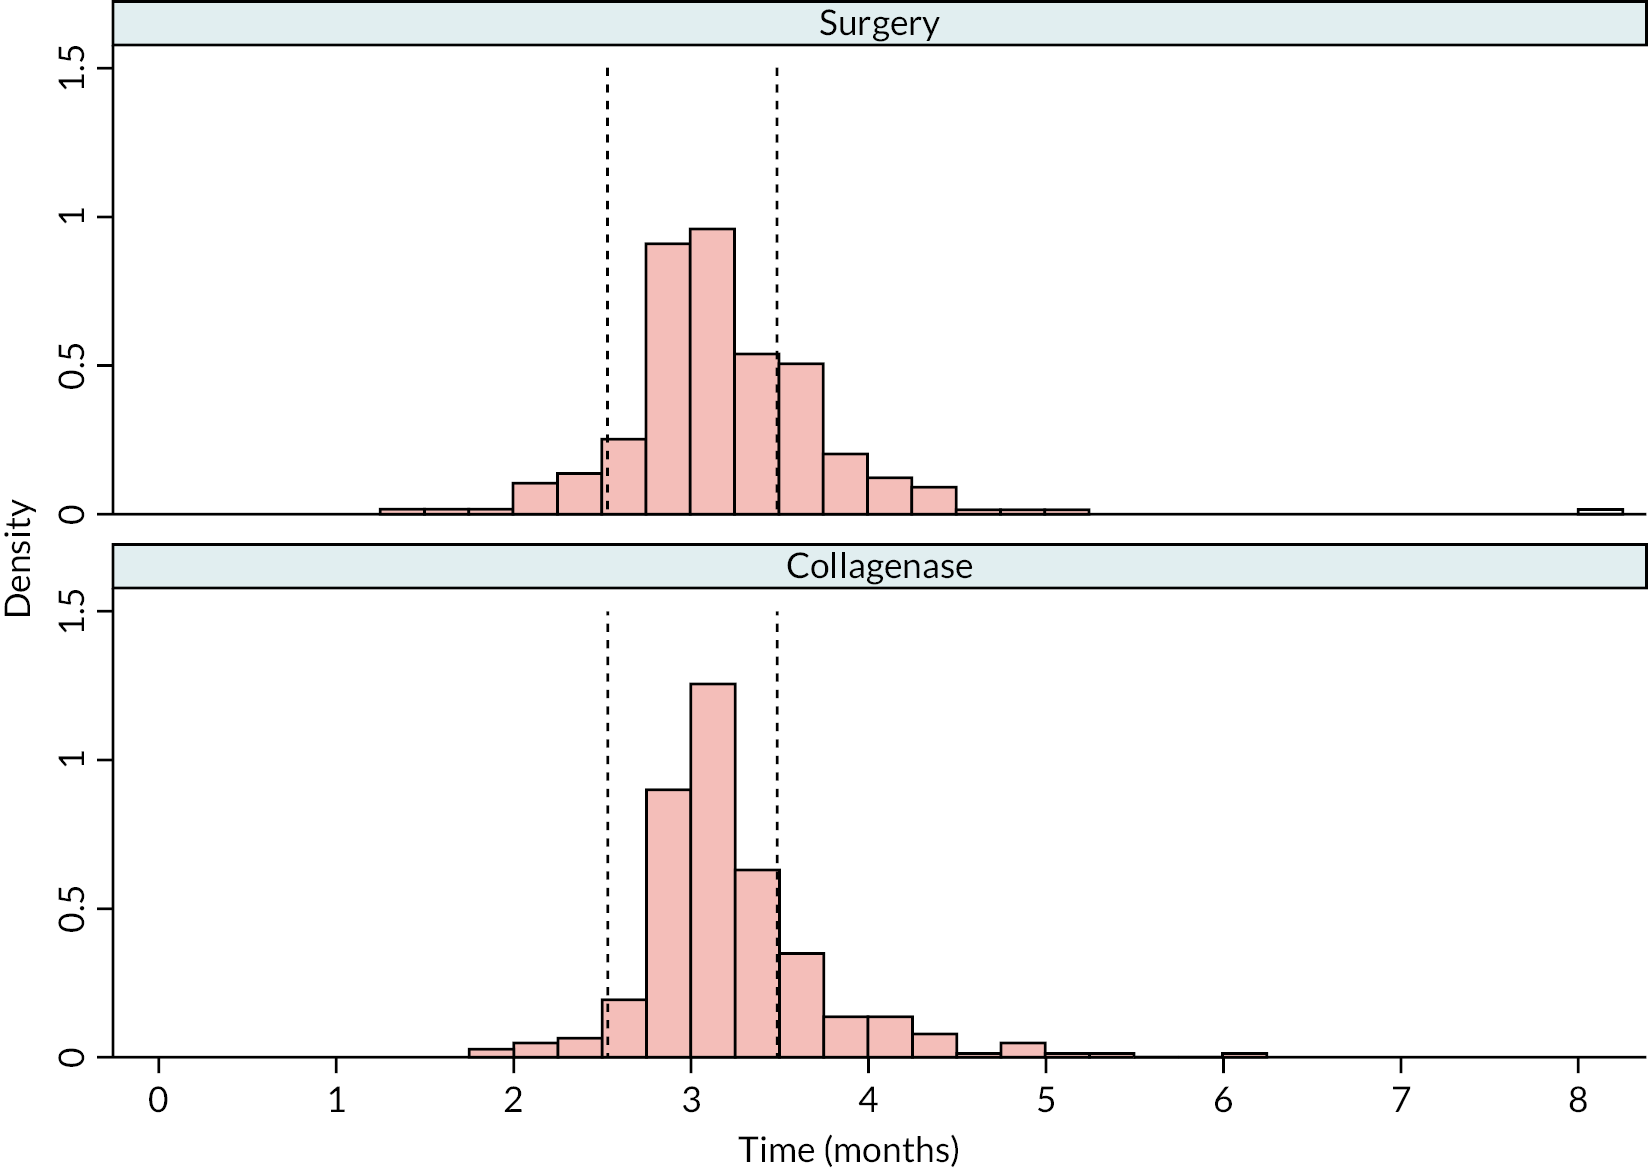
| Surgery N = 245 |
Collagenase N = 269 |
Total N = 514 |
|
|---|---|---|---|
| Time elapsed between treatment and month 6 (months) | |||
| N | 244 | 268 | 512 |
| Mean (SD) | 6.4 (0.8) | 6.5 (0.8) | 6.4 (0.8) |
| Median (Q1, Q3) | 6.2 (5.9, 6.6) | 6.3 (6.0, 6.9) | 6.2 (5.9, 6.7) |
| Minimum, maximum | 5.0, 11.1 | 4.2, 9.9 | 4.2, 11.1 |
| Inside month 6 visit window (± 14 days), n (%) | |||
| No | 85 (34.7) | 108 (40.1) | 193 (37.5) |
| Yes | 159 (64.9) | 160 (59.5) | 319 (62.1) |
| Missing | 1 (0.4) | 1 (0.4) | 2 (0.4) |
FIGURE 77.
Time elapsed between treatment and completion of the PEM at the 6-month post-treatment follow-up (vertical dashed lines denote the protocol specified visit window).
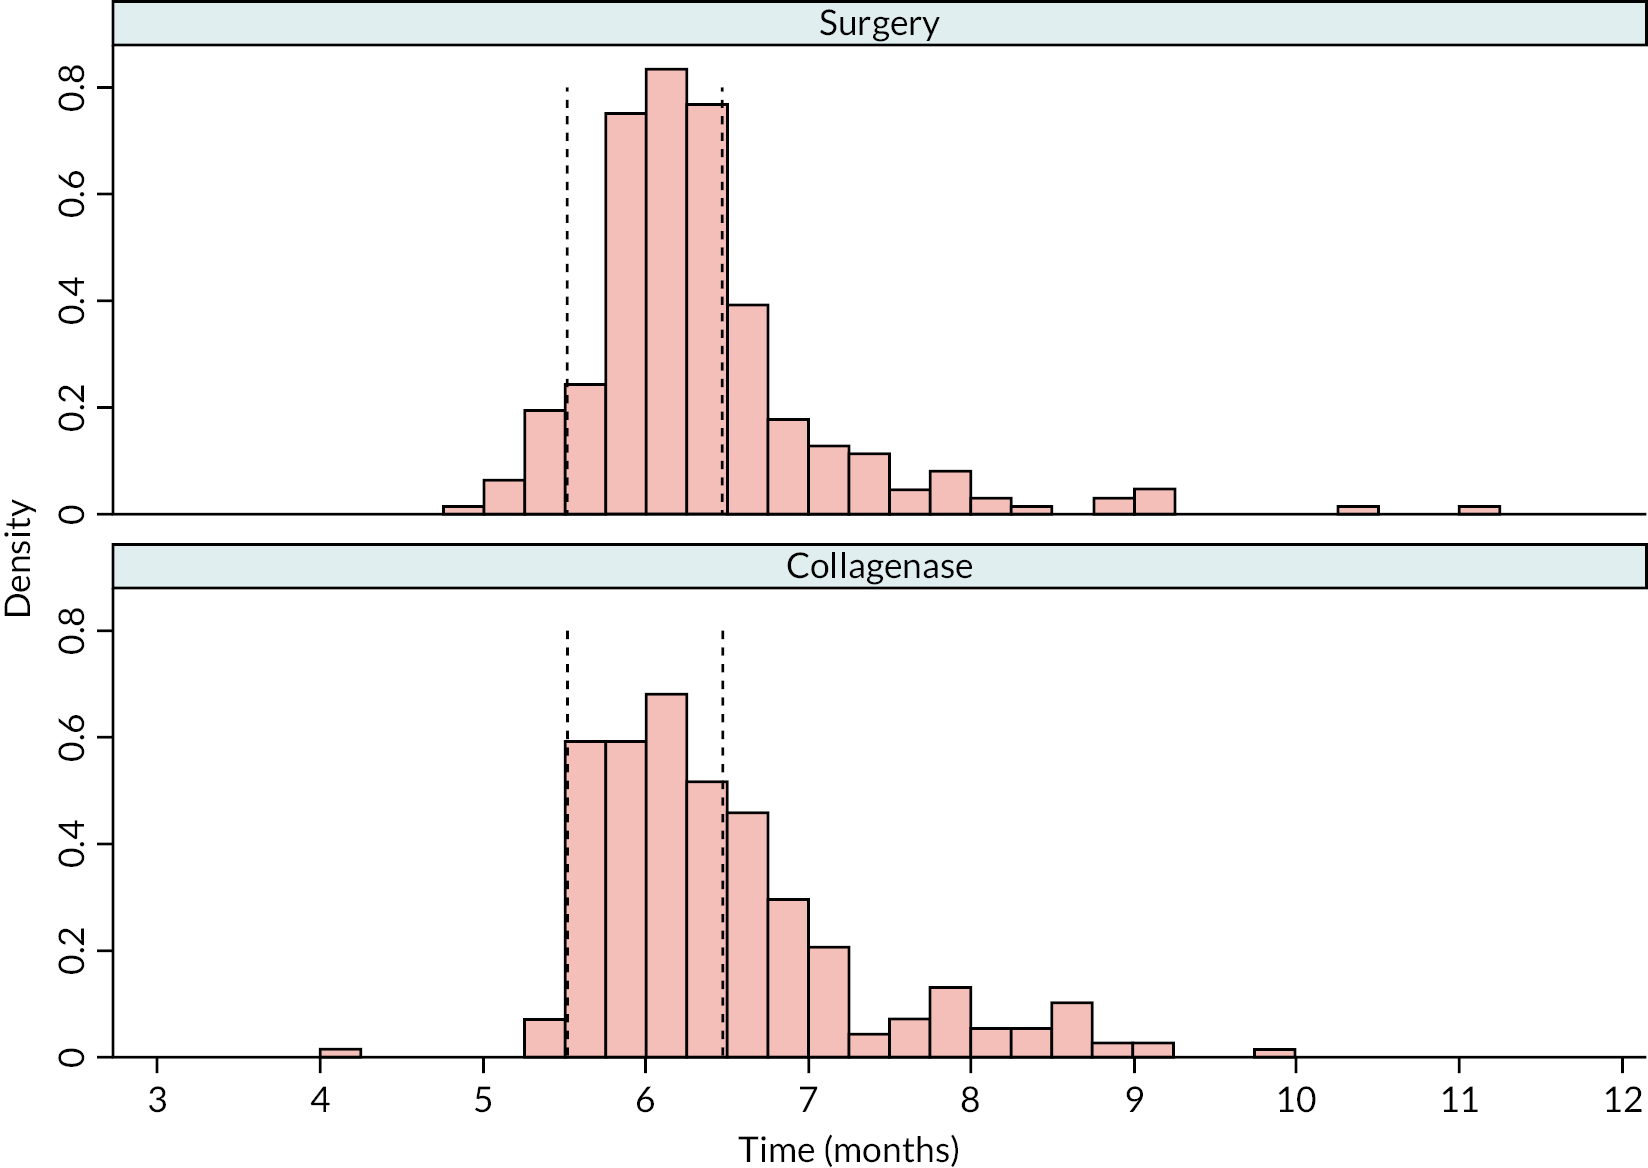
| Surgery N = 250 |
Collagenase N = 284 |
Total N = 534 |
|
|---|---|---|---|
| Time elapsed between treatment and month 12 (months) | |||
| N | 249 | 283 | 532 |
| Mean (SD) | 12.6 (1.5) | 12.5 (1.5) | 12.5 (1.5) |
| Median (Q1, Q3) | 12.4 (11.9, 13.4) | 12.4 (11.8, 13.2) | 12.4 (11.8, 13.3) |
| Minimum, maximum | 8.7, 17.7 | 8.3, 18.3 | 8.3, 18.3 |
| Inside month 12 visit window, n (%) | |||
| No | 19 (7.6) | 22 (7.7) | 41 (7.7) |
| Yes | 230 (92.0) | 261 (91.9) | 491 (91.9) |
| Missing | 1 (0.4) | 1 (0.4) | 2 (0.4) |
FIGURE 78.
Time elapsed between treatment and completion of the PEM at the 12-month post-treatment follow-up (vertical dashed lines denote the protocol specified visit window).
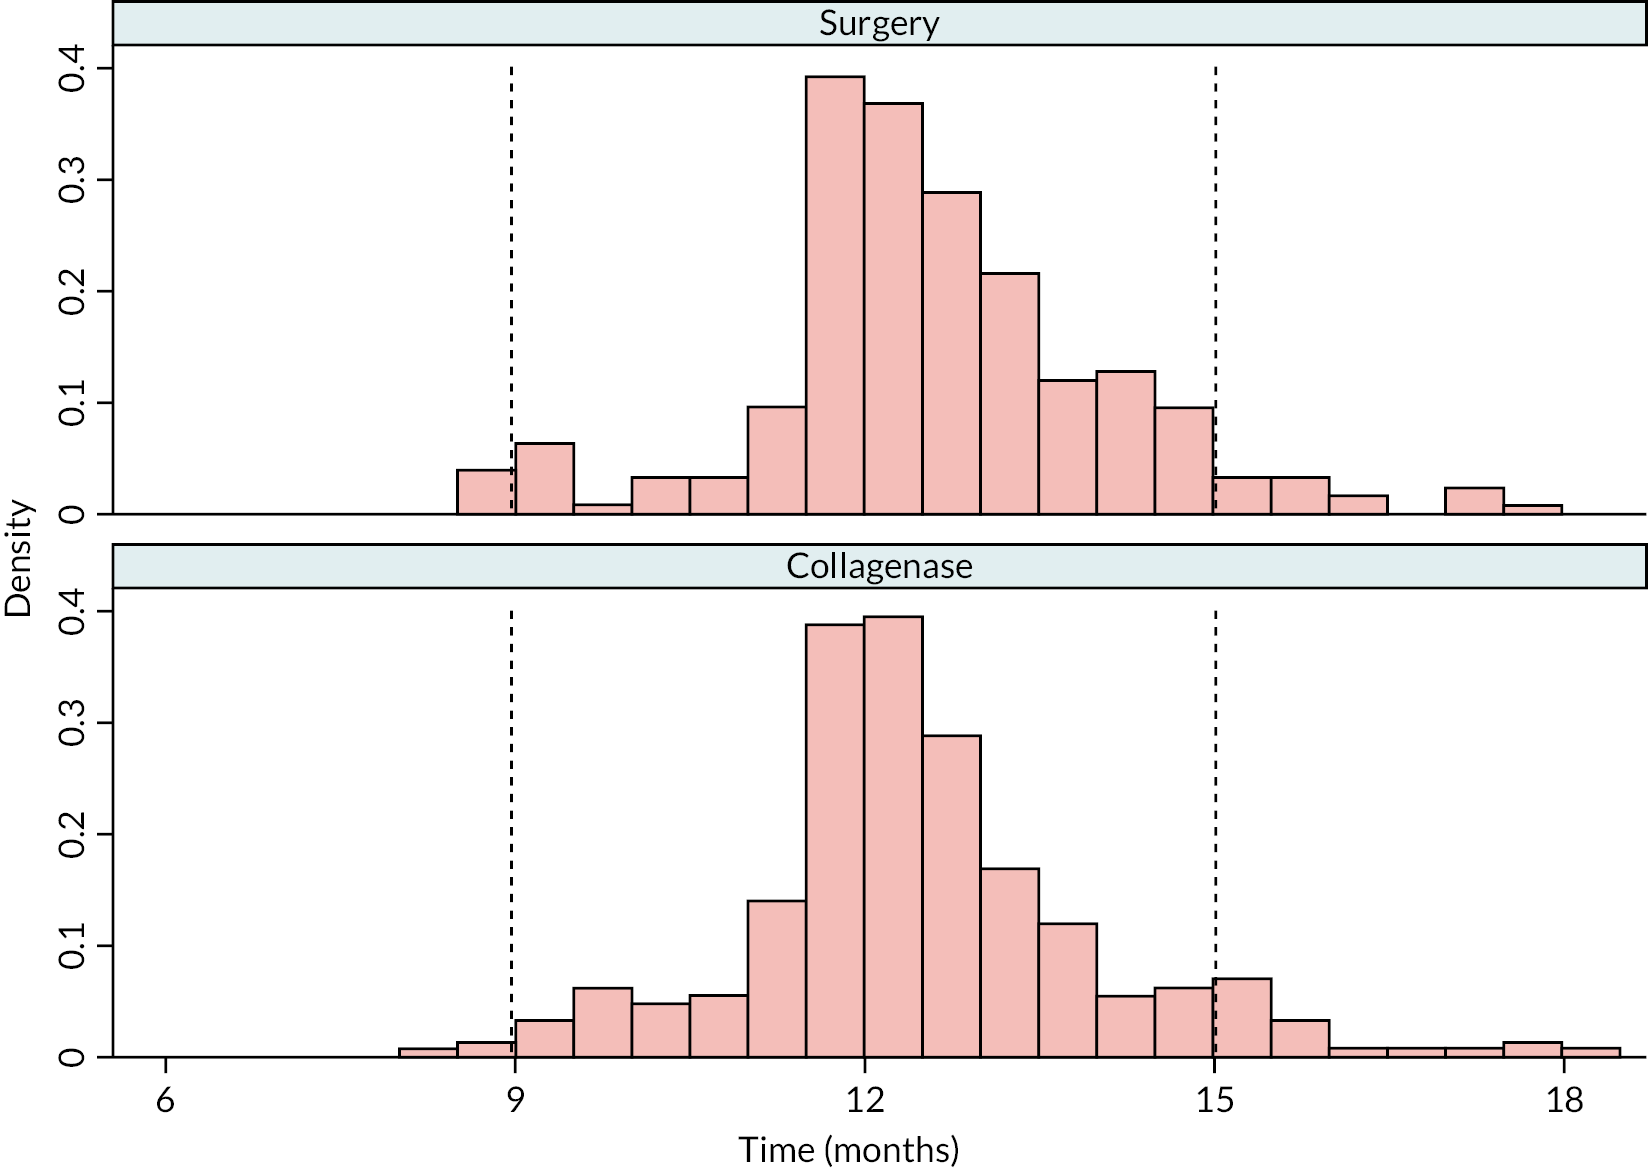
| Surgery N = 197 |
Collagenase N = 229 |
Total N = 426 |
|
|---|---|---|---|
| Time elapsed between treatment and month 24 (months) | |||
| N | 195 | 229 | 424 |
| Mean (SD) | 24.5 (1.6) | 24.7 (1.9) | 24.6 (1.8) |
| Median (Q1, Q3) | 24.3 (23.9, 25.2) | 24.4 (23.8, 25.8) | 24.3 (23.9, 25.4) |
| Minimum, maximum | 20.5, 33.9 | 21.1, 32.7 | 20.5, 33.9 |
| Inside month 24 visit window, n (%) | |||
| No | 16 (8.1) | 19 (8.3) | 35 (8.2) |
| Yes | 179 (90.9) | 210 (91.7) | 389 (91.3) |
| Missing | 2 (1.0) | 0 (0.0) | 2 (0.5) |
FIGURE 79.
Time elapsed between treatment and completion of the PEM at the 24-month post-treatment follow-up (vertical dashed lines denote the protocol specified visit window).
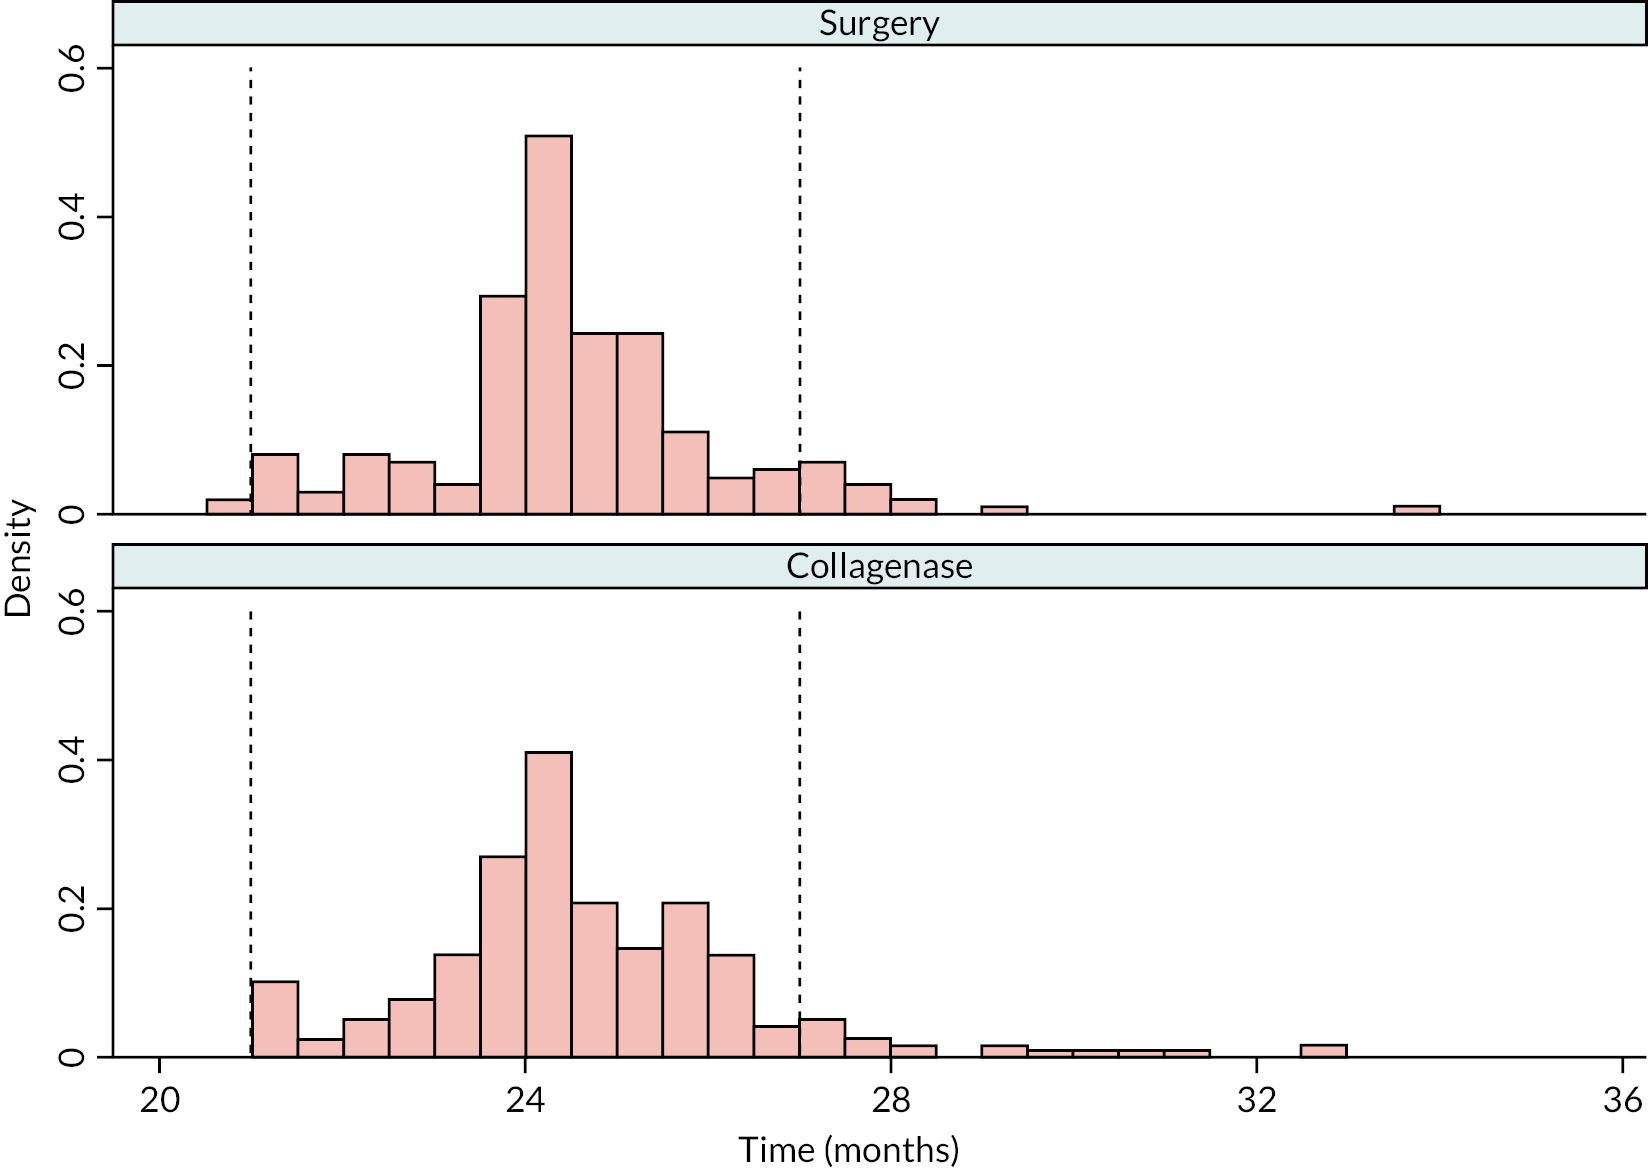
| LF (N = 295) | Collagenase (N = 326) | |||
|---|---|---|---|---|
| No complication(s) reported N = 189 |
Complication(s) reported N = 106 |
No complication(s) reported N = 191 |
Complication(s) reported N = 135 |
|
| Month 3 PEM available?, n (%) | ||||
| Yes | 154 (81.5) | 96 (90.6) | 156 (81.7) | 125 (92.6) |
| No | 35 (18.5) | 10 (9.4) | 35 (18.3) | 10 (7.4) |
| Month 6 PEM available?, n (%) | ||||
| Yes | 150 (79.4) | 95 (89.6) | 157 (82.2) | 112 (83.0) |
| No | 39 (20.6) | 11 (10.4) | 34 (17.8) | 23 (17.0) |
| Month 12 PEM available?, n (%) | ||||
| Yes | 158 (83.6) | 92 (86.8) | 170 (89.0) | 114 (84.4) |
| No | 31 (16.4) | 14 (13.2) | 21 (11.0) | 21 (15.6) |
| Month 24 PEM available?, n (%) | ||||
| Yes | 115 (60.8) | 82 (77.4) | 132 (69.1) | 97 (71.9) |
| No | 74 (39.2) | 24 (22.6) | 59 (30.9) | 38 (28.1) |
| Included in primary analysis?, n (%) | ||||
| Yes | 180 (95.2) | 105 (99.1) | 181 (94.8) | 133 (98.5) |
| No | 9 (4.8) | 1 (0.9) | 10 (5.2) | 2 (1.5) |
| Reference joint | Estimated difference (collagenase – LF) in expected score (95% CIa) | p-valueb H0 : δ = 0 |
p-valueb H0 : δ ≥ 6 |
|
|---|---|---|---|---|
| Month 3 | MCP | −3.20 (−5.26 to −1.13) | 0.0024 | – |
| PIP | −3.92 (−6.44 to −1.40) | 0.0023 | – | |
| Month 6 | MCP | 1.82 (−0.32 to 3.96) | 0.0948 | – |
| PIP | 2.24 (−0.40 to 4.89) | 0.0967 | – | |
| 1 year | MCP | 4.16 (1.91 to 6.40) | 0.0003 | 0.0539 |
| PIP | 5.49 (2.48 to 8.51) | 0.0004 | 0.3710 | |
| 2 years | MCP | 7.46 (4.67 to 10.24) | < 0.00005 | – |
| PIP | 9.71 (6.02 to 13.39) | < 0.00005 | – |
| LF N = 336 |
Collagenase N = 336 |
Total N = 672 |
|
|---|---|---|---|
| Treated – complete PEM follow-up data | 159 (47.3) | 179 (53.3) | 338 (50.3) |
| Treated – partially complete PEM follow-up data | 126 (37.5) | 135 (40.2) | 261 (38.8) |
| Treated – all PEM follow-up data missing | 10 (3.0) | 12 (3.6) | 22 (3.3) |
| Not treated | 41 (12.2) | 10 (3.0) | 51 (7.6) |
| Estimated difference (collagenase – LF) (95% CIa) |
p-valuea H0 : δ = 0 |
p-valueb H0 : δ ≥ 6 |
|
|---|---|---|---|
| Month 3 | −4.20 (−7.00 to −1.40) | 0.0033 | – |
| Month 6 | 1.26 (−1.49 to 4.01) | 0.3693 | – |
| 1 year | 5.66 (2.90 to 8.41) | 0.0001 | 0.4032 |
| 2 years | 7.64 (4.66 to 10.61) | < 0.00005 | – |
| LF N = 285 |
Collagenase N = 314 |
Total N = 599 |
|
|---|---|---|---|
| Bilateral disease, n (%) | |||
| Yes | 140 (49.1) | 163 (51.9) | 303 (50.6) |
| No | 130 (45.6) | 141 (44.9) | 271 (45.2) |
| Missing | 15 (5.3) | 10 (3.2) | 25 (4.2) |
| History of Garrods pads, Peyronie’s, or Ledderhose disease, n (%) | |||
| Yes | 66 (23.2) | 62 (19.7) | 128 (21.4) |
| No | 160 (56.1) | 197 (62.7) | 357 (59.6) |
| Missing | 59 (20.7) | 55 (17.5) | 114 (19.0) |
| Family history of DC, n (%) | |||
| Yes | 107 (37.5) | 107 (34.1) | 214 (35.7) |
| No | 177 (62.1) | 204 (65.0) | 381 (63.6) |
| Missing | 1 (0.4) | 3 (1.0) | 4 (0.7) |
| Age of DC onset (years) | |||
| N | 232 | 266 | 498 |
| Mean (SD) | 55.9 (12.3) | 57.3 (10.9) | 56.6 (11.6) |
| Median (Q1, Q3) | 57.0 (49.5, 64.0) | 58.0 (50.0, 65.0) | 58.0 (50.0, 65.0) |
| Minimum, maximum | 2.0, 85.0 | 18.0, 82.0 | 2.0, 85.0 |
| All four variables complete, n (%) | |||
| Yes | 177 (62.1) | 212 (67.5) | 389 (64.9) |
| No | 108 (37.9) | 102 (32.5) | 210 (35.1) |
| Estimated difference (collagenase – surgery) (95% CIa) |
p-valuea H0 : δ = 0 |
p-valueb H0 : δ ≥ 6 |
|
|---|---|---|---|
| Month 3 | −4.13 (−7.02 to −1.23) | 0.0052 | – |
| Month 6 | 1.71 (−1.60 to 5.02) | 0.3116 | – |
| 1 year | 6.36 (2.73 to 9.99) | 0.0006 | 0.5778 |
| 2 years | 8.48 (4.31 to 12.66) | 0.0001 | – |
| Received allocated treatment (N = 610) |
Did not receive allocated treatment (N = 9) |
|||
|---|---|---|---|---|
| LF N = 286 |
Collagenase N = 324 |
LF N = 8 |
Collagenase N = 1 |
|
| Age (years) | ||||
| N | 286 | 324 | 8 | 1 |
| Mean (SD) | 66.4 (9.0) | 66.3 (8.8) | 66.1 (7.5) | 54.1 (-) |
| Median (Q1, Q3) | 66.8 (61.8, 72.6) | 67.1 (60.7, 72.7) | 65.5 (59.6, 70.1) | 54.1 (54.1, 54.1) |
| Minimum, maximum | 31.1, 87.2 | 38.6, 89.1 | 57.9, 80.2 | 54.1, 54.1 |
| Gender, n (%) | ||||
| Male | 220 (76.9) | 264 (81.5) | 7 (87.5) | 1 (100.0) |
| Female | 66 (23.1) | 60 (18.5) | 1 (12.5) | 0 (0.0) |
| PEM Hand Health Questionnairea | ||||
| N | 284 | 322 | 8 | 1 |
| Mean (SD) | 34.3 (19.6) | 34.0 (20.0) | 32.4 (21.7) | 30.3 (-) |
| Median (Q1, Q3) | 31.8 (18.2, 48.5) | 31.8 (18.2, 45.5) | 28.8 (18.9, 44.7) | 30.3 (30.3, 30.3) |
| Minimum, maximum | 0.0, 86.4 | 0.0, 93.9 | 3.0, 71.2 | 30.3, 30.3 |
| URAM total scoreb | ||||
| N | 285 | 321 | 8 | 1 |
| Mean (SD) | 17.2 (9.5) | 16.9 (9.2) | 11.6 (8.7) | 6.0 (-) |
| Median (Q1, Q3) | 17.0 (10.0, 24.0) | 16.0 (10.0, 23.0) | 9.5 (4.5, 16.5) | 6.0 (6.0, 6.0) |
| Minimum, maximum | 0.0, 43.0 | 0.0, 44.0 | 4.0, 28.0 | 6.0, 6.0 |
| MHQ total scorec | ||||
| N | 279 | 314 | 8 | 1 |
| Mean (SD) | 67.8 (17.3) | 67.7 (16.9) | 69.5 (17.6) | 88.2 (-) |
| Median (Q1, Q3) | 70.5 (55.3, 81.0) | 70.1 (56.4, 81.1) | 73.8 (58.9, 84.0) | 88.2 (88.2, 88.2) |
| Minimum, maximum | 23.1, 100.0 | 15.5, 99.0 | 36.5, 86.4 | 88.2, 88.2 |
| Treatment preference | ||||
| No preference | 153 (53.5) | 160 (49.4) | 0 (0.0) | 1 (100.0) |
| Allocated preferred treatment | 25 (8.7) | 141 (43.5) | 0 (0.0) | 0 (0.0) |
| Not allocated preferred treatment | 104 (36.4) | 18 (5.6) | 8 (100.0) | 0 (0.0) |
| Missing | 4 (1.4) | 5 (1.5) | 0 (0.0) | 0 (0.0) |
| Estimated difference (collagenase – Surgery) (95% CIa) |
p-valuea H0 : δ = 0 |
p-valueb H0 : δ ≥ 6 |
|
|---|---|---|---|
| 1 year | 5.30 (2.90 to 7.71) | < 0.00005 | 0.2852 |
| LF N = 285 |
Collagenase N = 314 |
Total N = 599 |
|
|---|---|---|---|
| Treatment preference, n (%) | |||
| Collagenase injection | 108 (37.9) | 135 (43.0) | 243 (40.6) |
| LF | 25 (8.8) | 16 (5.1) | 41 (6.8) |
| No preference | 148 (51.9) | 158 (50.3) | 306 (51.1) |
| Missing | 4 (1.4) | 5 (1.6) | 9 (1.5) |
| LF N = 285 |
Collagenase N = 314 |
Total N = 599 |
|
|---|---|---|---|
| Study reference joint, n (%) | |||
| MCP | 172 (60.4) | 204 (65.0) | 376 (62.8) |
| PIP | 113 (39.6) | 110 (35.0) | 223 (37.2) |
| Time point | Baseline treatment preference | Estimated difference (collagenase – surgery)a (95% CI) |
|---|---|---|
| Month 3 | Preference – collagenase | −3.96 (−7.81 to −0.11) |
| Preference – LF | −4.09 (−13.49 to 5.30) | |
| No preference | −2.67 (−6.05 to 0.71) | |
| Month 6 | Preference – collagenase | 0.35 (−4.11 to 4.81) |
| Preference – LF | 3.03 (−7.47 to 13.53) | |
| No preference | 2.75 (−0.92 to 6.41) | |
| 1 year | Preference – collagenase | 5.20 (0.41 to 9.98) |
| Preference – LF | 4.94 (−5.90 to 15.77) | |
| No preference | 9.30 (5.36 to 13.23) | |
| 2 years | Preference – collagenase | 6.94 (1.32 to 12.56) |
| Preference – LF | 10.60 (−2.23 to 23.43) | |
| No preference | 10.53 (5.92 to 15.13) |
FIGURE 80.
Point estimates and two-sided 95% CIs for the difference (collagenase – surgery) in expected PEM score by baseline treatment preference subgroup and time point.
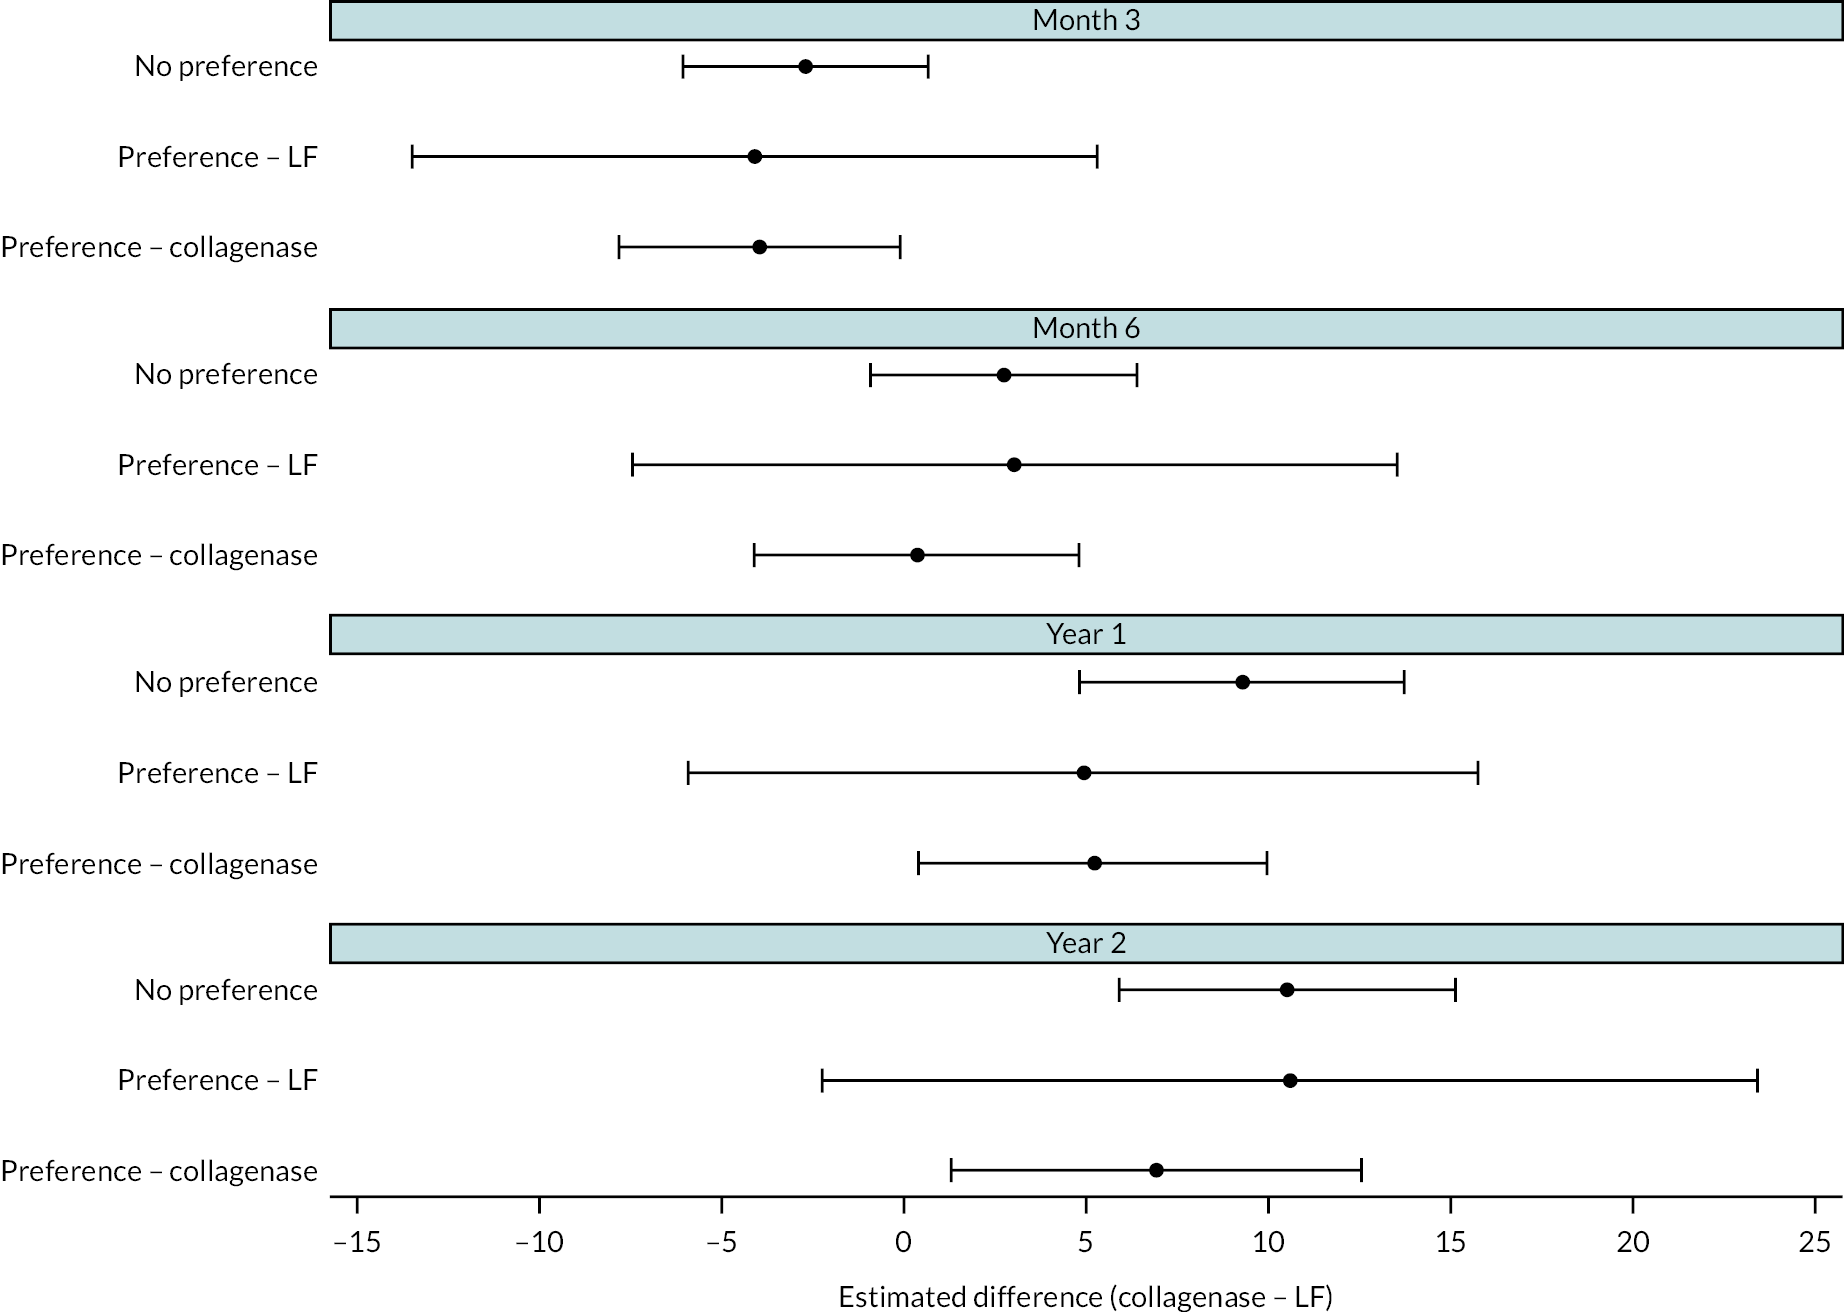
| Time point | Study reference joint | Estimated difference (collagenase – surgery) (95% CI) |
|---|---|---|
| Month 3 | MCP | −3.37 (−6.47 to −0.27) |
| PIP | −4.54 (−8.56 to −0.51) | |
| Month 6 | MCP | 1.72 (−1.61 to 5.06) |
| PIP | 0.73 (−3.88 to 5.33) | |
| 1 year | MCP | 6.83 (3.26 to 10.40) |
| PIP | 6.76 (1.86 to 11.66) | |
| 2 years | MCP | 8.82 (4.61 to 13.03) |
| PIP | 8.43 (2.69 to 14.17) |
FIGURE 81.
Point estimates and two-sided 95% CIs for the difference (collagenase – surgery) in expected PEM score by study reference joint subgroup and time point.
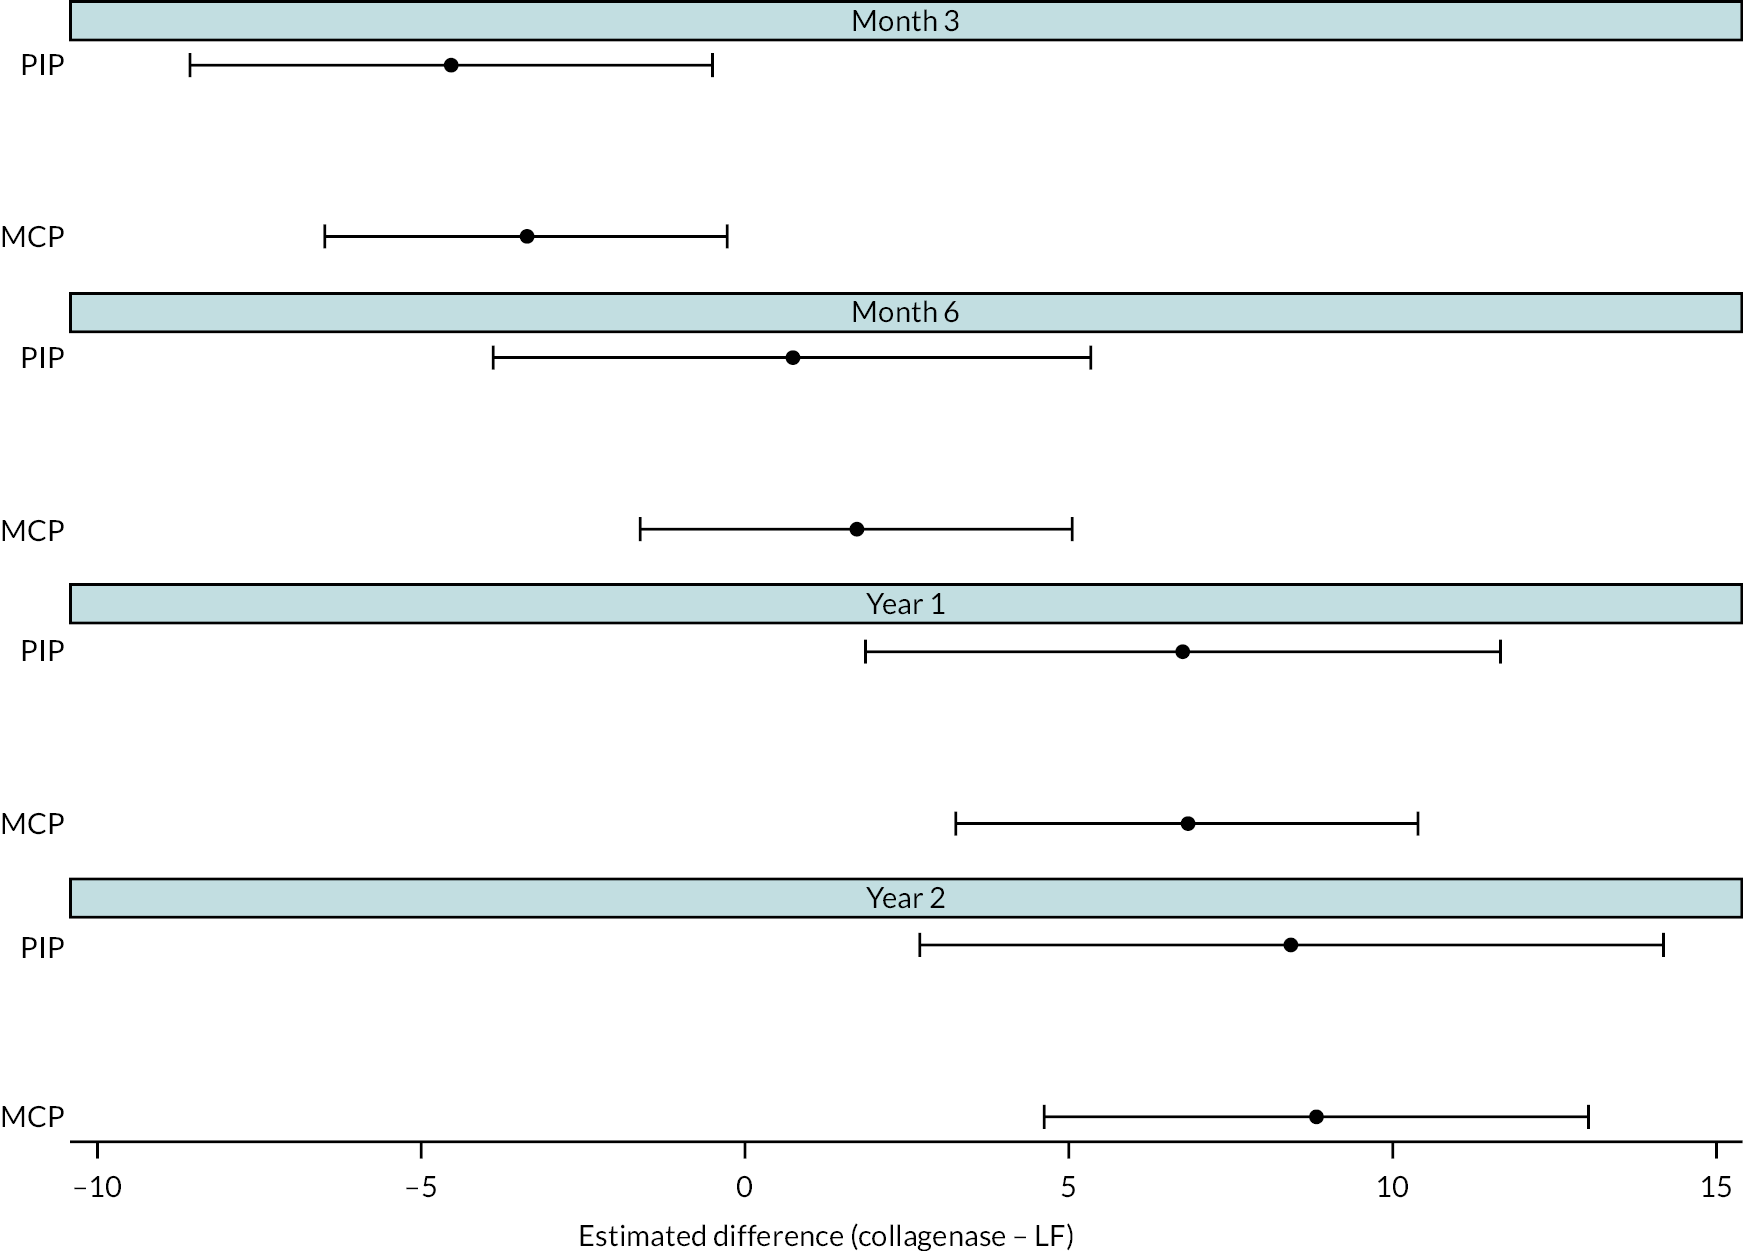
Appendix 7 Secondary outcomes – patient-reported outcome measures
| LF N = 295 |
Collagenase N = 326 |
Total N = 621 |
|
|---|---|---|---|
| Month 3 | |||
| N | 249 | 277 | 526 |
| Mean (SD) | 14.7 (15.3) | 12.5 (14.3) | 13.5 (14.8) |
| Median (Q1, Q3) | 9.5 (3.6, 22.6) | 8.3 (1.2, 19.0) | 8.3 (2.4, 19.0) |
| Minimum, maximum | 0.0, 78.6 | 0.0, 76.2 | 0.0, 78.6 |
| Month 6 | |||
| N | 245 | 265 | 510 |
| Mean (SD) | 12.3 (15.7) | 14.3 (16.2) | 13.3 (16.0) |
| Median (Q1, Q3) | 7.1 (1.2, 15.5) | 9.5 (2.4, 20.2) | 8.3 (2.4, 19.0) |
| Minimum, maximum | 0.0, 82.1 | 0.0, 85.7 | 0.0, 85.7 |
| 1 year | |||
| N | 246 | 283 | 529 |
| Mean (SD) | 11.5 (15.6) | 16.8 (19.1) | 14.3 (17.8) |
| Median (Q1, Q3) | 4.8 (1.2, 16.7) | 9.5 (2.4, 25.0) | 7.1 (1.2, 21.4) |
| Minimum, maximum | 0.0, 88.1 | 0.0, 87.7 | 0.0, 88.1 |
| 2 years | |||
| N | 195 | 228 | 423 |
| Mean (SD) | 11.9 (17.7) | 19.6 (20.8) | 16.1 (19.8) |
| Median (Q1, Q3) | 4.8 (0.0, 14.3) | 11.3 (3.6, 30.4) | 8.3 (1.2, 23.0) |
| Minimum, maximum | 0.0, 86.9 | 0.0, 88.1 | 0.0, 88.1 |
FIGURE 82.
Patient Evaluation Measure Overall Assessment Questionnaire scores – Kernel density estimates by allocation.
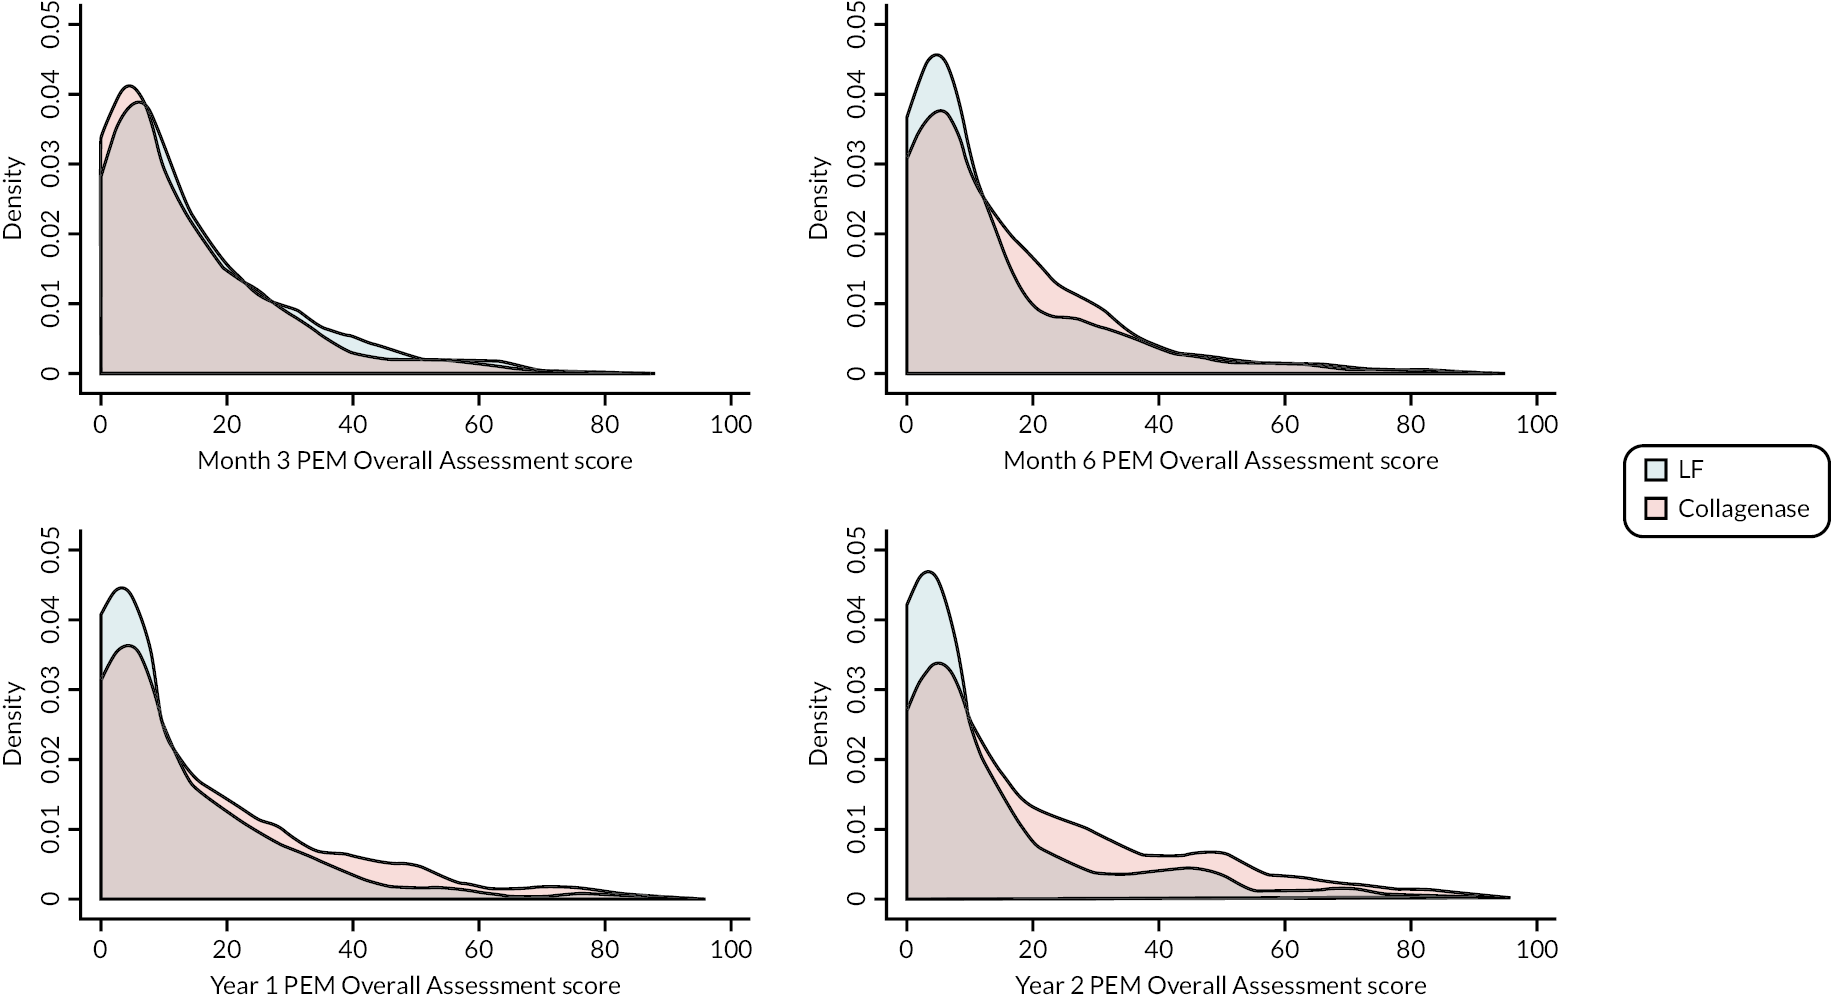
| LF N = 295 |
Collagenase N = 326 |
Total N = 621 |
|
|---|---|---|---|
| Month 3 | |||
| N | 249 | 281 | 530 |
| Mean (SD) | 1.7 (3.5) | 1.4 (3.4) | 1.5 (3.5) |
| Median (Q1, Q3) | 0.0 (0.0, 2.0) | 0.0 (0.0, 1.0) | 0.0 (0.0, 1.0) |
| Minimum, maximum | 0.0, 25.0 | 0.0, 30.0 | 0.0, 30.0 |
| Month 6 | |||
| N | 245 | 269 | 514 |
| Mean (SD) | 1.5 (3.3) | 1.3 (3.1) | 1.4 (3.2) |
| Median (Q1, Q3) | 0.0 (0.0, 1.0) | 0.0 (0.0, 1.0) | 0.0 (0.0, 1.0) |
| Minimum, maximum | 0.0, 18.0 | 0.0, 25.0 | 0.0, 25.0 |
| 1 year | |||
| N | 247 | 284 | 531 |
| Mean (SD) | 1.7 (4.3) | 1.5 (3.5) | 1.6 (3.9) |
| Median (Q1, Q3) | 0.0 (0.0, 1.0) | 0.0 (0.0, 1.0) | 0.0 (0.0, 1.0) |
| Minimum, maximum | 0.0, 30.0 | 0.0, 25.0 | 0.0, 30.0 |
| 2 years | |||
| N | 197 | 227 | 424 |
| Mean (SD) | 1.8 (4.4) | 1.9 (3.7) | 1.9 (4.0) |
| Median (Q1, Q3) | 0.0 (0.0, 1.0) | 0.0 (0.0, 2.0) | 0.0 (0.0, 2.0) |
| Minimum, maximum | 0.0, 29.0 | 0.0, 26.0 | 0.0, 29.0 |
| Reference joint | Estimated difference (collagenase – LF) (95% CIa)b |
p-valuea H0 : δ = 0 |
|
|---|---|---|---|
| MCP | Month 3 | 0.82 (0.05 to 1.59) | 0.0365 |
| Month 6 | 2.11 (1.28 to 2.94) | < 0.00005 | |
| 1 year | 2.55 (1.60 to 3.50) | < 0.00005 | |
| 2 years | 4.62 (3.37 to 5.87) | < 0.00005 | |
| PIP | Month 3 | 1.16 (0.06 to 2.26) | 0.0380 |
| Month 6 | 2.83 (1.68 to 3.97) | < 0.00005 | |
| 1 year | 3.58 (2.21 to 4.95) | < 0.00005 | |
| 2 years | 6.78 (4.94 to 8.62) | < 0.00005 |
FIGURE 83.
Histograms by allocation and time point – PEM Treatment Questionnaire scores.
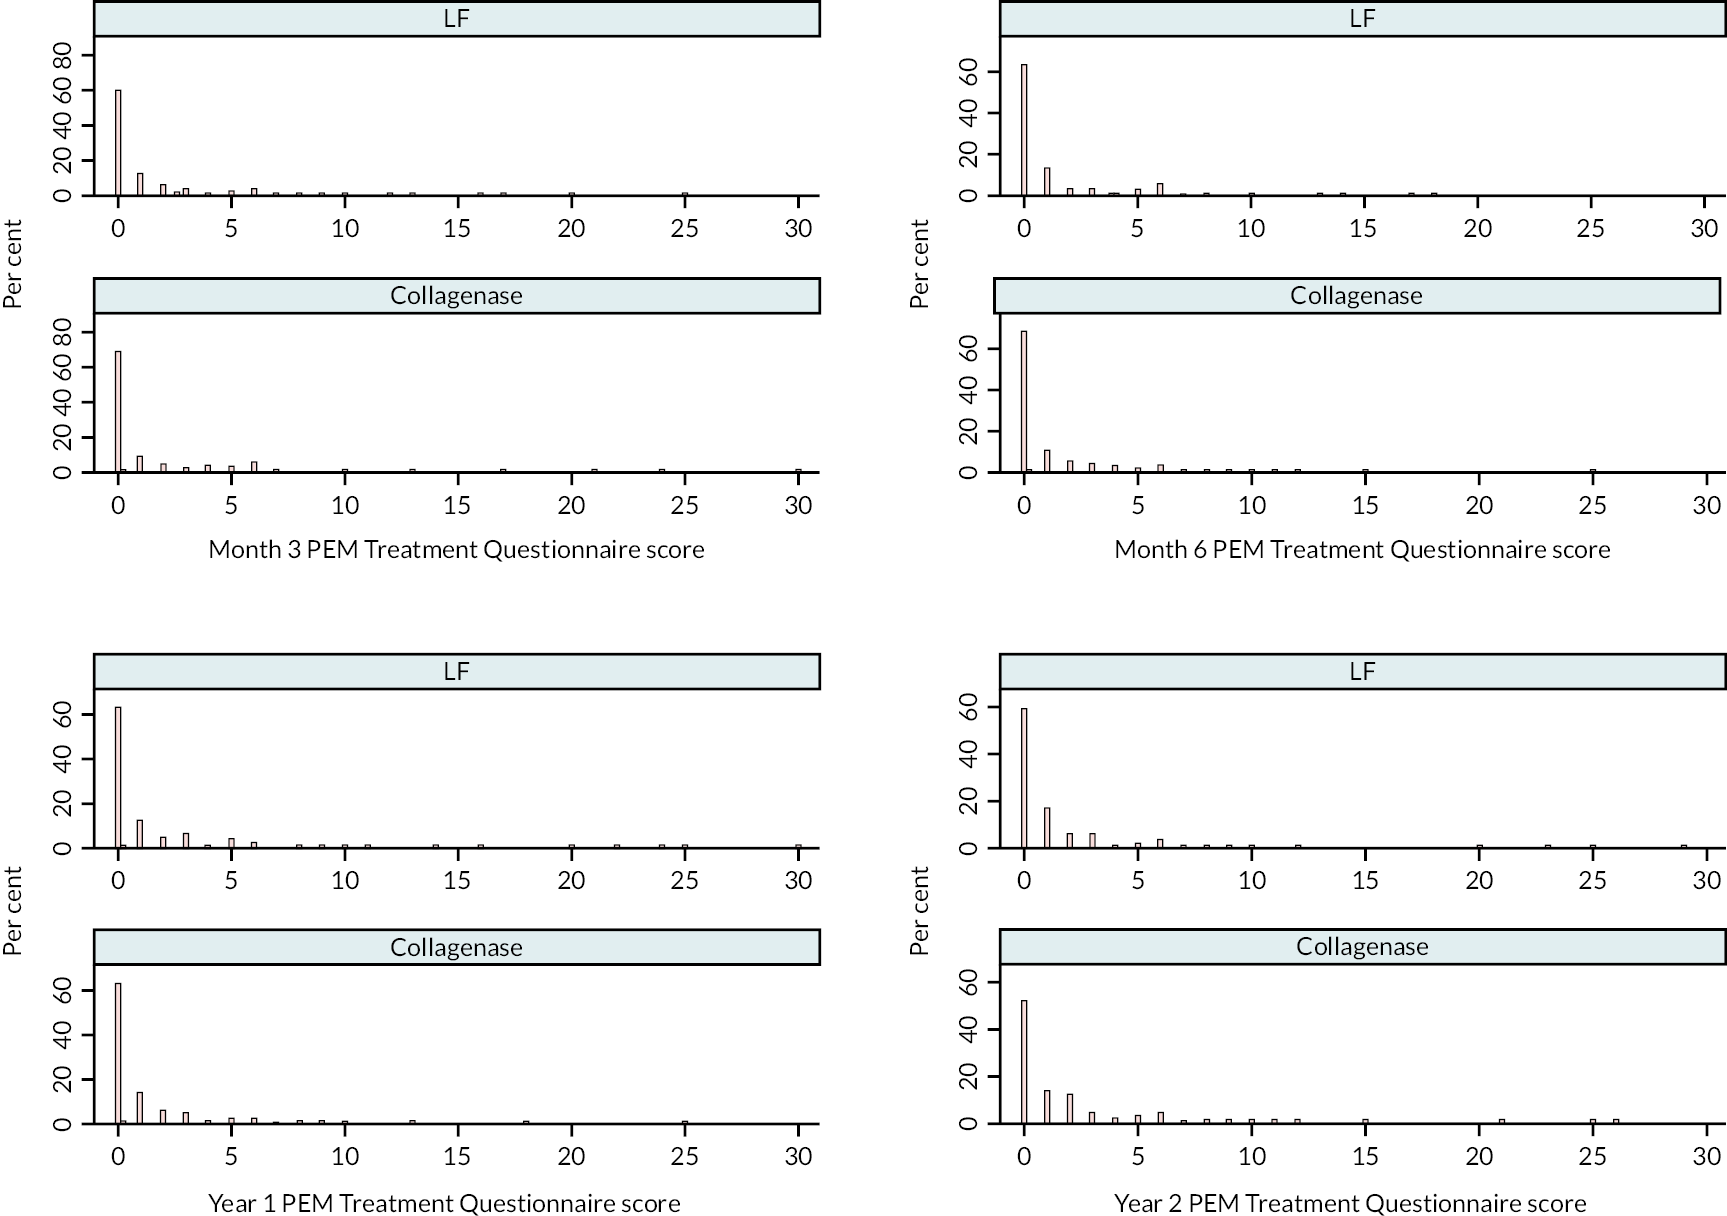
| Surgery N = 336 |
Collagenase N = 336 |
Total N = 672 |
|
|---|---|---|---|
| Overall a | |||
| N | 334 | 335 | 669 |
| Mean (SD) | 65.6 (19.4) | 66.0 (19.2) | 65.8 (19.3) |
| Median (Q1, Q3) | 65.0 (50.0, 80.0) | 65.0 (50.0, 80.0) | 65.0 (50.0, 80.0) |
| Minimum, maximum | 15.0, 100.0 | 15.0, 100.0 | 15.0, 100.0 |
| Activities of daily living a | |||
| N | 333 | 332 | 665 |
| Mean (SD) | 78.4 (21.6) | 78.9 (21.8) | 78.6 (21.7) |
| Median (Q1, Q3) | 83.9 (69.3, 96.4) | 86.6 (68.9, 96.4) | 85.0 (68.9, 96.4) |
| Minimum, maximum | 0.0, 100.0 | 5.4, 100.0 | 0.0, 100.0 |
| Work a | |||
| N | 333 | 331 | 664 |
| Mean (SD) | 76.0 (24.8) | 75.6 (23.5) | 75.8 (24.2) |
| Median (Q1, Q3) | 85.0 (60.0, 100.0) | 80.0 (60.0, 95.0) | 80.0 (60.0, 100.0) |
| Minimum, maximum | 0.0, 100.0 | 0.0, 100.0 | 0.0, 100.0 |
| Pain b | |||
| N | 333 | 333 | 666 |
| Mean (SD) | 26.6 (24.2) | 27.8 (23.6) | 27.2 (23.9) |
| Median (Q1, Q3) | 25.0 (0.0, 45.0) | 25.0 (5.0, 45.0) | 25.0 (0.0, 45.0) |
| Minimum, maximum | 0.0, 95.0 | 0.0, 90.0 | 0.0, 95.0 |
| Aesthetics a | |||
| N | 332 | 330 | 662 |
| Mean (SD) | 53.2 (21.5) | 53.6 (22.5) | 53.4 (22.0) |
| Median (Q1, Q3) | 50.0 (37.5, 68.8) | 50.0 (37.5, 68.8) | 50.0 (37.5, 68.8) |
| Minimum, maximum | 0.0, 100.0 | 0.0, 100.0 | 0.0, 100.0 |
| Satisfaction a | |||
| N | 334 | 332 | 666 |
| Mean (SD) | 58.2 (23.2) | 58.5 (21.6) | 58.3 (22.4) |
| Median (Q1, Q3) | 58.3 (41.7, 75.0) | 58.3 (41.7, 75.0) | 58.3 (41.7, 75.0) |
| Minimum, maximum | 4.2, 100.0 | 0.0, 100.0 | 0.0, 100.0 |
| Surgery N = 250 |
Collagenase N = 284 |
Total N = 534 |
|
|---|---|---|---|
| Overall a | |||
| N | 245 | 283 | 528 |
| Mean (SD) | 86.1 (17.4) | 81.6 (19.0) | 83.7 (18.4) |
| Median (Q1, Q3) | 95.0 (75.0, 100.0) | 85.0 (70.0, 100.0) | 90.0 (75.0, 100.0) |
| Minimum, maximum | 15.0, 100.0 | 20.0, 100.0 | 15.0, 100.0 |
| Activities of daily living a | |||
| N | 246 | 284 | 530 |
| Mean (SD) | 92.0 (13.8) | 90.2 (15.7) | 91.1 (14.9) |
| Median (Q1, Q3) | 98.2 (89.6, 100.0) | 98.2 (87.1, 100.0) | 98.2 (87.9, 100.0) |
| Minimum, maximum | 22.9, 100.0 | 8.6, 100.0 | 8.6, 100.0 |
| Work a | |||
| N | 246 | 281 | 527 |
| Mean (SD) | 84.5 (25.9) | 83.8 (25.5) | 84.1 (25.7) |
| Median (Q1, Q3) | 100.0 (80.0, 100.0) | 100.0 (75.0, 100.0) | 100.0 (75.0, 100.0) |
| Minimum, maximum | 0.0, 100.0 | 0.0, 100.0 | 0.0, 100.0 |
| Pain b | |||
| N | 242 | 279 | 521 |
| Mean (SD) | 11.7 (17.3) | 16.0 (21.9) | 14.0 (20.0) |
| Median (Q1, Q3) | 0.0 (0.0, 20.0) | 5.0 (0.0, 25.0) | 0.0 (0.0, 25.0) |
| Minimum, maximum | 0.0, 85.0 | 0.0, 90.0 | 0.0, 90.0 |
| Aesthetics a | |||
| N | 243 | 282 | 525 |
| Mean (SD) | 80.7 (26.1) | 70.5 (26.9) | 75.2 (27.0) |
| Median (Q1, Q3) | 93.8 (68.8, 100.0) | 75.0 (50.0, 93.8) | 87.5 (56.3, 100.0) |
| Minimum, maximum | 0.0, 100.0 | 6.3, 100.0 | 0.0, 100.0 |
| Satisfaction a | |||
| N | 246 | 282 | 528 |
| Mean (SD) | 86.4 (19.2) | 80.8 (23.9) | 83.4 (22.0) |
| Median (Q1, Q3) | 95.8 (75.0, 100.0) | 91.7 (70.8, 100.0) | 91.7 (75.0, 100.0) |
| Minimum, maximum | 8.3, 100.0 | 0.0, 100.0 | 0.0, 100.0 |
| Surgery N = 198 |
Collagenase N = 229 |
Total N = 427 |
|
|---|---|---|---|
| Overall a | |||
| N | 198 | 224 | 422 |
| Mean (SD) | 87.3 (17.1) | 79.8 (19.1) | 83.4 (18.6) |
| Median (Q1, Q3) | 95.0 (80.0, 100.0) | 85.0 (65.0, 100.0) | 90.0 (70.0, 100.0) |
| Minimum, maximum | 35.0, 100.0 | 25.0, 100.0 | 25.0, 100.0 |
| Activities of daily living a | |||
| N | 198 | 226 | 424 |
| Mean (SD) | 92.9 (15.0) | 88.4 (17.7) | 90.5 (16.6) |
| Median (Q1, Q3) | 100.0 (93.9, 100.0) | 96.4 (84.3, 100.0) | 98.2 (88.4, 100.0) |
| Minimum, maximum | 9.3, 100.0 | 5.4, 100.0 | 5.4, 100.0 |
| Work a | |||
| N | 195 | 224 | 419 |
| Mean (SD) | 86.8 (25.2) | 83.9 (23.7) | 85.2 (24.5) |
| Median (Q1, Q3) | 100.0 (85.0, 100.0) | 100.0 (75.0, 100.0) | 100.0 (80.0, 100.0) |
| Minimum, maximum | 0.0, 100.0 | 0.0, 100.0 | 0.0, 100.0 |
| Pain b | |||
| N | 196 | 226 | 422 |
| Mean (SD) | 11.3 (18.8) | 19.6 (22.2) | 15.7 (21.1) |
| Median (Q1, Q3) | 0.0 (0.0, 15.0) | 12.5 (0.0, 35.0) | 5.0 (0.0, 30.0) |
| Minimum, maximum | 0.0, 75.0 | 0.0, 80.0 | 0.0, 80.0 |
| Aesthetics a | |||
| N | 193 | 225 | 418 |
| Mean (SD) | 79.3 (26.2) | 68.9 (27.0) | 73.7 (27.1) |
| Median (Q1, Q3) | 93.8 (68.8, 100.0) | 75.0 (50.0, 93.8) | 81.3 (50.0, 100.0) |
| Minimum, maximum | 6.3, 100.0 | 0.0, 100.0 | 0.0, 100.0 |
| Satisfaction a | |||
| N | 196 | 226 | 422 |
| Mean (SD) | 88.4 (19.3) | 77.2 (24.7) | 82.4 (23.0) |
| Median (Q1, Q3) | 100.0 (83.3, 100.0) | 86.3 (58.3, 100.0) | 95.8 (70.8, 100.0) |
| Minimum, maximum | 20.8, 100.0 | 12.5, 100.0 | 12.5, 100.0 |
| Reference joint | Estimated differencea (95% CIb) |
p-valueb H0 : δ = 0 |
|
|---|---|---|---|
| MCP | 1 year | −4.22 (−6.54 to −1.91) | 0.0004 |
| 2 years | −6.93 (−9.67 to −4.20) | < 0.00005 | |
| PIP | 1 year | −4.99 (−7.75 to −2.23) | 0.0004 |
| 2 years | −8.08 (−11.31 to −4.86) | < 0.00005 |
| LF N = 336 |
Collagenase N = 336 |
Total N = 672 |
|
|---|---|---|---|
| Baseline (randomised participants) | |||
| N | 328 | 334 | 662 |
| Mean (SD) | 61.6 (21.7) | 62.0 (21.8) | 61.8 (21.7) |
| Median (Q1, Q3) | 65.0 (49.0, 80.0) | 65.0 (49.0, 80.0) | 65.0 (49.0, 80.0) |
| Minimum, maximum | 10.0, 100.0 | 0.0, 100.0 | 0.0, 100.0 |
| Baseline (treated participants) | |||
| N | 288 | 324 | 612 |
| Mean (SD) | 62.0 (21.4) | 62.0 (21.7) | 62.0 (21.5) |
| Median (Q1, Q3) | 65.0 (50.0, 80.0) | 65.0 (49.0, 80.0) | 65.0 (49.5, 80.0) |
| Minimum, maximum | 10.0, 100.0 | 0.0, 100.0 | 0.0, 100.0 |
| Week 2 | |||
| N | 256 | 287 | 543 |
| Mean (SD) | 62.5 (22.1) | 78.1 (17.7) | 70.7 (21.4) |
| Median (Q1, Q3) | 65.0 (50.0, 80.0) | 83.0 (70.0, 90.0) | 75.0 (60.0, 90.0) |
| Minimum, maximum | 0.0, 100.0 | 4.0, 100.0 | 0.0, 100.0 |
| Week 6 | |||
| N | 236 | 277 | 513 |
| Mean (SD) | 80.7 (16.1) | 86.0 (16.3) | 83.6 (16.4) |
| Median (Q1, Q3) | 85.0 (75.0, 91.0) | 90.0 (80.0, 95.0) | 90.0 (80.0, 95.0) |
| Minimum, maximum | 10.0, 100.0 | 4.0, 100.0 | 4.0, 100.0 |
| Month 3 | |||
| N | 244 | 280 | 524 |
| Mean (SD) | 86.5 (16.1) | 87.2 (16.5) | 86.9 (16.3) |
| Median (Q1, Q3) | 90.0 (80.0, 97.0) | 91.0 (83.0, 98.0) | 90.0 (80.0, 98.0) |
| Minimum, maximum | 8.0, 100.0 | 5.0, 100.0 | 5.0, 100.0 |
| Month 6 | |||
| N | 244 | 267 | 511 |
| Mean (SD) | 89.1 (14.3) | 85.8 (16.9) | 87.4 (15.8) |
| Median (Q1, Q3) | 95.0 (85.5, 98.0) | 90.0 (80.0, 98.0) | 93.0 (80.0, 98.0) |
| Minimum, maximum | 20.0, 100.0 | 5.0, 100.0 | 5.0, 100.0 |
| 1 year | |||
| N | 245 | 282 | 527 |
| Mean (SD) | 88.7 (14.7) | 84.8 (17.8) | 86.6 (16.5) |
| Median (Q1, Q3) | 95.0 (85.0, 99.0) | 90.0 (80.0, 98.0) | 91.0 (80.0, 98.0) |
| Minimum, maximum | 10.0, 100.0 | 9.0, 100.0 | 9.0, 100.0 |
| 2 years | |||
| N | 196 | 222 | 418 |
| Mean (SD) | 89.0 (14.8) | 81.4 (19.0) | 85.0 (17.5) |
| Median (Q1, Q3) | 95.0 (85.0, 99.0) | 89.5 (73.0, 95.0) | 90.0 (79.0, 97.0) |
| Minimum, maximum | 20.0, 100.0 | 12.0, 100.0 | 12.0, 100.0 |
| Reference joint | Estimated difference (collagenase – surgery)a (95% CIb) |
p-valueb H0 : δ = 0 |
|
|---|---|---|---|
| MCP | Week 2 | 14.68 (11.53 to 17.84) | < 0.00005 |
| Week 6 | 5.86 (3.57 to 8.15) | < 0.00005 | |
| Month 3 | 0.82 (−1.24 to 2.87) | 0.4361 | |
| Month 6 | −2.52 (−4.50 to −0.55) | 0.0122 | |
| 1 year | −3.36 (−5.43 to −1.29) | 0.0015 | |
| 2 years | −6.64 (−9.17 to −4.11) | < 0.00005 | |
| PIP | Week 2 | 16.12 (12.69 to 19.55) | < 0.00005 |
| Week 6 | 7.18 (4.39 to 9.98) | < 0.00005 | |
| Month 3 | 1.02 (−1.54 to 3.58) | 0.4353 | |
| Month 6 | −3.32 (−5.94 to −0.71) | 0.0127 | |
| 1 year | −4.33 (−7.03 to −1.63) | 0.0017 | |
| 2 years | −8.56 (−11.86 to −5.26) | < 0.00005 |
| LF N = 295 |
Collagenase N = 326 |
Total N = 621 |
|
|---|---|---|---|
| Month 3 | |||
| Cured | 87 (29.5) | 82 (25.2) | 169 (27.2) |
| Much better | 126 (42.7) | 144 (44.2) | 270 (43.5) |
| A little better | 20 (6.8) | 34 (10.4) | 54 (8.7) |
| The same | 5 (1.7) | 11 (3.4) | 16 (2.6) |
| A little worse | 8 (2.7) | 7 (2.1) | 15 (2.4) |
| Much worse | 3 (1.0) | 4 (1.2) | 7 (1.1) |
| Missing | 46 (15.6) | 44 (13.5) | 90 (14.5) |
| Month 6 | |||
| Cured | 113 (38.3) | 66 (20.2) | 179 (28.8) |
| Much better | 104 (35.3) | 147 (45.1) | 251 (40.4) |
| A little better | 15 (5.1) | 24 (7.4) | 39 (6.3) |
| The same | 3 (1.0) | 13 (4.0) | 16 (2.6) |
| A little worse | 6 (2.0) | 12 (3.7) | 18 (2.9) |
| Much worse | 3 (1.0) | 6 (1.8) | 9 (1.4) |
| Terrible | 0 (0.0) | 1 (0.3) | 1 (0.2) |
| Missing | 51 (17.3) | 57 (17.5) | 108 (17.4) |
| 1 year | |||
| Cured | 103 (34.9) | 67 (20.6) | 170 (27.4) |
| Much better | 112 (38.0) | 127 (39.0) | 239 (38.5) |
| A little better | 10 (3.4) | 37 (11.3) | 47 (7.6) |
| The same | 6 (2.0) | 18 (5.5) | 24 (3.9) |
| A little worse | 8 (2.7) | 21 (6.4) | 29 (4.7) |
| Much worse | 3 (1.0) | 12 (3.7) | 15 (2.4) |
| Terrible | 2 (0.7) | 1 (0.3) | 3 (0.5) |
| Missing | 51 (17.3) | 43 (13.2) | 94 (15.1) |
| 2 years | |||
| Cured | 99 (33.6) | 41 (12.6) | 140 (22.5) |
| Much better | 70 (23.7) | 91 (27.9) | 161 (25.9) |
| A little better | 14 (4.7) | 28 (8.6) | 42 (6.8) |
| The same | 5 (1.7) | 18 (5.5) | 23 (3.7) |
| A little worse | 6 (2.0) | 28 (8.6) | 34 (5.5) |
| Much worse | 2 (0.7) | 18 (5.5) | 20 (3.2) |
| Terrible | 1 (0.3) | 0 (0.0) | 1 (0.2) |
| Missing | 98 (33.2) | 102 (31.3) | 200 (32.2) |
Appendix 8 Secondary outcomes – clinical outcomes
| Time point | Estimated differencea (collagenase – LF) (95% CIb) |
p-valueb H0 : δ = 0 |
|---|---|---|
| Month 3 | 5.79 (2.79 to 8.79) | 0.0002 |
| Month 6 | 9.32 (5.77 to 12.86) | < 0.00005 |
| 1 year | 9.94 (5.84 to 14.04) | < 0.00005 |
| 2 years | 10.98 (6.08 to 15.88) | < 0.00005 |
| Summary of treatment effect | Covariate pattern X | Estimate (95% CIa) | p-valuea H0 : δ = 0 |
p-valueb H0 : δ ≥ 0.1 |
|---|---|---|---|---|
| OR | – | 1.45 (0.74 to 2.85) | 0.2815 | – |
| RD[Pr(Recurrence | X)] | Joint = MCP Digit = Ring Baseline PEM = Sample mean Baseline passive ext. = Sample mean |
0.04 (−0.03 to 0.10) | 0.2987 | 0.0339 |
| RD[Pr(Recurrence | X)] | Joint = PIP Digit = Ring Baseline PEM = Sample mean Baseline passive ext. = Sample mean |
0.06 (−0.05 to 0.18) | 0.2952 | 0.2531 |
| RD[Pr(Recurrence | X)] | Joint = MCP Digit = Little Baseline PEM = Sample mean Baseline passive ext. = Sample mean |
0.04 (−0.03 to 0.11) | 0.2881 | 0.0586 |
| RD[Pr(Recurrence | X)] | Joint = PIP Digit = Little Baseline PEM = Sample mean Baseline passive ext. = Sample mean |
0.07 (−0.05 to 0.19) | 0.2835 | 0.2926 |
| LF N = 295 |
Collagenase N = 326 |
Total N = 621 |
|
|---|---|---|---|
| Baseline – total passive extension deficit of reference digit (°) | |||
| N | 271 | 299 | 570 |
| Mean (SD) | 43.5 (35.9) | 42.3 (35.6) | 42.9 (35.8) |
| Median (Q1, Q3) | 38.0 (20.0, 64.0) | 39.3 (19.3, 64.0) | 38.7 (20.0, 64.0) |
| Minimum, maximum | −91.7, 175.0 | −65.0, 144.0 | −91.7, 175.0 |
| Pre-treatment – total passive extension of reference digit (°) | |||
| N | 252 | 300 | 552 |
| Mean (SD) | 52.6 (36.5) | 49.4 (36.9) | 50.8 (36.7) |
| Median (Q1, Q3) | 50.0 (28.0, 74.0) | 46.0 (24.5, 71.0) | 48.0 (26.0, 74.0) |
| Minimum, maximum | −42.0, 168.0 | −44.0, 186.0 | −44.0, 186.0 |
| Month 3 – total passive extension of reference digit (°) | |||
| N | 207 | 220 | 427 |
| Mean (SD) | −6.2 (29.7) | −1.5 (30.3) | −3.7 (30.1) |
| Median (Q1, Q3) | −7.3 (−27.3, 10.0) | −1.0 (−20.7, 15.5) | −3.3 (−23.3, 14.0) |
| Minimum, maximum | −83.7, 98.0 | −78.0, 102.0 | −83.7, 102.0 |
| Month 6 – total passive extension of reference digit (°) | |||
| N | 169 | 199 | 368 |
| Mean (SD) | −7.0 (31.9) | −0.7 (31.0) | −3.6 (31.5) |
| Median (Q1, Q3) | −10.0 (−28.7, 12.0) | 0.0 (−18.7, 17.3) | −4.7 (−26.0, 15.0) |
| Minimum, maximum | −73.3, 118.7 | −87.3, 123.3 | −87.3, 123.3 |
| 1 year – total passive extension of reference digit (°) | |||
| N | 145 | 169 | 314 |
| Mean (SD) | −8.7 (30.0) | 3.0 (34.0) | −2.4 (32.7) |
| Median (Q1, Q3) | −5.0 (−32.0, 11.3) | 0.0 (−19.3, 20.0) | −1.3 (−26.0, 17.3) |
| Minimum, maximum | −78.7, 60.0 | −75.0, 130.7 | −78.7, 130.7 |
| 2 years – total passive extension of reference digit (°) | |||
| N | 116 | 141 | 257 |
| Mean (SD) | −8.3 (33.6) | 9.0 (38.9) | 1.2 (37.5) |
| Median (Q1, Q3) | −9.3 (−34.8, 10.0) | 10.0 (−15.0, 28.0) | 0.0 (−25.3, 22.7) |
| Minimum, maximum | −77.3, 90.0 | −75.7, 145.3 | −77.3, 145.3 |
FIGURE 84.
Mean total passive extension deficit profiles by allocation (based on available measurements). The vertical dashed line is plotted at the median time elapsed between randomisation and treatment delivery with subsequent time points referenced to this.
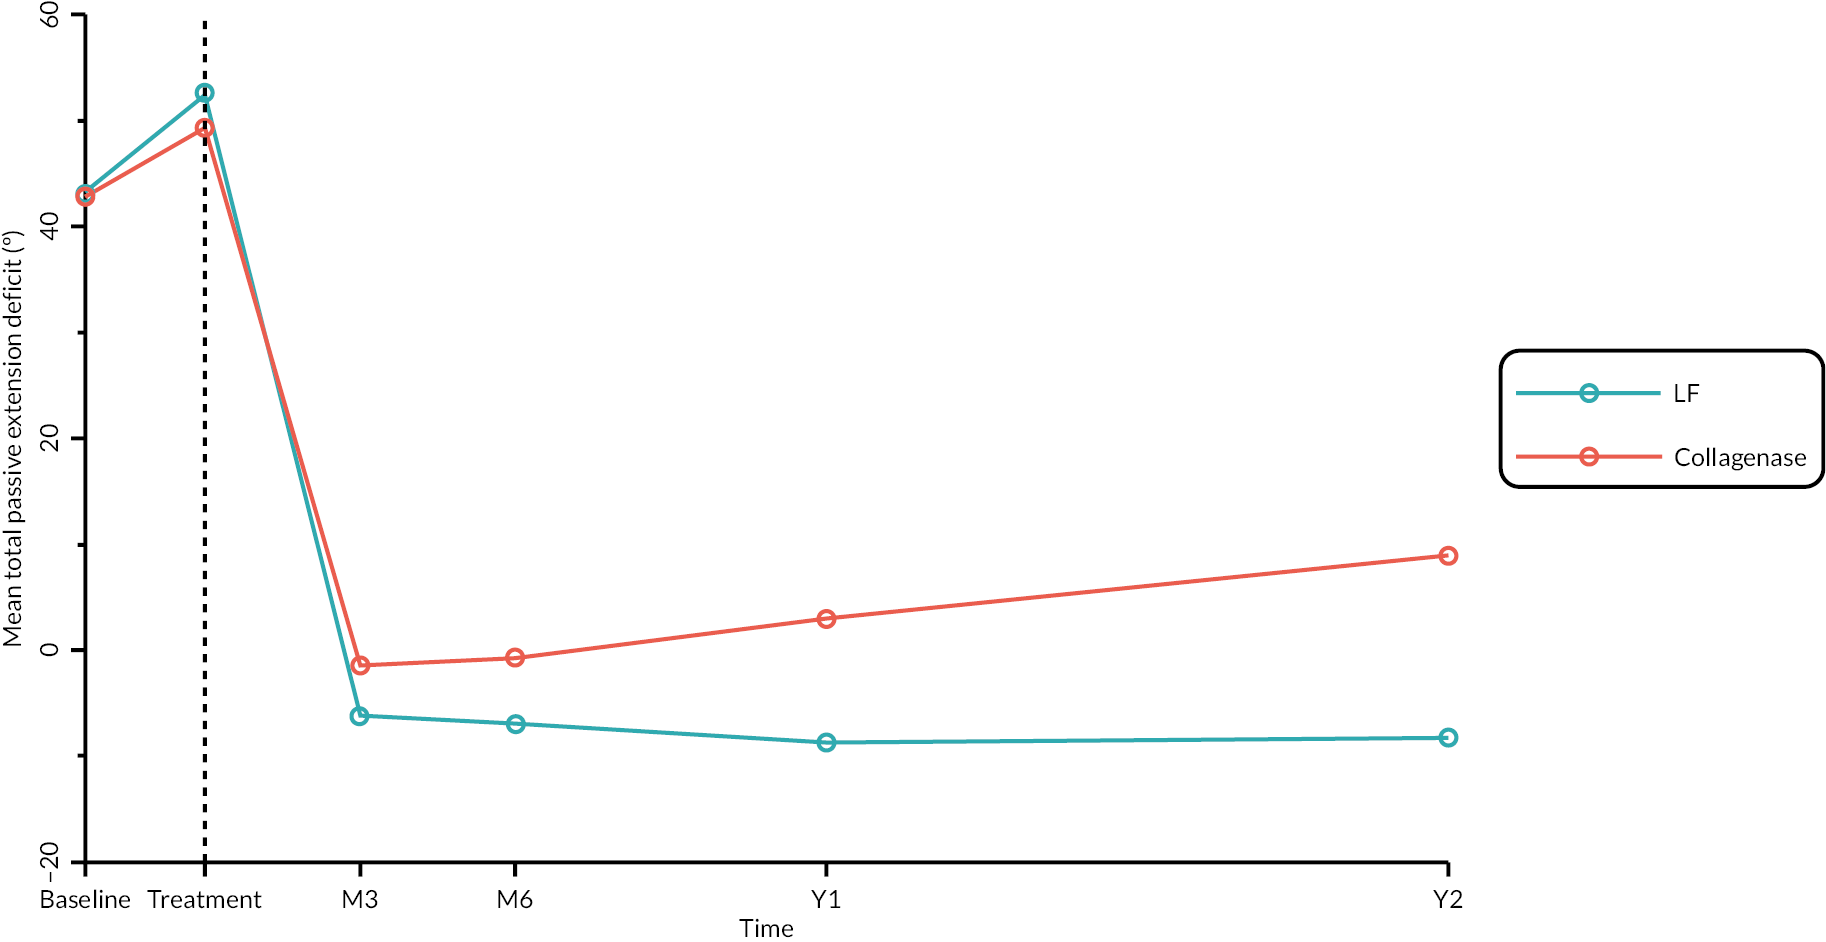
| Estimated differencea (collagenase – surgery) (95% CIb) |
p-valueb H0 : δ = 0 |
|
|---|---|---|
| Month 3 | 7.15 (2.25 to 12.05) | 0.0052 |
| Month 6 | 11.75 (6.29 to 17.21) | < 0.00005 |
| 1 year | 11.79 (5.68 to 17.89) | 0.0002 |
| 2 years | 18.18 (10.48 to 25.87) | < 0.00005 |
| LF N = 295 |
Collagenase N = 326 |
Total N = 621 |
|
|---|---|---|---|
| Baseline – passive RoM of reference joint (°) | |||
| N | 285 | 314 | 599 |
| Mean (SD) | 41.3 (17.1) | 40.5 (16.8) | 40.9 (16.9) |
| Median (Q1, Q3) | 41.7 (29.3, 52.7) | 40.7 (28.3, 51.3) | 41.3 (28.7, 52.0) |
| Minimum, maximum | 3.3, 90.0 | 0.0, 92.7 | 0.0, 92.7 |
| Month 3 – passive RoM of reference joint (°) | |||
| N | 206 | 225 | 431 |
| Mean (SD) | 78.1 (21.3) | 76.2 (20.3) | 77.1 (20.8) |
| Median (Q1, Q3) | 80.0 (67.3, 91.3) | 80.0 (64.7, 90.0) | 80.0 (66.0, 90.7) |
| Minimum, maximum | 11.3, 123.3 | 18.7, 130.0 | 11.3, 130.0 |
| Month 6 – passive RoM of reference joint (°) | |||
| N | 170 | 203 | 373 |
| Mean (SD) | 81.3 (22.8) | 74.5 (19.9) | 77.6 (21.5) |
| Median (Q1, Q3) | 84.0 (71.3, 95.0) | 77.3 (62.0, 90.0) | 80.0 (66.0, 91.3) |
| Minimum, maximum | 10.7, 134.0 | 19.3, 120.0 | 10.7, 134.0 |
| 1 year – passive RoM of reference joint (°) | |||
| N | 148 | 168 | 316 |
| Mean (SD) | 83.4 (23.2) | 73.4 (23.3) | 78.1 (23.8) |
| Median (Q1, Q3) | 85.7 (69.7, 98.0) | 77.3 (57.0, 90.7) | 81.3 (63.0, 94.0) |
| Minimum, maximum | 16.7, 157.3 | 14.0, 120.7 | 14.0, 157.3 |
| 2 years – passive RoM of reference joint (°) | |||
| N | 116 | 139 | 255 |
| Mean (SD) | 83.7 (26.4) | 71.5 (26.6) | 77.1 (27.2) |
| Median (Q1, Q3) | 88.0 (71.5, 99.7) | 75.0 (52.0, 91.0) | 82.0 (57.3, 97.3) |
| Minimum, maximum | −20.0, 136.7 | 2.7, 134.7 | −20.0, 136.7 |
FIGURE 85.
Mean passive RoM (of reference joint) profiles by allocation (all available measurements). Vertical dashed line plotted at median time elapsed between randomisation and treatment, with subsequent time points referenced to this.
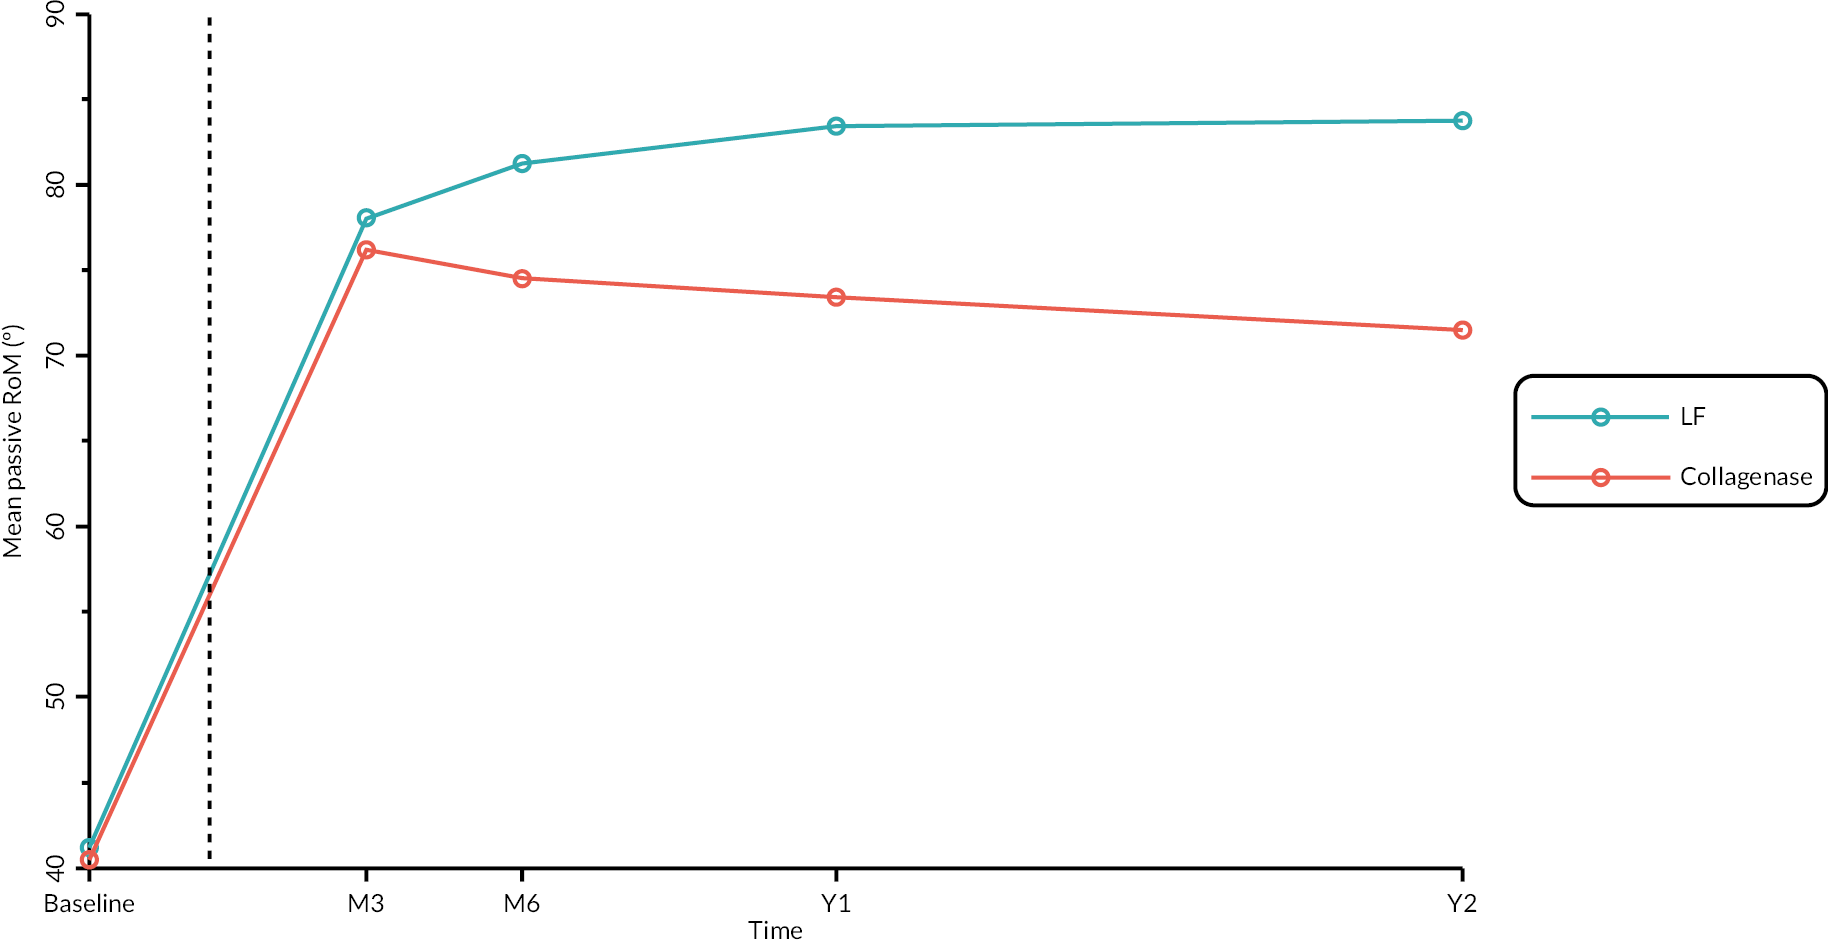
| Estimated differencea (collagenase – surgery) (95% CIb) |
p-valueb H0 : δ = 0 |
|
|---|---|---|
| Month 3 | −3.45 (−6.80 to −0.09) | 0.0441 |
| Month 6 | −8.93 (−12.56 to −5.31) | < 0.00005 |
| 1 year | −9.69 (−13.76 to −5.61) | < 0.00005 |
| 2 years | −13.20 (−18.33 to −8.08) | < 0.00005 |
| Estimated differencea (collagenase – surgery) (95% CIb) |
p-valueb H0 : δ = 0 |
|
|---|---|---|
| Month 3 | −3.28 (−6.94 to 0.38) | 0.0786 |
| Month 6 | −7.42 (−11.54 to −3.29) | 0.0004 |
| 1 year | −9.73 (−14.42 to −5.04) | 0.0001 |
| 2 years | −11.98 (−17.46 to −6.50) | < 0.00005 |
| LF N = 295 |
Collagenase N = 326 |
Total N = 621 |
|
|---|---|---|---|
| Baseline (goniometry only) – active extension of reference joint (°) a | |||
| N | 289 | 319 | 608 |
| Mean (SD) | 52.7 (15.3) | 51.7 (16.4) | 52.2 (15.9) |
| Median (Q1, Q3) | 51.7 (40.0, 63.3) | 50.7 (39.3, 63.3) | 51.5 (40.0, 63.3) |
| Minimum, maximum | 11.7, 91.3 | 2.3, 90.7 | 2.3, 91.3 |
| Baseline (goniometry and photography) – active extension of reference joint (°) a | |||
| N | 292 | 324 | 616 |
| % obtained via photography | 1.0 | 1.5 | 1.3 |
| Mean (SD) | 52.5 (15.5) | 51.4 (16.6) | 51.9 (16.1) |
| Median (Q1, Q3) | 51.7 (40.0, 63.3) | 50.7 (39.2, 62.7) | 51.3 (40.0, 63.3) |
| Minimum, maximum | 10.0, 91.3 | 2.3, 90.7 | 2.3, 91.3 |
| Pre-treatment (goniometry only) – active extension of reference joint (°) | |||
| N | 272 | 316 | 588 |
| Mean (SD) | 54.6 (16.3) | 53.0 (16.5) | 53.8 (16.4) |
| Median (Q1, Q3) | 54.0 (41.0, 66.0) | 50.0 (42.0, 64.0) | 52.0 (42.0, 65.0) |
| Minimum, maximum | 10.0, 100.0 | 8.0, 91.0 | 8.0, 100.0 |
| Pre-treatment (goniometry and photography) – active extension of reference joint (°) | |||
| N | 282 | 318 | 600 |
| % obtained via photography | 3.5 | 0.6 | 2.0 |
| Mean (SD) | 54.1 (16.6) | 52.8 (16.8) | 53.4 (16.7) |
| Median (Q1, Q3) | 54.0 (40.0, 66.0) | 50.0 (42.0, 64.0) | 50.0 (42.0, 65.0) |
| Minimum, maximum | 10.0, 100.0 | 8.0, 91.0 | 8.0, 100.0 |
| Month 3 (goniometry only) – active extension of reference joint (°) | |||
| N | 213 | 232 | 445 |
| Mean (SD) | 11.6 (18.9) | 15.3 (19.7) | 13.5 (19.4) |
| Median (Q1, Q3) | 5.3 (0.0, 21.3) | 11.3 (0.0, 27.0) | 8.7 (0.0, 25.3) |
| Minimum, maximum | −26.7, 77.0 | −34.0, 71.3 | −34.0, 77.0 |
| Month 3 (goniometry and photography) – active extension of reference joint (°) | |||
| N | 224 | 249 | 473 |
| % obtained via photography | 4.9 | 6.8 | 5.9 |
| Mean (SD) | 12.1 (19.0) | 15.4 (19.7) | 13.8 (19.4) |
| Median (Q1, Q3) | 5.3 (0.0, 23.3) | 10.7 (0.0, 27.3) | 9.3 (0.0, 26.0) |
| Minimum, maximum | −26.7, 77.0 | −34.0, 71.3 | −34.0, 77.0 |
| Month 6 (goniometry only) – active extension of reference joint (°) | |||
| N | 177 | 205 | 382 |
| Mean (SD) | 11.0 (22.1) | 18.4 (22.9) | 15.0 (22.8) |
| Median (Q1, Q3) | 4.7 (−1.3, 20.0) | 13.3 (0.0, 34.0) | 9.7 (0.0, 28.0) |
| Minimum, maximum | −28.0, 81.0 | −48.7, 86.7 | −48.7, 86.7 |
| Month 6 (goniometry and photography) – active extension of reference joint (°) | |||
| N | 196 | 222 | 418 |
| % obtained via photography | 9.7 | 7.7 | 8.6 |
| Mean (SD) | 10.9 (21.5) | 18.1 (22.8) | 14.7 (22.5) |
| Median (Q1, Q3) | 4.7 (−0.7, 20.0) | 12.7 (0.0, 32.0) | 9.7 (0.0, 26.7) |
| Minimum, maximum | −28.0, 81.0 | −48.7, 86.7 | −48.7, 86.7 |
| 1 year (goniometry only) – active extension of reference joint (°) | |||
| N | 152 | 174 | 326 |
| Mean (SD) | 10.3 (22.8) | 21.2 (25.3) | 16.1 (24.7) |
| Median (Q1, Q3) | 5.3 (−0.5, 19.8) | 15.8 (0.0, 39.3) | 10.0 (0.0, 32.7) |
| Minimum, maximum | −74.7, 77.3 | −40.0, 86.0 | −74.7, 86.0 |
| 1 year (goniometry and photography) – active extension of reference joint (°) | |||
| N | 188 | 209 | 397 |
| % obtained via photography | 19.1 | 16.7 | 17.9 |
| Mean (SD) | 10.7 (22.9) | 20.0 (24.5) | 15.6 (24.2) |
| Median (Q1, Q3) | 5.3 (0.0, 19.3) | 14.7 (1.3, 35.0) | 9.0 (0.0, 30.7) |
| Minimum, maximum | −74.7, 87.5 | −40.0, 86.0 | −74.7, 87.5 |
| 2 years (goniometry only) – active extension of reference joint (°) | |||
| N | 122 | 144 | 266 |
| Mean (SD) | 12.2 (24.1) | 25.3 (26.6) | 19.3 (26.3) |
| Median (Q1, Q3) | 6.0 (−1.3, 22.3) | 22.3 (5.7, 44.3) | 14.8 (0.0, 36.3) |
| Minimum, maximum | −28.7, 90.0 | −50.0, 90.0 | −50.0, 90.0 |
| 2 years (goniometry and photography) – active extension of reference joint (°) | |||
| N | 162 | 181 | 343 |
| % obtained via photography | 24.7 | 20.4 | 22.4 |
| Mean (SD) | 12.1 (23.7) | 22.7 (26.0) | 17.7 (25.5) |
| Median (Q1, Q3) | 5.2 (0.0, 22.3) | 19.0 (3.0, 41.5) | 10.0 (0.0, 34.0) |
| Minimum, Maximum | −29.0, 90.0 | −50.0, 90.0 | −50.0, 90.0 |
FIGURE 86.
Mean profiles by allocation for the full set of available goniometric and photographic measurements at each time point. The vertical dashed line denotes the median time elapsed between randomisation and treatment, with subsequent time points referenced to this.
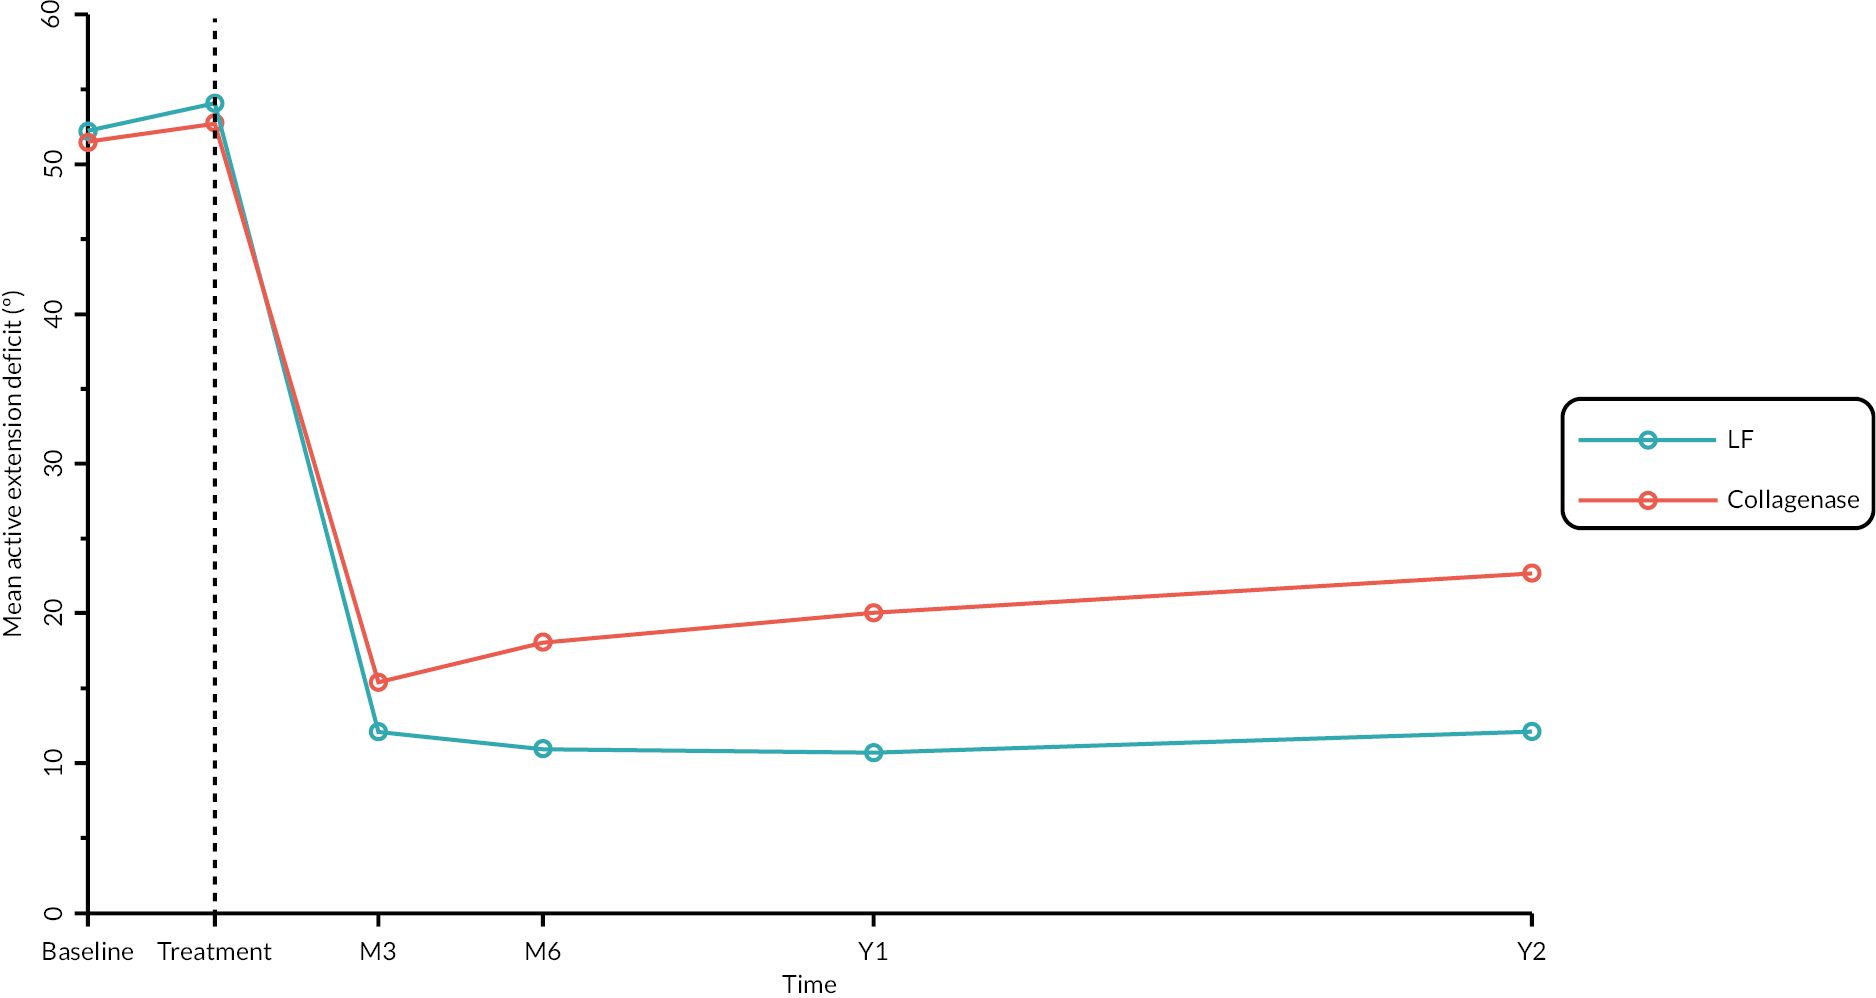
| Estimated differencea (collagenase – surgery) (95% CIb) |
p-valueb H0 : δ = 0 |
|
|---|---|---|
| Month 3 | 5.57 (3.02 to 8.12) | < 0.00005 |
| Month 6 | 9.86 (6.71 to 13.02) | < 0.00005 |
| 1 year | 11.52 (8.13 to 14.91) | < 0.00005 |
| 2 years | 12.26 (8.30 to 16.23) | < 0.00005 |
| Time point | Estimated differencea (collagenase – surgery) (95% CIb) |
p-valueb H0 : δ = 0 |
|---|---|---|
| Month 3 | 5.52 (2.63 to 8.41) | 0.0002 |
| Month 6 | 10.87 (7.33 to 14.40) | < 0.00005 |
| 1 year | 11.59 (7.43 to 15.75) | < 0.00005 |
| 2 years | 12.79 (8.21 to 17.37) | < 0.00005 |
FIGURE 87.
Mean active extension deficit profiles by allocation based on measurements obtained using investigator taken photographs. The vertical dashed line denotes the median time elapsed between randomisation and treatment, with subsequent time points referenced to this.
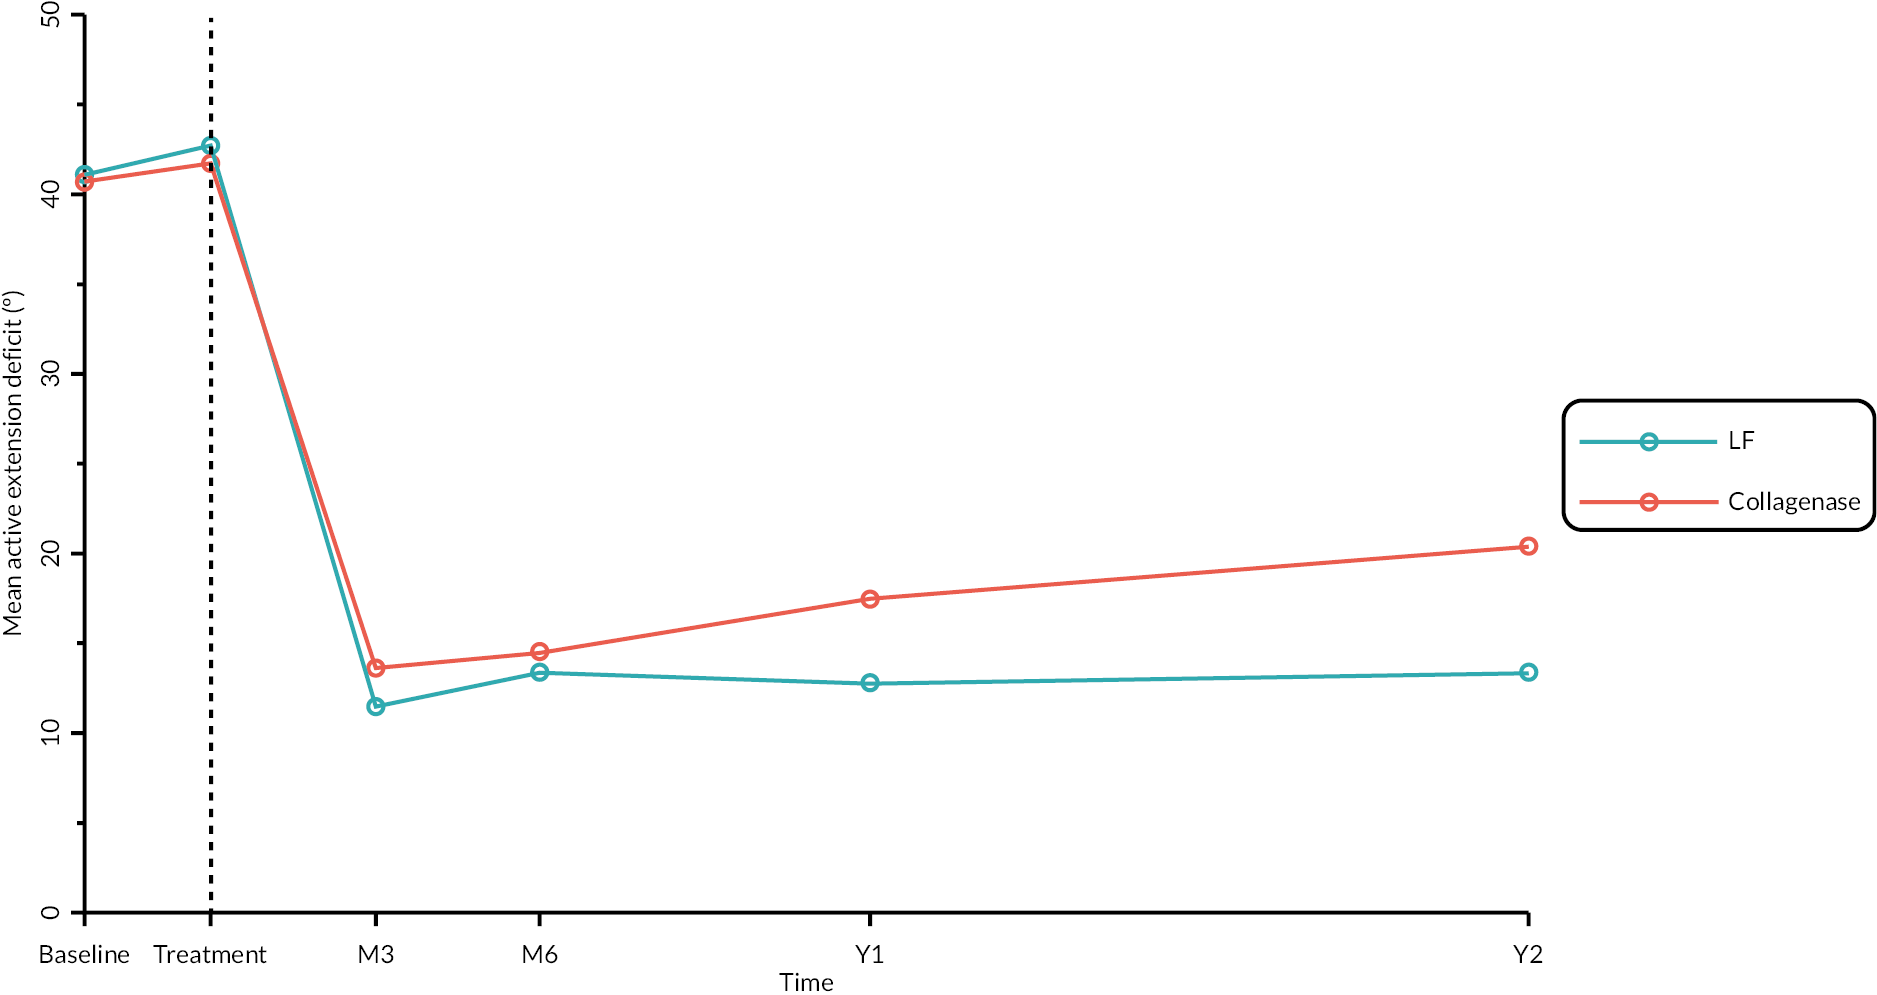
| Estimated differencea (collagenase – surgery) (95% CIb) |
p-valueb H0 : δ = 0 |
|
|---|---|---|
| Month 3 | 4.15 (1.77 to 6.52) | 0.0006 |
| Month 6 | 5.25 (2.38 to 8.11) | 0.0003 |
| 1 year | 6.30 (3.22 to 9.37) | 0.0001 |
| 2 years | 8.11 (3.98 to 12.25) | 0.0001 |
| LF N = 295 |
Collagenase N = 326 |
Total N = 621 |
|
|---|---|---|---|
| Baseline – total active extension deficit of reference digit (°) | |||
| N | 286 | 322 | 608 |
| Mean (SD) | 64.6 (30.8) | 62.4 (31.7) | 63.4 (31.3) |
| Median (Q1, Q3) | 59.4 (40.0, 87.3) | 56.8 (40.0, 80.0) | 58.7 (40.0, 83.5) |
| Minimum, maximum | 4.7, 151.7 | 0.0, 160.0 | 0.0, 160.0 |
| Pre-treatment – total active extension deficit of reference digit (°) | |||
| N | 275 | 317 | 592 |
| Mean (SD) | 69.2 (33.8) | 65.5 (33.2) | 67.2 (33.5) |
| Median (Q1, Q3) | 62.0 (44.0, 90.0) | 60.0 (42.0, 82.0) | 60.0 (42.0, 87.0) |
| Minimum, maximum | 4.0, 178.0 | −3.5, 190.0 | −3.5, 190.0 |
| Month 3 – total active extension deficit of reference digit joint (°) | |||
| N | 224 | 248 | 472 |
| Mean (SD) | 11.7 (26.2) | 15.7 (25.4) | 13.8 (25.8) |
| Median (Q1, Q3) | 8.5 (−4.3, 28.0) | 14.0 (0.0, 31.0) | 11.5 (−2.2, 30.0) |
| Minimum, maximum | −56.0, 90.0 | −50.0, 100.0 | −56.0, 100.0 |
| Month 6 – total active extension deficit of reference digit joint (°) | |||
| N | 195 | 222 | 417 |
| Mean (SD) | 10.7 (27.8) | 19.1 (28.1) | 15.1 (28.2) |
| Median (Q1, Q3) | 7.0 (−6.7, 27.3) | 15.7 (0.0, 34.0) | 11.7 (−2.0, 30.7) |
| Minimum, maximum | −54.0, 140.0 | −63.3, 130.0 | −63.3, 140.0 |
| 1 year – total active extension deficit of reference digit (°) | |||
| N | 188 | 209 | 397 |
| Mean (SD) | 11.4 (25.9) | 25.4 (33.2) | 18.7 (30.7) |
| Median (Q1, Q3) | 10.0 (−3.0, 29.2) | 18.5 (3.5, 41.5) | 13.3 (0.0, 34.0) |
| Minimum, maximum | −64.0, 120.0 | −65.3, 152.7 | −65.3, 152.7 |
| 2 years – total active extension deficit of reference digit (°) | |||
| N | 162 | 181 | 343 |
| Mean (SD) | 14.1 (31.2) | 30.3 (35.2) | 22.7 (34.3) |
| Median (Q1, Q3) | 10.0 (−4.7, 30.0) | 25.0 (8.0, 50.0) | 16.0 (0.0, 42.0) |
| Minimum, maximum | −49.3, 183.0 | −62.0, 180.0 | −62.0, 183.0 |
FIGURE 88.
Mean total active extension deficit profiles by allocation (based on available photographic and goniometric measurements). The vertical dashed line is plotted at the median time elapsed between randomisation and treatment delivery with subsequent time points referenced to this.
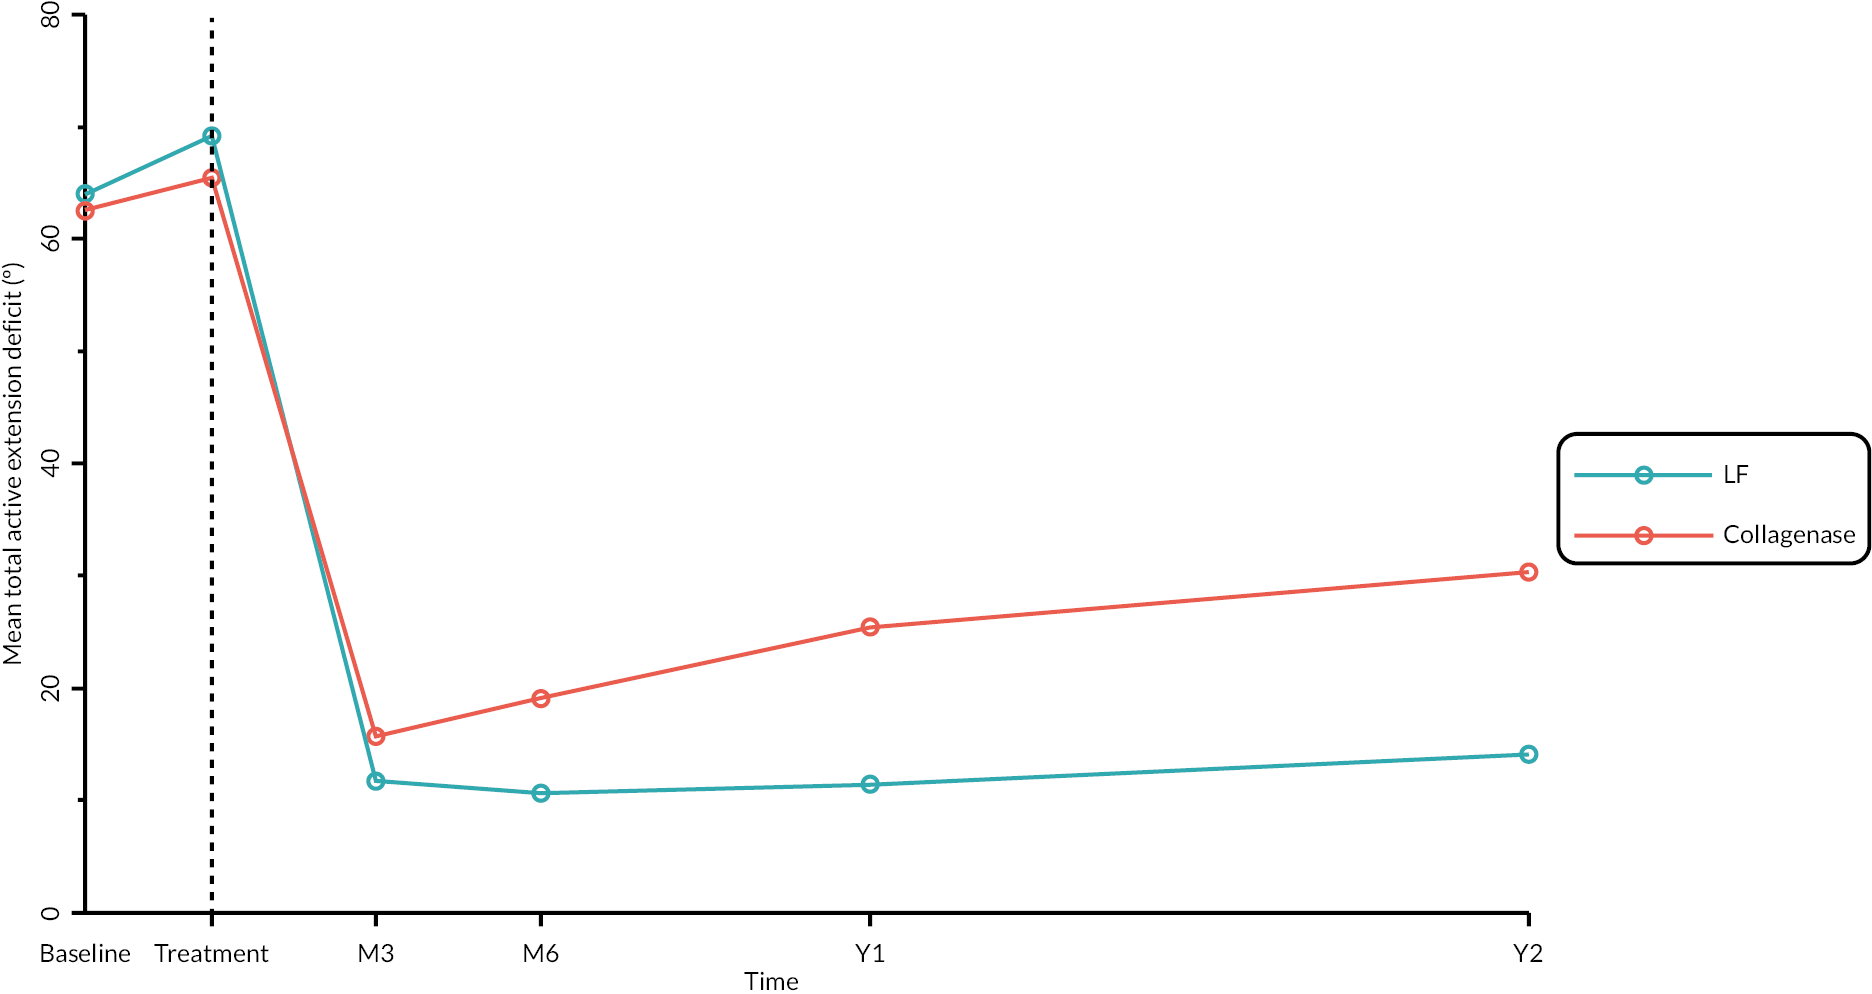
| Estimated differencea (collagenase – surgery) (95% CIb) |
p-valueb H0 : δ = 0 |
|
|---|---|---|
| Month 3 | 6.10 (2.08 to 10.11) | 0.0030 |
| Month 6 | 12.53 (7.82 to 17.25) | < 0.00005 |
| 1 year | 15.87 (10.53 to 21.22) | < 0.00005 |
| 2 years | 15.95 (9.75 to 22.14) | < 0.00005 |
| LF N = 295 |
Collagenase N = 326 |
Total N = 621 |
|
|---|---|---|---|
| Baseline (goniometry only) – active RoM of reference joint (°) a | |||
| N | 286 | 315 | 601 |
| Mean (SD) | 34.7 (15.6) | 34.5 (15.3) | 34.6 (15.4) |
| Median (Q1, Q3) | 34.0 (23.3, 46.0) | 34.7 (22.7, 46.0) | 34.0 (23.3, 46.0) |
| Minimum, maximum | 0.0, 86.0 | 0.0, 79.3 | 0.0, 86.0 |
| Baseline (goniometry and photography) – active RoM of reference joint (°) a | |||
| N | 290 | 322 | 612 |
| % obtained via photography | 1.4 | 2.2 | 1.8 |
| Mean (SD) | 34.7 (15.8) | 34.8 (15.4) | 34.7 (15.6) |
| Median (Q1, Q3) | 34.0 (23.3, 46.0) | 34.7 (23.0, 46.0) | 34.6 (23.3, 46.0) |
| Minimum, maximum, | 0.0, 86.0 | 0.0, 79.3 | 0.0, 86.0 |
| Month 3 (goniometry only) – active RoM of reference joint (°) | |||
| N | 209 | 231 | 440 |
| Mean (SD) | 72.2 (20.6) | 70.1 (19.2) | 71.1 (19.9) |
| Median (Q1, Q3) | 76.0 (62.0, 86.7) | 72.7 (56.7, 84.0) | 74.8 (59.3, 85.0) |
| Minimum, maximum | 6.0, 122.7 | 0.0, 121.3 | 0.0, 122.7 |
| Month 3 (goniometry and photography) – active RoM of reference joint (°) | |||
| N | 216 | 241 | 457 |
| % obtained via photography | 3.2 | 4.1 | 3.7 |
| Mean (SD) | 71.6 (21.2) | 70.1 (19.4) | 70.8 (20.2) |
| Median (Q1, Q3) | 76.0 (61.3, 86.7) | 72.7 (56.7, 84.0) | 74.7 (58.7, 85.0) |
| Minimum, maximum | 6.0, 122.7 | 0.0, 121.3 | 0.0, 122.7 |
| Month 6 (goniometry only) – active RoM of reference joint (°) | |||
| N | 176 | 205 | 381 |
| Mean (SD) | 75.4 (21.7) | 67.7 (19.9) | 71.2 (21.1) |
| Median (Q1, Q3) | 80.3 (65.7, 90.0) | 69.3 (55.0, 85.0) | 73.7 (57.3, 87.3) |
| Minimum, maximum | 8.0, 116.7 | 0.7, 112.7 | 0.7, 116.7 |
| Month 6 (goniometry and photography) – active RoM of reference joint (°) | |||
| N | 186 | 218 | 404 |
| % obtained via photography | 5.4 | 6.0 | 5.7 |
| Mean (SD) | 74.5 (23.2) | 68.3 (20.5) | 71.1 (22.0) |
| Median (Q1, Q3) | 80.0 (64.7, 90.0) | 70.0 (55.0, 85.3) | 74.0 (57.3, 87.3) |
| Minimum, maximum | −11.5, 116.7 | 0.7, 112.7 | −11.5, 116.7 |
| 1 year (goniometry only) – active RoM of reference joint (°) | |||
| N | 152 | 170 | 322 |
| Mean (SD) | 77.3 (22.2) | 65.0 (23.1) | 70.8 (23.4) |
| Median (Q1, Q3) | 80.0 (65.8, 90.0) | 68.7 (50.0, 83.3) | 73.5 (56.0, 87.7) |
| Minimum, maximum | 15.3, 160.0 | 5.0, 118.0 | 5.0, 160.0 |
| 1 year (goniometry and photography) – active RoM of reference joint (°) | |||
| N | 172 | 191 | 363 |
| % obtained via photography | 11.6 | 11.0 | 11.3 |
| Mean (SD) | 77.5 (22.6) | 65.5 (22.8) | 71.2 (23.4) |
| Median (Q1, Q3) | 80.7 (67.2, 90.3) | 70.0 (50.0, 84.0) | 74.0 (57.3, 87.5) |
| Minimum, maximum | −6.0, 160.0 | 5.0, 118.0 | −6.0, 160.0 |
| 2 years (goniometry only) – active RoM of reference joint (°) | |||
| N | 121 | 139 | 260 |
| Mean (SD) | 77.1 (23.6) | 62.8 (25.4) | 69.4 (25.5) |
| Median (Q1, Q3) | 81.0 (69.3, 93.3) | 64.7 (40.7, 82.0) | 73.7 (52.0, 88.2) |
| Minimum, maximum | −20.0, 114.7 | 7.3, 134.7 | −20.0, 134.7 |
| 2 years (goniometry and photography) – active RoM of reference joint (°) | |||
| N | 149 | 173 | 322 |
| % obtained via photography | 18.8 | 19.7 | 19.3 |
| Mean (SD) | 77.0 (24.2) | 64.1 (25.4) | 70.1 (25.6) |
| Median (Q1, Q3) | 81.0 (68.7, 93.3) | 66.7 (45.3, 82.0) | 74.8 (52.7, 88.7) |
| Minimum, maximum | −20.0, 138.0 | −3.0, 134.7 | −20.0, 138.0 |
FIGURE 89.
Mean profiles by allocation for the full set of available goniometric and photographic RoM measurements at each time point. The vertical dashed line denotes the median time elapsed between randomisation and treatment, with subsequent time points referenced to this.
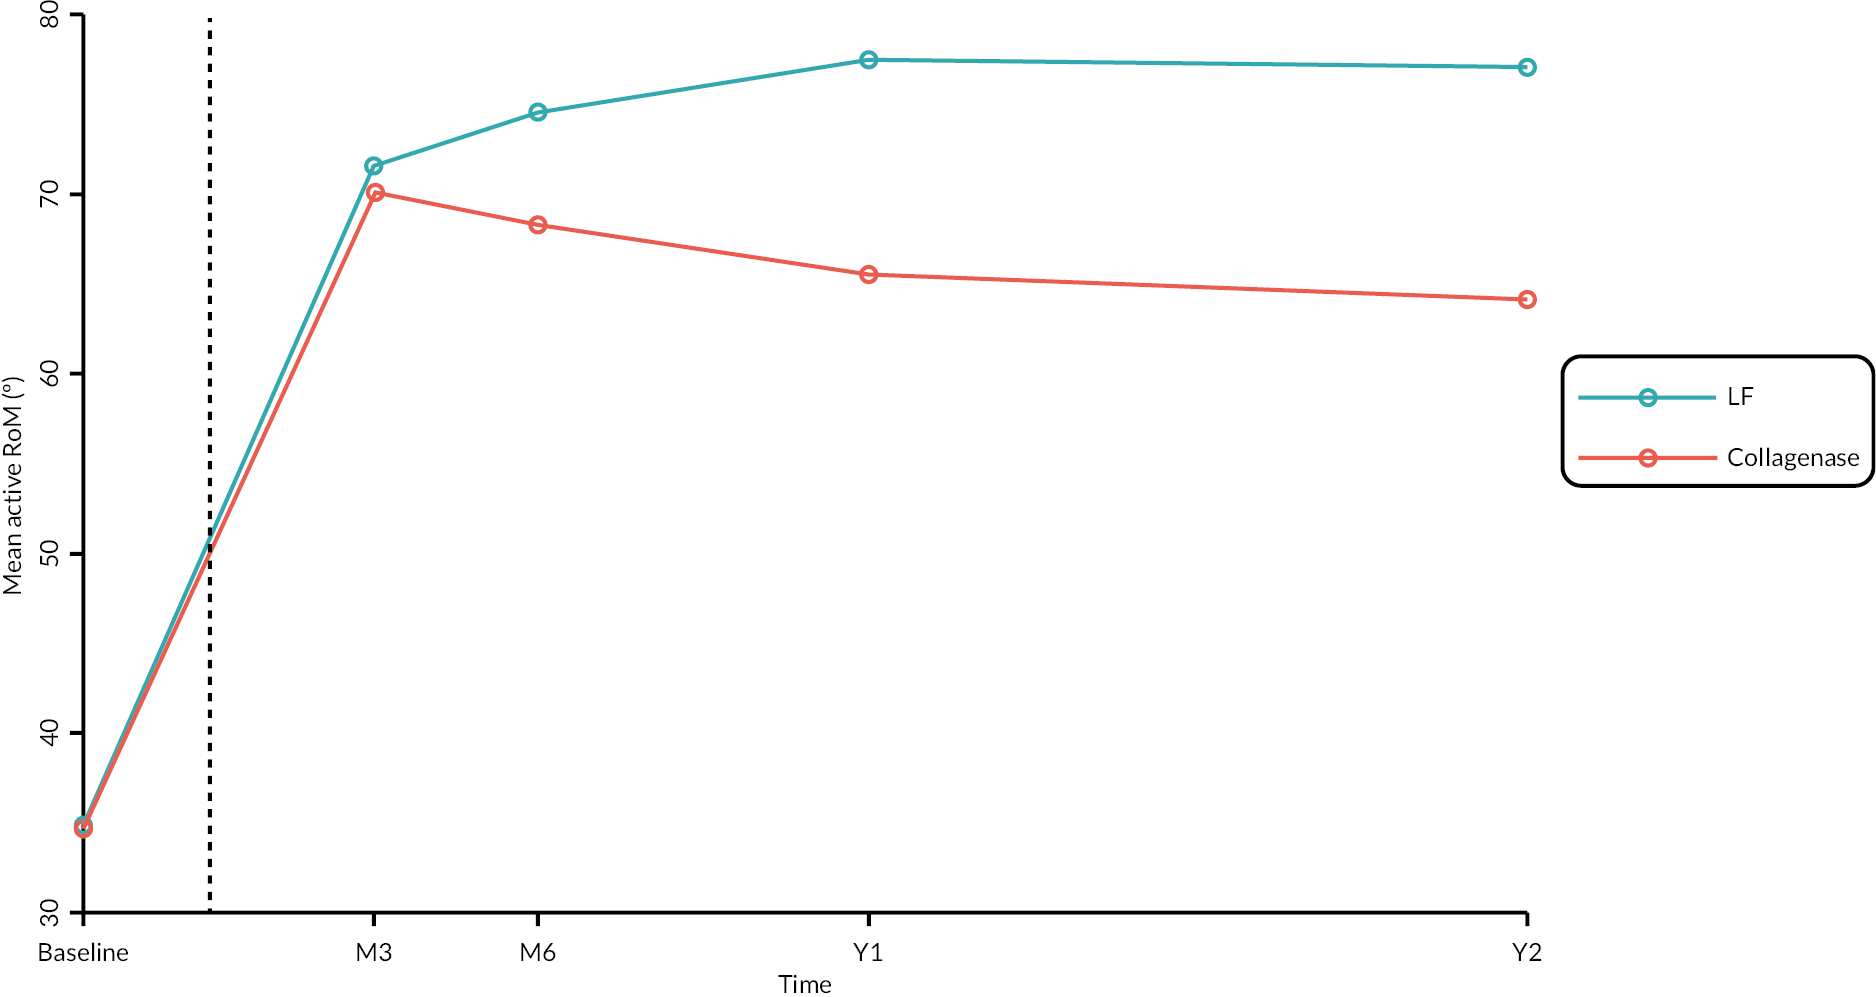
| Estimated differencea (collagenase – surgery) (95% CIb) |
p-valueb H0 : δ = 0 |
|
|---|---|---|
| Month 3 | −3.18 (−6.39 to 0.03) | 0.0521 |
| Month 6 | −8.37 (−11.99 to −4.75) | < 0.00005 |
| 1 year | −12.73 (−16.59 to −8.88) | < 0.00005 |
| 2 years | −13.26 (−17.78 to −8.74) | < 0.00005 |
| Estimated differencea (collagenase – surgery) (95% CIb) |
p-valueb H0 : δ = 0 |
|
|---|---|---|
| Month 3 | −2.71 (−6.14 to 0.72) | 0.1209 |
| Month 6 | −8.74 (−12.74 to −4.74) | < 0.00005 |
| 1 year | −11.19 (−15.82 to −6.55) | < 0.00005 |
| 2 years | −13.75 (−18.77 to −8.72) | < 0.00005 |
| ID (Event) | Allocation | Treatment received | Grade | Description |
|---|---|---|---|---|
| 1 | Collagenase | Collagenase | Moderate | Large skin laceration (larger than 2 cm) |
| 2 | Surgery | Surgery | Severe | Left little finger amputation. Flexion at the PIPJ for patient was affecting function and use of hand. Now happy with function in hand post-surgery |
| 3 | Surgery | Surgery | Moderate | Stiffening, hypoesthesia and pain in finger. Suspected trapped nerve in scar tissue |
| 4 | Surgery | Surgery | Moderate | Numbness at base of finger following procedure |
| 5 | Collagenase | Collagenase | Moderate | Pain in right hand that is getting progressively worse. Patient struggles to grip especially in the morning time; but this does ease off over the day |
| 6 | Surgery | Surgery | Moderate | Paraesthesia and numbness of ulnar digital nerve. Not improved at 6 months |
| 7 | Surgery | Surgery | Moderate | Patient-reported numbness to finger. No further documentation in clinic letters or medical notes |
| 8 | Surgery | Surgery | Moderate | Delayed healing identified at 3-month follow- up – small open area at the PIP joint crease which is still damp |
| 9 | Surgery | Surgery | Moderate | Scar tissue and stiffness at 3-month follow- up |
| 10 (1) | Surgery | Surgery | Moderate | Stiffness reported in reference digit associated with scar tissue at 3 months |
| 10 (2) | Surgery | Surgery | Moderate | Minimal to mild swelling on reference joint at 3-month follow-up |
| 11 | Surgery | Surgery | Severe | Post-fasciectomy participant has had a significant swelling to hand and digits of left hand. This is particularly painful in MCP and PIP joints of third, fourth and fifth finger. Swelling has caused stiffness to all associated joints and is struggling with flexion RoM actively due to the above. It is improving very slowly since initial onset |
| 12 | Collagenase | Collagenase | Moderate | Patient attended 3-month review. The MCP joint contracture has been corrected but he has developed instability of this joint because of releasing the chronic flexion contracture he had |
| Grade (y) | Reference joint | RD(Pr[Y ≥ y | X]) Estimate (95% CIa); p-valueb |
RR(Pr[Y ≥ y | X]) Estimate (95% CIa); p-valueb |
|---|---|---|---|
| Very minor | MCP | −0.027 (−0.105 to 0.050); p = 0.4897 | 0.960 (0.850 to 1.084); p = 0.5074 |
| PIP | −0.024 (−0.092 to 0.045); p = 0.5001 | 0.969 (0.881 to 1.066); p = 0.5154 | |
| Mild | MCP | −0.132 (−0.227 to −0.037); p = 0.0066 | 0.813 (0.680 to 0.973); p = 0.0235 |
| PIP | −0.116 (−0.209 to −0.022); p = 0.0157 | 0.851 (0.729 to 0.994); p = 0.0416 | |
| Moderate | MCP | −0.091 (−0.235 to 0.053); p = 0.2149 | 0.905 (0.765 to 1.070); p = 0.2431 |
| PIP | −0.067 (−0.179 to 0.046); p = 0.2458 | 0.931 (0.822 to 1.056); p = 0.2669 |
FIGURE 90.
Grade of worst single complication by allocation excluding skin tears sustained during joint manipulation (treated participants only).
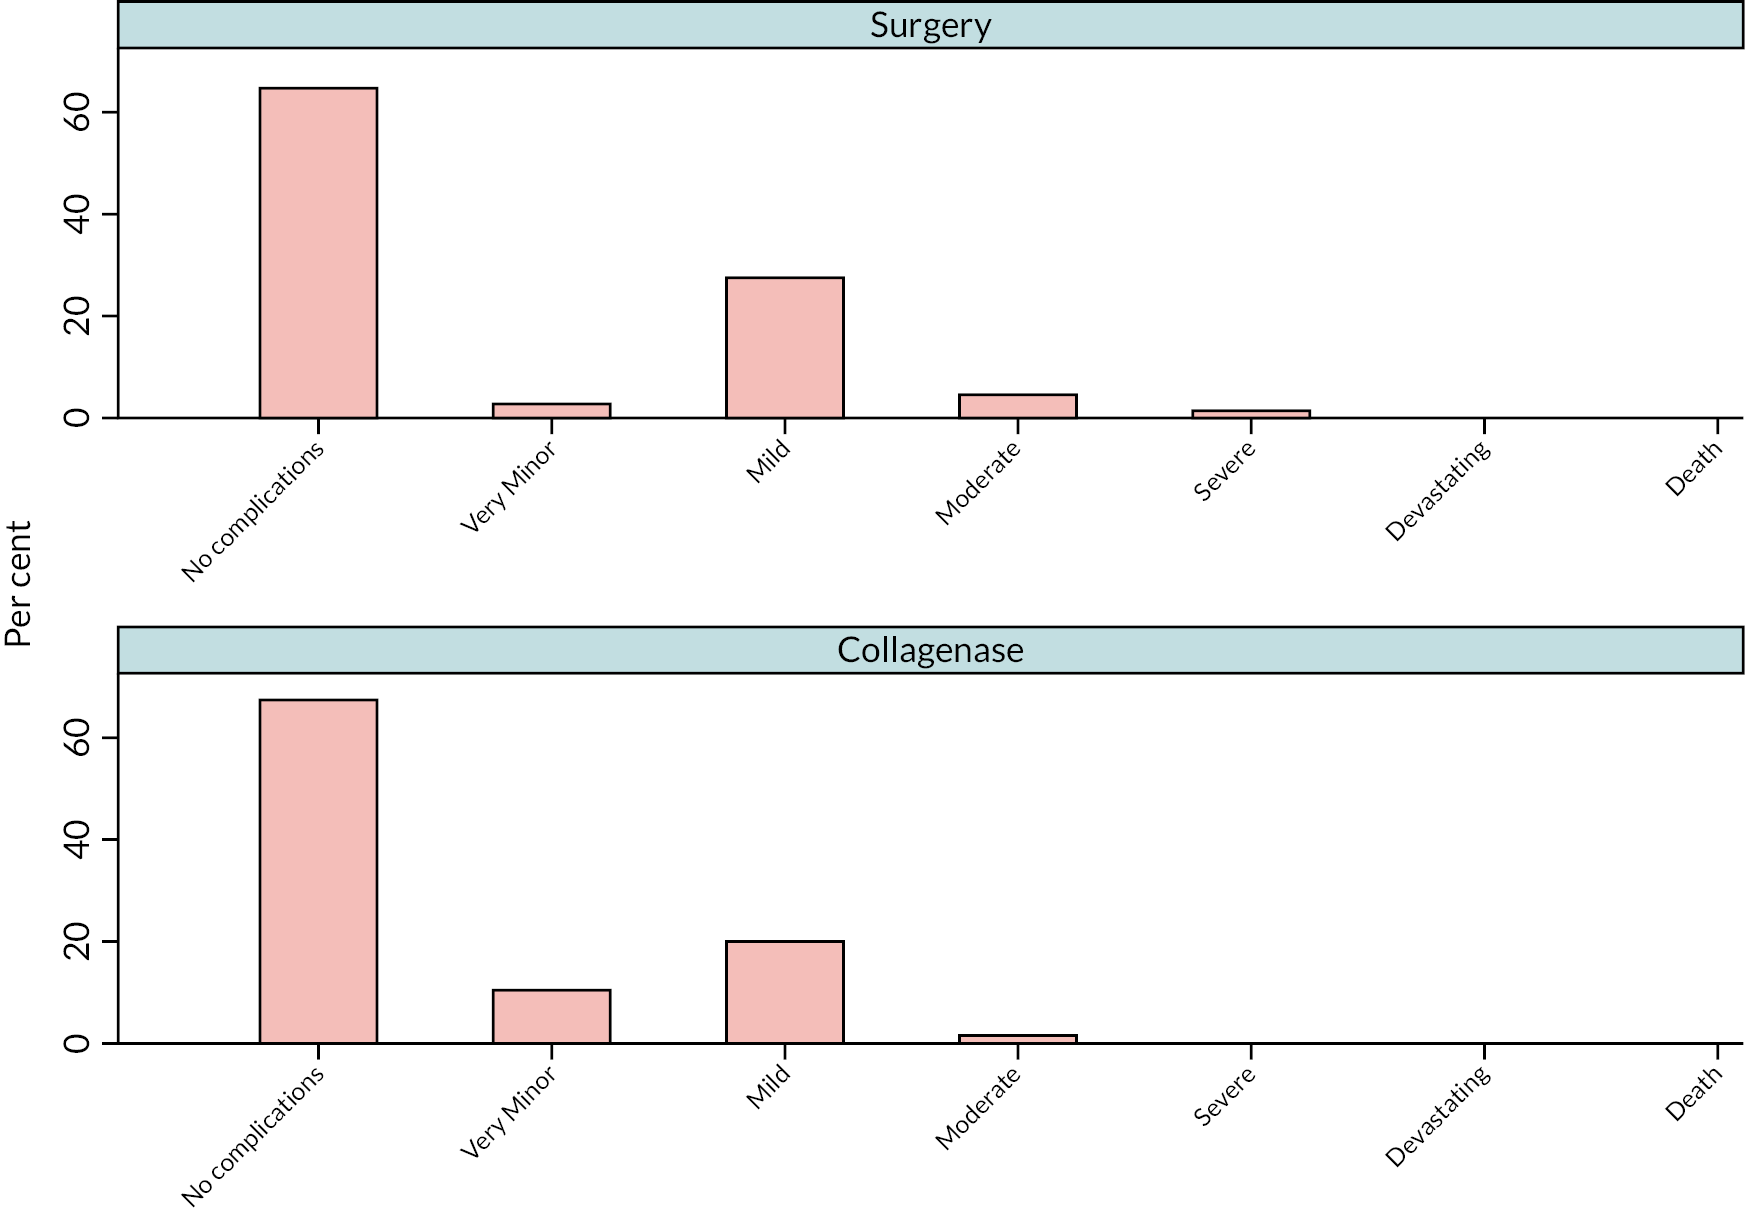
Appendix 9 Cost-effectiveness evaluation
| Number of participants | Total number of staff members | Number of staff per participant | Mean time (minutes) | Total staff cost | Cost per participant | Total staff cost % | |
|---|---|---|---|---|---|---|---|
| LF | |||||||
| Consultant | 279 | 282 | 1.01 | 109 | £58,984 | £211 | 38 |
| Trainee surgeon | 279 | 238 | 0.85 | 109 | £21,680 | £78 | 14 |
| Nurse | 279 | 429 | 1.54 | 109 | £35,931 | £129 | 23 |
| Healthcare assistant | 279 | 250 | 0.90 | 109 | £11,843 | £42 | 8 |
| Operating department practitioner | 279 | 206 | 0.74 | 109 | £16,810 | £60 | 11 |
| Other staff | 279 | 140 | 0.50 | 109 | £11,604 | £42 | 7 |
| Total | 279 | 1545 | 5.54 | 109 | £156,852 | £562 | 100 |
| Wound clinic appointment | |||||||
| Consultant | 266 | 106 | 0.4 | 32 | £6095 | £23 | 34 |
| Trainee surgeon | 266 | 39 | 0.1 | 32 | £1086 | £4 | 6 |
| Nurse | 266 | 235 | 0.9 | 32 | £5841 | £22 | 32 |
| Other staff | 266 | 187 | 0.7 | 32 | £4991 | £19 | 28 |
| Total | 266 | 567 | 2.1 | 32 | £18,013 | £68 | 100 |
| Number of participants | Total number of staff members | Number of staff per participants | Mean time (minutes) | Total staff cost | Cost per participant | Total staff cost % | ||
|---|---|---|---|---|---|---|---|---|
| Collagenase administration | ||||||||
| Consultant | 331 | 376 | 1.14 | 40 | £28,576 | £86 | 60 | |
| Trainee surgeon | 331 | 95 | 0.29 | 40 | £3154 | £10 | 7 | |
| Nurse | 331 | 311 | 0.94 | 40 | £9454 | £29 | 20 | |
| Healthcare assistant | 331 | 118 | 0.36 | 40 | £2077 | £6 | 4 | |
| Operating department practitioner | 331 | 25 | 0.08 | 40 | £760 | £2 | 2 | |
| Other staff | 331 | 111 | 0.34 | 40 | £3374 | £10 | 7 | |
| Total | 331 | 1036 | 3.13 | 40 | £47,396 | £143 | 100 | |
| Manipulation | ||||||||
| Consultant | 328 | 329 | 1.0 | 50 | £31,255 | £95 | 57 | |
| Trainee surgeon | 328 | 117 | 0.4 | 50 | £4856 | £15 | 9 | |
| Nurse | 328 | 282 | 0.9 | 50 | £10,716 | £33 | 20 | |
| Other staff | 328 | 210 | 0.6 | 50 | £7980 | £24 | 15 | |
| Total | 328 | 938 | 2.9 | 50 | £54,807 | £167 | 100 | |
FIGURE 91.
Proportions of staff cost by intervention component.
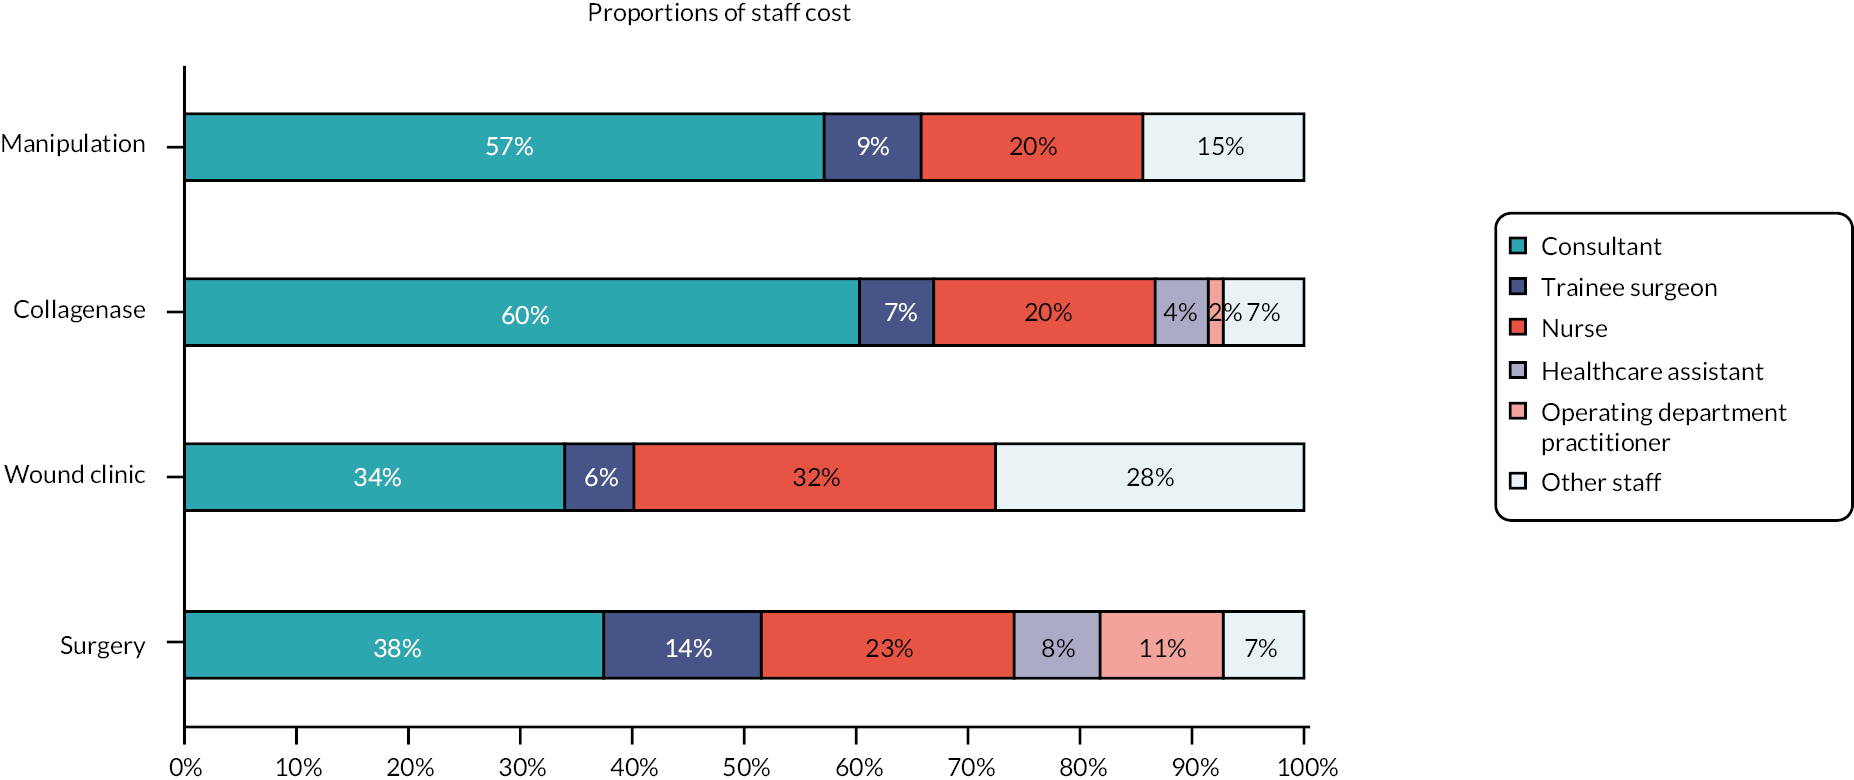
| 3 months | LF group (N = 260) | Collagenase group (N = 289) | Mean difference (95% CI) |
|---|---|---|---|
| Mean (SD) | Mean (SD) | ||
| GP visit (practice) | £1.1 (£6.7) | £1.8 (£19.9) | £0.7 (−£1.9 to £3.2) |
| Nurse visit at (practice) | £1.4 (£6.4) | £0.7 (£7.0) | −£0.7 (−£1.8 to £0.5) |
| Physiotherapist | £12.3 (£50.8) | £4.9 (£27.5) | −£7.3 (−£14.1 to −£0.6) |
| Occupational therapist | £27.8 (£100.6) | £8.1 (£40.6) | −£19.6 (−£32.3 to −£7.0) |
| Total primary care | £42.6 (£128.4) | £15.6 (£57.6) | −£27.0 (−£43.4 to −£10.6) |
| Medication | £15.1 (£20.8) | £16.6 (£22.3) | £1.5 (−£2.1 to £5.2) |
| Physiotherapy | £71.1 (£119.6) | £29.0 (£71.2) | −£42.1 (−£58.4 to −£25.8) |
| Splinting of finger | £36.7 (£58.8) | £24.2 (£44.8) | −£12.4 (−£21.2 to −£3.7) |
| Wound care | £14.7 (£20.4) | £3.3 (£10.7) | −£11.4 (−£14.1 to −£8.7) |
| Collagenase injection | £0.0 (£0.0) | £4.0 (£67.2) | £4.0 (−£4.2 to £12.1) |
| LF | £33.9 (£314.2) | £10.2 (£172.7) | −£23.7 (−£65.7 to £18.2) |
| Dermo-fasciectomy | £0.0 (£0.0) | £0.0 (£0.0) | £0.0 (£0.0 to £0.0) |
| PNF | £4.4 (£70.9) | £11.9 (£116.0) | £7.5 (−£8.9 to £23.8) |
| Other treatment | £44.5 (£117.4) | £17.0 (£57.7) | −£27.5 (−£42.8 to −£12.2) |
| Observation | £10.1 (£16.1) | £6.6 (£14.1) | −£3.4 (−£6.0 to −£0.9) |
| Total outpatient visit | £215.3 (£402.3) | £106.2 (£255.8) | −£109.1 (−£165.1 to −£53.2) |
| A&E | £9.1 (£39.7) | £8.8 (£61.9) | −£0.3 (−£9.1 to £8.5) |
| Hospital inpatient | £30.6 (£245.6) | £101.0 (£719.3) | £70.4 (−£21.7 to £162.5) |
| Total secondary care | £255.0 (£473.4) | £216.0 (£822.3) | −£39.0 (−£153.2 to £75.1) |
| Total healthcare resource use cost a | £312.7 (£502.2) | £248.2 (£831.8) | −£64.5 (−£181.2 to £52.3) |
| 6 months | LF group (N = 251) | Collagenase group (N = 284) | Mean difference (95% CI) |
|---|---|---|---|
| Mean (SD) | Mean (SD) | ||
| GP visit (practice) | £1.8 (£14.6) | £0.8 (£6.5) | −£1.0 (−£2.9 to £0.9) |
| Nurse visit (practice) | £0.5 (£5.8) | £0.1 (£0.9) | −£0.4 (−£1.1 to £0.3) |
| Physiotherapist | £1.4 (£11.3) | £2.0 (£17.2) | £0.6 (−£1.9 to £3.1) |
| Occupational therapist | £7.0 (£60.4) | £5.0 (£40.6) | −£2.0 (−£10.7 to £6.7) |
| Total primary care | £10.7 (£65.2) | £7.9 (£44.6) | −£2.8 (−£12.2 to £6.6) |
| Medication | £15.7 (£20.3) | £15.1 (£21.3) | −£0.6 (−£4.2 to £2.9) |
| Physiotherapy | £13.3 (£67.3) | £5.5 (£29.2) | −£7.9 (−£16.5 to £0.8) |
| Splinting of finger | £3.0 (£28.6) | £1.8 (£14.1) | −£1.2 (−£5.0 to £2.5) |
| Wound care | £0.5 (£5.3) | £0.2 (£2.2) | −£0.3 (−£0.9 to £0.4) |
| Collagenase injection | £0.0 (£0.0) | £4.0 (£67.8) | £4.0 (−£4.4 to £12.4) |
| LF | £0.0 (£0.0) | £10.3 (£174.2) | £10.3 (−£11.3 to £31.9) |
| Dermo-fasciectomy | £0.0 (£0.0) | £0.0 (£0.0) | £0.0 (£0.0 to £0.0) |
| PNF | £0.0 (£0.0) | £0.0 (£0.0) | £0.0 (£0.0 to £0.0) |
| Other treatment | £4.8 (£29.9) | £7.0 (£37.3) | £2.3 (−£3.5 to £8.0) |
| Observation | £2.6 (£7.6) | £2.3 (£8.8) | −£0.3 (−£1.7 to £1.1) |
| Total outpatient visit | £24.3 (£88.7) | £31.2 (£202.3) | £6.9 (−£20.2 to £34.0) |
| A&E | £4.4 (£32.3) | £6.4 (£33.6) | −£2.1 (−£3.6 to £7.7) |
| Hospital inpatient | £42.2 (£426.7) | £86.4 (£685.9) | £44.2 (−£54.3 to £142.7) |
| Total secondary care | £70.8 (£444.5) | £124.0 (£718.5) | £53.2 (−£51.2 to £157.5) |
| Total healthcare resource use cost a | £97.3 (£452.8) | £147.0 (£736.4) | £49.8 (−£55.7 to £155.2) |
| 1 year | LF group (N = 258) | Collagenase group (N = 293) | Mean difference (95% CI) |
|---|---|---|---|
| Mean (SD) | Mean (SD) | ||
| GP visit (practice) | £1.0 (£10.8) | £1.0 (£7.9) | £0.09 (−£1.6 to £1.6) |
| Nurse visit (practice) | £0.1 (£1.4) | £0.0 (£0.6) | £0.05 (−£0.2 to £0.1) |
| Physiotherapist | £2.9 (£20.8) | £1.4 (£11.0) | −£1.5 (−£4.3 to £1.2) |
| Occupational therapist | £3.6 (£34.2) | £0.6 (£6.9) | −£3.0 (−£7.0 to £1.0) |
| Total primary care | £7.6 (£49.5) | £3.0 (£17.8) | −£4.6 (−£10.7 to £1.5) |
| Medication | £14.4 (£21.2) | £16.1 (£23.3) | £1.8 (−£2.0 to £5.5) |
| Physiotherapy | £5.0 (£35.7) | £4.4 (£27.0) | −£0.6 (−£5.9 to £4.7) |
| Splinting of finger | £4.3 (£29.9) | £3.5 (£24.9) | −£0.8 (−£5.4 to £3.8) |
| Wound care | £0.5 (£4.1) | £0.4 (£3.1) | −£0.1 (−£0.7 to £0.5) |
| Collagenase injection | £0.0 (£0.0) | £3.9 (£66.8) | £3.9 (−£4.3 to £12.1) |
| LF | £22.8 (£258.0) | £60.1 (£416.5) | £37.4 (−£21.6 to £96.3) |
| Dermo-fasciectomy | £0.0 (£0.0) | £0.0 (£0.0) | £0.0 (£0.0 to £0.0) |
| PNF | £4.4 (£71.2) | £0.0 (£0.0) | −£4.4 (−£12.6 to £3.7) |
| Other treatment | £7.7 (£56.3) | £8.2 (£40.4) | £0.4 (−£7.7 to £8.6) |
| Observation | £2.9 (£11.0) | £2.7 (£9.8) | −£0.2 (−£2.0 to £1.5) |
| Total outpatient visit | £47.7 (£322.3) | £83.2 (£467.3) | £35.5 (−£32.5 to £103.6) |
| A&E | £4.2 (£27.5) | £8.7 (£44.3) | £4.5 (−£1.8 to £10.7) |
| Hospital inpatient | £41.0 (£402.1) | £125.3 (£875.5) | £84.2 (−£32.4 to £200.8) |
| Total secondary care | £93.0 (£515.4) | £217.2 (£1025.3) | £124.2 (−£14.2 to £262.9) |
| Total healthcare resource use cost a | £114.9 (£518.8) | £236.3 (£1029.2) | £121.4 (−£17.8 to £260.6) |
| 2 years | LF group (N = 209) | Collagenase group (N = 239) | Mean difference (95% CI) |
|---|---|---|---|
| Mean (SD) | Mean (SD) | ||
| GP visit (practice) | £0.6 (£5.6) | £1.1 (£6.7) | £0.5 (−£0.7 to £1.6) |
| Nurse visit (practice) | £0.1 (£0.8) | £0.1 (£1.2) | £0.1 (−£0.1 to £0.3) |
| Physiotherapist | £0.3 (£3.9) | £1.0 (£14.7) | £0.7 (−£1.4 to £2.7) |
| Occupational therapist | £0.0 (£0.0) | £3.2 (£34.7) | £3.2 (−£1.6 to £7.9) |
| Total primary care | £1.0 (£8.0) | £5.4 (£38.2) | £4.4 (−£0.9 to £9.7) |
| Medication | £16.0 (£21.8) | £19.4 (£23.7) | £3.5 (−£0.8 to £7.7) |
| Physiotherapy | £5.0 (£31.5) | £9.1 (£58.8) | £4.0 (−£4.9 to £13.0) |
| Splinting of finger | £2.0 (£15.3) | £4.2 (£26.5) | £2.2 (−£1.9 to £6.3) |
| Wound care | £0.7 (£6.1) | £1.3 (£8.9) | £0.6 (−£0.8 to £2.0) |
| Collagenase injection | £0.0 (£0.0) | £0.0 (£0.0) | £0.0 (£0.0 to £0.0) |
| LF | £28.1 (£286.5) | £98.3 (£529.2) | £70.2 (−£10.5 to £150.8) |
| Dermo-fasciectomy | £0.0 (£0.0) | £0.0 (£0.0) | £0.0 (£0.0 to £0.0) |
| PNF | £5.5 (£79.1) | £4.8 (£73.9) | −£0.7 (−£14.9 to £13.5) |
| Other treatment | £16.5 (£63.1) | £26.2 (£175.8) | £9.6 (−£15.6 to £34.8) |
| Observation | £6.1 (£22.8) | £5.8 (£20.6) | −£0.3 (−£4.3 to £3.7) |
| Total outpatient visit | £64.0 (£347.8) | £149.7 (£575.2) | £85.7 (−£4.2 to £175.5) |
| A&E | £13.9 (£70.0) | £12.2 (£48.5) | £1.7 (−£12.8 to £9.3) |
| Hospital inpatient | £332.2 (£1813.4) | £79.1 (£364.2) | −£253.2 (−£488.9 to −£17.4) |
| Total secondary care | £410.2 (£1881.2) | £240.9 (£703.3) | −£169.2 (−£426.7 to £88.3) |
| Total healthcare resource use cost a | £427.1 (£1884.8) | £265.7 (£707.4) | −£161.3 (−£419.5 to £96.8) |
FIGURE 92.
Mean cost of resource use per participant at each follow-up.
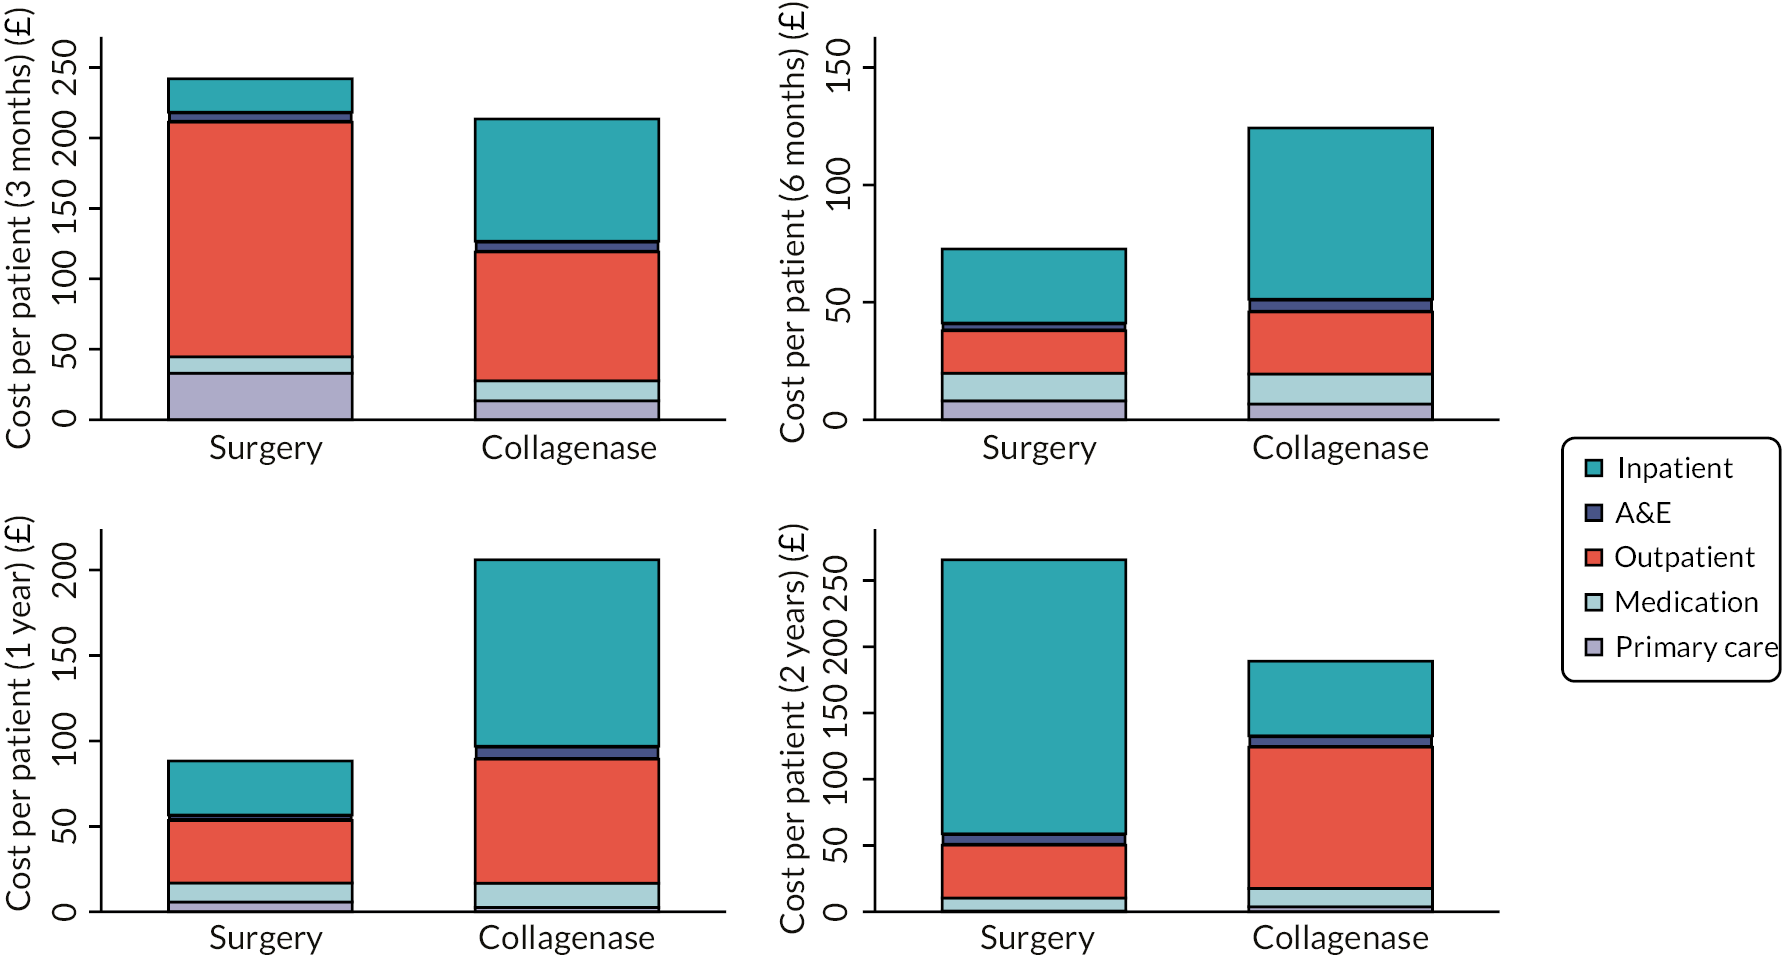
| Outpatient visits | LF group | Collagenase group | p-value (Pearson chi-square test) | ||
|---|---|---|---|---|---|
| Number of visits | Total visits % | Number of visits | Total visits % | ||
| 3 months | N = 260 | N = 289 | |||
| All outpatient visits | 706 | 100% | 369 | 100% | |
| Visits re reference hand | 692 | 98% | 338 | 92% | < 0.01 |
| Visits re complications/AE | 42 | 6% | 49 | 13% | < 0.01 |
| 6 months | N = 251 | N = 284 | |||
| All outpatient visits | 102 | 100% | 85 | 100% | |
| Visits re reference hand | 80 | 78% | 52 | 61% | 0.01 |
| Visits re complications/AE | 15 | 15% | 5 | 6% | 0.05 |
| 1 year | N = 258 | N = 293 | |||
| All outpatient visits | 87 | 100% | 98 | 100% | |
| Visits re reference hand | 41 | 47% | 56 | 57% | 0.17 |
| Visits re complications/AE | 6 | 7% | 9 | 9% | 0.57 |
| 2 years | N = 209 | N = 239 | |||
| All outpatient visits | 123 | 100% | 183 | 100% | |
| Visits re reference hand | 36 | 29% | 111 | 61% | < 0.01 |
| Visits re complications/AE | 5 | 4.1% | 3 | 1.6% | 0.19 |
| A&E attendance | LF group | Collagenase group | |||
|---|---|---|---|---|---|
| Number of visits | Total visits % | Number of visits | Total visits % | p-value (Pearson chi-square test) | |
| 3 months | N = 260 | N = 289 | |||
| All A&E attendance | 13 | 100 | 14 | 100 | |
| Visits re reference hand | 5 | 38 | 3 | 21 | 0.33 |
| Visits re complications/AE | 6 | 46 | 2 | 14 | 0.07 |
| 6 months | N = 251 | N = 284 | |||
| All A&E visits | 6 | 100 | 10 | 100 | |
| Visits re reference hand | 0 | 0 | 0 | 0 | |
| Visits re complications/AE | 0 | 0 | 0 | 0 | |
| 1 year | N = 258 | N = 293 | |||
| All A&E visits | 6 | 100 | 14 | 100 | |
| Visits re reference hand | 1 | 17 | 0 | 0 | 0.12 |
| Visits re complications/AE | 0 | 0 | 0 | 0 | |
| 2 years | N = 209 | N = 239 | |||
| All A&E visits | 16 | 100 | 16 | 100 | |
| Visits re reference hand | 0 | 0 | 1 | 6 | 0.31 |
| Visits re complications/AE | 0 | 0.0 | 0 | 0.0 | |
| Inpatient admissions | LF group | Collagenase group | p-value (Pearson chi-square test) | ||
|---|---|---|---|---|---|
| Number of visits | Total visits % | Number of visits | Total visits % | ||
| 3 months | N = 260 | N = 289 | |||
| All inpatient admissions | 5 | 100 | 10 | 100 | |
| Visits re reference hand | 1 | 20 | 3 | 30 | 0.68 |
| Visits re complications/AE | 1 | 20 | 0 | 0 | 0.14 |
| 6 months | N = 251 | N = 284 | |||
| All inpatient admissions | 5 | 100 | 9 | 100 | |
| Visits re reference hand | 0 | 0 | 1 | 11 | 0.44 |
| Visits re complications/AE | 0 | 0 | 1 | 11 | 0.44 |
| 1 year | N = 258 | N = 293 | |||
| All inpatient admissions | 5 | 100 | 15 | 100 | |
| Visits re reference hand | 1 | 20 | 3 | 20 | 1.00 |
| Visits re complications/AE | 0 | 0 | 1 | 7 | 0.55 |
| 2 years | N = 209 | N = 239 | |||
| All inpatient admissions | 21 | 100 | 18 | 100 | |
| Visits re reference hand | 1 | 5 | 7 | 39 | 0.01 |
| Visits re complications/AE | 1 | 4.8 | 0 | 0.0 | 0.35 |
| LF group (N = 295) | Collagenase group (N = 326) | |||||||
|---|---|---|---|---|---|---|---|---|
| Collagenase | LF | PNF | Dermo-fasciectomy | Collagenase | LF | PNF | Dermo-fasciectomy | |
| First year post treatment | ||||||||
| Inpatient | 0 | 0 | 0 | 0 | 0 | 8 | 0 | 0 |
| Outpatient | 0 | 5 | 2 | 0 | 3 | 9 | 3 | 0 |
| Total | 0 | 5 | 2 | 0 | 3 | 17 | 3 | 0 |
| Second year post treatment | ||||||||
| Inpatient | 0 | 1 | 0 | 0 | 0 | 6 | 0 | 1 |
| Outpatient | 0 | 2 | 1 | 0 | 0 | 8 | 1 | 0 |
| Total | 0 | 3 | 1 | 0 | 0 | 14 | 1 | 1 |
FIGURE 93.
EuroQol-5 Dimensions utility scores at baseline and follow-up points – Kernel density estimates by allocation.
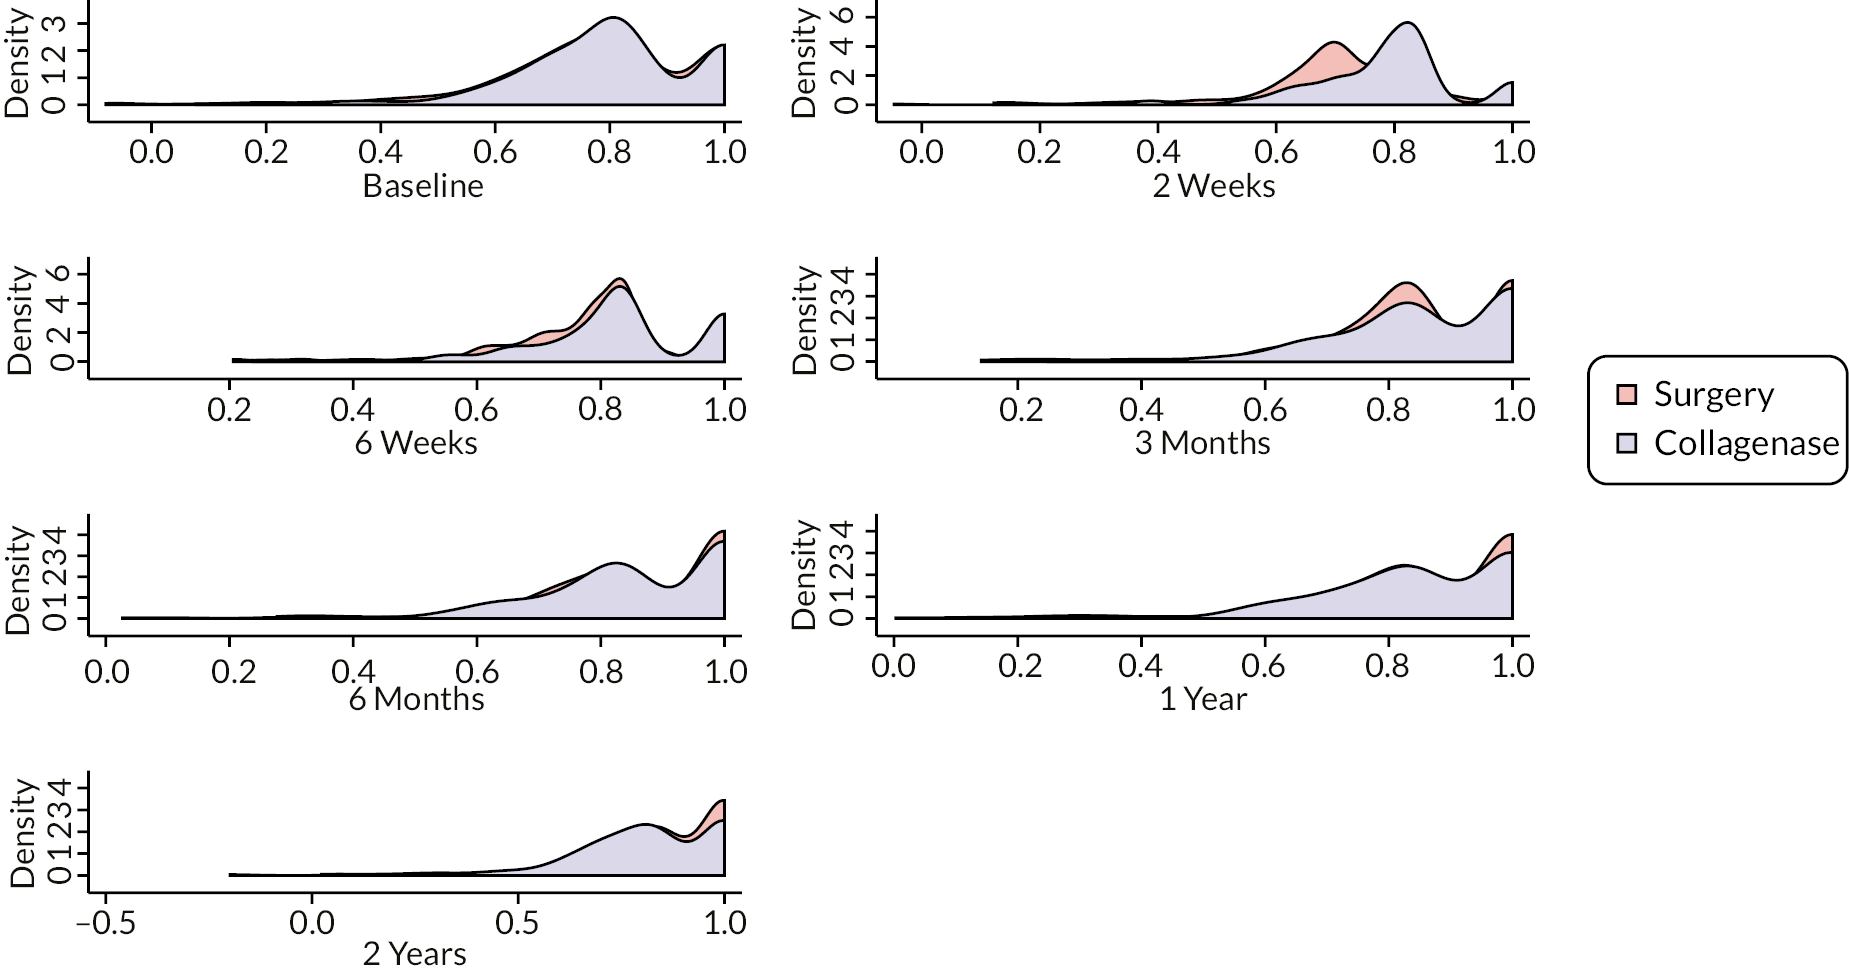
FIGURE 94.
Percentage of participants’ response to each level of mobility question in EQ-5D-5L at each time point in complete cases.
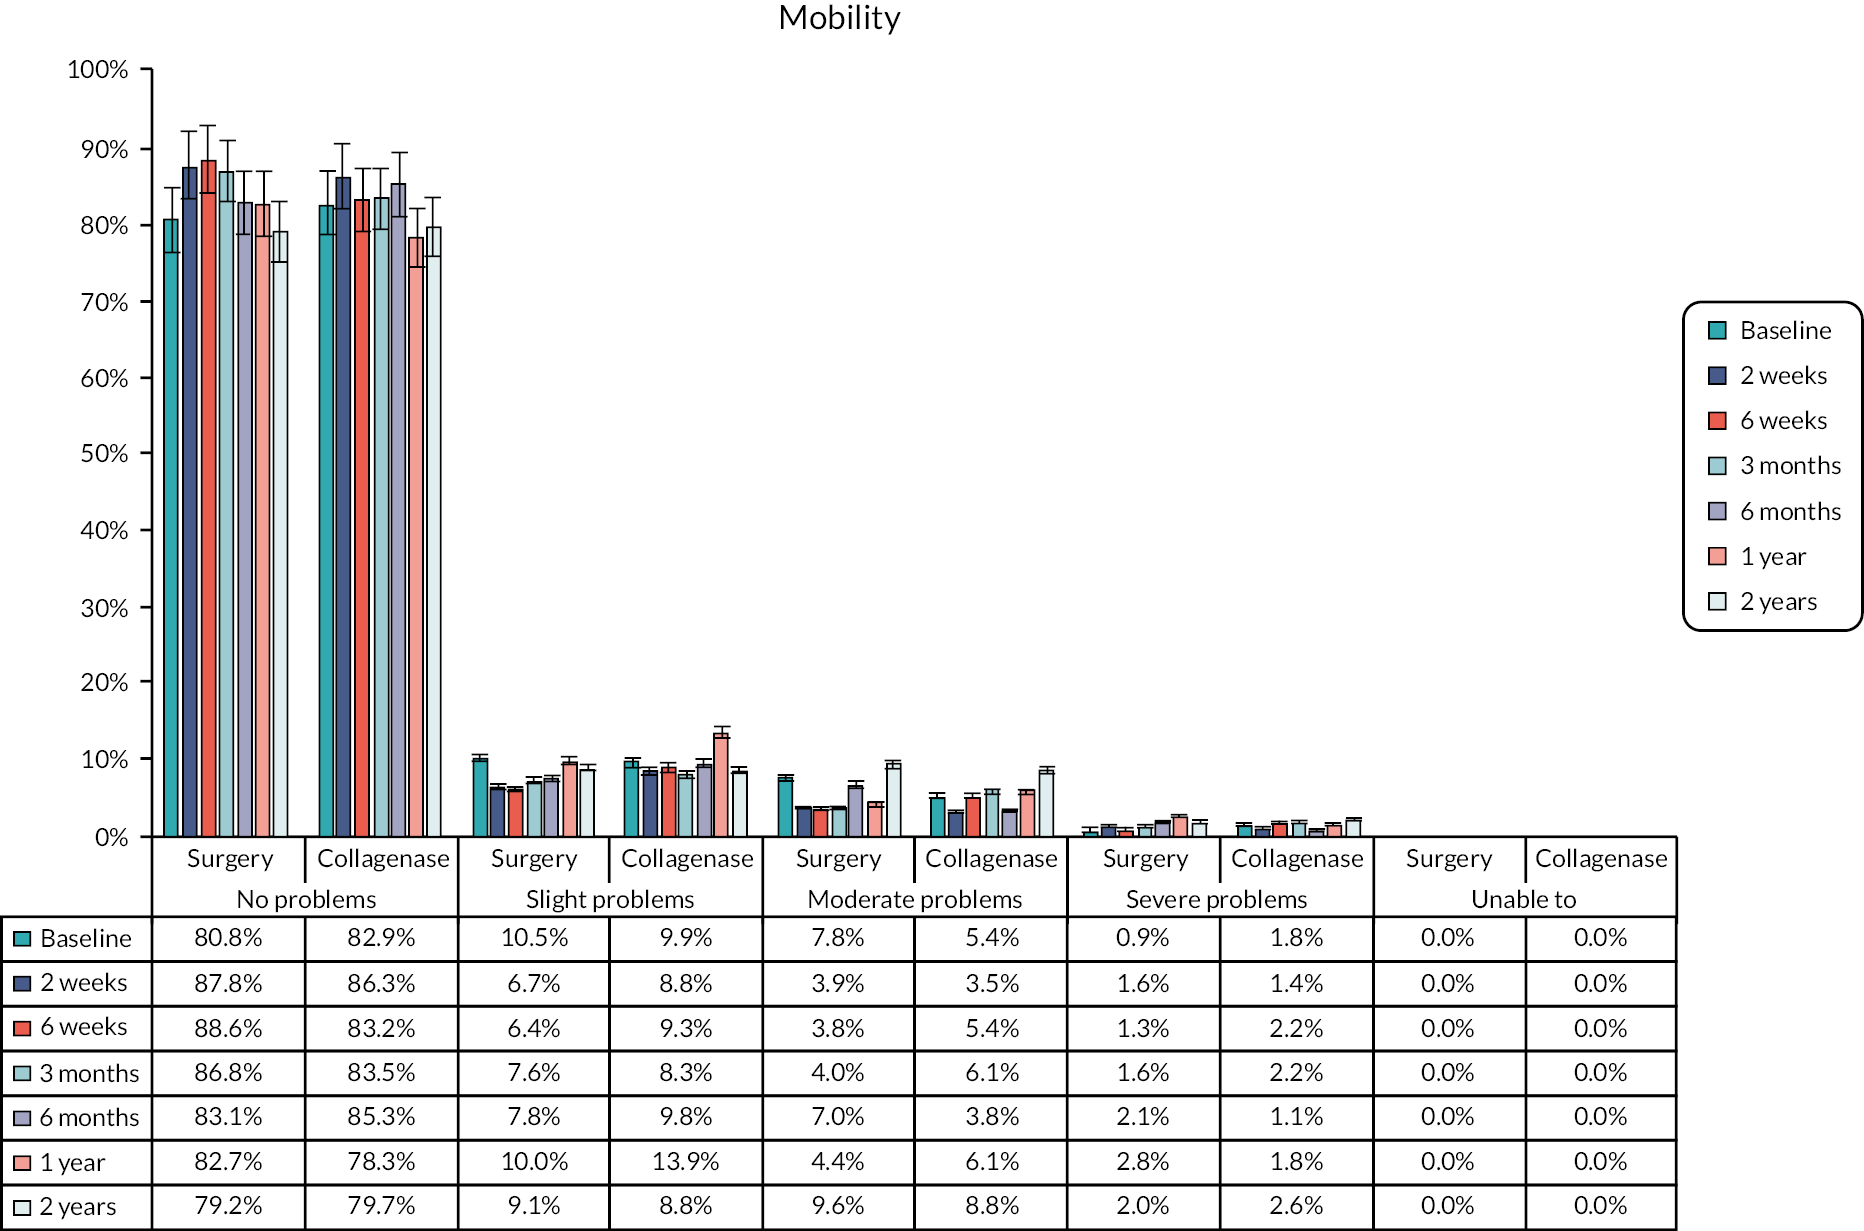
FIGURE 95.
Percentage of participants’ response to each level of self-care question in EQ-5D-5L at each time point in complete cases.
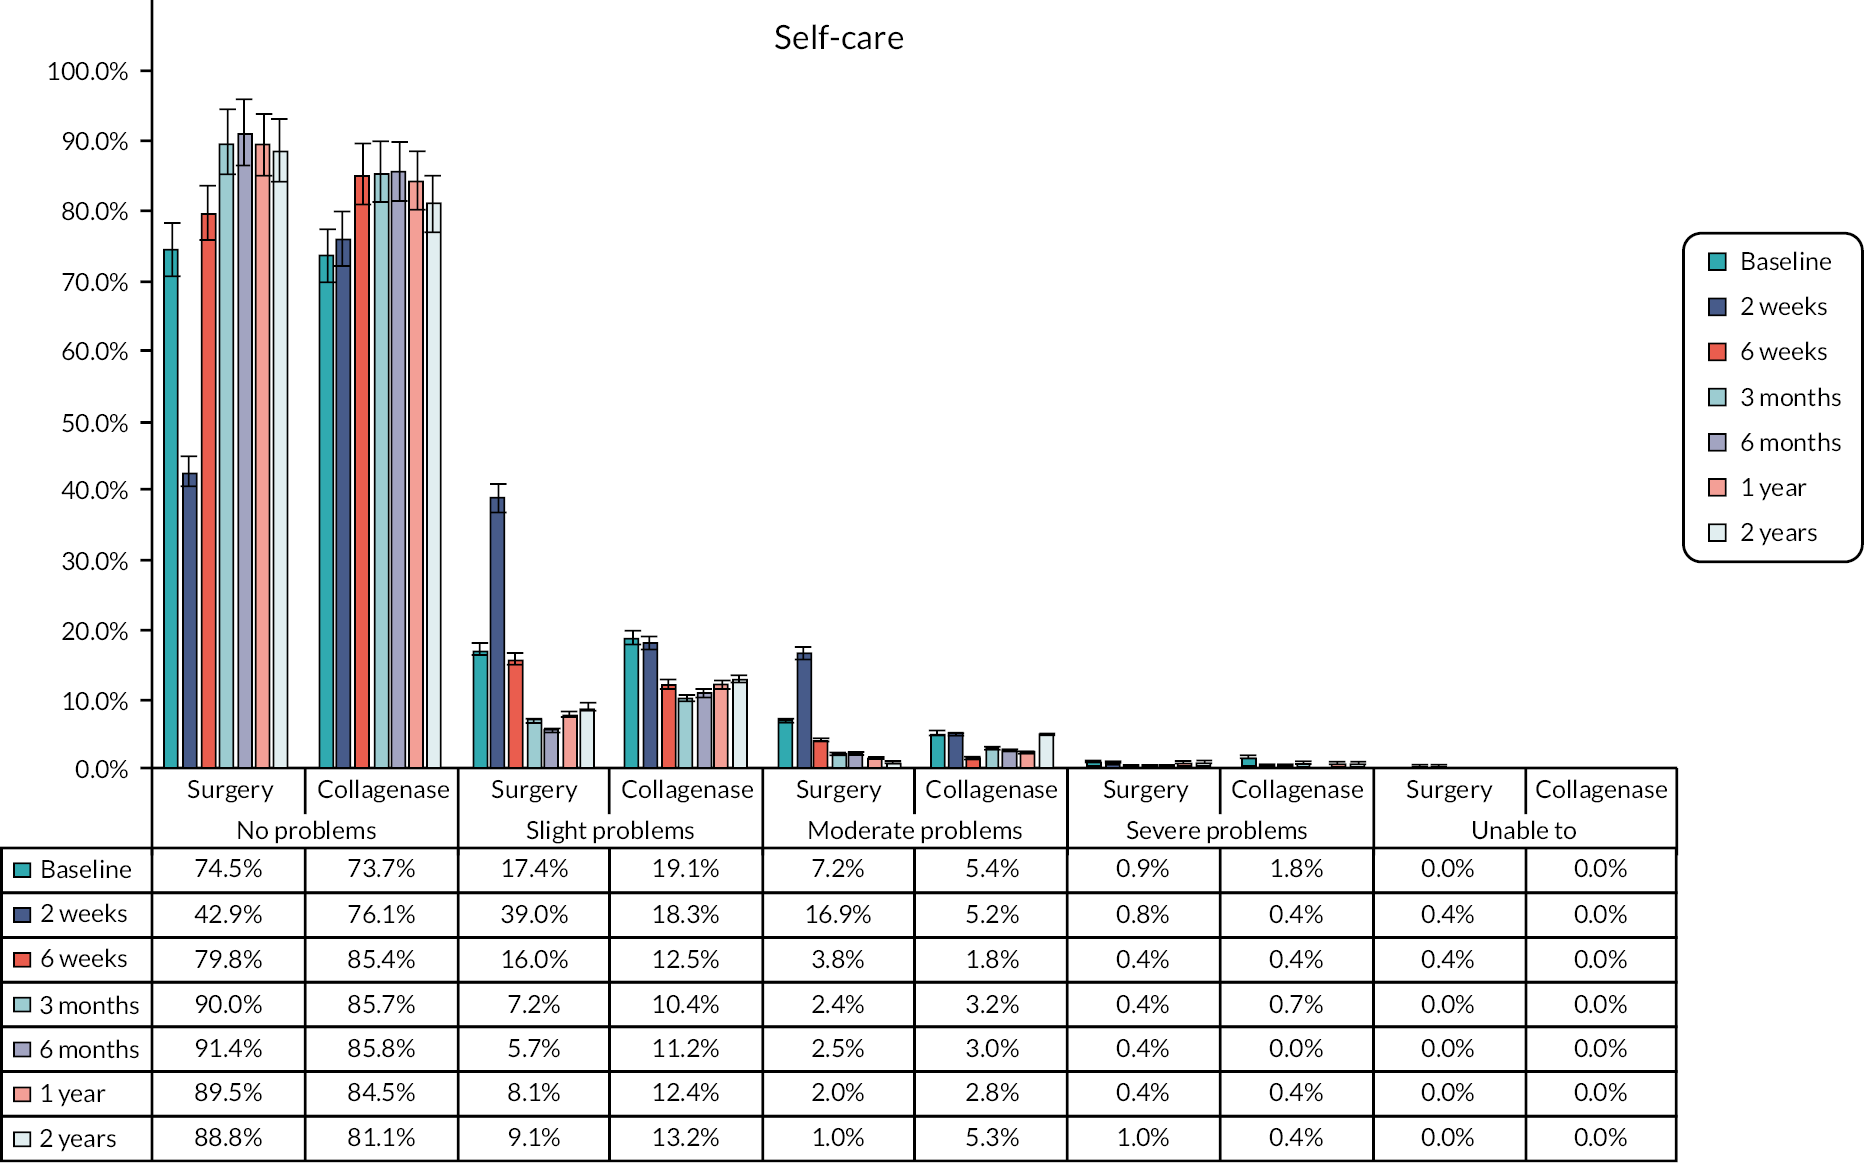
FIGURE 96.
Percentage of participants’ response to each level of usual activities question in EQ-5D-5L at each time point in complete cases.
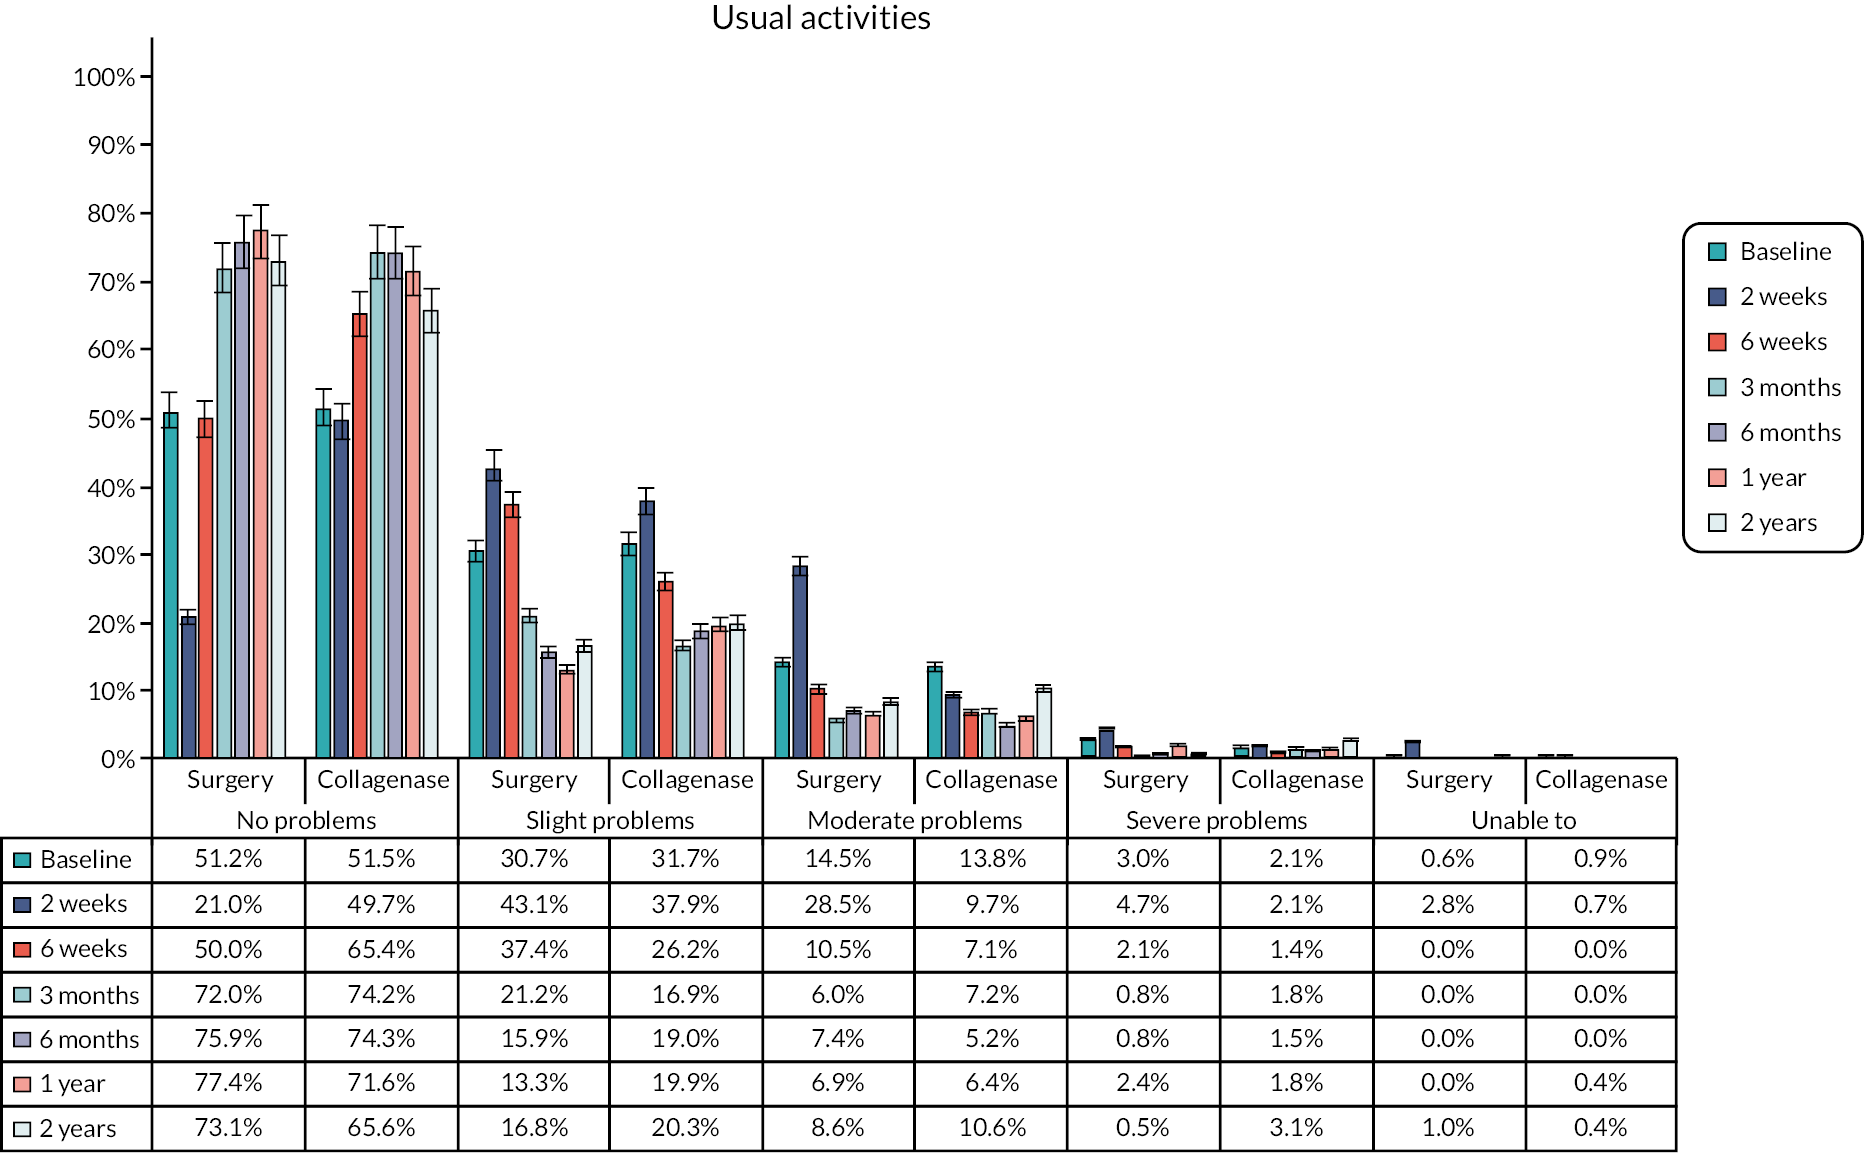
FIGURE 97.
Percentage of participants’ response to each level of pain/discomfort question in EQ-5D-5L at each time point in complete cases.
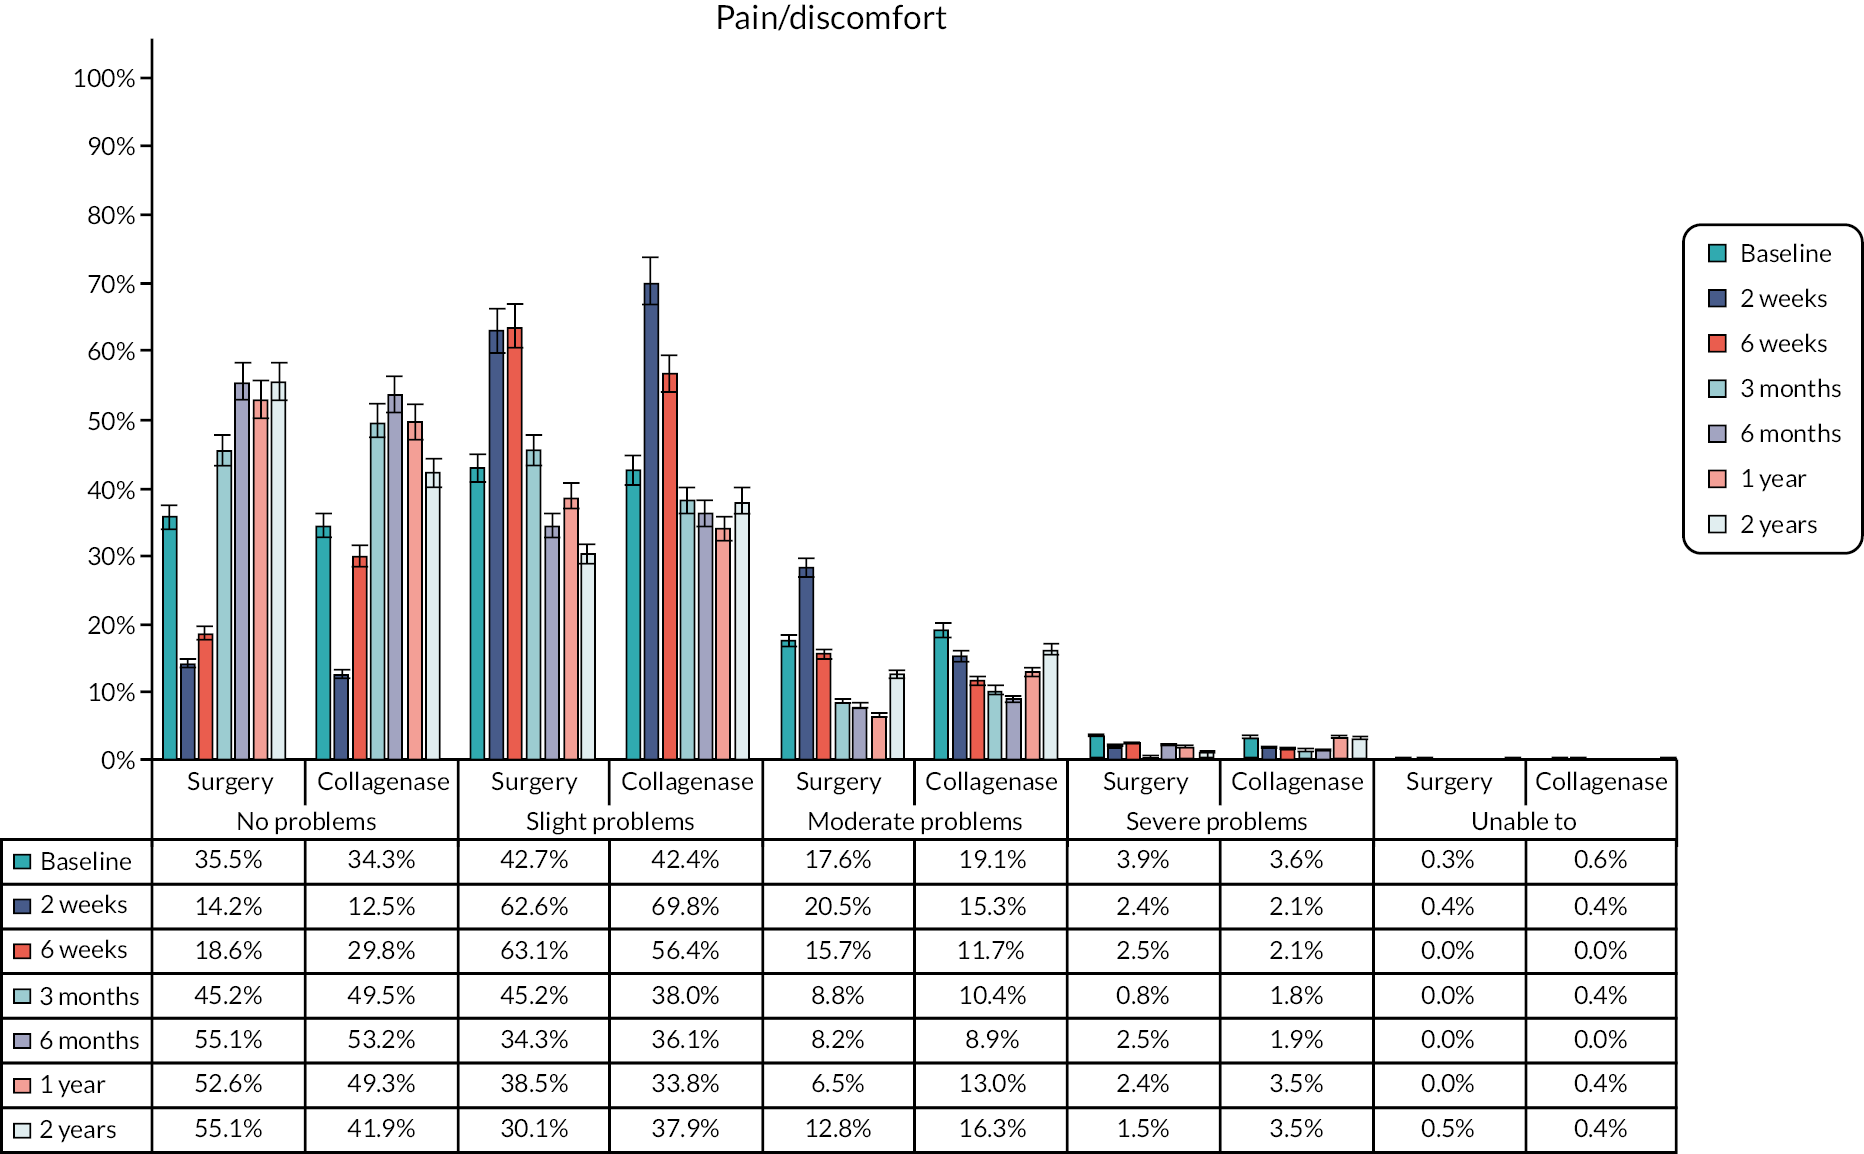
FIGURE 98.
Percentage of participants’ response to each level of anxiety/depression question in EQ-5D-5L at each time point in complete cases.
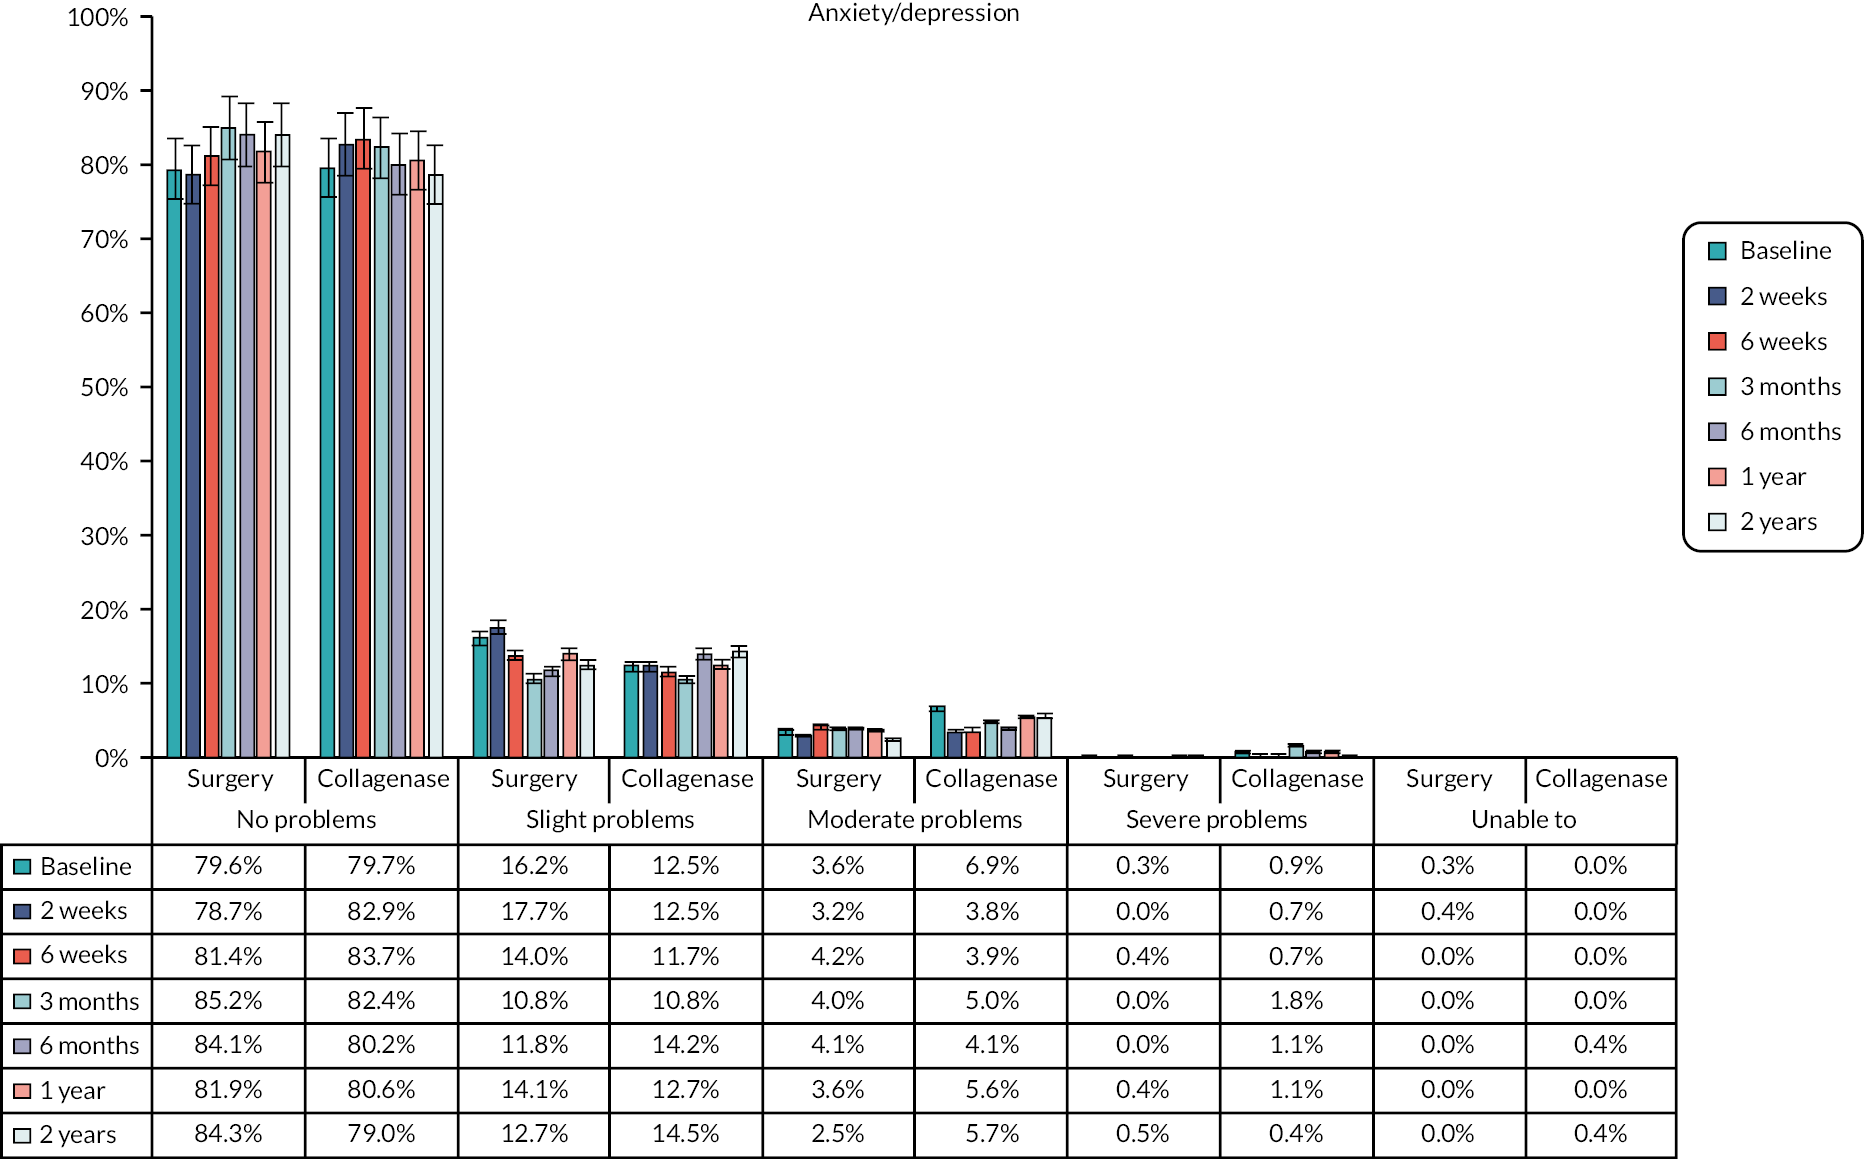
| Time point | LF group | Collagenase group | Mean difference (95% CI) | ||
|---|---|---|---|---|---|
| Available cases | Mean (SD) | Available cases | Mean (SD) | ||
| Baseline | 331 | 83.8 (14.8) | 335 | 85.3 (15.1) | 1.45 (−0.85 to 3.75) |
| 2 weeks | 255 | 83.4 (13.0) | 290 | 86.3 (13.3) | 2.98 (0.75 to 5.12) |
| 6 weeks | 238 | 86.5 (12.8) | 283 | 88.3 (12.9) | 1.80 (−0.43 to 4.03) |
| 3 months | 249 | 88.3 (12.1) | 280 | 88.9 (12.6) | 0.62 (−1.54 to 2.79) |
| 6 months | 243 | 87.9 (13.7) | 269 | 88.6 (14.3) | 0.75 (−1.74 to 3.24) |
| 1 year | 248 | 88.0 (12.8) | 284 | 87.9 (12.9) | −0.17 (−2.37 to 2.04) |
| 2 years | 194 | 85.5 (15.0) | 227 | 86.1 (15.1) | 0.58 (−2.33 to 3.49) |
FIGURE 99.
Mean EQ VAS scores at baseline and follow-up points.
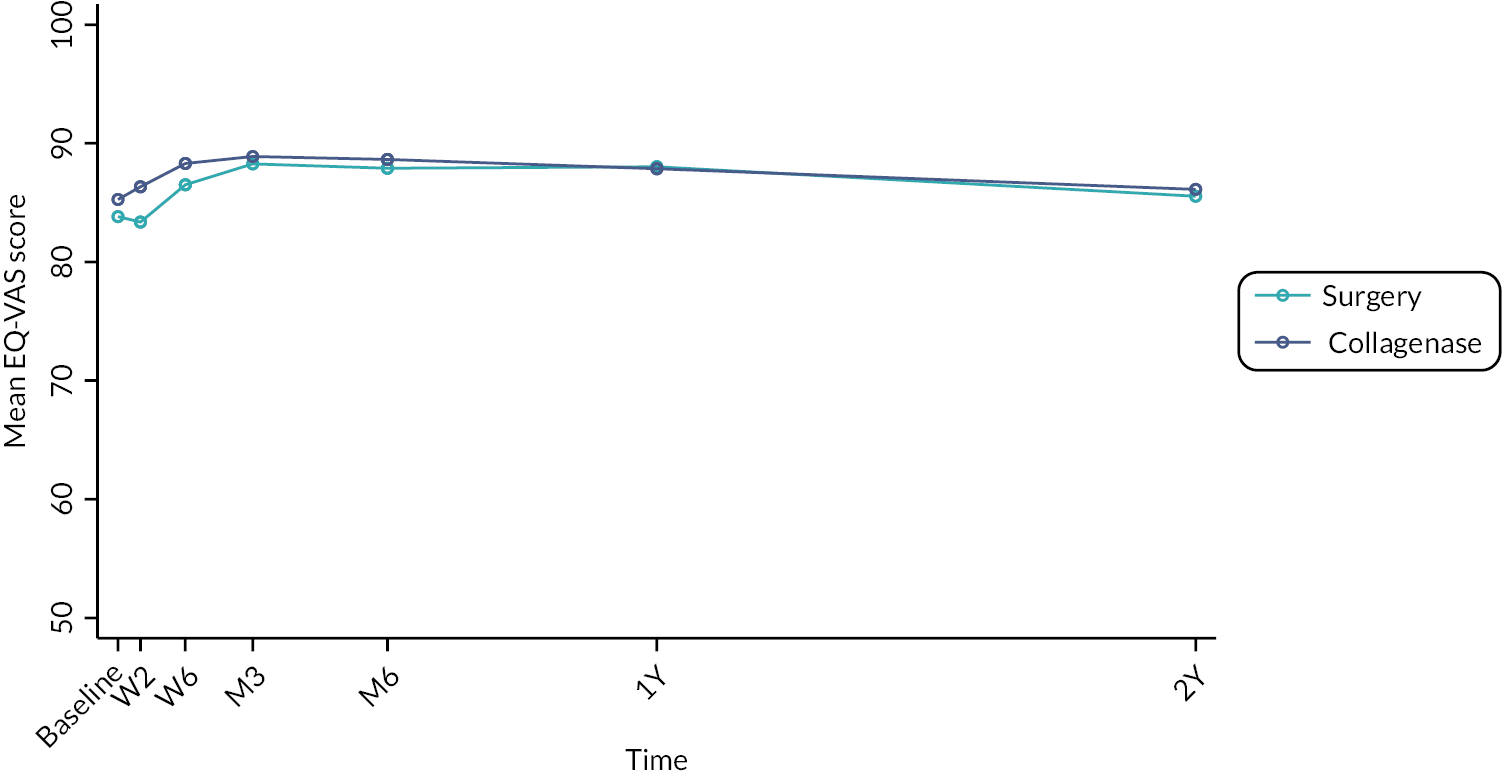
| Variable by time point | Number of missing value, n (%) | Total number of missing value, n (%) | |
|---|---|---|---|
| LF group | Collagenase group | ||
| EQ-5D utility scores | |||
| Baseline | 7 (2.1%) | 4 (1.2%) | 11 (1.6%) |
| 2 weeks | 83 (24.7%) | 55 (16.4%) | 138 (20.5%) |
| 6 weeks | 102 (30.4%) | 61 (18.2%) | 163 (24.3%) |
| 3 months | 87 (25.9%) | 58 (17.3%) | 145 (21.6%) |
| 6 months | 93 (27.7%) | 72 (21.4%) | 165 (24.6%) |
| 1 year | 89 (26.5%) | 55 (16.4%) | 144 (21.4%) |
| 2 years | 140 (41.7%) | 109 (32.4%) | 249 (37.1%) |
| Intervention cost | 0 (0.0%) | 0 (0.0%) | 0 (0.0%) |
| Healthcare resource use cost | |||
| Baseline | 0 (0.0%) | 0 (0.0%) | 0 (0.0%) |
| 3 months | 76 (22.6%) | 47 (14.0%) | 123 (18.3%) |
| 6 months | 85 (25.3%) | 52 (15.5%) | 137 (20.4%) |
| 1 year | 78 (23.2%) | 43 (12.8%) | 121 (18.0%) |
| 2 years | 127 (37.8%) | 97 (28.9%) | 224 (33.3%) |
FIGURE 100.
Comparison of the distribution of imputed values (imputation number 1–25) and the observed data (imputation number 0) for 2-year costs (left) and QALYs (right).
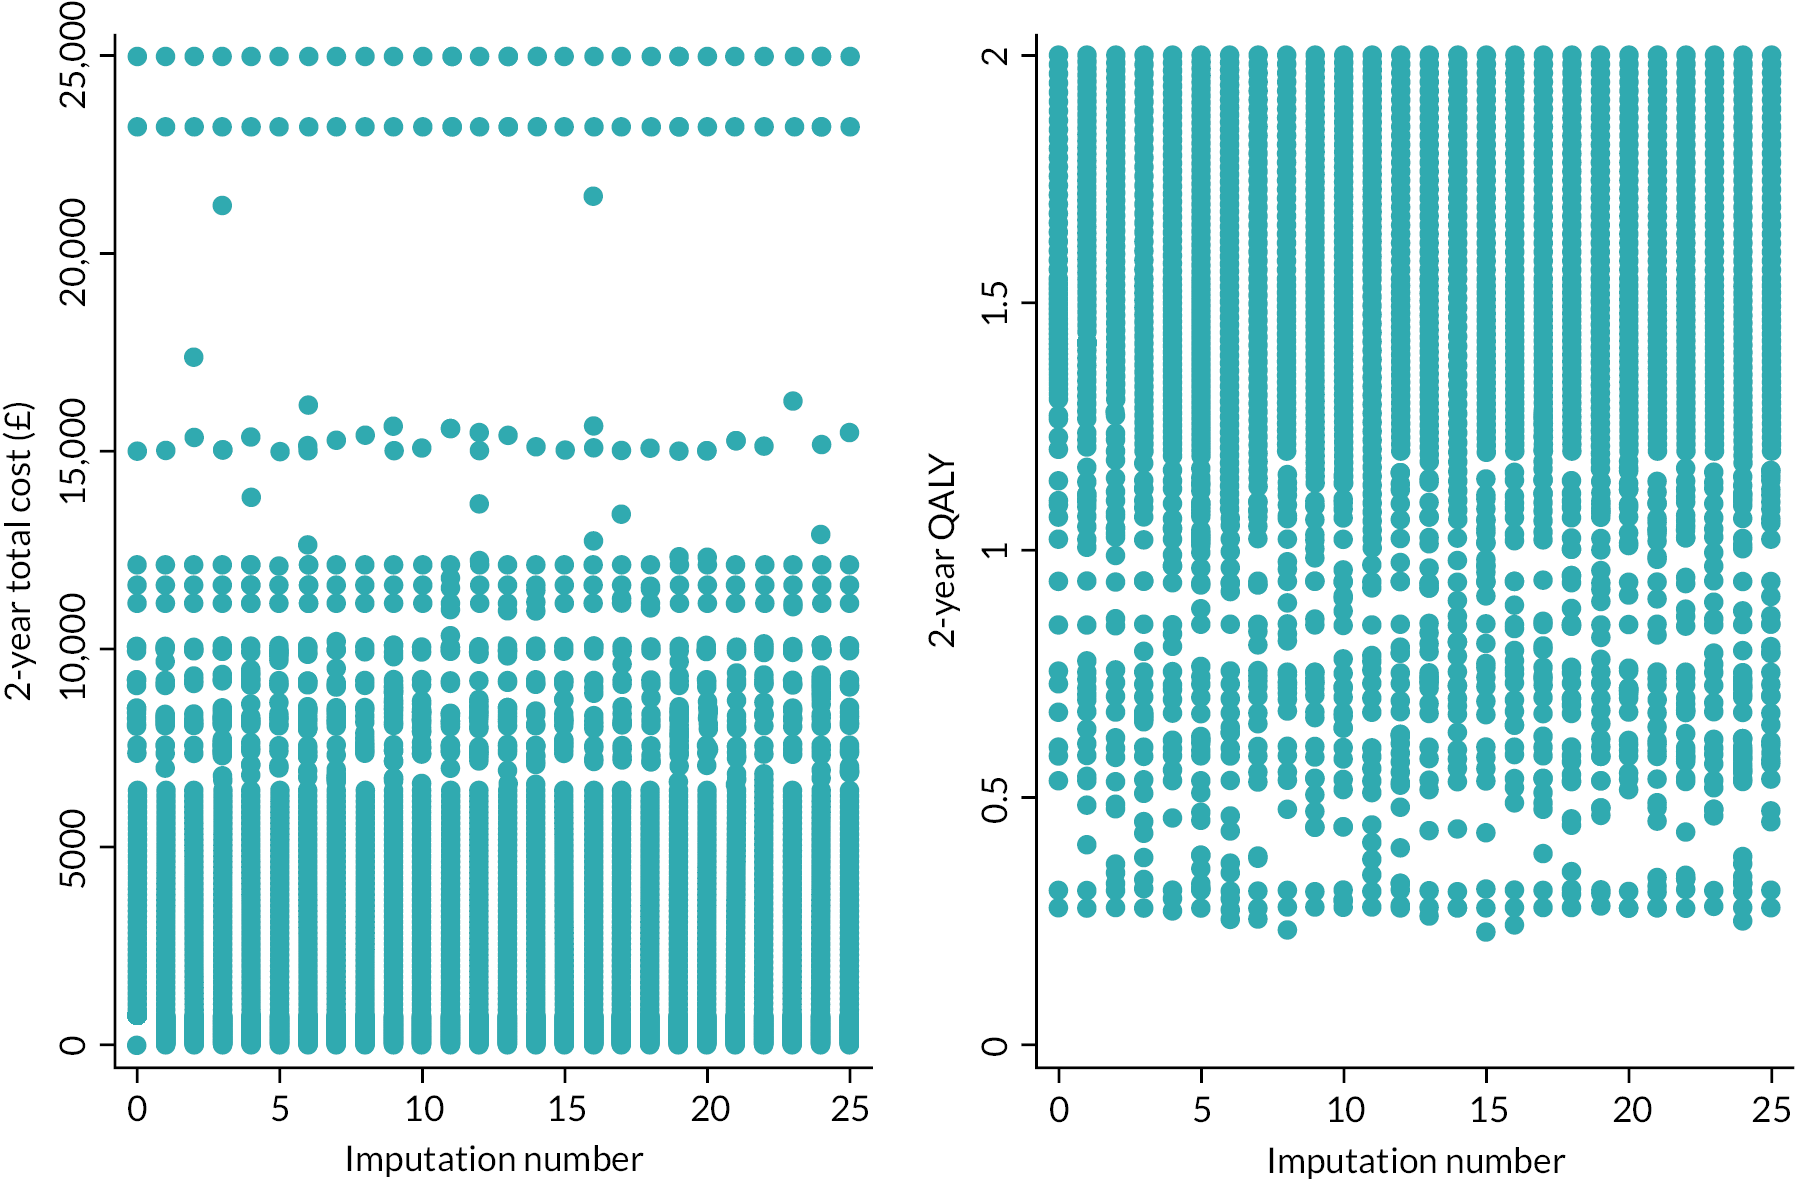
FIGURE 101.
Two-way sensitivity analysis for different combinations of 1-year recurrence rates of LF and collagenase at a WTP threshold of £30,000 per QALY at 1 year, 2 years, 3 years, 4 years and beyond. This figure illustrates that collagenase is the optimal treatment option at 1 year (top left), regardless of changes in recurrence rates. The base-case scenario is marked with a star, and its proximity to the boundary indicates how sensitive the cost-effectiveness decision is to changes in recurrence rates. For example, at 2 years, lowering LF’s recurrence rate to 11% or increasing collagenase’s recurrence rate to 21% would tip the scales in favour of LF (top right). Beyond a 4-year time horizon, LF consistently appears as the more cost-effective option (bottom right).
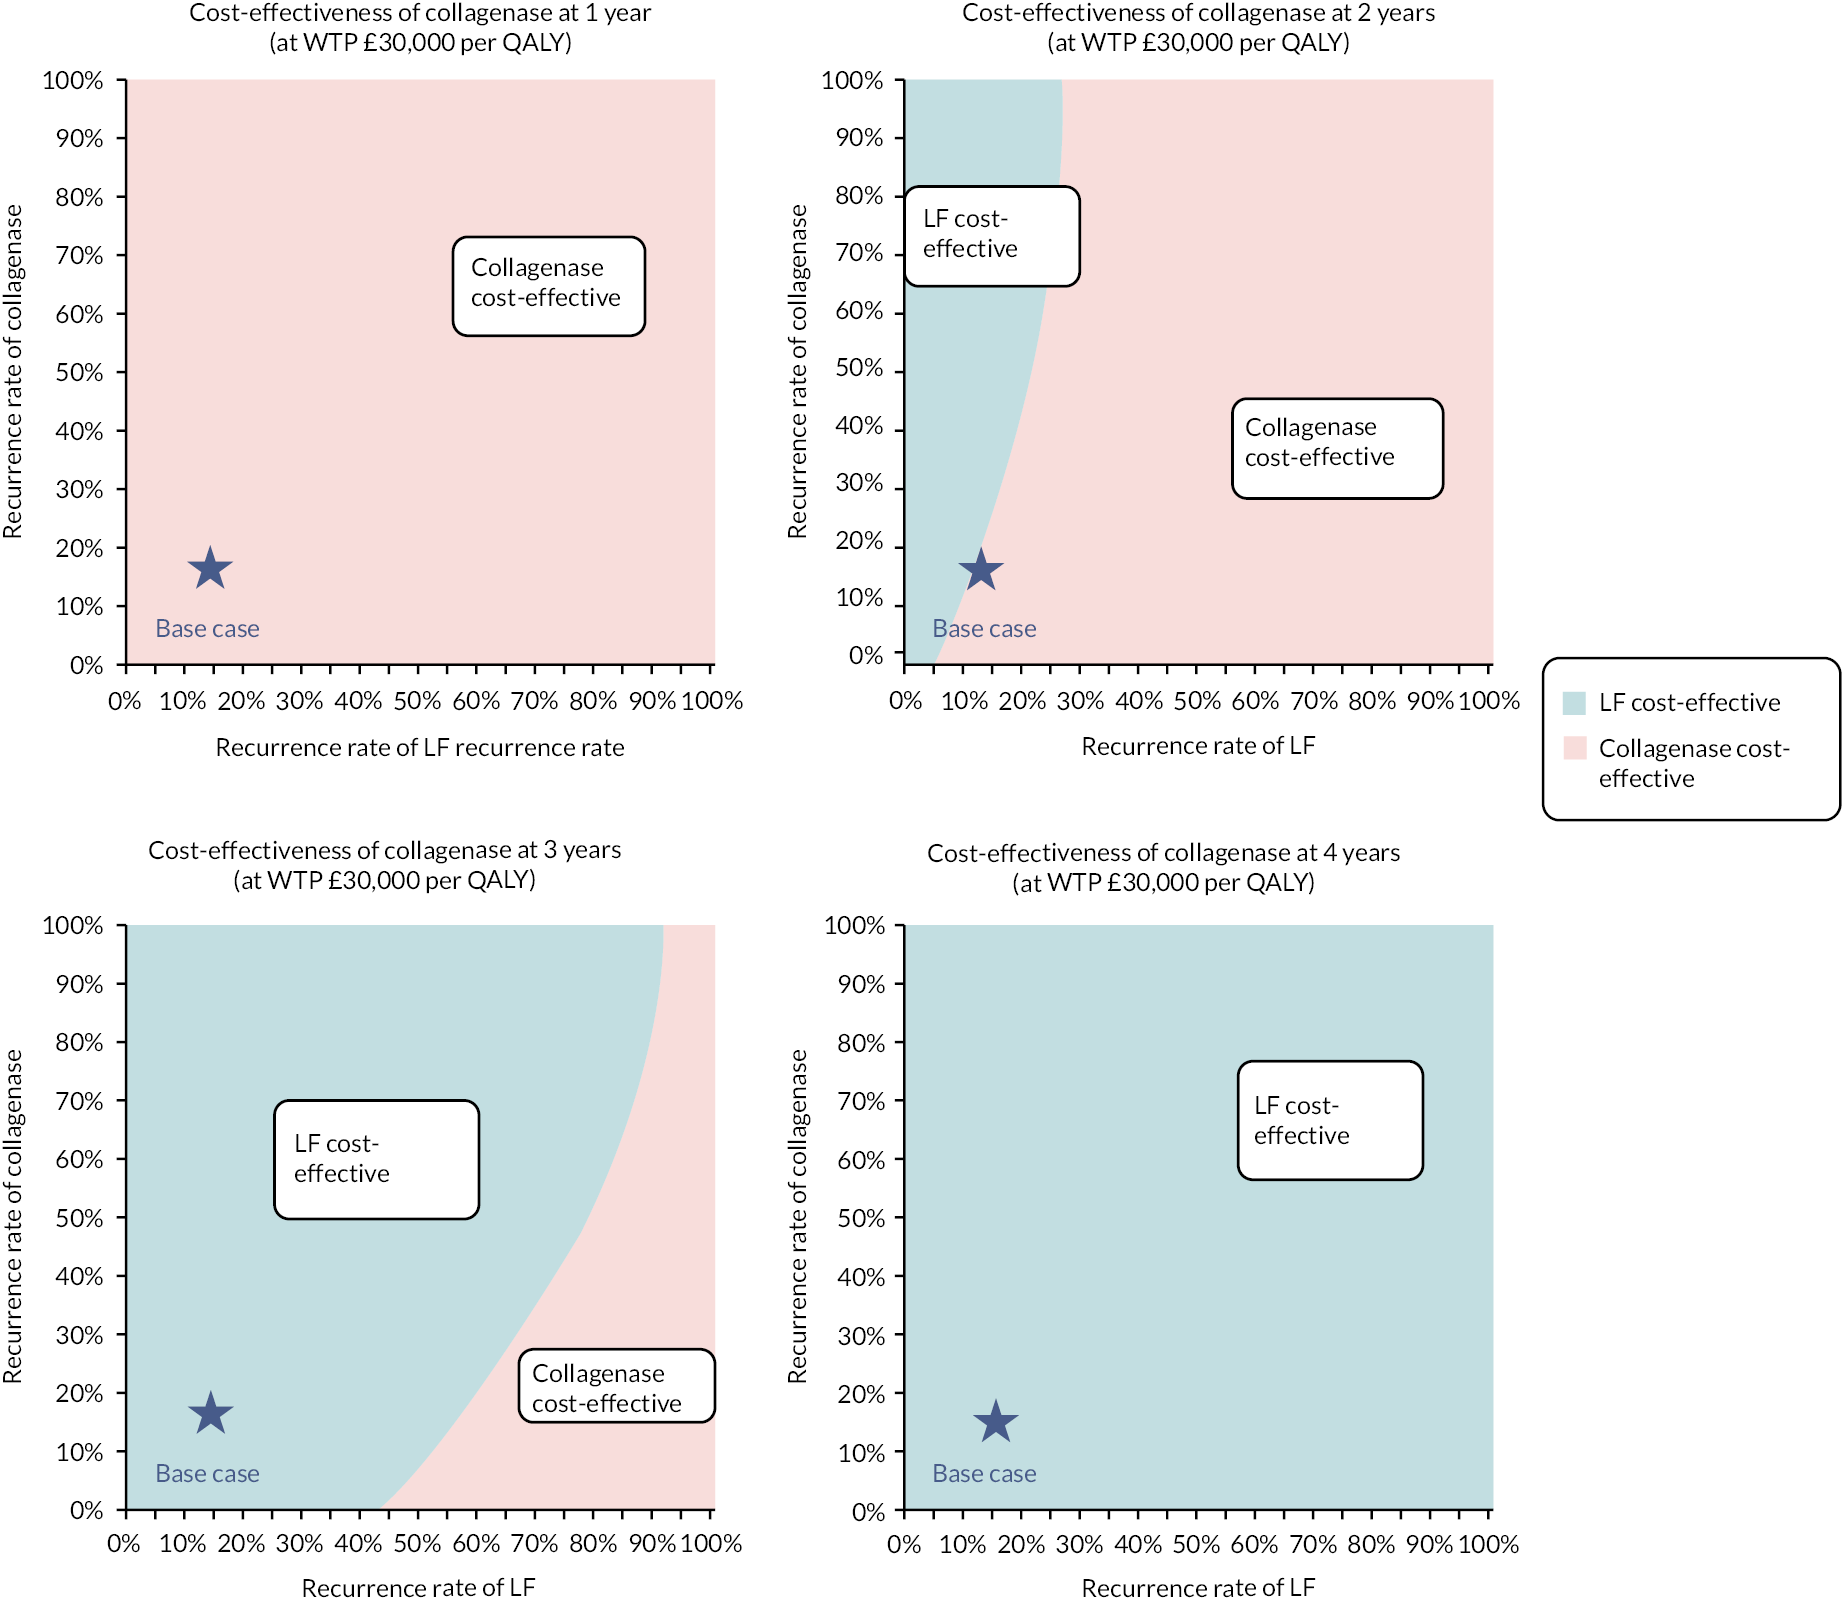
FIGURE 102.
Two-way sensitivity analysis for different combinations of re-intervention rates of LF and collagenase at a WTP threshold of £30,000 per QALY at 1 year, 2 years, 3 years, 4 years and beyond. This figure illustrates that collagenase is the optimal treatment option at 1 year (top left), regardless of variations in re-intervention rates. The base-case scenario is marked with a star, and its closeness to the boundary indicates the sensitivity of the cost-effectiveness decision to changes in re-intervention rates. At 2 years (top right), the base case shows collagenase as cost-effective with a 40% re-intervention rate for both groups. This could change if the re-intervention rate for LF falls below 36% or rises above 59% for collagenase. At the origin, where no re-intervention is considered (0% for both), LF is the cost-effective choice, aligning with within-trial findings. Beyond a 3-year time horizon, LF consistently emerges as the more cost-effective option (bottom left and bottom right).
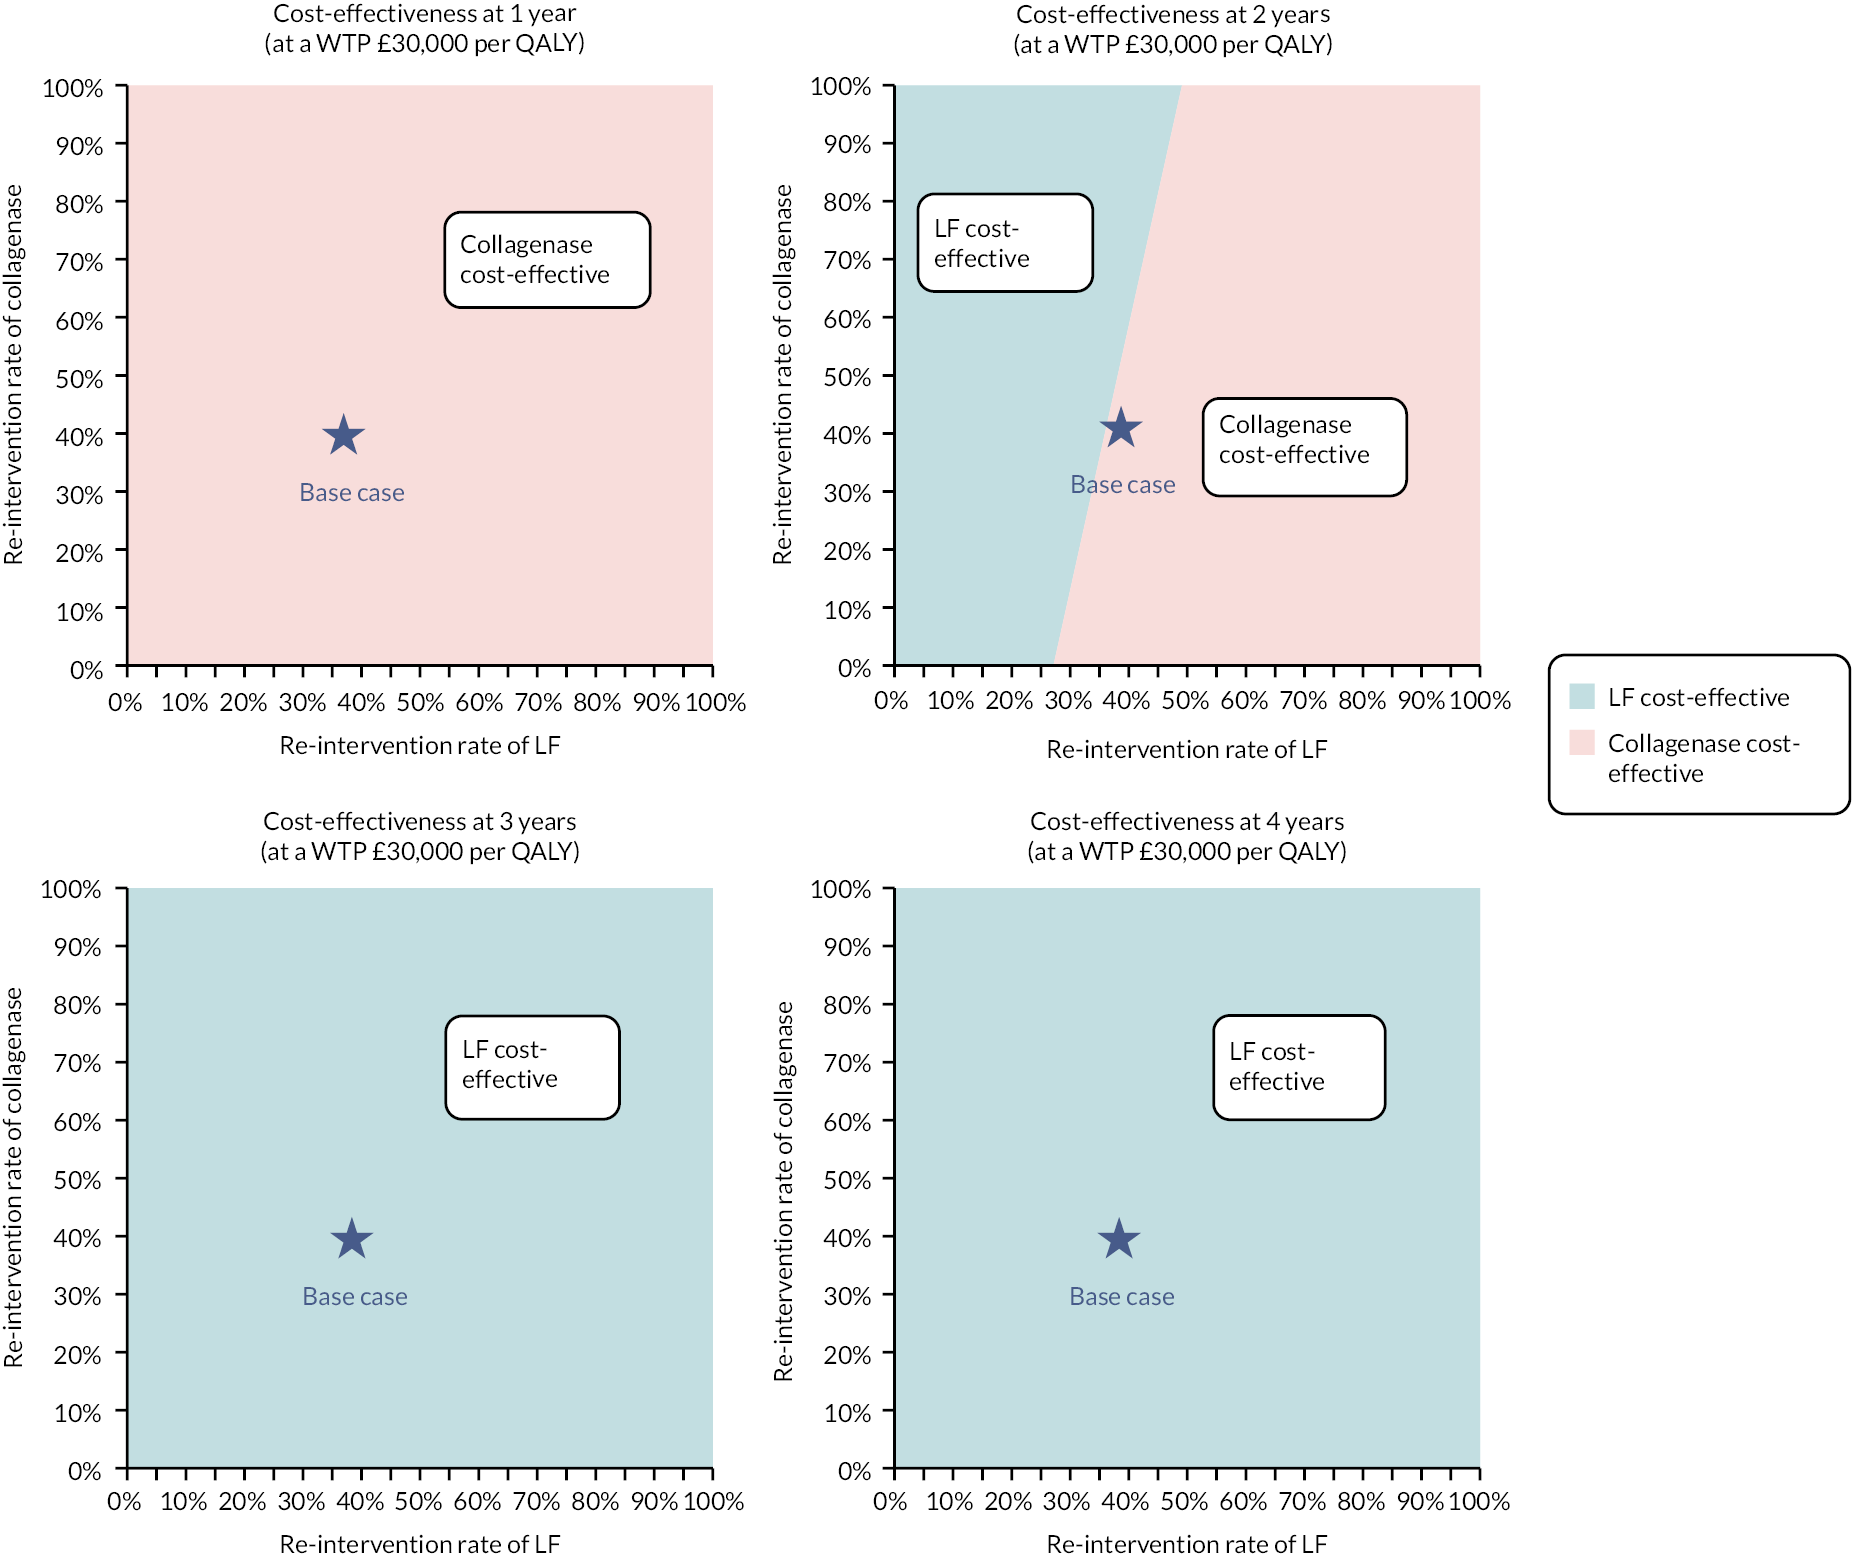
Appendix 10 Qualitative study topic guide
Part 1 – Your Dupuytren’s and its impact
To start we would like to find out how long you have experienced Dupuytren’s contracture?
-
(i) When did you start to notice the contracture? What did you notice? Pain/discomfort? What did you think about it to start with? What did you do about it (ignore it/worry about it/act immediately)?
-
(ii) How quickly did the contracture develop (quickly/slowly)? Has it changed over time (spread to other fingers/hand)?
How has it affected you?
-
Is this your dominant hand? Has the contracture affected you in normal daily activities? Has the contracture affected you at work? Are there any specific activities (sports/leisure) that the contracture has affected?
We would like to know how the contracture has affected other aspects of your life.
-
(i) Feelings about the contracture – cosmetic impact of contracture (i.e. how it looks)? frustrations at inabilities, feeling ‘disabled’ – general sense of well-being and quality of life?
-
(ii) Has your contracture made you more reliant on other people in any way? Parent? Friend? Work colleagues? Has this had affected your relationship with this/these individuals? Positive? Negative?
Part 2 – Treatment of your contracture
What did you know about the treatment of Dupuytren’s before your treatment started?
-
(i) Did you know what to expect? Did you know about different types of treatment? Did you have a preference for a particular type of treatment? Why?
-
(ii) What sort of information did you want to know before your treatment started (Success rate, complications, burden, etc.)?
-
(iii) What did you think the outcome of treatment should be (quick repair, permanent repair, regain full use, etc.)?
Can you tell us about the treatment you have received?
-
(i) Different aspects of this – initial presentation; ‘diagnosis’; treatment; rehab (initial/ongoing).
-
(ii) Were you surprised by any aspect of your care? Have you experienced any complications associated with your treatment? Have you found any element of your treatment problematic/difficult to manage?
-
(iii) What are your expectations for ongoing treatment? What are your goals for recovery? How long do you think your recovery will take?
Are you satisfied with the treatment that you have received?
-
(i) Has it worked?/Do you feel that you are improving?/Have improved? How ‘strong’ does your hand feel?
-
(ii) Are you content that you have made appropriate progress? What does this mean to you? Are you concerned about recurrence of Dupuytren’s? Would you change anything about your treatment?
Part 3 – Comparing treatments
If we asked you to think about comparing different treatments for Dupuytren’s what would be important to you? (Likely to be foreshadowed above – success rate, complications, burden, etc., but also speed of recovery, full recovery, etc. others?)
-
(i) What would be most important?
-
(ii) Can you describe what you perceive to the benefits and difficulties of Dupuytren’s surgery? Can you describe what you perceive to the benefits and difficulties of injection for Dupuytren’s?
By these criteria, which treatment do you think is best for Dupuytren’s? Is this the one that you would choose?
How would you view a hypothetical trade-off between ‘easier treatment’ and ‘better outcomes’?
-
(i) For example, risk of more complications but with better repair of the hand/finger
-
(ii) For example, quicker recovery versus higher chance of recovery.
Before we close, is there anything that you like to ask me, or anything else that you would like to tell me about your Dupuytren’s and its treatment?
List of abbreviations
- A&E
- accident and emergency
- AE
- adverse events
- AR
- adverse reaction
- AToMS
- Academic Team of Musculoskeletal Surgery
- BSSH
- British Society for Surgery of the Hand
- CACE
- complier-average causal effect
- CCH
- collagenase Clostridium histolyticum
- CEA
- cost-effectiveness analysis
- CEAC
- cost-effectiveness acceptability curve
- CEP
- cost-effectiveness plane
- CORDLESS
- Collagenase Option for Reduction of Dupuytren Long-Term Evaluation of Safety Study
- CRF
- case report form
- DC
- Dupuytren’s contracture
- DIP
- distal interphalangeal
- DISC
- Dupuytren’s interventions surgery versus collagenase
- DMEC
- Data Monitoring and Ethics Committee
- ECDF
- empirical cumulative distribution functions
- EQ-5D
- EuroQol-5 Dimensions
- EQ-5D-5L
- EuroQol-5 Dimensions, five-level version
- GCP
- good clinical practice
- GP
- general practitioner
- HRG
- Health Resource Group
- HRQoL
- health-related quality of life
- ICC
- intraclass correlation coefficient
- ICER
- incremental cost-effectiveness ratio
- IMP
- investigational medicinal product
- ITT
- intention to treat
- LF
- limited fasciectomy surgery
- MAR
- missing at random
- MCP
- metacarpophalangeal
- MHQ
- Michigan Hand Outcomes Questionnaire
- MHRA
- Medicines and Healthcare products Regulatory Agency
- MI
- multiple imputation
- MNAR
- missing not at random
- NHB
- net health benefit
- NICE
- National Institute for Health and Care Excellence
- NIHR
- National Institute for Health and Care Research
- NSAE
- non-serious adverse event
- PEM
- Patient Evaluation Measure
- PI
- principal investigator
- PIP
- proximal interphalangeal
- PNF
- percutaneous needle fasciotomy
- PPI
- patient and public involvement
- PSS
- Personal Social Services
- PSSRU
- Personal Social Services Research Unit
- QALY
- quality-adjusted life-year
- REC
- Research Ethics Committee
- RCT
- randomised controlled trial
- RoM
- range of movement
- SAE
- serious adverse event
- SANE
- Single Assessment Numeric Evaluation
- SIV
- site initiation visit
- SmPC
- summary of product characteristics
- SUSAR
- suspected unexpected serious adverse reaction
- TMG
- Trial Management Group
- TSC
- (independent) Trial Steering Committee
- URAM
- Unité Rhumatologique des Affections de la Main
- WTP
- willingness to pay
- YTU
- York Trials Unit
Notes
-
Dupuytren’s interventions surgery versus collagenase trial photography in hospital version 1
-
Dupuytren’s interventions surgery versus collagenase photography substudy appendix 1 v1.4
-
Dupuytren’s interventions surgery versus collagenase confirmation of Elig_v2
-
Dupuytren’s interventions surgery versus collagenase PIS v1.2
-
Dupuytren’s interventions surgery versus collagenase infographic v2.0
-
Dupuytren’s interventions surgery versus collagenase main study consent form v1.2
-
Dupuytren’s interventions surgery versus collagenase baseline participant questionnaire booklet_v1.2
-
Dupuytren’s interventions surgery versus collagenase photography substudy consent form v1.1
-
Dupuytren’s interventions surgery versus collagenase qualitative substudy consent form v1.1
-
Dupuytren’s interventions surgery versus collagenase participant change of status form_v1
-
DISC_TreatmentDel_v1.2 (investigator Treatment delivery CRF)
-
Dupuytren’s interventions surgery versus collagenase participant pretreatment delivery questionnaire booklet_v1.1
-
Dupuytren’s interventions surgery versus collagenase 6-week participant questionnaire booklet_v1.1
-
Dupuytren’s interventions surgery versus collagenase AE follow-up form_v1.0
Supplementary material can be found on the NIHR Journals Library report page (https://doi.org/10.3310/KGXD8528).
Supplementary material has been provided by the authors to support the report and any files provided at submission will have been seen by peer reviewers, but not extensively reviewed. Any supplementary material provided at a later stage in the process may not have been peer reviewed.
